Cambridge A Level Economics 9708 — 2020 Oct/Nov Paper 1 · Variant 1
9708/11/O/N/20 · 30 questions · 30 marks · ≈34 min
The question paper and its mark scheme, free to read here and free to download. This is Cambridge’s own paper, exactly as it was sat.
Question paper12 pages
Mark scheme3 pages
Answers below. Sit the paper first if you are practising.
Questions as text
Q1 · The diagram shows an economy’s production possibility curve
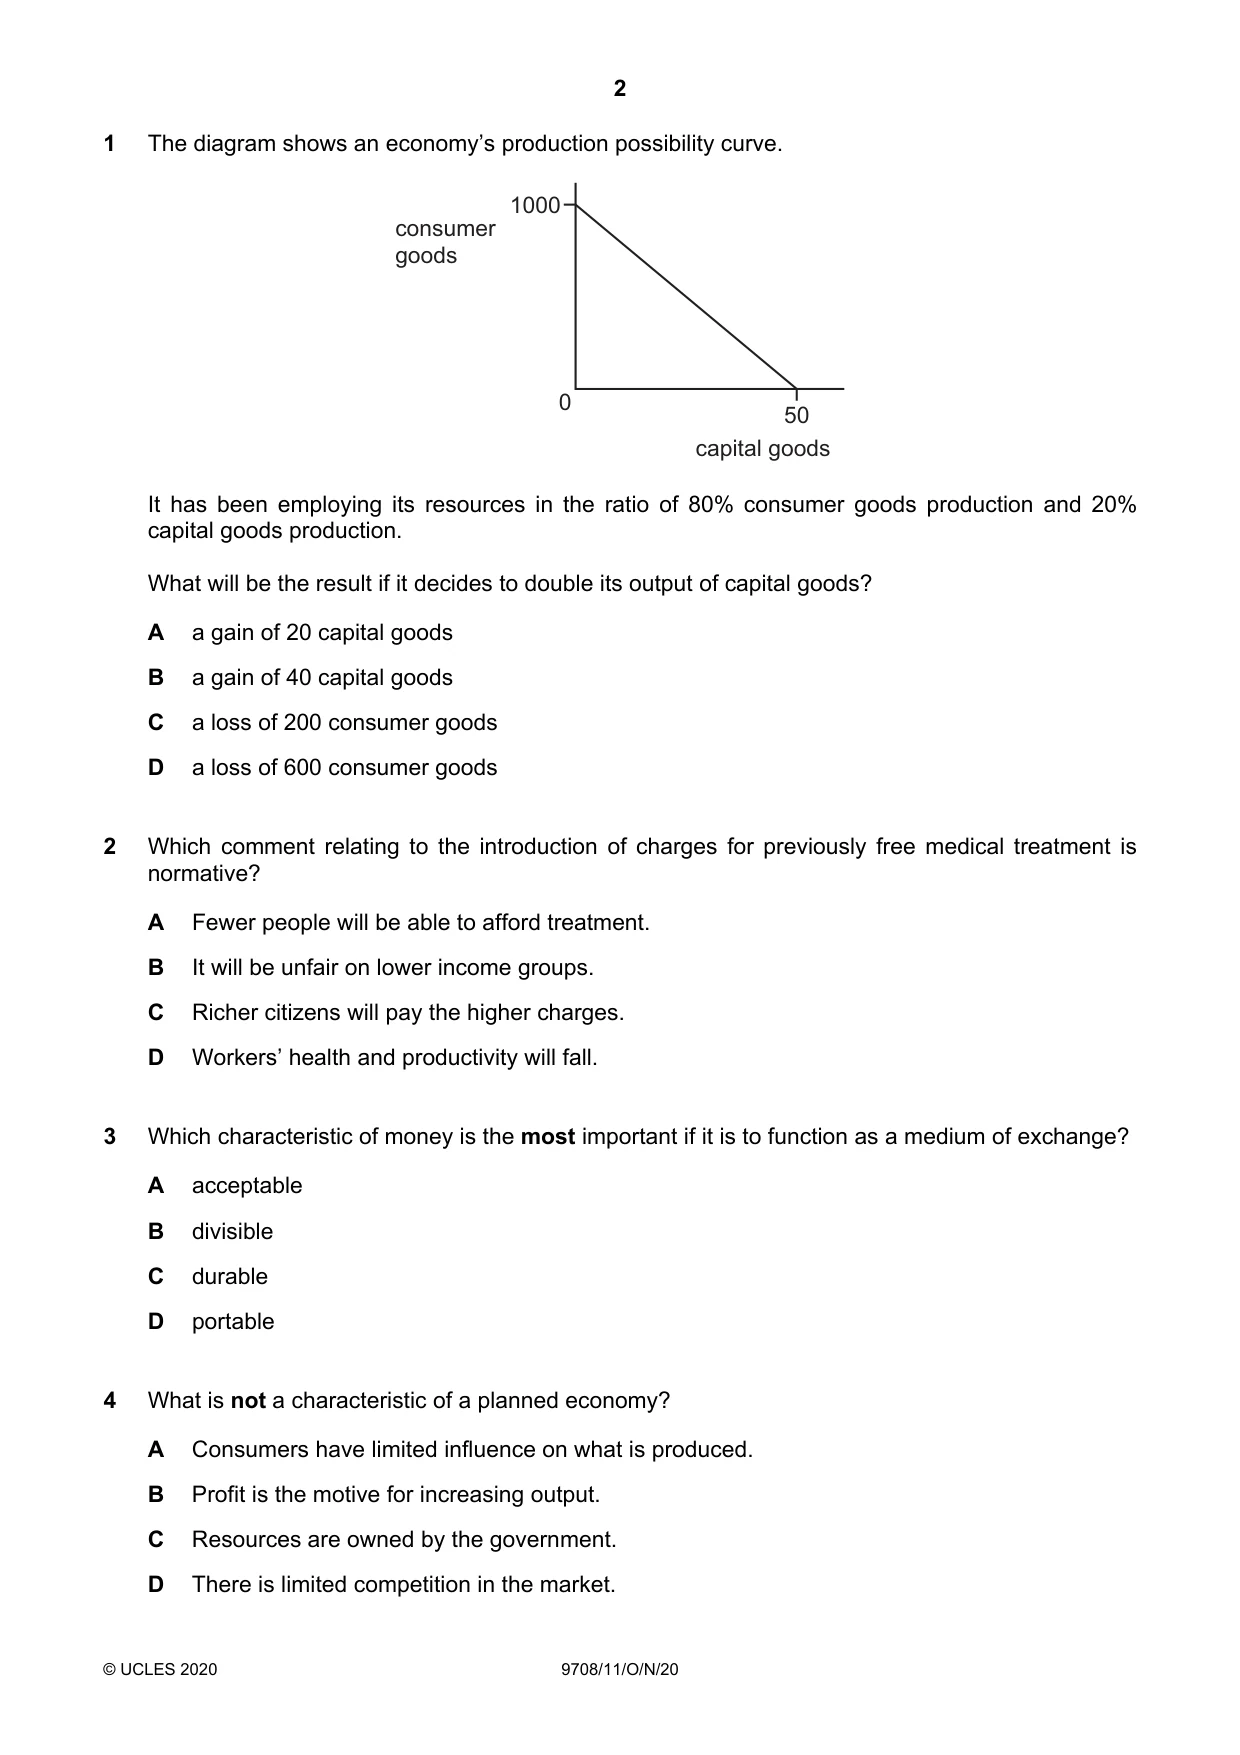
1 The diagram shows an economy’s production possibility curve. 1000 consumer goods 0 50 capital goods It has been employing its resources in the ratio of 80% consumer goods production and 20% capital goods production. What will be the result if it decides to double its output of capital goods? A a gain of 20 capital goods B a gain of 40 capital goods C a loss of 200 consumer goods D a loss of 600 consumer goods
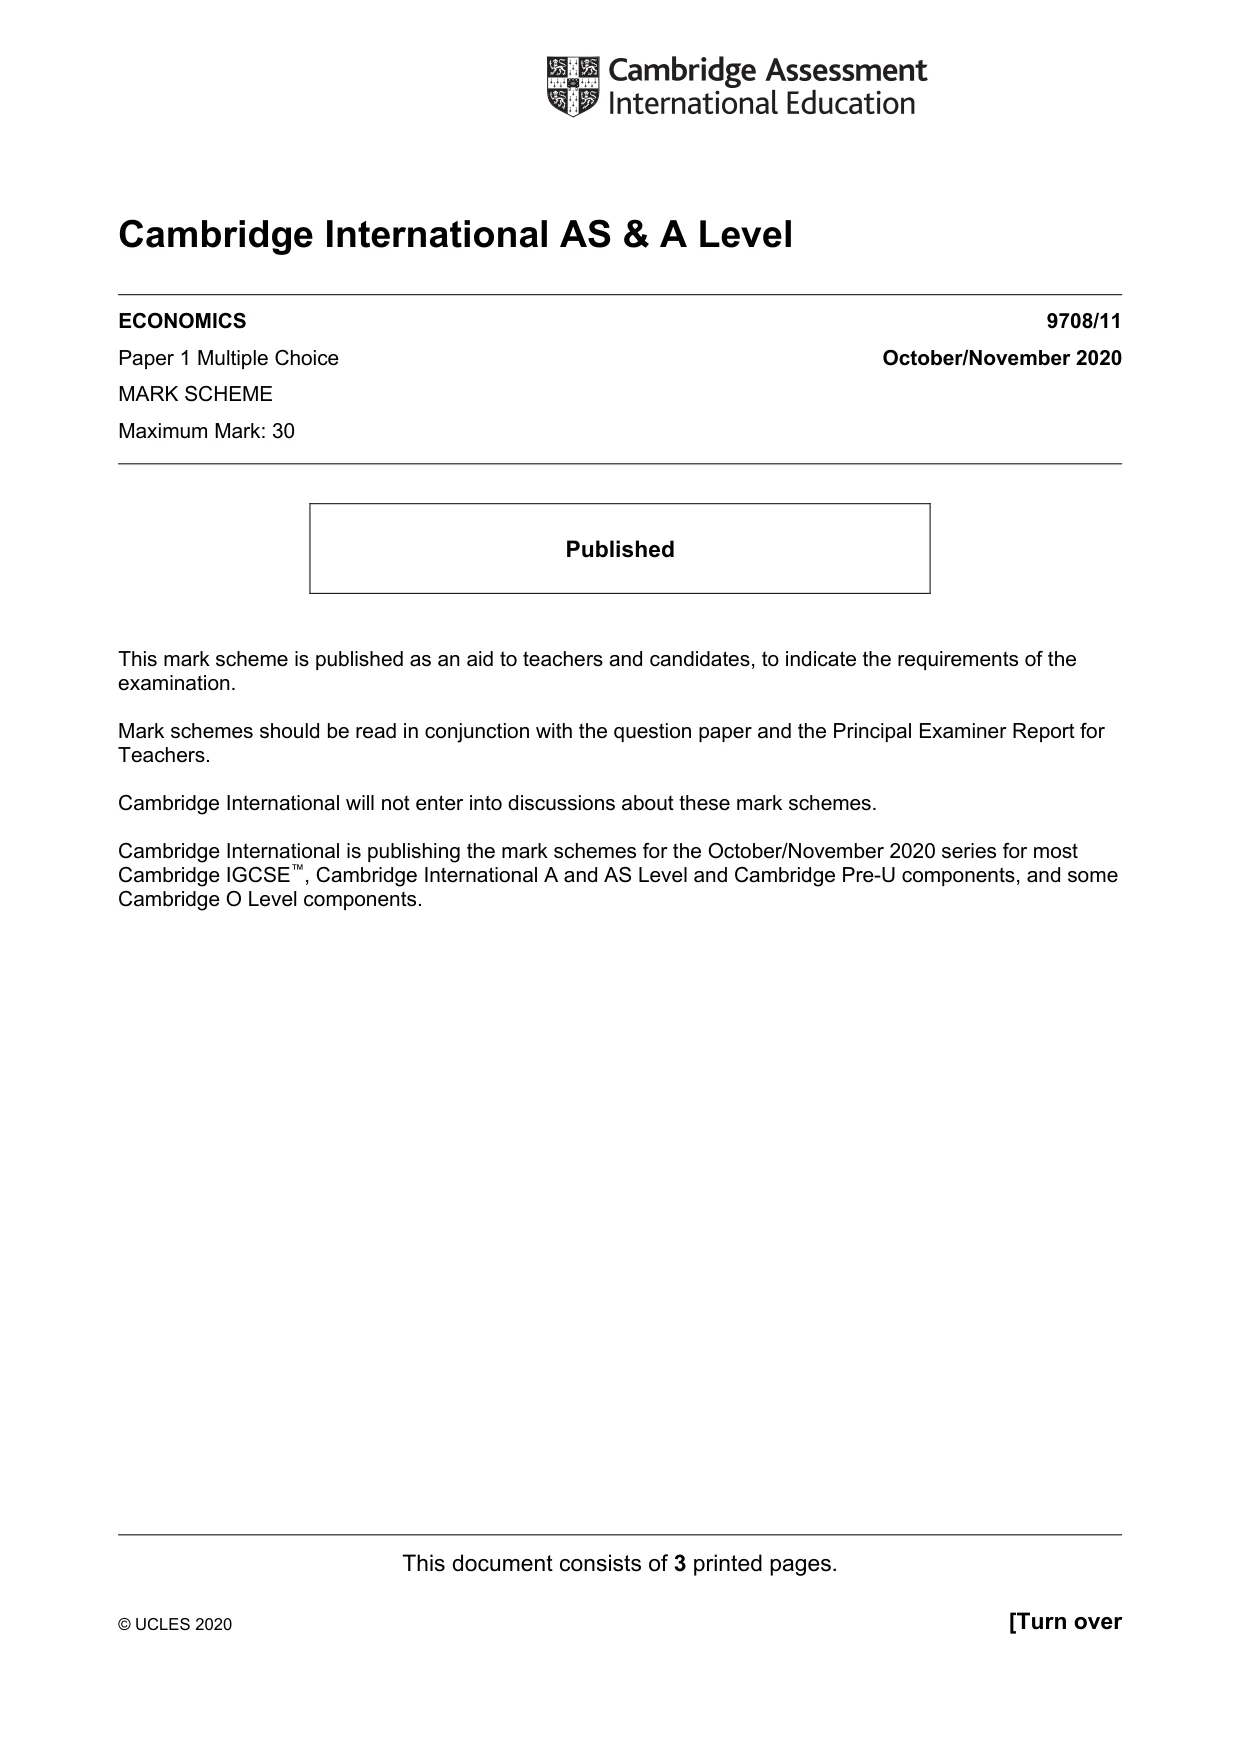
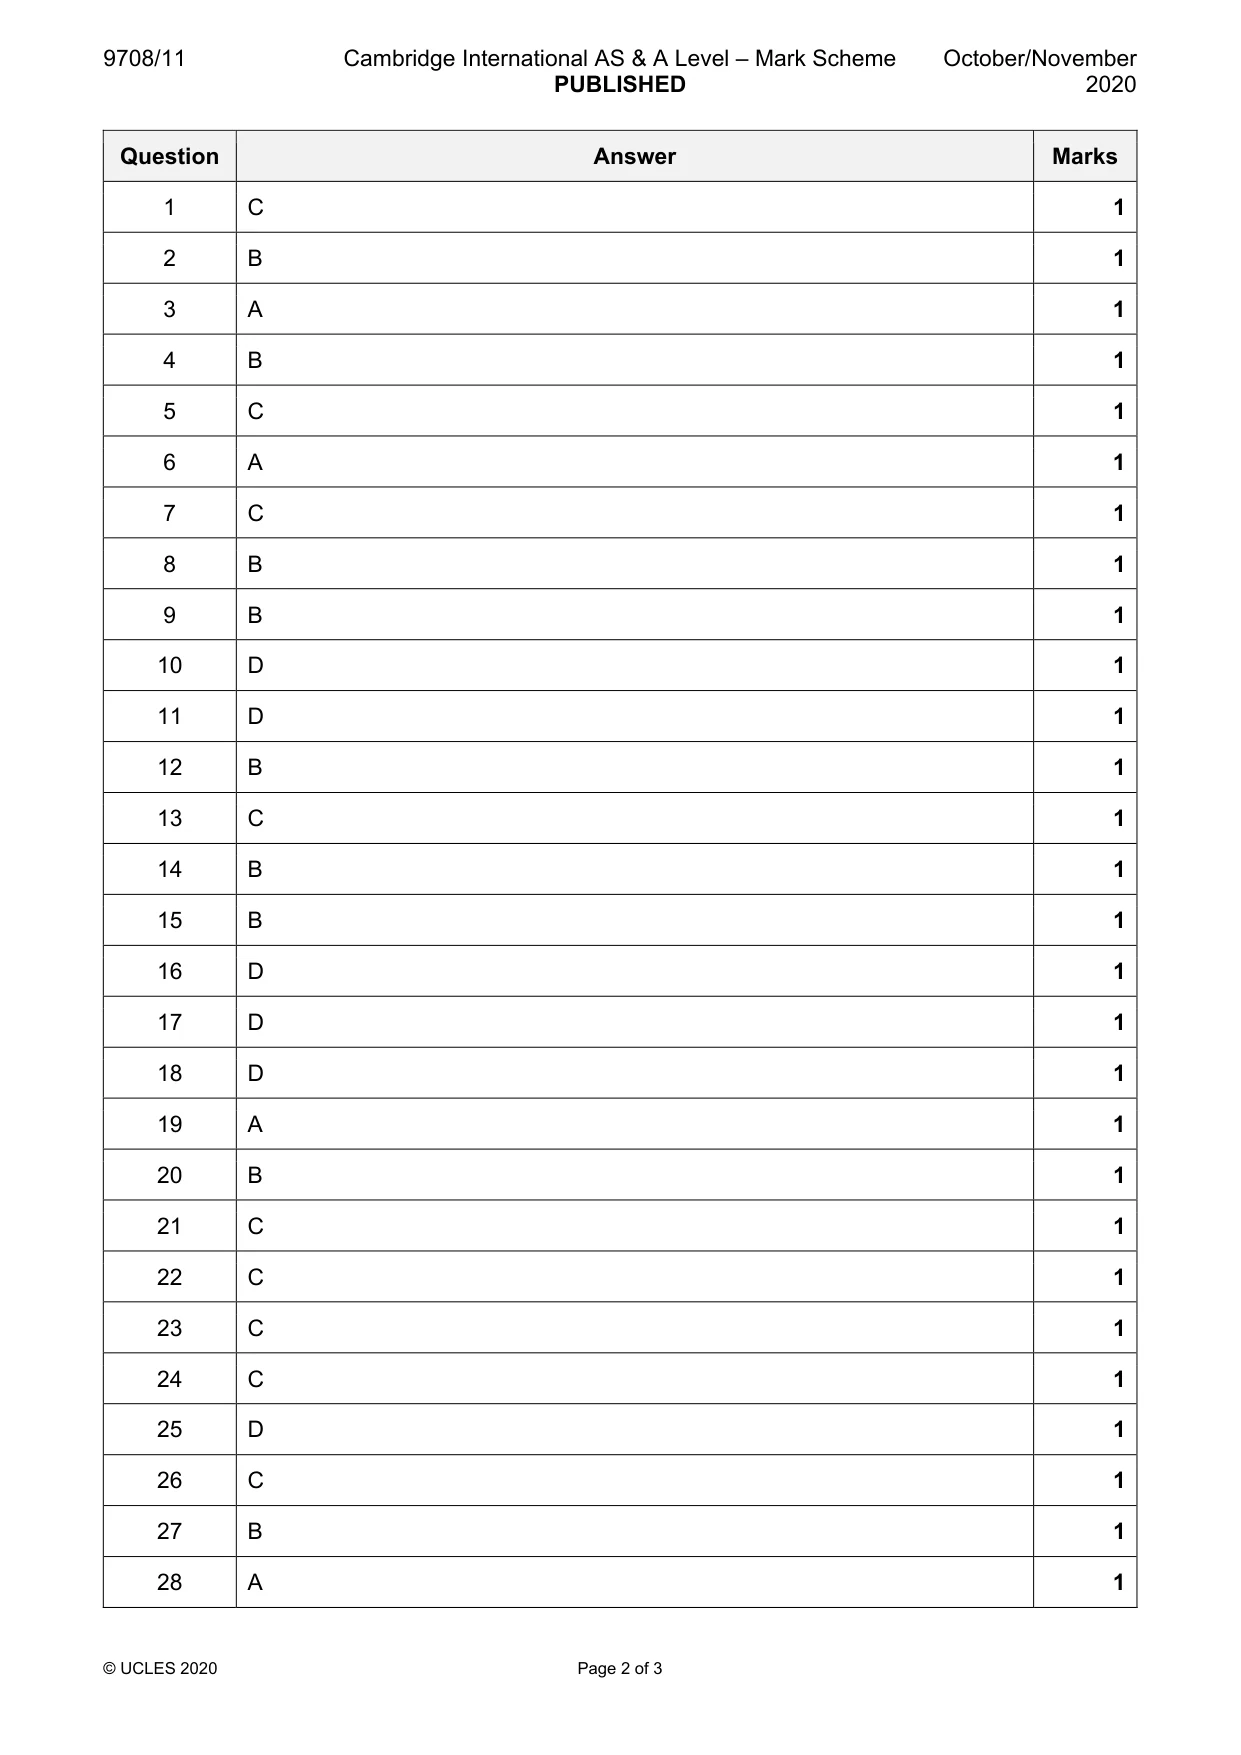
Mark scheme: C
Q2 · Which comment relating to the introduction of charges for previously free medical…
2 Which comment relating to the introduction of charges for previously free medical treatment is normative? A Fewer people will be able to afford treatment. B It will be unfair on lower income groups. C Richer citizens will pay the higher charges. D Workers’ health and productivity will fall.
Mark scheme: B
Q3 · Which characteristic of money is the most important if it is to function as a medium of…
3 Which characteristic of money is the most important if it is to function as a medium of exchange? A acceptable B divisible C durable D portable
Mark scheme: A
Q4 · What is not a characteristic of a planned economy?
4 What is not a characteristic of a planned economy? A Consumers have limited influence on what is produced. B Profit is the motive for increasing output. C Resources are owned by the government. D There is limited competition in the market.
Mark scheme: B
More questions on Resource allocation in different economic systems
Q5 · Good X is a substitute for good Y and a complement to good Z
5 Good X is a substitute for good Y and a complement to good Z. What would happen after a fall in the price of good X? A Only the demand for X will rise. B Demand for X, Y and Z will rise. C Demand for Y will fall and for Z will rise. D Demand for Y will rise and for Z will fall.
Mark scheme: C
Q6 · The table shows how an individual’s weekly consumption of biscuits and coffee varies with…
6 The table shows how an individual’s weekly consumption of biscuits and coffee varies with income. income ($) biscuits (packs) coffee (cups) 100 0 5 150 5 10 Which statement about the income elasticity of demand over the range of income shown is true? A For biscuits it is greater than 1. B For biscuits it is zero. C For coffee it is less than 1. D For coffee it is unitary.
Mark scheme: A
More questions on Price elasticity, income elasticity and cross elasticity of demand
Q7 · The diagram shows four supply curves
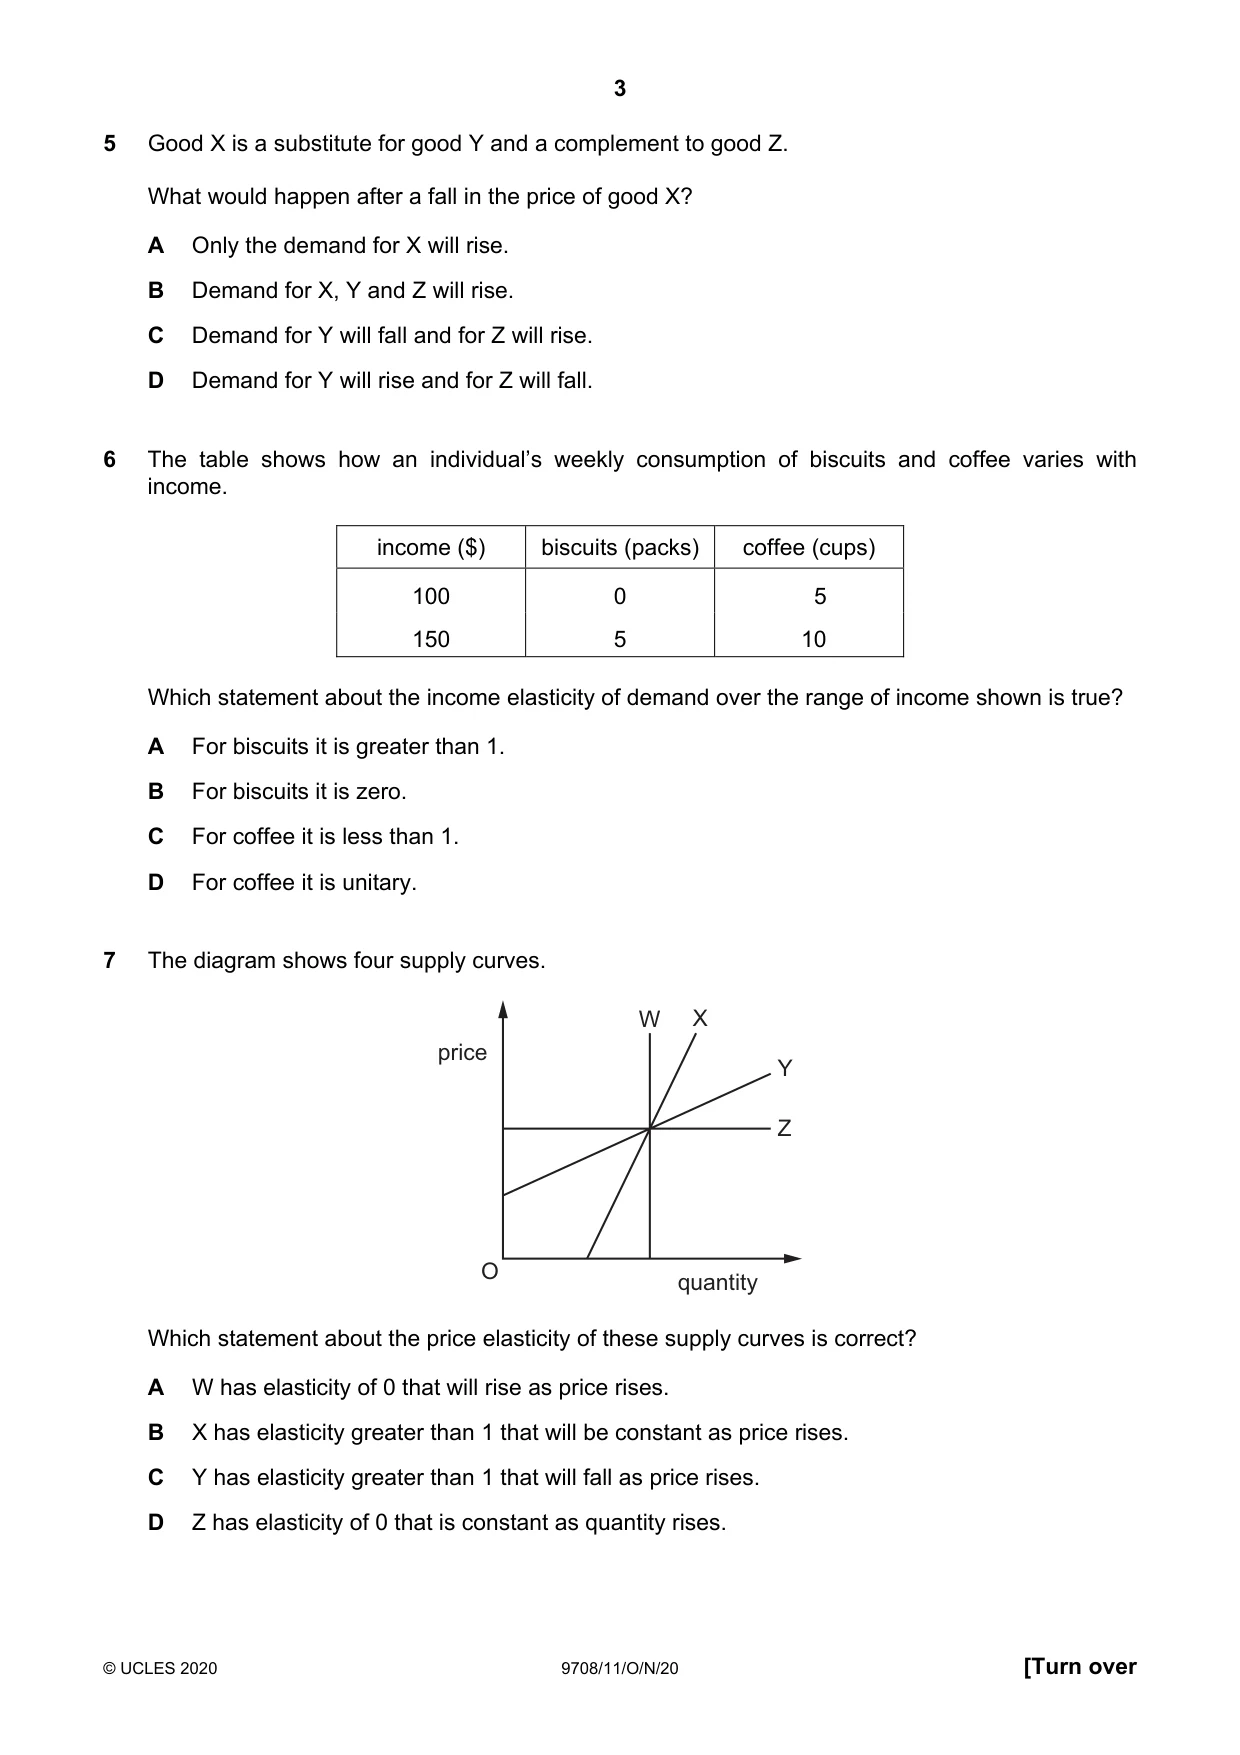
7 The diagram shows four supply curves. W X price Y Z O quantity Which statement about the price elasticity of these supply curves is correct? A W has elasticity of 0 that will rise as price rises. B X has elasticity greater than 1 that will be constant as price rises. C Y has elasticity greater than 1 that will fall as price rises. D Z has elasticity of 0 that is constant as quantity rises.
Mark scheme: C
Q8 · The diagram shows the market for a good with an initial equilibrium price of $10
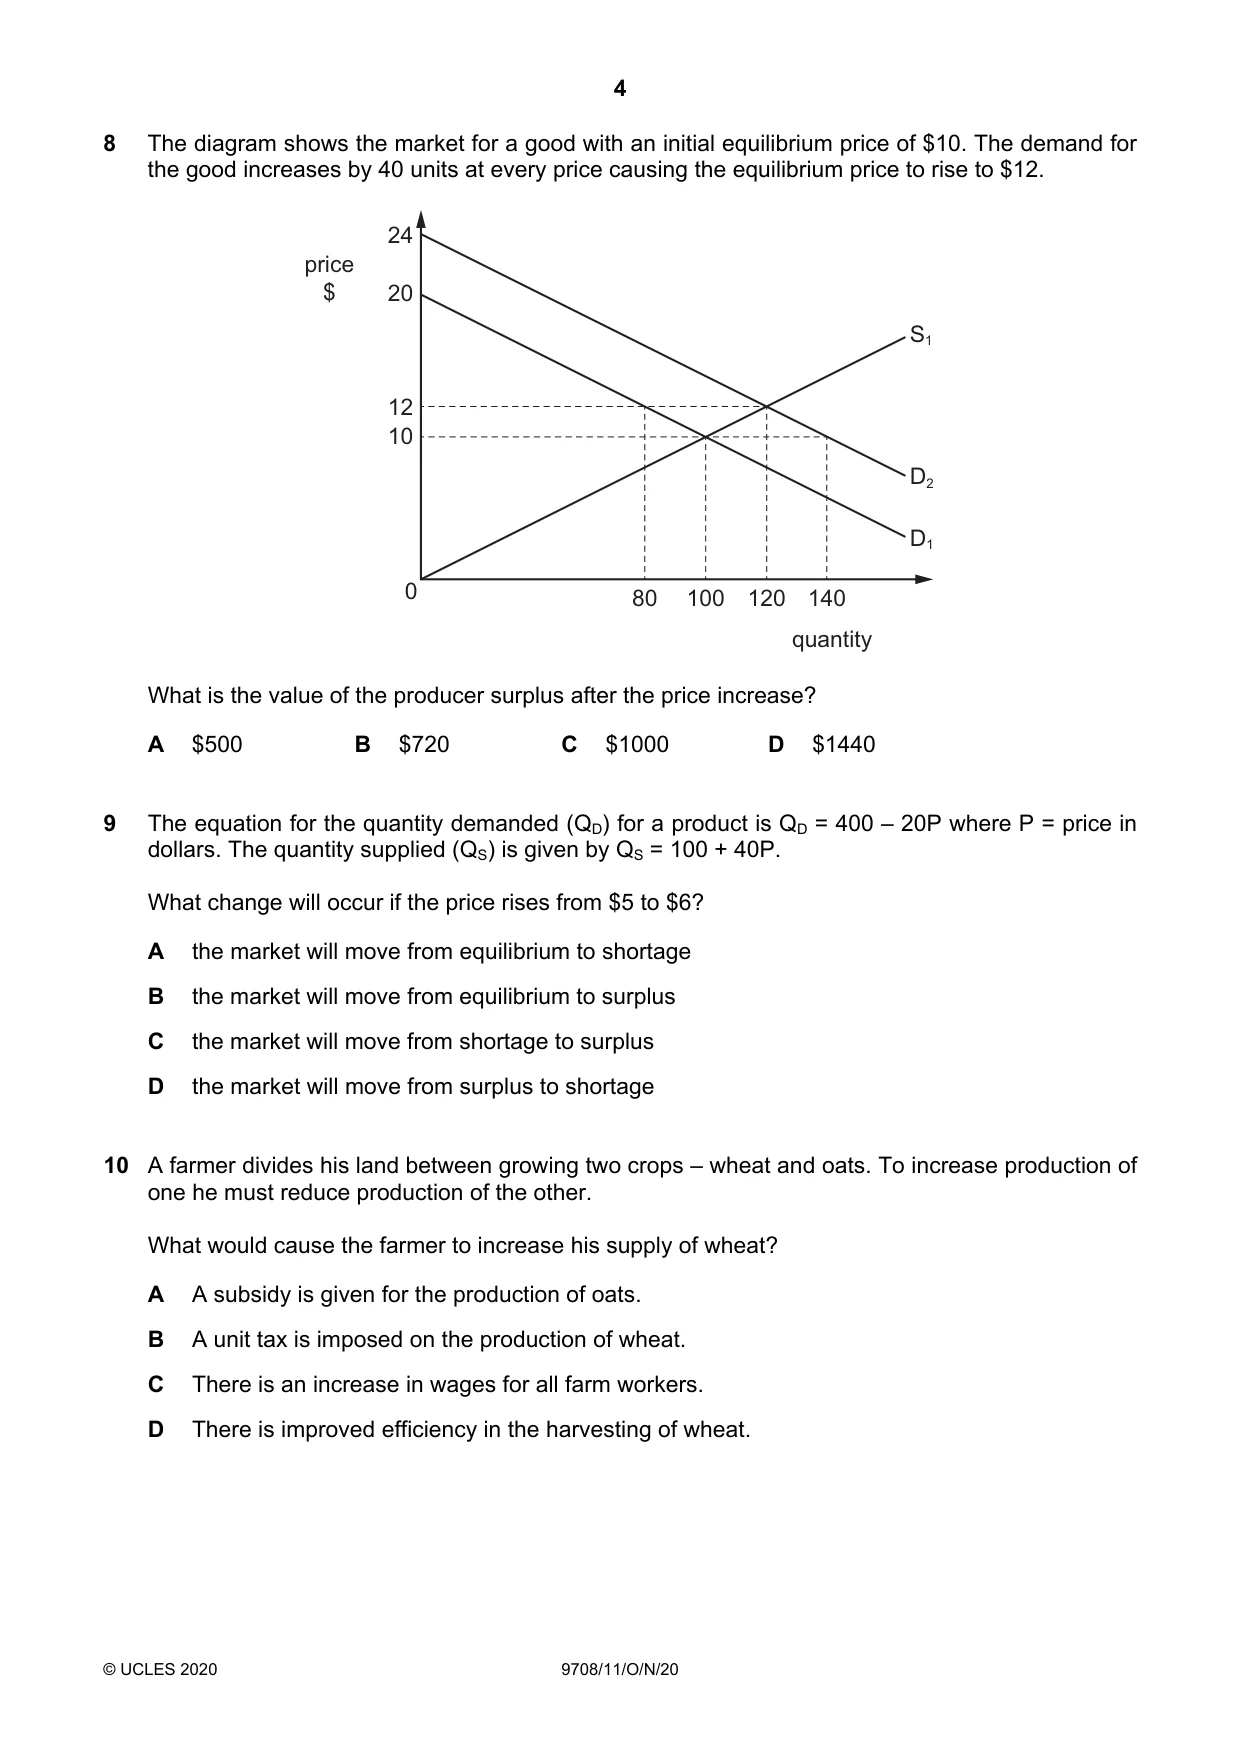
8 The diagram shows the market for a good with an initial equilibrium price of $10. The demand for the good increases by 40 units at every price causing the equilibrium price to rise to $12. 24 price $ 20 S1 12 10 D2 D1 0 80 100 120 140 quantity What is the value of the producer surplus after the price increase? A $500 B $720 C $1000 D $1440
Mark scheme: B
Q9 · The equation for the quantity demanded (QD) for a product is QD = 400 – 20P where P =…
9 The equation for the quantity demanded (QD) for a product is QD = 400 – 20P where P = price in dollars. The quantity supplied (QS) is given by QS = 100 + 40P. What change will occur if the price rises from $5 to $6? A the market will move from equilibrium to shortage B the market will move from equilibrium to surplus C the market will move from shortage to surplus D the market will move from surplus to shortage
Mark scheme: B
Q10 · A farmer divides his land between growing two crops – wheat and oats
10 A farmer divides his land between growing two crops – wheat and oats. To increase production of one he must reduce production of the other. What would cause the farmer to increase his supply of wheat? A A subsidy is given for the production of oats. B A unit tax is imposed on the production of wheat. C There is an increase in wages for all farm workers. D There is improved efficiency in the harvesting of wheat.
Mark scheme: D
Q11 · What would cause the demand curve for vegetables to shift from D1 to D2 as shown?
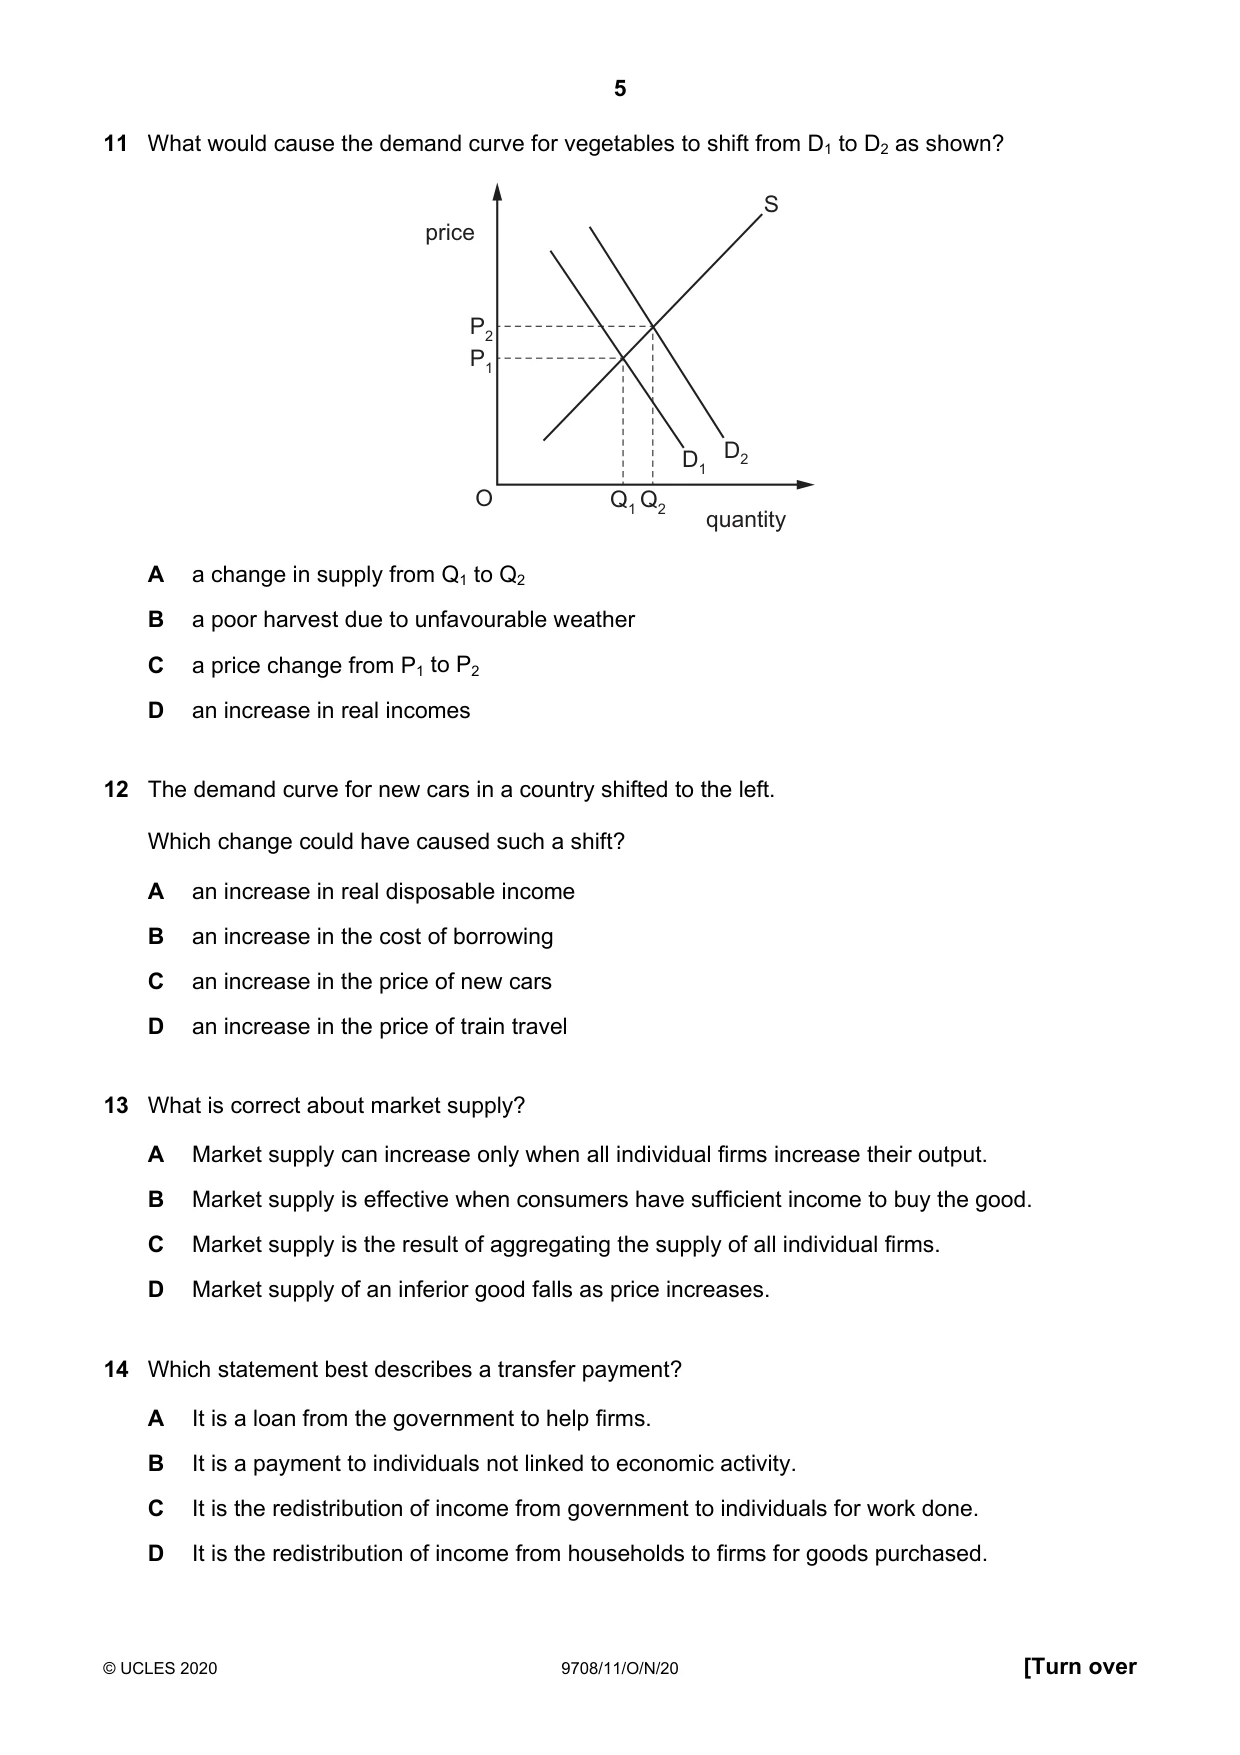
11 What would cause the demand curve for vegetables to shift from D1 to D2 as shown? S price P2 P1 D1 D2 O Q1 Q2 quantity A a change in supply from Q1 to Q2 B a poor harvest due to unfavourable weather C a price change from P1 to P2 D an increase in real incomes
Mark scheme: D
Q12 · The demand curve for new cars in a country shifted to the left
12 The demand curve for new cars in a country shifted to the left. Which change could have caused such a shift? A an increase in real disposable income B an increase in the cost of borrowing C an increase in the price of new cars D an increase in the price of train travel
Mark scheme: B
Q13 · What is correct about market supply?
13 What is correct about market supply? A Market supply can increase only when all individual firms increase their output. B Market supply is effective when consumers have sufficient income to buy the good. C Market supply is the result of aggregating the supply of all individual firms. D Market supply of an inferior good falls as price increases.
Mark scheme: C
Q14 · Which statement best describes a transfer payment?
14 Which statement best describes a transfer payment? A It is a loan from the government to help firms. B It is a payment to individuals not linked to economic activity. C It is the redistribution of income from government to individuals for work done. D It is the redistribution of income from households to firms for goods purchased.
Mark scheme: B
Q15 · The diagram shows the impact of a unit tax imposed by a government on a good
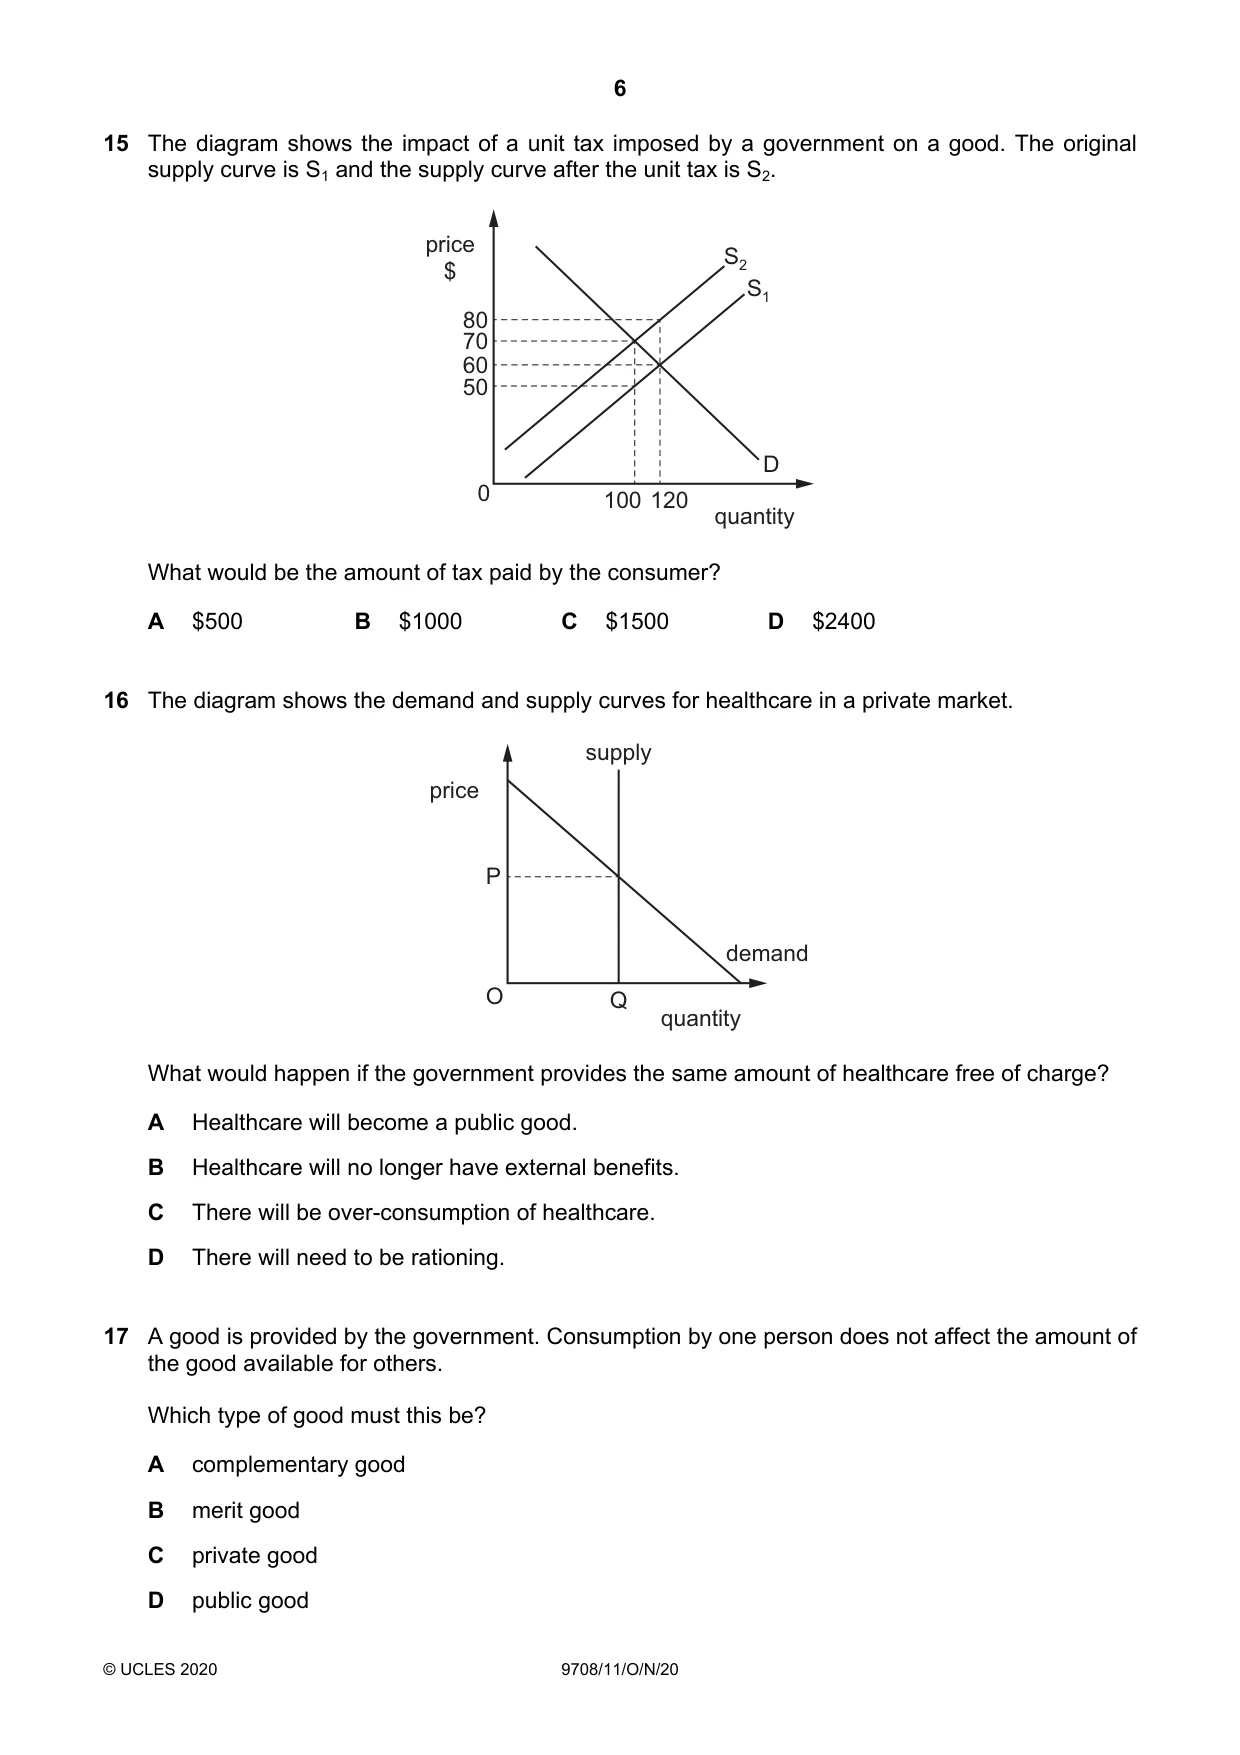
15 The diagram shows the impact of a unit tax imposed by a government on a good. The original supply curve is S1 and the supply curve after the unit tax is S2. price S2 $ S1 80 70 60 50 D 0 100 120 quantity What would be the amount of tax paid by the consumer? A $500 B $1000 C $1500 D $2400
Mark scheme: B
More questions on Methods and effects of government intervention in markets
Q16 · The diagram shows the demand and supply curves for healthcare in a private market
16 The diagram shows the demand and supply curves for healthcare in a private market. supply price P demand O Q quantity What would happen if the government provides the same amount of healthcare free of charge? A Healthcare will become a public good. B Healthcare will no longer have external benefits. C There will be over-consumption of healthcare. D There will need to be rationing.
Mark scheme: D
More questions on Methods and effects of government intervention in markets
Q17 · A good is provided by the government
17 A good is provided by the government. Consumption by one person does not affect the amount of the good available for others. Which type of good must this be? A complementary good B merit good C private good D public good
Mark scheme: D
Q18 · A government imposes an income tax on individuals
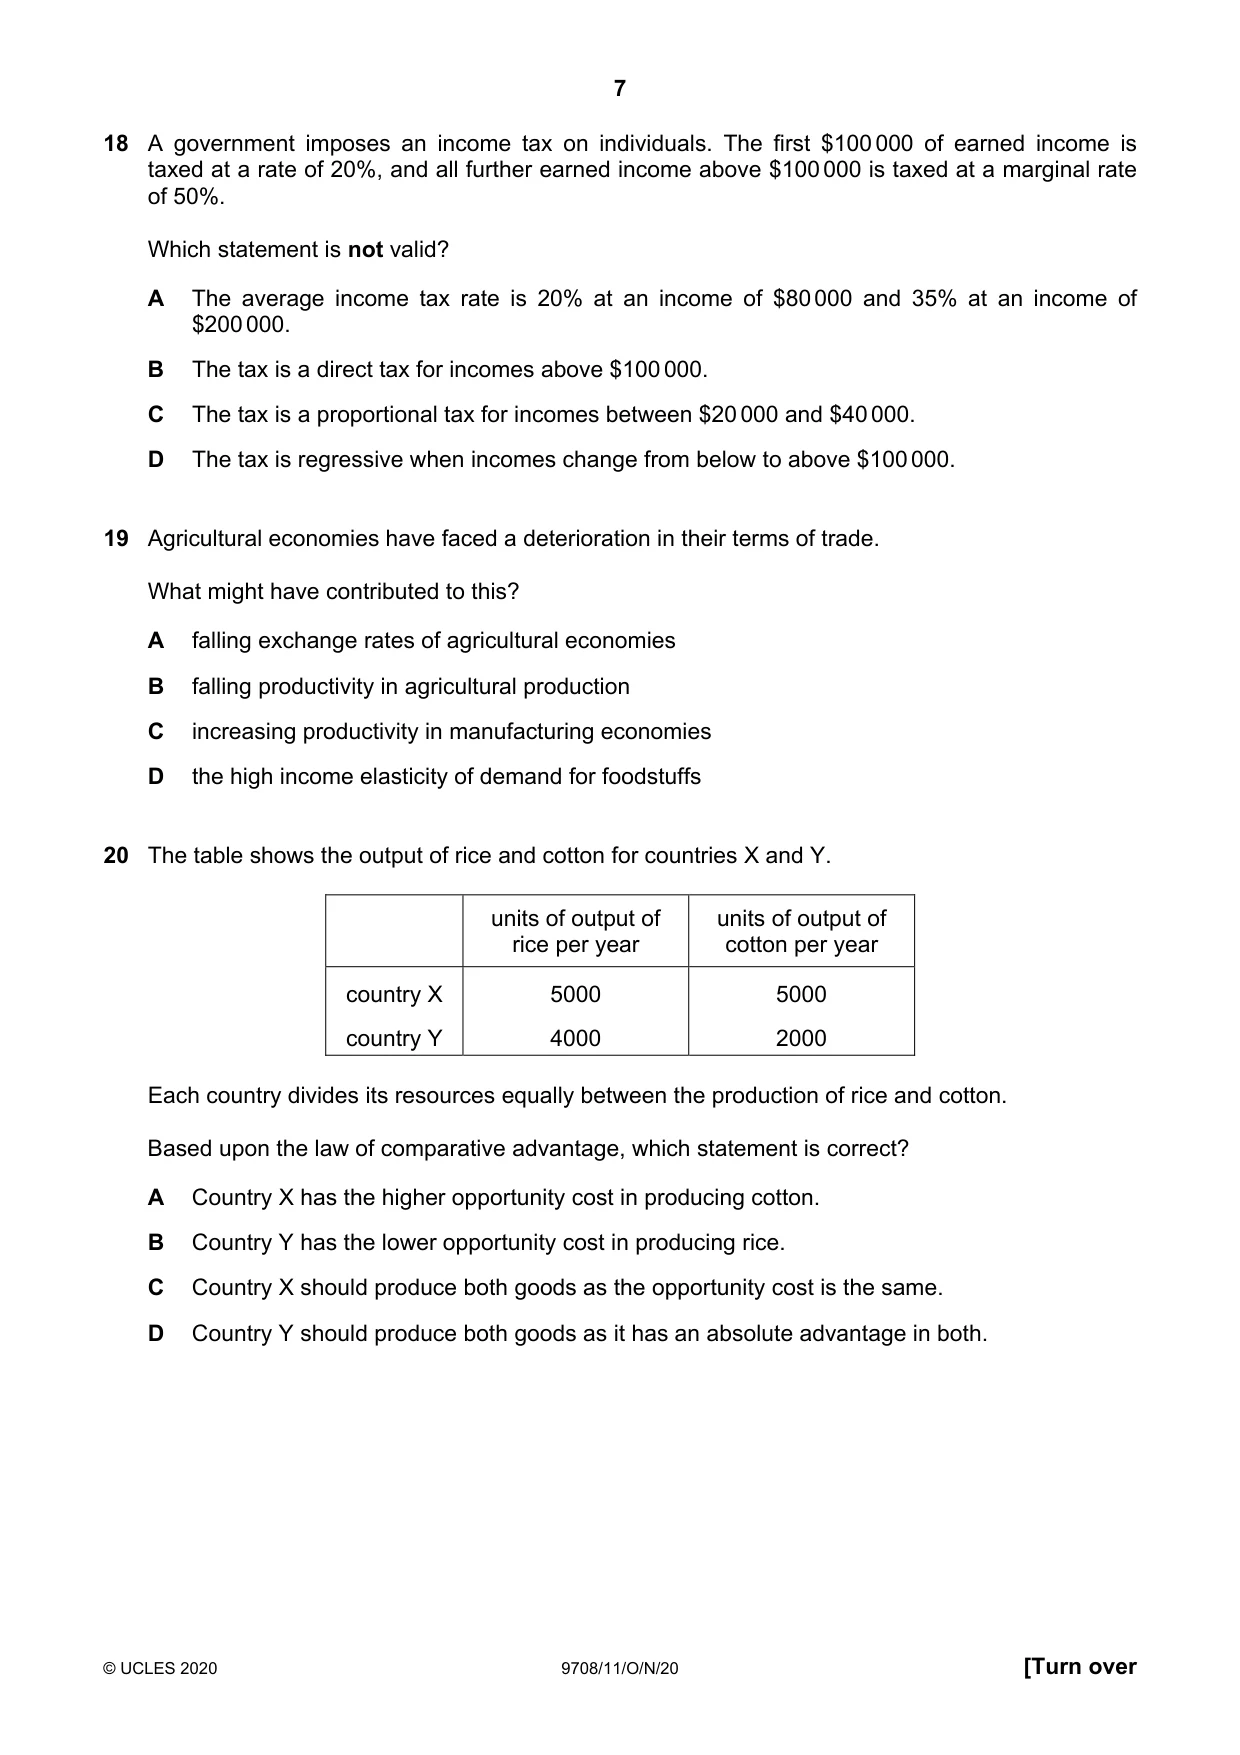
18 A government imposes an income tax on individuals. The first $100 000 of earned income is taxed at a rate of 20%, and all further earned income above $100 000 is taxed at a marginal rate of 50%. Which statement is not valid? A The average income tax rate is 20% at an income of $80 000 and 35% at an income of $200 000. B The tax is a direct tax for incomes above $100 000. C The tax is a proportional tax for incomes between $20 000 and $40 000. D The tax is regressive when incomes change from below to above $100 000.
Mark scheme: D
Q19 · Agricultural economies have faced a deterioration in their terms of trade
19 Agricultural economies have faced a deterioration in their terms of trade. What might have contributed to this? A falling exchange rates of agricultural economies B falling productivity in agricultural production C increasing productivity in manufacturing economies D the high income elasticity of demand for foodstuffs
Mark scheme: A
Q20 · The table shows the output of rice and cotton for countries X and Y
20 The table shows the output of rice and cotton for countries X and Y. units of output of units of output of rice per year cotton per year country X 5000 5000 country Y 4000 2000 Each country divides its resources equally between the production of rice and cotton. Based upon the law of comparative advantage, which statement is correct? A Country X has the higher opportunity cost in producing cotton. B Country Y has the lower opportunity cost in producing rice. C Country X should produce both goods as the opportunity cost is the same. D Country Y should produce both goods as it has an absolute advantage in both.
Mark scheme: B
Q21 · An economy is represented by the AD / AS diagram, which is initially in macroeconomic…
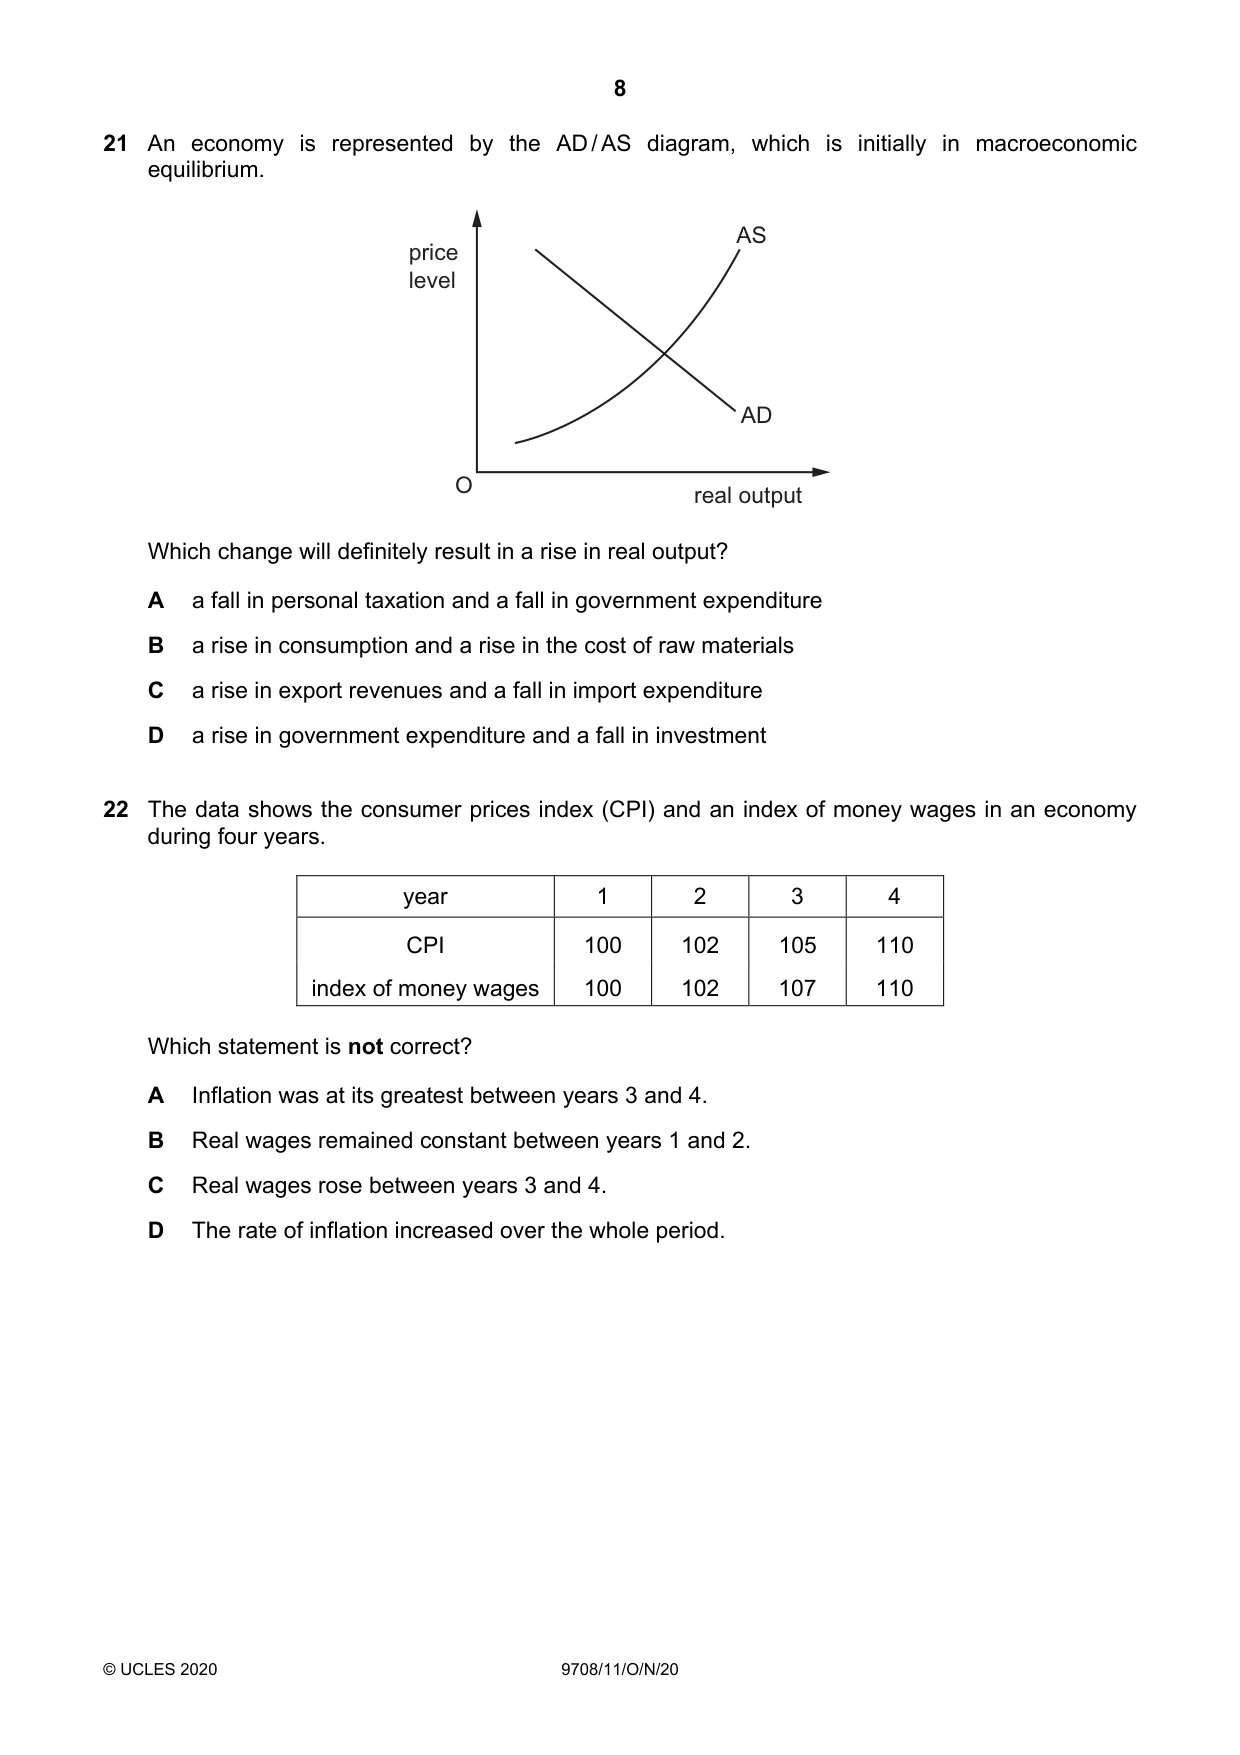
21 An economy is represented by the AD / AS diagram, which is initially in macroeconomic equilibrium. AS price level AD O real output Which change will definitely result in a rise in real output? A a fall in personal taxation and a fall in government expenditure B a rise in consumption and a rise in the cost of raw materials C a rise in export revenues and a fall in import expenditure D a rise in government expenditure and a fall in investment
Mark scheme: C
More questions on Aggregate Demand and Aggregate Supply analysis
Q22 · The data shows the consumer prices index (CPI) and an index of money wages in an economy…
22 The data shows the consumer prices index (CPI) and an index of money wages in an economy during four years. year 1 2 3 4 CPI 100 102 105 110 index of money wages 100 102 107 110 Which statement is not correct? A Inflation was at its greatest between years 3 and 4. B Real wages remained constant between years 1 and 2. C Real wages rose between years 3 and 4. D The rate of inflation increased over the whole period.
Mark scheme: C
Q23 · A country has a deficit of $300 million on the current account of its balance of payments
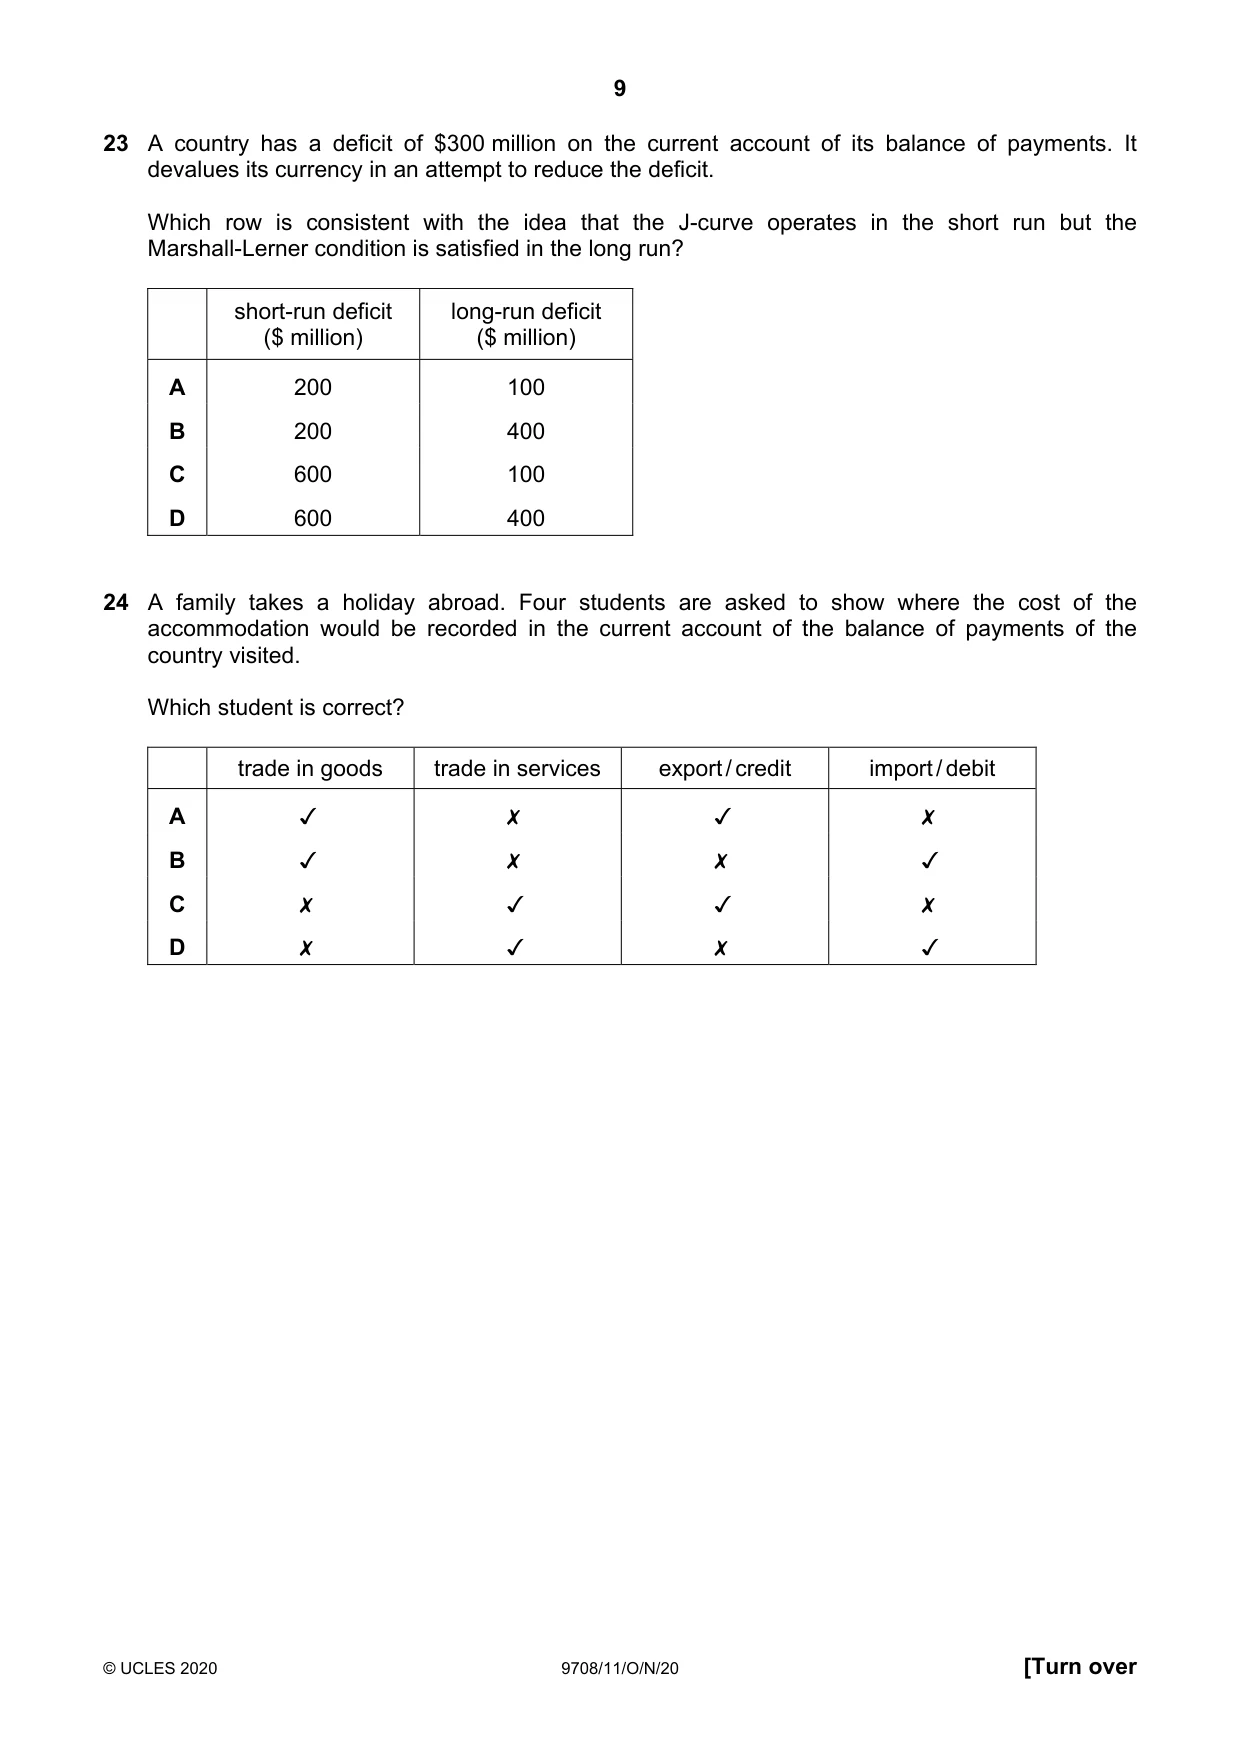
23 A country has a deficit of $300 million on the current account of its balance of payments. It devalues its currency in an attempt to reduce the deficit. Which row is consistent with the idea that the J-curve operates in the short run but the Marshall-Lerner condition is satisfied in the long run? short-run deficit long-run deficit ($ million) ($ million) A 200 100 B 200 400 C 600 100 D 600 400
Mark scheme: C
More questions on Policies to correct imbalances in the current account of the balance of payments
Q24 · A family takes a holiday abroad
24 A family takes a holiday abroad. Four students are asked to show where the cost of the accommodation would be recorded in the current account of the balance of payments of the country visited. Which student is correct? trade in goods trade in services export/ credit import/ debit A v x Jv x B J x x J Cc x Jv Jv x D x Jv x Jv
Mark scheme: C
More questions on Current account of the balance of payments
Q25 · The diagram shows the imposition of a tariff on imports
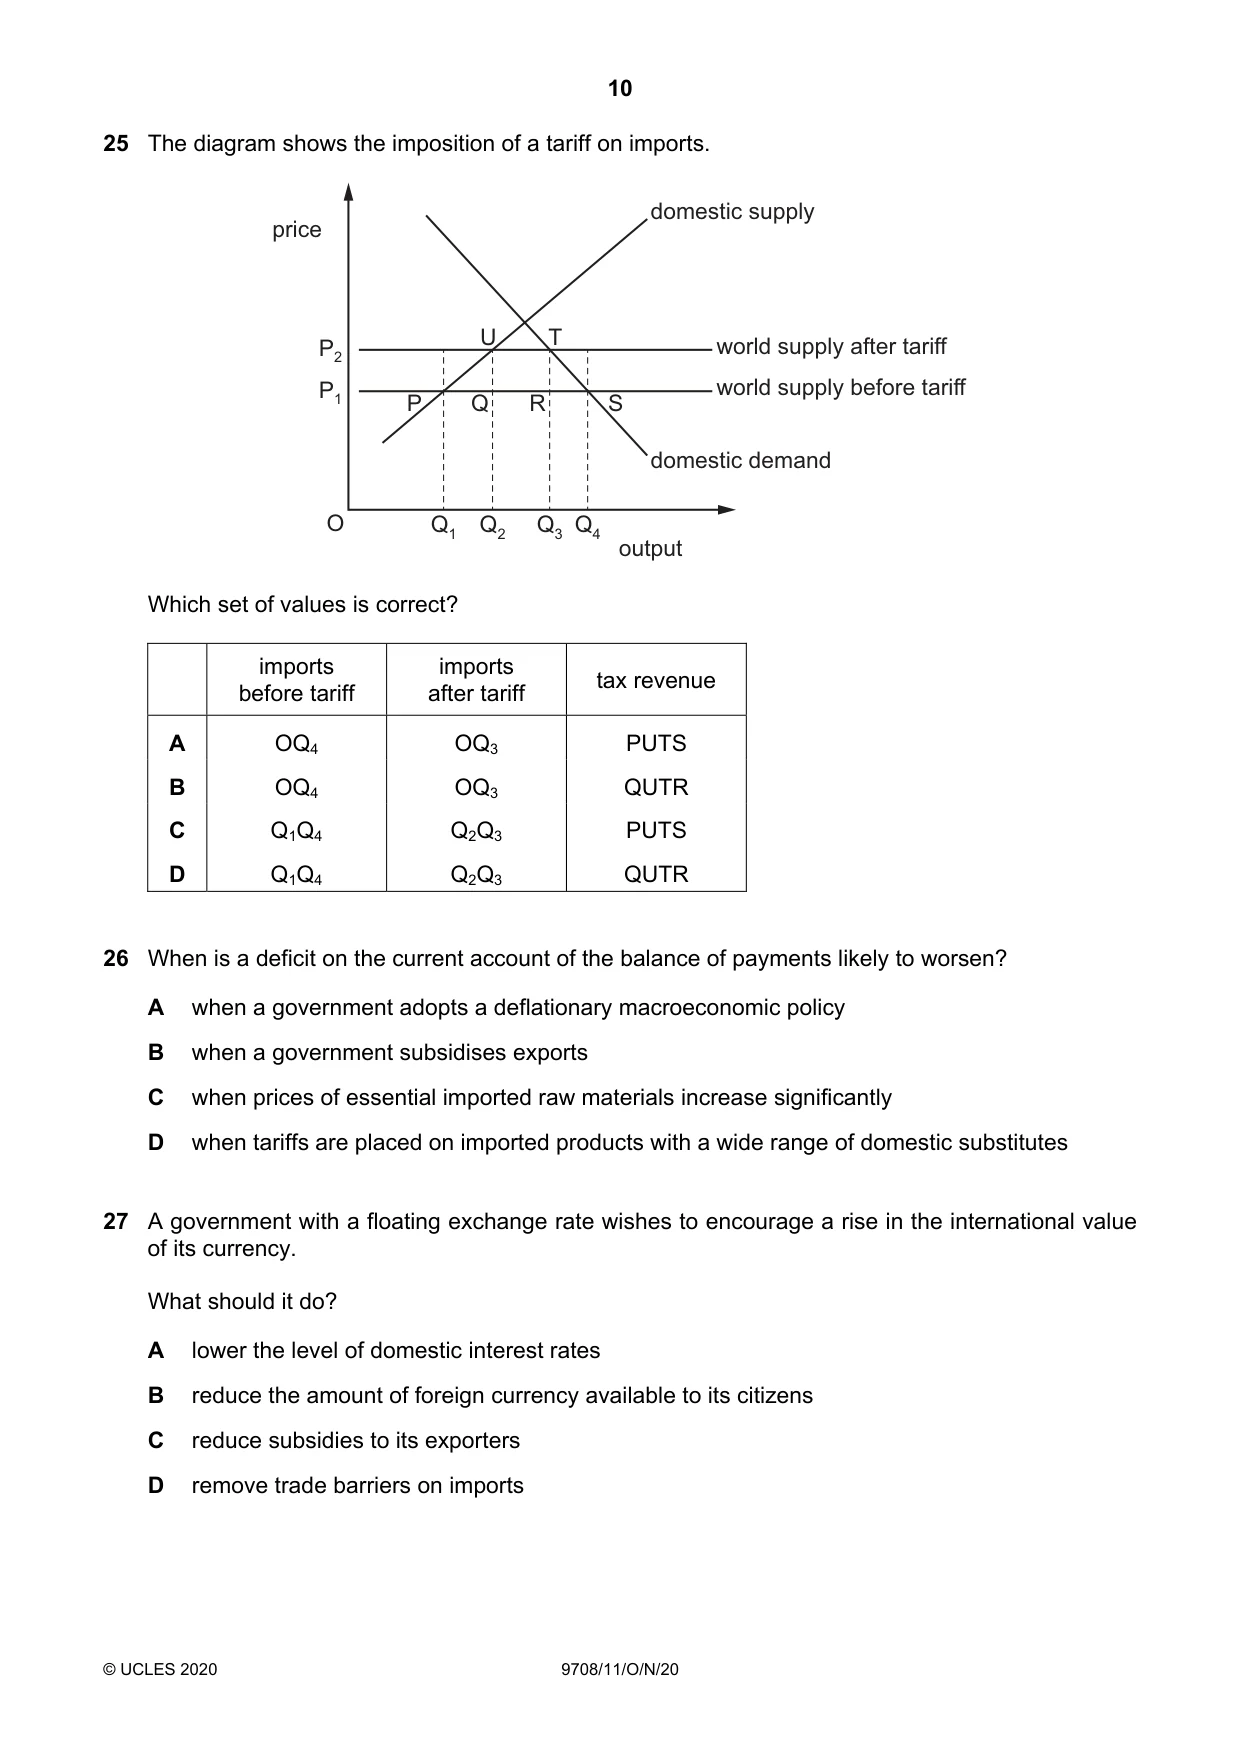
25 The diagram shows the imposition of a tariff on imports. domestic supply price U T world supply after tariff P2 P1 world supply before tariff P Q R S domestic demand O Q1 Q2 Q3 Q4 output Which set of values is correct? imports imports tax revenue before tariff after tariff A OQ4 OQ3 PUTS B OQ4 OQ3 QUTR C Q1Q4 Q2Q3 PUTS D Q1Q4 Q2Q3 QUTR
Mark scheme: D
Q26 · When is a deficit on the current account of the balance of payments likely to worsen?
26 When is a deficit on the current account of the balance of payments likely to worsen? A when a government adopts a deflationary macroeconomic policy B when a government subsidises exports C when prices of essential imported raw materials increase significantly D when tariffs are placed on imported products with a wide range of domestic substitutes
Mark scheme: C
More questions on Current account of the balance of payments
Q27 · A government with a floating exchange rate wishes to encourage a rise in the…
27 A government with a floating exchange rate wishes to encourage a rise in the international value of its currency. What should it do? A lower the level of domestic interest rates B reduce the amount of foreign currency available to its citizens C reduce subsidies to its exporters D remove trade barriers on imports
Mark scheme: B
Q28 · Greece had an unemployment rate of over 20% in 2016
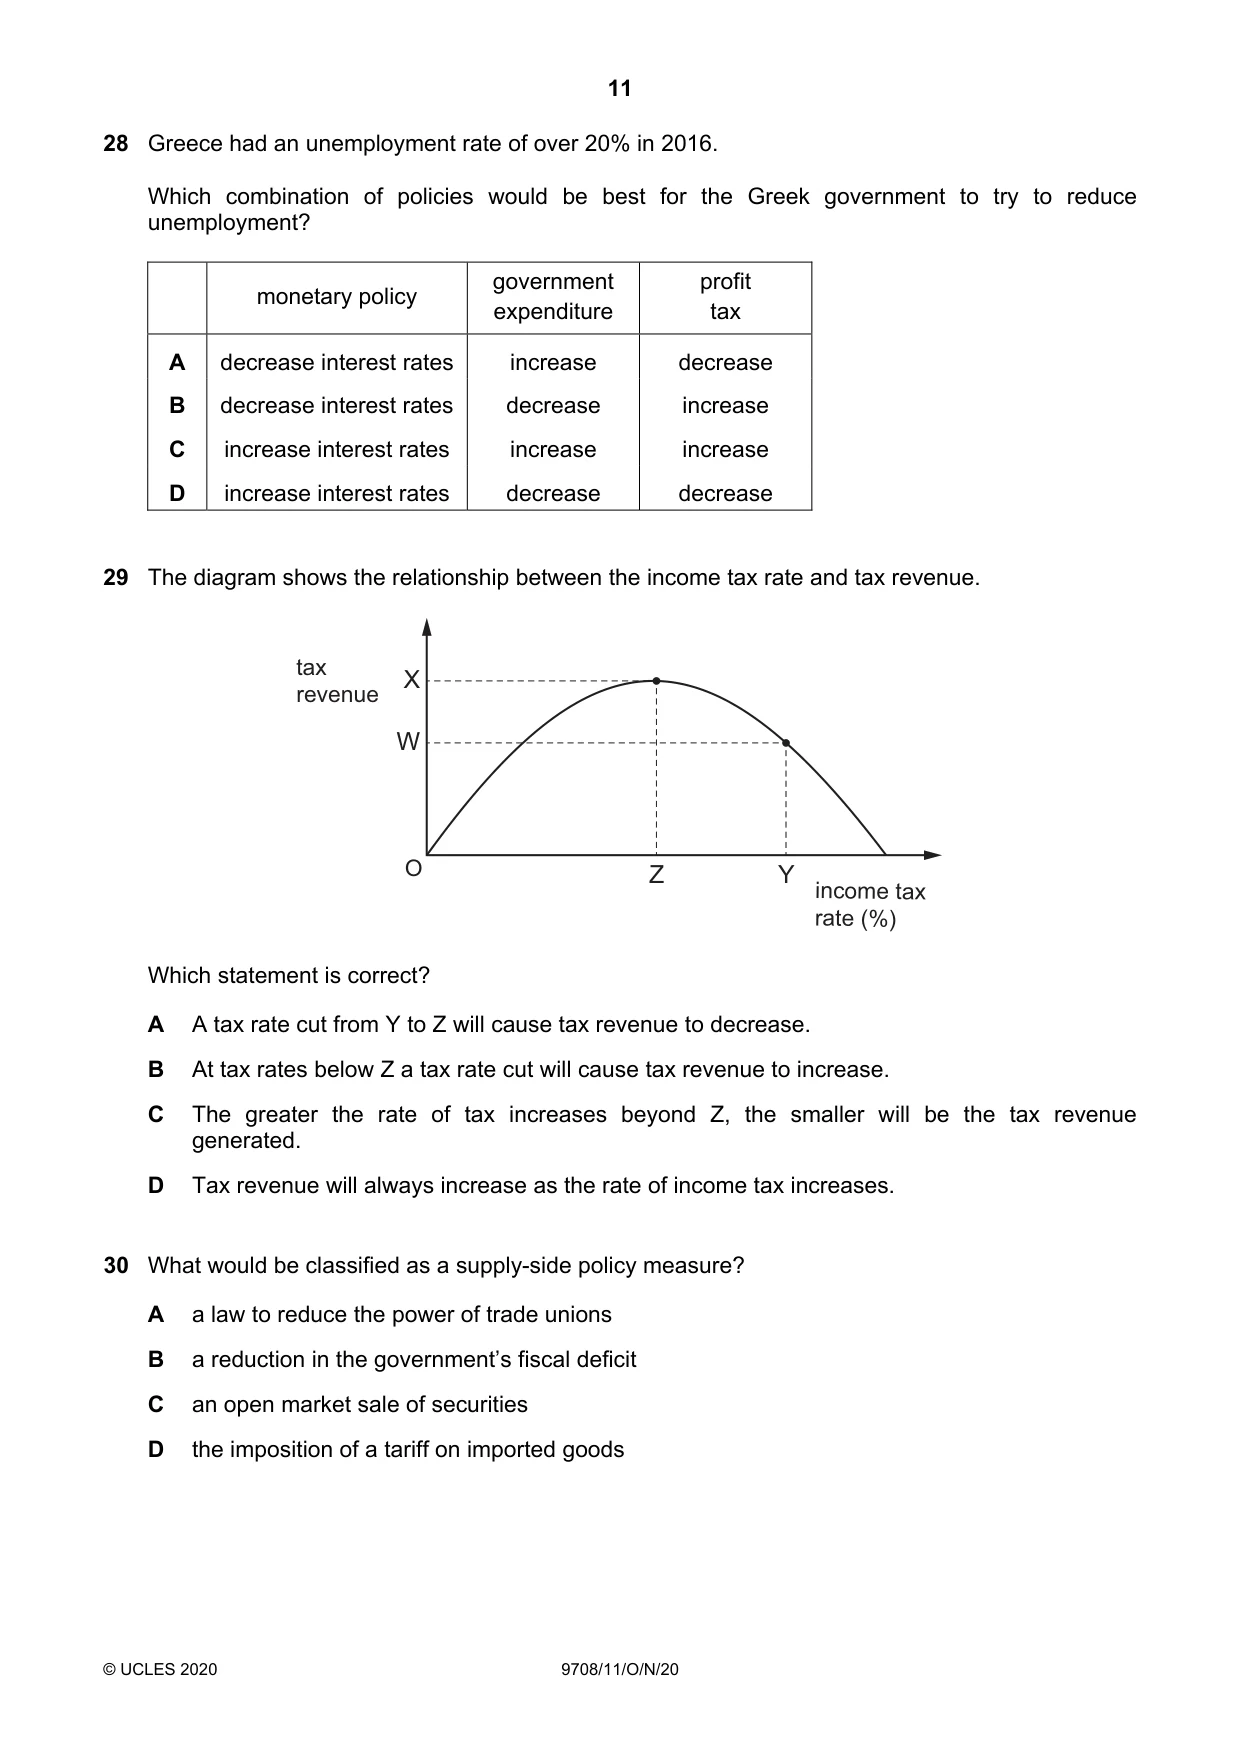
28 Greece had an unemployment rate of over 20% in 2016. Which combination of policies would be best for the Greek government to try to reduce unemployment? government profit monetary policy expenditure tax A decrease interest rates increase decrease B decrease interest rates decrease increase C increase interest rates increase increase D increase interest rates decrease decrease
Mark scheme: A
Q29 · The diagram shows the relationship between the income tax rate and tax revenue
29 The diagram shows the relationship between the income tax rate and tax revenue. tax X revenue W O Z Y income tax rate (%) Which statement is correct? A A tax rate cut from Y to Z will cause tax revenue to decrease. B At tax rates below Z a tax rate cut will cause tax revenue to increase. C The greater the rate of tax increases beyond Z, the smaller will be the tax revenue generated. D Tax revenue will always increase as the rate of income tax increases.
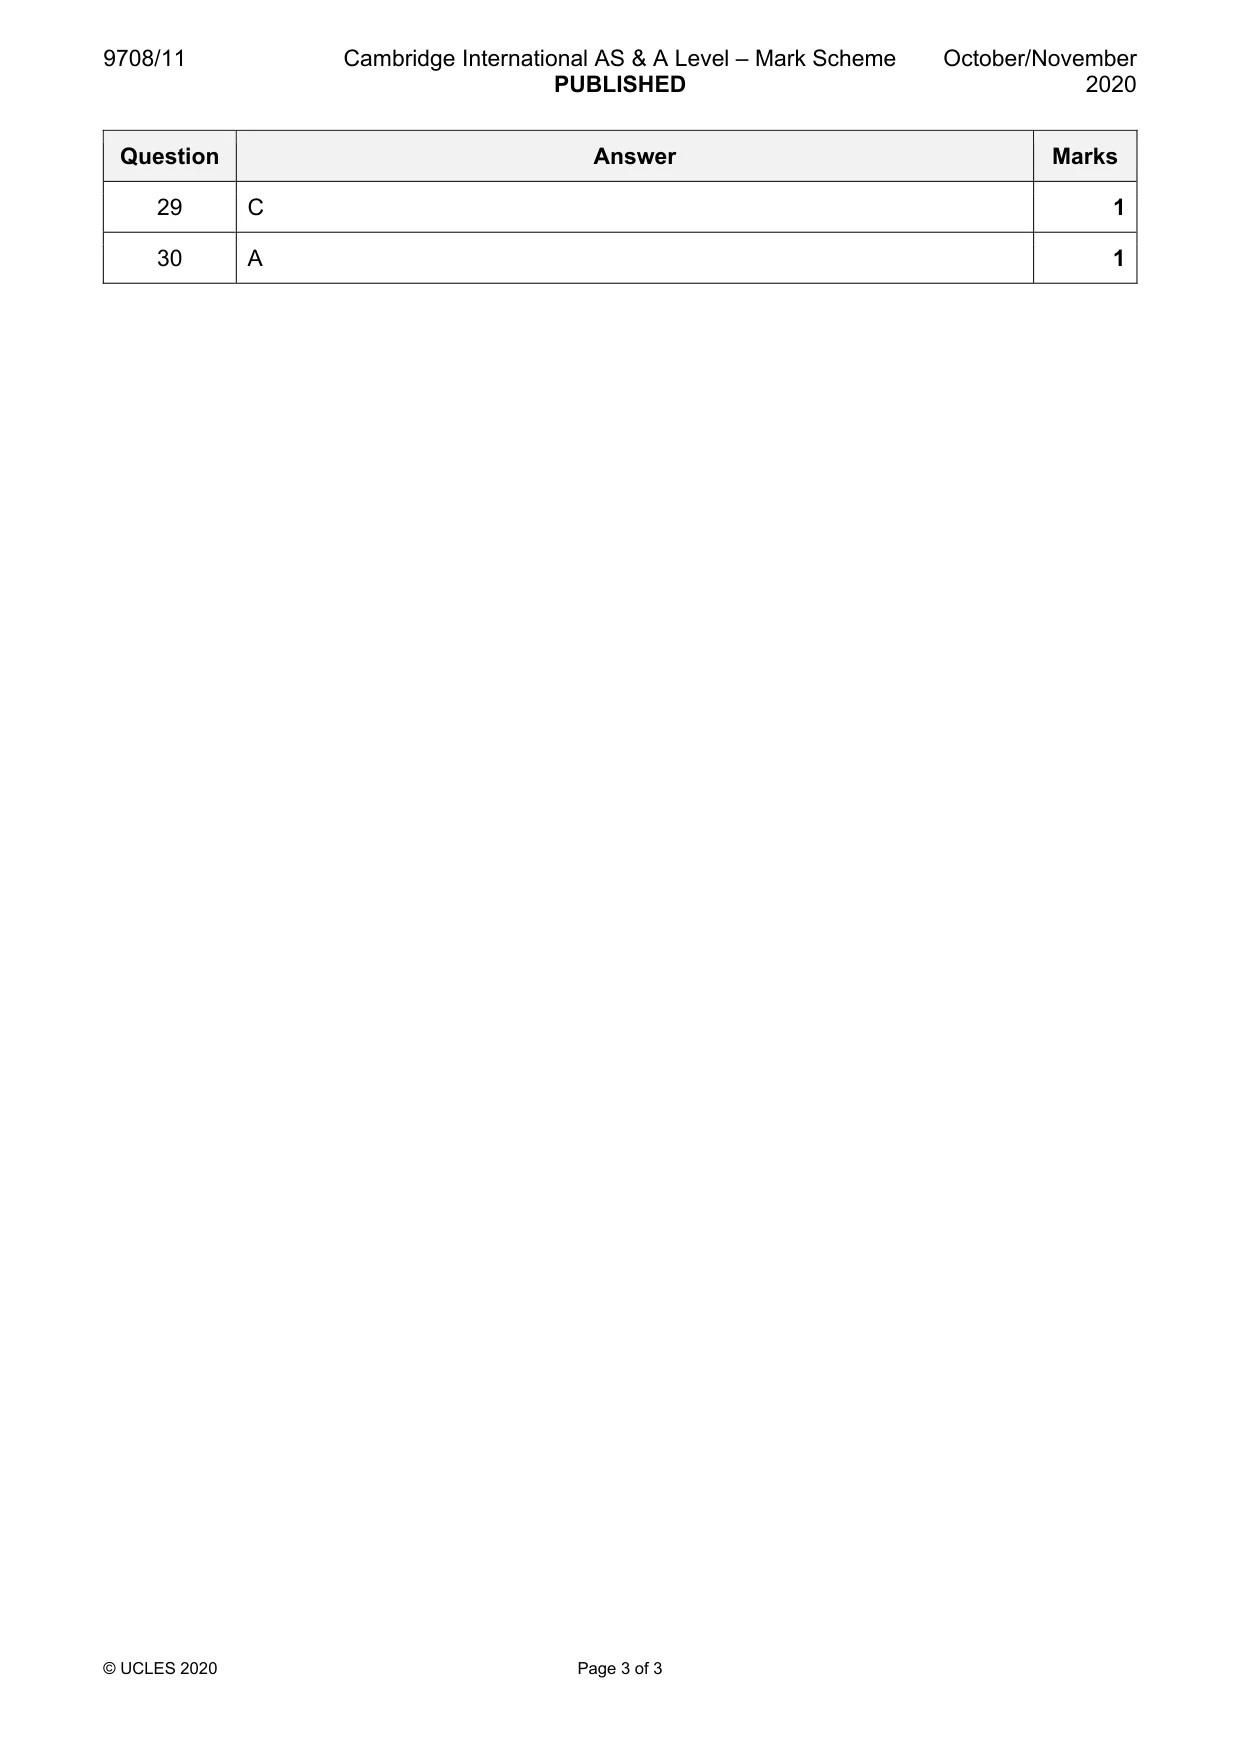
Mark scheme: C
Q30 · What would be classified as a supply-side policy measure?
30 What would be classified as a supply-side policy measure? A a law to reduce the power of trade unions B a reduction in the government’s fiscal deficit C an open market sale of securities D the imposition of a tariff on imported goods
Mark scheme: A
What was in this paper
The subtopics covered by these 30 questions, and how many questions each got. Open one in a new tab to see every Cambridge question on it.
5Addressing income and wealth inequality2Current account of the balance of payments2Methods and effects of government intervention in markets2The reasons for international trade2Aggregate Demand and Aggregate Supply analysis1Classification of goods and services1Consumer and producer surplus1Economic methodology1Exchange rates1Fiscal policy1Monetary policy1Money and banking1Policies to correct imbalances in the current account of the balance of payments1Price elasticity of supply1Price elasticity, income elasticity and cross elasticity of demand1Price stability1Production possibility curves1Protectionism1Resource allocation in different economic systems1Supply-side policy1The interaction of demand and supply1What you needed in this session
Cambridge’s own grade thresholds for 2020 Oct/Nov, Paper 1 · Variant 1. A higher threshold means an easier paper — the bar moves with how the cohort did.