Cambridge A Level Economics 9708 — 2017 May/June Paper 1 · Variant 3
9708/13/M/J/17 · 30 questions · 30 marks · ≈34 min
The question paper and its mark scheme, free to read here and free to download. This is Cambridge’s own paper, exactly as it was sat.
Question paper12 pages
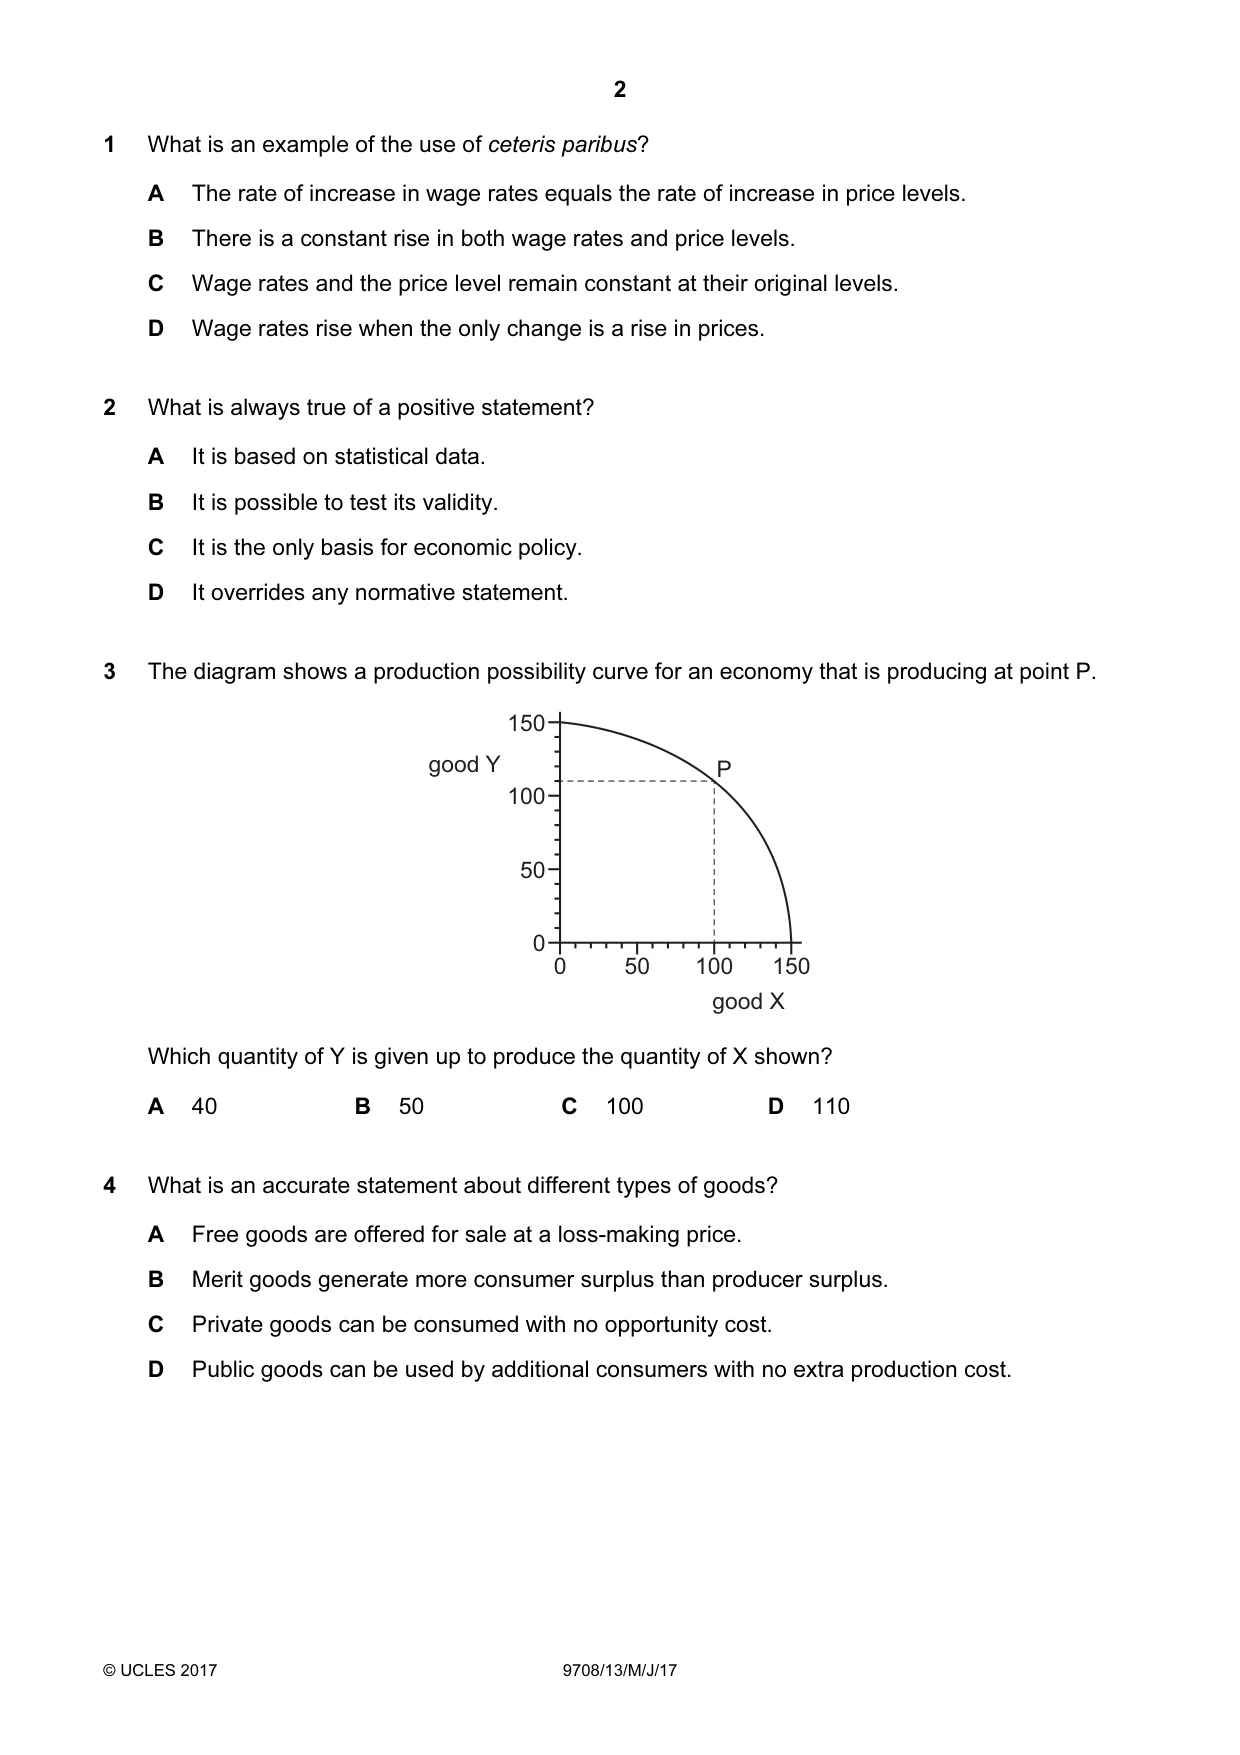
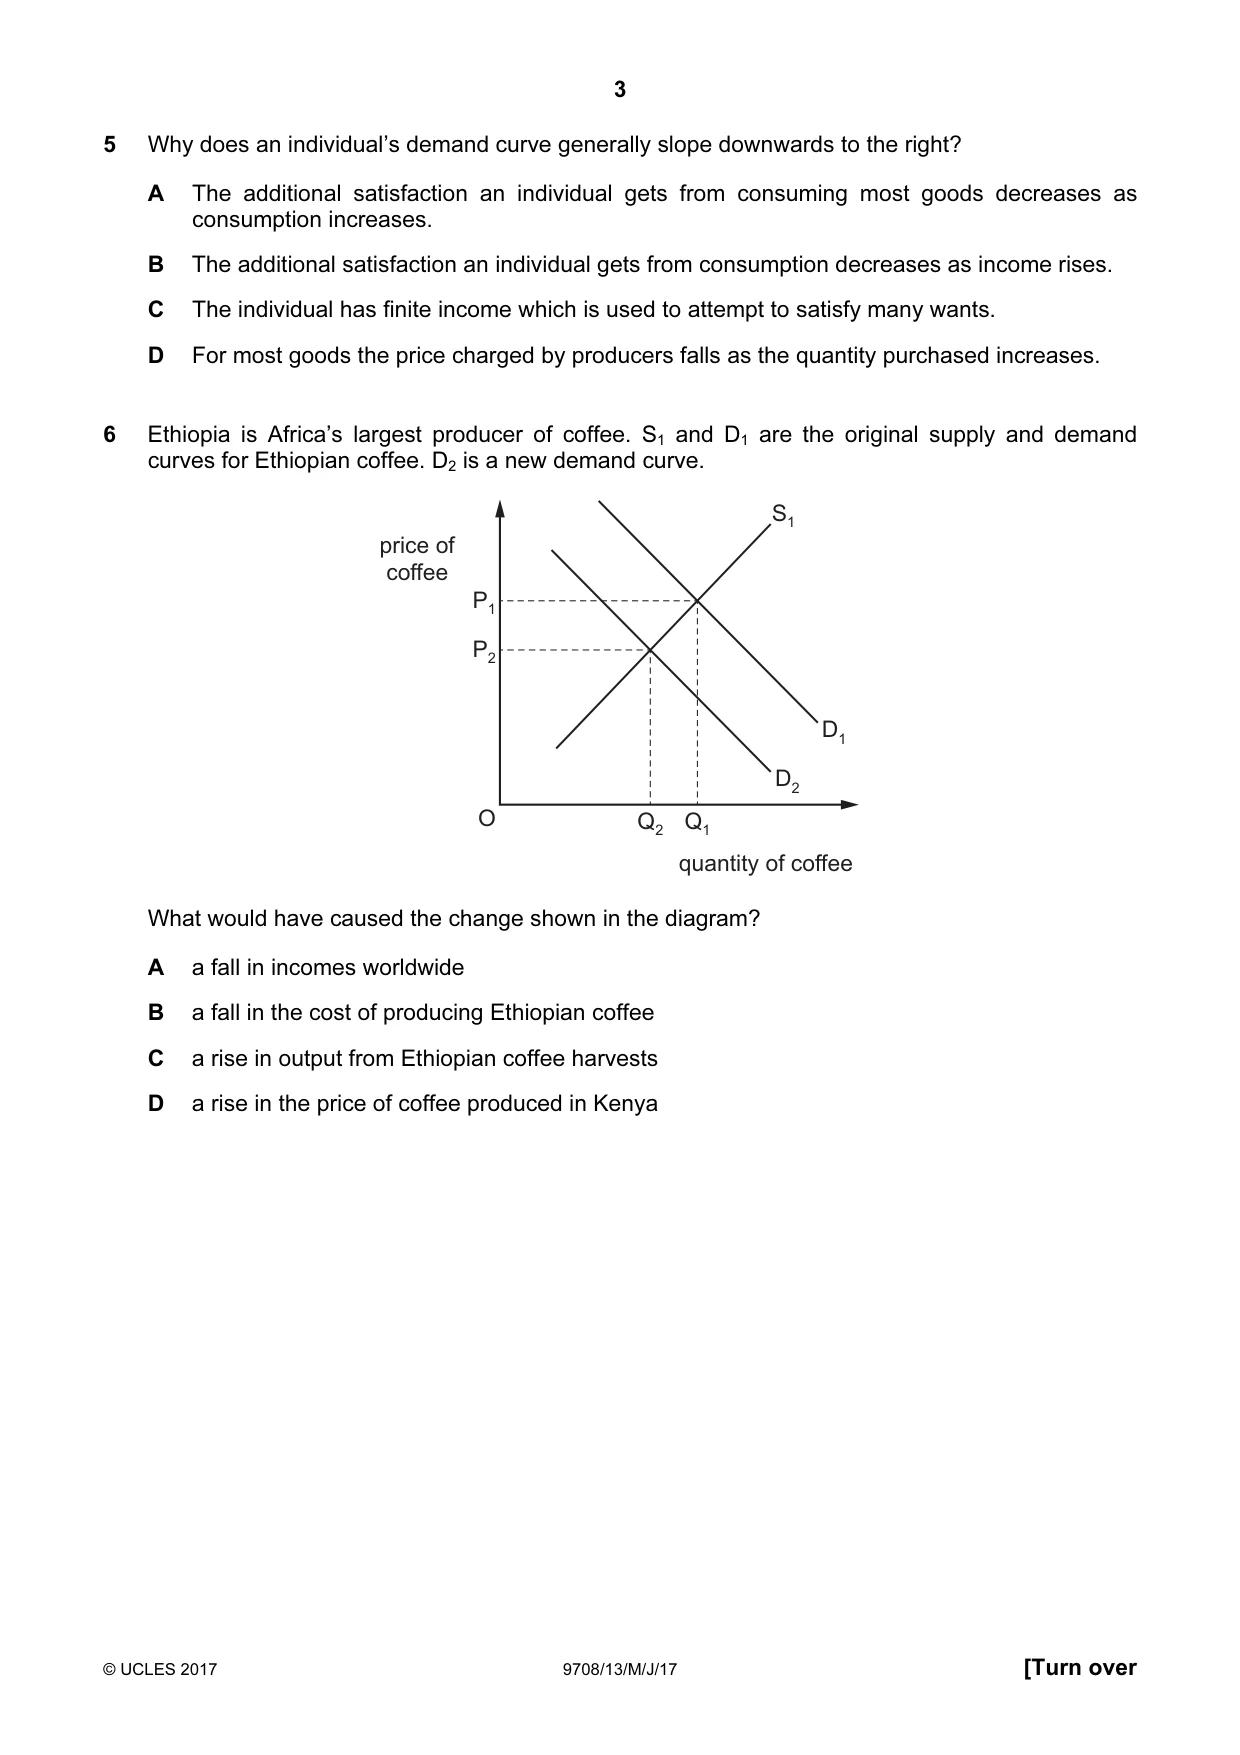
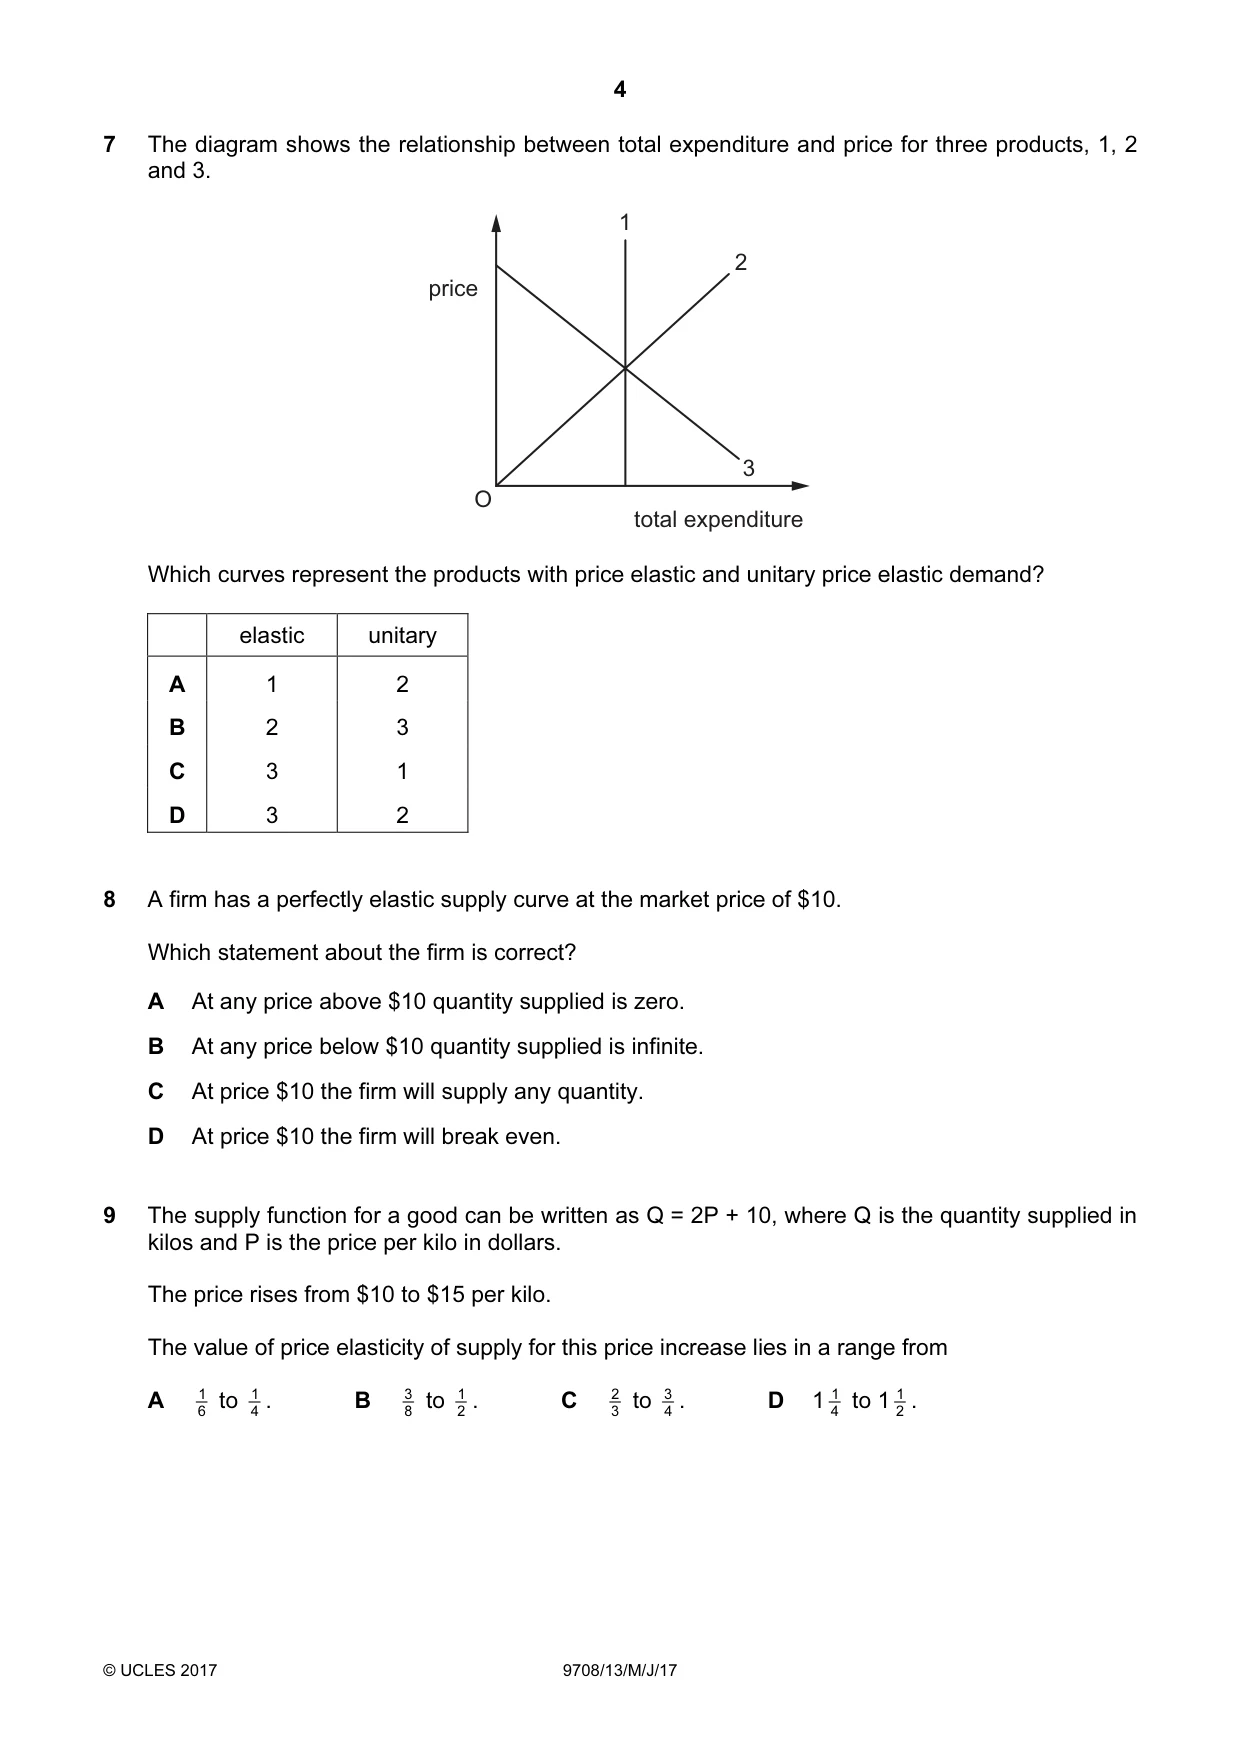
Mark scheme3 pages
Answers below. Sit the paper first if you are practising.
Questions as text
Q1 · What is an example of the use of ceteris paribus?
1 What is an example of the use of ceteris paribus? A The rate of increase in wage rates equals the rate of increase in price levels. B There is a constant rise in both wage rates and price levels. C Wage rates and the price level remain constant at their original levels. D Wage rates rise when the only change is a rise in prices.
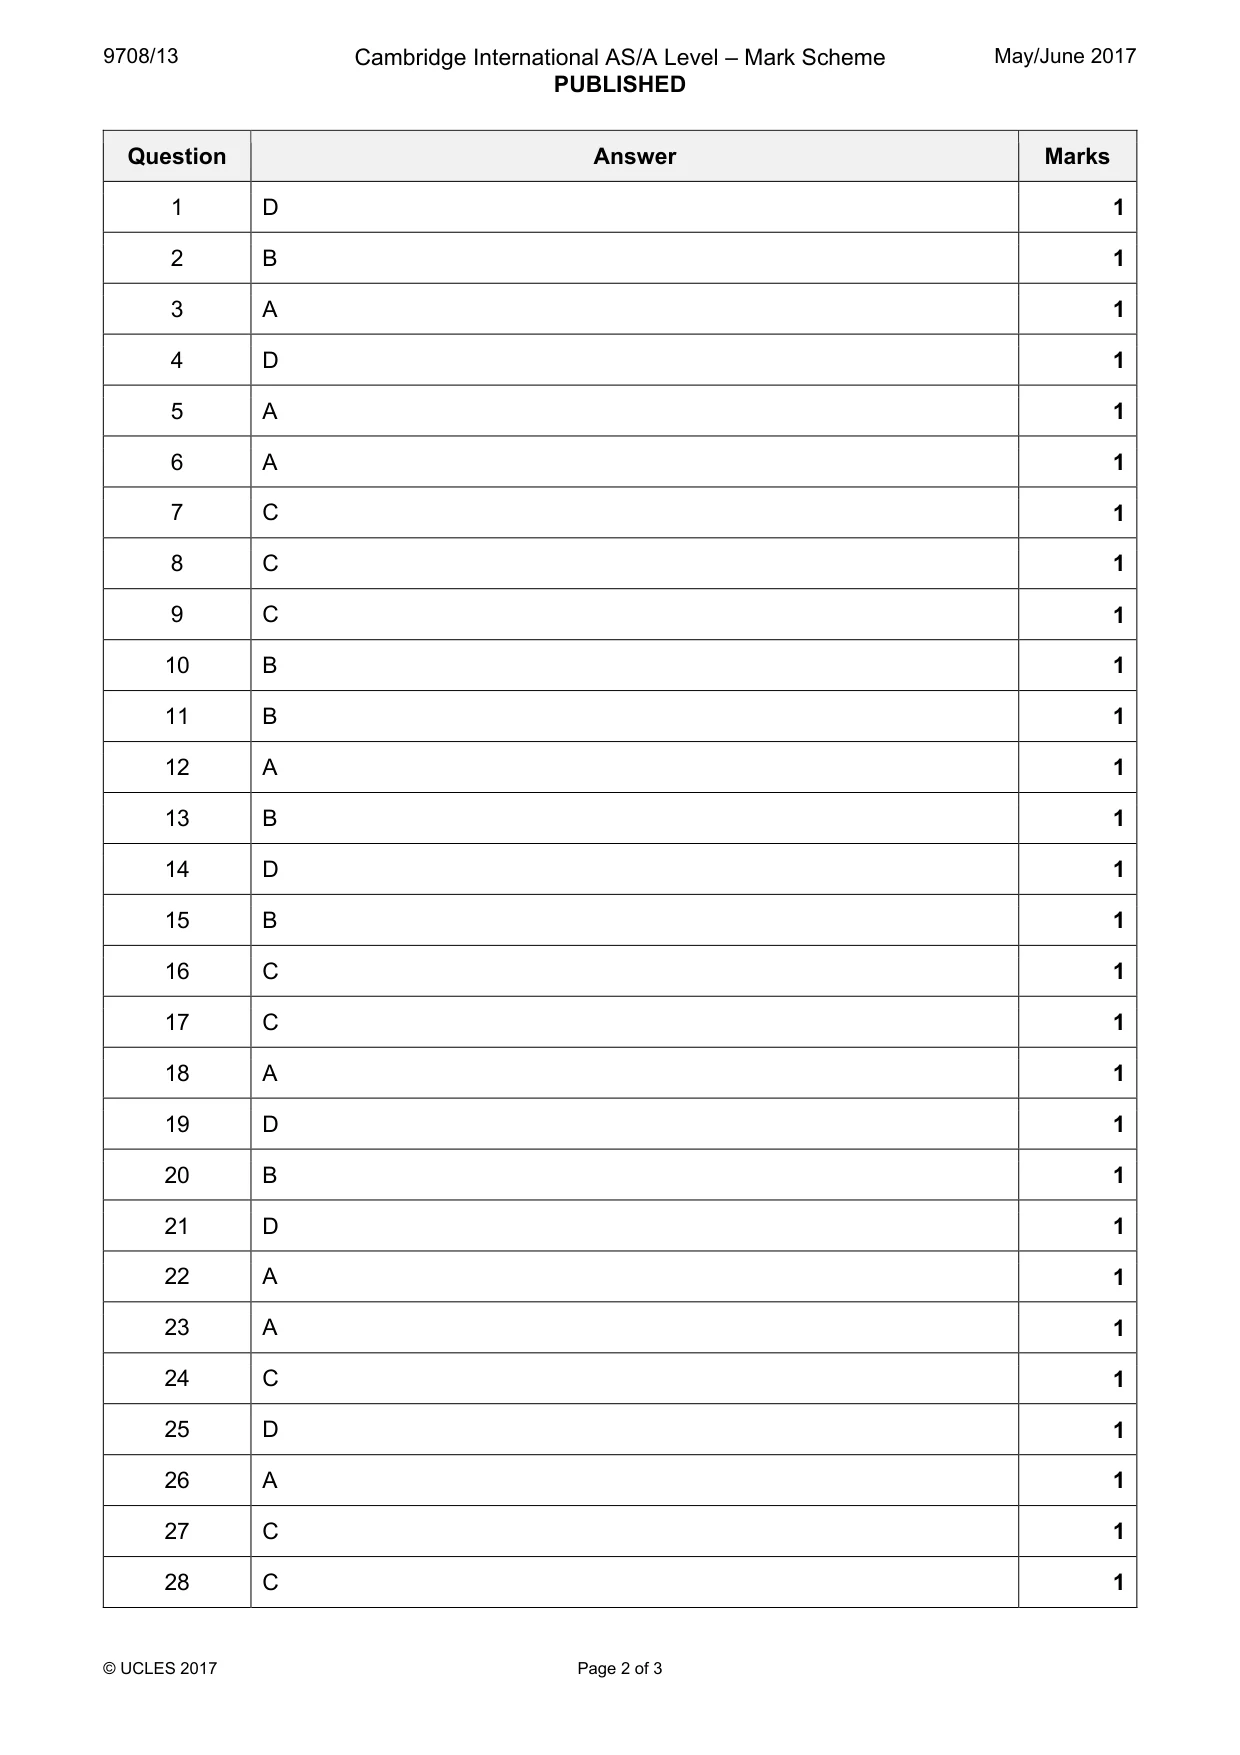
Mark scheme: D
Q2 · What is always true of a positive statement?
2 What is always true of a positive statement? A It is based on statistical data. B It is possible to test its validity. C It is the only basis for economic policy. D It overrides any normative statement.
Mark scheme: B
Q3 · The diagram shows a production possibility curve for an economy that is producing at…
3 The diagram shows a production possibility curve for an economy that is producing at point P. 150 good Y P 100 50 0 0 50 100 150 good X Which quantity of Y is given up to produce the quantity of X shown? A 40 B 50 C 100 D 110
Mark scheme: A
Q4 · What is an accurate statement about different types of goods?
4 What is an accurate statement about different types of goods? A Free goods are offered for sale at a loss-making price. B Merit goods generate more consumer surplus than producer surplus. C Private goods can be consumed with no opportunity cost. D Public goods can be used by additional consumers with no extra production cost.
Mark scheme: D
Q5 · Why does an individual’s demand curve generally slope downwards to the right?
5 Why does an individual’s demand curve generally slope downwards to the right? A The additional satisfaction an individual gets from consuming most goods decreases as consumption increases. B The additional satisfaction an individual gets from consumption decreases as income rises. C The individual has finite income which is used to attempt to satisfy many wants. D For most goods the price charged by producers falls as the quantity purchased increases.
Mark scheme: A
Q6 · Ethiopia is Africa’s largest producer of coffee
6 Ethiopia is Africa’s largest producer of coffee. S1 and D1 are the original supply and demand curves for Ethiopian coffee. D2 is a new demand curve. S1 price of coffee P1 P2 D1 D2 O Q2 Q1 quantity of coffee What would have caused the change shown in the diagram? A a fall in incomes worldwide B a fall in the cost of producing Ethiopian coffee C a rise in output from Ethiopian coffee harvests D a rise in the price of coffee produced in Kenya
Mark scheme: A
Q7 · The diagram shows the relationship between total expenditure and price for three…
7 The diagram shows the relationship between total expenditure and price for three products, 1, 2 and 3. 1 2 price 3 O total expenditure Which curves represent the products with price elastic and unitary price elastic demand? elastic unitary A 1 2 B 2 3 C 3 1 D 3 2
Mark scheme: C
More questions on Price elasticity, income elasticity and cross elasticity of demand
Q8 · A firm has a perfectly elastic supply curve at the market price of $10
8 A firm has a perfectly elastic supply curve at the market price of $10. Which statement about the firm is correct? A At any price above $10 quantity supplied is zero. B At any price below $10 quantity supplied is infinite. C At price $10 the firm will supply any quantity. D At price $10 the firm will break even.
Mark scheme: C
Q9 · The supply function for a good can be written as Q = 2P + 10, where Q is the quantity…
9 The supply function for a good can be written as Q = 2P + 10, where Q is the quantity supplied in kilos and P is the price per kilo in dollars. The price rises from $10 to $15 per kilo. The value of price elasticity of supply for this price increase lies in a range from A 1 to 4 1 . B 3 to 2 1 . C 2 to 4 3 . D 1 4 1 to 1 2 1 . 6 8 3
Mark scheme: C
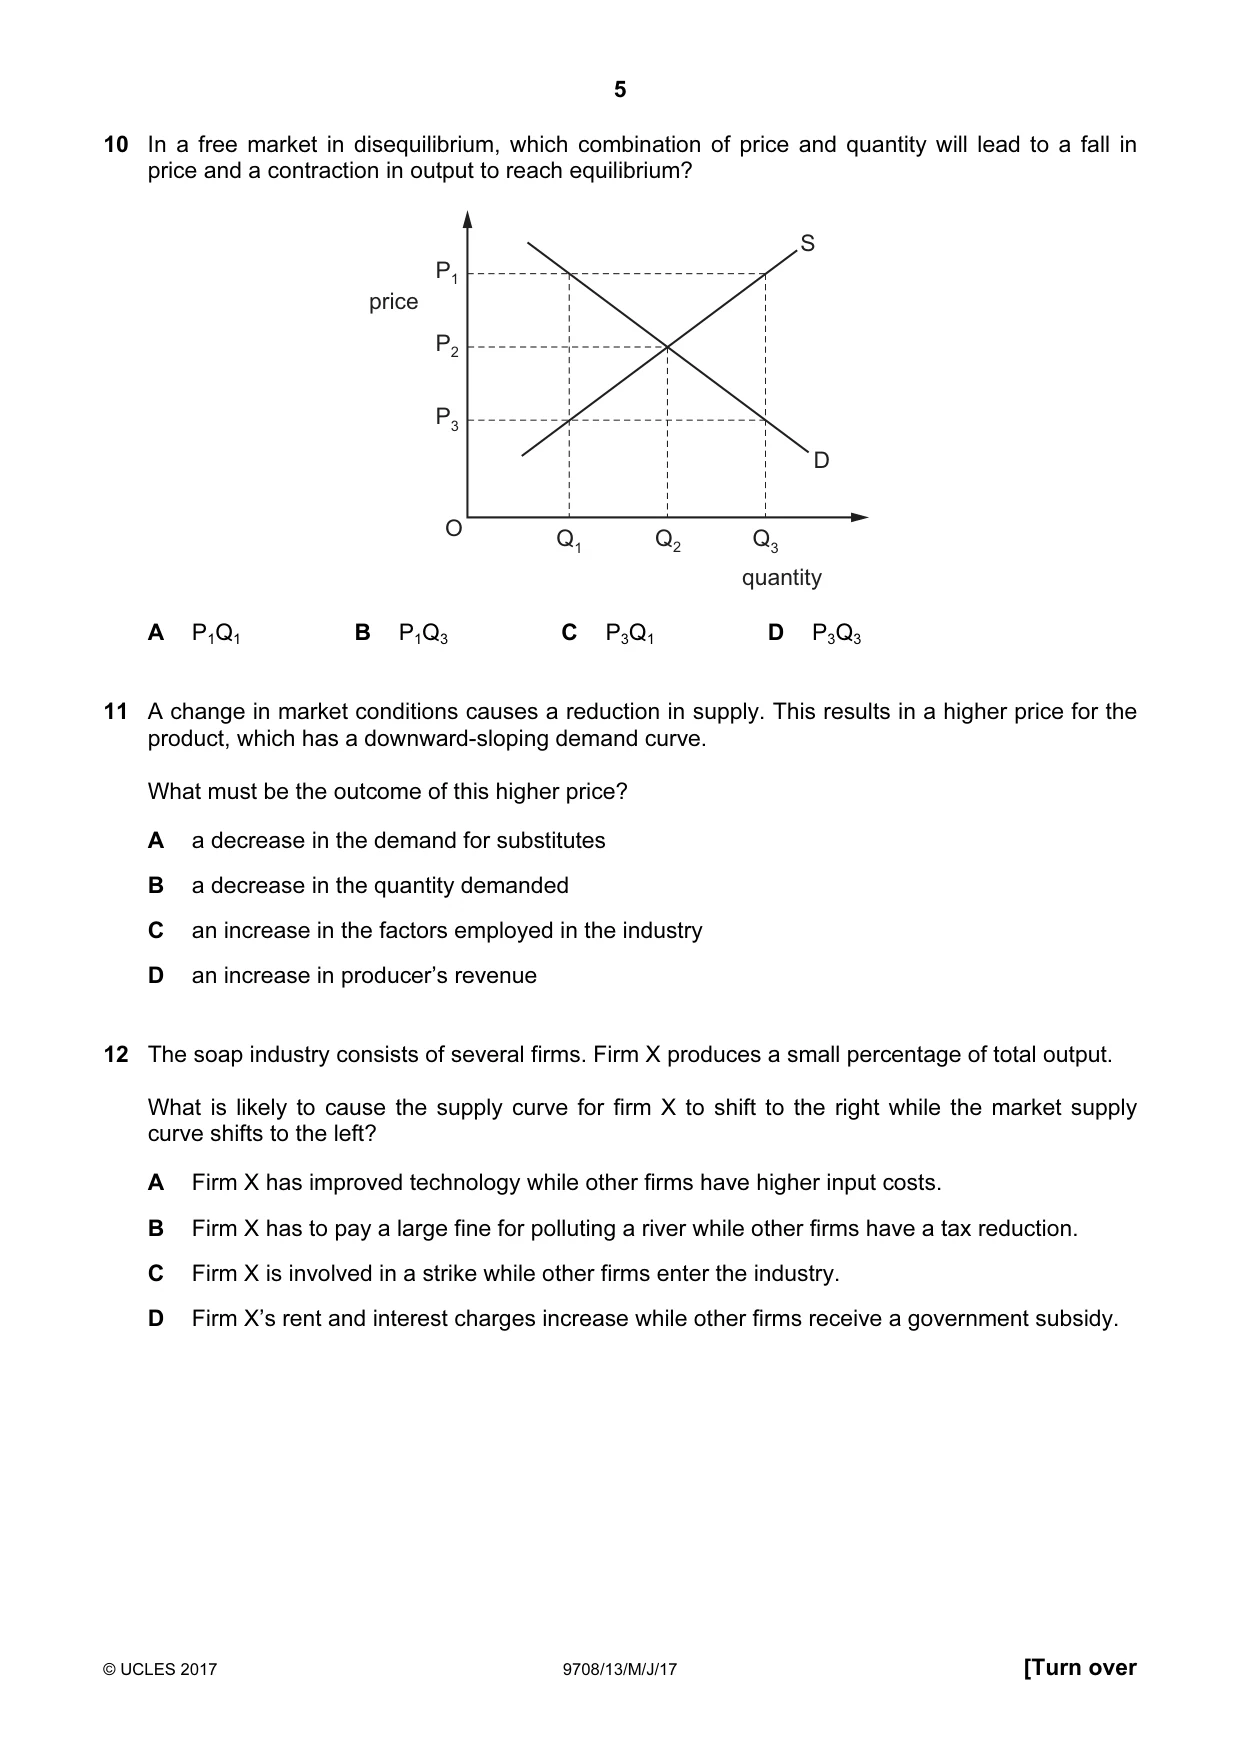
Q10 · In a free market in disequilibrium, which combination of price and quantity will lead to…
10 In a free market in disequilibrium, which combination of price and quantity will lead to a fall in price and a contraction in output to reach equilibrium? S P1 price P2 P3 D O Q1 Q2 Q3 quantity A P1Q1 B P1Q3 C P3Q1 D P3Q3
Mark scheme: B
Q11 · A change in market conditions causes a reduction in supply
11 A change in market conditions causes a reduction in supply. This results in a higher price for the product, which has a downward-sloping demand curve. What must be the outcome of this higher price? A a decrease in the demand for substitutes B a decrease in the quantity demanded C an increase in the factors employed in the industry D an increase in producer’s revenue
Mark scheme: B
Q12 · The soap industry consists of several firms
12 The soap industry consists of several firms. Firm X produces a small percentage of total output. What is likely to cause the supply curve for firm X to shift to the right while the market supply curve shifts to the left? A Firm X has improved technology while other firms have higher input costs. B Firm X has to pay a large fine for polluting a river while other firms have a tax reduction. C Firm X is involved in a strike while other firms enter the industry. D Firm X’s rent and interest charges increase while other firms receive a government subsidy.
Mark scheme: A
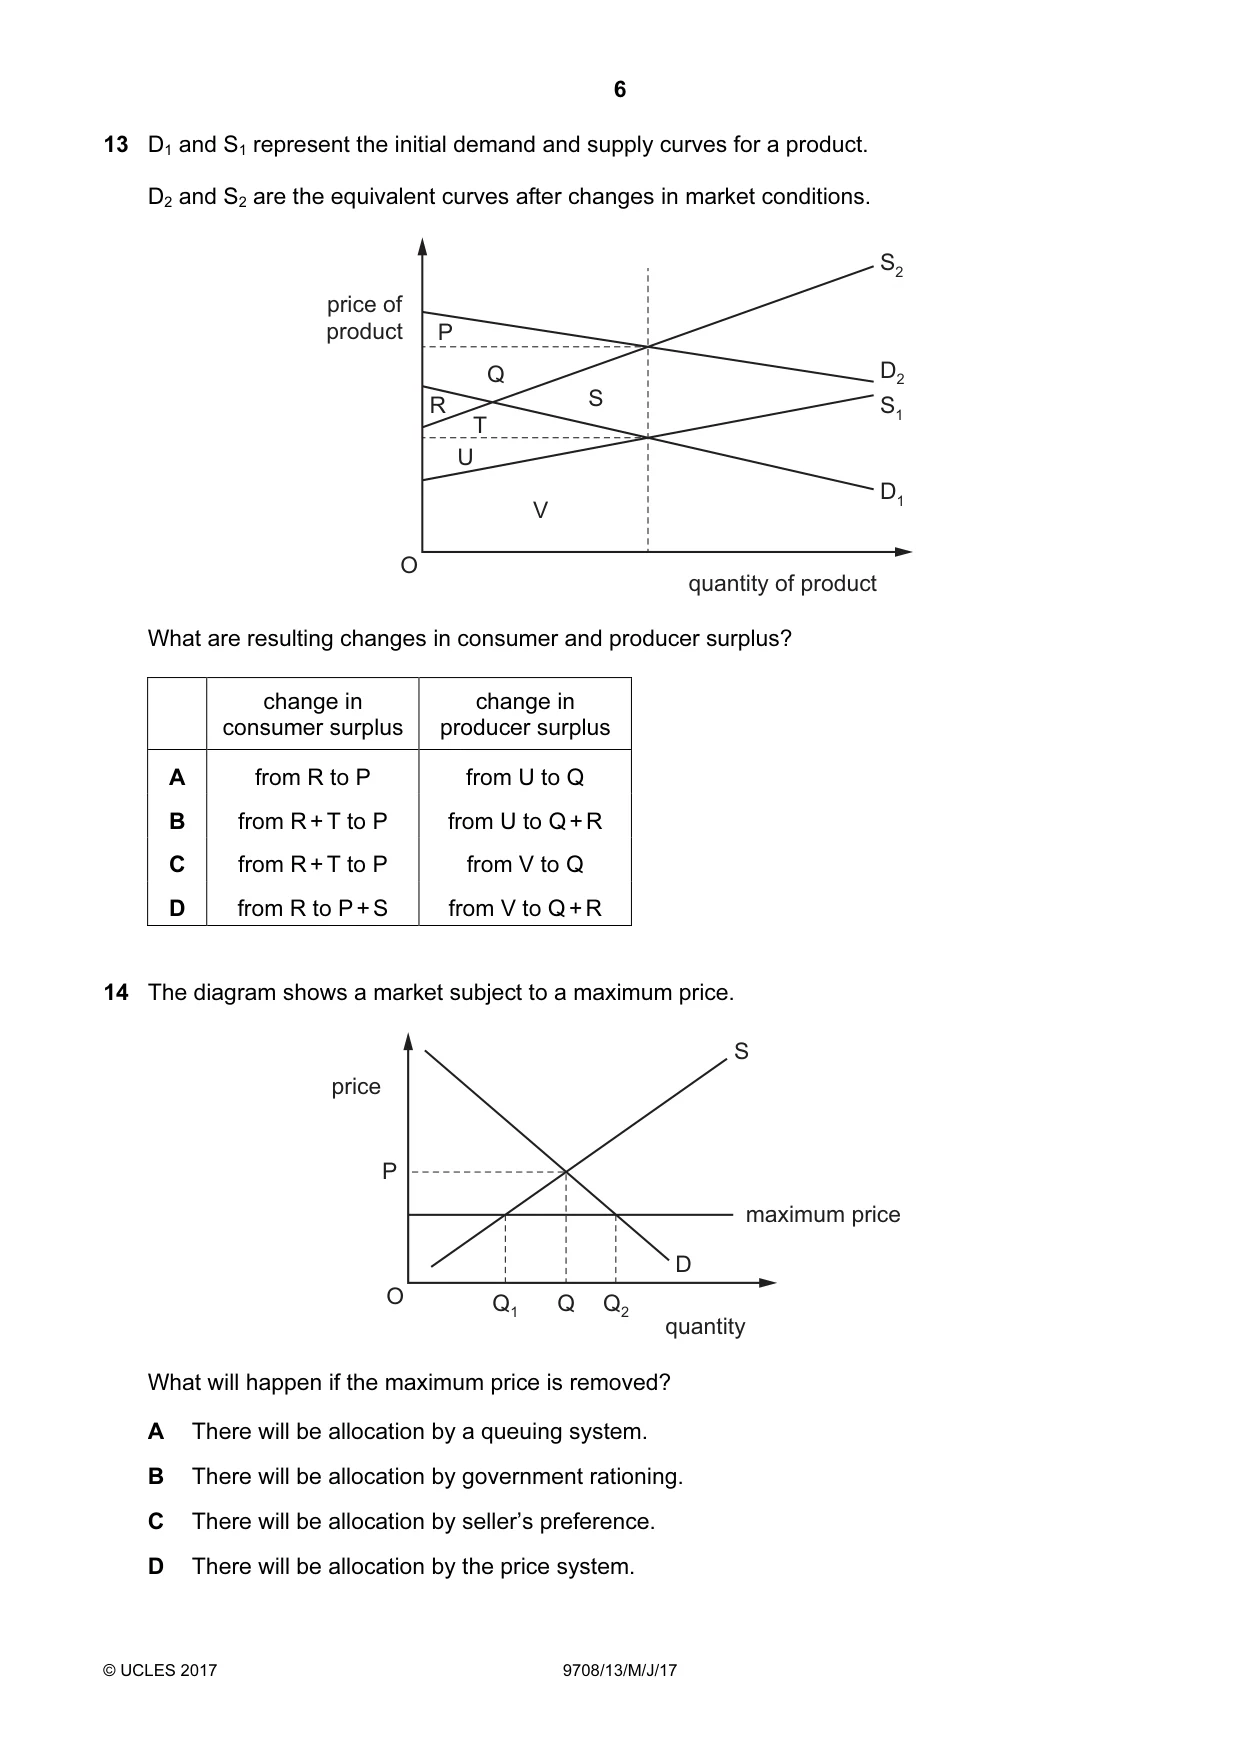
Q13 · D1 and S1 represent the initial demand and supply curves for a product
13 D1 and S1 represent the initial demand and supply curves for a product. D2 and S2 are the equivalent curves after changes in market conditions. S2 price of product P Q D2 R S S1 T U D1 V O quantity of product What are resulting changes in consumer and producer surplus? change in change in consumer surplus producer surplus A from R to P from U to Q B from R + T to P from U to Q + R C from R + T to P from V to Q D from R to P + S from V to Q + R
Mark scheme: B
Q14 · The diagram shows a market subject to a maximum price
14 The diagram shows a market subject to a maximum price. S price P maximum price D O Q1 Q Q2 quantity What will happen if the maximum price is removed? A There will be allocation by a queuing system. B There will be allocation by government rationing. C There will be allocation by seller’s preference. D There will be allocation by the price system.
Mark scheme: D
More questions on Methods and effects of government intervention in markets
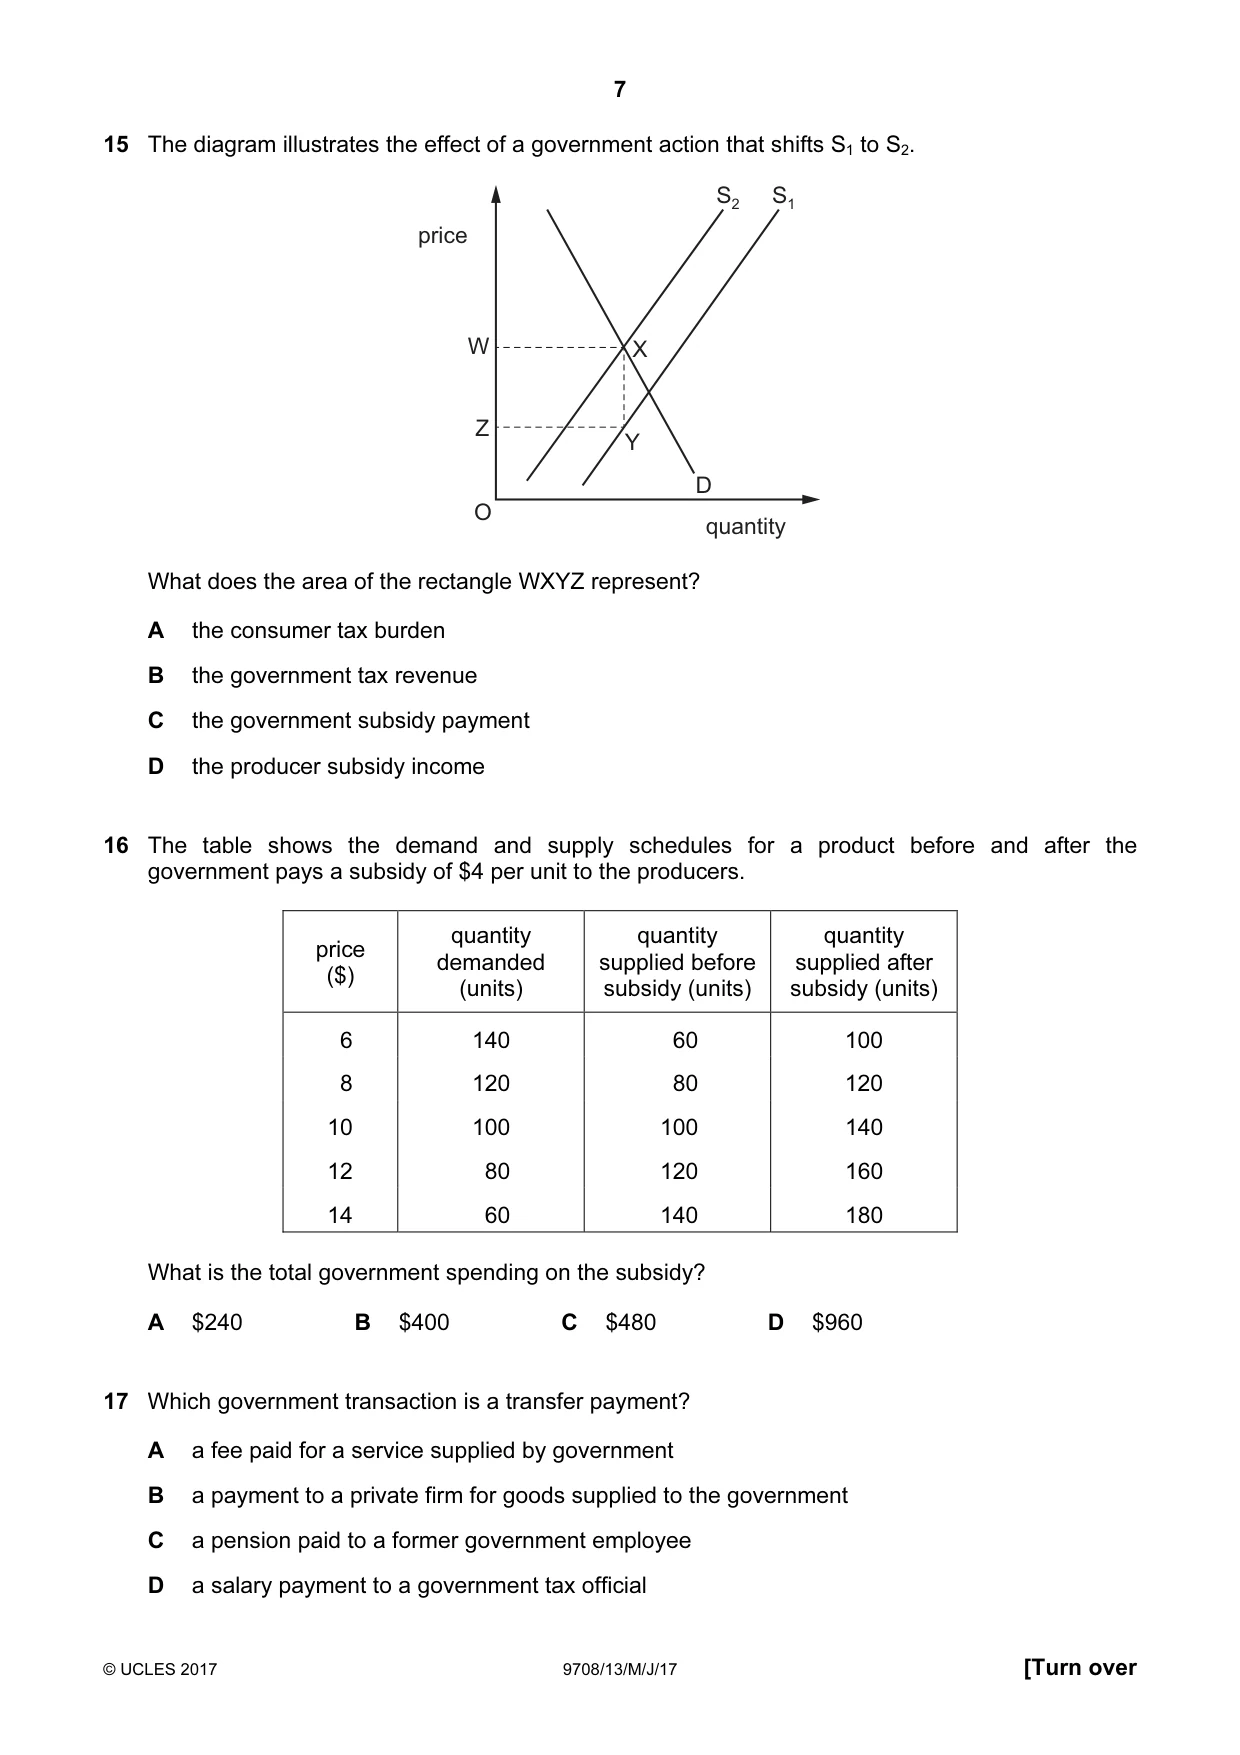
Q15 · The diagram illustrates the effect of a government action that shifts S1 to S2
15 The diagram illustrates the effect of a government action that shifts S1 to S2. S2 S1 price W X Z Y D O quantity What does the area of the rectangle WXYZ represent? A the consumer tax burden B the government tax revenue C the government subsidy payment D the producer subsidy income
Mark scheme: B
More questions on Methods and effects of government intervention in markets
Q16 · The table shows the demand and supply schedules for a product before and after the…
16 The table shows the demand and supply schedules for a product before and after the government pays a subsidy of $4 per unit to the producers. quantity quantity quantity price demanded supplied before supplied after ($) (units) subsidy (units) subsidy (units) 6 140 60 100 8 120 80 120 10 100 100 140 12 80 120 160 14 60 140 180 What is the total government spending on the subsidy? A $240 B $400 C $480 D $960
Mark scheme: C
More questions on Methods and effects of government intervention in markets
Q17 · Which government transaction is a transfer payment?
17 Which government transaction is a transfer payment? A a fee paid for a service supplied by government B a payment to a private firm for goods supplied to the government C a pension paid to a former government employee D a salary payment to a government tax official
Mark scheme: C
Q18 · Following deregulation, state-owned enterprises in an economy are to be privatised
18 Following deregulation, state-owned enterprises in an economy are to be privatised. What is least likely to result? A Private companies will put customer needs before profits. B Private companies will raise their own share capital. C The level of incentive for the enterprises will rise. D The number of companies will increase.
Mark scheme: A
More questions on Resource allocation in different economic systems
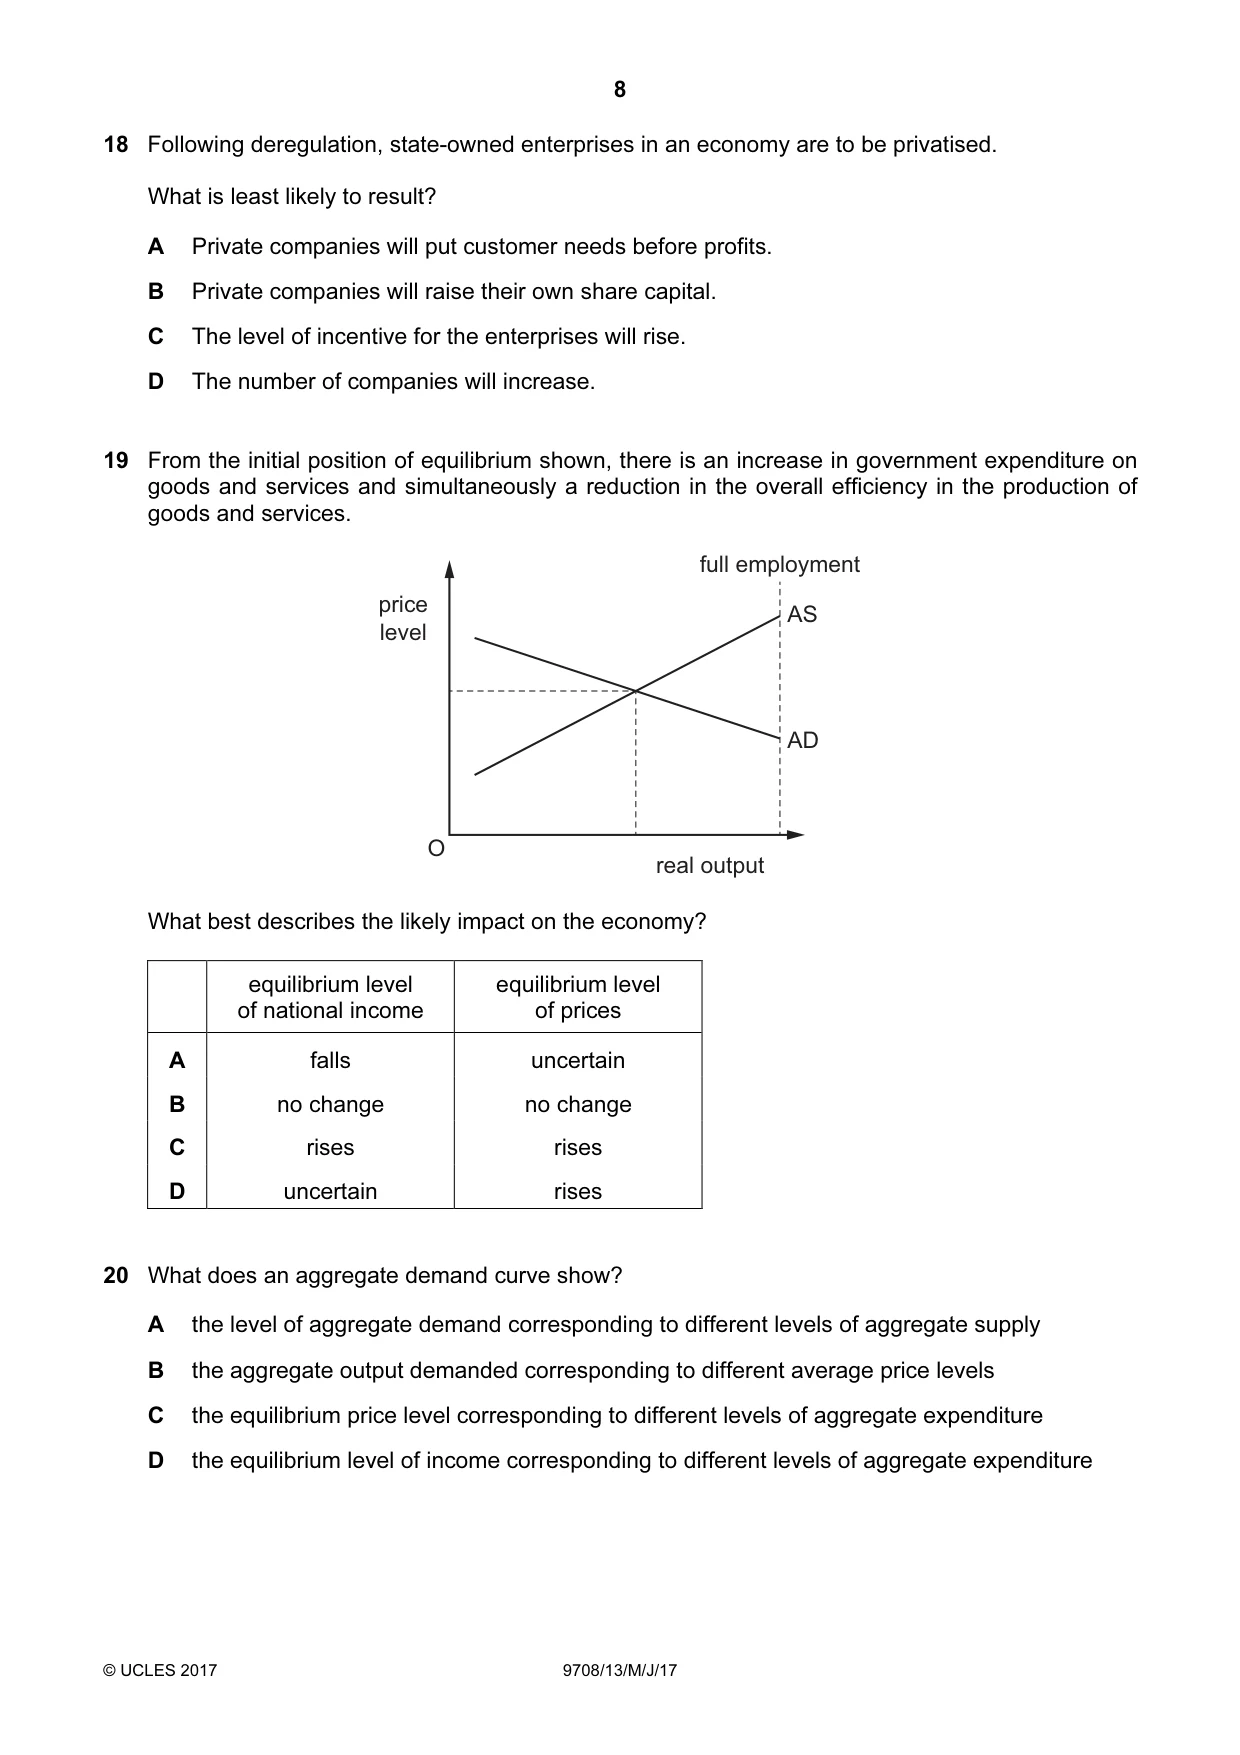
Q19 · From the initial position of equilibrium shown, there is an increase in government…
19 From the initial position of equilibrium shown, there is an increase in government expenditure on goods and services and simultaneously a reduction in the overall efficiency in the production of goods and services. full employment price AS level AD O real output What best describes the likely impact on the economy? equilibrium level equilibrium level of national income of prices A falls uncertain B no change no change C rises rises D uncertain rises
Mark scheme: D
More questions on Aggregate Demand and Aggregate Supply analysis
Q20 · What does an aggregate demand curve show?
20 What does an aggregate demand curve show? A the level of aggregate demand corresponding to different levels of aggregate supply B the aggregate output demanded corresponding to different average price levels C the equilibrium price level corresponding to different levels of aggregate expenditure D the equilibrium level of income corresponding to different levels of aggregate expenditure
Mark scheme: B
More questions on Aggregate Demand and Aggregate Supply analysis
Q21 · The table shows the year-on-year percentage changes for a country’s consumer price index…
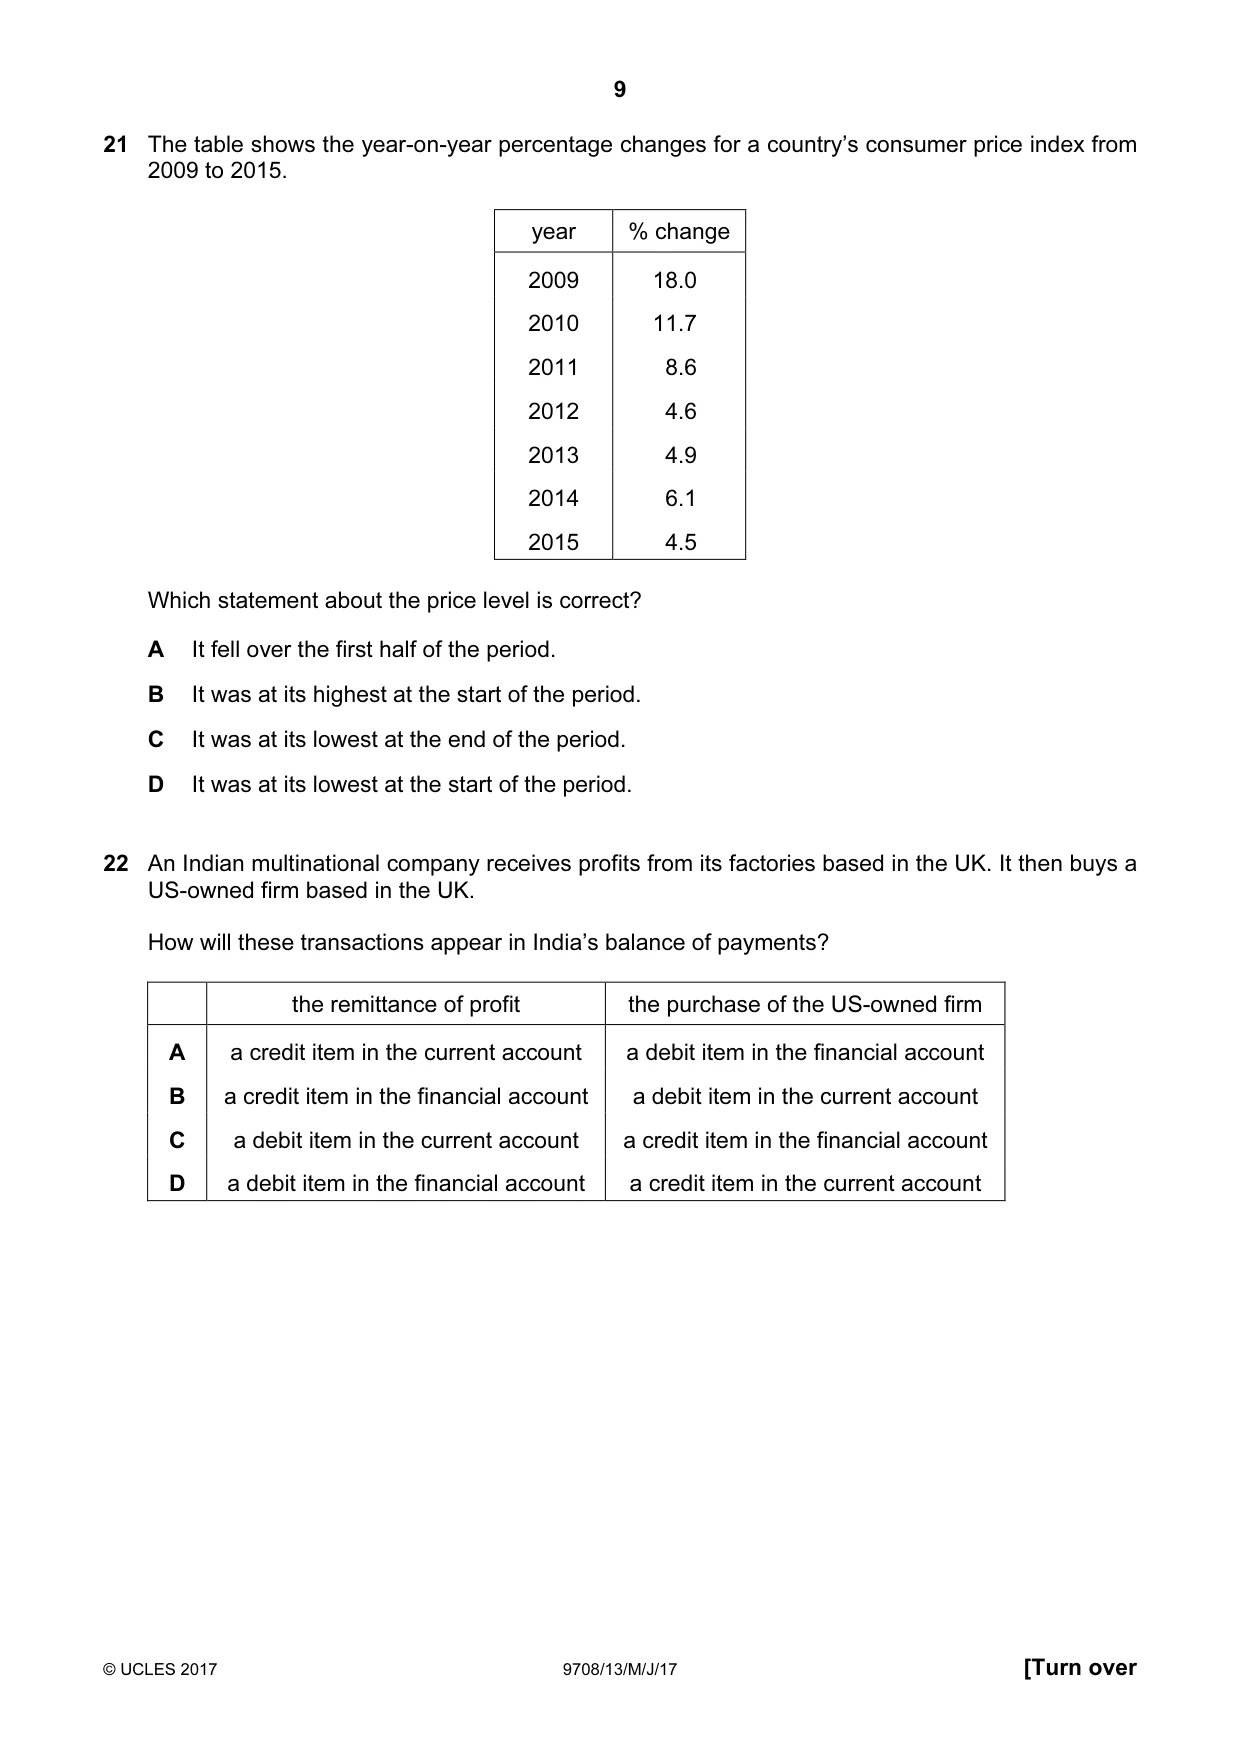
21 The table shows the year-on-year percentage changes for a country’s consumer price index from 2009 to 2015. year % change 2009 18.0 2010 11.7 2011 8.6 2012 4.6 2013 4.9 2014 6.1 2015 4.5 Which statement about the price level is correct? A It fell over the first half of the period. B It was at its highest at the start of the period. C It was at its lowest at the end of the period. D It was at its lowest at the start of the period.
Mark scheme: D
Q22 · An Indian multinational company receives profits from its factories based in the UK
22 An Indian multinational company receives profits from its factories based in the UK. It then buys a US-owned firm based in the UK. How will these transactions appear in India’s balance of payments? the remittance of profit the purchase of the US-owned firm A a credit item in the current account a debit item in the financial account B a credit item in the financial account a debit item in the current account C a debit item in the current account a credit item in the financial account D a debit item in the financial account a credit item in the current account
Mark scheme: A
More questions on Current account of the balance of payments
Q23 · In the diagram D1 and S1 are the initial supply and demand curves of the pound sterling…
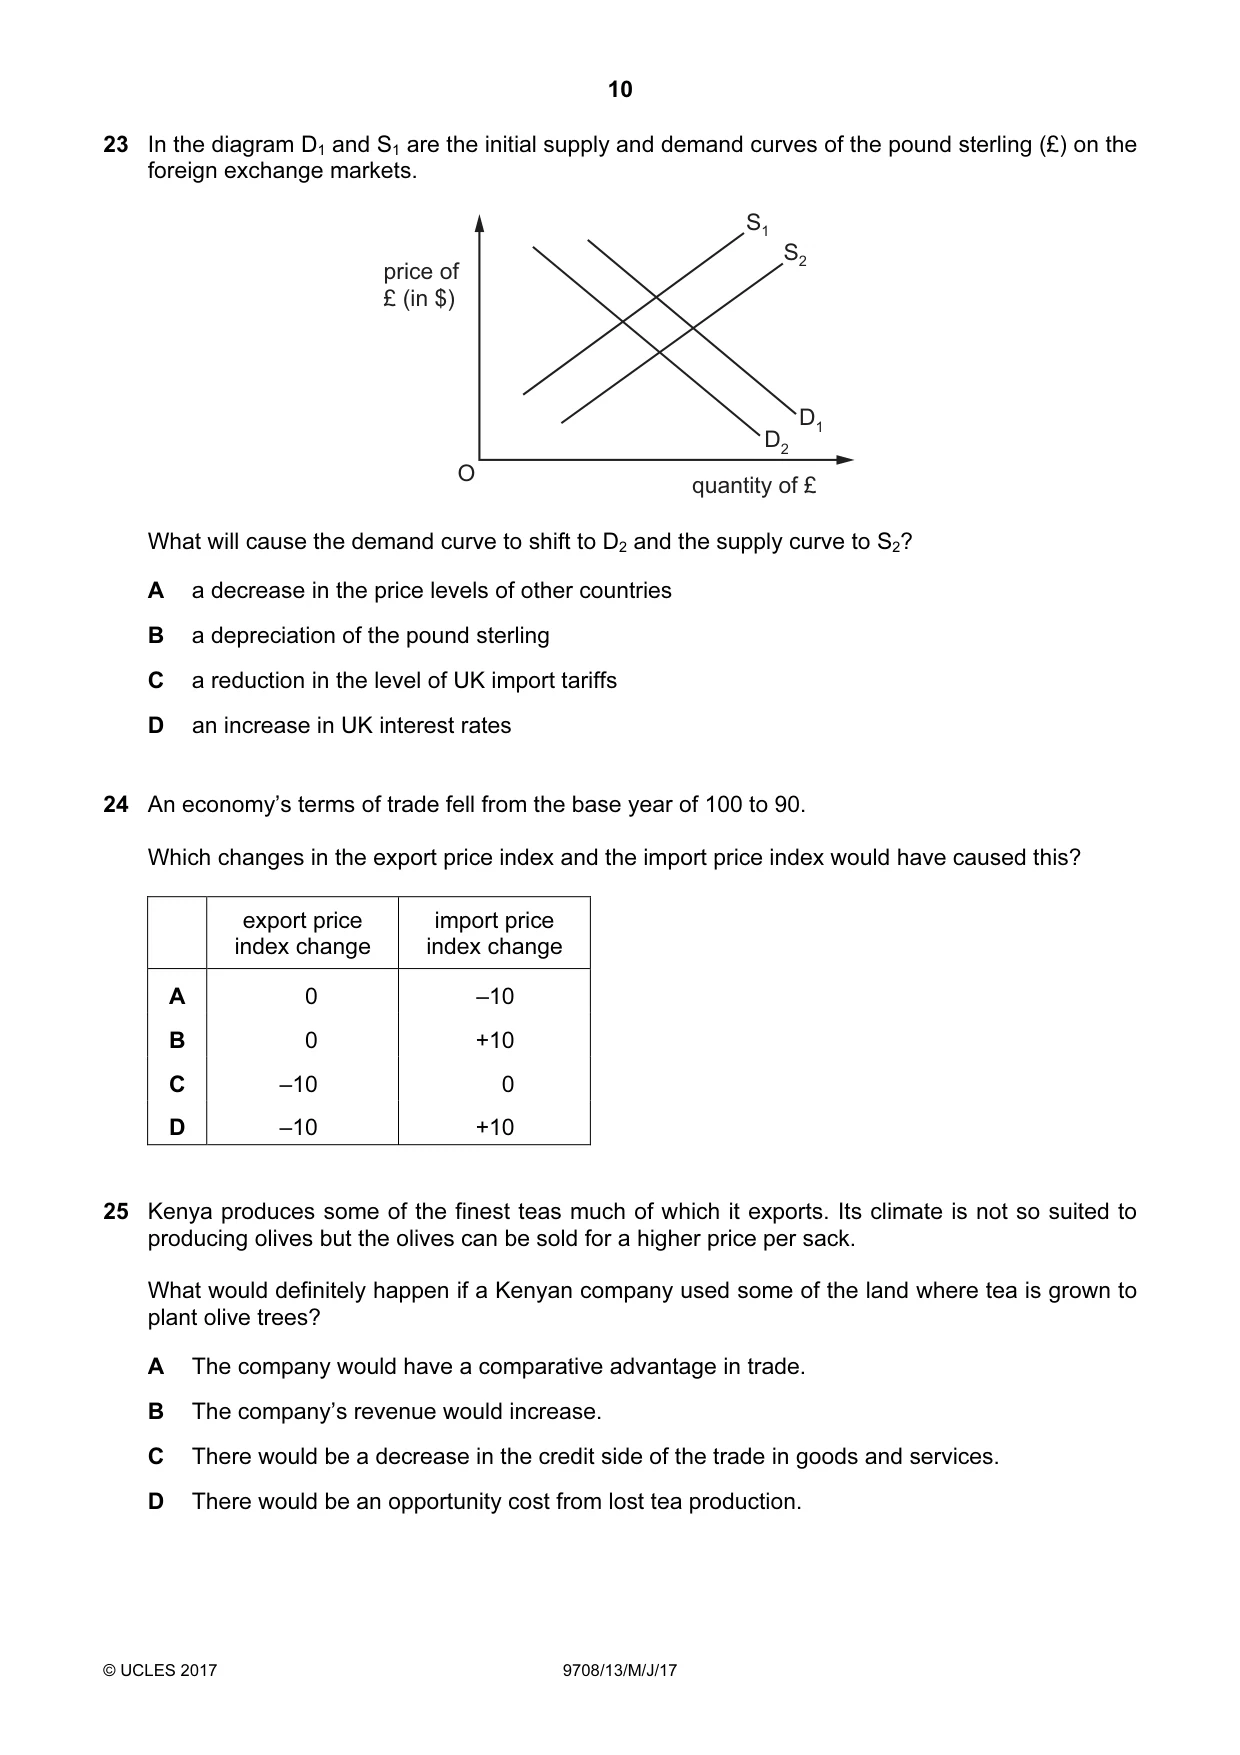
23 In the diagram D1 and S1 are the initial supply and demand curves of the pound sterling (£) on the foreign exchange markets. S1 S2 price of £ (in $) D1 D2 O quantity of £ What will cause the demand curve to shift to D2 and the supply curve to S2? A a decrease in the price levels of other countries B a depreciation of the pound sterling C a reduction in the level of UK import tariffs D an increase in UK interest rates
Mark scheme: A
Q24 · An economy’s terms of trade fell from the base year of 100 to 90
24 An economy’s terms of trade fell from the base year of 100 to 90. Which changes in the export price index and the import price index would have caused this? export price import price index change index change A 0 –10 B 0 +10 C –10 0 D –10 +10
Mark scheme: C
Q25 · Kenya produces some of the finest teas much of which it exports
25 Kenya produces some of the finest teas much of which it exports. Its climate is not so suited to producing olives but the olives can be sold for a higher price per sack. What would definitely happen if a Kenyan company used some of the land where tea is grown to plant olive trees? A The company would have a comparative advantage in trade. B The company’s revenue would increase. C There would be a decrease in the credit side of the trade in goods and services. D There would be an opportunity cost from lost tea production.
Mark scheme: D
Q26 · The diagram shows that the imposition of a tariff raises a good’s world price from $10 to…
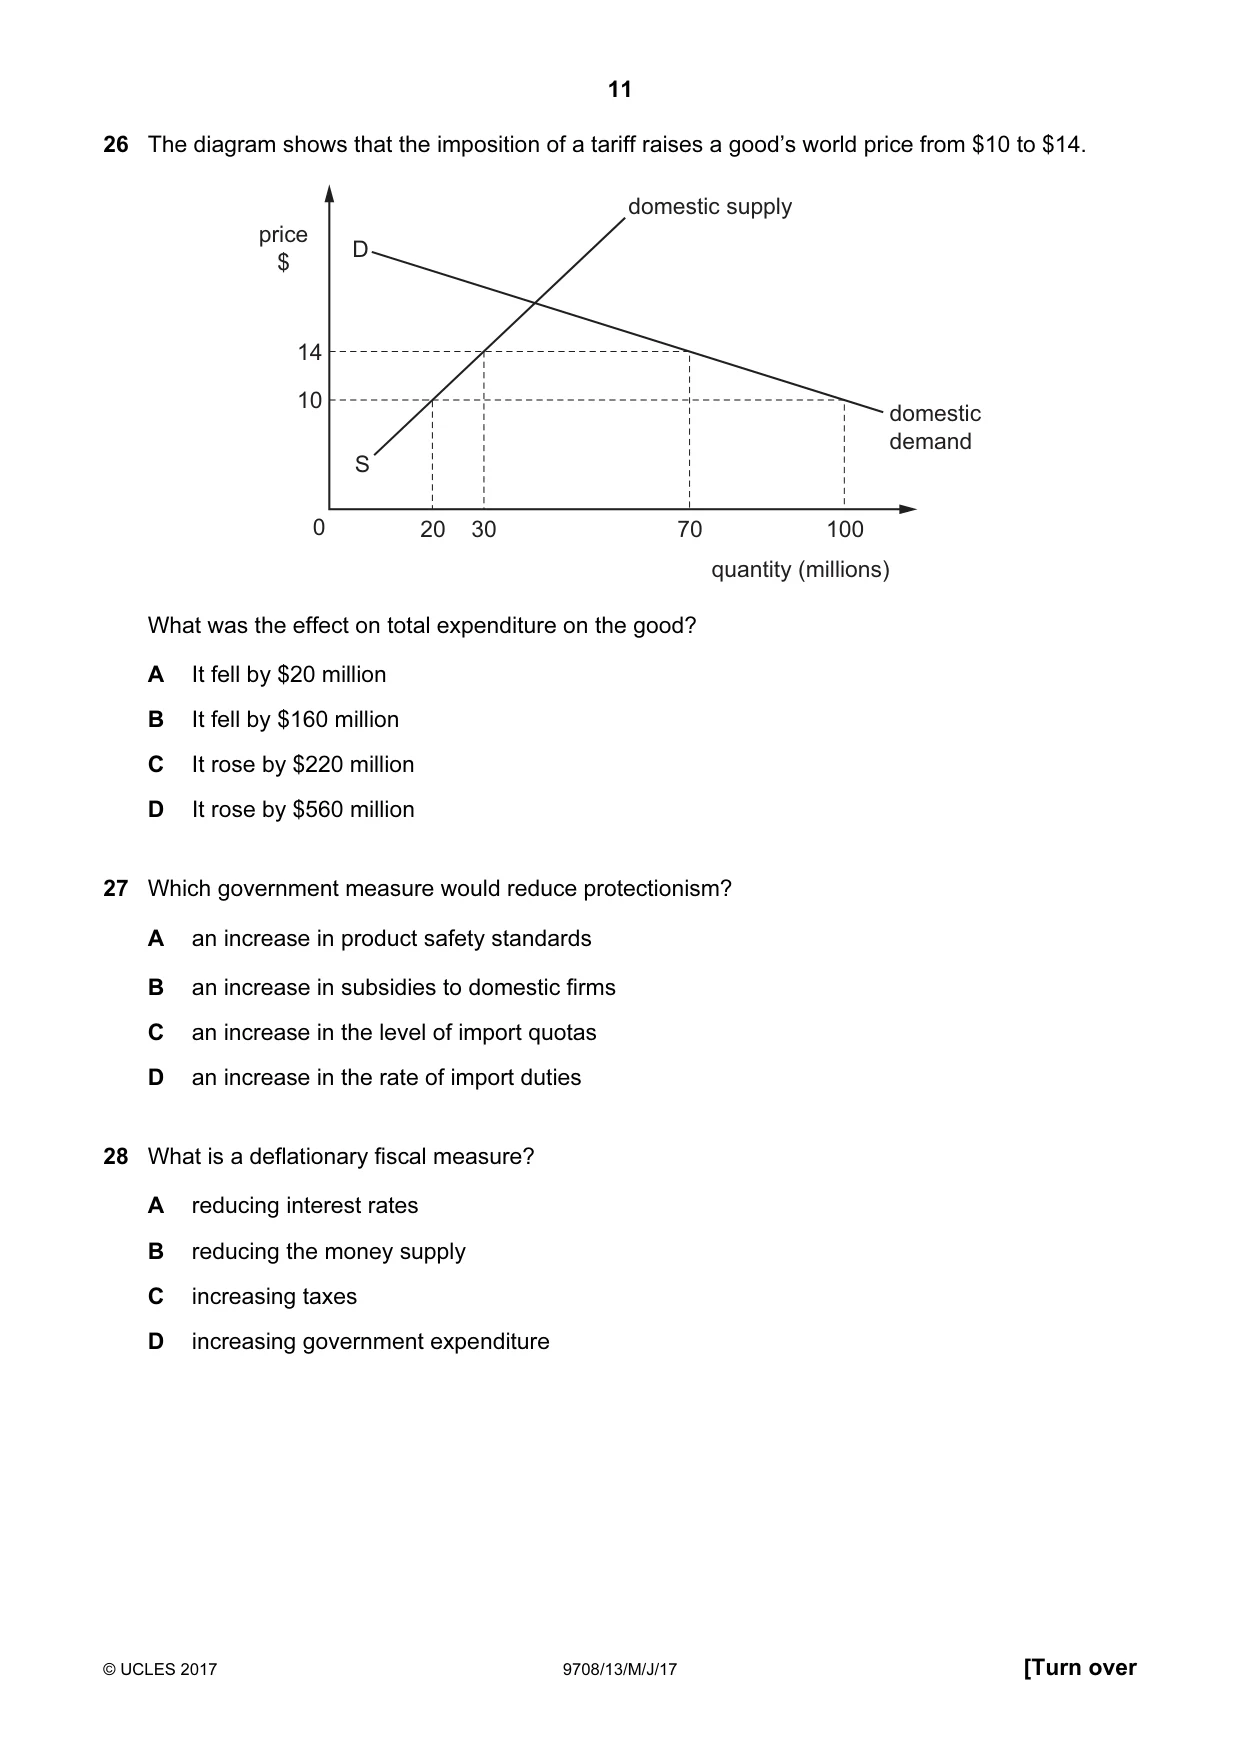
26 The diagram shows that the imposition of a tariff raises a good’s world price from $10 to $14. domestic supply price D $ 14 10 domestic demand S 0 20 30 70 100 quantity (millions) What was the effect on total expenditure on the good? A It fell by $20 million B It fell by $160 million C It rose by $220 million D It rose by $560 million
Mark scheme: A
Q27 · Which government measure would reduce protectionism?
27 Which government measure would reduce protectionism? A an increase in product safety standards B an increase in subsidies to domestic firms C an increase in the level of import quotas D an increase in the rate of import duties
Mark scheme: C
Q28 · What is a deflationary fiscal measure?
28 What is a deflationary fiscal measure? A reducing interest rates B reducing the money supply C increasing taxes D increasing government expenditure
Mark scheme: C
Q29 · Policies to correct a balance of payments deficit fall into two categories…
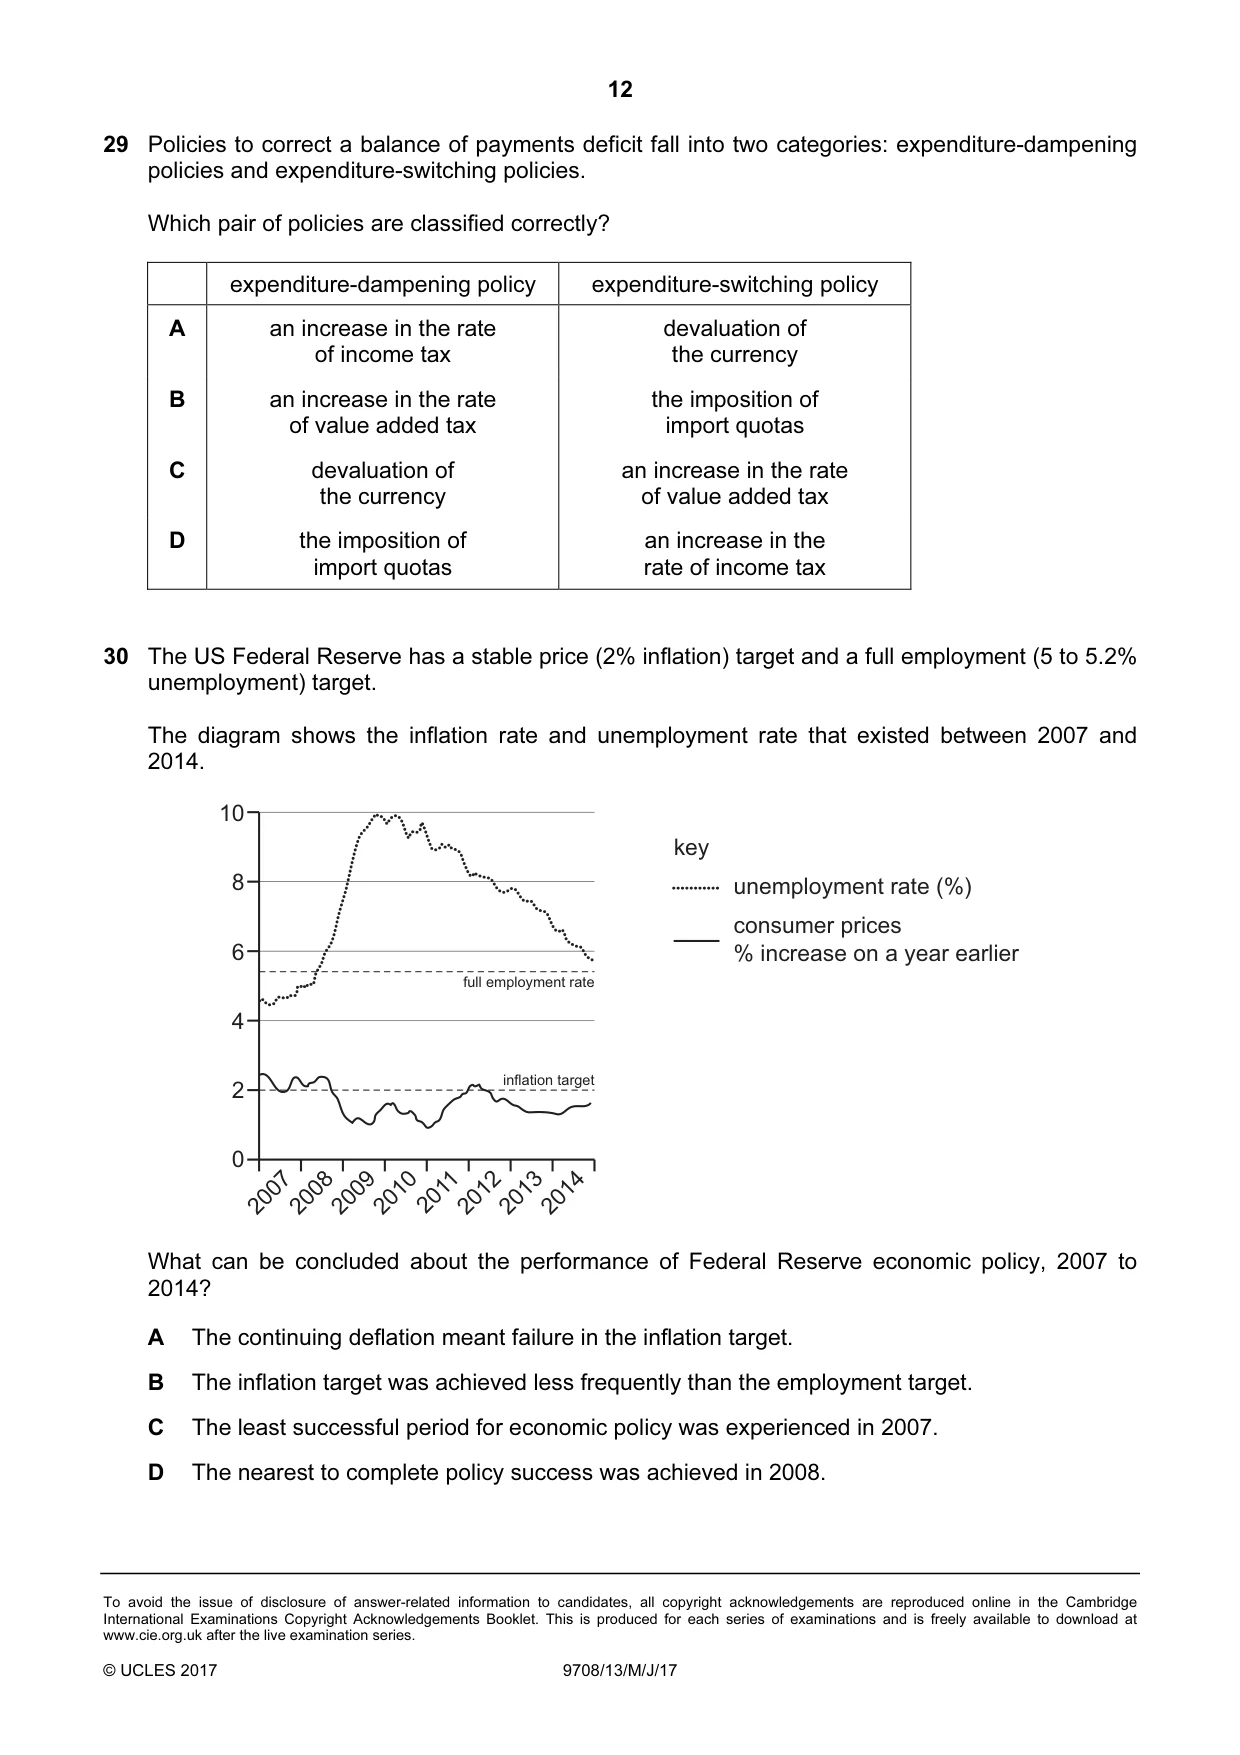
29 Policies to correct a balance of payments deficit fall into two categories: expenditure-dampening policies and expenditure-switching policies. Which pair of policies are classified correctly? expenditure-dampening policy expenditure-switching policy A an increase in the rate devaluation of of income tax the currency B an increase in the rate the imposition of of value added tax import quotas C devaluation of an increase in the rate the currency of value added tax D the imposition of an increase in the import quotas rate of income tax
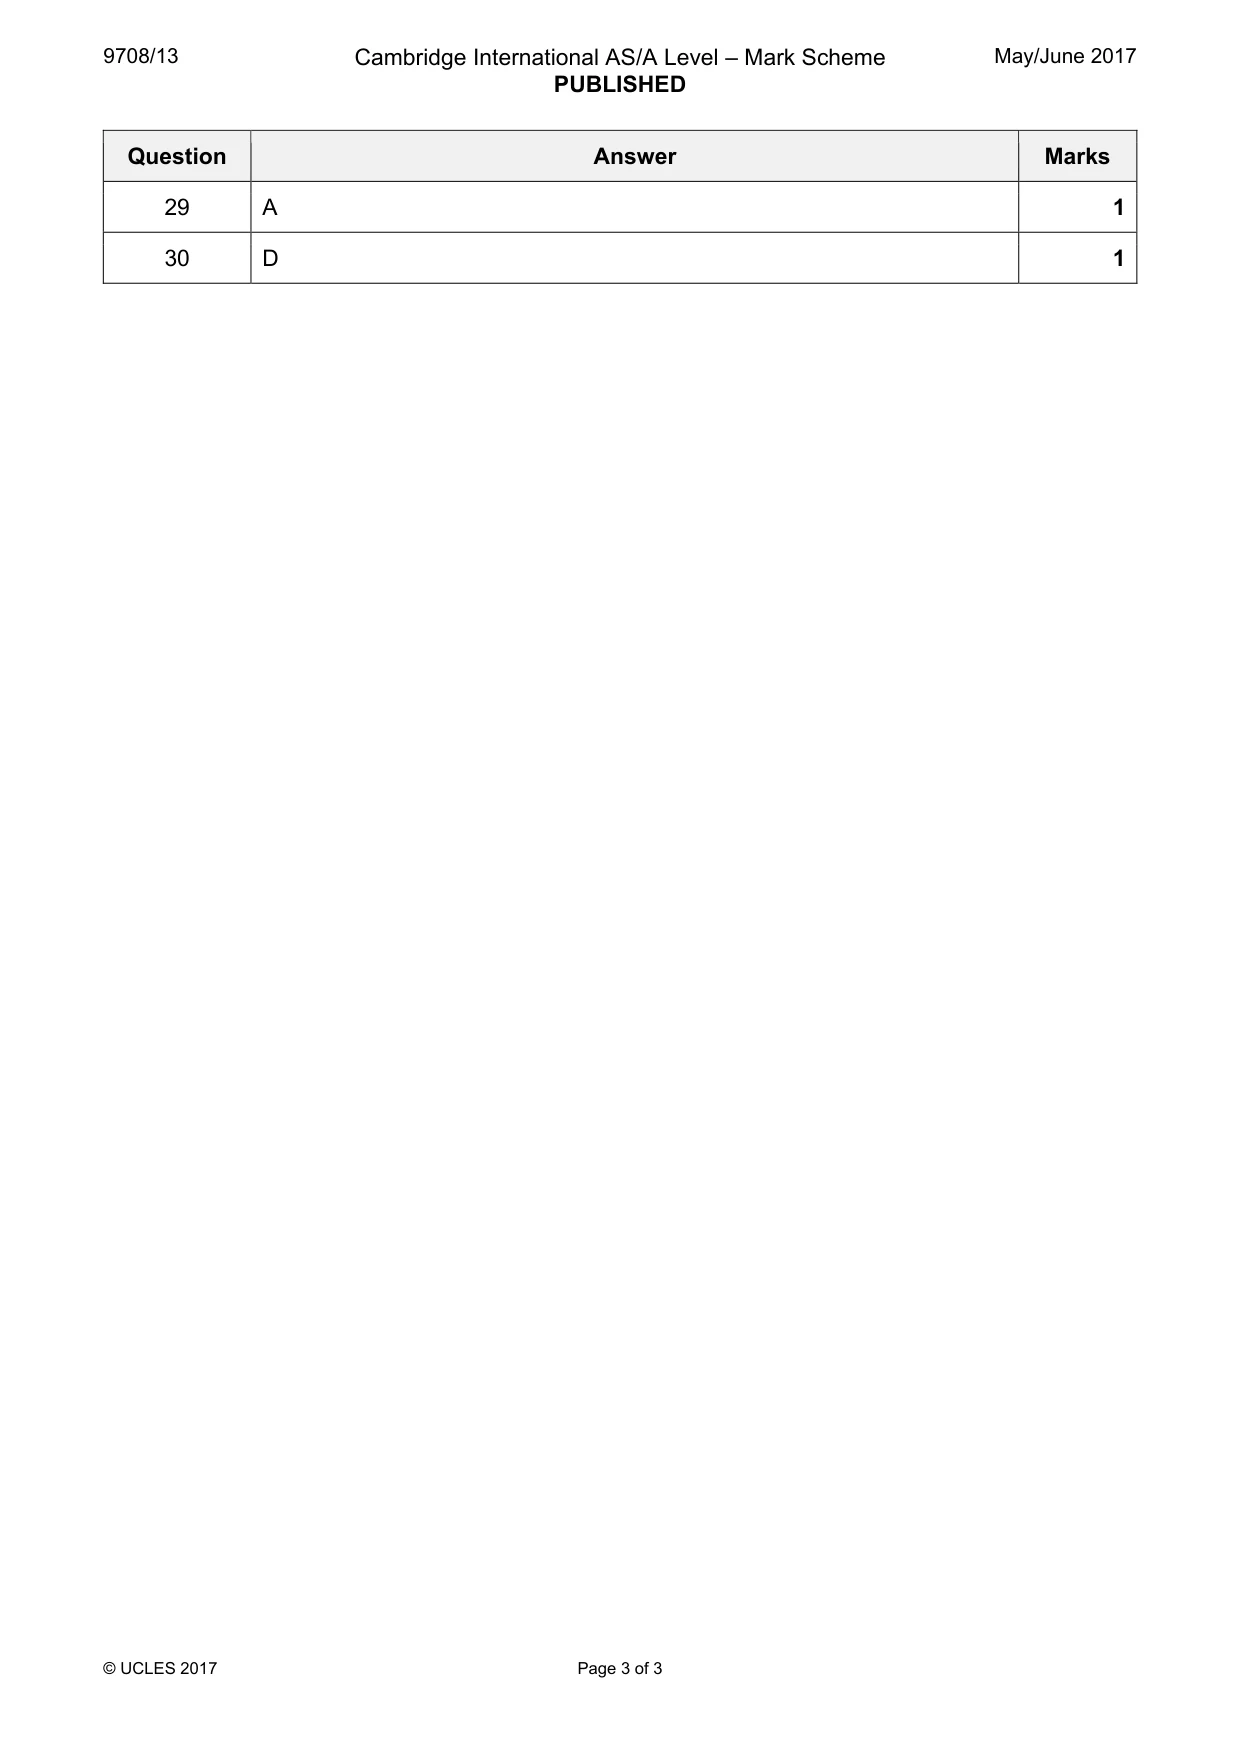
Mark scheme: A
More questions on Policies to correct imbalances in the current account of the balance of payments
Q30 · The US Federal Reserve has a stable price (2% inflation) target and a full employment (5…
30 The US Federal Reserve has a stable price (2% inflation) target and a full employment (5 to 5.2% unemployment) target. The diagram shows the inflation rate and unemployment rate that existed between 2007 and 2014. 10 key 8 unemployment rate (%) consumer prices 6 % increase on a year earlier full employment rate 4 2 inflation target 0 2007 2008 2009 2010 2011 2012 2013 2014 What can be concluded about the performance of Federal Reserve economic policy, 2007 to 2014? A The continuing deflation meant failure in the inflation target. B The inflation target was achieved less frequently than the employment target. C The least successful period for economic policy was experienced in 2007. D The nearest to complete policy success was achieved in 2008.
Mark scheme: D
More questions on Government macroeconomic policy objectives
What was in this paper
The subtopics covered by these 30 questions, and how many questions each got. Open one in a new tab to see every Cambridge question on it.
3The interaction of demand and supply3Aggregate Demand and Aggregate Supply analysis2Demand and supply curves2Economic methodology2Fiscal policy2Price elasticity of supply2Protectionism2Classification of goods and services1Consumer and producer surplus1Current account of the balance of payments1Exchange rates1Government macroeconomic policy objectives1Policies to correct imbalances in the current account of the balance of payments1Price elasticity, income elasticity and cross elasticity of demand1Price stability1Production possibility curves1Resource allocation in different economic systems1Scarcity, choice and opportunity cost1The reasons for international trade1What you needed in this session
Cambridge’s own grade thresholds for 2017 May/June, Paper 1 · Variant 3. A higher threshold means an easier paper — the bar moves with how the cohort did.