Cambridge A Level Economics 9708 — 2016 Oct/Nov Paper 1 · Variant 2
9708/12/O/N/16 · 30 questions · 30 marks · ≈34 min
The question paper and its mark scheme, free to read here and free to download. This is Cambridge’s own paper, exactly as it was sat.
Question paper12 pages
Mark scheme2 pages
Answers below. Sit the paper first if you are practising.
Questions as text
Q1 · The diagram shows a production possibility curve for an economy that produces only two…
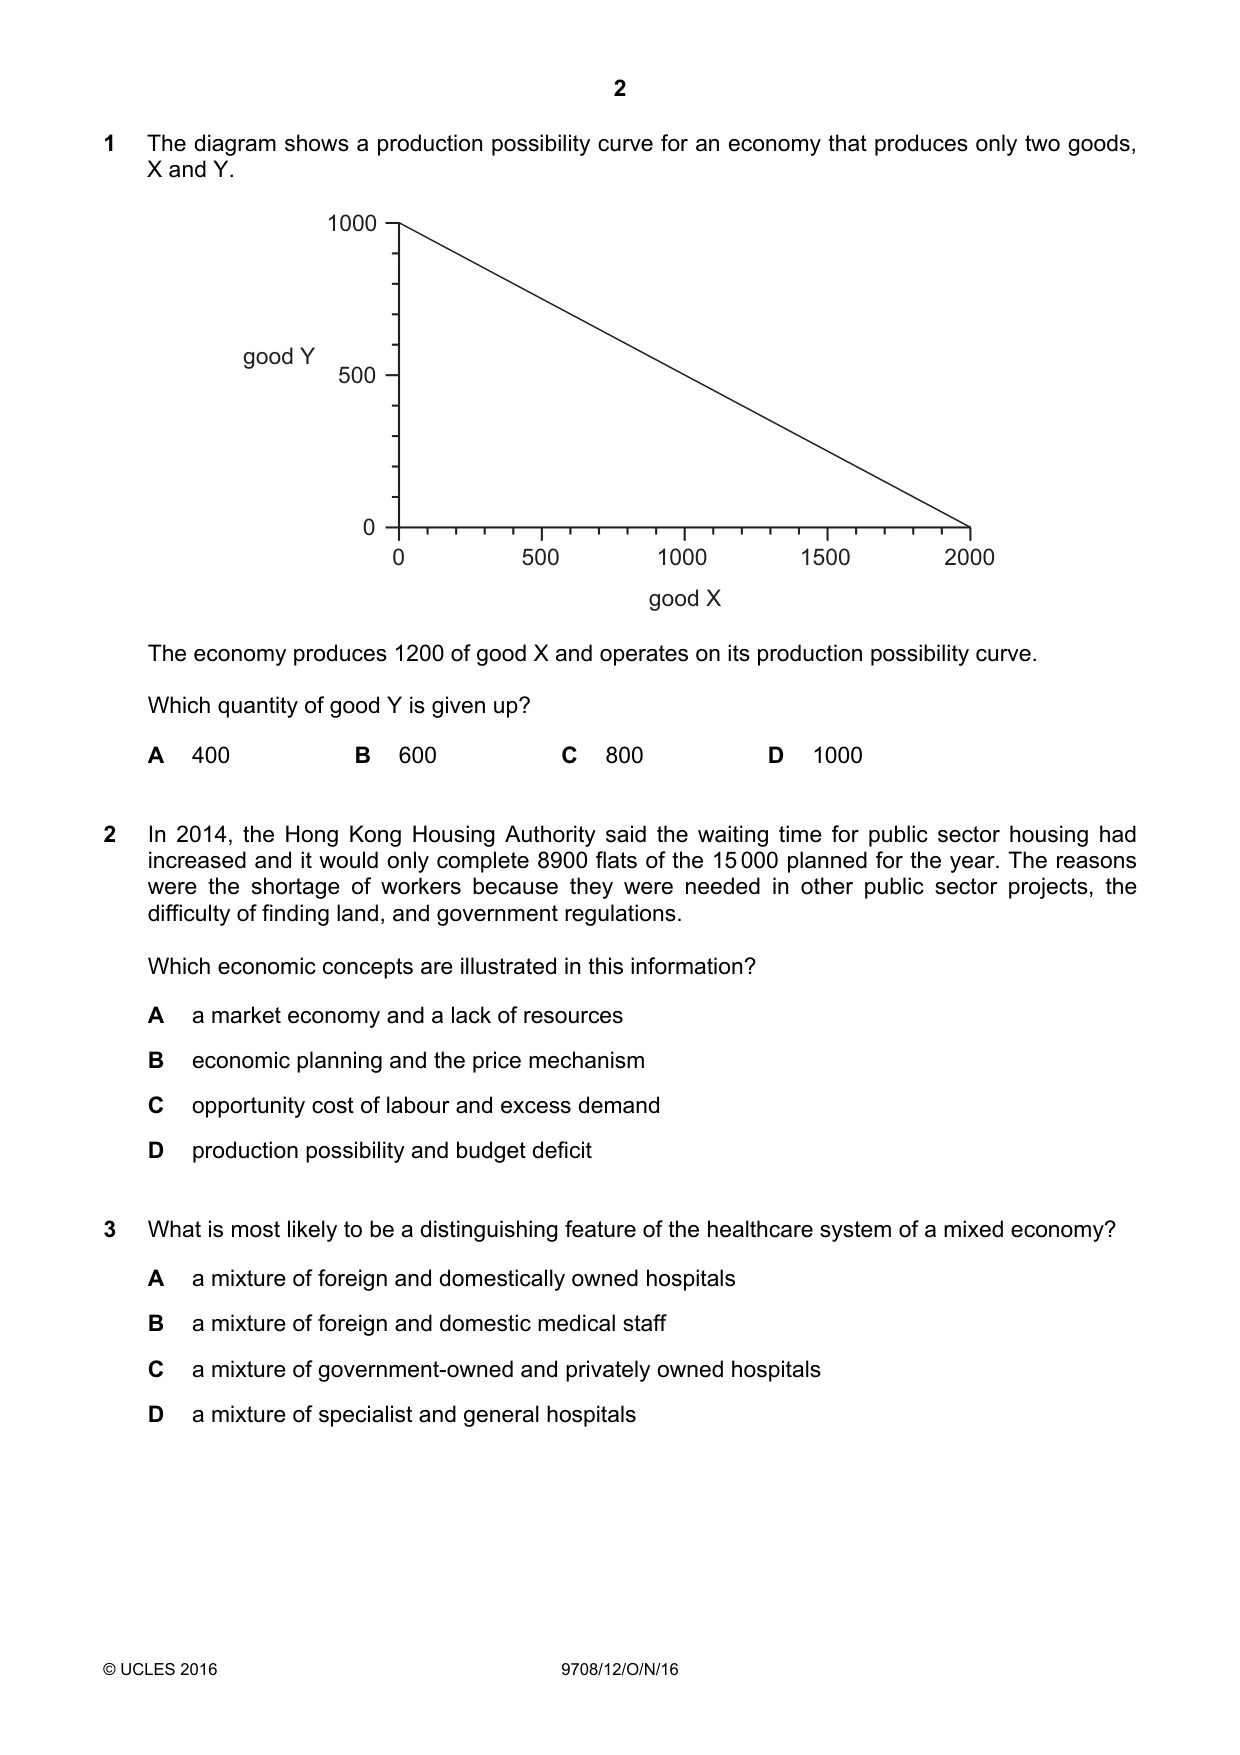
1 The diagram shows a production possibility curve for an economy that produces only two goods, X and Y. 1000 good Y 500 0 0 500 1000 1500 2000 good X The economy produces 1200 of good X and operates on its production possibility curve. Which quantity of good Y is given up? A 400 B 600 C 800 D 1000
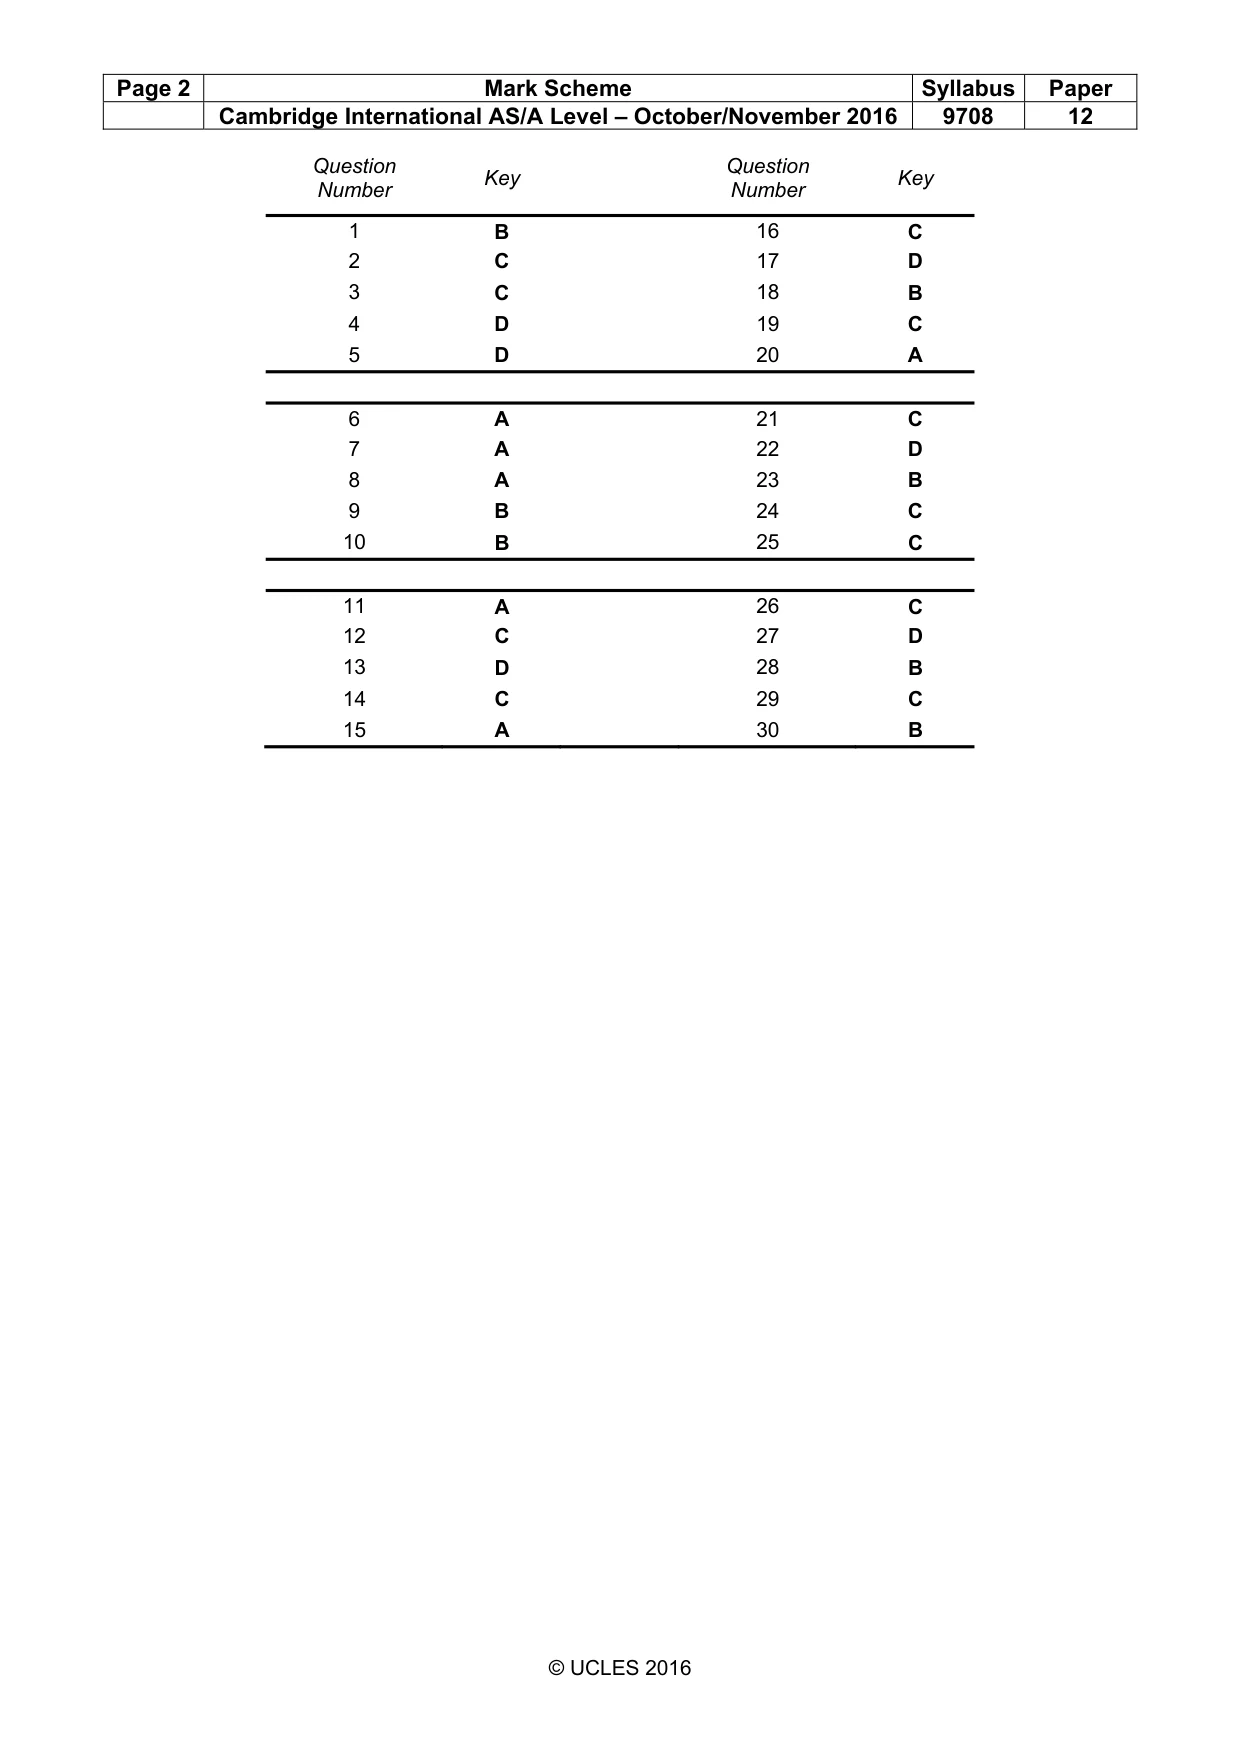
Mark scheme: B
Q2 · In 2014, the Hong Kong Housing Authority said the waiting time for public sector housing…
2 In 2014, the Hong Kong Housing Authority said the waiting time for public sector housing had increased and it would only complete 8900 flats of the 15 000 planned for the year. The reasons were the shortage of workers because they were needed in other public sector projects, the difficulty of finding land, and government regulations. Which economic concepts are illustrated in this information? A a market economy and a lack of resources B economic planning and the price mechanism C opportunity cost of labour and excess demand D production possibility and budget deficit
Mark scheme: C
Q3 · What is most likely to be a distinguishing feature of the healthcare system of a mixed…
3 What is most likely to be a distinguishing feature of the healthcare system of a mixed economy? A a mixture of foreign and domestically owned hospitals B a mixture of foreign and domestic medical staff C a mixture of government-owned and privately owned hospitals D a mixture of specialist and general hospitals
Mark scheme: C
More questions on Resource allocation in different economic systems
Q4 · An economy can produce only two goods at any one time
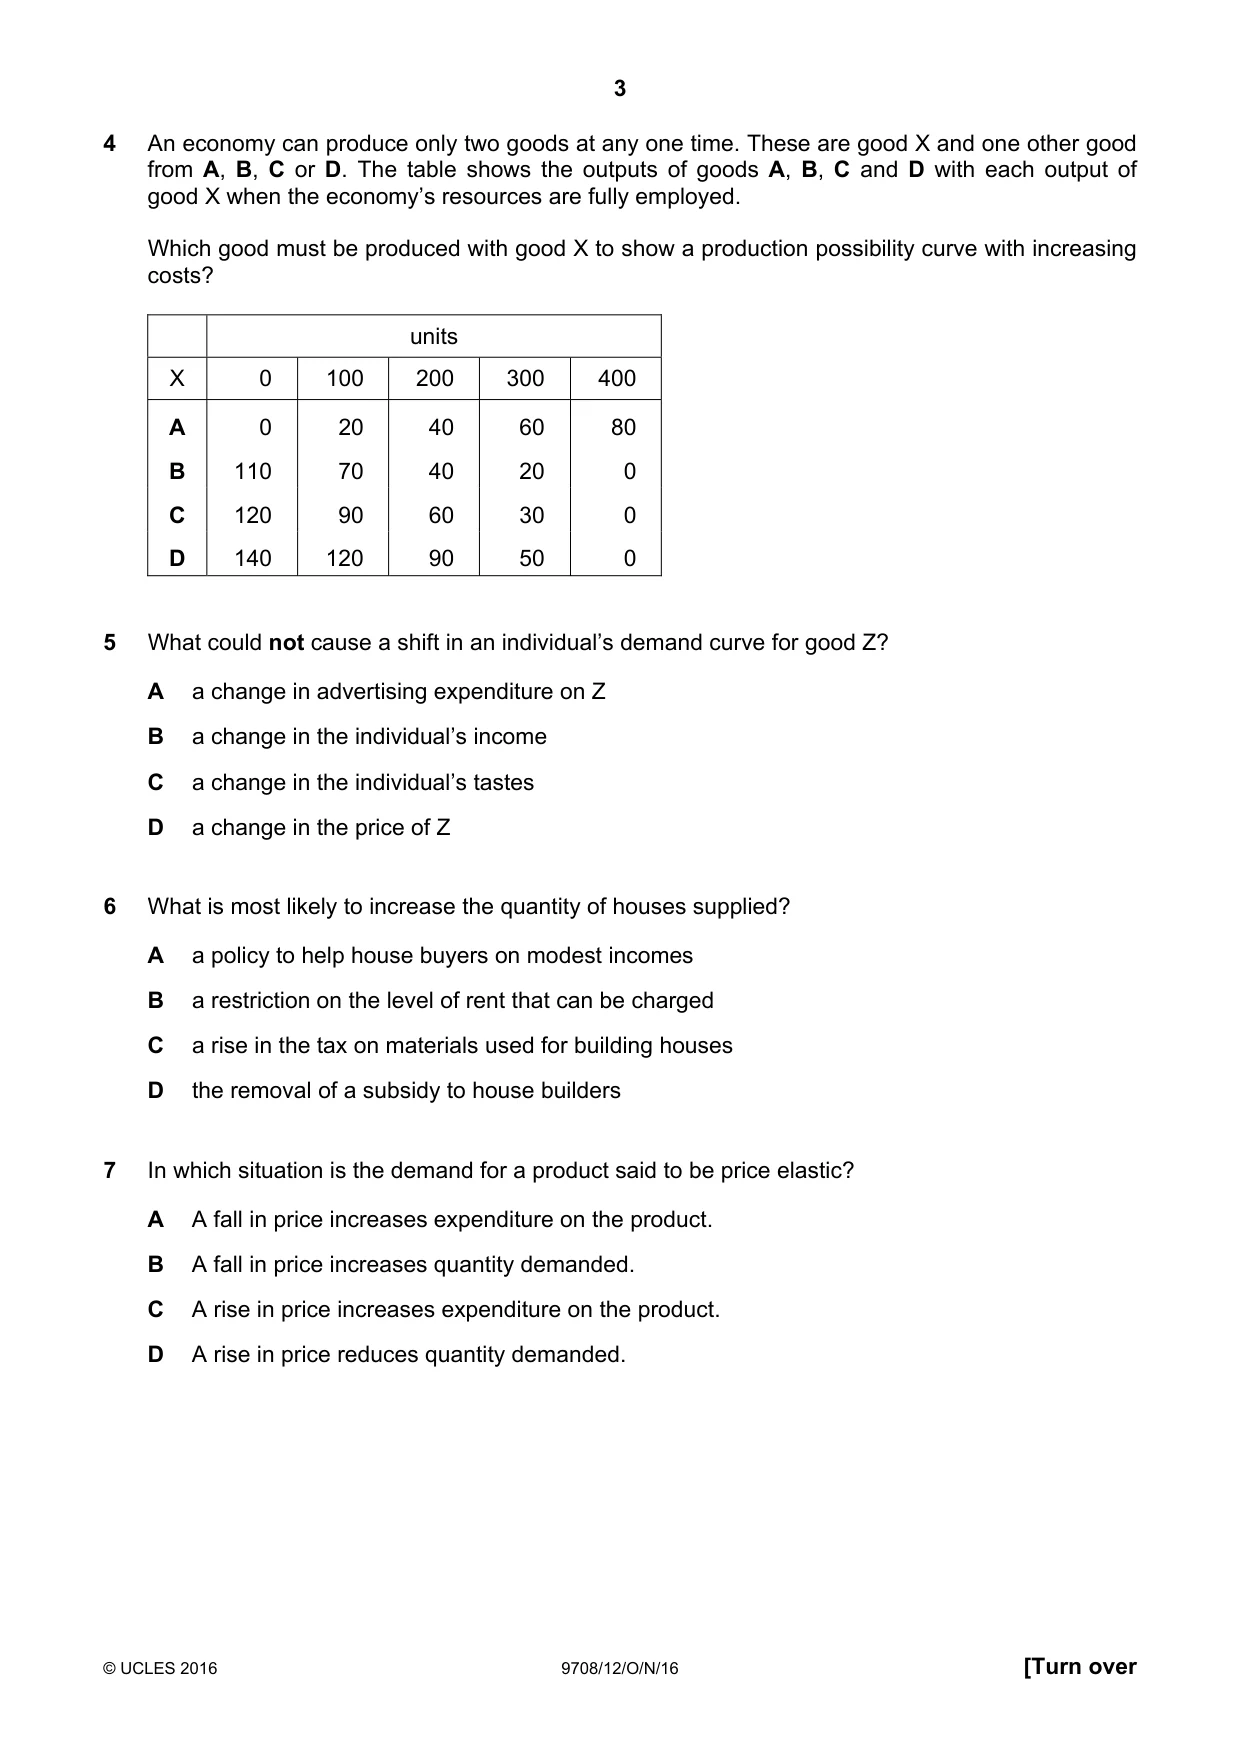
4 An economy can produce only two goods at any one time. These are good X and one other good from A, B, C or D. The table shows the outputs of goods A, B, C and D with each output of good X when the economy’s resources are fully employed. Which good must be produced with good X to show a production possibility curve with increasing costs? units X 0 100 200 300 400 A 0 20 40 60 80 B 110 70 40 20 0 C 120 90 60 30 0 D 140 120 90 50 0
Mark scheme: D
Q5 · What could not cause a shift in an individual’s demand curve for good Z?
5 What could not cause a shift in an individual’s demand curve for good Z? A a change in advertising expenditure on Z B a change in the individual’s income C a change in the individual’s tastes D a change in the price of Z
Mark scheme: D
Q6 · What is most likely to increase the quantity of houses supplied?
6 What is most likely to increase the quantity of houses supplied? A a policy to help house buyers on modest incomes B a restriction on the level of rent that can be charged C a rise in the tax on materials used for building houses D the removal of a subsidy to house builders
Mark scheme: A
Q7 · In which situation is the demand for a product said to be price elastic?
7 In which situation is the demand for a product said to be price elastic? A A fall in price increases expenditure on the product. B A fall in price increases quantity demanded. C A rise in price increases expenditure on the product. D A rise in price reduces quantity demanded.
Mark scheme: A
More questions on Price elasticity, income elasticity and cross elasticity of demand
Q8 · Goods X and Y are complements with a cross-elasticity of demand of – 0.8
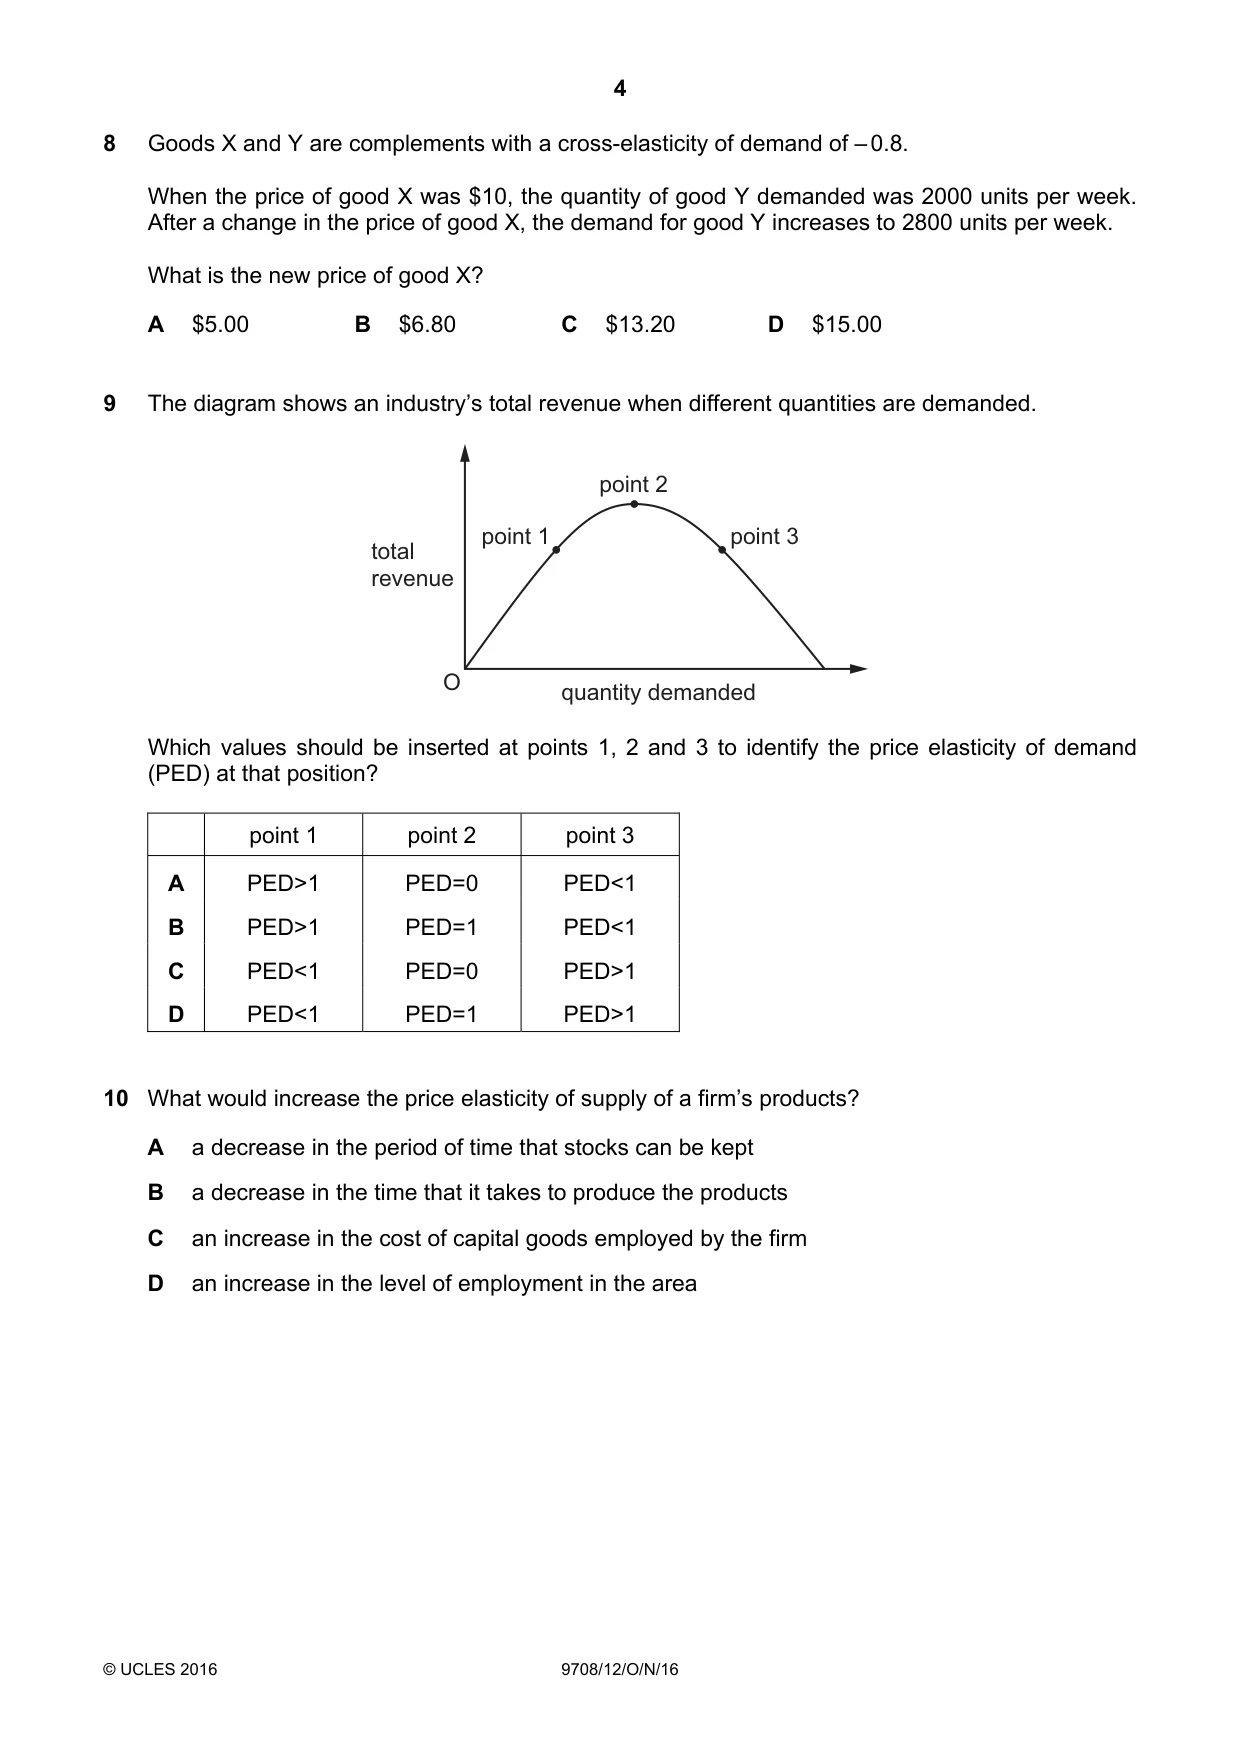
8 Goods X and Y are complements with a cross-elasticity of demand of – 0.8. When the price of good X was $10, the quantity of good Y demanded was 2000 units per week. After a change in the price of good X, the demand for good Y increases to 2800 units per week. What is the new price of good X? A $5.00 B $6.80 C $13.20 D $15.00
Mark scheme: A
More questions on Price elasticity, income elasticity and cross elasticity of demand
Q9 · The diagram shows an industry’s total revenue when different quantities are demanded
9 The diagram shows an industry’s total revenue when different quantities are demanded. point 2 point 1 point 3 total revenue O quantity demanded Which values should be inserted at points 1, 2 and 3 to identify the price elasticity of demand (PED) at that position? point 1 point 2 point 3 A PED>1 PED=0 PED<1 B PED>1 PED=1 PED<1 C PED<1 PED=0 PED>1 D PED<1 PED=1 PED>1
Mark scheme: B
More questions on Price elasticity, income elasticity and cross elasticity of demand
Q10 · What would increase the price elasticity of supply of a firm’s products?
10 What would increase the price elasticity of supply of a firm’s products? A a decrease in the period of time that stocks can be kept B a decrease in the time that it takes to produce the products C an increase in the cost of capital goods employed by the firm D an increase in the level of employment in the area
Mark scheme: B
Q11 · The diagram shows the market for a luxury brand of smartphones
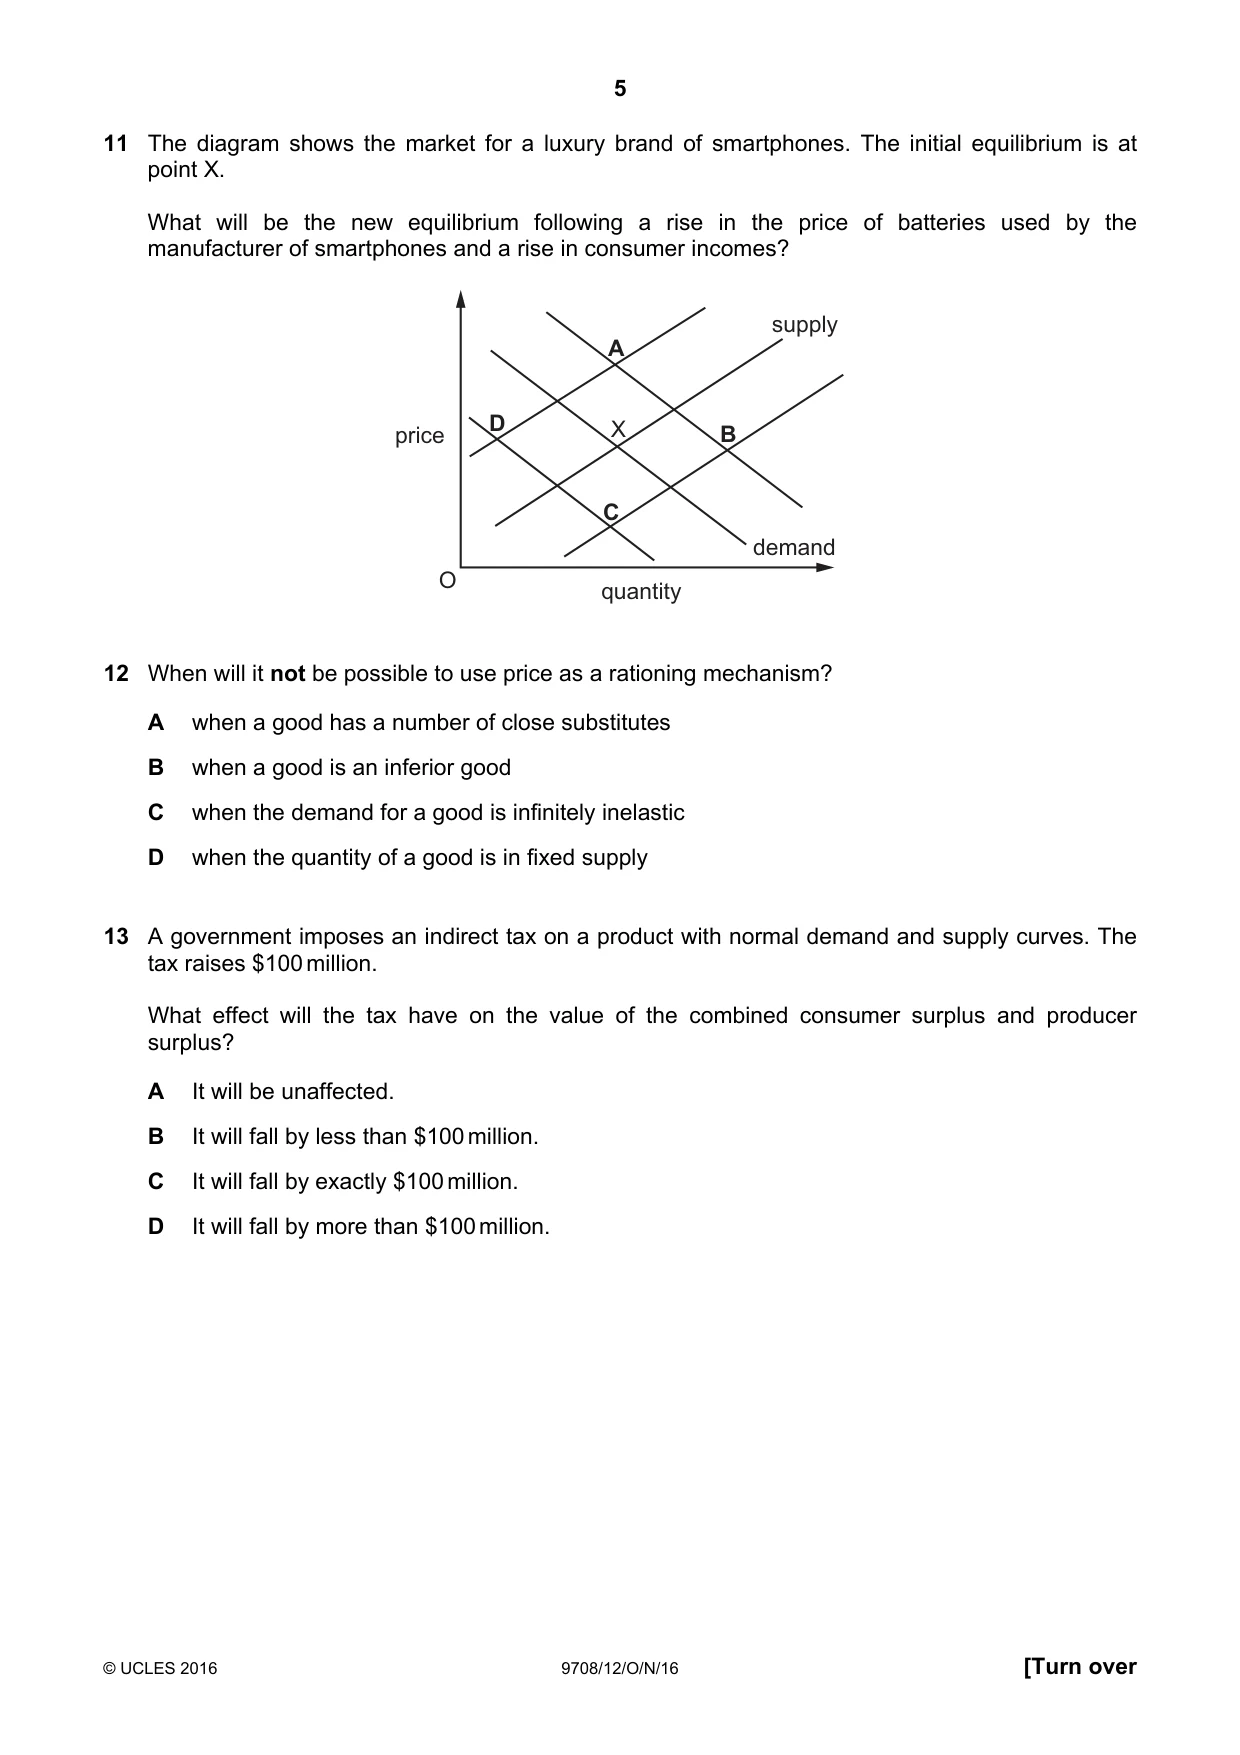
11 The diagram shows the market for a luxury brand of smartphones. The initial equilibrium is at point X. What will be the new equilibrium following a rise in the price of batteries used by the manufacturer of smartphones and a rise in consumer incomes? supply A D X price B C demand O quantity
Mark scheme: A
Q12 · When will it not be possible to use price as a rationing mechanism?
12 When will it not be possible to use price as a rationing mechanism? A when a good has a number of close substitutes B when a good is an inferior good C when the demand for a good is infinitely inelastic D when the quantity of a good is in fixed supply
Mark scheme: C
Q13 · A government imposes an indirect tax on a product with normal demand and supply curves
13 A government imposes an indirect tax on a product with normal demand and supply curves. The tax raises $100 million. What effect will the tax have on the value of the combined consumer surplus and producer surplus? A It will be unaffected. B It will fall by less than $100 million. C It will fall by exactly $100 million. D It will fall by more than $100 million.
Mark scheme: D
Q14 · In the diagram, D is the demand curve of an agricultural commodity and S is the initial…
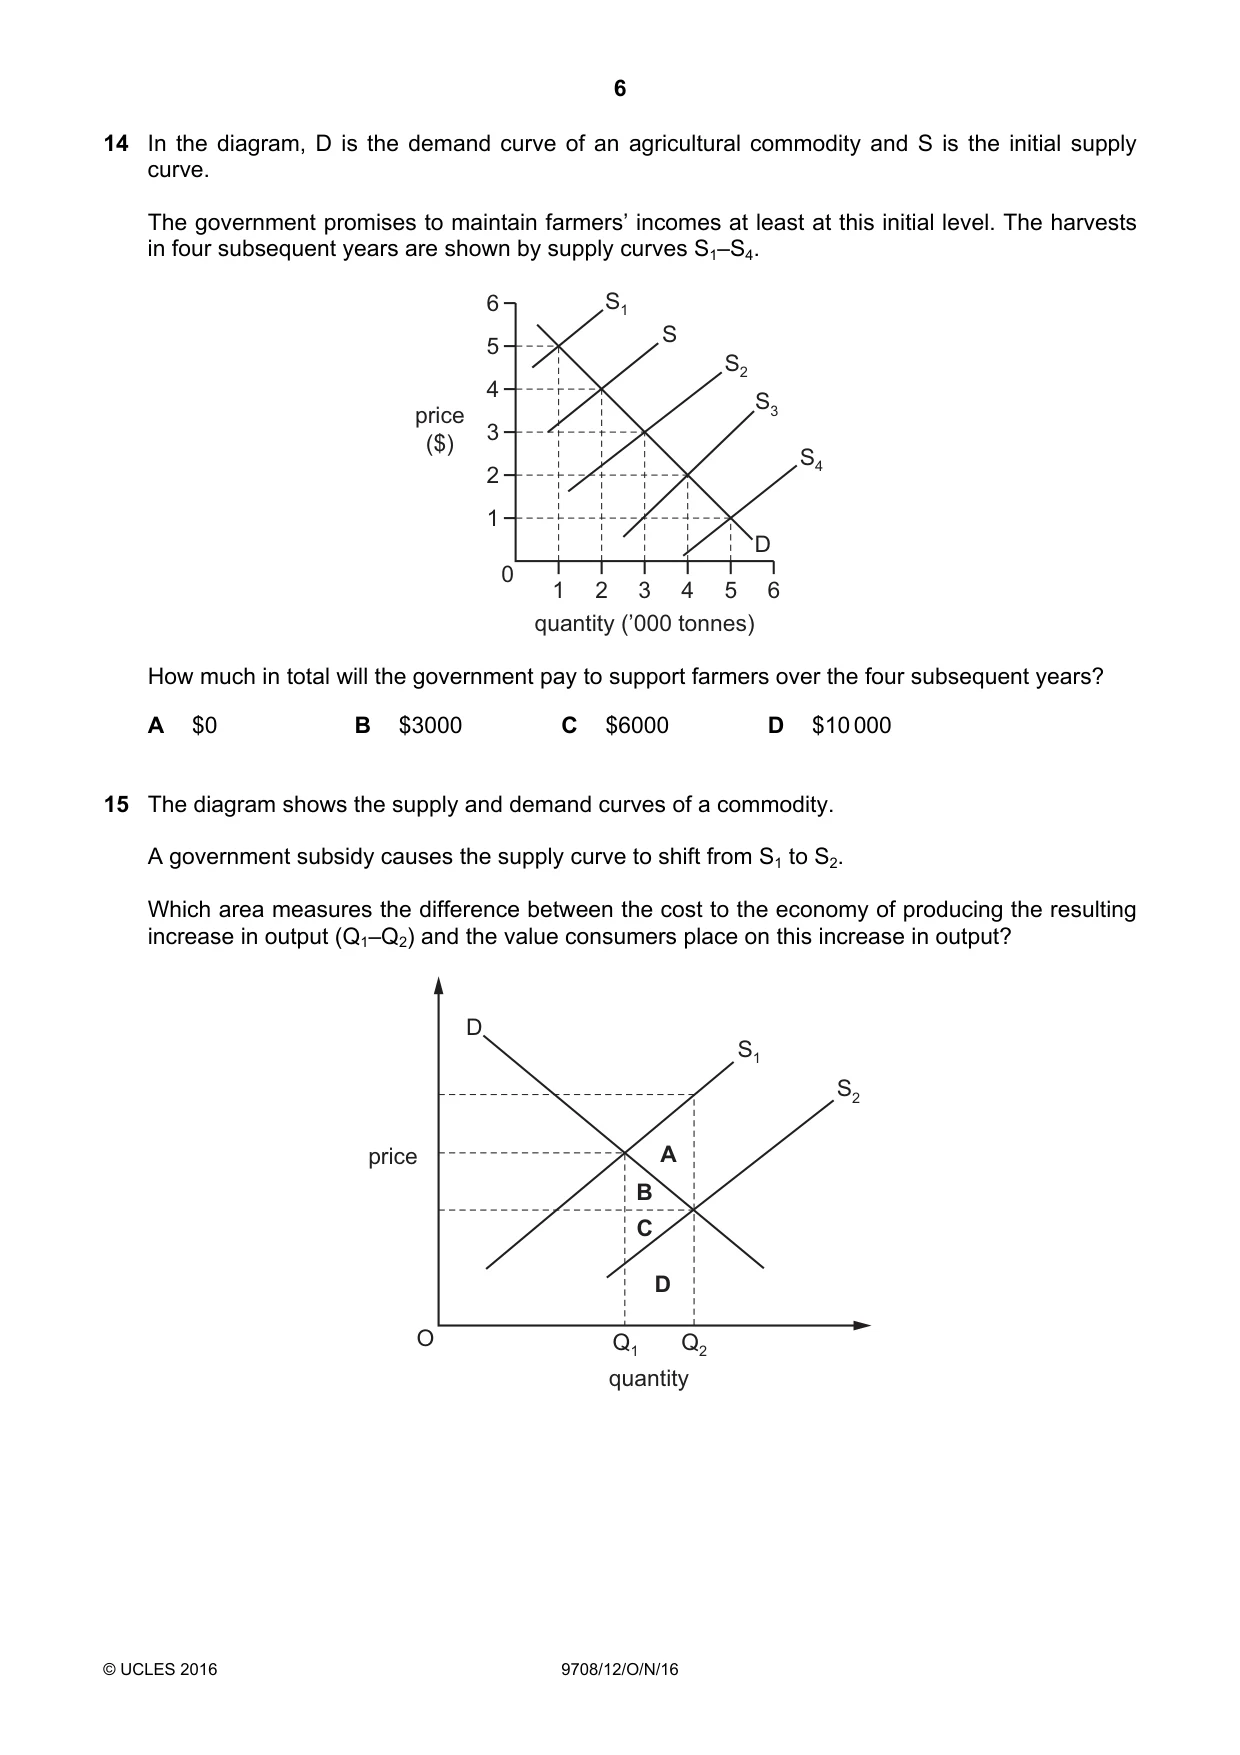
14 In the diagram, D is the demand curve of an agricultural commodity and S is the initial supply curve. The government promises to maintain farmers’ incomes at least at this initial level. The harvests in four subsequent years are shown by supply curves S1–S4. 6 S1 S 5 S2 4 S3 price 3 ($) S4 2 1 D 0 1 2 3 4 5 6 quantity (’000 tonnes) How much in total will the government pay to support farmers over the four subsequent years? A $0 B $3000 C $6000 D $10 000
Mark scheme: C
More questions on Methods and effects of government intervention in markets
Q15 · The diagram shows the supply and demand curves of a commodity
15 The diagram shows the supply and demand curves of a commodity. A government subsidy causes the supply curve to shift from S1 to S2. Which area measures the difference between the cost to the economy of producing the resulting increase in output (Q1–Q2) and the value consumers place on this increase in output? D S1 S2 price A B C D O Q1 Q2 quantity
Mark scheme: A
More questions on Methods and effects of government intervention in markets
Q16 · Total public spending in the UK, excluding interest payments, is planned to be £679…
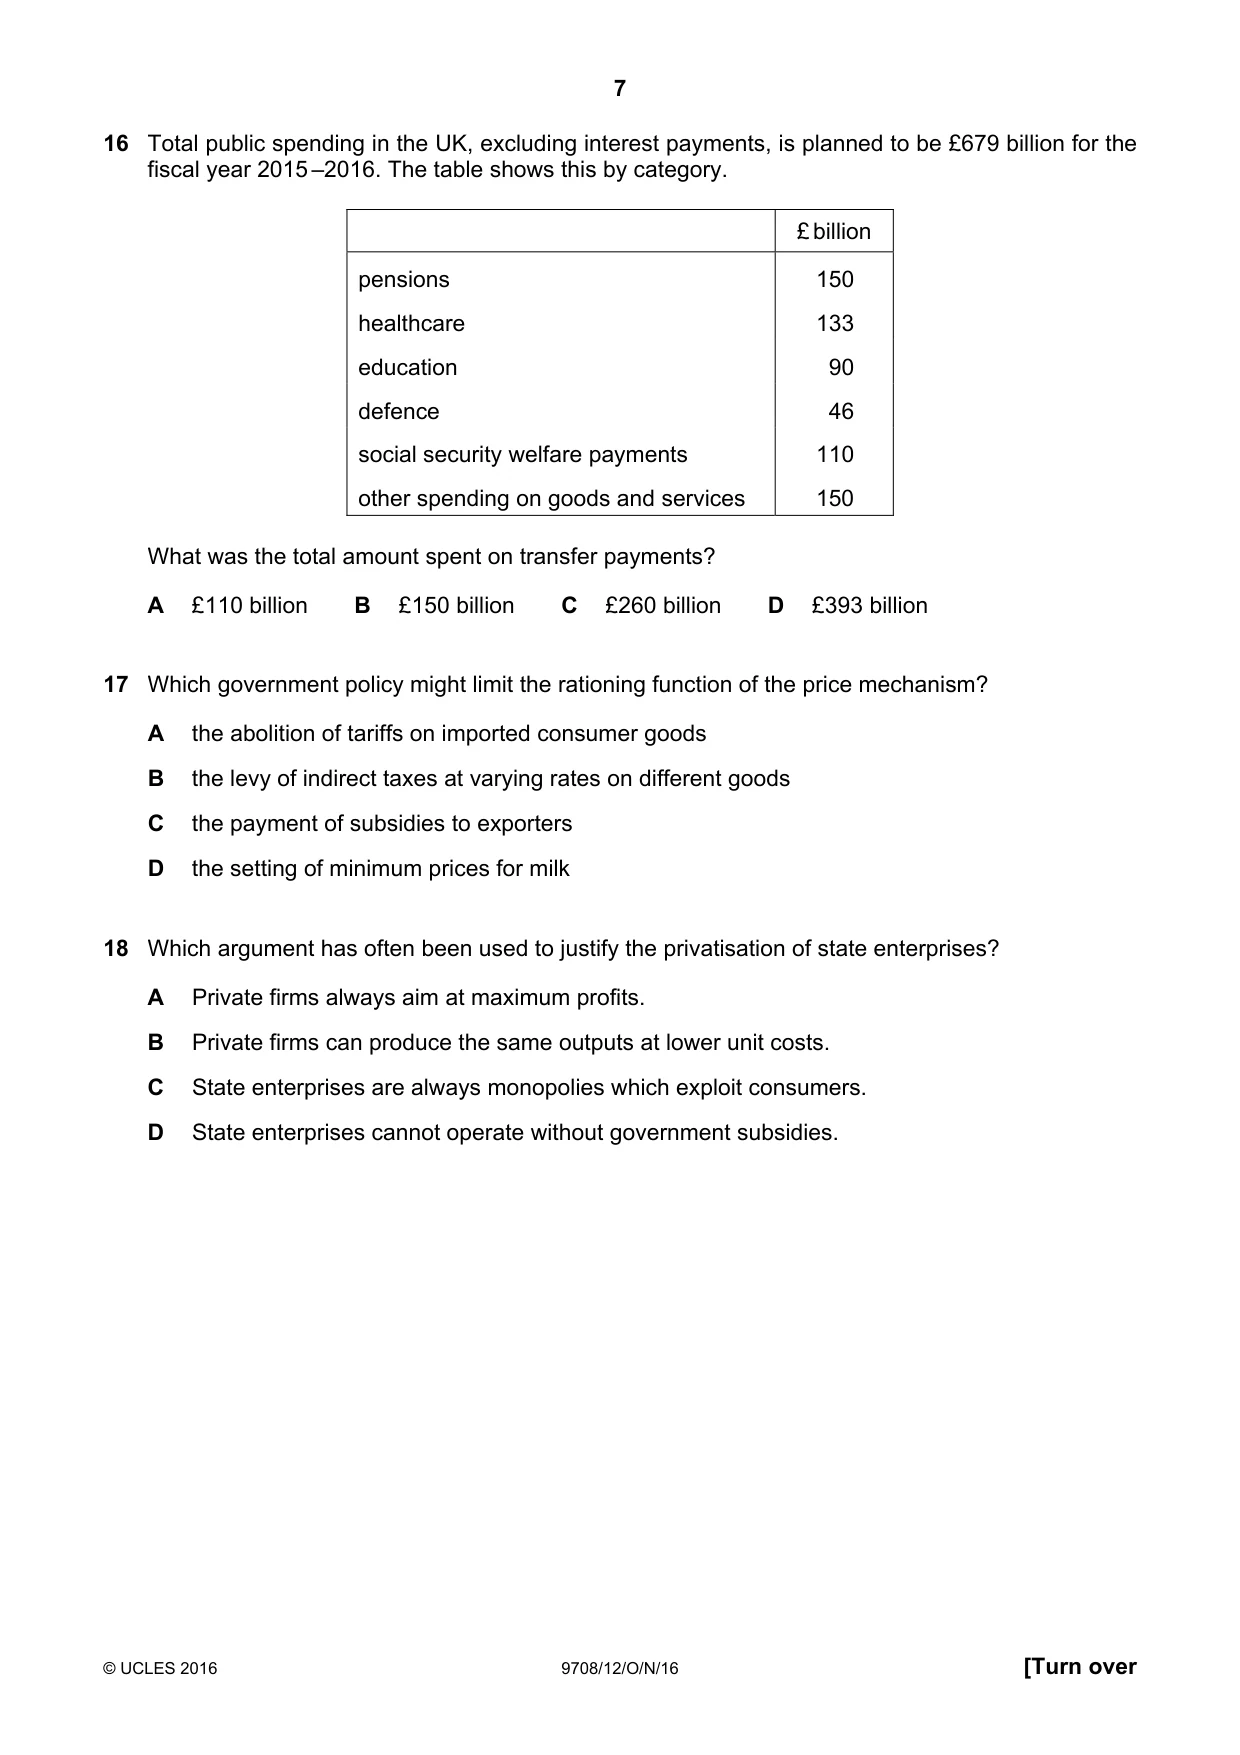
16 Total public spending in the UK, excluding interest payments, is planned to be £679 billion for the fiscal year 2015 –2016. The table shows this by category. £ billion pensions 150 healthcare 133 education 90 defence 46 social security welfare payments 110 other spending on goods and services 150 What was the total amount spent on transfer payments? A £110 billion B £150 billion C £260 billion D £393 billion
Mark scheme: C
Q17 · Which government policy might limit the rationing function of the price mechanism?
17 Which government policy might limit the rationing function of the price mechanism? A the abolition of tariffs on imported consumer goods B the levy of indirect taxes at varying rates on different goods C the payment of subsidies to exporters D the setting of minimum prices for milk
Mark scheme: D
More questions on Methods and effects of government intervention in markets
Q18 · Which argument has often been used to justify the privatisation of state enterprises?
18 Which argument has often been used to justify the privatisation of state enterprises? A Private firms always aim at maximum profits. B Private firms can produce the same outputs at lower unit costs. C State enterprises are always monopolies which exploit consumers. D State enterprises cannot operate without government subsidies.
Mark scheme: B
More questions on Methods and effects of government intervention in markets
Q19 · A government plans to increase spending on education and training every year
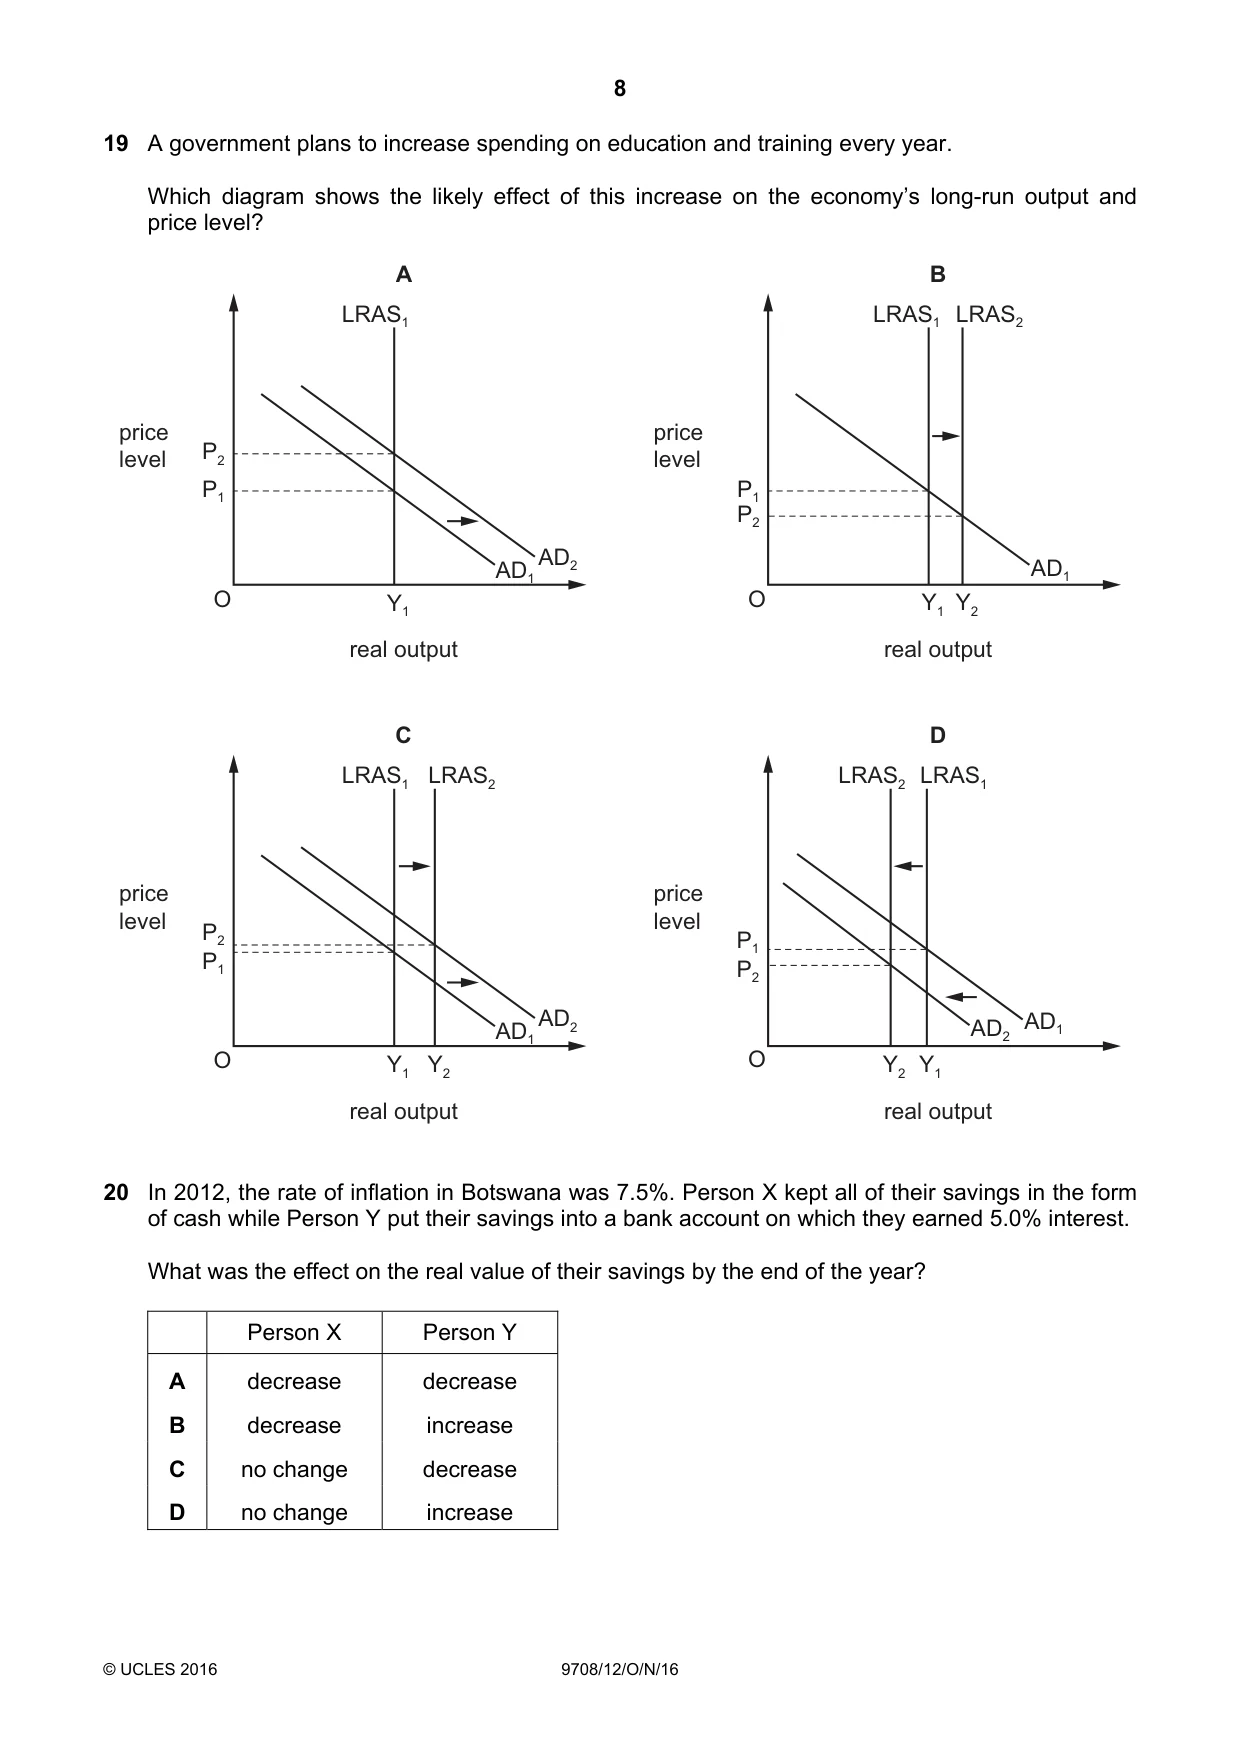
19 A government plans to increase spending on education and training every year. Which diagram shows the likely effect of this increase on the economy’s long-run output and price level? A B LRAS1 LRAS1 LRAS2 price price level P2 level P1 P1 P2 AD1 AD2 AD1 O Y1 O Y1 Y2 real output real output C D LRAS1 LRAS2 LRAS2 LRAS1 price price level level P2 P1 P1 P2 AD1 AD2 AD2 AD1 O Y1 Y2 O Y2 Y1 real output real output
Mark scheme: C
More questions on Aggregate Demand and Aggregate Supply analysis
Q20 · In 2012, the rate of inflation in Botswana was 7.5%
20 In 2012, the rate of inflation in Botswana was 7.5%. Person X kept all of their savings in the form of cash while Person Y put their savings into a bank account on which they earned 5.0% interest. What was the effect on the real value of their savings by the end of the year? Person X Person Y A decrease decrease B decrease increase C no change decrease D no change increase
Mark scheme: A
Q21 · The graph shows the annual percentage change in the prices of services and in the prices…
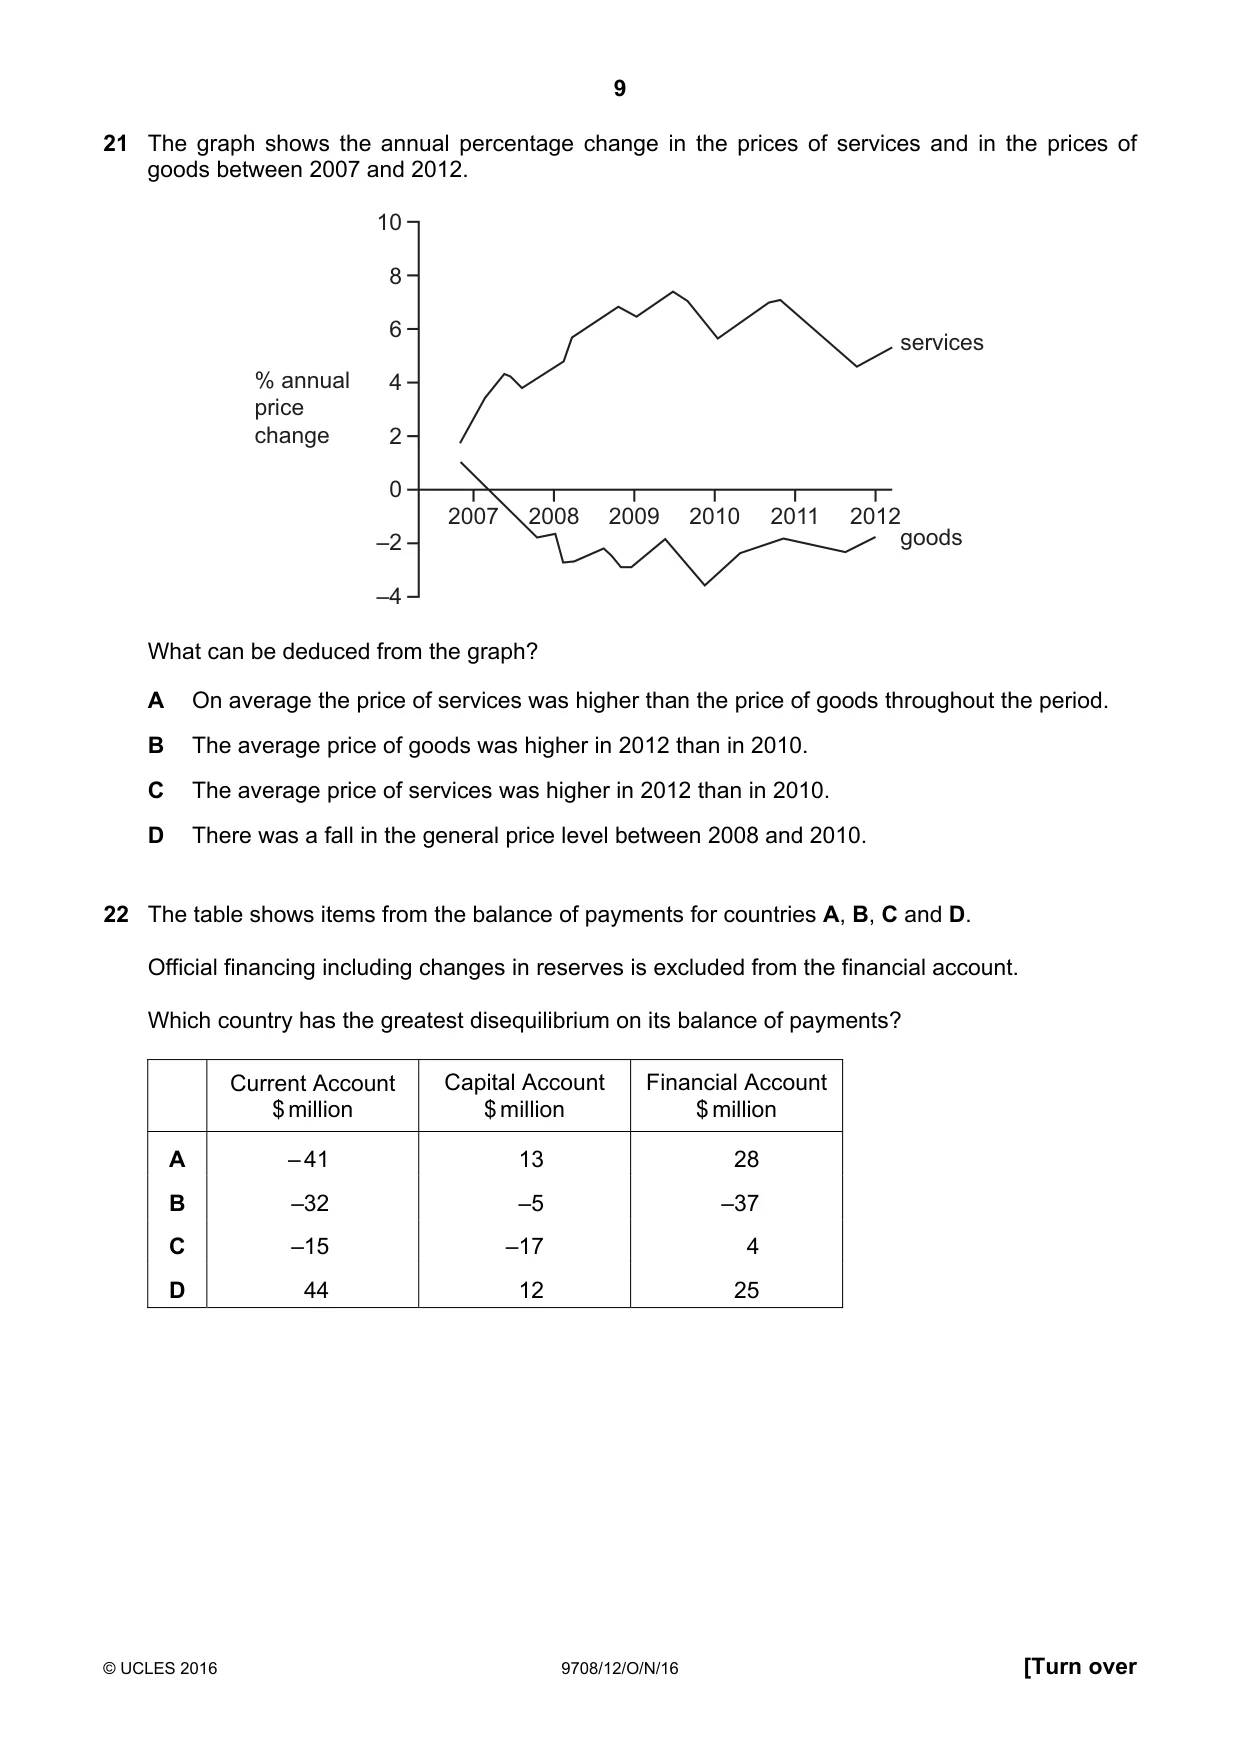
21 The graph shows the annual percentage change in the prices of services and in the prices of goods between 2007 and 2012. 10 8 6 services % annual 4 price change 2 0 2007 2008 2009 2010 2011 2012 –2 goods –4 What can be deduced from the graph? A On average the price of services was higher than the price of goods throughout the period. B The average price of goods was higher in 2012 than in 2010. C The average price of services was higher in 2012 than in 2010. D There was a fall in the general price level between 2008 and 2010.
Mark scheme: C
Q22 · The table shows items from the balance of payments for countries A, B, C and D
22 The table shows items from the balance of payments for countries A, B, C and D. Official financing including changes in reserves is excluded from the financial account. Which country has the greatest disequilibrium on its balance of payments? Current Account Capital Account Financial Account $ million $ million $ million A – 41 13 28 B –32 –5 –37 C –15 –17 4 D 44 12 25
Mark scheme: D
More questions on Current account of the balance of payments
Q23 · An increase or decrease in exchange rates can take place in both a floating and a fixed…
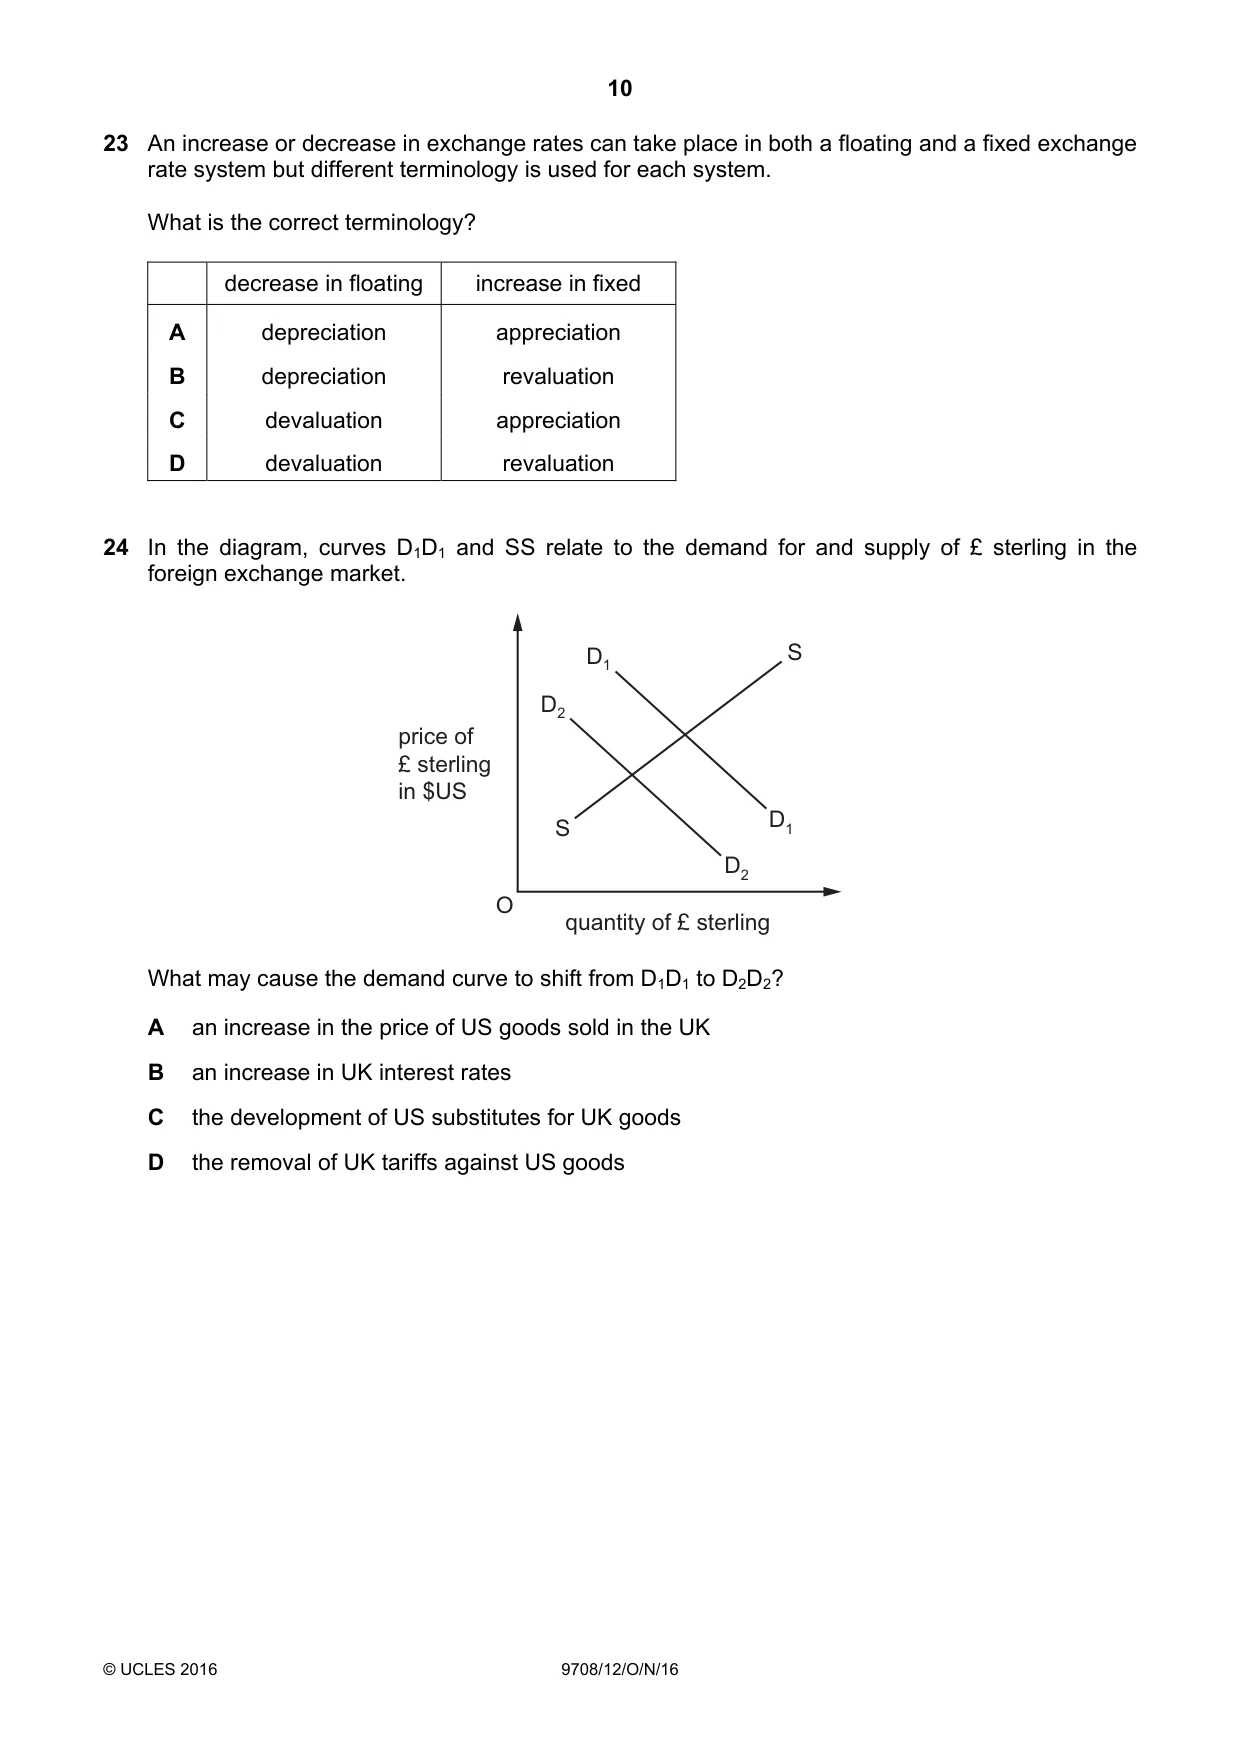
23 An increase or decrease in exchange rates can take place in both a floating and a fixed exchange rate system but different terminology is used for each system. What is the correct terminology? decrease in floating increase in fixed A depreciation appreciation B depreciation revaluation C devaluation appreciation D devaluation revaluation
Mark scheme: B
Q24 · In the diagram, curves D1D1 and SS relate to the demand for and supply of £ sterling in…
24 In the diagram, curves D1D1 and SS relate to the demand for and supply of £ sterling in the foreign exchange market. D1 S D2 price of £ sterling in $US S D1 D2 O quantity of £ sterling What may cause the demand curve to shift from D1D1 to D2D2? A an increase in the price of US goods sold in the UK B an increase in UK interest rates C the development of US substitutes for UK goods D the removal of UK tariffs against US goods
Mark scheme: C
Q25 · The table shows the indices of import prices and export prices of four countries between…
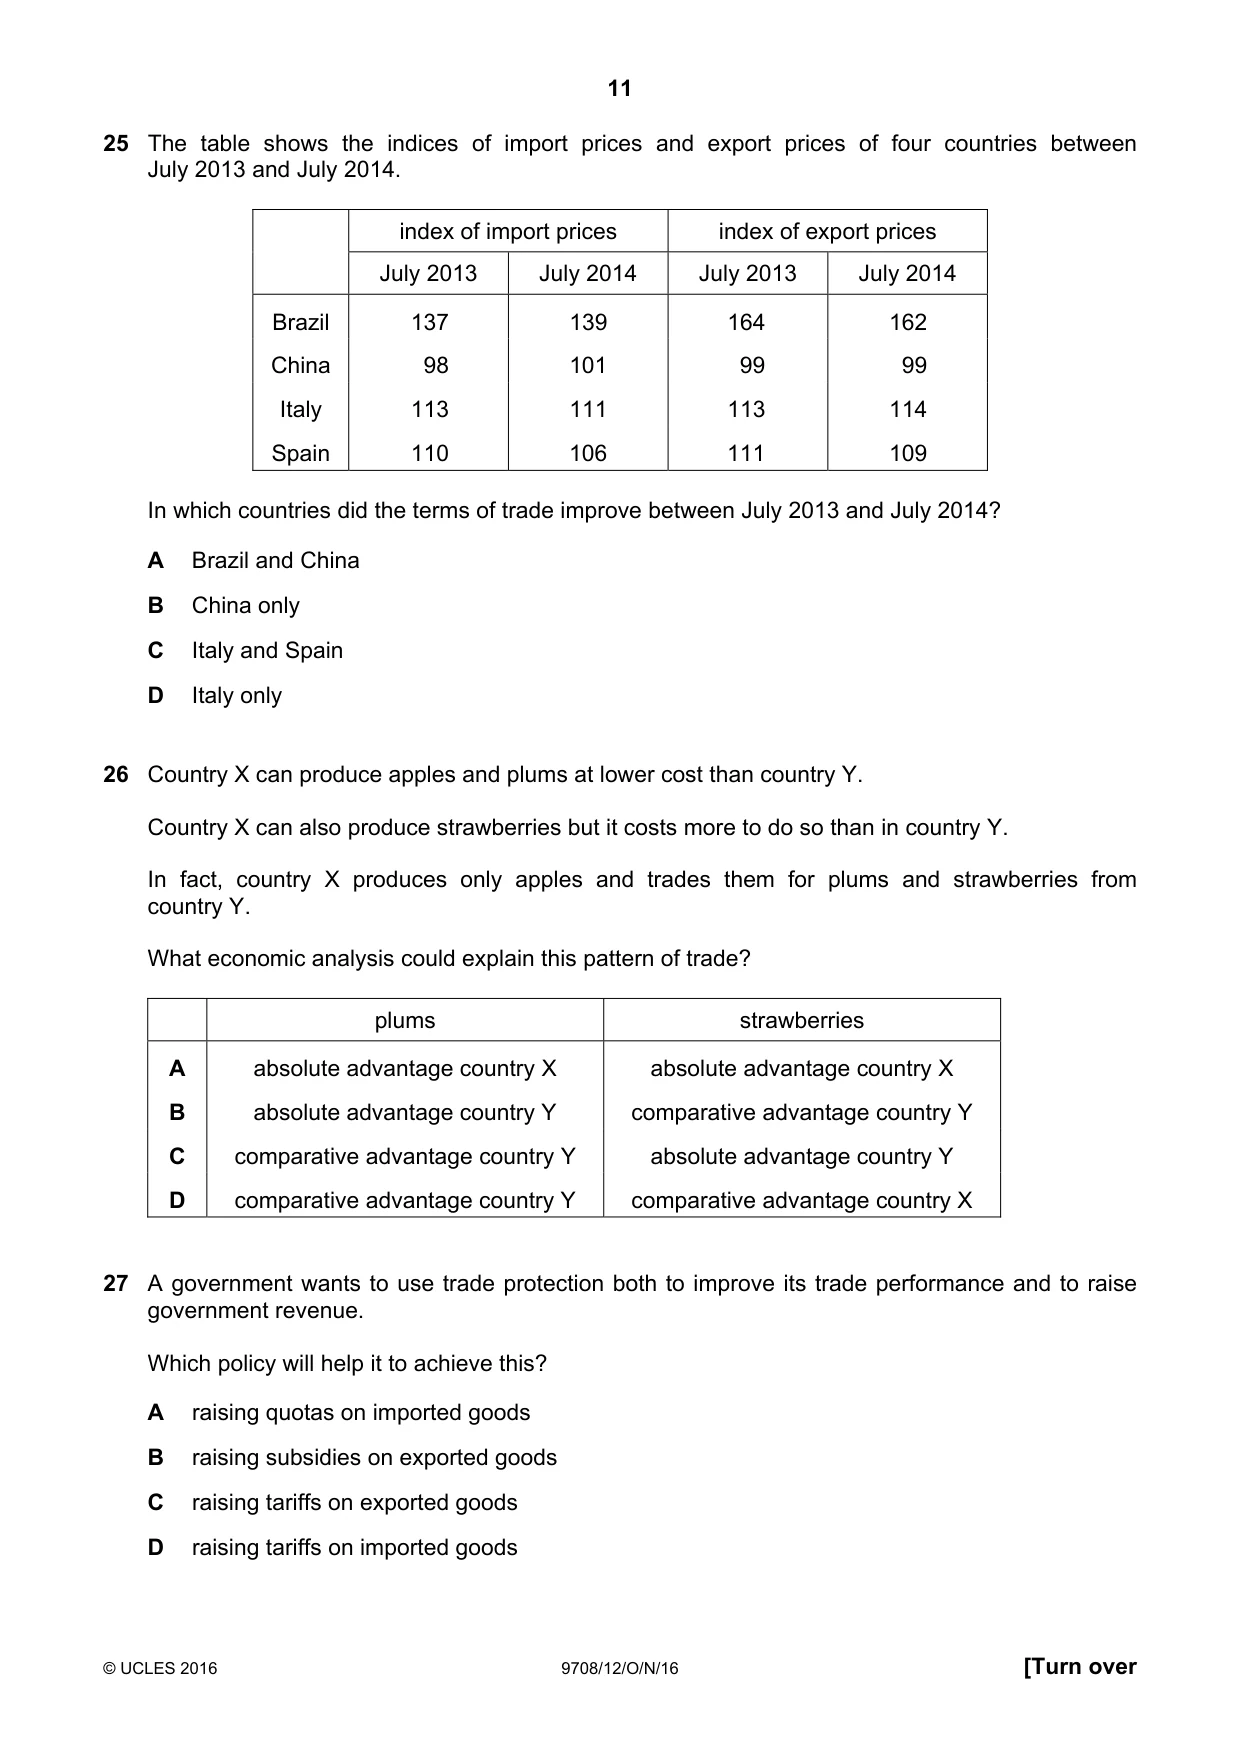
25 The table shows the indices of import prices and export prices of four countries between July 2013 and July 2014. index of import prices index of export prices July 2013 July 2014 July 2013 July 2014 Brazil 137 139 164 162 China 98 101 99 99 Italy 113 111 113 114 Spain 110 106 111 109 In which countries did the terms of trade improve between July 2013 and July 2014? A Brazil and China B China only C Italy and Spain D Italy only
Mark scheme: C
Q26 · Country X can produce apples and plums at lower cost than country Y
26 Country X can produce apples and plums at lower cost than country Y. Country X can also produce strawberries but it costs more to do so than in country Y. In fact, country X produces only apples and trades them for plums and strawberries from country Y. What economic analysis could explain this pattern of trade? plums strawberries A absolute advantage country X absolute advantage country X B absolute advantage country Y comparative advantage country Y C comparative advantage country Y absolute advantage country Y D comparative advantage country Y comparative advantage country X
Mark scheme: C
Q27 · A government wants to use trade protection both to improve its trade performance and to…
27 A government wants to use trade protection both to improve its trade performance and to raise government revenue. Which policy will help it to achieve this? A raising quotas on imported goods B raising subsidies on exported goods C raising tariffs on exported goods D raising tariffs on imported goods
Mark scheme: D
Q28 · A newly-built public sector engineering training college received poor inspection reports
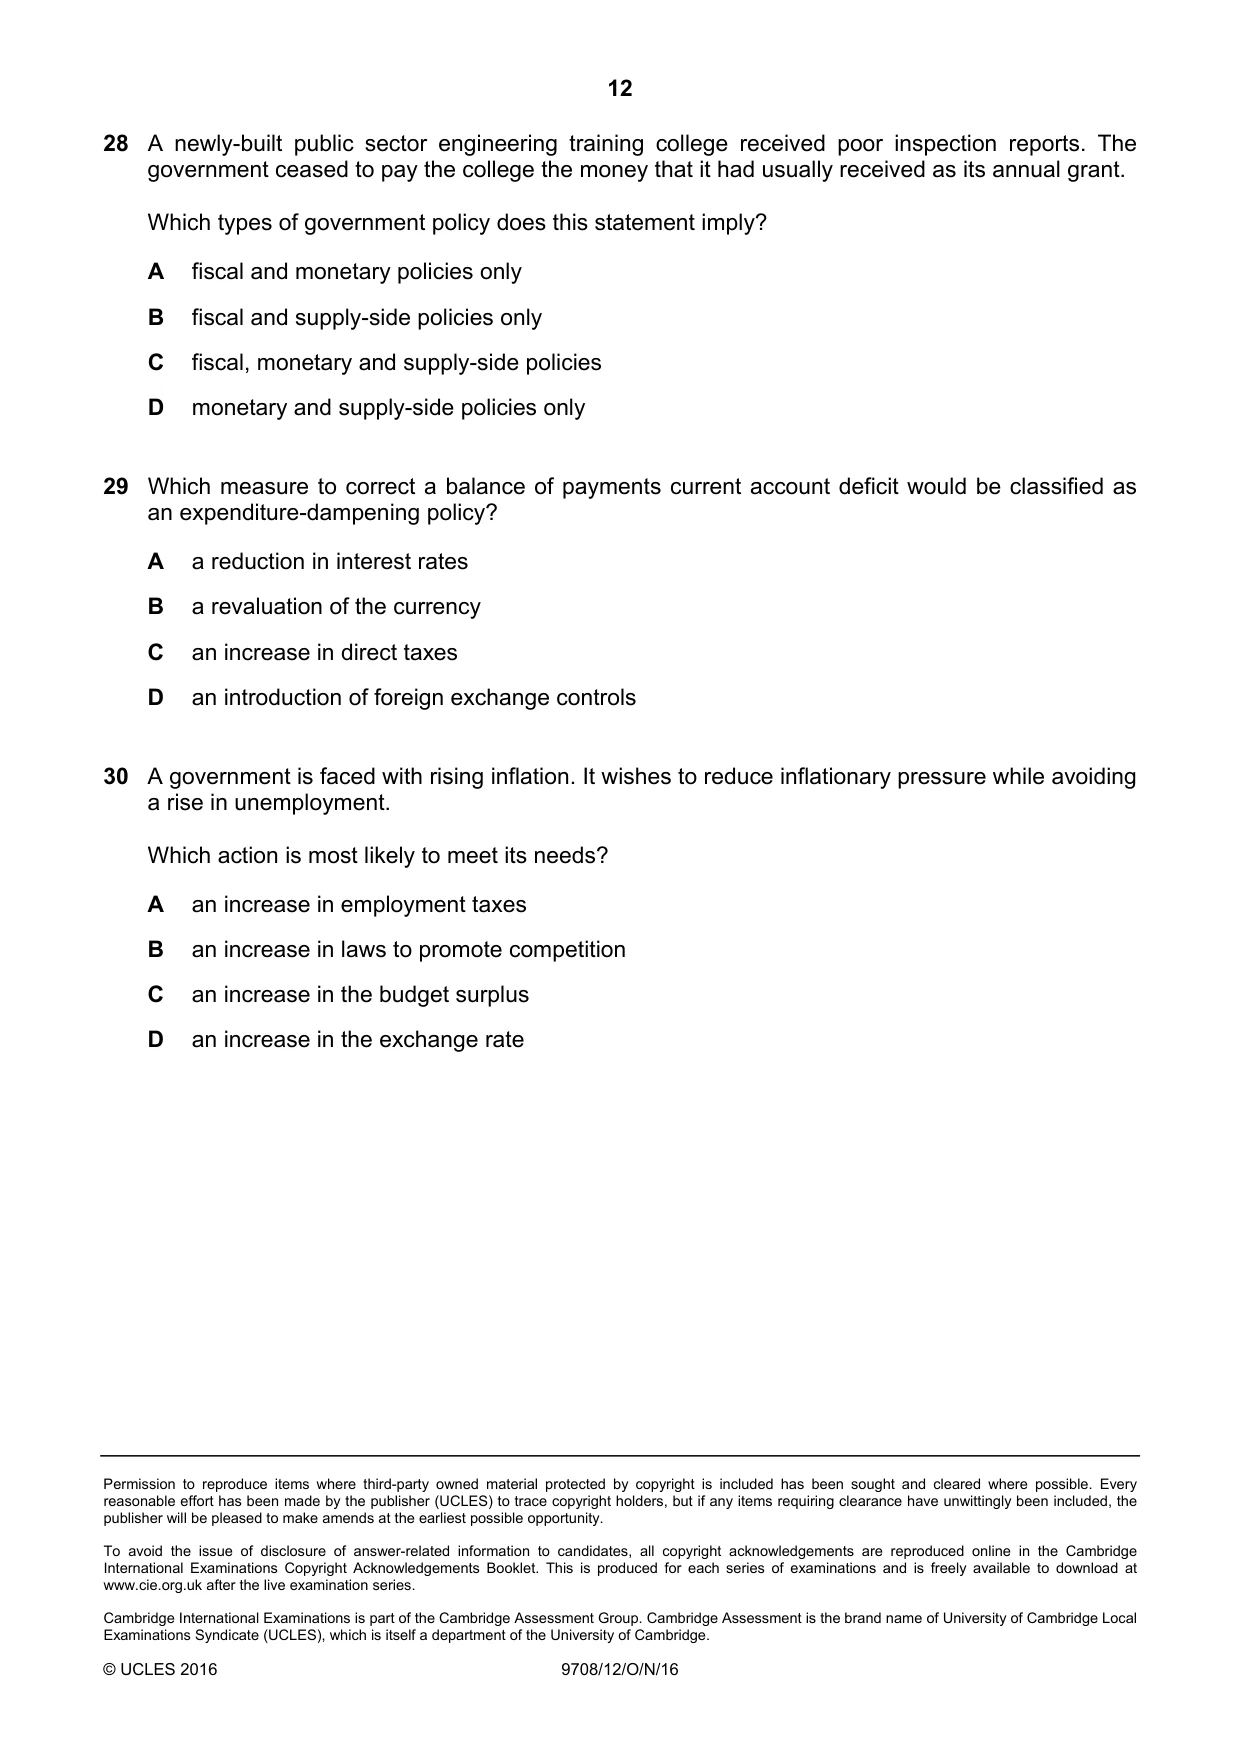
28 A newly-built public sector engineering training college received poor inspection reports. The government ceased to pay the college the money that it had usually received as its annual grant. Which types of government policy does this statement imply? A fiscal and monetary policies only B fiscal and supply-side policies only C fiscal, monetary and supply-side policies D monetary and supply-side policies only
Mark scheme: B
Q29 · Which measure to correct a balance of payments current account deficit would be…
29 Which measure to correct a balance of payments current account deficit would be classified as an expenditure-dampening policy? A a reduction in interest rates B a revaluation of the currency C an increase in direct taxes D an introduction of foreign exchange controls
Mark scheme: C
More questions on Policies to correct imbalances in the current account of the balance of payments
Q30 · A government is faced with rising inflation
30 A government is faced with rising inflation. It wishes to reduce inflationary pressure while avoiding a rise in unemployment. Which action is most likely to meet its needs? A an increase in employment taxes B an increase in laws to promote competition C an increase in the budget surplus D an increase in the exchange rate
Mark scheme: B
What was in this paper
The subtopics covered by these 30 questions, and how many questions each got. Open one in a new tab to see every Cambridge question on it.
4Price elasticity, income elasticity and cross elasticity of demand3Demand and supply curves2Exchange rates2Price stability2Scarcity, choice and opportunity cost2The interaction of demand and supply2The reasons for international trade2Aggregate Demand and Aggregate Supply analysis1Consumer and producer surplus1Current account of the balance of payments1Fiscal policy1National income statistics1Policies to correct imbalances in the current account of the balance of payments1Price elasticity of supply1Production possibility curves1Protectionism1Resource allocation in different economic systems1Supply-side policy1What you needed in this session
Cambridge’s own grade thresholds for 2016 Oct/Nov, Paper 1 · Variant 2. A higher threshold means an easier paper — the bar moves with how the cohort did.