Cambridge A Level Economics 9708 — 2021 Oct/Nov Paper 1 · Variant 2
9708/12/O/N/21 · 30 questions · 30 marks · ≈34 min
The question paper and its mark scheme, free to read here and free to download. This is Cambridge’s own paper, exactly as it was sat.
Question paper16 pages


Mark scheme3 pages
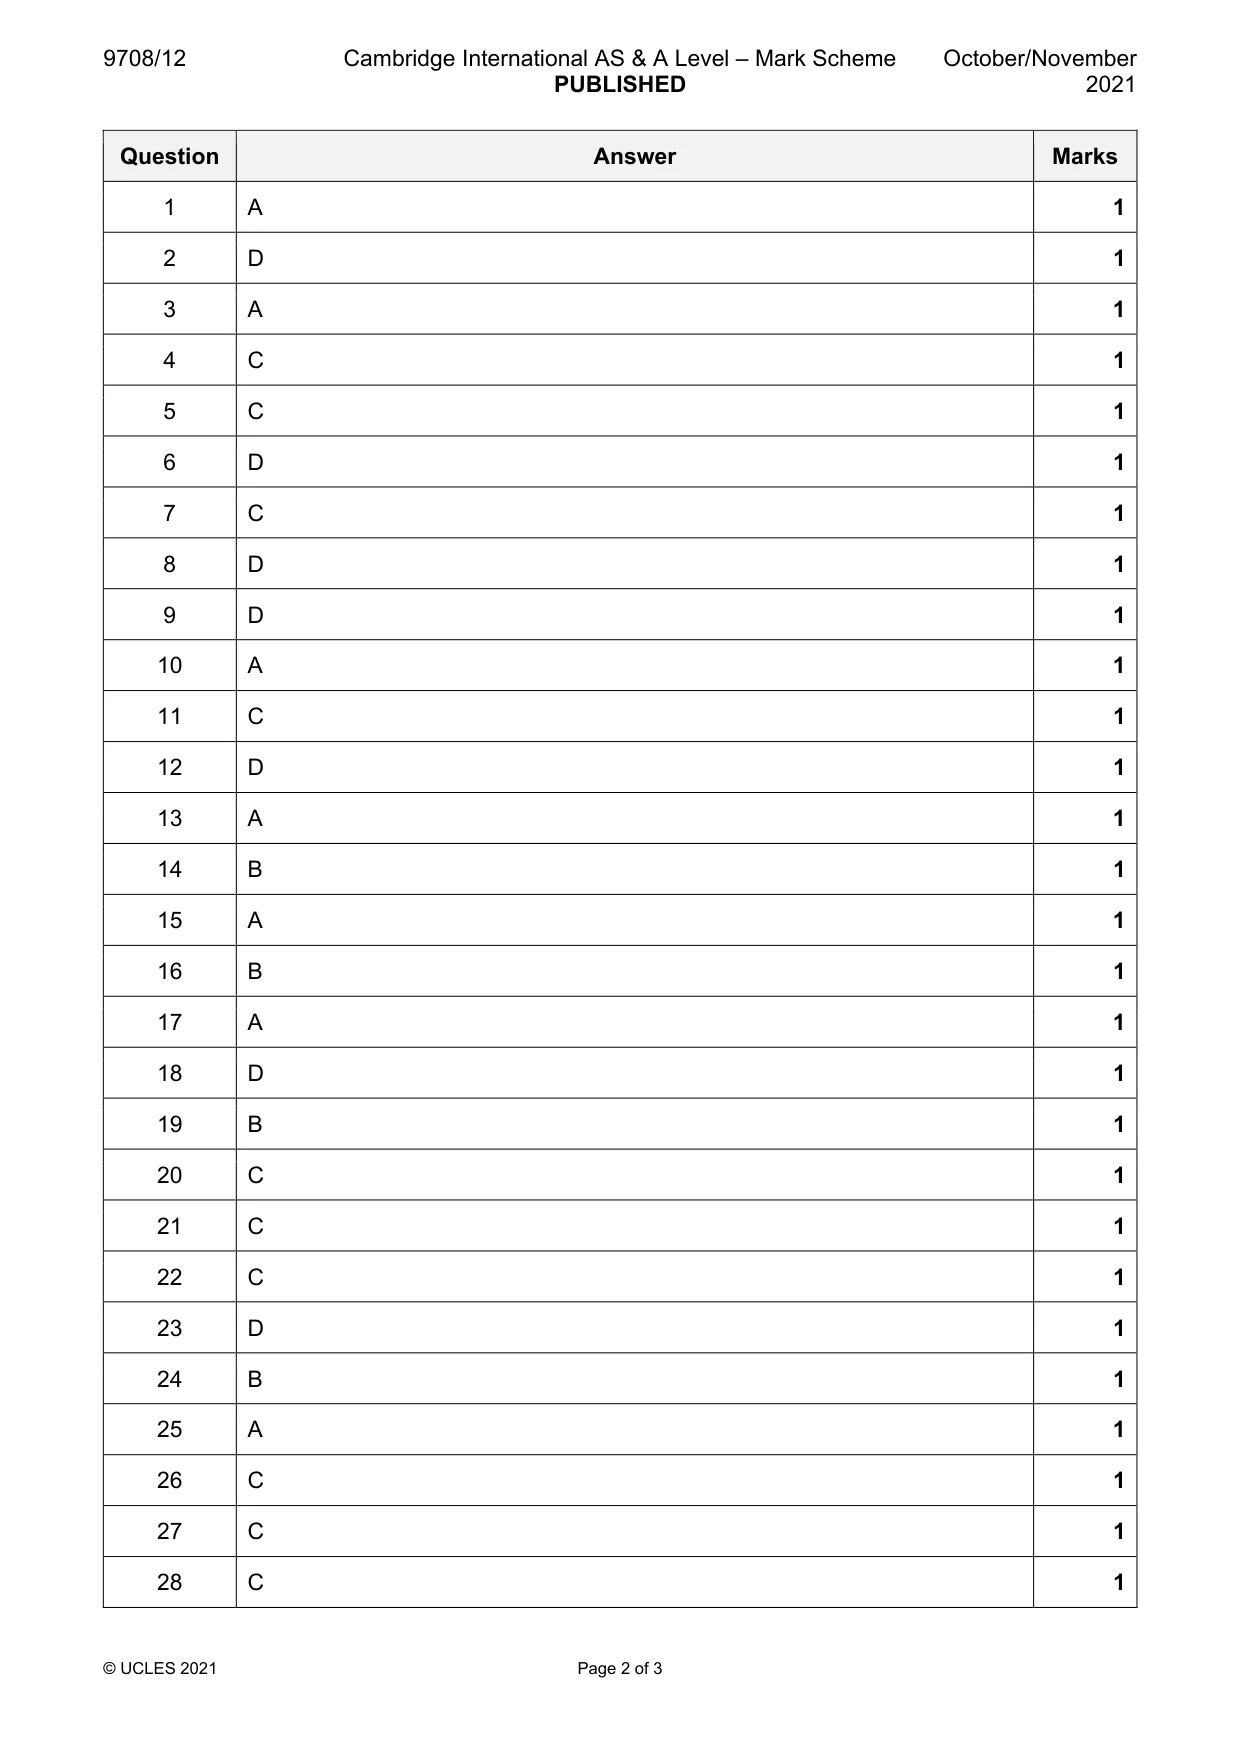
Answers below. Sit the paper first if you are practising.
Questions as text
Q1 · Line XX is the production possibility curve (PPC) of a worker picking peas and beans in a…
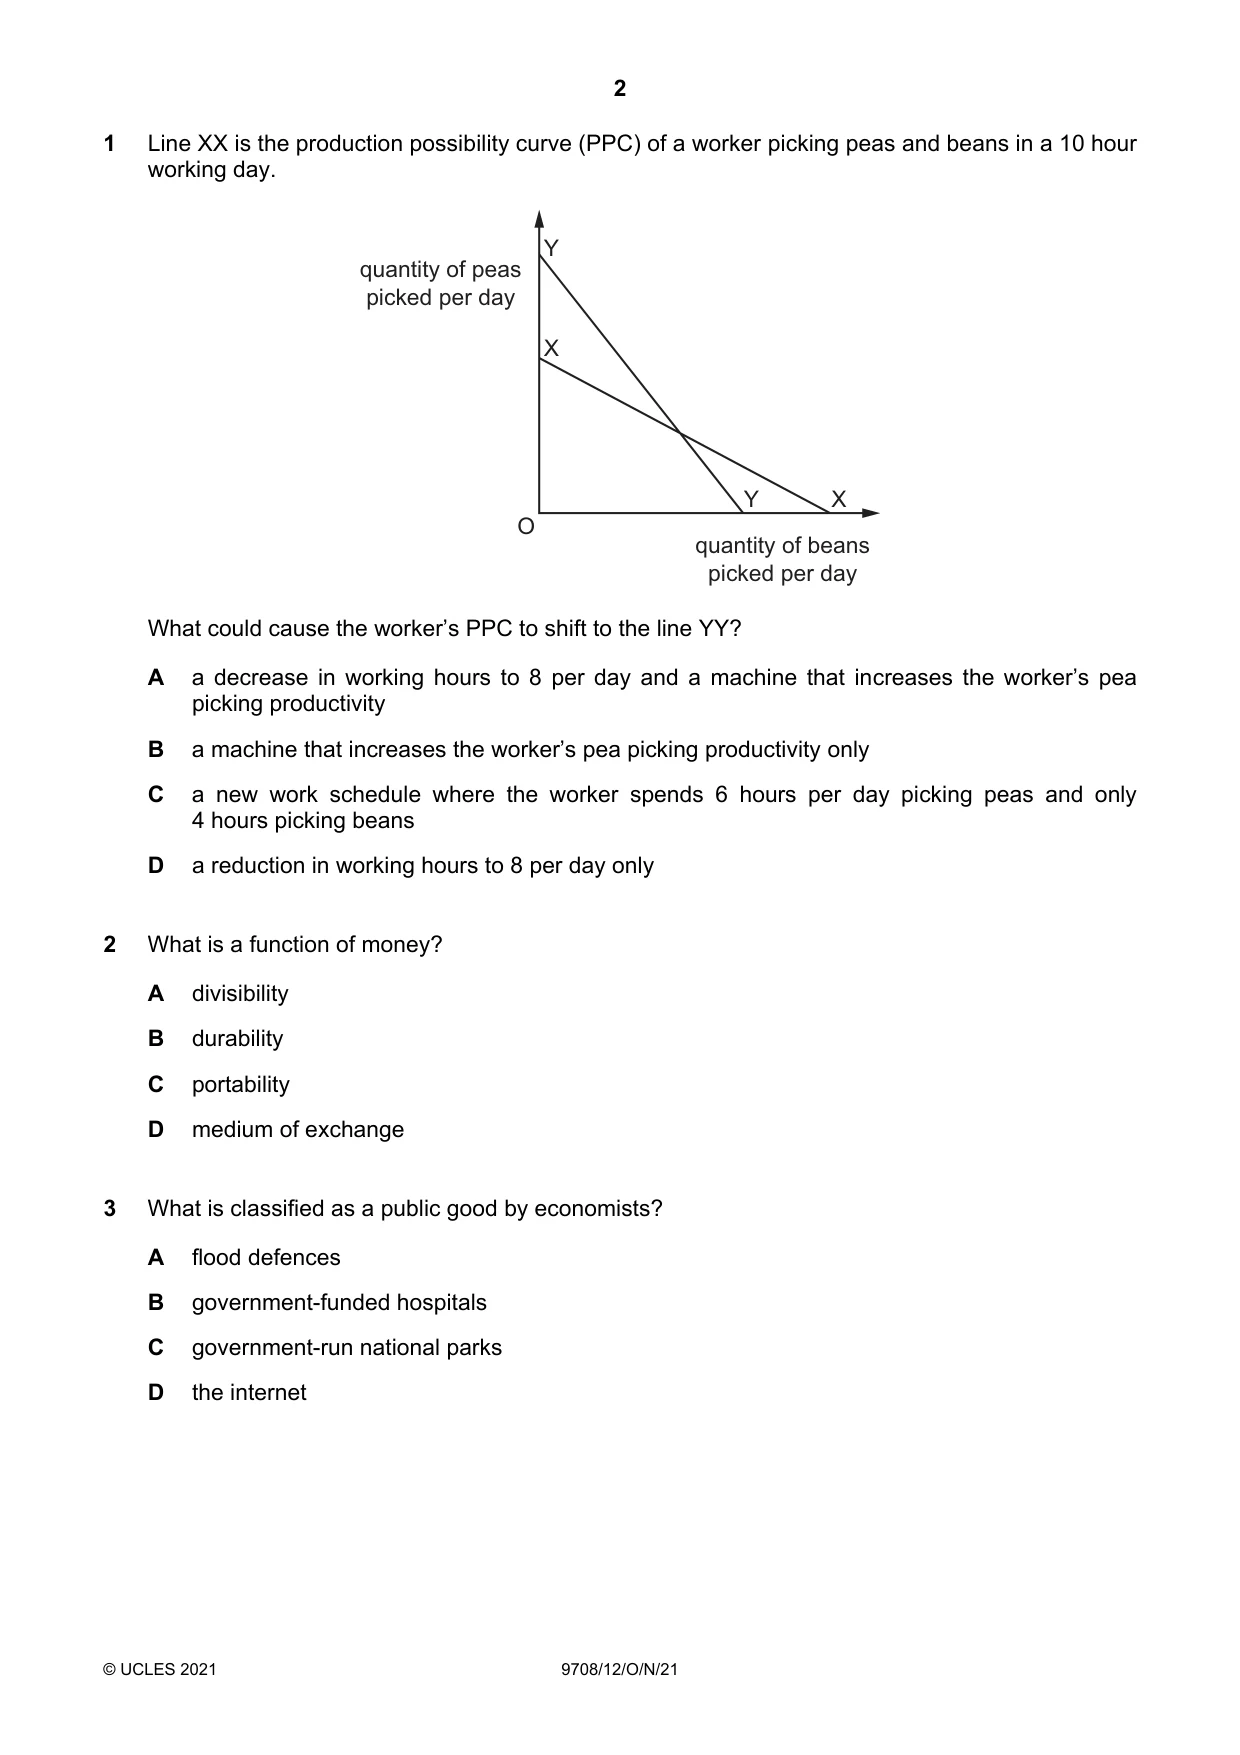
1 Line XX is the production possibility curve (PPC) of a worker picking peas and beans in a 10 hour working day. Y quantity of peas picked per day X Y X O quantity of beans picked per day What could cause the worker’s PPC to shift to the line YY? A a decrease in working hours to 8 per day and a machine that increases the worker’s pea picking productivity B a machine that increases the worker’s pea picking productivity only C a new work schedule where the worker spends 6 hours per day picking peas and only 4 hours picking beans D a reduction in working hours to 8 per day only
Mark scheme: A
Q2 · What is a function of money?
2 What is a function of money? A divisibility B durability C portability D medium of exchange
Mark scheme: D
Q3 · What is classified as a public good by economists?
3 What is classified as a public good by economists? A flood defences B government-funded hospitals C government-run national parks D the internet
Mark scheme: A
Q4 · Which statement about the factors of production is correct?
4 Which statement about the factors of production is correct? A The factor capital includes shares and deposit accounts at banks. B The factor labour includes human-made resources. C The factor land includes forests and undiscovered copper. D The factor enterprise takes risks and is rewarded with interest.
Mark scheme: C
Q5 · Which supply curve shows that the price elasticity of supply of the good is always equal…
5 Which supply curve shows that the price elasticity of supply of the good is always equal to 1? A a straight line that intersects the horizontal axis B a straight line that intersects the vertical axis C a straight line that passes through the origin D a straight line that is vertical to the horizontal axis
Mark scheme: C
Q6 · What could cause a shift in the supply curve of good X and a movement along its supply…
6 What could cause a shift in the supply curve of good X and a movement along its supply curve? shift in the supply curve movement along the supply curve A a change in demand for good X an increase in the price of a substitute good B a decrease in factor productivity the imposition of a tax on good X C an increase in the price of a an increase in factor productivity complementary good D an increase in the wage rates a change in demand for good X in the industry
Mark scheme: D
Q7 · The market for mobile phones is initially in equilibrium at X
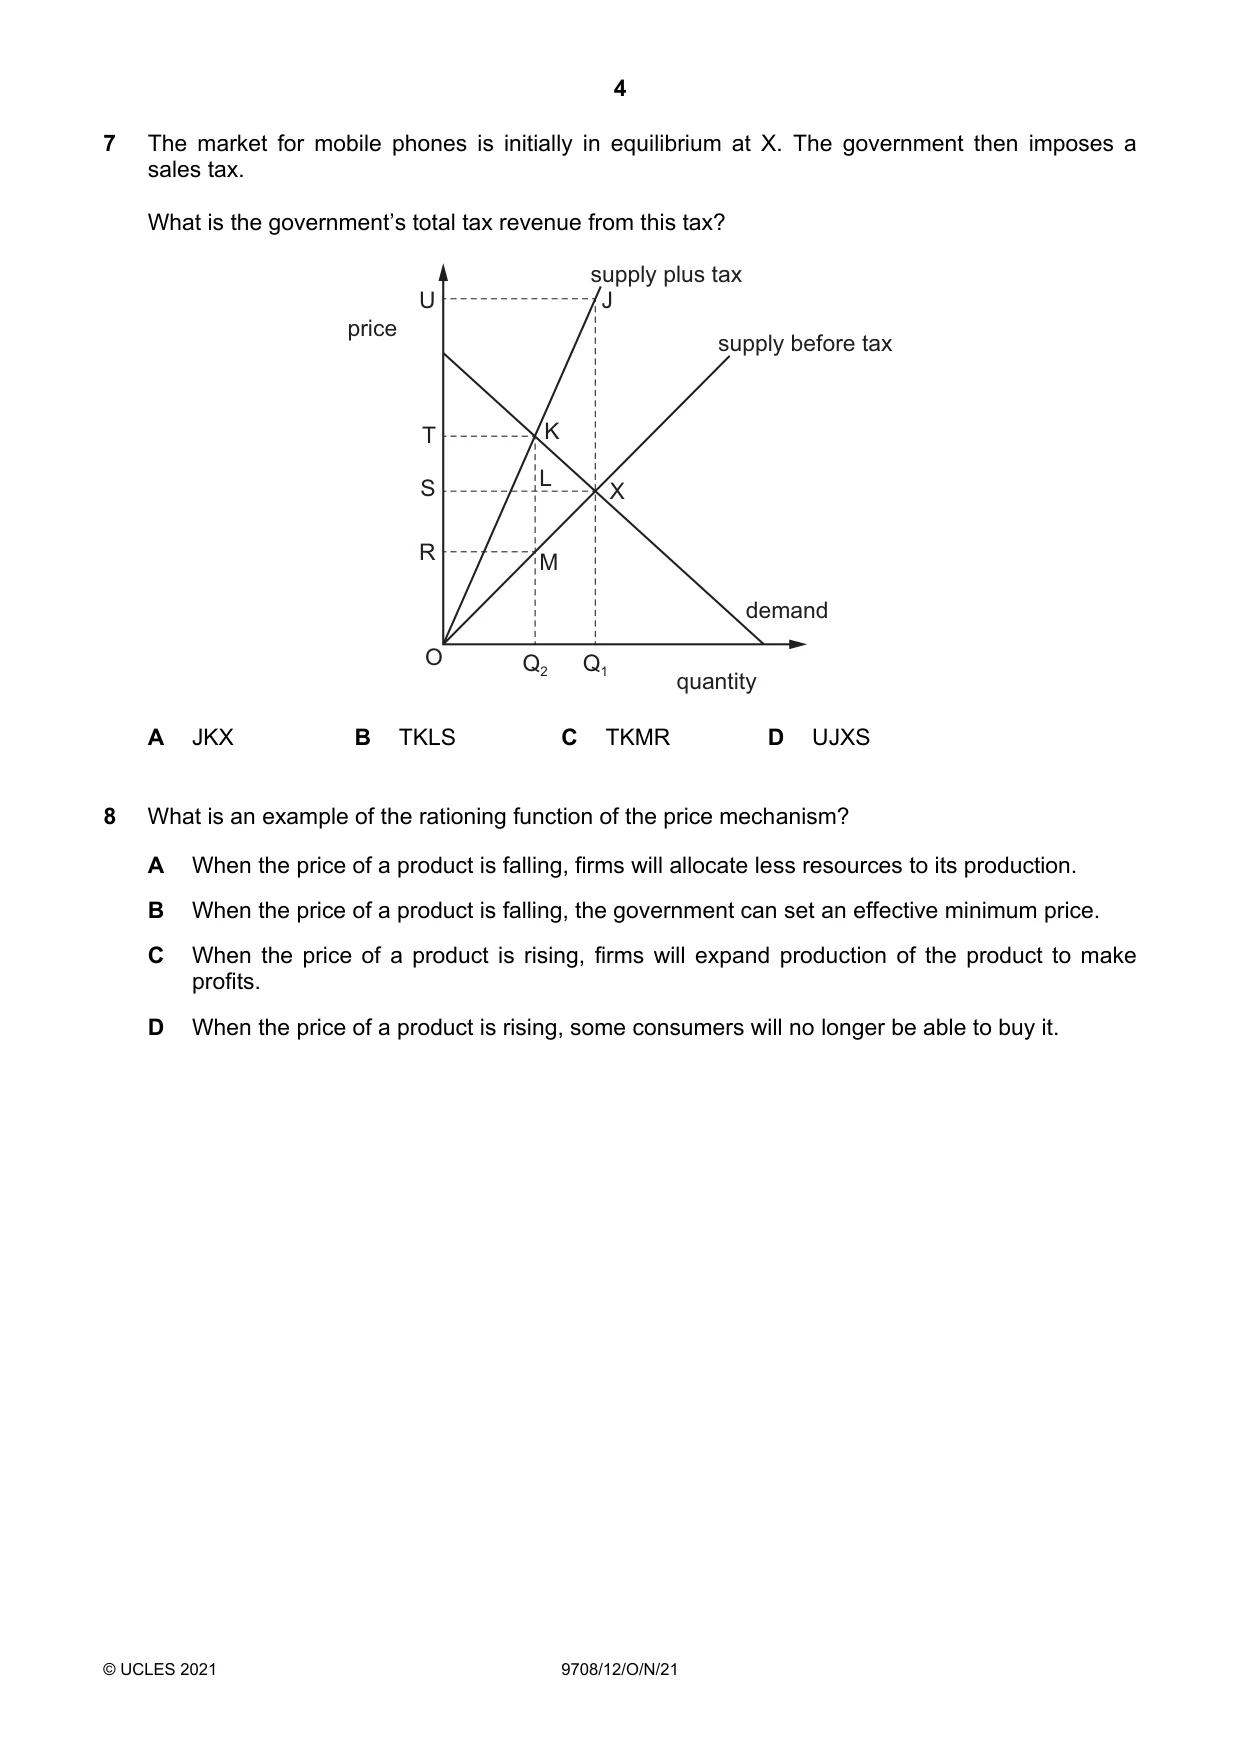
7 The market for mobile phones is initially in equilibrium at X. The government then imposes a sales tax. What is the government’s total tax revenue from this tax? supply plus tax U J price supply before tax T K S L X R M demand O Q2 Q1 quantity A JKX B TKLS C TKMR D UJXS
Mark scheme: C
More questions on Methods and effects of government intervention in markets
Q8 · What is an example of the rationing function of the price mechanism?
8 What is an example of the rationing function of the price mechanism? A When the price of a product is falling, firms will allocate less resources to its production. B When the price of a product is falling, the government can set an effective minimum price. C When the price of a product is rising, firms will expand production of the product to make profits. D When the price of a product is rising, some consumers will no longer be able to buy it.
Mark scheme: D
More questions on Resource allocation in different economic systems
Q9 · In 2016 car drivers bought more fuel because the price of oil from which it was made had…
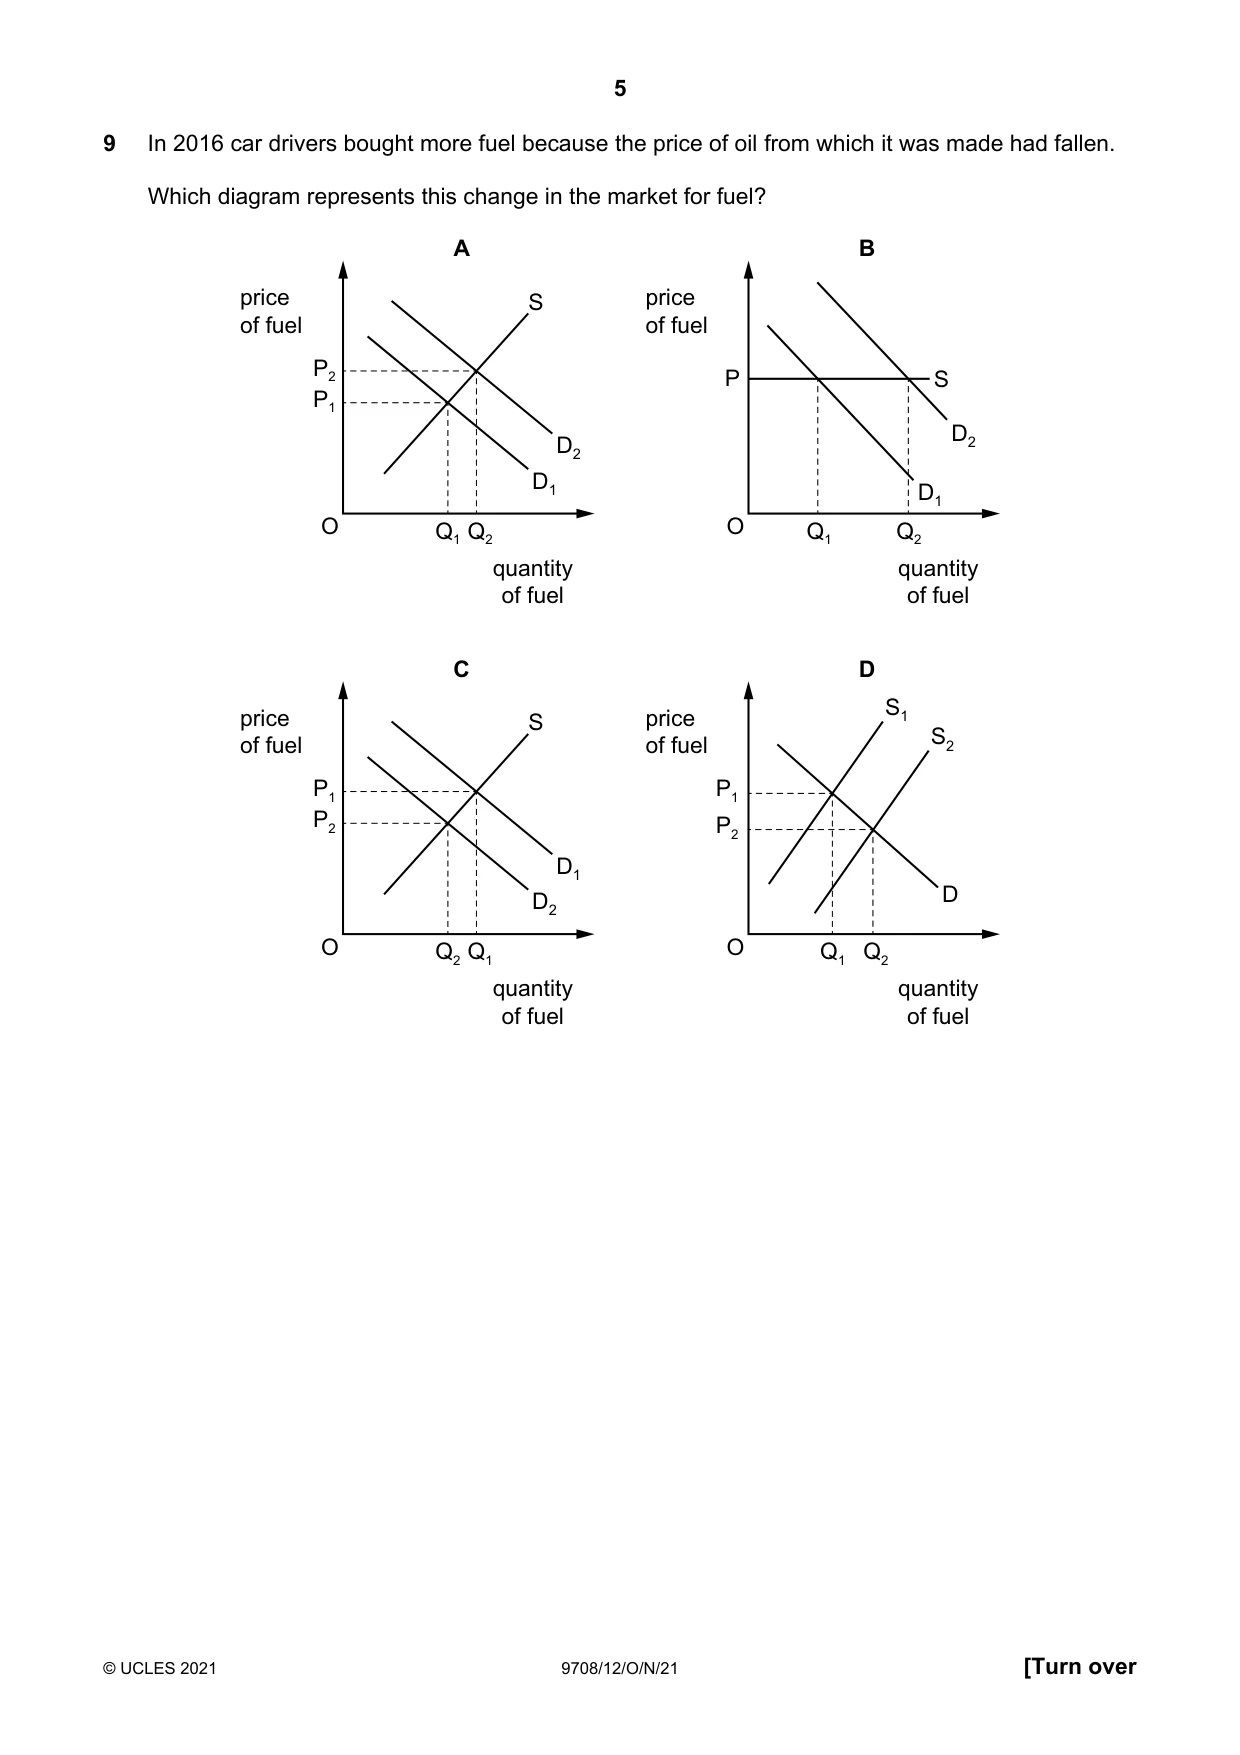
9 In 2016 car drivers bought more fuel because the price of oil from which it was made had fallen. Which diagram represents this change in the market for fuel? A B price S price of fuel of fuel P2 P S P1 D2 D2 D1 D1 O Q1 Q2 O Q1 Q2 quantity quantity of fuel of fuel C D S1 price S price of fuel of fuel S2 P1 P1 P2 P2 D1 D2 D O Q2 Q1 O Q1 Q2 quantity quantity of fuel of fuel
Mark scheme: D
Q10 · The diagram shows the demand and supply curves for bread in a developed economy
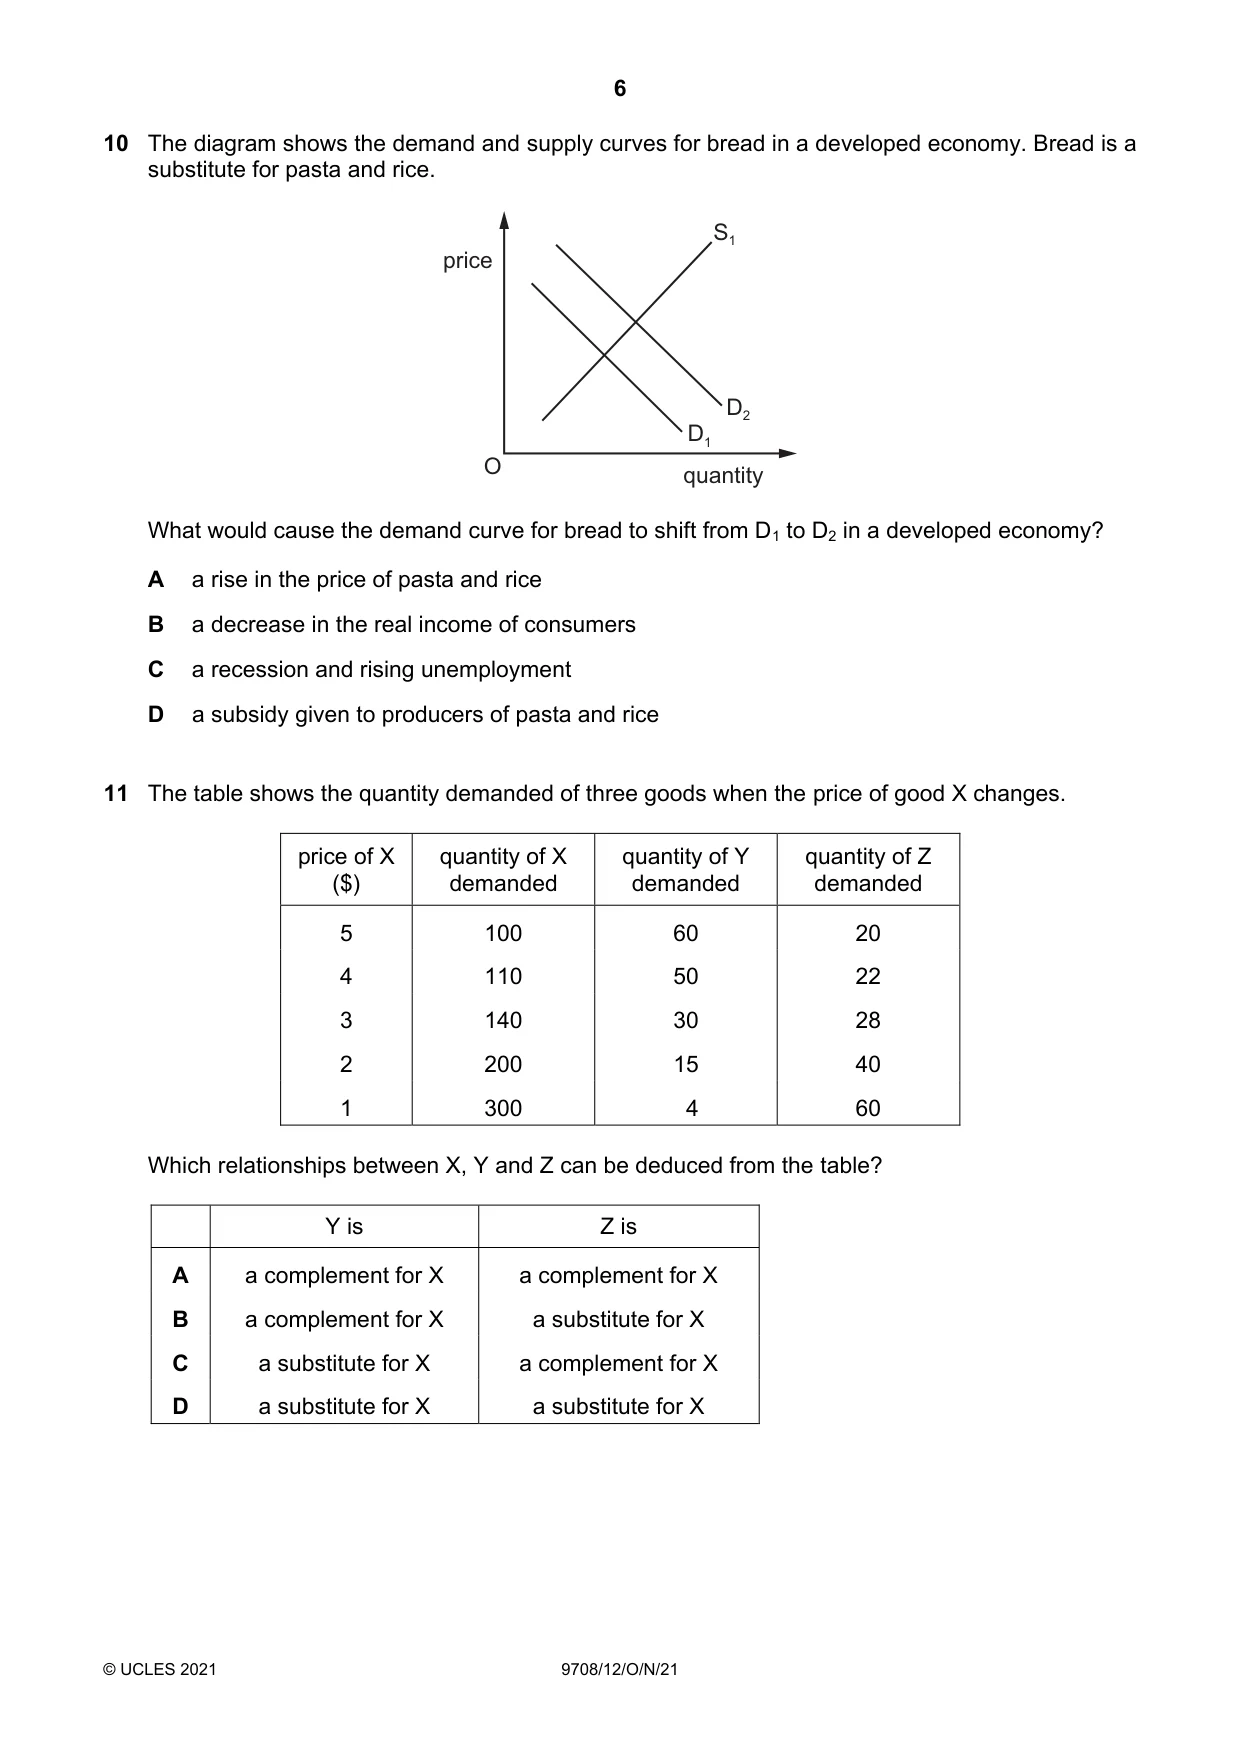
10 The diagram shows the demand and supply curves for bread in a developed economy. Bread is a substitute for pasta and rice. S1 price D2 D1 O quantity What would cause the demand curve for bread to shift from D1 to D2 in a developed economy? A a rise in the price of pasta and rice B a decrease in the real income of consumers C a recession and rising unemployment D a subsidy given to producers of pasta and rice
Mark scheme: A
Q11 · The table shows the quantity demanded of three goods when the price of good X changes
11 The table shows the quantity demanded of three goods when the price of good X changes. price of X quantity of X quantity of Y quantity of Z ($) demanded demanded demanded 5 100 60 20 4 110 50 22 3 140 30 28 2 200 15 40 1 300 4 60 Which relationships between X, Y and Z can be deduced from the table? Y is Z is A a complement for X a complement for X B a complement for X a substitute for X C a substitute for X a complement for X D a substitute for X a substitute for X
Mark scheme: C
More questions on Price elasticity, income elasticity and cross elasticity of demand
Q12 · The diagram shows three supply curves
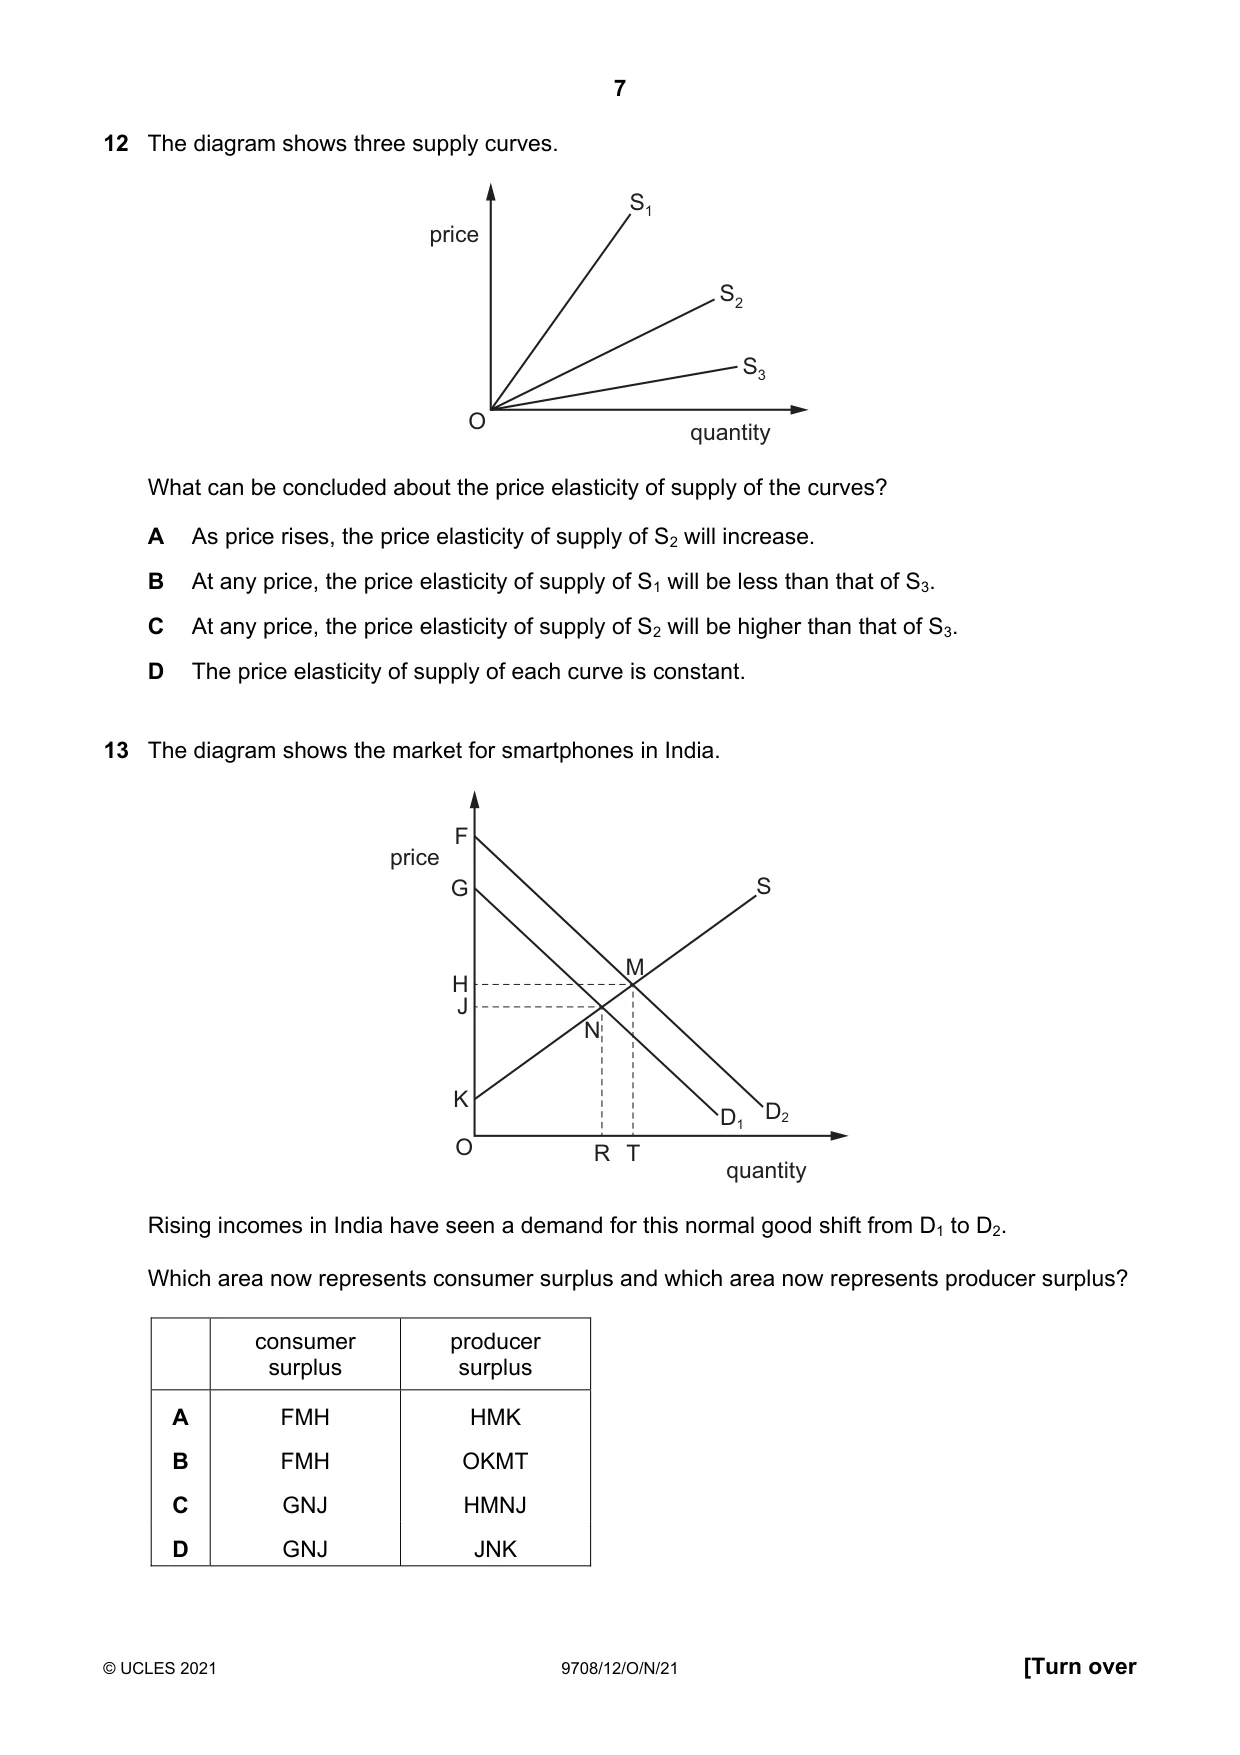
12 The diagram shows three supply curves. S1 price S2 S3 O quantity What can be concluded about the price elasticity of supply of the curves? A As price rises, the price elasticity of supply of S2 will increase. B At any price, the price elasticity of supply of S1 will be less than that of S3. C At any price, the price elasticity of supply of S2 will be higher than that of S3. D The price elasticity of supply of each curve is constant.
Mark scheme: D
Q13 · The diagram shows the market for smartphones in India
13 The diagram shows the market for smartphones in India. F price G S M H J N K D1 D2 O R T quantity Rising incomes in India have seen a demand for this normal good shift from D1 to D2. Which area now represents consumer surplus and which area now represents producer surplus? consumer producer surplus surplus A FMH HMK B FMH OKMT C GNJ HMNJ D GNJ JNK
Mark scheme: A
Q14 · A nationalised industry is privatised
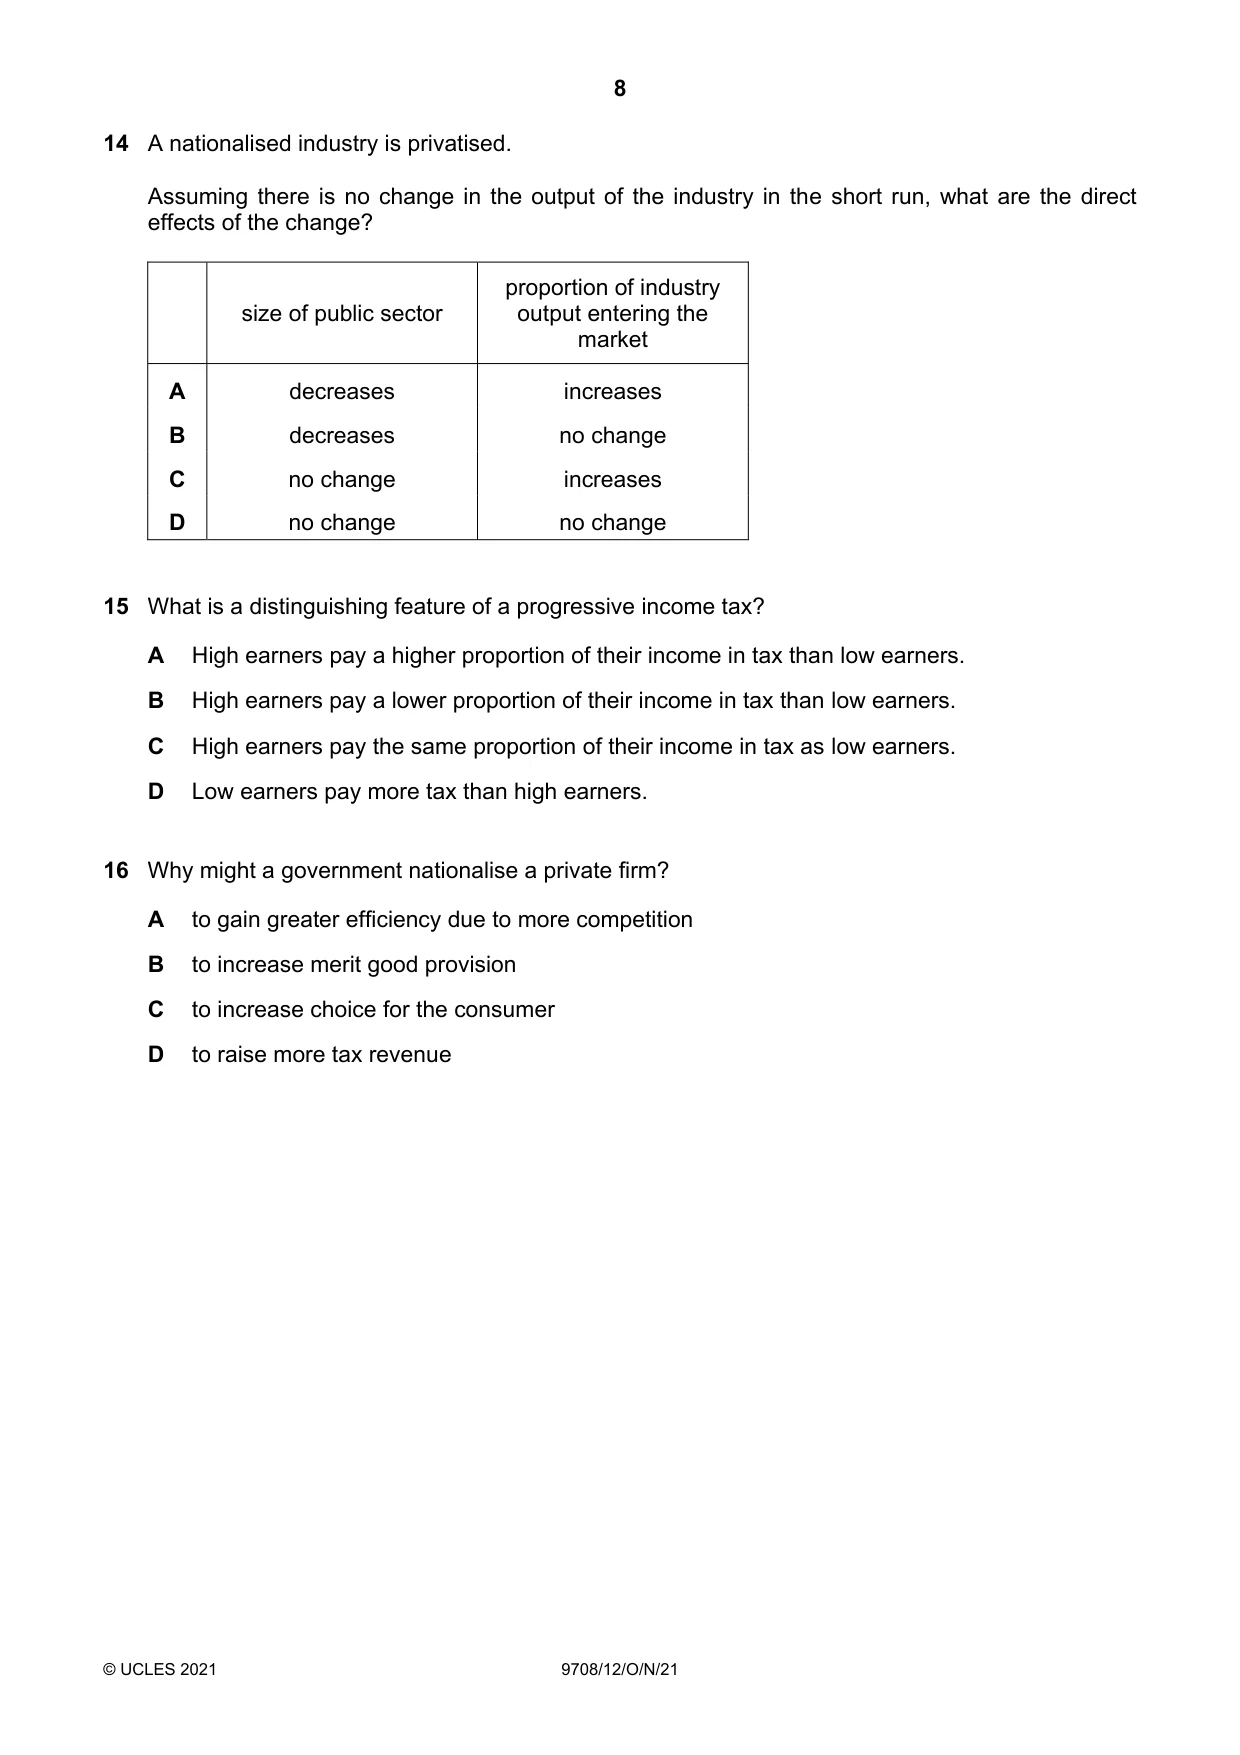
14 A nationalised industry is privatised. Assuming there is no change in the output of the industry in the short run, what are the direct effects of the change? proportion of industry size of public sector output entering the market A decreases increases B decreases no change C no change increases D no change no change
Mark scheme: B
More questions on Resource allocation in different economic systems
Q15 · What is a distinguishing feature of a progressive income tax?
15 What is a distinguishing feature of a progressive income tax? A High earners pay a higher proportion of their income in tax than low earners. B High earners pay a lower proportion of their income in tax than low earners. C High earners pay the same proportion of their income in tax as low earners. D Low earners pay more tax than high earners.
Mark scheme: A
Q16 · Why might a government nationalise a private firm?
16 Why might a government nationalise a private firm? A to gain greater efficiency due to more competition B to increase merit good provision C to increase choice for the consumer D to raise more tax revenue
Mark scheme: B
More questions on Reasons for government intervention in markets
Q17 · The diagram shows a firm’s supply of and demand for apples
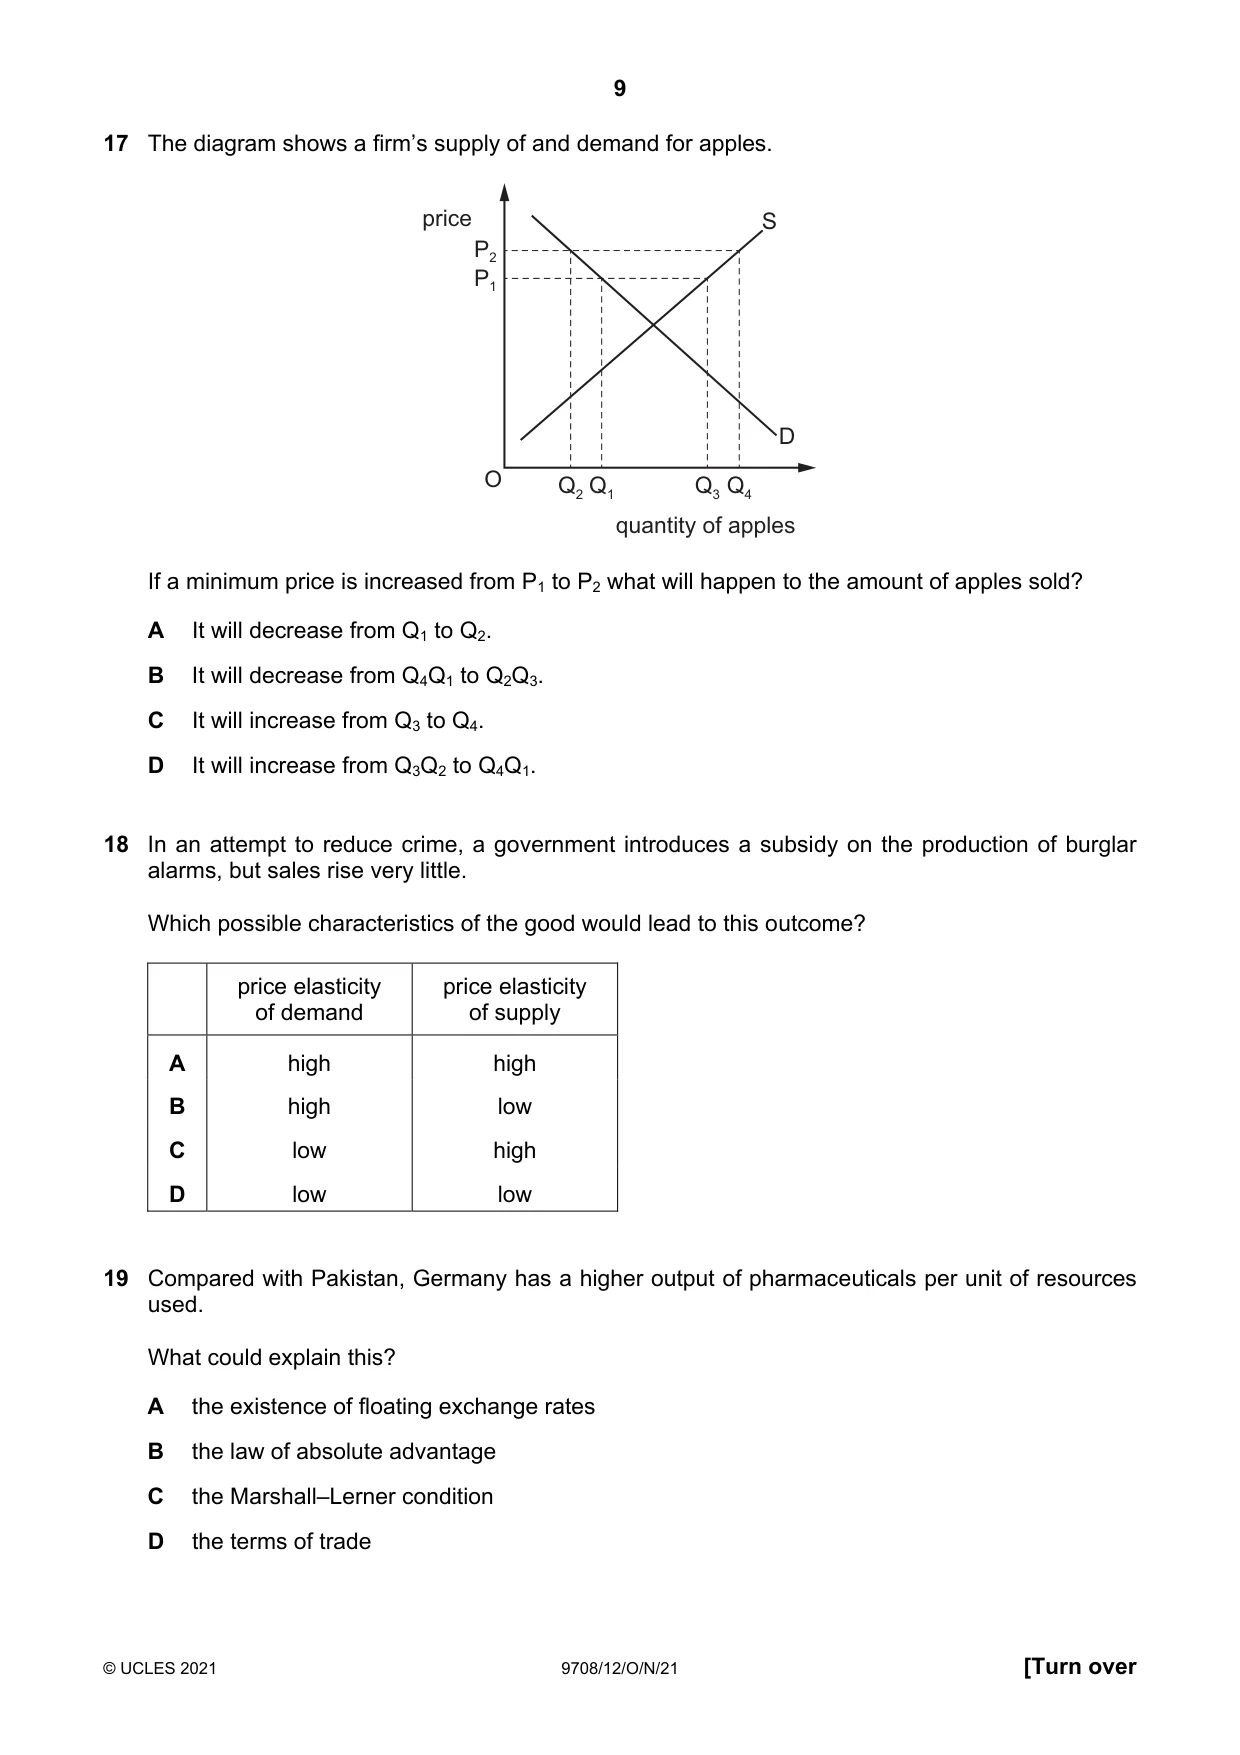
17 The diagram shows a firm’s supply of and demand for apples. price S P2 P1 D O Q2 Q1 Q3 Q4 quantity of apples If a minimum price is increased from P1 to P2 what will happen to the amount of apples sold? A It will decrease from Q1 to Q2. B It will decrease from Q4Q1 to Q2Q3. C It will increase from Q3 to Q4. D It will increase from Q3Q2 to Q4Q1.
Mark scheme: A
More questions on Methods and effects of government intervention in markets
Q18 · In an attempt to reduce crime, a government introduces a subsidy on the production of…
18 In an attempt to reduce crime, a government introduces a subsidy on the production of burglar alarms, but sales rise very little. Which possible characteristics of the good would lead to this outcome? price elasticity price elasticity of demand of supply A high high B high low C low high D low low
Mark scheme: D
More questions on Methods and effects of government intervention in markets
Q19 · Compared with Pakistan, Germany has a higher output of pharmaceuticals per unit of…
19 Compared with Pakistan, Germany has a higher output of pharmaceuticals per unit of resources used. What could explain this? A the existence of floating exchange rates B the law of absolute advantage C the Marshall–Lerner condition D the terms of trade
Mark scheme: B
Q20 · Which statement about inflation is correct?
20 Which statement about inflation is correct? A Inflation will lead to a rise in exports. B Inflation will lead to a rise in real incomes. C Inflation will lead to a rise in the cost of living. D Inflation will lead to a rise in the purchasing power of money.
Mark scheme: C
Q21 · Why is it that a country’s balance of payments must always balance?
21 Why is it that a country’s balance of payments must always balance? A Exchange rate changes will correct any deficit or surplus. B One country’s deficit is balanced by another country’s surplus. C The current account is balanced by the capital and financial accounts. D The government must act to correct any disequilibrium.
Mark scheme: C
More questions on Current account of the balance of payments
Q22 · Which argument for protection would be most relevant if the government of country X…
22 Which argument for protection would be most relevant if the government of country X decided to exercise voluntary export restraint in its trade with country Y? A Voluntary export restraint would achieve an immediate correction for X’s balance of trade deficit. B Voluntary export restraint would cause the level of GDP to increase in country X. C Voluntary export restraint would help to negotiate improved trading conditions between X and Y. D Voluntary export restraint would help to reduce the level of unemployment in country X.
Mark scheme: C
Q23 · The average price of a country’s exports increased by 5% and the average price of its…
23 The average price of a country’s exports increased by 5% and the average price of its imports increased by 10%. What can definitely be concluded from this information? A Its balance of trade will improve. B Its balance of trade will worsen. C Its terms of trade have improved. D Its terms of trade have worsened.
Mark scheme: D
Q24 · There is an increase in indirect taxes
24 There is an increase in indirect taxes. What will be the impact on demand-pull inflation and on cost-push inflation? demand-pull cost-push inflation inflation A fall fall B fall rise C rise fall D rise rise
Mark scheme: B
Q25 · The table shows the number of biscuits and cakes that can be produced by four workers in…
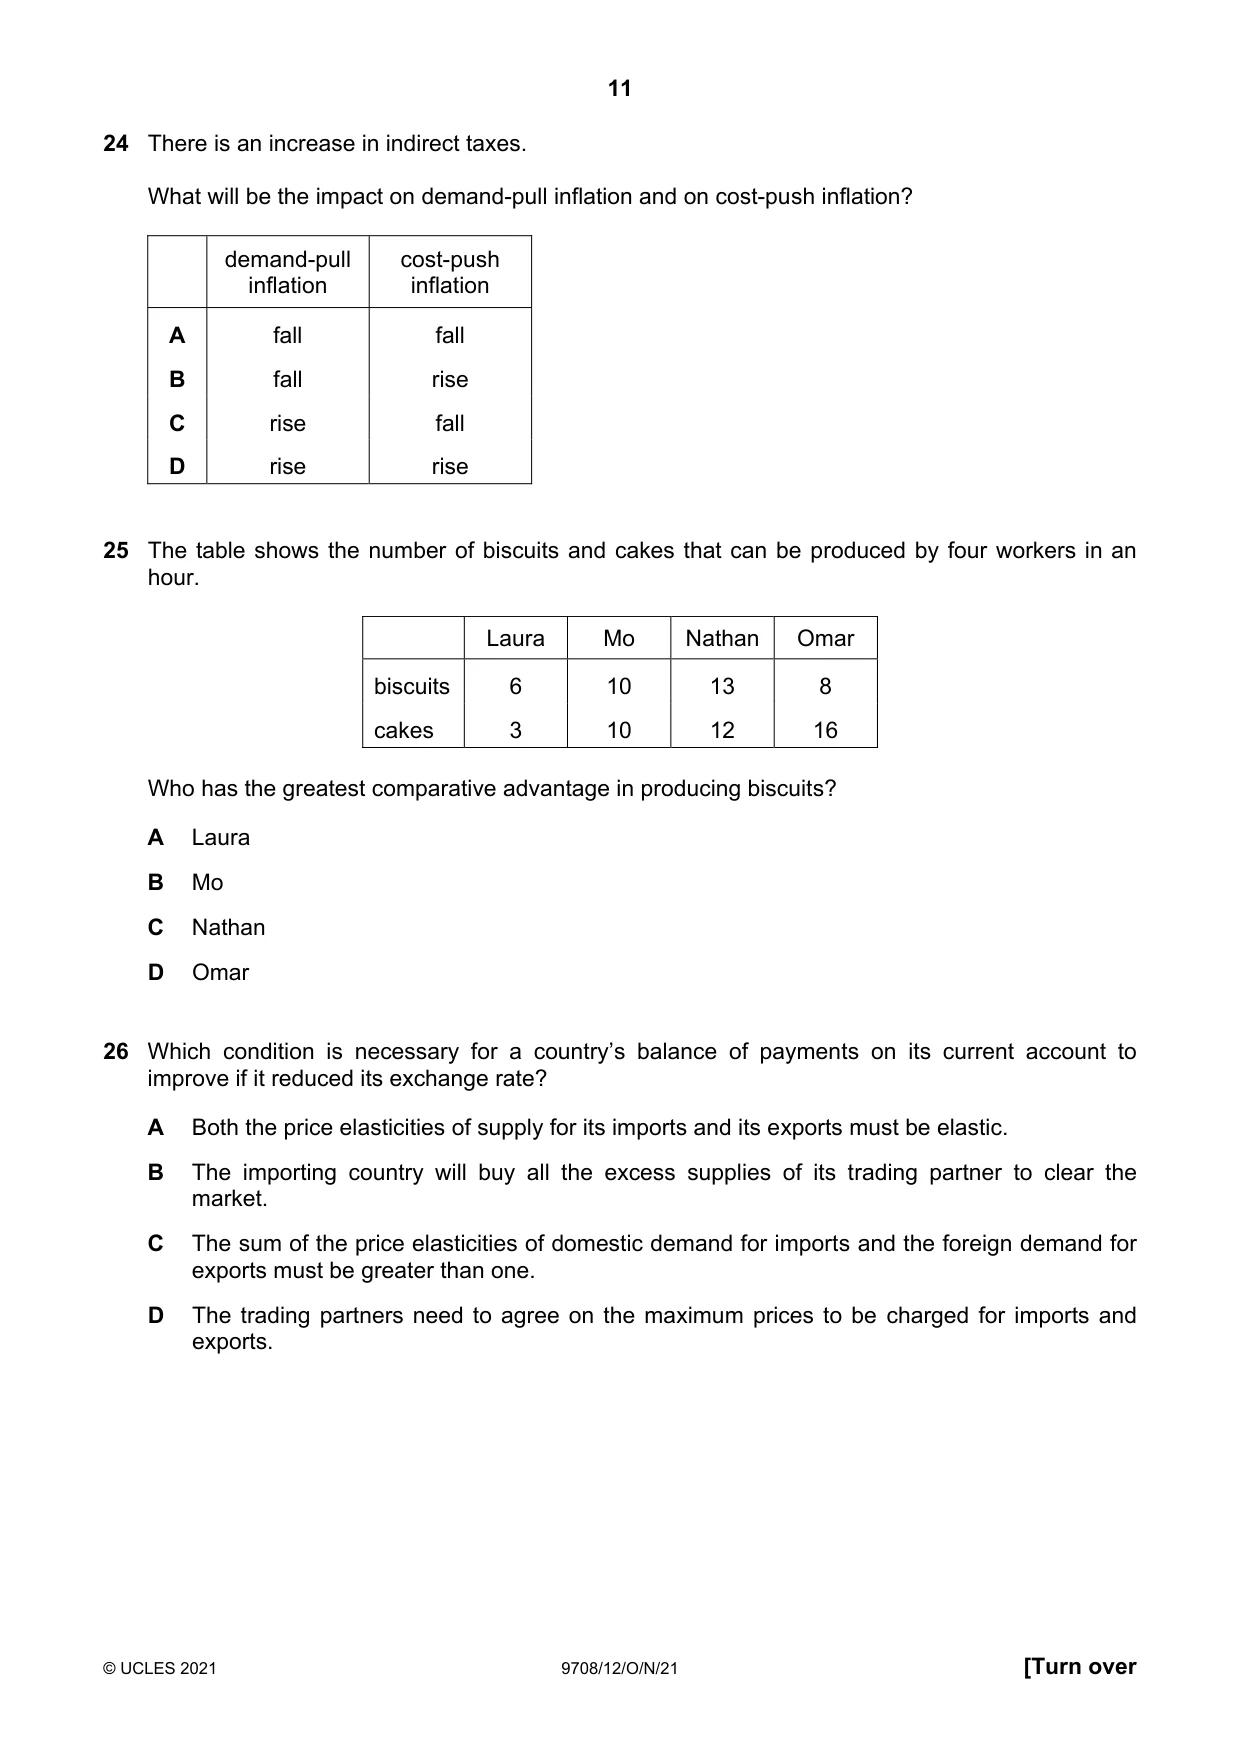
25 The table shows the number of biscuits and cakes that can be produced by four workers in an hour. Laura Mo Nathan Omar biscuits 6 10 13 8 cakes 3 10 12 16 Who has the greatest comparative advantage in producing biscuits? A Laura B Mo C Nathan D Omar
Mark scheme: A
Q26 · Which condition is necessary for a country’s balance of payments on its current account…
26 Which condition is necessary for a country’s balance of payments on its current account to improve if it reduced its exchange rate? A Both the price elasticities of supply for its imports and its exports must be elastic. B The importing country will buy all the excess supplies of its trading partner to clear the market. C The sum of the price elasticities of domestic demand for imports and the foreign demand for exports must be greater than one. D The trading partners need to agree on the maximum prices to be charged for imports and exports.
Mark scheme: C
More questions on Policies to correct imbalances in the current account of the balance of payments
Q27 · The diagram shows the effect of the United States (US) imposing a tariff on the import of…
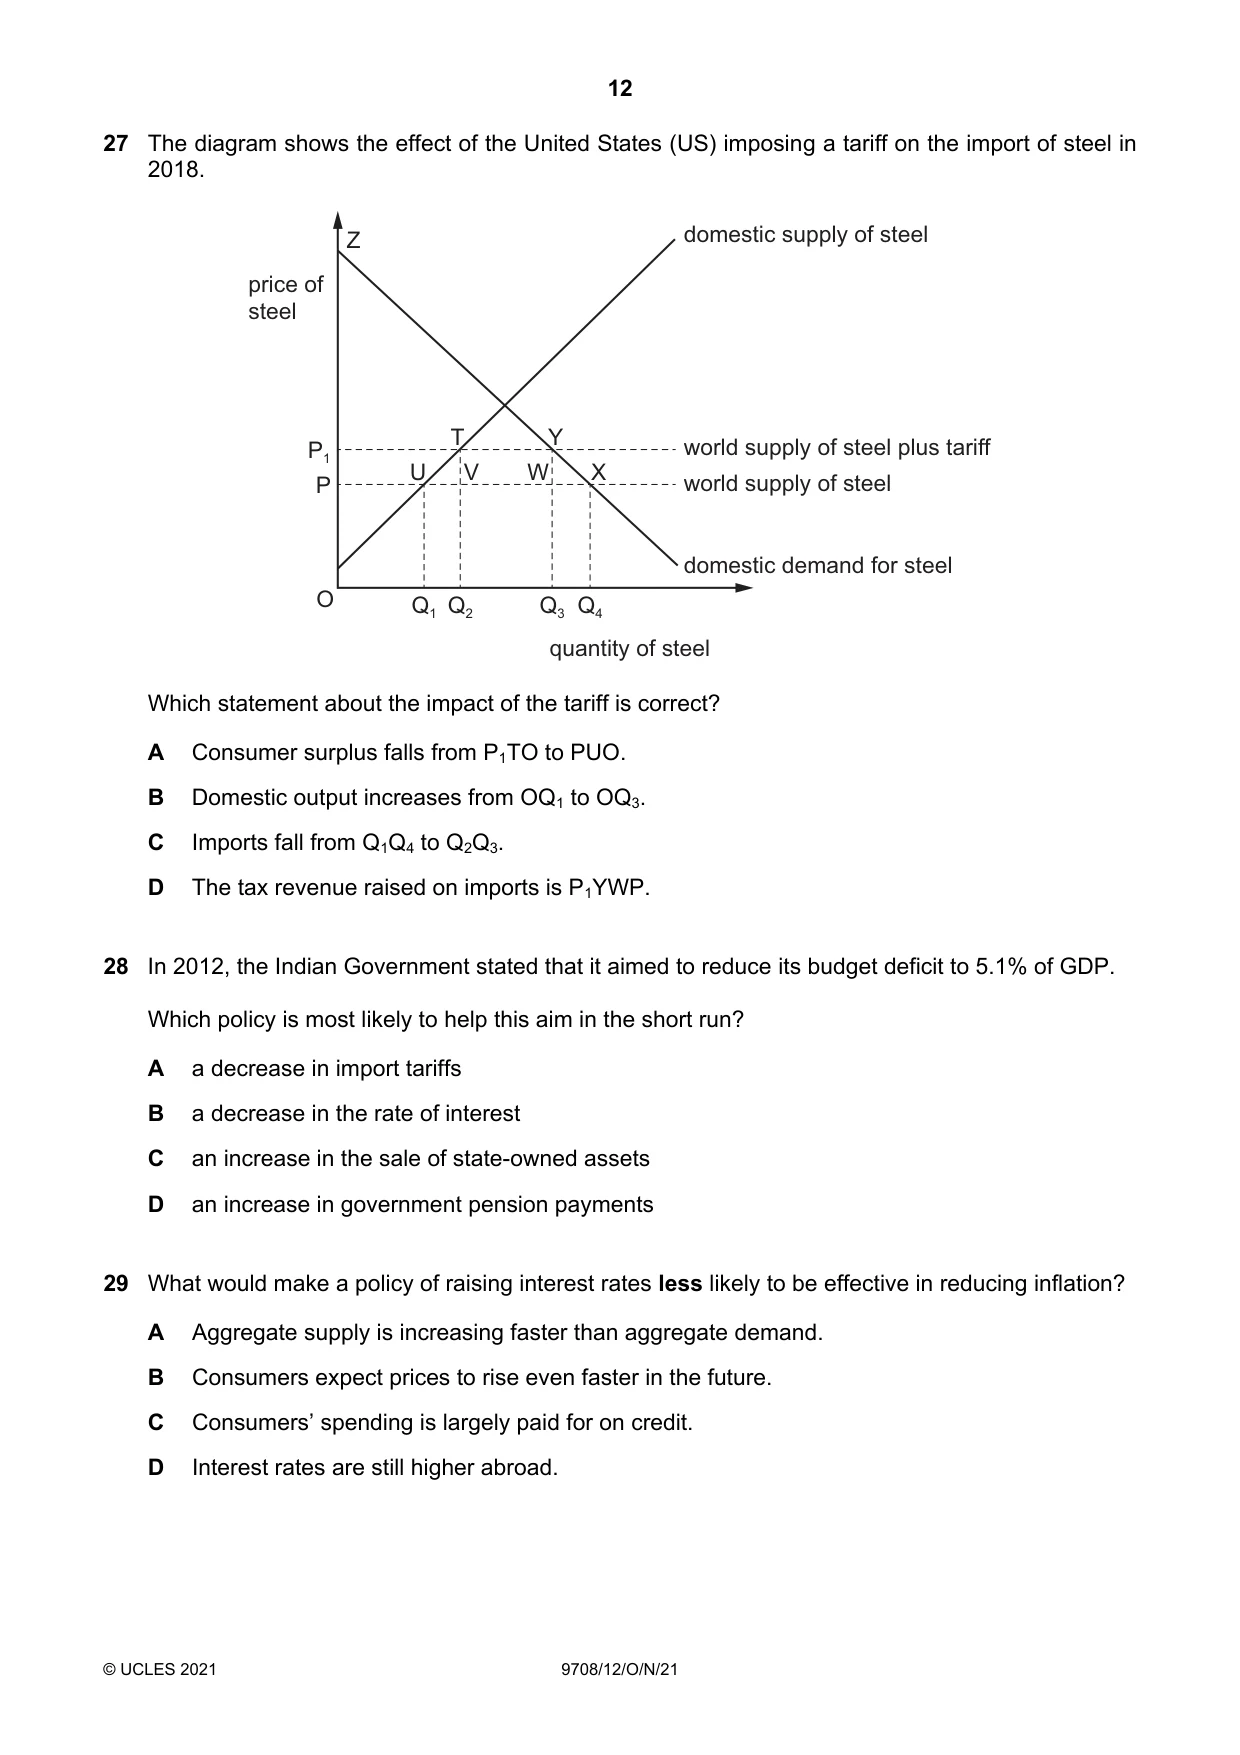
27 The diagram shows the effect of the United States (US) imposing a tariff on the import of steel in 2018. Z domestic supply of steel price of steel T Y P1 world supply of steel plus tariff U V W X P world supply of steel domestic demand for steel O Q1 Q2 Q3 Q4 quantity of steel Which statement about the impact of the tariff is correct? A Consumer surplus falls from P1TO to PUO. B Domestic output increases from OQ1 to OQ3. C Imports fall from Q1Q4 to Q2Q3. D The tax revenue raised on imports is P1YWP.
Mark scheme: C
Q28 · In 2012, the Indian Government stated that it aimed to reduce its budget deficit to 5.1%…
28 In 2012, the Indian Government stated that it aimed to reduce its budget deficit to 5.1% of GDP. Which policy is most likely to help this aim in the short run? A a decrease in import tariffs B a decrease in the rate of interest C an increase in the sale of state-owned assets D an increase in government pension payments
Mark scheme: C
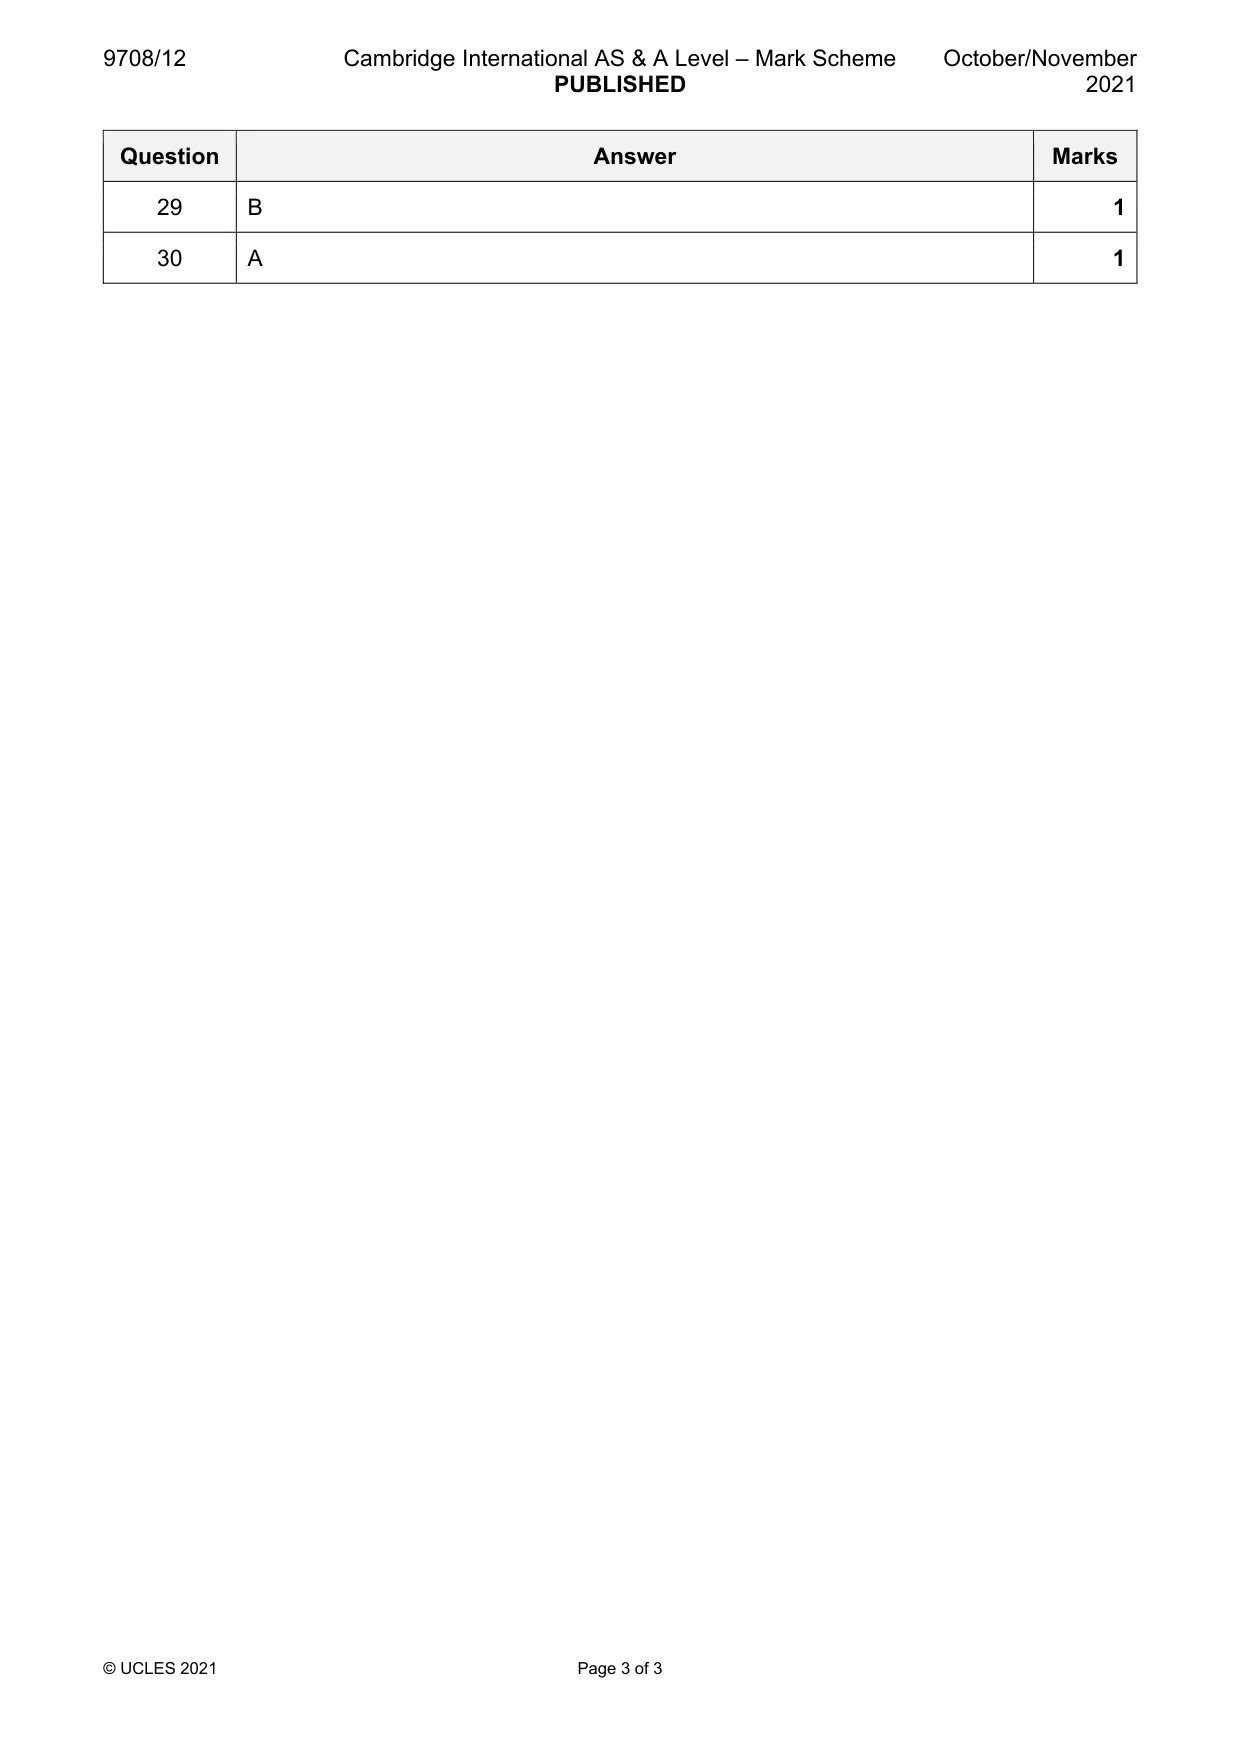
Q29 · What would make a policy of raising interest rates less likely to be effective in…
29 What would make a policy of raising interest rates less likely to be effective in reducing inflation? A Aggregate supply is increasing faster than aggregate demand. B Consumers expect prices to rise even faster in the future. C Consumers’ spending is largely paid for on credit. D Interest rates are still higher abroad.
Mark scheme: B
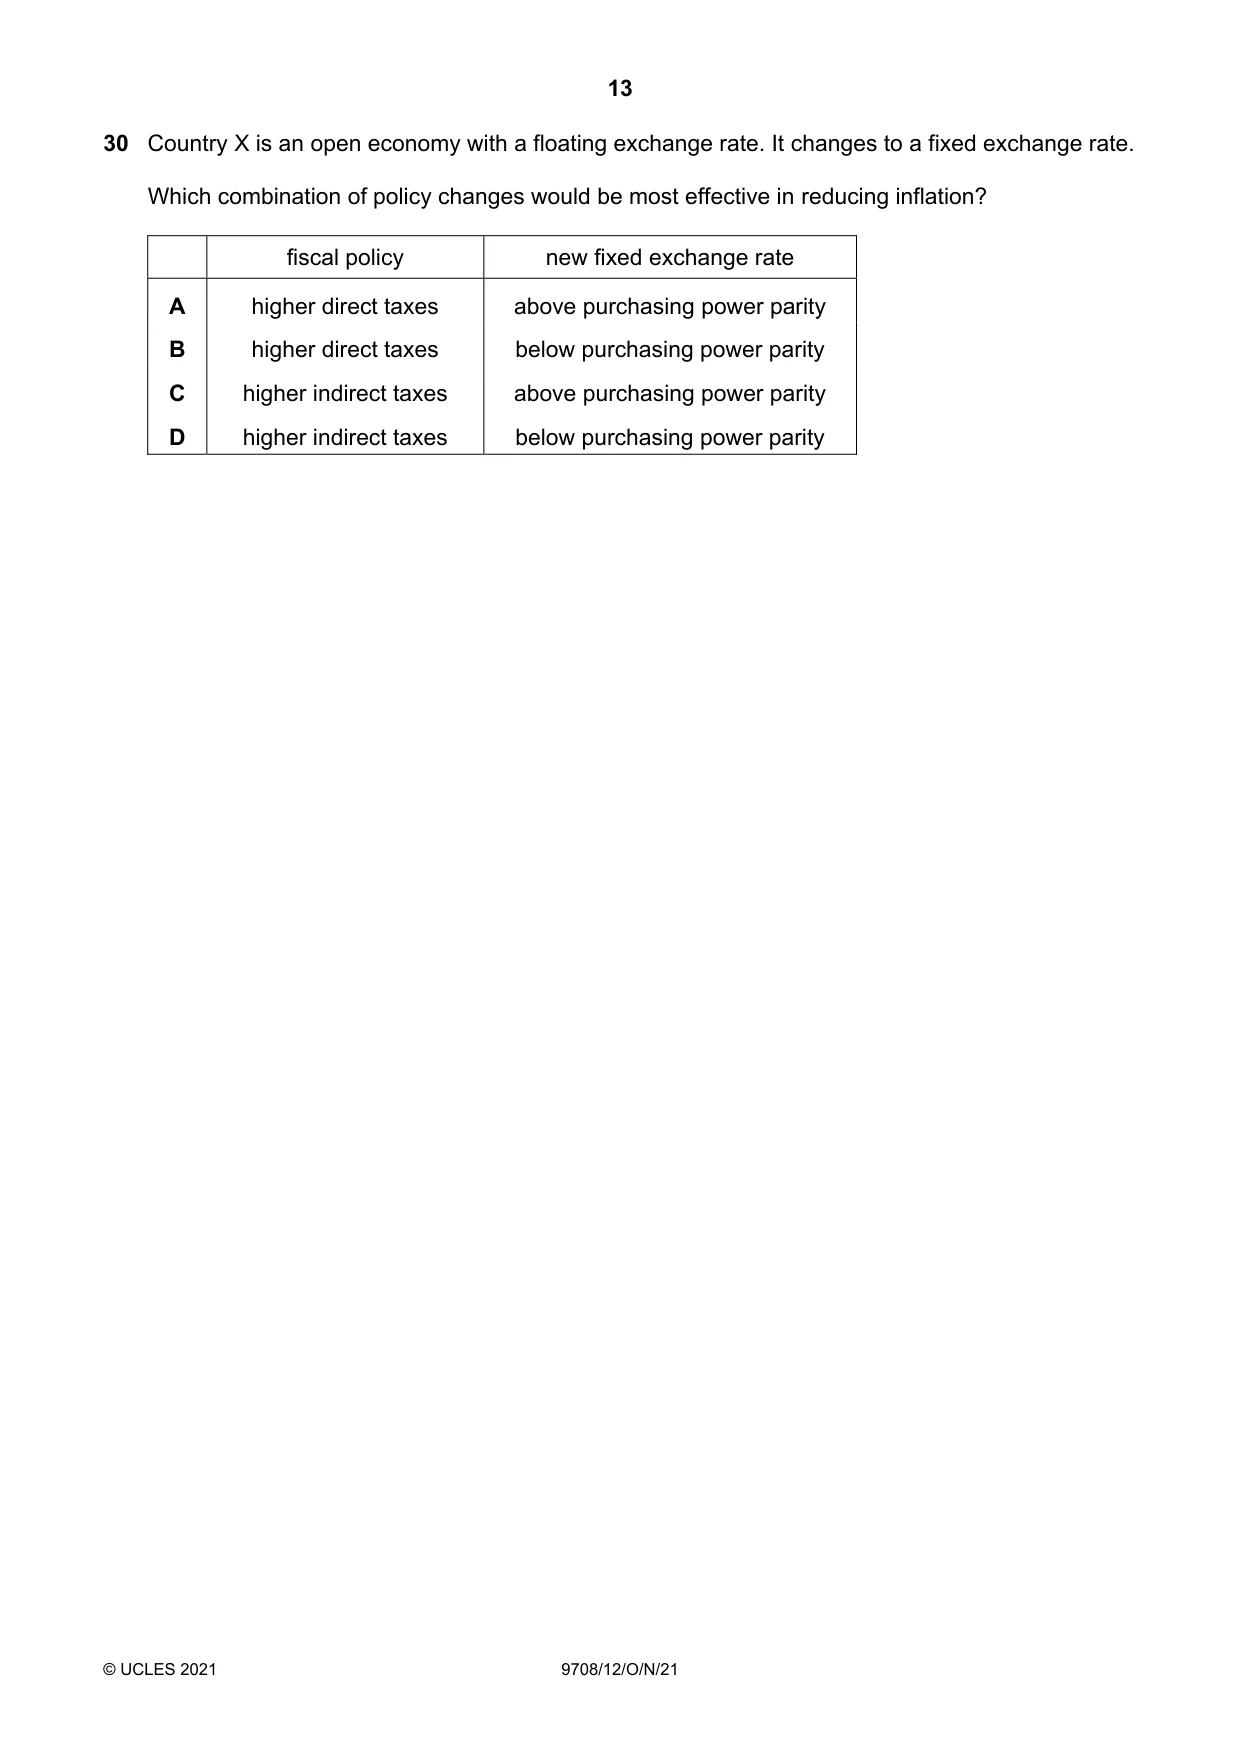
Q30 · Country X is an open economy with a floating exchange rate
30 Country X is an open economy with a floating exchange rate. It changes to a fixed exchange rate. Which combination of policy changes would be most effective in reducing inflation? fiscal policy new fixed exchange rate A higher direct taxes above purchasing power parity B higher direct taxes below purchasing power parity C higher indirect taxes above purchasing power parity D higher indirect taxes below purchasing power parity
Mark scheme: A
What was in this paper
The subtopics covered by these 30 questions, and how many questions each got. Open one in a new tab to see every Cambridge question on it.
3The reasons for international trade3Demand and supply curves2Fiscal policy2Price elasticity of supply2Price stability2Protectionism2Resource allocation in different economic systems2Addressing income and wealth inequality1Classification of goods and services1Consumer and producer surplus1Current account of the balance of payments1Factors of production1Monetary policy1Money and banking1Policies to correct imbalances in the current account of the balance of payments1Price elasticity, income elasticity and cross elasticity of demand1Production possibility curves1Reasons for government intervention in markets1The interaction of demand and supply1What you needed in this session
Cambridge’s own grade thresholds for 2021 Oct/Nov, Paper 1 · Variant 2. A higher threshold means an easier paper — the bar moves with how the cohort did.