Cambridge A Level Economics 9708 — 2025 Feb/March Paper 1 · Variant 2
9708/12/F/M/25 · 30 questions · 30 marks · ≈34 min
The question paper and its mark scheme, free to read here and free to download. This is Cambridge’s own paper, exactly as it was sat.
Question paper12 pages
Mark scheme3 pages
Answers below. Sit the paper first if you are practising.
Questions as text
Q1 · Which statement about a market economy is not correct?
1 Which statement about a market economy is not correct? A Competition is promoted among firms which can increase productive efficiency. B Immobility of the factors of production can lead to allocative inefficiency. C Price always reflects all the costs and all the benefits associated with production. D The entrepreneur is encouraged to innovate and take risks, motivated by profit.
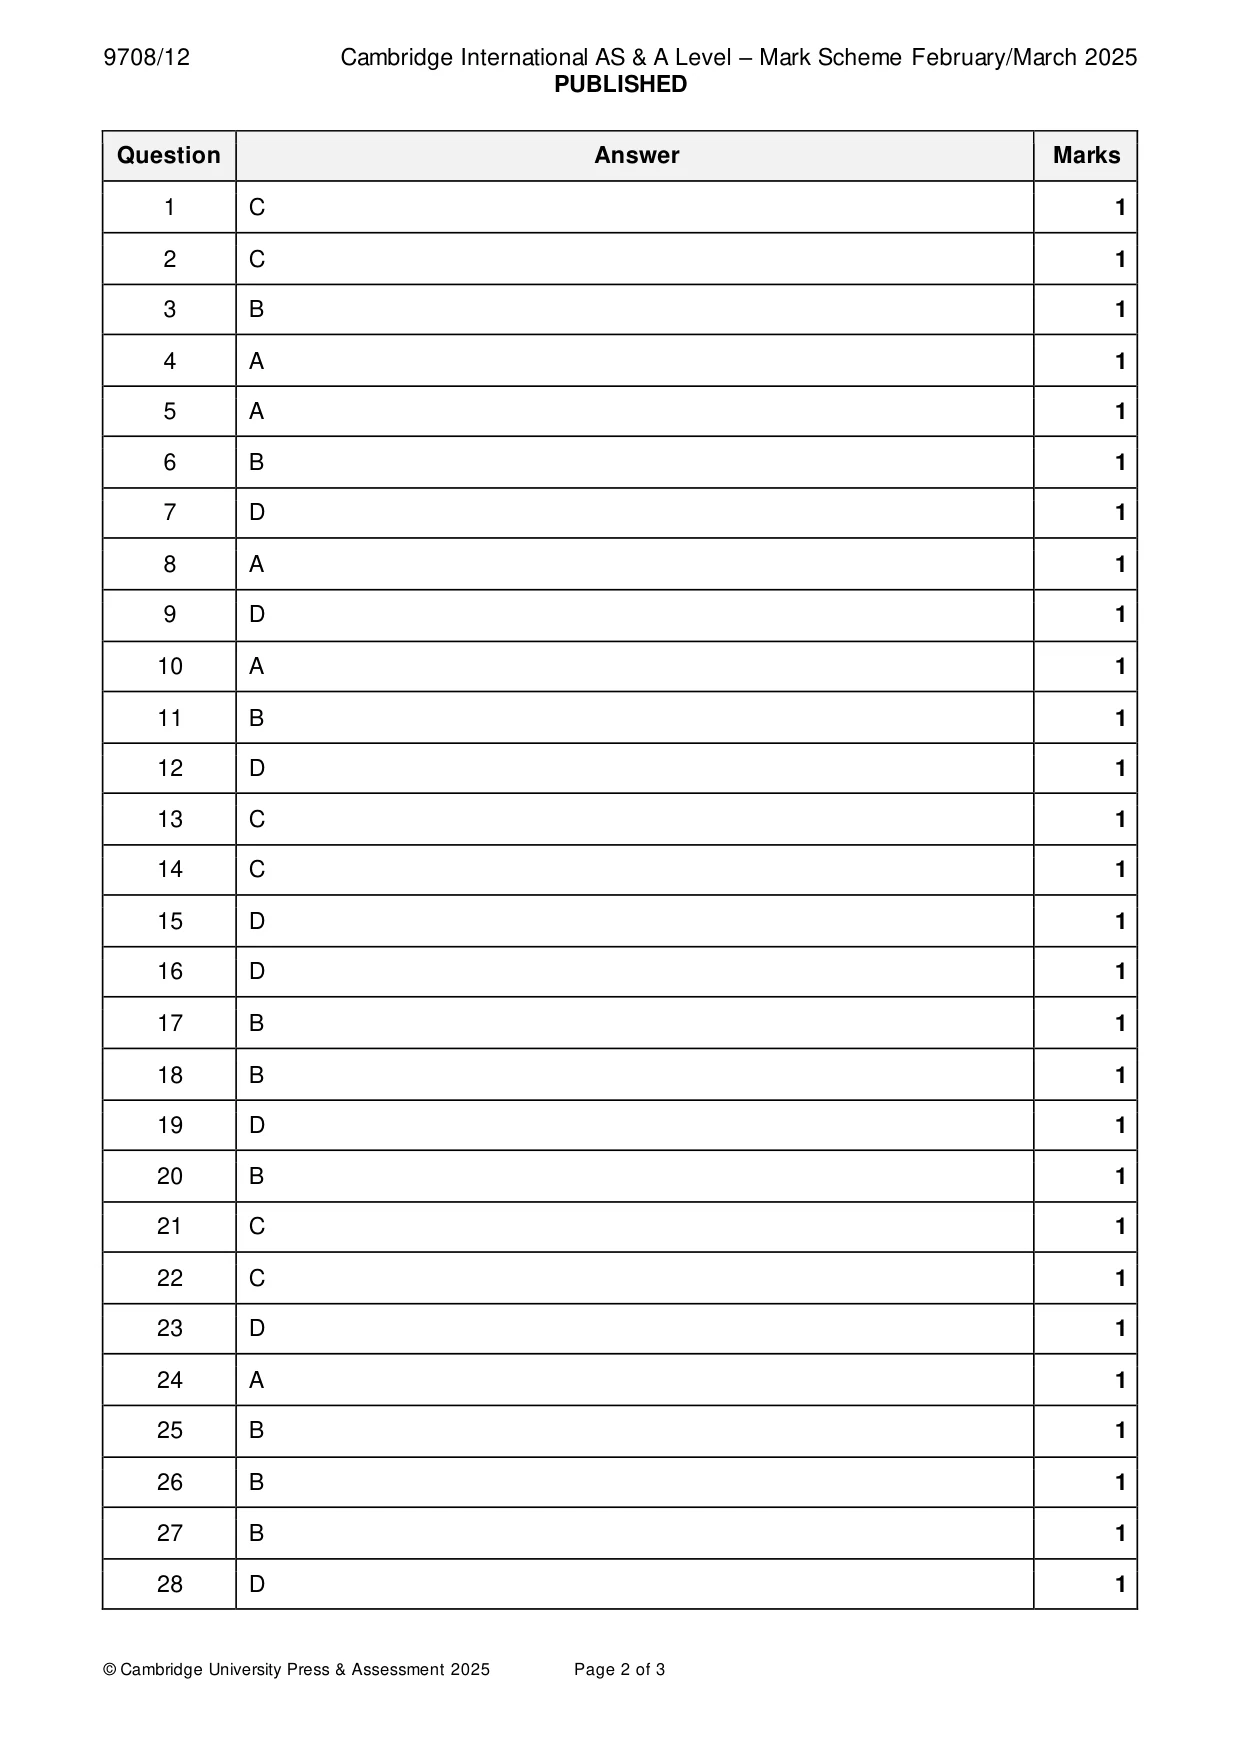
Mark scheme: C
More questions on Resource allocation in different economic systems
Q2 · To increase production, a firm in industry X needs to install capital equipment, while a…
2 To increase production, a firm in industry X needs to install capital equipment, while a firm in industry Y needs to research and introduce a new technology. What time periods are illustrated by these cases? industry X industry Y A short run long run B long run long run C long run very long run D very long run very long run
Mark scheme: C
More questions on Types of cost, revenue and profit, short-run and long-run production
Q3 · The production possibility curve shows the maximum potential output of apples and pears…
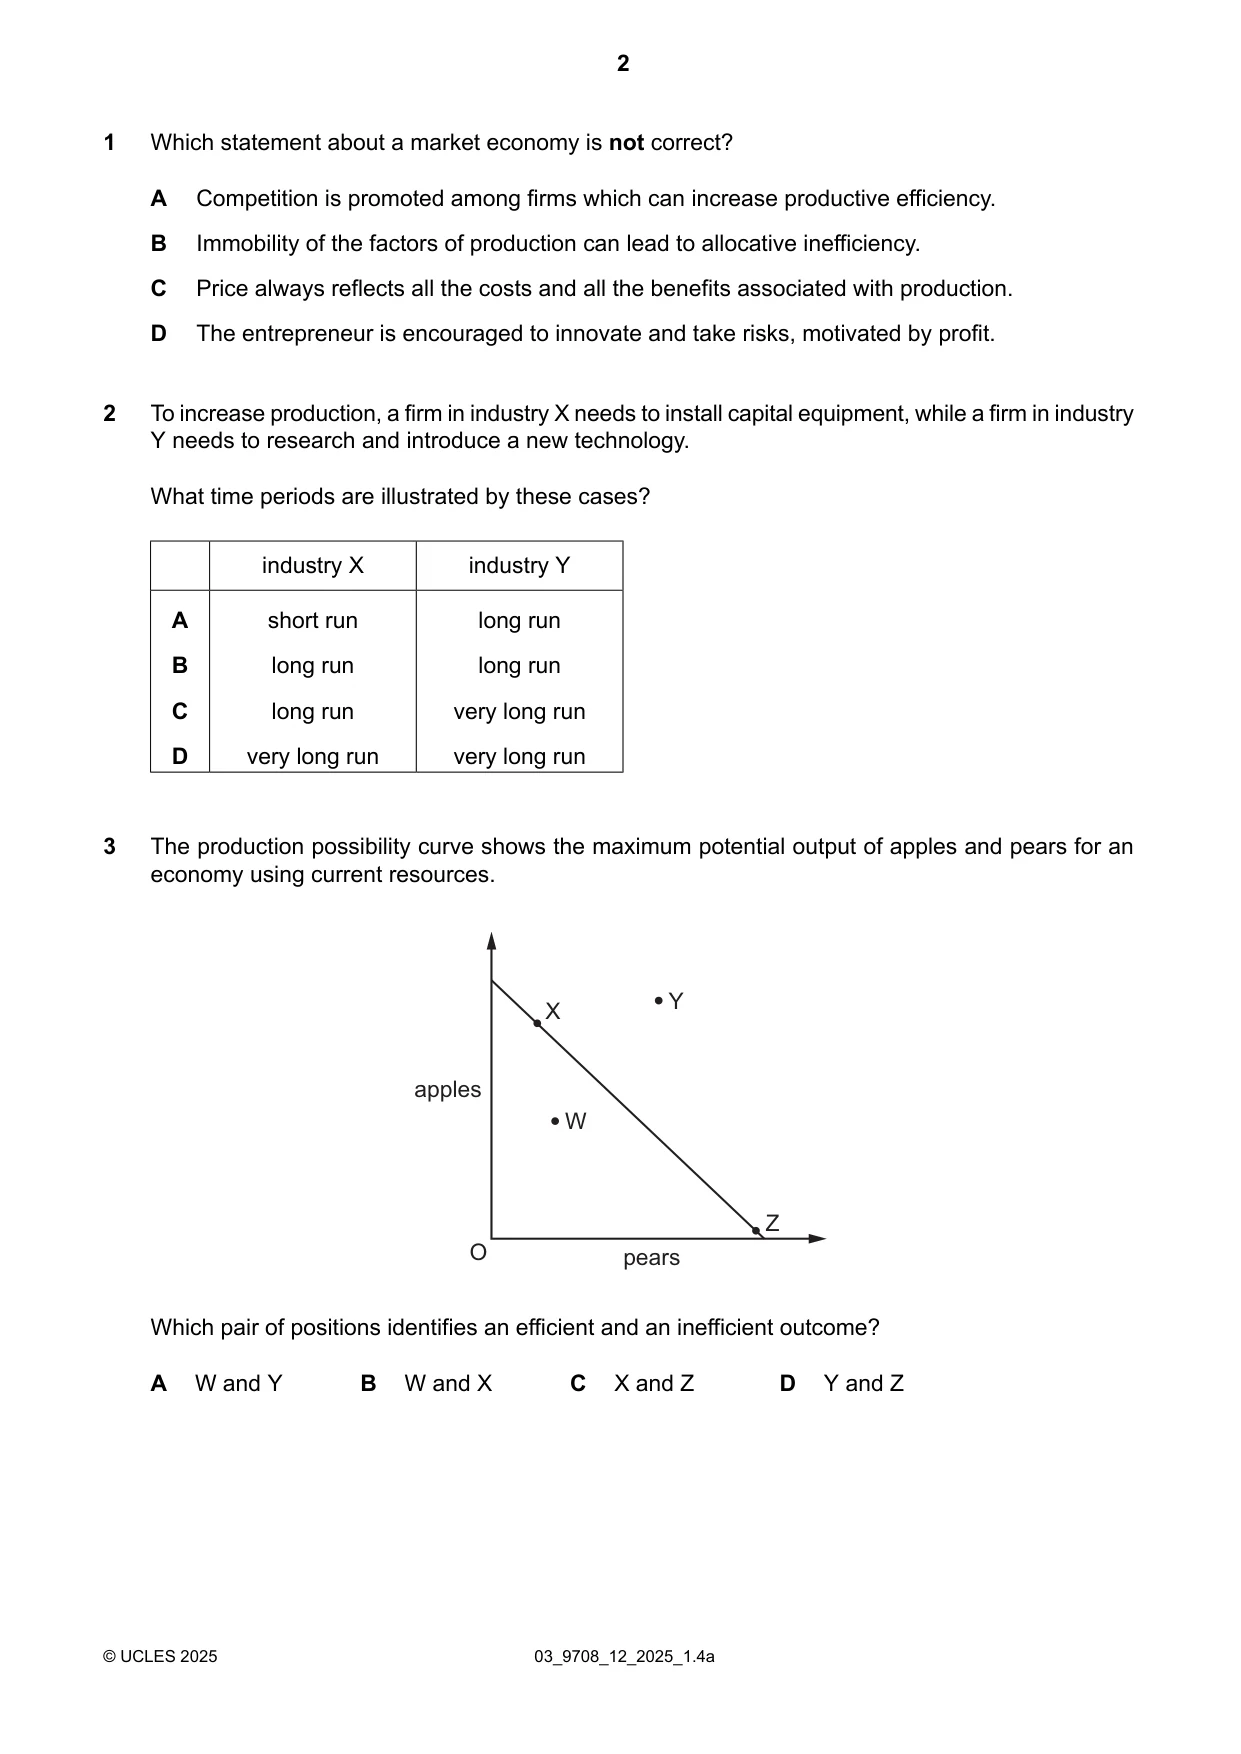
3 The production possibility curve shows the maximum potential output of apples and pears for an economy using current resources. Y X apples W Z O pears Which pair of positions identifies an efficient and an inefficient outcome? A W and Y B W and X C X and Z D Y and Z
Mark scheme: B
Q4 · The price of a good rises by 5% and the quantity of it demanded rises by 3%
4 The price of a good rises by 5% and the quantity of it demanded rises by 3%. At the same time, the incomes of consumers of the good rise by 4%. The law of demand appears not to be working in this case. What is the most likely explanation? A Other things did not remain equal. B The demand for the good was price inelastic. C The real price of the good fell. D The time period was the very short run.
Mark scheme: A
Q5 · When is division of labour likely to be most effective?
5 When is division of labour likely to be most effective? A in a large market with stable demand B in a market where consumers prefer a handmade product over a product made using machines C in a market where consumers require a variety of goods D in a small market where consumers require a custom-made product
Mark scheme: A
Q6 · What will influence the value of the price elasticity of supply of a good?
6 What will influence the value of the price elasticity of supply of a good? A the level of producer surplus B the time period under consideration C the total income spent on the good D whether the good is a necessity
Mark scheme: B
Q7 · The diagram represents the market for a good
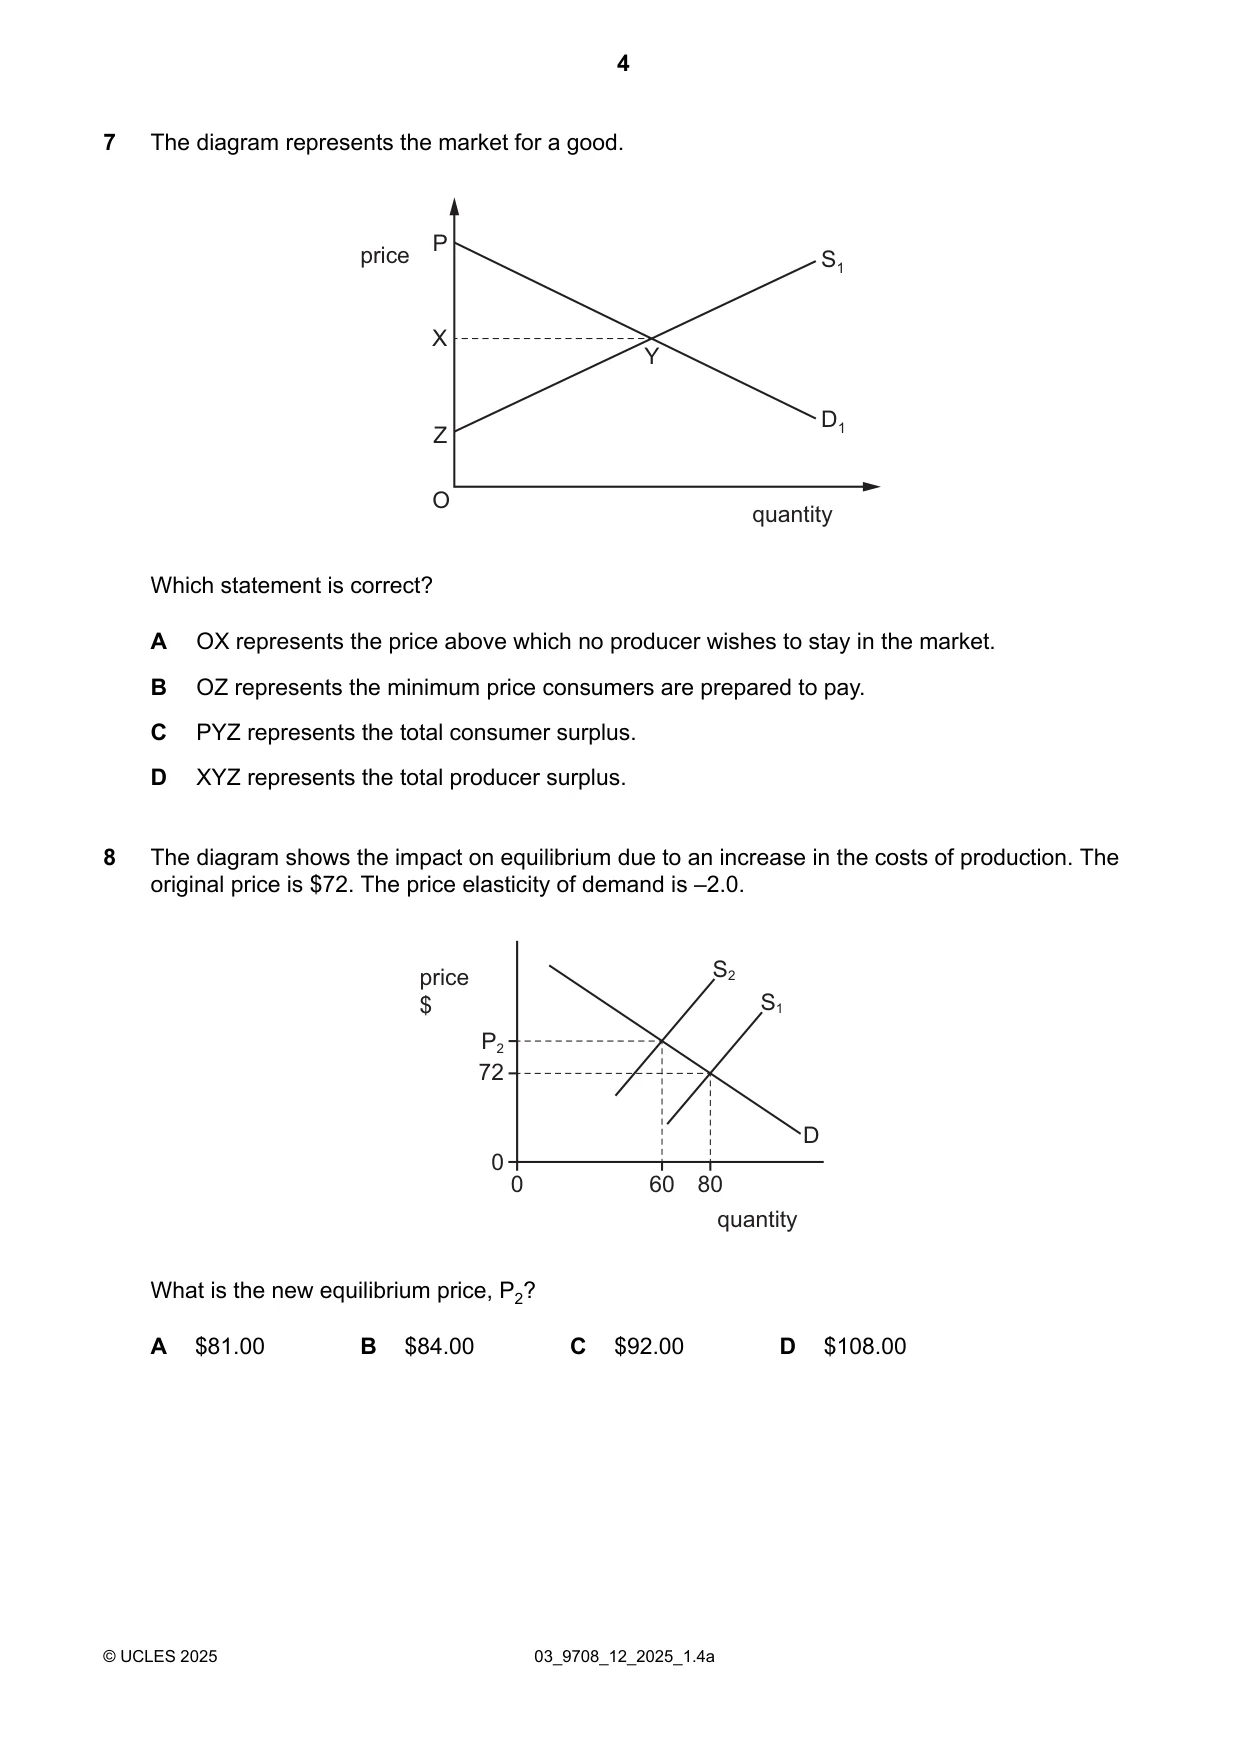
7 The diagram represents the market for a good. P price S1 X Y D1 Z O quantity Which statement is correct? A OX represents the price above which no producer wishes to stay in the market. B OZ represents the minimum price consumers are prepared to pay. C PYZ represents the total consumer surplus. D XYZ represents the total producer surplus.
Mark scheme: D
Q8 · The diagram shows the impact on equilibrium due to an increase in the costs of production
8 The diagram shows the impact on equilibrium due to an increase in the costs of production. The original price is $72. The price elasticity of demand is –2.0. price S2 $ S1 P2 72 D 0 0 60 80 quantity What is the new equilibrium price, P2? A $81.00 B $84.00 C $92.00 D $108.00
Mark scheme: A
Q9 · What is likely to have a greater effect on an individual demand curve than on a market…
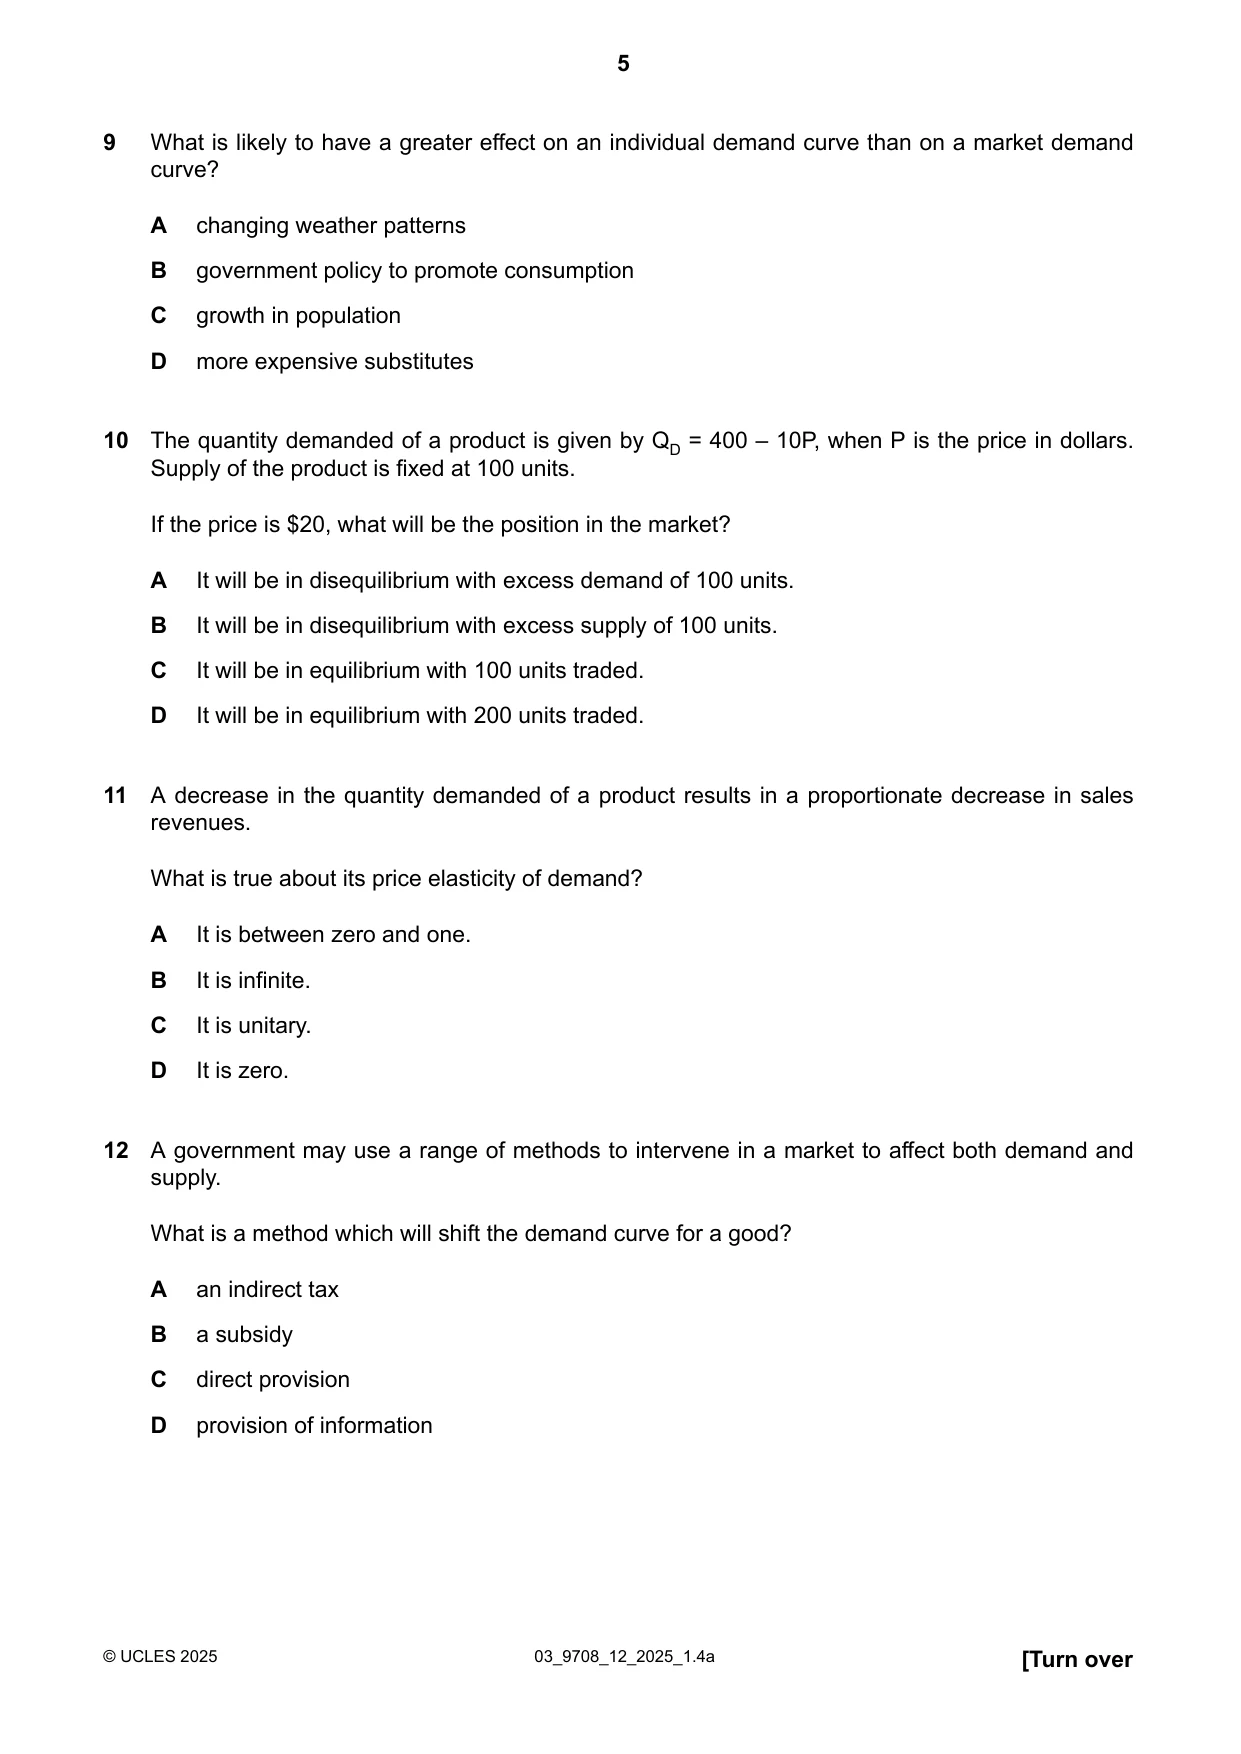
9 What is likely to have a greater effect on an individual demand curve than on a market demand curve? A changing weather patterns B government policy to promote consumption C growth in population D more expensive substitutes
Mark scheme: D
Q10 · The quantity demanded of a product is given by QD = 400 – 10P, when P is the price in…
10 The quantity demanded of a product is given by QD = 400 – 10P, when P is the price in dollars. Supply of the product is fixed at 100 units. If the price is $20, what will be the position in the market? A It will be in disequilibrium with excess demand of 100 units. B It will be in disequilibrium with excess supply of 100 units. C It will be in equilibrium with 100 units traded. D It will be in equilibrium with 200 units traded.
Mark scheme: A
Q11 · A decrease in the quantity demanded of a product results in a proportionate decrease in…
11 A decrease in the quantity demanded of a product results in a proportionate decrease in sales revenues. What is true about its price elasticity of demand? A It is between zero and one. B It is infinite. C It is unitary. D It is zero.
Mark scheme: B
More questions on Price elasticity, income elasticity and cross elasticity of demand
Q12 · A government may use a range of methods to intervene in a market to affect both demand…
12 A government may use a range of methods to intervene in a market to affect both demand and supply. What is a method which will shift the demand curve for a good? A an indirect tax B a subsidy C direct provision D provision of information
Mark scheme: D
More questions on Methods and effects of government intervention in markets
Q13 · To help achieve price stability, the government in country F operates a buffer stock…
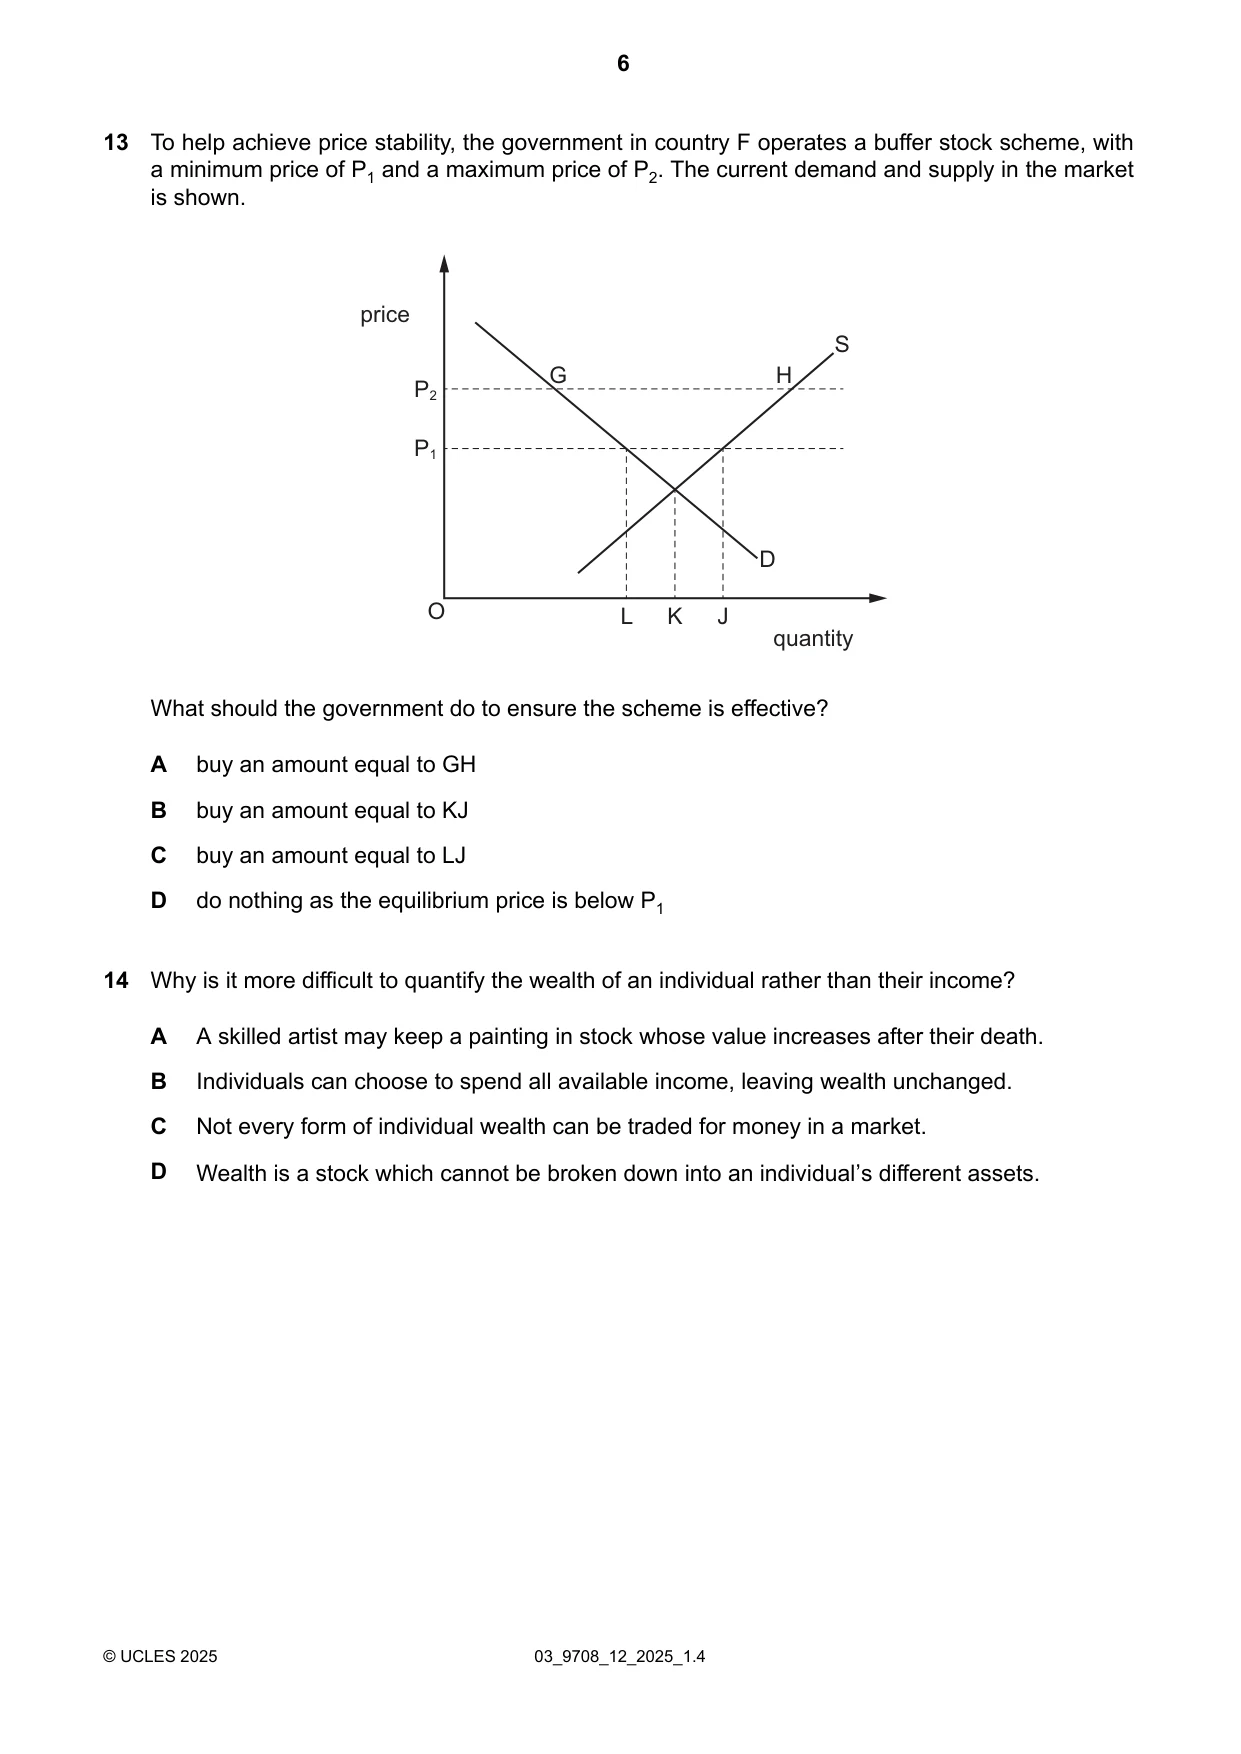
13 To help achieve price stability, the government in country F operates a buffer stock scheme, with a minimum price of P1 and a maximum price of P2. The current demand and supply in the market is shown. price S G H P2 P1 D O L K J quantity What should the government do to ensure the scheme is effective? A buy an amount equal to GH B buy an amount equal to KJ C buy an amount equal to LJ D do nothing as the equilibrium price is below P1
Mark scheme: C
More questions on Methods and effects of government intervention in markets
Q14 · Why is it more difficult to quantify the wealth of an individual rather than their income?
14 Why is it more difficult to quantify the wealth of an individual rather than their income? A A skilled artist may keep a painting in stock whose value increases after their death. B Individuals can choose to spend all available income, leaving wealth unchanged. C Not every form of individual wealth can be traded for money in a market. D Wealth is a stock which cannot be broken down into an individual’s different assets.
Mark scheme: C
Q15 · The table shows the Gini coefficient for income in three countries
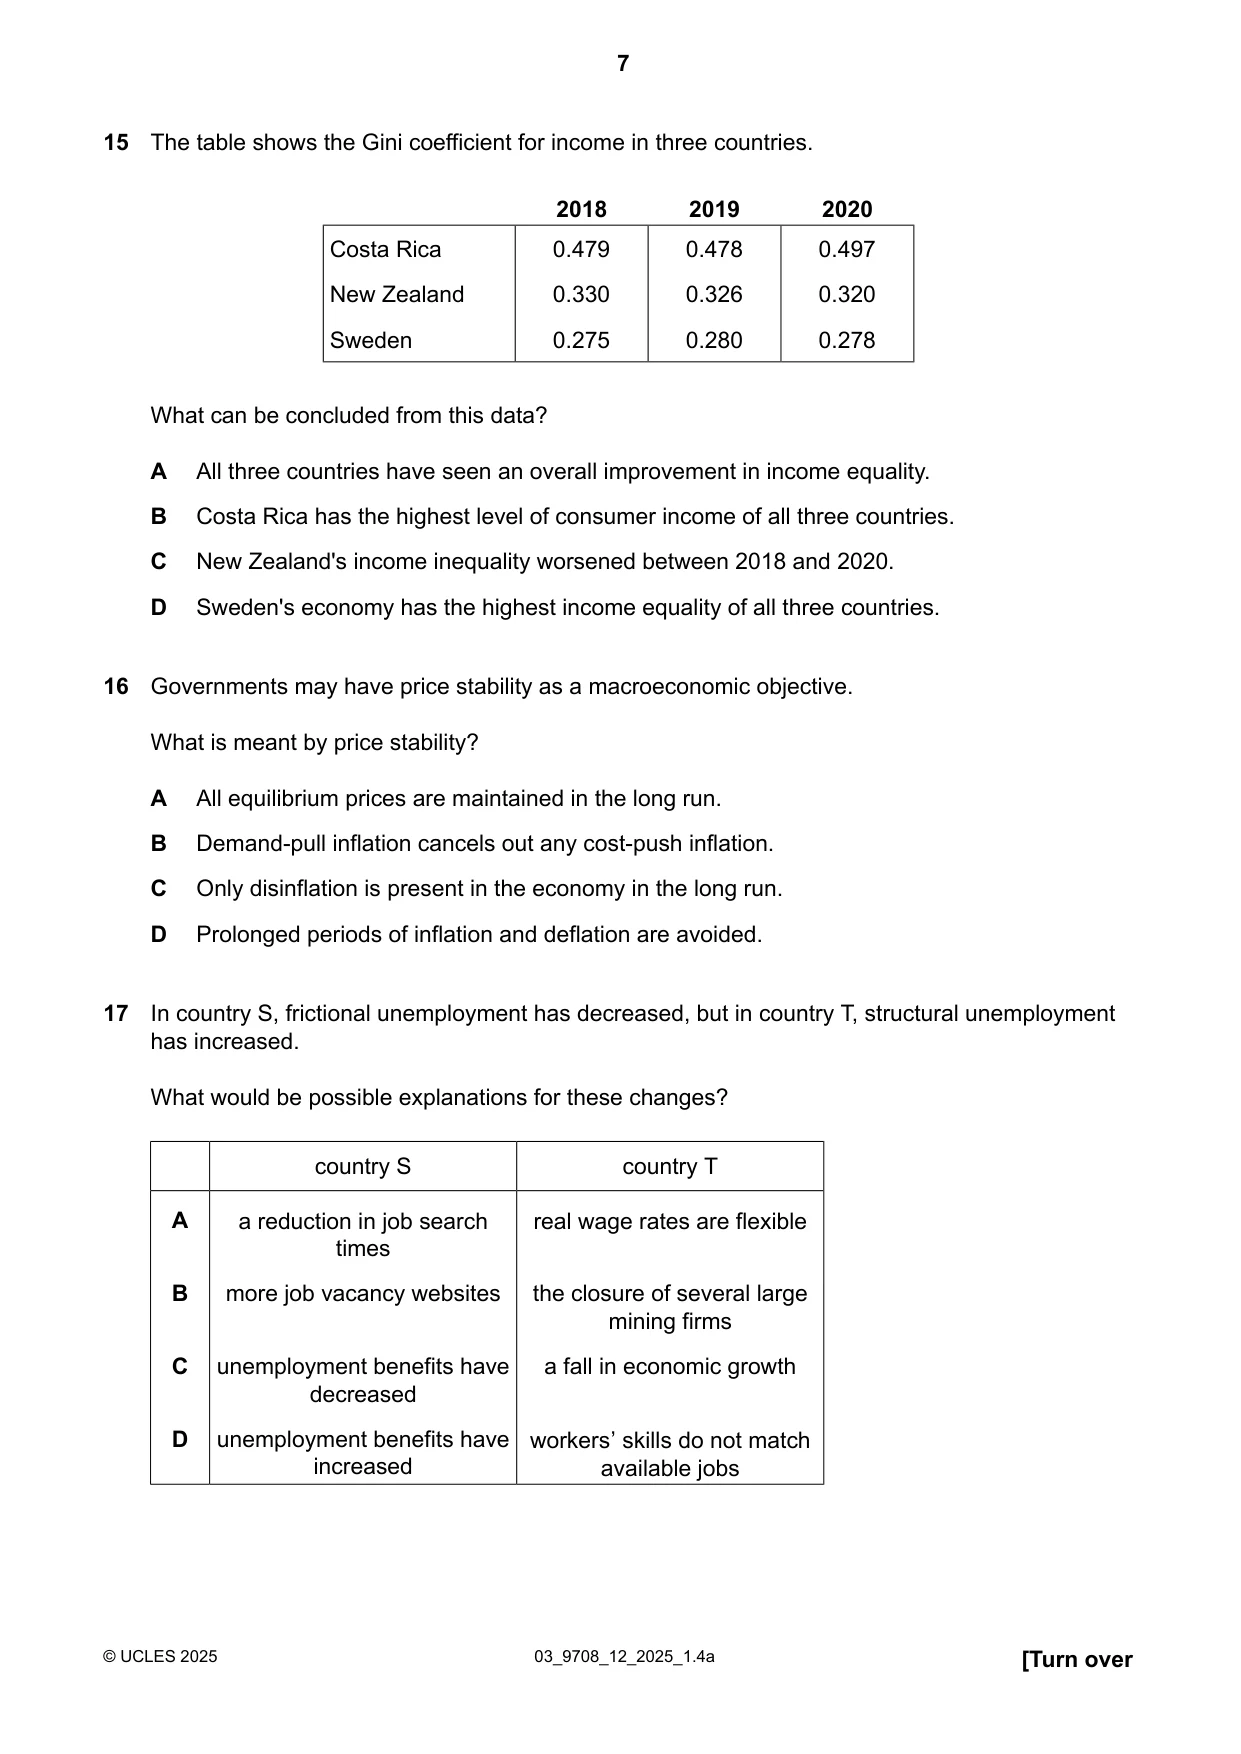
15 The table shows the Gini coefficient for income in three countries. 2018 2019 2020 Costa Rica 0.479 0.478 0.497 New Zealand 0.330 0.326 0.320 Sweden 0.275 0.280 0.278 What can be concluded from this data? A All three countries have seen an overall improvement in income equality. B Costa Rica has the highest level of consumer income of all three countries. C New Zealand's income inequality worsened between 2018 and 2020. D Sweden's economy has the highest income equality of all three countries.
Mark scheme: D
Q16 · Governments may have price stability as a macroeconomic objective
16 Governments may have price stability as a macroeconomic objective. What is meant by price stability? A All equilibrium prices are maintained in the long run. B Demand-pull inflation cancels out any cost-push inflation. C Only disinflation is present in the economy in the long run. D Prolonged periods of inflation and deflation are avoided.
Mark scheme: D
Q17 · In country S, frictional unemployment has decreased, but in country T, structural…
17 In country S, frictional unemployment has decreased, but in country T, structural unemployment has increased. What would be possible explanations for these changes? country S country T A a reduction in job search real wage rates are flexible times B more job vacancy websites the closure of several large mining firms C unemployment benefits have a fall in economic growth decreased D unemployment benefits have workers’ skills do not match increased available jobs
Mark scheme: B
Q18 · The diagram shows aggregate demand (AD) and long-run aggregate supply (LRAS) with X as…
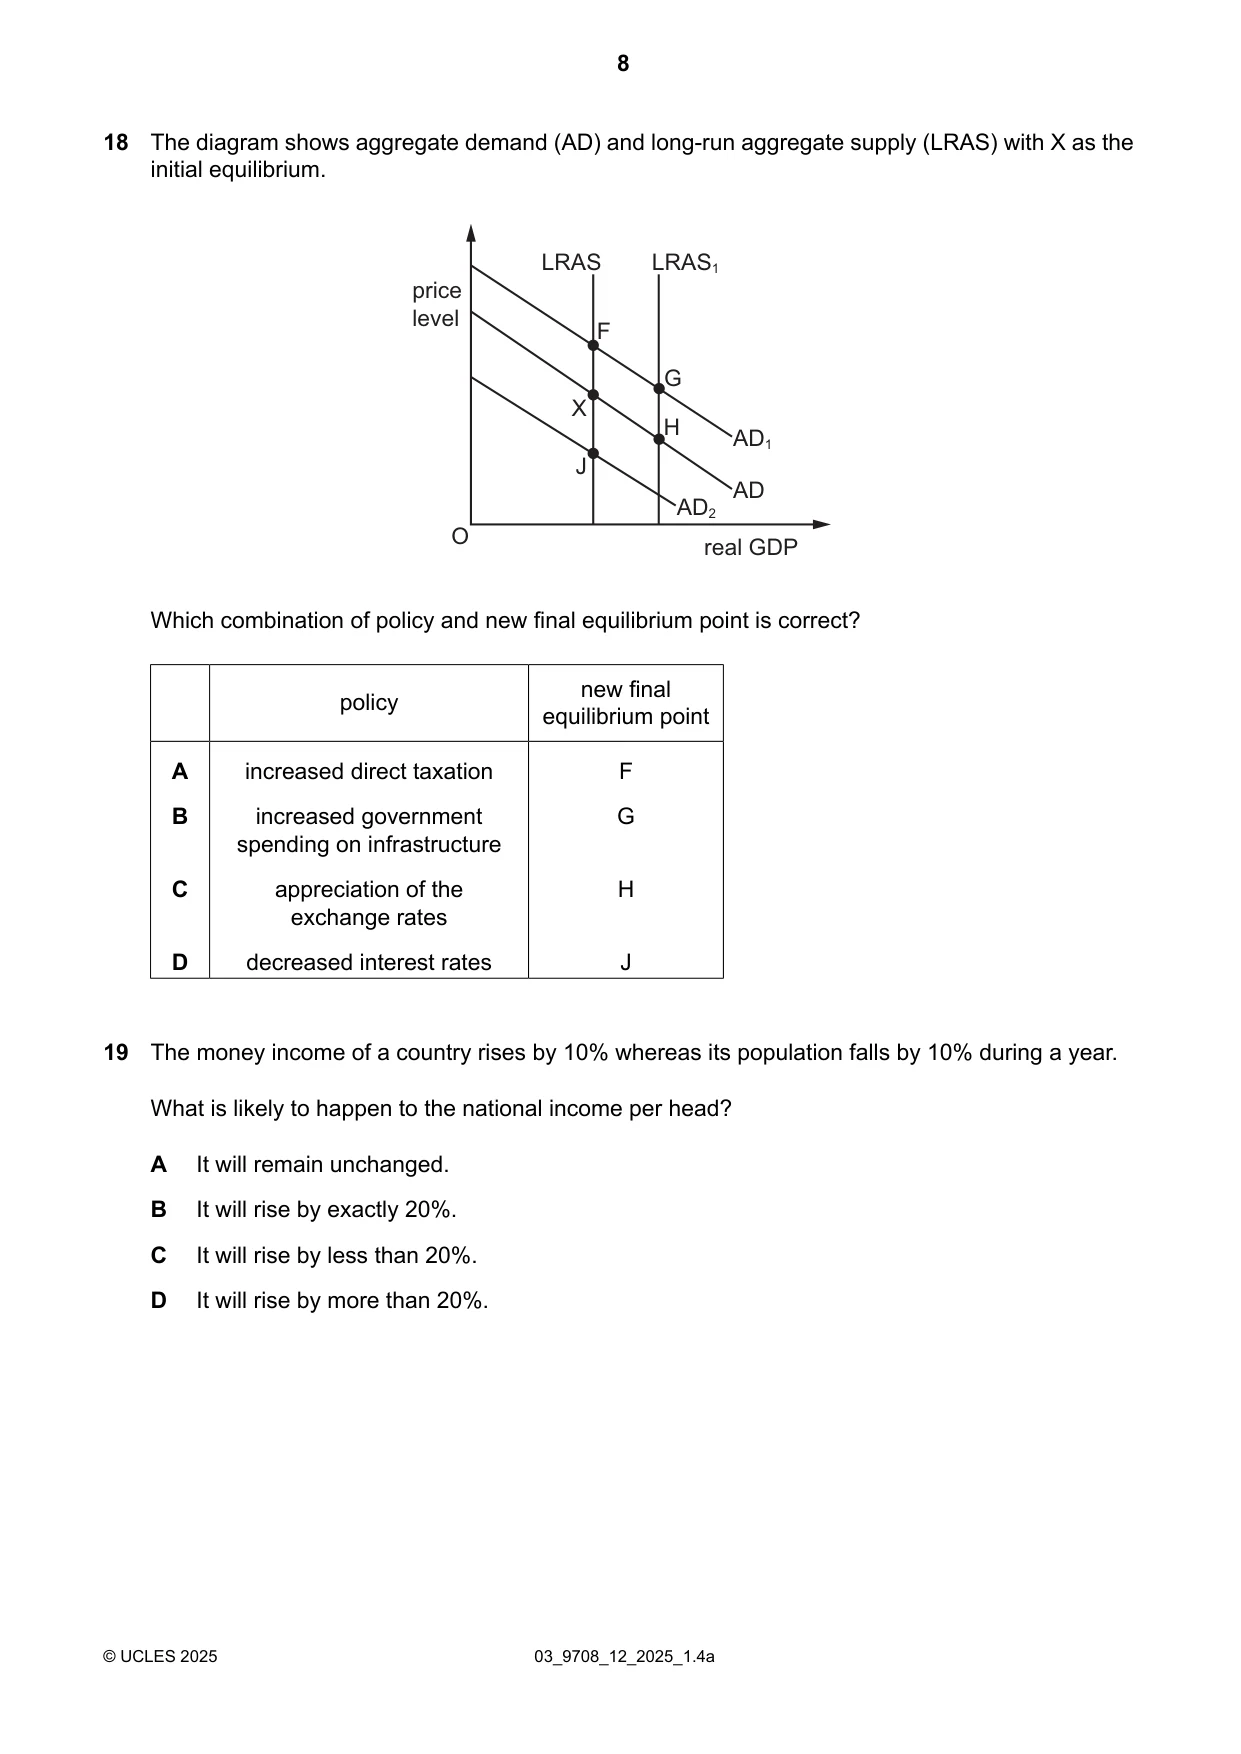
18 The diagram shows aggregate demand (AD) and long-run aggregate supply (LRAS) with X as the initial equilibrium. LRAS LRAS1 price level F G X H AD1 J AD AD2 O real GDP Which combination of policy and new final equilibrium point is correct? new final policy equilibrium point A increased direct taxation F B increased government G spending on infrastructure C appreciation of the H exchange rates D decreased interest rates J
Mark scheme: B
More questions on Aggregate Demand and Aggregate Supply analysis
Q19 · The money income of a country rises by 10% whereas its population falls by 10% during a…
19 The money income of a country rises by 10% whereas its population falls by 10% during a year. What is likely to happen to the national income per head? A It will remain unchanged. B It will rise by exactly 20%. C It will rise by less than 20%. D It will rise by more than 20%.
Mark scheme: D
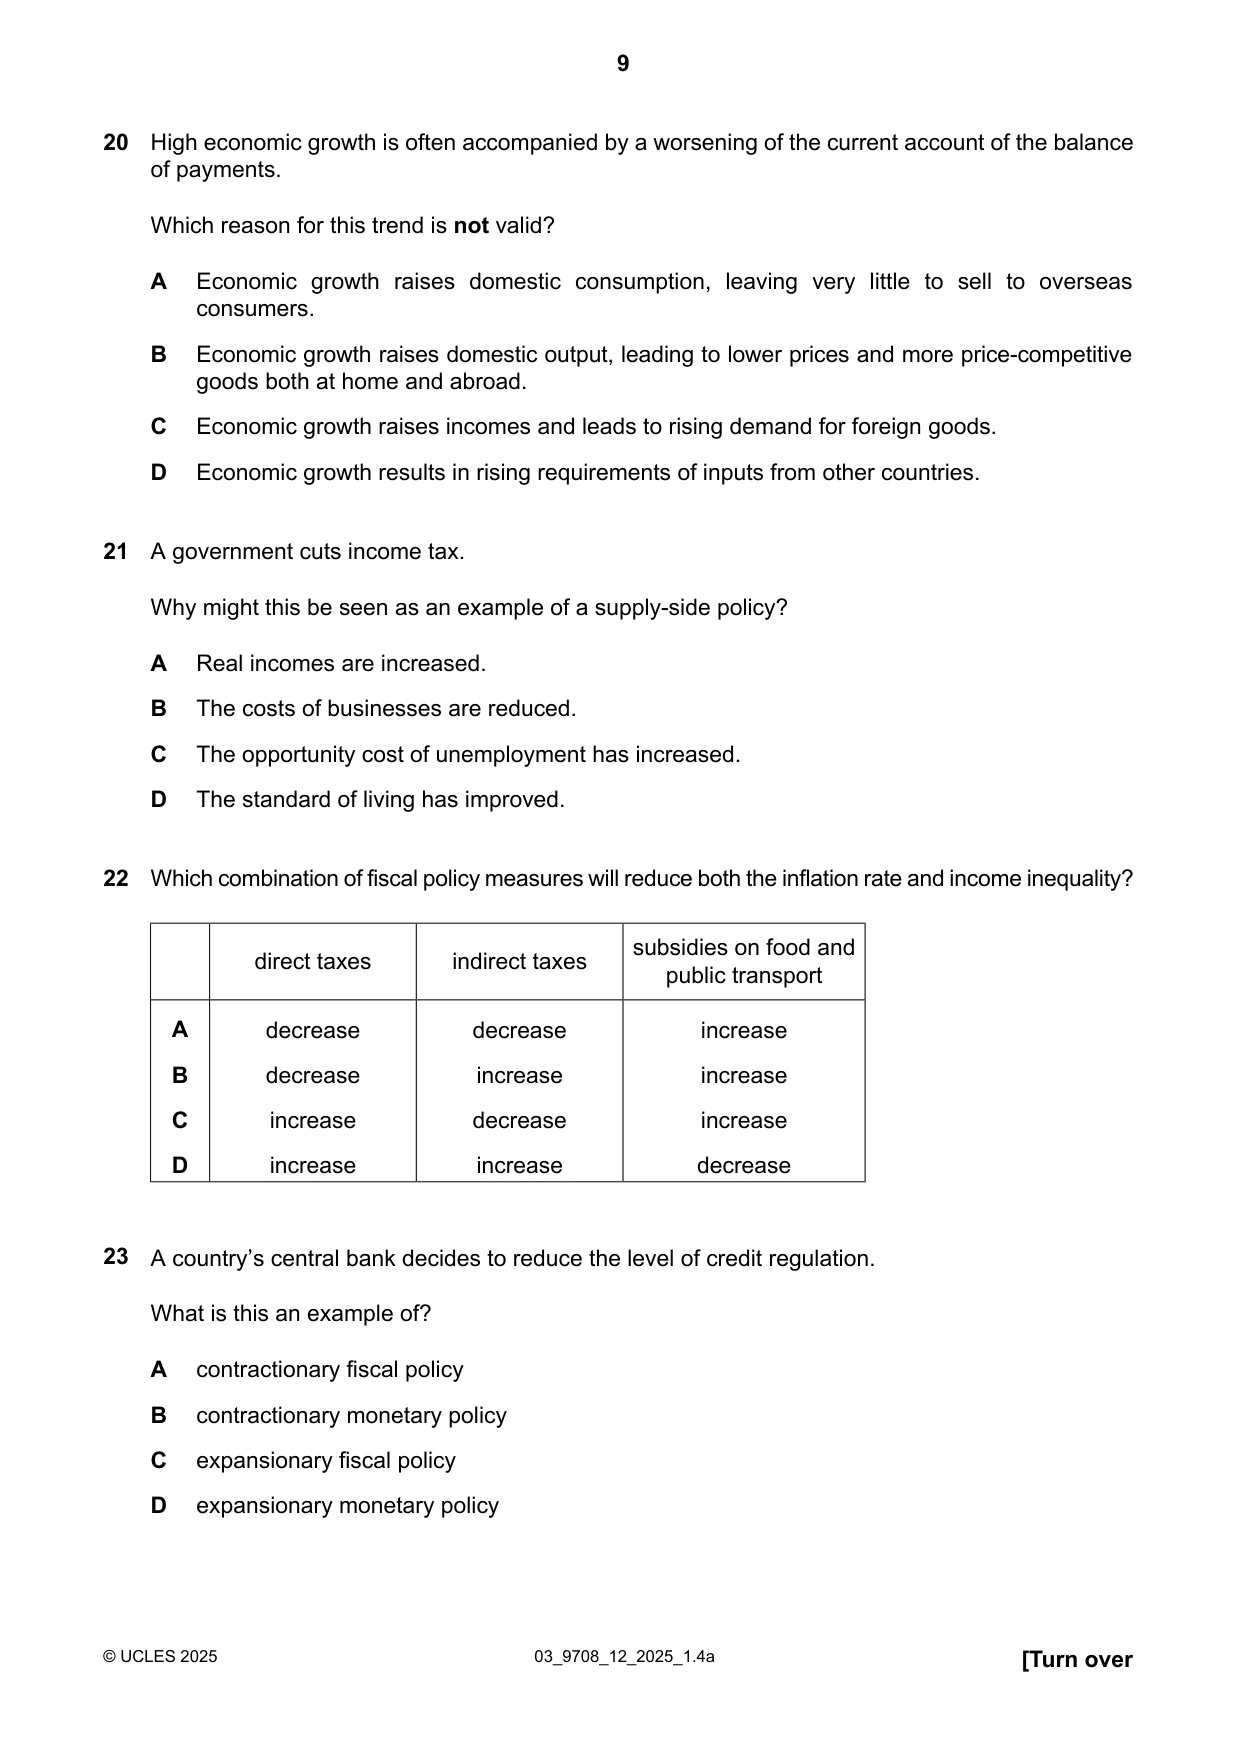
Q20 · High economic growth is often accompanied by a worsening of the current account of the…
20 High economic growth is often accompanied by a worsening of the current account of the balance of payments. Which reason for this trend is not valid? A Economic growth raises domestic consumption, leaving very little to sell to overseas consumers. B Economic growth raises domestic output, leading to lower prices and more price-competitive goods both at home and abroad. C Economic growth raises incomes and leads to rising demand for foreign goods. D Economic growth results in rising requirements of inputs from other countries.
Mark scheme: B
More questions on Current account of the balance of payments
Q21 · A government cuts income tax
21 A government cuts income tax. Why might this be seen as an example of a supply-side policy? A Real incomes are increased. B The costs of businesses are reduced. C The opportunity cost of unemployment has increased. D The standard of living has improved.
Mark scheme: C
Q22 · Which combination of fiscal policy measures will reduce both the inflation rate and…
22 Which combination of fiscal policy measures will reduce both the inflation rate and income inequality? subsidies on food and direct taxes indirect taxes public transport A decrease decrease increase B decrease increase increase C increase decrease increase D increase increase decrease
Mark scheme: C
Q23 · A country’s central bank decides to reduce the level of credit regulation
23 A country’s central bank decides to reduce the level of credit regulation. What is this an example of? A contractionary fiscal policy B contractionary monetary policy C expansionary fiscal policy D expansionary monetary policy
Mark scheme: D
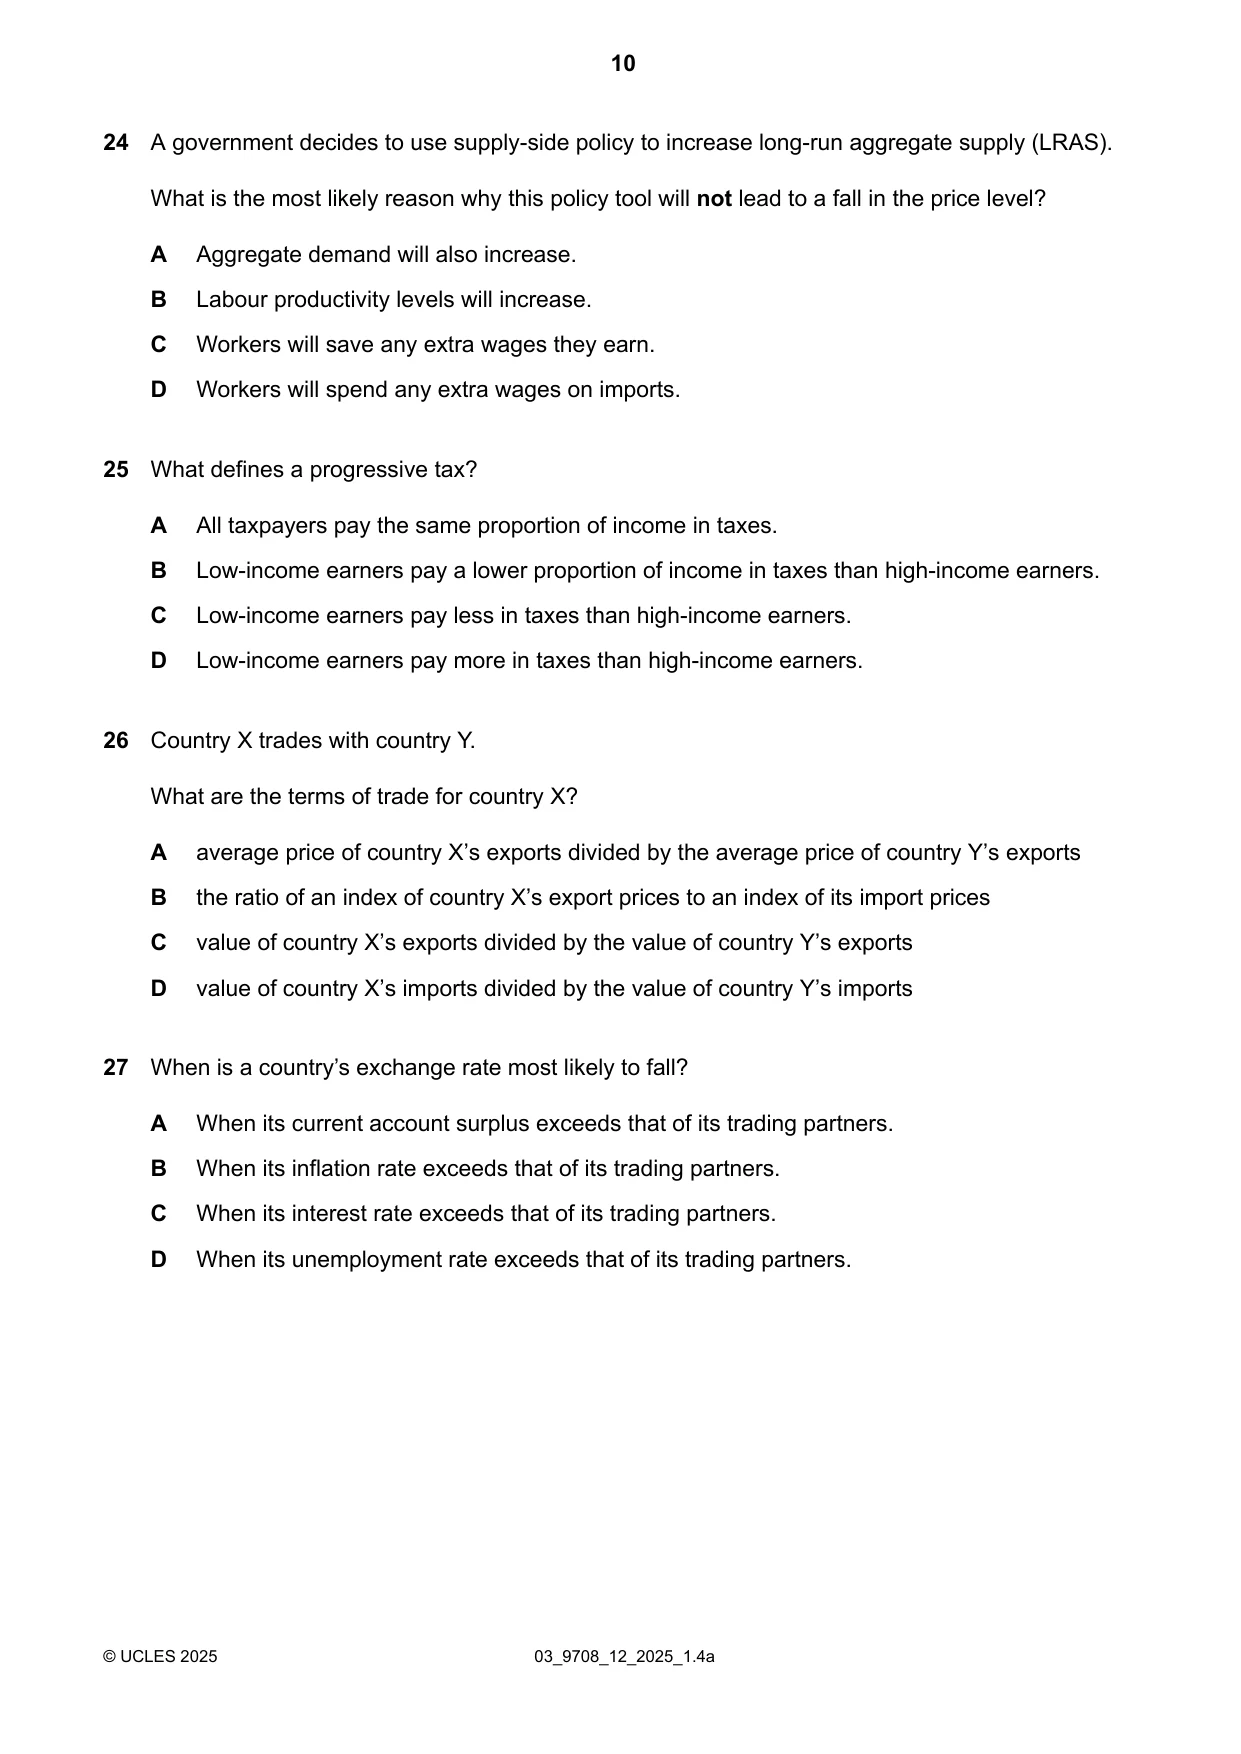
Q24 · A government decides to use supply-side policy to increase long-run aggregate supply…
24 A government decides to use supply-side policy to increase long-run aggregate supply (LRAS). What is the most likely reason why this policy tool will not lead to a fall in the price level? A Aggregate demand will also increase. B Labour productivity levels will increase. C Workers will save any extra wages they earn. D Workers will spend any extra wages on imports.
Mark scheme: A
Q25 · What defines a progressive tax?
25 What defines a progressive tax? A All taxpayers pay the same proportion of income in taxes. B Low-income earners pay a lower proportion of income in taxes than high-income earners. C Low-income earners pay less in taxes than high-income earners. D Low-income earners pay more in taxes than high-income earners.
Mark scheme: B
Q26 · Country X trades with country Y
26 Country X trades with country Y. What are the terms of trade for country X? A average price of country X’s exports divided by the average price of country Y’s exports B the ratio of an index of country X’s export prices to an index of its import prices C value of country X’s exports divided by the value of country Y’s exports D value of country X’s imports divided by the value of country Y’s imports
Mark scheme: B
Q27 · When is a country’s exchange rate most likely to fall?
27 When is a country’s exchange rate most likely to fall? A When its current account surplus exceeds that of its trading partners. B When its inflation rate exceeds that of its trading partners. C When its interest rate exceeds that of its trading partners. D When its unemployment rate exceeds that of its trading partners.
Mark scheme: B
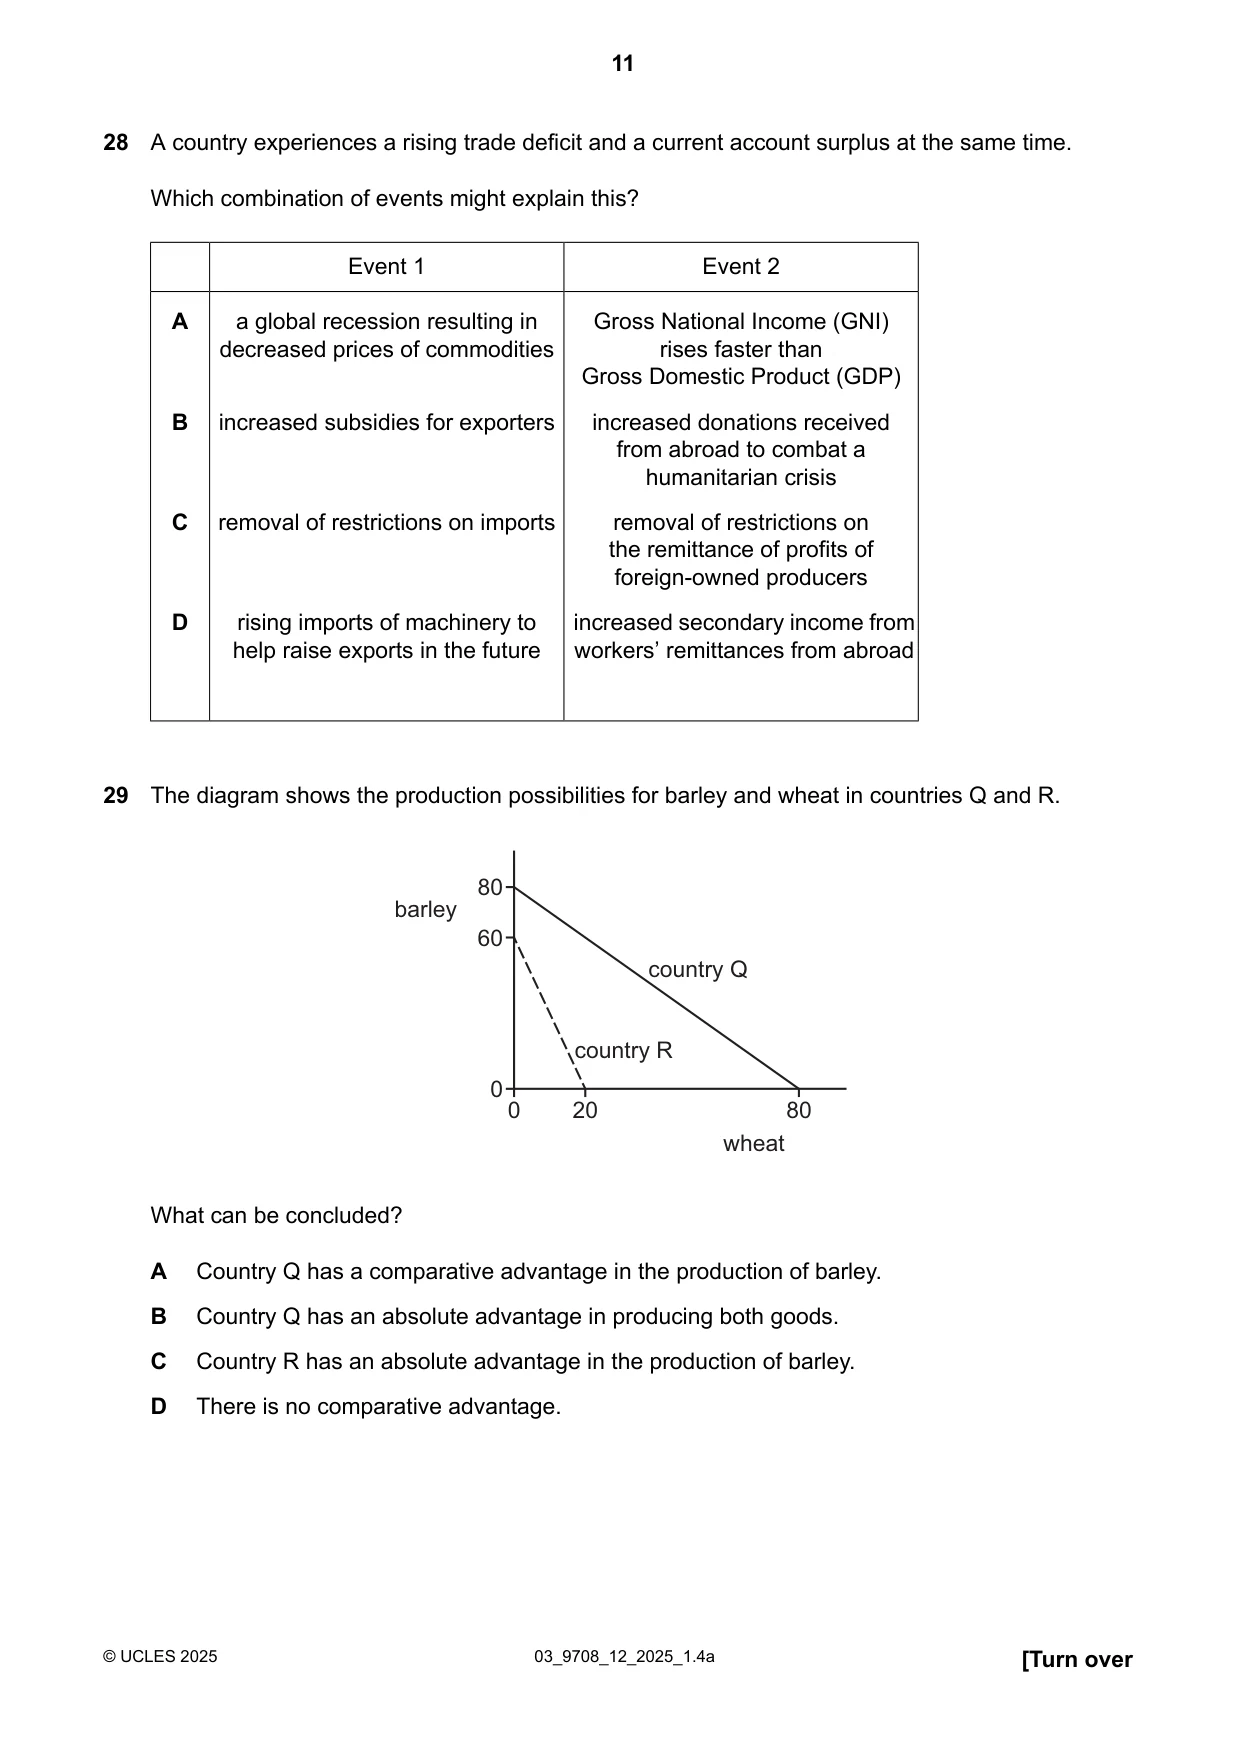
Q28 · A country experiences a rising trade deficit and a current account surplus at the same…
28 A country experiences a rising trade deficit and a current account surplus at the same time. Which combination of events might explain this? Event 1 Event 2 A a global recession resulting in Gross National Income (GNI) decreased prices of commodities rises faster than Gross Domestic Product (GDP) B increased subsidies for exporters increased donations received from abroad to combat a humanitarian crisis C removal of restrictions on imports removal of restrictions on the remittance of profits of foreign-owned producers D rising imports of machinery to increased secondary income from help raise exports in the future workers’ remittances from abroad
Mark scheme: D
More questions on Current account of the balance of payments
Q29 · The diagram shows the production possibilities for barley and wheat in countries Q and R
29 The diagram shows the production possibilities for barley and wheat in countries Q and R. 80 barley 60 country Q country R 0 0 20 80 wheat What can be concluded? A Country Q has a comparative advantage in the production of barley. B Country Q has an absolute advantage in producing both goods. C Country R has an absolute advantage in the production of barley. D There is no comparative advantage.
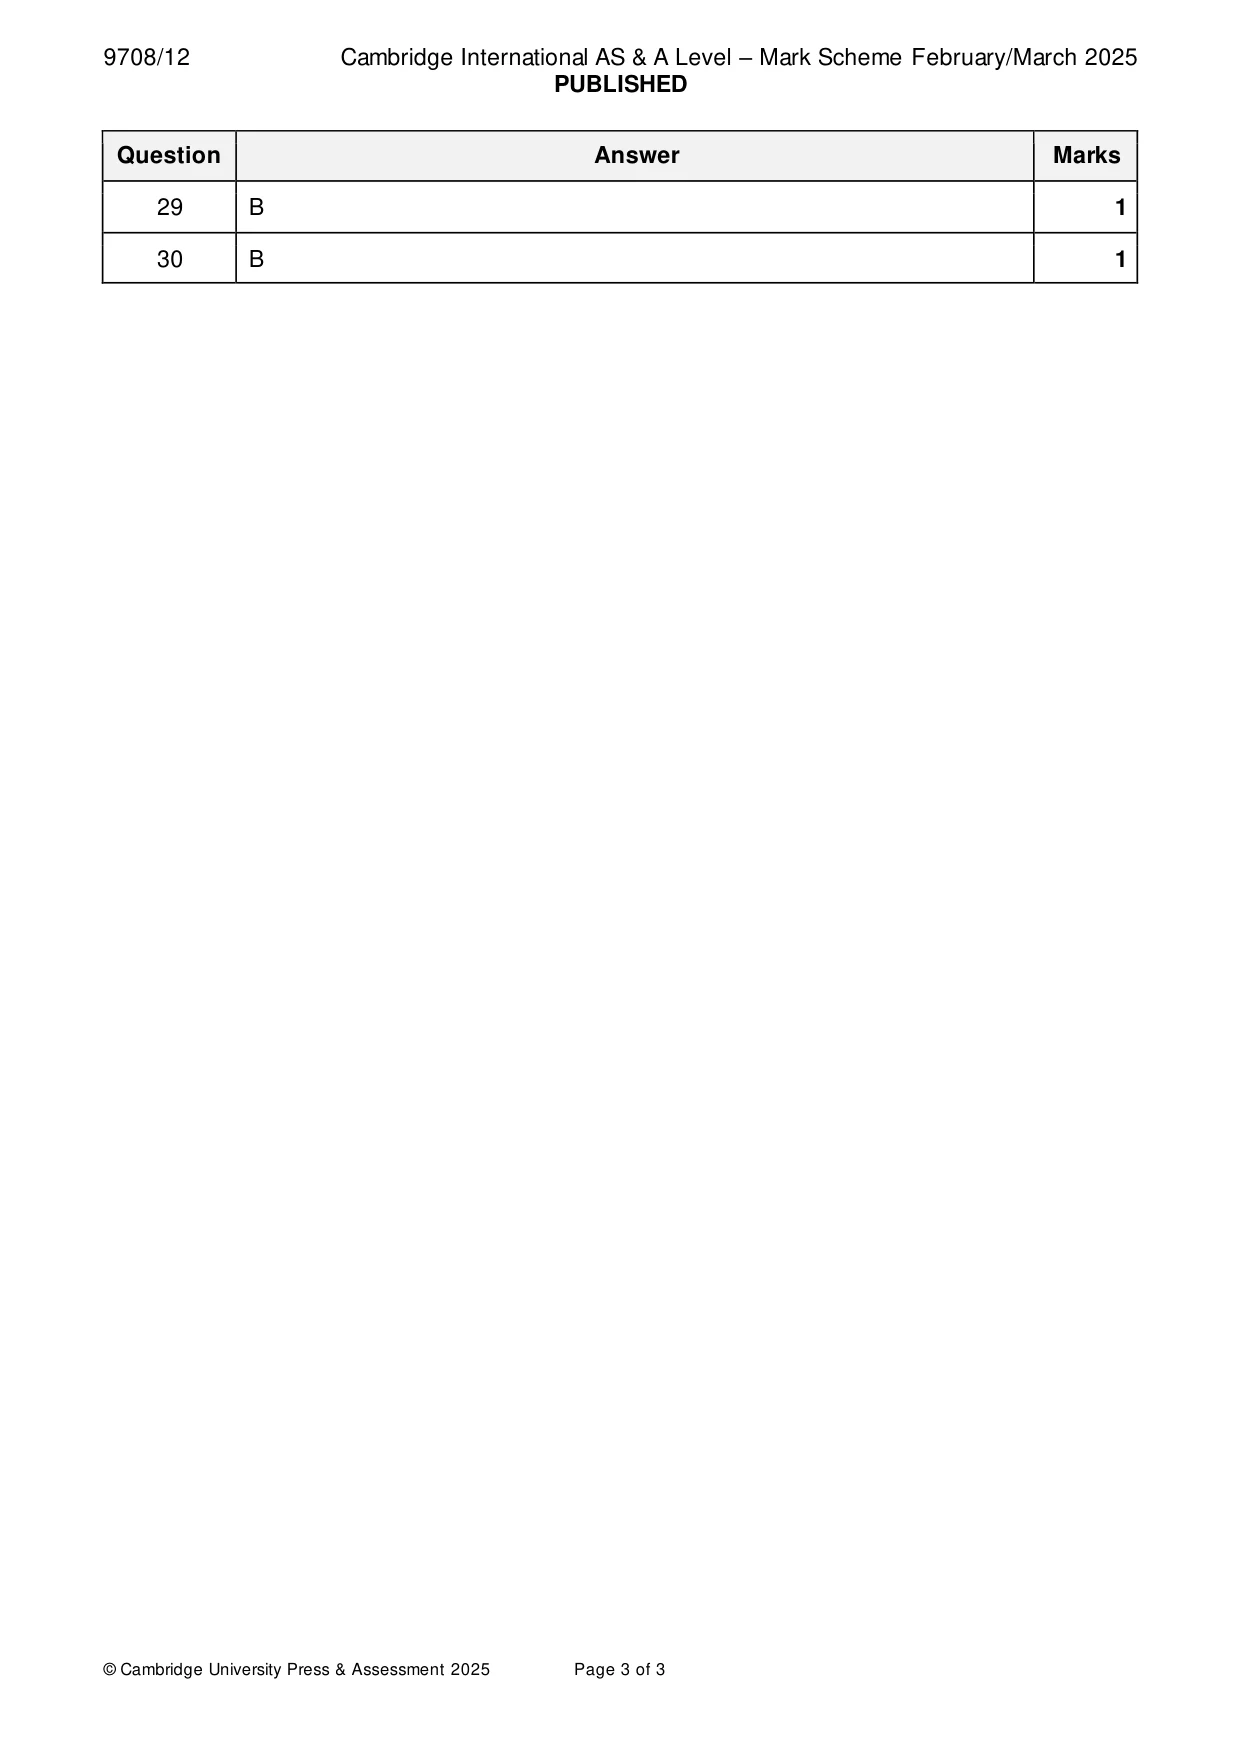
Mark scheme: B
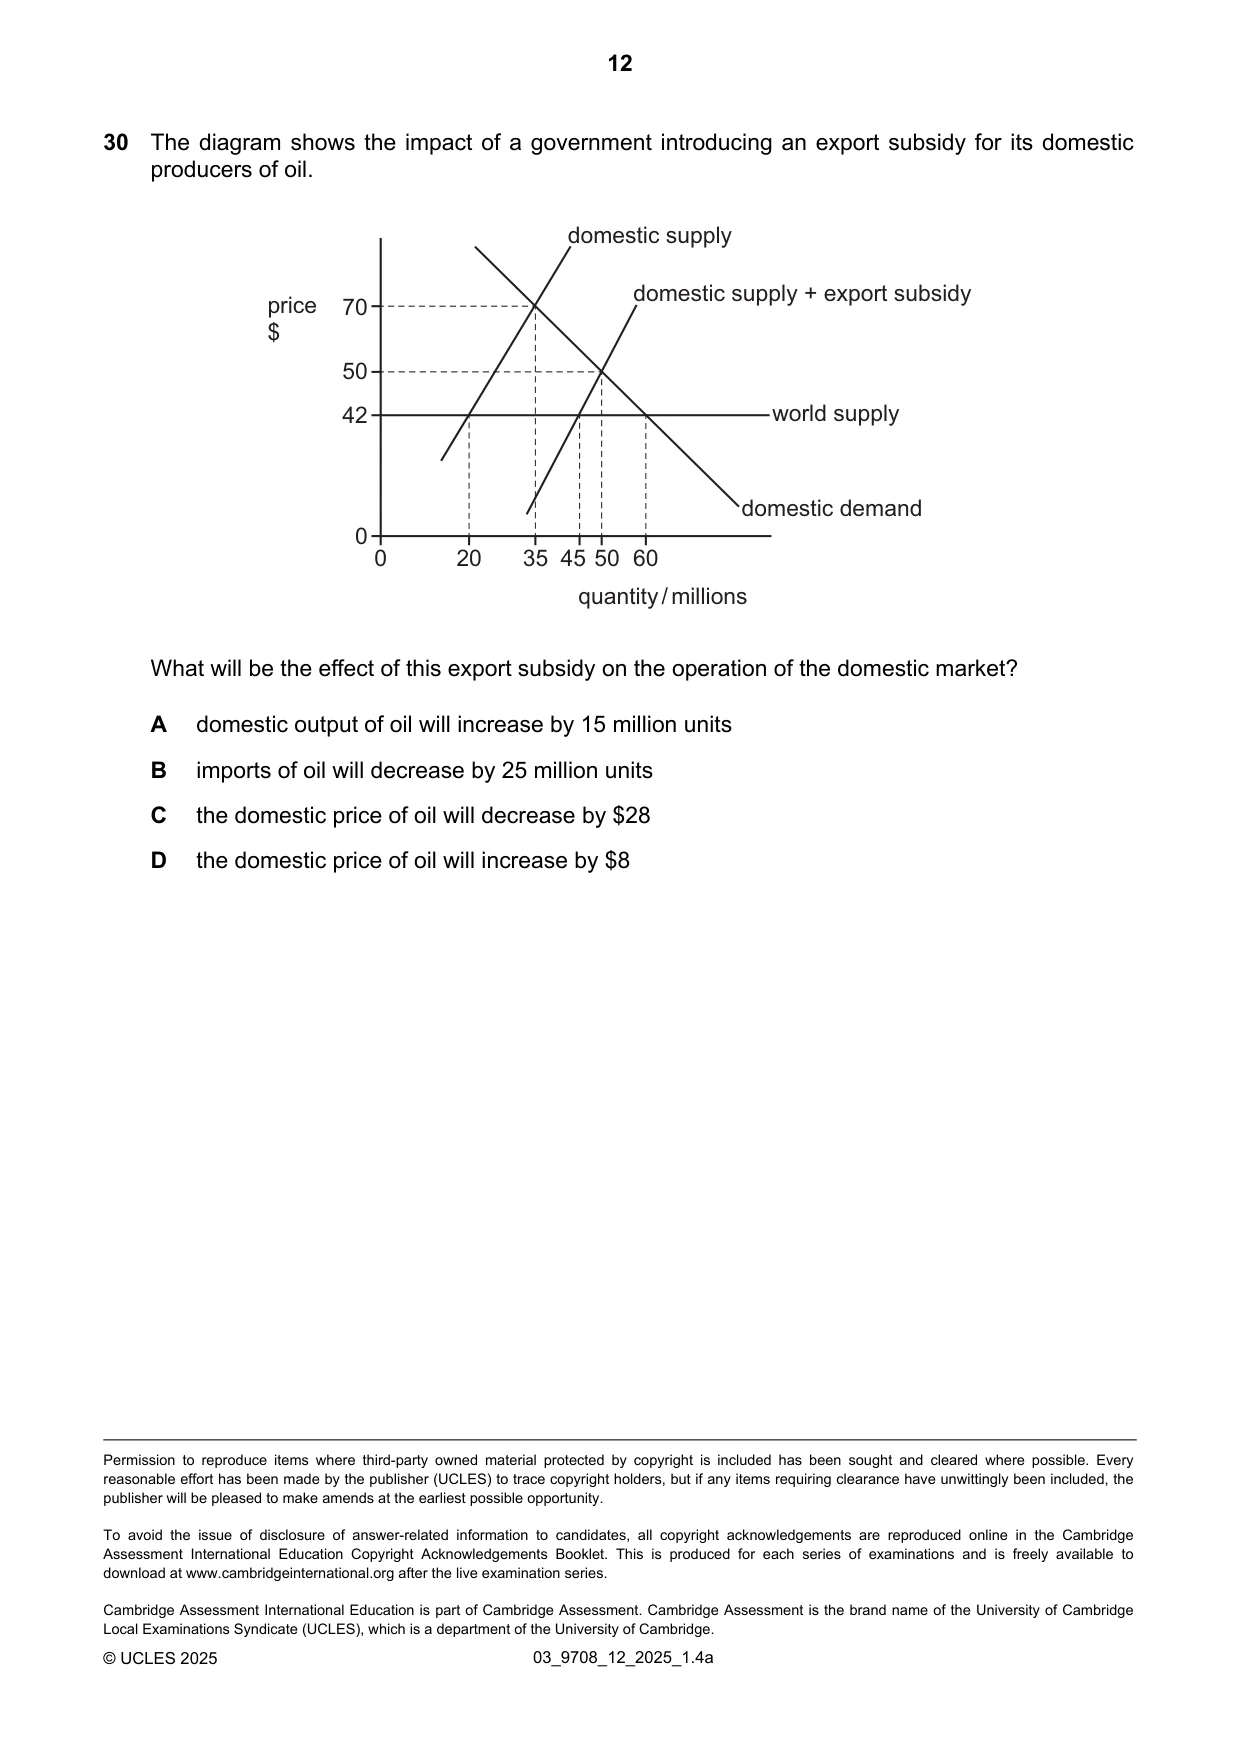
Q30 · The diagram shows the impact of a government introducing an export subsidy for its…
30 The diagram shows the impact of a government introducing an export subsidy for its domestic producers of oil. domestic supply domestic supply + export subsidy price 70 $ 50 42 world supply domestic demand 0 0 20 35 45 50 60 quantity / millions What will be the effect of this export subsidy on the operation of the domestic market? A domestic output of oil will increase by 15 million units B imports of oil will decrease by 25 million units C the domestic price of oil will decrease by $28 D the domestic price of oil will increase by $8
Mark scheme: B
What was in this paper
The subtopics covered by these 30 questions, and how many questions each got. Open one in a new tab to see every Cambridge question on it.
2Current account of the balance of payments2Fiscal policy2Methods and effects of government intervention in markets2Supply-side policy2The interaction of demand and supply2The reasons for international trade2Aggregate Demand and Aggregate Supply analysis1Consumer and producer surplus1Demand and supply curves1Economic methodology1Exchange rates1Factors of production1Monetary policy1National income statistics1Price elasticity of supply1Price elasticity, income elasticity and cross elasticity of demand1Price stability1Production possibility curves1Protectionism1Resource allocation in different economic systems1Types of cost, revenue and profit, short-run and long-run production1Unemployment1What you needed in this session
Cambridge’s own grade thresholds for 2025 Feb/March, Paper 1 · Variant 2. A higher threshold means an easier paper — the bar moves with how the cohort did.