Cambridge A Level Economics 9708 — 2023 Feb/March Paper 1 · Variant 2
9708/12/F/M/23 · 30 questions · 30 marks · ≈34 min
The question paper and its mark scheme, free to read here and free to download. This is Cambridge’s own paper, exactly as it was sat.
Question paper12 pages
Mark scheme3 pages
Answers below. Sit the paper first if you are practising.
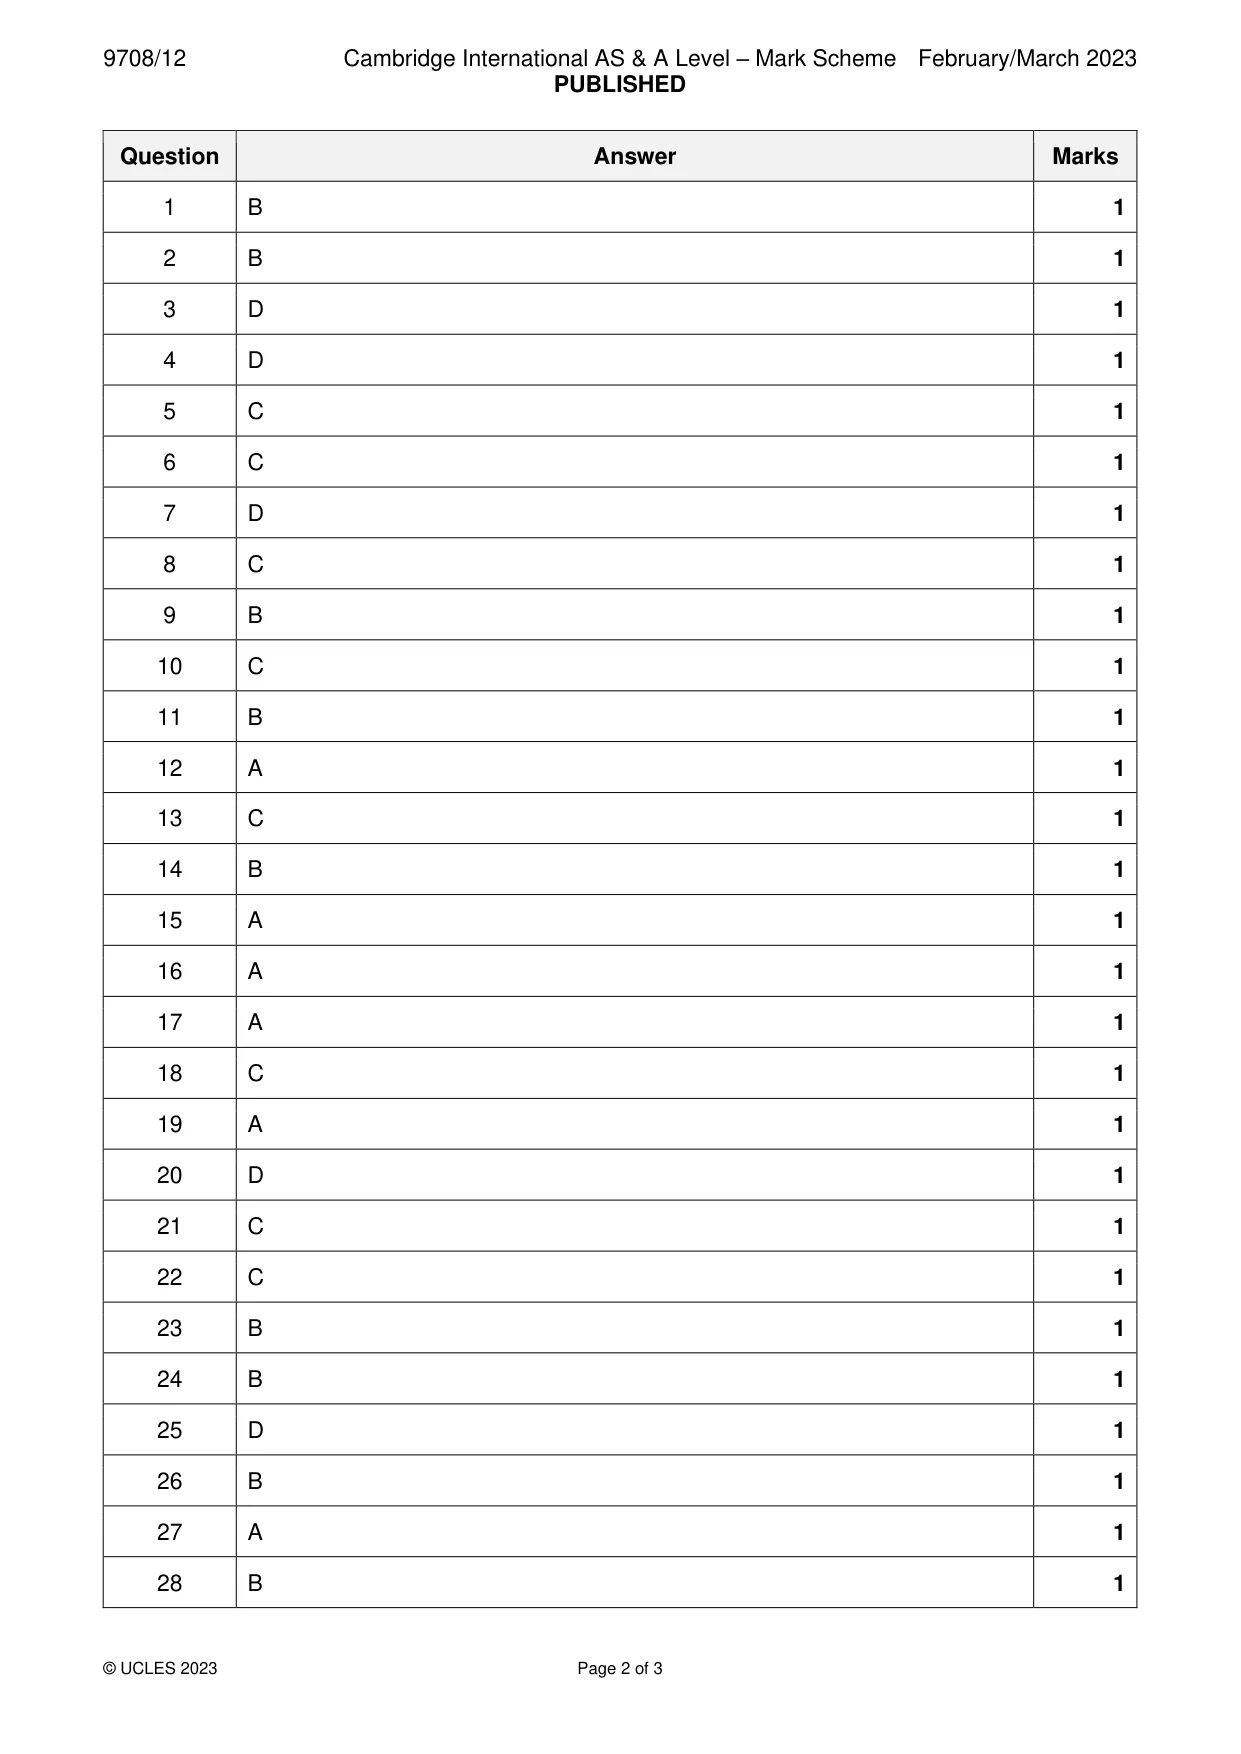
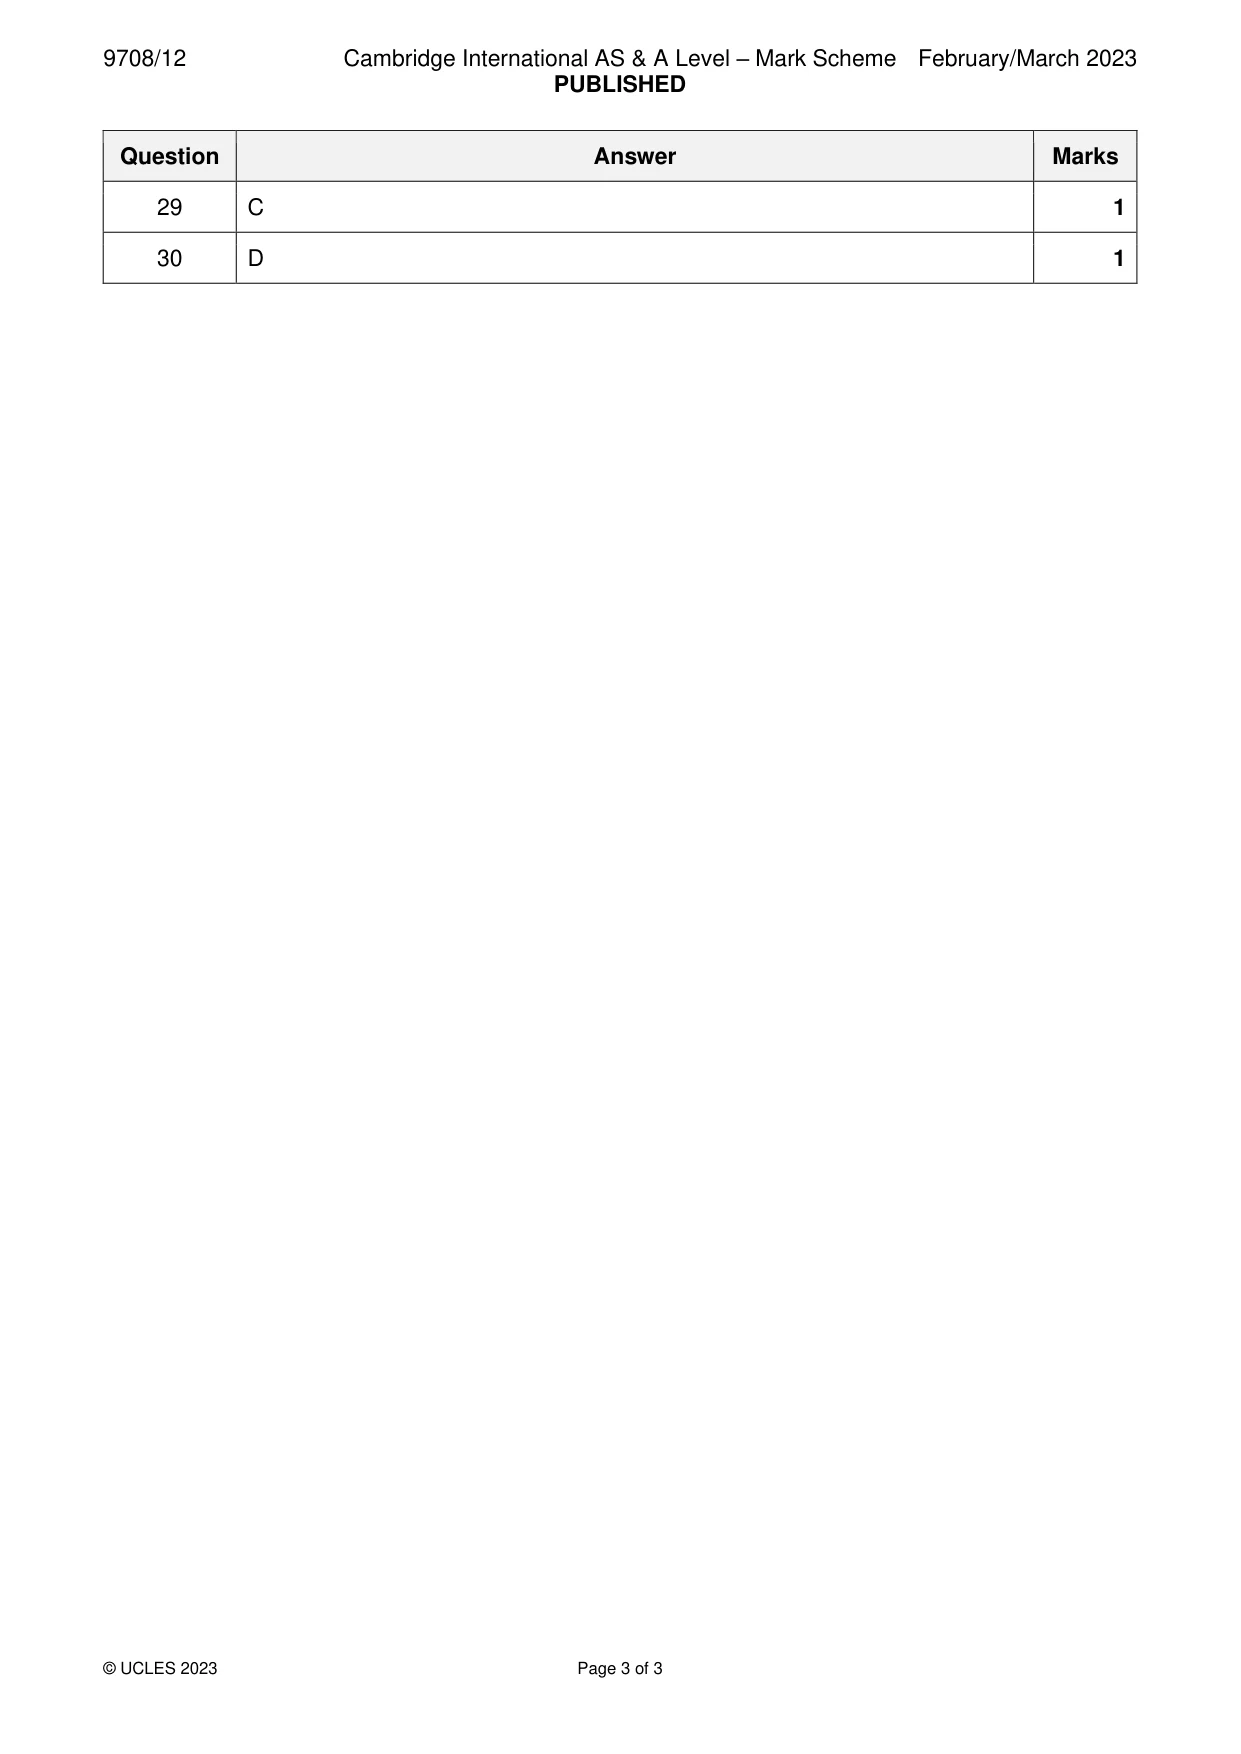
Questions as text
Q1 · A good is most suitable to be provided by the market if it is A excludable and non-rival
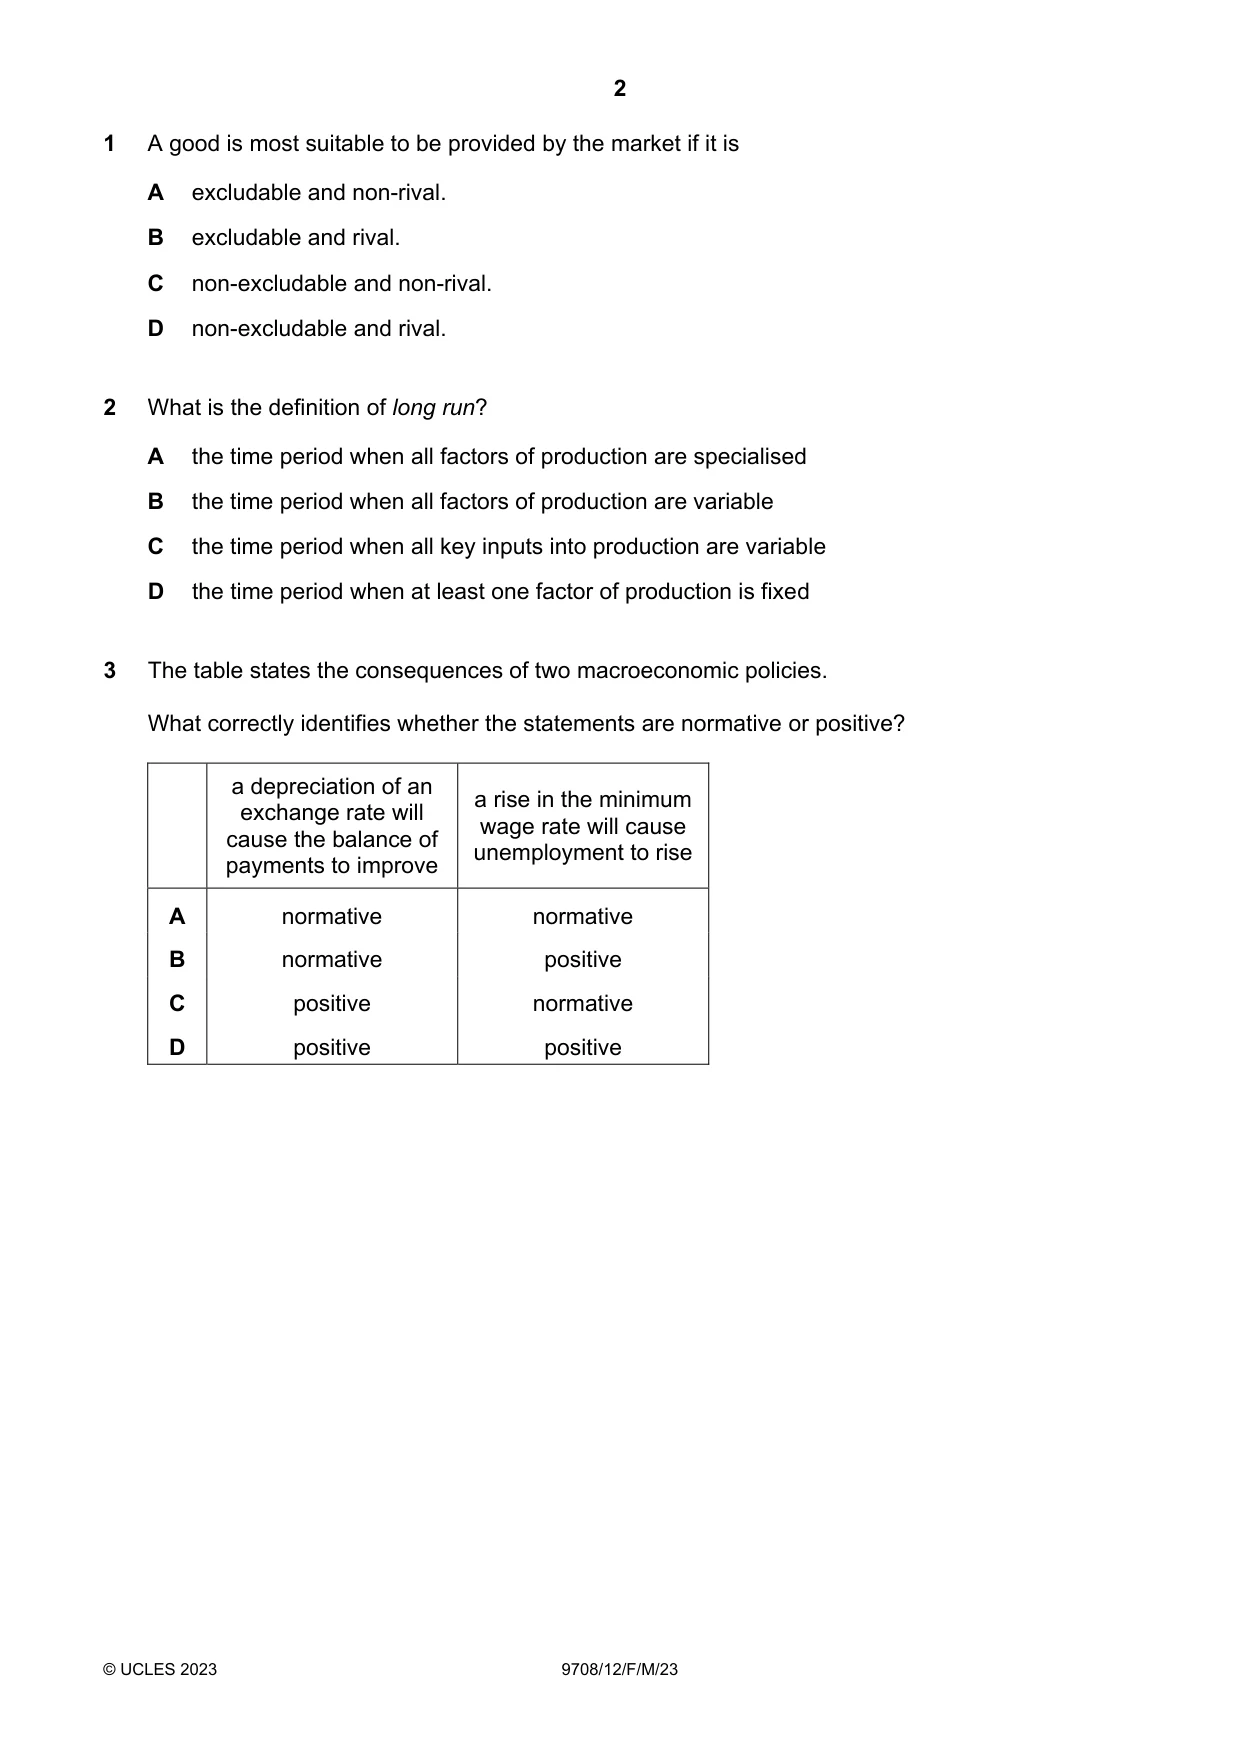
1 A good is most suitable to be provided by the market if it is A excludable and non-rival. B excludable and rival. C non-excludable and non-rival. D non-excludable and rival.
Mark scheme: B
Q2 · What is the definition of long run?
2 What is the definition of long run? A the time period when all factors of production are specialised B the time period when all factors of production are variable C the time period when all key inputs into production are variable D the time period when at least one factor of production is fixed
Mark scheme: B
More questions on Types of cost, revenue and profit, short-run and long-run production
Q3 · The table states the consequences of two macroeconomic policies
3 The table states the consequences of two macroeconomic policies. What correctly identifies whether the statements are normative or positive? a depreciation of an a rise in the minimum exchange rate will wage rate will cause cause the balance of unemployment to rise payments to improve A normative normative B normative positive C positive normative D positive positive
Mark scheme: D
Q4 · The diagram shows the production possibility curve for wheat and corn
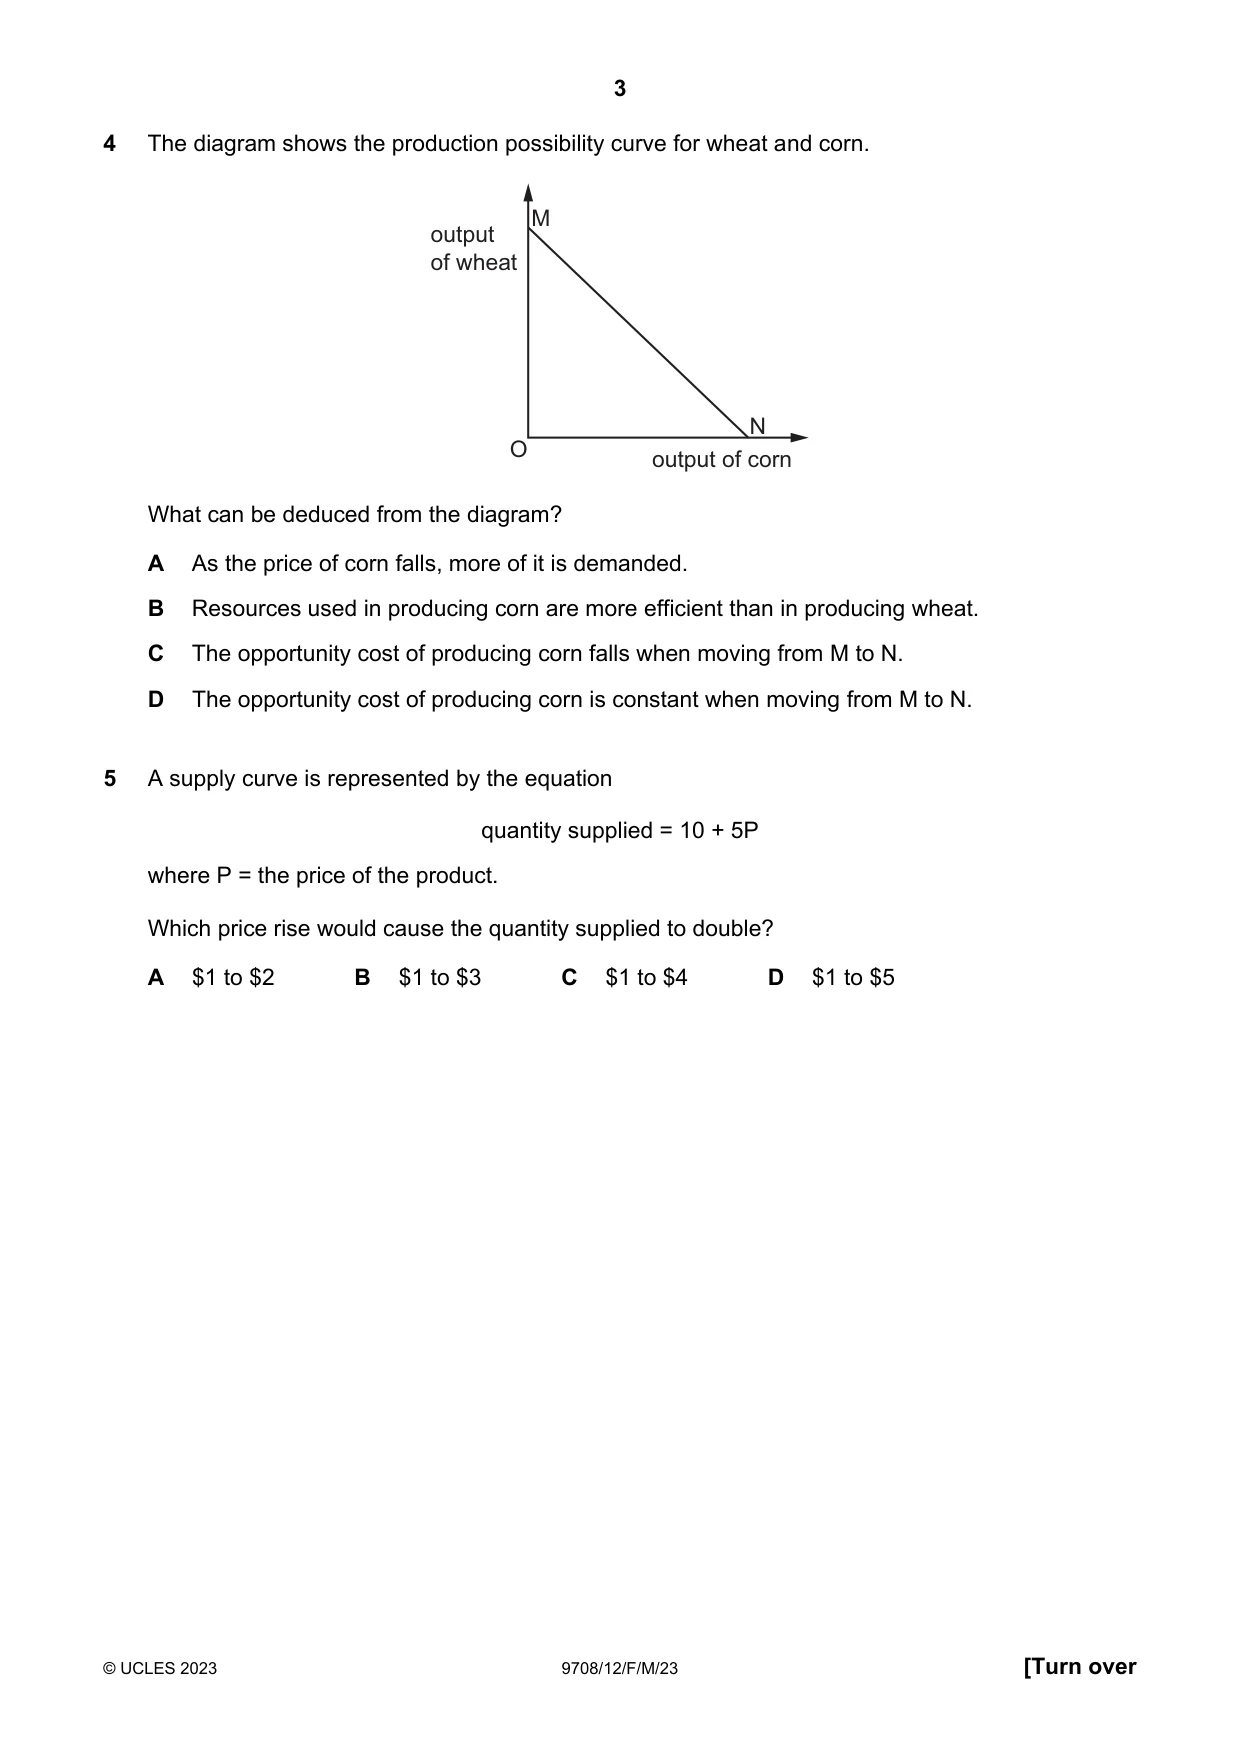
4 The diagram shows the production possibility curve for wheat and corn. M output of wheat N O output of corn What can be deduced from the diagram? A As the price of corn falls, more of it is demanded. B Resources used in producing corn are more efficient than in producing wheat. C The opportunity cost of producing corn falls when moving from M to N. D The opportunity cost of producing corn is constant when moving from M to N.
Mark scheme: D
Q5 · A supply curve is represented by the equation quantity supplied = 10 + 5P where P = the…
5 A supply curve is represented by the equation quantity supplied = 10 + 5P where P = the price of the product. Which price rise would cause the quantity supplied to double? A $1 to $2 B $1 to $3 C $1 to $4 D $1 to $5
Mark scheme: C
Q6 · Which diagram illustrates unitary elasticity of supply?
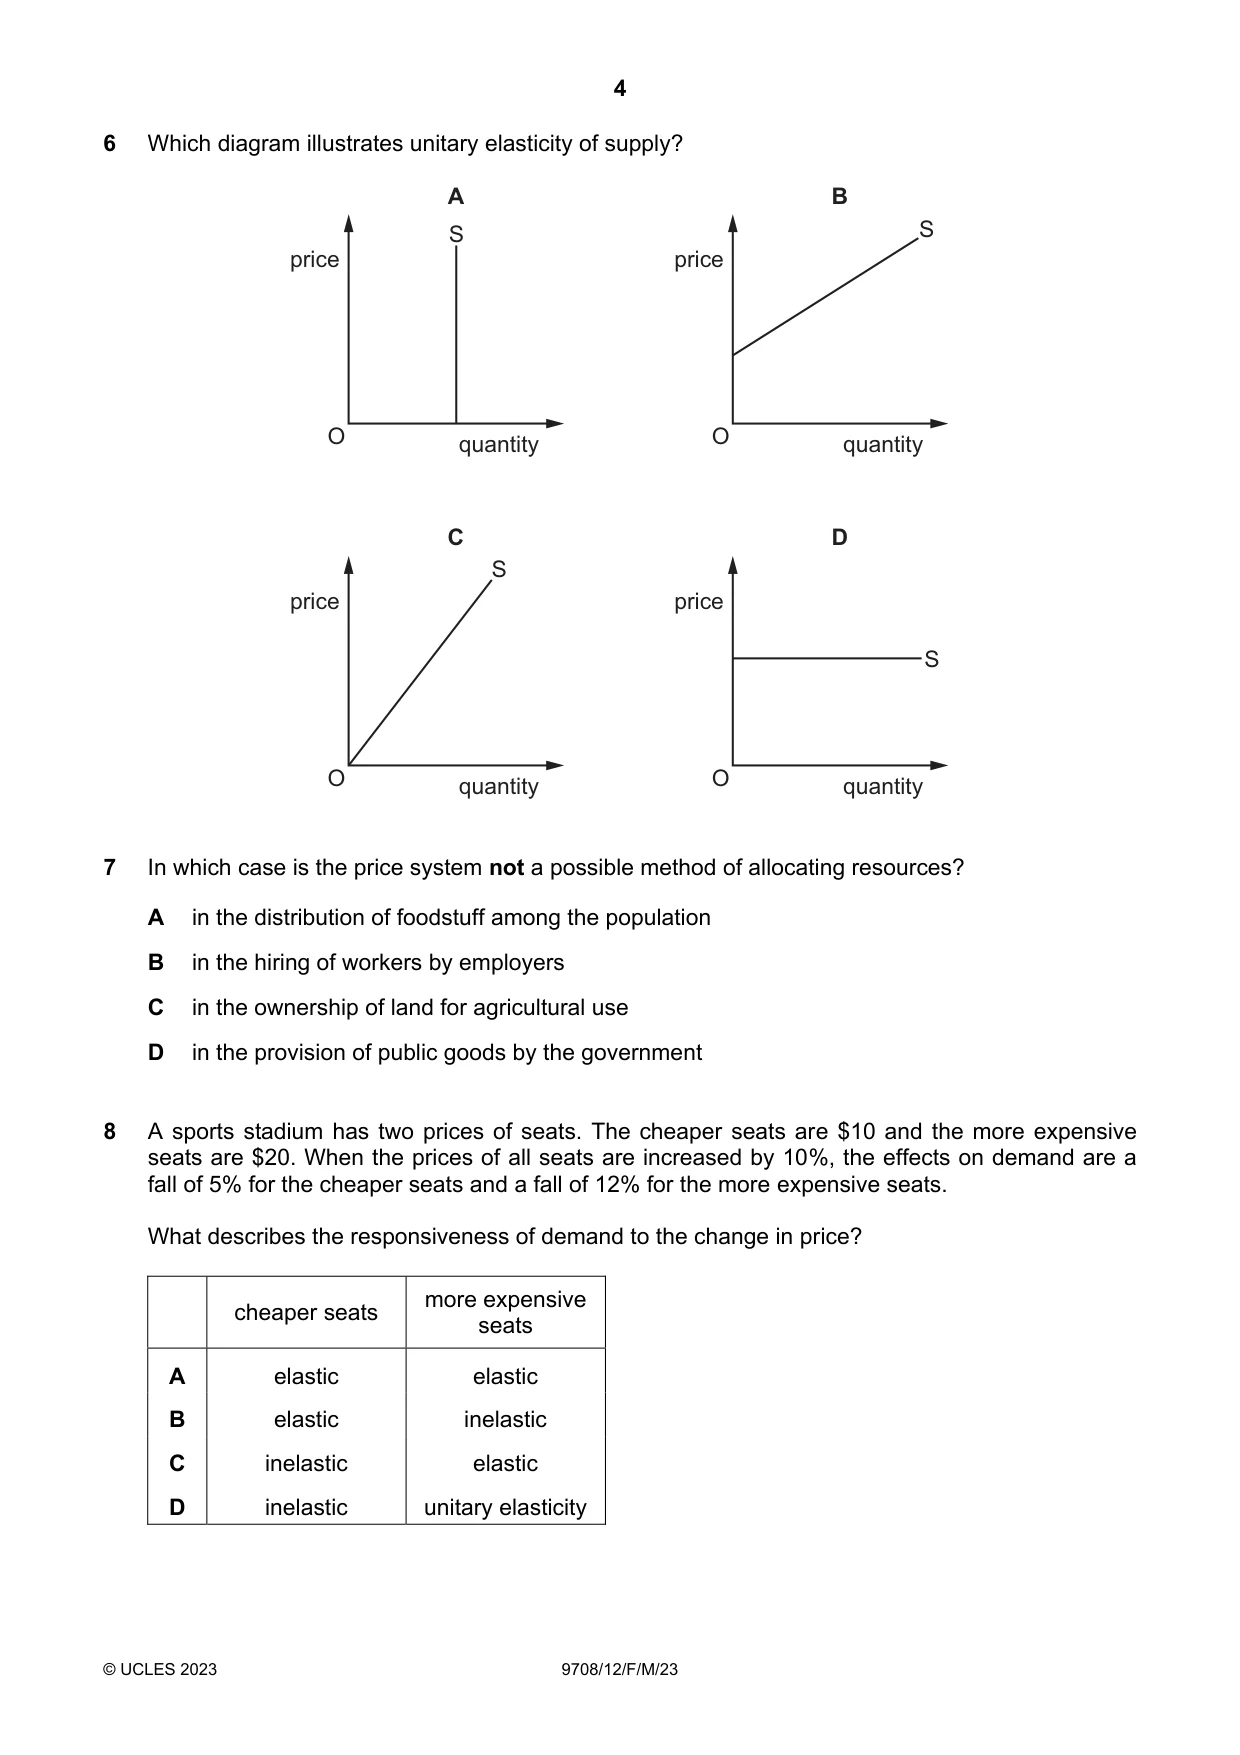
6 Which diagram illustrates unitary elasticity of supply? A B S S price price O quantity O quantity C D S price price S O quantity O quantity
Mark scheme: C
Q7 · In which case is the price system not a possible method of allocating resources?
7 In which case is the price system not a possible method of allocating resources? A in the distribution of foodstuff among the population B in the hiring of workers by employers C in the ownership of land for agricultural use D in the provision of public goods by the government
Mark scheme: D
More questions on Resource allocation in different economic systems
Q8 · A sports stadium has two prices of seats
8 A sports stadium has two prices of seats. The cheaper seats are $10 and the more expensive seats are $20. When the prices of all seats are increased by 10%, the effects on demand are a fall of 5% for the cheaper seats and a fall of 12% for the more expensive seats. What describes the responsiveness of demand to the change in price? more expensive cheaper seats seats A elastic elastic B elastic inelastic C inelastic elastic D inelastic unitary elasticity
Mark scheme: C
More questions on Price elasticity, income elasticity and cross elasticity of demand
Q9 · Which statement correctly describes the shape of the demand curve for a normal good?
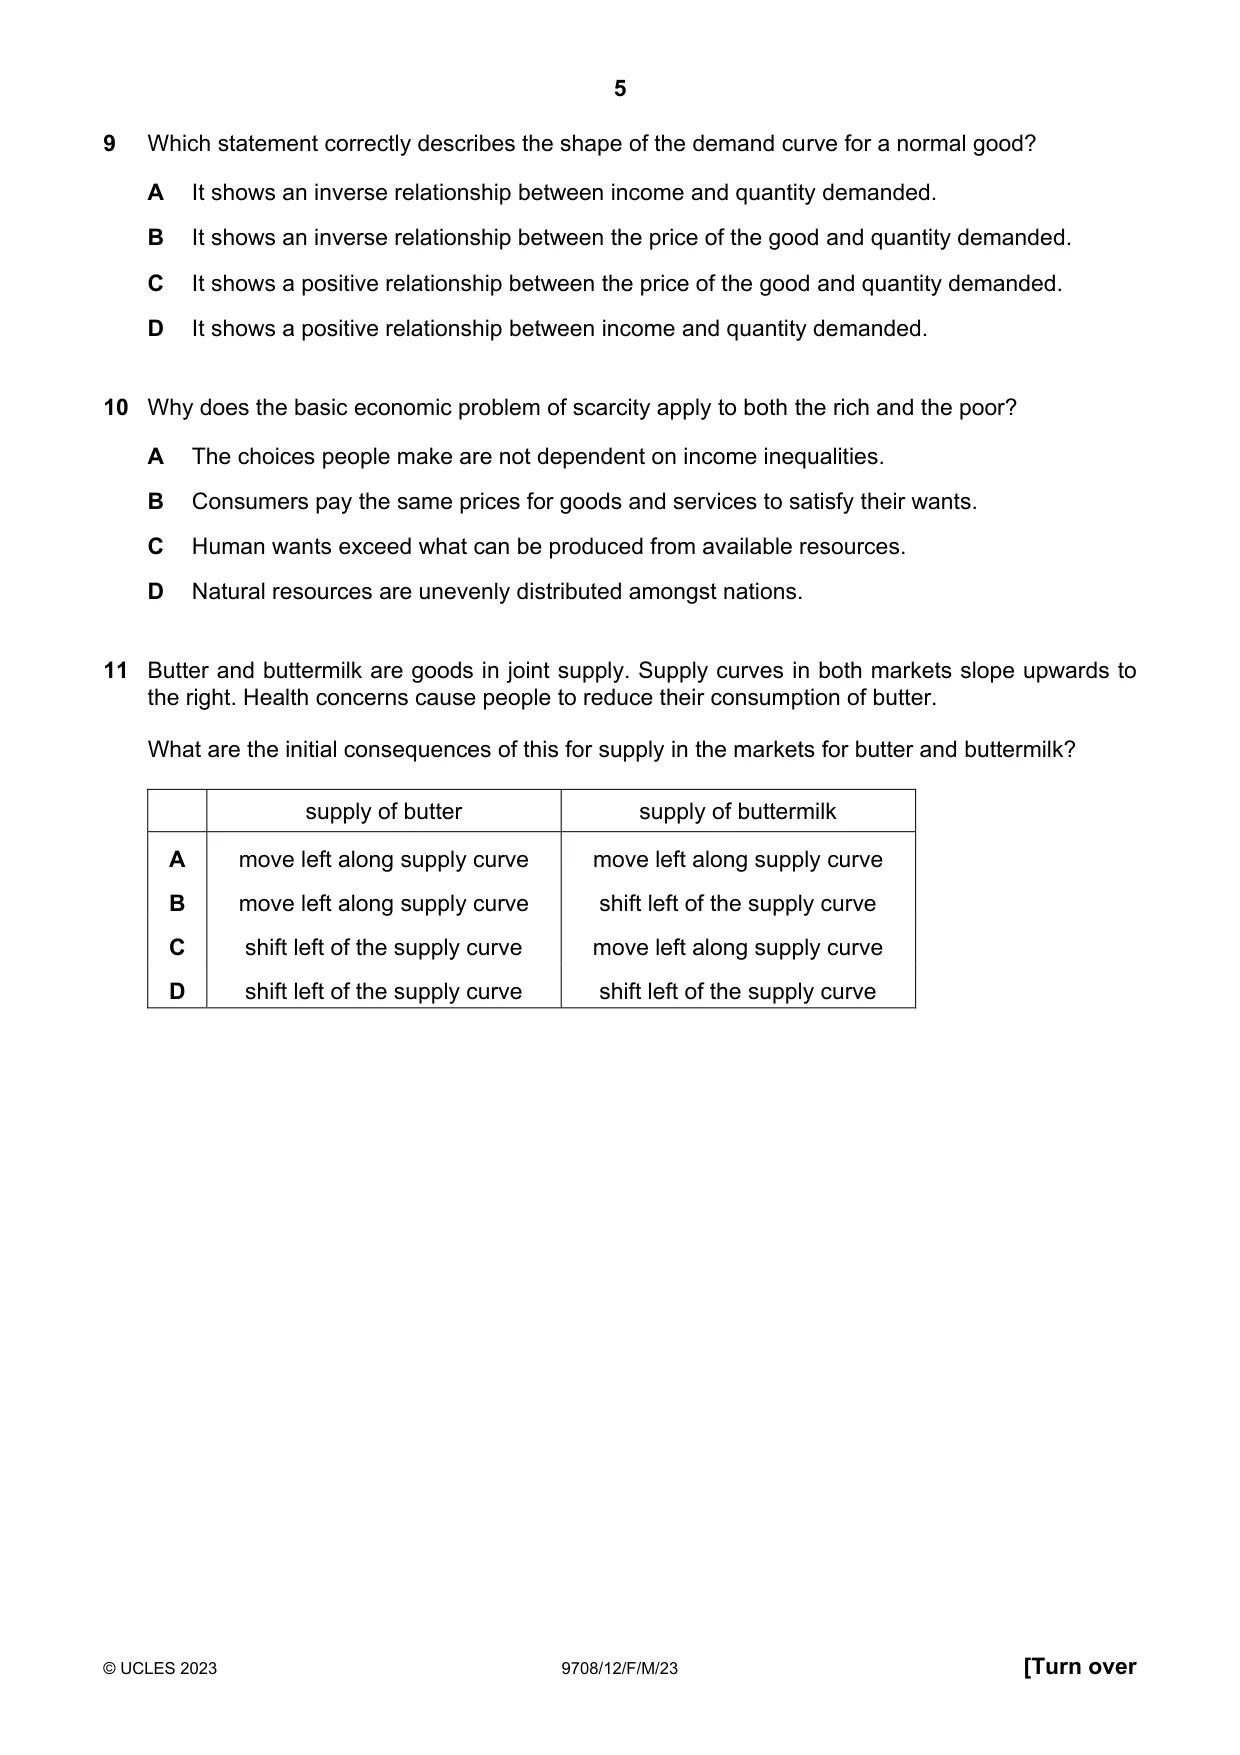
9 Which statement correctly describes the shape of the demand curve for a normal good? A It shows an inverse relationship between income and quantity demanded. B It shows an inverse relationship between the price of the good and quantity demanded. C It shows a positive relationship between the price of the good and quantity demanded. D It shows a positive relationship between income and quantity demanded.
Mark scheme: B
Q10 · Why does the basic economic problem of scarcity apply to both the rich and the poor?
10 Why does the basic economic problem of scarcity apply to both the rich and the poor? A The choices people make are not dependent on income inequalities. B Consumers pay the same prices for goods and services to satisfy their wants. C Human wants exceed what can be produced from available resources. D Natural resources are unevenly distributed amongst nations.
Mark scheme: C
Q11 · Butter and buttermilk are goods in joint supply
11 Butter and buttermilk are goods in joint supply. Supply curves in both markets slope upwards to the right. Health concerns cause people to reduce their consumption of butter. What are the initial consequences of this for supply in the markets for butter and buttermilk? supply of butter supply of buttermilk A move left along supply curve move left along supply curve B move left along supply curve shift left of the supply curve C shift left of the supply curve move left along supply curve D shift left of the supply curve shift left of the supply curve
Mark scheme: B
Q12 · The diagram shows the demand and supply of a good
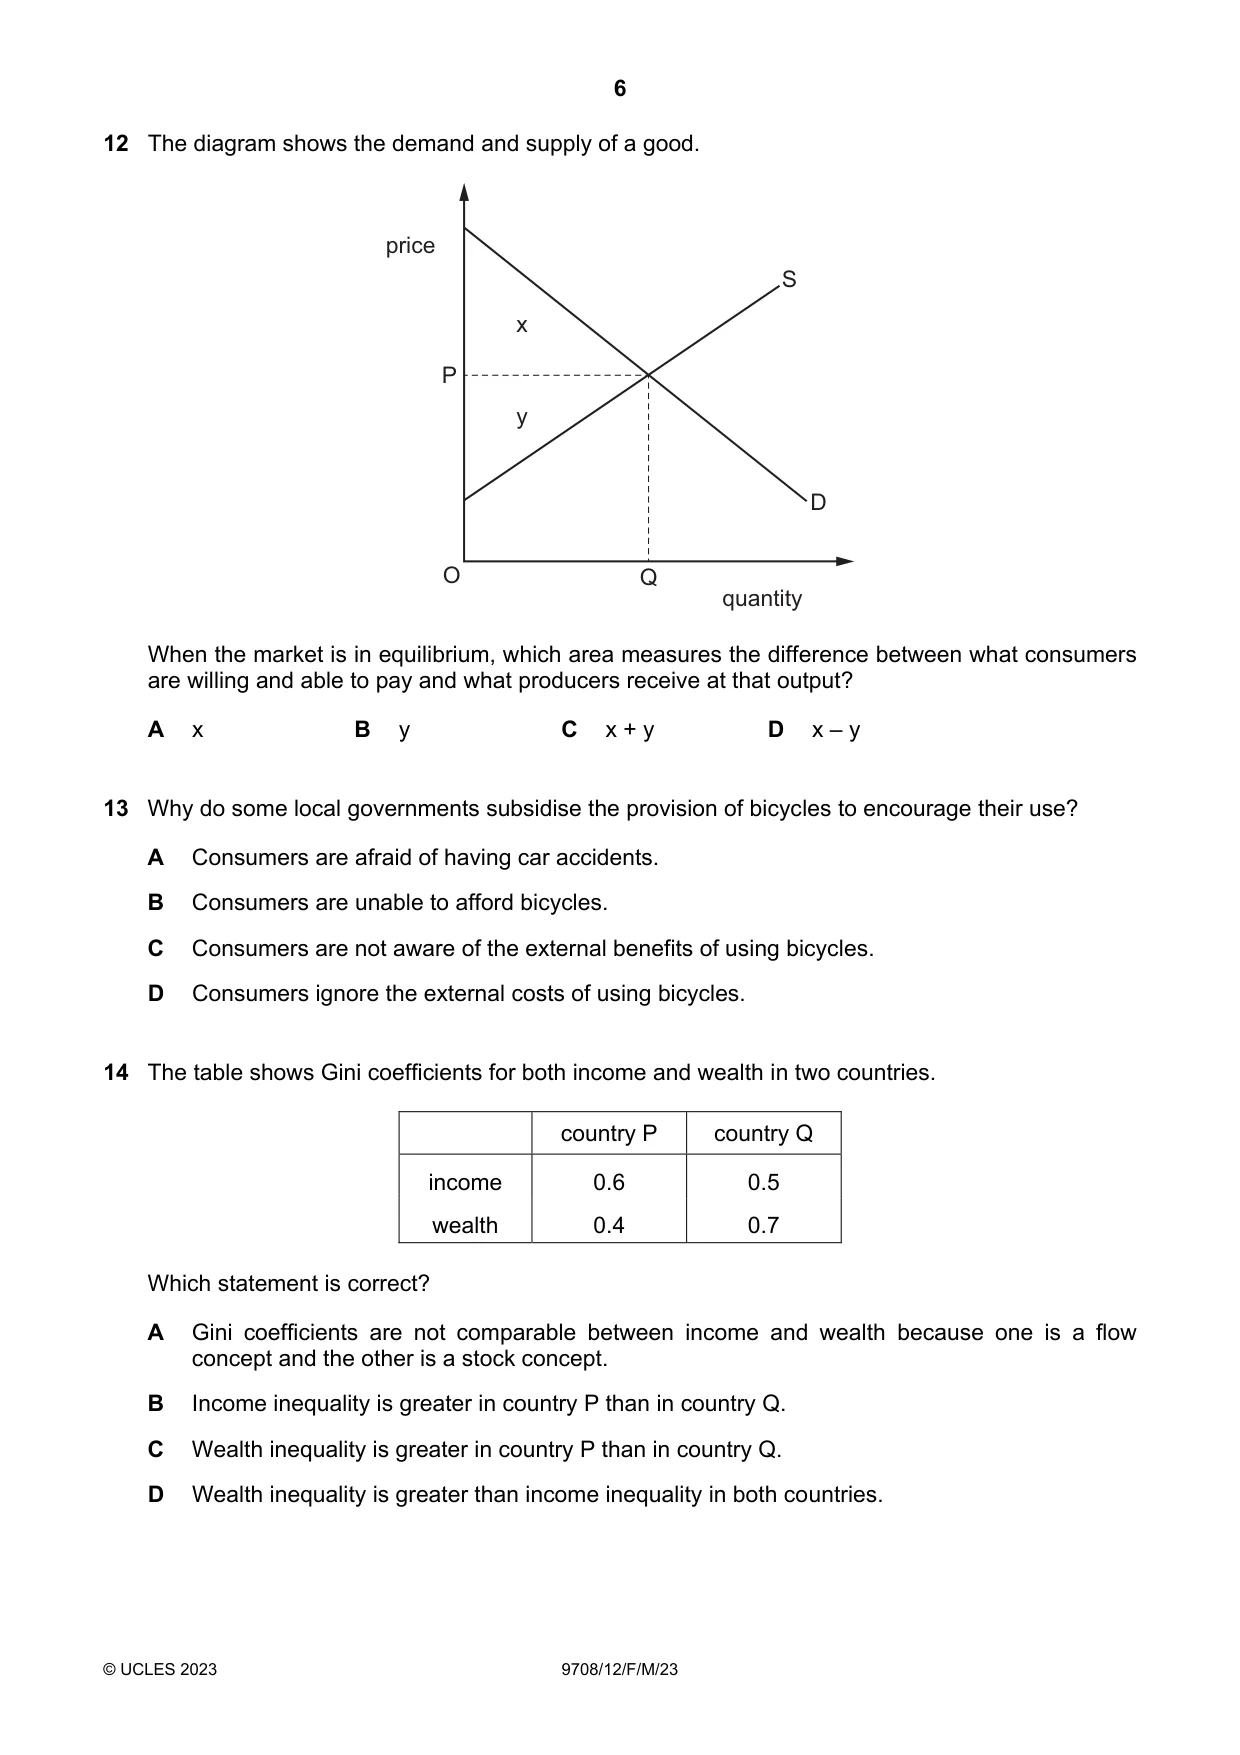
12 The diagram shows the demand and supply of a good. price S x P y D O Q quantity When the market is in equilibrium, which area measures the difference between what consumers are willing and able to pay and what producers receive at that output? A x B y C x + y D x – y
Mark scheme: A
Q13 · Why do some local governments subsidise the provision of bicycles to encourage their use?
13 Why do some local governments subsidise the provision of bicycles to encourage their use? A Consumers are afraid of having car accidents. B Consumers are unable to afford bicycles. C Consumers are not aware of the external benefits of using bicycles. D Consumers ignore the external costs of using bicycles.
Mark scheme: C
More questions on Private costs and benefits, externalities and social costs and benefits
Q14 · The table shows Gini coefficients for both income and wealth in two countries
14 The table shows Gini coefficients for both income and wealth in two countries. country P country Q income 0.6 0.5 wealth 0.4 0.7 Which statement is correct? A Gini coefficients are not comparable between income and wealth because one is a flow concept and the other is a stock concept. B Income inequality is greater in country P than in country Q. C Wealth inequality is greater in country P than in country Q. D Wealth inequality is greater than income inequality in both countries.
Mark scheme: B
Q15 · A government is faced with rising inflation
15 A government is faced with rising inflation. It wishes to reduce inflationary pressure while avoiding a fall in output. Which action is most likely to meet its needs? A an increase in laws to promote competition B an increase in taxation C an increase in the budget surplus D an increase in the exchange rate
Mark scheme: A
Q16 · The table shows selected information from a country’s national accounts
16 The table shows selected information from a country’s national accounts. $ billion GDP 28 net property income from abroad –3 capital consumption 6 national debt 2 What is the country’s net national income? A $19 billion B $25 billion C $31 billion D $33 billion
Mark scheme: A
Q17 · The graphs show the changes in the exchange rates of the pound sterling (£) against the…
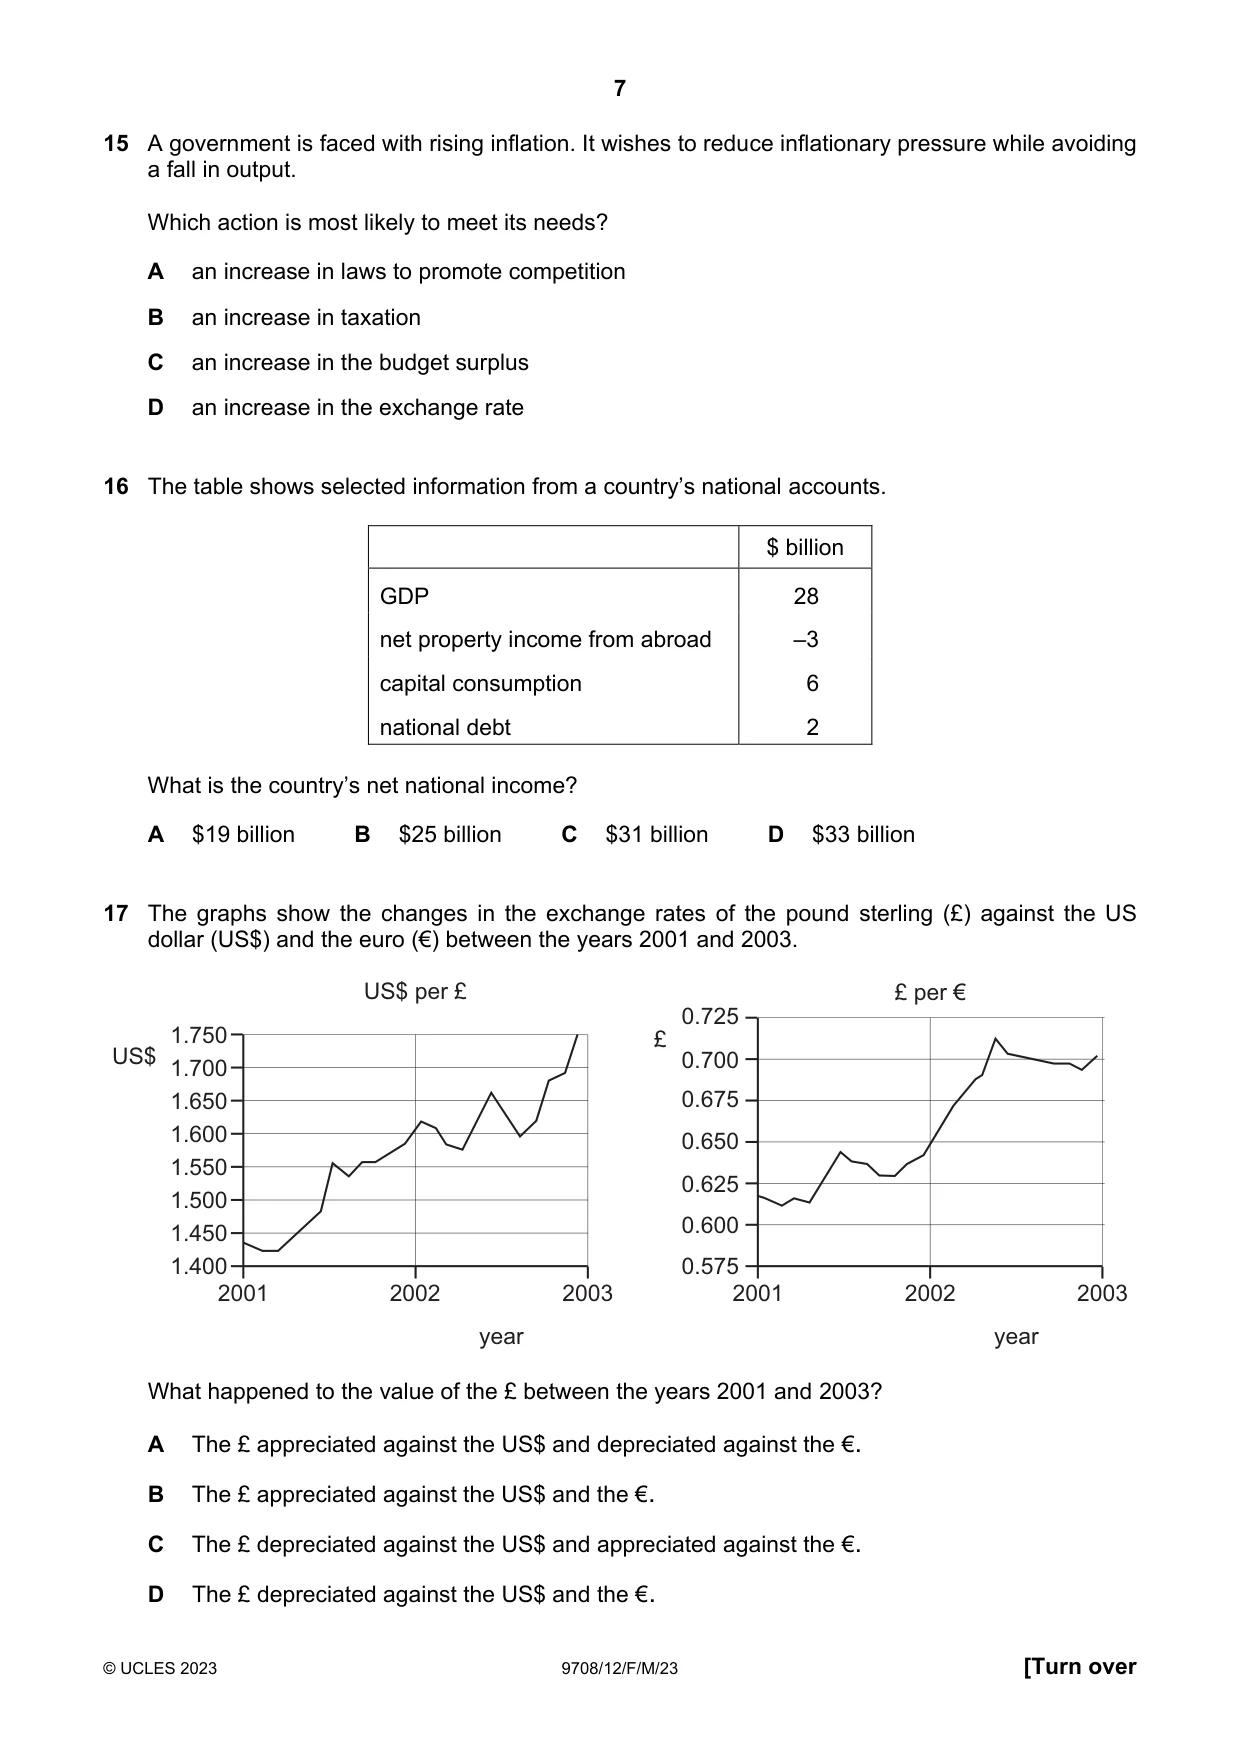
17 The graphs show the changes in the exchange rates of the pound sterling (£) against the US dollar (US$) and the euro (€) between the years 2001 and 2003. US$ per £ £ per € 0.725 1.750 £ US$ 0.700 1.700 1.650 0.675 1.600 0.650 1.550 0.625 1.500 1.450 0.600 1.400 0.575 2001 2002 2003 2001 2002 2003 year year What happened to the value of the £ between the years 2001 and 2003? A The £ appreciated against the US$ and depreciated against the €. B The £ appreciated against the US$ and the €. C The £ depreciated against the US$ and appreciated against the €. D The £ depreciated against the US$ and the €.
Mark scheme: A
Q18 · Which statement about the circular flow of income is correct?
18 Which statement about the circular flow of income is correct? A Exports and imports do not affect the equilibrium level of national income because they always cancel each other out. B The greater the level of saving, the greater the level of injections in the form of investment must be. C When consumers use past savings to increase their spending, there will be a rise in national income. D When a government increases withdrawals by increasing the rate of income tax, there must be an equivalent increase in injections to compensate.
Mark scheme: C
More questions on Introduction to the circular flow of income
Q19 · The graph shows a country’s average annual inflation rate over a five-year period
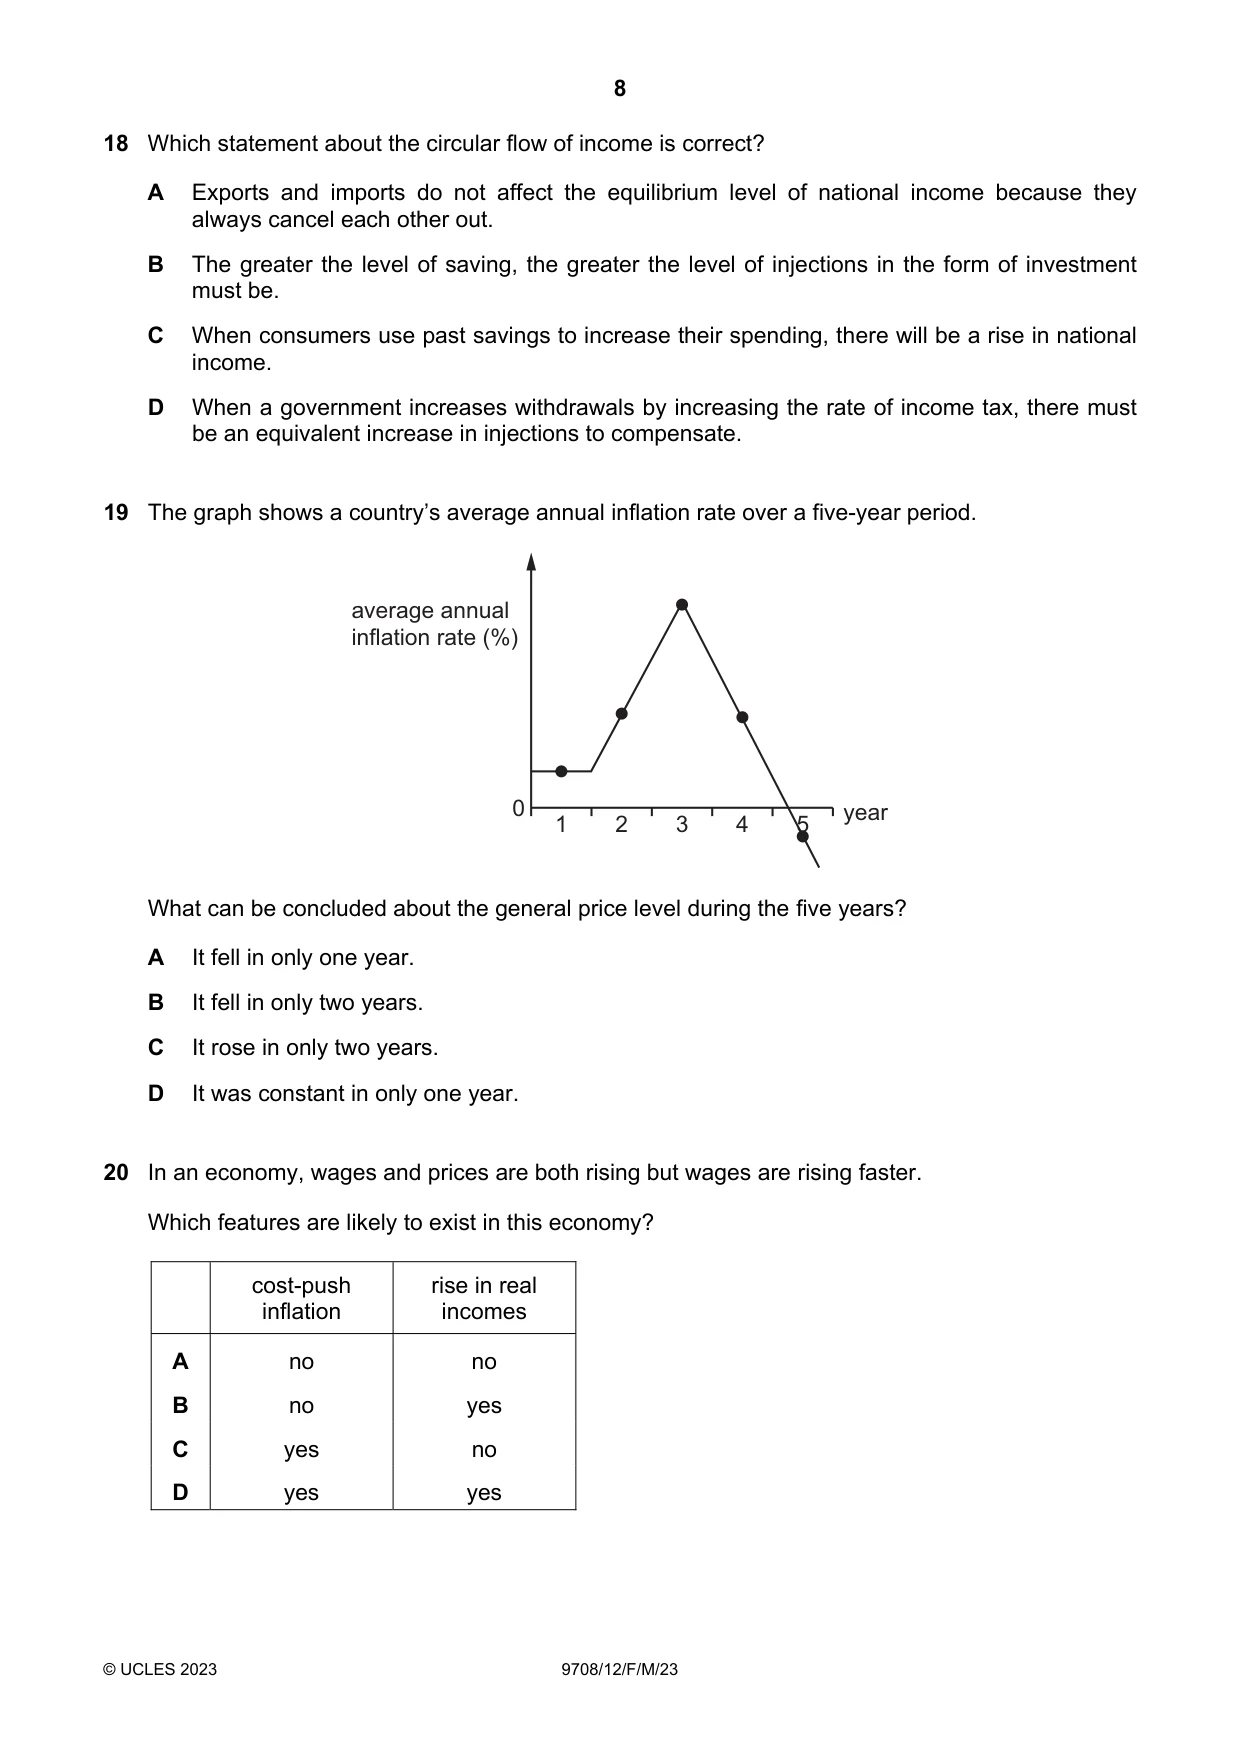
19 The graph shows a country’s average annual inflation rate over a five-year period. average annual inflation rate (%) 0 year 1 2 3 4 5 What can be concluded about the general price level during the five years? A It fell in only one year. B It fell in only two years. C It rose in only two years. D It was constant in only one year.
Mark scheme: A
Q20 · In an economy, wages and prices are both rising but wages are rising faster
20 In an economy, wages and prices are both rising but wages are rising faster. Which features are likely to exist in this economy? cost-push rise in real inflation incomes A no no B no yes C yes no D yes yes
Mark scheme: D
Q21 · The diagram shows the aggregate demand (AD) and long-run aggregate supply (LRAS) curves…
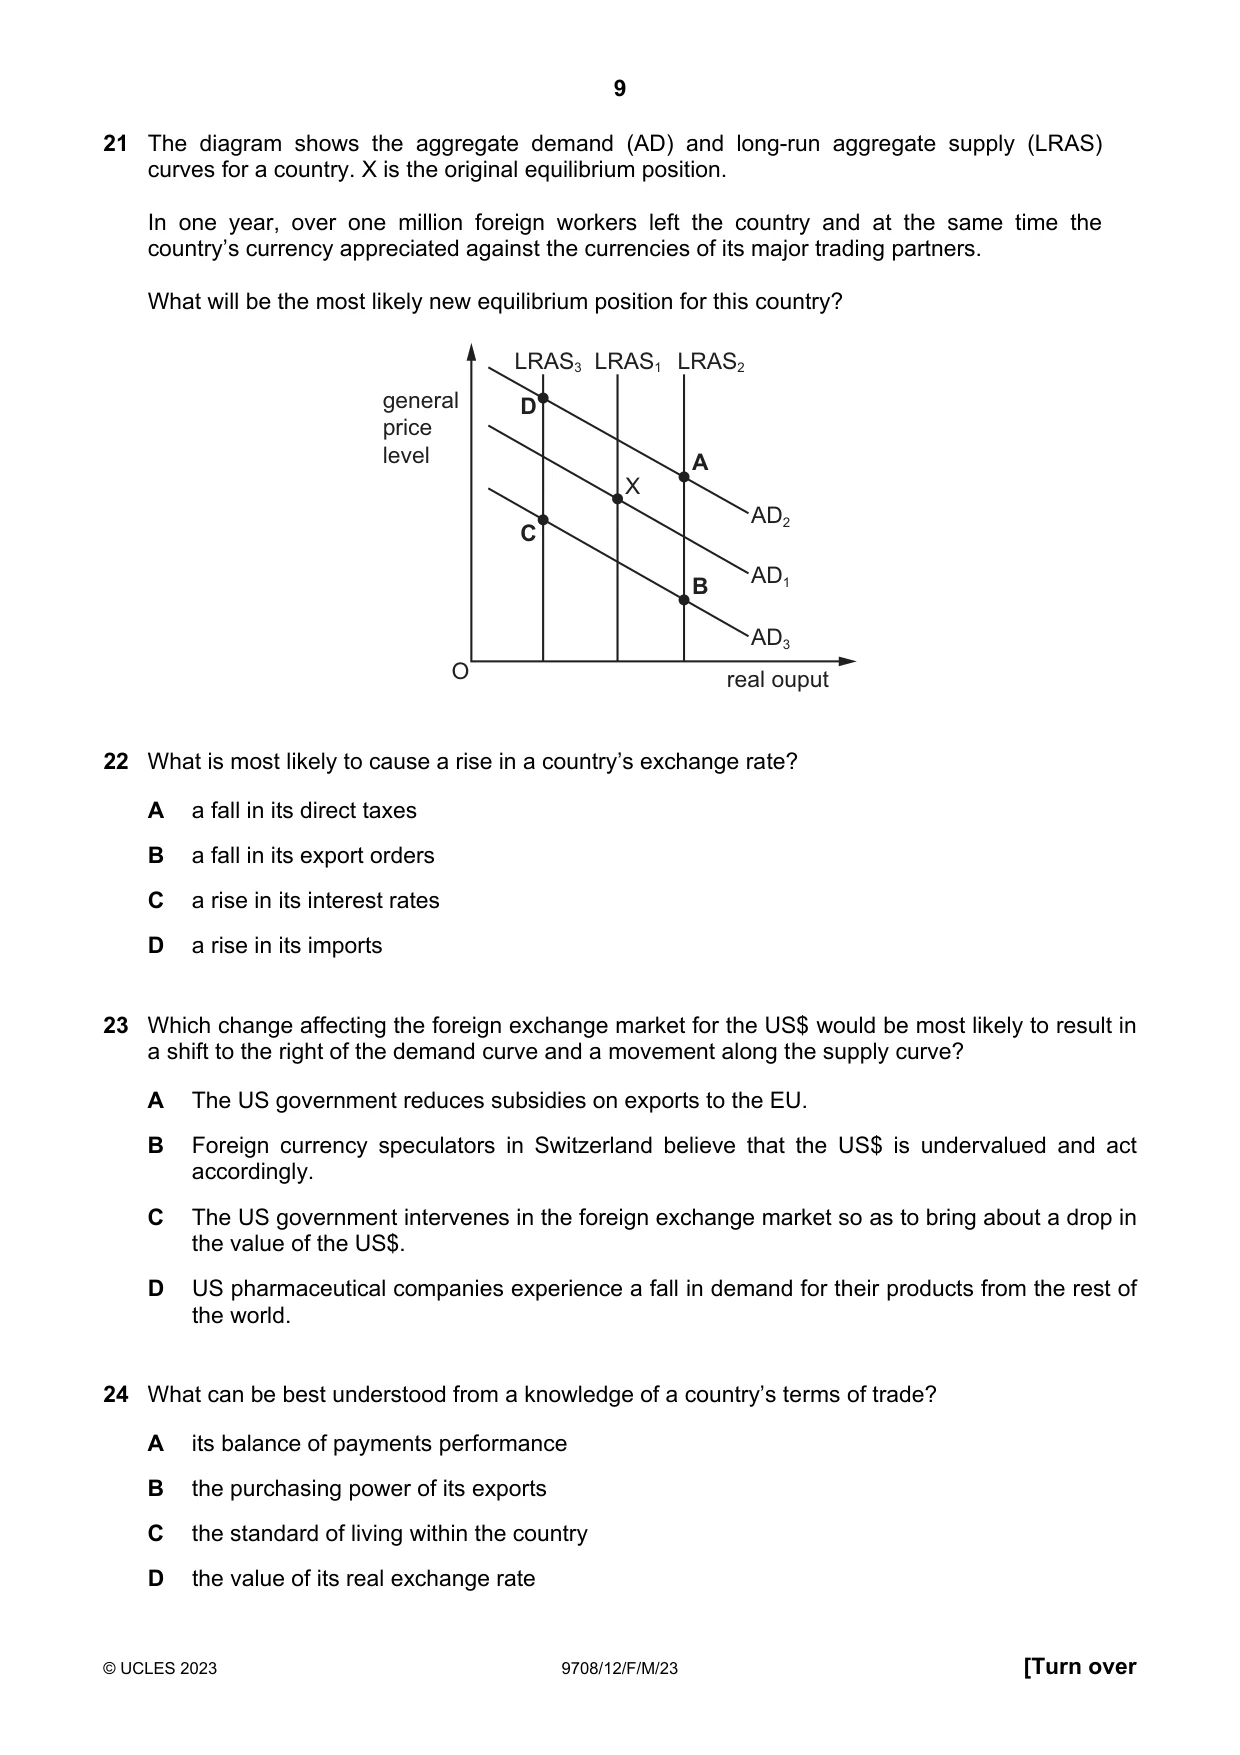
21 The diagram shows the aggregate demand (AD) and long-run aggregate supply (LRAS) curves for a country. X is the original equilibrium position. In one year, over one million foreign workers left the country and at the same time the country’s currency appreciated against the currencies of its major trading partners. What will be the most likely new equilibrium position for this country? LRAS3 LRAS1 LRAS2 general D price level A X AD2 C AD1 B AD3 O real ouput
Mark scheme: C
More questions on Aggregate Demand and Aggregate Supply analysis
Q22 · What is most likely to cause a rise in a country’s exchange rate?
22 What is most likely to cause a rise in a country’s exchange rate? A a fall in its direct taxes B a fall in its export orders C a rise in its interest rates D a rise in its imports
Mark scheme: C
Q23 · Which change affecting the foreign exchange market for the US$ would be most likely to…
23 Which change affecting the foreign exchange market for the US$ would be most likely to result in a shift to the right of the demand curve and a movement along the supply curve? A The US government reduces subsidies on exports to the EU. B Foreign currency speculators in Switzerland believe that the US$ is undervalued and act accordingly. C The US government intervenes in the foreign exchange market so as to bring about a drop in the value of the US$. D US pharmaceutical companies experience a fall in demand for their products from the rest of the world.
Mark scheme: B
Q24 · What can be best understood from a knowledge of a country’s terms of trade?
24 What can be best understood from a knowledge of a country’s terms of trade? A its balance of payments performance B the purchasing power of its exports C the standard of living within the country D the value of its real exchange rate
Mark scheme: B
Q25 · A company produces goods for export only
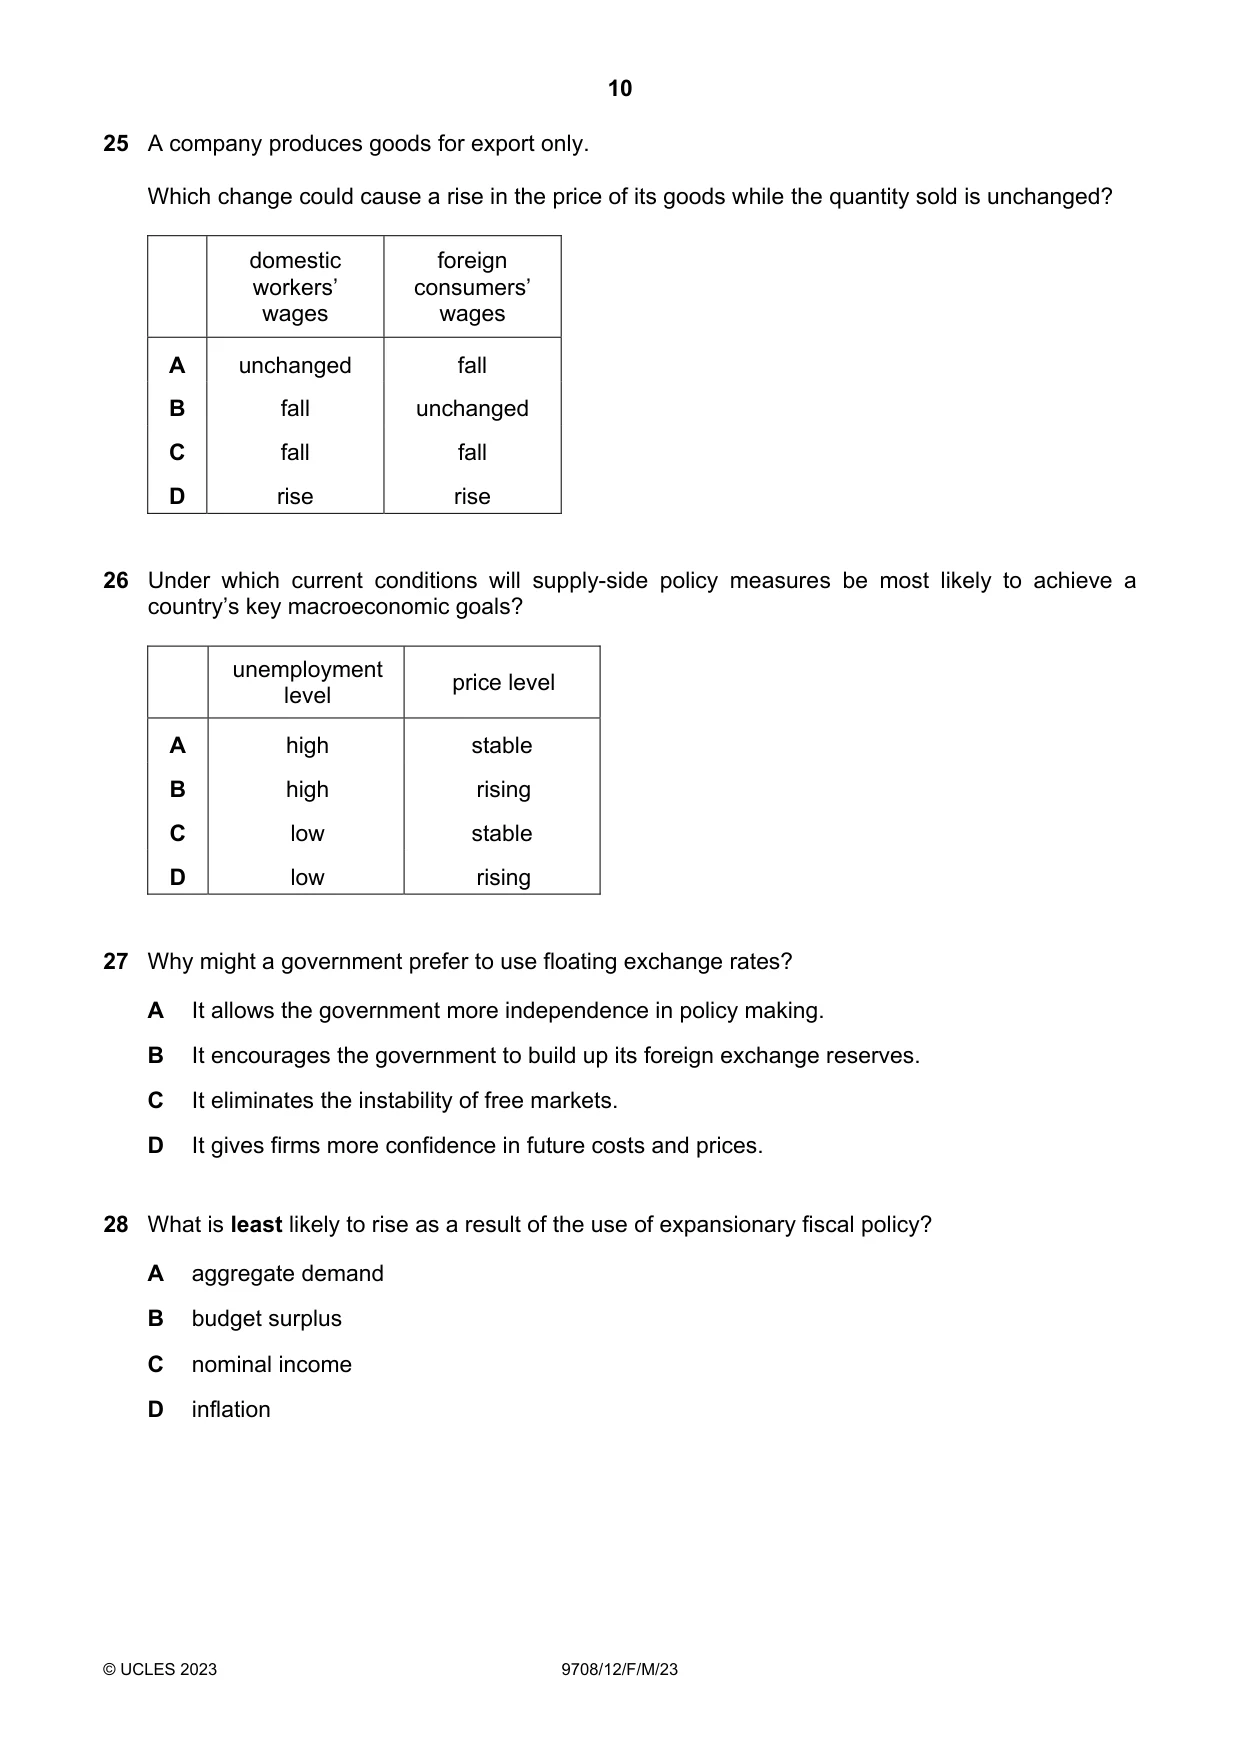
25 A company produces goods for export only. Which change could cause a rise in the price of its goods while the quantity sold is unchanged? domestic foreign workers’ consumers’ wages wages A unchanged fall B fall unchanged C fall fall D rise rise
Mark scheme: D
Q26 · Under which current conditions will supply-side policy measures be most likely to achieve…
26 Under which current conditions will supply-side policy measures be most likely to achieve a country’s key macroeconomic goals? unemployment price level level A high stable B high rising C low stable D low rising
Mark scheme: B
Q27 · Why might a government prefer to use floating exchange rates?
27 Why might a government prefer to use floating exchange rates? A It allows the government more independence in policy making. B It encourages the government to build up its foreign exchange reserves. C It eliminates the instability of free markets. D It gives firms more confidence in future costs and prices.
Mark scheme: A
Q28 · What is least likely to rise as a result of the use of expansionary fiscal policy?
28 What is least likely to rise as a result of the use of expansionary fiscal policy? A aggregate demand B budget surplus C nominal income D inflation
Mark scheme: B
Q29 · The table shows GDP indices for a country over a three-year period
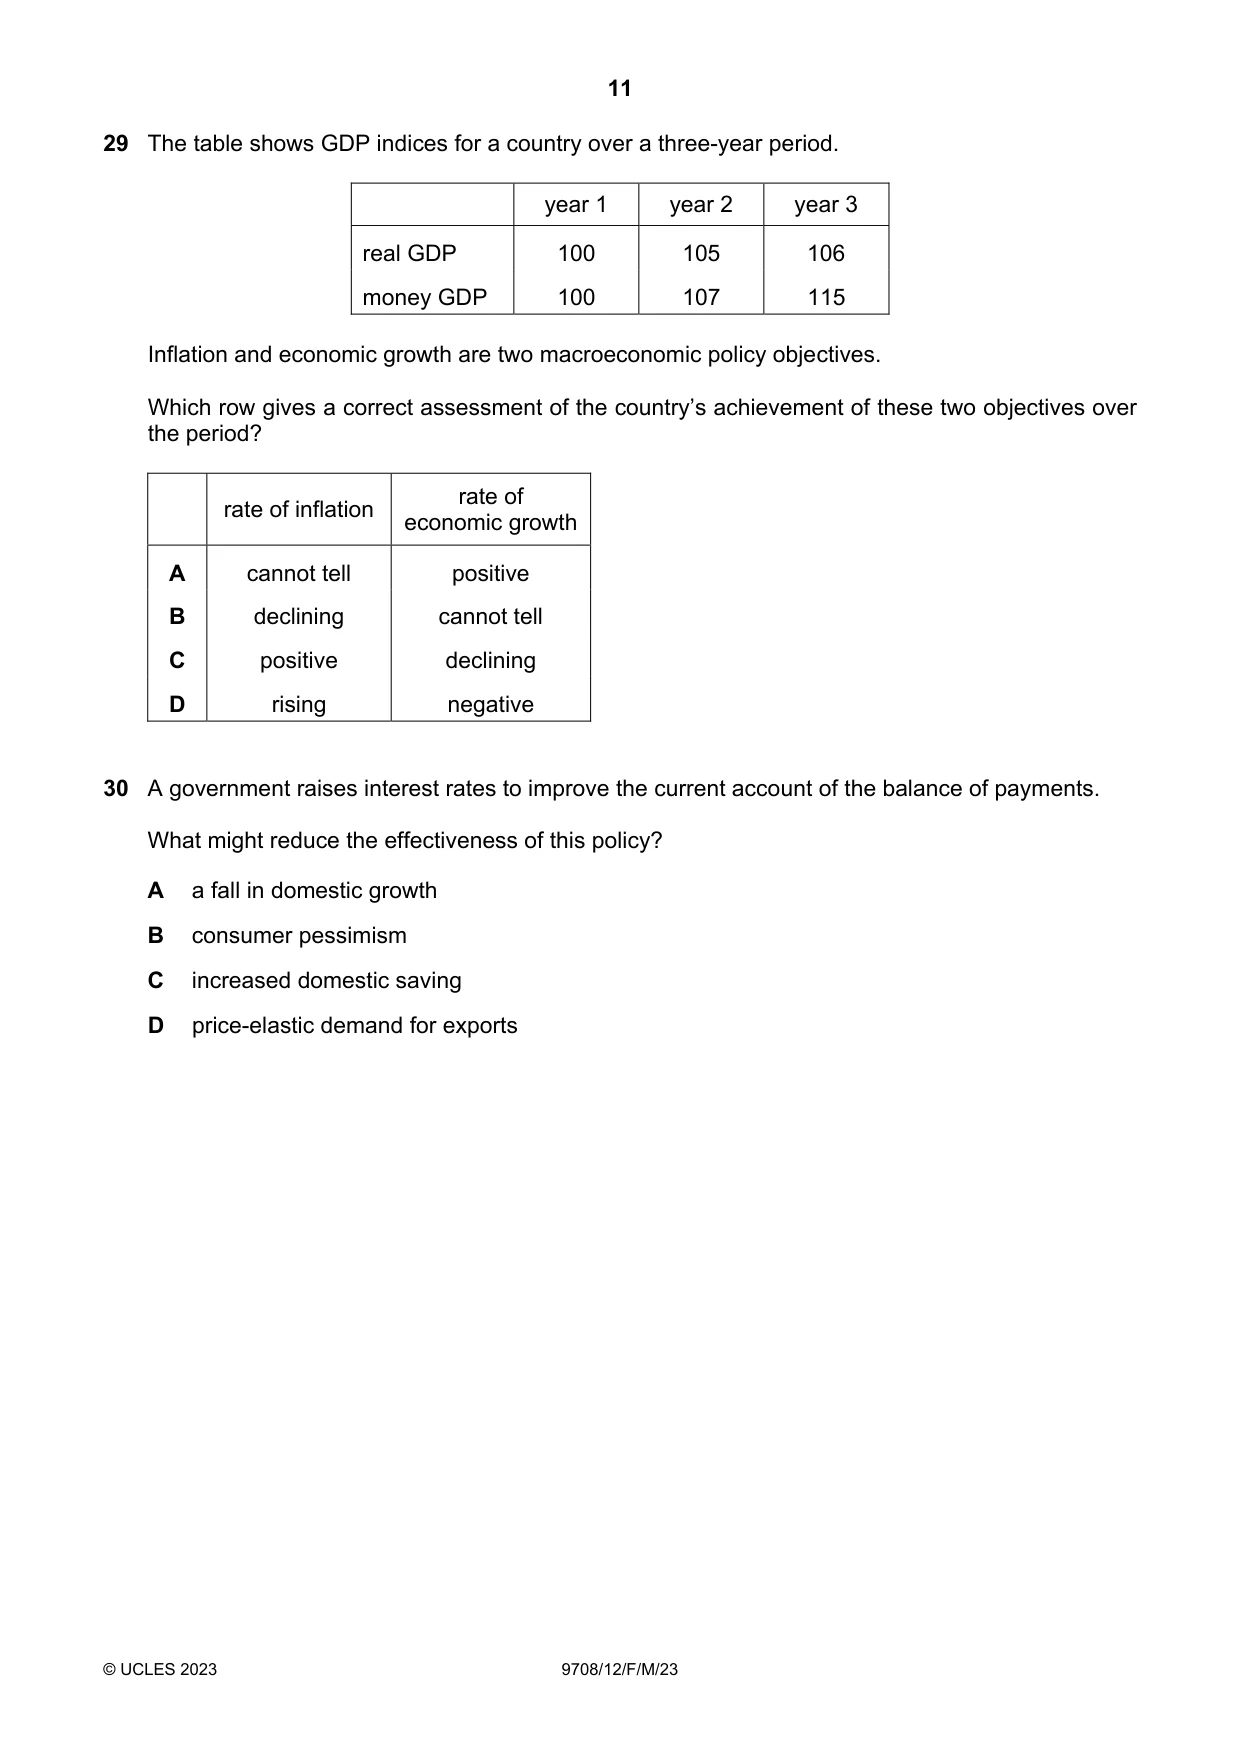
29 The table shows GDP indices for a country over a three-year period. year 1 year 2 year 3 real GDP 100 105 106 money GDP 100 107 115 Inflation and economic growth are two macroeconomic policy objectives. Which row gives a correct assessment of the country’s achievement of these two objectives over the period? rate of rate of inflation economic growth A cannot tell positive B declining cannot tell C positive declining D rising negative
Mark scheme: C
Q30 · A government raises interest rates to improve the current account of the balance of…
30 A government raises interest rates to improve the current account of the balance of payments. What might reduce the effectiveness of this policy? A a fall in domestic growth B consumer pessimism C increased domestic saving D price-elastic demand for exports
Mark scheme: D
More questions on Policies to correct imbalances in the current account of the balance of payments
What was in this paper
The subtopics covered by these 30 questions, and how many questions each got. Open one in a new tab to see every Cambridge question on it.
4Demand and supply curves2Price elasticity of supply2Price stability2Supply-side policy2The reasons for international trade2Addressing income and wealth inequality1Aggregate Demand and Aggregate Supply analysis1Classification of goods and services1Consumer and producer surplus1Economic growth1Economic methodology1Fiscal policy1Introduction to the circular flow of income1National income statistics1Policies to correct imbalances in the current account of the balance of payments1Price elasticity, income elasticity and cross elasticity of demand1Private costs and benefits, externalities and social costs and benefits1Production possibility curves1Resource allocation in different economic systems1Scarcity, choice and opportunity cost1Types of cost, revenue and profit, short-run and long-run production1What you needed in this session
Cambridge’s own grade thresholds for 2023 Feb/March, Paper 1 · Variant 2. A higher threshold means an easier paper — the bar moves with how the cohort did.