Questions as text
Q1 · The table shows the weights used over three years in the UK consumer price index 9708/11 Oct/Nov 2005
24 The table shows the weights used over three years in the UK consumer price index. 2001 2002 2003 food 116 114 109 motoring expenditure 140 141 146 housing 205 199 203 leisure goods 49 48 48 What can be deduced from the table? A Housing was a bigger proportion of the average UK household’s spending in 2003 than in 2002. B The average UK household ate less in 2003 than in 2001. C The average UK household spent more on motoring in 2003 than in 2001. D The price of leisure goods remained unchanged between 2002 and 2003.
1 marks
Answer: A
This question in 9708/11 Oct/Nov 2005
Q2 · The data given below refers to money supply and prices in the years 2001 and 2004 in four… 9708/11 Oct/Nov 2005
25 The data given below refers to money supply and prices in the years 2001 and 2004 in four countries A, B, C and D. Between 2001 and 2004, in which country was the rate of inflation the highest? 2001 2004 money supply price index money supply price index ($ million) (2000 = 100) ($ million) (2000 = 100) A 69 104 78 153 B 65 112 120 247 C 70 101 213 157 D 172 105 360 210
1 marks
Answer: B
This question in 9708/11 Oct/Nov 2005
Q3 · A government announces that it has achieved its target of 2.5 % inflation per annum and… 9708/11 Oct/Nov 2005
26 A government announces that it has achieved its target of 2.5 % inflation per annum and that it expects to maintain it. How might such an announcement reduce inflationary pressure? A by encouraging the government to reduce its spending B by putting downward pressure on the country’s exchange rate C by putting pressure on the central bank to reduce interest rates D by reducing workers’ expectations of future inflation
1 marks
Answer: D
This question in 9708/11 Oct/Nov 2005
Q4 · The table shows the year-on-year percentage changes for a country's consumer price index… 9708/11 May/June 2006
24 The table shows the year-on-year percentage changes for a country's consumer price index from 1999 to 2005. year % change 1999 18.0 2000 11.7 2001 8.6 2002 4.6 2003 4.9 2004 6.1 2005 4.5 Which statement about the price level is correct? A It fell over the first half of the period. B It was at its highest at the start of the period. C It was at its lowest at the end of the period. D It was at its lowest at the start of the period.
1 marks
Answer: D
This question in 9708/11 May/June 2006
Q5 · What is most likely to cause demand-pull inflation? 9708/11 May/June 2006
25 What is most likely to cause demand-pull inflation? A an increase in indirect taxes B an increase in interest rates C a reduction in direct taxes D a reduction in the money supply
1 marks
Answer: C
This question in 9708/11 May/June 2006
Q6 · Increased international competition leads to a worsening in a country’s current account… 9708/11 May/June 2006
27 Increased international competition leads to a worsening in a country’s current account balance. In the absence of any offsetting factors, how is this likely to affect domestic inflation and the exchange rate? inflation exchange rate A increase appreciate B increase depreciate C decrease appreciate D decrease depreciate
1 marks
Answer: D
This question in 9708/11 May/June 2006
Q7 · The diagram shows rates of inflation as measured by the Consumer Price Index (CPI)… 9708/11 Oct/Nov 2006
24 The diagram shows rates of inflation as measured by the Consumer Price Index (CPI) between 1997 and 2004. services and goods CPI inflation % year on year 5 services 4 3 2 1 goods 0 –1 –2 –3 –4 –5 1997 1998 1999 2000 2001 2002 2003 2004 Which conclusion can be drawn from this data? A The prices of goods fell in 1999. B The prices of goods rose between 2000 and 2001. C The prices of services fell between 2002 and 2004. D Between 1997 and 2004, services cost more than goods.
1 marks
Answer: A
This question in 9708/11 Oct/Nov 2006
Q8 · The table shows a country’s rate of inflation for four years 9708/11 Oct/Nov 2006
25 The table shows a country’s rate of inflation for four years. rate of inflation year % 2000 4.0 2001 3.0 2002 2.5 2003 2.0 What fell between 2000 and 2003? A average prices B the cost of living C the exchange rate D the value of money
1 marks
Answer: D
This question in 9708/11 Oct/Nov 2006
Q9 · What is not a possible cause of cost-push inflation? 9708/11 Oct/Nov 2006
26 What is not a possible cause of cost-push inflation? A an increase in firms’ profit margins B an increase in the supply of money C an increase in trade union power D an increase in world oil prices
1 marks
Answer: B
This question in 9708/11 Oct/Nov 2006
Q10 · The table shows the retail prices index for four countries for years 2 and 3 9708/11 May/June 2007
24 The table shows the retail prices index for four countries for years 2 and 3. (Year 1 index = 100 for all countries.) Which country had a higher rate of inflation in year 2 than year 3? country year 2 index year 3 index A 100 115 B 110 132 C 120 144 D 130 150
1 marks
Answer: D
This question in 9708/11 May/June 2007
Q11 · Which combination is likely to result from demand-pull inflation? 9708/11 May/June 2007
25 Which combination is likely to result from demand-pull inflation? balance of trade profits A worsening rising B improving rising C worsening falling D improving falling
1 marks
Answer: A
This question in 9708/11 May/June 2007
Q12 · What would be likely to increase inflation in an economy? 9708/11 May/June 2007
26 What would be likely to increase inflation in an economy? A an increase in consumer saving B an increase in interest rates C an increase in labour productivity D an increase in taxes on imports
1 marks
Answer: D
This question in 9708/11 May/June 2007
Q13 · In the UK in the summer of 2002 the Euro was worth £0.62 9708/11 May/June 2007
29 In the UK in the summer of 2002 the Euro was worth £0.62. In the summer of 2003 the Euro was worth £0.72. How was this change likely to have affected the UK? A higher demand for imports B higher imported inflation C higher priced exports D higher unemployment
1 marks
Answer: B
This question in 9708/11 May/June 2007
Q14 · A country experienced an annual inflation rate of 4 % for three successive years 9708/11 Oct/Nov 2007
25 A country experienced an annual inflation rate of 4 % for three successive years. Which statement is correct for the three-year period? A The price level rose by 12 %. B The price level rose by more than 12 %. C The real value of money rose by 12 %. D The real value of money rose by more than 12 %.
1 marks
Answer: B
This question in 9708/11 Oct/Nov 2007
Q15 · What would be likely to decrease inflation in an economy? 9708/11 Oct/Nov 2007
26 What would be likely to decrease inflation in an economy? A an increase in consumer spending B an increase in employment C an increase in labour productivity D an increase in taxes on imports
1 marks
Answer: C
This question in 9708/11 Oct/Nov 2007
Q16 · A country’s Consumer Price Index increased from 100 to 200 over a five-year period 9708/11 May/June 2008
24 A country’s Consumer Price Index increased from 100 to 200 over a five-year period. What can be deduced from this? A The economy experienced creeping inflation. B The standard of living halved. C The cost of living fell by 50 %. D The purchasing power of money halved.
1 marks
Answer: D
This question in 9708/11 May/June 2008
Q17 · Before 1999 the Brazilian government did not have a desired target rate of inflation 9708/11 May/June 2008
25 Before 1999 the Brazilian government did not have a desired target rate of inflation. From 1999 it set target rates within an upper and lower boundary. The diagram shows the rate of inflation between 1994 and 2003 and the target rate between 1999 and 2003. Inflation and inflation targets in Brazil, 1994 to 2003 916 % 30 government target 25 and range 20 rate of inflation 15 10 5 0 1994 95 96 97 98 99 2000 01 02 03 What can be concluded from the diagram? A The Brazilian government achieved its target in each year from 1999 to 2003. B The inflation target was continuously reduced. C The lowest level of inflation was achieved when an inflation target was used. D The inflation rate was more stable after inflation targets were introduced.
1 marks
Answer: D
This question in 9708/11 May/June 2008
Q18 · The figures were taken from the consumer price indices of retail prices for three… 9708/11 Oct/Nov 2008
24 The figures were taken from the consumer price indices of retail prices for three countries. country 2006 2007 X 100 120 Y 140 150 Z 90 99 Between 2006 and 2007, what is correct? A Country X has the highest growth in the purchasing power of money. B Country Y has the highest growth in the purchasing power of money. C Country Z has the lowest rate of inflation. D Country Y has the lowest rate of inflation.
1 marks
Answer: D
This question in 9708/11 Oct/Nov 2008
Q19 · What is correct about the causes of inflation? 9708/11 Oct/Nov 2008
25 What is correct about the causes of inflation? A Cost-push inflation can be caused by a rising exchange rate. B Cost-push inflation can be caused by lower indirect taxes. C Demand-pull inflation can be caused by a rising exchange rate. D Demand-pull inflation can be caused by lower direct taxes.
1 marks
Answer: D
This question in 9708/11 Oct/Nov 2008
Q20 · What is the average weighted price change illustrated by the table below? 9708/11 May/June 2009
24 What is the average weighted price change illustrated by the table below? percentage of income price change product spent on product % P 10 +8 Q 15 +6 R 25 +4 S 50 –9 A 9.0 % B 7.2 % C 4.5 % D –1.8 %
1 marks
Answer: D
This question in 9708/11 May/June 2009
Q21 · The diagram shows the annual rate of inflation in a country between 2000 and 2003 9708/11 May/June 2009
25 The diagram shows the annual rate of inflation in a country between 2000 and 2003. 10 8 6 rate of inflation % 4 2 0 2000 2001 2002 2003 year Which statement is true of the period 2000 to 2003? A The cost of living fell. B The price level rose. C The Retail Prices Index fell. D The value of money rose.
1 marks
Answer: B
This question in 9708/11 May/June 2009
Q22 · The graphs show consumer prices and employment for Ireland 9708/11 Oct/Nov 2009
24 The graphs show consumer prices and employment for Ireland. 4 3 consumer prices % increase on a 2 year earlier 1 0 2002 03 04 05 06 07 7.0 6.0 unemployment as % of 5.0 labour force 4.0 2002 03 04 05 06 07 What can be concluded from the graphs? A Between 2003 and 2004, unemployment and prices moved in the same direction. B Prices were at their lowest in 2004. C Prices rose continuously over the period. D The number of unemployed workers fell over the period.
1 marks
Answer: C
This question in 9708/11 Oct/Nov 2009
Q23 · What may cause cost-push inflation? 9708/11 Oct/Nov 2009
25 What may cause cost-push inflation? A an appreciation of the exchange rate B a higher level of consumption C an increase in labour productivity D an increase in trade union power
1 marks
Answer: D
This question in 9708/11 Oct/Nov 2009
Q24 · What may cause cost-push inflation? 9708/12 Oct/Nov 2009
23 What may cause cost-push inflation? A an appreciation of the exchange rate B a higher level of consumption C an increase in labour productivity D an increase in trade union power
1 marks
Answer: D
This question in 9708/12 Oct/Nov 2009
Q25 · The graphs show consumer prices and employment for Ireland 9708/12 Oct/Nov 2009
24 The graphs show consumer prices and employment for Ireland. 4 3 consumer prices % increase on a 2 year earlier 1 0 2002 03 04 05 06 07 7.0 6.0 unemployment as % of 5.0 labour force 4.0 2002 03 04 05 06 07 What can be concluded from the graphs? A Between 2003 and 2004, unemployment and prices moved in the same direction. B Prices were at their lowest in 2004. C Prices rose continuously over the period. D The number of unemployed workers fell over the period.
1 marks
Answer: C
This question in 9708/12 Oct/Nov 2009
Q26 · The average consumer divides his expenditure between food, accommodation and clothing in… 9708/11 May/June 2010
24 The average consumer divides his expenditure between food, accommodation and clothing in the ratio 5 : 3 : 2. During the course of a year, the price of food rises by 10 %, the price of accommodation remains constant and the price of clothing falls by 5 %. What is the increase in the Consumer Price Index over the year? A 2.5 % B 4 % C 5 % D 6 %
1 marks
Answer: B
This question in 9708/11 May/June 2010
Q27 · Which statement about inflation is correct? 9708/11 May/June 2010
25 Which statement about inflation is correct? A Cost-push inflation is likely to occur when the government increases its expenditure. B Demand-pull inflation is likely to occur when the country’s exchange rate appreciates. C The Quantity Theory of Money predicts that changes in money supply can cause inflation. D When inflation is unanticipated real values remain unchanged.
1 marks
Answer: C
This question in 9708/11 May/June 2010
Q28 · The table shows a country’s rate of inflation for four years 9708/11 May/June 2010
26 The table shows a country’s rate of inflation for four years. rate of inflation year % 2005 4.0 2006 3.0 2007 2.5 2008 2.0 What fell between 2005 and 2008? A average prices B the cost of living C the exchange rate D the value of money
1 marks
Answer: D
This question in 9708/11 May/June 2010
Q29 · The average consumer divides his expenditure between food, accommodation and clothing in… 9708/12 May/June 2010
23 The average consumer divides his expenditure between food, accommodation and clothing in the ratio 5 : 3 : 2. During the course of a year, the price of food rises by 10 %, the price of accommodation remains constant and the price of clothing falls by 5 %. What is the increase in the Consumer Price Index over the year? A 2.5 % B 4 % C 5 % D 6 %
1 marks
Answer: B
This question in 9708/12 May/June 2010
Q30 · Which statement about inflation is correct? 9708/12 May/June 2010
24 Which statement about inflation is correct? A Cost-push inflation is likely to occur when the government increases its expenditure. B Demand-pull inflation is likely to occur when the country’s exchange rate appreciates. C The Quantity Theory of Money predicts that changes in money supply can cause inflation. D When inflation is unanticipated real values remain unchanged.
1 marks
Answer: C
This question in 9708/12 May/June 2010
Q31 · The table shows a country’s rate of inflation for four years 9708/12 May/June 2010
25 The table shows a country’s rate of inflation for four years. rate of inflation year % 2005 4.0 2006 3.0 2007 2.5 2008 2.0 What fell between 2005 and 2008? A average prices B the cost of living C the exchange rate D the value of money
1 marks
Answer: D
This question in 9708/12 May/June 2010
Q32 · The average consumer divides his expenditure between food, accommodation and clothing in… 9708/13 May/June 2010
22 The average consumer divides his expenditure between food, accommodation and clothing in the ratio 5 : 3 : 2. During the course of a year, the price of food rises by 10 %, the price of accommodation remains constant and the price of clothing falls by 5 %. What is the increase in the Consumer Price Index over the year? A 2.5 % B 4 % C 5 % D 6 %
1 marks
Answer: B
This question in 9708/13 May/June 2010
Q33 · Which statement about inflation is correct? 9708/13 May/June 2010
23 Which statement about inflation is correct? A Cost-push inflation is likely to occur when the government increases its expenditure. B Demand-pull inflation is likely to occur when the country’s exchange rate appreciates. C The Quantity Theory of Money predicts that changes in money supply can cause inflation. D When inflation is unanticipated real values remain unchanged.
1 marks
Answer: C
This question in 9708/13 May/June 2010
Q34 · The table shows a country’s rate of inflation for four years 9708/13 May/June 2010
24 The table shows a country’s rate of inflation for four years. rate of inflation year % 2005 4.0 2006 3.0 2007 2.5 2008 2.0 What fell between 2005 and 2008? A average prices B the cost of living C the exchange rate D the value of money
1 marks
Answer: D
This question in 9708/13 May/June 2010
Q35 · The table shows the percentage price changes in some items in the UK Consumer Price Index… 9708/11 Oct/Nov 2010
24 The table shows the percentage price changes in some items in the UK Consumer Price Index (CPI) in the year to 1 June 2006. item % change in price rents, electricity and gas 9.0 education 4.7 transport 4.0 restaurants and hotels 3.2 health services 2.9 The increase in the overall CPI over the same period was 2.5 %. What can be concluded from the data above? A The CPI is not an accurate measure of inflation. B Some prices must have fallen. C The average price increase of other items was less than 2.5 %. D The real value of money rose by more than 2.5 %.
1 marks
Answer: C
This question in 9708/11 Oct/Nov 2010
Q36 · In Year 1 the price of a barrel of oil increased from $60 to $110 9708/11 Oct/Nov 2010
25 In Year 1 the price of a barrel of oil increased from $60 to $110. In Year 2 there was a further increase to $115 a barrel. Assume that oil price changes have an immediate impact on the general level of prices. What will be the effect of the changes in the oil price on a country’s Consumer Price Index and on its inflation rate in Year 2 compared with Year 1? effect on the effect on the Consumer Price Index rate of inflation A decrease decrease B decrease increase C increase decrease D increase increase
1 marks
Answer: C
This question in 9708/11 Oct/Nov 2010
Q37 · The table shows the percentage price changes in some items in the UK Consumer Price Index… 9708/12 Oct/Nov 2010
24 The table shows the percentage price changes in some items in the UK Consumer Price Index (CPI) in the year to 1 June 2006. item % change in price rents, electricity and gas 9.0 education 4.7 transport 4.0 restaurants and hotels 3.2 health services 2.9 The increase in the overall CPI over the same period was 2.5 %. What can be concluded from the data above? A The CPI is not an accurate measure of inflation. B Some prices must have fallen. C The average price increase of other items was less than 2.5 %. D The real value of money rose by more than 2.5 %.
1 marks
Answer: C
This question in 9708/12 Oct/Nov 2010
Q38 · In Year 1 the price of a barrel of oil increased from $60 to $110 9708/12 Oct/Nov 2010
25 In Year 1 the price of a barrel of oil increased from $60 to $110. In Year 2 there was a further increase to $115 a barrel. Assume that oil price changes have an immediate impact on the general level of prices. What will be the effect of the changes in the oil price on a country’s Consumer Price Index and on its inflation rate in Year 2 compared with Year 1? effect on the effect on the Consumer Price Index rate of inflation A decrease decrease B decrease increase C increase decrease D increase increase
1 marks
Answer: C
This question in 9708/12 Oct/Nov 2010
Q39 · The table shows the percentage price changes in some items in the UK Consumer Price Index… 9708/13 Oct/Nov 2010
23 The table shows the percentage price changes in some items in the UK Consumer Price Index (CPI) in the year to 1 June 2006. item % change in price rents, electricity and gas 9.0 education 4.7 transport 4.0 restaurants and hotels 3.2 health services 2.9 The increase in the overall CPI over the same period was 2.5 %. What can be concluded from the data above? A The CPI is not an accurate measure of inflation. B Some prices must have fallen. C The average price increase of other items was less than 2.5 %. D The real value of money rose by more than 2.5 %.
1 marks
Answer: C
This question in 9708/13 Oct/Nov 2010
Q40 · In Year 1 the price of a barrel of oil increased from $60 to $110 9708/13 Oct/Nov 2010
24 In Year 1 the price of a barrel of oil increased from $60 to $110. In Year 2 there was a further increase to $115 a barrel. Assume that oil price changes have an immediate impact on the general level of prices. What will be the effect of the changes in the oil price on a country’s Consumer Price Index and on its inflation rate in Year 2 compared with Year 1? effect on the effect on the Consumer Price Index rate of inflation A decrease decrease B decrease increase C increase decrease D increase increase
1 marks
Answer: C
This question in 9708/13 Oct/Nov 2010
Q41 · The table shows inflation rates, unemployment rates and changes in money wage rates… 9708/11 May/June 2011
23 The table shows inflation rates, unemployment rates and changes in money wage rates between 2008 and 2009 for a number of countries. inflation unemployment money wages country % % % France +0.2 9.4 +3.0 Germany +0.2 8.3 +2.7 UK +1.8 7.8 +2.5 US –0.3 9.4 +2.5 What can be concluded from the table? A On average, those in employment in the UK had an increase in real incomes. B The same number of people were unemployed in the US and France. C The same product would have the same price in France and Germany. D Unemployment was highest where inflation was highest.
1 marks
Answer: A
This question in 9708/11 May/June 2011
Q42 · The diagram compares the inflation rates of Paraguay and Argentina between 1950 and 2005 9708/11 May/June 2011
24 The diagram compares the inflation rates of Paraguay and Argentina between 1950 and 2005. 120 100 key 80 inflation Paraguay 60 (%) Argentina 40 20 0 1950 1955 1960 1965 1970 1975 1980 1985 1990 1995 2000 2005 What can be concluded about inflation rates in the two countries in the period 1950 to 2005? A Argentina’s prices fell rapidly between 1992 and 1995. B Argentina stabilised its price level between 1973 and 1992. C Paraguay was always more successful than Argentina at controlling its inflation rate. D Paraguay was most successful at controlling its inflation rate between 1962 and 1970.
1 marks
Answer: D
This question in 9708/11 May/June 2011
Q43 · Over a period of a year, the annual rate of inflation falls from 10 % to 6 % 9708/11 May/June 2011
25 Over a period of a year, the annual rate of inflation falls from 10 % to 6 %. Which statement is correct? A The cost of living has increased. B The purchasing power of money has increased. C There has been a reduction in the Retail Price Index. D The standard of living has increased.
1 marks
Answer: A
This question in 9708/11 May/June 2011
Q44 · The table shows inflation rates, unemployment rates and changes in money wage rates… 9708/12 May/June 2011
22 The table shows inflation rates, unemployment rates and changes in money wage rates between 2008 and 2009 for a number of countries. inflation unemployment money wages country % % % France +0.2 9.4 +3.0 Germany +0.2 8.3 +2.7 UK +1.8 7.8 +2.5 US –0.3 9.4 +2.5 What can be concluded from the table? A On average, those in employment in the UK had an increase in real incomes. B The same number of people were unemployed in the US and France. C The same product would have the same price in France and Germany. D Unemployment was highest where inflation was highest.
1 marks
Answer: A
This question in 9708/12 May/June 2011
Q45 · The diagram compares the inflation rates of Paraguay and Argentina between 1950 and 2005 9708/12 May/June 2011
23 The diagram compares the inflation rates of Paraguay and Argentina between 1950 and 2005. 120 100 key 80 inflation Paraguay 60 (%) Argentina 40 20 0 1950 1955 1960 1965 1970 1975 1980 1985 1990 1995 2000 2005 What can be concluded about inflation rates in the two countries in the period 1950 to 2005? A Argentina’s prices fell rapidly between 1992 and 1995. B Argentina stabilised its price level between 1973 and 1992. C Paraguay was always more successful than Argentina at controlling its inflation rate. D Paraguay was most successful at controlling its inflation rate between 1962 and 1970.
1 marks
Answer: D
This question in 9708/12 May/June 2011
Q46 · Over a period of a year, the annual rate of inflation falls from 10 % to 6 % 9708/12 May/June 2011
24 Over a period of a year, the annual rate of inflation falls from 10 % to 6 %. Which statement is correct? A The cost of living has increased. B The purchasing power of money has increased. C There has been a reduction in the Retail Price Index. D The standard of living has increased.
1 marks
Answer: A
This question in 9708/12 May/June 2011
Q47 · The table shows inflation rates, unemployment rates and changes in money wage rates… 9708/13 May/June 2011
21 The table shows inflation rates, unemployment rates and changes in money wage rates between 2008 and 2009 for a number of countries. inflation unemployment money wages country % % % France +0.2 9.4 +3.0 Germany +0.2 8.3 +2.7 UK +1.8 7.8 +2.5 US –0.3 9.4 +2.5 What can be concluded from the table? A On average, those in employment in the UK had an increase in real incomes. B The same number of people were unemployed in the US and France. C The same product would have the same price in France and Germany. D Unemployment was highest where inflation was highest.
1 marks
Answer: A
This question in 9708/13 May/June 2011
Q48 · The diagram compares the inflation rates of Paraguay and Argentina between 1950 and 2005 9708/13 May/June 2011
22 The diagram compares the inflation rates of Paraguay and Argentina between 1950 and 2005. 120 100 key 80 inflation Paraguay 60 (%) Argentina 40 20 0 1950 1955 1960 1965 1970 1975 1980 1985 1990 1995 2000 2005 What can be concluded about inflation rates in the two countries in the period 1950 to 2005? A Argentina’s prices fell rapidly between 1992 and 1995. B Argentina stabilised its price level between 1973 and 1992. C Paraguay was always more successful than Argentina at controlling its inflation rate. D Paraguay was most successful at controlling its inflation rate between 1962 and 1970.
1 marks
Answer: D
This question in 9708/13 May/June 2011
Q49 · Over a period of a year, the annual rate of inflation falls from 10 % to 6 % 9708/13 May/June 2011
23 Over a period of a year, the annual rate of inflation falls from 10 % to 6 %. Which statement is correct? A The cost of living has increased. B The purchasing power of money has increased. C There has been a reduction in the Retail Price Index. D The standard of living has increased.
1 marks
Answer: A
This question in 9708/13 May/June 2011
Q50 · The table shows the annual percentage change in an index of prices 9708/11 Oct/Nov 2011
24 The table shows the annual percentage change in an index of prices. country 2008 2009 China 6.3 –1.2 Pakistan 24.3 11.2 Saudi Arabia 10.9 10.7 United States 5.6 –1.4 What can be concluded from the table? A Prices were lowest in the United States in both 2008 and 2009. B Prices were most stable in Saudi Arabia. C The fall in inflation between 2008 and 2009 was greater in China than Saudi Arabia. D The price of all products sold by Chinese firms fell in 2009.
1 marks
Answer: C
This question in 9708/11 Oct/Nov 2011
Q51 · Which combination is likely to result from demand-pull inflation? 9708/11 Oct/Nov 2011
25 Which combination is likely to result from demand-pull inflation? balance of trade profits A improving falling B improving rising C worsening falling D worsening rising
1 marks
Answer: D
This question in 9708/11 Oct/Nov 2011
Q52 · The average consumer divides his expenditure between food, clothing, accommodation and… 9708/12 Oct/Nov 2011
24 The average consumer divides his expenditure between food, clothing, accommodation and transport in the ratio 2 : 1 : 4 : 3. During the course of a year, the price of food falls by 2 %, the price of clothing increases by 4 %, the price of accommodation increases by 10 % and the price of transport remains constant. Assuming that the weights of a price index reflect the expenditure of the average consumer, what is the increase in the index over the year? A 2.5 % B 4 % C 10 % D 12 %
1 marks
Answer: B
This question in 9708/12 Oct/Nov 2011
Q53 · At the start of 2009, a worker earned $100 a week 9708/12 Oct/Nov 2011
25 At the start of 2009, a worker earned $100 a week. In 2009, the Retail Price Index (RPI) rose 4 % and his average wage rose 7 %. In 2010, the RPI fell 3 % and his wage fell 2 %. What happened to his real wage between the start of 2009 and the end of 2010? A It fell by less than 5 %. B It fell by more than 5 %. C It rose by less than 5 %. D It rose by more than 5 %.
1 marks
Answer: C
This question in 9708/12 Oct/Nov 2011
Q54 · The table shows the annual percentage change in an index of prices 9708/13 Oct/Nov 2011
22 The table shows the annual percentage change in an index of prices. country 2008 2009 China 6.3 –1.2 Pakistan 24.3 11.2 Saudi Arabia 10.9 10.7 United States 5.6 –1.4 What can be concluded from the table? A Prices were lowest in the United States in both 2008 and 2009. B Prices were most stable in Saudi Arabia. C The fall in inflation between 2008 and 2009 was greater in China than Saudi Arabia. D The price of all products sold by Chinese firms fell in 2009.
1 marks
Answer: C
This question in 9708/13 Oct/Nov 2011
Q55 · Which combination is likely to result from demand-pull inflation? 9708/13 Oct/Nov 2011
23 Which combination is likely to result from demand-pull inflation? balance of trade profits A improving falling B improving rising C worsening falling D worsening rising
1 marks
Answer: D
This question in 9708/13 Oct/Nov 2011
Q56 · In which year did the real value of money rise? 9708/11 May/June 2012
24 In which year did the real value of money rise? Price Index year (base year 2001) A 2002 100 B 2003 104 C 2004 104 D 2005 103
1 marks
Answer: D
This question in 9708/11 May/June 2012
Q57 · Before 1999 the Brazilian government did not have a desired target rate of inflation 9708/11 May/June 2012
26 Before 1999 the Brazilian government did not have a desired target rate of inflation. From 1999 it set target rates within an upper and lower boundary. The diagram shows the rate of inflation between 1994 and 2003 and the target rate between 1999 and 2003. Inflation and inflation targets in Brazil, 1994 to 2003 916 % 30 government target 25 and range 20 rate of inflation 15 10 5 0 1994 95 96 97 98 99 2000 01 02 03 What can be concluded from the diagram? A The Brazilian government achieved its target in each year from 1999 to 2003. B The inflation target was continuously reduced. C The lowest level of inflation was achieved when an inflation target was used. D The inflation rate was more stable after inflation targets were introduced.
1 marks
Answer: D
This question in 9708/11 May/June 2012
Q58 · The figures show the Consumer Price Index (CPI) of a country 9708/12 May/June 2012
24 The figures show the Consumer Price Index (CPI) of a country. (1990 = 100) CPI 2007 200 2008 204 2009 206 2010 209 What can be deduced from the data? A There was hyperinflation between 1990 and 2007. B The rate of inflation rose in 2009. C The rate of inflation in 2008 was 4 %. D The country experienced inflation in each year from 2008 to 2010.
1 marks
Answer: D
This question in 9708/12 May/June 2012
Q59 · In which year did the real value of money rise? 9708/13 May/June 2012
24 In which year did the real value of money rise? Price Index year (base year 2001) A 2002 100 B 2003 104 C 2004 104 D 2005 103
1 marks
Answer: D
This question in 9708/13 May/June 2012
Q60 · The table shows the price indices and weights for the three commodity groups that make up… 9708/13 May/June 2012
25 The table shows the price indices and weights for the three commodity groups that make up the calculation of a country’s consumer price index. commodity index weight group X 400 5 Y 120 3 Z 80 2 By how much has the cost of living increased since the base year? A 52 % B 60 % C 152 % D 520 %
1 marks
Answer: C
This question in 9708/13 May/June 2012
Q61 · Before 1999 the Brazilian government did not have a desired target rate of inflation 9708/13 May/June 2012
26 Before 1999 the Brazilian government did not have a desired target rate of inflation. From 1999 it set target rates within an upper and lower boundary. The diagram shows the rate of inflation between 1994 and 2003 and the target rate between 1999 and 2003. Inflation and inflation targets in Brazil, 1994 to 2003 916 % 30 government target 25 and range 20 rate of inflation 15 10 5 0 1994 95 96 97 98 99 2000 01 02 03 What can be concluded from the diagram? A The Brazilian government achieved its target in each year from 1999 to 2003. B The inflation target was continuously reduced. C The lowest level of inflation was achieved when an inflation target was used. D The inflation rate was more stable after inflation targets were introduced.
1 marks
Answer: D
This question in 9708/13 May/June 2012
Q62 · Which statement about a rise in the general price level in a country is correct? 9708/11 Oct/Nov 2012
24 Which statement about a rise in the general price level in a country is correct? A It is likely to create economic winners and losers in the country. B It is unacceptable to modern governments. C It means that no goods have fallen in price. D It must make the average citizen poorer.
1 marks
Answer: A
This question in 9708/11 Oct/Nov 2012
Q63 · The table shows detail of the nominal interest rate and the inflation rate for selected… 9708/11 Oct/Nov 2012
25 The table shows detail of the nominal interest rate and the inflation rate for selected countries in July 2010. nominal country inflation rate interest rate China 2.5 2.9 India 5.7 13.9 Indonesia 7.0 5.0 Japan 0.2 –1.1 Pakistan 12.3 12.7 What can be concluded from this information? A The cost of living was higher in India than in China. B The money rate of interest was higher in Indonesia than in Pakistan. C The real rate of interest was positive in Japan but negative in Pakistan. D The standard of living was higher in Indonesia than in India.
1 marks
Answer: C
This question in 9708/11 Oct/Nov 2012
Q64 · The table gives some information on inflation rates, unemployment rates, and changes in… 9708/12 Oct/Nov 2012
23 The table gives some information on inflation rates, unemployment rates, and changes in wages for a number of countries in 2006. annual inflation rate unemployment change in country % rate % wages % Britain +1.9 +5.0 +3.5 Germany +2.1 +11.3 +0.8 Italy +2.1 +7.5 +2.3 Japan +0.5 +4.5 –0.6 Spain +4.0 +8.4 +2.5 What can be concluded from the table about 2006? A Britain had an increase in real incomes. B High wage rises caused high rates of inflation. C The price of an identical product was the same in Germany and Italy. D There were more people unemployed in Spain than in Japan.
1 marks
Answer: A
This question in 9708/12 Oct/Nov 2012
Q65 · The data given below refers to money supply and prices in the years 2006 and 2010 in four… 9708/12 Oct/Nov 2012
25 The data given below refers to money supply and prices in the years 2006 and 2010 in four countries. Between 2006 and 2010, in which country was the rate of inflation the highest? 2006 2010 Country money supply price index money supply price index ($ million) (2005 = 100) ($ million) (2005 = 100) A 69 104 78 153 B 65 112 120 247 C 70 101 213 157 D 172 105 360 210
1 marks
Answer: B
This question in 9708/12 Oct/Nov 2012
Q66 · A sudden rise in the price of imported oil caused the annual rate of inflation in a given… 9708/12 Oct/Nov 2012
26 A sudden rise in the price of imported oil caused the annual rate of inflation in a given period to be higher than expected. What might be a likely result of this? A Borrowers would gain. B Real wages would rise. C The balance of trade would improve. D Unemployment would fall.
1 marks
Answer: A
This question in 9708/12 Oct/Nov 2012
Q67 · The graph shows a country’s average annual inflation rate over a five year period 9708/13 Oct/Nov 2012
25 The graph shows a country’s average annual inflation rate over a five year period. average annual inflation rate (%) 1 2 3 4 5 year What can be concluded about the general price level during the five years? A It fell in only one year. B It fell in only two years. C It rose in only two years. D It was constant in only one year.
1 marks
Answer: A
This question in 9708/13 Oct/Nov 2012
Q68 · The table shows the annual rate of inflation in the UK between 2005 and 2010 measured by… 9708/11 May/June 2013
24 The table shows the annual rate of inflation in the UK between 2005 and 2010 measured by the retail price index (RPI) and the consumer price index (CPI). year RPI (%) CPI (%) 2005 2.8 2.1 2006 3.2 2.3 2007 4.3 2.3 2008 4.0 3.6 2009 –0.5 2.2 2010 4.6 3.6 What is a correct conclusion from the table? A The RPI and the CPI both record a fall at some time in the general price level in the UK. B The RPI and the CPI both show the same direction of change in inflation in each year. C The RPI records a lower rate of total inflation for the whole period than the CPI. D The RPI records a more unstable rate of inflation than the CPI.
1 marks
Answer: D
This question in 9708/11 May/June 2013
Q69 · The diagram shows the annual rate of inflation in a country between 2006 and 2009 9708/11 May/June 2013
25 The diagram shows the annual rate of inflation in a country between 2006 and 2009. 10 8 6 rate of inflation % 4 2 0 2006 2007 2008 2009 year Which statement about the period 2006 to 2009 is correct? A The cost of living fell. B The price level rose. C The Retail Prices Index fell. D The value of money rose.
1 marks
Answer: B
This question in 9708/11 May/June 2013
Q70 · The exchange rate of the Mexican peso against the US$ changed from 10 pesos = 1 US$ to 9… 9708/12 May/June 2013
24 The exchange rate of the Mexican peso against the US$ changed from 10 pesos = 1 US$ to 9 pesos = 1 US$. During the same period, the general price level in Mexico fell by 10% while the US price level remained unchanged. What happened to the nominal and real exchange rate of the peso against the US$? nominal peso real peso exchange rate exchange rate A appreciated appreciated B appreciated unchanged C depreciated depreciated D depreciated unchanged
1 marks
Answer: B
This question in 9708/12 May/June 2013
Q71 · The table shows an index number of prices between 2009 and 2012 9708/12 May/June 2013
25 The table shows an index number of prices between 2009 and 2012. In the base year of 2008, inflation was 2% per annum. What was the first year in which the rate of inflation fell? year price index A 2009 103 B 2010 104 C 2011 104 D 2012 101
1 marks
Answer: B
This question in 9708/12 May/June 2013
Q72 · What will be the probable effect of an increase in indirect taxes on demand-pull… 9708/12 May/June 2013
26 What will be the probable effect of an increase in indirect taxes on demand-pull inflation and on cost-push inflation? demand-pull cost-push inflation inflation A increase increase B increase decrease C decrease decrease D decrease increase
1 marks
Answer: D
This question in 9708/12 May/June 2013
Q73 · A country experienced an annual inflation rate of 2% for four successive years 9708/13 May/June 2013
25 A country experienced an annual inflation rate of 2% for four successive years. Which statement is correct for the four-year period? A The price level rose by 8%. B The price level rose by more than 8%. C The real value of money rose by 8%. D The real value of money rose by more than 8%.
1 marks
Answer: B
This question in 9708/13 May/June 2013
Q74 · In 2010 it was reported that there were concerns when a government kept interest rates… 9708/13 May/June 2013
26 In 2010 it was reported that there were concerns when a government kept interest rates very low despite a threat of inflation. Why might the government’s policy have caused concern at this time? A Low interest rates encourage increased consumer spending. B Low interest rates lead to increased spending on capital equipment. C Low interest rates mean imports will increase. D Low interest rates will cause an increase in the exchange rate.
1 marks
Answer: A
This question in 9708/13 May/June 2013
Q75 · The diagram shows the aggregate demand (AD) and short-run aggregate supply (SRAS) for an… 9708/11 Oct/Nov 2013
24 The diagram shows the aggregate demand (AD) and short-run aggregate supply (SRAS) for an economy with a price level OP. SRAS price P level AD O real output Which combination of events would definitely cause a rise in the general price level? world commodity domestic prices unemployment A decrease decrease B decrease increase C increase decrease D increase increase
1 marks
Answer: C
This question in 9708/11 Oct/Nov 2013
Q76 · It is anticipated that the rate of inflation in a country will continue to rise 9708/11 Oct/Nov 2013
25 It is anticipated that the rate of inflation in a country will continue to rise. What is most likely to increase as a result? A balance of payments surplus B confidence in fixed interest bonds C individuals’ need for cash balances D the real value of money
1 marks
Answer: C
This question in 9708/11 Oct/Nov 2013
Q77 · The diagram illustrates what happens to aggregate demand (AD) and aggregate supply (AS)… 9708/12 Oct/Nov 2013
24 The diagram illustrates what happens to aggregate demand (AD) and aggregate supply (AS) in an economy during a year. AS general P1 price level P AD1 AD O Q Q1 real output What explains the rise in the general price level? A boom in consumer spending B higher taxes on company profits C reduction in government-financed projects D rising costs of raw materials
1 marks
Answer: A
This question in 9708/12 Oct/Nov 2013
Q78 · What would increase both demand-pull and cost-push inflation? 9708/12 Oct/Nov 2013
25 What would increase both demand-pull and cost-push inflation? A an appreciation of a country’s currency B an increase in the cost of borrowing C an increase in the level of its import tariffs D an increase in the price of oil
1 marks
Answer: C
This question in 9708/12 Oct/Nov 2013
Q79 · The graph shows the annual percentage change in the prices of services and in the prices… 9708/13 Oct/Nov 2013
25 The graph shows the annual percentage change in the prices of services and in the prices of goods between 2007 and 2012. 10 8 6 services % annual 4 price change 2 0 2007 2008 2009 2010 2011 2012 –2 goods –4 What can be deduced from the graph? A On average the price of services was higher than the price of goods throughout the period. B The average price of goods was higher in 2012 than in 2010. C The average price of services was higher in 2012 than in 2010. D There was a fall in the general price level between 2008 and 2010.
1 marks
Answer: C
This question in 9708/13 Oct/Nov 2013
Q80 · The table shows an index of consumer prices (2005 = 100) for a number of countries for… 9708/11 May/June 2014
25 The table shows an index of consumer prices (2005 = 100) for a number of countries for 2009, 2010 and 2011. 2009 2010 2011 Canada 107.8 108.9 112.0 Greece 111.9 117.2 121.1 India 135.2 151.4 164.8 Japan 100.3 99.6 99.3 Portugal 107.4 108.9 112.9 Switzerland 104.3 104.5 104.7 Which statement about the period 2009 to 2011 is not correct? A Prices fell in Japan. B Prices increased in Switzerland. C Prices rose more in Greece than in India. D Prices rose more in Portugal than in Canada.
1 marks
Answer: C
This question in 9708/11 May/June 2014
Q81 · In what circumstances will money lose its value? 9708/11 May/June 2014
26 In what circumstances will money lose its value? A The economy experiences a period of deflation. B The general level of prices is falling. C The growth of money supply falls below the growth of output. D The rate of inflation is positive.
1 marks
Answer: D
This question in 9708/11 May/June 2014
Q82 · The table shows a country’s rate of inflation for four years 9708/12 May/June 2014
25 The table shows a country’s rate of inflation for four years. rate of inflation year % 2009 4.0 2010 3.0 2011 2.5 2012 2.0 What fell between 2009 and 2012? A average prices B the cost of living C the exchange rate D the value of money
1 marks
Answer: D
This question in 9708/12 May/June 2014
Q83 · What is not a possible cause of cost-push inflation? 9708/12 May/June 2014
26 What is not a possible cause of cost-push inflation? A an increase in firms’ profit margins B an increase in raw material prices C an increase in the supply of money D an increase in trade union power
1 marks
Answer: C
This question in 9708/12 May/June 2014
Q84 · The table shows the changes in the general price level of four countries over three years… 9708/13 May/June 2014
24 The table shows the changes in the general price level of four countries over three years expressed as index numbers. Which country experienced a constant rate of fall in the real value of money? year 1 year 2 year 3 A 100 80 60 B 100 90 81 C 100 108 116 D 100 120 144
1 marks
Answer: D
This question in 9708/13 May/June 2014
Q85 · In Year 1 the price of a barrel of oil increased from $60 to $110 9708/13 May/June 2014
25 In Year 1 the price of a barrel of oil increased from $60 to $110. In Year 2 there was a further increase to $115 a barrel. Assume that oil price changes have an immediate impact on the general level of prices and that their Consumer Price Index weightings remains unchanged. What will be the effect of the changes in the oil price on a country’s Consumer Price Index and on its inflation rate in Year 2 compared with Year 1? effect on the effect on the Consumer Price Index rate of inflation A decrease decrease B decrease increase C increase decrease D increase increase
1 marks
Answer: C
This question in 9708/13 May/June 2014
Q86 · The table shows an index of consumer prices (2005 = 100) for a number of countries for… 9708/11 Oct/Nov 2014
25 The table shows an index of consumer prices (2005 = 100) for a number of countries for 2009, 2010 and 2011. Which country experienced the lowest rate of fall in the real value of money between 2009 and 2011? 2009 2010 2011 A Canada 107.8 108.9 112.0 B Japan 100.3 99.6 99.3 C Portugal 107.4 108.9 112.9 D Switzerland 104.3 104.5 104.7
1 marks
This question in 9708/11 Oct/Nov 2014
Q87 · National inflation rates vary widely but they have declined for most countries in recent… 9708/11 Oct/Nov 2014
26 National inflation rates vary widely but they have declined for most countries in recent years. Which combination might best explain this decline in inflation rates? A increased consumer expenditure and tighter control on international trade B increasing international competition and reduced world incomes C low interest rates and expectations of future price increases D protectionist trade measures and a rise in raw material prices
1 marks
This question in 9708/11 Oct/Nov 2014
Q88 · The graph shows the rate of inflation in a country in a 5 year period 9708/12 Oct/Nov 2014
25 The graph shows the rate of inflation in a country in a 5 year period. + rate of inflation 0 % 1 1 2 2 3 4 5 – year What can be concluded from the graph? A The price level fell during two years. B The price level was highest during year 4. C The value of money fell for 5 years. D The value of money rose in 1 year.
1 marks
Answer: D
This question in 9708/12 Oct/Nov 2014
Q89 · Which economic change might contribute to both cost-push and demand-pull inflation? 9708/12 Oct/Nov 2014
28 Which economic change might contribute to both cost-push and demand-pull inflation? A a fall in the exchange rate B a fall in the interest rate C a rise in the productivity of industrial workers D an improvement in the terms of trade
1 marks
Answer: A
This question in 9708/12 Oct/Nov 2014
Q90 · The weighting given to food in the construction of the United Kingdom’s Retail Price… 9708/13 Oct/Nov 2014
23 The weighting given to food in the construction of the United Kingdom’s Retail Price Index fell from 16.7% in 1987 to 11.8% in 2011. What would help to explain this? A The average price of food decreased by 4.9% points between 1987 and 2011. B The demand for food is price inelastic. C The income elasticity of the demand for food is less than one. D There was an increase in the relative price of food over the period.
1 marks
Answer: C
This question in 9708/13 Oct/Nov 2014
Q91 · Which statement about inflation is correct? 9708/13 Oct/Nov 2014
25 Which statement about inflation is correct? A Cost-push inflation is likely to occur when the government increases its expenditure. B Demand-pull inflation is likely to occur when the country’s exchange rate appreciates. C The Quantity Theory of Money predicts that changes in money supply can cause inflation. D When inflation is unanticipated real values remain unchanged.
1 marks
Answer: C
This question in 9708/13 Oct/Nov 2014
Q92 · A country experienced an annual inflation rate of 4% for three successive years 9708/13 Oct/Nov 2014
26 A country experienced an annual inflation rate of 4% for three successive years. Which statement is correct for the three-year period? A The price level rose by 12%. B The price level rose by more than 12%. C The real value of money rose by 12%. D The real value of money rose by more than 12%.
1 marks
Answer: B
This question in 9708/13 Oct/Nov 2014
Q93 · The table shows the CPI rate of inflation (%) in the US from 2006 to 2013 9708/11 May/June 2015
25 The table shows the CPI rate of inflation (%) in the US from 2006 to 2013. 2006 2007 2008 2009 2010 2011 2012 2013 2.5% 4.1% 0.1% 2.7% 1.5% 3.0% 1.7% 2.0% What can be concluded from the figures about the period 2006 to 2013? A There was one year of constant prices. B There were three years of deflation. C There were only four years of inflation. D There were eight years of rising living costs.
1 marks
Answer: D
This question in 9708/11 May/June 2015
Q94 · How might an increase in the general price level lead to a rise in real household… 9708/11 May/June 2015
26 How might an increase in the general price level lead to a rise in real household expenditure? A by increasing the expectations of further price increases B by increasing the level of real household debts C by increasing the level of real wages D by increasing the spending on exports
1 marks
Answer: A
This question in 9708/11 May/June 2015
Q95 · There is a depreciation in a country’s exchange rate 9708/11 May/June 2015
29 There is a depreciation in a country’s exchange rate. If wage costs remain unchanged, what would be the most likely consequence? A a fall in the rate of inflation B an increase in profits of manufacturing exporters C an increase in unemployment D an outflow of foreign direct investment
1 marks
Answer: B
This question in 9708/11 May/June 2015
Q96 · In an economy with an interest rate of 4% per annum, the rate of inflation falls from 5%… 9708/12 May/June 2015
25 In an economy with an interest rate of 4% per annum, the rate of inflation falls from 5% to 3% per annum. What will be a benefit of this fall? A Menu costs will fall to zero. B People on fixed incomes will be better off in real terms. C Savers will gain in real terms. D The purchasing power of the currency will rise.
1 marks
Answer: C
This question in 9708/12 May/June 2015
Q97 · A country increases its labour productivity in the manufacturing industry 9708/13 May/June 2015
23 A country increases its labour productivity in the manufacturing industry. What is least likely to result from this? A higher economic growth B higher levels of exports of manufacturing C lower inflation D lower wage rates in manufacturing
1 marks
Answer: D
This question in 9708/13 May/June 2015
Q98 · What will be the impact on demand-pull inflation and on cost-push inflation of an… 9708/13 May/June 2015
25 What will be the impact on demand-pull inflation and on cost-push inflation of an increase in indirect taxes? demand-pull cost-push inflation inflation A lower lower B lower raise C raise lower D raise raise
1 marks
Answer: B
This question in 9708/13 May/June 2015
Q99 · At the start of 2009, a worker earned US$ 100 a week 9708/13 May/June 2015
26 At the start of 2009, a worker earned US$ 100 a week. In 2009, the Retail Price Index (RPI) rose by 4% and his average wage rose by 7%. In 2010, the RPI fell by 3% and his wage fell by 2%. What happened to his real wage between the start of 2009 and the end of 2010? A It fell by less than 5%. B It fell by more than 5%. C It rose by less than 5%. D It rose by more than 5%.
1 marks
Answer: C
This question in 9708/13 May/June 2015
Q100 · What is the most likely cause of cost-push inflation in an economy? 9708/11 Oct/Nov 2015
25 What is the most likely cause of cost-push inflation in an economy? A an increase in the exchange rate B an increase in the money supply C an increase in the prices of imports D an increase in the rate of income tax
1 marks
Answer: C
This question in 9708/11 Oct/Nov 2015
Q101 · The table shows the consumer price index (CPI) for a country 9708/11 Oct/Nov 2015
26 The table shows the consumer price index (CPI) for a country. year CPI 1 100 2 110 3 105 4 103 5 108 What can be concluded from the table? A Prices fell continuously from year 2 to year 5. B Prices rose between year 1 and year 5. C Prices rose only from year 1 to year 2. D Prices were at their highest in year 5.
1 marks
Answer: B
This question in 9708/11 Oct/Nov 2015
Q102 · In the absence of offsetting changes, what would be likely to increase if a country’s… 9708/11 Oct/Nov 2015
29 In the absence of offsetting changes, what would be likely to increase if a country’s exchange rate appreciates? A the cost of imported consumer goods B the level of domestic inflation C the rate of unemployment D the volume of manufacturing exports
1 marks
Answer: C
This question in 9708/11 Oct/Nov 2015
Q103 · An economy is experiencing accelerating cost-push inflation 9708/12 Oct/Nov 2015
25 An economy is experiencing accelerating cost-push inflation. Which group is likely to be least concerned by this? A borrowers B consumers C creditors D exporters
1 marks
Answer: A
This question in 9708/12 Oct/Nov 2015
Q104 · The table shows the Consumer Price Index (CPI) for a country 9708/12 Oct/Nov 2015
26 The table shows the Consumer Price Index (CPI) for a country. year CPI 2008 100 2009 104 2010 102 2011 105 2012 108 2013 111 Which statement about the period 2008 to 2013 is correct? A Prices increased each year. B Prices increased fastest in 2011. C The rate of inflation was 2% in 2010. D The smallest rise in prices was in 2013.
1 marks
Answer: D
This question in 9708/12 Oct/Nov 2015
Q105 · In June 2013, the Governor of the Bank of Namibia announced that the Central Bank’s… 9708/13 Oct/Nov 2015
25 In June 2013, the Governor of the Bank of Namibia announced that the Central Bank’s lending rate would remain low as long as inflation remained low. What would not lead to a risk of inflation? A increased output in the mining, manufacturing and construction industries B Namibian dollar depreciation against the currencies of its trading partners C severe weather problems that harm crop production D the Namibian Government’s policy of increased public expenditure
1 marks
Answer: A
This question in 9708/13 Oct/Nov 2015
Q106 · The capital value of a non-interest bearing asset is index-linked 9708/13 Oct/Nov 2015
26 The capital value of a non-interest bearing asset is index-linked. During a period of inflation, how will its money value and its real value change? money value real value A rises rises B rises stays constant C stays constant falls D stays constant stays constant
1 marks
Answer: B
This question in 9708/13 Oct/Nov 2015
Q107 · What is the likely effect on the volume of exports and imports if a country with a fixed… 9708/13 Oct/Nov 2015
28 What is the likely effect on the volume of exports and imports if a country with a fixed exchange rate experiences a higher rate of inflation than its trading partners? exports imports A increase decrease B decrease increase C increase increase D decrease decrease
1 marks
Answer: B
This question in 9708/13 Oct/Nov 2015
Q108 · The table gives data for an economy 9708/12 Feb/March 2016
20 The table gives data for an economy. 2010 2011 2012 2013 2014 Gross Domestic Product (GDP) 200 220 240 300 320 at current prices ($ billion) GDP deflator (price index) 100 109 125 149 154 In which year did real GDP decline compared with the previous year? A 2011 B 2012 C 2013 D 2014
1 marks
Answer: B
This question in 9708/12 Feb/March 2016
Q109 · What always happens when there is an increase in the Consumer Price Index? 9708/12 Feb/March 2016
21 What always happens when there is an increase in the Consumer Price Index? A an increase in consumer expenditure B an increase in the cost of living C a reduction in living standards D a reduction in real disposable income
1 marks
Answer: B
This question in 9708/12 Feb/March 2016
Q110 · In March 2014, Sweden had a change in its Consumer Price Index of –0.6% 9708/12 Feb/March 2016
30 In March 2014, Sweden had a change in its Consumer Price Index of –0.6%. Which combination of policies might the government use to restore price stability? A increase interest rates and increase indirect taxes B increase interest rates and reduce government expenditure C reduce government spending and increase income tax D reduce interest rates and increase government expenditure
1 marks
Answer: D
This question in 9708/12 Feb/March 2016
Q111 · The table shows information about a country whose consumers spend their income on three… 9708/11 May/June 2016
21 The table shows information about a country whose consumers spend their income on three commodities, P, Q and R. index of index of consumers’ commodity prices in prices in expenditure year 1 year 2 in year 1 P 100 160 $100 million Q 100 80 $300 million R 100 100 $100 million Between year 1 and year 2 how has the general level of prices changed? A It has risen by 40%. B It has risen by 10%. C It has remained the same. D It has fallen by 5%.
1 marks
Answer: C
This question in 9708/11 May/June 2016
Q112 · The UK inflation rate as measured by the Consumer Price Index was 5.2% in September 2011 9708/11 May/June 2016
22 The UK inflation rate as measured by the Consumer Price Index was 5.2% in September 2011. In June 2014 the UK inflation rate as measured by the Consumer Price Index was 1.6%. What can definitely be concluded about the period September 2011 to June 2014? A Fixed income earners had increased purchasing power. B Prices were falling. C The rate of price increases was slowing. D The real rate of interest became positive.
1 marks
Answer: C
This question in 9708/11 May/June 2016
Q113 · A country experienced an annual deflation rate of 2% for four successive years 9708/12 May/June 2016
21 A country experienced an annual deflation rate of 2% for four successive years. Which statement is correct for the four-year period? A The price level fell by 8%. B The price level fell by less than 8%. C The real value of money fell by 8%. D The real value of money fell by less than 8%.
1 marks
Answer: B
This question in 9708/12 May/June 2016
Q114 · What must be true if an economy is experiencing inflation? 9708/13 May/June 2016
20 What must be true if an economy is experiencing inflation? A Aggregate demand is increasing. B Aggregate supply is decreasing. C The interest rate is increasing. D The real value of money is decreasing.
1 marks
Answer: D
This question in 9708/13 May/June 2016
Q115 · Suppose the average consumer’s expenditure is divided between bread, meat, milk and… 9708/13 May/June 2016
21 Suppose the average consumer’s expenditure is divided between bread, meat, milk and vegetables in the ratio 4 : 3 : 2 : 1. During the course of a year, the price of bread falls by 10%, the price of meat increases by 20% and the prices of both milk and vegetables increase by 10%. What is the increase in the average price level during the year? A 5% B 7.3% C 10% D 12.5%
1 marks
Answer: A
This question in 9708/13 May/June 2016
Q116 · The table shows the share of a worker’s income spent on three classes of good and the… 9708/11 Oct/Nov 2016
20 The table shows the share of a worker’s income spent on three classes of good and the percentage change in the prices of the goods over a year. share of income change in spent on goods prices of goods clothing 25% +25% food 50% +50% fuel 25% –25% Over the same period the worker’s money income rises by 25%. What happens to the worker’s real income? A It falls by 25%. B It falls by 50%. C It rises by 25%. D It is unchanged.
1 marks
Answer: D
This question in 9708/11 Oct/Nov 2016
Q117 · Over a period of a year, the annual rate of inflation becomes negative 9708/11 Oct/Nov 2016
21 Over a period of a year, the annual rate of inflation becomes negative. Which statement must be correct? A The cost of living has fallen. B The purchasing power of money has fallen. C The standard of living has increased. D There has been an increase in the Consumer Price Index.
1 marks
Answer: A
This question in 9708/11 Oct/Nov 2016
Q118 · In 2012, the rate of inflation in Botswana was 7.5% 9708/12 Oct/Nov 2016
20 In 2012, the rate of inflation in Botswana was 7.5%. Person X kept all of their savings in the form of cash while Person Y put their savings into a bank account on which they earned 5.0% interest. What was the effect on the real value of their savings by the end of the year? Person X Person Y A decrease decrease B decrease increase C no change decrease D no change increase
1 marks
Answer: A
This question in 9708/12 Oct/Nov 2016
Q119 · The graph shows the annual percentage change in the prices of services and in the prices… 9708/12 Oct/Nov 2016
21 The graph shows the annual percentage change in the prices of services and in the prices of goods between 2007 and 2012. 10 8 6 services % annual 4 price change 2 0 2007 2008 2009 2010 2011 2012 –2 goods –4 What can be deduced from the graph? A On average the price of services was higher than the price of goods throughout the period. B The average price of goods was higher in 2012 than in 2010. C The average price of services was higher in 2012 than in 2010. D There was a fall in the general price level between 2008 and 2010.
1 marks
Answer: C
This question in 9708/12 Oct/Nov 2016
Q120 · During a period of deflation an economy’s aggregate monetary demand falls 9708/13 Oct/Nov 2016
4 During a period of deflation an economy’s aggregate monetary demand falls. Which function of money explains this fall? A a measure of value B a medium of exchange C a standard for deferred payment D a store of value
1 marks
Answer: D
This question in 9708/13 Oct/Nov 2016
Q121 · An increase in a country’s consumer price index implies an increase in A the cost of… 9708/13 Oct/Nov 2016
20 An increase in a country’s consumer price index implies an increase in A the cost of living. B the rate of inflation. C the standard of living. D the value of money.
1 marks
Answer: A
This question in 9708/13 Oct/Nov 2016
Q122 · The figures in the table were taken from the consumer price indices of retail prices for… 9708/13 Oct/Nov 2016
21 The figures in the table were taken from the consumer price indices of retail prices for three countries. Country 2014 2015 X 100 120 Y 140 150 Z 90 99 Between 2014 and 2015, what is correct? A Country X has the highest growth in the purchasing power of money. B Country Y has the highest growth in the purchasing power of money. C Country Z has the lowest rate of inflation. D Country Y has the lowest rate of inflation.
1 marks
Answer: D
This question in 9708/13 Oct/Nov 2016
Q123 · Relative weights are used in calculating the index of retail prices to reflect the… 9708/12 Feb/March 2017
21 Relative weights are used in calculating the index of retail prices to reflect the different A amounts of money spent by consumers on each good. B levels of prices for each good. C numbers of people buying each good. D rates of change in price of each good over time.
1 marks
Answer: A
This question in 9708/12 Feb/March 2017
Q124 · The diagram shows the long-run aggregate supply (LRAS) curve of an economy 9708/11 May/June 2017
20 The diagram shows the long-run aggregate supply (LRAS) curve of an economy. At which equilibrium level of national income is a balance of trade surplus likely to cause the greatest inflationary increase for the economy? price LRAS level O A B C D real national income
1 marks
Answer: D
This question in 9708/11 May/June 2017
Q125 · A government succeeds in changing a current account deficit into a current account surplus 9708/11 May/June 2017
21 A government succeeds in changing a current account deficit into a current account surplus. Why might this current account surplus increase the country’s inflation rate? A It raises aggregate demand. B It raises production costs. C It reduces the exchange rate. D It reduces the money supply.
1 marks
Answer: A
This question in 9708/11 May/June 2017
Q126 · In recent years an economy has experienced changes in its price level as shown 9708/11 May/June 2017
30 In recent years an economy has experienced changes in its price level as shown. 6 percentage change of 4 price level 2 0 2010 2015 –2 Which government policy is most effective in reversing the trend shown in the price level? A encourage firms to expand production through tax incentives B introduce an incomes policy to directly control wage increases C promote household savings by issuing savings bonds D reduce interest rates and increase money supply
1 marks
Answer: D
This question in 9708/11 May/June 2017
Q127 · Which statement about changing price levels is correct? 9708/12 May/June 2017
20 Which statement about changing price levels is correct? A Anyone on a fixed income has rising real income during deflation. B Government revenue from indirect taxes falls during inflation. C Producers prefer deflation to inflation. D Savers prefer index-linked savings when there is deflation rather than inflation.
1 marks
Answer: A
This question in 9708/12 May/June 2017
Q128 · Which combination of events is most likely to cause inflation? 9708/12 May/June 2017
21 Which combination of events is most likely to cause inflation? exchange rate direct taxes money supply A falling falling falling B falling falling rising C rising rising rising D rising rising falling
1 marks
Answer: B
This question in 9708/12 May/June 2017
Q129 · The table shows the year-on-year percentage changes for a country’s consumer price index… 9708/13 May/June 2017
21 The table shows the year-on-year percentage changes for a country’s consumer price index from 2009 to 2015. year % change 2009 18.0 2010 11.7 2011 8.6 2012 4.6 2013 4.9 2014 6.1 2015 4.5 Which statement about the price level is correct? A It fell over the first half of the period. B It was at its highest at the start of the period. C It was at its lowest at the end of the period. D It was at its lowest at the start of the period.
1 marks
Answer: D
This question in 9708/13 May/June 2017
Q130 · The table shows a country’s consumer price index for March and April 2015 9708/11 Oct/Nov 2017
20 The table shows a country’s consumer price index for March and April 2015. consumer price index March 2015 151.3 April 2015 148.6 Which statement correctly describes what happened between these two months? A There was a decrease in the annual rate of inflation. B There was a decrease in real interest rates. C There was an increase in the purchasing power of money. D There was an increase in the standard of living.
1 marks
Answer: C
This question in 9708/11 Oct/Nov 2017
Q131 · What would be likely to increase inflation in an economy? 9708/11 Oct/Nov 2017
21 What would be likely to increase inflation in an economy? A an increase in consumer saving B an increase in interest rates C an increase in labour productivity D an increase in taxes on imports
1 marks
Answer: D
This question in 9708/11 Oct/Nov 2017
Q132 · The table shows the retail prices index for four countries for years 2 and 3 9708/12 Oct/Nov 2017
20 The table shows the retail prices index for four countries for years 2 and 3. (Year 1 index = 100 for all countries.) Which country had a higher rate of inflation in year 2 than year 3? country year 2 index year 3 index A 100 115 B 110 132 C 120 144 D 130 150
1 marks
Answer: D
This question in 9708/12 Oct/Nov 2017
Q133 · What would be likely to decrease inflation in an economy? 9708/13 Oct/Nov 2017
20 What would be likely to decrease inflation in an economy? A a decrease in consumer saving B a decrease in unemployment C an increase in labour productivity D an increase in taxes on imports
1 marks
Answer: C
This question in 9708/13 Oct/Nov 2017
Q134 · What is the average weighted price change illustrated by the table below? 9708/13 Oct/Nov 2017
21 What is the average weighted price change illustrated by the table below? percentage of income price change product spent on product % P 10 +8 Q 15 +6 R 25 +4 S 50 –9 A –1.8% B 4.5% C 7.2% D 9.0%
1 marks
Answer: A
This question in 9708/13 Oct/Nov 2017
Q135 · During one year the national output of a country valued in terms of money prices… 9708/12 Feb/March 2018
21 During one year the national output of a country valued in terms of money prices increased by 8% while the index of the prices of all goods and services produced in the country increased by 3%. By how much did the real national output increase? A 3% B 5% C 8% D 11%
1 marks
Answer: B
This question in 9708/12 Feb/March 2018
Q136 · The table shows the CPI rate of inflation (%) in the United States from 2006 to 2013 9708/12 Feb/March 2018
22 The table shows the CPI rate of inflation (%) in the United States from 2006 to 2013. 2006 2007 2008 2009 2010 2011 2012 2013 2.5% 4.1% 0.1% 2.7% 1.5% 3.0% 1.7% 2.0% What can be concluded from the figures about the period 2006 to 2013? A There was one year of constant prices. B There were three years of deflation. C There were only four years of inflation. D There were eight years of rising living costs.
1 marks
Answer: D
This question in 9708/12 Feb/March 2018
Q137 · What would be certain to cause a fall in a country’s cost of living? 9708/11 May/June 2018
20 What would be certain to cause a fall in a country’s cost of living? A a fall in real incomes B a fall in the inflation rate C a negative inflation rate D a reduction in direct tax rates
1 marks
Answer: C
This question in 9708/11 May/June 2018
Q138 · The table gives figures for household spending in the UK economy between 2008 and 2010 9708/11 May/June 2018
21 The table gives figures for household spending in the UK economy between 2008 and 2010. nominal household real household consumption spending consumption spending (£ million) (£ million) 2008 878 024 878 024 2009 858 242 846 961 2010 900 204 855 302 What can be concluded from the figures? A All households bought more goods and services in 2010 than in 2008. B Households saved more in 2008 than in 2010. C Living standards were lower in 2009 than 2010. D The rate of inflation was higher in 2010 than in 2009.
1 marks
Answer: D
This question in 9708/11 May/June 2018
Q139 · The diagrams show the inflation rate over time in four countries 9708/12 May/June 2018
20 The diagrams show the inflation rate over time in four countries. Which country experiences a falling cost of living throughout the period? A B inflation inflation rate rate + + O time O time – – C D inflation inflation rate rate + + O time O time – –
1 marks
Answer: D
This question in 9708/12 May/June 2018
Q140 · The average consumer divides his expenditure between food, clothing, accommodation and… 9708/13 May/June 2018
20 The average consumer divides his expenditure between food, clothing, accommodation and transport in the ratio 2 : 1 : 4 : 3. During the course of a year, the price of food falls by 2%, the price of clothing increases by 4%, the price of accommodation increases by 10% and the price of transport remains constant. Assuming that the weights of a price index reflect the expenditure of the average consumer, what is the increase in the index over the year? A 2.5% B 4% C 10% D 12%
1 marks
Answer: B
This question in 9708/13 May/June 2018
Q141 · In June 2016 the UK voted to leave the European Union 9708/13 May/June 2018
22 In June 2016 the UK voted to leave the European Union. The table shows what happened to the value of the pound sterling before and after the vote. June Sept £1 = $1.48 £1 = $1.32 The UK is a major trading nation. What is likely to be the short-term impact of the changes in the value of the pound sterling on the UK economy? A increased disinflation B increase in cost-push inflation C more purchasing power of money D reduced demand-pull inflation
1 marks
Answer: B
This question in 9708/13 May/June 2018
Q142 · The diagram shows the change in an economy’s rate of inflation over 4 years 9708/11 Oct/Nov 2018
21 The diagram shows the change in an economy’s rate of inflation over 4 years. inflation rate (%) 0 1 2 3 4 year What happened to the general price level over the 4 years? year 1 year 2 year 3 year 4 A constant constant fell constant B rose constant fell fell C rose rose rose constant D rose rose rose fell
1 marks
Answer: D
This question in 9708/11 Oct/Nov 2018
Q143 · The table shows the consumer price index (CPI) and national output at current prices in… 9708/12 Oct/Nov 2018
20 The table shows the consumer price index (CPI) and national output at current prices in 2014 and 2015 for an economy. national output year CPI at current prices 2014 100 100 2015 120 110 What can be concluded when 2015 is compared with 2014? A Money national output decreased by 10%. B Money national output increased by 20%. C Real national output fell. D Real national output increased.
1 marks
Answer: C
This question in 9708/12 Oct/Nov 2018
Q144 · A country experiences a fall in the consumer price index 9708/13 Oct/Nov 2018
21 A country experiences a fall in the consumer price index. What must be associated with such a fall? A a decrease in average wage rates B a decrease in borrowing C a decrease in consumers’ expenditure D a decrease in the cost of living
1 marks
Answer: D
This question in 9708/13 Oct/Nov 2018
Q145 · A government is faced with rising inflation 9708/12 Feb/March 2019
29 A government is faced with rising inflation. It wishes to reduce inflationary pressure while avoiding a fall in output. Which action is most likely to meet its needs? A an increase in laws to promote competition B an increase in taxation C an increase in the budget surplus D an increase in the exchange rate
1 marks
Answer: A
This question in 9708/12 Feb/March 2019
Q146 · Which effect of inflation is described as redistributive? 9708/11 May/June 2019
21 Which effect of inflation is described as redistributive? A the improvement in the terms of trade B the increased reluctance of people to hold money C the inconvenience of frequently changing prices D the loss of purchasing power of people on fixed incomes
1 marks
Answer: D
This question in 9708/11 May/June 2019
Q147 · An economy is experiencing a period of deflation 9708/12 May/June 2019
25 An economy is experiencing a period of deflation. What must be happening? A The average price level is falling. B The output of the economy is falling. C The rate of inflation is falling. D The real value of money is falling.
1 marks
Answer: A
This question in 9708/12 May/June 2019
Q148 · How is a rate of inflation that is lower than that expected likely to affect lenders and… 9708/13 May/June 2019
19 How is a rate of inflation that is lower than that expected likely to affect lenders and borrowers in an economy? effect on lenders effect on borrowers A beneficial beneficial B beneficial harmful C harmful beneficial D harmful harmful
1 marks
Answer: B
This question in 9708/13 May/June 2019
Q149 · What is likely to be the least effective store of value during a period of rapid… 9708/13 May/June 2019
26 What is likely to be the least effective store of value during a period of rapid inflation? A antique furniture B fixed interest government securities C houses D shares of industrial companies
1 marks
Answer: B
This question in 9708/13 May/June 2019
Q150 · What always happens when there is an increase in the Consumer Price Index? 9708/11 Oct/Nov 2019
26 What always happens when there is an increase in the Consumer Price Index? A an increase in consumer expenditure B an increase in the cost of living C a reduction in living standards D a reduction in real disposable income
1 marks
Answer: B
This question in 9708/11 Oct/Nov 2019
Q151 · Which change in economic circumstances is most likely to lead to a reduction in the rate… 9708/11 Oct/Nov 2019
30 Which change in economic circumstances is most likely to lead to a reduction in the rate of domestic inflation in an economy? A a depreciation in the currency B a reduction in the productivity of labour C a world-wide recession D an increase in direct taxes to finance increased welfare payments
1 marks
Answer: C
This question in 9708/11 Oct/Nov 2019
Q152 · The table shows the annual percentage increases in a country’s consumer prices index (CPI) 9708/12 Oct/Nov 2019
22 The table shows the annual percentage increases in a country’s consumer prices index (CPI). year % change 2015 8.3 2016 6.0 2017 6.0 2018 1.0 Which statement is correct? A Consumer prices, on average, fell throughout the period. B Consumer prices, on average, remained the same in 2016 and 2017. C The general level of consumer prices was at its highest in 2015. D The general level of consumer prices was at its highest in 2018.
1 marks
Answer: D
This question in 9708/12 Oct/Nov 2019
Q153 · The graph shows the rate of inflation for seven countries for 2015 and 2016 9708/13 Oct/Nov 2019
21 The graph shows the rate of inflation for seven countries for 2015 and 2016. 7 6 5 4 3 key 2015 2 2016 1 0 Costa Ecuador India Japan Malaysia Mauritius Thailand Thailand Thailand Rica –1 –2 What can be concluded from this graph? A Prices in Costa Rica rose in 2015 but remained constant in 2016. B Prices in Ecuador and Mauritius were lower in 2016 than in 2015. C Prices in India and Malaysia remained constant in 2016 and 2015. D Prices in Thailand and Japan were lower in 2016 than in 2015.
1 marks
Answer: A
This question in 9708/13 Oct/Nov 2019
Q154 · What must be true if an economy is experiencing inflation? 9708/13 Oct/Nov 2019
25 What must be true if an economy is experiencing inflation? A Aggregate demand is increasing. B Aggregate supply is decreasing. C The interest rate is increasing. D The real value of money is decreasing.
1 marks
Answer: D
This question in 9708/13 Oct/Nov 2019
Q155 · Which statement describes disinflation? 9708/12 Feb/March 2020
26 Which statement describes disinflation? A a fall in the price level B a fall in the rate of inflation C a rise in the value of money D inflation below zero
1 marks
Answer: B
This question in 9708/12 Feb/March 2020
Q156 · A country experienced a significant fall in unemployment but its inflation rate remained… 9708/11 May/June 2020
30 A country experienced a significant fall in unemployment but its inflation rate remained low. What could explain this? A Global competition prevented firms passing on higher costs. B Increased spending on imports had lowered the exchange rate. C There was a low level of spare capacity in the economy. D Wage rates had increased by more than labour productivity.
1 marks
Answer: A
This question in 9708/11 May/June 2020
Q157 · According to US Consumer Prices Index (CPI) statistics, an identical good that cost $100… 9708/12 May/June 2020
23 According to US Consumer Prices Index (CPI) statistics, an identical good that cost $100 in 1913 would cost $2359.60 in 2013. What was the approximate cumulative rate of inflation over the period? A 23% B 230% C 2300% D 23 000%
1 marks
Answer: C
This question in 9708/12 May/June 2020
Q158 · In an economy with an interest rate of 4% per annum, the rate of inflation falls from 5%… 9708/12 May/June 2020
27 In an economy with an interest rate of 4% per annum, the rate of inflation falls from 5% to 3% per annum. What will be a benefit of this fall? A Menu costs will fall to zero. B People on fixed incomes will be better off in real terms. C Savers will gain in real terms. D The purchasing power of the currency will rise.
1 marks
Answer: C
This question in 9708/12 May/June 2020
Q159 · The graph shows the annual percentage change in the prices of services and in the prices… 9708/13 May/June 2020
19 The graph shows the annual percentage change in the prices of services and in the prices of goods between 2007 and 2012. 10 % annual 8 price change 6 services 4 2 0 2007 2008 2009 2010 2011 2012 –2 goods –4 What can be deduced from the graph? A On average the price of services was higher than the price of goods throughout the period. B The average price of goods was higher in 2012 than in 2010. C The average price of services was higher in 2012 than in 2010. D There was a fall in the general price level between 2008 and 2010.
1 marks
Answer: C
This question in 9708/13 May/June 2020
Q160 · The real national income of a country fell by 3% 9708/13 May/June 2020
25 The real national income of a country fell by 3%. What could have caused this? A Money national income fell by 3% when the rate of inflation was 6%. B Money national income fell by 6% when the rate of inflation was 3%. C Money national income rose by 3% when the rate of inflation was 6%. D Money national income rose by 6% when the rate of inflation was 3%.
1 marks
Answer: C
This question in 9708/13 May/June 2020
Q161 · The data shows the consumer prices index (CPI) and an index of money wages in an economy… 9708/11 Oct/Nov 2020
22 The data shows the consumer prices index (CPI) and an index of money wages in an economy during four years. year 1 2 3 4 CPI 100 102 105 110 index of money wages 100 102 107 110 Which statement is not correct? A Inflation was at its greatest between years 3 and 4. B Real wages remained constant between years 1 and 2. C Real wages rose between years 3 and 4. D The rate of inflation increased over the whole period.
1 marks
Answer: C
This question in 9708/11 Oct/Nov 2020
Q162 · The government of an open economy with an overvalued currency decides to abandon its… 9708/12 Oct/Nov 2020
26 The government of an open economy with an overvalued currency decides to abandon its fixed exchange rate in favour of a floating exchange rate. Which macroeconomic policy aim is least likely to be met because of this change? A a low inflation rate B a low level of unemployment C a reduced balance of payments deficit D a sustainable rate of economic growth
1 marks
Answer: A
This question in 9708/12 Oct/Nov 2020
Q163 · Under which circumstance would the rate of inflation be most likely to fall? 9708/13 Oct/Nov 2020
19 Under which circumstance would the rate of inflation be most likely to fall? A Government spending increases and society’s marginal propensity to save falls. B Reduced interest rates result in consumers increasing their spending. C The government increases direct taxes and the level of investment falls. D The prices of imported raw materials rise, whilst demand for exports falls.
1 marks
Answer: C
This question in 9708/13 Oct/Nov 2020
Q164 · What term relates to a fall in the domestic real value of a currency? 9708/13 Oct/Nov 2020
25 What term relates to a fall in the domestic real value of a currency? A deflation B depreciation C devaluation D inflation
1 marks
Answer: D
This question in 9708/13 Oct/Nov 2020
Q165 · To counter deflation a central bank uses expansionary monetary policy 9708/13 Oct/Nov 2020
27 To counter deflation a central bank uses expansionary monetary policy. What is likely to result? A a higher cost of borrowing B a higher rate of inflation C an appreciation of the exchange rate D an increase in government debt
1 marks
Answer: B
This question in 9708/13 Oct/Nov 2020
Q166 · Which statement about a rise in the general price level in a country is correct? 9708/12 Feb/March 2021
19 Which statement about a rise in the general price level in a country is correct? A It is likely to create economic winners and losers in the country. B It is never acceptable to modern governments. C It means that no goods have fallen in price. D It must make the average citizen poorer.
1 marks
Answer: A
This question in 9708/12 Feb/March 2021
Q167 · The table shows a country’s consumer prices index (CPI) for March and April 2018 9708/12 Feb/March 2021
26 The table shows a country’s consumer prices index (CPI) for March and April 2018. CPI March 2018 151.3 April 2018 148.6 Which statement correctly describes what happened between these two months? A There was a decrease in the annual rate of inflation. B There was a decrease in real interest rates. C There was an increase in the purchasing power of money. D There was an increase in the standard of living.
1 marks
Answer: C
This question in 9708/12 Feb/March 2021
Q168 · The diagram shows the rate of inflation over time in four countries 9708/12 Feb/March 2021
27 The diagram shows the rate of inflation over time in four countries. Which country has a rising real value of money over time? A inflation rate B + C 0 – time D
1 marks
Answer: D
This question in 9708/12 Feb/March 2021
Q169 · Other things being equal, what is most likely to be reduced by falling labour… 9708/12 Feb/March 2021
29 Other things being equal, what is most likely to be reduced by falling labour productivity? A the balance of trade deficit B the internal value of money C the level of unemployment D the rate of domestic inflation
1 marks
Answer: B
This question in 9708/12 Feb/March 2021
Q170 · If the rate of inflation rises from 2% to 20%, which function of money is likely to be… 9708/12 May/June 2021
3 If the rate of inflation rises from 2% to 20%, which function of money is likely to be most affected? A medium of exchange B standard for deferred payment C store of value D unit of account
1 marks
Answer: C
This question in 9708/12 May/June 2021
Q171 · What is correct about the causes of inflation? 9708/12 May/June 2021
22 What is correct about the causes of inflation? A Cost-push inflation can be caused by a rising exchange rate. B Cost-push inflation can be caused by lower indirect taxes. C Demand-pull inflation can be caused by a rising exchange rate. D Demand-pull inflation can be caused by lower direct taxes.
1 marks
Answer: D
This question in 9708/12 May/June 2021
Q172 · What would be certain to cause a fall in a country’s cost of living? 9708/13 May/June 2021
19 What would be certain to cause a fall in a country’s cost of living? A a fall in real incomes B a fall in the inflation rate C a negative inflation rate D a reduction in direct tax rates
1 marks
Answer: C
This question in 9708/13 May/June 2021
Q173 · A sudden rise in the price of imported oil caused the annual rate of inflation in a given… 9708/13 May/June 2021
22 A sudden rise in the price of imported oil caused the annual rate of inflation in a given period to be higher than expected. What might be a likely result of this? A Borrowers would gain. B Real wages would rise. C The balance of trade would improve. D Unemployment would fall.
1 marks
Answer: A
This question in 9708/13 May/June 2021
Q174 · The graph shows inflation rates over 10 years for selected emerging economies 9708/13 May/June 2021
30 The graph shows inflation rates over 10 years for selected emerging economies. 7 inflation % year on year 6 W 5 X 4 Y Z 3 2 2009 2010 2011 2012 2013 2014 2015 2016 2017 2018 year Government central banks set target minimum inflation rates before readjusting interest rates to stabilise the economy. If the minimum inflation rate target set by central banks was 4% per year, at which points would they allow interest rates to fall? A W and X B X and Y C Y and Z D Z and W
1 marks
Answer: C
This question in 9708/13 May/June 2021
Question 175 9708/11 Oct/Nov 2021
20 What is disinflation? A a fall in output B a fall in the price level C a fall in the rate of increase of the price level D a fall in the value of national income
1 marks
Answer: C
This question in 9708/11 Oct/Nov 2021
Q176 · A developed country has a price-inelastic demand for oil, all of which it imports 9708/11 Oct/Nov 2021
22 A developed country has a price-inelastic demand for oil, all of which it imports. The oil-producing countries increase the supply of oil. What is likely to happen to the developed country’s rate of inflation and its balance of trade? rate of inflation balance of trade A decreases improves B decreases worsens C increases improves D increases worsens
1 marks
Answer: A
This question in 9708/11 Oct/Nov 2021
Q177 · What is the most likely cause of cost-push inflation in an economy? 9708/11 Oct/Nov 2021
26 What is the most likely cause of cost-push inflation in an economy? A an increase in the exchange rate B an increase in the money supply C an increase in the prices of imports D an increase in the rate of income tax
1 marks
Answer: C
This question in 9708/11 Oct/Nov 2021
Q178 · Which changes are most likely to reduce the accuracy of the consumer prices index (CPI)… 9708/11 Oct/Nov 2021
27 Which changes are most likely to reduce the accuracy of the consumer prices index (CPI) as a measurement of inflation? A A larger sample is used in the household spending survey. B Technology makes it easier for retailers to submit accurate monthly price data. C Households change their spending habits. D The weightings attached to the basket of goods are reviewed more often.
1 marks
Answer: C
This question in 9708/11 Oct/Nov 2021
Q179 · Which statement about inflation is correct? 9708/12 Oct/Nov 2021
20 Which statement about inflation is correct? A Inflation will lead to a rise in exports. B Inflation will lead to a rise in real incomes. C Inflation will lead to a rise in the cost of living. D Inflation will lead to a rise in the purchasing power of money.
1 marks
Answer: C
This question in 9708/12 Oct/Nov 2021
Q180 · There is an increase in indirect taxes 9708/12 Oct/Nov 2021
24 There is an increase in indirect taxes. What will be the impact on demand-pull inflation and on cost-push inflation? demand-pull cost-push inflation inflation A fall fall B fall rise C rise fall D rise rise
1 marks
Answer: B
This question in 9708/12 Oct/Nov 2021
Q181 · Which policy would be likely to increase inflation? 9708/13 Oct/Nov 2021
29 Which policy would be likely to increase inflation? A an increase in income tax B an increase in interest rates C limiting the amount banks can lend D raising the level of import tariffs
1 marks
Answer: D
This question in 9708/13 Oct/Nov 2021
Q182 · The diagram shows the annual consumer prices index for Japan over the years 1990–2010… 9708/12 Feb/March 2022
19 The diagram shows the annual consumer prices index for Japan over the years 1990–2010 inclusive. 5 consumer 4 prices 3 index (%) 2 1 0 –1 –2 –3 1990 1992 1994 1996 1998 2000 2002 2004 2006 2008 2010 year In which period did Japan experience both inflation at a rate of approximately 2% and deflation at a rate of approximately 2.5%? A 1992–1994 B 1996–1998 C 2006–2008 D 2008–2010
1 marks
Answer: D
This question in 9708/12 Feb/March 2022
Q183 · The table shows a country’s total output and its average price in each of three years 9708/11 May/June 2022
20 The table shows a country’s total output and its average price in each of three years. output price year (millions) ($) 1 10 20 2 12 24 3 13 26 What can be concluded about output? A Nominal output and real output increased at the same rate. B Nominal output rose at a faster rate than real output. C Nominal output rose at an increasing rate. D Real output rose at a constant rate.
1 marks
Answer: B
This question in 9708/11 May/June 2022
Q184 · The aggregate demand (AD) and aggregate supply (AS) diagram shows an economy in… 9708/11 May/June 2022
22 The aggregate demand (AD) and aggregate supply (AS) diagram shows an economy in equilibrium at X. In this economy, a severe shortage of raw materials causes a large rise in their price. The effect of this change is shown by a move to which point? AD3 AS2 AD1 general AD2 AS1 price level C B D A X O real national income
1 marks
Answer: B
This question in 9708/11 May/June 2022
Q185 · Why will a contractionary monetary policy reduce inflation? 9708/11 May/June 2022
29 Why will a contractionary monetary policy reduce inflation? A Banks will lend more. B Consumers will have higher disposable income. C Consumers will pay more tax. D Consumers will save more.
1 marks
Answer: D
This question in 9708/11 May/June 2022
Q186 · The diagram shows the annual inflation rate in an economy 9708/12 May/June 2022
22 The diagram shows the annual inflation rate in an economy. 4 the rate of 3 inflation (%) 2 1 0 –1 –2 2012 2013 2014 2015 2016 2017 2018 year What can be deduced from the graph? A The price of goods and services fell between 2013 and 2014. B Disinflation took place between 2014 and 2015. C The purchasing power of money increased between 2014 and 2015. D The cost of living fell from 2016 onwards.
1 marks
Answer: C
This question in 9708/12 May/June 2022
Q187 · What, if decreased, will help to reduce the rate of inflation? 9708/12 May/June 2022
28 What, if decreased, will help to reduce the rate of inflation? A budget deficit B direct taxes C exchange rate D interest rate
1 marks
Answer: A
This question in 9708/12 May/June 2022
Q188 · A household’s income increased by 3% 9708/13 May/June 2022
23 A household’s income increased by 3%. Over the same period, the rate of inflation was also 3%. Which statement is correct? A Both the nominal income of the household and the real income of the household increased by 3%. B The nominal income of the household remained unchanged while the real income of the household increased by 3%. C The nominal income of the household increased by 3% while the real income of the household remained unchanged. D The nominal income of the household increased by 3% while the real income of the household increased by 6%.
1 marks
Answer: C
This question in 9708/13 May/June 2022
Q189 · In 2018, the inflation rate in Argentina was over 100% 9708/13 May/June 2022
25 In 2018, the inflation rate in Argentina was over 100%. Which combination correctly identifies the winners and losers during this period? winners losers A firms selling goods households paying back abroad loans B firms unable to decrease firms paying back loans on real wages fixed monthly repayments C individuals with a high amount households that hold most of debt at a fixed rate of interest of their assets in cash D workers on fixed the retired on fixed wage contracts incomes
1 marks
Answer: C
This question in 9708/13 May/June 2022
Q190 · A country is suffering from severe deflation 9708/13 May/June 2022
30 A country is suffering from severe deflation. What is most likely to prevent the deflation from worsening? A increasing income tax to help reduce the government’s budget deficit B increasing interest rates to encourage more saving C increasing transfer payments to reduce inequality of income D revaluing the currency to bring in more revenue from exports
1 marks
Answer: C
This question in 9708/13 May/June 2022
Q191 · What is a likely consequence of inflation? 9708/14 May/June 2022
23 What is a likely consequence of inflation? A Fixed-income earners gain more than those whose income is gained from the ownership of property. B Real wages rise more than money wages. C The assets of creditors decrease in value at the expense of those of debtors. D The domestic purchasing power of money increases.
1 marks
Answer: C
This question in 9708/14 May/June 2022
Q192 · The diagram shows an aggregate demand (AD) and an aggregate supply (AS) curve 9708/14 May/June 2022
24 The diagram shows an aggregate demand (AD) and an aggregate supply (AS) curve. AS price level AD O national output There is a sustained rise in the prices of imported raw materials on which the economy depends. Assuming AD remains independent of AS, what are the most likely effects on the economy? AS price level A decreases falls B increases falls C decreases rises D increases rises
1 marks
Answer: C
This question in 9708/14 May/June 2022
Q193 · Assuming the demand for oil is price-inelastic, what will be the effect on demand-pull… 9708/11 Oct/Nov 2022
19 Assuming the demand for oil is price-inelastic, what will be the effect on demand-pull inflation and on cost-push inflation in an oil-importing country of an increase in the world price of oil? effect on demand-pull effect on cost-push inflation inflation A increase increase B increase reduce C reduce increase D reduce reduce
1 marks
Answer: C
This question in 9708/11 Oct/Nov 2022
Q194 · Which effect of inflation is described as redistributive? 9708/12 Oct/Nov 2022
21 Which effect of inflation is described as redistributive? A the improvement in the terms of trade B the deterioration in the balance of trade C the inconvenience of frequently changing prices D the loss of purchasing power for people on fixed incomes
1 marks
Answer: D
This question in 9708/12 Oct/Nov 2022
Q195 · During a period of deflation an economy’s aggregate monetary demand falls 9708/13 Oct/Nov 2022
2 During a period of deflation an economy’s aggregate monetary demand falls. Which function of money explains this fall? A a measure of value B a medium of exchange C a standard for deferred payment D a store of value
1 marks
Answer: D
This question in 9708/13 Oct/Nov 2022
Q196 · Which statement about changing price levels is correct? 9708/13 Oct/Nov 2022
26 Which statement about changing price levels is correct? A Anyone on a fixed income has rising real income during deflation. B Government revenue from indirect taxes falls during inflation. C Producers prefer deflation to inflation. D Savers prefer index-linked savings when there is deflation rather than inflation.
1 marks
Answer: A
This question in 9708/13 Oct/Nov 2022
Q197 · What would be likely to decrease inflation in an economy? 9708/13 Oct/Nov 2022
27 What would be likely to decrease inflation in an economy? A a decrease in consumer saving B a decrease in unemployment C an increase in labour productivity D an increase in taxes on imports
1 marks
Answer: C
This question in 9708/13 Oct/Nov 2022
Q198 · Which change in economic circumstances is most likely to lead to a reduction in the rate… 9708/13 Oct/Nov 2022
28 Which change in economic circumstances is most likely to lead to a reduction in the rate of domestic inflation in an economy? A a depreciation in the currency B a reduction in the productivity of labour C a worldwide recession D an increase in direct taxes to finance increased welfare payments
1 marks
Answer: C
This question in 9708/13 Oct/Nov 2022
Q199 · The graph shows a country’s average annual inflation rate over a five-year period 9708/12 Feb/March 2023
19 The graph shows a country’s average annual inflation rate over a five-year period. average annual inflation rate (%) 0 year 1 2 3 4 5 What can be concluded about the general price level during the five years? A It fell in only one year. B It fell in only two years. C It rose in only two years. D It was constant in only one year.
1 marks
Answer: A
This question in 9708/12 Feb/March 2023
Q200 · In an economy, wages and prices are both rising but wages are rising faster 9708/12 Feb/March 2023
20 In an economy, wages and prices are both rising but wages are rising faster. Which features are likely to exist in this economy? cost-push rise in real inflation incomes A no no B no yes C yes no D yes yes
1 marks
Answer: D
This question in 9708/12 Feb/March 2023
Q201 · The table shows GDP indices for a country over a three-year period 9708/12 Feb/March 2023
29 The table shows GDP indices for a country over a three-year period. year 1 year 2 year 3 real GDP 100 105 106 money GDP 100 107 115 Inflation and economic growth are two macroeconomic policy objectives. Which row gives a correct assessment of the country’s achievement of these two objectives over the period? rate of rate of inflation economic growth A cannot tell positive B declining cannot tell C positive declining D rising negative
1 marks
Answer: C
This question in 9708/12 Feb/March 2023
Q202 · Which group is most likely to suffer during high inflation? 9708/11 May/June 2023
17 Which group is most likely to suffer during high inflation? A borrowers B importers C producers D fixed wage earners
1 marks
Answer: D
This question in 9708/11 May/June 2023
Q203 · If a country is experiencing a period of high inflation, which groups will benefit the… 9708/12 May/June 2023
24 If a country is experiencing a period of high inflation, which groups will benefit the most from this? companies that fixed income those with export the majority earners high debts of their output A yes yes no B no yes yes C yes no no D no no yes
1 marks
Answer: D
This question in 9708/12 May/June 2023
Q204 · Supply-side policies can be used to correct cost-push inflation 9708/12 May/June 2023
29 Supply-side policies can be used to correct cost-push inflation. Which policy would best achieve this aim in the long run? A allowing trade unions to maintain work practices irrespective of productivity B encouraging workers to work extra hours for extra pay C increasing total labour supply by employing more unskilled workers D supporting the replacement of labour-manned machines by the use of robots
1 marks
Answer: D
This question in 9708/12 May/June 2023
Q205 · Which statement best describes the consumer prices index (CPI)? 9708/11 Oct/Nov 2023
19 Which statement best describes the consumer prices index (CPI)? A It is a measure of changes in the spending patterns of the average household. B It is a measure of changes in the standard of living of the average household. C It is a measure of the average change in prices of a basket of goods and services over time. D It is a measure of the level of prices of all goods and services.
1 marks
Answer: C
This question in 9708/11 Oct/Nov 2023
Q206 · Under which conditions will nominal GDP and real GDP increase at the same rate in an… 9708/11 Oct/Nov 2023
23 Under which conditions will nominal GDP and real GDP increase at the same rate in an economy? rate of change of rate of change of national output general price level (% per annum) (% per annum) A 0 –2 B 0 +2 C +2 0 D +2 +2
1 marks
Answer: C
This question in 9708/11 Oct/Nov 2023
Q207 · Over a period of a year, the annual rate of inflation becomes negative 9708/11 Oct/Nov 2023
27 Over a period of a year, the annual rate of inflation becomes negative. Which statement must be correct? A The cost of living has fallen. B The purchasing power of money has fallen. C The standard of living has increased. D There has been an increase in the Consumer Price Index.
1 marks
Answer: A
This question in 9708/11 Oct/Nov 2023
Q208 · An economy is experiencing accelerating cost-push inflation 9708/11 Oct/Nov 2023
30 An economy is experiencing accelerating cost-push inflation. Which group is likely to be least concerned by this? A borrowers B consumers C creditors D exporters
1 marks
Answer: A
This question in 9708/11 Oct/Nov 2023
Q209 · Which combination is possible for an economy experiencing zero inflation? 9708/12 Oct/Nov 2023
21 Which combination is possible for an economy experiencing zero inflation? average average nominal wages real wages A falling falling B falling rising C rising falling D unchanging rising
1 marks
Answer: A
This question in 9708/12 Oct/Nov 2023
Q210 · The graph shows the rate of inflation in Japan from April 2020 to February 2021 9708/12 Oct/Nov 2023
22 The graph shows the rate of inflation in Japan from April 2020 to February 2021. 0.4 0.3 0.2 inflation 0.2 0.1 0.1 0.1 rate 0 0 –0.2 –0.4 –0.4 –0.4 –0.6 –0.6 –0.8 –1 –0.9 –1.2 –1.2 Apr May June July Aug Sept Oct Nov Dec Jan Feb 2020 2021 Over which period did disinflation occur in Japan? A July 2020 to February 2021 B July 2020 to September 2020 C October 2020 to December 2020 D October 2020 to February 2021
1 marks
Answer: B
This question in 9708/12 Oct/Nov 2023
Q211 · The graph shows the rate of inflation for seven countries for 2015 and 2016 9708/13 Oct/Nov 2023
23 The graph shows the rate of inflation for seven countries for 2015 and 2016. 7 6 5 4 3 key 2015 2 2016 1 0 Costa Ecuador India Japan Malaysia Mauritius Thailand Thailand Thailand Rica –1 –2 What can be concluded from this graph? A Prices in Costa Rica rose in 2015 but remained constant in 2016. B Prices in Ecuador and Mauritius were lower in 2016 than in 2015. C Prices in India and Malaysia remained constant in 2016 and 2015. D Prices in Thailand and Japan were lower in 2016 than in 2015.
1 marks
Answer: A
This question in 9708/13 Oct/Nov 2023
Q212 · What is least likely to cause a simultaneous increase in demand-pull and cost-push… 9708/12 Feb/March 2024
16 What is least likely to cause a simultaneous increase in demand-pull and cost-push inflation? A depreciation of currency B increased import tariffs C decreased spending on infrastructure D increased wages
1 marks
Answer: C
This question in 9708/12 Feb/March 2024
Q213 · The table gives the value of the price index of an economy in two years 9708/12 May/June 2024
16 The table gives the value of the price index of an economy in two years. year price index 1 60 2 120 What can be concluded about the period? A Nominal income doubled. B Real income doubled. C The cost of living doubled. D The standard of living doubled.
1 marks
Answer: C
This question in 9708/12 May/June 2024
Q214 · What causes a rise in cost-push inflation? 9708/12 May/June 2024
17 What causes a rise in cost-push inflation? A a fall in the rate of income tax B a rise in the rate of income tax C a depreciation of the exchange rate D an appreciation of the exchange rate
1 marks
Answer: C
This question in 9708/12 May/June 2024
Q215 · The diagram shows the effect on the average price level when aggregate demand (AD)… 9708/13 May/June 2024
16 The diagram shows the effect on the average price level when aggregate demand (AD) increases from AD1 to AD2. average LRAS price level P2 P1 AD2 AD1 O real GDP Which statement relating to this change in aggregate demand is correct? A Nominal GDP has increased. B Nominal GDP is unchanged. C Real GDP has increased. D Real GDP has fallen.
1 marks
Answer: A
This question in 9708/13 May/June 2024
Q216 · The table shows the Consumer Prices Index (CPI) for a country 9708/11 Oct/Nov 2024
15 The table shows the Consumer Prices Index (CPI) for a country. year CPI 2008 100 2009 104 2010 102 2011 105 2012 108 2013 111 Which statement about the period 2008 to 2013 is correct? A Prices increased each year. B Prices increased fastest in 2011. C The rate of inflation was 2% in 2010. D The smallest rise in prices was in 2013.
1 marks
Answer: D
This question in 9708/11 Oct/Nov 2024
Q217 · What is most likely to cause the price level to rise? 9708/11 Oct/Nov 2024
16 What is most likely to cause the price level to rise? An increase in A productivity of labour. B raw material prices. C income taxes. D subsidies paid to producers.
1 marks
Answer: B
This question in 9708/11 Oct/Nov 2024
Q218 · The table shows the values of Consumer Prices Index (CPI) and a worker’s salary in 2022… 9708/12 Oct/Nov 2024
15 The table shows the values of Consumer Prices Index (CPI) and a worker’s salary in 2022 and 2023. CPI 2022 100 CPI 2023 110 worker’s salary 2022 $20 000 worker’s salary 2023 $25 000 What is the real value of the worker’s salary in 2023 compared with 2022? A $18 182 B $22 727 C $25 000 D $27 500
1 marks
Answer: B
This question in 9708/12 Oct/Nov 2024
Q219 · In an economy with an interest rate of 4% per annum, the rate of inflation falls from 5%… 9708/12 Oct/Nov 2024
19 In an economy with an interest rate of 4% per annum, the rate of inflation falls from 5% to 3% per annum. What will be a benefit of this fall? A Menu costs will fall to zero. B People on fixed incomes will be better off in real terms. C Savers will gain in real terms. D The purchasing power of the currency will rise.
1 marks
Answer: C
This question in 9708/12 Oct/Nov 2024
Q220 · A country experienced an annual deflation rate of 2% for four successive years 9708/13 Oct/Nov 2024
15 A country experienced an annual deflation rate of 2% for four successive years. Which statement is correct for the four-year period? A The price level fell by 8%. B The price level fell by less than 8%. C The real value of money fell by 8%. D The real value of money fell by less than 8%.
1 marks
Answer: B
This question in 9708/13 Oct/Nov 2024
Q221 · Governments may have price stability as a macroeconomic objective 9708/12 Feb/March 2025
16 Governments may have price stability as a macroeconomic objective. What is meant by price stability? A All equilibrium prices are maintained in the long run. B Demand-pull inflation cancels out any cost-push inflation. C Only disinflation is present in the economy in the long run. D Prolonged periods of inflation and deflation are avoided.
1 marks
Answer: D
This question in 9708/12 Feb/March 2025
Q222 · Which statement correctly describes an increase in real GDP? 9708/11 May/June 2025
16 Which statement correctly describes an increase in real GDP? A Nominal GDP rising faster than nominal income. B Nominal GDP rising faster than the rate of inflation. C The rate of inflation rising faster than aggregate demand. D The rate of inflation rising faster than nominal income.
1 marks
Answer: B
This question in 9708/11 May/June 2025
Q223 · The price of a pack of six eggs rises from $1.00 to $1.32 over a year 9708/11 May/June 2025
20 The price of a pack of six eggs rises from $1.00 to $1.32 over a year. Consumer prices, as measured by the consumer price index, rise by 10% over the same period. What is the real price of a pack of six eggs at the end of the year? A $1.00 B $1.10 C $1.20 D $1.32
1 marks
Answer: C
This question in 9708/11 May/June 2025
Q224 · The table shows the change in the value of UK sterling over a three-month period 9708/11 May/June 2025
30 The table shows the change in the value of UK sterling over a three-month period. June Sept £1 = $1.38 £1 = $1.32 What is likely to be the short-term impact of the change in the value of UK sterling on the UK economy? A increased disinflation B increase in cost-push inflation C more purchasing power of money D reduced demand-pull inflation
1 marks
Answer: B
This question in 9708/11 May/June 2025
Q225 · Price stability can be said to occur if the measured value of the consumer prices index… 9708/12 May/June 2025
16 Price stability can be said to occur if the measured value of the consumer prices index (CPI) is unchanged during the year. Which statement is correct? A For price stability to occur, there must be no changes in prices of any products. B For price stability to occur, the number of products whose prices rise must exactly match the number whose prices fall. C If some prices rise and others fall, there cannot be price stability. D Different weightings of items used in the calculation of CPI mean that price stability can occur in many ways.
1 marks
Answer: D
This question in 9708/12 May/June 2025
Q226 · An economy is experiencing a period of deflation 9708/13 May/June 2025
19 An economy is experiencing a period of deflation. What must be happening? A The average price level is falling. B The output of the economy is falling. C The rate of inflation is falling. D The real value of money is falling.
1 marks
Answer: A
This question in 9708/13 May/June 2025
Q227 · The table gives the terms of trade index for a country over three years 9708/13 May/June 2025
29 The table gives the terms of trade index for a country over three years. year 1 year 2 year 3 terms of trade 100 105 112 What is the most likely impact of this change? A there will be a decrease in cost-push inflation B there will be a decrease in living standards C there will be an increase in the budget surplus D there will be an increase in the volume of exports
1 marks
Answer: A
This question in 9708/13 May/June 2025
Q228 · The diagram shows the AD and AS curves for a low income country 9708/11 Oct/Nov 2025
21 The diagram shows the AD and AS curves for a low income country. Oil and gas make up 90% of its exports. The initial equilibrium level of national income is Y1. What is the most likely new equilibrium point if the worldwide prices of oil and gas rise dramatically? AS general price level A B D C AD O Y1 national income
1 marks
Answer: B
This question in 9708/11 Oct/Nov 2025
Q229 · A central bank increases interest rates to reduce inflation 9708/11 Oct/Nov 2025
23 A central bank increases interest rates to reduce inflation. When will this policy be most likely to succeed? A When household spending is inelastic in response to interest rate changes. B When the country has a floating exchange rate that appreciates. C When the government has an increasing budget deficit. D When trade unions demand higher wages to protect the living standards of their members.
1 marks
Answer: B
This question in 9708/11 Oct/Nov 2025
Q230 · A country’s currency depreciates in terms of other currencies 9708/11 Oct/Nov 2025
26 A country’s currency depreciates in terms of other currencies. What would be a consequence of this depreciation? A There would be a decrease in structural unemployment. B There would be a decrease in the volume of exports. C There would be an increase in cost-push inflationary pressure. D There would be an increase in the budget deficit.
1 marks
Answer: C
This question in 9708/11 Oct/Nov 2025
Q231 · Under which conditions will real Gross Domestic Product (GDP) grow the fastest? 9708/13 Oct/Nov 2025
18 Under which conditions will real Gross Domestic Product (GDP) grow the fastest? rate of change in rate of change in nominal GDP general price level (% per year) (% per year) A 0 −2 B 0 +2 C +2 −2 D +2 +2
1 marks
Answer: C
This question in 9708/13 Oct/Nov 2025
Q232 · The diagram shows changes in a country’s price level over a number of years 9708/13 Oct/Nov 2025
22 The diagram shows changes in a country’s price level over a number of years. During which period of time did only disinflation occur? 5 price change 4 % 3 2 1 0 2020 2021 2022 2023 2024 2025 –1 year –2 –3 A from the start of 2020 to the end of 2025 B from the start of 2021 to the end of 2022 C from the start of 2021 to the end of 2023 D from the start of 2023 to the end of 2024
1 marks
Answer: B
This question in 9708/13 Oct/Nov 2025
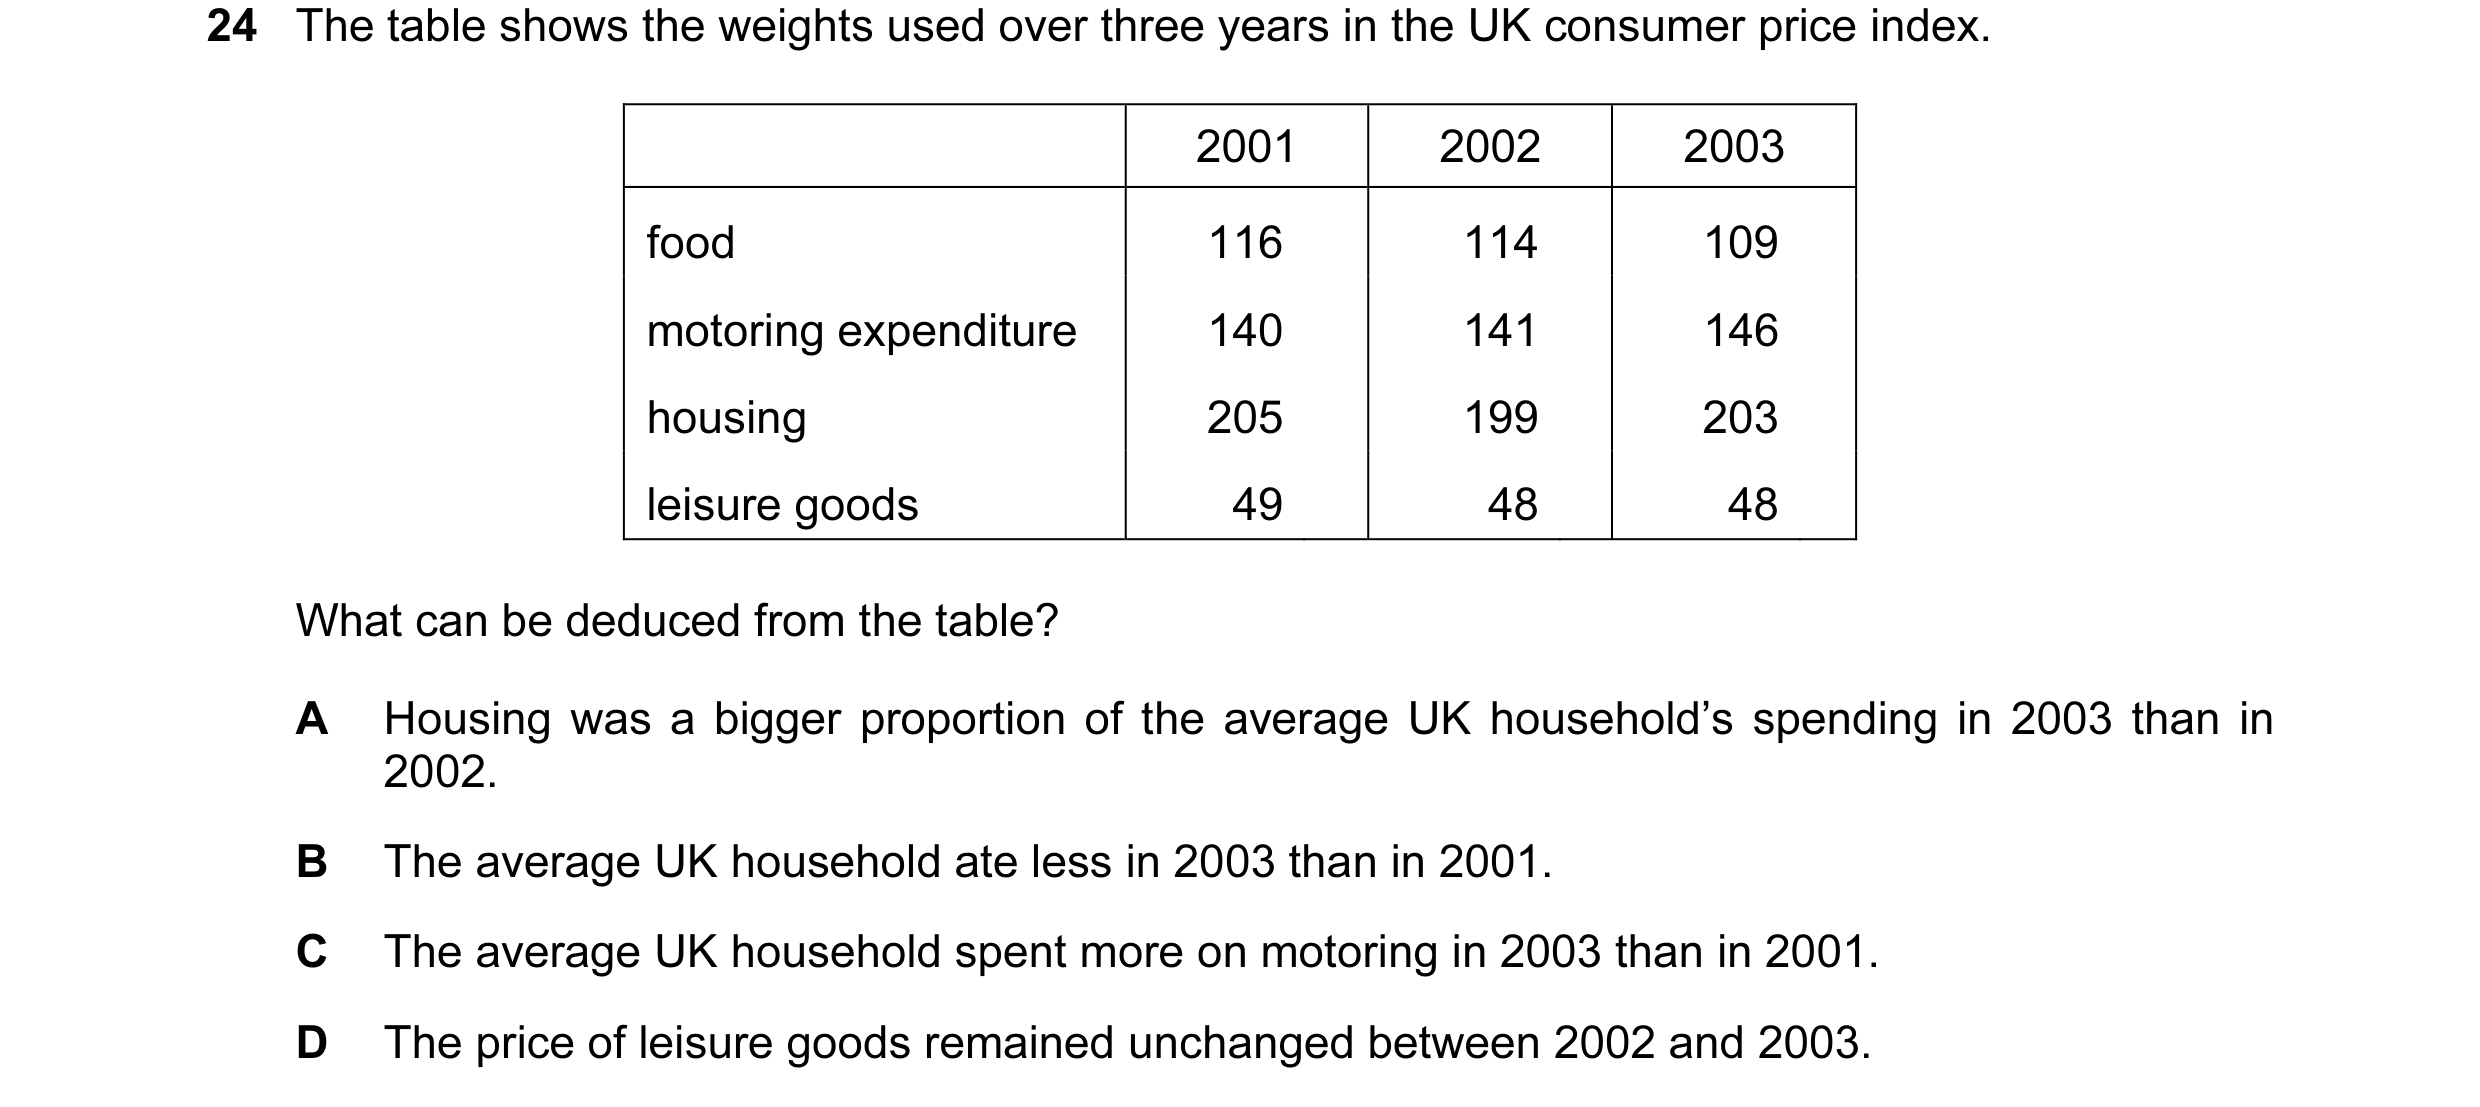
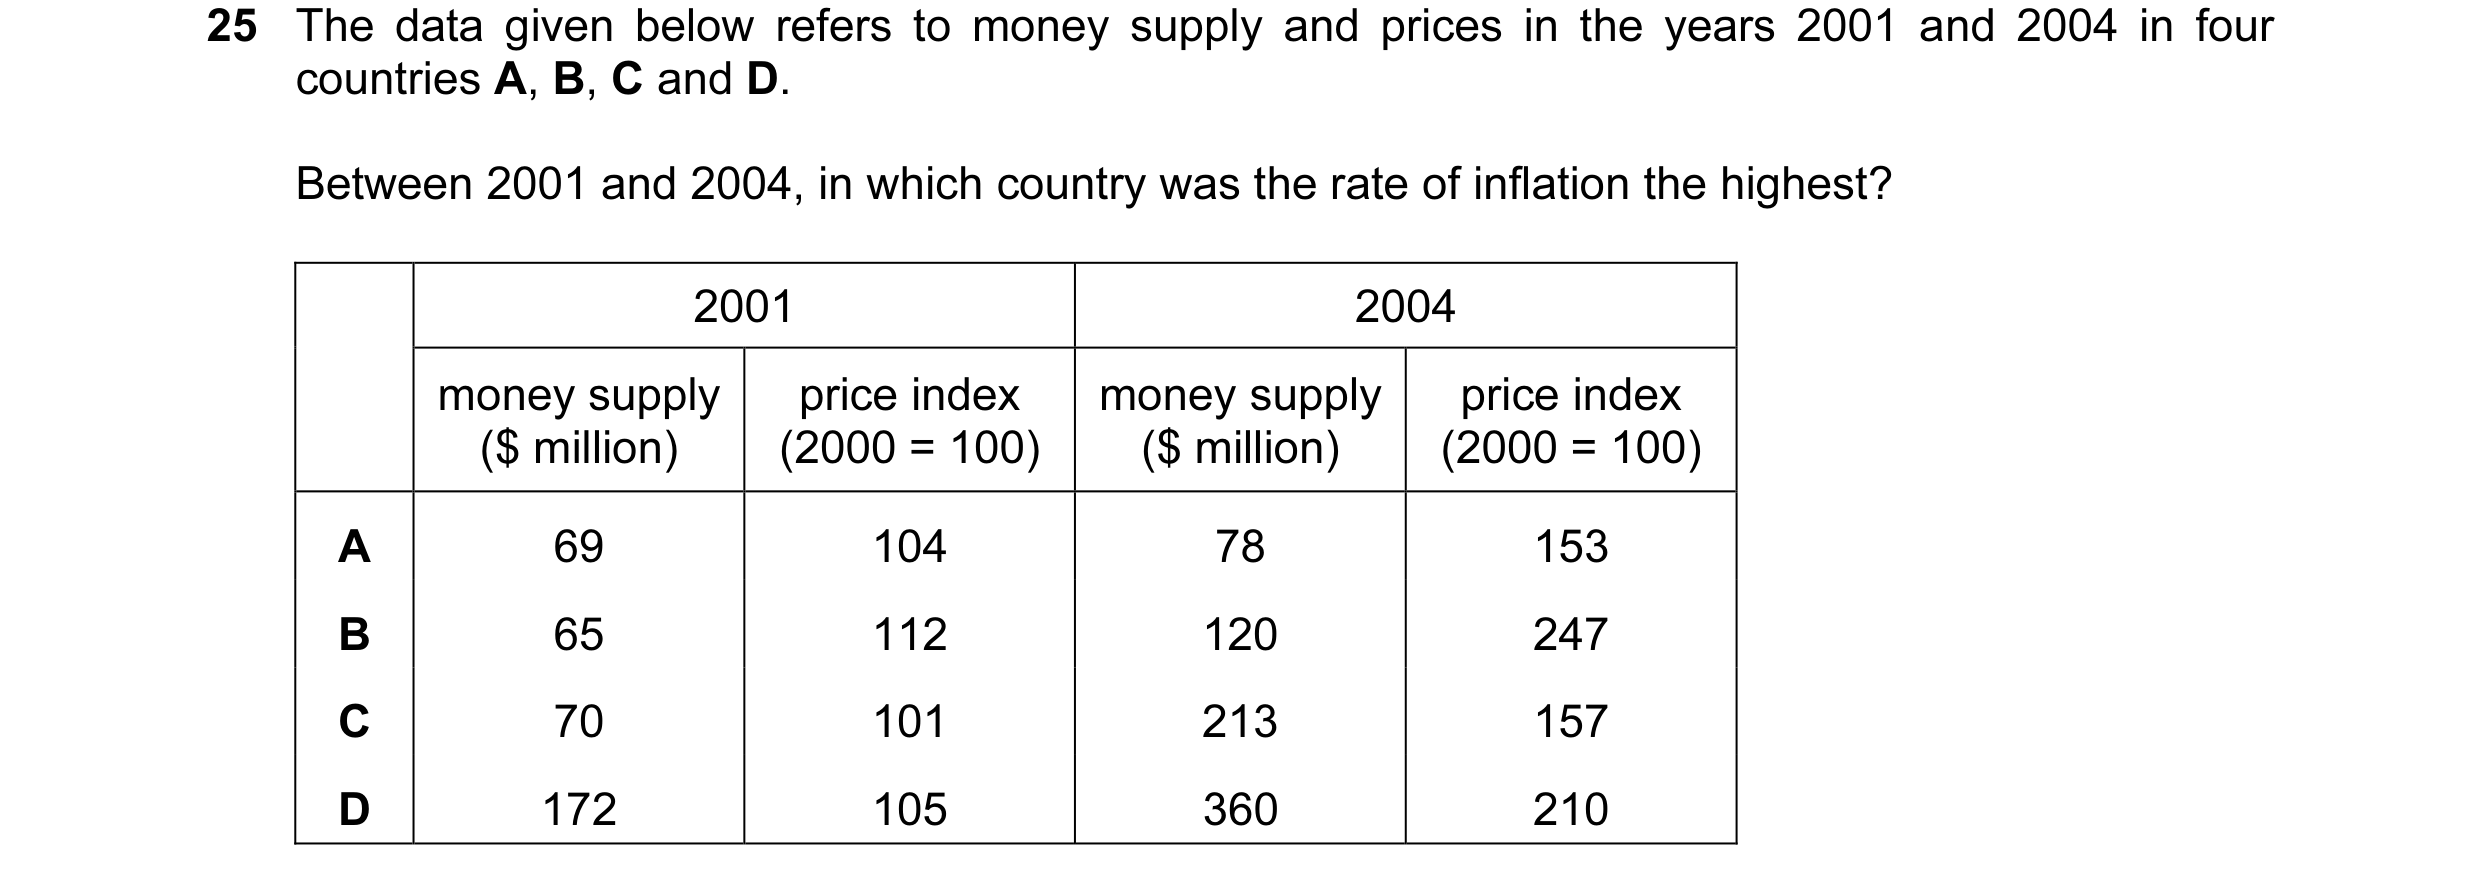
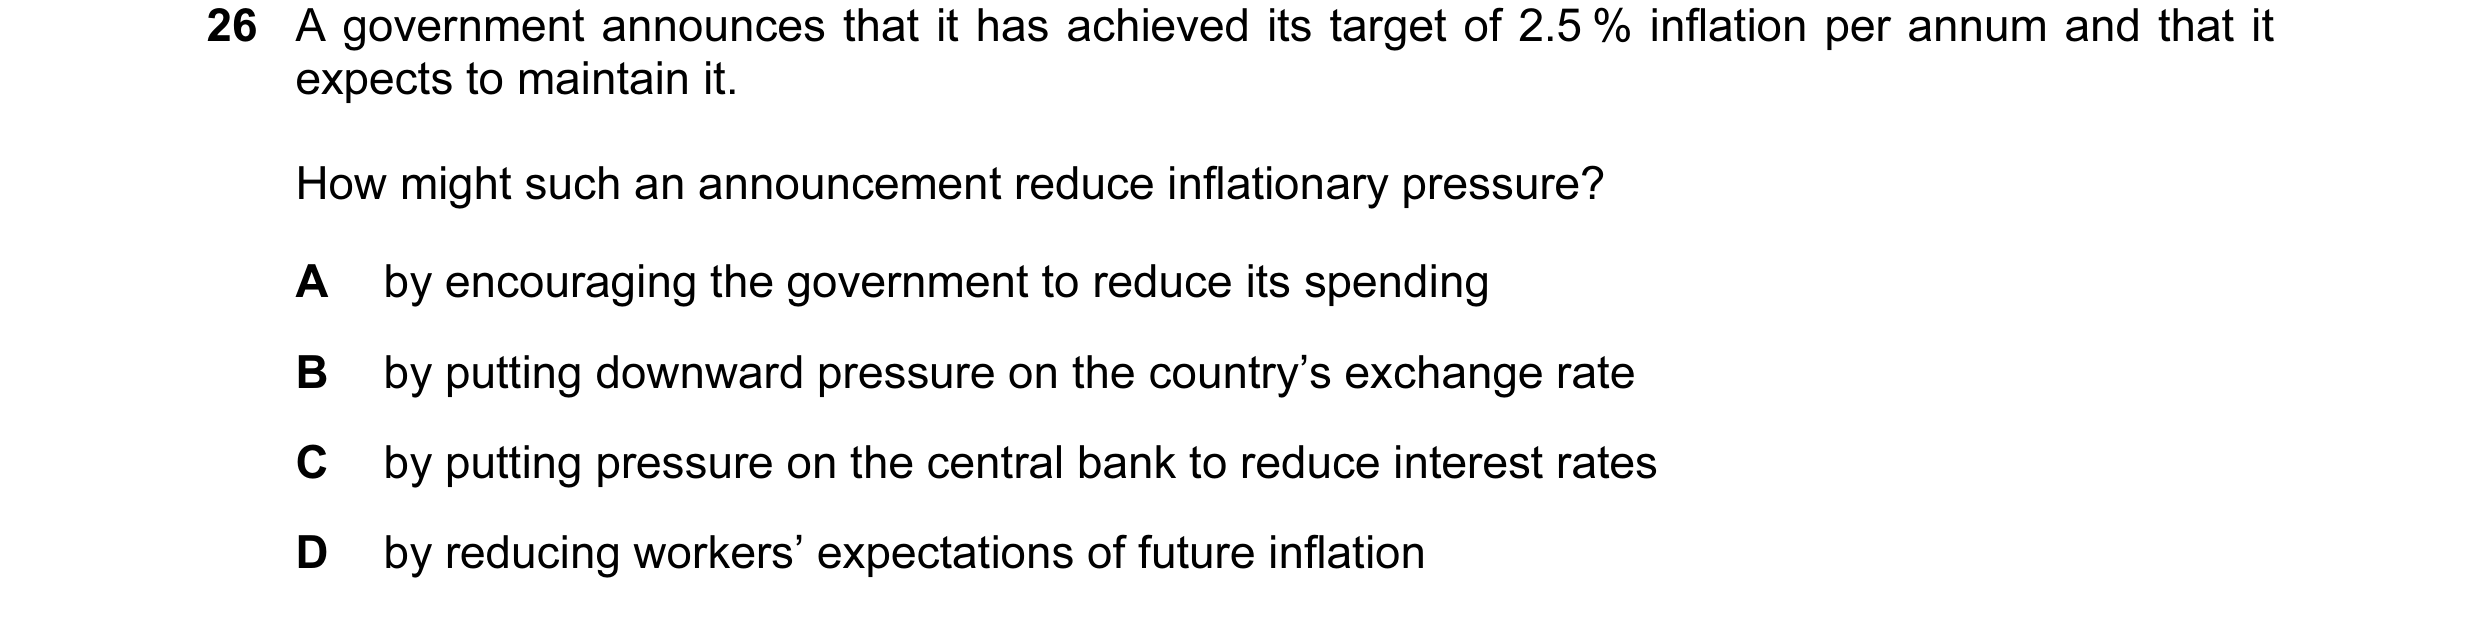 1 / 67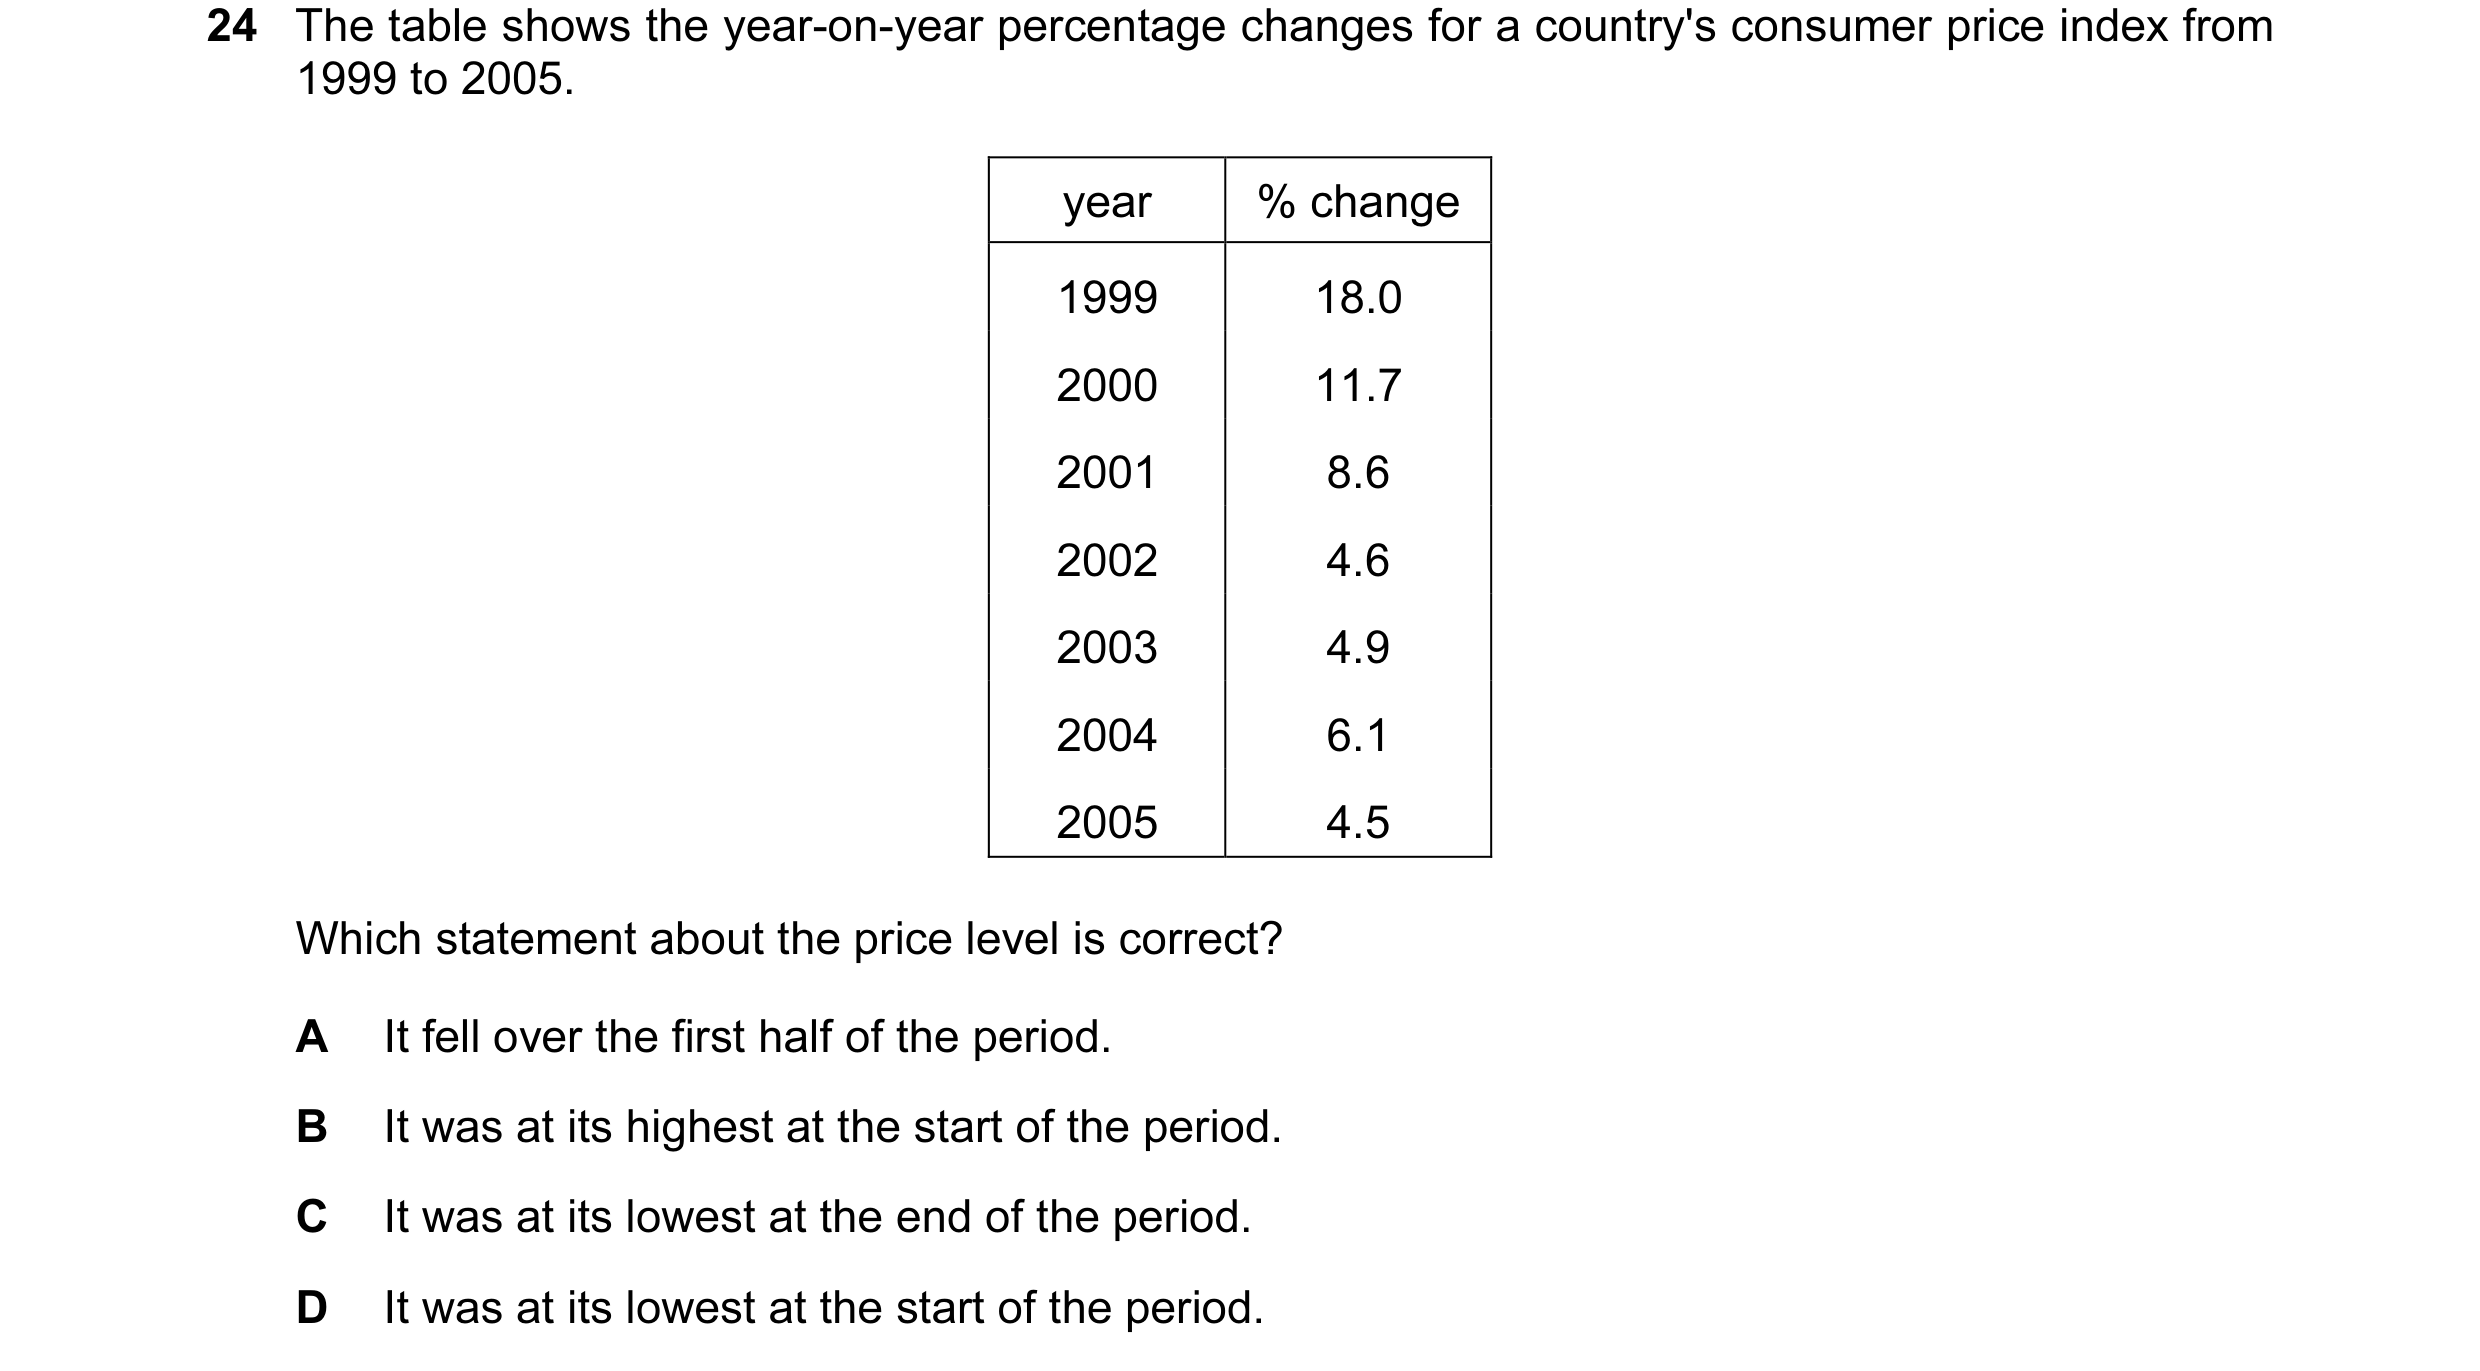

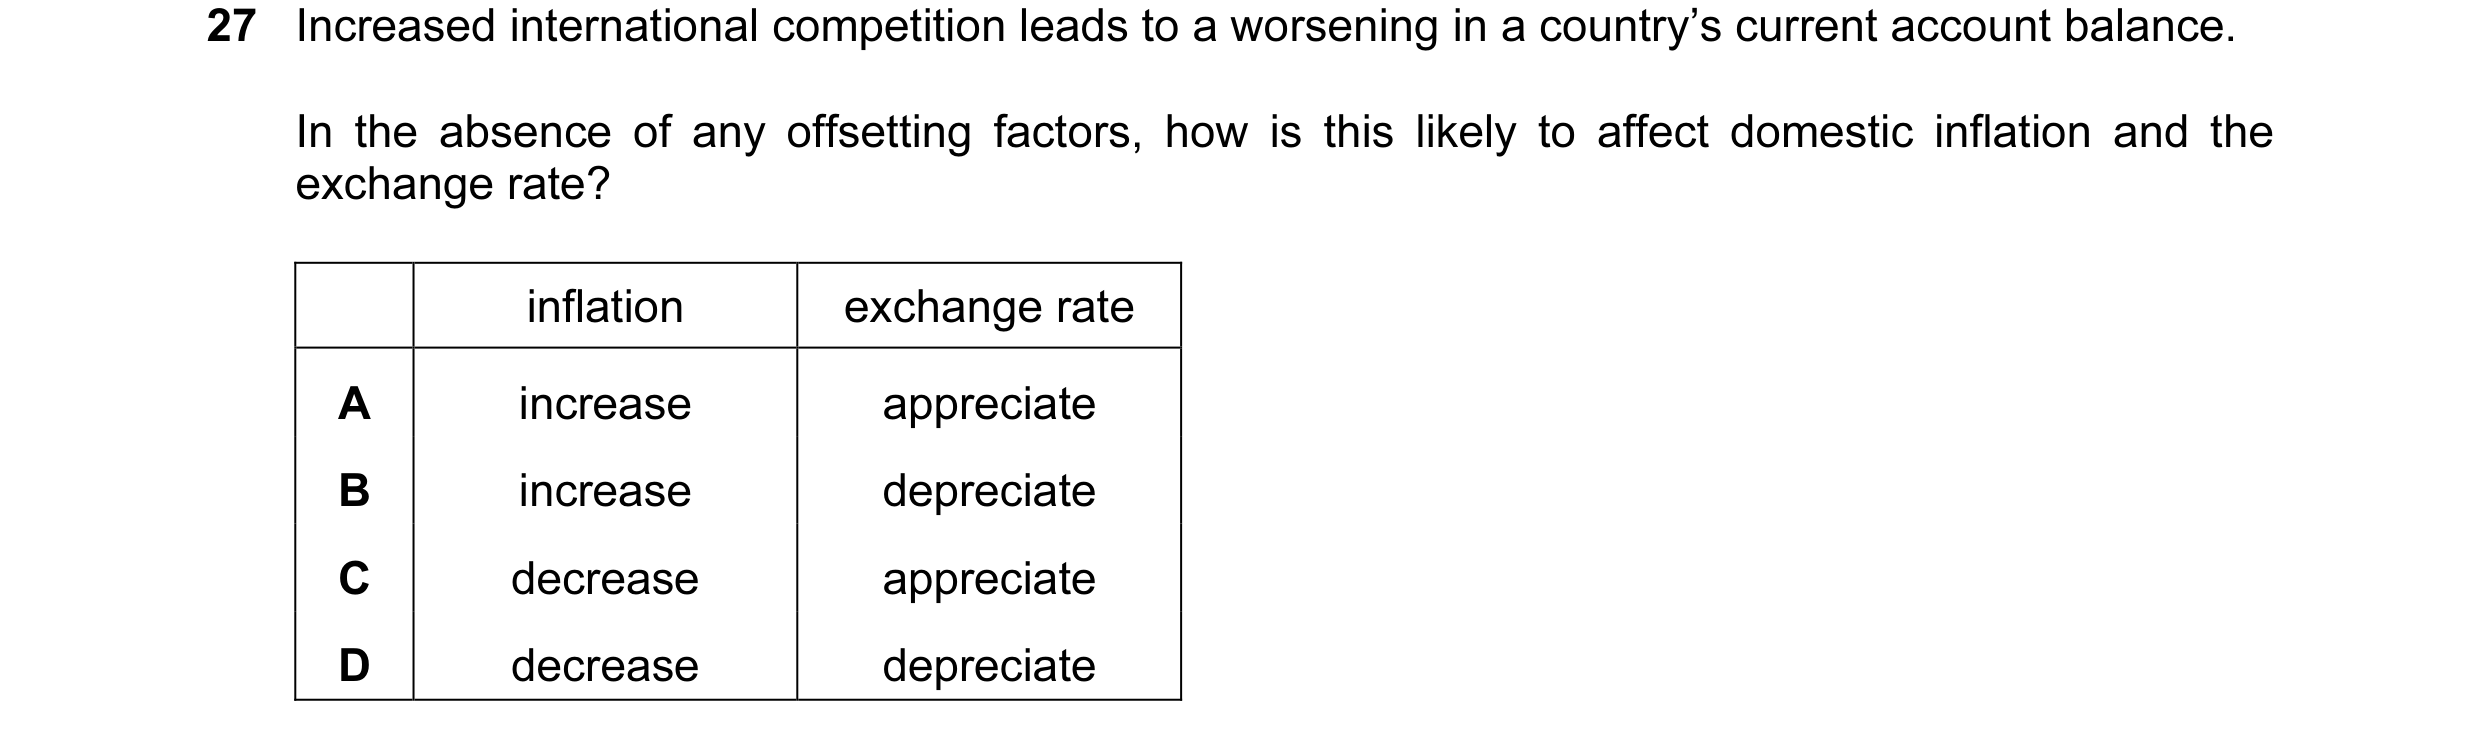 2 / 67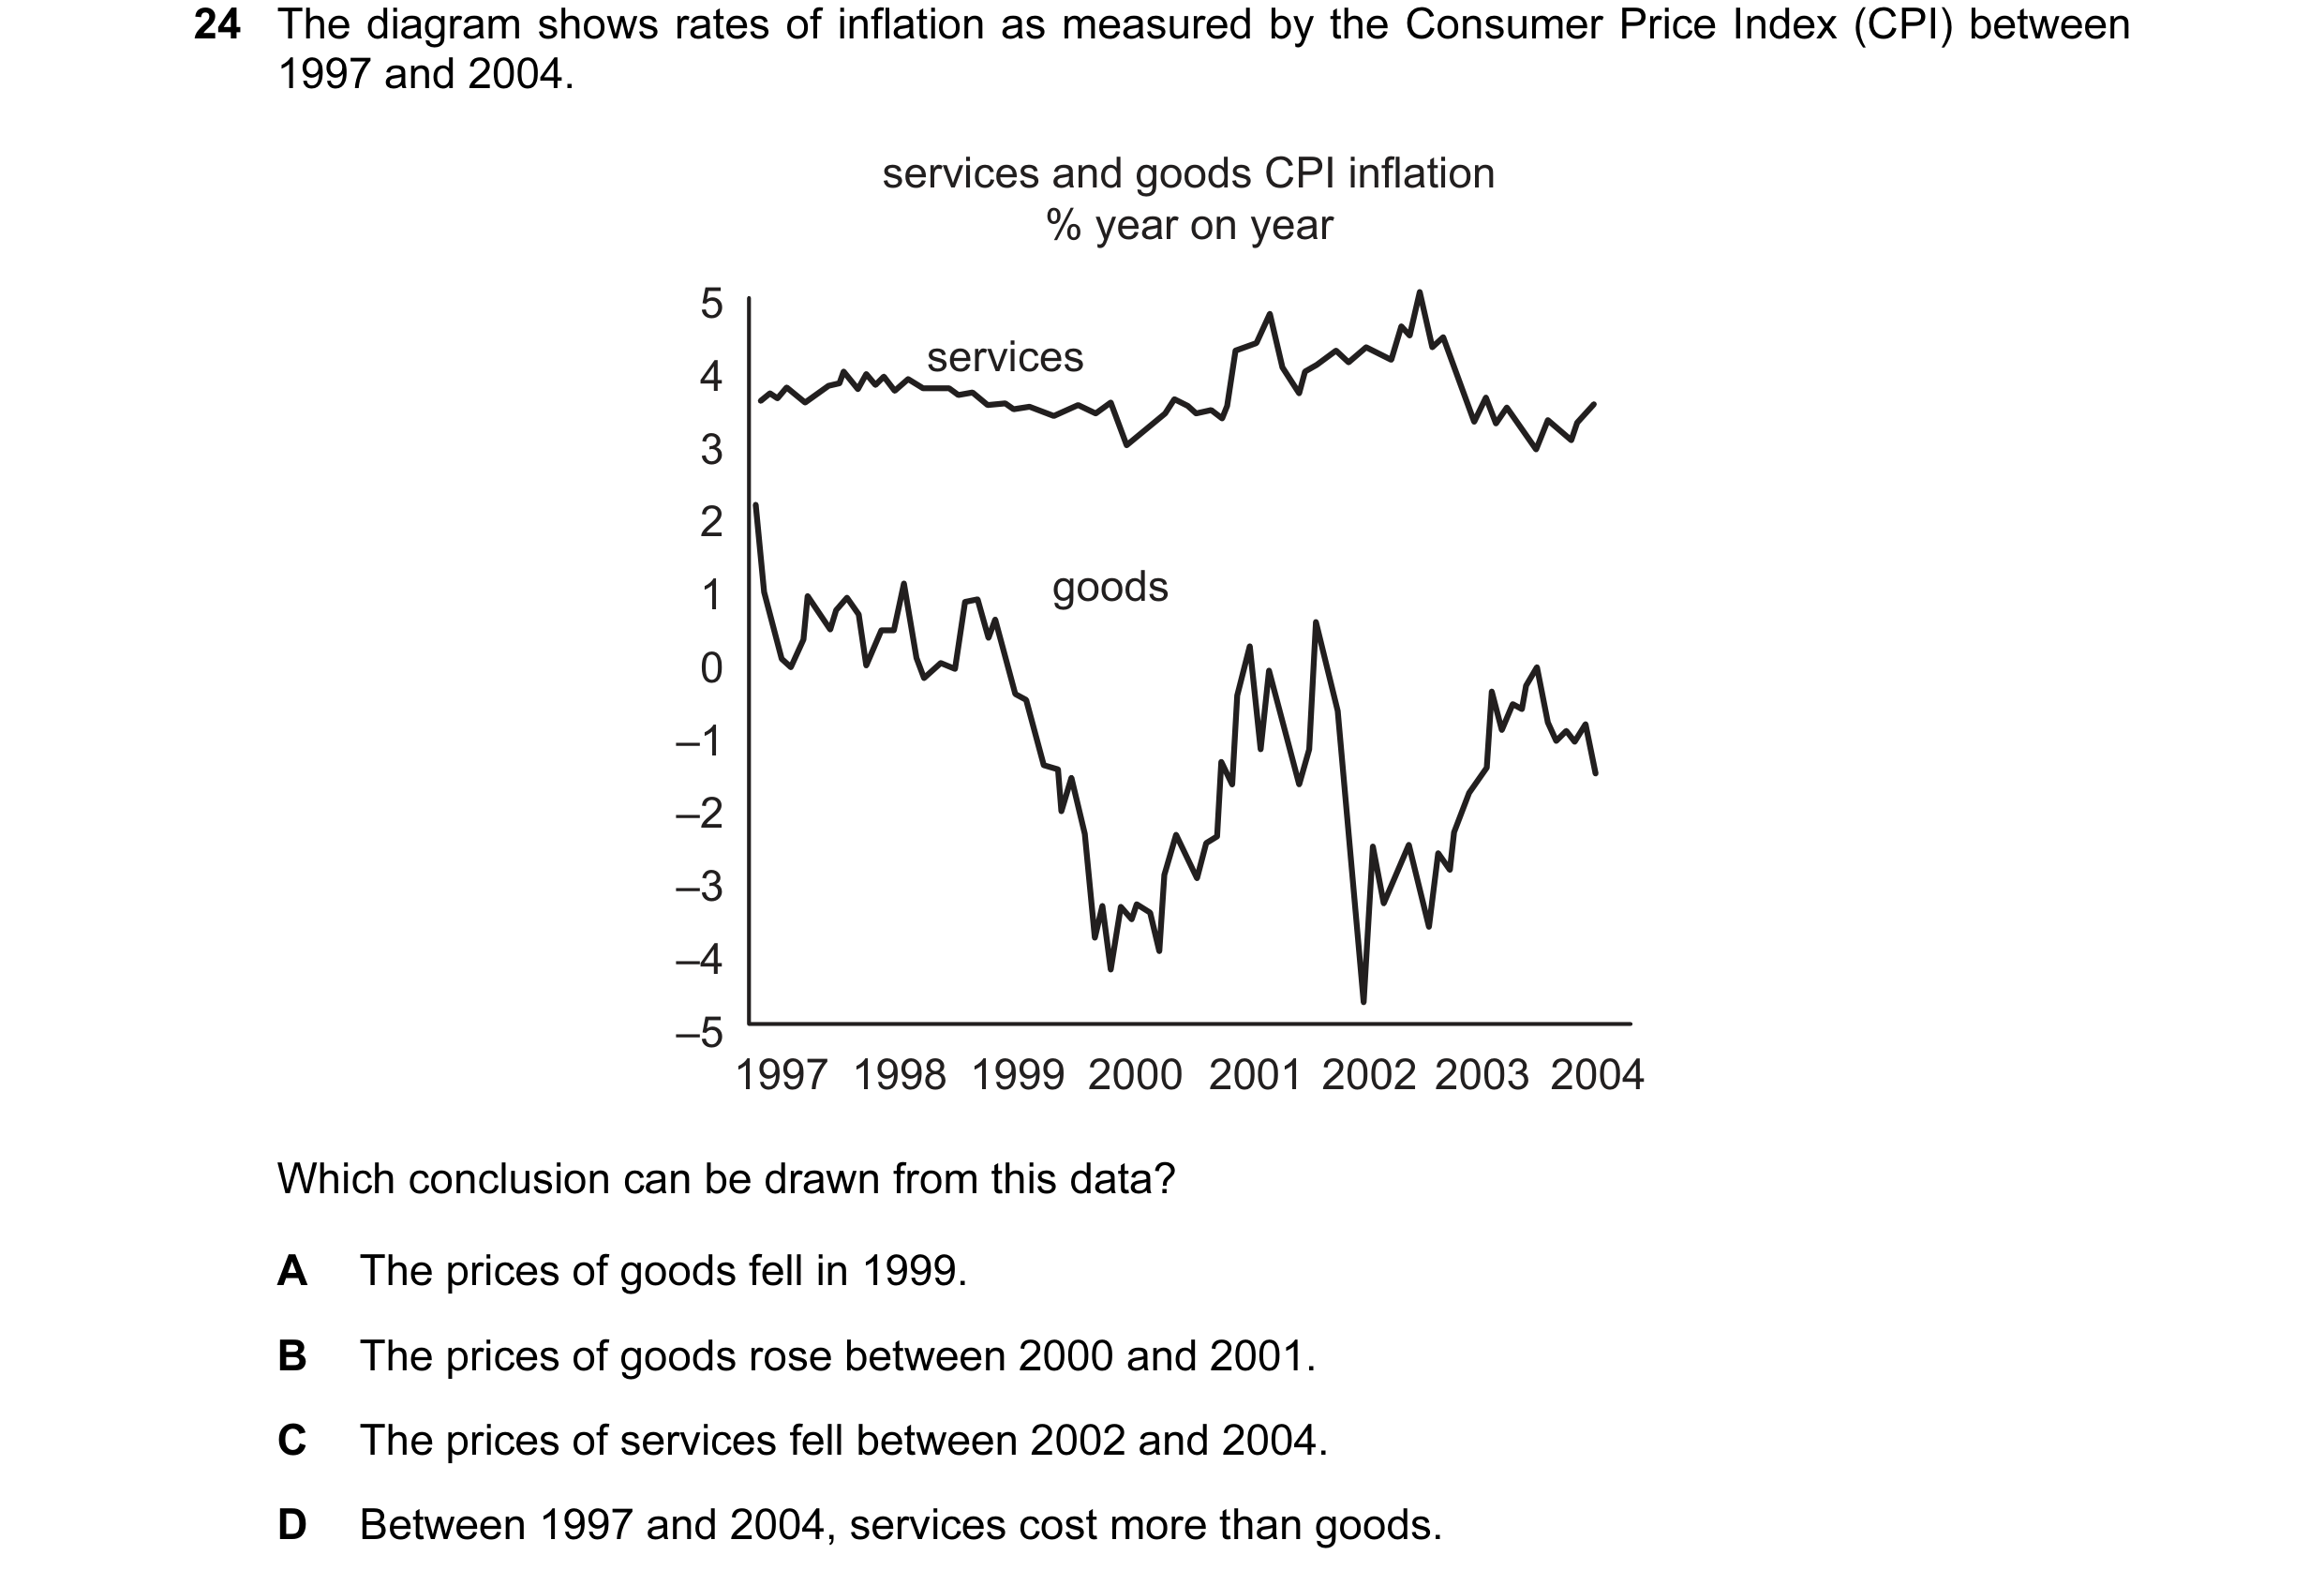
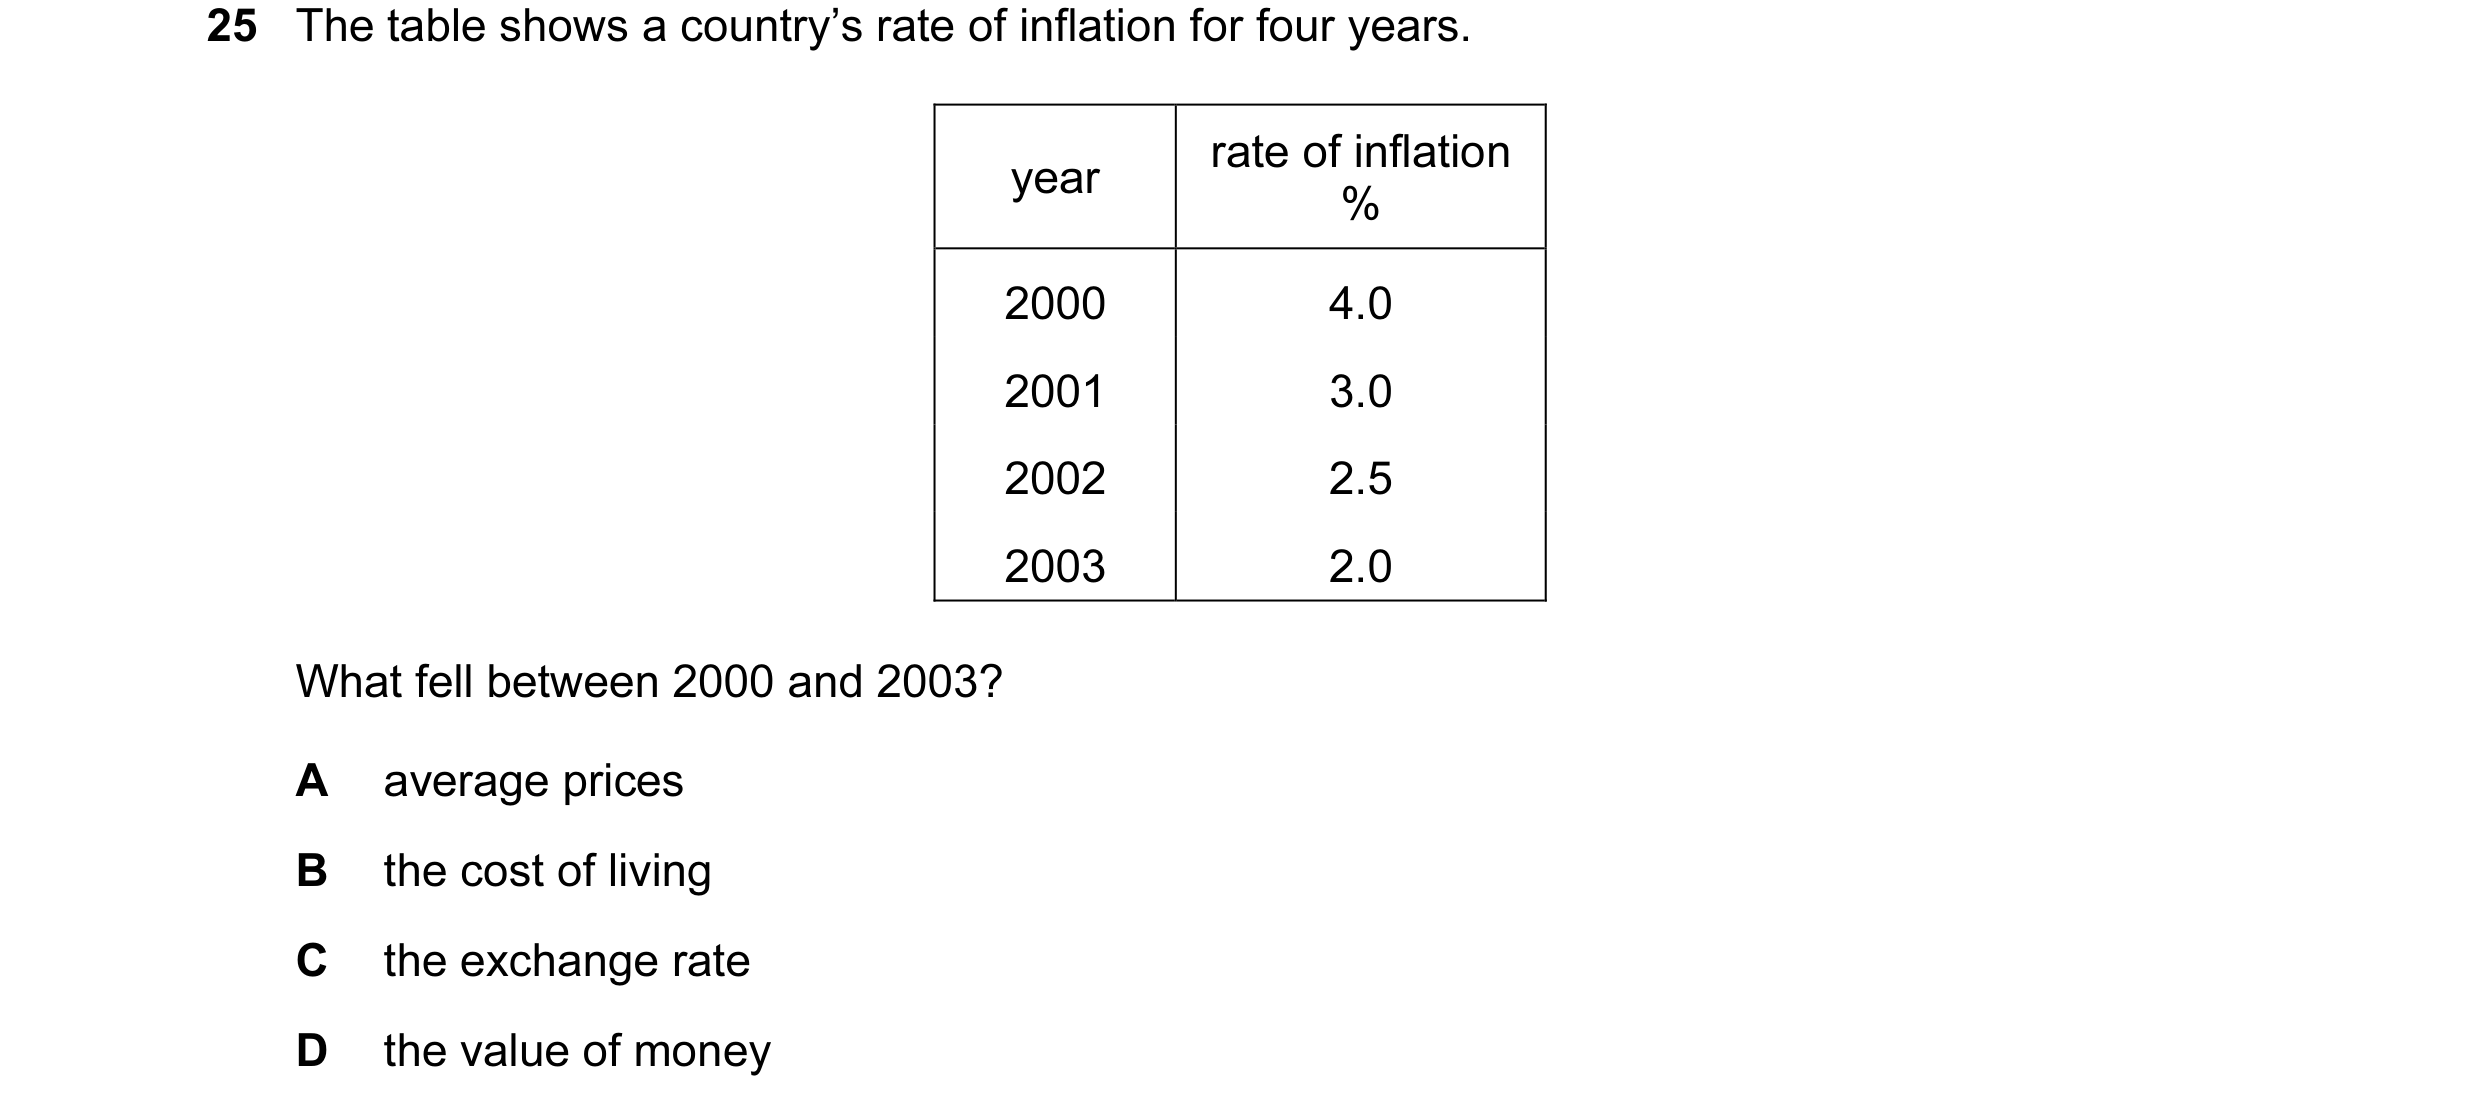
 3 / 67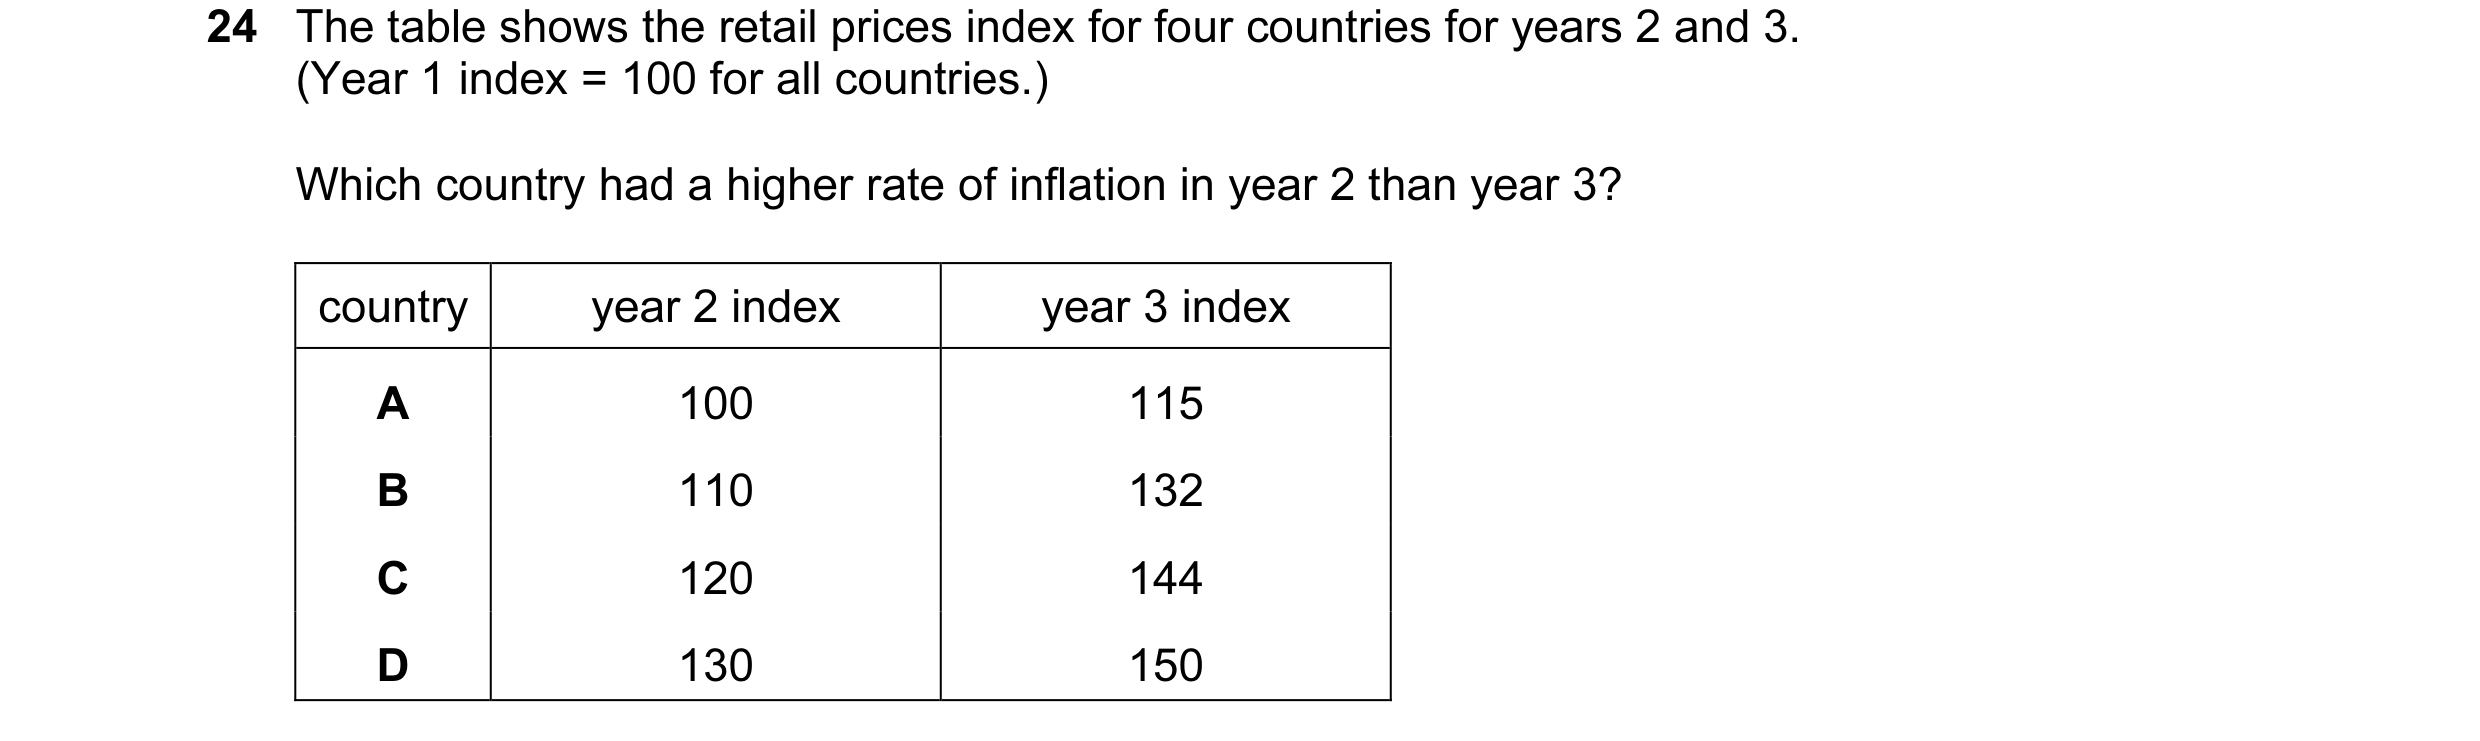
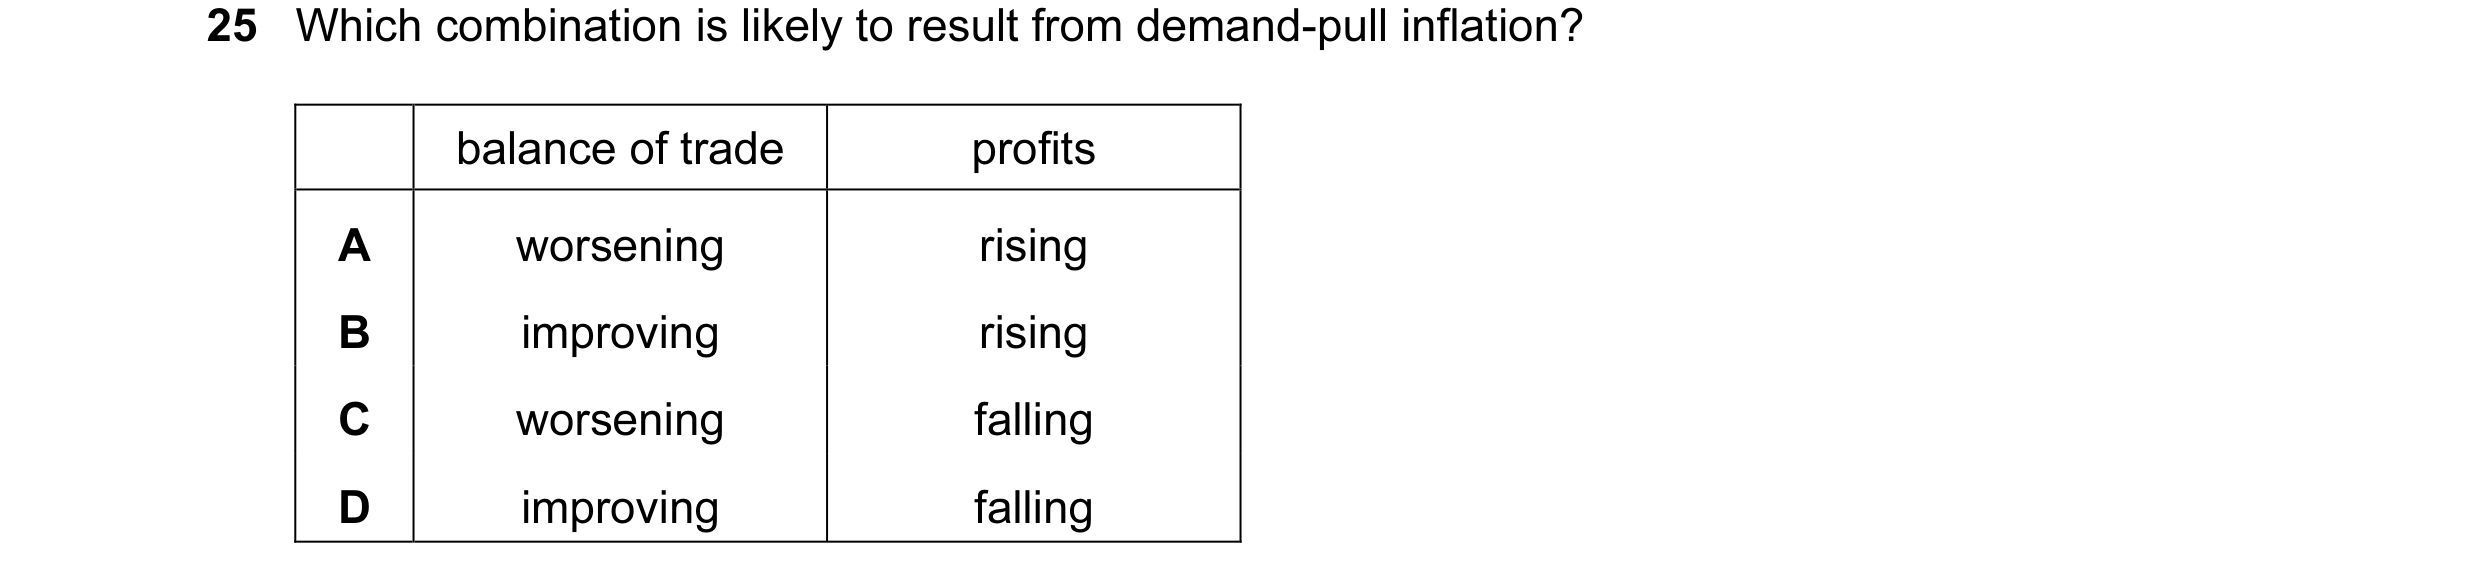

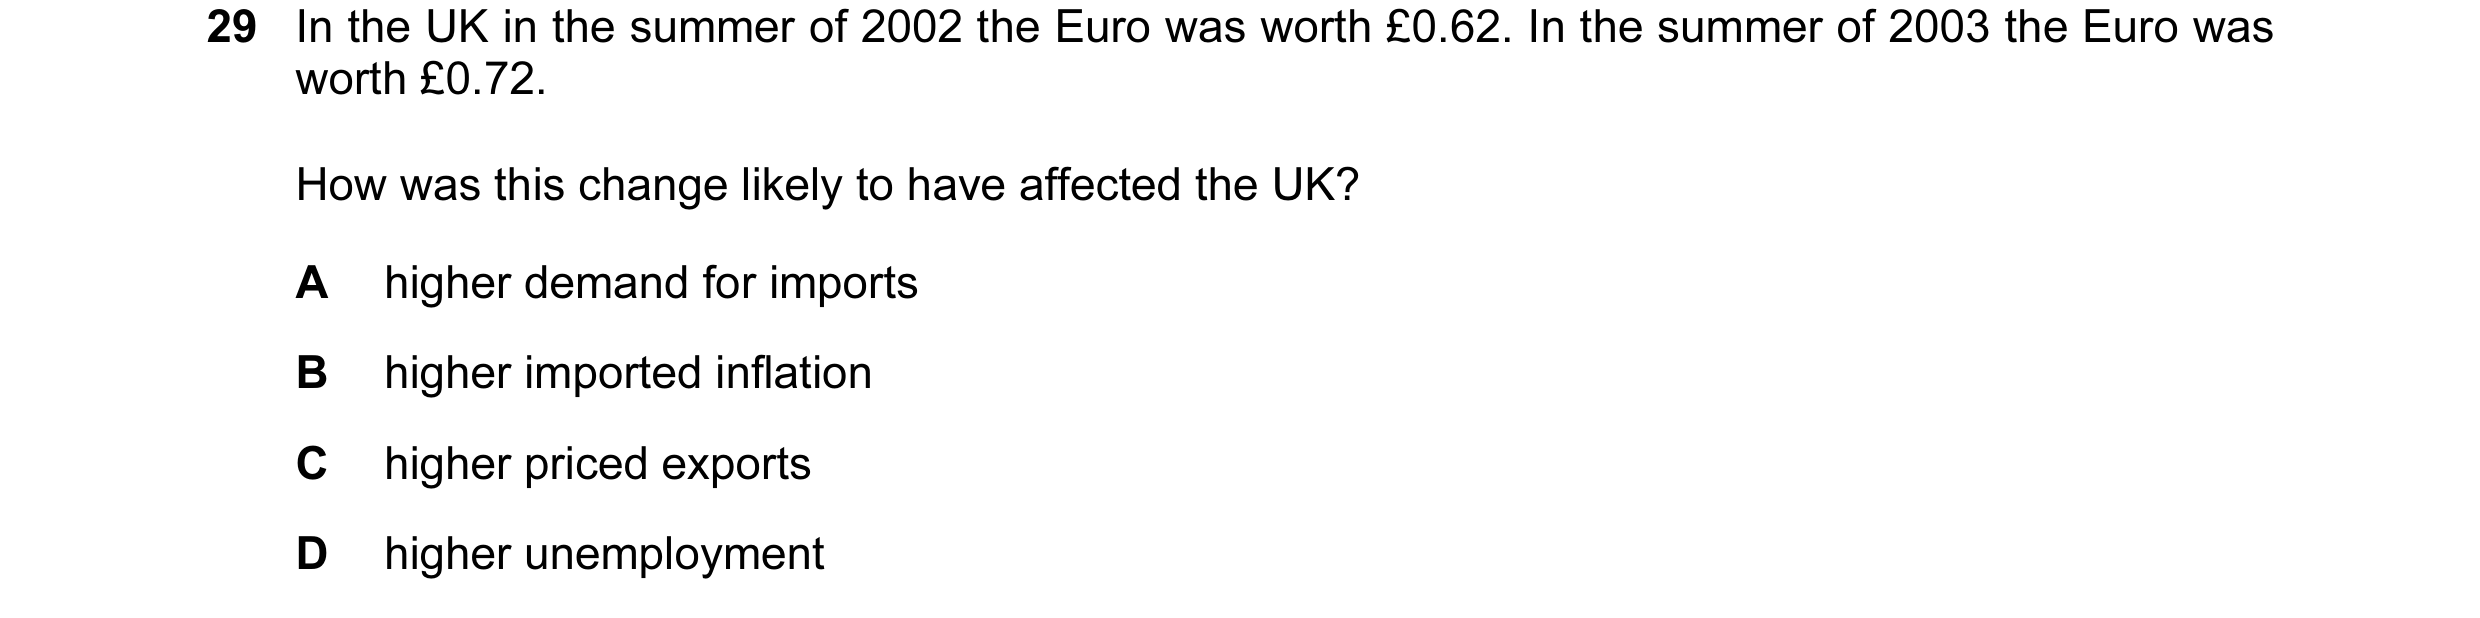
 4 / 67
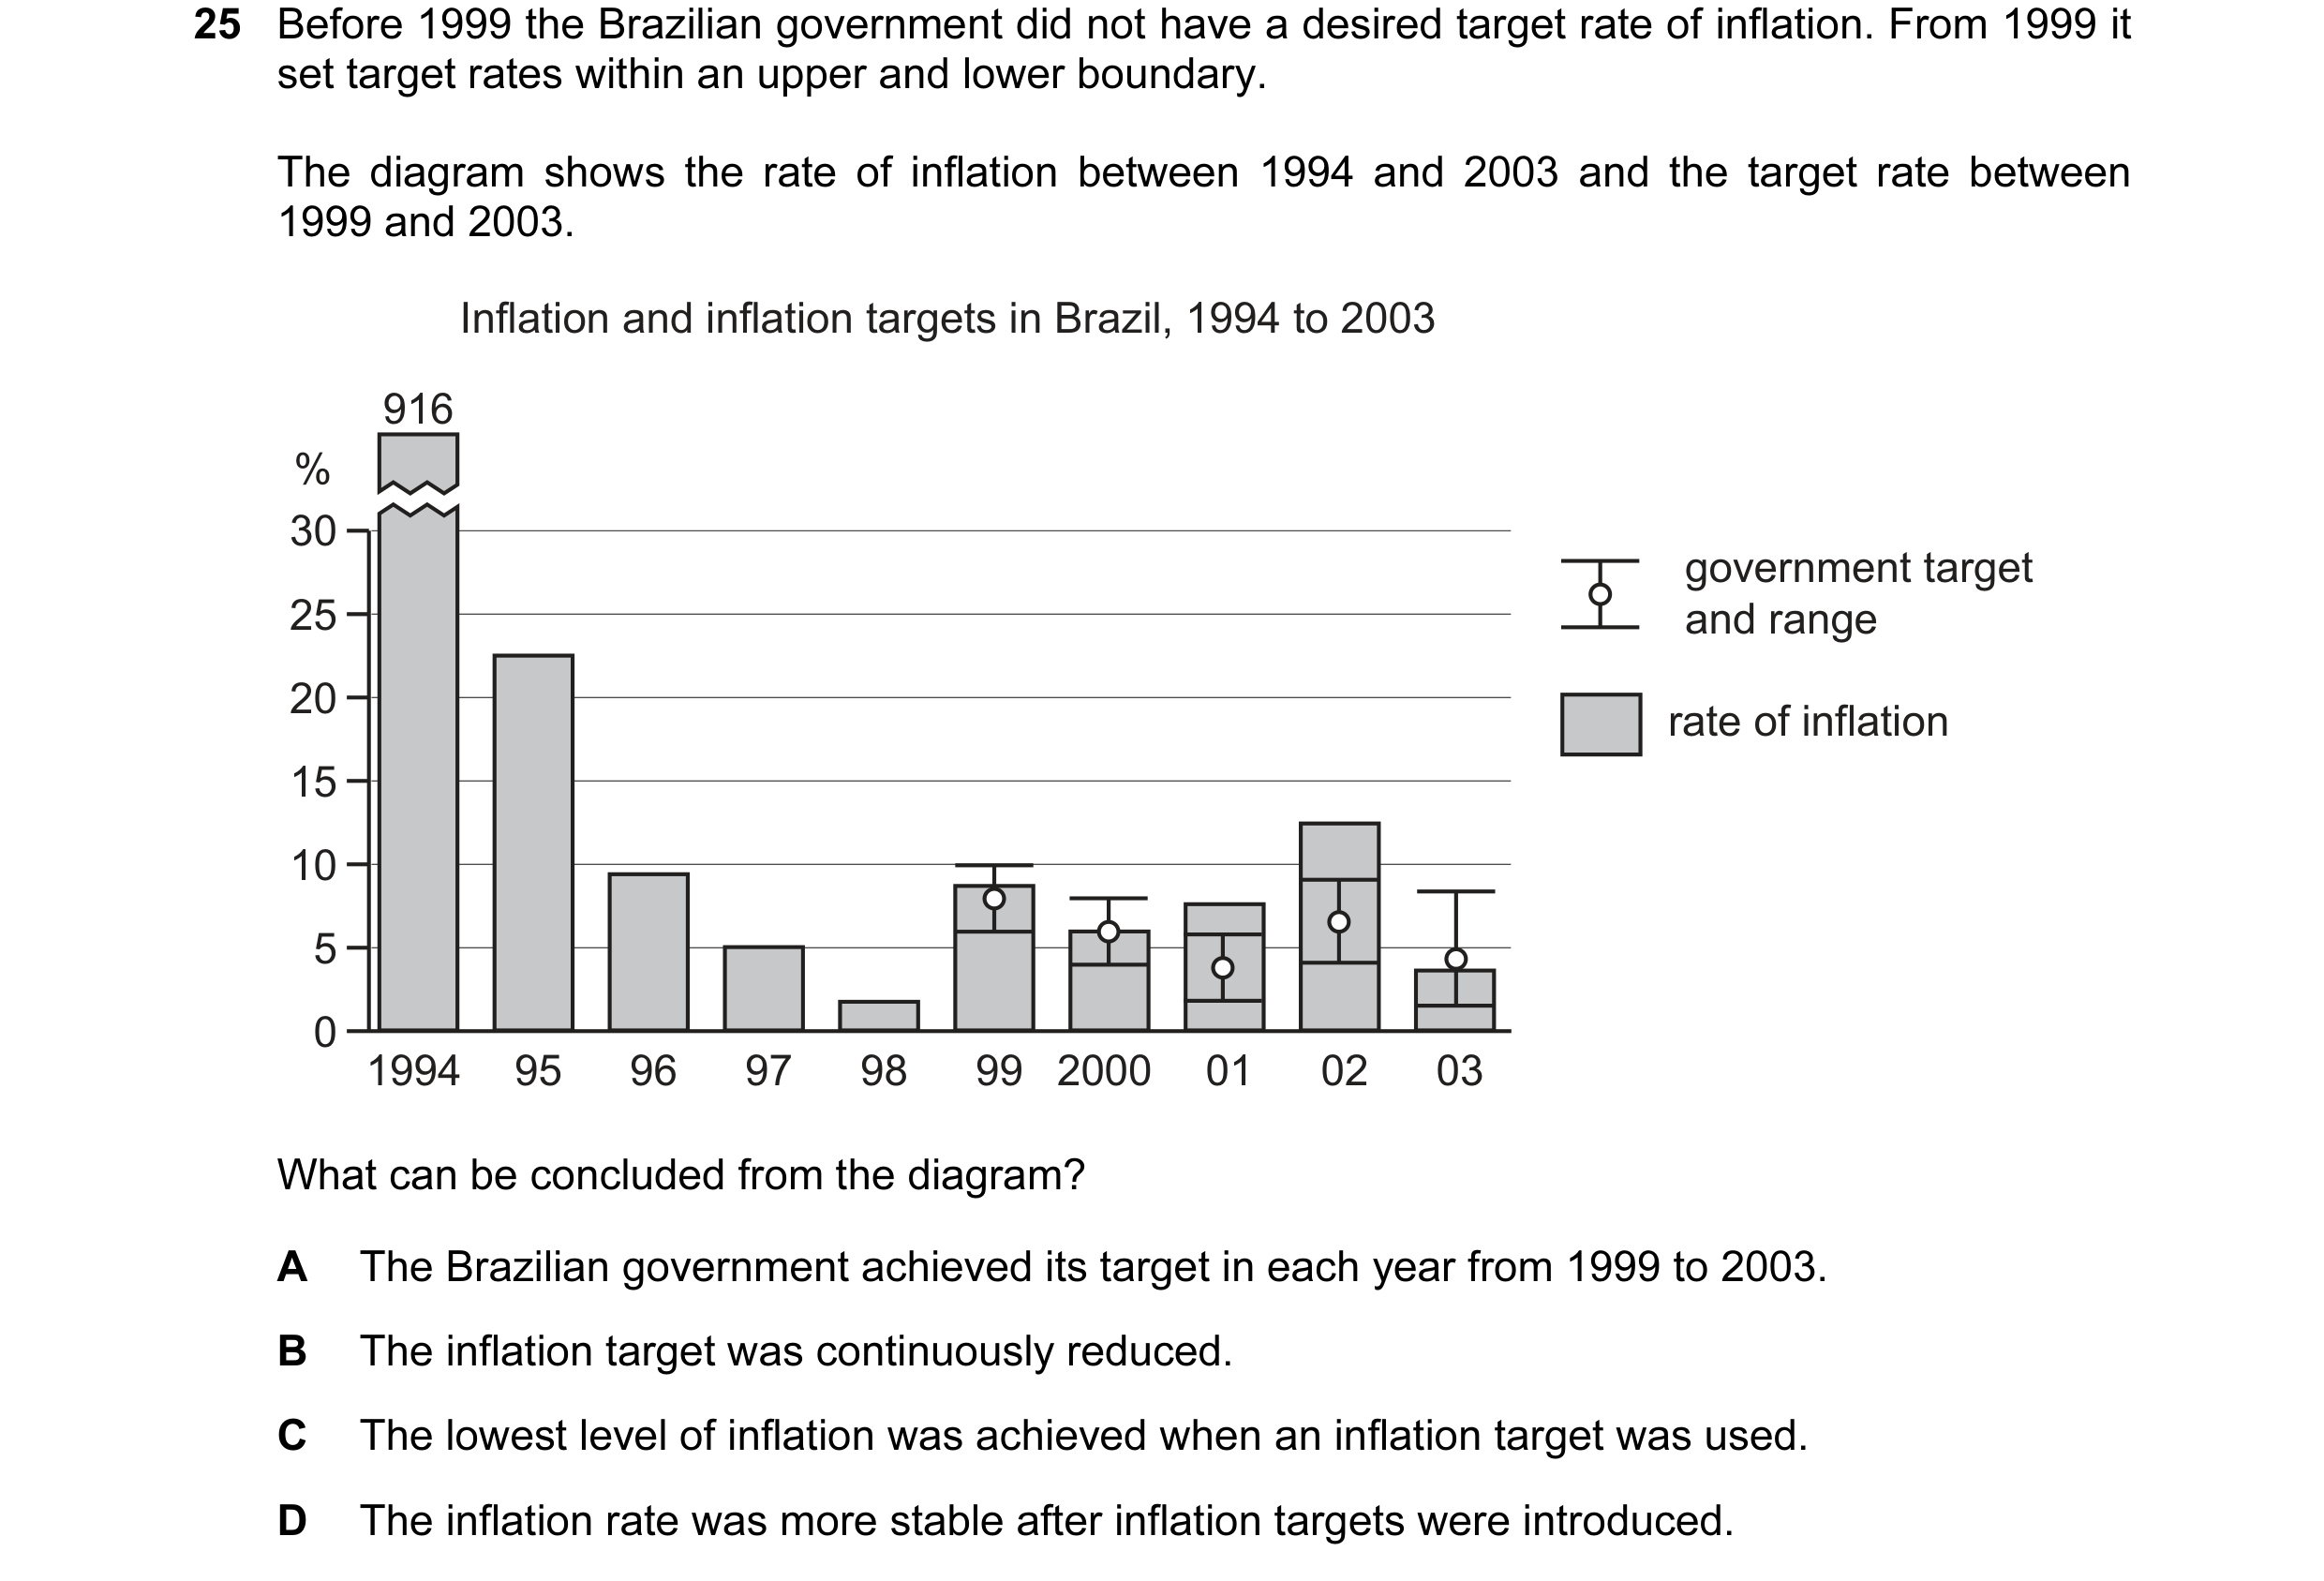 5 / 67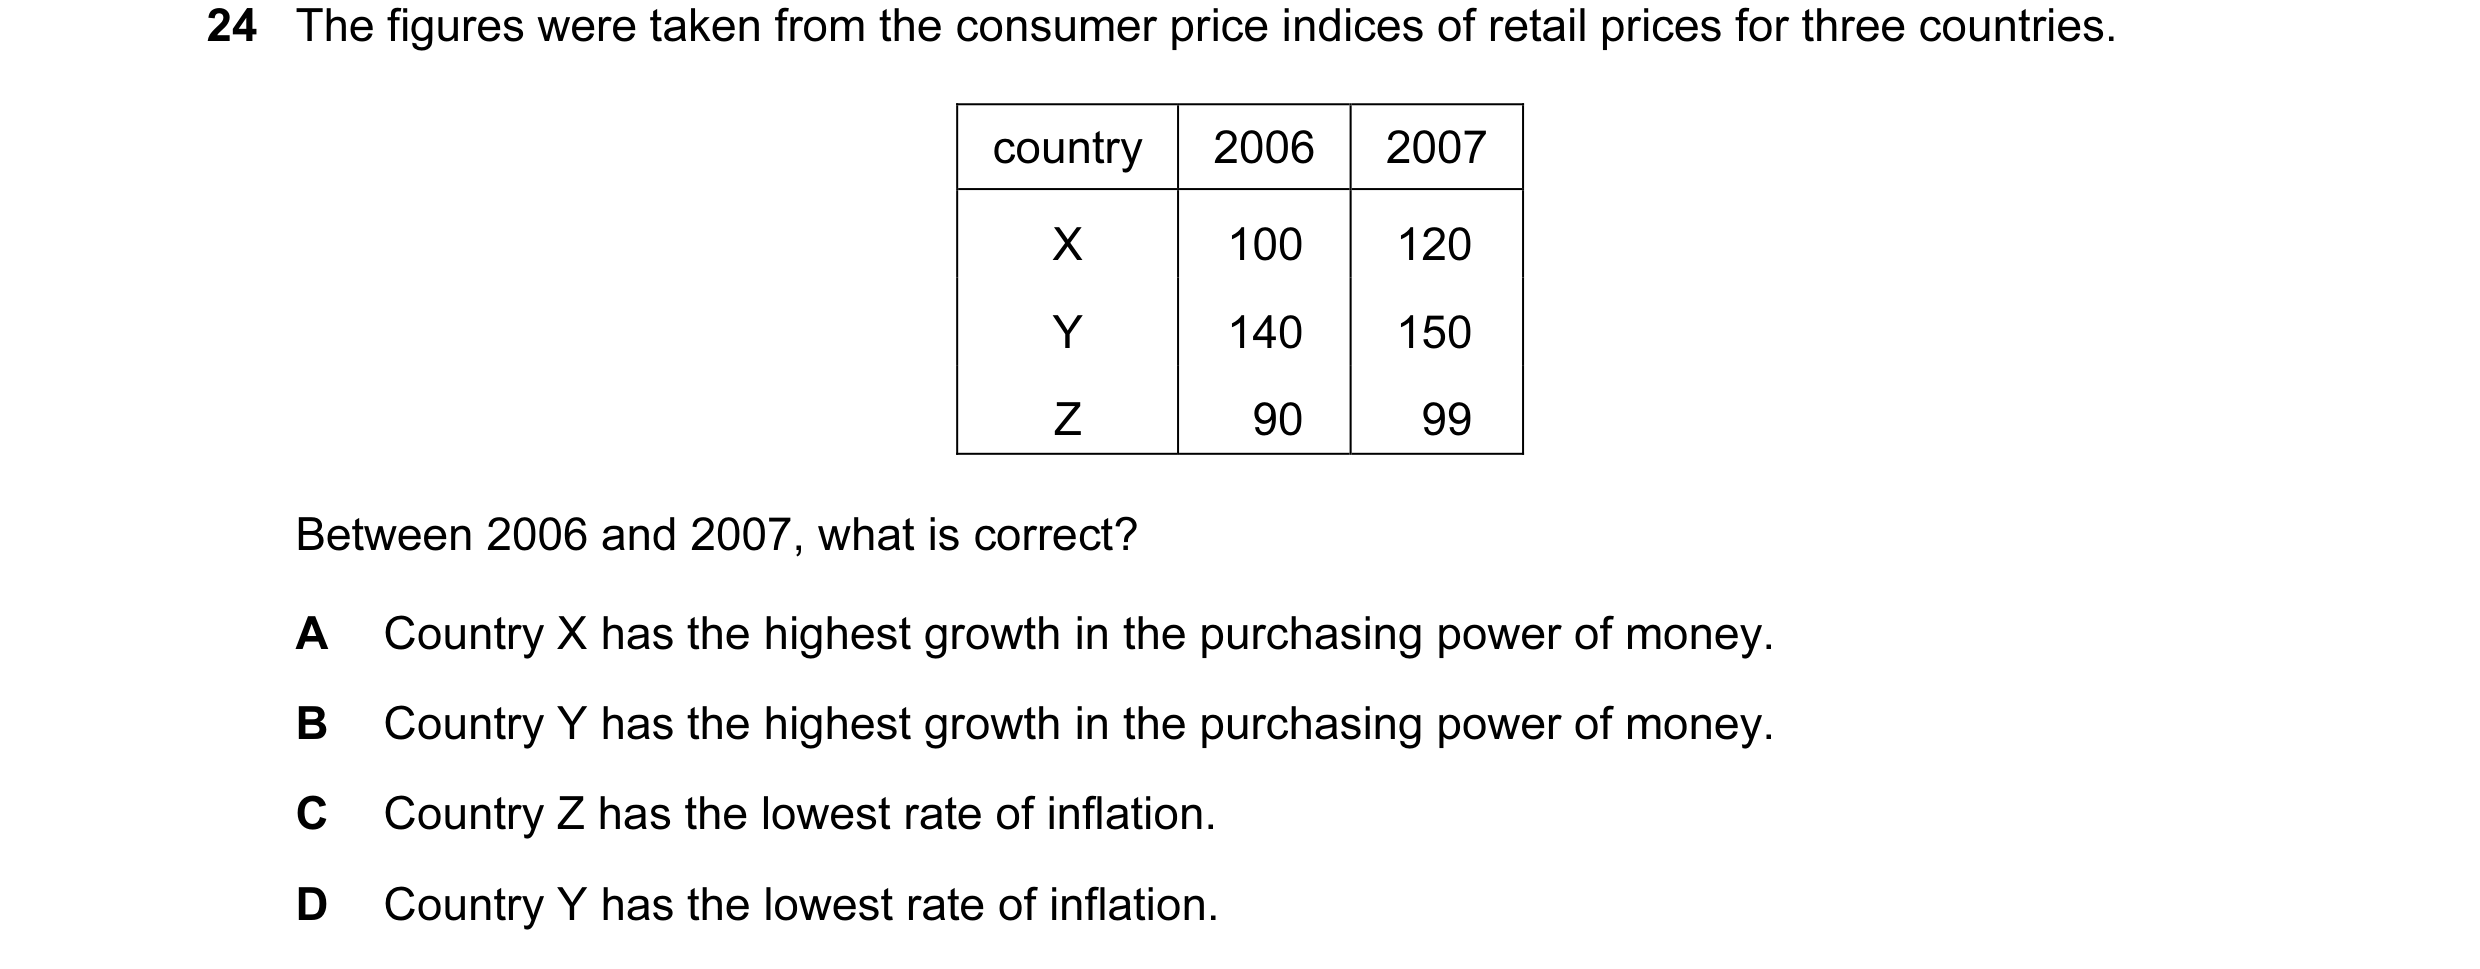

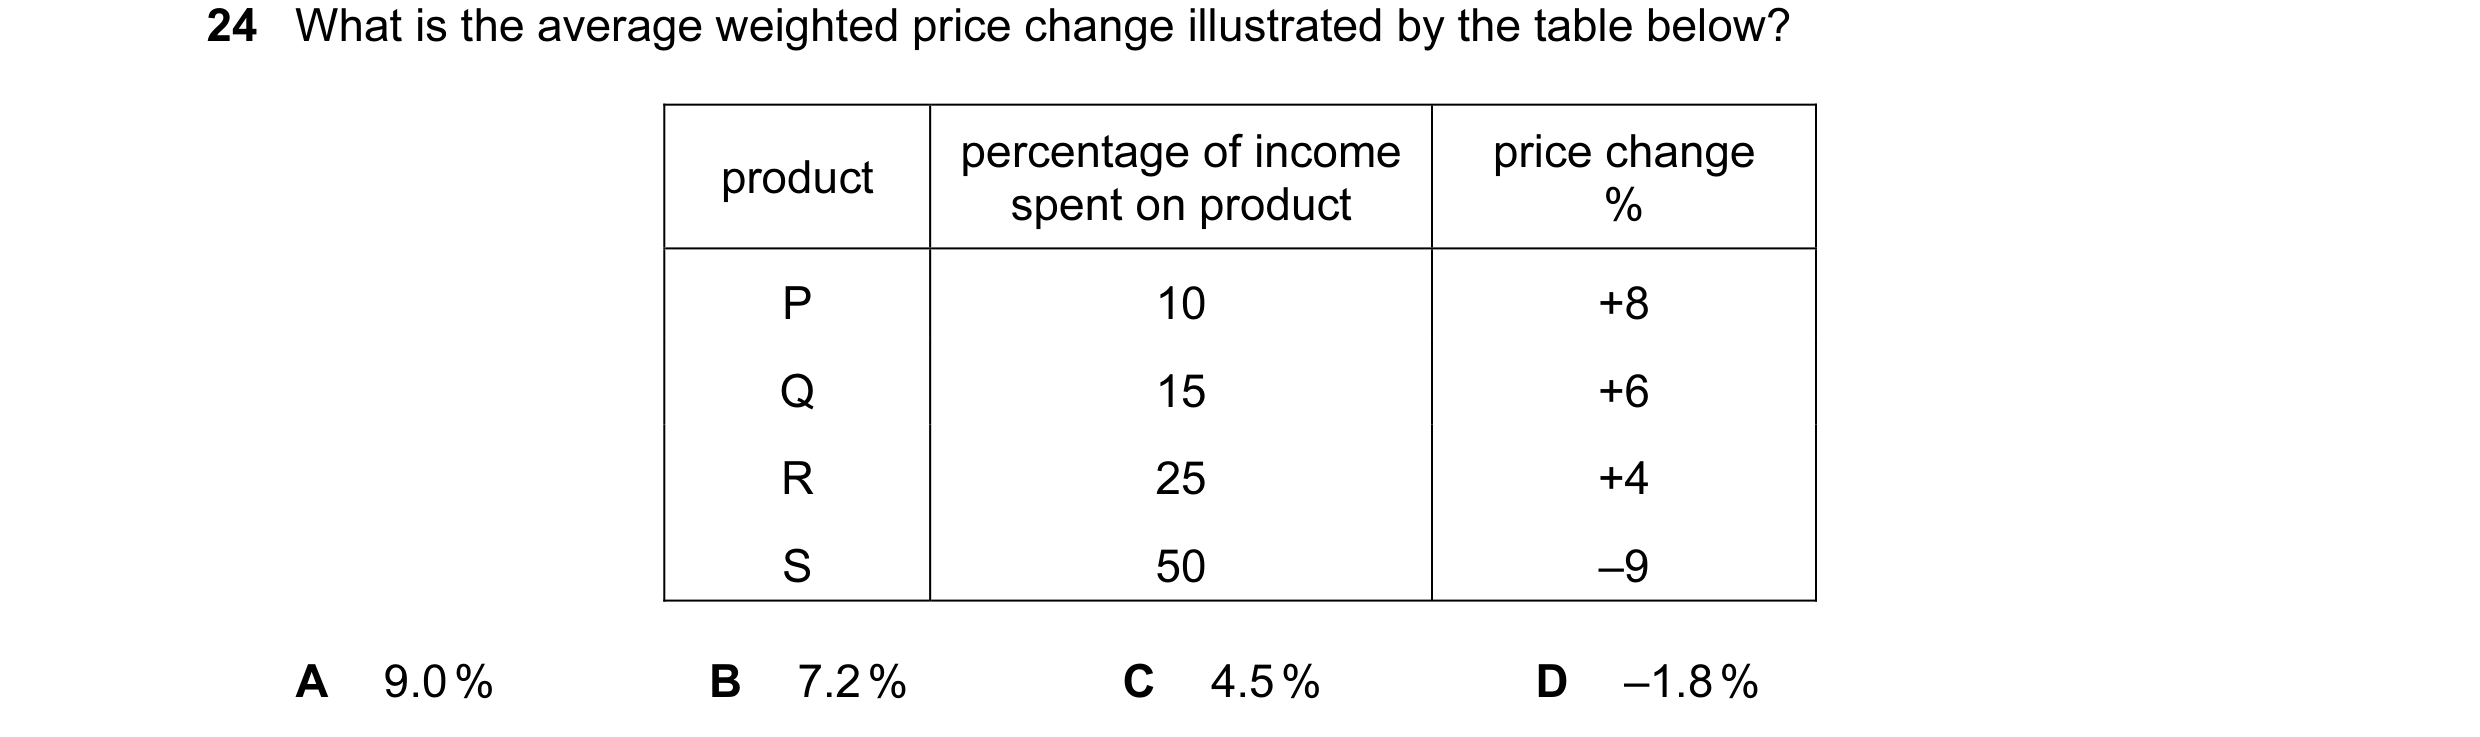 6 / 67
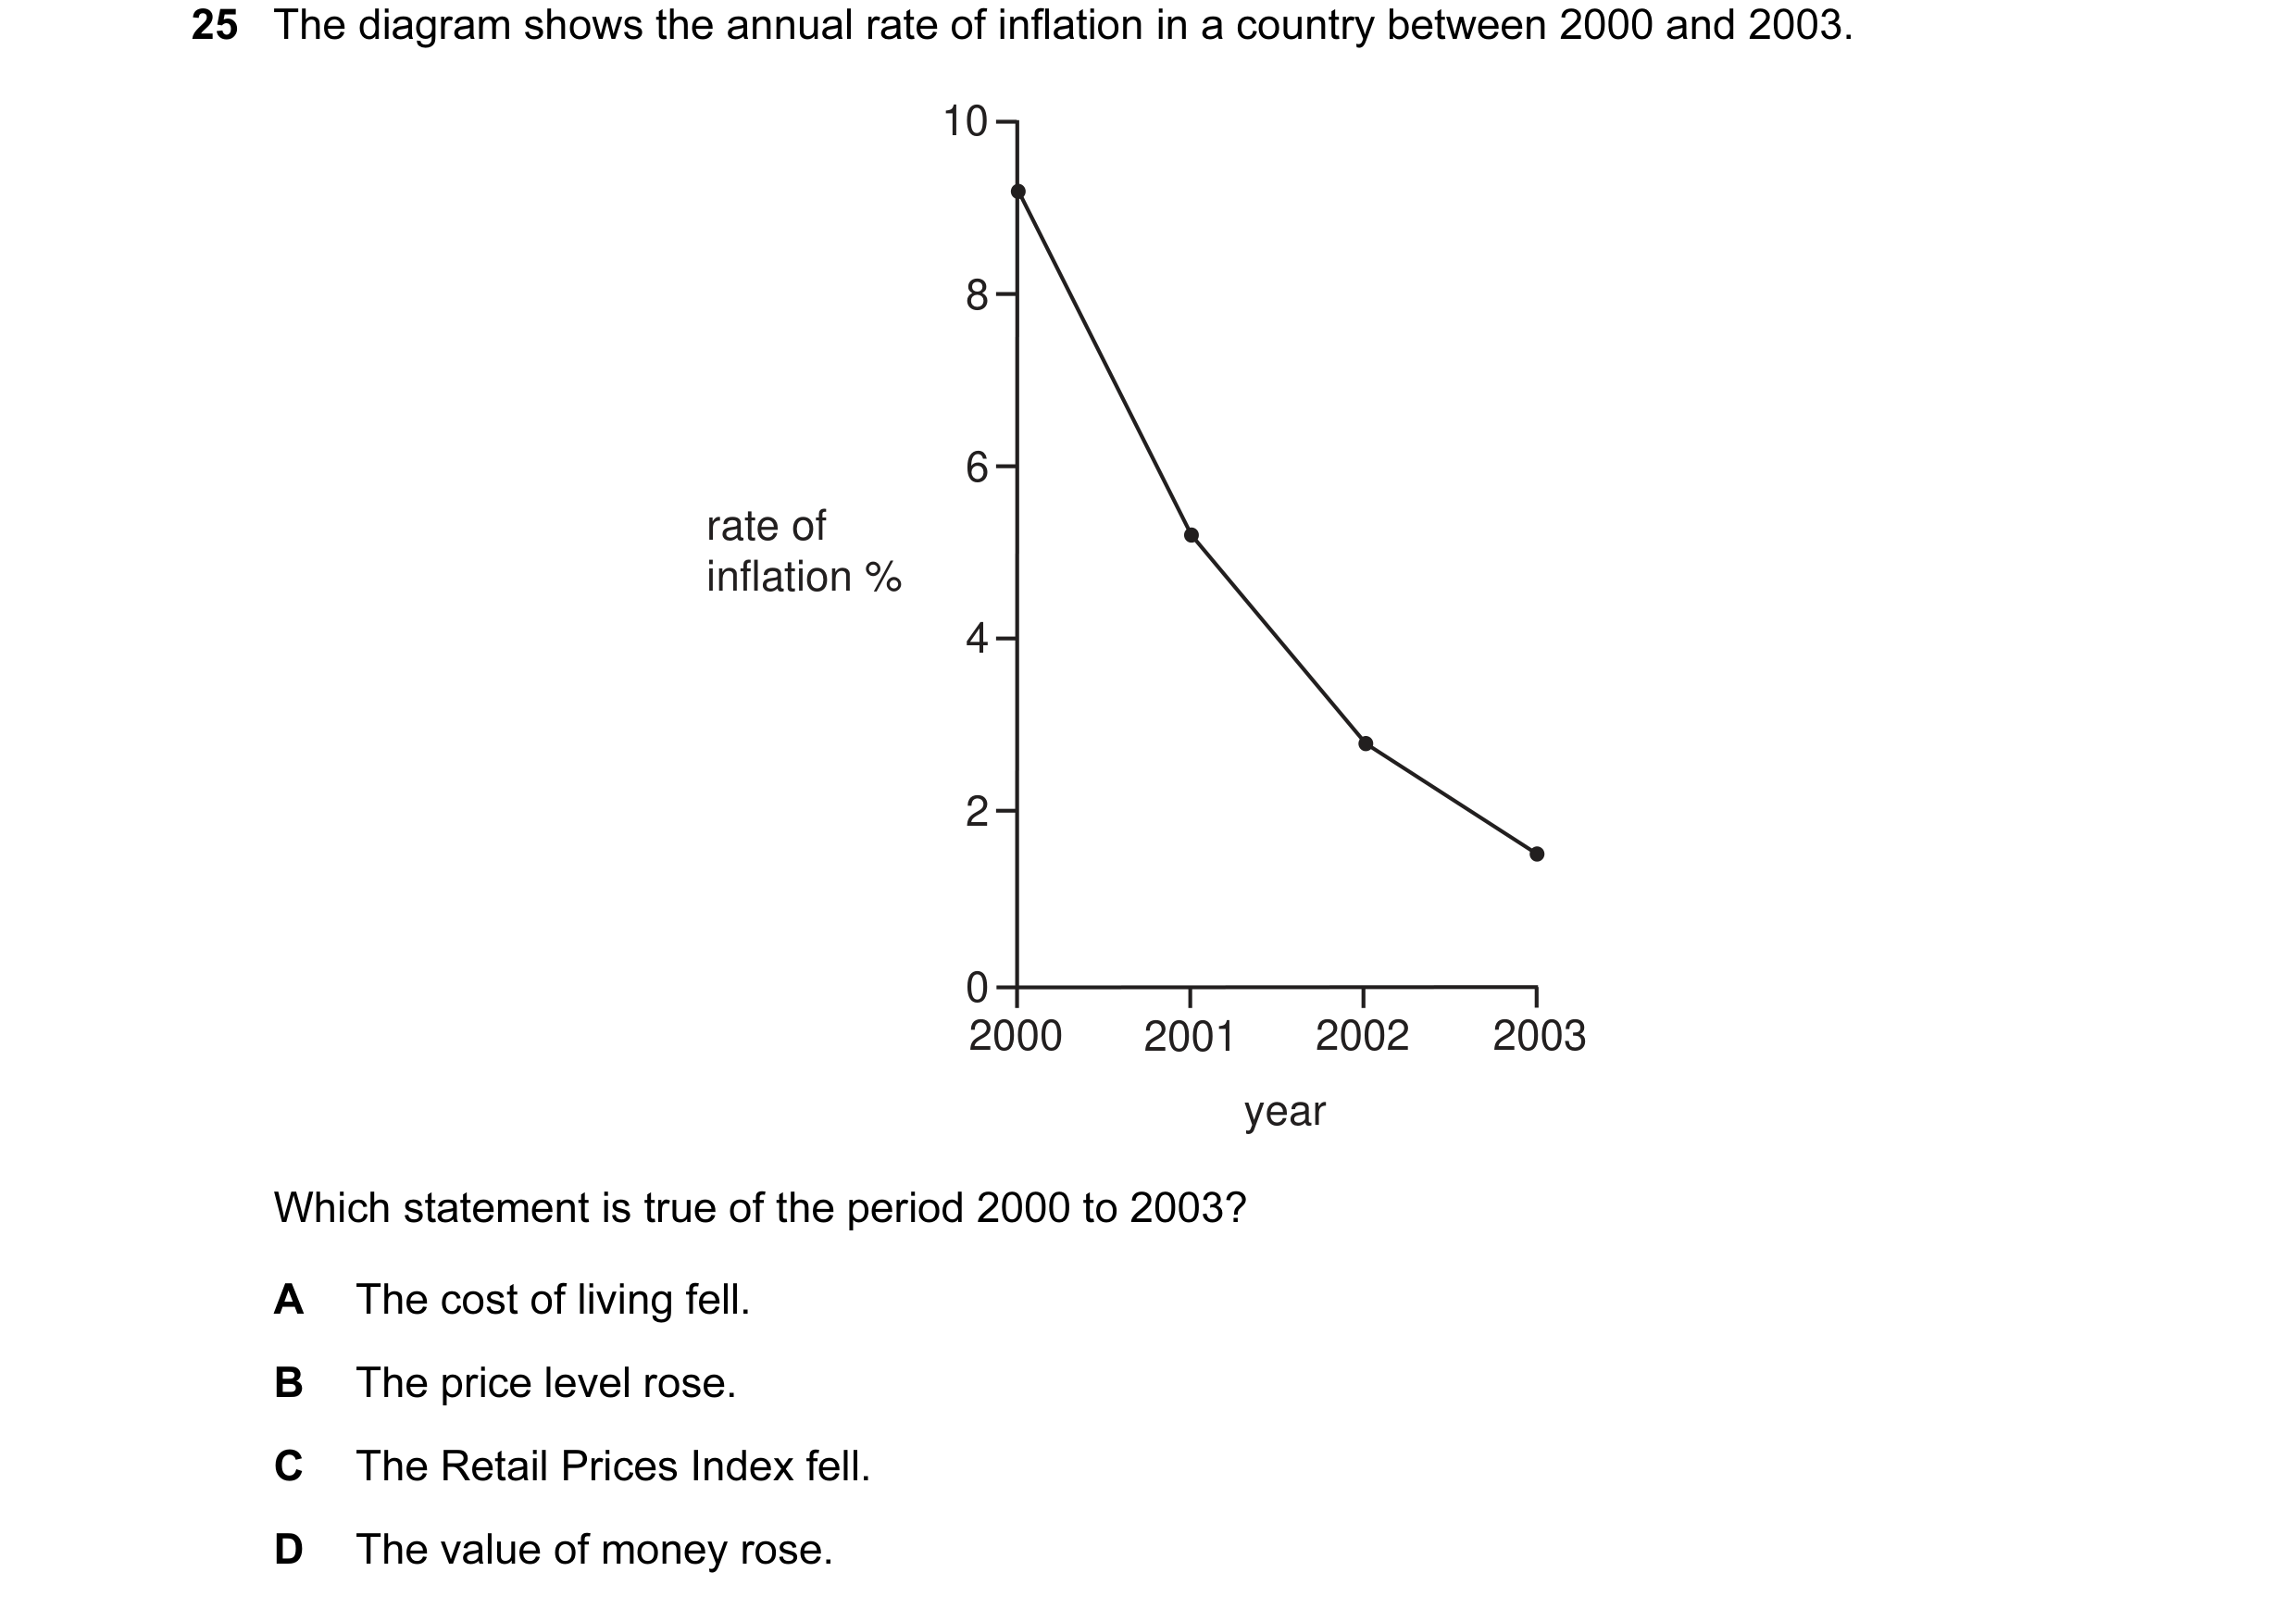 7 / 67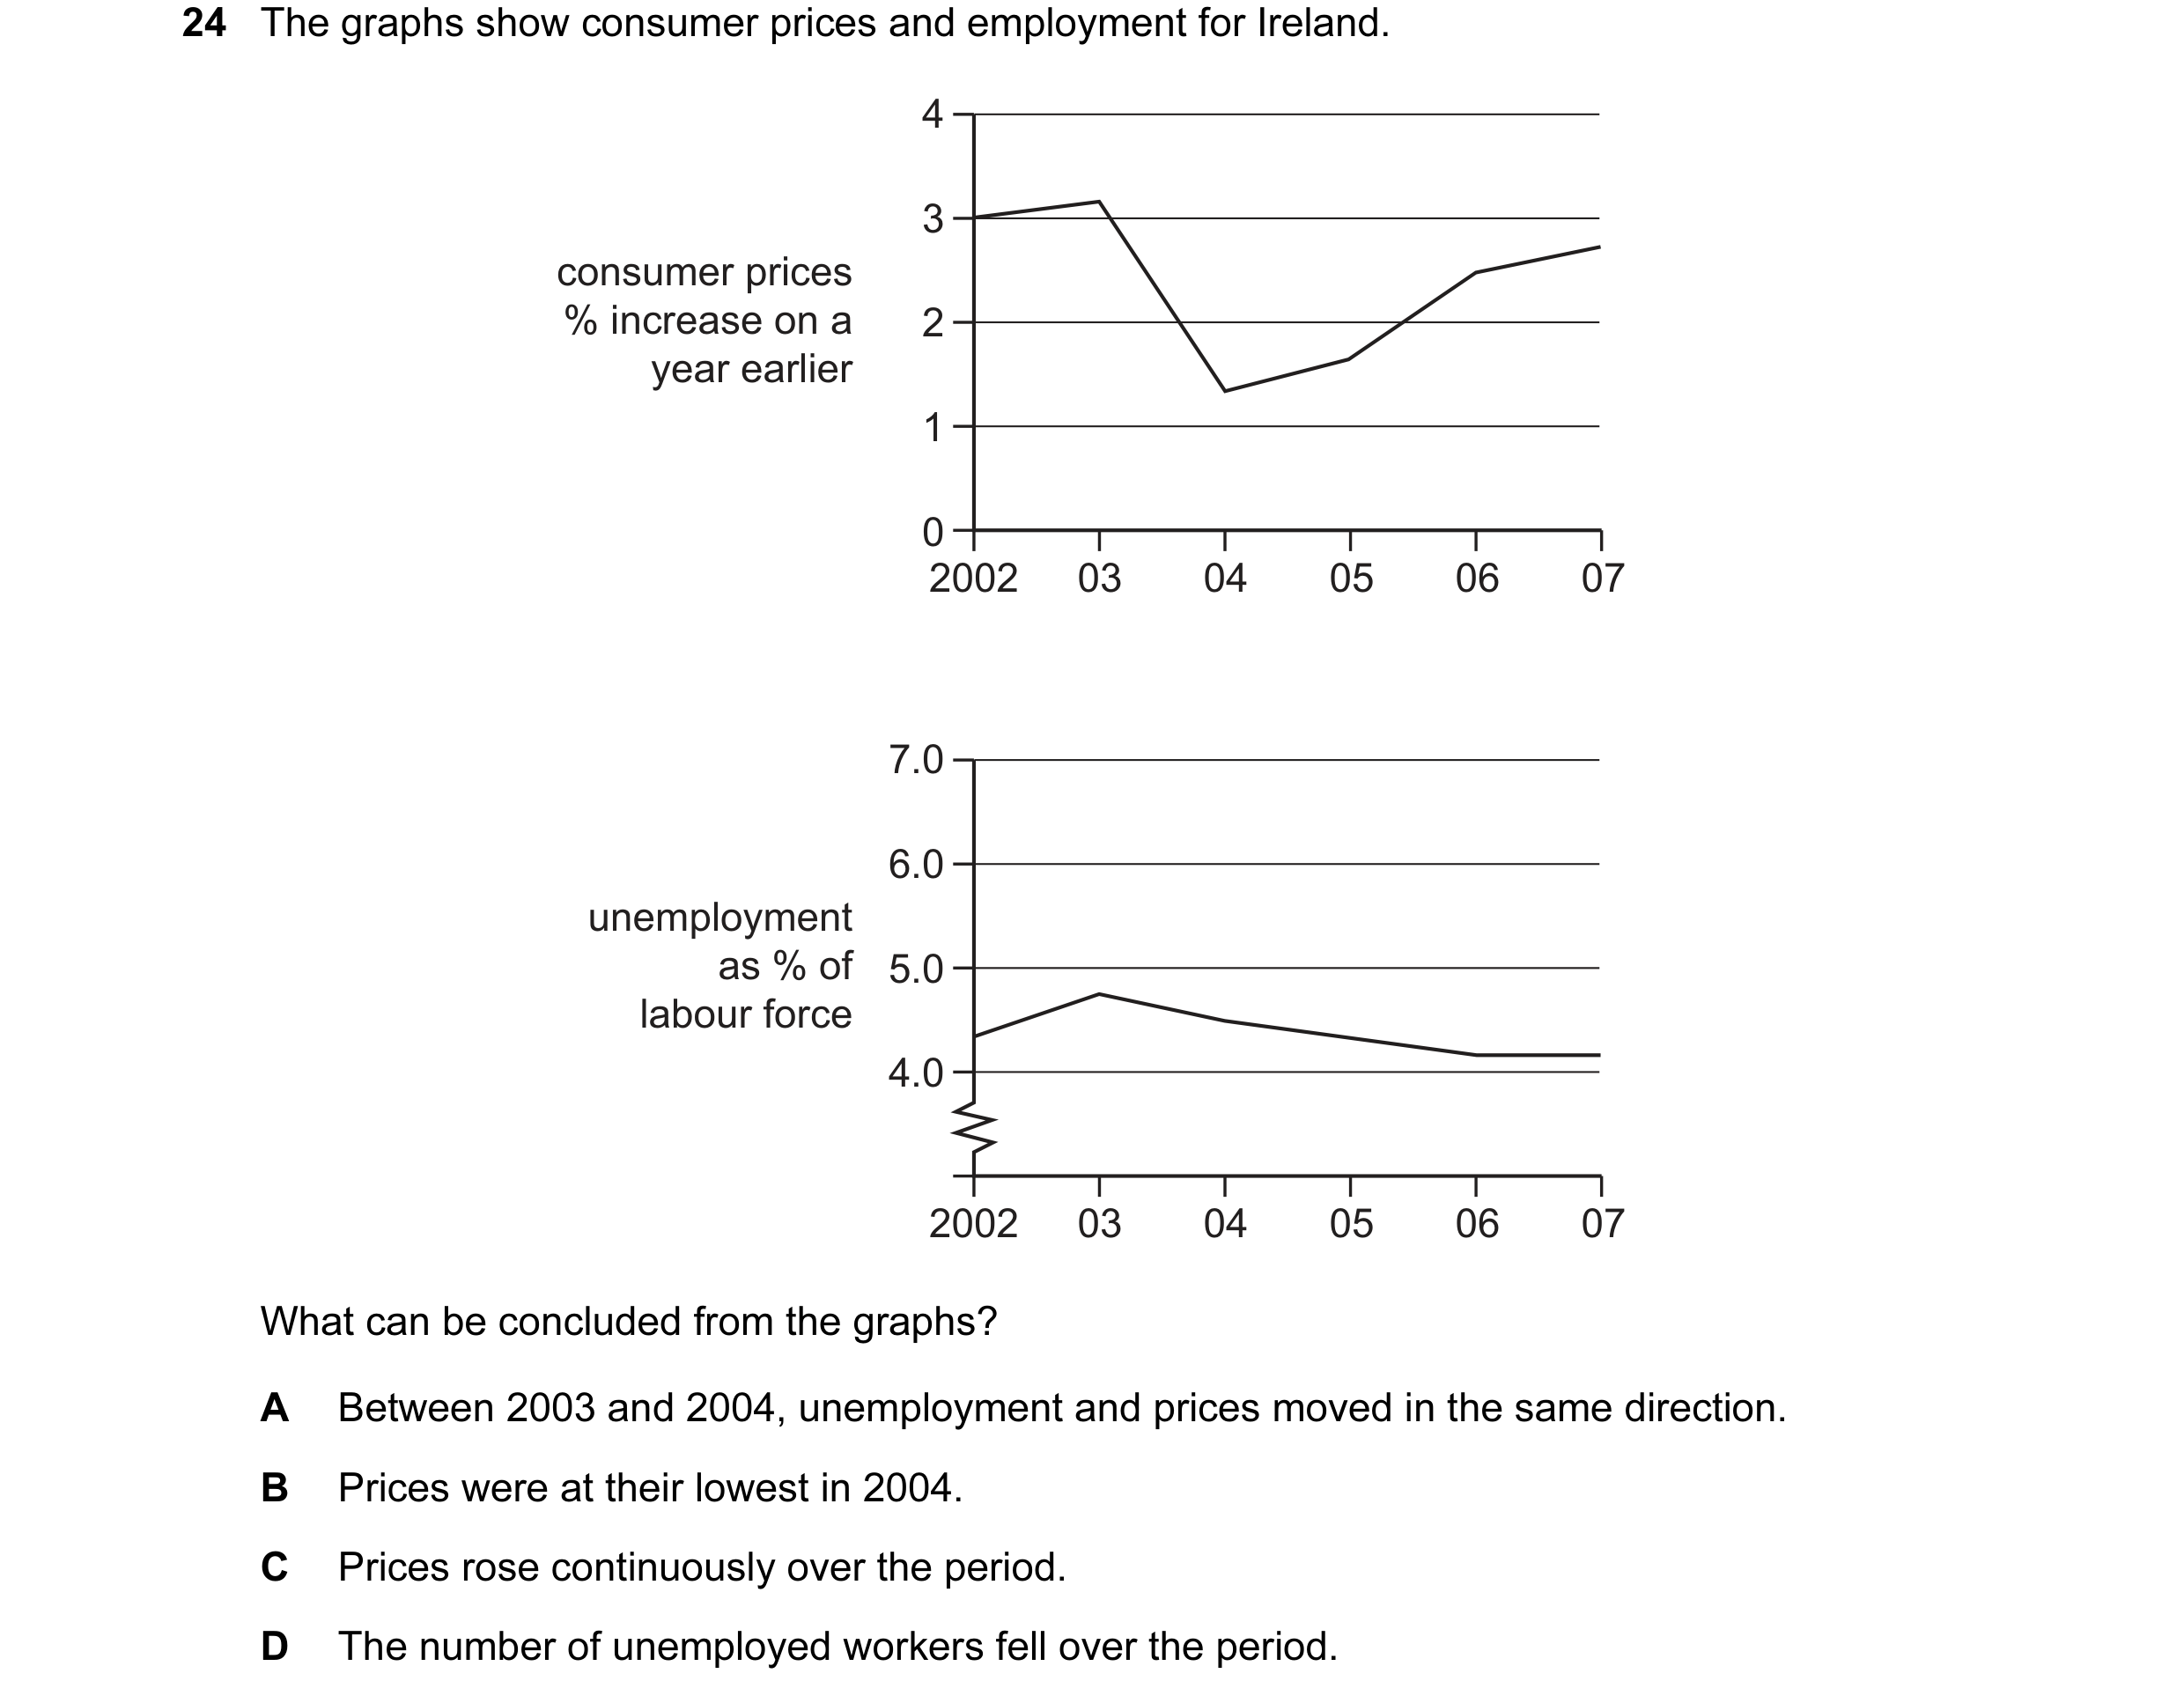

 8 / 67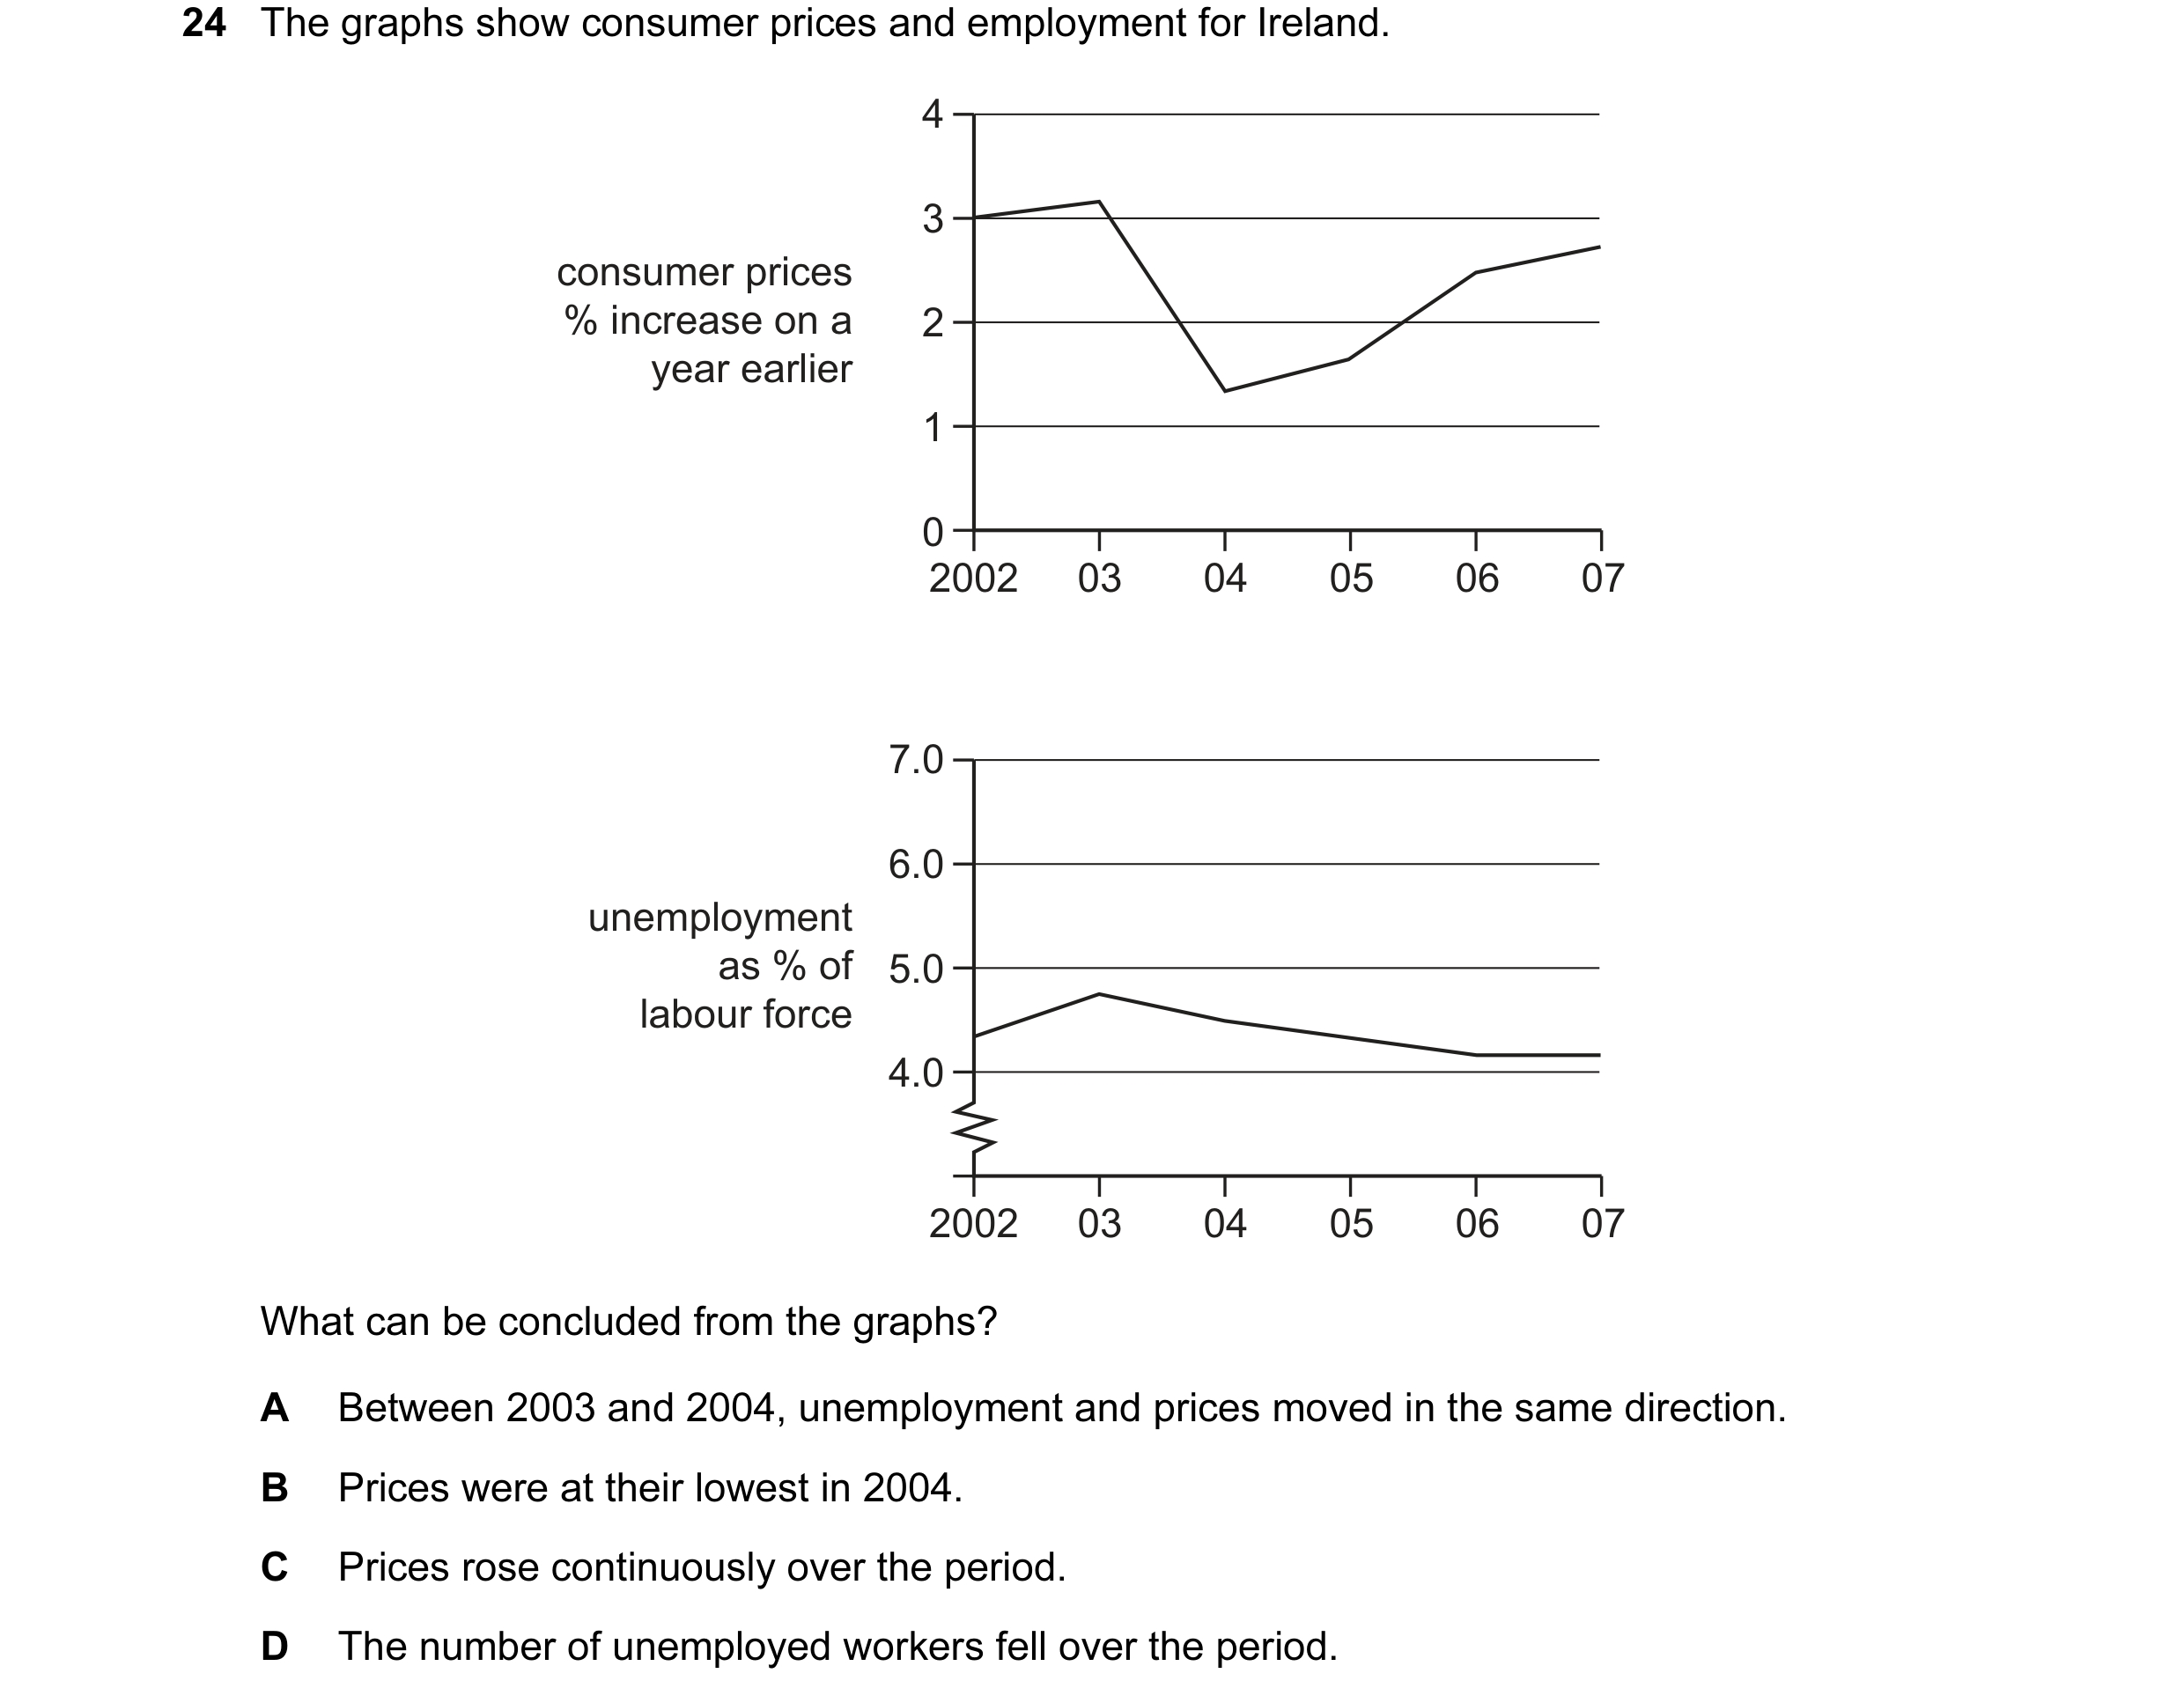
 9 / 67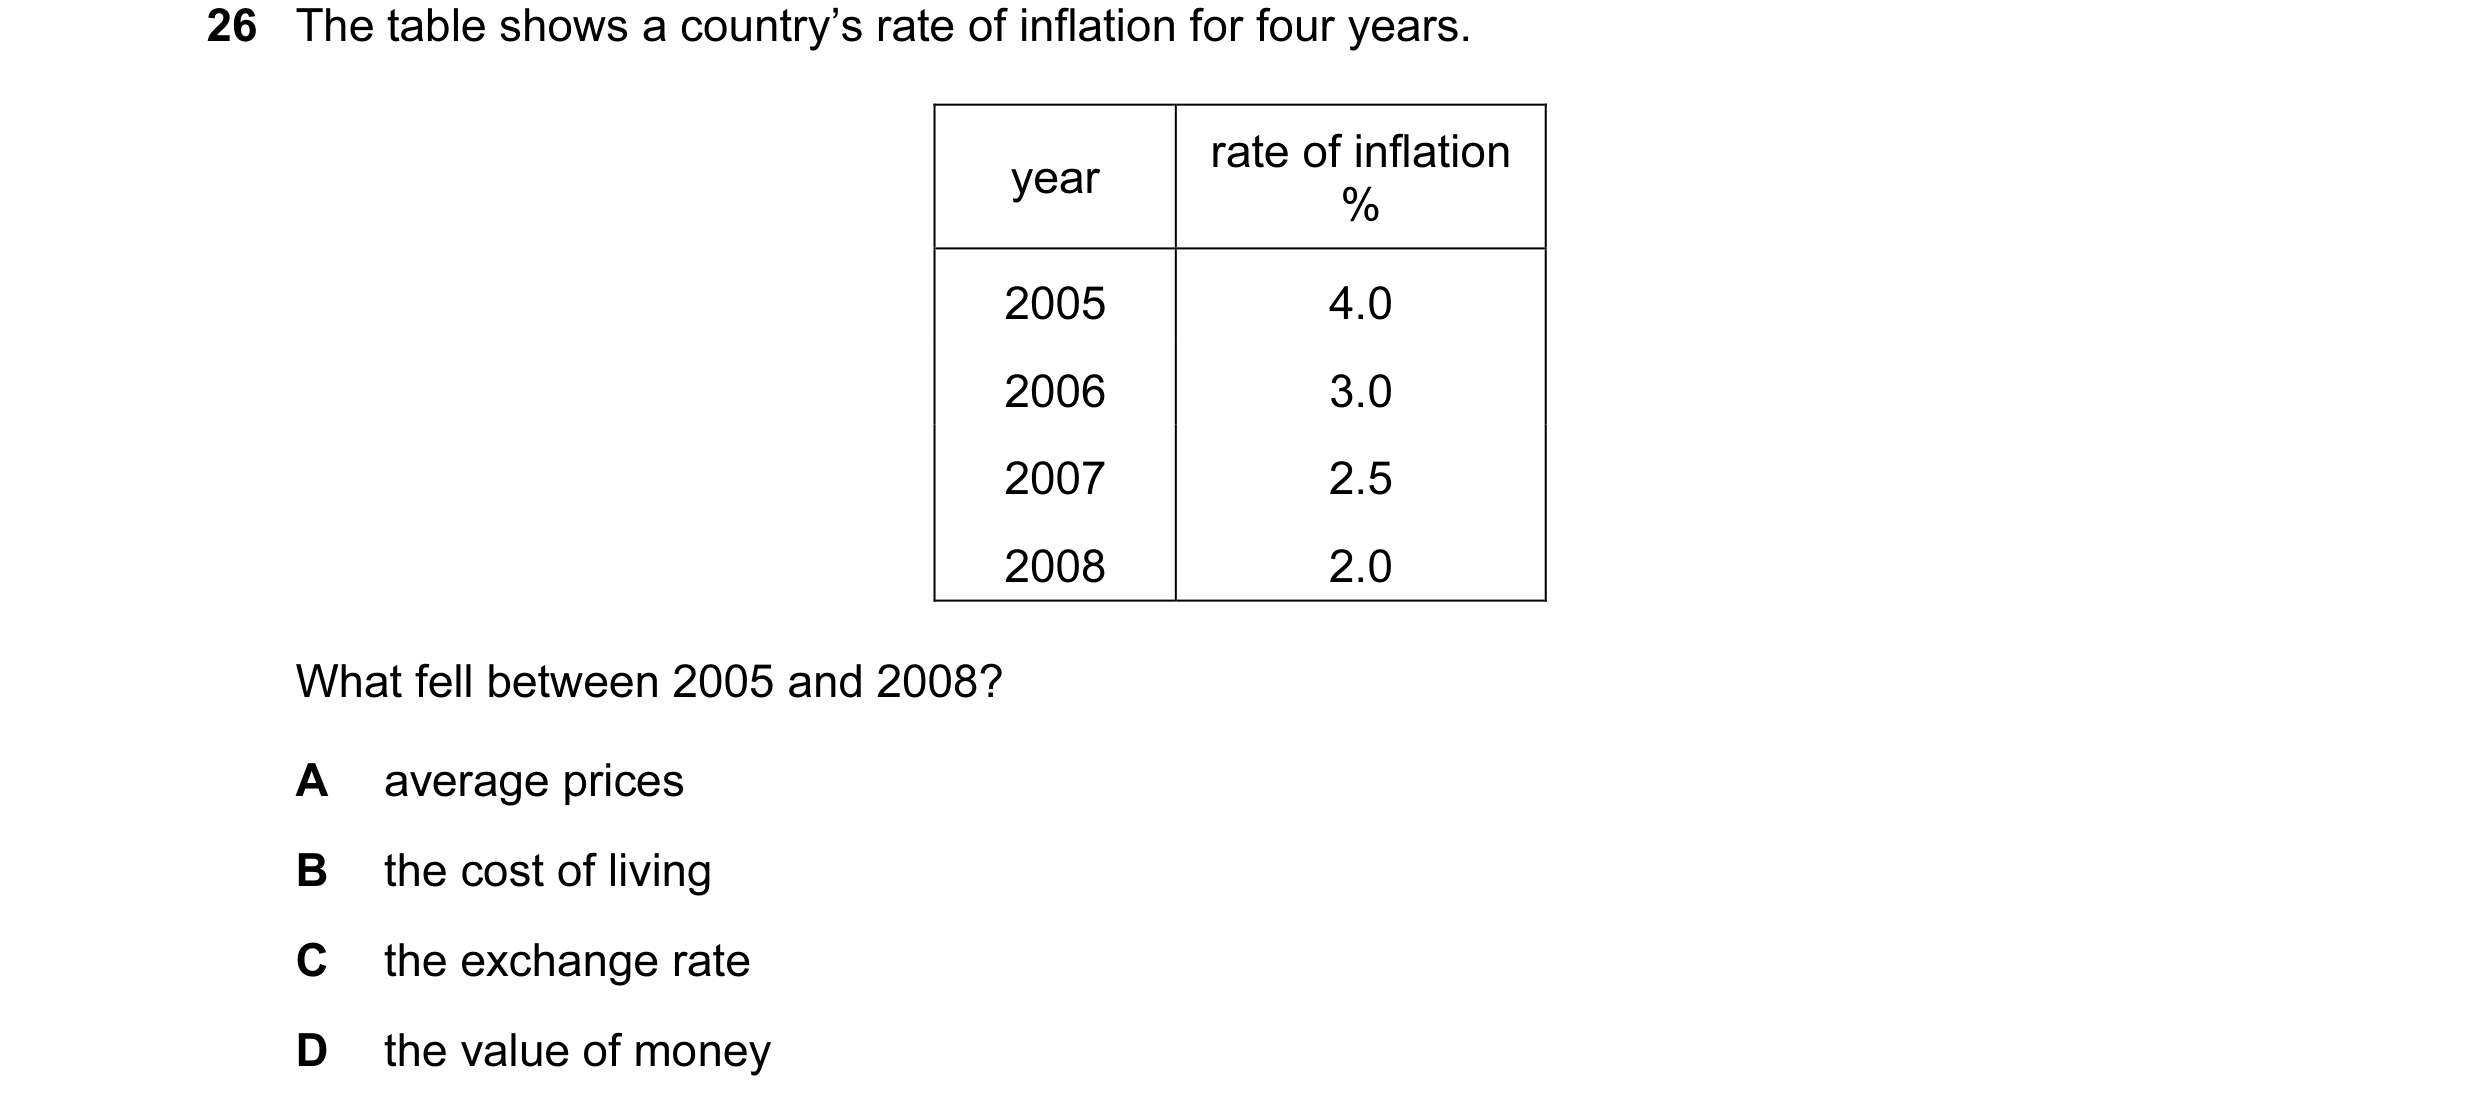
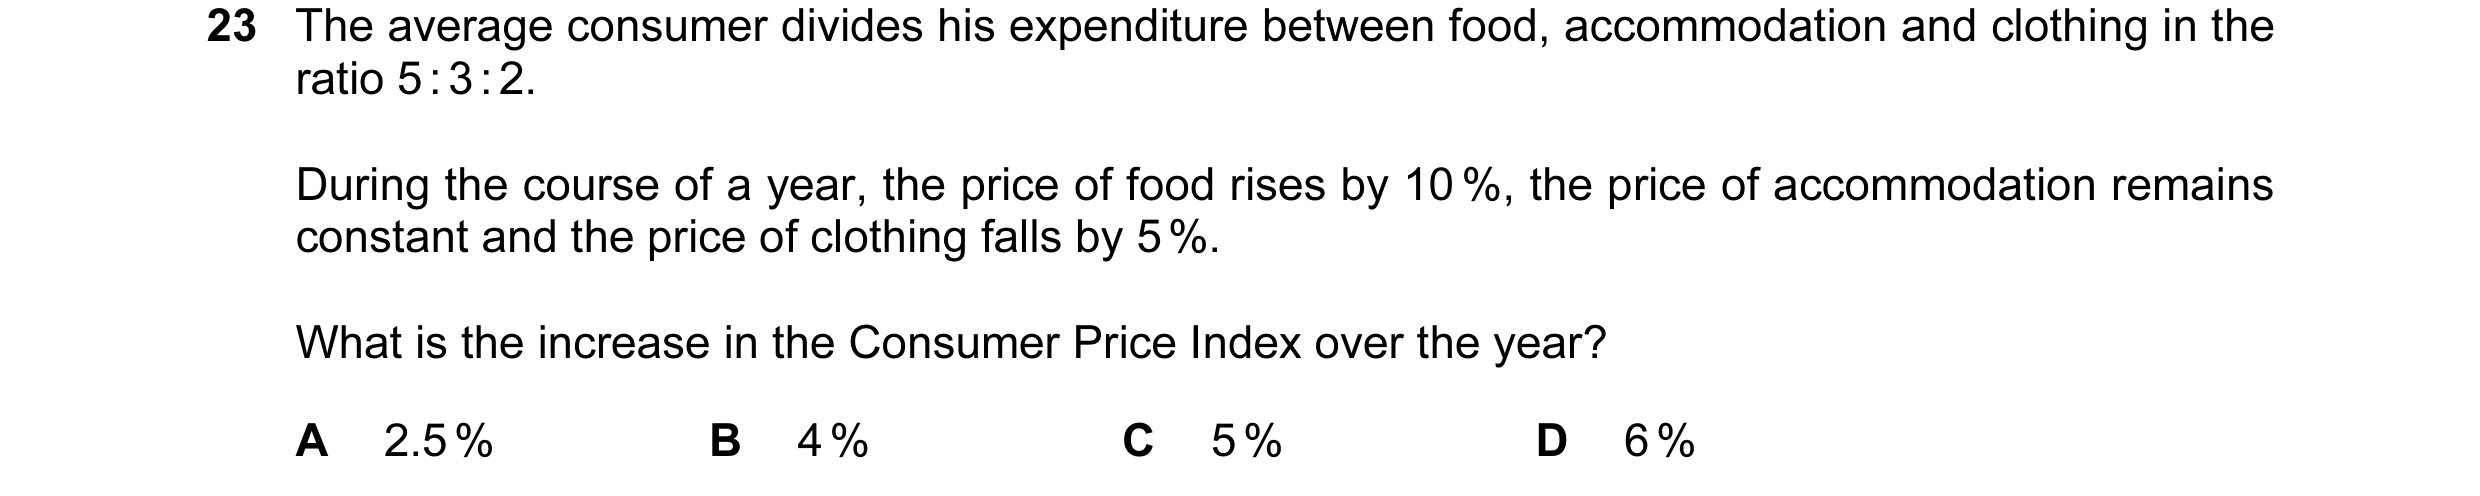

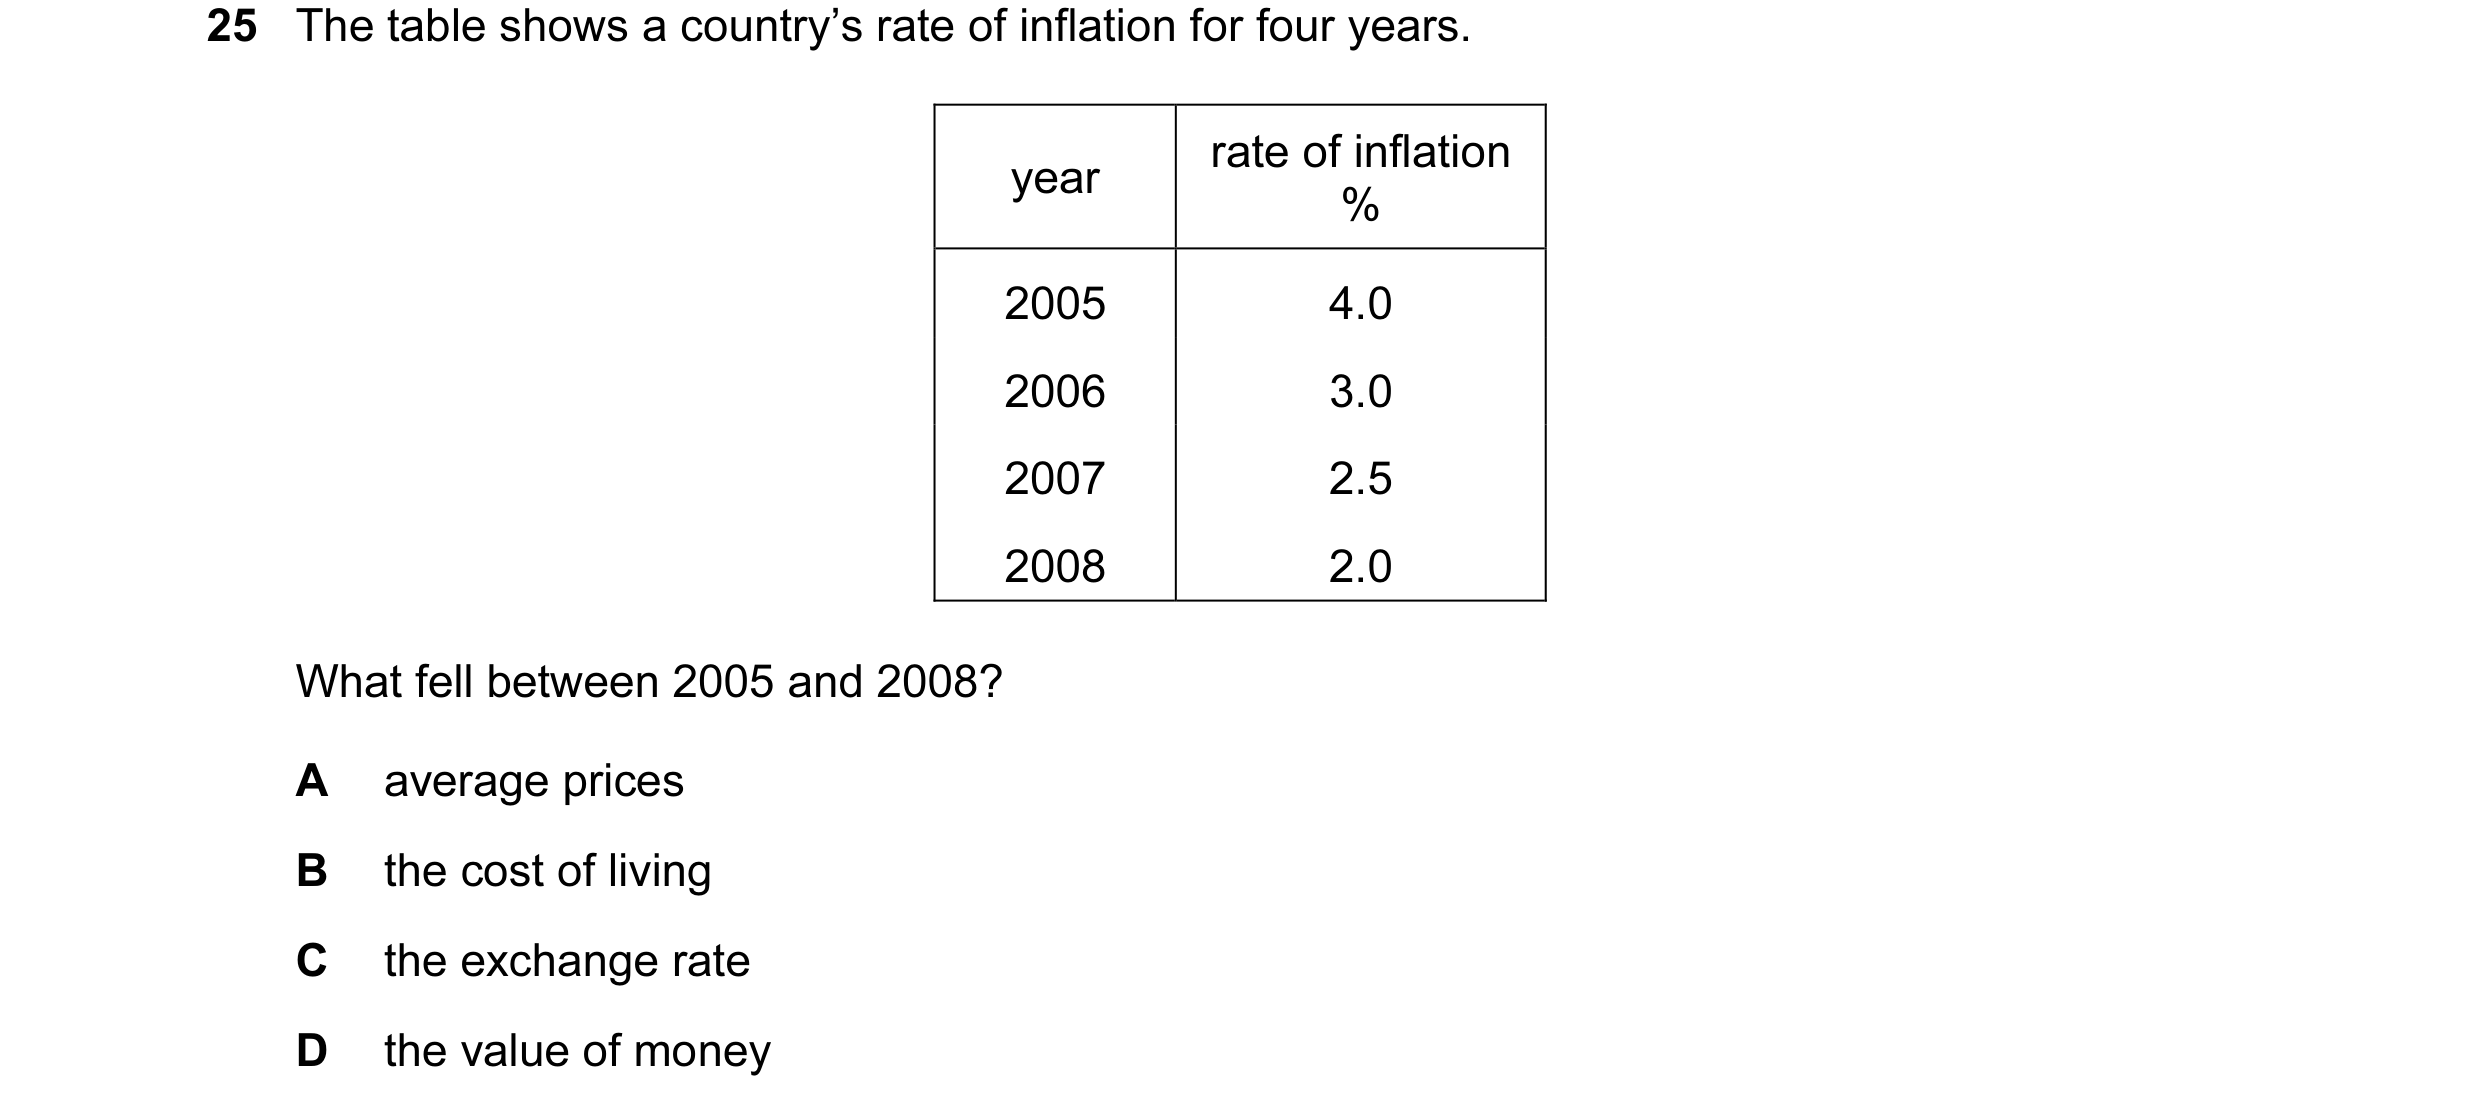 10 / 67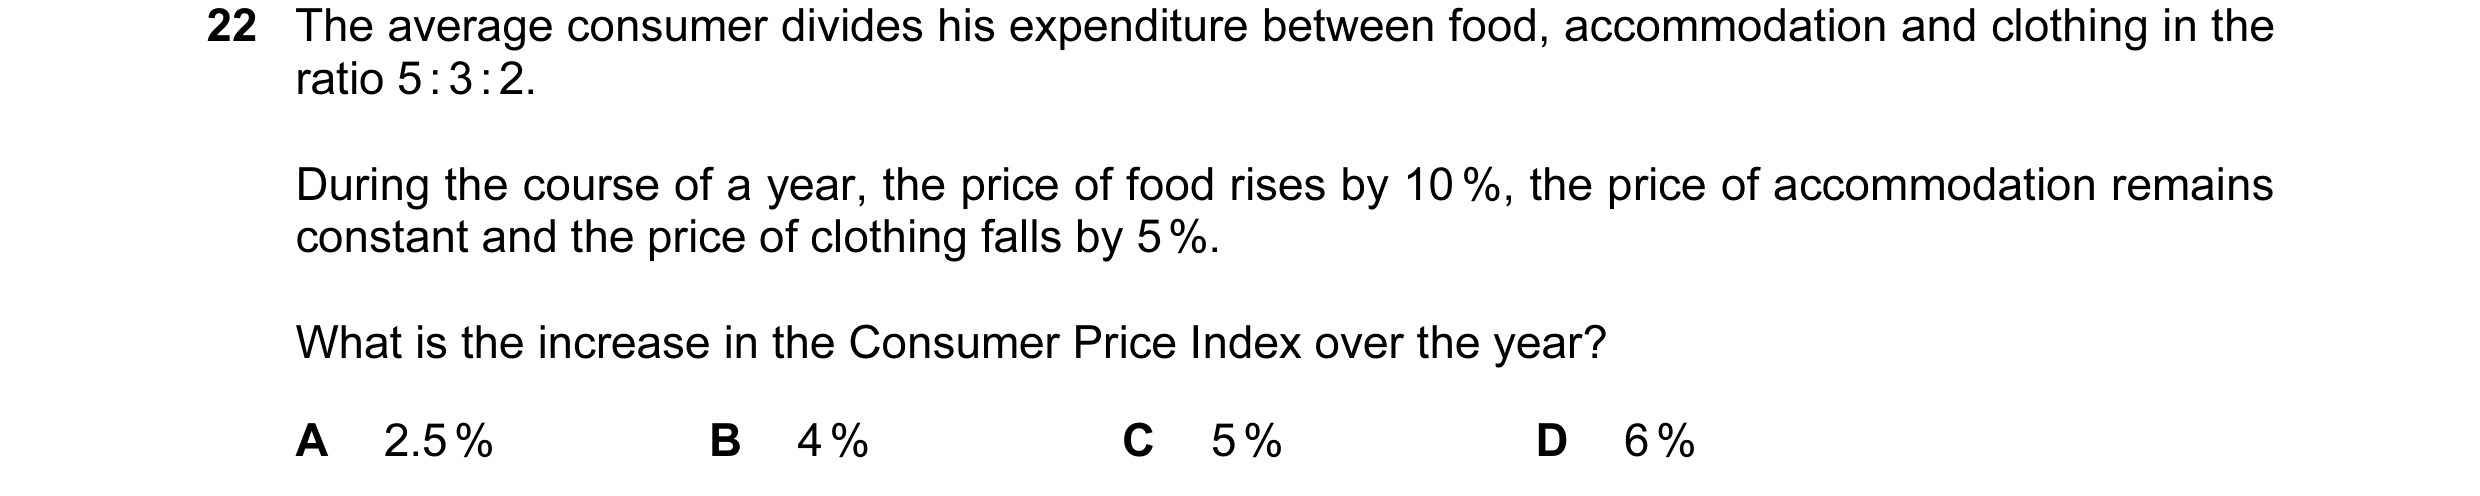

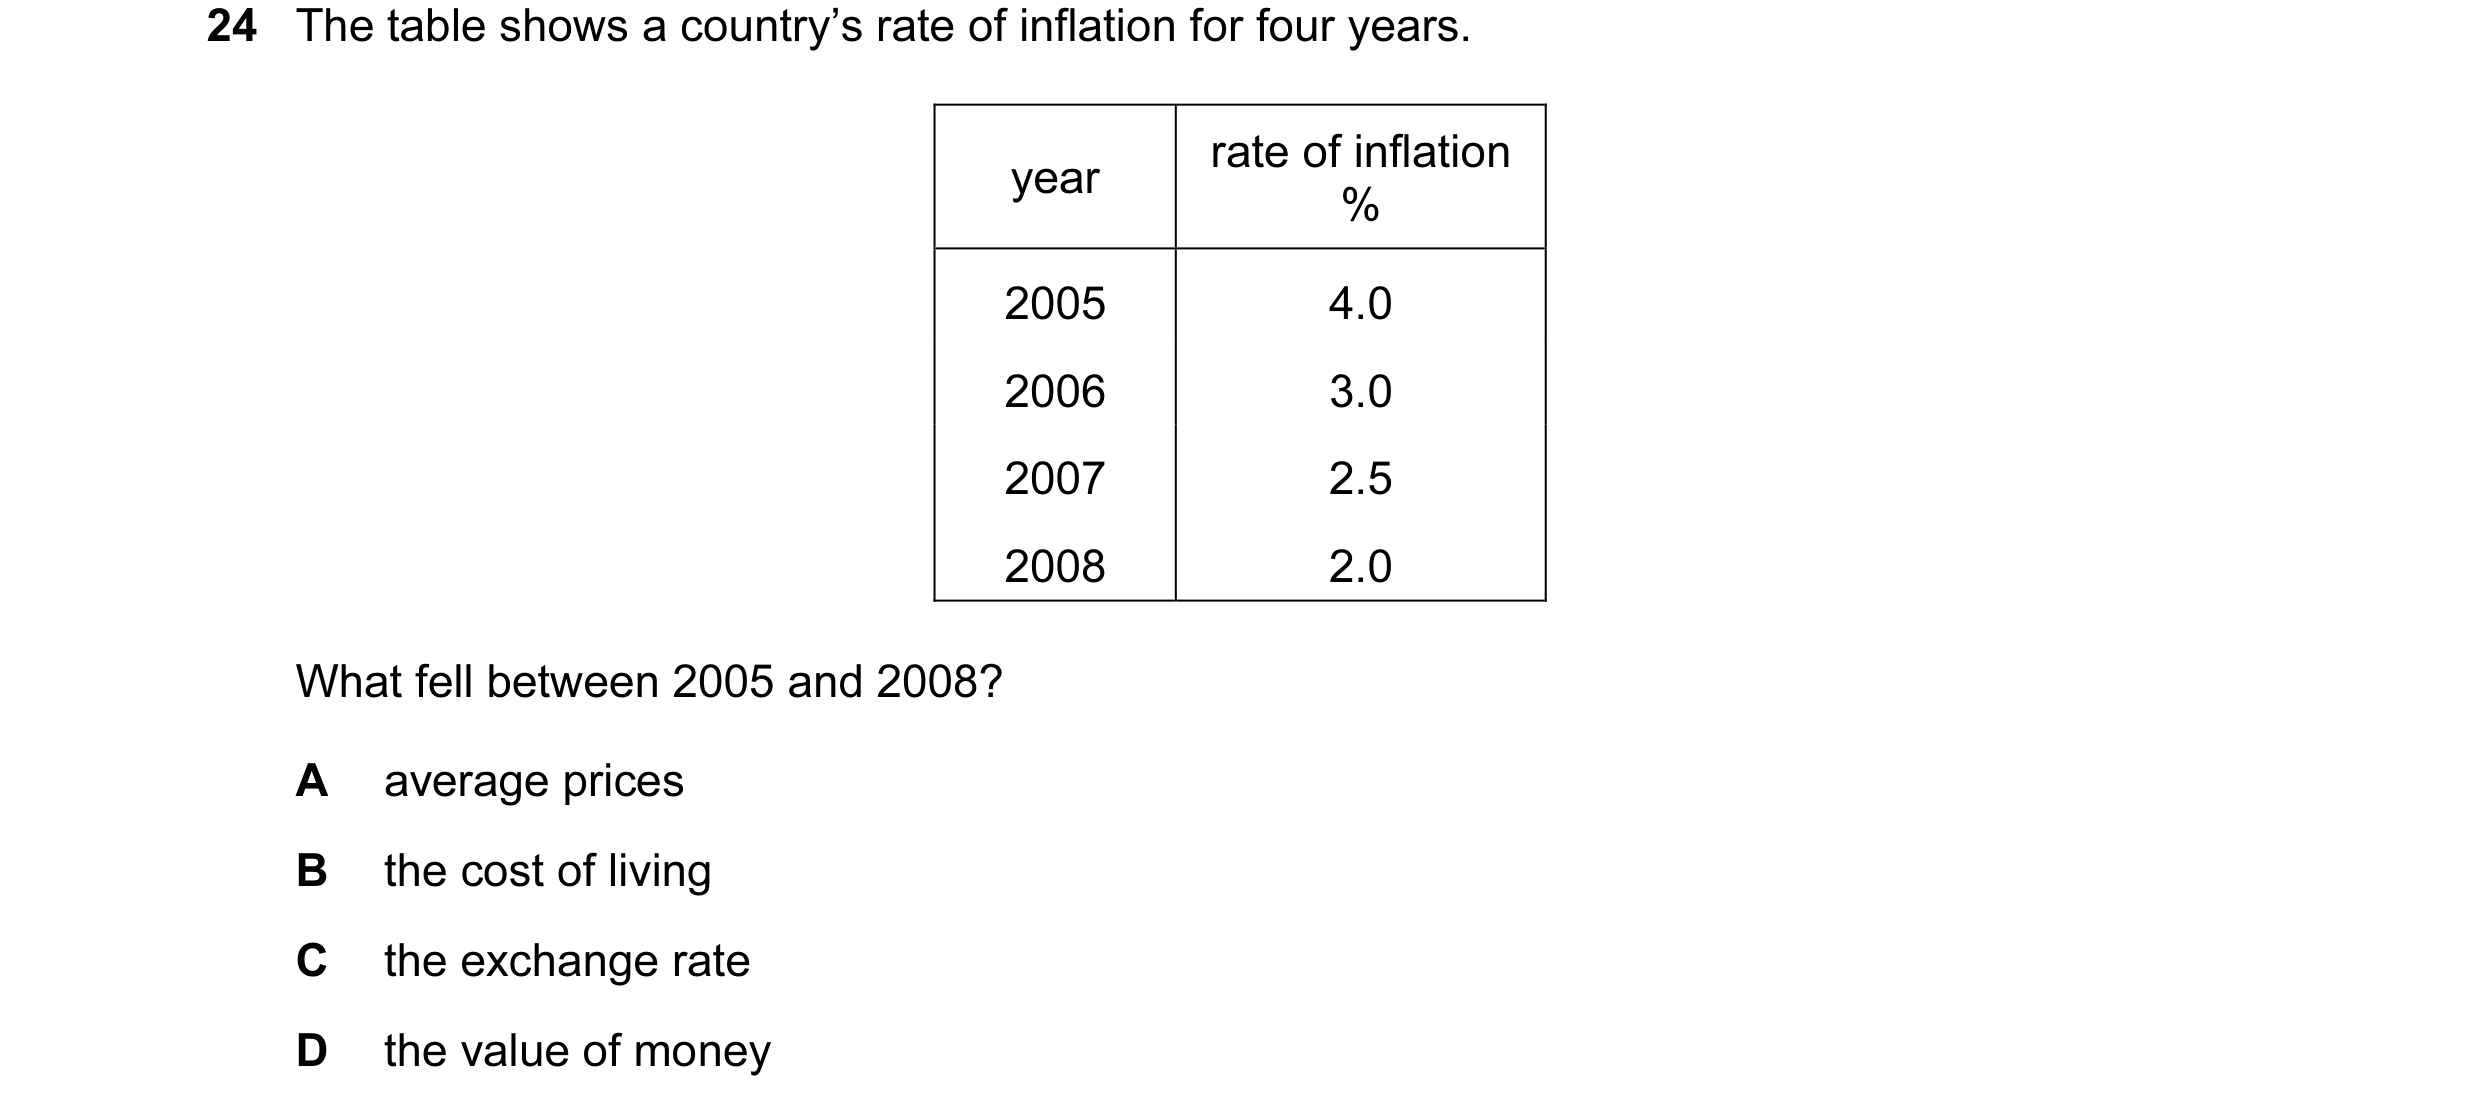 11 / 67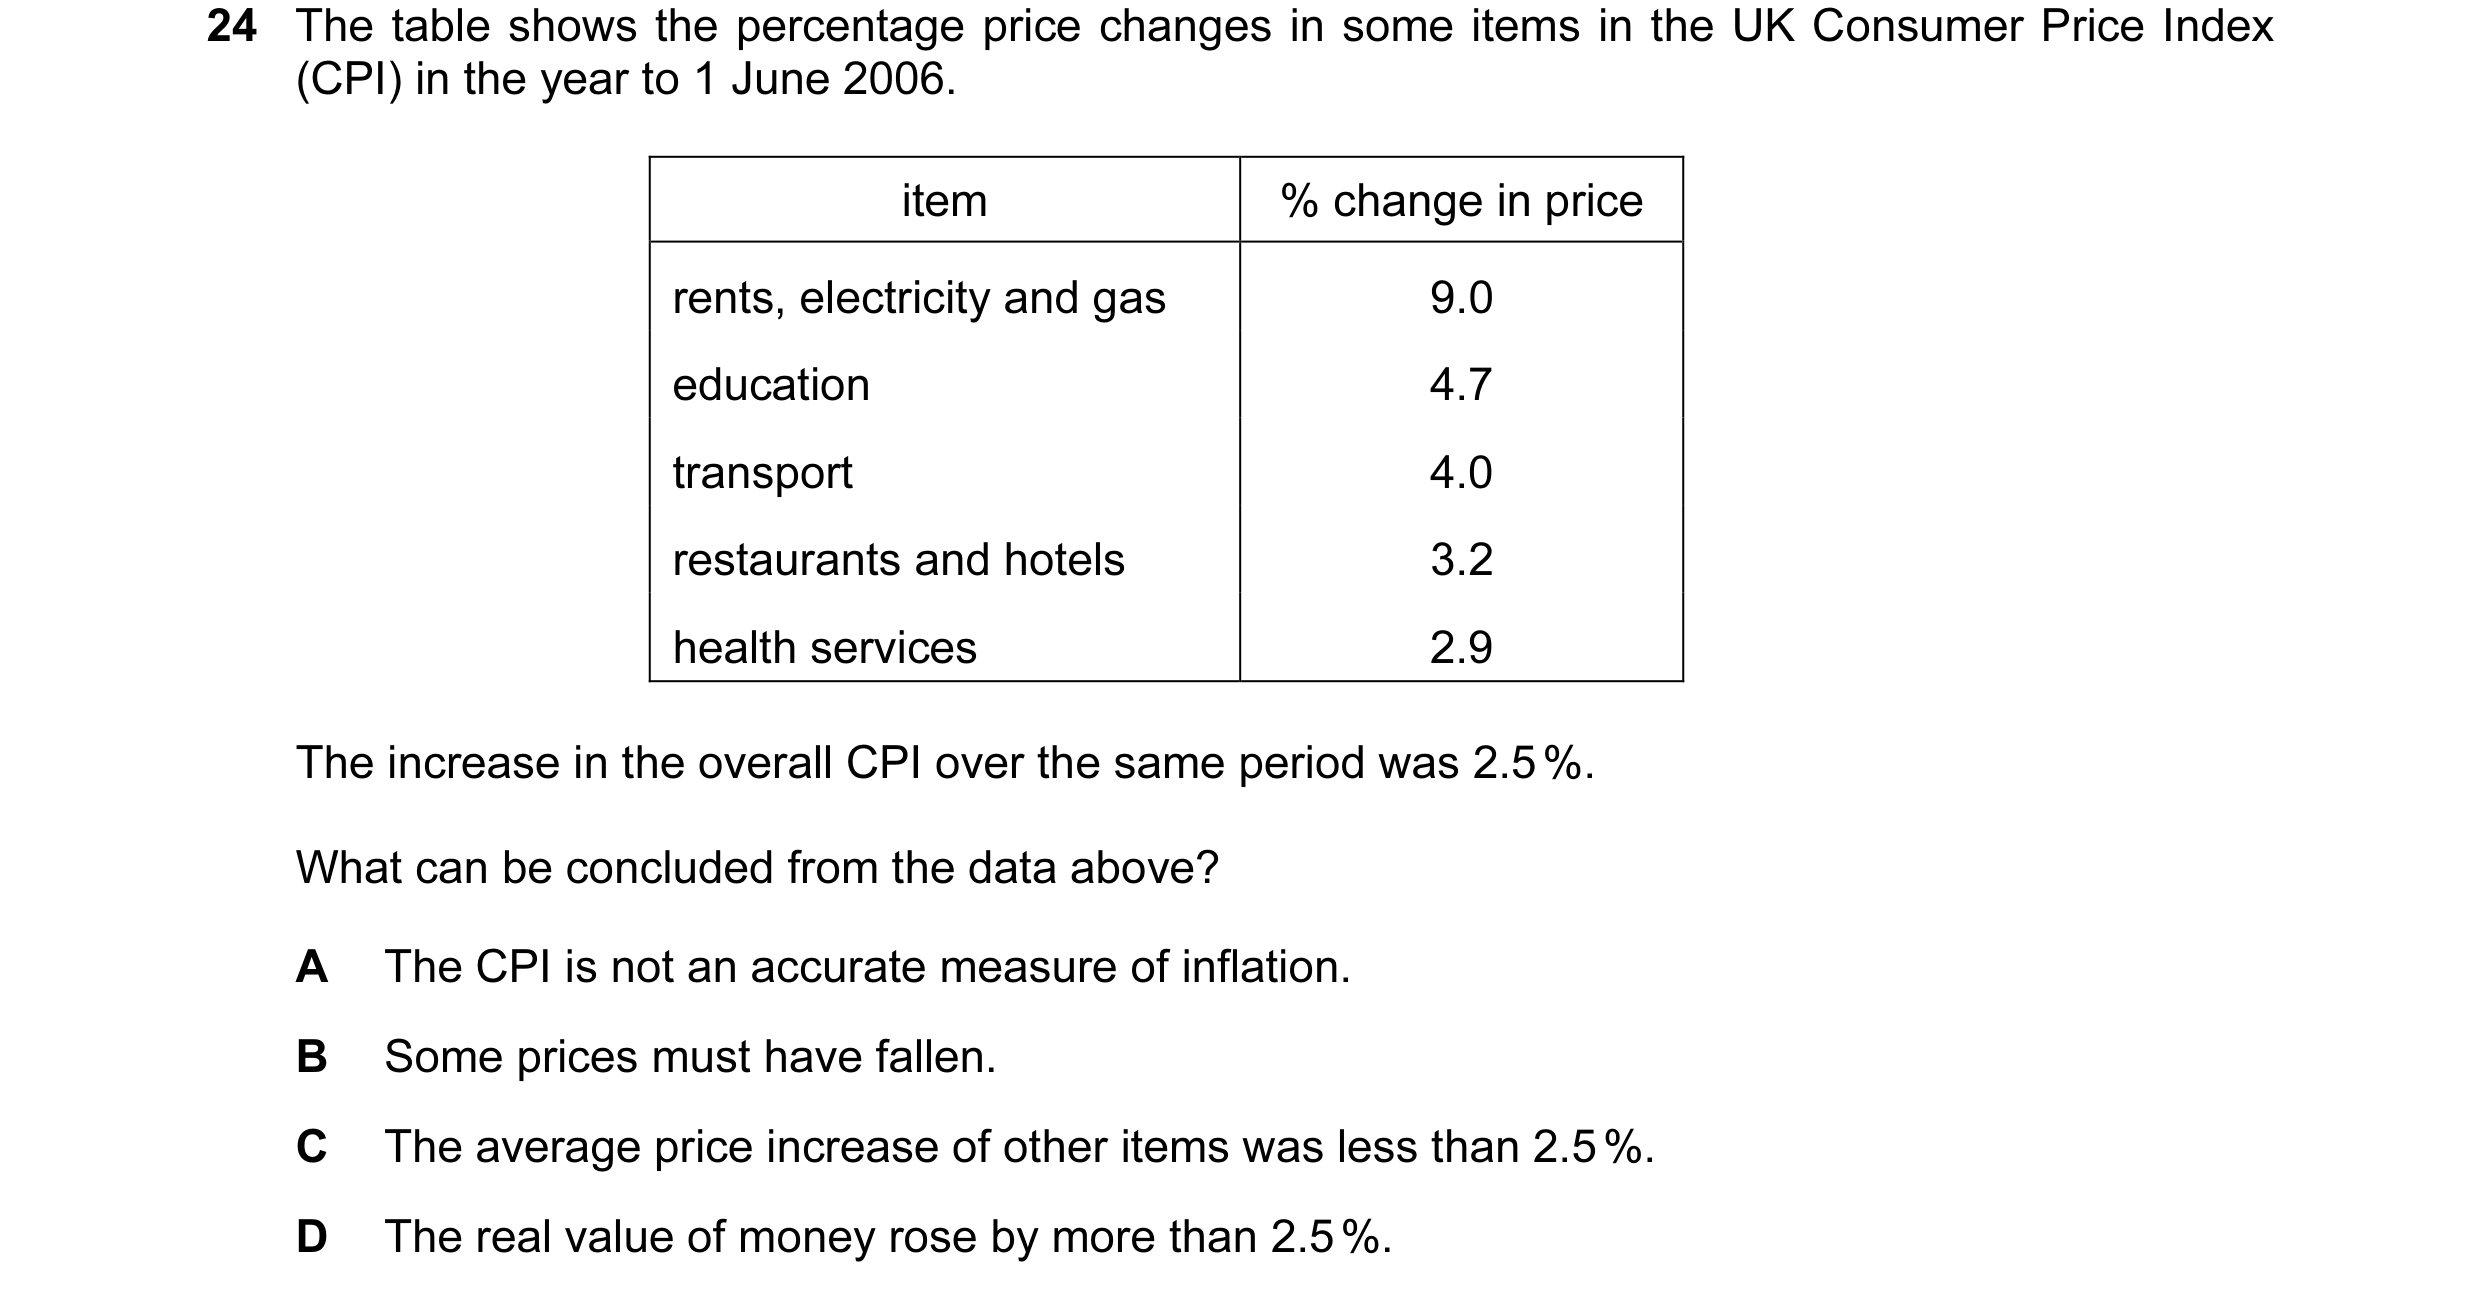
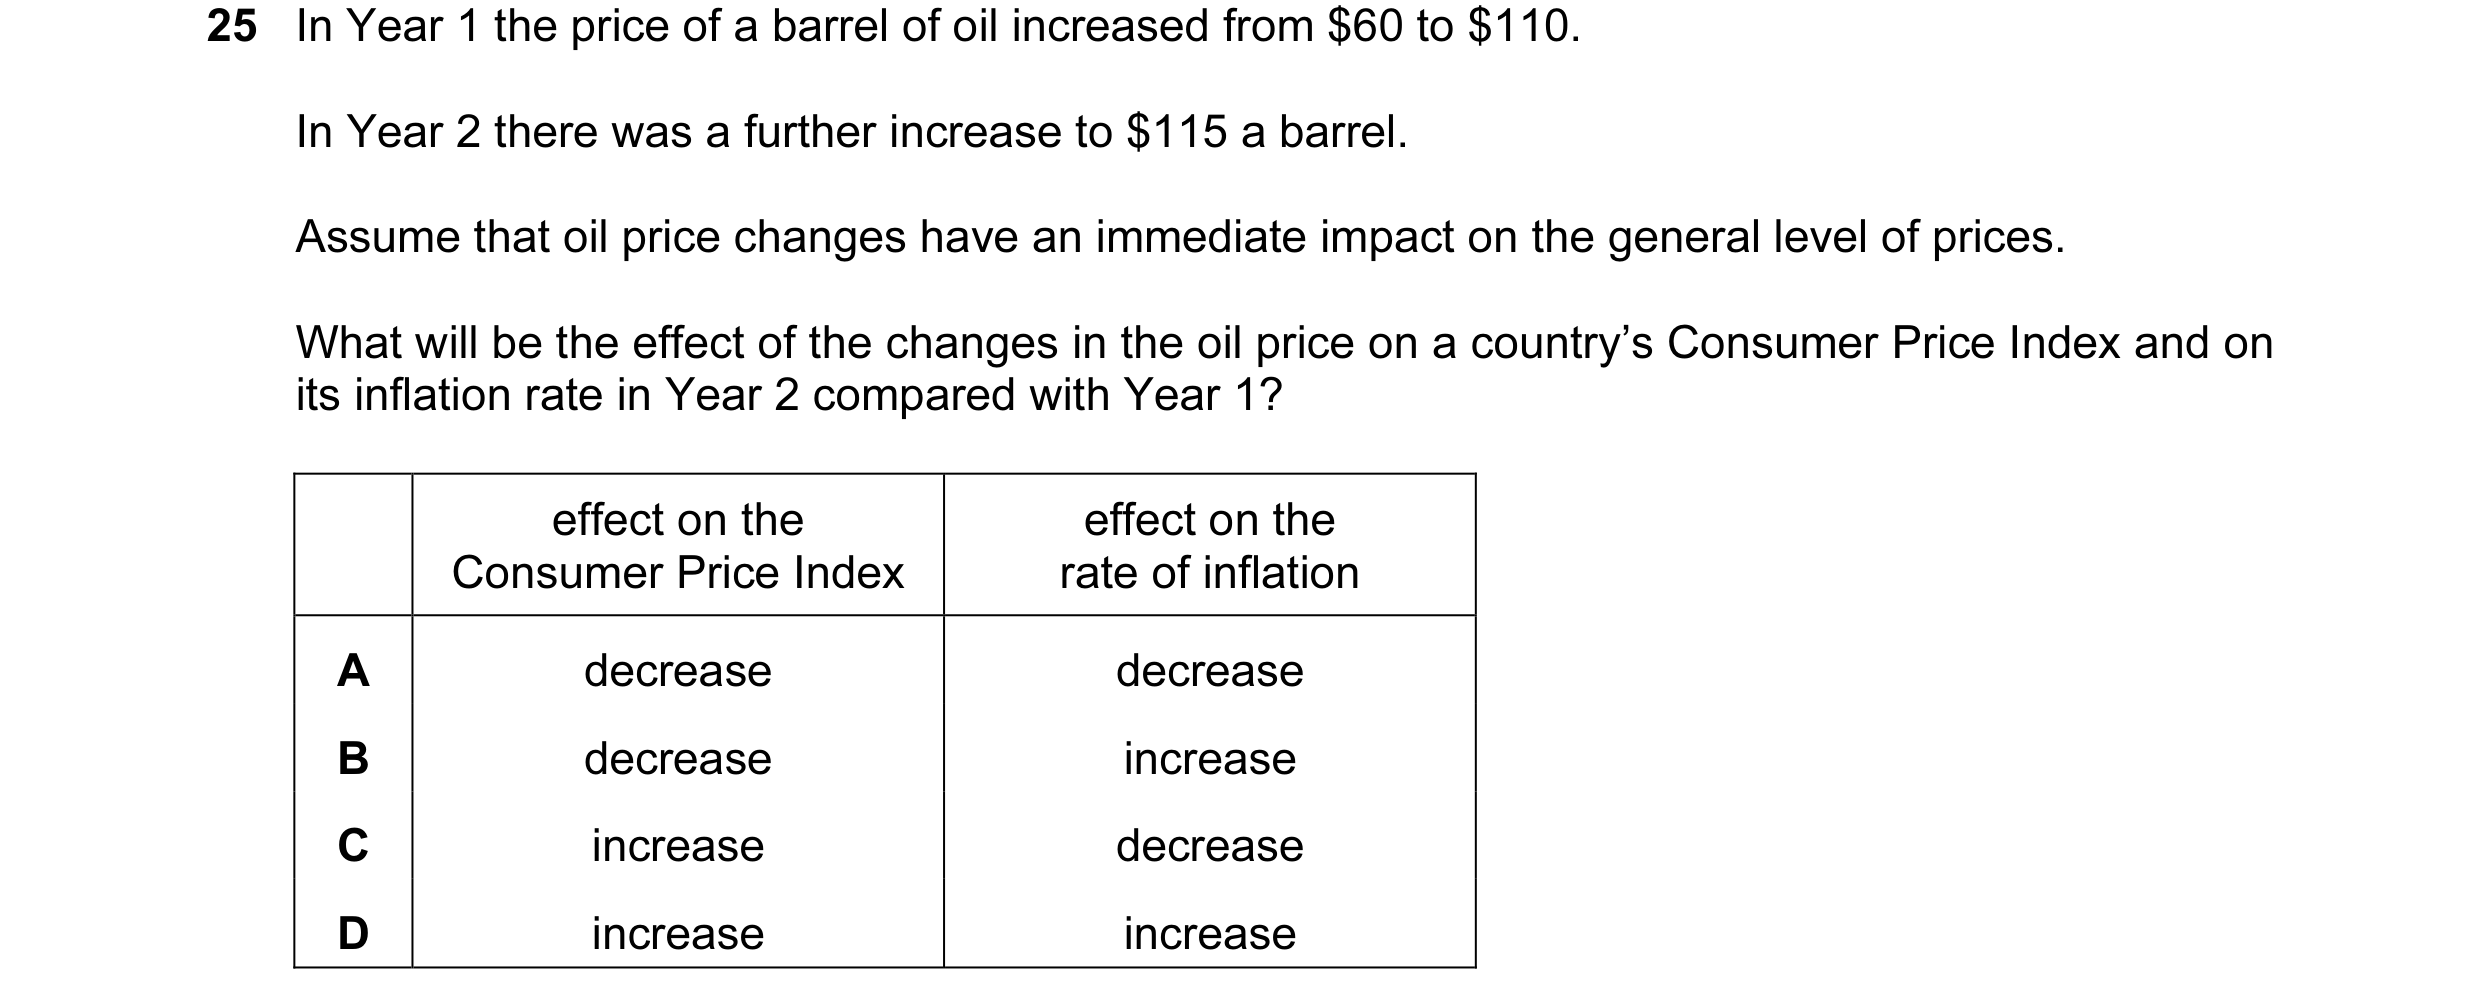 12 / 67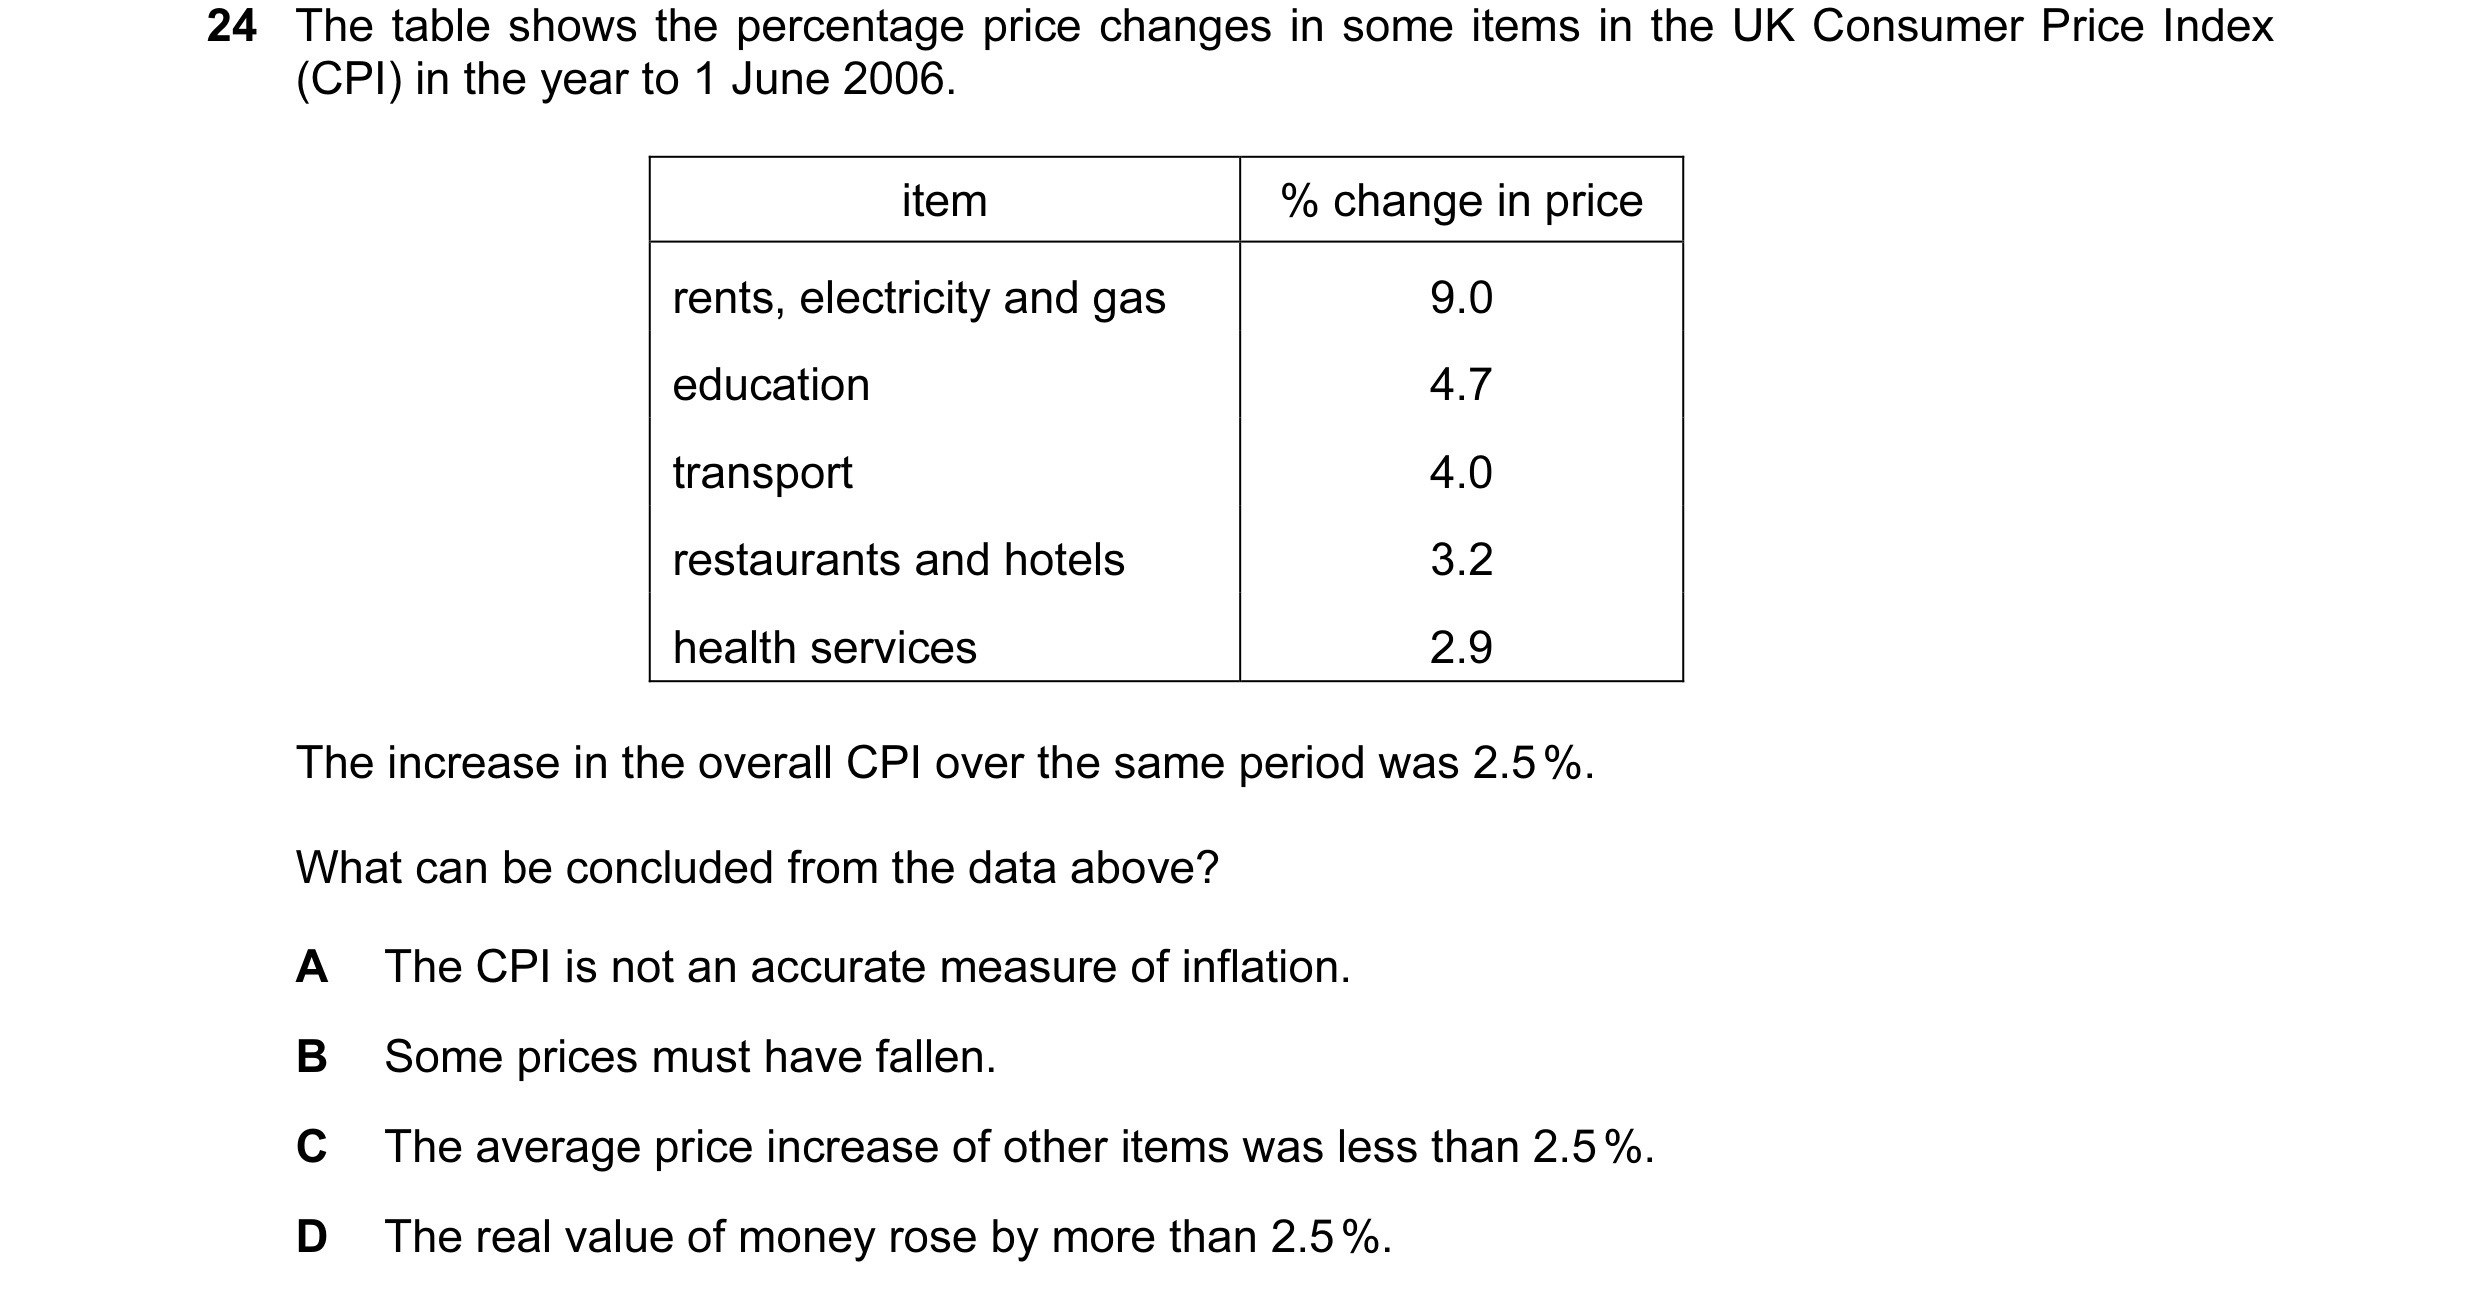
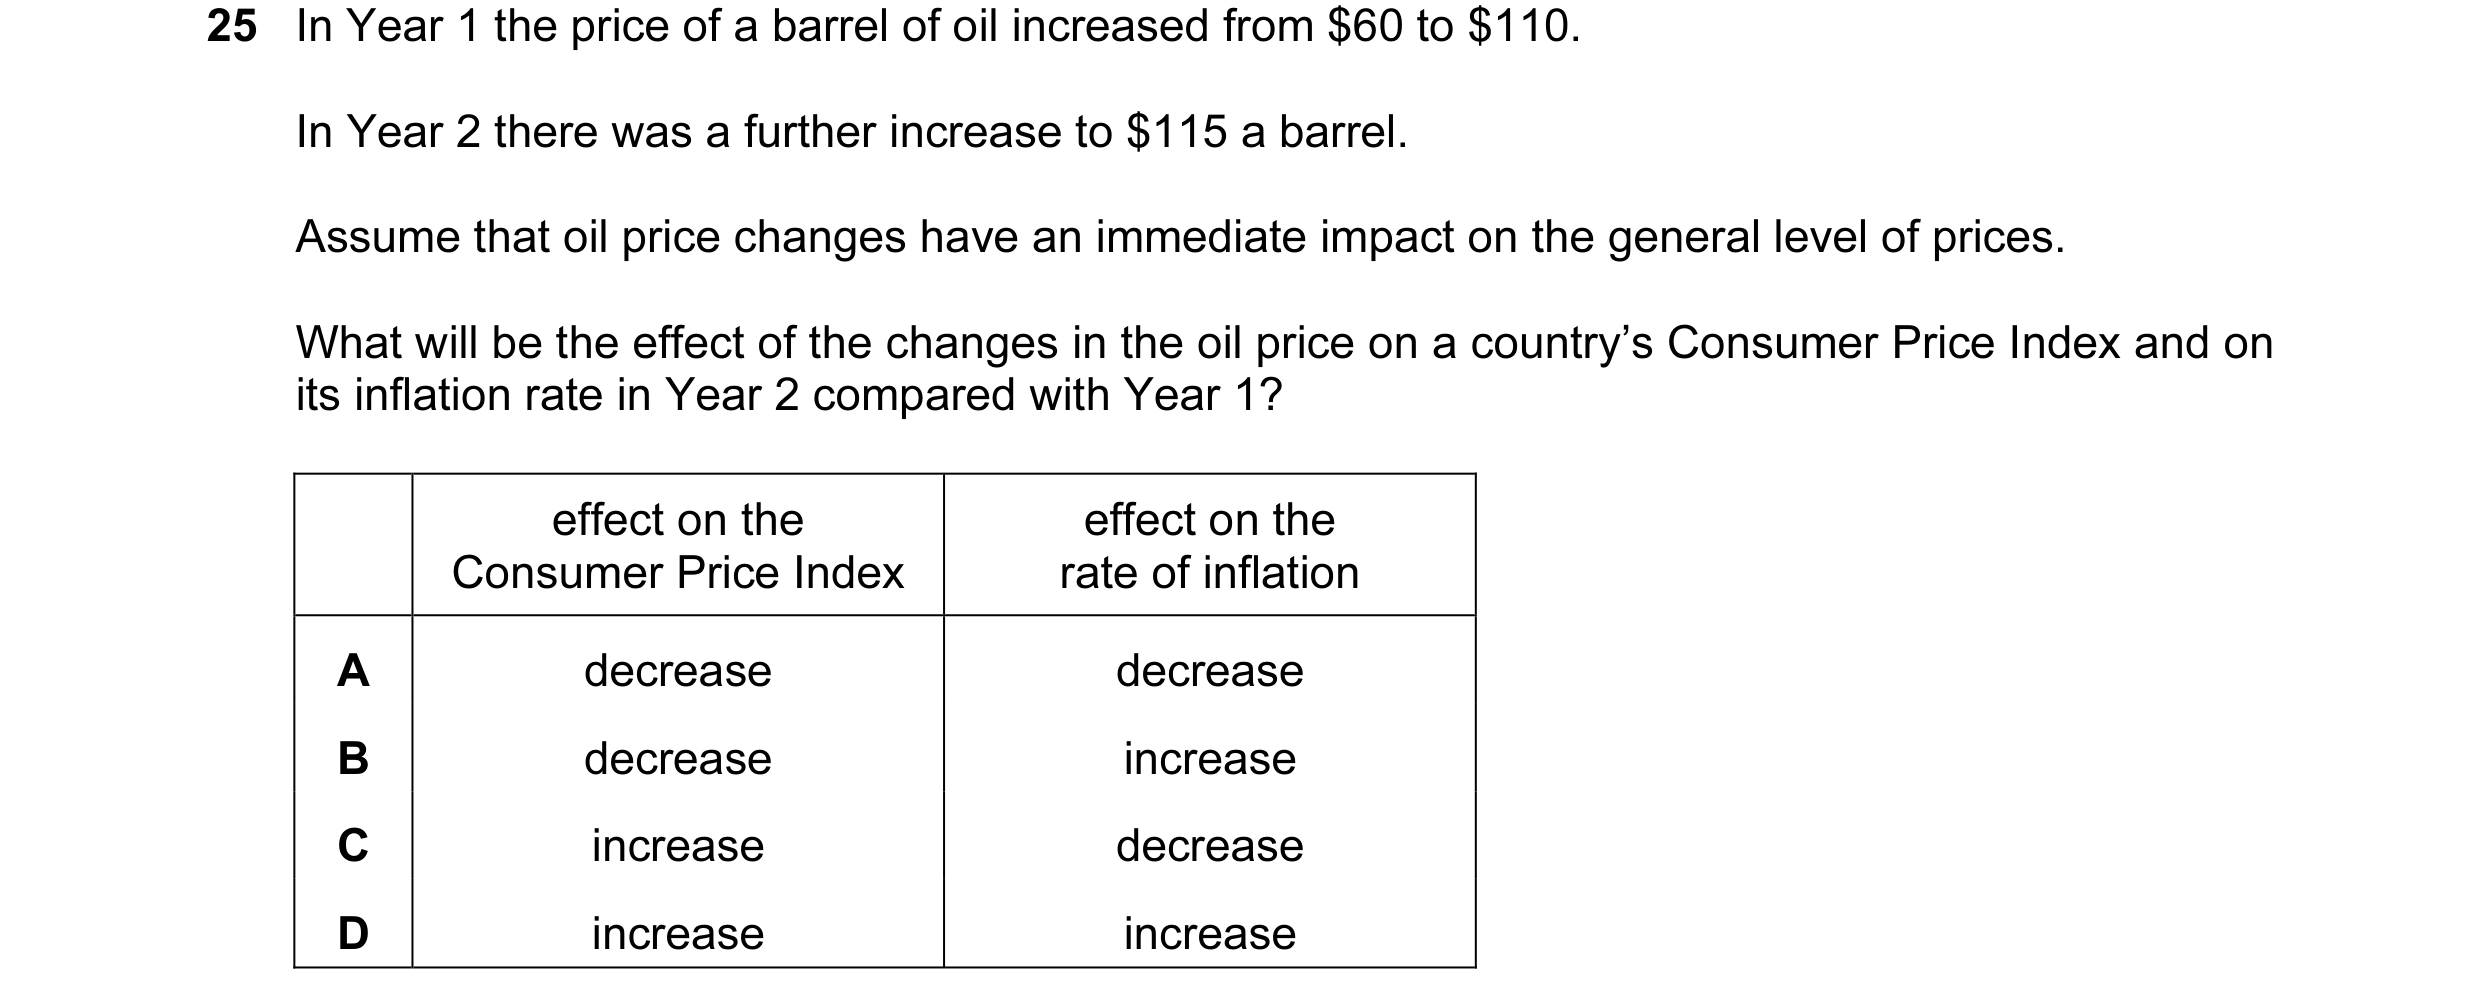 13 / 67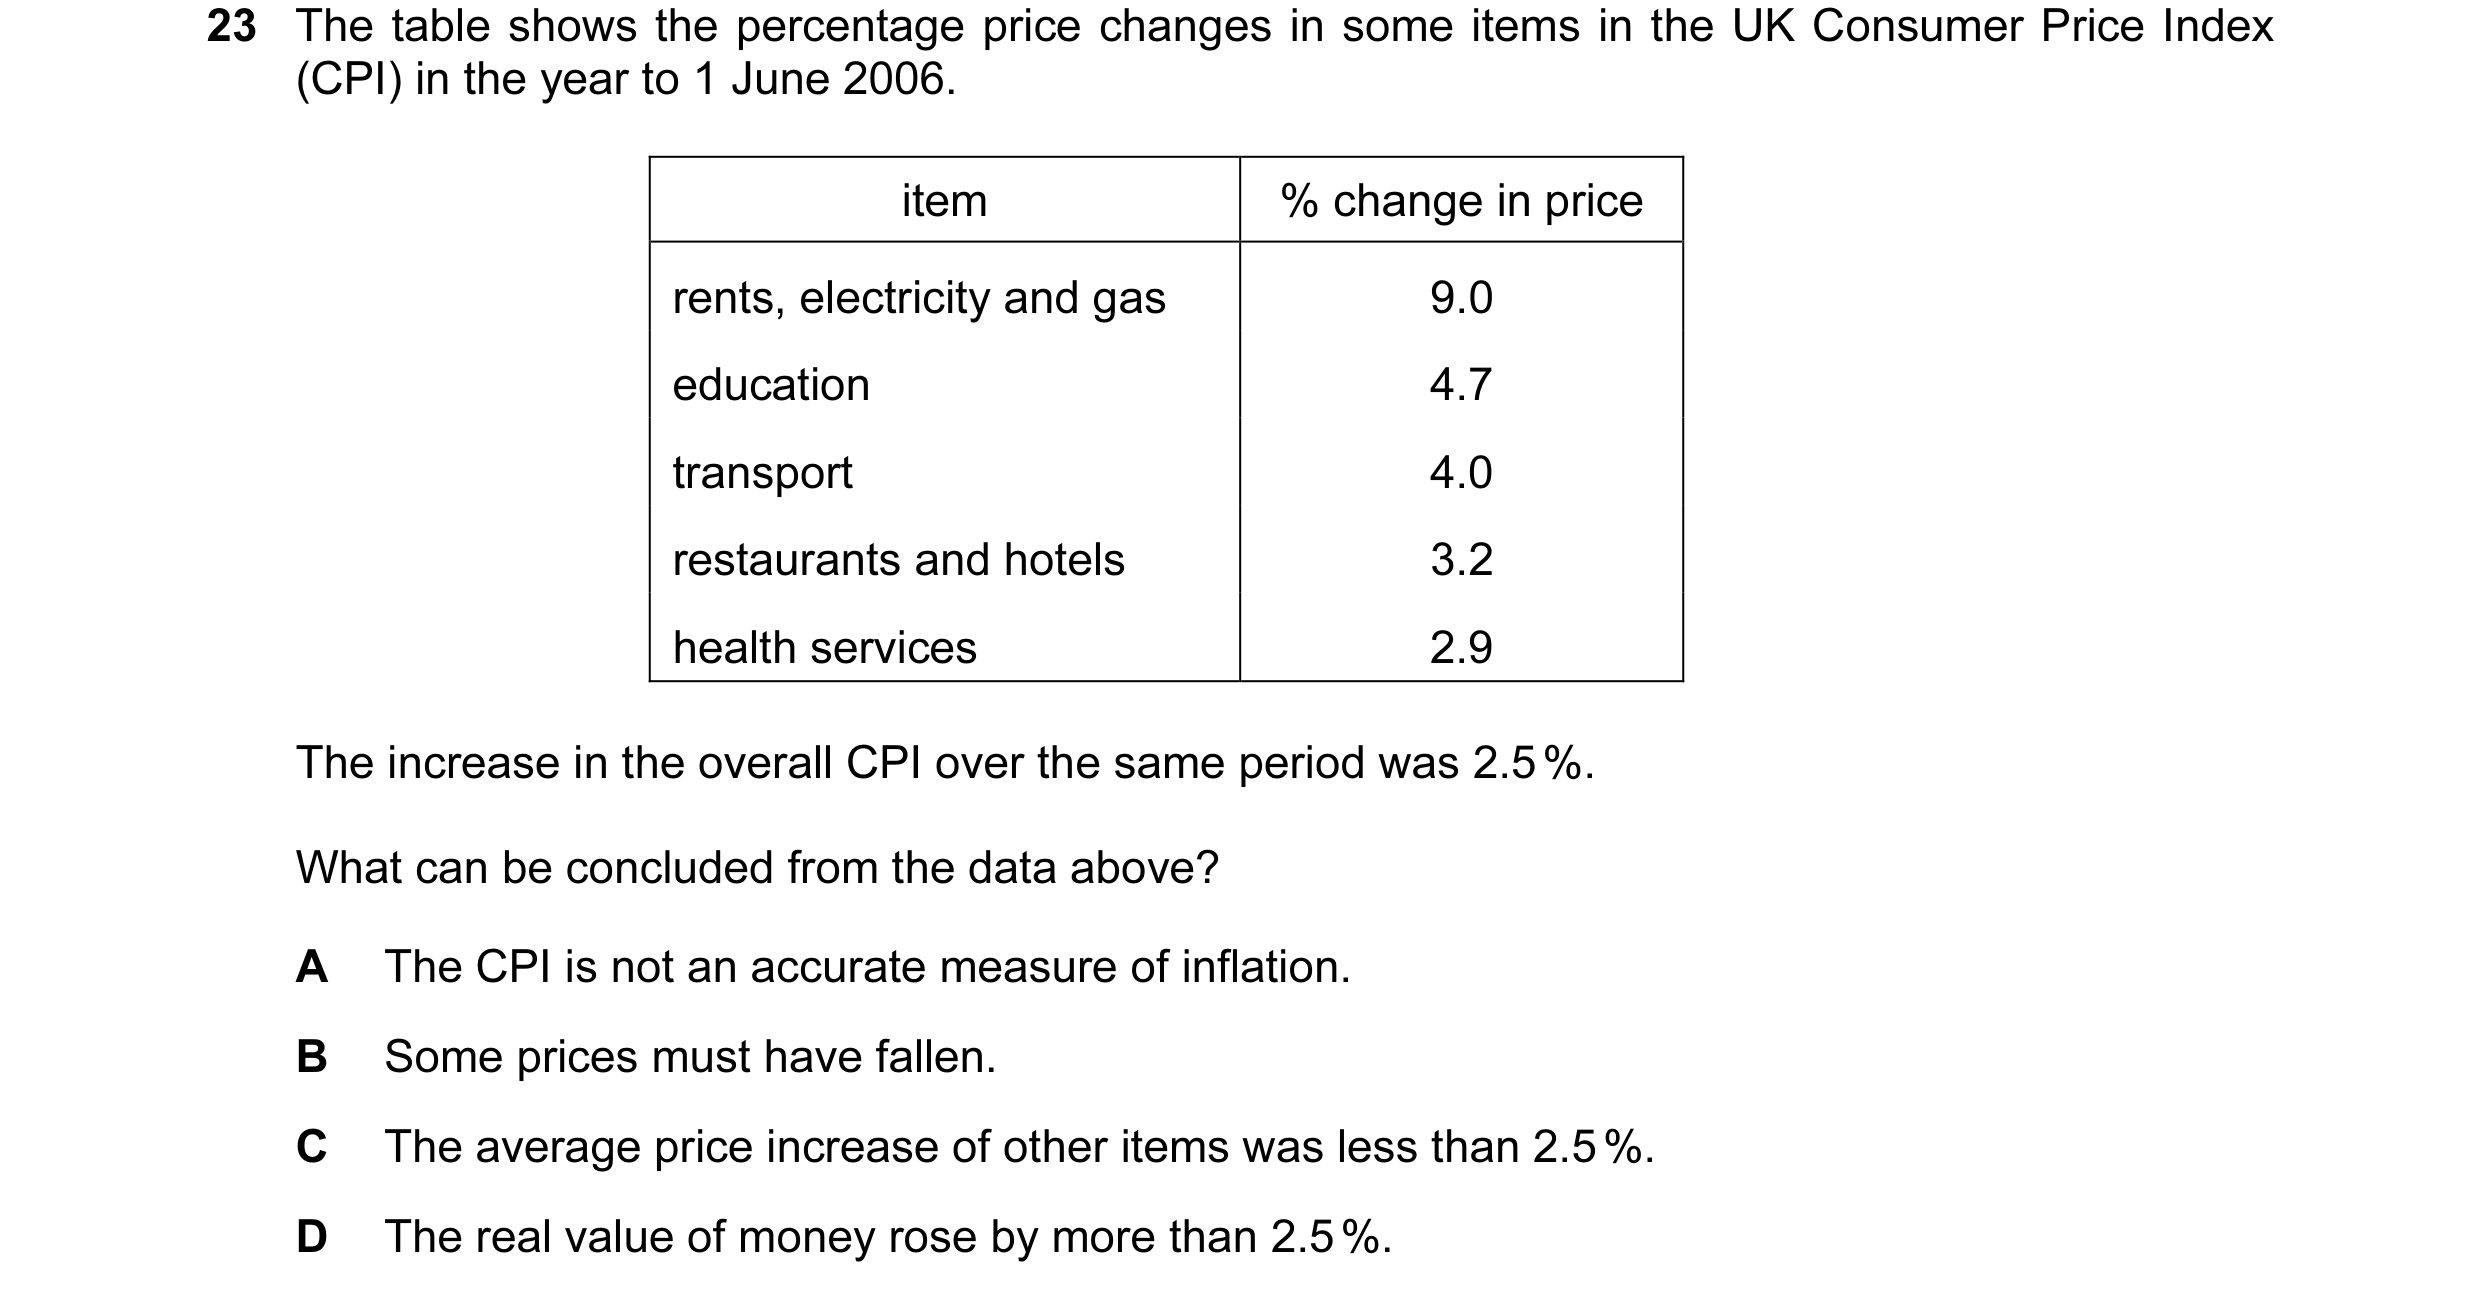
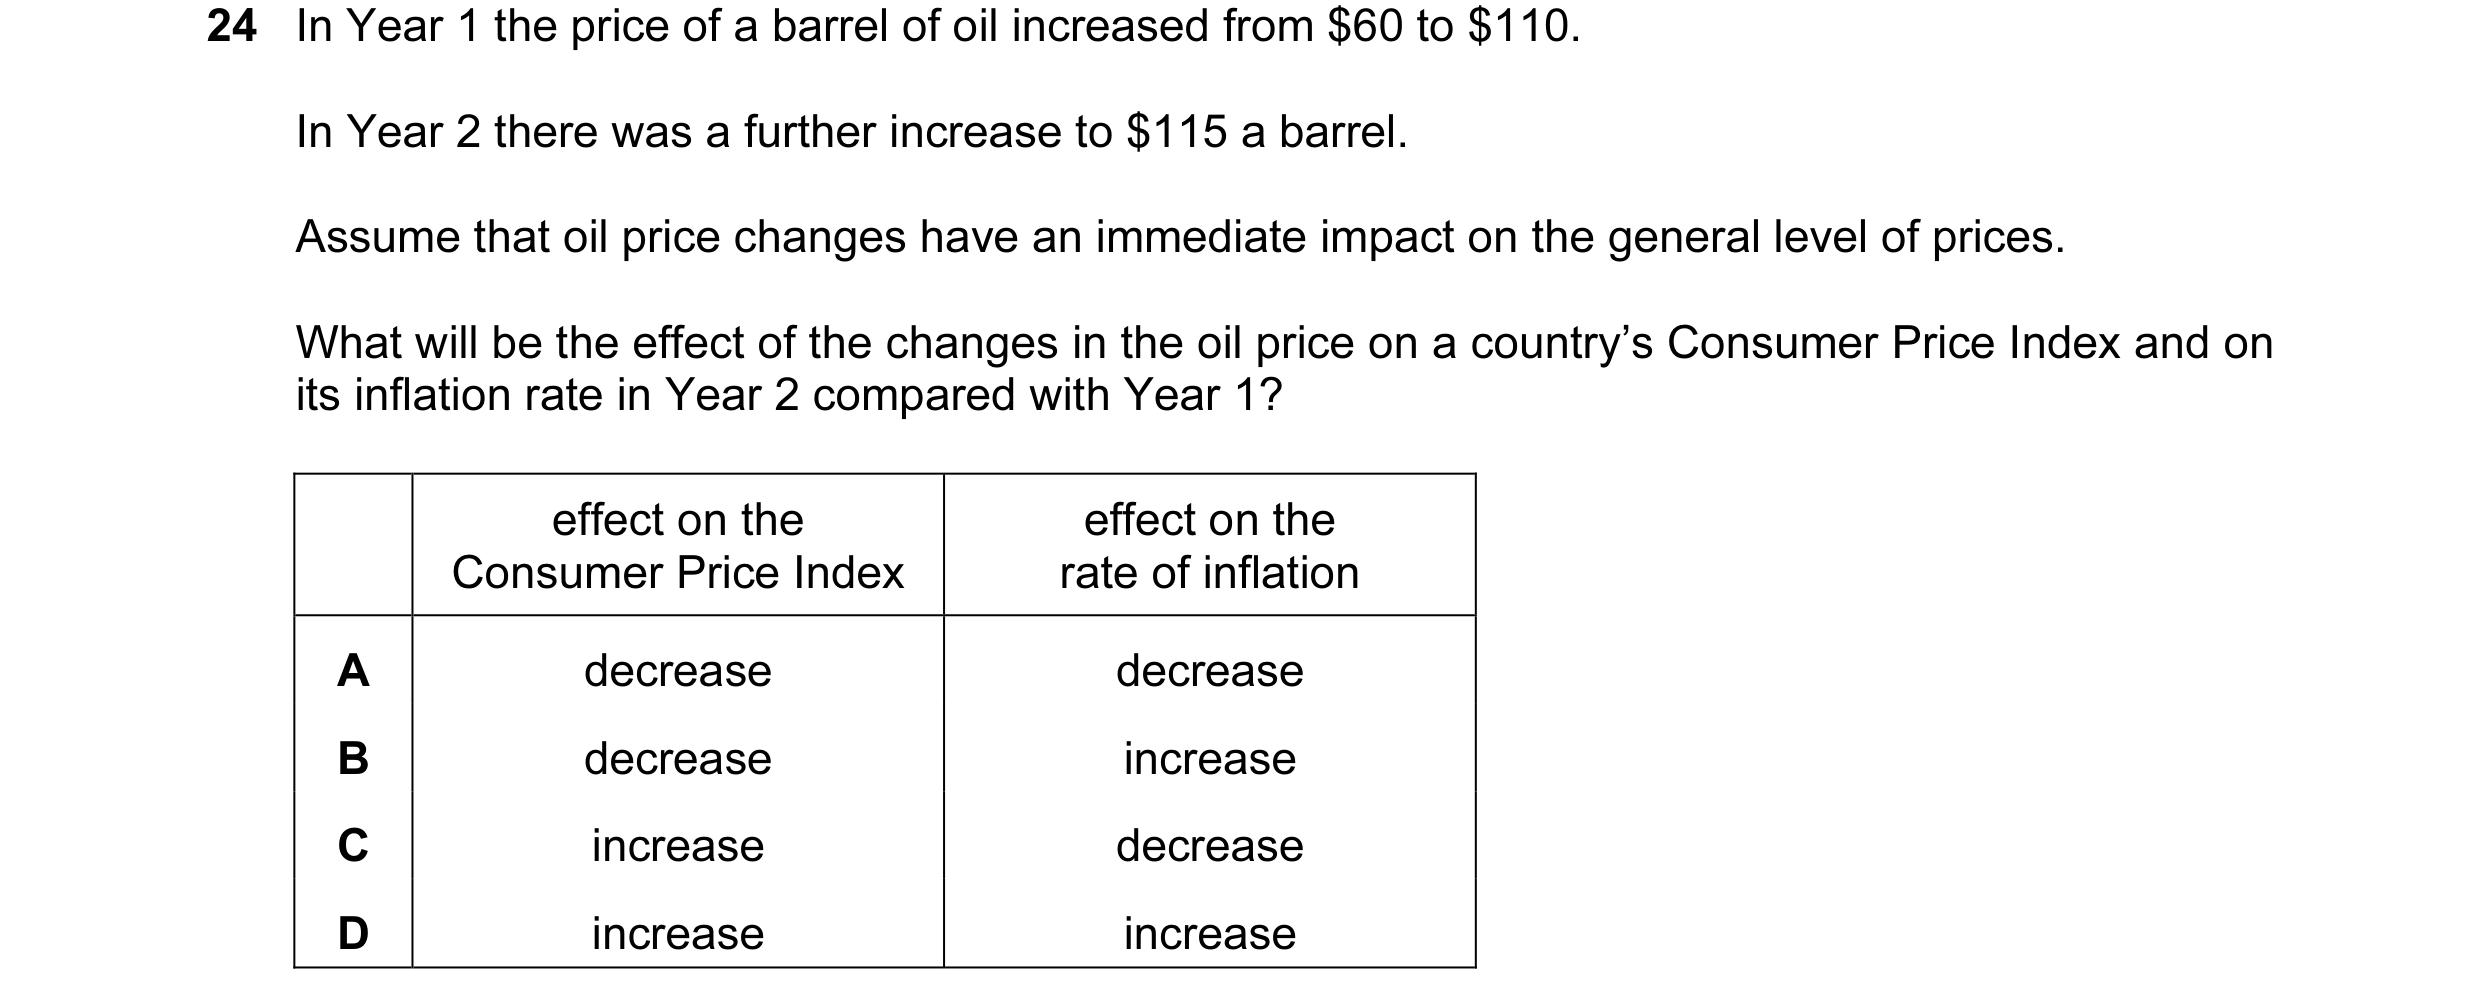 14 / 67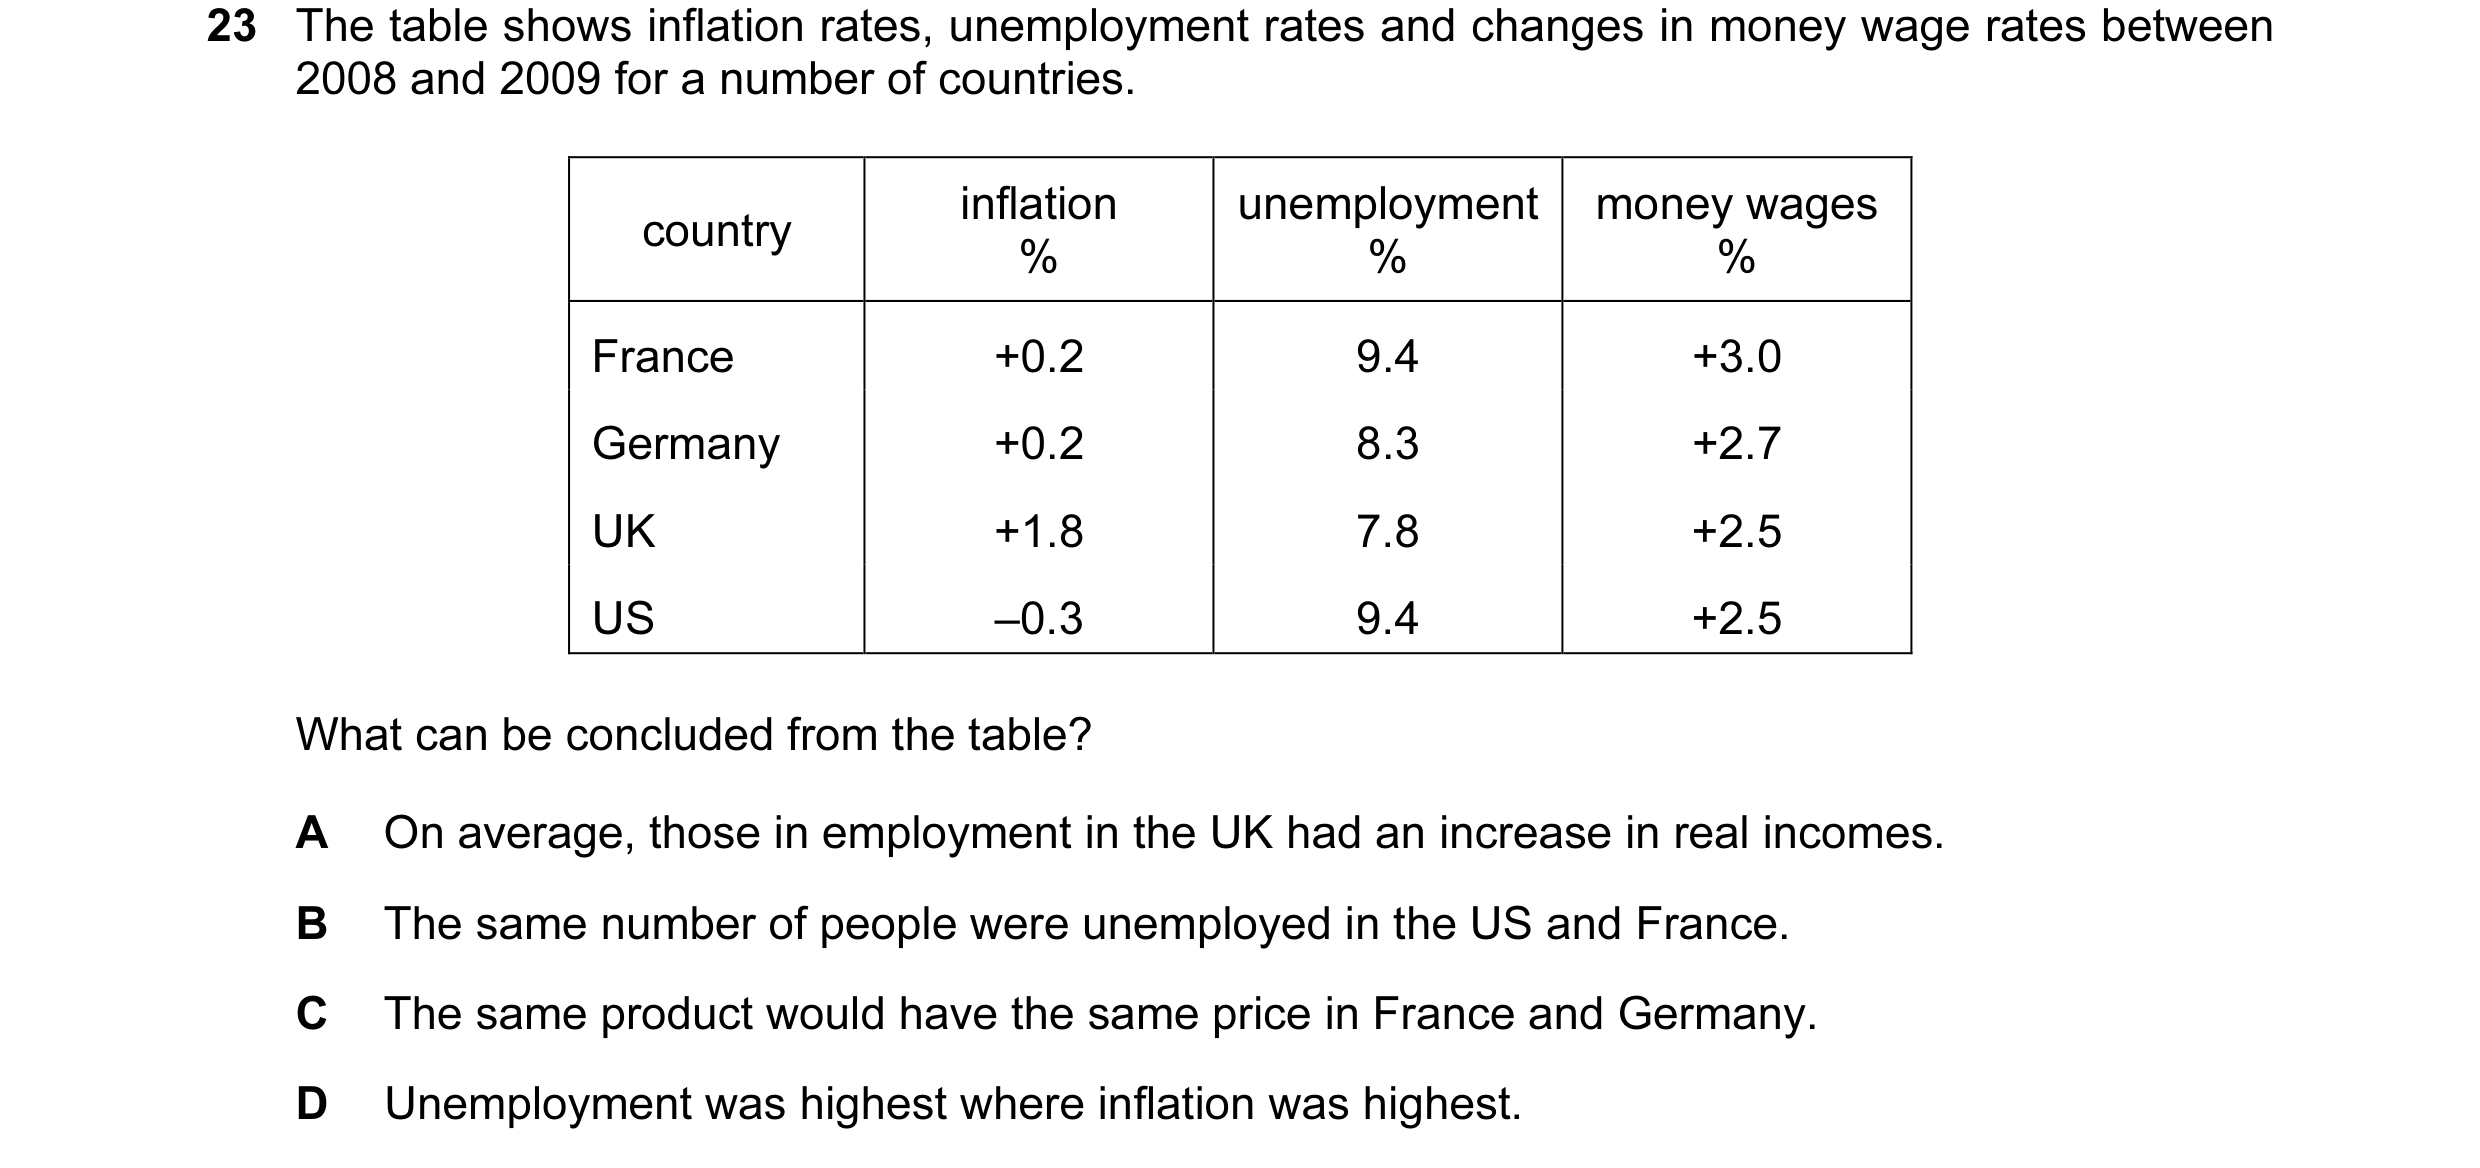
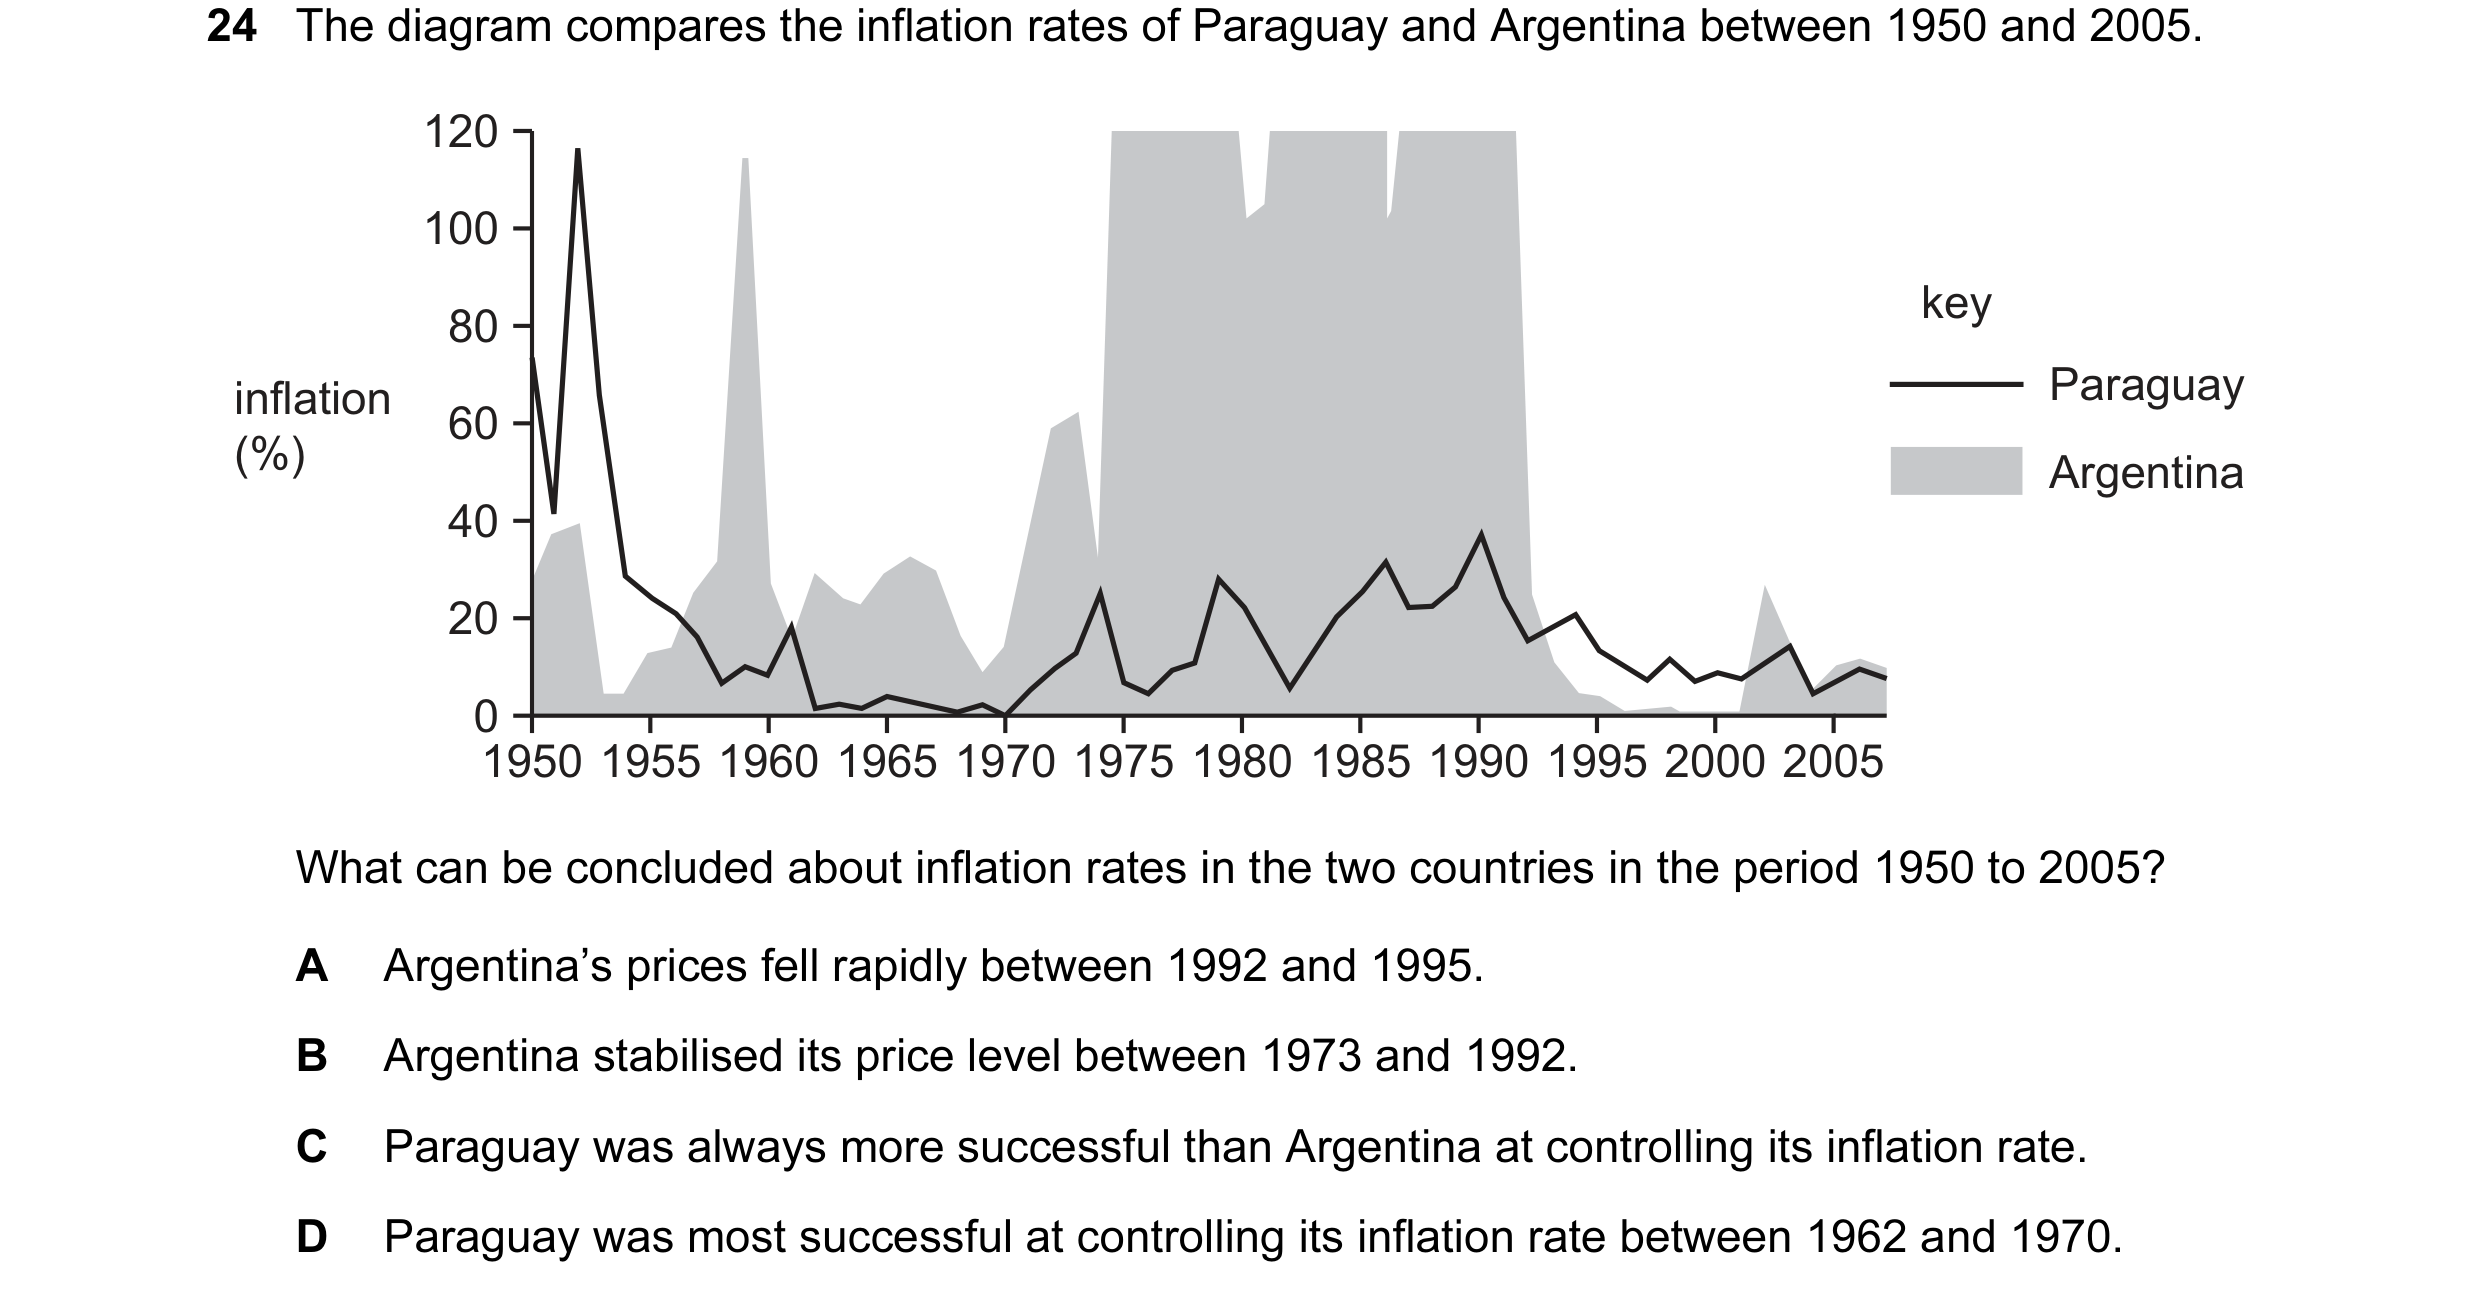
 15 / 67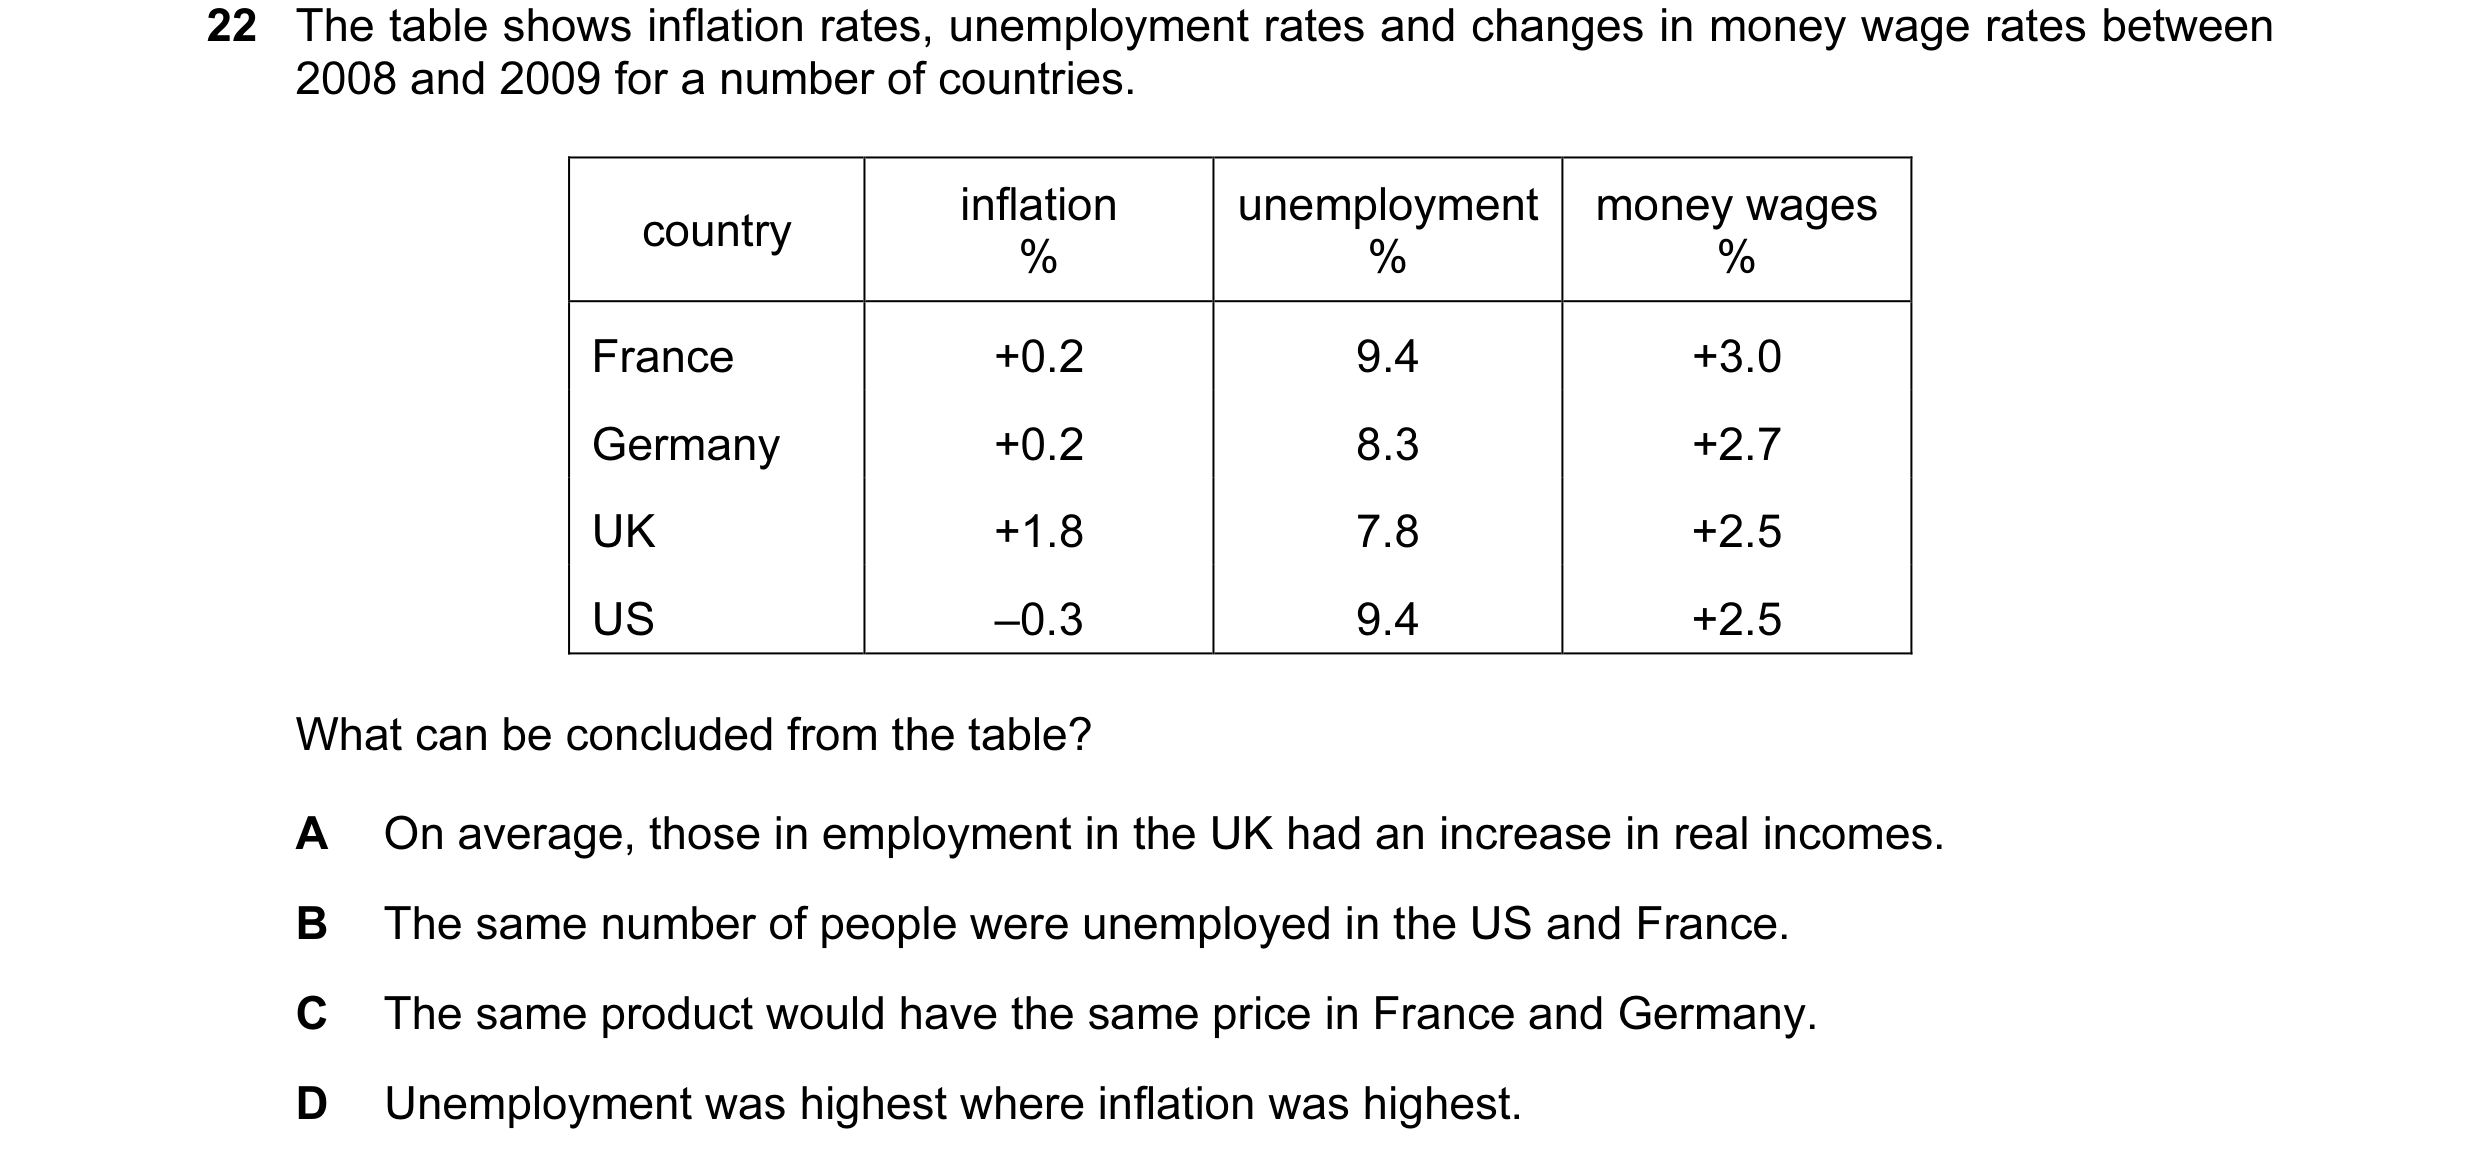
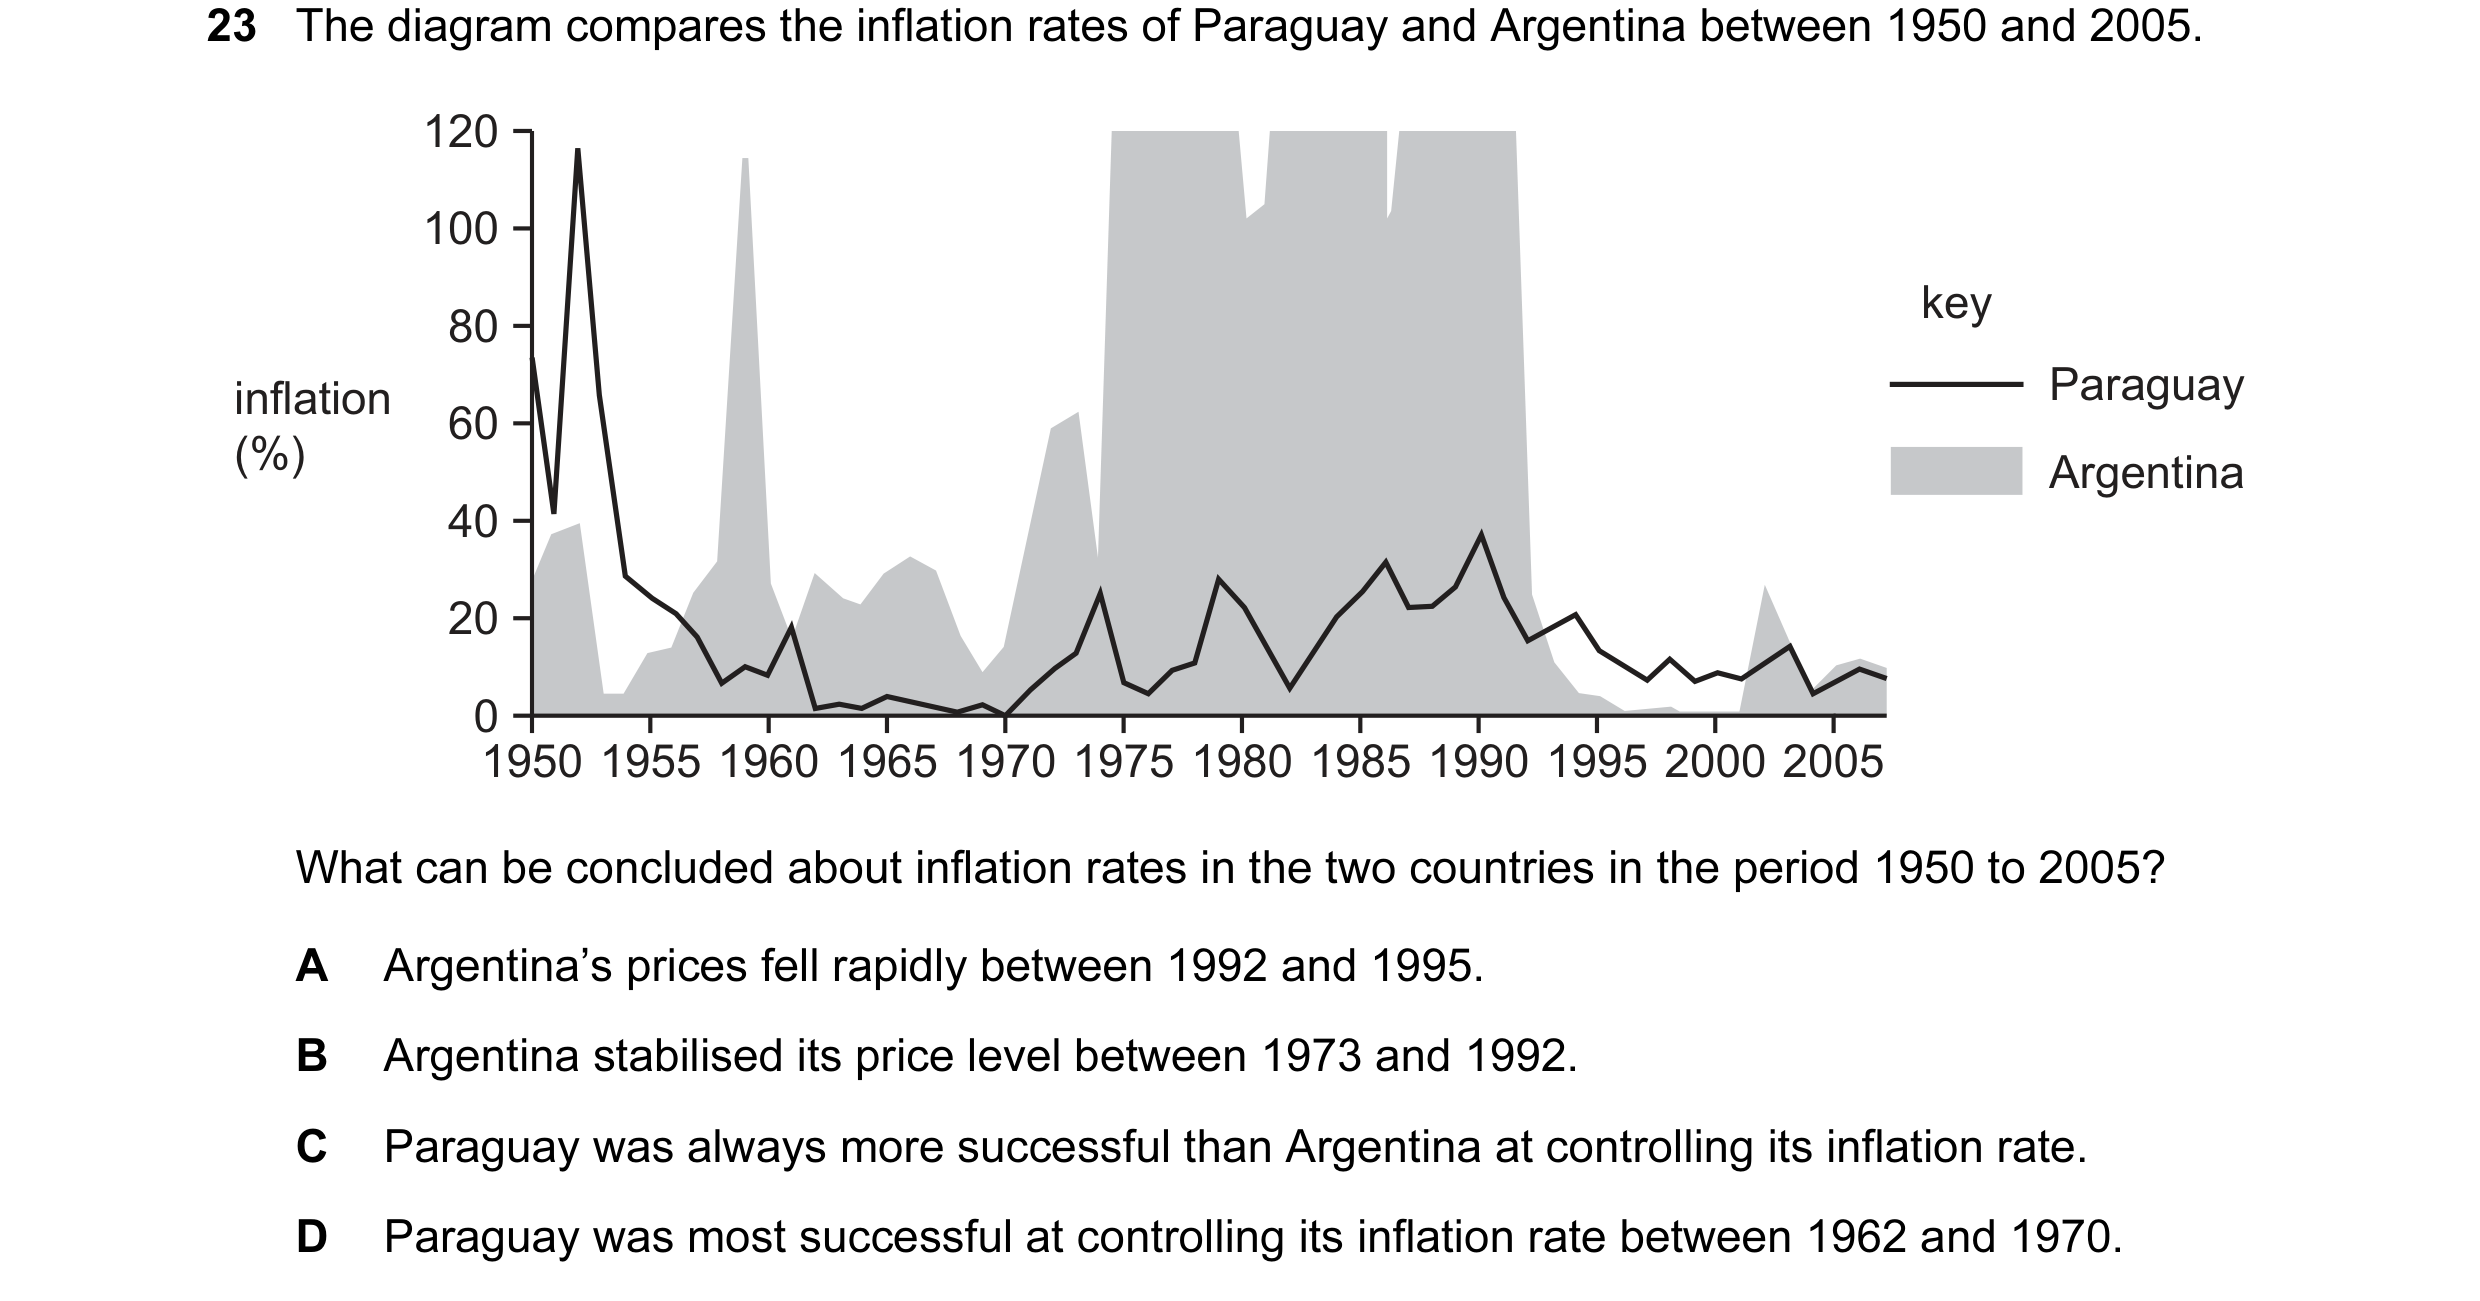
 16 / 67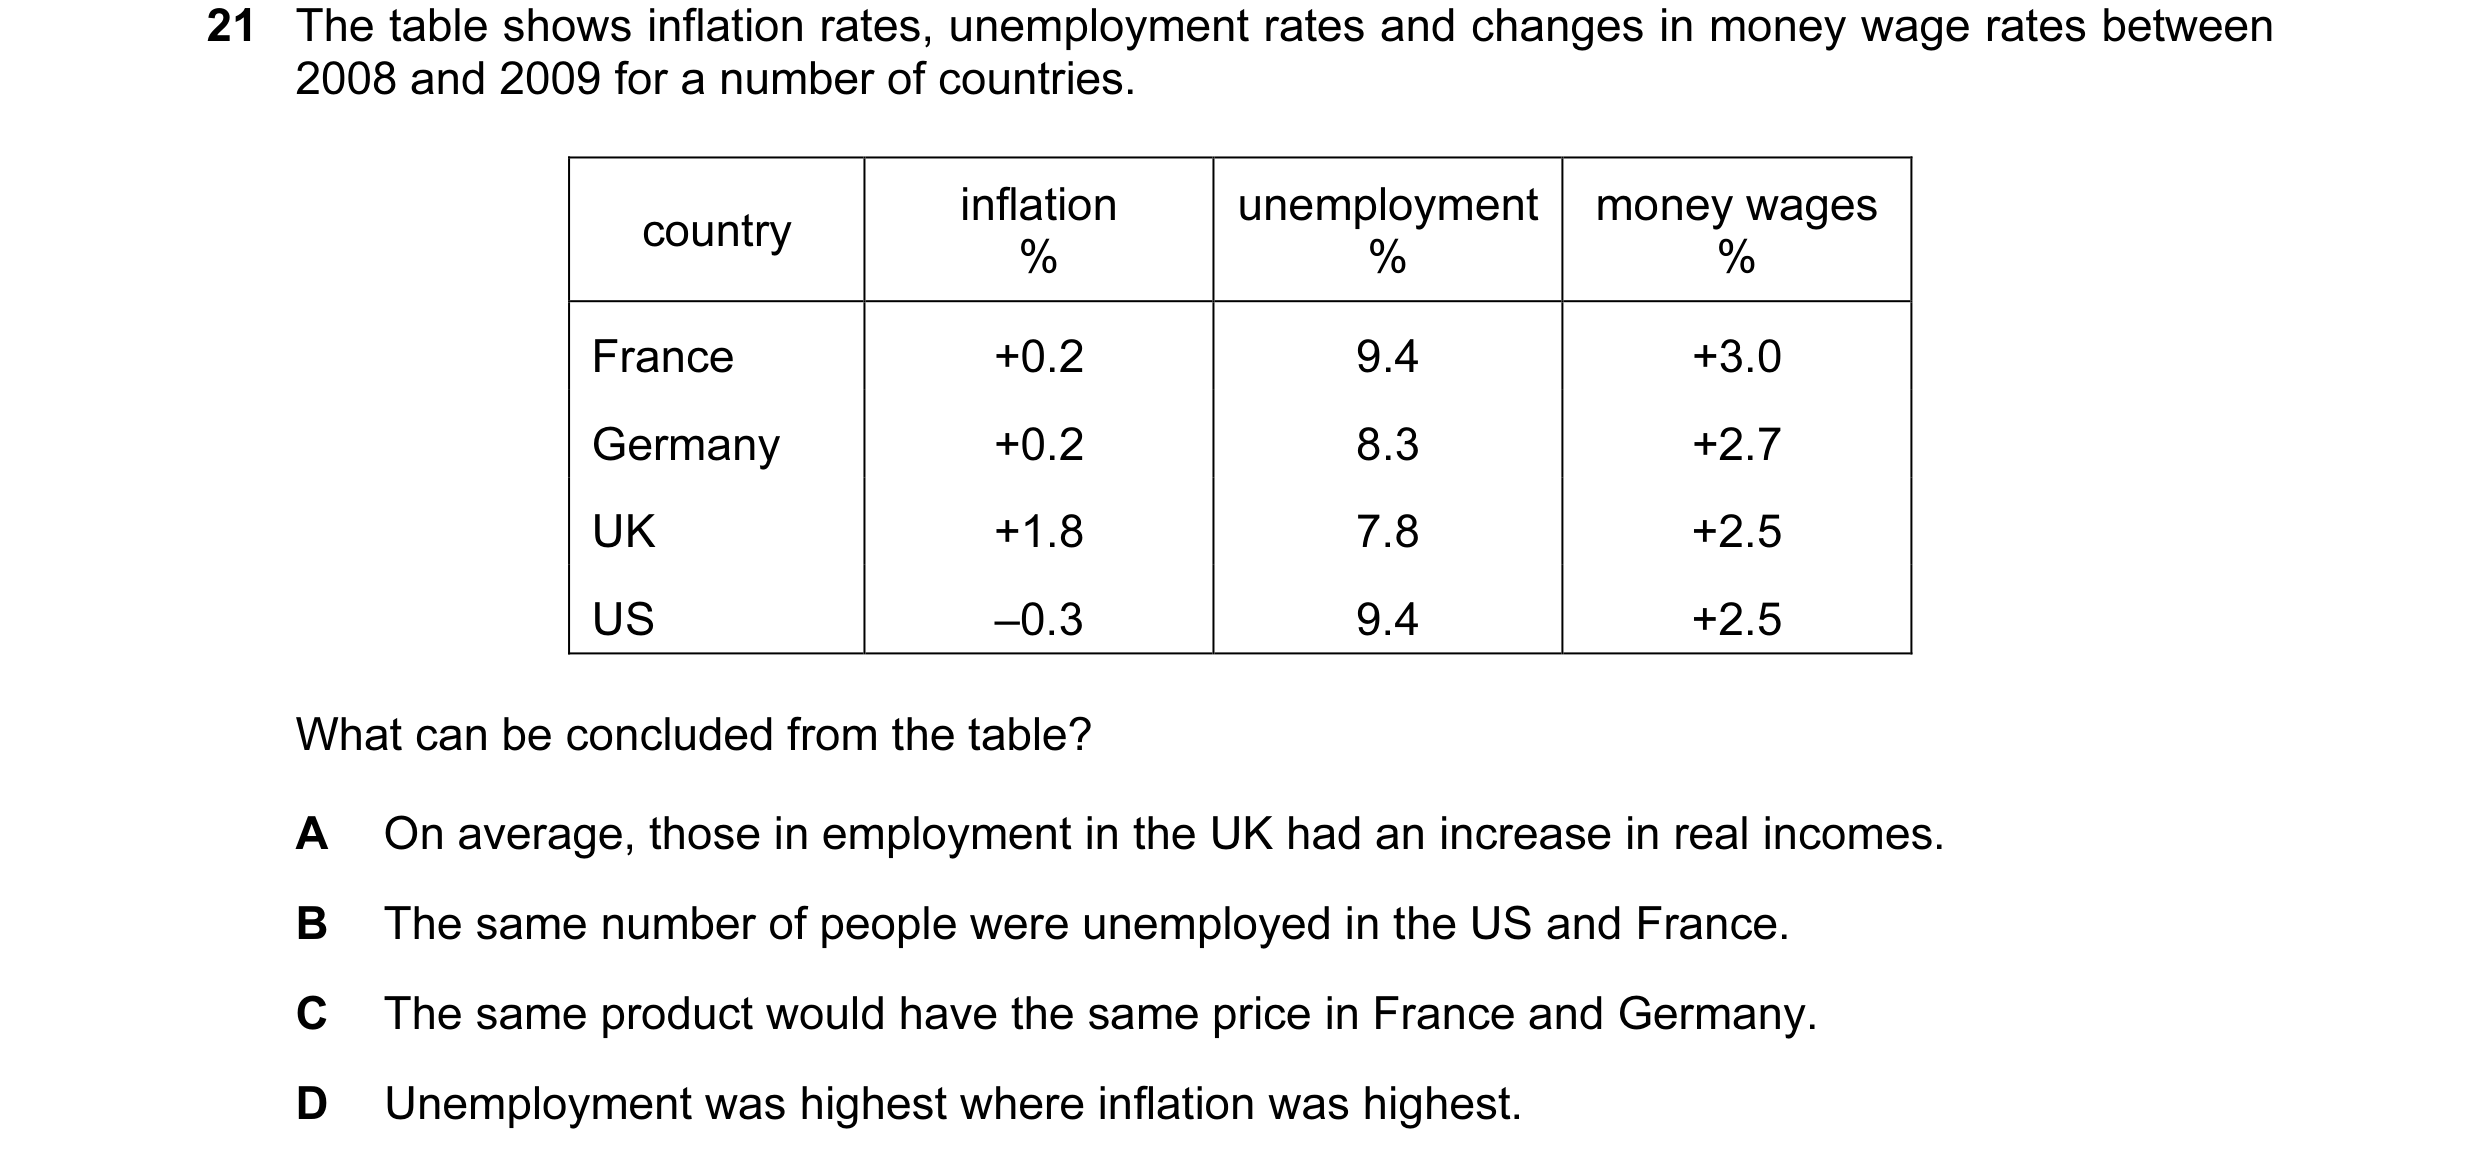
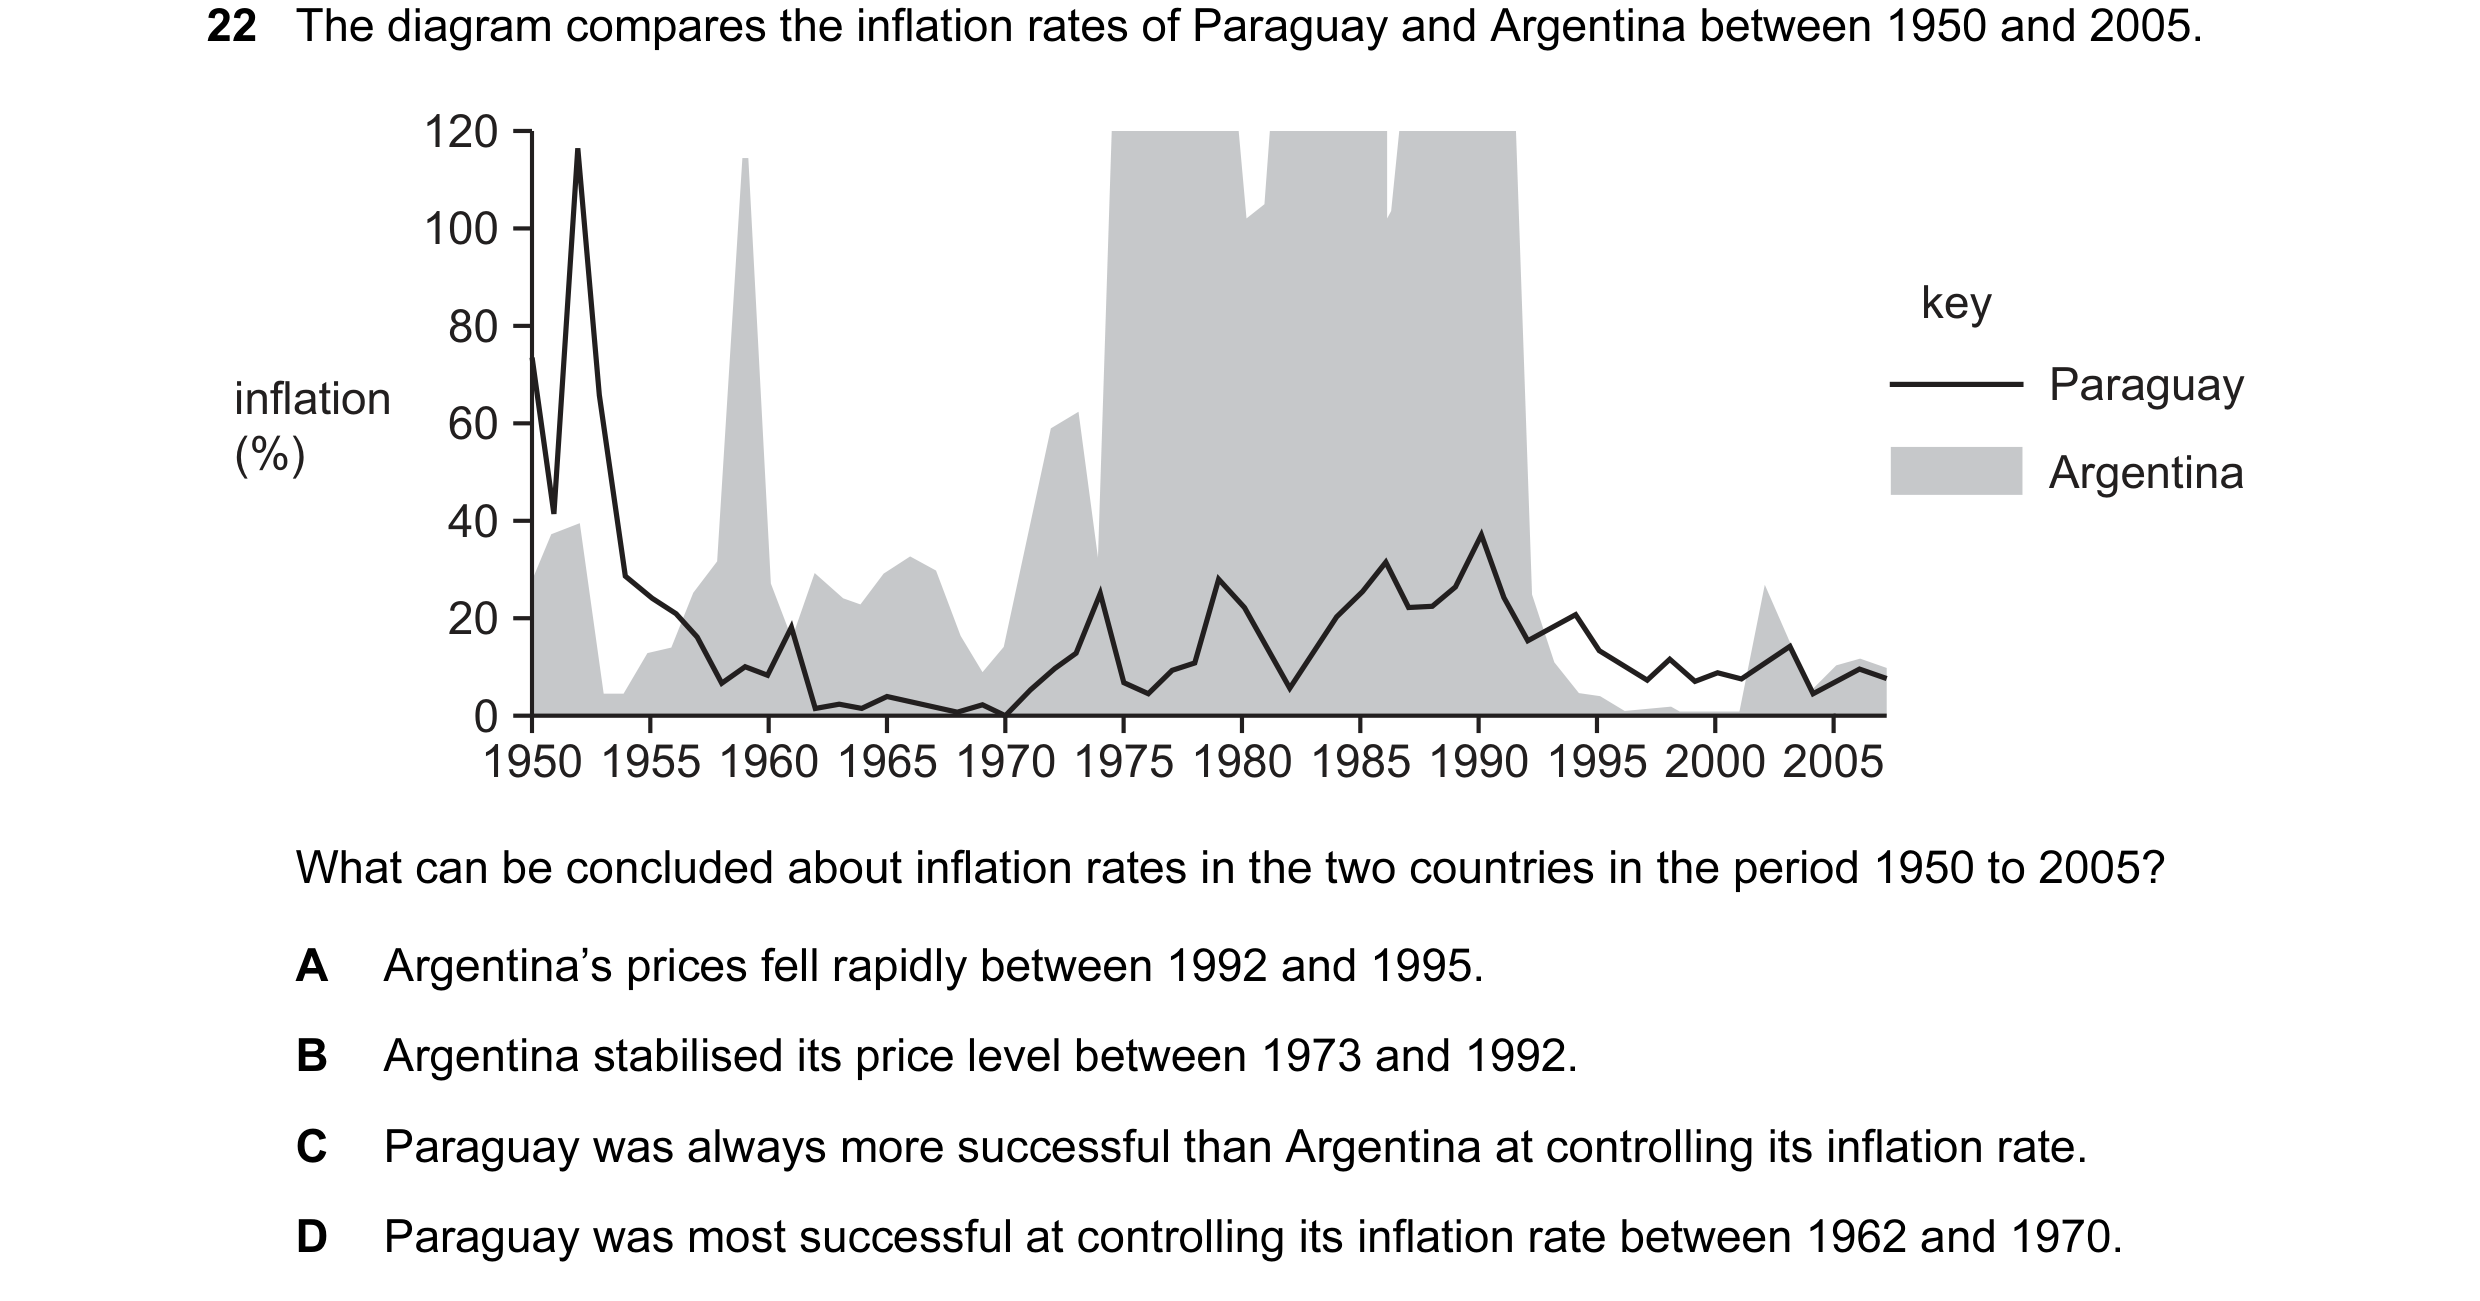
 17 / 67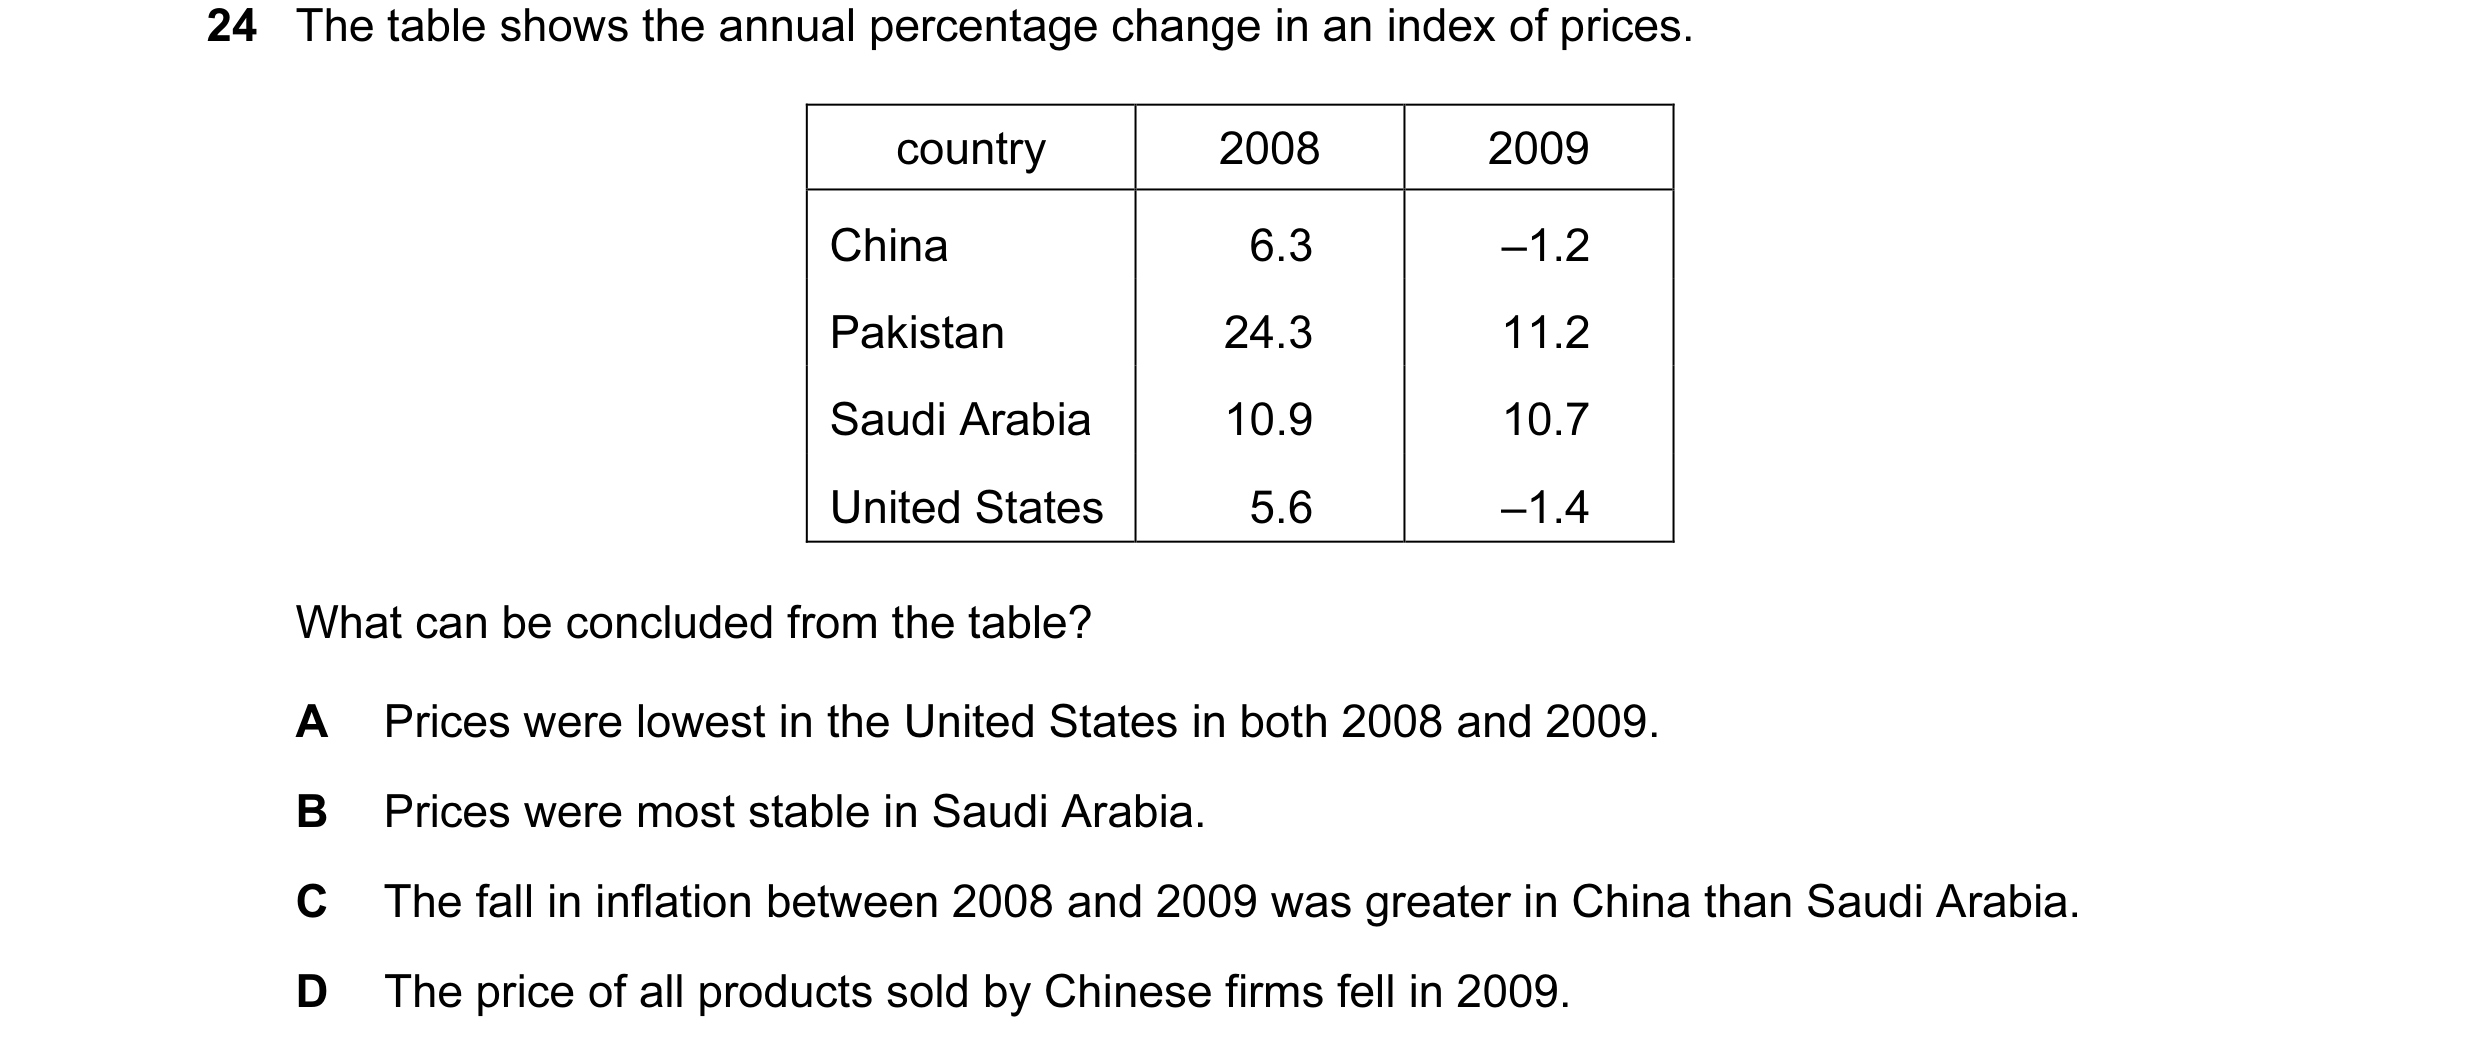
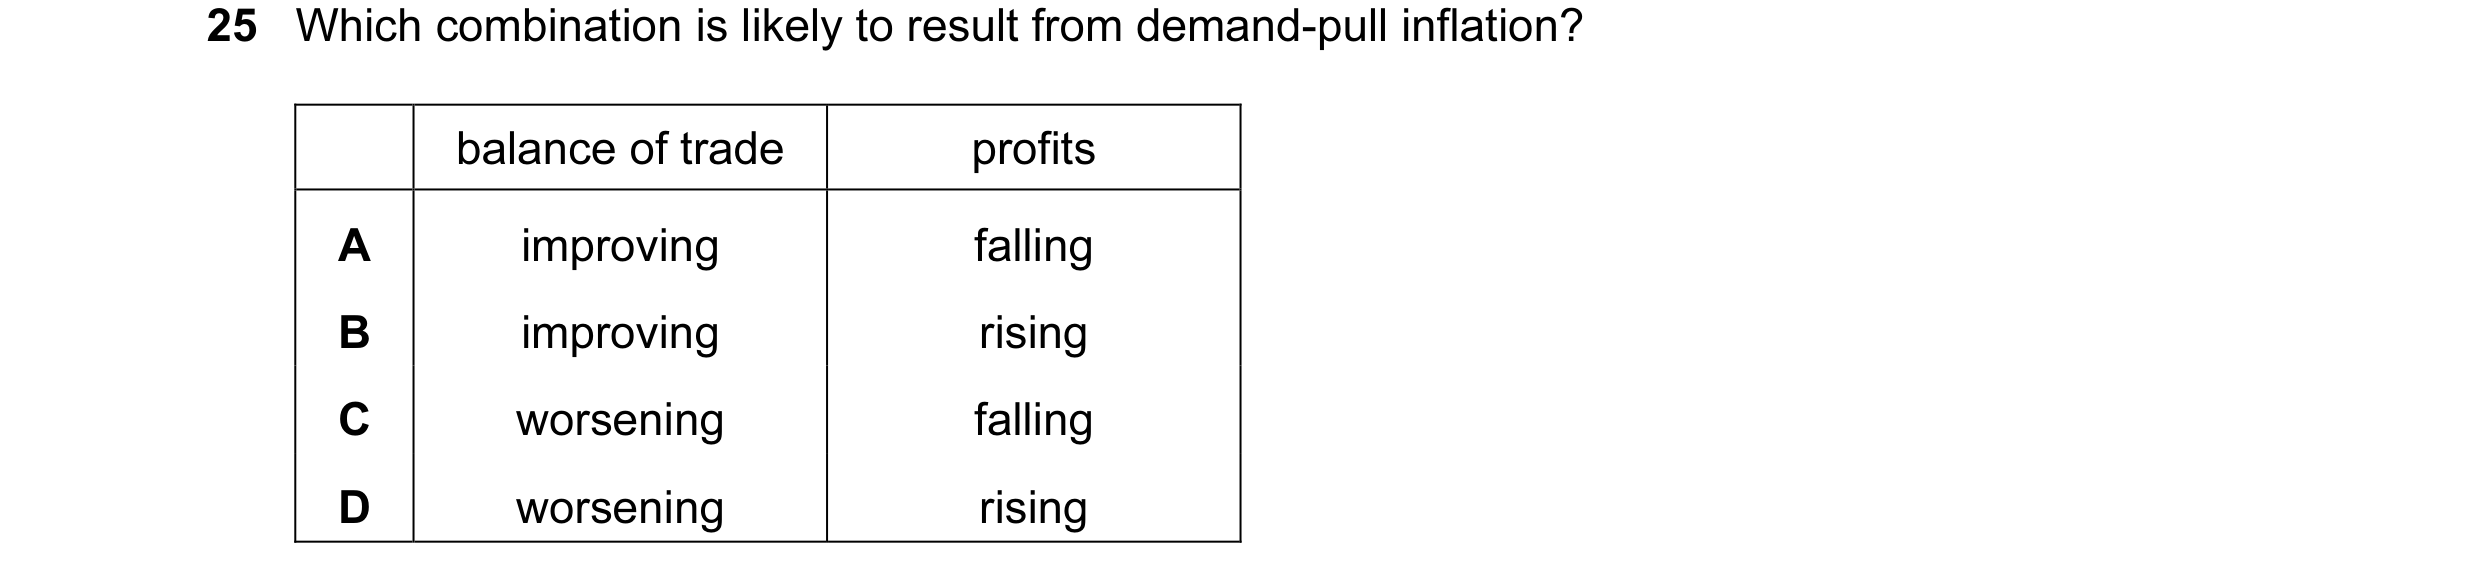
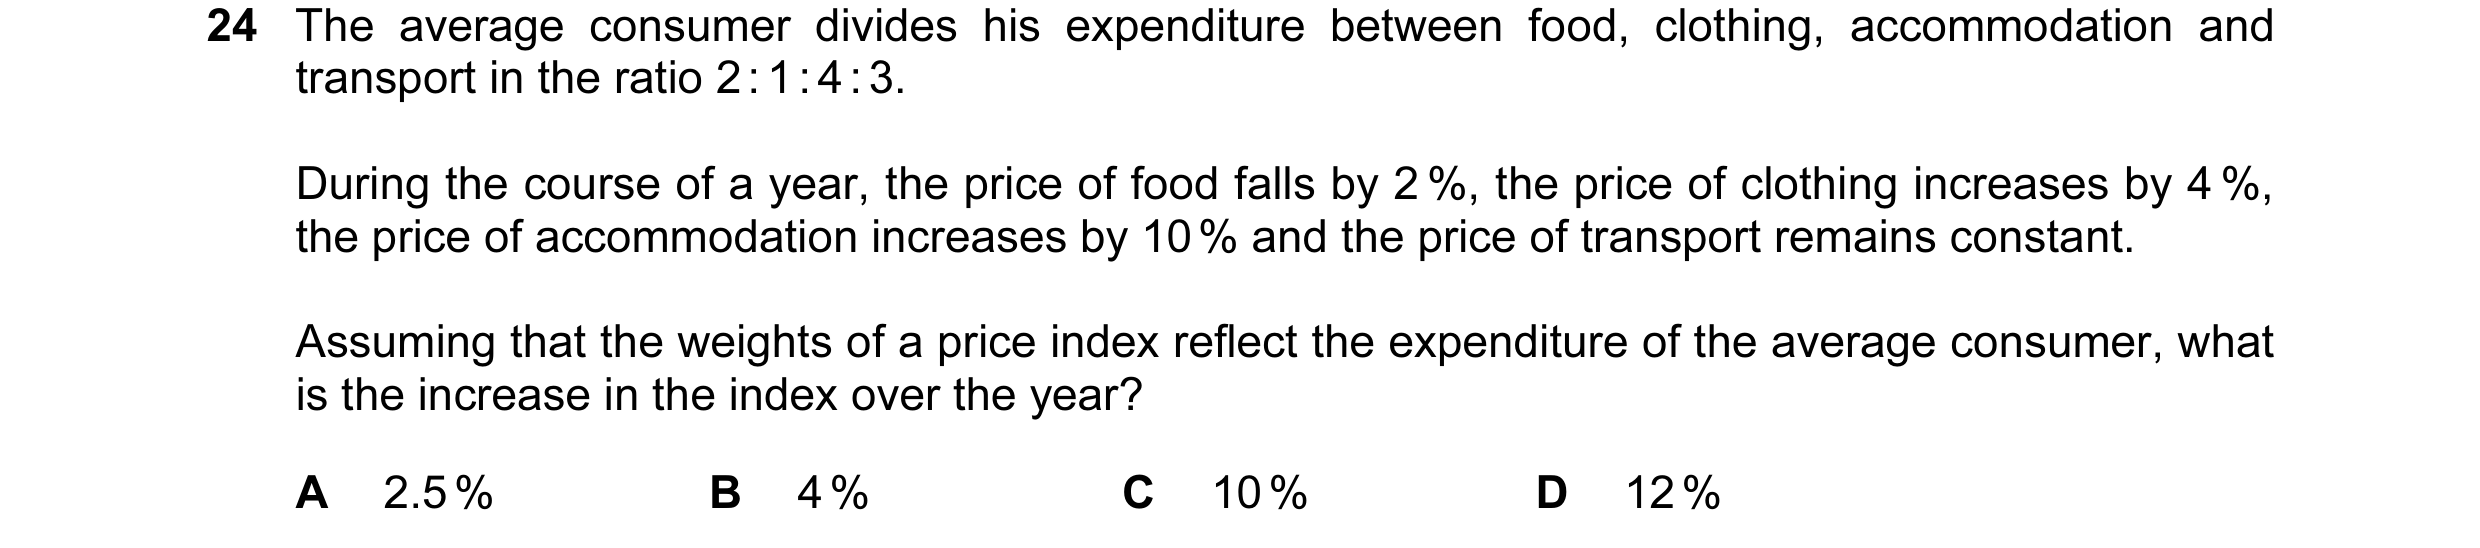
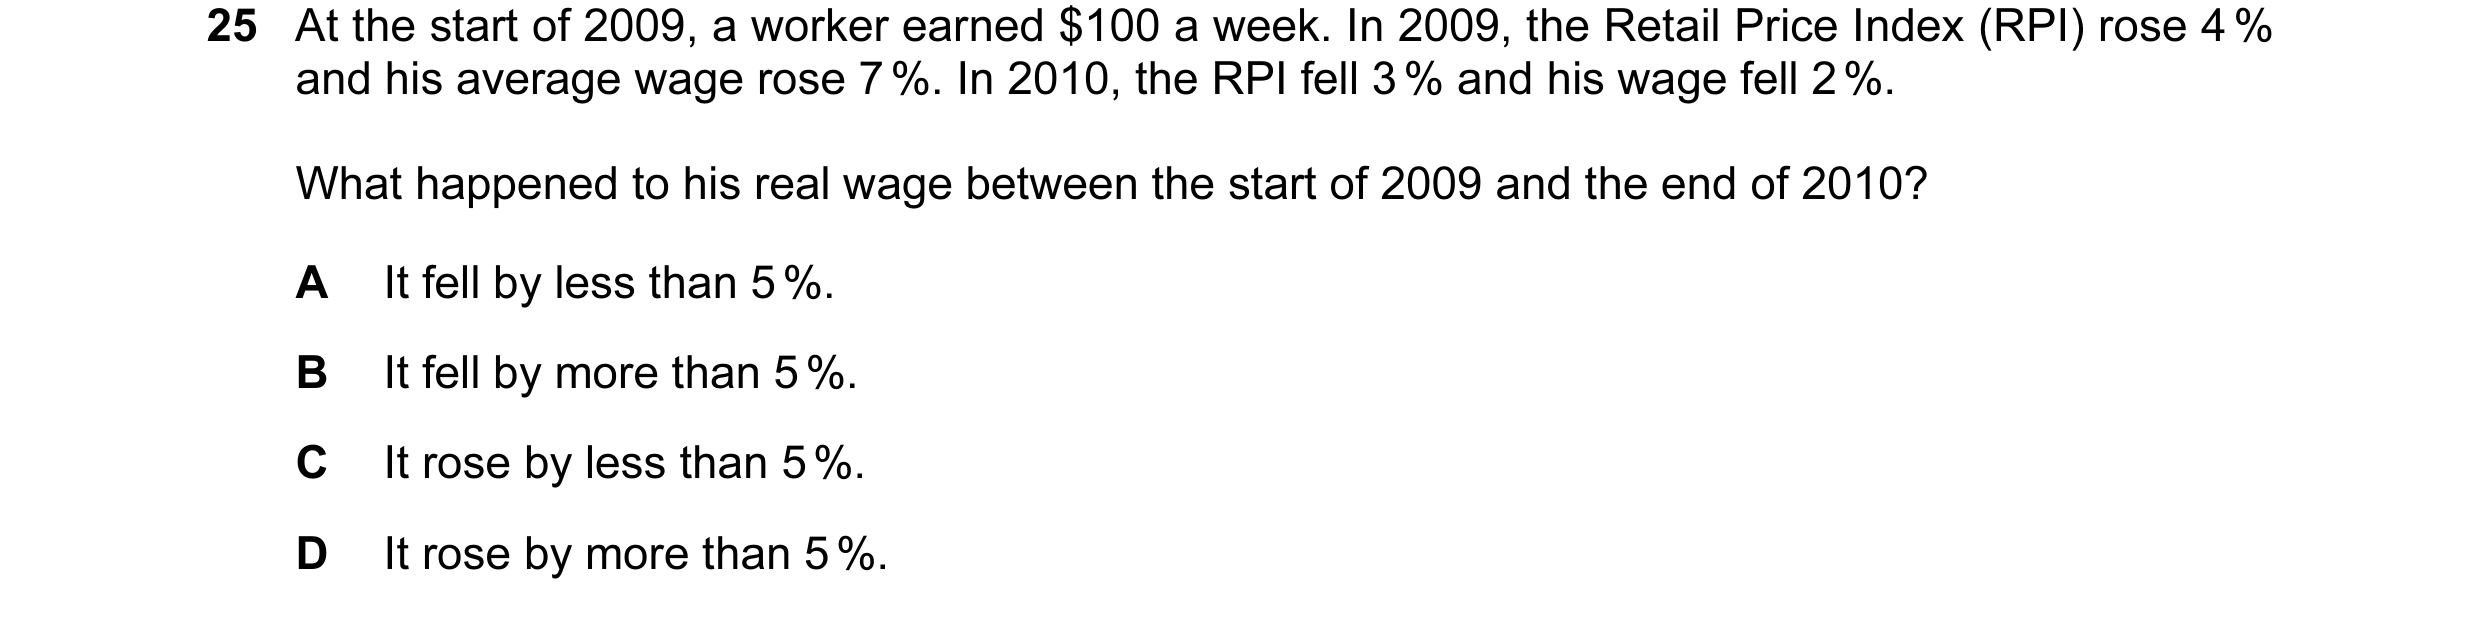 18 / 67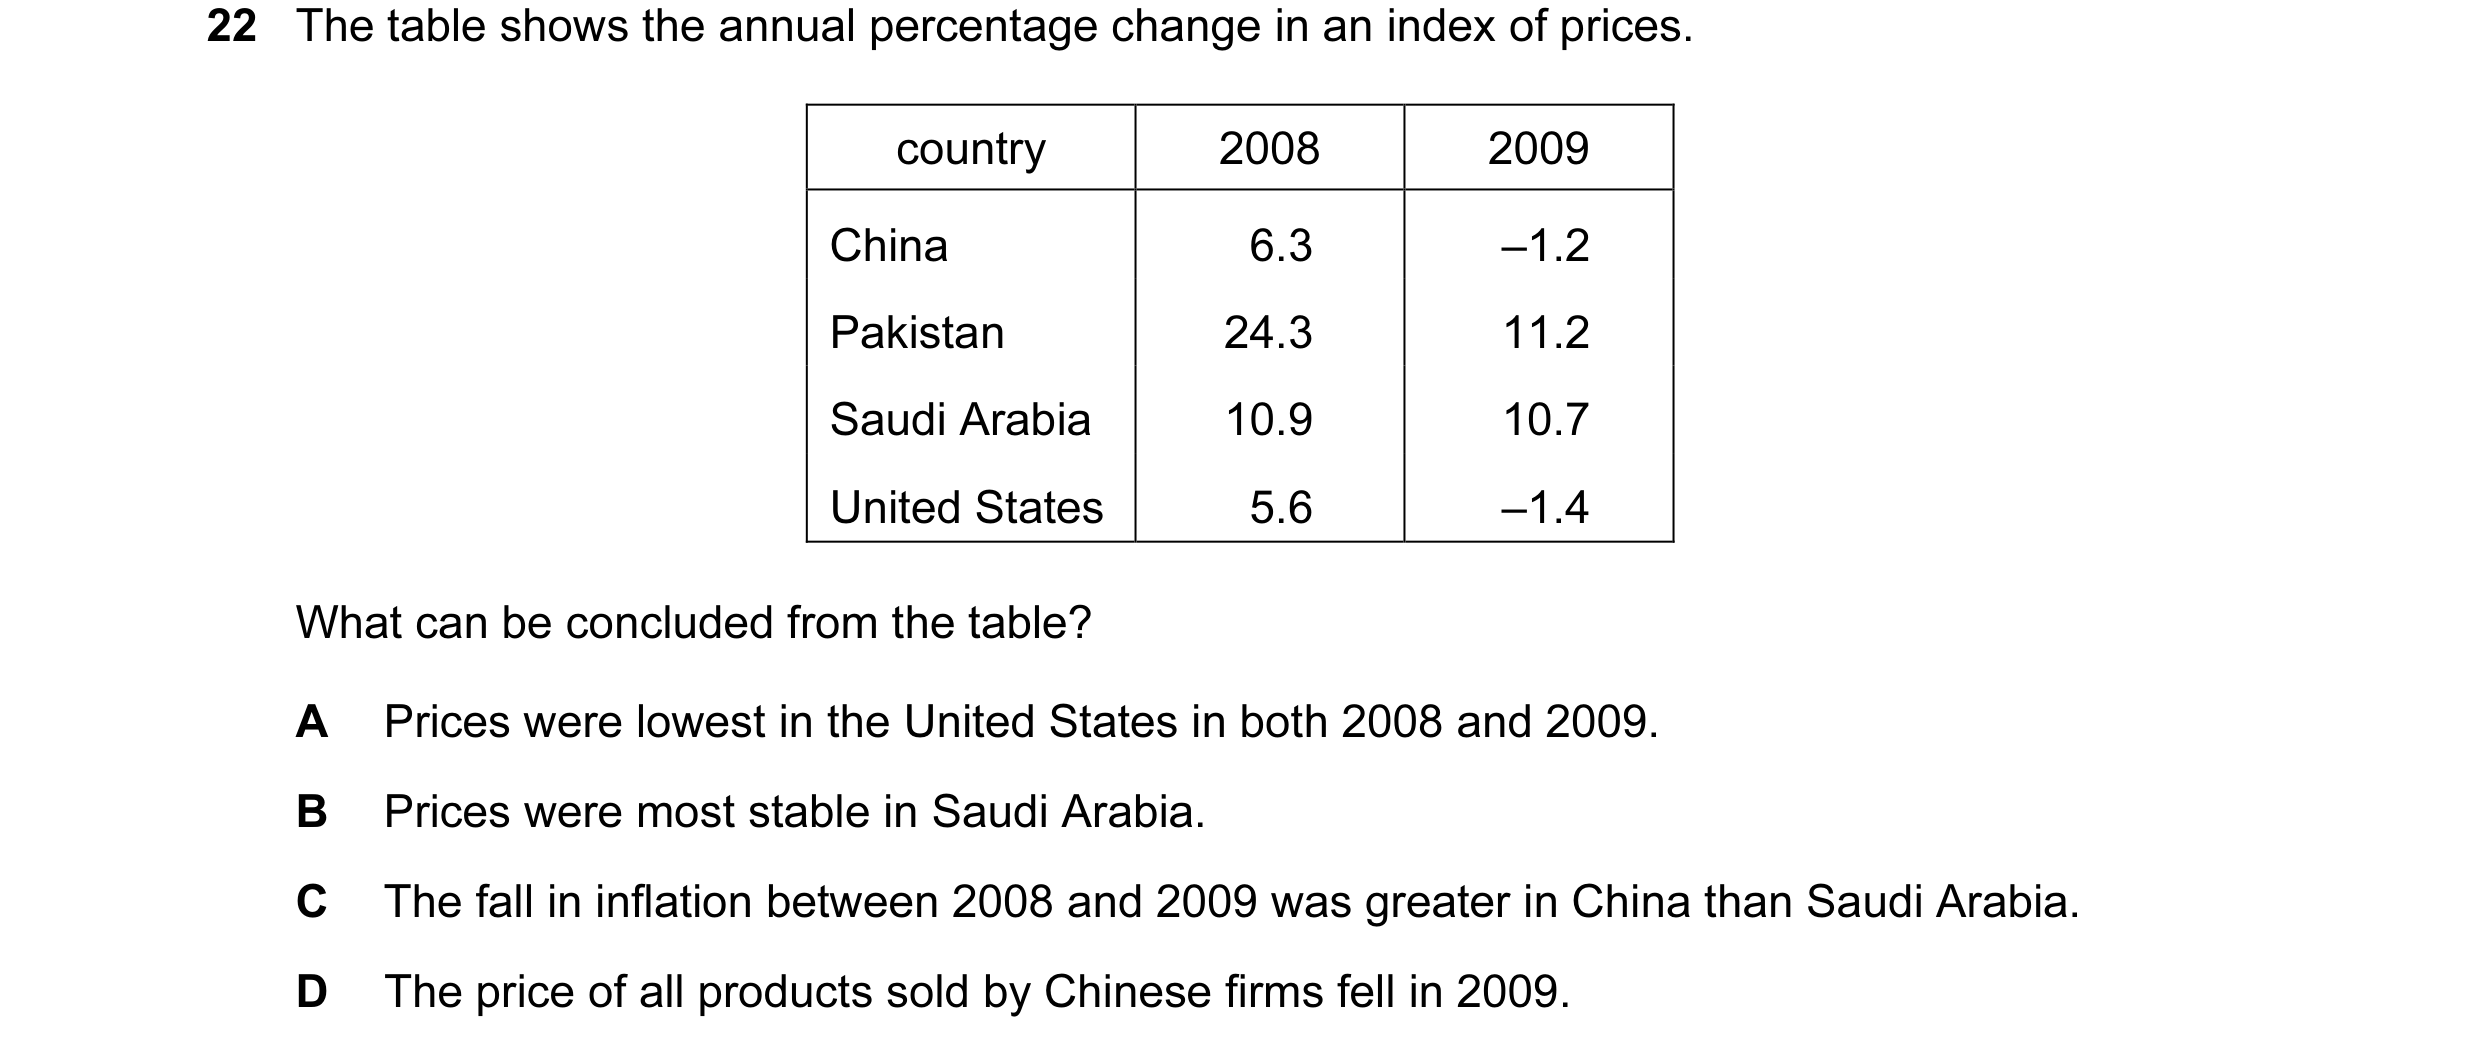
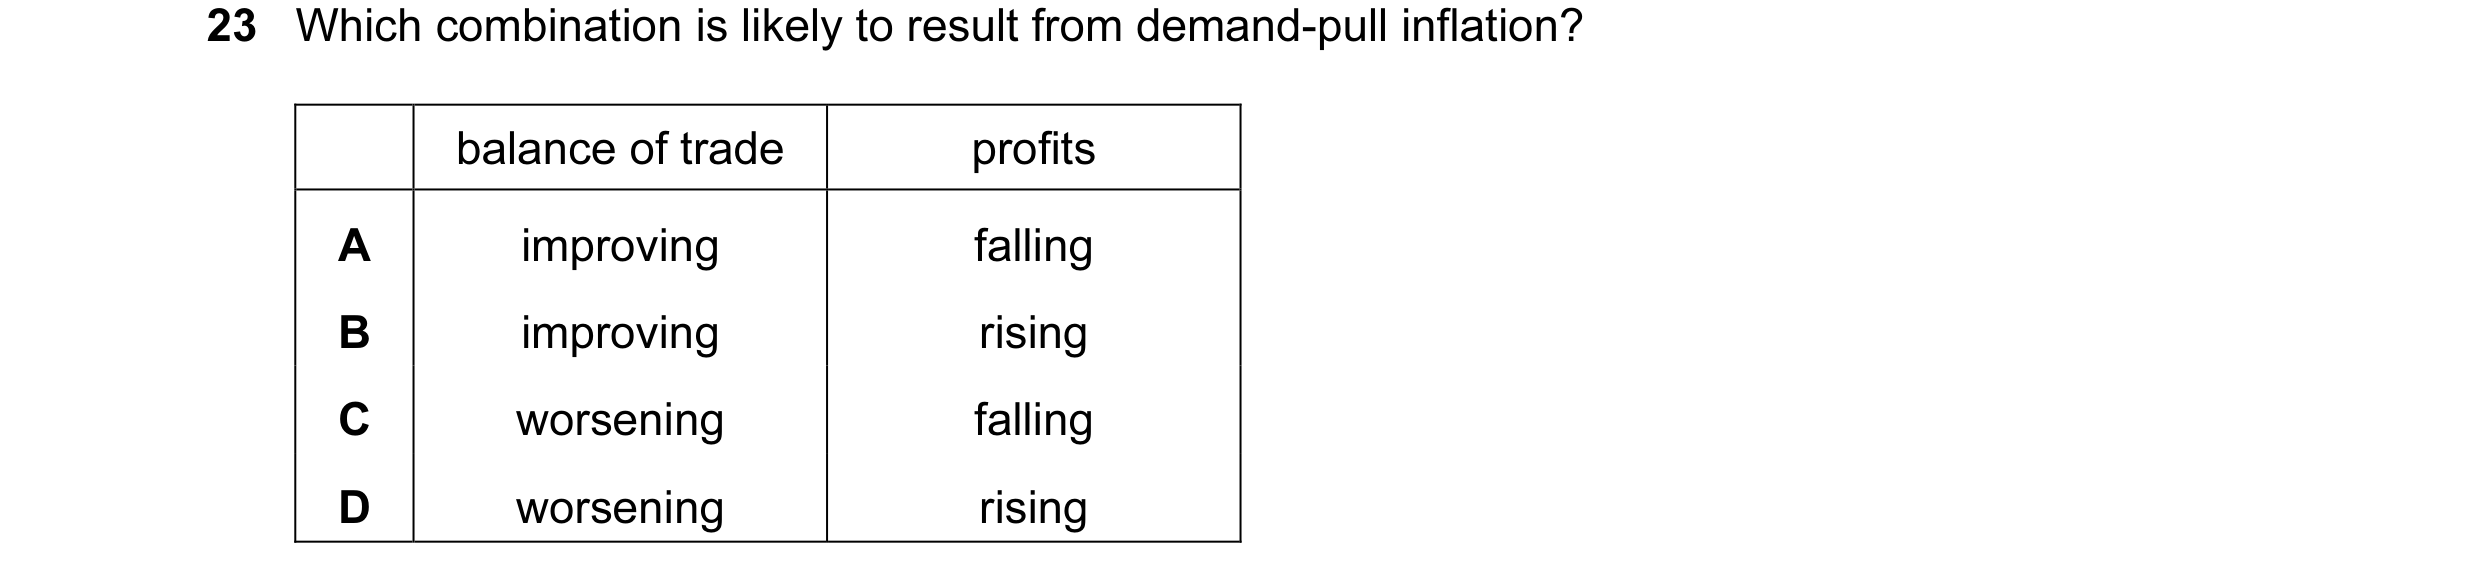
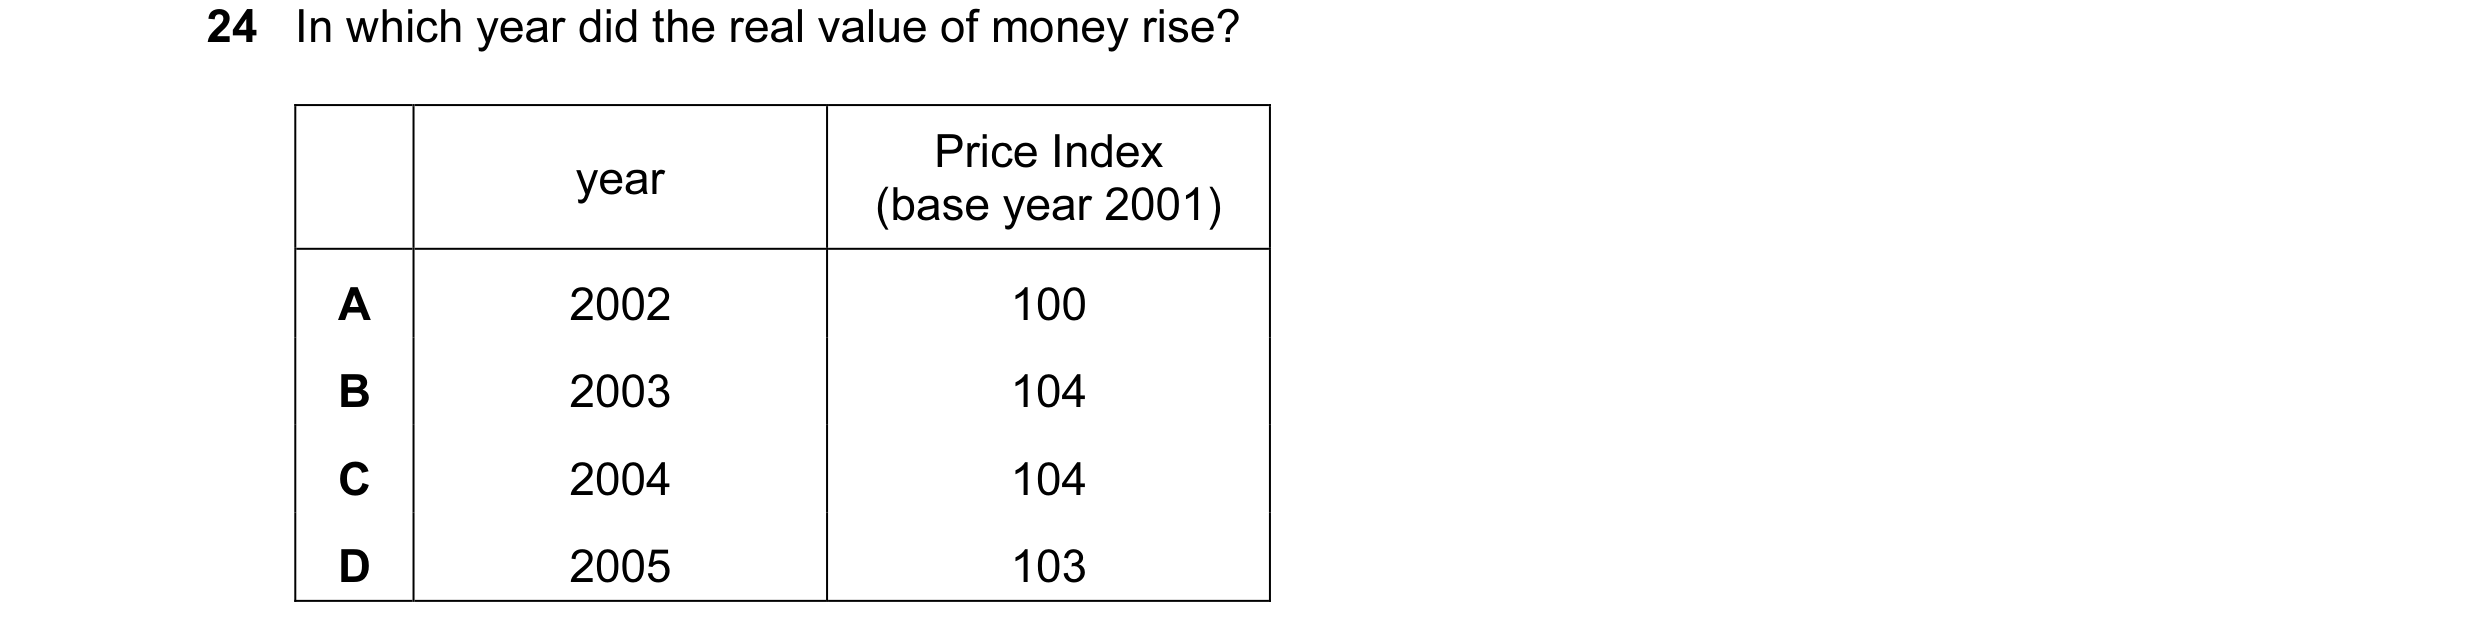 19 / 67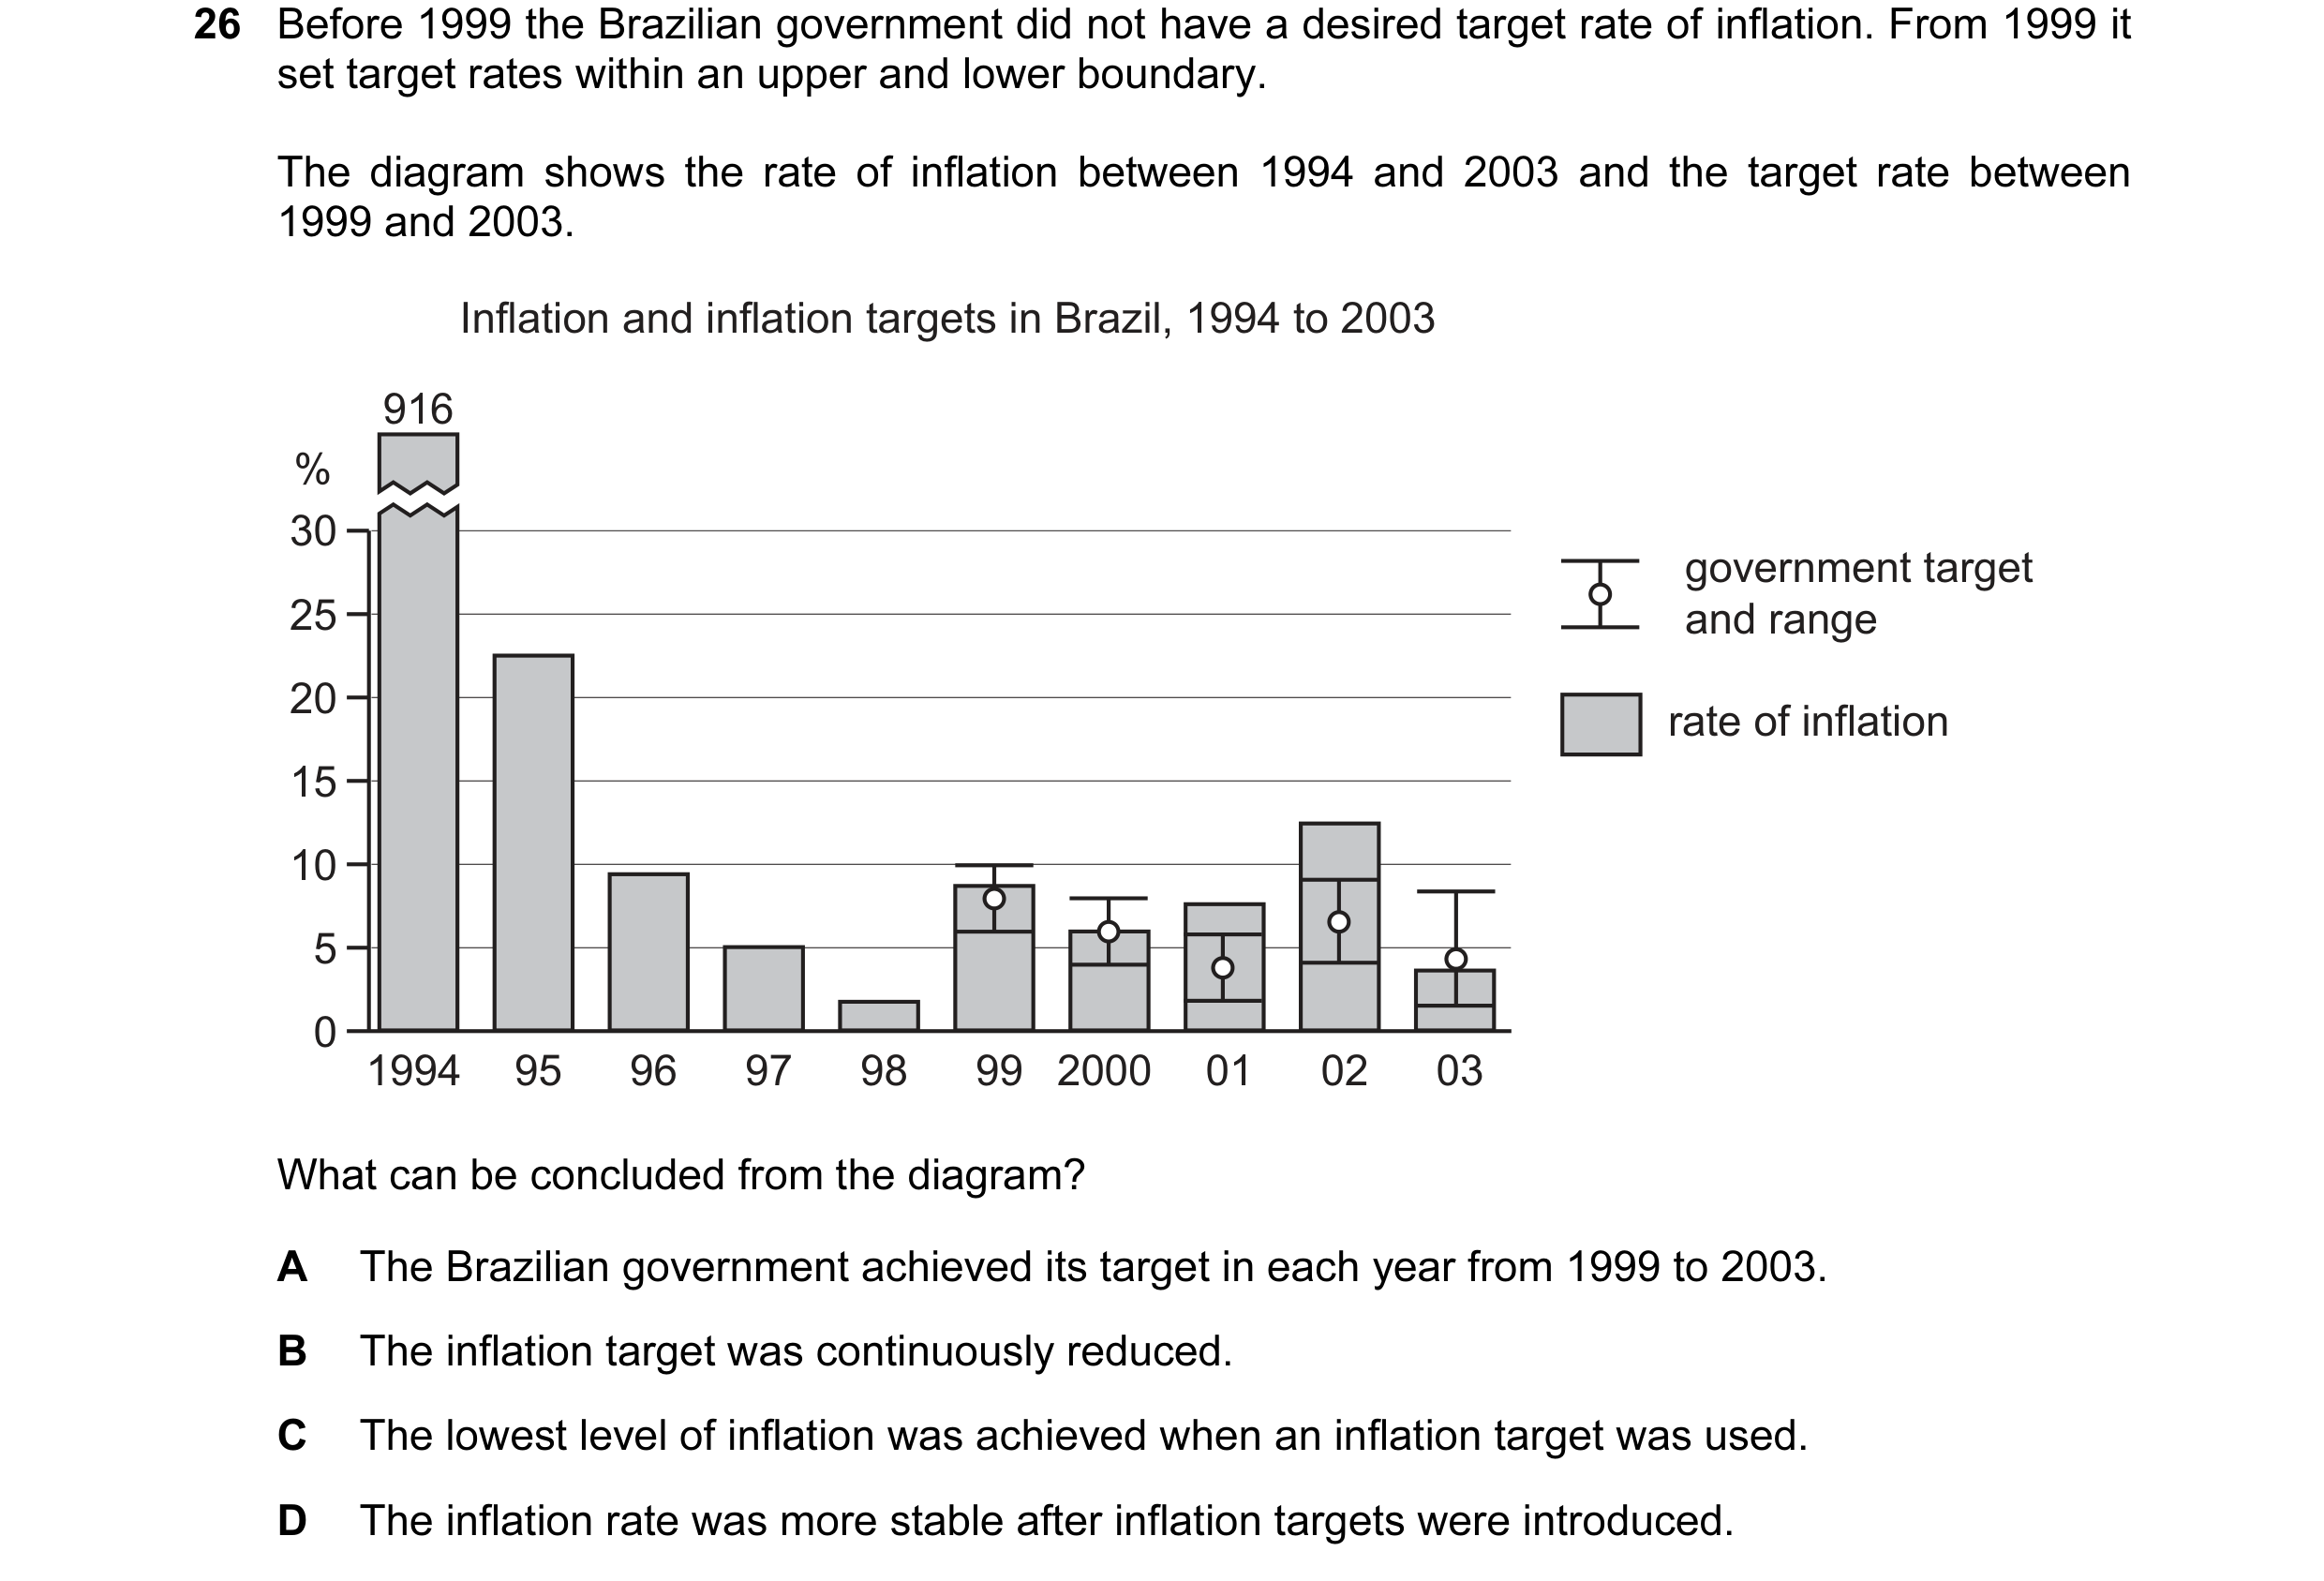
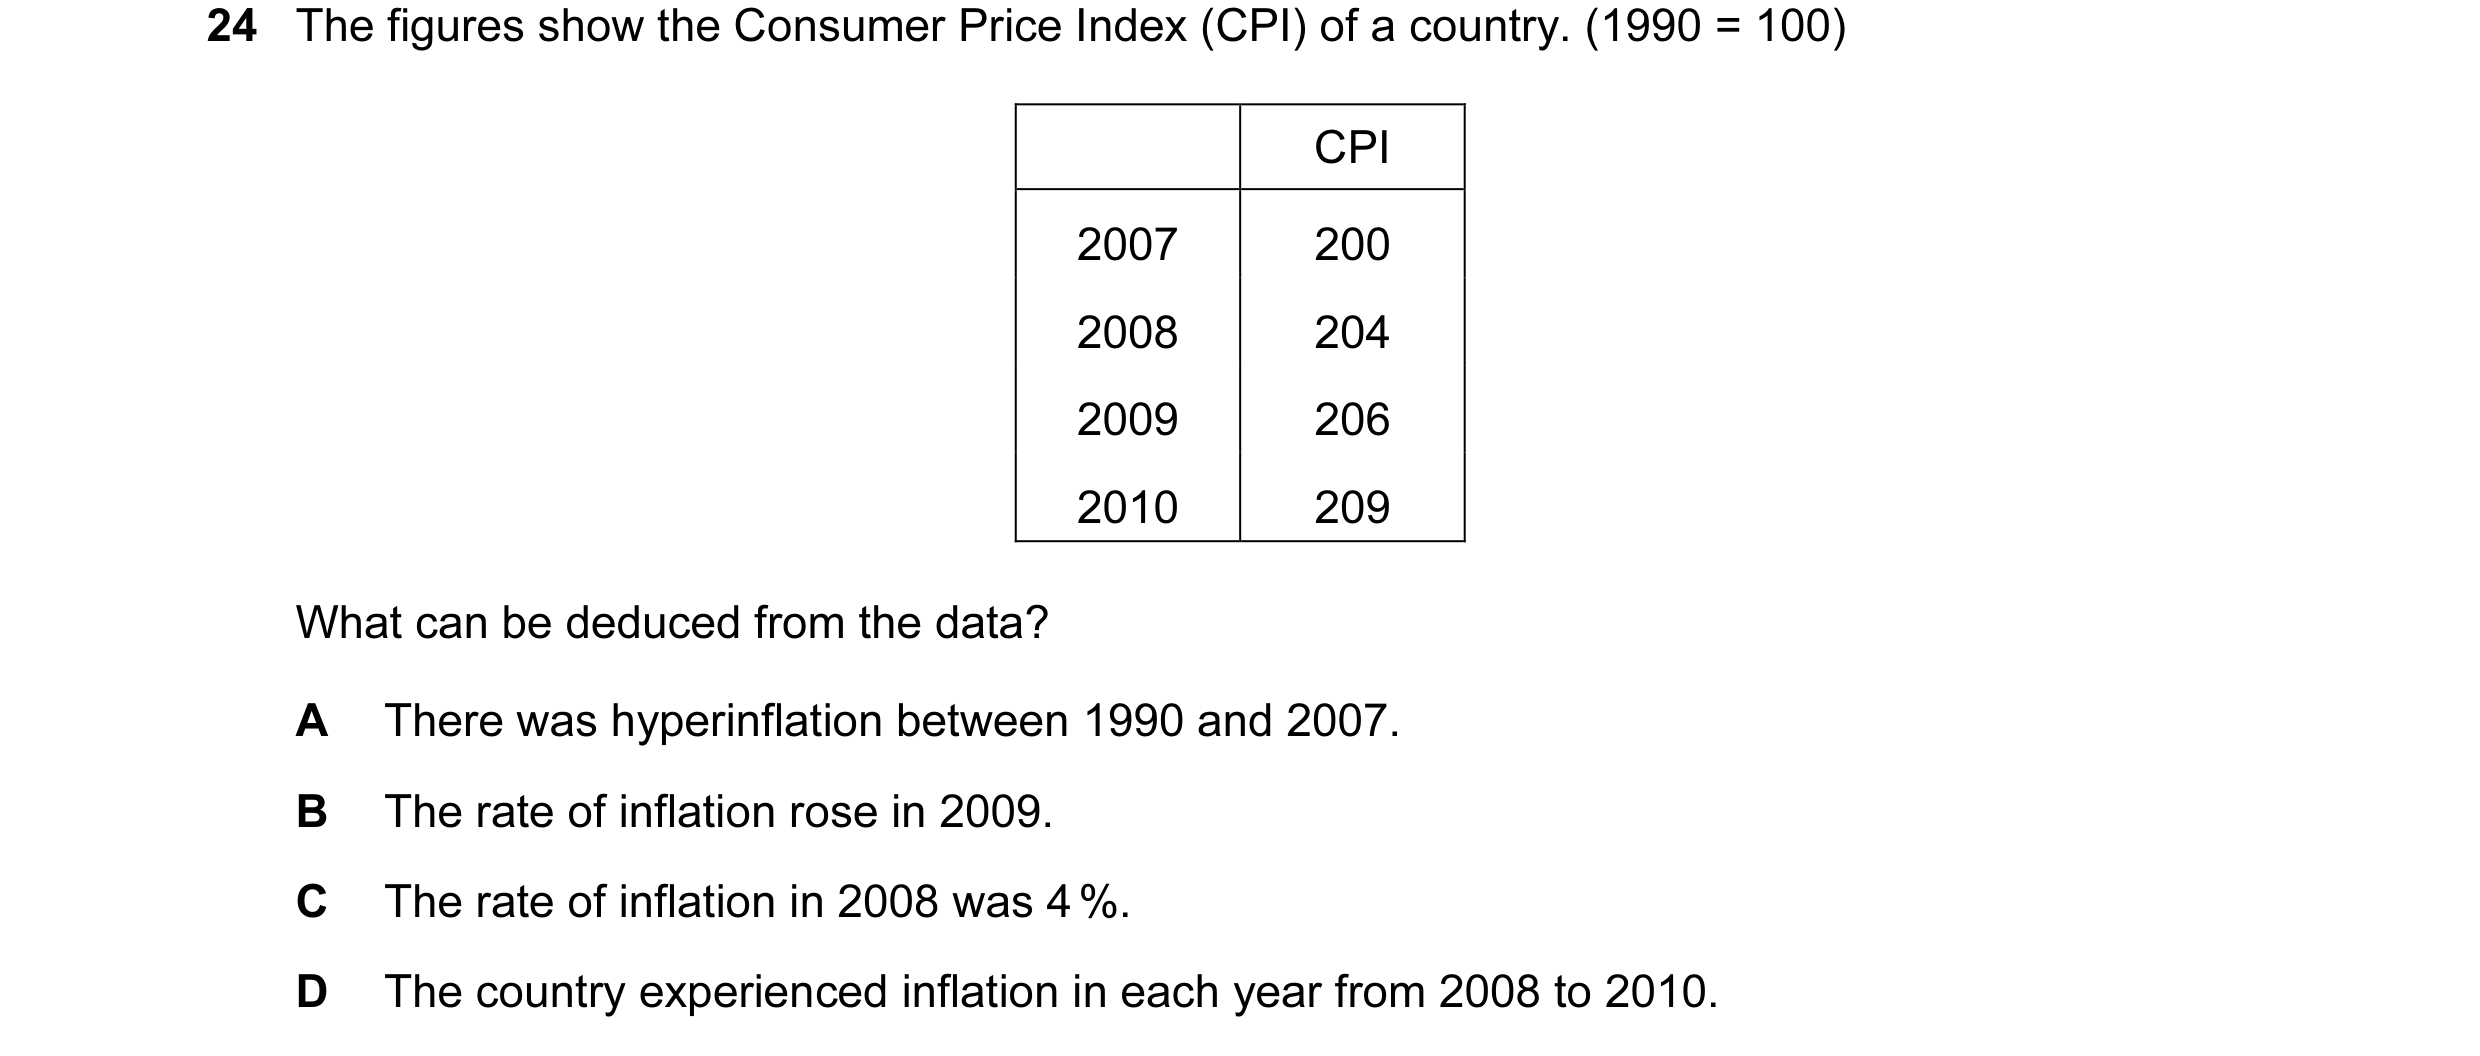
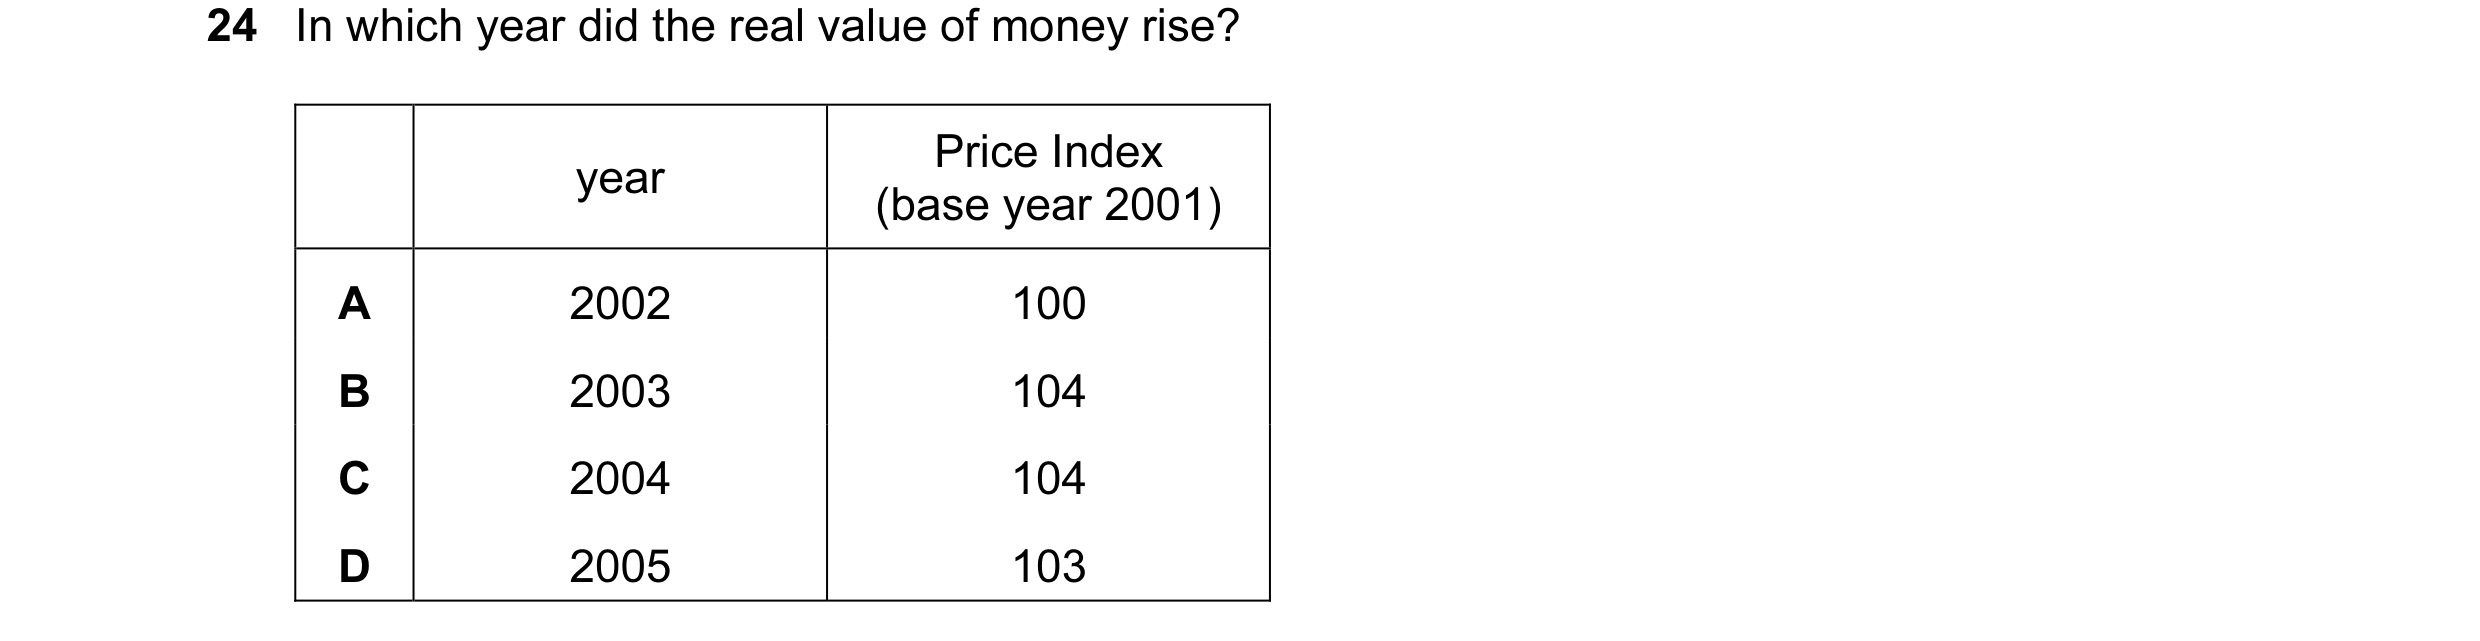 20 / 67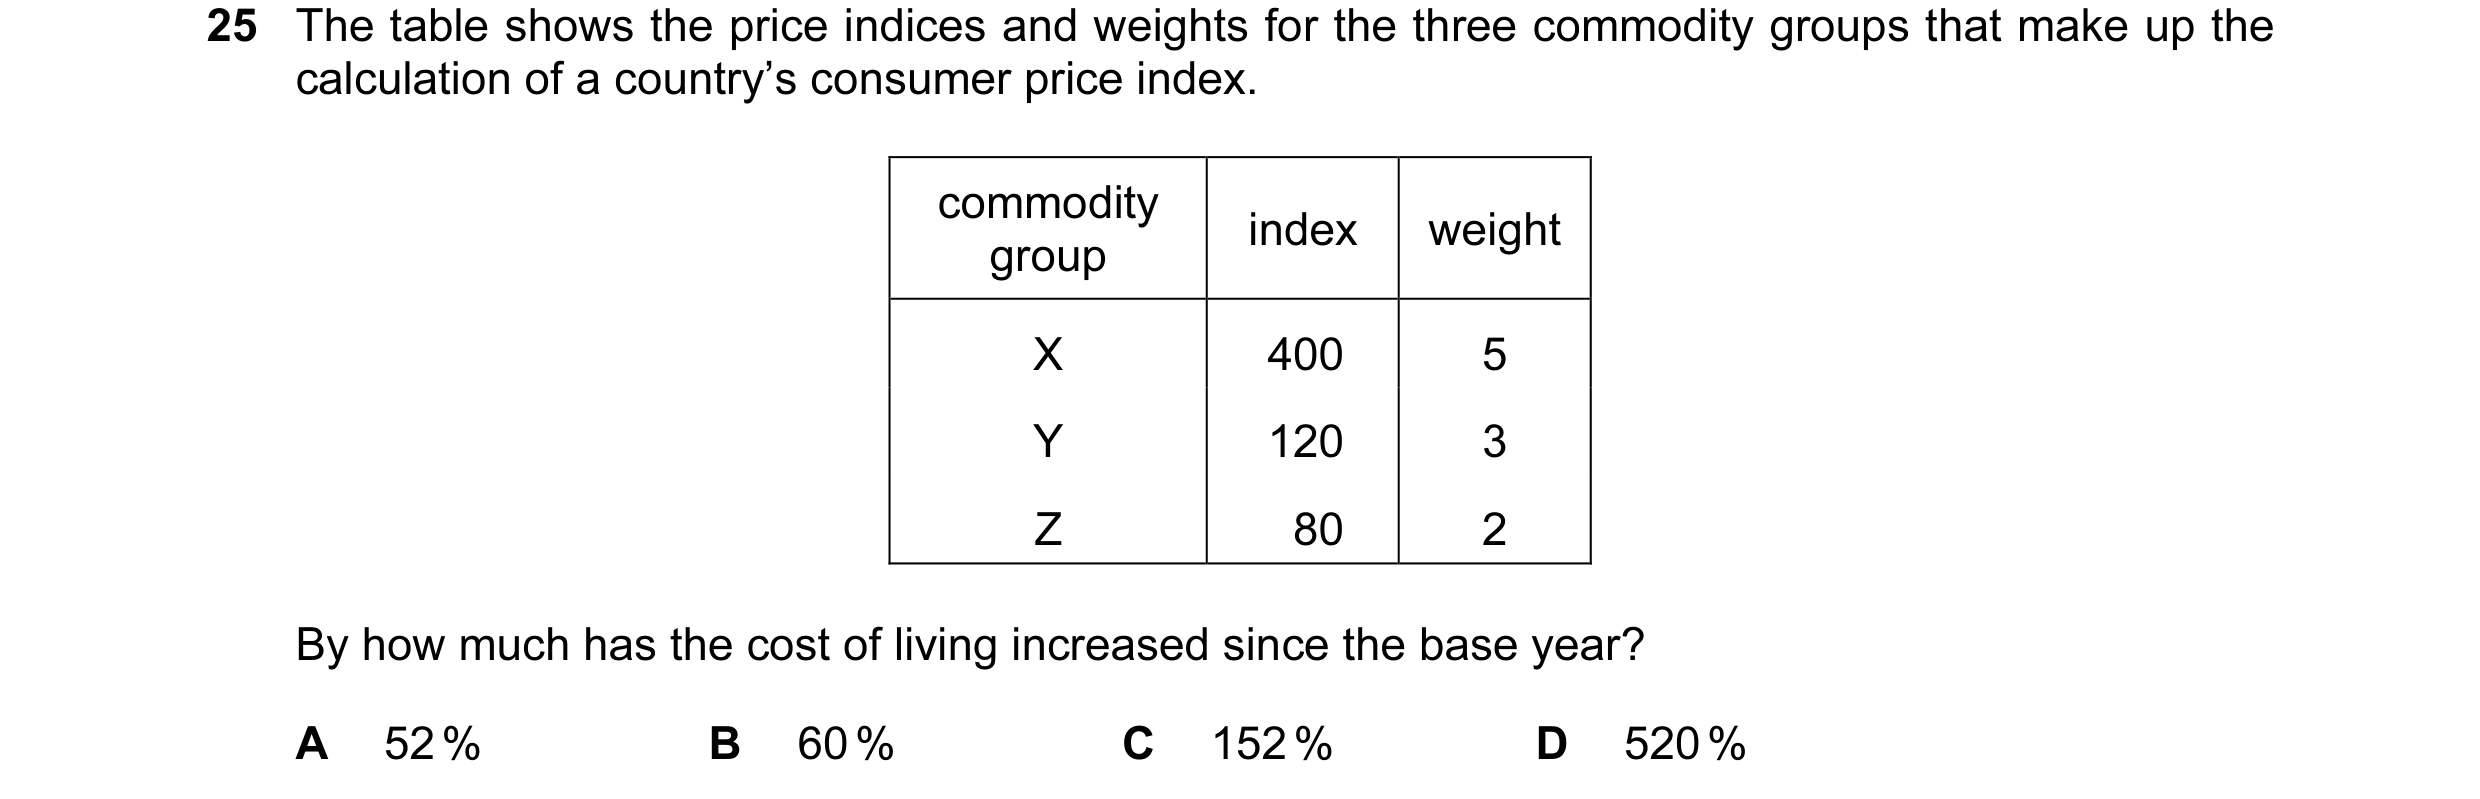
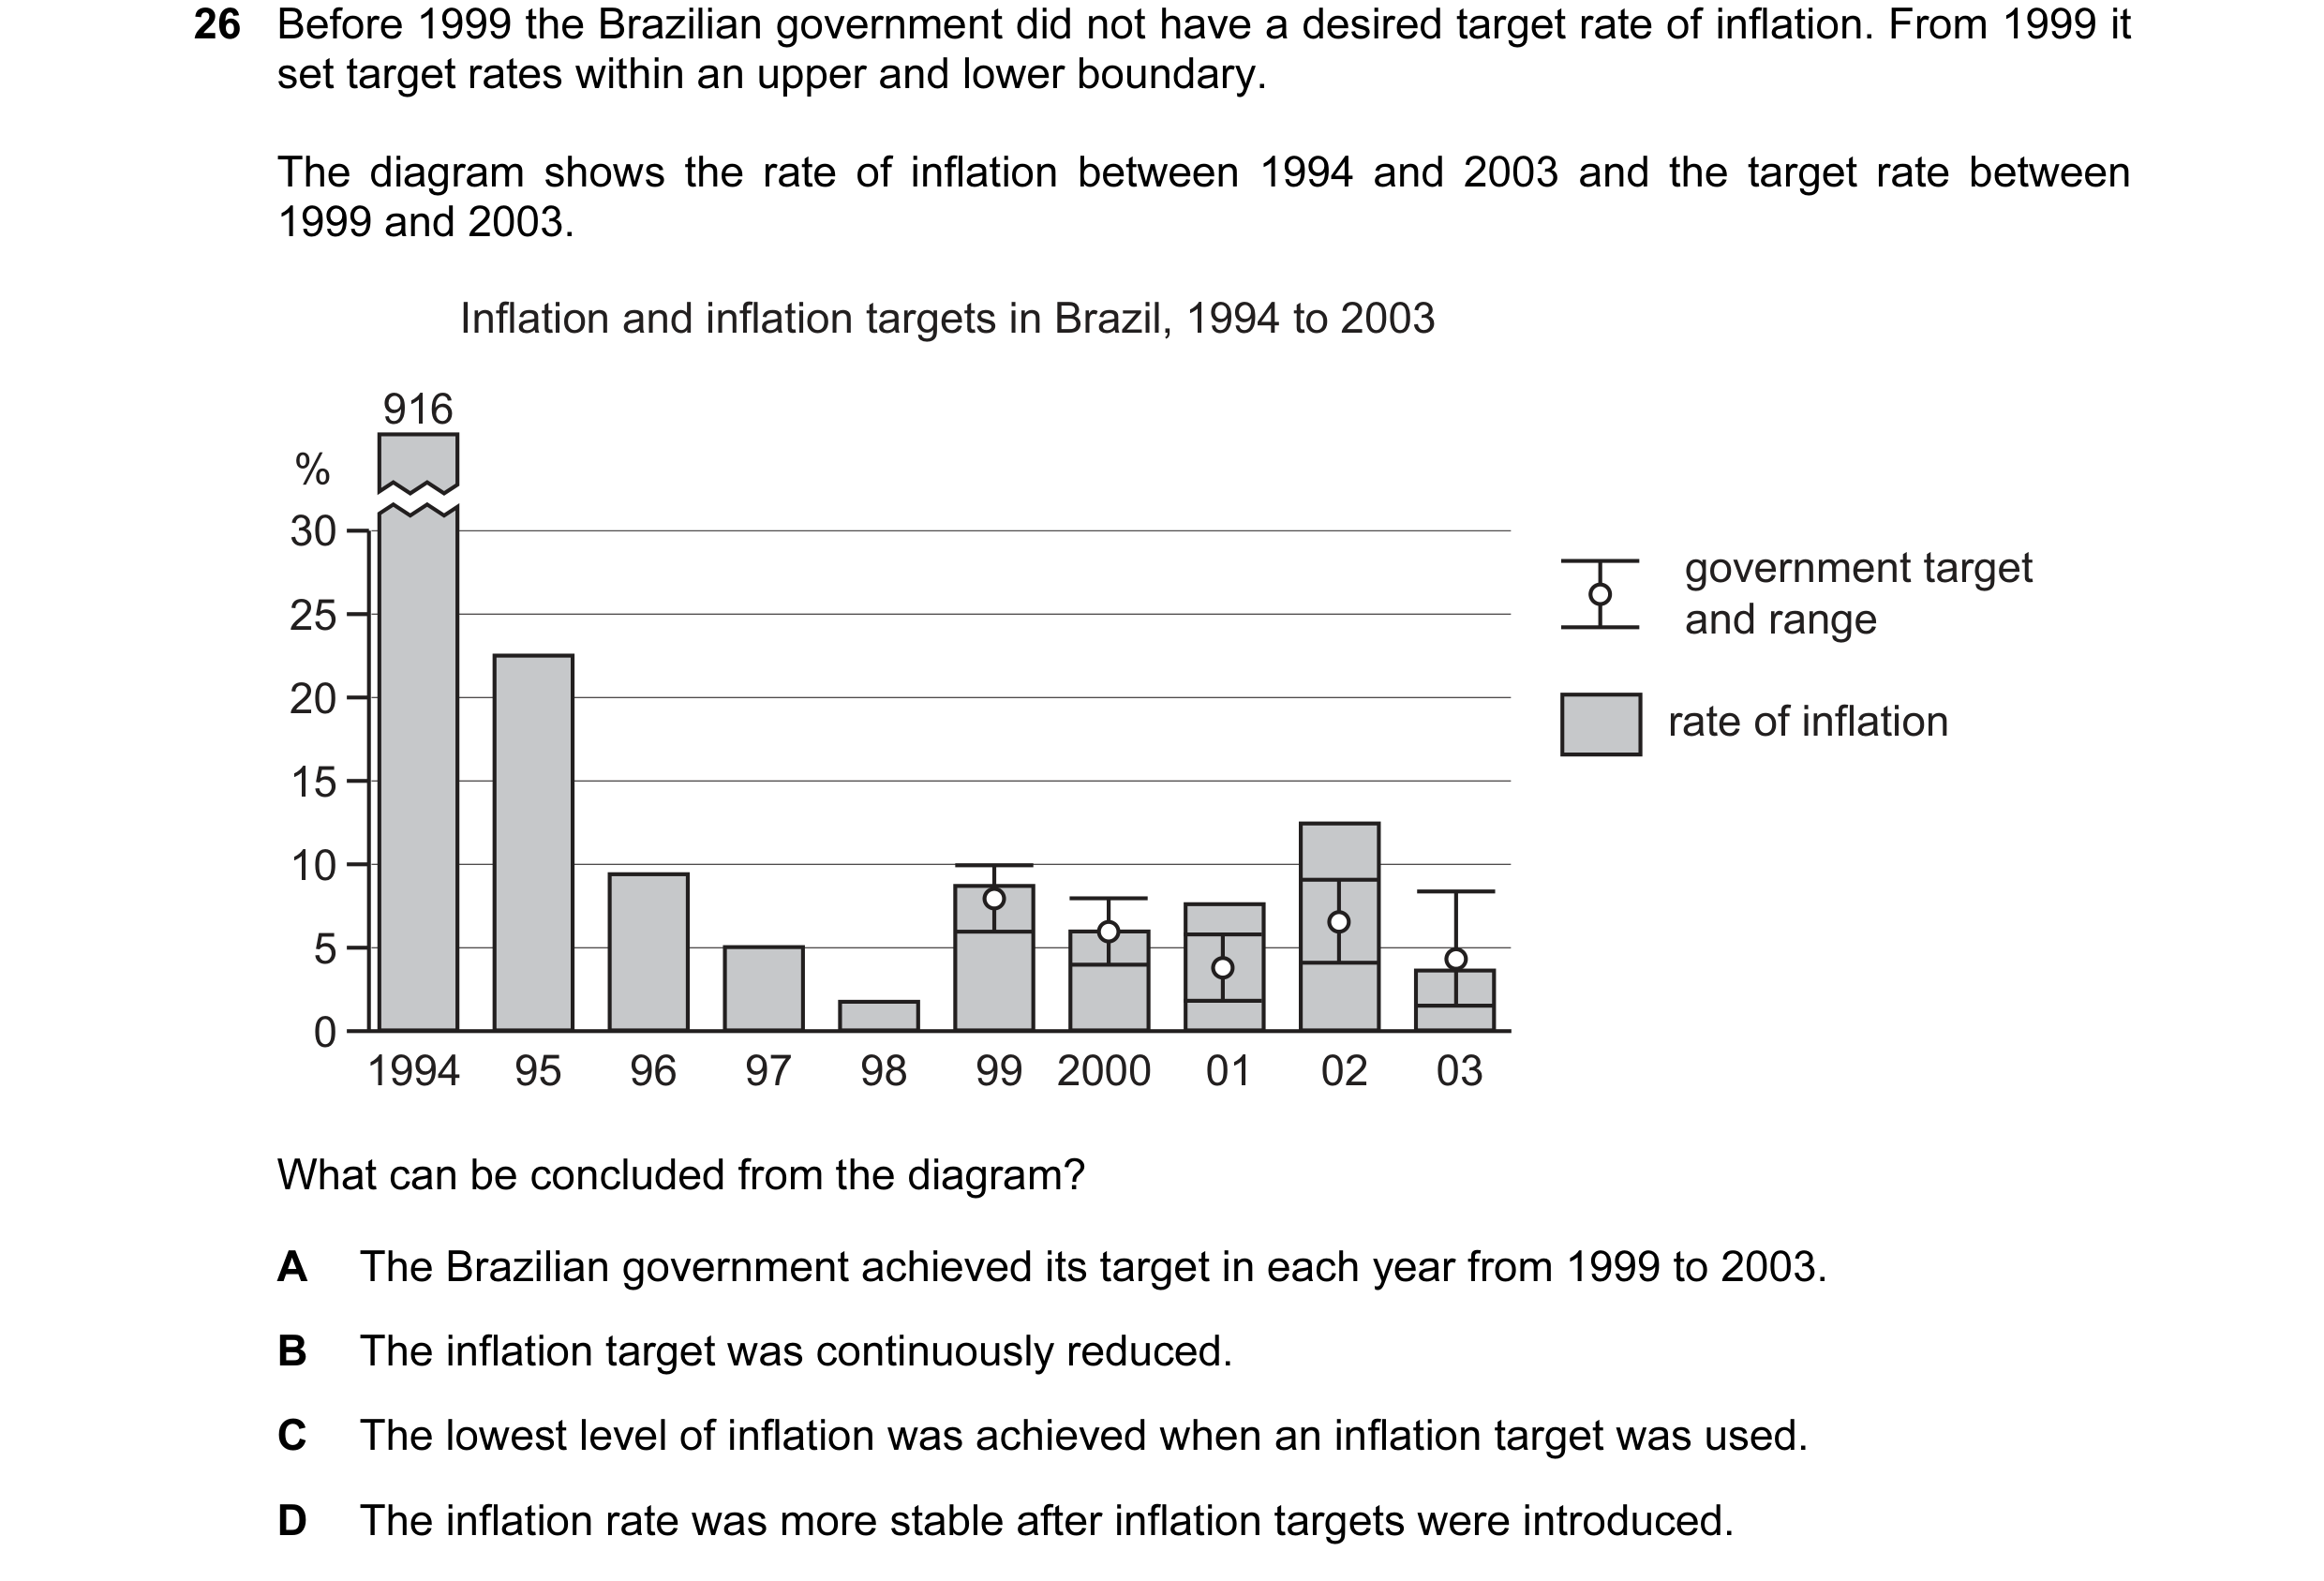
 21 / 67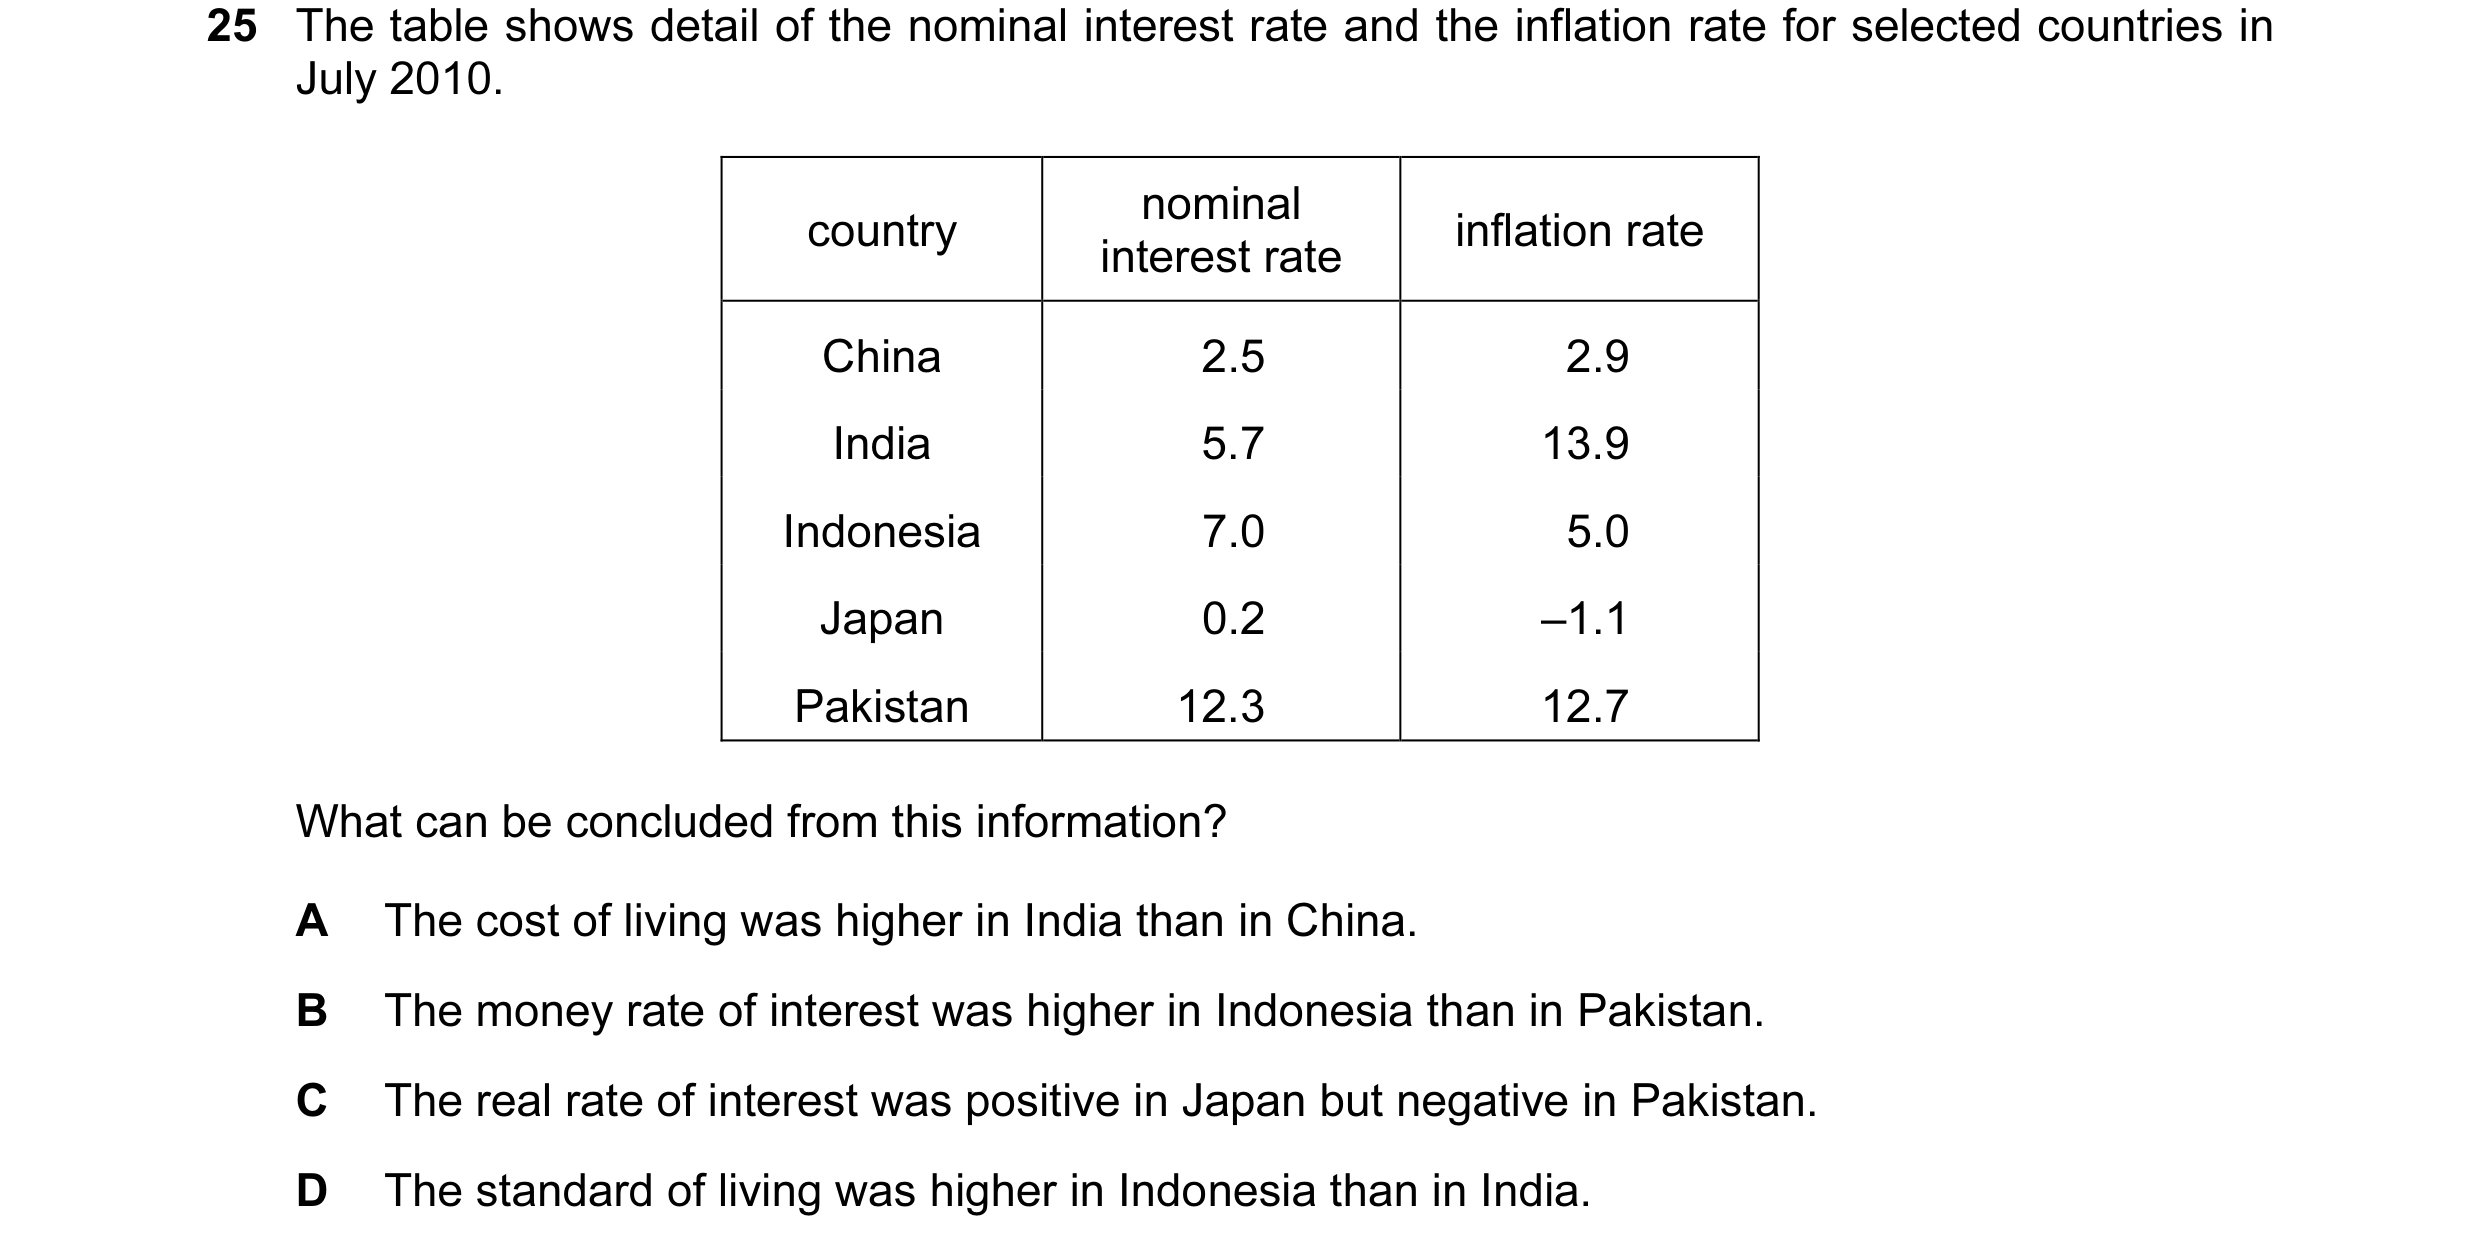
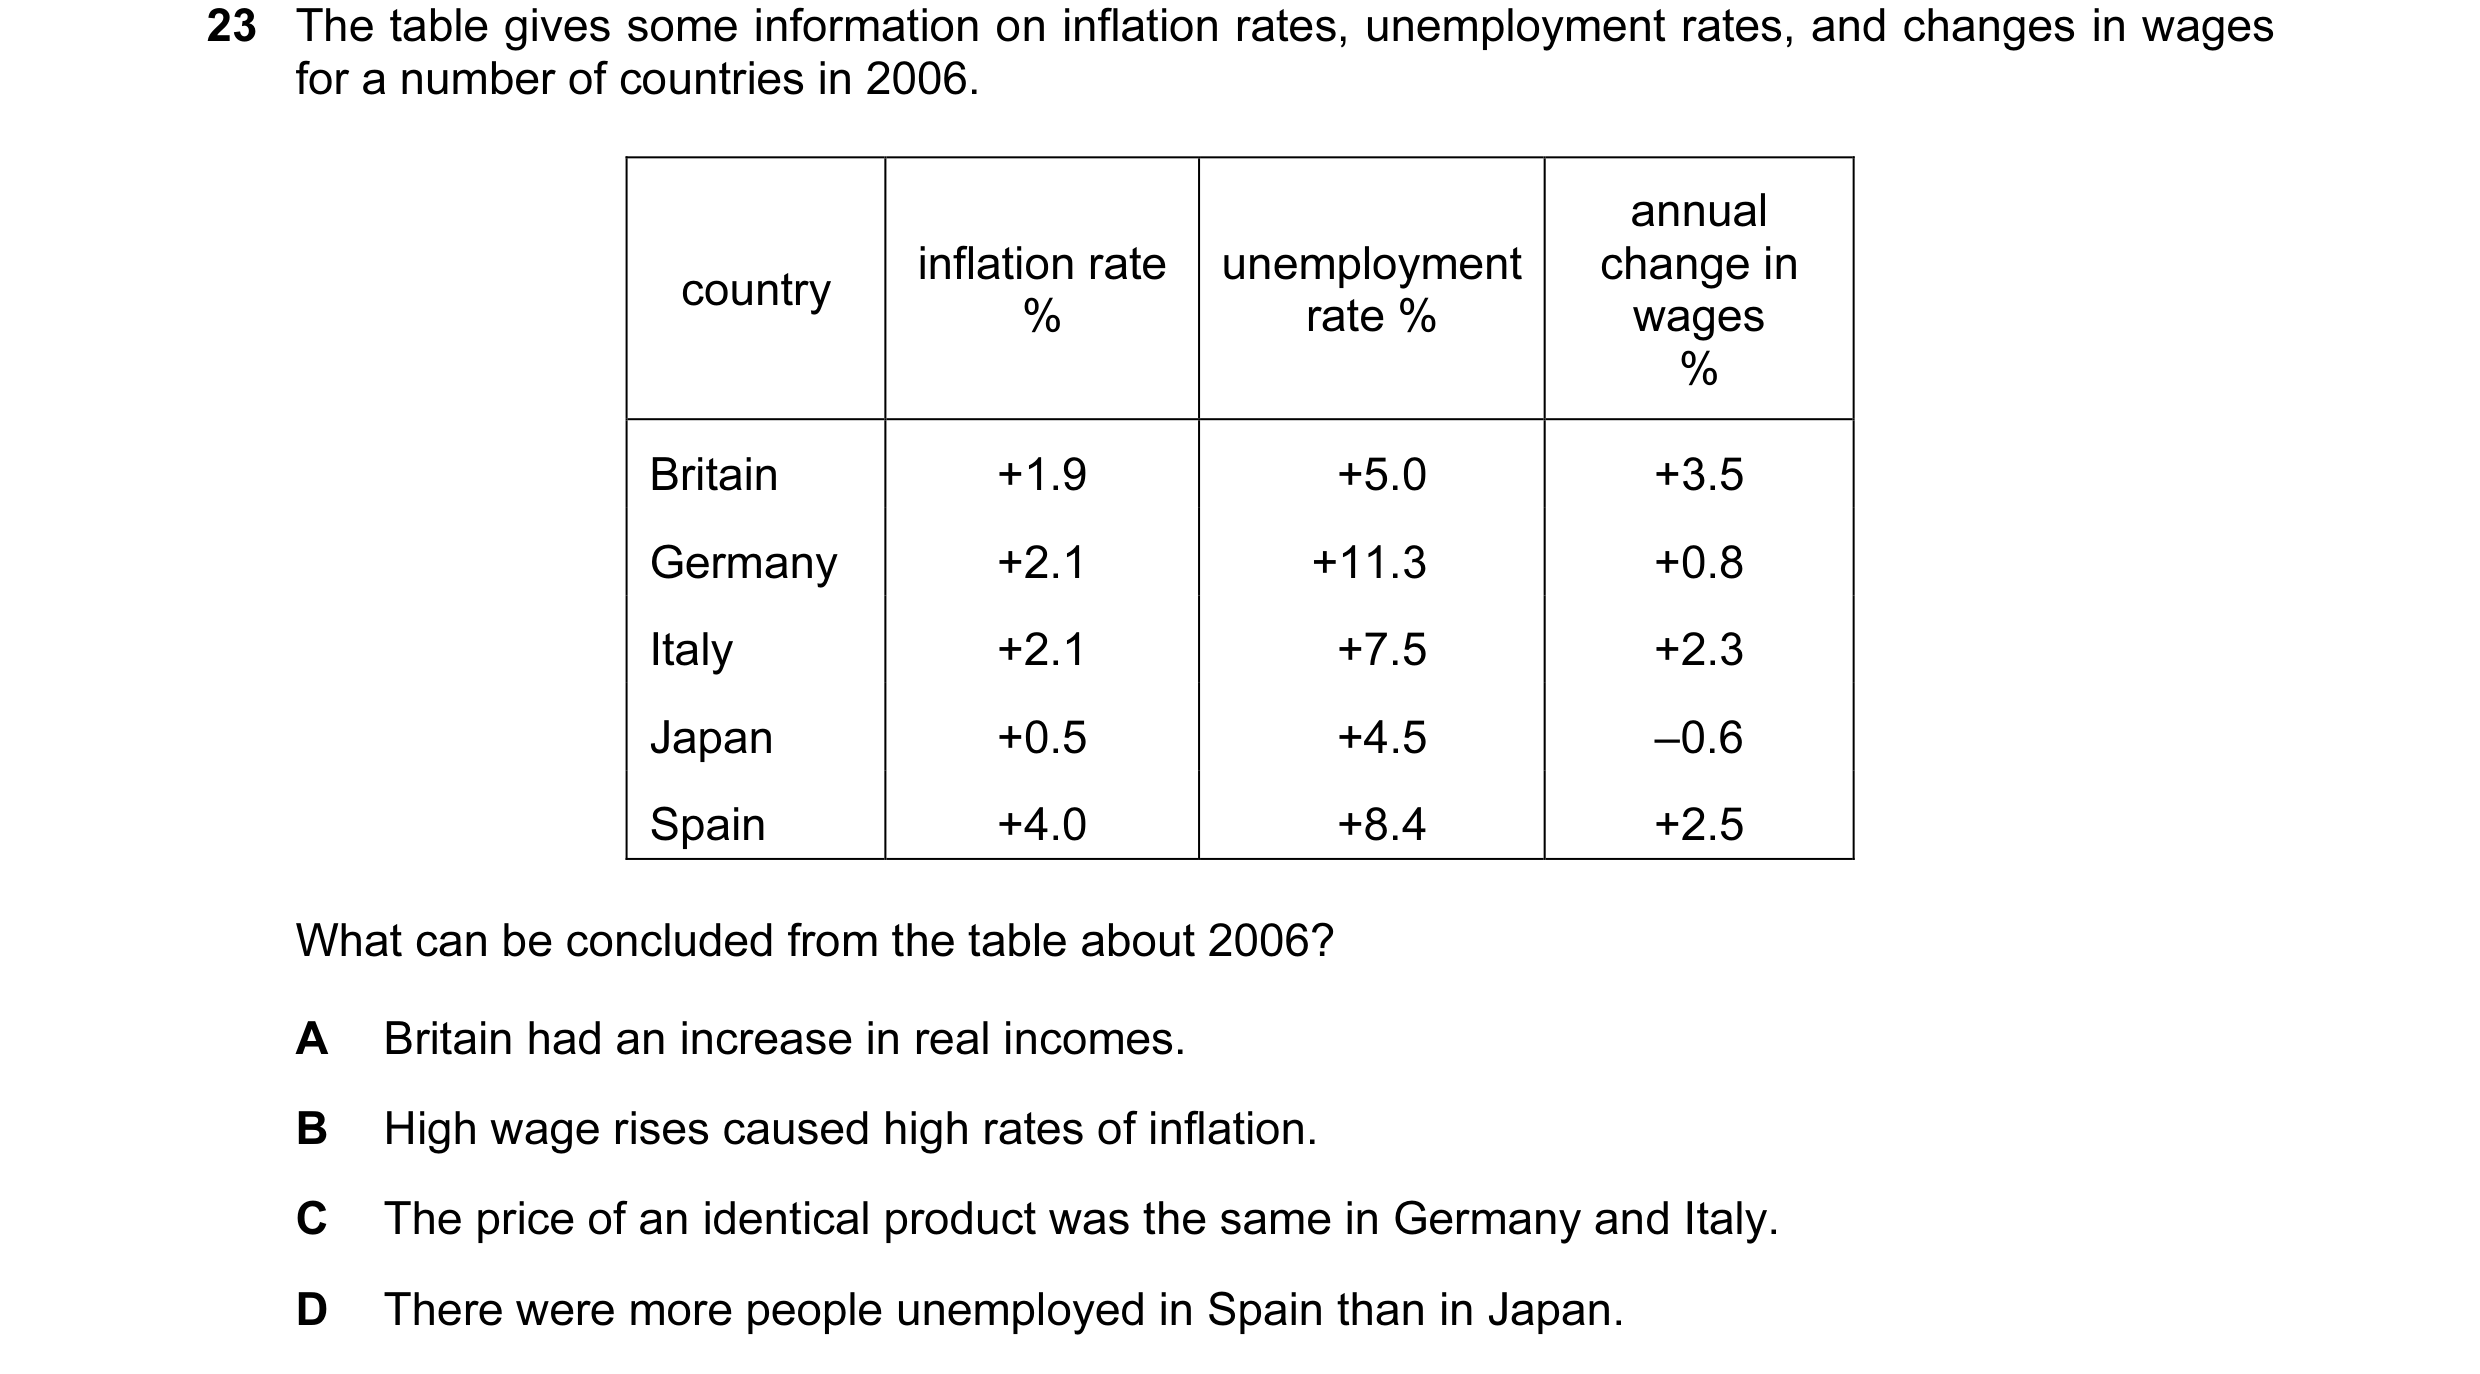 22 / 67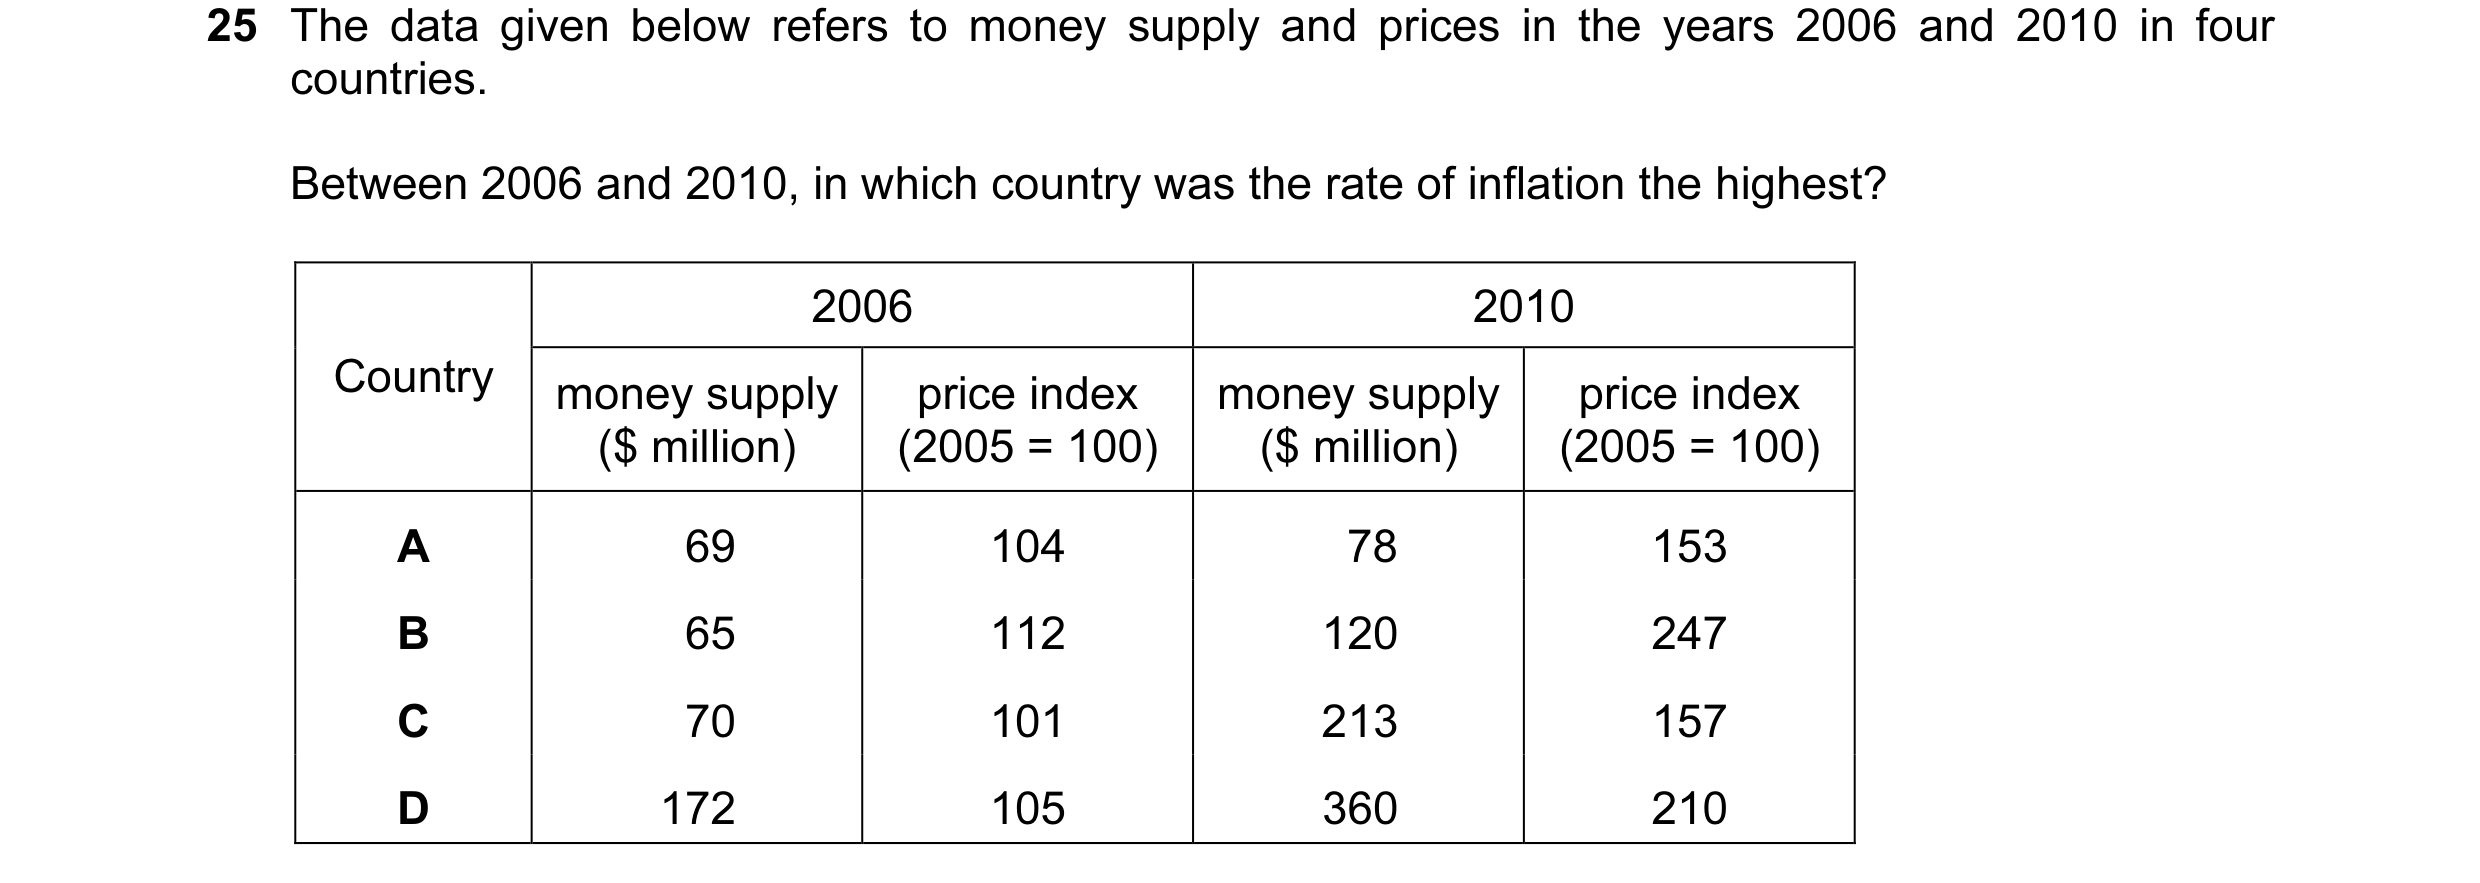
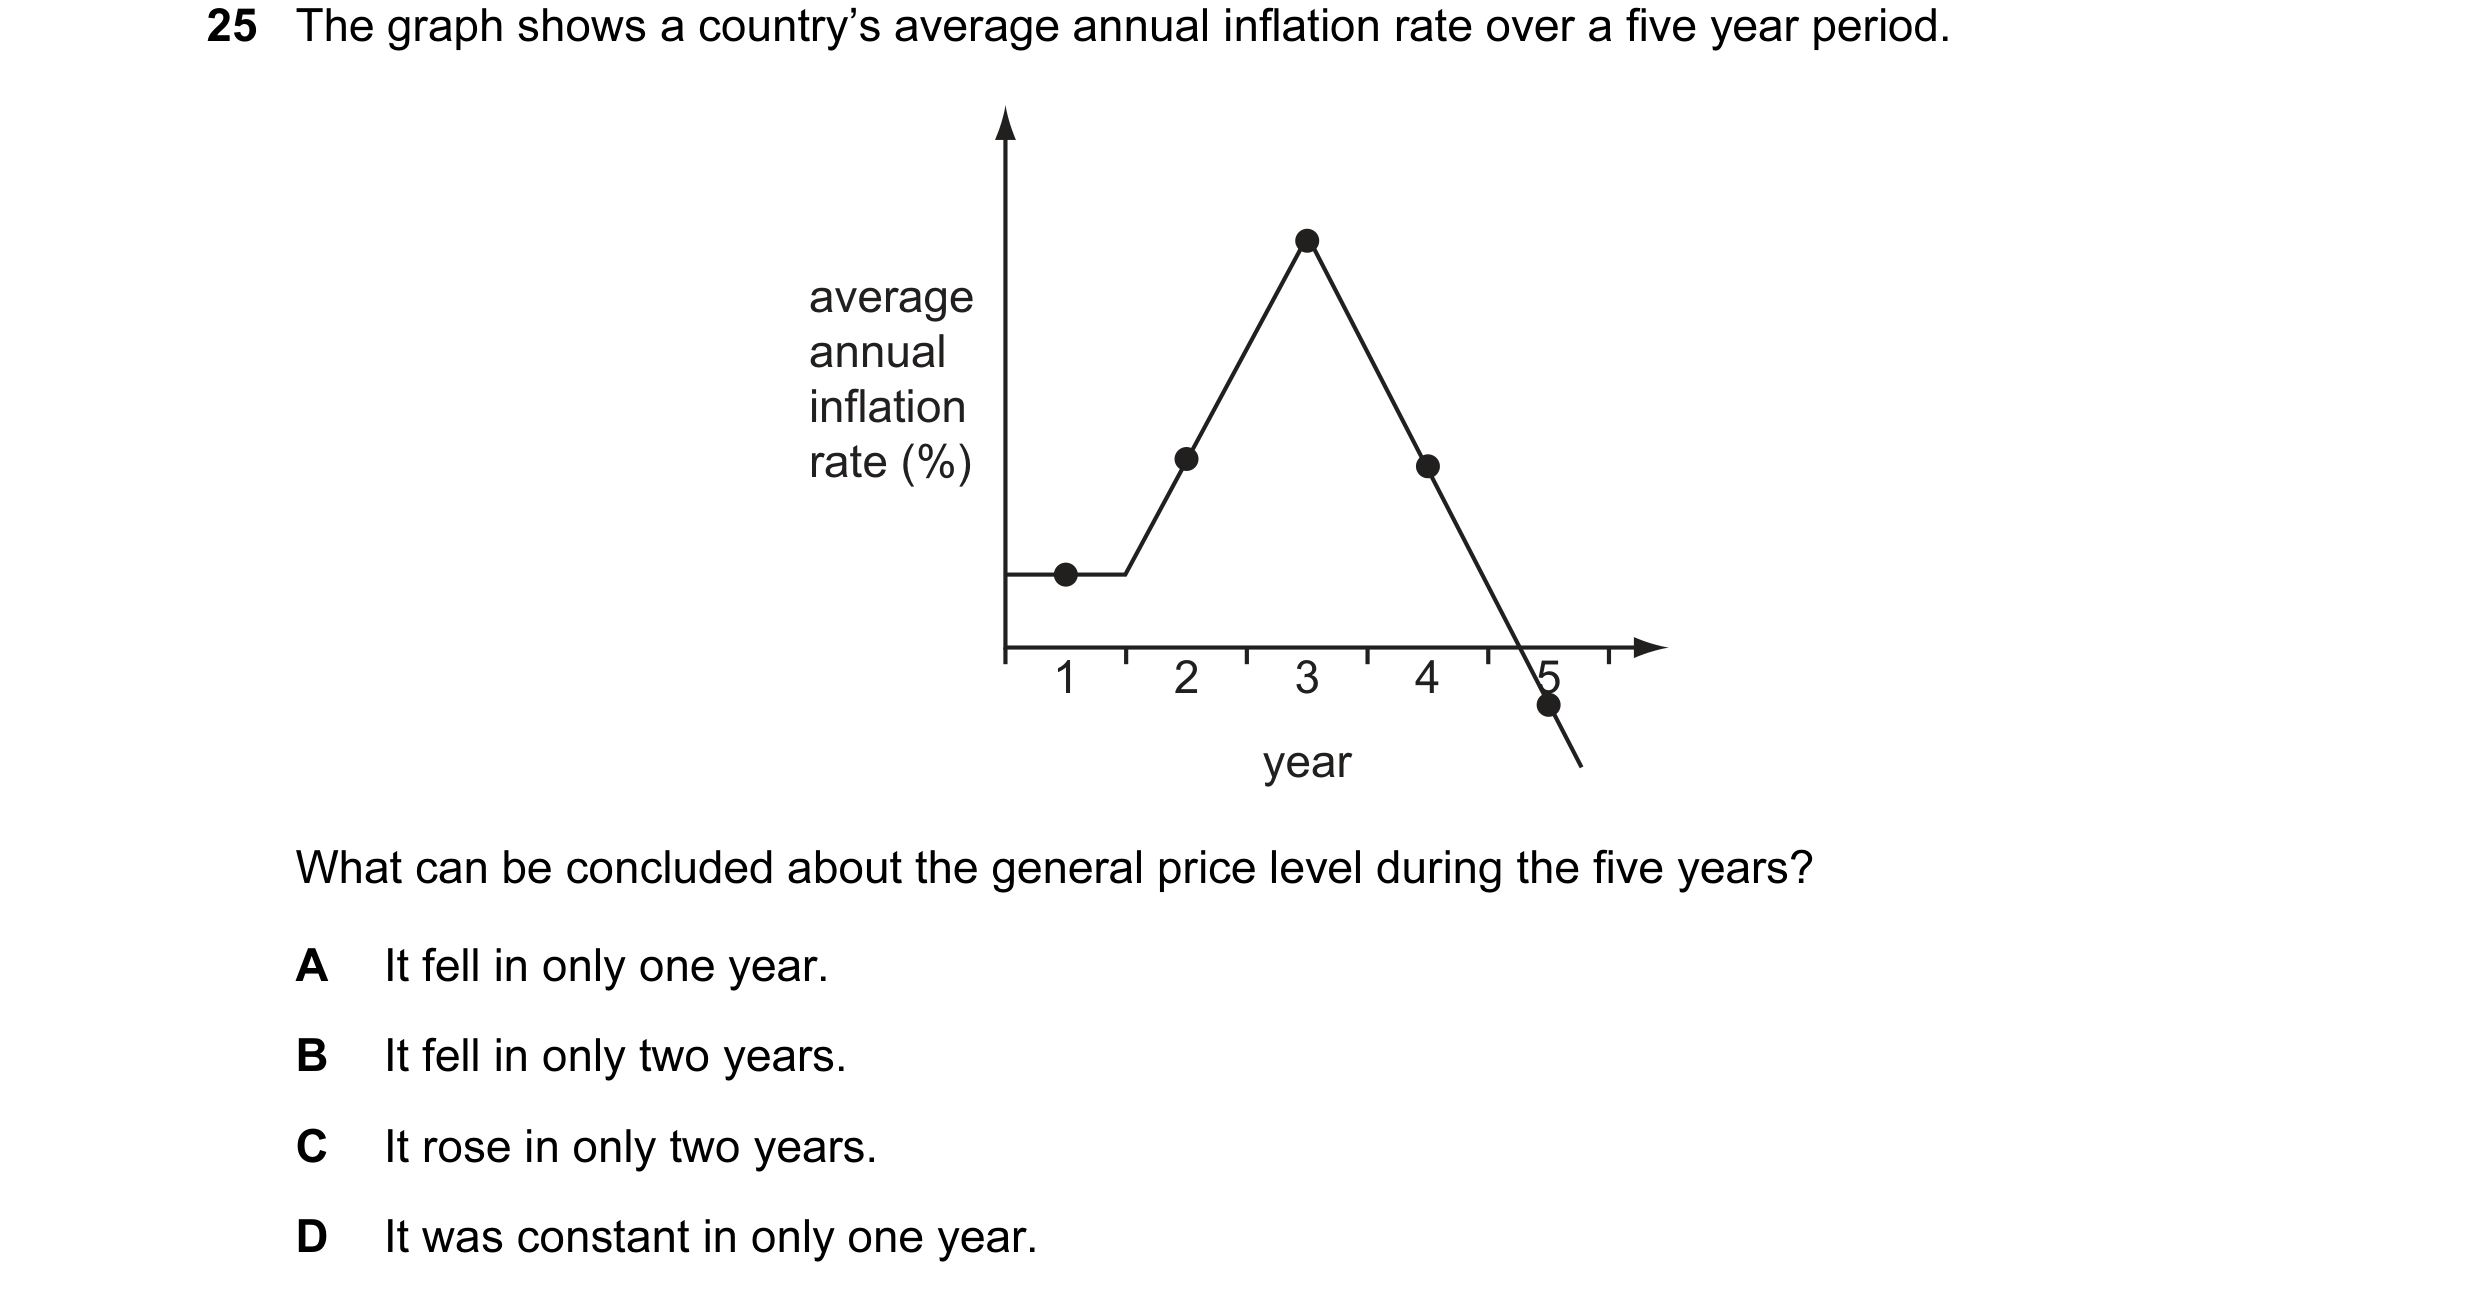 23 / 67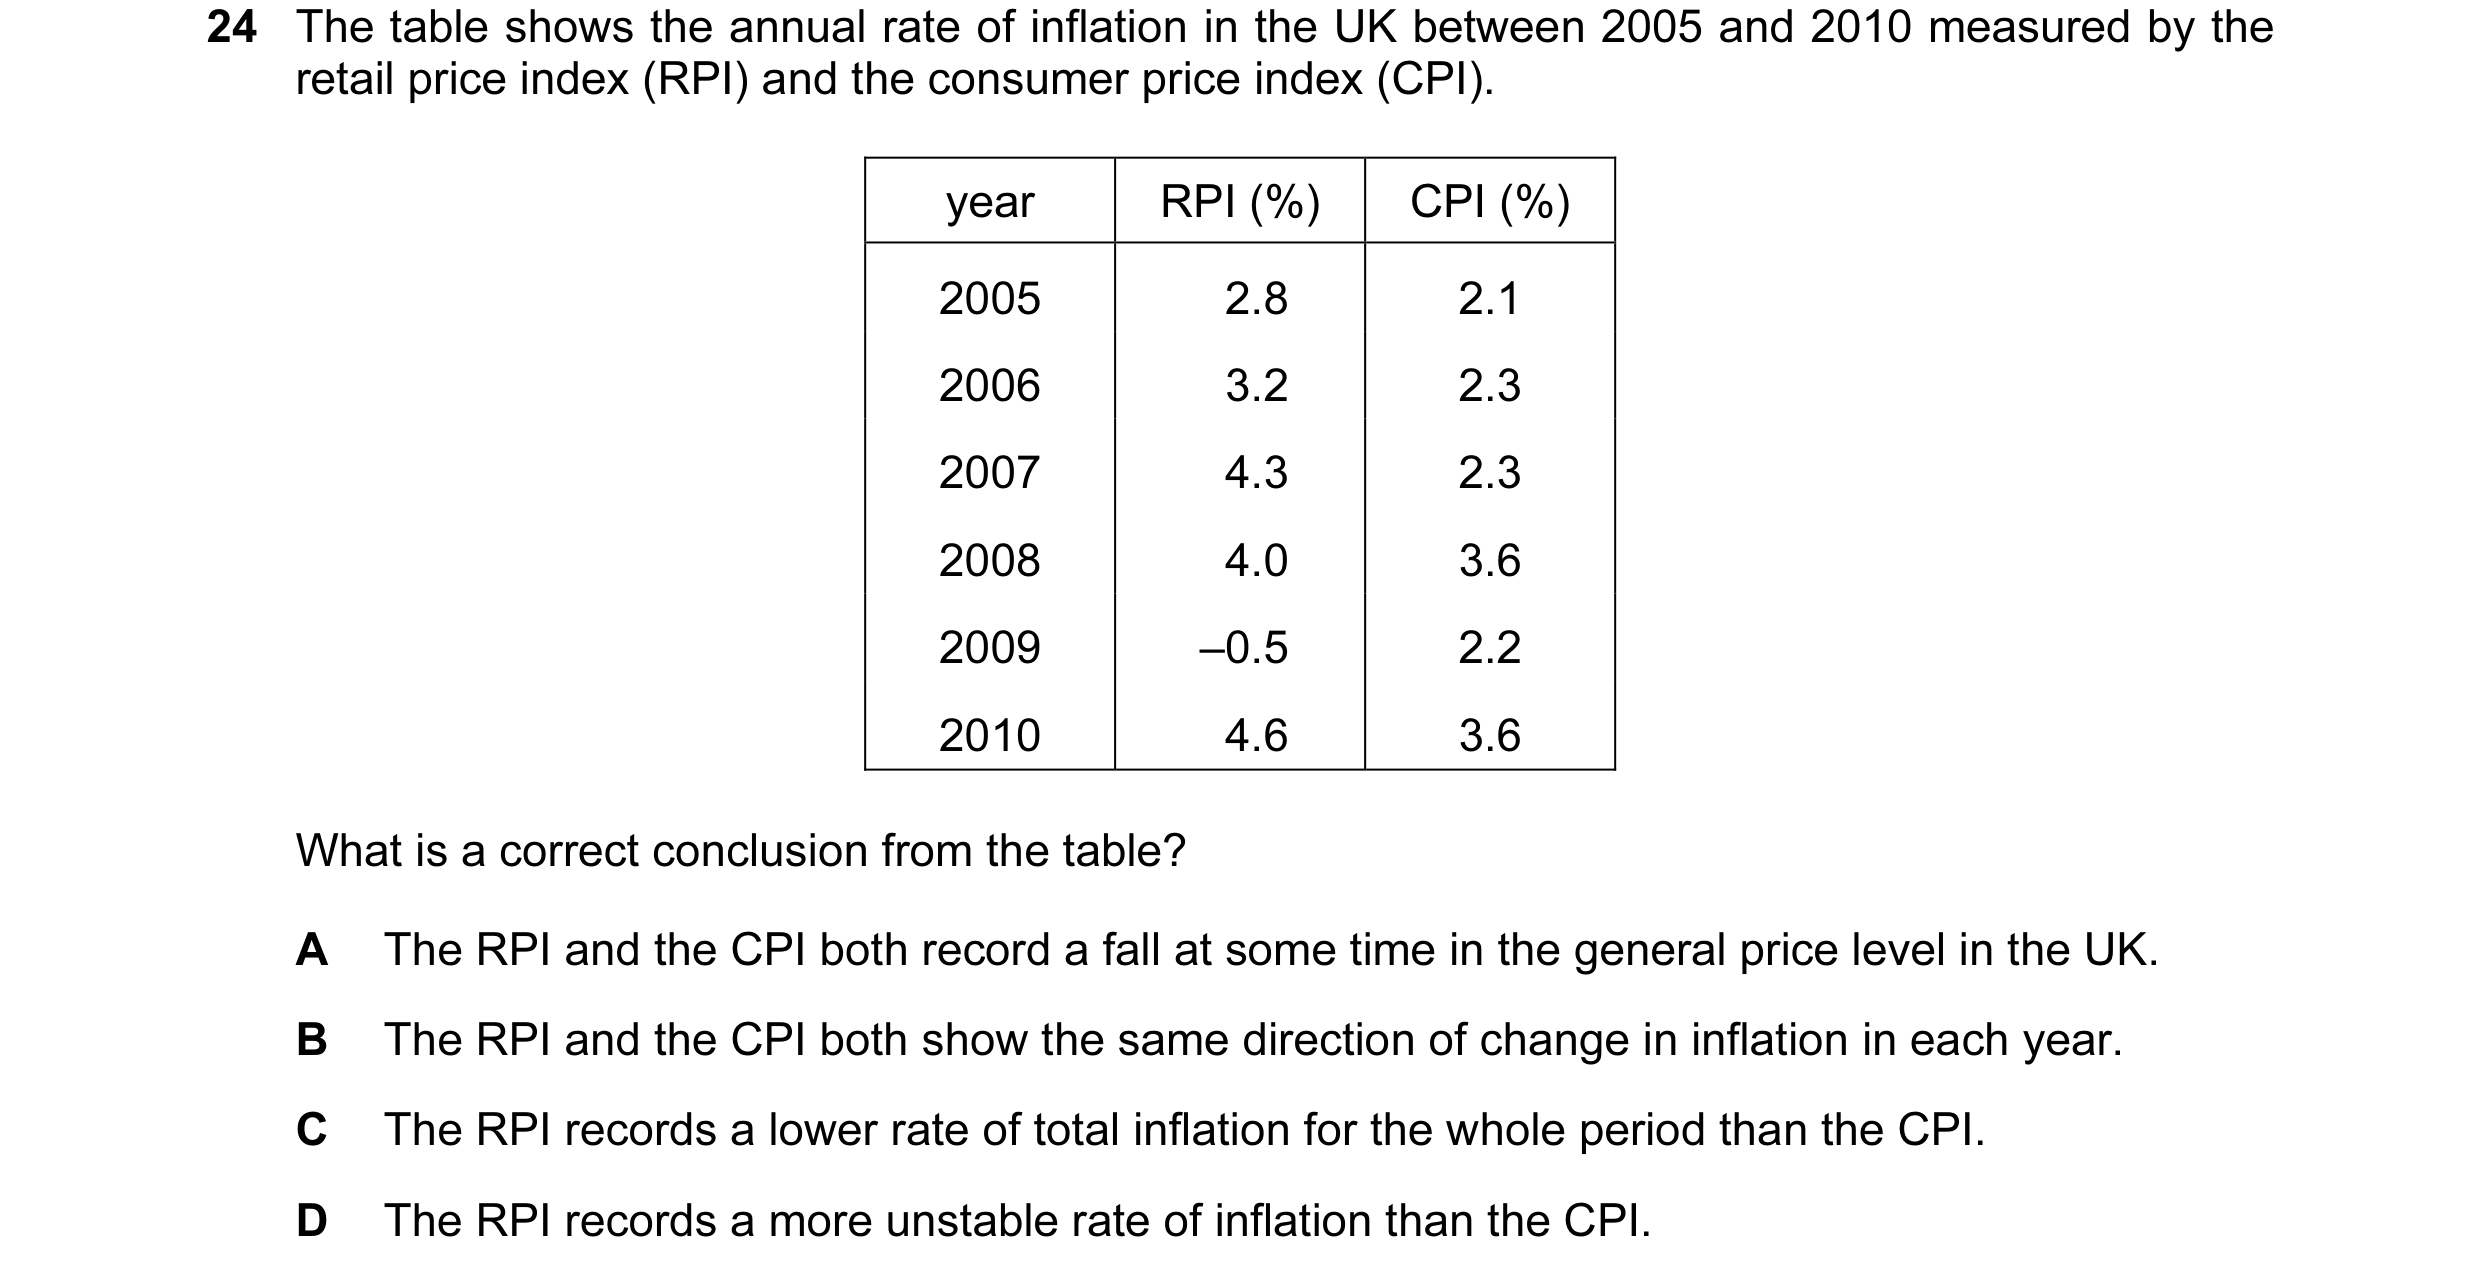
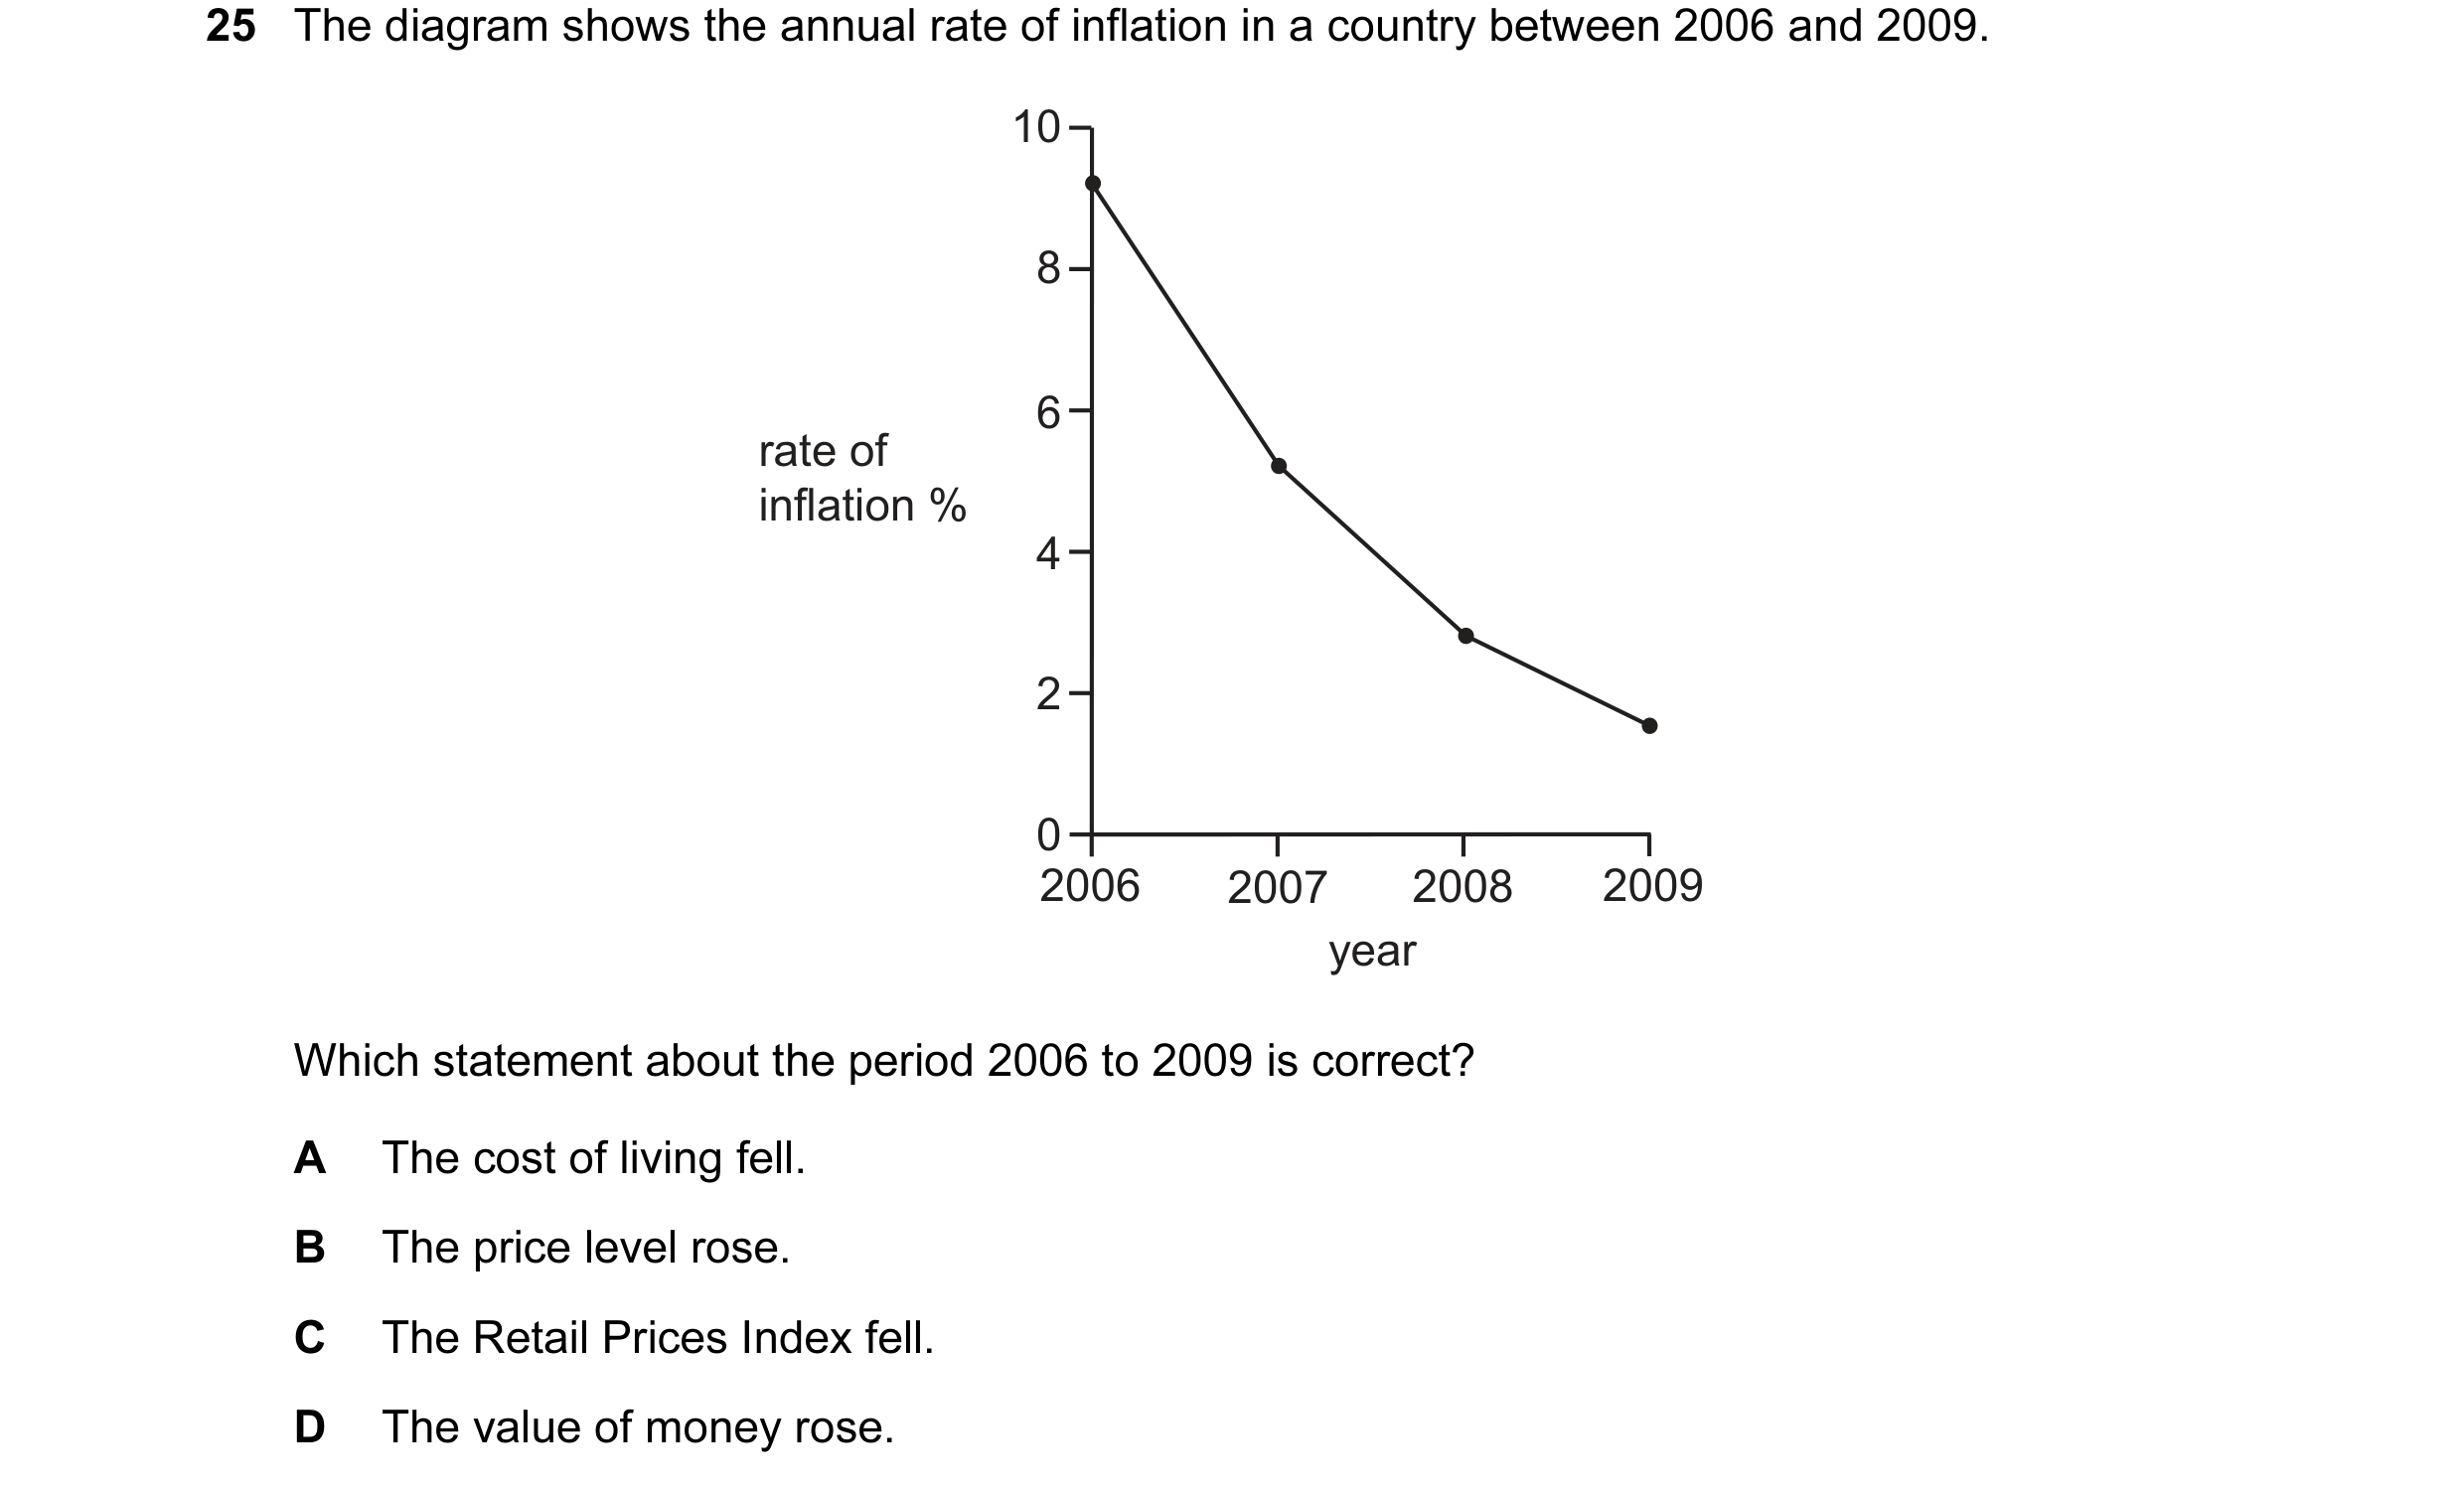 24 / 67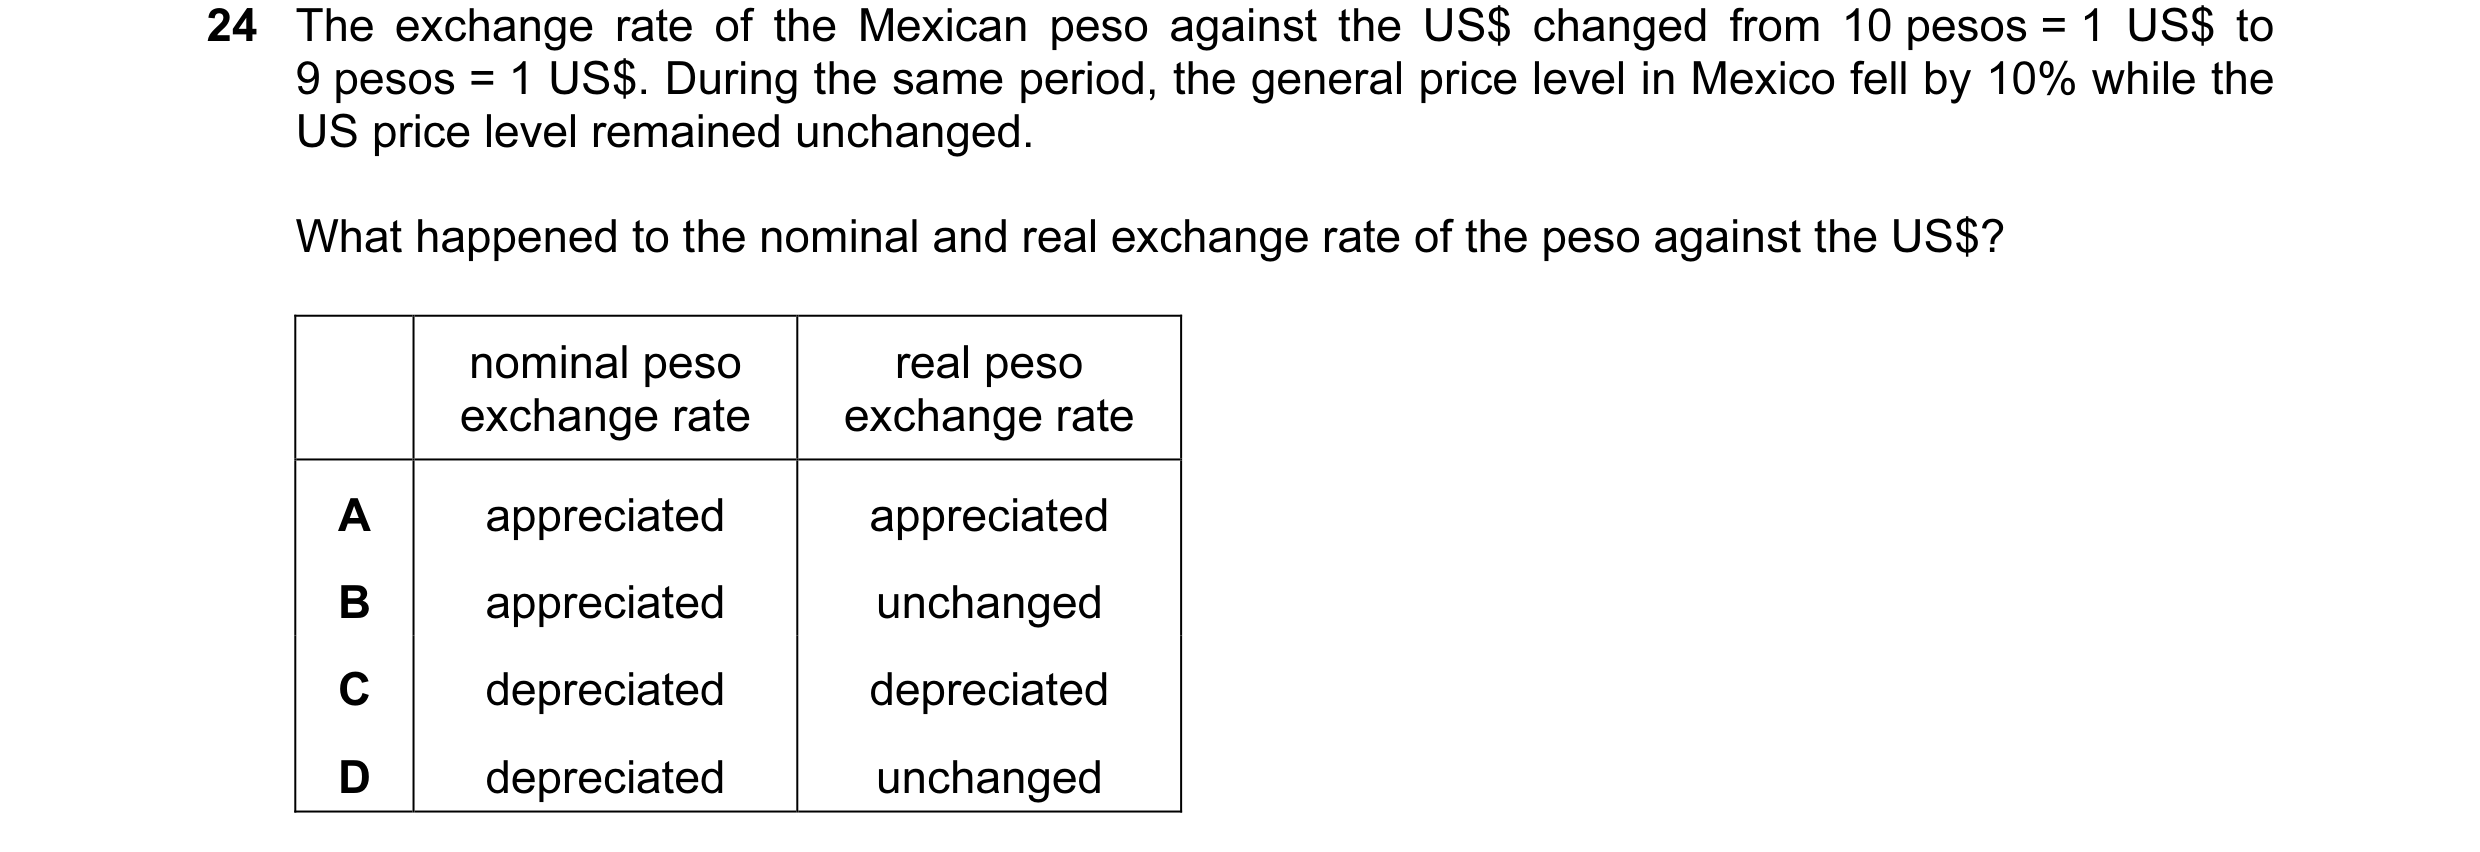
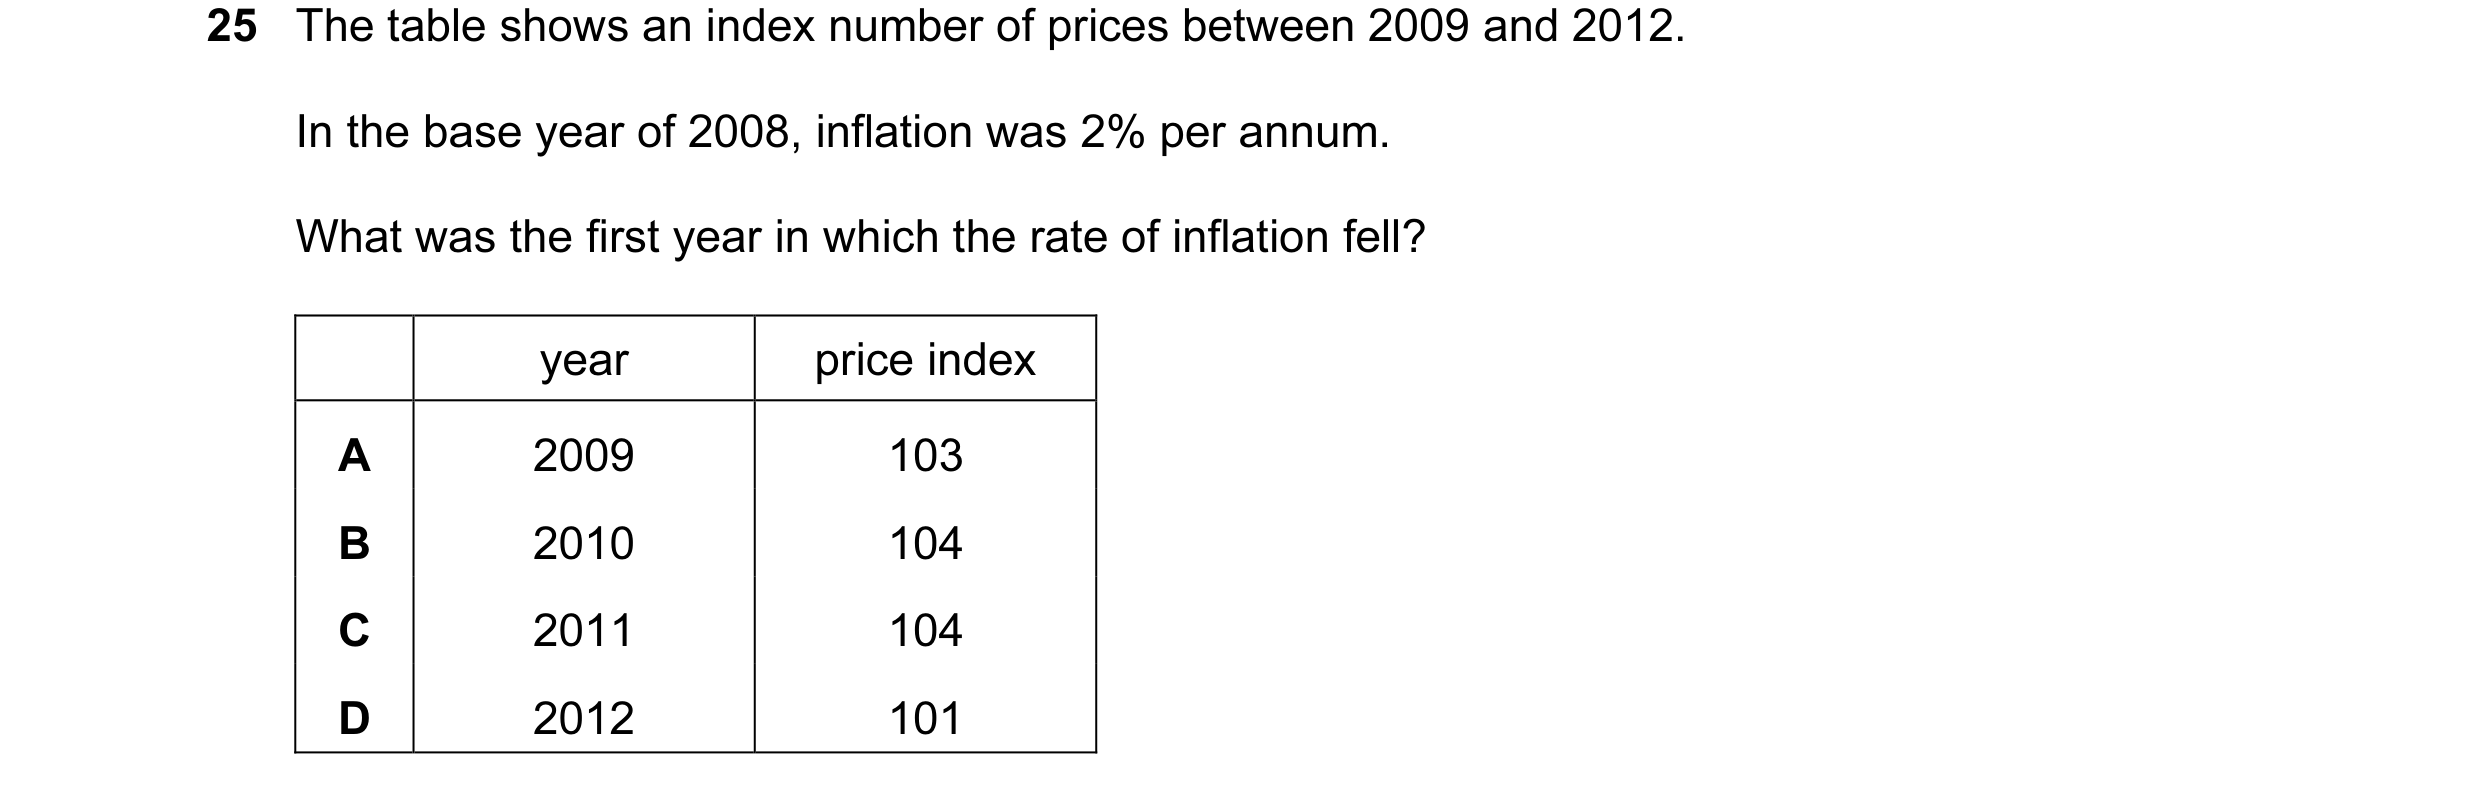
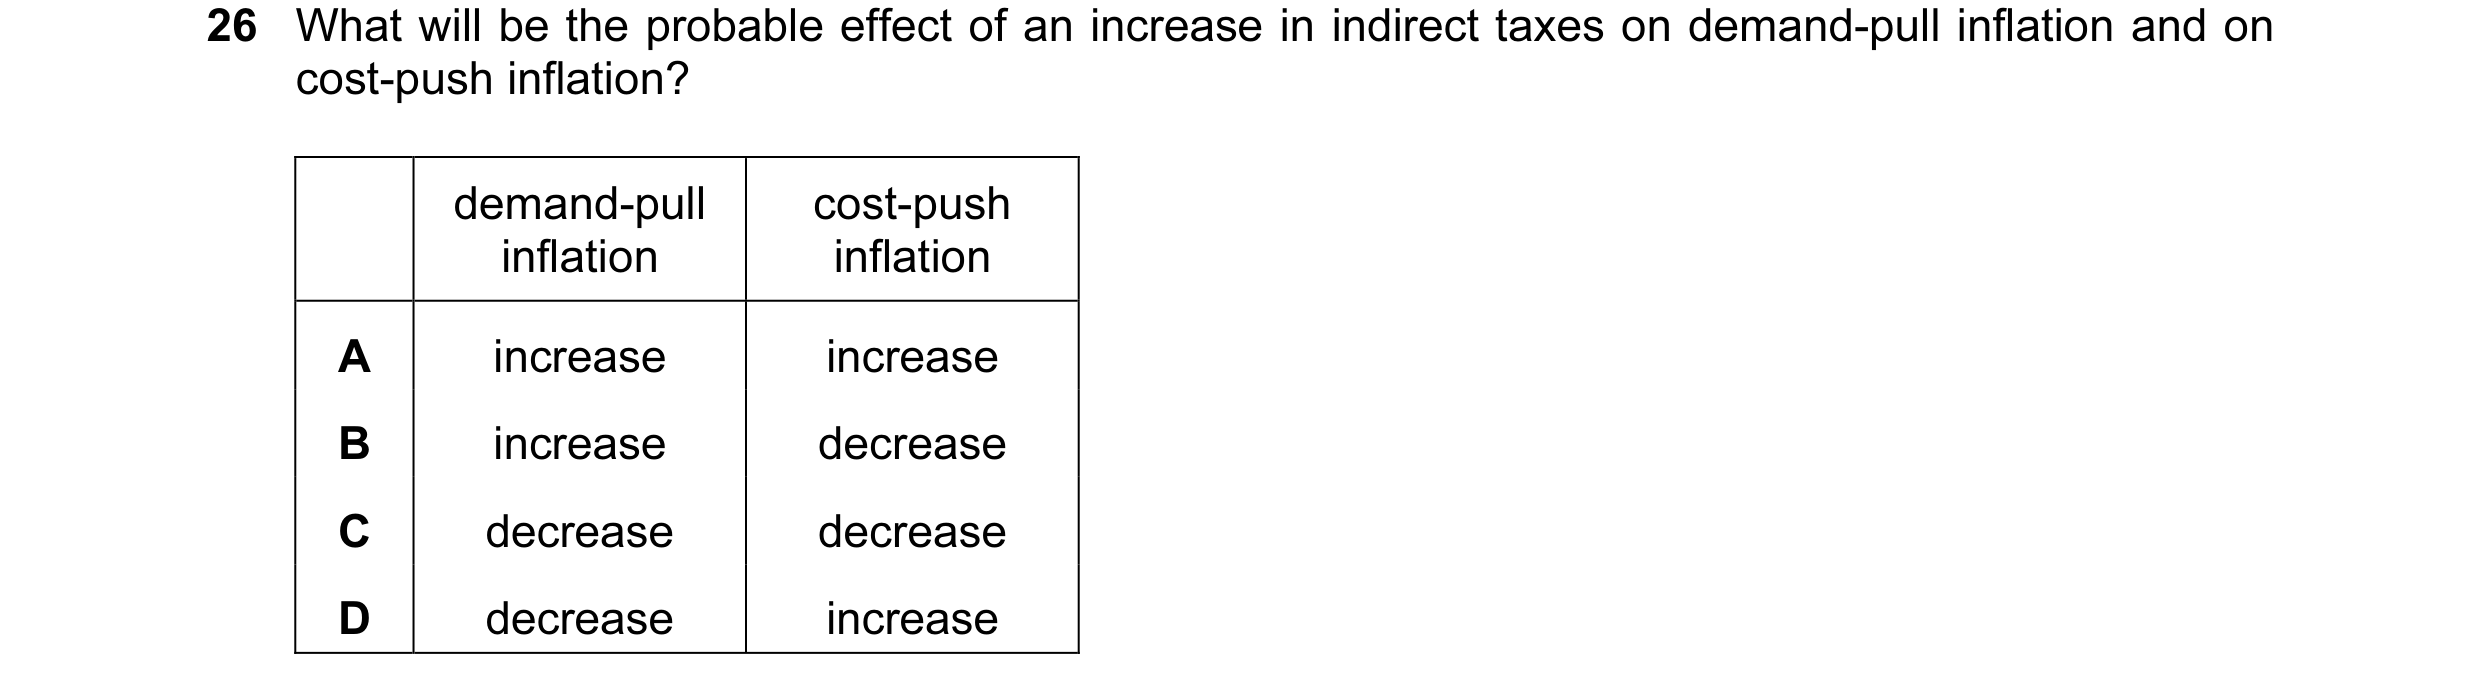
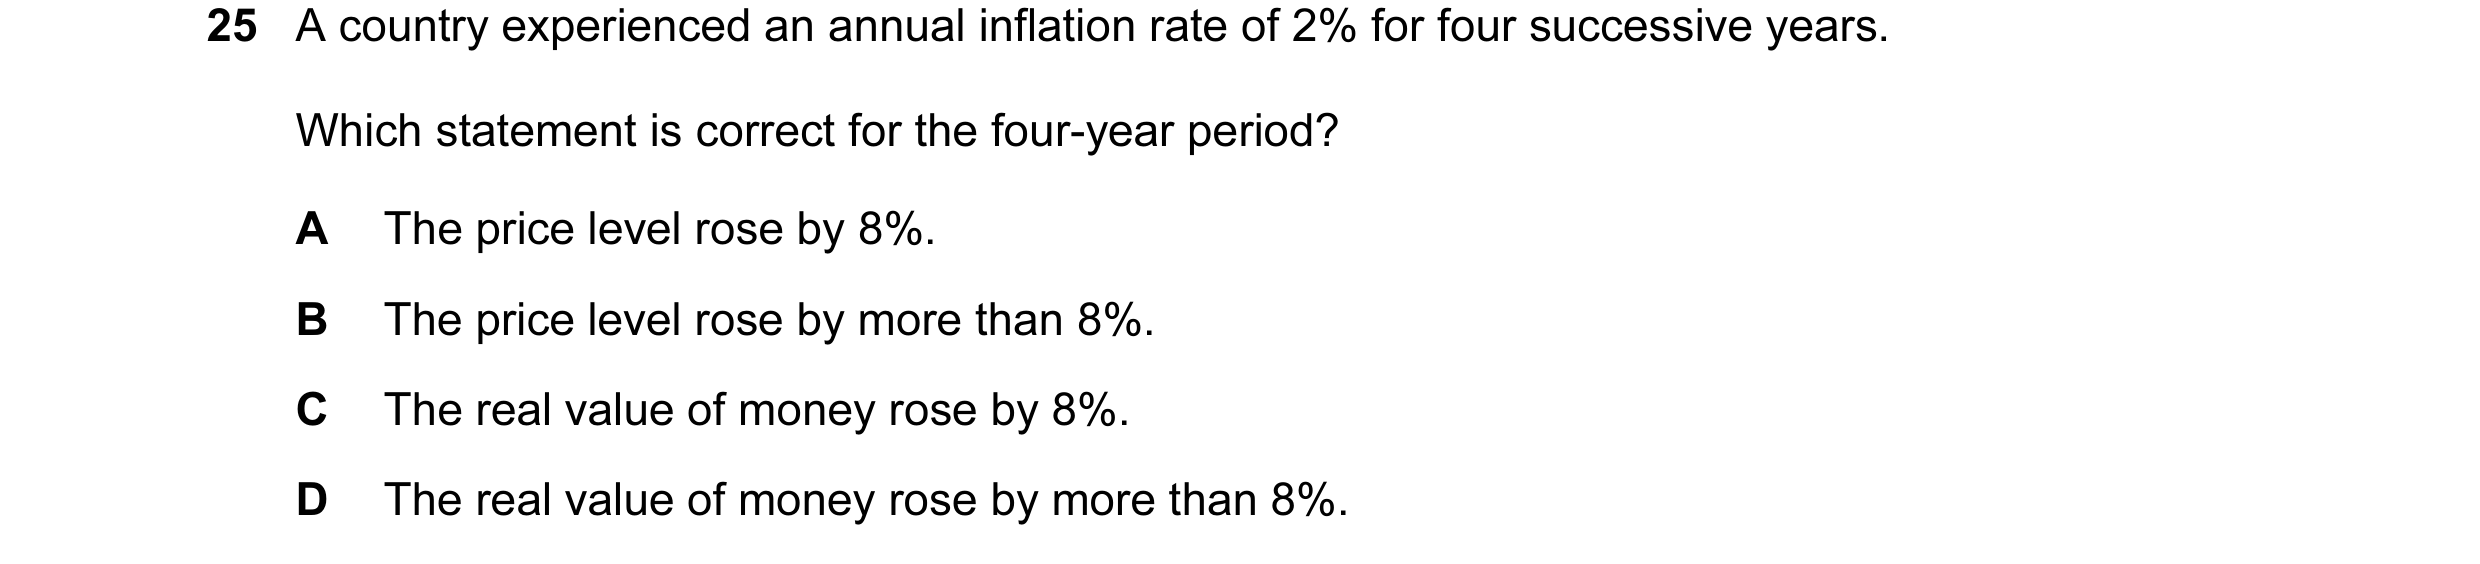 25 / 67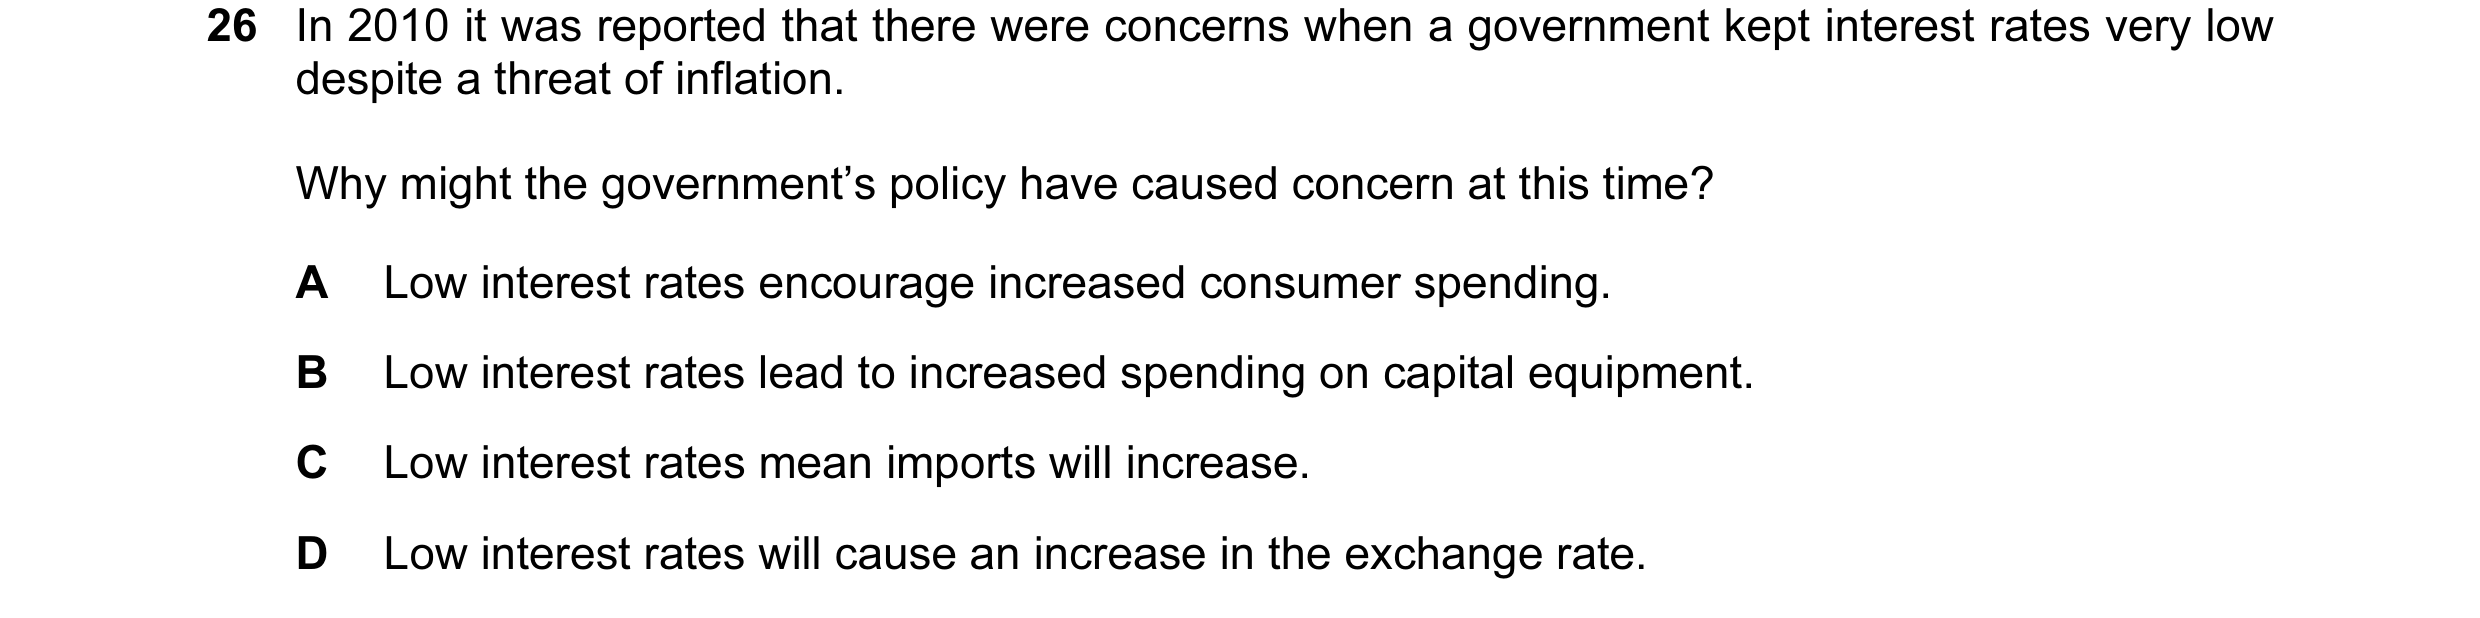
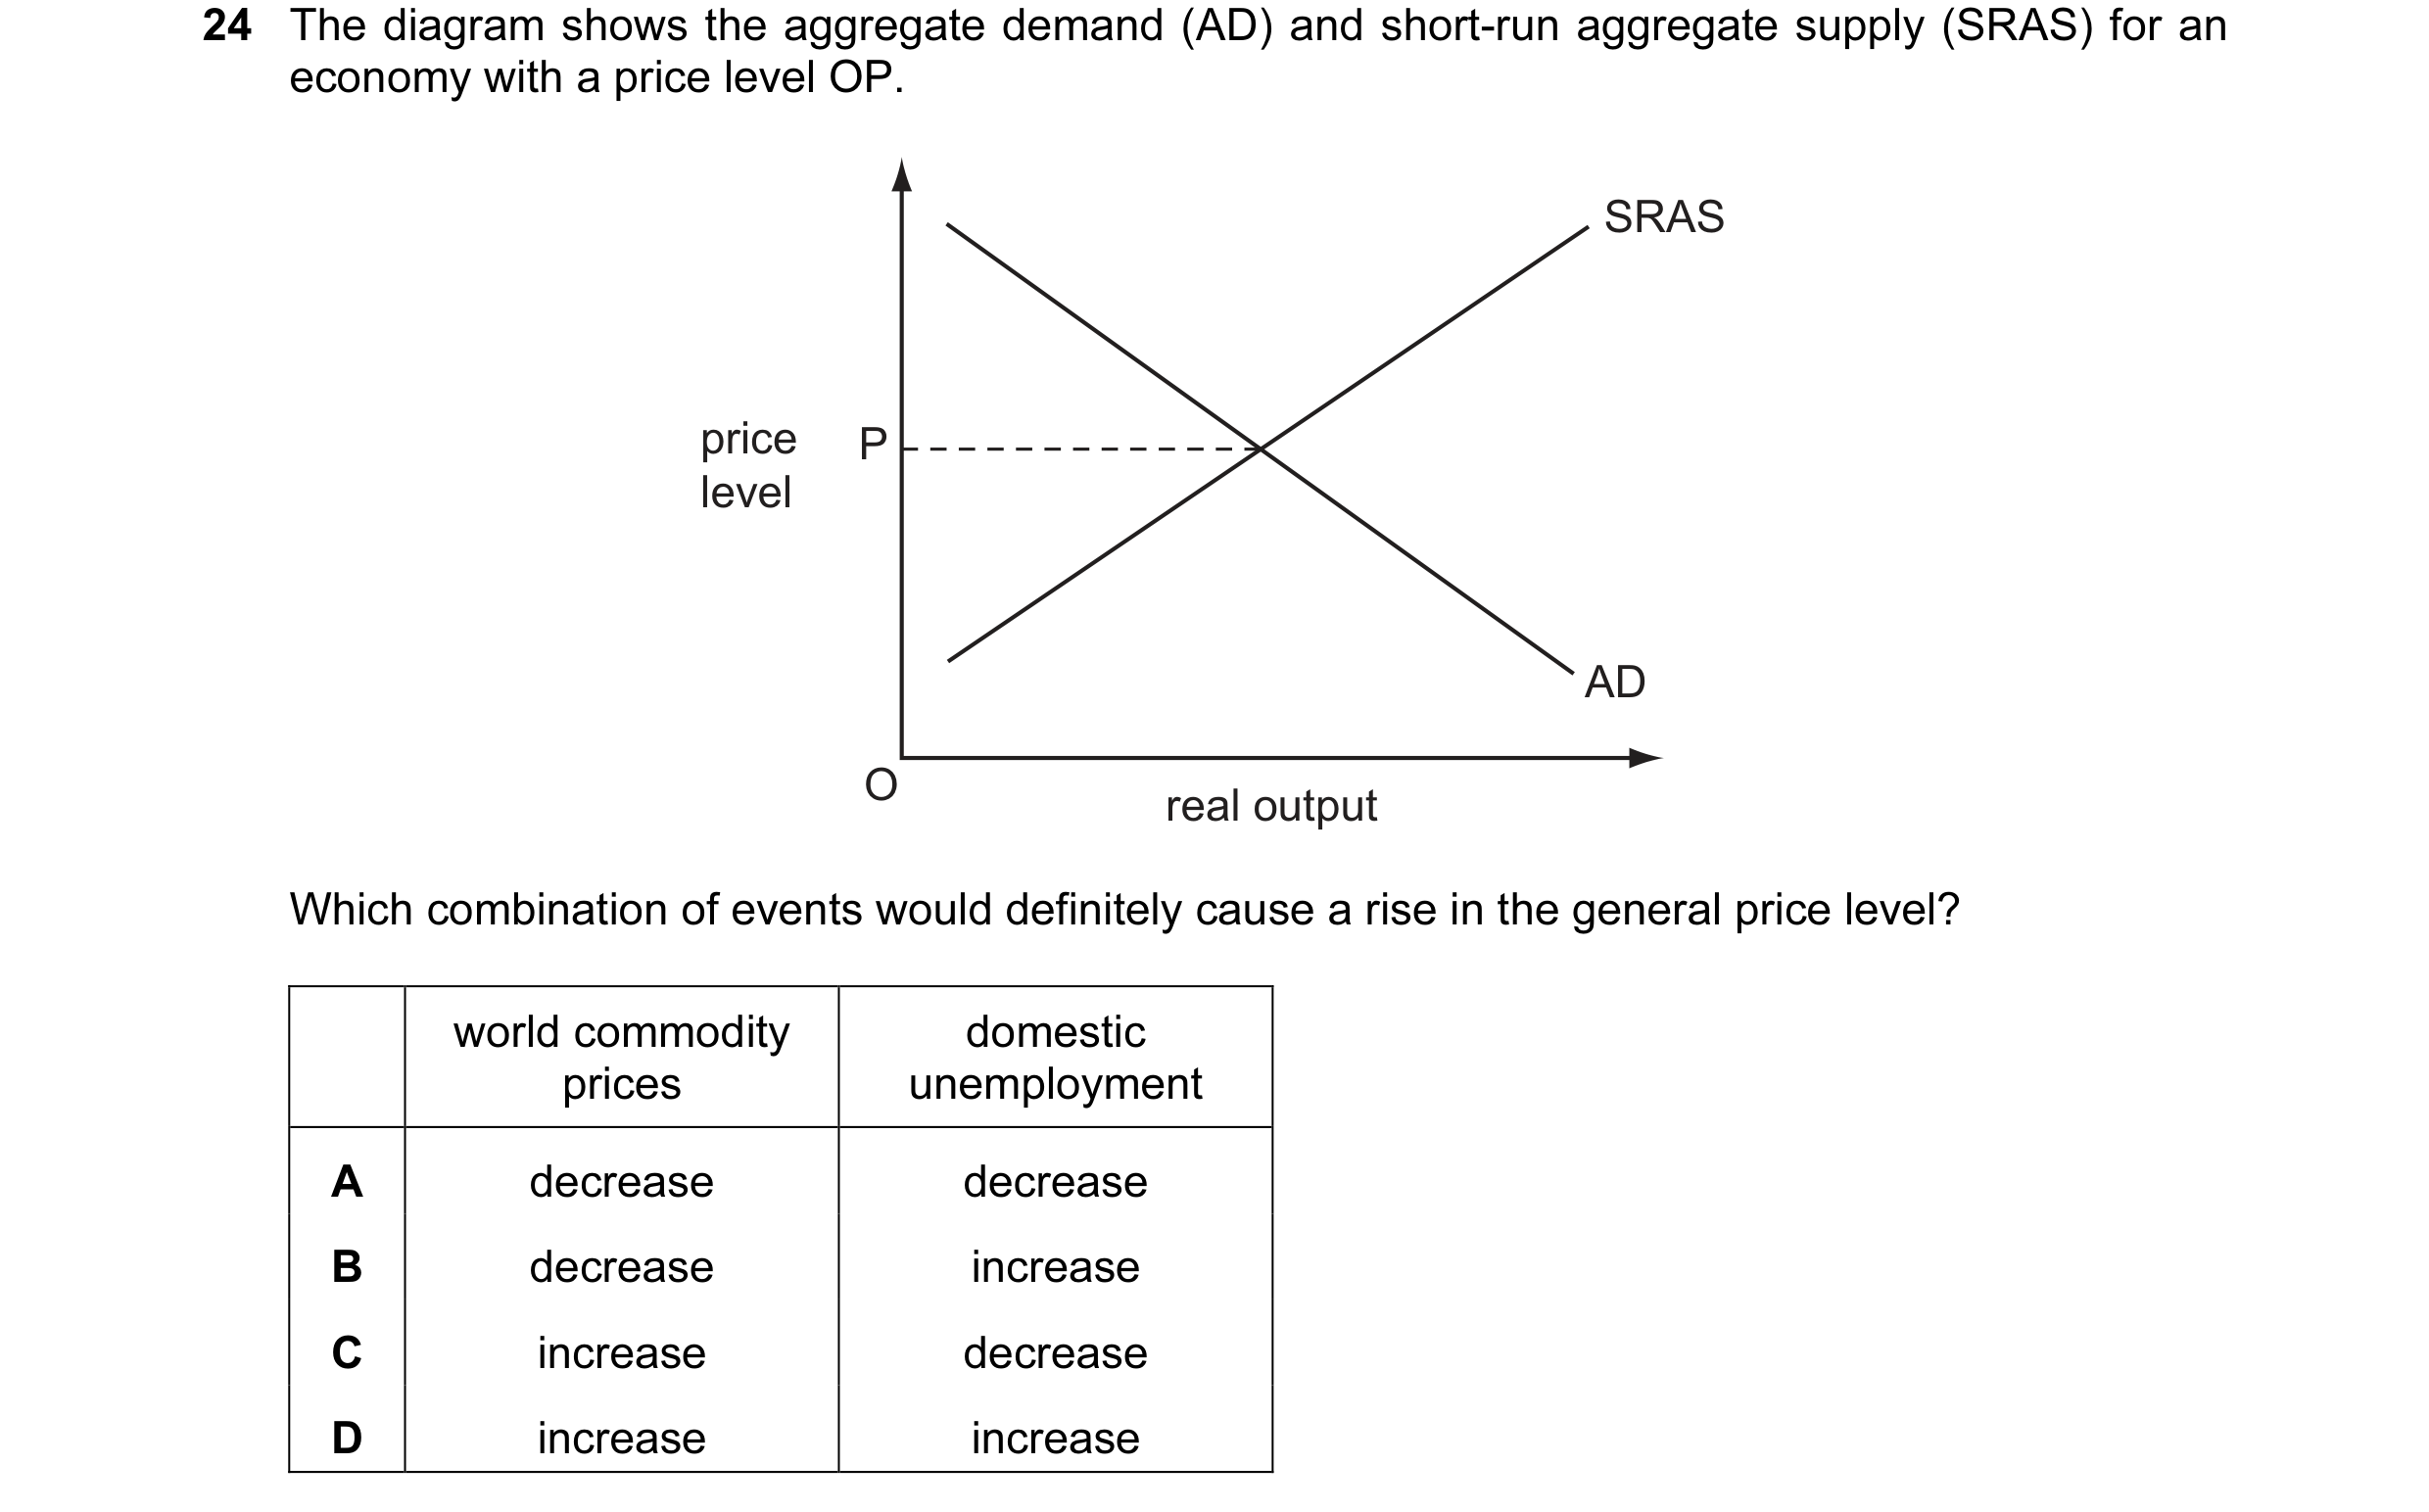
 26 / 67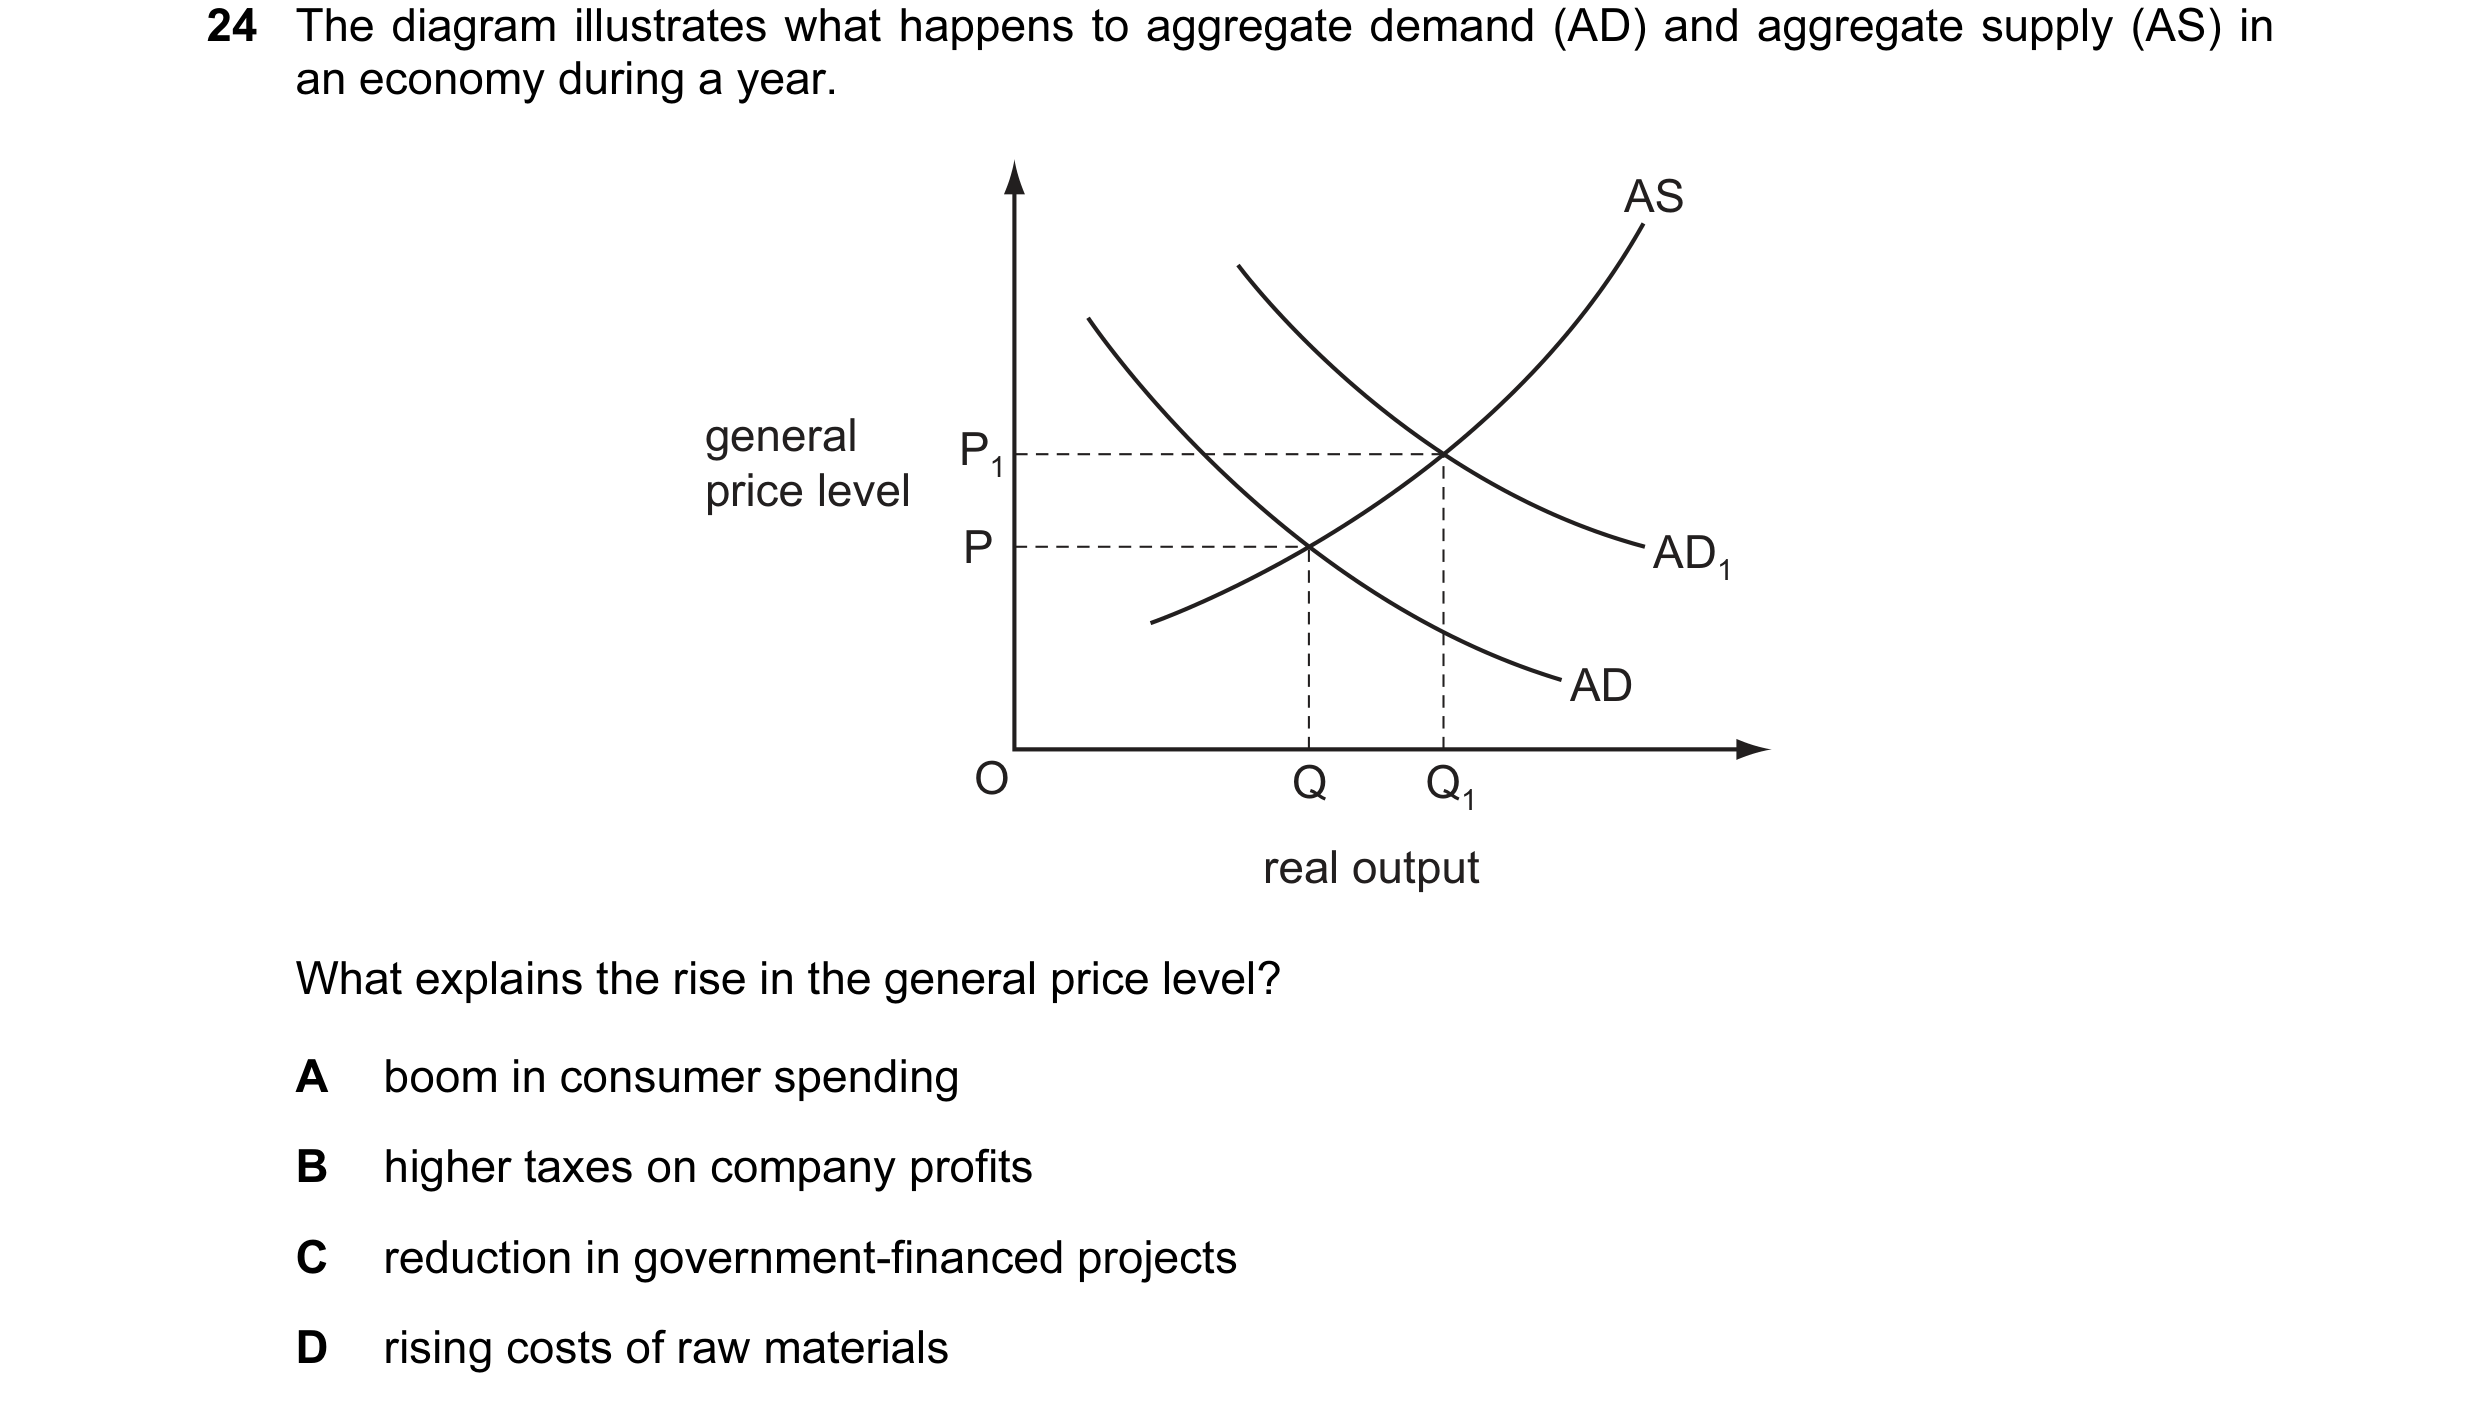

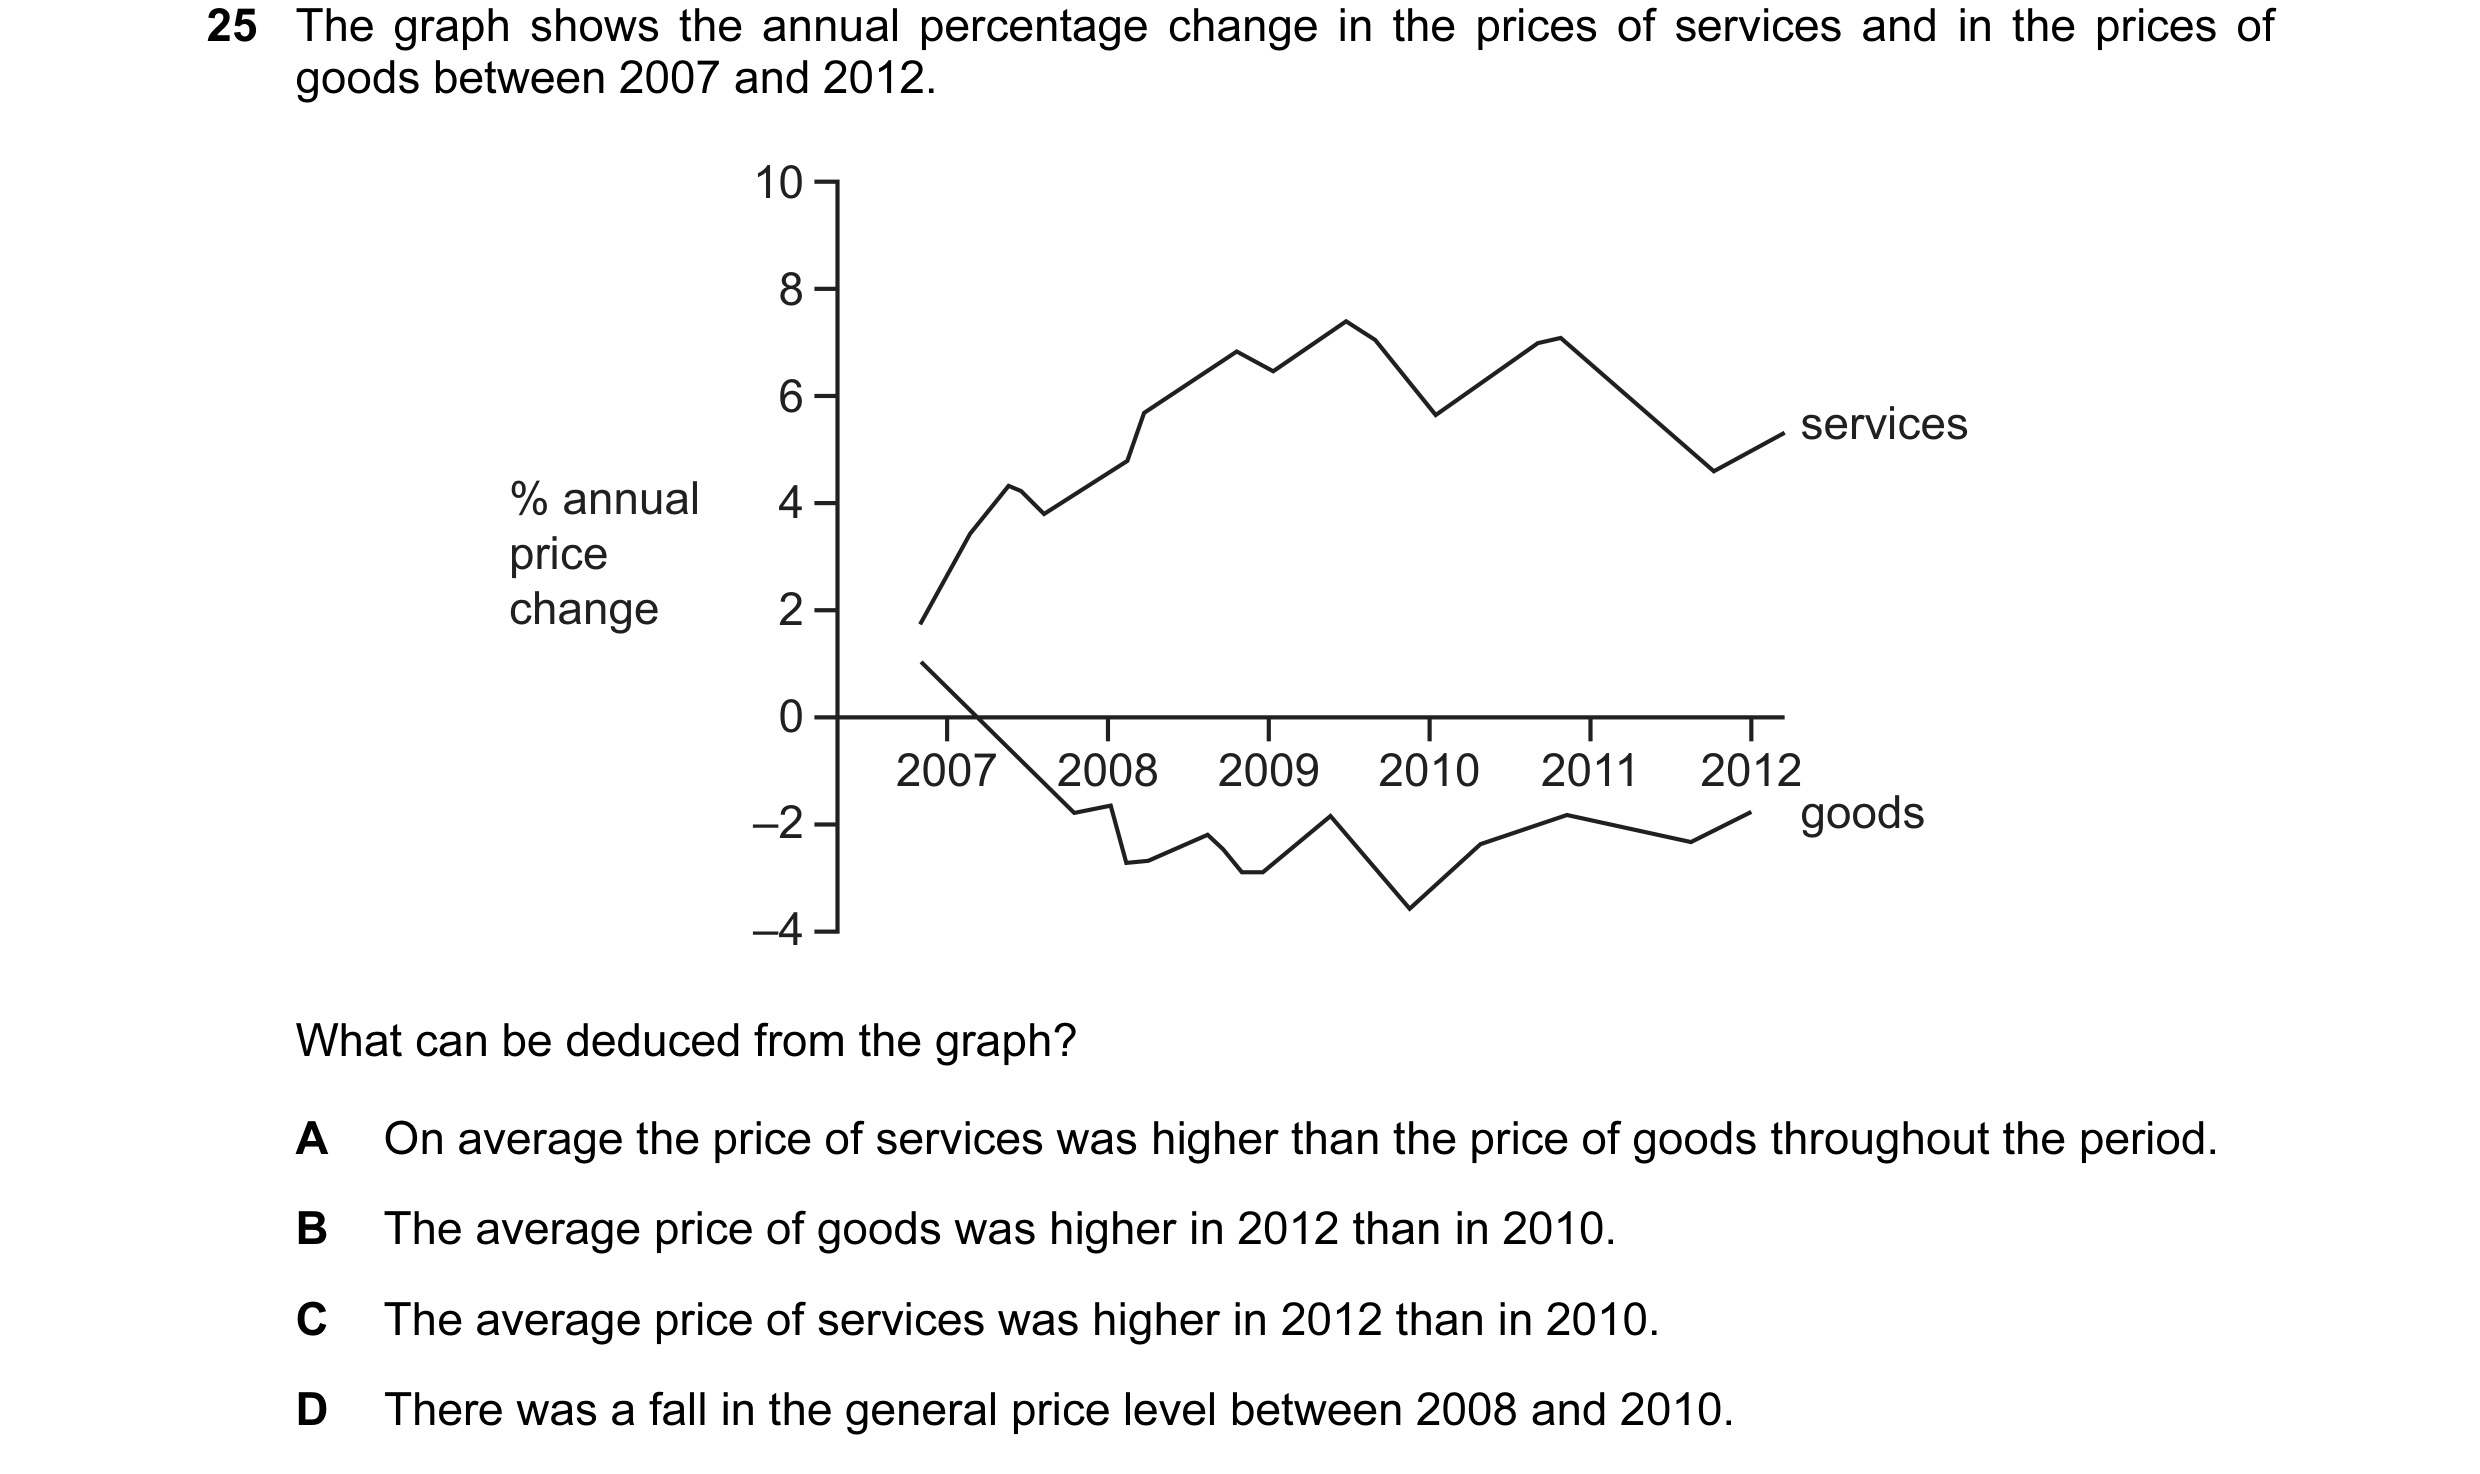 27 / 67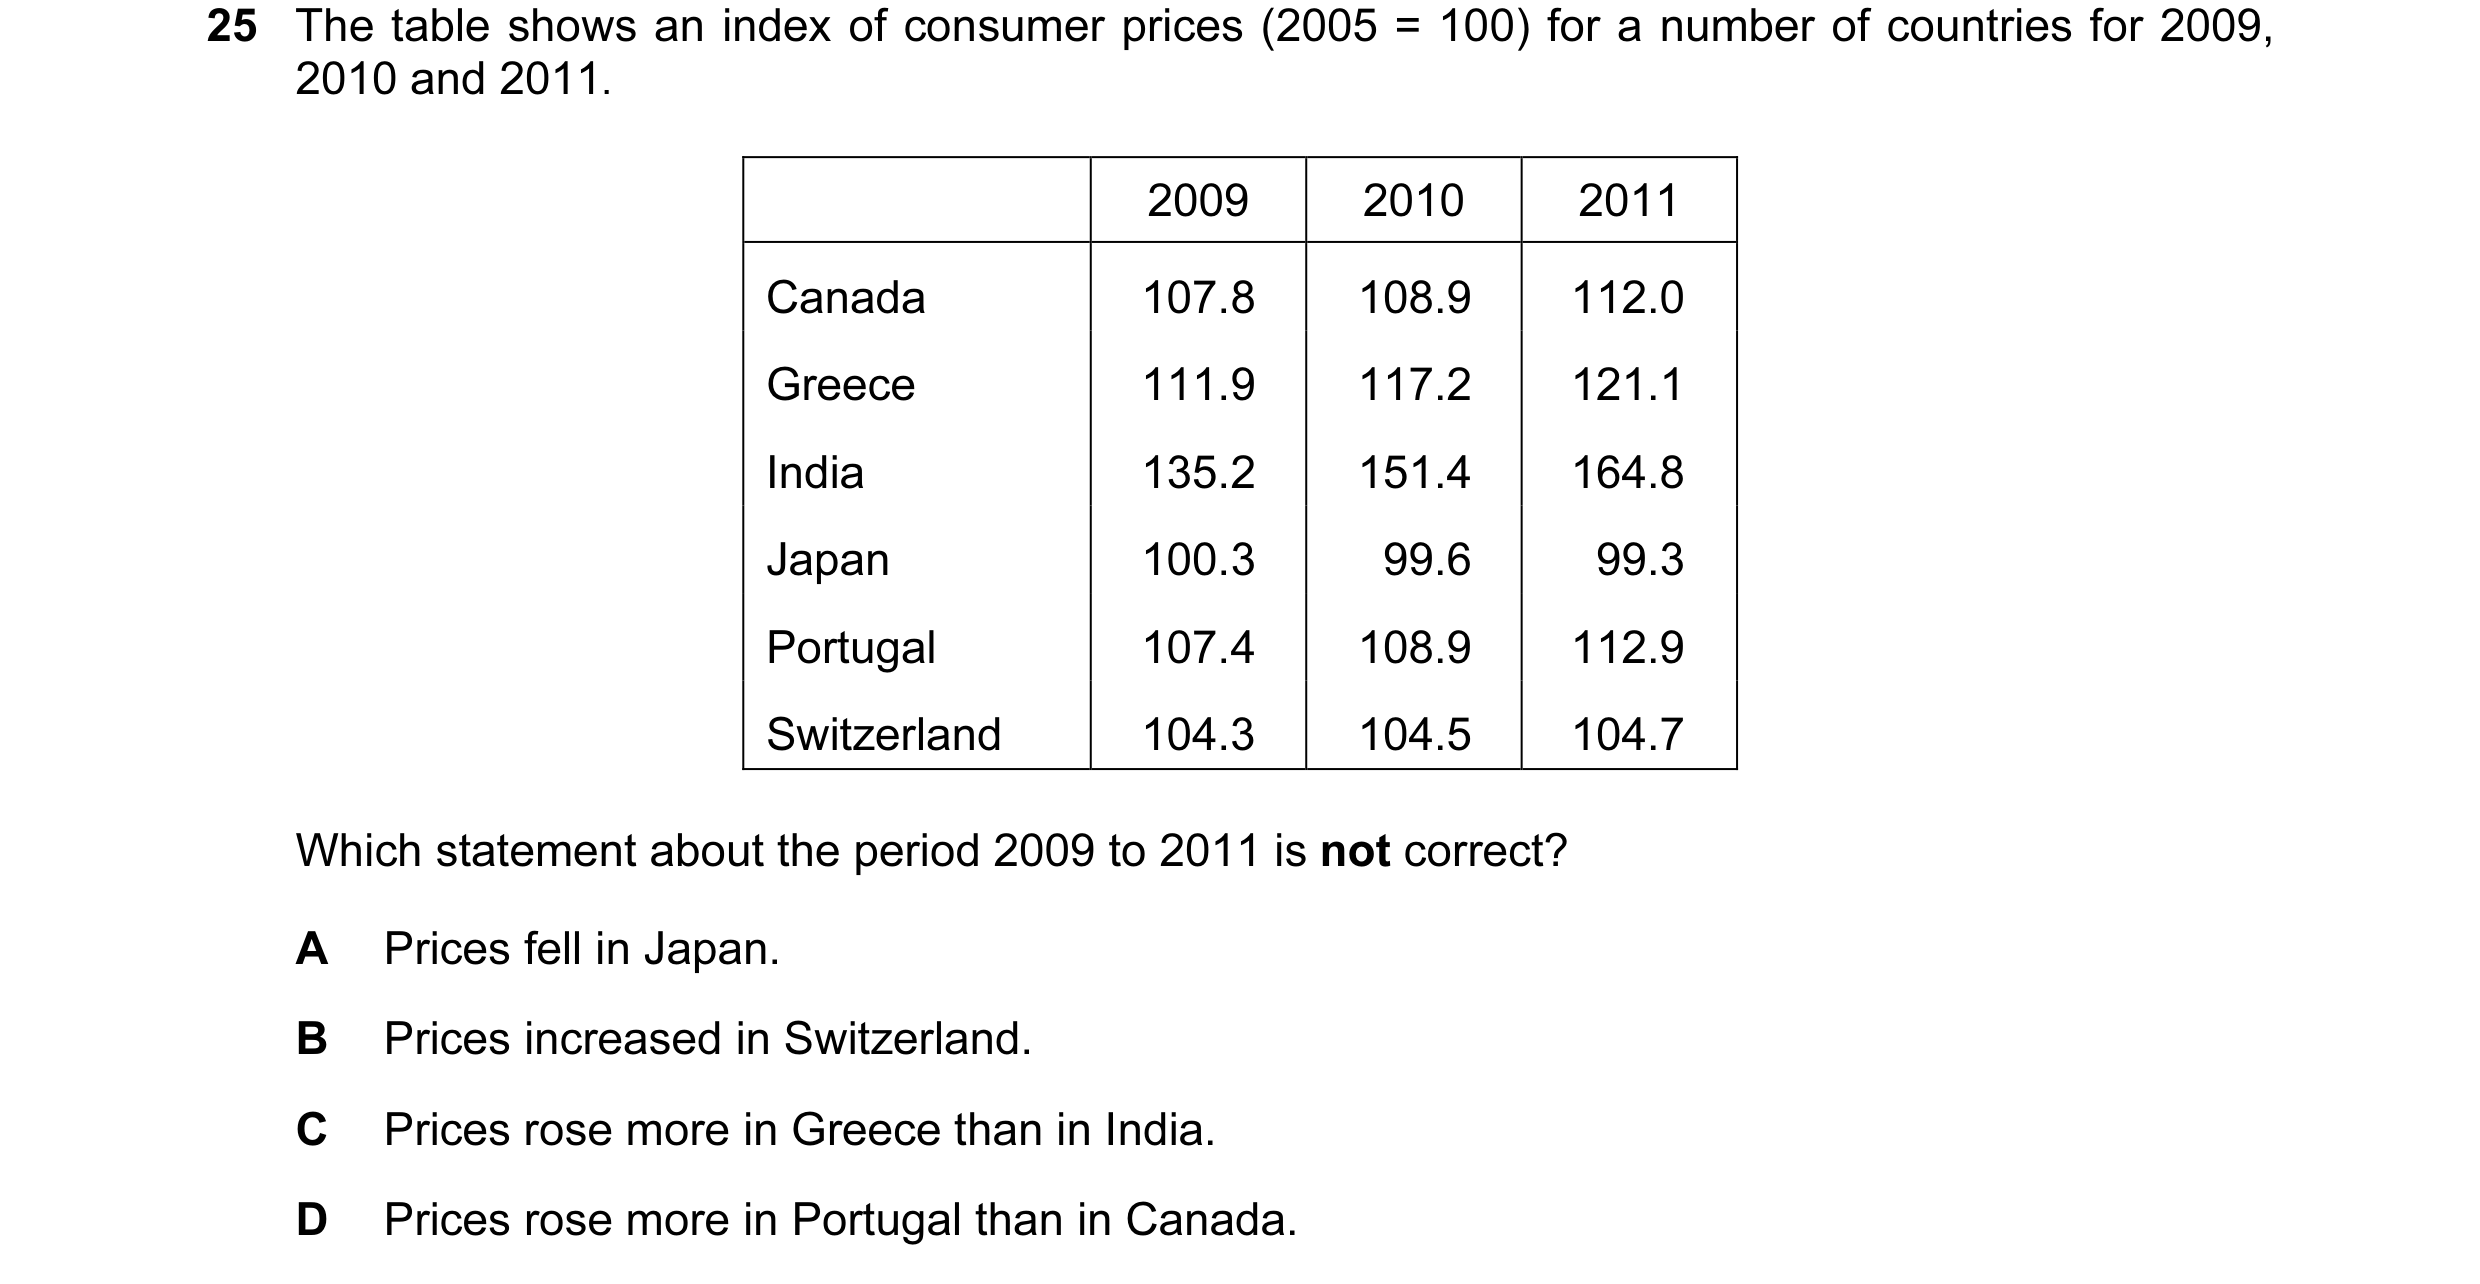

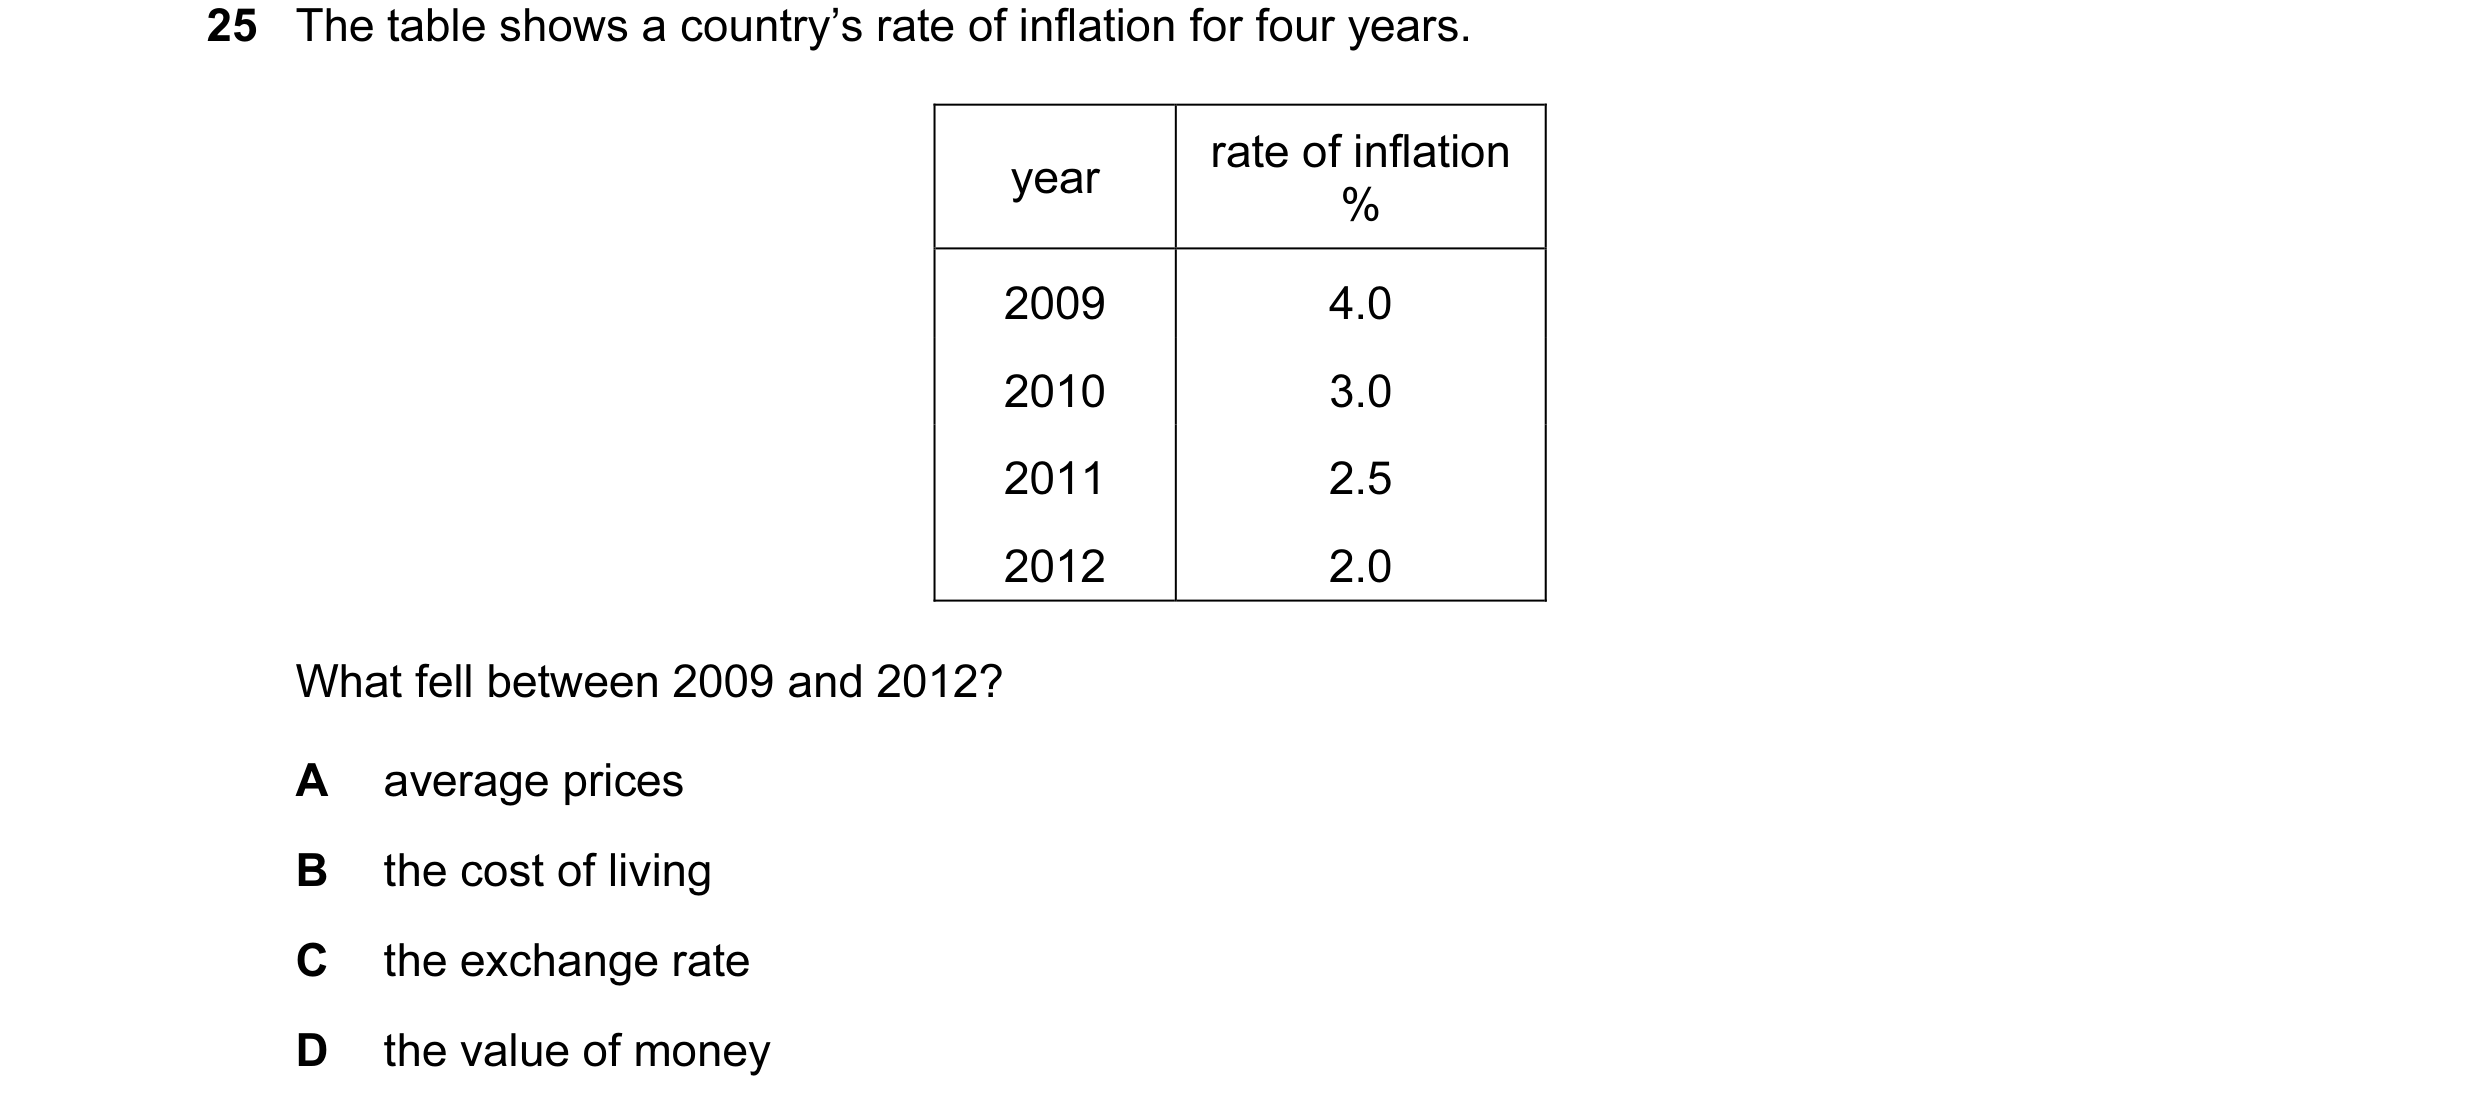
 28 / 67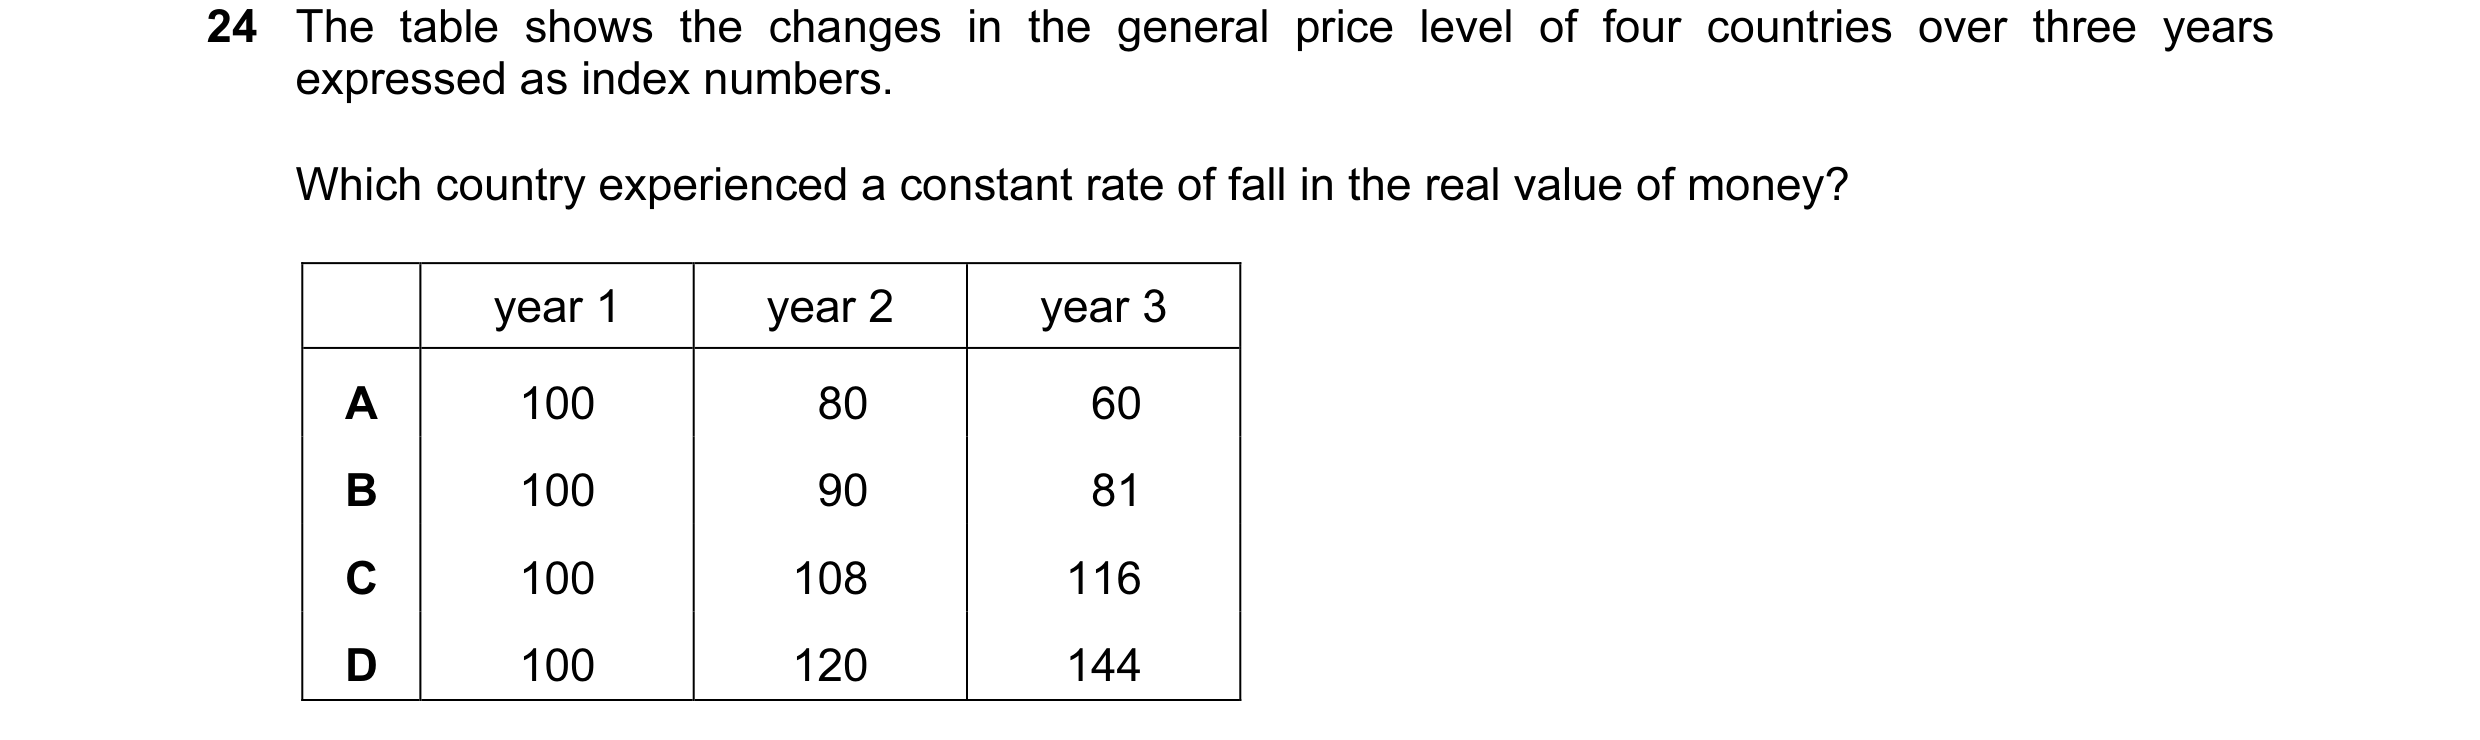
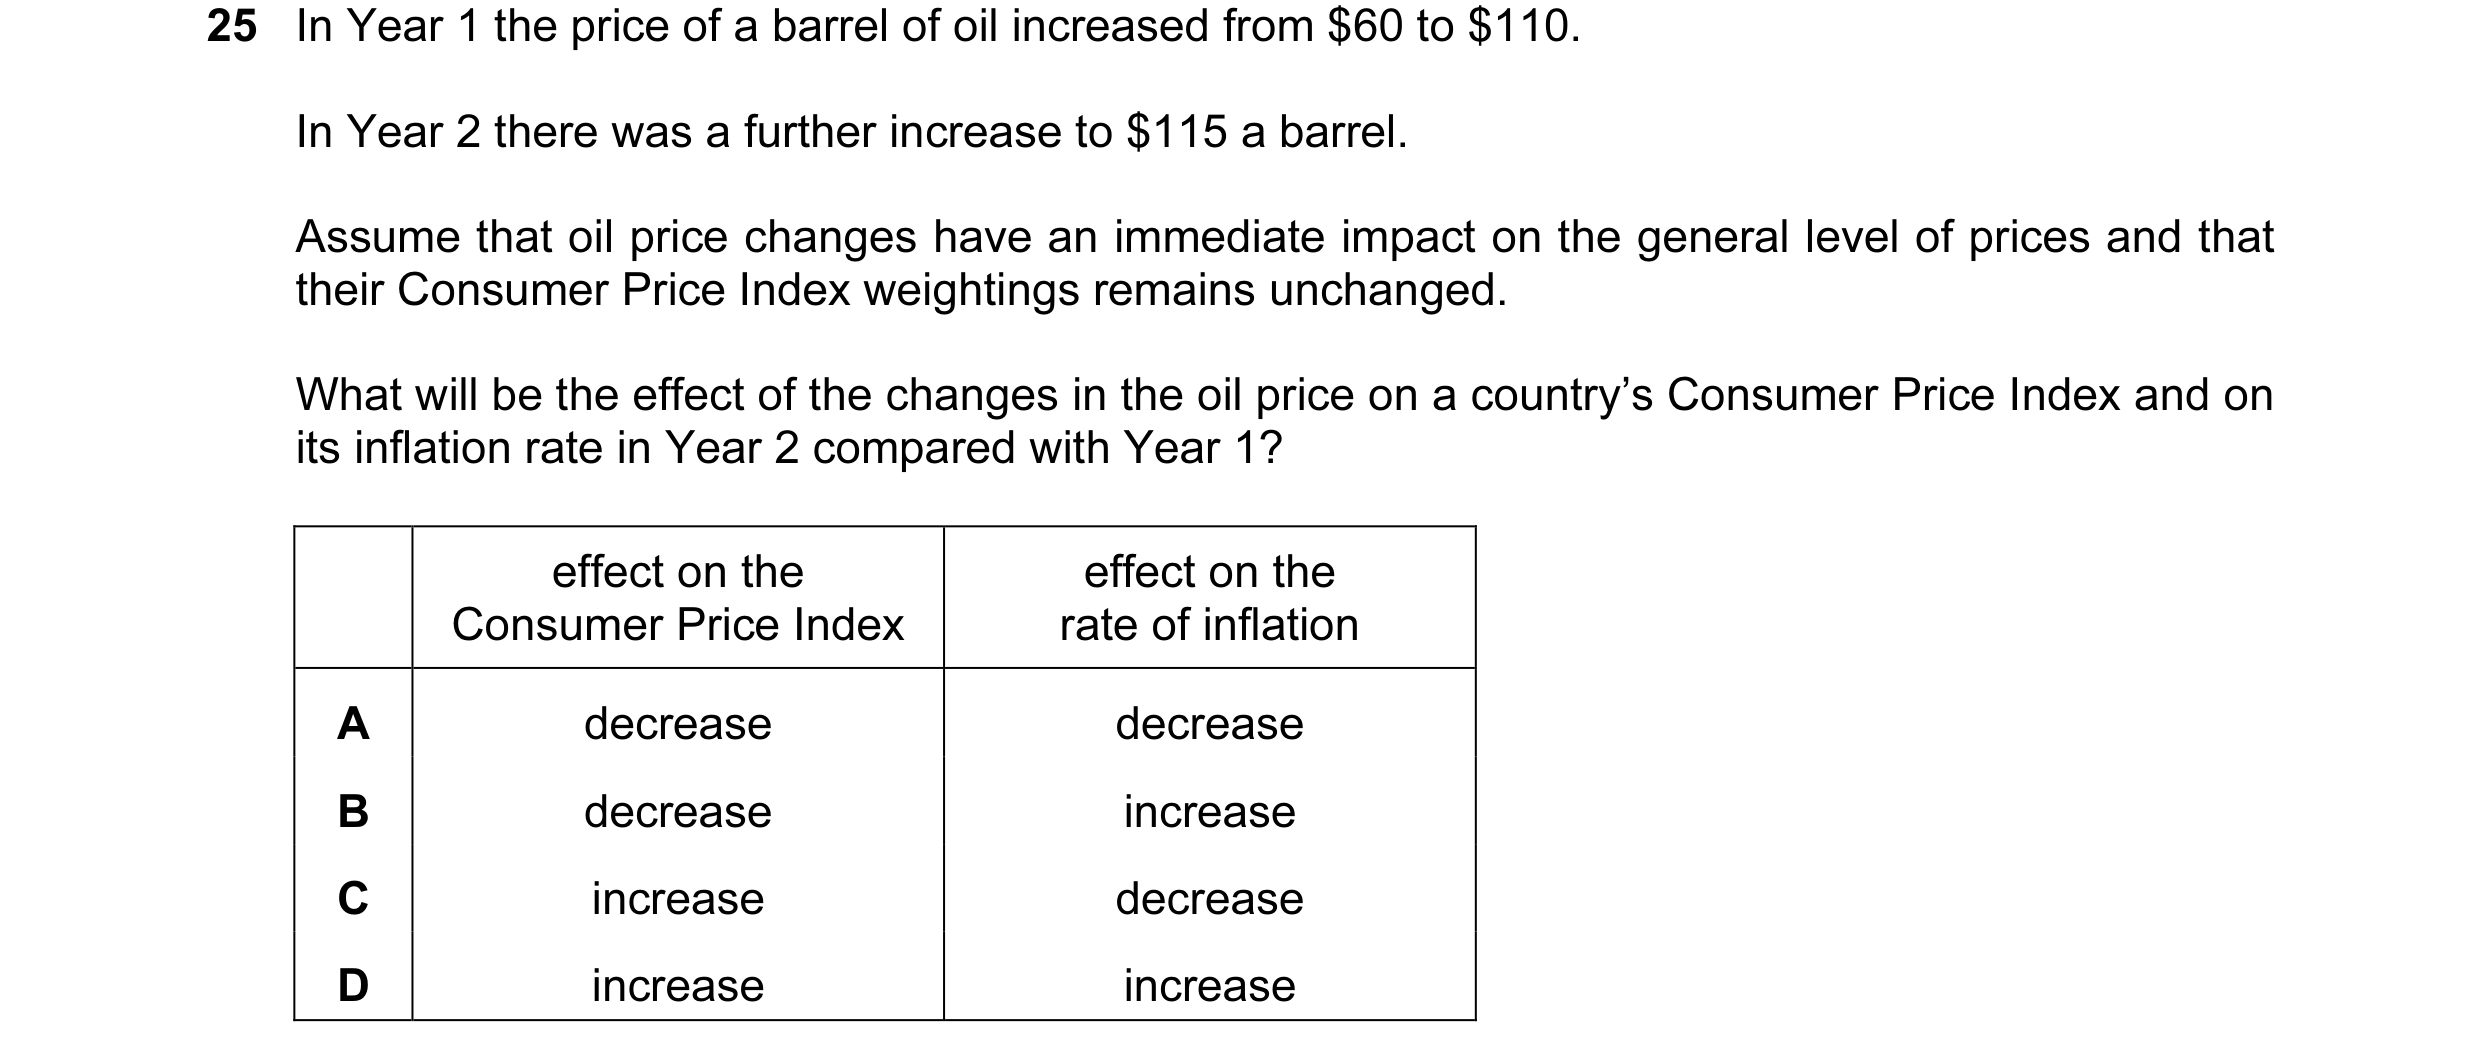
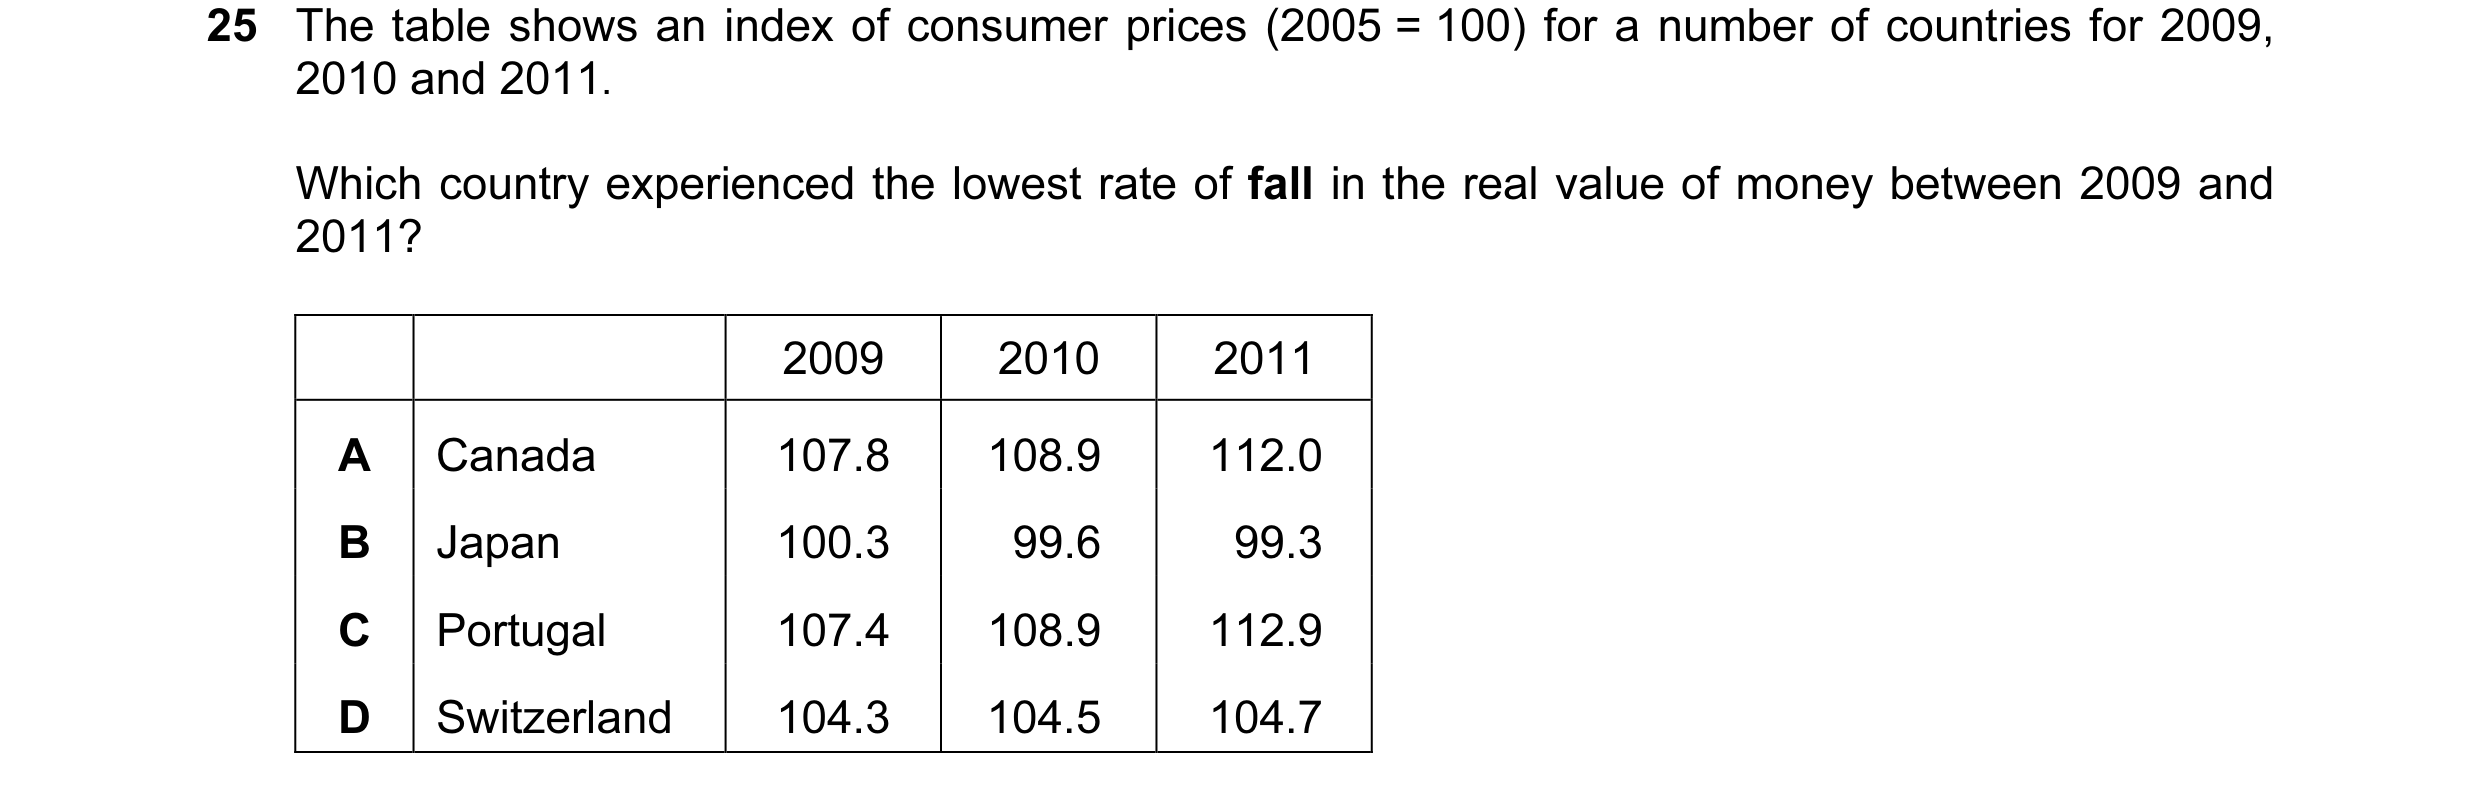
 29 / 67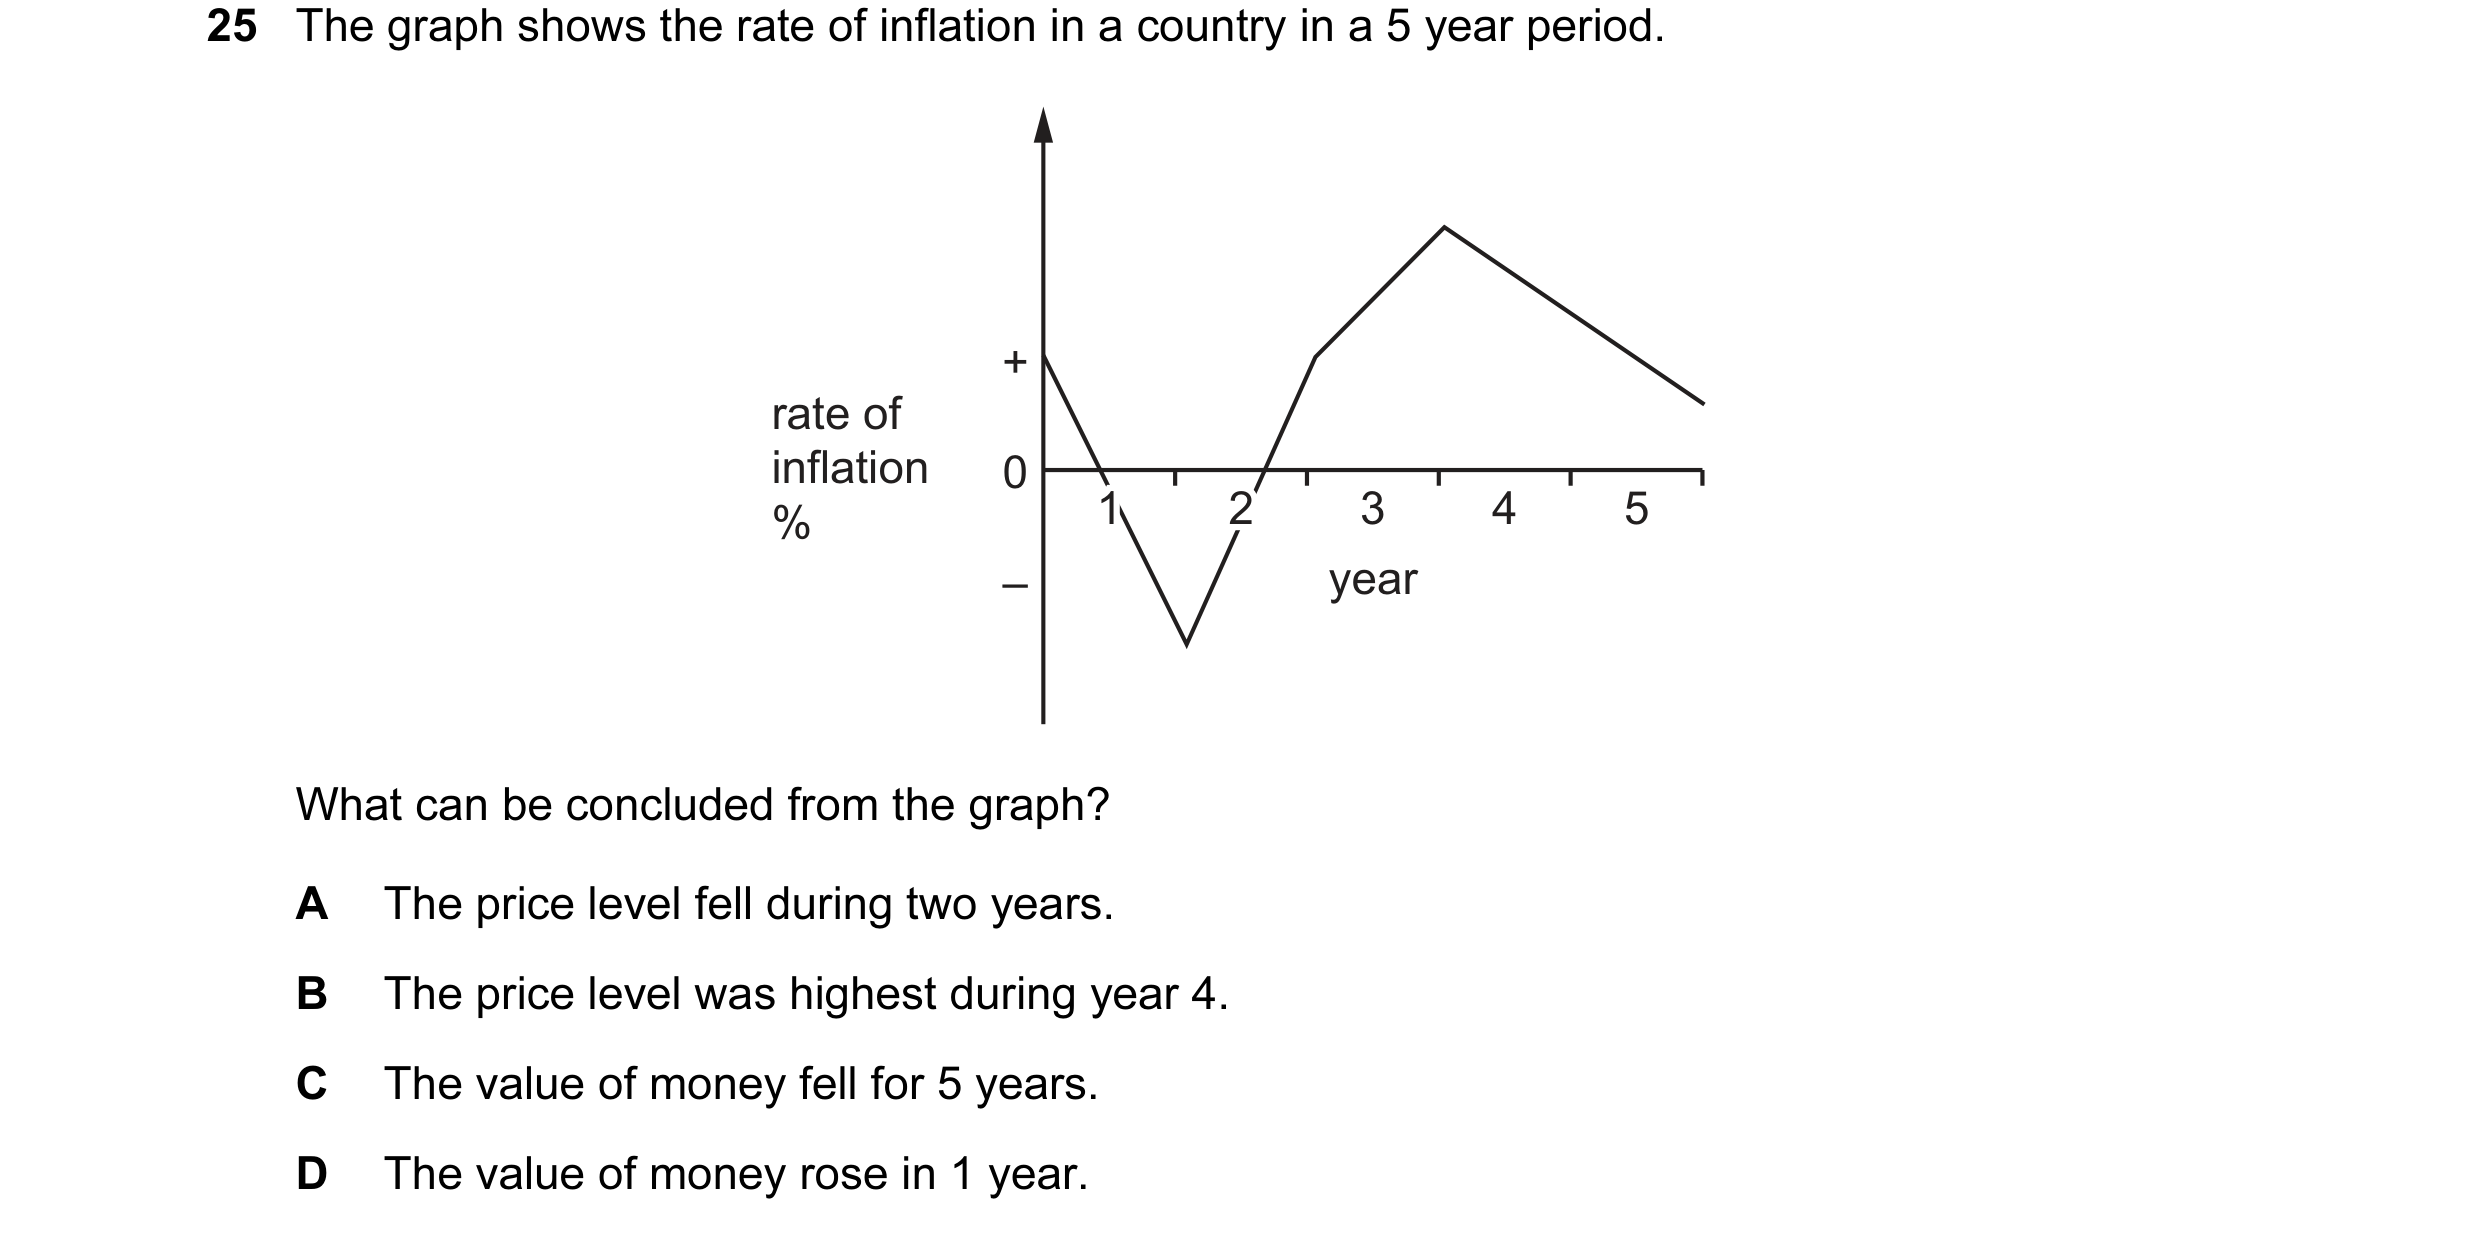

 30 / 67
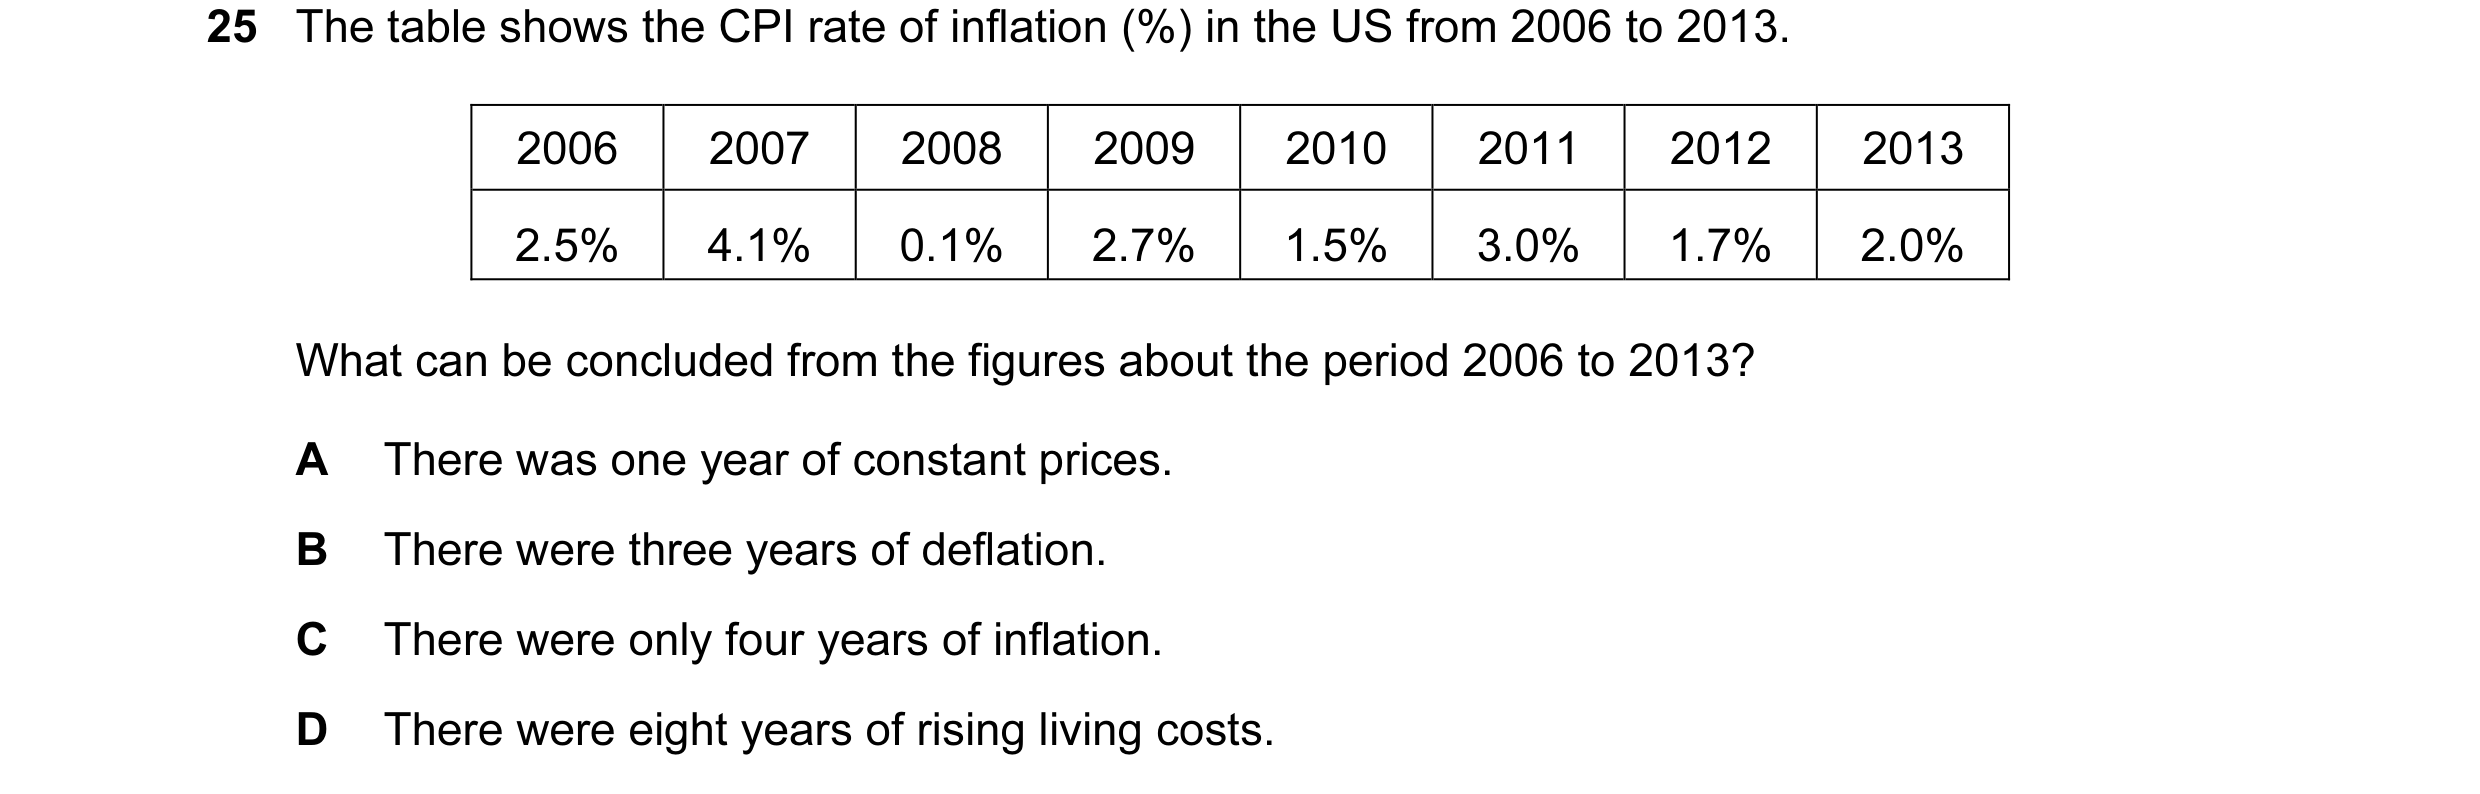

 31 / 67
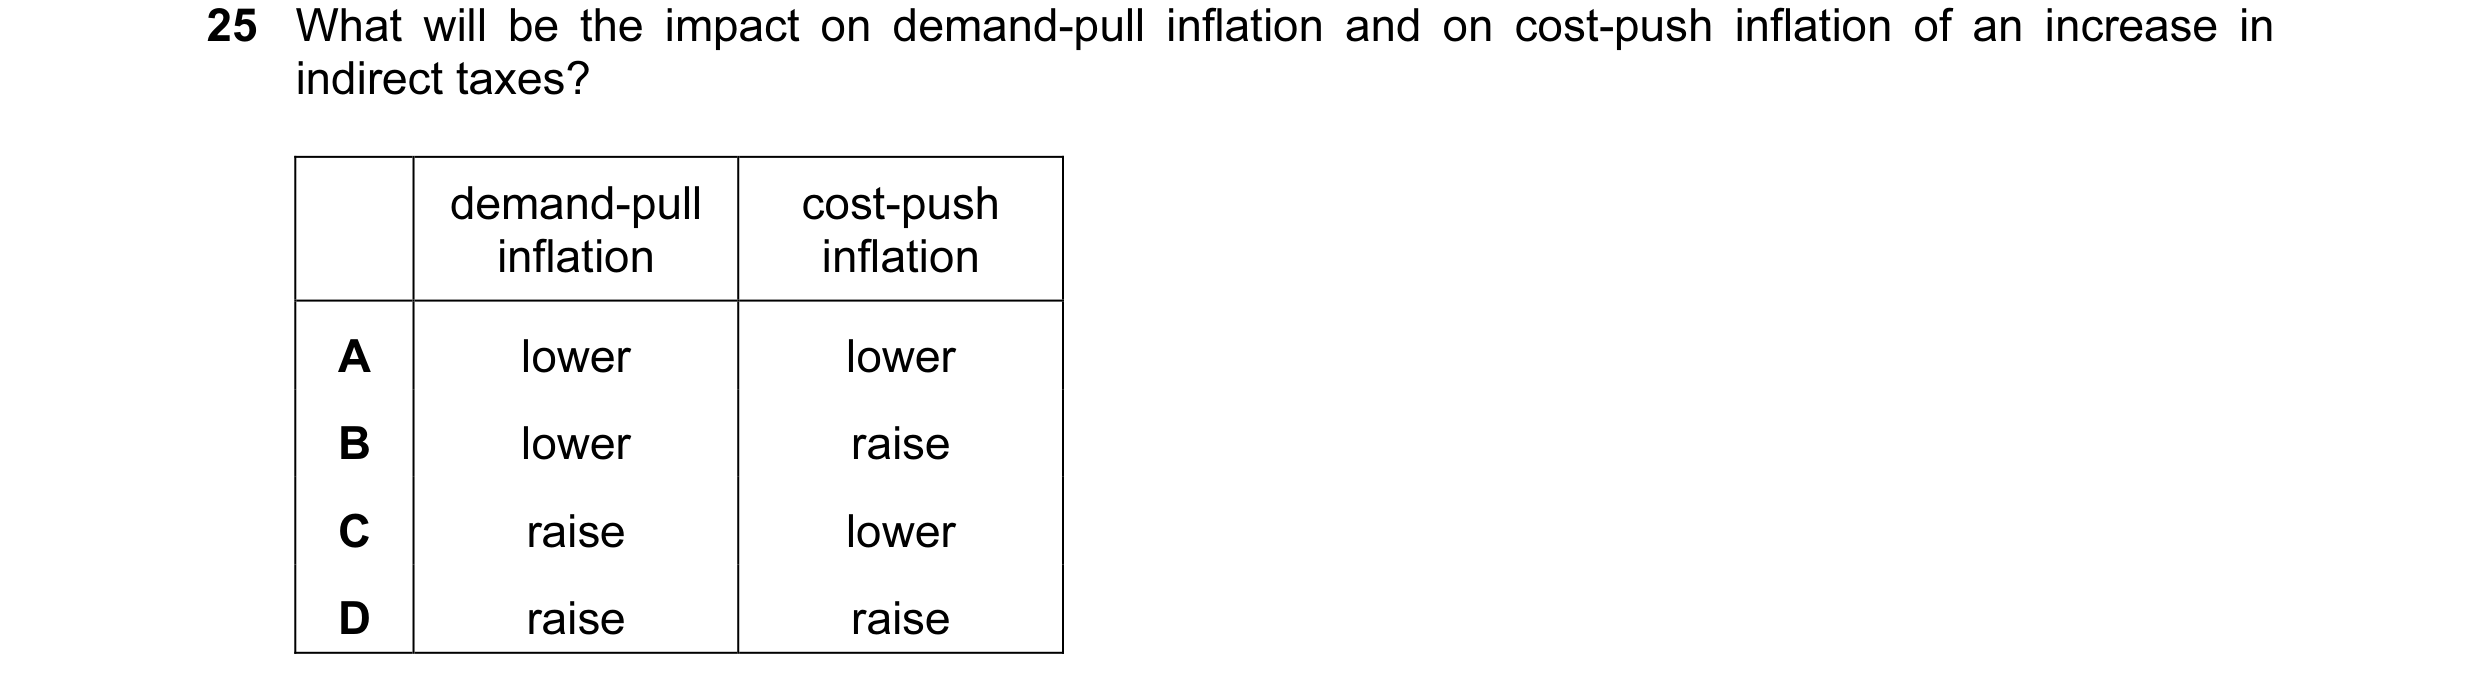
 32 / 67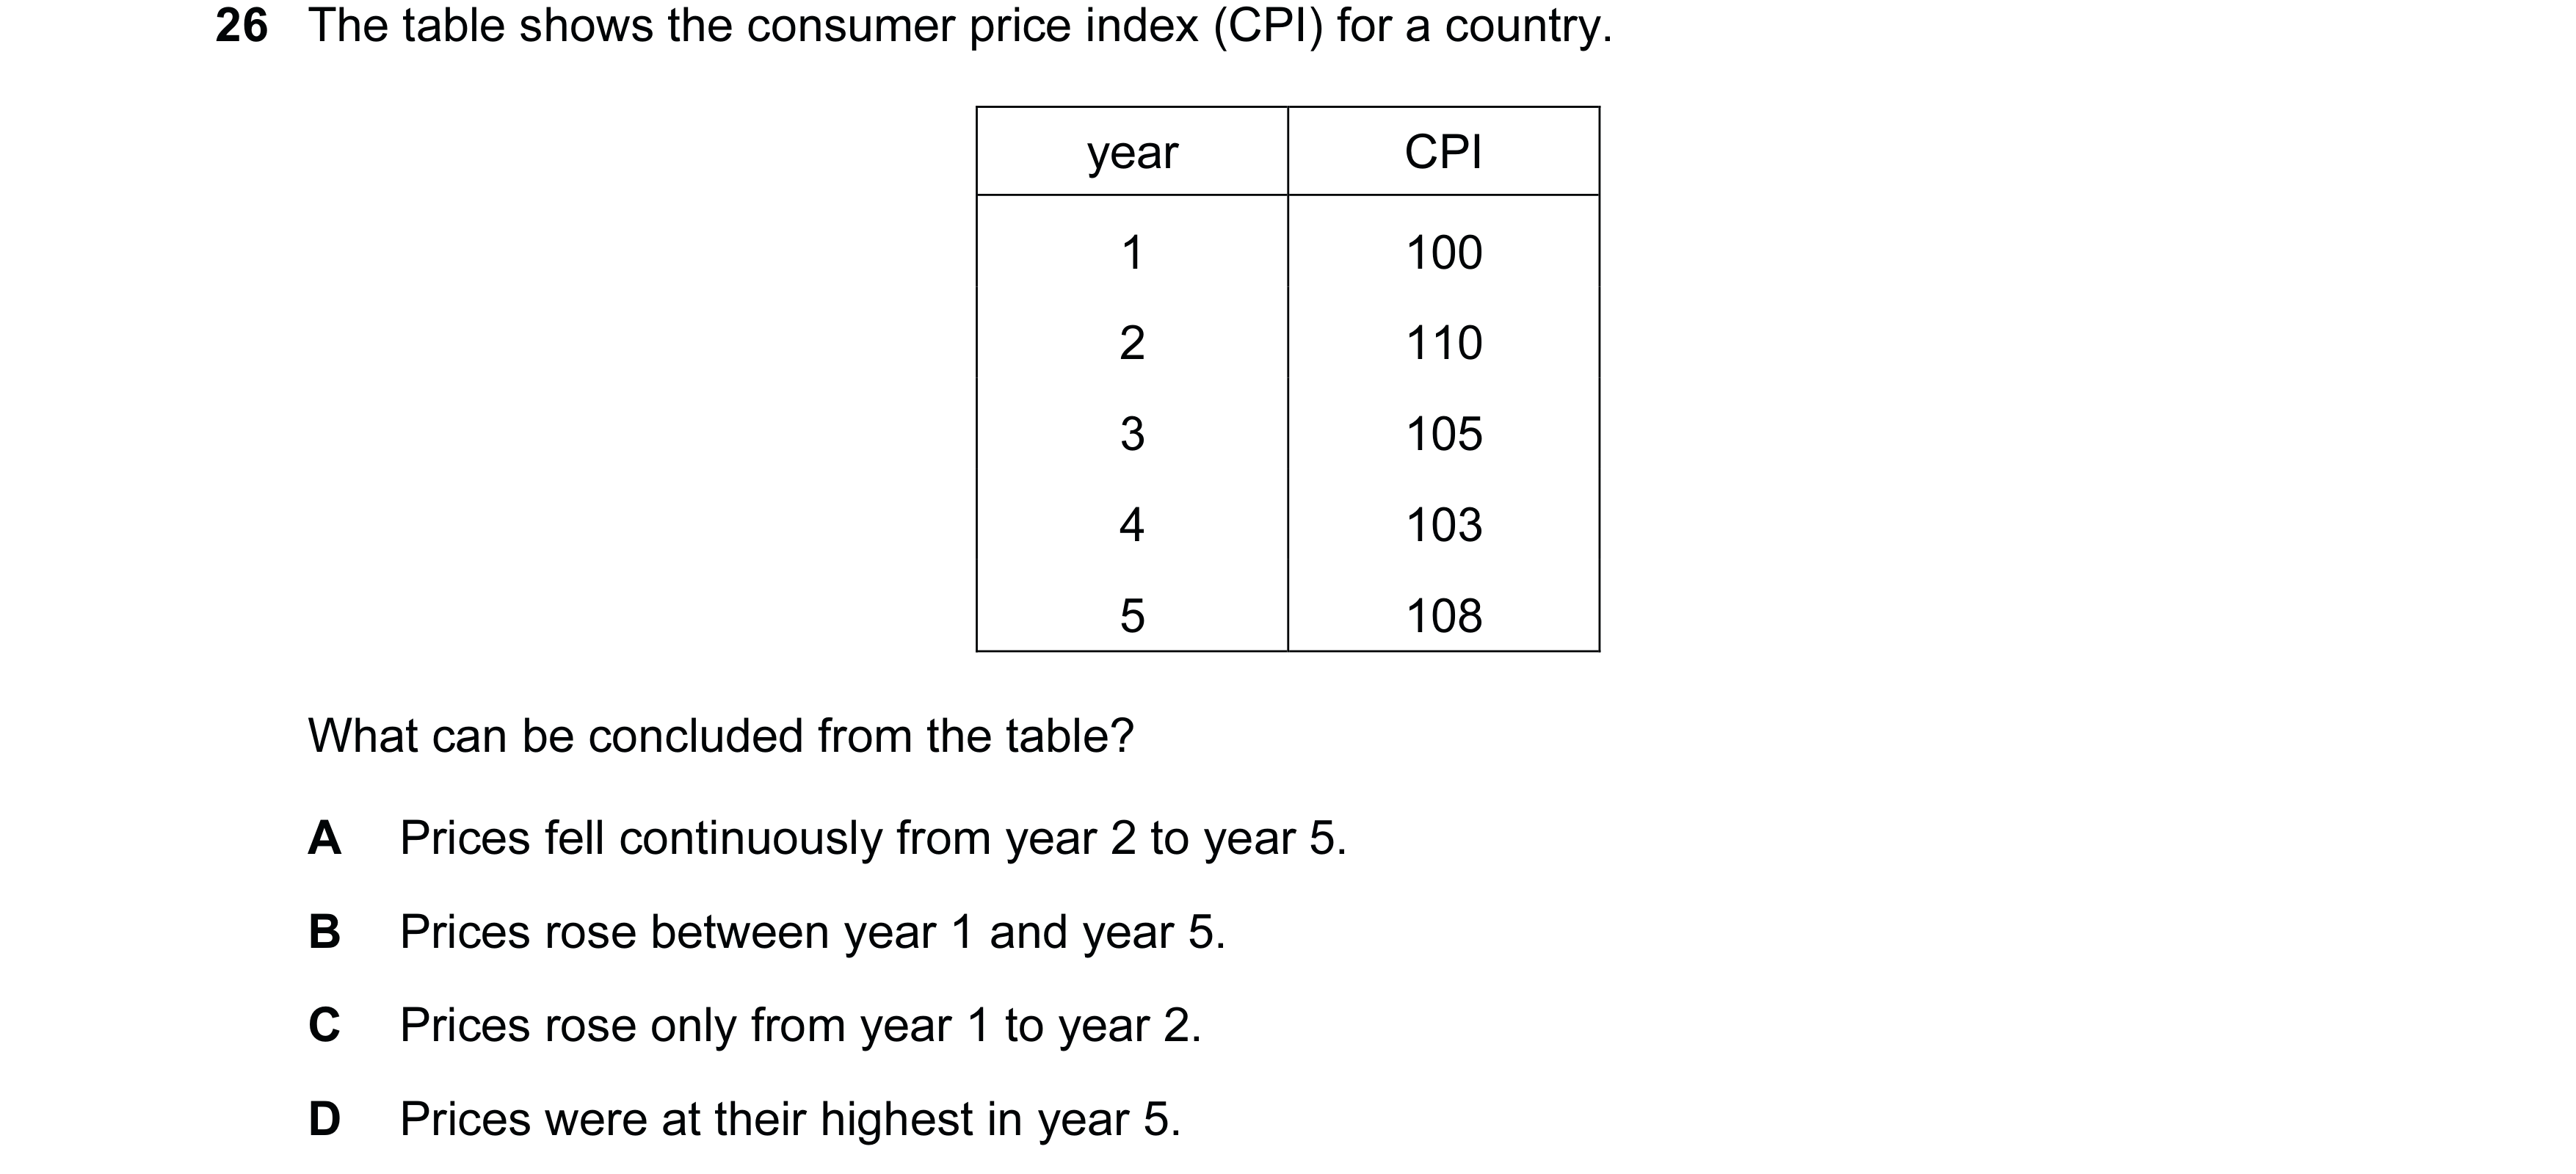
 33 / 67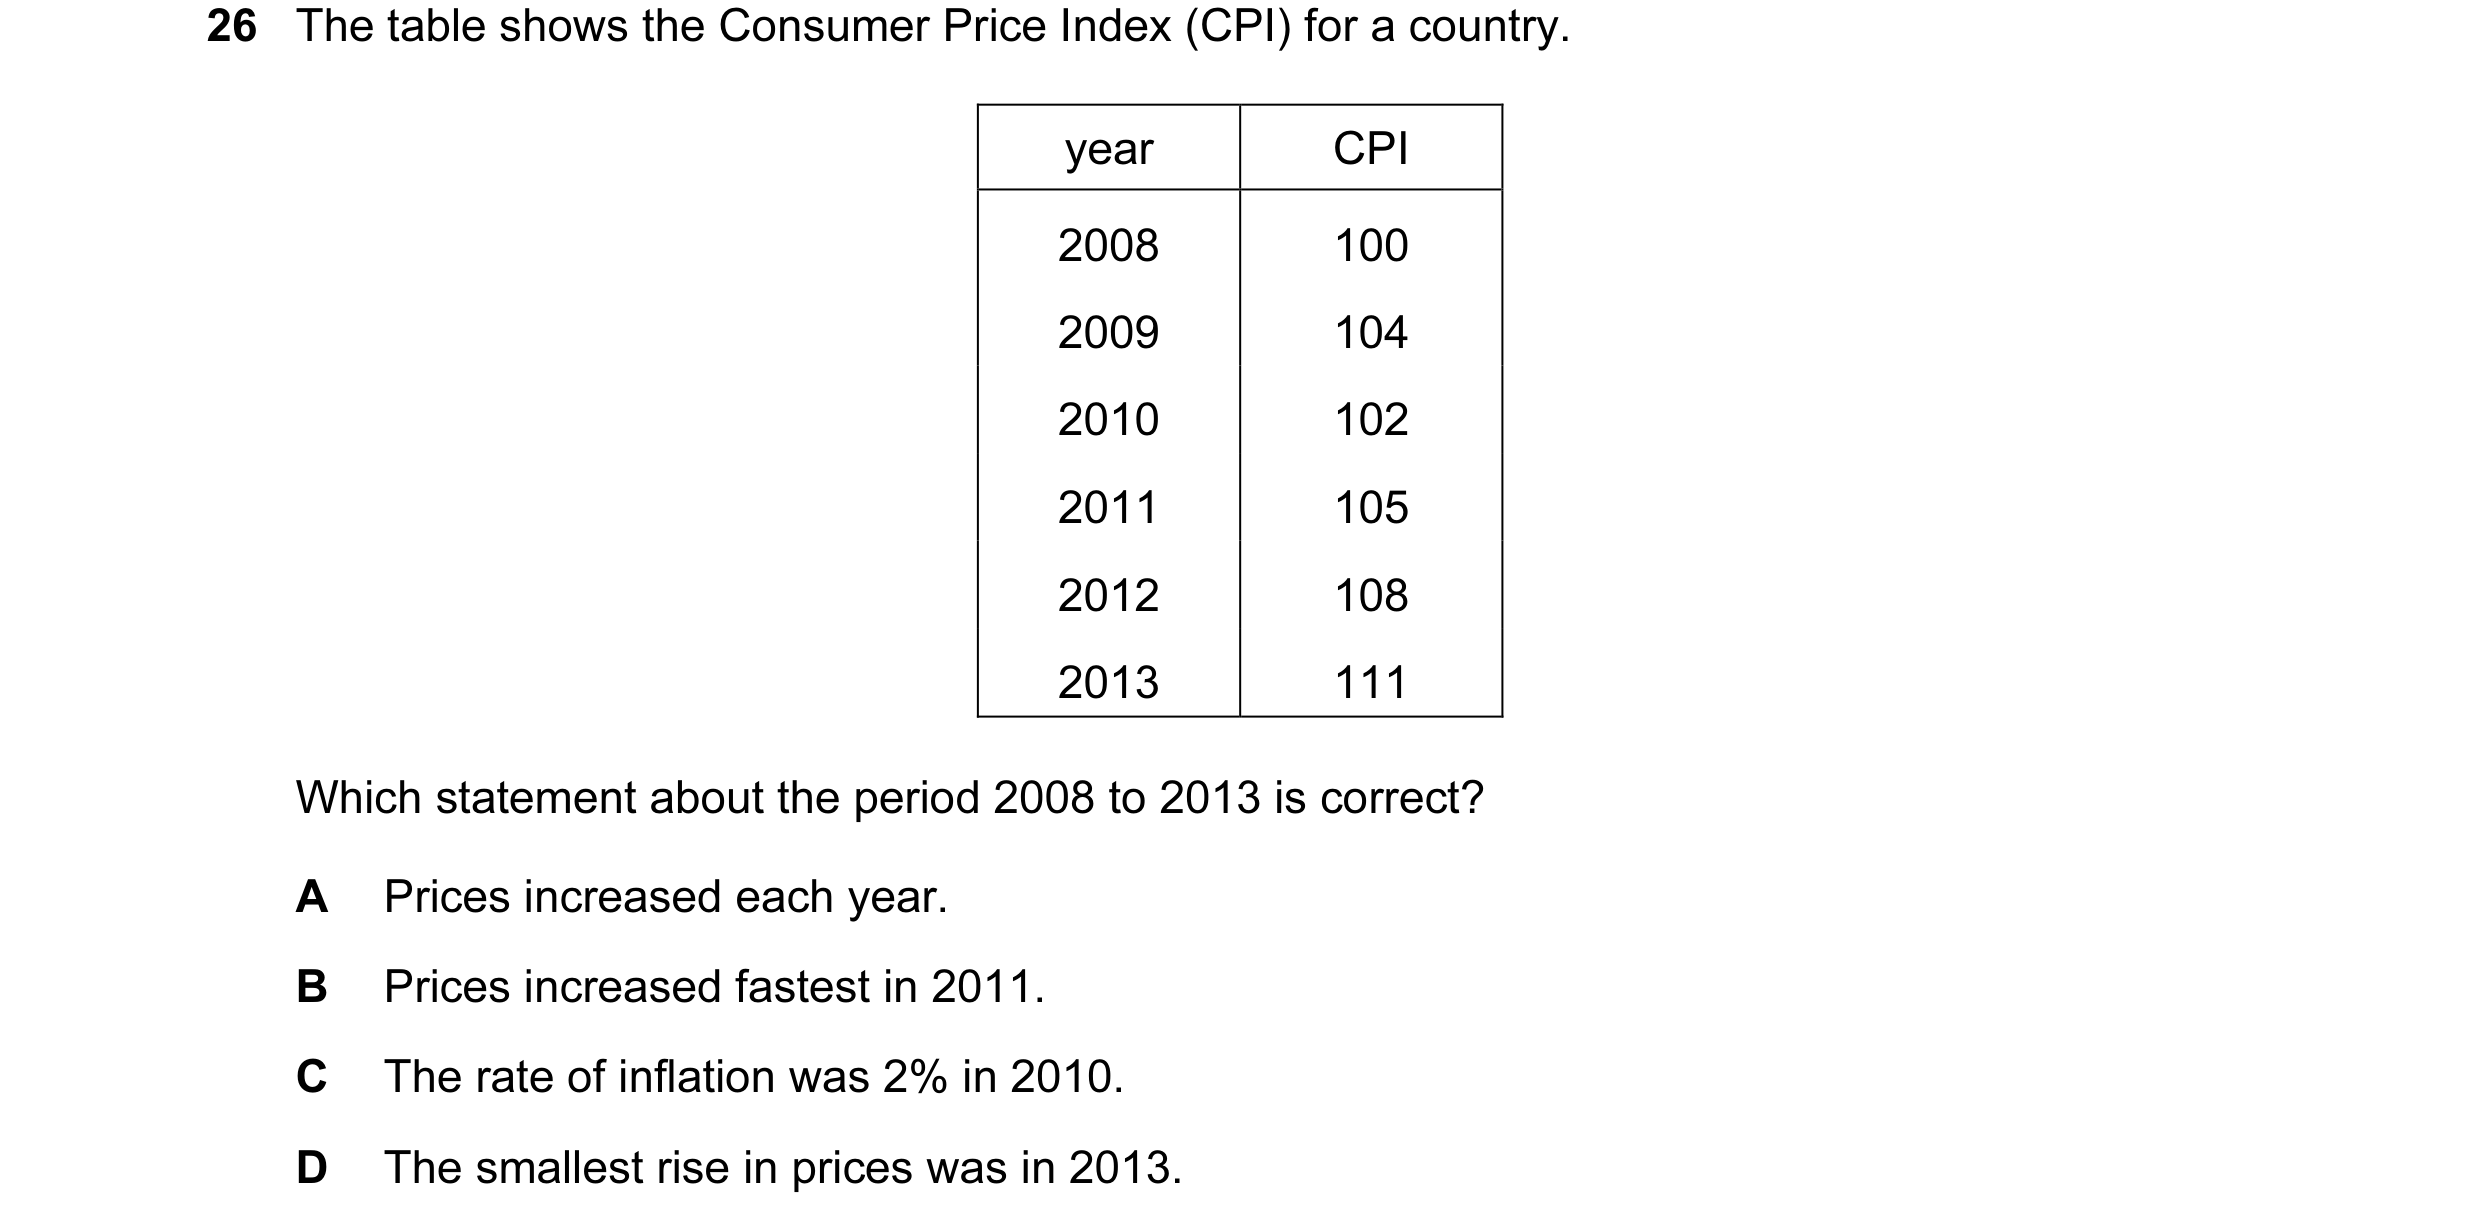
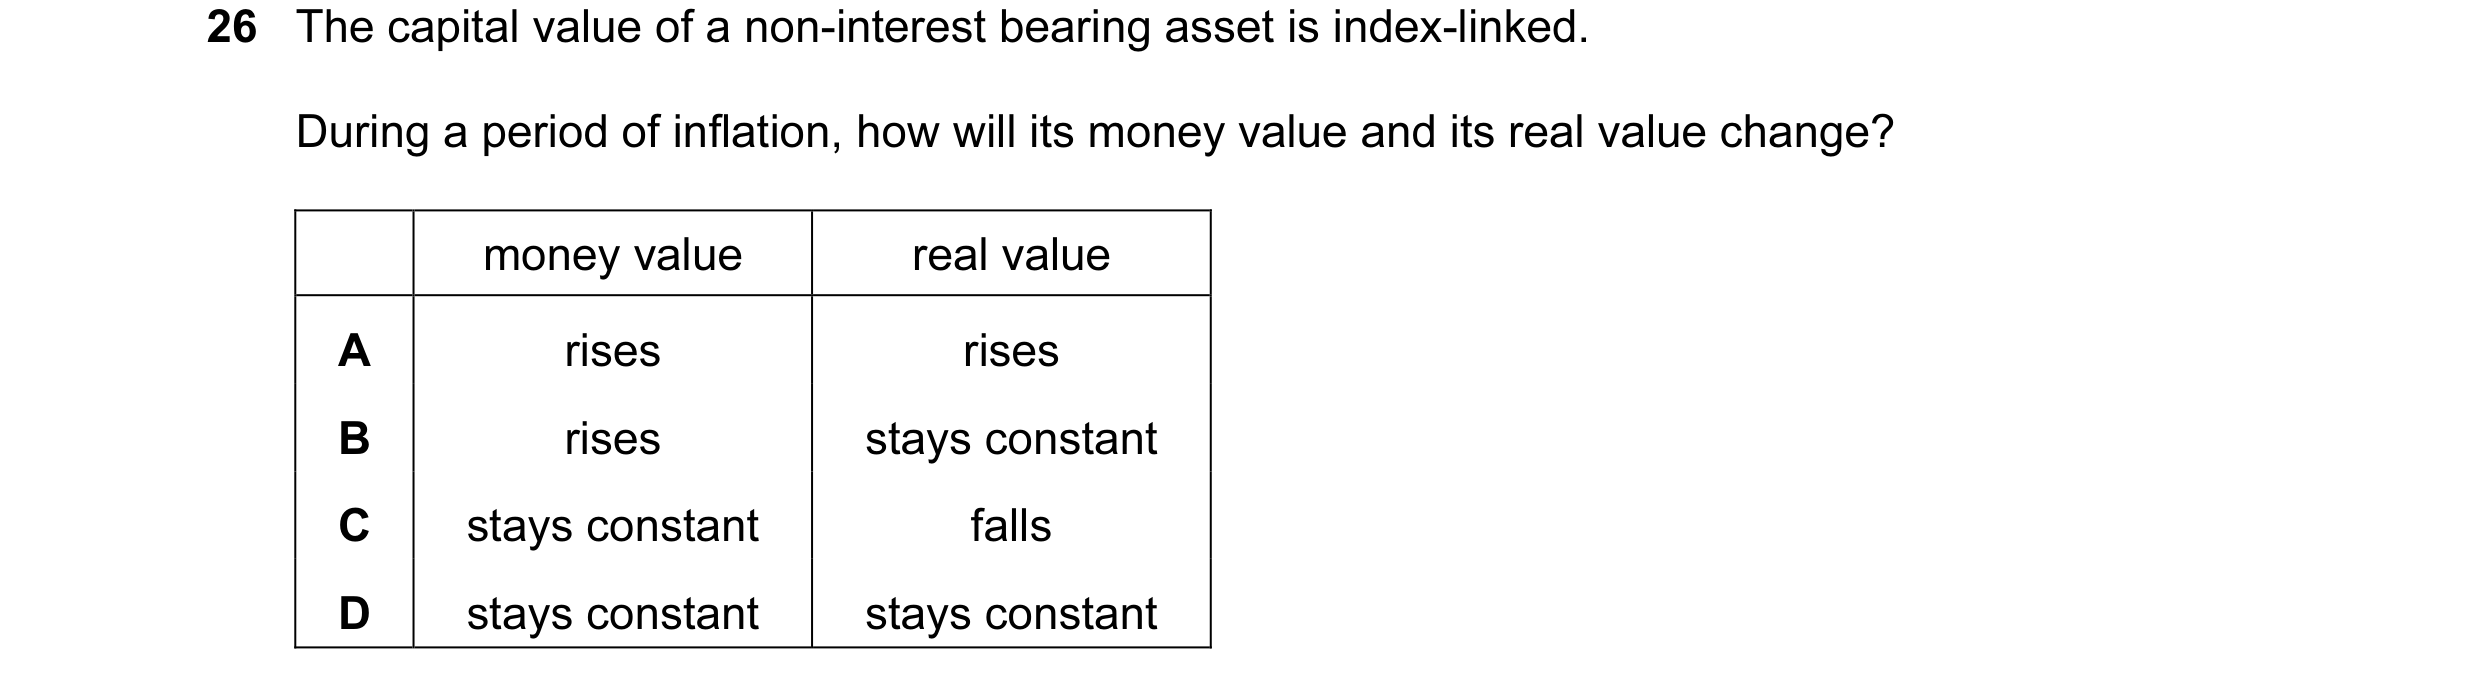
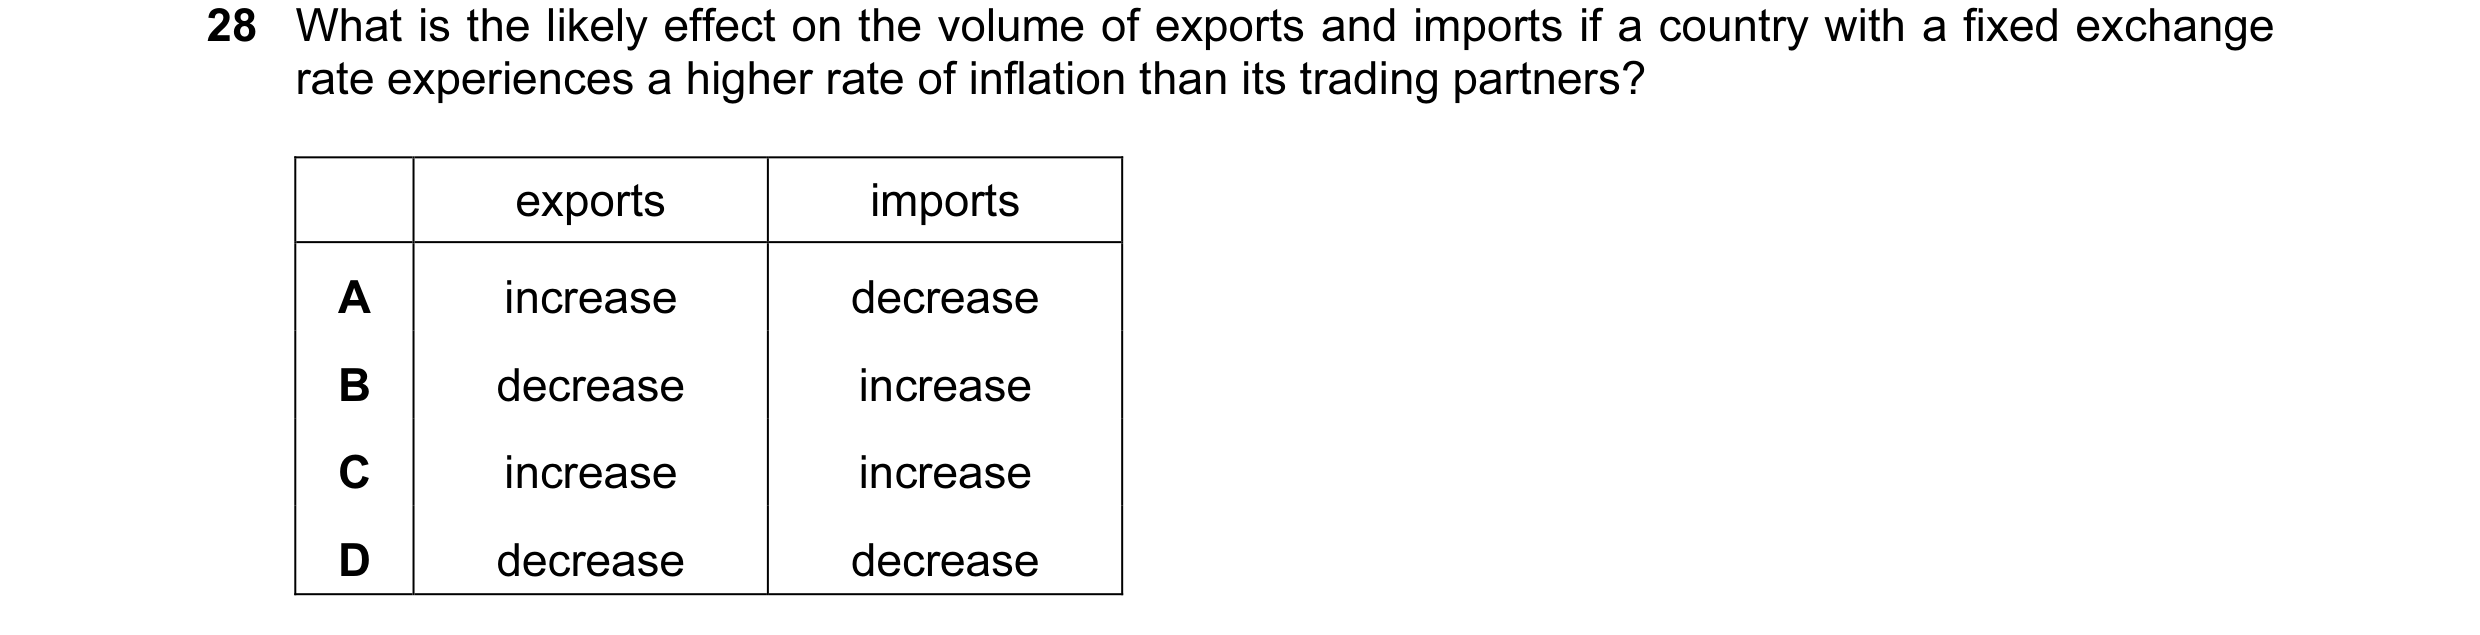 34 / 67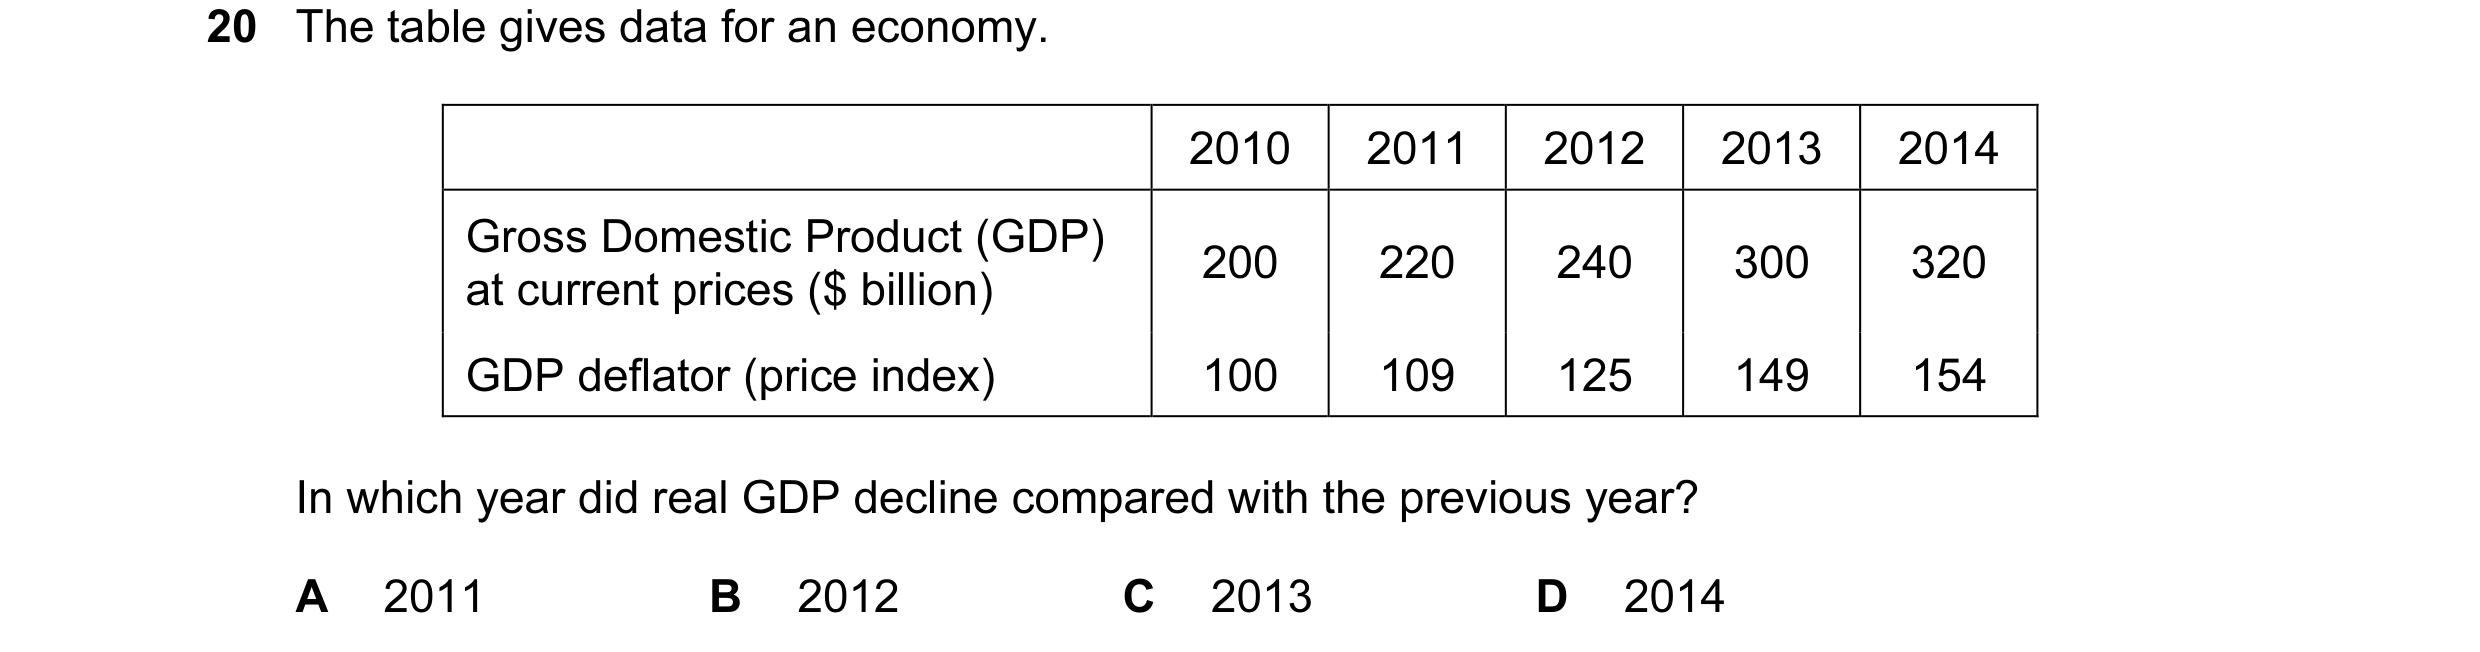

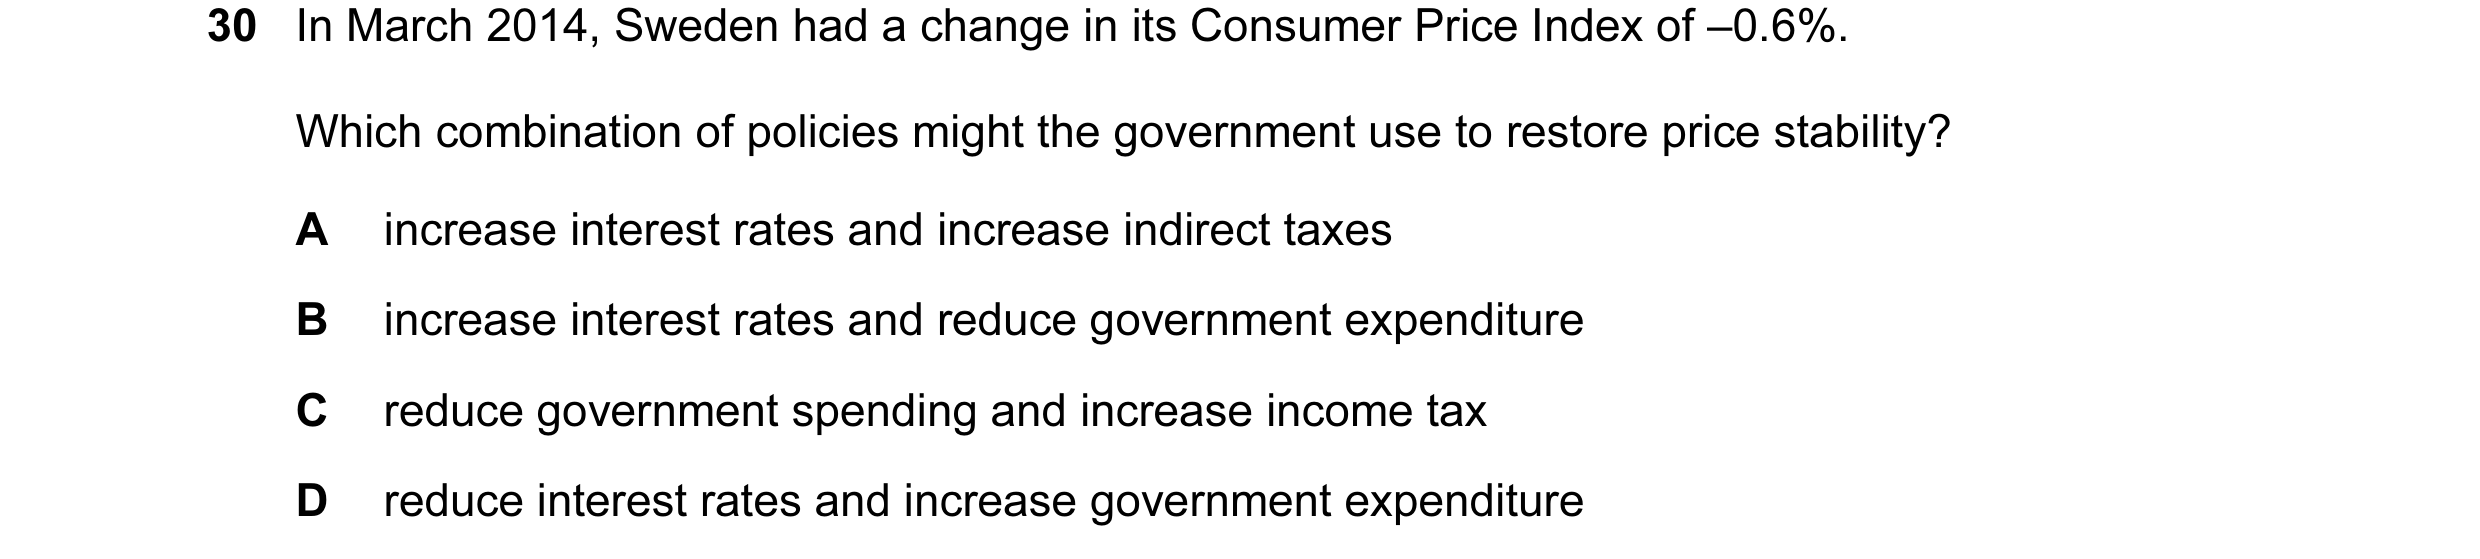
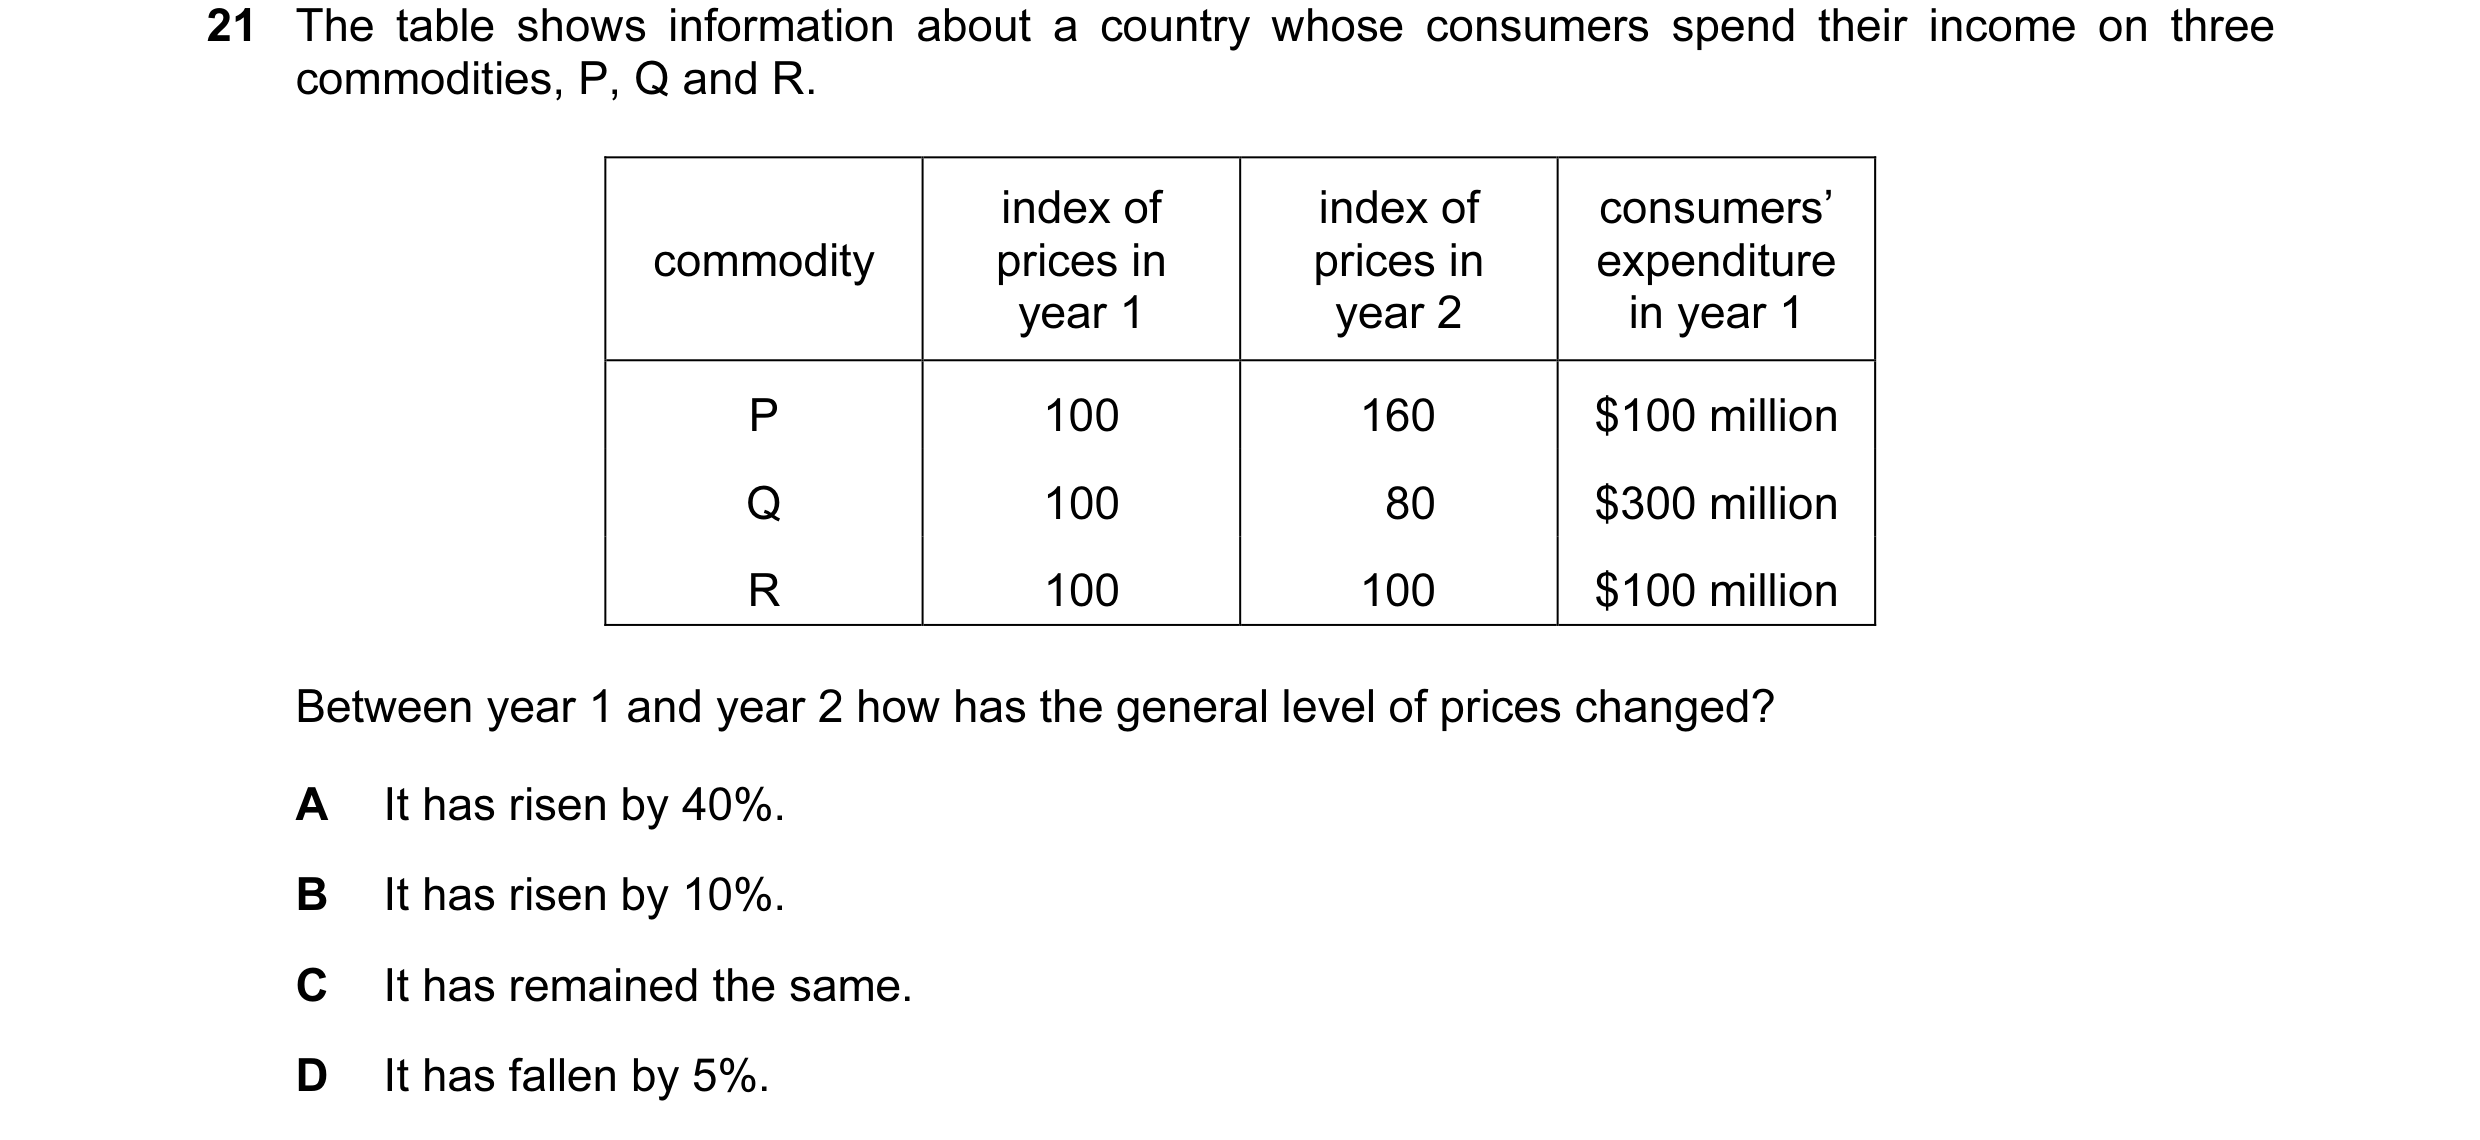 35 / 67

 36 / 67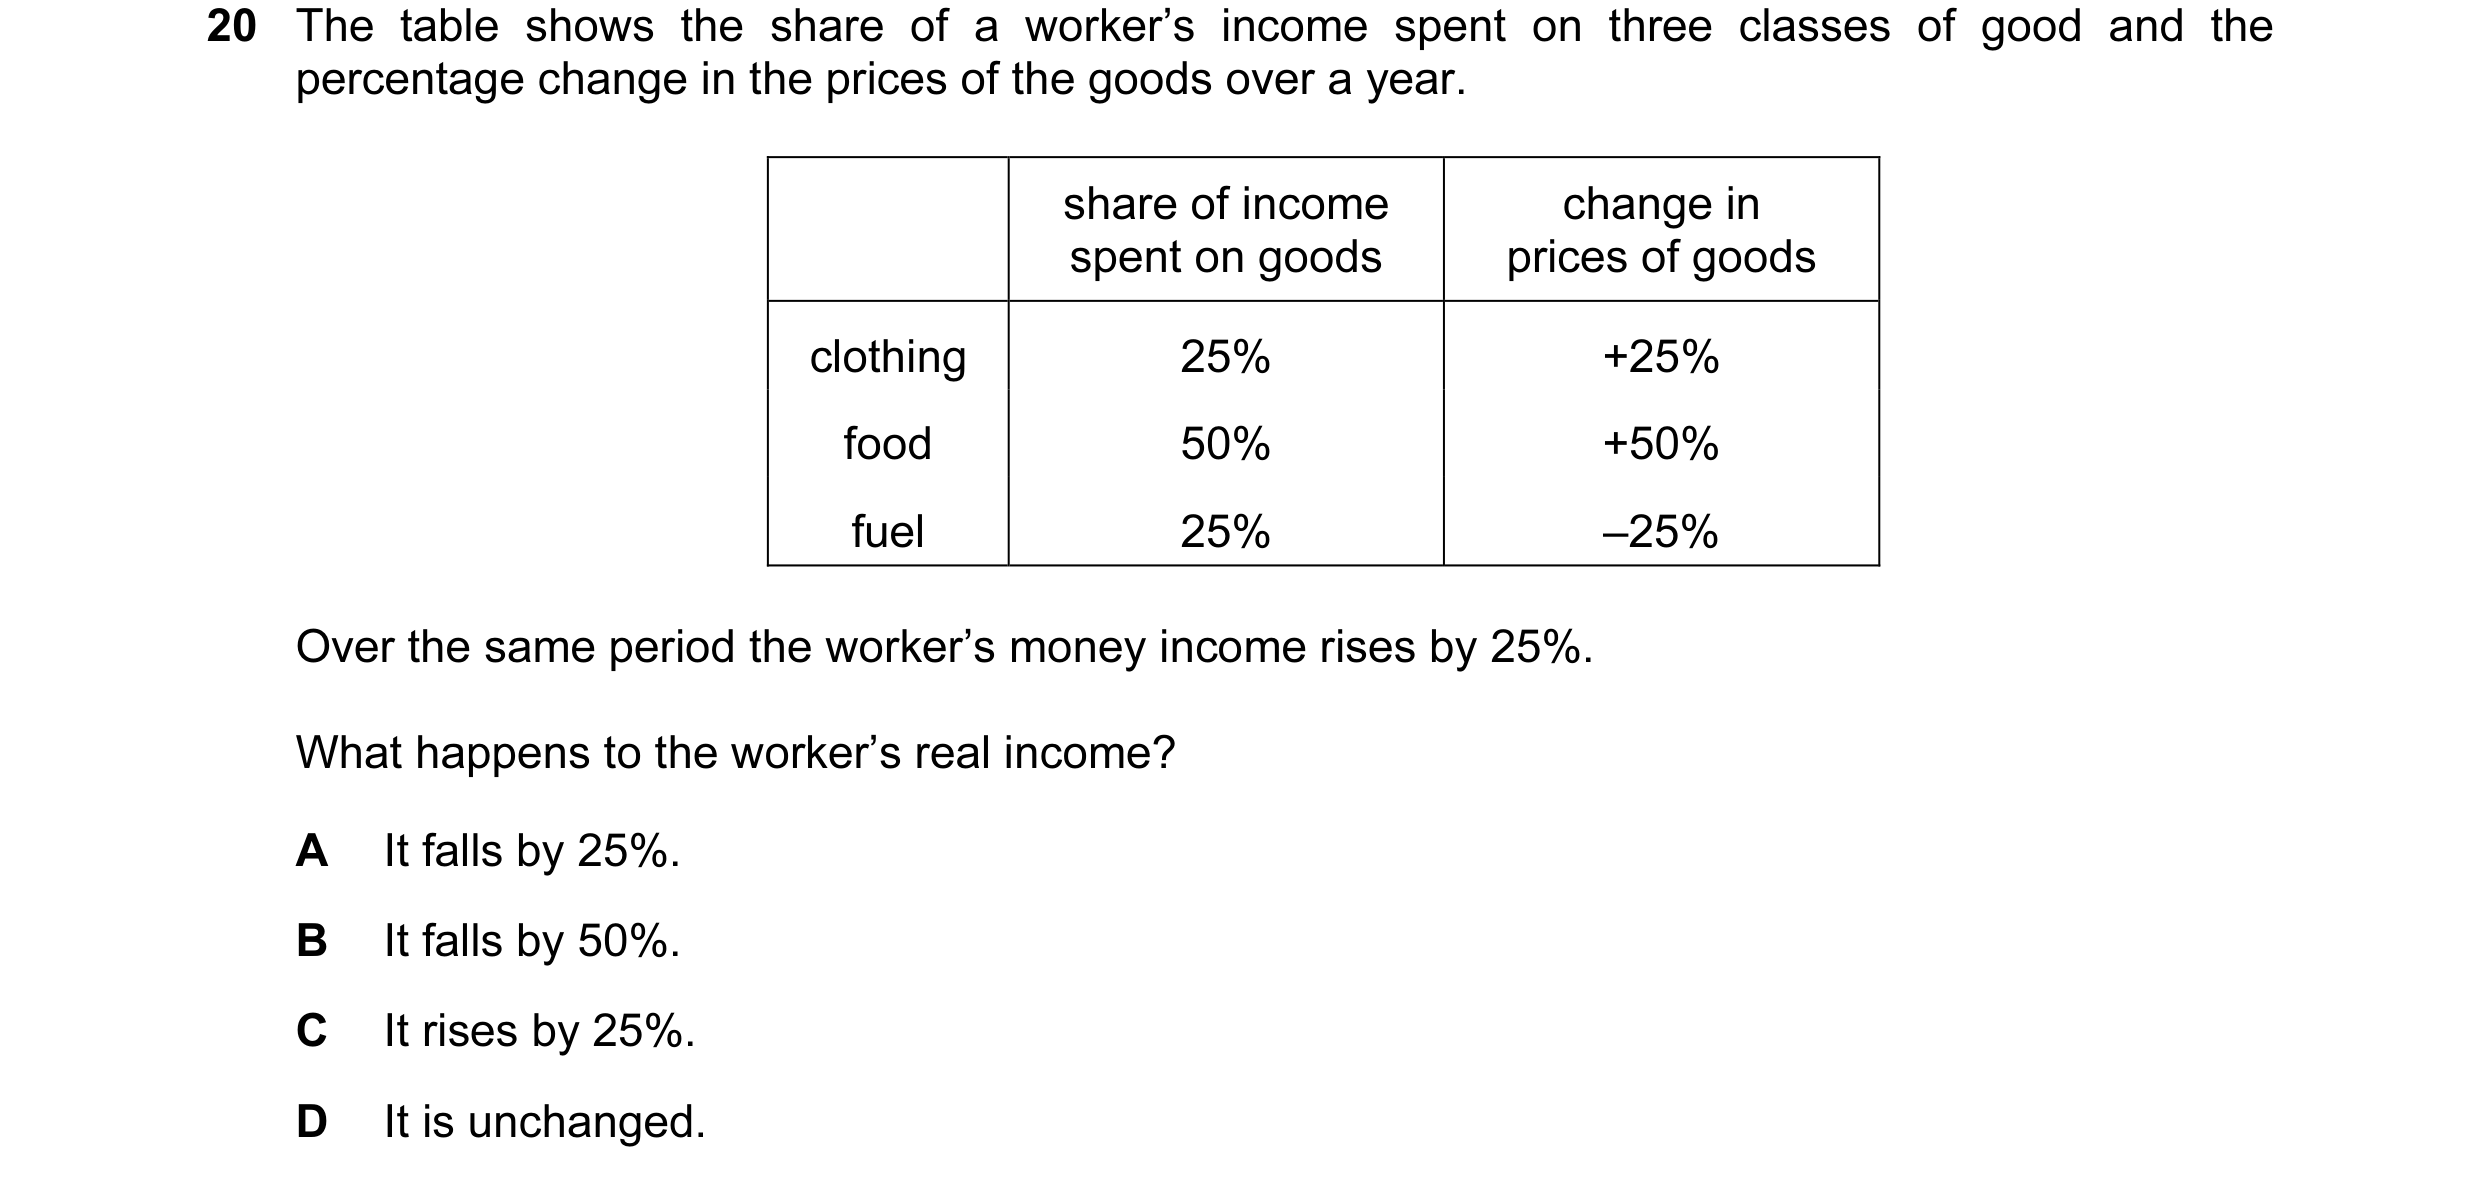
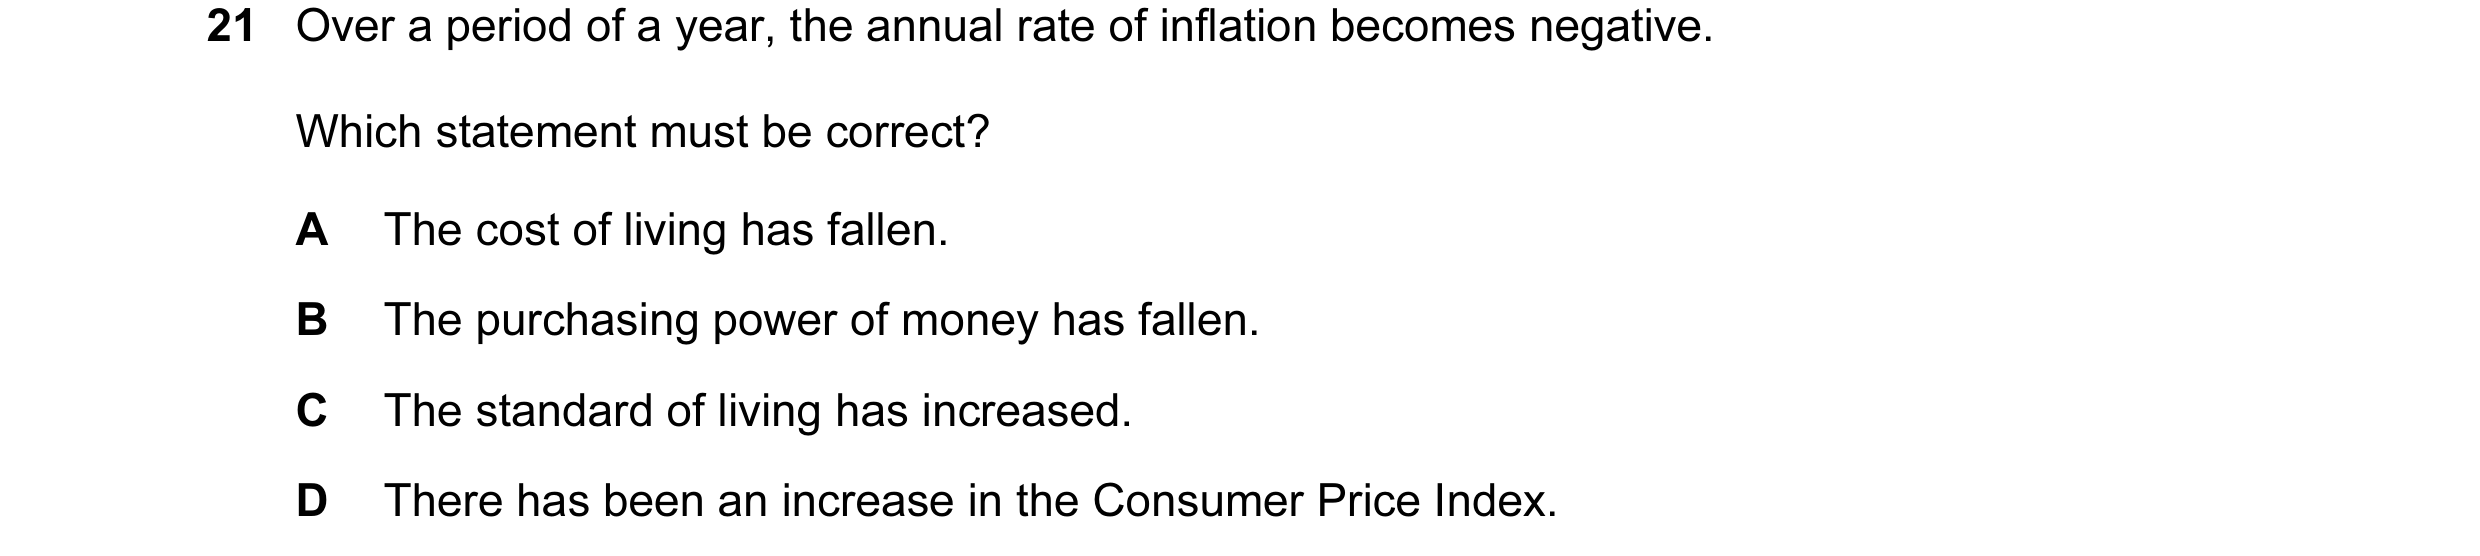
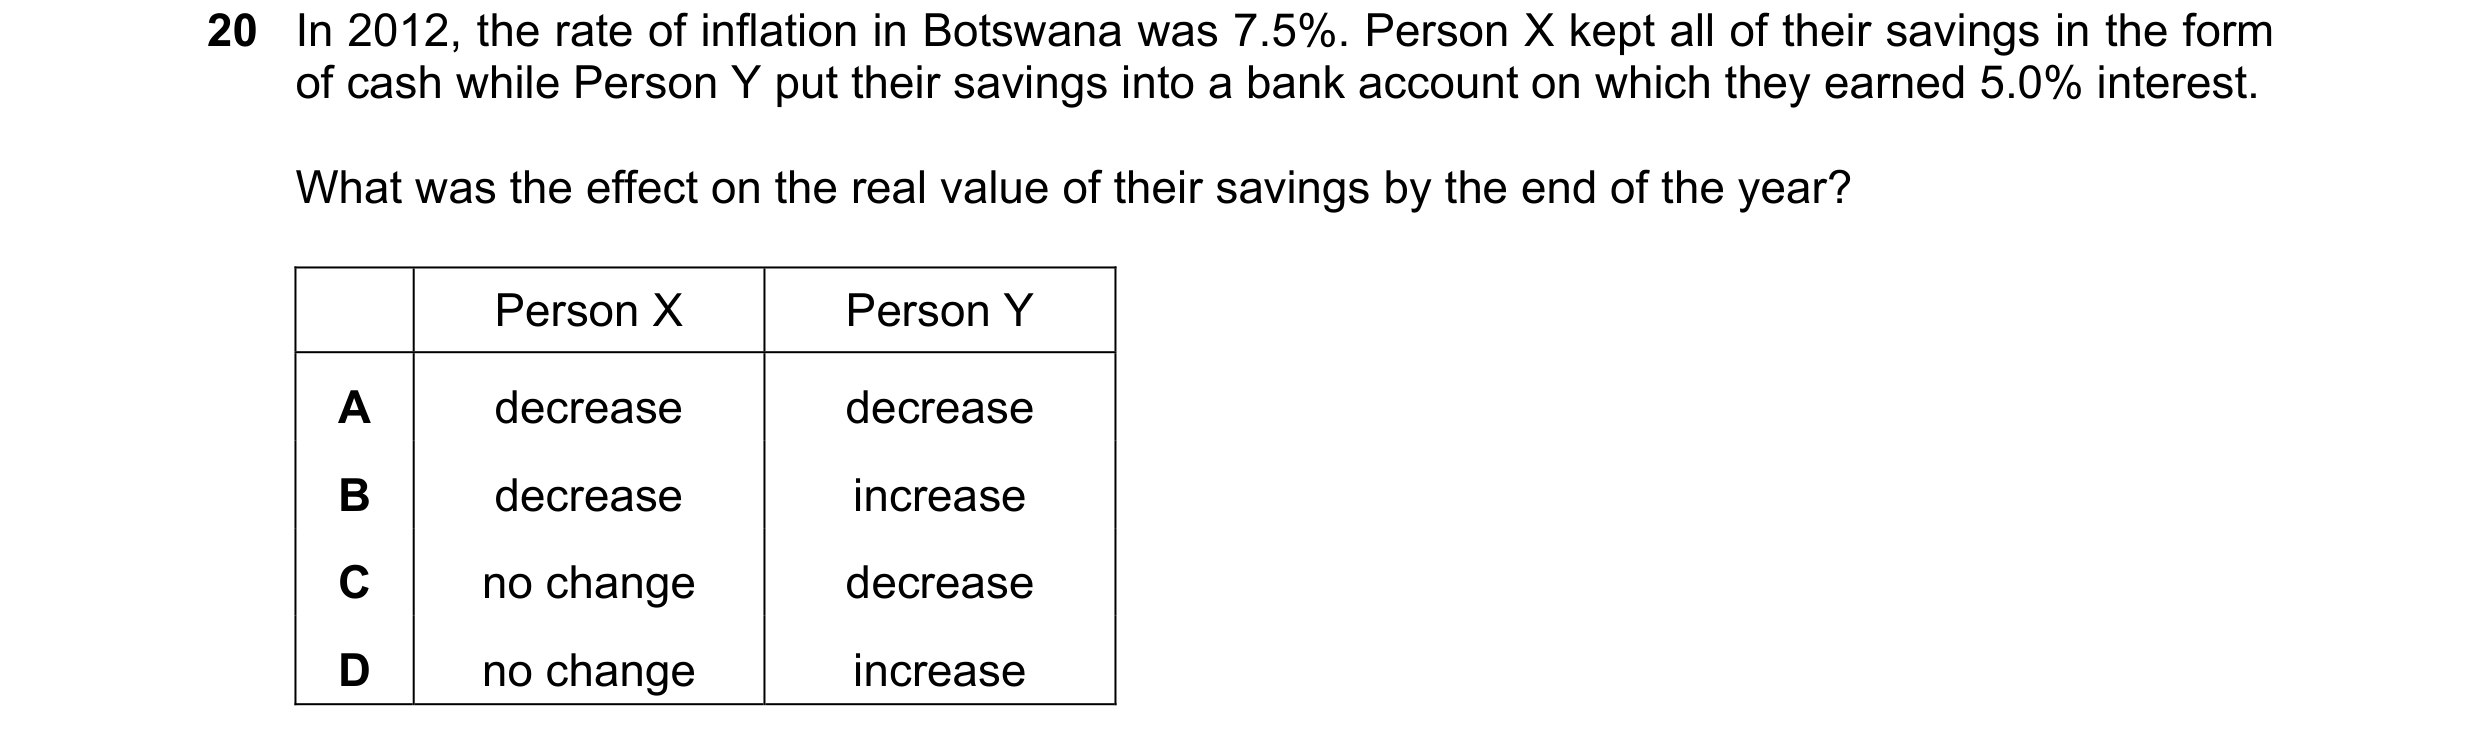 37 / 67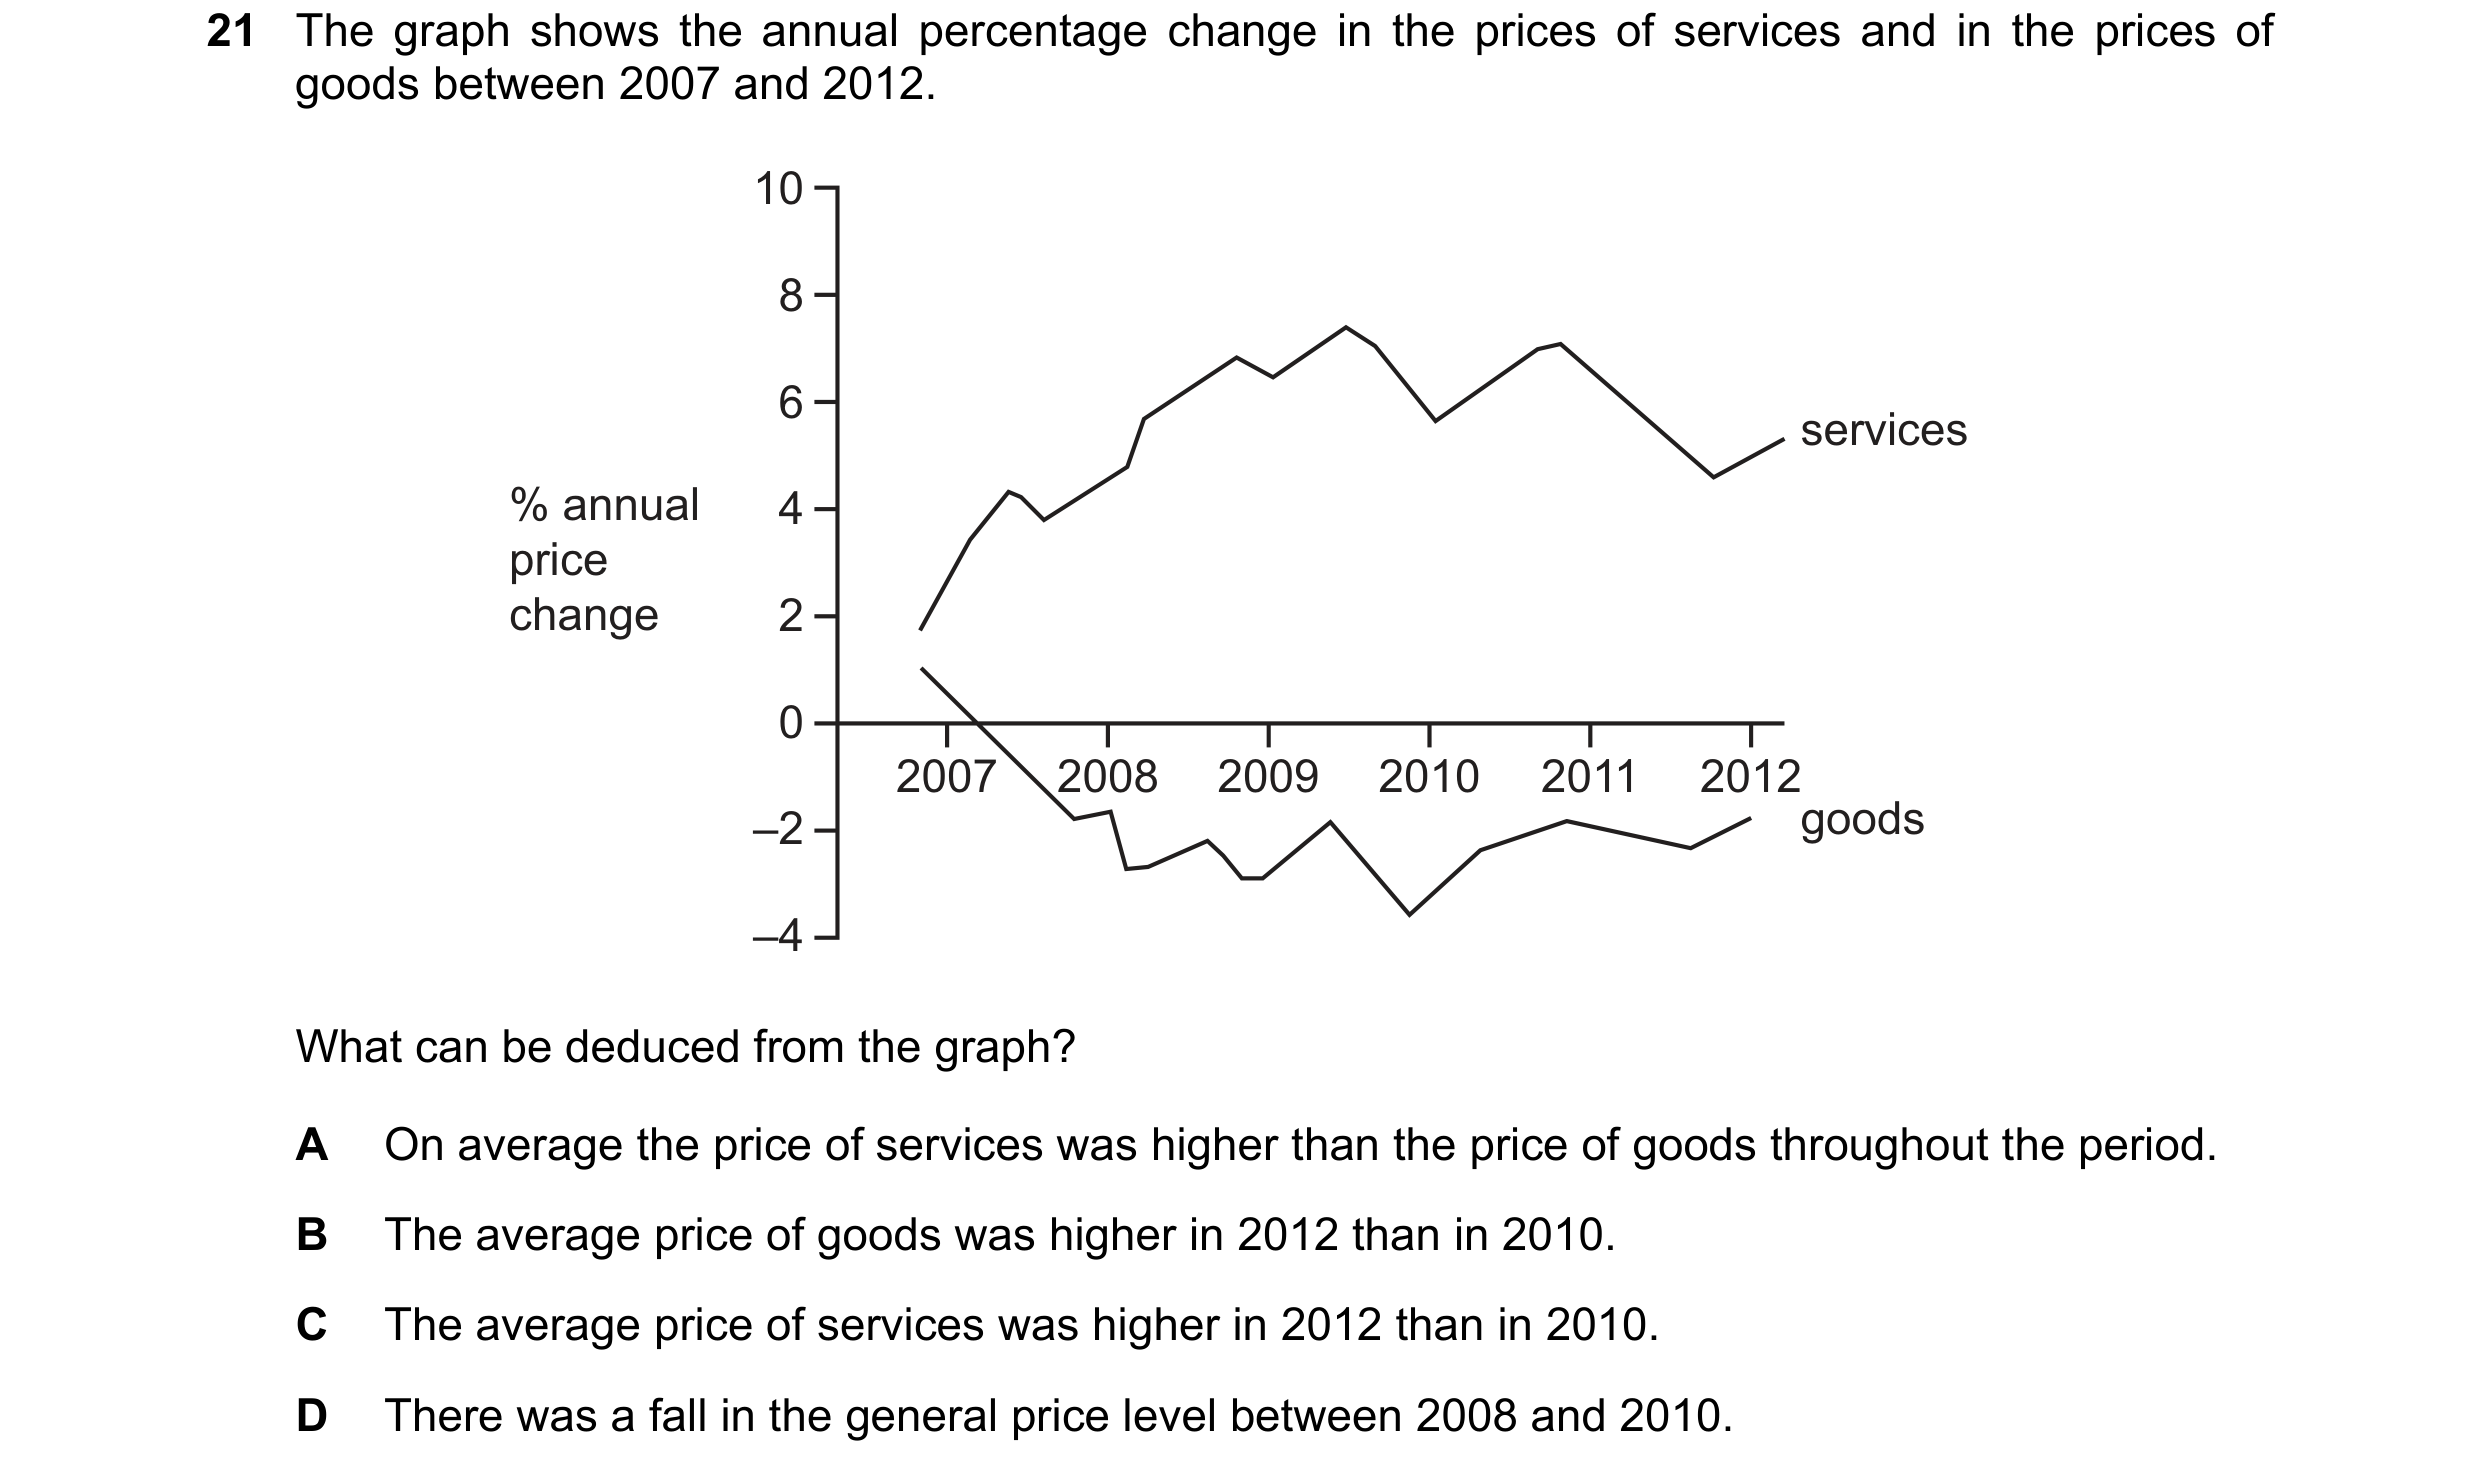
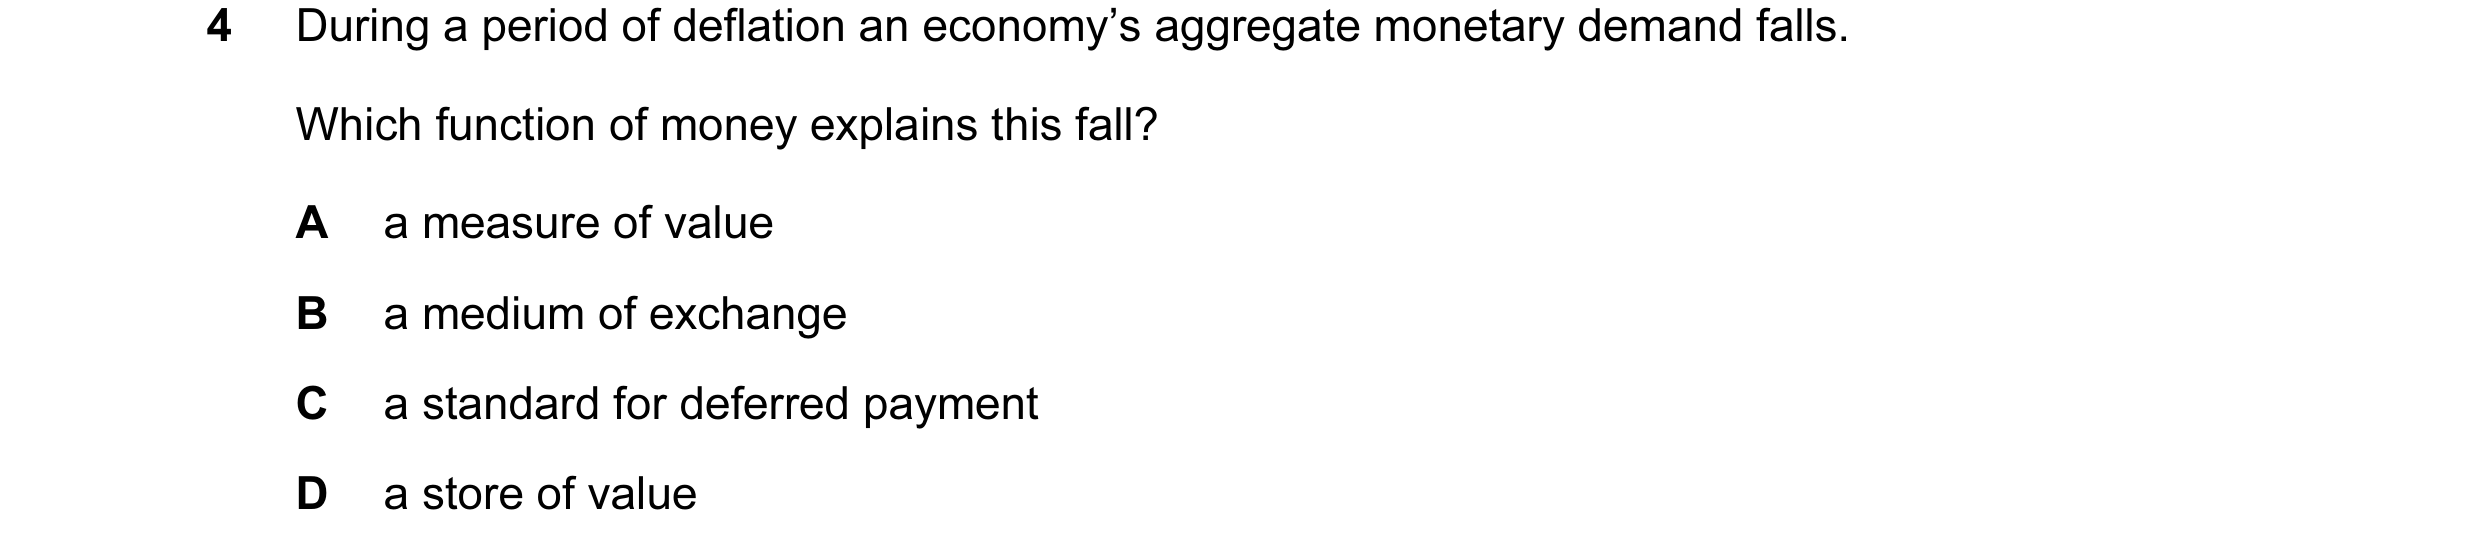
 38 / 67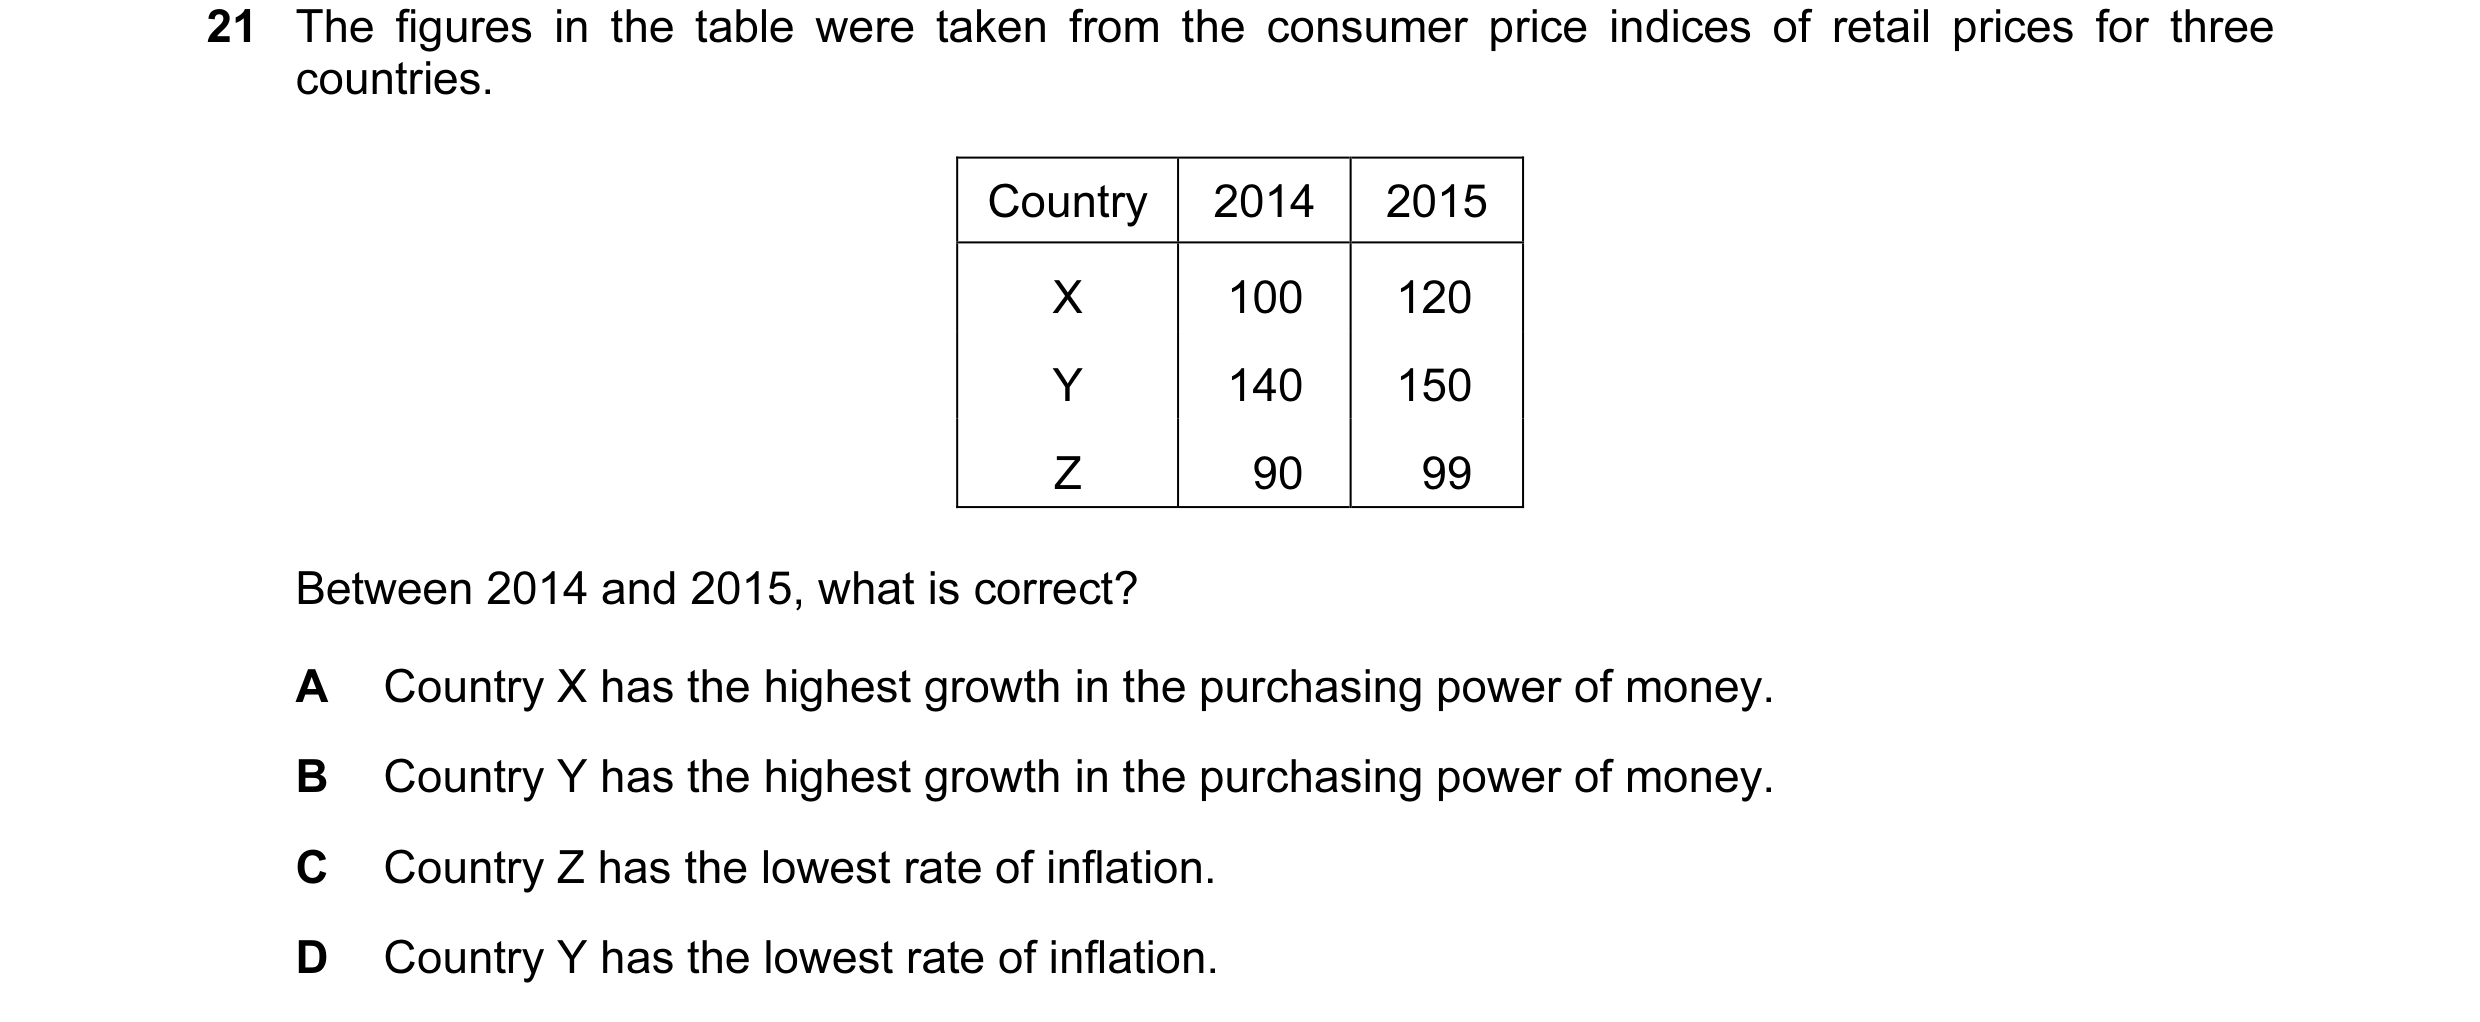

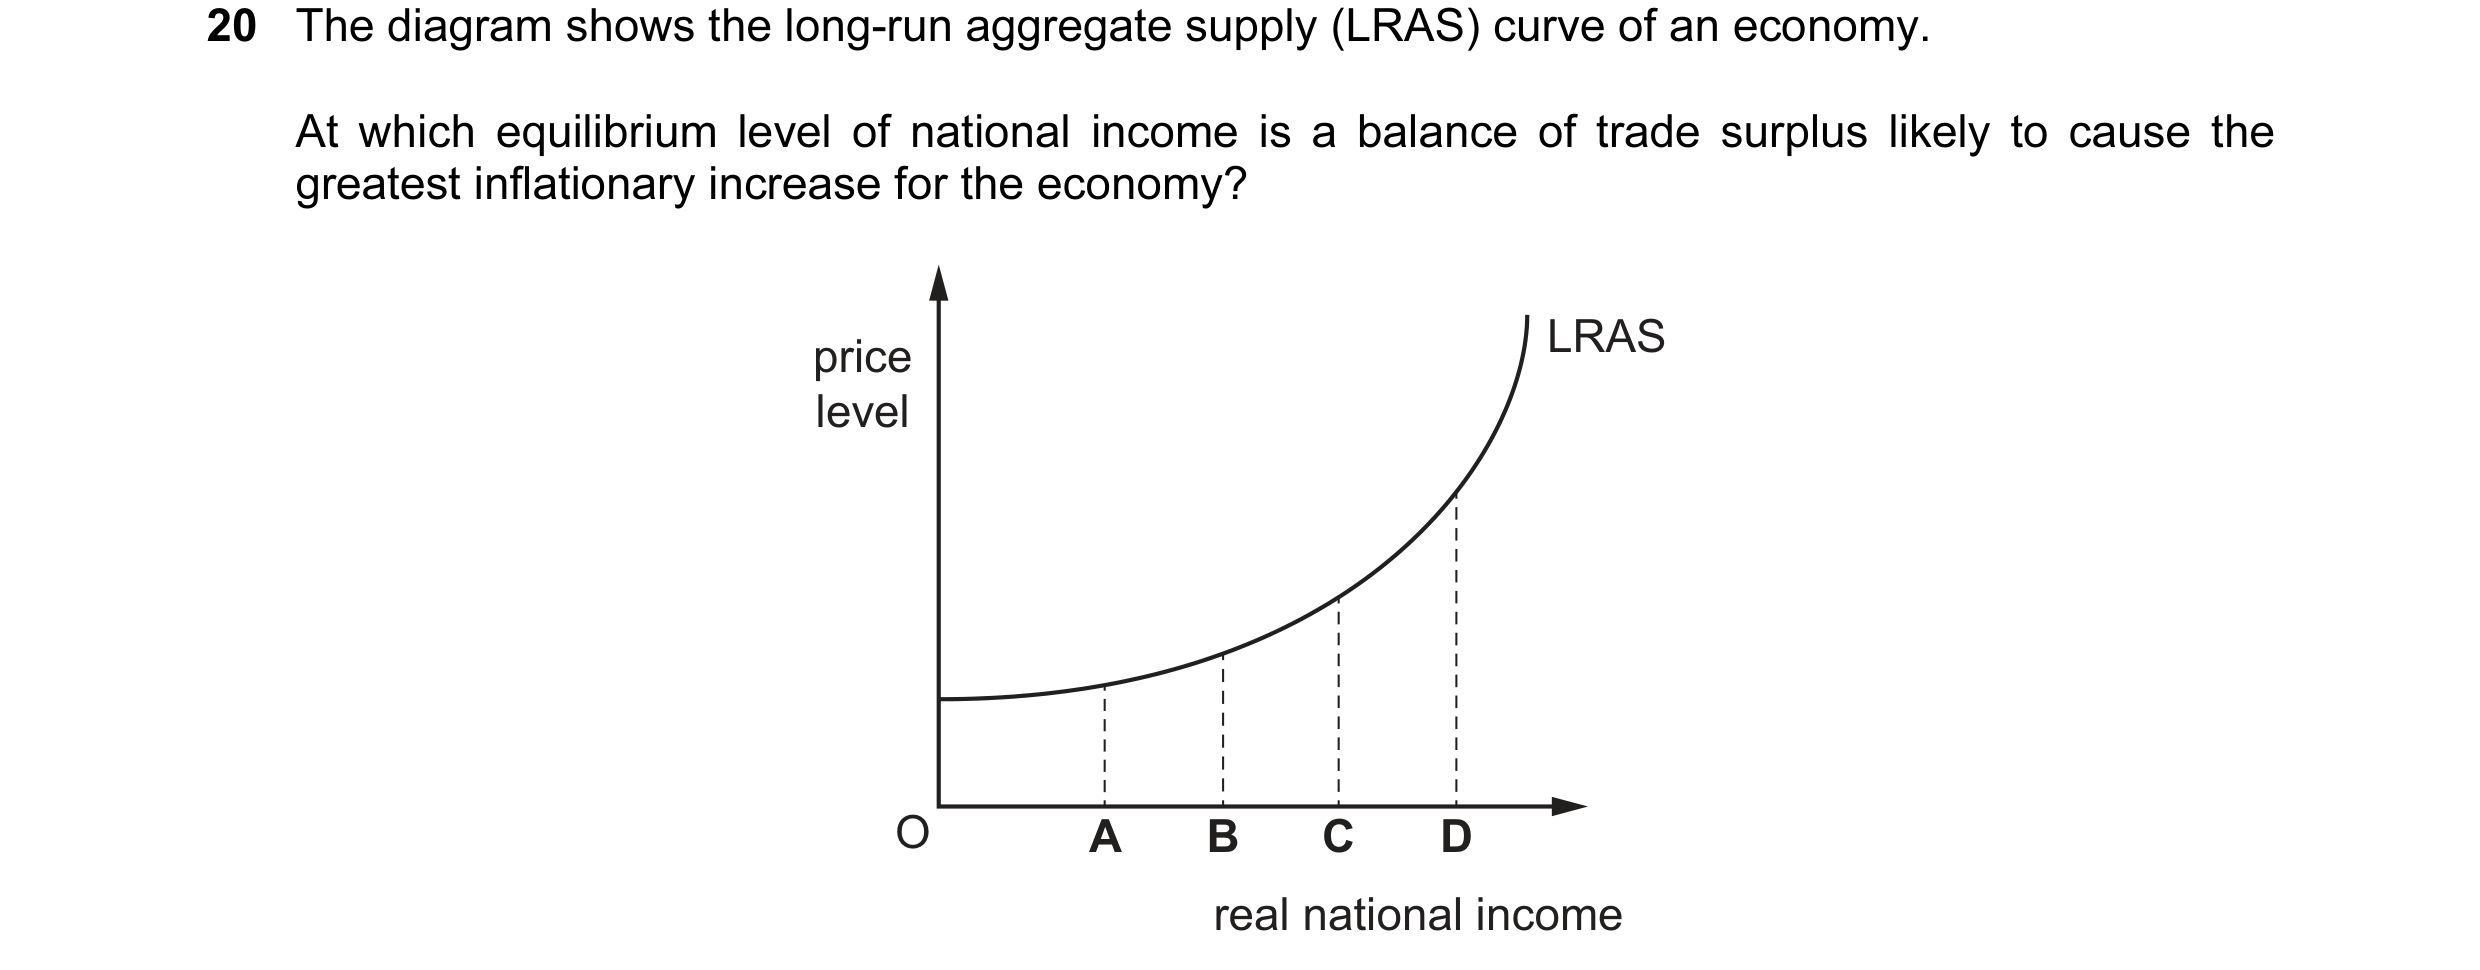
 39 / 67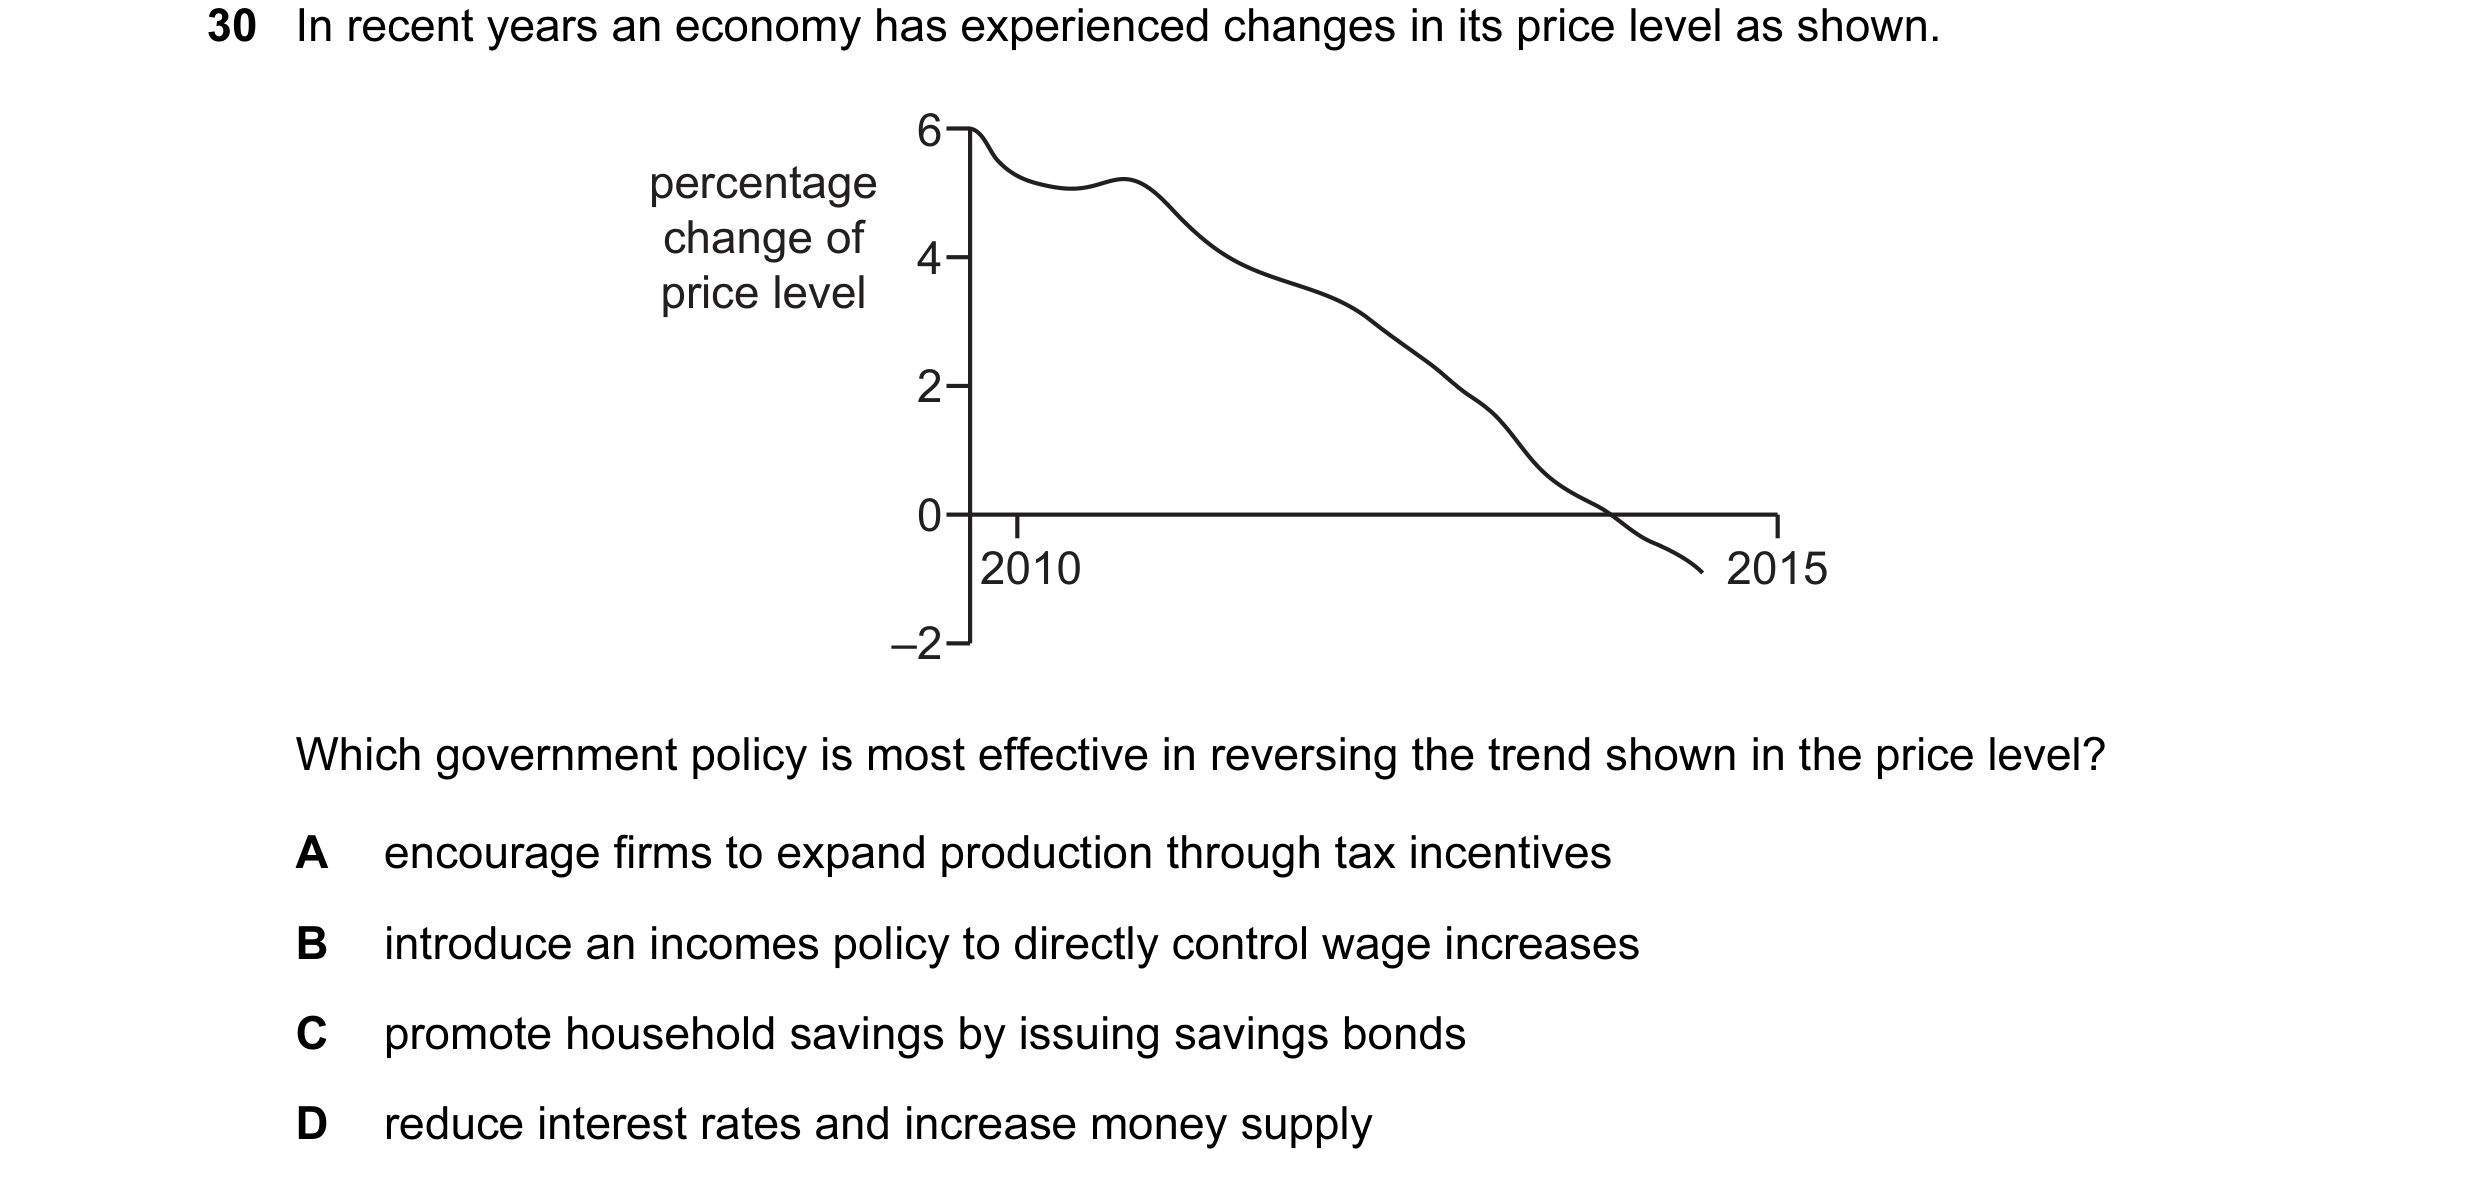

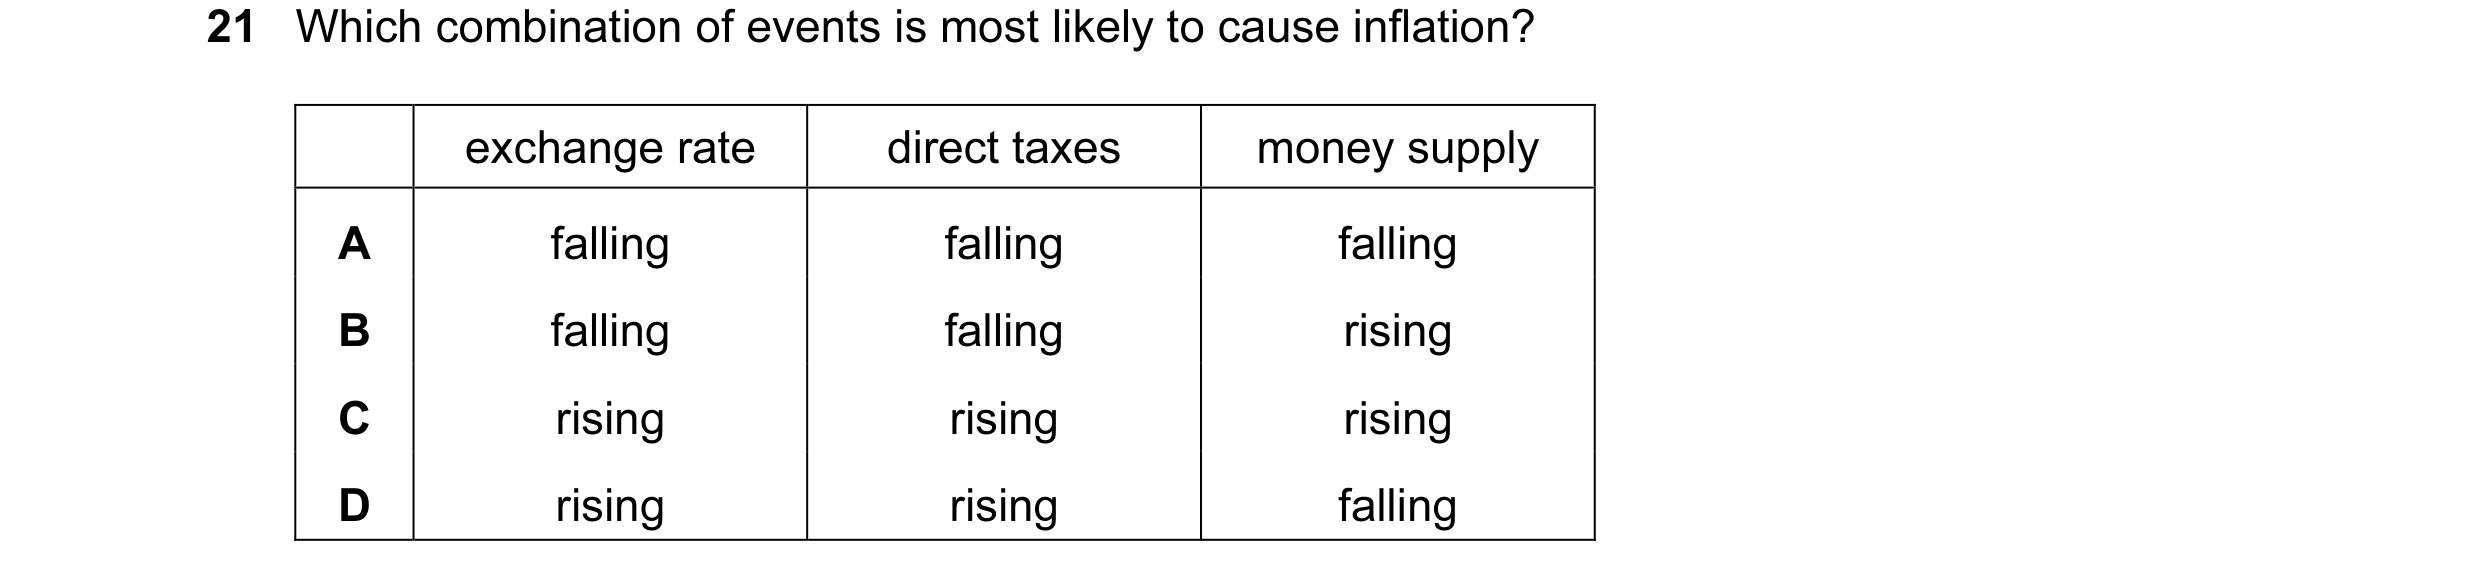 40 / 67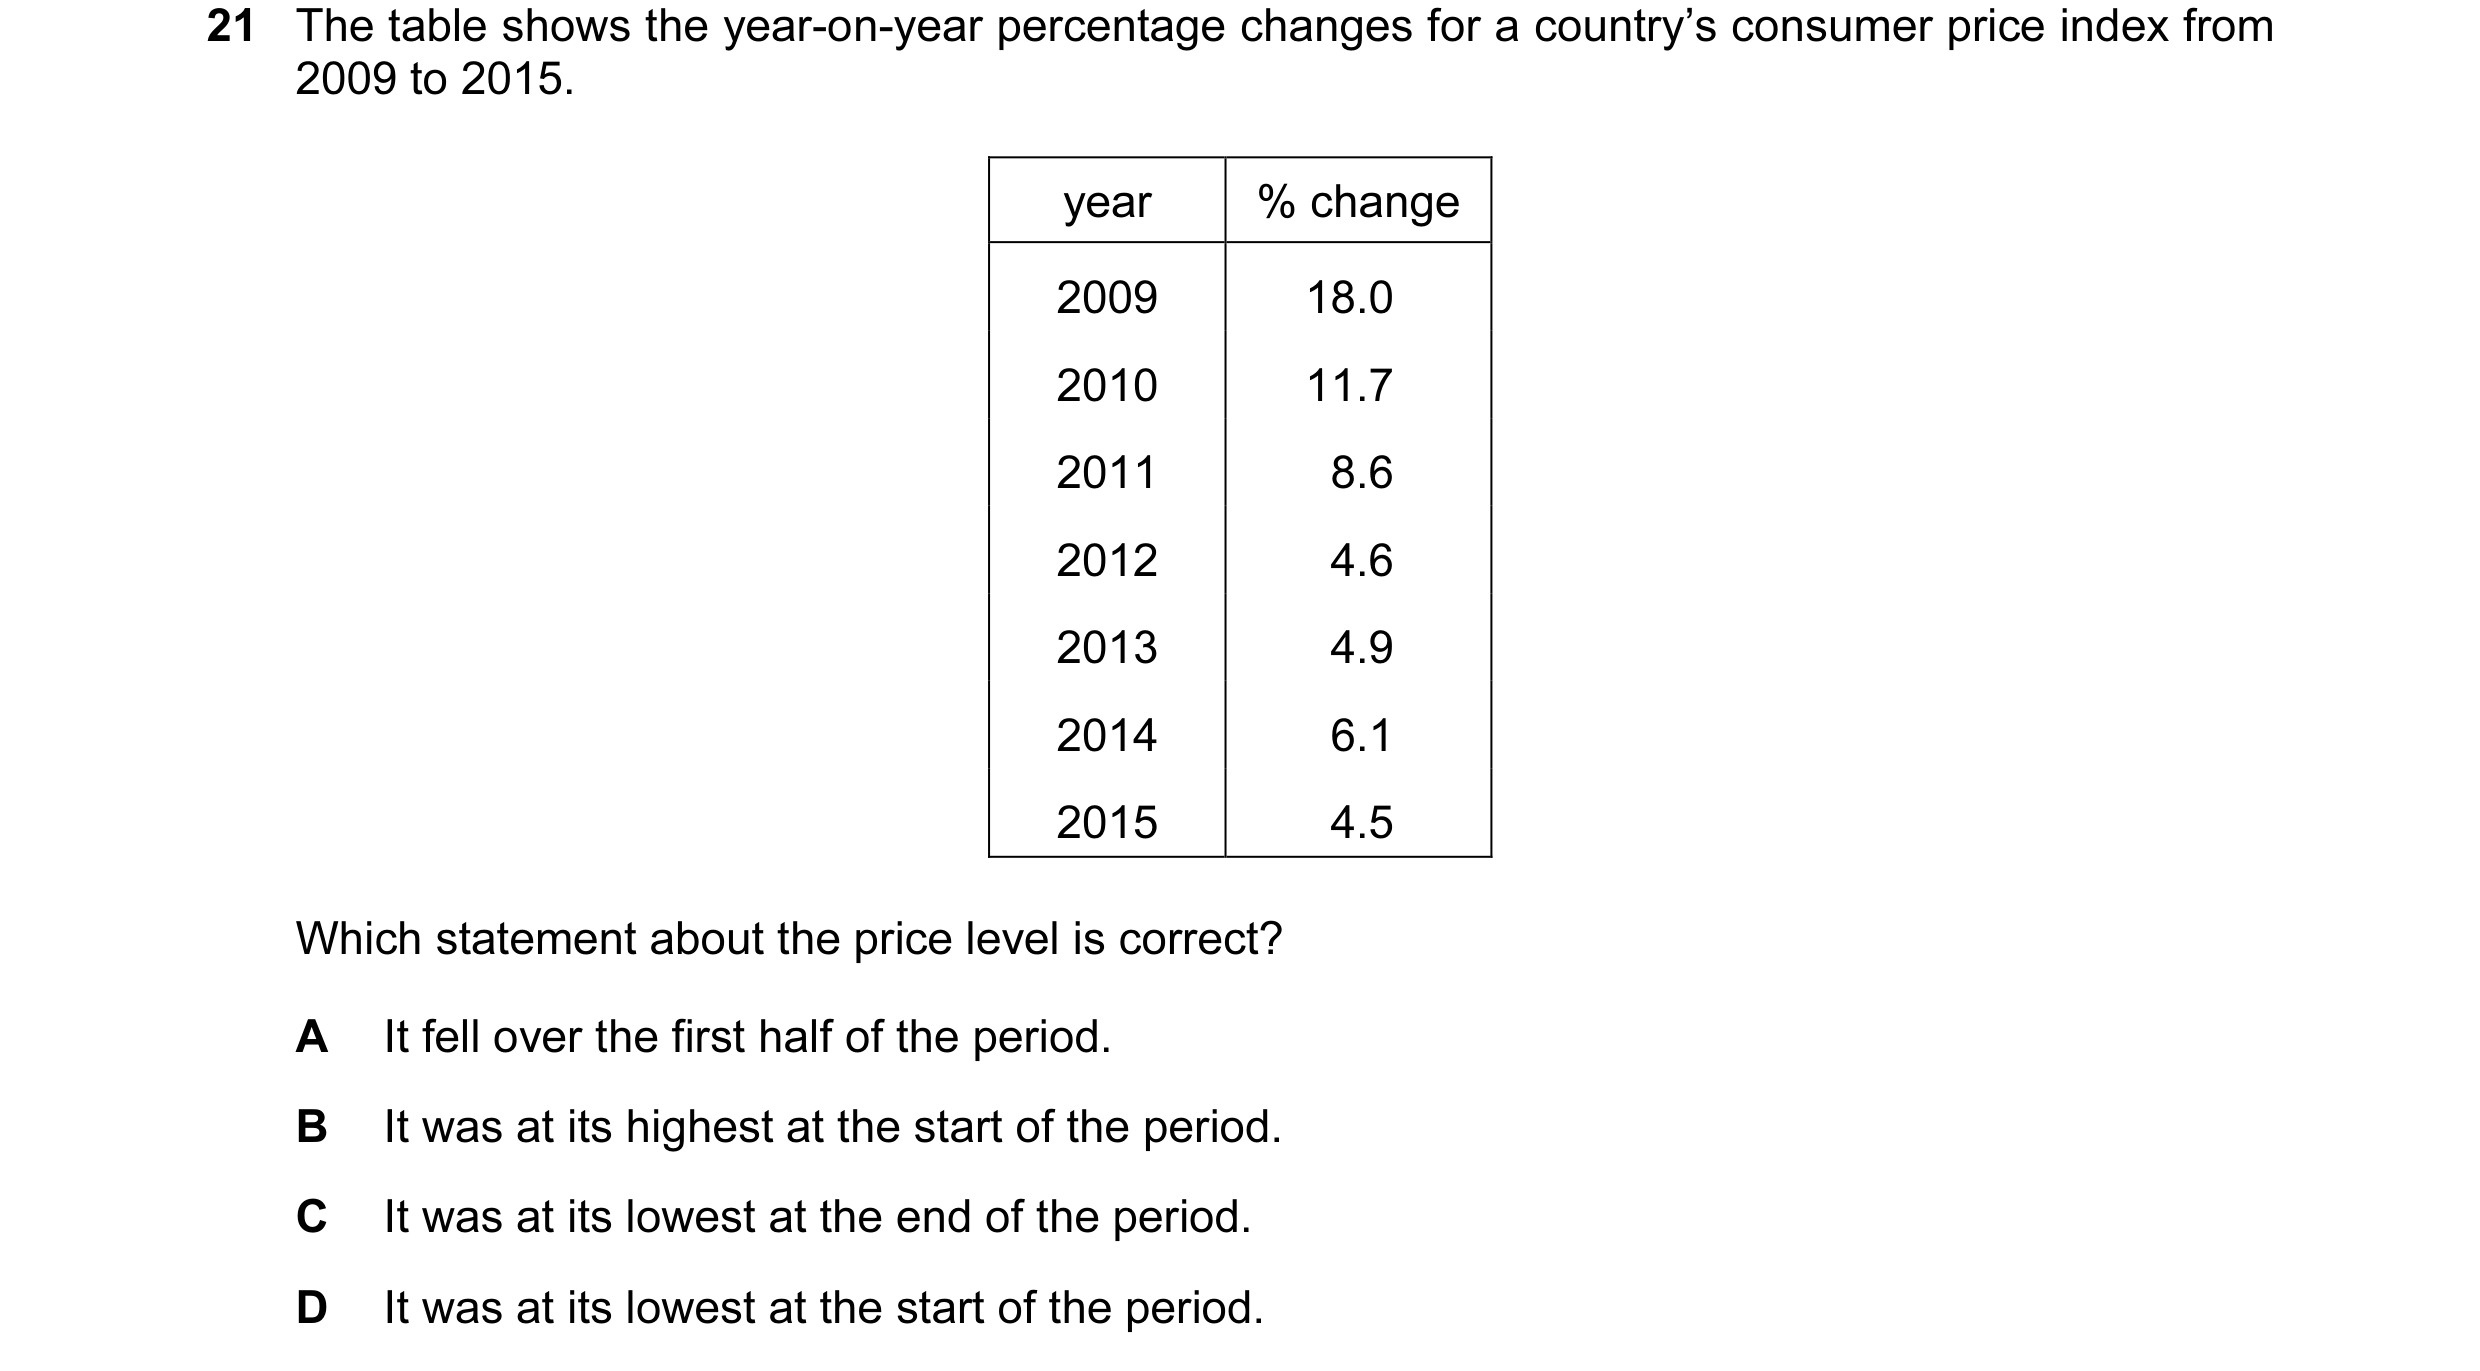
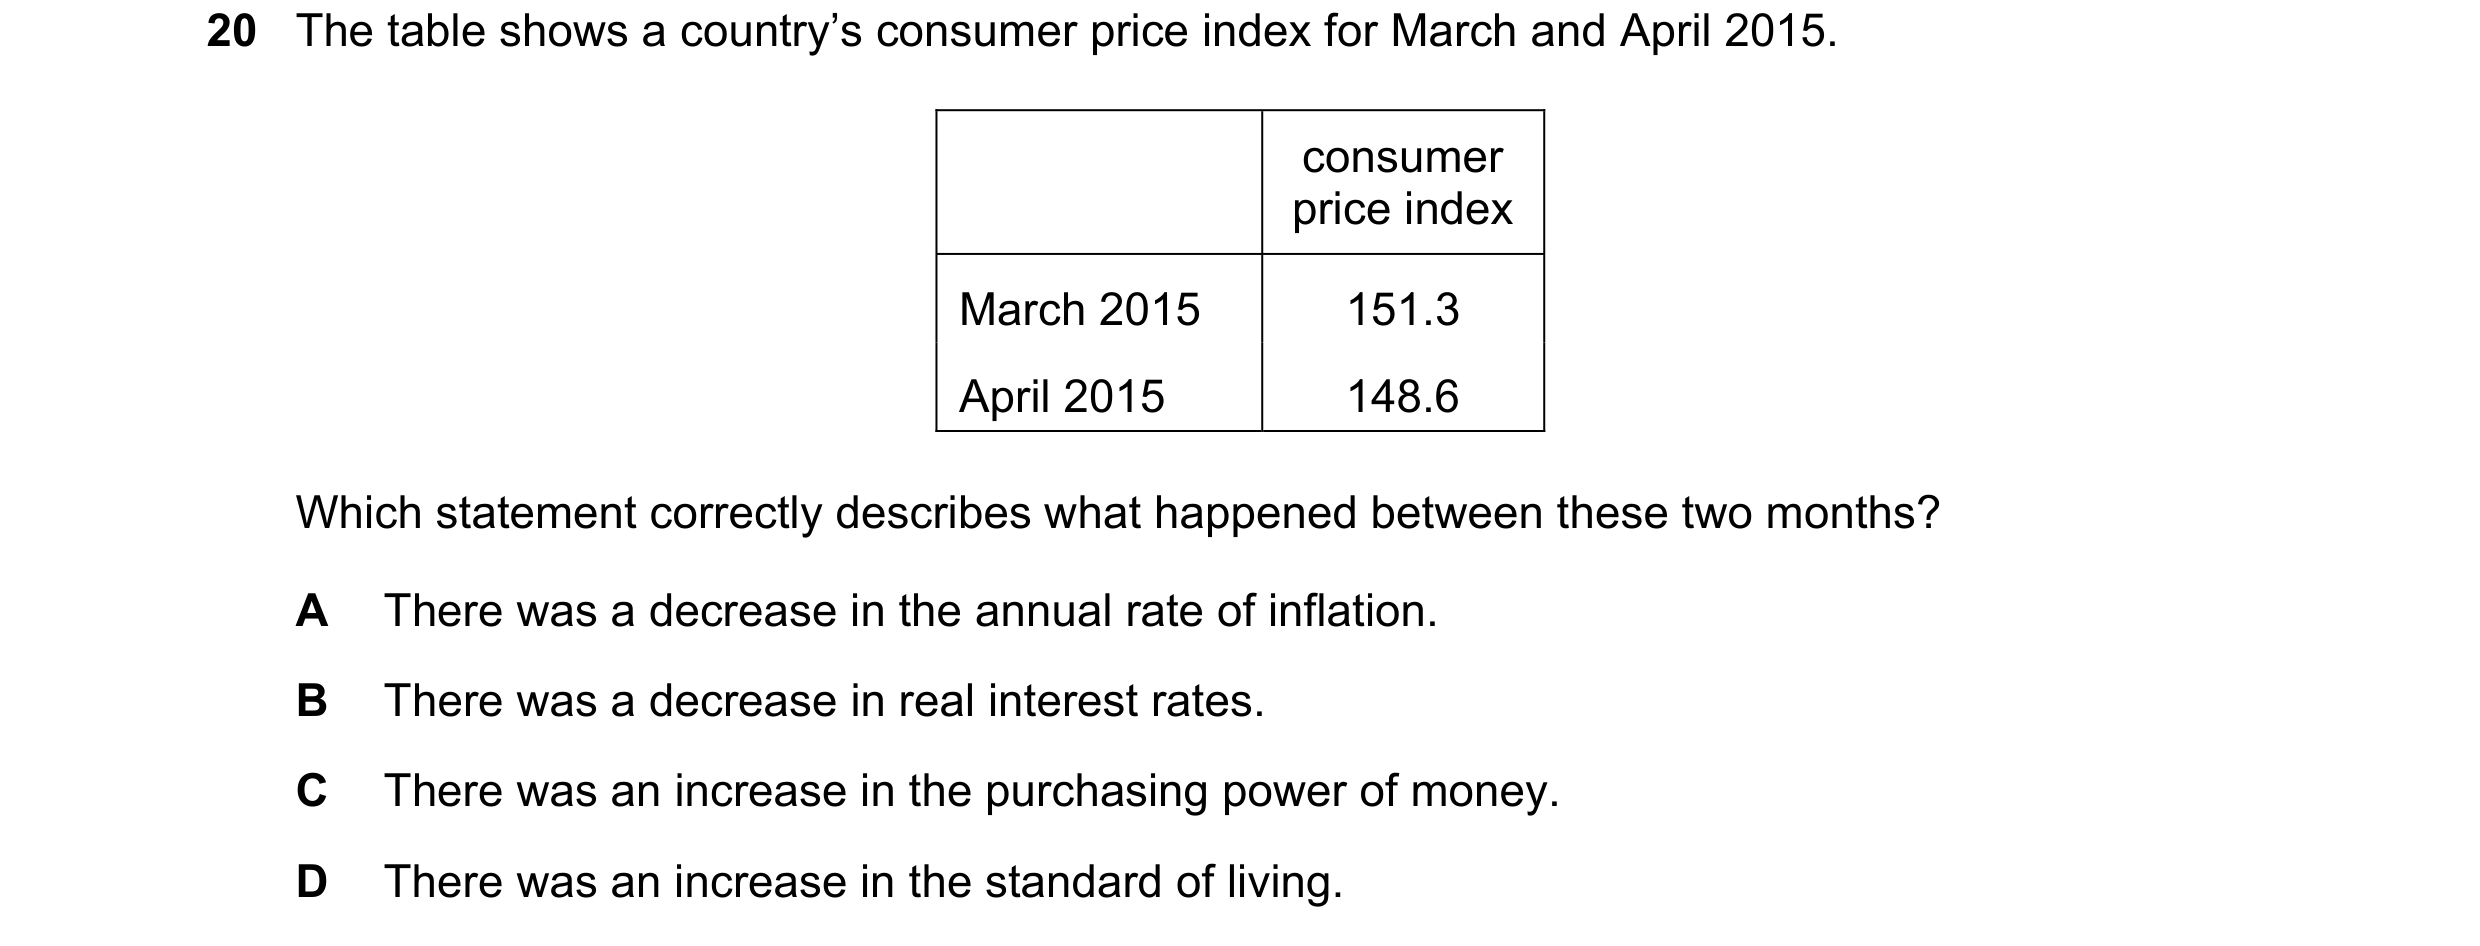
 41 / 67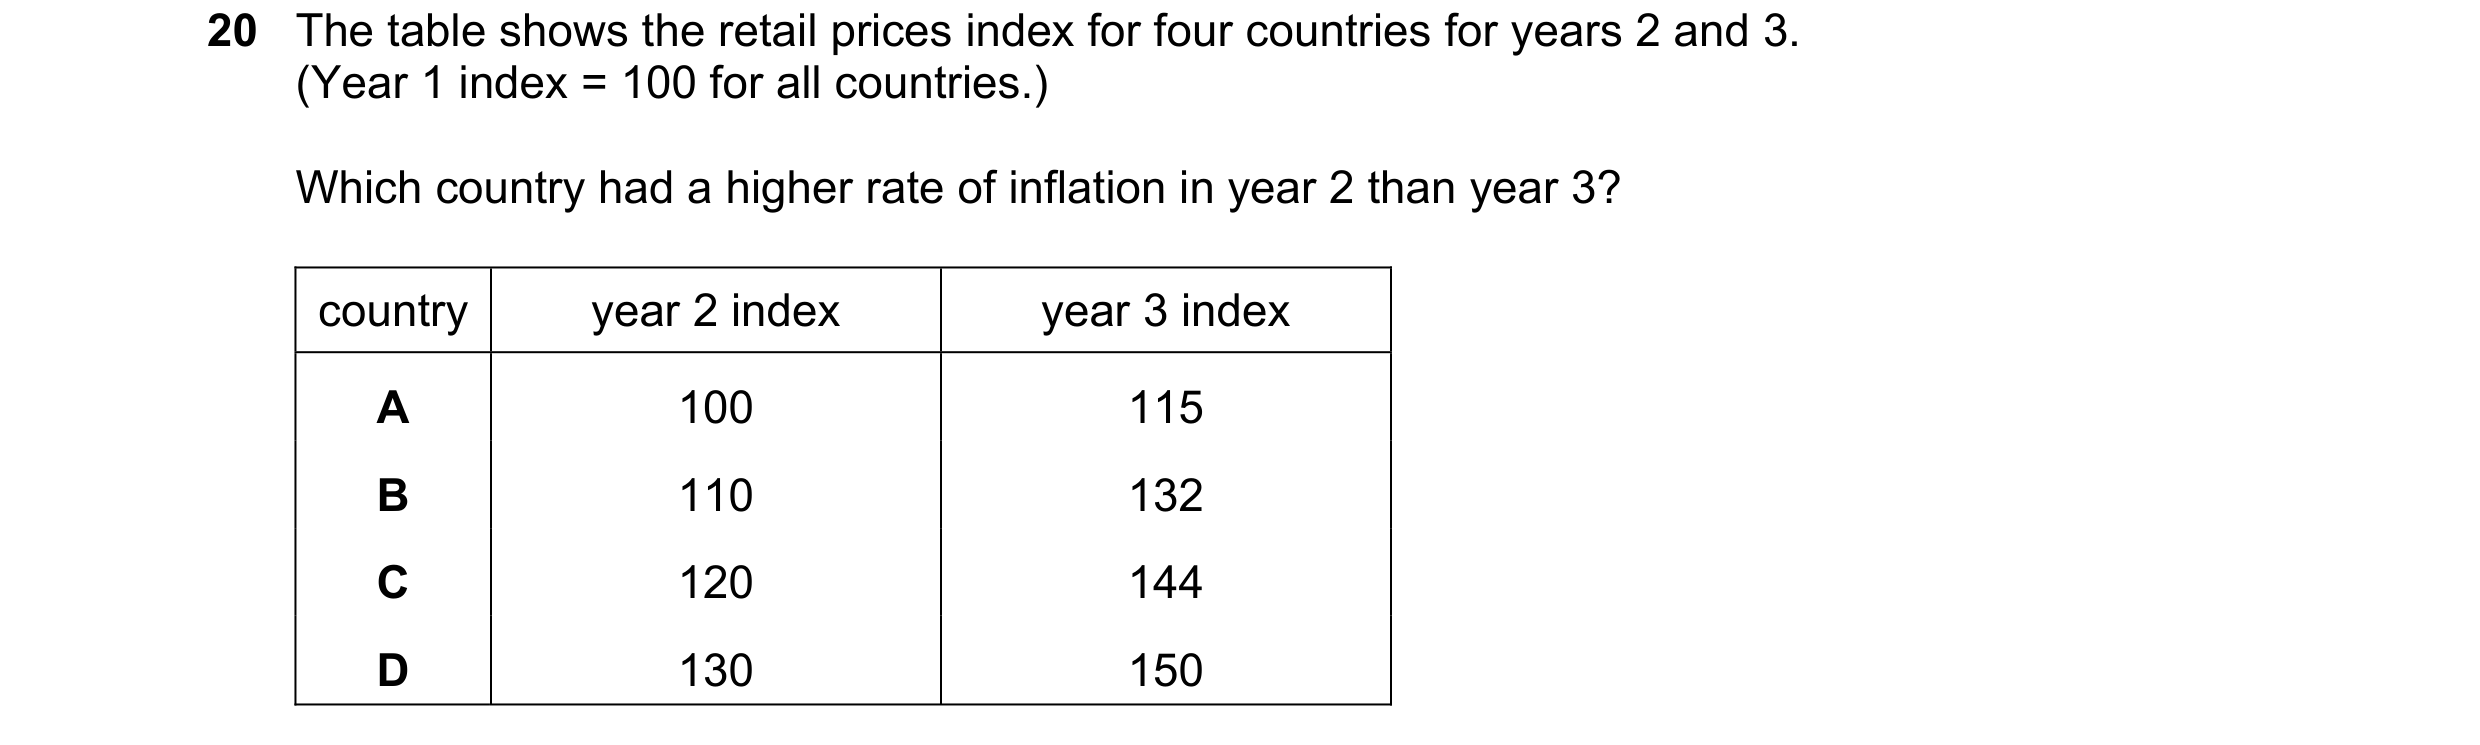

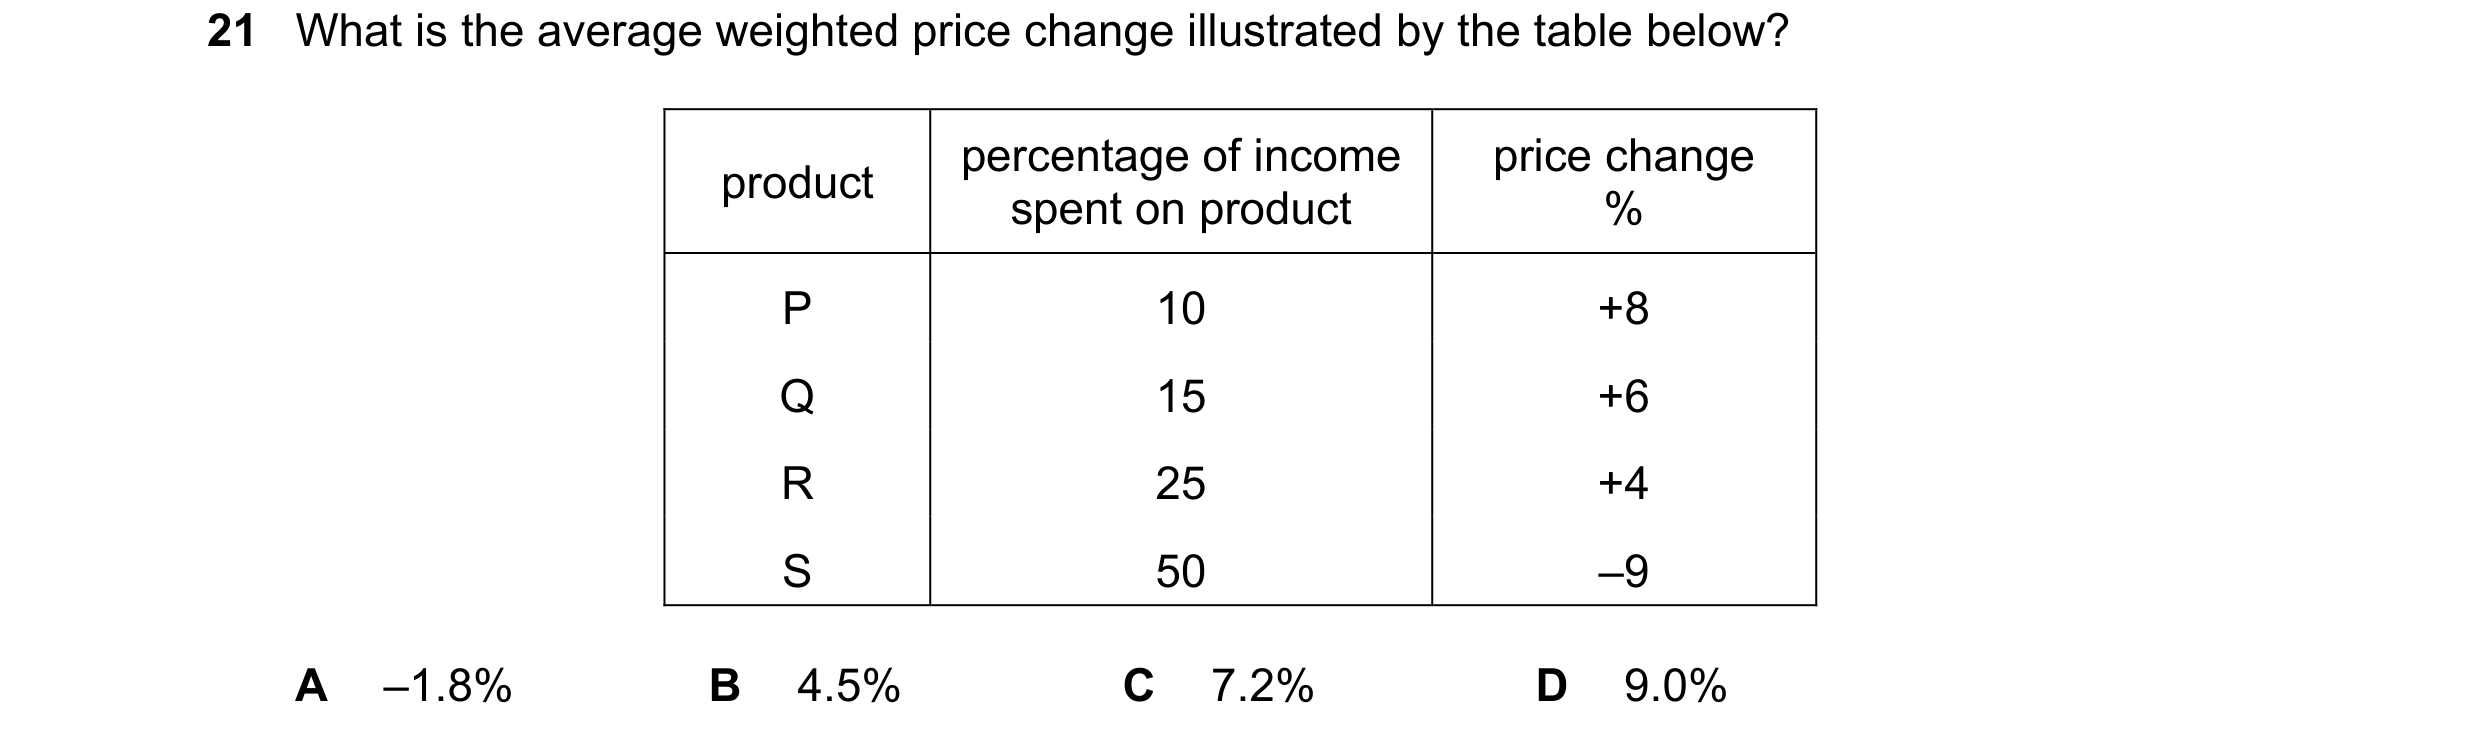

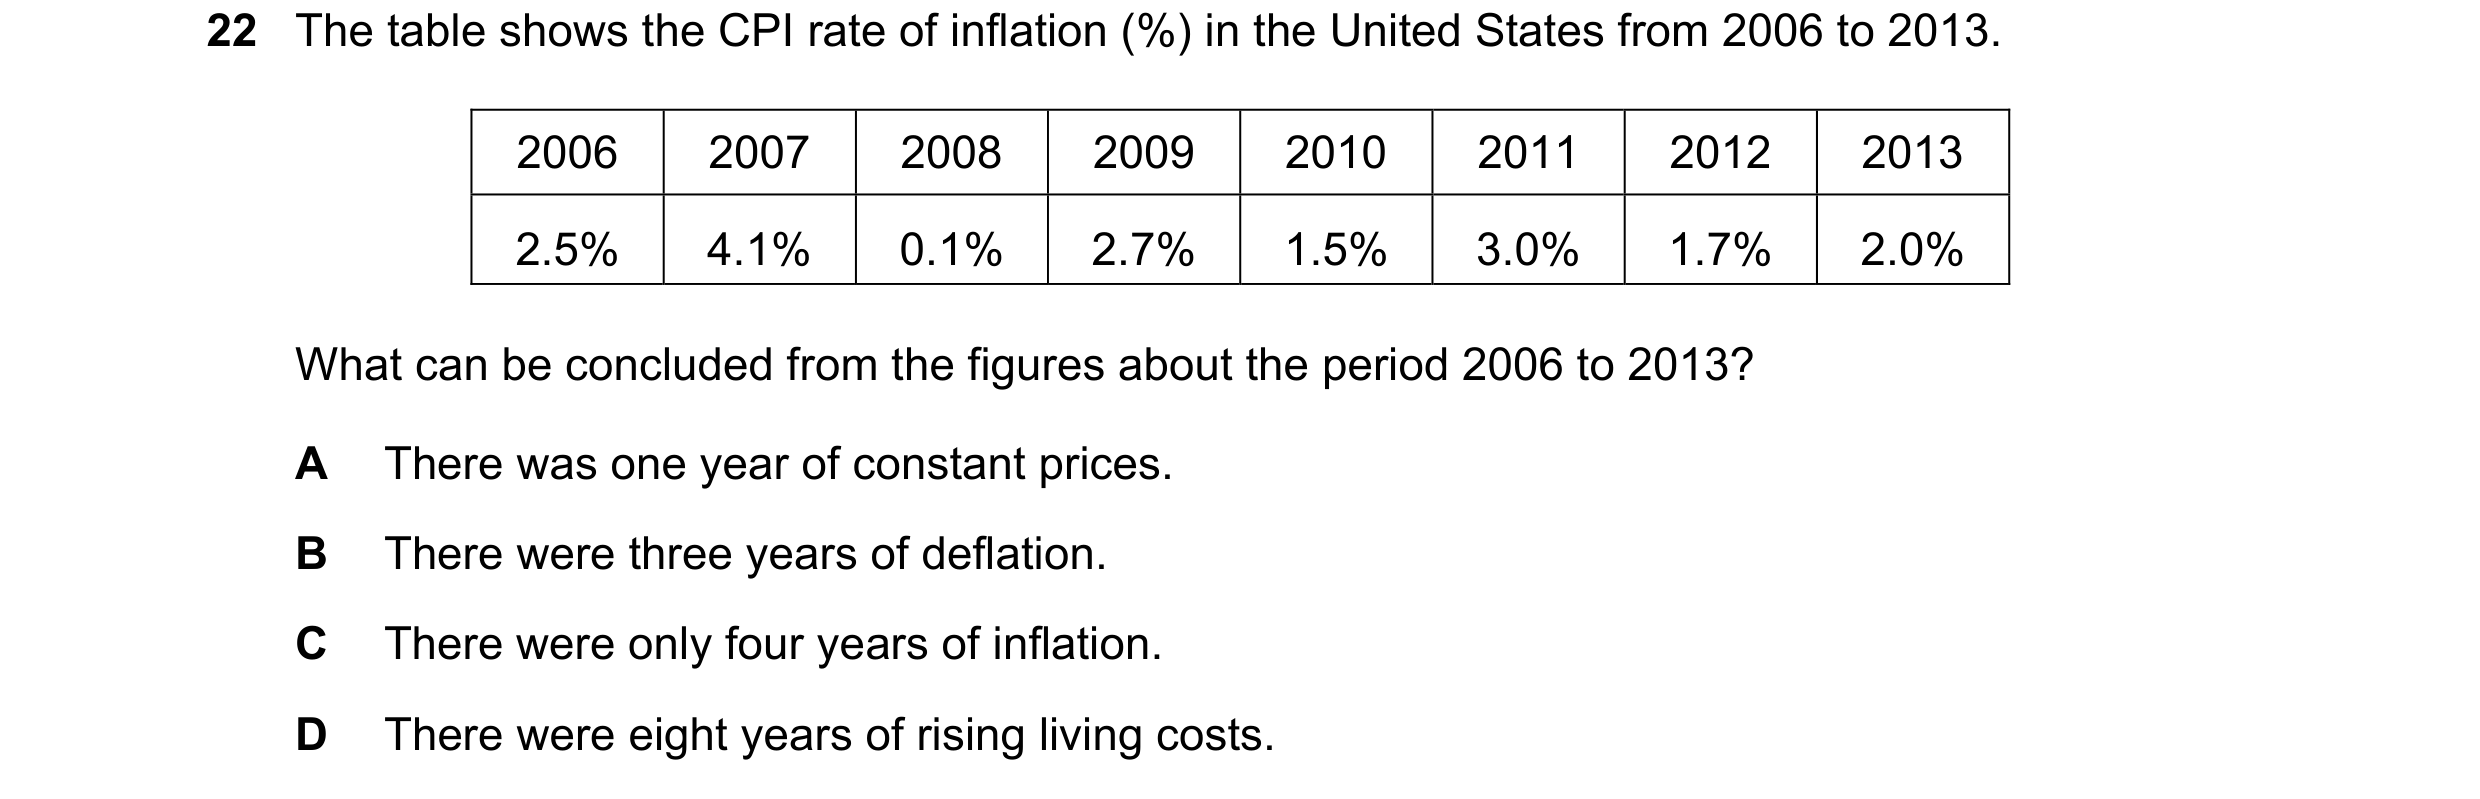 42 / 67
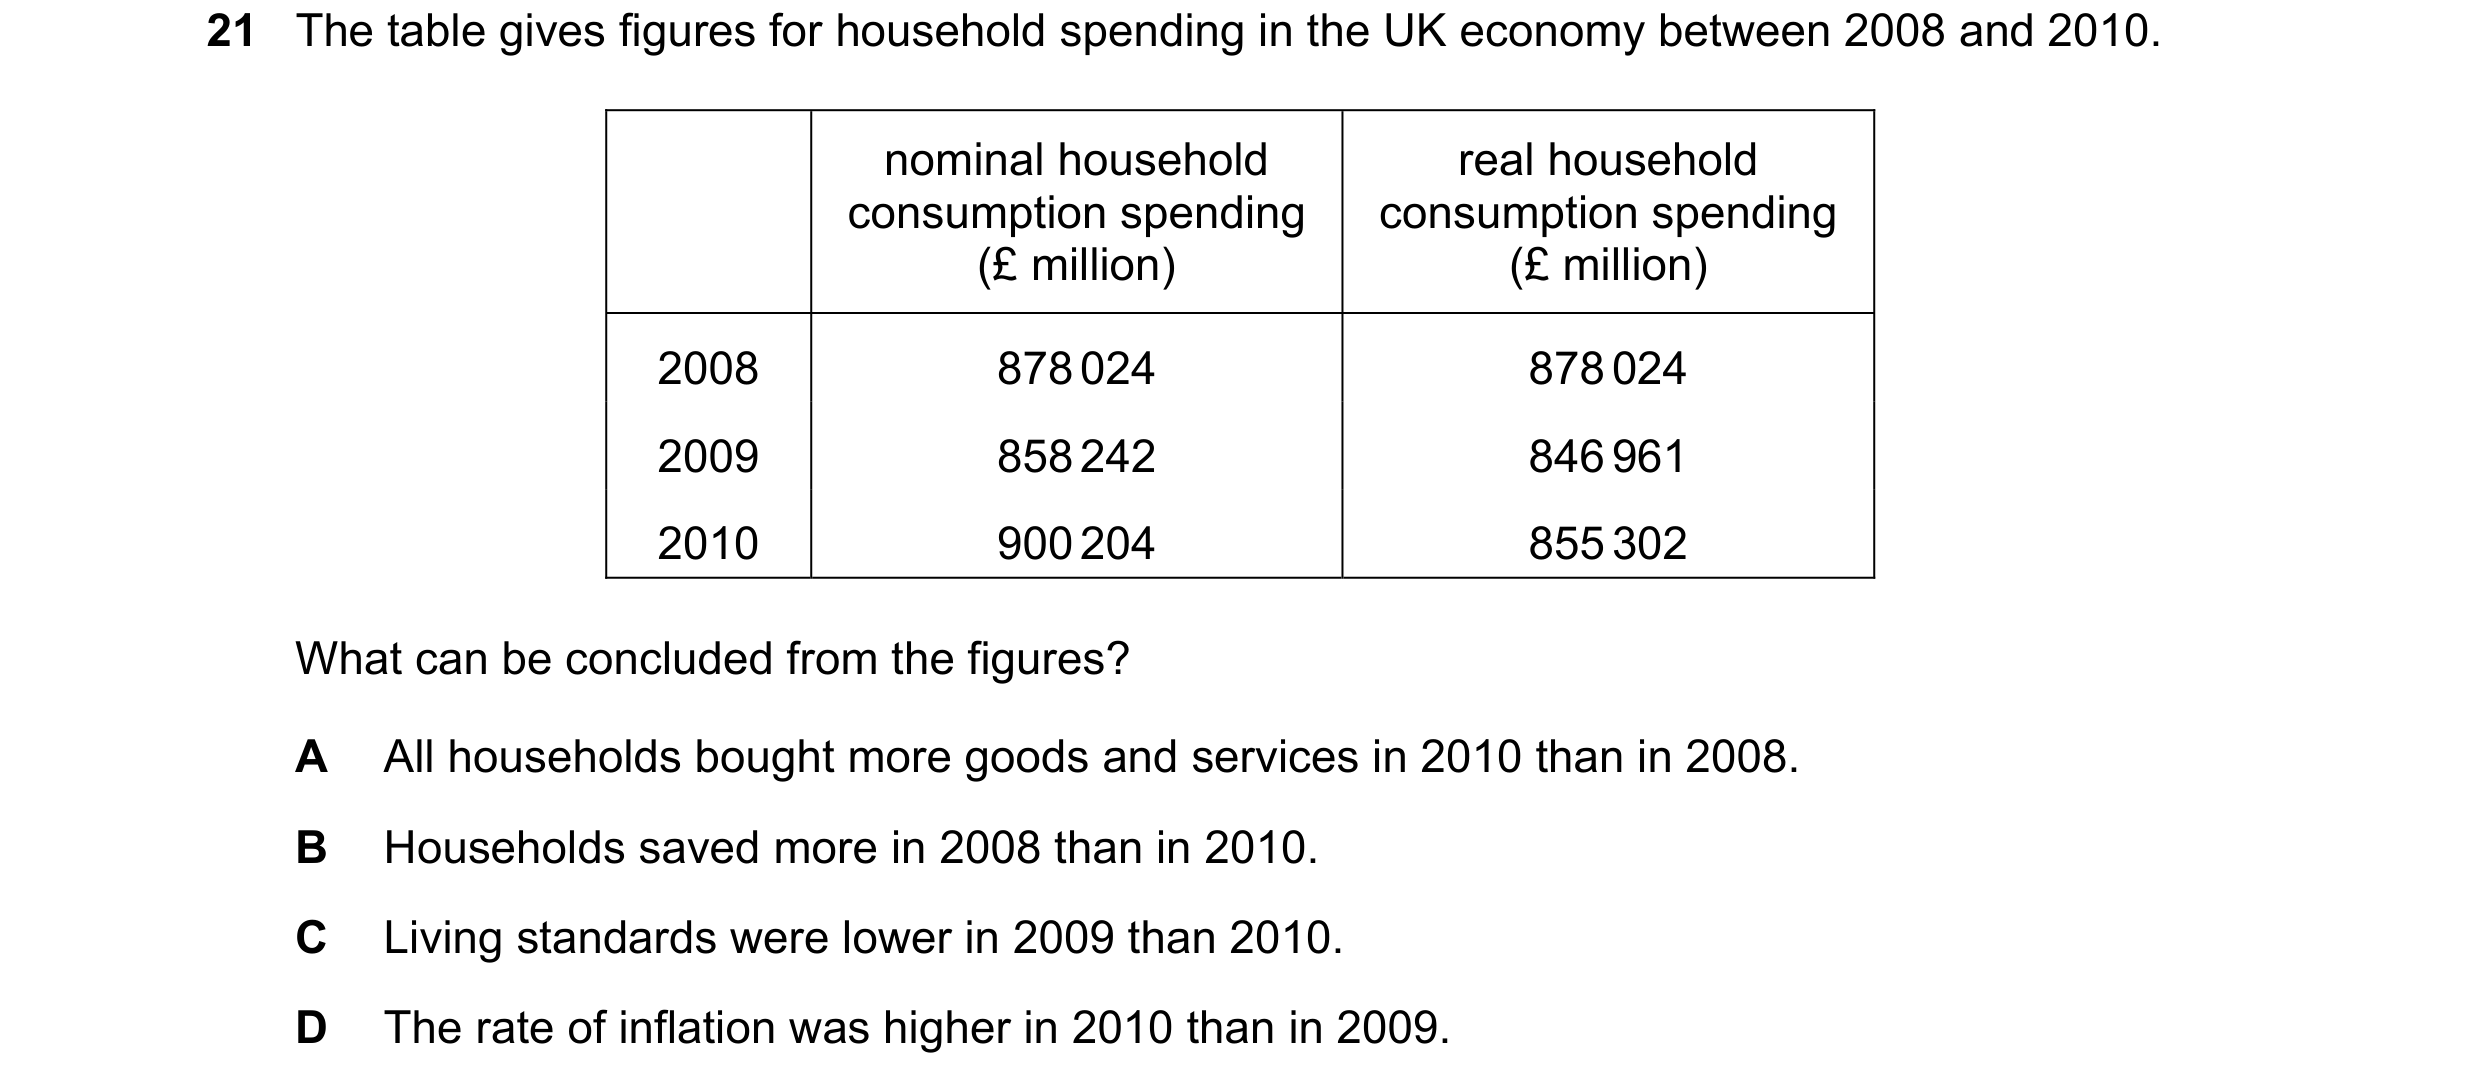
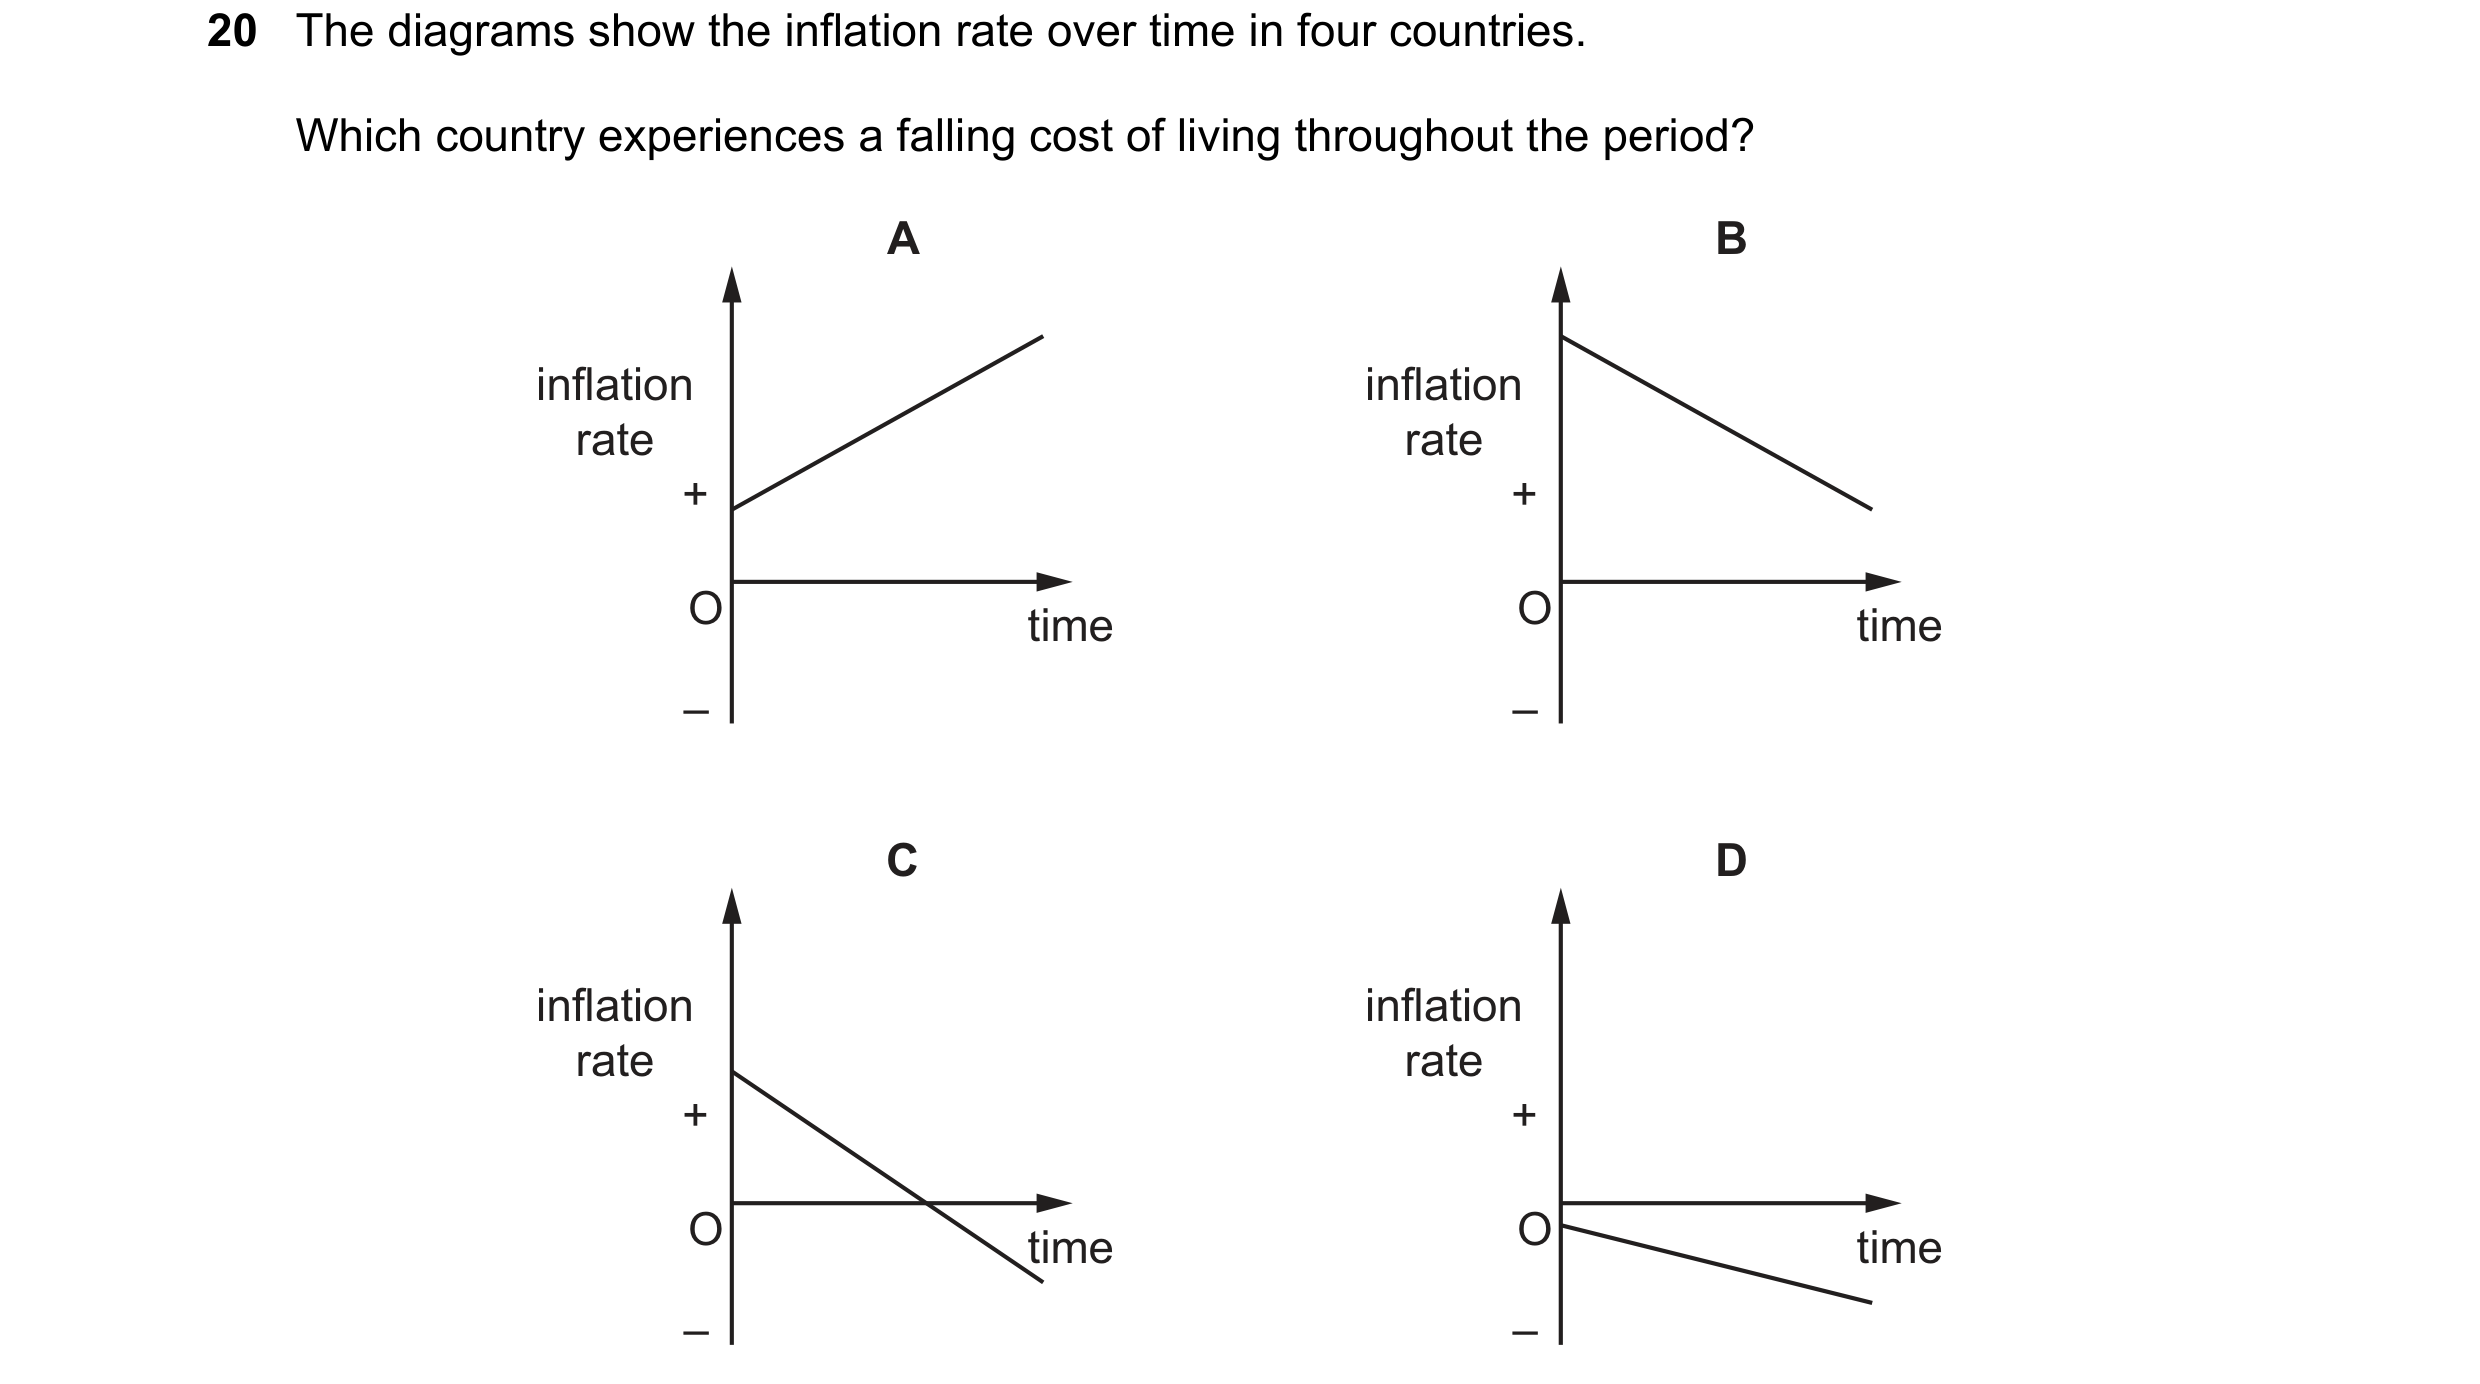 43 / 67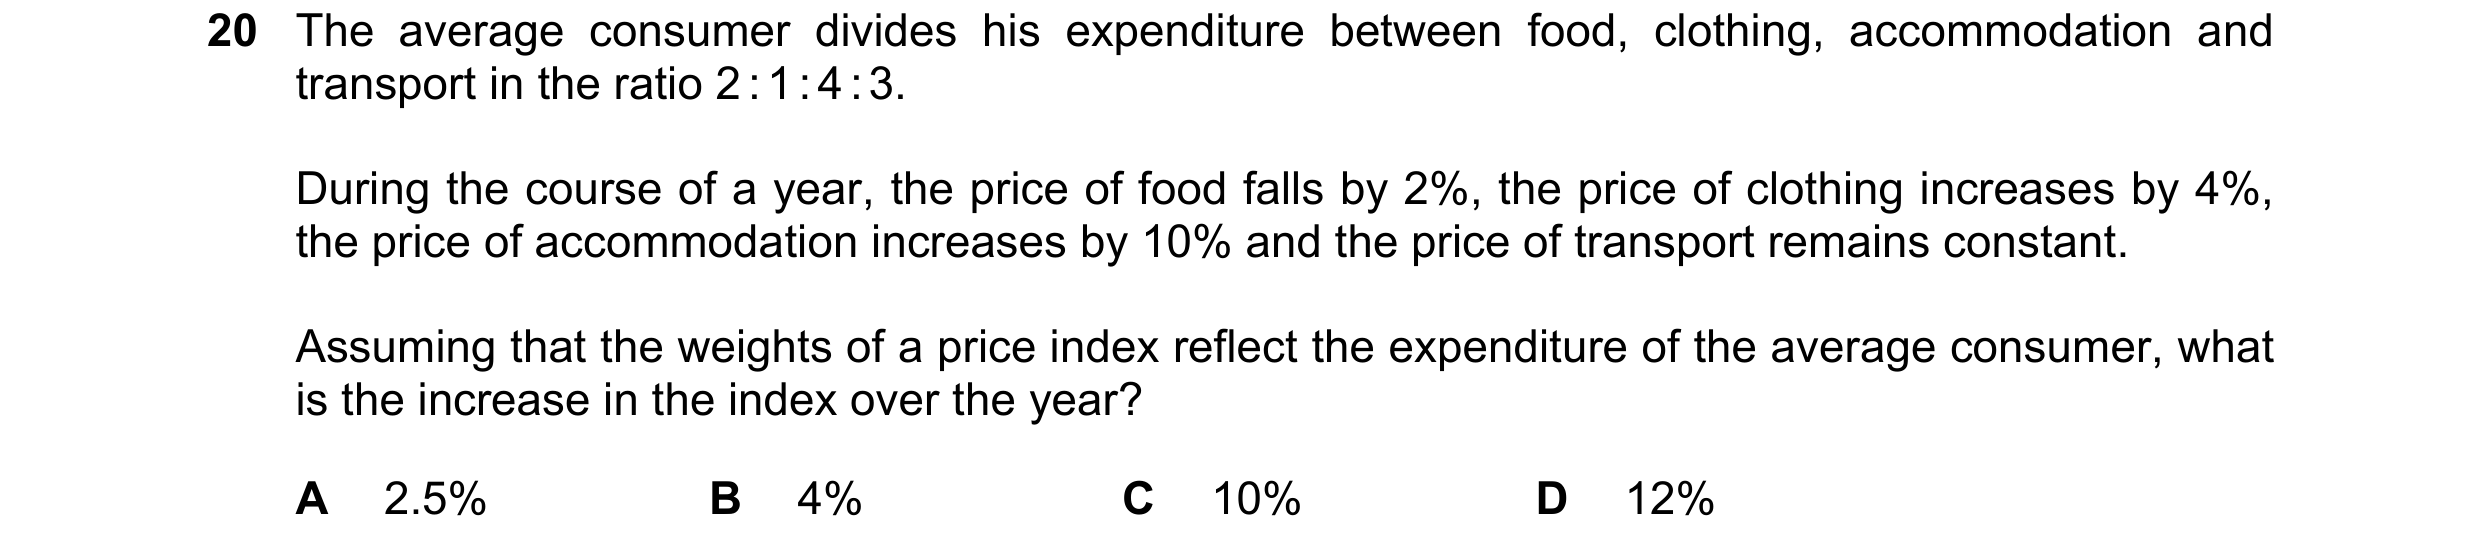
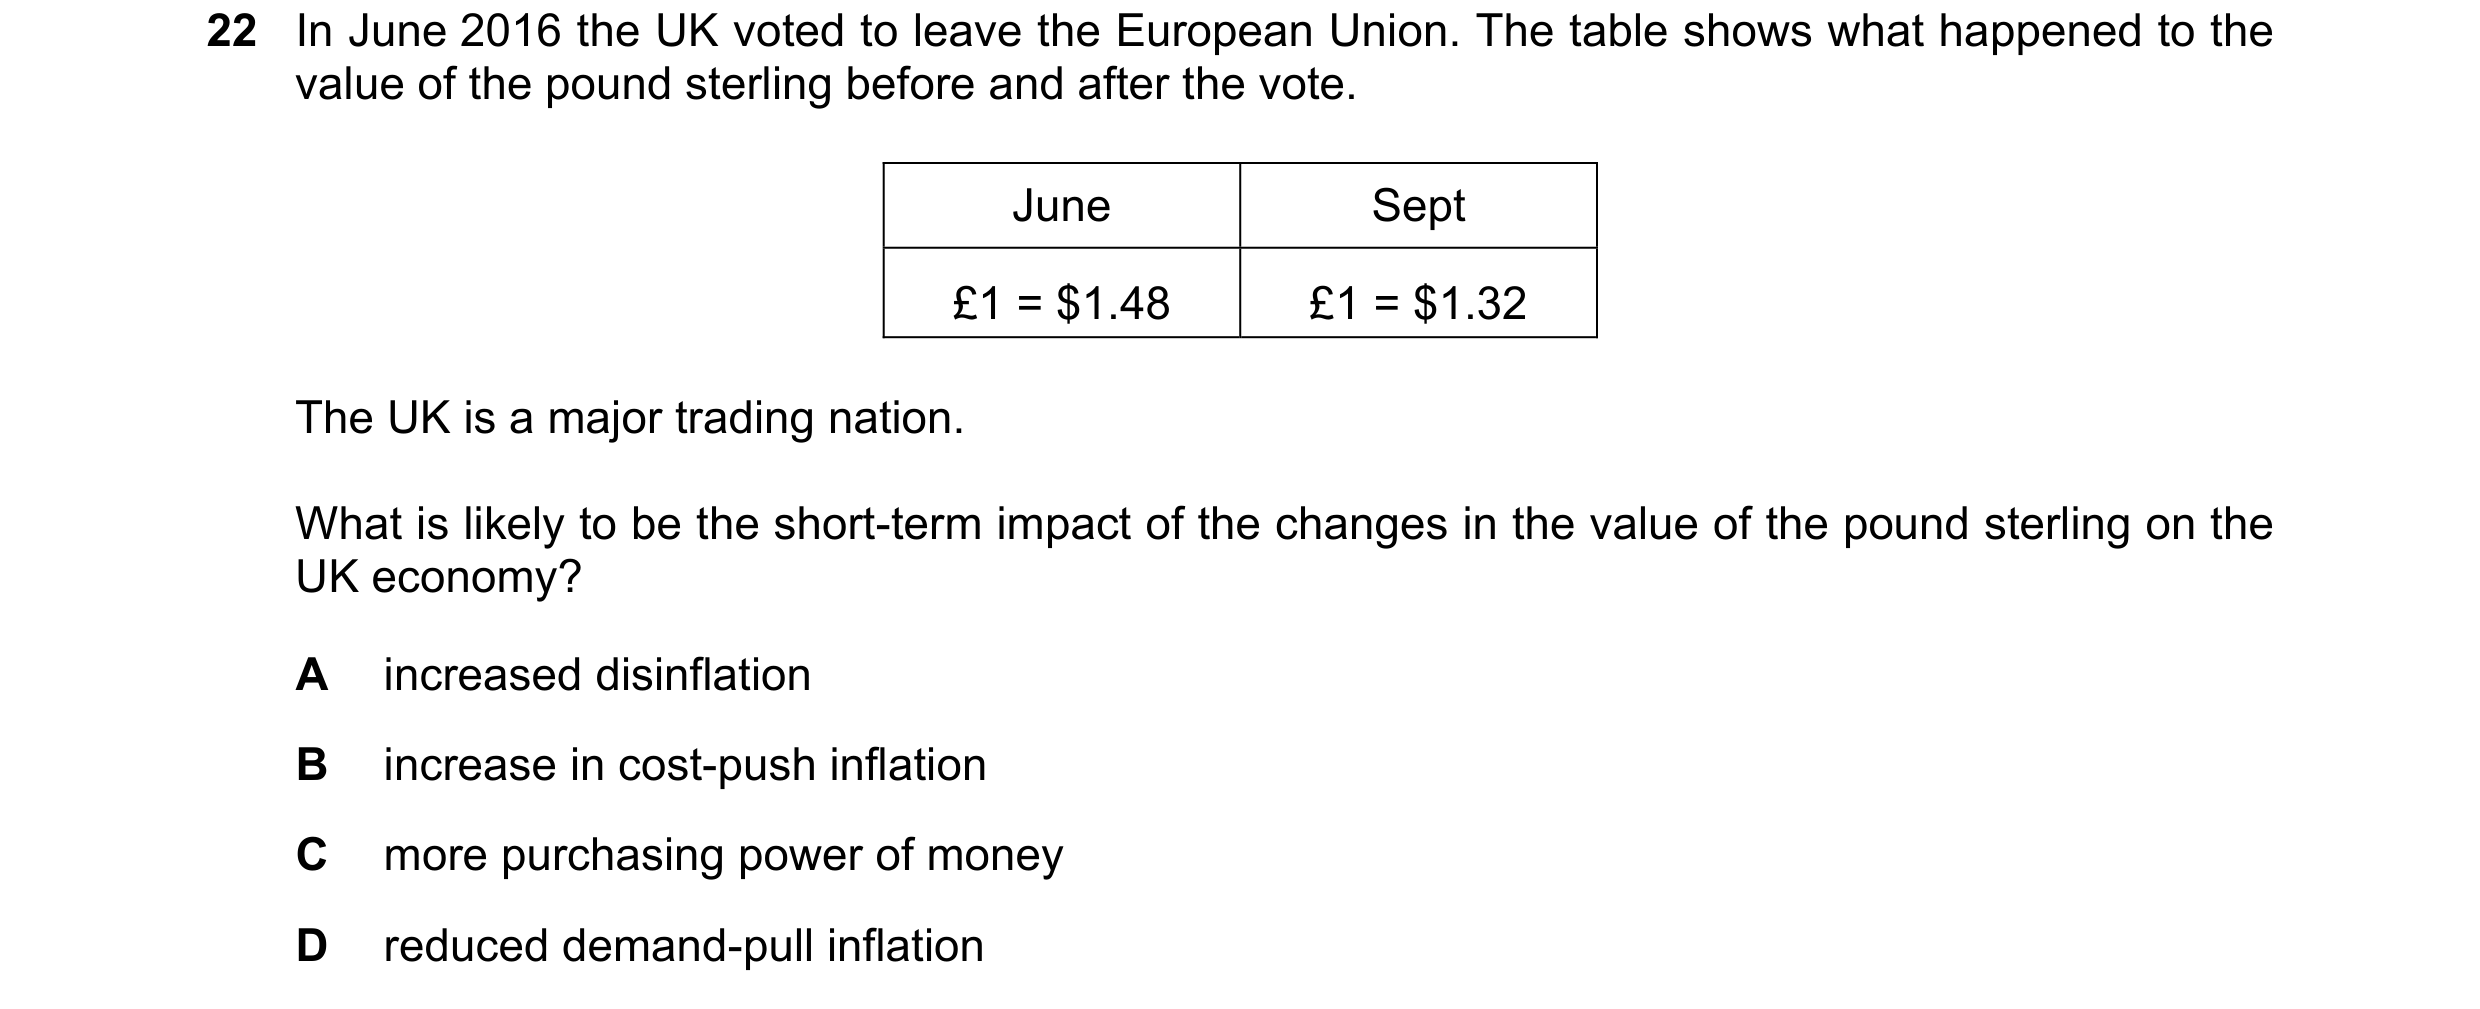
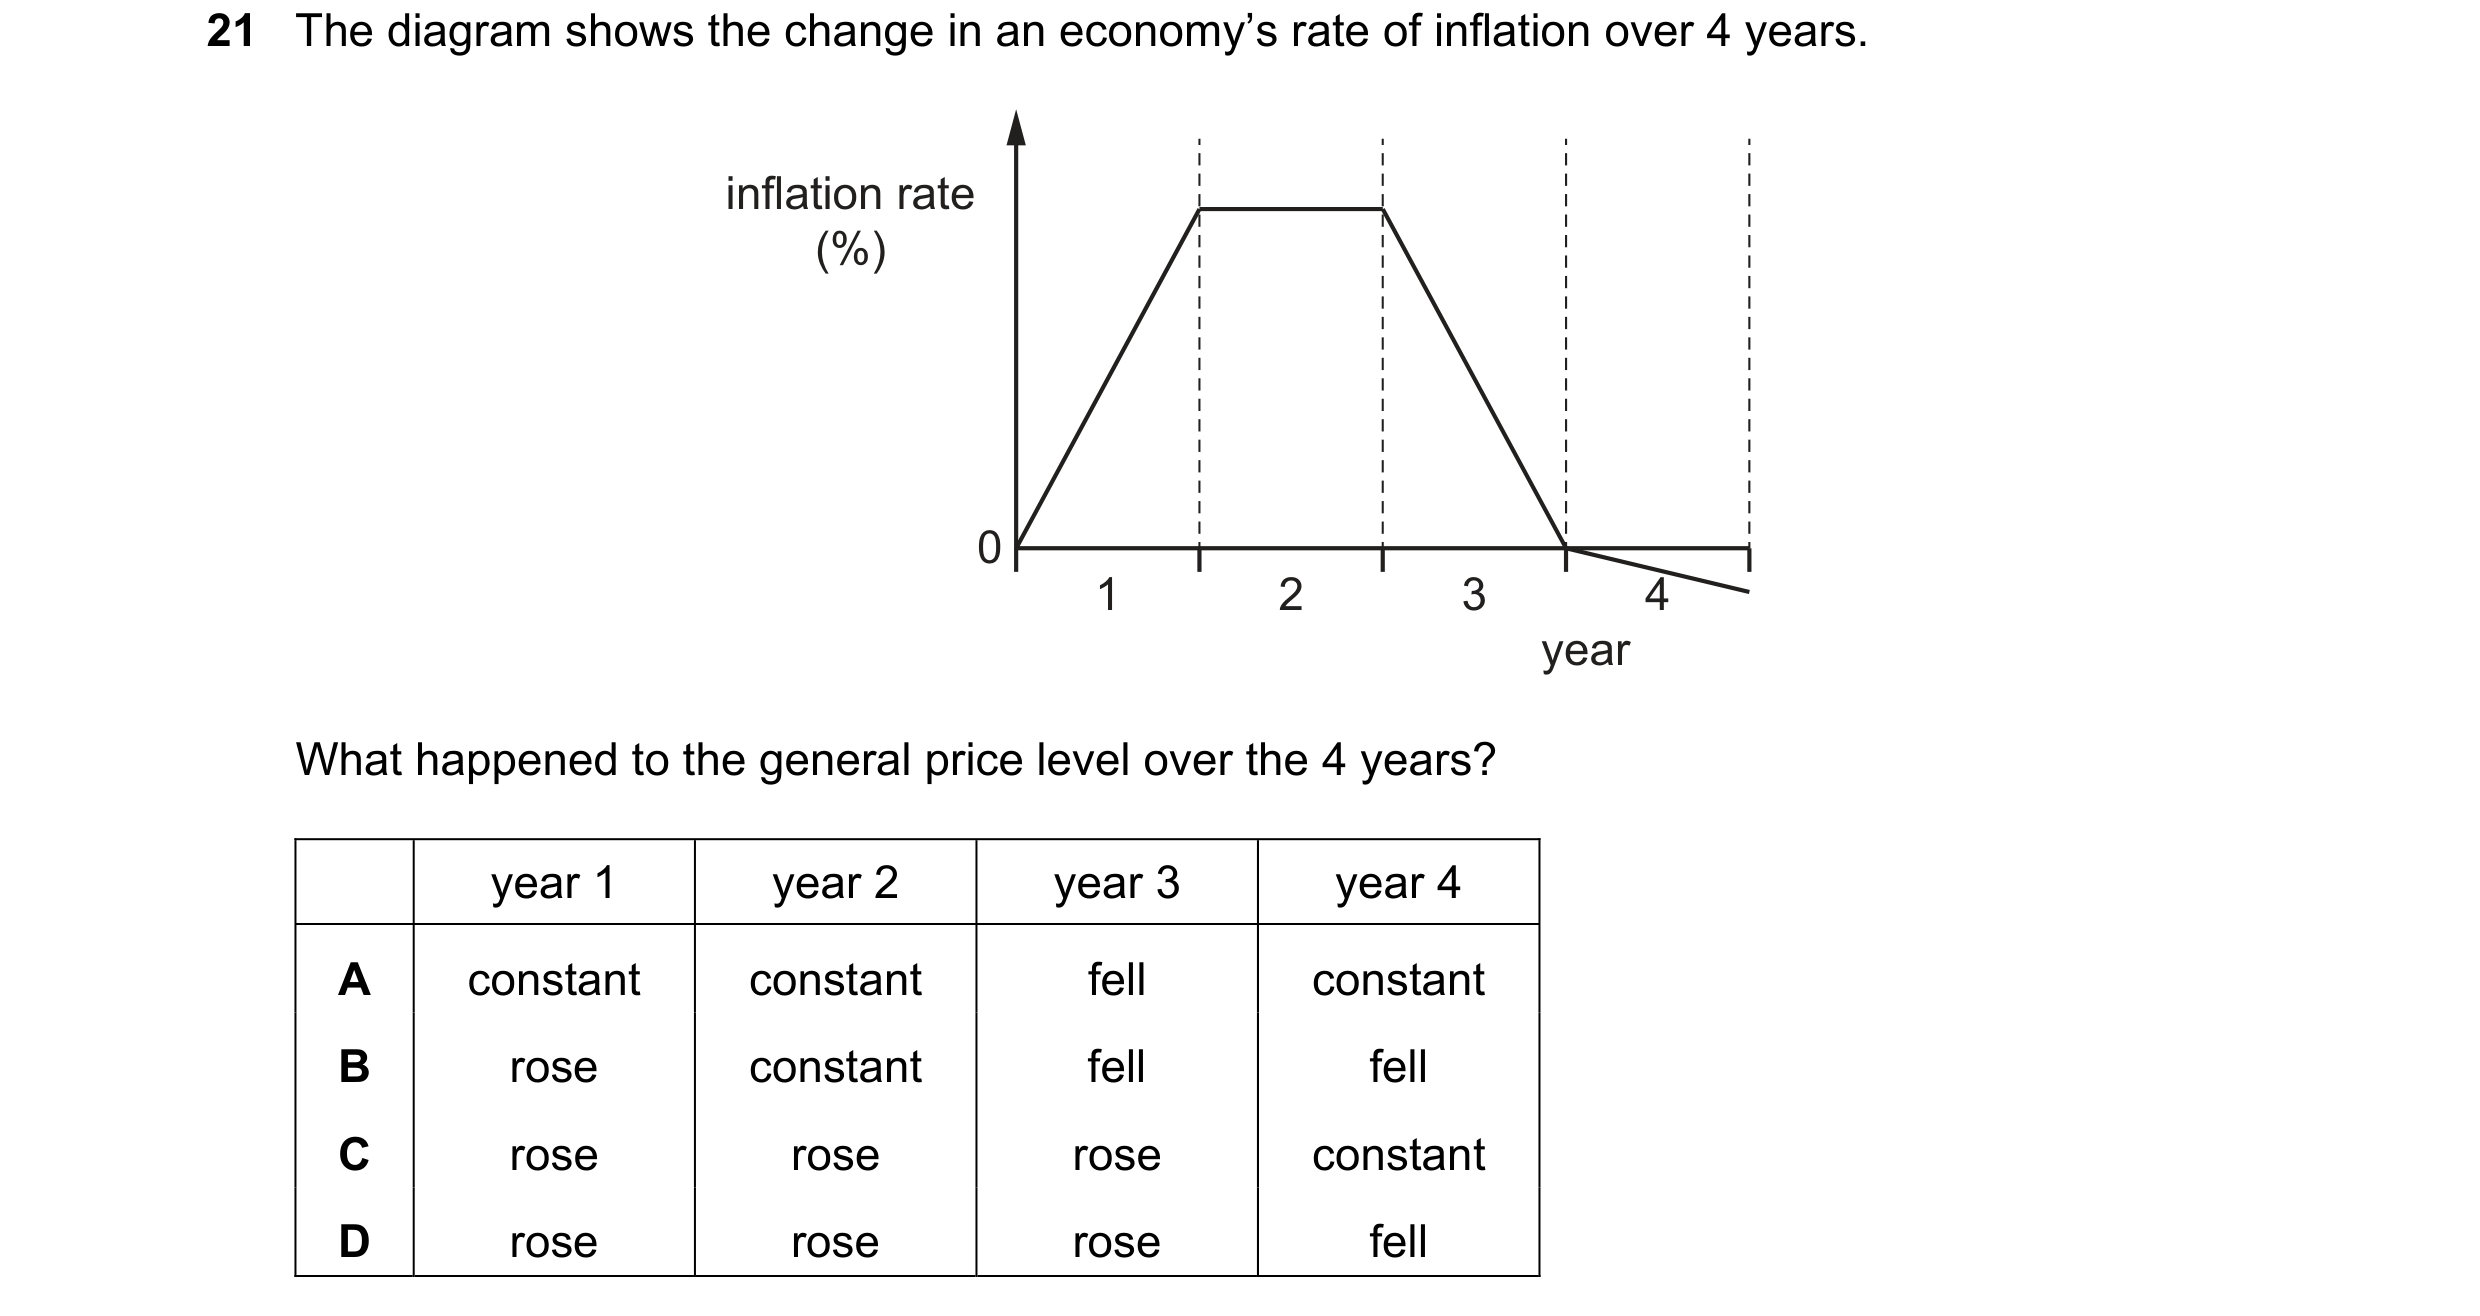 44 / 67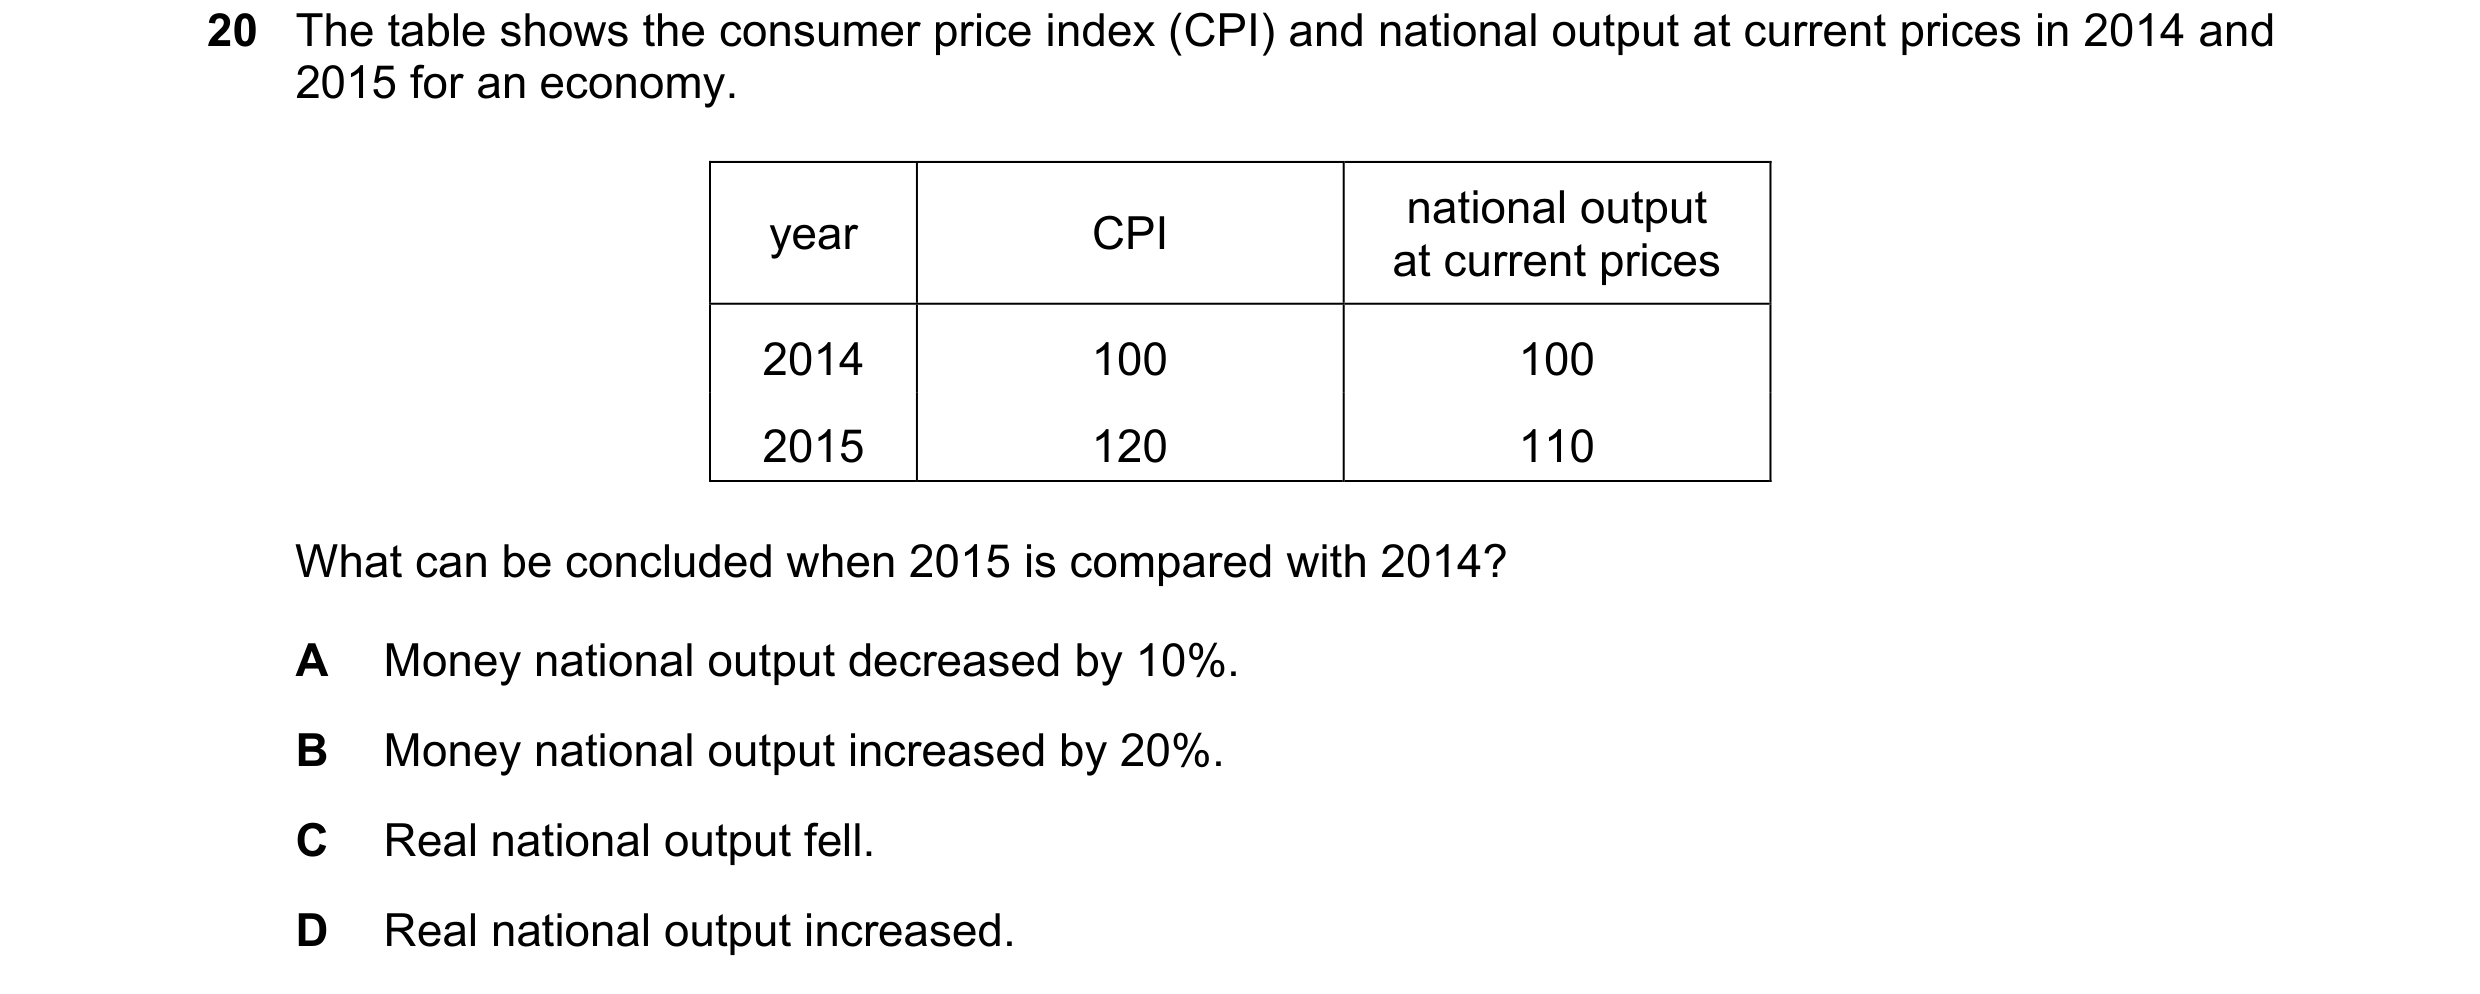
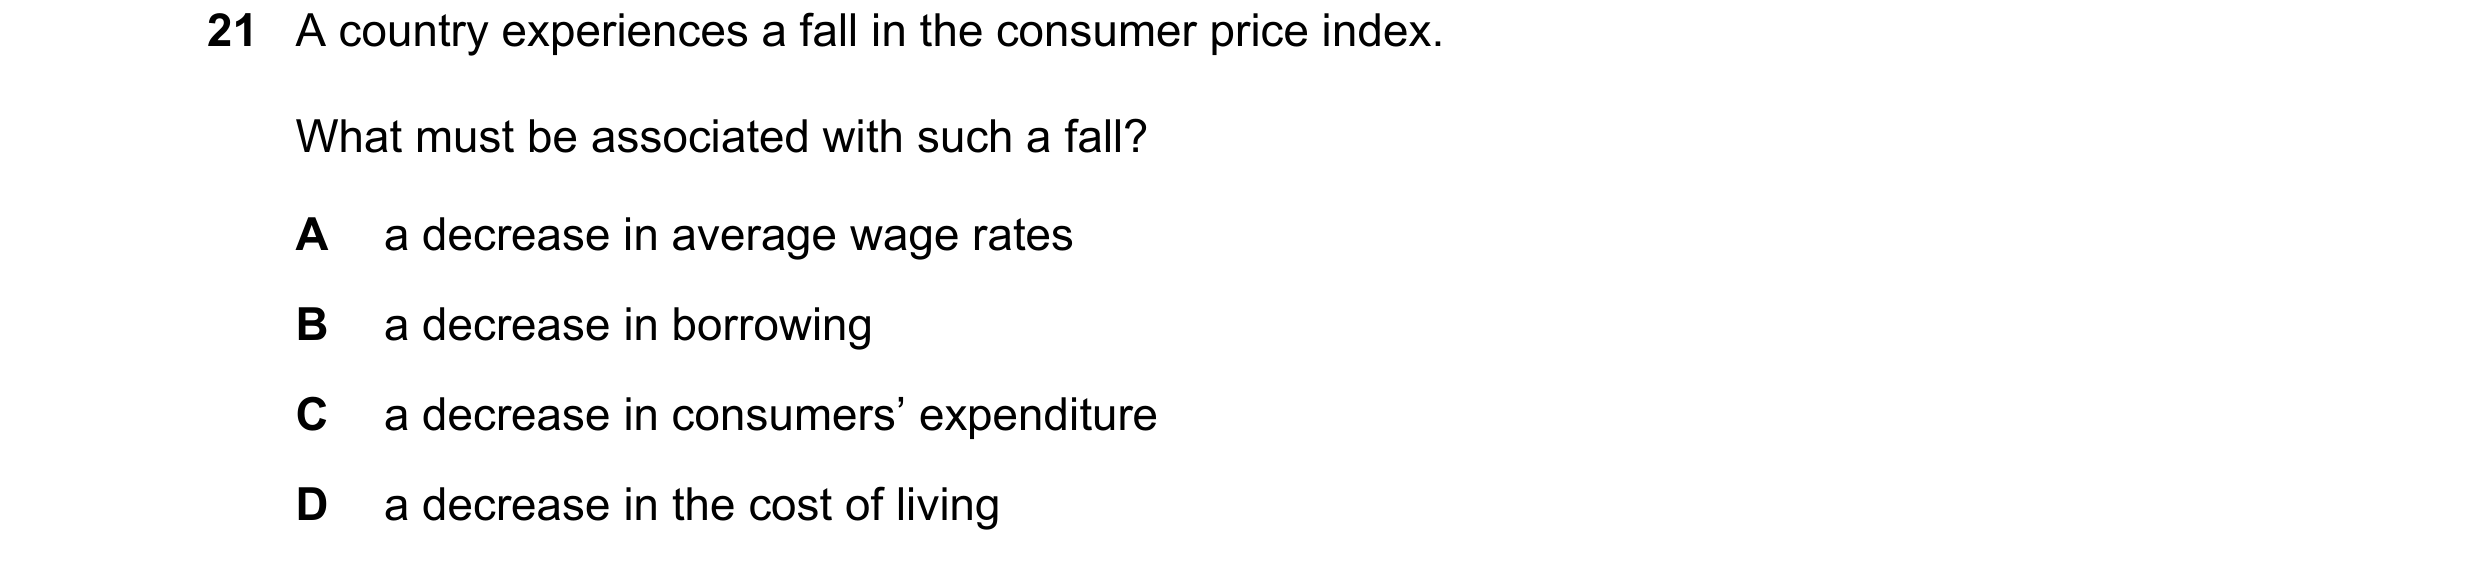
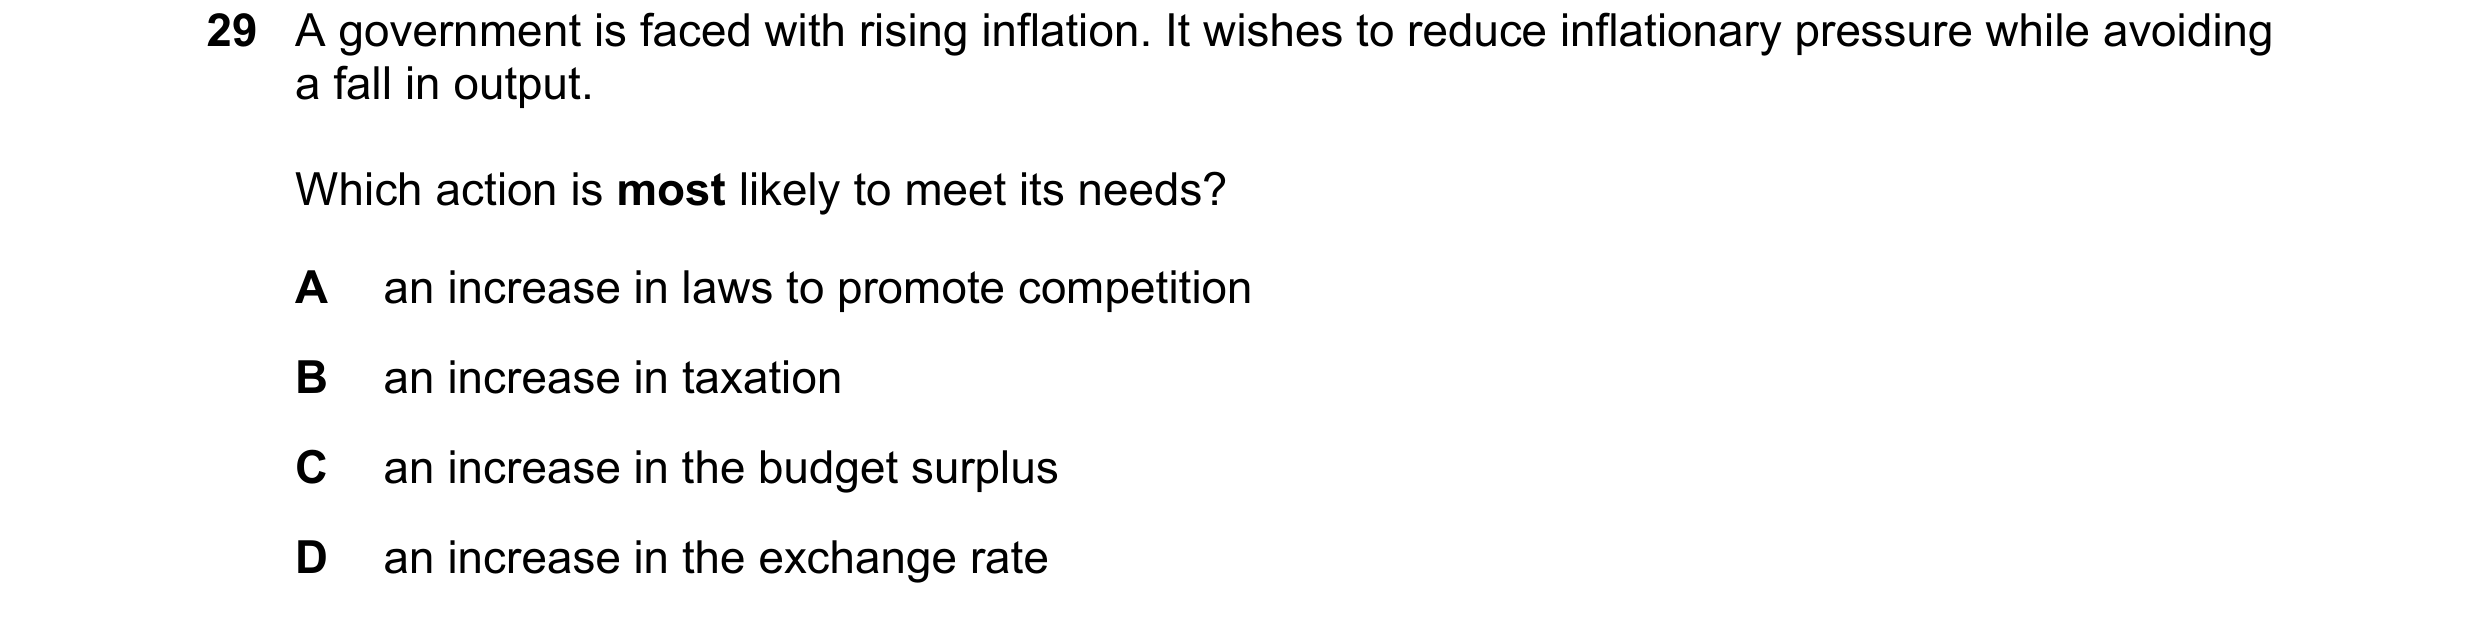

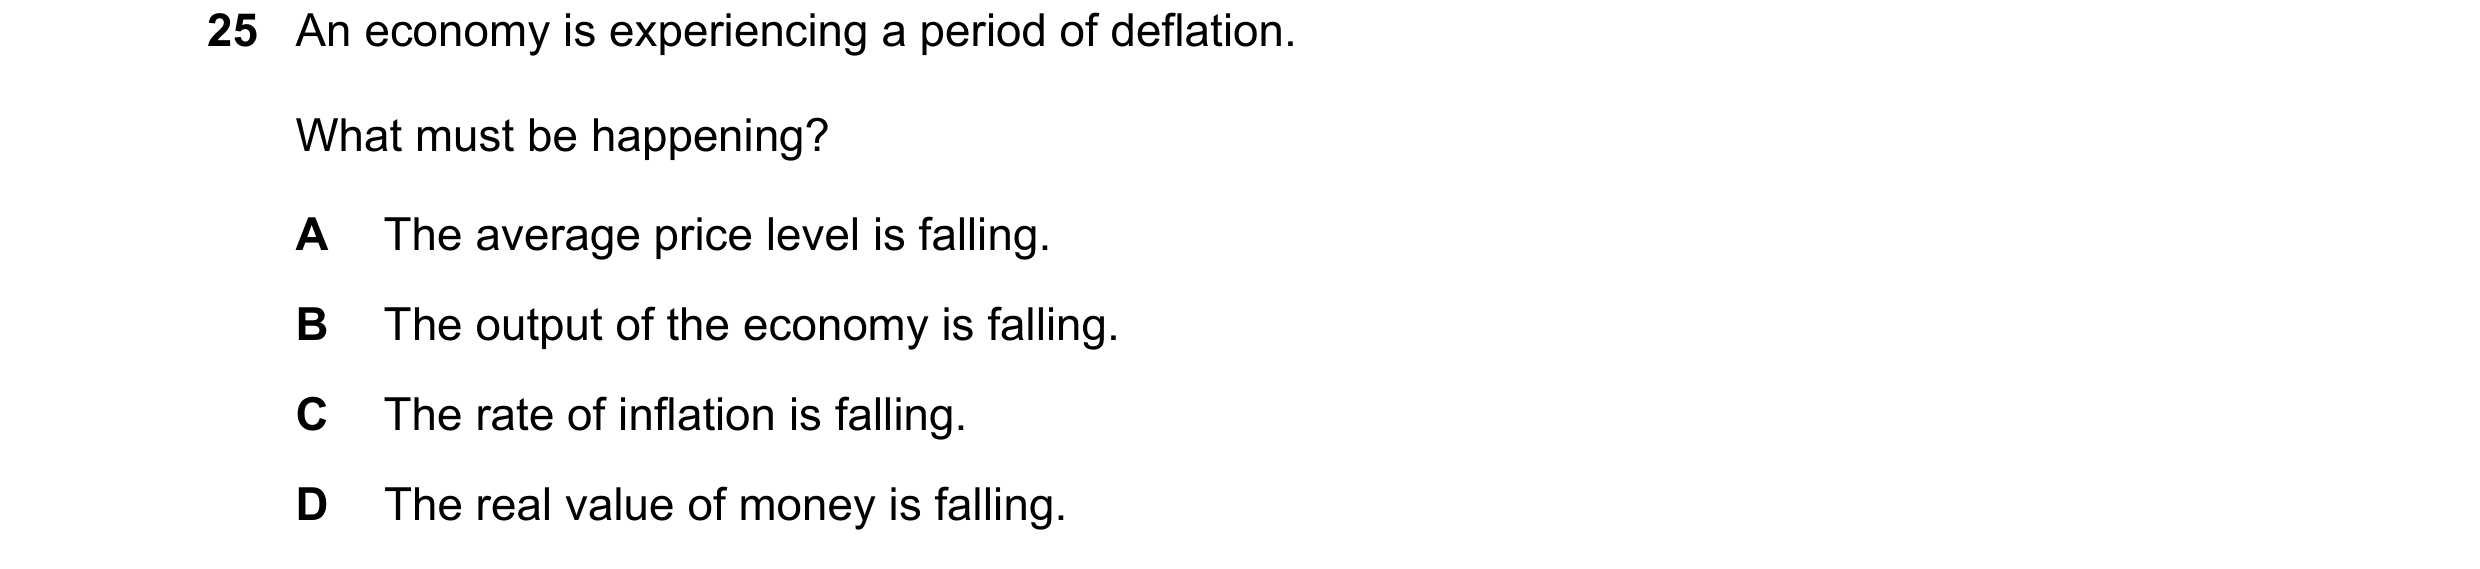 45 / 67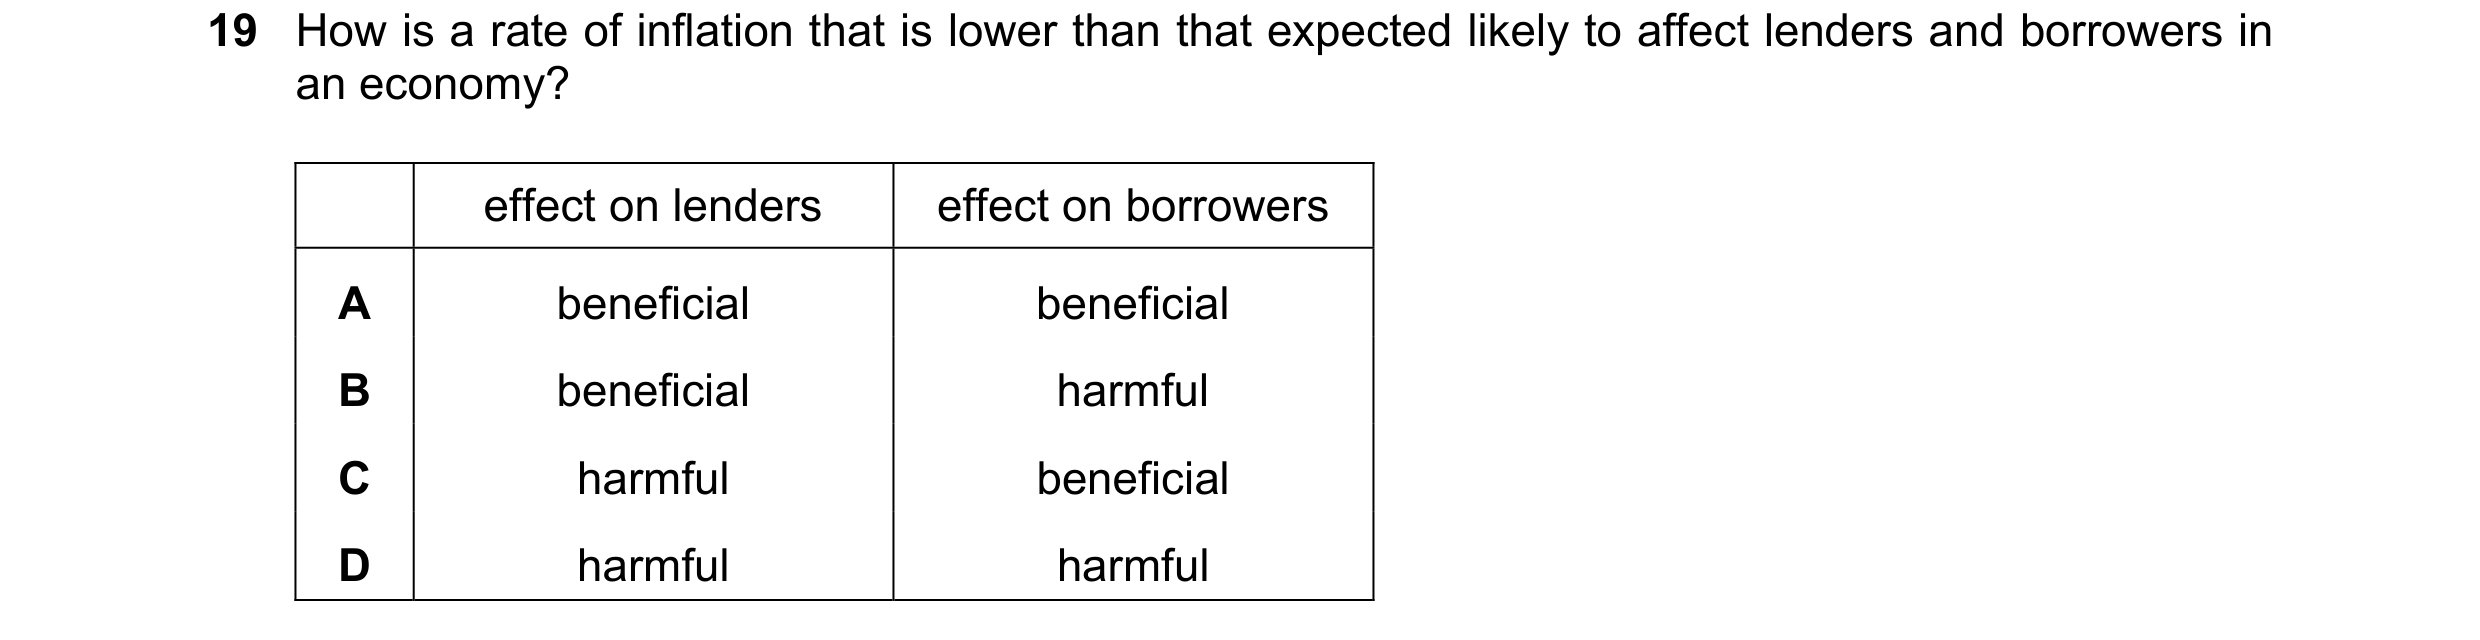


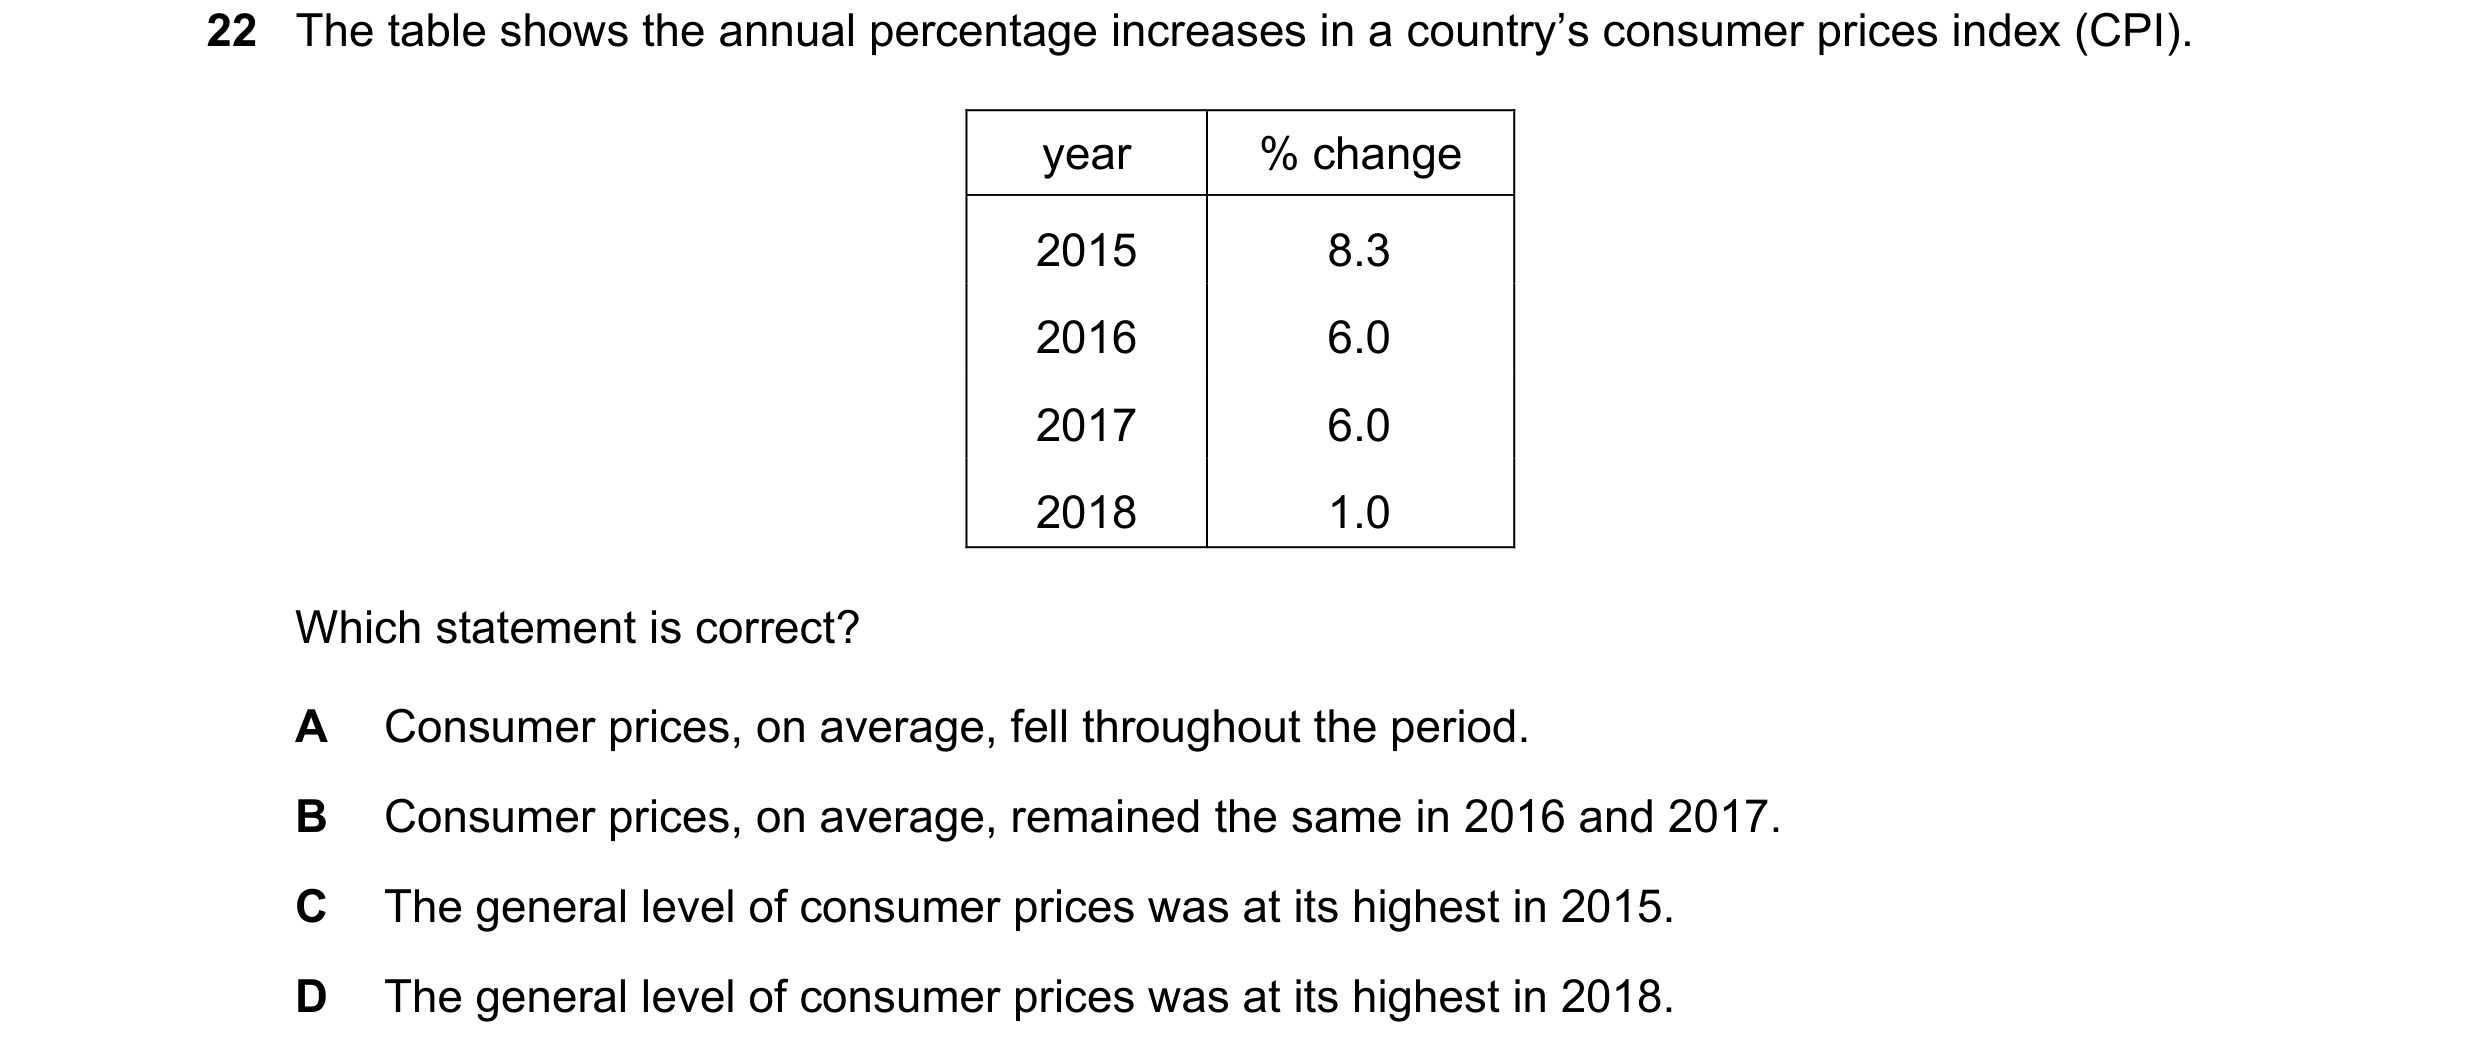 46 / 67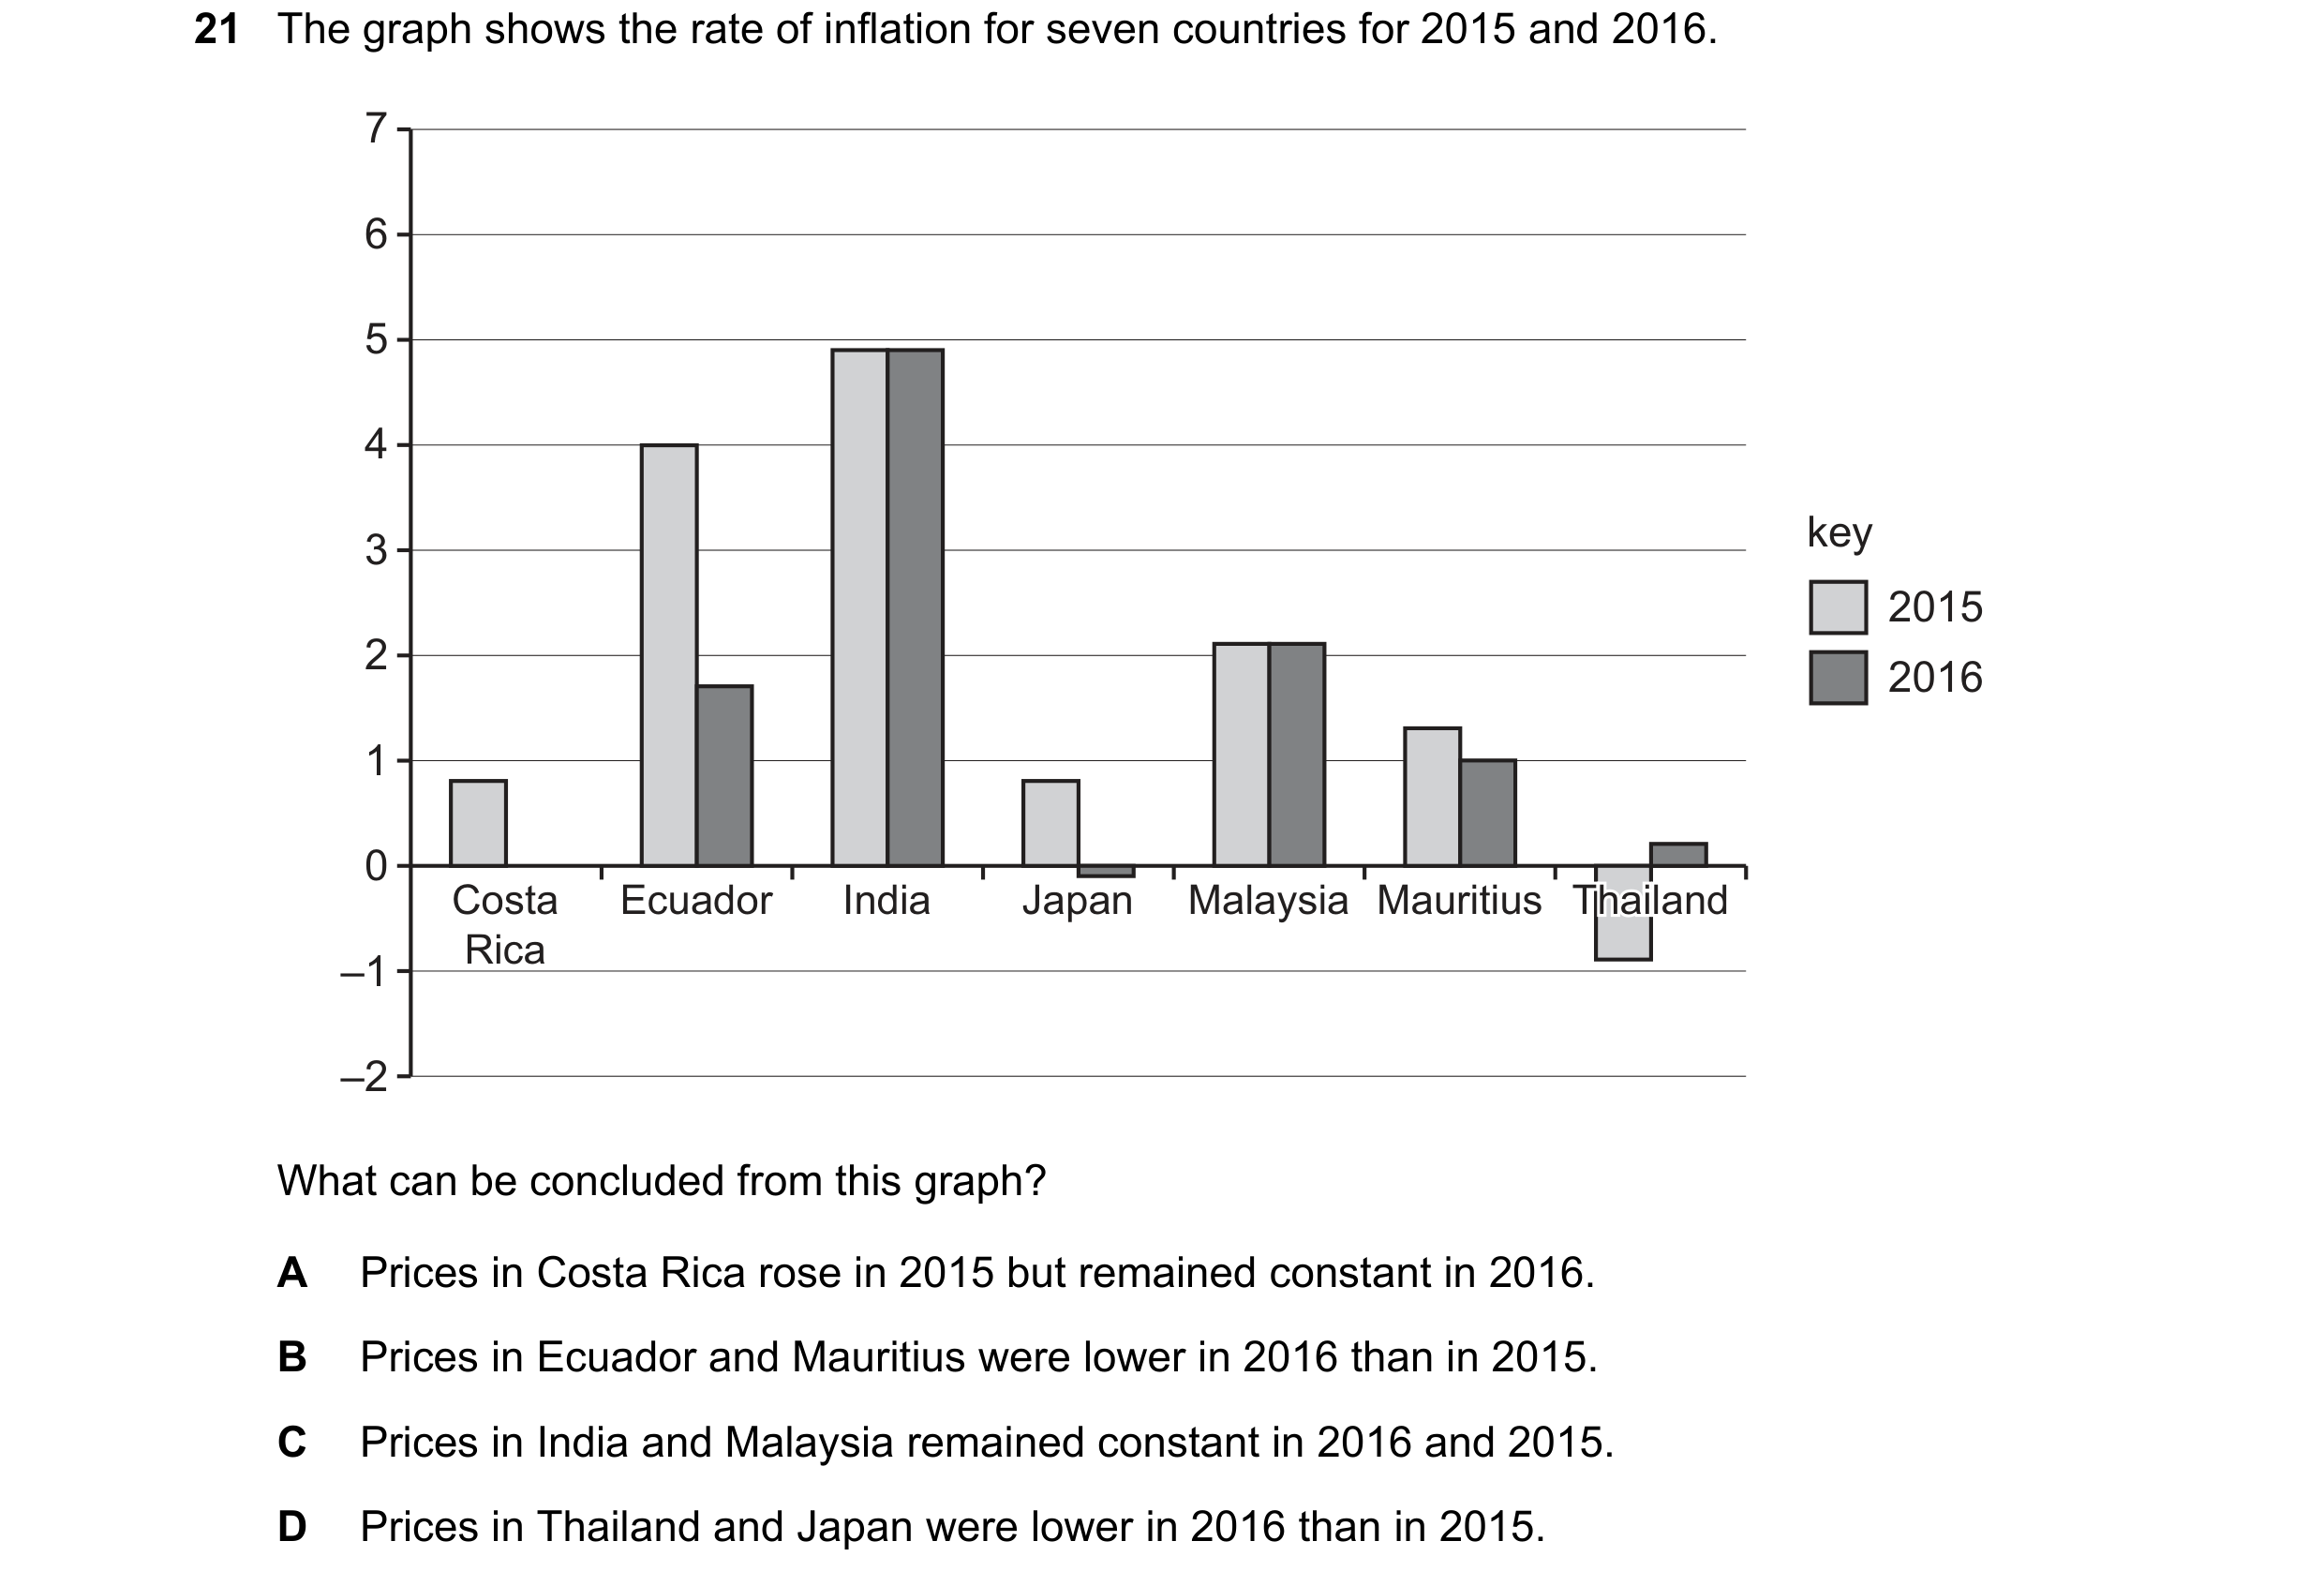


 47 / 67
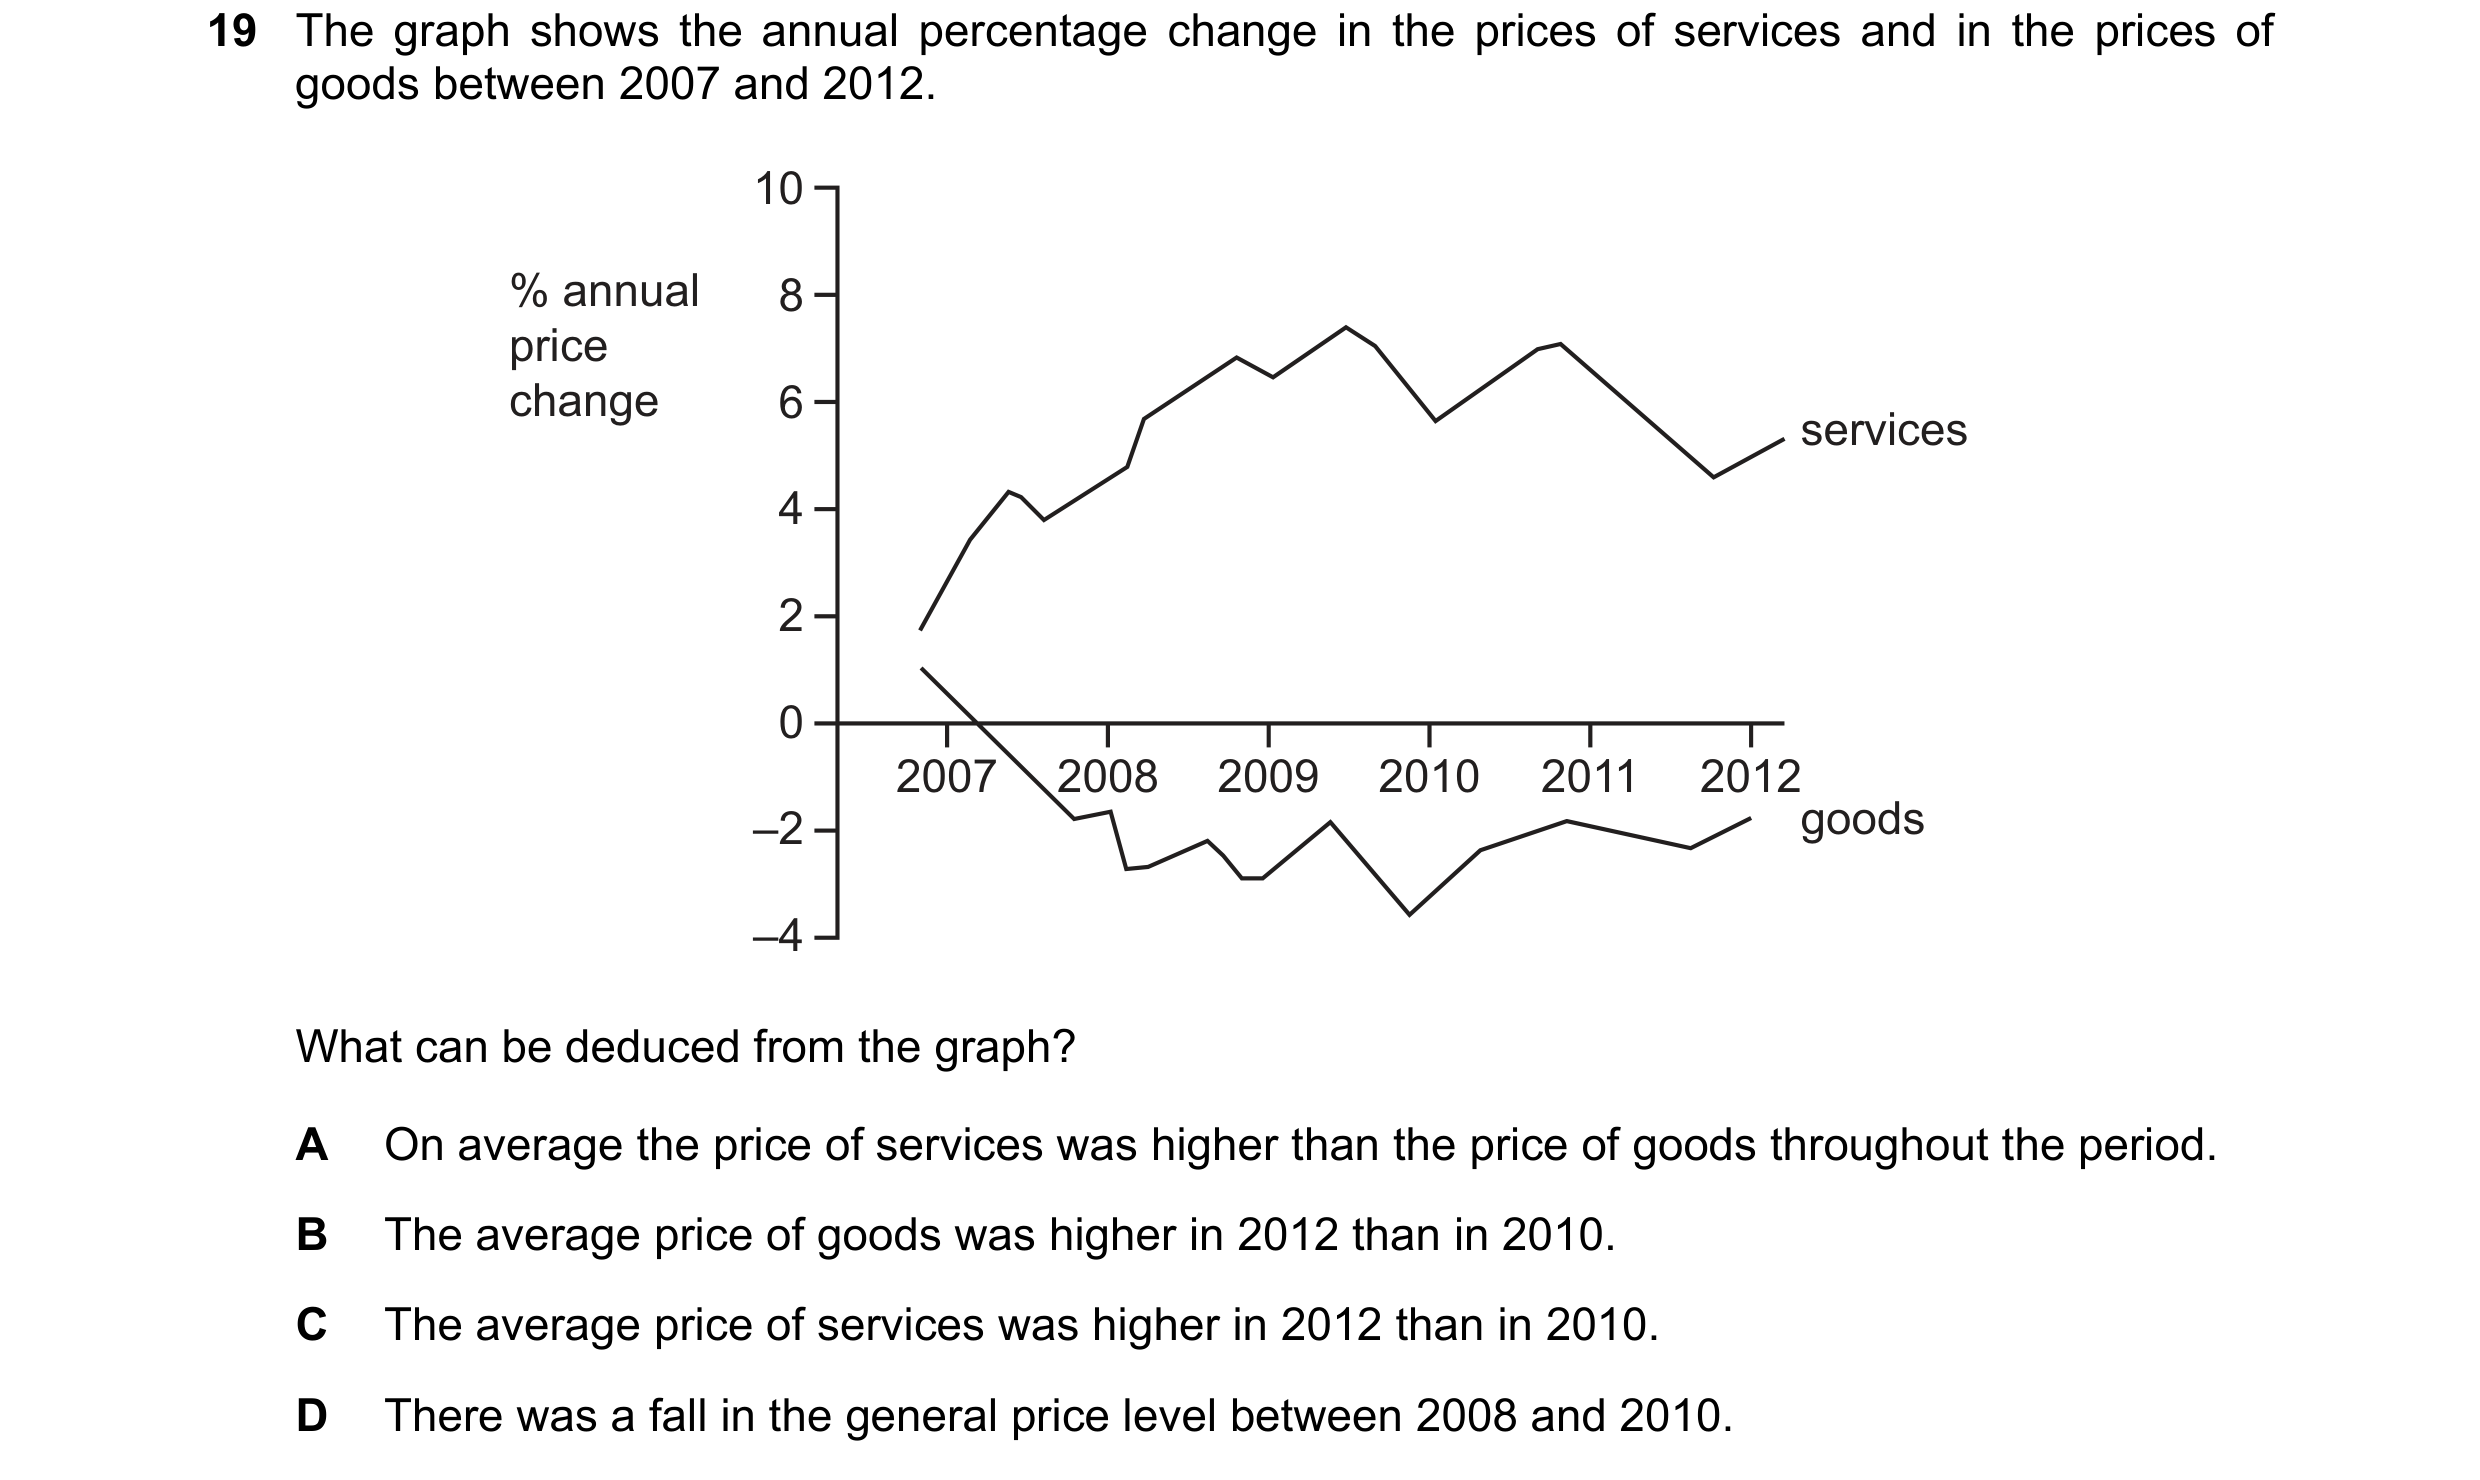
 48 / 67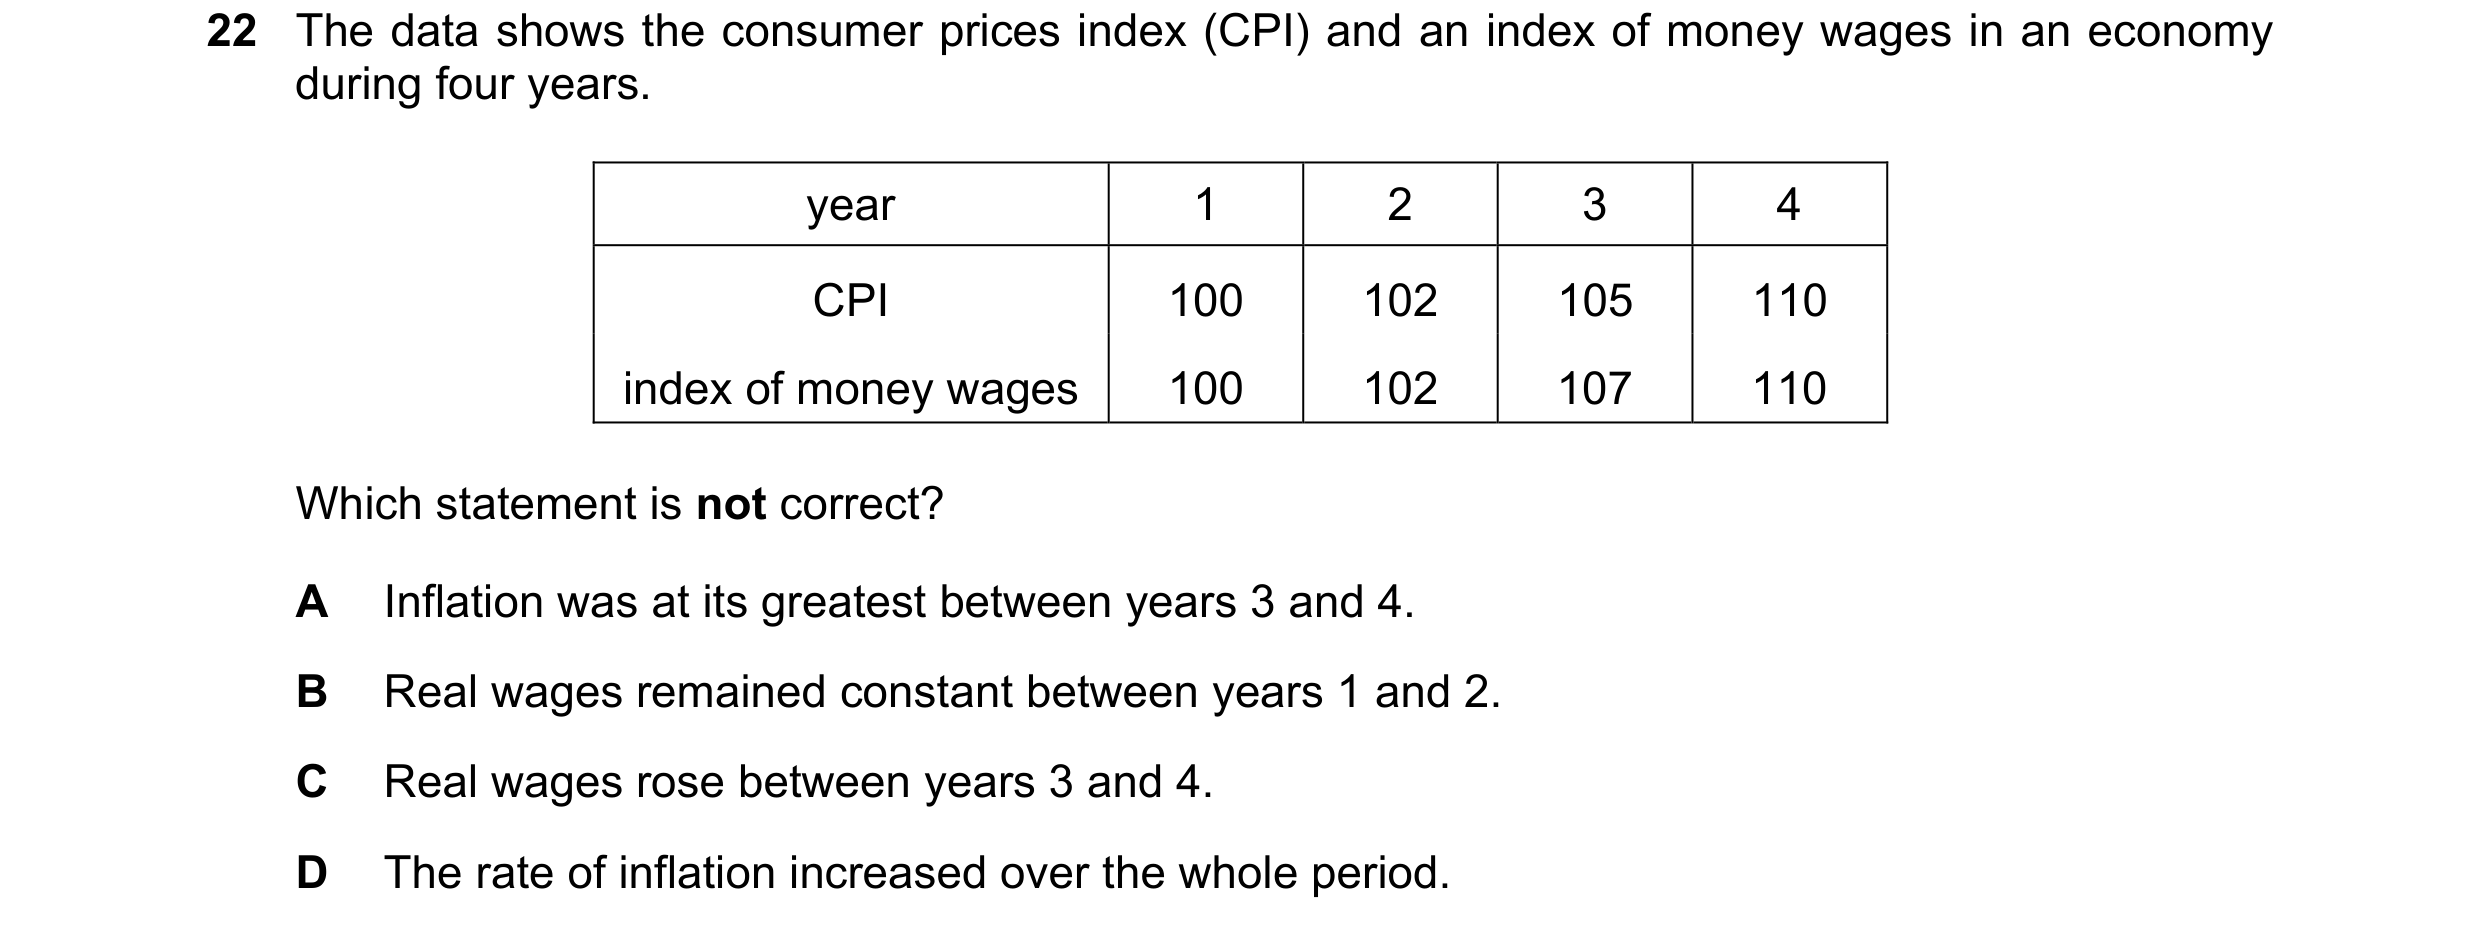
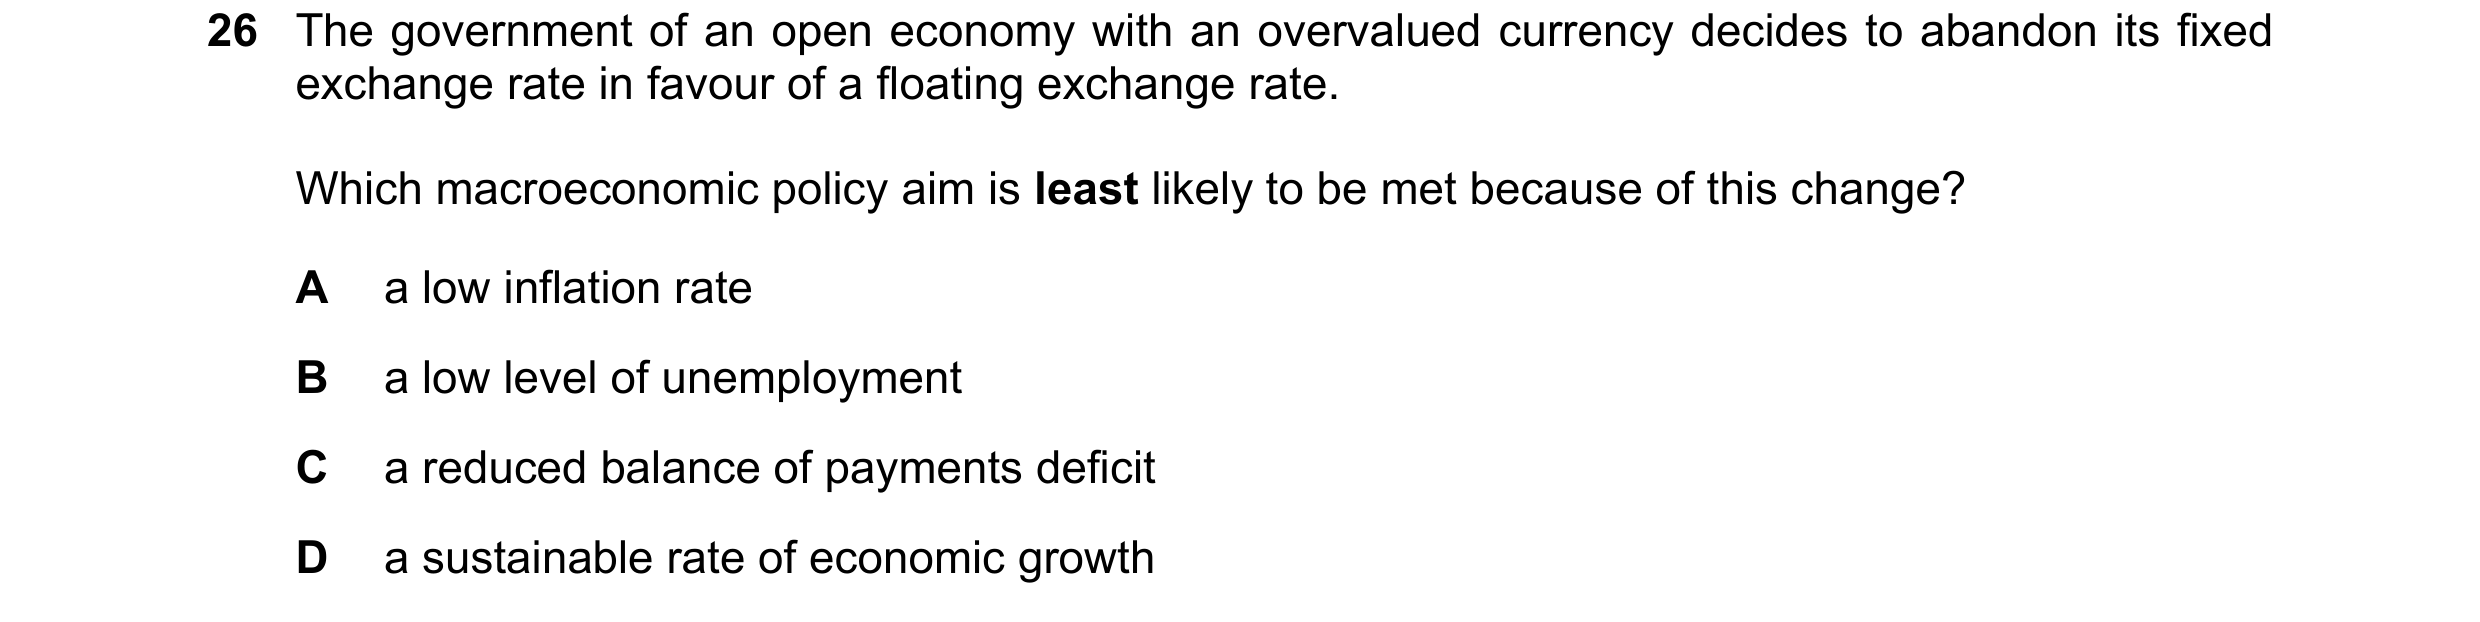


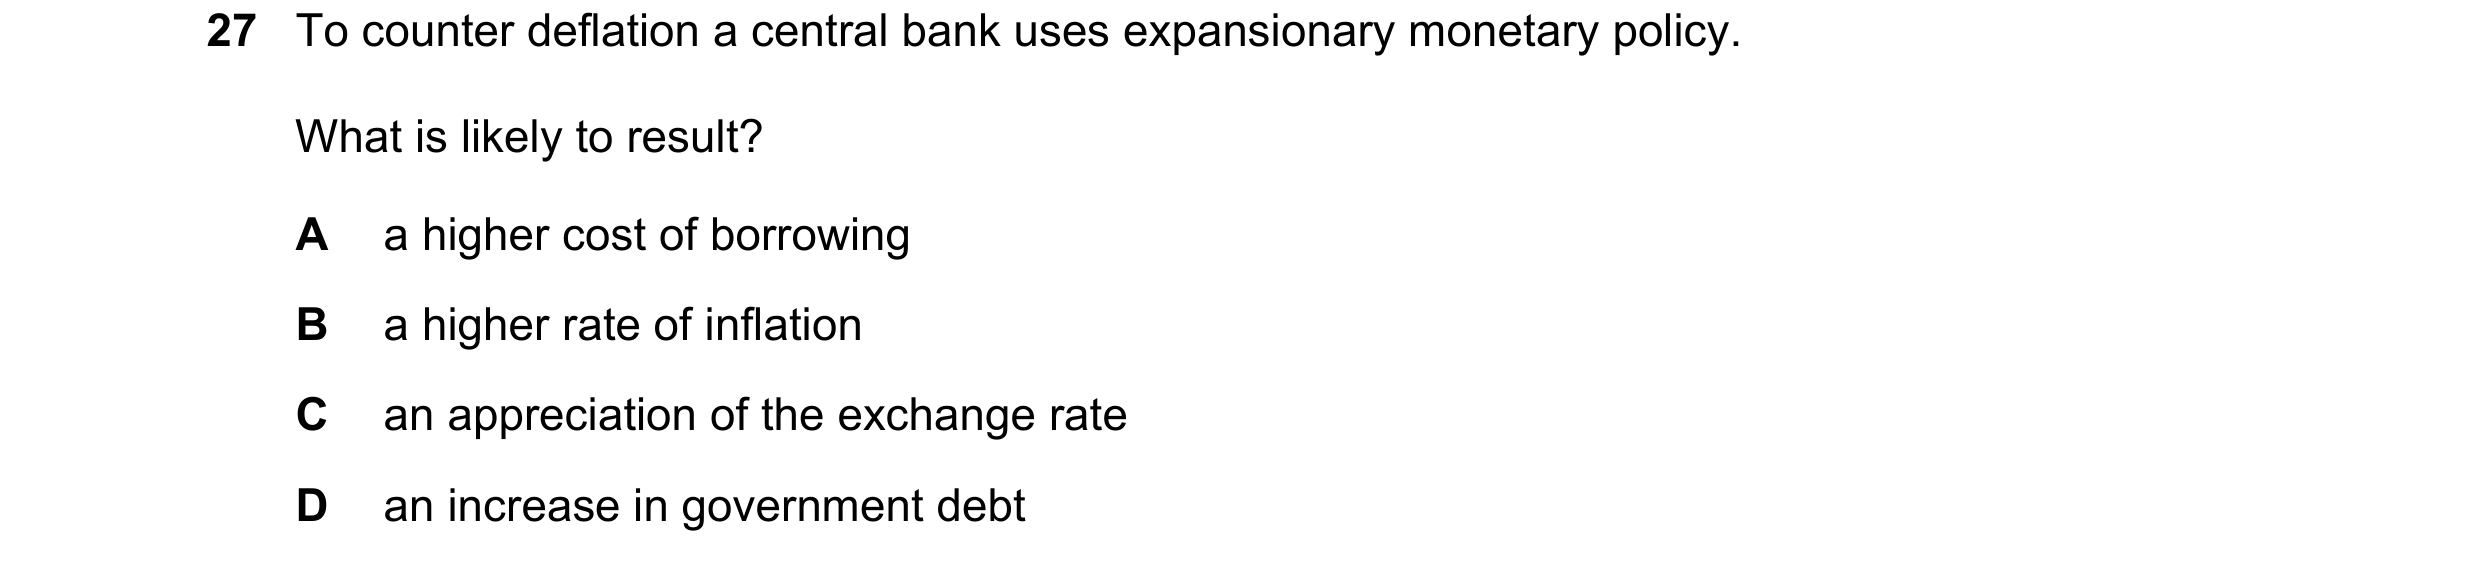 49 / 67
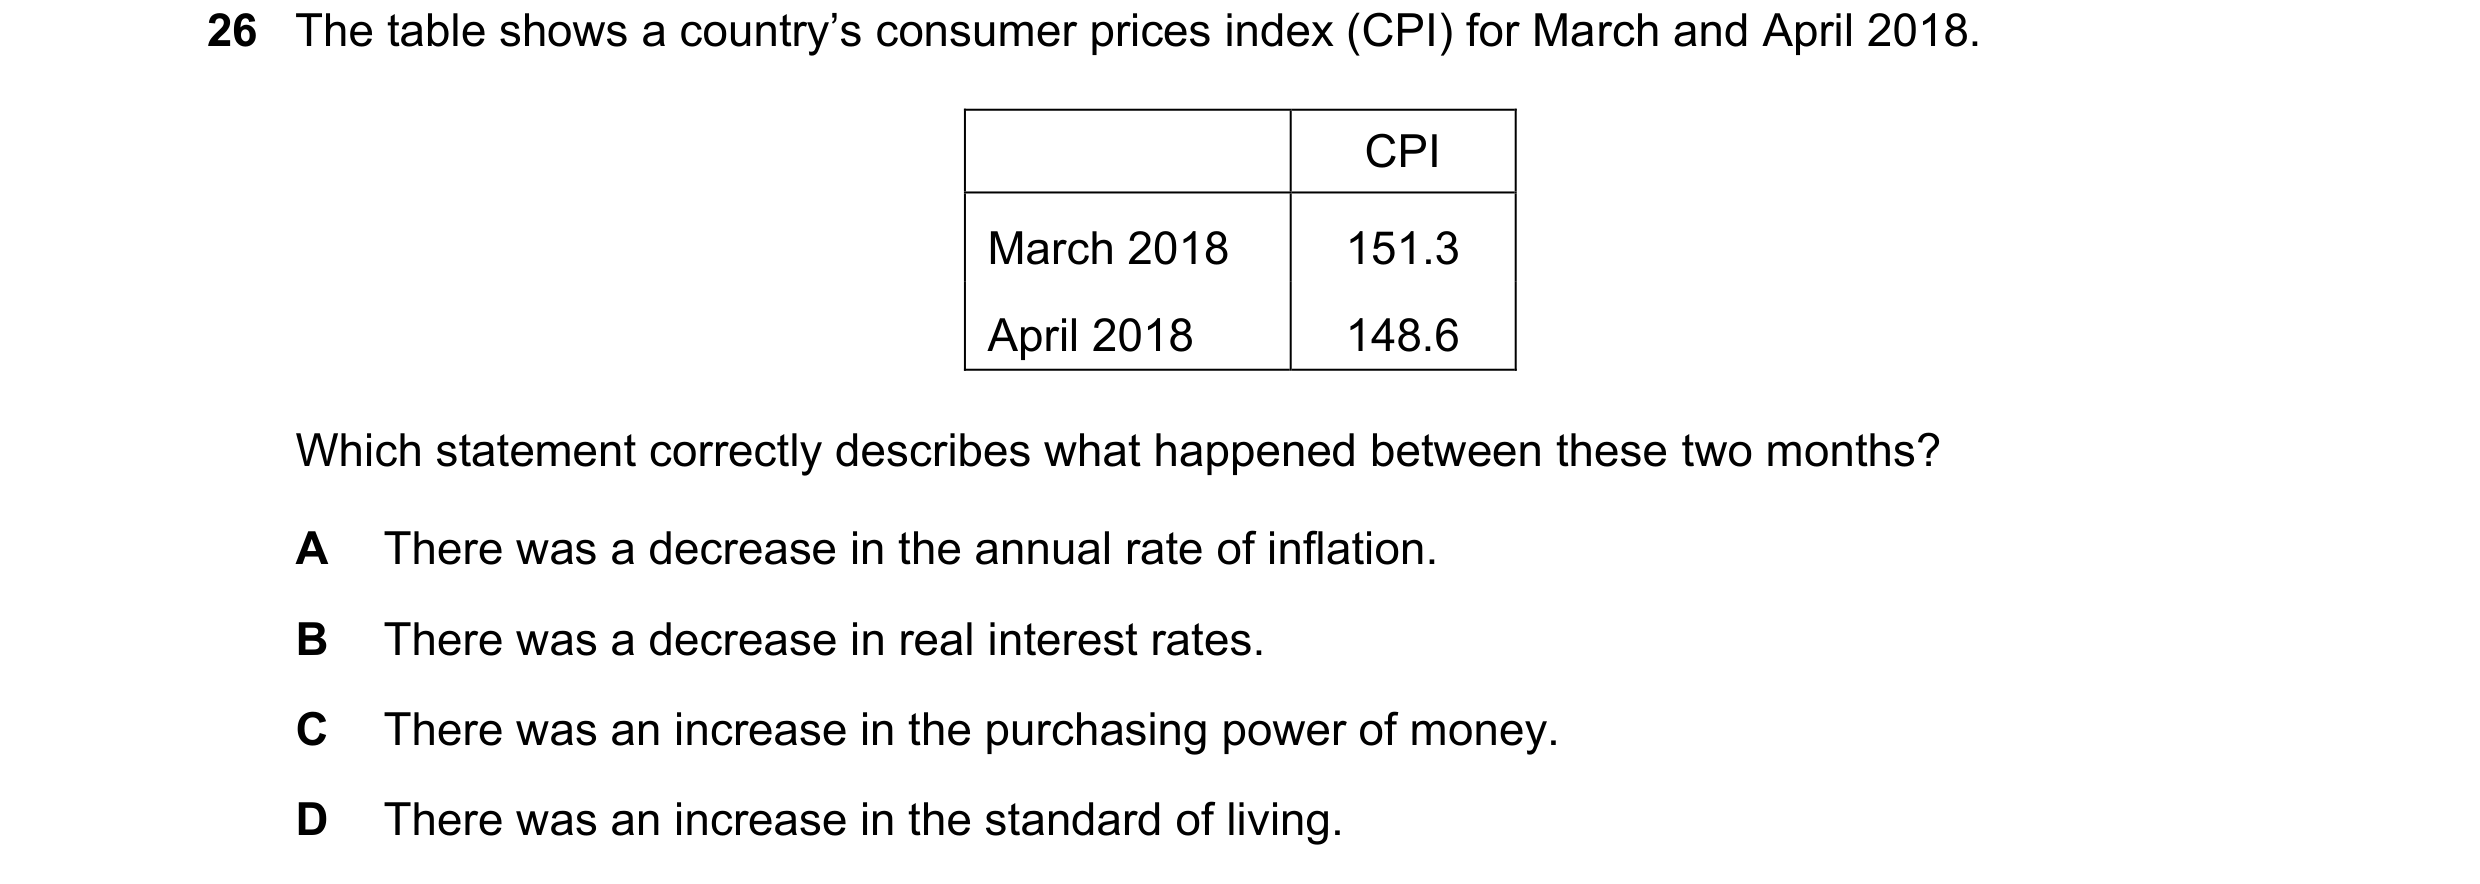
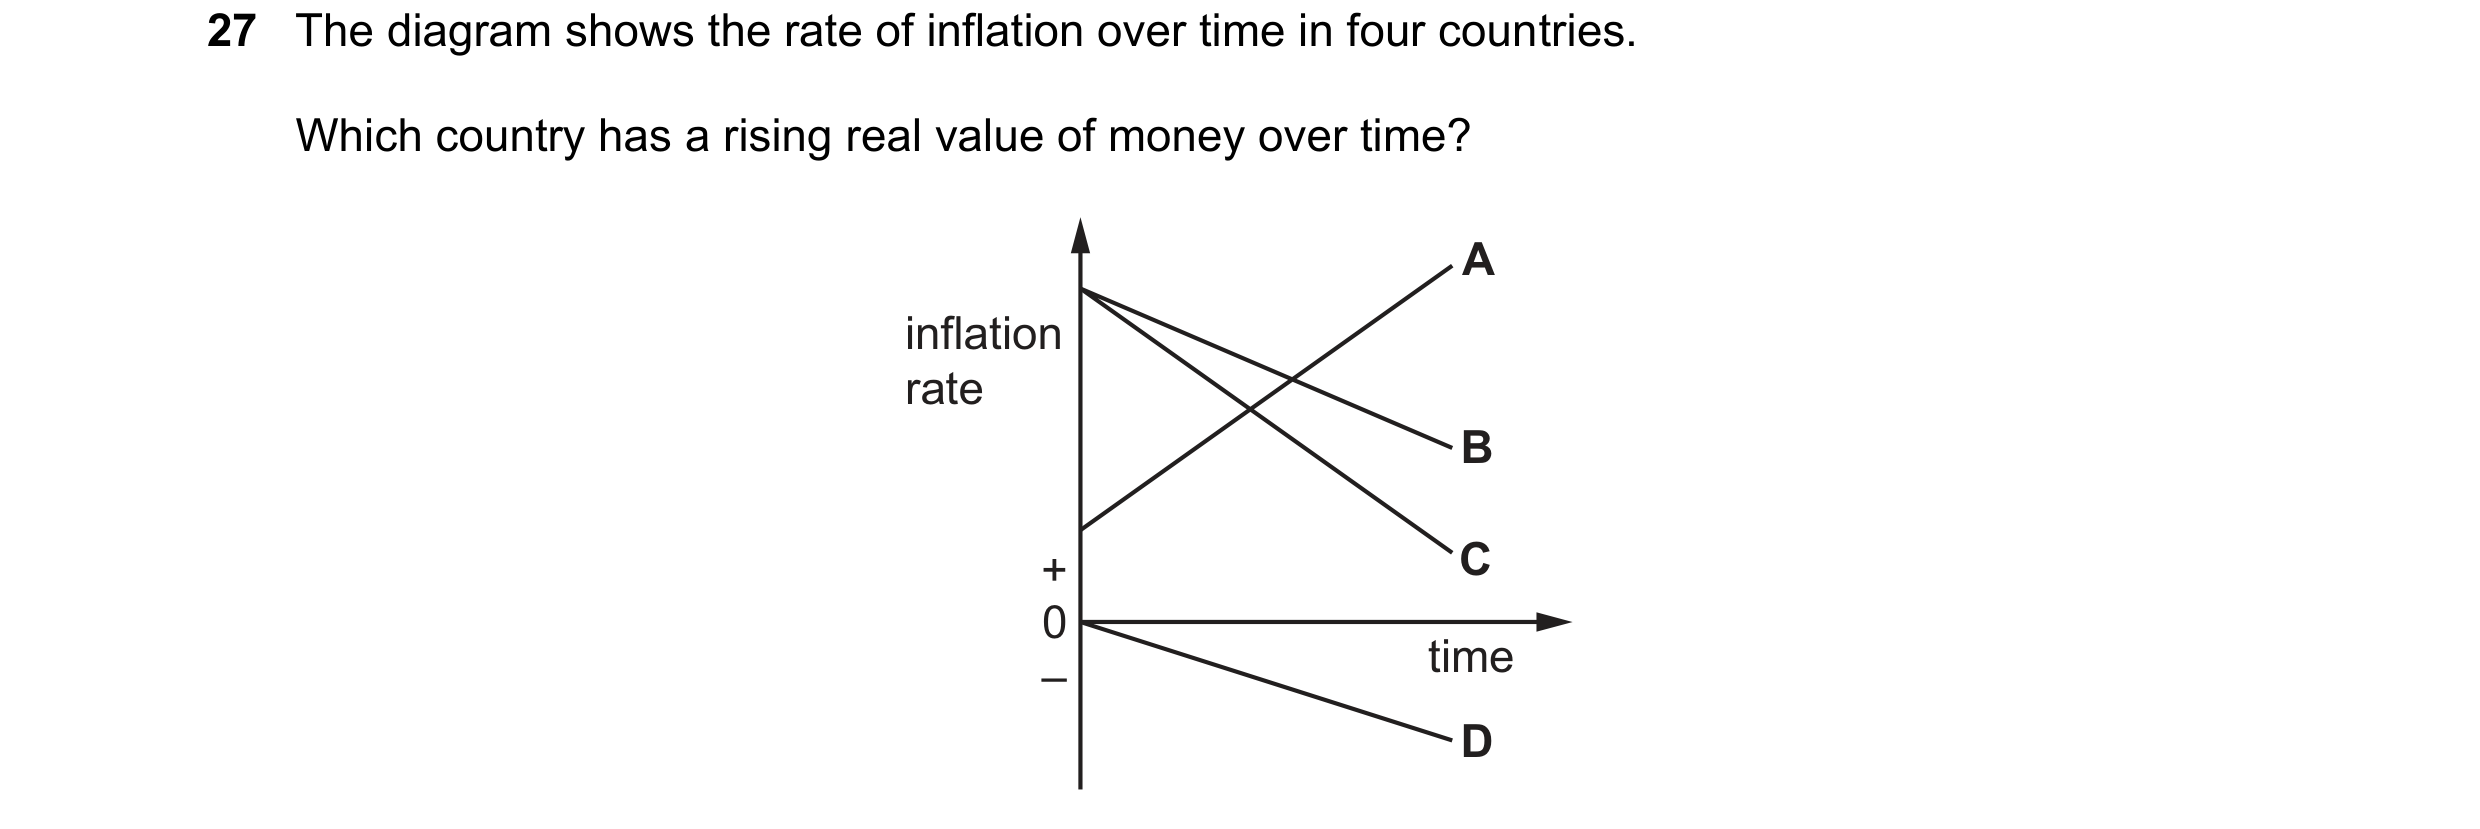

 50 / 67

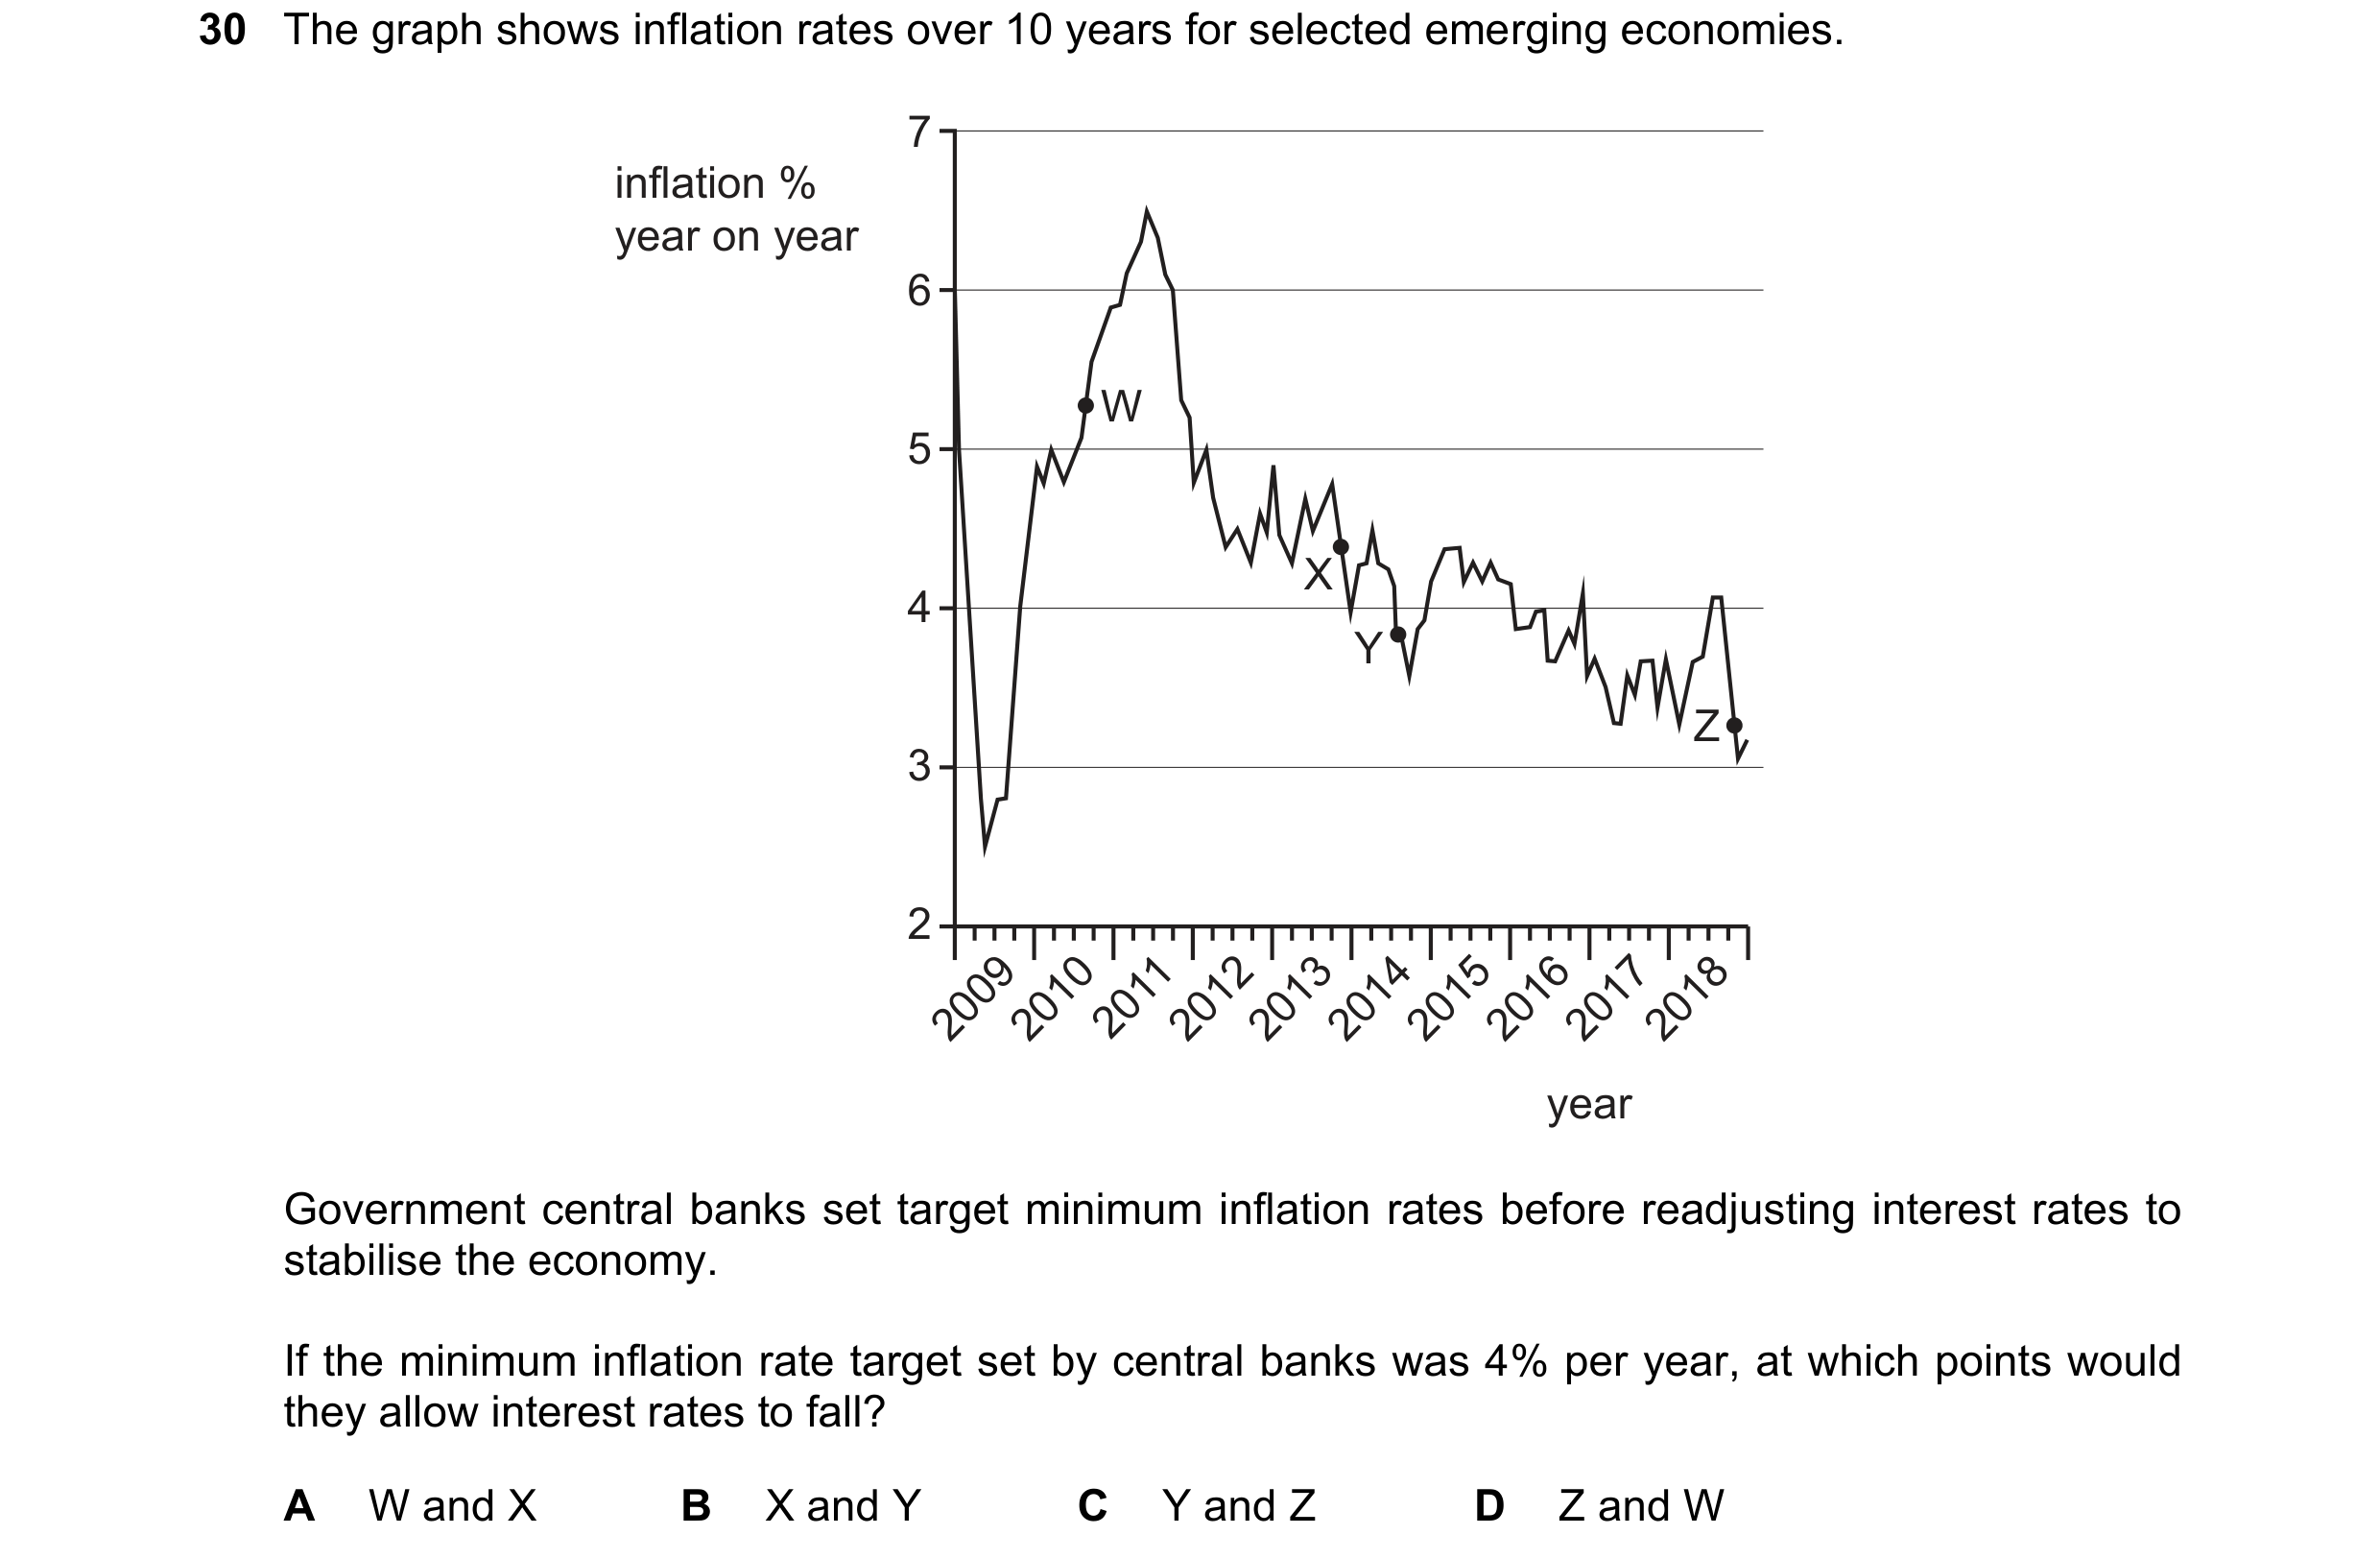 51 / 67
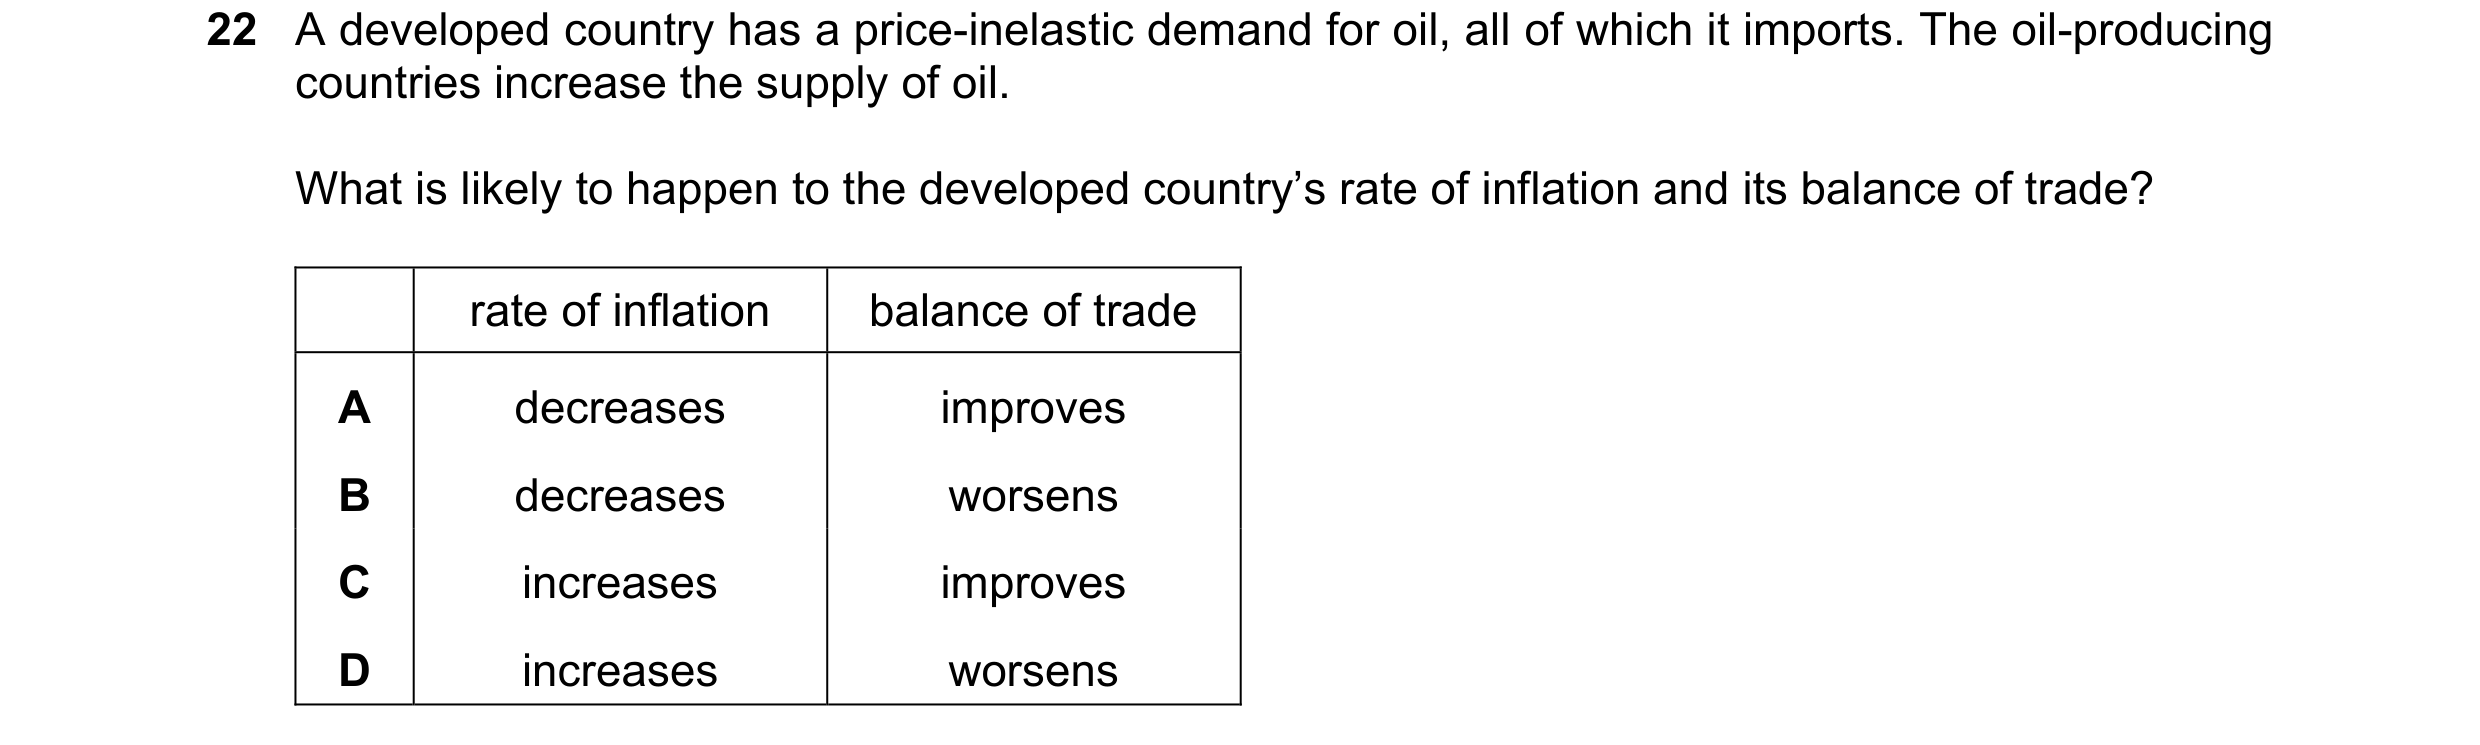

 52 / 67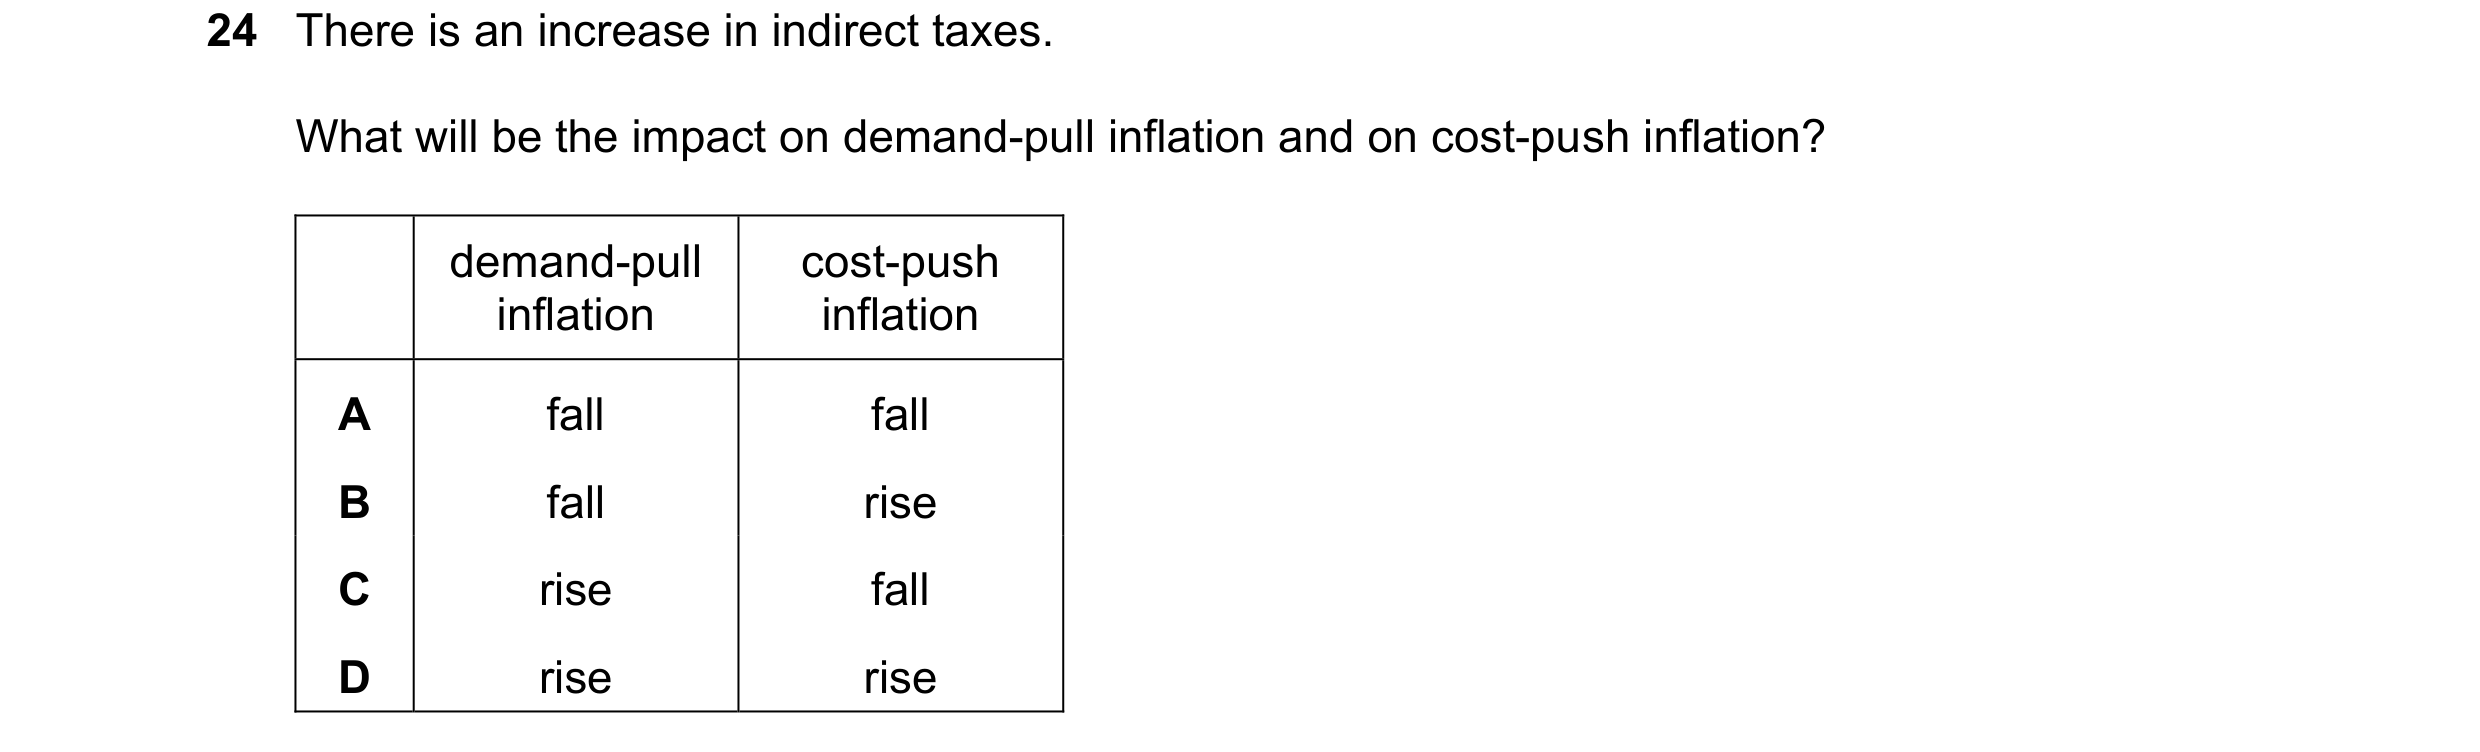

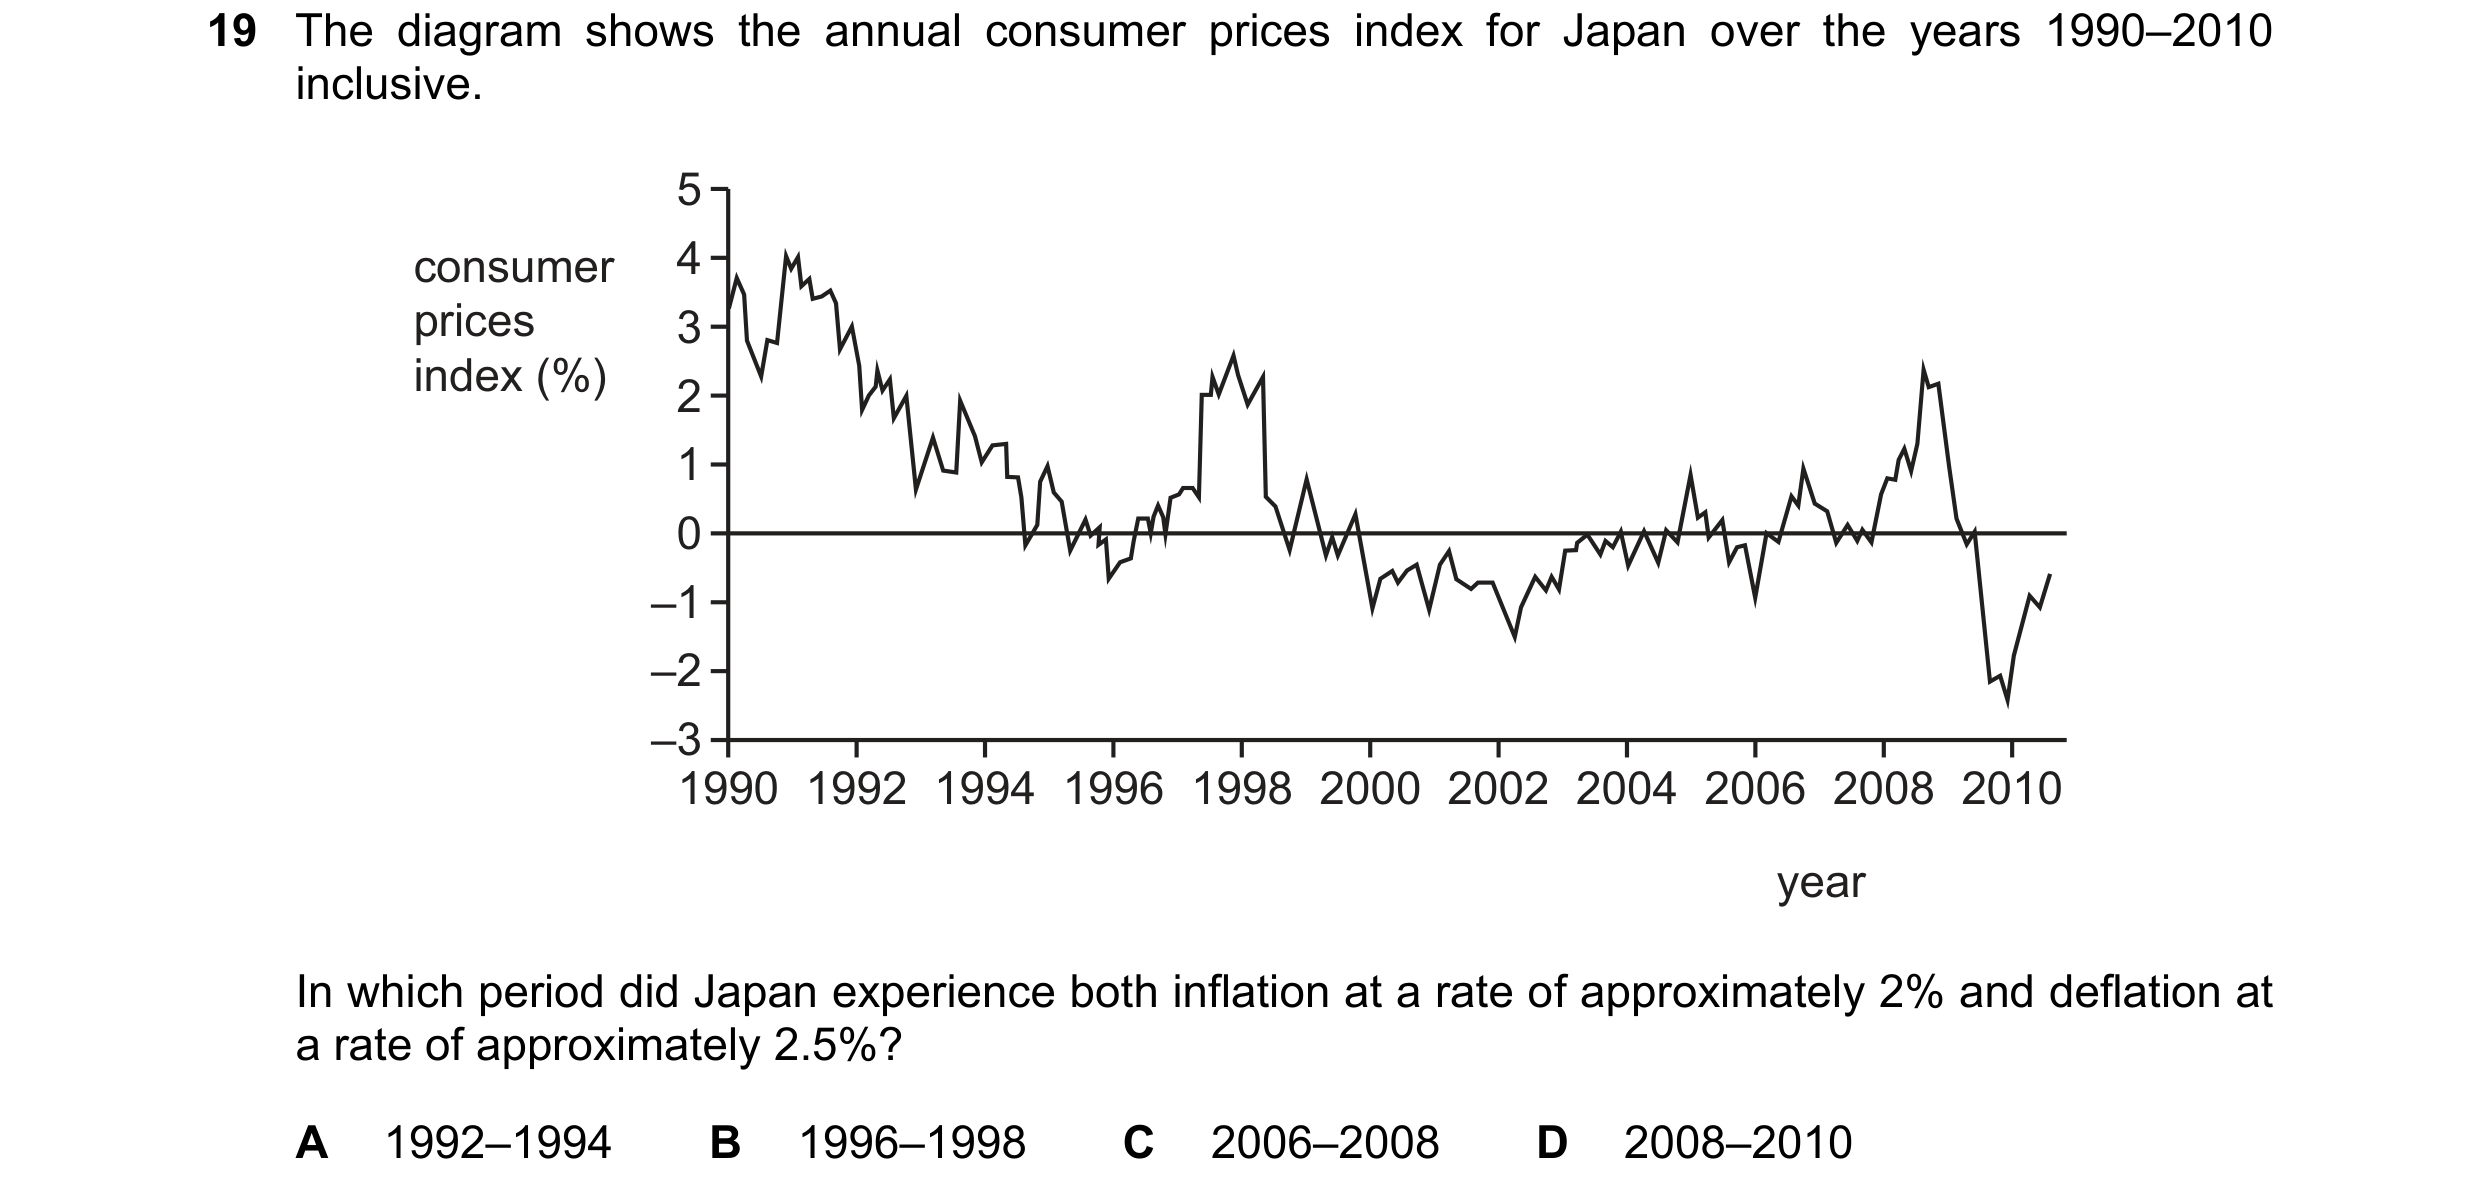 53 / 67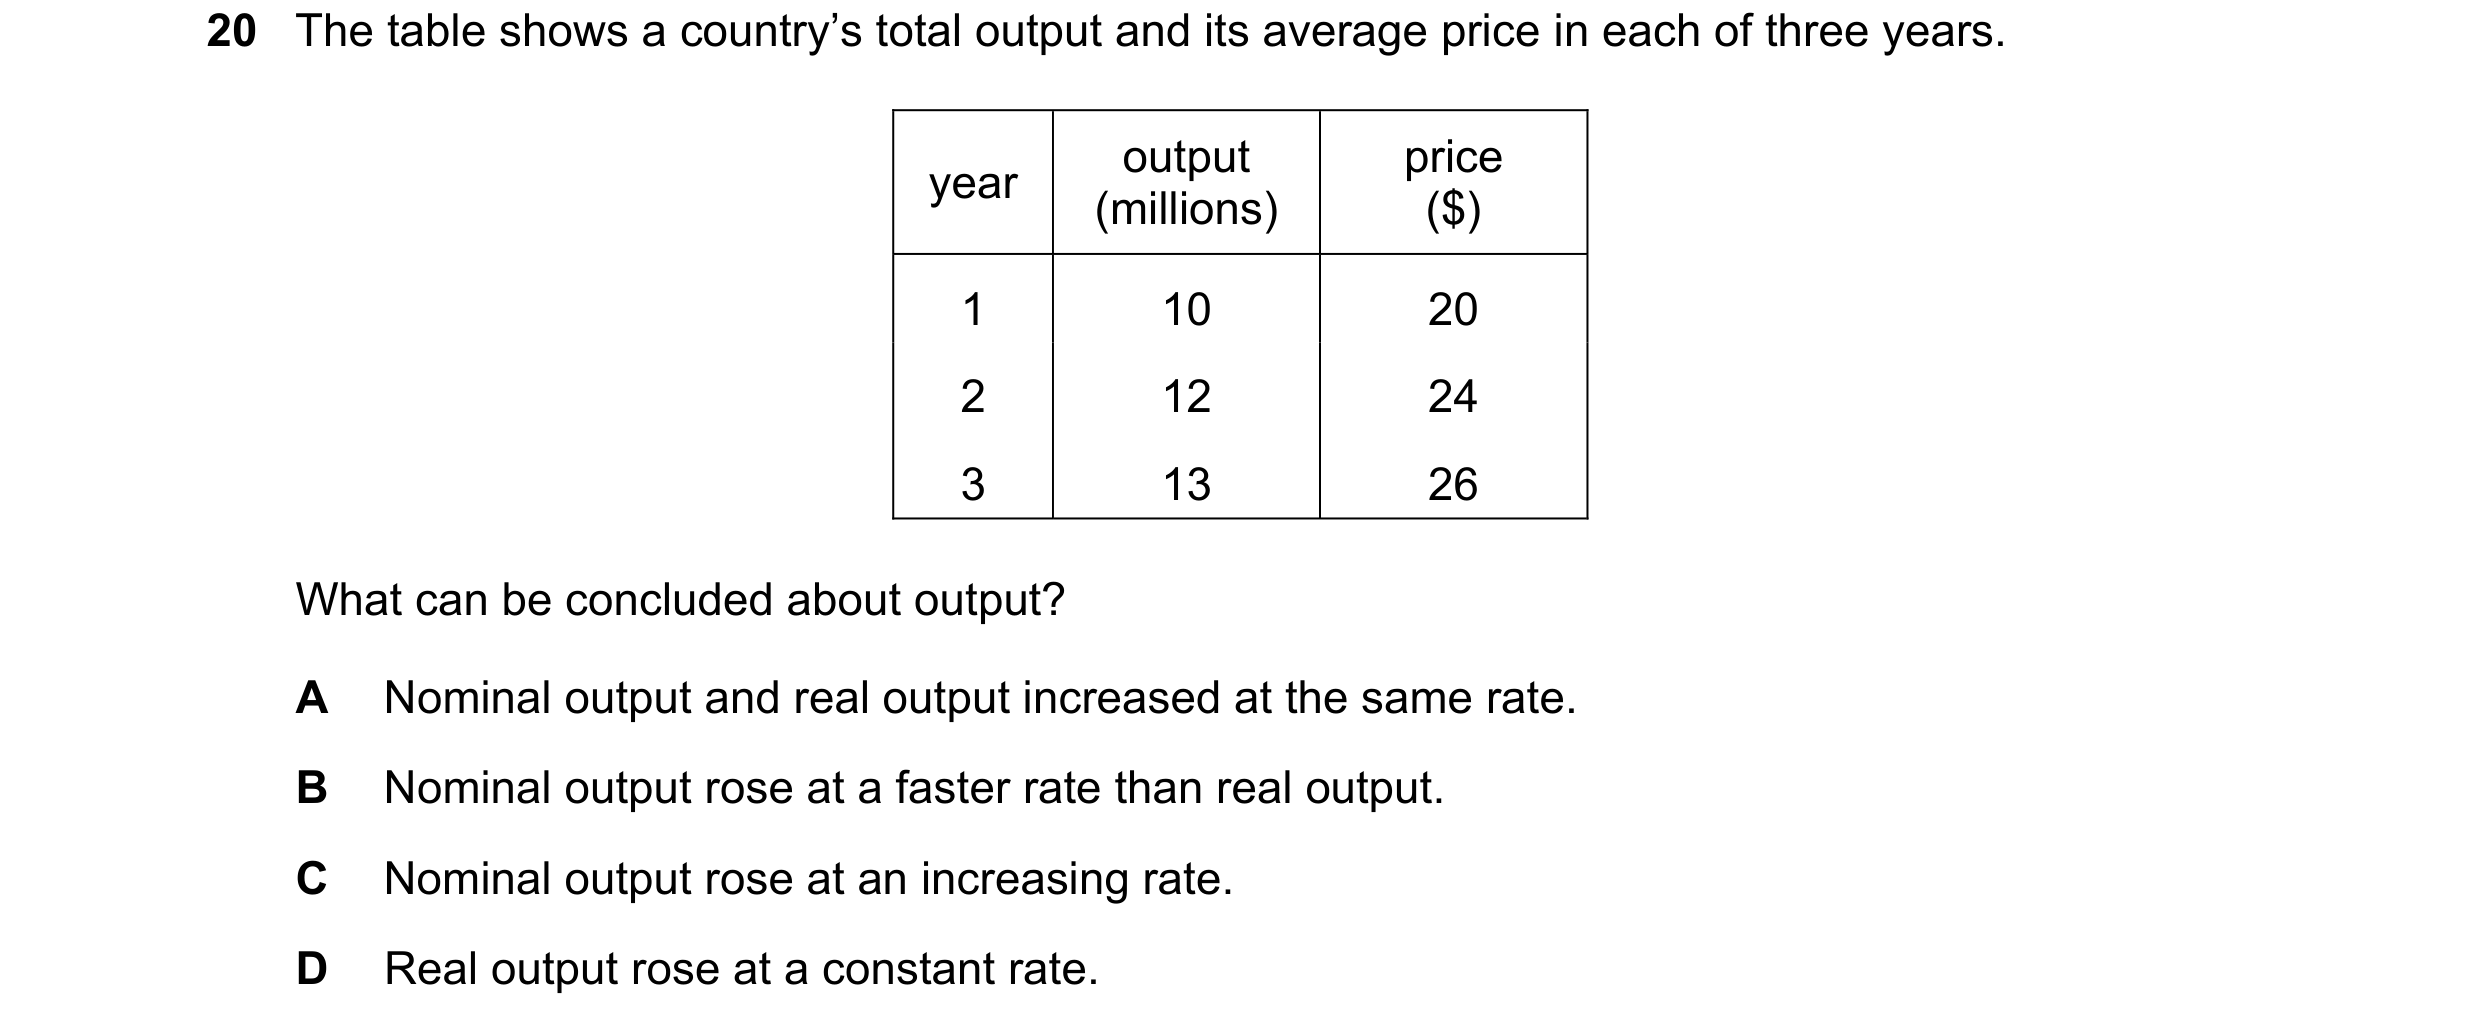
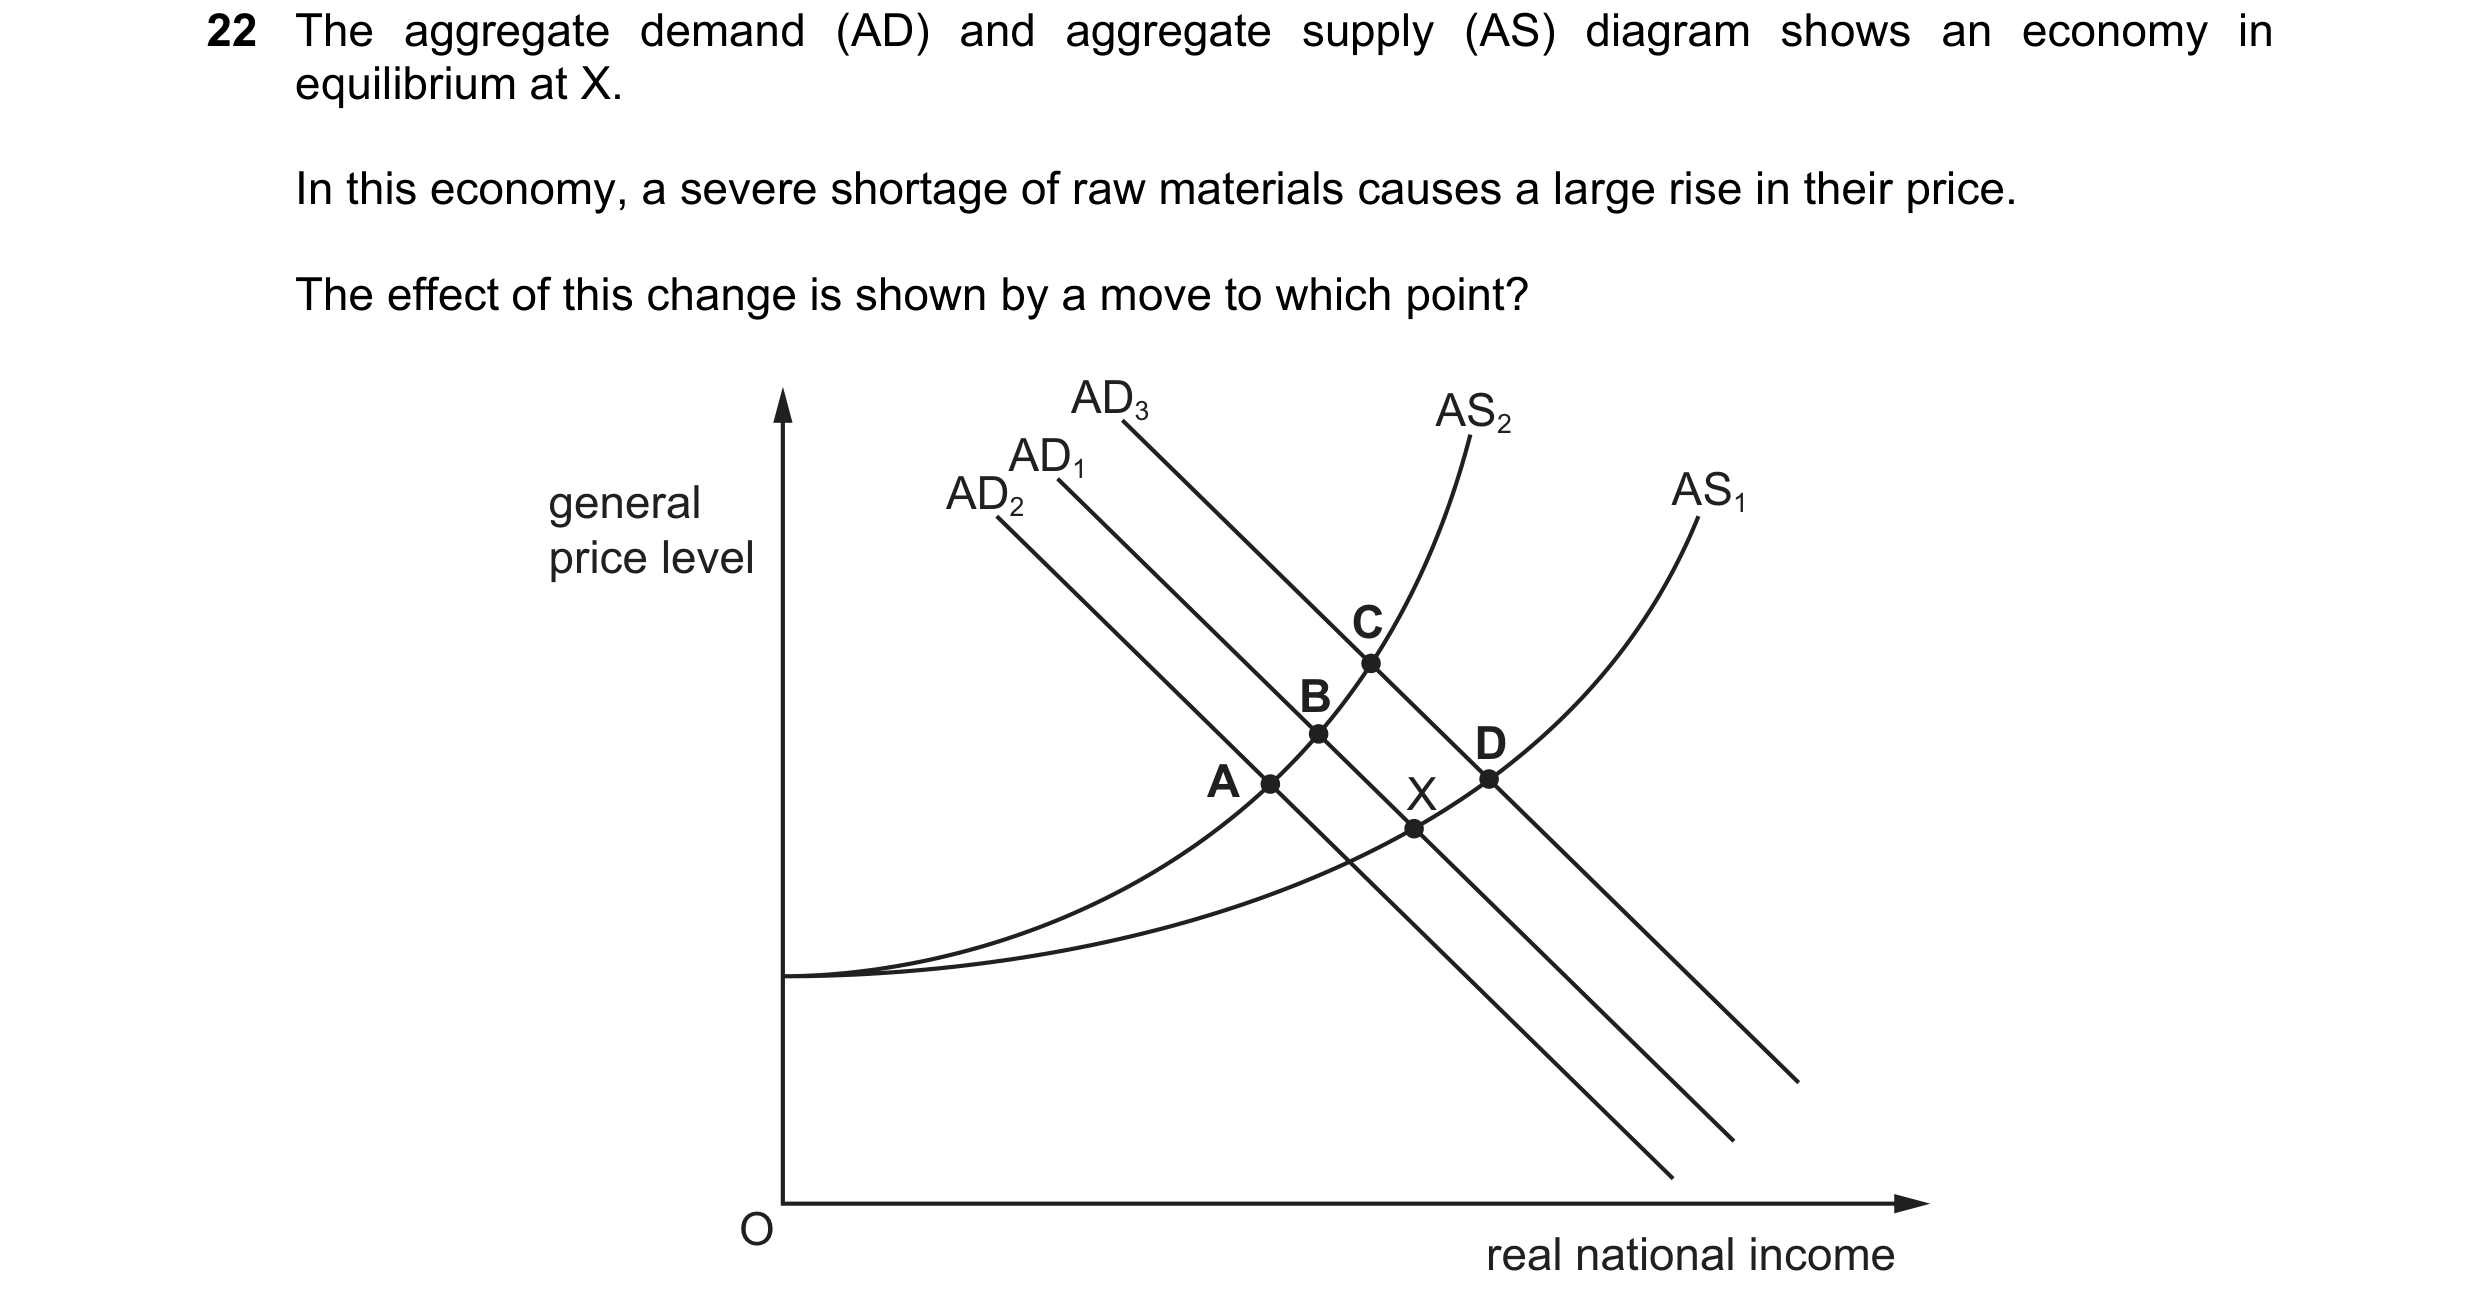
 54 / 67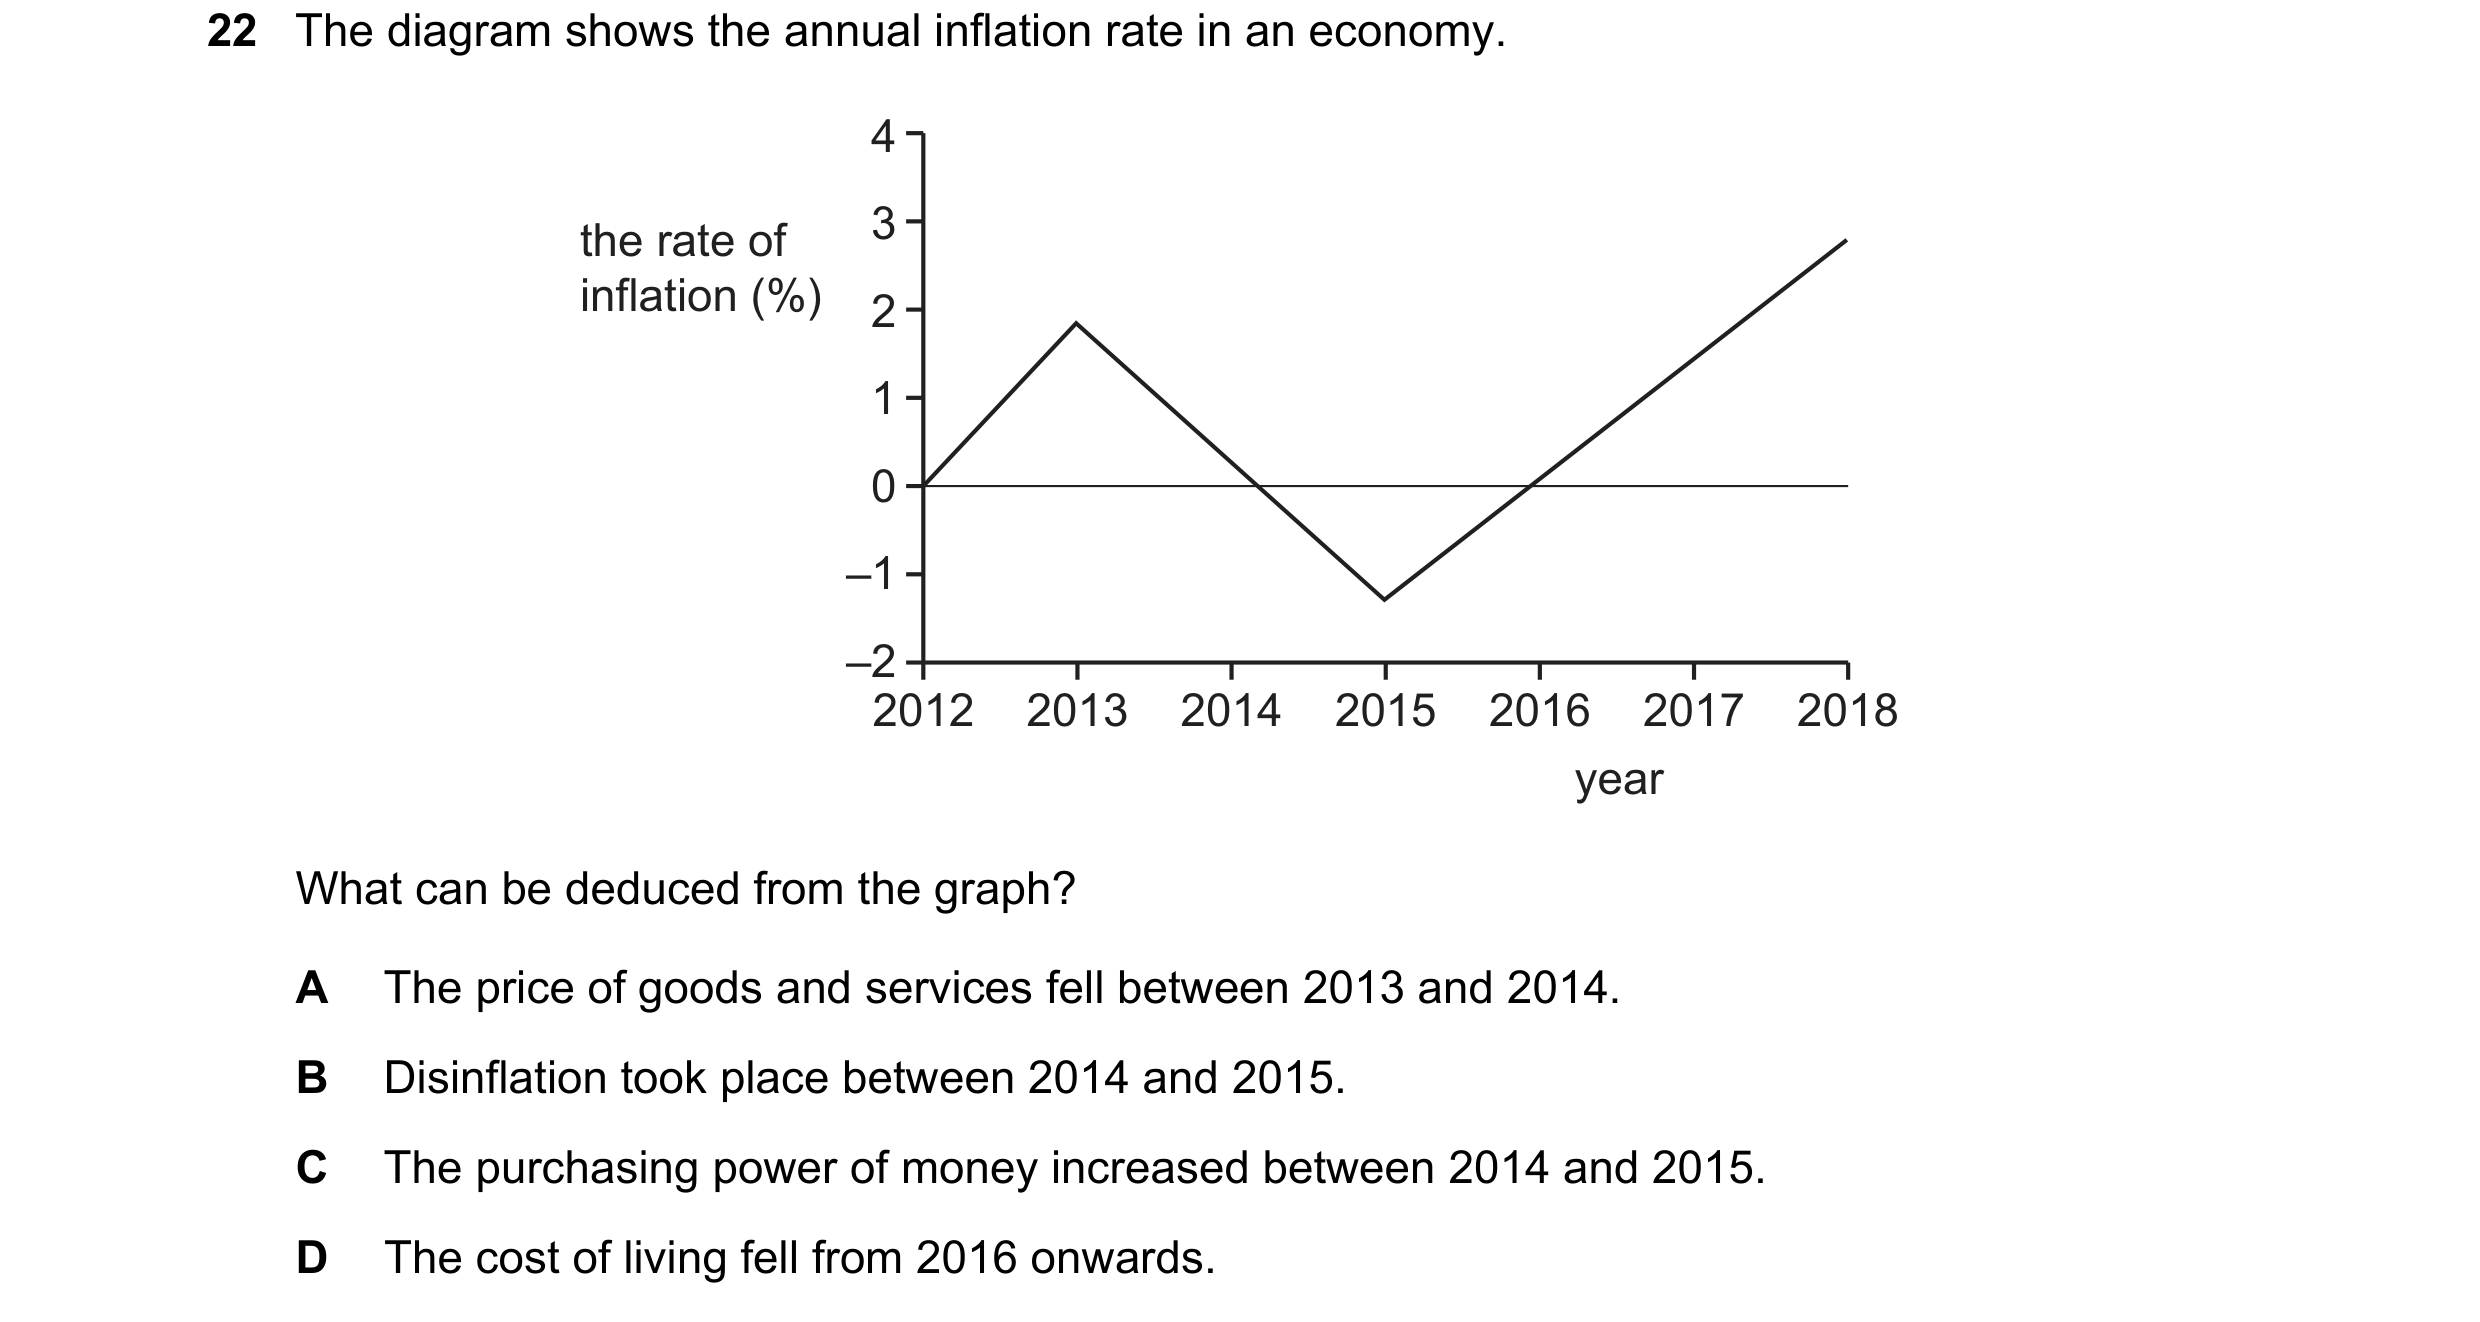

 55 / 67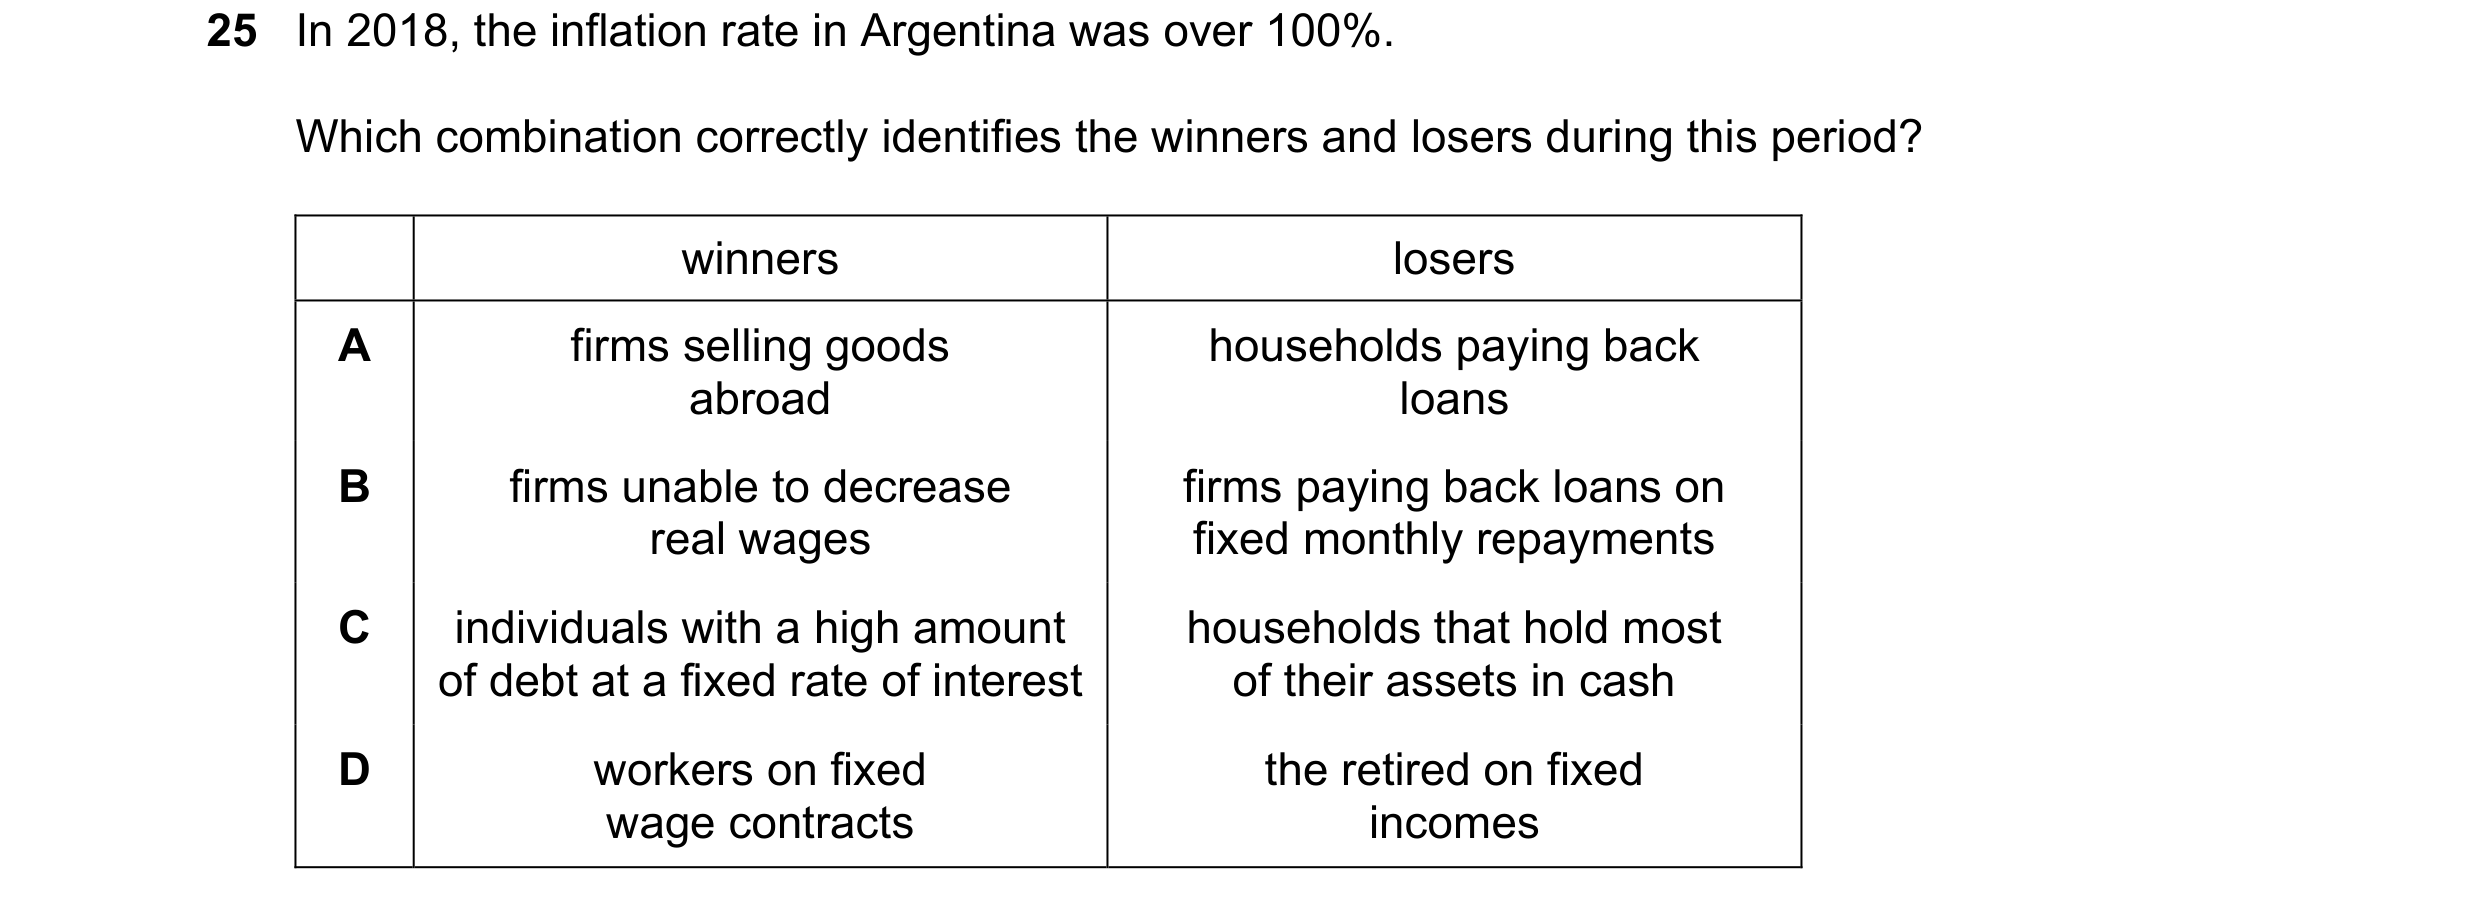
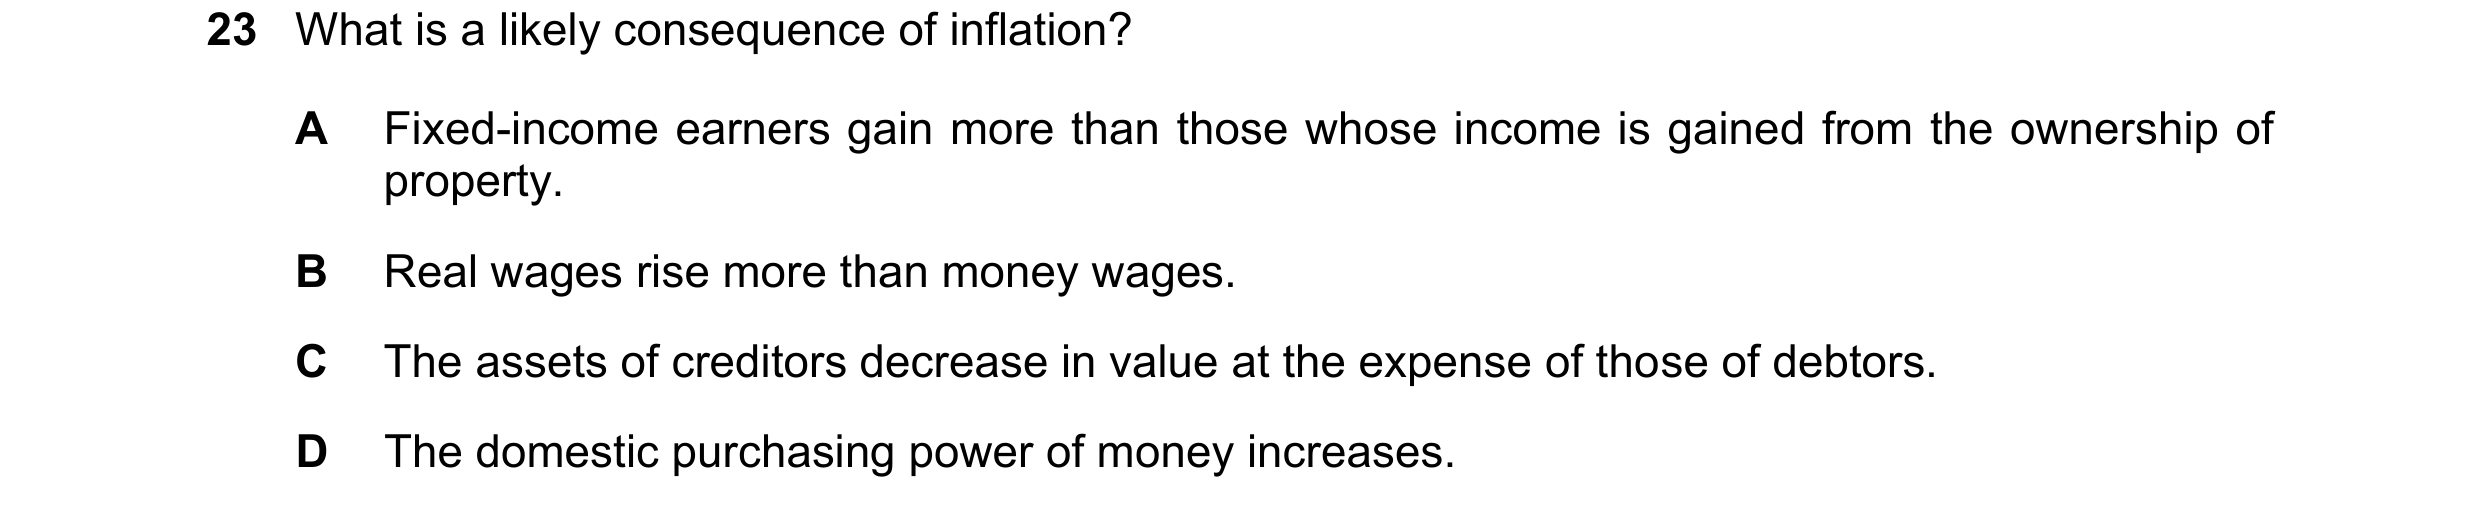 56 / 67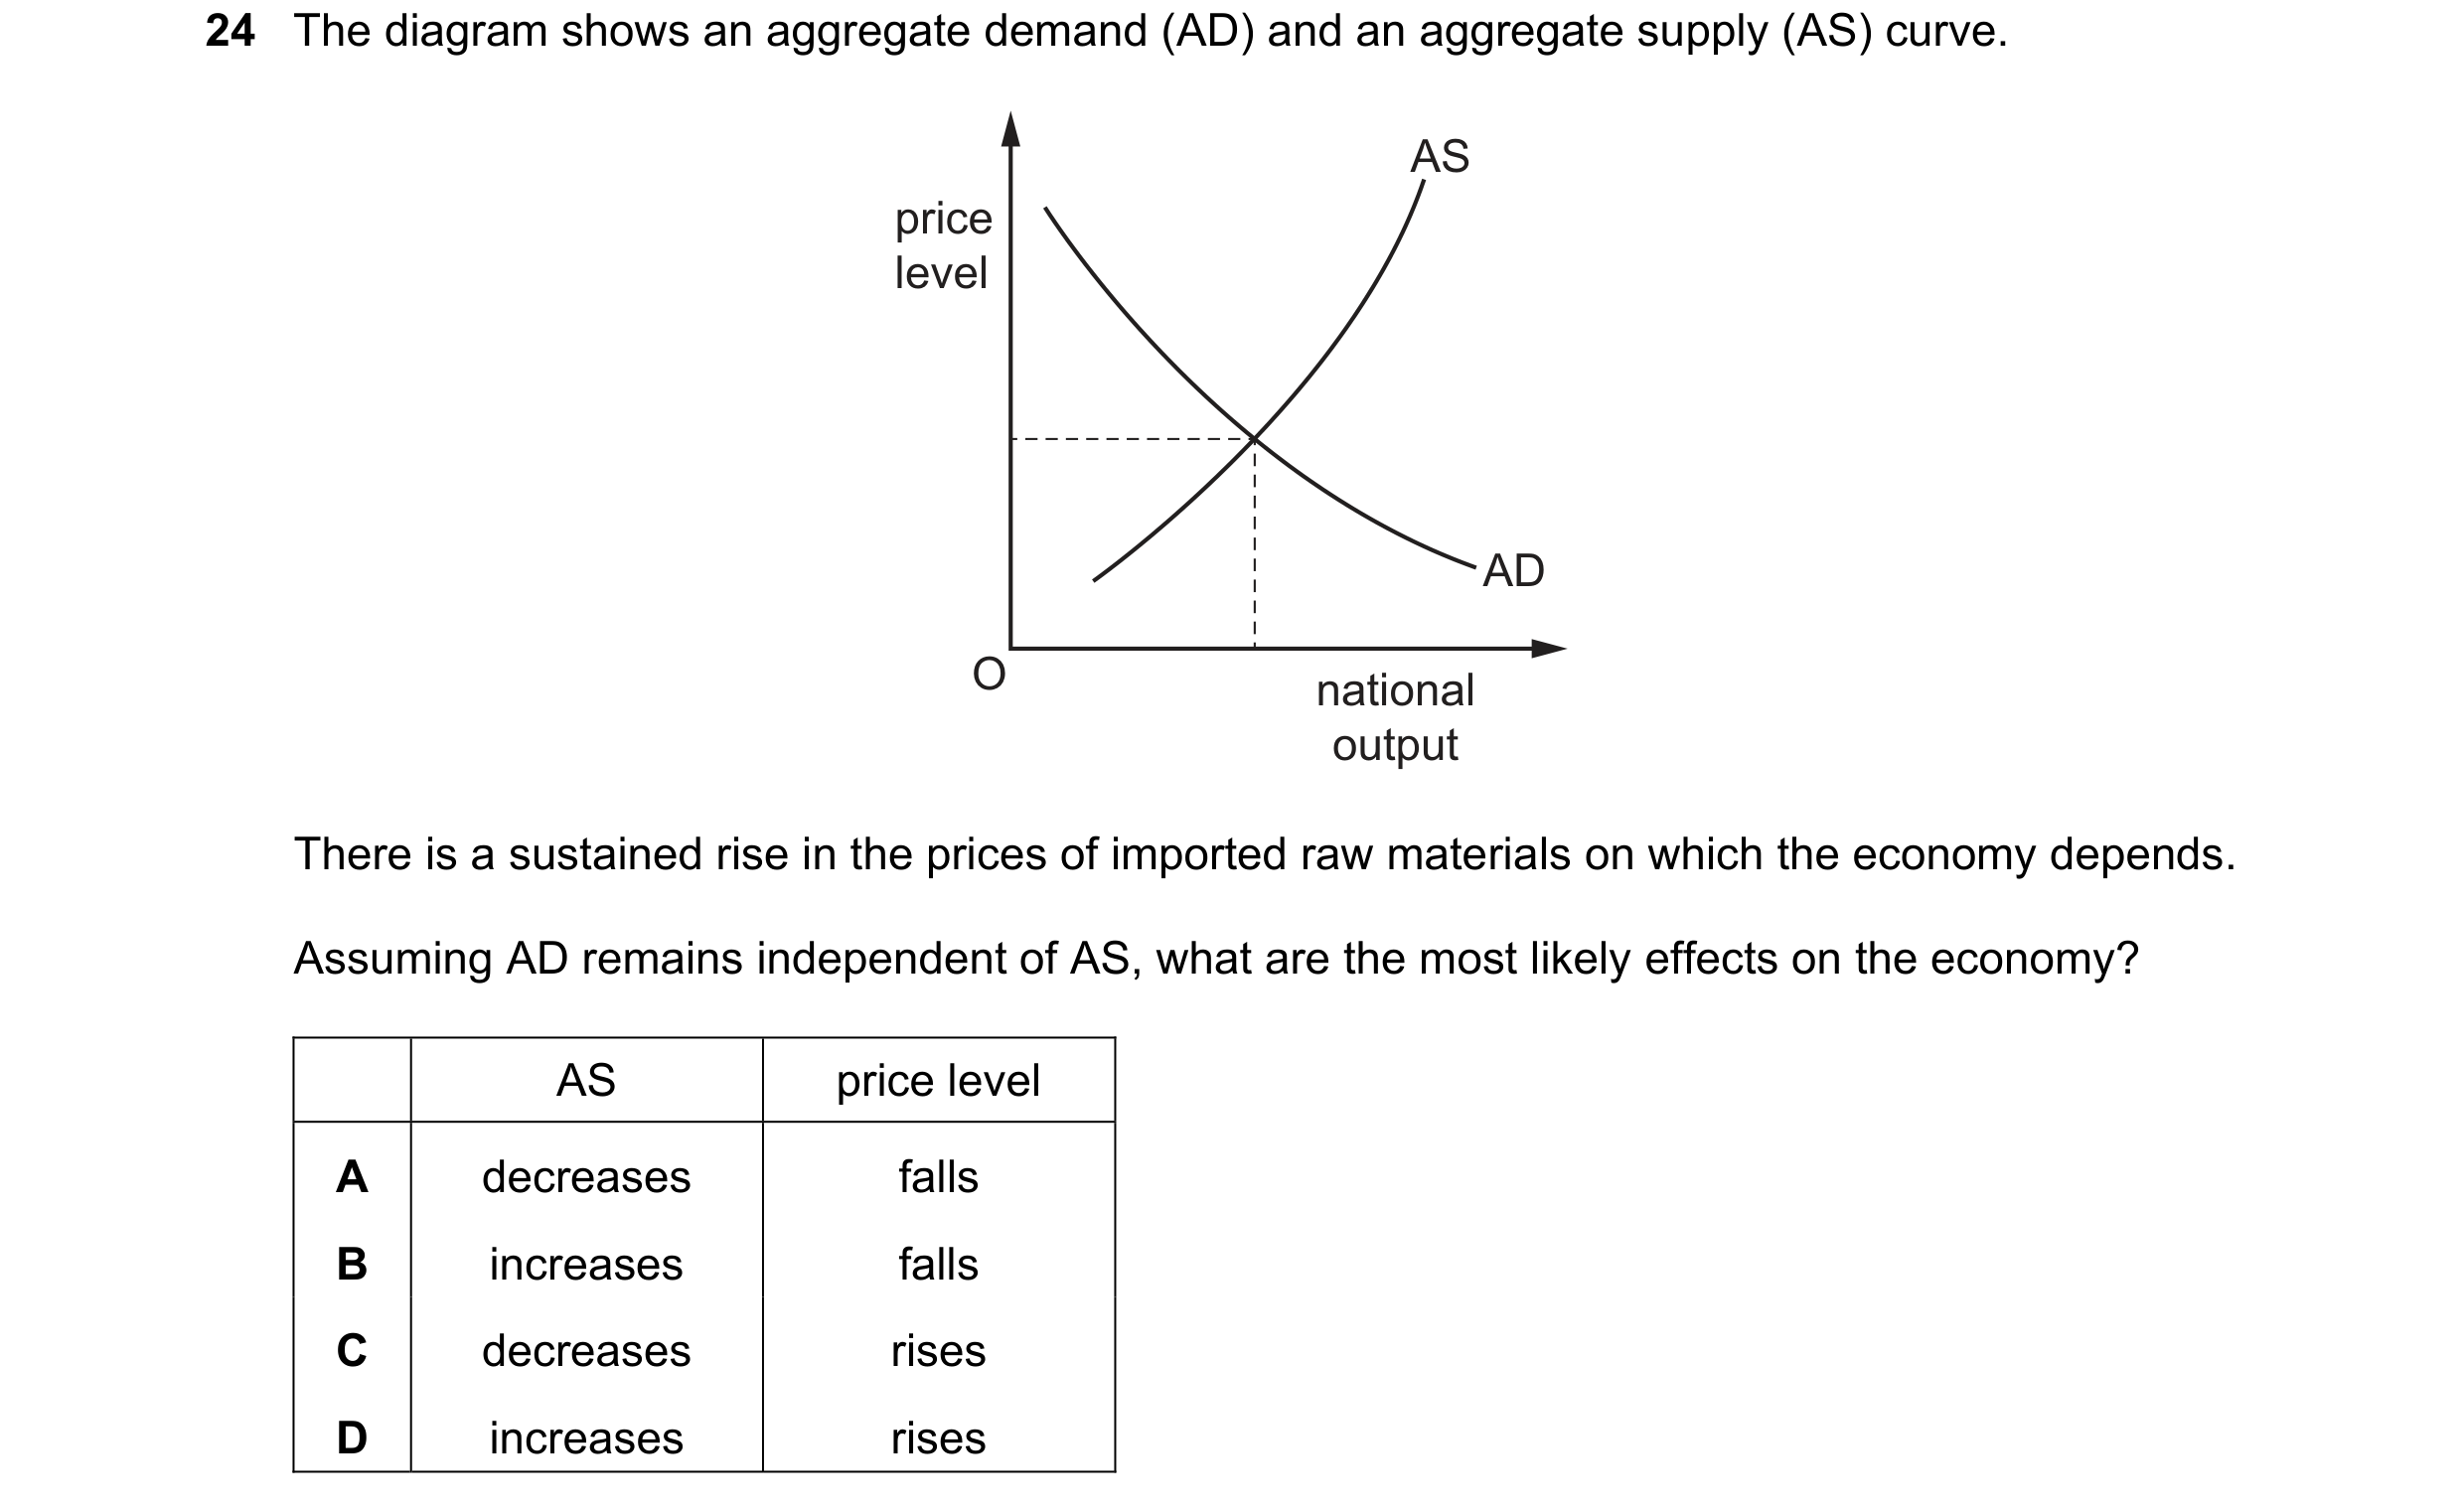
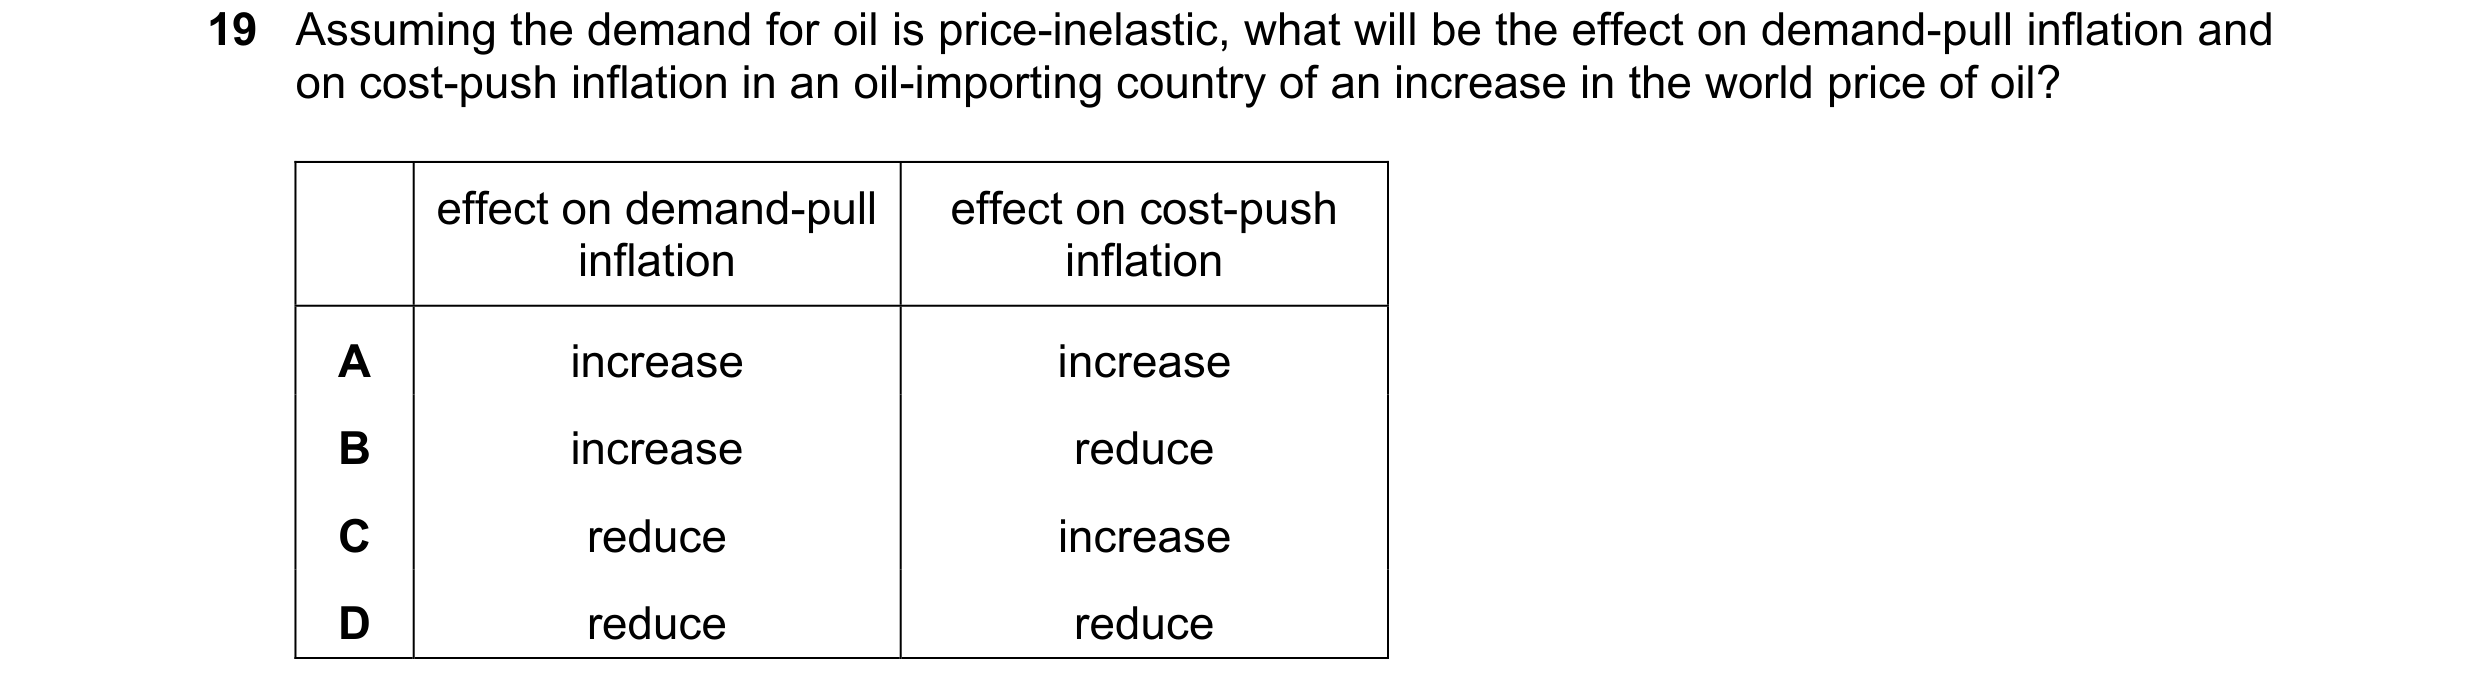

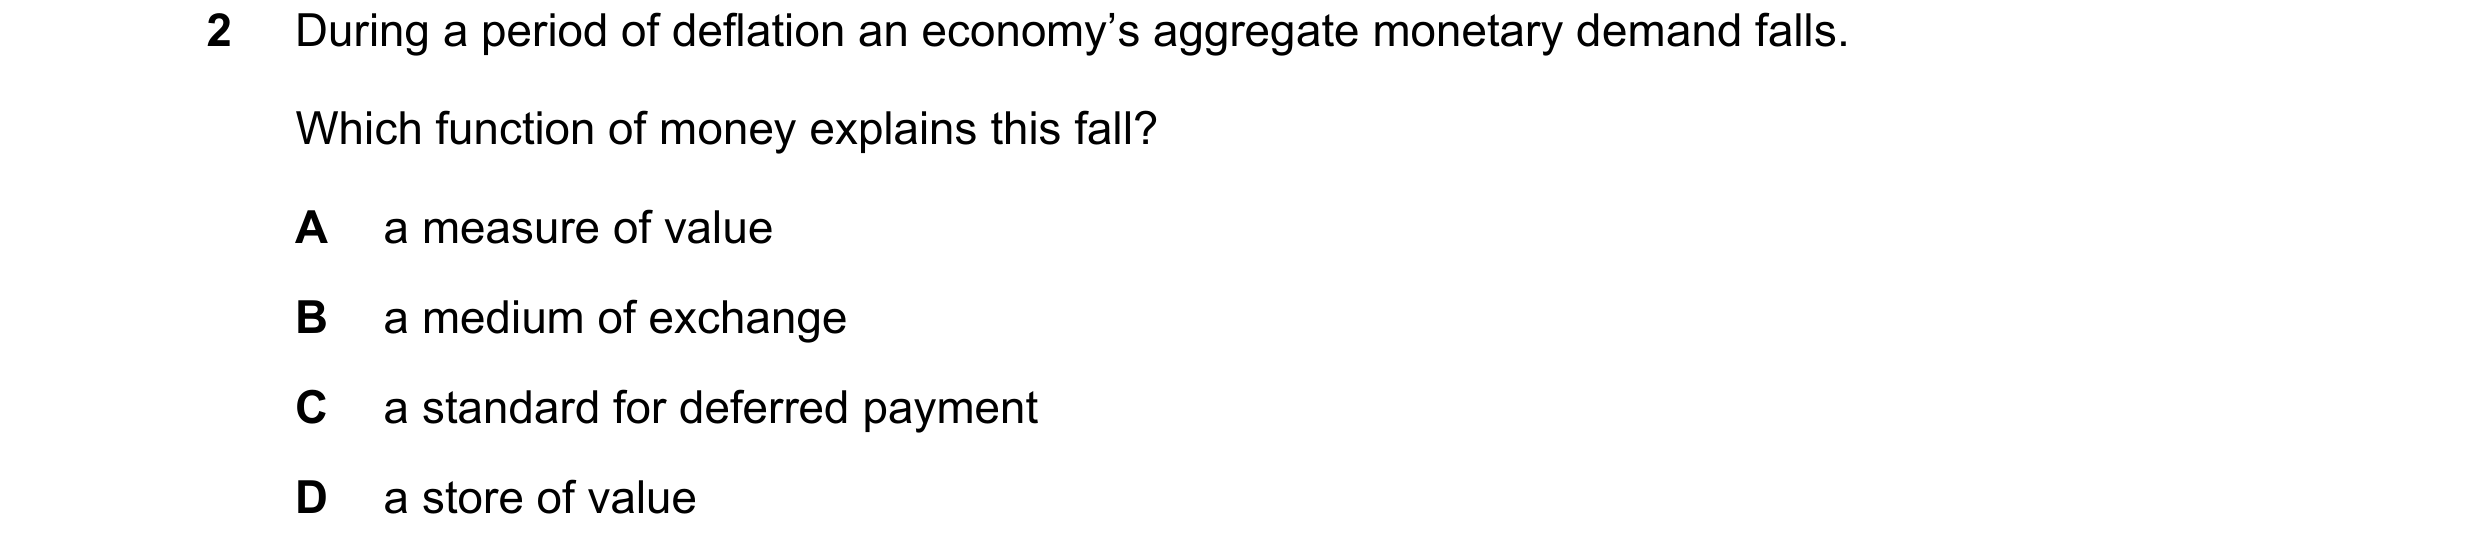 57 / 67

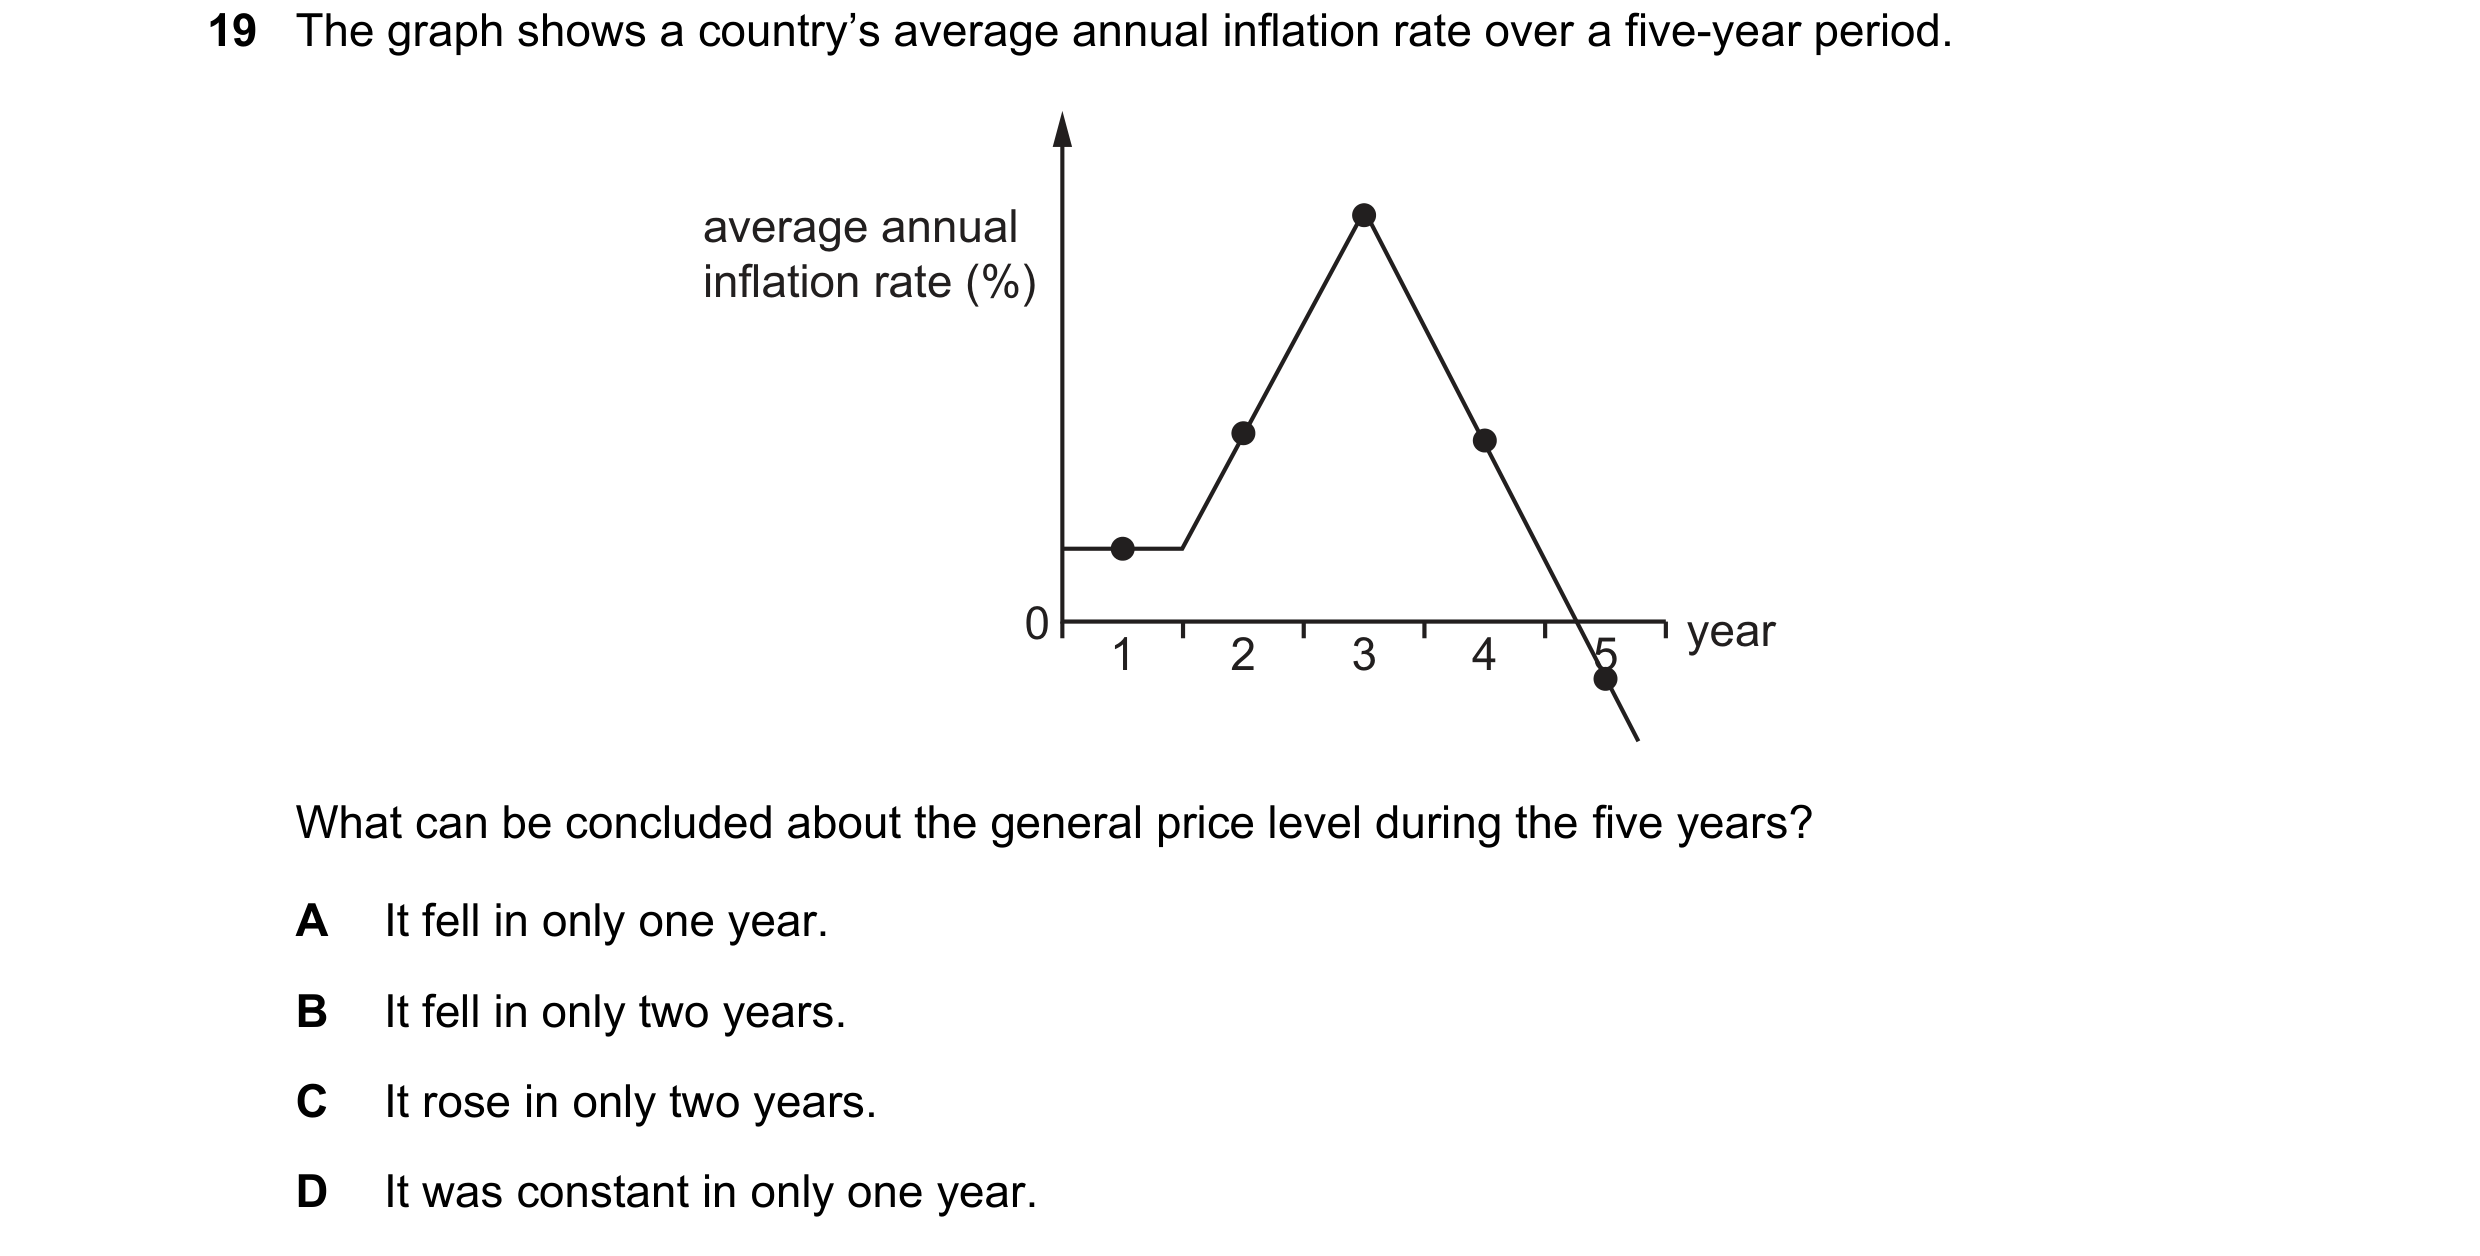 58 / 67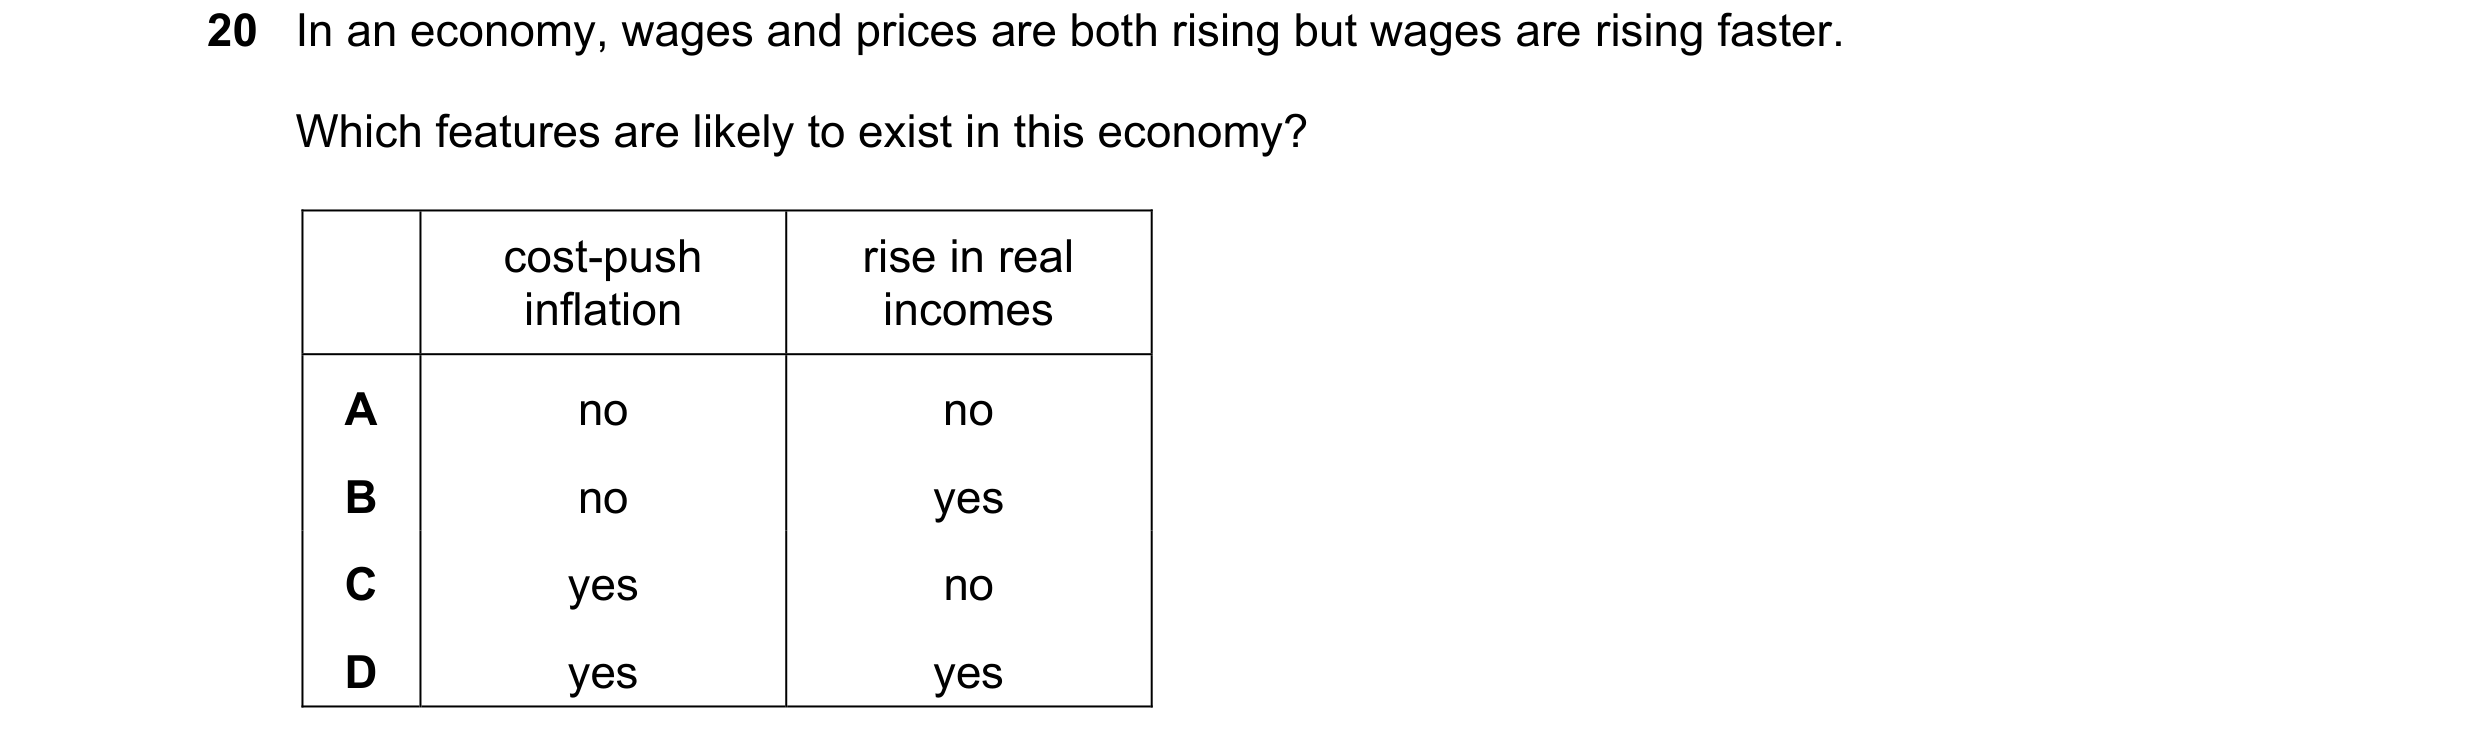
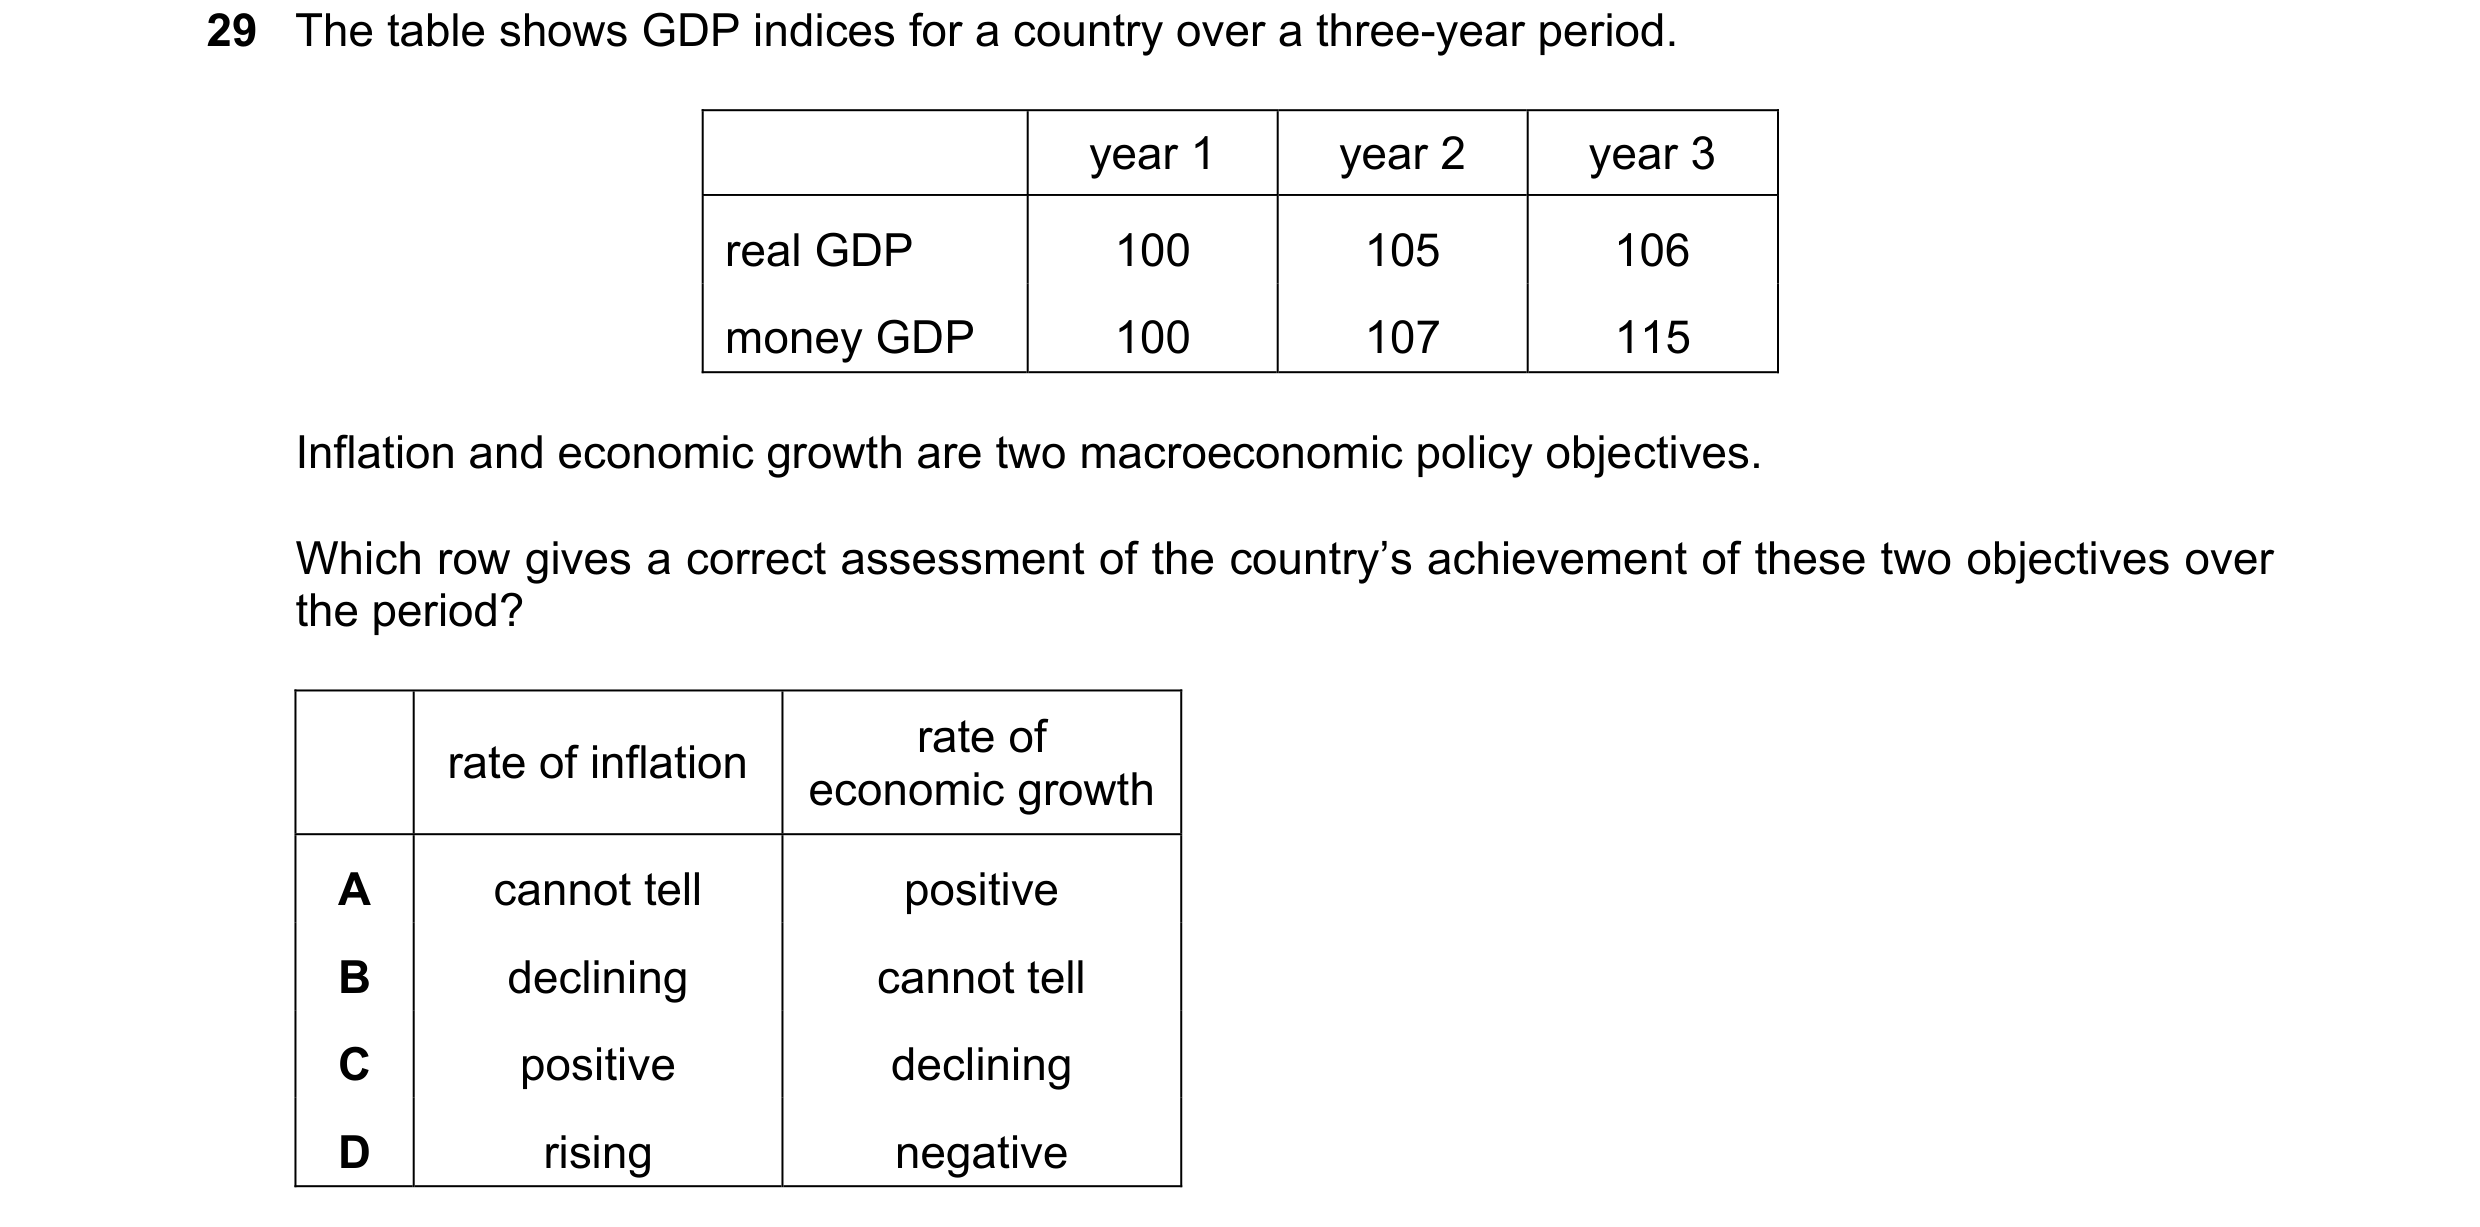

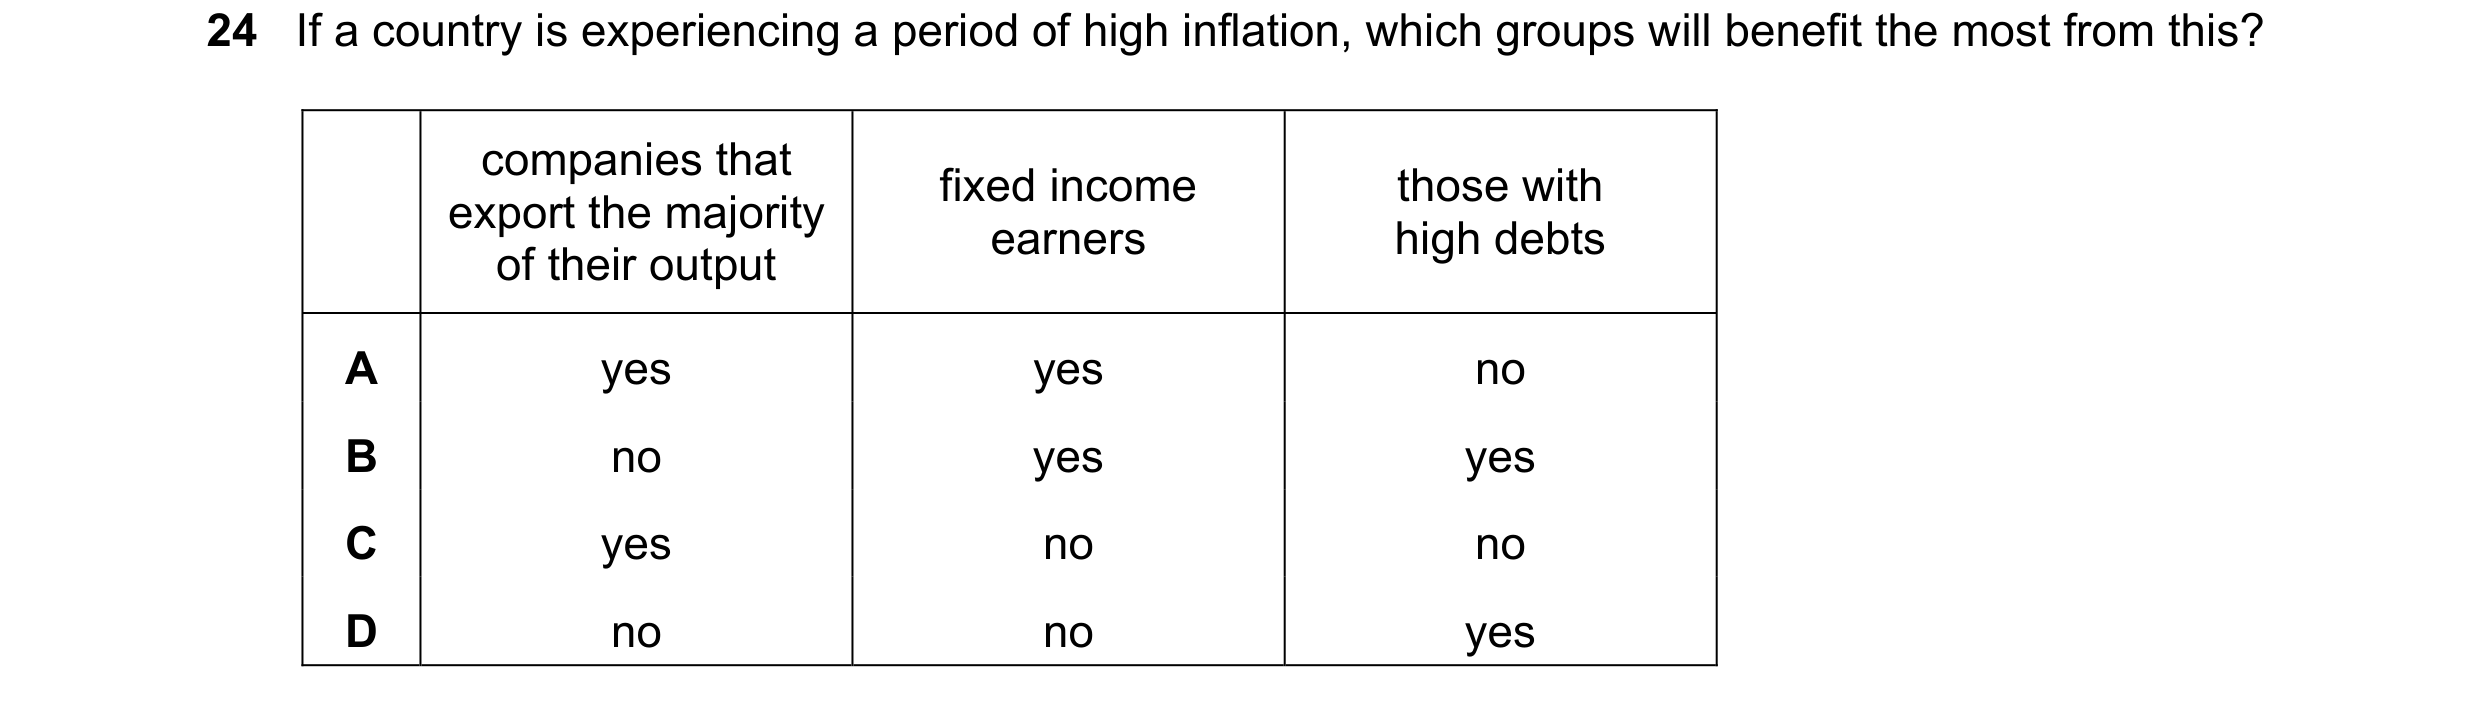 59 / 67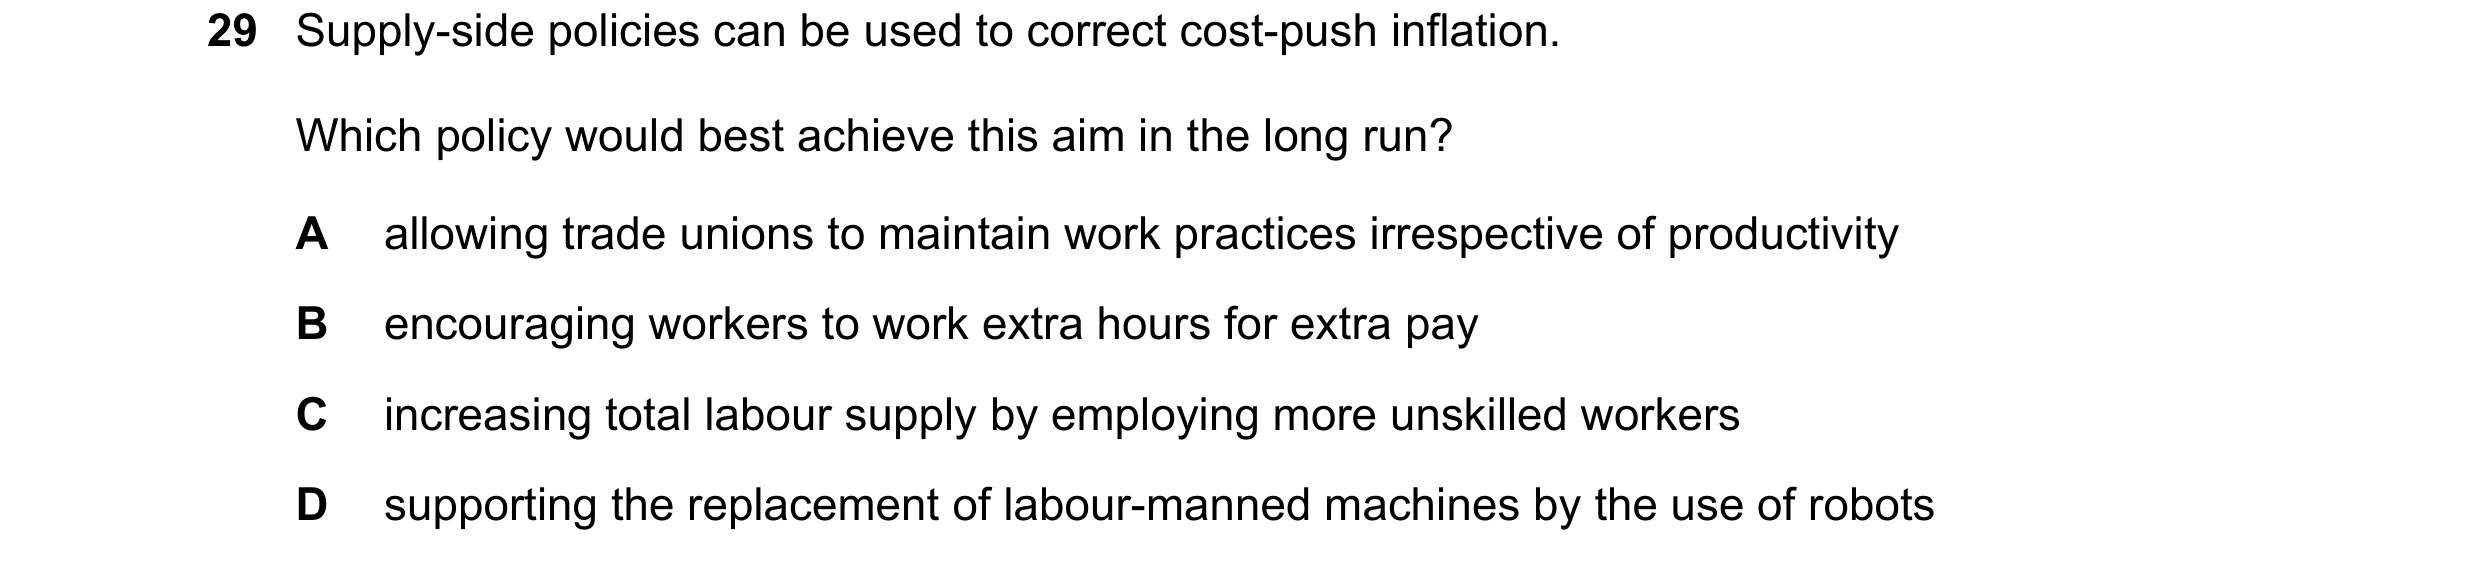

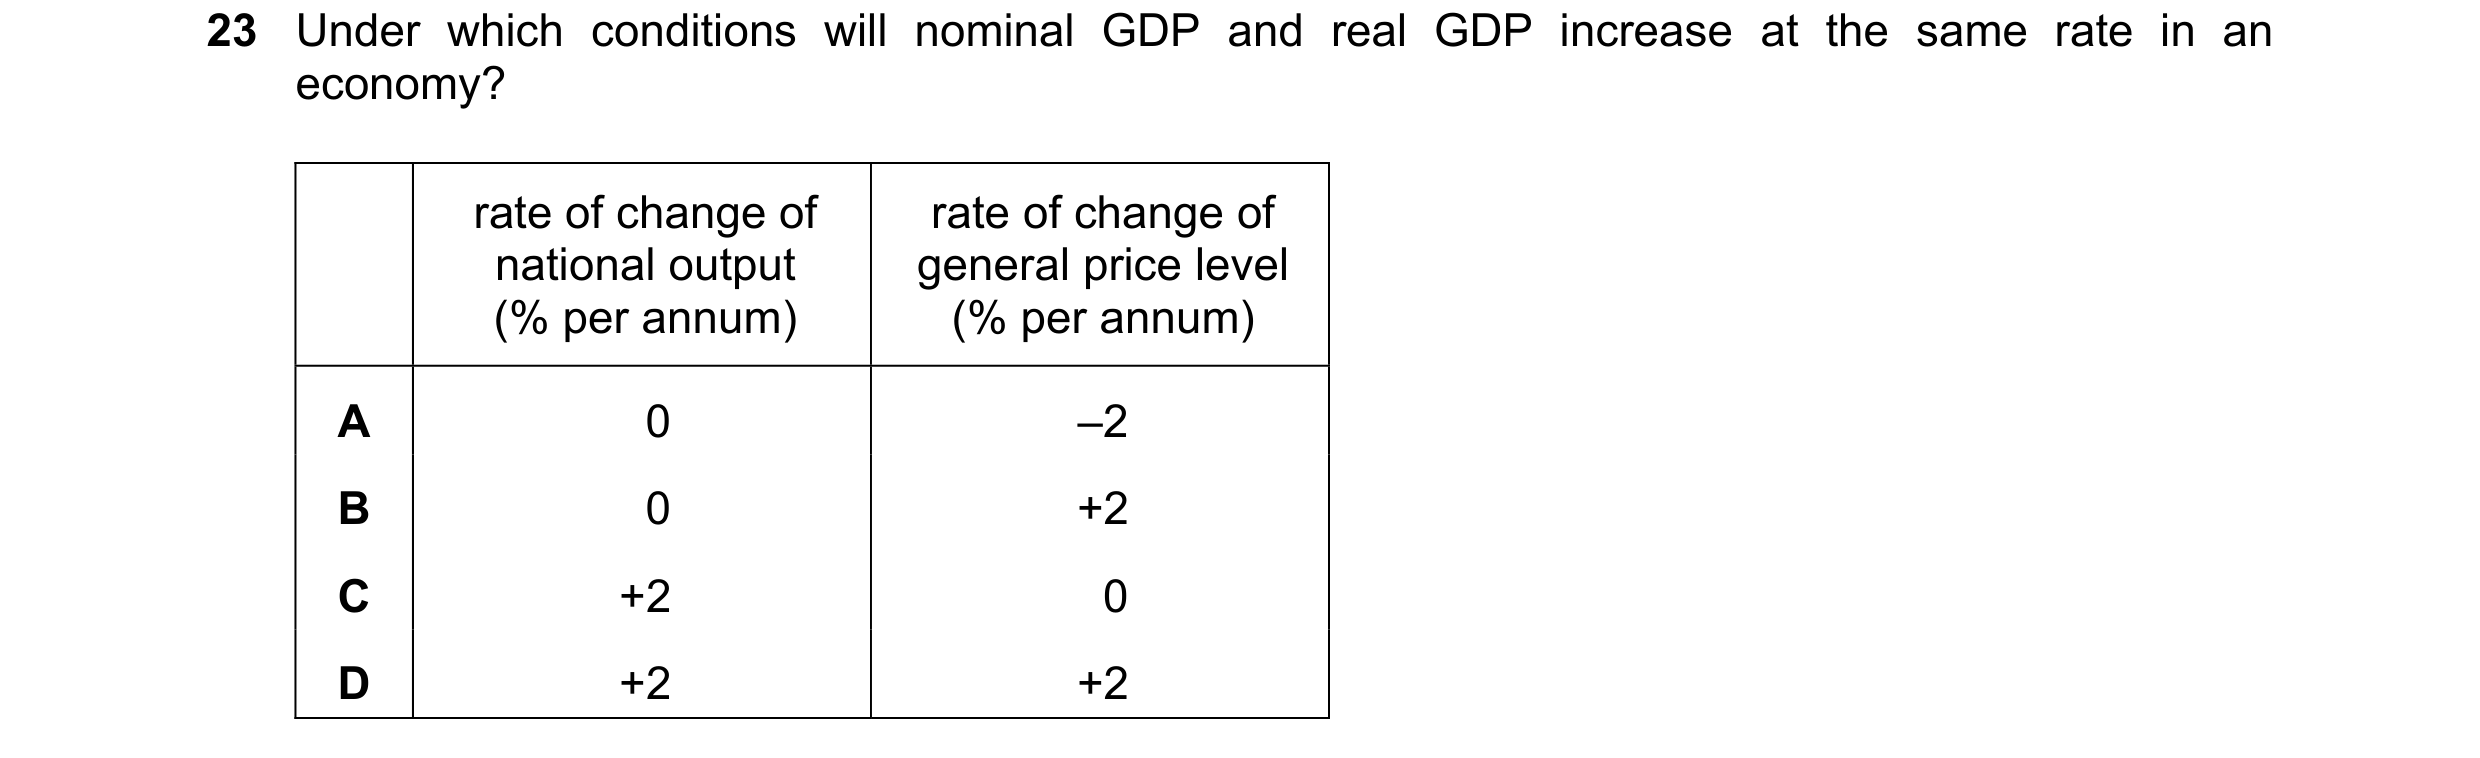
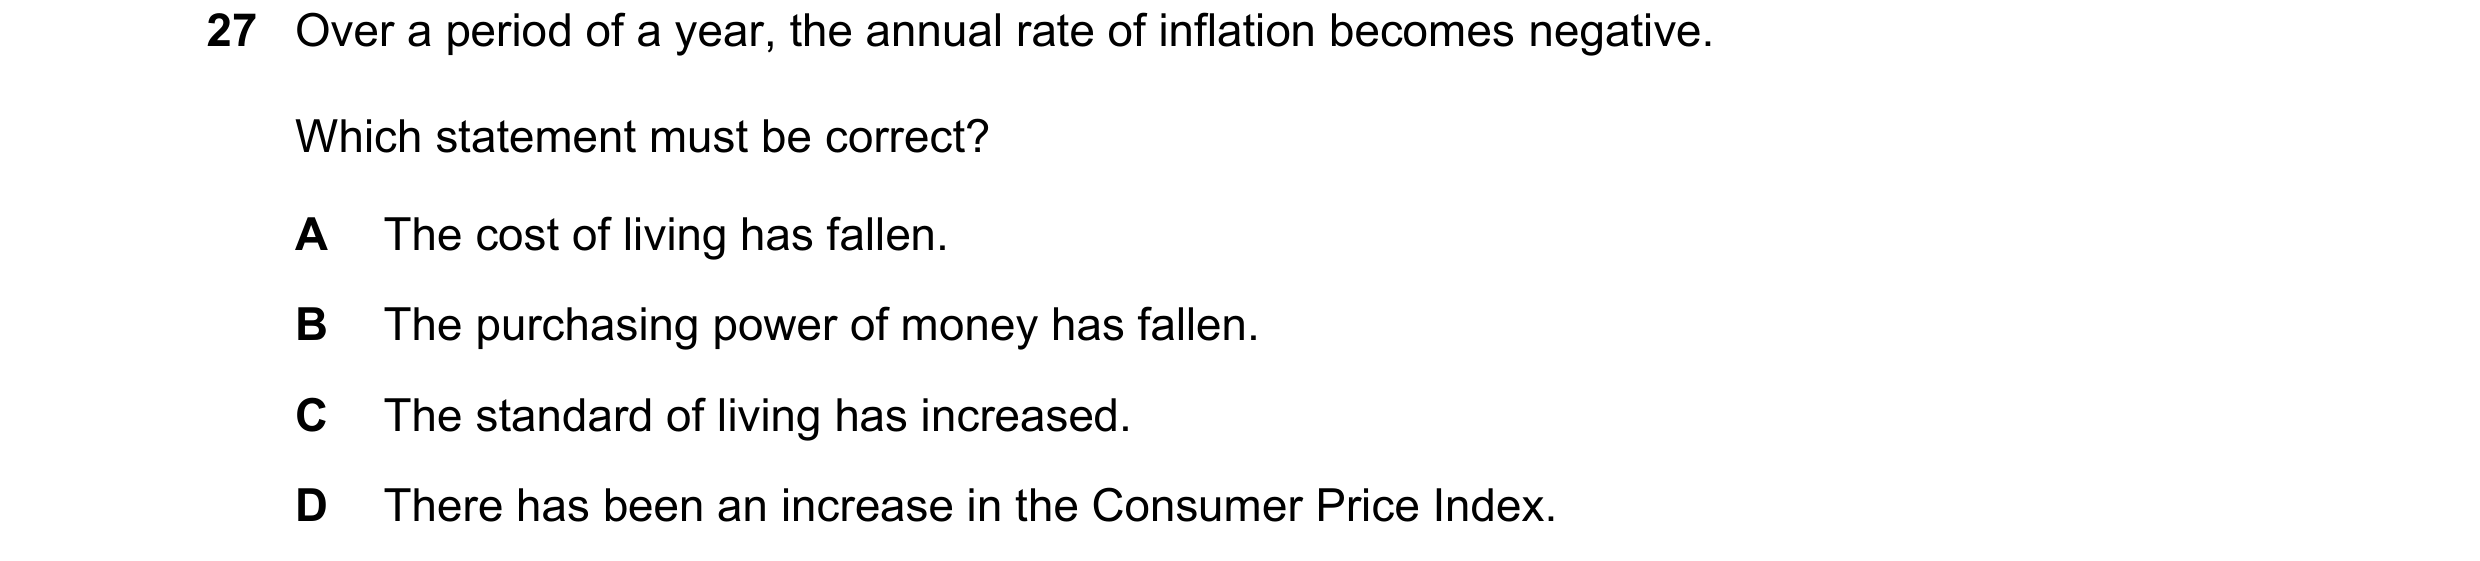
 60 / 67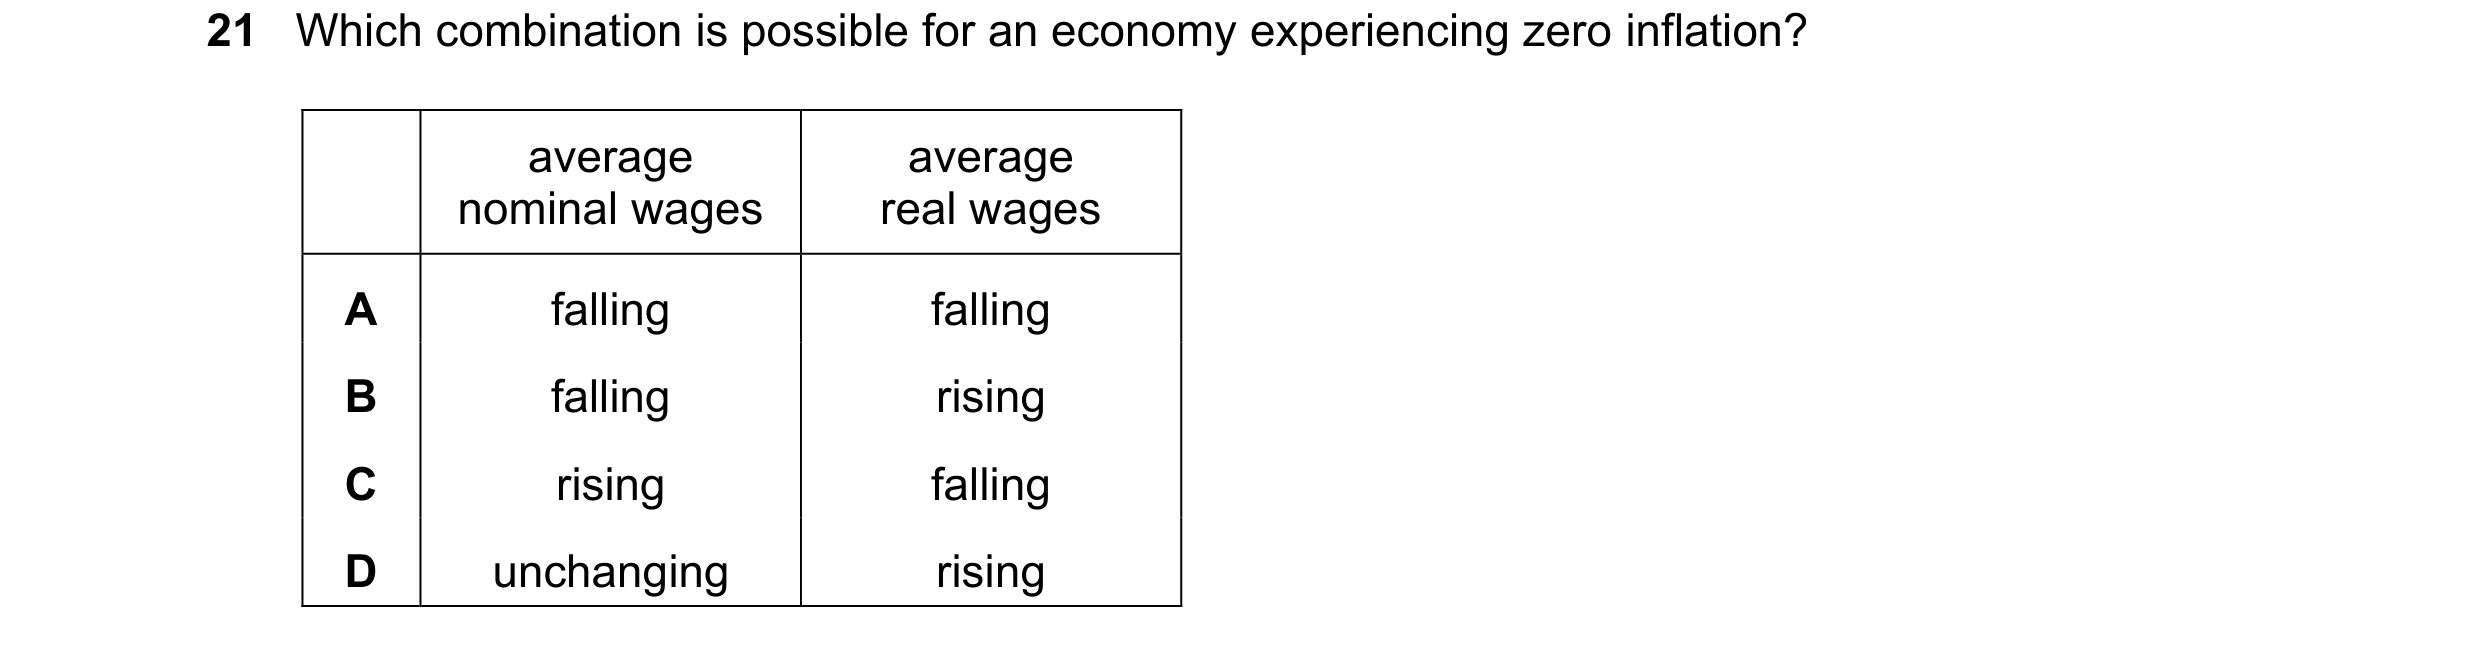
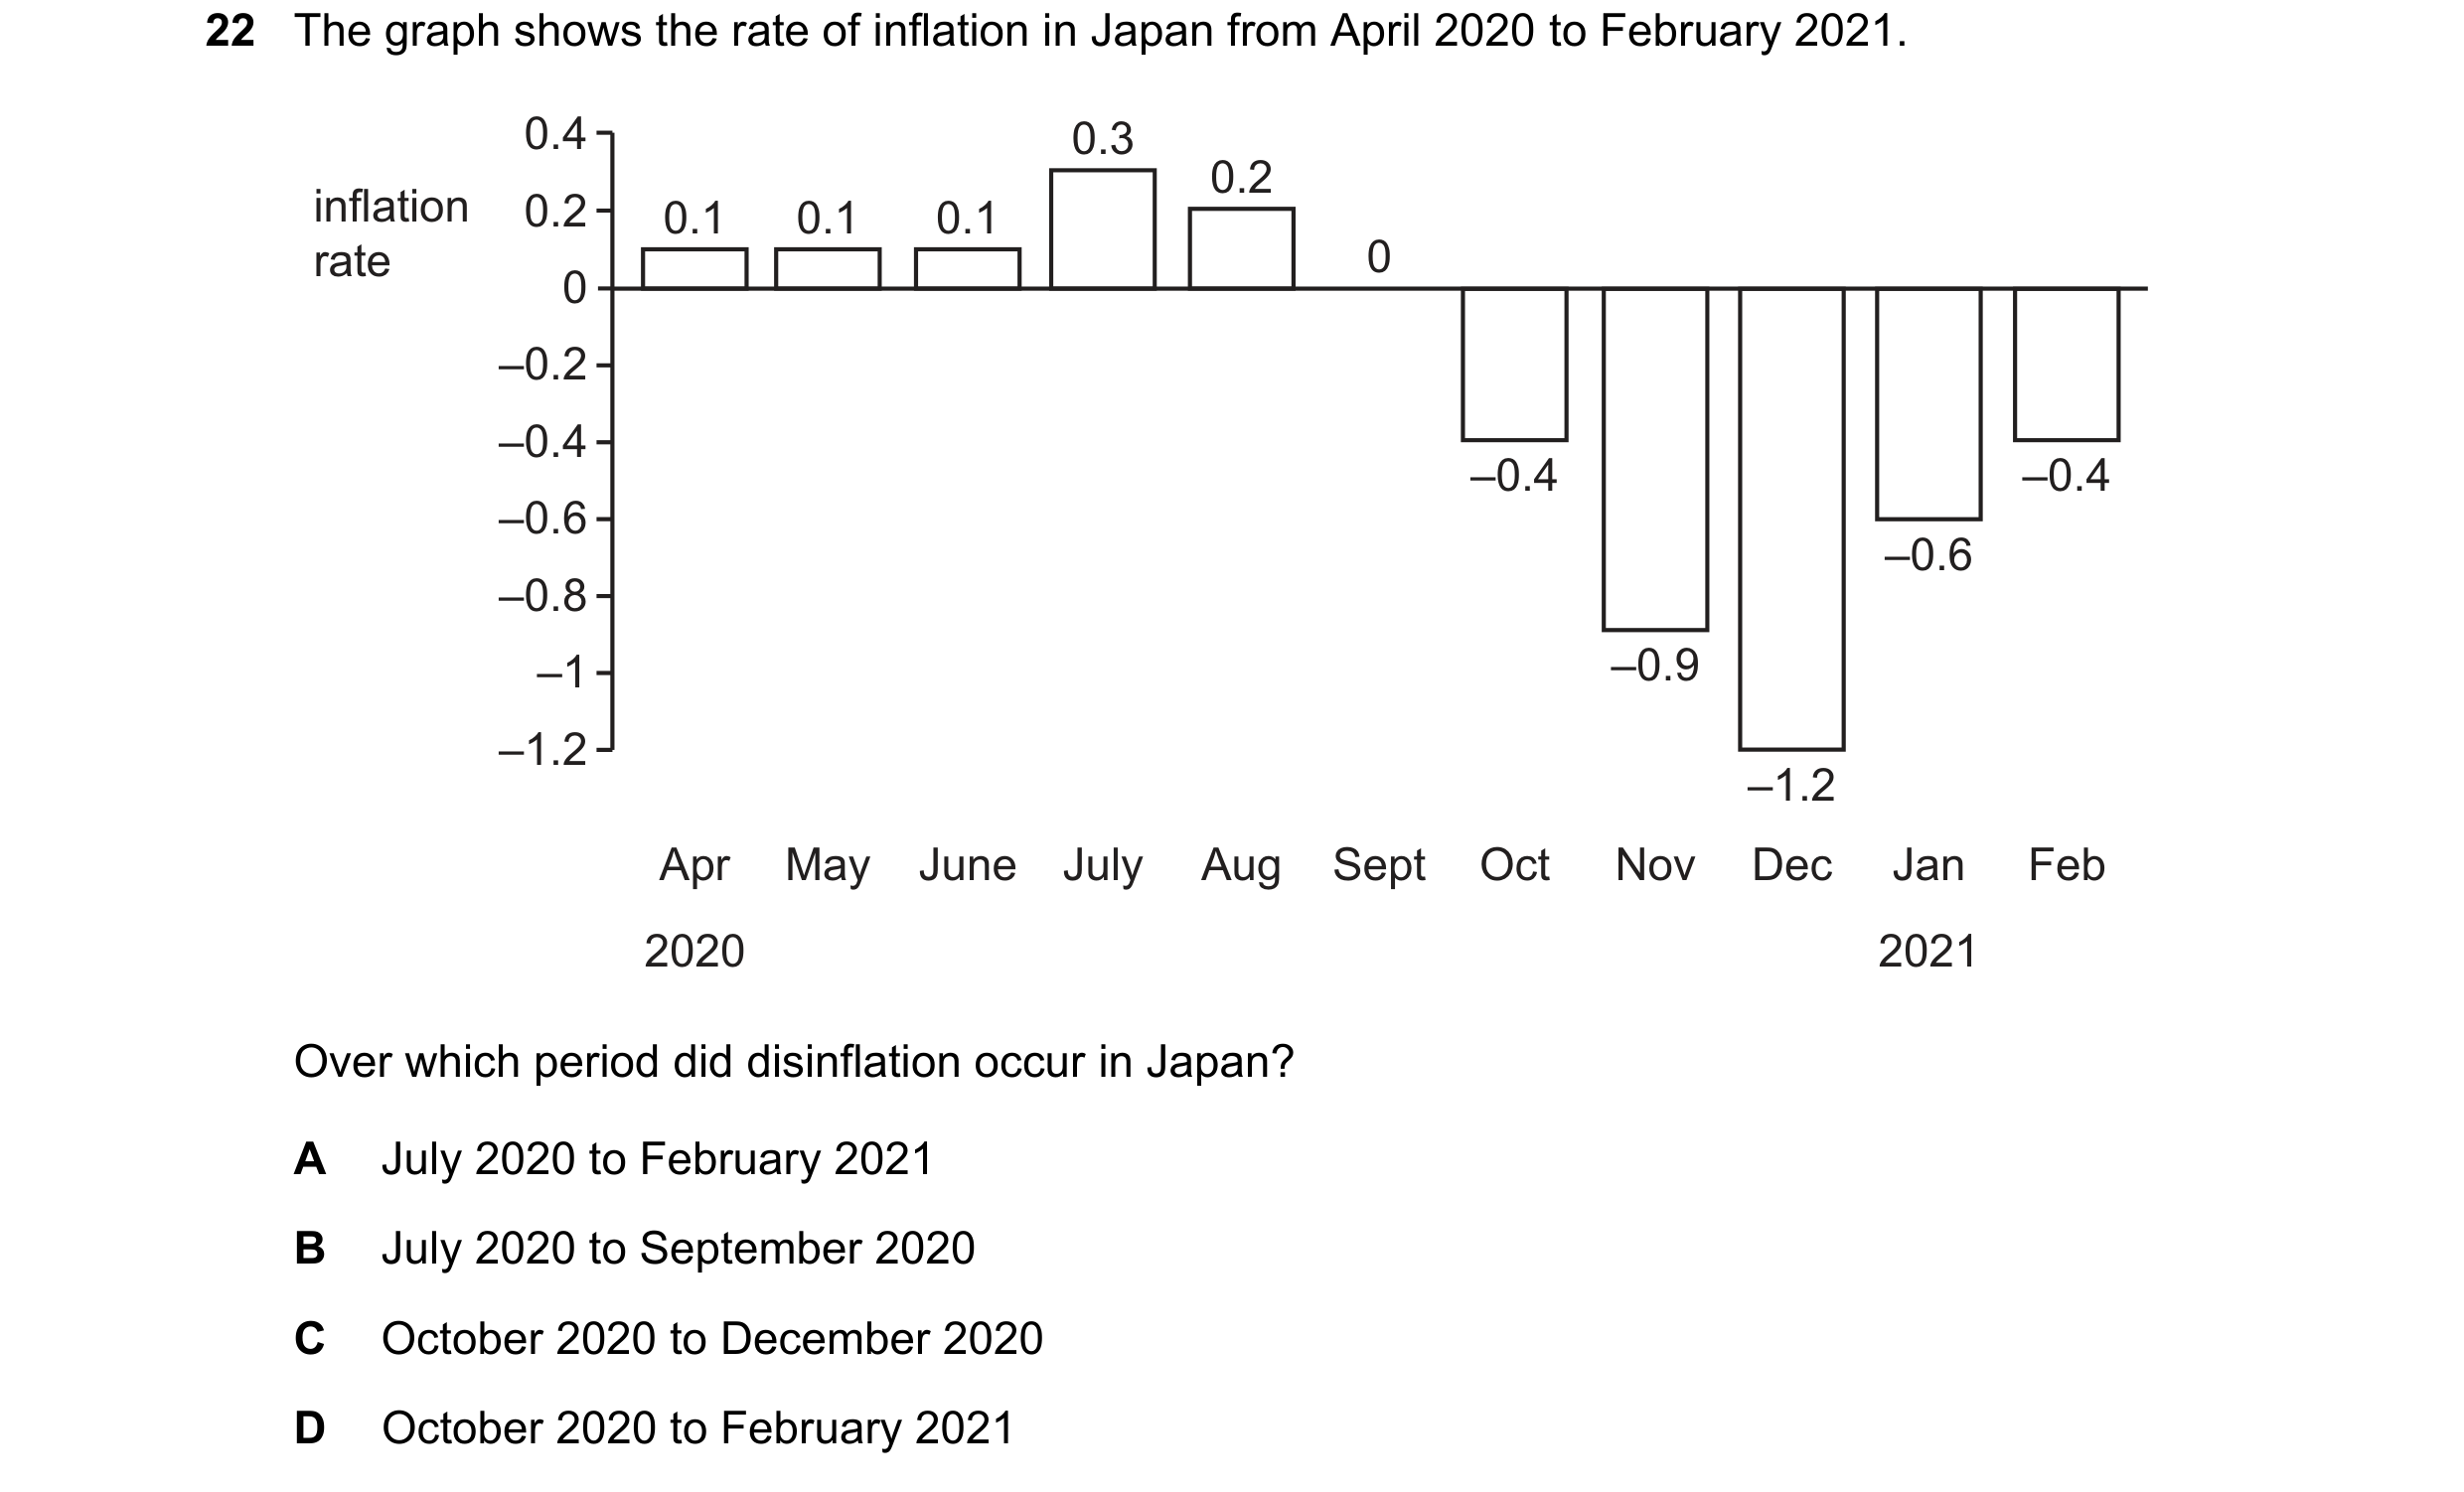 61 / 67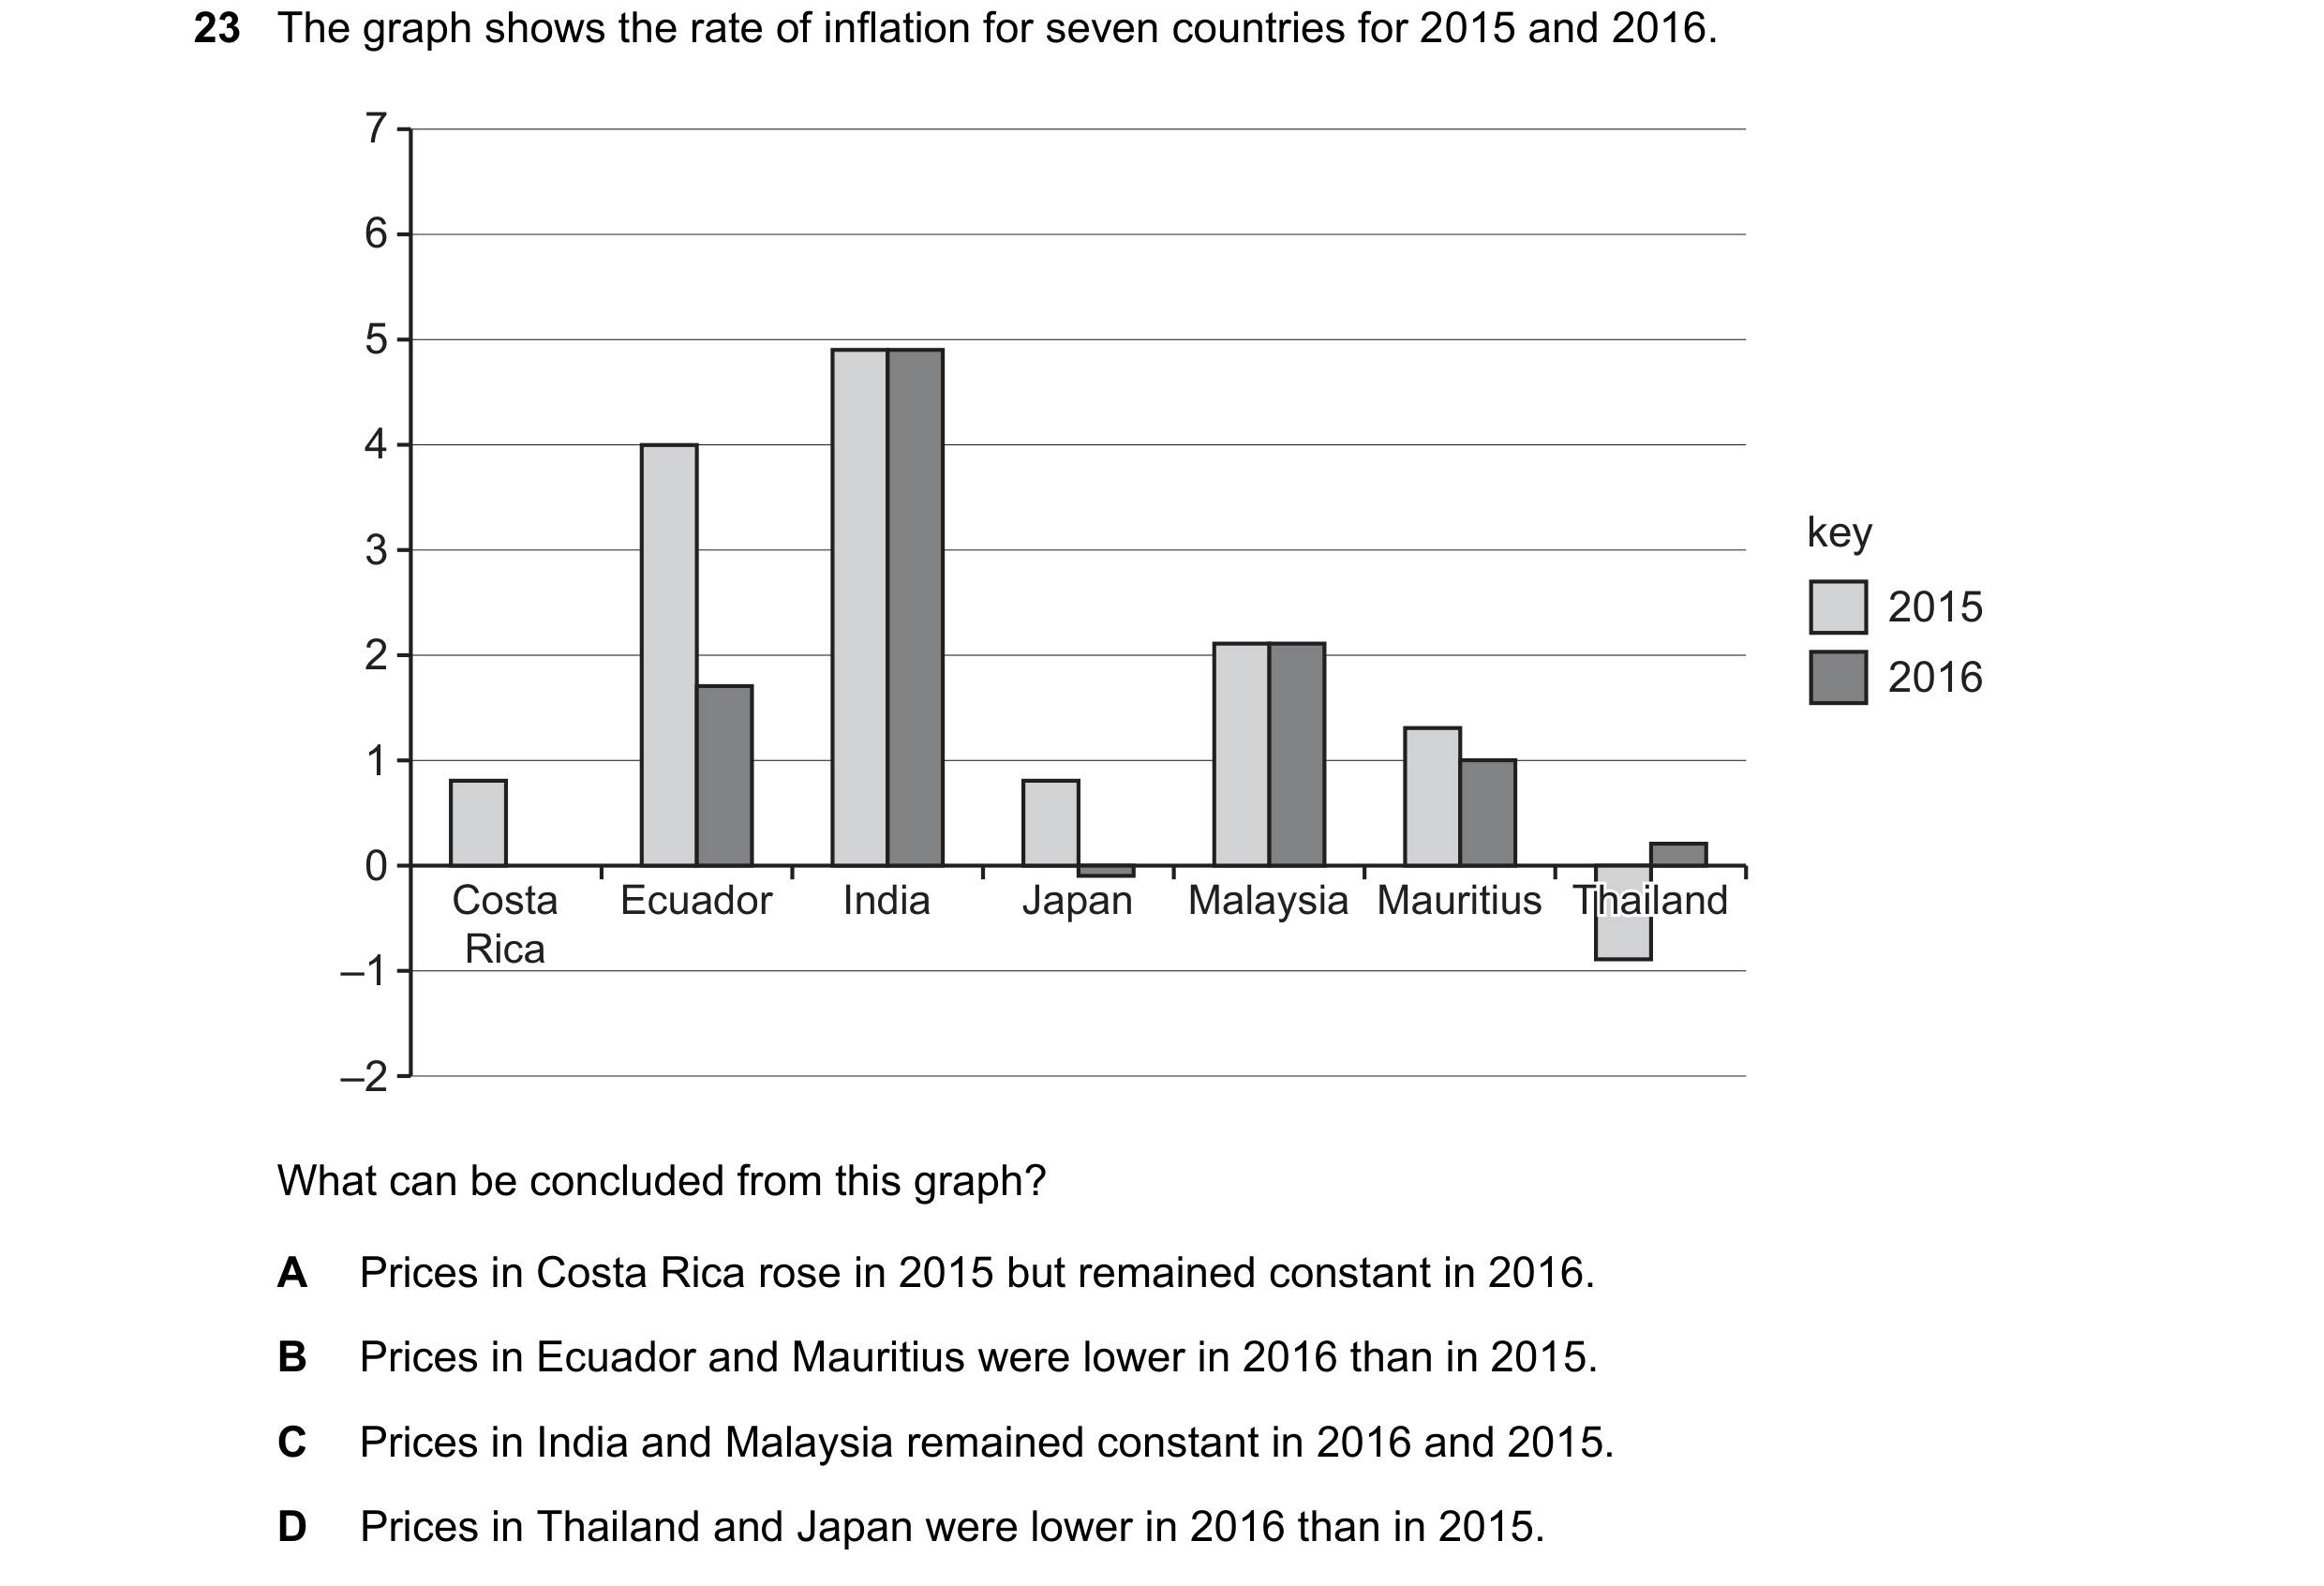

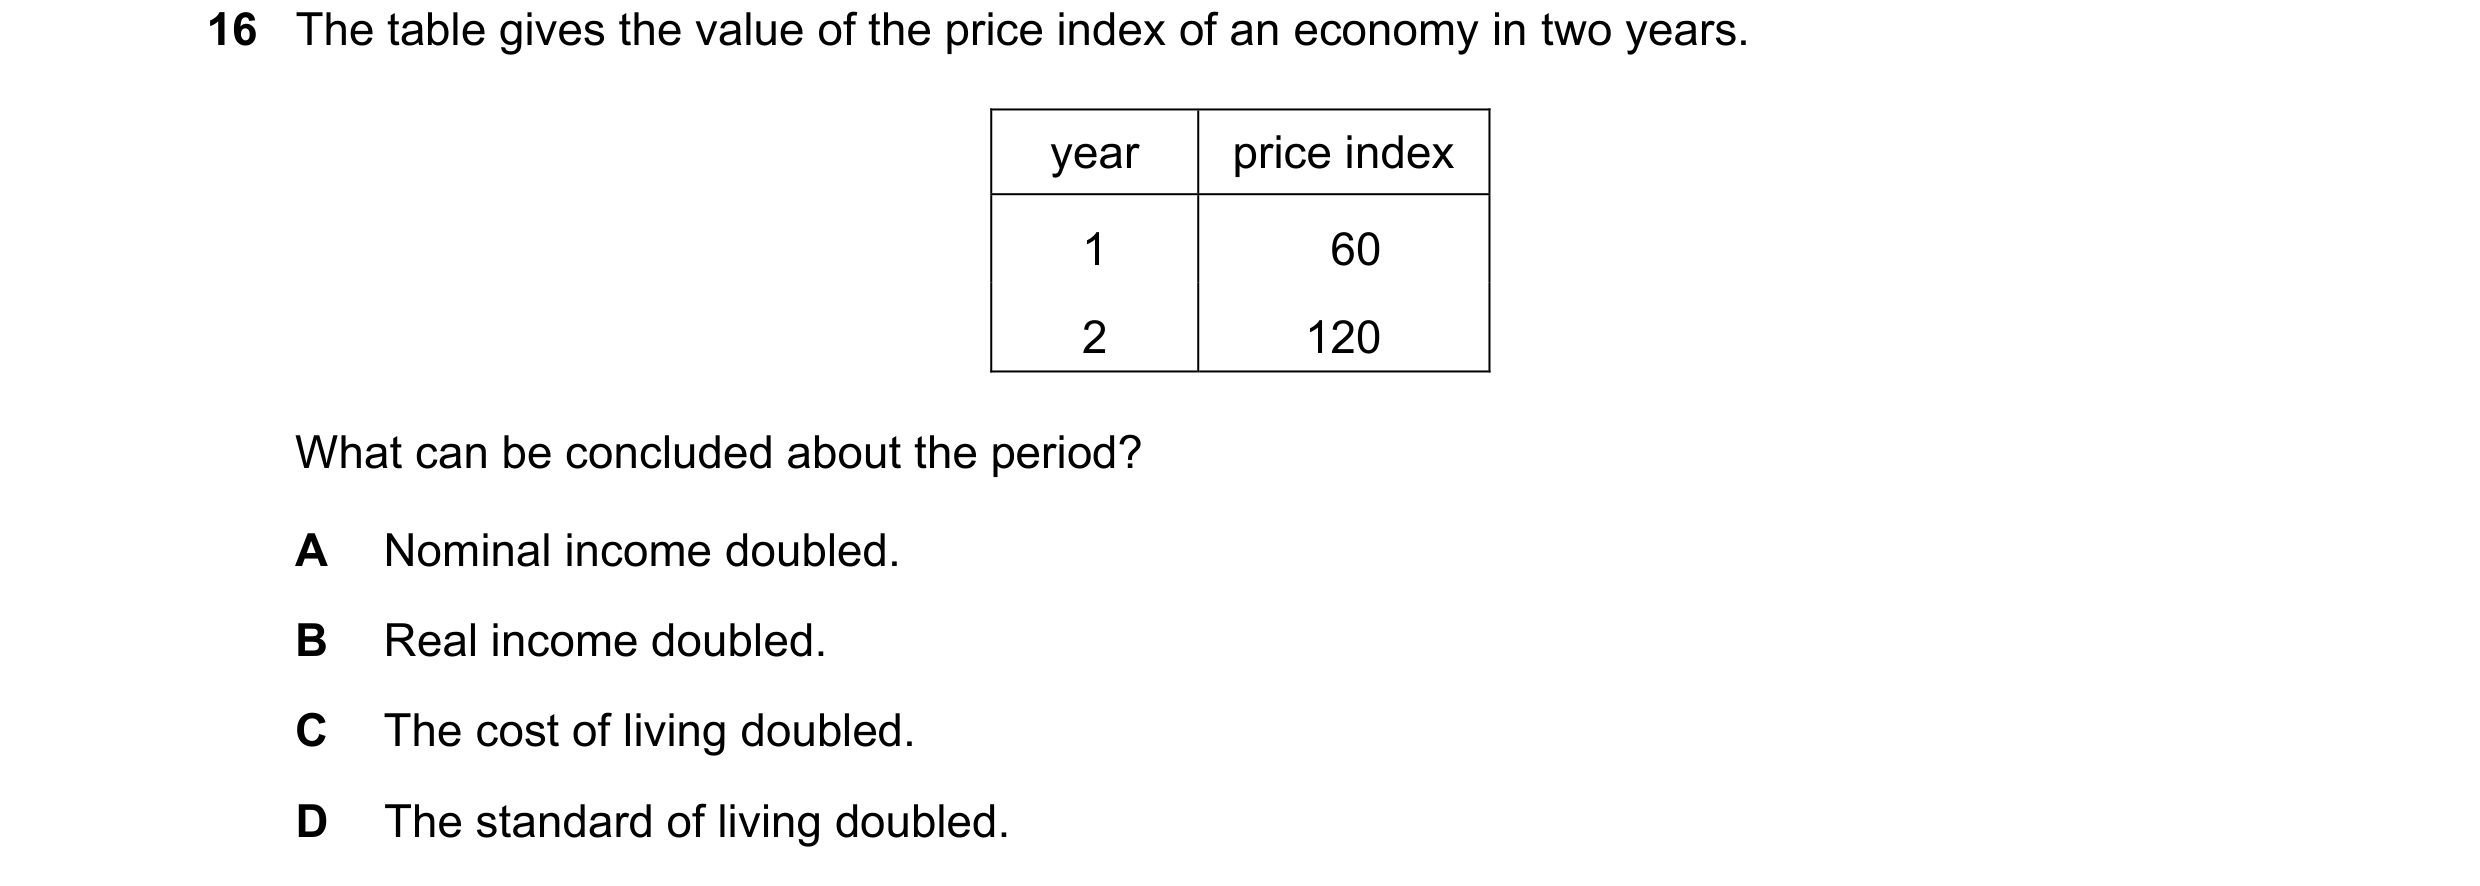 62 / 67
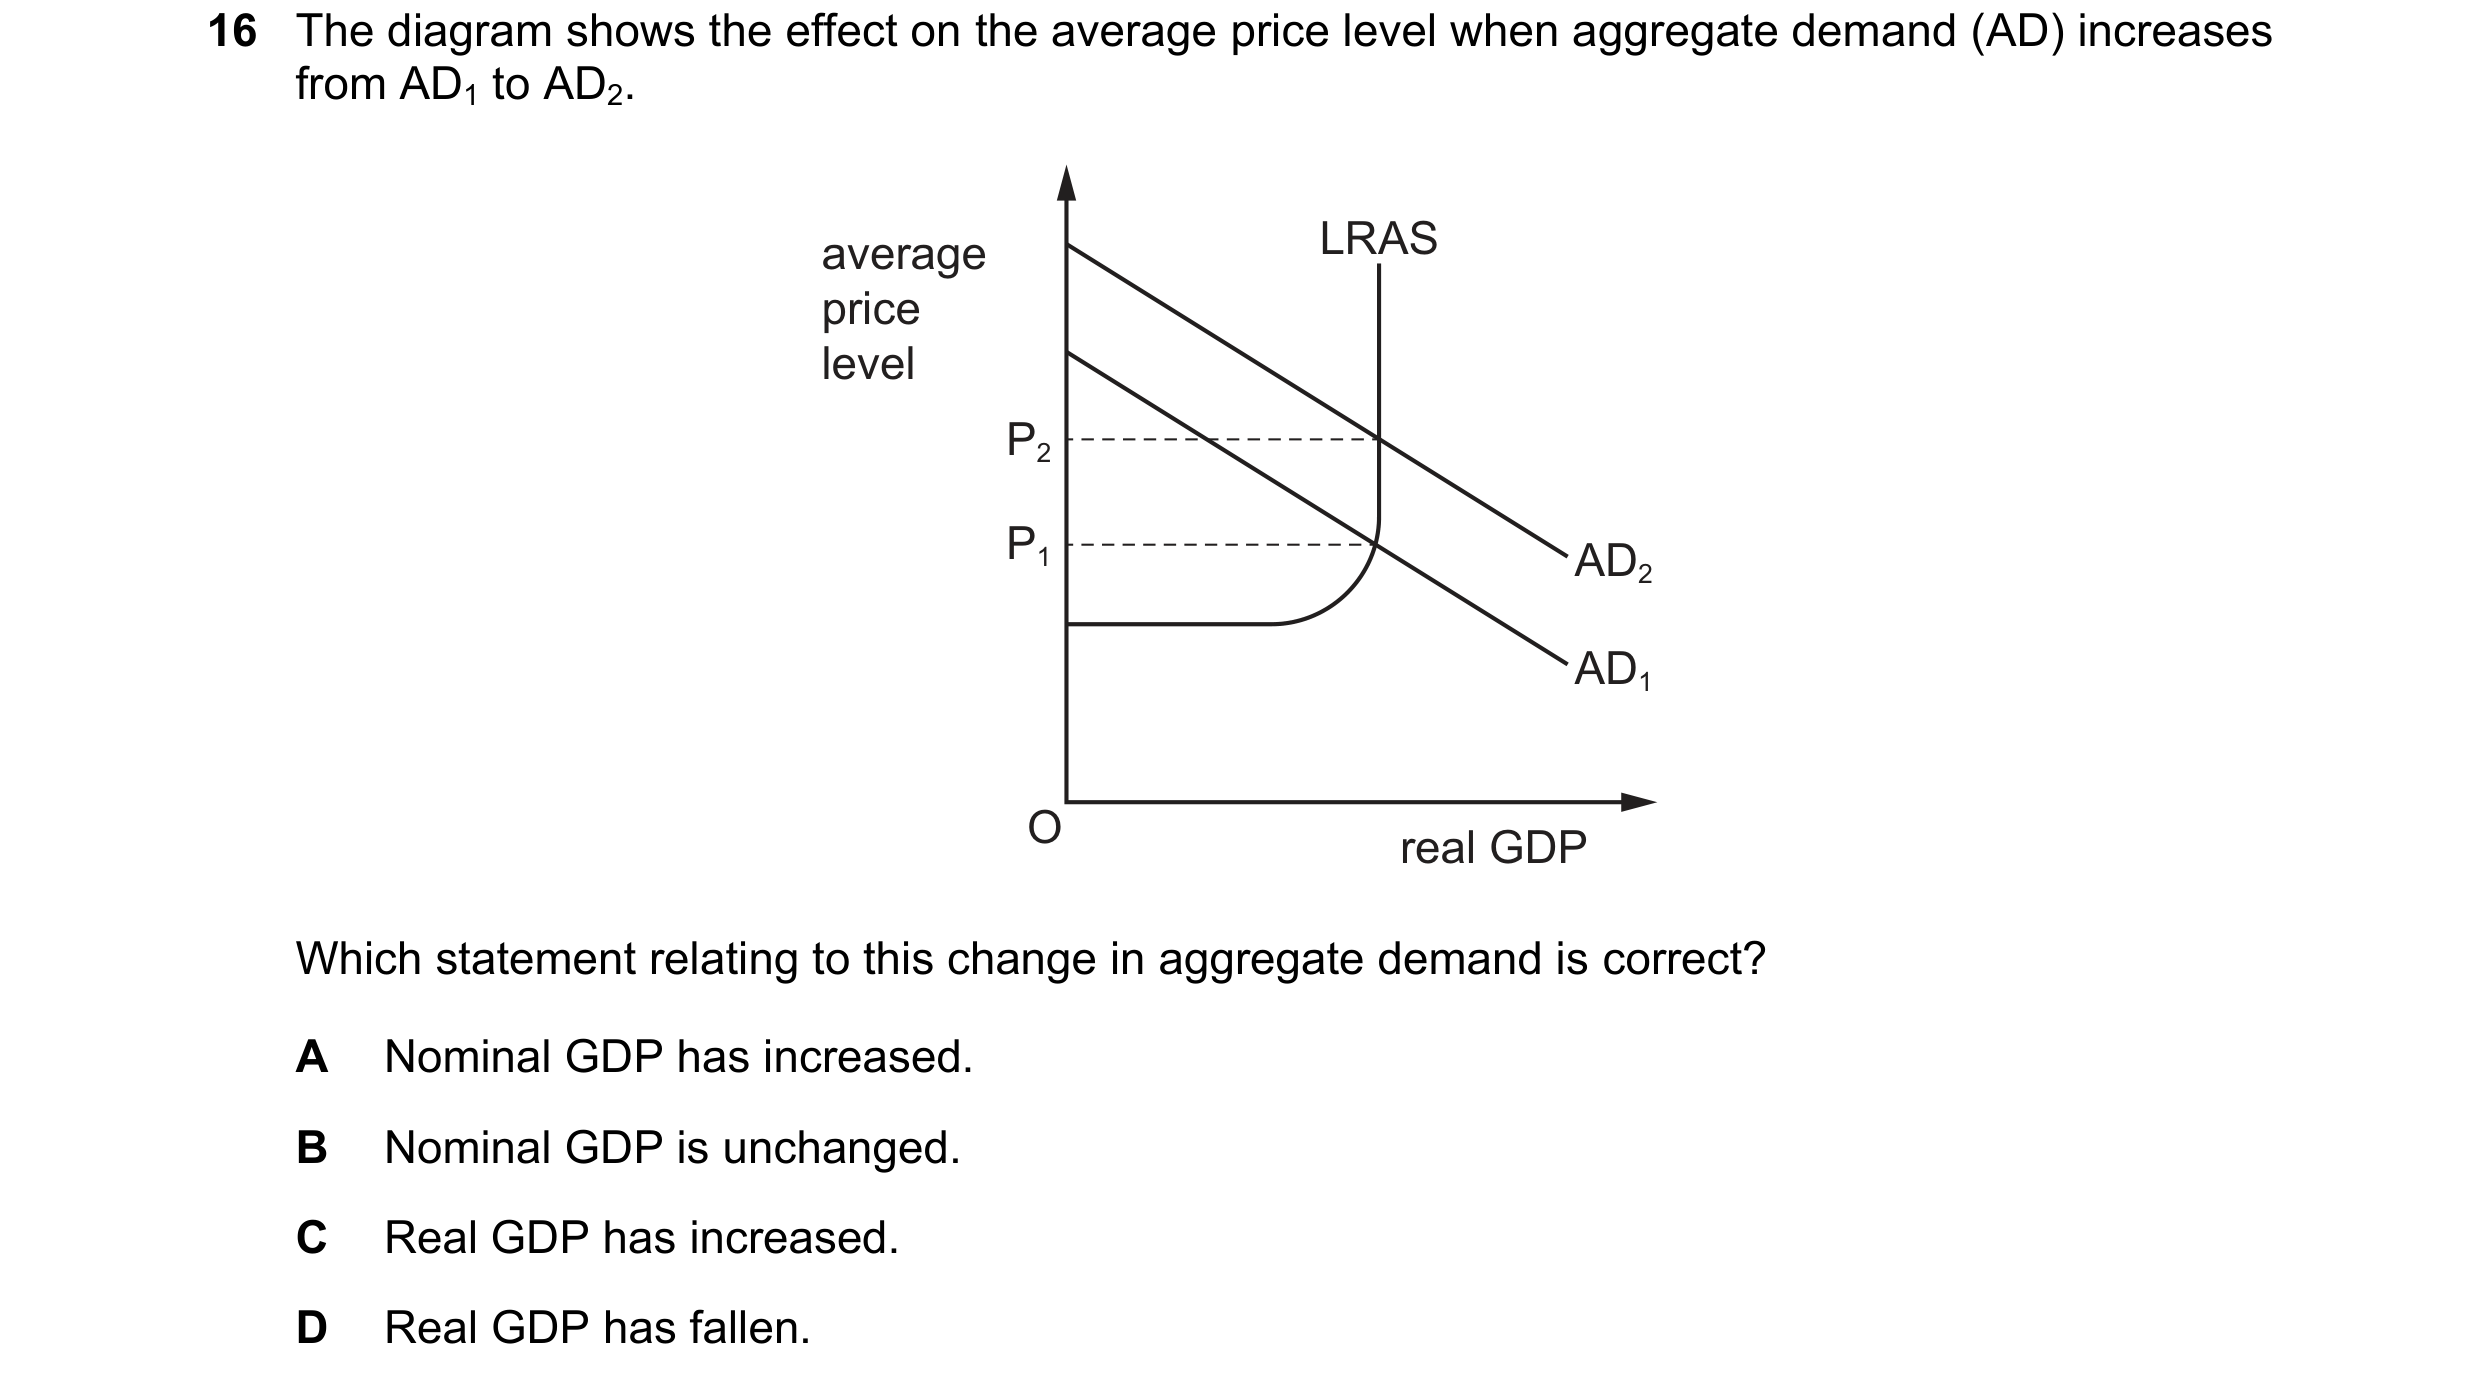
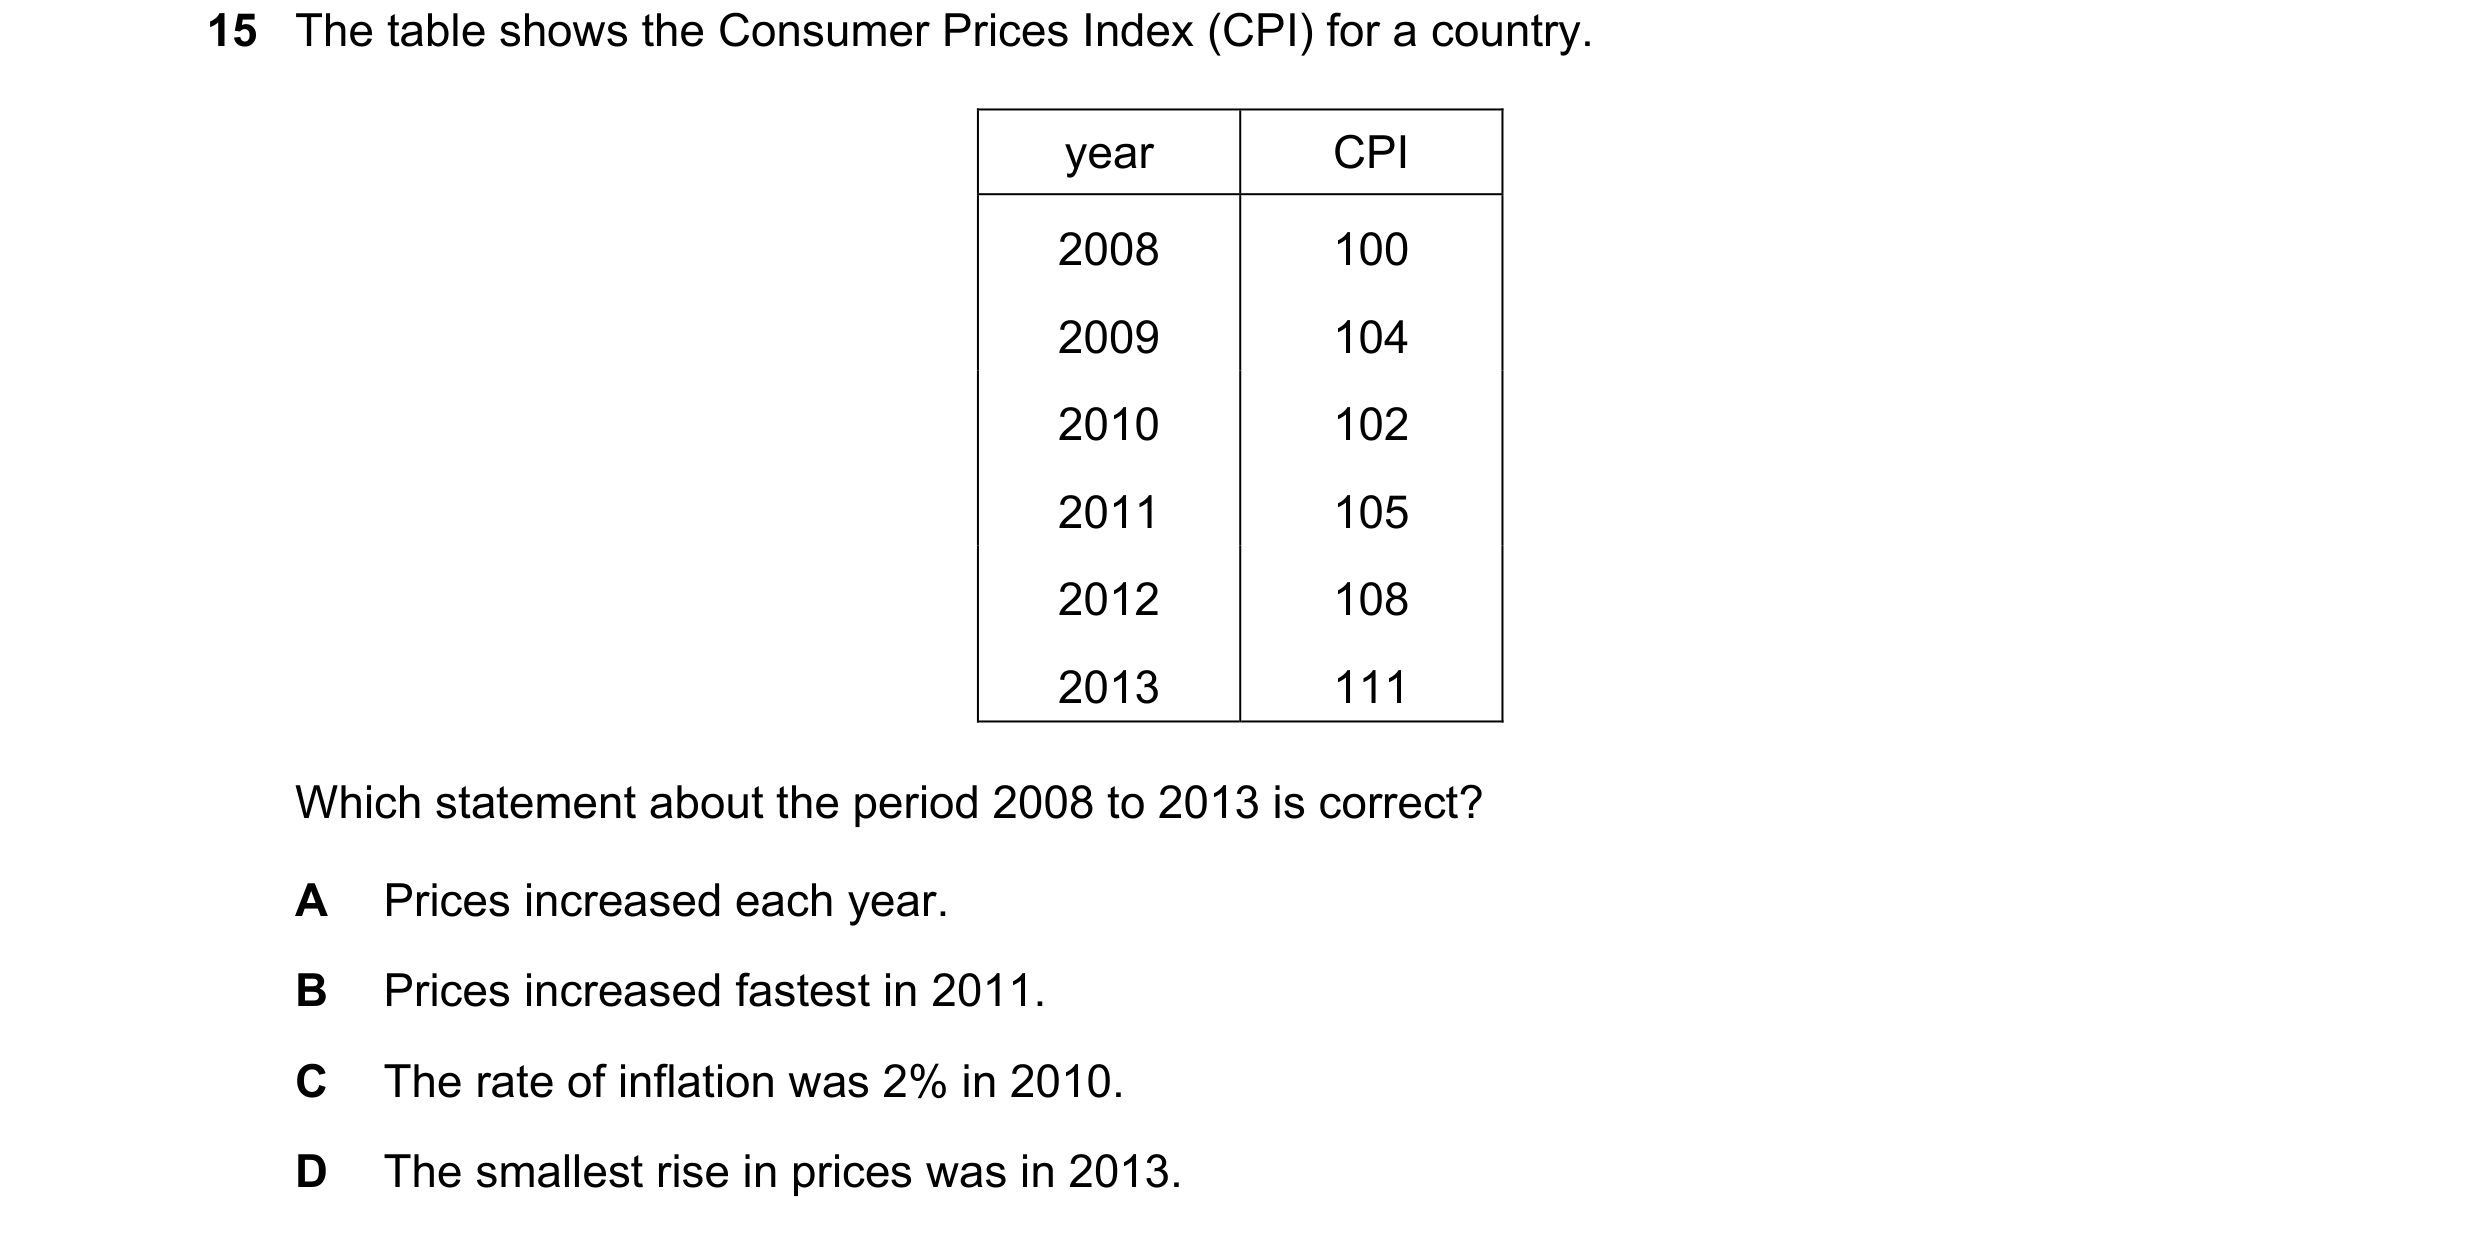 63 / 67
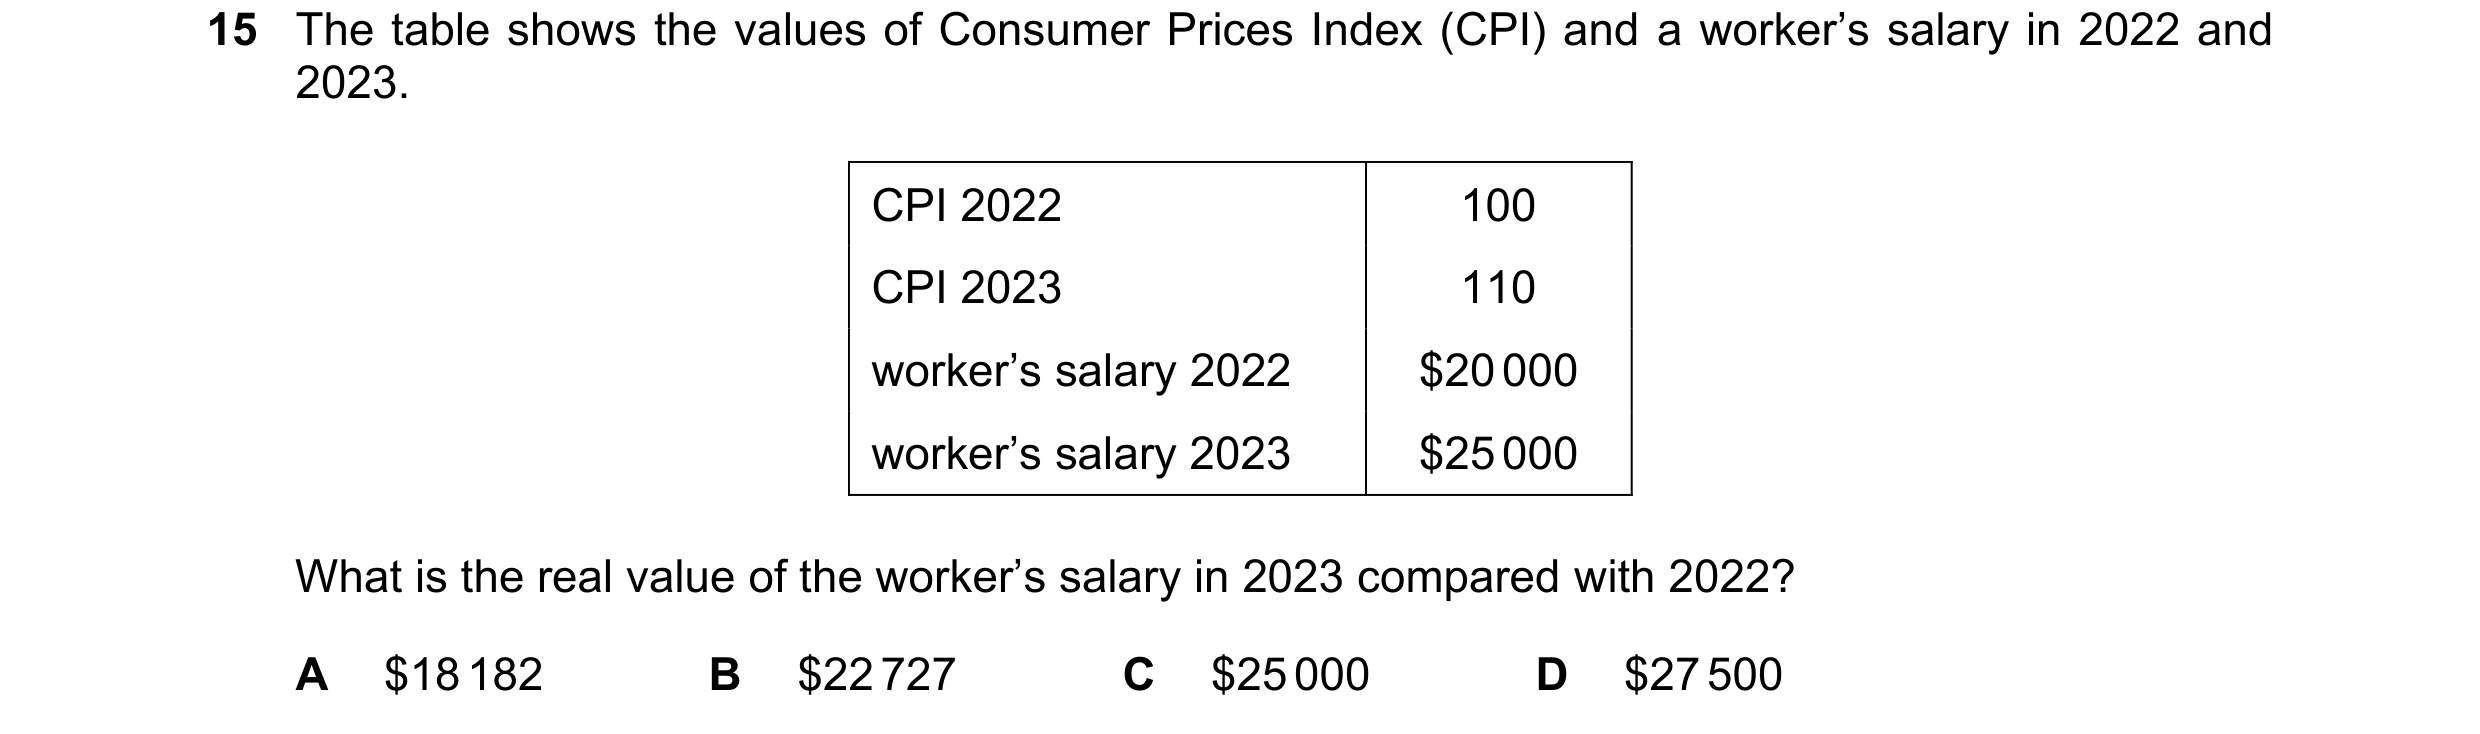
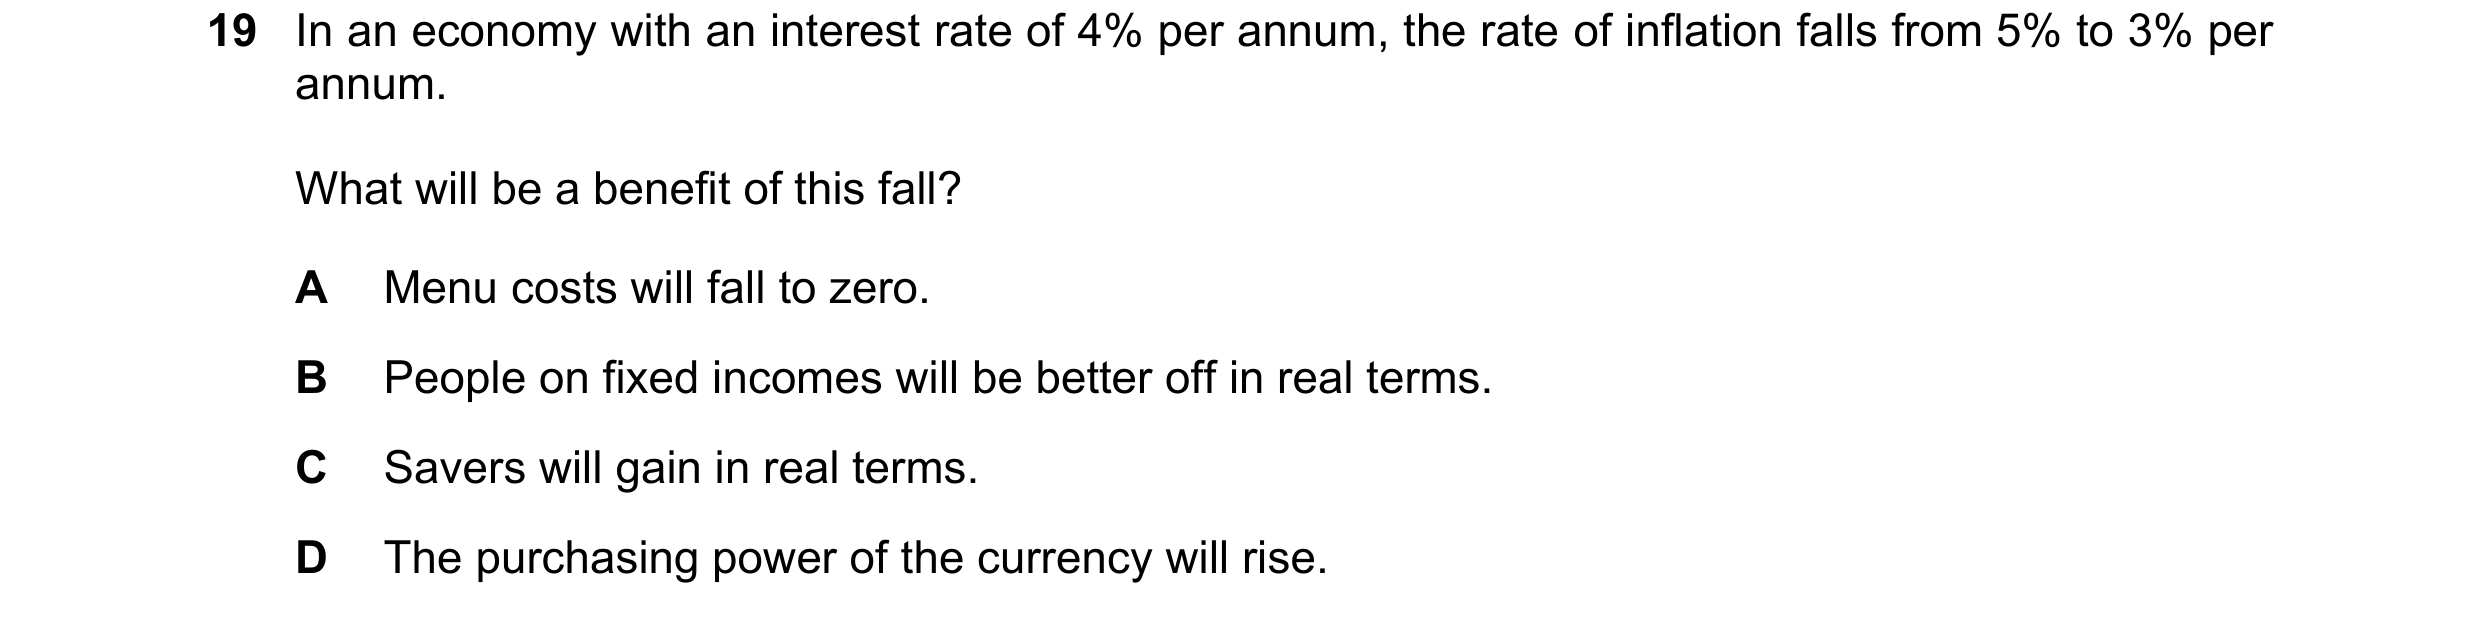
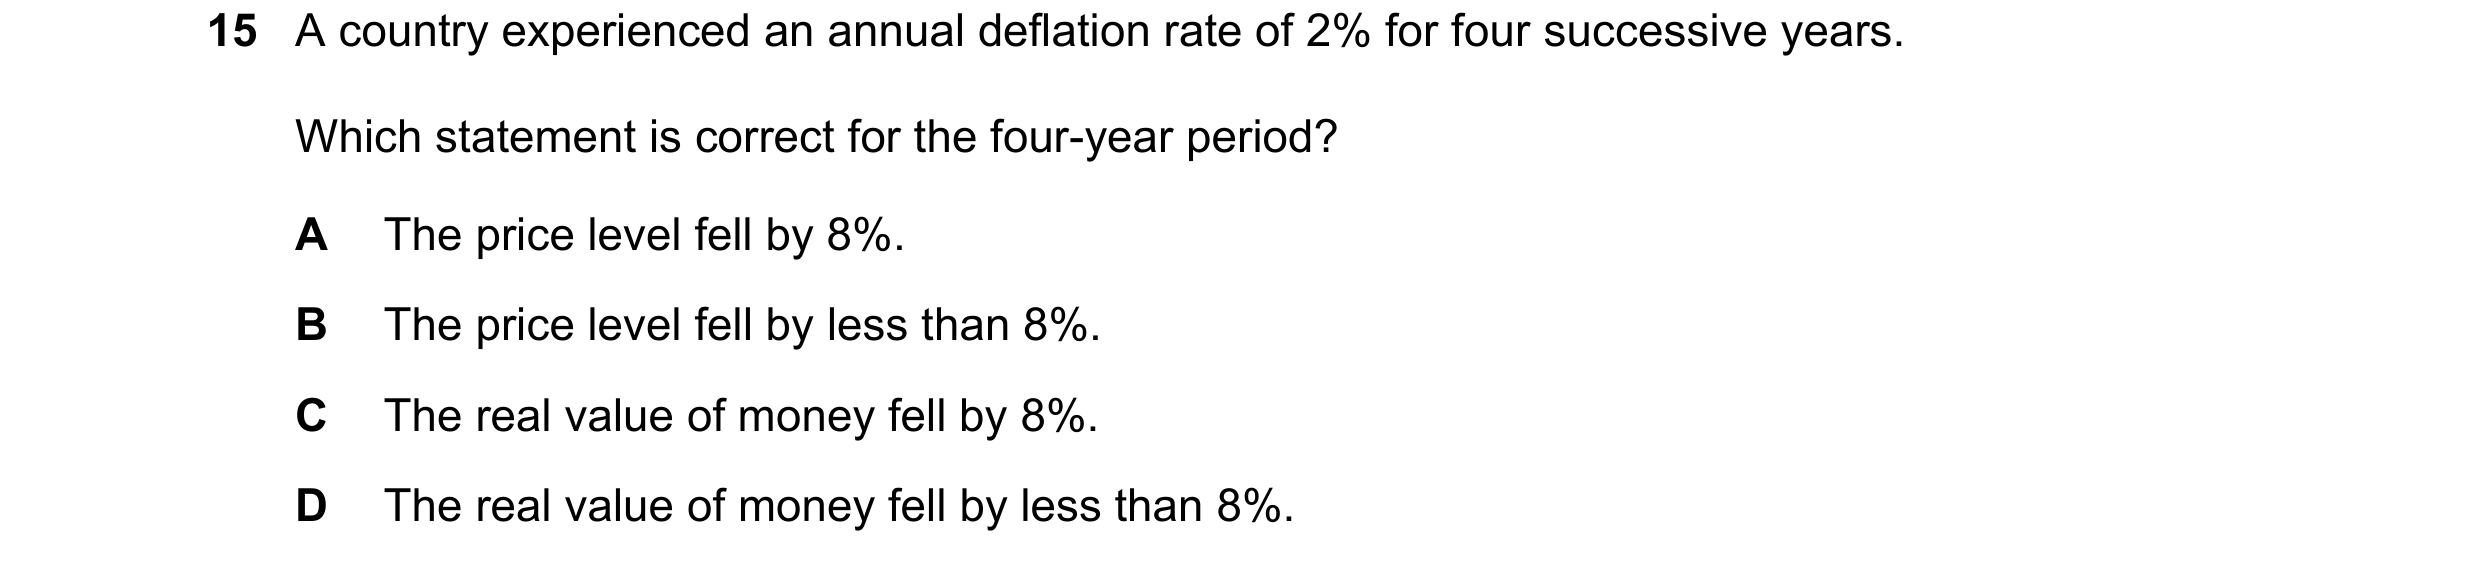
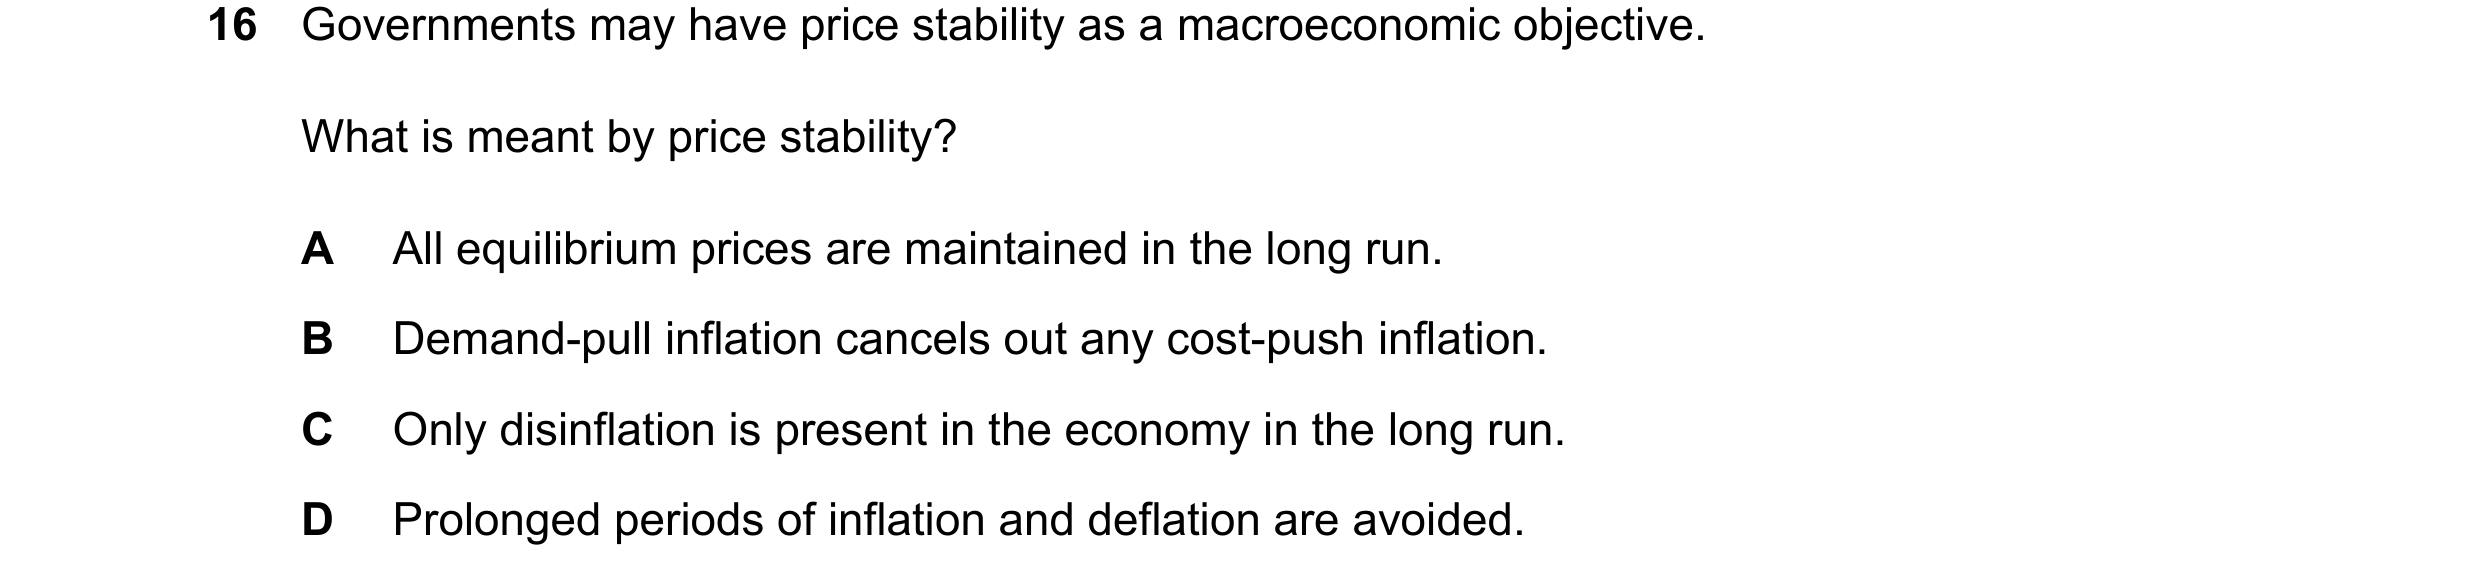 64 / 67

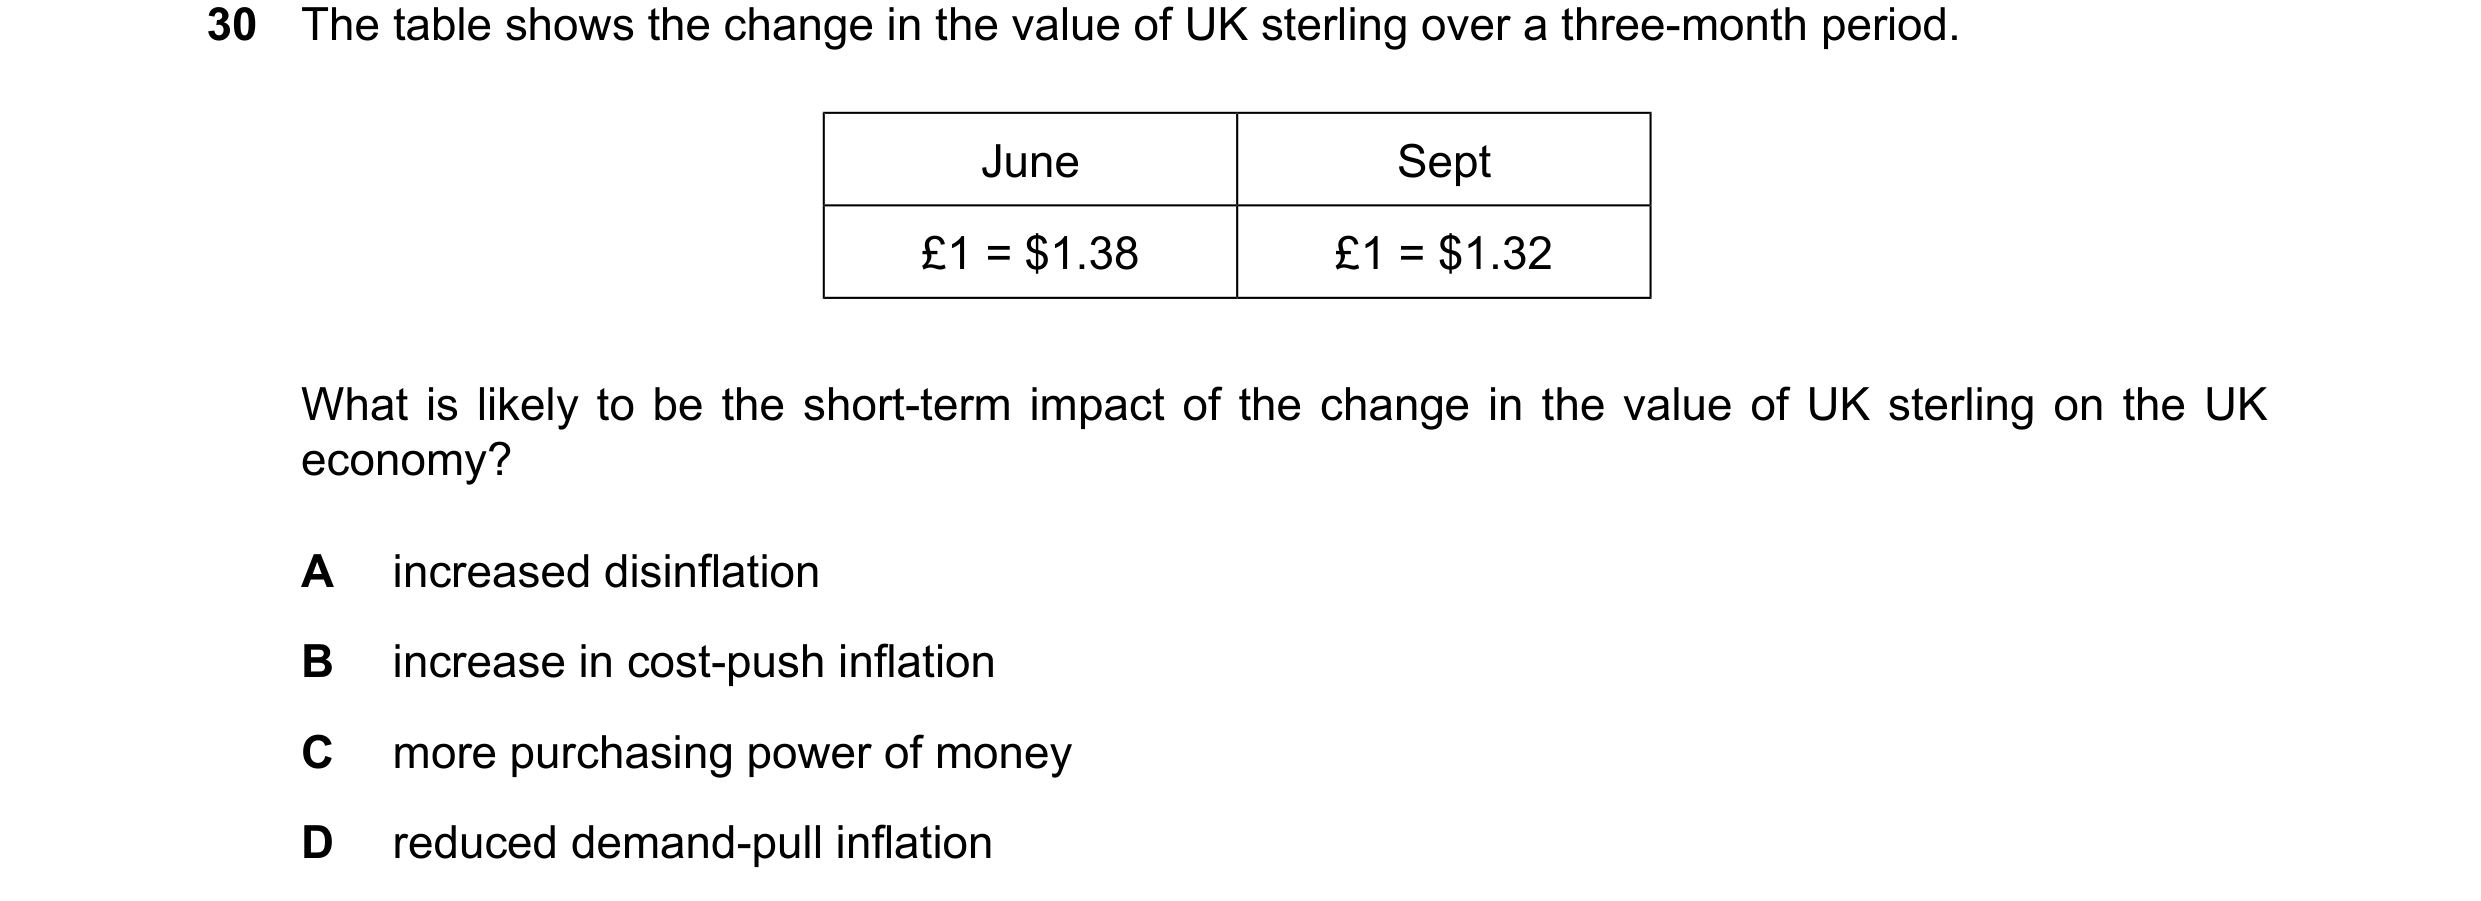
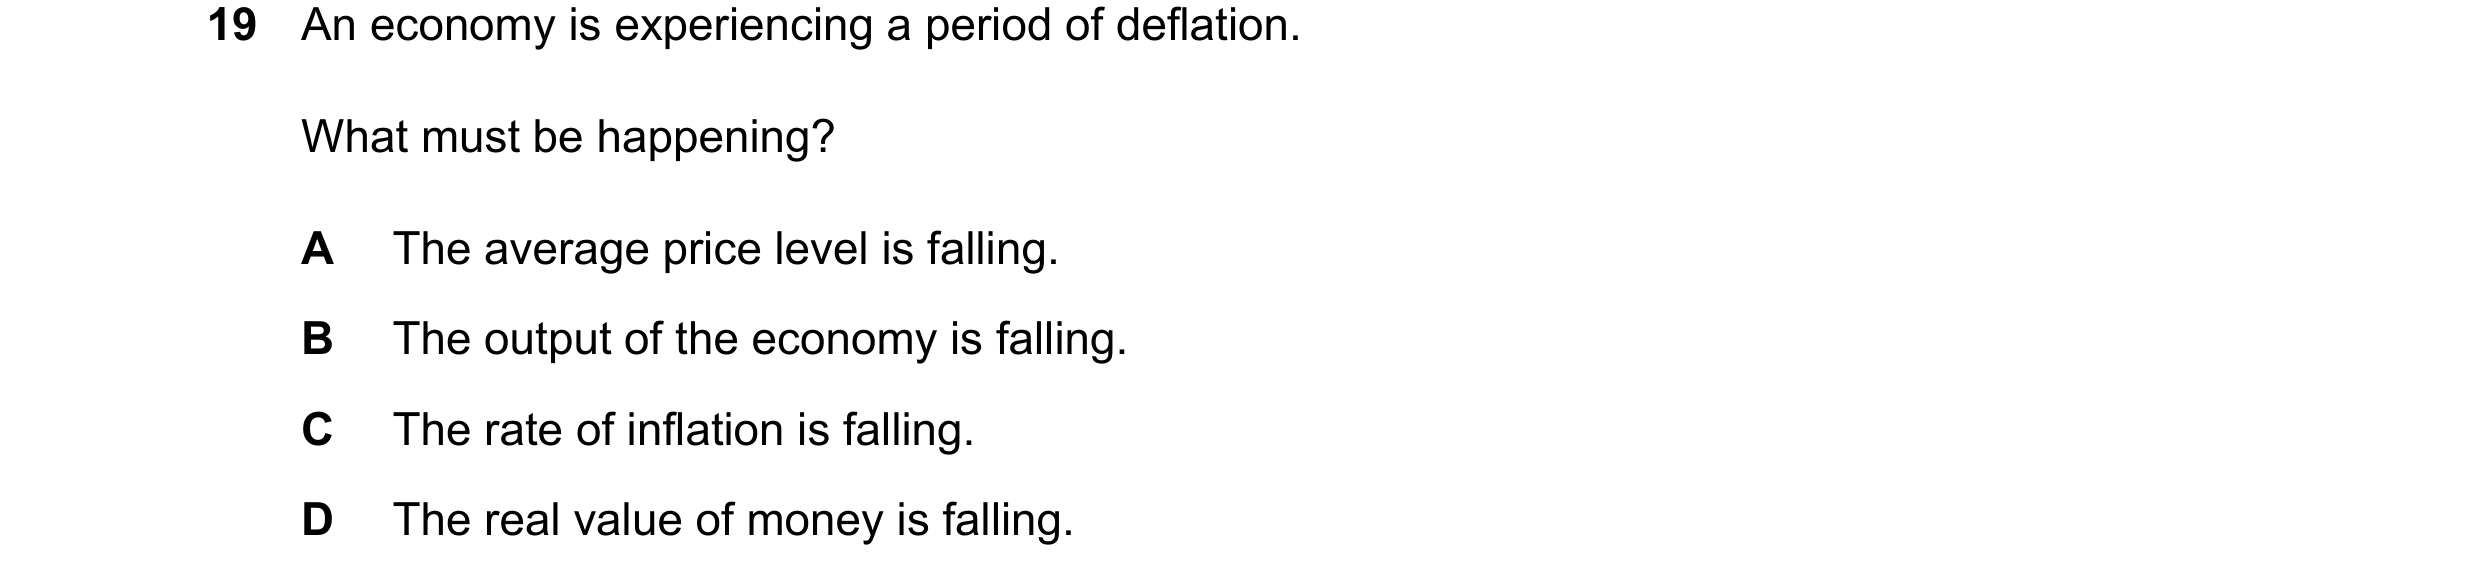 65 / 67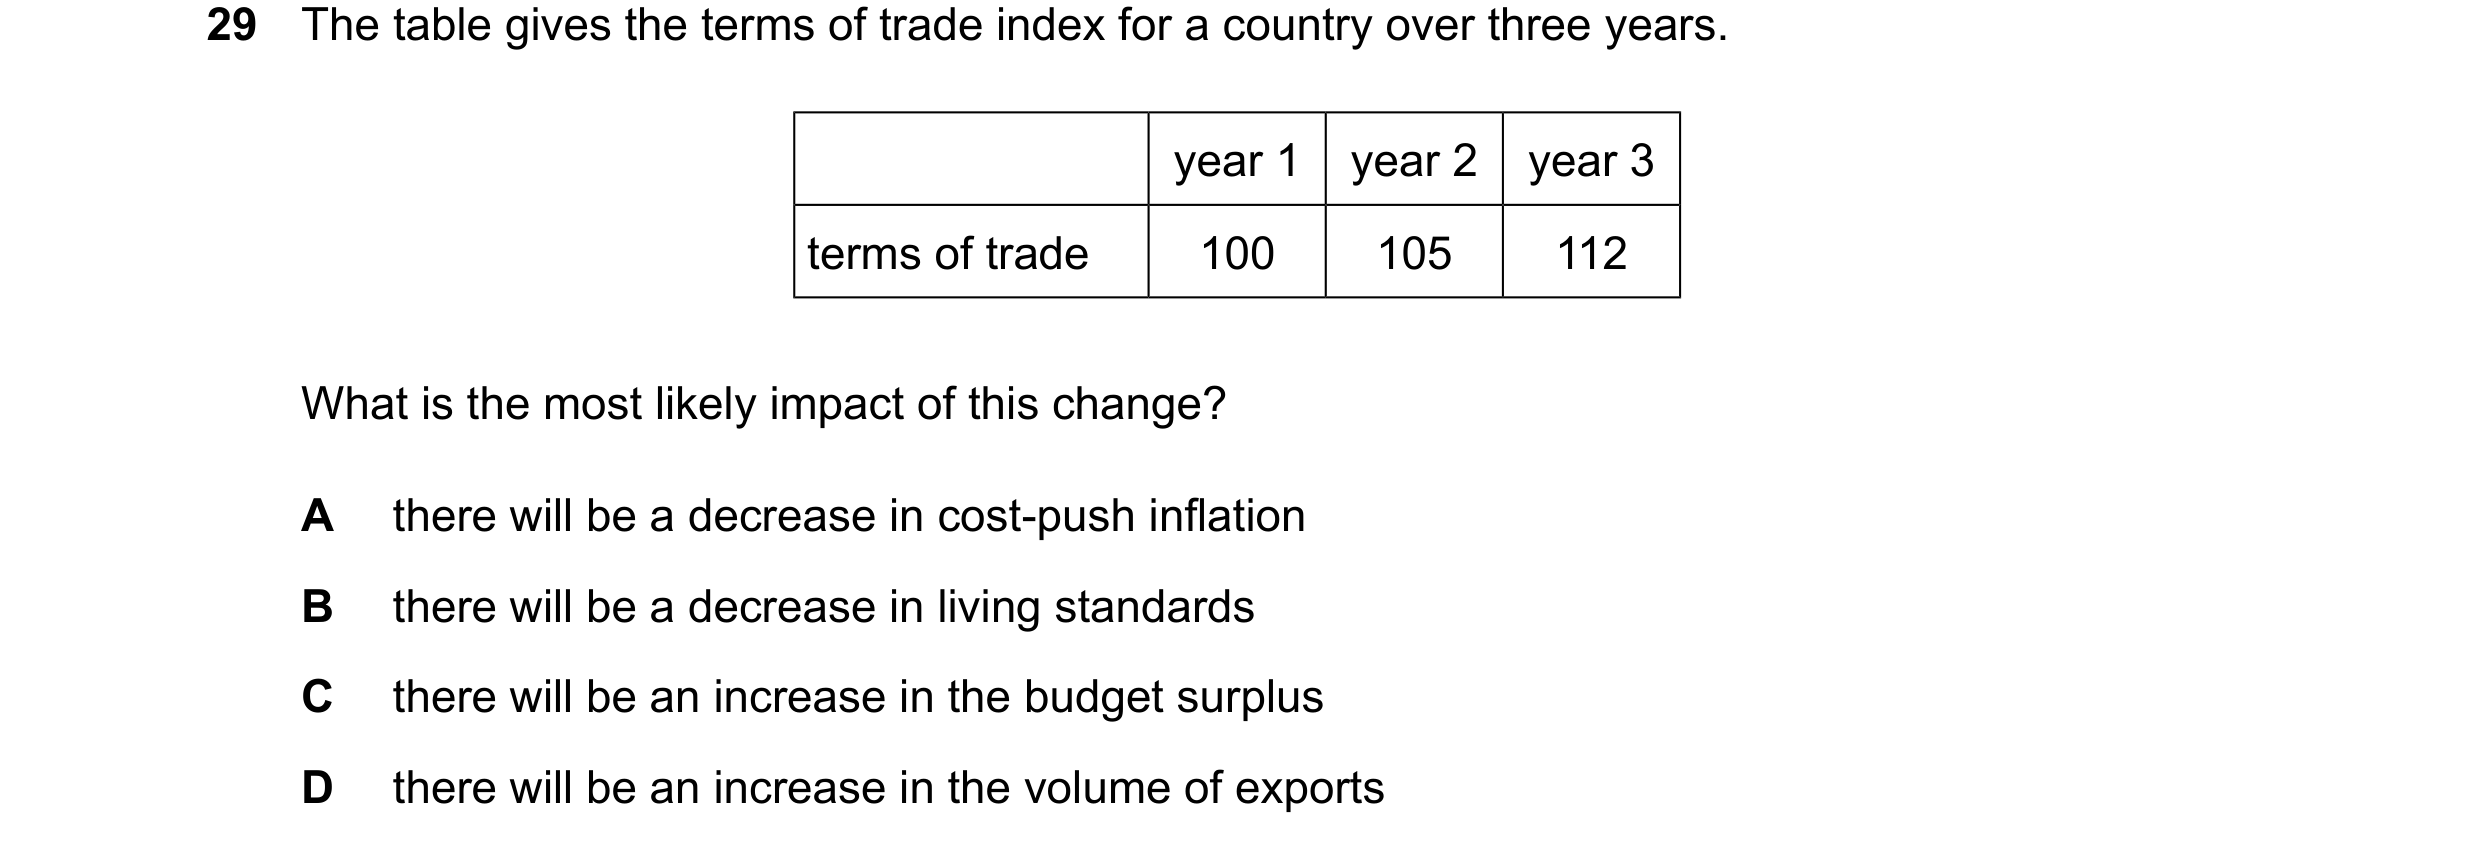
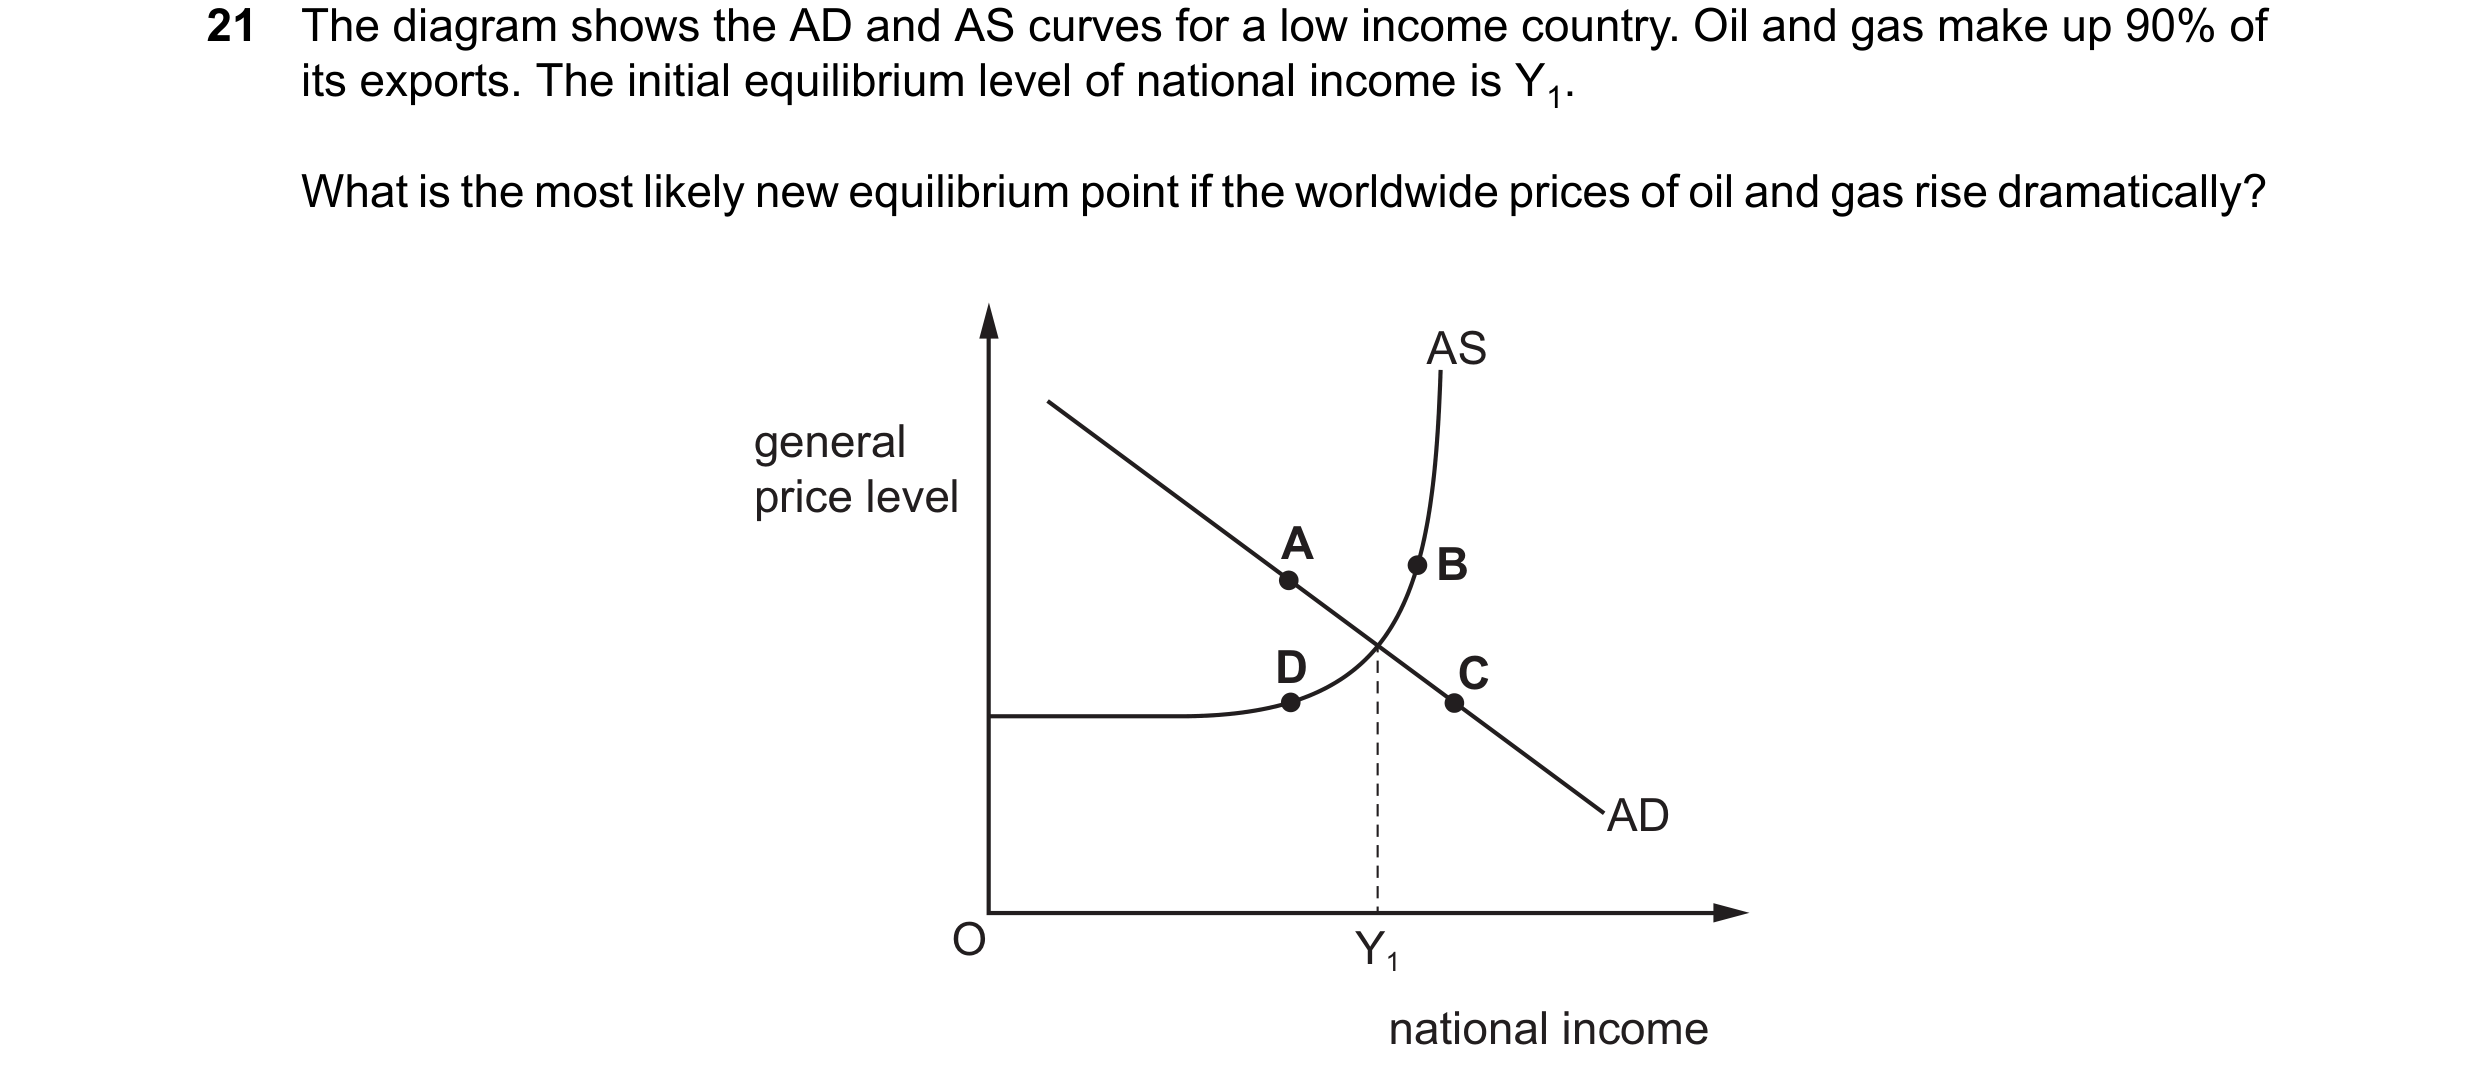
 66 / 67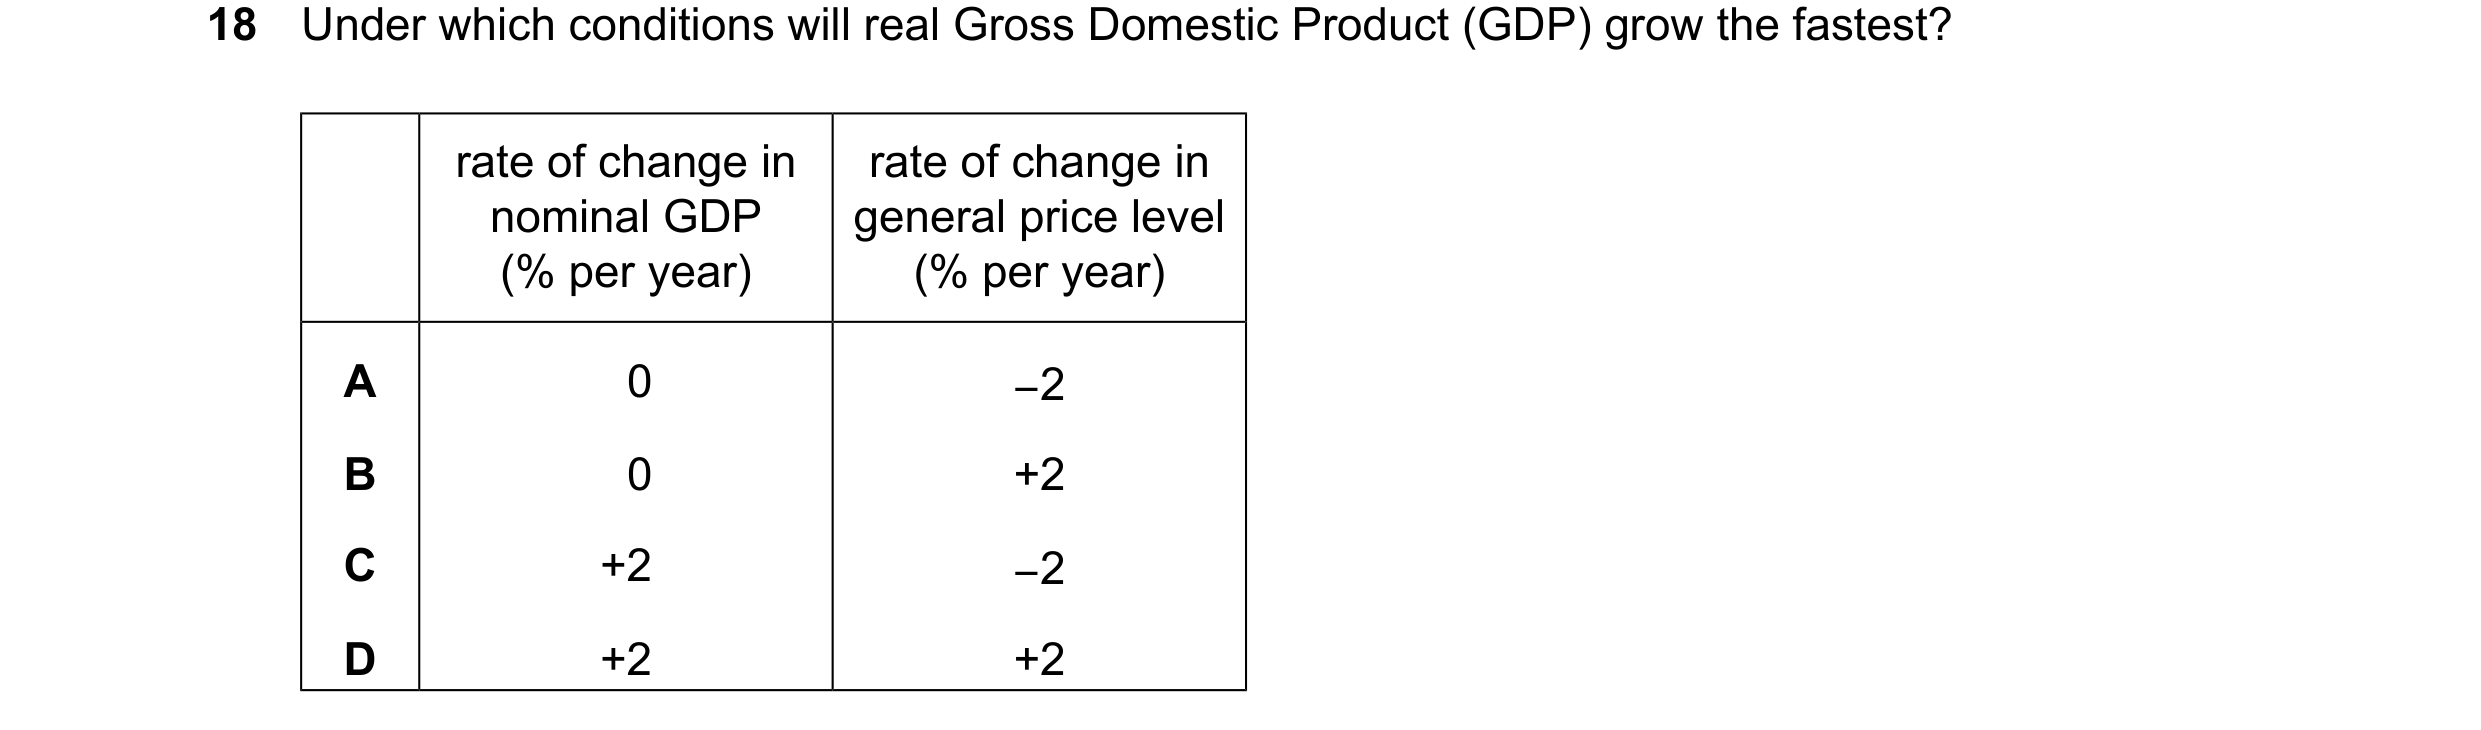
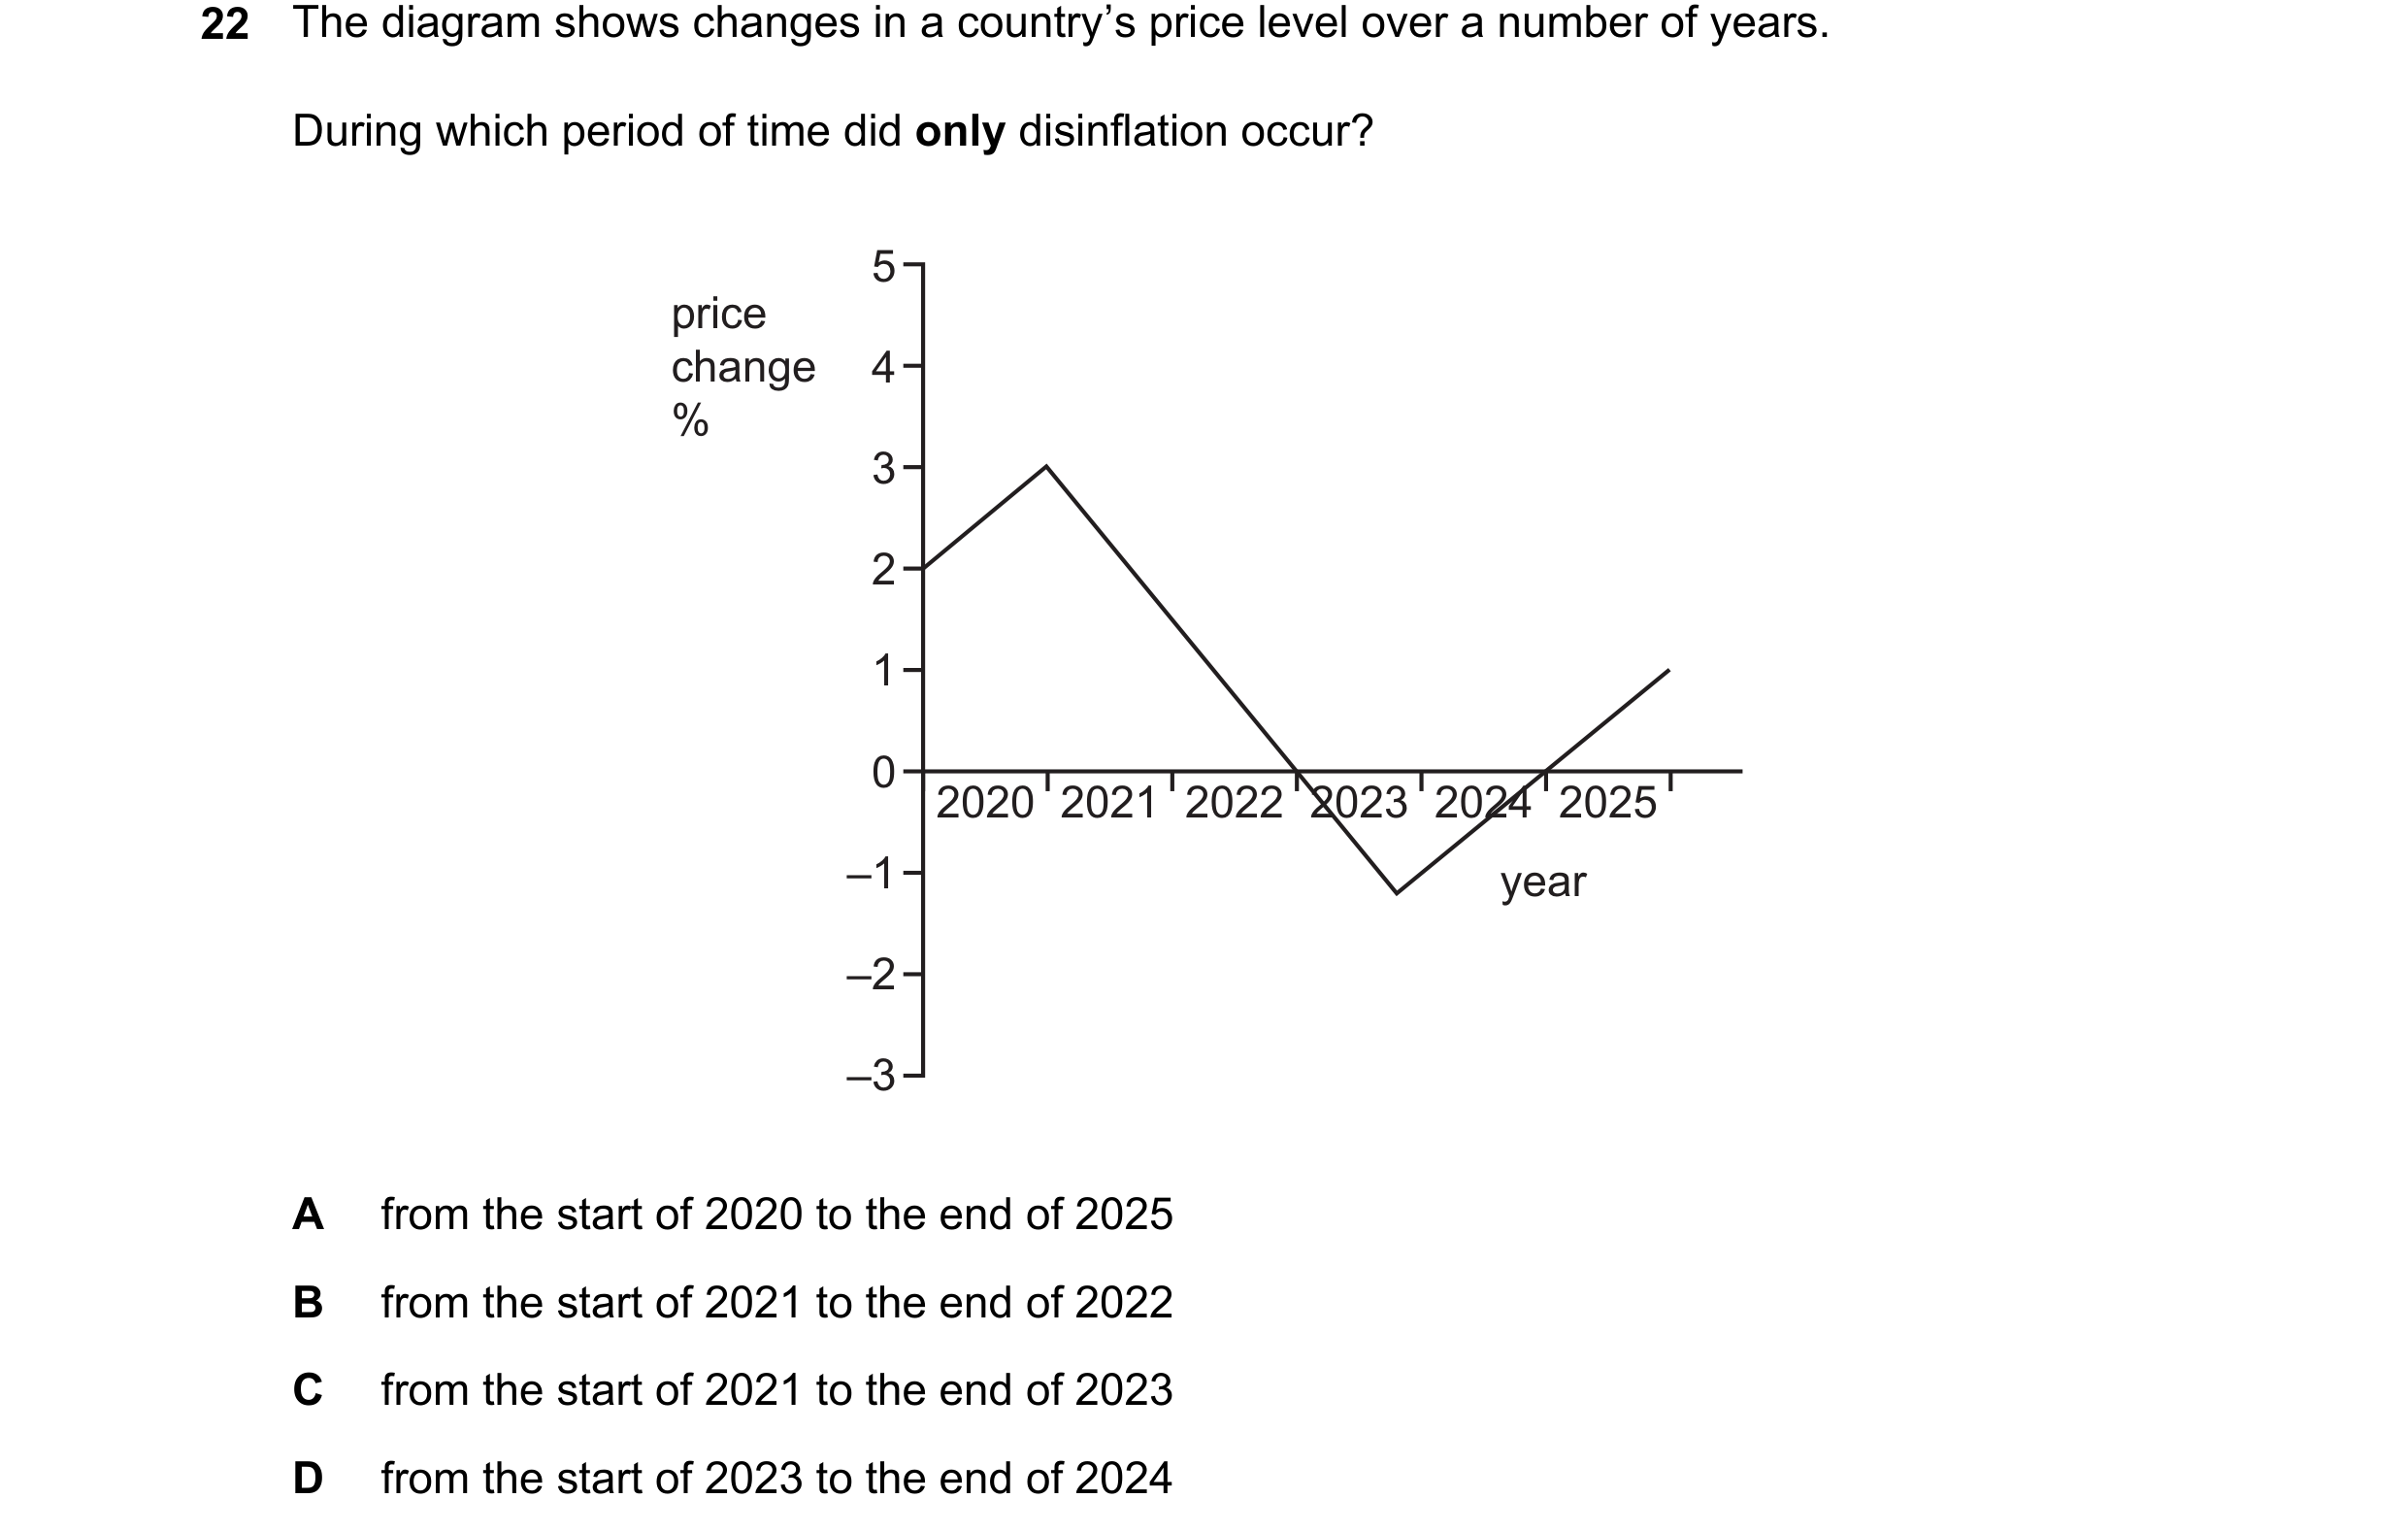 67 / 67