Questions as text
Q1 · Assuming a constant income velocity of circulation of money, if the rate of growth of the… 9708/31 Oct/Nov 2009
17 Assuming a constant income velocity of circulation of money, if the rate of growth of the money supply is 8 % and the average price level increases by 5 %, what will be the approximate change in real output? A –3 % B +3 % C +8 % D +13 %
1 marks
Answer: B
This question in 9708/31 Oct/Nov 2009
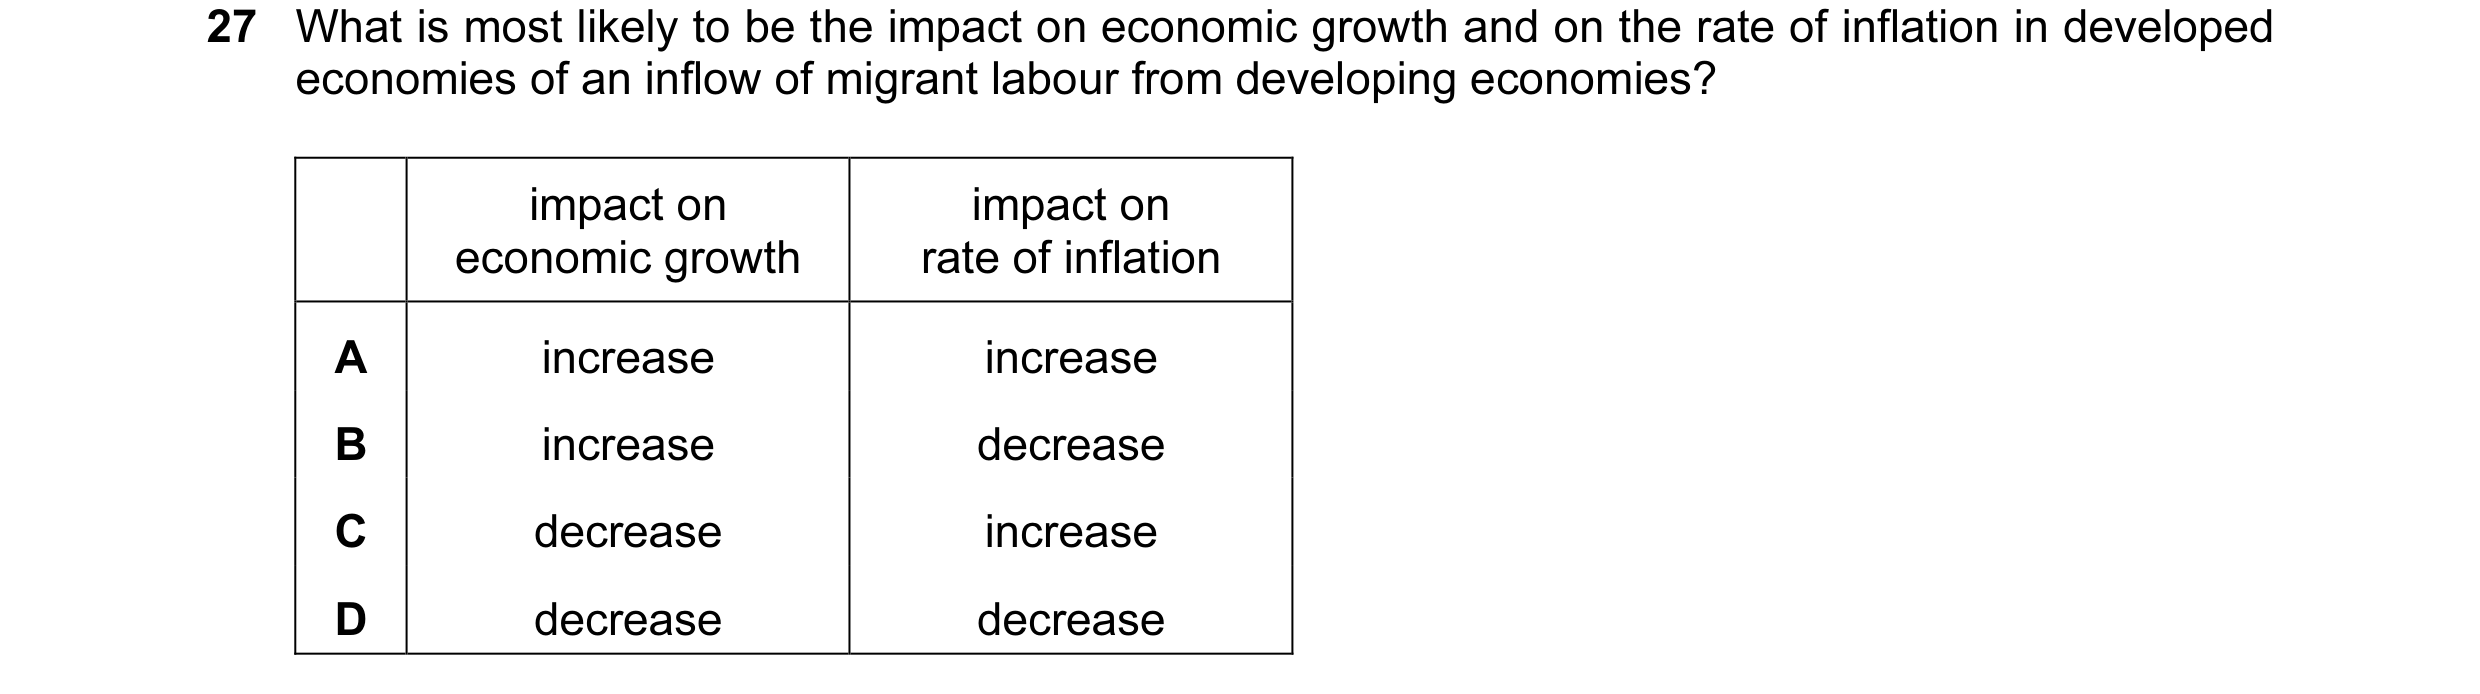
Q2 · What is most likely to be the impact on economic growth and on the rate of inflation in… 9708/31 Oct/Nov 2009
27 What is most likely to be the impact on economic growth and on the rate of inflation in developed economies of an inflow of migrant labour from developing economies? impact on impact on economic growth rate of inflation A increase increase B increase decrease C decrease increase D decrease decrease
1 marks
Answer: B
This question in 9708/31 Oct/Nov 2009
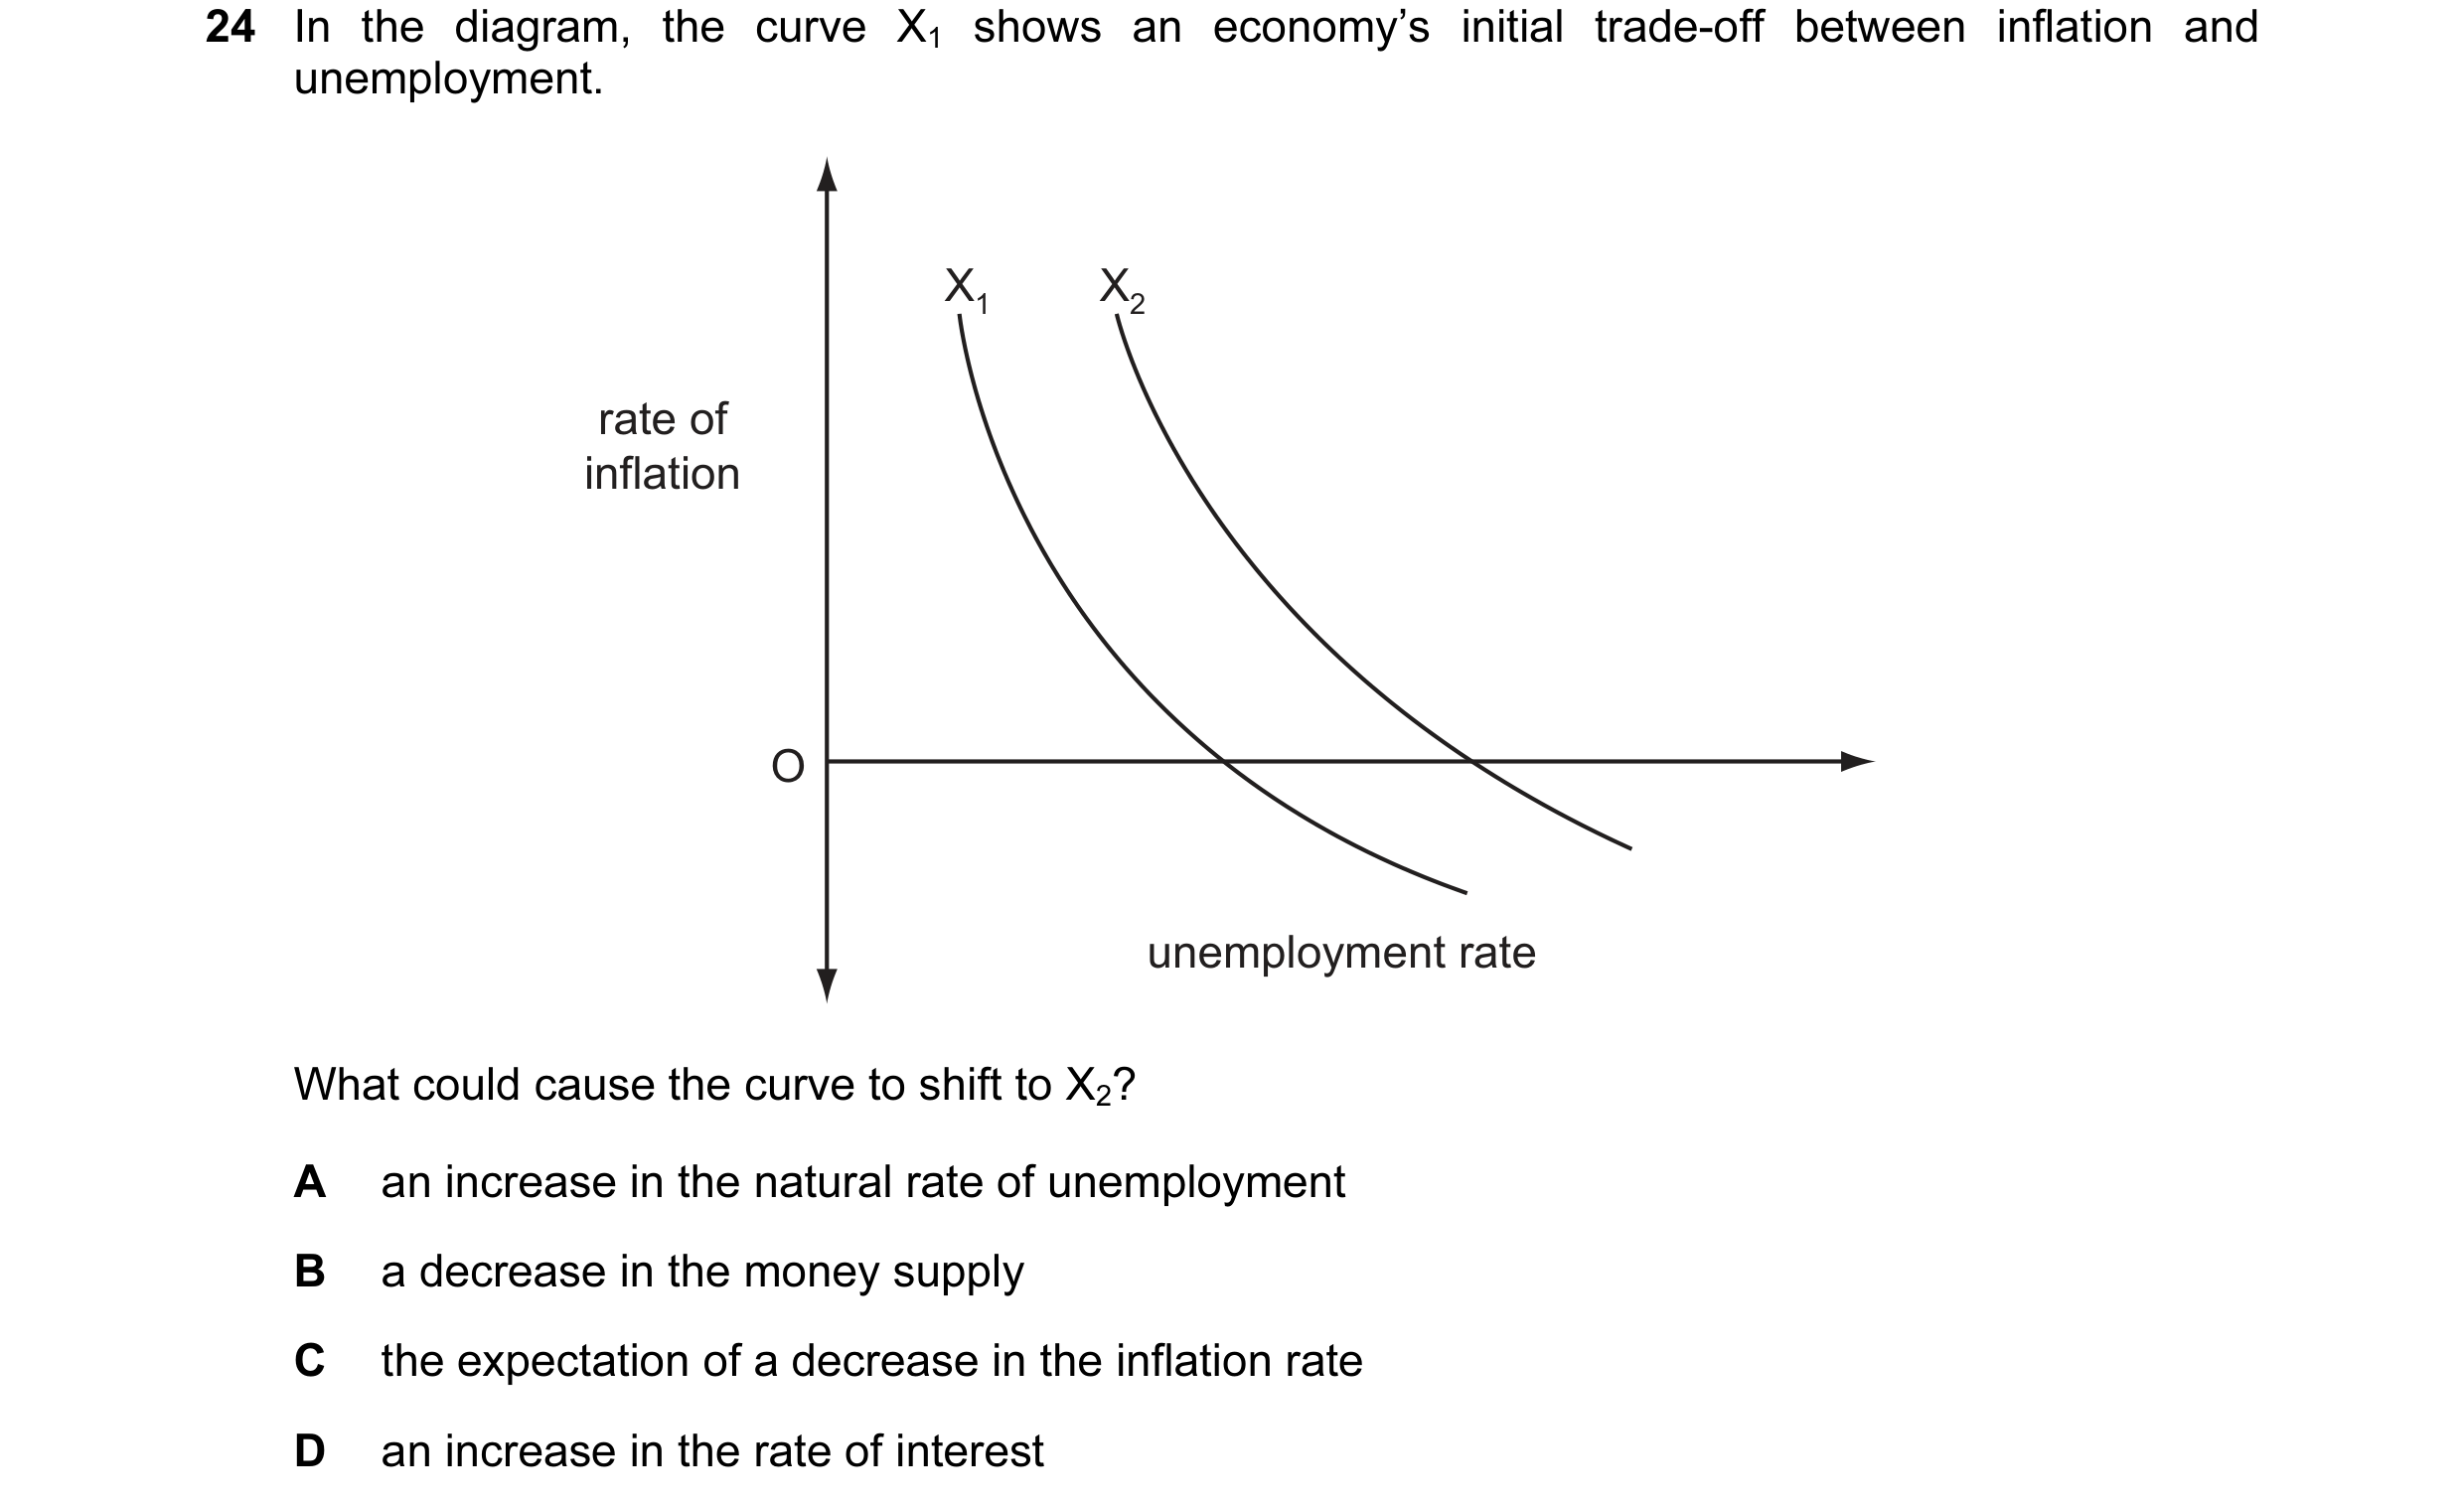
Q3 · In the diagram, the curve X1 shows an economy’s initial trade-off between inflation and… 9708/32 Oct/Nov 2009
24 In the diagram, the curve X1 shows an economy’s initial trade-off between inflation and unemployment. X1 X2 rate of inflation O unemployment rate What could cause the curve to shift to X2? A an increase in the natural rate of unemployment B a decrease in the money supply C the expectation of a decrease in the inflation rate D an increase in the rate of interest
1 marks
Answer: A
This question in 9708/32 Oct/Nov 2009
Q4 · Between 2008 and 2009 a country’s national income at current prices increased by 15 % 9708/31 May/June 2010
15 Between 2008 and 2009 a country’s national income at current prices increased by 15 %. At the same time the country experienced 5 % inflation. Which index number most closely represents the country’s national income in 2009 at 2008 prices (2008 = 100)? A 103 B 110 C 115 D 120
1 marks
Answer: B
This question in 9708/31 May/June 2010
Q5 · Between 2008 and 2009 a country’s national income at current prices increased by 15 % 9708/32 May/June 2010
14 Between 2008 and 2009 a country’s national income at current prices increased by 15 %. At the same time the country experienced 5 % inflation. Which index number most closely represents the country’s national income in 2009 at 2008 prices (2008 = 100)? A 103 B 110 C 115 D 120
1 marks
Answer: B
This question in 9708/32 May/June 2010
Q6 · According to monetarist theory, what will be the short-run and the long-run effect of an… 9708/31 Oct/Nov 2010
18 According to monetarist theory, what will be the short-run and the long-run effect of an unexpected increase in the money supply on the real wage level? short-run long-run A decrease increase B decrease unchanged C unchanged increase D unchanged unchanged
1 marks
Answer: B
This question in 9708/31 Oct/Nov 2010
Q7 · What is likely to be the effect of a fall in oil prices on the global economy? 9708/31 Oct/Nov 2010
25 What is likely to be the effect of a fall in oil prices on the global economy? A a decrease in the rate of economic growth B a decrease in unemployment C a strengthening of cost-push inflation D a weakening of demand-pull inflation
1 marks
Answer: B
This question in 9708/31 Oct/Nov 2010
Q8 · What could be expected to increase the pressure of demand-pull inflation in an open… 9708/31 Oct/Nov 2010
27 What could be expected to increase the pressure of demand-pull inflation in an open economy? A an appreciation of the foreign exchange rate B an increase in indirect taxes C an increase in interest rates D the imposition of import controls
1 marks
Answer: D
This question in 9708/31 Oct/Nov 2010
Q9 · What is likely to be the effect of a fall in oil prices on the global economy? 9708/32 Oct/Nov 2010
25 What is likely to be the effect of a fall in oil prices on the global economy? A a decrease in the rate of economic growth B a decrease in unemployment C a strengthening of cost-push inflation D a weakening of demand-pull inflation
1 marks
Answer: B
This question in 9708/32 Oct/Nov 2010
Q10 · What is likely to be the effect of a fall in oil prices on the global economy? 9708/33 Oct/Nov 2010
24 What is likely to be the effect of a fall in oil prices on the global economy? A a decrease in the rate of economic growth B a decrease in unemployment C a strengthening of cost-push inflation D a weakening of demand-pull inflation
1 marks
Answer: B
This question in 9708/33 Oct/Nov 2010
Q11 · In an economy, the volume of output rises by 2 % in a year, while the quantity of money… 9708/31 Oct/Nov 2011
18 In an economy, the volume of output rises by 2 % in a year, while the quantity of money rises by 5 %. If the velocity of circulation of money remains the same, what will be the approximate increases in the price level and the money value of national income? increase in money increase in price level value of national income A 2 % 5 % B 2 % 7 % C 3 % 5 % D 3 % 7 %
1 marks
Answer: C
This question in 9708/31 Oct/Nov 2011
Q12 · Why are high and variable rates of inflation likely to be harmful to long-run economic… 9708/31 Oct/Nov 2011
24 Why are high and variable rates of inflation likely to be harmful to long-run economic growth? A They hide relative price changes leading to a misallocation of resources. B They increase the real burden of household debt leading to lower consumption. C They lead to an increase in the household saving ratio. D They result in an increase in real interest rates.
1 marks
Answer: A
This question in 9708/31 Oct/Nov 2011
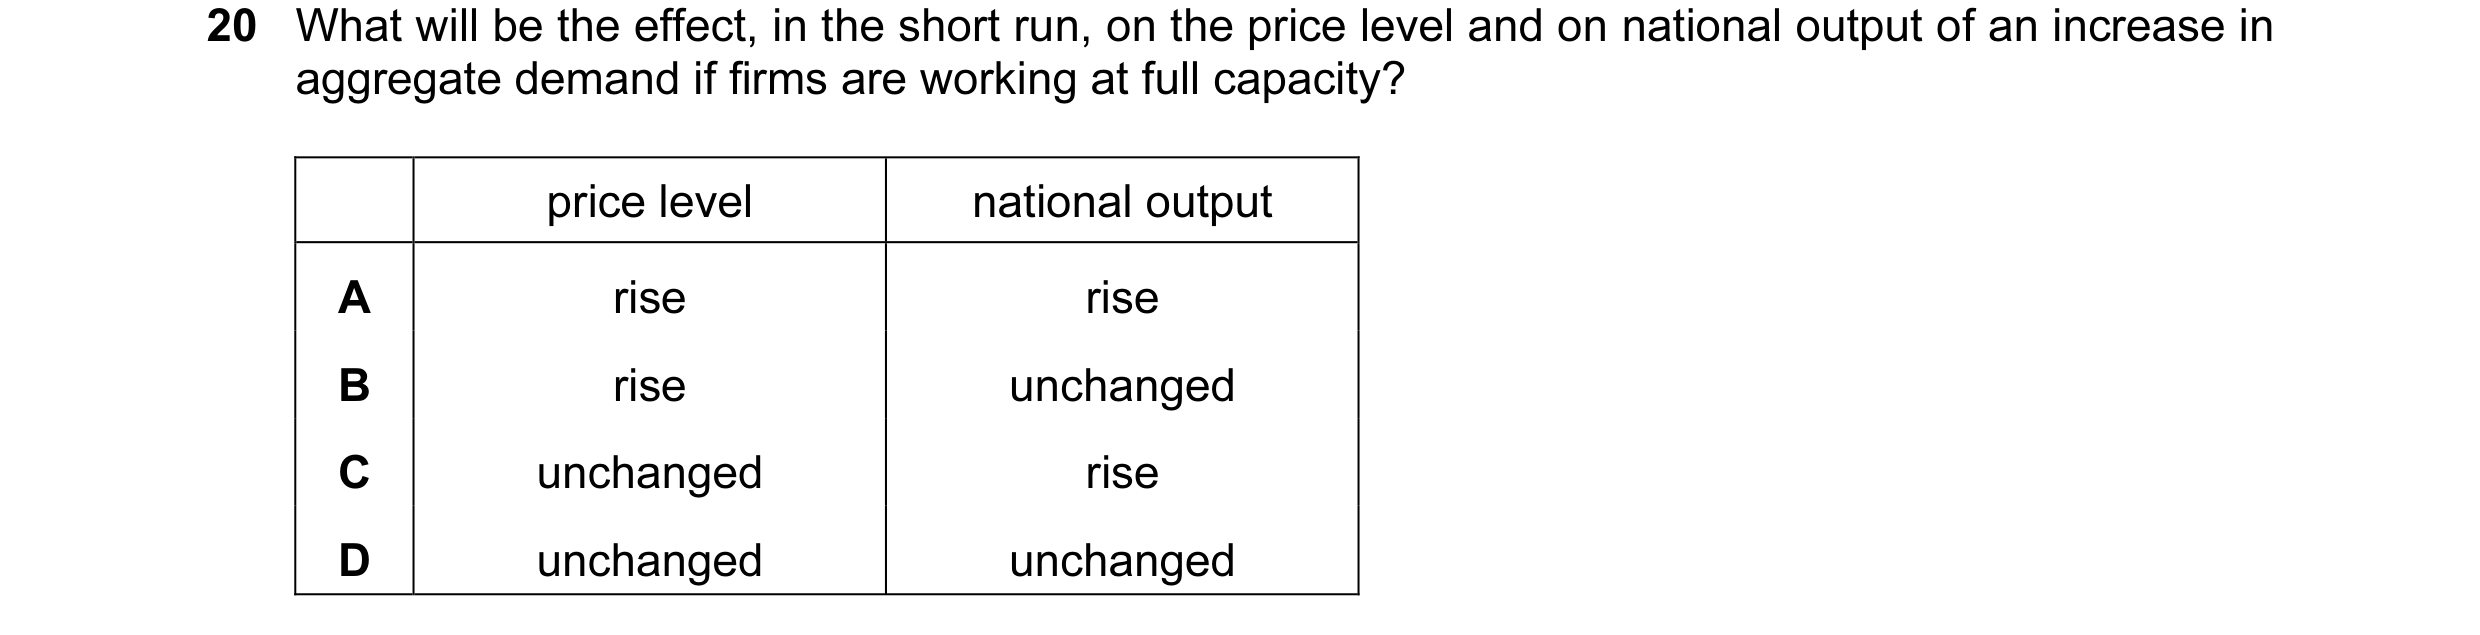
Q13 · What will be the effect, in the short run, on the price level and on national output of… 9708/32 Oct/Nov 2011
20 What will be the effect, in the short run, on the price level and on national output of an increase in aggregate demand if firms are working at full capacity? price level national output A rise rise B rise unchanged C unchanged rise D unchanged unchanged
1 marks
Answer: B
This question in 9708/32 Oct/Nov 2011
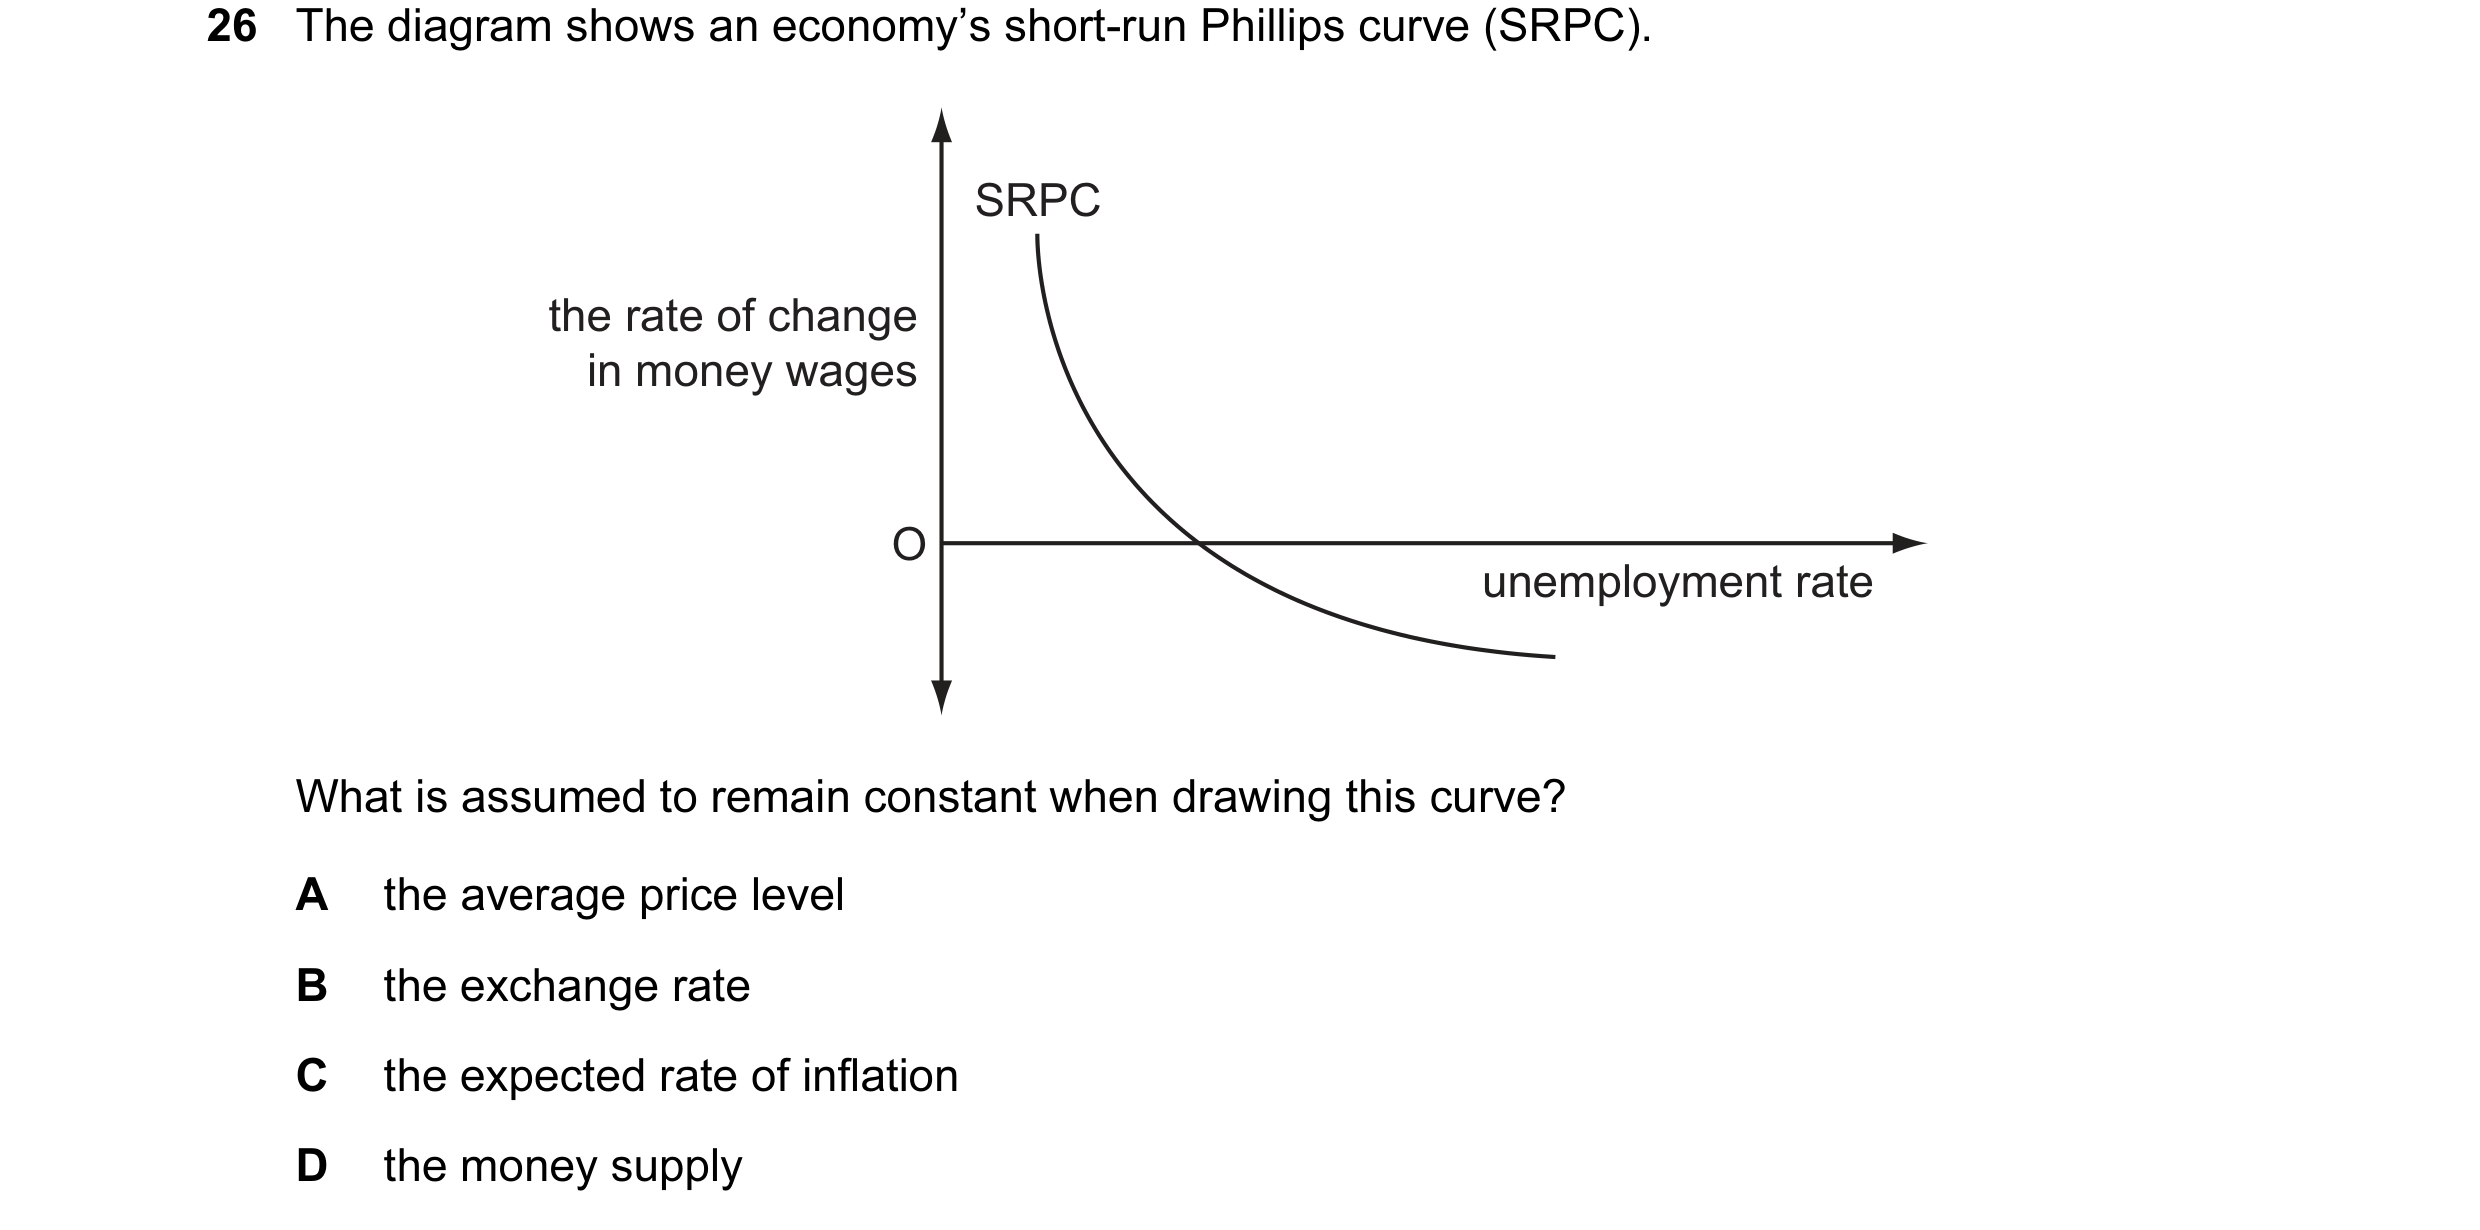
Q14 · The diagram shows an economy’s short-run Phillips curve (SRPC) 9708/32 Oct/Nov 2011
26 The diagram shows an economy’s short-run Phillips curve (SRPC). SRPC the rate of change in money wages O unemployment rate What is assumed to remain constant when drawing this curve? A the average price level B the exchange rate C the expected rate of inflation D the money supply
1 marks
Answer: C
This question in 9708/32 Oct/Nov 2011
Q15 · Why are high and variable rates of inflation likely to be harmful to long-run economic… 9708/33 Oct/Nov 2011
23 Why are high and variable rates of inflation likely to be harmful to long-run economic growth? A They hide relative price changes leading to a misallocation of resources. B They increase the real burden of household debt leading to lower consumption. C They lead to an increase in the household saving ratio. D They result in an increase in real interest rates.
1 marks
Answer: A
This question in 9708/33 Oct/Nov 2011
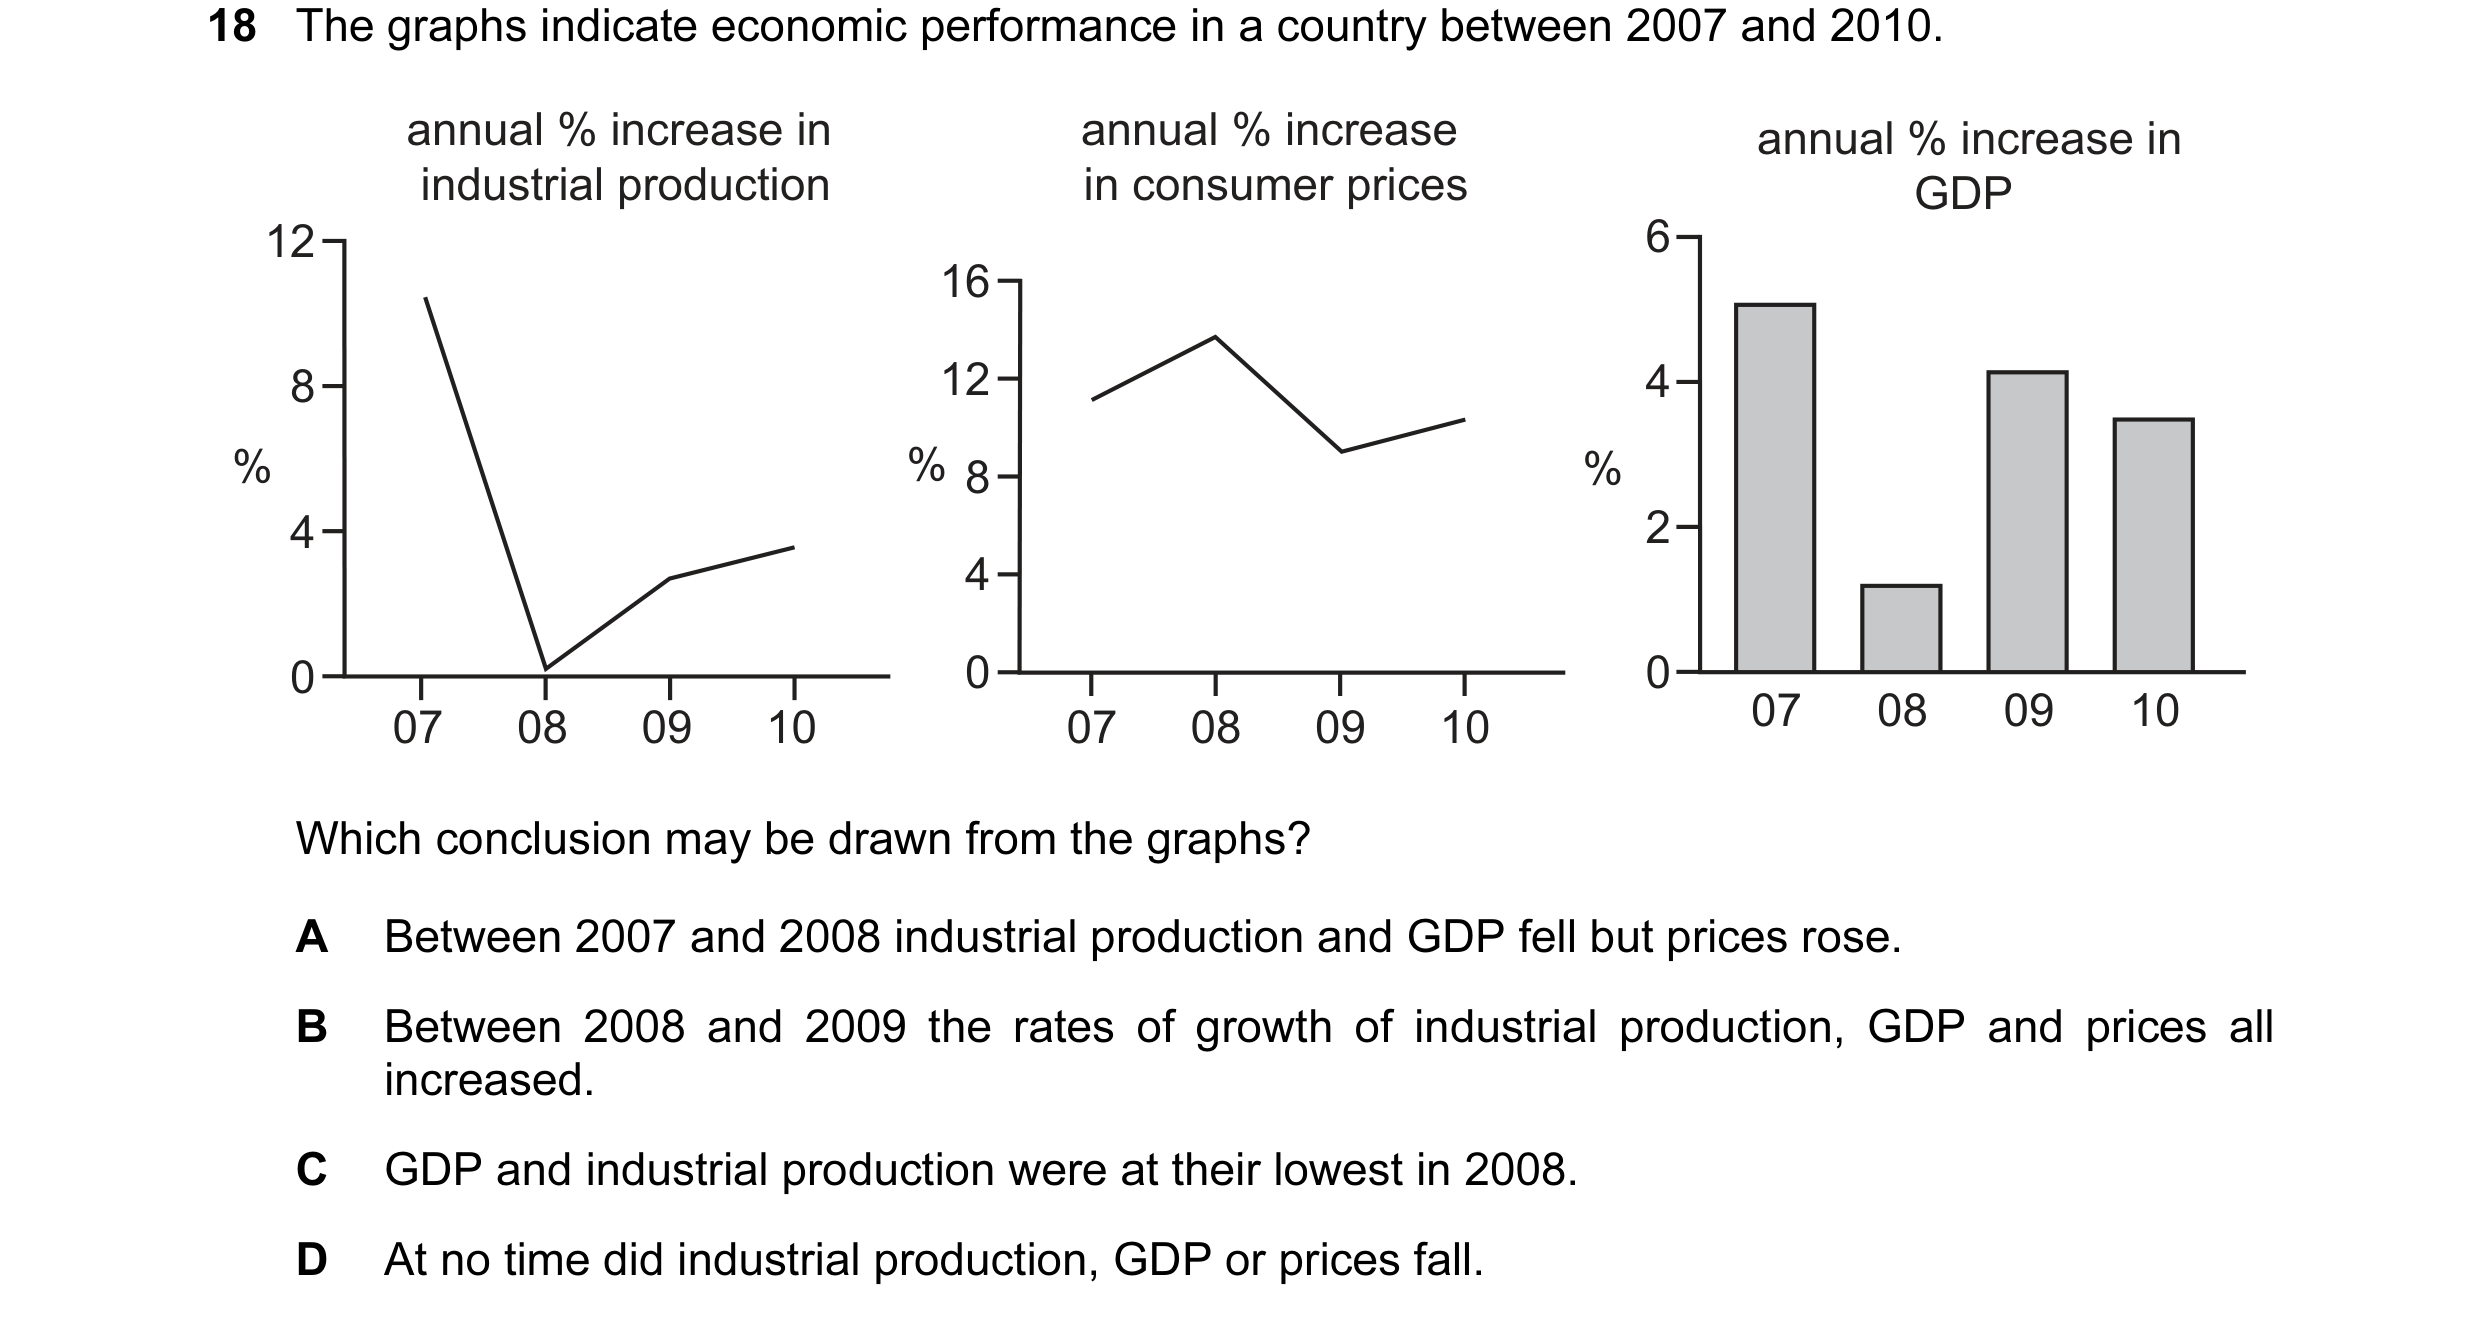
Q16 · The graphs indicate economic performance in a country between 2007 and 2010 9708/32 May/June 2012
18 The graphs indicate economic performance in a country between 2007 and 2010. annual % increase in annual % increase annual % increase in industrial production in consumer prices GDP 12 6 16 8 12 4 % % 8 % 4 2 4 0 0 0 07 08 09 10 07 08 09 10 07 08 09 10 Which conclusion may be drawn from the graphs? A Between 2007 and 2008 industrial production and GDP fell but prices rose. B Between 2008 and 2009 the rates of growth of industrial production, GDP and prices all increased. C GDP and industrial production were at their lowest in 2008. D At no time did industrial production, GDP or prices fall.
1 marks
Answer: D
This question in 9708/32 May/June 2012
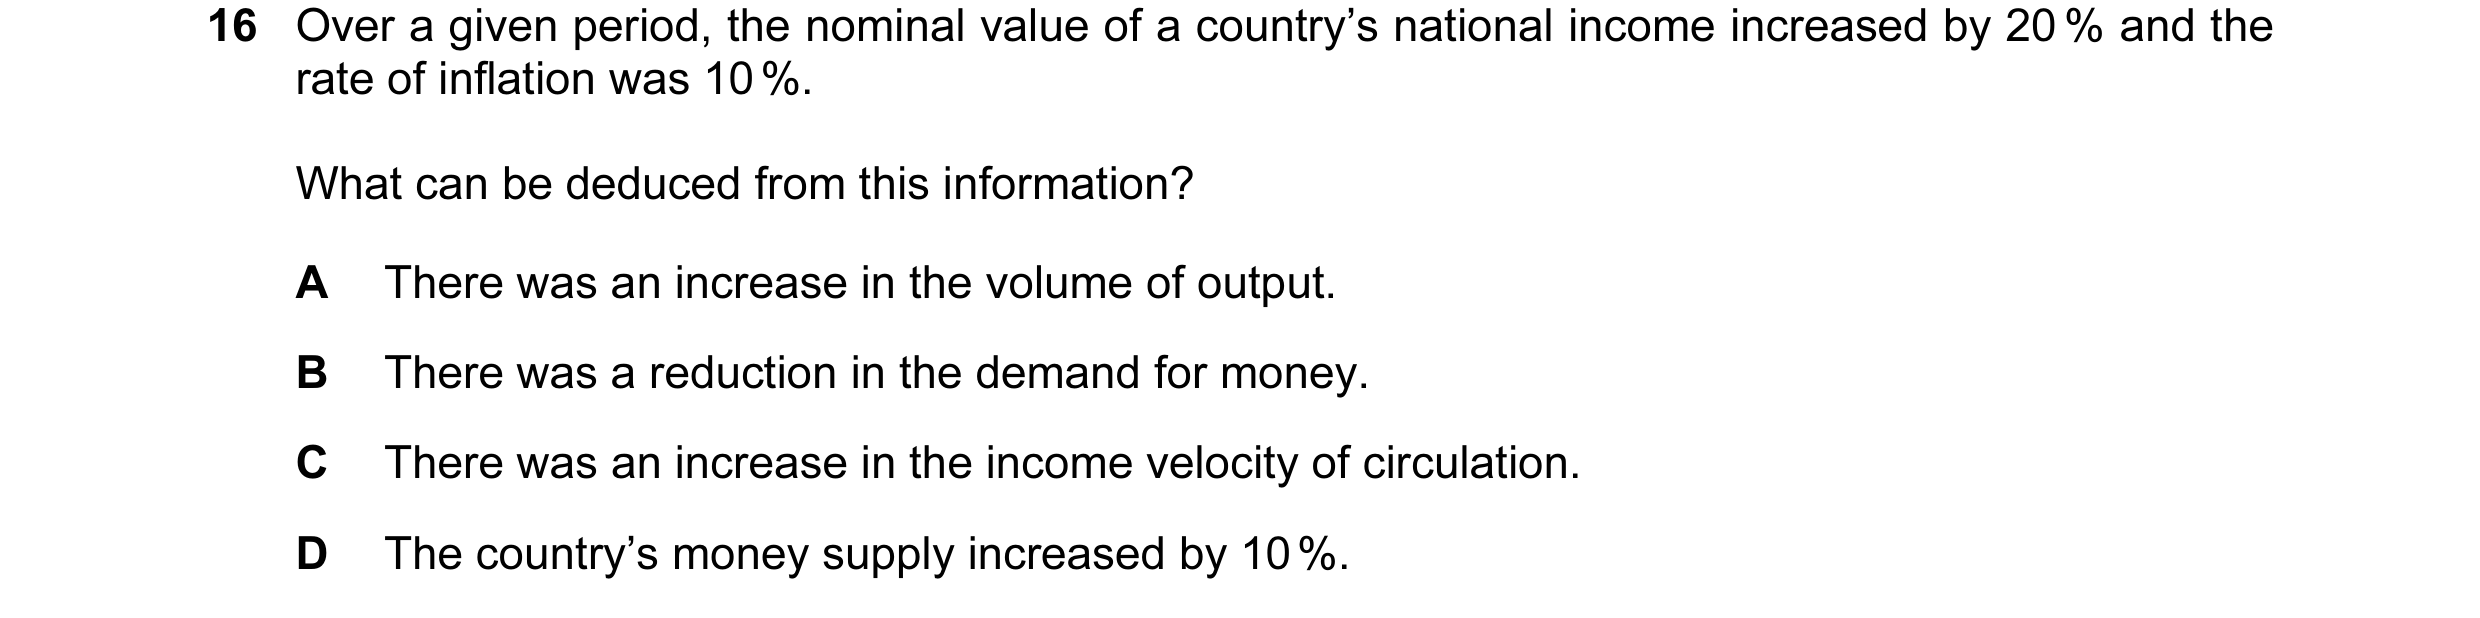
Q17 · Over a given period, the nominal value of a country’s national income increased by 20 %… 9708/32 Oct/Nov 2012
16 Over a given period, the nominal value of a country’s national income increased by 20 % and the rate of inflation was 10 %. What can be deduced from this information? A There was an increase in the volume of output. B There was a reduction in the demand for money. C There was an increase in the income velocity of circulation. D The country’s money supply increased by 10 %.
1 marks
Answer: A
This question in 9708/32 Oct/Nov 2012
Q18 · An economy’s unemployment rate is below the natural rate 9708/32 Oct/Nov 2012
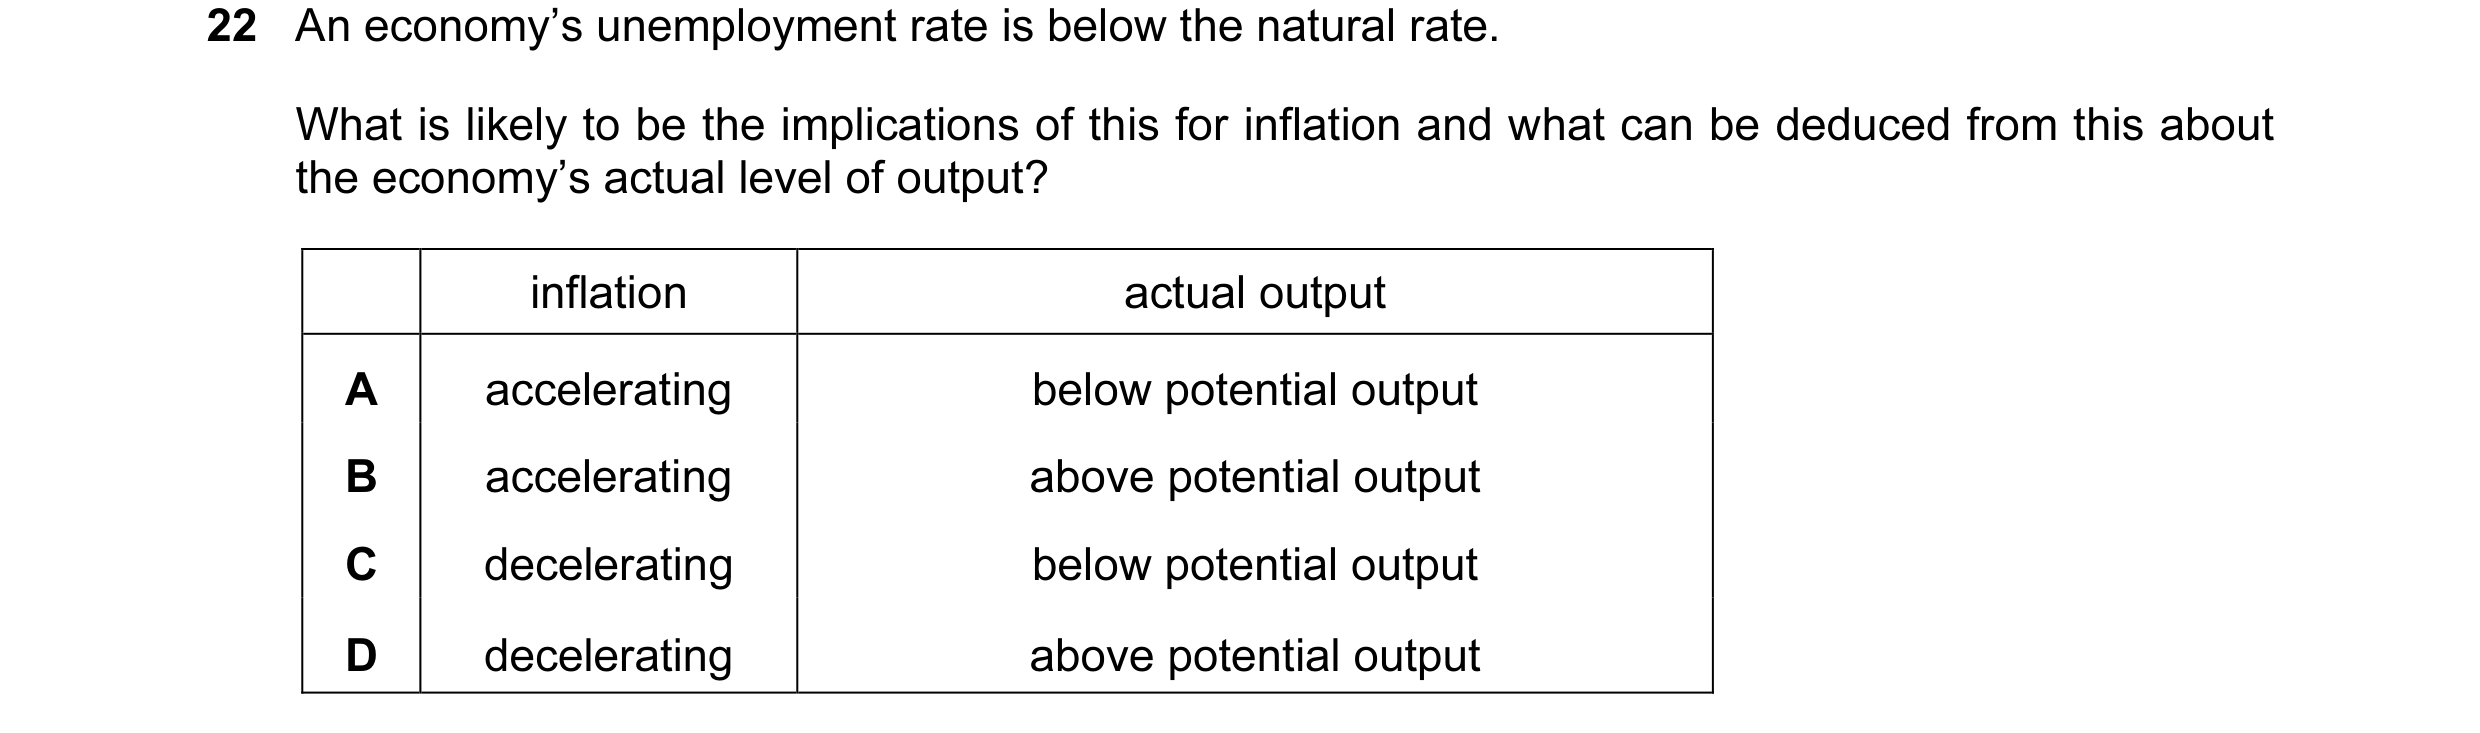
22 An economy’s unemployment rate is below the natural rate. What is likely to be the implications of this for inflation and what can be deduced from this about the economy’s actual level of output? inflation actual output A accelerating below potential output B accelerating above potential output C decelerating below potential output D decelerating above potential output
1 marks
Answer: B
This question in 9708/32 Oct/Nov 2012
Q19 · The graphs below show percentage changes in money GDP and consumer prices in a country… 9708/33 Oct/Nov 2012
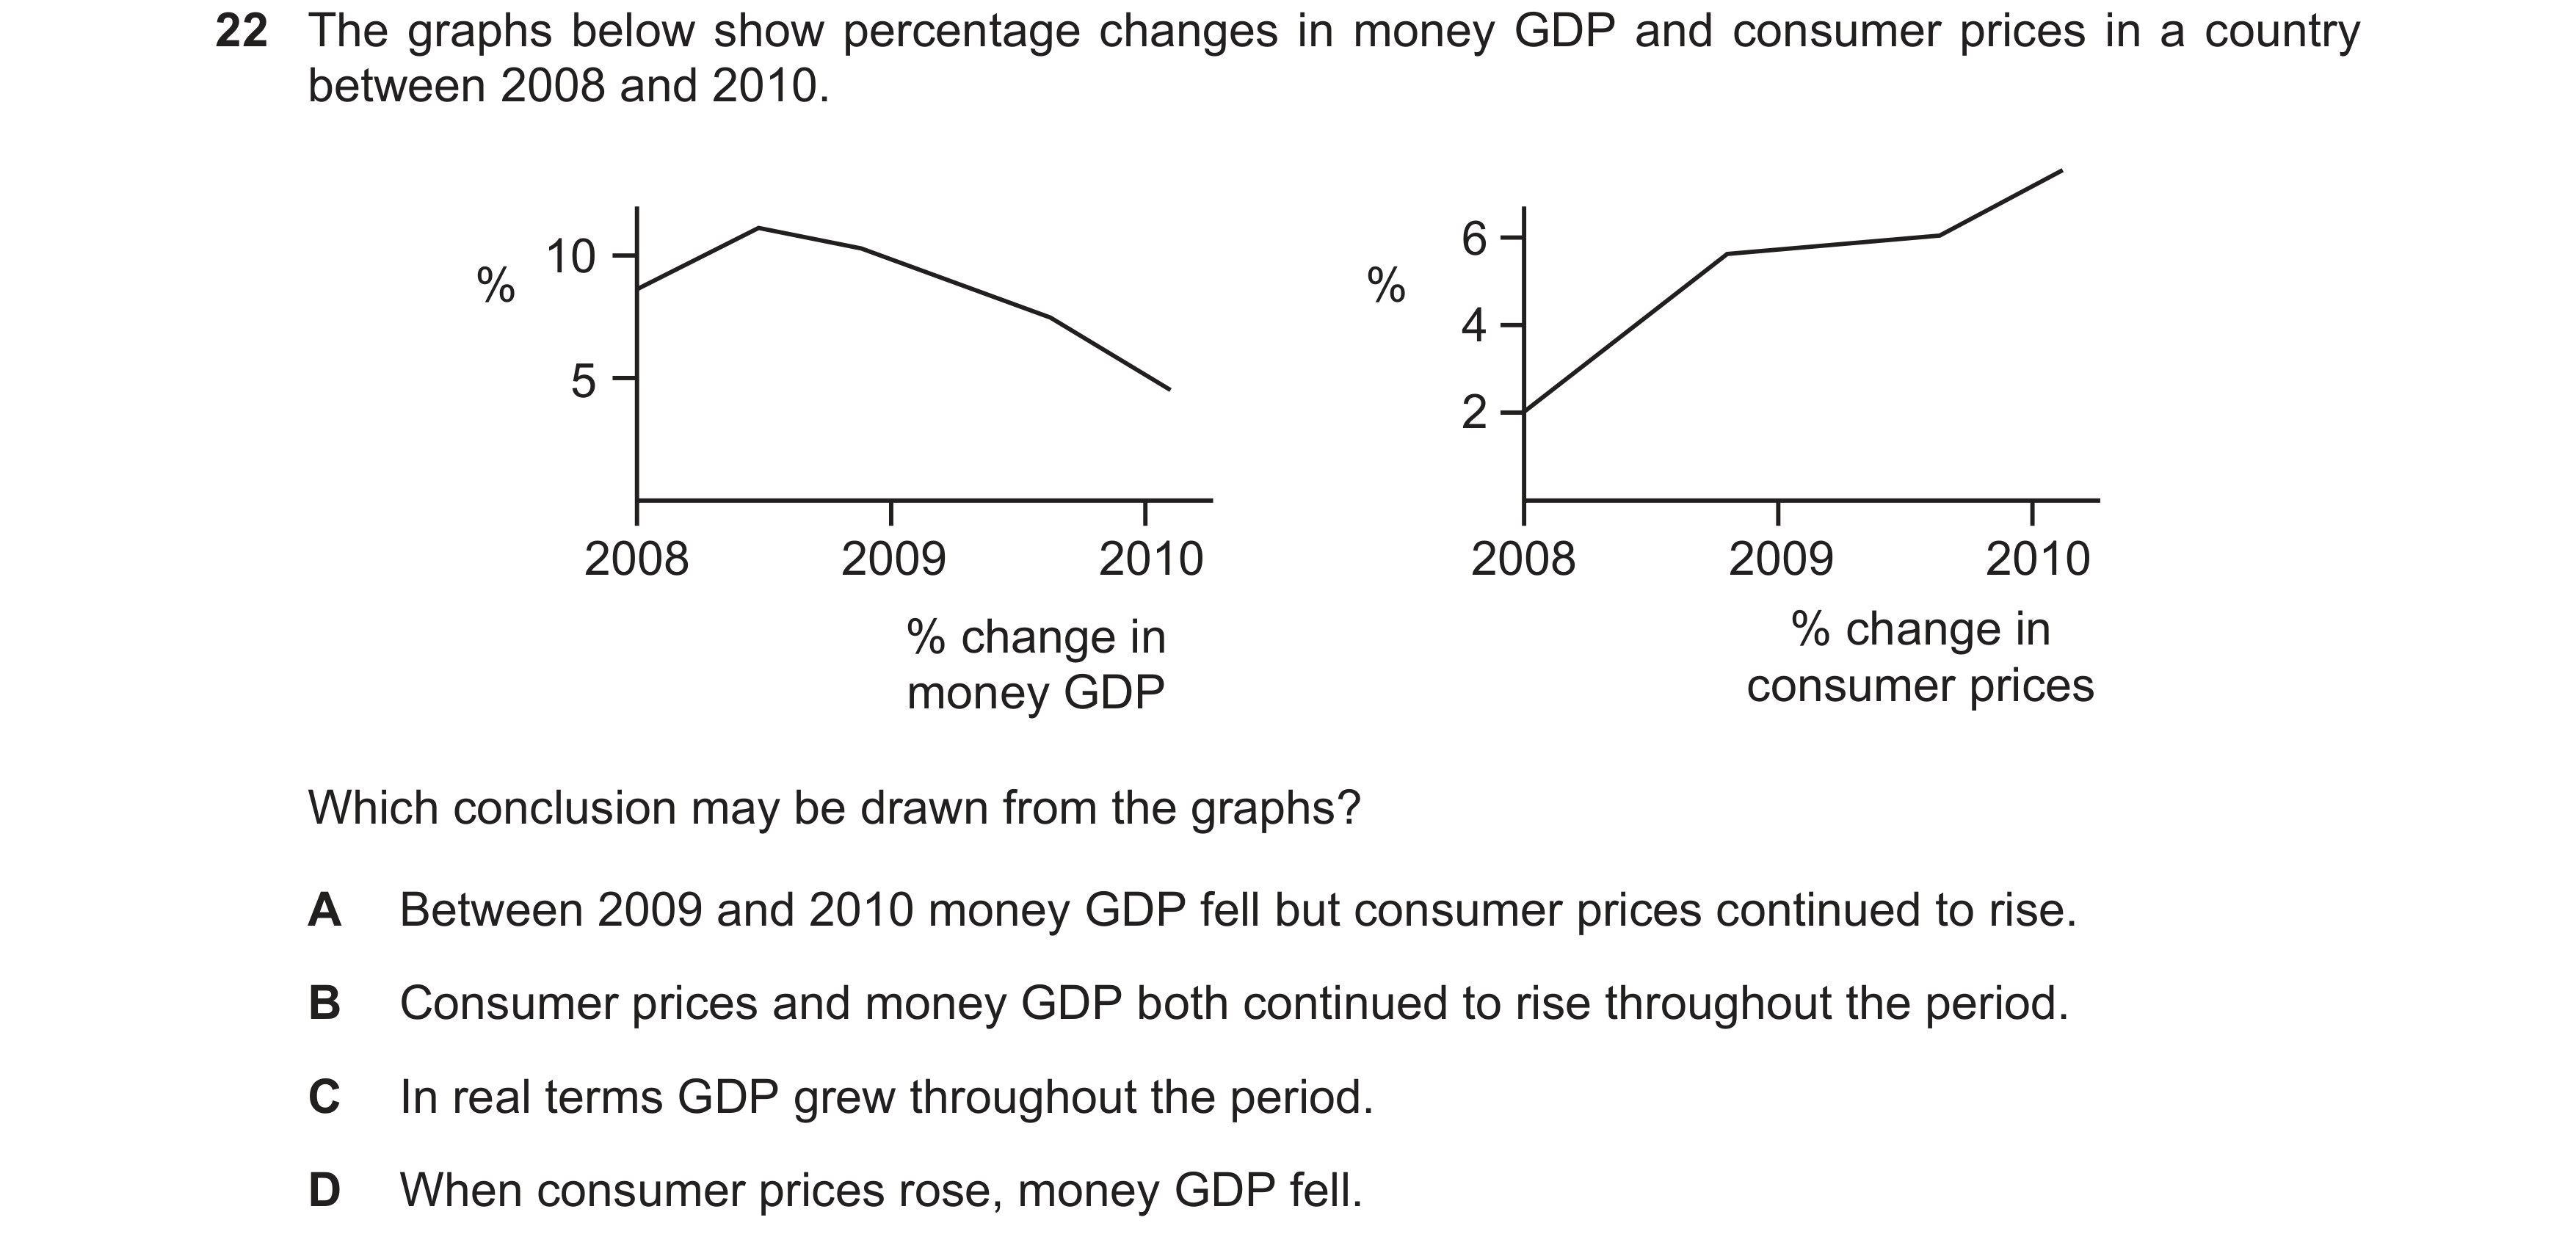
16 The graphs below show percentage changes in money GDP and consumer prices in a country between 2008 and 2010. 10 6 4 % % 5 2 2008 2009 2010 2008 2009 2010 % change in % change in money GDP consumer prices Which conclusion may be drawn from the graphs? A Between 2009 and 2010 money GDP fell but consumer prices continued to rise. B Consumer prices and money GDP both continued to rise throughout the period. C In real terms GDP grew throughout the period. D When consumer prices rose, money GDP fell.
1 marks
This question in 9708/33 Oct/Nov 2012
Q20 · Assuming a constant income velocity of circulation of money, if real output grows by 4 %… 9708/33 Oct/Nov 2012
21 Assuming a constant income velocity of circulation of money, if real output grows by 4 %, and the money supply grows by 3 %, what will be the approximate change in the price level? A –1 % B +1 % C +3 % D +7 %
1 marks
This question in 9708/33 Oct/Nov 2012
Q21 · The natural rate of unemployment in an economy is 5 % 9708/33 Oct/Nov 2012
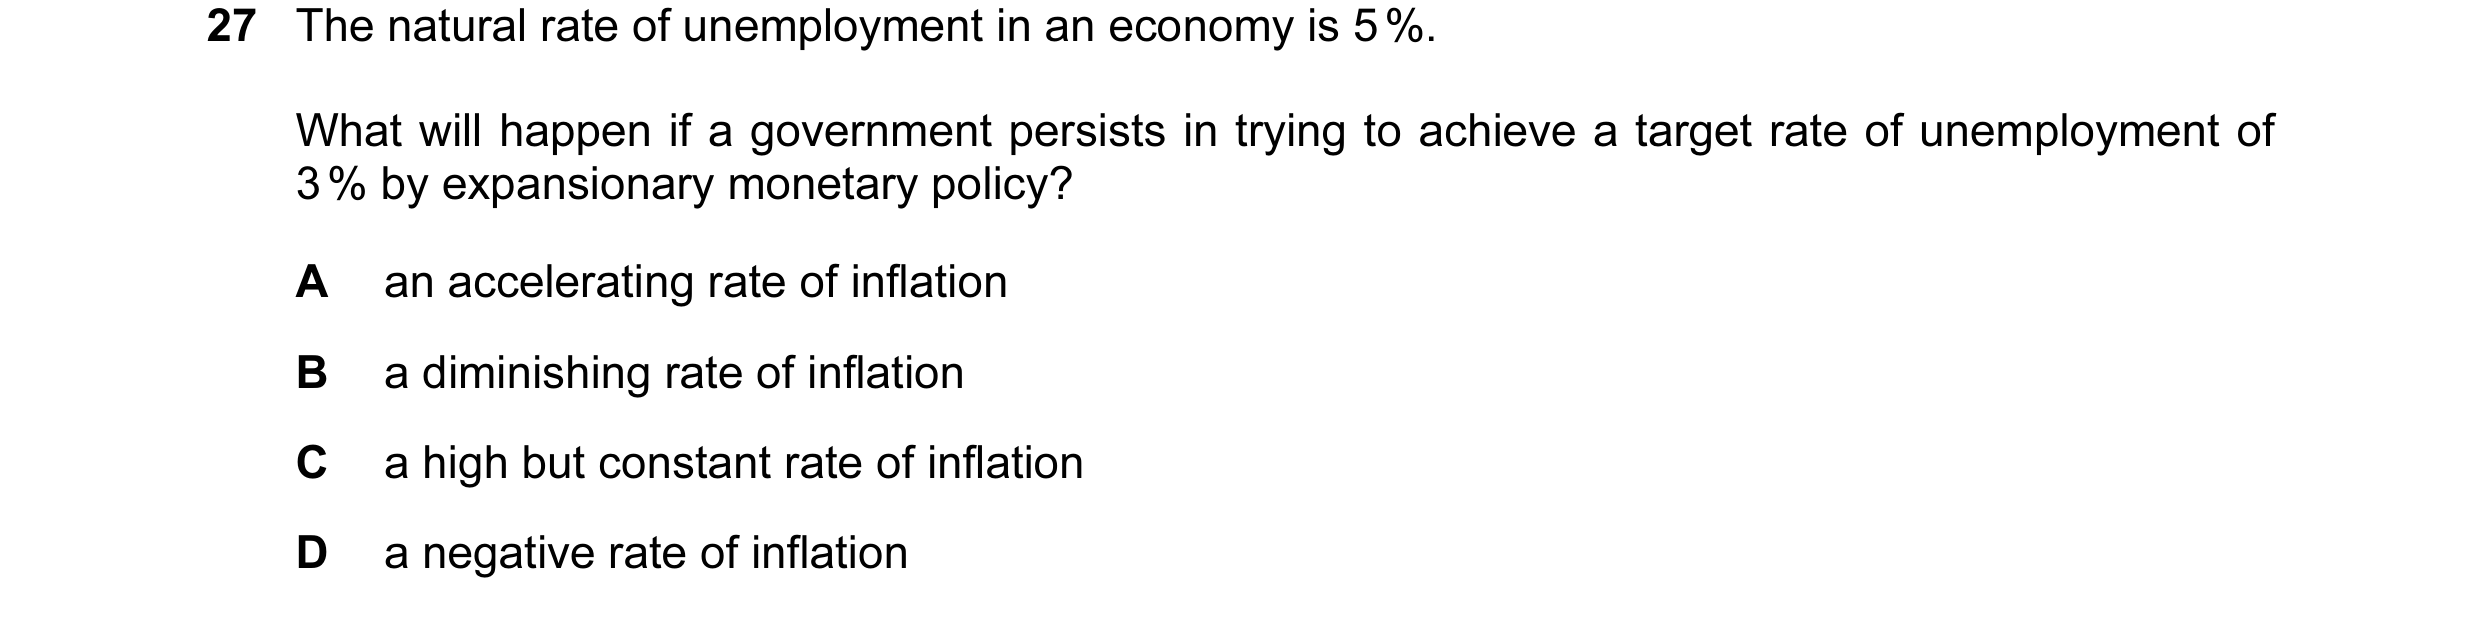
27 The natural rate of unemployment in an economy is 5 %. What will happen if a government persists in trying to achieve a target rate of unemployment of 3 % by expansionary monetary policy? A an accelerating rate of inflation B a diminishing rate of inflation C a high but constant rate of inflation D a negative rate of inflation
1 marks
This question in 9708/33 Oct/Nov 2012
Q22 · An economy has a low level of unemployment 9708/31 Oct/Nov 2013
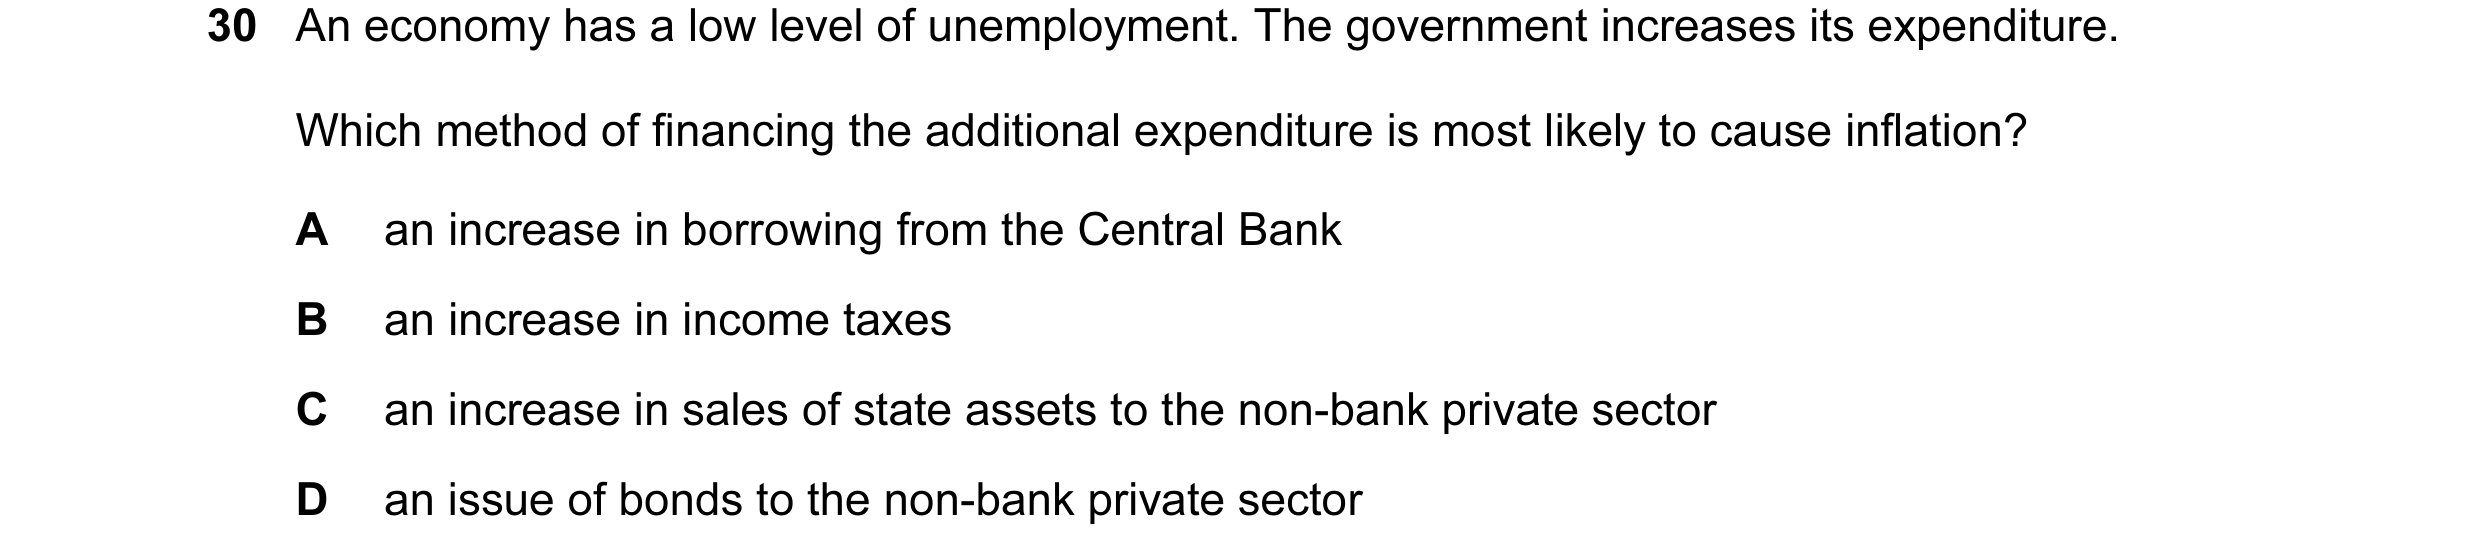
30 An economy has a low level of unemployment. The government increases its expenditure. Which method of financing the additional expenditure is most likely to cause inflation? A an increase in borrowing from the Central Bank B an increase in income taxes C an increase in sales of state assets to the non-bank private sector D an issue of bonds to the non-bank private sector
1 marks
Answer: A
This question in 9708/31 Oct/Nov 2013
Q23 · According to monetarist theory, what will be affected in the long run by a change in the… 9708/33 Oct/Nov 2013
17 According to monetarist theory, what will be affected in the long run by a change in the money supply? the level the price the level of of output level unemployment A no no yes B no yes no C yes no yes D yes yes no
1 marks
Answer: B
This question in 9708/33 Oct/Nov 2013
Q24 · A 6% increase in the money supply leads to a 4% increase in the level of money income 9708/33 Oct/Nov 2013
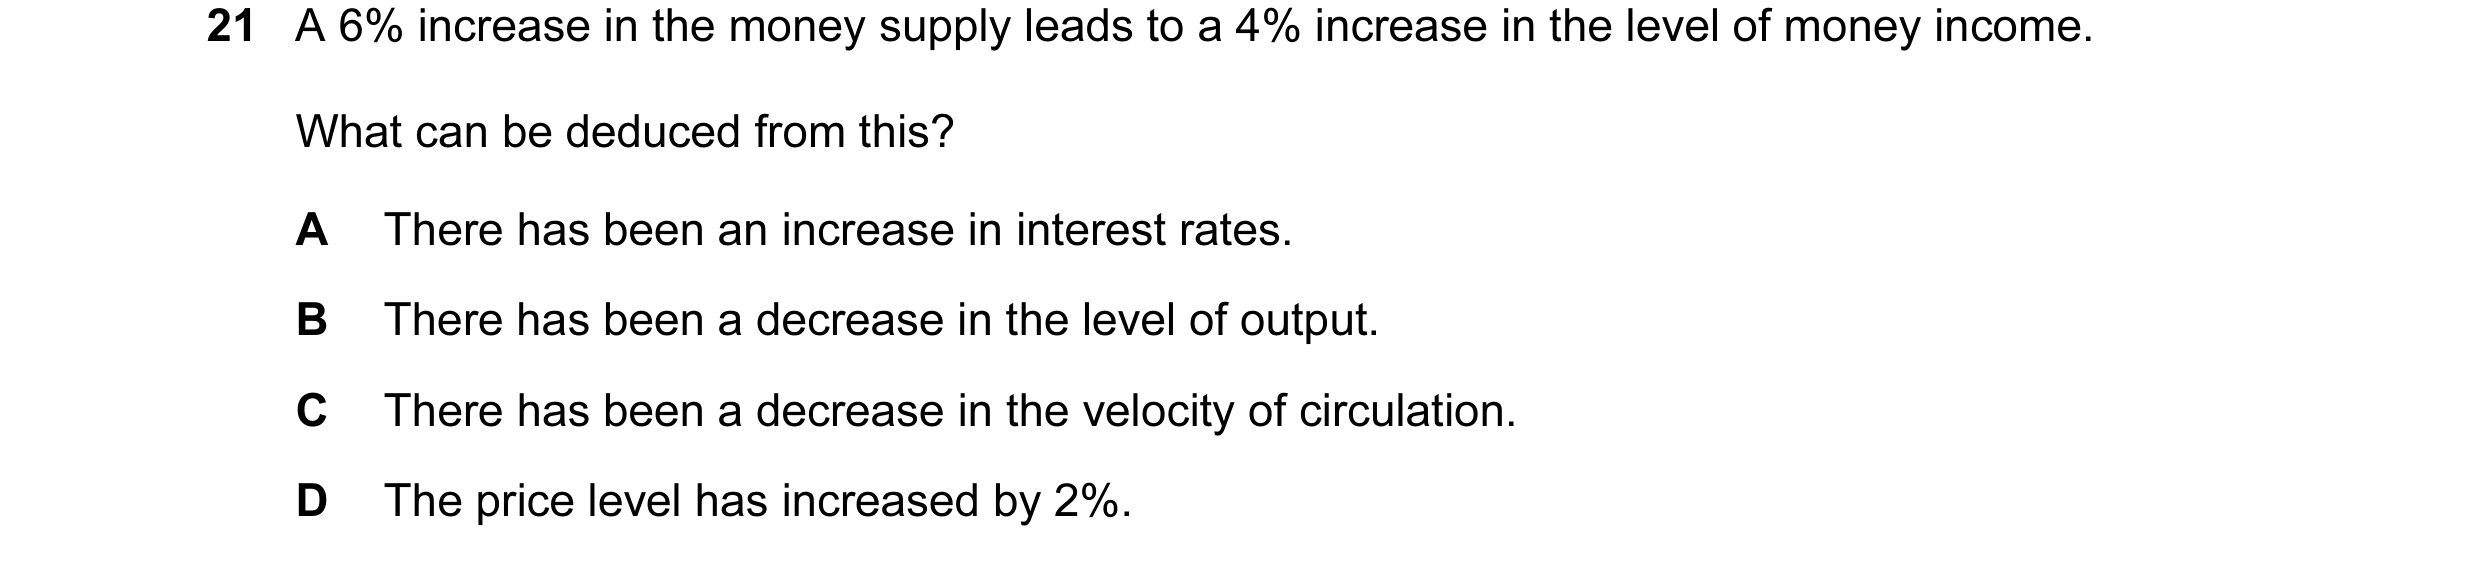
21 A 6% increase in the money supply leads to a 4% increase in the level of money income. What can be deduced from this? A There has been an increase in interest rates. B There has been a decrease in the level of output. C There has been a decrease in the velocity of circulation. D The price level has increased by 2%.
1 marks
Answer: C
This question in 9708/33 Oct/Nov 2013
Q25 · Assuming a constant income velocity of circulation of money, if the rate of inflation is… 9708/31 Oct/Nov 2014
22 Assuming a constant income velocity of circulation of money, if the rate of inflation is 10% and the rate of growth of the money supply is 7%, what will be the approximate change in the volume of national output? A –7% B –3% C +3% D +13%
1 marks
Answer: B
This question in 9708/31 Oct/Nov 2014
Q26 · The graph shows the annual percentage changes in the prices of new houses and existing… 9708/33 Oct/Nov 2014
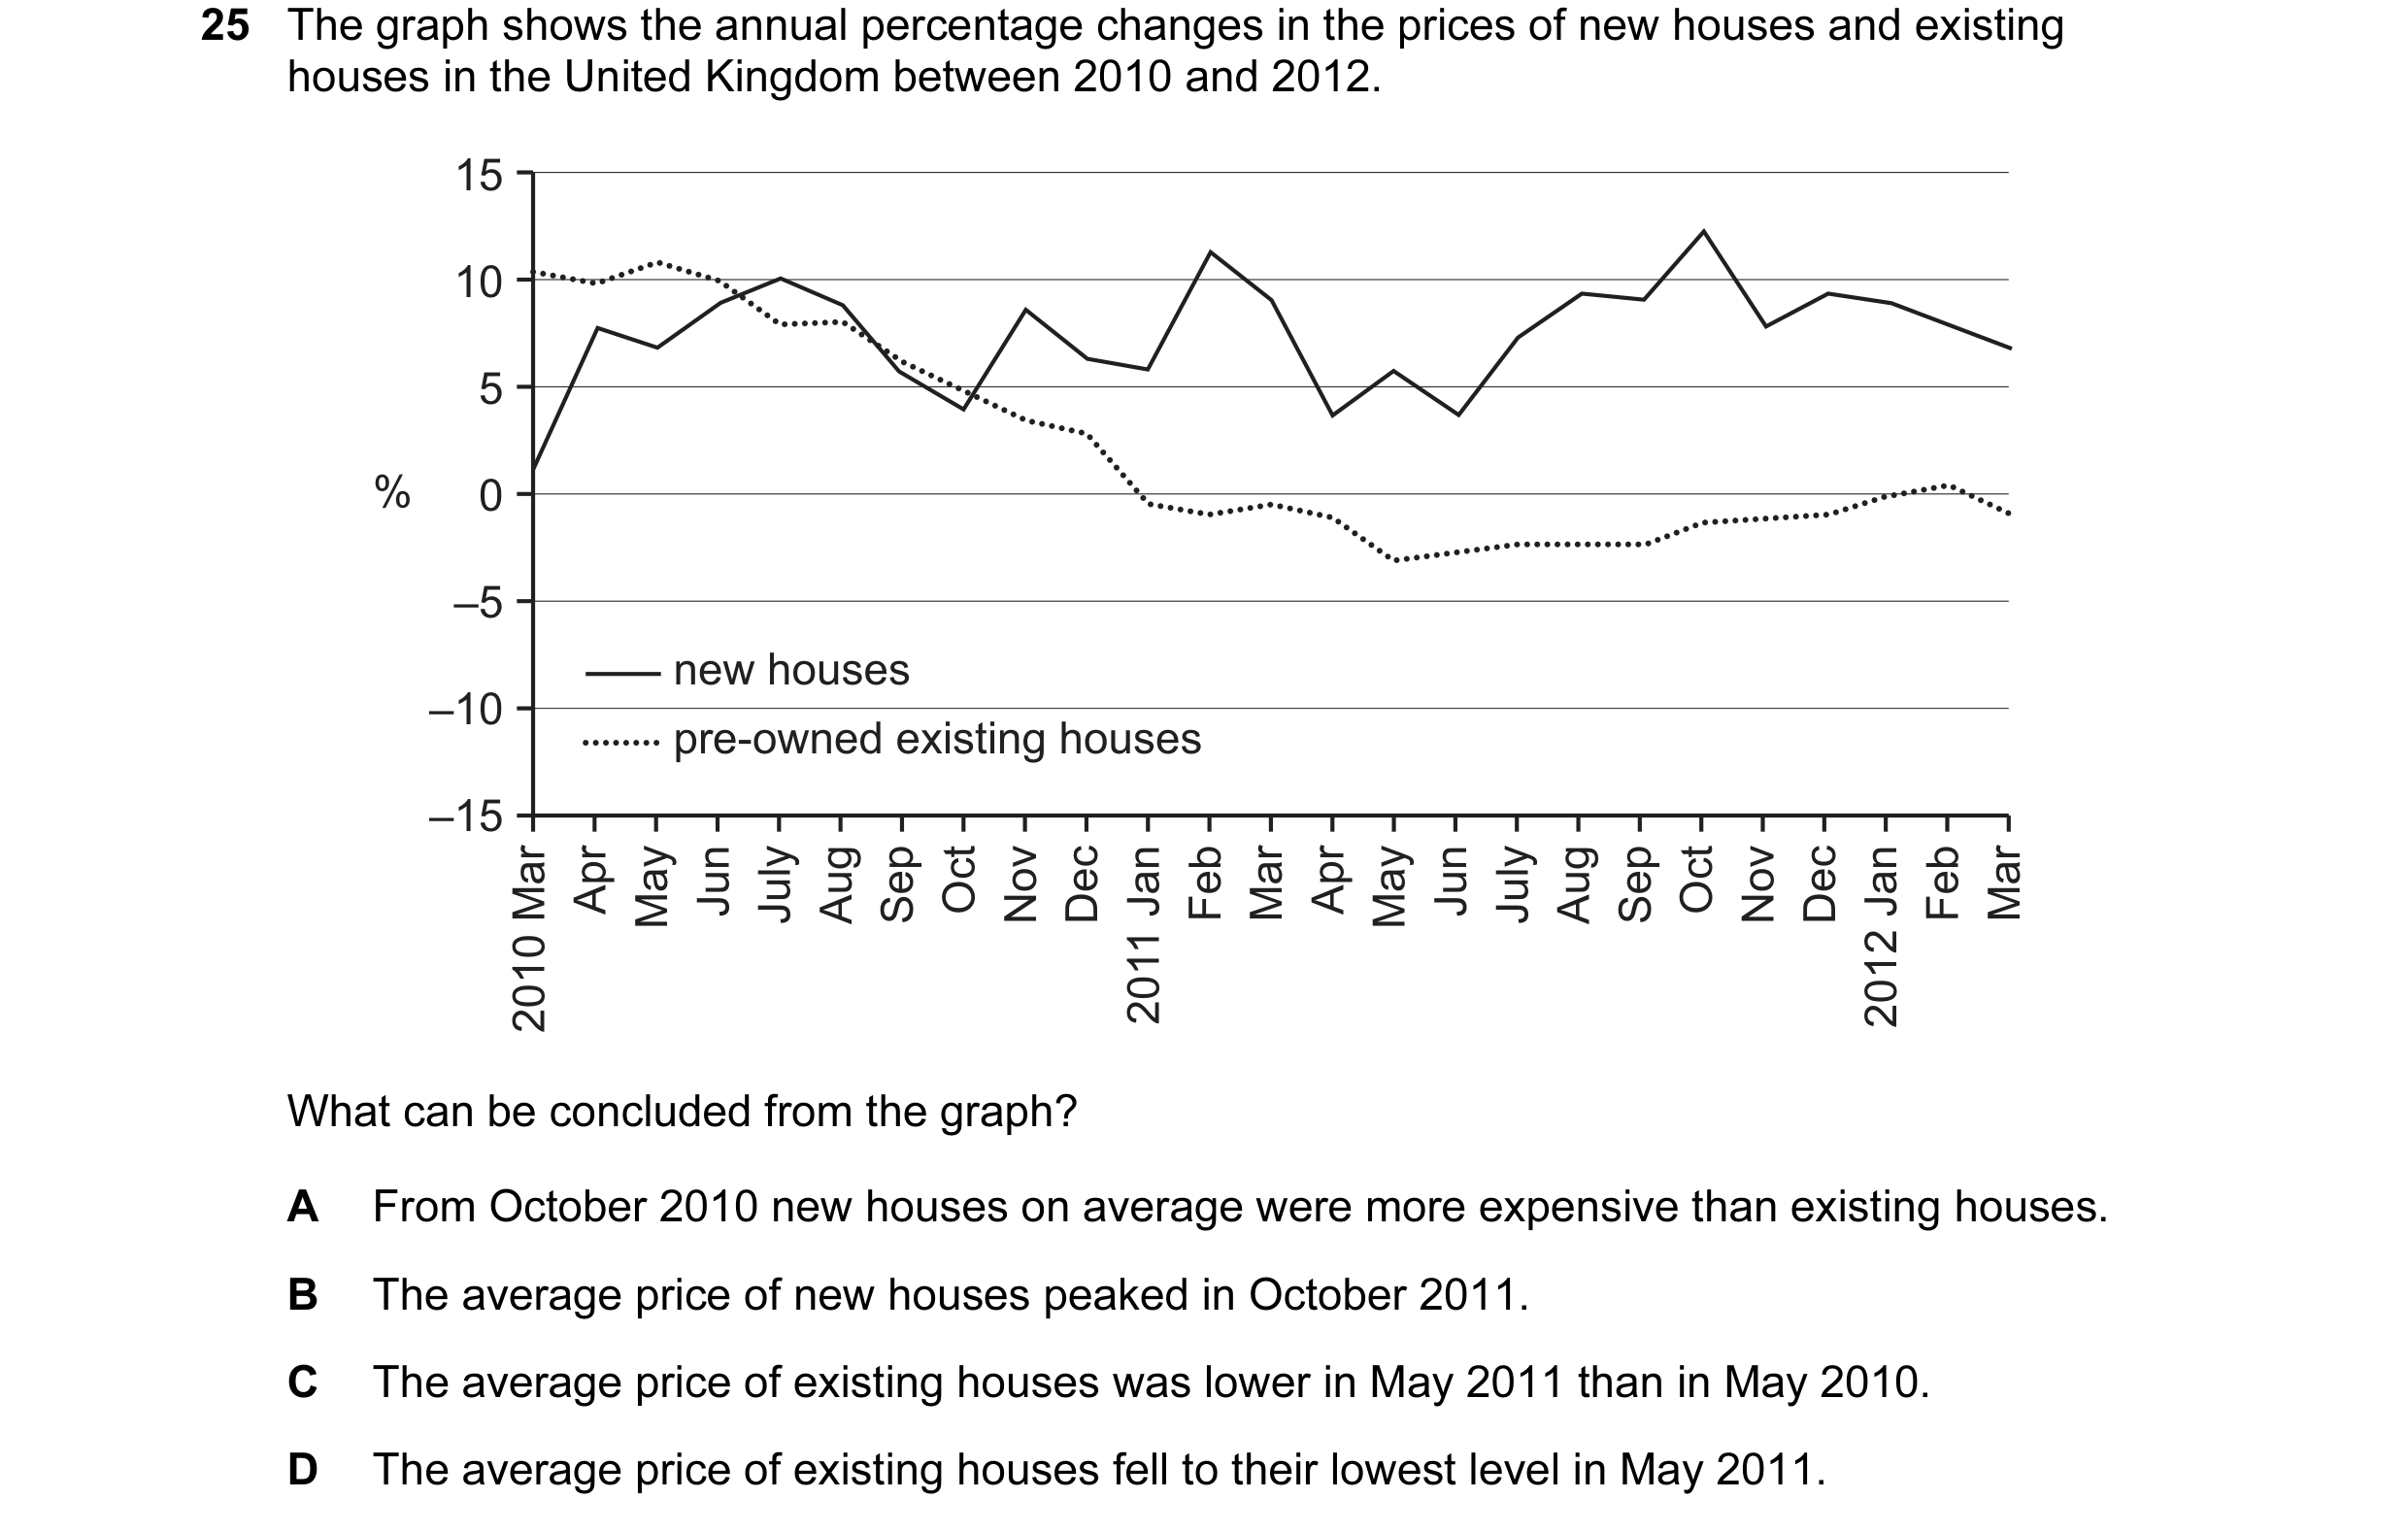
25 The graph shows the annual percentage changes in the prices of new houses and existing houses in the United Kingdom between 2010 and 2012. 15 10 5 % 0 –5 new houses –10 pre-owned existing houses –15 2010 Mar Apr May Jun July Aug Sep Oct Nov Dec 2011 Jan Feb Mar Apr May Jun July Aug Sep Oct Nov Dec 2012 Jan Feb Mar What can be concluded from the graph? A From October 2010 new houses on average were more expensive than existing houses. B The average price of new houses peaked in October 2011. C The average price of existing houses was lower in May 2011 than in May 2010. D The average price of existing houses fell to their lowest level in May 2011.
1 marks
Answer: C
This question in 9708/33 Oct/Nov 2014
Q27 · Over one year the money income in an economy increased by 6% 9708/32 Oct/Nov 2015
20 Over one year the money income in an economy increased by 6%. In the same period prices rose by 4%. What can be concluded from this? A Real incomes decreased by 2%. B The velocity of circulation decreased by 2%. C The money supply increased by 10%. D The volume of output increased by 2%.
1 marks
Answer: D
This question in 9708/32 Oct/Nov 2015
Q28 · The graphs below show percentage changes in money GDP and consumer prices in a country… 9708/32 May/June 2017
22 The graphs below show percentage changes in money GDP and consumer prices in a country between 2008 and 2010. 6 10 % % 4 5 2 2008 2009 2010 2008 2009 2010 % change in % change in money GDP consumer prices Which conclusion may be drawn from the graphs? A Between 2009 and 2010 money GDP fell but consumer prices continued to rise. B Consumer prices and money GDP both continued to rise throughout the period. C In real terms GDP grew throughout the period. D When consumer prices rose, money GDP fell.
1 marks
Answer: B
This question in 9708/32 May/June 2017
Q29 · The graphs indicate economic performance in a country between 2011 and 2014 9708/33 May/June 2017
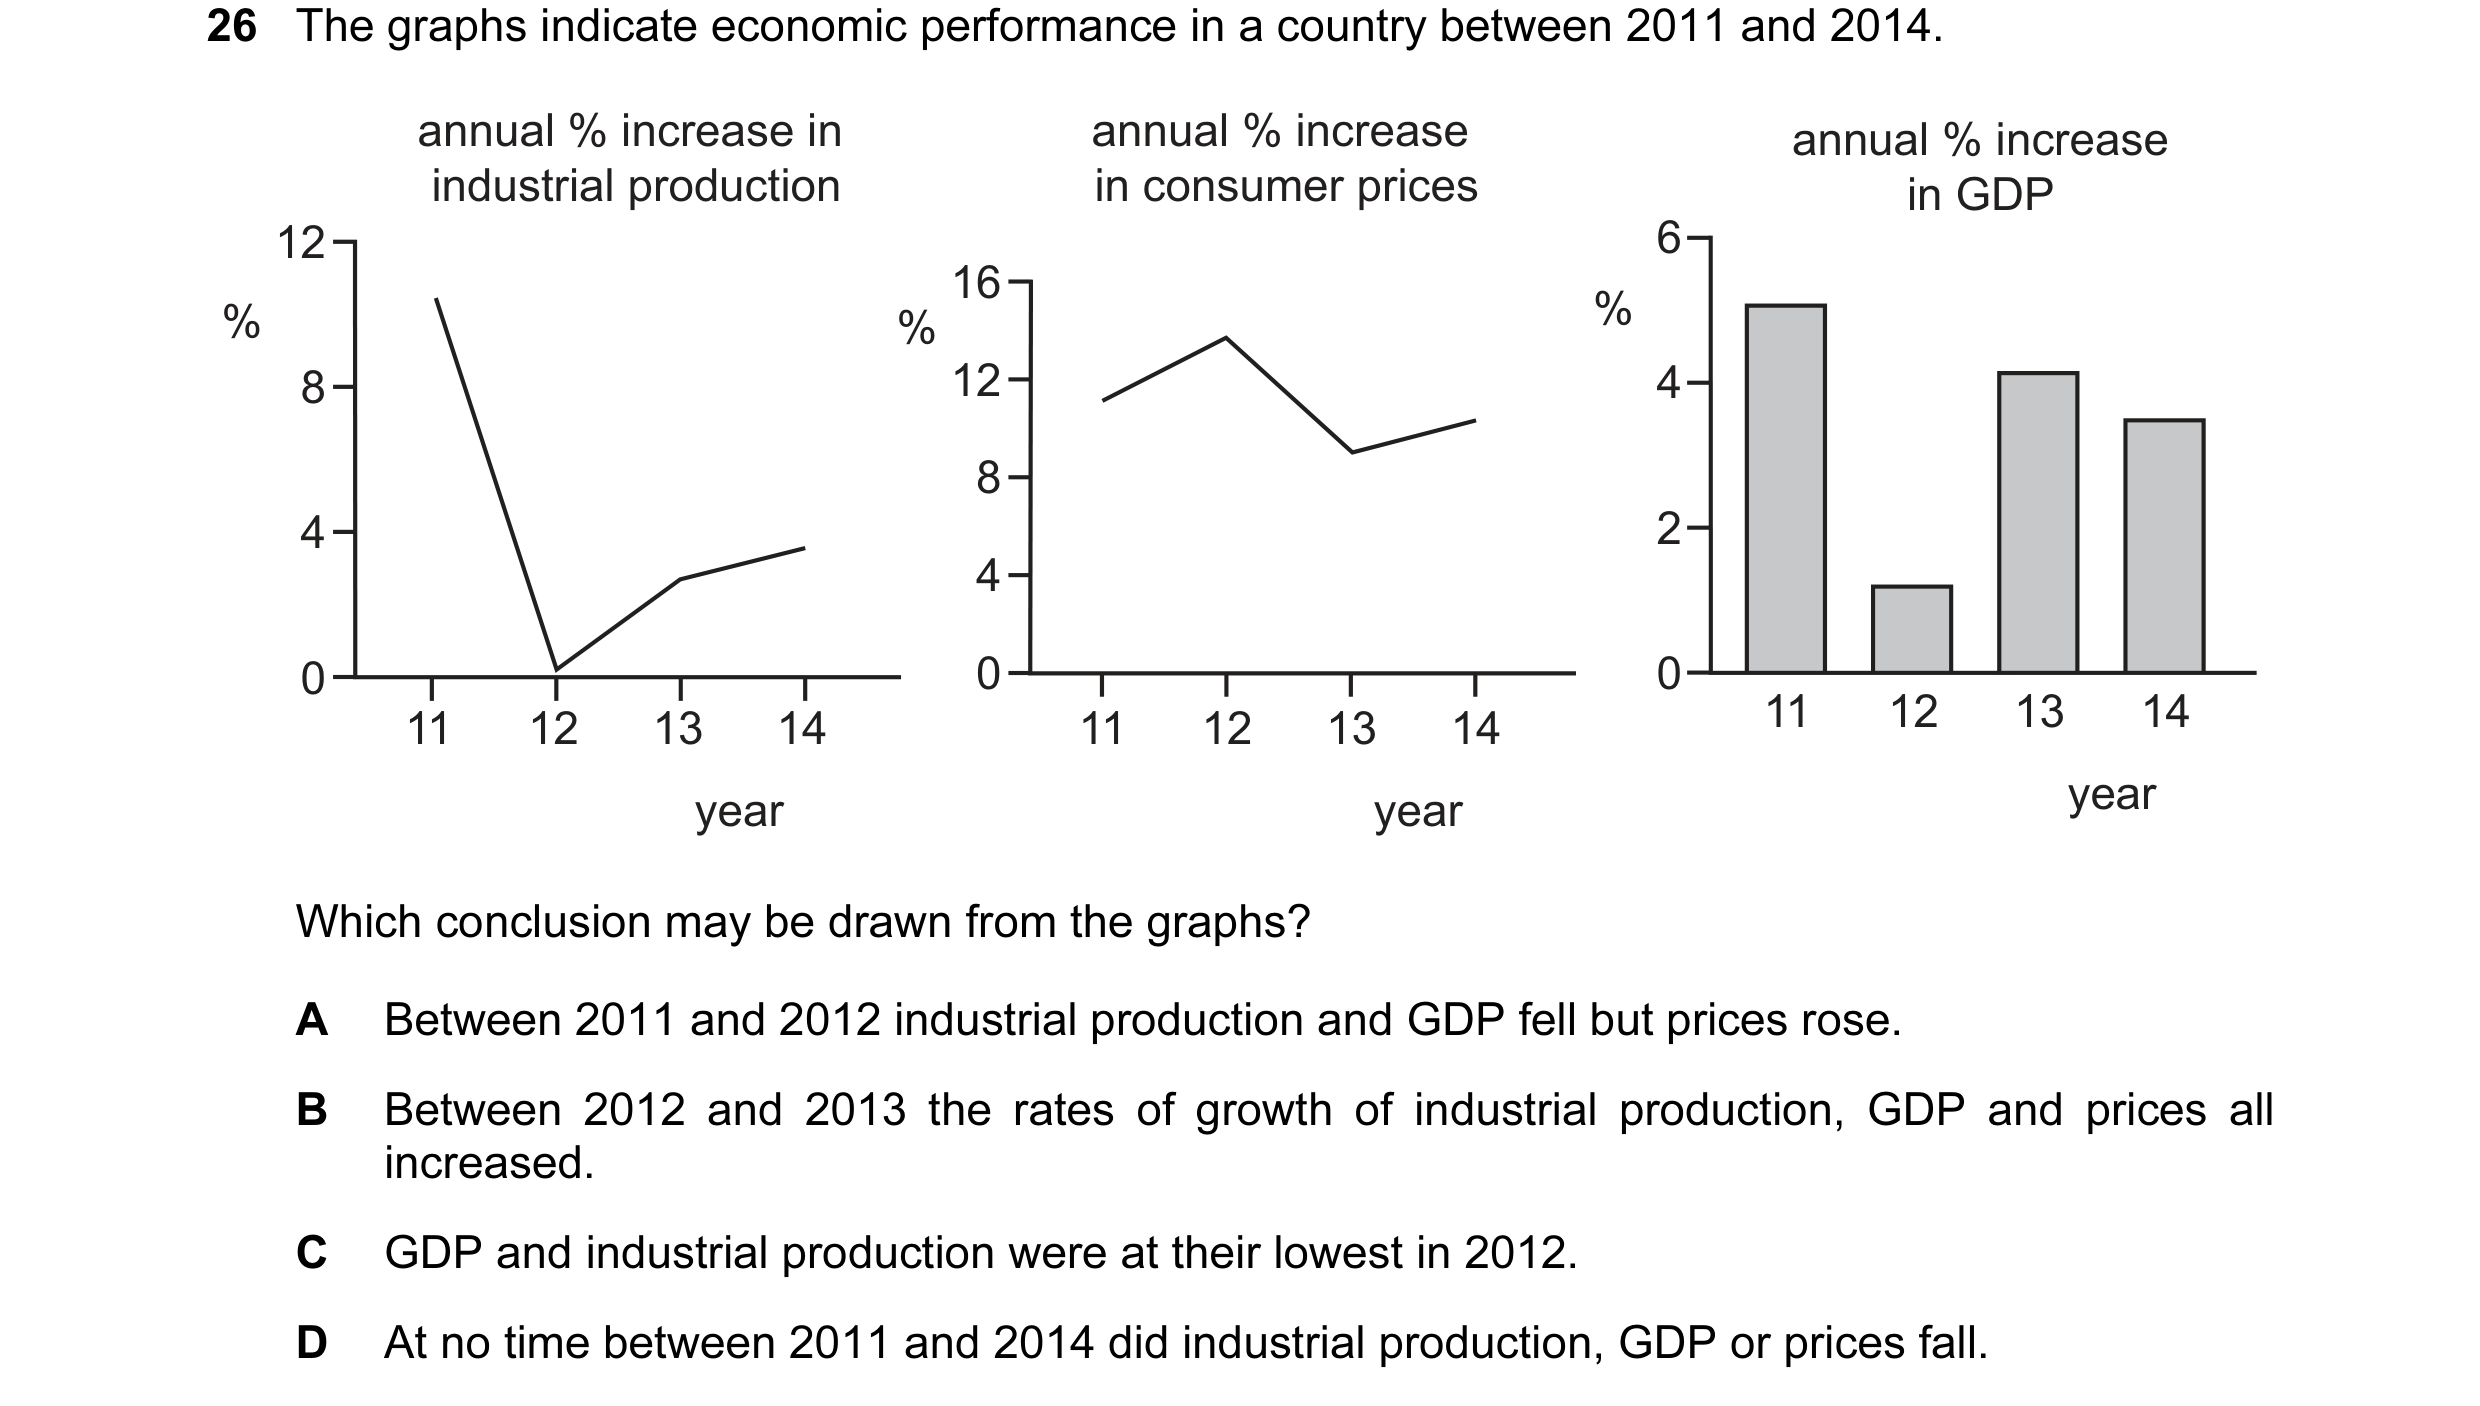
26 The graphs indicate economic performance in a country between 2011 and 2014. annual % increase in annual % increase annual % increase industrial production in consumer prices in GDP 12 6 16 % % % 8 12 4 8 4 2 4 0 0 0 11 12 13 14 11 12 13 14 11 12 13 14 year year year Which conclusion may be drawn from the graphs? A Between 2011 and 2012 industrial production and GDP fell but prices rose. B Between 2012 and 2013 the rates of growth of industrial production, GDP and prices all increased. C GDP and industrial production were at their lowest in 2012. D At no time between 2011 and 2014 did industrial production, GDP or prices fall.
1 marks
Answer: D
This question in 9708/33 May/June 2017
Q30 · What will result in the short run from rising unemployment in an economy? 9708/33 May/June 2017
27 What will result in the short run from rising unemployment in an economy? A The government’s budget deficit will fall. B Any existing inflationary pressure will be reduced. C Potential output will fall. D The economy’s production possibility curve will move inwards.
1 marks
Answer: B
This question in 9708/33 May/June 2017
Q31 · The diagram shows an economy in equilibrium at point X 9708/32 Oct/Nov 2018
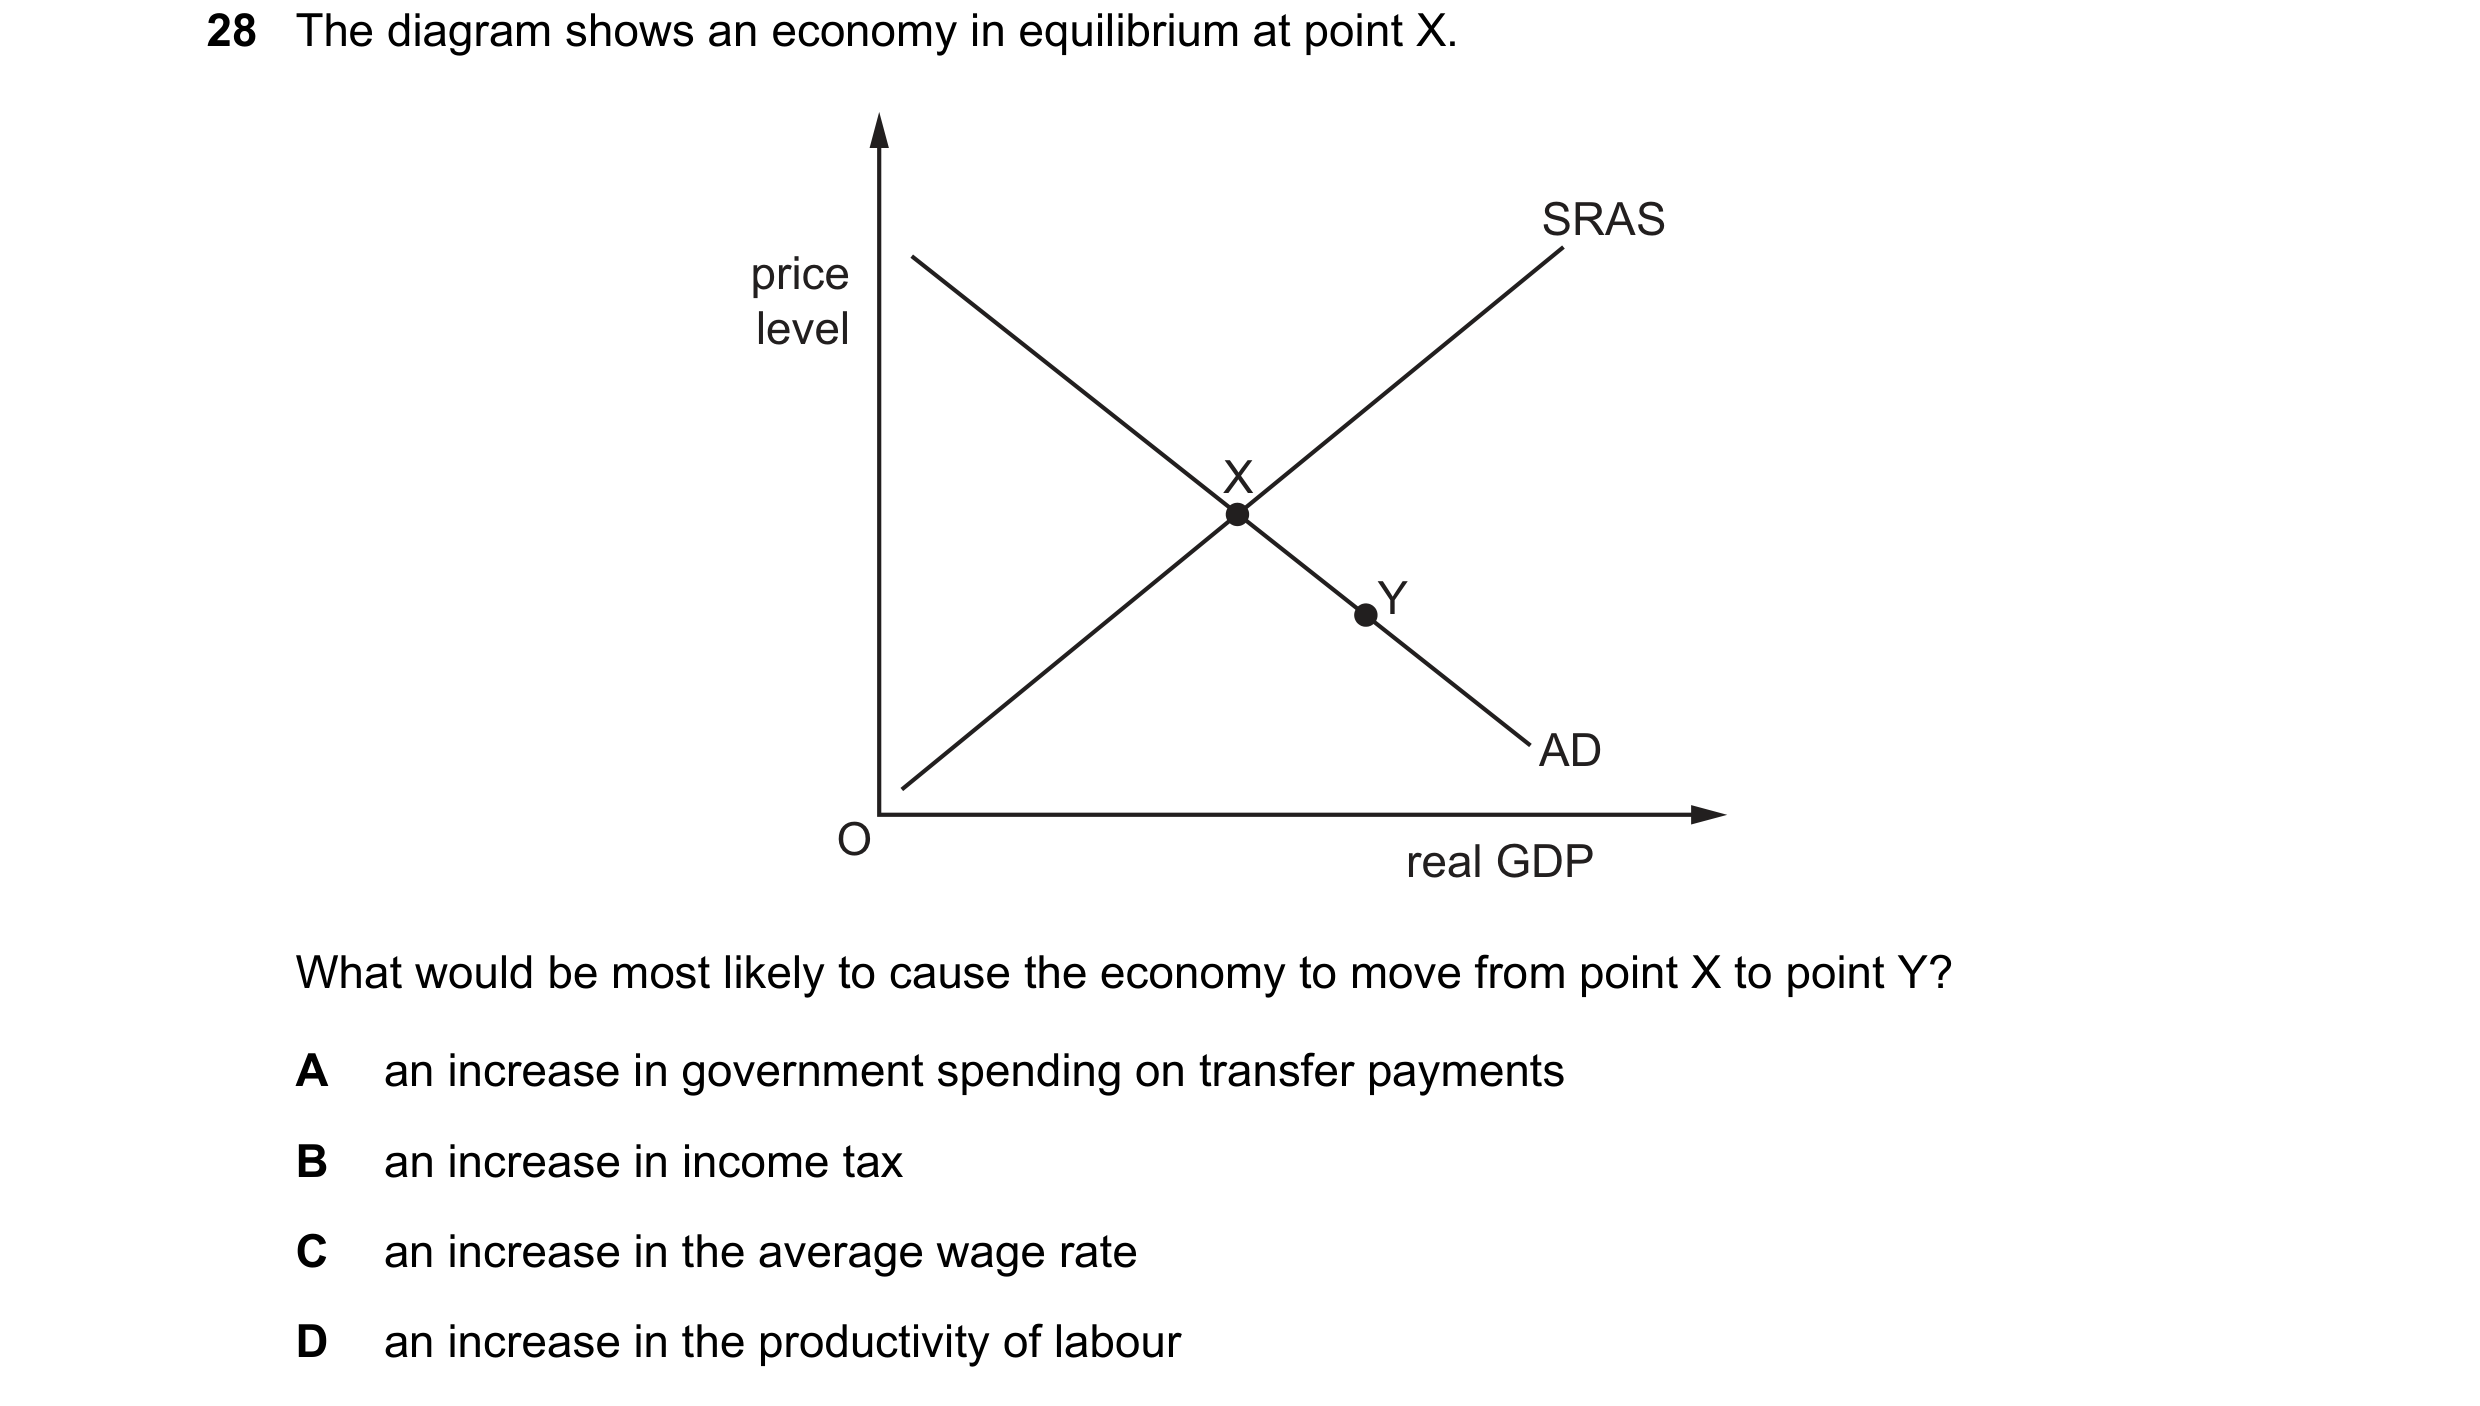
28 The diagram shows an economy in equilibrium at point X. SRAS price level X Y AD O real GDP What would be most likely to cause the economy to move from point X to point Y? A an increase in government spending on transfer payments B an increase in income tax C an increase in the average wage rate D an increase in the productivity of labour
1 marks
Answer: D
This question in 9708/32 Oct/Nov 2018
Q32 · What is most likely to increase in the short run following a rise in an economy’s rate of… 9708/32 May/June 2019
29 What is most likely to increase in the short run following a rise in an economy’s rate of inflation caused by a demand-side shock? A the current account deficit on the balance of payments B the price of government bonds C the purchasing power of the currency D the rate of unemployment
1 marks
Answer: A
This question in 9708/32 May/June 2019
Q33 · What is measured on the vertical axis of the Phillips curve? 9708/32 Oct/Nov 2019
29 What is measured on the vertical axis of the Phillips curve? A the rate of change of real wages B the rate of change of take-home pay C the rate of inflation D the rate of interest
1 marks
Answer: C
This question in 9708/32 Oct/Nov 2019
Q34 · Which macroeconomic policy is most likely to be used as a long-run means of reducing… 9708/32 Feb/March 2020
29 Which macroeconomic policy is most likely to be used as a long-run means of reducing inflationary pressures? A exchange rate policy B fiscal policy C monetary policy D supply-side policy
1 marks
Answer: D
This question in 9708/32 Feb/March 2020
Q35 · The graphs below show percentage changes in money GDP and consumer prices in a country… 9708/32 Oct/Nov 2020
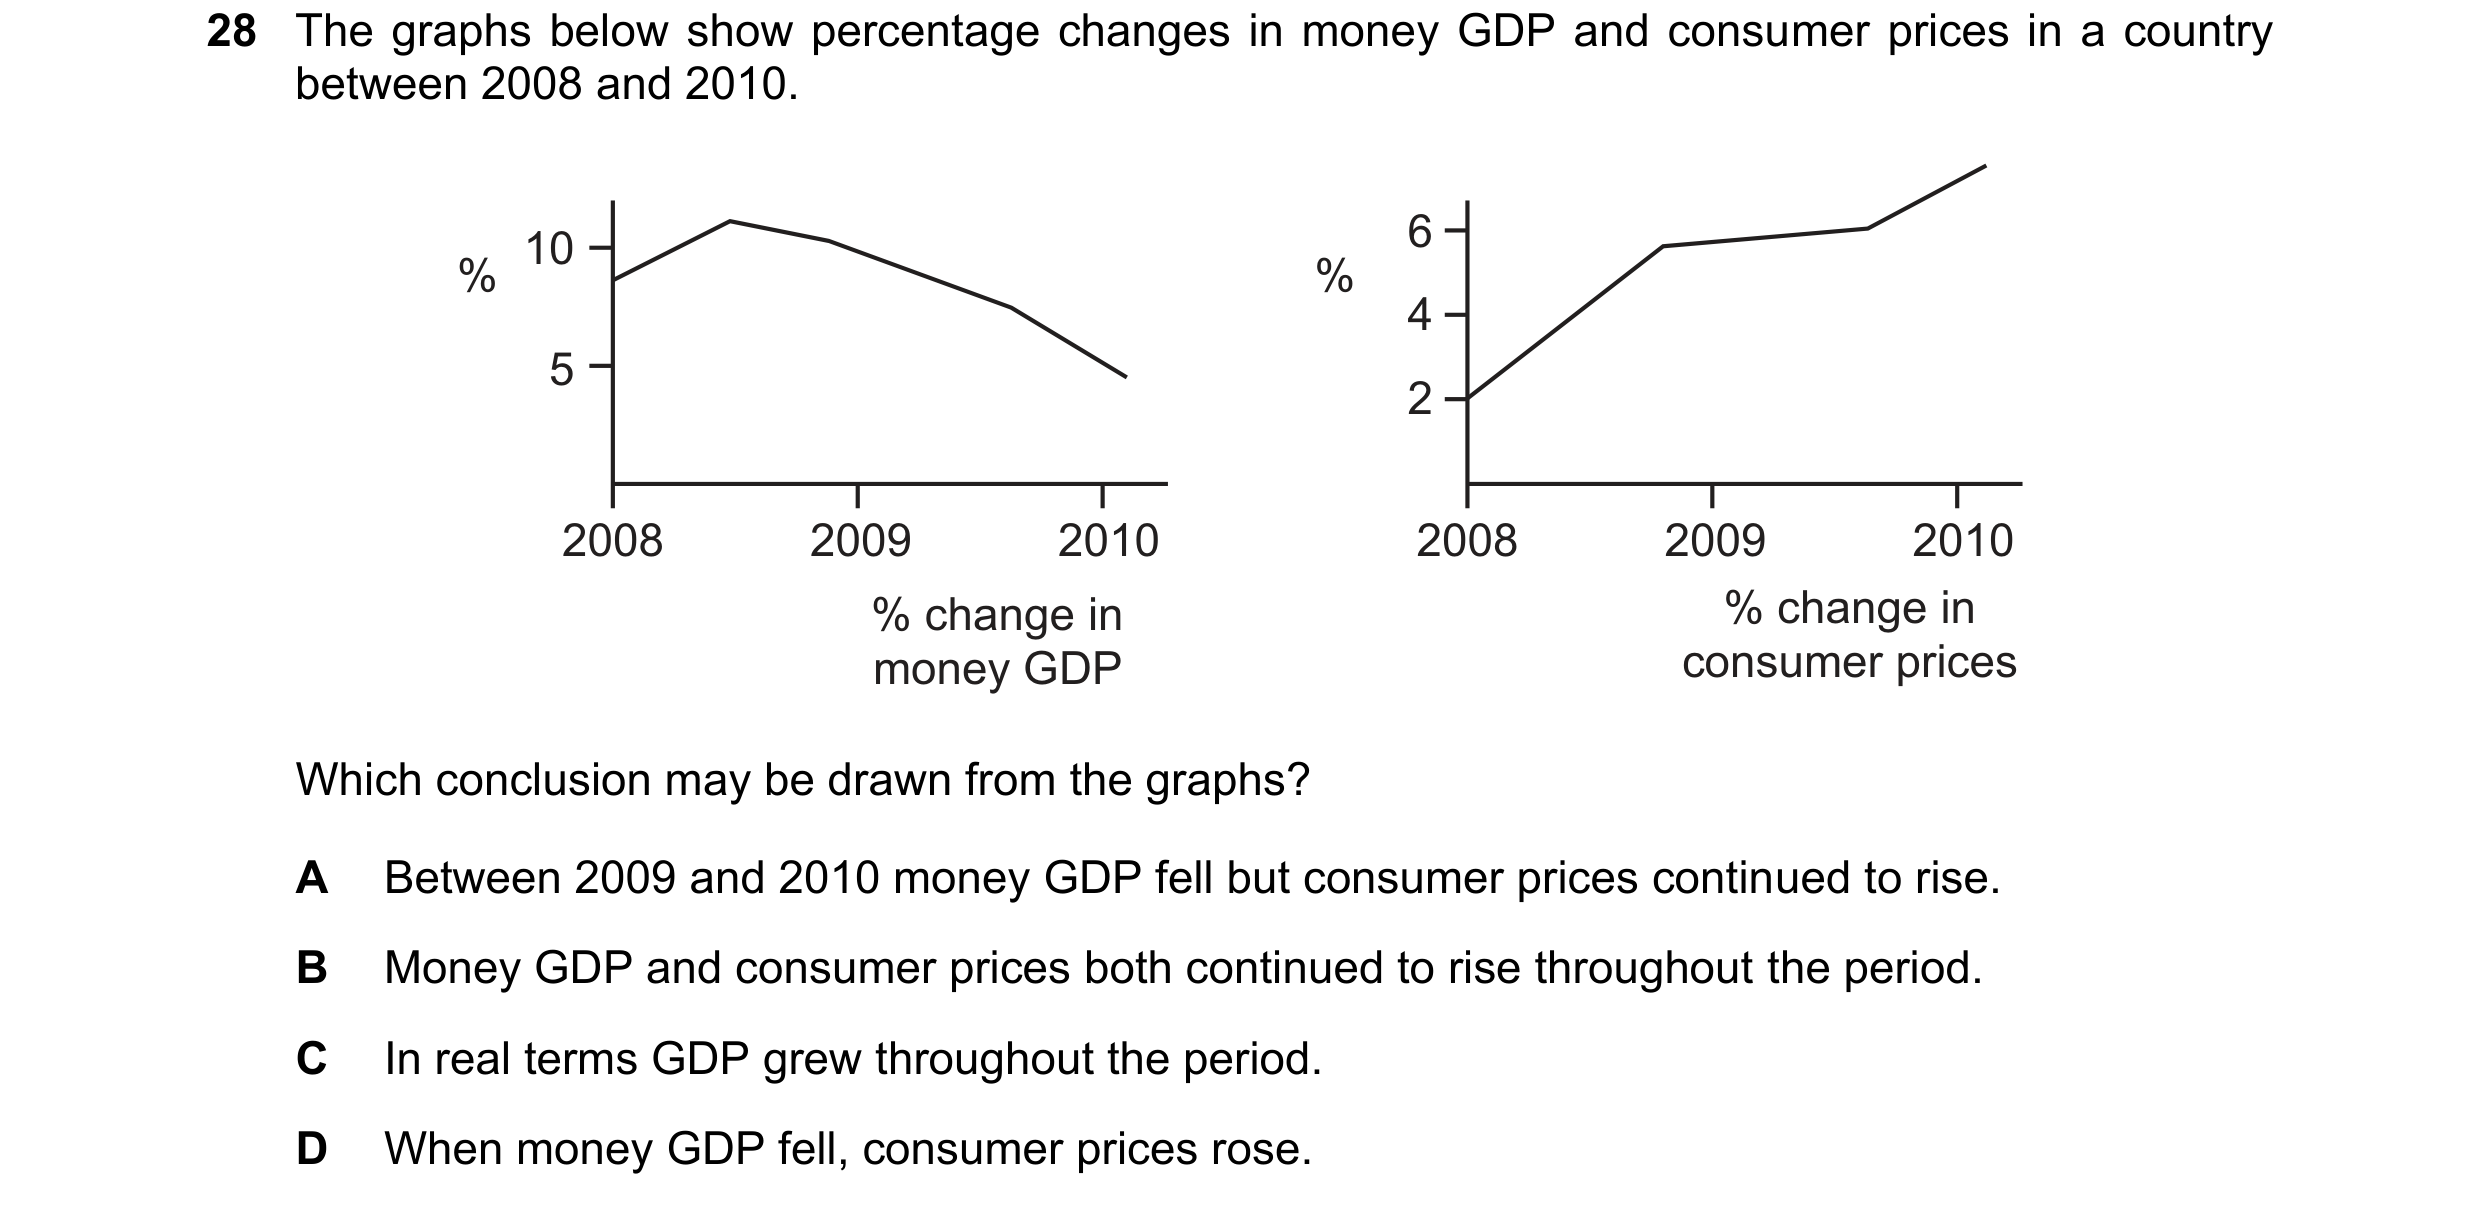
28 The graphs below show percentage changes in money GDP and consumer prices in a country between 2008 and 2010. 10 6 % % 4 5 2 2008 2009 2010 2008 2009 2010 % change in % change in money GDP consumer prices Which conclusion may be drawn from the graphs? A Between 2009 and 2010 money GDP fell but consumer prices continued to rise. B Money GDP and consumer prices both continued to rise throughout the period. C In real terms GDP grew throughout the period. D When money GDP fell, consumer prices rose.
1 marks
Answer: B
This question in 9708/32 Oct/Nov 2020
Q36 · Which statement does not correctly characterise the Monetarist view of the way in which… 9708/31 Oct/Nov 2022
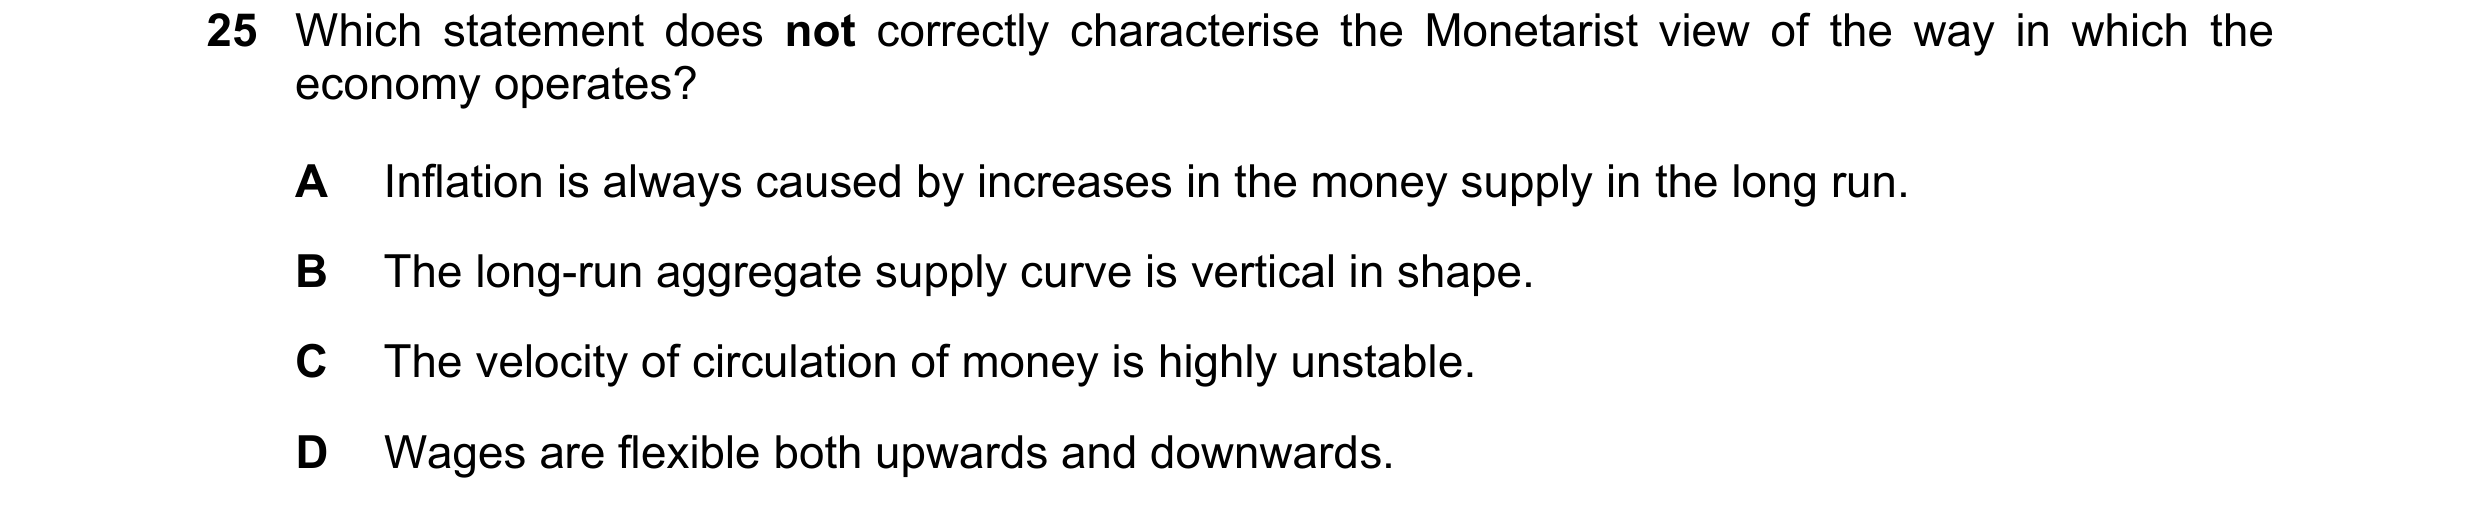
25 Which statement does not correctly characterise the Monetarist view of the way in which the economy operates? A Inflation is always caused by increases in the money supply in the long run. B The long-run aggregate supply curve is vertical in shape. C The velocity of circulation of money is highly unstable. D Wages are flexible both upwards and downwards.
1 marks
Answer: C
This question in 9708/31 Oct/Nov 2022
Q37 · An economy is experiencing a negative output gap 9708/32 Oct/Nov 2022
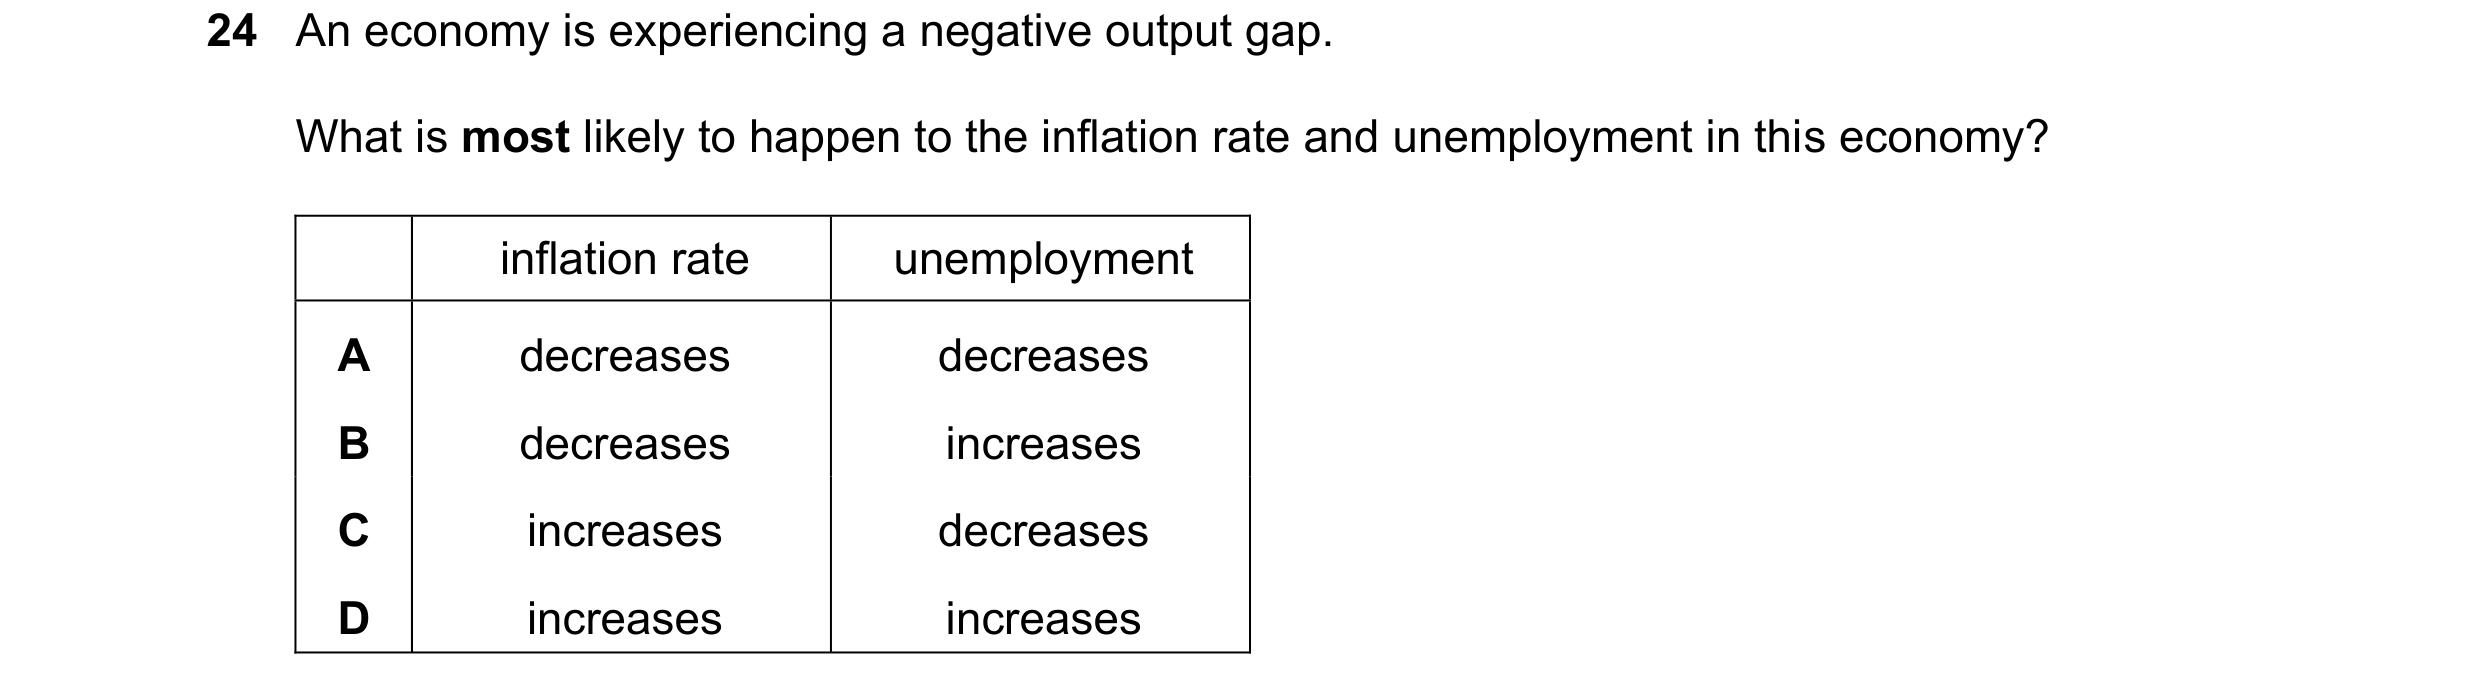
24 An economy is experiencing a negative output gap. What is most likely to happen to the inflation rate and unemployment in this economy? inflation rate unemployment A decreases decreases B decreases increases C increases decreases D increases increases
1 marks
Answer: B
This question in 9708/32 Oct/Nov 2022


 1 / 9
1 / 9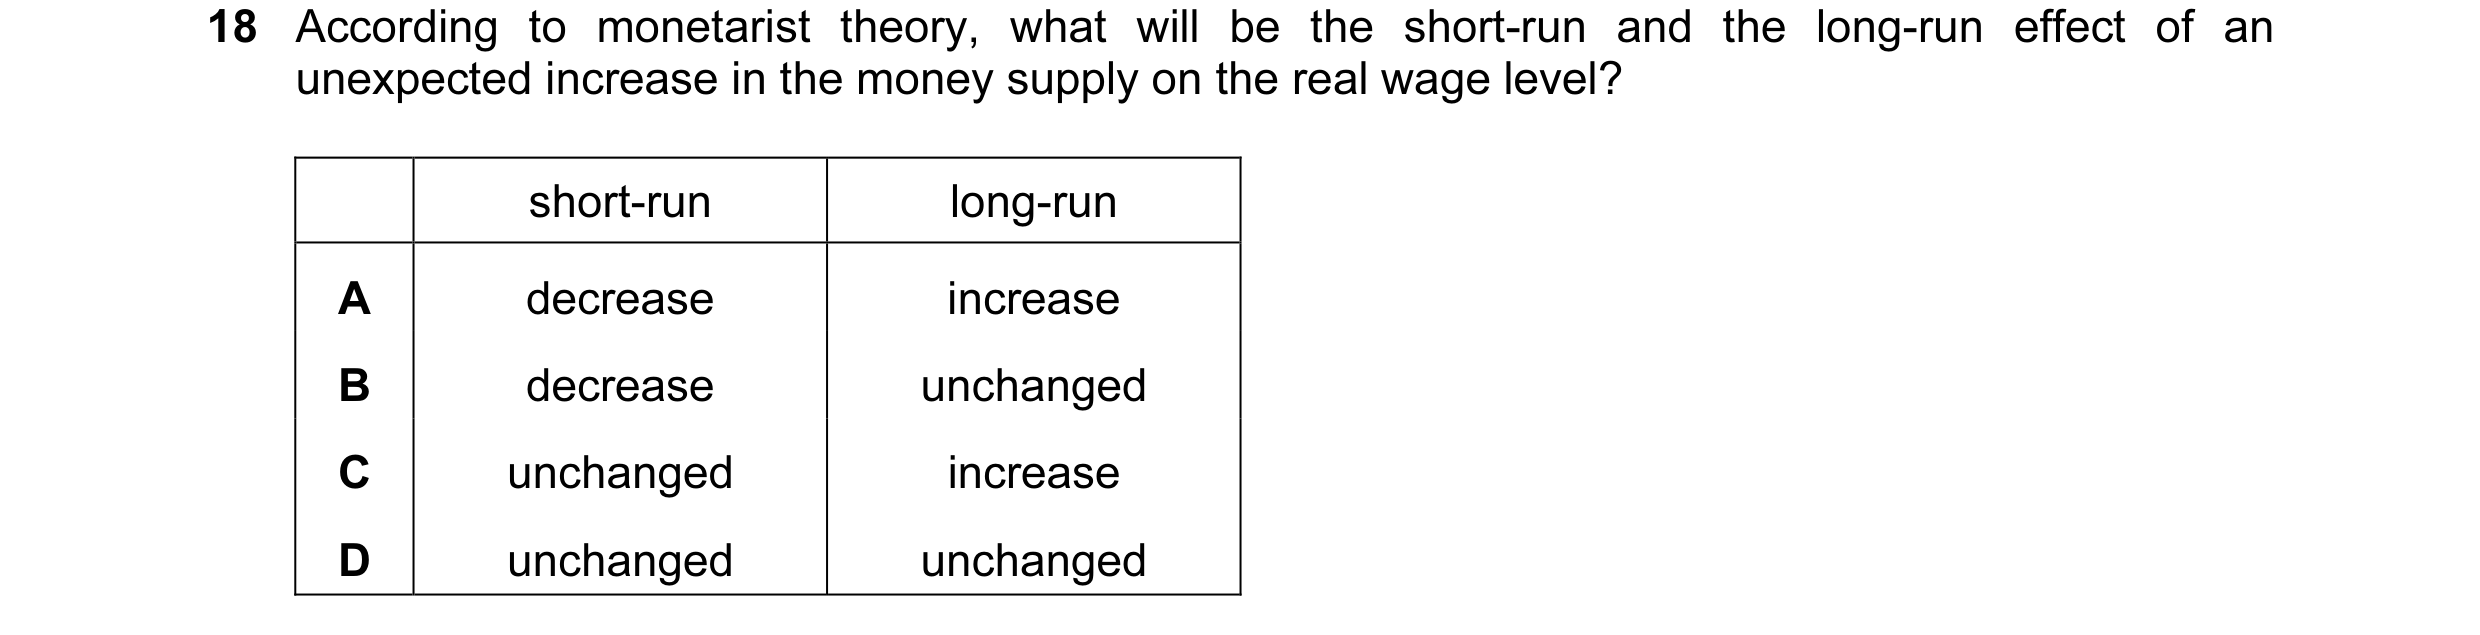



 2 / 9
2 / 9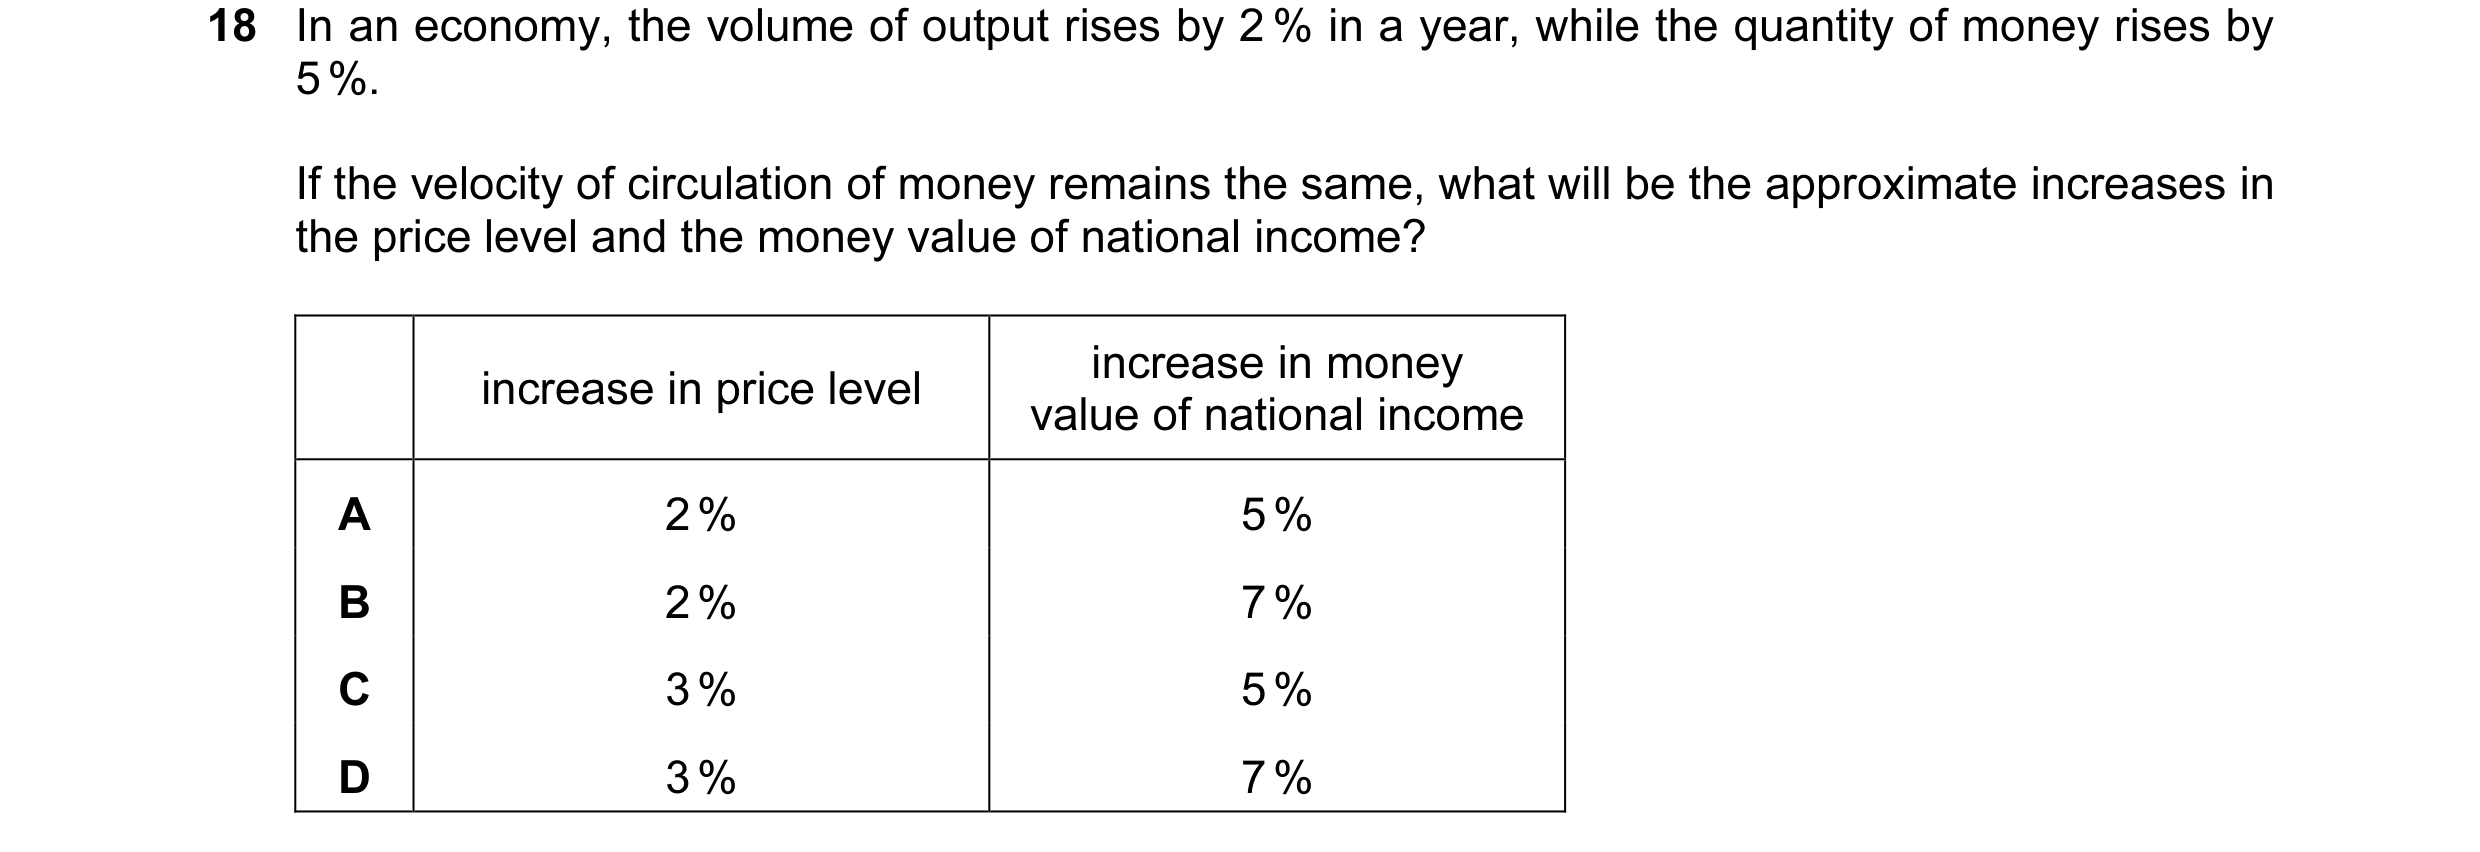

 3 / 9
3 / 9
 4 / 9
4 / 9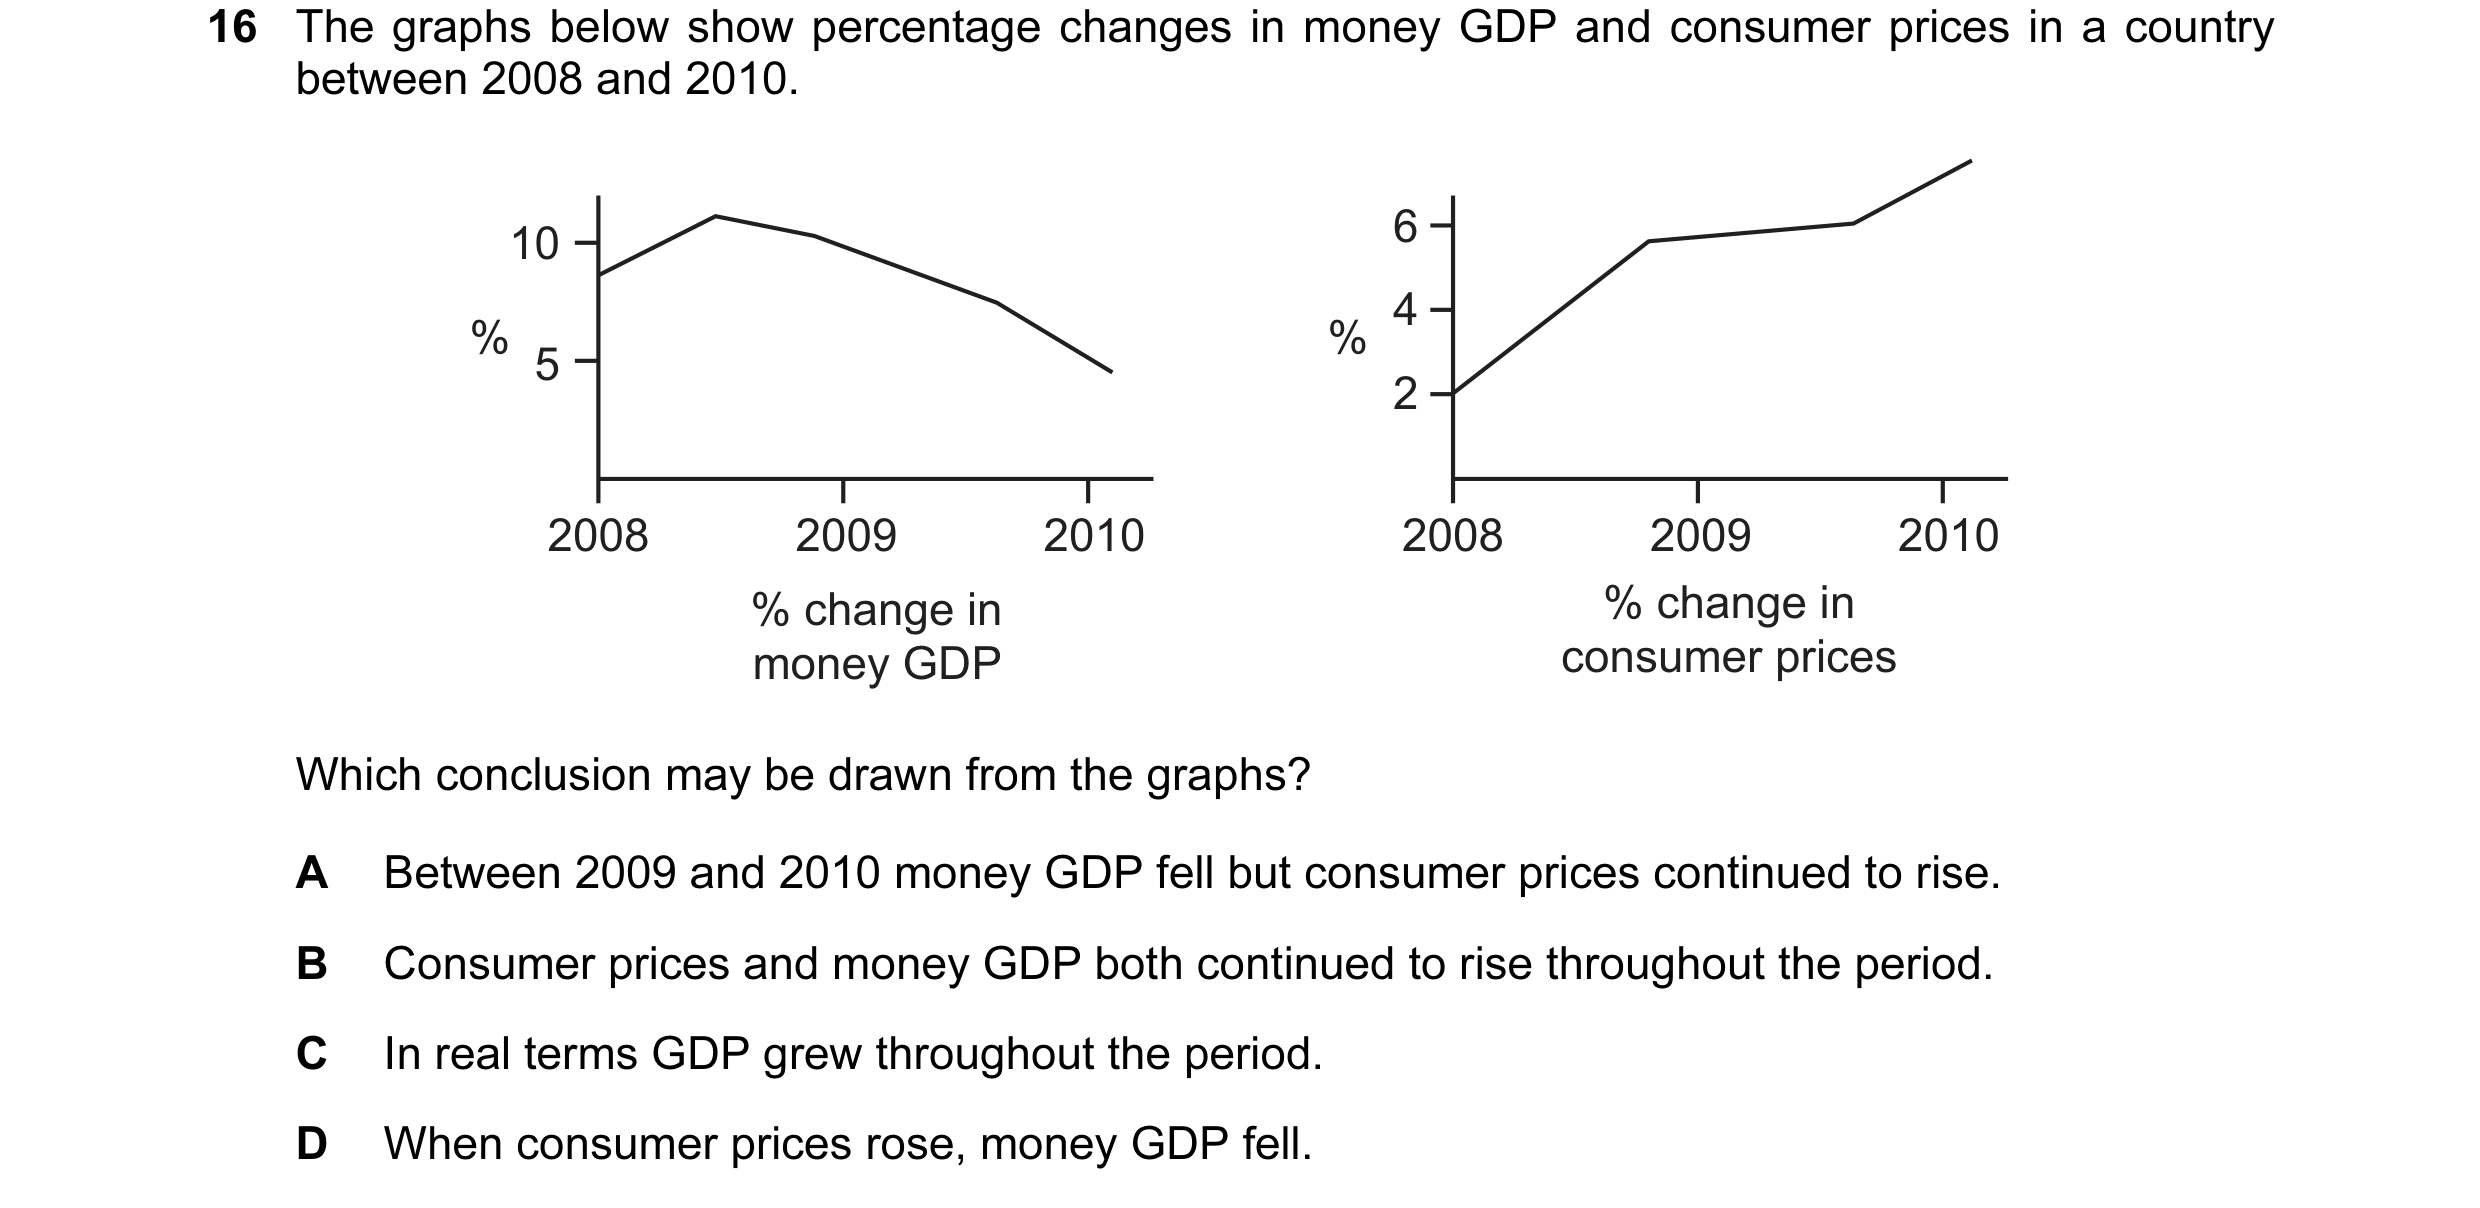

 5 / 9
5 / 9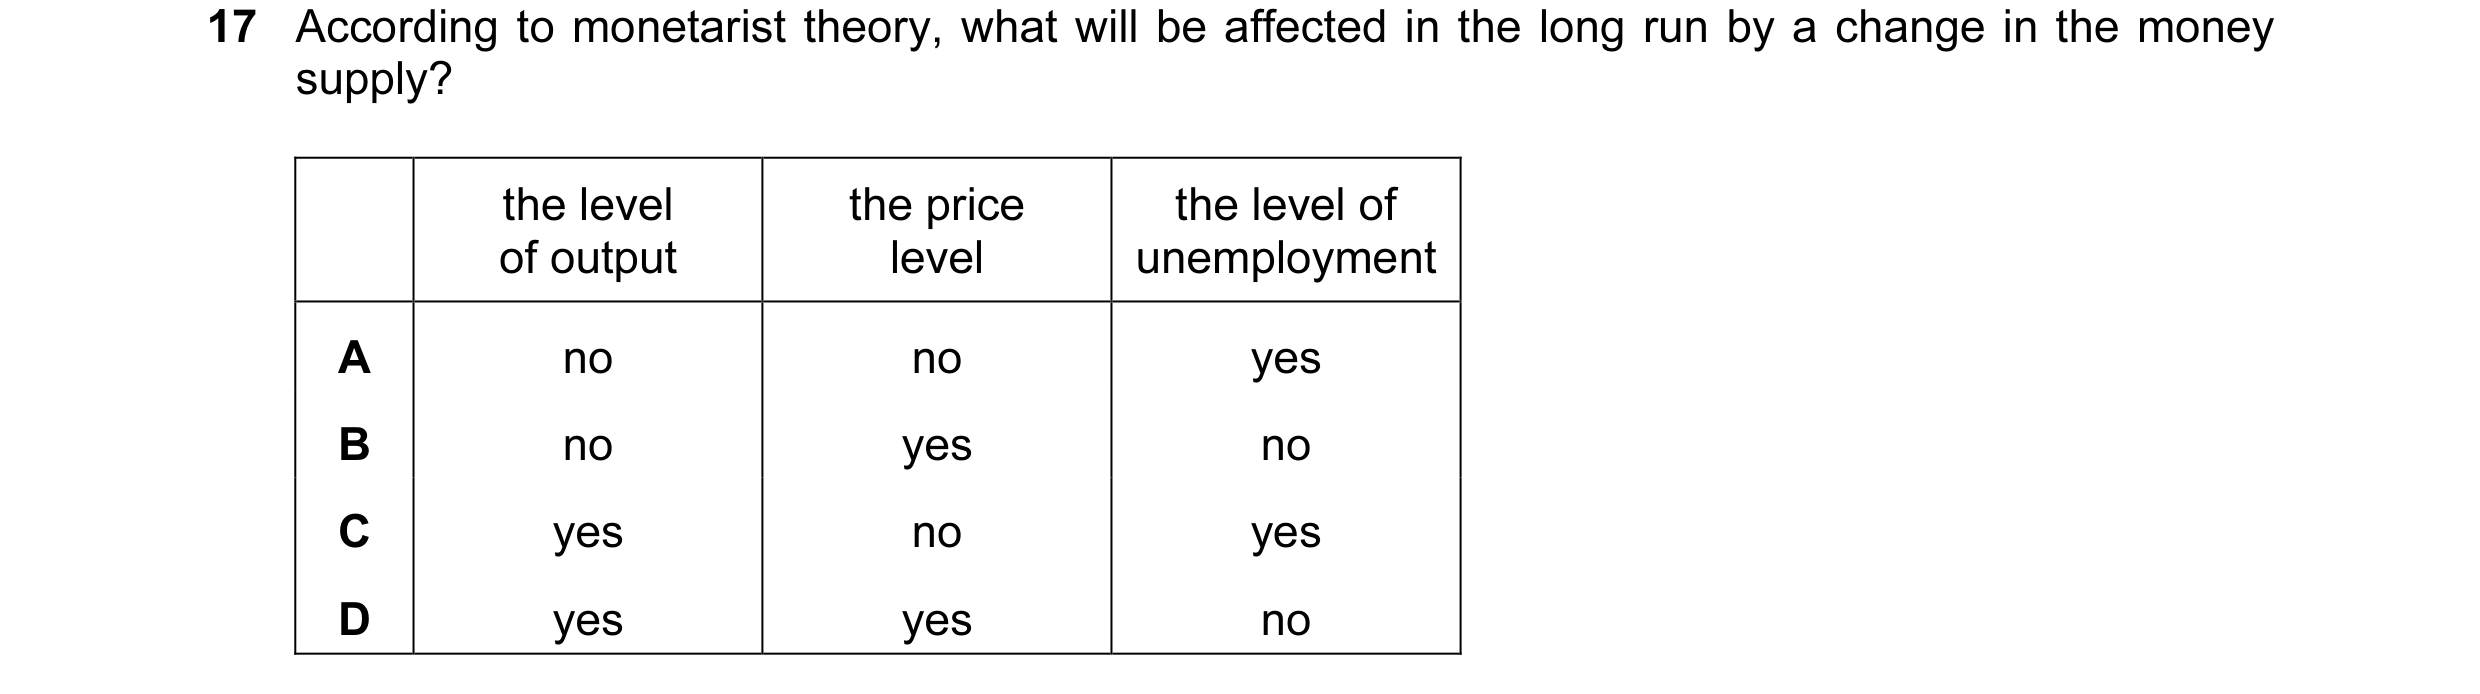

 6 / 9
6 / 9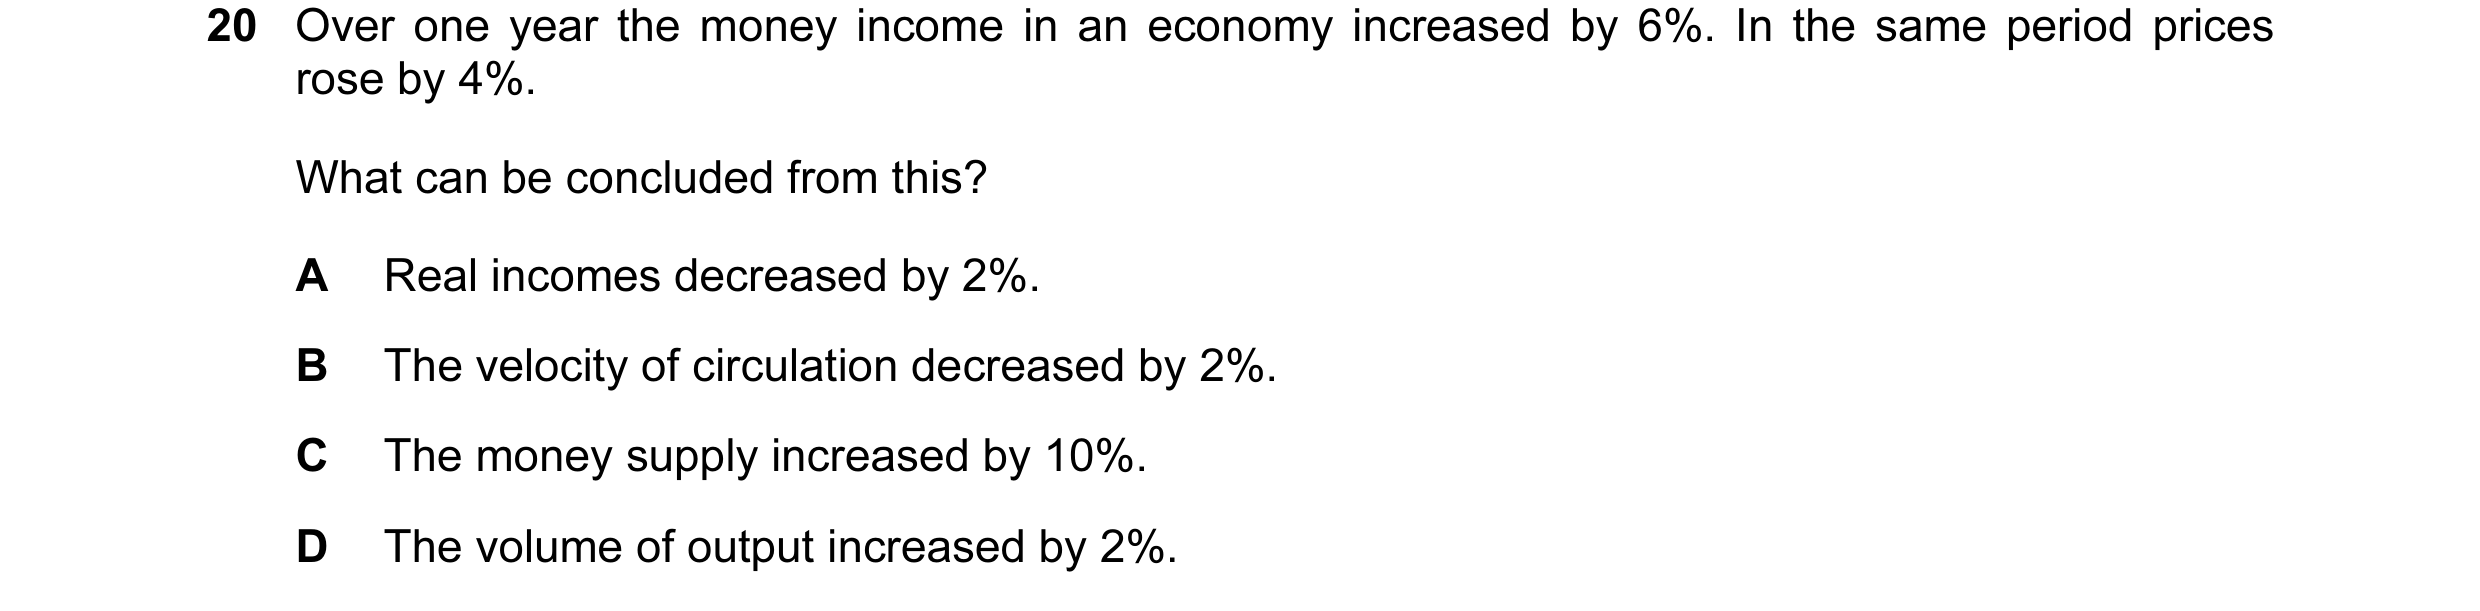
 7 / 9
7 / 9
 8 / 9
8 / 9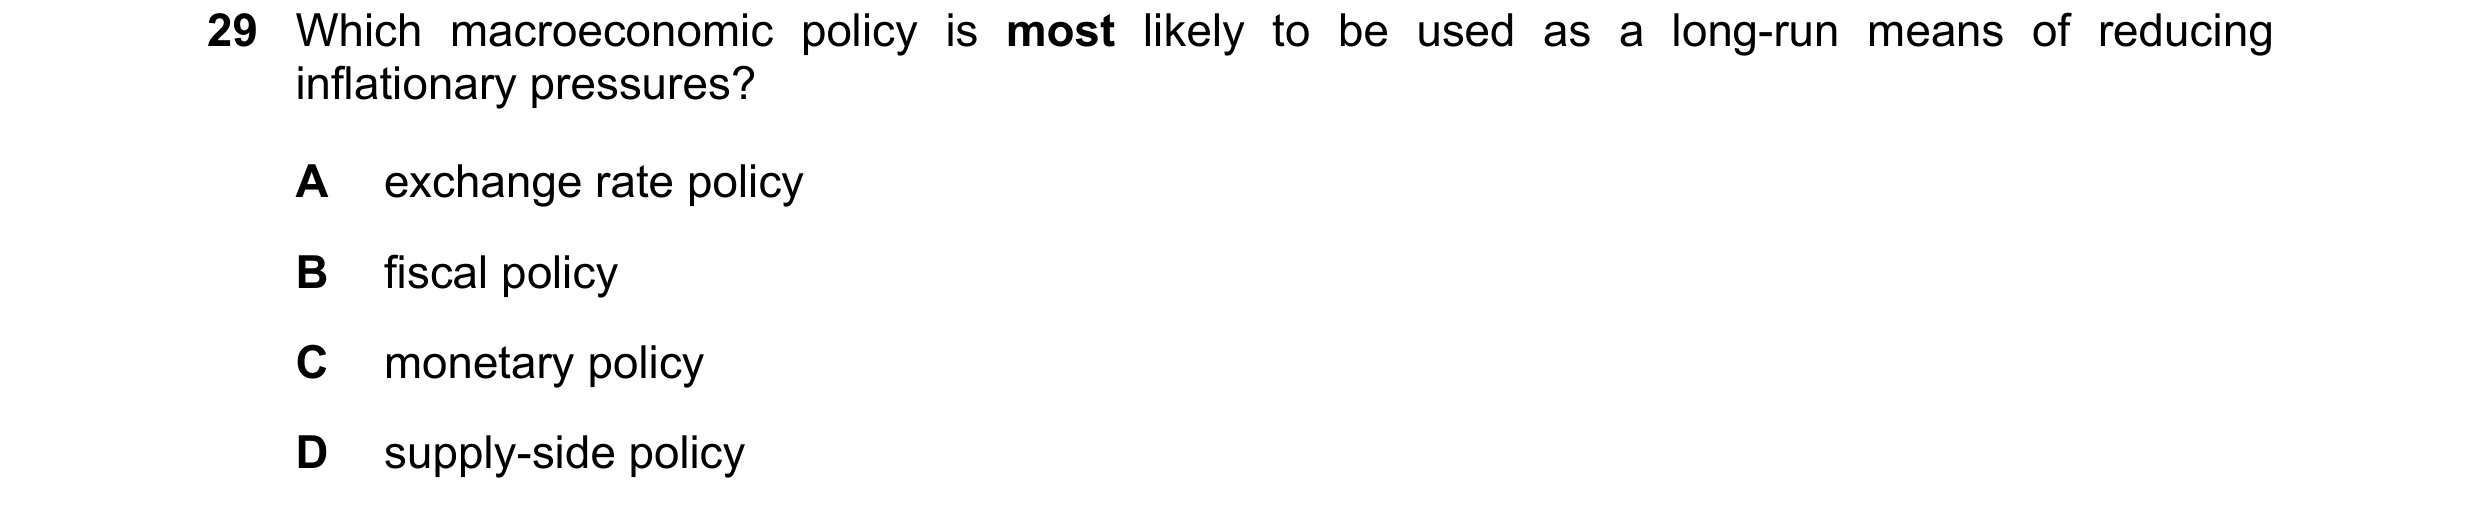
 9 / 9
9 / 9