Questions as text
Q1 · The diagram shows the demand and supply curves of a commodity before and after a specific… 9708/11 Oct/Nov 2005
13 The diagram shows the demand and supply curves of a commodity before and after a specific tax is removed. S S 12 10 8 price 6 4 2 D 0 quantity What is the tax per unit of output and what is the price after the removal of the tax? price after the tax per unit removal of the tax A 6 6 B 6 8 C 4 6 D 4 8
1 marks
Answer: A
This question in 9708/11 Oct/Nov 2005
Q2 · The diagram shows the original market clearing price is P1 9708/11 Oct/Nov 2005
17 The diagram shows the original market clearing price is P1. The government then imposes a maximum price of P2 on the industry. S P2 P1 price D O quantity What will result from this? A a higher price and output B a shortage C a surplus D an unchanged price and output
1 marks
Answer: D
This question in 9708/11 Oct/Nov 2005
Q3 · The diagram shows the demand curve for an agricultural commodity that has unitary… 9708/11 Oct/Nov 2005
18 The diagram shows the demand curve for an agricultural commodity that has unitary elasticity. S1 is the supply curve if there is a bad harvest and S2 is the supply curve if there is a good harvest. S1 S2 price P D O Q quantity What should the government do in order to stabilise the incomes of farmers? A allow the price of the commodity to be determined by the market B fix the price paid to farmers at price OP C introduce a quota on production equal to OQ D subsidise farmers in bad years and impose a tax on farmers in good years
1 marks
Answer: A
This question in 9708/11 Oct/Nov 2005
Q4 · The diagram illustrates a market for wheat 9708/11 May/June 2006
17 The diagram illustrates a market for wheat. The government sets a maximum price of OP. S P price D O quantity What could cause the maximum price to have an impact on the market? A an increased wheat harvest B a fall in the price of rice C an advertising campaign for bread D an increase in subsidies to wheat farmers
1 marks
Answer: C
This question in 9708/11 May/June 2006
Q5 · A government wishes to encourage the consumption of a merit good and reduce the… 9708/11 May/June 2006
18 A government wishes to encourage the consumption of a merit good and reduce the consumption of a demerit good. Which policy should it adopt towards each good? merit good demerit good A impose a minimum price produce only in the public sector B increase advertising on the benefits of put legal controls on output the good C confine access to certain age groups tax output D subsidise the good set a minimum level of output
1 marks
Answer: B
This question in 9708/11 May/June 2006
Q6 · The diagram shows a market subject to a maximum price 9708/11 Oct/Nov 2006
12 The diagram shows a market subject to a maximum price. S price P maximum price D O Q1 Q Q2 quantity What will happen if the maximum price is removed? A There will be allocation by a queuing system. B There will be allocation by government rationing. C There will be allocation by seller’s preference. D There will be allocation by the price system.
1 marks
Answer: D
This question in 9708/11 Oct/Nov 2006
Q7 · The diagram shows the market demand and supply curves for an agricultural product 9708/11 Oct/Nov 2006
17 The diagram shows the market demand and supply curves for an agricultural product. The government allows the price paid by consumers to be determined by the market, but guarantees producers a price of OP2. supply P2 z x y P1 price w demand O quantity Which area in the diagram represents the total subsidy payments made by the government to producers? A w + y + z B y + z C x D x + y + z
1 marks
Answer: D
This question in 9708/11 Oct/Nov 2006
Q8 · A government intends to introduce a minimum price for rice, a maximum price for heating… 9708/11 Oct/Nov 2006
18 A government intends to introduce a minimum price for rice, a maximum price for heating oil and a tax on chewing gum. Who, in each market, is meant to benefit from these policies? market for rice market for heating oil market for chewing gum A consumers government producers B government producers government C producers producers consumers D producers consumers government
1 marks
Answer: D
This question in 9708/11 Oct/Nov 2006
Q9 · The diagram illustrates the effects of placing a specific tax equal to JM on a good 9708/11 May/June 2007
10 The diagram illustrates the effects of placing a specific tax equal to JM on a good. S2 S1 price J X L K Y Z M D O quantity Which area represents total tax receipts? A JKM B XJKY C XJLY D XJMZ
1 marks
Answer: D
This question in 9708/11 May/June 2007
Q10 · The diagram represents a market for a good, in which the equilibrium price is OU 9708/11 May/June 2007
12 The diagram represents a market for a good, in which the equilibrium price is OU. W supply X Z maximum V price price Y U demand O quantity A maximum price of OV is imposed by law. What effect does this have on consumer surplus? A It decreases by area VXYU. B It increases by area WXV. C It increases by area XYZ. D It is not affected.
1 marks
Answer: D
This question in 9708/11 May/June 2007
Q11 · A given production process uses both labour and capital 9708/11 May/June 2007
14 A given production process uses both labour and capital. What will be the effect on the quantities of labour and capital employed if the government introduces a subsidy on capital investment? quantity of labour quantity of capital A decrease uncertain B uncertain uncertain C decrease increase D uncertain increase
1 marks
Answer: D
This question in 9708/11 May/June 2007
Q12 · The government imposes a sales tax to reduce consumption of good X 9708/11 Oct/Nov 2007
9 The government imposes a sales tax to reduce consumption of good X. With which combination of price elasticity of demand and price elasticity of supply will this have the greatest effect? A elastic demand and elastic supply B elastic demand and inelastic supply C inelastic demand and elastic supply D inelastic demand and inelastic supply
1 marks
Answer: A
This question in 9708/11 Oct/Nov 2007
Q13 · The diagram shows the demand curve and supply curve for a good on which the government… 9708/11 May/June 2008
12 The diagram shows the demand curve and supply curve for a good on which the government imposes a specific tax. S D price D S O quantity What will be the result of this tax? A Most of the incidence of the tax will fall on the producer. B The new demand curve will be parallel to DD. C The price will rise by the full amount of the tax. D The quantity bought will fall proportionately to the tax rate.
1 marks
Answer: A
This question in 9708/11 May/June 2008
Q14 · Which government policy might limit the rationing function of the price mechanism? 9708/11 May/June 2008
13 Which government policy might limit the rationing function of the price mechanism? A the imposition of tariffs on imported consumer goods B the levy of indirect taxes at varying rates on different goods C the payment of subsidies to food producers D the setting of maximum prices for rented housing
1 marks
Answer: D
This question in 9708/11 May/June 2008
Q15 · The diagram shows the imposition of a maximum price (OM) on a product 9708/11 May/June 2008
18 The diagram shows the imposition of a maximum price (OM) on a product. supply S T U W R price V M demand O X Y quantity An organisation buys up the total supply at the maximum price and then resells it illegally to gain maximum revenue. What is the organisation’s revenue? A OMVY B ORUX C ORWY D OSTX
1 marks
Answer: D
This question in 9708/11 May/June 2008
Q16 · In which types of economy might a government control prices? 9708/11 Oct/Nov 2008
3 In which types of economy might a government control prices? A market and mixed only B market and planned only C market, mixed and planned D mixed and planned only
1 marks
Answer: D
This question in 9708/11 Oct/Nov 2008
Q17 · What might explain a simultaneous increase in both price and quantity traded in the… 9708/11 Oct/Nov 2008
10 What might explain a simultaneous increase in both price and quantity traded in the market for a normal good? A the removal of an effective maximum price on the good B technological progress in the production of the good C the imposition of a tax on the good D the granting of a subsidy to producers of the good
1 marks
Answer: A
This question in 9708/11 Oct/Nov 2008
Q18 · The diagram shows the market for apples 9708/11 Oct/Nov 2008
17 The diagram shows the market for apples. A government maintains a minimum price P2 by buying apples. D S V W P2 price Z P1 X Y S D O Q1 Q Q2 quantity Which area shows the amount of money the government has to spend to maintain the price P2? A P2WYP1 B P2VQ1O C P2WQ2O D VWQ2Q1
1 marks
Answer: D
This question in 9708/11 Oct/Nov 2008
Q19 · The table shows the demand and supply schedules for a good before and after the… 9708/11 May/June 2009
7 The table shows the demand and supply schedules for a good before and after the imposition of a tax. price quantity quantity supplied quantity supplied ($) demanded before tax after tax 20 340 440 380 19 340 430 340 18 340 410 290 17 340 380 230 16 340 340 160 15 340 290 80 14 340 230 0 What was the amount of the tax? A $1 B $2 C $3 D $4
1 marks
Answer: C
This question in 9708/11 May/June 2009
Q20 · The market price of an agricultural commodity was so low that the government fixed a… 9708/11 May/June 2009
18 The market price of an agricultural commodity was so low that the government fixed a minimum price for it above the market equilibrium price. However, the government did not buy any of the commodity itself. What would happen as a result? A There would be an equilibrium in the market but the change in farmers’ incomes would be uncertain. B There would be a shortage on the market and farmers’ incomes would rise. C There would be a surplus on the market and farmers’ incomes would fall. D There would be a surplus on the market but the change in farmers’ incomes would be uncertain.
1 marks
Answer: D
This question in 9708/11 May/June 2009
Q21 · A government wishes to impose a tax on a good so that the consumer and not the producer… 9708/11 Oct/Nov 2009
6 A government wishes to impose a tax on a good so that the consumer and not the producer pays most of the tax increase. Which type of elasticity would best achieve this aim? A high price elasticity of supply B low price elasticity of supply C unitary price elasticity of supply D perfectly inelastic price elasticity of supply
1 marks
Answer: A
This question in 9708/11 Oct/Nov 2009
Q22 · A specific tax is placed upon each bottle of perfume sold 9708/11 Oct/Nov 2009
9 A specific tax is placed upon each bottle of perfume sold. In the diagram, SS is the supply curve before tax, StSt the supply curve after tax. St S W R price U Q X P T St D S O Y Z quantity Which area represents the revenue received by the government from the tax? A ORWY B PQUT C PRWT D QRWU
1 marks
Answer: C
This question in 9708/11 Oct/Nov 2009
Q23 · What would cause a failure of the market mechanism’s rationing function? 9708/11 Oct/Nov 2009
13 What would cause a failure of the market mechanism’s rationing function? A falling prices B price controls C rising profits D self interest
1 marks
Answer: B
This question in 9708/11 Oct/Nov 2009
Q24 · The diagram shows the market for wheat 9708/11 Oct/Nov 2009
17 The diagram shows the market for wheat. S P2 price P1 D O X Y Z quantity What quantity of wheat must the government buy if it wishes to raise the market price from P1 to P2? A OZ B XY C XZ D YZ
1 marks
Answer: C
This question in 9708/11 Oct/Nov 2009
Q25 · The government places a maximum price P1 on an agricultural product 9708/11 Oct/Nov 2009
18 The government places a maximum price P1 on an agricultural product. The supply and demand conditions for this product are shown. S P1 price D O quantity What will be the outcome in the market for this product? A There will be an equilibrium price and output. B There will be a surplus of the product. C There will be higher than expected profits. D There will be shortages of this product.
1 marks
Answer: A
This question in 9708/11 Oct/Nov 2009
Q26 · A government has been protecting its domestic car industry with a quota on imported cars 9708/11 Oct/Nov 2009
20 A government has been protecting its domestic car industry with a quota on imported cars. It then removes the quota and replaces it with a subsidy to domestic car producers. How will this change affect the price of cars and the level of consumer choice? price of cars level of choice A decrease decrease B decrease increase C increase decrease D increase increase
1 marks
Answer: B
This question in 9708/11 Oct/Nov 2009
Q27 · A government wishes to impose a tax on a good so that the consumer and not the producer… 9708/12 Oct/Nov 2009
5 A government wishes to impose a tax on a good so that the consumer and not the producer pays most of the tax increase. Which type of elasticity would best achieve this aim? A high price elasticity of supply B low price elasticity of supply C unitary price elasticity of supply D perfectly inelastic price elasticity of supply
1 marks
Answer: A
This question in 9708/12 Oct/Nov 2009
Q28 · A specific tax is placed upon each bottle of perfume sold 9708/12 Oct/Nov 2009
8 A specific tax is placed upon each bottle of perfume sold. In the diagram, SS is the supply curve before tax, StSt the supply curve after tax. St S W R price U Q X P T St D S O Y Z quantity Which area represents the revenue received by the government from the tax? A ORWY B PQUT C PRWT D QRWU
1 marks
Answer: C
This question in 9708/12 Oct/Nov 2009
Q29 · The diagram shows the market for wheat 9708/12 Oct/Nov 2009
16 The diagram shows the market for wheat. S P2 price P1 D O X Y Z quantity What quantity of wheat must the government buy if it wishes to raise the market price from P1 to P2? A OZ B XY C XZ D YZ
1 marks
Answer: C
This question in 9708/12 Oct/Nov 2009
Q30 · The government places a maximum price P1 on an agricultural product 9708/12 Oct/Nov 2009
17 The government places a maximum price P1 on an agricultural product. The supply and demand conditions for this product are shown. S P1 price D O quantity What will be the outcome in the market for this product? A There will be an equilibrium price and output. B There will be a surplus of the product. C There will be higher than expected profits. D There will be shortages of this product.
1 marks
Answer: A
This question in 9708/12 Oct/Nov 2009
Q31 · The government imposes a maximum price of P2 on a product 9708/11 May/June 2010
11 The government imposes a maximum price of P2 on a product. S P2 P1 price D O Q2 Q1 Q3 quantity What will be the position after this action? A an equilibrium with price P1 and quantity Q1 B an equilibrium with price P2 and a quantity between Q2 and Q3 C an oversupply in the market by Q2Q3 D a shortage in the market of Q2Q3
1 marks
Answer: A
This question in 9708/11 May/June 2010
Q32 · The diagram shows the demand and supply curves of a good 9708/11 May/June 2010
18 The diagram shows the demand and supply curves of a good. S price J D O quantity The government sets a maximum price of OJ for the good. How will this affect the consumers and producers of the good? effect on consumers effect on producers A All consumers will gain. Producers will lose. B All consumers will gain. Producers will gain. C Some consumers will gain and some will lose. Producers will gain. D Some consumers will gain and some will lose. Producers will lose.
1 marks
Answer: D
This question in 9708/11 May/June 2010
Q33 · The government imposes a maximum price of P2 on a product 9708/12 May/June 2010
10 The government imposes a maximum price of P2 on a product. S P2 P1 price D O Q2 Q1 Q3 quantity What will be the position after this action? A an equilibrium with price P1 and quantity Q1 B an equilibrium with price P2 and a quantity between Q2 and Q3 C an oversupply in the market by Q2Q3 D a shortage in the market of Q2Q3
1 marks
Answer: A
This question in 9708/12 May/June 2010
Q34 · The diagram shows the demand and supply curves of a good 9708/12 May/June 2010
17 The diagram shows the demand and supply curves of a good. S price J D O quantity The government sets a maximum price of OJ for the good. How will this affect the consumers and producers of the good? effect on consumers effect on producers A All consumers will gain. Producers will lose. B All consumers will gain. Producers will gain. C Some consumers will gain and some will lose. Producers will gain. D Some consumers will gain and some will lose. Producers will lose.
1 marks
Answer: D
This question in 9708/12 May/June 2010
Q35 · The government imposes a maximum price of P2 on a product 9708/13 May/June 2010
9 The government imposes a maximum price of P2 on a product. S P2 P1 price D O Q2 Q1 Q3 quantity What will be the position after this action? A an equilibrium with price P1 and quantity Q1 B an equilibrium with price P2 and a quantity between Q2 and Q3 C an oversupply in the market by Q2Q3 D a shortage in the market of Q2Q3
1 marks
Answer: A
This question in 9708/13 May/June 2010
Q36 · The diagram shows the demand and supply curves of a good 9708/13 May/June 2010
16 The diagram shows the demand and supply curves of a good. S price J D O quantity The government sets a maximum price of OJ for the good. How will this affect the consumers and producers of the good? effect on consumers effect on producers A All consumers will gain. Producers will lose. B All consumers will gain. Producers will gain. C Some consumers will gain and some will lose. Producers will gain. D Some consumers will gain and some will lose. Producers will lose.
1 marks
Answer: D
This question in 9708/13 May/June 2010
Q37 · Which area in the diagram represents the amount of consumer surplus that would occur in a… 9708/11 Oct/Nov 2010
11 Which area in the diagram represents the amount of consumer surplus that would occur in a market if a government enforced an effective maximum price? supply f g price h j i k maximum price demand O quantity A f only B f + g + h only C f + g + i only D f + g + h + i + j + k
1 marks
Answer: C
This question in 9708/11 Oct/Nov 2010
Q38 · What will make it more likely that road tolls will reduce traffic congestion? 9708/11 Oct/Nov 2010
17 What will make it more likely that road tolls will reduce traffic congestion? A Cross-elasticity of demand between private and public transport is zero. B Demand for car use is income-elastic. C Demand for car use is price-elastic. D Supply of public transport is price-inelastic.
1 marks
Answer: C
This question in 9708/11 Oct/Nov 2010
Q39 · In the diagram, S1S1 and DD represent the original supply and demand curves for an… 9708/11 Oct/Nov 2010
18 In the diagram, S1S1 and DD represent the original supply and demand curves for an agricultural product. S2 D S1 price P1 D S2 S1 O Q1 Q2 Q3 quantity Bad weather then reduces supply to S2S2. The government does not allow the price to rise above OP1. How much of the product will the government have to supply from stocks if the price is to be maintained at OP1? A OQ3 B Q1Q3 C Q1Q2 D Q2Q3
1 marks
Answer: B
This question in 9708/11 Oct/Nov 2010
Q40 · Which area in the diagram represents the amount of consumer surplus that would occur in a… 9708/12 Oct/Nov 2010
11 Which area in the diagram represents the amount of consumer surplus that would occur in a market if a government enforced an effective maximum price? supply f g price h j i k maximum price demand O quantity A f only B f + g + h only C f + g + i only D f + g + h + i + j + k
1 marks
Answer: C
This question in 9708/12 Oct/Nov 2010
Q41 · What will make it more likely that road tolls will reduce traffic congestion? 9708/12 Oct/Nov 2010
17 What will make it more likely that road tolls will reduce traffic congestion? A Cross-elasticity of demand between private and public transport is zero. B Demand for car use is income-elastic. C Demand for car use is price-elastic. D Supply of public transport is price-inelastic.
1 marks
Answer: C
This question in 9708/12 Oct/Nov 2010
Q42 · In the diagram, S1S1 and DD represent the original supply and demand curves for an… 9708/12 Oct/Nov 2010
18 In the diagram, S1S1 and DD represent the original supply and demand curves for an agricultural product. S2 D S1 price P1 D S2 S1 O Q1 Q2 Q3 quantity Bad weather then reduces supply to S2S2. The government does not allow the price to rise above OP1. How much of the product will the government have to supply from stocks if the price is to be maintained at OP1? A OQ3 B Q1Q3 C Q1Q2 D Q2Q3
1 marks
Answer: B
This question in 9708/12 Oct/Nov 2010
Q43 · Which area in the diagram represents the amount of consumer surplus that would occur in a… 9708/13 Oct/Nov 2010
10 Which area in the diagram represents the amount of consumer surplus that would occur in a market if a government enforced an effective maximum price? supply f g price h j i k maximum price demand O quantity A f only B f + g + h only C f + g + i only D f + g + h + i + j + k
1 marks
Answer: C
This question in 9708/13 Oct/Nov 2010
Q44 · In the diagram, S1S1 and DD represent the original supply and demand curves for an… 9708/13 Oct/Nov 2010
17 In the diagram, S1S1 and DD represent the original supply and demand curves for an agricultural product. S2 D S1 price P1 D S2 S1 O Q1 Q2 Q3 quantity Bad weather then reduces supply to S2S2. The government does not allow the price to rise above OP1. How much of the product will the government have to supply from stocks if the price is to be maintained at OP1? A OQ3 B Q1Q3 C Q1Q2 D Q2Q3
1 marks
Answer: B
This question in 9708/13 Oct/Nov 2010
Q45 · The diagram shows the demand and supply curves for a good 9708/11 May/June 2011
12 The diagram shows the demand and supply curves for a good. S P1 P price D O Q1 Q Q2 quantity The government fixed a maximum price of OP1. What would this have achieved? A the guarantee of supplies of OQ2 B the market equilibrium of quantity OQ C the need for a government subsidy of PP1 D the rationing of the product for consumers to OQ1
1 marks
Answer: B
This question in 9708/11 May/June 2011
Q46 · In the diagram S and S1 are the supply curves for an agricultural product in years 1 and… 9708/11 May/June 2011
18 In the diagram S and S1 are the supply curves for an agricultural product in years 1 and 2 respectively. D is the demand curve in years 1 and 2. In year 1 the government purchased an amount necessary to ensure that the price was OP. S S1 (year 1) (year 2) P price D O W X Y Z quantity The price is held at OP in year 2. How much more must the government buy in year 2 than it bought in year 1? A WX B XY C XZ D YZ
1 marks
Answer: D
This question in 9708/11 May/June 2011
Q47 · The diagram shows the demand and supply curves for a good 9708/12 May/June 2011
11 The diagram shows the demand and supply curves for a good. S P1 P price D O Q1 Q Q2 quantity The government fixed a maximum price of OP1. What would this have achieved? A the guarantee of supplies of OQ2 B the market equilibrium of quantity OQ C the need for a government subsidy of PP1 D the rationing of the product for consumers to OQ1
1 marks
Answer: B
This question in 9708/12 May/June 2011
Q48 · In the diagram S and S1 are the supply curves for an agricultural product in years 1 and… 9708/12 May/June 2011
17 In the diagram S and S1 are the supply curves for an agricultural product in years 1 and 2 respectively. D is the demand curve in years 1 and 2. In year 1 the government purchased an amount necessary to ensure that the price was OP. S S1 (year 1) (year 2) P price D O W X Y Z quantity The price is held at OP in year 2. How much more must the government buy in year 2 than it bought in year 1? A WX B XY C XZ D YZ
1 marks
Answer: D
This question in 9708/12 May/June 2011
Q49 · The diagram shows the demand and supply curves for a good 9708/13 May/June 2011
10 The diagram shows the demand and supply curves for a good. S P1 P price D O Q1 Q Q2 quantity The government fixed a maximum price of OP1. What would this have achieved? A the guarantee of supplies of OQ2 B the market equilibrium of quantity OQ C the need for a government subsidy of PP1 D the rationing of the product for consumers to OQ1
1 marks
Answer: B
This question in 9708/13 May/June 2011
Q50 · In the diagram S and S1 are the supply curves for an agricultural product in years 1 and… 9708/13 May/June 2011
16 In the diagram S and S1 are the supply curves for an agricultural product in years 1 and 2 respectively. D is the demand curve in years 1 and 2. In year 1 the government purchased an amount necessary to ensure that the price was OP. S S1 (year 1) (year 2) P price D O W X Y Z quantity The price is held at OP in year 2. How much more must the government buy in year 2 than it bought in year 1? A WX B XY C XZ D YZ
1 marks
Answer: D
This question in 9708/13 May/June 2011
Q51 · The diagram shows the effect on the market for rice of a change in government policy that… 9708/11 Oct/Nov 2011
12 The diagram shows the effect on the market for rice of a change in government policy that causes a shift in the supply curve from S to S1. S S1 L price K J M D O quantity What does the area JKLM represent? A the additional saving to importers of the removal of a tariff on rice B the cost to the government of a subsidy to rice growers C the increase in consumer surplus from the introduction of a maximum price for rice D the loss in government revenue from the reduction in a lump sum tax on rice
1 marks
Answer: B
This question in 9708/11 Oct/Nov 2011
Q52 · What must a government do to stabilise the price of an agricultural commodity? 9708/11 Oct/Nov 2011
18 What must a government do to stabilise the price of an agricultural commodity? when demand exceeds supply when supply exceeds demand A add the excess demand to a buffer stock release an amount equal to the excess supply from a buffer stock B meet excess demand by running purchase the excess supply and down a buffer stock add it to a buffer stock C subsidise production impose a tax on consumers D tax consumers of the commodity subsidise production
1 marks
Answer: B
This question in 9708/11 Oct/Nov 2011
Q53 · The table shows demand and supply schedules for red peppers 9708/12 Oct/Nov 2011
9 The table shows demand and supply schedules for red peppers. The equilibrium price is initially 15 cents per kg. price per kg amount demanded amount supplied cents kg (thousands) kg (thousands) 30 11 22 25 12 19 20 13 17 15 15 15 10 17 13 5 20 11 The government pays a subsidy of 10 cents per kg to producers. What will be the new equilibrium price charged to consumers? A 5 cents B 10 cents C 15 cents D 20 cents
1 marks
Answer: B
This question in 9708/12 Oct/Nov 2011
Q54 · The diagram shows the market demand and supply curves for rice 9708/12 Oct/Nov 2011
18 The diagram shows the market demand and supply curves for rice. S 10 price 8 ($) D O Q1 Q2 Q3 quantity What would happen if a government imposed a maximum price of $10? A The government would need to supply Q1 to Q3. B The quantity sold would be Q1. C The quantity sold would be Q2. D The quantity sold would increase from Q2 to Q3.
1 marks
Answer: C
This question in 9708/12 Oct/Nov 2011
Q55 · The diagram shows the effect on the market for rice of a change in government policy that… 9708/13 Oct/Nov 2011
10 The diagram shows the effect on the market for rice of a change in government policy that causes a shift in the supply curve from S to S1. S S1 L price K J M D O quantity What does the area JKLM represent? A the additional saving to importers of the removal of a tariff on rice B the cost to the government of a subsidy to rice growers C the increase in consumer surplus from the introduction of a maximum price for rice D the loss in government revenue from the reduction in a lump sum tax on rice
1 marks
Answer: B
This question in 9708/13 Oct/Nov 2011
Q56 · What must a government do to stabilise the price of an agricultural commodity? 9708/13 Oct/Nov 2011
16 What must a government do to stabilise the price of an agricultural commodity? when demand exceeds supply when supply exceeds demand A add the excess demand to a buffer stock release an amount equal to the excess supply from a buffer stock B meet excess demand by running purchase the excess supply and down a buffer stock add it to a buffer stock C subsidise production impose a tax on consumers D tax consumers of the commodity subsidise production
1 marks
Answer: B
This question in 9708/13 Oct/Nov 2011
Q57 · The diagram shows the demand and supply curves of a commodity before and after a specific… 9708/11 May/June 2012
9 The diagram shows the demand and supply curves of a commodity before and after a specific tax is removed. S S 12 10 8 price 6 4 2 D 0 quantity What is the tax per unit of output and what is the price after the removal of the tax? price after the tax per unit removal of the tax A 6 6 B 6 8 C 4 6 D 4 8
1 marks
Answer: A
This question in 9708/11 May/June 2012
Q58 · The diagram shows the effect of the imposition of a tax equal to FG on a commodity 9708/11 May/June 2012
11 The diagram shows the effect of the imposition of a tax equal to FG on a commodity. S2 S1 price u x y v F w G D O quantity Which area represents the reduction in consumer surplus? A u + v B u + x C u + x + y D x + w
1 marks
Answer: C
This question in 9708/11 May/June 2012
Q59 · The diagram shows the market for spectacles 9708/11 May/June 2012
18 The diagram shows the market for spectacles. Initially the market equilibrium price is PO and quantity Q3 is bought and sold. S PX price PO PM D O Q1 Q2 Q3 Q4 Q5 quantity The government then sets both a maximum price of PX and a minimum price of PM. What effect will these measures have on the market for spectacles? A create a shortage of spectacles equal to Q1Q5 B create a surplus of spectacles equal to Q2Q4 C create a surplus of spectacles equal to Q3Q4 D leave the quantity bought and sold unchanged
1 marks
Answer: D
This question in 9708/11 May/June 2012
Q60 · The diagram shows the demand and supply curves of a commodity before and after a specific… 9708/12 May/June 2012
9 The diagram shows the demand and supply curves of a commodity before and after a specific tax is removed. S S 12 10 8 price 6 4 2 D 0 quantity What is the tax per unit of output and what is the price after the removal of the tax? price after the tax per unit removal of the tax A 6 6 B 6 8 C 4 6 D 4 8
1 marks
Answer: A
This question in 9708/12 May/June 2012
Q61 · The diagrams show a change in demand from D1 to D2 and a change in supply from S1 to S2… 9708/12 May/June 2012
11 The diagrams show a change in demand from D1 to D2 and a change in supply from S1 to S2 for four different goods. Which diagram illustrates the good for which additional new uses have been found and which receives an increase in government subsidy? A B C D S2 S2 S1 S1 S1 S1 S2 S2 price price price price D2 D2 D1 D2D1 D1 D2D1 O quantity O quantity O quantity O quantity
1 marks
Answer: C
This question in 9708/12 May/June 2012
Q62 · The diagram shows the market for spectacles 9708/12 May/June 2012
18 The diagram shows the market for spectacles. Initially the market equilibrium price is PO and quantity Q3 is bought and sold. S PX price PO PM D O Q1 Q2 Q3 Q4 Q5 quantity The government then sets both a maximum price of PX and a minimum price of PM. What effect will these measures have on the market for spectacles? A create a shortage of spectacles equal to Q1Q5 B create a surplus of spectacles equal to Q2Q4 C create a surplus of spectacles equal to Q3Q4 D leave the quantity bought and sold unchanged
1 marks
Answer: D
This question in 9708/12 May/June 2012
Q63 · The diagram shows the equilibrium price (OP) and quantity (OQ) in the market for maize 9708/13 May/June 2012
10 The diagram shows the equilibrium price (OP) and quantity (OQ) in the market for maize. S P1 P price P2 D O Q Q1 quantity The government wants to achieve a target price of OP1. What will be the outcome if the government enters the market and increases the demand by Q-Q1? A The original equilibrium price will continue to operate. B The equilibrium price will be at the target price. C The equilibrium price will be OP2. D The equilibrium price will be between the target price and the original equilibrium price.
1 marks
Answer: D
This question in 9708/13 May/June 2012
Q64 · The diagram shows the effect of the imposition of a tax equal to FG on a commodity 9708/13 May/June 2012
11 The diagram shows the effect of the imposition of a tax equal to FG on a commodity. S2 S1 price u x y v F w G D O quantity Which area represents the reduction in consumer surplus? A u + v B u + x C u + x + y D x + w
1 marks
Answer: C
This question in 9708/13 May/June 2012
Q65 · In Europe it was decided that farm subsidies would be paid to farmers who protect the… 9708/13 May/June 2012
14 In Europe it was decided that farm subsidies would be paid to farmers who protect the environment as well as producing food. What would this mean for farmers who receive the subsidy? A They must not increase the price of food. B They must not make excessive profits. C They must take into account external costs as well as private costs. D They should produce additional food only if externalities are zero.
1 marks
Answer: C
This question in 9708/13 May/June 2012
Q66 · The diagram shows the market for apples 9708/13 May/June 2012
18 The diagram shows the market for apples. A government maintains a minimum price P2 by buying apples. D S V W P2 price Z P1 X Y S D O Q1 Q Q2 quantity Which area shows the amount of money the government has to spend to maintain the price P2? A P2WYP1 B P2VQ1O C P2WQ2O D VWQ2Q1
1 marks
Answer: D
This question in 9708/13 May/June 2012
Q67 · The diagram shows a market subject to a maximum price 9708/11 Oct/Nov 2012
13 The diagram shows a market subject to a maximum price. S price P maximum price D O Q1 Q Q2 quantity What will happen if the maximum price is removed? A There will be allocation by a queuing system. B There will be allocation by government rationing. C There will be allocation by seller’s preference. D There will be allocation by the price system.
1 marks
Answer: D
This question in 9708/11 Oct/Nov 2012
Q68 · A government wishes to encourage the consumption of a merit good and reduce the… 9708/11 Oct/Nov 2012
17 A government wishes to encourage the consumption of a merit good and reduce the consumption of a demerit good. Which policy should it adopt towards each good? merit good demerit good A confine access to certain age groups tax output B increase advertising on the benefits of set a minimum level of output the good C subsidise the good put legal controls on output D tax the good produce only in the public sector
1 marks
Answer: C
This question in 9708/11 Oct/Nov 2012
Q69 · A government aims to stabilise the incomes received by farmers 9708/11 Oct/Nov 2012
18 A government aims to stabilise the incomes received by farmers. To achieve this it uses a policy of buying and selling farm products on the free market. When will it not need to respond to changes in the supply of farm products? A when elasticity of supply of farm products is zero B when farmers produce record harvests C when price elasticity of demand for farm products is unitary D when weather conditions can be accurately predicted
1 marks
Answer: C
This question in 9708/11 Oct/Nov 2012
Q70 · The diagram illustrates the effects of placing a specific tax equal to JM on a good 9708/12 Oct/Nov 2012
12 The diagram illustrates the effects of placing a specific tax equal to JM on a good. S2 S1 J X price K L Y Z M D O quantity Which area represents total tax receipts? A JKM B XJKY C XJLY D XJMZ
1 marks
Answer: D
This question in 9708/12 Oct/Nov 2012
Q71 · In which situation will it be necessary to use an alternative to the price mechanism to… 9708/12 Oct/Nov 2012
13 In which situation will it be necessary to use an alternative to the price mechanism to allocate a good between consumers? A Producers of the good receive a subsidy. B The government imposes a specific tax on the good. C The government sets a maximum price below the equilibrium price. D The quantity of the good available is fixed.
1 marks
Answer: C
This question in 9708/12 Oct/Nov 2012
Q72 · A government wishes to raise the incomes of farmers without raising the price of food to… 9708/12 Oct/Nov 2012
17 A government wishes to raise the incomes of farmers without raising the price of food to consumers. Which policy should it use? A a maximum price below the market price for food B a minimum price below the market price for food C a payment of a subsidy to farmers to produce food D a release of government food stocks onto the market
1 marks
Answer: C
This question in 9708/12 Oct/Nov 2012
Q73 · The diagram shows the market supply and demand curves for an agricultural product 9708/12 Oct/Nov 2012
18 The diagram shows the market supply and demand curves for an agricultural product. The government guarantees producers a minimum price of OX for their output, but allows the market price to be freely determined by demand and supply. supply U X Y Z V price W demand O S T quantity Which area in the diagram represents the total subsidy payments made by the government to producers? A UYTS B UYZW C XUWV D XYZV
1 marks
Answer: D
This question in 9708/12 Oct/Nov 2012
Q74 · A government wishes to impose a tax on a good so that the producer and not the consumer… 9708/13 Oct/Nov 2012
7 A government wishes to impose a tax on a good so that the producer and not the consumer pays most of the tax. Which type of elasticity would it be best for the good to have to achieve this aim? A high price elasticity of demand B low price elasticity of demand C totally inelastic price elasticity of demand D unitary price elasticity of demand
1 marks
Answer: A
This question in 9708/13 Oct/Nov 2012
Q75 · The diagram shows the demand curve, DD1, and the supply curve, SS1, for eye operations 9708/13 Oct/Nov 2012
11 The diagram shows the demand curve, DD1, and the supply curve, SS1, for eye operations. S D price P O S1 D1 number of operations The operations are provided free to the consumer. Which statement is correct? A Consumer surplus from the operations is ODD1. B The equilibrium price is P. C The equilibrium price is indeterminate, because the supply curve is vertical. D The equilibrium price is zero.
1 marks
Answer: B
This question in 9708/13 Oct/Nov 2012
Q76 · The diagram represents a market for a good, in which the equilibrium price is OU 9708/13 Oct/Nov 2012
12 The diagram represents a market for a good, in which the equilibrium price is OU. W supply X Z maximum V price Y price U demand O quantity A maximum price of OV is imposed by the government. What effect does this have on consumer surplus? A It decreases by area VXYU. B It increases by area WXV. C It increases by area XYZ. D It is not affected.
1 marks
Answer: D
This question in 9708/13 Oct/Nov 2012
Q77 · Which government policy might limit the rationing function of the price mechanism? 9708/13 Oct/Nov 2012
13 Which government policy might limit the rationing function of the price mechanism? A the imposition of tariffs on imported consumer goods B the levy of indirect taxes at varying rates on different goods C the payment of subsidies to food producers D the setting of maximum prices for rented housing
1 marks
Answer: D
This question in 9708/13 Oct/Nov 2012
Q78 · A government introduces a maximum price for house rentals (maxPh) and a minimum price for… 9708/13 Oct/Nov 2012
18 A government introduces a maximum price for house rentals (maxPh) and a minimum price for cleaning services (minPc). Both markets have identical demand and supply curves. Which diagram shows that the maximum price will be effective and the minimum price will be ineffective in the respective markets? A B S S maxPh minPc price price minPc maxPh D D O quantity O quantity C D S S maxPh minPc price price maxPh minPc D D O quantity O quantity
1 marks
Answer: C
This question in 9708/13 Oct/Nov 2012
Q79 · The diagram shows the demand curve and supply curve for a good on which the government… 9708/11 May/June 2013
11 The diagram shows the demand curve and supply curve for a good on which the government imposes a specific tax. S D price D S O quantity What will be the result of this tax? A Most of the incidence of the tax will fall on the producer. B There will be a new demand curve parallel to DD. C The price will rise by the full amount of the tax. D The quantity bought will fall proportionately to the tax rate.
1 marks
Answer: A
This question in 9708/11 May/June 2013
Q80 · A government fixes a maximum price for a product in order to increase its consumption 9708/11 May/June 2013
17 A government fixes a maximum price for a product in order to increase its consumption. What would be the likely outcome of such a policy? A Consumption will fall if the maximum price is above the current equilibrium price. B Consumption will rise if the maximum price is below the current equilibrium price. C Production will fall if the maximum price is above the current equilibrium price. D Production will fall if the maximum price is below the current equilibrium price.
1 marks
Answer: D
This question in 9708/11 May/June 2013
Q81 · In the diagram, S1S1 and DD represent the original supply and demand curves for an… 9708/11 May/June 2013
18 In the diagram, S1S1 and DD represent the original supply and demand curves for an agricultural product. S2 D S1 price P1 D S2 S1 O Q1 Q2 Q3 quantity Bad weather then reduces supply to S2S2. How much of the product will the government have to supply from stocks if it wishes to keep the price at OP1? A OQ3 B Q1Q3 C Q1Q2 D Q2Q3
1 marks
Answer: B
This question in 9708/11 May/June 2013
Q82 · A specific tax is placed upon each bottle of perfume sold 9708/12 May/June 2013
12 A specific tax is placed upon each bottle of perfume sold. In the diagram, SS is the supply curve before tax, StSt is the supply curve after tax. D St S W R price U Q X P T St D S O Y Z quantity Which area represents that part of the tax revenue paid by consumers? A ORWY B PQUT C PRWT D QRWU
1 marks
Answer: D
This question in 9708/12 May/June 2013
Q83 · A tax on a product is removed causing supply to increase from SS to S1S1 as shown in the… 9708/12 May/June 2013
16 A tax on a product is removed causing supply to increase from SS to S1S1 as shown in the diagram. S S1 D 20 18 price D $ S 15 S1 0 40 60 quantity What effect does the move have on government tax revenue and consumer expenditure? consumer tax revenue expenditure A reduce by $80 increase by $280 B reduce by $80 increase by $480 C reduce by $200 increase by $280 D reduce by $200 increase by $480
1 marks
Answer: C
This question in 9708/12 May/June 2013
Q84 · Which type of government intervention runs the risk of causing shortages? 9708/12 May/June 2013
17 Which type of government intervention runs the risk of causing shortages? A maximum price controls B specific indirect taxes C subsidies paid to some producers D taxes on company profits
1 marks
Answer: A
This question in 9708/12 May/June 2013
Q85 · In the diagram, D is the demand curve of an agricultural commodity and S is the initial… 9708/12 May/June 2013
18 In the diagram, D is the demand curve of an agricultural commodity and S is the initial supply curve. The government promises to maintain farmers’ incomes at least at this initial level. The harvests in four subsequent years are shown by supply curves S1 – S4. 6 S1 S 5 S2 4 S3 price 3 ($) S4 2 1 D 0 1 2 3 4 5 6 quantity (’000 tonnes) In which years will the government need to provide extra income to farmers? A 1 and 2 B 1 and 4 C 2 and 3 D 3 and 4
1 marks
Answer: B
This question in 9708/12 May/June 2013
Q86 · A specific tax is placed on the sale of bottles of lemonade 9708/13 May/June 2013
12 A specific tax is placed on the sale of bottles of lemonade. In the diagram, SS is the supply curve before imposition of the tax and StSt is the supply curve after tax. St D W S U price X St D T S O quantity Which distance represents the specific tax on each bottle? A UT B WT C WU D WX
1 marks
Answer: B
This question in 9708/13 May/June 2013
Q87 · The diagram shows the market for wheat 9708/13 May/June 2013
18 The diagram shows the market for wheat. S P2 P1 price D O X Y Z quantity If the government wishes to fix the price at OP2 what quantity of wheat must the government buy? A OZ B XY C XZ D YZ
1 marks
Answer: C
This question in 9708/13 May/June 2013
Q88 · The diagram shows the demand and supply curves for tractors 9708/12 Oct/Nov 2013
9 The diagram shows the demand and supply curves for tractors. The present equilibrium point is at X. What could be the new equilibrium if the government were to tax the country’s tractor manufacturers? S2 A S1 D price C X D2 B D1 D3 O quantity
1 marks
Answer: D
This question in 9708/12 Oct/Nov 2013
Q89 · The diagram shows the market for sugar which is in equilibrium at a price of OP 9708/12 Oct/Nov 2013
11 The diagram shows the market for sugar which is in equilibrium at a price of OP. S Q R price P P1 S U T D O L M N quantity A government then fixes a maximum price of OP1. What will happen as a result? A an increase in consumer surplus equal to PRUP1 B a reduction in expenditure by people who still buy sugar equal to PQSP1 C a reduction in farmers’ receipts equal to QRML D farmers’ receipts would be PQLO
1 marks
Answer: B
This question in 9708/12 Oct/Nov 2013
Q90 · A government introduces a subsidy to reduce the price of heating oil, maximum rents for… 9708/12 Oct/Nov 2013
17 A government introduces a subsidy to reduce the price of heating oil, maximum rents for apartments and a national minimum wage rate. Who is meant to benefit from each of these? heating oil apartment labour market market market A consumers landlords employers B consumers tenants workers C producers landlords workers D producers tenants employers
1 marks
Answer: B
This question in 9708/12 Oct/Nov 2013
Q91 · In the diagram, D is the demand curve for a commodity 9708/12 Oct/Nov 2013
18 In the diagram, D is the demand curve for a commodity. S1 and S2 are the supply curves before and after an intervention by the government. S1 S2 price P1 P2 D O Q1 Q2 quantity What action has the government taken? A It has given producers a subsidy to encourage greater output. B It has given a subsidy to consumers. C It has imposed a tax equal to P1 – P2 to discourage production. D It has purchased a quantity Q2 – Q1 for government use.
1 marks
Answer: A
This question in 9708/12 Oct/Nov 2013
Q92 · The table shows the demand and supply schedules for a good before and after the… 9708/13 Oct/Nov 2013
10 The table shows the demand and supply schedules for a good before and after the imposition of a tax. price quantity quantity supplied quantity supplied ($) demanded before tax after tax 20 340 440 380 19 340 430 340 18 340 410 290 17 340 380 230 16 340 340 160 15 340 290 80 14 340 230 0 What was the amount of the tax revenue raised for the government? A $1020 B $1360 C $5440 D $6460
1 marks
Answer: A
This question in 9708/13 Oct/Nov 2013
Q93 · Which pair of government actions are intended to directly benefit suppliers? 9708/13 Oct/Nov 2013
17 Which pair of government actions are intended to directly benefit suppliers? A government provision of consumer goods and maximum price laws B maximum price laws and price stabilisation policies C price stabilisation policies and indirect taxes D production subsidies and minimum price laws
1 marks
Answer: D
This question in 9708/13 Oct/Nov 2013
Q94 · The diagram shows the imposition of a maximum price (OM) on a product 9708/13 Oct/Nov 2013
18 The diagram shows the imposition of a maximum price (OM) on a product. S S T U W R price V M D O X Y quantity An organisation buys up the total supply at the maximum price and then resells it illegally to gain maximum revenue. What is the organisation’s revenue? A OMVY B ORUX C ORWY D OSTX
1 marks
Answer: D
This question in 9708/13 Oct/Nov 2013
Q95 · The diagram shows the original market clearing price is P1 9708/11 May/June 2014
18 The diagram shows the original market clearing price is P1. The government then imposes a maximum price of P2 on the industry. S P2 P1 price D O quantity What will result from this? A a higher price and output B a shortage C a surplus D an unchanged price and output
1 marks
Answer: D
This question in 9708/11 May/June 2014
Q96 · The diagram illustrates the effects of placing a specific tax equal to JM on a good 9708/12 May/June 2014
11 The diagram illustrates the effects of placing a specific tax equal to JM on a good. S2 S1 J X price K L Y Z M D O quantity Which area represents total tax receipts? A JKM B XJKY C XJLY D XJMZ
1 marks
Answer: D
This question in 9708/12 May/June 2014
Q97 · In the diagram, the initial quantity traded was Q and the price was P 9708/12 May/June 2014
18 In the diagram, the initial quantity traded was Q and the price was P. D S1 S P1 price P S1 S D O Q Q1 quantity The price then rose to P1 and the quantity traded rose to Q1. Which combination of government policy measures could explain this change? A the removal of a maximum price and the imposition of an income tax on consumers B the removal of a maximum price and the removal of a subsidy to producers C the removal of a minimum price and the granting of a subsidy to producers D the removal of a minimum price and the imposition of an indirect tax on the product
1 marks
Answer: B
This question in 9708/12 May/June 2014
Q98 · In the diagram, D is the demand curve of an agricultural commodity and S1 is the initial… 9708/13 May/June 2014
18 In the diagram, D is the demand curve of an agricultural commodity and S1 is the initial supply curve. S1 6 5 4 price 3 S2 ($) 2 1 D 0 0 1 2 3 4 5 6 quantity (000 tonnes) The government introduces a buffer scheme to maintain farm incomes at their initial level. What quantity would the government need to buy from the farmers to add to the buffer stock if a bumper harvest causes the supply curve to move to S2? A 1000 tonnes B 2000 tonnes C 3000 tonnes D 4000 tonnes
1 marks
Answer: A
This question in 9708/13 May/June 2014
Q99 · A specific tax is placed upon each bottle of perfume sold 9708/11 Oct/Nov 2014
9 A specific tax is placed upon each bottle of perfume sold. In the diagram, SS is the supply curve before tax and StSt is the supply curve after tax. St S W R price U Q X P T St D S O Y Z quantity Which area represents the revenue received by the government from the tax? A ORWY B PQUT C PRWT D QRWU
1 marks
This question in 9708/11 Oct/Nov 2014
Q100 · In moving towards a market economy government price controls were removed 9708/11 Oct/Nov 2014
18 In moving towards a market economy government price controls were removed. In the diagram below, the government initially set an effective maximum price. D S 10 price 8 $ 6 S D 0 quantity What effect was there on price and quantity when the government removed the maximum price? price quantity A falls from $10 to $8 removes shortage B falls from $10 to $8 removes surplus C rises from $6 to $8 removes shortage D rises from $6 to $8 removes surplus
1 marks
This question in 9708/11 Oct/Nov 2014
Q101 · A government wishes to impose a tax on a good so that the producer and not the consumer… 9708/12 Oct/Nov 2014
6 A government wishes to impose a tax on a good so that the producer and not the consumer pays most of the tax increase. Which level of price elasticity of demand would it be best for the good to have to achieve this aim? A price elasticity of demand is elastic B price elasticity of demand is inelastic C price elasticity of demand is perfectly inelastic D price elasticity of demand is unitary
1 marks
Answer: A
This question in 9708/12 Oct/Nov 2014
Q102 · The government imposes a maximum price of P2 on a product 9708/12 Oct/Nov 2014
18 The government imposes a maximum price of P2 on a product. S P2 P1 price D O Q2 Q1 Q3 quantity What will be the position after this action? A an equilibrium with price P1 and quantity Q1 B an equilibrium with price P2 and a quantity between Q2 and Q3 C an oversupply in the market by Q2Q3 D a shortage in the market of Q2Q3
1 marks
Answer: A
This question in 9708/12 Oct/Nov 2014
Q103 · A country exports olives 9708/13 Oct/Nov 2014
16 A country exports olives. The government is involved in their production because it wishes to ensure that private producers of olives have the confidence to plan investment despite changes in the harvest of olives. Which economic term would describe this situation? A a command economy B a constant income elasticity C an export quota D a price stabilisation policy
1 marks
Answer: D
This question in 9708/13 Oct/Nov 2014
Q104 · The table shows demand and supply schedules for a product 9708/13 Oct/Nov 2014
17 The table shows demand and supply schedules for a product. The government then subsidises the product because it provides external benefits. quantity quantity quantity price ($) demanded supplied before supplied after (units) subsidy (units) subsidy (units) 10 160 80 120 11 140 100 140 12 120 120 160 13 100 140 180 14 80 160 200 By how much does the subsidy increase consumption of the product? A 20 units B 40 units C 120 units D 140 units
1 marks
Answer: A
This question in 9708/13 Oct/Nov 2014
Q105 · The diagram illustrates a market for wheat 9708/13 Oct/Nov 2014
18 The diagram illustrates a market for wheat. The government sets a maximum price of OP. S P price D O quantity What could cause the maximum price to have an impact on the market? A a fall in the price of rice B an advertising campaign for bread C an increased wheat harvest D an increase in subsidies to wheat farmers
1 marks
Answer: B
This question in 9708/13 Oct/Nov 2014
Q106 · The government places a maximum price P1 on an agricultural product 9708/11 May/June 2015
18 The government places a maximum price P1 on an agricultural product. The supply and demand conditions for this product are shown in the diagram. S P1 price D O quantity What will be the outcome in the market for this product? A There will be an equilibrium price and output. B There will be a surplus of the product. C There will be higher than expected profits. D There will be shortages of the product.
1 marks
Answer: A
This question in 9708/11 May/June 2015
Q107 · The diagram shows the effect on the market for rice of a change in government policy that… 9708/12 May/June 2015
9 The diagram shows the effect on the market for rice of a change in government policy that causes a shift in the supply curve from S to S1. S S1 L price K J M D O quantity What does the area JKLM represent? A the cost to the government of a subsidy to rice growers B the extra saving to importers of the removal of a tariff on rice C the increase in consumer surplus from the introduction of a maximum price for rice D the loss in government revenue from the reduction in a lump sum tax on rice
1 marks
Answer: A
This question in 9708/12 May/June 2015
Q108 · Many people used to smoke in restaurants 9708/12 May/June 2015
11 Many people used to smoke in restaurants. Restaurant owners have found that the decline in smoking caused by a tax on cigarettes has decreased their sales of meals. How would this be shown on demand and supply diagrams for cigarettes and for meals? cigarettes meals A a movement along the demand curve a shift inwards of the demand curve B a movement along the supply curve a movement along the demand curve C a shift outwards of the demand curve a shift outwards of the supply curve D a shift outwards of the supply curve a movement along the supply curve
1 marks
Answer: A
This question in 9708/12 May/June 2015
Q109 · The diagram shows the effects of placing a unit tax equal to AB on a good 9708/12 May/June 2015
18 The diagram shows the effects of placing a unit tax equal to AB on a good. S2 S1 A price Z E G C F B D O X Y quantity Which area represents the burden of tax paid by the producer? A ECBF B EGBF C ZABF D ZAGE
1 marks
Answer: B
This question in 9708/12 May/June 2015
Q110 · The table shows the demand and supply schedules for a good before and after the… 9708/13 May/June 2015
9 The table shows the demand and supply schedules for a good before and after the imposition of a tax. price quantity quantity supplied quantity supplied ($) demanded before tax after tax 20 340 440 380 19 340 430 340 18 340 410 290 17 340 380 230 16 340 340 160 15 340 290 80 14 340 230 0 What was the amount of the tax? A $1 B $2 C $3 D $4
1 marks
Answer: C
This question in 9708/13 May/June 2015
Q111 · The diagram shows the demand and supply curves of a good 9708/13 May/June 2015
18 The diagram shows the demand and supply curves of a good. S PM price D O X Y Z quantity If the government sets a maximum price of OPM, what will be the quantity bought by consumers and the quantity supplied by producers? quantity bought quantity supplied by consumers by producers A OX OX B OX OZ C OY OY D OY OZ
1 marks
Answer: C
This question in 9708/13 May/June 2015
Q112 · The table shows demand and supply schedules for red peppers 9708/11 Oct/Nov 2015
11 The table shows demand and supply schedules for red peppers. The equilibrium price is initially 15 cents per kilogram (kg). price per kg amount demanded amount supplied cents kg (thousands) kg (thousands) 30 11 22 25 12 19 20 13 17 15 15 15 10 17 13 5 20 11 The government pays a subsidy of 10 cents per kg to producers. What will be the new equilibrium price? A 5 cents B 10 cents C 15 cents D 20 cents
1 marks
Answer: B
This question in 9708/11 Oct/Nov 2015
Q113 · The diagram shows the demand curve for an agricultural commodity that has unitary… 9708/11 Oct/Nov 2015
18 The diagram shows the demand curve for an agricultural commodity that has unitary elasticity. S1 is the supply curve if there is a bad harvest and S2 is the supply curve if there is a good harvest. S1 S2 price P D (unitary) O Q quantity What should the government do to keep the total revenue of farmers the same? A allow the price of the commodity to be determined by the market B fix the price paid to farmers at price OP C introduce a quota on production equal to OQ D provide subsidies in bad years and impose indirect taxes in good years
1 marks
Answer: A
This question in 9708/11 Oct/Nov 2015
Q114 · The diagram shows the market for onions in equilibrium at point X 9708/12 Oct/Nov 2015
18 The diagram shows the market for onions in equilibrium at point X. The government has a stock of onions and wants to establish a new equilibrium at point Y. supply Z X price Y demand O quantity Which actions should the government take? A It should buy an amount equal to XY and subsidise producers by a sum equal to YZ. B It should buy an amount equal to XY and tax producers by a sum equal to YZ. C It should sell an amount equal to XY and subsidise producers by a sum equal to YZ. D It should sell an amount equal to XY and tax producers by a sum equal to YZ.
1 marks
Answer: A
This question in 9708/12 Oct/Nov 2015
Q115 · The diagram shows the demand and supply curves for a good 9708/13 Oct/Nov 2015
13 The diagram shows the demand and supply curves for a good. S P1 P price D O Q1 Q Q2 quantity The government fixes a maximum price of OP1. What would happen? A Consumers would have to be rationed to quantity OQ1. B The government would have to introduce a subsidy of PP1. C The market equilibrium quantity OQ would be demanded and supplied. D The supply of quantity OQ2 would be guaranteed.
1 marks
Answer: C
This question in 9708/13 Oct/Nov 2015
Q116 · The diagram shows the demand and supply curves of a good 9708/13 Oct/Nov 2015
18 The diagram shows the demand and supply curves of a good. S J price D O quantity The government sets a minimum price of OJ for the good. How will this affect the producers and consumers of the good? effect on producers effect on consumers A all producers will gain consumers will lose B all producers will gain consumers will gain C some producers will gain and some will lose consumers will lose D some producers will gain and some will lose consumers will gain
1 marks
Answer: C
This question in 9708/13 Oct/Nov 2015
Q117 · A specific tax is placed upon each bottle of perfume sold 9708/12 Feb/March 2016
11 A specific tax is placed upon each bottle of perfume sold. In the diagram, SS is the supply curve before tax, StSt is the supply curve after tax. D St S W R price U Q X P T St D S O Y Z quantity Which area represents that part of the tax revenue paid by producers? A ORWY B PQUT C PRWT D QRWU
1 marks
Answer: B
This question in 9708/12 Feb/March 2016
Q118 · A company opened a garden to the public and charged for entry 9708/12 Feb/March 2016
13 A company opened a garden to the public and charged for entry. The government then provided a grant to improve the garden on the condition that entry became free. What would result from the government’s action? A The consumer surplus would increase. B The demand curve would shift to the left. C The supply curve would be infinitely elastic. D There would be no equilibrium position as the garden is free.
1 marks
Answer: A
This question in 9708/12 Feb/March 2016
Q119 · The diagram shows the percentages of those on low pay and those on extremely low pay in… 9708/12 Feb/March 2016
14 The diagram shows the percentages of those on low pay and those on extremely low pay in the UK from 1976 to 2012. A national minimum wage was introduced in 1999. 25 low paid 20 15 introduction of % minimum wage 10 extremely low paid 5 0 1976 1980 1984 1988 1992 1996 2000 2004 2008 2012 year What conclusion is consistent with the diagram? A The minimum wage helped the low paid more than the extremely low paid. B The minimum wage reduced the numbers of both low paid and extremely low paid. C The minimum wage reversed the trend in low pay of the previous 20 years. D The minimum wage was responsible for the largest reduction of low pay in the period.
1 marks
Answer: C
This question in 9708/12 Feb/March 2016
Q120 · A 10% tax is placed on a good 9708/12 Feb/March 2016
15 A 10% tax is placed on a good. What type of product would be most likely to face the biggest impact on its equilibrium price as a result? A one with elastic demand B one with inelastic demand C one with infinite elasticity of demand D one with unitary elasticity of demand
1 marks
Answer: B
This question in 9708/12 Feb/March 2016
Q121 · The diagram shows the market for wheat 9708/12 Feb/March 2016
17 The diagram shows the market for wheat. S P2 price P1 D O X Y Z quantity If the government wishes to fix the price at OP2 what quantity of wheat must the government buy? A OZ B XY C XZ D YZ
1 marks
Answer: C
This question in 9708/12 Feb/March 2016
Q122 · A specific tax is placed upon each bottle of perfume sold 9708/11 May/June 2016
11 A specific tax is placed upon each bottle of perfume sold. In the diagram, SS is the supply curve before tax, StSt is the supply curve after tax. D St S W R price U Q X P T St D S O Y Z quantity Which area represents that part of the tax revenue paid by consumers? A ORWY B PQUT C PRWT D QRWU
1 marks
Answer: D
This question in 9708/11 May/June 2016
Q123 · The diagram shows the market supply and demand curves for wheat 9708/11 May/June 2016
14 The diagram shows the market supply and demand curves for wheat. D S P2 P1 price O K L R output What should a government do to maintain a minimum price of OP2? A buy quantity KL B buy quantity KR C sell quantity LR D sell quantity KR
1 marks
Answer: B
This question in 9708/11 May/June 2016
Q124 · A product with infinite elasticity of supply has sales of 1000 units a week at a price of… 9708/11 May/June 2016
15 A product with infinite elasticity of supply has sales of 1000 units a week at a price of $1 per unit. Price elasticity of demand is 1.5 over the relevant range. The government imposes a tax of 10%. What will be the government’s weekly tax revenue? A $15 B $85 C $100 D $150
1 marks
Answer: B
This question in 9708/11 May/June 2016
Q125 · A government pays a subsidy to a country’s onion producers 9708/11 May/June 2016
16 A government pays a subsidy to a country’s onion producers. With which price elasticity of demand (PED) will this action be most effective in reducing the price of onions? A PED equals 0. B PED is greater than 0 but less than 1. C PED equals 1. D PED is greater than 1 but less than infinity.
1 marks
Answer: A
This question in 9708/11 May/June 2016
Q126 · The diagram shows the demand curve and supply curve for a good on which the government… 9708/12 May/June 2016
12 The diagram shows the demand curve and supply curve for a good on which the government imposes a specific tax. S D price D S O quantity What will be the result of this tax? A Most of the incidence of the tax will fall on the producer. B There will be a new demand curve parallel to DD. C The price will rise by the full amount of the tax. D The quantity bought will fall proportionately to the tax rate.
1 marks
Answer: A
This question in 9708/12 May/June 2016
Q127 · A government imposes a maximum rent in order to make rented housing more affordable 9708/12 May/June 2016
14 A government imposes a maximum rent in order to make rented housing more affordable. What is likely to be a long-run consequence if the maximum is set below the current free market level? A a shortage of applicants for rented housing B a shortage of rented housing C an increase in supply to satisfy the increased demand for rented housing D an increase in the number of occupants of rented housing
1 marks
Answer: B
This question in 9708/12 May/June 2016
Q128 · The diagram shows demand and supply curves for a good 9708/12 May/June 2016
15 The diagram shows demand and supply curves for a good. S1 is the original supply curve, S2 is supply after a tax is added. S2 8 price S1 ($) 4 3 D 0 10 14 quantity How much tax revenue is earned by the government? A $10 B $40 C $50 D $80
1 marks
Answer: C
This question in 9708/12 May/June 2016
Q129 · In the diagram, DD is the demand curve for an agricultural commodity, S1 is the supply… 9708/12 May/June 2016
17 In the diagram, DD is the demand curve for an agricultural commodity, S1 is the supply curve in period 1 and S2 is the supply curve in period 2. The broken curve is a rectangular hyperbola. S1 D S2 P1 price P2 D O quantity The government operates a buffer stock scheme fixing the price at OP1 in period 1 and OP2 in period 2. How do output and farm revenue in period 2 compare with period 1? output farm revenue A higher same B higher higher C lower higher D lower same
1 marks
Answer: A
This question in 9708/12 May/June 2016
Q130 · A government decides to privatise a nationalised company by transferring ownership… 9708/12 May/June 2016
18 A government decides to privatise a nationalised company by transferring ownership directly to its managers and workers. What is its most likely motive for this decision? A to increase the amount of innovation B to increase the level of competition C to increase the level of incentive D to increase the scale of production
1 marks
Answer: C
This question in 9708/12 May/June 2016
Q131 · In the market for a good the quantity supplied (QS) and the quantity demanded (QD) are… 9708/13 May/June 2016
11 In the market for a good the quantity supplied (QS) and the quantity demanded (QD) are given by QS = P – 30 and QD = 240 – 2P where P = price in dollars. A change in the tax on the good makes QS = P – 36. How will the change affect equilibrium price? A It will fall by $2. B It will fall by $6. C It will rise by $2. D It will rise by $6.
1 marks
Answer: C
This question in 9708/13 May/June 2016
Q132 · In the diagram, D is the demand curve for Indian tea exports and S1 is the initial supply… 9708/13 May/June 2016
13 In the diagram, D is the demand curve for Indian tea exports and S1 is the initial supply curve. S1 S2 price x z w y D O quantity The Indian government removes the tax on tea exports, which causes the supply curve to shift to S2. Which areas in the diagram measure the resulting loss in tax revenue to the Indian government and the resulting gain in consumer surplus? loss in tax gain in revenue consumer surplus A x w + y B x y C x + y z D x + y z + x
1 marks
Answer: D
This question in 9708/13 May/June 2016
Q133 · In the diagram, D is the demand curve of an agricultural commodity and S is the initial… 9708/13 May/June 2016
17 In the diagram, D is the demand curve of an agricultural commodity and S is the initial supply curve. The government promises to maintain farmers’ incomes at least at their initial level. The harvests in four subsequent years are shown by supply curves S1 – S4. 6 S1 S 5 S2 4 S3 price 3 ($) S4 2 1 D 0 1 2 3 4 5 6 quantity (’000 tonnes) In which years will the government not need to provide extra income to farmers? A 1 and 2 B 1 and 4 C 2 and 3 D 3 and 4
1 marks
Answer: C
This question in 9708/13 May/June 2016
Q134 · A government imposes a tax on a good 9708/11 Oct/Nov 2016
7 A government imposes a tax on a good. The equilibrium price rises by the same amount as the tax. What can be concluded about the price elasticity of demand for the good? A It is perfectly elastic. B It is perfectly inelastic. C It is unitary. D Nothing can be determined about price elasticity of demand.
1 marks
Answer: B
This question in 9708/11 Oct/Nov 2016
Q135 · The diagram shows the demand and supply curves of a good 9708/11 Oct/Nov 2016
14 The diagram shows the demand and supply curves of a good. S price J D O quantity The government sets a maximum price of OJ for the good. How will this affect the consumers and producers of the good? effect on consumers effect on producers A All consumers will gain. Producers will lose. B All consumers will gain. Producers will gain. C Some consumers will gain and some will lose. Producers will gain. D Some consumers will gain and some will lose. Producers will lose.
1 marks
Answer: D
This question in 9708/11 Oct/Nov 2016
Q136 · The diagram shows possible demand and supply curves for places in colleges in a country 9708/11 Oct/Nov 2016
16 The diagram shows possible demand and supply curves for places in colleges in a country. The initial equilibrium position is X. To increase the number of students in colleges, a government subsidises the colleges and also gives a grant of money to the students. What would be the new equilibrium position? D1 B S1 A price X C S1 D D1 O college places
1 marks
Answer: C
This question in 9708/11 Oct/Nov 2016
Q137 · A government imposes an indirect tax on a product with normal demand and supply curves 9708/12 Oct/Nov 2016
13 A government imposes an indirect tax on a product with normal demand and supply curves. The tax raises $100 million. What effect will the tax have on the value of the combined consumer surplus and producer surplus? A It will be unaffected. B It will fall by less than $100 million. C It will fall by exactly $100 million. D It will fall by more than $100 million.
1 marks
Answer: D
This question in 9708/12 Oct/Nov 2016
Q138 · In the diagram, D is the demand curve of an agricultural commodity and S is the initial… 9708/12 Oct/Nov 2016
14 In the diagram, D is the demand curve of an agricultural commodity and S is the initial supply curve. The government promises to maintain farmers’ incomes at least at this initial level. The harvests in four subsequent years are shown by supply curves S1–S4. 6 S1 S 5 S2 4 S3 price 3 ($) S4 2 1 D 0 1 2 3 4 5 6 quantity (’000 tonnes) How much in total will the government pay to support farmers over the four subsequent years? A $0 B $3000 C $6000 D $10 000
1 marks
Answer: C
This question in 9708/12 Oct/Nov 2016
Q139 · The diagram shows the supply and demand curves of a commodity 9708/12 Oct/Nov 2016
15 The diagram shows the supply and demand curves of a commodity. A government subsidy causes the supply curve to shift from S1 to S2. Which area measures the difference between the cost to the economy of producing the resulting increase in output (Q1–Q2) and the value consumers place on this increase in output? D S1 S2 price A B C D O Q1 Q2 quantity
1 marks
Answer: A
This question in 9708/12 Oct/Nov 2016
Q140 · Which government policy might limit the rationing function of the price mechanism? 9708/12 Oct/Nov 2016
17 Which government policy might limit the rationing function of the price mechanism? A the abolition of tariffs on imported consumer goods B the levy of indirect taxes at varying rates on different goods C the payment of subsidies to exporters D the setting of minimum prices for milk
1 marks
Answer: D
This question in 9708/12 Oct/Nov 2016
Q141 · Which argument has often been used to justify the privatisation of state enterprises? 9708/12 Oct/Nov 2016
18 Which argument has often been used to justify the privatisation of state enterprises? A Private firms always aim at maximum profits. B Private firms can produce the same outputs at lower unit costs. C State enterprises are always monopolies which exploit consumers. D State enterprises cannot operate without government subsidies.
1 marks
Answer: B
This question in 9708/12 Oct/Nov 2016
Q142 · The diagram shows demand and supply for bread made from wheat and X is the original… 9708/13 Oct/Nov 2016
12 The diagram shows demand and supply for bread made from wheat and X is the original equilibrium point. What will the new equilibrium position be following removal of subsidies to the wheat industry and successful advertising about the benefits of a wheat-free diet? S1 A price X B D C D1 O quantity
1 marks
Answer: D
This question in 9708/13 Oct/Nov 2016
Q143 · The diagram shows the market demand and supply curves for rice 9708/13 Oct/Nov 2016
14 The diagram shows the market demand and supply curves for rice. S 10 price 8 ($) D O Q1 Q2 Q3 quantity What would happen if a government imposed a maximum price of $10? A The government would need to supply Q1 to Q3. B The quantity sold would be Q1. C The quantity sold would be Q2. D The quantity sold would increase from Q2 to Q3.
1 marks
Answer: C
This question in 9708/13 Oct/Nov 2016
Q144 · What will cause the payment of a subsidy to firms to result in the greatest increase in… 9708/13 Oct/Nov 2016
16 What will cause the payment of a subsidy to firms to result in the greatest increase in sales? A a shift in the demand curve to the right B a shift in the supply curve to the left C an elastic price elasticity of demand for the product D an inelastic price elasticity of supply for the product
1 marks
Answer: C
This question in 9708/13 Oct/Nov 2016
Q145 · Privatisation can be achieved by the sale of shares to the general public (public offers… 9708/13 Oct/Nov 2016
18 Privatisation can be achieved by the sale of shares to the general public (public offers, PO) or by the direct sale to a private company (private sales, PS). The diagram shows privatisation transactions and revenue for the European Union between 1981 and 2012. 90 000 key 200 revenues (current EUR mil) 80 000 revenues from PS 180 70 000 revenues from PO 160 transactions 140 60 000 transactions 120 50 000 100 40 000 80 30 000 60 20 000 40 10 000 20 0 0 1981 1982 1983 1984 1985 1986 1987 1988 1989 1990 1991 1992 1993 1994 1995 1996 1997 1998 1999 2000 2001 2002 2003 2004 2005 2006 2007 2008 2009 2010 2011 2012 year What can be concluded from the diagram? A Any increase in the number of privatisations resulted in an increase in privatisation revenue. B The average revenue per privatisation was highest in 2000. C The main method of privatisation changed from public offers to private sales. D The number of privatisations and revenue raised peaked in the same year.
1 marks
Answer: C
This question in 9708/13 Oct/Nov 2016
Q146 · In 2014 some supermarkets reduced the price they were willing to pay farmers for milk to… 9708/12 Feb/March 2017
14 In 2014 some supermarkets reduced the price they were willing to pay farmers for milk to below what was then the market equilibrium price. They passed the lower price onto the consumers in order to try and encourage them into the store. The government then fixed an effective minimum price which the supermarkets had to pay the farmers. These two actions are shown in the diagram. price S D 0 4 6 9 13 17 ’000 litres What would be the outcome after the supermarket action and then the government action? after supermarket action after government action A a shortage of 5000 litres a surplus of 4000 litres B a shortage of 5000 litres a surplus of 7000 litres C a shortage of 13 000 litres a surplus of 4000 litres D a shortage of 13 000 litres a surplus of 7000 litres
1 marks
Answer: D
This question in 9708/12 Feb/March 2017
Q147 · The initial market for a product is represented by the demand and supply curves D1 and S1… 9708/12 Feb/March 2017
15 The initial market for a product is represented by the demand and supply curves D1 and S1 respectively. A subsidy is then introduced, represented by the shift of S1 to S2 (+ subsidy). S1 price of product T P R S2 (+ subsidy) N Q D1 O A B quantity of product What is the incidence of the subsidy for the consumer and producer? consumer producer A PN NA B QR TR C QT QB D TR QR
1 marks
Answer: B
This question in 9708/12 Feb/March 2017
Q148 · In the diagram, D is the demand curve of an agricultural commodity and S is the initial… 9708/12 Feb/March 2017
17 In the diagram, D is the demand curve of an agricultural commodity and S is the initial supply curve. The government promises to maintain farmers’ incomes at least at this initial level. The harvests in four subsequent years are shown by supply curves S1–S4. 6 S price S1 5 ($) S2 4 S3 3 S4 2 1 D 0 1 2 3 4 5 6 quantity (’000 tonnes) How much in total will the government need to pay to support farmers over the four subsequent years? A $0 B $3000 C $6000 D $10 000
1 marks
Answer: A
This question in 9708/12 Feb/March 2017
Q149 · A government imposes a specific indirect tax on a product 9708/11 May/June 2017
12 A government imposes a specific indirect tax on a product. When will the tax cause the greatest reduction in consumer surplus for the buyers of the product? A The product has price elastic demand and price elastic supply. B The product has price elastic demand and price inelastic supply. C The product has price inelastic demand and price elastic supply. D The product has price inelastic demand and price inelastic supply.
1 marks
Answer: C
This question in 9708/11 May/June 2017
Q150 · A government fixes a minimum price for a service 9708/11 May/June 2017
14 A government fixes a minimum price for a service. What will be the outcome of such a policy? A Demand will fall if the minimum price is below the equilibrium price. B Demand will rise if the minimum price is above the equilibrium price. C Production will fall if the minimum price is above the equilibrium price. D Production will stay the same if the minimum price is below the equilibrium price.
1 marks
Answer: D
This question in 9708/11 May/June 2017
Q151 · The diagram illustrates the effects of placing a specific tax equal to JM on a good 9708/11 May/June 2017
15 The diagram illustrates the effects of placing a specific tax equal to JM on a good. S2 price S1 J X L K Y Z M D O quantity Which area represents total tax receipts? A JKM B XJKY C XJLY D XJMZ
1 marks
Answer: D
This question in 9708/11 May/June 2017
Q152 · The diagram shows the demand curve, D1, and the supply curve, S1, for a good 9708/11 May/June 2017
16 The diagram shows the demand curve, D1, and the supply curve, S1, for a good. S3 price S1 S2 S4 D2 D1 O quantity The government decides to pay producers a specific subsidy for each unit supplied to the market. Which curve shows the new effective demand or supply curve? A D2 B S2 C S3 D S4
1 marks
Answer: B
This question in 9708/11 May/June 2017
Q153 · What is likely to occur when the government privatises public sector monopolies? 9708/11 May/June 2017
18 What is likely to occur when the government privatises public sector monopolies? A Consumer choice will increase. B Employment will increase in the short run. C Innovation will be discouraged. D The production of public goods will increase.
1 marks
Answer: A
This question in 9708/11 May/June 2017
Q154 · A specific tax is placed on the sale of bottles of lemonade 9708/12 May/June 2017
14 A specific tax is placed on the sale of bottles of lemonade. In the diagram, SS is the supply curve before imposition of the tax and StSt is the supply curve after tax. St price D W S U X St D T S O quantity Which distance represents the specific tax on each bottle? A UT B WT C WU D WX
1 marks
Answer: B
This question in 9708/12 May/June 2017
Q155 · A market is in equilibrium at point X 9708/12 May/June 2017
15 A market is in equilibrium at point X. The government then subsidises both consumers and producers by direct payments. What will be the new equilibrium position? S2 S1 S3 price A B X C D D1 D2 O quantity
1 marks
Answer: C
This question in 9708/12 May/June 2017
Q156 · What is an example of direct public provision of goods and services? 9708/12 May/June 2017
17 What is an example of direct public provision of goods and services? A a charity hospital funded by public donations that offers free treatment to the rural poor B a mobile government library that travels to rural villages offering access to books C a pharmacy in a local shopping centre that provides treatment direct to the public D a private school that offers free places to children of low income families
1 marks
Answer: B
This question in 9708/12 May/June 2017
Q157 · What would supporters of a nationalised public transport service expect to be the most… 9708/12 May/June 2017
18 What would supporters of a nationalised public transport service expect to be the most likely outcome from the privatisation of train and bus services? A fewer destinations served by trains and buses B lower fares C more frequent services to all destinations D more people employed in public transport services
1 marks
Answer: A
This question in 9708/12 May/June 2017
Q158 · The diagram shows a market subject to a maximum price 9708/13 May/June 2017
14 The diagram shows a market subject to a maximum price. S price P maximum price D O Q1 Q Q2 quantity What will happen if the maximum price is removed? A There will be allocation by a queuing system. B There will be allocation by government rationing. C There will be allocation by seller’s preference. D There will be allocation by the price system.
1 marks
Answer: D
This question in 9708/13 May/June 2017
Q159 · The diagram illustrates the effect of a government action that shifts S1 to S2 9708/13 May/June 2017
15 The diagram illustrates the effect of a government action that shifts S1 to S2. S2 S1 price W X Z Y D O quantity What does the area of the rectangle WXYZ represent? A the consumer tax burden B the government tax revenue C the government subsidy payment D the producer subsidy income
1 marks
Answer: B
This question in 9708/13 May/June 2017
Q160 · The table shows the demand and supply schedules for a product before and after the… 9708/13 May/June 2017
16 The table shows the demand and supply schedules for a product before and after the government pays a subsidy of $4 per unit to the producers. quantity quantity quantity price demanded supplied before supplied after ($) (units) subsidy (units) subsidy (units) 6 140 60 100 8 120 80 120 10 100 100 140 12 80 120 160 14 60 140 180 What is the total government spending on the subsidy? A $240 B $400 C $480 D $960
1 marks
Answer: C
This question in 9708/13 May/June 2017
Q161 · The diagram shows the market for labour 9708/11 Oct/Nov 2017
14 The diagram shows the market for labour. At which level would an effective minimum wage rate have to be set? labour supply wage rate A B C D labour demand O quantity of labour employed
1 marks
Answer: A
This question in 9708/11 Oct/Nov 2017
Q162 · What is an accurate statement about a production subsidy? 9708/11 Oct/Nov 2017
15 What is an accurate statement about a production subsidy? A It causes demand for the good to increase so the demand curve shifts to the right. B It enables firms to supply more so the supply curve shifts to the left. C It is financial assistance to firms from the government to help increase output. D It is money taken from firms by the government to reduce harmful side effects of production.
1 marks
Answer: C
This question in 9708/11 Oct/Nov 2017
Q163 · The diagram shows the market supply and demand curves for an agricultural product 9708/11 Oct/Nov 2017
16 The diagram shows the market supply and demand curves for an agricultural product. The government guarantees producers a price of at least OX for their output, but allows the market price to be freely determined by demand and supply. supply price U X Y Z V W demand O S T quantity Which area in the diagram represents the total subsidy payments made by the government to producers? A UYTS B UYZW C XUWV D XYZV
1 marks
Answer: D
This question in 9708/11 Oct/Nov 2017
Q164 · What is not an example of protectionism? 9708/11 Oct/Nov 2017
27 What is not an example of protectionism? A a ban on the imports of chicken products B import tariffs on agricultural products C maximum supermarket food prices D strict health and safety requirements
1 marks
Answer: C
This question in 9708/11 Oct/Nov 2017
Q165 · In the diagram, S1 is the original supply curve and D is the original demand curve 9708/12 Oct/Nov 2017
13 In the diagram, S1 is the original supply curve and D is the original demand curve. S2 W price S1 V T R P Q D O M N quantity If supply shifts to S2, which area represents the change in consumer surplus? A PQVT B PQW C PRVT D TVW
1 marks
Answer: A
This question in 9708/12 Oct/Nov 2017
Q166 · After a series of poor harvests, a government imposes an effective maximum price on… 9708/12 Oct/Nov 2017
14 After a series of poor harvests, a government imposes an effective maximum price on cereals. What would be a consequence of this policy? A Both rich and poor people would satisfy their demands equally. B Illegal buying and selling through a black market would be prevented. C Rationing would be necessary to ensure a fair distribution of cereals. D The market would fail to clear leaving a surplus of cereals.
1 marks
Answer: C
This question in 9708/12 Oct/Nov 2017
Q167 · The diagram shows the demand and supply curves of a commodity before and after a specific… 9708/12 Oct/Nov 2017
15 The diagram shows the demand and supply curves of a commodity before and after a specific tax is removed. S S 12 price 10 8 6 4 2 D 0 quantity What is the tax per unit of output and what is the price after the removal of the tax? price after the tax per unit removal of the tax A 6 6 B 6 8 C 4 6 D 4 8
1 marks
Answer: A
This question in 9708/12 Oct/Nov 2017
Q168 · The diagram shows the market for heating oil 9708/12 Oct/Nov 2017
16 The diagram shows the market for heating oil. S price D O quantity If the government introduces a production subsidy, how will the financial benefit be shared between consumers and producers? A It will be shared equally between producer and consumer. B It will go entirely to the producer. C The majority will go to the consumer. D The majority will go to the producer.
1 marks
Answer: D
This question in 9708/12 Oct/Nov 2017
Q169 · Health services in an economy are provided by private clinics that charge high fees 9708/12 Oct/Nov 2017
18 Health services in an economy are provided by private clinics that charge high fees. The government decides health services should be provided for everyone, not based on ability to pay. Which direct action should it take? A Build government clinics to compete in the market. B Close private clinics where provision by the market is inadequate. C Increase the taxes on profits made by private clinics. D Nationalise private clinics and remove charging.
1 marks
Answer: D
This question in 9708/12 Oct/Nov 2017
Q170 · In which situation will it be necessary to use an alternative to the price mechanism to… 9708/13 Oct/Nov 2017
11 In which situation will it be necessary to use an alternative to the price mechanism to allocate a good between consumers? A Supply exceeds the quantity demanded at the initial market price. B The government sets a price ceiling below the equilibrium price. C The product is excludable and rival. D There is a single monopoly producer.
1 marks
Answer: B
This question in 9708/13 Oct/Nov 2017
Q171 · A government has introduced an effective maximum price on rice 9708/13 Oct/Nov 2017
14 A government has introduced an effective maximum price on rice. Which combination of changes must cause an existing shortage of rice to increase the most? A a fall in the maximum price and a less price-elastic supply B a fall in the maximum price and a more price-elastic supply C a rise in the maximum price and a less price-elastic supply D a rise in the maximum price and more price-elastic supply
1 marks
Answer: B
This question in 9708/13 Oct/Nov 2017
Q172 · The diagram shows the market for a product before and after the introduction of a subsidy 9708/13 Oct/Nov 2017
15 The diagram shows the market for a product before and after the introduction of a subsidy. supply before subsidy supply after S subsidy price T Y R U Q V X P W demand O T1 T2 quantity Which area represents the total amount paid in subsidies? A PRYX B QRUV C QSTV D RSTU
1 marks
Answer: C
This question in 9708/13 Oct/Nov 2017
Q173 · The table shows the demand and supply schedules for a good before and after the… 9708/13 Oct/Nov 2017
17 The table shows the demand and supply schedules for a good before and after the imposition of a tax. price quantity quantity supplied quantity supplied ($) demanded before tax after tax 20 340 440 380 19 340 430 340 18 340 410 290 17 340 380 230 16 340 340 160 15 340 290 80 14 340 230 0 What was the tax and the price change? tax price change ($) ($) A 3 2 B 3 3 C 4 3 D 4 4
1 marks
Answer: B
This question in 9708/13 Oct/Nov 2017
Q174 · Which benefit is most likely to result from a rise in the minimum price of labour (wage… 9708/12 Feb/March 2018
14 Which benefit is most likely to result from a rise in the minimum price of labour (wage rate)? A a reduction in costs of production B a reduction in income inequality C a reduction in the level of unemployment D a reduction in the rate of inflation
1 marks
Answer: B
This question in 9708/12 Feb/March 2018
Q175 · The diagram shows the equilibrium price and quantity of good X 9708/12 Feb/March 2018
15 The diagram shows the equilibrium price and quantity of good X. price S F E D O quantity The initial market equilibrium is shown by point E. What might cause the market equilibrium to move to point F? A a decrease in the costs of producing good X B a decrease in the demand for good X C an increase in the price of a substitute good D the imposition of a specific sales tax on producers of good X
1 marks
Answer: D
This question in 9708/12 Feb/March 2018
Q176 · The table shows the demand and supply schedules for a product before and after the… 9708/12 Feb/March 2018
16 The table shows the demand and supply schedules for a product before and after the government pays a subsidy of $4 per unit to the producers. quantity quantity supplied quantity supplied price demanded before subsidy after subsidy $ (units) (units) (units) 6 250 50 150 8 200 100 200 10 150 150 250 12 100 200 300 14 50 250 350 Assuming that any extra sales are to new consumers, how much do the original consumers of the product save as a result of the subsidy? A $300 B $600 C $900 D $1500
1 marks
Answer: A
This question in 9708/12 Feb/March 2018
Q177 · A specific tax is placed upon each bottle of perfume sold 9708/11 May/June 2018
12 A specific tax is placed upon each bottle of perfume sold. In the diagram, S is the supply curve before tax and St is the supply curve after tax. St price S W R U Q X P T D O Y Z quantity Which area represents the revenue received by the government from the tax? A ORWY B PQUT C PRWT D QRWU
1 marks
Answer: C
This question in 9708/11 May/June 2018
Q178 · Which statement about maximum and minimum prices is correct? 9708/11 May/June 2018
14 Which statement about maximum and minimum prices is correct? A With an effective maximum price for a product, a shortage will develop. B With an effective maximum price for a product, the market price will rise. C With an effective minimum price for a product, rationing will be necessary. D With an effective minimum price for a product, the market price will fall.
1 marks
Answer: A
This question in 9708/11 May/June 2018
Q179 · The diagram shows the effect on the market for a product of the introduction of a… 9708/11 May/June 2018
15 The diagram shows the effect on the market for a product of the introduction of a government subsidy. 25 price ($) 20 S1 15 S2 10 D 5 0 0 10 20 30 40 50 60 quantity What is the result of the payment of the subsidy? A Consumer surplus increases. B The price to the consumer halves. C The subsidy provides over half of producer income. D Total consumer expenditure on the product increases.
1 marks
Answer: A
This question in 9708/11 May/June 2018
Q180 · Which government action would be identified as the direct provision of goods and services? 9708/11 May/June 2018
18 Which government action would be identified as the direct provision of goods and services? A increasing road maintenance because of poor weather conditions B making payments to low-income families with elderly dependants C subsidising firms in order to encourage them to increase their output D taxing firms because they have been emitting damaging fumes
1 marks
Answer: A
This question in 9708/11 May/June 2018
Q181 · A government wishes to impose a tax on a good so that the producer and not the consumer… 9708/12 May/June 2018
14 A government wishes to impose a tax on a good so that the producer and not the consumer pays most of the tax. Which type of elasticity would it be best for the good to have to achieve this aim? A high price elasticity of demand B low price elasticity of demand C totally inelastic price elasticity of demand D unitary price elasticity of demand
1 marks
Answer: A
This question in 9708/12 May/June 2018
Q182 · The diagram shows the effect on the supply curve of a product when the government… 9708/12 May/June 2018
15 The diagram shows the effect on the supply curve of a product when the government provides a subsidy. 25 price ($) 20 S1 15 10 S2 5 0 0 10 20 30 40 50 60 quantity What can be concluded about the nature of the subsidy as the quantity supplied increases? A It is a falling percentage (%) of the price of each unit. B It is a fixed percentage (%) of the price of each unit. C It is a fixed sum on each unit. D It is a rising percentage (%) of the price of each unit.
1 marks
Answer: B
This question in 9708/12 May/June 2018
Q183 · The demand and supply functions for a product are quantity demanded = 1500 + 50P and… 9708/13 May/June 2018
14 The demand and supply functions for a product are quantity demanded = 1500 + 50P and quantity supplied = 300P – 2000 where P = price. With government regulation, the current price in the market is $15. What can be concluded about the form of price regulation and the balance of demand and supply in the market? form of price regulation balance of demand and supply A effective maximum price excess demand B effective maximum price excess supply C effective minimum price excess demand D effective minimum price excess supply
1 marks
Answer: D
This question in 9708/13 May/June 2018
Q184 · Which element of a tax and benefits system is regressive? 9708/13 May/June 2018
15 Which element of a tax and benefits system is regressive? A rent subsidies to tenants of publicly owned housing B specific taxes on beer and tobacco C the payment of child benefits to families D the taxation of capital gains
1 marks
Answer: B
This question in 9708/13 May/June 2018
Q185 · A government decides to encourage apple consumption as a report states that eating apples… 9708/13 May/June 2018
16 A government decides to encourage apple consumption as a report states that eating apples is good for health. It subsidises apple growers. The diagram shows the market for apples. S1 price P3 P2 P1 D1 O Q1 Q2 quantity of apples What would the subsidy need to be to change the market equilibrium quantity from Q1 to Q2? A OP1 B P1P2 C P1P3 D P2P3
1 marks
Answer: C
This question in 9708/13 May/June 2018
Q186 · The government fixes a minimum price for a product above the current equilibrium price 9708/11 Oct/Nov 2018
9 The government fixes a minimum price for a product above the current equilibrium price. Which value for the product’s price elasticity of supply will result in the smallest excess supply in its market? A between zero and one B greater than one C one D zero
1 marks
Answer: D
This question in 9708/11 Oct/Nov 2018
Q187 · In the diagram S and S1 are the supply curves for an agricultural product in years 1 and… 9708/11 Oct/Nov 2018
12 In the diagram S and S1 are the supply curves for an agricultural product in years 1 and 2 respectively. D is the demand curve in years 1 and 2. In year 1 the government purchased an amount necessary to ensure that the price was OP. S S1 price (year 1) (year 2) P D O W X Y Z quantity The price is held at OP in year 2. How much more must the government buy in year 2 than it bought in year 1? A WZ B XY C XZ D YZ
1 marks
Answer: D
This question in 9708/11 Oct/Nov 2018
Q188 · The diagram shows the demand and supply curves for a good 9708/11 Oct/Nov 2018
14 The diagram shows the demand and supply curves for a good. S price P1 P D O Q1 Q Q2 quantity The government fixes a maximum price of OP1. What would happen? A Consumers would have to be rationed to quantity OQ1. B The government would have to introduce a subsidy of PP1. C The market equilibrium quantity OQ would be demanded and supplied. D The supply of quantity OQ2 would be guaranteed.
1 marks
Answer: C
This question in 9708/11 Oct/Nov 2018
Q189 · The diagram shows the equilibrium price, P1, and quantity bought and sold, Q1, in a… 9708/11 Oct/Nov 2018
16 The diagram shows the equilibrium price, P1, and quantity bought and sold, Q1, in a market before a subsidy is granted. S1 price S2 P3 L P1 M P2 N D1 O Q1 Q2 quantity What represents the producer incidence (benefit) after the subsidy is granted and what is government expenditure on the subsidy? producer government incidence (benefit) expenditure A P1P2NM P1P2NM B P1P2NM P3P2NL C P1P3LM P1P3LM D P1P3LM P3P2NL
1 marks
Answer: D
This question in 9708/11 Oct/Nov 2018
Q190 · The diagram shows the market for cocoa, which is a normal good 9708/12 Oct/Nov 2018
10 The diagram shows the market for cocoa, which is a normal good. Initially the market is in equilibrium with price Pe and quantity Qe bought and sold. S2 price S1 X Pe D2 D1 O Qe quantity Which sequence of events (event 1 followed by event 2) must have occurred in order to move to the new equilibrium at point X? event 1 event 2 A a decline in the removal of a subsidy popularity of cocoa previously paid to cocoa producers B a decrease in a decrease in costs disposable income of producing cocoa C an increase in an increase in the number disposable income of cocoa producers D a successful advertising an increase in the campaign by cocoa producers taxation of cocoa
1 marks
Answer: D
This question in 9708/12 Oct/Nov 2018
Q191 · The government fixes a maximum price for wheat flour below the market equilibrium price 9708/12 Oct/Nov 2018
14 The government fixes a maximum price for wheat flour below the market equilibrium price. After the maximum price is imposed, which statement is not correct? A Producers’ revenue is increased. B Some consumers may encourage illegal sales. C The quantity supplied of flour will decrease. D There will be an excess demand for flour.
1 marks
Answer: A
This question in 9708/12 Oct/Nov 2018
Q192 · In 2014 Egypt reduced subsidies on fossil fuels such as gasoline and diesel 9708/12 Oct/Nov 2018
16 In 2014 Egypt reduced subsidies on fossil fuels such as gasoline and diesel. The diagram shows the initial equilibrium at point X. What will be the new equilibrium after the reduction of subsidies? S1 price B C X A D D1 O quantity
1 marks
Answer: B
This question in 9708/12 Oct/Nov 2018
Q193 · In the diagram D1 is the demand curve for Indian tea and S1 is the initial supply curve 9708/13 Oct/Nov 2018
12 In the diagram D1 is the demand curve for Indian tea and S1 is the initial supply curve. S2 price v S1 w x y D1 O quantity The Indian government imposes a tax on tea, which causes the supply curve to shift to S2. Which areas in the diagram measure the resulting tax revenue to the Indian government and the new producer surplus? tax new revenue producer surplus A w + x v B w + x w C w + x + y v D w + x + y w
1 marks
Answer: D
This question in 9708/13 Oct/Nov 2018
Q194 · A ««1«« price set below the market equilibrium will cause a ««2«« of the product, and a… 9708/13 Oct/Nov 2018
14 A ««1«« price set below the market equilibrium will cause a ««2«« of the product, and a ««3«« price set above the market equilibrium will cause a ««4«« of the product. Which words complete gaps 1, 2, 3 and 4? 1 2 3 4 A maximum shortage minimum surplus B maximum surplus minimum shortage C minimum shortage maximum surplus D minimum surplus maximum shortage
1 marks
Answer: A
This question in 9708/13 Oct/Nov 2018
Q195 · The diagram shows the original demand curve D1 and original supply curve S1 for a good 9708/13 Oct/Nov 2018
15 The diagram shows the original demand curve D1 and original supply curve S1 for a good. price S1 $ S2 30 25 20 15 D1 0 5 6 quantity The government introduces a subsidy. What will be the total consumer spending after the introduction of the subsidy? A $75 B $120 C $125 D $180
1 marks
Answer: B
This question in 9708/13 Oct/Nov 2018
Q196 · A government wishes to raise the incomes of farmers without raising the price of food to… 9708/12 Feb/March 2019
14 A government wishes to raise the incomes of farmers without raising the price of food to consumers. Which policy should it use? A a maximum price below the market price for food B a minimum price below the market price for food C a payment of a subsidy to farmers to produce food D a release of government food stocks onto the market
1 marks
Answer: C
This question in 9708/12 Feb/March 2019
Q197 · An economy has a 20% housing shortage 9708/11 May/June 2019
15 An economy has a 20% housing shortage. The government builds 10% more houses for poorer families and fixes the rent below the equilibrium for the market. Which effect will this direct provision have on the market? A A greater imbalance in the market in private housing will develop. B Housing waiting lists for poorer families will be cleared. C The supply of government housing will fall short of demand. D The supply of private housing for rent will fall by 10%.
1 marks
Answer: C
This question in 9708/11 May/June 2019
Q198 · Which statement about nationalised and privatised industries is correct? 9708/11 May/June 2019
16 Which statement about nationalised and privatised industries is correct? A A privatised industry is usually less competitive than a nationalised industry. B A profitable private company cannot be nationalised. C Privatisation is a form of monetary policy. D Privatisation is a way of raising money for the government.
1 marks
Answer: D
This question in 9708/11 May/June 2019
Q199 · What is not true about subsidies? 9708/11 May/June 2019
17 What is not true about subsidies? A They are paid to firms. B They have to be paid back. C They reduce the cost of production. D They shift the supply curve to the right.
1 marks
Answer: B
This question in 9708/11 May/June 2019
Q200 · Too much sugar causes an increase in a consumer’s weight 9708/12 May/June 2019
15 Too much sugar causes an increase in a consumer’s weight. A government has introduced a ‘sugar tax’ on the consumption of soft drinks that have a high sugar content. How might this policy help to reduce the number of overweight people? A Consumers switch to cheaper brands of soft drink with a high sugar content. B Consumers switch to other high-sugar substitute goods, such as alcohol or sweets. C The price elasticity of demand for soft drinks is inelastic. D The tax revenue is spent on education about the dangers of soft drink consumption.
1 marks
Answer: D
This question in 9708/12 May/June 2019
Q201 · A government intends to introduce a minimum price for rice, a maximum price for heating… 9708/12 May/June 2019
16 A government intends to introduce a minimum price for rice, a maximum price for heating oil and a tax on chewing gum. Who, in each market, is meant to benefit from these policies? market for rice market for heating oil market for chewing gum A consumers government producers B government producers government C producers producers consumers D producers consumers government
1 marks
Answer: D
This question in 9708/12 May/June 2019
Q202 · The diagram shows the effect on the market for rice of a change in government policy that… 9708/13 May/June 2019
14 The diagram shows the effect on the market for rice of a change in government policy that causes a shift in the supply curve from S to S1. price S S1 L K J M D O quantity What does the area JKLM represent? A the cost to the government of a subsidy to rice growers B the extra saving to importers of the removal of a tariff on rice C the increase in consumer surplus from the introduction of a maximum price for rice D the loss in government revenue from the reduction in a lump sum tax on rice
1 marks
Answer: A
This question in 9708/13 May/June 2019
Q203 · Doctors are concerned about the negative health effects of sugary drinks 9708/13 May/June 2019
17 Doctors are concerned about the negative health effects of sugary drinks. When would a tax on sugary drinks be least effective in improving health? A when the demand for sugary drinks is income elastic B when the demand for sugary drinks is income inelastic C when the demand for sugary drinks is price elastic D when the demand for sugary drinks is price inelastic
1 marks
Answer: D
This question in 9708/13 May/June 2019
Q204 · The table shows the market demand and supply for bananas over a year 9708/11 Oct/Nov 2019
5 The table shows the market demand and supply for bananas over a year. At a market price of 8 cents per kg there is disequilibrium in the market. total market total market price of bananas demand (million supply (million (cents per kg) tonnes) tonnes) 4 1000 150 6 800 300 8 600 450 10 400 600 12 200 750 What action would the government have to take to achieve market equilibrium at a price of 8 cents per kg? A grant a subsidy of 2 cents per kg to producers B impose a tax of 4 cents per kg on consumers C purchase the entire supply at 8 cents and sell at 4 cents D ration consumers to 75 kg each per year
1 marks
Answer: A
This question in 9708/11 Oct/Nov 2019
Q205 · The diagram shows the outcome when a landowner, who has allowed motorists to park on his… 9708/11 Oct/Nov 2019
8 The diagram shows the outcome when a landowner, who has allowed motorists to park on his field at no cost, introduces a parking charge of $1. supply charge X $1 Y demand Z O parking spaces What is the loss of consumer surplus that results? A X only B X + Y C Y only D Y + Z
1 marks
Answer: C
This question in 9708/11 Oct/Nov 2019
Q206 · The diagram shows the market for a good 9708/11 Oct/Nov 2019
9 The diagram shows the market for a good. price S P2 maximum price P P1 minimum price D O quantity If the government imposes a minimum price at OP1 and maximum price at OP2 what would happen? A The price will be unchanged at OP. B The price will fall to OP1. C The price will rise to OP2. D There will need to be rationing by the government.
1 marks
Answer: A
This question in 9708/11 Oct/Nov 2019
Q207 · A government gives a subsidy to a producer of a product 9708/11 Oct/Nov 2019
17 A government gives a subsidy to a producer of a product. What will be the likely effect of this? A a shift to the left in the demand curve and a rise in equilibrium quantity B a shift to the left in the supply curve and a rise in equilibrium quantity C a shift to the right in the demand curve and a fall in equilibrium price D a shift to the right in the supply curve and a fall in equilibrium price
1 marks
Answer: D
This question in 9708/11 Oct/Nov 2019
Q208 · A government introduces a maximum price above the market price 9708/12 Oct/Nov 2019
8 A government introduces a maximum price above the market price. What will be the effect on consumer and producer surplus? consumer surplus producer surplus A fall rise B rise fall C rise unchanged D unchanged unchanged
1 marks
Answer: D
This question in 9708/12 Oct/Nov 2019
Q209 · The diagram shows an initial market equilibrium for an agricultural product of $6 and 800… 9708/12 Oct/Nov 2019
16 The diagram shows an initial market equilibrium for an agricultural product of $6 and 800 units. S price 10 ($) 6 D 0 0 400 800 quantity How much will the government have to spend to increase the market price to $10? A $1600 B $2400 C $3200 D $4000
1 marks
Answer: D
This question in 9708/12 Oct/Nov 2019
Q210 · A subsidy is given to the producers of a good with perfectly elastic demand 9708/12 Oct/Nov 2019
18 A subsidy is given to the producers of a good with perfectly elastic demand. What will be the outcome? A Consumer and producer receive equal amounts of subsidy. B There will be no change in price; the incidence of the subsidy will fall on the producer. C There will be a large increase in quantity consumed; the incidence of the subsidy will fall on the consumer. D There will be no change in the quantity consumed; the incidence of the subsidy will fall on the consumer.
1 marks
Answer: B
This question in 9708/12 Oct/Nov 2019
Q211 · A government decides to put a tax on a good 9708/13 Oct/Nov 2019
11 A government decides to put a tax on a good. Which price elasticity conditions would result in most of the tax being paid by the consumer? demand supply elasticity elasticity A elastic elastic B elastic inelastic C inelastic elastic D inelastic inelastic
1 marks
Answer: C
This question in 9708/13 Oct/Nov 2019
Q212 · What is most likely to decrease if the government pays a subsidy to the producers of a… 9708/13 Oct/Nov 2019
13 What is most likely to decrease if the government pays a subsidy to the producers of a product? A government spending B output of the product C price of the product D rates of taxation
1 marks
Answer: C
This question in 9708/13 Oct/Nov 2019
Q213 · The government introduces a new transfer payment, to help people on low incomes afford… 9708/13 Oct/Nov 2019
14 The government introduces a new transfer payment, to help people on low incomes afford housing. What will be the effects of this in the housing market? effect on the demand curve effect on the supply curve A a movement along demand a movement along supply B a movement along demand a shift in supply C a shift in demand a shift in supply D a shift in demand a movement along supply
1 marks
Answer: D
This question in 9708/13 Oct/Nov 2019
Q214 · A specific tax is placed upon each bottle of perfume sold 9708/13 Oct/Nov 2019
15 A specific tax is placed upon each bottle of perfume sold. In the diagram, SS is the supply curve before tax, StSt is the supply curve after tax. D St price S W R U Q X P T St D S O Y Z quantity Which area represents that part of the tax revenue paid by producers? A ORWY B PQUT C PRWT D QRWU
1 marks
Answer: B
This question in 9708/13 Oct/Nov 2019
Q215 · In each diagram the initial supply is S1 and the new supply after subsidy is S2 9708/13 Oct/Nov 2019
16 In each diagram the initial supply is S1 and the new supply after subsidy is S2. The subsidy is identical in each case. Which diagram shows the greatest incidence of the subsidy on the consumers? A B S1 S1 price S2 price S2 P3 P3 P1 P1 P2 P2 D D O Q1 Q2 quantity O Q1 Q2 quantity C D price price P3 S1 P3 S1 P1 P1 S2 P2 S2 P2 D D O Q1 Q2 quantity O Q1 Q2 quantity
1 marks
Answer: C
This question in 9708/13 Oct/Nov 2019
Q216 · Which statement is not correct? 9708/13 Oct/Nov 2019
17 Which statement is not correct? A A progressive tax usually improves the distribution of income. B A regressive tax benefits the rich more than the poor. C An ad valorem tax causes a parallel shift left of the supply curve. D Some consumers can avoid paying indirect tax.
1 marks
Answer: C
This question in 9708/13 Oct/Nov 2019
Q217 · The diagram shows the market supply and demand curves for wheat 9708/13 Oct/Nov 2019
18 The diagram shows the market supply and demand curves for wheat. D S price P2 P1 O K L R output What should a government do to maintain a minimum price of OP2? A buy quantity KL B buy quantity KR C sell quantity LR D sell quantity KR
1 marks
Answer: B
This question in 9708/13 Oct/Nov 2019
Q218 · A government imposes a maximum rent in order to make rented housing more affordable 9708/12 Feb/March 2020
15 A government imposes a maximum rent in order to make rented housing more affordable. What is likely to be a long-run consequence if the maximum is set below the current free market level? A a shortage of applicants for rented housing B a shortage of rented housing C an increase in supply to satisfy the increased demand for rented housing D an increase in the number of houses being rented
1 marks
Answer: B
This question in 9708/12 Feb/March 2020
Q219 · What would be categorised as direct government provision of goods and services? 9708/12 Feb/March 2020
16 What would be categorised as direct government provision of goods and services? A a government grant to a firm to provide healthcare services B a government regulation on the amount of sugar in soft drinks C a government subsidy to a firm that operates a regional train service D a government takeover of a local bus service
1 marks
Answer: D
This question in 9708/12 Feb/March 2020
Q220 · Which type of tax is the 15% sales tax levied in South Africa? 9708/12 Feb/March 2020
17 Which type of tax is the 15% sales tax levied in South Africa? A ad valorem direct B ad valorem indirect C specific direct D specific indirect
1 marks
Answer: B
This question in 9708/12 Feb/March 2020
Q221 · In the diagram, D is the demand curve for Indian tea exports and S1 is the supply curve… 9708/11 May/June 2020
6 In the diagram, D is the demand curve for Indian tea exports and S1 is the supply curve when there is a tax on tea exports. S1 price S2 x z w y D O quantity The Indian government removes the tax, which causes the supply curve to shift to S2. Which areas in the diagram measure the resulting loss in tax revenue to the Indian government and the resulting gain in consumer surplus? loss in tax gain in revenue consumer surplus A x w + y B x x + z C x + y z D x + y x + z
1 marks
Answer: D
This question in 9708/11 May/June 2020
Q222 · An indirect tax is imposed on a product in a competitive market 9708/11 May/June 2020
9 An indirect tax is imposed on a product in a competitive market. Under which circumstances would the value of the consumer surplus be most likely to remain unchanged? A New substitutes are developed for the product and production costs rise. B Some producers merge so there is less competition in the market. C The product is an inferior good, consumer incomes increase and production costs rise. D The product is a normal good, consumer incomes increase and production costs fall.
1 marks
Answer: D
This question in 9708/11 May/June 2020
Q223 · A specific tax is imposed on a product for which the elasticity of supply is zero 9708/11 May/June 2020
14 A specific tax is imposed on a product for which the elasticity of supply is zero. Which statement is correct? A The burden of this tax will fall entirely on consumers. B The burden of this tax will fall entirely on suppliers. C The burden of this tax will fall mainly on consumers. D The burden of this tax will fall mainly on suppliers.
1 marks
Answer: B
This question in 9708/11 May/June 2020
Q224 · The diagram shows a market where a government has set a minimum price of OM 9708/11 May/June 2020
15 The diagram shows a market where a government has set a minimum price of OM. S price M minimum price P D O quantity What can be concluded from the diagram? A At prices above OM, there would be a surplus of the good. B At the minimum price OM, there would be a shortage of the good. C Price will fall automatically from OM to OP. D The minimum price will be ineffective.
1 marks
Answer: A
This question in 9708/11 May/June 2020
Q225 · In the market for a good the quantity supplied (QS) and the quantity demanded (QD) are… 9708/12 May/June 2020
13 In the market for a good the quantity supplied (QS) and the quantity demanded (QD) are given by QS = P – 30 and QD = 240 – 2P where P = price in dollars. A change in the tax on the good makes QS = P – 36. How will the change affect equilibrium price? A It will fall by $2. B It will fall by $6. C It will rise by $2. D It will rise by $6.
1 marks
Answer: C
This question in 9708/12 May/June 2020
Q226 · The diagram shows the market demand and supply curves for rice 9708/12 May/June 2020
15 The diagram shows the market demand and supply curves for rice. S price ($) 10 8 D O Q1 Q2 Q3 quantity What would happen if a government imposed a maximum price of $10? A The government would need to supply Q1 to Q3. B The quantity sold would be Q1. C The quantity sold would be Q2. D The quantity sold would increase from Q2 to Q3.
1 marks
Answer: C
This question in 9708/12 May/June 2020
Q227 · The equilibrium price of a product is $10 9708/13 May/June 2020
8 The equilibrium price of a product is $10. The government introduces an effective minimum price of $12 for the product. Under which condition will the value of the producer surplus increase the most? price elasticity of demand A 0 B between 0 and 1 C 1 D greater than 1
1 marks
Answer: A
This question in 9708/13 May/June 2020
Q228 · The diagram shows the market for bus services before and after a government subsidy 9708/13 May/June 2020
15 The diagram shows the market for bus services before and after a government subsidy. supply before subsidy price supply after subsidy G P3 L H P1 J P2 I K demand O Q1 Q2 number of bus journeys Which area on the diagram shows the incidence of the subsidy for the consumer? A P1HIP2 B P1JKP2 C P2IGP3 D P2KLP3
1 marks
Answer: B
This question in 9708/13 May/June 2020
Q229 · The diagram shows the market for eye tests 9708/13 May/June 2020
16 The diagram shows the market for eye tests. price of eye S tests ($) P3 P2 P1 D O Q1 Q2 quantity of eye tests Which policy would enable the government to increase the number of eye tests from OQ1 to OQ2? A a maximum price of OP3 per test B a minimum price of OP2 per test C a subsidy paid to opticians of P3–P2 per test D a subsidy paid to opticians of P3–P1 per test
1 marks
Answer: D
This question in 9708/13 May/June 2020
Q230 · In November 2017, the Scottish government introduced a minimum price for alcohol because… 9708/13 May/June 2020
17 In November 2017, the Scottish government introduced a minimum price for alcohol because of the detrimental health effects of alcohol consumption. Which combination of actions is most likely to lead to a failure with respect to reducing the detrimental effects of the consumption of alcohol? action 1 action 2 A minimum price is set too high effective information provision regarding the health effects of consuming alcohol B minimum price is set too high effective subsidisation of non-alcoholic beverages C minimum price is set too low health benefits of reduced alcohol consumption have been overestimated D minimum price is set too low stricter enforcement of the regulations relating to the sale of alcohol
1 marks
Answer: C
This question in 9708/13 May/June 2020
Q231 · What is an example of direct provision by a government? 9708/13 May/June 2020
18 What is an example of direct provision by a government? A The government introduces a subsidy on renewable fuels to help the environment. B The government introduces a unit tax on cigarettes to discourage consumption. C The government sets a maximum rent on housing to protect tenants. D The government takes over a private library to improve local services.
1 marks
Answer: D
This question in 9708/13 May/June 2020
Q232 · The diagram shows the impact of a unit tax imposed by a government on a good 9708/11 Oct/Nov 2020
15 The diagram shows the impact of a unit tax imposed by a government on a good. The original supply curve is S1 and the supply curve after the unit tax is S2. price S2 $ S1 80 70 60 50 D 0 100 120 quantity What would be the amount of tax paid by the consumer? A $500 B $1000 C $1500 D $2400
1 marks
Answer: B
This question in 9708/11 Oct/Nov 2020
Q233 · The diagram shows the demand and supply curves for healthcare in a private market 9708/11 Oct/Nov 2020
16 The diagram shows the demand and supply curves for healthcare in a private market. supply price P demand O Q quantity What would happen if the government provides the same amount of healthcare free of charge? A Healthcare will become a public good. B Healthcare will no longer have external benefits. C There will be over-consumption of healthcare. D There will need to be rationing.
1 marks
Answer: D
This question in 9708/11 Oct/Nov 2020
Q234 · In year 1, in the market for a good represented in the diagram, the initial demand and… 9708/12 Oct/Nov 2020
16 In year 1, in the market for a good represented in the diagram, the initial demand and supply conditions are shown by D1 and S1, and the government has set a maximum price of OP2. price S1 P1 P2 P3 D2 D1 O Q1 Q2 Q3 Q4 Q5 quantity In year 2, demand increases to D2, but there are no other changes to the conditions of supply or to the maximum price. Which row accurately shows the price and quantity in the market in each year? year 1 year 2 price quantity price quantity A OP2 OQ1 OP1 OQ4 B OP2 OQ3 OP2 OQ5 C OP3 OQ2 OP1 OQ4 D OP3 OQ2 OP2 OQ3
1 marks
Answer: D
This question in 9708/12 Oct/Nov 2020
Q235 · The market for good X is in equilibrium 9708/12 Oct/Nov 2020
18 The market for good X is in equilibrium. The government introduces a subsidy to the producers of good X. Under which conditions will the total expenditure by the government on the subsidy be the greatest? price elasticity of price elasticity of demand for good X supply for good X A <1 <1 B <1 >1 C >1 <1 D >1 >1
1 marks
Answer: D
This question in 9708/12 Oct/Nov 2020
Q236 · The diagram shows the market demand for and supply of good E 9708/13 Oct/Nov 2020
12 The diagram shows the market demand for and supply of good E. price of good E S1 Y X D2 D1 O quantity of good E The equilibrium has changed from X to Y. Which statement is not correct? A Incomes of consumers may have increased and good E is a normal good. B The quantity supplied has risen because price has increased. C The quantity supplied has risen because the production of good E has been subsidised. D The price of good F, which is a substitute for good E, may have risen.
1 marks
Answer: C
This question in 9708/13 Oct/Nov 2020
Q237 · The diagram shows the market for CDs 9708/13 Oct/Nov 2020
13 The diagram shows the market for CDs. price S ($) 14 12 10 D 0 4 5 6 7 8 quantity A government raises the minimum price of CDs from $12 to $14. What will be the outcome? A Excess demand increases by 2 units. B Excess demand increases by 4 units. C Excess supply decreases by 2 units. D Excess supply increases by 2 units.
1 marks
Answer: D
This question in 9708/13 Oct/Nov 2020
Q238 · A government regards alcoholic drinks as a demerit good and introduces a minimum price… 9708/13 Oct/Nov 2020
14 A government regards alcoholic drinks as a demerit good and introduces a minimum price above the equilibrium in an attempt to protect consumers. Demand for alcoholic drinks is price inelastic. What is the most likely outcome? A a fall in the revenue of alcoholic drink producers B a fall in the quantity of alcoholic drink sales C a long-run shortage of alcoholic drinks D an increase in specific tax revenue from the sale of alcoholic drinks
1 marks
Answer: B
This question in 9708/13 Oct/Nov 2020
Q239 · A government subsidy of $50 per unit is paid to manufacturers of solar panels 9708/13 Oct/Nov 2020
15 A government subsidy of $50 per unit is paid to manufacturers of solar panels. What will be the impact of this? A It will guarantee equilibrium in the solar panel market. B It will maintain high market prices. C It will reduce total production costs. D It will stabilise levels of output.
1 marks
Answer: C
This question in 9708/13 Oct/Nov 2020
Q240 · The diagram shows the market for sugar which is initially in equilibrium at a price of OP 9708/12 Feb/March 2021
6 The diagram shows the market for sugar which is initially in equilibrium at a price of OP. S price R P P1 S U T D P2 O L M N quantity A government then fixes a maximum price of OP1. What will happen as a result? A a reduction in farmers’ revenue equal to PRSP1 B expenditure on sugar will be equal to PRMO C farmers’ revenue would be P1UNO D producer surplus will be P1SP2
1 marks
Answer: D
This question in 9708/12 Feb/March 2021
Q241 · After a series of poor harvests, a government imposes an effective maximum price on… 9708/12 Feb/March 2021
14 After a series of poor harvests, a government imposes an effective maximum price on cereals. What would be a consequence of this policy? A Both rich and poor people would satisfy their demands equally. B Illegal buying and selling through a black market would be prevented. C Rationing would be necessary to ensure a fair distribution of cereals. D The market would fail to clear leaving a surplus of cereals.
1 marks
Answer: C
This question in 9708/12 Feb/March 2021
Q242 · A government wishes to increase the supply of houses 9708/12 Feb/March 2021
17 A government wishes to increase the supply of houses. It pays a subsidy to brick manufacturers to increase supplies of bricks to S2. The diagram shows the supply of and demand for bricks. price of S1 bricks P1 S2 P2 P3 D1 O quantity of bricks Which size of subsidy per unit is required to increase supply to S2? A OP3 B P1P2 C P1P3 D P2P3
1 marks
Answer: C
This question in 9708/12 Feb/March 2021
Q243 · A market is in equilibrium with 100 units of the product sold at a price of US$10 each 9708/12 May/June 2021
8 A market is in equilibrium with 100 units of the product sold at a price of US$10 each. The price elasticity of supply for the product is +2.0 and the price elasticity of demand is –1.0. What will be the state of the market if a minimum price of US$11 is imposed? A an excess demand of 10 units B an excess demand of 30 units C an excess supply of 20 units D an excess supply of 30 units
1 marks
Answer: D
This question in 9708/12 May/June 2021
Q244 · A private company achieves a producer surplus at the market equilibrium price 9708/12 May/June 2021
11 A private company achieves a producer surplus at the market equilibrium price. What might reduce the size of the private company’s producer surplus? A Private companies choose to prioritise profits over customer needs. B Private companies start to pay dividends out of profits. C The government fixes the price of electricity below the market price. D The private company supply curve becomes more elastic.
1 marks
Answer: D
This question in 9708/12 May/June 2021
Q245 · The diagram shows the effect of the government introducing a subsidy on a product 9708/12 May/June 2021
15 The diagram shows the effect of the government introducing a subsidy on a product. price S1 (US$) S2 12 10 8 D 0 100 120 quantity (million units) What are the effects of the subsidy on government spending and consumer spending? government spending consumer spending A increases by US$240 million decreases by US$40 million B increases by US$240 million decreases by US$200 million C increases by US$480 million decreases by US$40 million D increases by US$480 million decreases by US$200 million
1 marks
Answer: C
This question in 9708/12 May/June 2021
Q246 · In the diagram, S1 and D1 are the initial supply and demand curves of a product 9708/12 May/June 2021
16 In the diagram, S1 and D1 are the initial supply and demand curves of a product. What would be the new supply curve following the removal of an ad valorem tax on the product? A B S1 price C D D1 O quantity
1 marks
Answer: D
This question in 9708/12 May/June 2021
Q247 · The table shows sources of government revenue in a fiscal year for an economy 9708/12 May/June 2021
17 The table shows sources of government revenue in a fiscal year for an economy. source of revenue $ billions sale of government assets 100 tax on self employed 1000 carbon tax on goods produced 100 corporate taxes 500 capital gains tax 100 goods and services tax 1000 air passenger tax 100 What is the total amount, in $ billions, of tax revenue raised by indirect taxes? A 1200 B 1300 C 1400 D 1600
1 marks
Answer: A
This question in 9708/12 May/June 2021
Q248 · The diagram shows the original demand curve D1 and supply curve S1 for diesel cars in… 9708/13 May/June 2021
9 The diagram shows the original demand curve D1 and supply curve S1 for diesel cars in Europe. Point X is the initial equilibrium. There is a successful advertising campaign by electric car producers and a new unit tax on diesel cars. What will be the new equilibrium? price S2 S1 A S3 D X B C D1 D3 D2 O quantity
1 marks
Answer: D
This question in 9708/13 May/June 2021
Q249 · The diagram represents the original demand curve D1 and the original supply curve S1 for… 9708/13 May/June 2021
16 The diagram represents the original demand curve D1 and the original supply curve S1 for electric cars. The government decides to provide a subsidy to electric car manufacturers. price of electric S1 cars S2 R E F M G N H T D1 O X Y quantity of electric cars Which area represents the total revenue of the car manufacturer after receiving the subsidy from the government? A OERY B OFMX C OGNY D OHTX
1 marks
Answer: A
This question in 9708/13 May/June 2021
Q250 · A government decides to build additional public sector housing to be rented to people… 9708/13 May/June 2021
17 A government decides to build additional public sector housing to be rented to people receiving low incomes. What is most likely to fall as a result of this increase in public sector housing? A employment in the construction industry B land prices in towns and cities C rents of houses in the private sector D total government spending
1 marks
Answer: C
This question in 9708/13 May/June 2021
Q251 · The diagram shows the demand curve and supply curve for a good on which the government… 9708/11 Oct/Nov 2021
12 The diagram shows the demand curve and supply curve for a good on which the government imposes a specific tax. S price D D S O quantity What will be the result of this tax? A Most of the incidence of the tax will fall on the producer. B There will be a new demand curve parallel to DD. C The price will rise by the full amount of the tax. D The quantity bought will fall proportionately to the tax rate.
1 marks
Answer: A
This question in 9708/11 Oct/Nov 2021
Q252 · A government decides to remove fees for higher education provided by the public sector… 9708/11 Oct/Nov 2021
16 A government decides to remove fees for higher education provided by the public sector and the private sector. What is the consequence of this policy? A Higher education is less likely to be provided by the private sector. B Resources in higher education will be allocated through the price mechanism. C The demand for higher education will be perfectly elastic when the price is zero. D The opportunity cost of higher education to students will be zero.
1 marks
Answer: A
This question in 9708/11 Oct/Nov 2021
Q253 · What would be the main effect of imposing an effective maximum price on foodstuffs? 9708/11 Oct/Nov 2021
17 What would be the main effect of imposing an effective maximum price on foodstuffs? A Inflation would rise. B The price of foodstuffs would rise. C There would be a decrease in the import of foodstuffs. D There would be a shortage of foodstuffs.
1 marks
Answer: D
This question in 9708/11 Oct/Nov 2021
Q254 · An effective minimum price is applied to alcohol in an attempt to reduce consumption 9708/11 Oct/Nov 2021
18 An effective minimum price is applied to alcohol in an attempt to reduce consumption. Why would a government not buy up any surplus created? A Buying the surplus would be costly to the government. B Buying the surplus would decrease the incomes of producers. C Buying the surplus would lead to a shortage. D Buying the surplus would lead to unemployment.
1 marks
Answer: A
This question in 9708/11 Oct/Nov 2021
Q255 · The market for mobile phones is initially in equilibrium at X 9708/12 Oct/Nov 2021
7 The market for mobile phones is initially in equilibrium at X. The government then imposes a sales tax. What is the government’s total tax revenue from this tax? supply plus tax U J price supply before tax T K S L X R M demand O Q2 Q1 quantity A JKX B TKLS C TKMR D UJXS
1 marks
Answer: C
This question in 9708/12 Oct/Nov 2021
Q256 · The diagram shows a firm’s supply of and demand for apples 9708/12 Oct/Nov 2021
17 The diagram shows a firm’s supply of and demand for apples. price S P2 P1 D O Q2 Q1 Q3 Q4 quantity of apples If a minimum price is increased from P1 to P2 what will happen to the amount of apples sold? A It will decrease from Q1 to Q2. B It will decrease from Q4Q1 to Q2Q3. C It will increase from Q3 to Q4. D It will increase from Q3Q2 to Q4Q1.
1 marks
Answer: A
This question in 9708/12 Oct/Nov 2021
Q257 · In an attempt to reduce crime, a government introduces a subsidy on the production of… 9708/12 Oct/Nov 2021
18 In an attempt to reduce crime, a government introduces a subsidy on the production of burglar alarms, but sales rise very little. Which possible characteristics of the good would lead to this outcome? price elasticity price elasticity of demand of supply A high high B high low C low high D low low
1 marks
Answer: D
This question in 9708/12 Oct/Nov 2021
Q258 · The table shows the market demand and market supply for kiwifruit over a year 9708/13 Oct/Nov 2021
12 The table shows the market demand and market supply for kiwifruit over a year. At a market price of $3 per kg there is disequilibrium in the market. price of total market total market kiwifruit demand supply ($ per kg) (thousand tonnes) (thousand tonnes) 1 220 120 2 190 130 3 160 140 4 130 150 5 100 160 Which action would the government have to take to achieve market equilibrium at a price of $3 per kg? A impose an indirect tax of $2 per kg on kiwifruit B purchase the entire supply at $3 per kg and sell at $2 per kg C set a maximum price of $3 per kg D subsidise kiwifruit production by $2 per kg
1 marks
Answer: D
This question in 9708/13 Oct/Nov 2021
Q259 · The diagram shows the effects of a subsidy in the market for wheat 9708/13 Oct/Nov 2021
17 The diagram shows the effects of a subsidy in the market for wheat. S1 price S2 I P4 F P3 P2 J G P1 H D1 O Q1 Q2 quantity Which area shows the total government spending on the subsidy? A OP2JQ2 B OP3FQ1 C P3FJP2 D P2P4IJ
1 marks
Answer: D
This question in 9708/13 Oct/Nov 2021
Q260 · A government wishes to reduce the consumption of alcohol 9708/13 Oct/Nov 2021
18 A government wishes to reduce the consumption of alcohol. Which policy will it use to achieve this aim by fixing the price of alcohol? A fix maximum price above market price B fix maximum price below market price C fix minimum price above market price D fix minimum price below market price
1 marks
Answer: C
This question in 9708/13 Oct/Nov 2021
Q261 · The diagram shows the demand and supply curves for cars in India 9708/12 Feb/March 2022
6 The diagram shows the demand and supply curves for cars in India. The initial equilibrium is at X. What will be the new equilibrium if there is a subsidy given to Indian car manufacturers and there is also an increase in the price of train and bus journeys in India? price S2 S1 A S3 X D B C D1 D3 D2 O quantity
1 marks
Answer: B
This question in 9708/12 Feb/March 2022
Q262 · What are the effects of a government imposing a maximum price below the equilibrium price? 9708/12 Feb/March 2022
15 What are the effects of a government imposing a maximum price below the equilibrium price? demand supply A falls falls B falls rises C rises falls D rises rises
1 marks
Answer: C
This question in 9708/12 Feb/March 2022
Q263 · Three types of tax are listed 9708/12 Feb/March 2022
17 Three types of tax are listed. a sales tax (VAT) on fuel a specific tax of 10% on cigarettes the percentage of income tax on individual earnings increases as taxable income increases Which combination describes the effect of each of these types of tax? VAT specific tax income tax A progressive progressive regressive B progressive regressive progressive C regressive progressive regressive D regressive regressive progressive
1 marks
Answer: D
This question in 9708/12 Feb/March 2022
Q264 · The bus fare in a rural area is $5 per journey 9708/12 Feb/March 2022
18 The bus fare in a rural area is $5 per journey. The government decides to improve local transport by giving bus firms a subsidy of $2 per journey. The diagram shows the possible changes in demand and supply. S S S bus fare per 7 journey ($) 6 5 4 3 2 D D 1 D 0 950 1050 quantity of journeys per week What is the new quantity of journeys and the bus fare for a journey? quantity of bus fare journeys ($) A 950 3 B 950 7 C 1050 4 D 1050 6
1 marks
Answer: C
This question in 9708/12 Feb/March 2022
Q265 · When will the price mechanism not function as a system for allocating goods? 9708/11 May/June 2022
11 When will the price mechanism not function as a system for allocating goods? A when the government bans advertising B when the government maintains an effective maximum price C when there is a limited supply of the good D when there is a powerful company able to set the market price
1 marks
Answer: B
This question in 9708/11 May/June 2022
Q266 · Which row shows the effect of the maximum and minimum prices described in the headings of… 9708/11 May/June 2022
14 Which row shows the effect of the maximum and minimum prices described in the headings of the table? maximum price maximum price minimum price above below above equilibrium price equilibrium price equilibrium price A excess demand no effect no effect B excess supply no effect no effect C no effect excess demand excess supply D no effect excess supply excess demand
1 marks
Answer: C
This question in 9708/11 May/June 2022
Q267 · A government decides to introduce tolls (charges) to drive on all major roads 9708/11 May/June 2022
15 A government decides to introduce tolls (charges) to drive on all major roads. What is most likely to happen to the number of journeys made on major roads and on minor roads? journeys on journeys on major roads minor roads A reduce increase B reduce no change C no change increase D no change no change
1 marks
Answer: A
This question in 9708/11 May/June 2022
Q268 · The diagram shows the market for electricity in a country that has a fixed supply of… 9708/11 May/June 2022
17 The diagram shows the market for electricity in a country that has a fixed supply of electricity and introduces a maximum price to make it affordable for poorer households. S price of electricity market price maximum price D O quantity of electricity What will be the effect of this? A It will encourage producers to build more power stations in the future. B It will encourage the development of renewable sources of electricity. C It will increase producer surplus. D It will increase the probability of power cuts.
1 marks
Answer: D
This question in 9708/11 May/June 2022
Q269 · Which combination of tax changes is most likely to be regressive in a developed economy? 9708/12 May/June 2022
14 Which combination of tax changes is most likely to be regressive in a developed economy? A increasing the rate of wealth tax and raising the rate of sales tax (VAT) on luxury products B introducing a tax on owning property based on its sales value and increasing the rate of income tax C reducing the basic rate of income tax and increasing the duty on fuel D removing the tax-free allowance for income tax and extending sales tax (VAT) to include all food
1 marks
Answer: D
This question in 9708/12 May/June 2022
Q270 · The demand and supply functions for a product are quantity demanded = 1500 + 50P and… 9708/12 May/June 2022
15 The demand and supply functions for a product are quantity demanded = 1500 + 50P and quantity supplied = 300P – 2000 where P = price. With government regulation, the current price in the market is $15. What can be concluded about the form of price regulation and the balance of demand and supply in the market? form of price regulation balance of demand and supply A effective maximum price excess demand B effective maximum price excess supply C effective minimum price excess demand D effective minimum price excess supply
1 marks
Answer: D
This question in 9708/12 May/June 2022
Q271 · To improve the air quality for its citizens, a government introduces a subsidy for the… 9708/12 May/June 2022
16 To improve the air quality for its citizens, a government introduces a subsidy for the producers of cars powered by batteries charged from the electricity supply. What are the likely effects of this subsidy on the price and sales of electricity? price of electricity sales of electricity A falls falls B falls rises C rises falls D rises rises
1 marks
Answer: D
This question in 9708/12 May/June 2022
Q272 · The diagram shows the effect on the market for rice of a change in government policy that… 9708/13 May/June 2022
14 The diagram shows the effect on the market for rice of a change in government policy that causes a shift in the supply curve from S1 to S2. price S1 S2 L K J M D O quantity What does the area JKLM represent? A the cost to the government of a subsidy to rice growers B the extra saving to importers of the removal of a tariff on rice C the increase in consumer surplus from the introduction of a maximum price for rice D the loss in government revenue from the reduction in a lump sum tax on rice
1 marks
Answer: A
This question in 9708/13 May/June 2022
Q273 · Which type of tax used in different countries is a direct tax? 9708/13 May/June 2022
16 Which type of tax used in different countries is a direct tax? A corporation tax in India that is imposed on the profits of companies B import duties in Brazil that are imposed on imported goods C specific tax in South Africa imposed on the purchase of cigarettes D stamp duty in Malaysia that is the tax on the purchase of a residential property
1 marks
Answer: A
This question in 9708/13 May/June 2022
Q274 · A government imposes a maximum price on medical face masks, below the market equilibrium 9708/13 May/June 2022
17 A government imposes a maximum price on medical face masks, below the market equilibrium. What is the most likely effect of this? A Some consumers will be unable to buy face masks at the maximum price. B Firms will produce more masks to meet the excess demand at the maximum price. C Poorer consumers will be able to obtain all the masks they need at the maximum price. D The market will clear at the maximum price.
1 marks
Answer: A
This question in 9708/13 May/June 2022
Q275 · What is not a producer subsidy? 9708/13 May/June 2022
18 What is not a producer subsidy? A a grant given to cover losses in an essential industry, such as the rail industry B a guaranteed minimum price paid to farmers to ensure the long run supply of food C financial assistance given to a pharmaceutical company to develop a new vaccine D a payment made to the unemployed to allow them to buy essential goods and services
1 marks
Answer: D
This question in 9708/13 May/June 2022
Q276 · What would be a valid objection to the government provision of goods and services? 9708/14 May/June 2022
15 What would be a valid objection to the government provision of goods and services? A There will be an increase in consumer sovereignty. B Only the private sector can provide merit goods. C Tax rates and tax income are likely to fall. D Investment in the private sector might be reduced.
1 marks
Answer: D
This question in 9708/14 May/June 2022
Q277 · What will be the result of a subsidy that is given to the producers of a good with an… 9708/14 May/June 2022
16 What will be the result of a subsidy that is given to the producers of a good with an inelastic demand curve? A The equilibrium price of the good will fall by a larger percentage than the fall in equilibrium quantity. B The equilibrium price of the good will fall by a larger percentage than the rise in equilibrium quantity. C The equilibrium price of the good will fall by a smaller percentage than the fall in equilibrium quantity. D The equilibrium price of the good will fall by a smaller percentage than the rise in equilibrium quantity.
1 marks
Answer: B
This question in 9708/14 May/June 2022
Q278 · The market for good X is in equilibrium 9708/14 May/June 2022
17 The market for good X is in equilibrium. A government then introduces an effective minimum price on good X. What will decrease as a result of this minimum price? A the excess supply of the product B the market price of the product C the quantity of the product supplied D the size of the consumer surplus
1 marks
Answer: D
This question in 9708/14 May/June 2022
Q279 · The diagram shows the percentages of those on low pay and those on extremely low pay in a… 9708/11 Oct/Nov 2022
15 The diagram shows the percentages of those on low pay and those on extremely low pay in a country from 1976 to 2012. A national minimum wage was introduced in 1999. 25 % low paid 20 15 introduction of minimum wage 10 extremely low paid 5 0 1976 1980 1984 1988 1992 1996 2000 2004 2008 2012 year Which conclusion is consistent with the diagram? A The minimum wage helped the low paid more than the extremely low paid. B The minimum wage reduced the numbers of both low paid and extremely low paid. C The minimum wage reversed the trend in low pay of the previous 20 years. D The minimum wage was responsible for the largest reduction of low pay in the period.
1 marks
Answer: C
This question in 9708/11 Oct/Nov 2022
Q280 · The government has decided to guarantee manufacturers a price OPa for a product and to… 9708/11 Oct/Nov 2022
16 The government has decided to guarantee manufacturers a price OPa for a product and to provide a subsidy to ensure that the market clears. In the diagram, QePe was the original equilibrium before the policy changes. S U price Pa W V Pe X Pb Y Z D O Qe Qa quantity Which area represents the total cost to the government of this subsidy? A PaUZPb B PaWYPb C PeXYPb D VWYZ
1 marks
Answer: B
This question in 9708/11 Oct/Nov 2022
Q281 · A concert arena has a fixed capacity that allows it to sell 10 000 tickets for a concert 9708/11 Oct/Nov 2022
17 A concert arena has a fixed capacity that allows it to sell 10 000 tickets for a concert. The current equilibrium price for a ticket is $10. The owners of the arena decide to set a minimum price for a ticket. Under which conditions will there be the most unsold tickets? minimum ticket price elasticity of price ($) demand for tickets A 11 inelastic B 11 elastic C 12 inelastic D 12 elastic
1 marks
Answer: D
This question in 9708/11 Oct/Nov 2022
Q282 · An indirect tax is imposed on a product, causing total expenditure by consumers to… 9708/12 Oct/Nov 2022
6 An indirect tax is imposed on a product, causing total expenditure by consumers to increase. Which row identifies this situation? price price elasticity A decreases elastic B decreases inelastic C increases elastic D increases inelastic
1 marks
Answer: D
This question in 9708/12 Oct/Nov 2022
Q283 · A country has health care provided by the free market 9708/12 Oct/Nov 2022
10 A country has health care provided by the free market. This is replaced by the government provision of Sg free health care. D Sg price $ S 1 p 2 3 4 5 O quantity What is the change in consumer surplus? A from 1 to (1 + 2) B from 1 to (1 + 2 + 3 + 4) C from (1 + 2) to (1 + 2 + 3) D from (1 + 2) to (2 + 3 + 4 + 5)
1 marks
Answer: B
This question in 9708/12 Oct/Nov 2022
Q284 · A government fixes a maximum price for a product in order to increase its consumption 9708/12 Oct/Nov 2022
15 A government fixes a maximum price for a product in order to increase its consumption. What would be the likely outcome of such a policy? A Consumption will fall if the maximum price is above the current equilibrium price. B Consumption will rise if the maximum price is below the current equilibrium price. C Production will fall if the maximum price is above the current equilibrium price. D Production will fall if the maximum price is below the current equilibrium price.
1 marks
Answer: D
This question in 9708/12 Oct/Nov 2022
Q285 · The diagram shows demand and supply curves for a good 9708/12 Oct/Nov 2022
16 The diagram shows demand and supply curves for a good. S1 is the original supply curve, S2 is supply after a tax is added. S2 16 price S1 ($) 8 6 D 0 0 20 28 quantity How much tax revenue is earned by the government? A $40 B $160 C $200 D $320
1 marks
Answer: C
This question in 9708/12 Oct/Nov 2022
Q286 · The market for good Z is in equilibrium with 1000 units sold at a price of $10 9708/13 Oct/Nov 2022
16 The market for good Z is in equilibrium with 1000 units sold at a price of $10. The government pays a subsidy of $2 per unit to producers of good Z. Under which conditions will the total spending by the government on the subsidy be smallest? price elasticity of price elasticity of demand for good Z supply for good Z A < 1 < 1 B < 1 > 1 C > 1 < 1 D > 1 > 1
1 marks
Answer: A
This question in 9708/13 Oct/Nov 2022
Q287 · If an industry is currently state-owned and state-run, what does not represent a reason… 9708/13 Oct/Nov 2022
17 If an industry is currently state-owned and state-run, what does not represent a reason for it being privatised? A Decisions will no longer be taken with political considerations in mind. B The benefits of merit goods will be taken into account in decision-making. C Its owners would have more incentive to make it operate profitably. D There will be greater incentives for managers to introduce modern technology.
1 marks
Answer: B
This question in 9708/13 Oct/Nov 2022
Q288 · What does the incidence of an indirect tax on a product refer to? 9708/13 Oct/Nov 2022
18 What does the incidence of an indirect tax on a product refer to? A the proportion of the tax paid by the consumer relative to the producer B the reduction in output as a result of the imposition of the tax C the revenue the tax generates for the government D the increase in the hidden economy as a result of tax evasion after the tax is imposed
1 marks
Answer: A
This question in 9708/13 Oct/Nov 2022
Q289 · A government wishes to influence the price of a good 9708/13 Oct/Nov 2022
19 A government wishes to influence the price of a good. It introduces a maximum price, Pmax, and a minimum price, Pmin. The diagram shows these prices relative to the current market price P. S price P Pmax Pmin D O quantity What can be concluded from the diagram? A Both the maximum and the minimum price will be effective. B Only the maximum price will be effective. C Only the minimum price will be effective. D The market price will continue to operate.
1 marks
Answer: B
This question in 9708/13 Oct/Nov 2022
Q290 · Why do some local governments subsidise the provision of bicycles to encourage their use? 9708/12 Feb/March 2023
13 Why do some local governments subsidise the provision of bicycles to encourage their use? A Consumers are afraid of having car accidents. B Consumers are unable to afford bicycles. C Consumers are not aware of the external benefits of using bicycles. D Consumers ignore the external costs of using bicycles.
1 marks
Answer: C
This question in 9708/12 Feb/March 2023
Q291 · A specific tax is placed on the sale of bottles of lemonade 9708/11 May/June 2023
12 A specific tax is placed on the sale of bottles of lemonade. In the diagram, S is the supply curve before imposition of the tax and St is the supply curve after tax. St price W S U X D T O quantity Which distance represents the specific tax on each bottle? A UT B WT C WU D WX
1 marks
Answer: B
This question in 9708/11 May/June 2023
Q292 · Demand for medical face masks exceeds supply during a disease outbreak 9708/11 May/June 2023
13 Demand for medical face masks exceeds supply during a disease outbreak. What is the most likely cause of this excess demand? A Some consumers do not have effective demand. B The demand for medical face masks is price inelastic in the short run. C The price of medical face masks is fixed below the equilibrium price. D The supply of medical face masks is inelastic in the short run.
1 marks
Answer: C
This question in 9708/11 May/June 2023
Q293 · The diagram shows the demand and supply curves for a good 9708/11 May/June 2023
14 The diagram shows the demand and supply curves for a good. S price P1 P D O Q1 Q Q2 quantity The government fixes a maximum price of OP1. What would happen? A Consumers would have to be rationed to quantity OQ1. B The government would have to introduce a subsidy of PP1. C The market equilibrium quantity OQ would be demanded and supplied. D The supply of quantity OQ2 would be guaranteed.
1 marks
Answer: C
This question in 9708/11 May/June 2023
Q294 · A specific tax is placed upon each bottle of perfume sold 9708/12 May/June 2023
10 A specific tax is placed upon each bottle of perfume sold. In the diagram, S is the supply curve before tax, St is the supply curve after tax. St price S W R U Q X P T D O Y Z quantity Which area represents that part of the tax revenue paid by producers? A ORWY B PQUT C PRWT D QRWU
1 marks
Answer: B
This question in 9708/12 May/June 2023
Q295 · Which combination of government measures is most likely to increase the consumption of a… 9708/12 May/June 2023
16 Which combination of government measures is most likely to increase the consumption of a merit good? A setting an effective maximum price on the product and paying producers a subsidy B setting an effective maximum price on the product and imposing an indirect tax on producers C setting an effective minimum price on the product and paying producers a subsidy D setting an effective minimum price on the product and imposing an indirect tax on producers
1 marks
Answer: A
This question in 9708/12 May/June 2023
Q296 · There are 10 000 tickets available to watch a sports final at a national stadium 9708/13 May/June 2023
14 There are 10 000 tickets available to watch a sports final at a national stadium. The initial market equilibrium ticket price is $20. The government decides to fix an effective minimum price for the tickets. Under which conditions will the consumer surplus for the tickets decrease the most as a result of the minimum price? minimum price elasticity price level of demand $ for tickets A 18 –0.5 B 18 –1.5 C 22 –0.5 D 22 –1.5
1 marks
Answer: C
This question in 9708/13 May/June 2023
Q297 · The diagram shows the impact of a government imposing a unit tax on a demerit good 9708/13 May/June 2023
15 The diagram shows the impact of a government imposing a unit tax on a demerit good. S is the supply curve before the tax and S1 is the supply curve after the tax. price $ S1 S 50 40 30 20 D 0 0 5 10 quantity What is the after-tax revenue of the firm producing the demerit good? A $100 B $200 C $300 D $500
1 marks
Answer: A
This question in 9708/13 May/June 2023
Q298 · The diagrams show the demand for and the supply of houses 9708/12 Oct/Nov 2023
11 The diagrams show the demand for and the supply of houses. In the short run, the stock of houses for sale, S1, is fixed. A government decides to allow some agricultural land to be used for building houses and subsidises lower-income buyers of the new houses. Which diagram shows the long-run situation? A B S1 S1 price of price of houses houses $ $ D2 D1 D1 O O quantity quantity C D S1 S1 price of price of houses houses $ $ D2 D1 D1 O O quantity quantity
1 marks
Answer: D
This question in 9708/12 Oct/Nov 2023
Q299 · The government imposes a specific indirect tax of $1 on each unit of a good sold 9708/12 Oct/Nov 2023
16 The government imposes a specific indirect tax of $1 on each unit of a good sold. How does the imposition of the tax shift the demand or supply curve of the good? A The demand curve of the good will shift vertically downwards by $1. B The demand curve of the good will shift vertically upwards by $1. C The supply curve of the good will shift vertically downwards by $1. D The supply curve of the good will shift vertically upwards by $1.
1 marks
Answer: D
This question in 9708/12 Oct/Nov 2023
Q300 · In the diagram, the demand and supply curves for wheat in Australia are shown 9708/13 Oct/Nov 2023
13 In the diagram, the demand and supply curves for wheat in Australia are shown. Initial equilibrium is at X. The government imposes a sales tax on wheat at the same time as increasing the rate of income tax. Which point could represent the new equilibrium? S1 price S A S2 D X B D1 C D D2 O quantity
1 marks
Answer: D
This question in 9708/13 Oct/Nov 2023
Q301 · A free market is currently experiencing excess supply at a price of P1 9708/13 Oct/Nov 2023
14 A free market is currently experiencing excess supply at a price of P1. What will be the effect on the current market situation if a maximum price is set above P1? A The excess supply will increase. B The market will move into an equilibrium position. C There will be no effect. D There will be excess demand.
1 marks
Answer: C
This question in 9708/13 Oct/Nov 2023
Q302 · Which combination of policies would increase the inequality of the distribution of income… 9708/13 Oct/Nov 2023
16 Which combination of policies would increase the inequality of the distribution of income and wealth? progressive minimum transfer taxes wage payments A decrease increase reduce B decrease reduce reduce C increase increase increase D increase reduce increase
1 marks
Answer: B
This question in 9708/13 Oct/Nov 2023
Q303 · A government wishes to raise the incomes of farmers without raising the price of food to… 9708/11 May/June 2024
13 A government wishes to raise the incomes of farmers without raising the price of food to consumers. Which policy should it use? A a maximum price below the market price for food B a minimum price below the market price for food C a payment of a subsidy to farmers to produce food D a release of government food stocks onto the market
1 marks
Answer: C
This question in 9708/11 May/June 2024
Q304 · A market is in equilibrium 9708/12 May/June 2024
12 A market is in equilibrium. The government intervenes by creating a price floor below which the market price cannot fall. Which term describes this form of government intervention? A maximum price B minimum price C subsidy D unit tax
1 marks
Answer: B
This question in 9708/12 May/June 2024
Q305 · The diagram shows an initial market equilibrium for an agricultural product of $6 and 800… 9708/12 May/June 2024
14 The diagram shows an initial market equilibrium for an agricultural product of $6 and 800 units. S price 10 ($) 6 D 0 0 400 800 quantity How much will the government have to spend to increase the market price to $10? A $1600 B $2400 C $3200 D $4000
1 marks
Answer: D
This question in 9708/12 May/June 2024
Q306 · A government wants to protect its textile industry from imports 9708/12 May/June 2024
25 A government wants to protect its textile industry from imports. Which policy is likely to have the least impact on the import of textiles? A a ban on the import of textiles B a sales tax on all textiles sold in the country C a tariff on the import of textiles D all textiles sold in the country are required to meet minimum quality standards
1 marks
Answer: B
This question in 9708/12 May/June 2024
Q307 · A government introduces an effective minimum price for a product but makes no other… 9708/13 May/June 2024
12 A government introduces an effective minimum price for a product but makes no other intervention in the market. This policy suggests that the government’s objective is A to discourage consumption of a demerit good. B to increase the consumption of a merit good. C to reduce the price of a private good. D to support the incomes of producers.
1 marks
Answer: A
This question in 9708/13 May/June 2024
Q308 · The diagram shows the effect of an indirect tax imposed on cigarettes 9708/13 May/June 2024
13 The diagram shows the effect of an indirect tax imposed on cigarettes. The market is initially in equilibrium at point X. price S1 Z S P1 W X Pe P2 Y D O Q1 Qe quantity Which area represents the incidence of the tax on consumers? A P1ZYP2 B P1ZWPe C PeWYP2 D PeXZP1
1 marks
Answer: B
This question in 9708/13 May/June 2024
Q309 · The diagram shows the supply curve of a product 9708/13 May/June 2024
14 The diagram shows the supply curve of a product. S 20 price ($) 15 10 5 0 quantity The government imposes a specific indirect tax of $5 on the product. How will the price elasticity of supply of the product change? A from elastic (>1) to inelastic (<1) B from inelastic (<1) to elastic (>1) C from inelastic (<1) to unitary (=1) D from unitary (=1) to elastic (>1)
1 marks
Answer: D
This question in 9708/13 May/June 2024
Q310 · Which government action would be identified as the direct provision of goods and services? 9708/11 Oct/Nov 2024
12 Which government action would be identified as the direct provision of goods and services? A increasing road maintenance because of poor weather conditions B making payments to low-income families with elderly dependents C subsidising firms in order to encourage them to increase their output D taxing firms because they have been emitting damaging fumes
1 marks
Answer: A
This question in 9708/11 Oct/Nov 2024
Q311 · A specific tax is imposed on a product for which the elasticity of supply is zero 9708/11 Oct/Nov 2024
13 A specific tax is imposed on a product for which the elasticity of supply is zero. Which statement is correct? A The burden of this tax will fall entirely on consumers. B The burden of this tax will fall entirely on suppliers. C The burden of this tax will fall mainly on consumers. D The burden of this tax will fall mainly on suppliers.
1 marks
Answer: B
This question in 9708/11 Oct/Nov 2024
Q312 · In the diagram, S1 and S2 are the supply curves for an agricultural product in years 1… 9708/12 Oct/Nov 2024
12 In the diagram, S1 and S2 are the supply curves for an agricultural product in years 1 and 2 respectively. D is the demand curve in years 1 and 2. In year 1, the government purchased an amount necessary to ensure that the price was OP. S1 S2 price (year 1) (year 2) P D O W X Y Z quantity The price is held at OP in year 2. How much more must the government buy in year 2 than it bought in year 1? A WZ B XY C XZ D YZ
1 marks
Answer: D
This question in 9708/12 Oct/Nov 2024
Q313 · A product with infinite elasticity of supply has sales of 1000 units a week at a price of… 9708/12 Oct/Nov 2024
14 A product with infinite elasticity of supply has sales of 1000 units a week at a price of $1 per unit. Price elasticity of demand is 1.5 over the relevant range. The government imposes a tax of 10%. What will be the government’s weekly tax revenue from this product? A $15 B $85 C $100 D $150
1 marks
Answer: B
This question in 9708/12 Oct/Nov 2024
Q314 · A government wishes to encourage the consumption of a merit good and reduce the… 9708/13 Oct/Nov 2024
5 A government wishes to encourage the consumption of a merit good and reduce the consumption of a demerit good. Which policy should it adopt towards each good? merit good demerit good A impose a minimum price produce only in the public sector B increase advertising on the benefits put legal controls on output of the good C confine access to certain age groups tax output D subsidise the good set a minimum level of output
1 marks
Answer: B
This question in 9708/13 Oct/Nov 2024
Q315 · A government may use a range of methods to intervene in a market to affect both demand… 9708/12 Feb/March 2025
12 A government may use a range of methods to intervene in a market to affect both demand and supply. What is a method which will shift the demand curve for a good? A an indirect tax B a subsidy C direct provision D provision of information
1 marks
Answer: D
This question in 9708/12 Feb/March 2025
Q316 · To help achieve price stability, the government in country F operates a buffer stock… 9708/12 Feb/March 2025
13 To help achieve price stability, the government in country F operates a buffer stock scheme, with a minimum price of P1 and a maximum price of P2. The current demand and supply in the market is shown. price S G H P2 P1 D O L K J quantity What should the government do to ensure the scheme is effective? A buy an amount equal to GH B buy an amount equal to KJ C buy an amount equal to LJ D do nothing as the equilibrium price is below P1
1 marks
Answer: C
This question in 9708/12 Feb/March 2025
Q317 · Too much sugar causes an increase in a consumer’s weight 9708/11 May/June 2025
12 Too much sugar causes an increase in a consumer’s weight. A government has introduced a ‘sugar tax’ on the consumption of soft drinks that have a high sugar content. How might this policy help to reduce the number of overweight people? A Consumers switch to cheaper brands of soft drink with a high sugar content. B Consumers switch to other high-sugar substitute goods, such as alcohol or sweets. C The price elasticity of demand for soft drinks is inelastic. D The tax revenue is spent on education about the dangers of soft drink consumption.
1 marks
Answer: D
This question in 9708/11 May/June 2025
Question 318 9708/11 May/June 2025
13. A … To... price set below the market equilibrium will cause a … 22.26. of the product, and a
settee 3 … price set above the market equilibrium will cause a … 4 … of the product.
Which words complete gaps 1, 2, 3 and 4?
1 2 3 4
A maximum shortage minimum surplus
B maximum surplus minimum shortage
Cc minimum shortage maximum surplus
D minimum surplus maximum shortage
1 marks
Answer: A
This question in 9708/11 May/June 2025
Q319 · The diagram shows the demand for and supply of eye tests provided by opticians 9708/11 May/June 2025
14 The diagram shows the demand for and supply of eye tests provided by opticians. S price P3 P2 P1 D O Q1 Q2 quantity Which policy would enable the government to increase the number of eye tests from OQ1 to OQ2? A a maximum price of OP3 per test B a minimum price of OP2 per test C a subsidy paid to opticians of P3-P2 per test D a subsidy paid to opticians of P3-P1 per test
1 marks
Answer: D
This question in 9708/11 May/June 2025
Q320 · An indirect tax is imposed on good X 9708/12 May/June 2025
11 An indirect tax is imposed on good X. Which situation is most likely to result in producers bearing a higher burden of the tax? A price elasticity of demand is elastic B price elasticity of demand is inelastic C price elasticity of supply is elastic D price elasticity of supply is inelastic
1 marks
Answer: A
This question in 9708/12 May/June 2025
Q321 · The diagram shows the demand and supply for rice 9708/12 May/June 2025
14 The diagram shows the demand and supply for rice. The market for rice is initially in equilibrium at a price of P1. The government introduces a maximum price of Pmax. At the same time the supply of rice increases. S1 price S2 P1 Pmax D O Q1 quantity What is the impact of these changes on the market for rice? A A new market equilibrium will be established. B An illegal market for rice will develop. C There will be a shortage of rice. D There will be a surplus of rice.
1 marks
Answer: A
This question in 9708/12 May/June 2025
Q322 · In the diagram, D is the demand curve of an agricultural commodity and S is the initial… 9708/12 May/June 2025
15 In the diagram, D is the demand curve of an agricultural commodity and S is the initial supply curve. The government promises to maintain farmers’ incomes at least at this initial level. The harvests in four subsequent years are shown by supply curves S1–S4. 6 S price S1 5 ($) S2 4 S3 3 S4 2 1 D 0 1 2 3 4 5 6 quantity (’000 tonnes) How much in total will the government need to pay to support farmers over the four subsequent years? A $0 B $3000 C $6000 D $10000
1 marks
Answer: A
This question in 9708/12 May/June 2025
Q323 · Which statement about maximum and minimum prices is correct? 9708/13 May/June 2025
12 Which statement about maximum and minimum prices is correct? A With an effective maximum price for a product, a shortage will develop. B With an effective maximum price for a product, the market price will rise. C With an effective minimum price for a product, rationing will be necessary. D With an effective minimum price for a product, the market price will fall.
1 marks
Answer: A
This question in 9708/13 May/June 2025
Q324 · A country depends heavily on the production of an agricultural product, good X 9708/13 May/June 2025
14 A country depends heavily on the production of an agricultural product, good X. It decides to introduce a buffer stock scheme for good X. The government allocates a fixed amount of money for setting up and running the scheme. In which situation is the scheme least likely to run out of money? ability of new cost of storing global demand farmers to start good X for good X growing good X A easy high constant B easy low rising C difficult high constant D difficult low rising
1 marks
Answer: D
This question in 9708/13 May/June 2025
Q325 · What is an example of direct provision by a government? 9708/11 Oct/Nov 2025
10 What is an example of direct provision by a government? A The government introduces a subsidy on renewable fuels to help the environment. B The government introduces a unit tax on cigarettes to discourage consumption. C The government sets a maximum rent on housing to protect tenants. D The government takes over a private library to improve local services.
1 marks
Answer: D
This question in 9708/11 Oct/Nov 2025
Q326 · A government gives a subsidy to a producer of a product 9708/11 Oct/Nov 2025
12 A government gives a subsidy to a producer of a product. What will be the likely effect of this? A a shift to the left in the demand curve and a rise in equilibrium quantity B a shift to the left in the supply curve and a rise in equilibrium quantity C a shift to the right in the demand curve and a fall in equilibrium price D a shift to the right in the supply curve and a fall in equilibrium price
1 marks
Answer: D
This question in 9708/11 Oct/Nov 2025
Q327 · Why might a government introduce a minimum price for a product? 9708/11 Oct/Nov 2025
14 Why might a government introduce a minimum price for a product? A to benefit poorer consumers B to encourage consumption of a merit good C to encourage production of a public good D to support the incomes of producers
1 marks
Answer: D
This question in 9708/11 Oct/Nov 2025
Q328 · An indirect tax is imposed on a product 9708/11 Oct/Nov 2025
15 An indirect tax is imposed on a product. S2 U S1 price V Z W Y X D O quantity What is the change in consumer surplus? A UWY B UVZ C ZVWY D ZVXY
1 marks
Answer: C
This question in 9708/11 Oct/Nov 2025
Q329 · The demand for electric vehicle batteries is derived from the demand for electric vehicles 9708/12 Oct/Nov 2025
11 The demand for electric vehicle batteries is derived from the demand for electric vehicles. To tackle climate change, a government subsidises producers of electric vehicles. What are the likely effects of this subsidy on the price and sales of electric vehicle batteries? price sales A decrease decrease B decrease increase C increase decrease D increase increase
1 marks
Answer: D
This question in 9708/12 Oct/Nov 2025
Q330 · The diagram shows the market for a demerit good 9708/12 Oct/Nov 2025
12 The diagram shows the market for a demerit good. The initial equilibrium is at point X. What will be the new equilibrium if the government imposes a unit tax on this demerit good and successfully informs consumers of its harmful effects? price S3 S1 S2 A D X B C D2 D1 D3 O quantity
1 marks
Answer: D
This question in 9708/12 Oct/Nov 2025
Q331 · To improve the health of people, a government puts a tax on the sale of drinks that… 9708/12 Oct/Nov 2025
13 To improve the health of people, a government puts a tax on the sale of drinks that contain sugar. What are the likely effects of this tax on both the prices of the drinks that contain sugar and the price of sugar? prices of drinks price of sugar A decrease decrease B decrease increase C increase decrease D increase increase
1 marks
Answer: C
This question in 9708/12 Oct/Nov 2025
Q332 · The diagram shows supply and demand for a good 9708/13 Oct/Nov 2025
11 The diagram shows supply and demand for a good. The original equilibrium is X. What will be the new equilibrium if subsidies are given to firms for new machinery? S3 price B S1 S2 C A X D D2 D1 D3 O quantity
1 marks
Answer: D
This question in 9708/13 Oct/Nov 2025
Q333 · The market for good X is in equilibrium when its price is $10 9708/13 Oct/Nov 2025
12 The market for good X is in equilibrium when its price is $10. The government decides to set a maximum price for good X. Which maximum price will cause the largest change in consumer surplus? maximum price for good X ($) A 9 B 10 C 11 D 12
1 marks
Answer: A
This question in 9708/13 Oct/Nov 2025
Q334 · Assuming demand is price elastic, what will rise the most if an indirect tax is removed? 9708/13 Oct/Nov 2025
13 Assuming demand is price elastic, what will rise the most if an indirect tax is removed? A consumer expenditures B price of the product C producers’ revenues D tax receipts
1 marks
Answer: C
This question in 9708/13 Oct/Nov 2025
Q335 · A government provides a subsidy for a product with a perfectly price inelastic demand 9708/13 Oct/Nov 2025
15 A government provides a subsidy for a product with a perfectly price inelastic demand. What prevents producers from benefiting from this subsidy? The subsidy causes a large reduction in the price of the product, as its price elasticity of demand A is infinite. The subsidy causes a large reduction in the price of the product, as its price elasticity of demand B is zero. The subsidy causes a small reduction in the price of the product, as its price elasticity of demand C is relatively elastic. The subsidy causes a small reduction in the price of the product, as its price elasticity of demand D is relatively inelastic.
1 marks
Answer: B
This question in 9708/13 Oct/Nov 2025
Q336 · A government intervenes in the market for good X 9708/13 Oct/Nov 2025
16 A government intervenes in the market for good X. It fixes a minimum price above the market equilibrium. Which situation explains why the government would do this? good X reason for intervention A demerit good to decrease consumption B demerit good to increase consumption C merit good to decrease consumption D merit good to increase consumption
1 marks
Answer: A
This question in 9708/13 Oct/Nov 2025
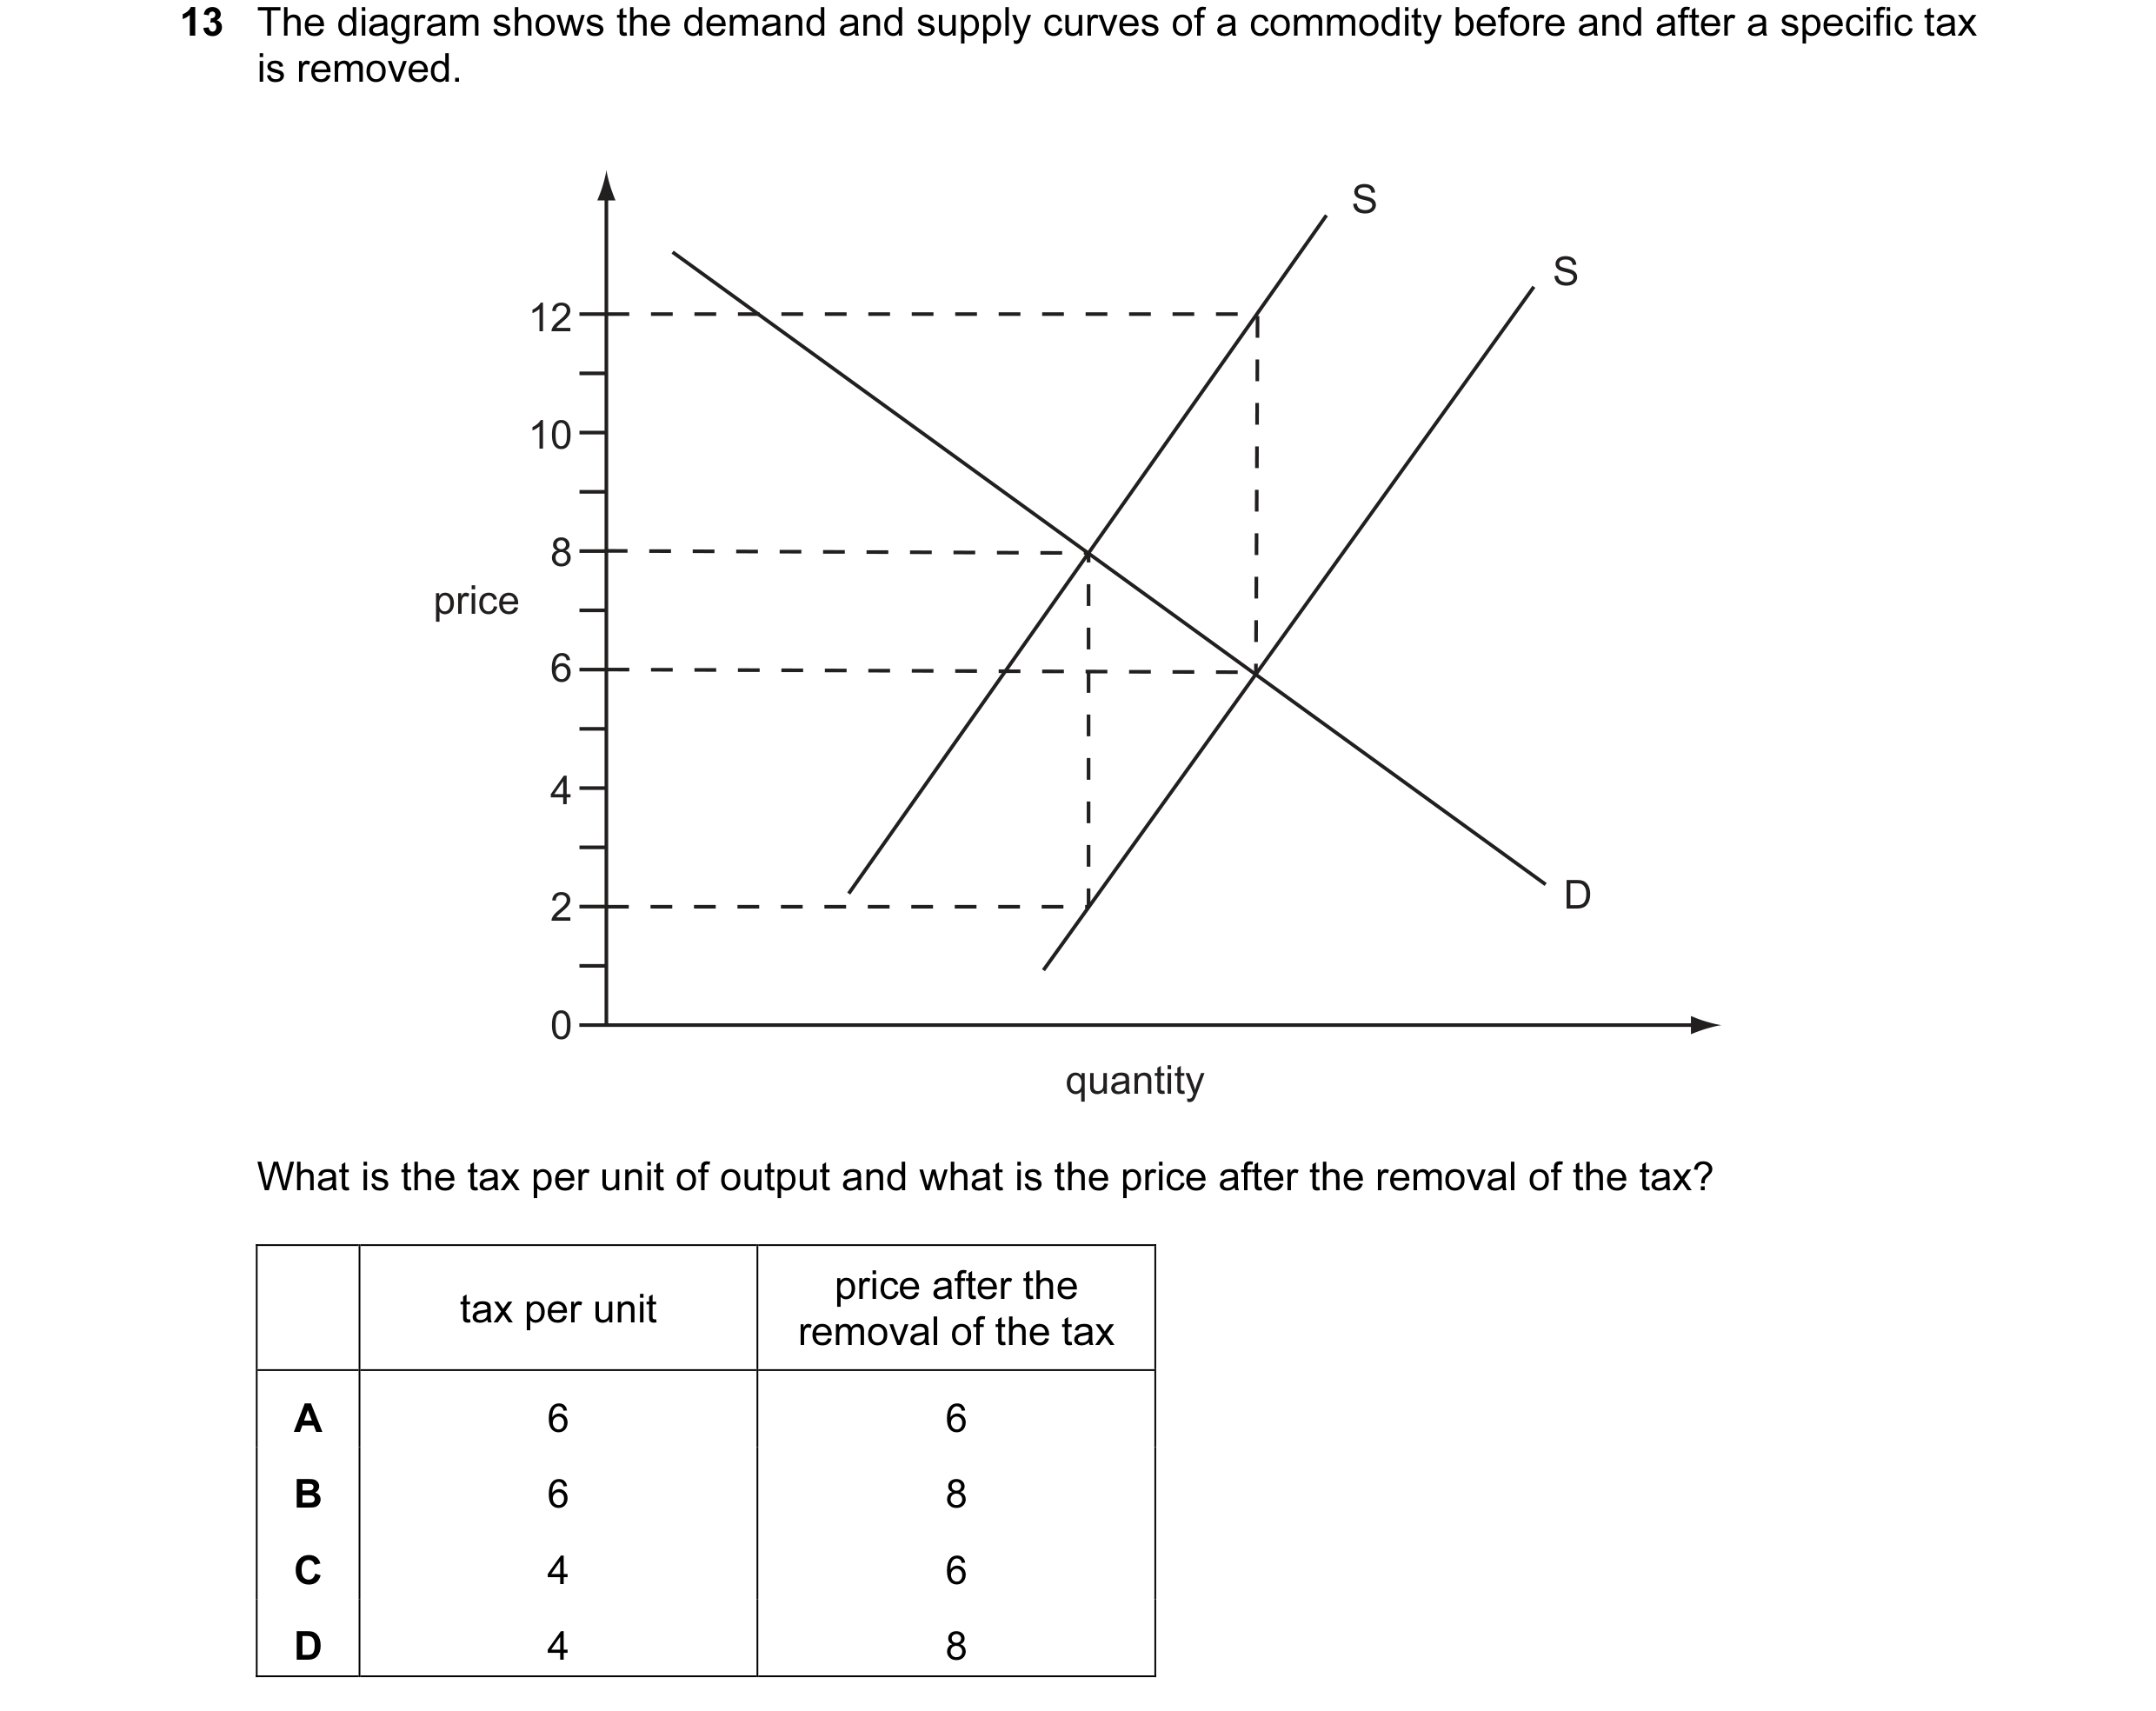
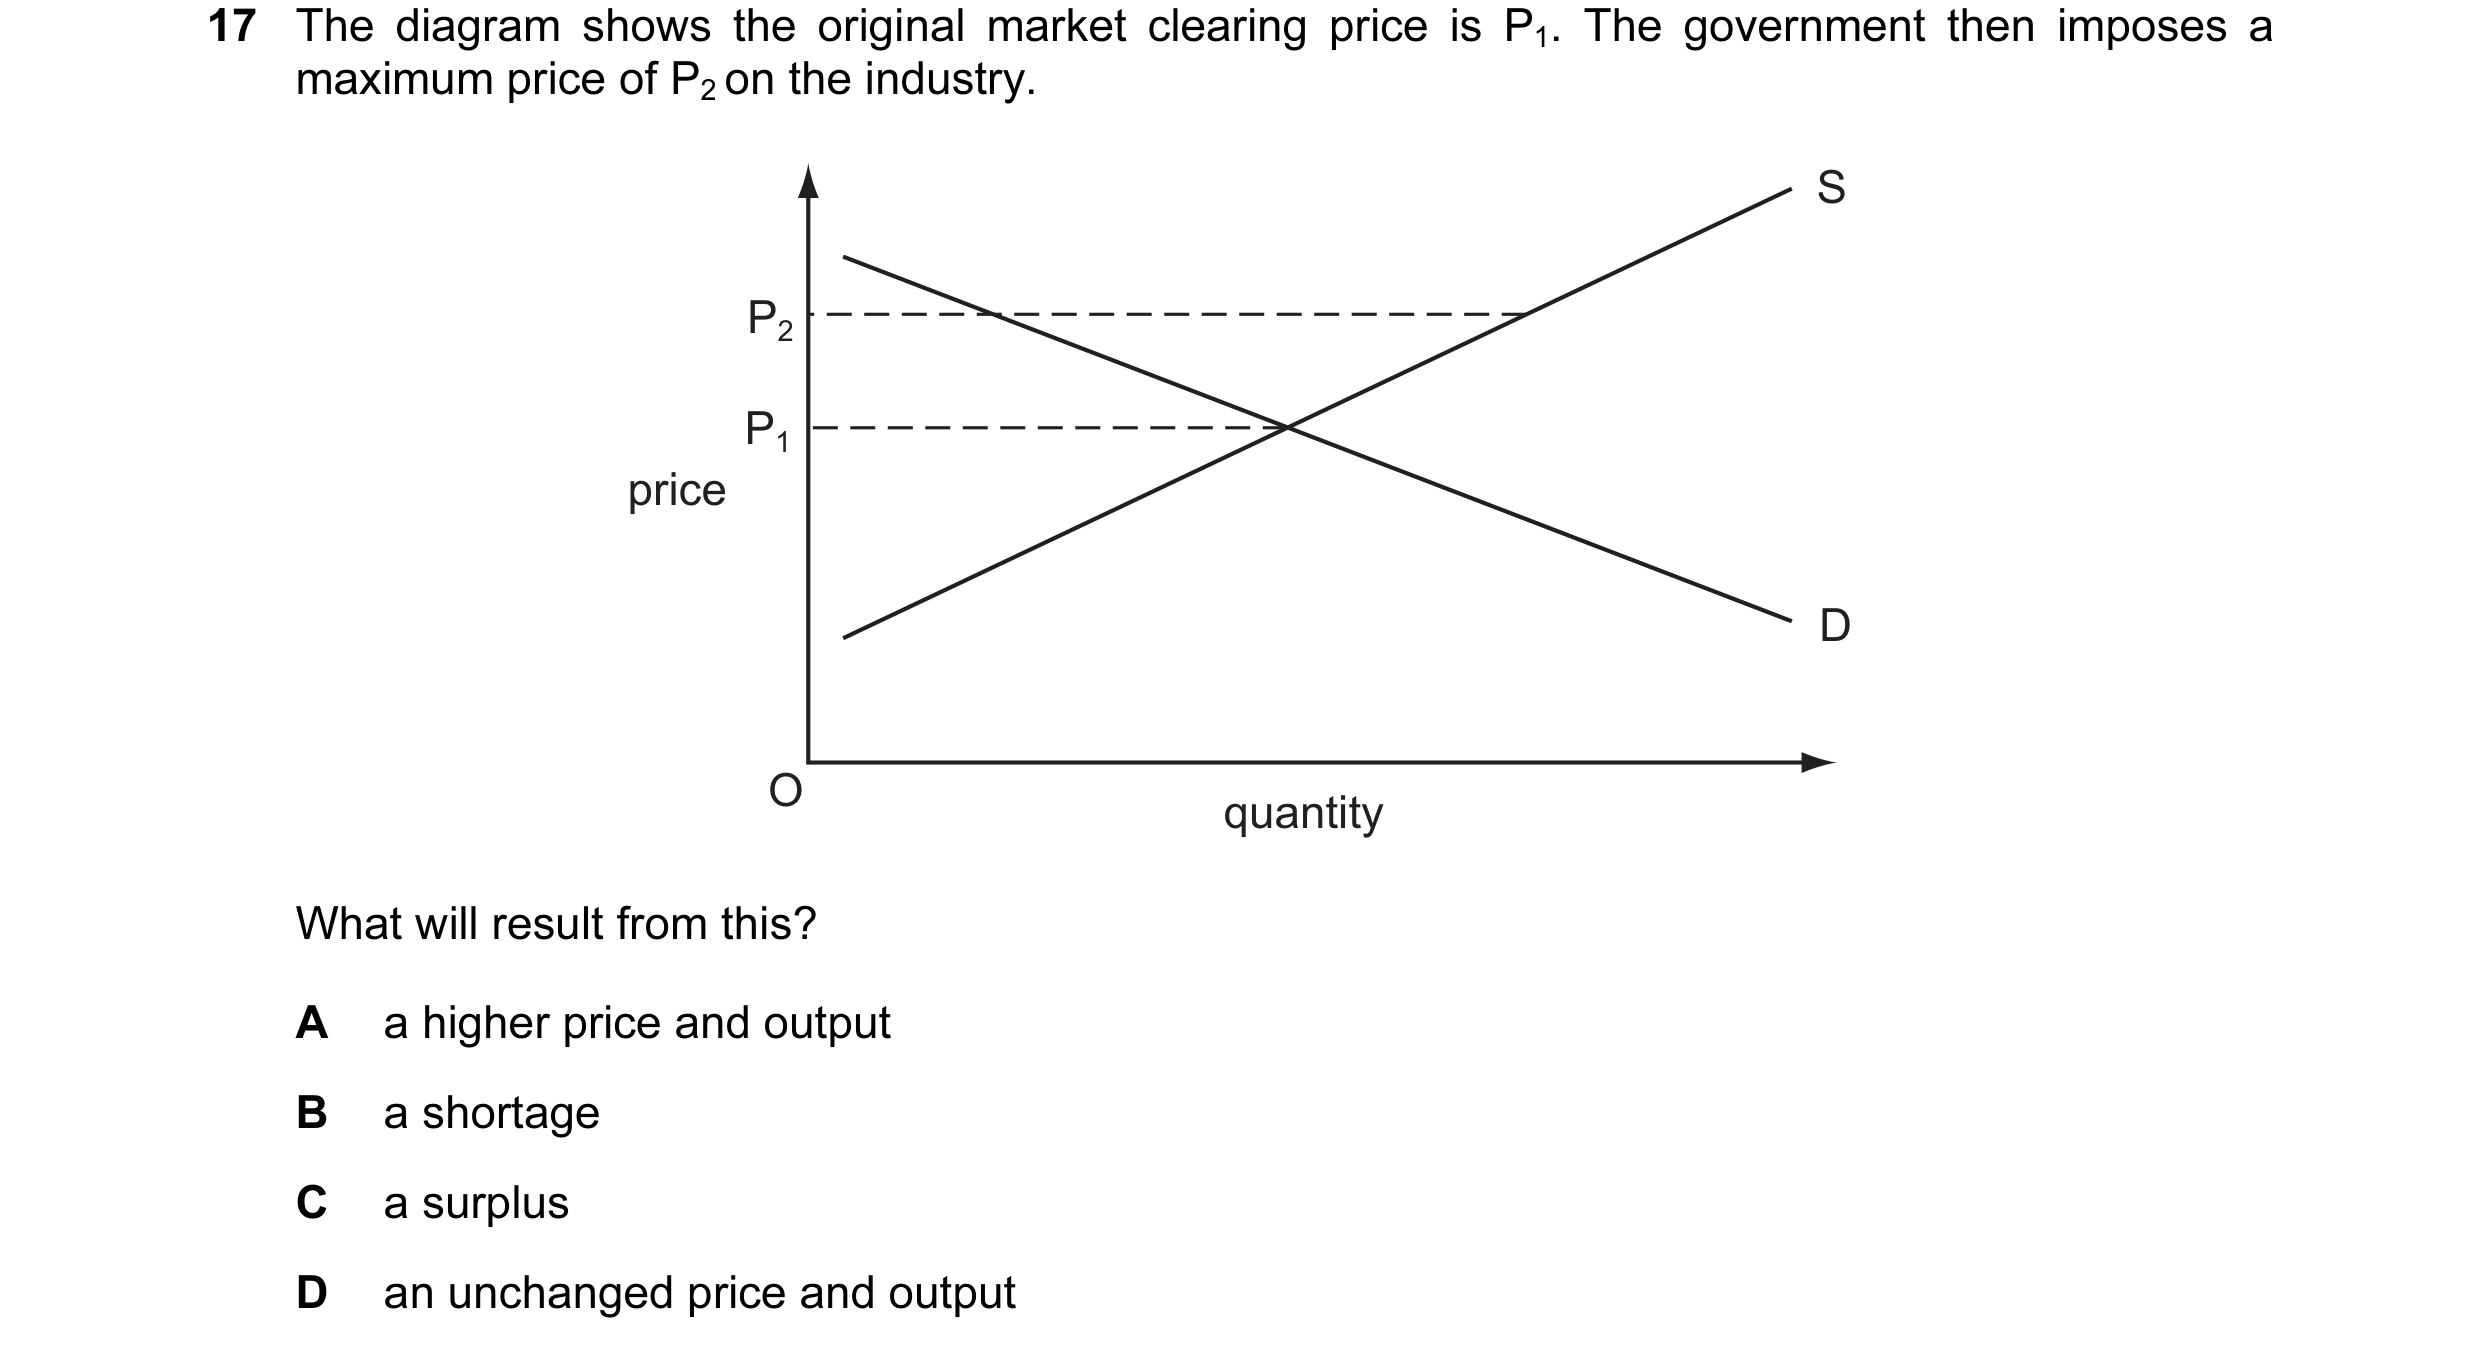 1 / 119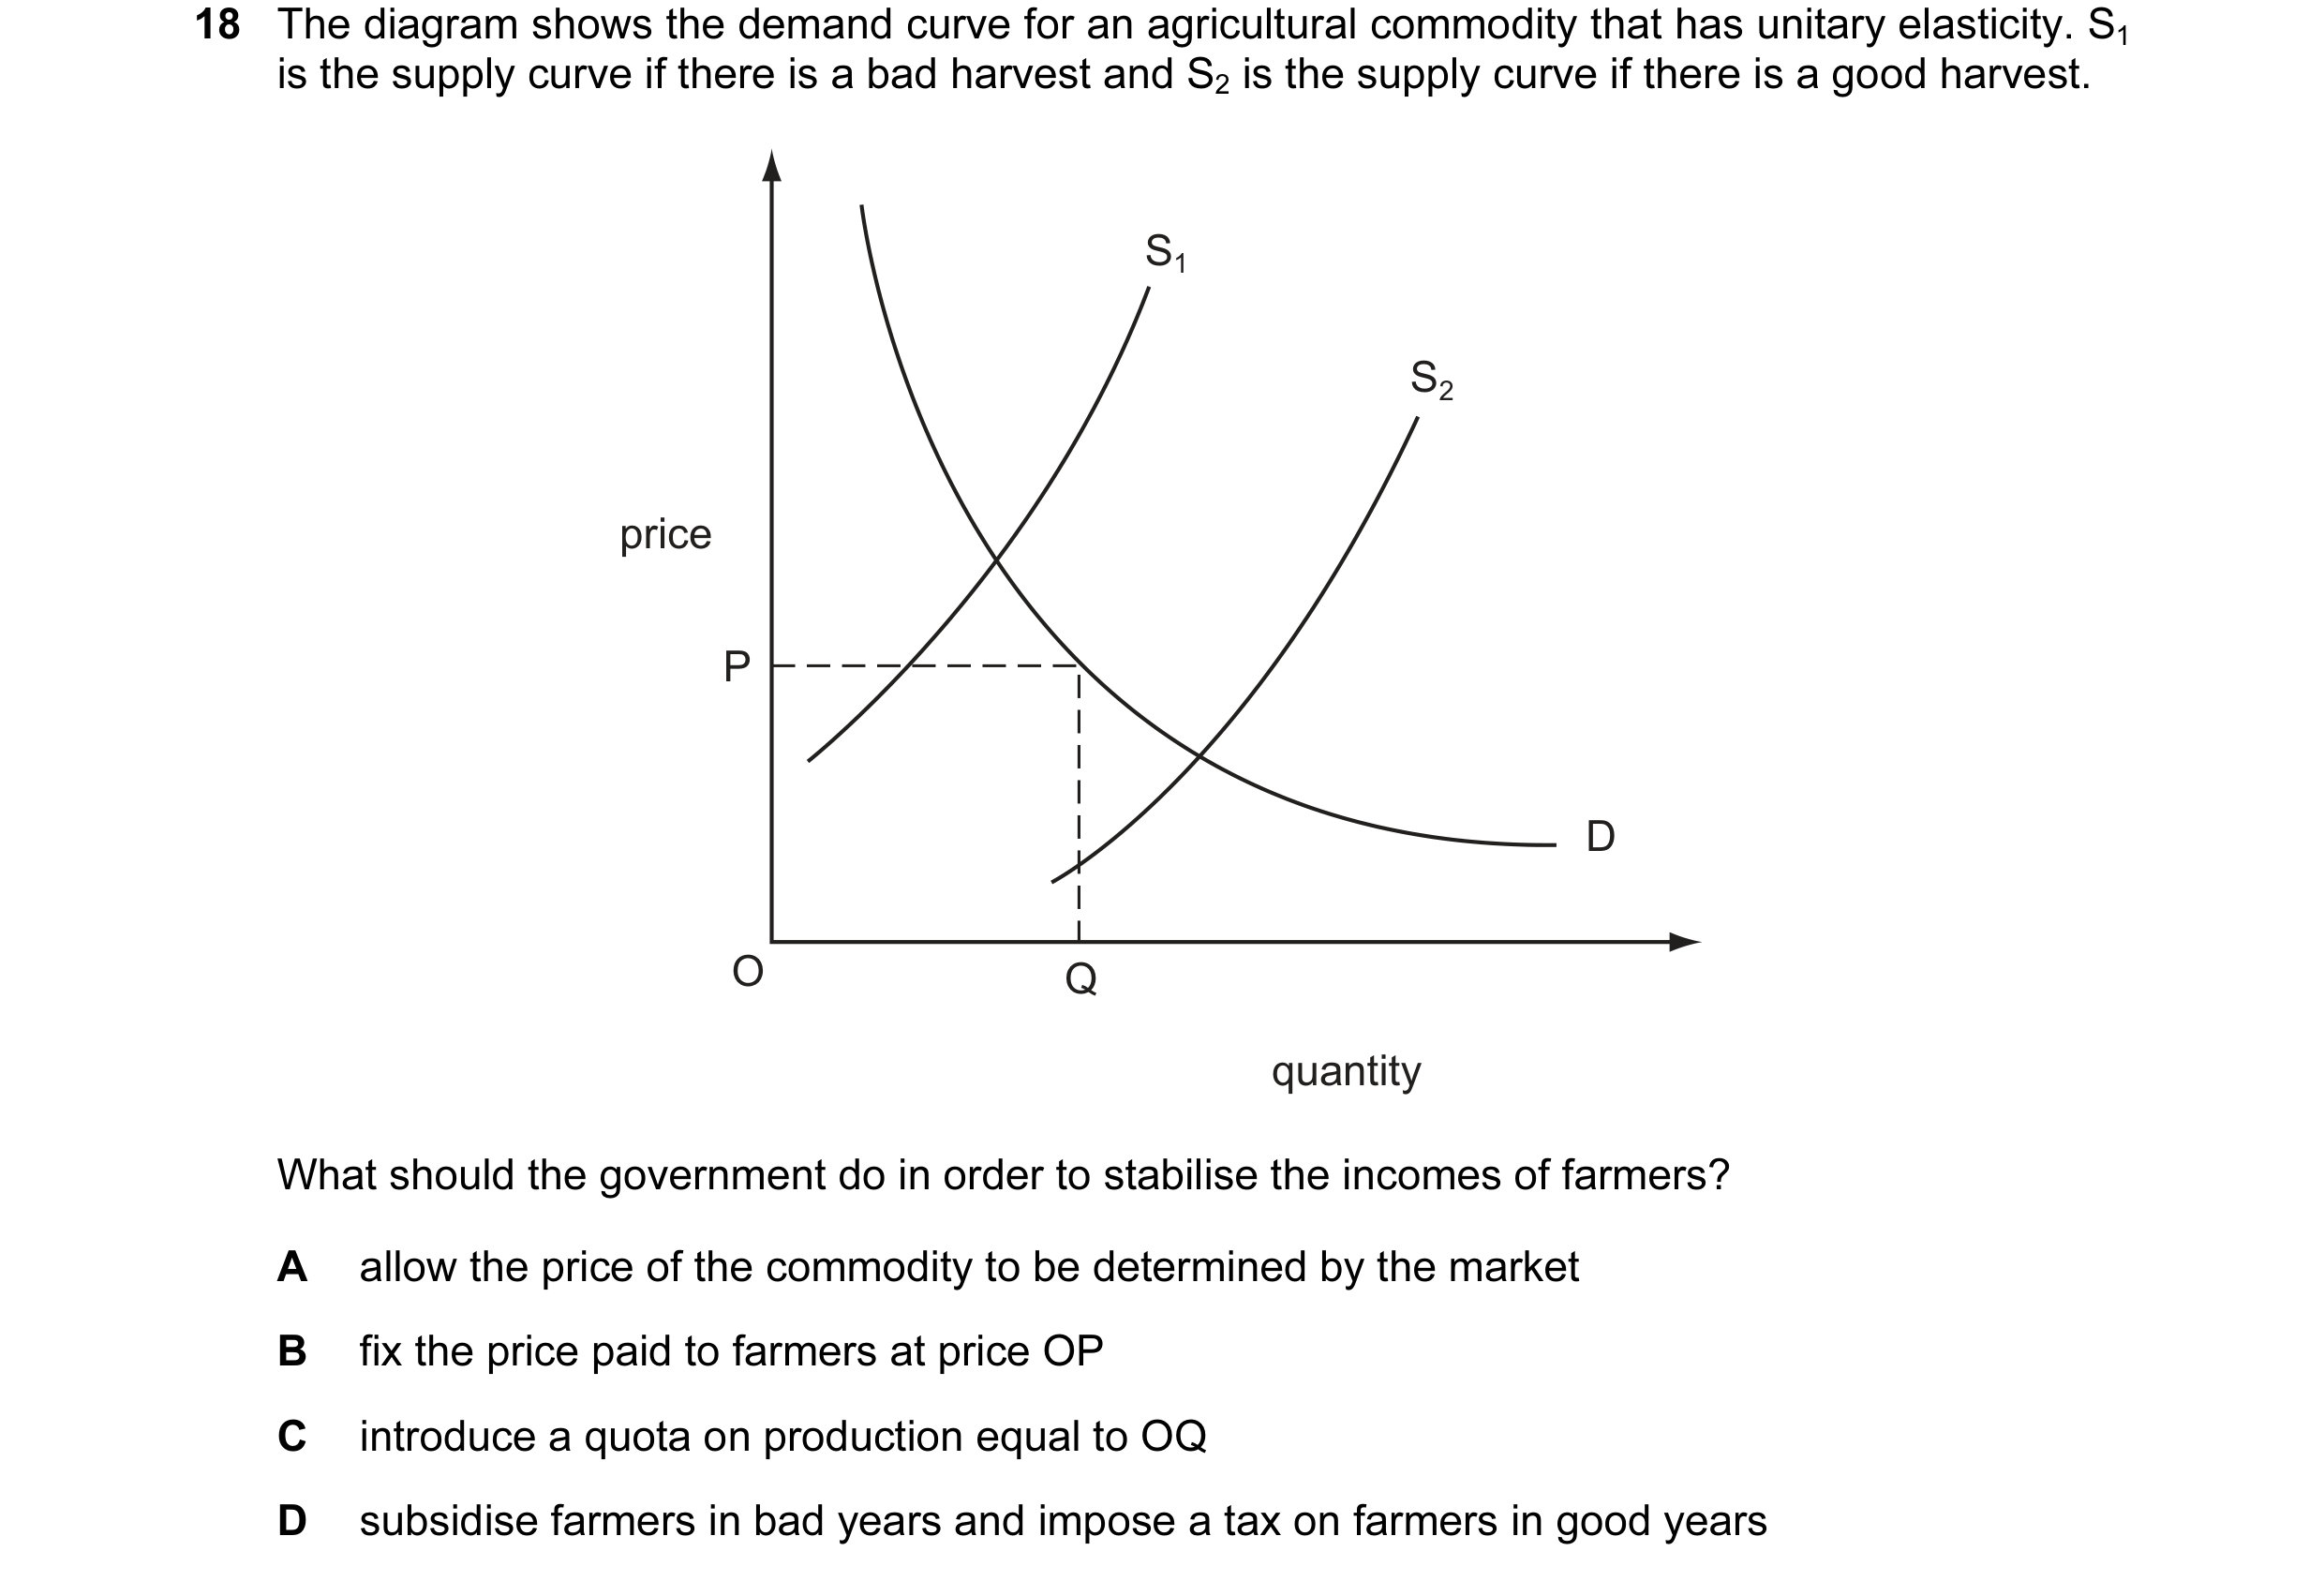
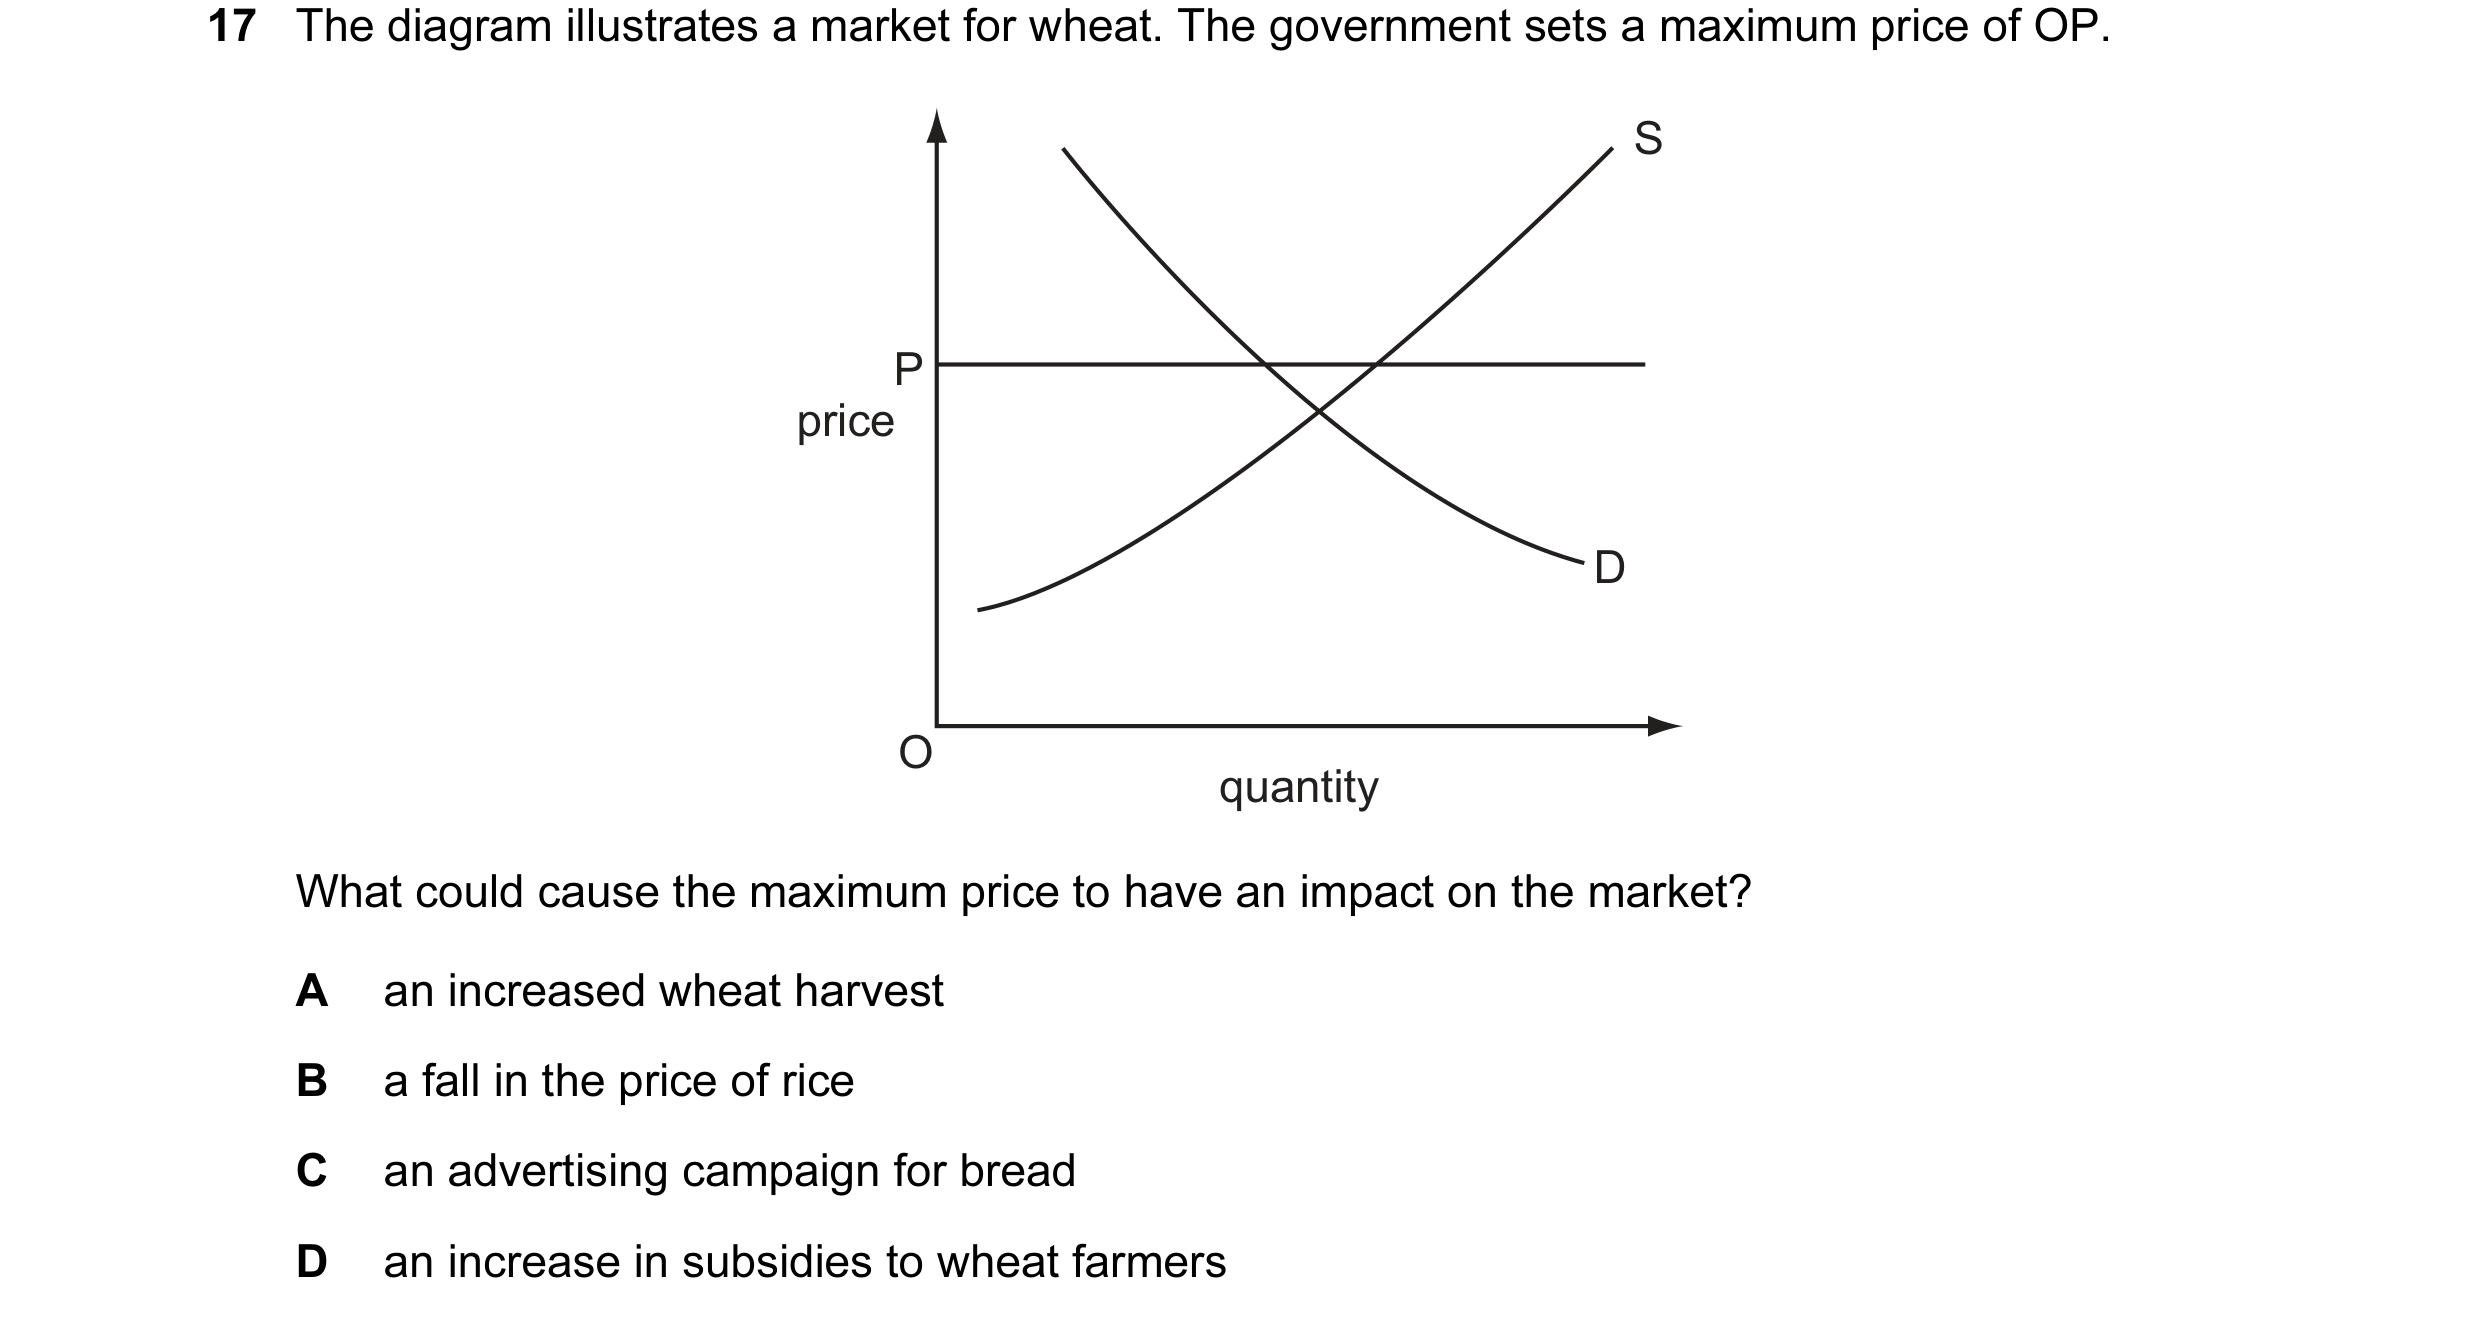 2 / 119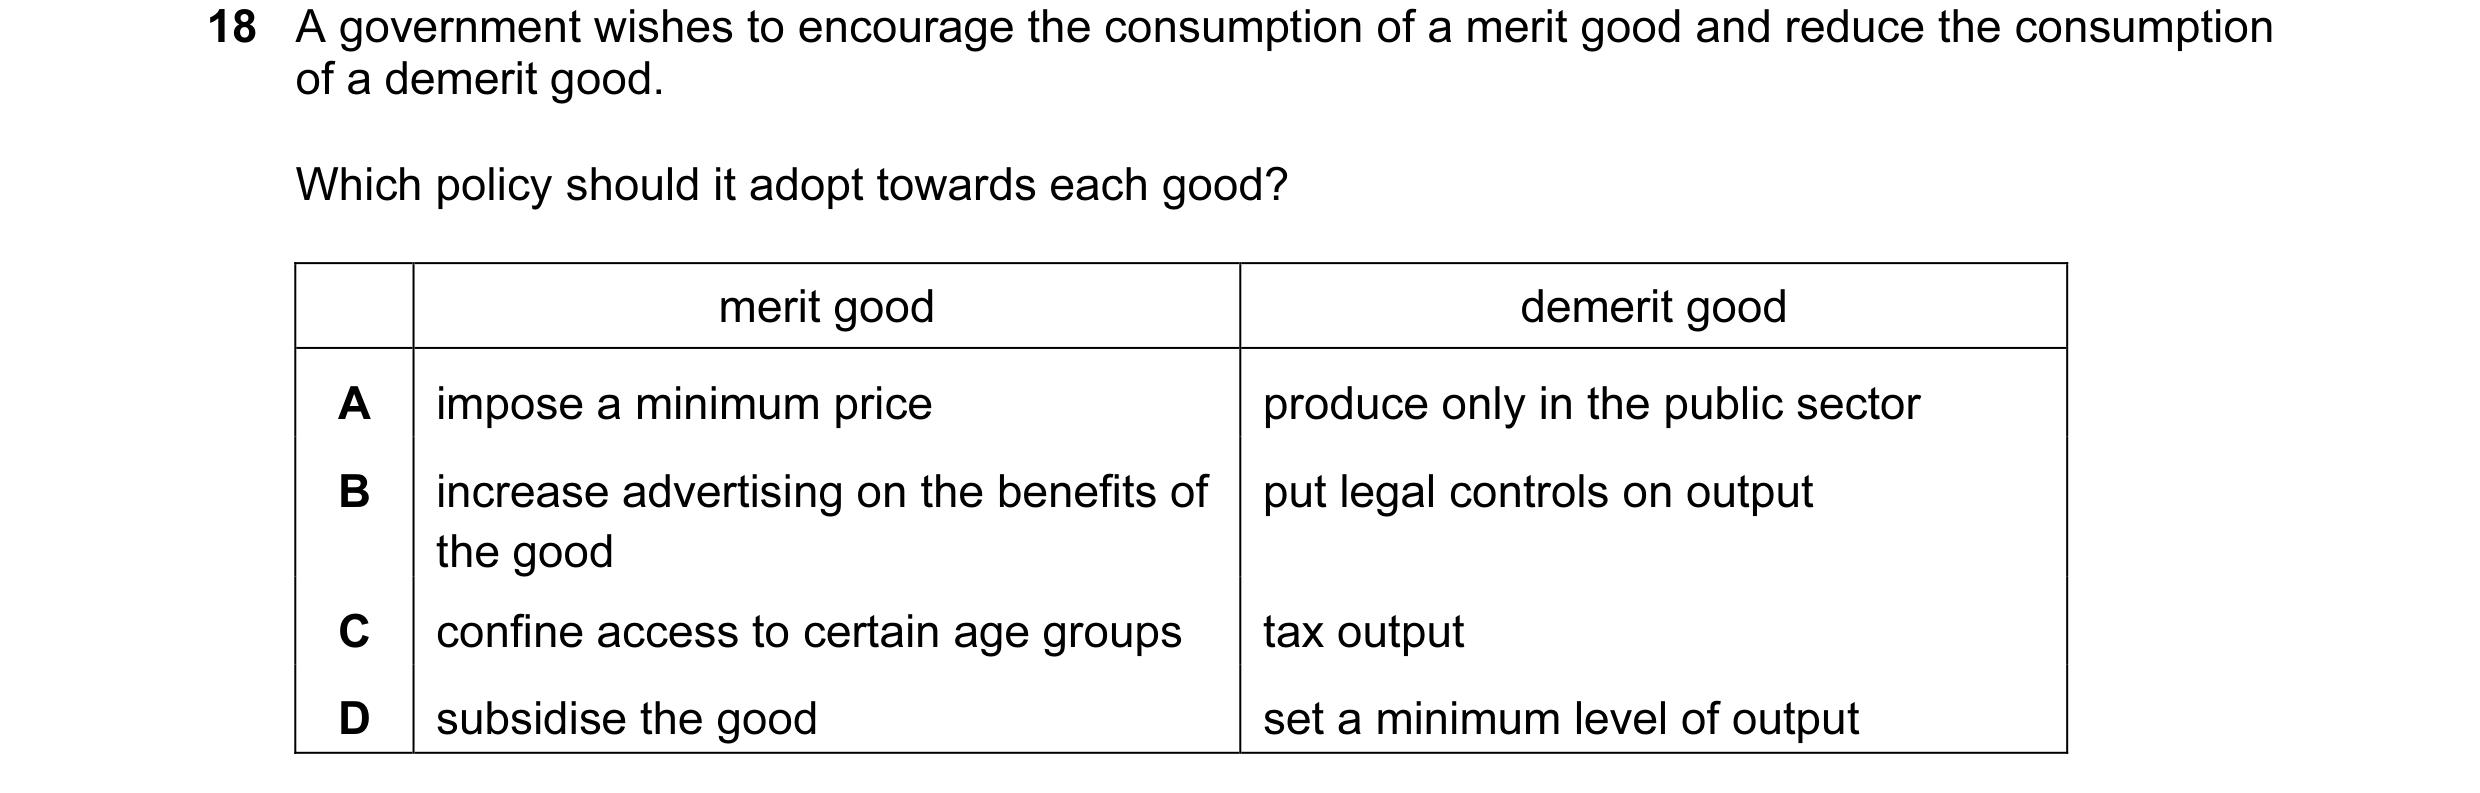
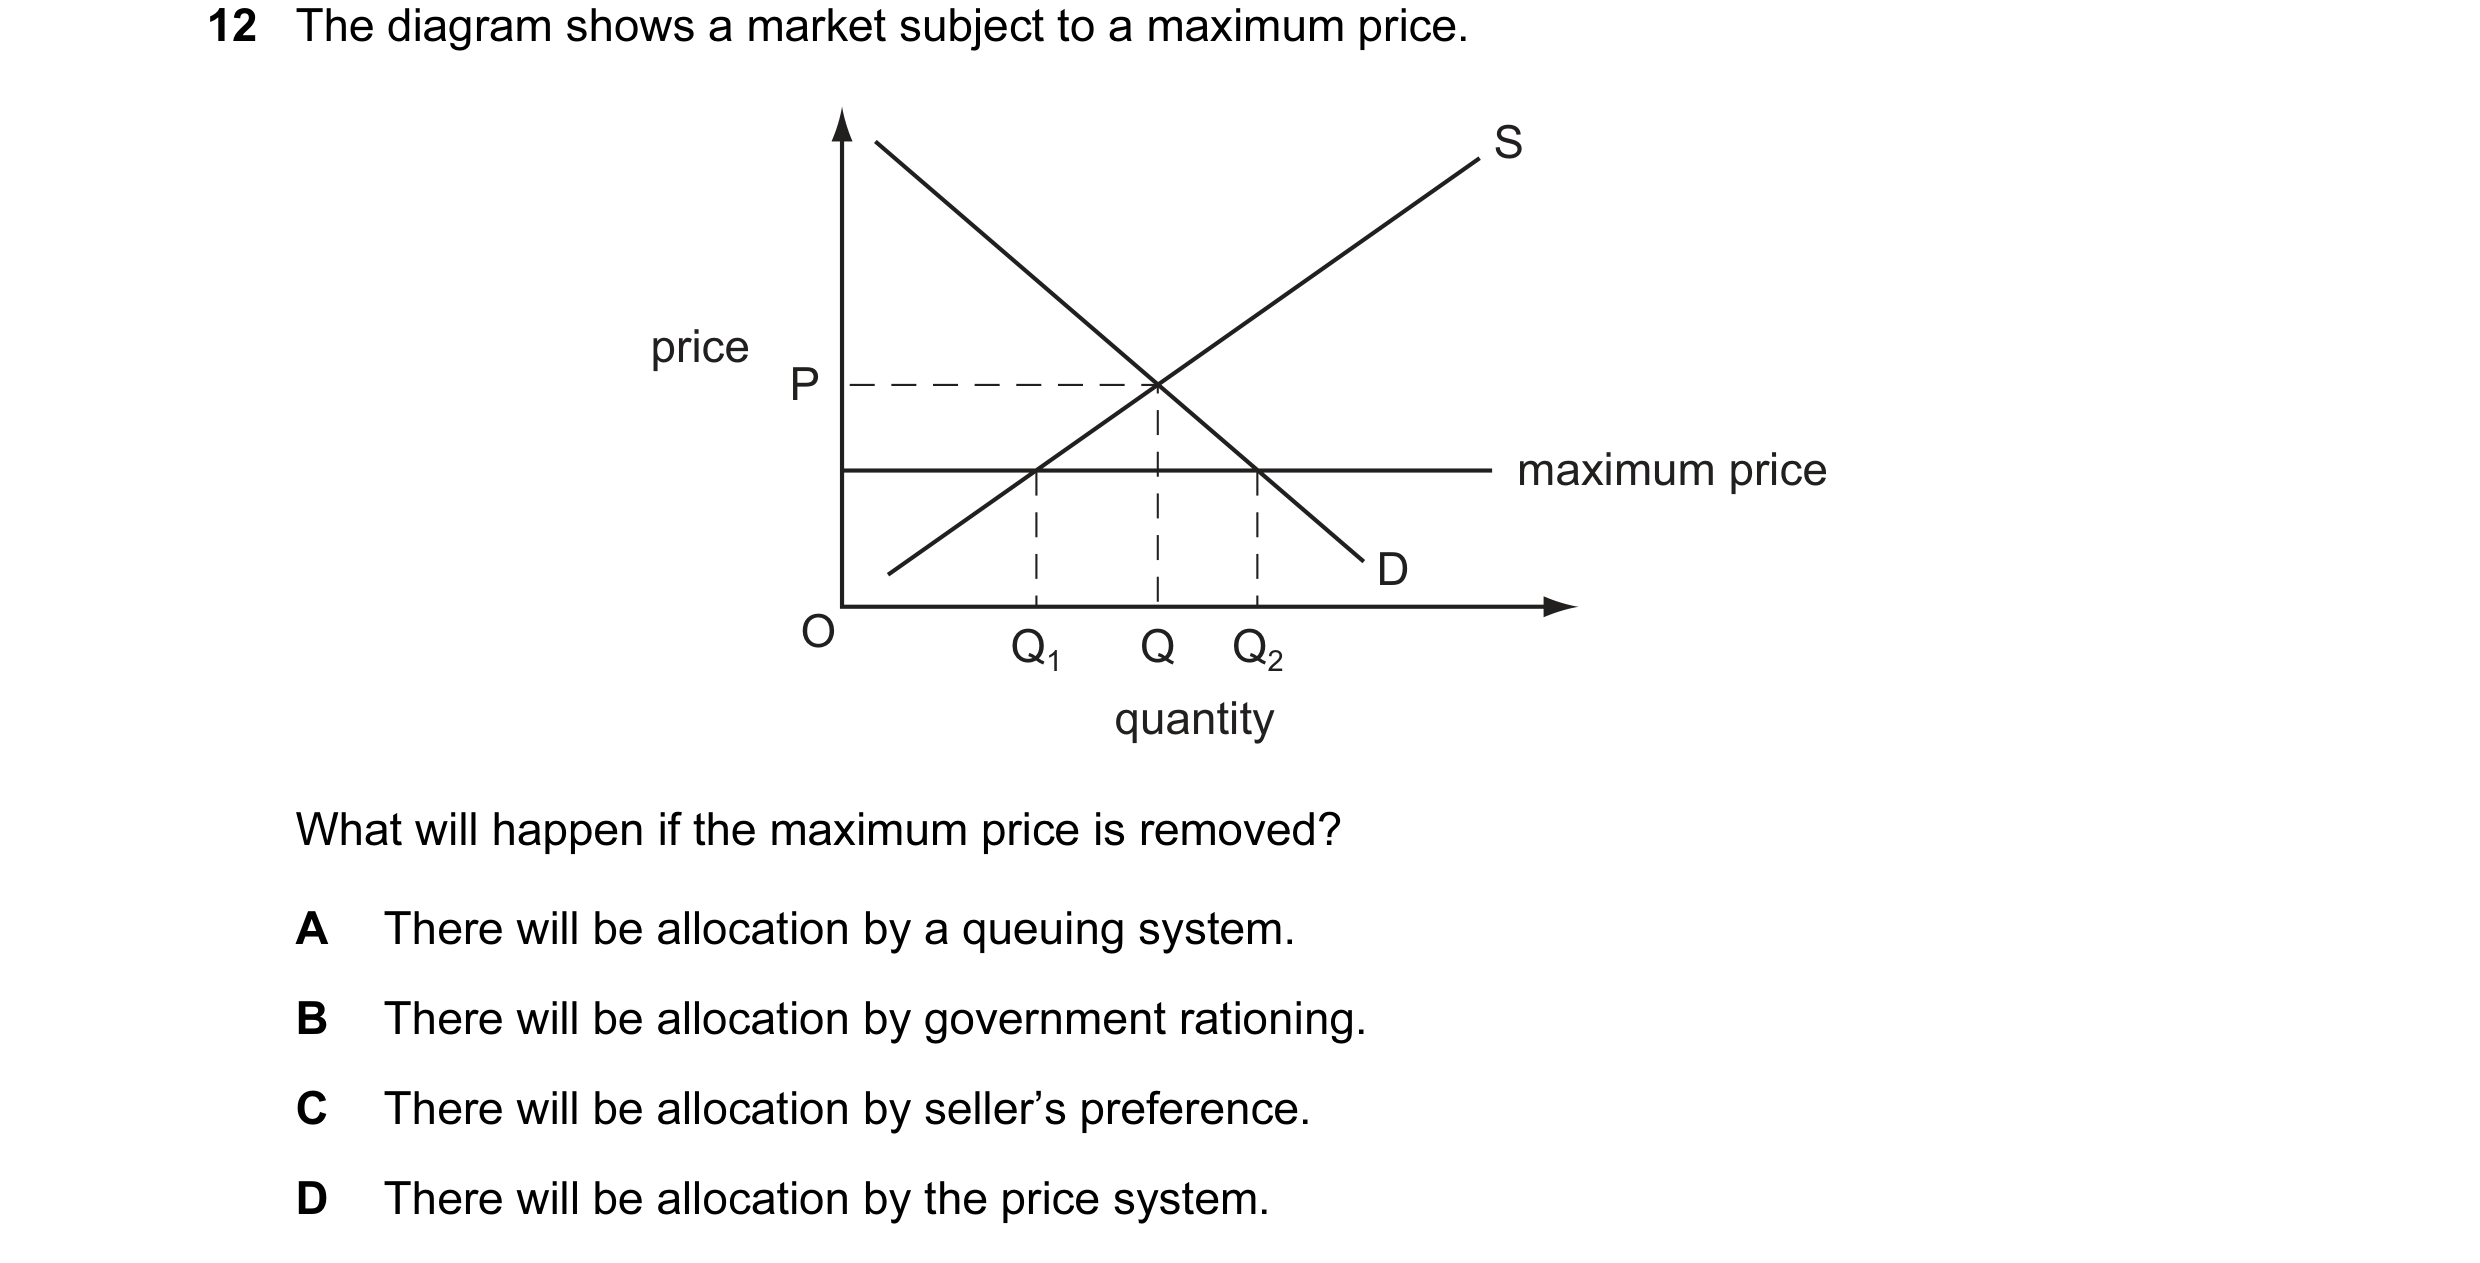
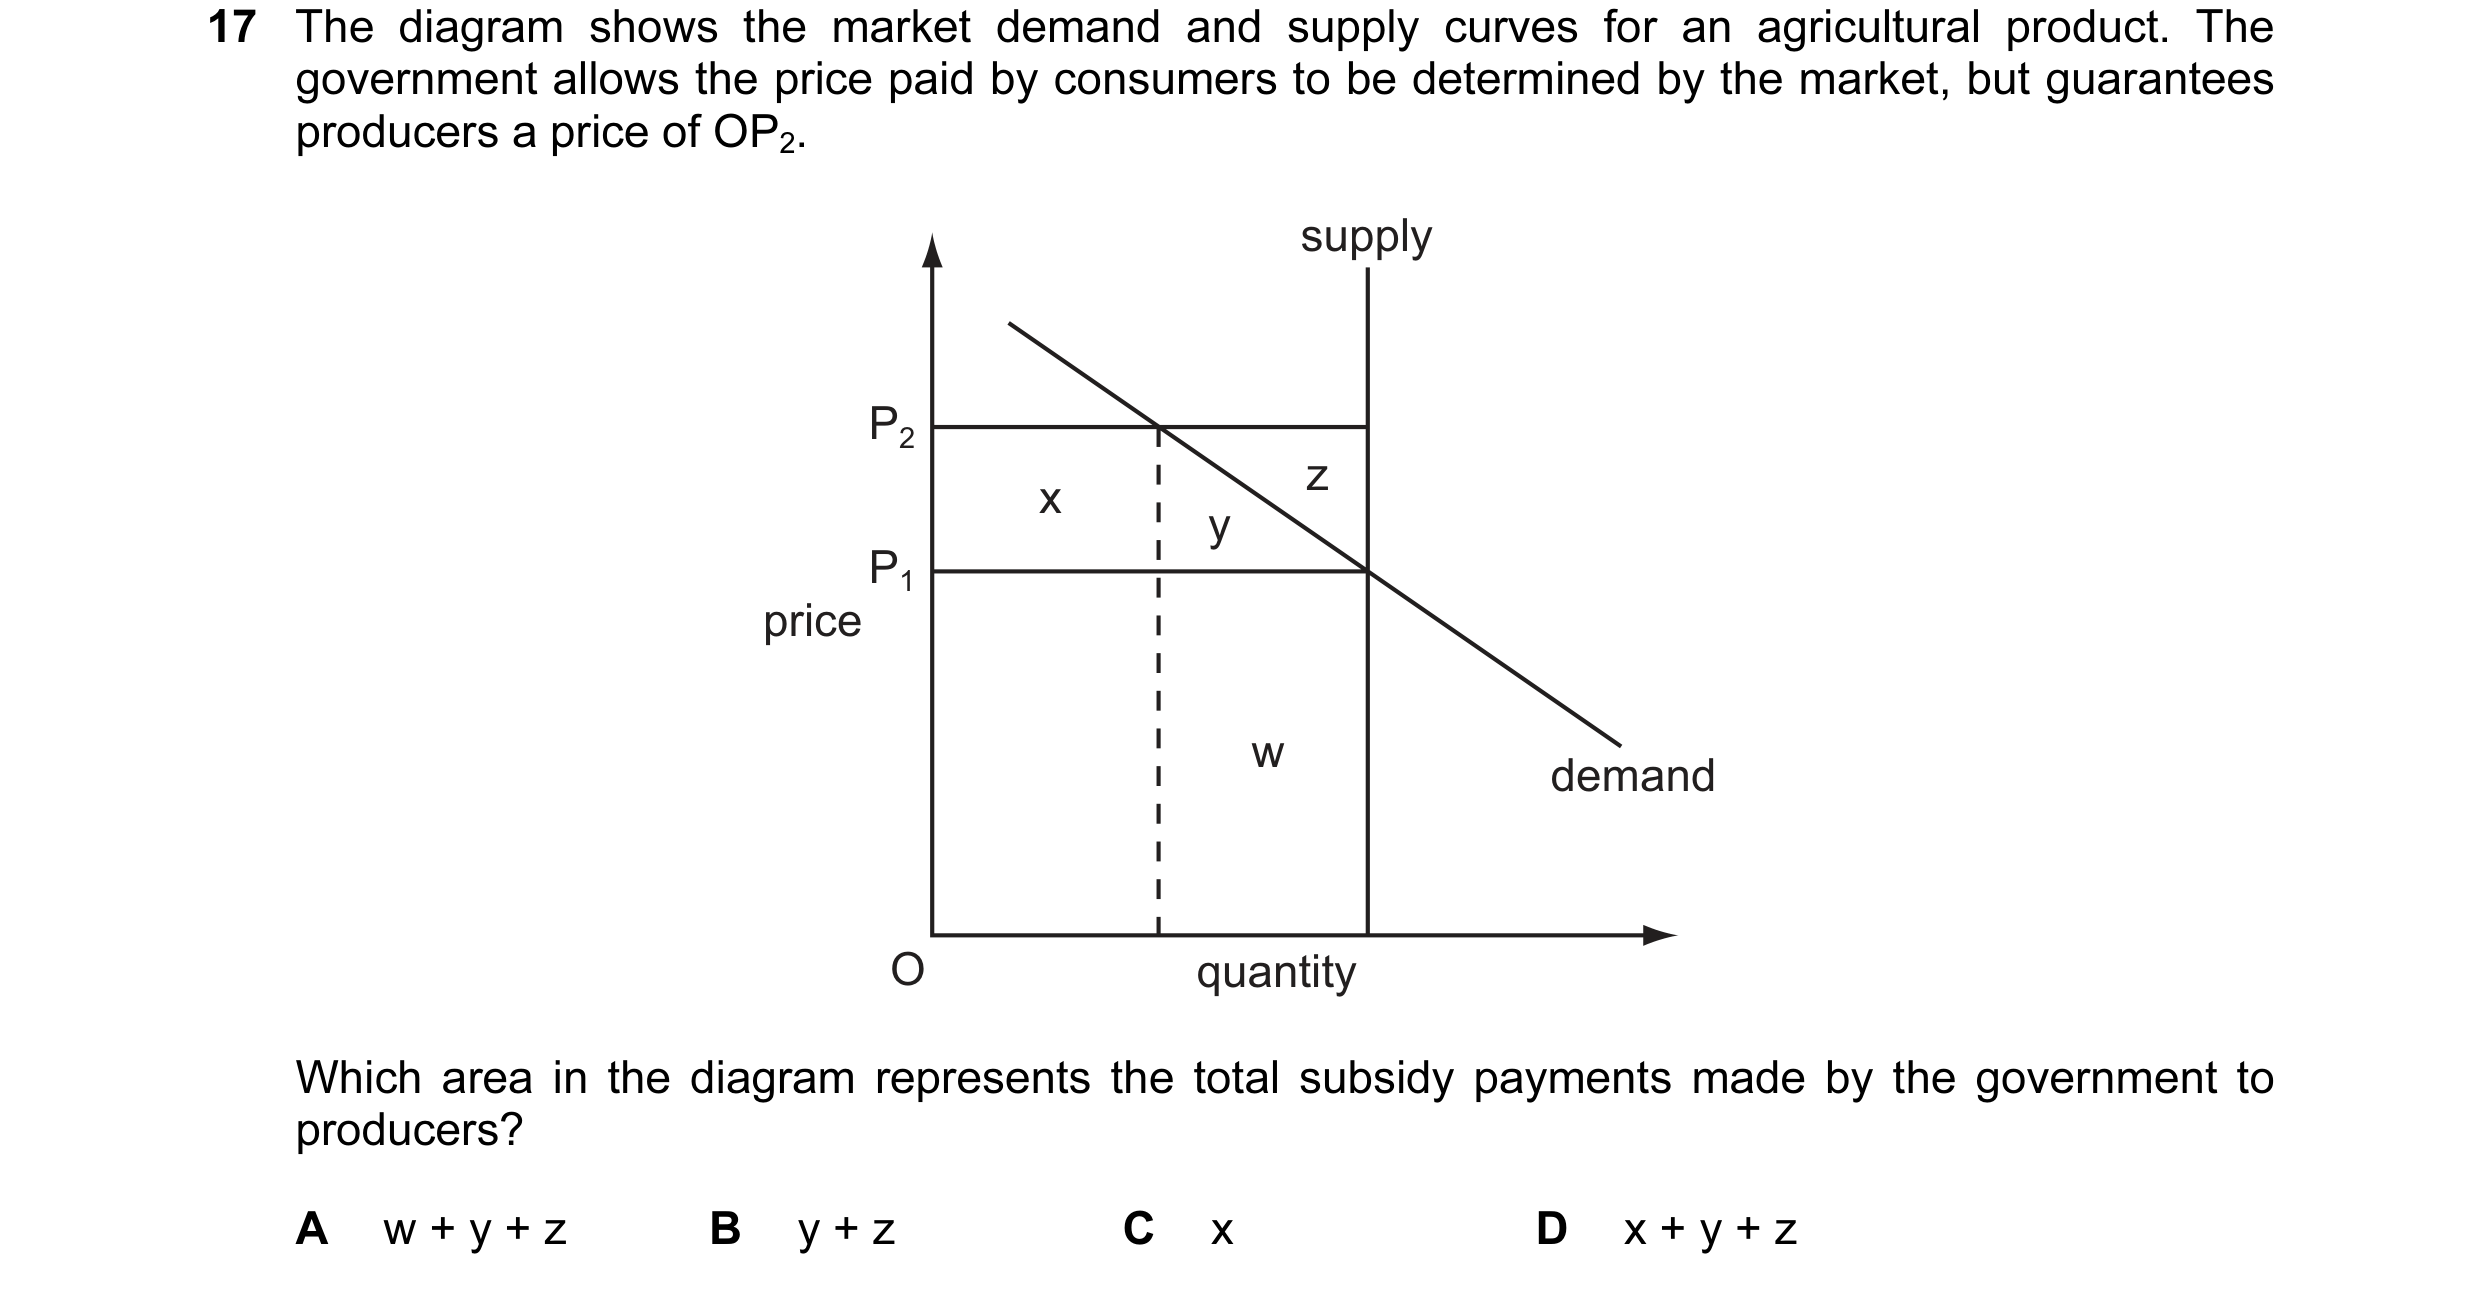 3 / 119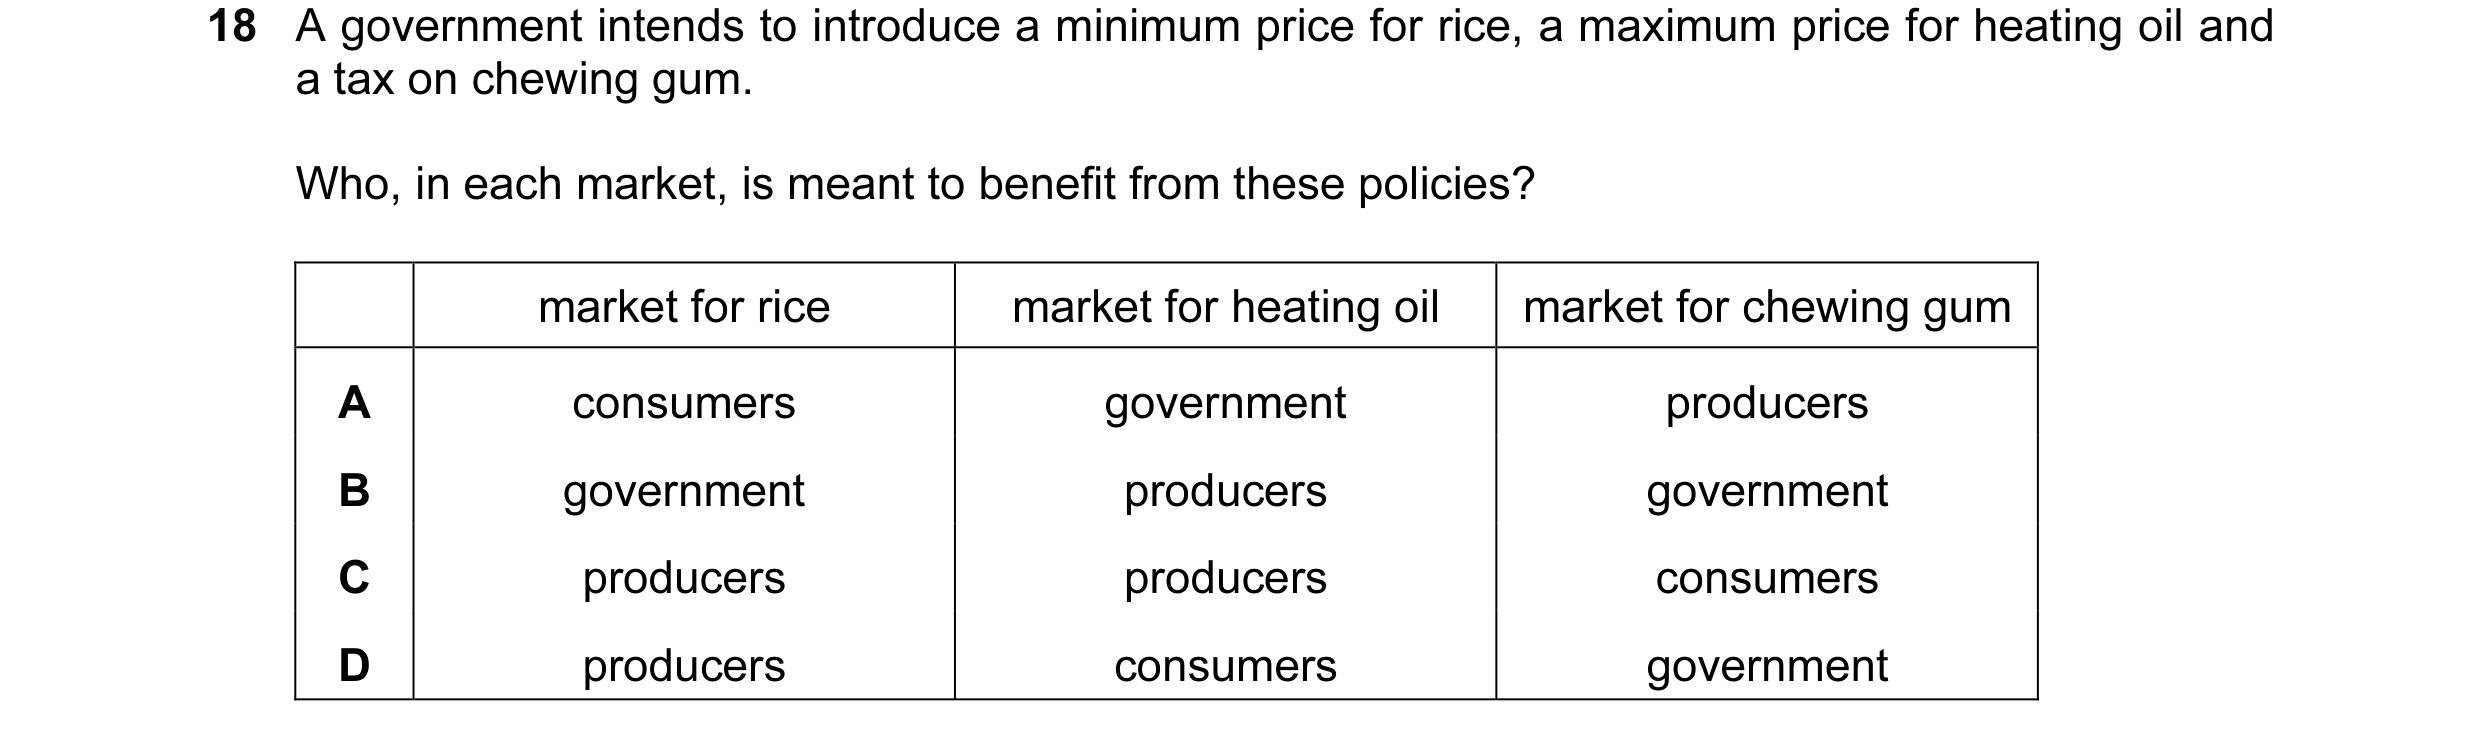
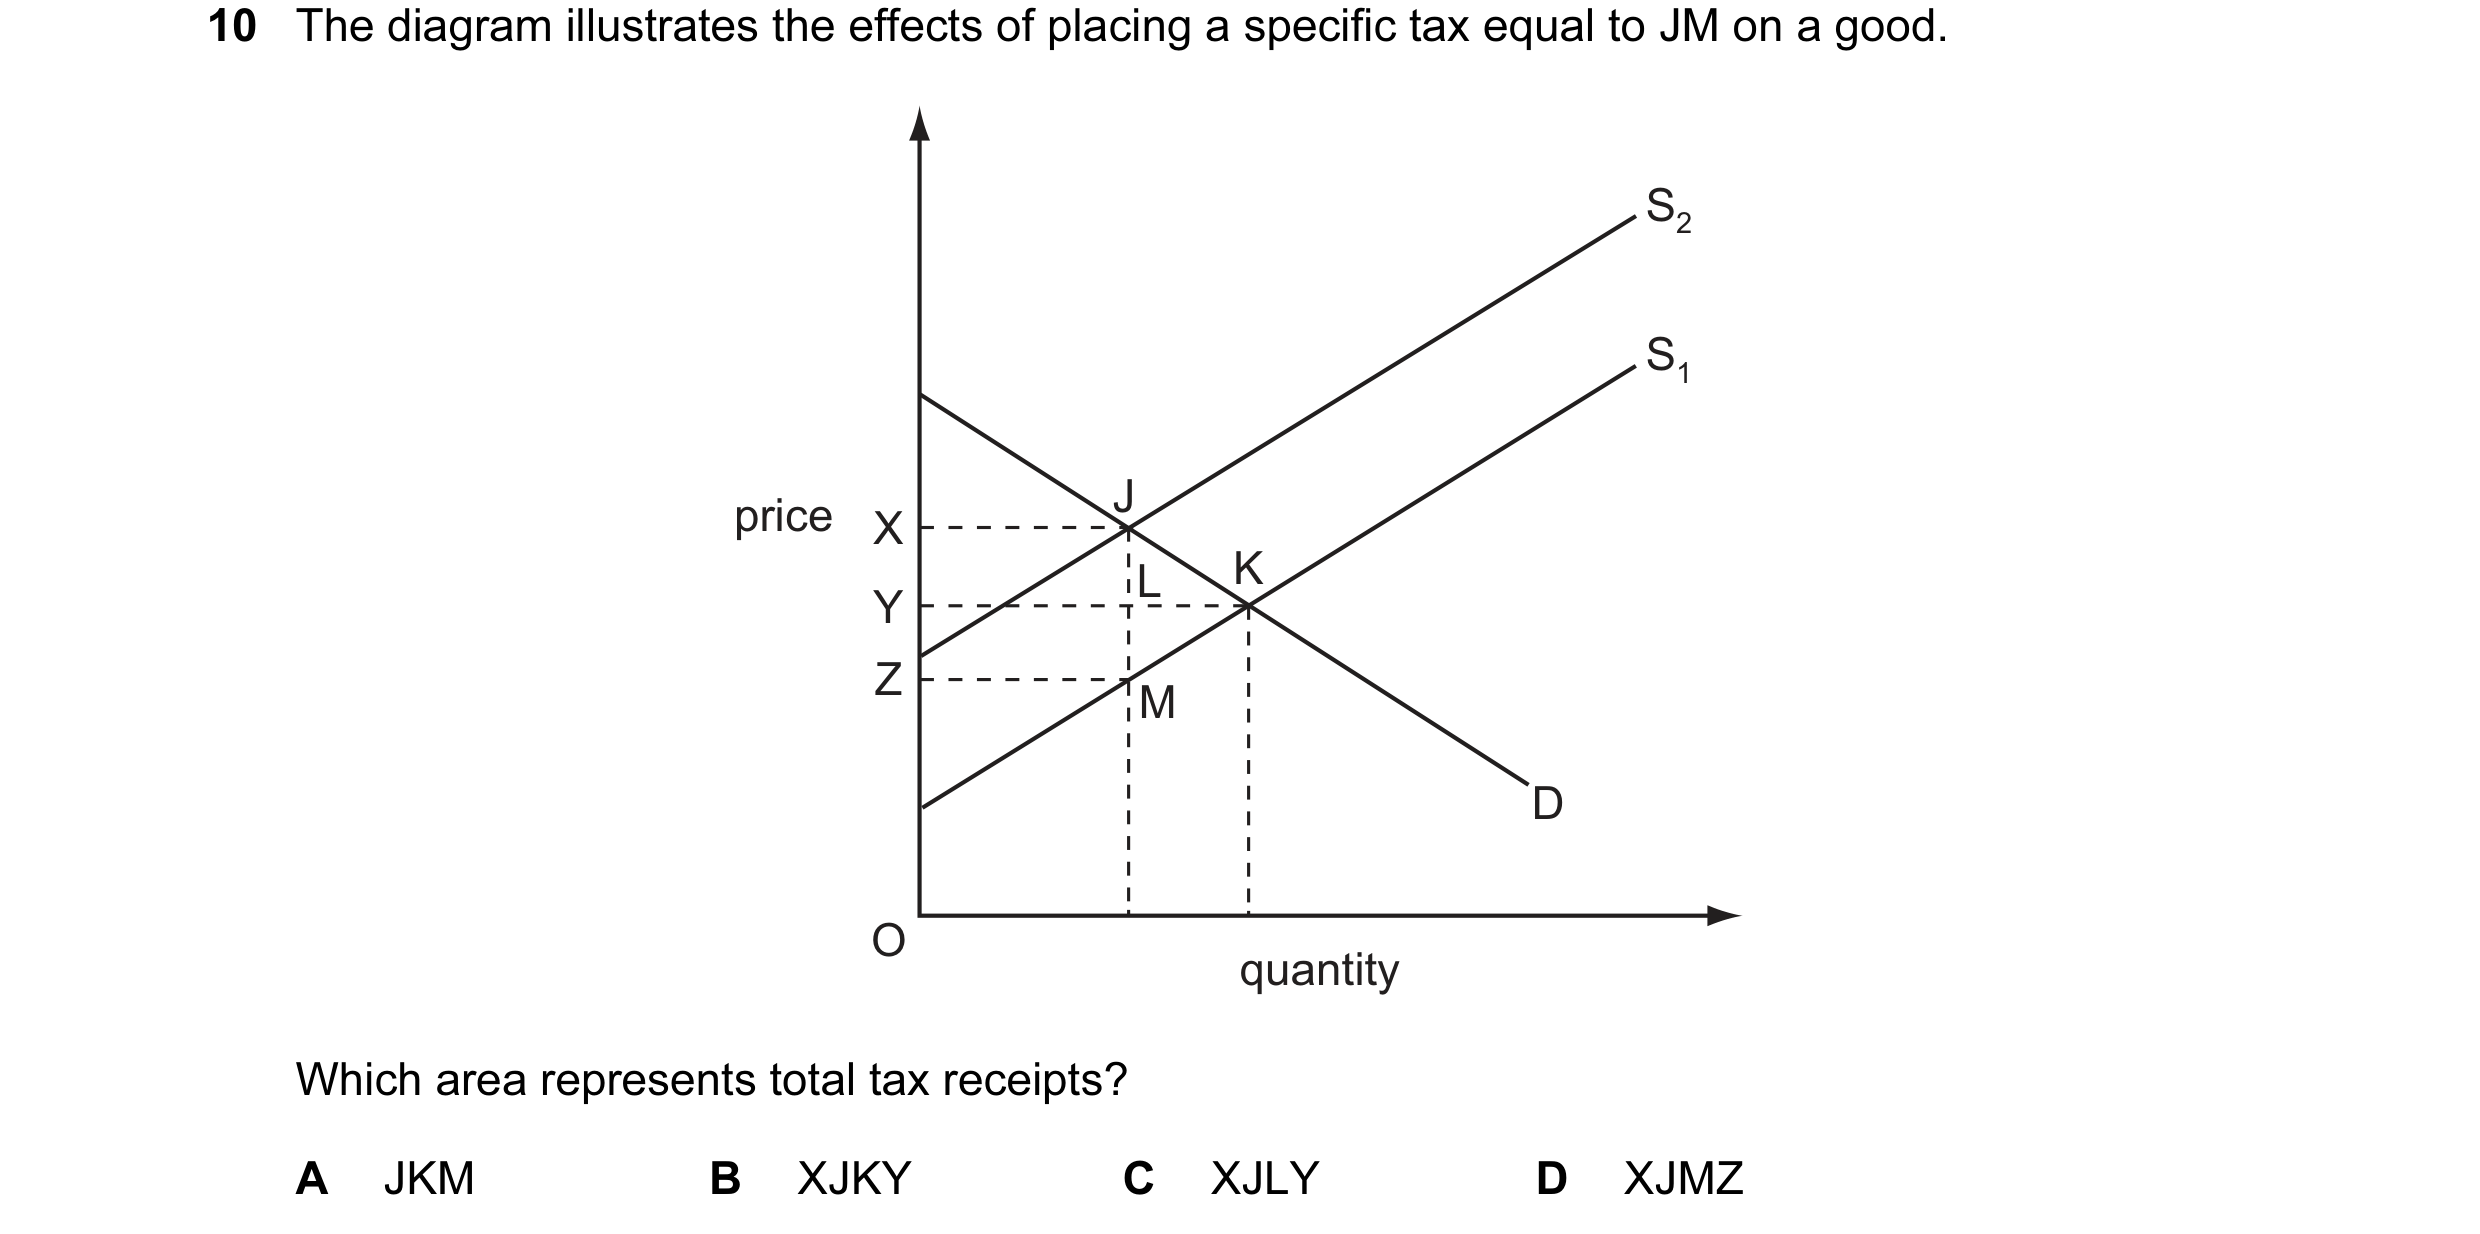
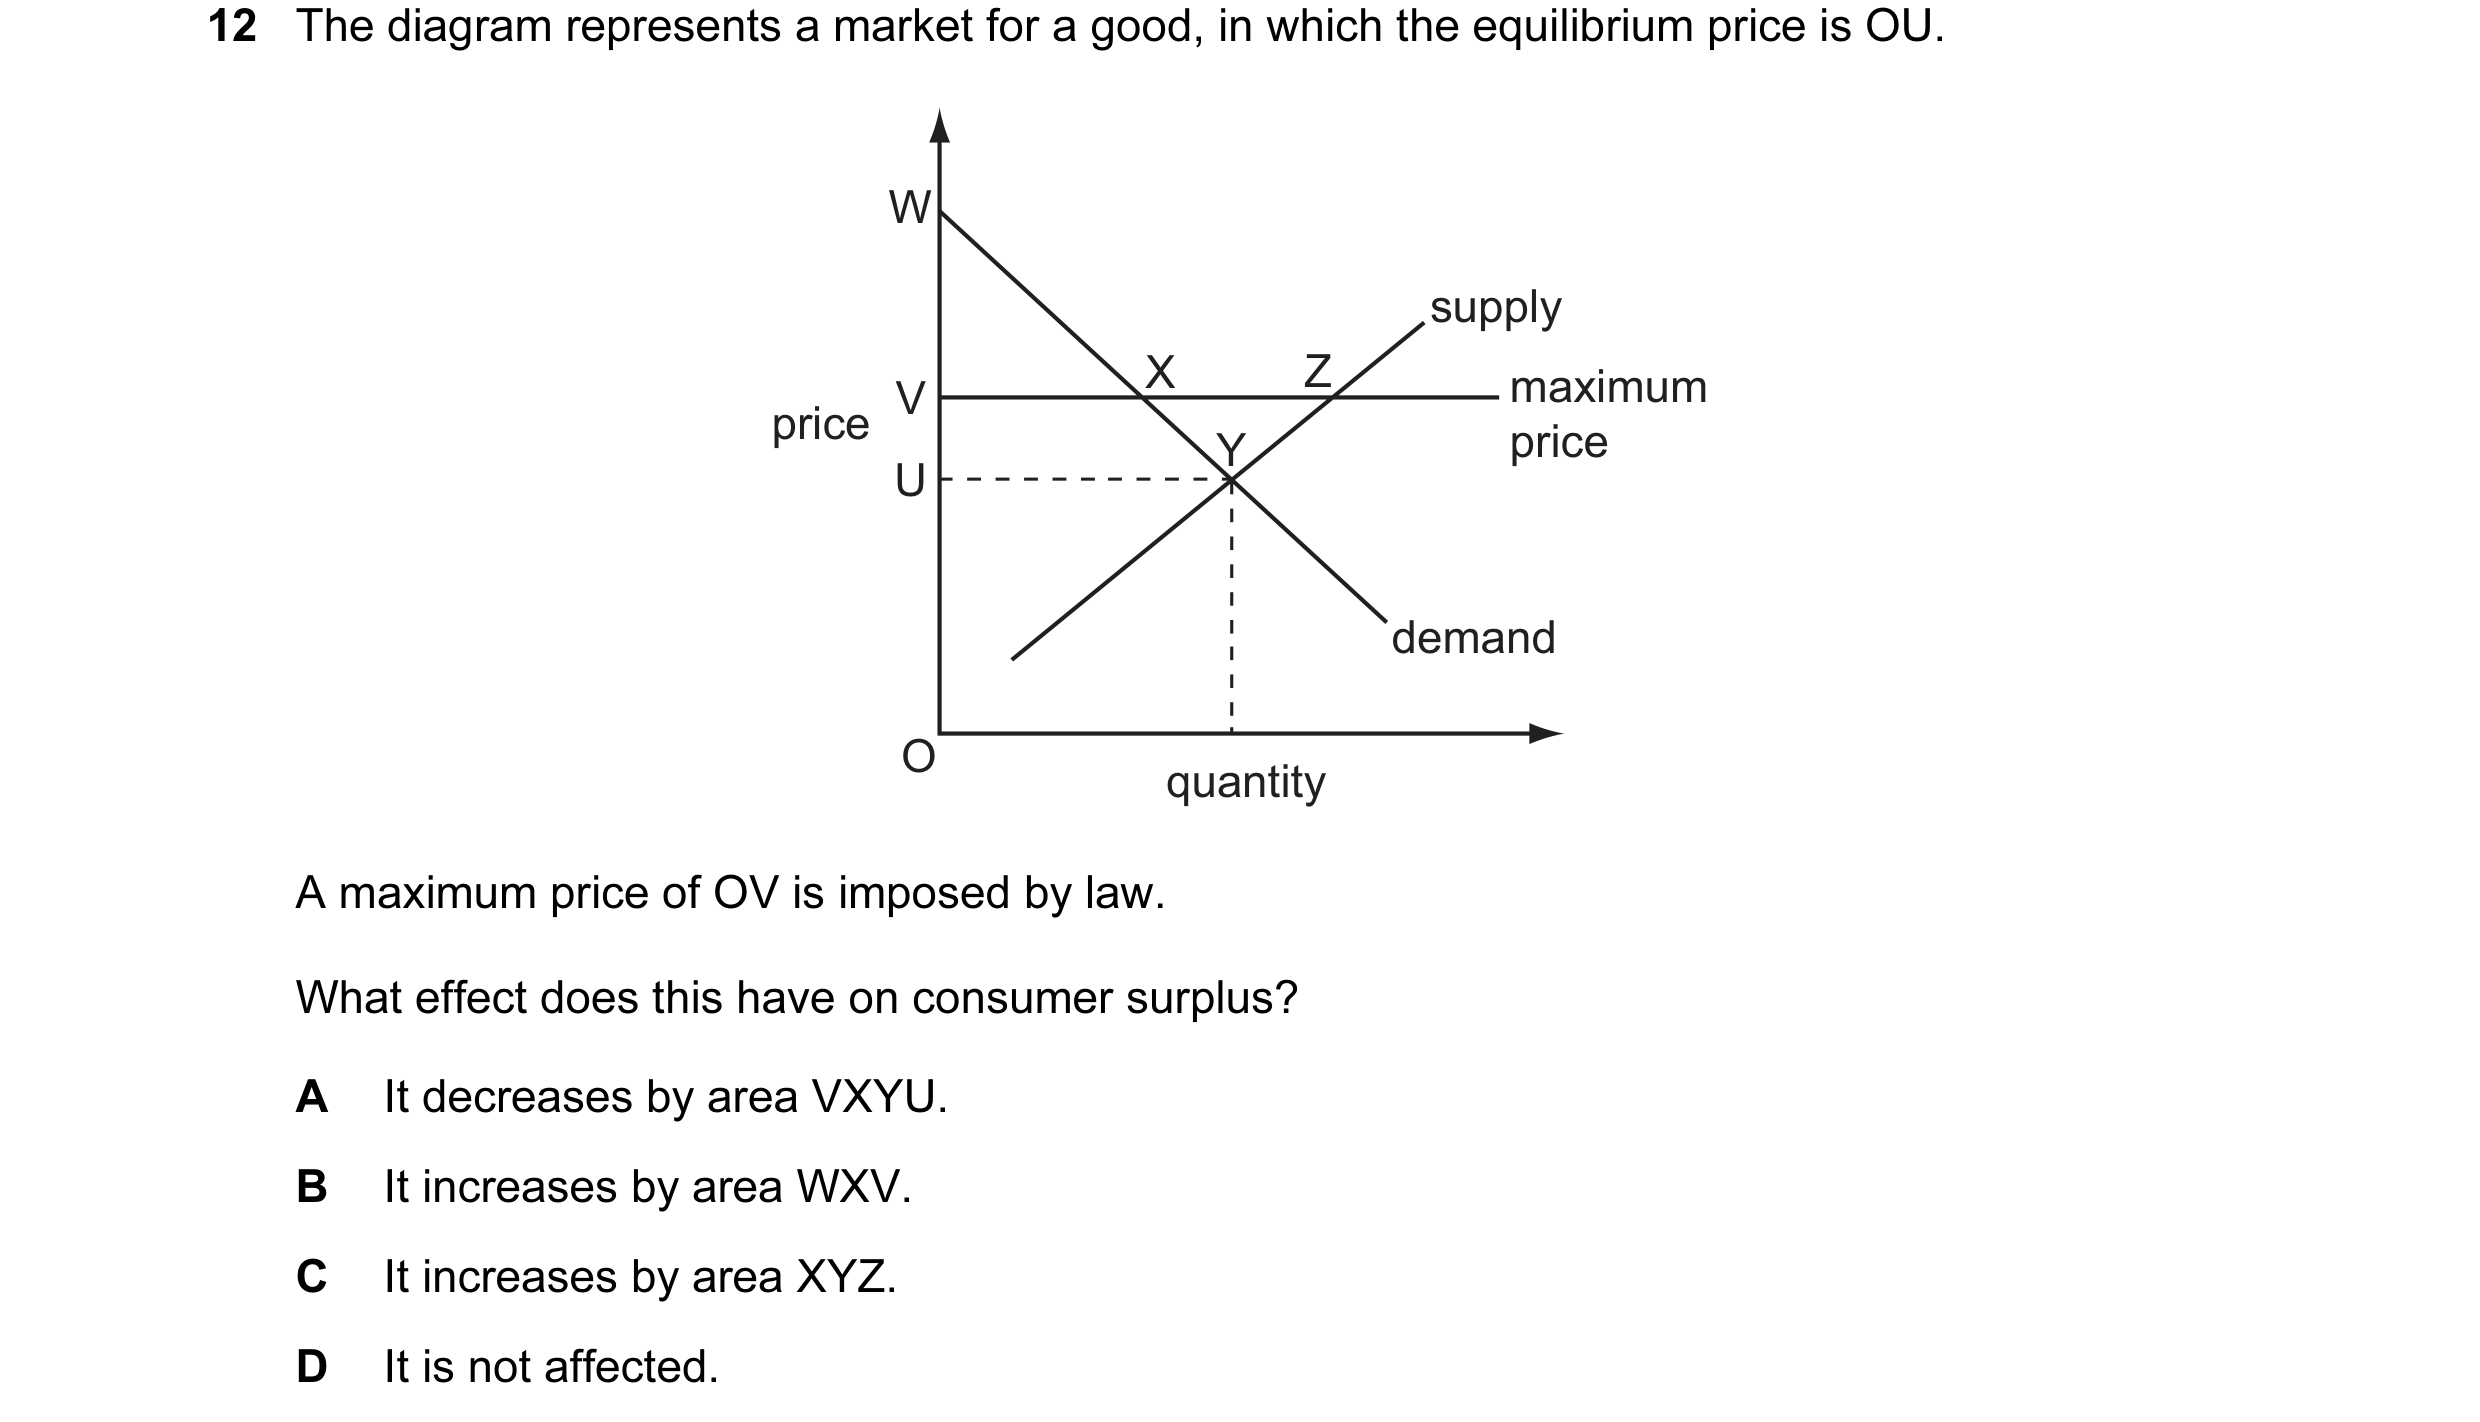 4 / 119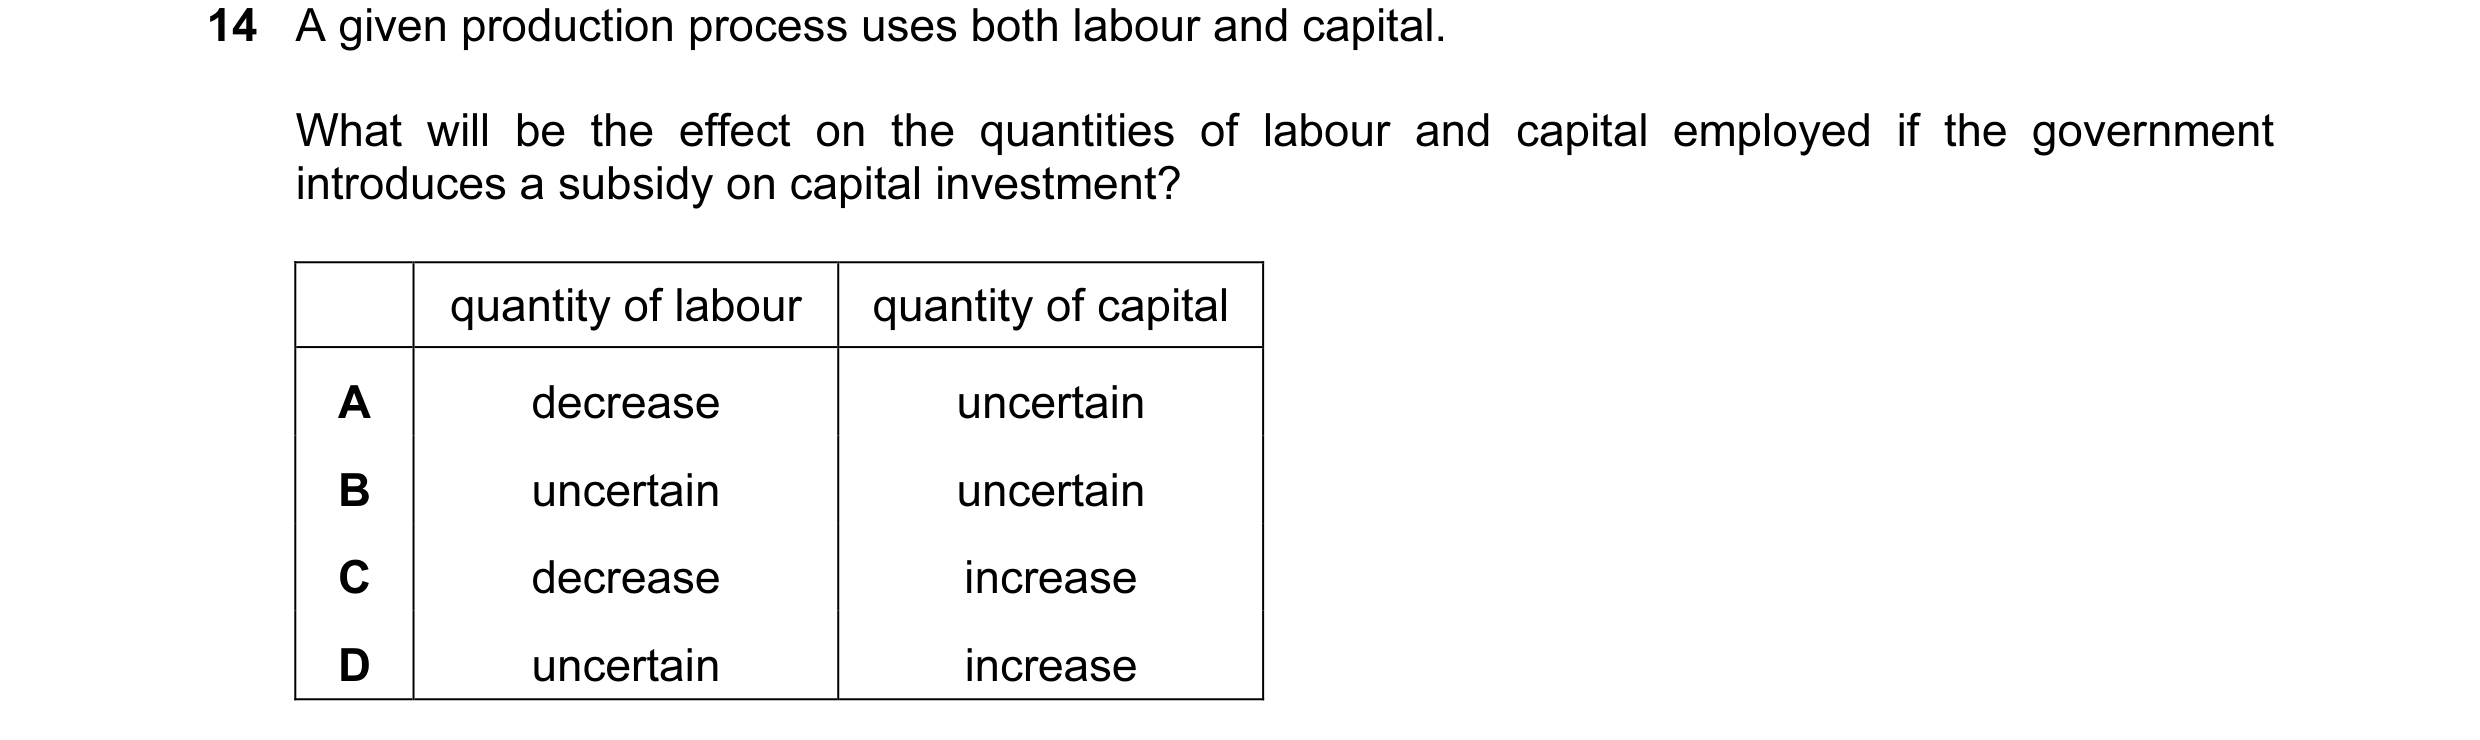
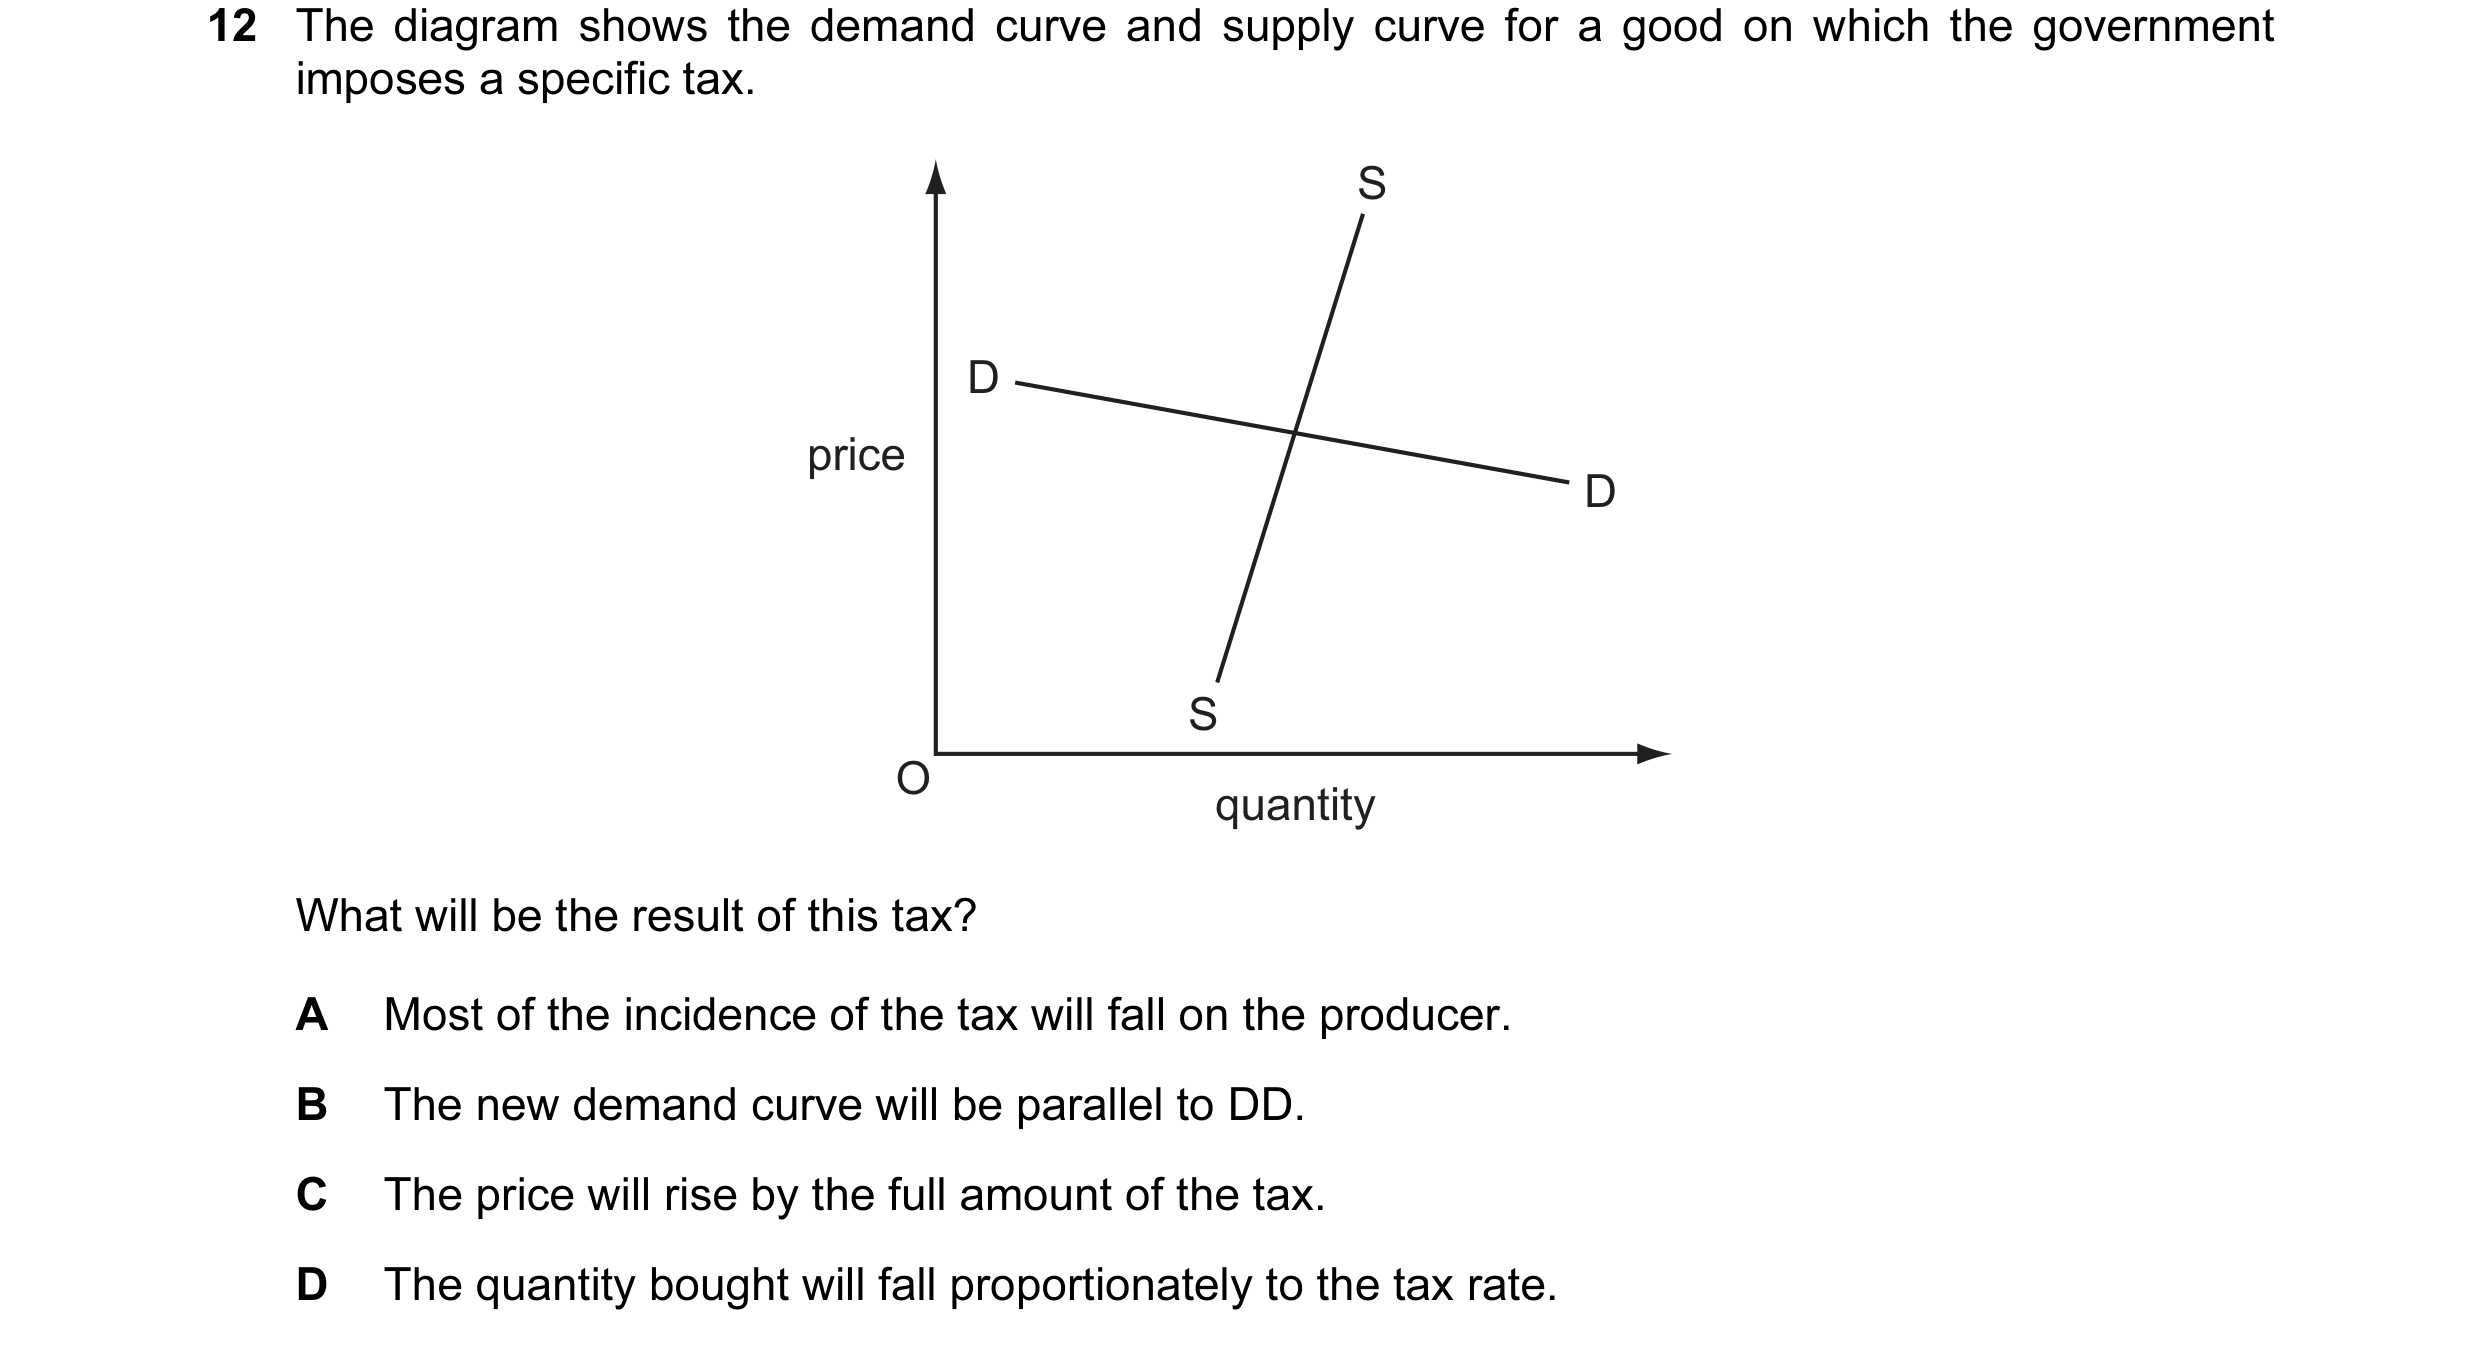
 5 / 119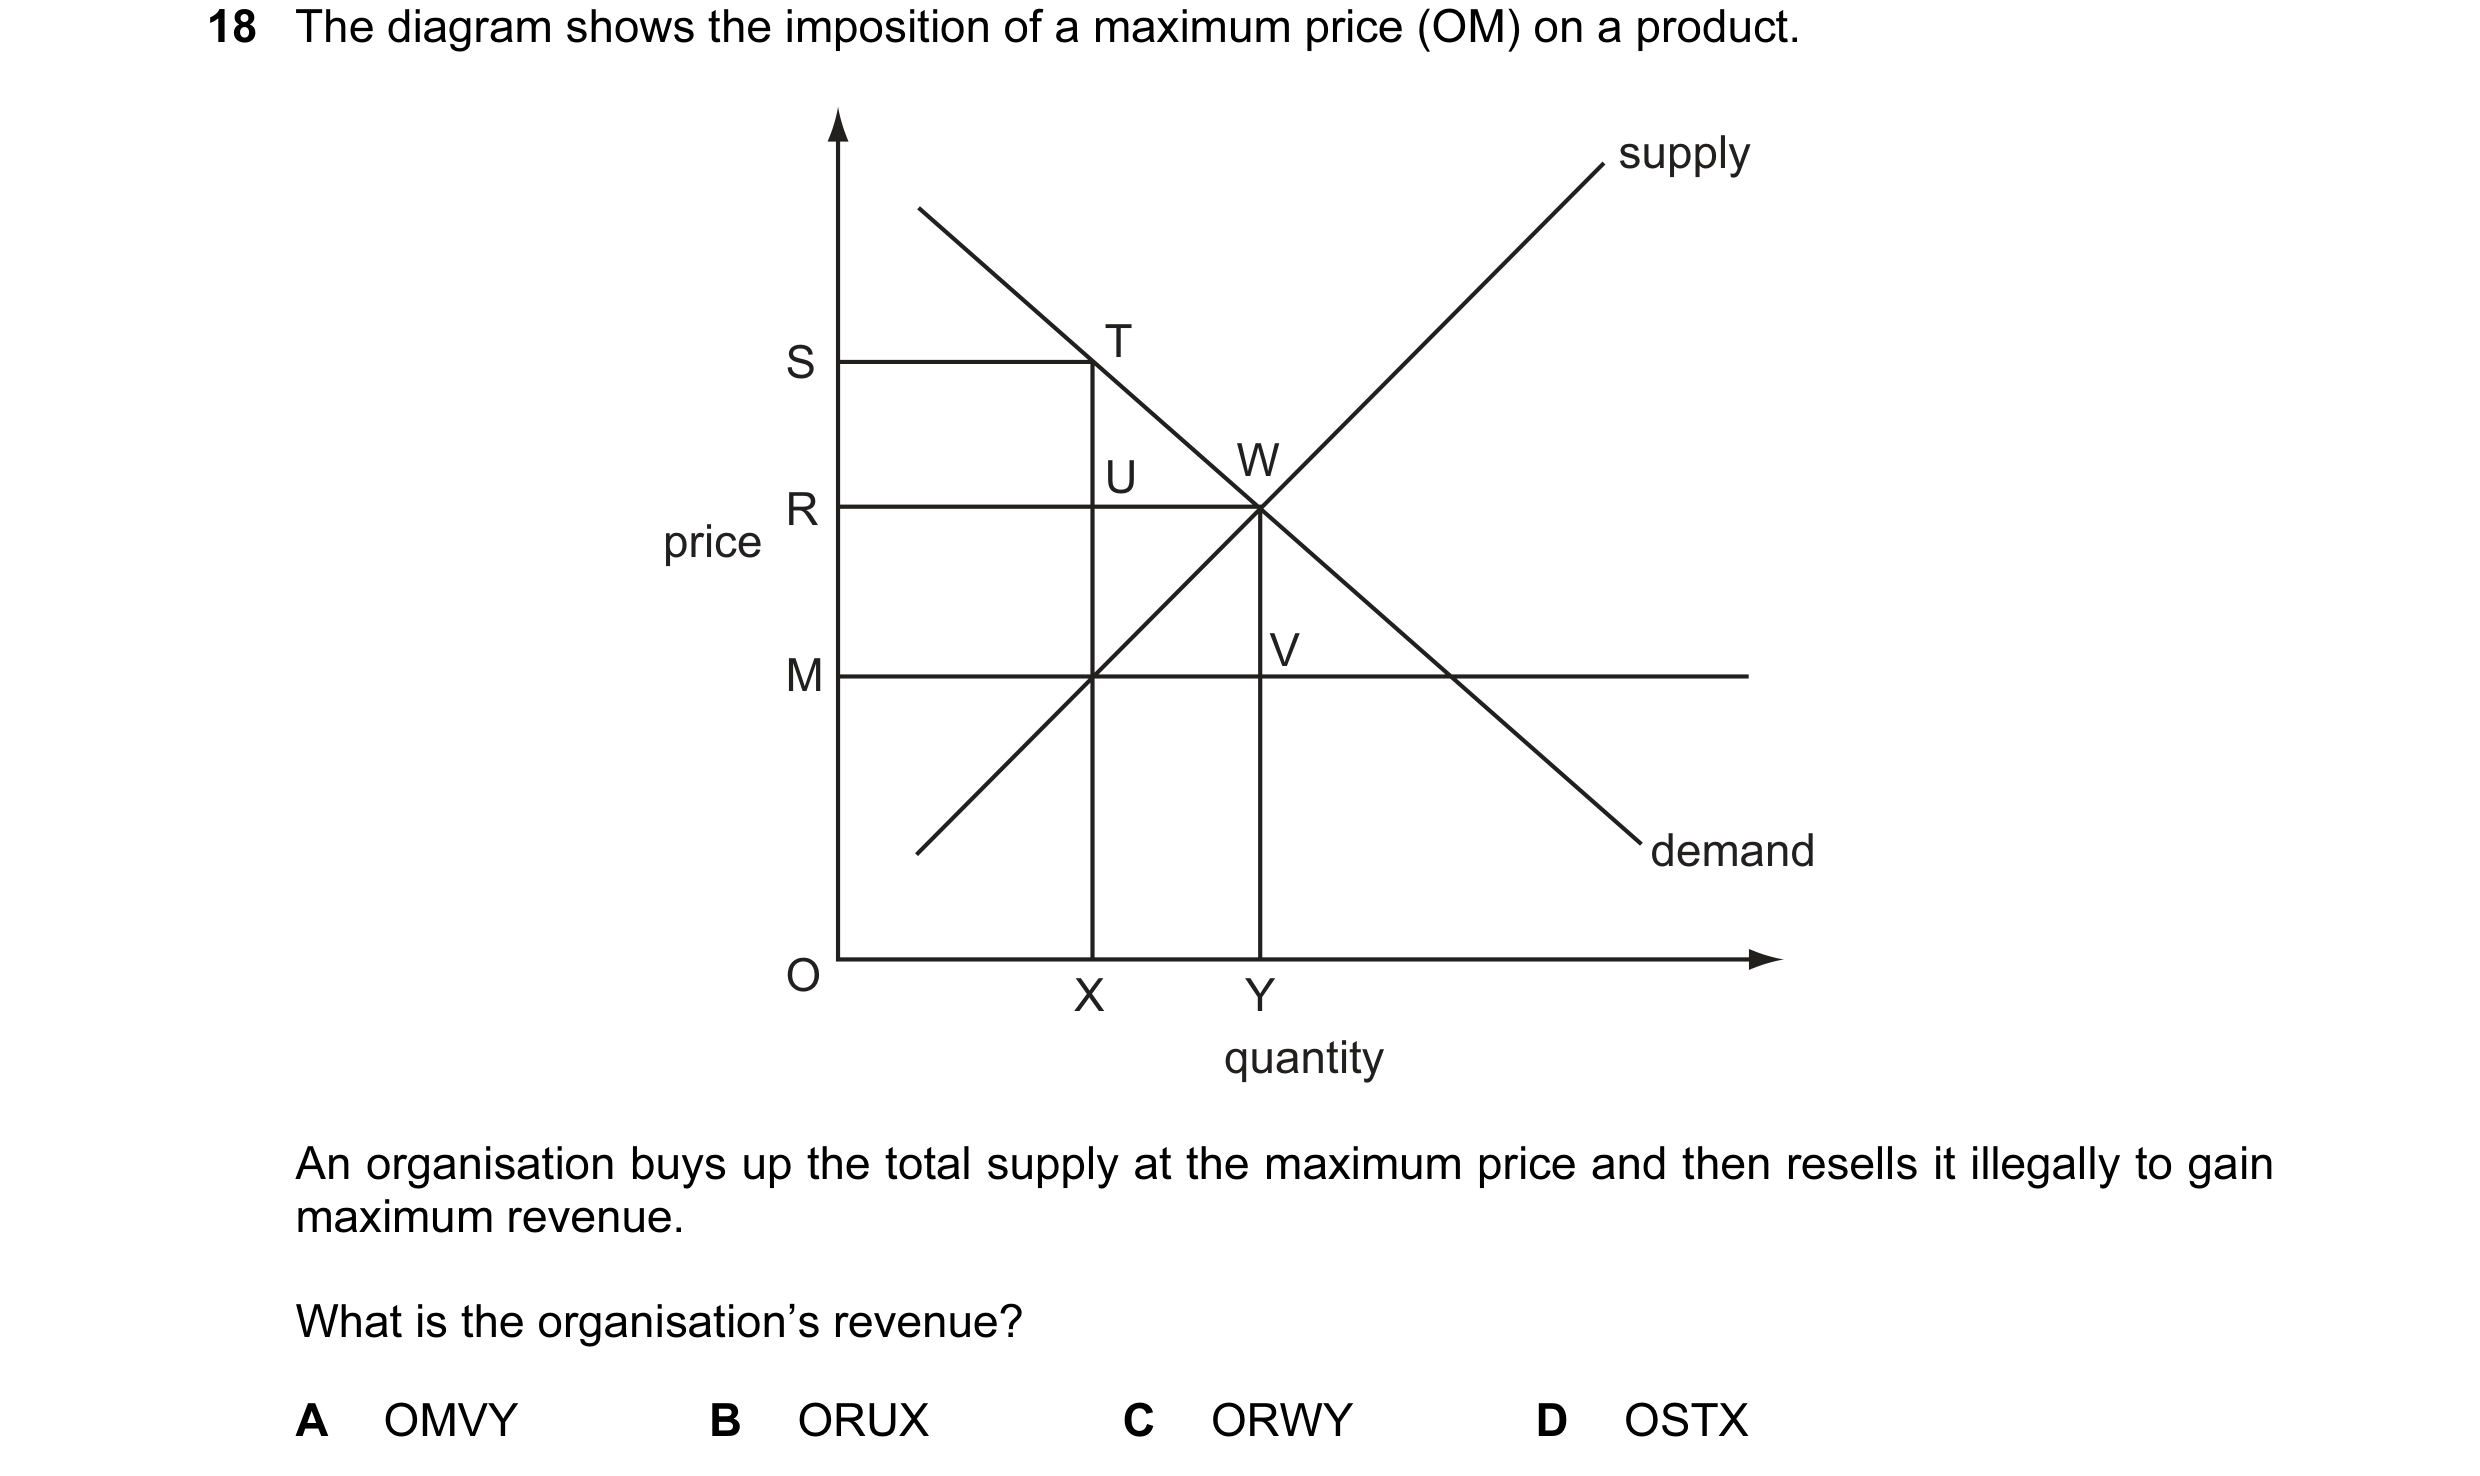

 6 / 119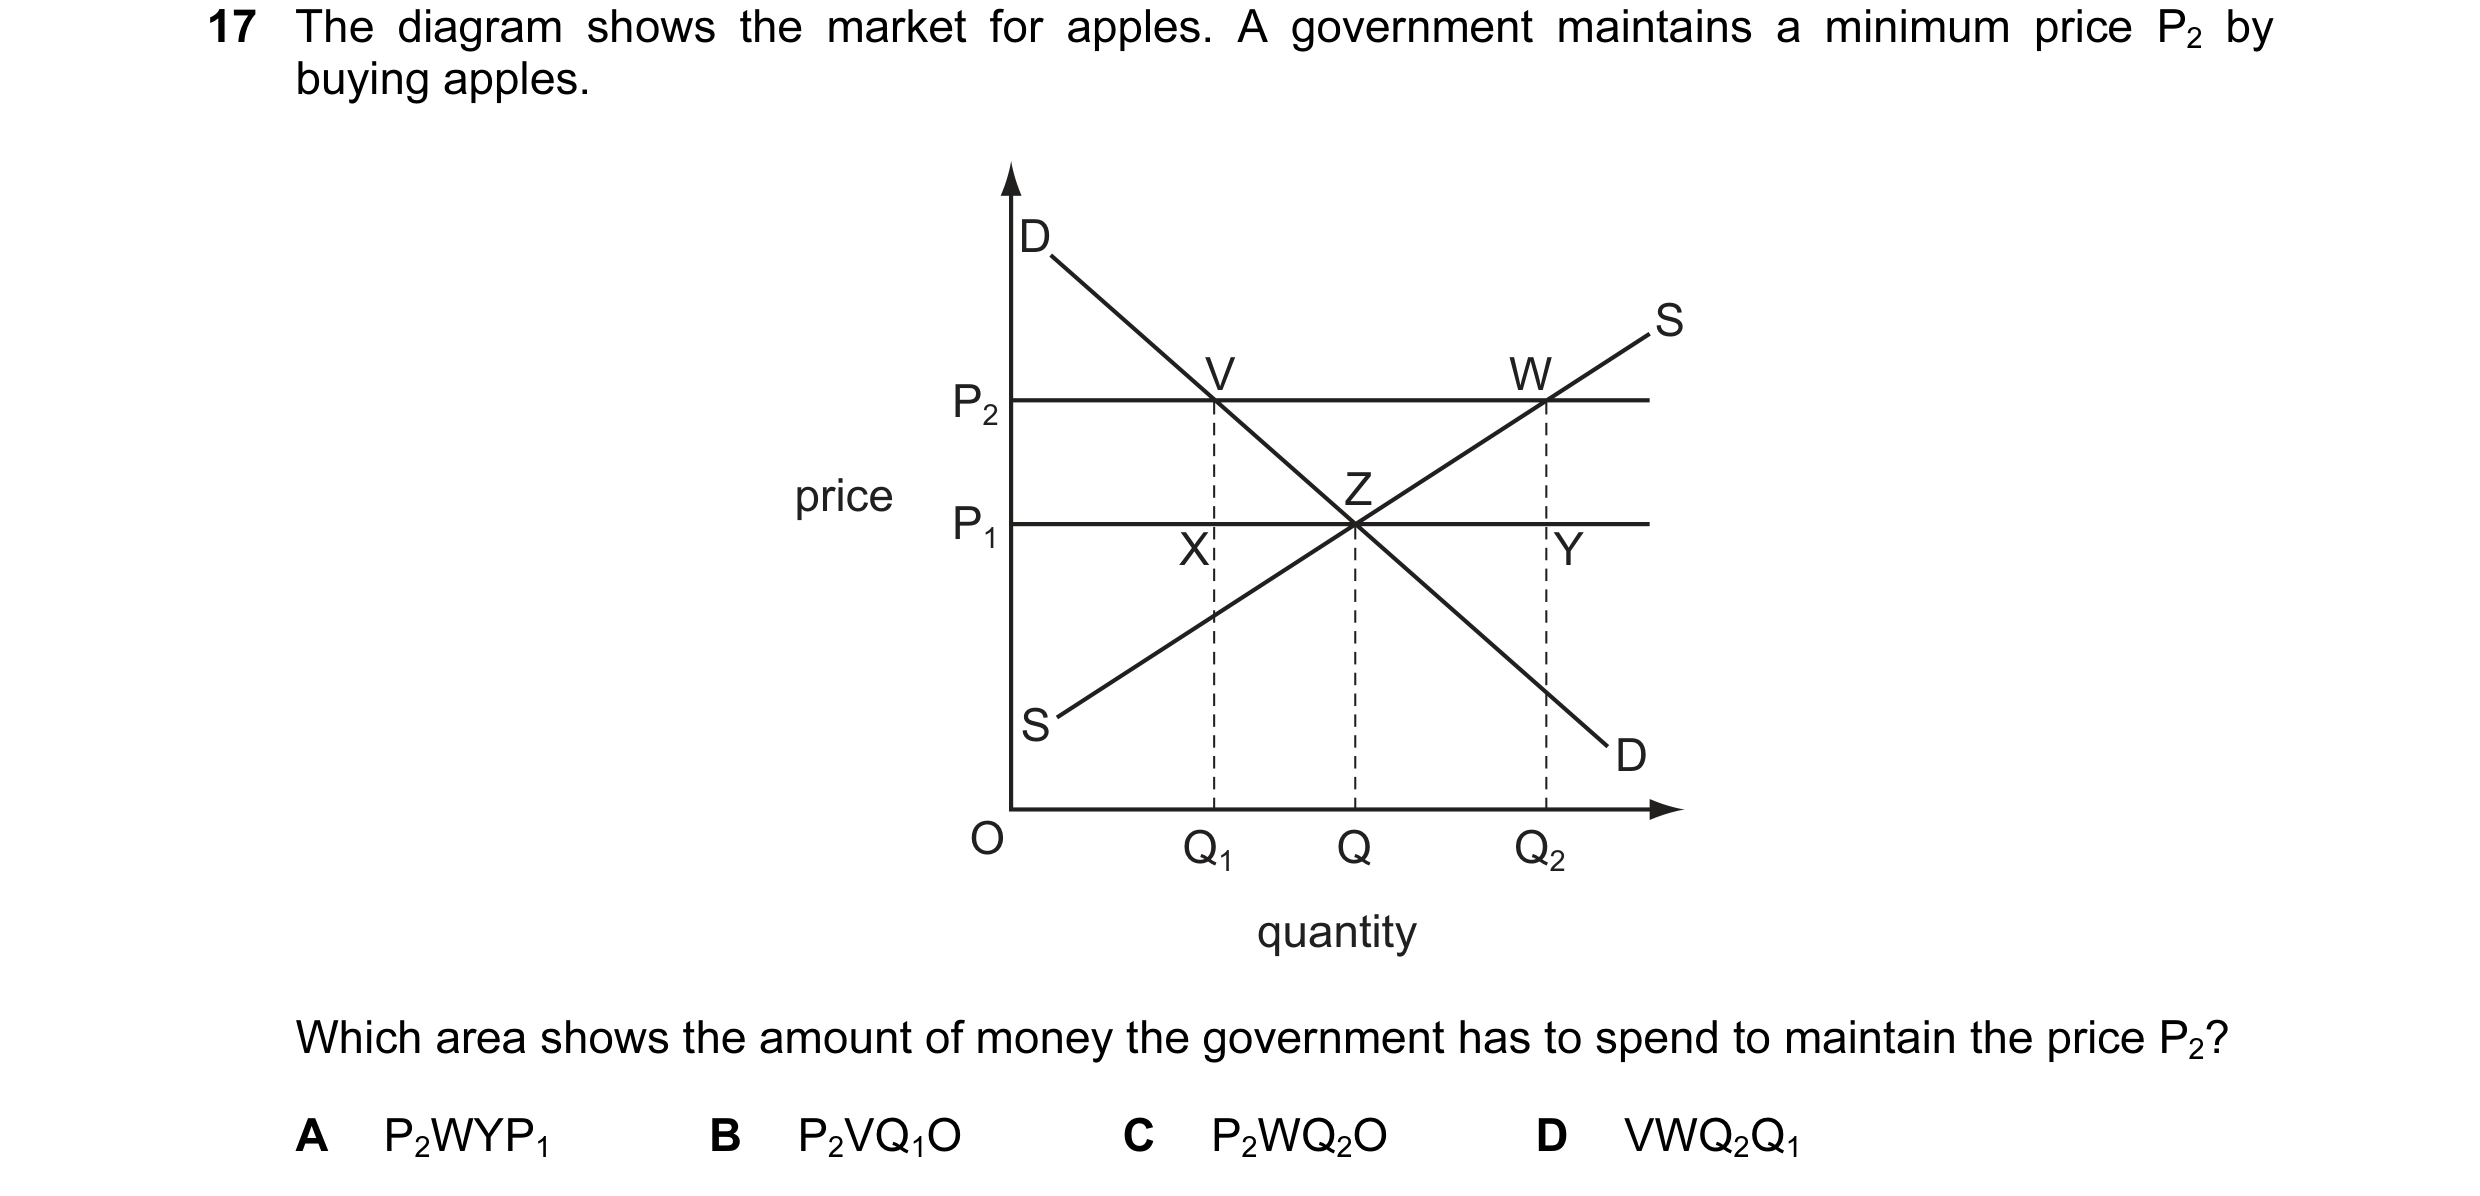
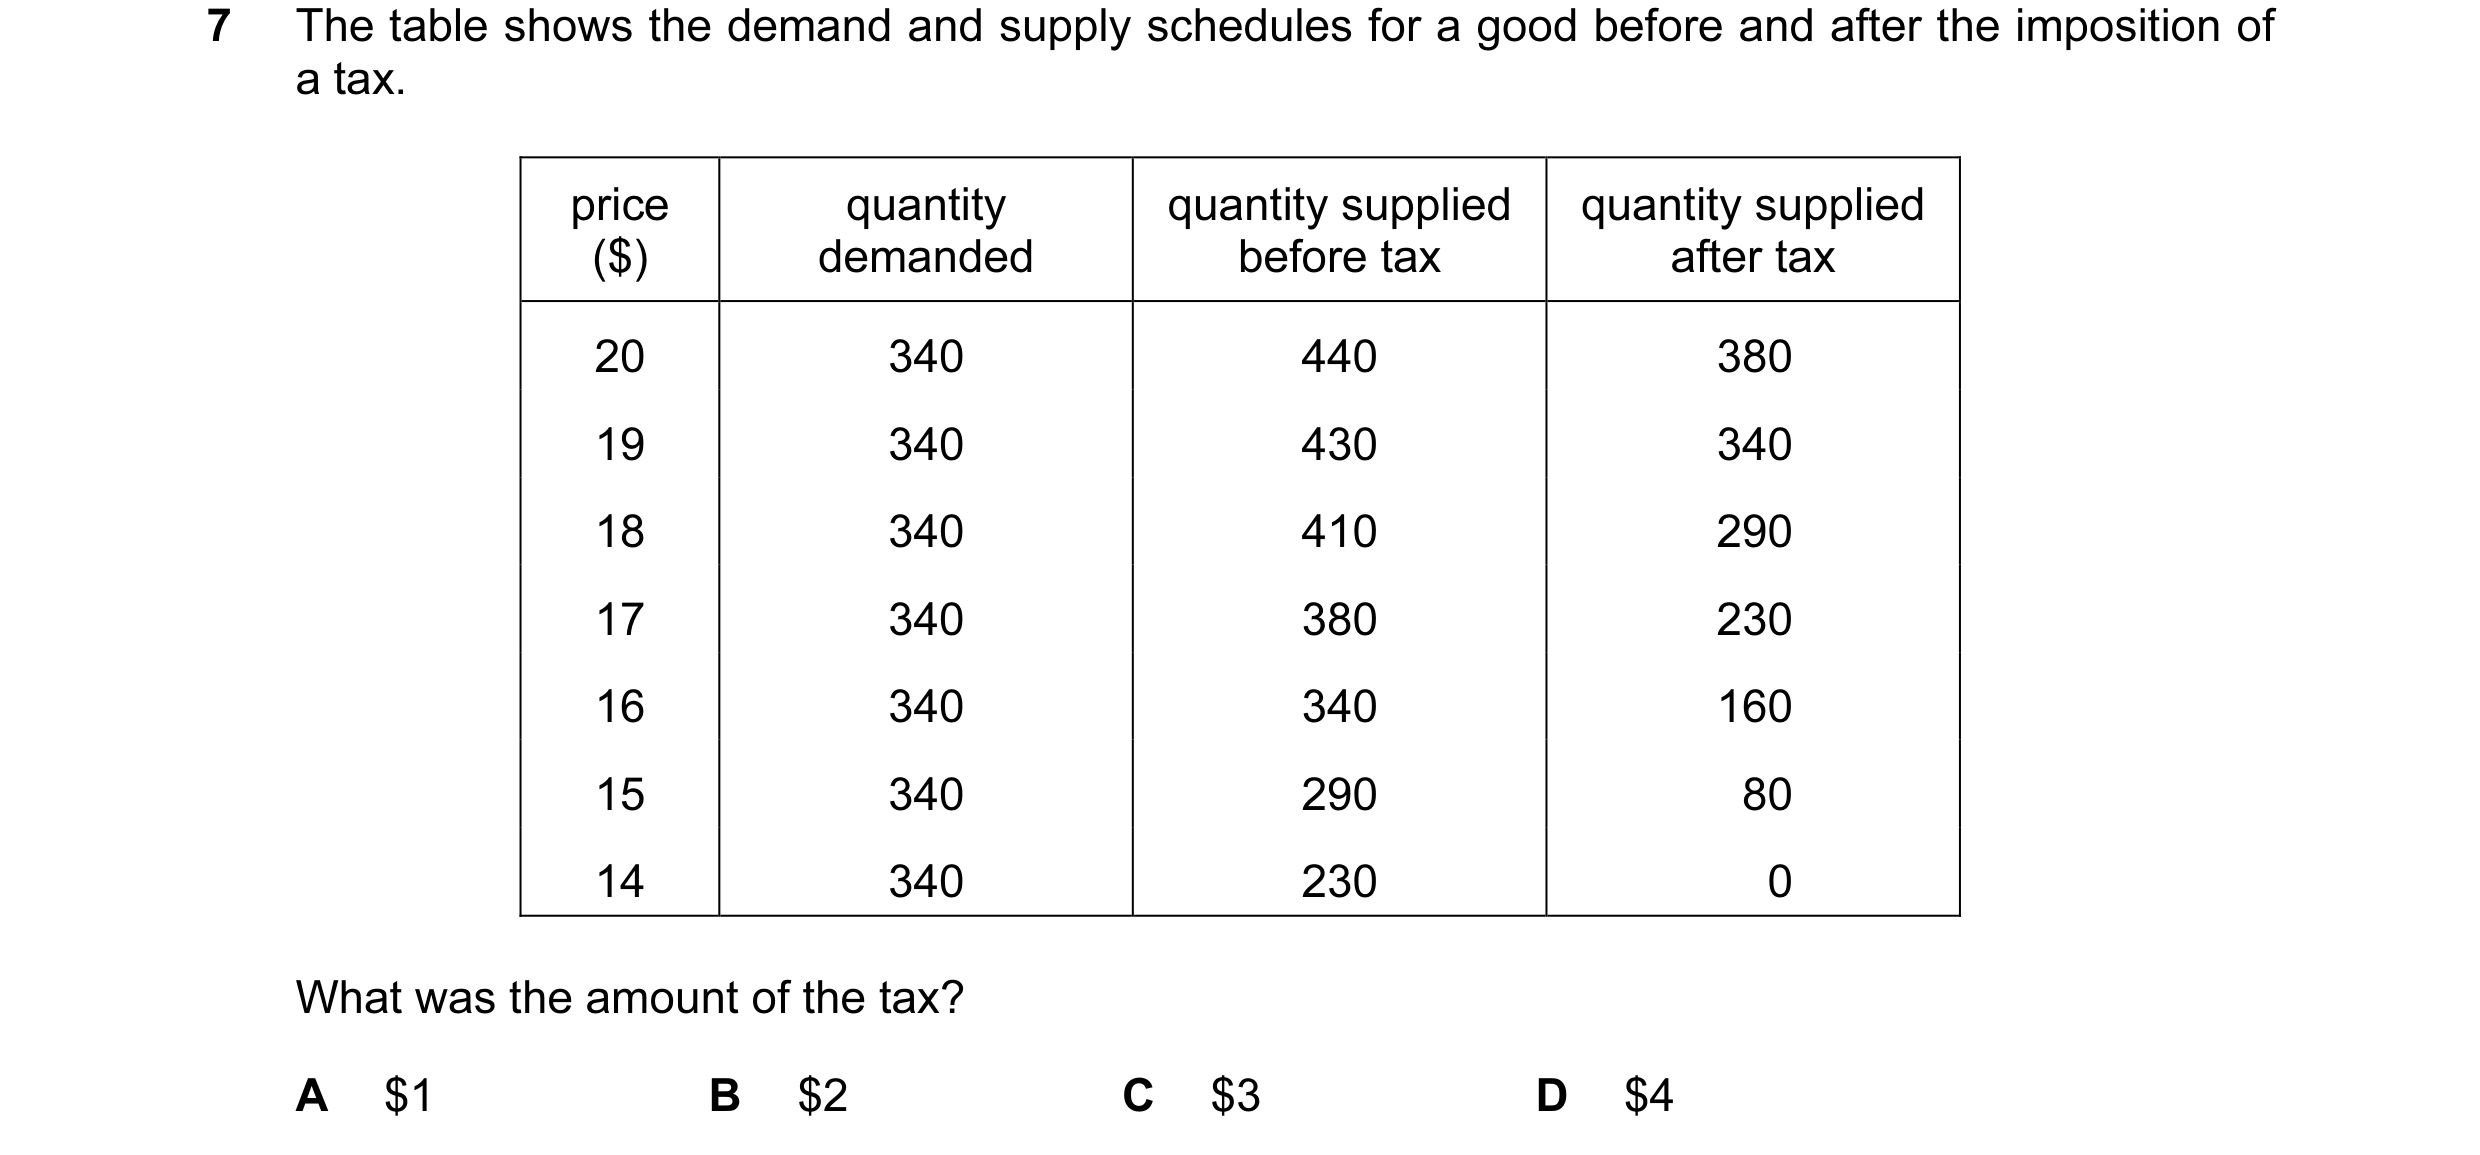
 7 / 119
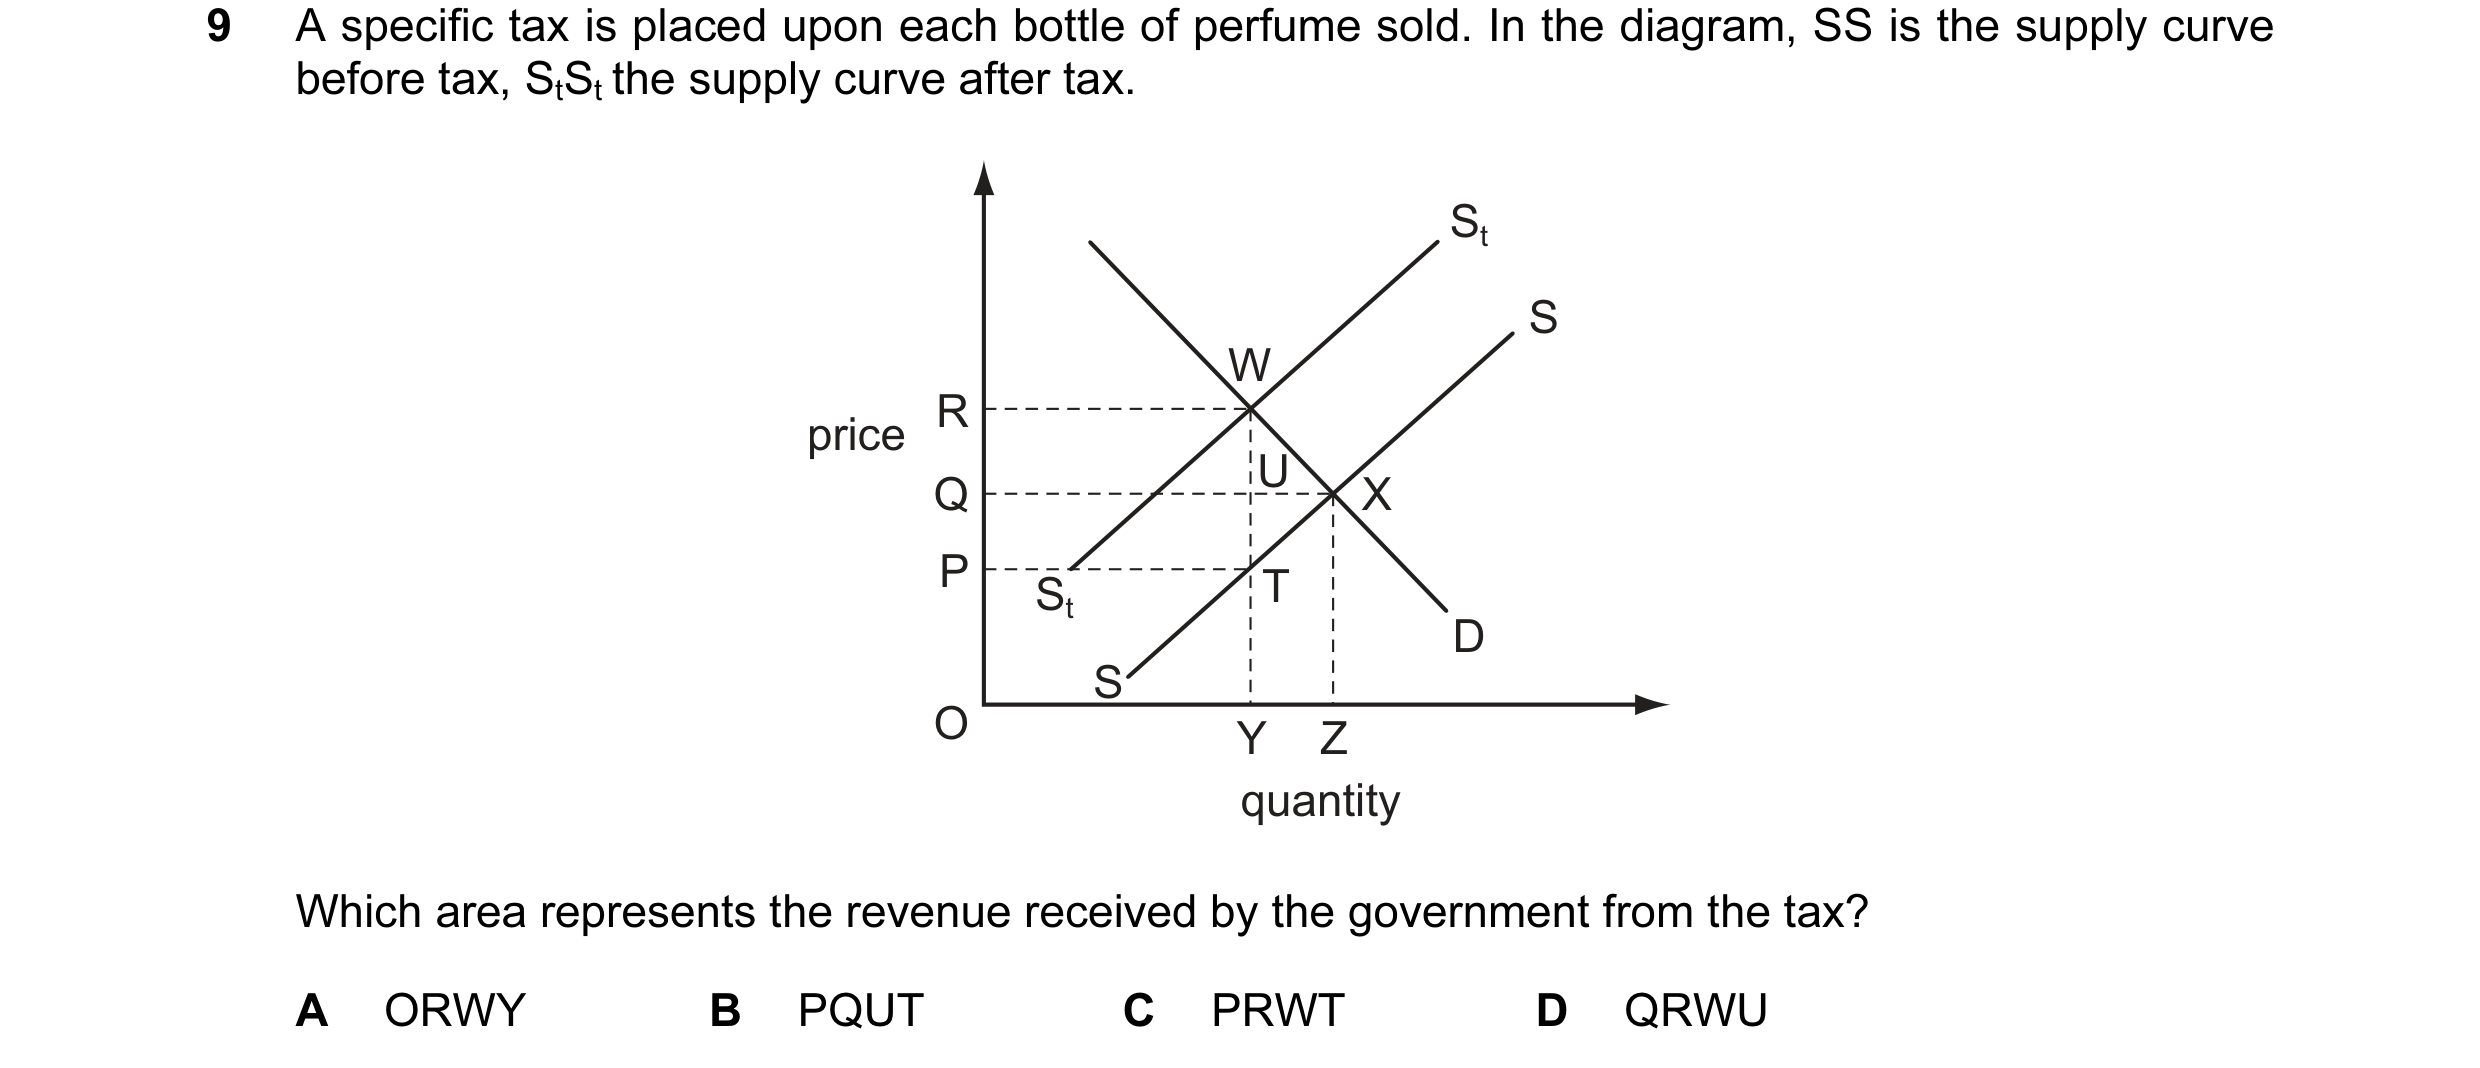
 8 / 119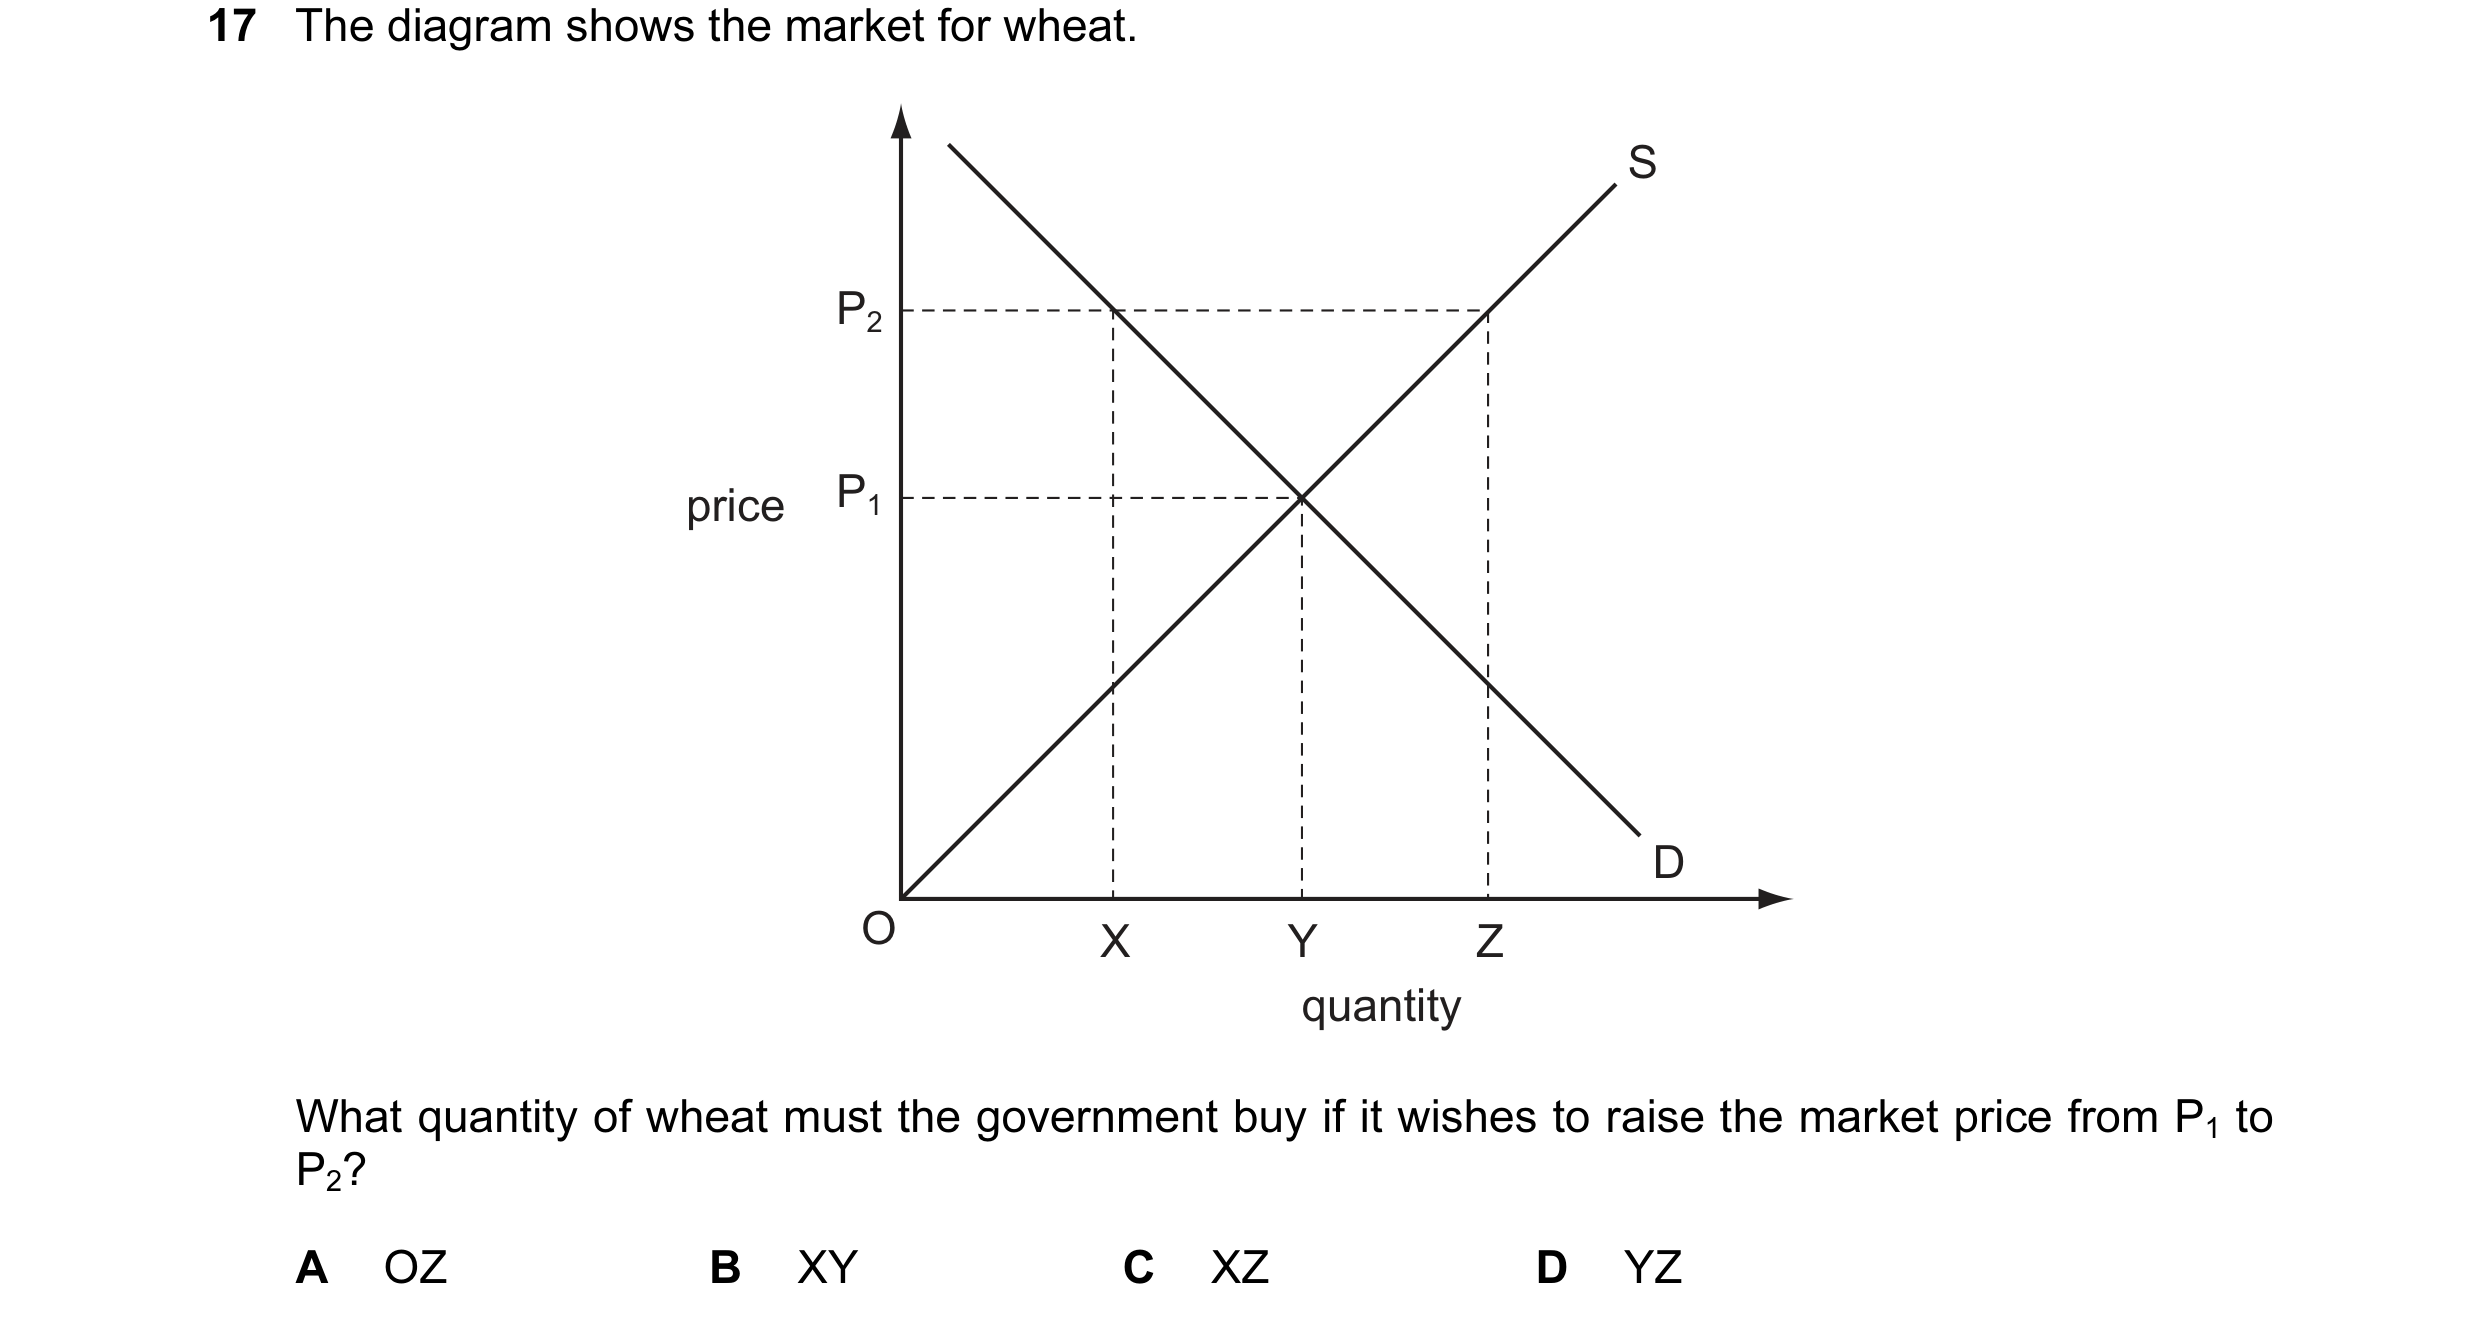
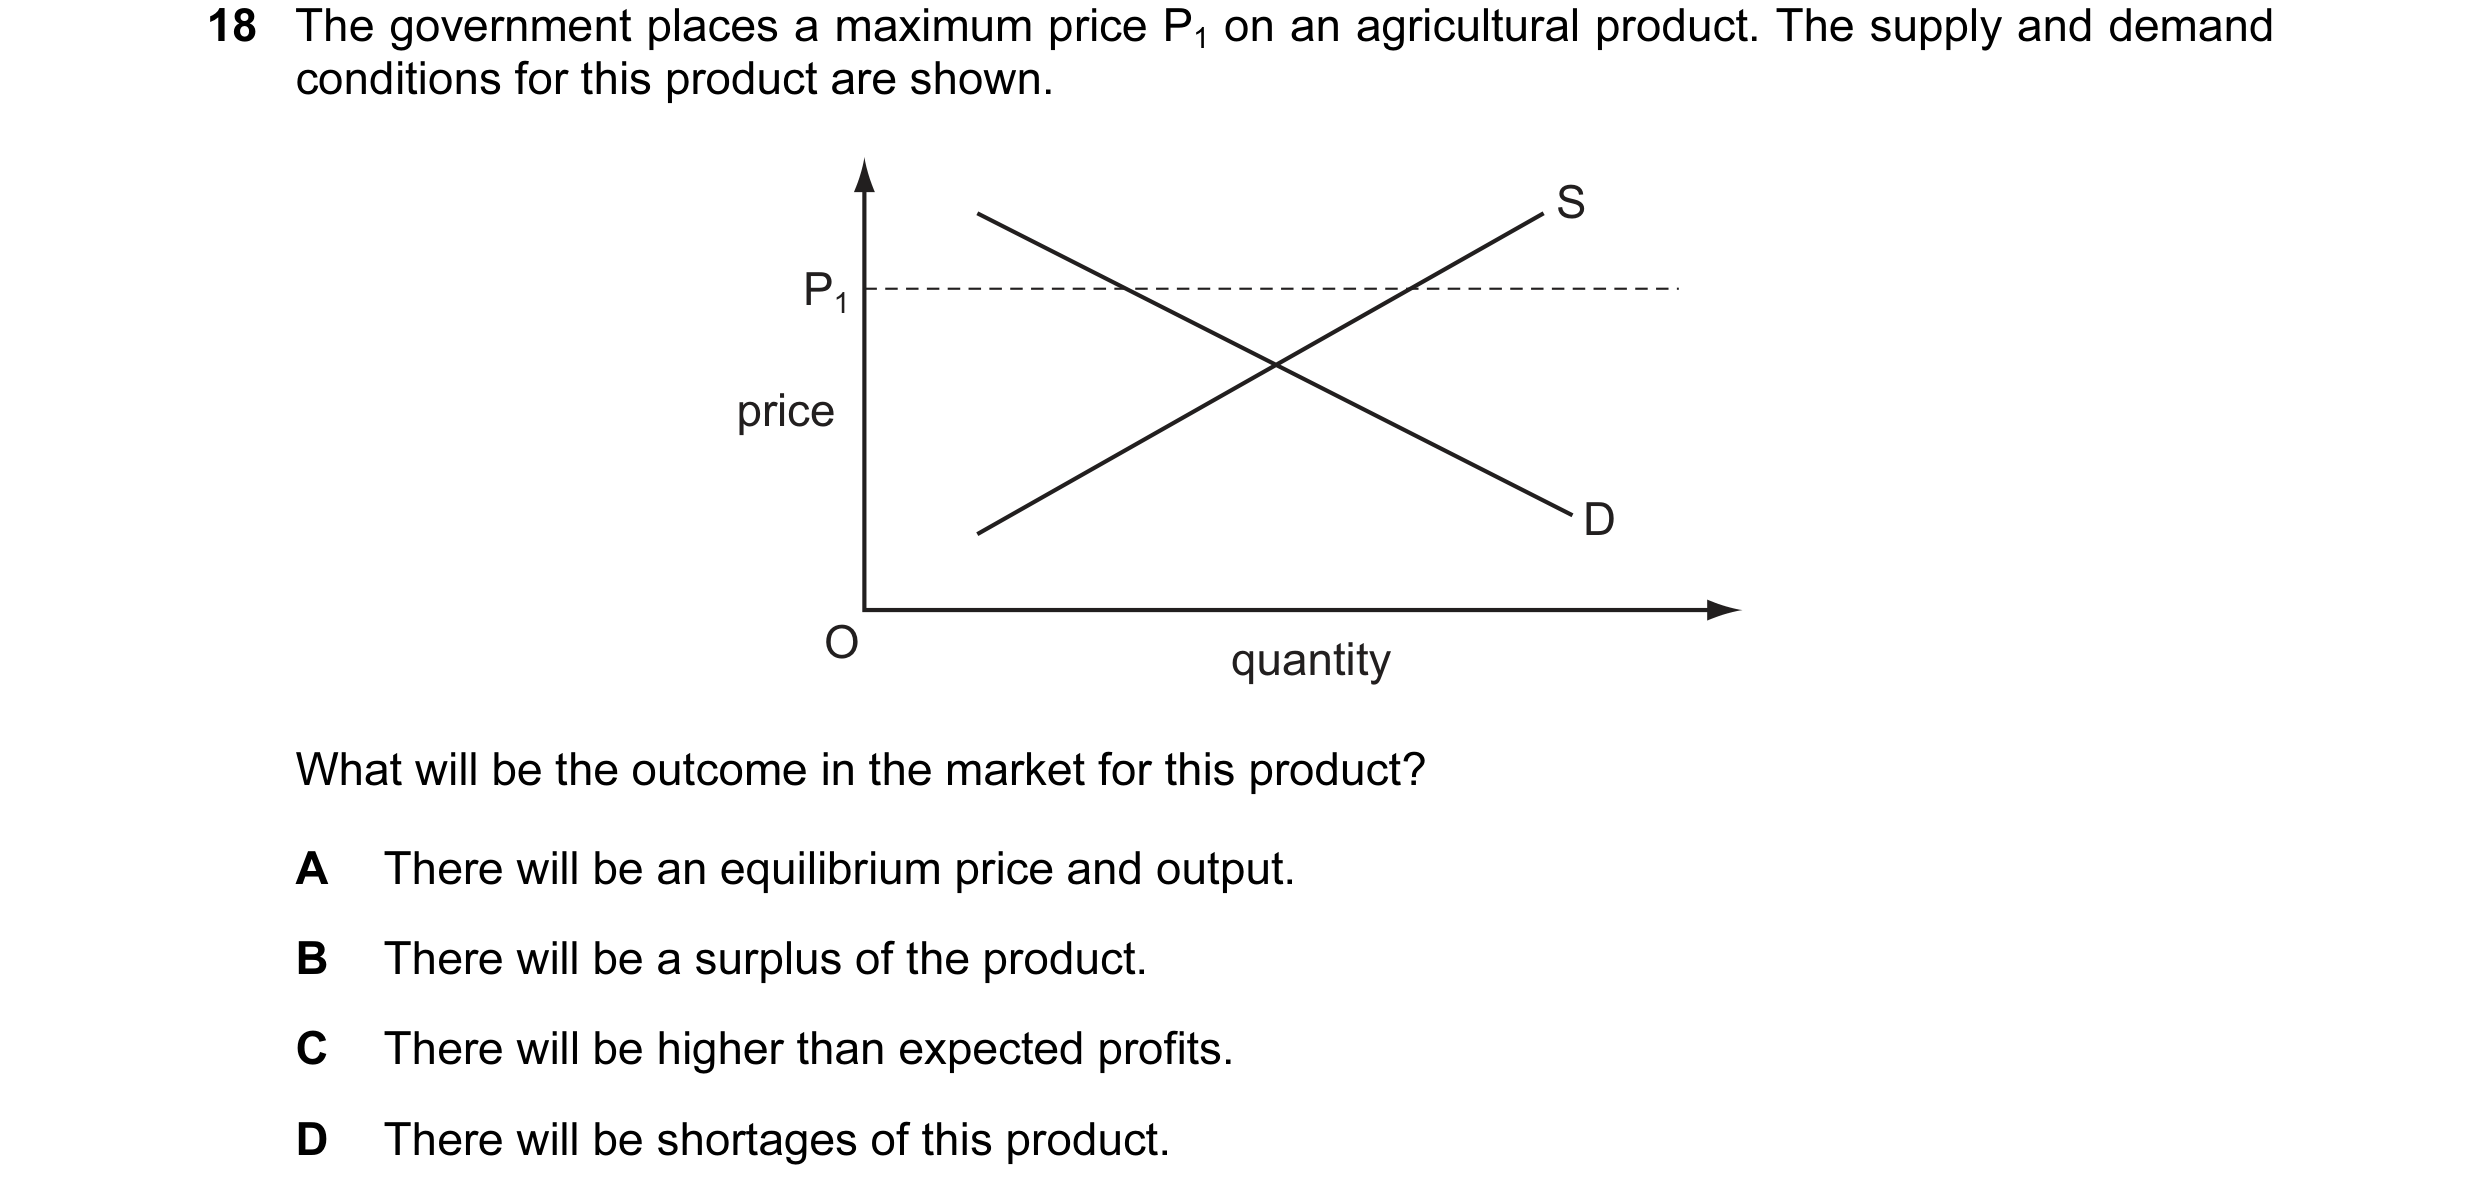
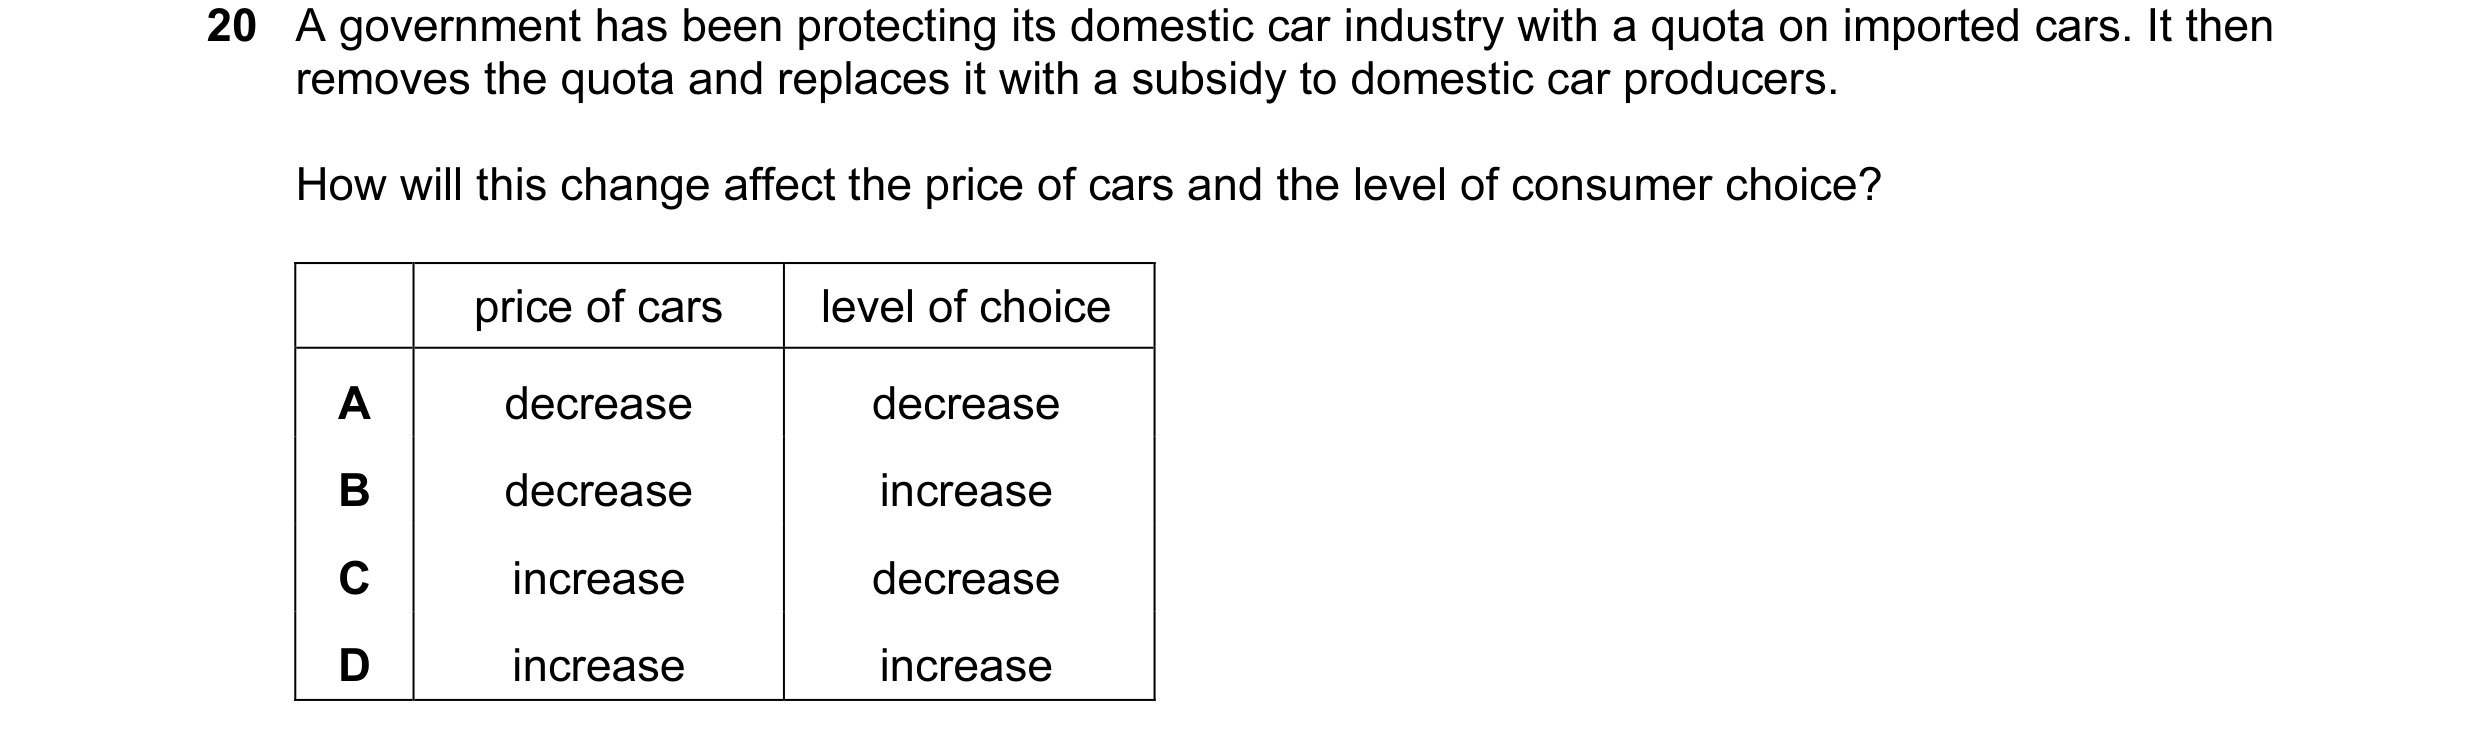 9 / 119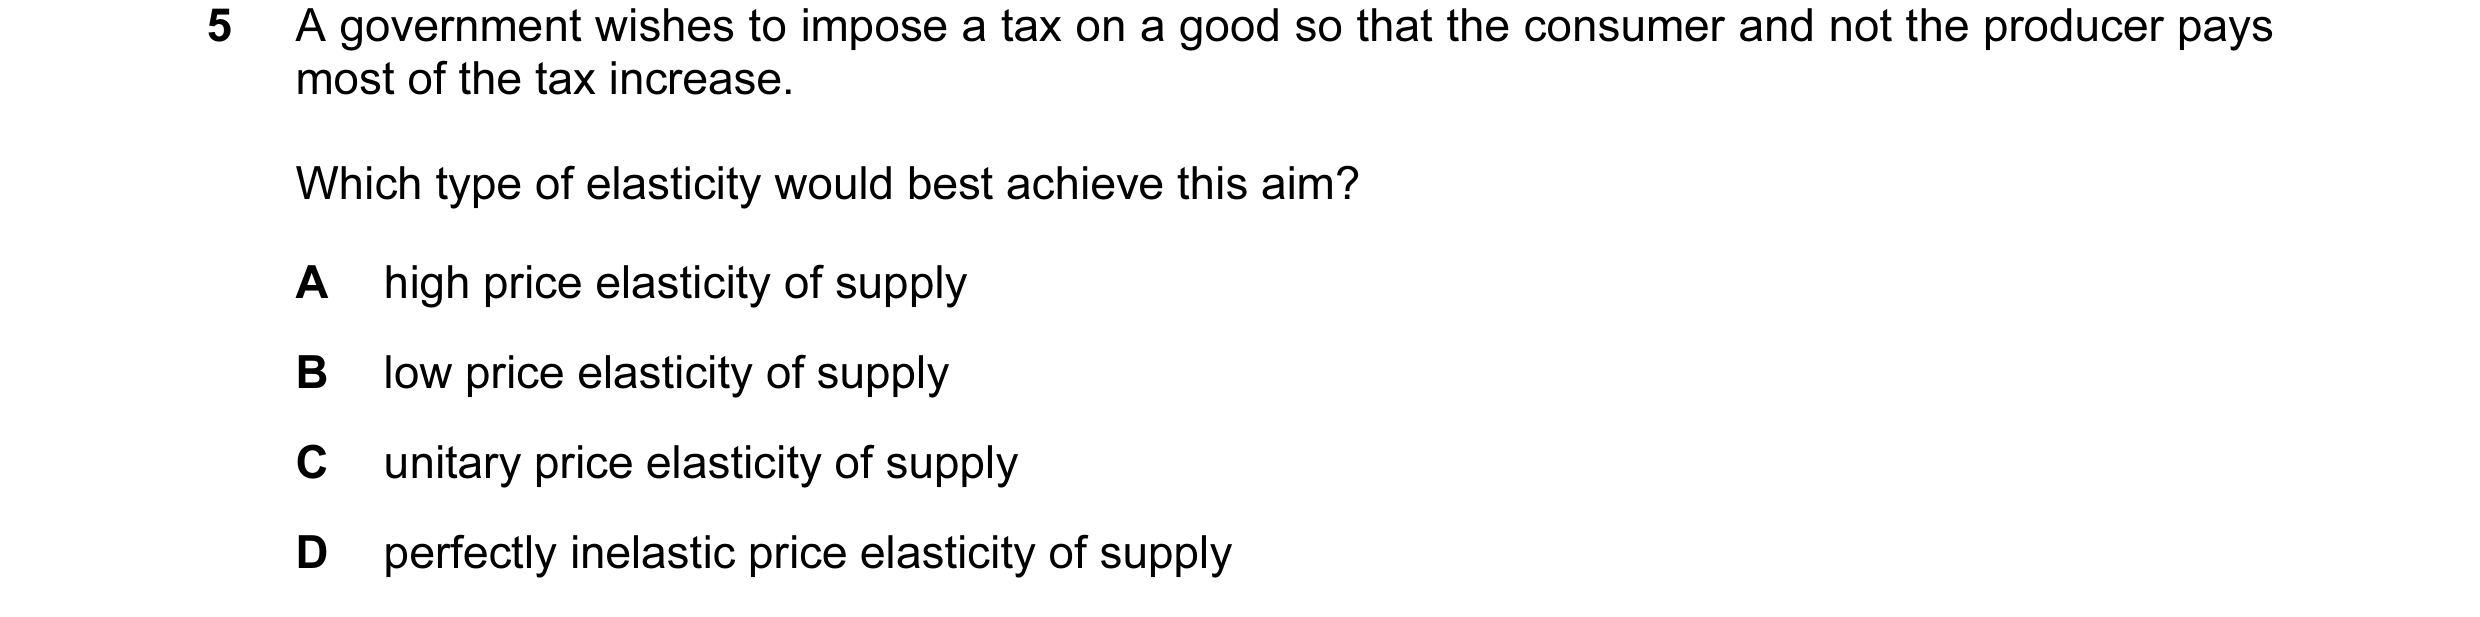
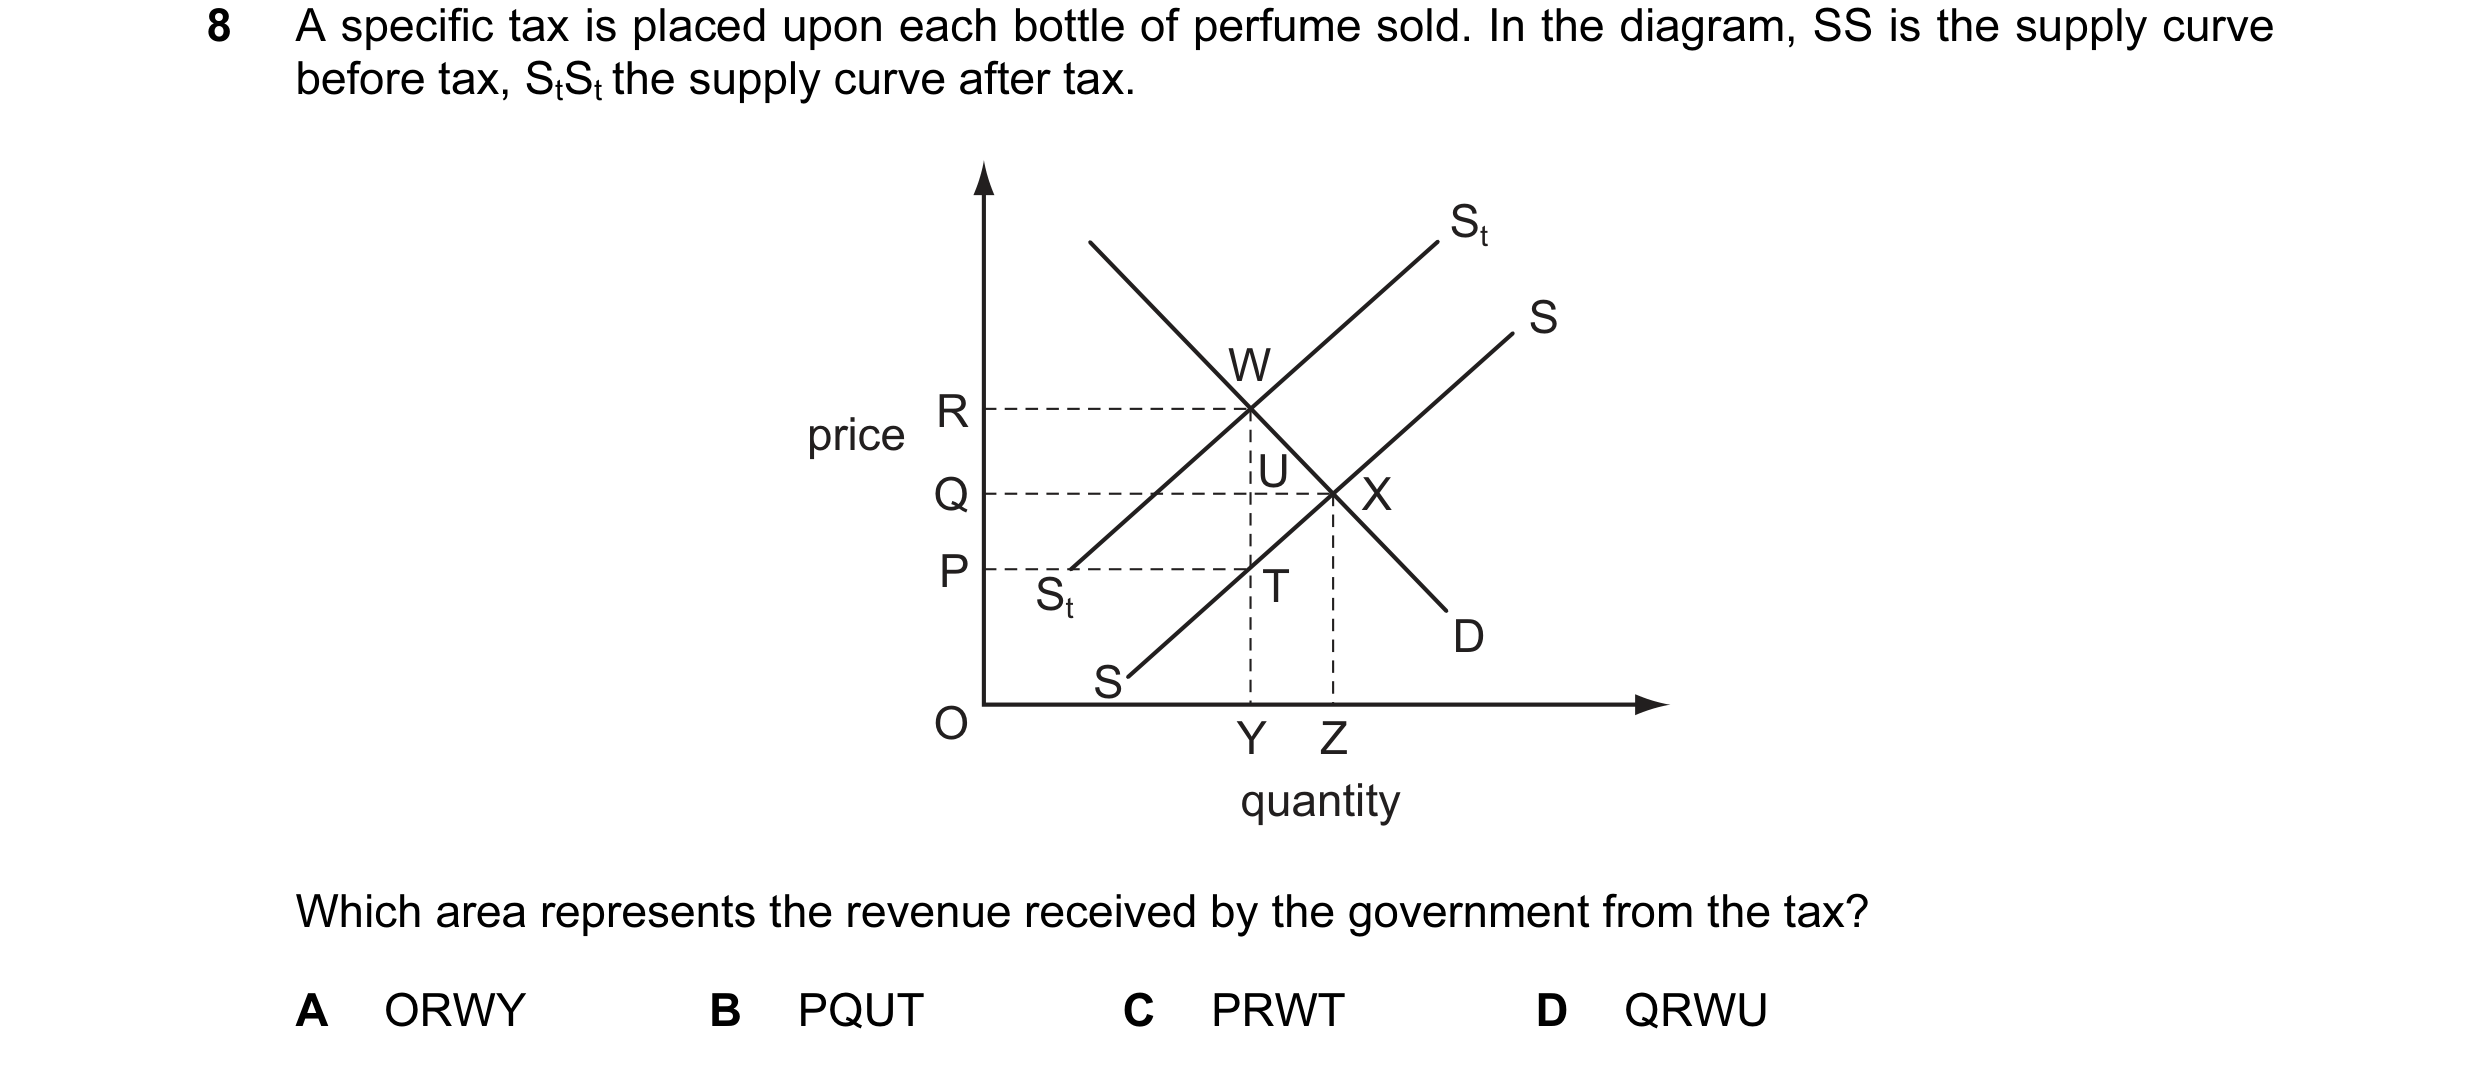
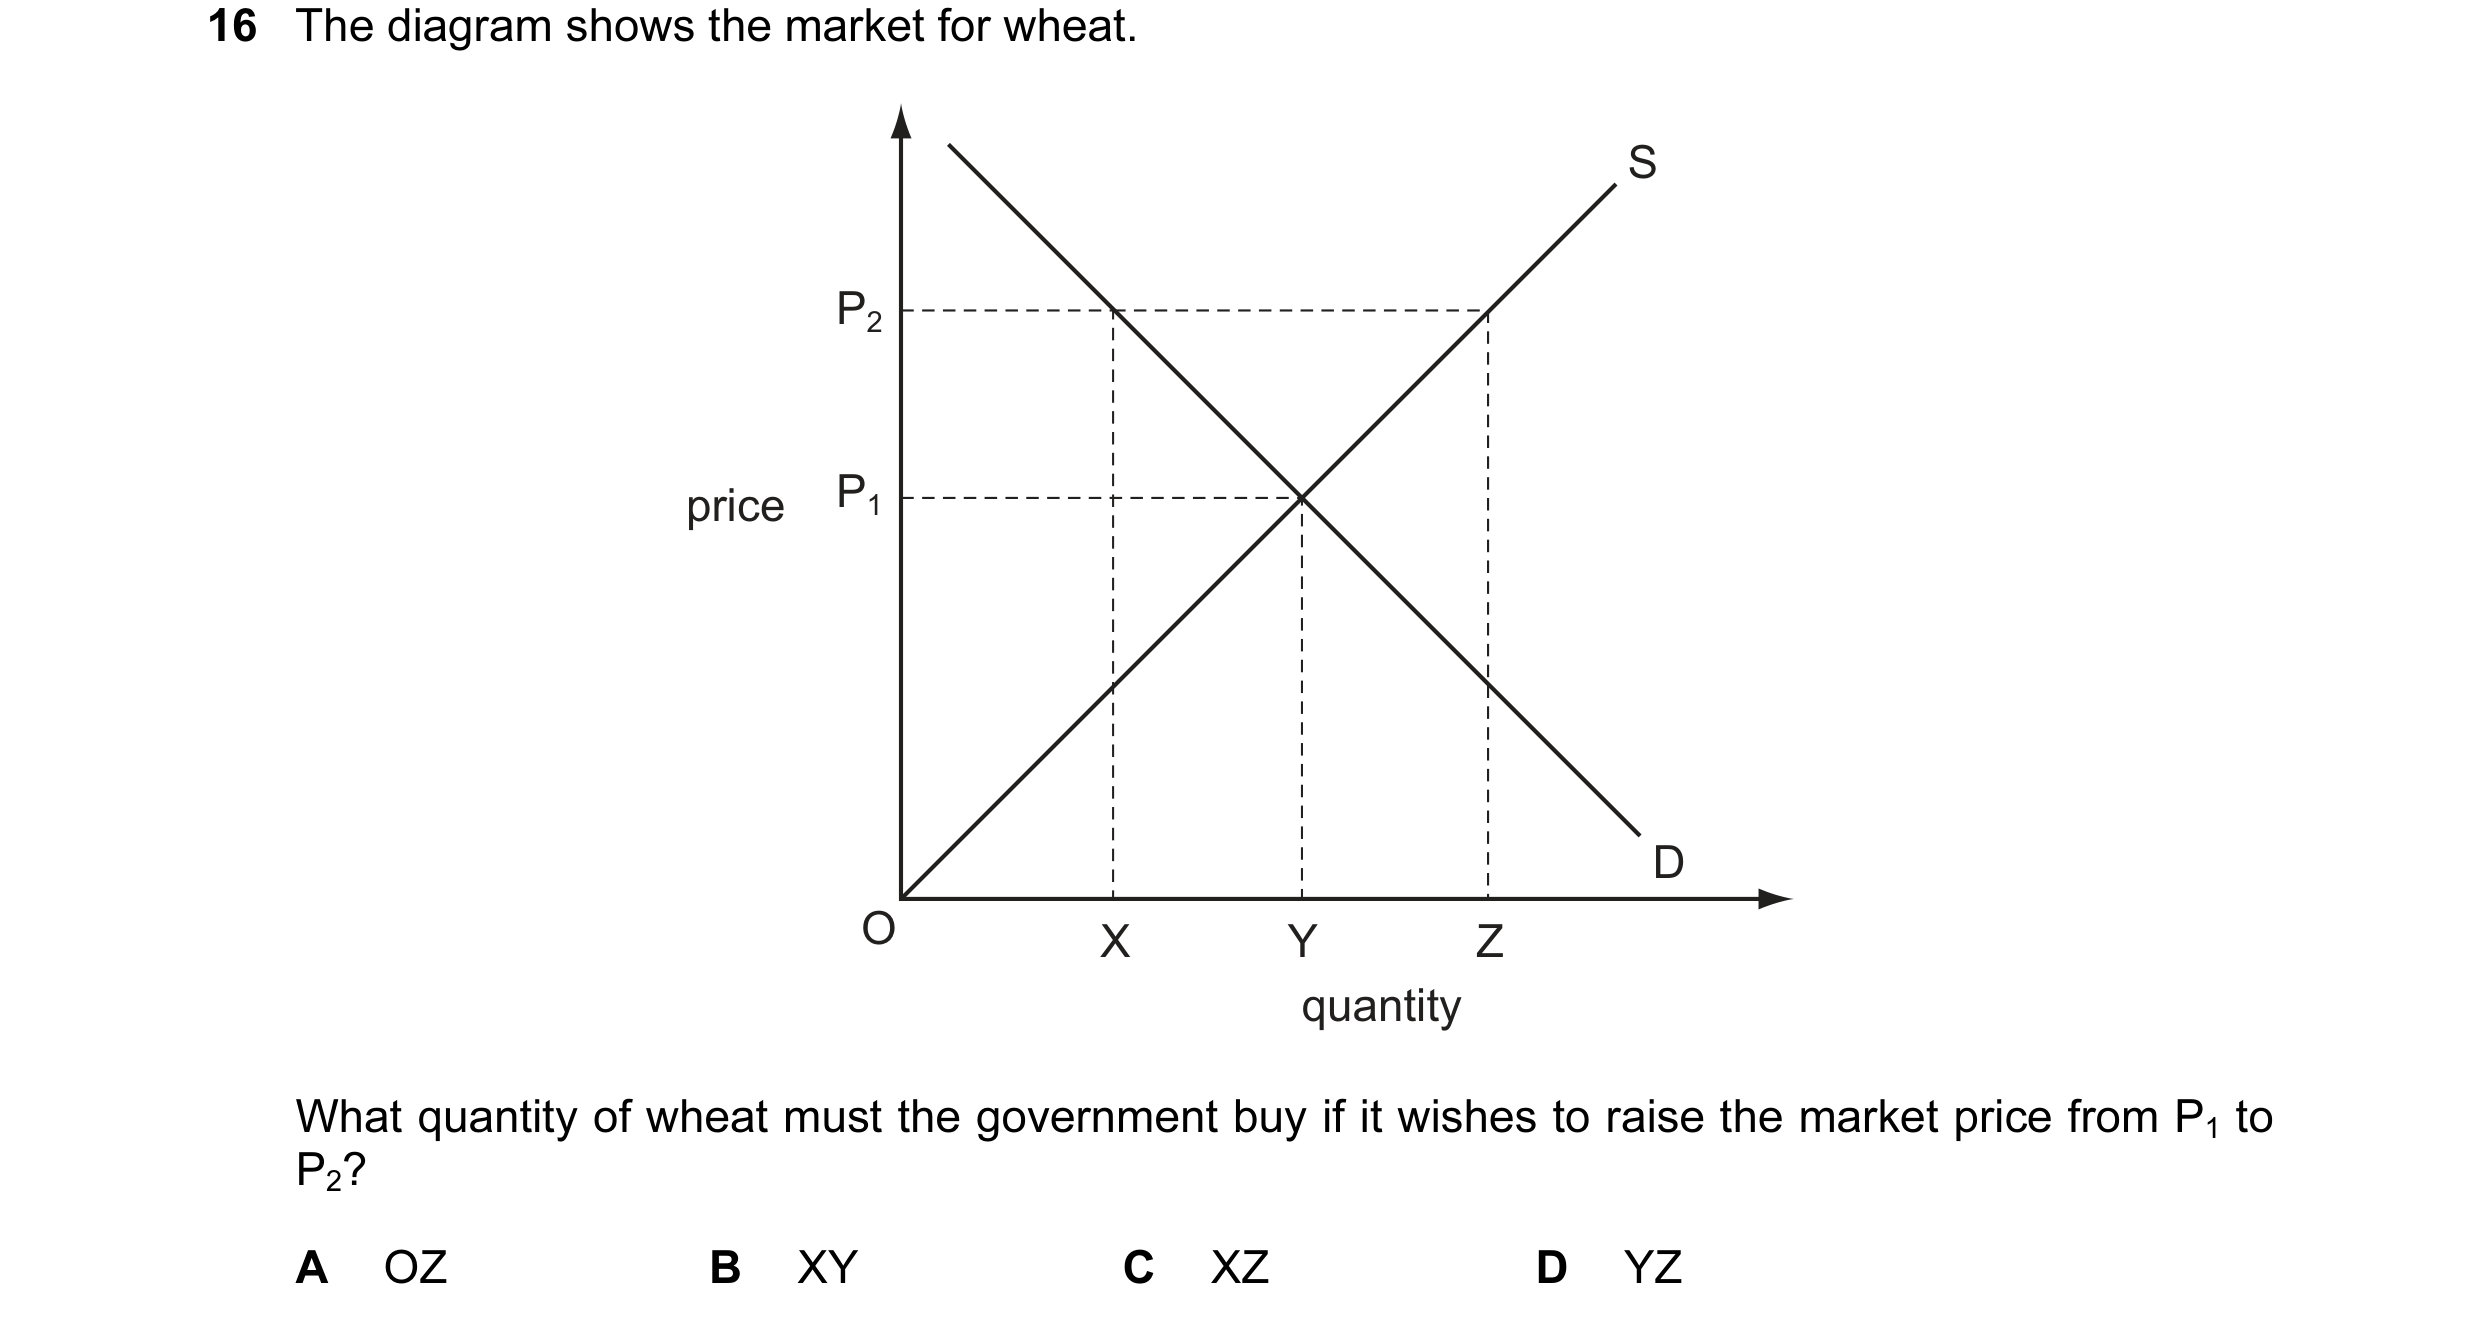 10 / 119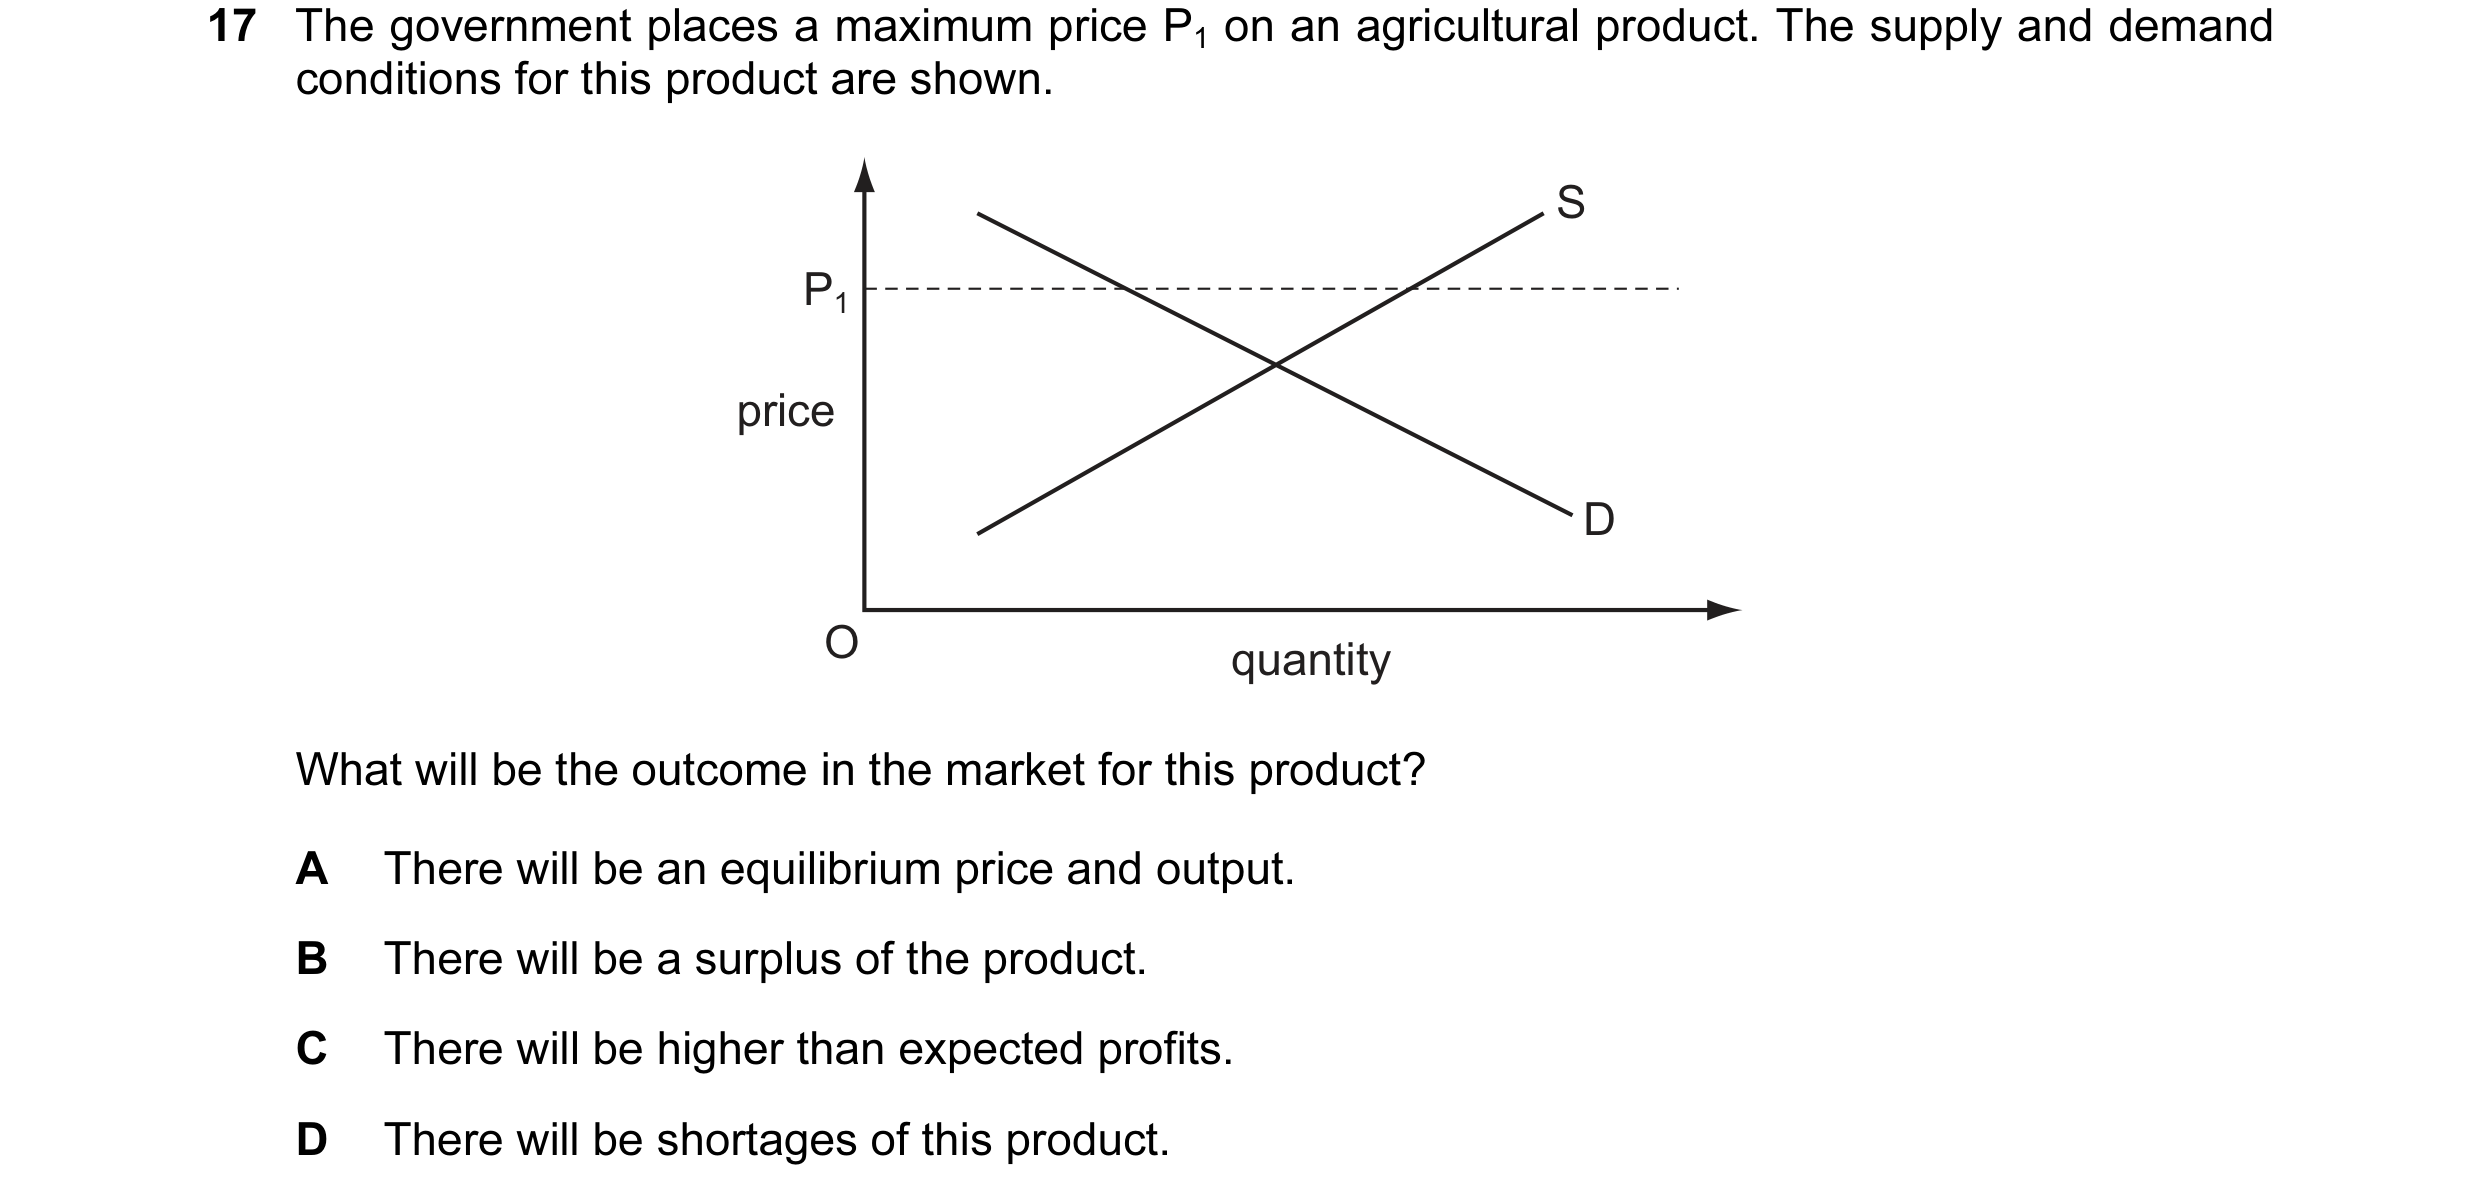
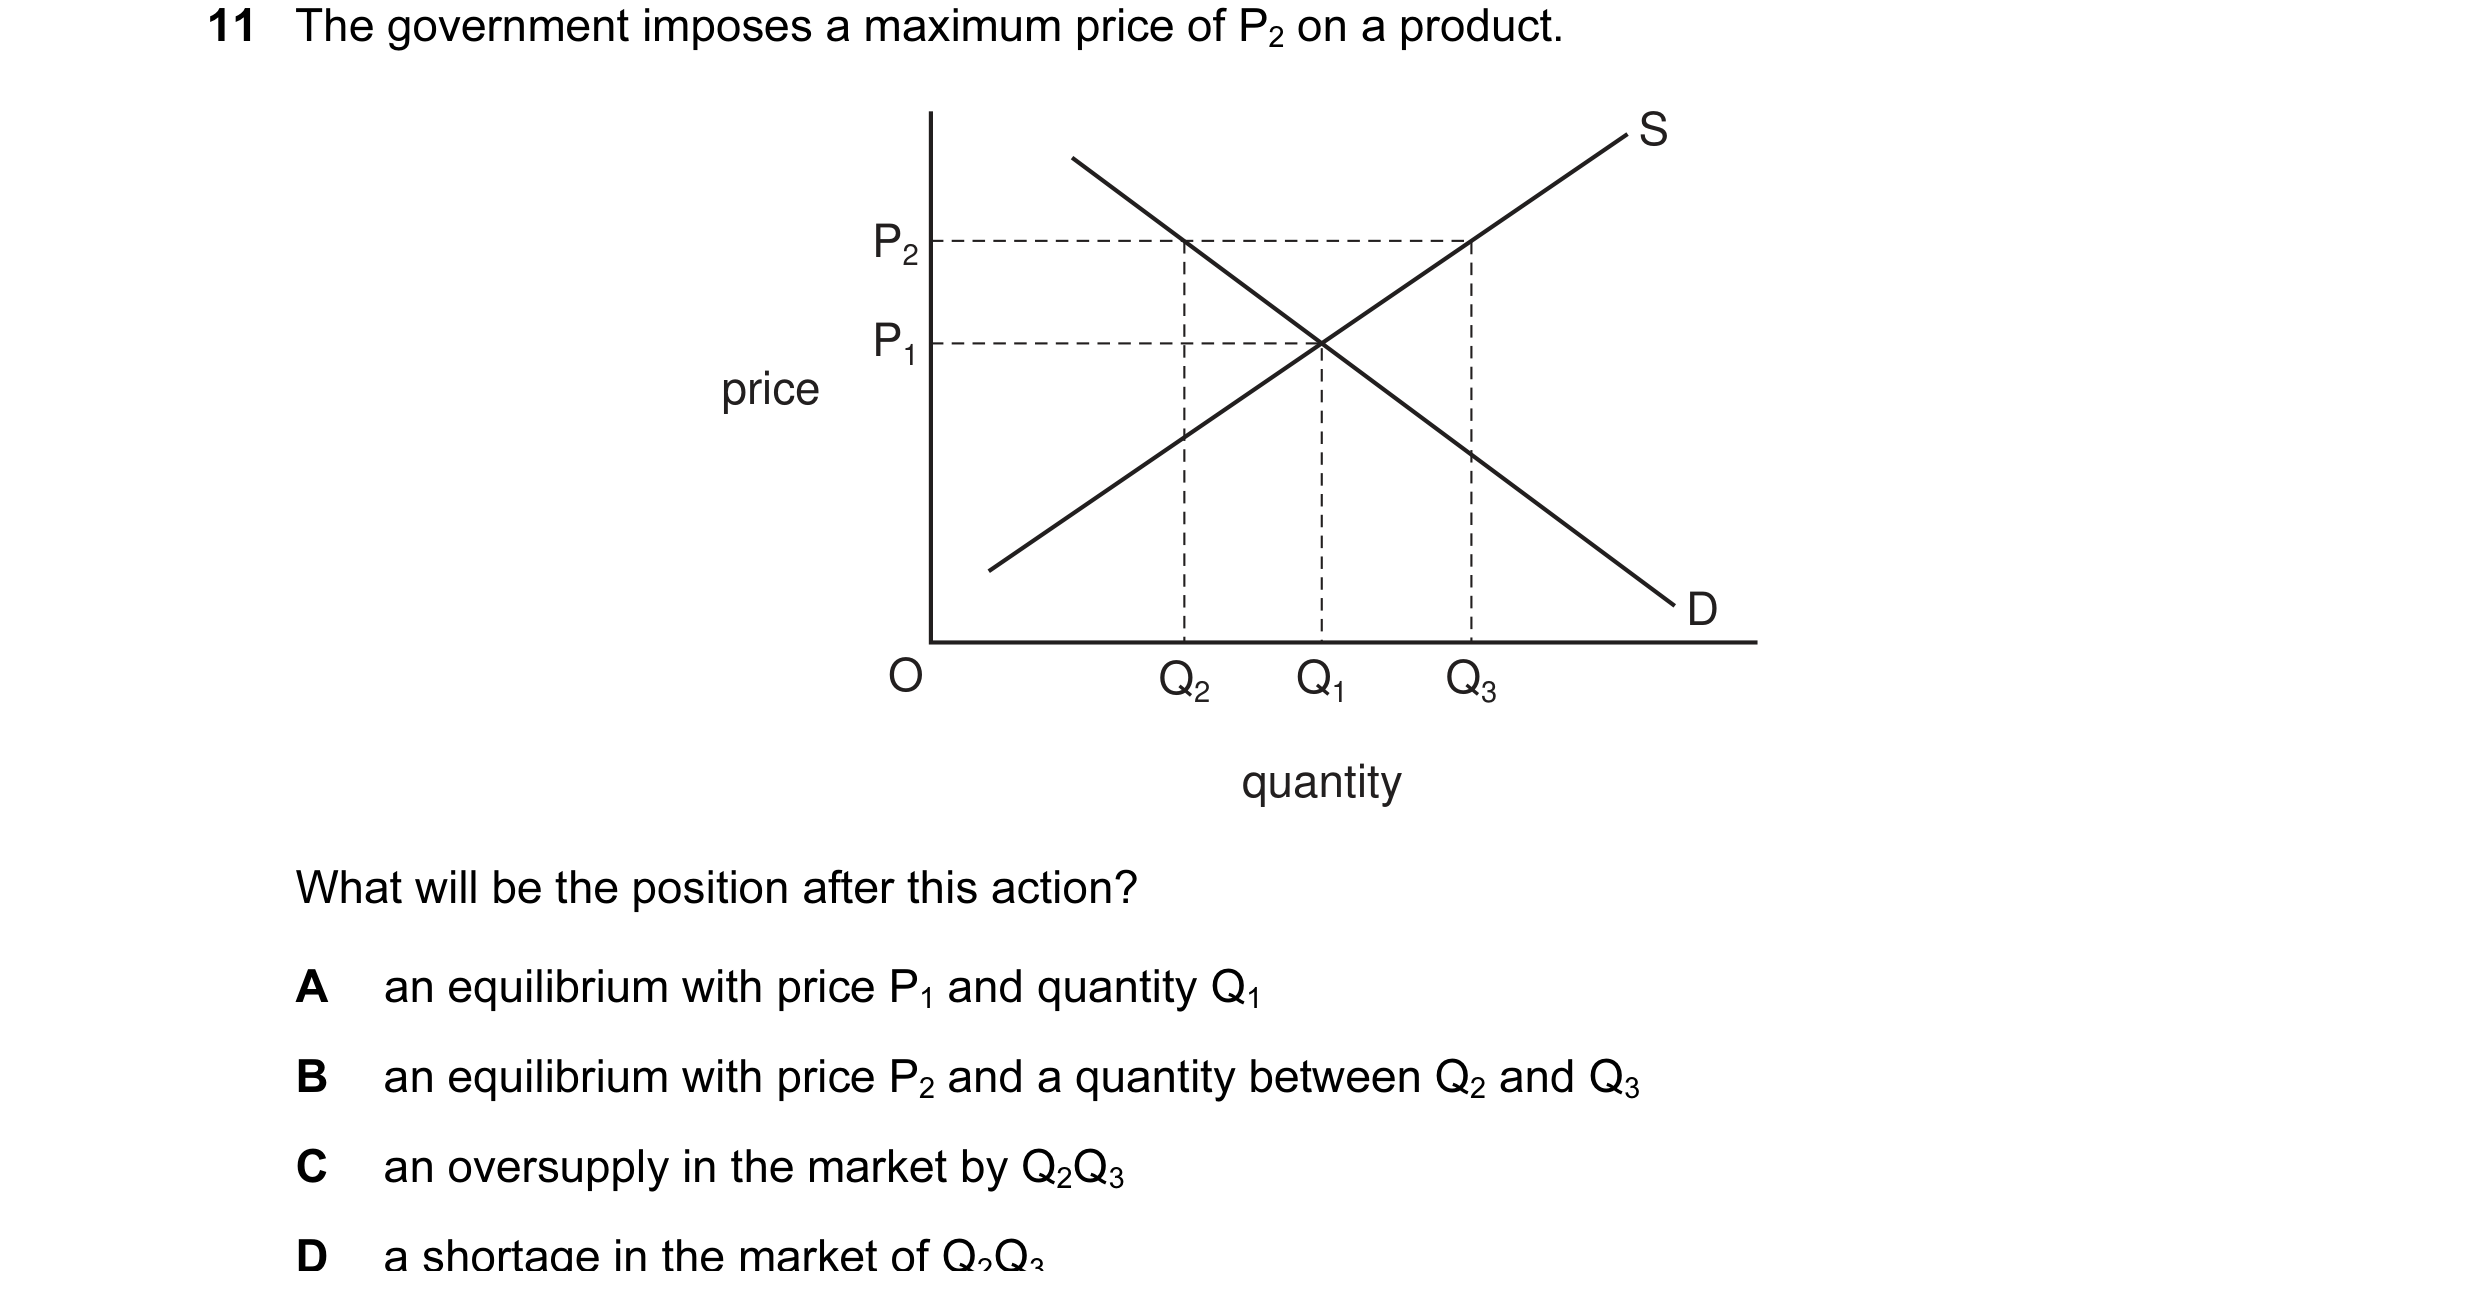 11 / 119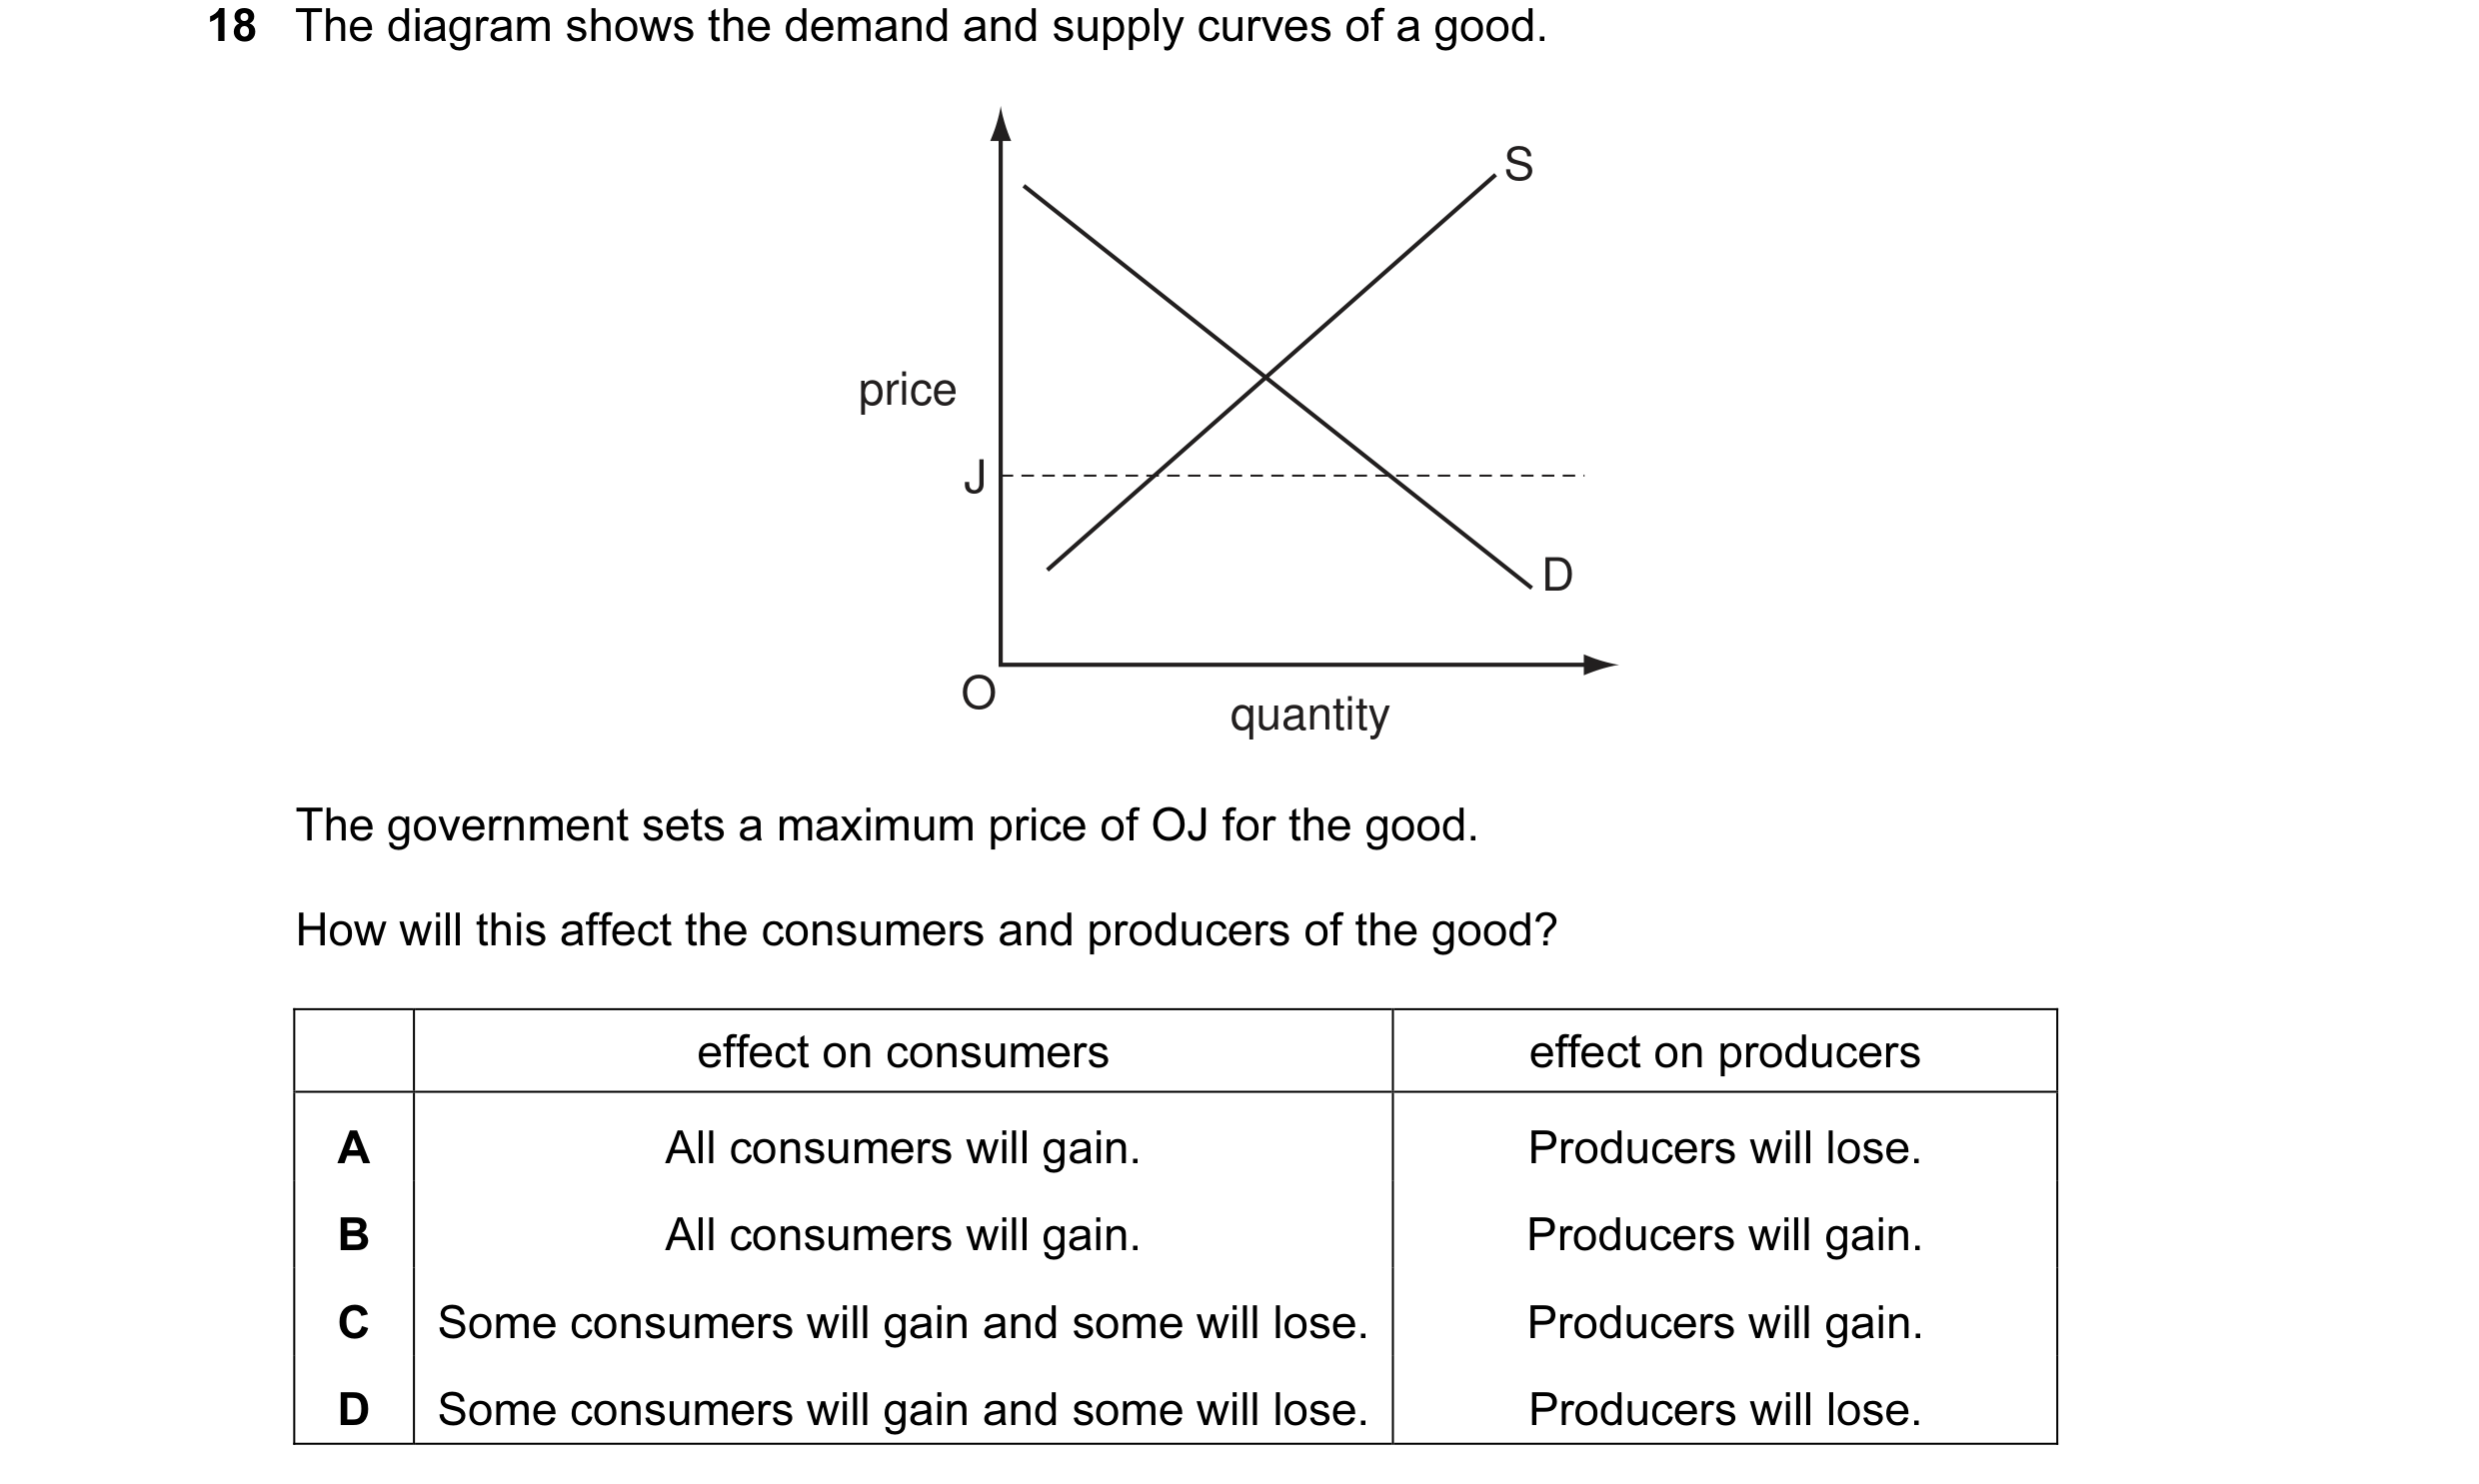
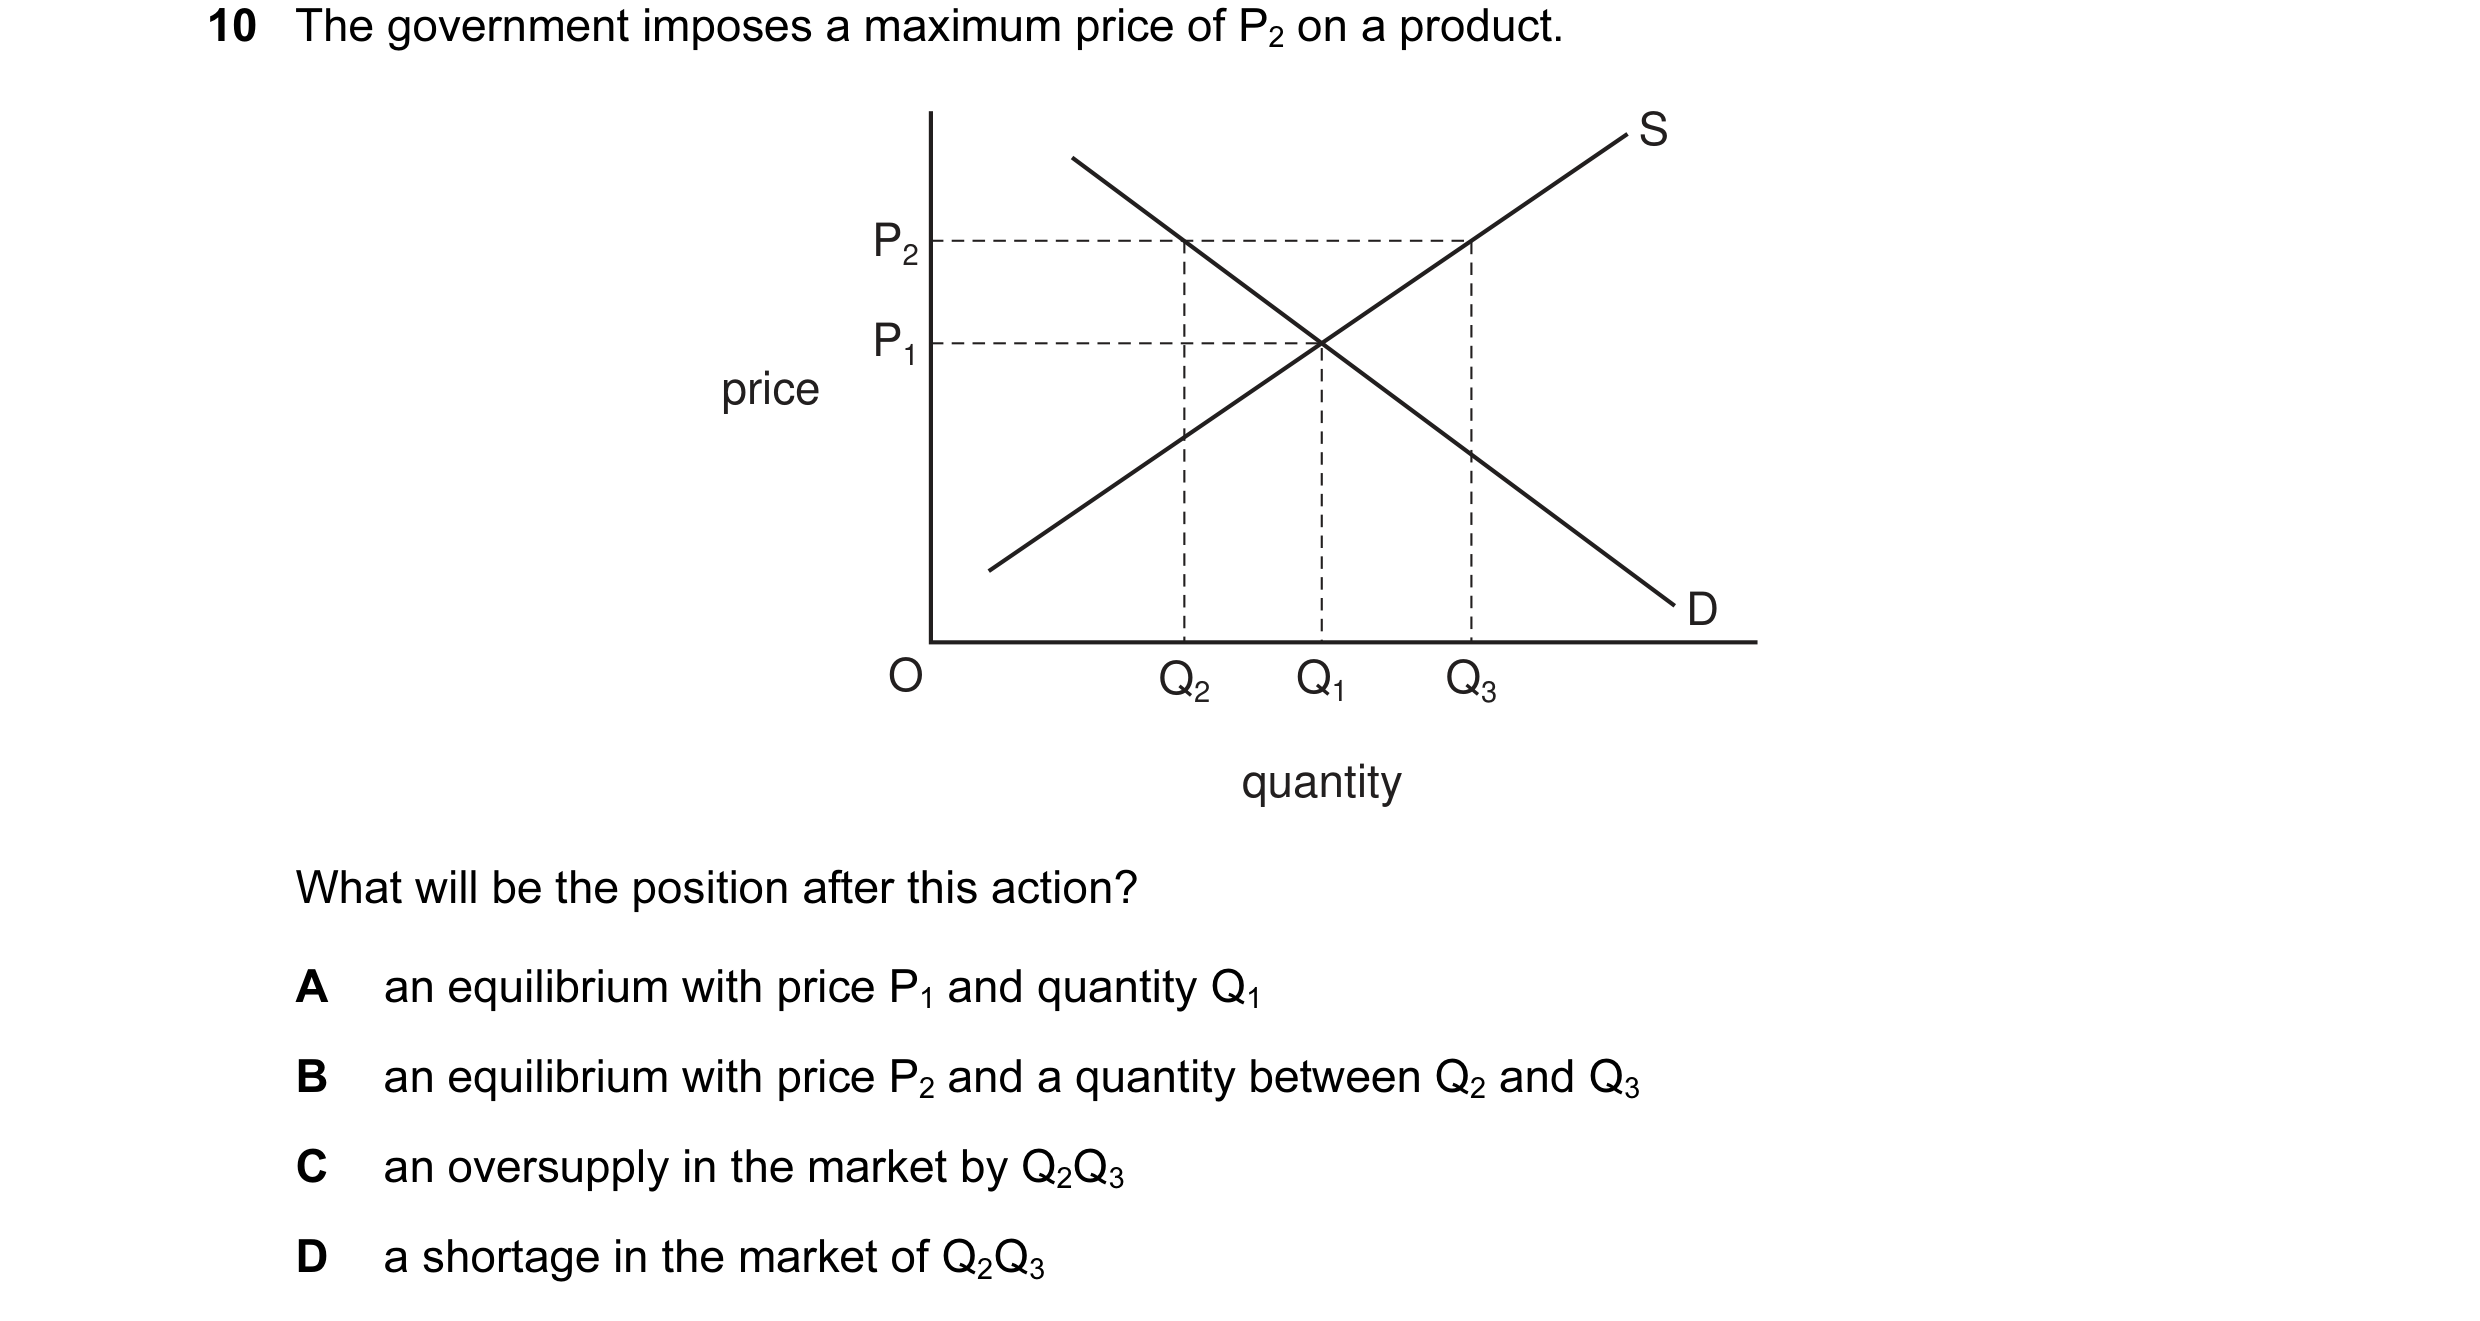 12 / 119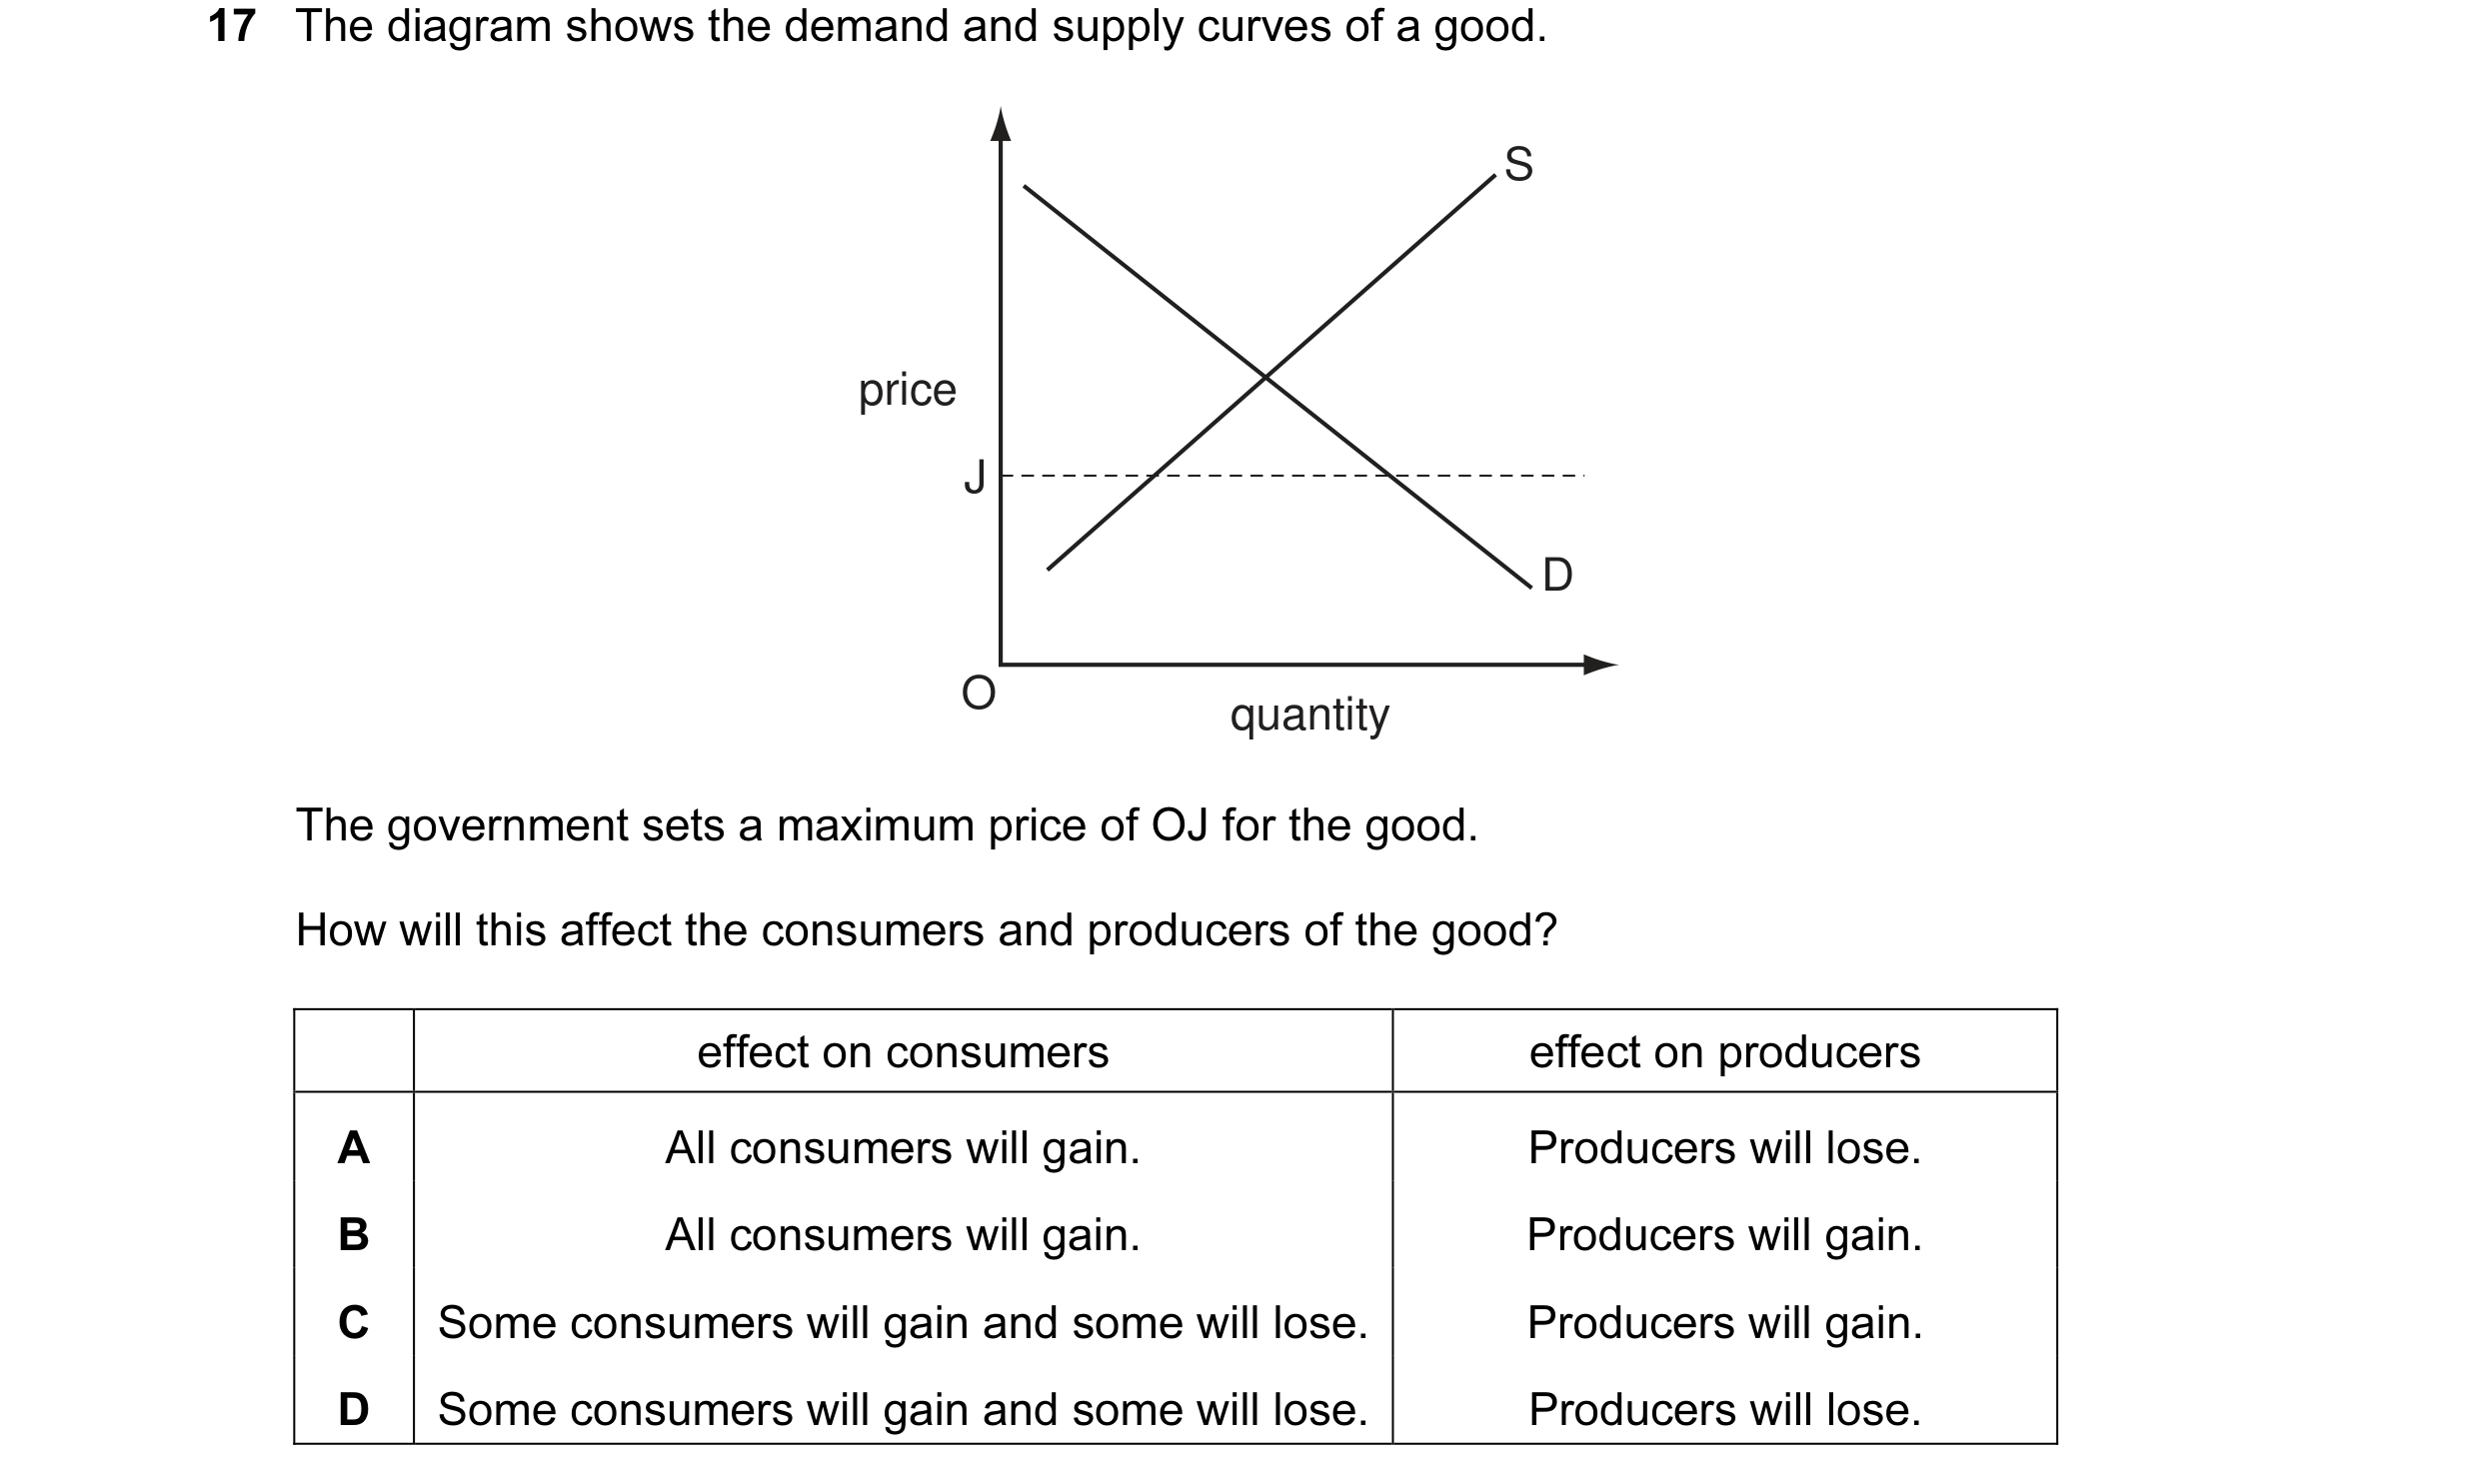
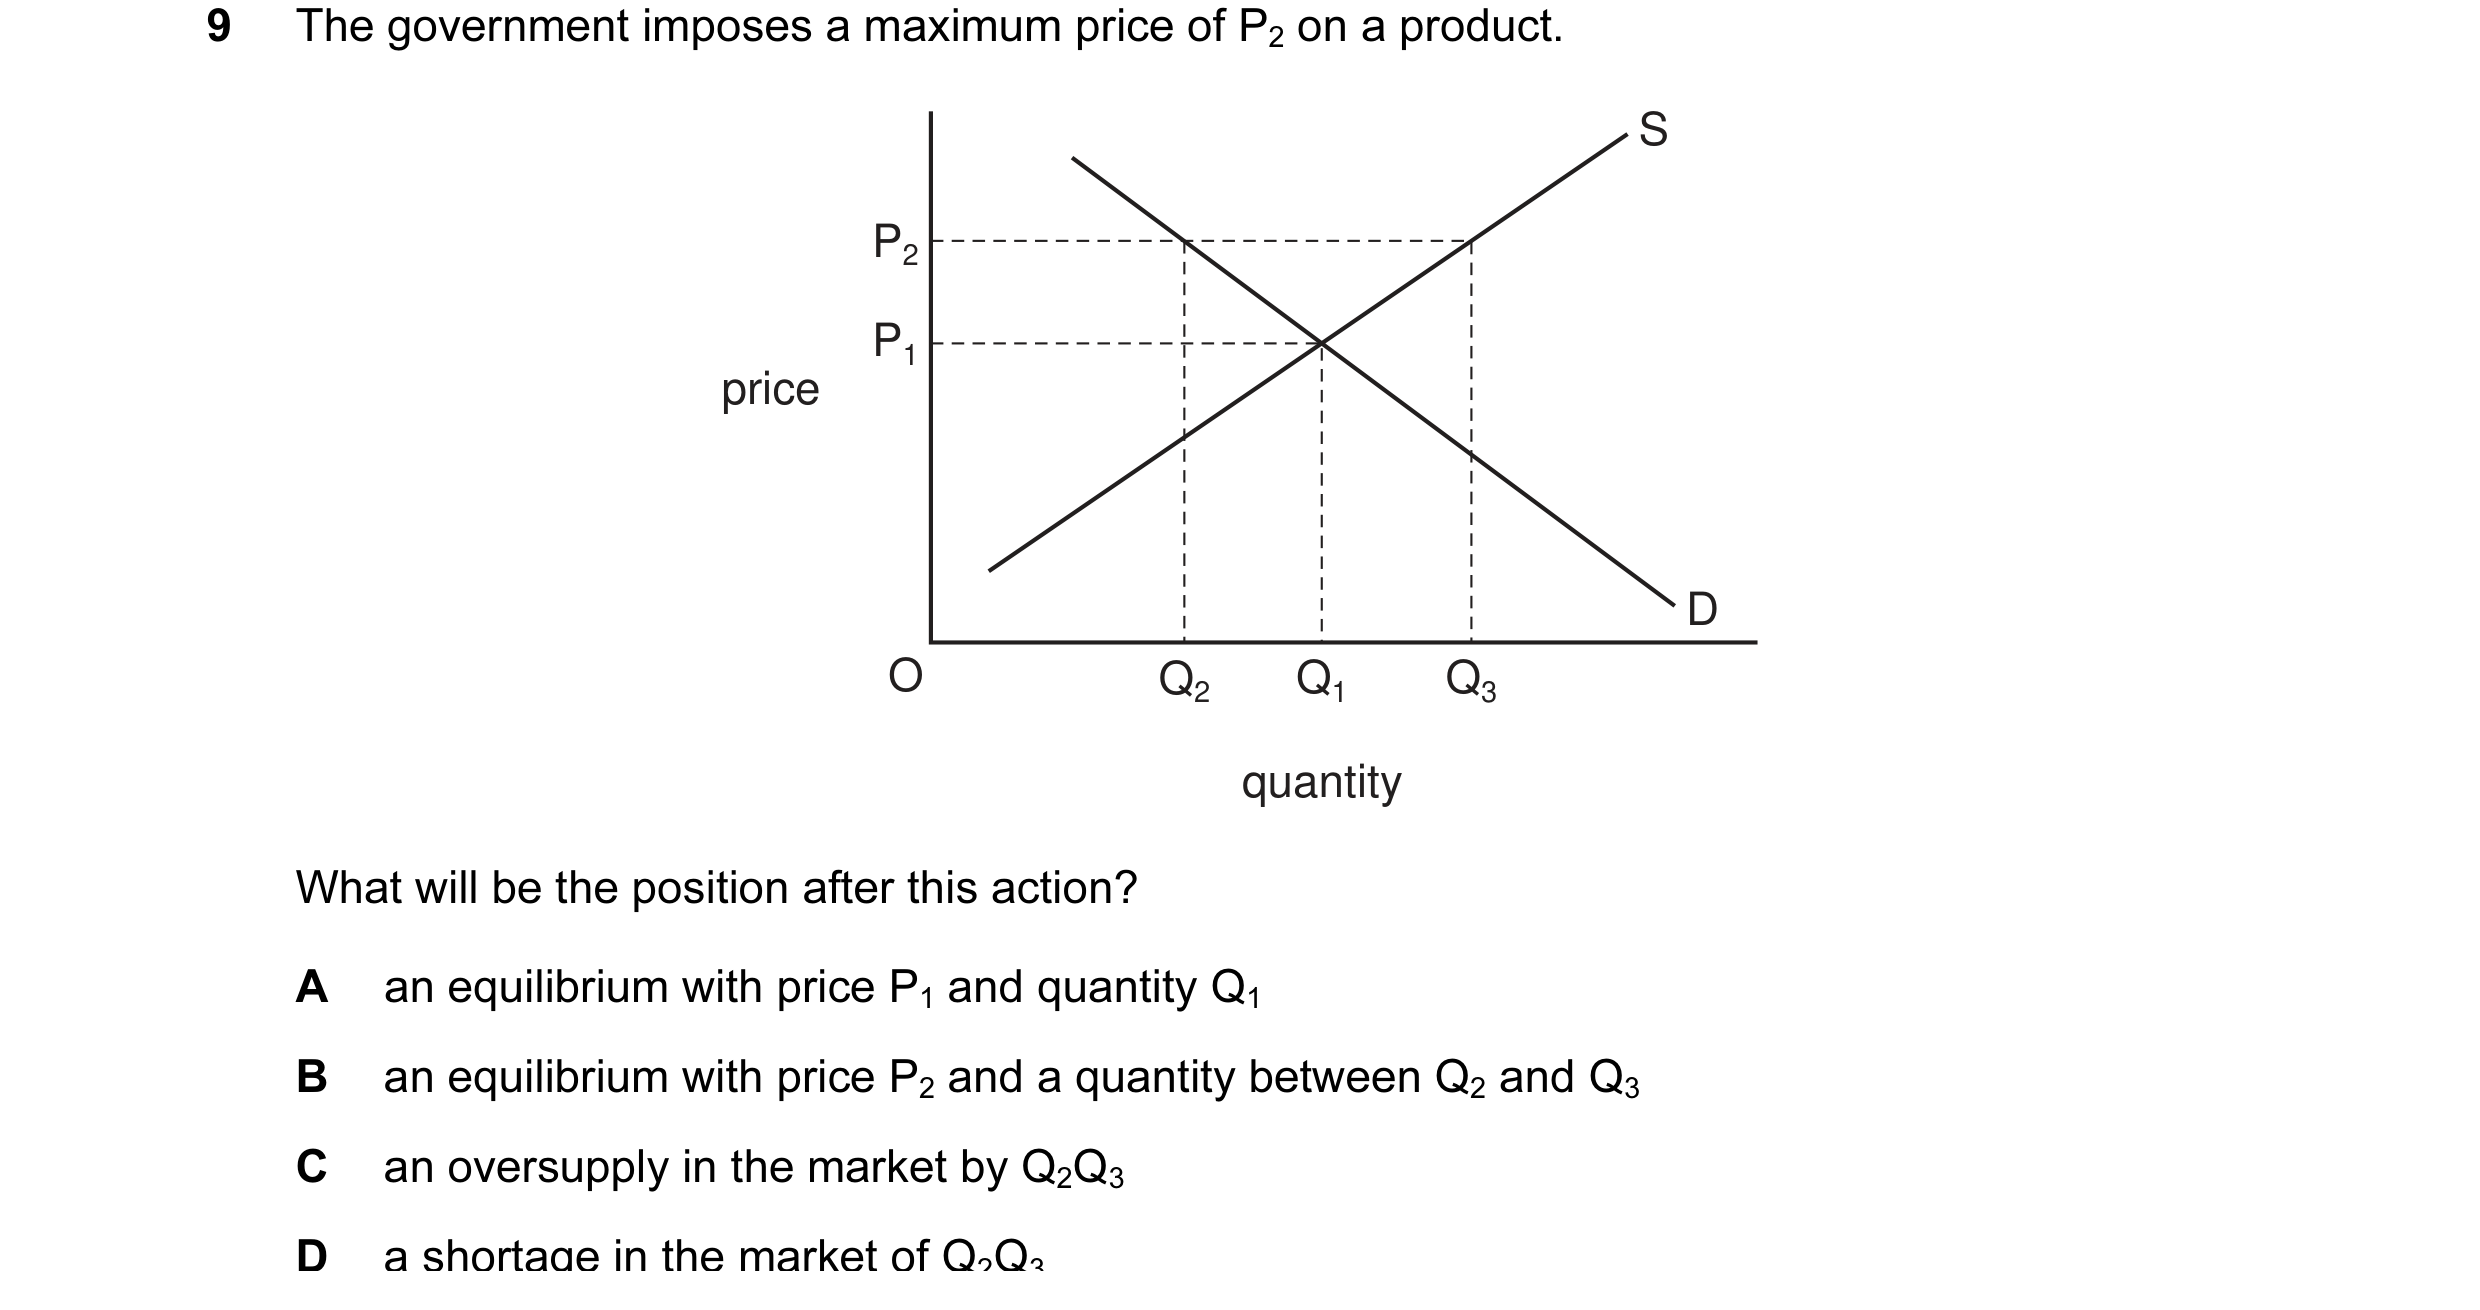 13 / 119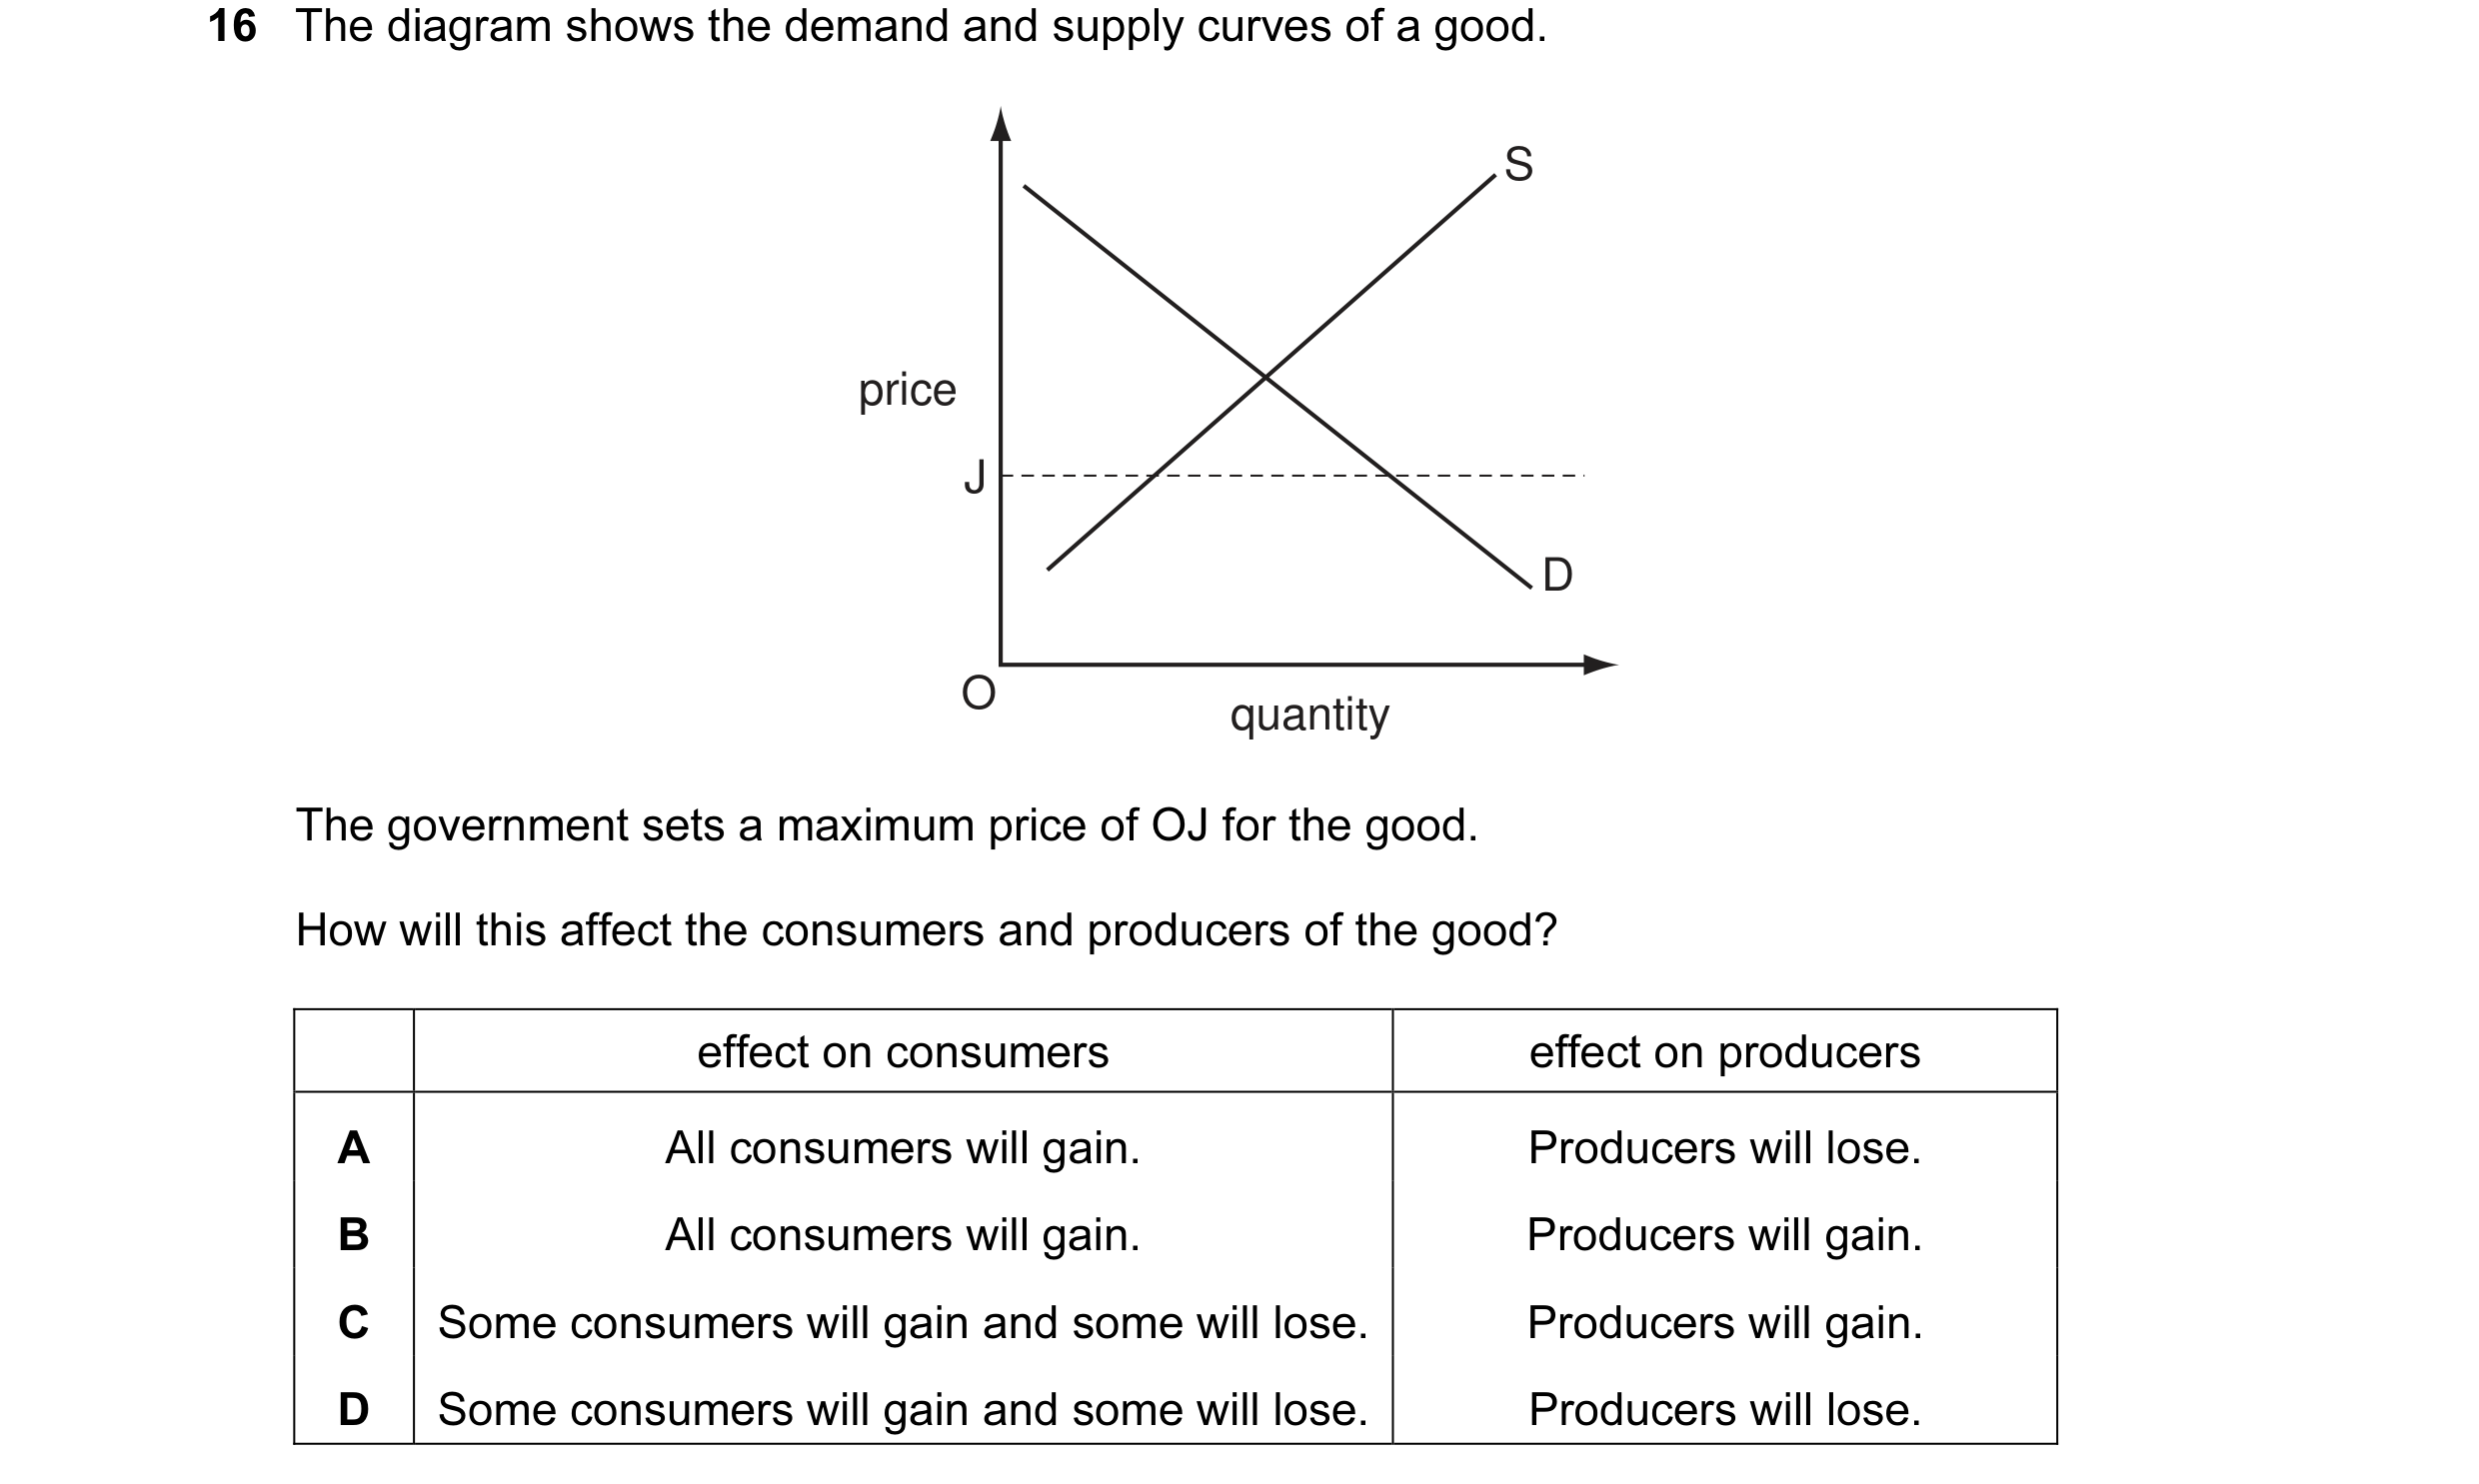
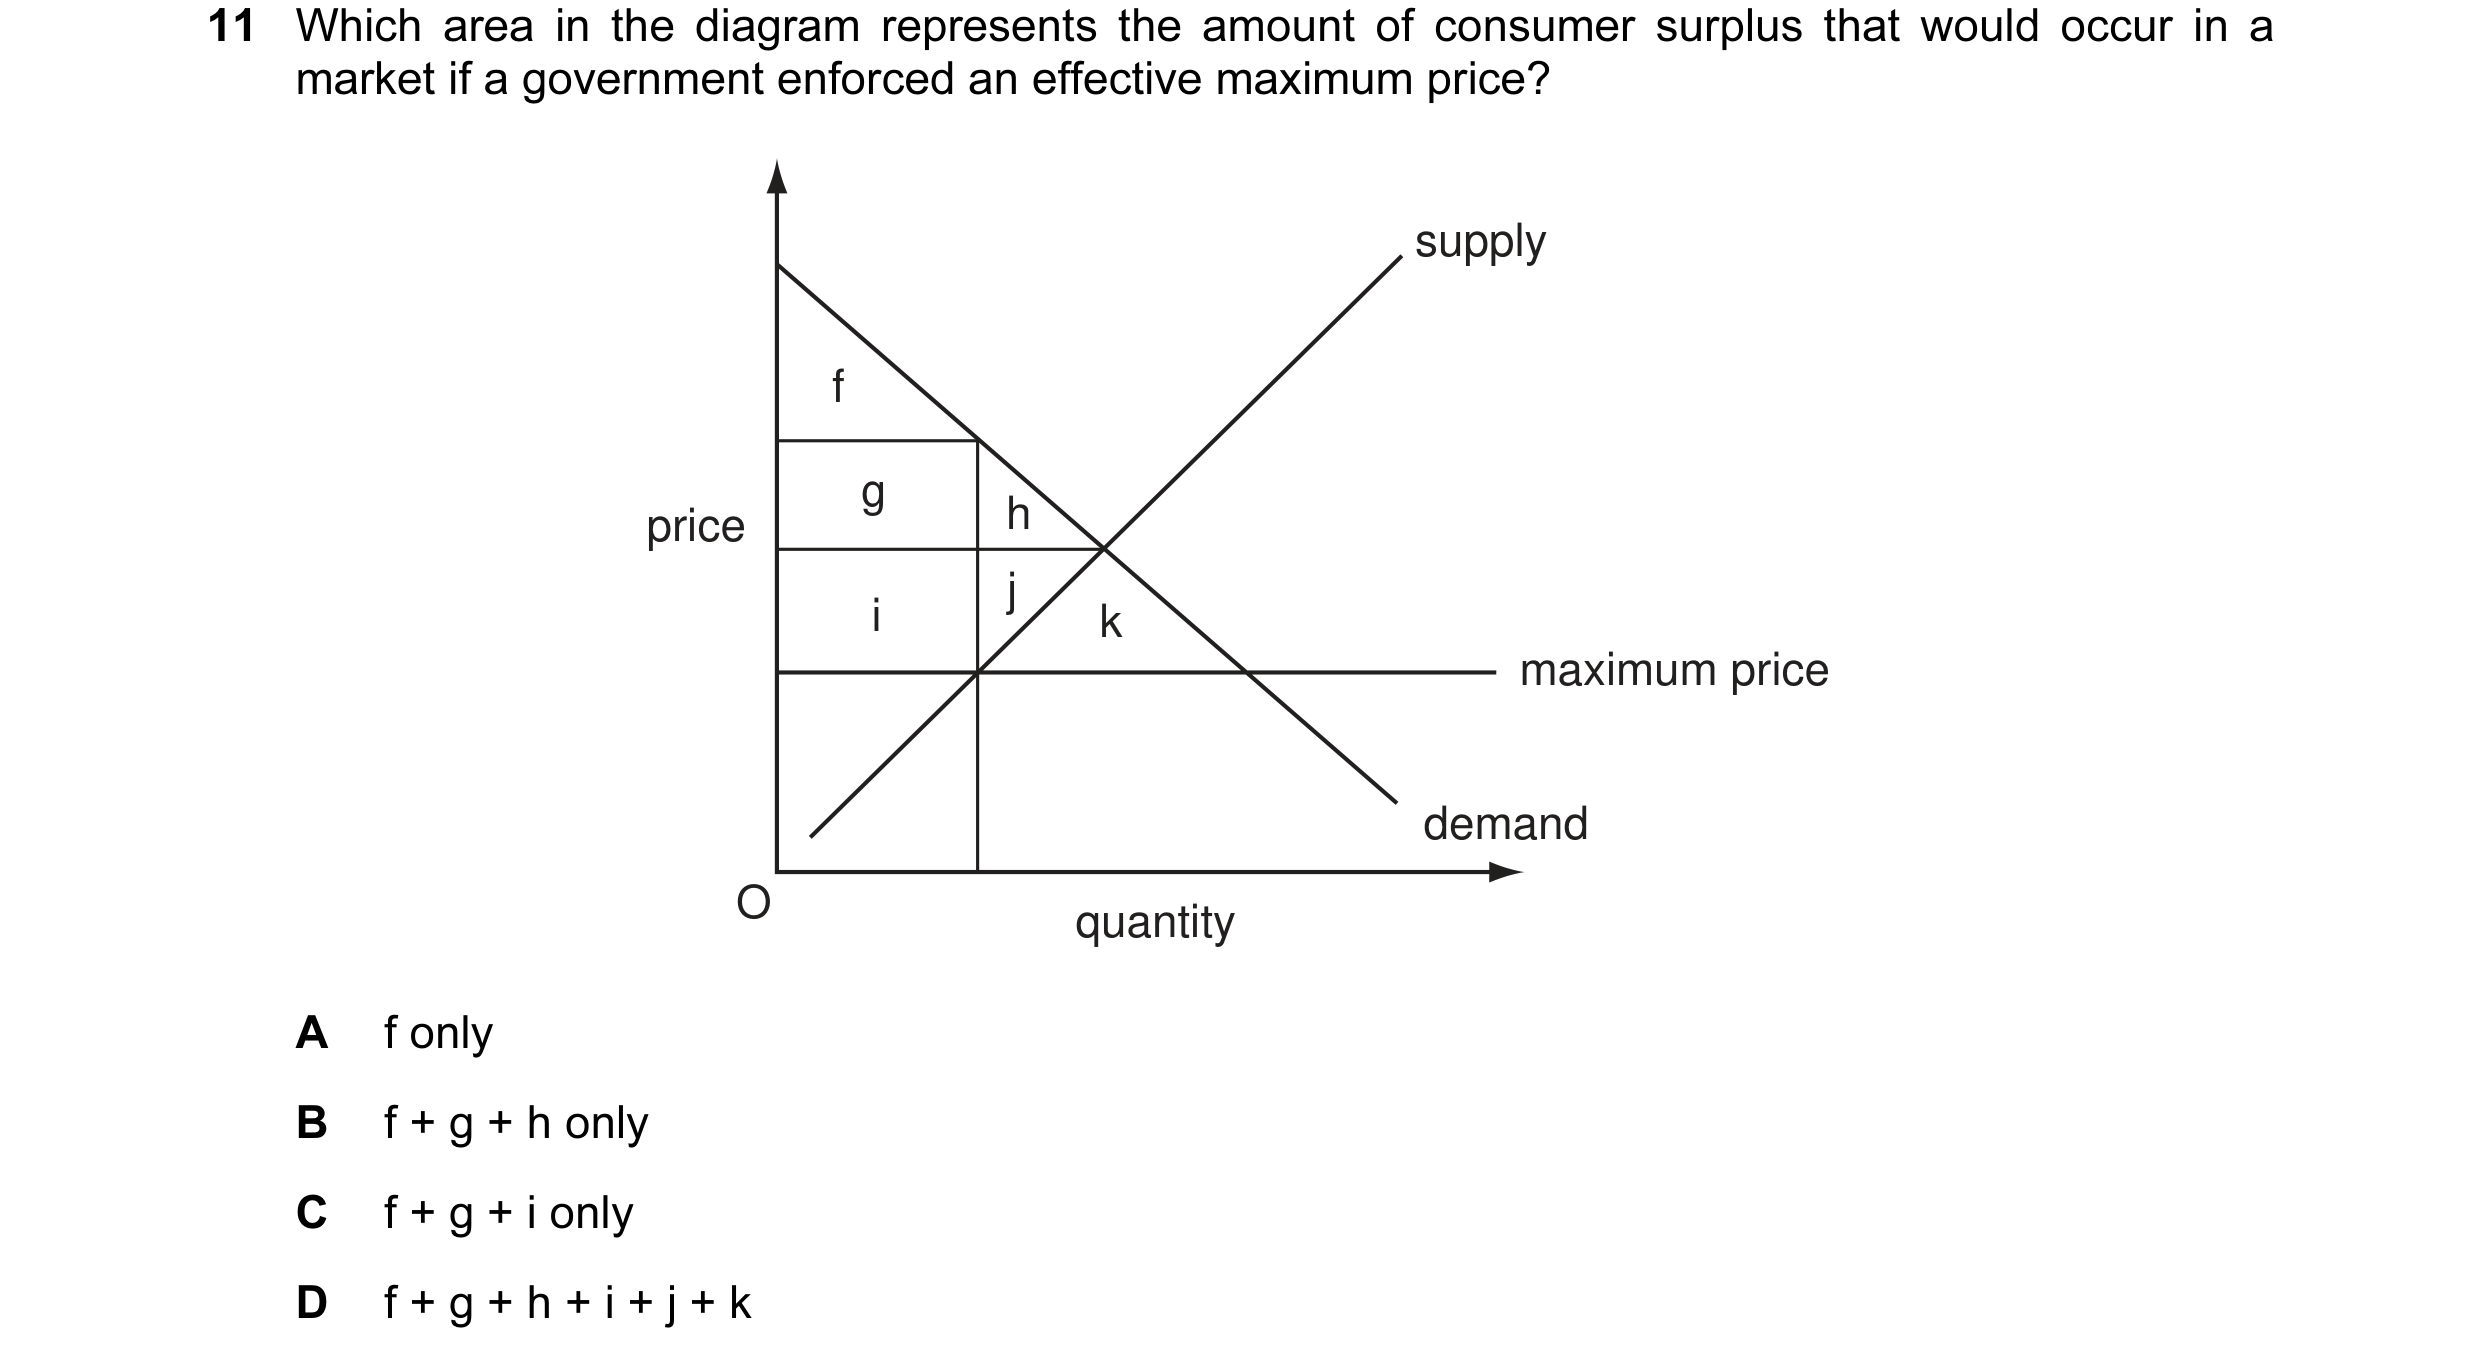
 14 / 119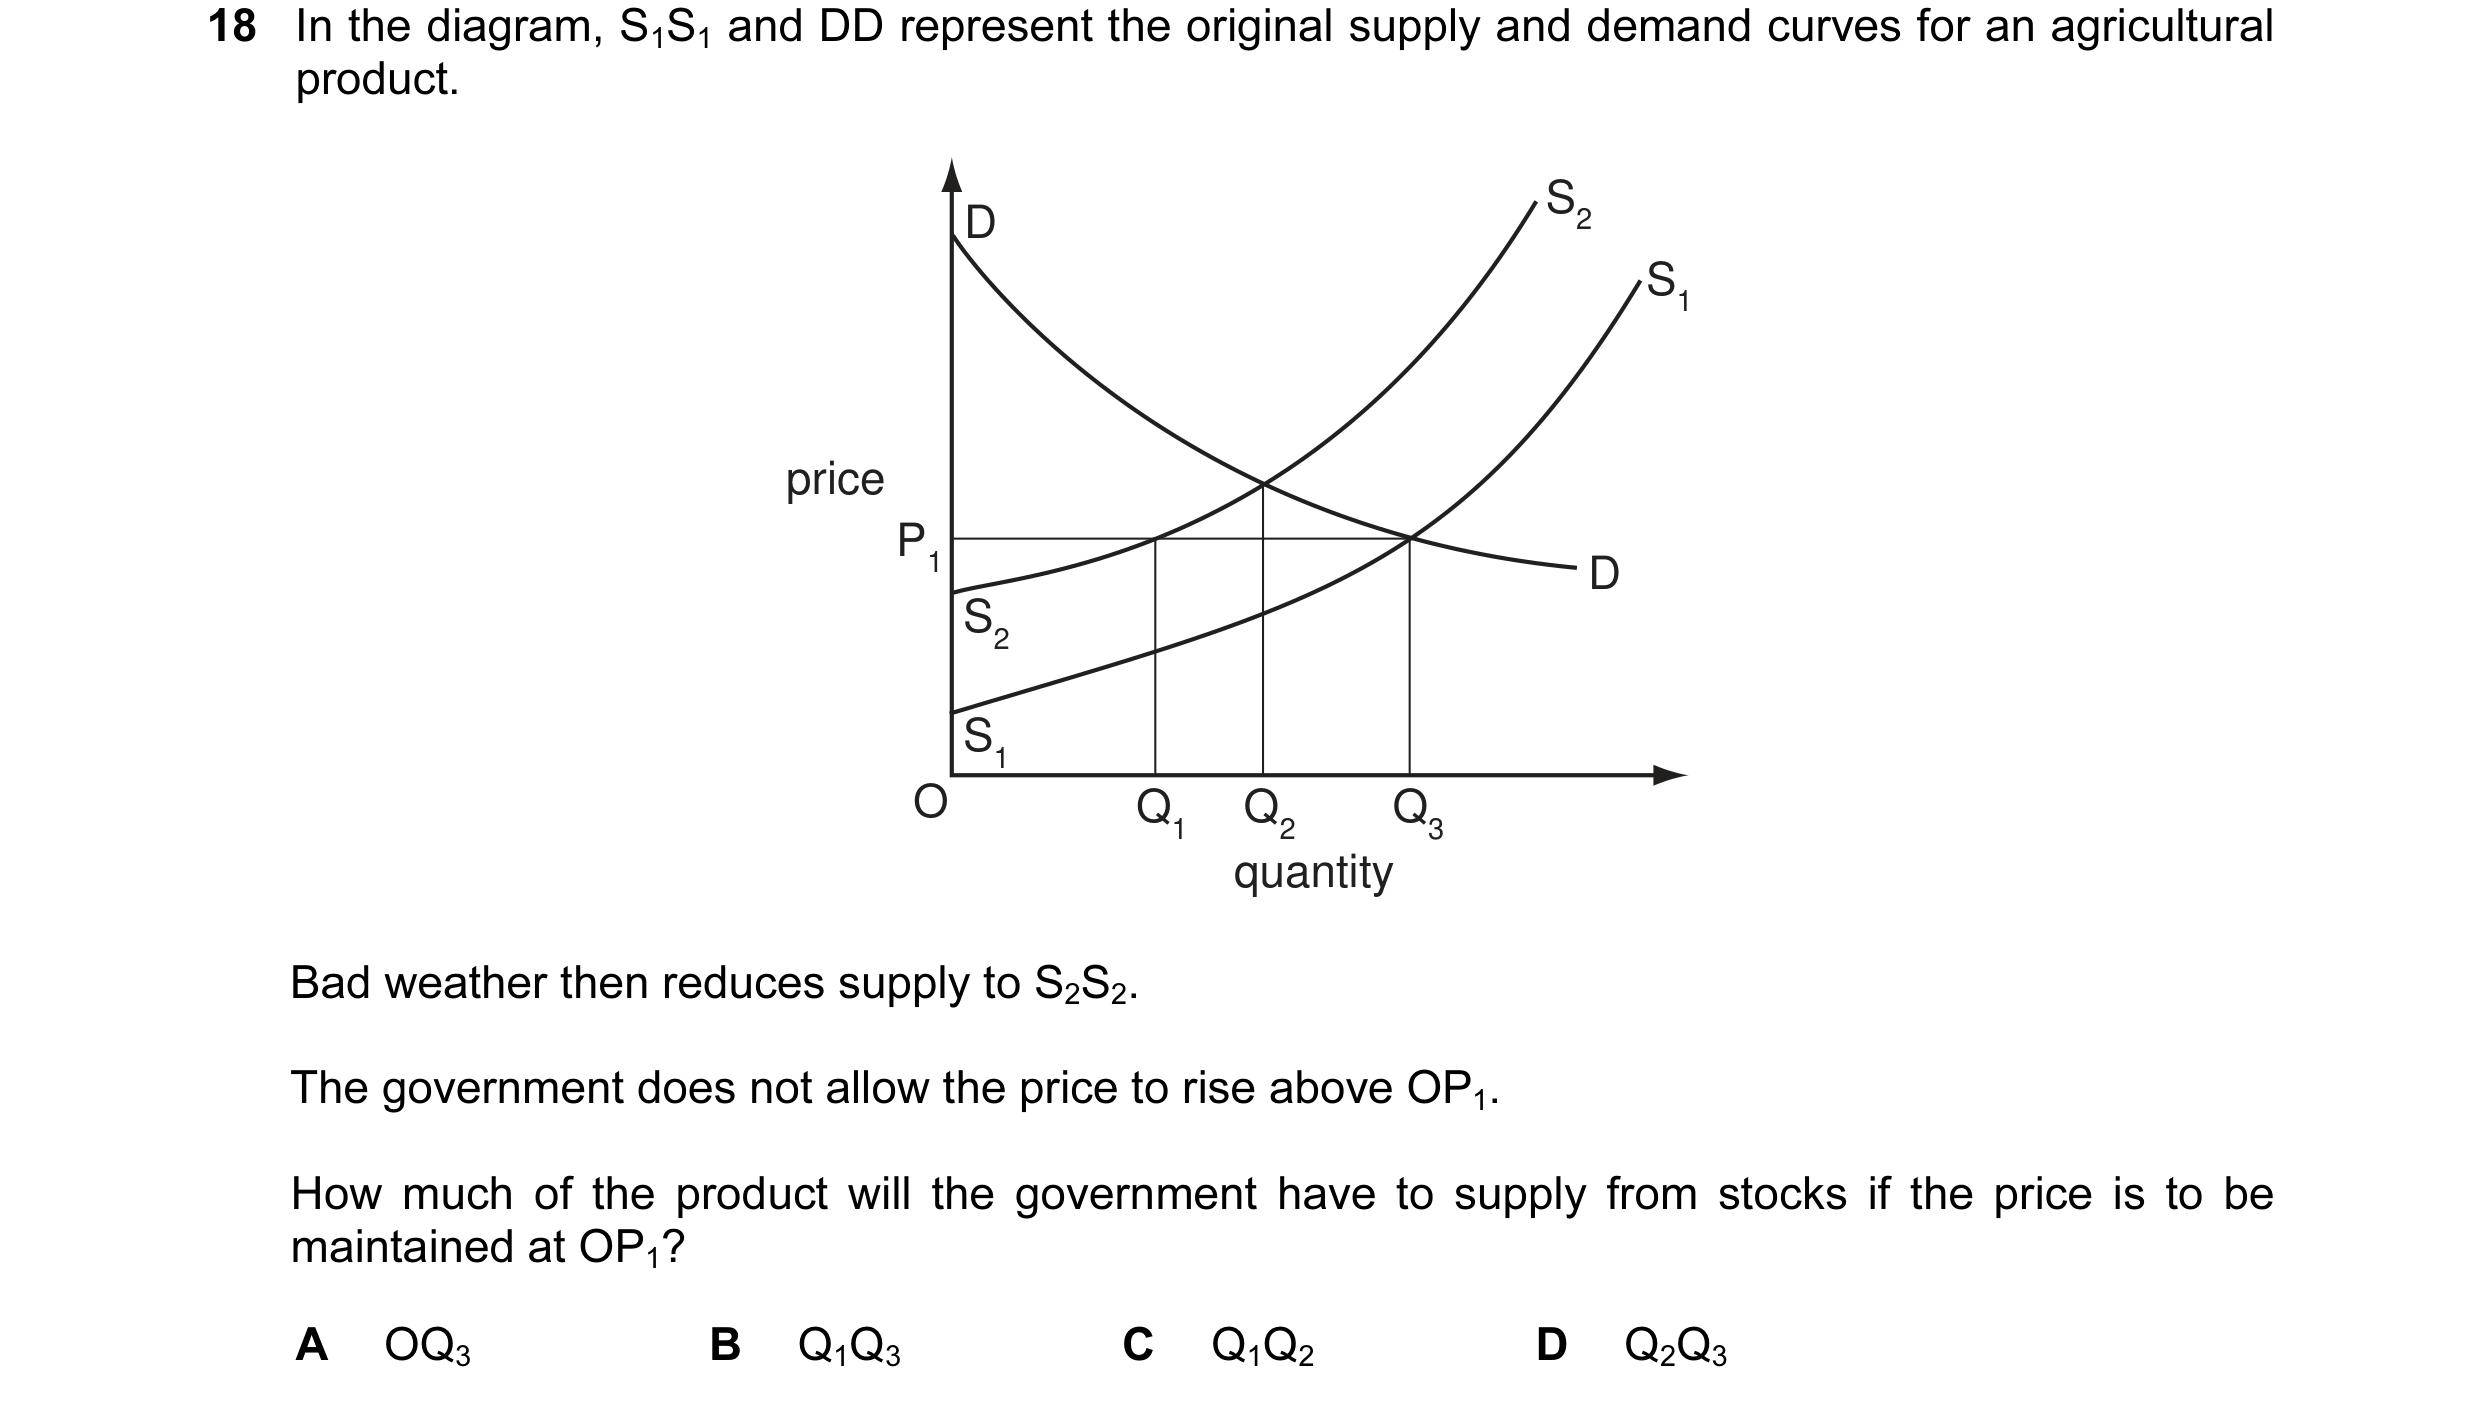
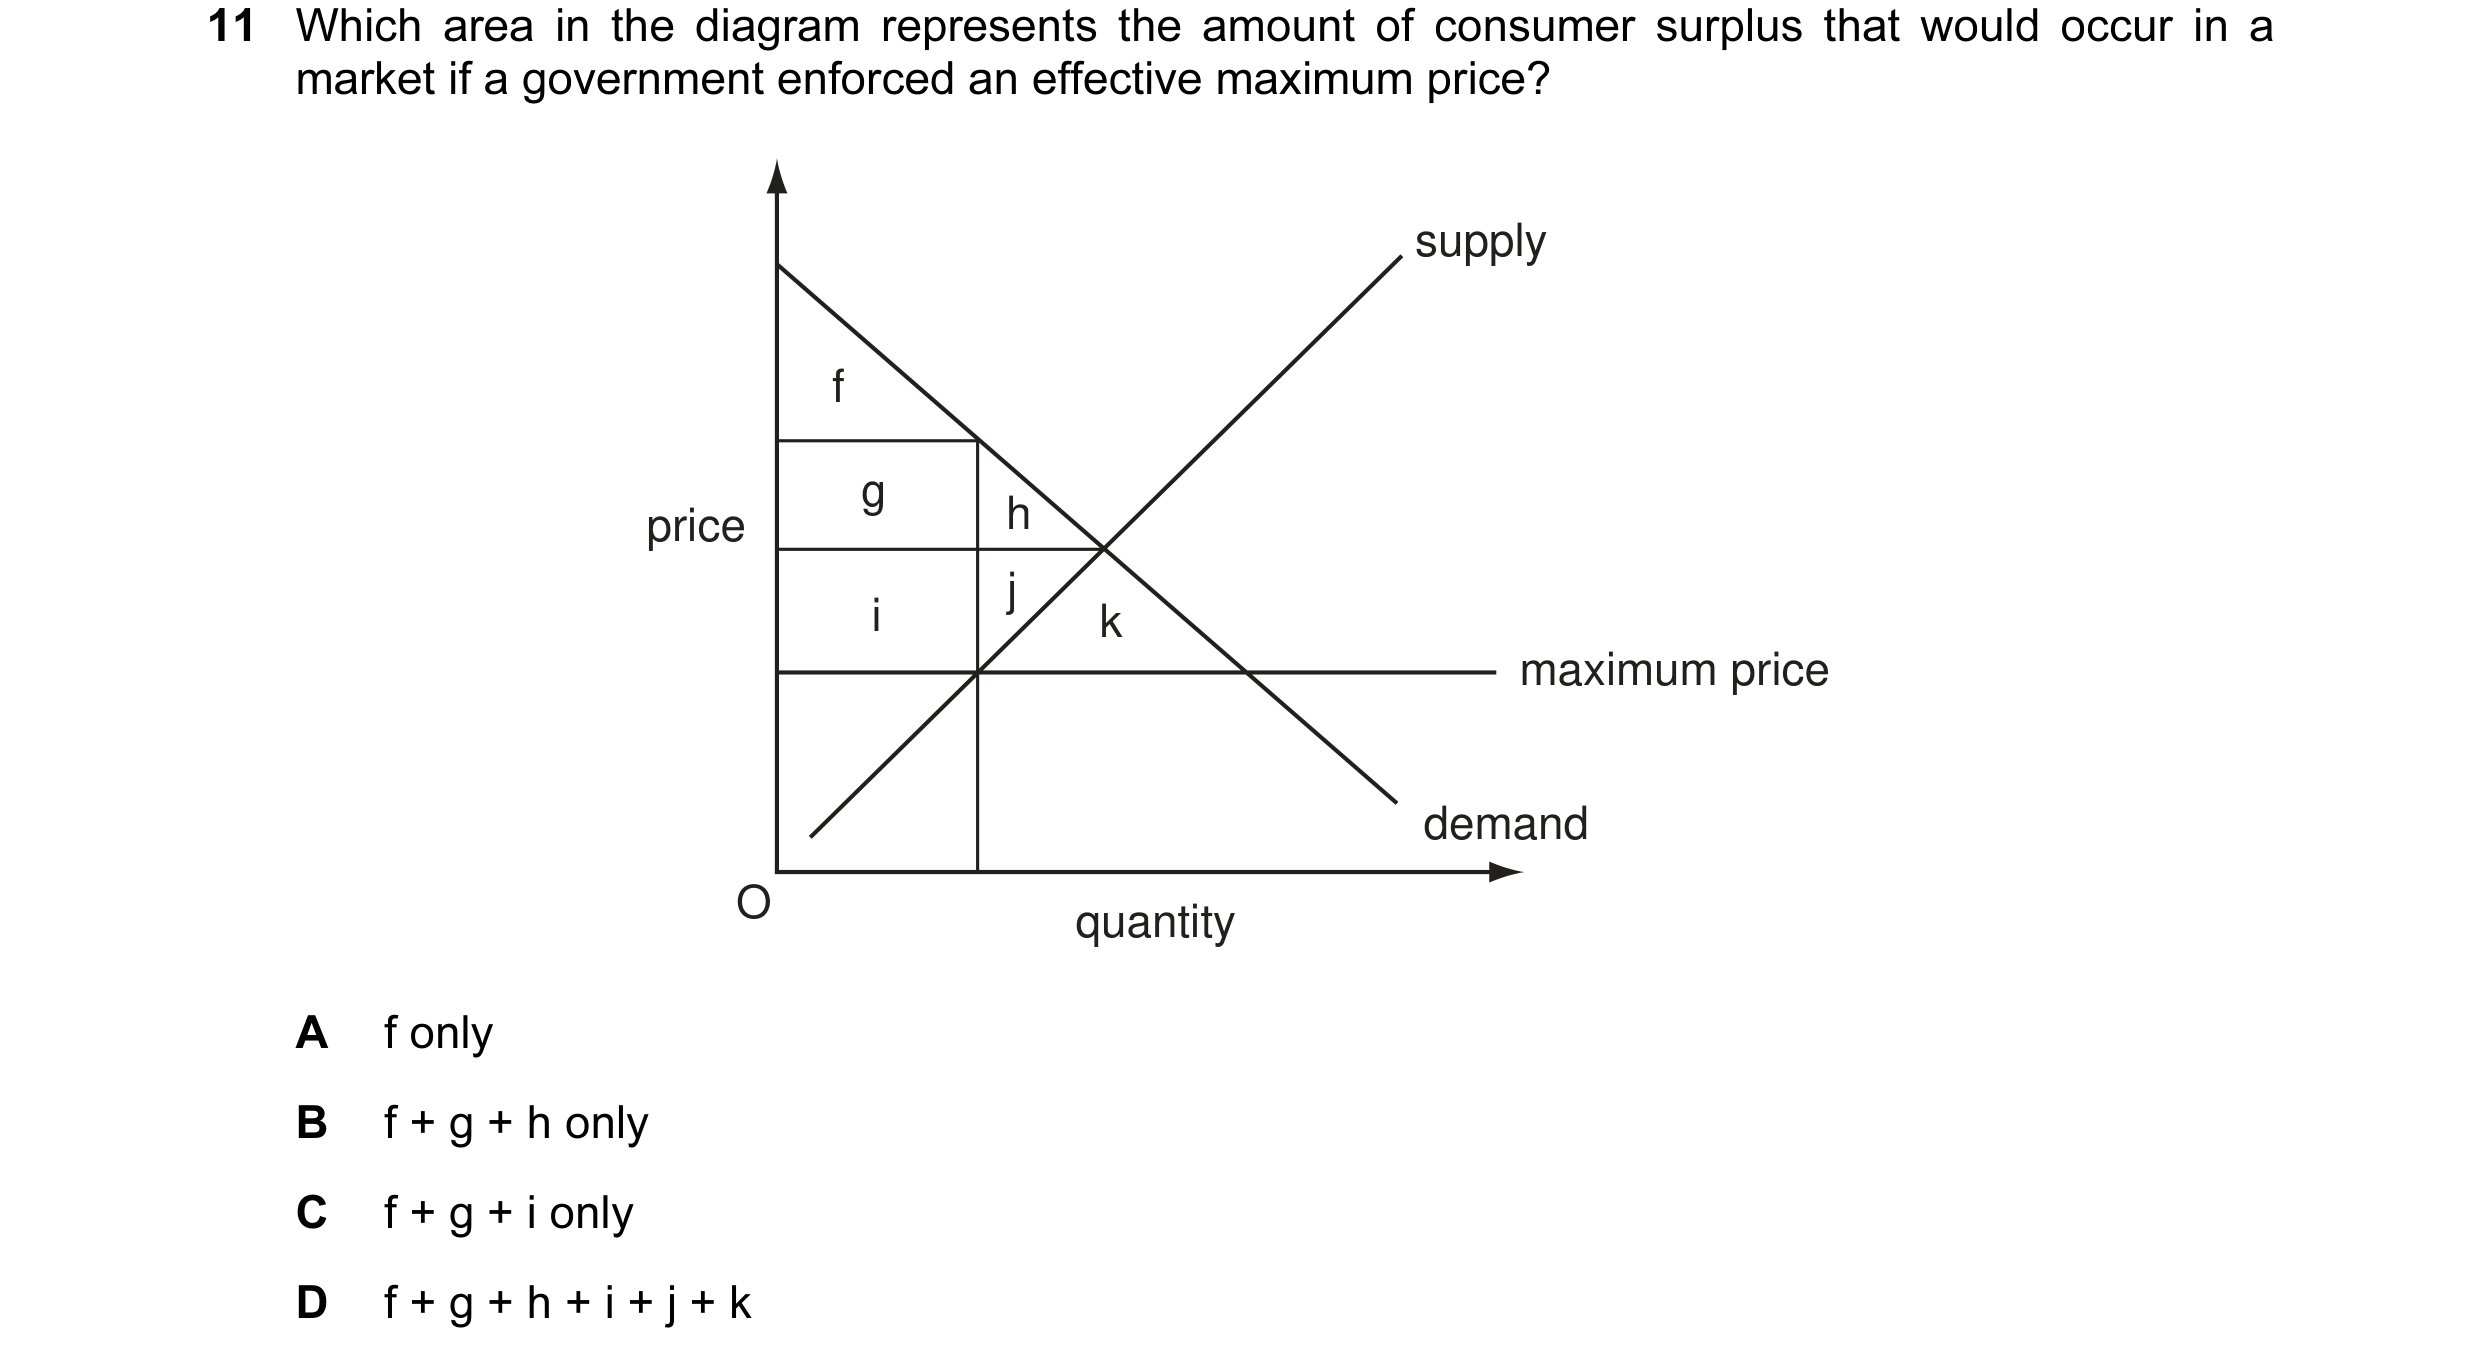
 15 / 119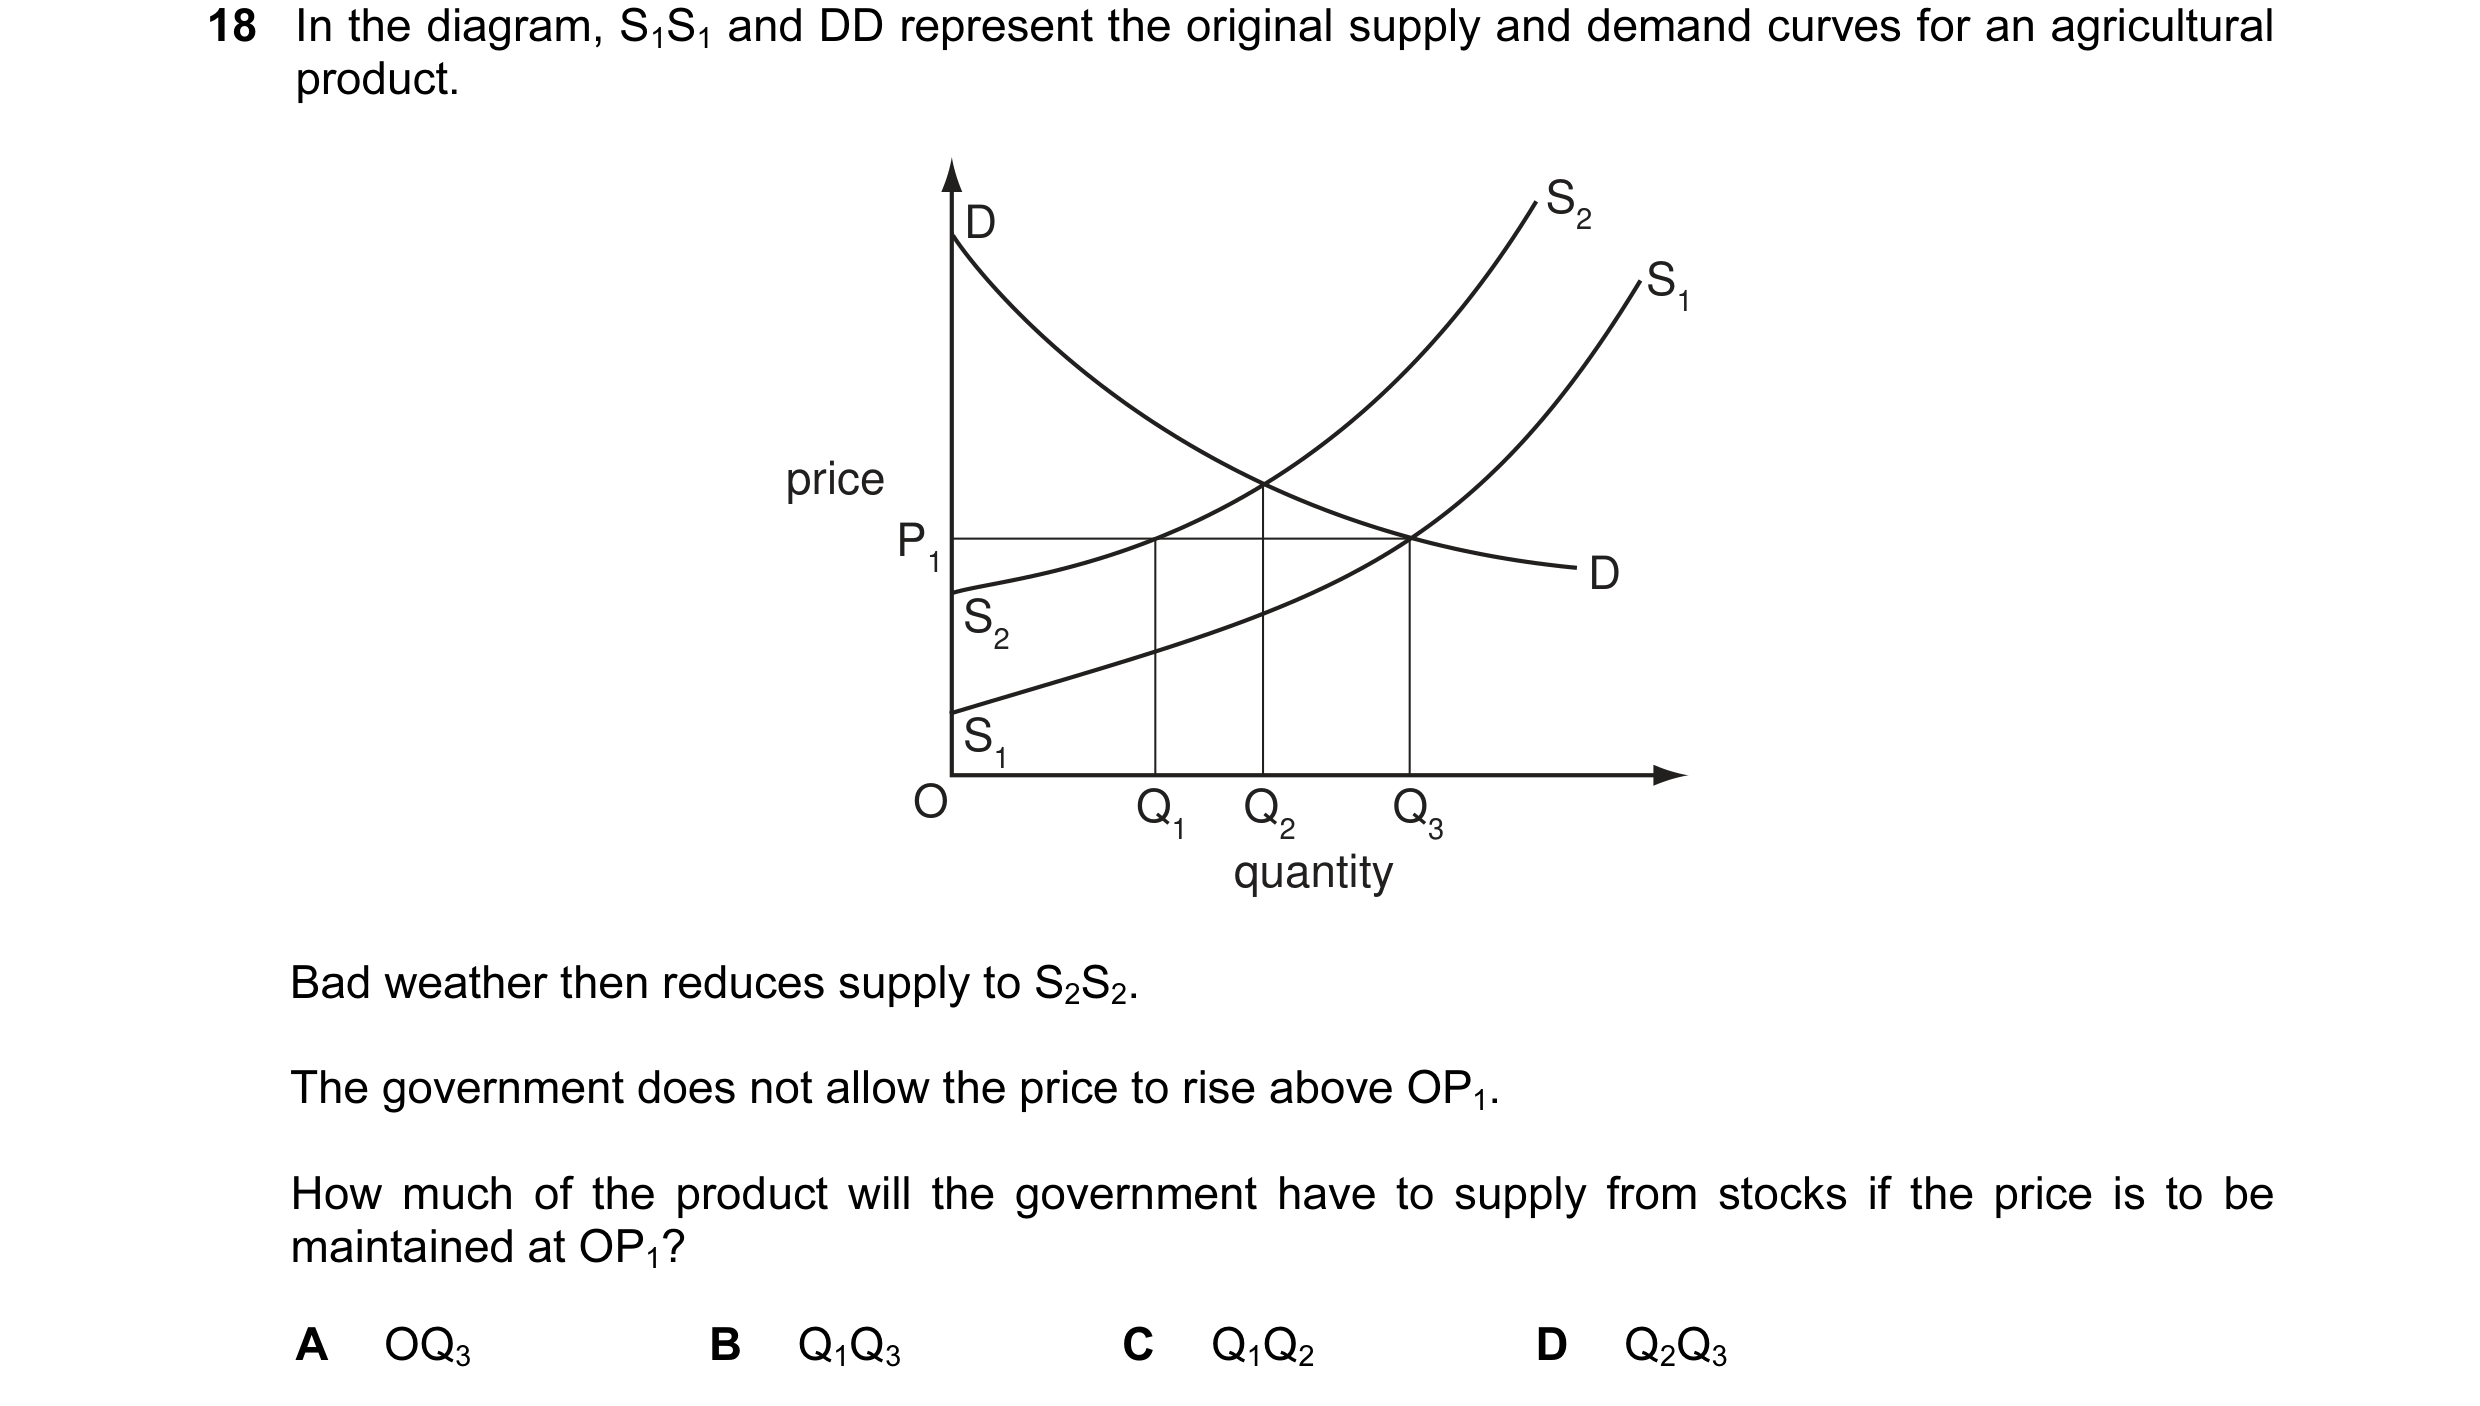
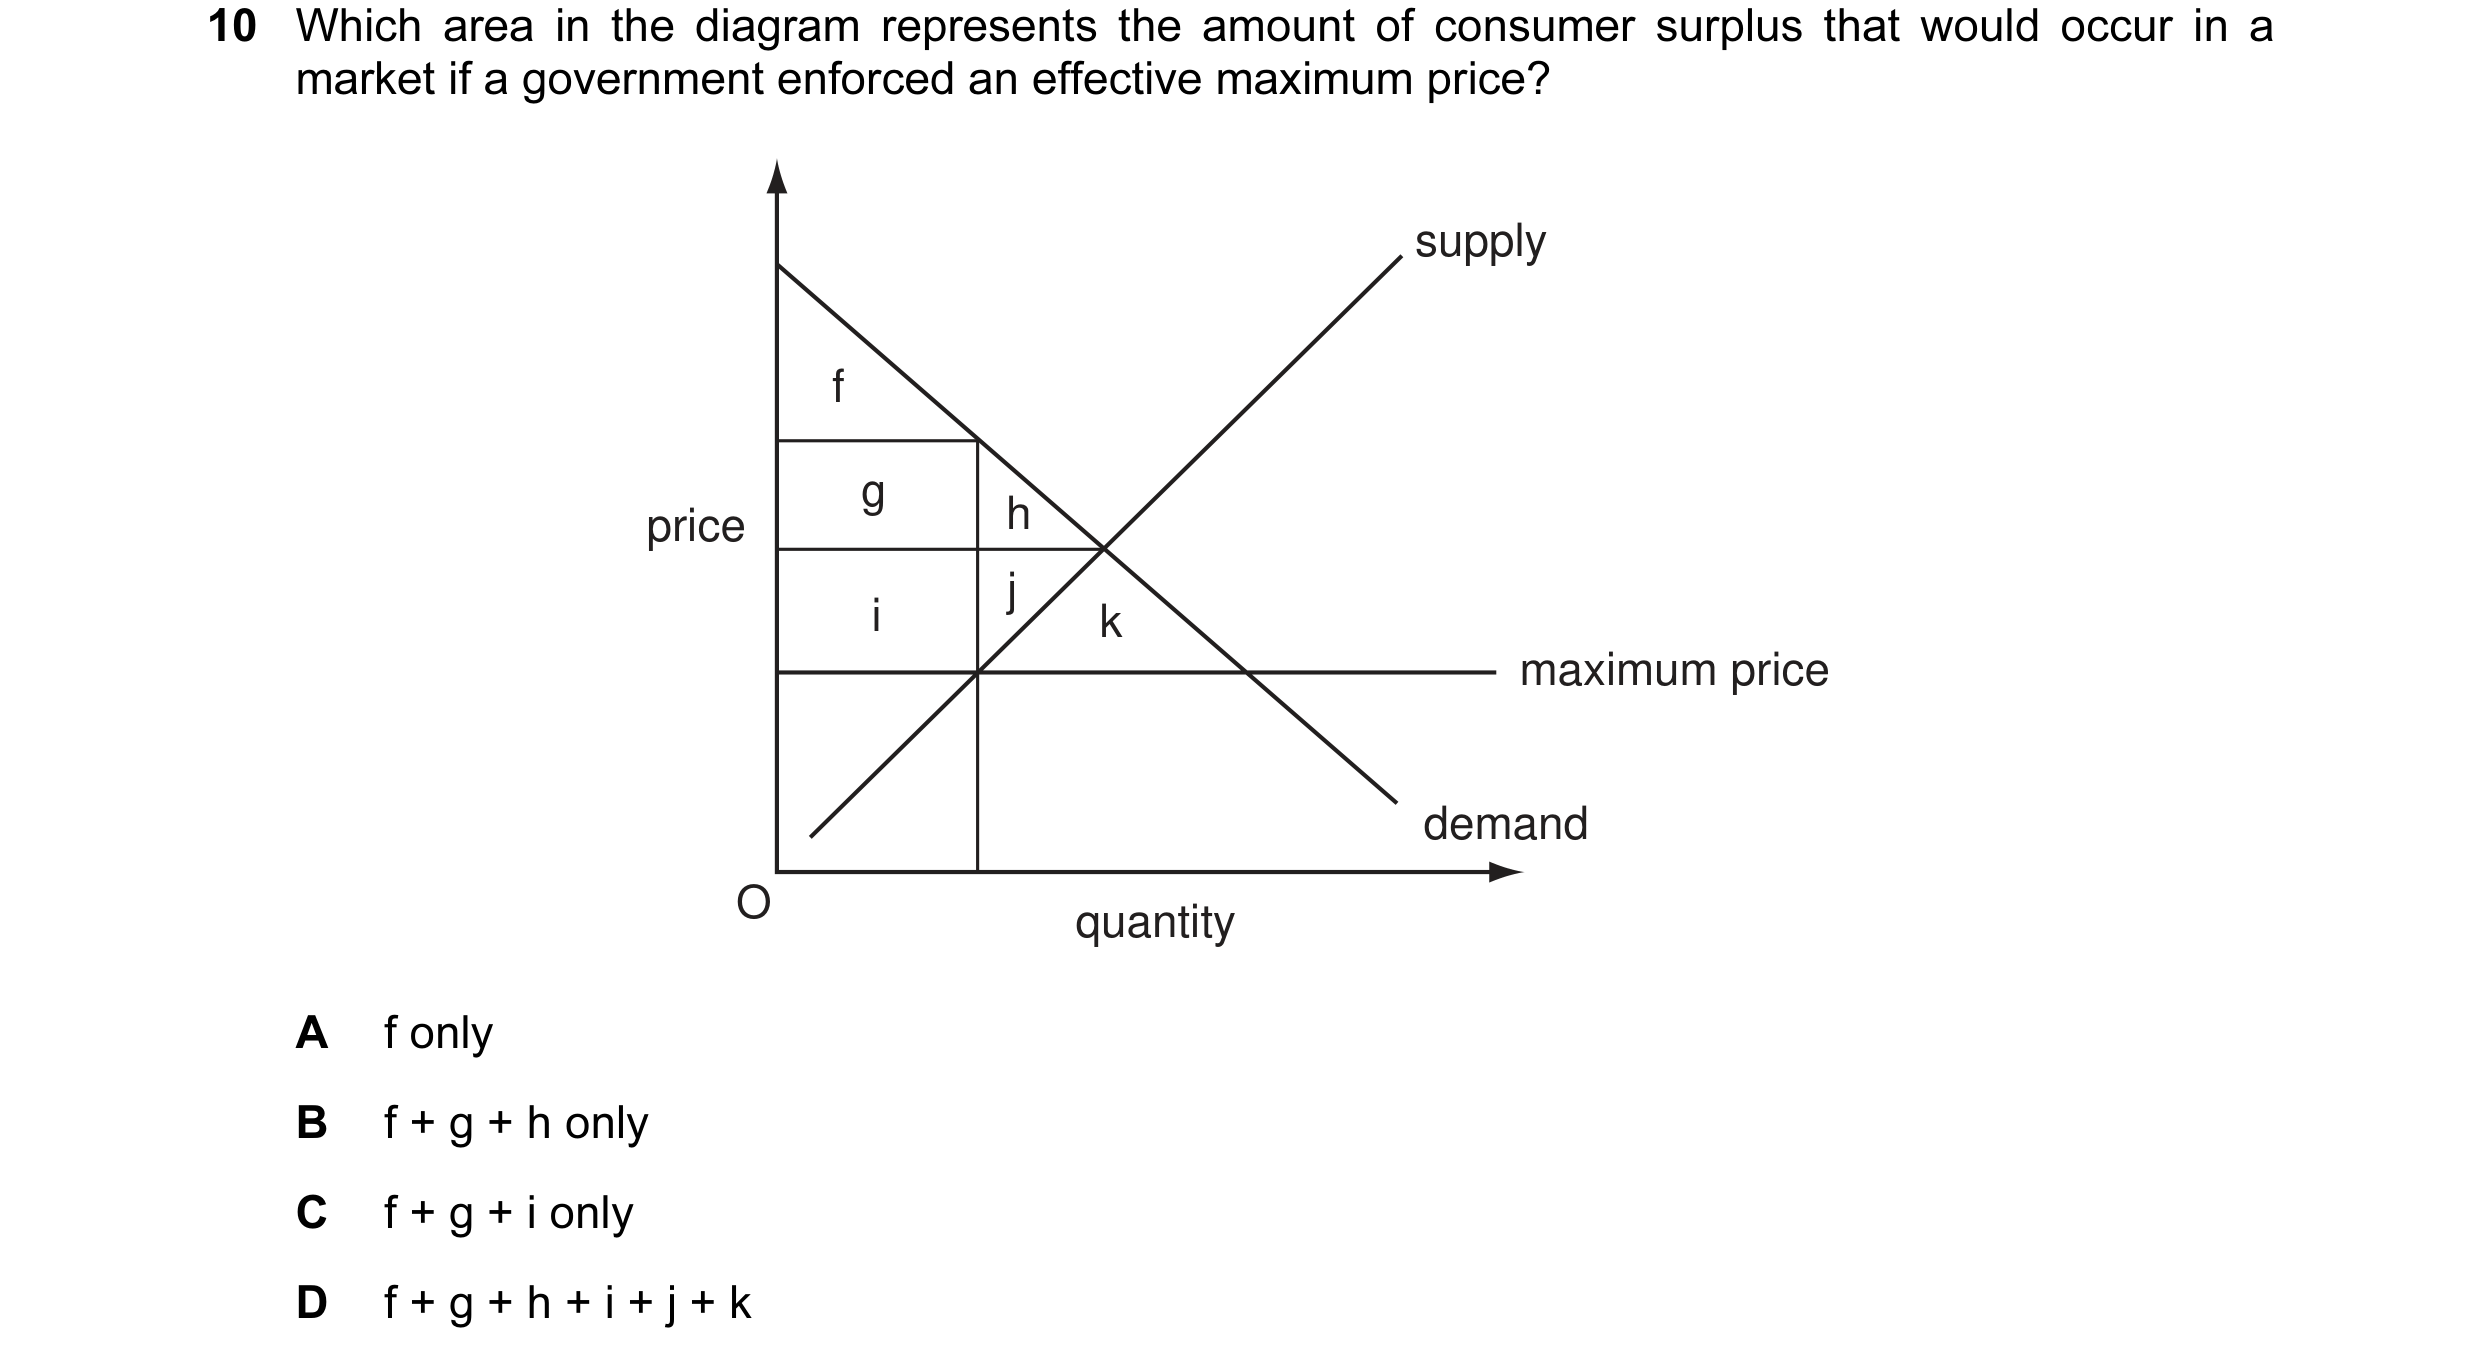 16 / 119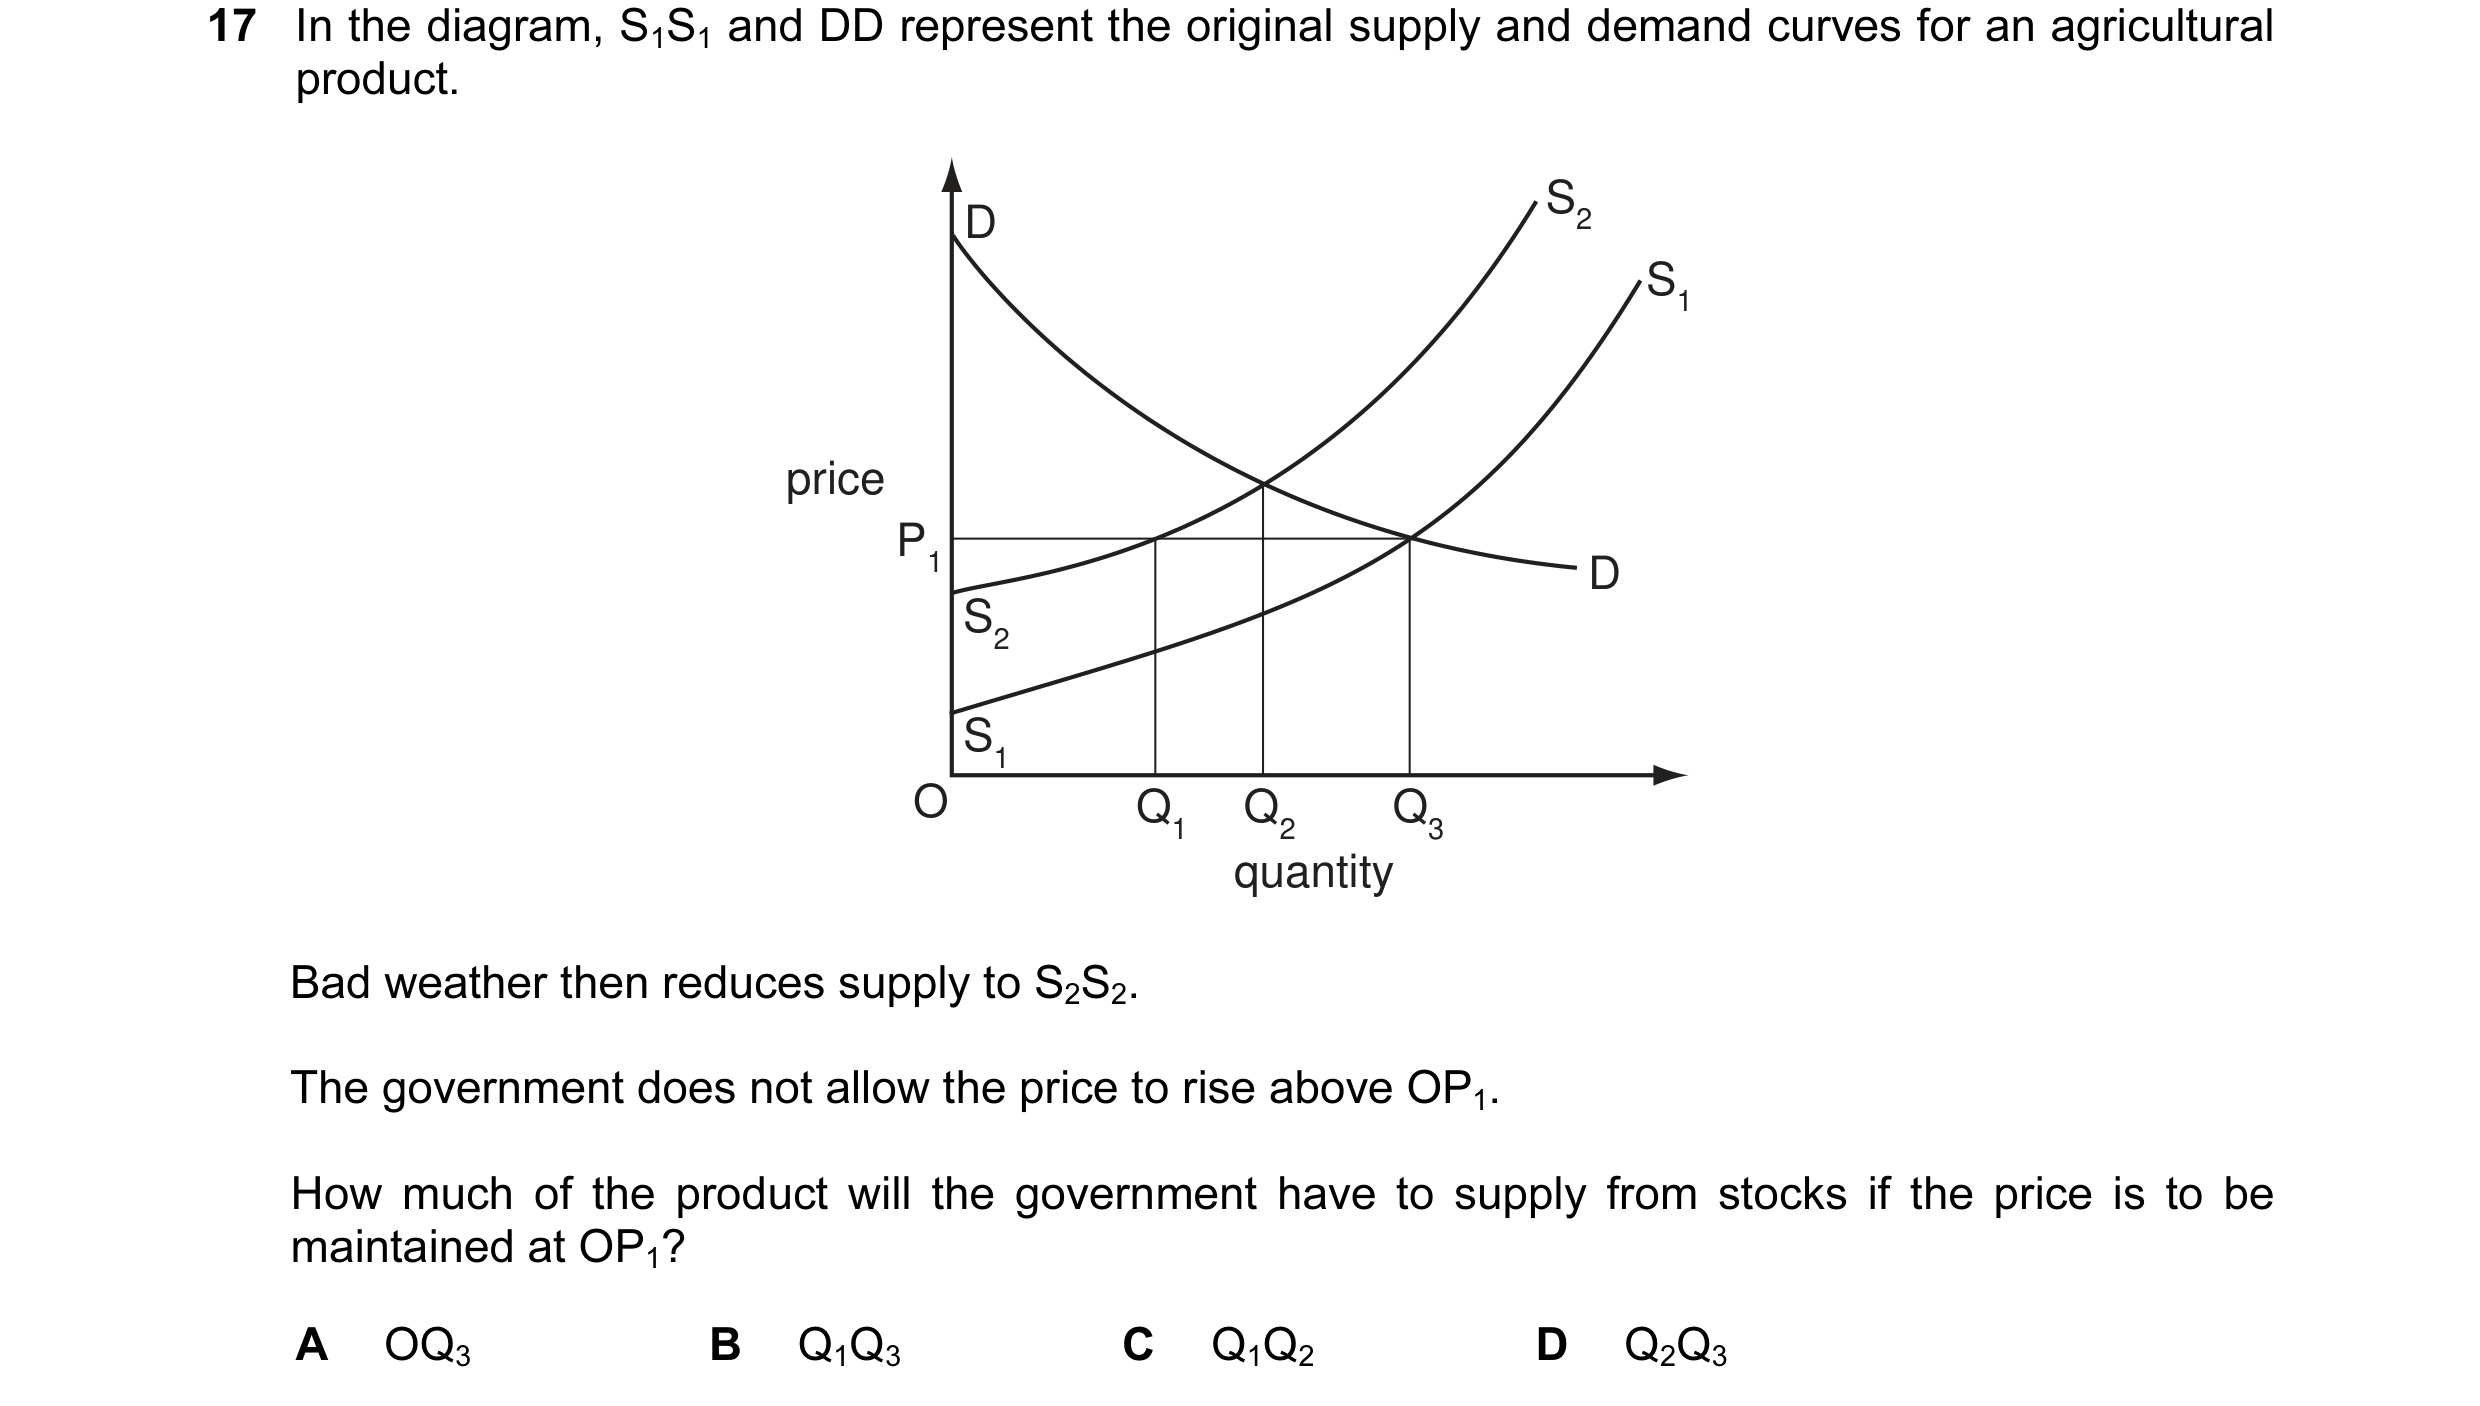
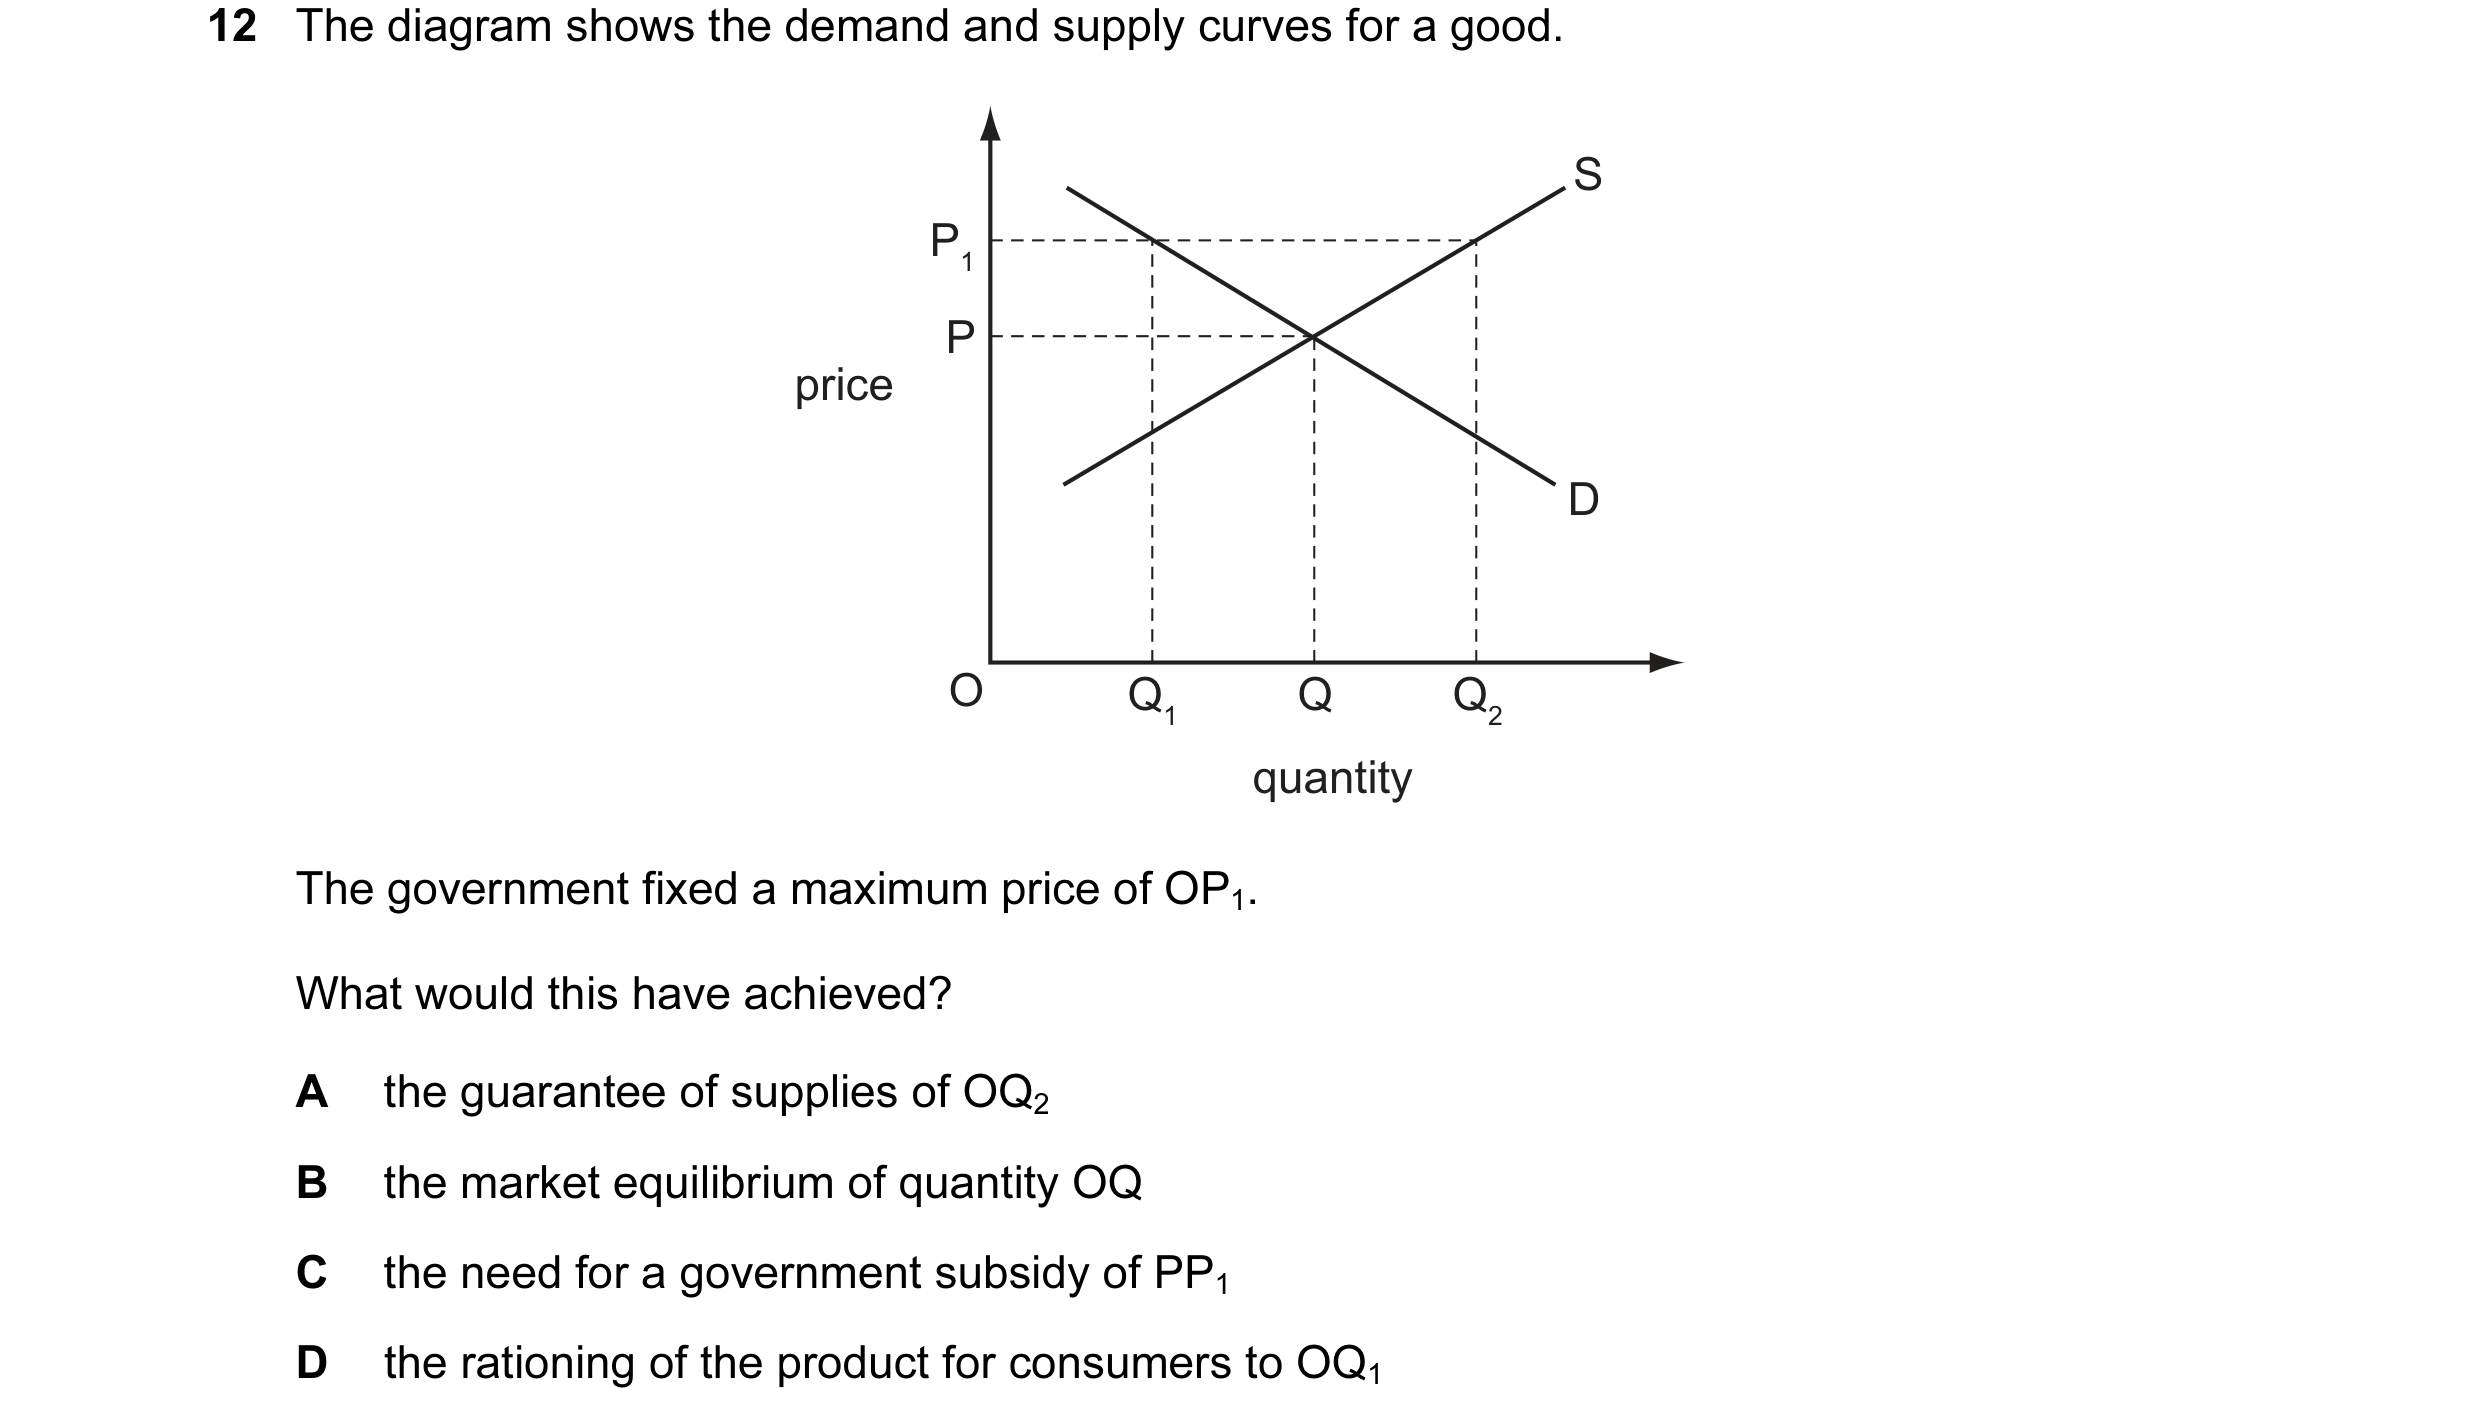 17 / 119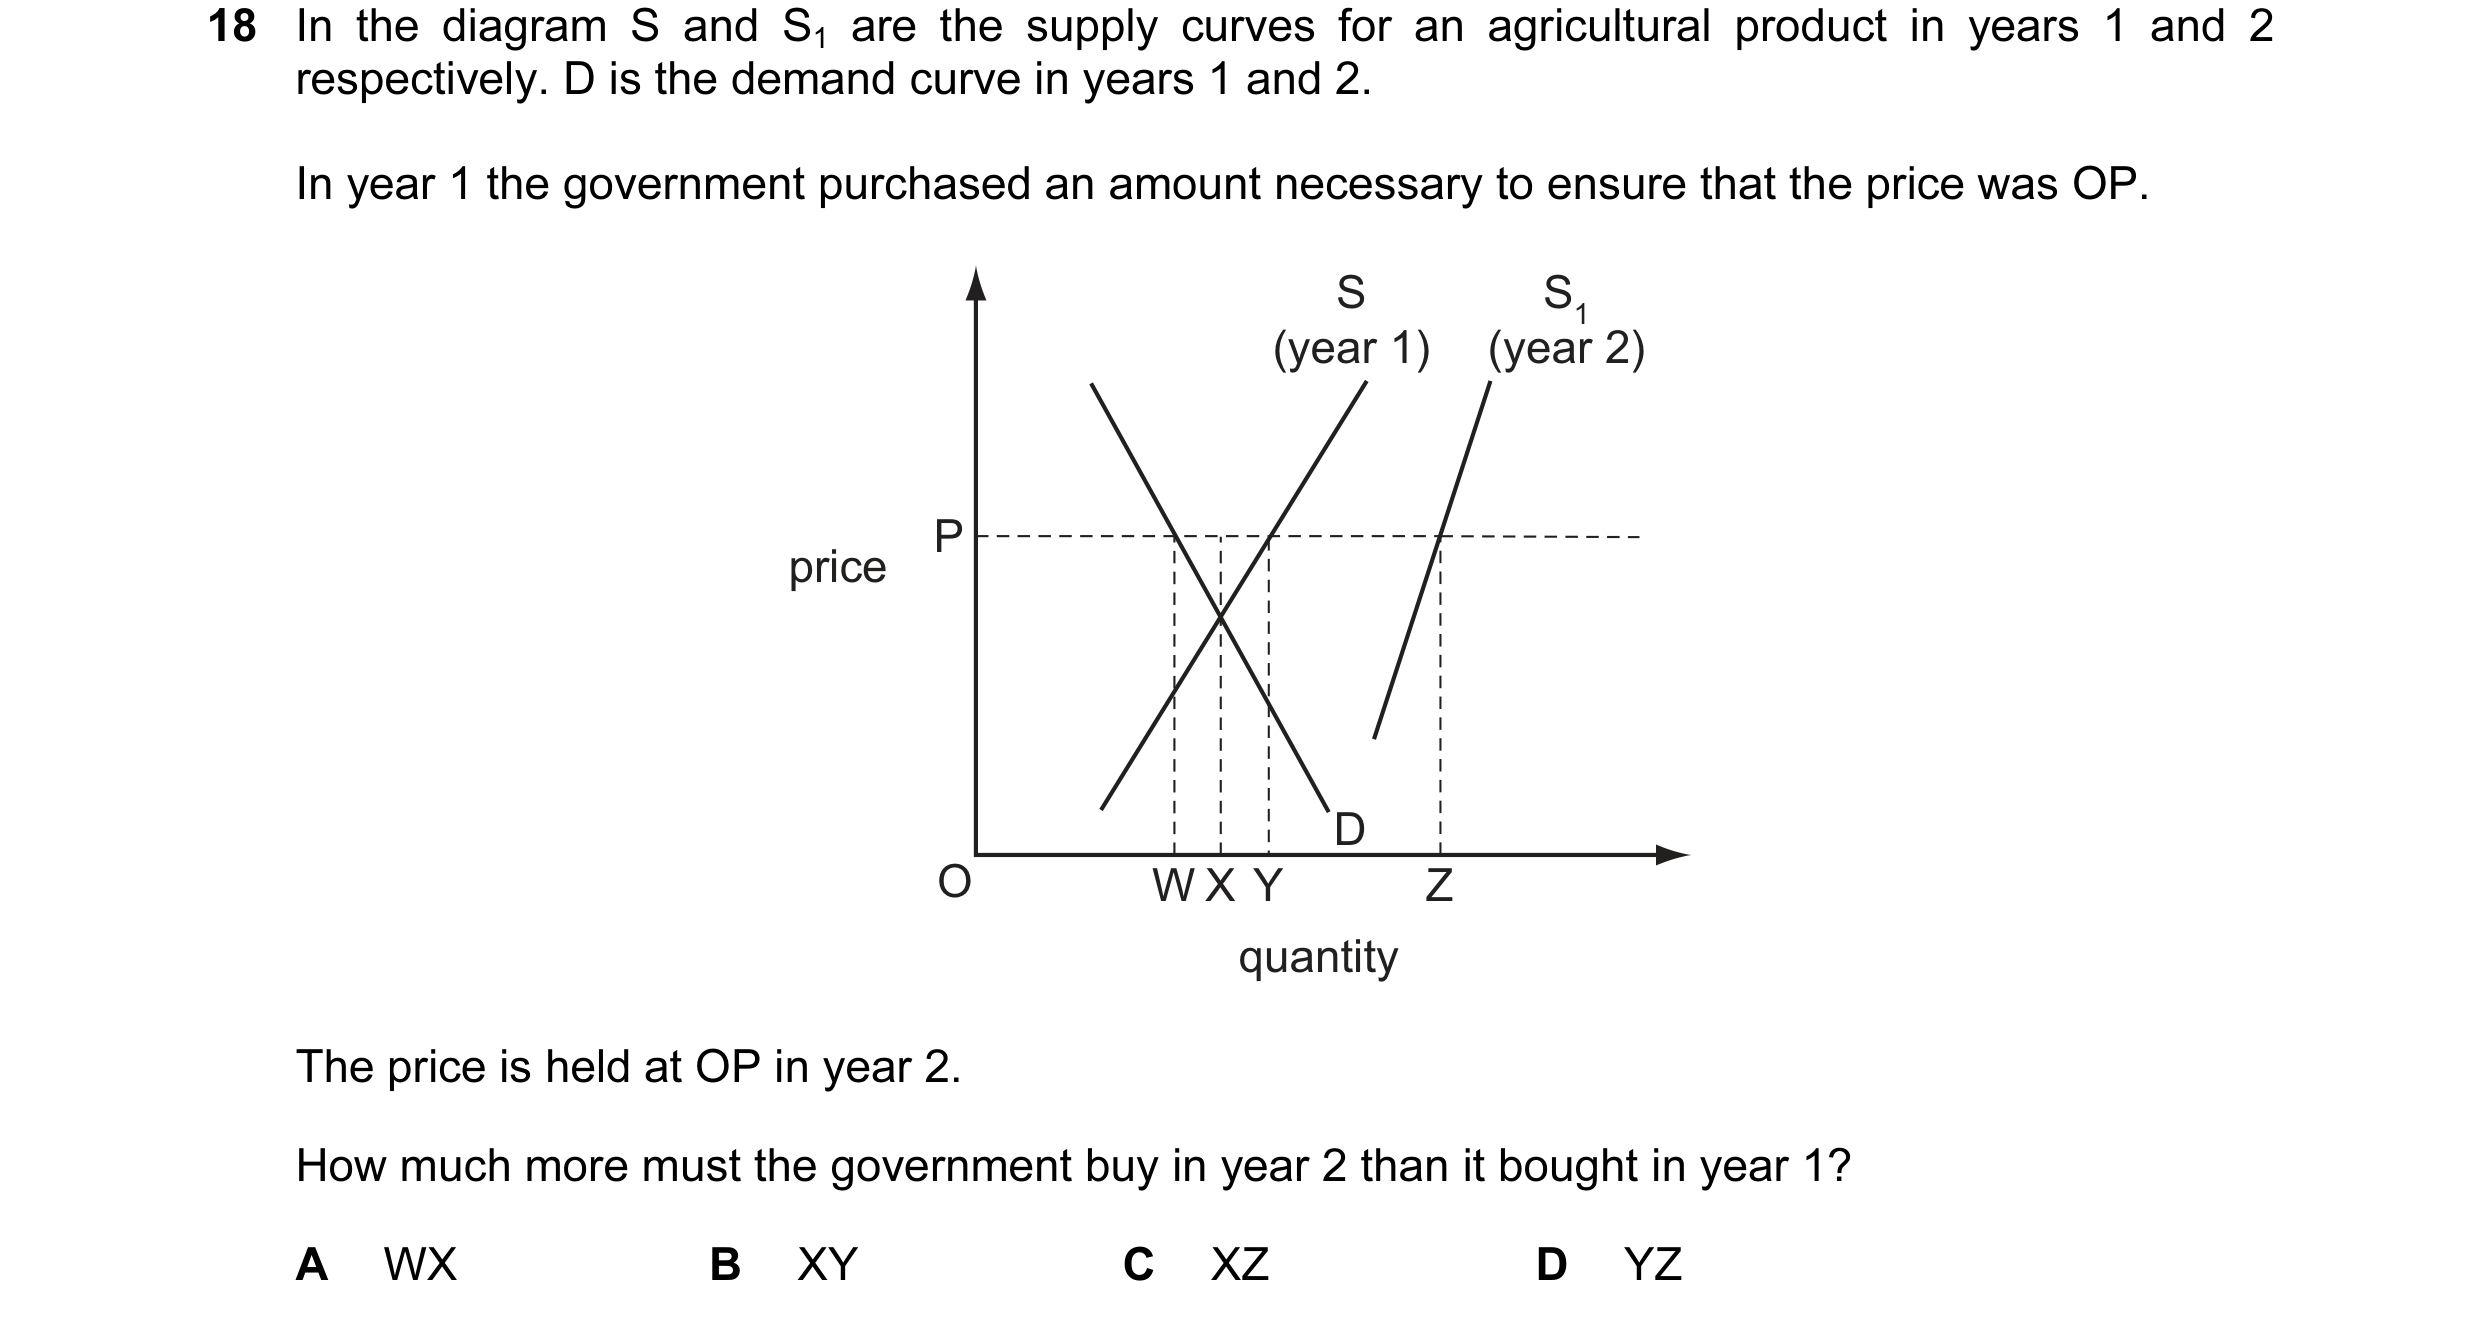
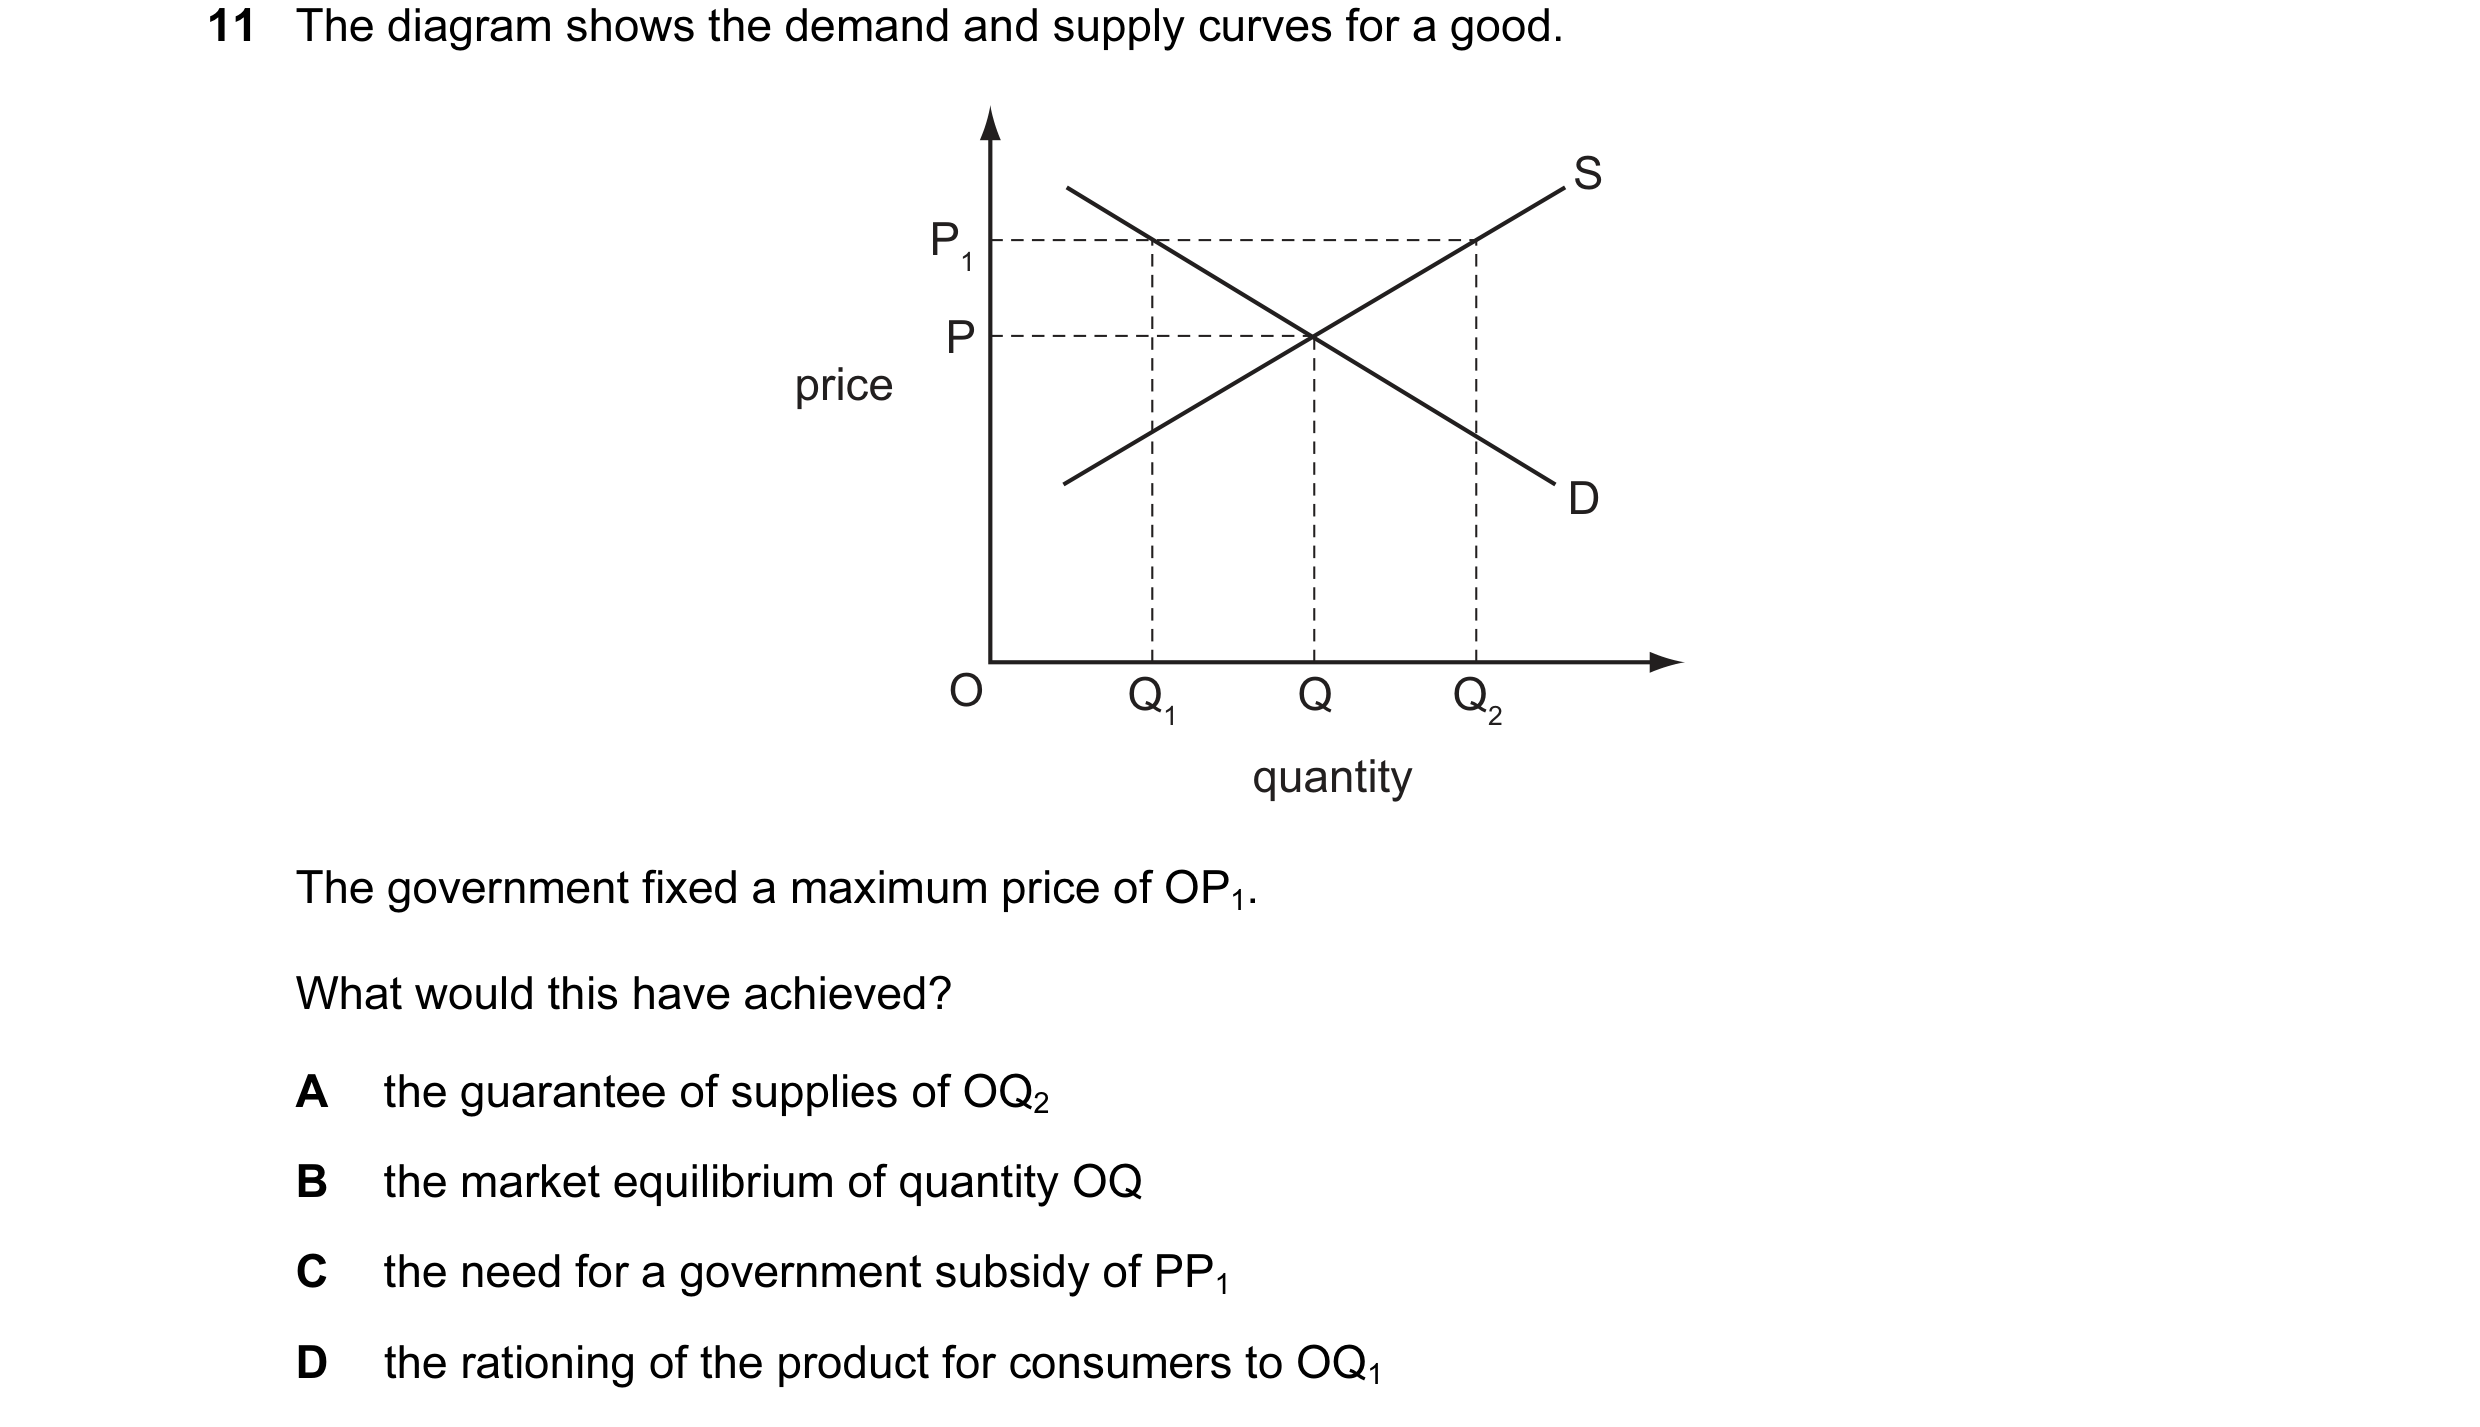 18 / 119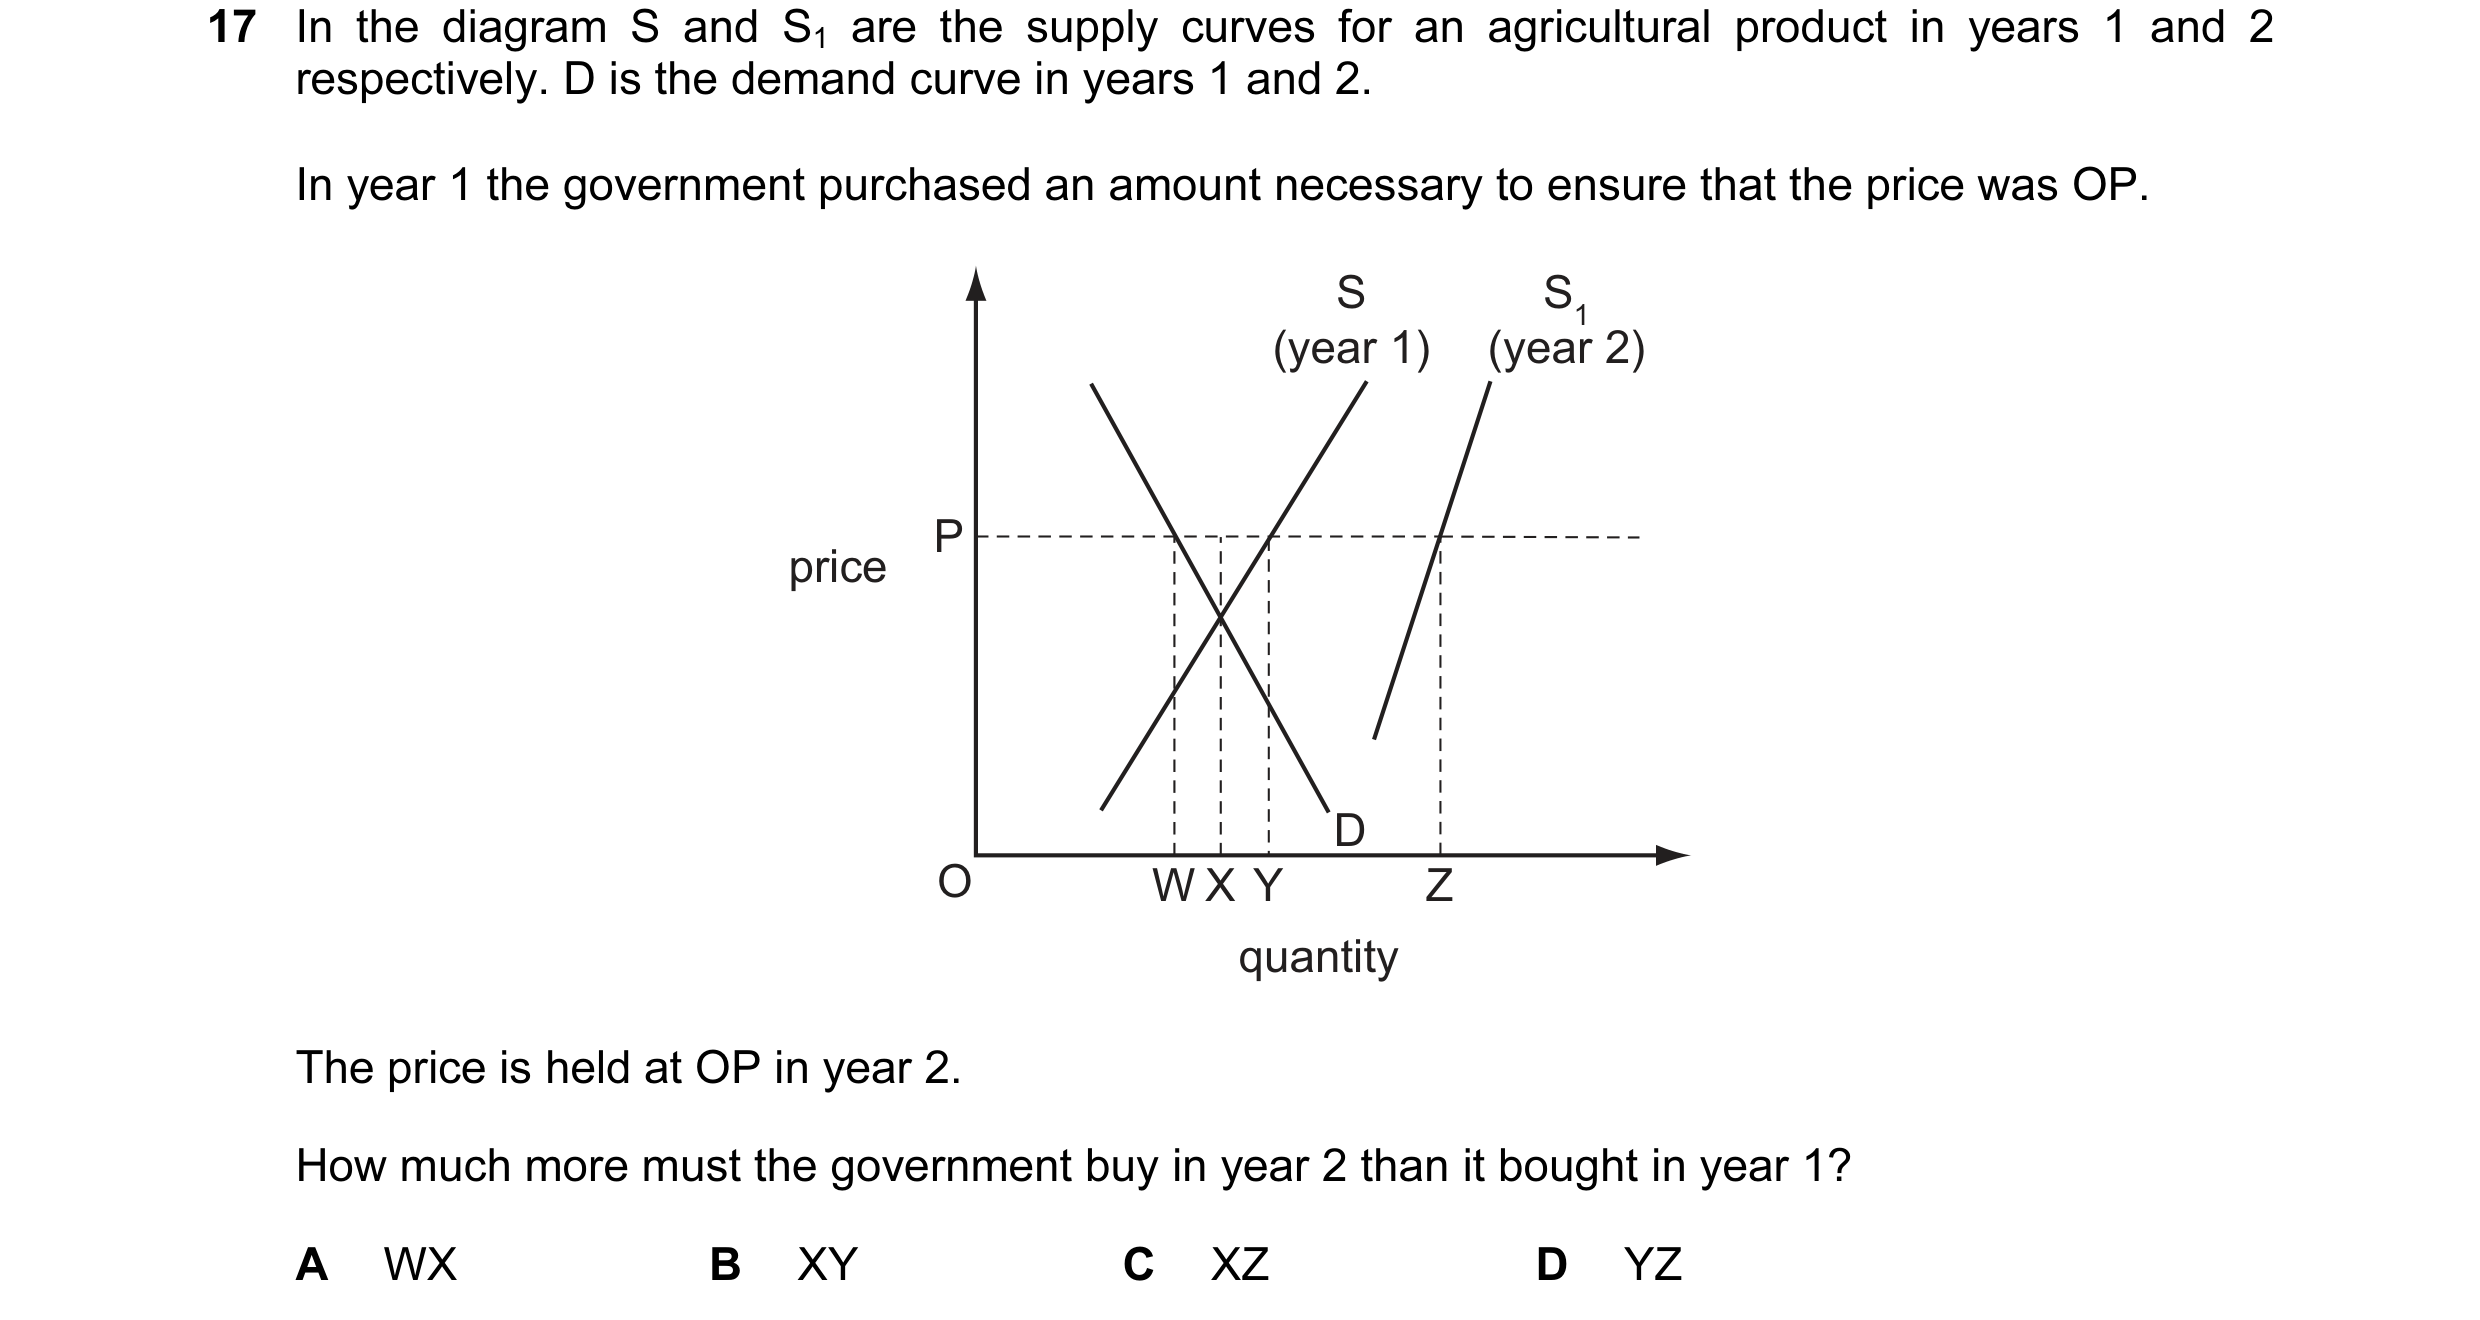
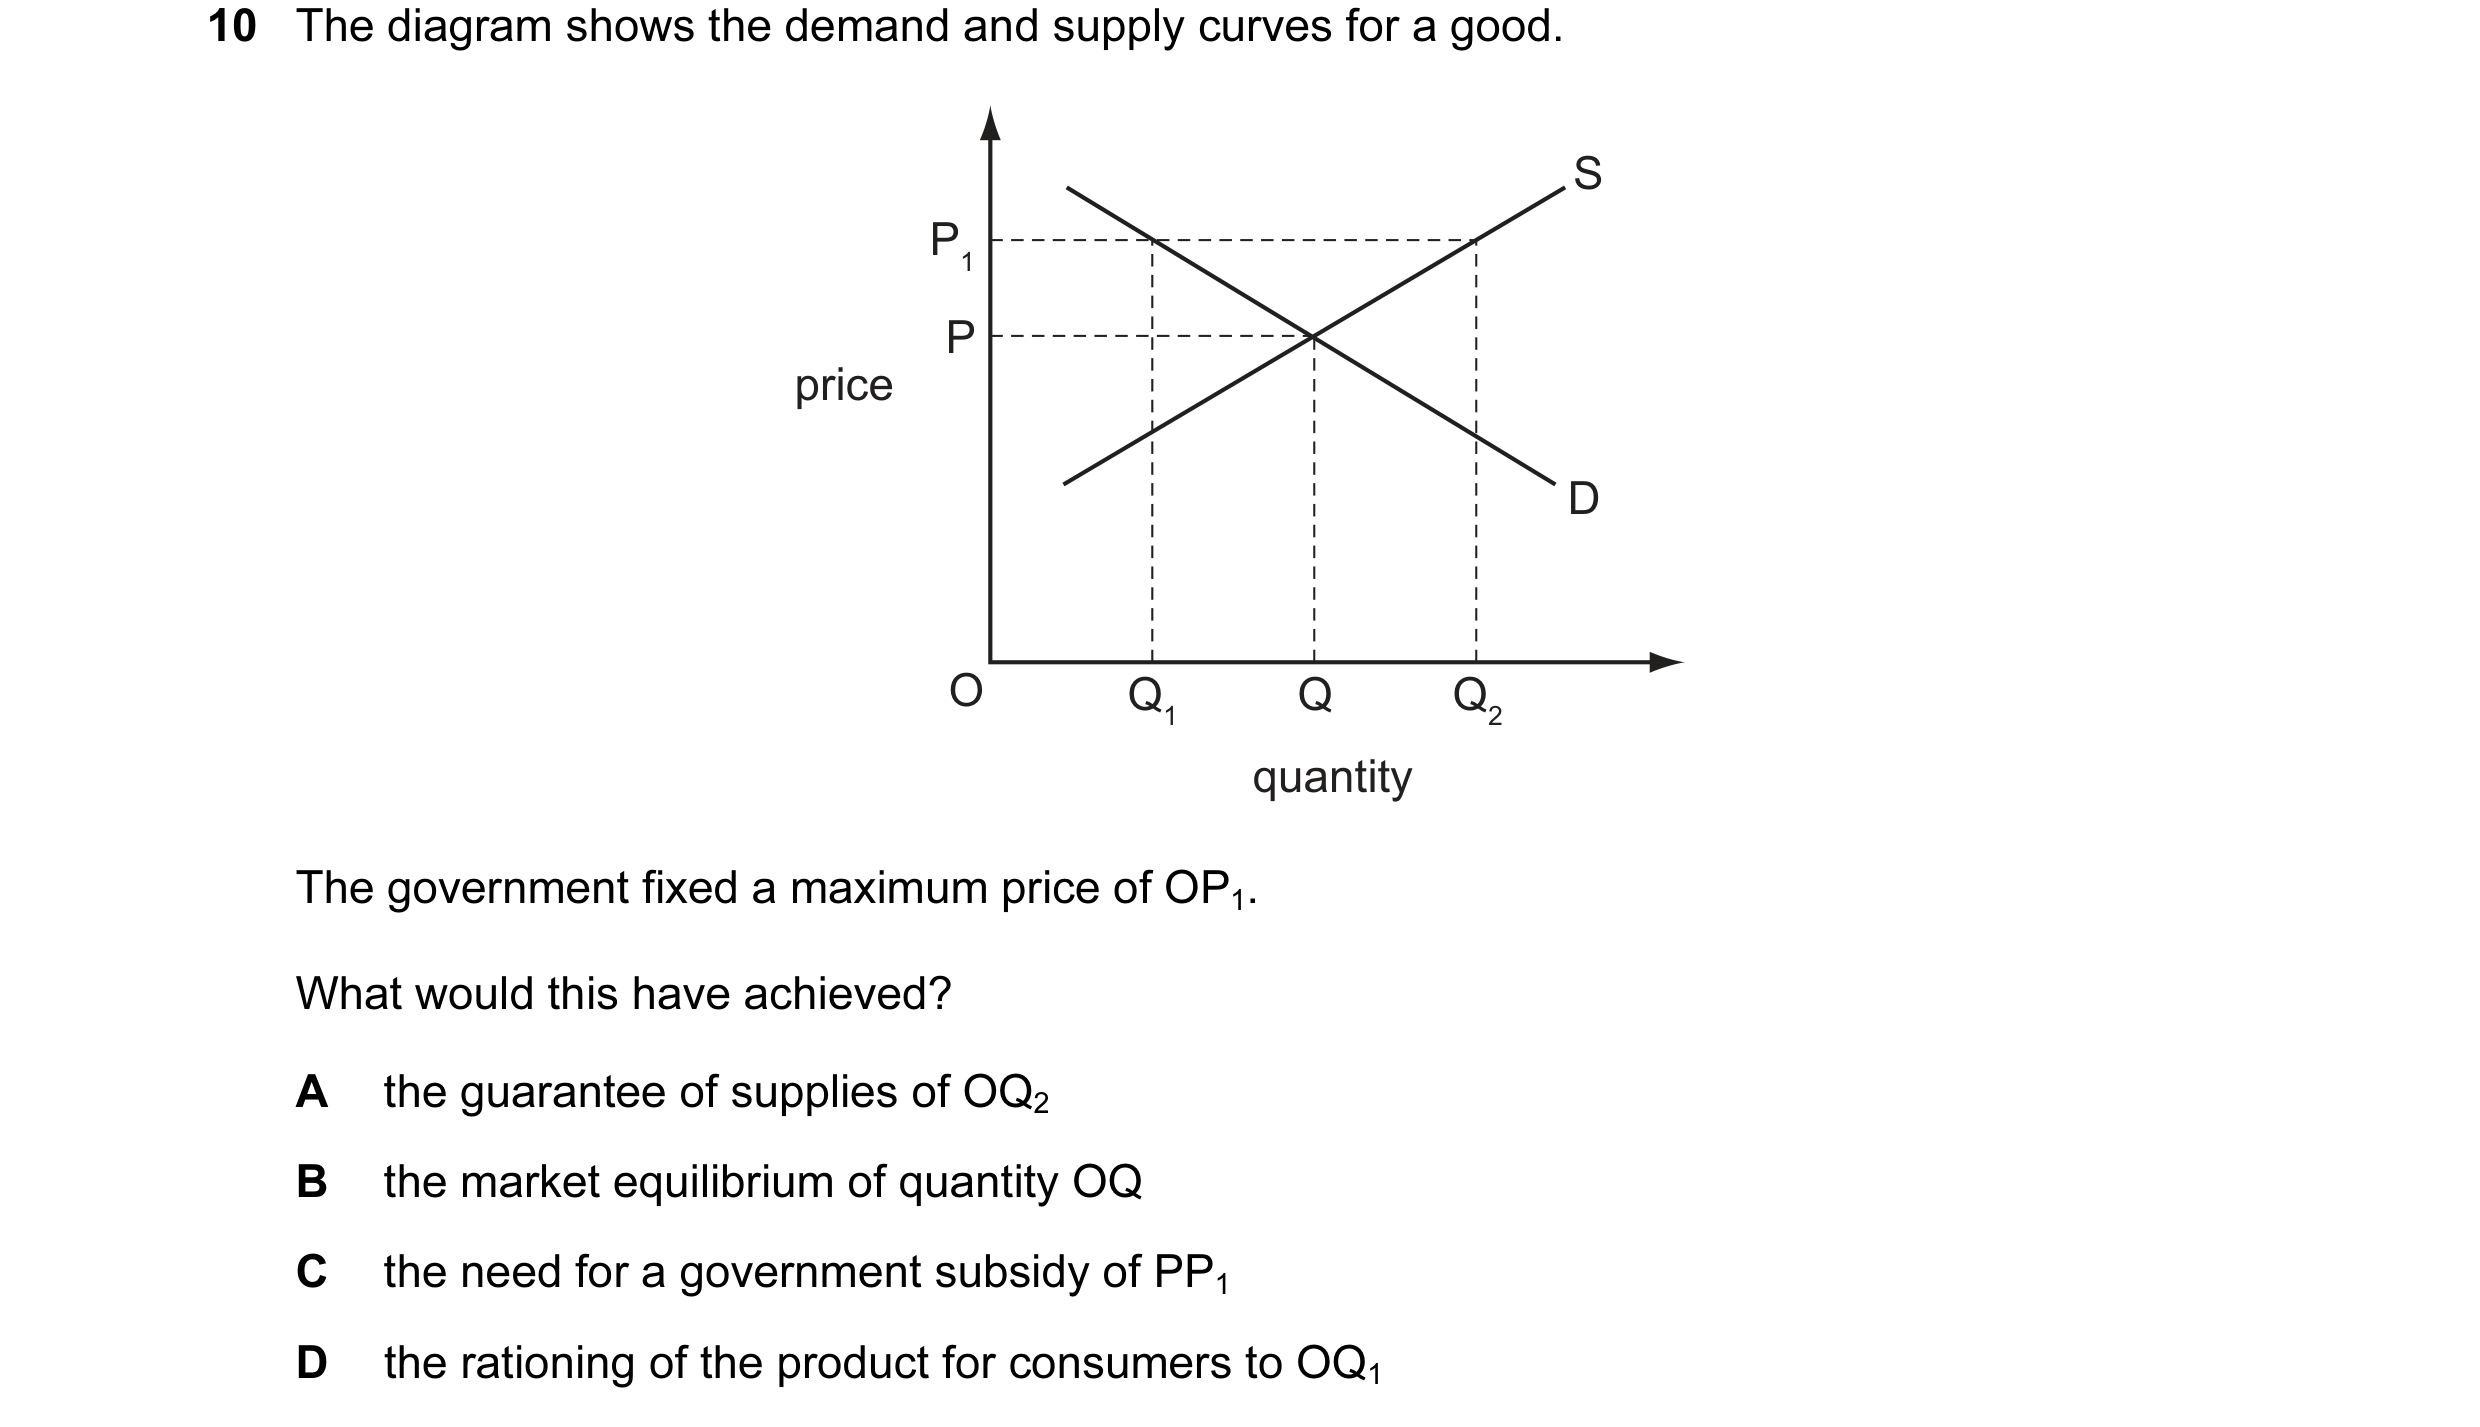 19 / 119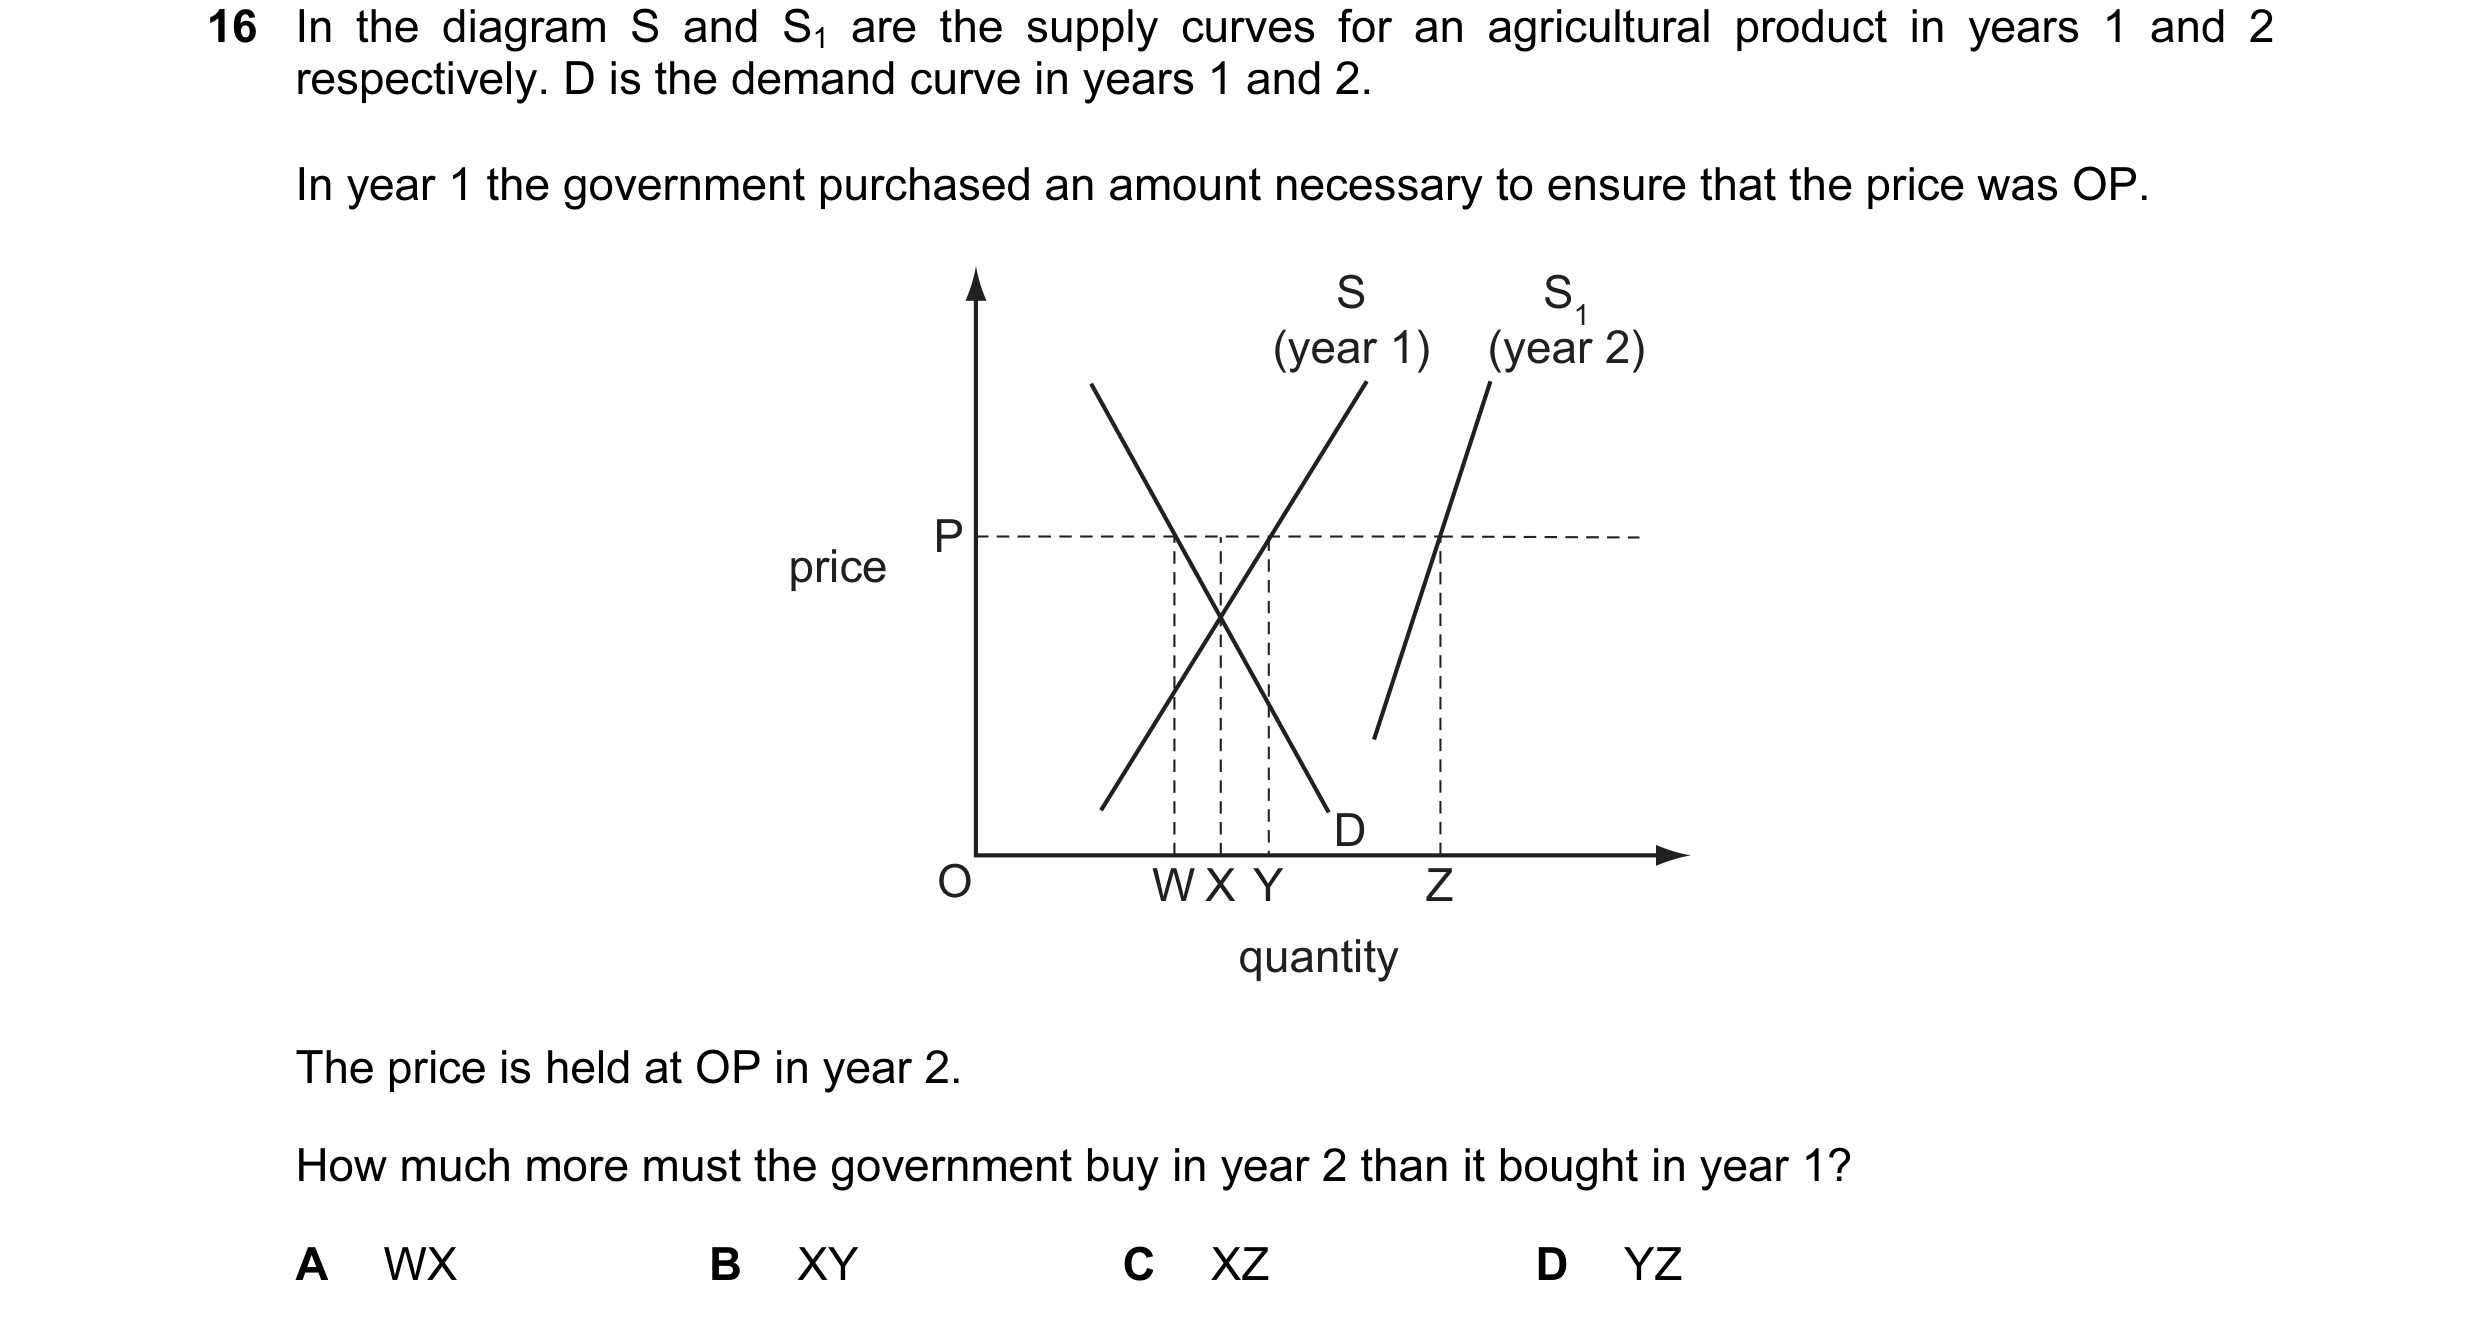
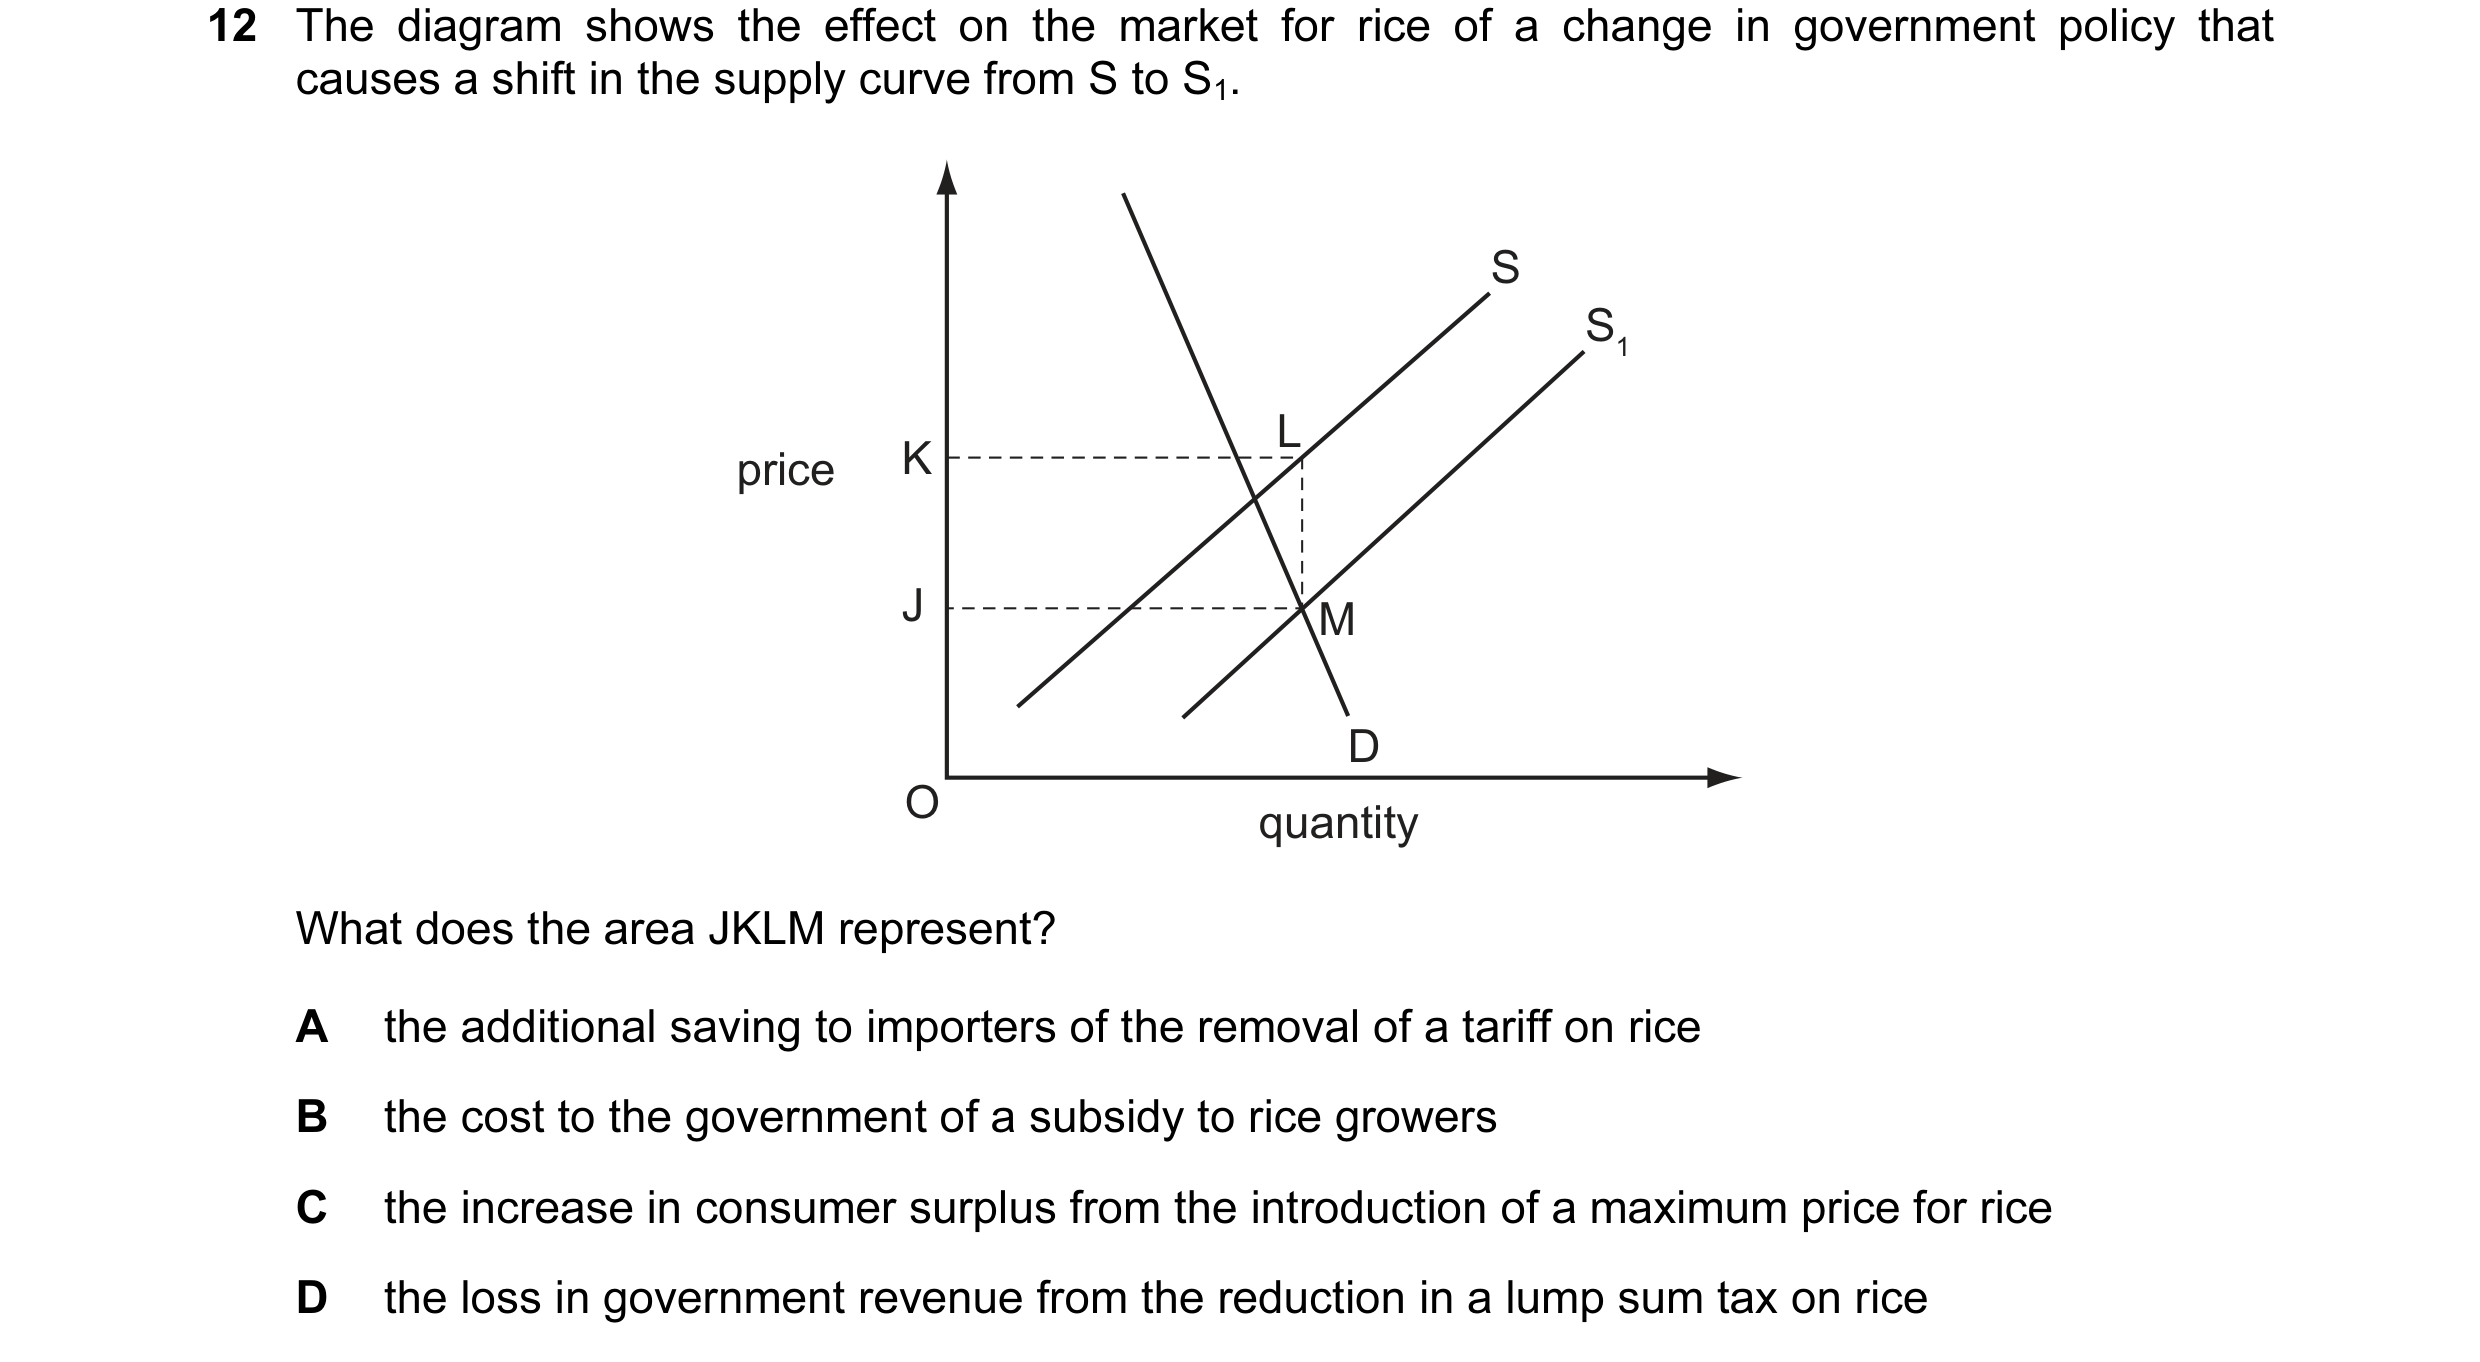
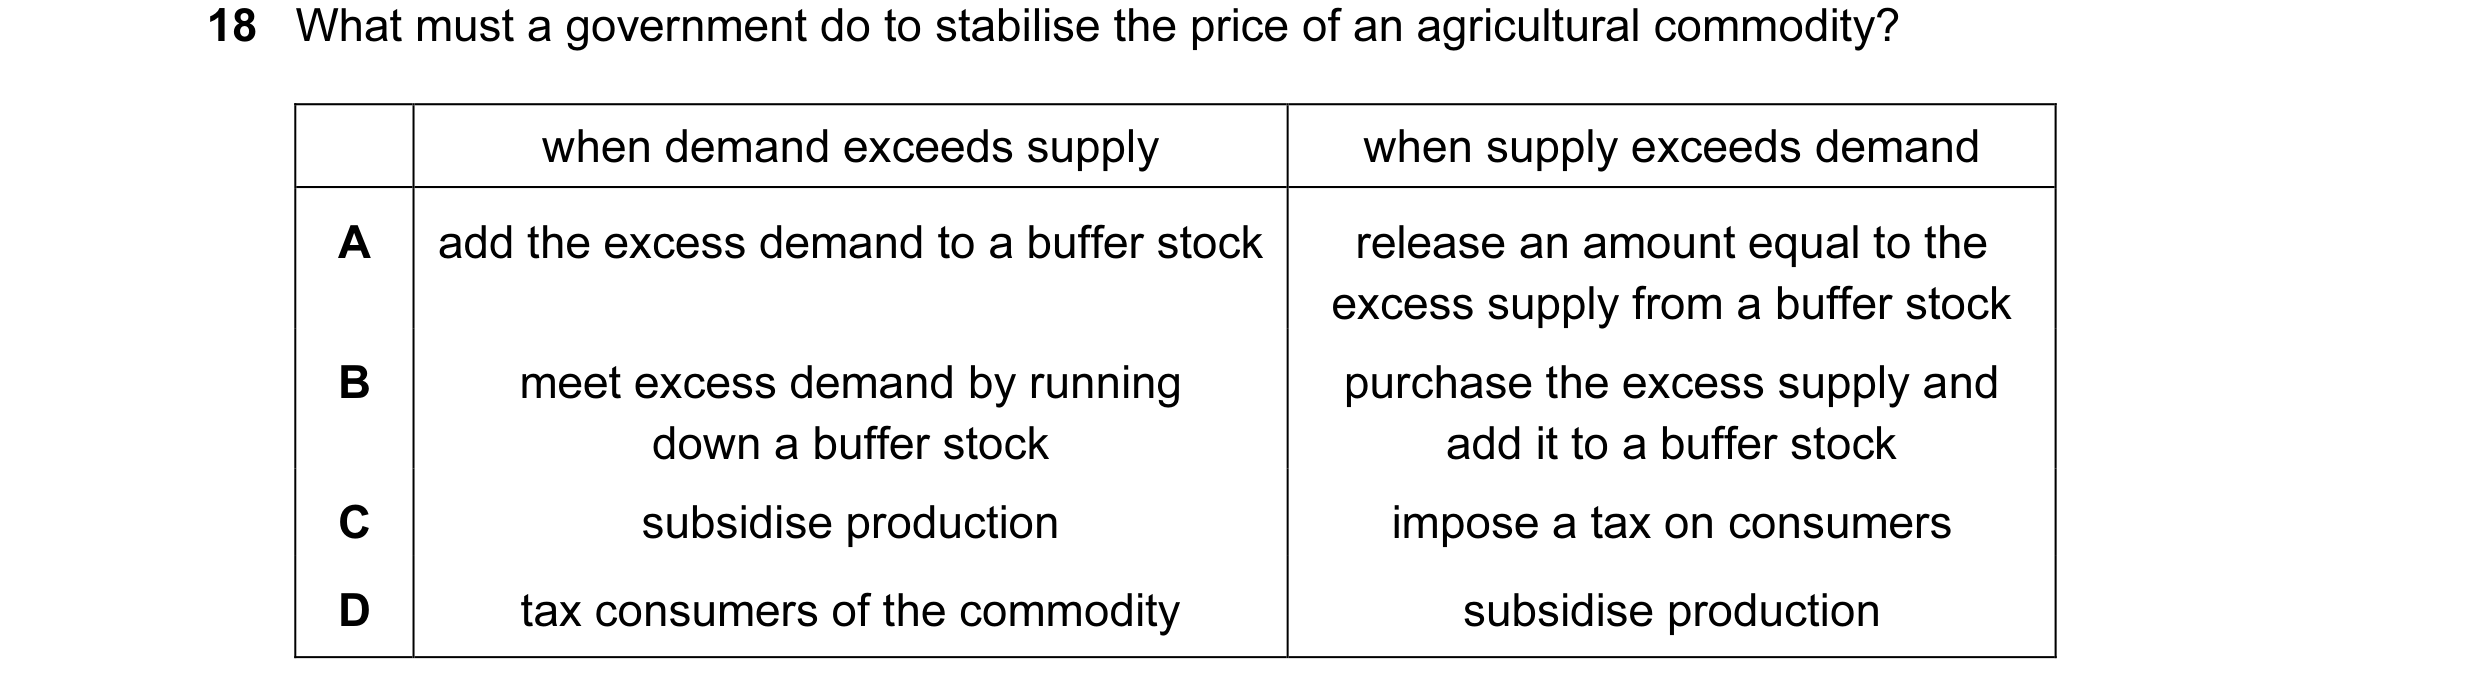 20 / 119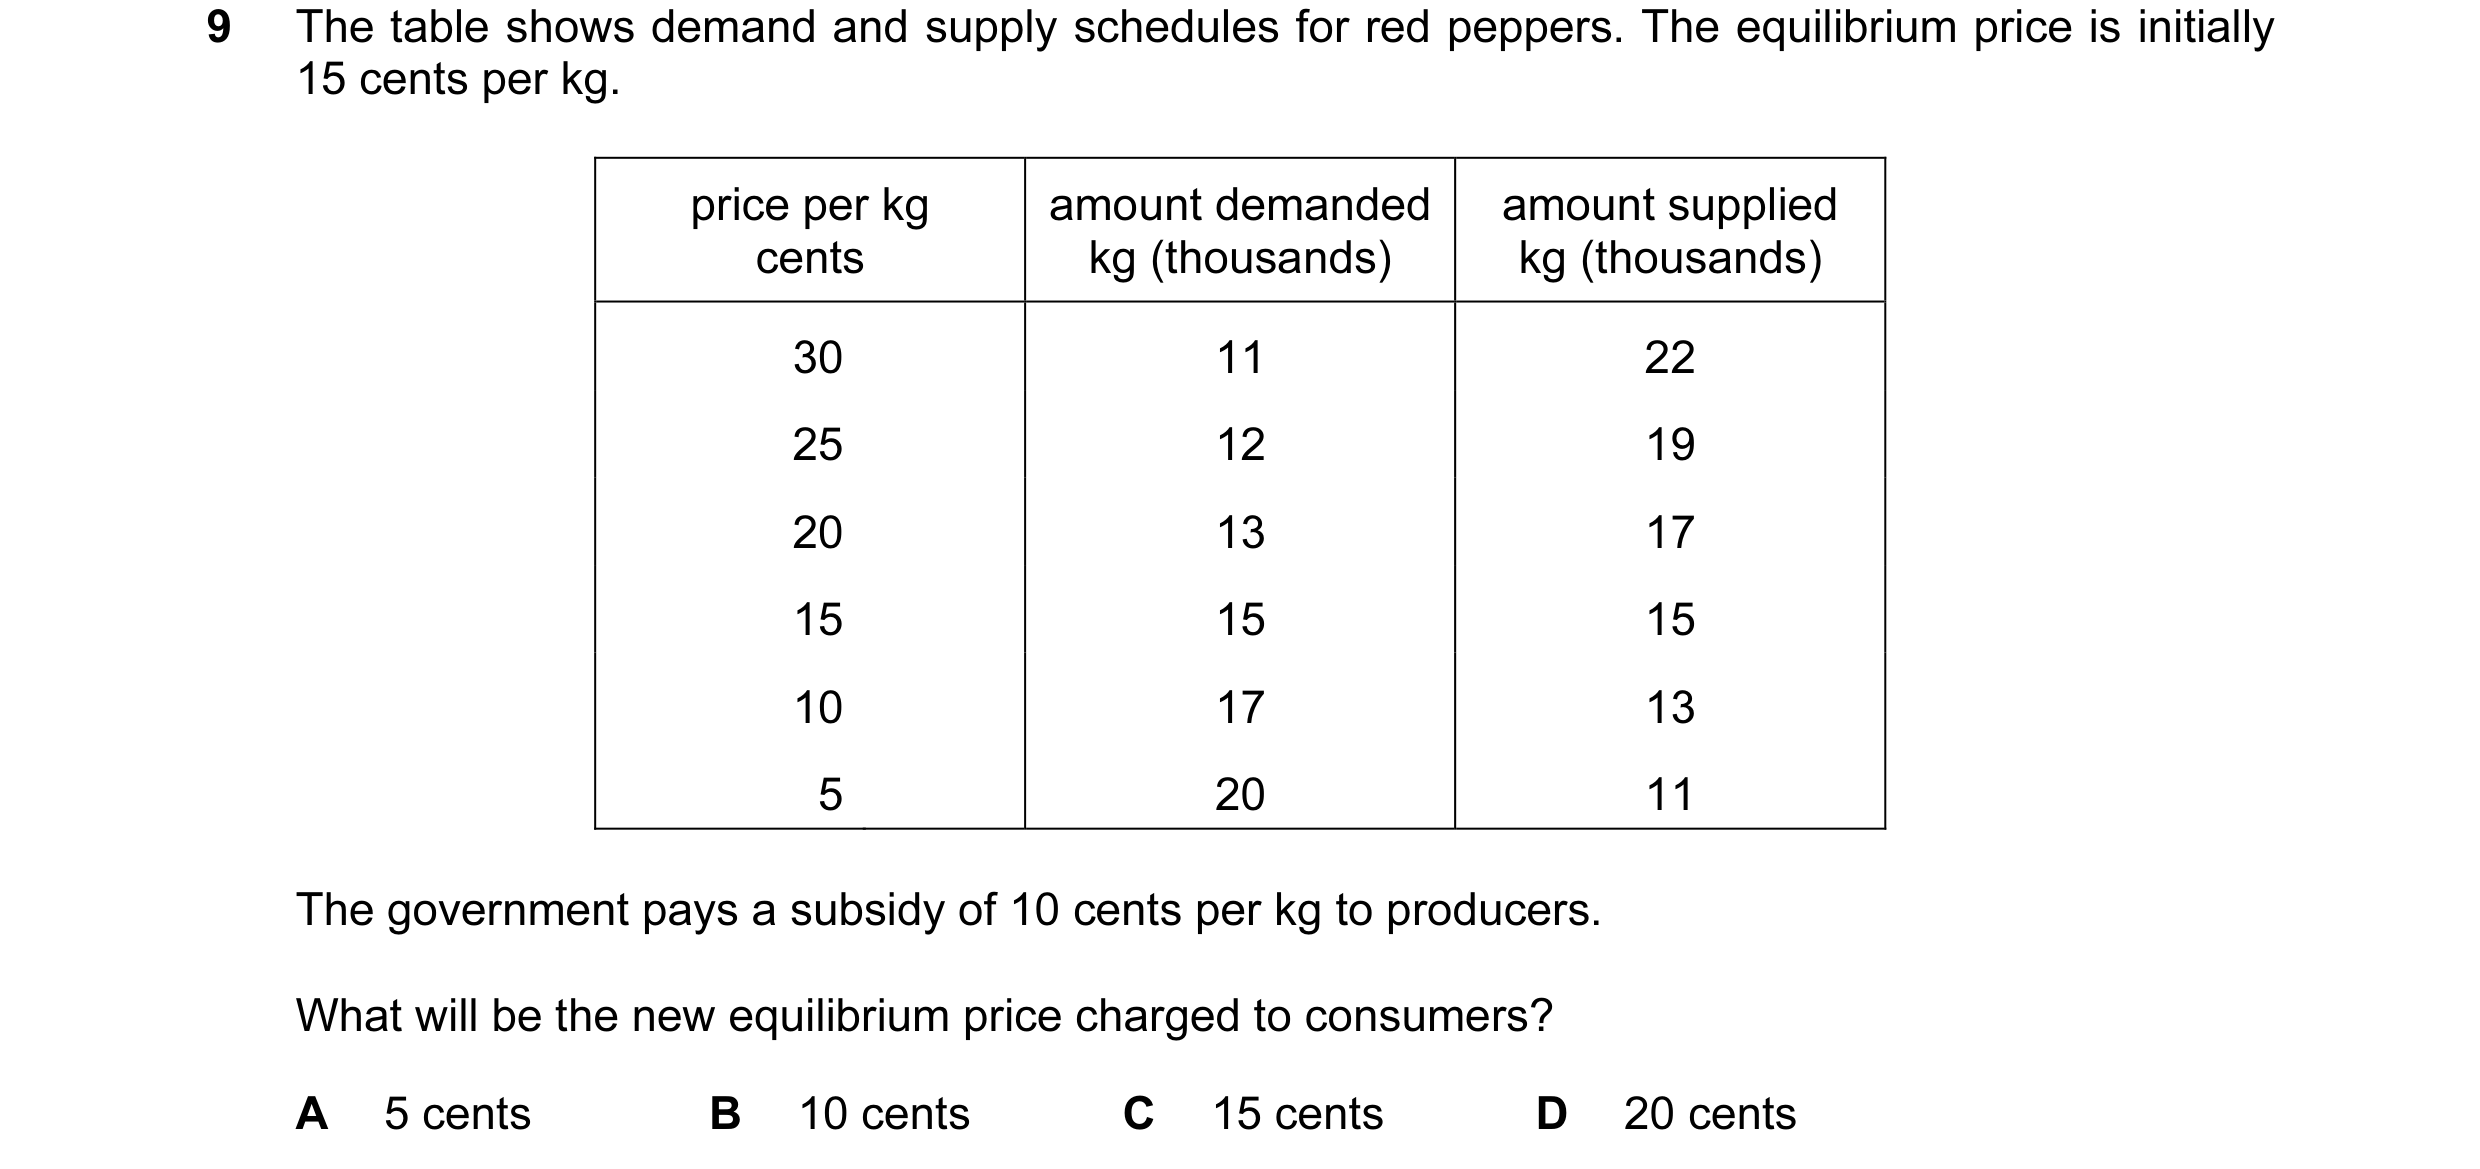
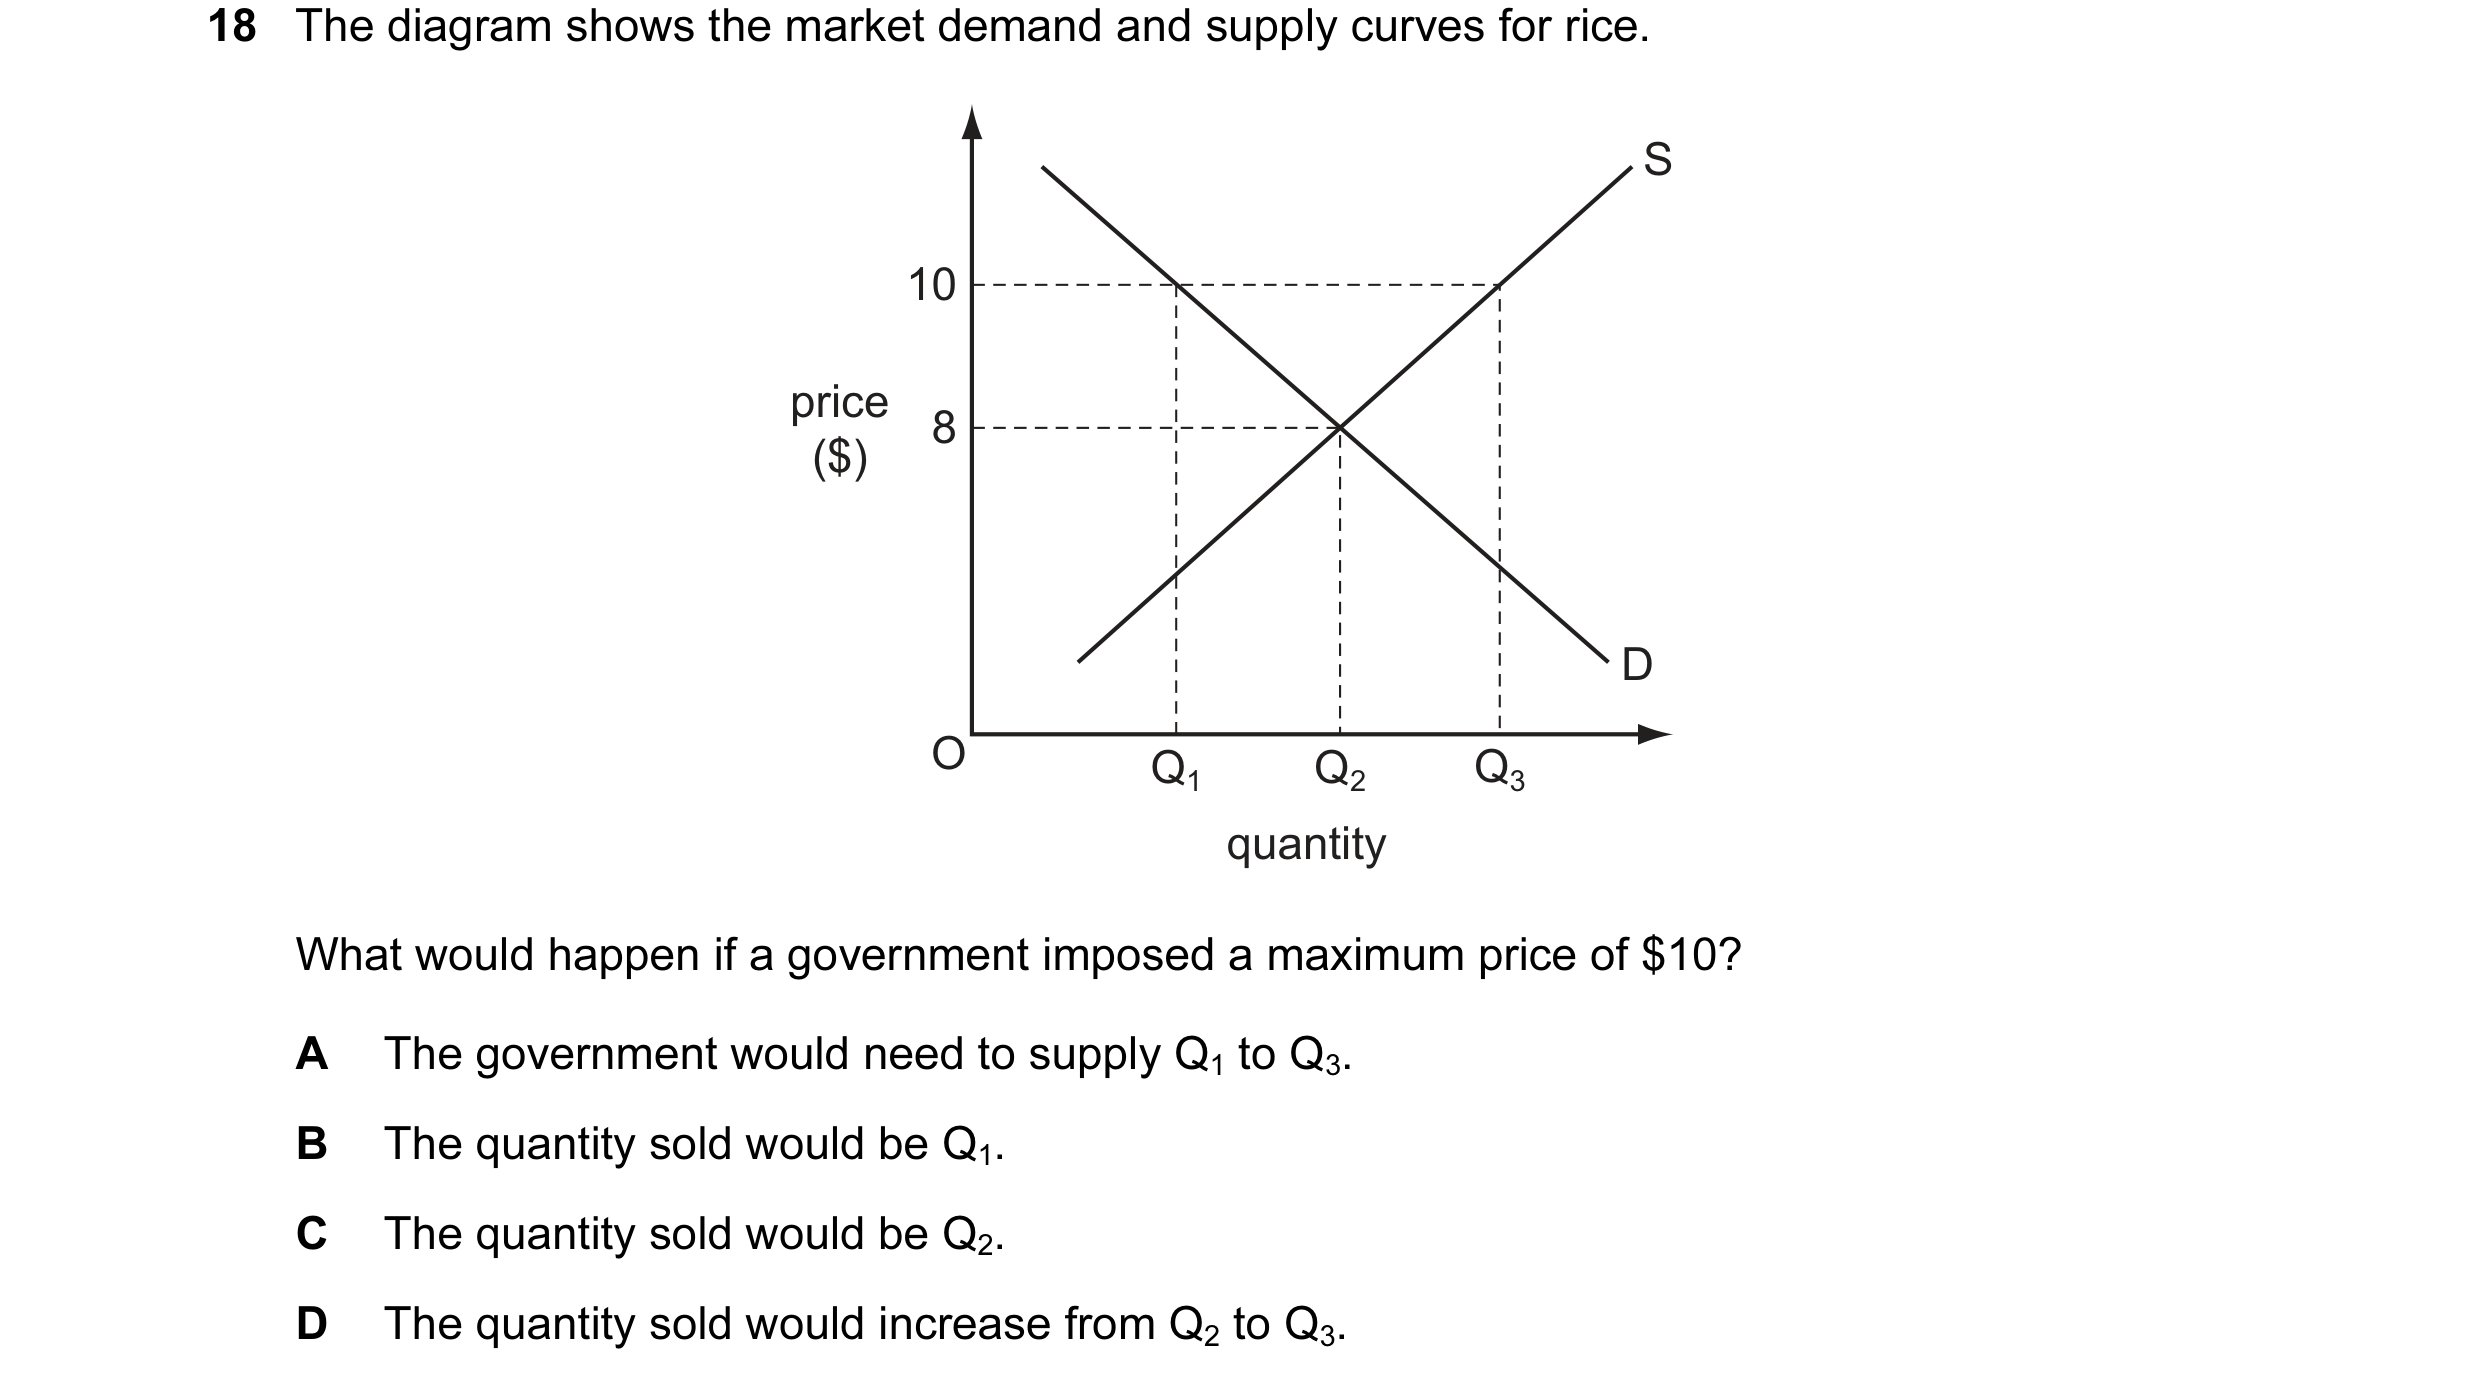 21 / 119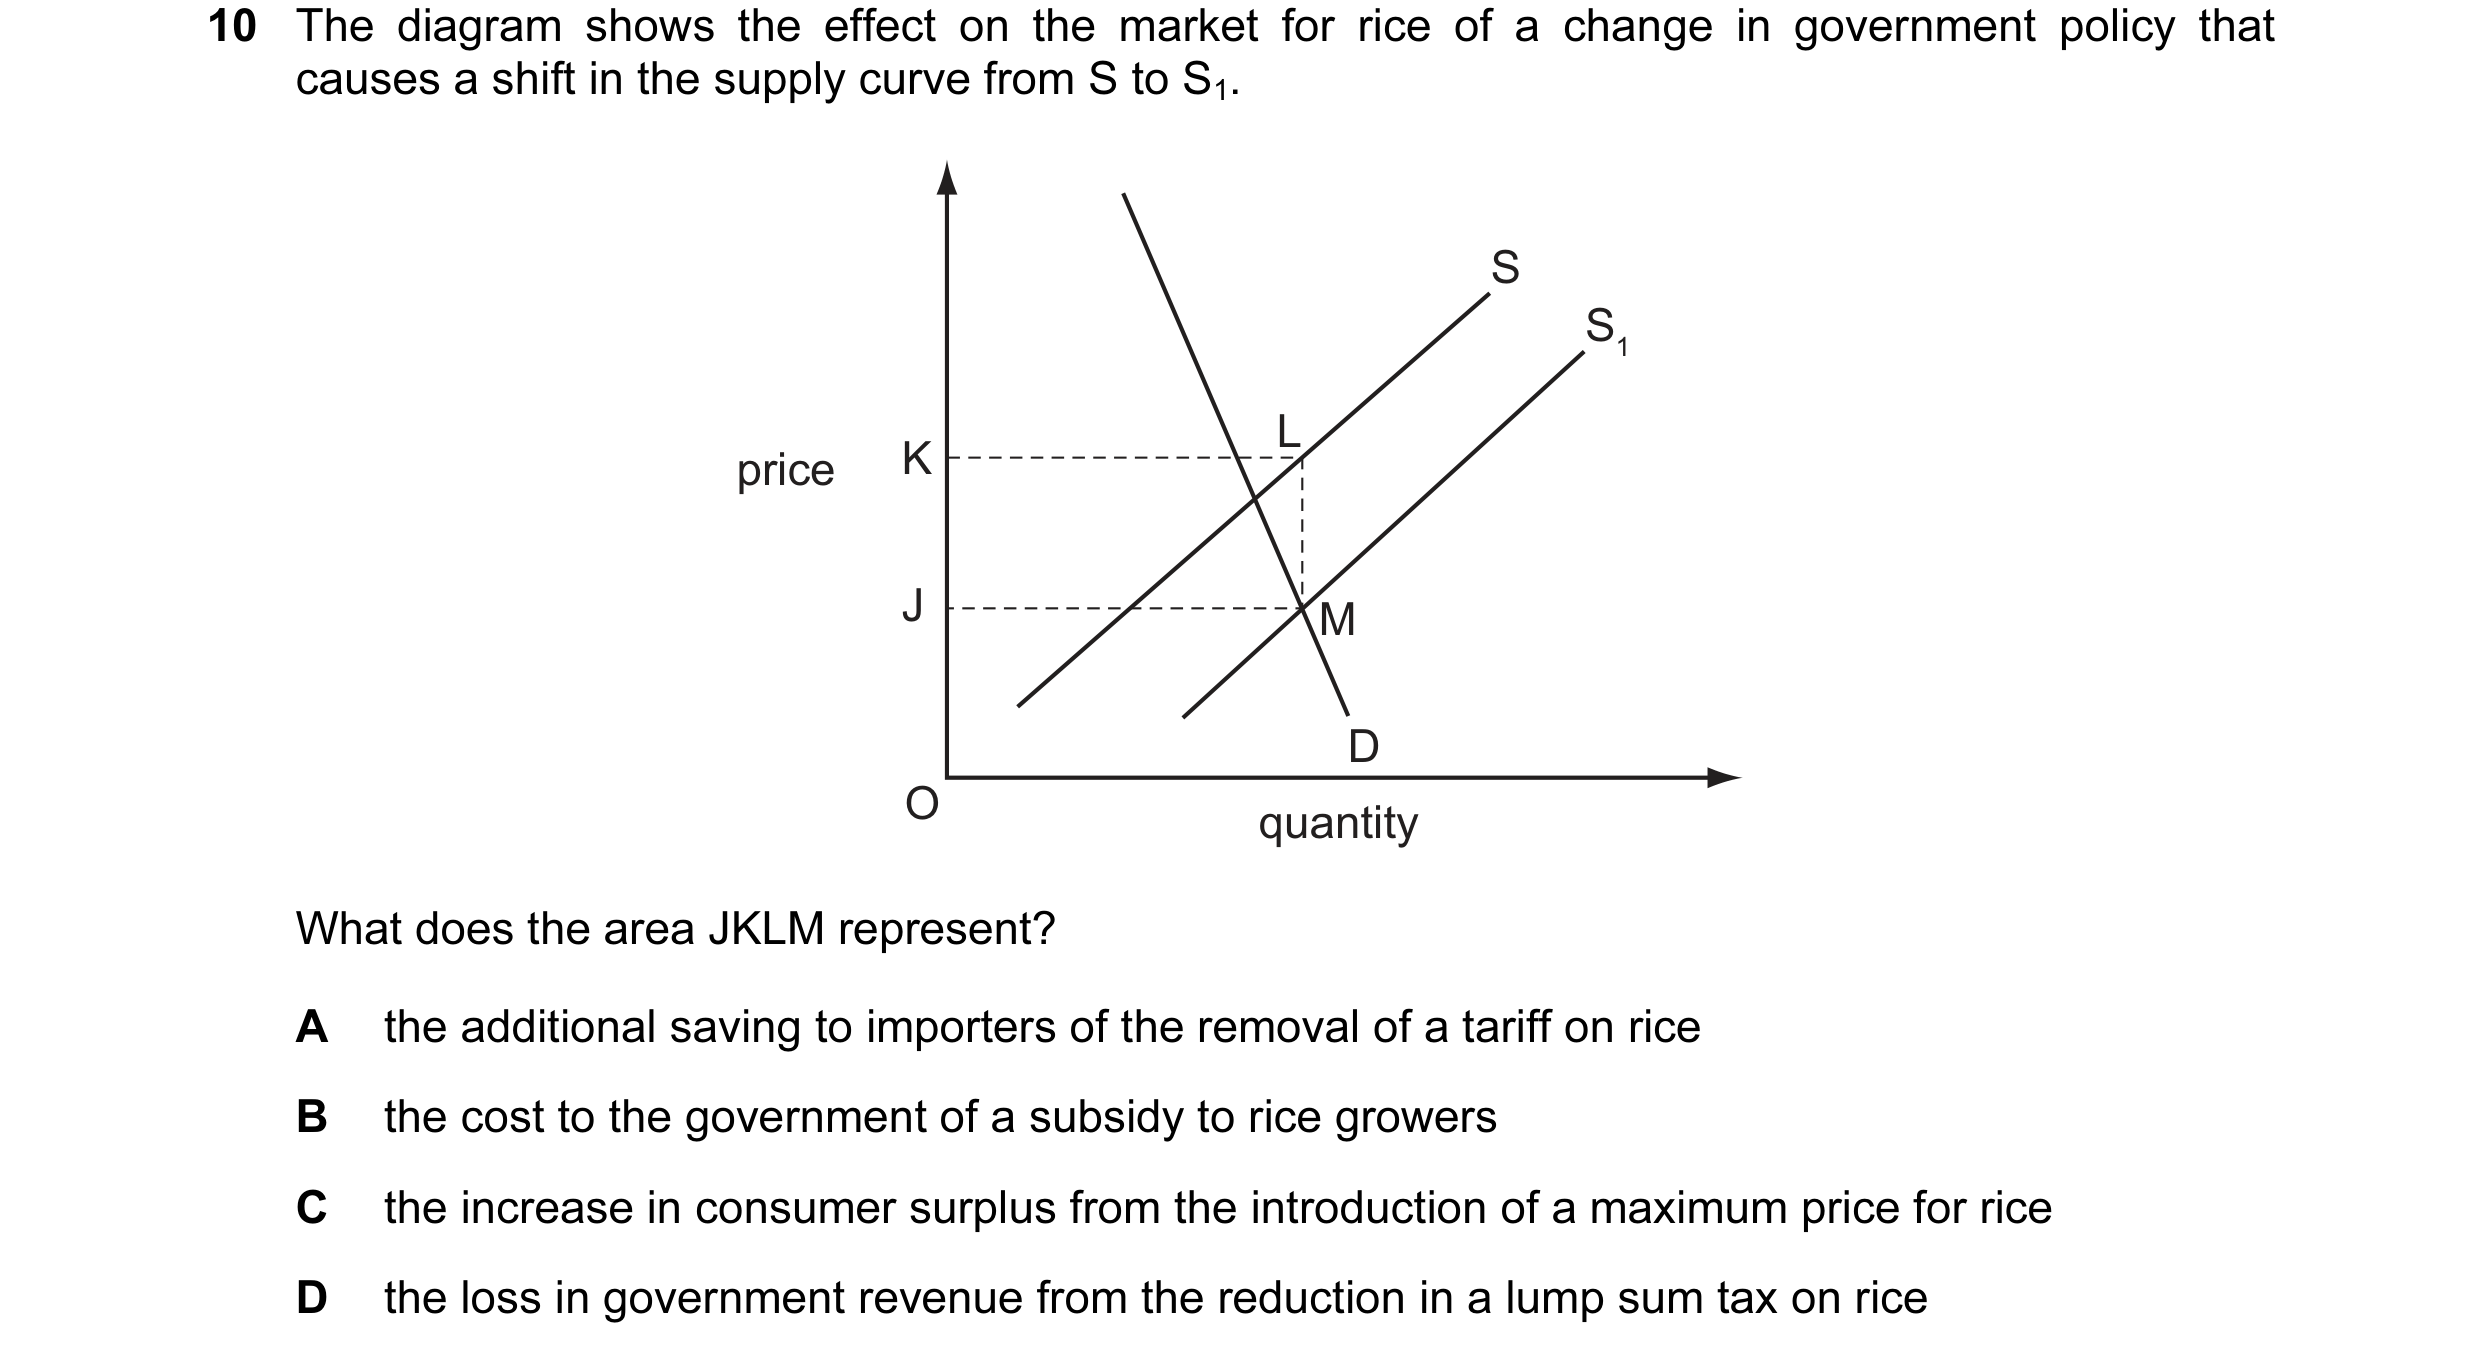
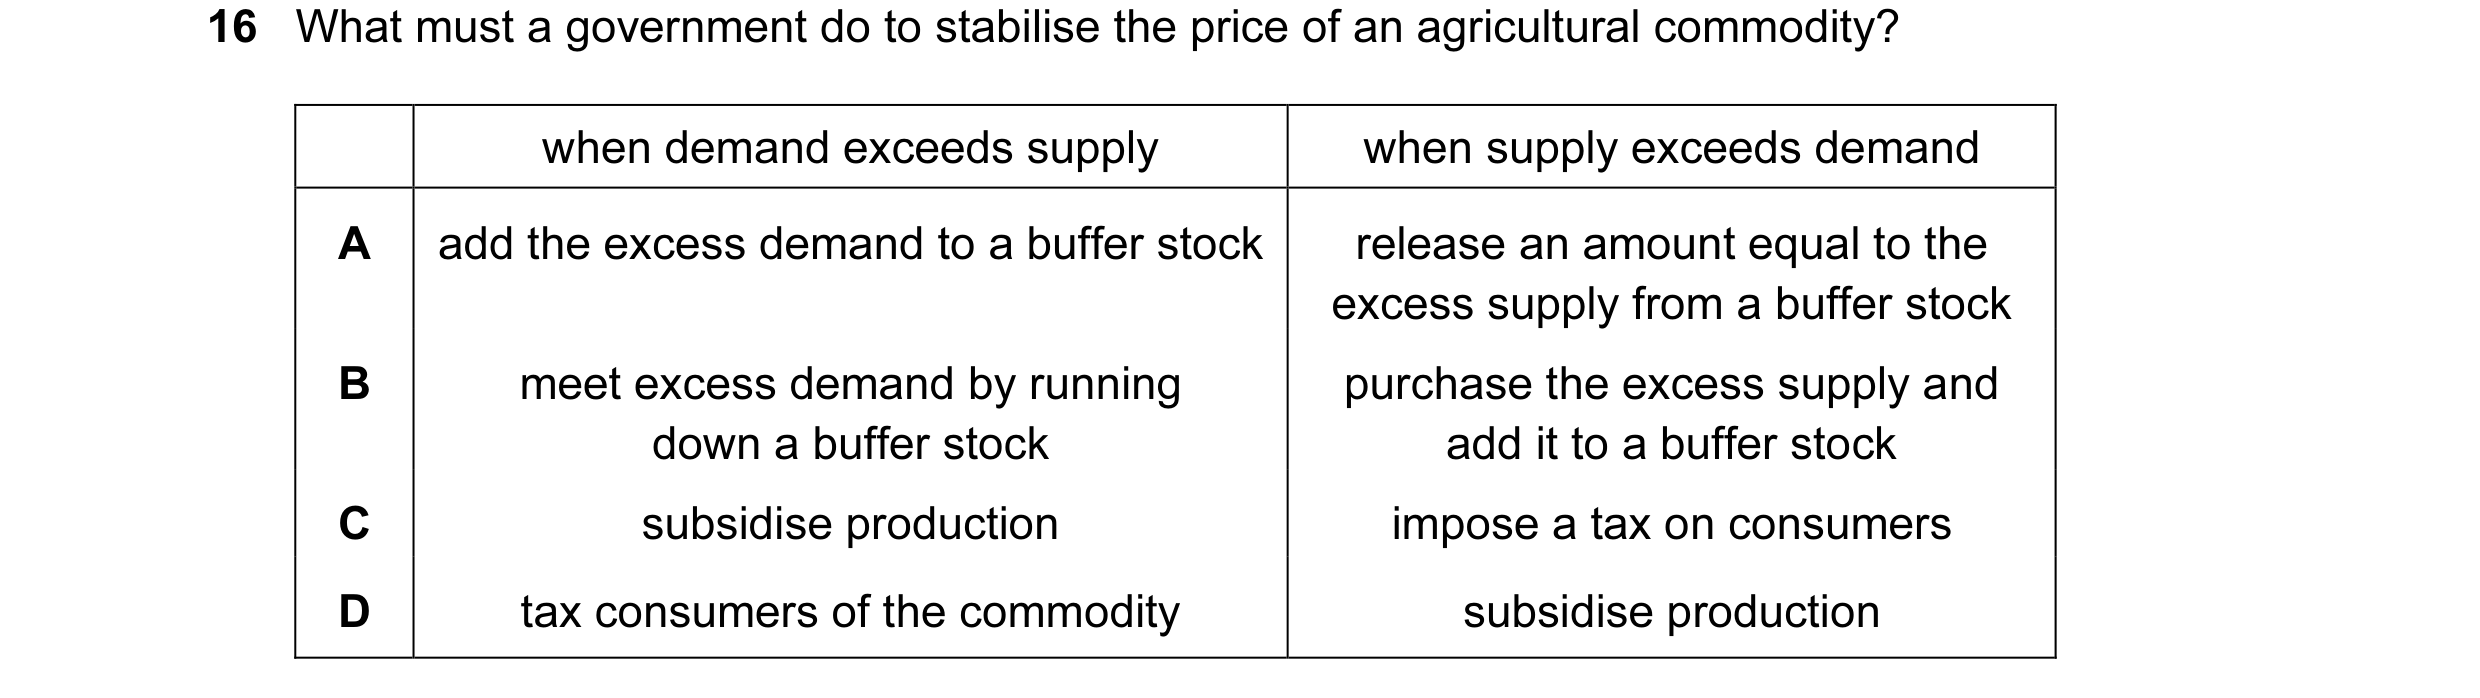 22 / 119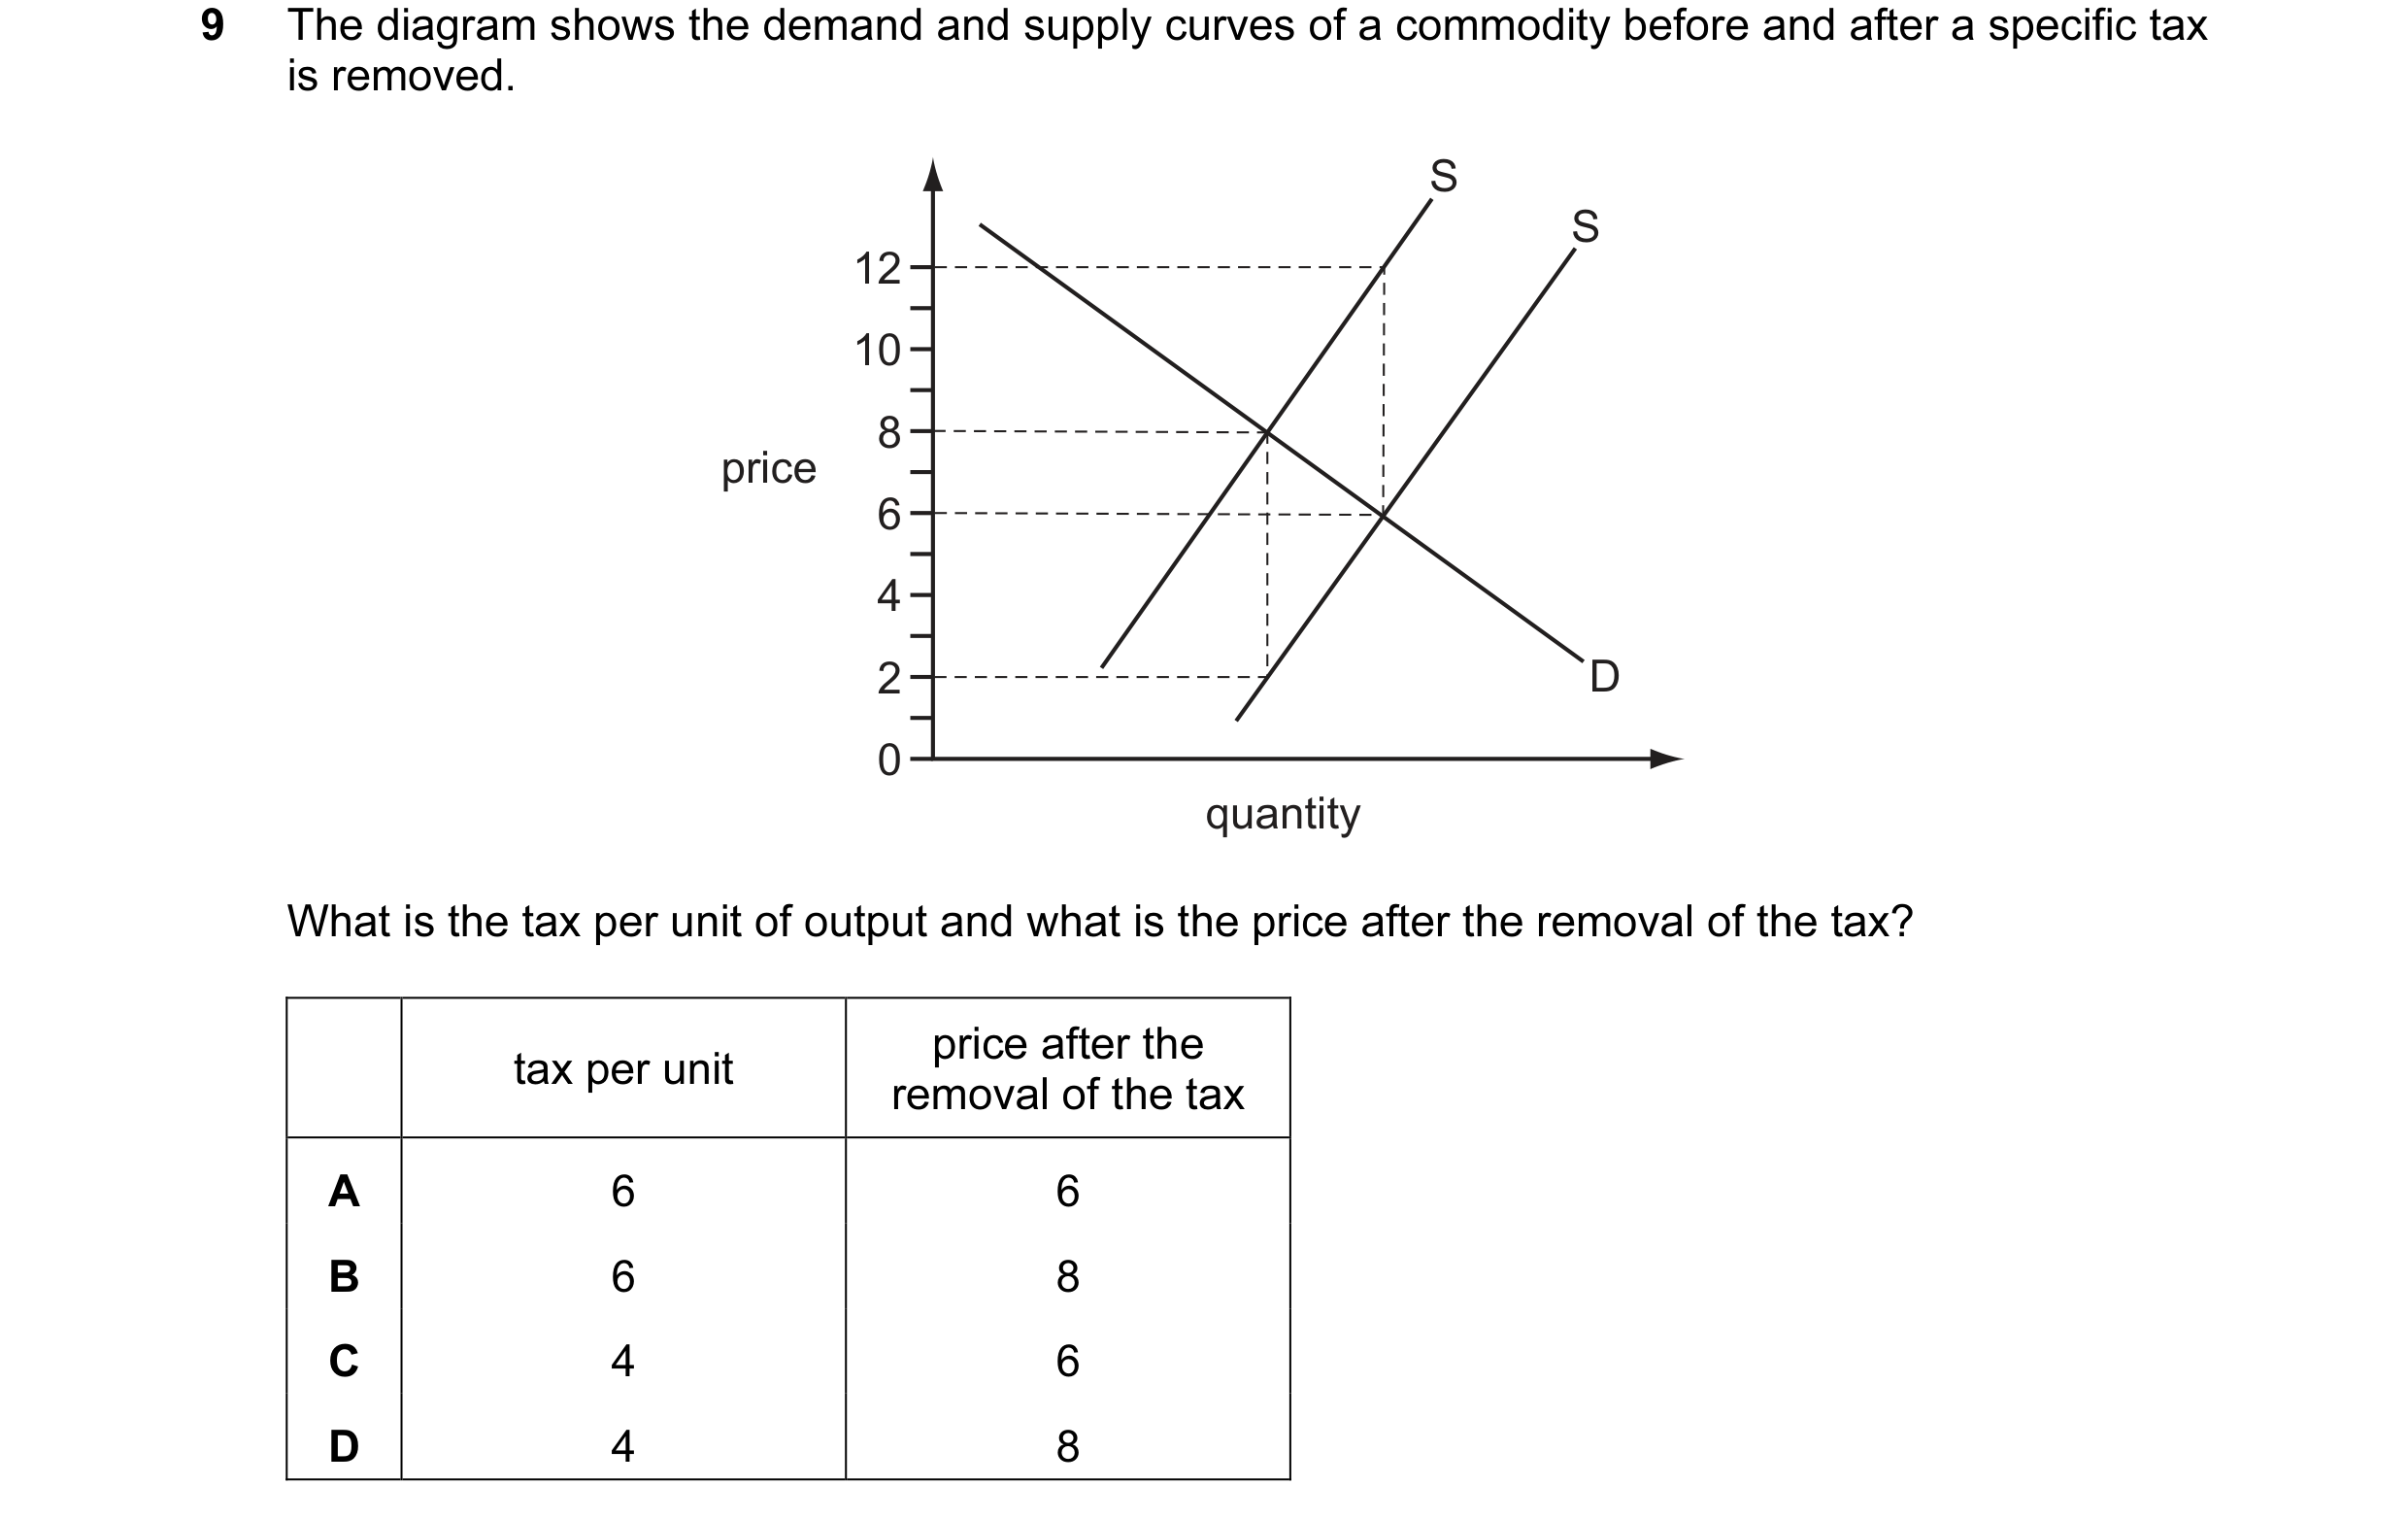
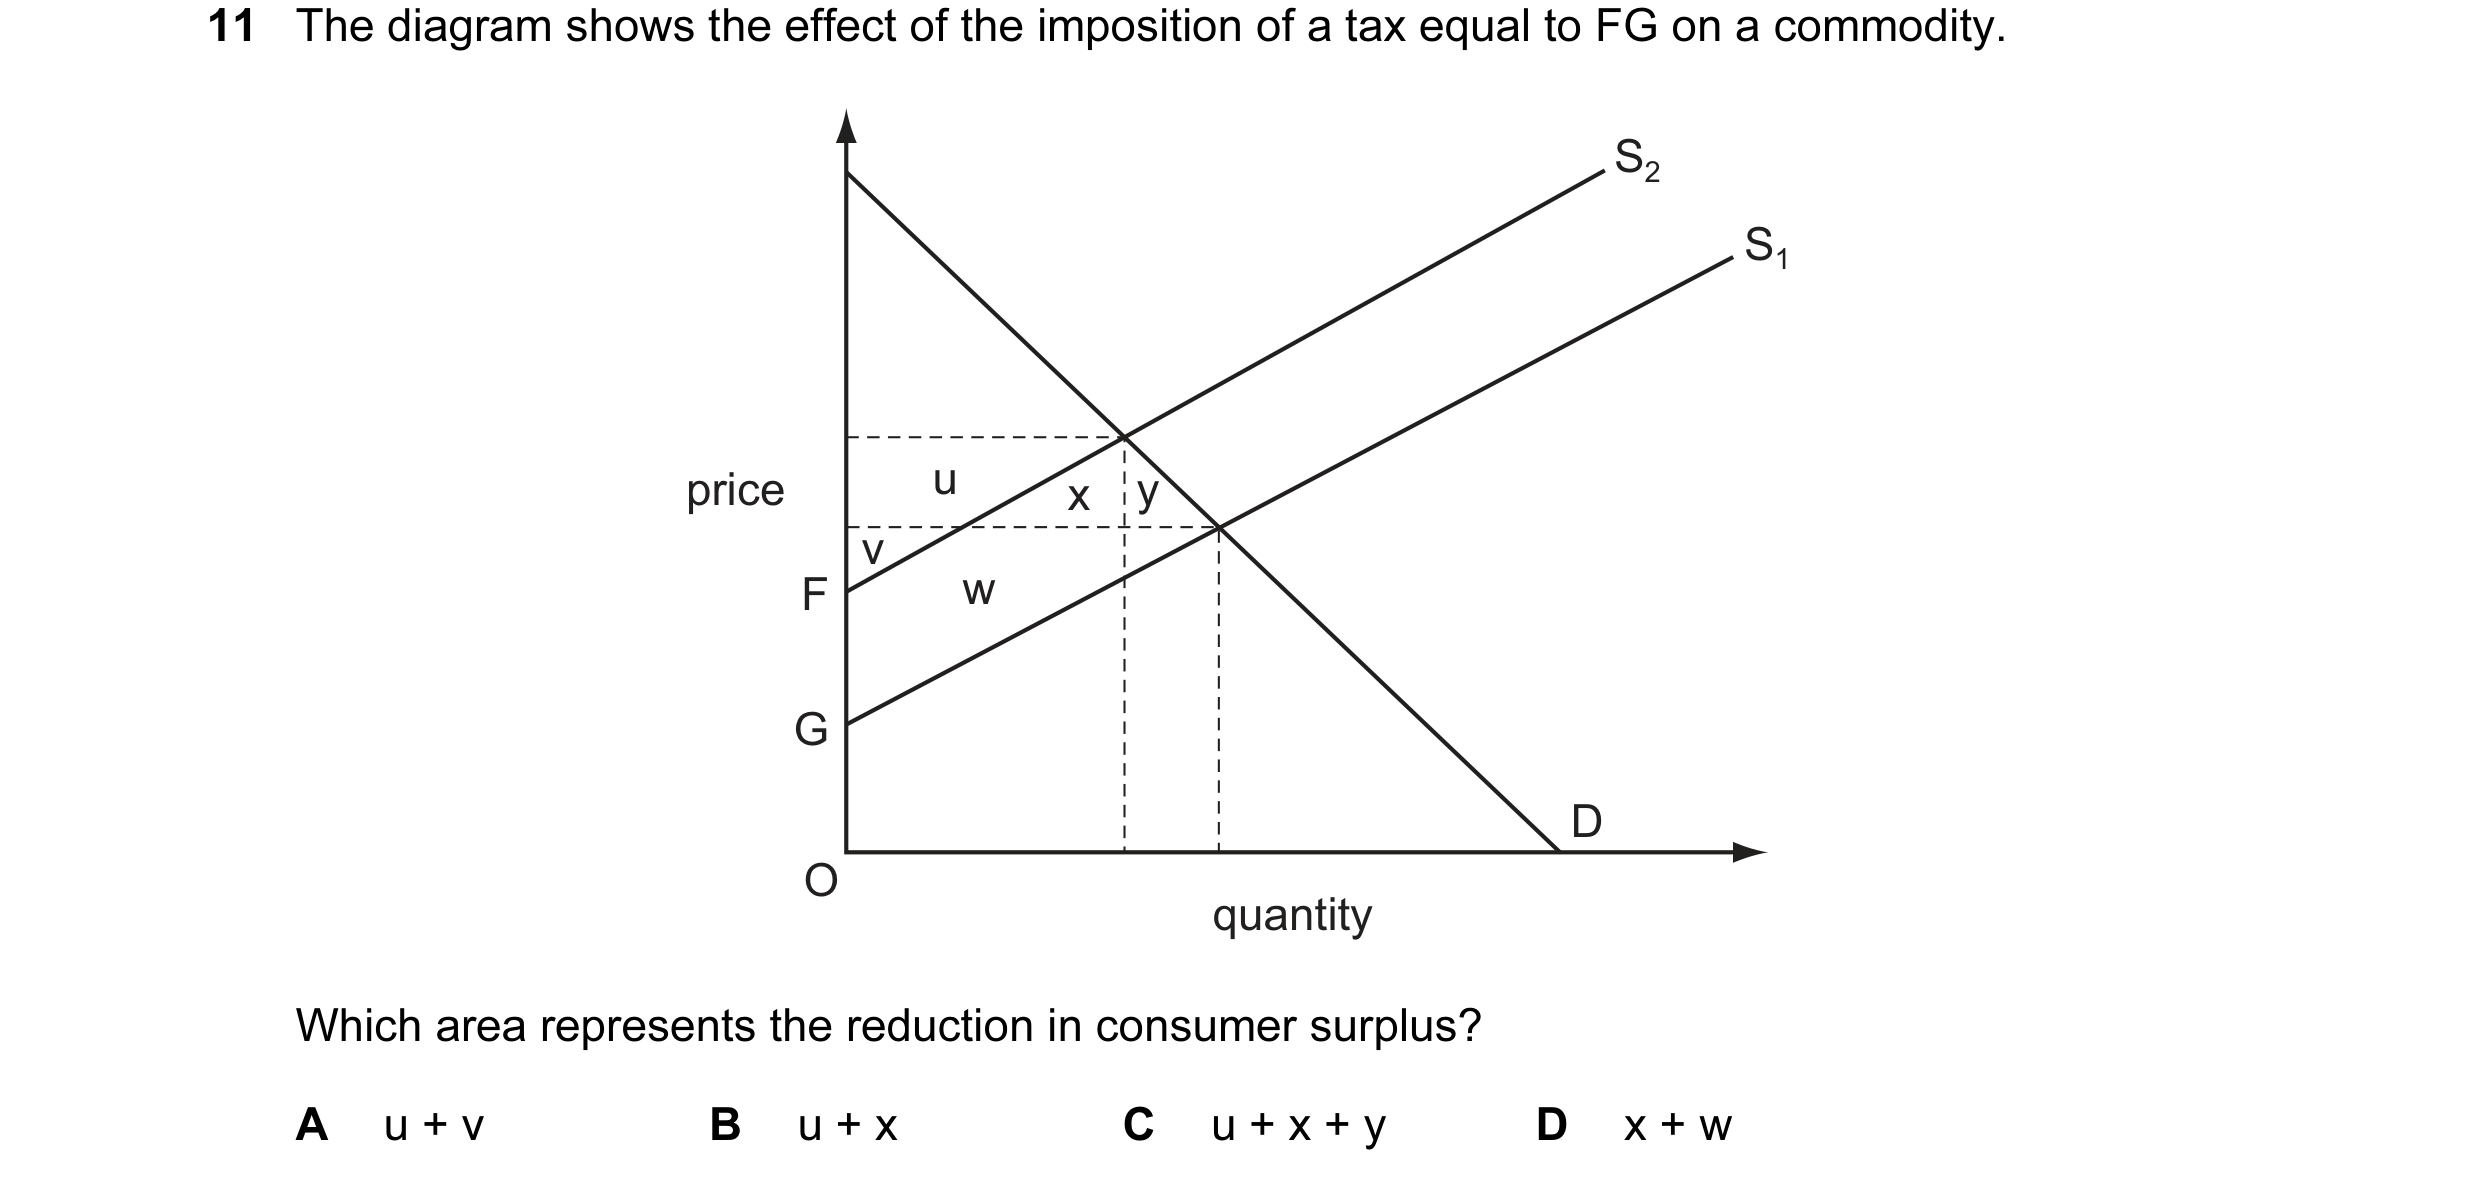 23 / 119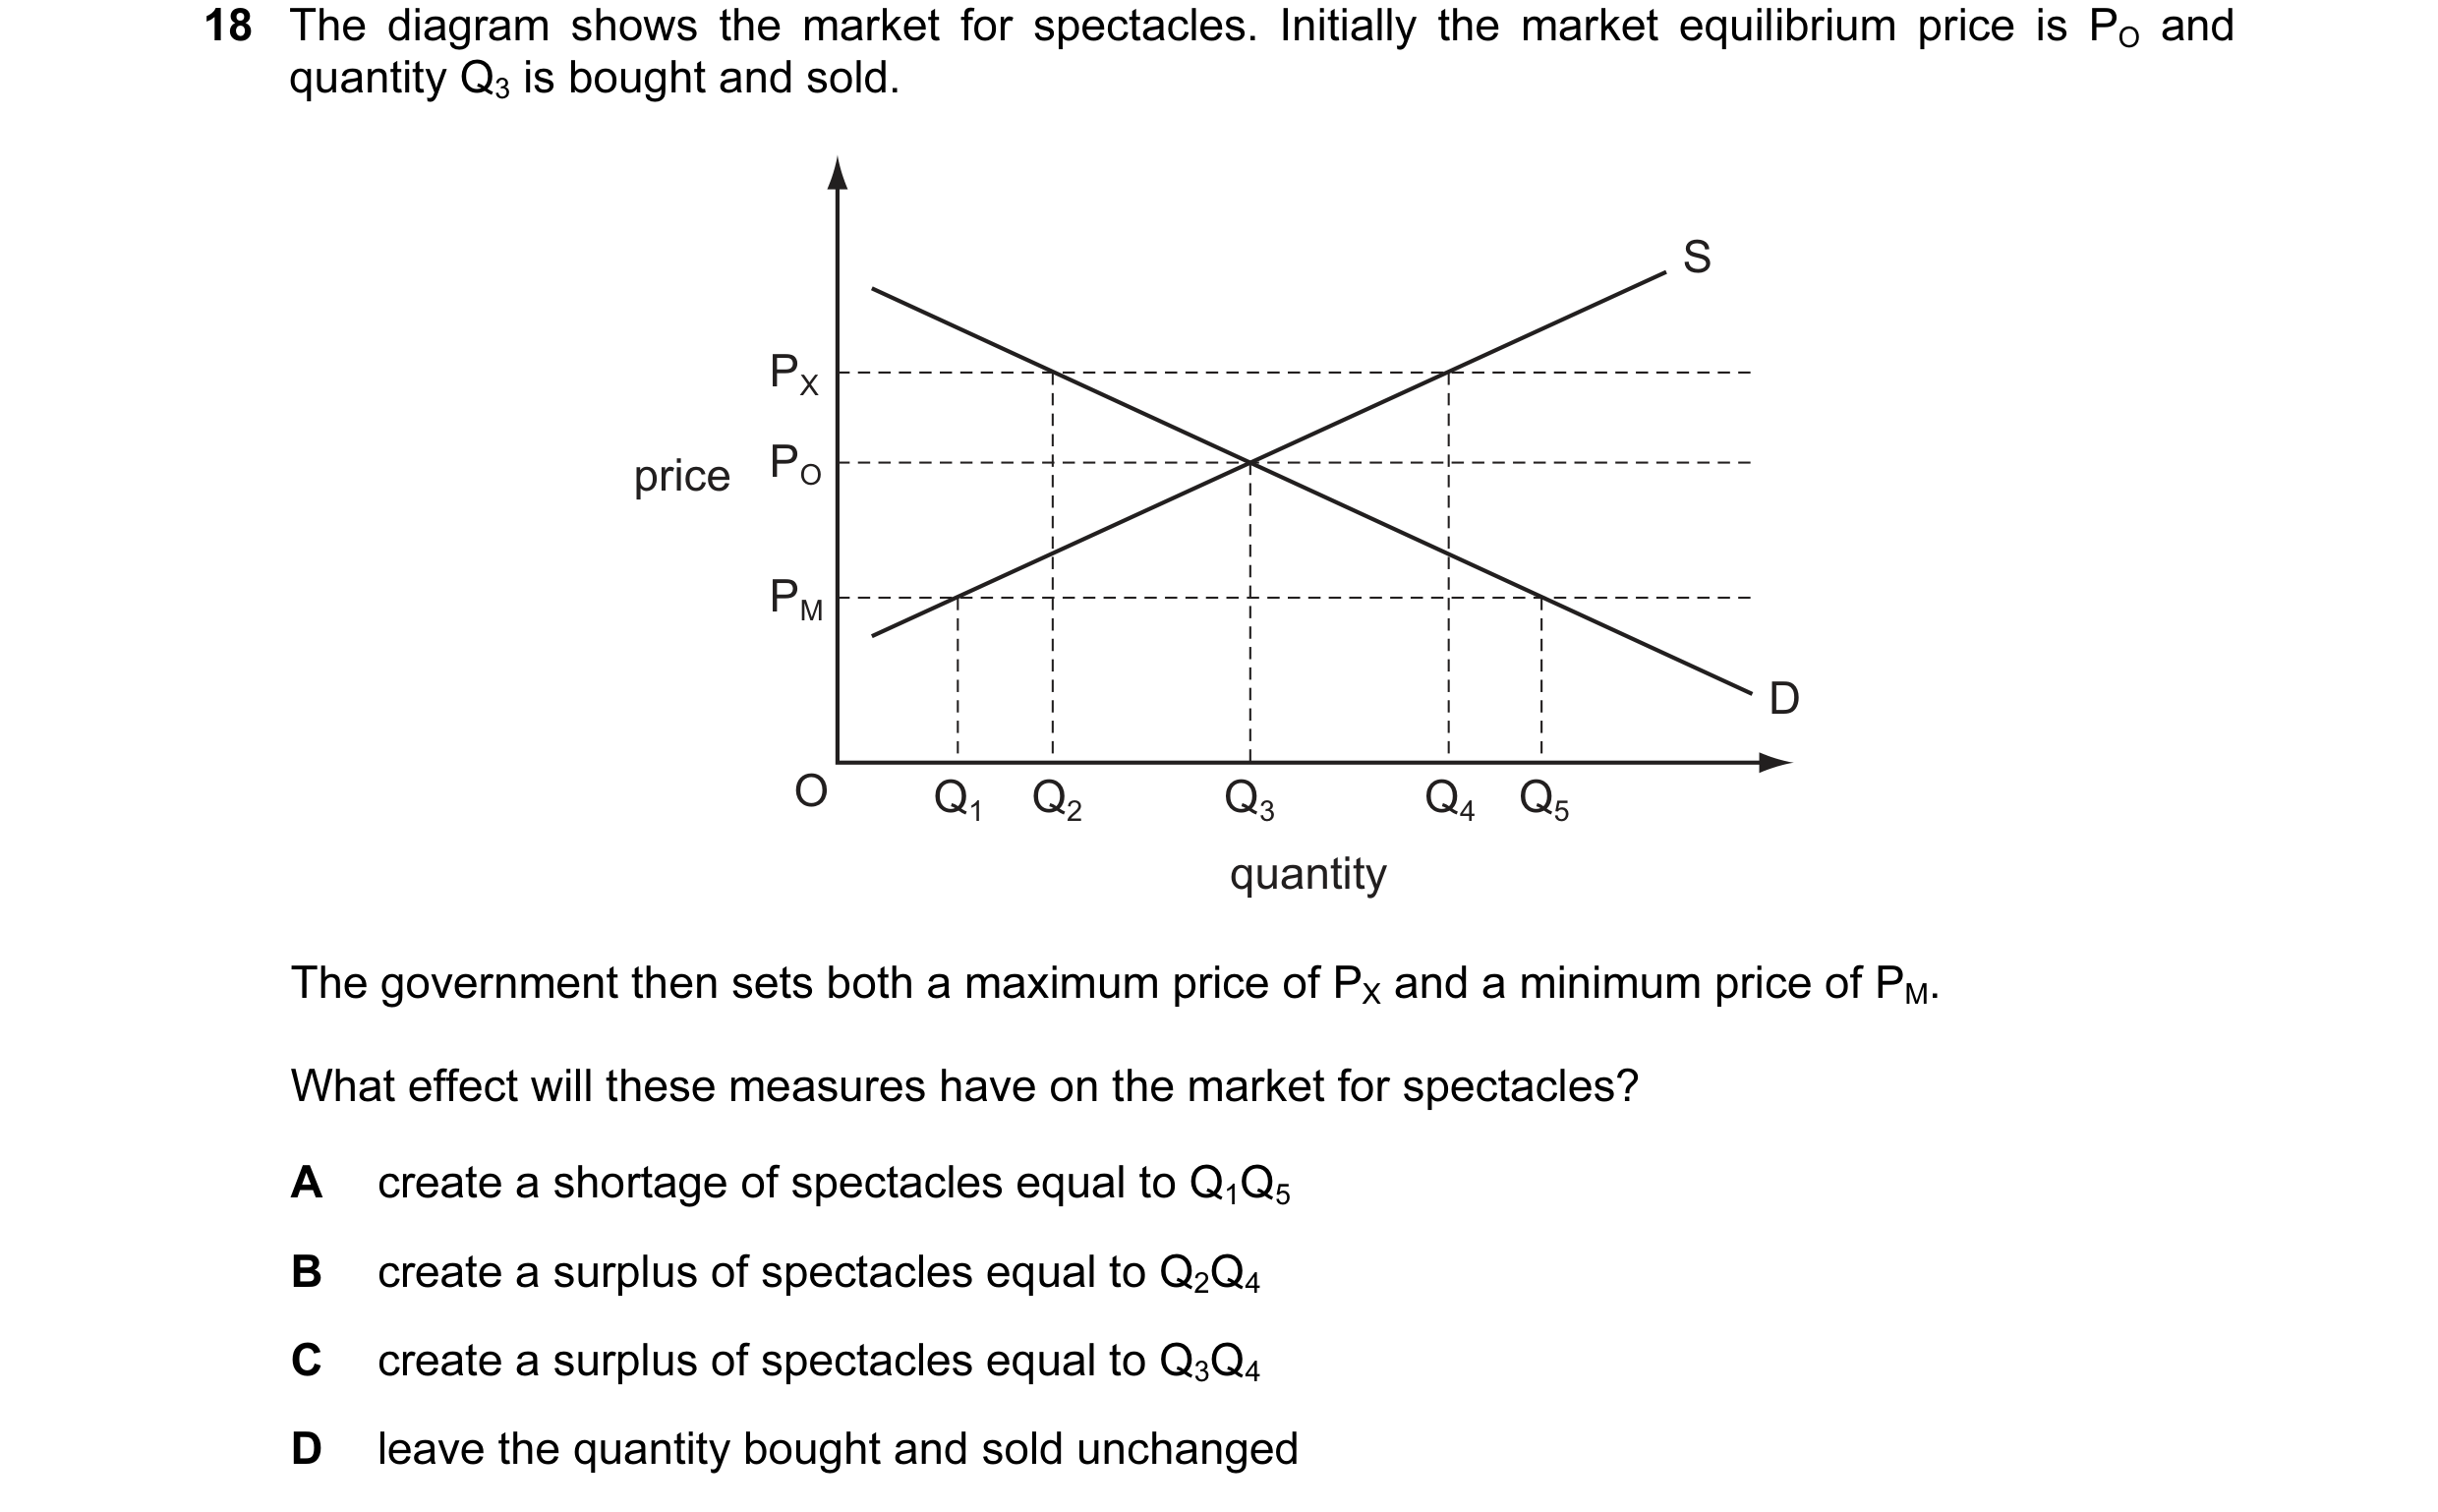
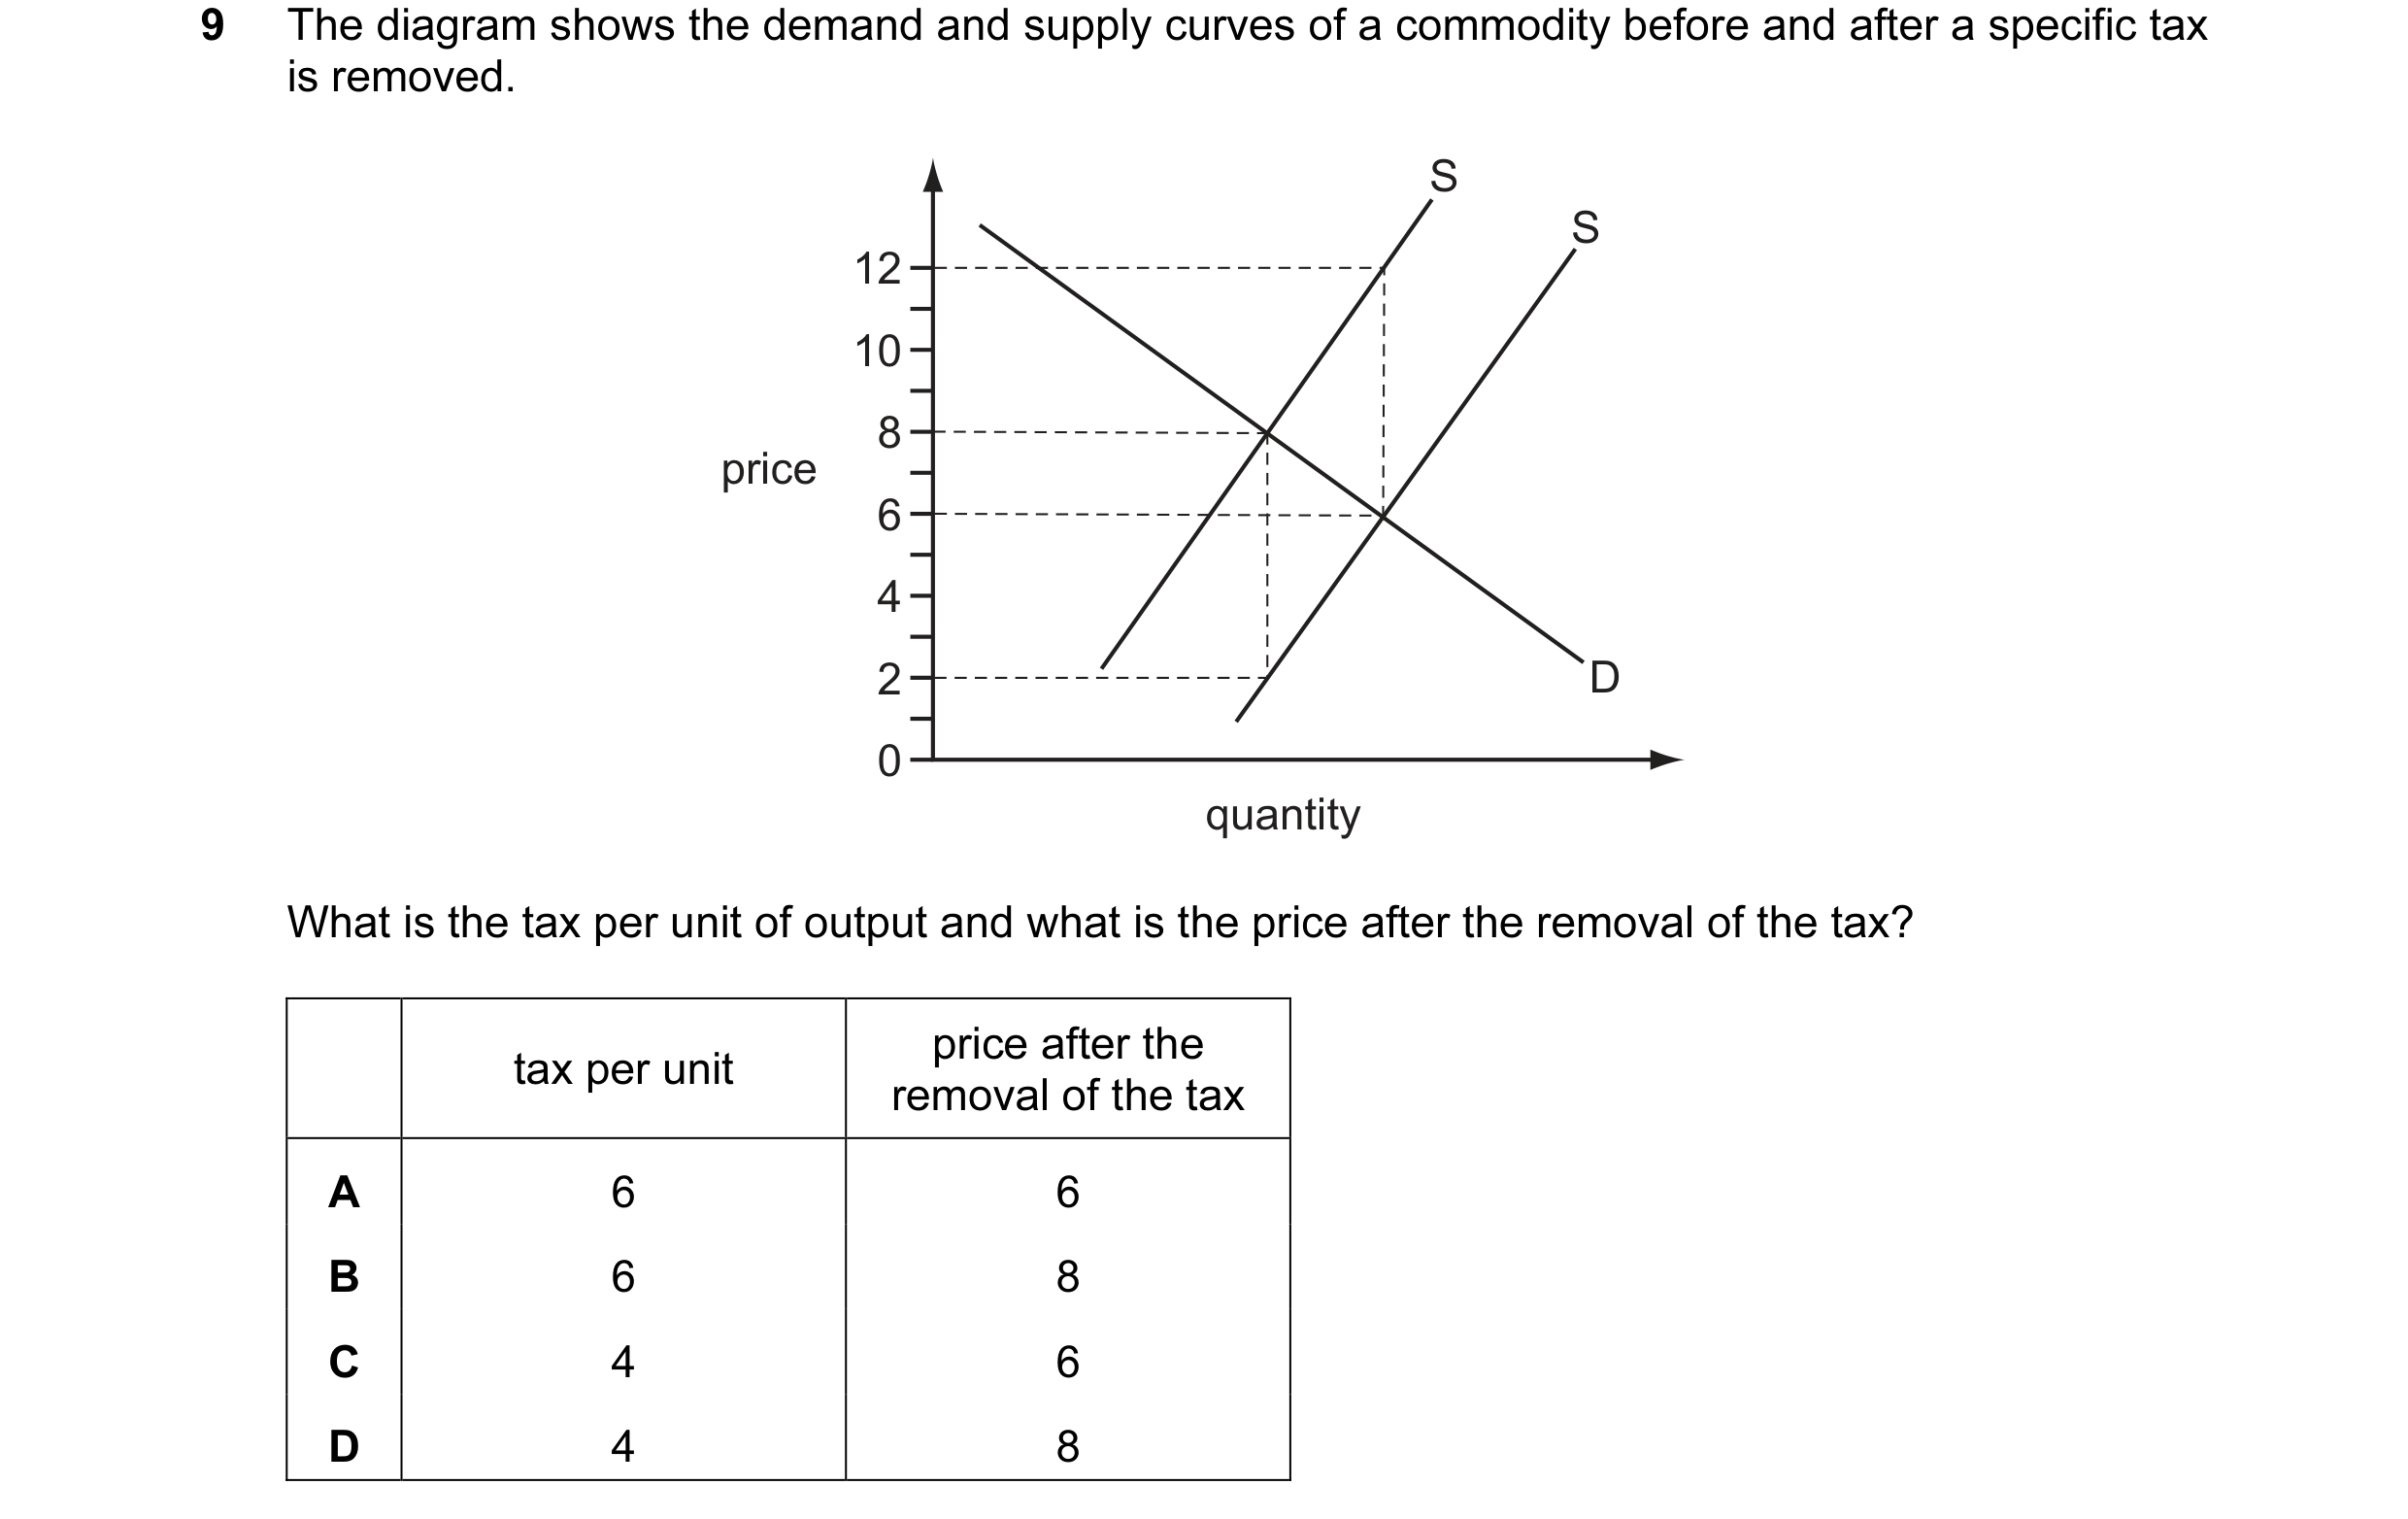 24 / 119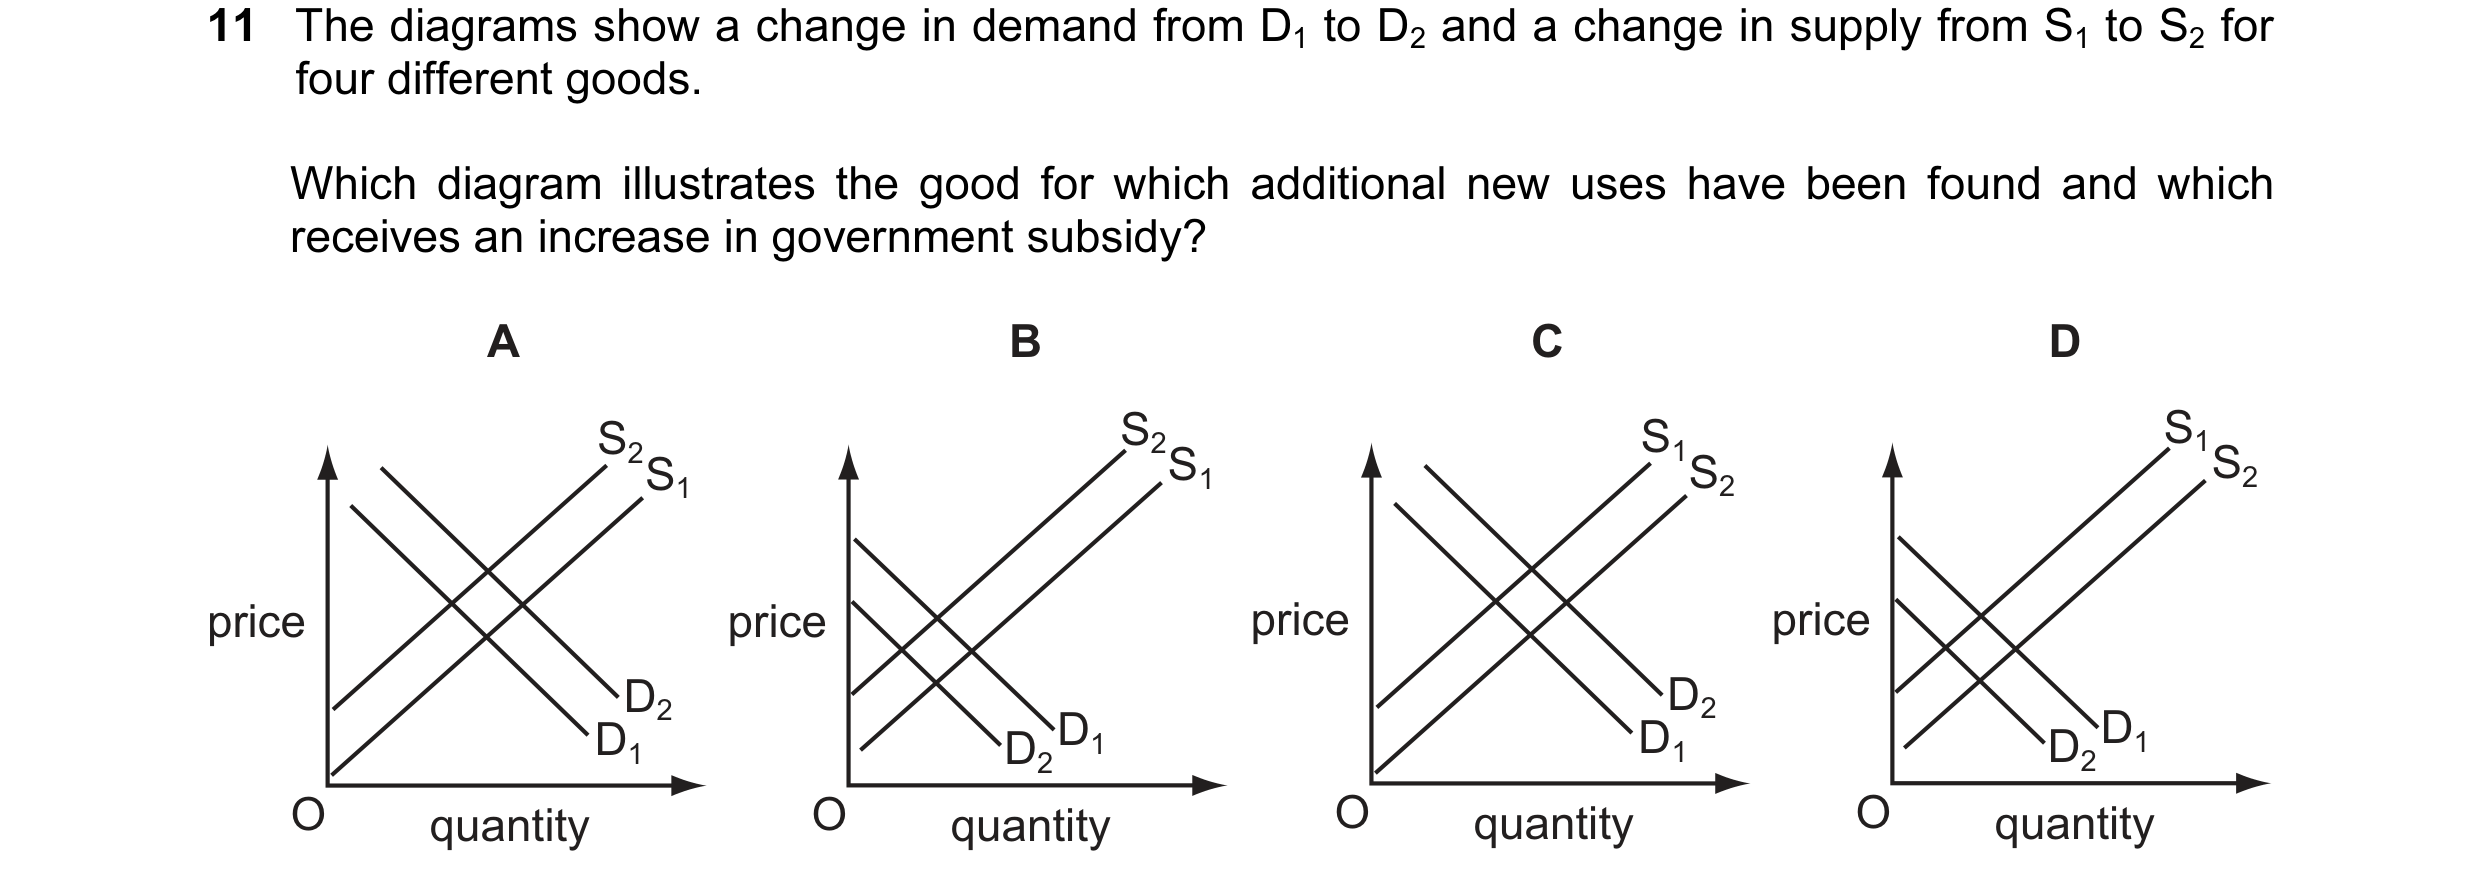
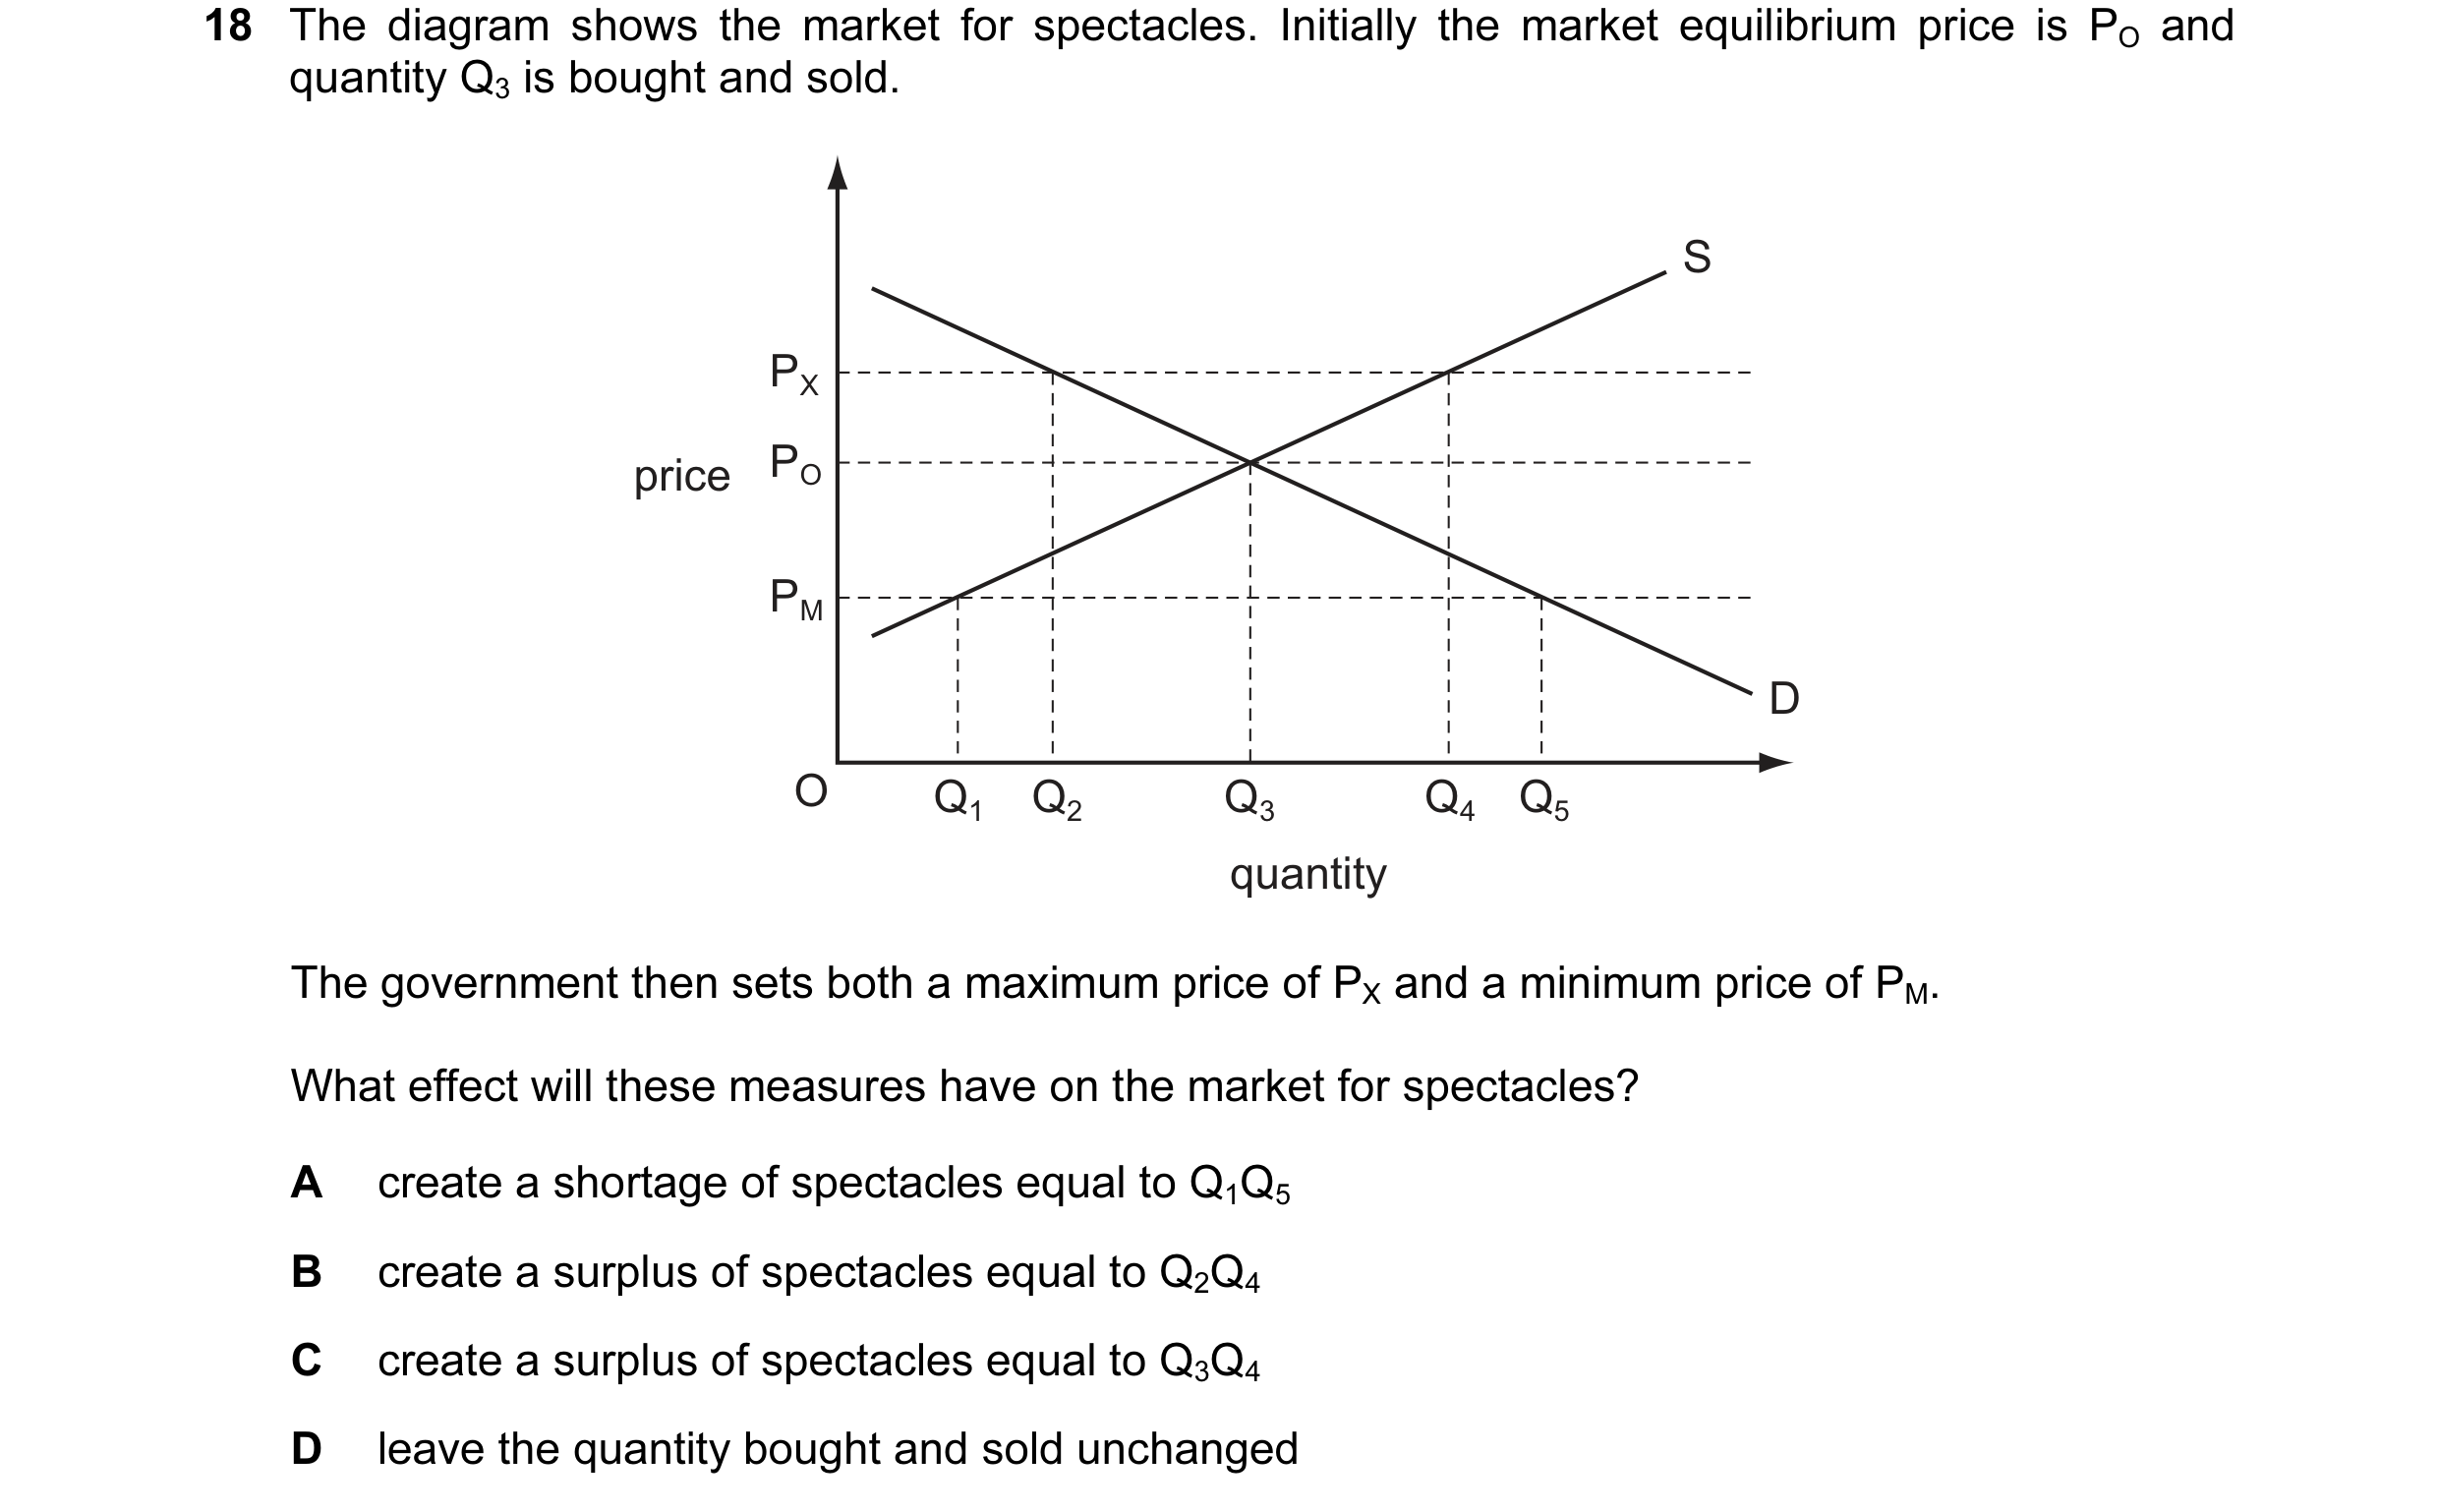 25 / 119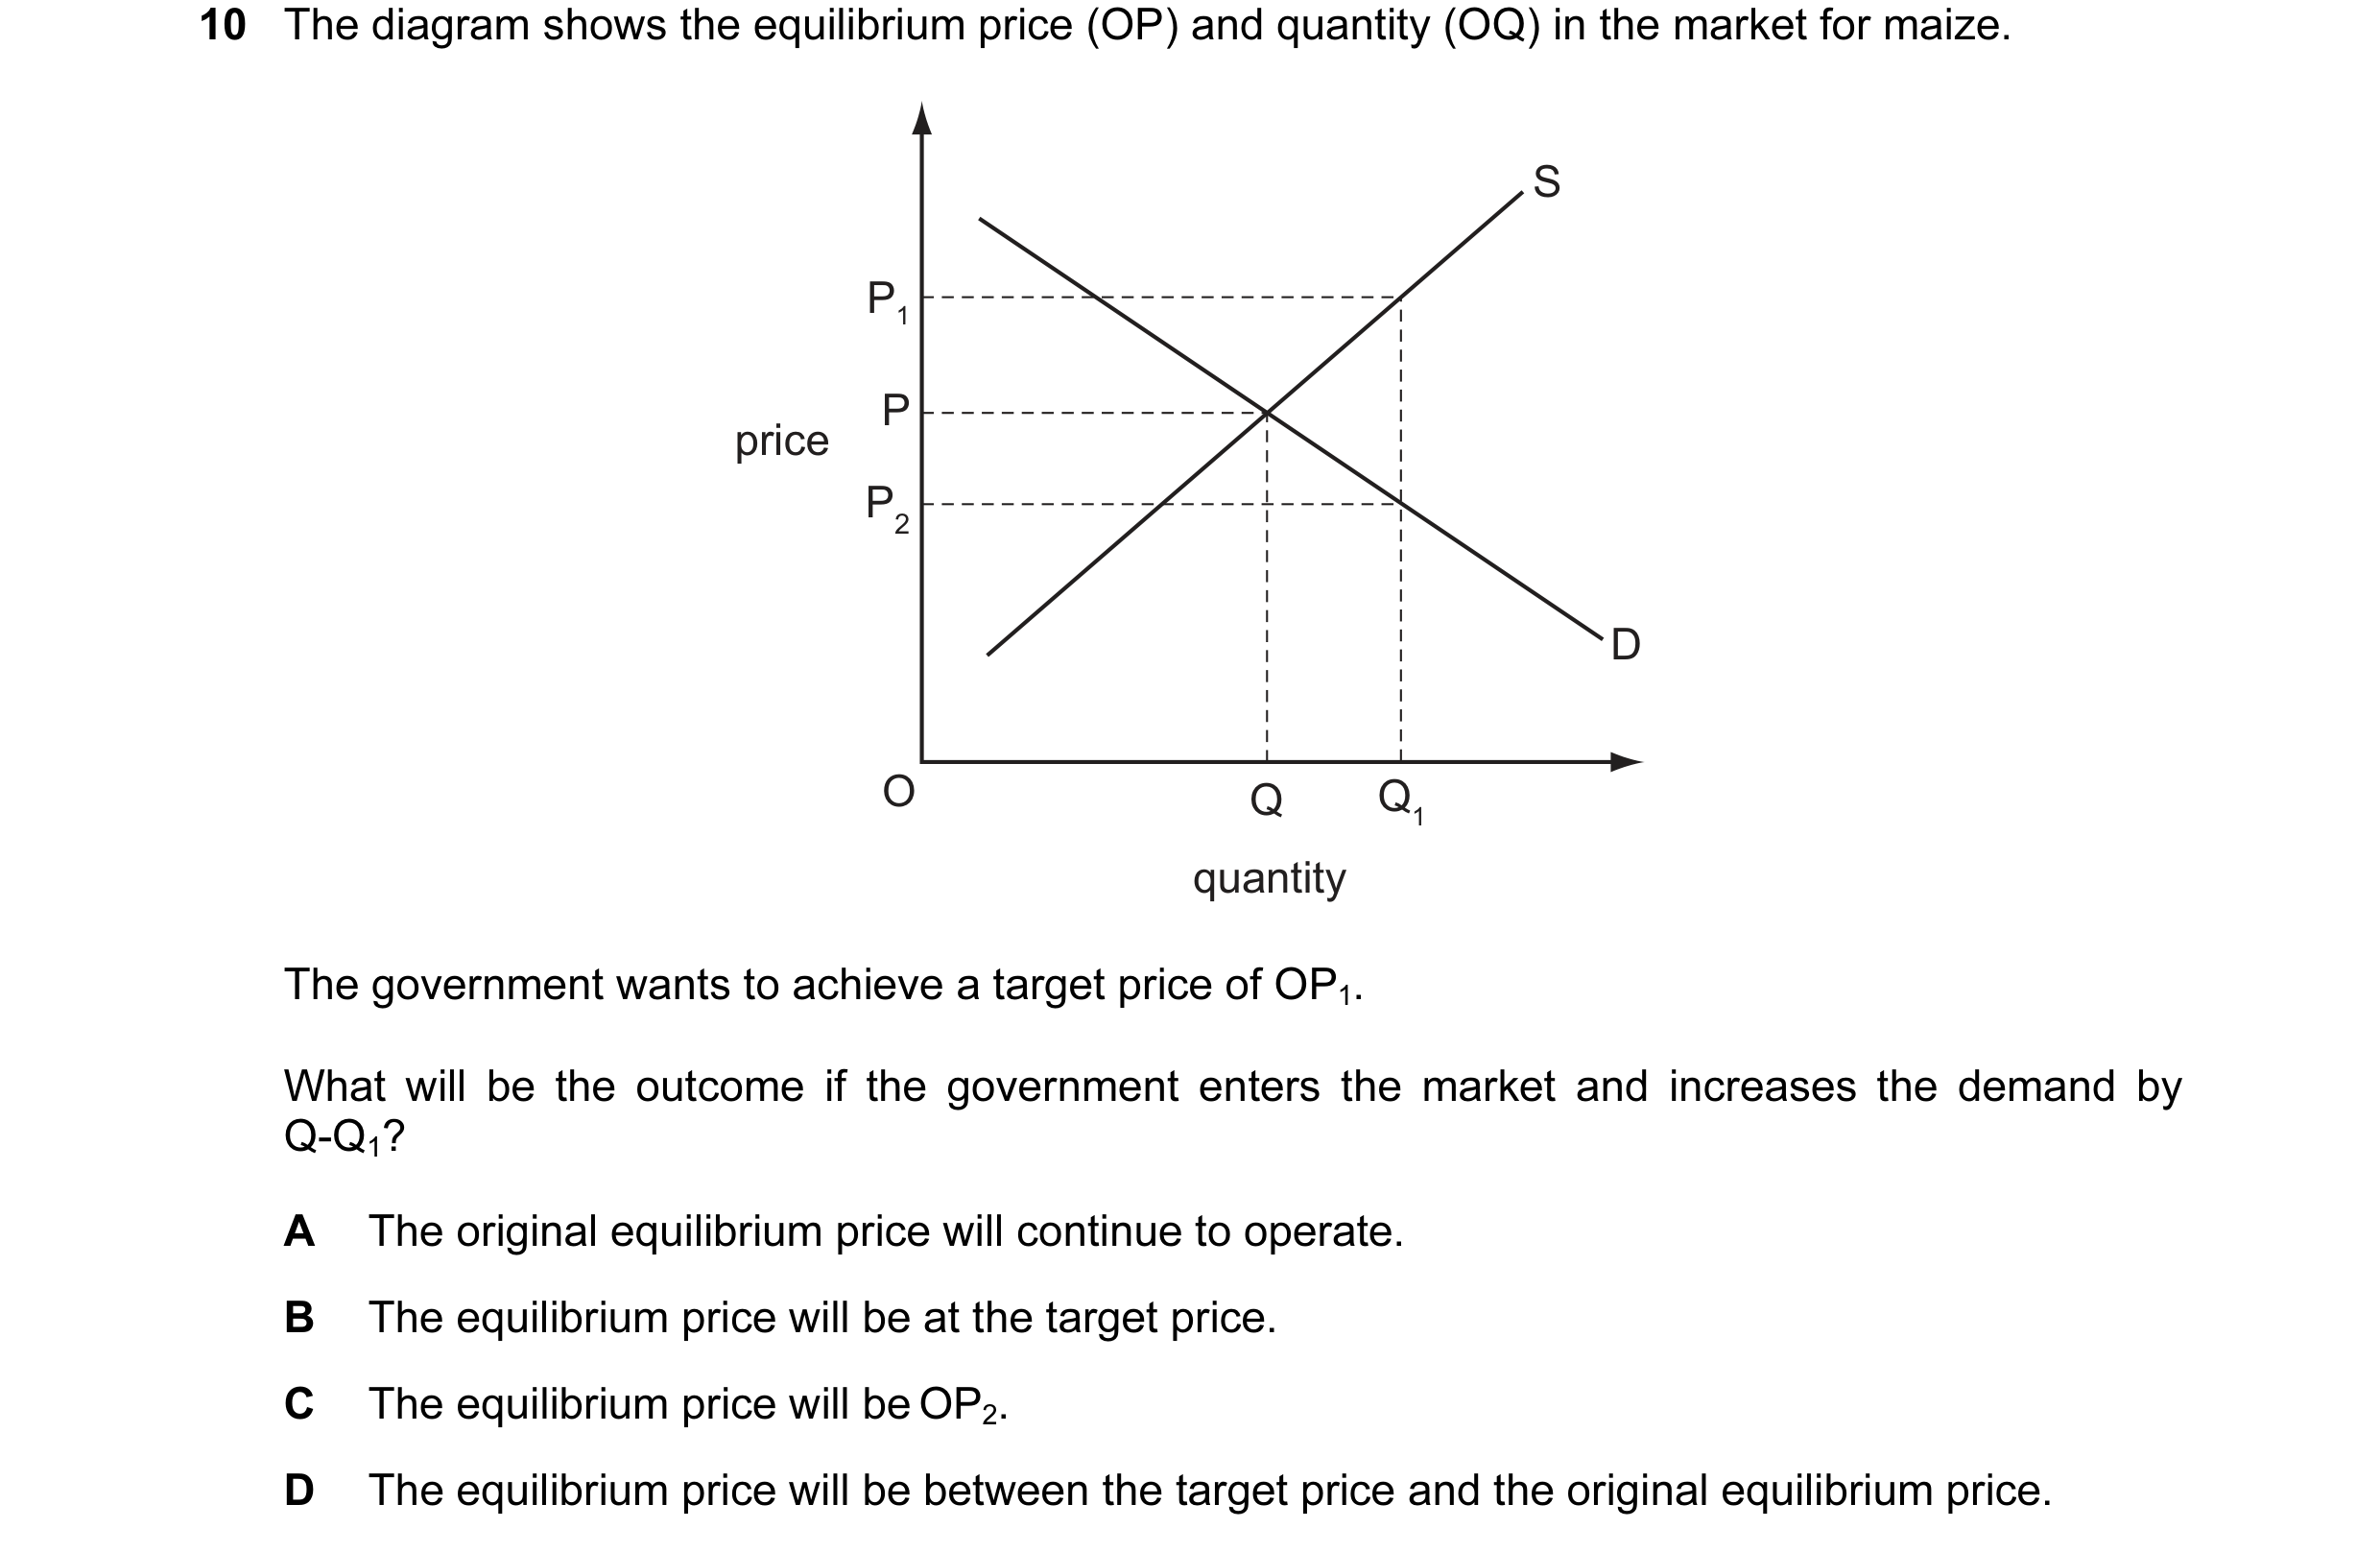
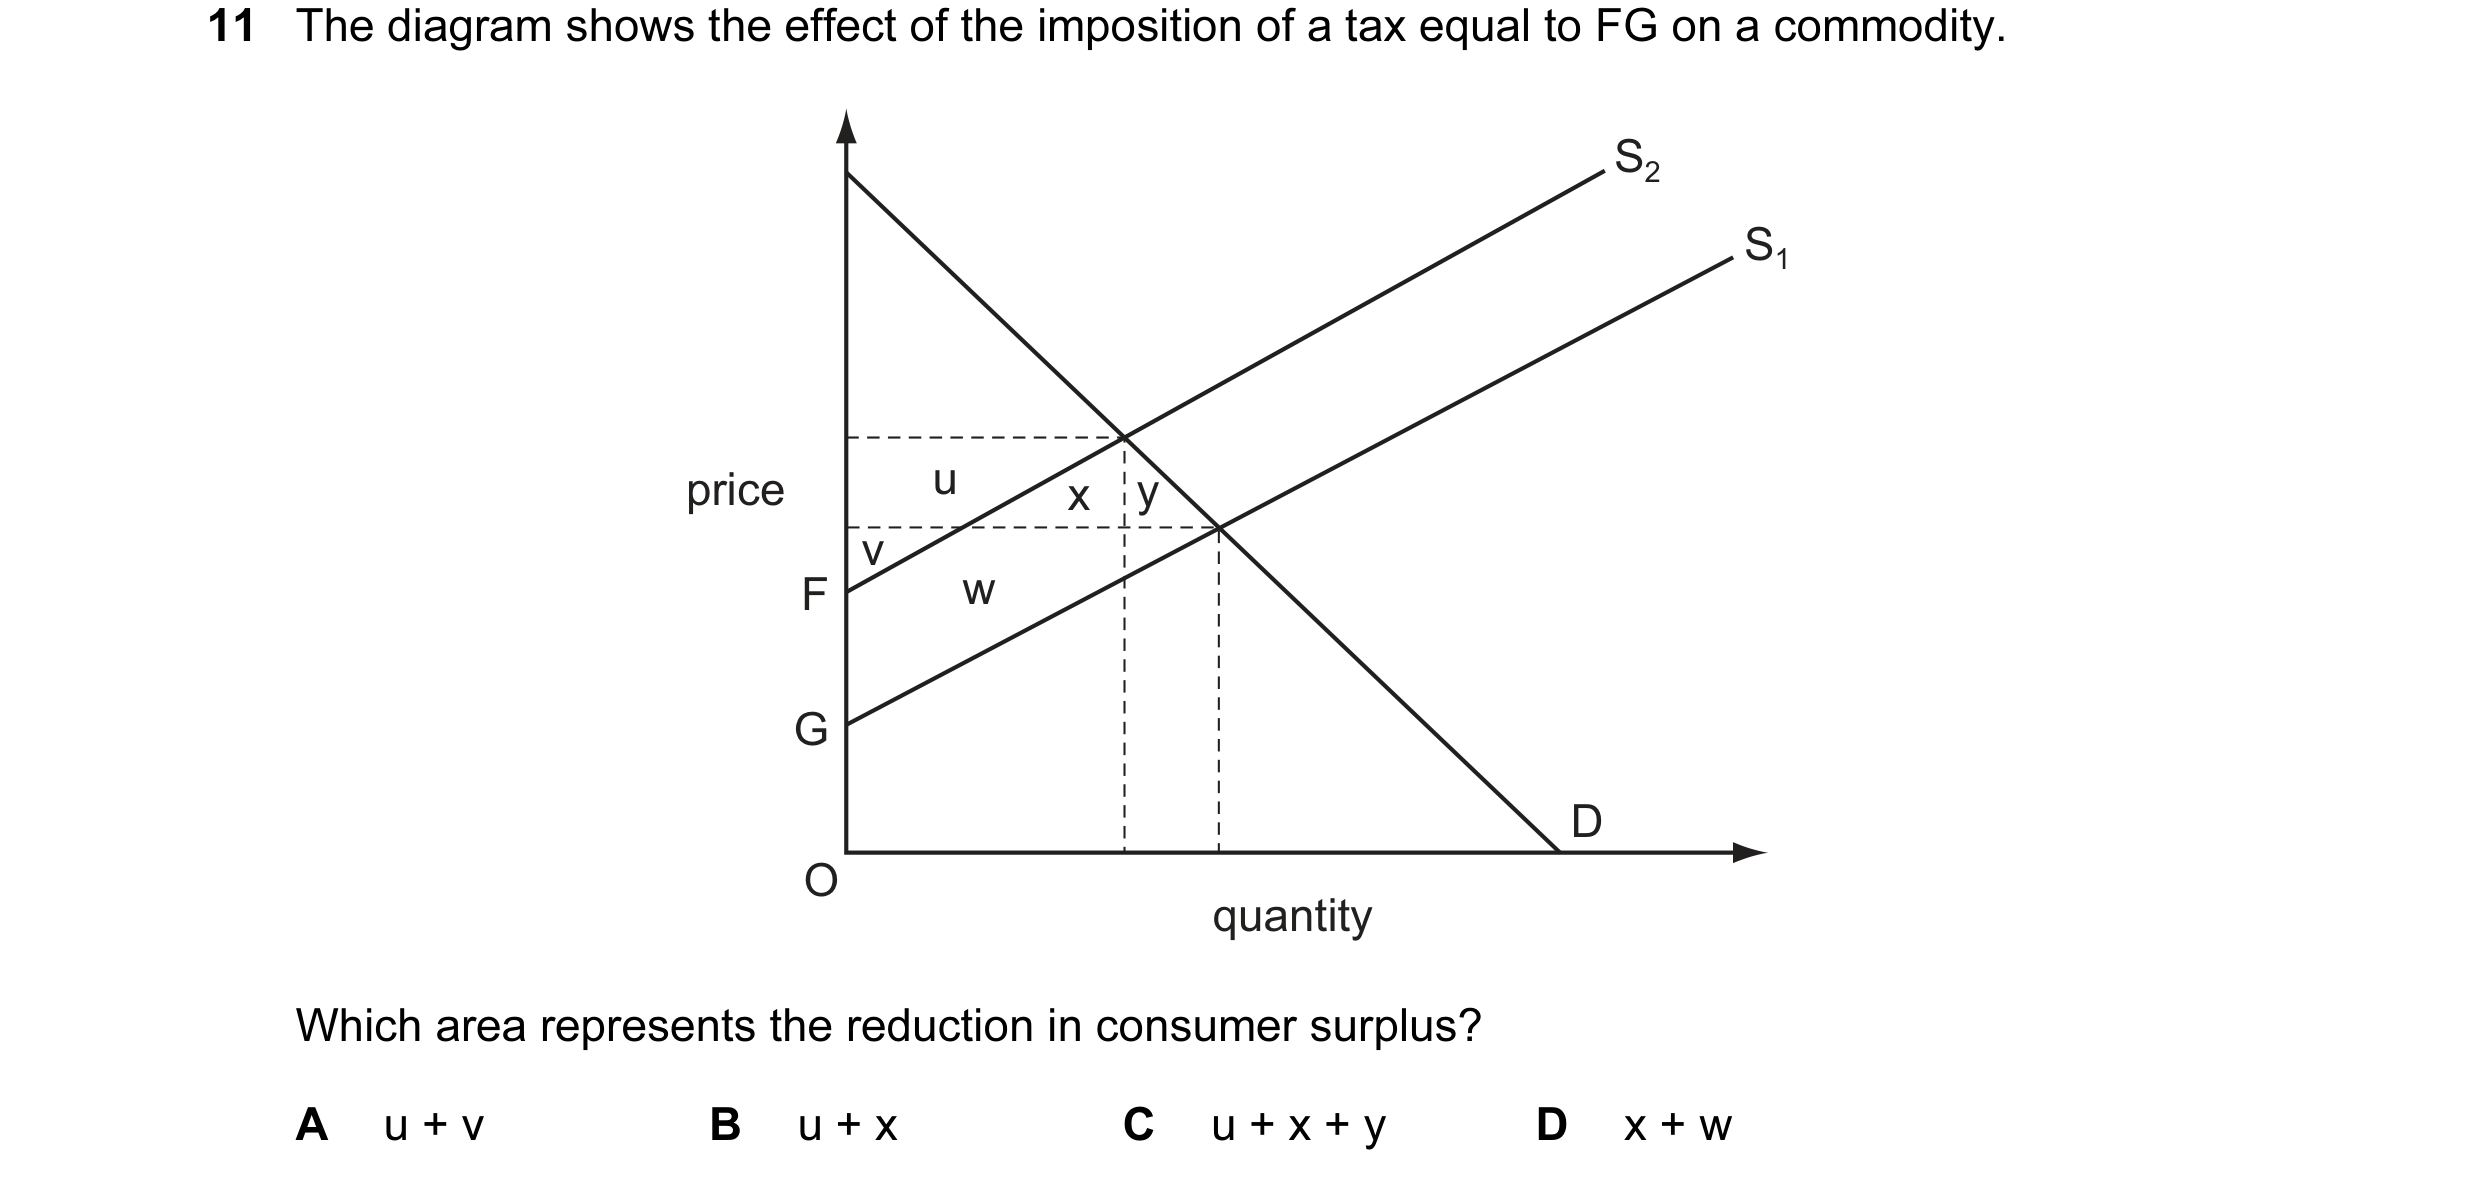
 26 / 119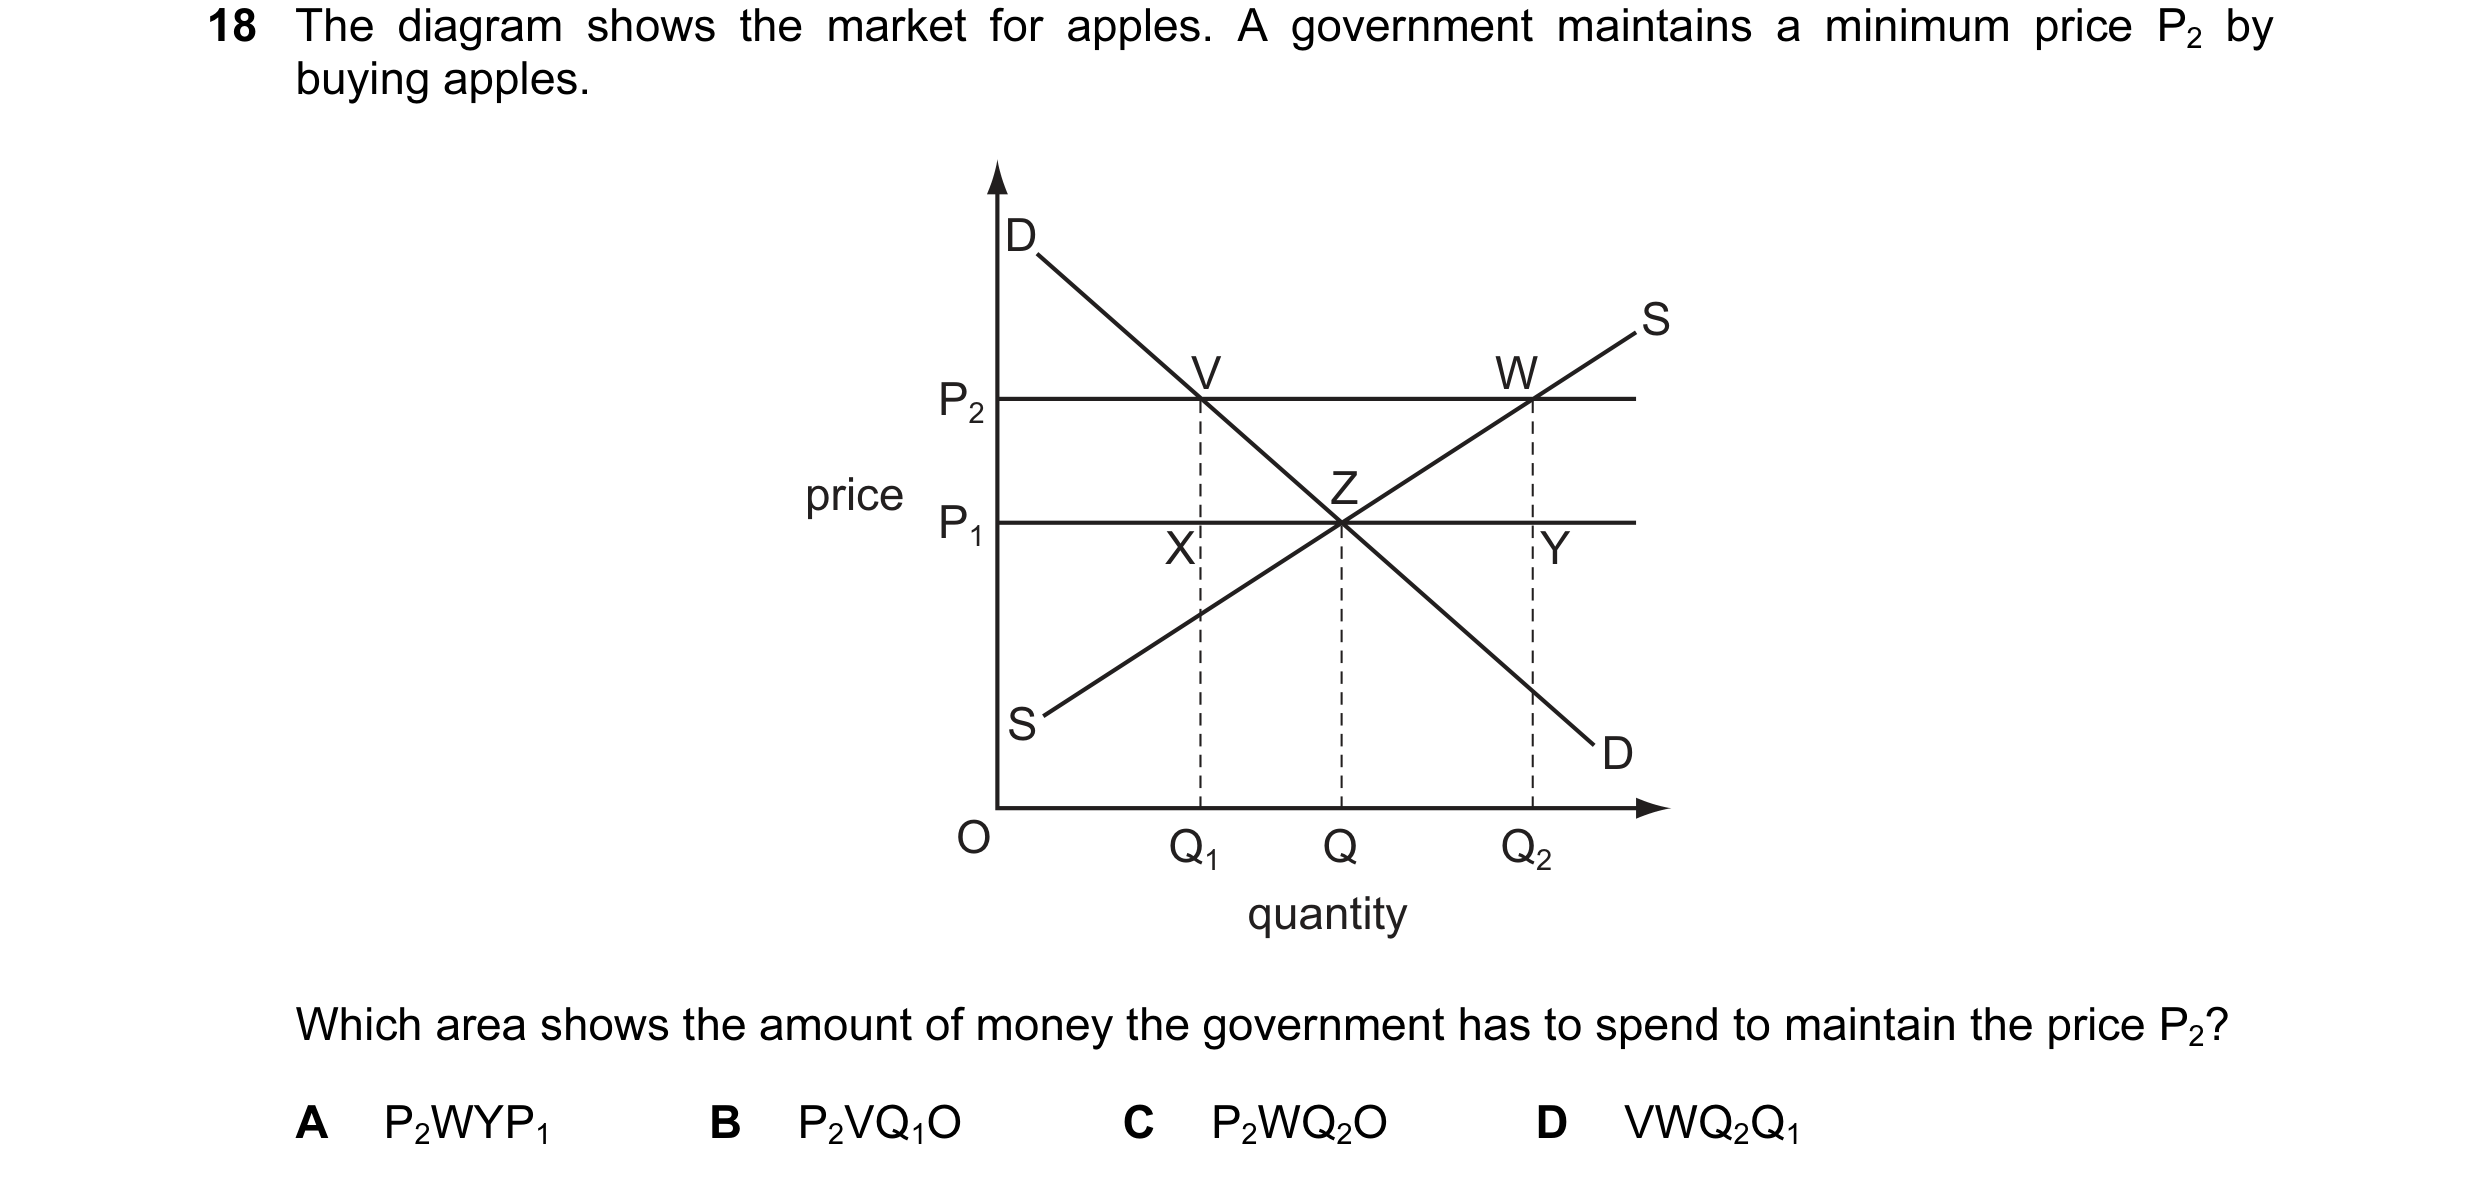
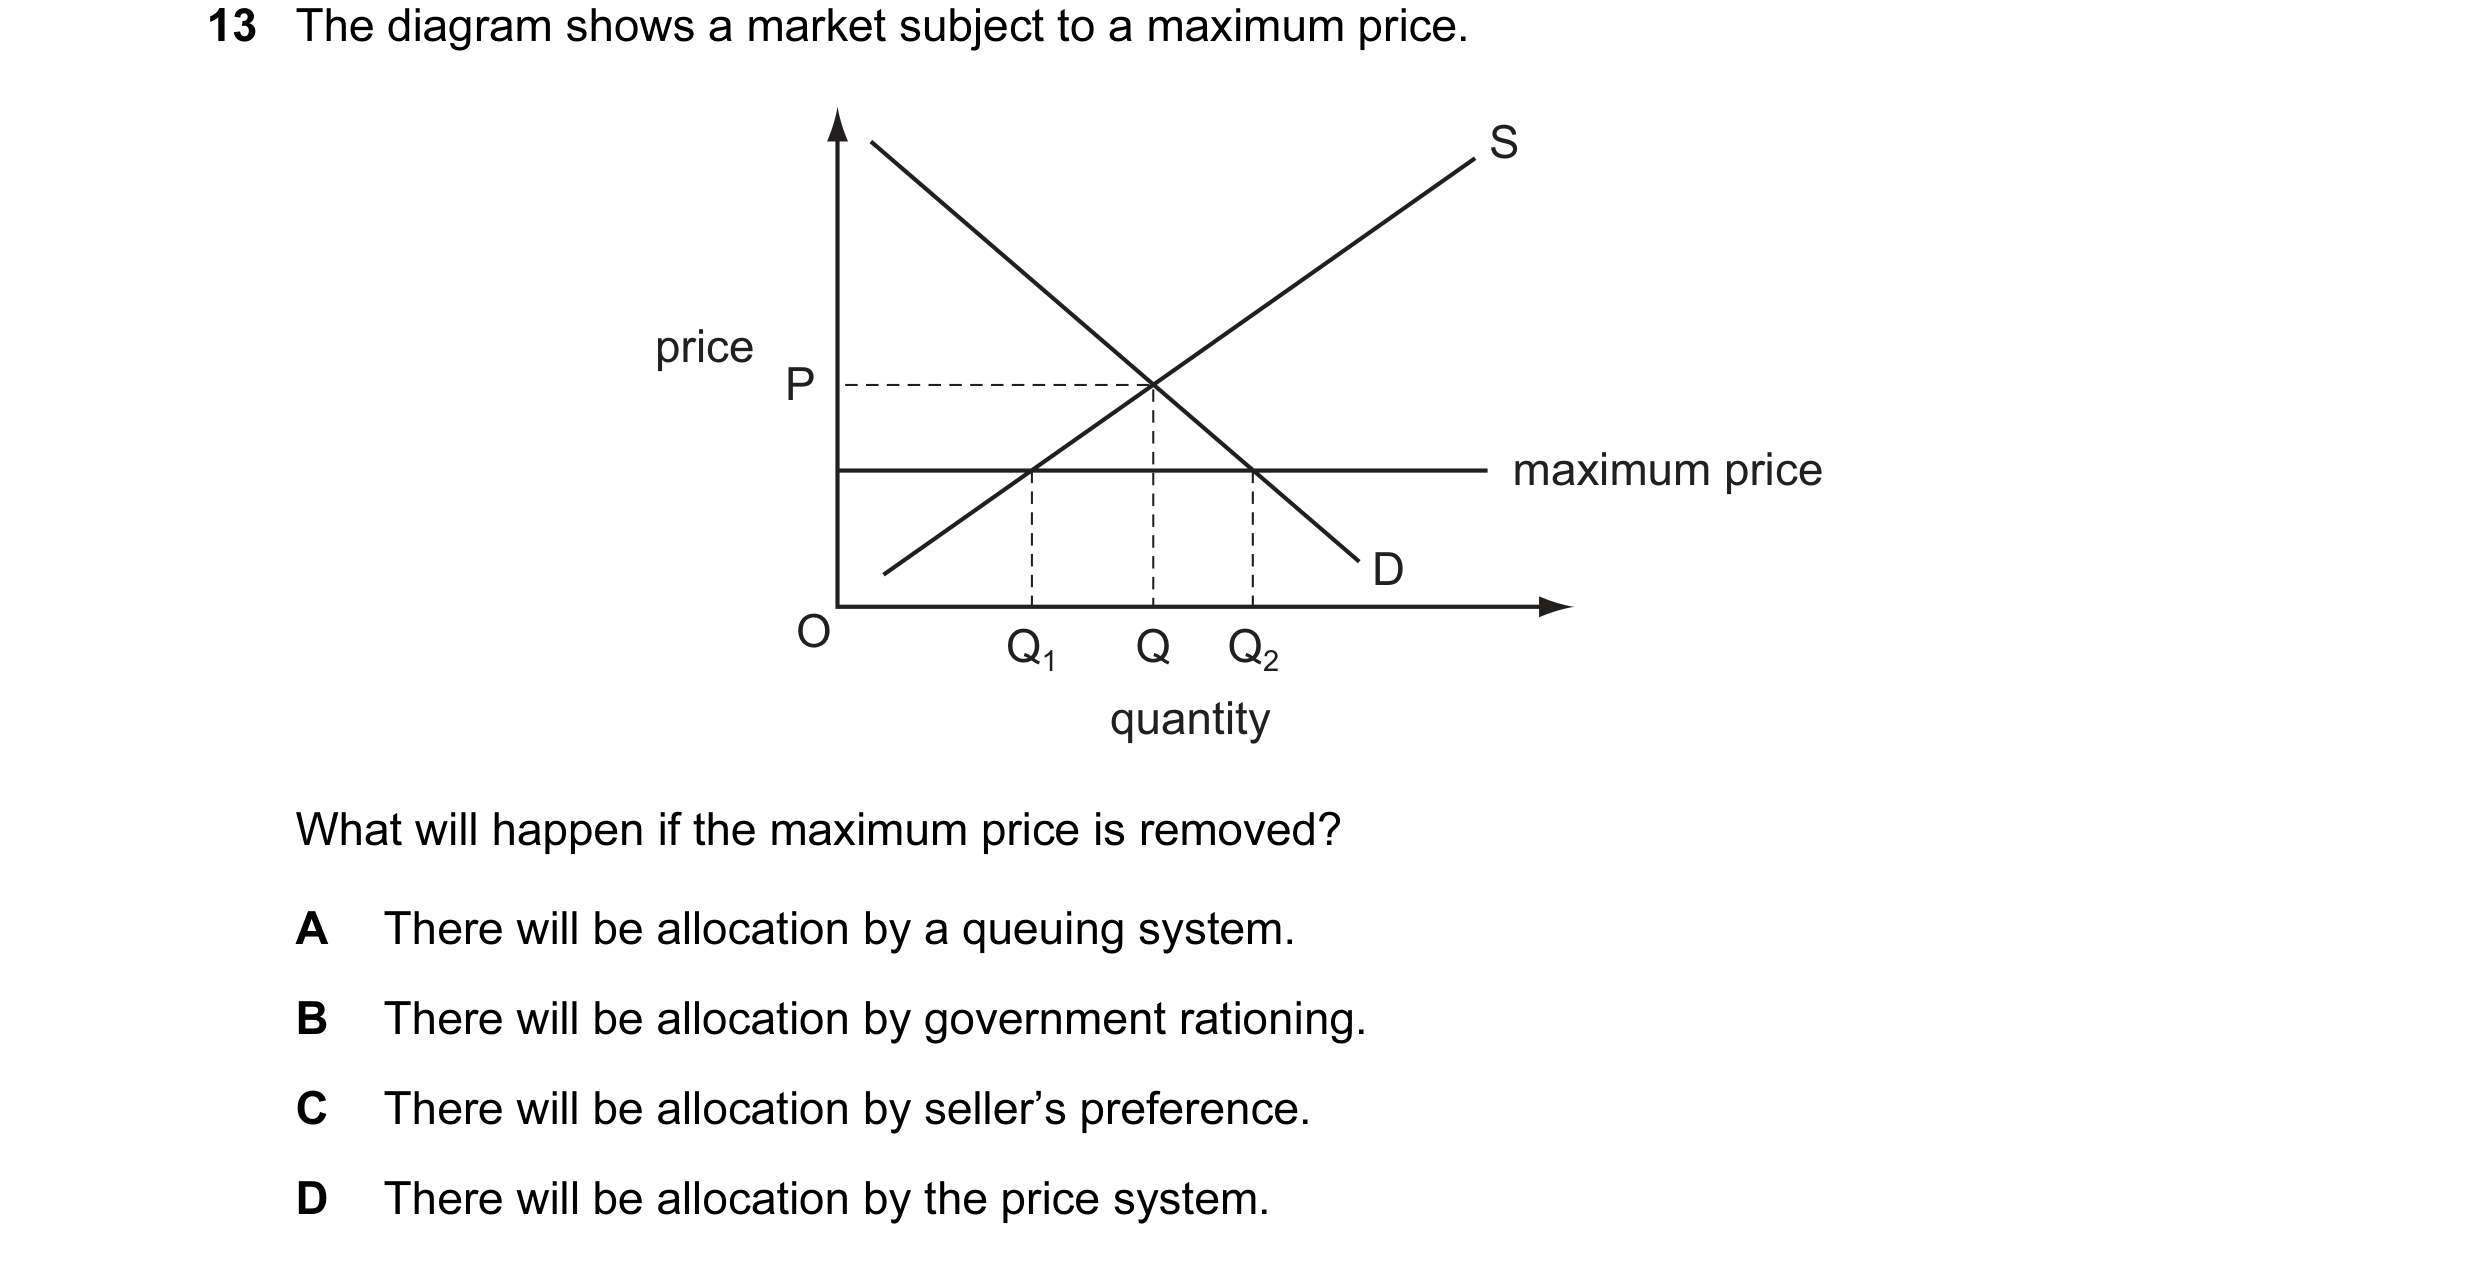
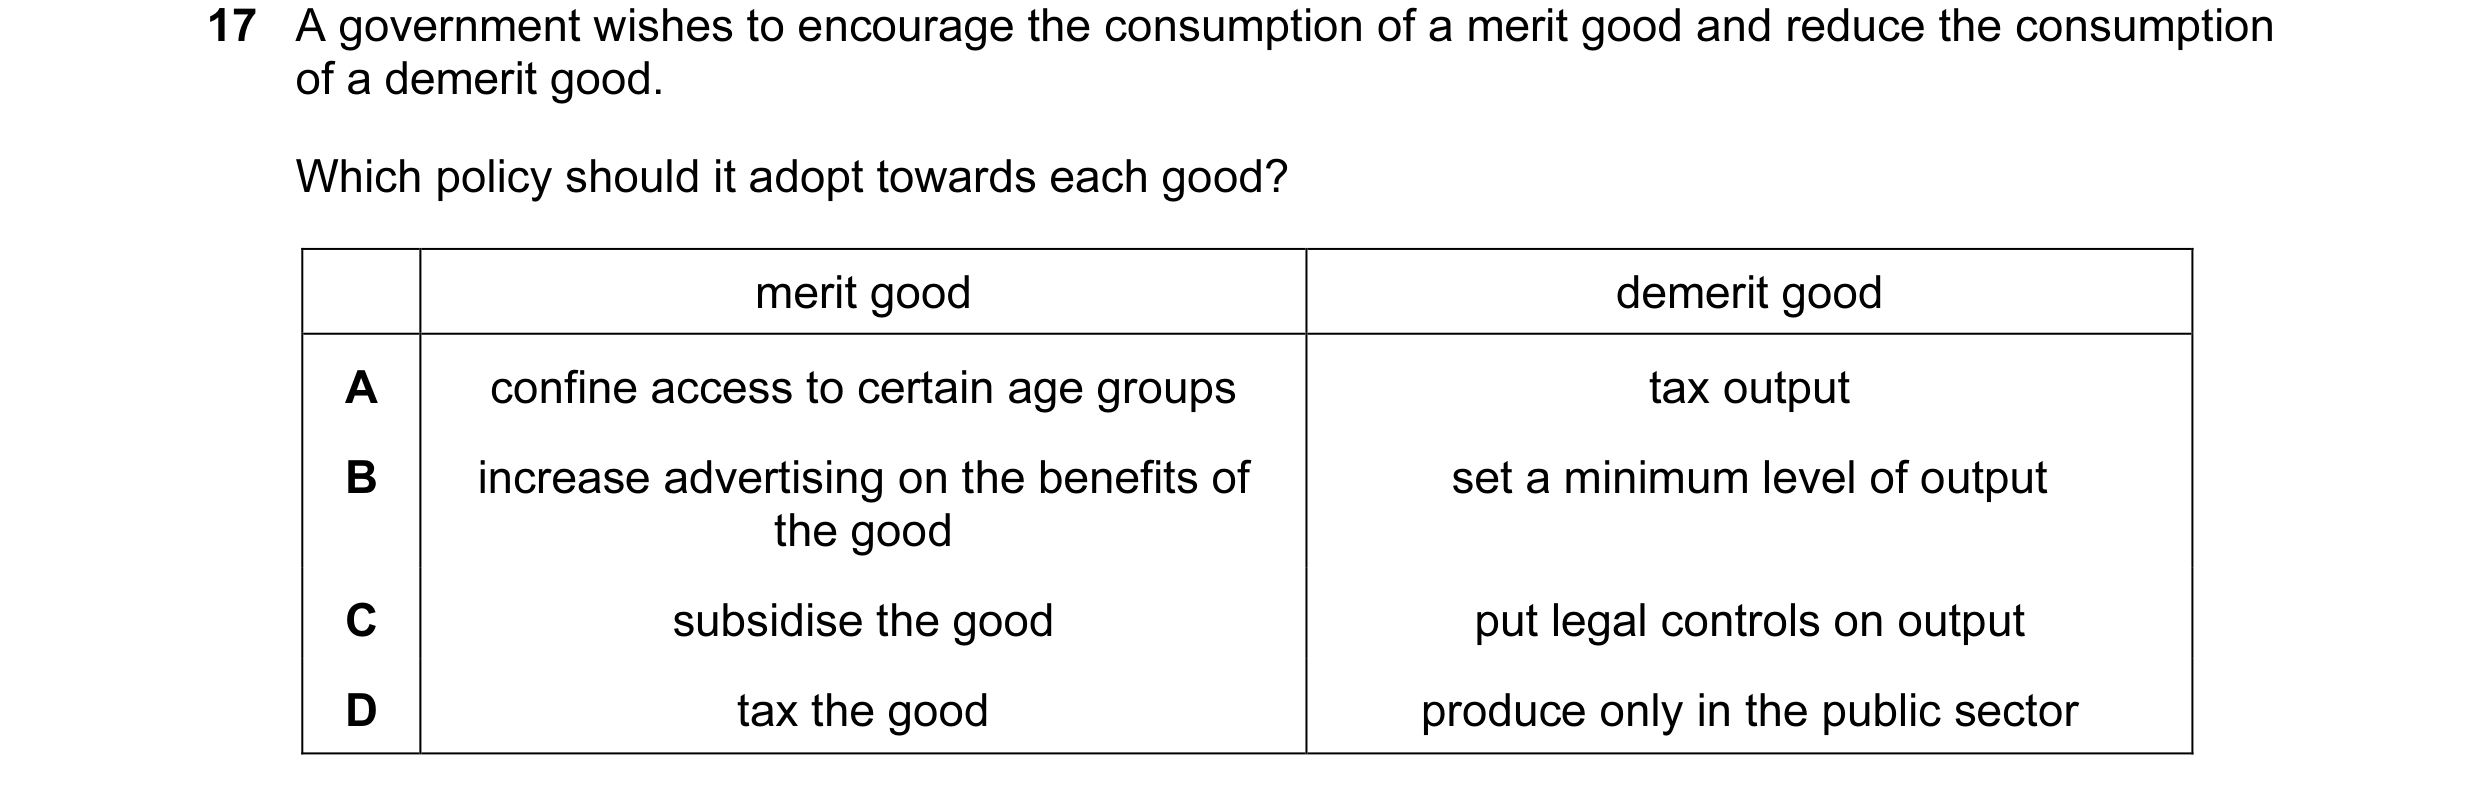 27 / 119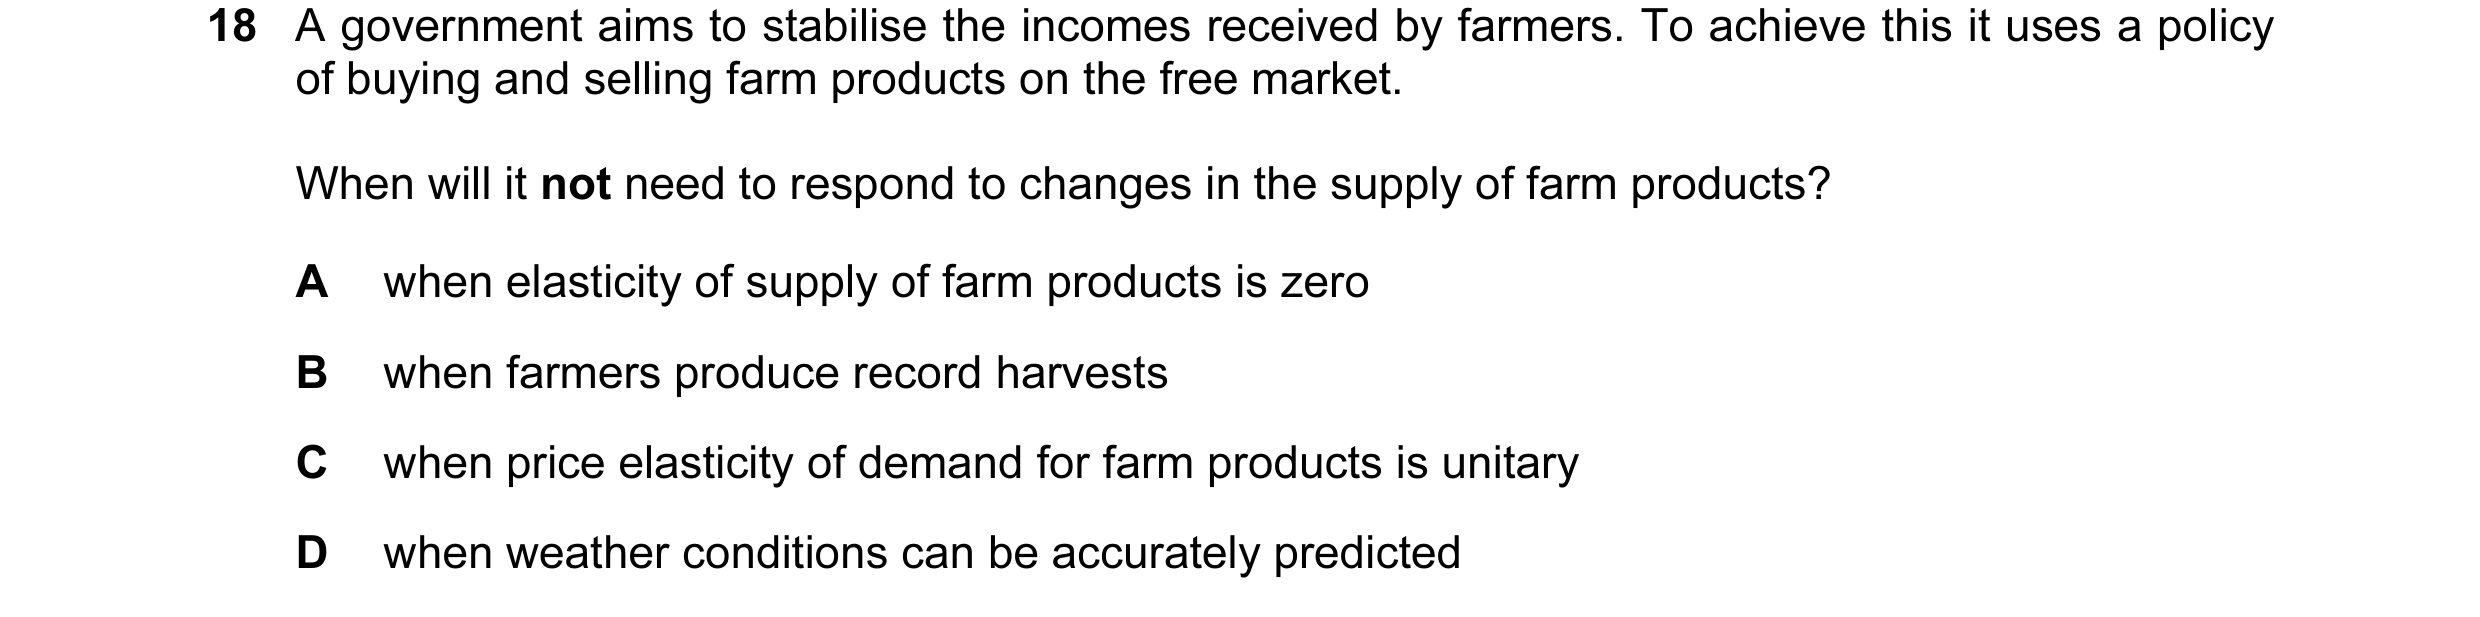
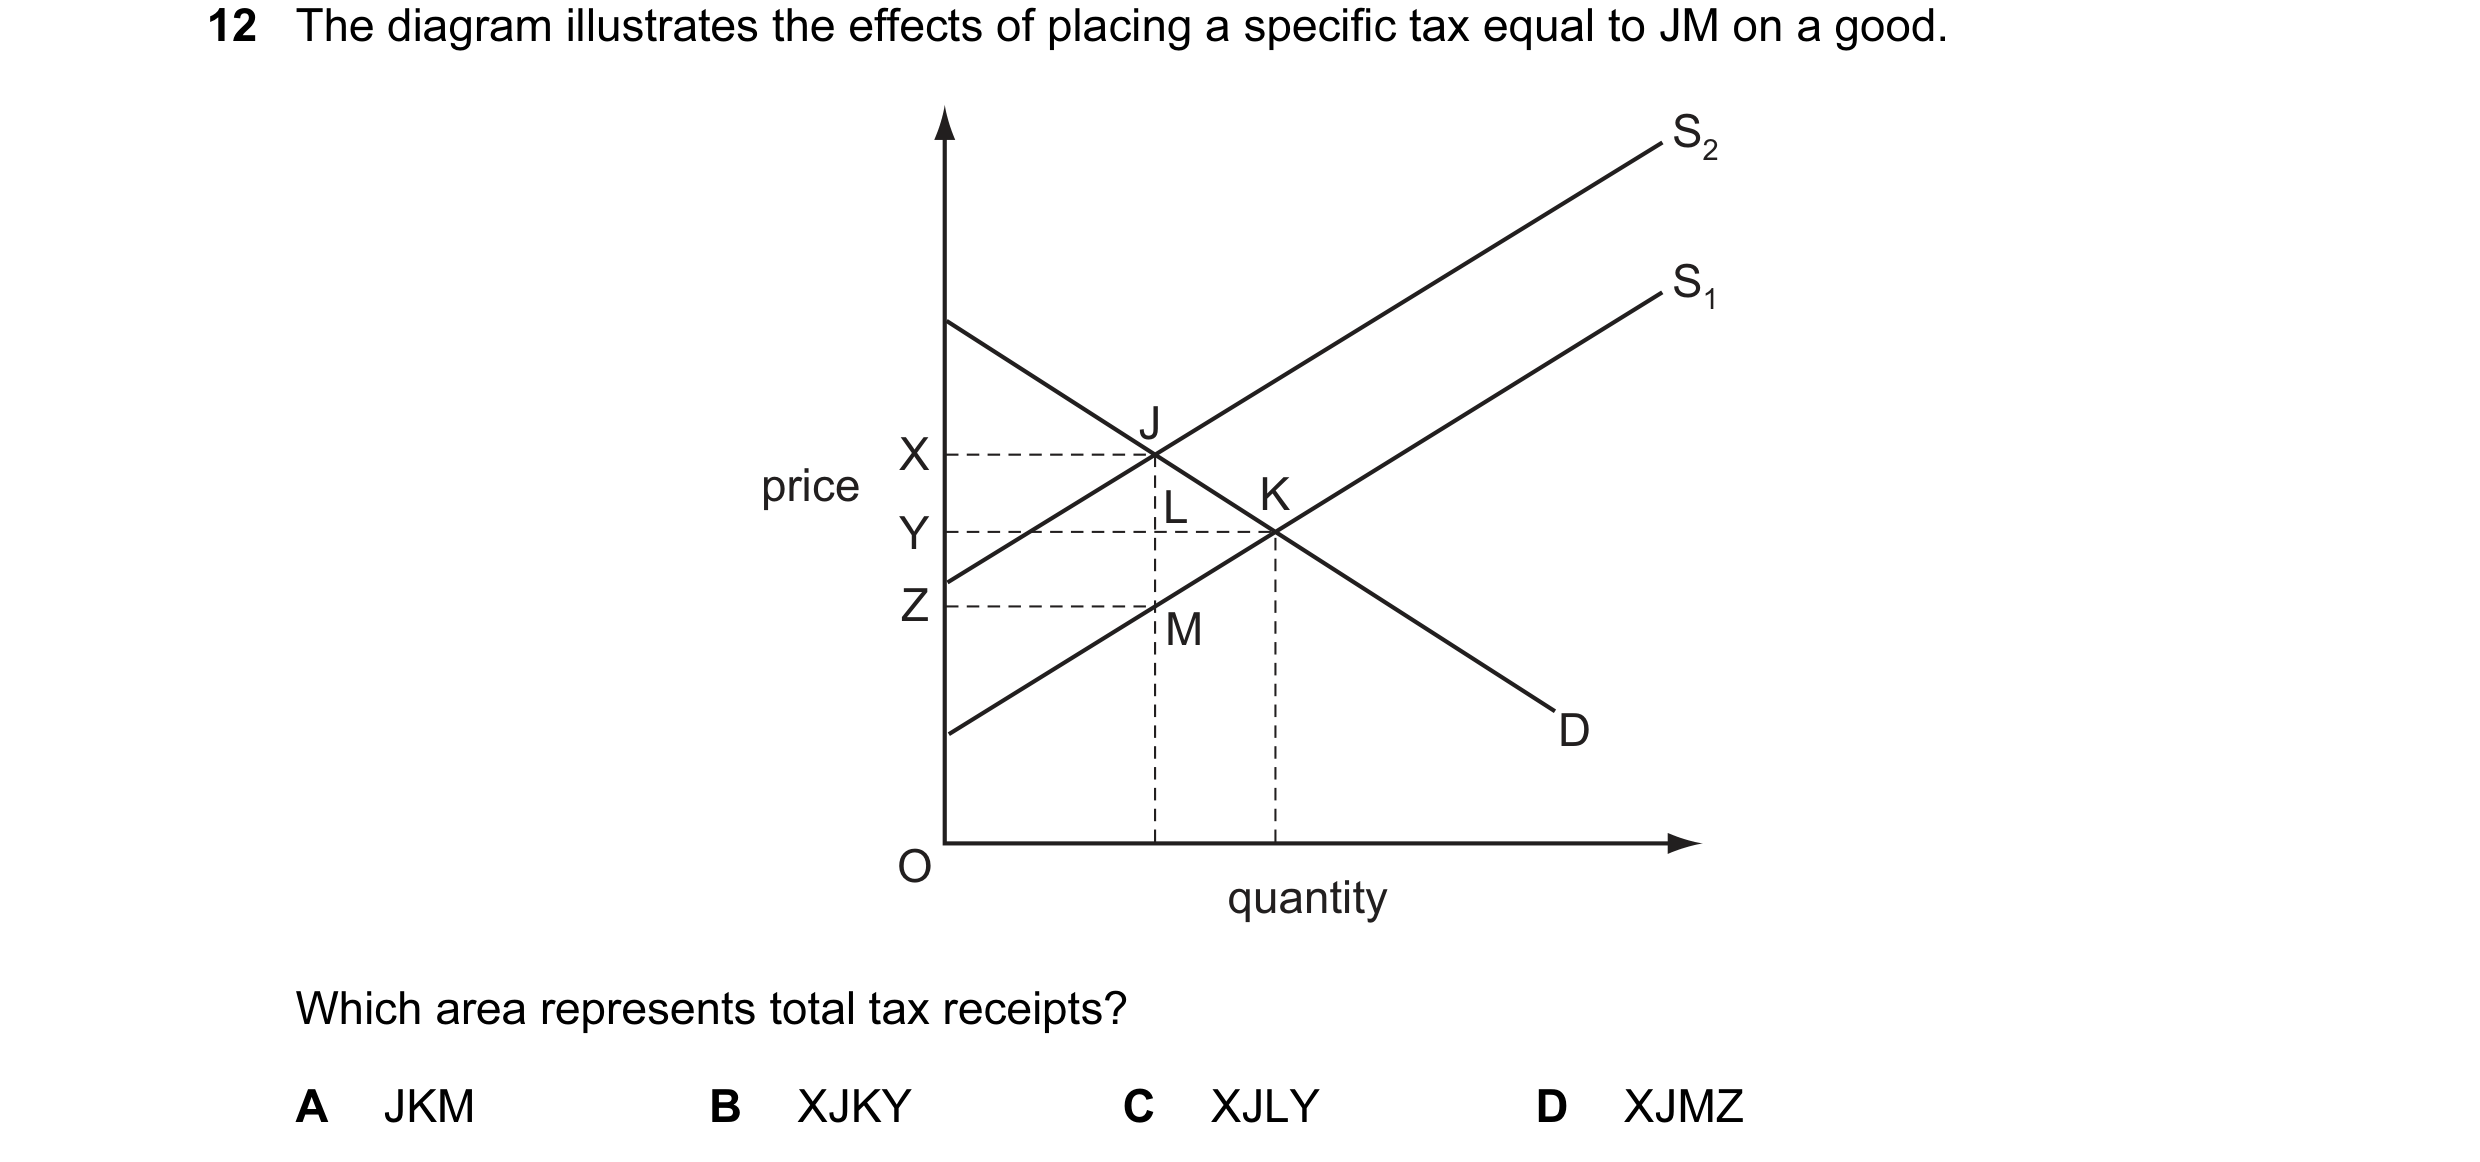
 28 / 119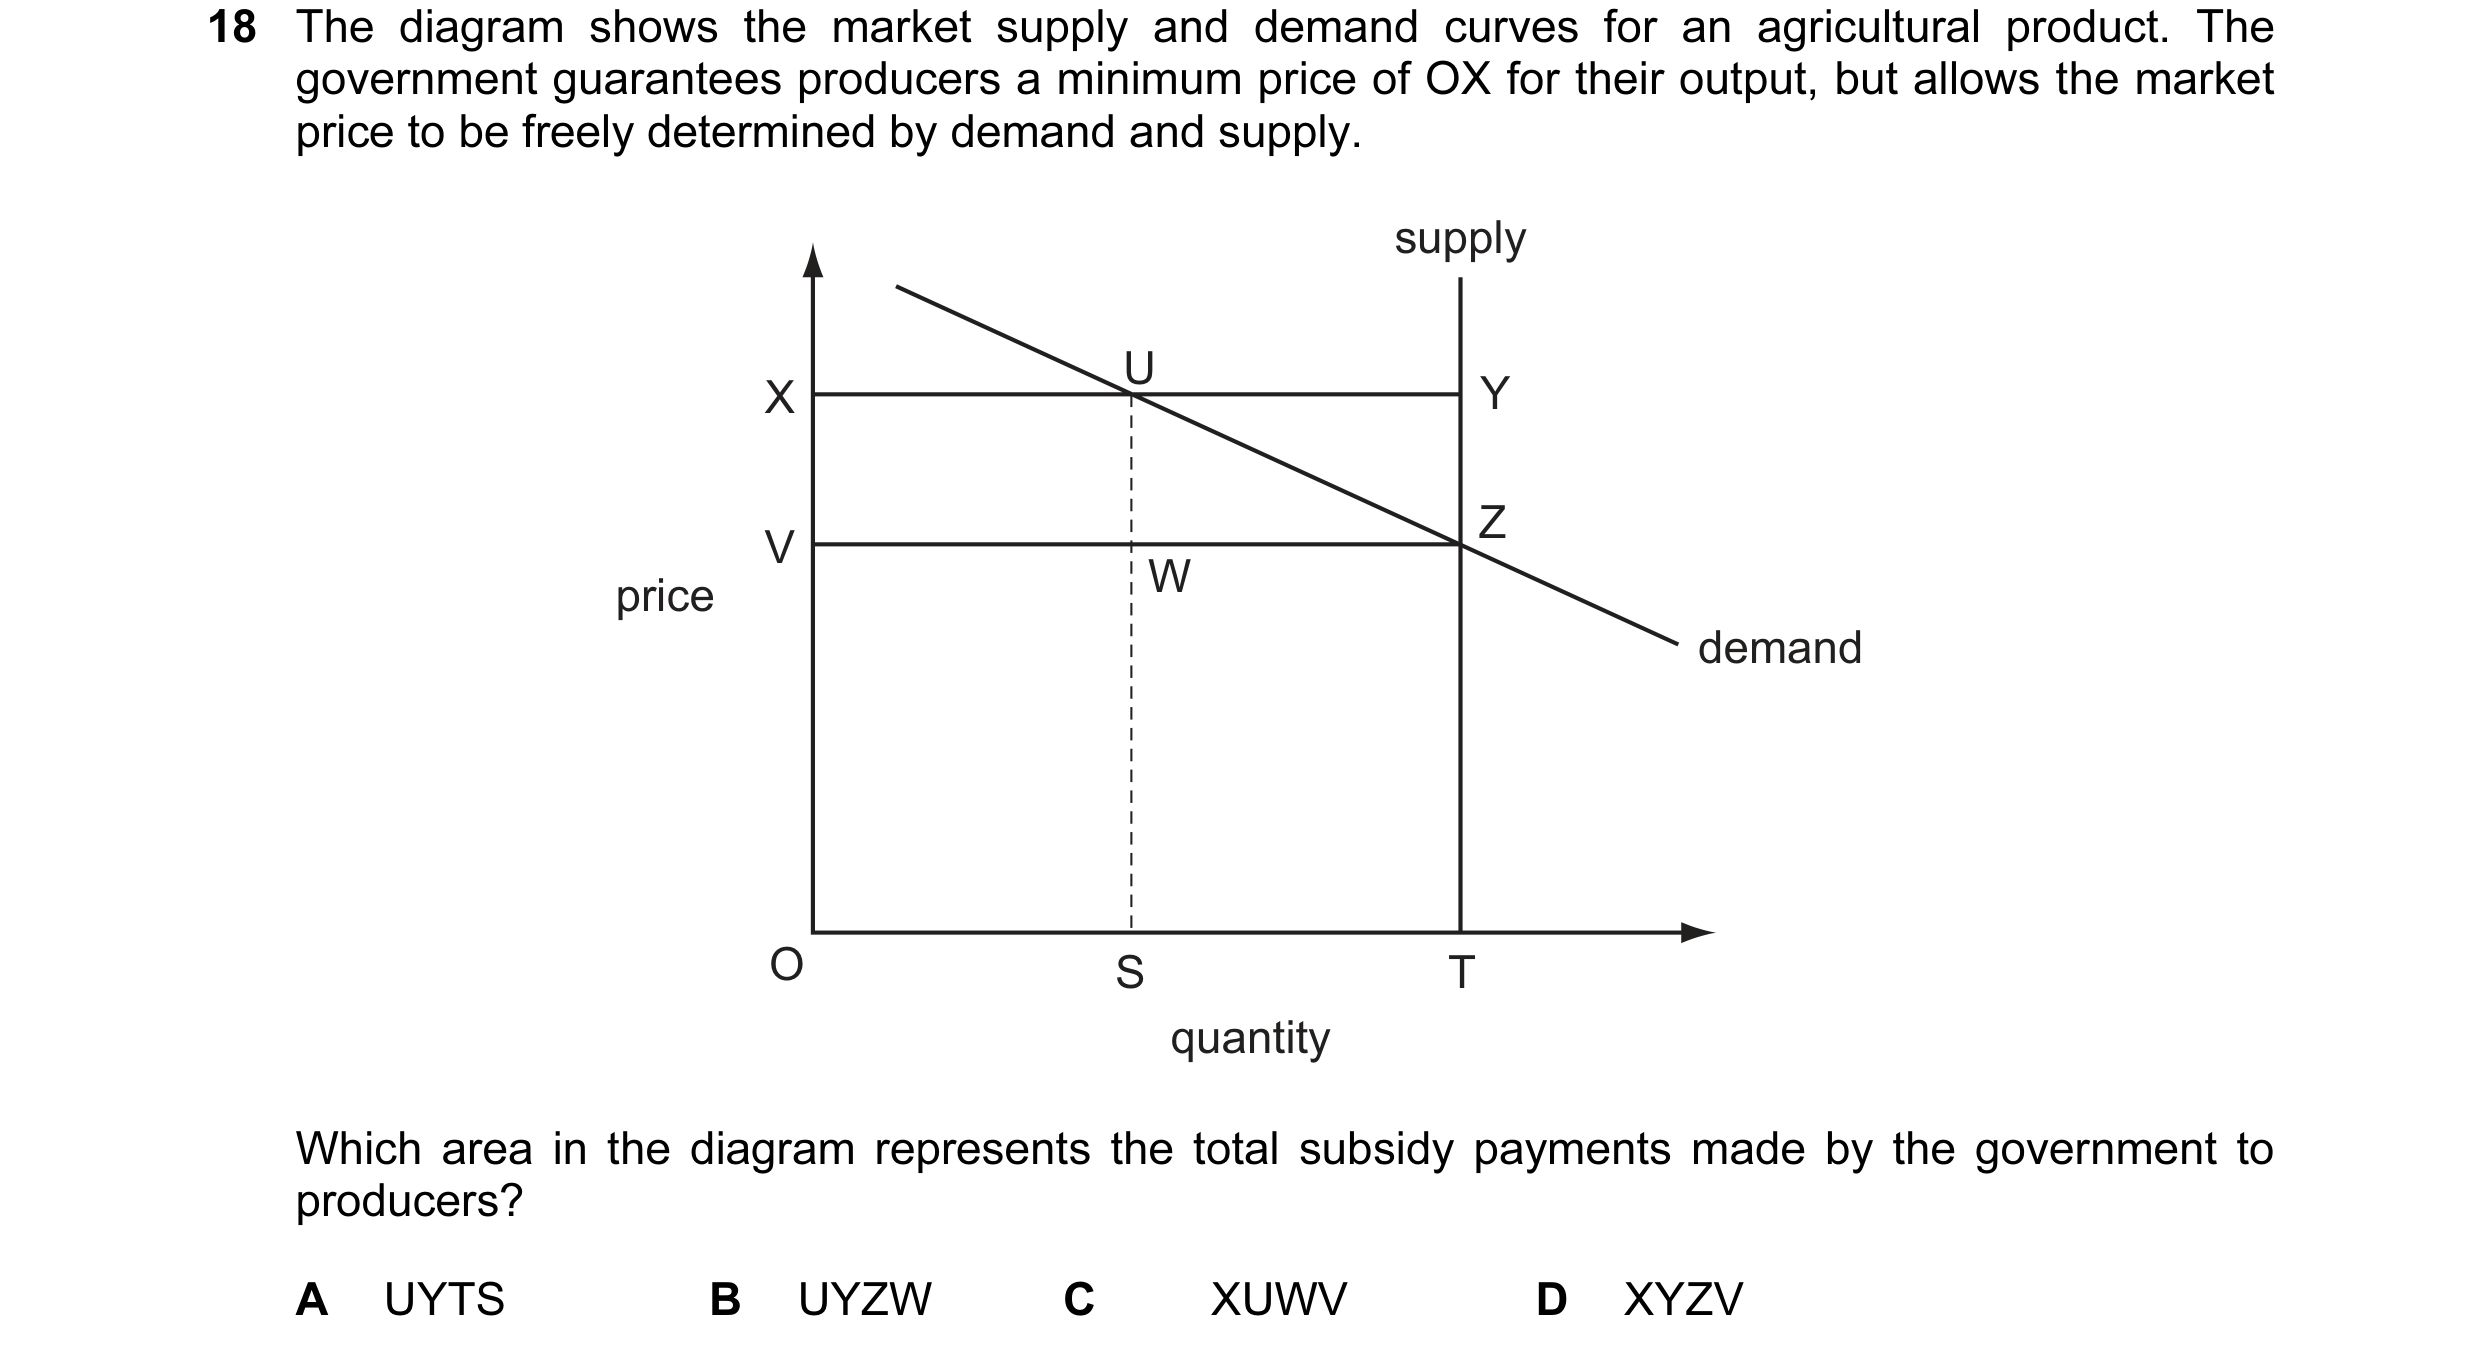
 29 / 119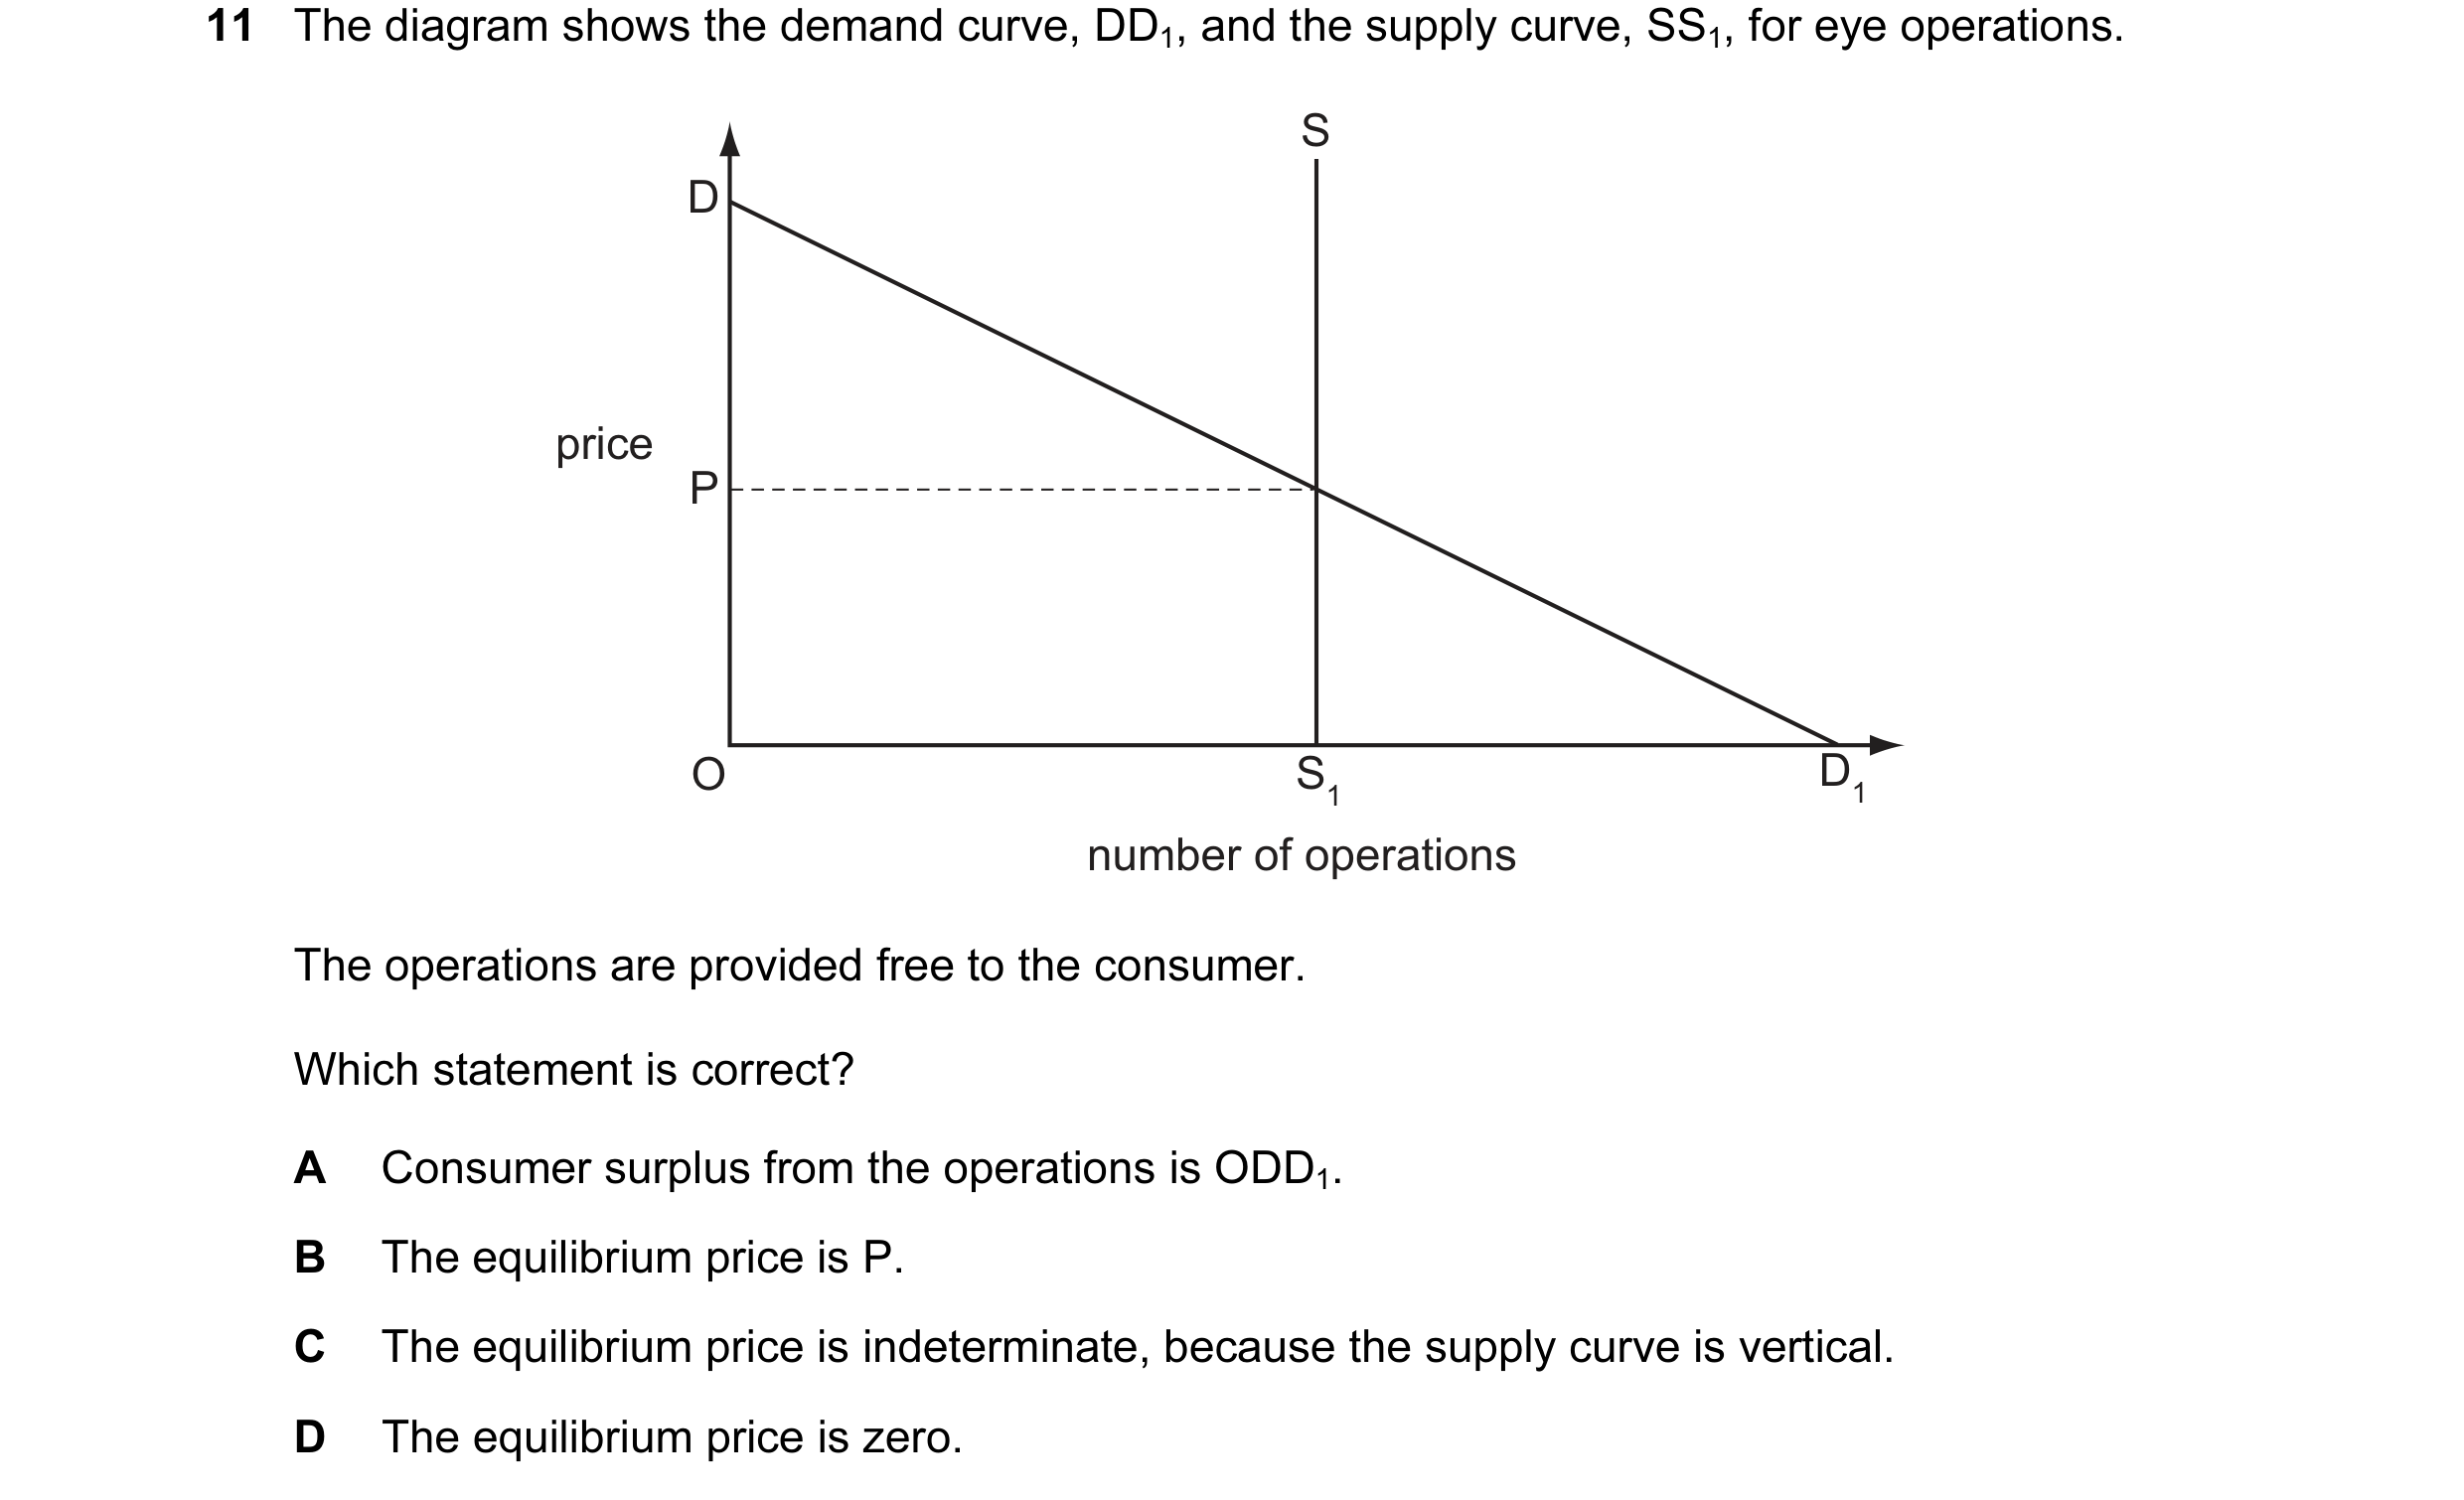
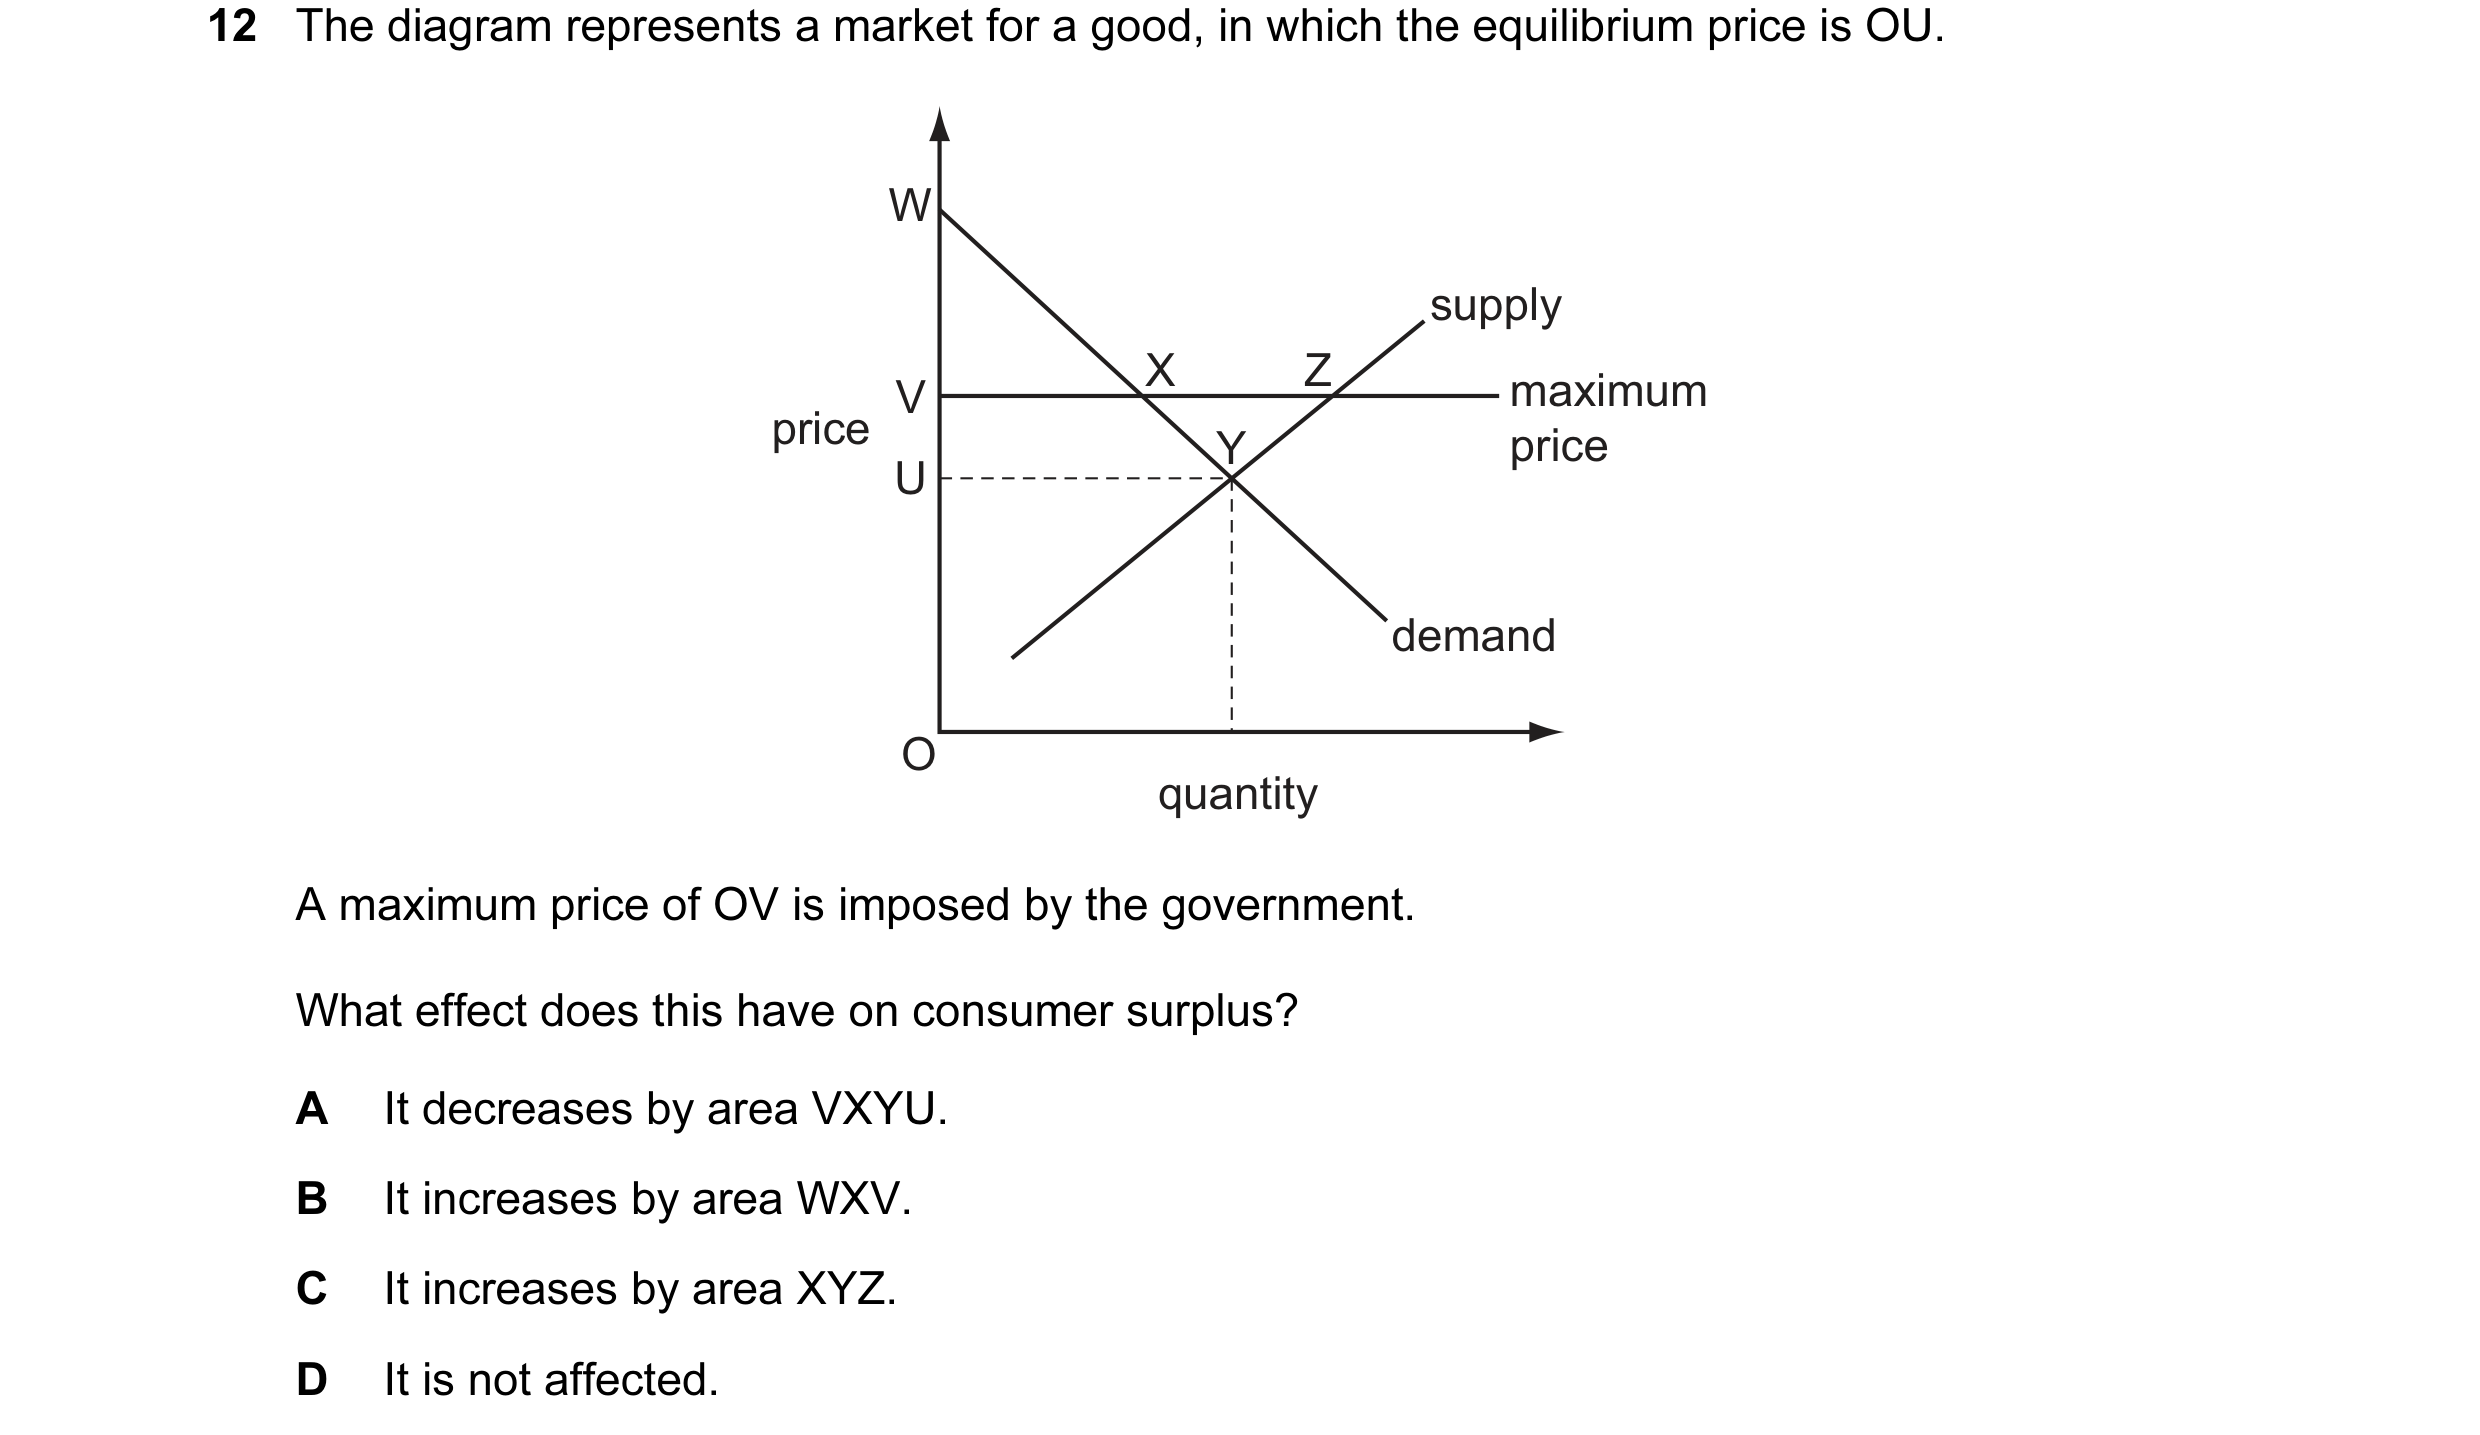
 30 / 119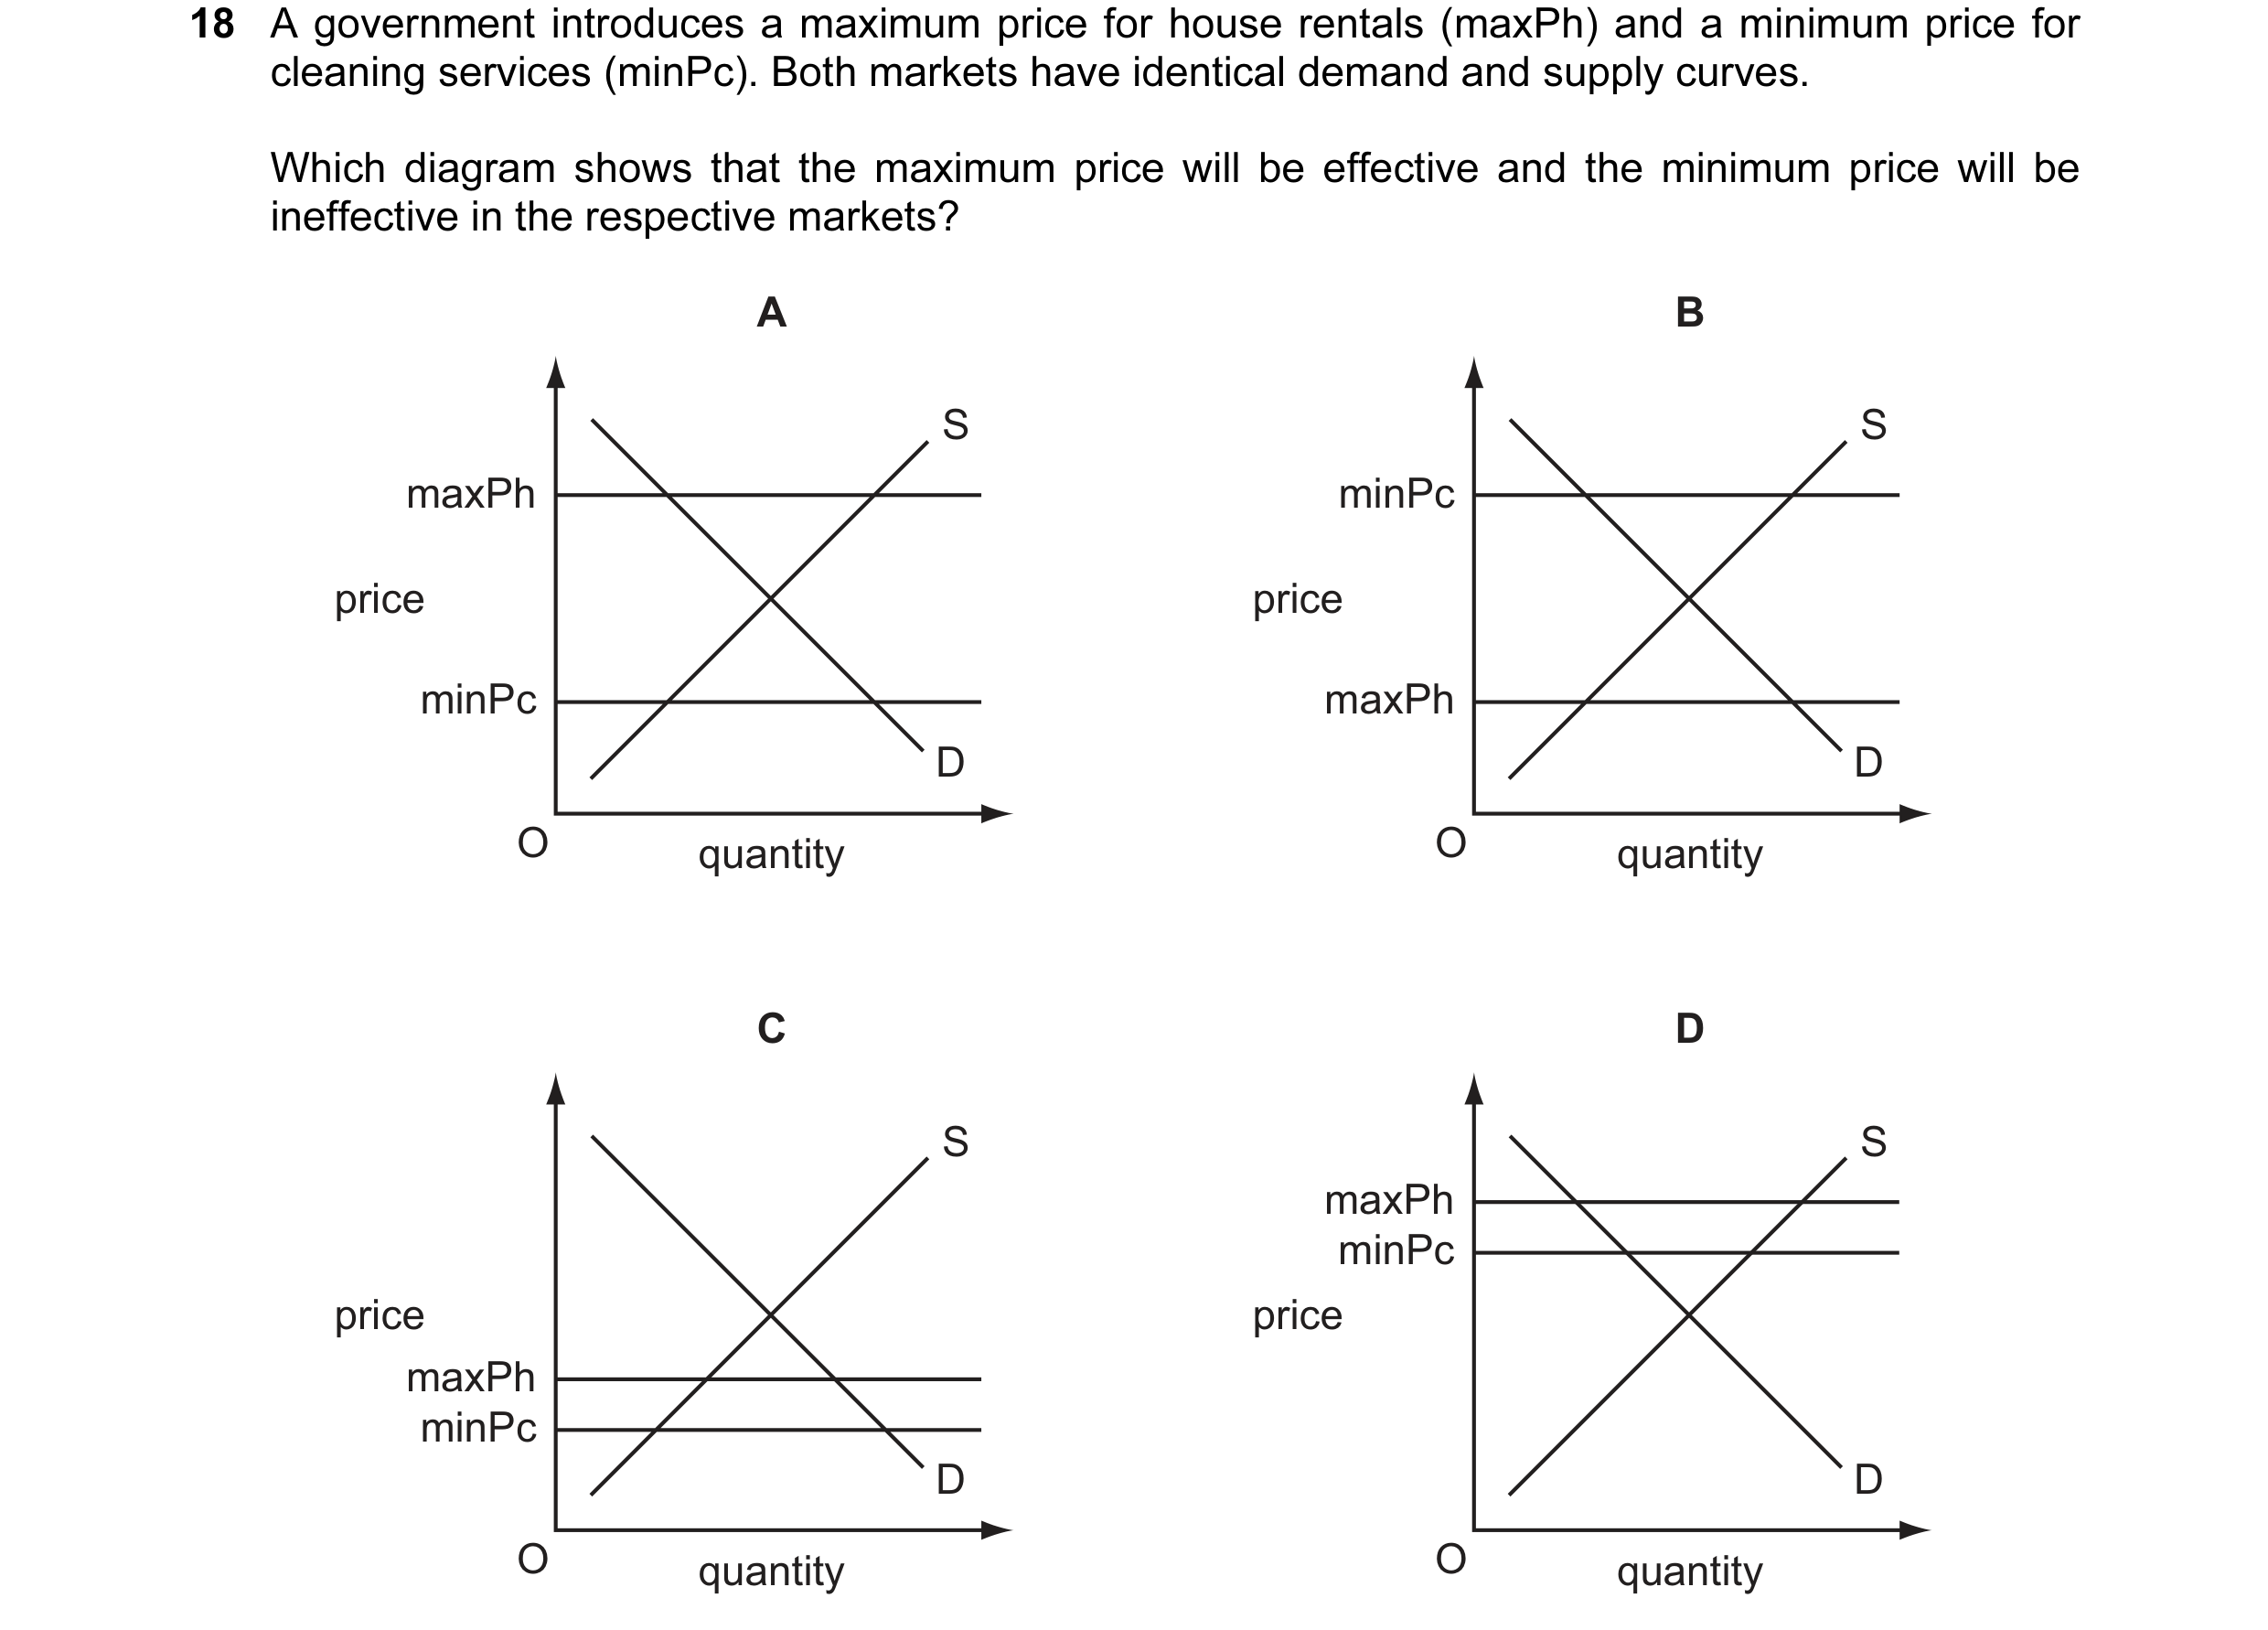
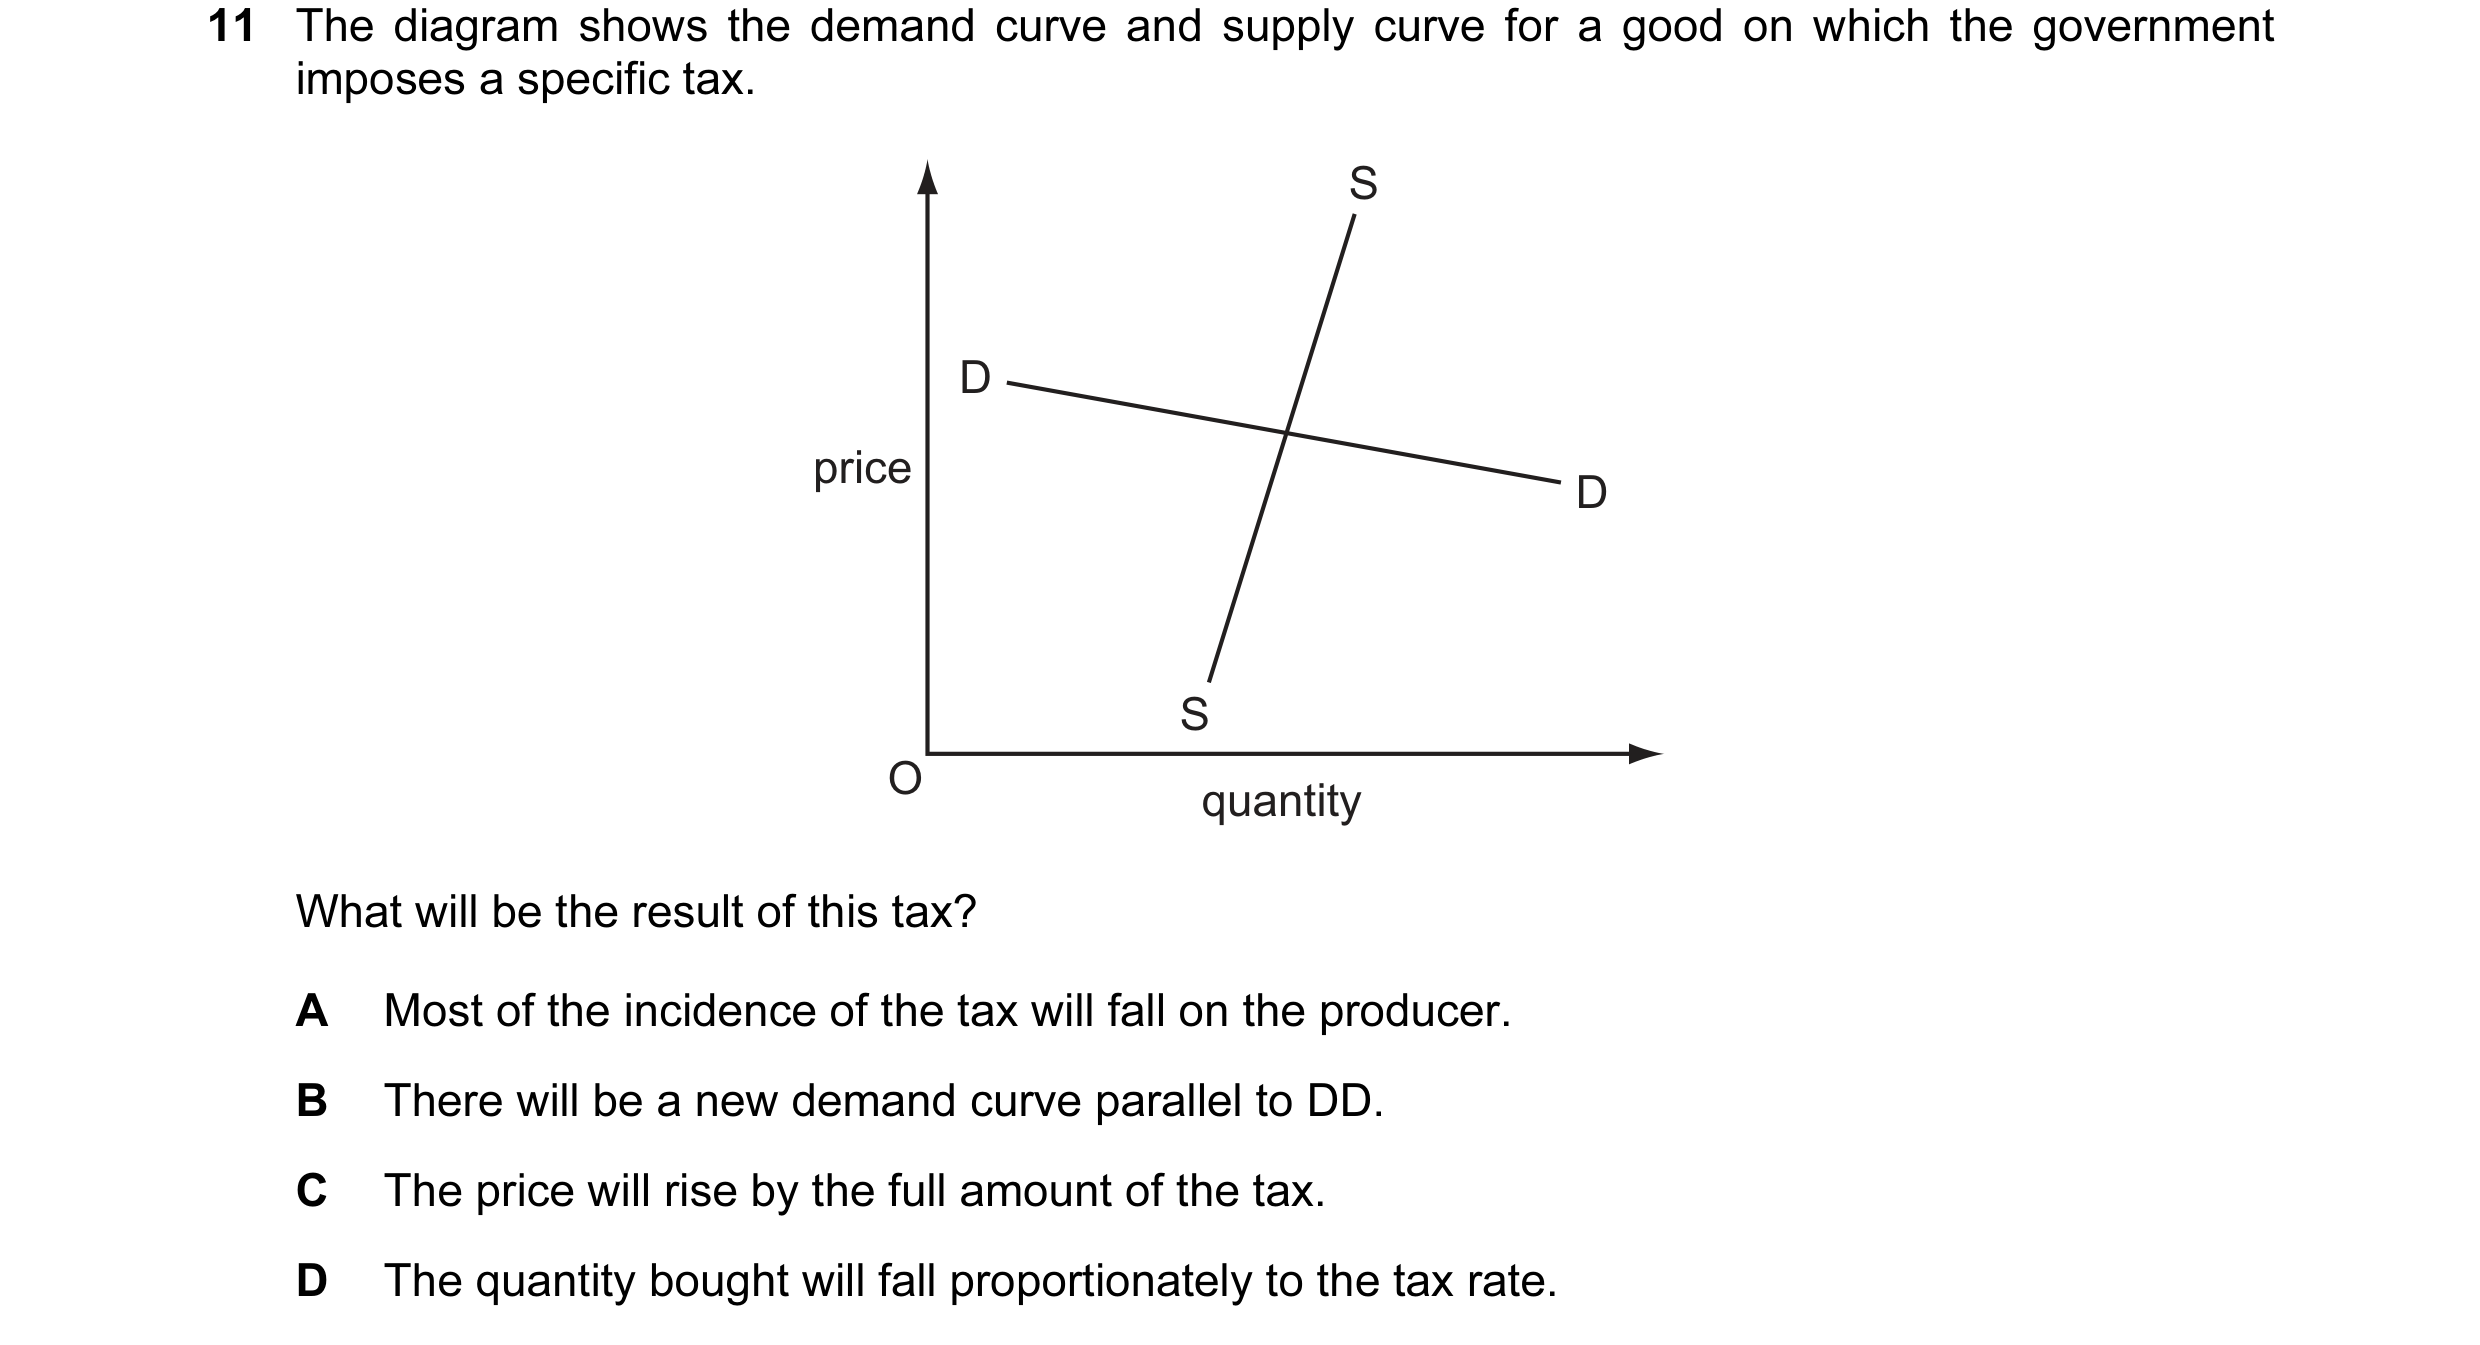 31 / 119
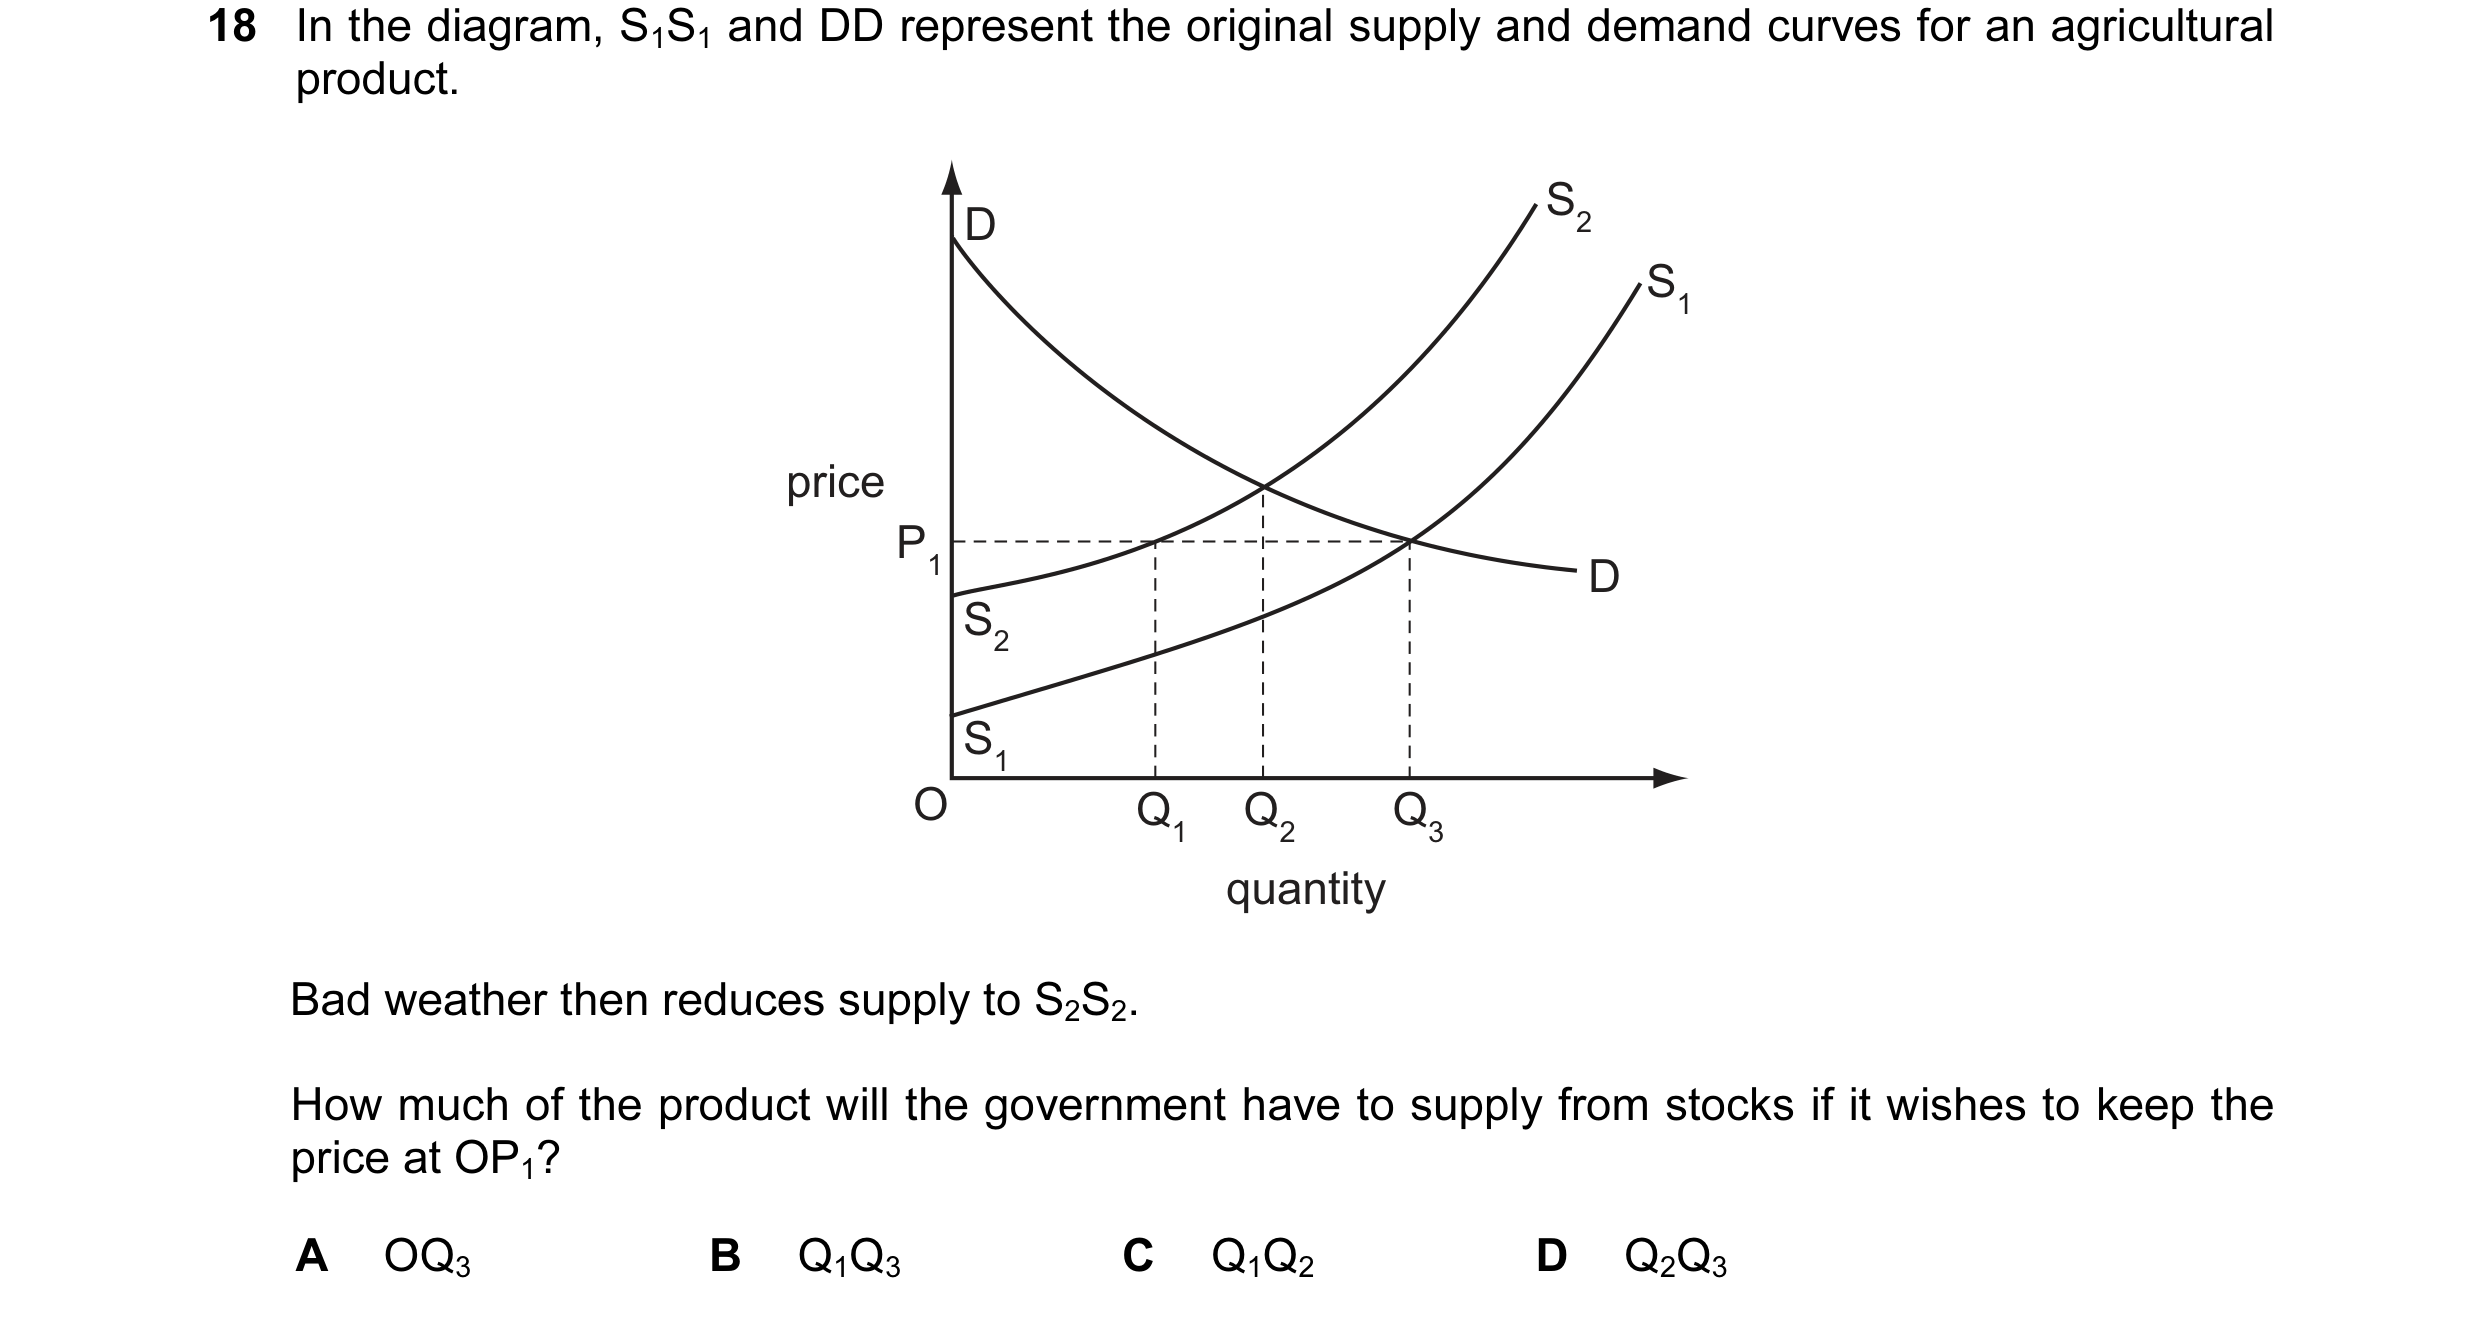
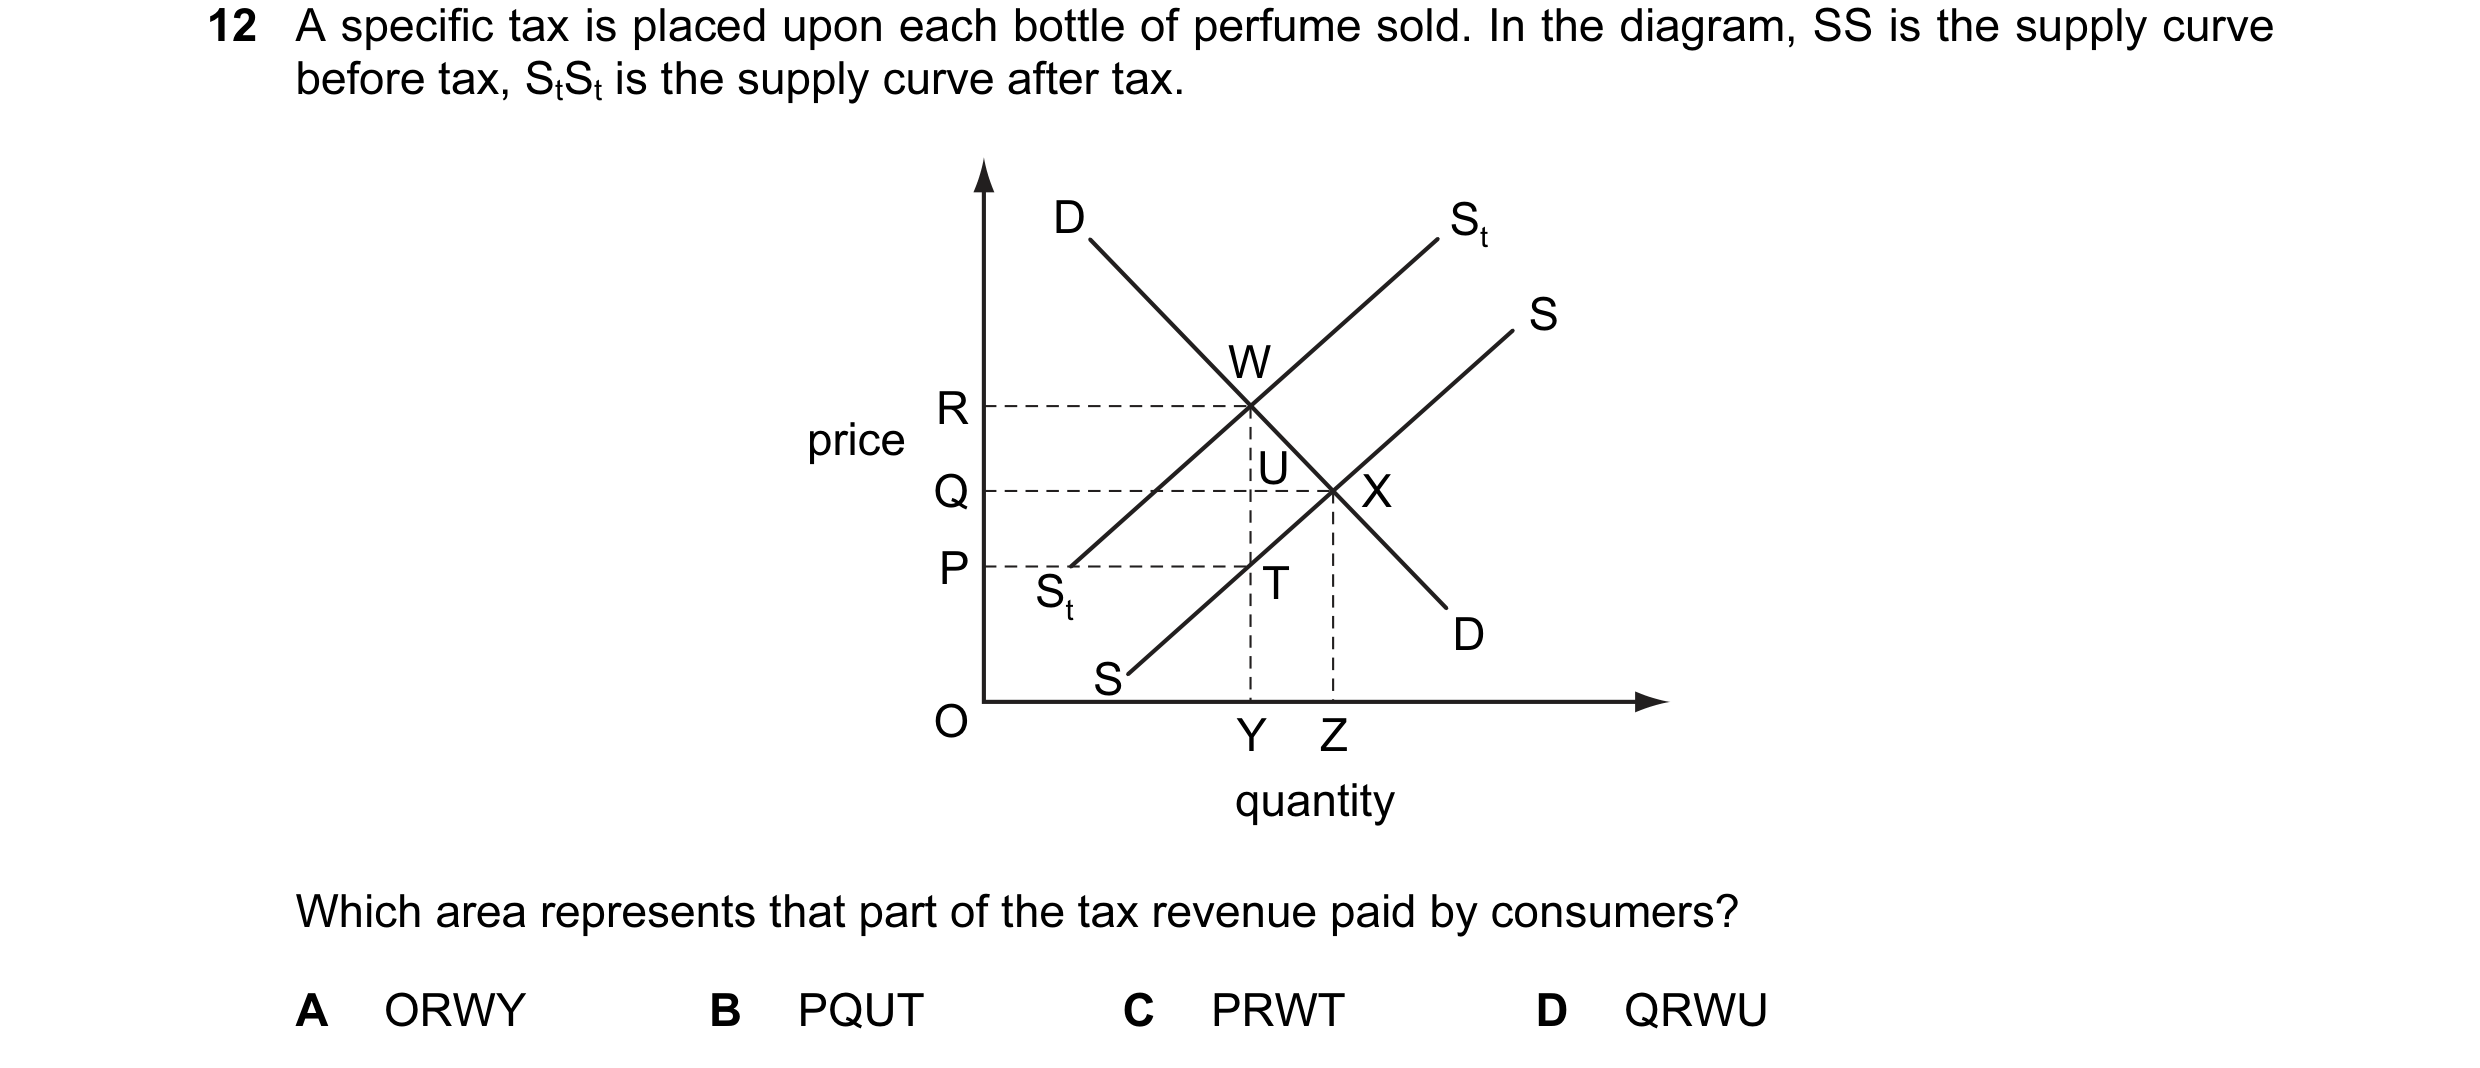 32 / 119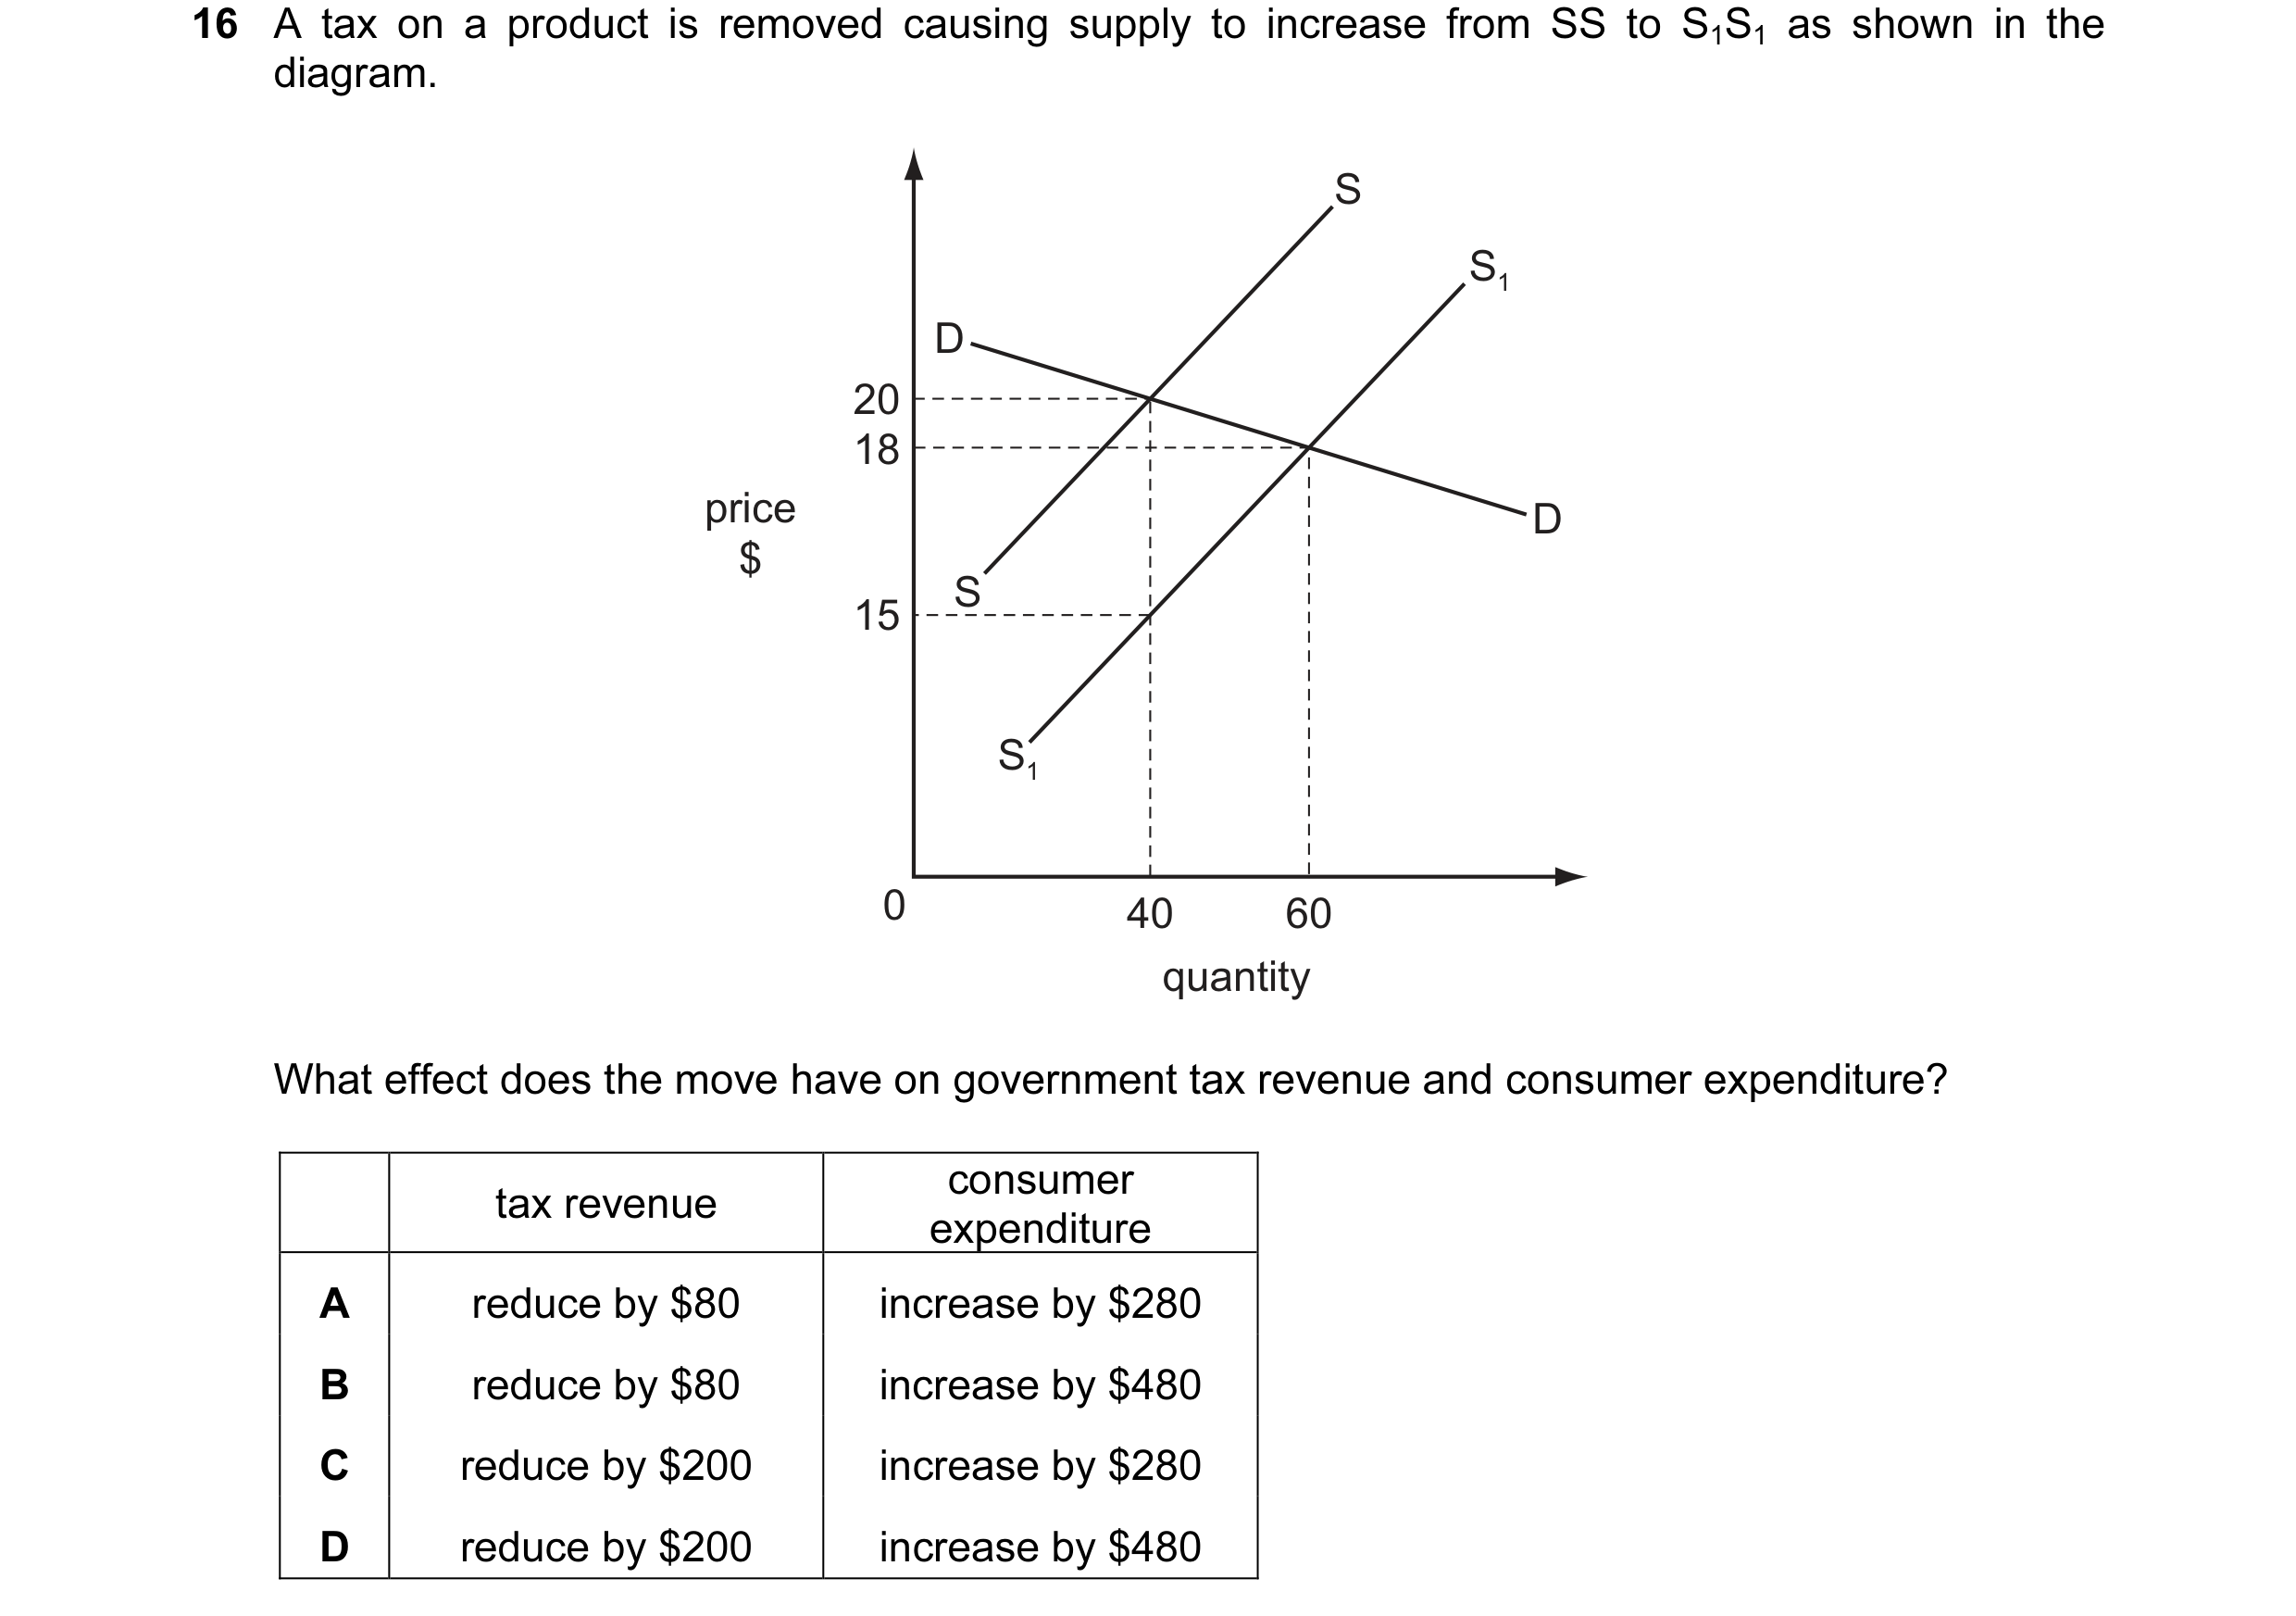
 33 / 119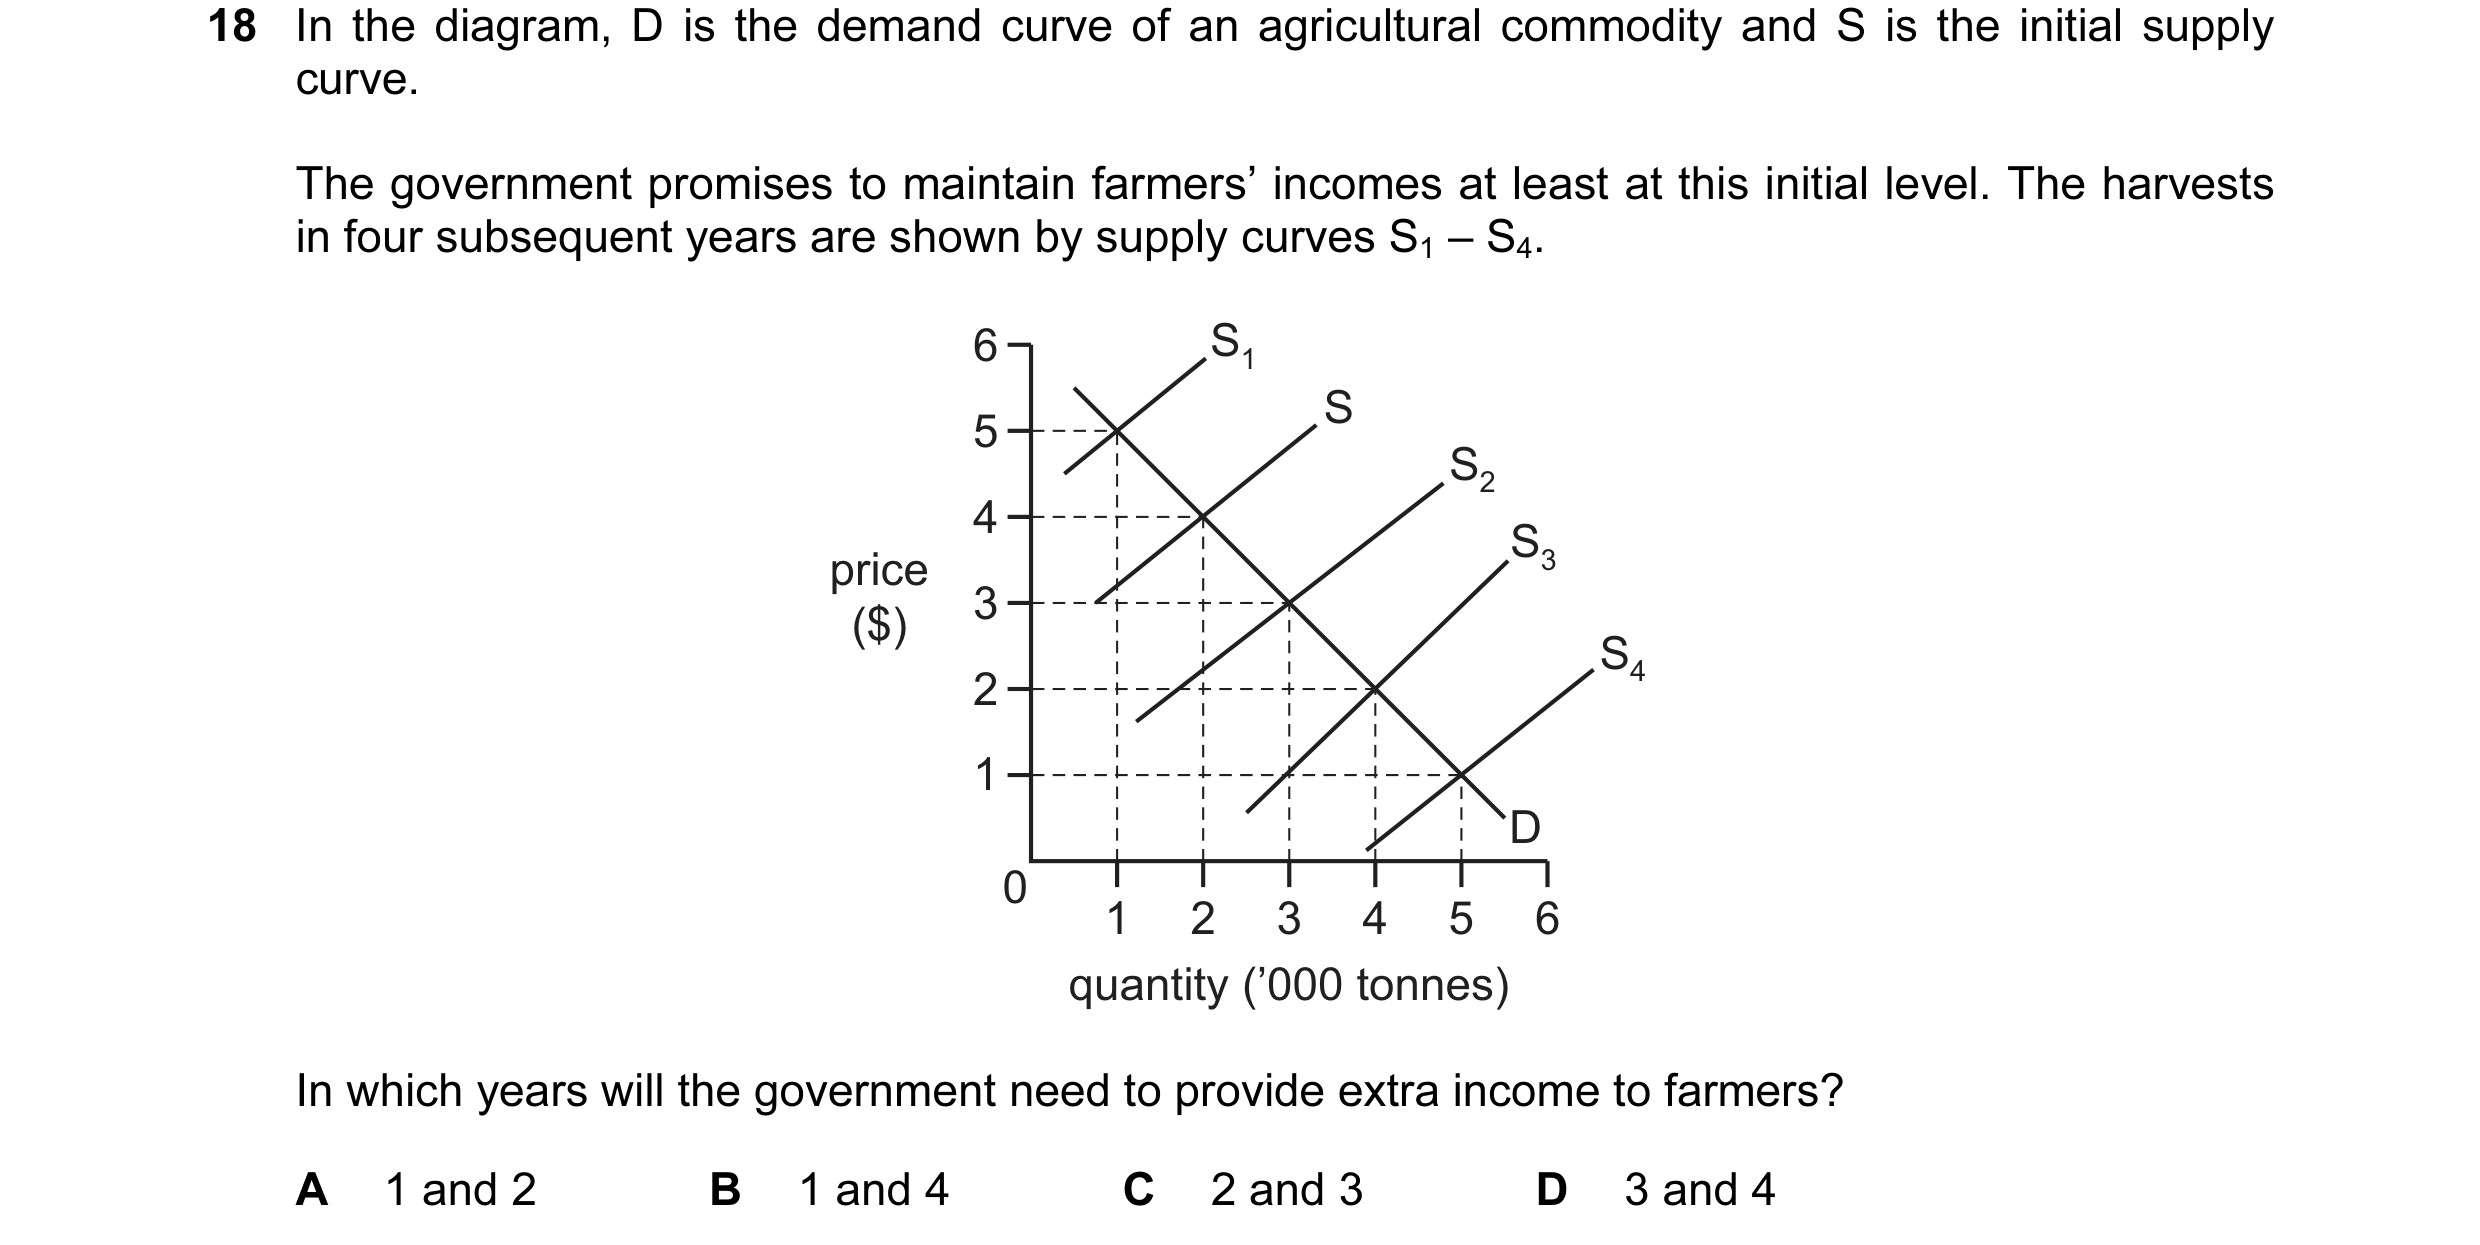
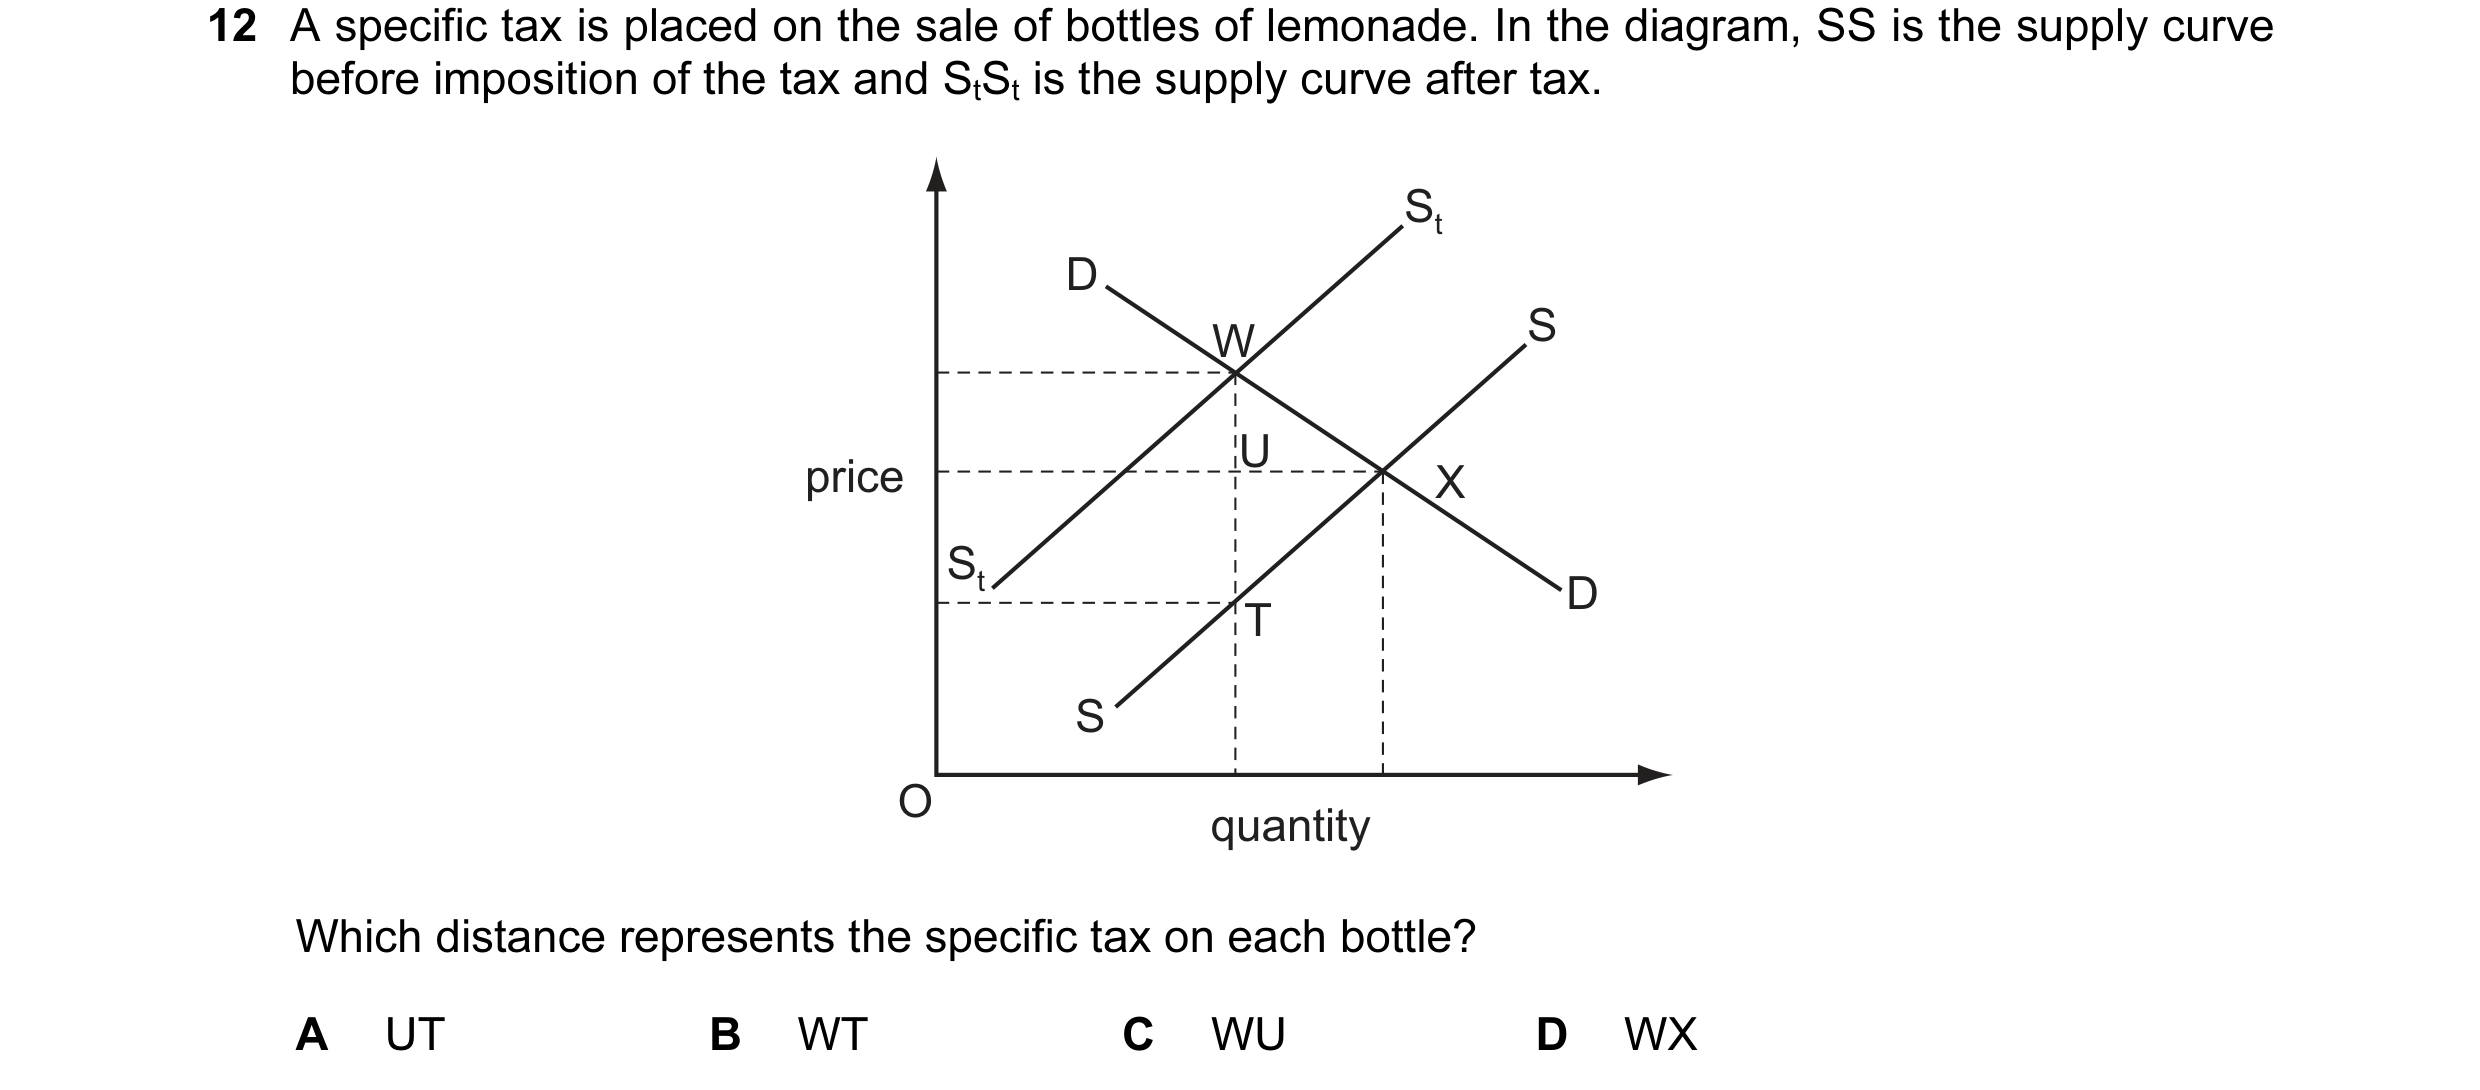 34 / 119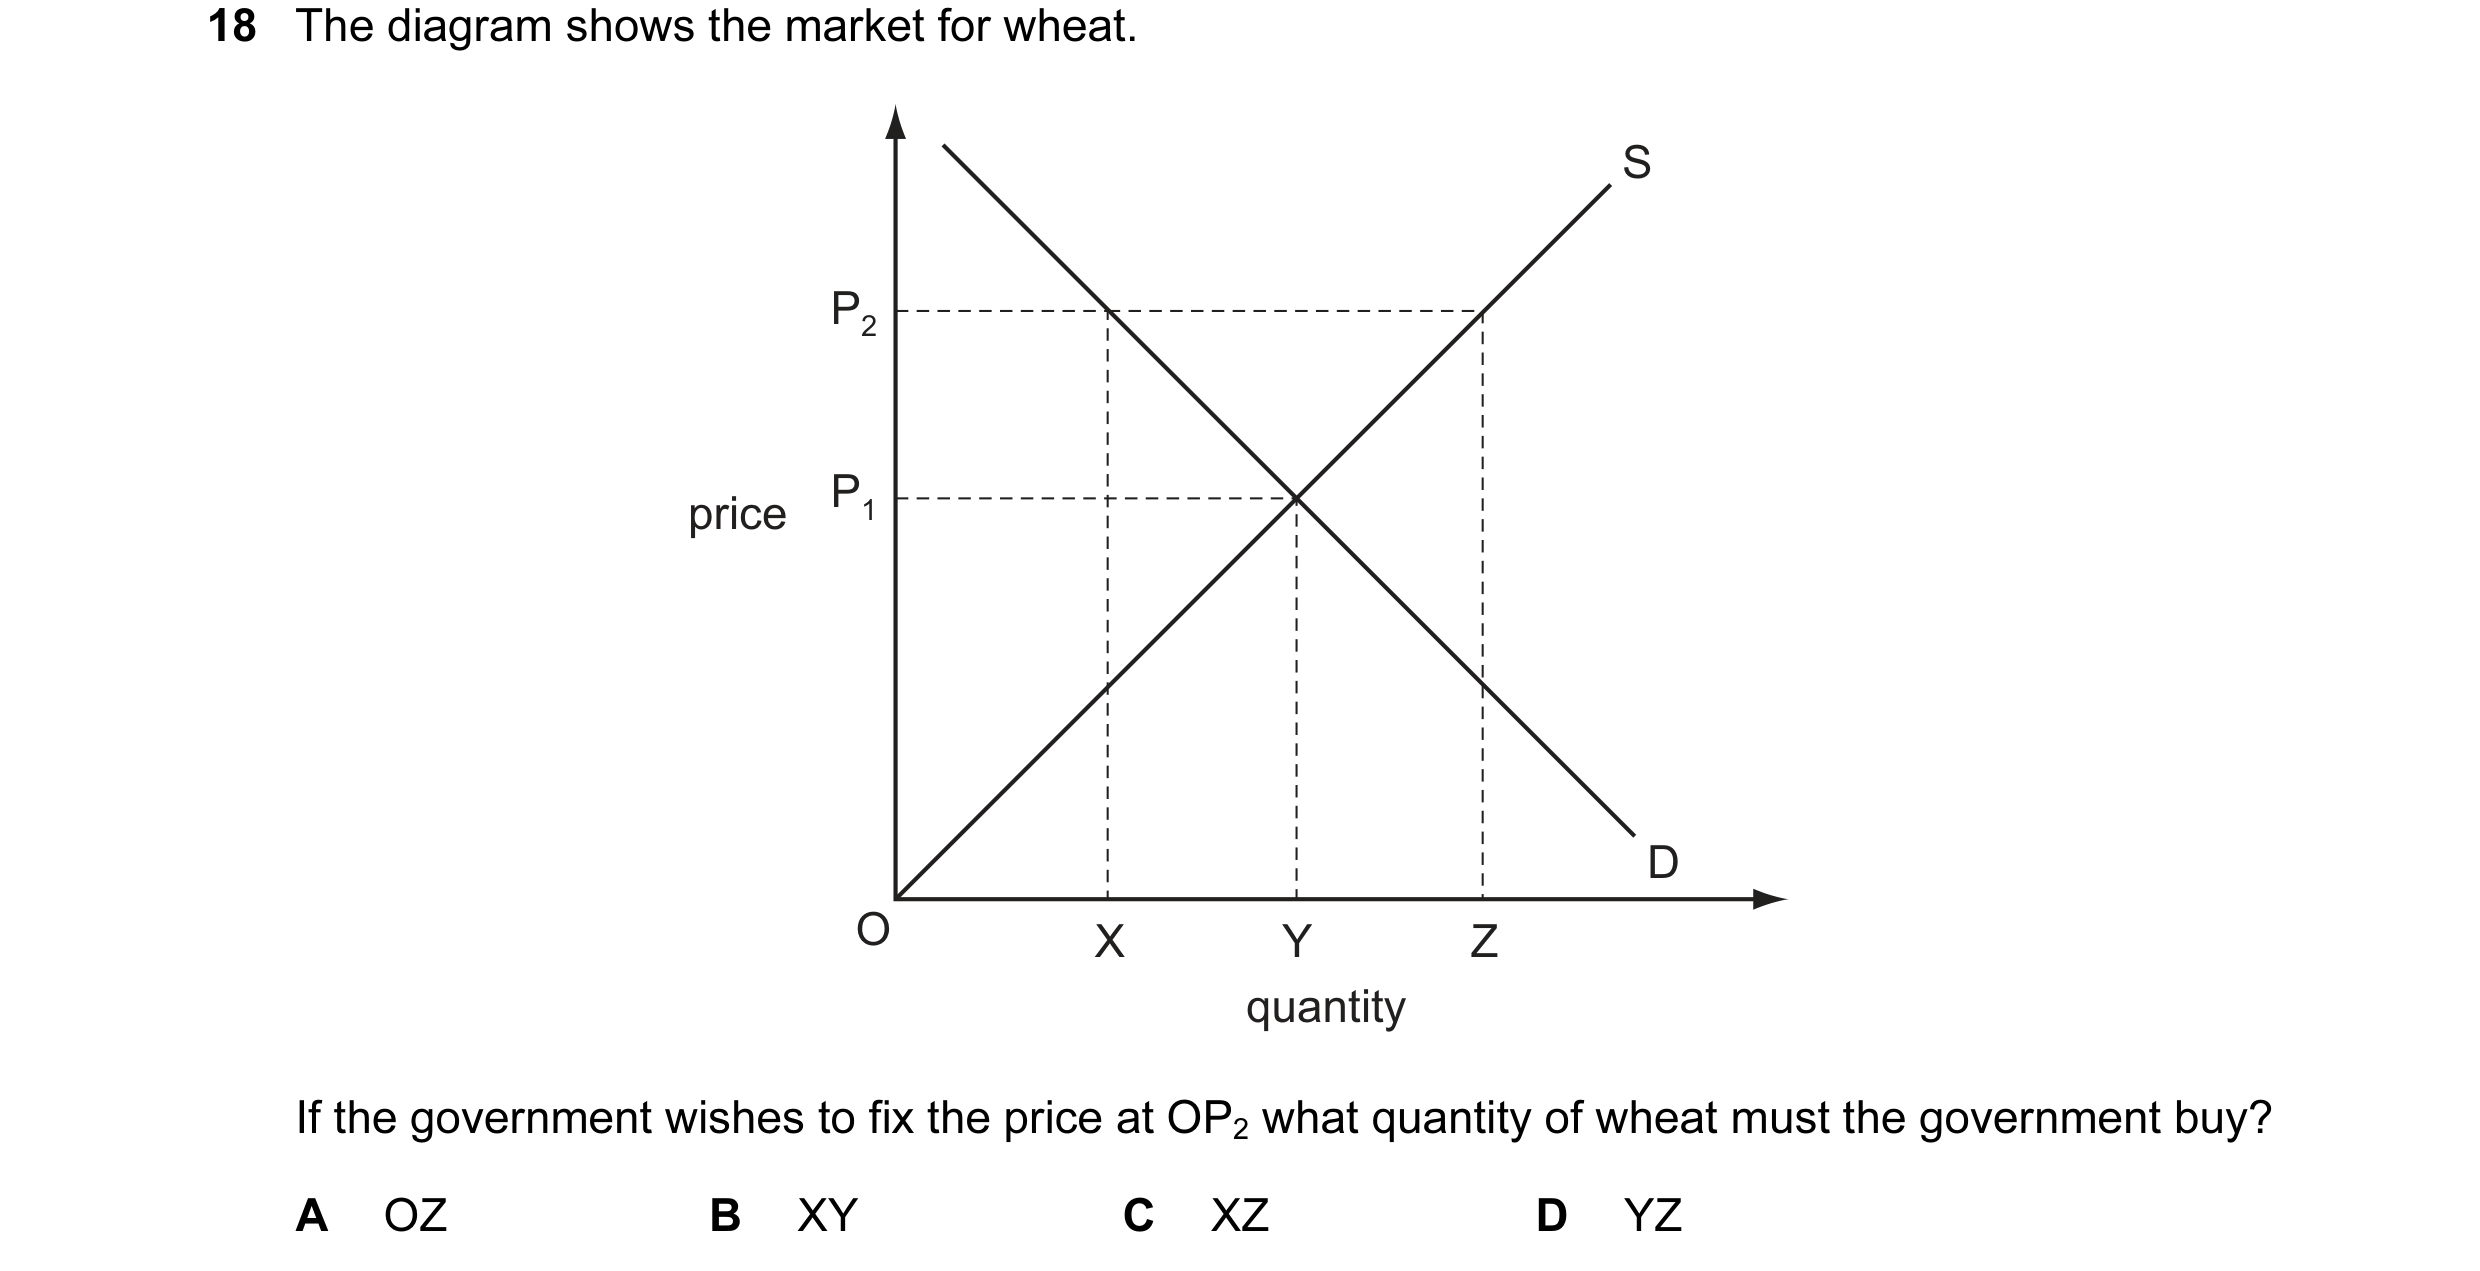
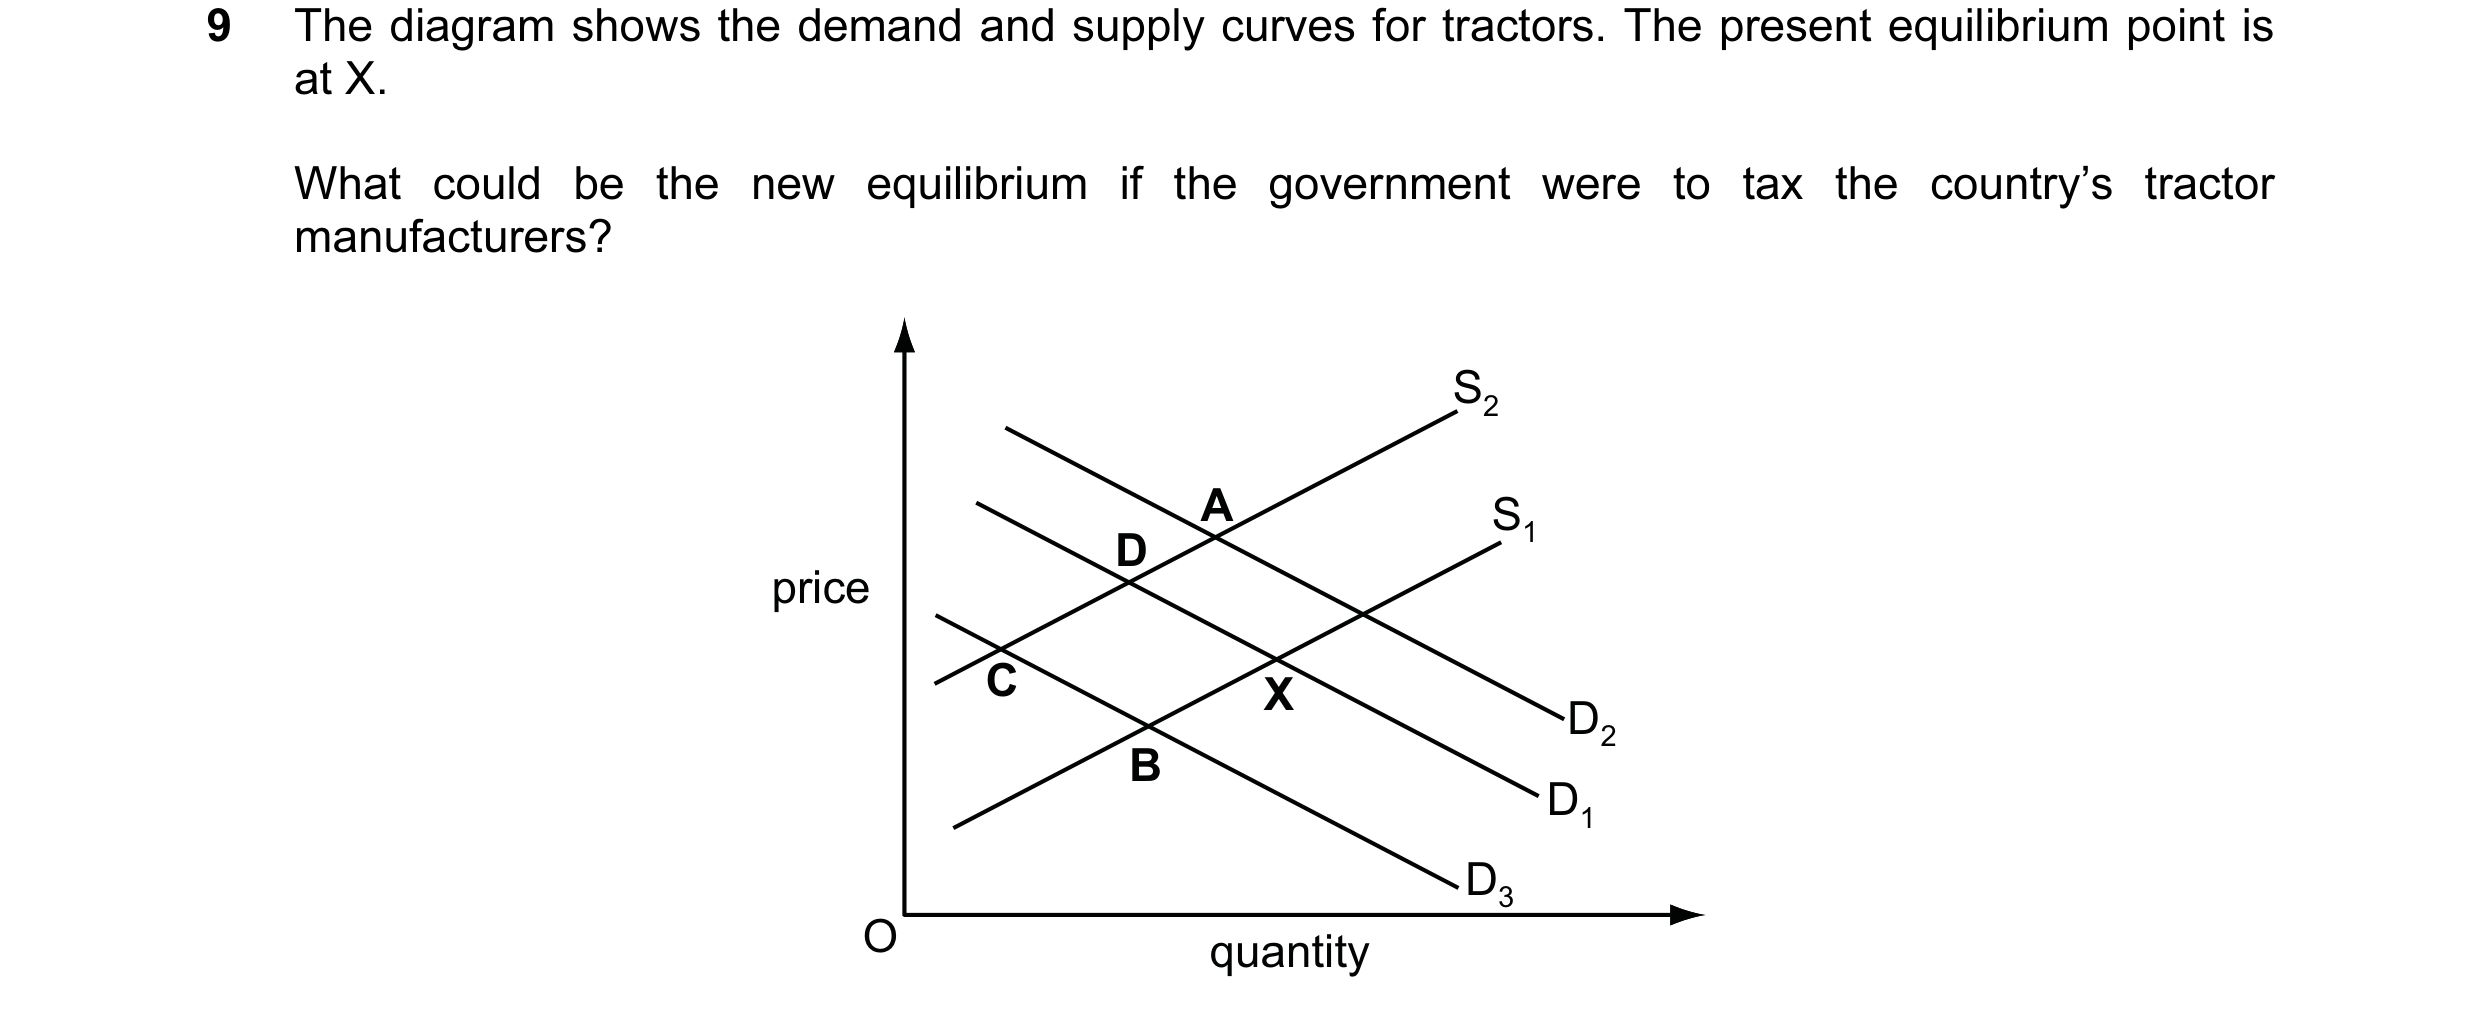 35 / 119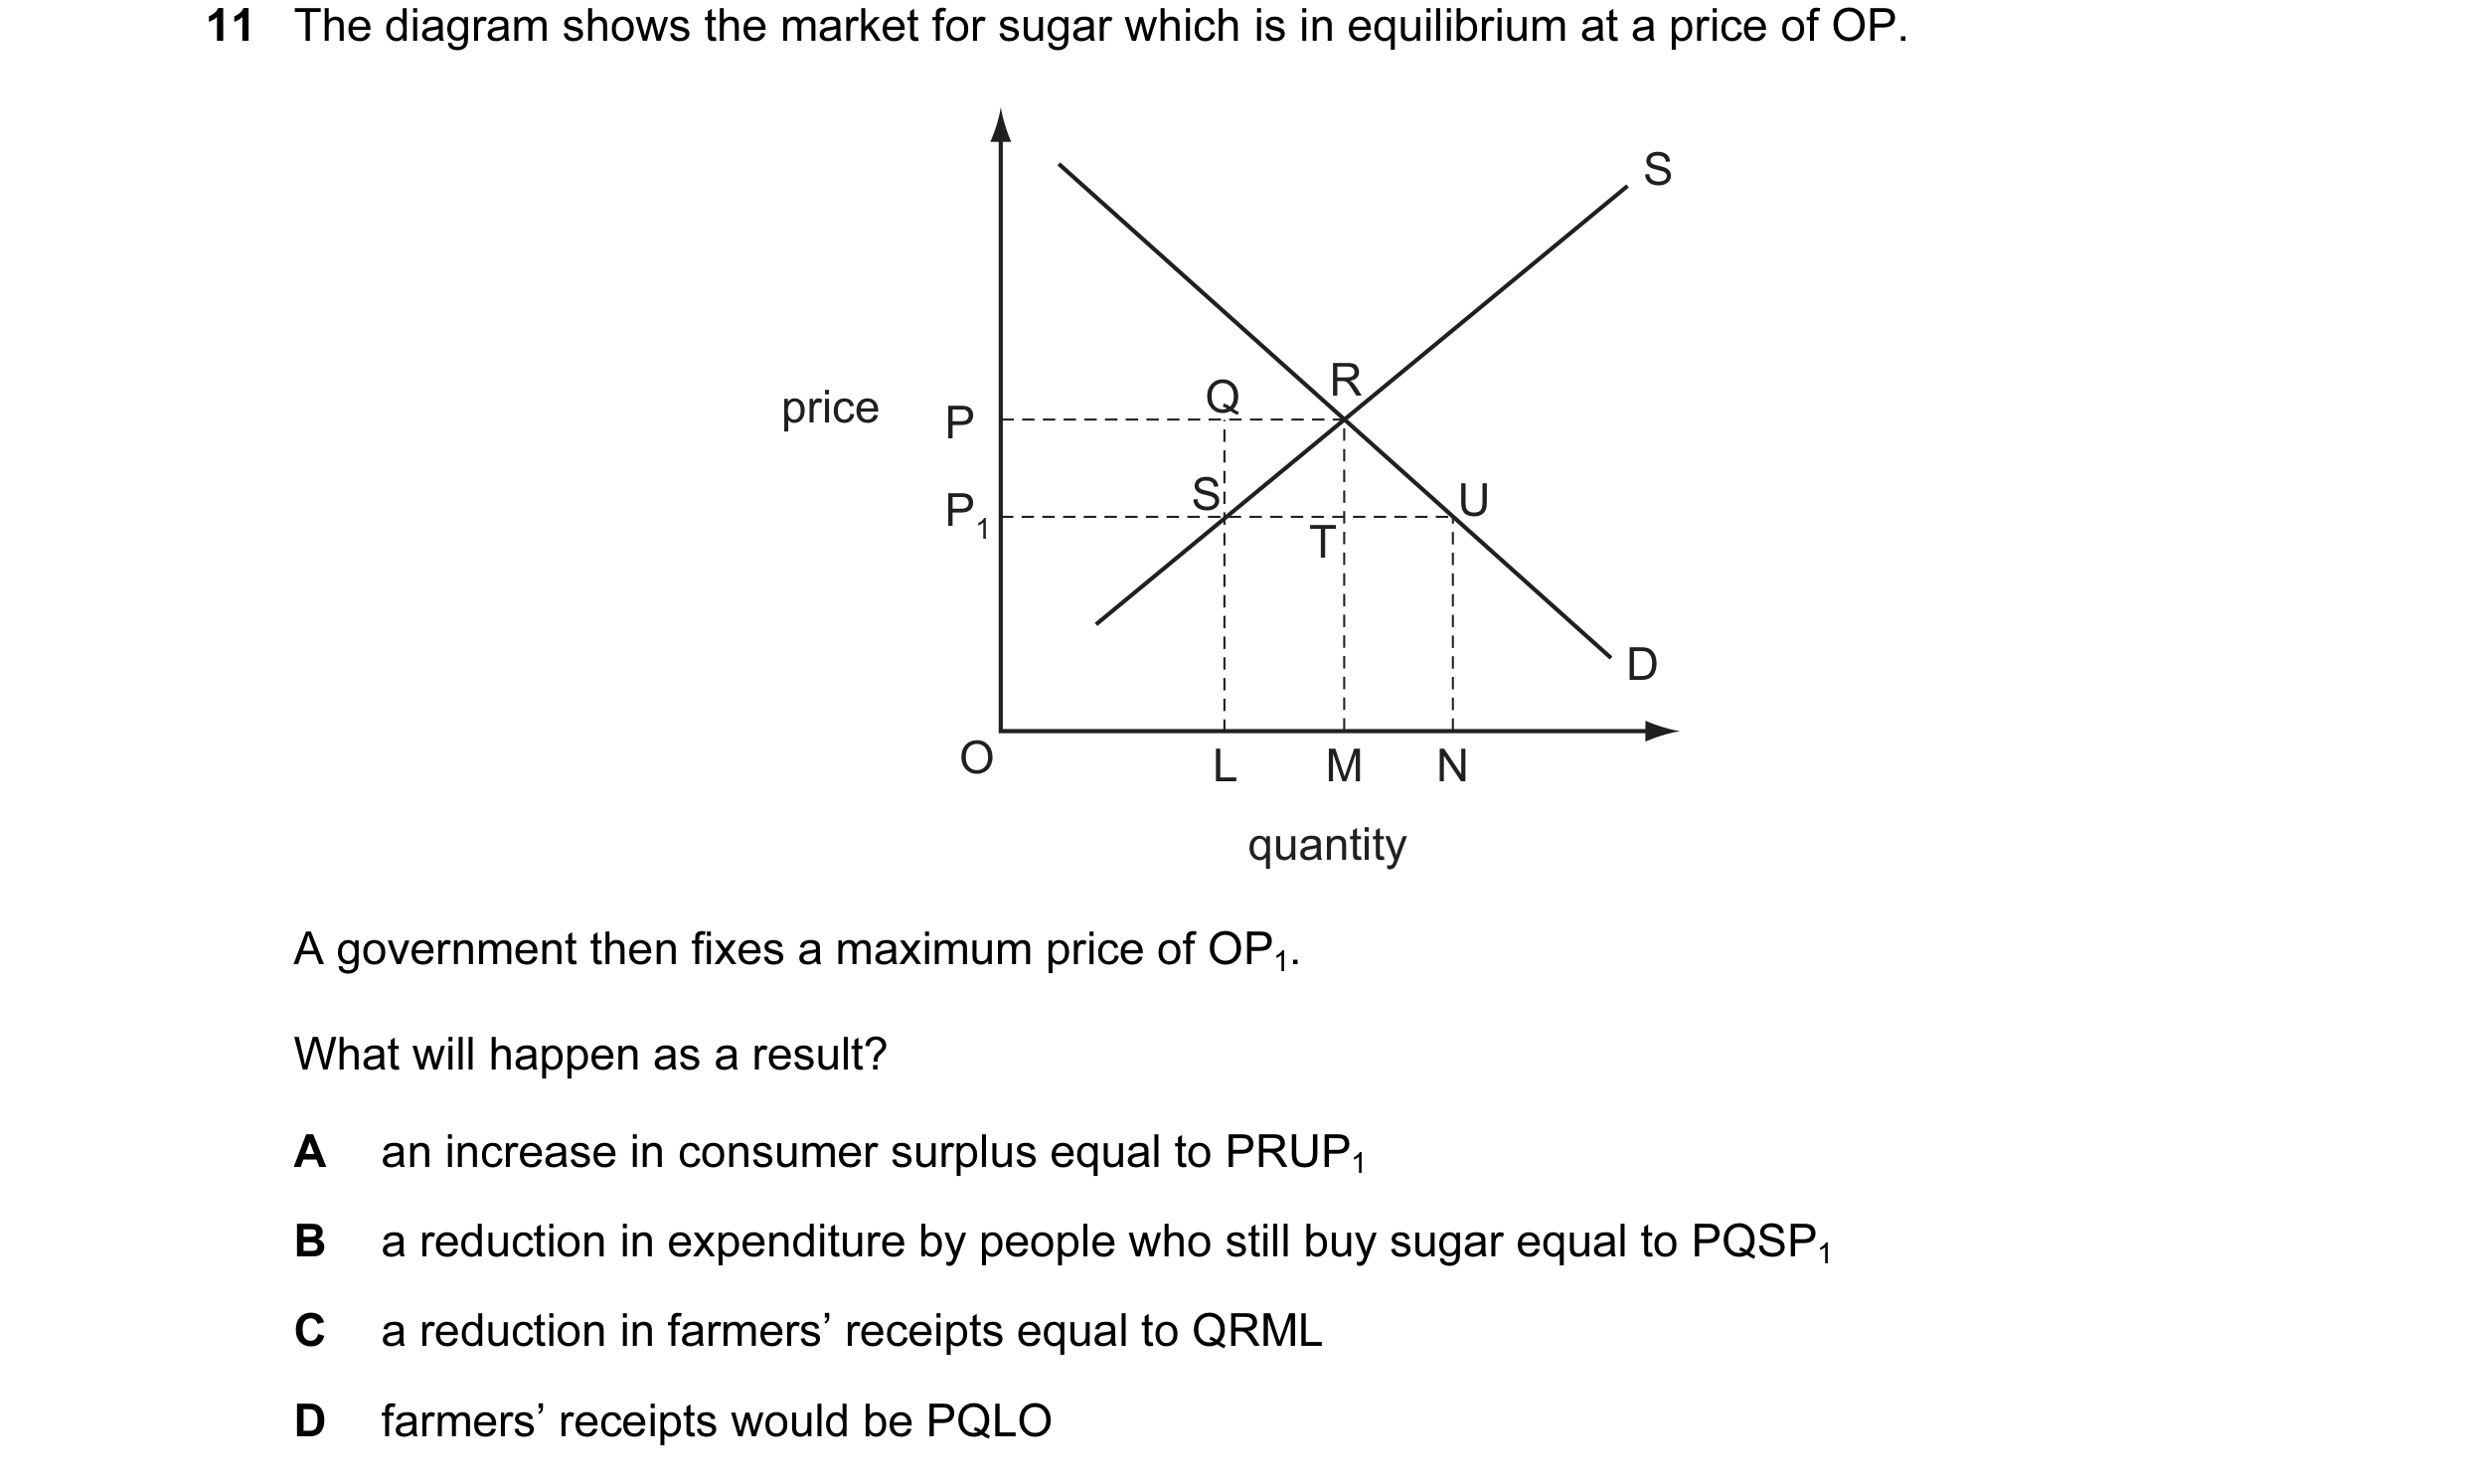
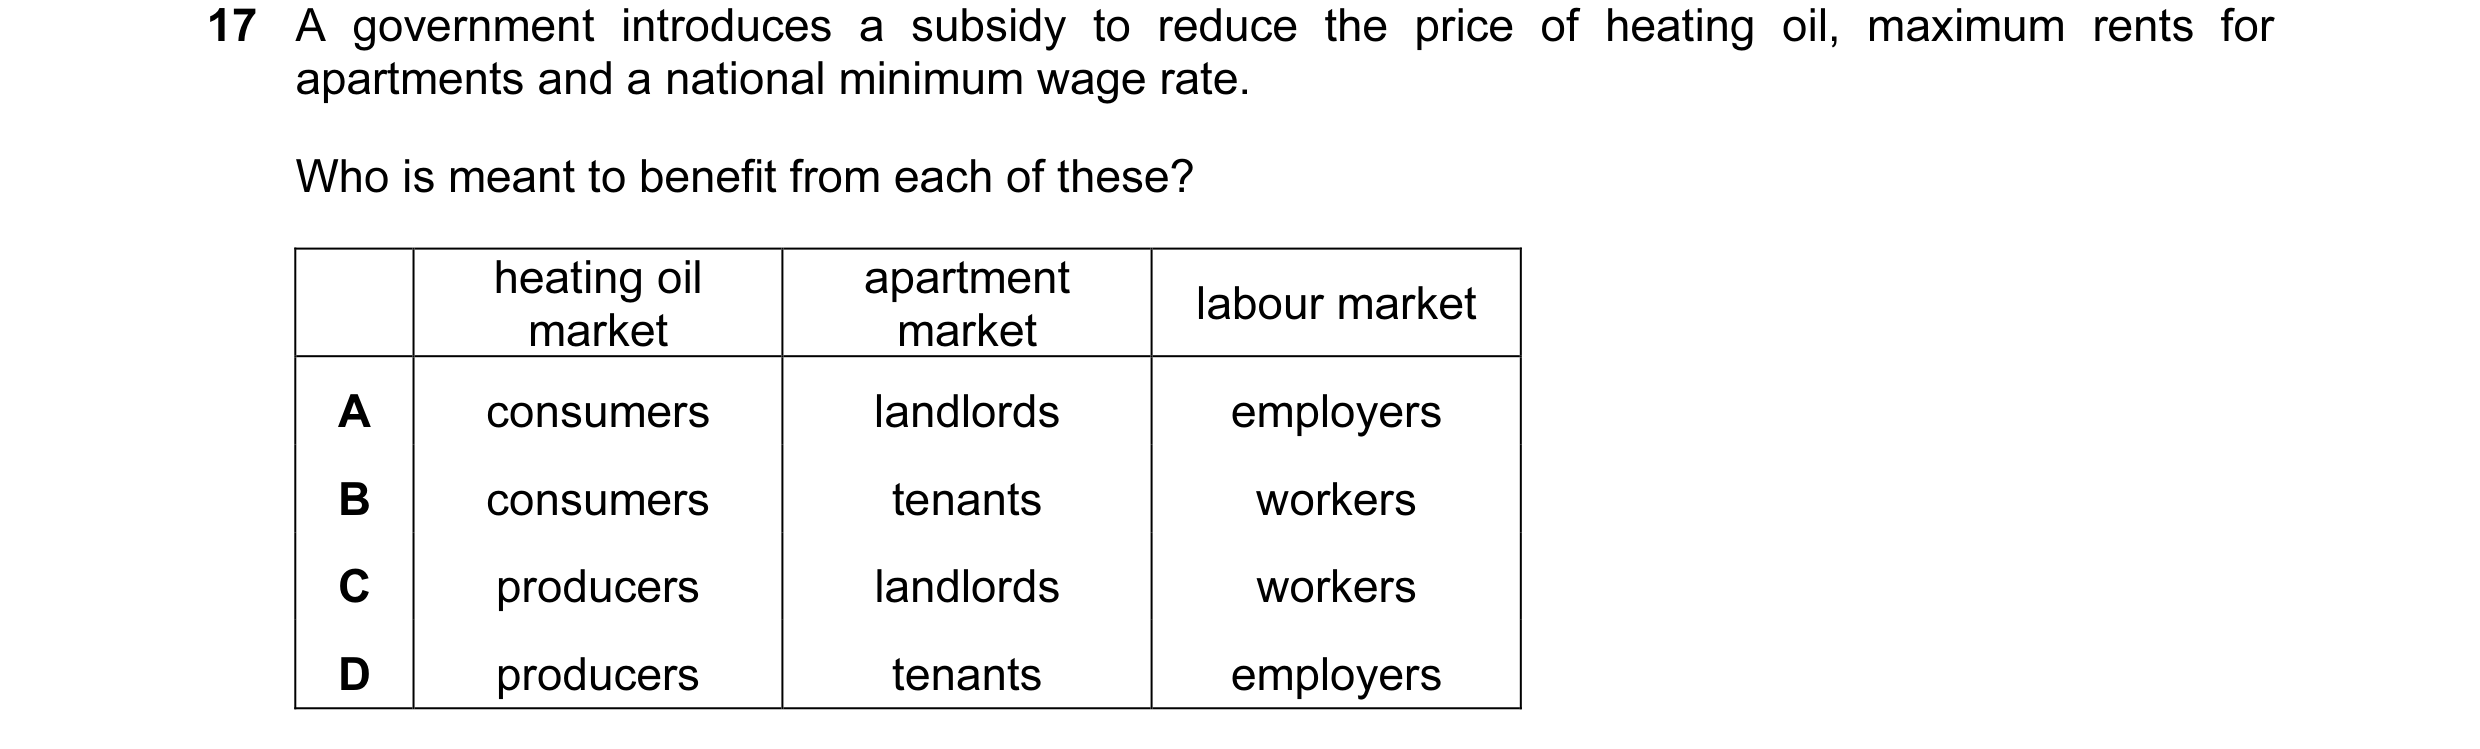 36 / 119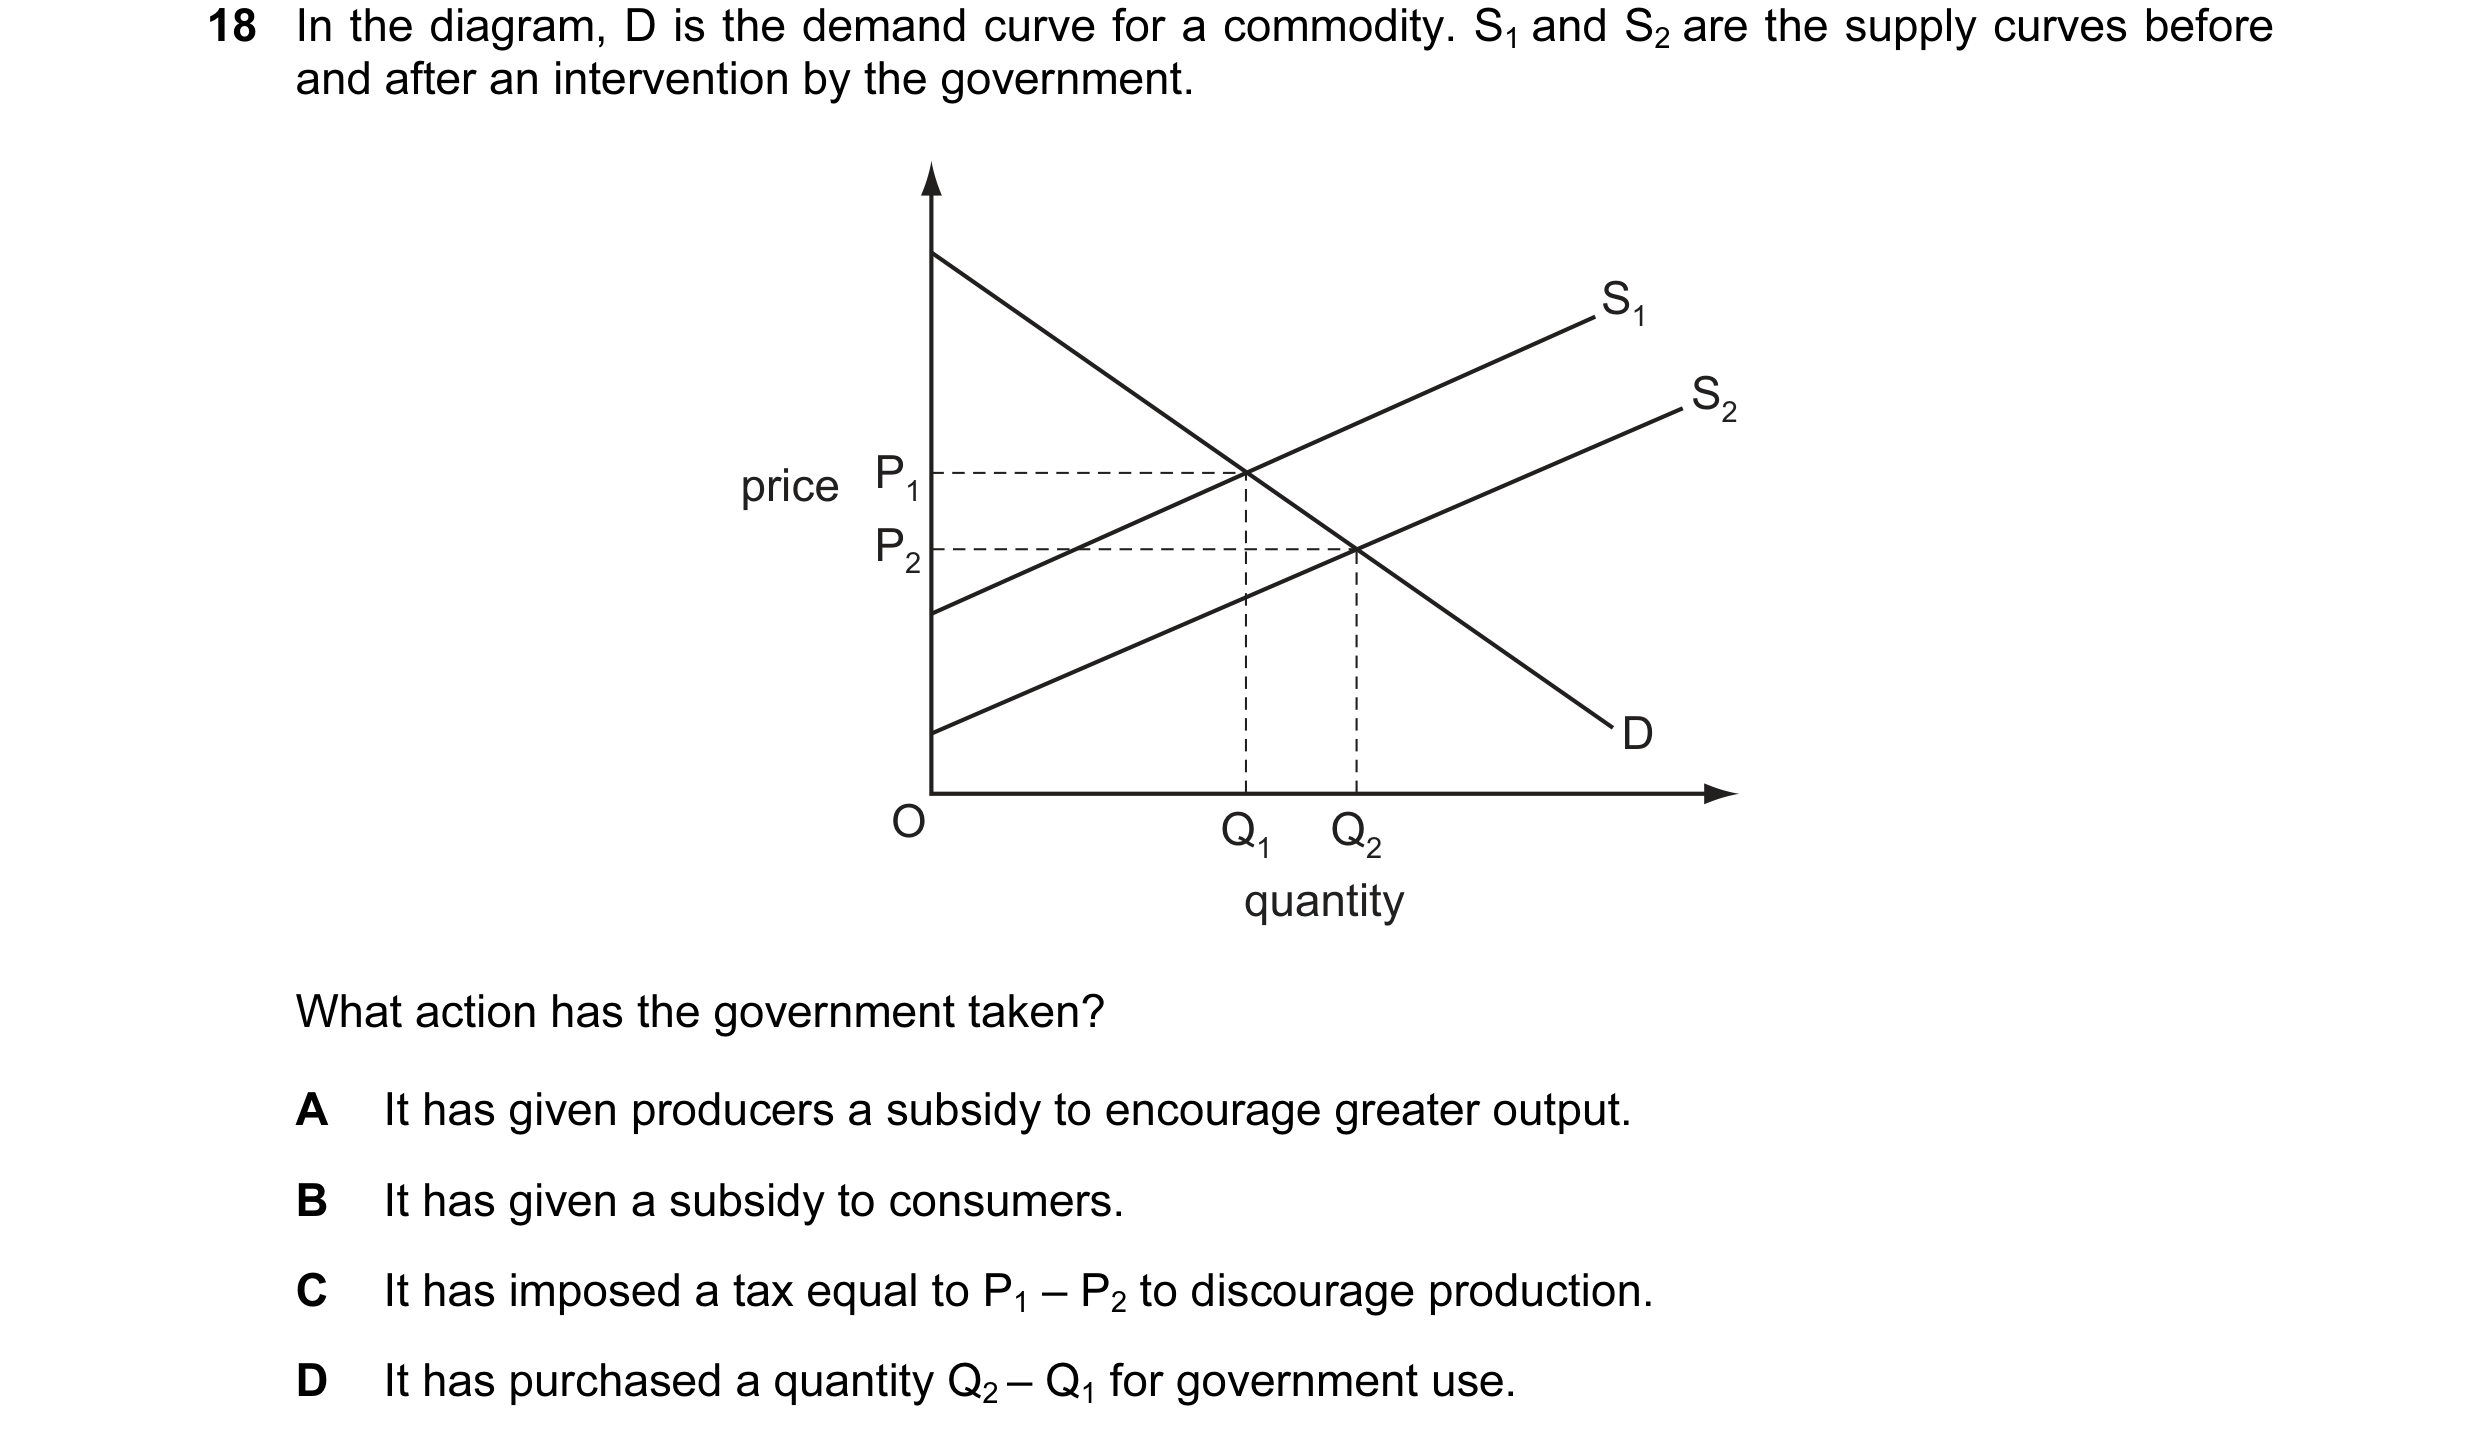
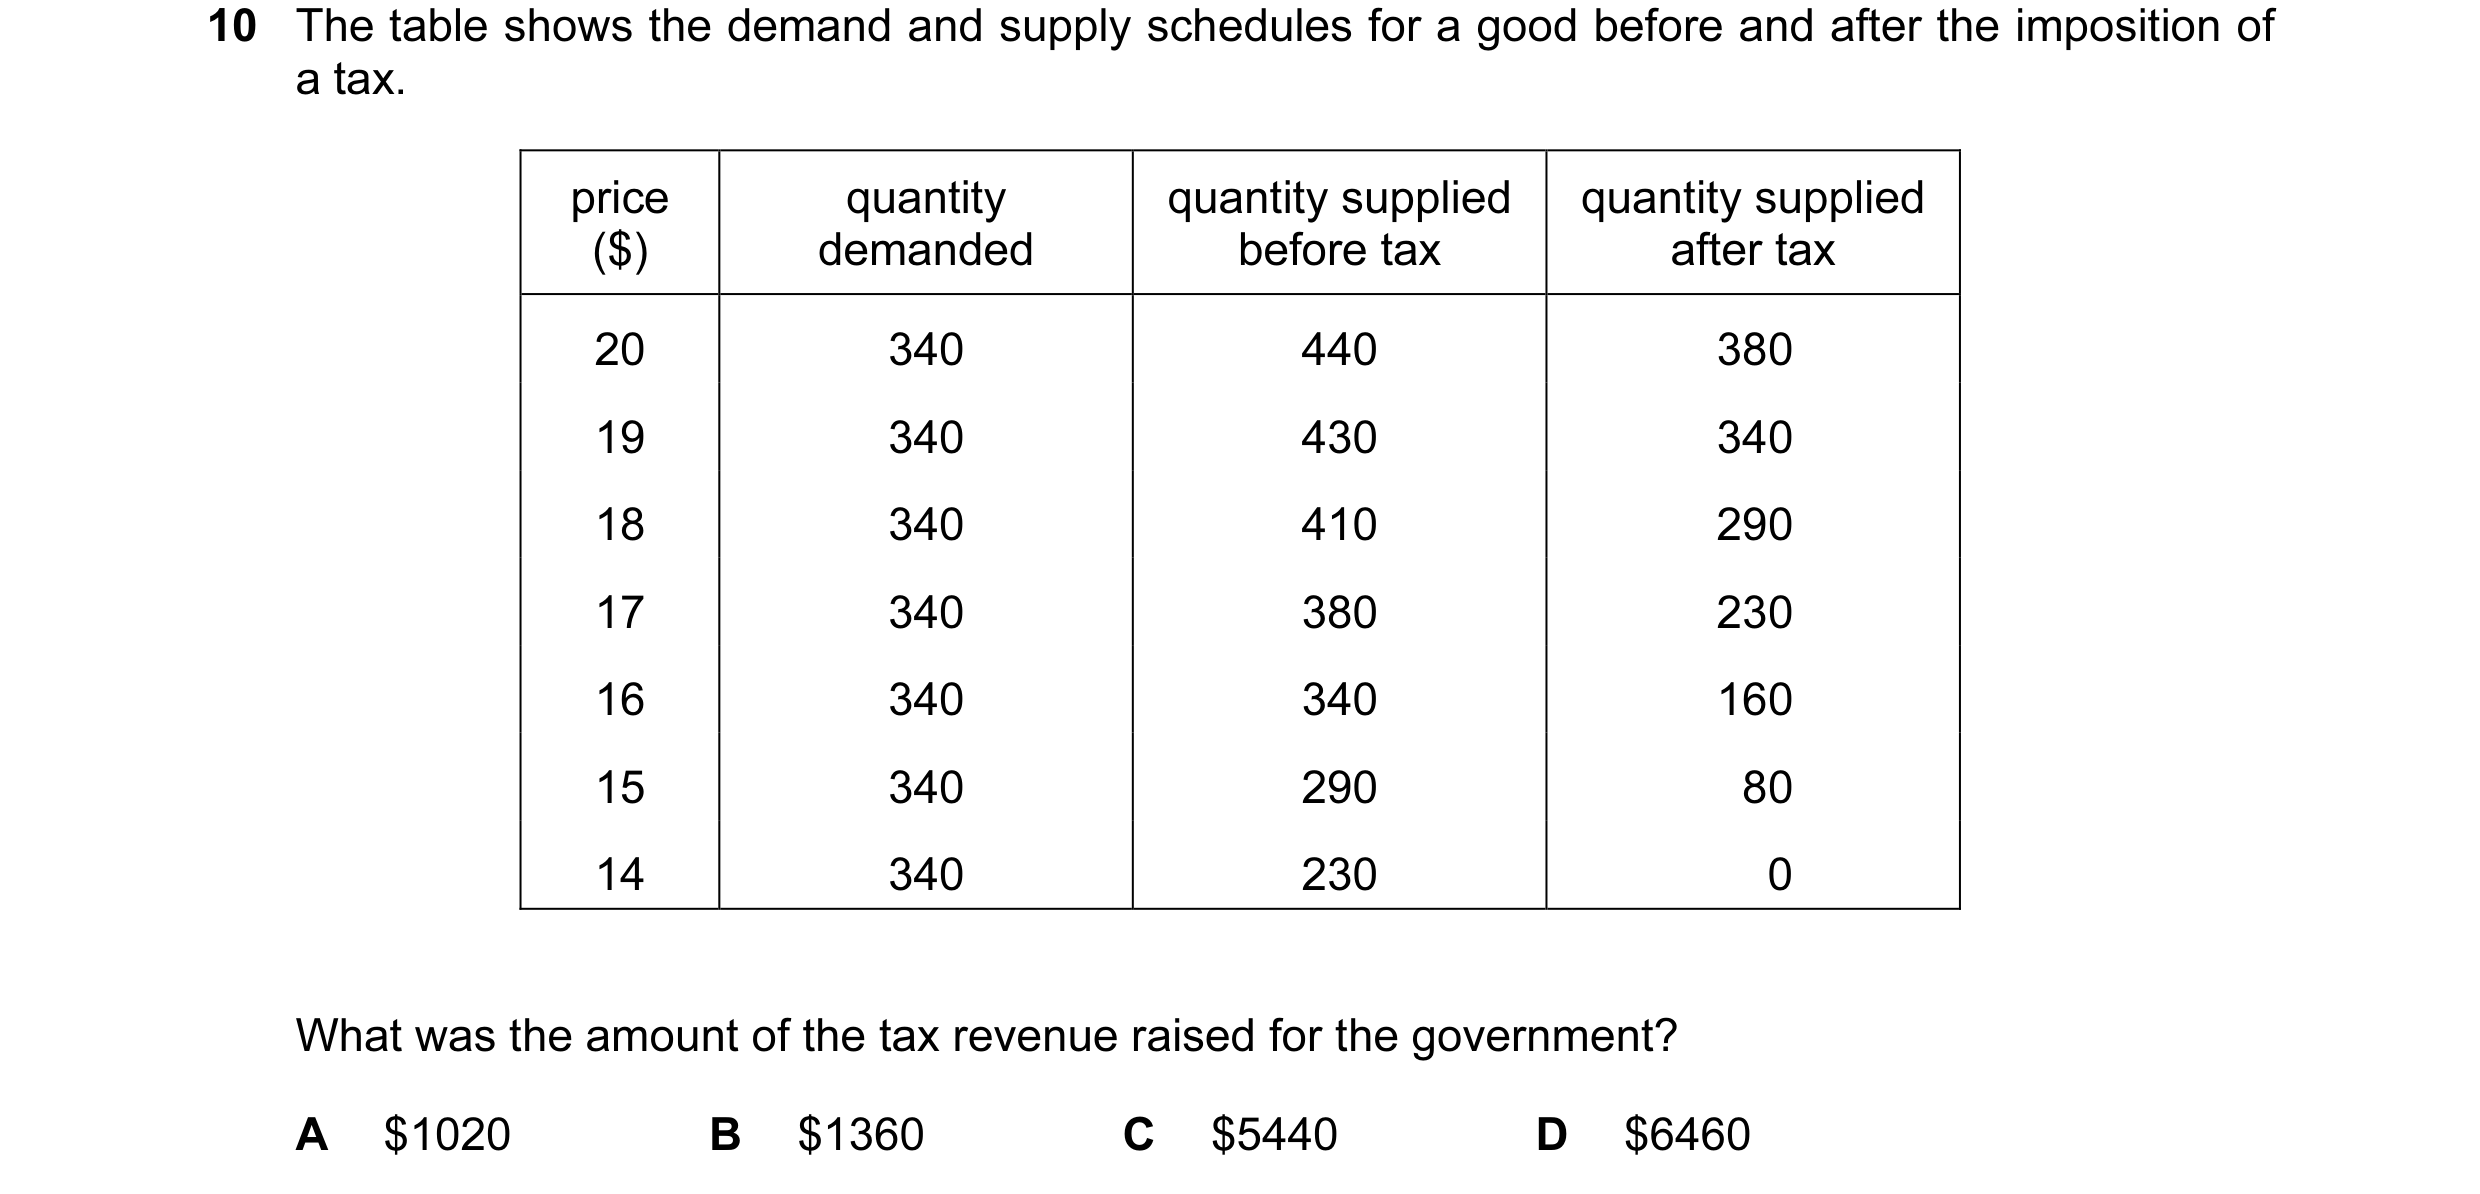
 37 / 119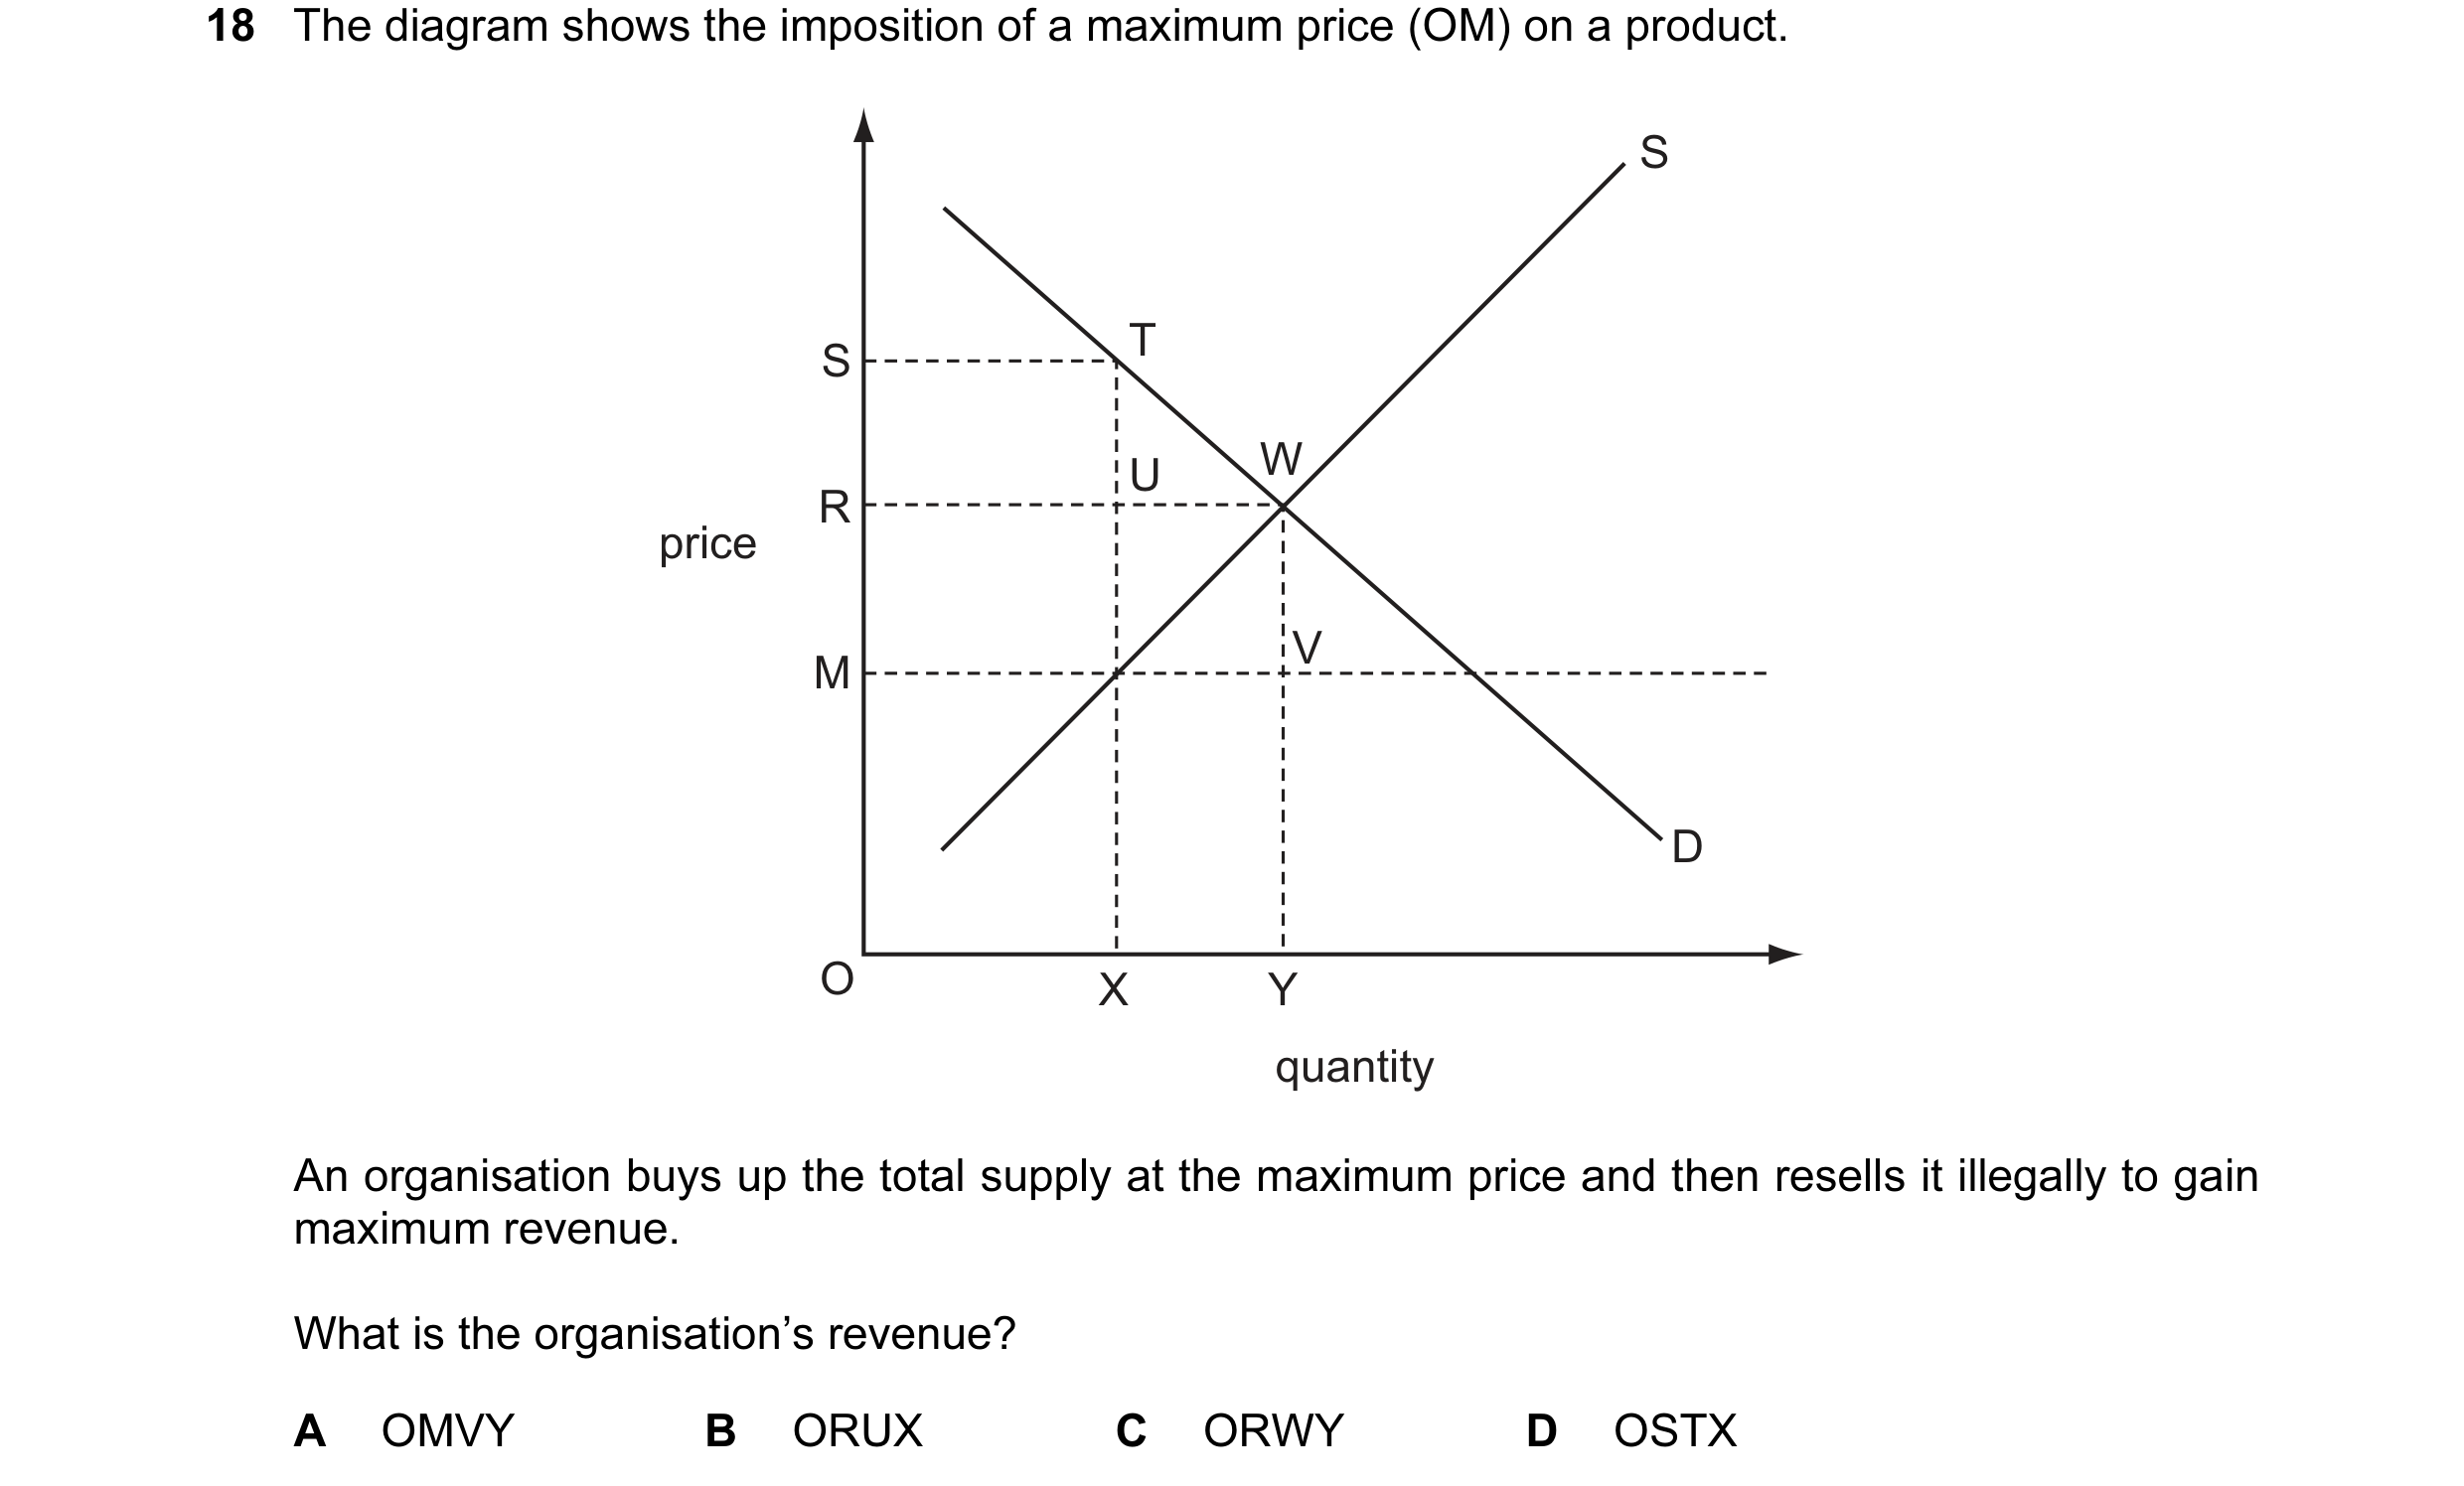
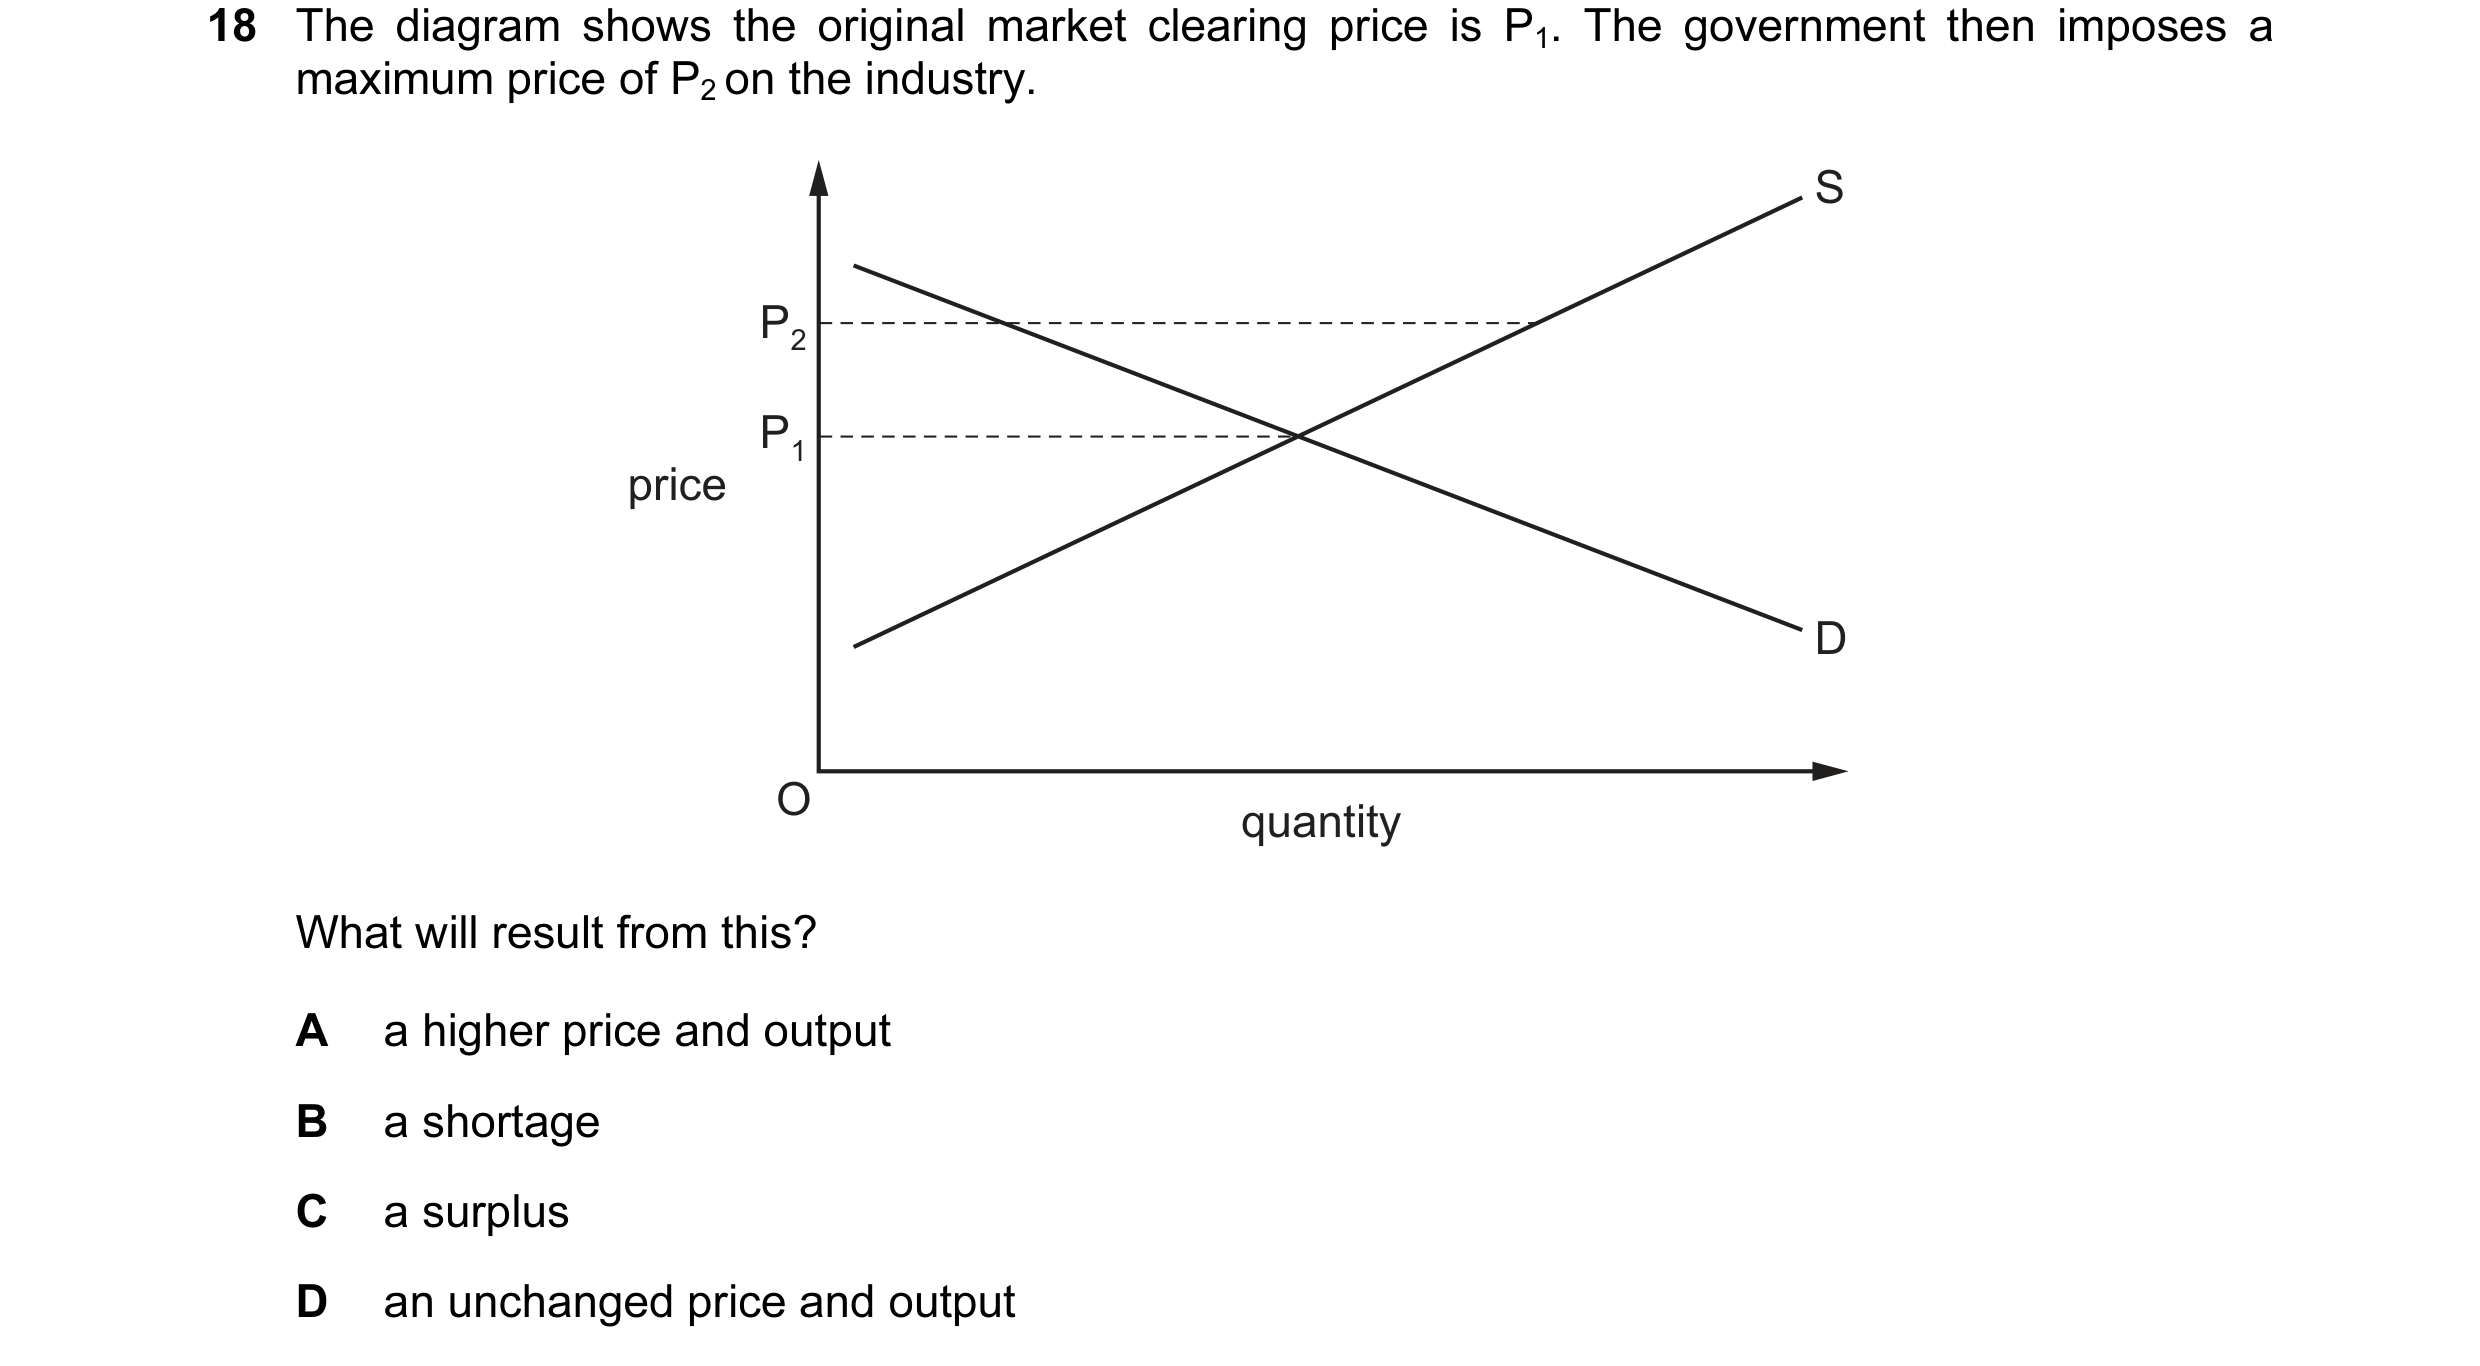 38 / 119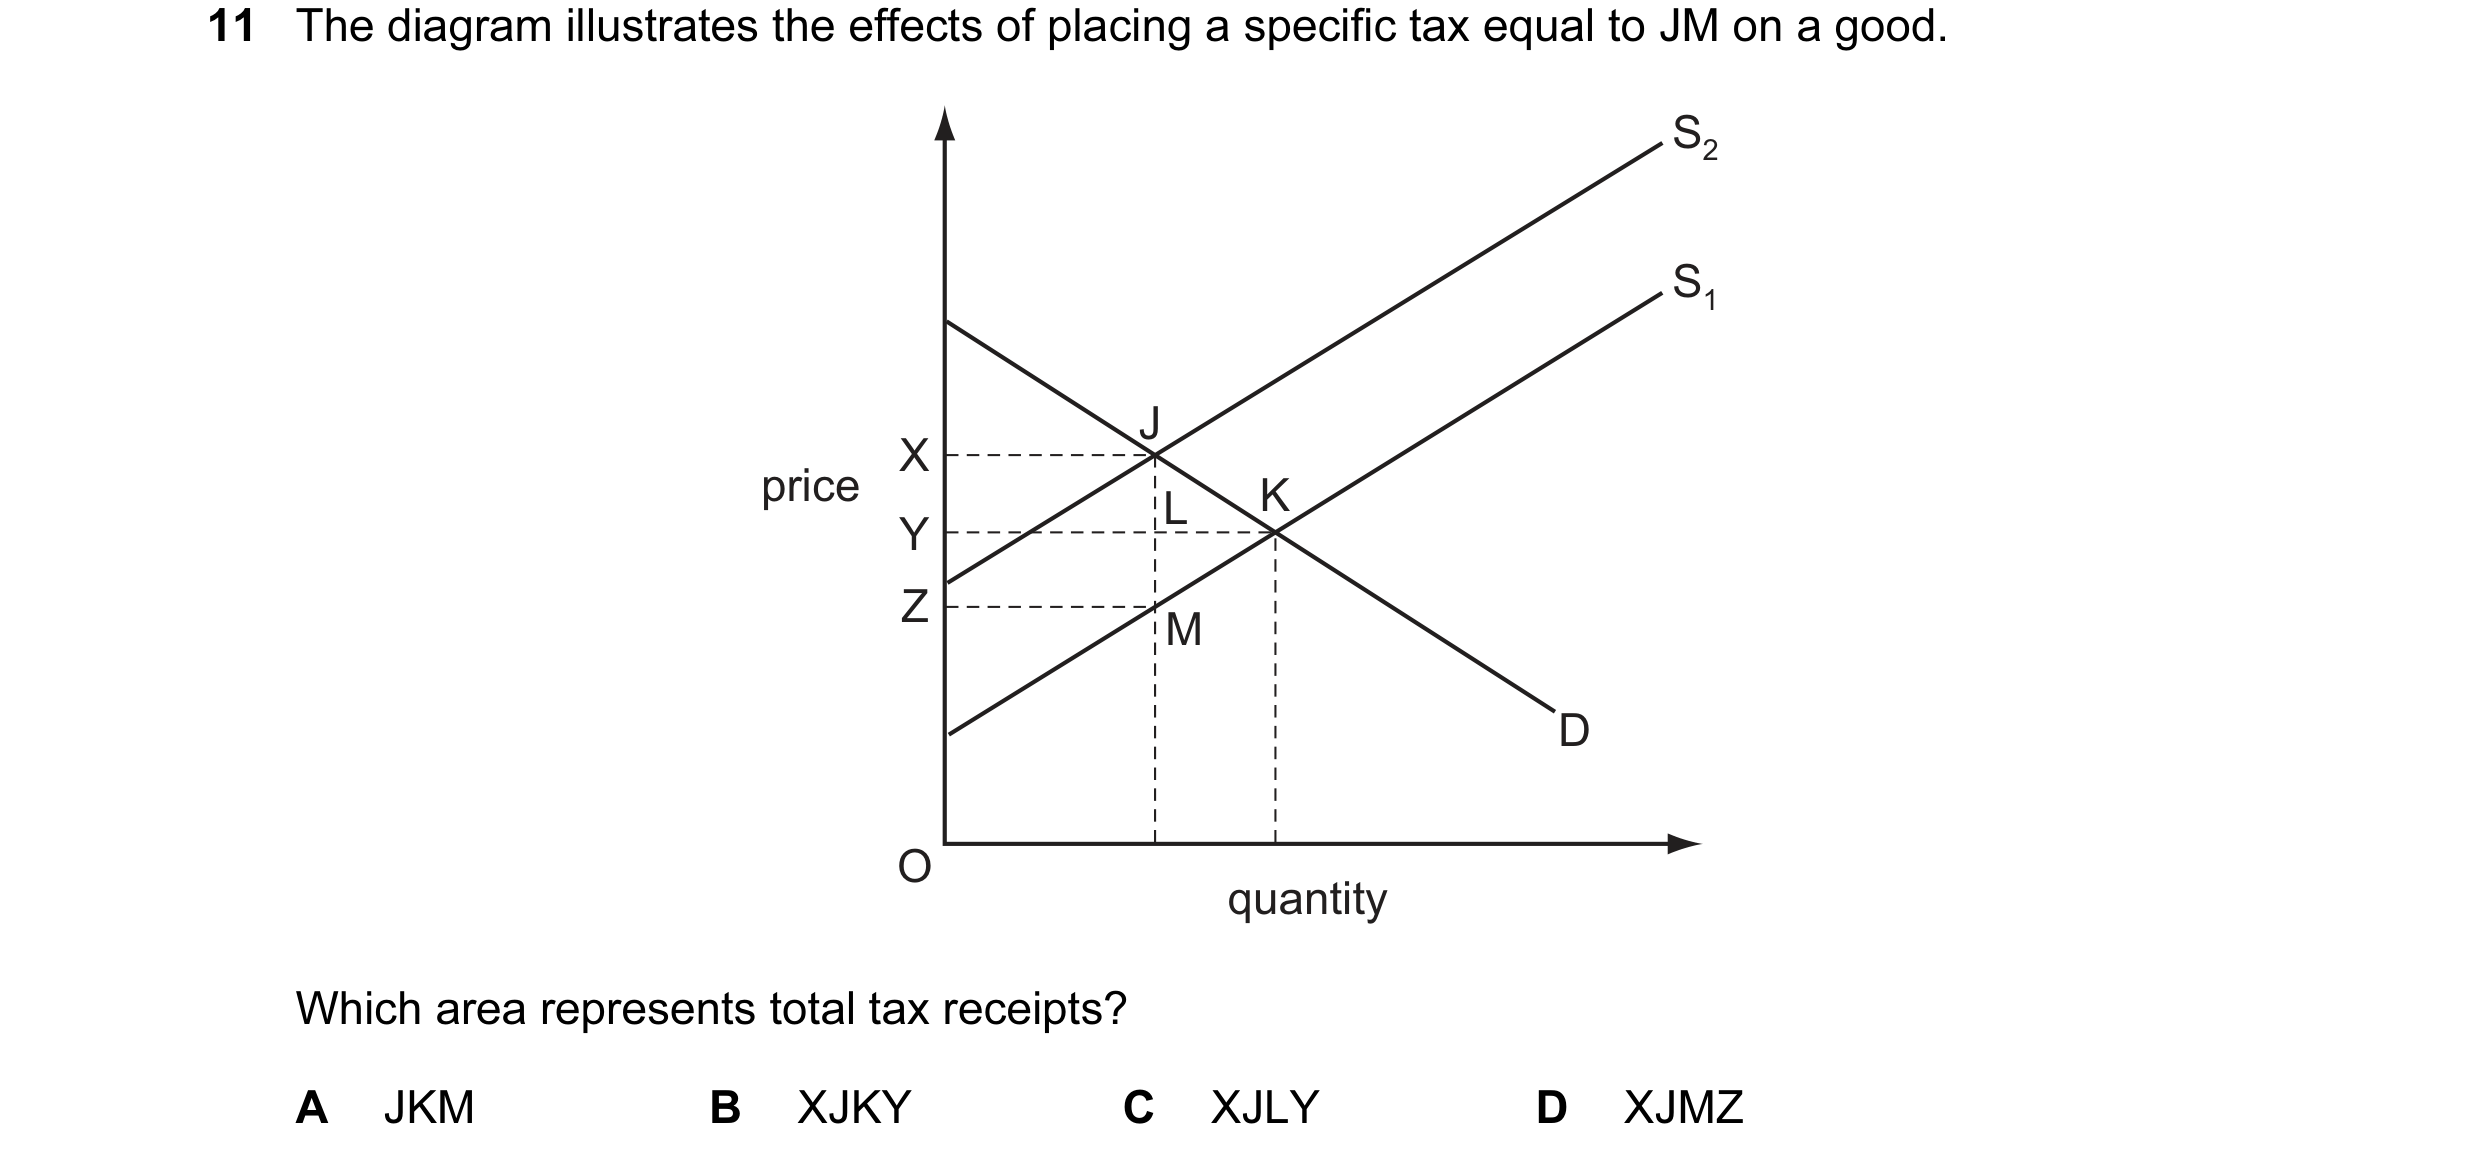
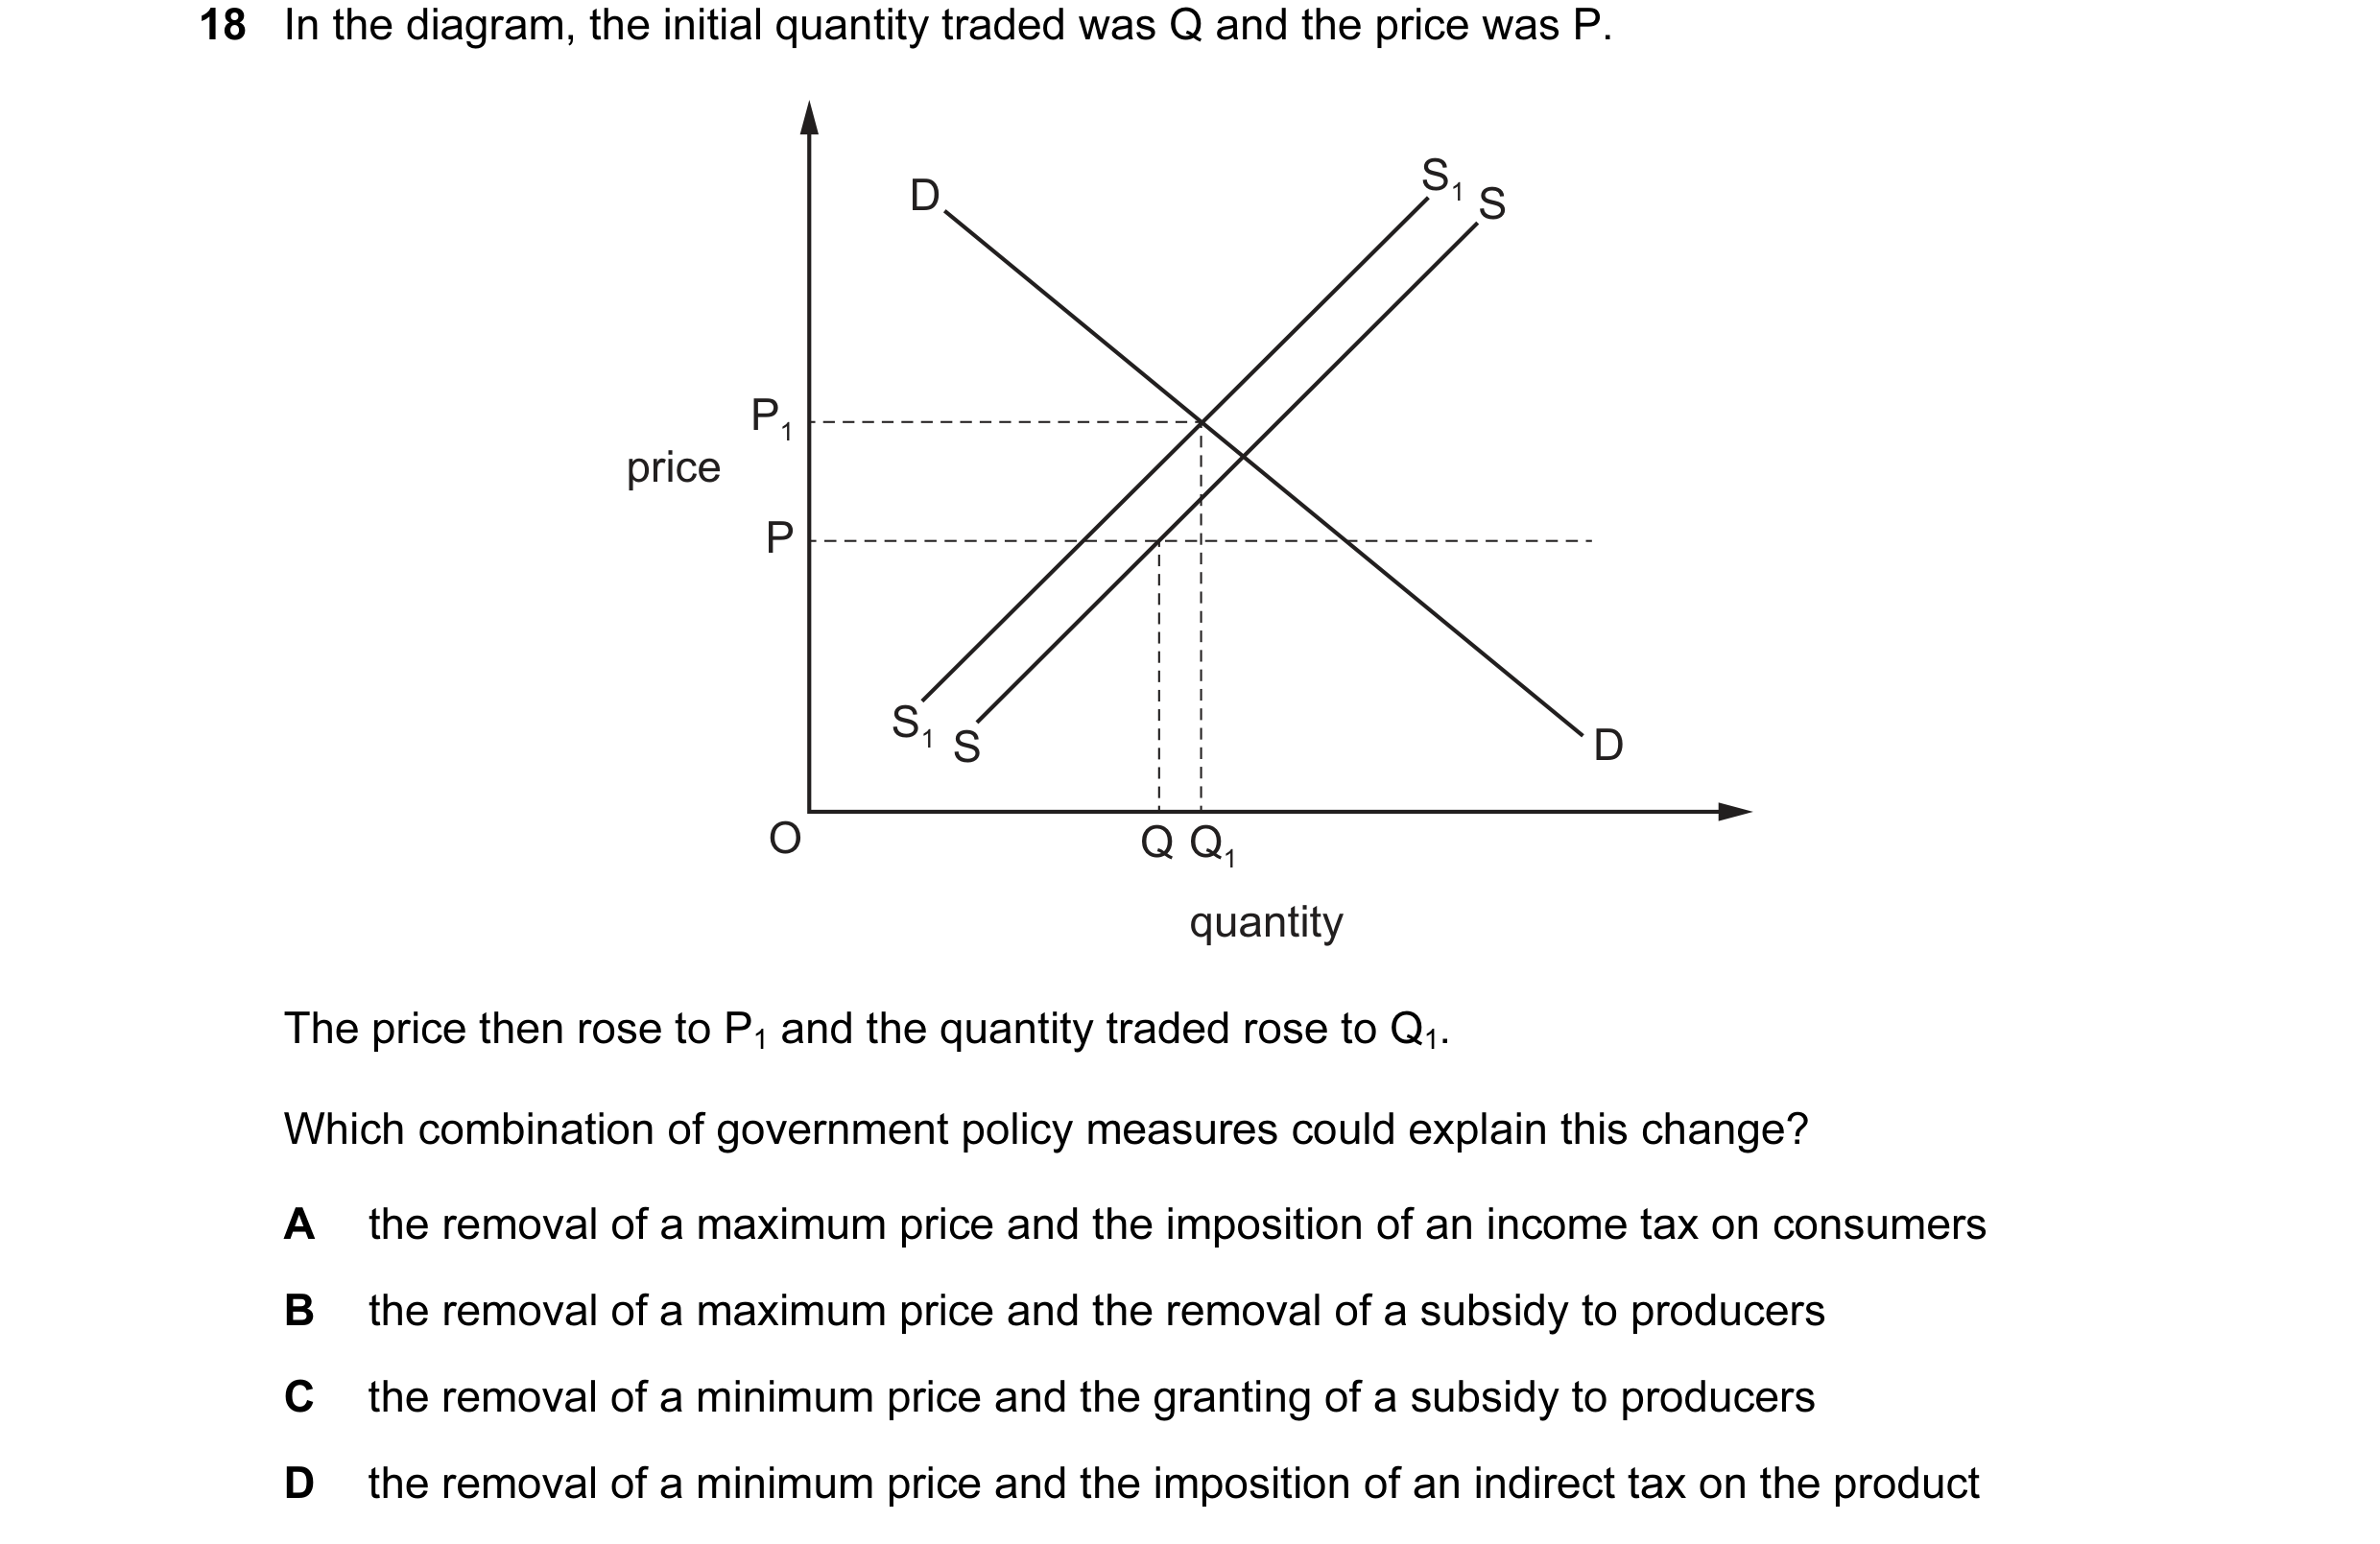 39 / 119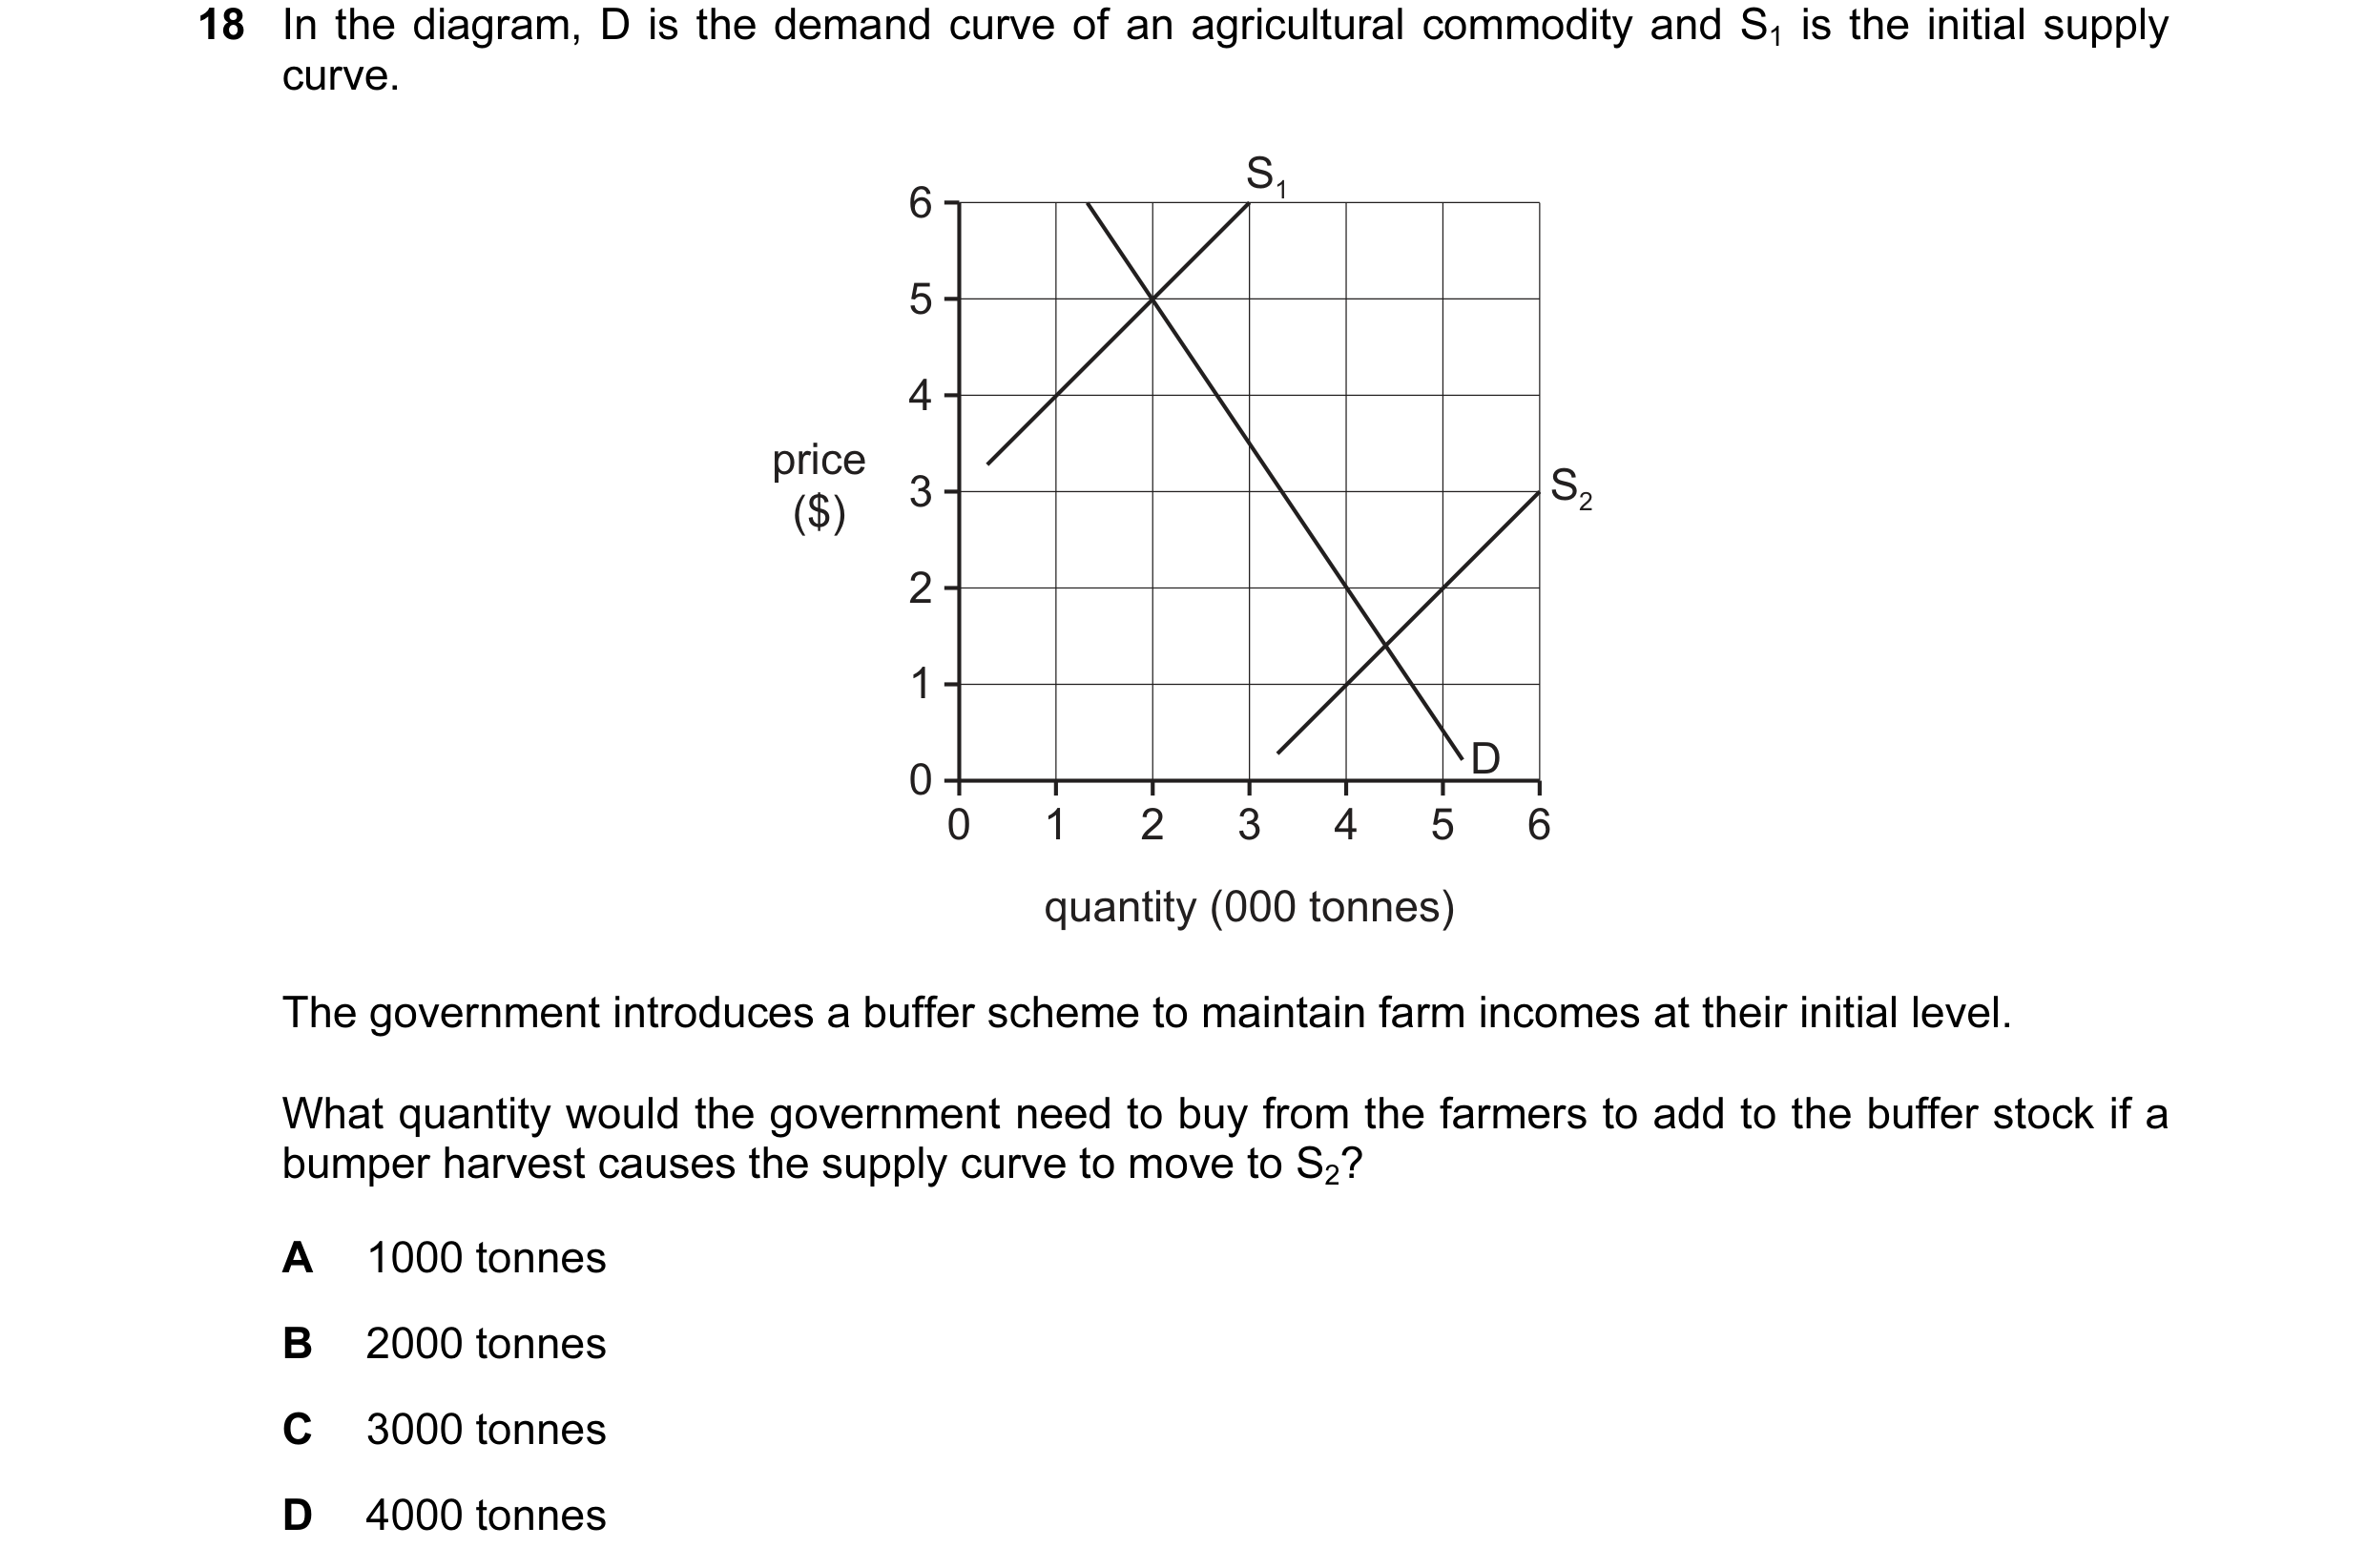
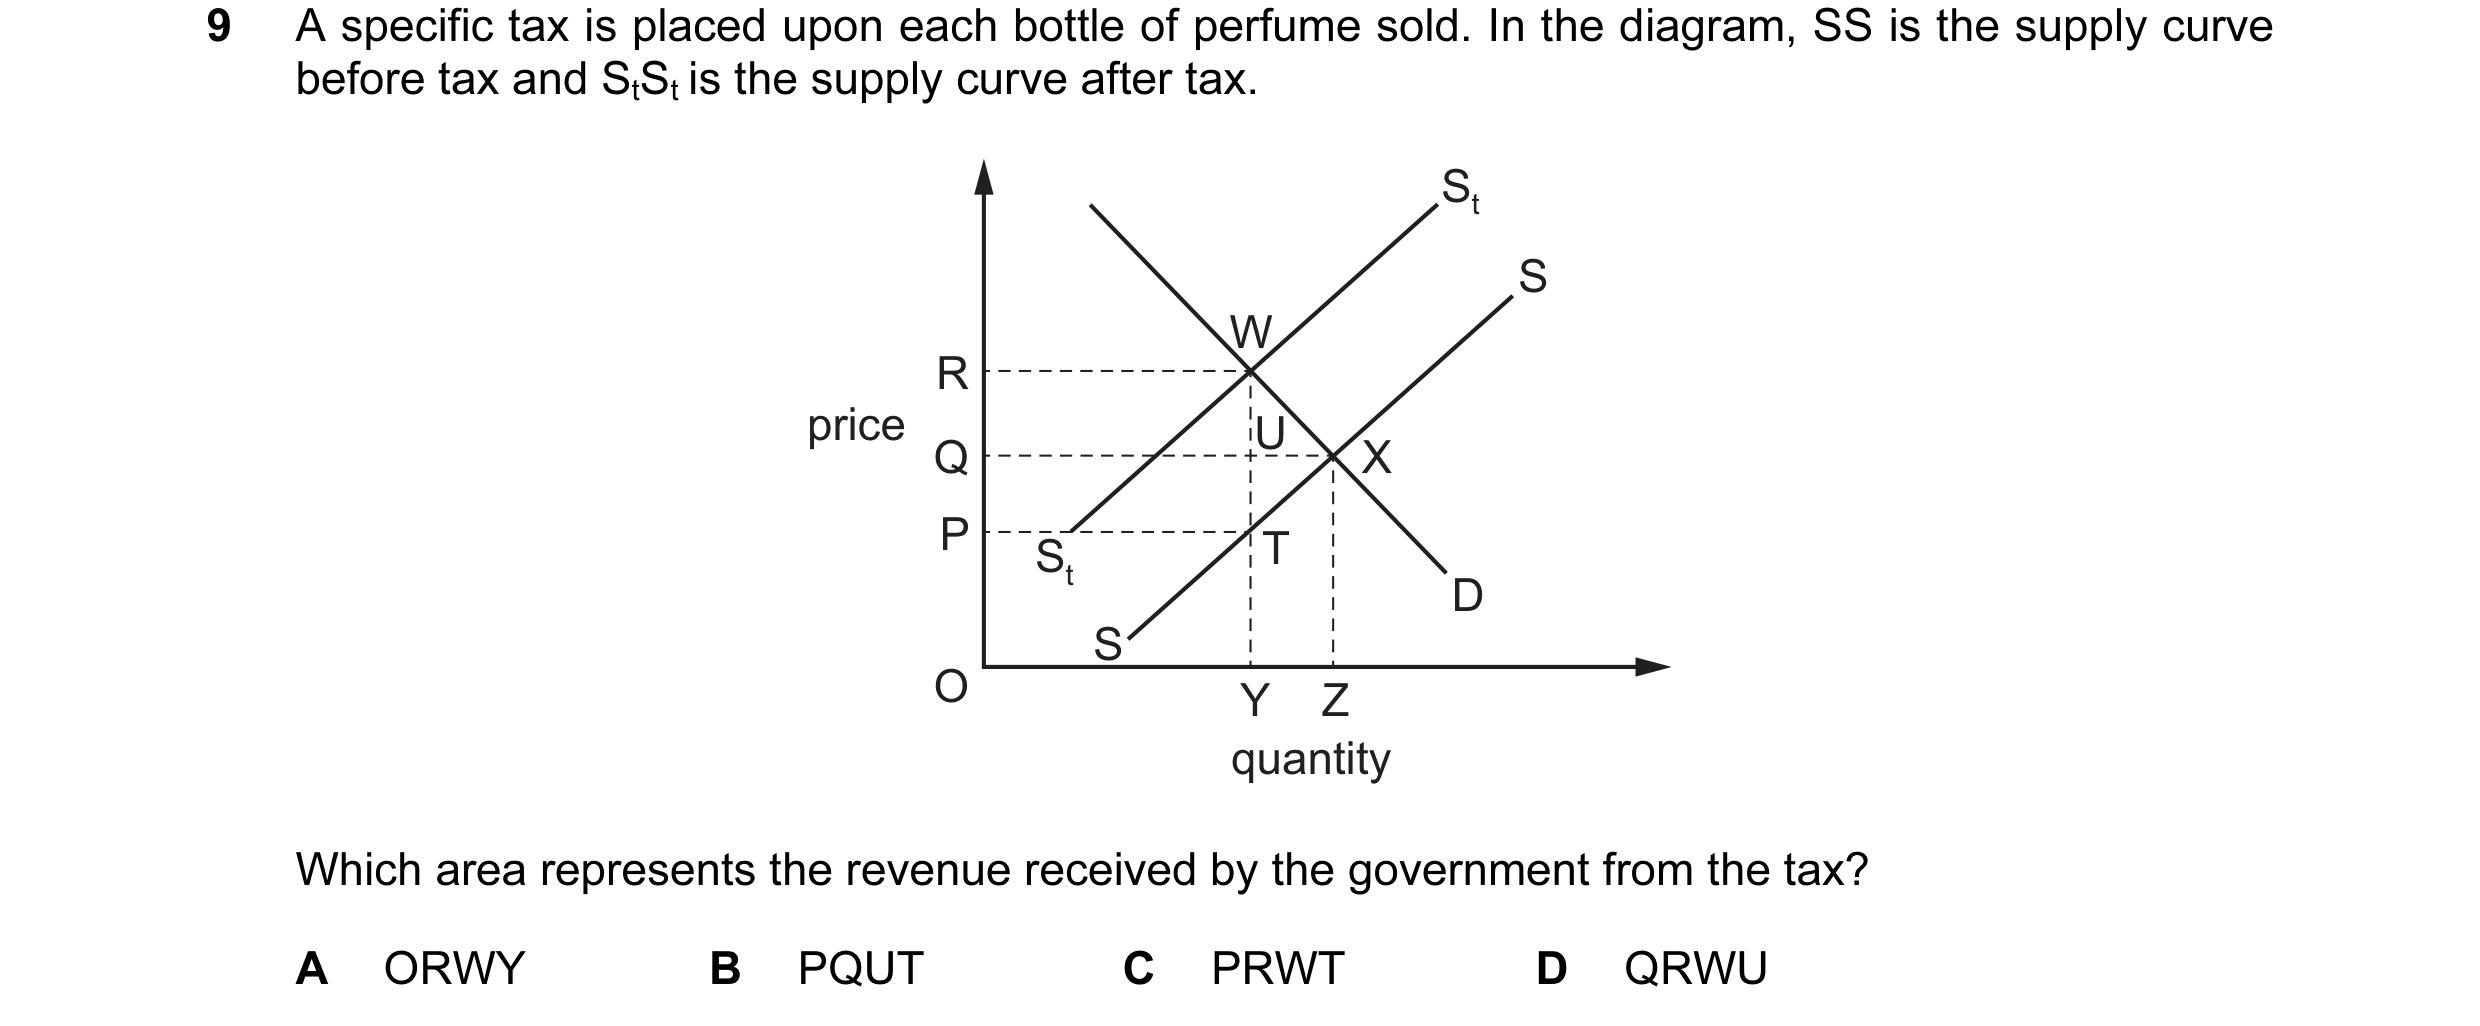 40 / 119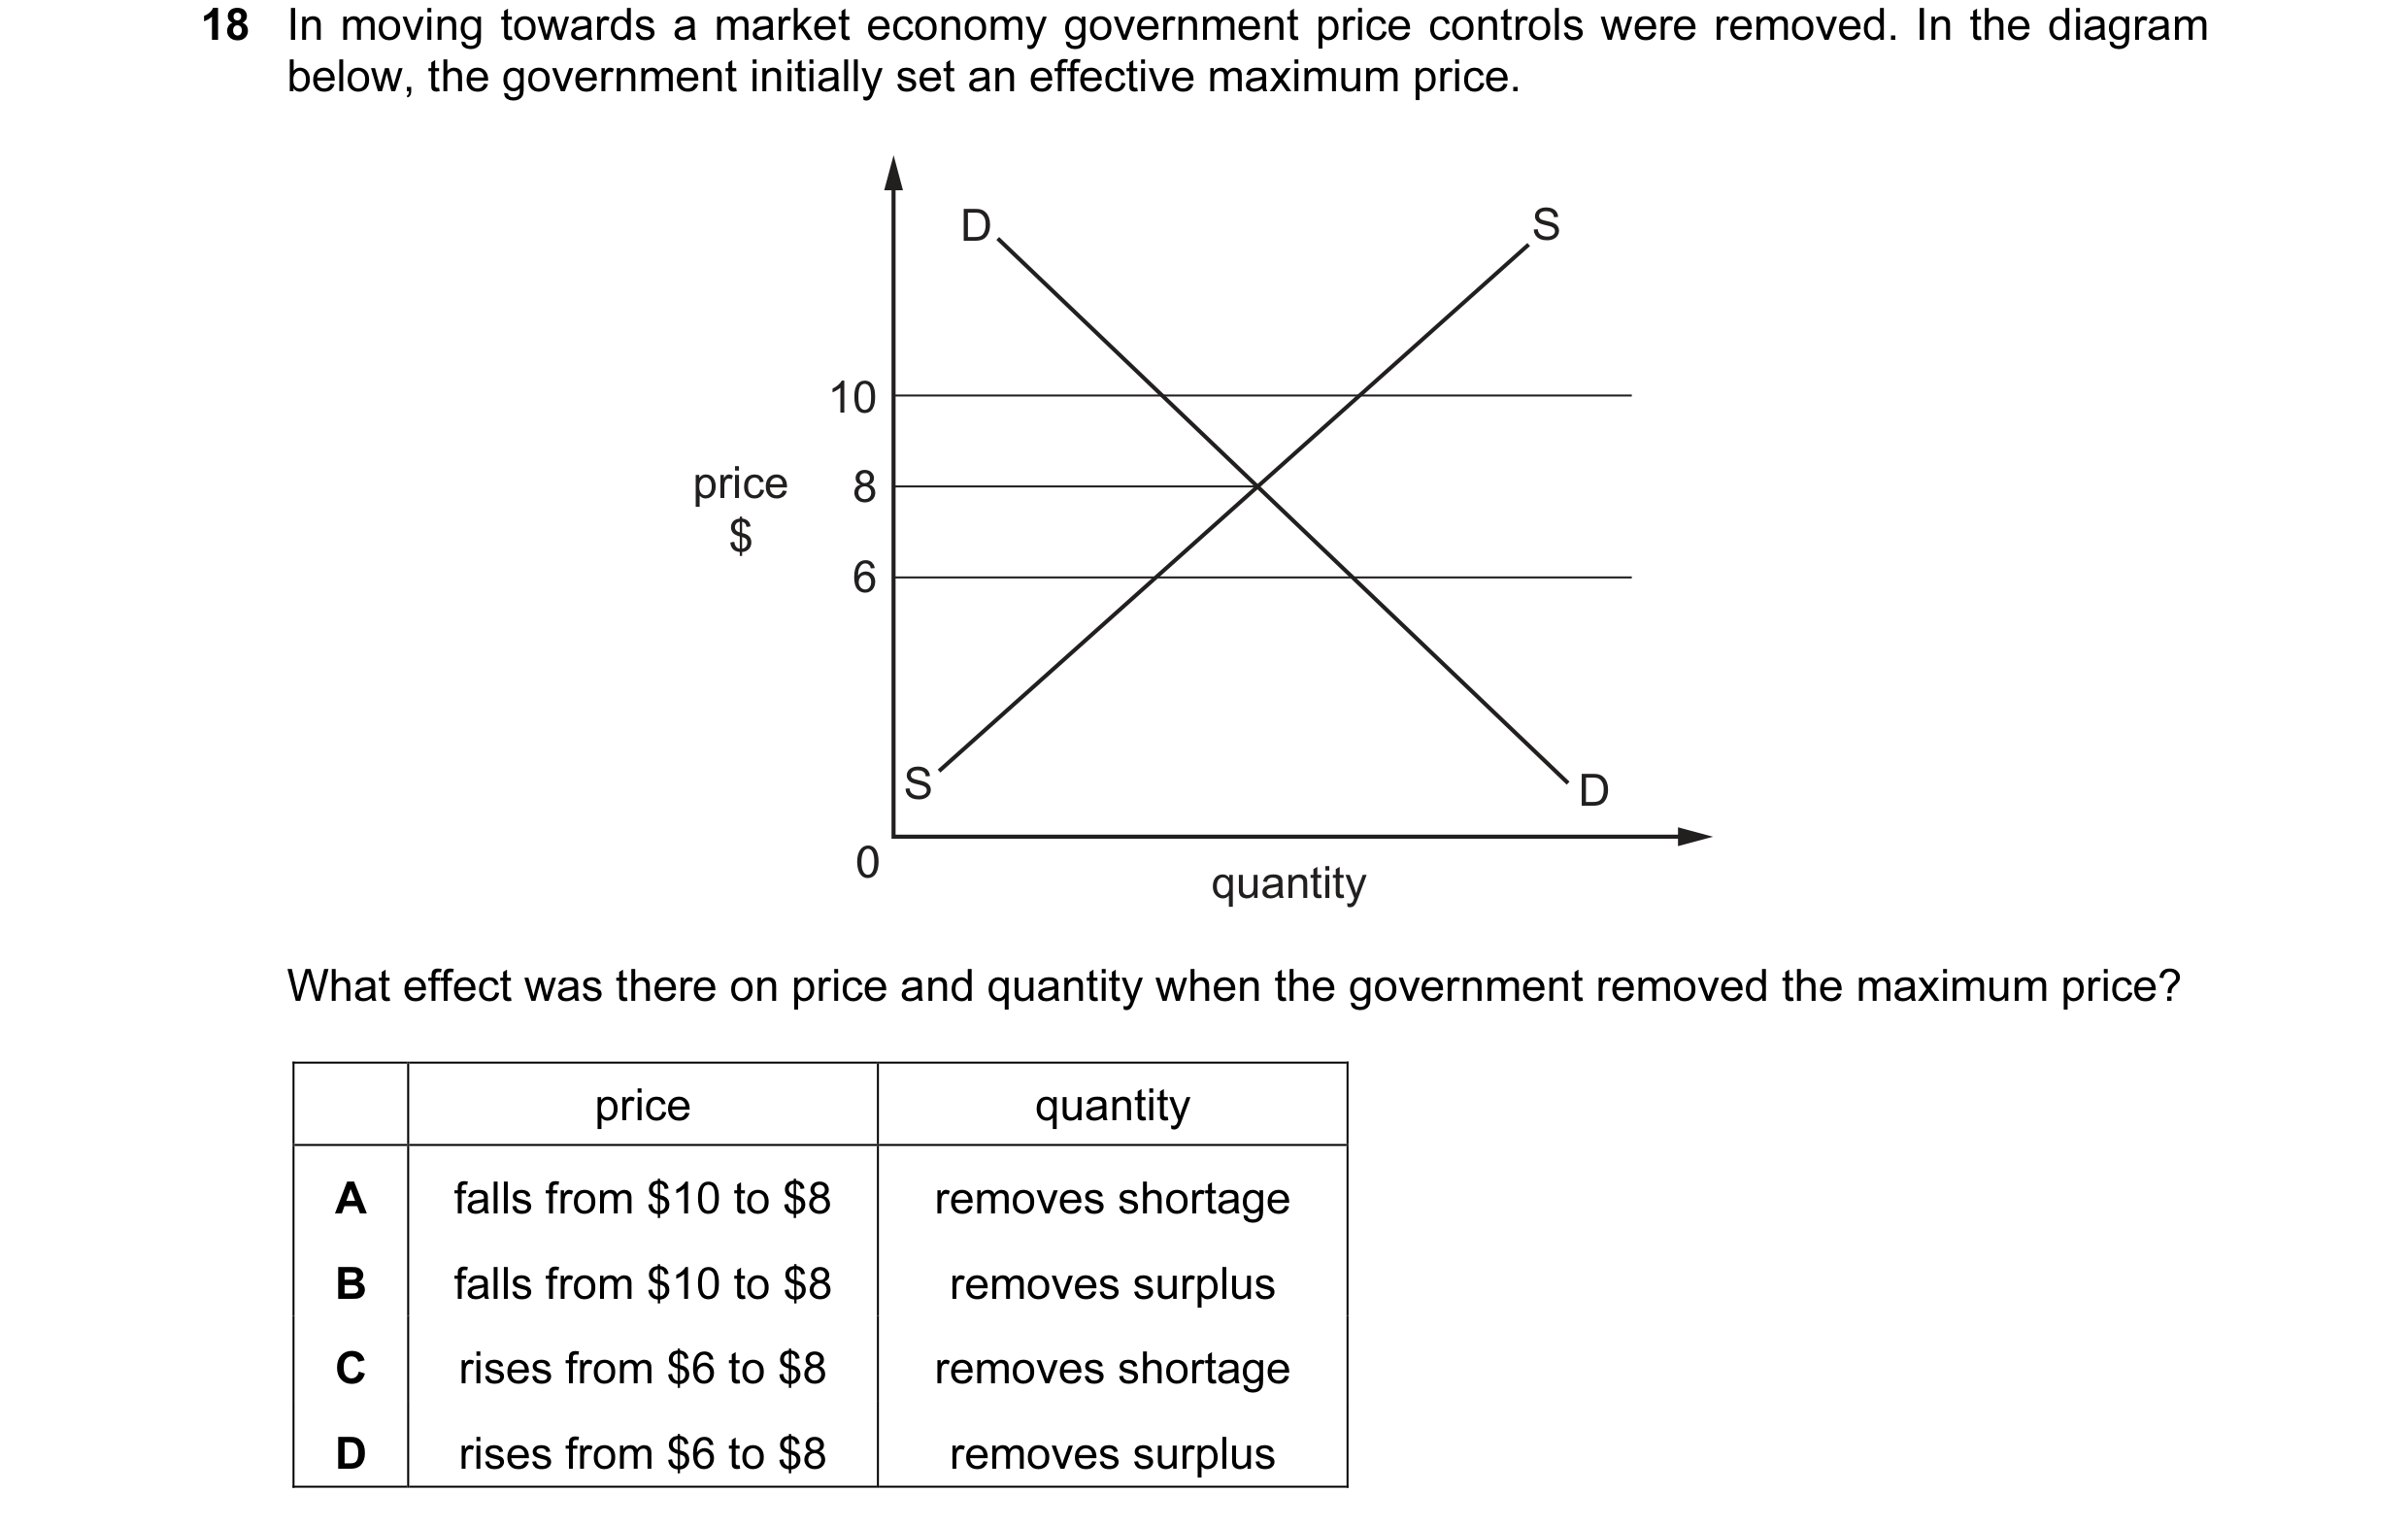
 41 / 119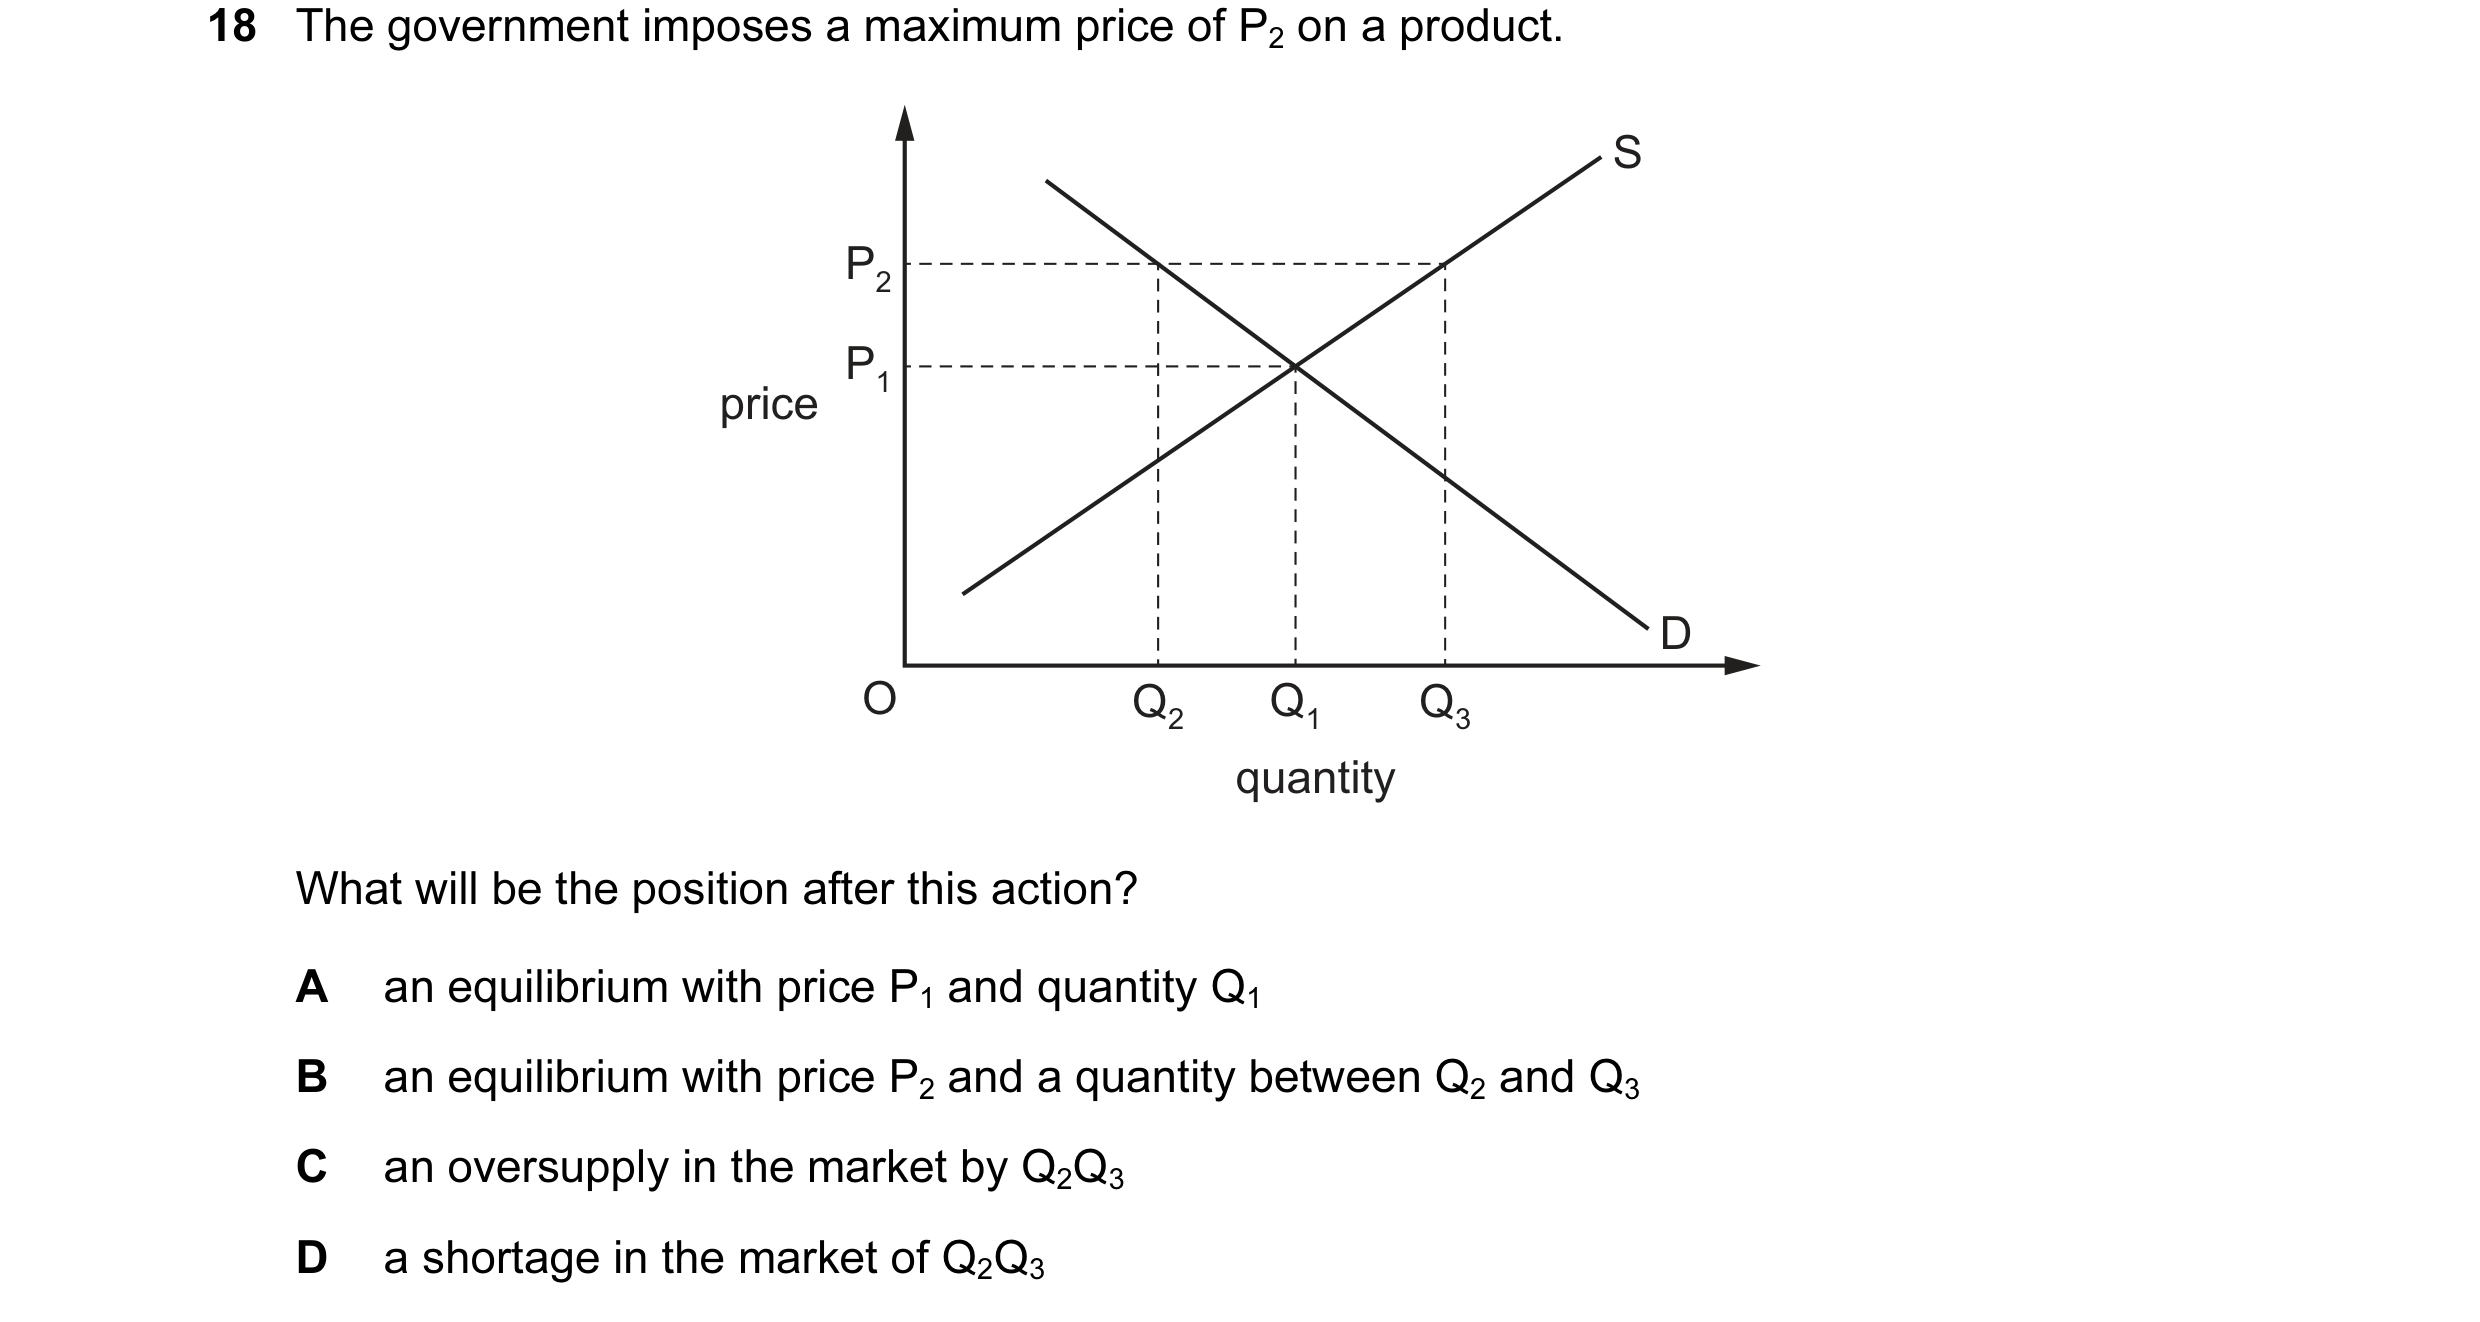
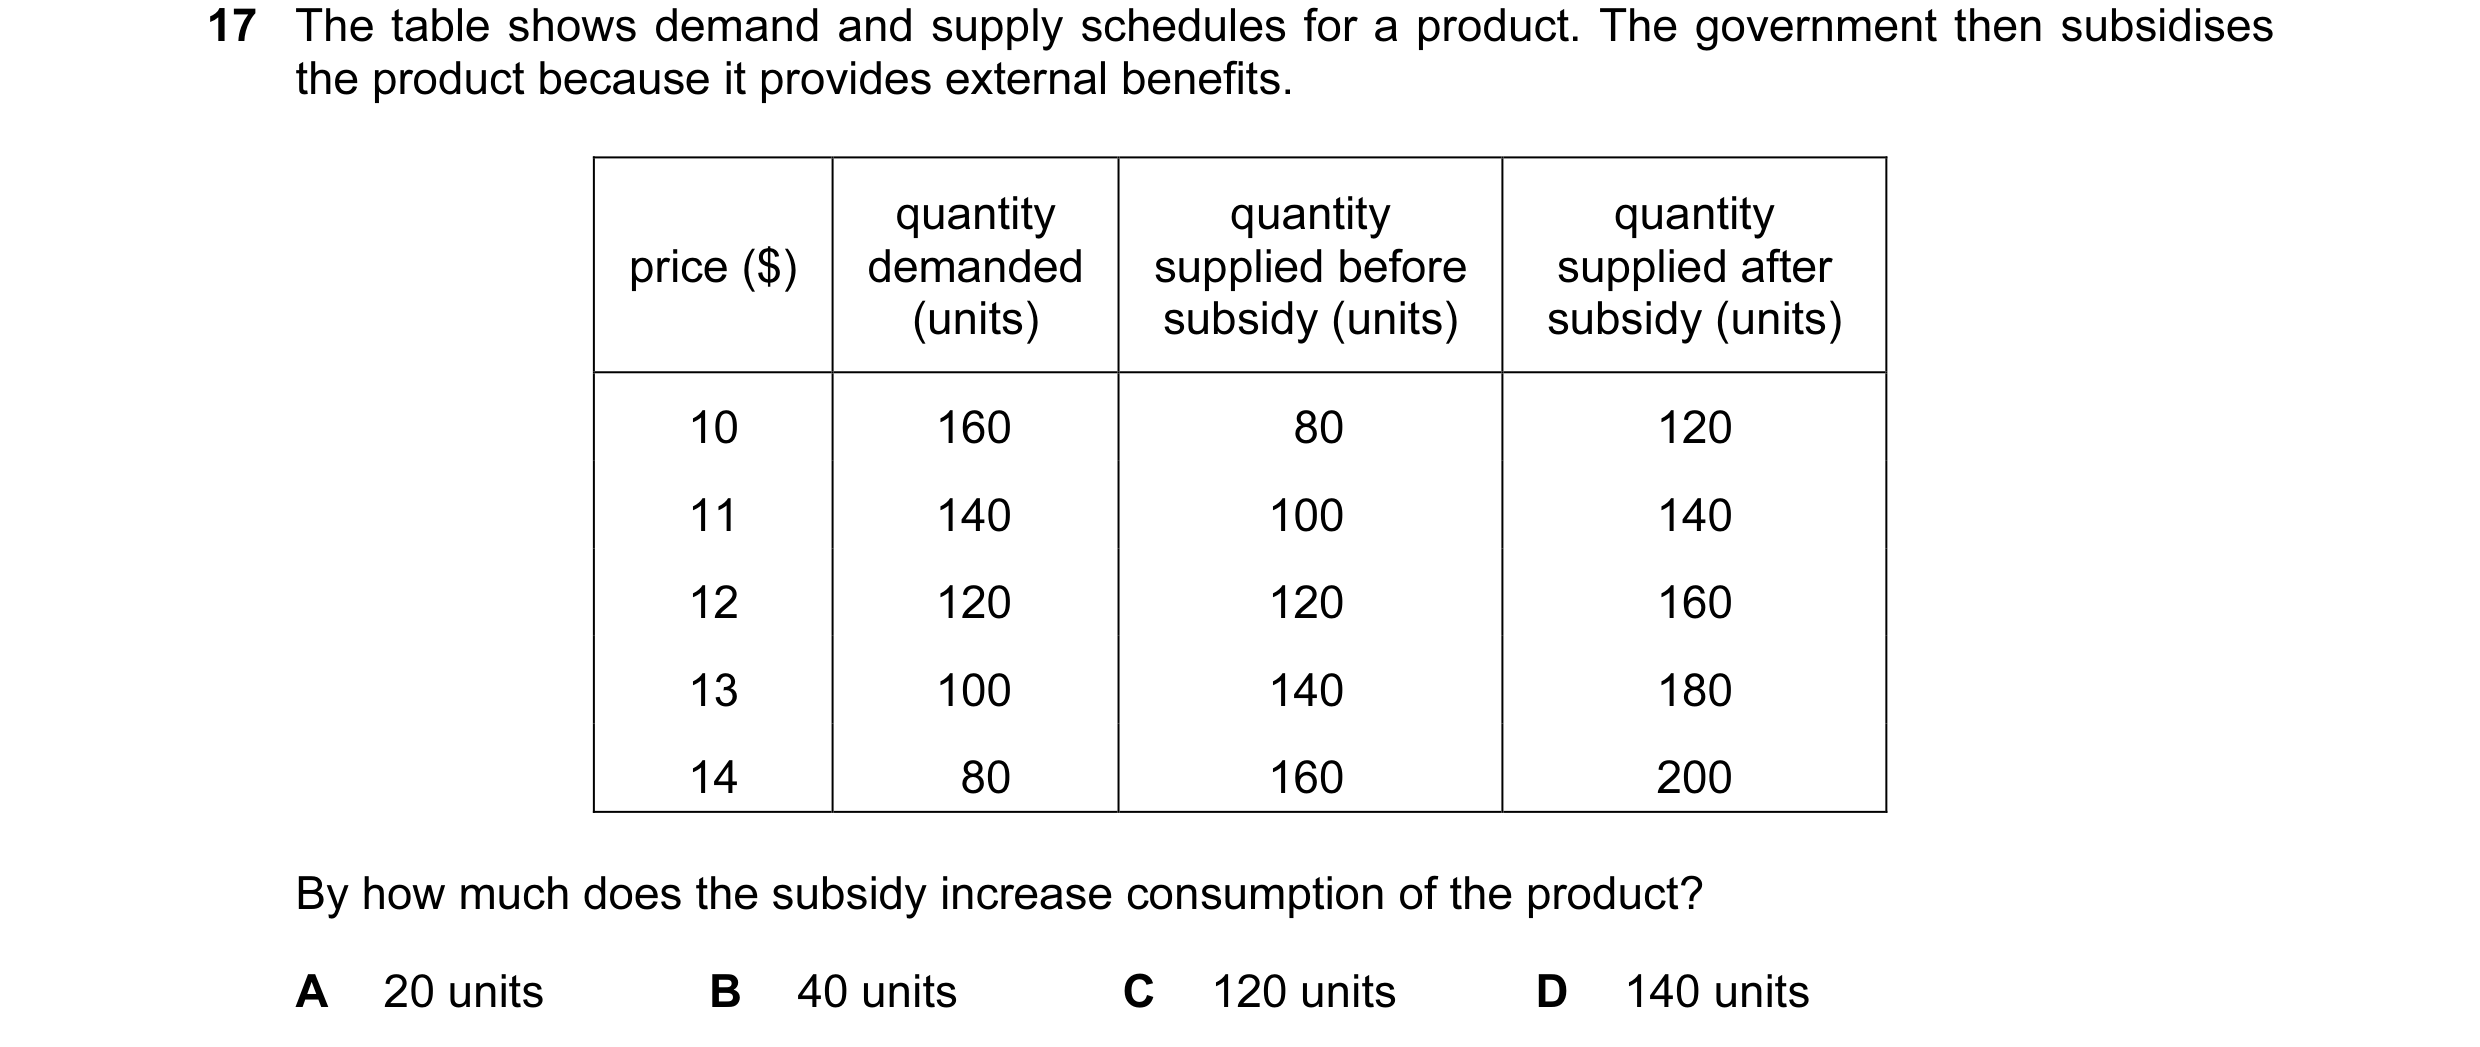 42 / 119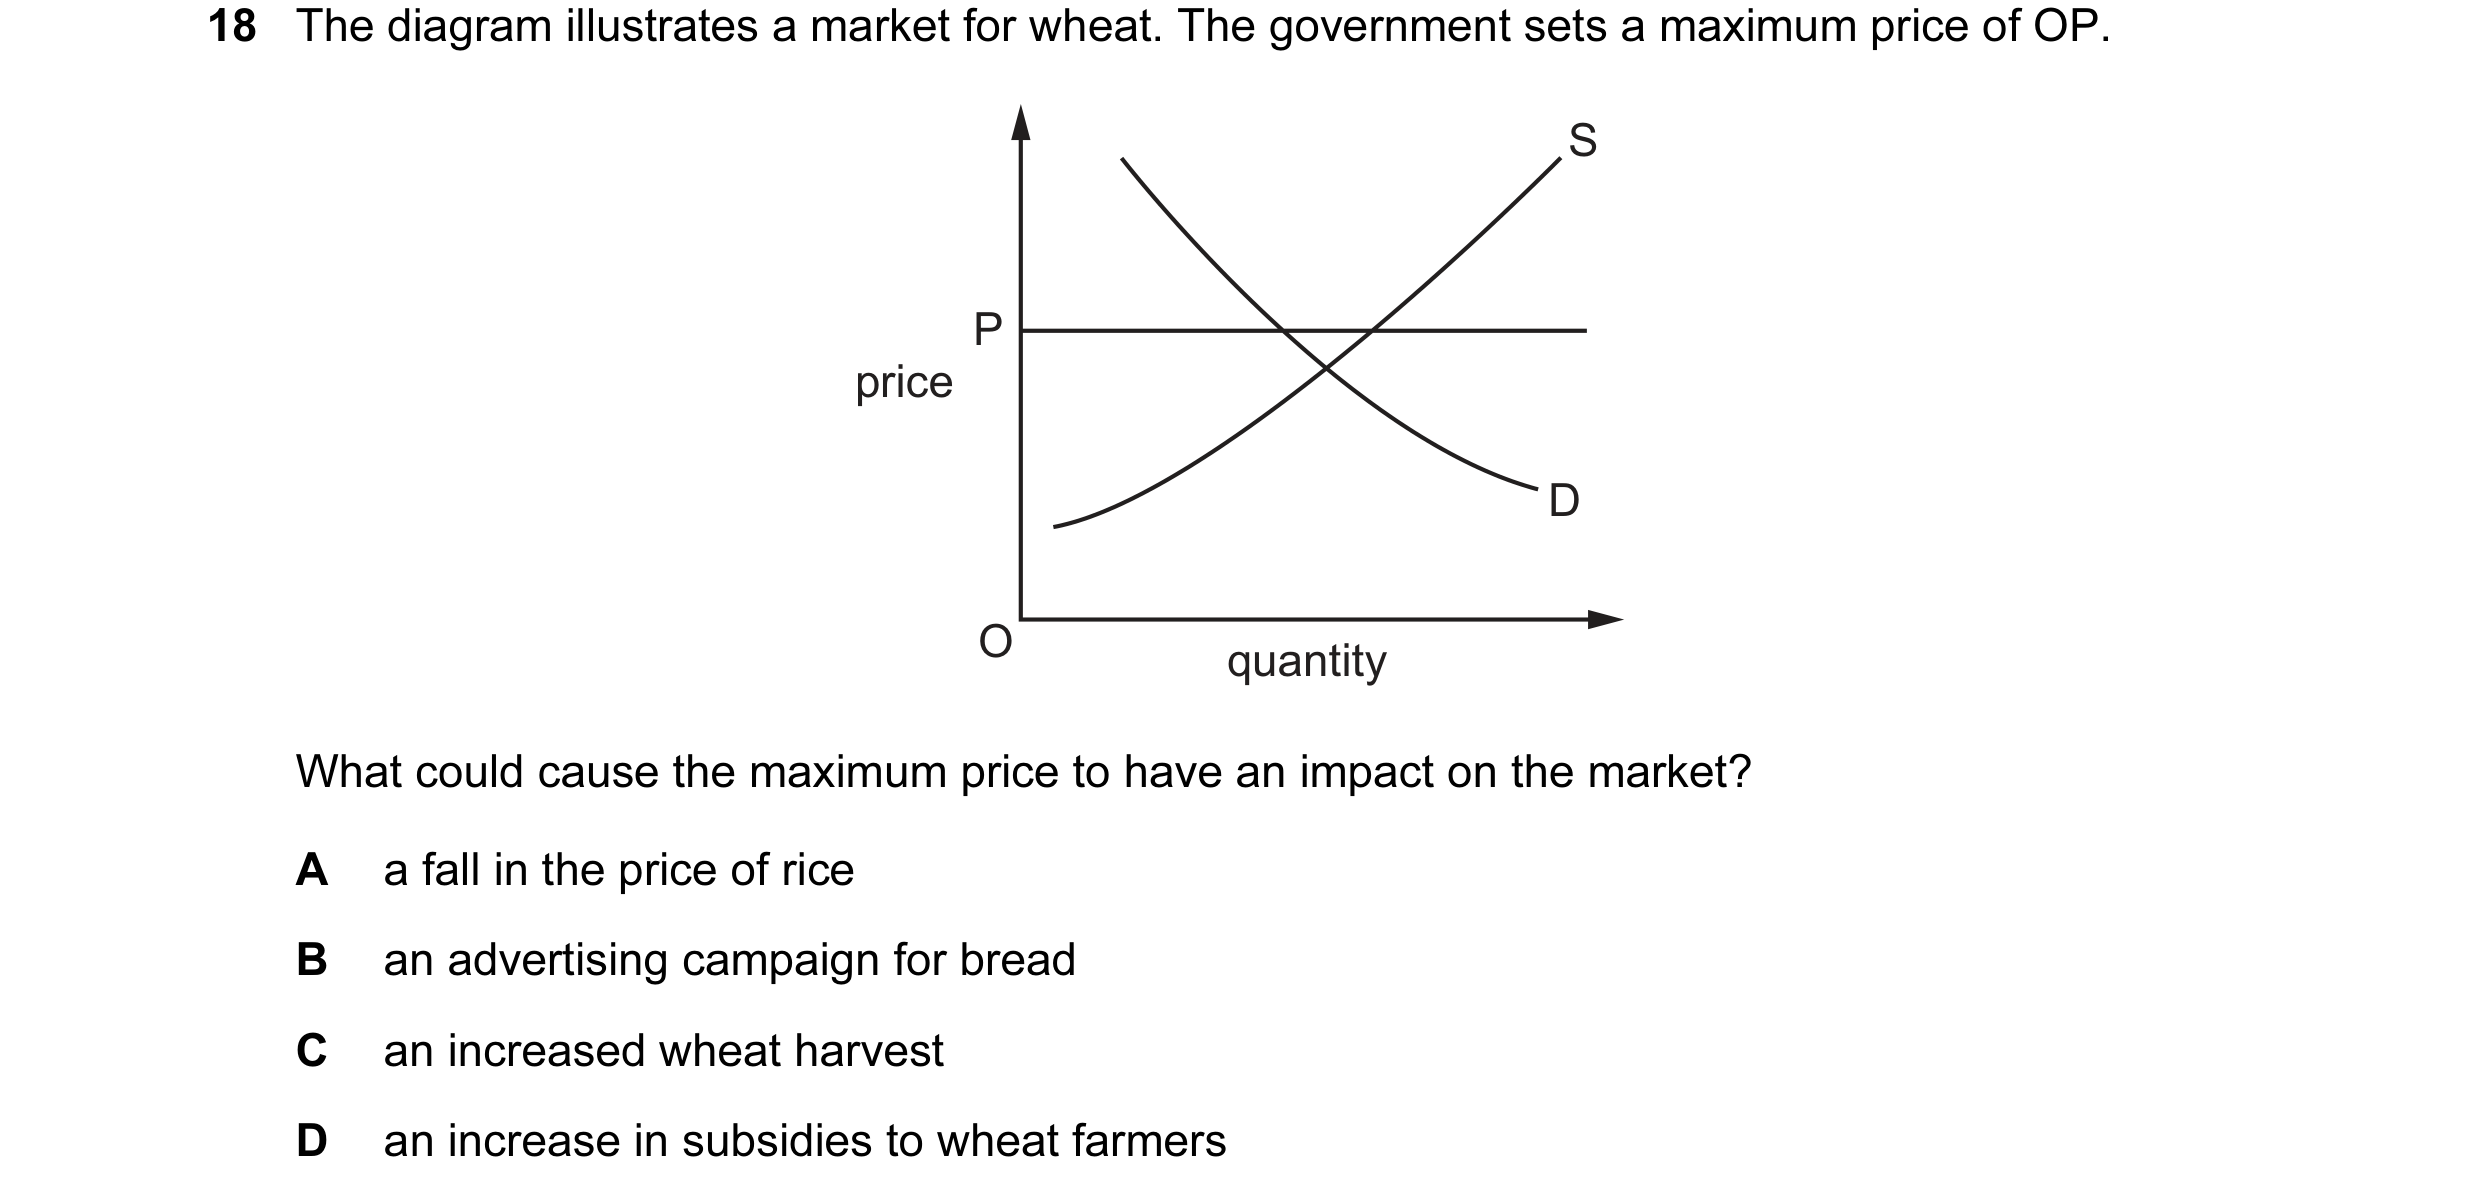
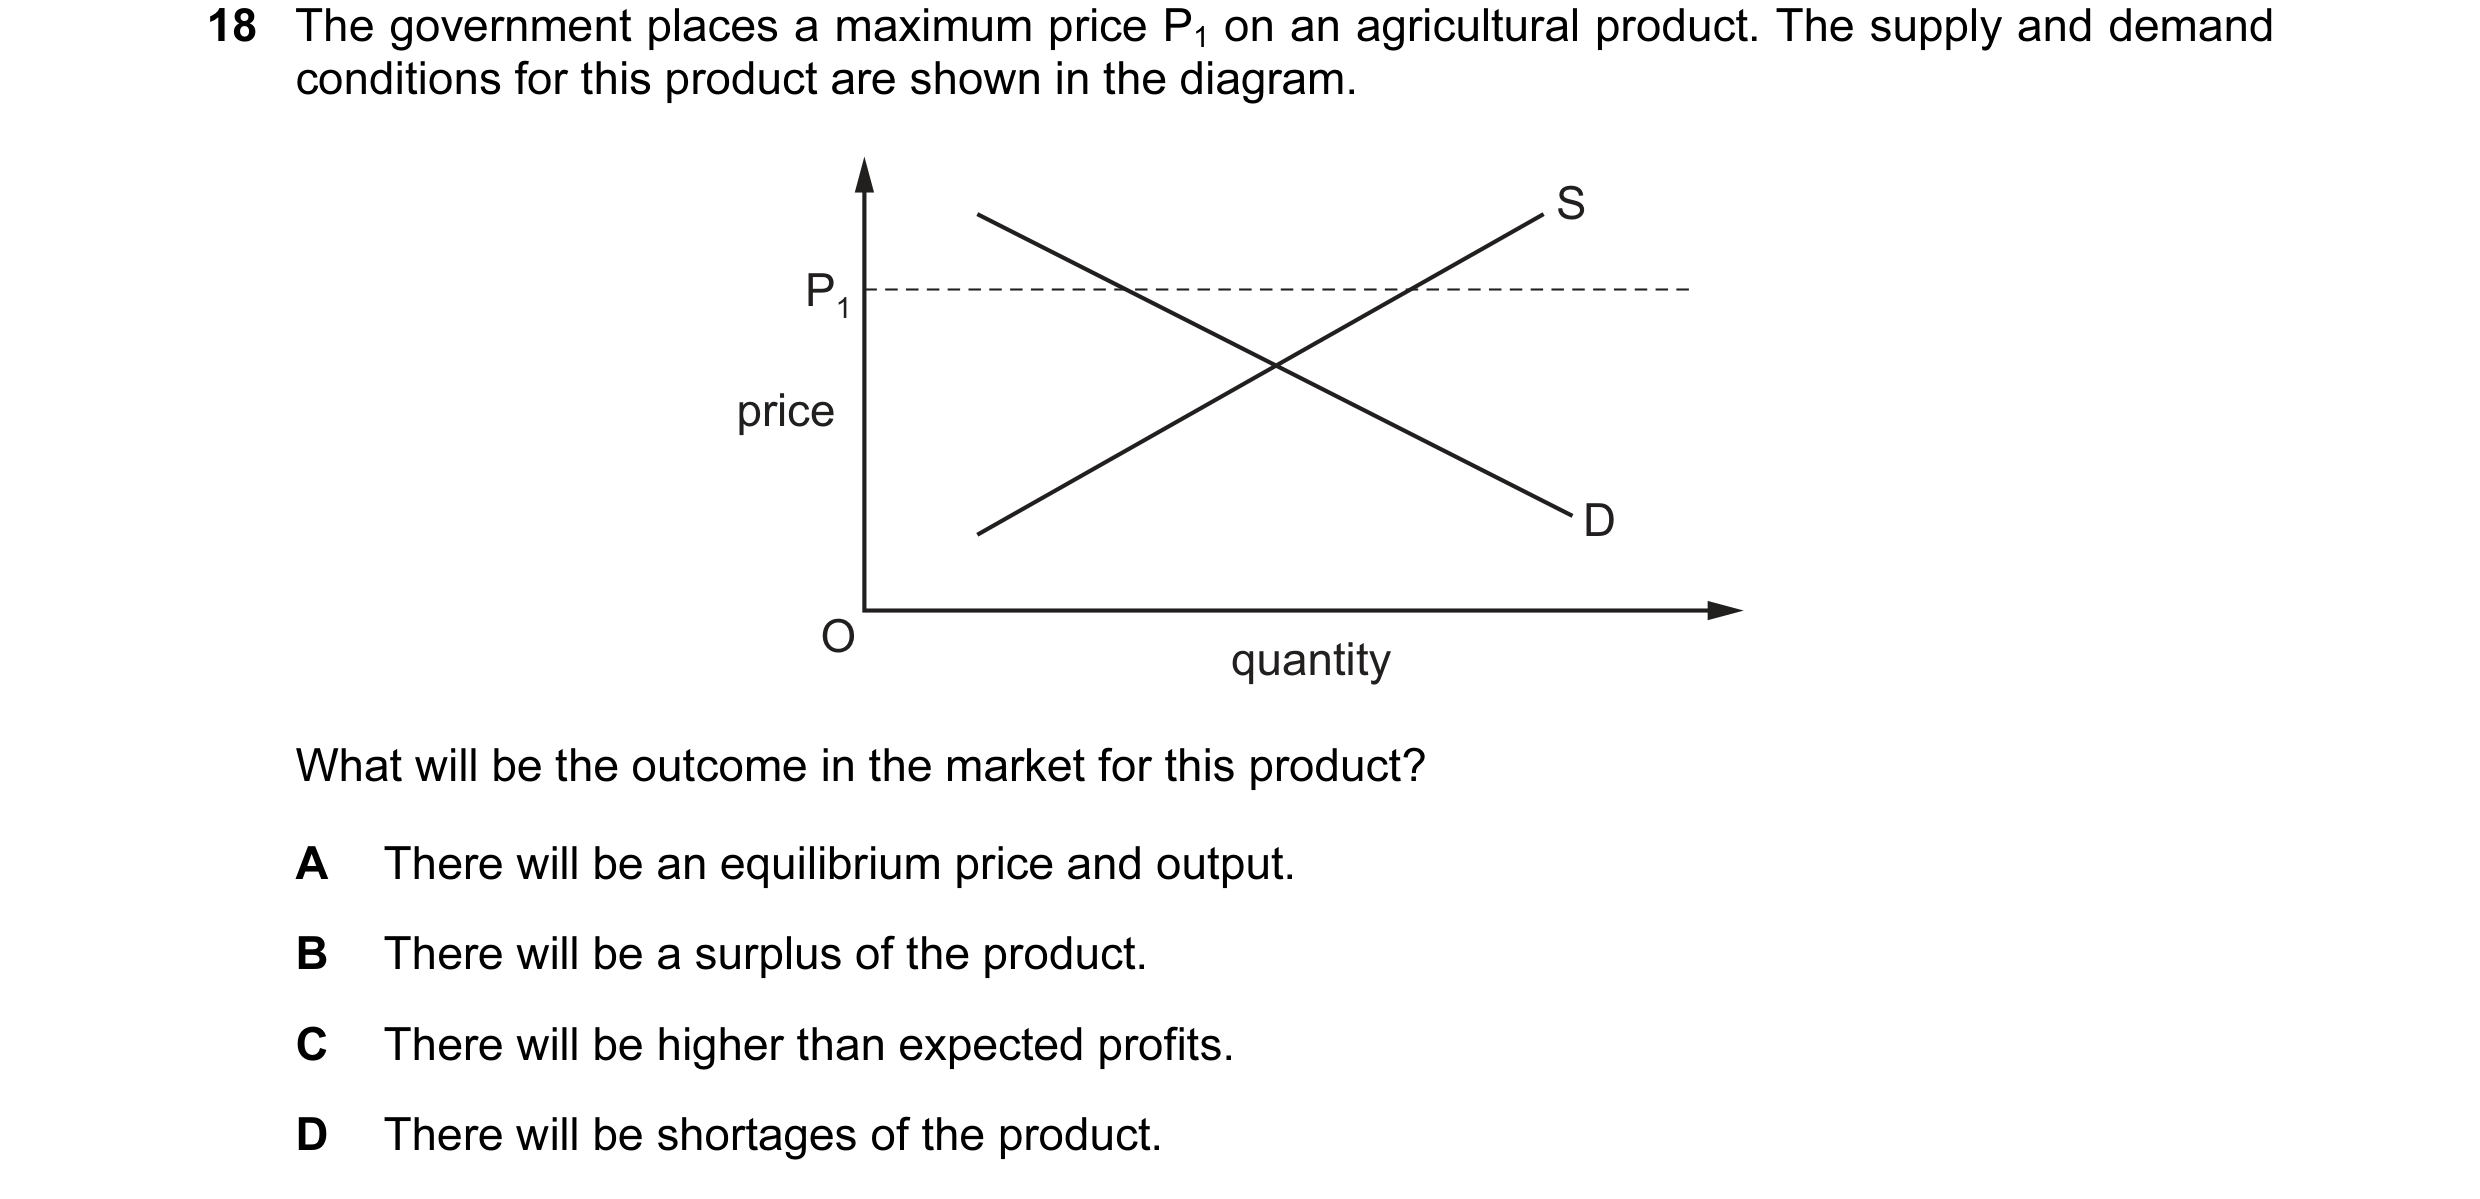 43 / 119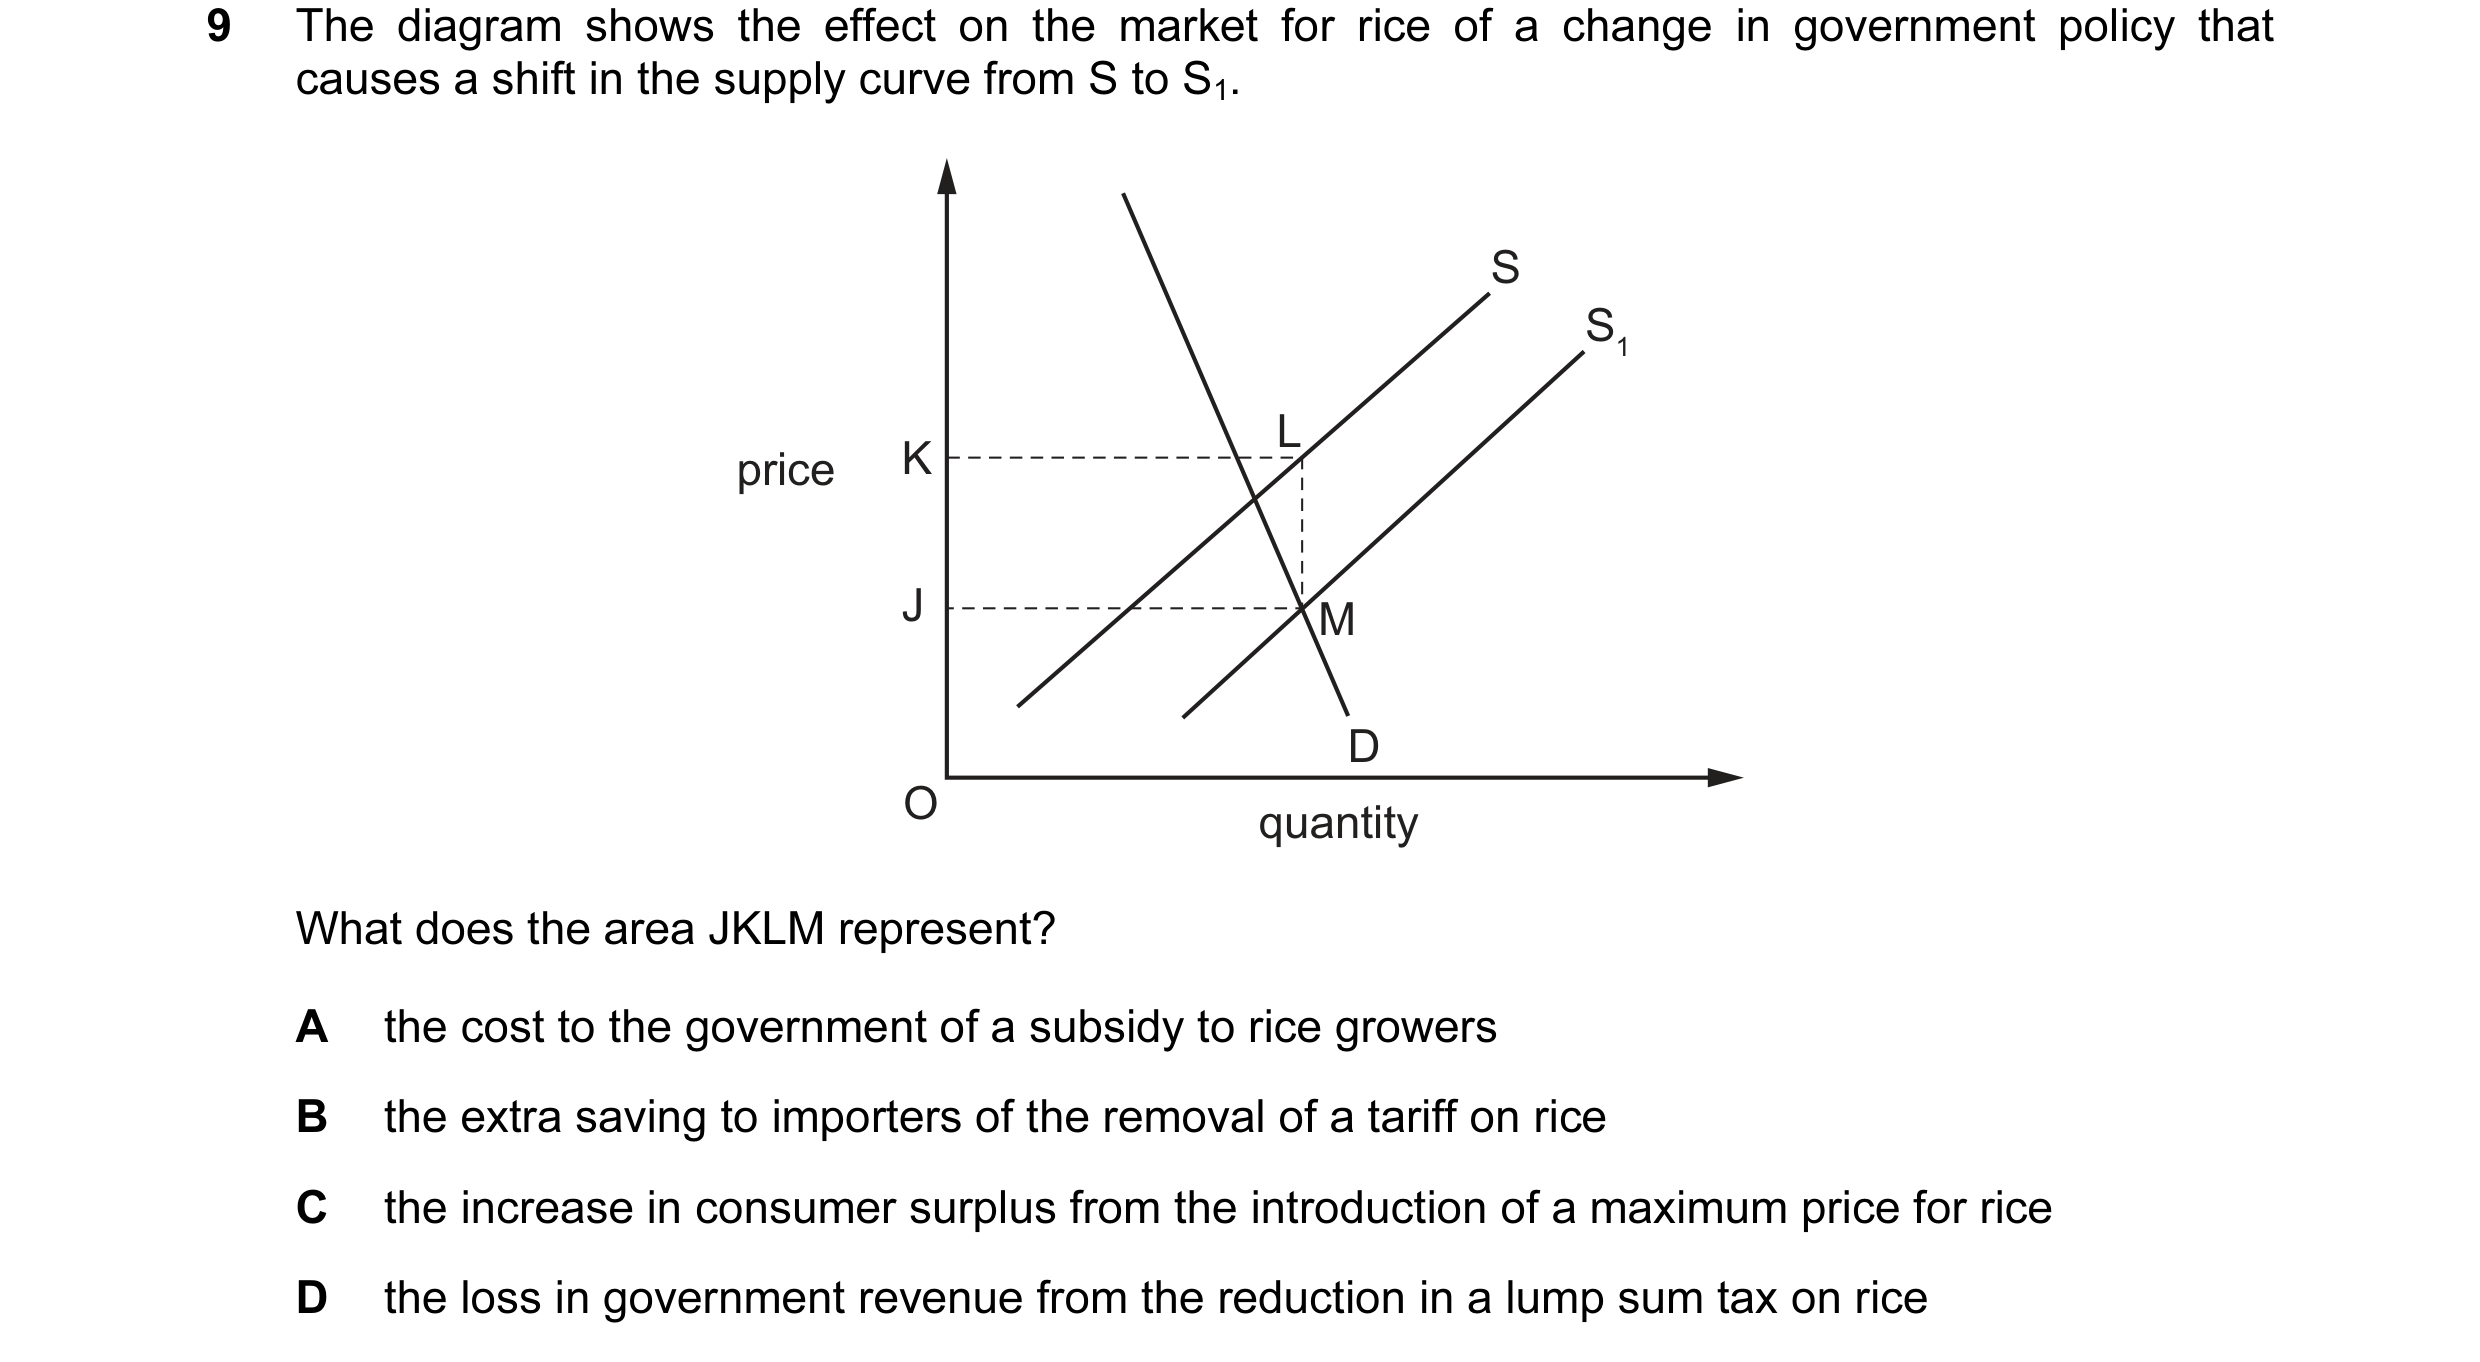
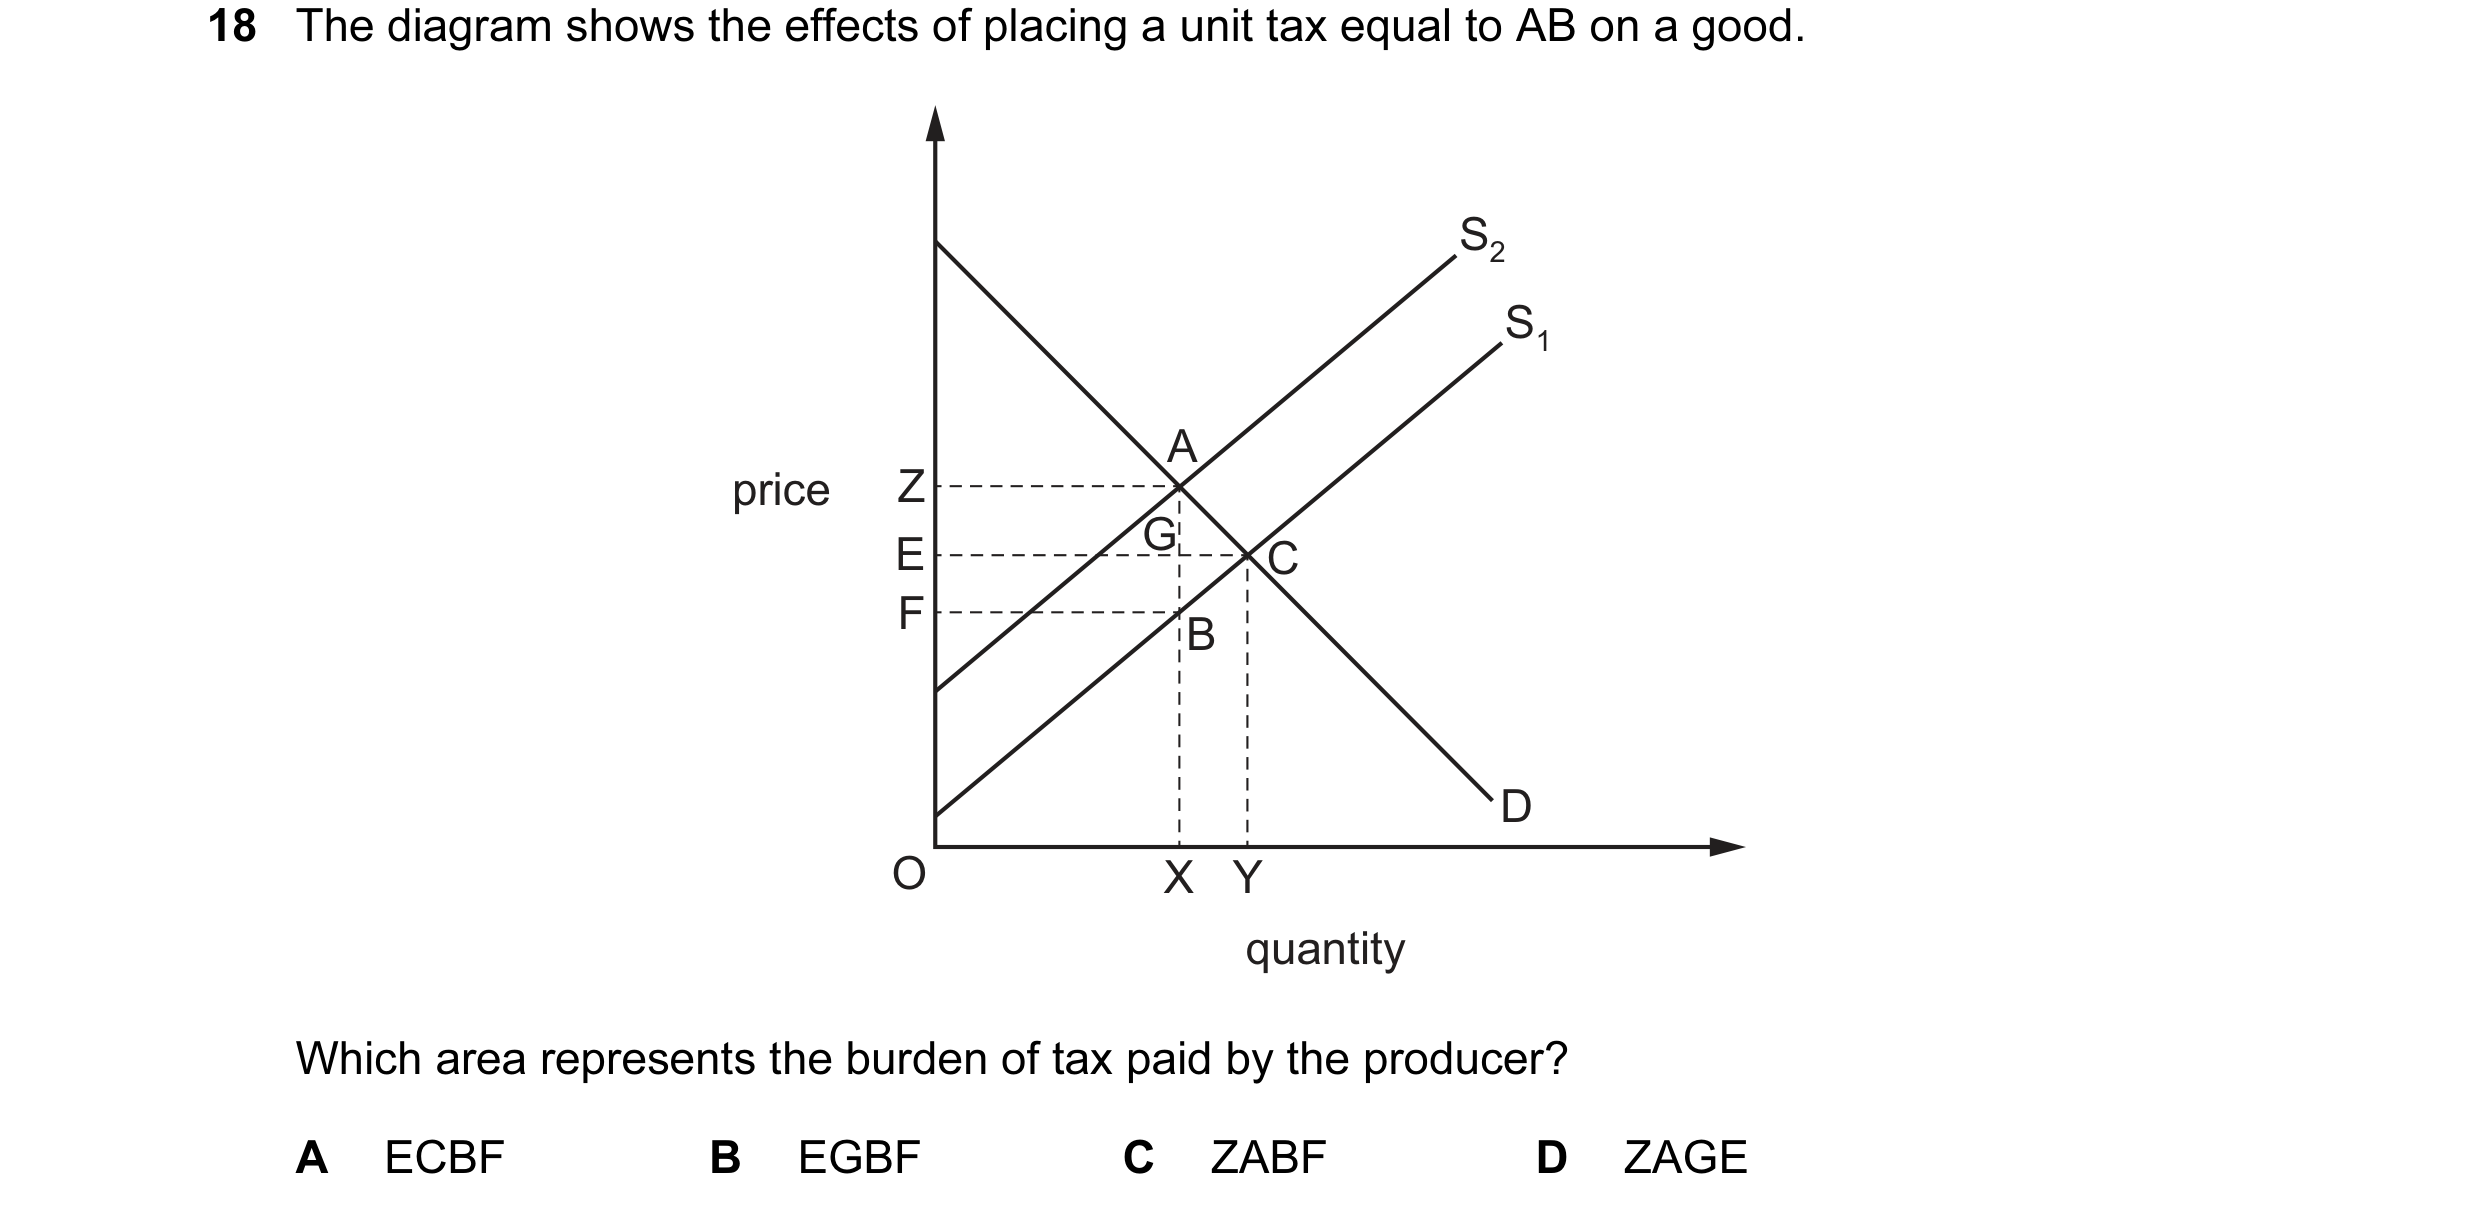 44 / 119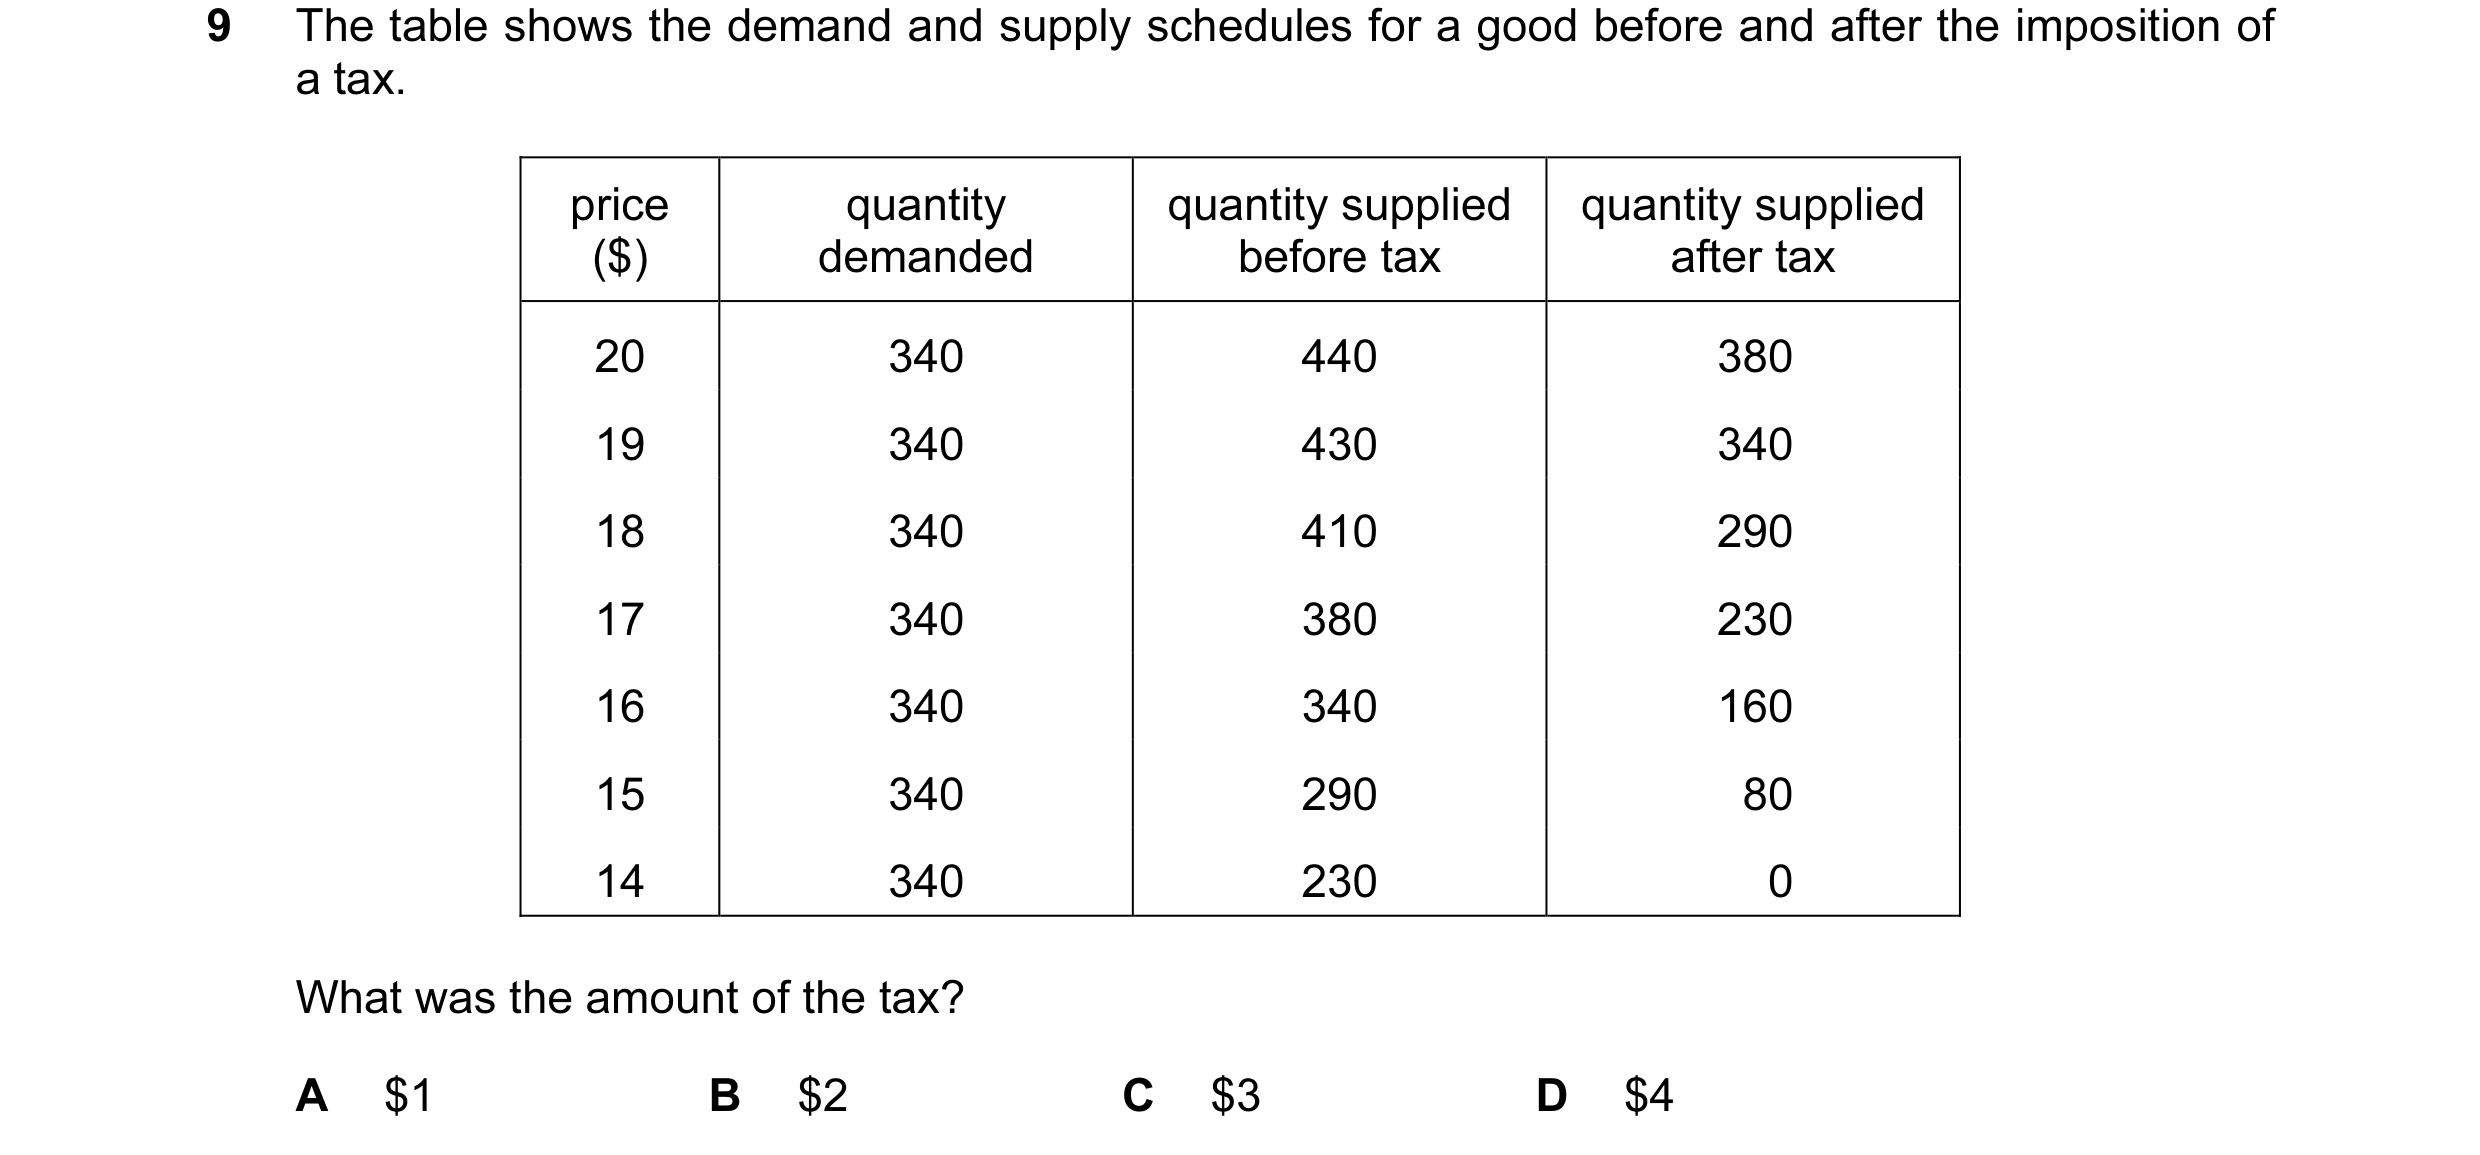
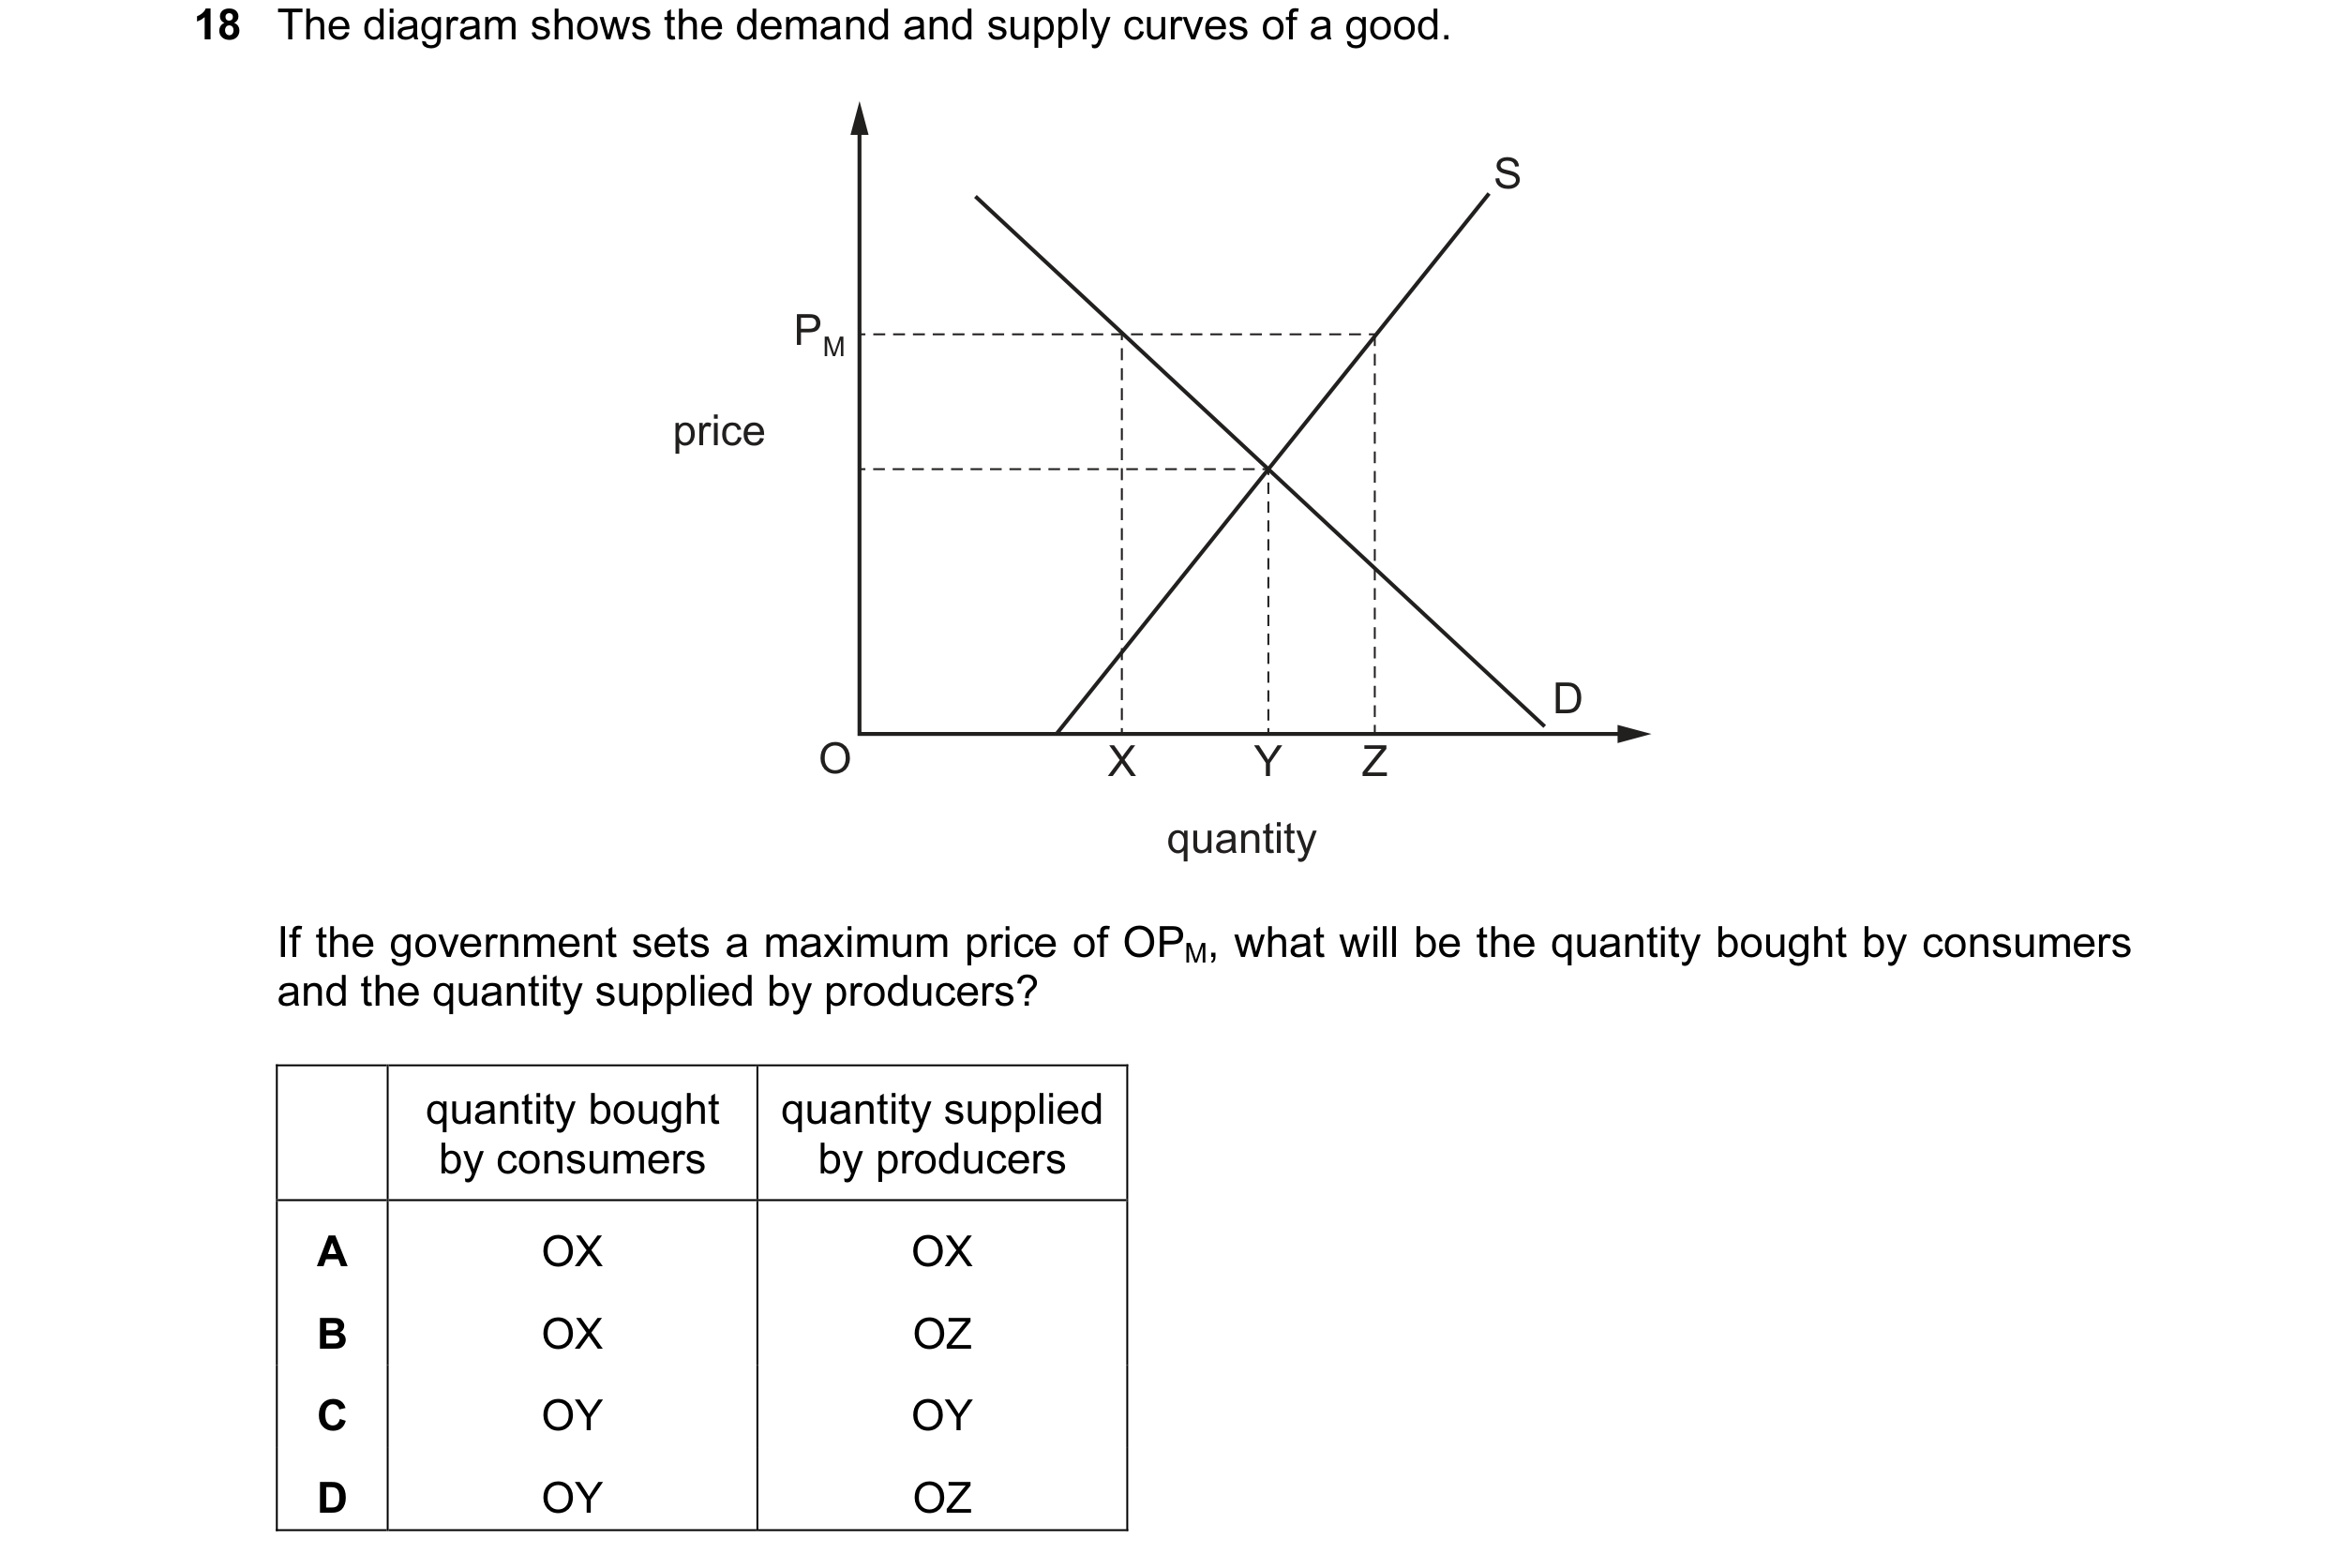 45 / 119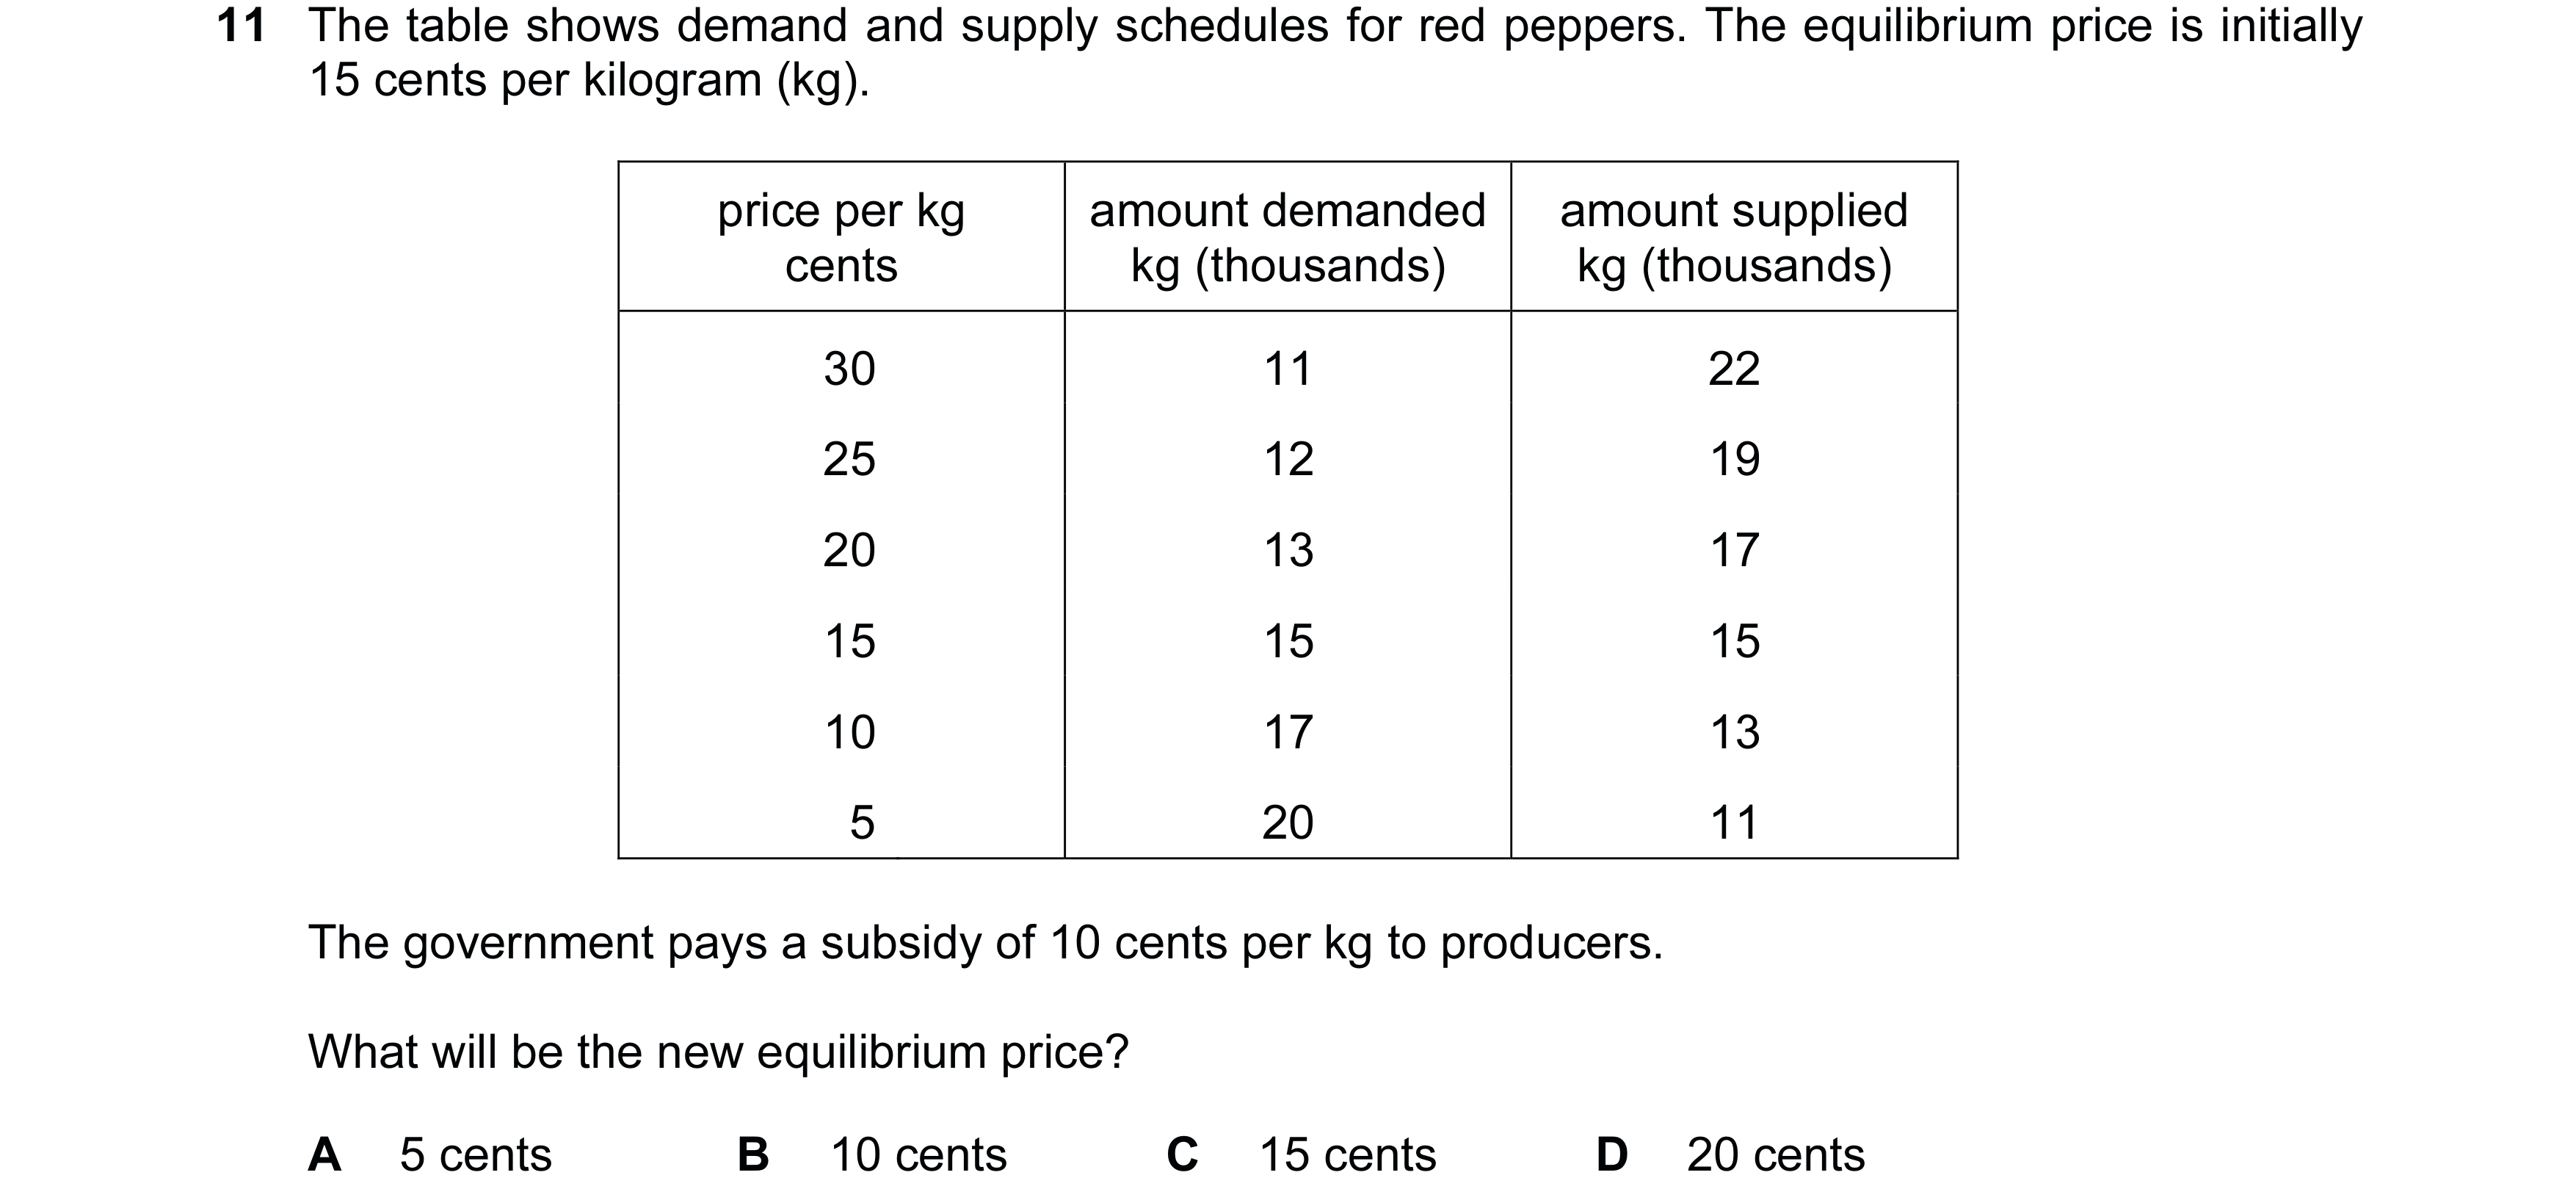
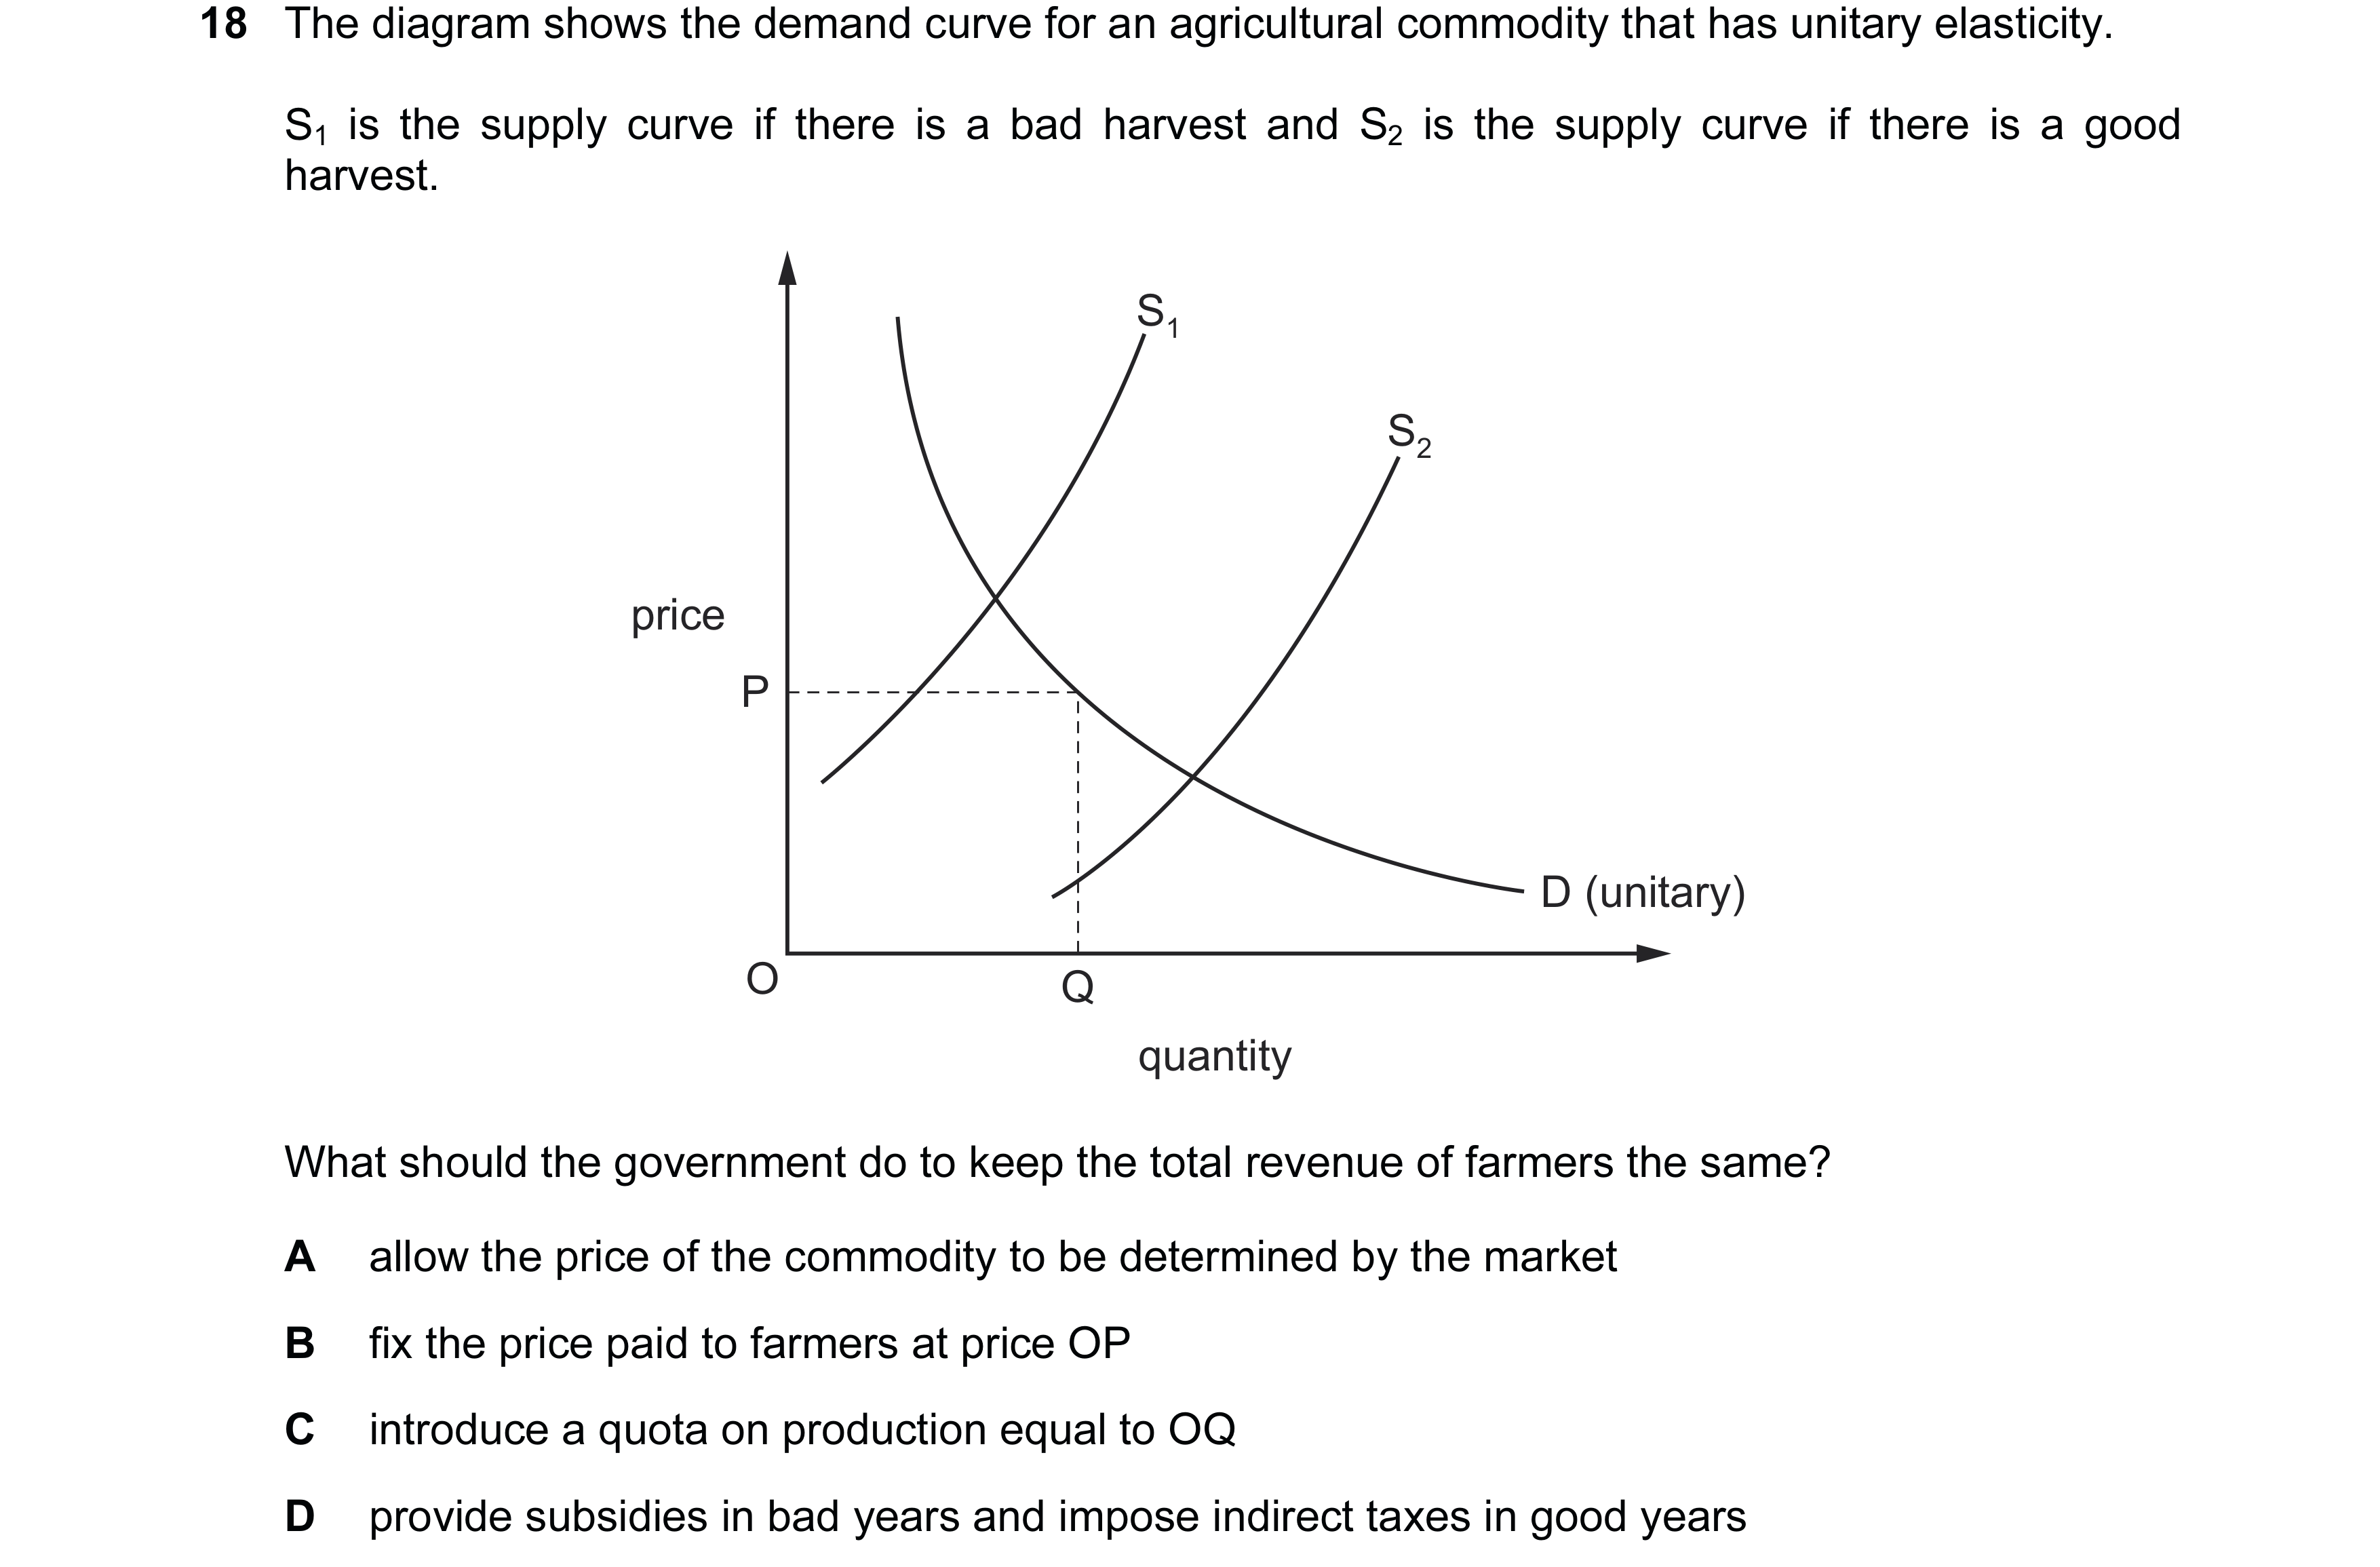 46 / 119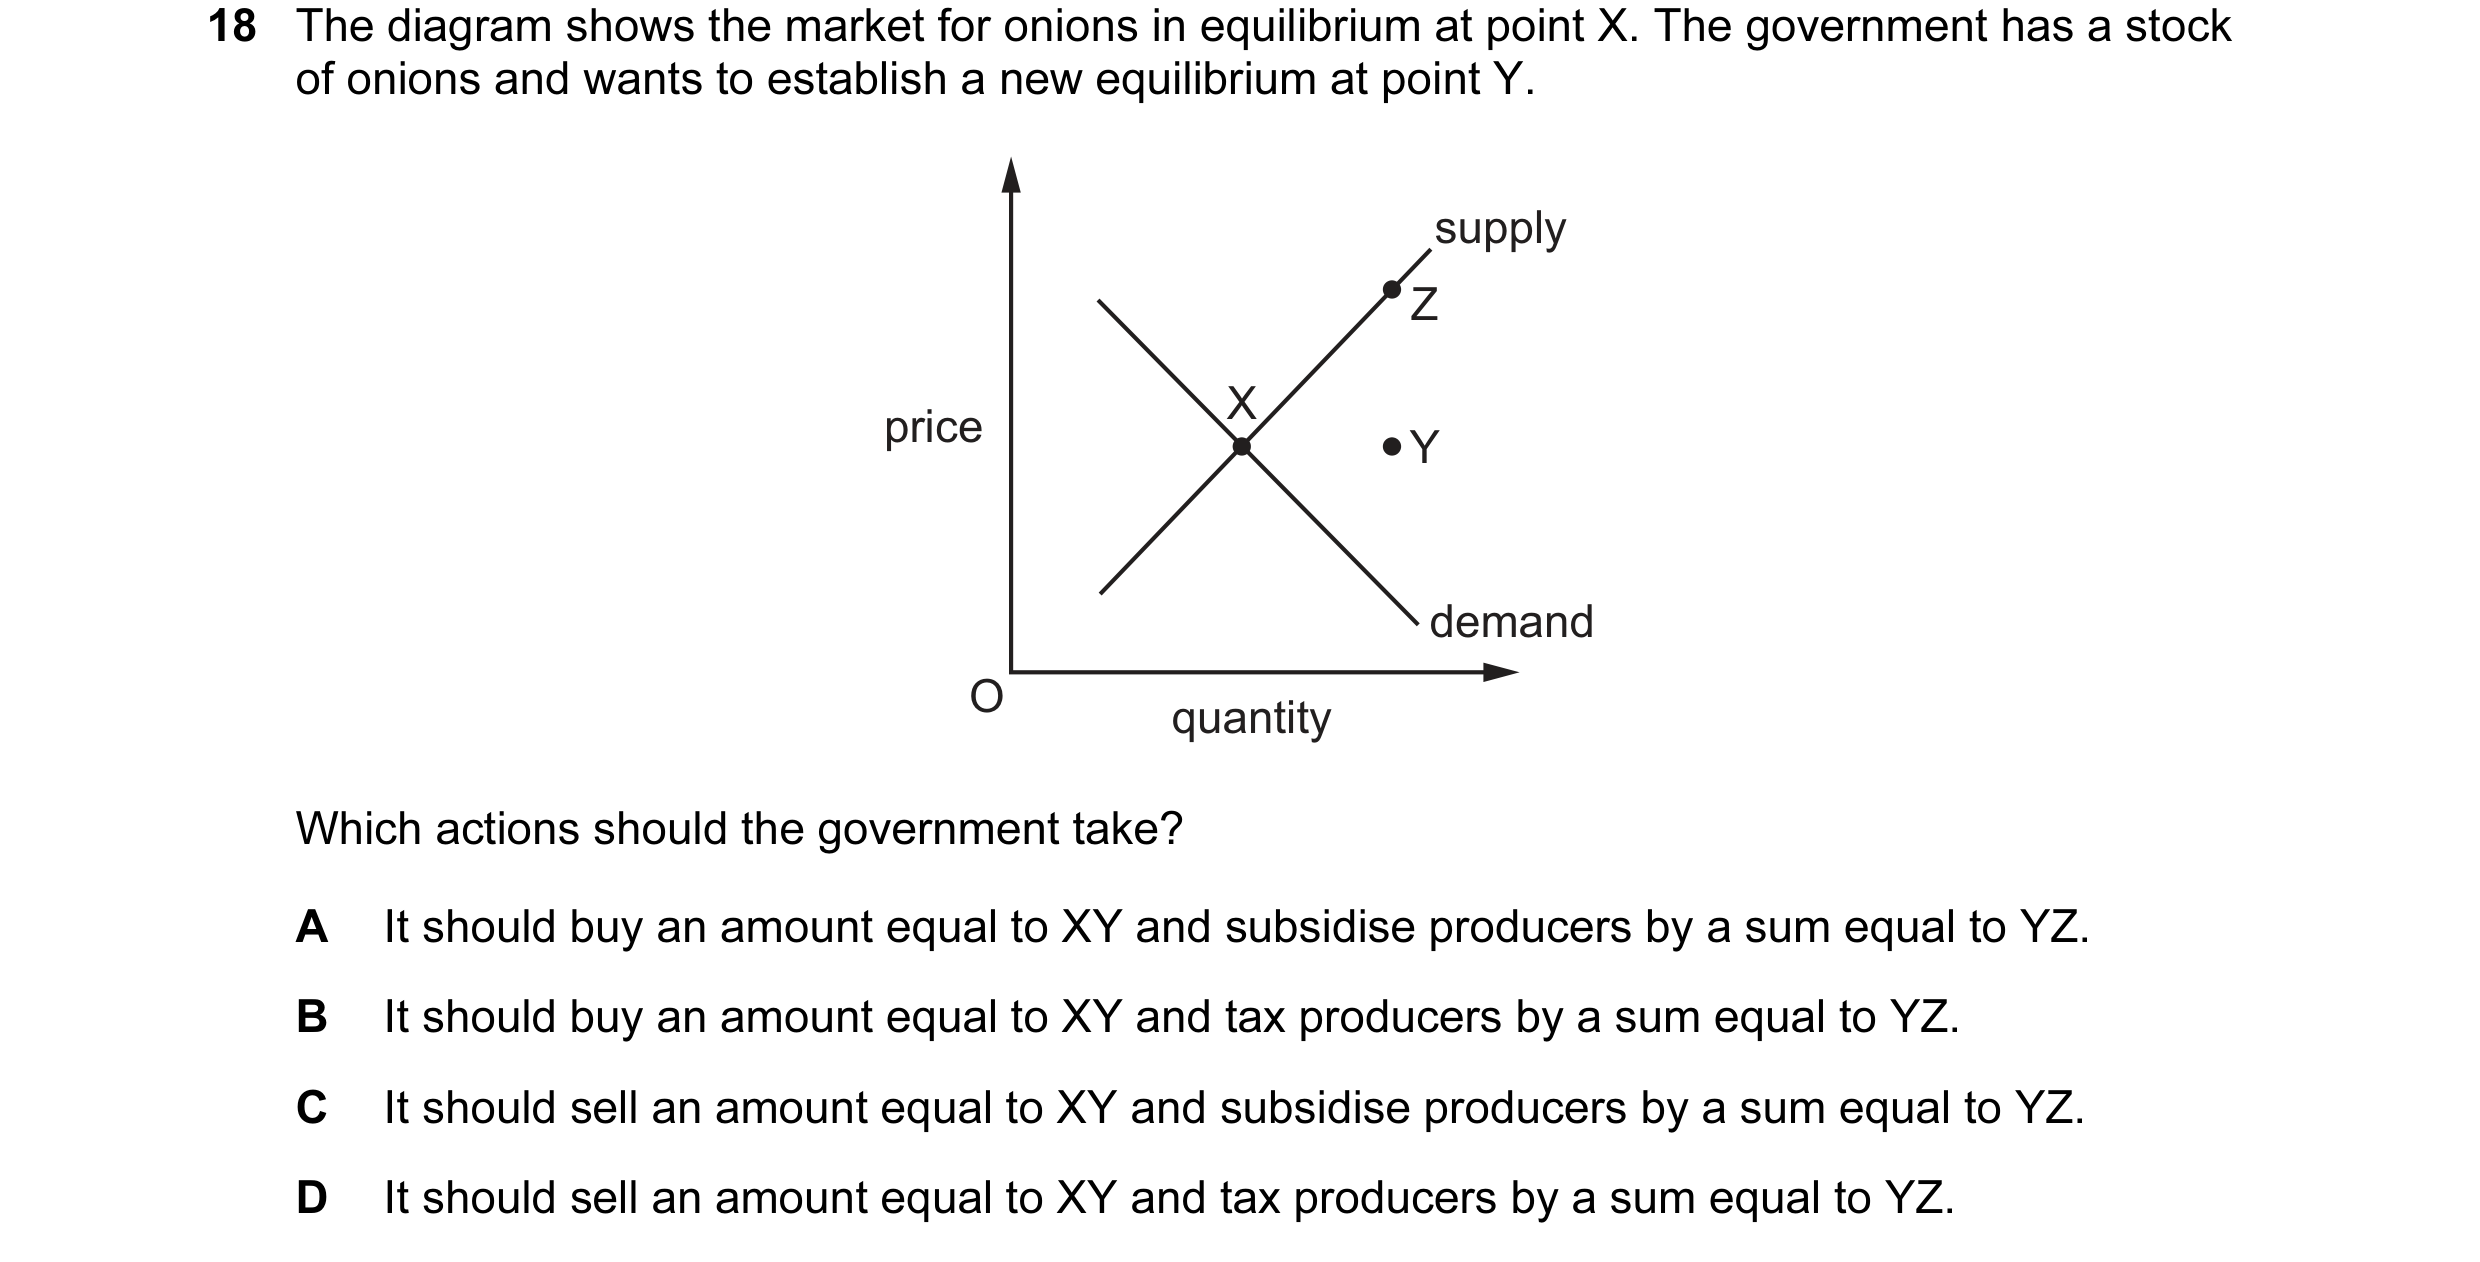
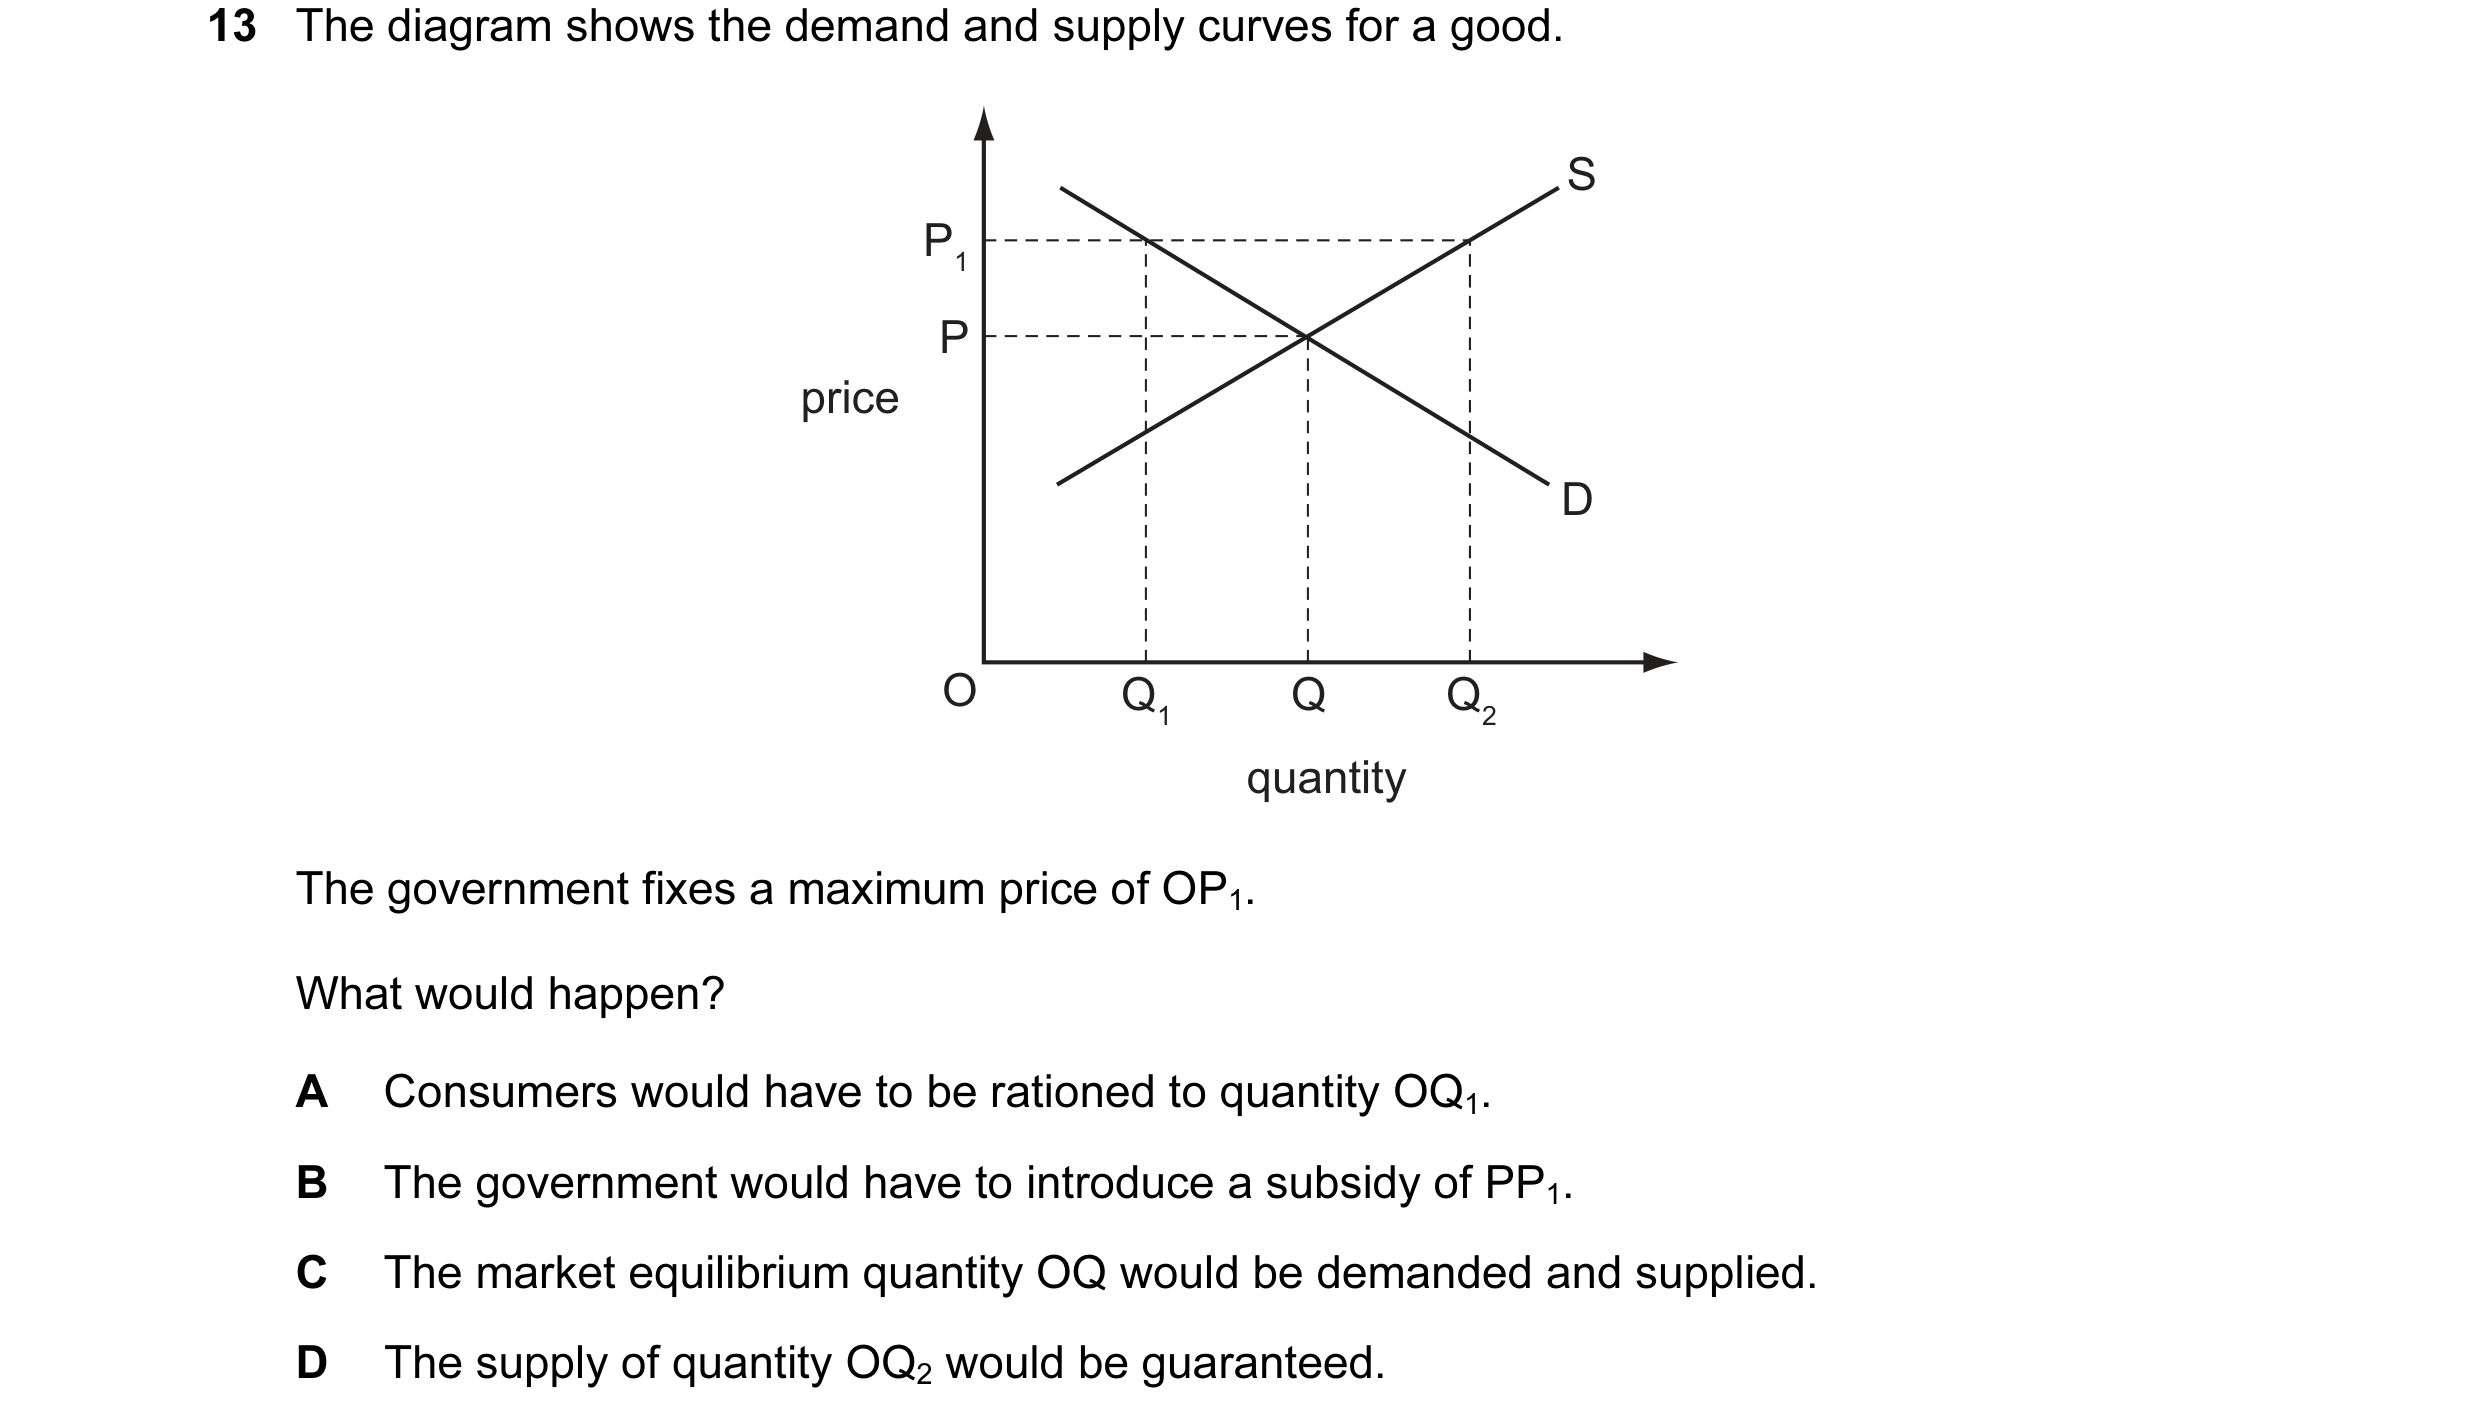 47 / 119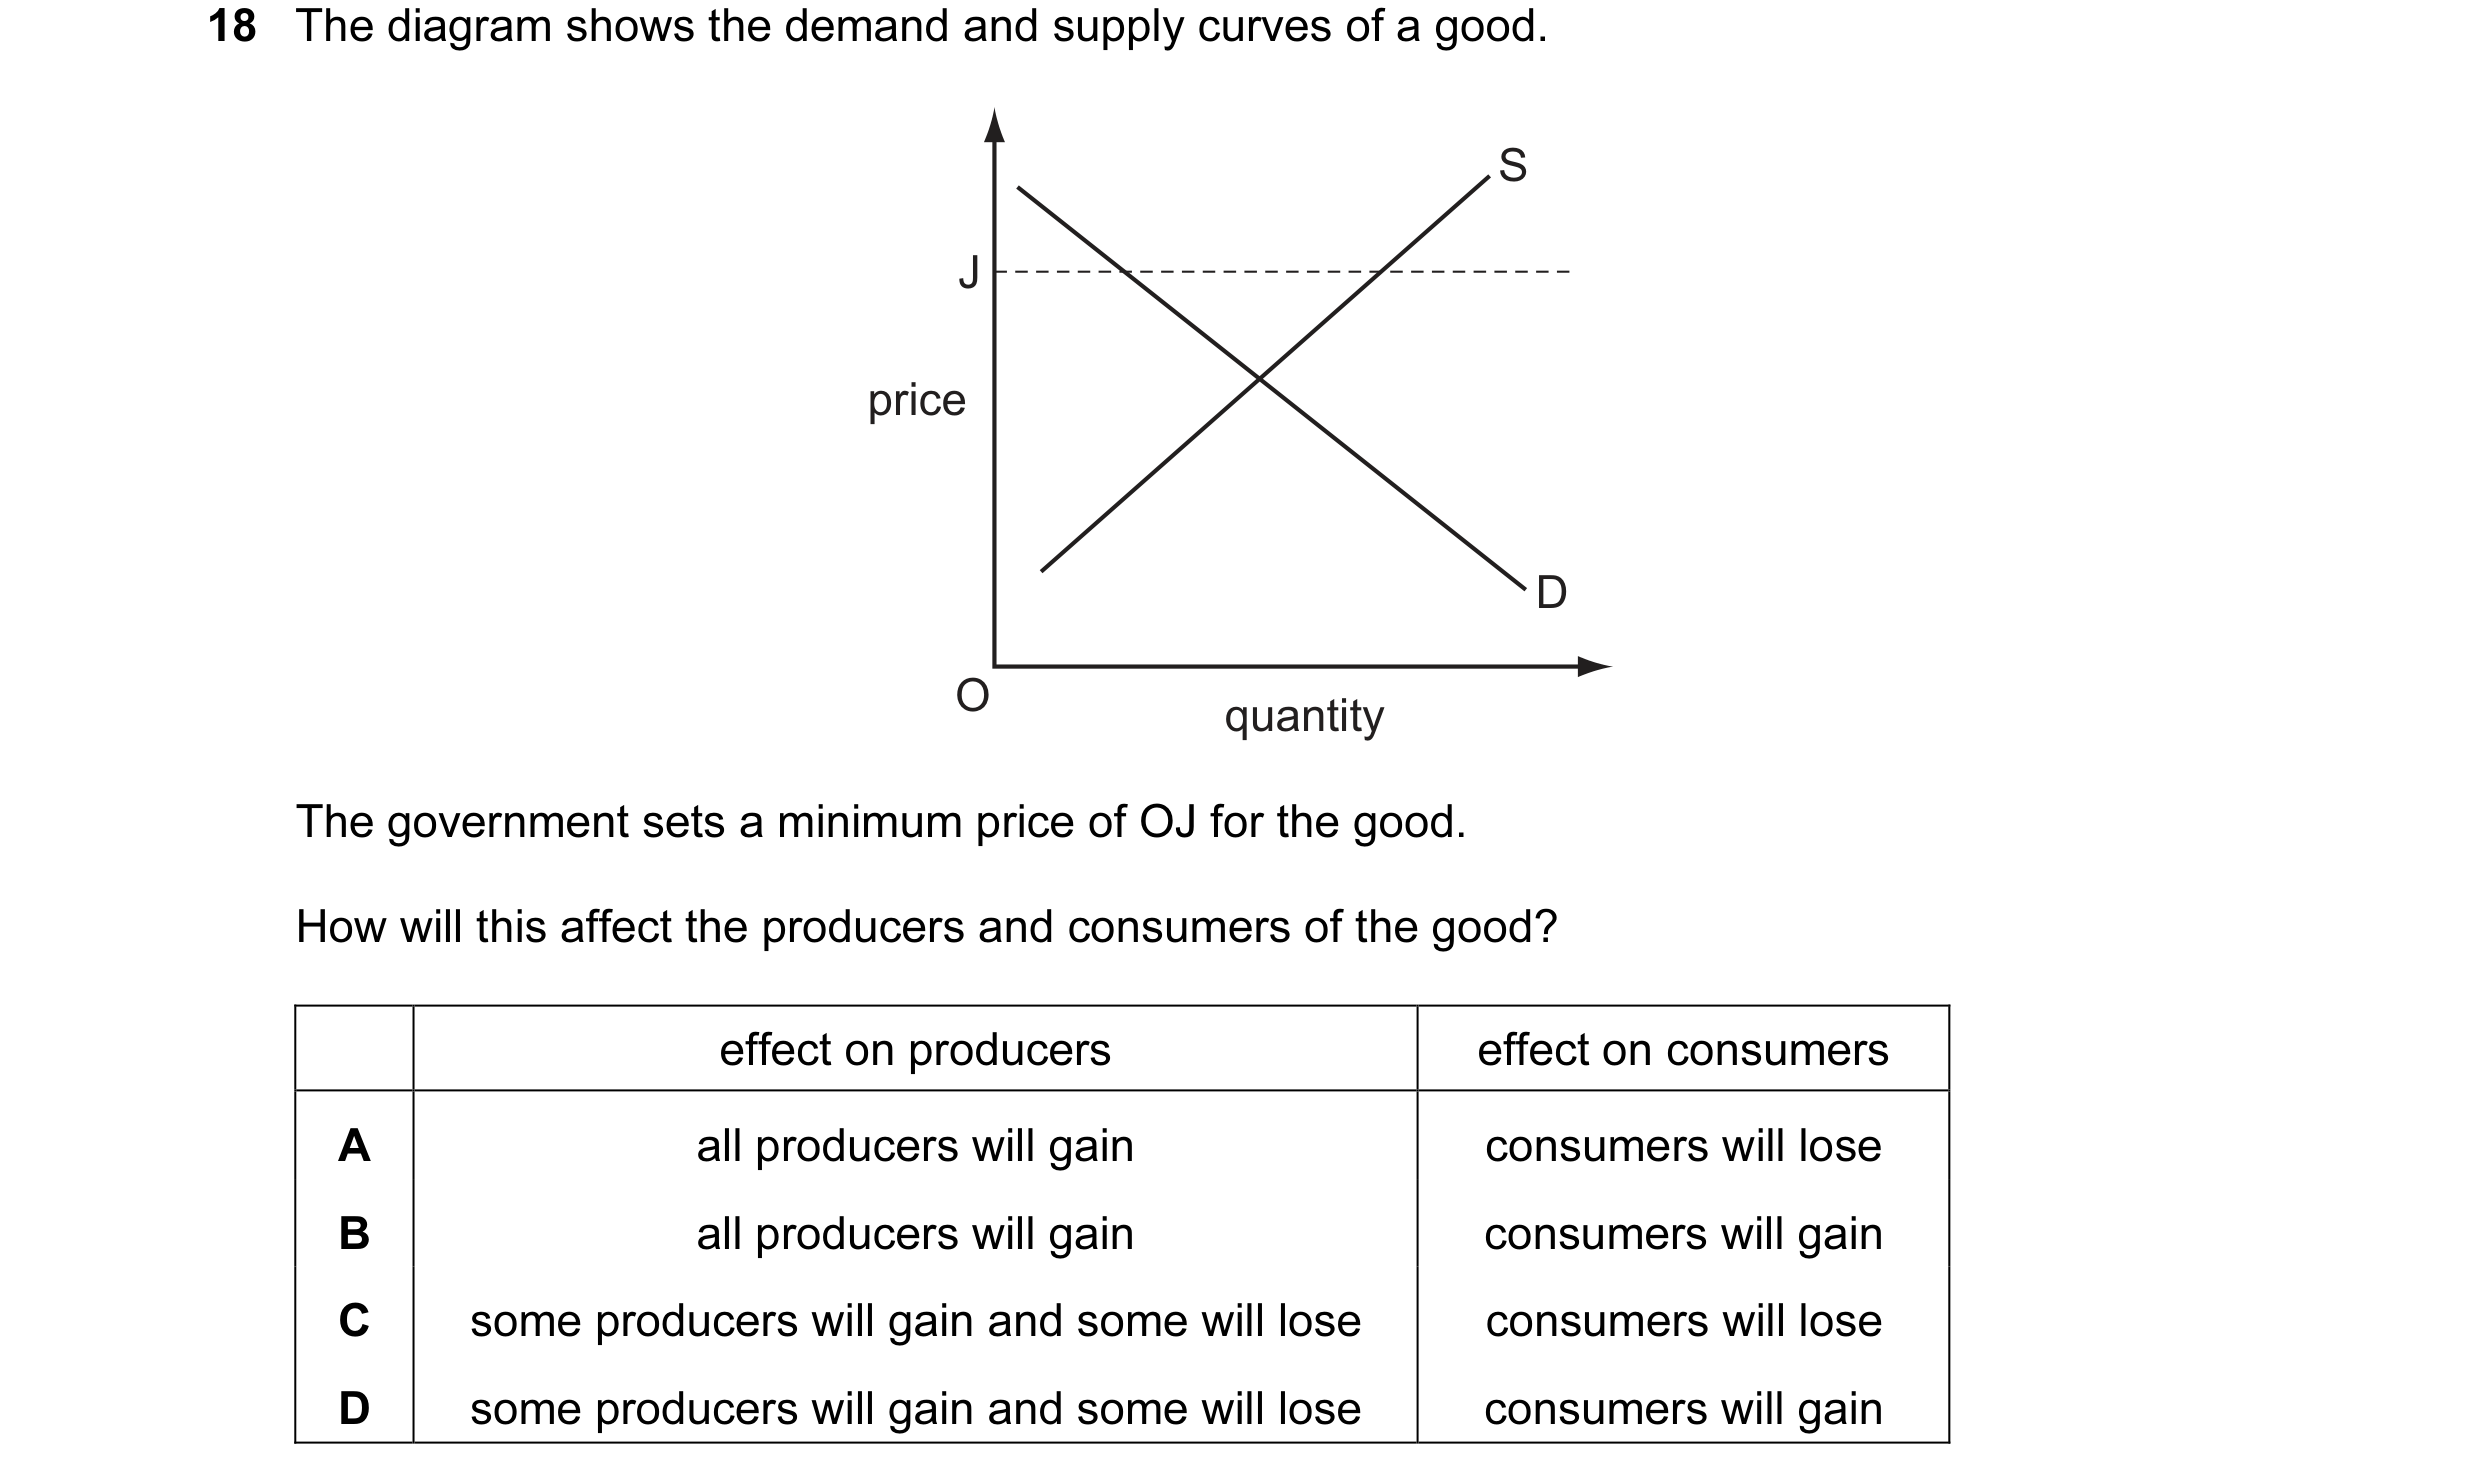
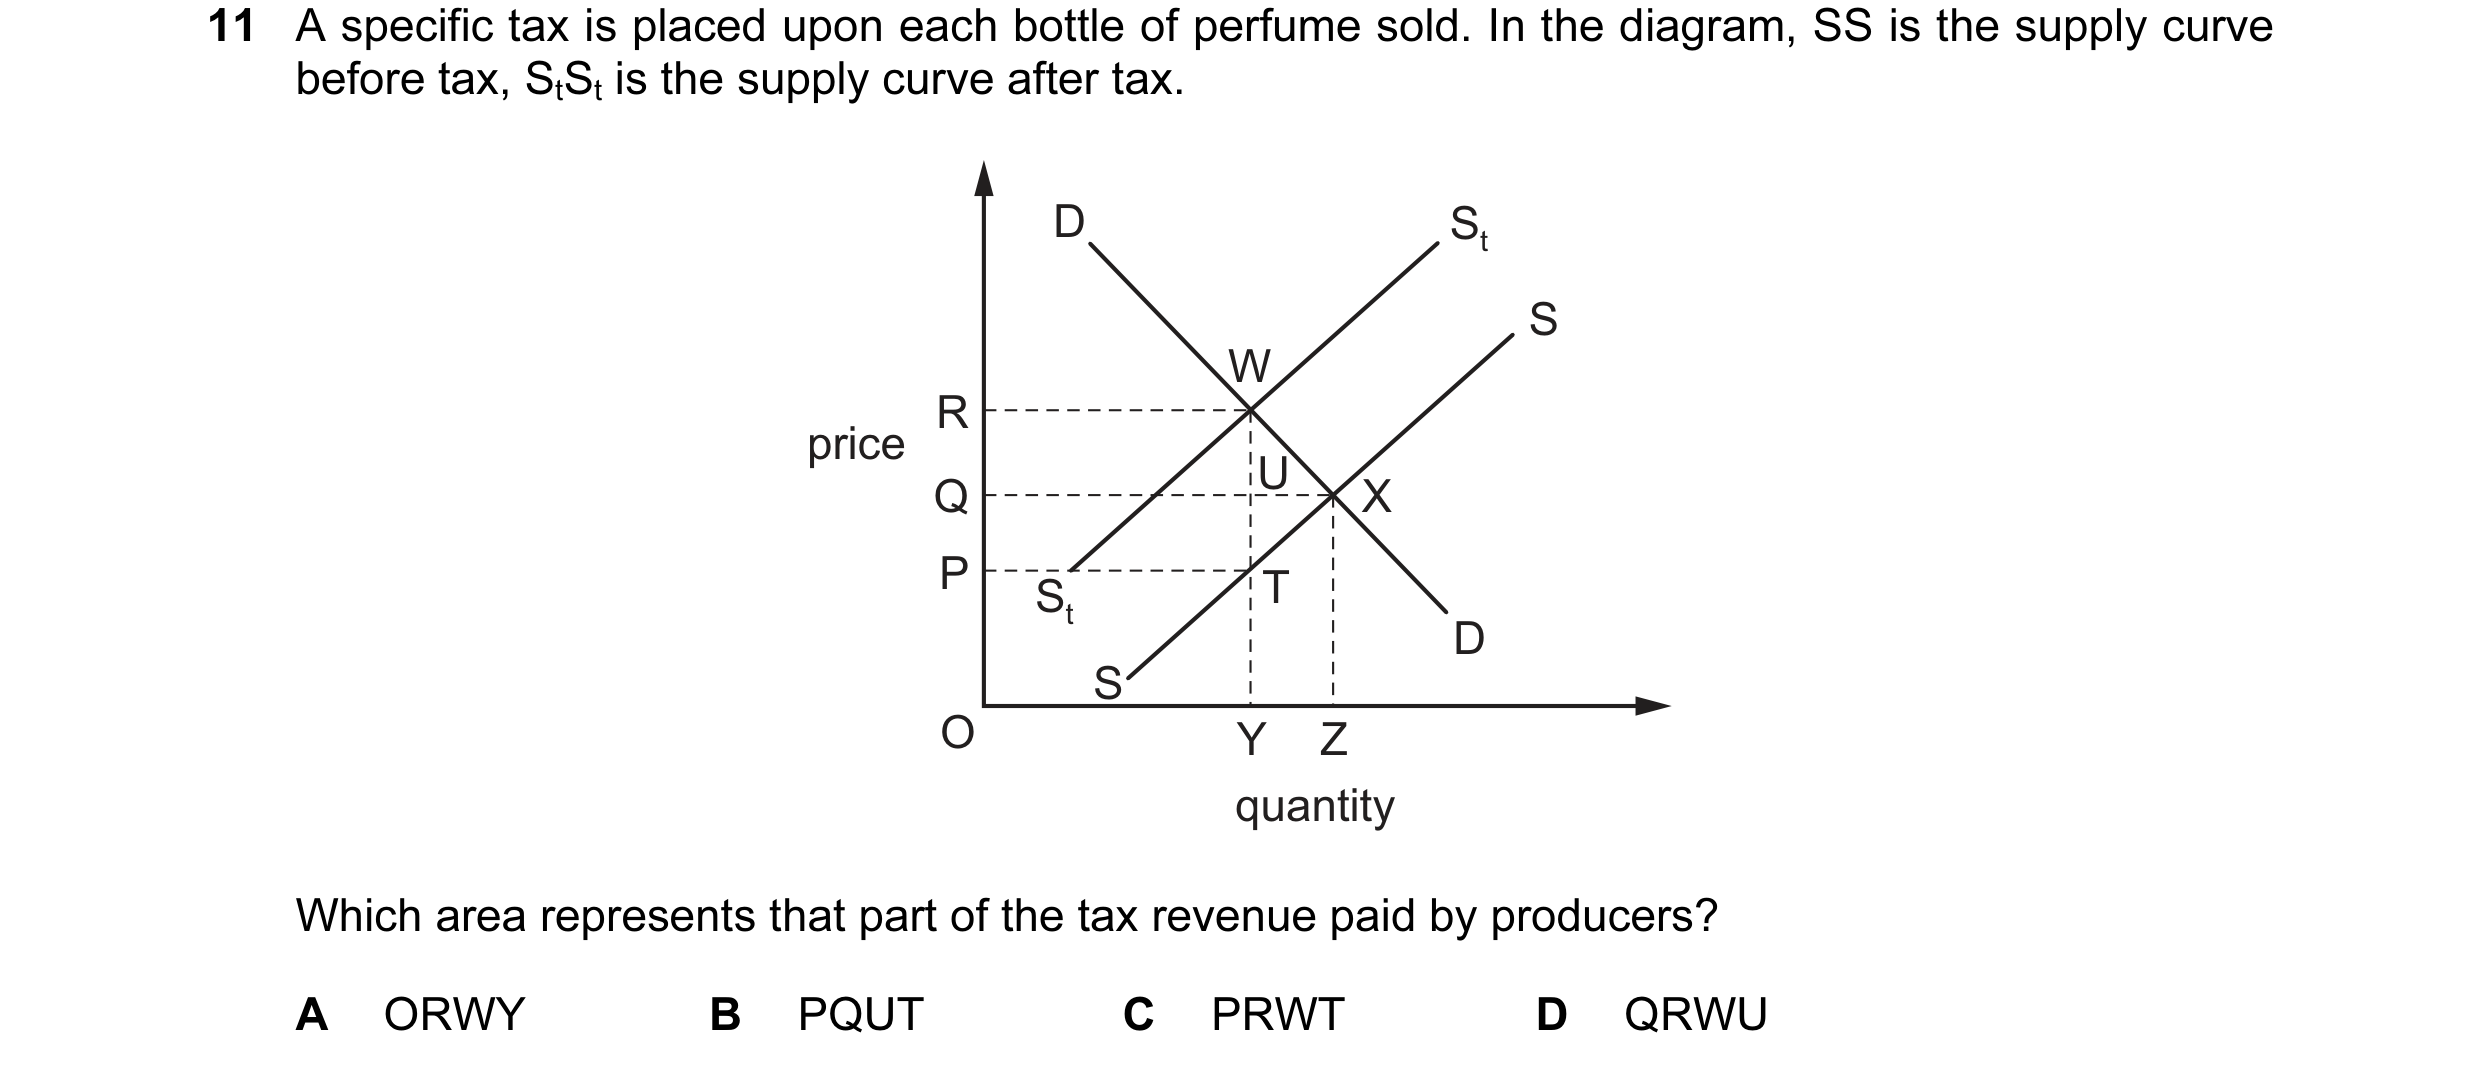
 48 / 119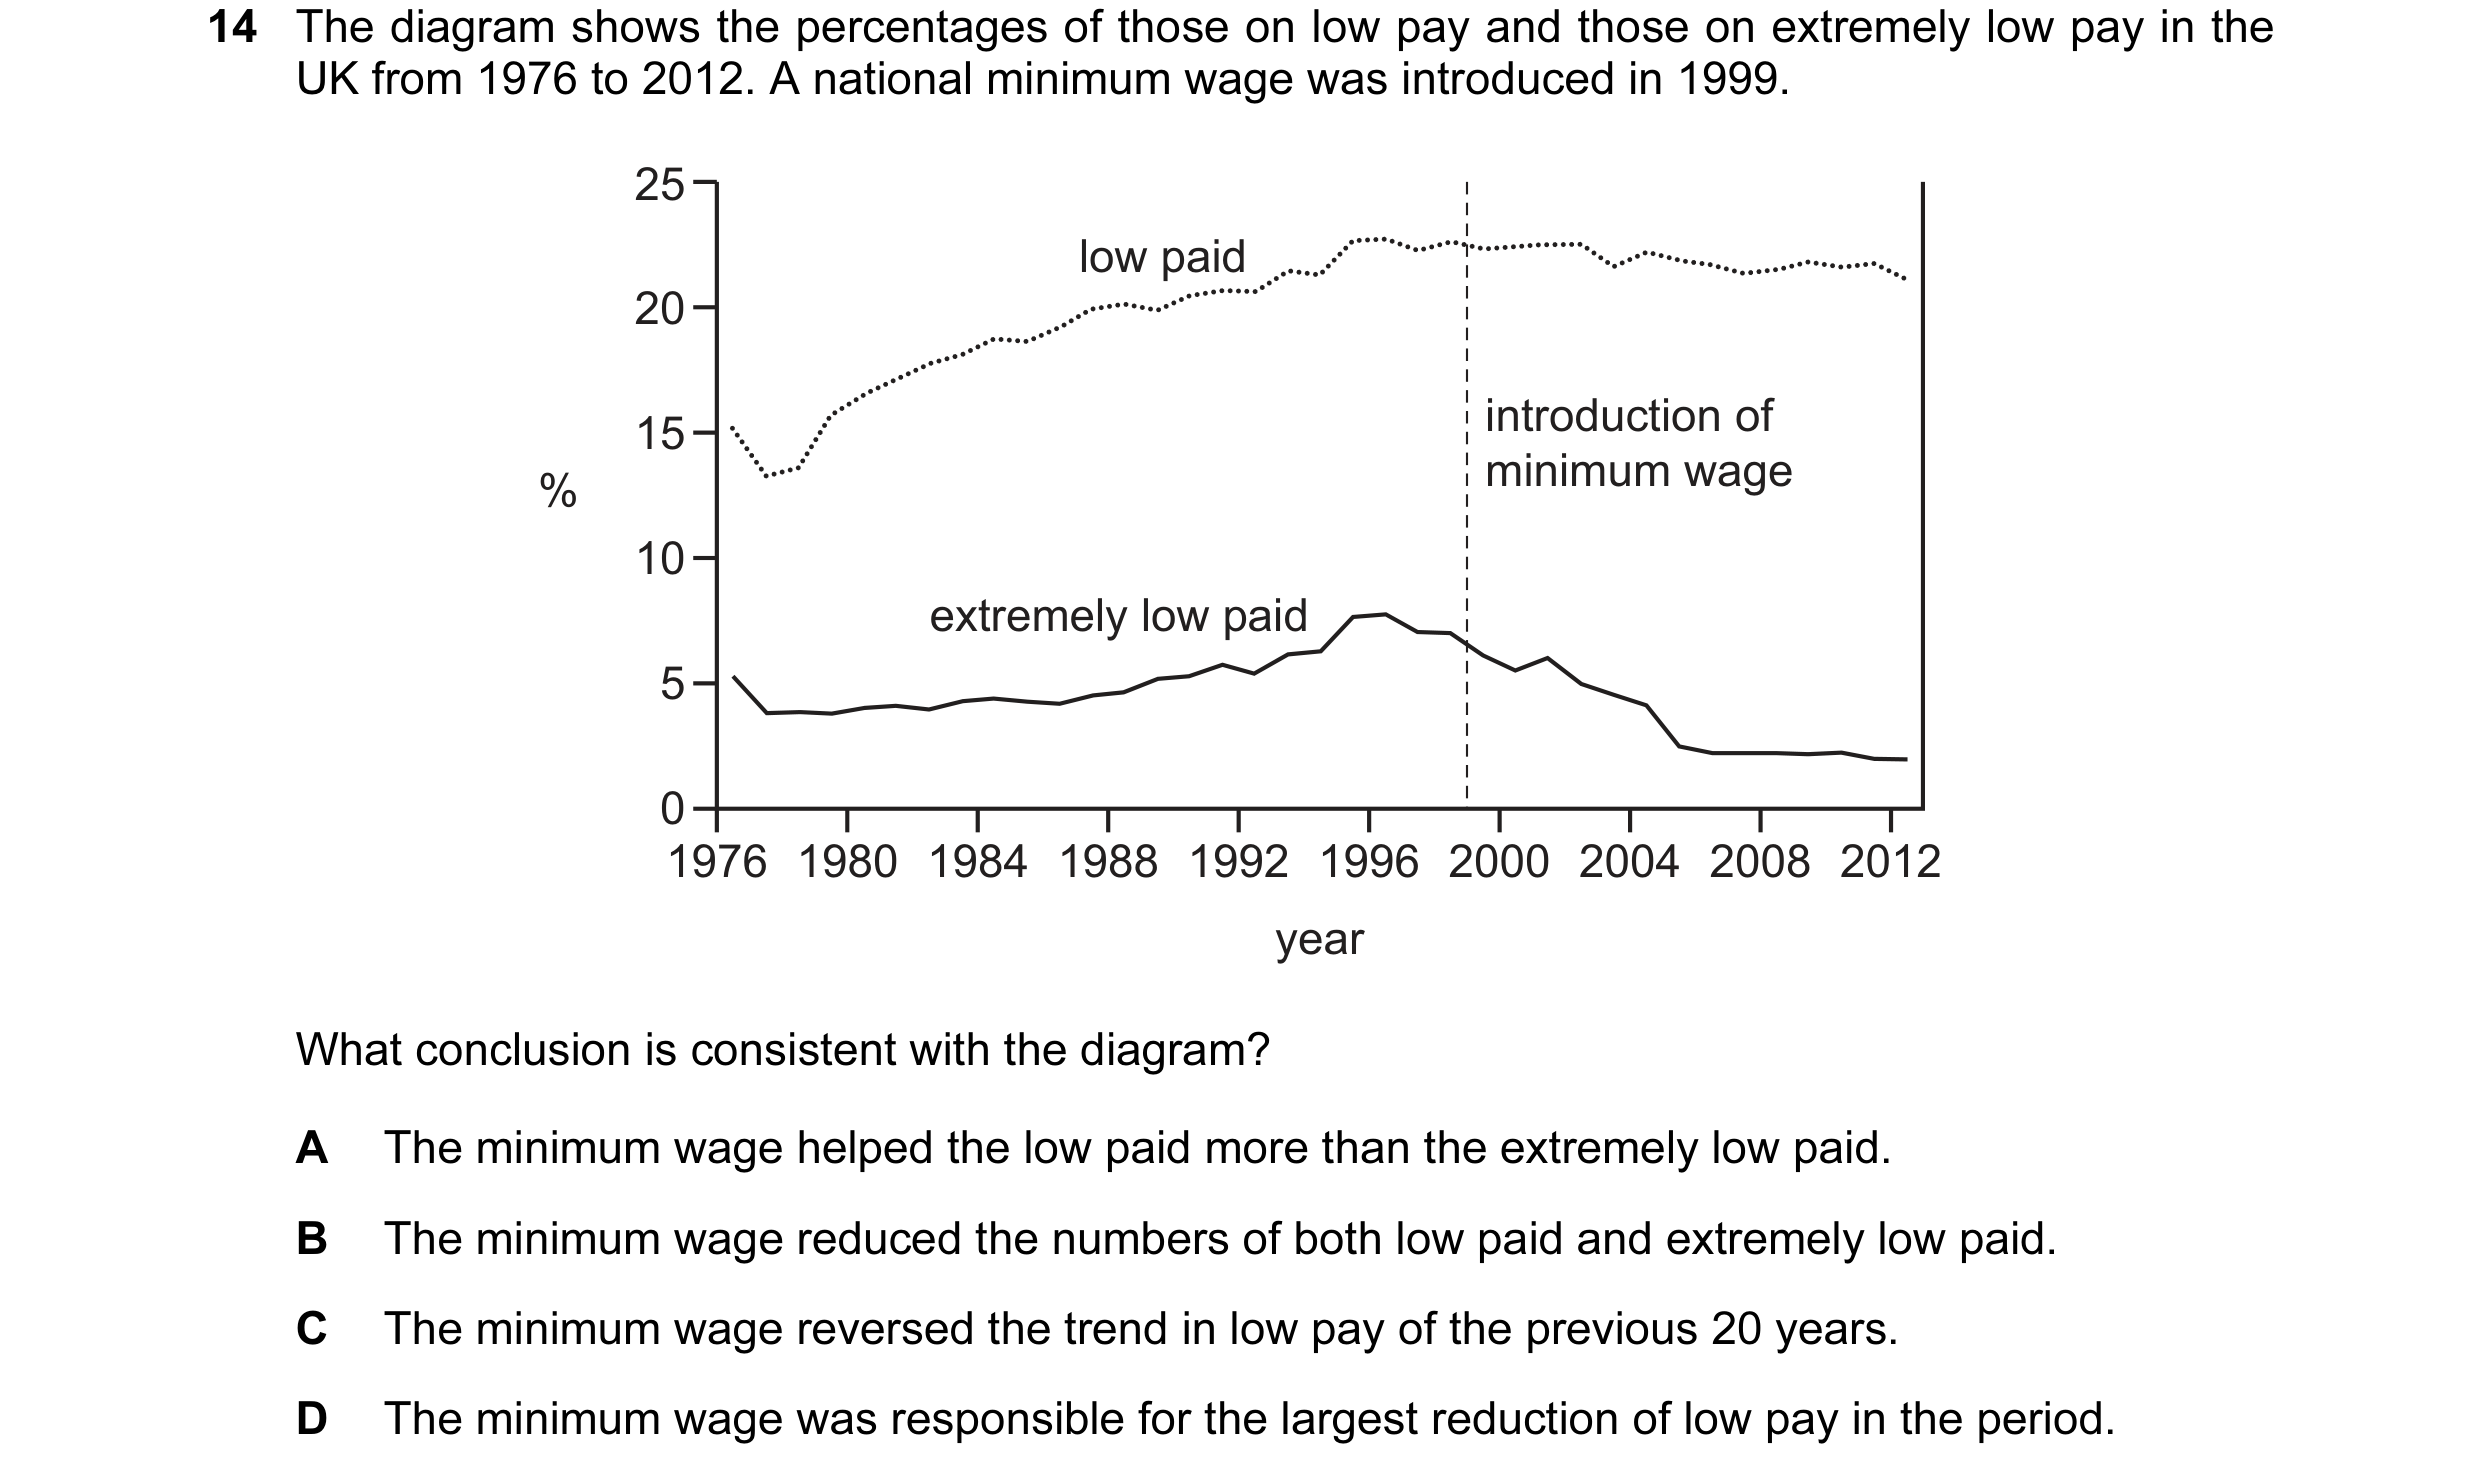
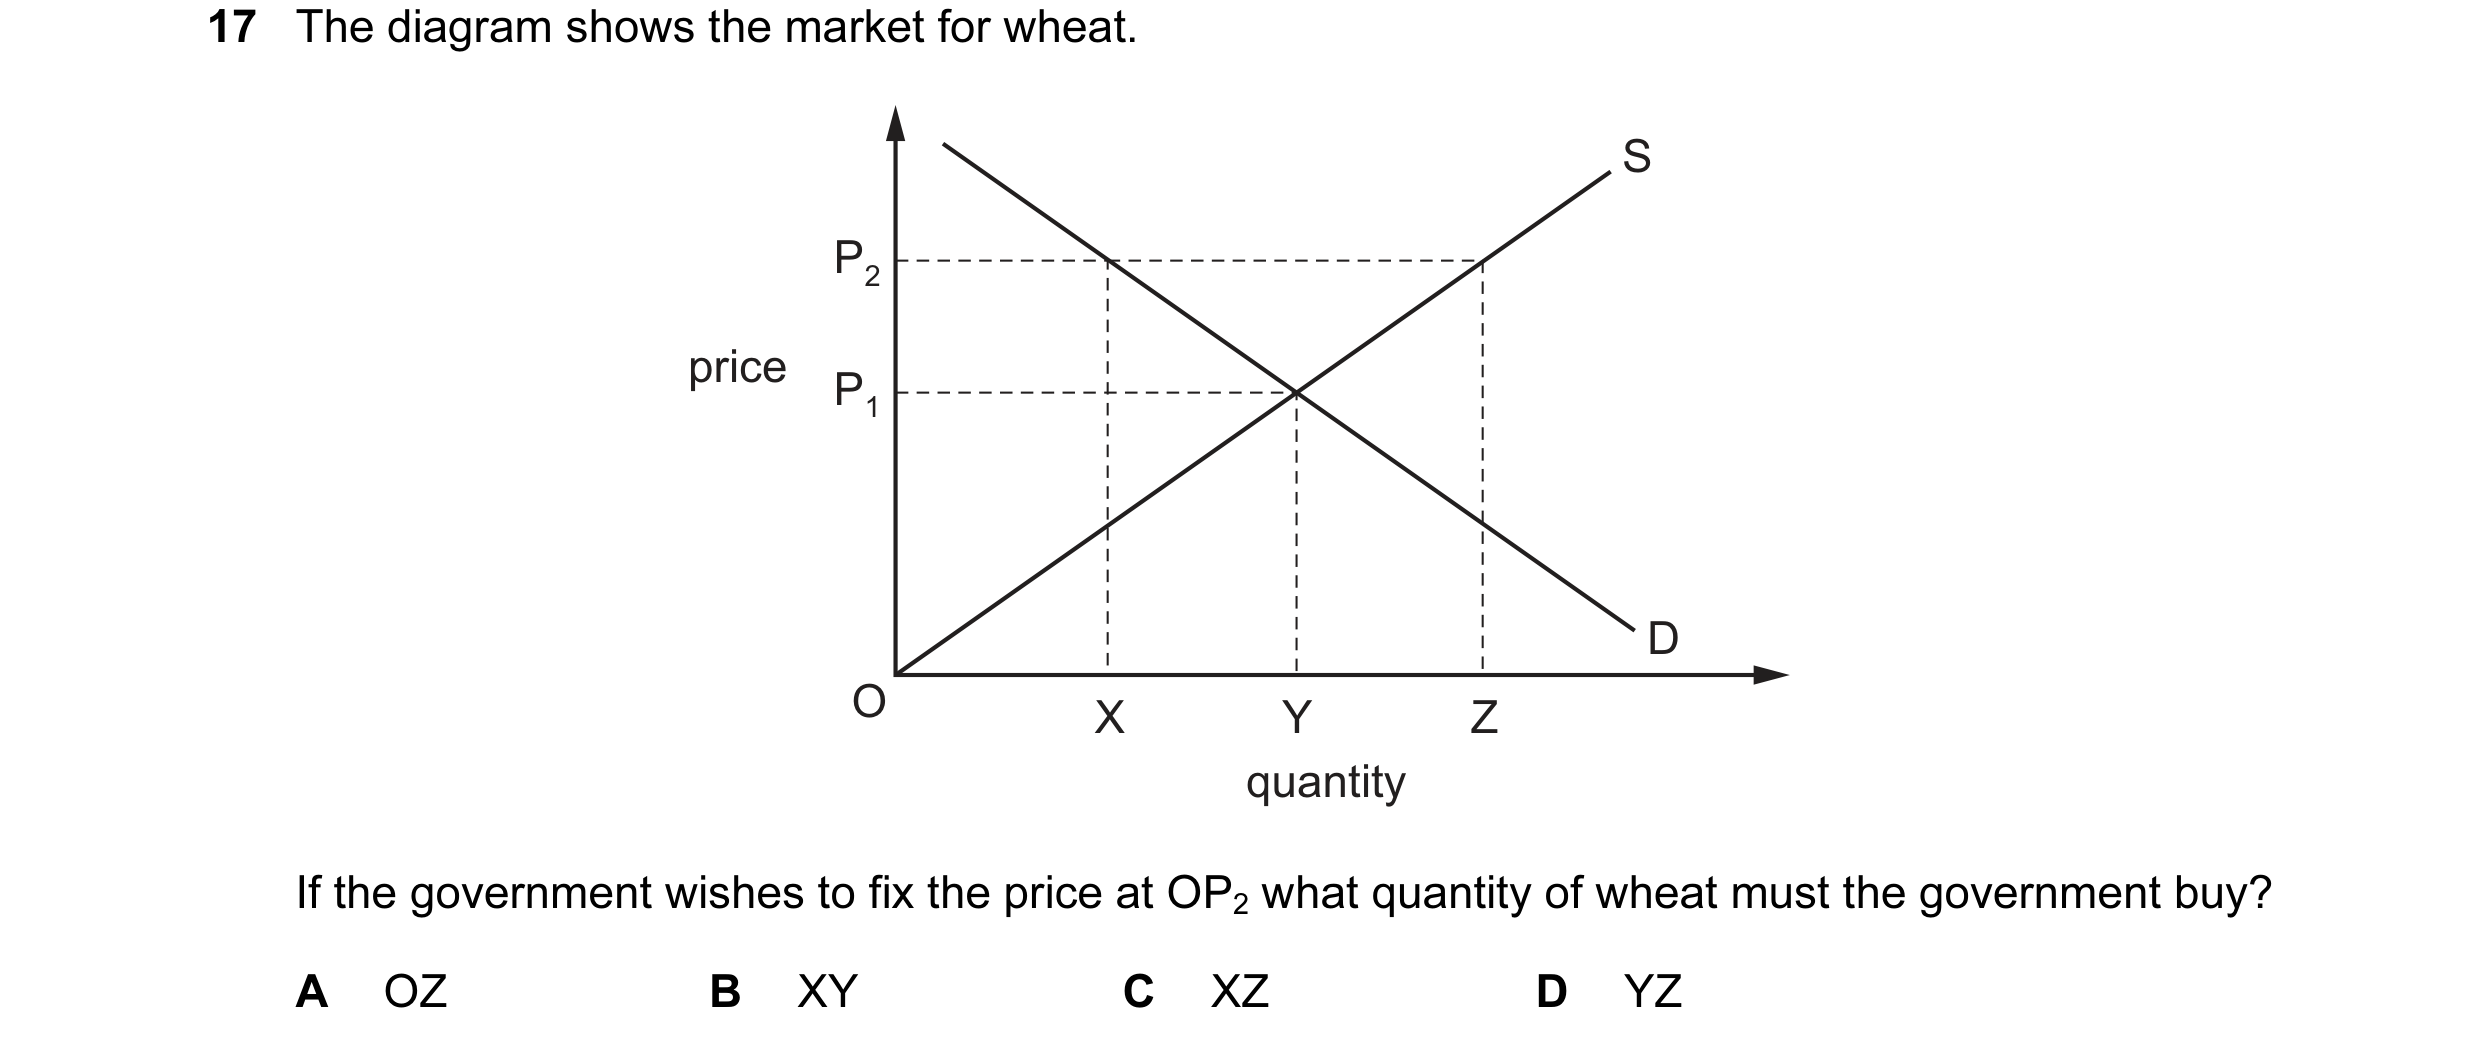 49 / 119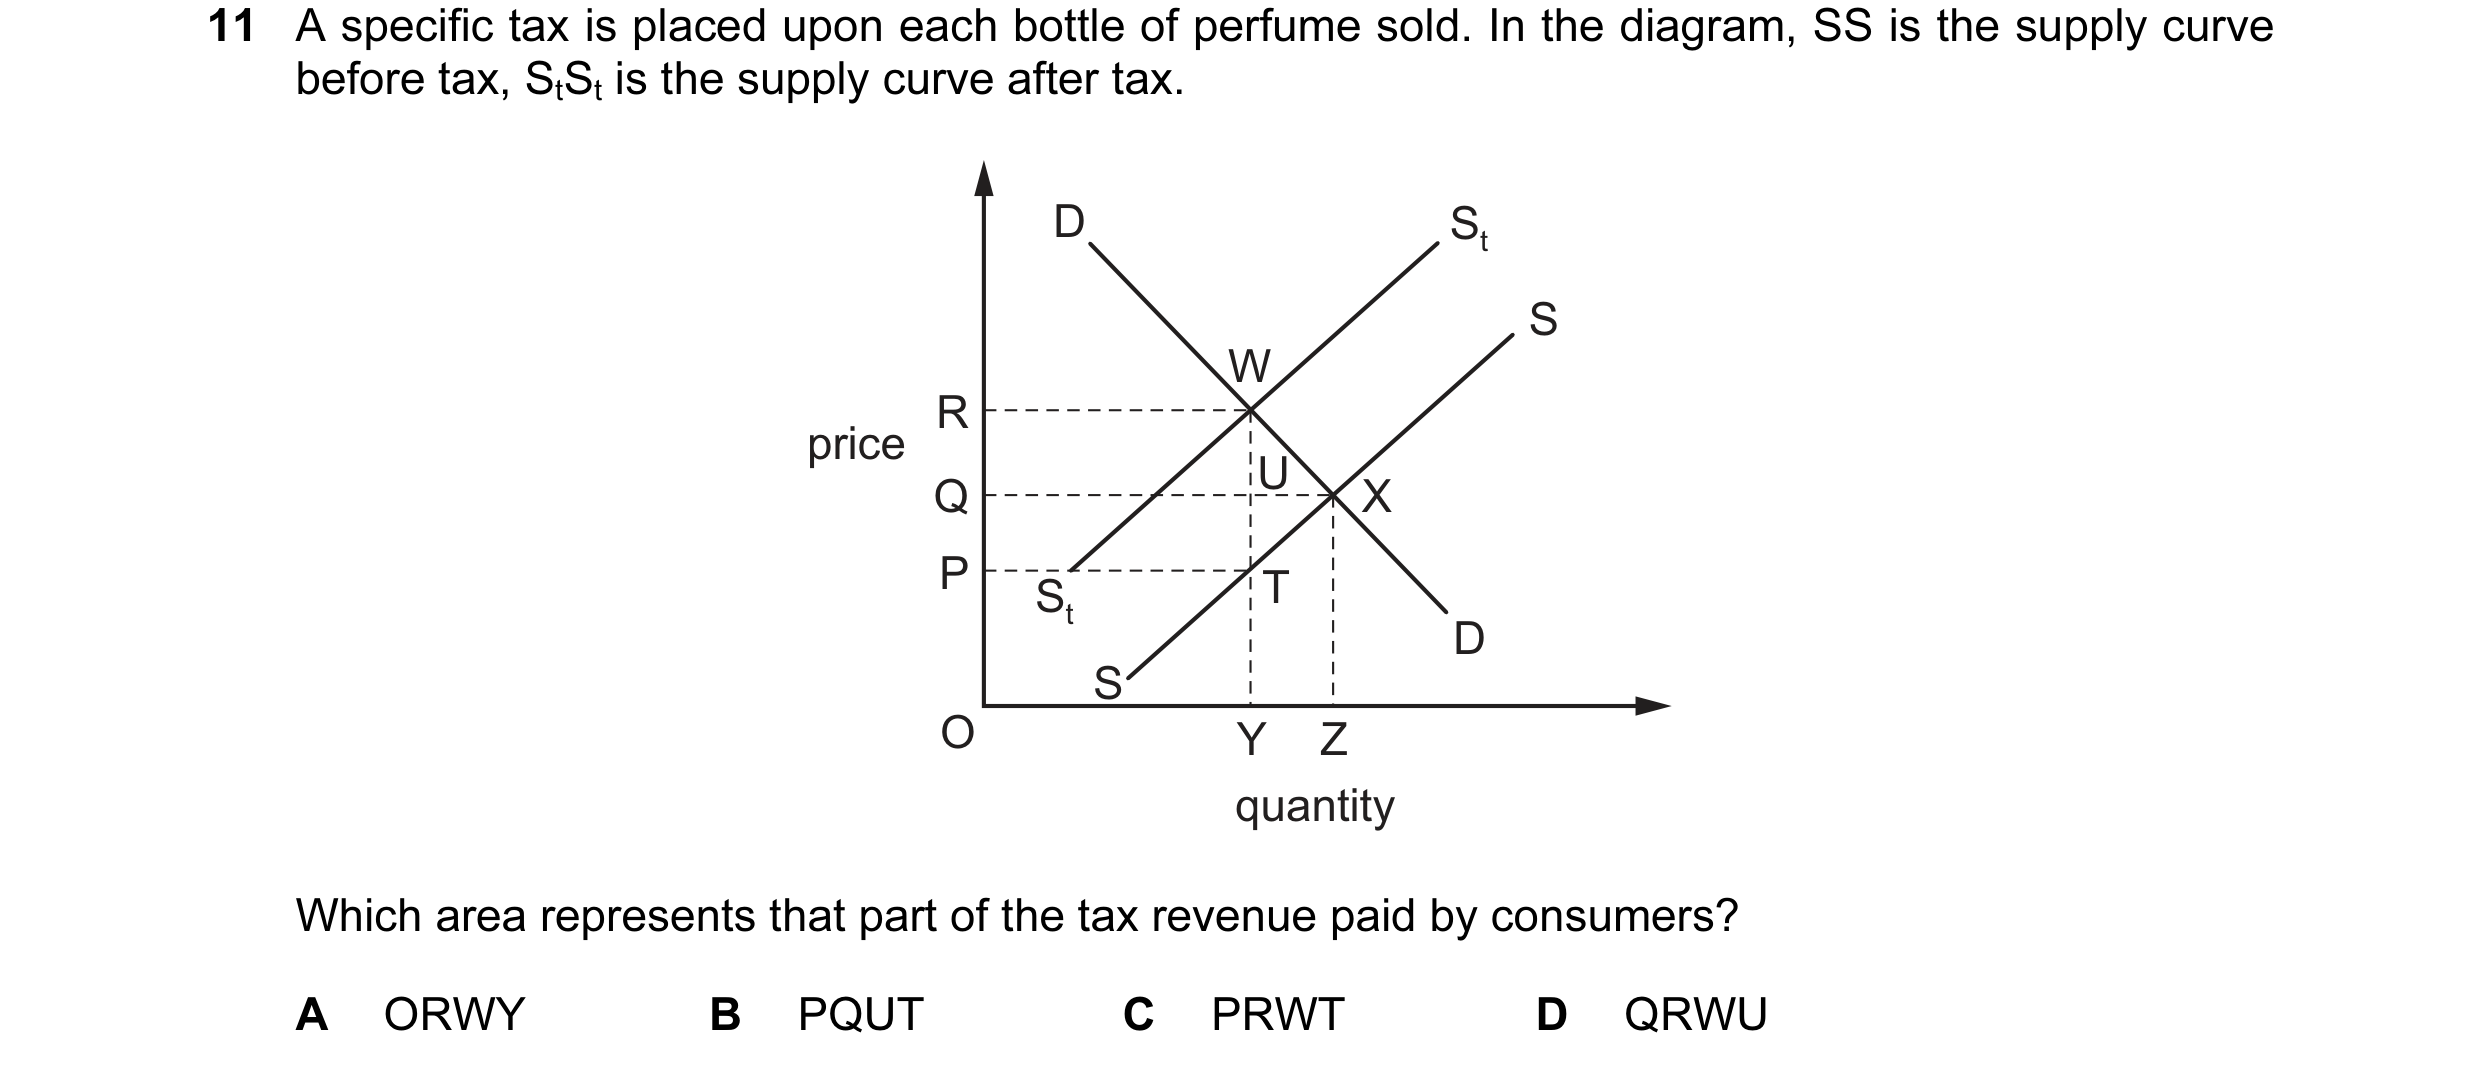
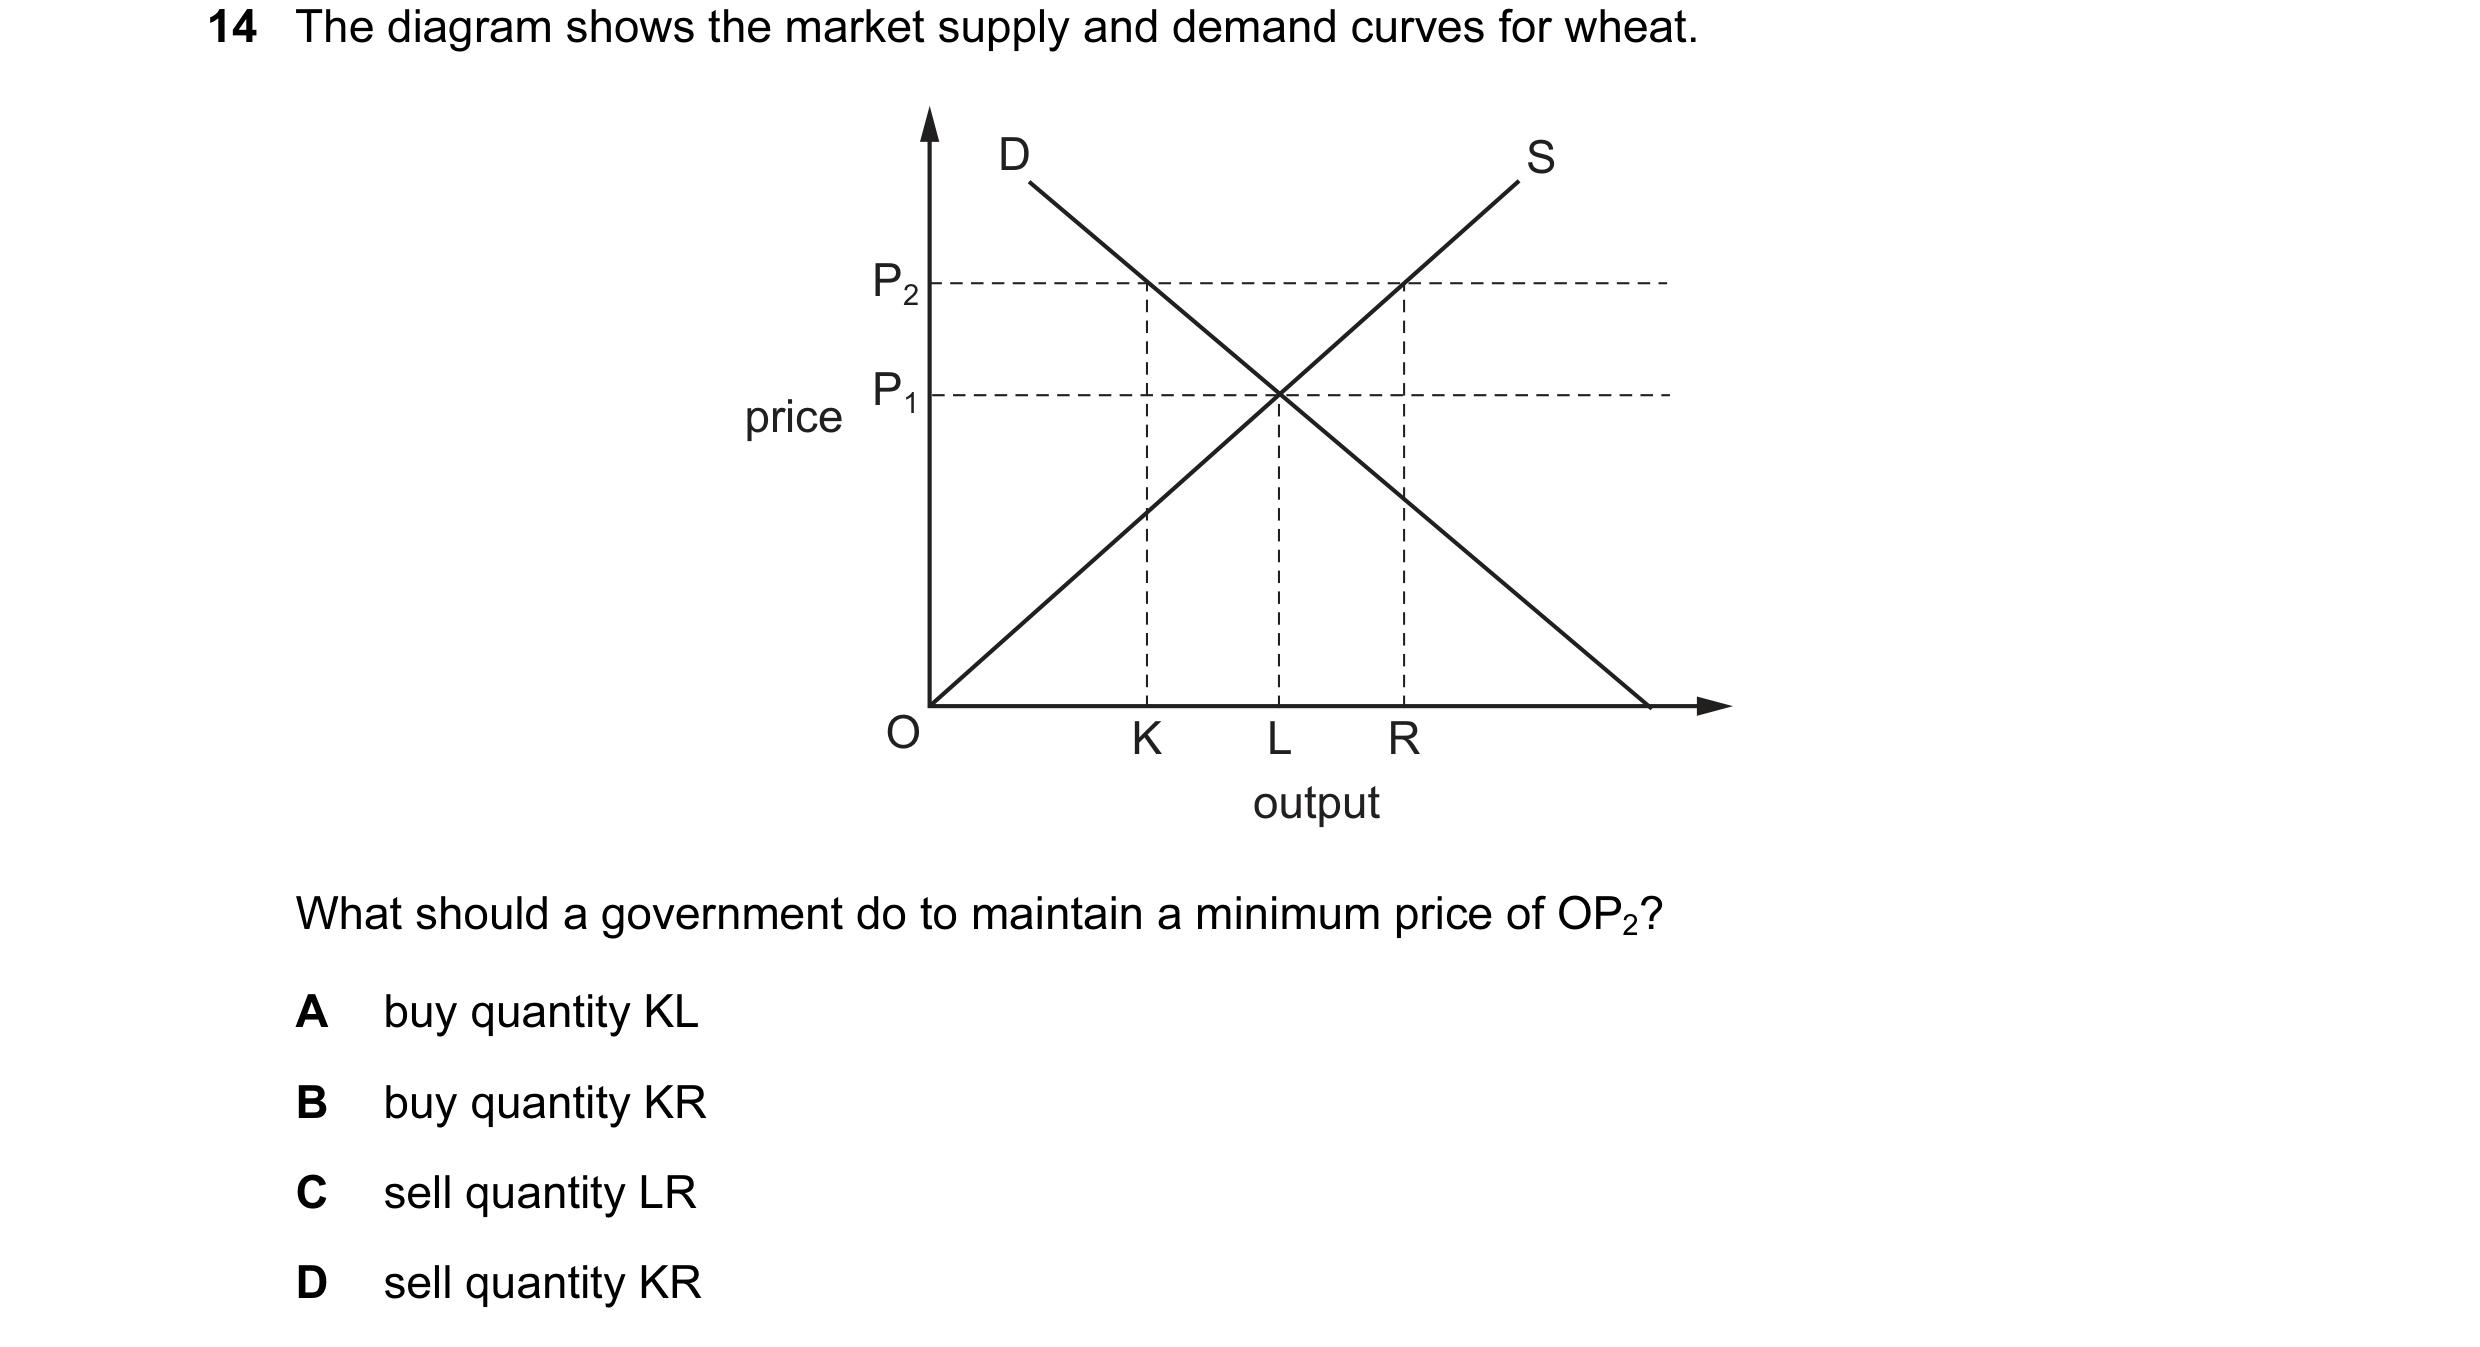
 50 / 119
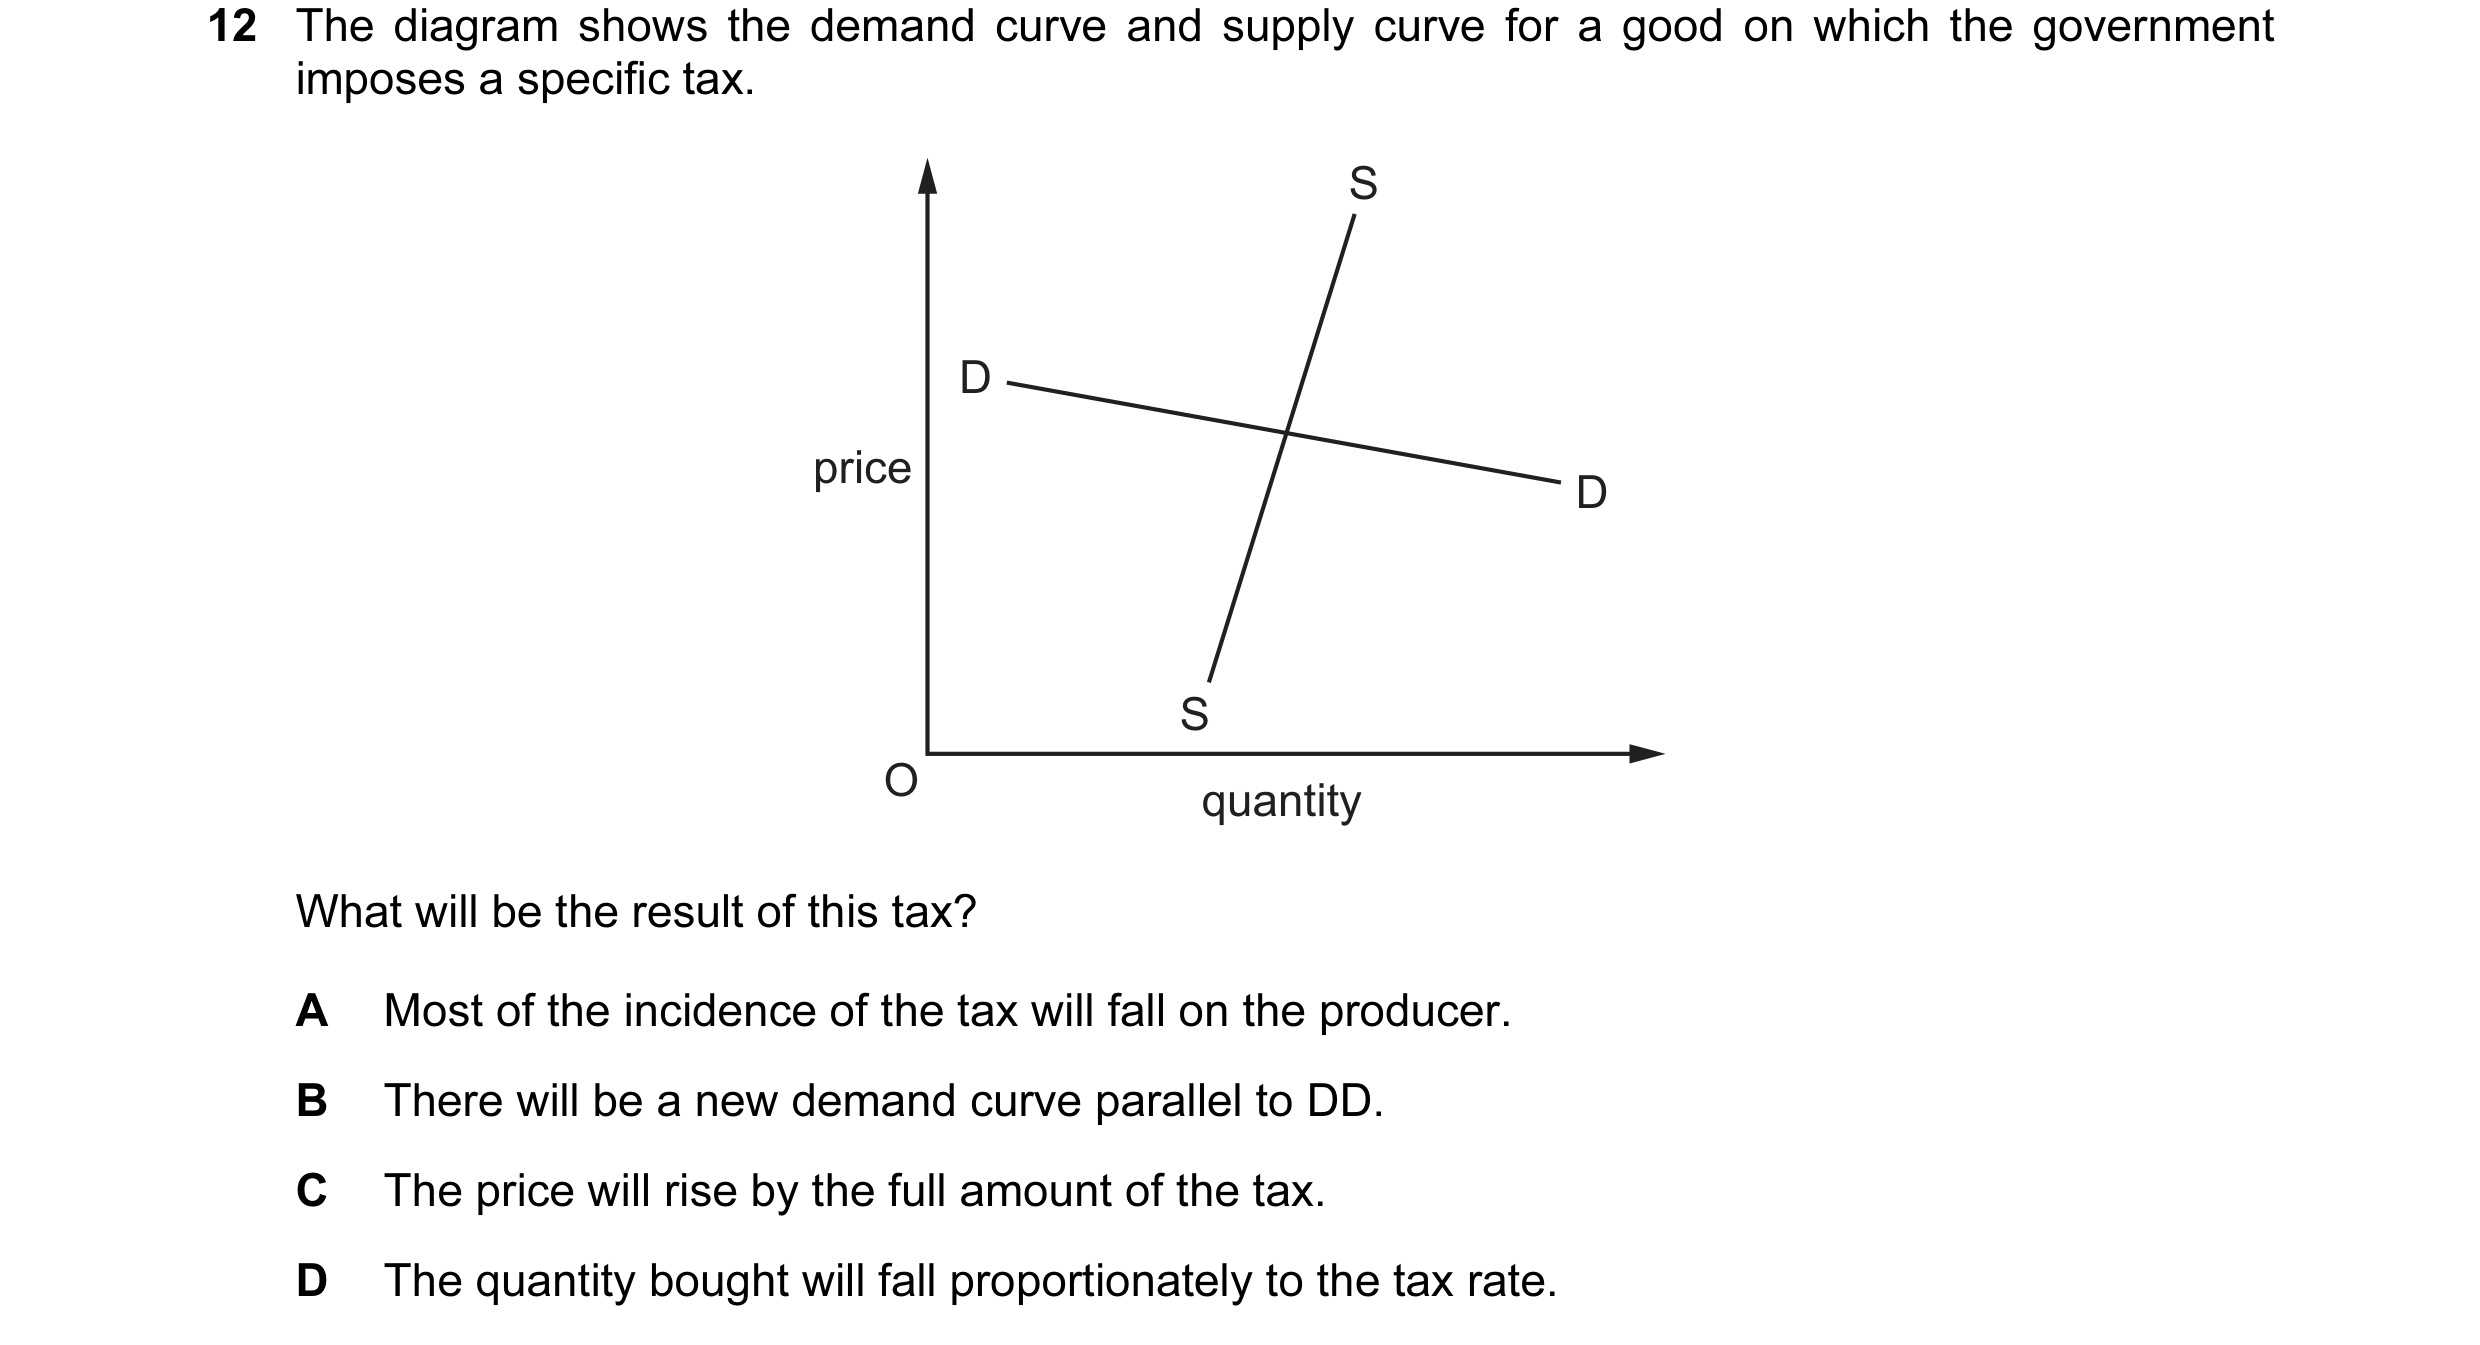
 51 / 119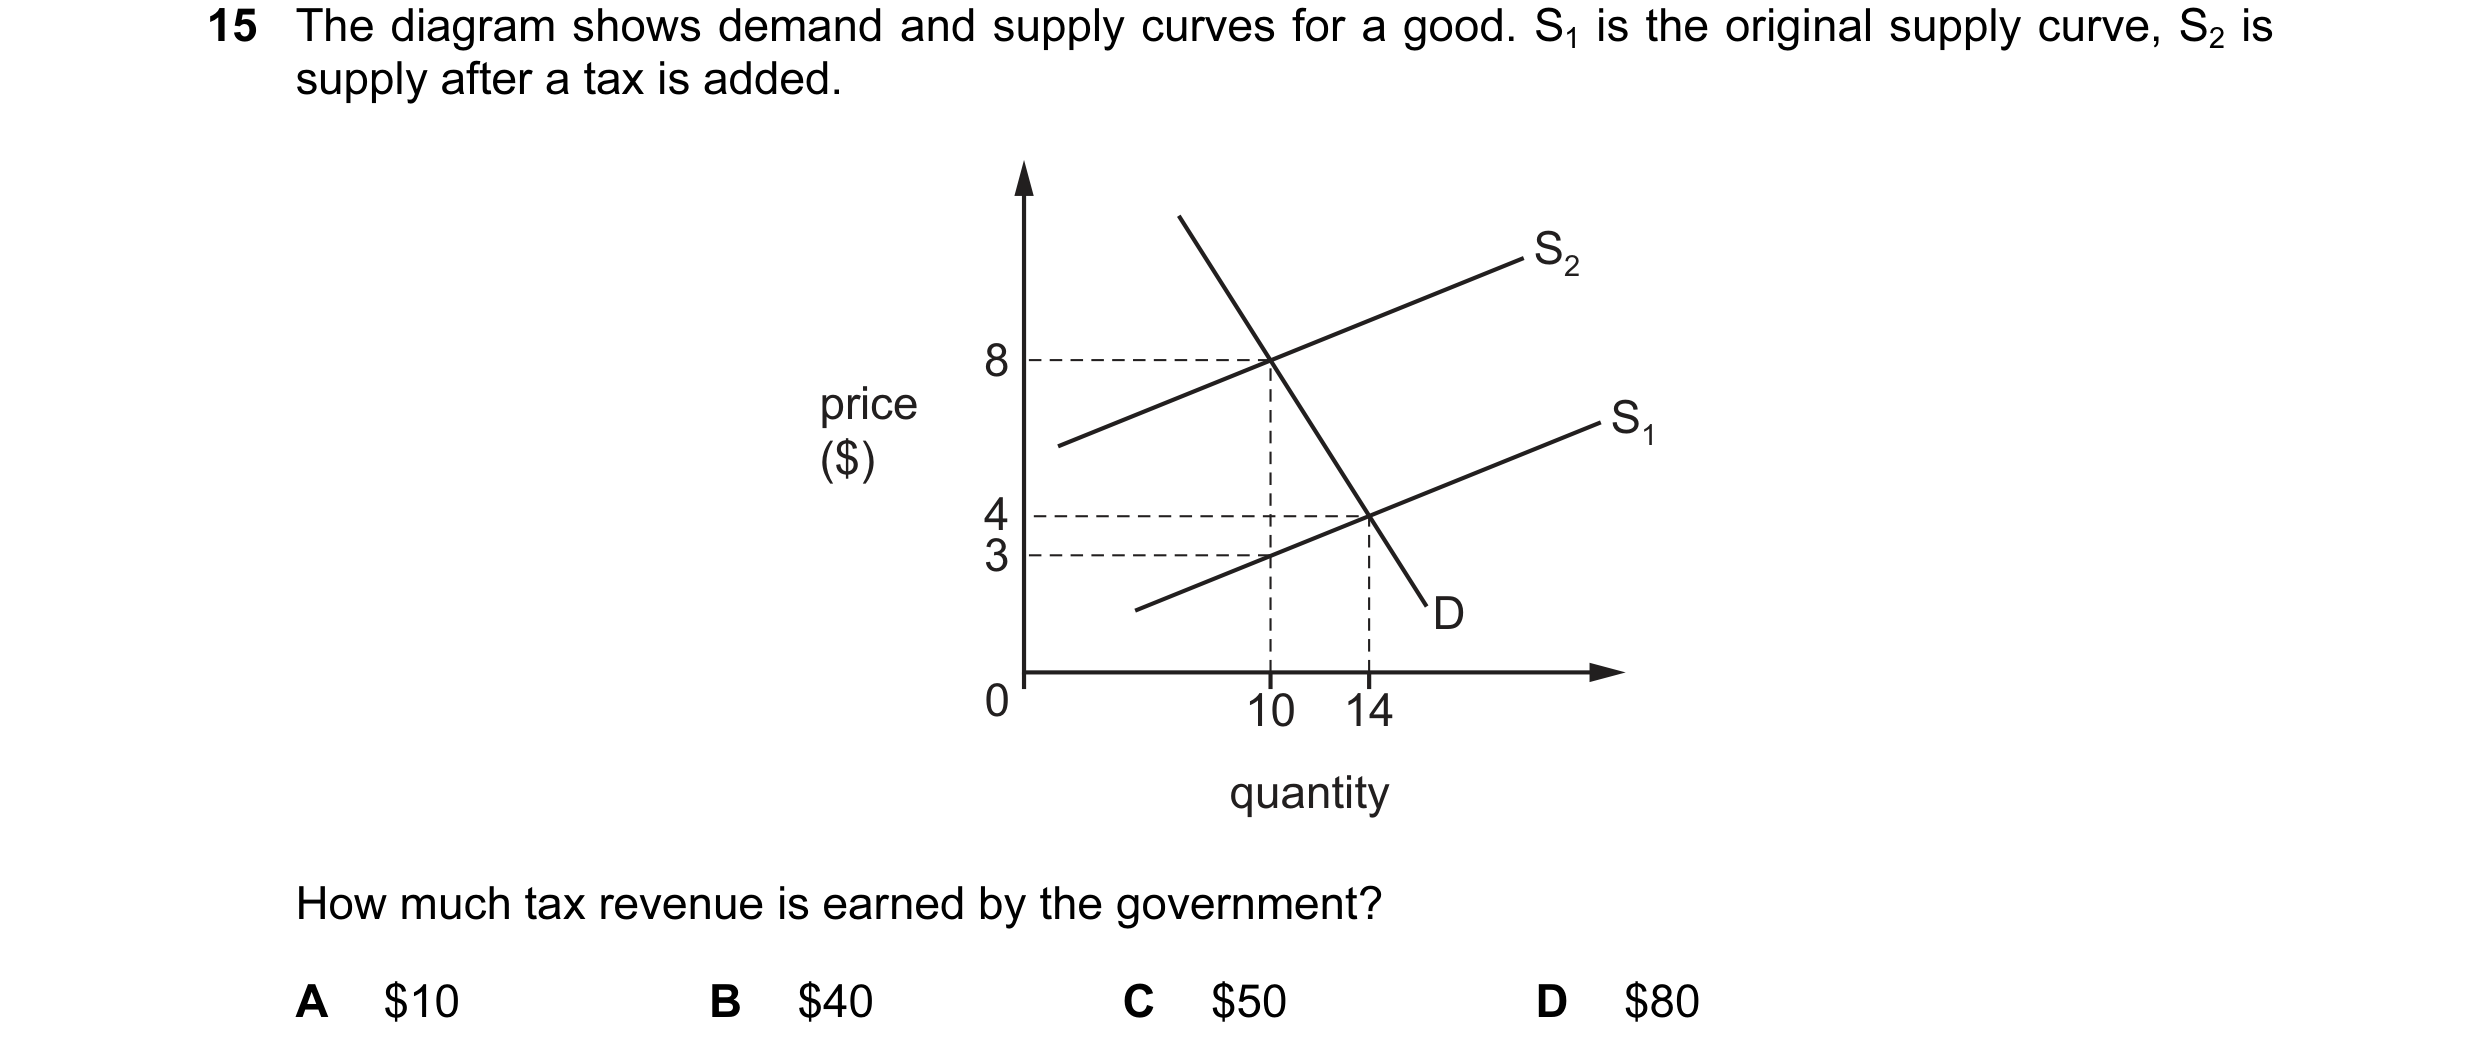
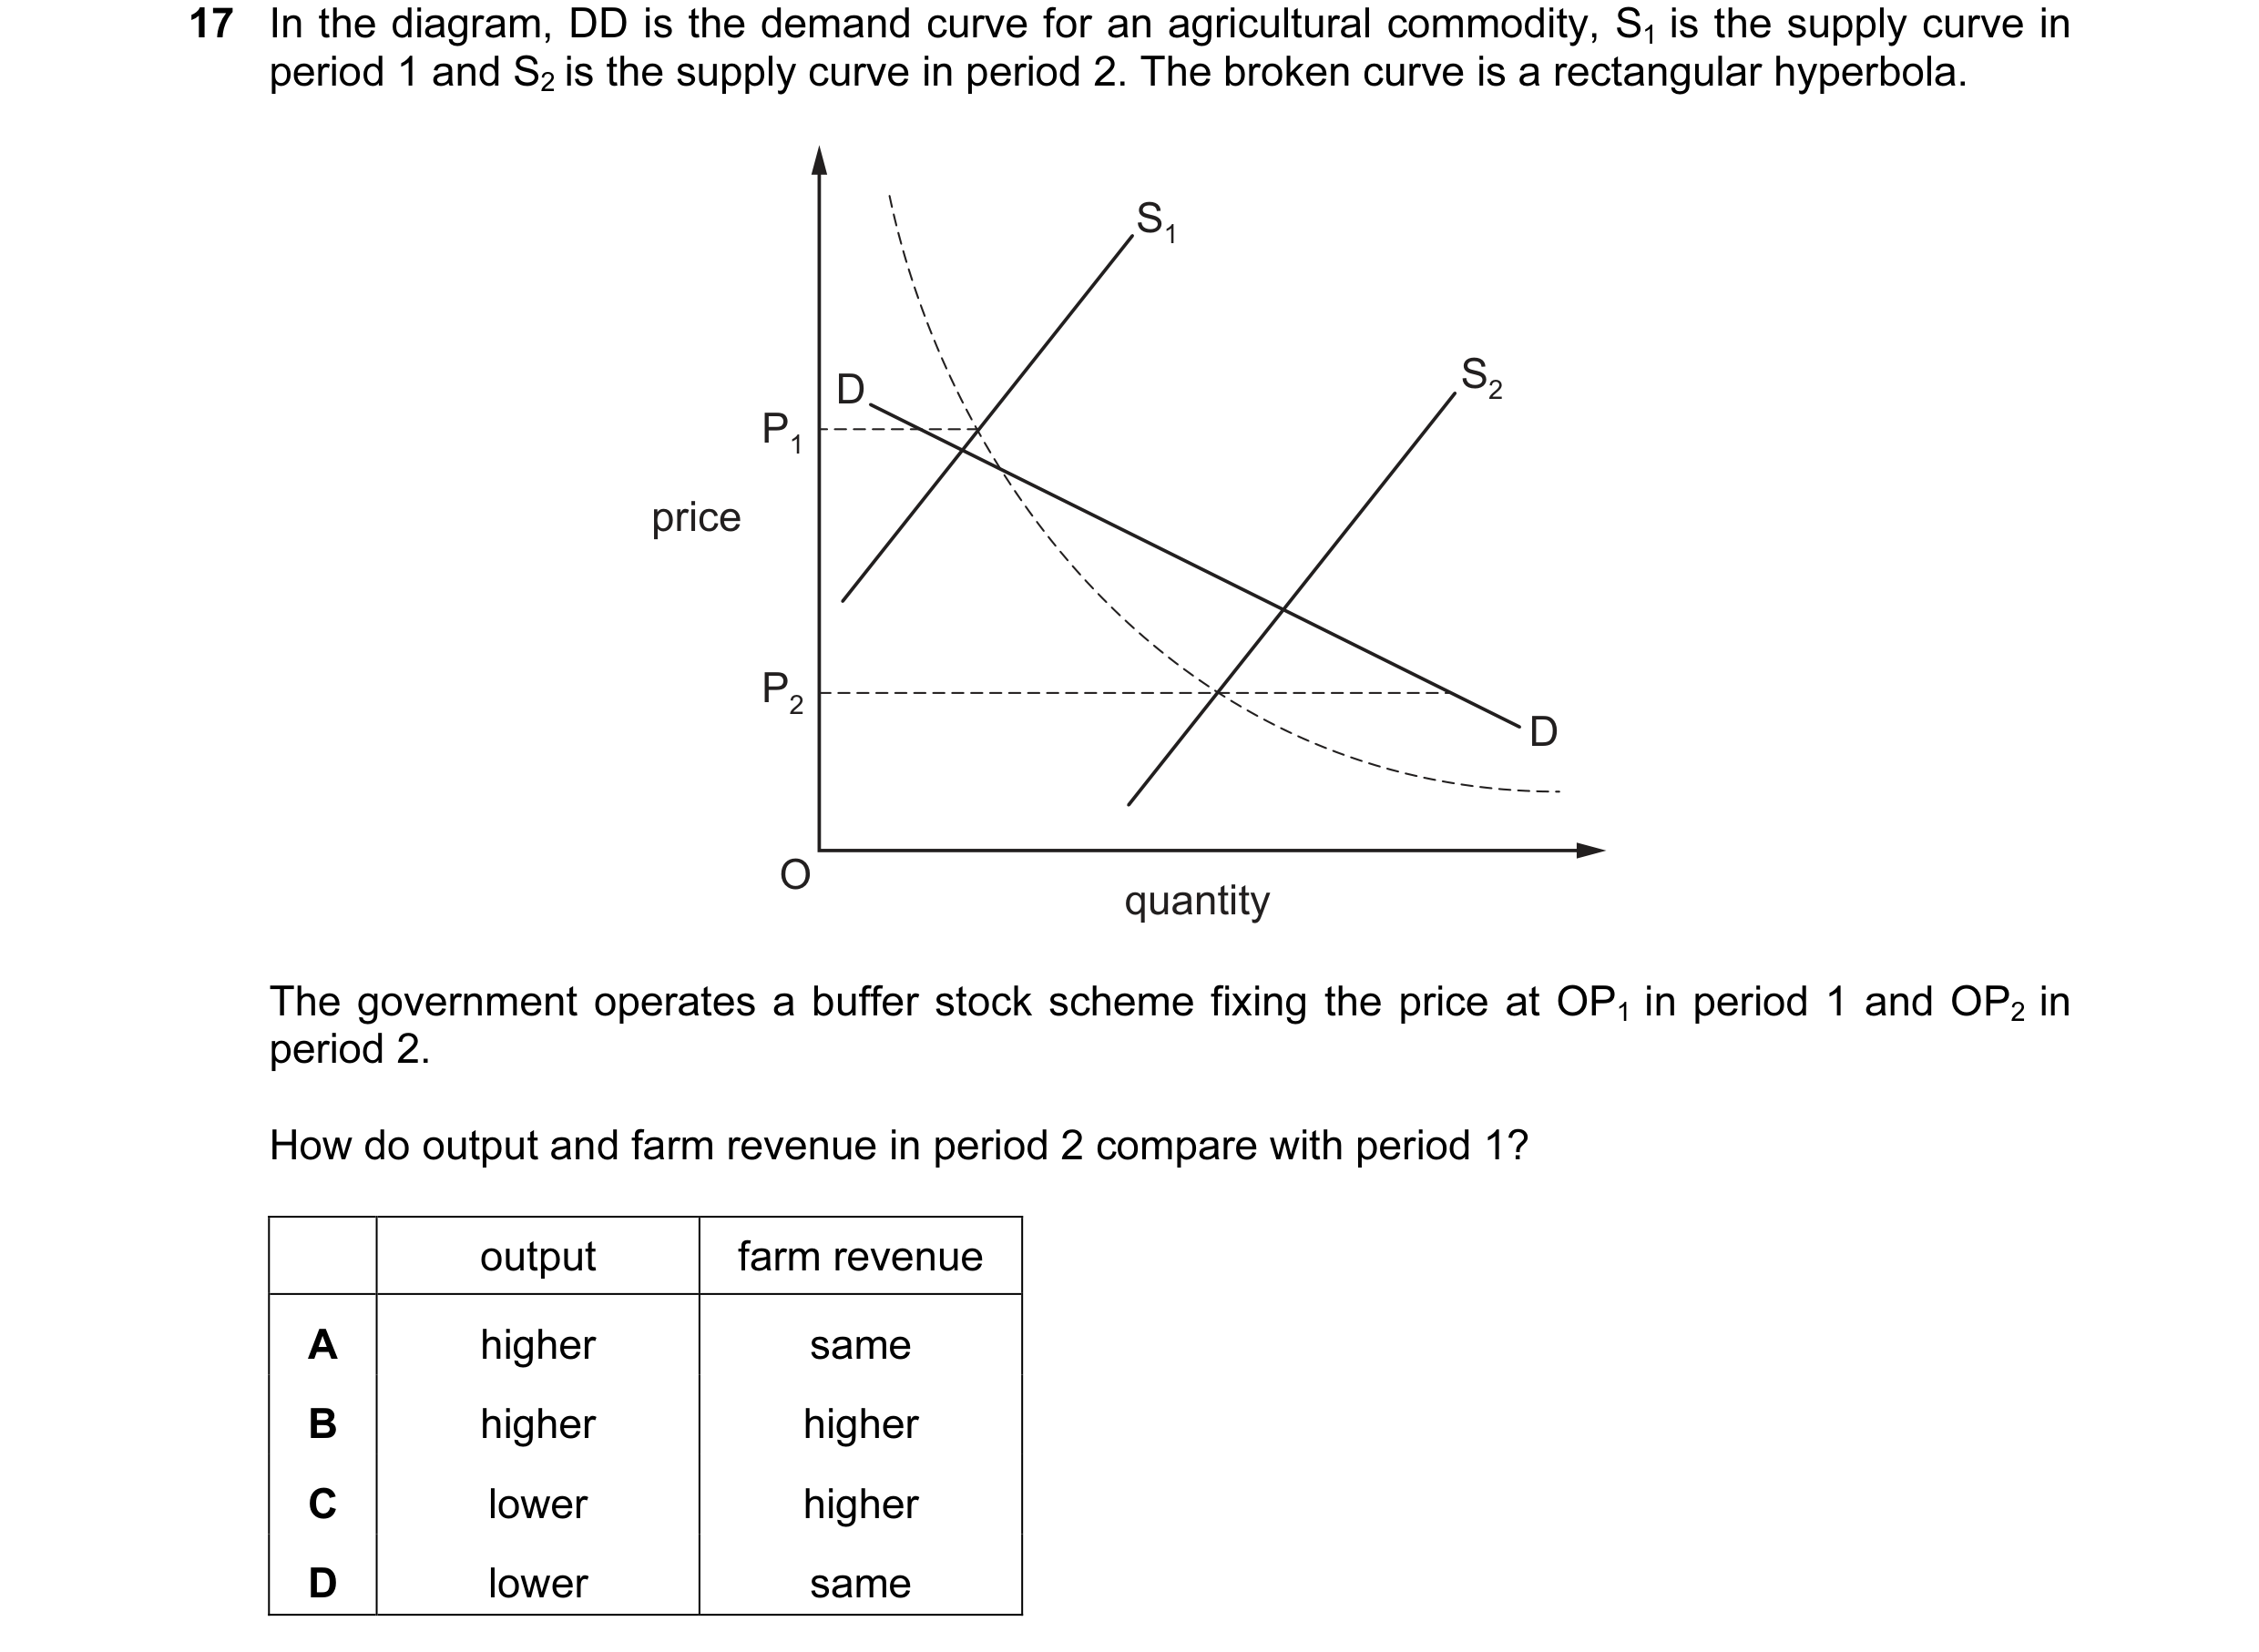 52 / 119
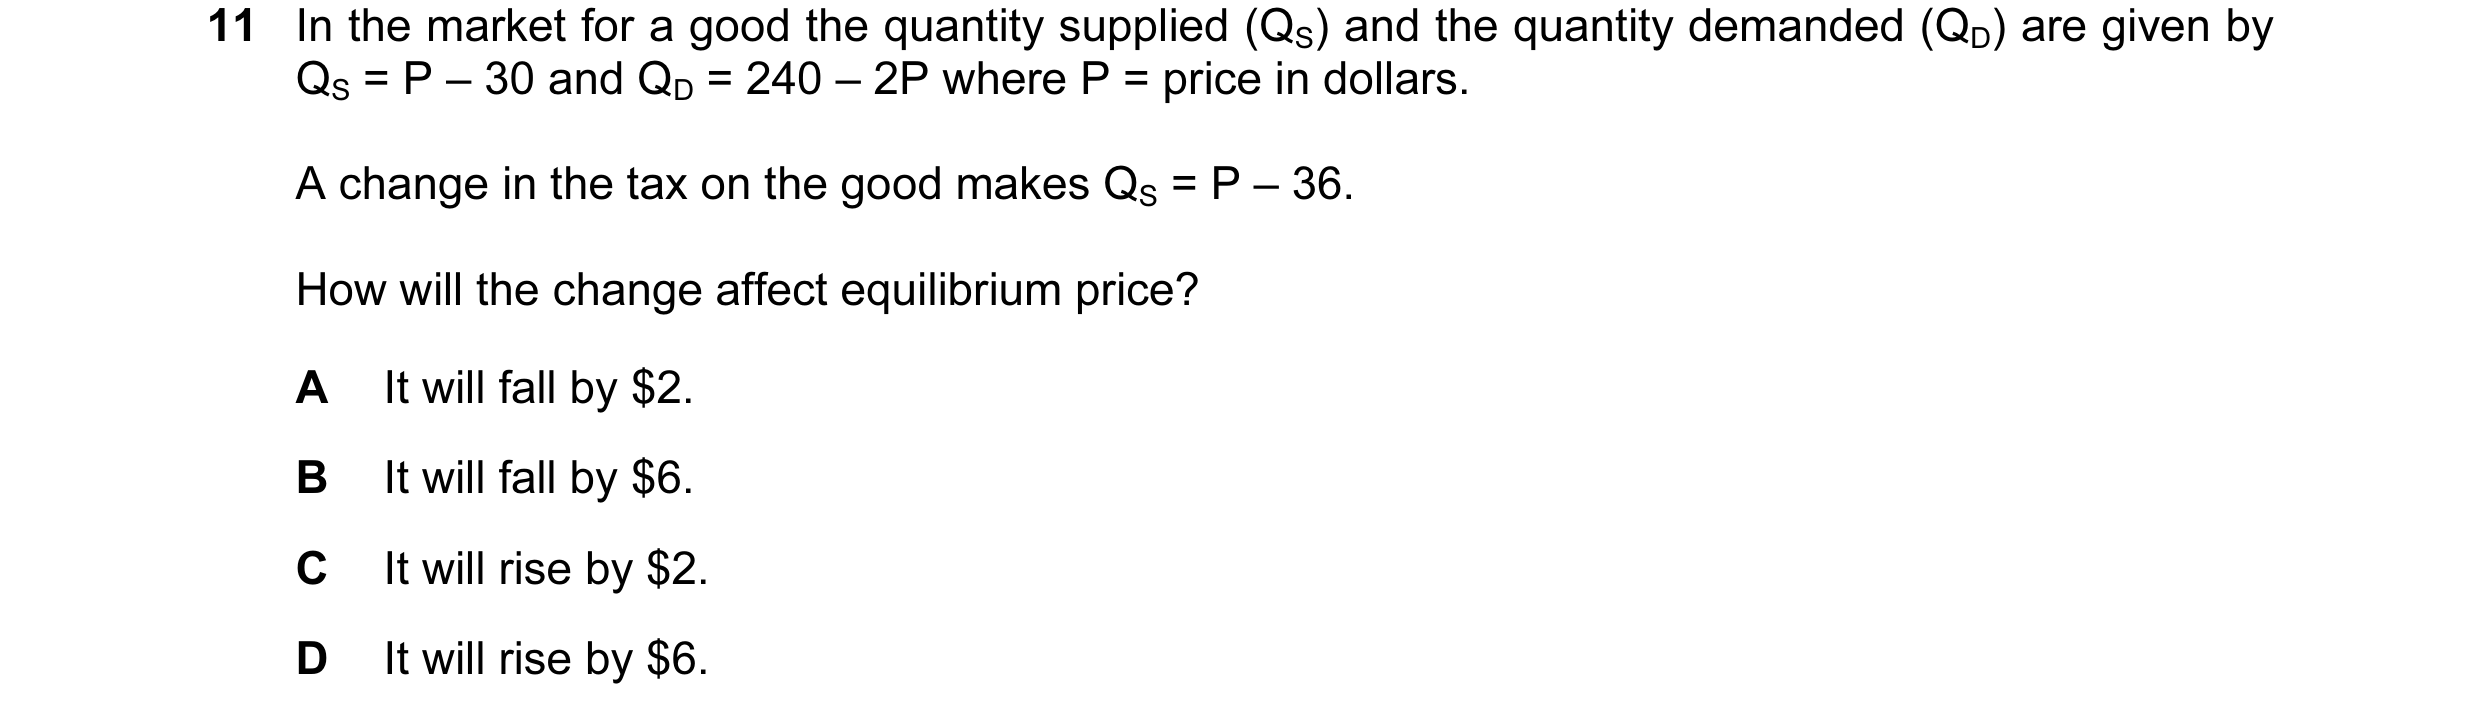
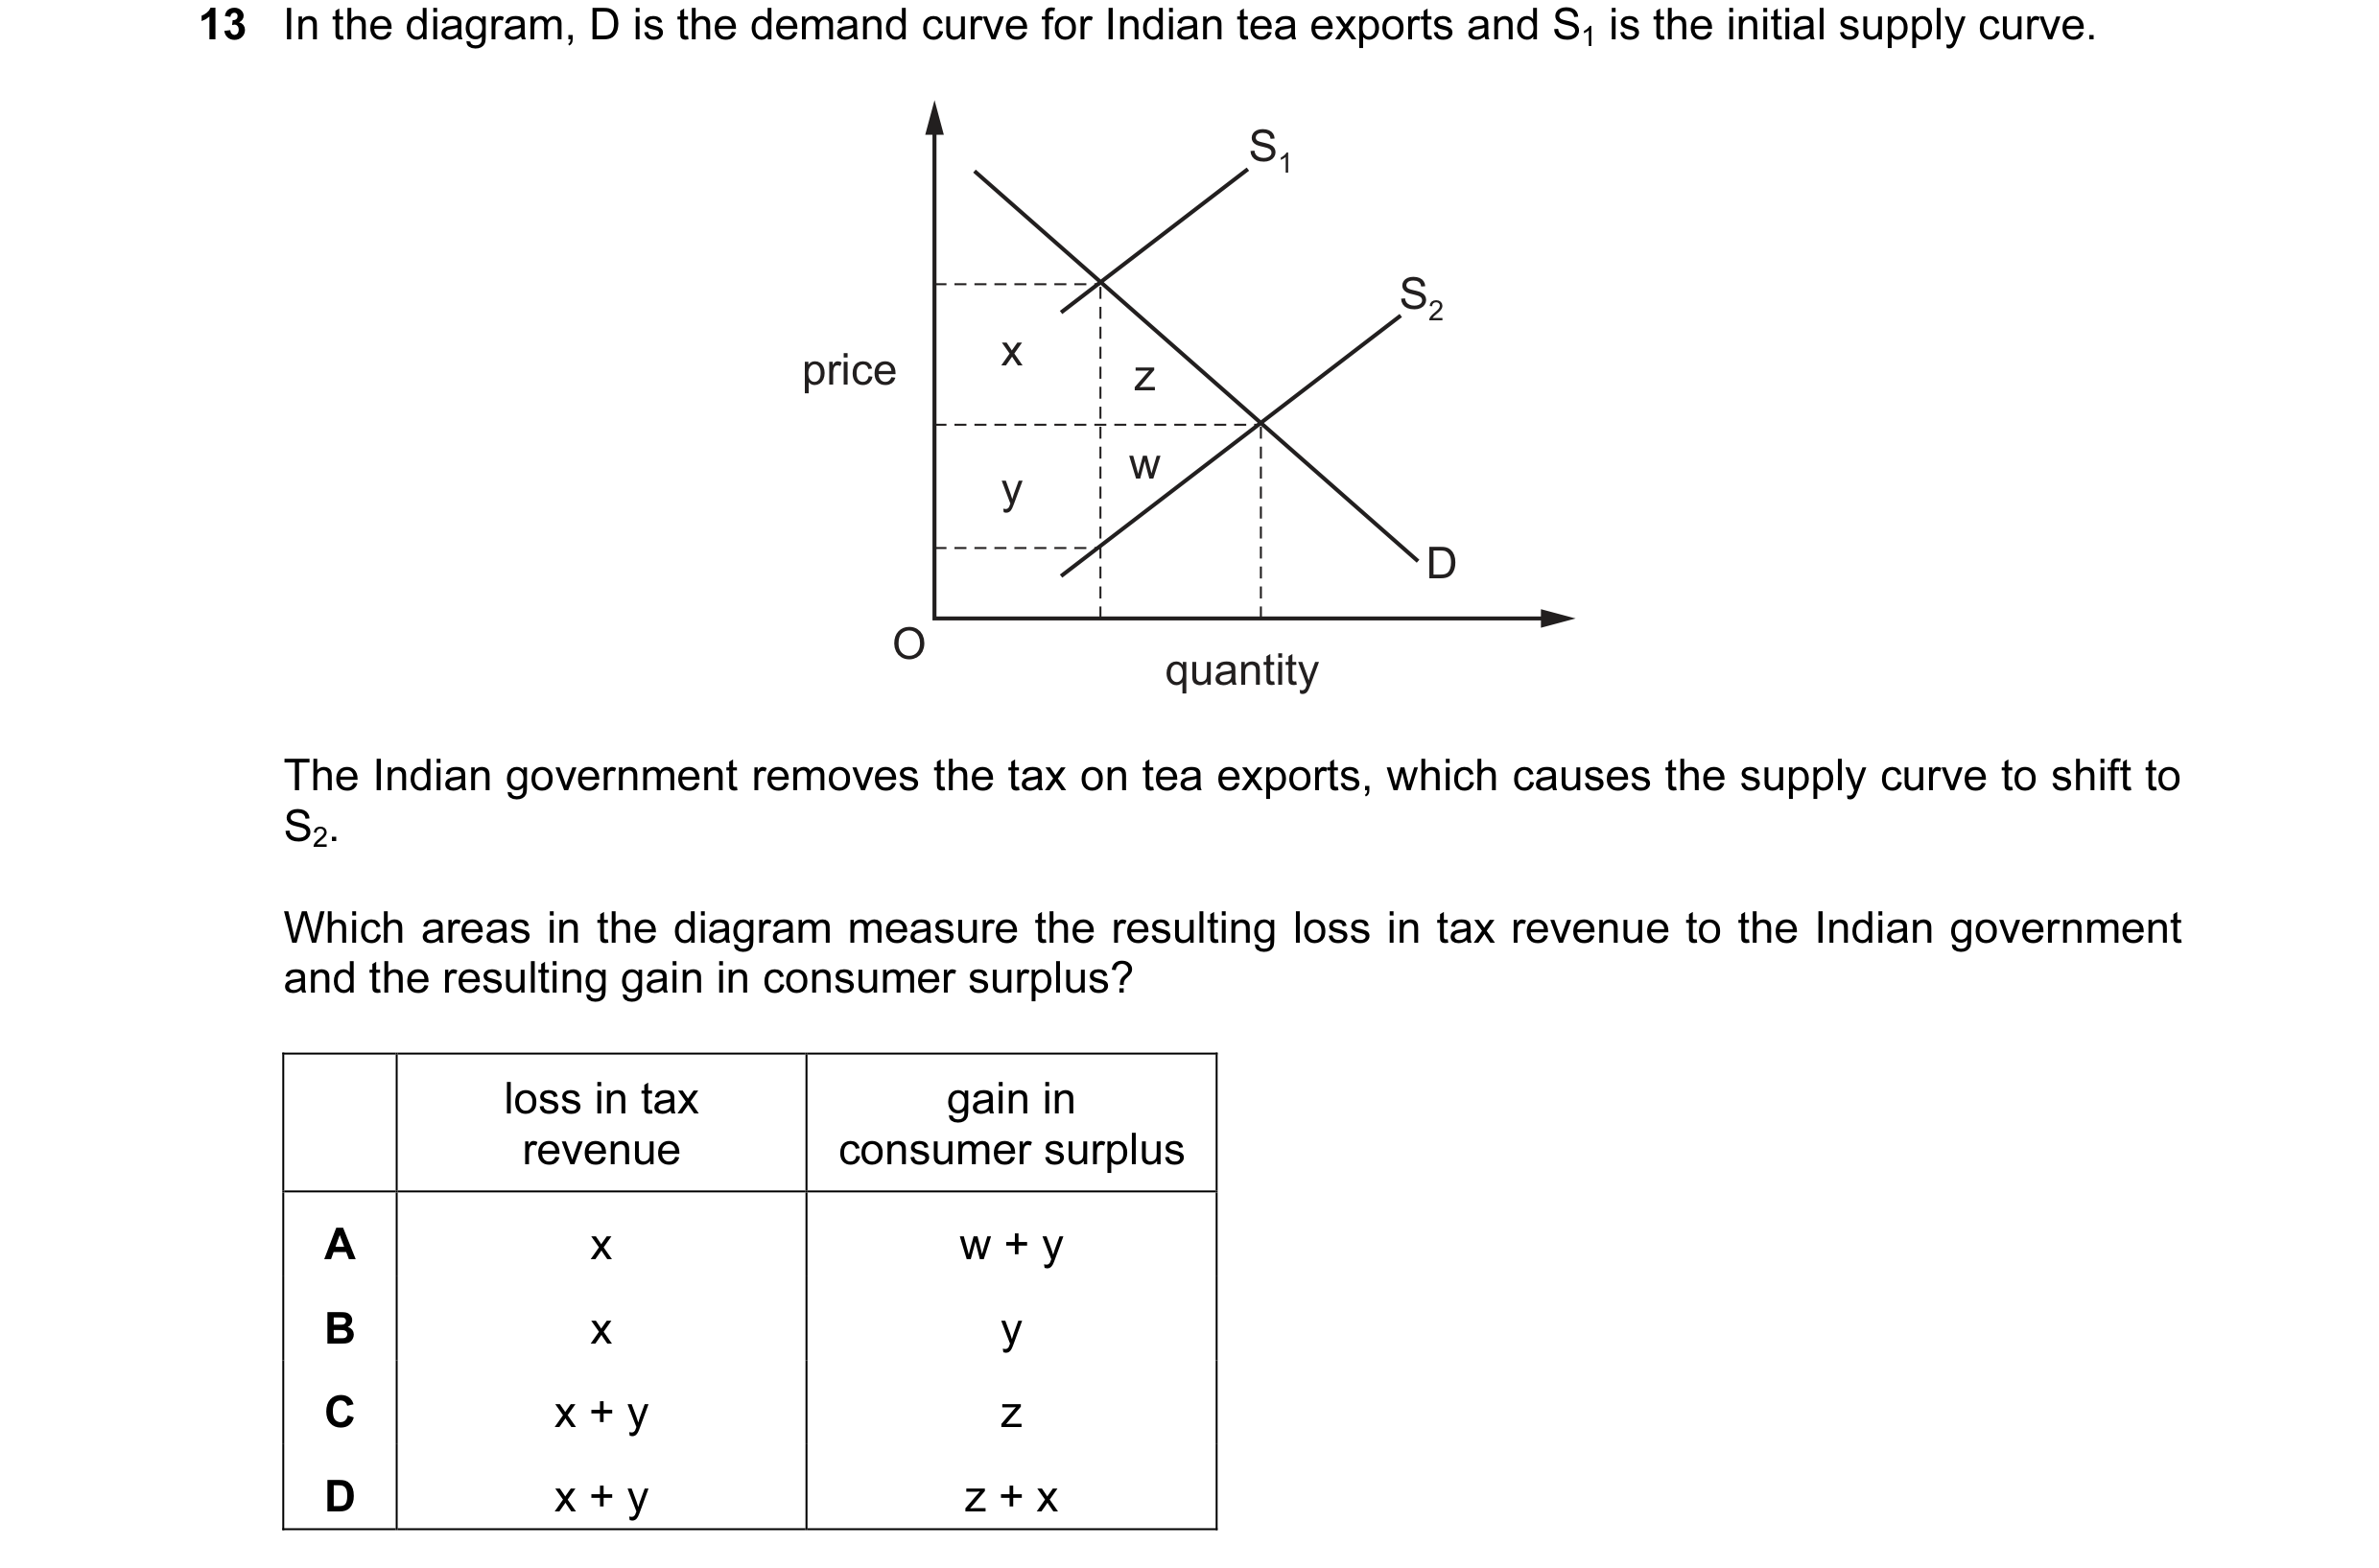 53 / 119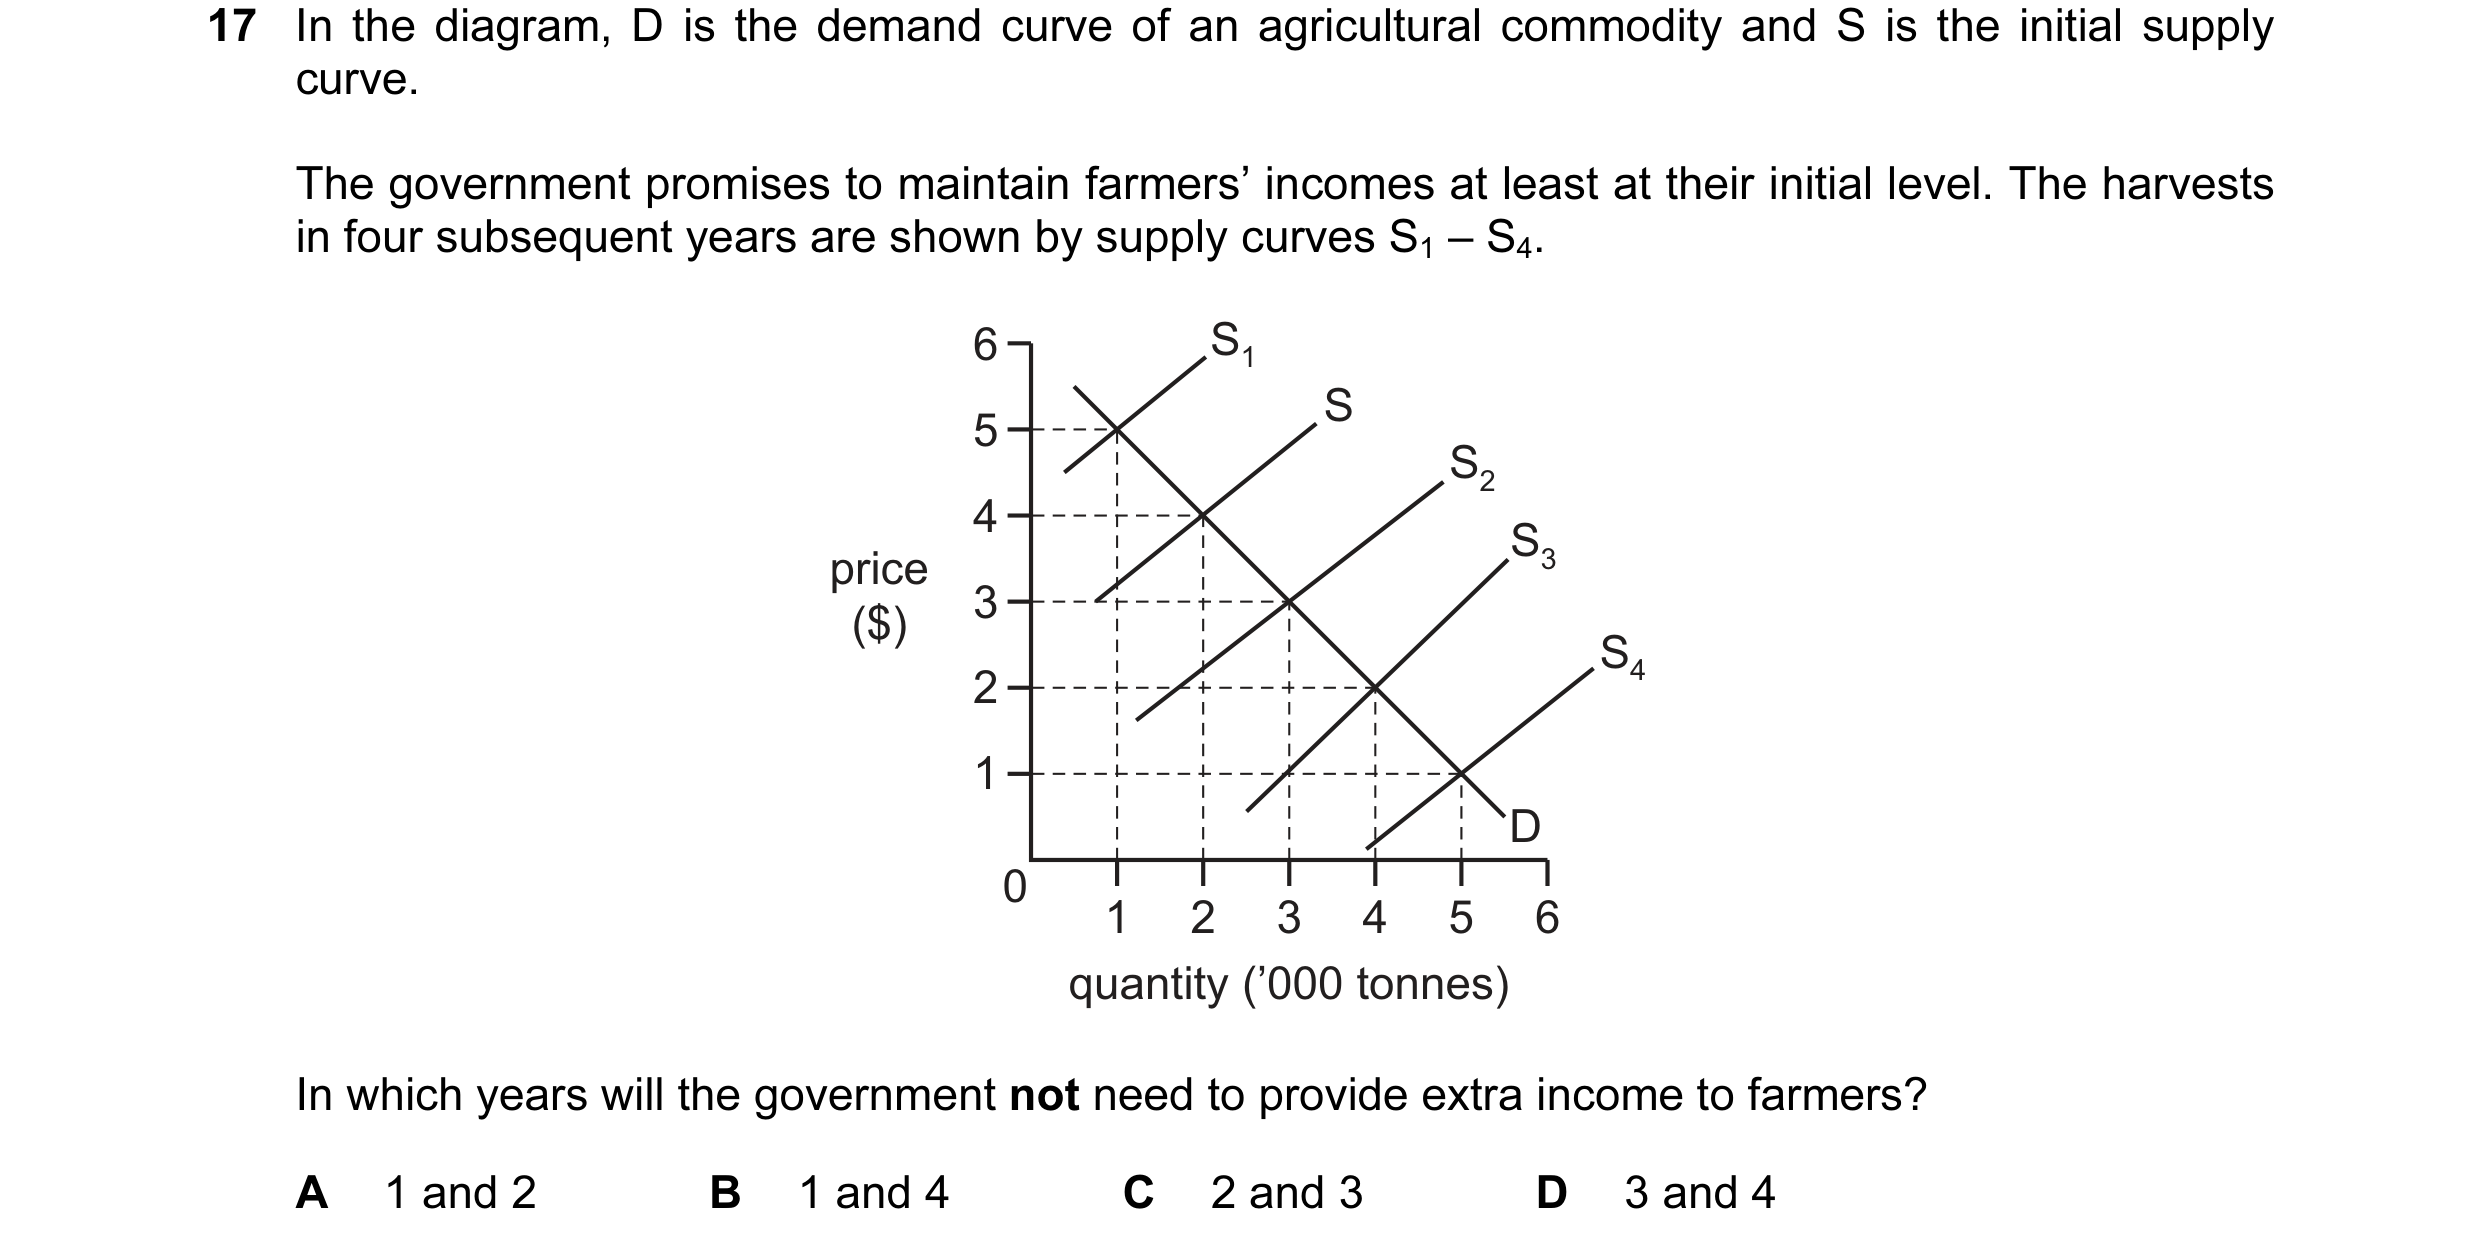
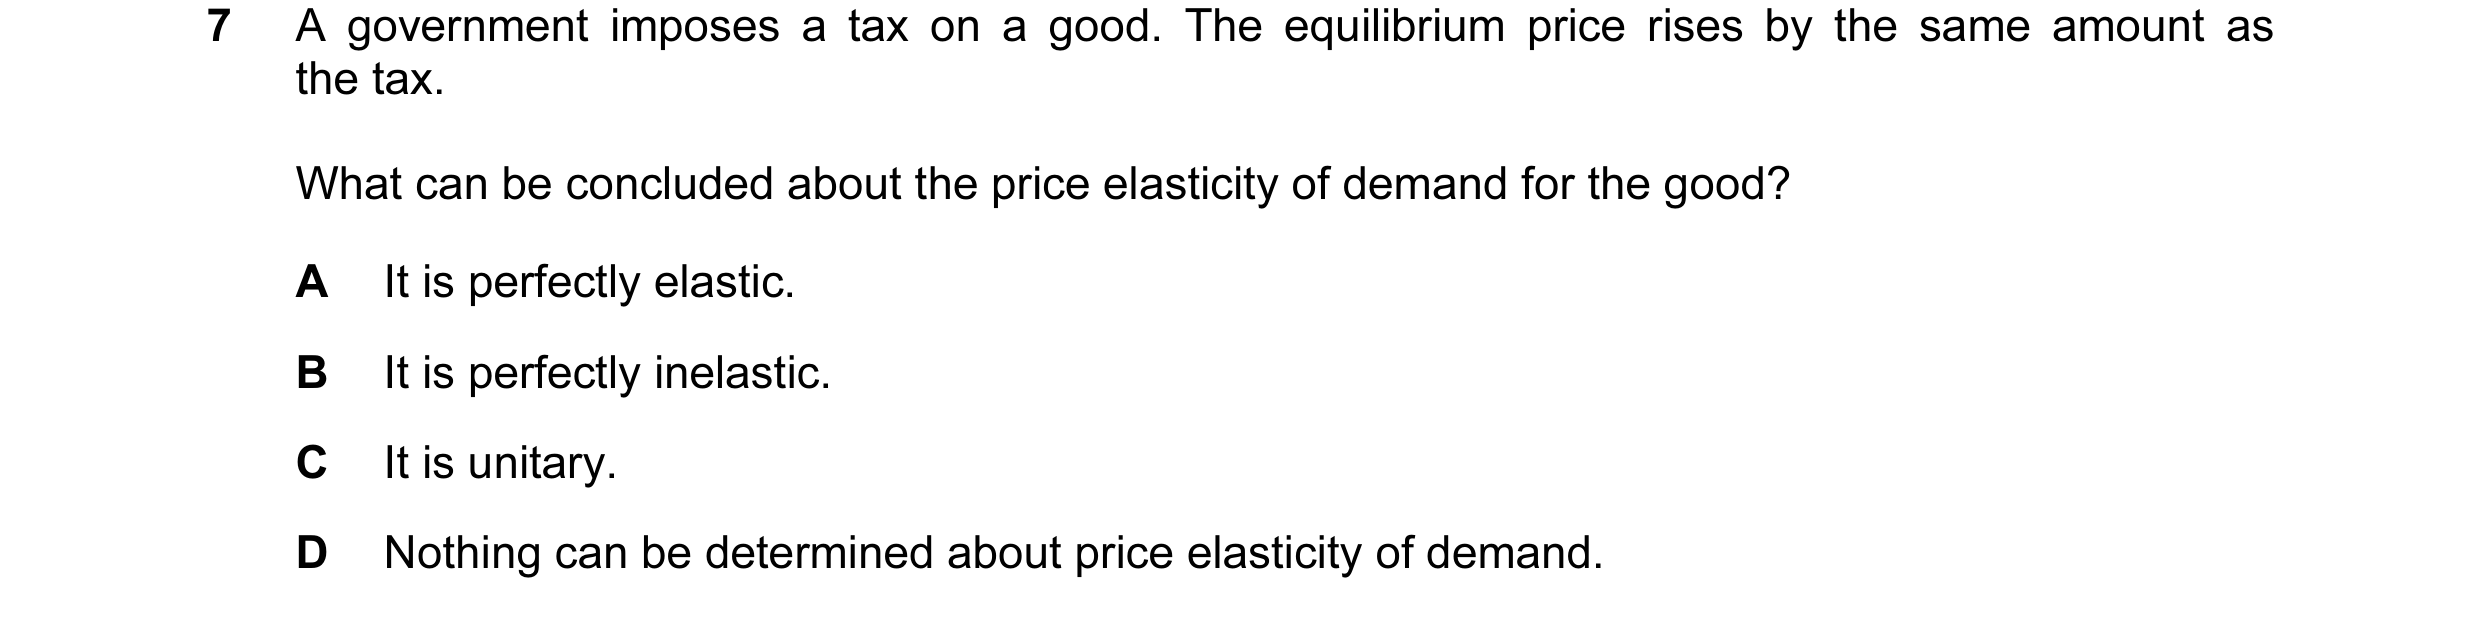
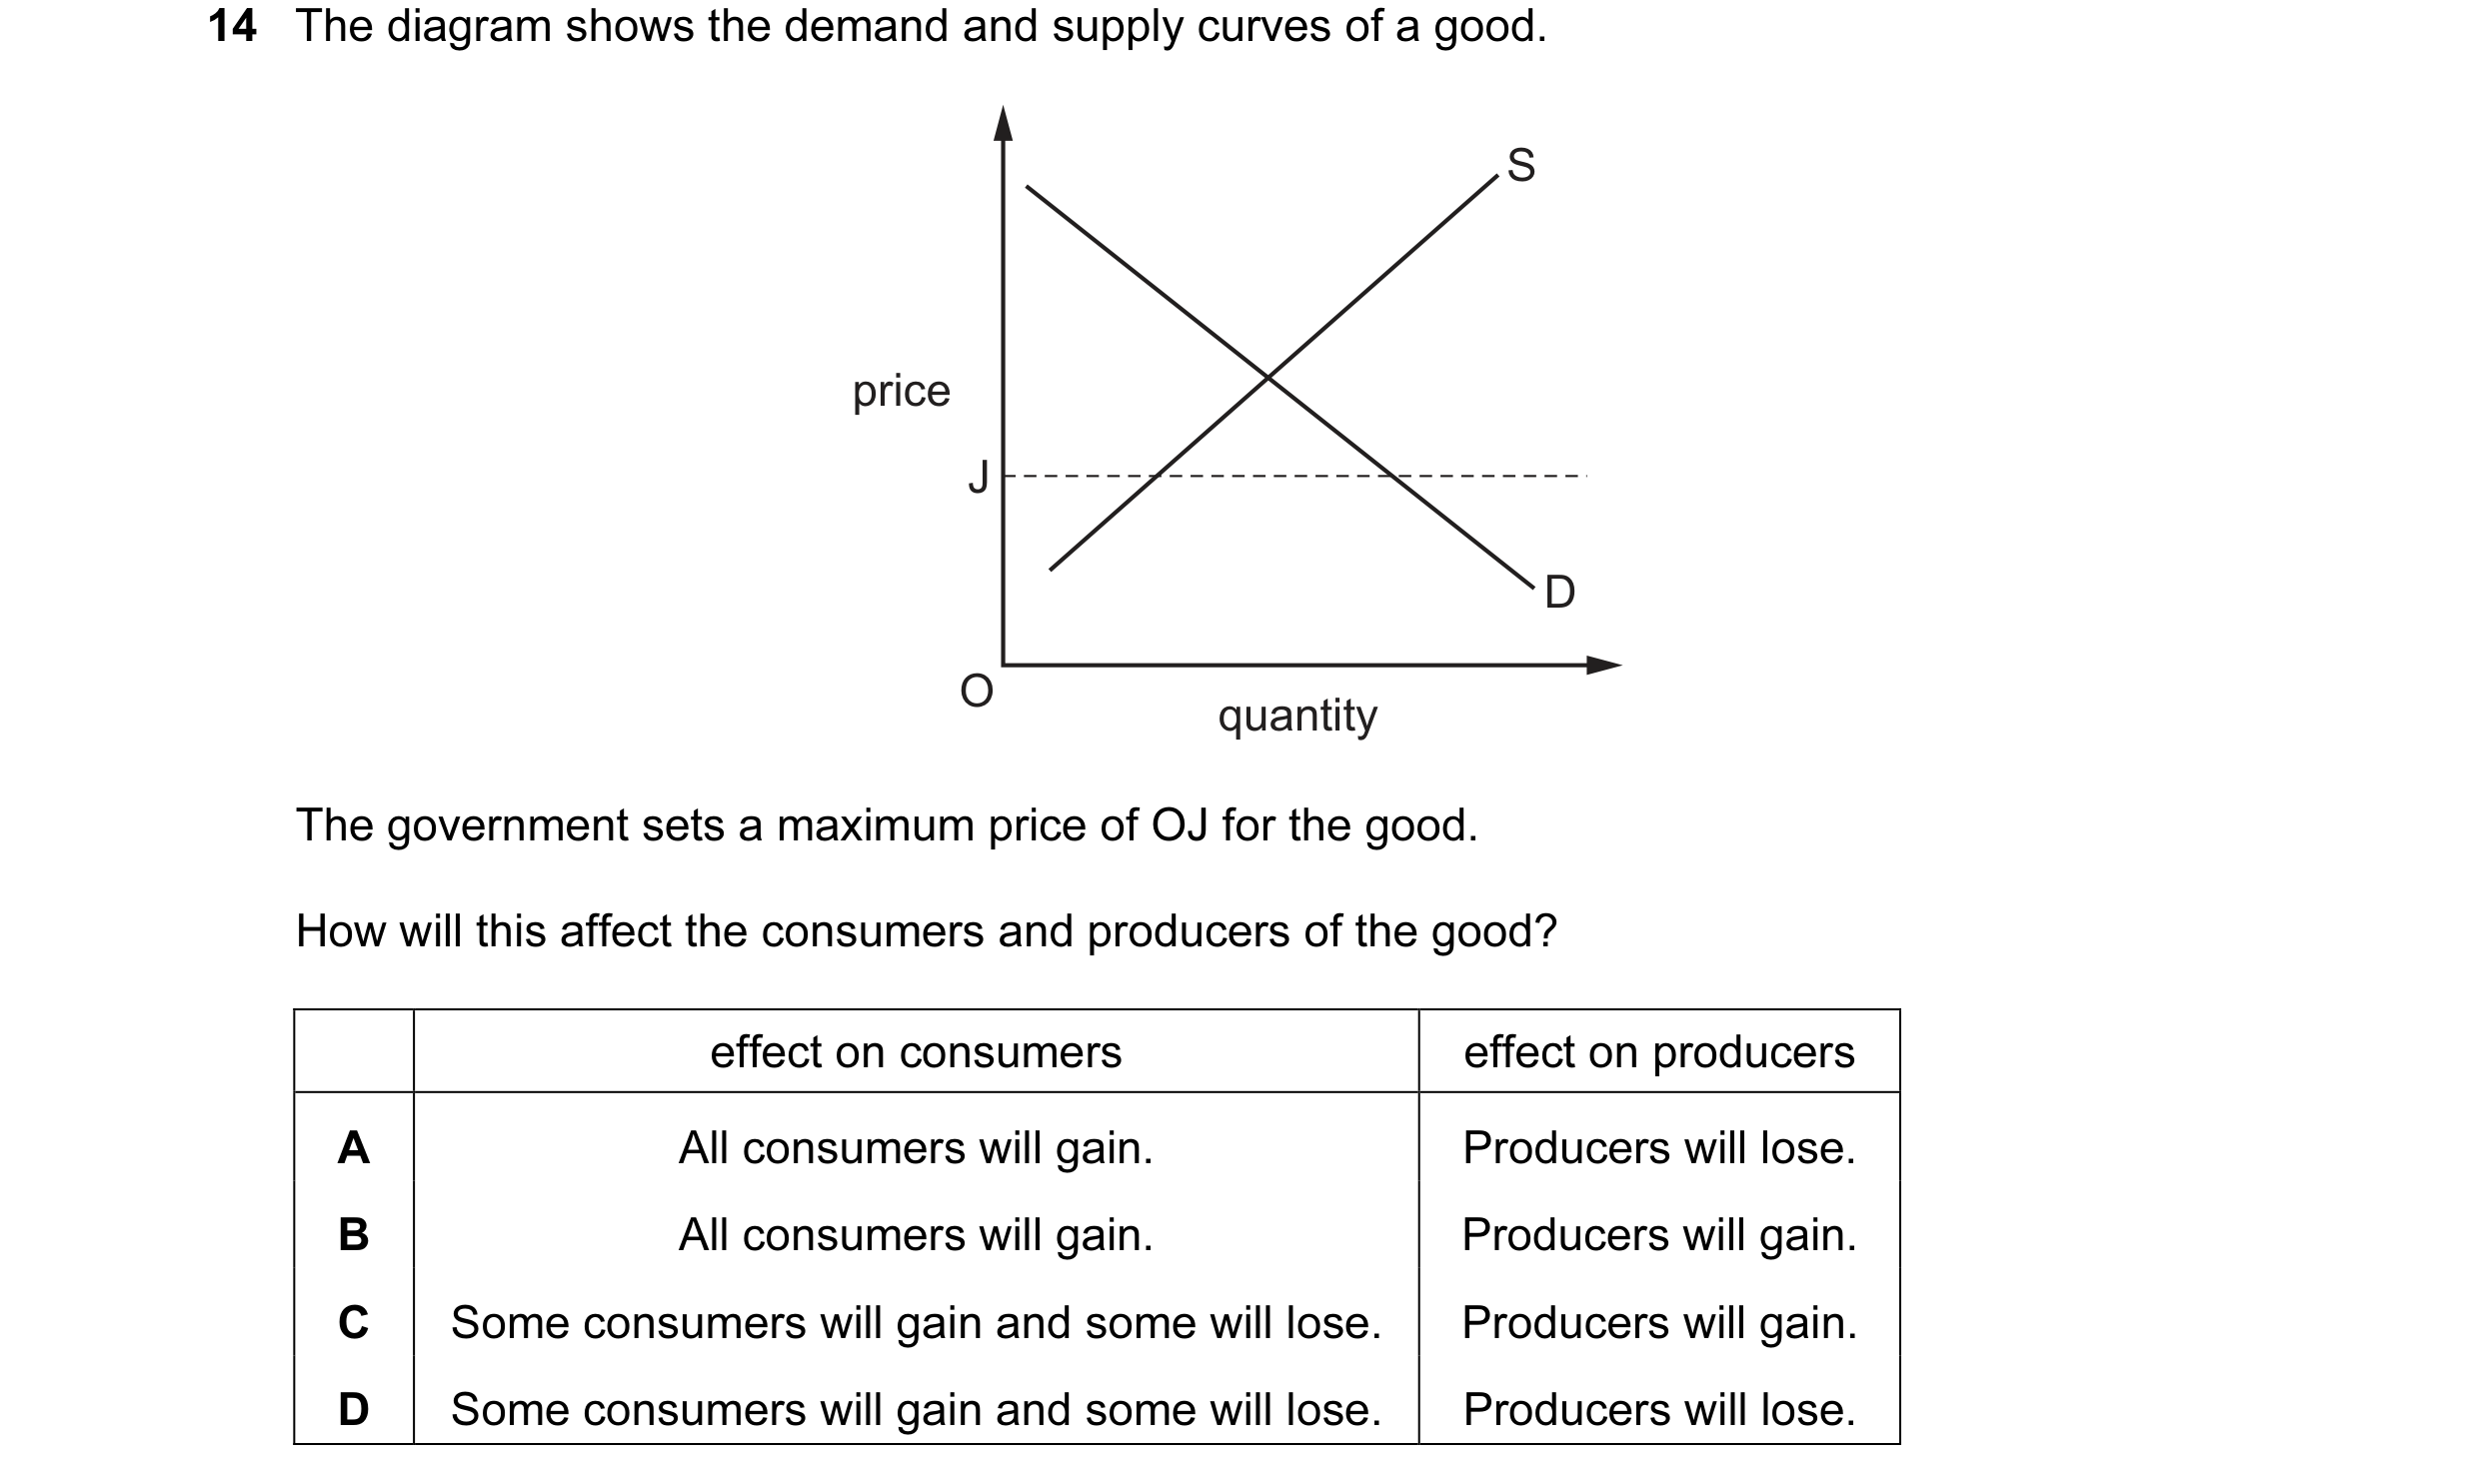 54 / 119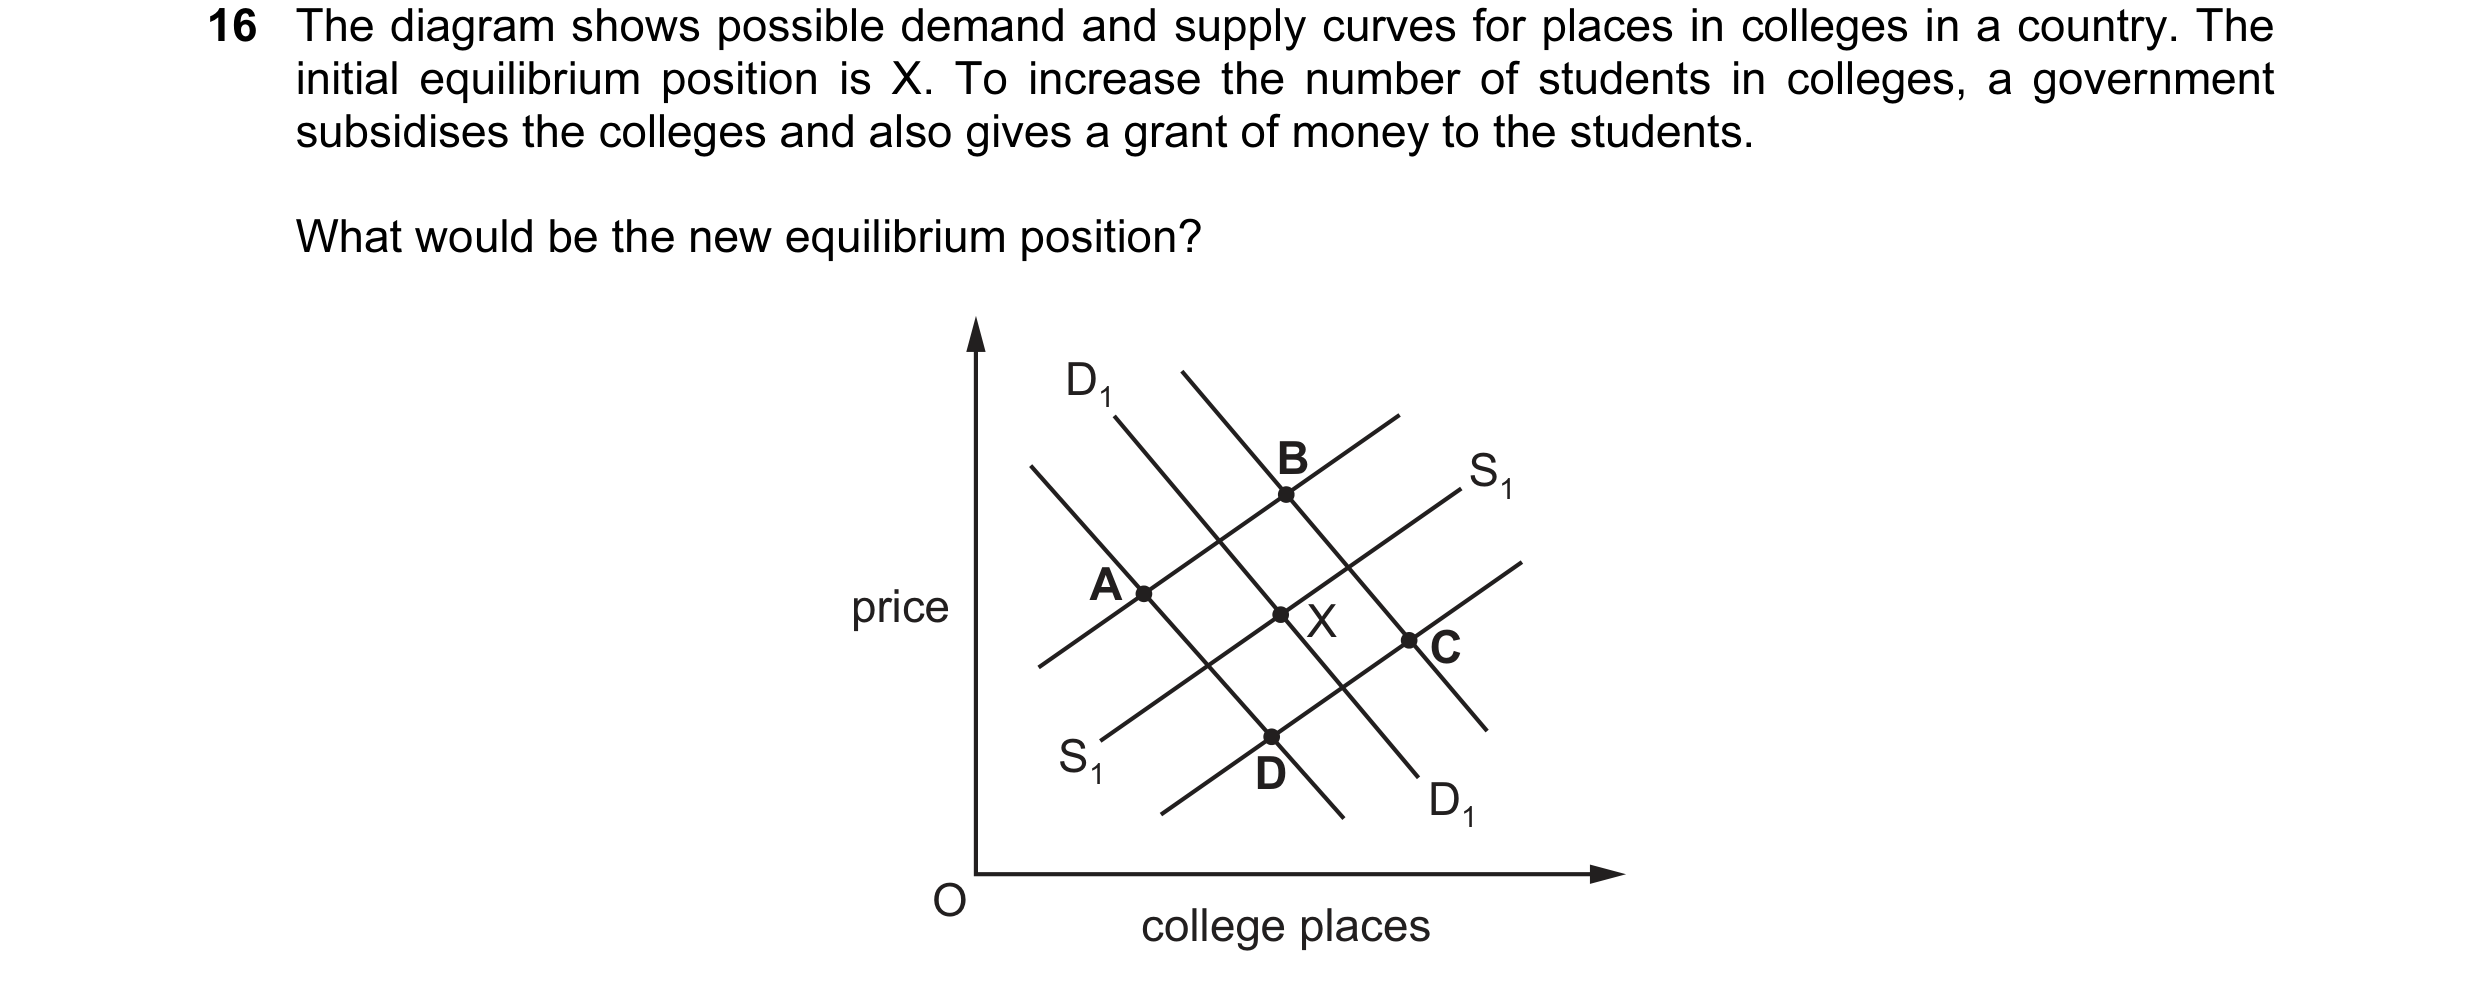
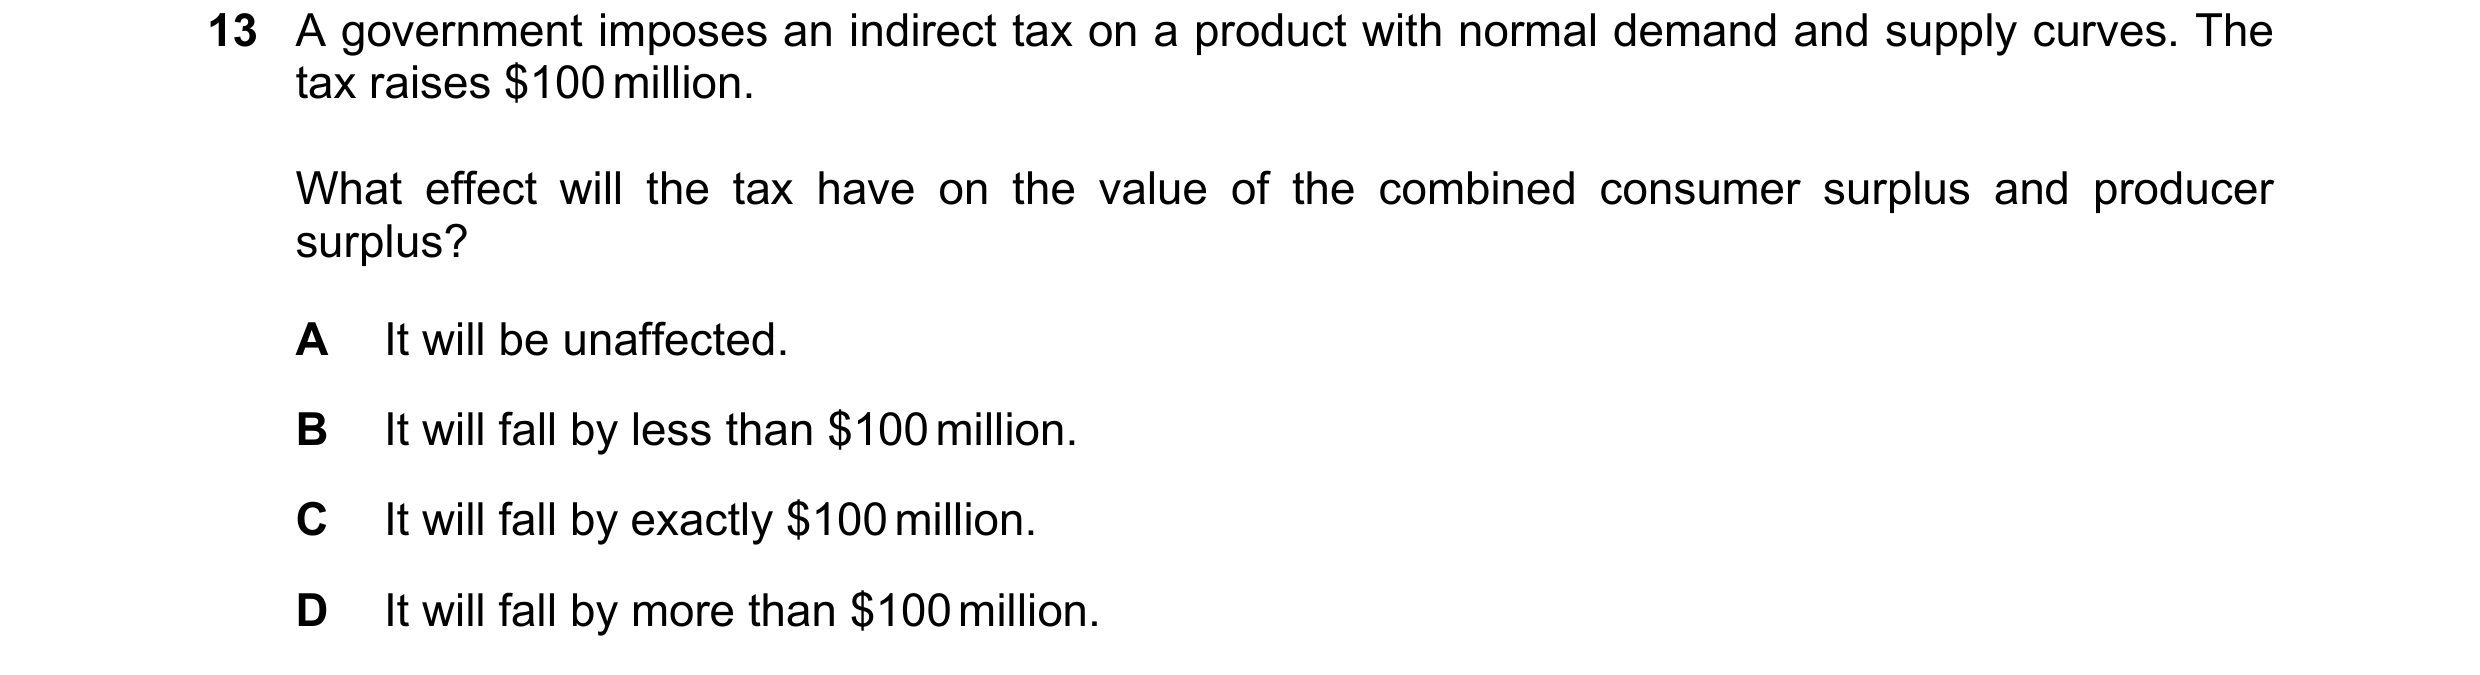
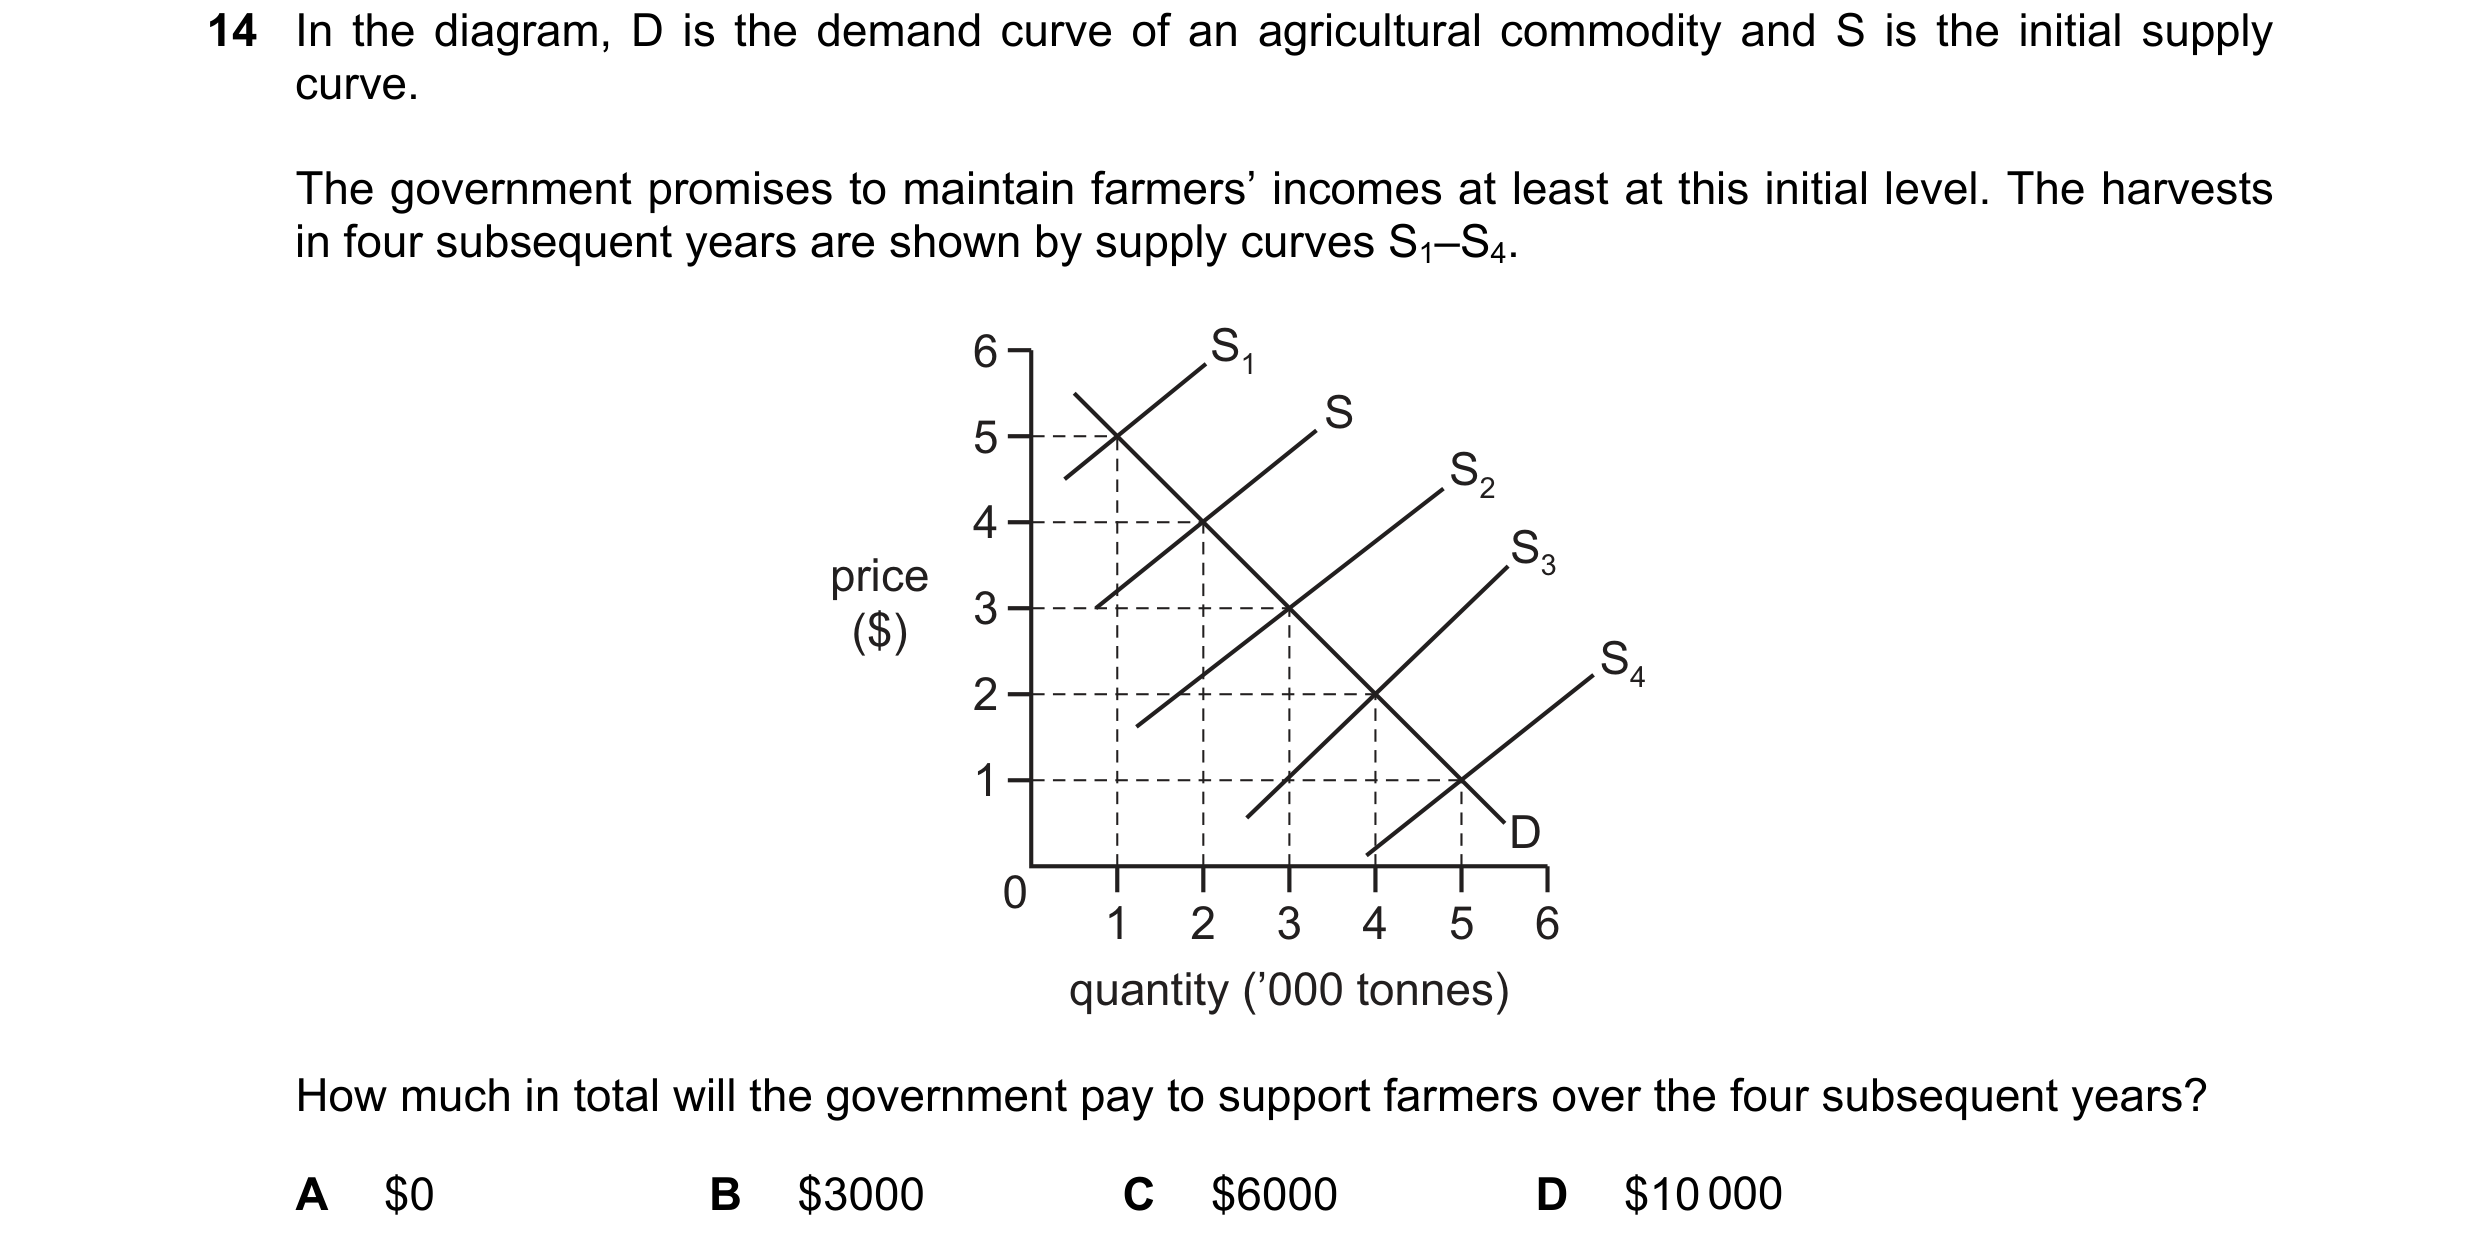 55 / 119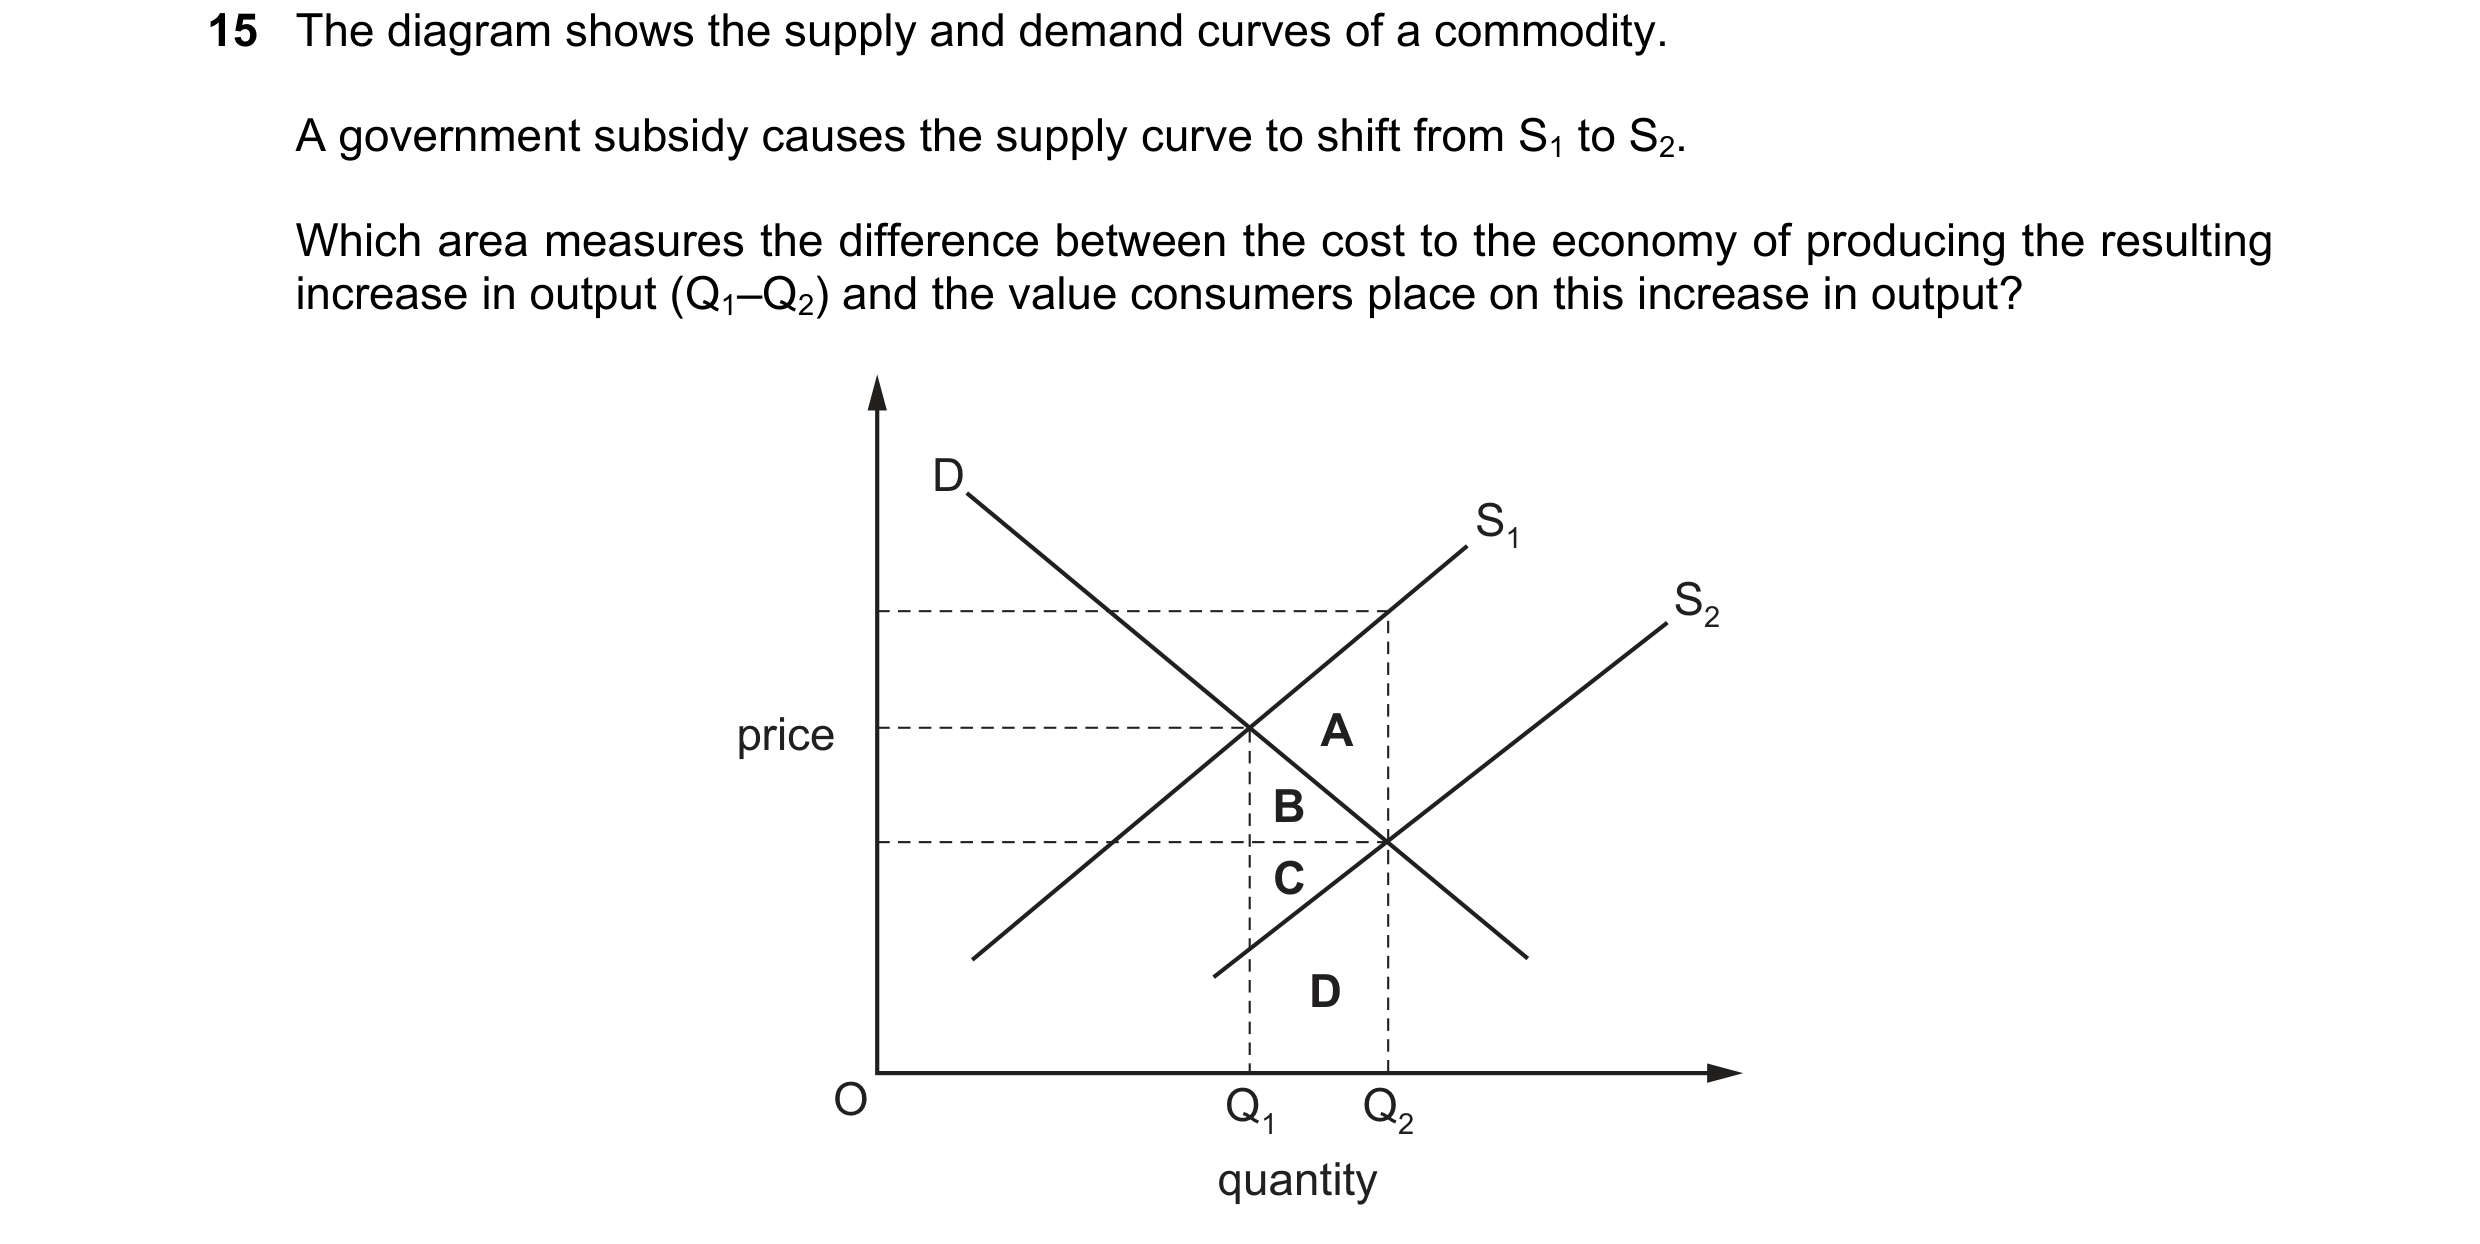


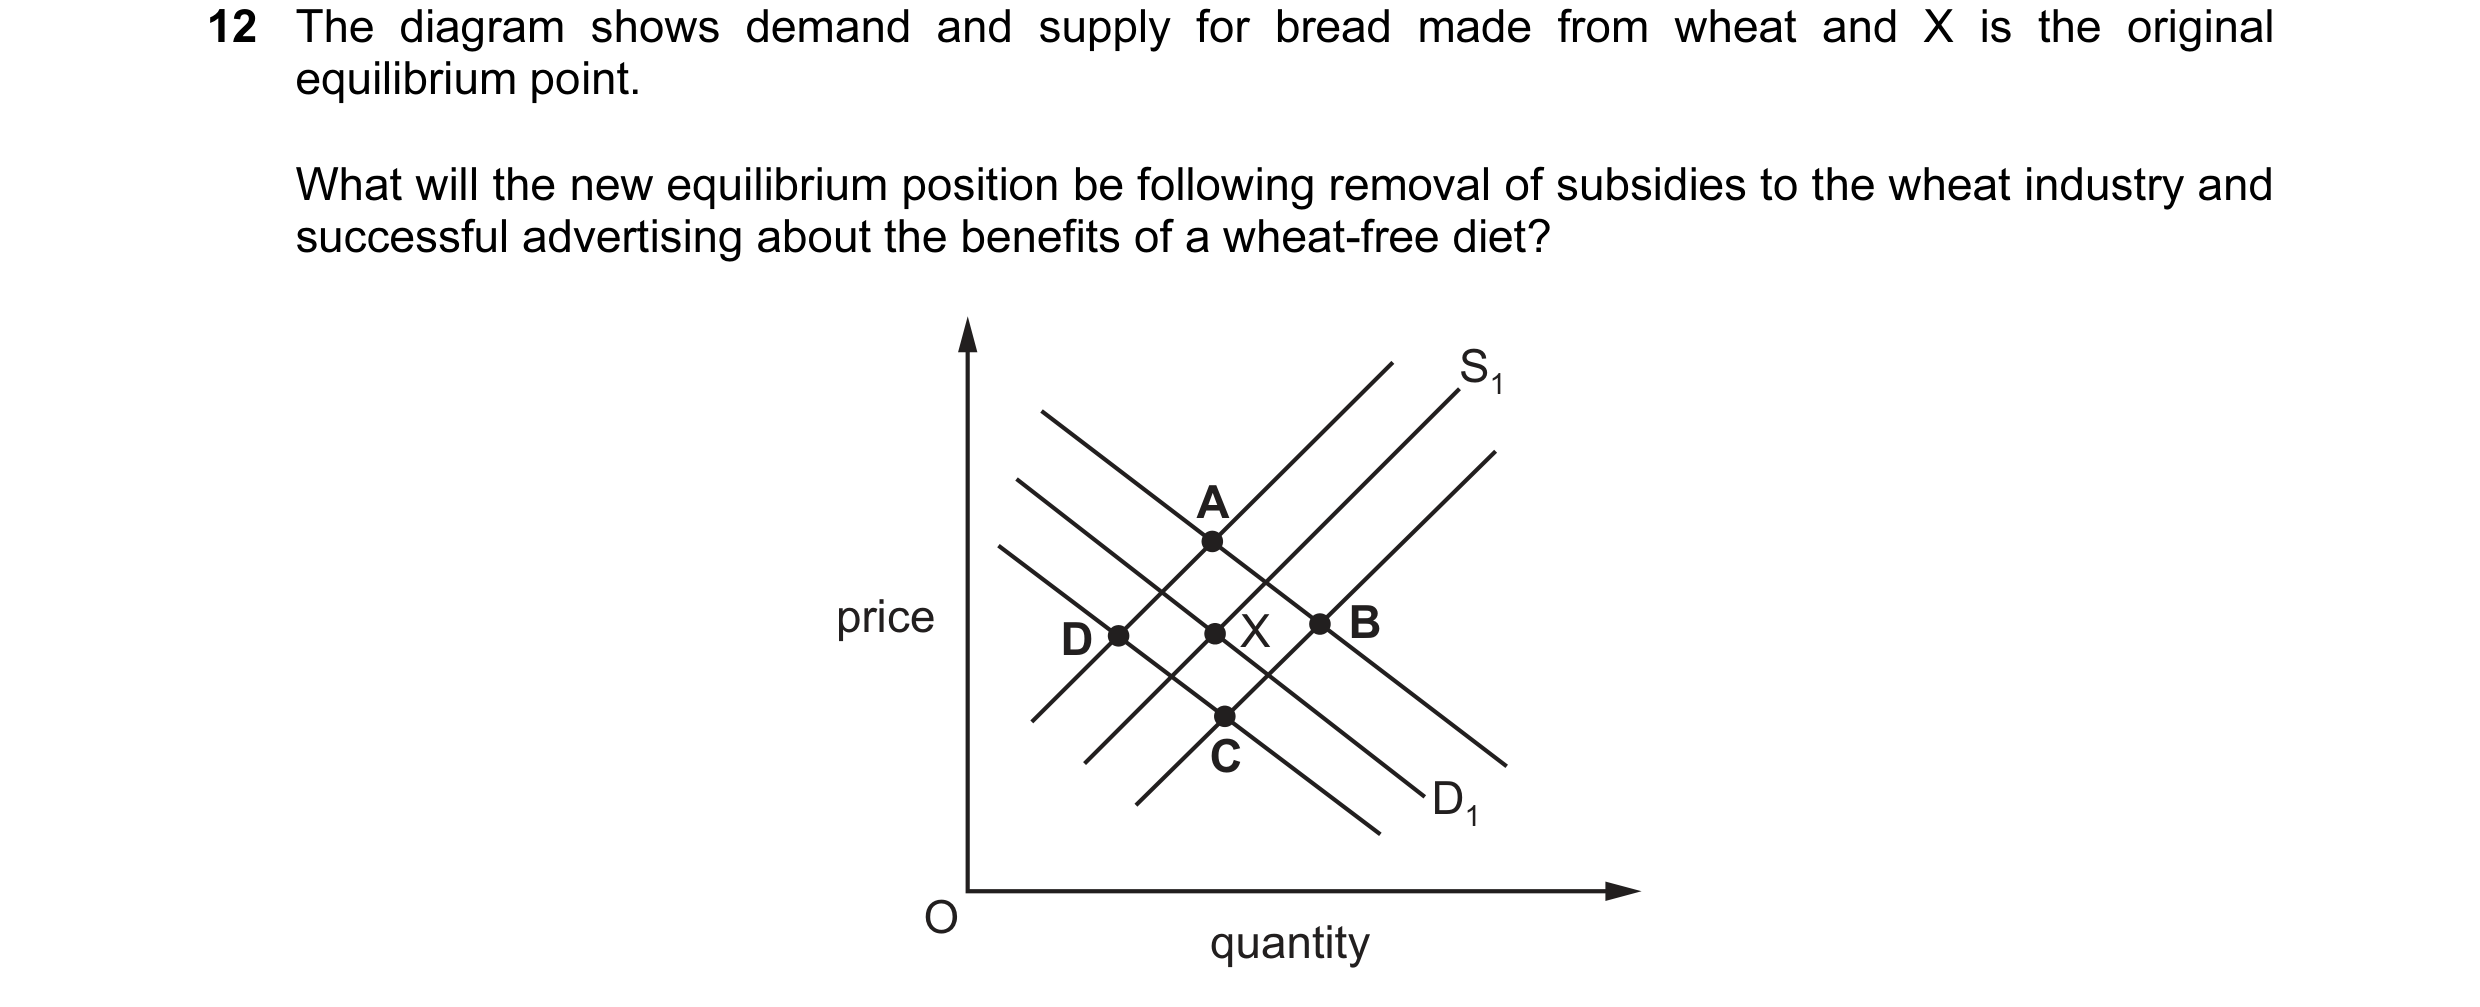 56 / 119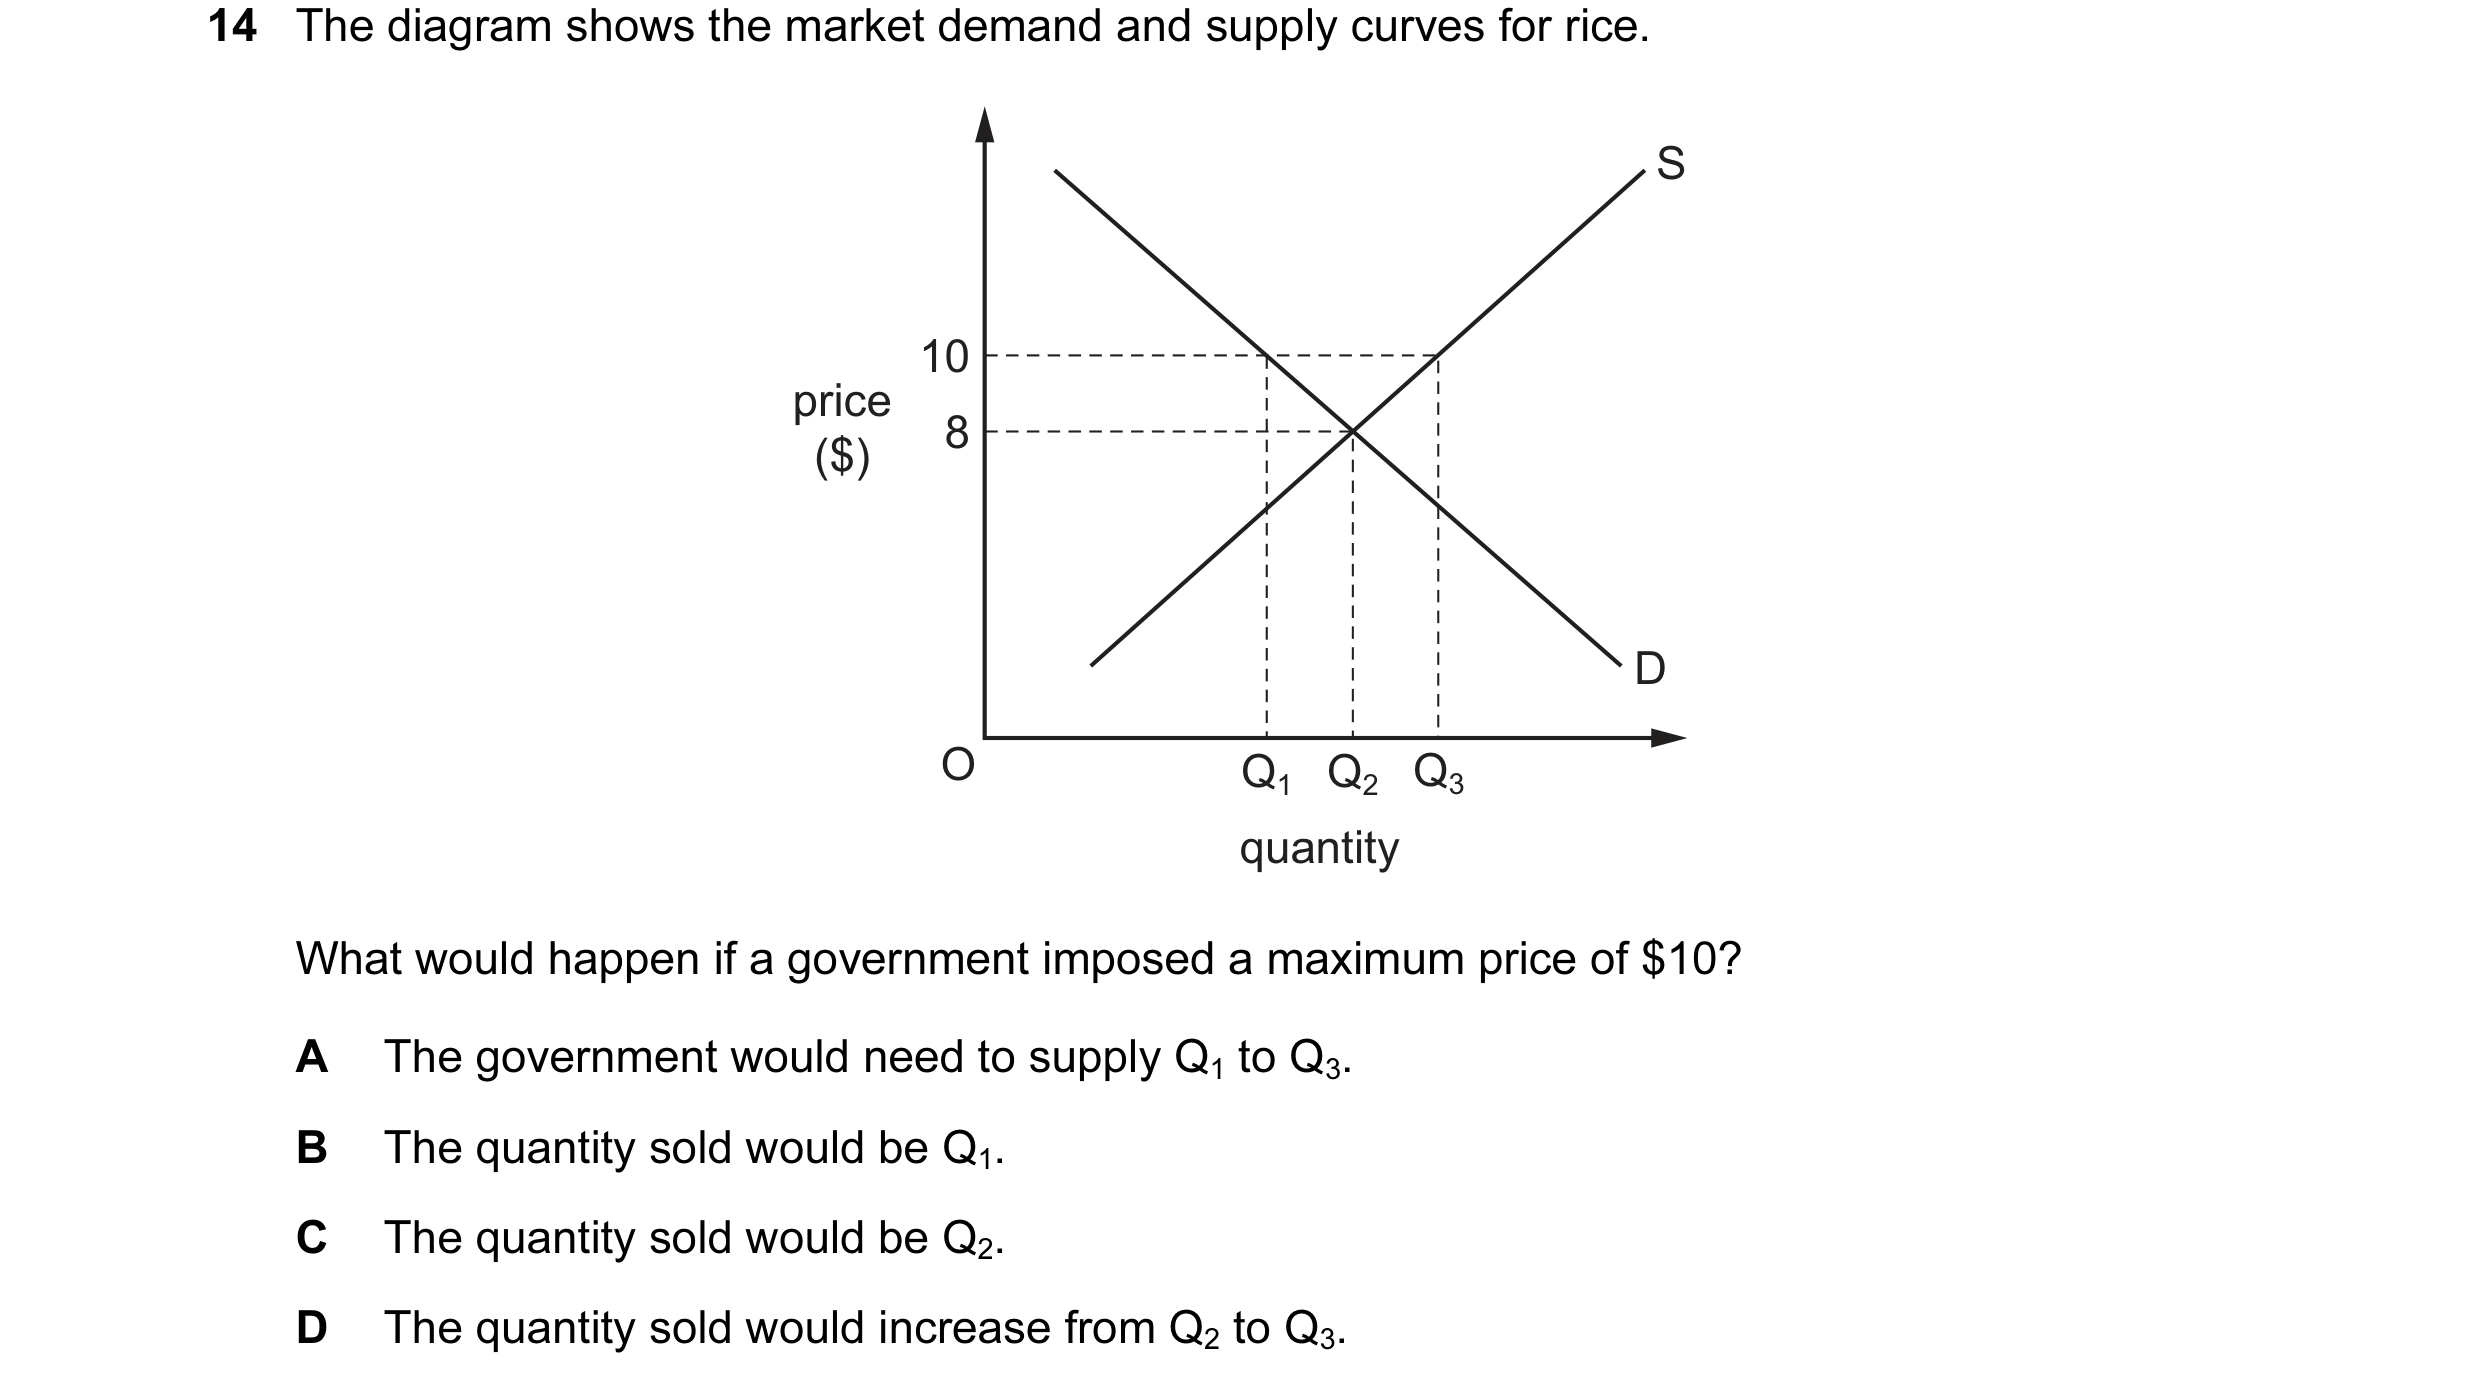

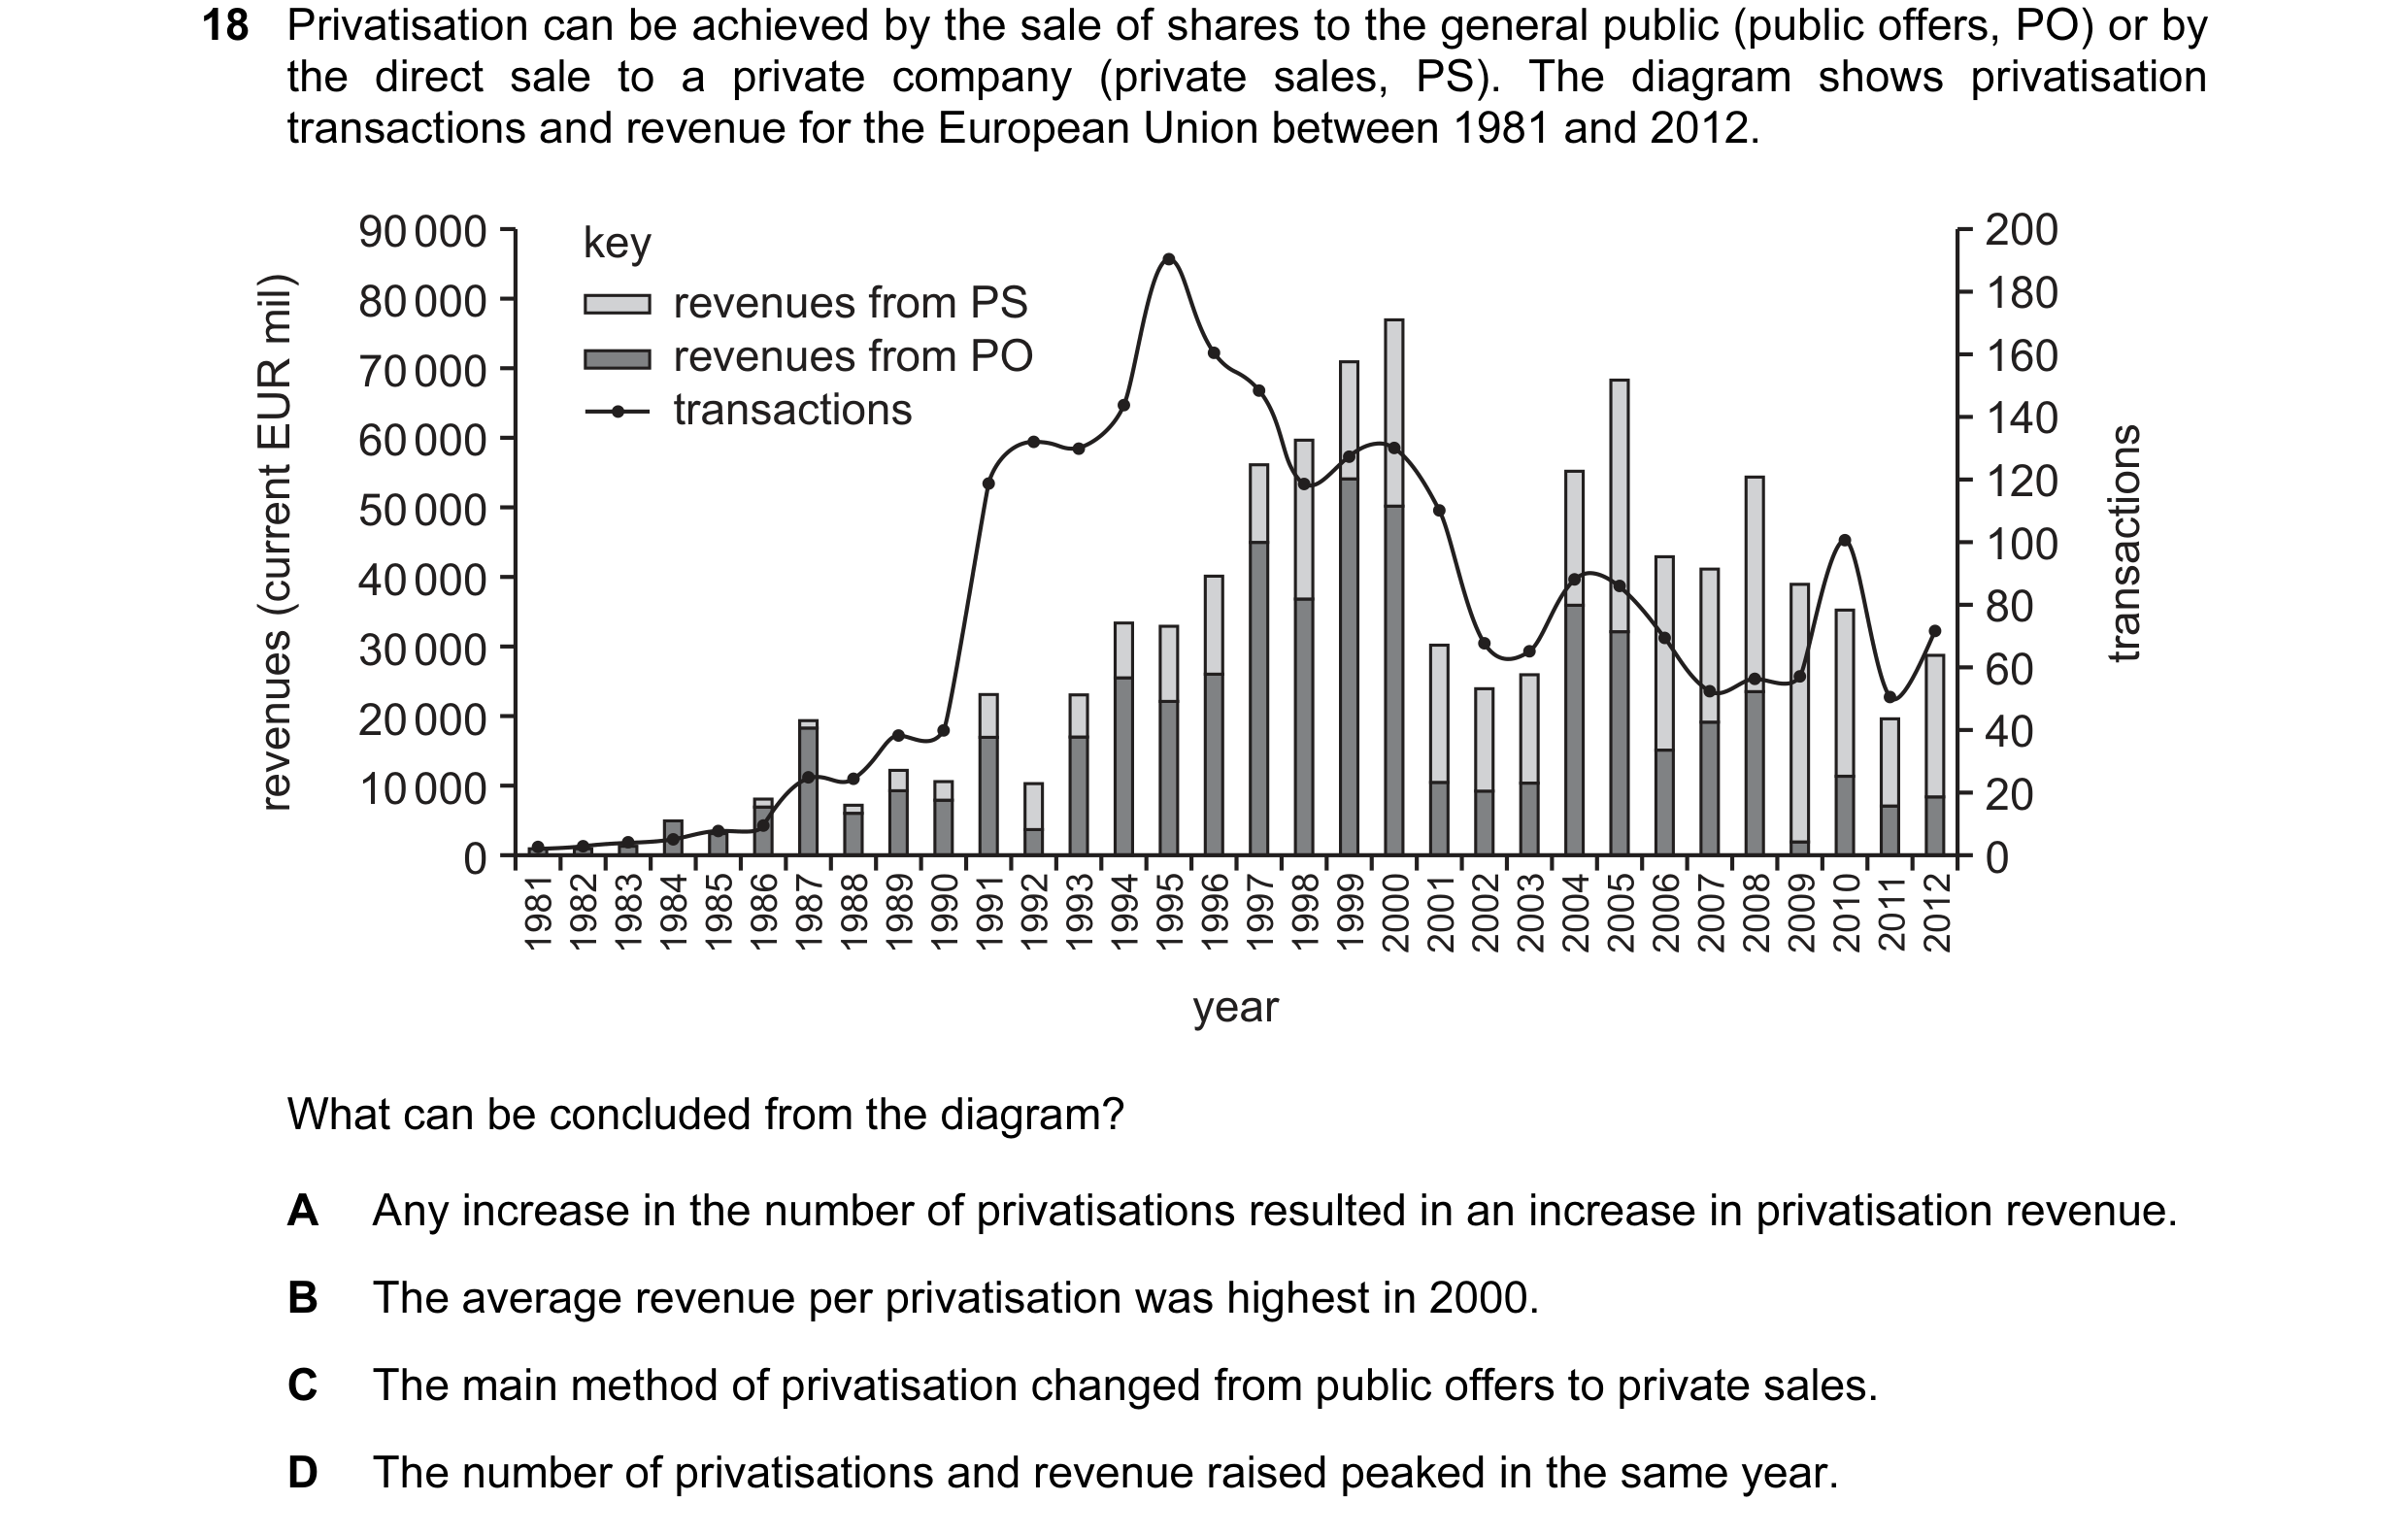 57 / 119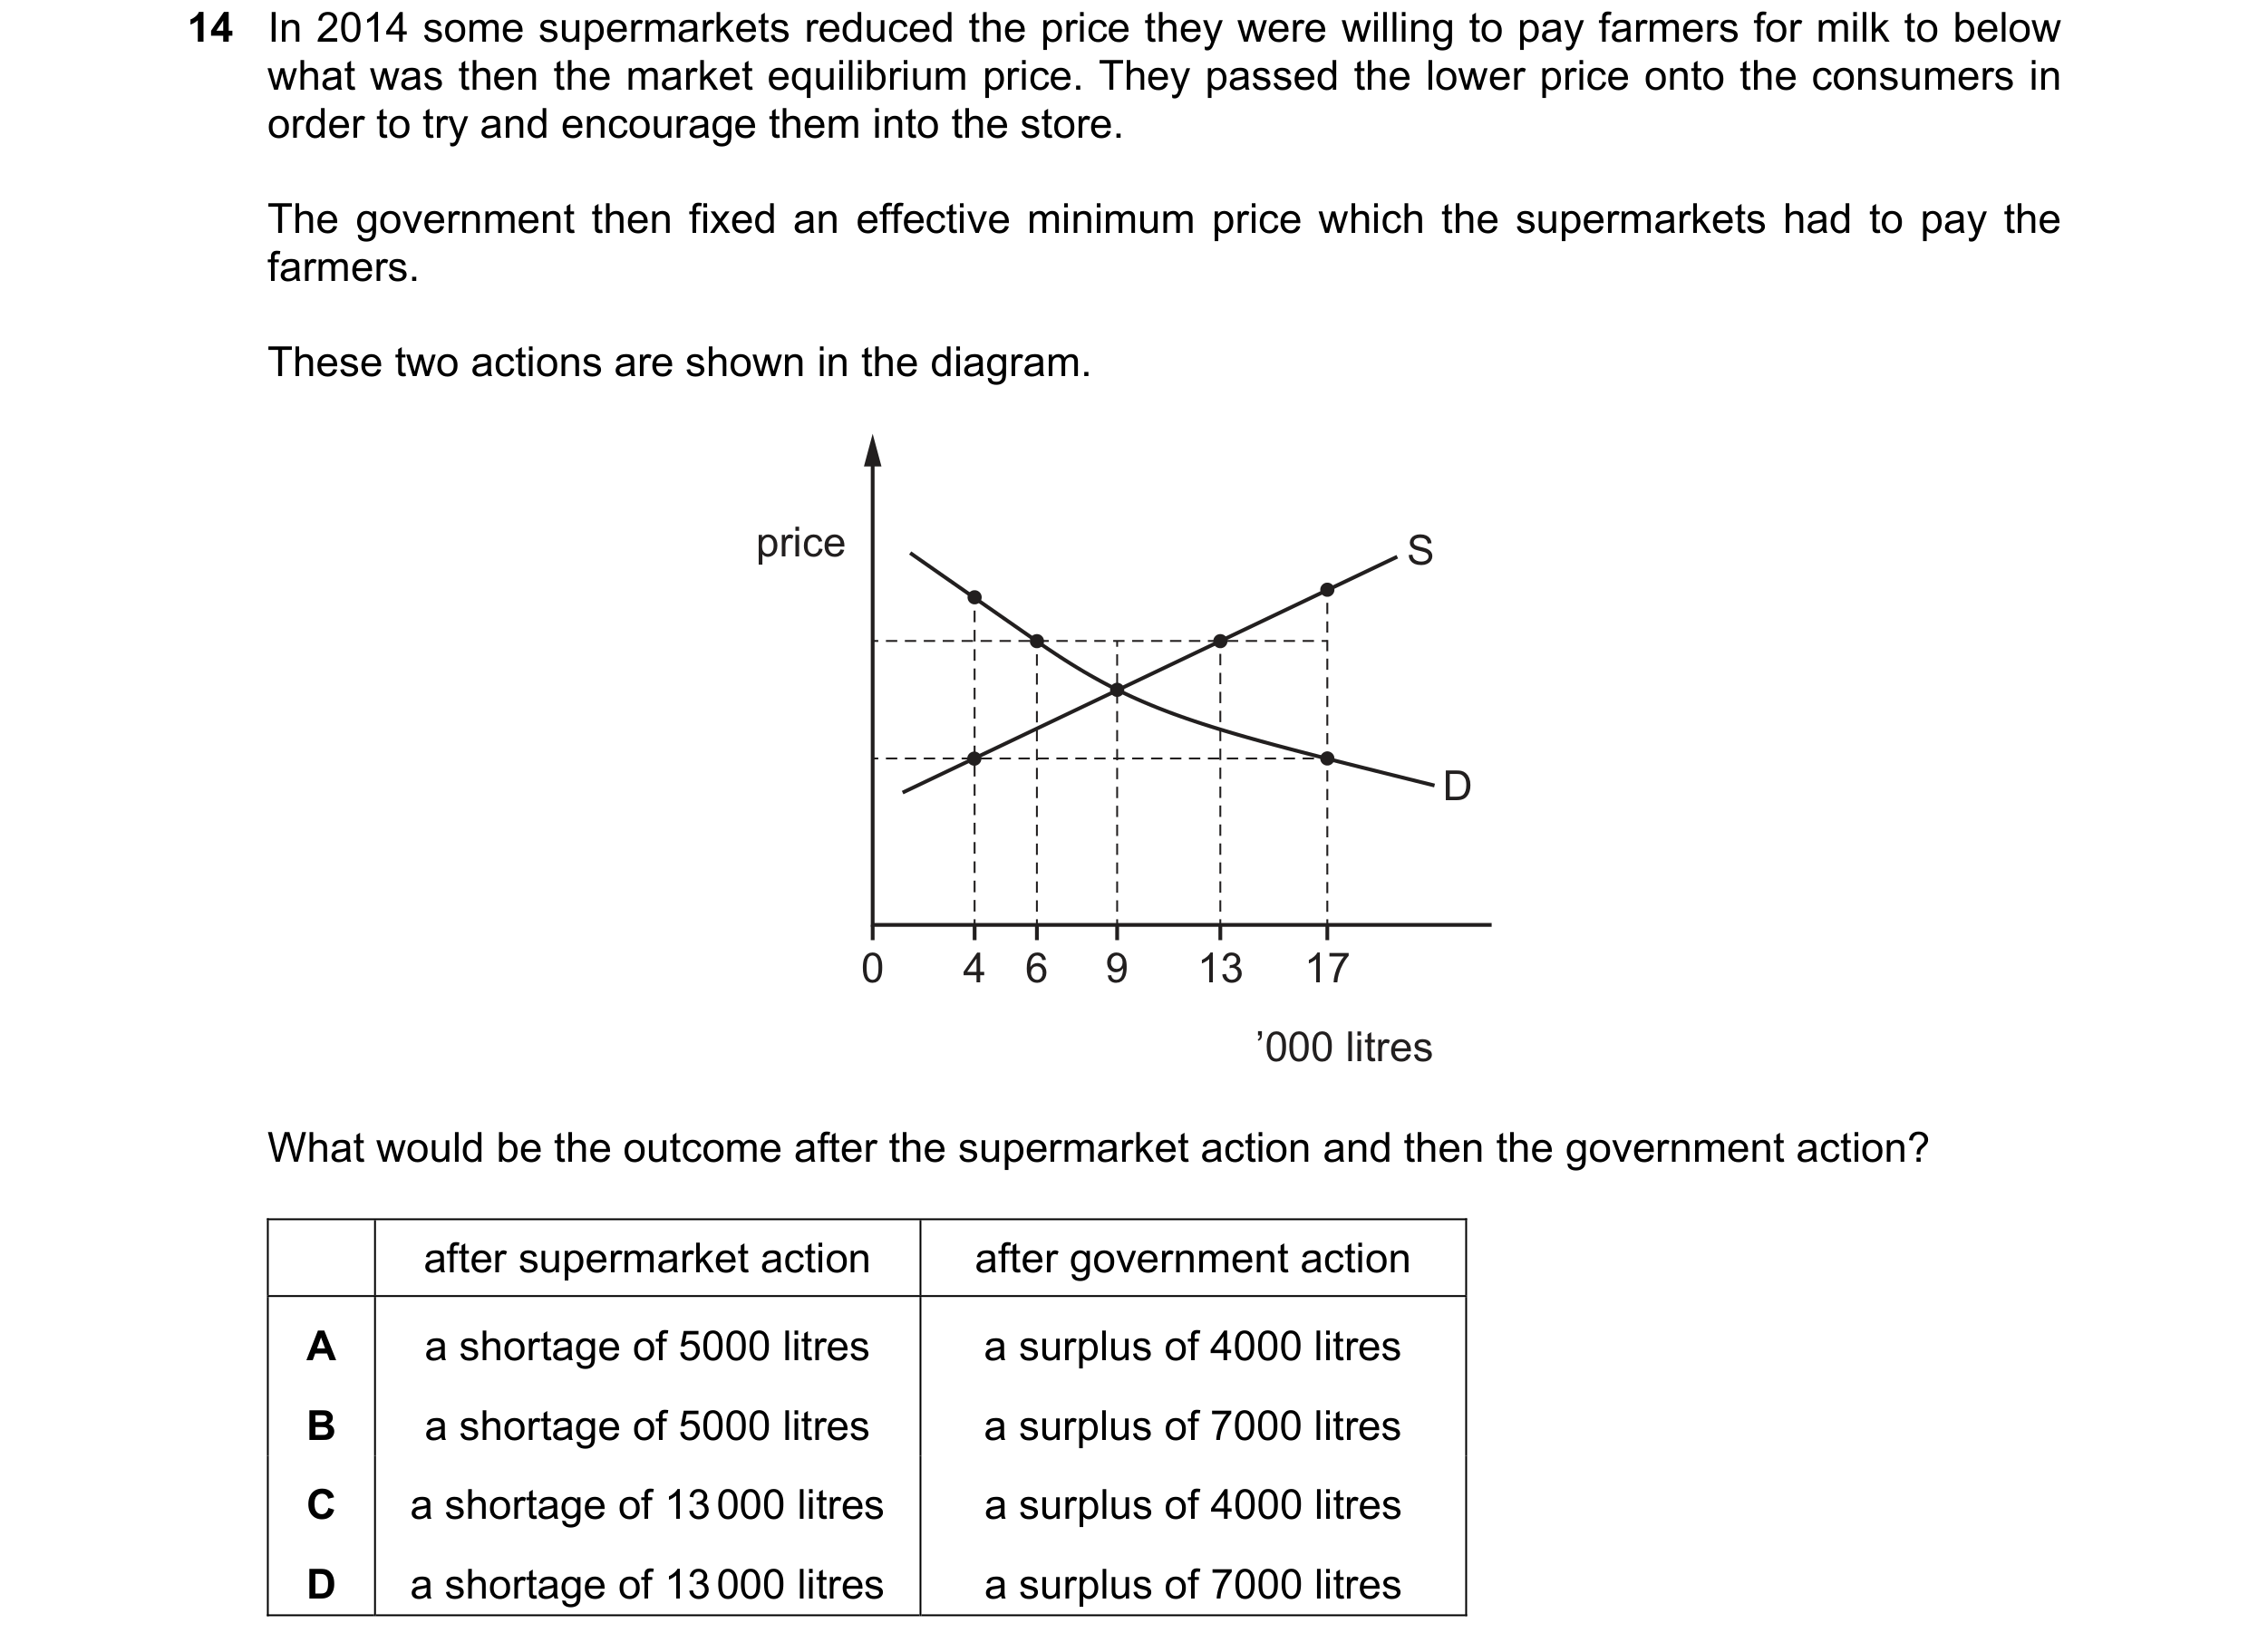
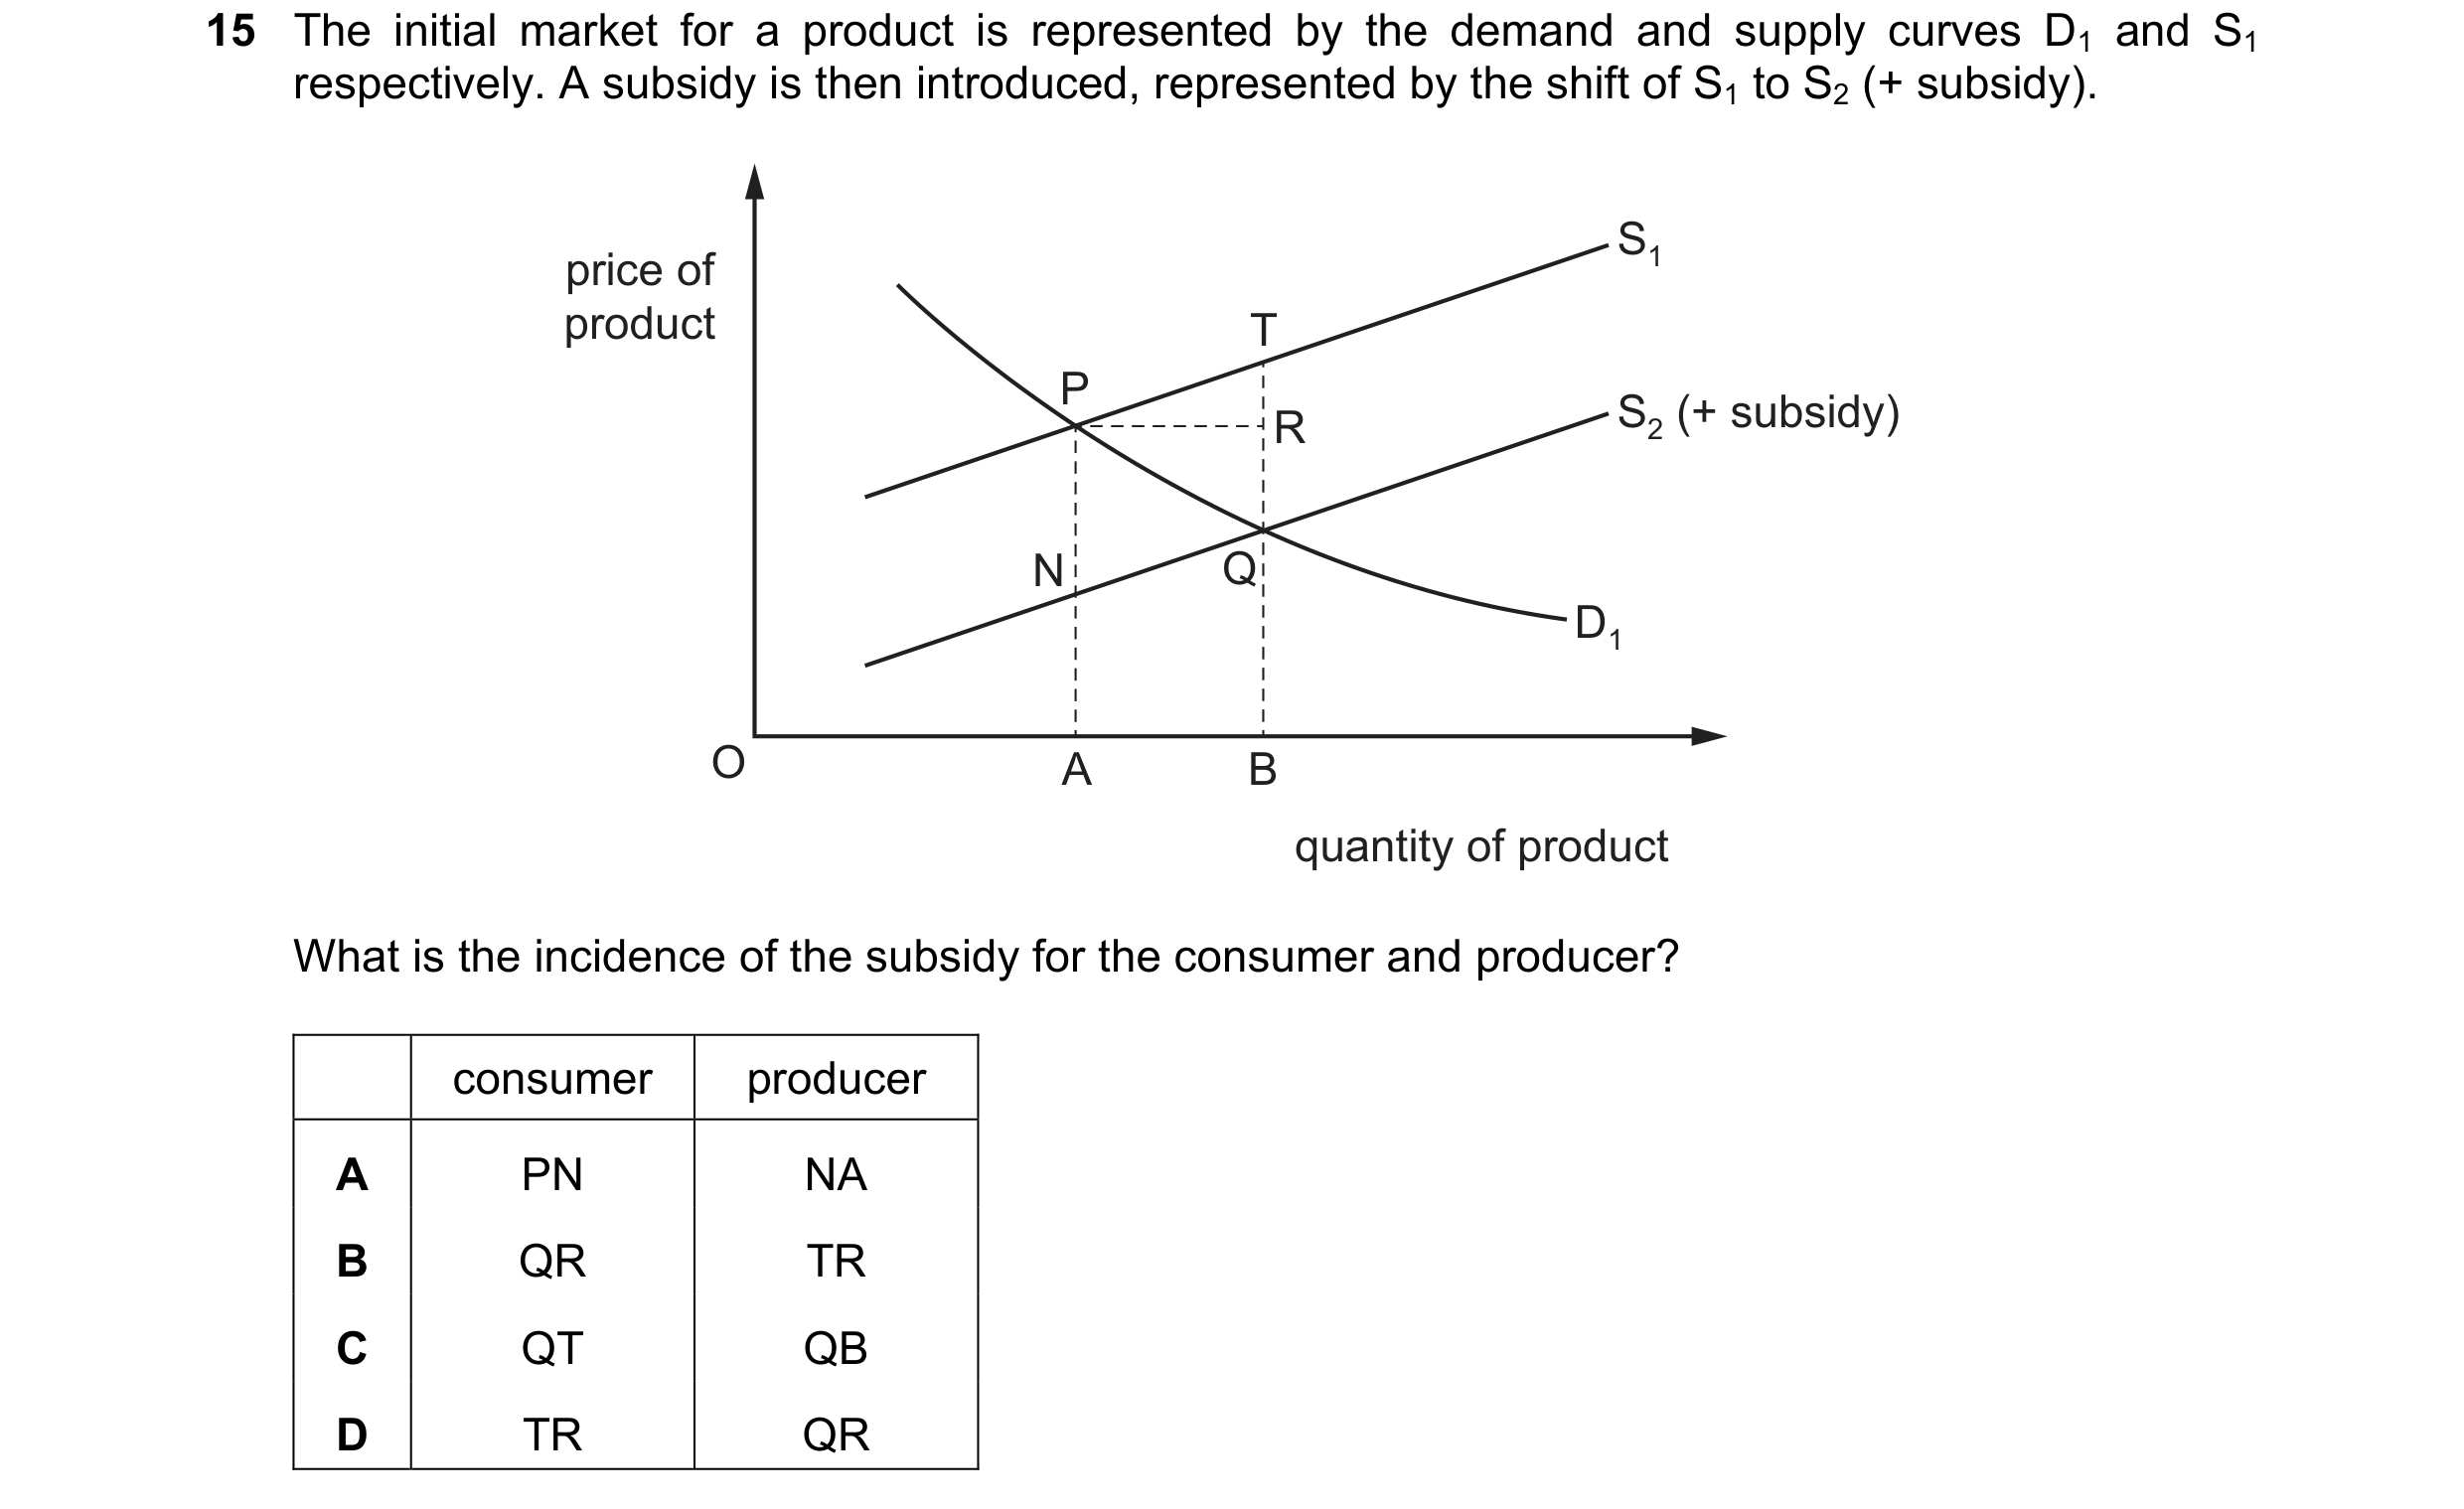 58 / 119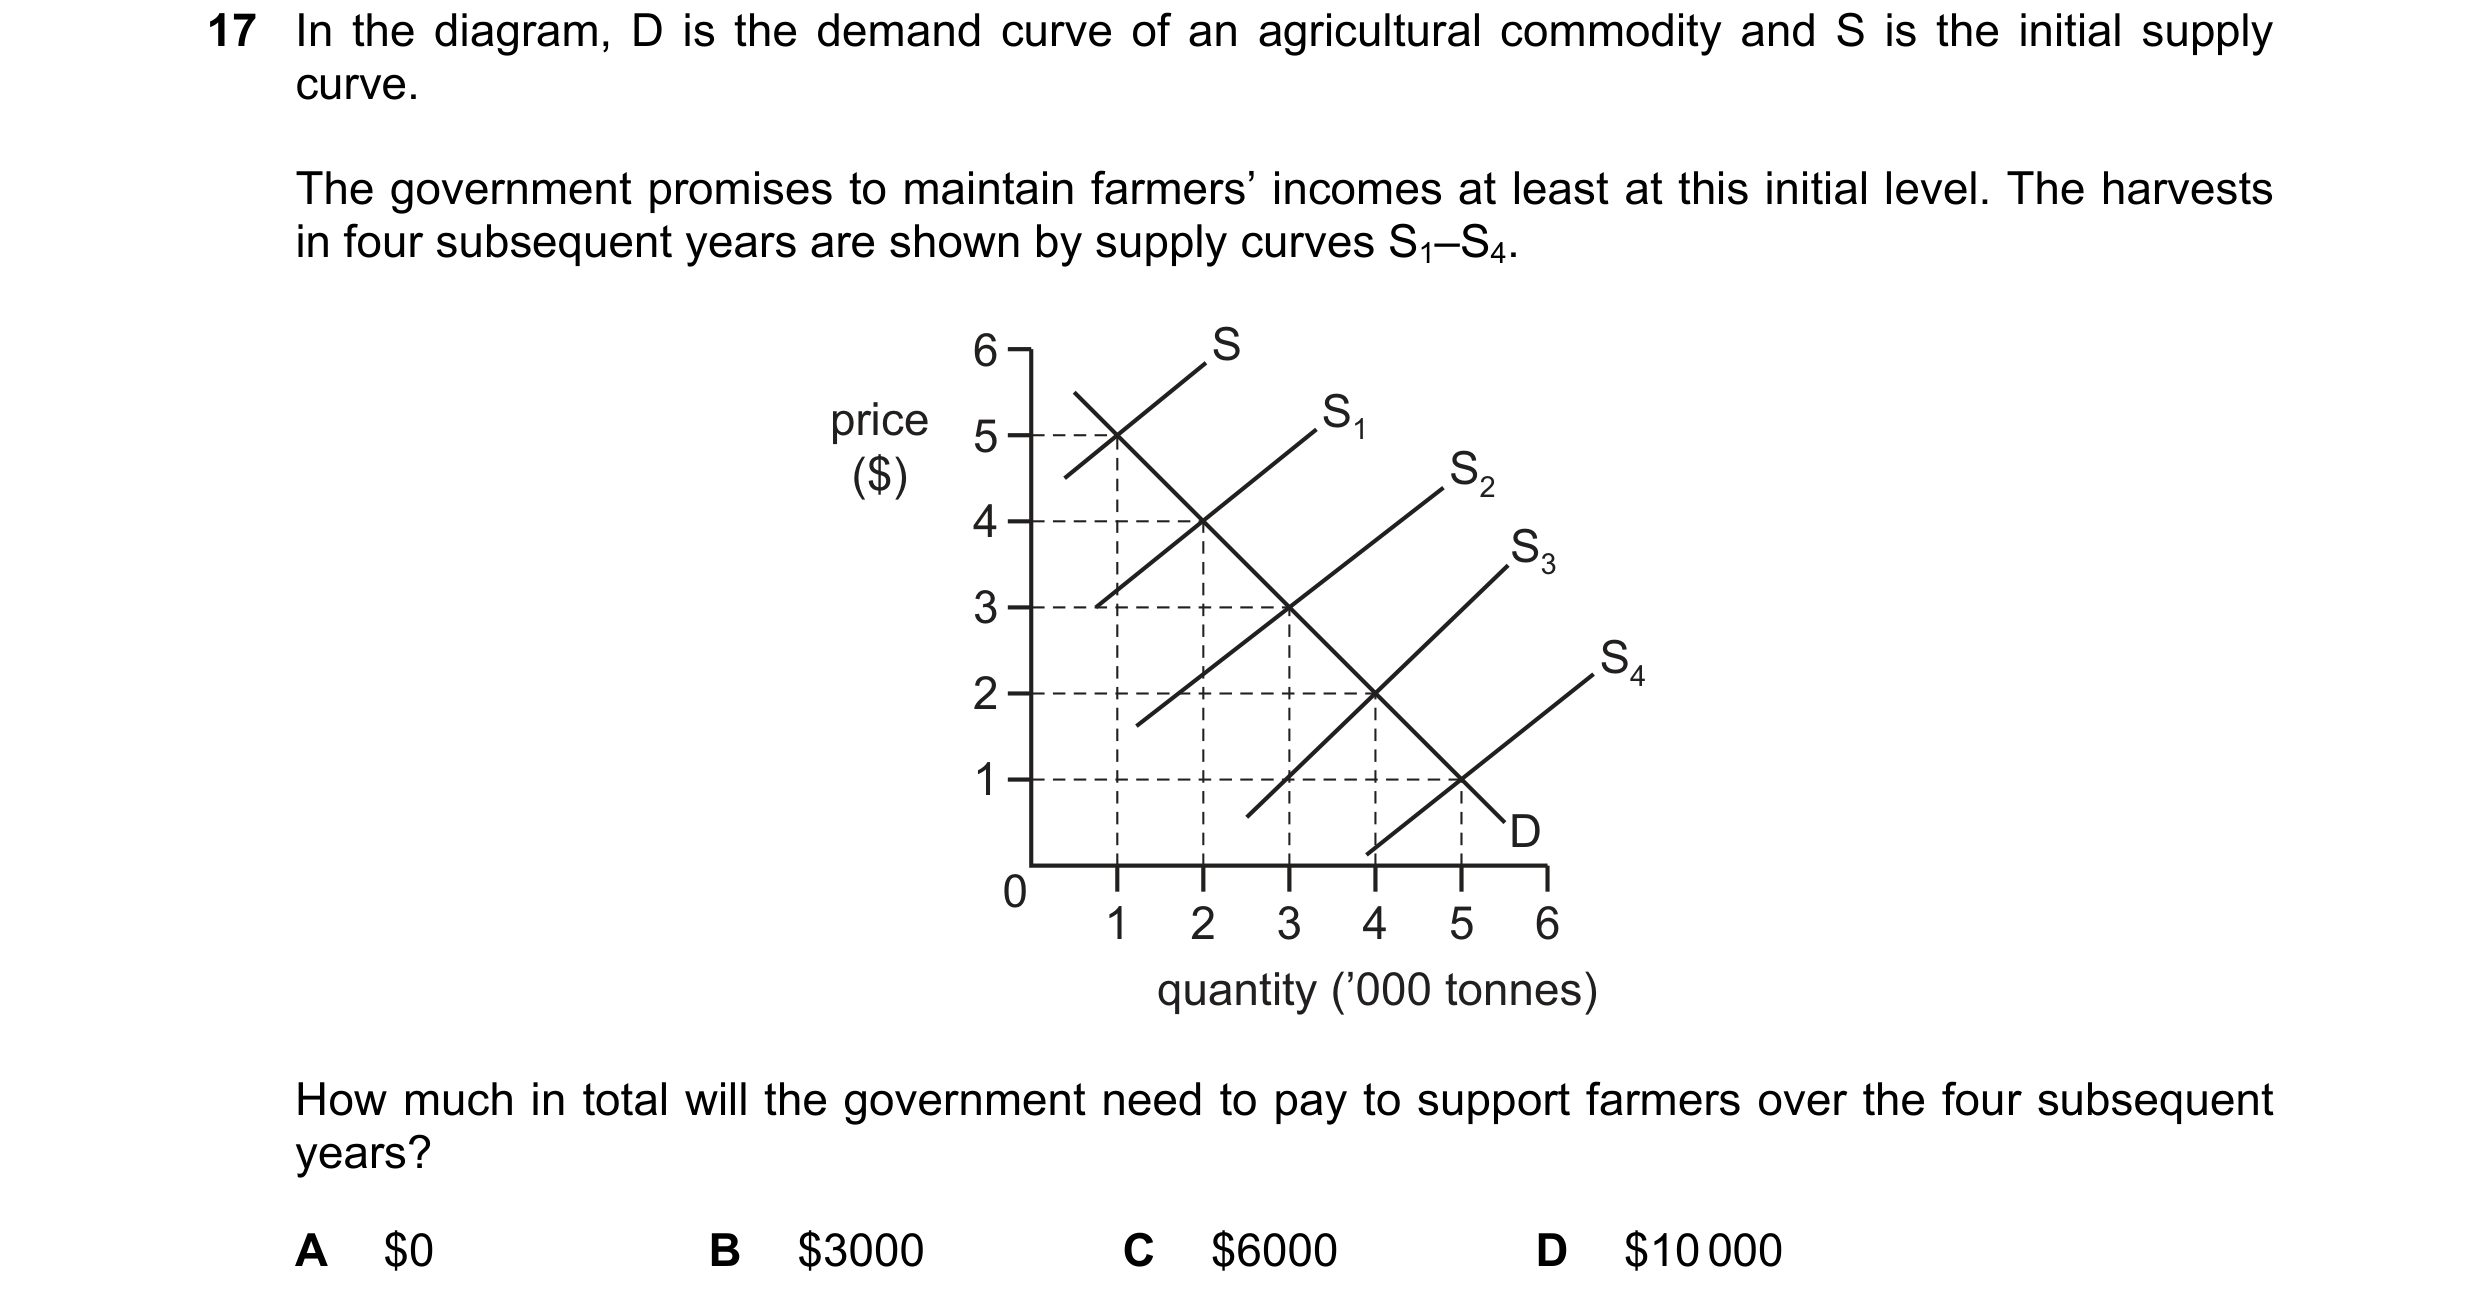
 59 / 119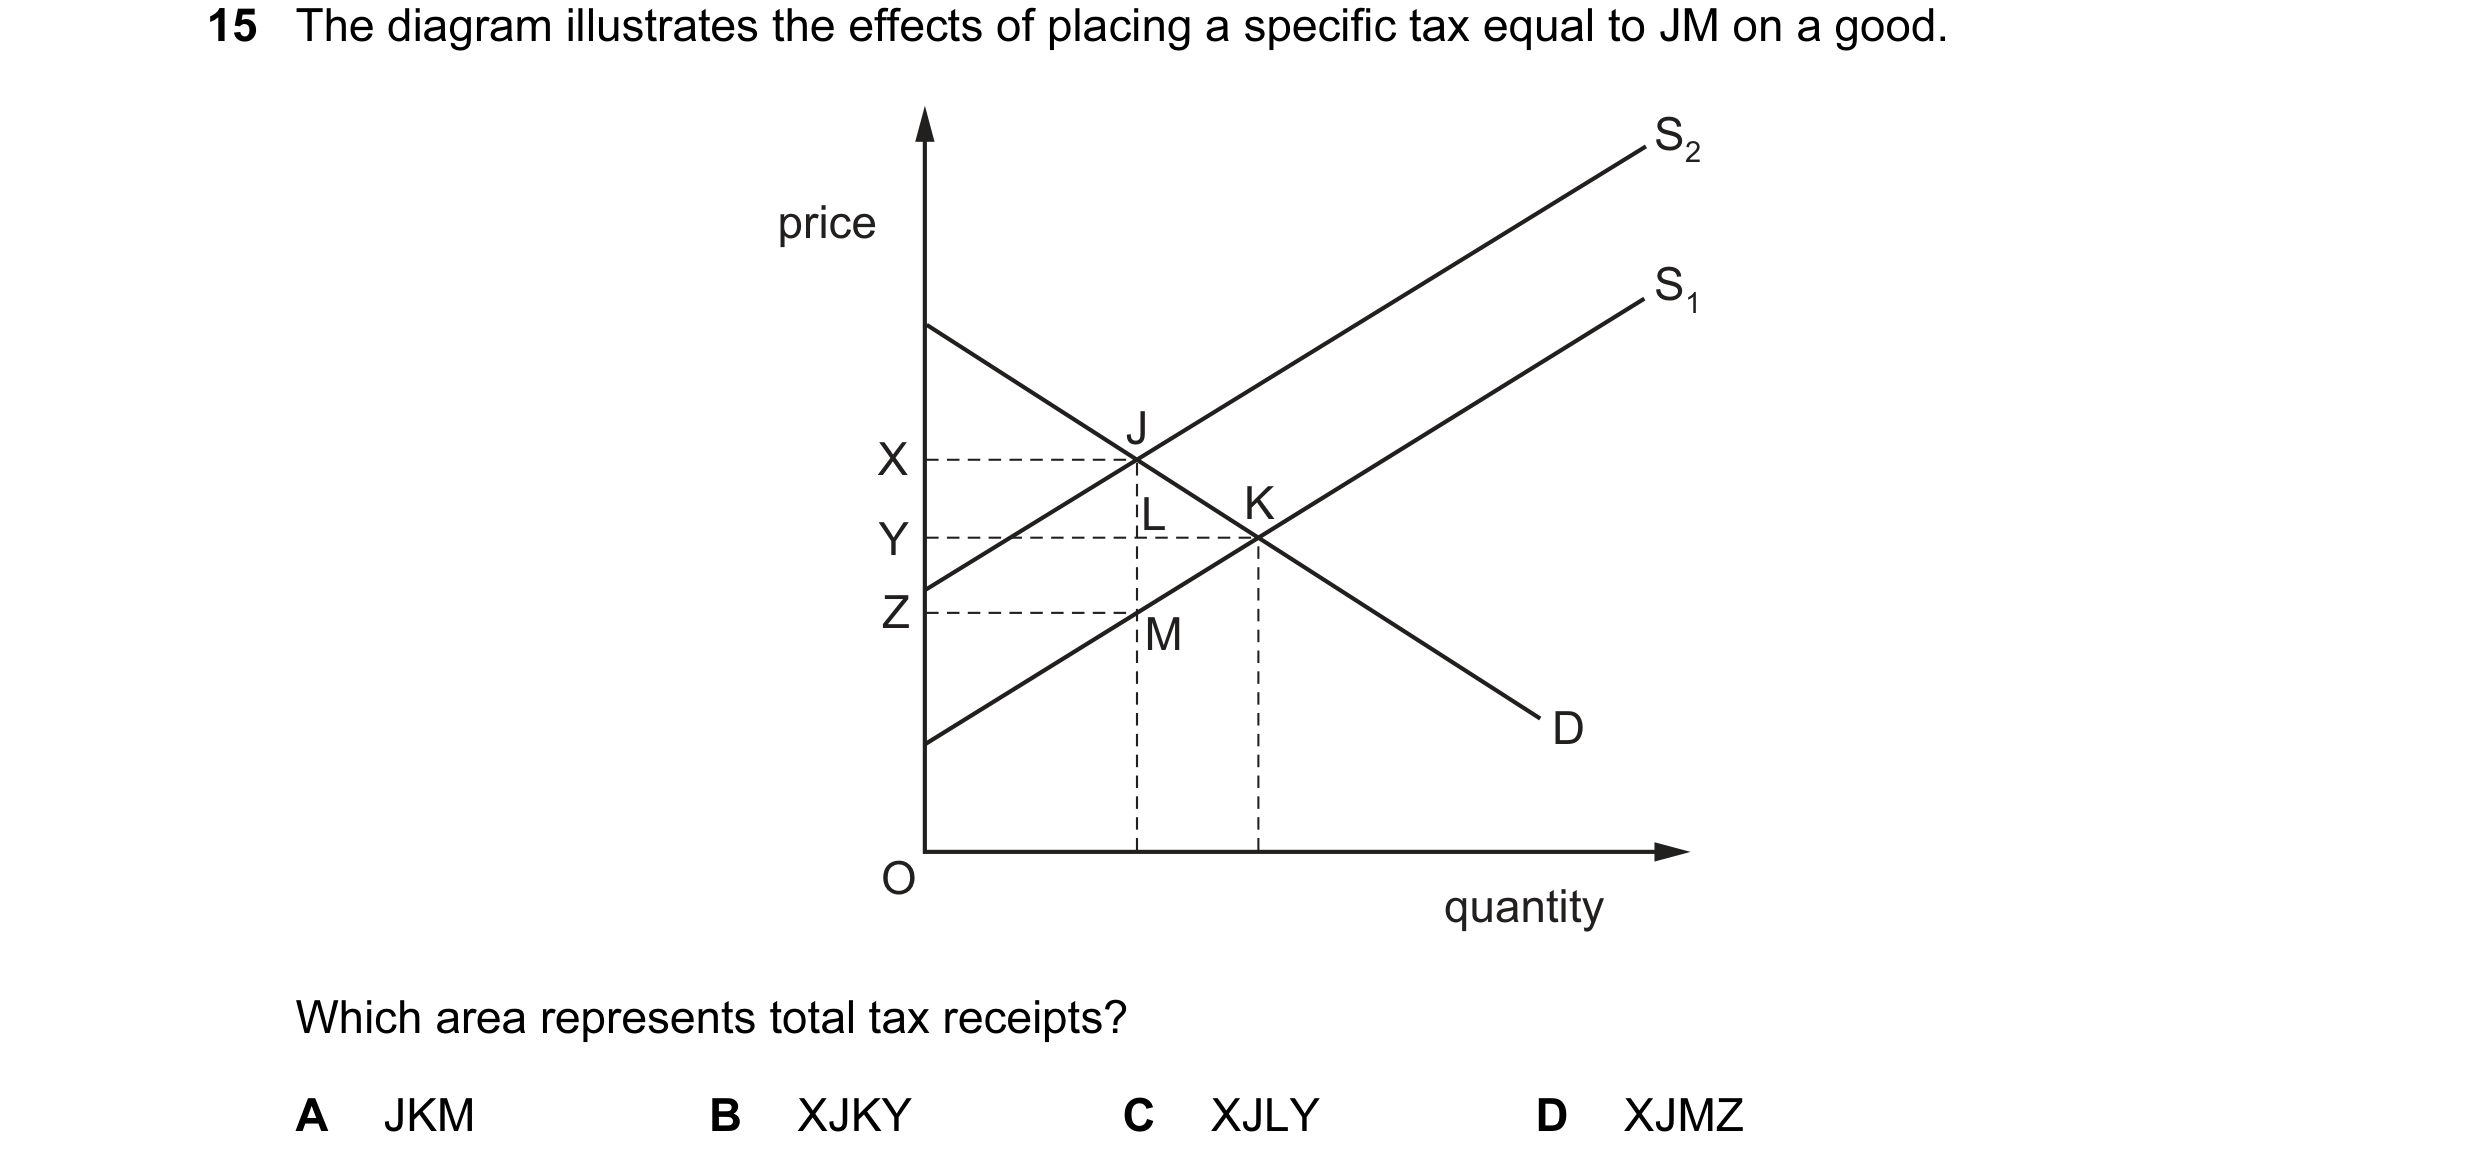
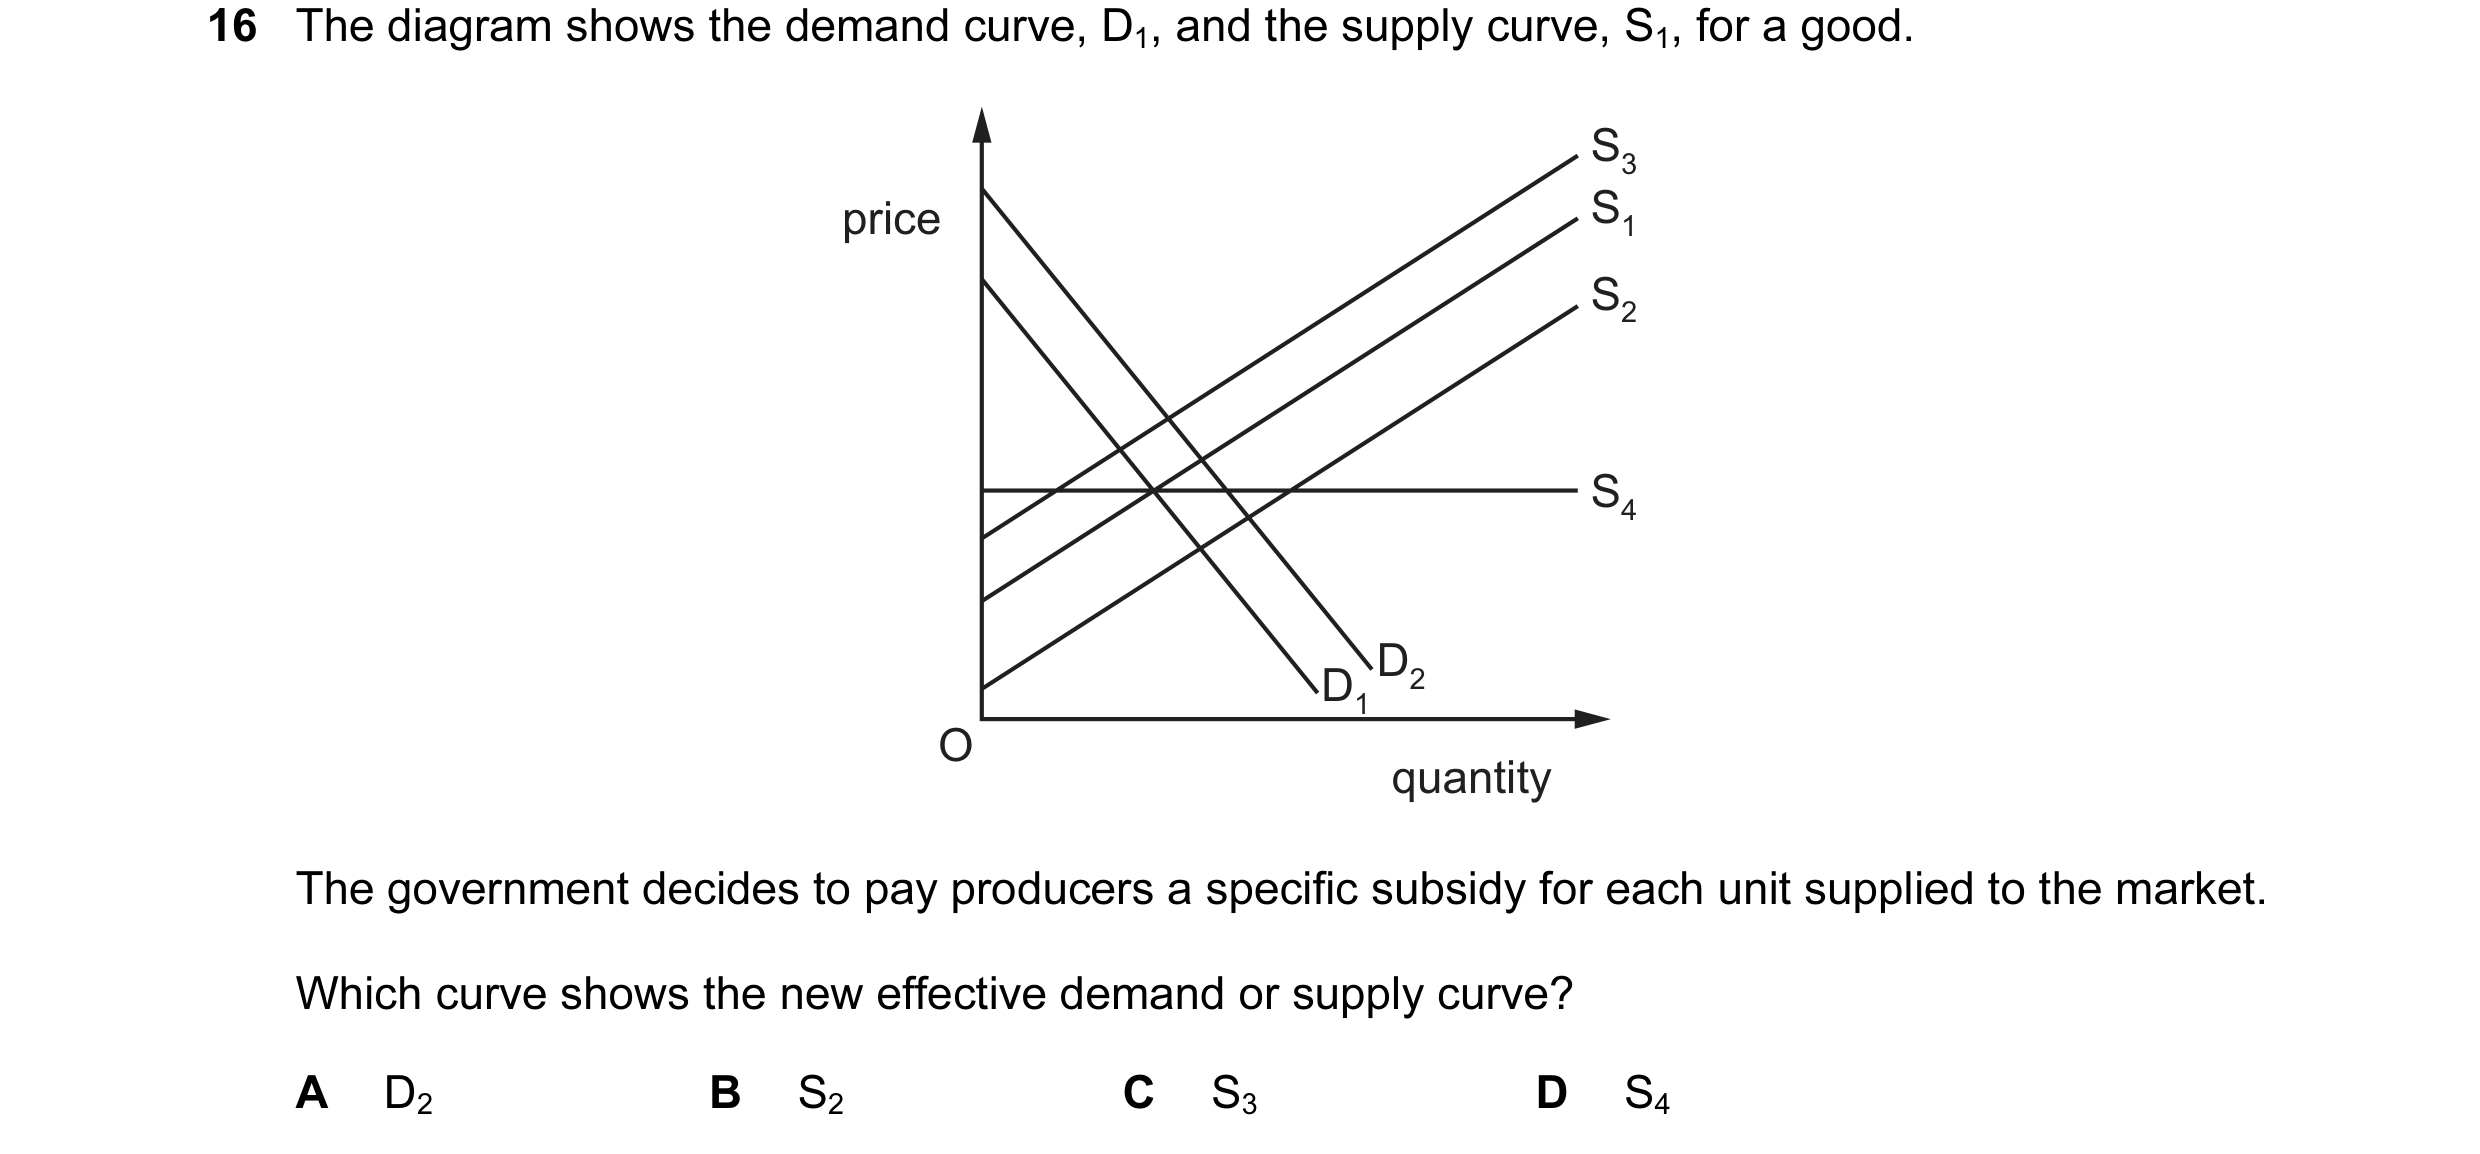
 60 / 119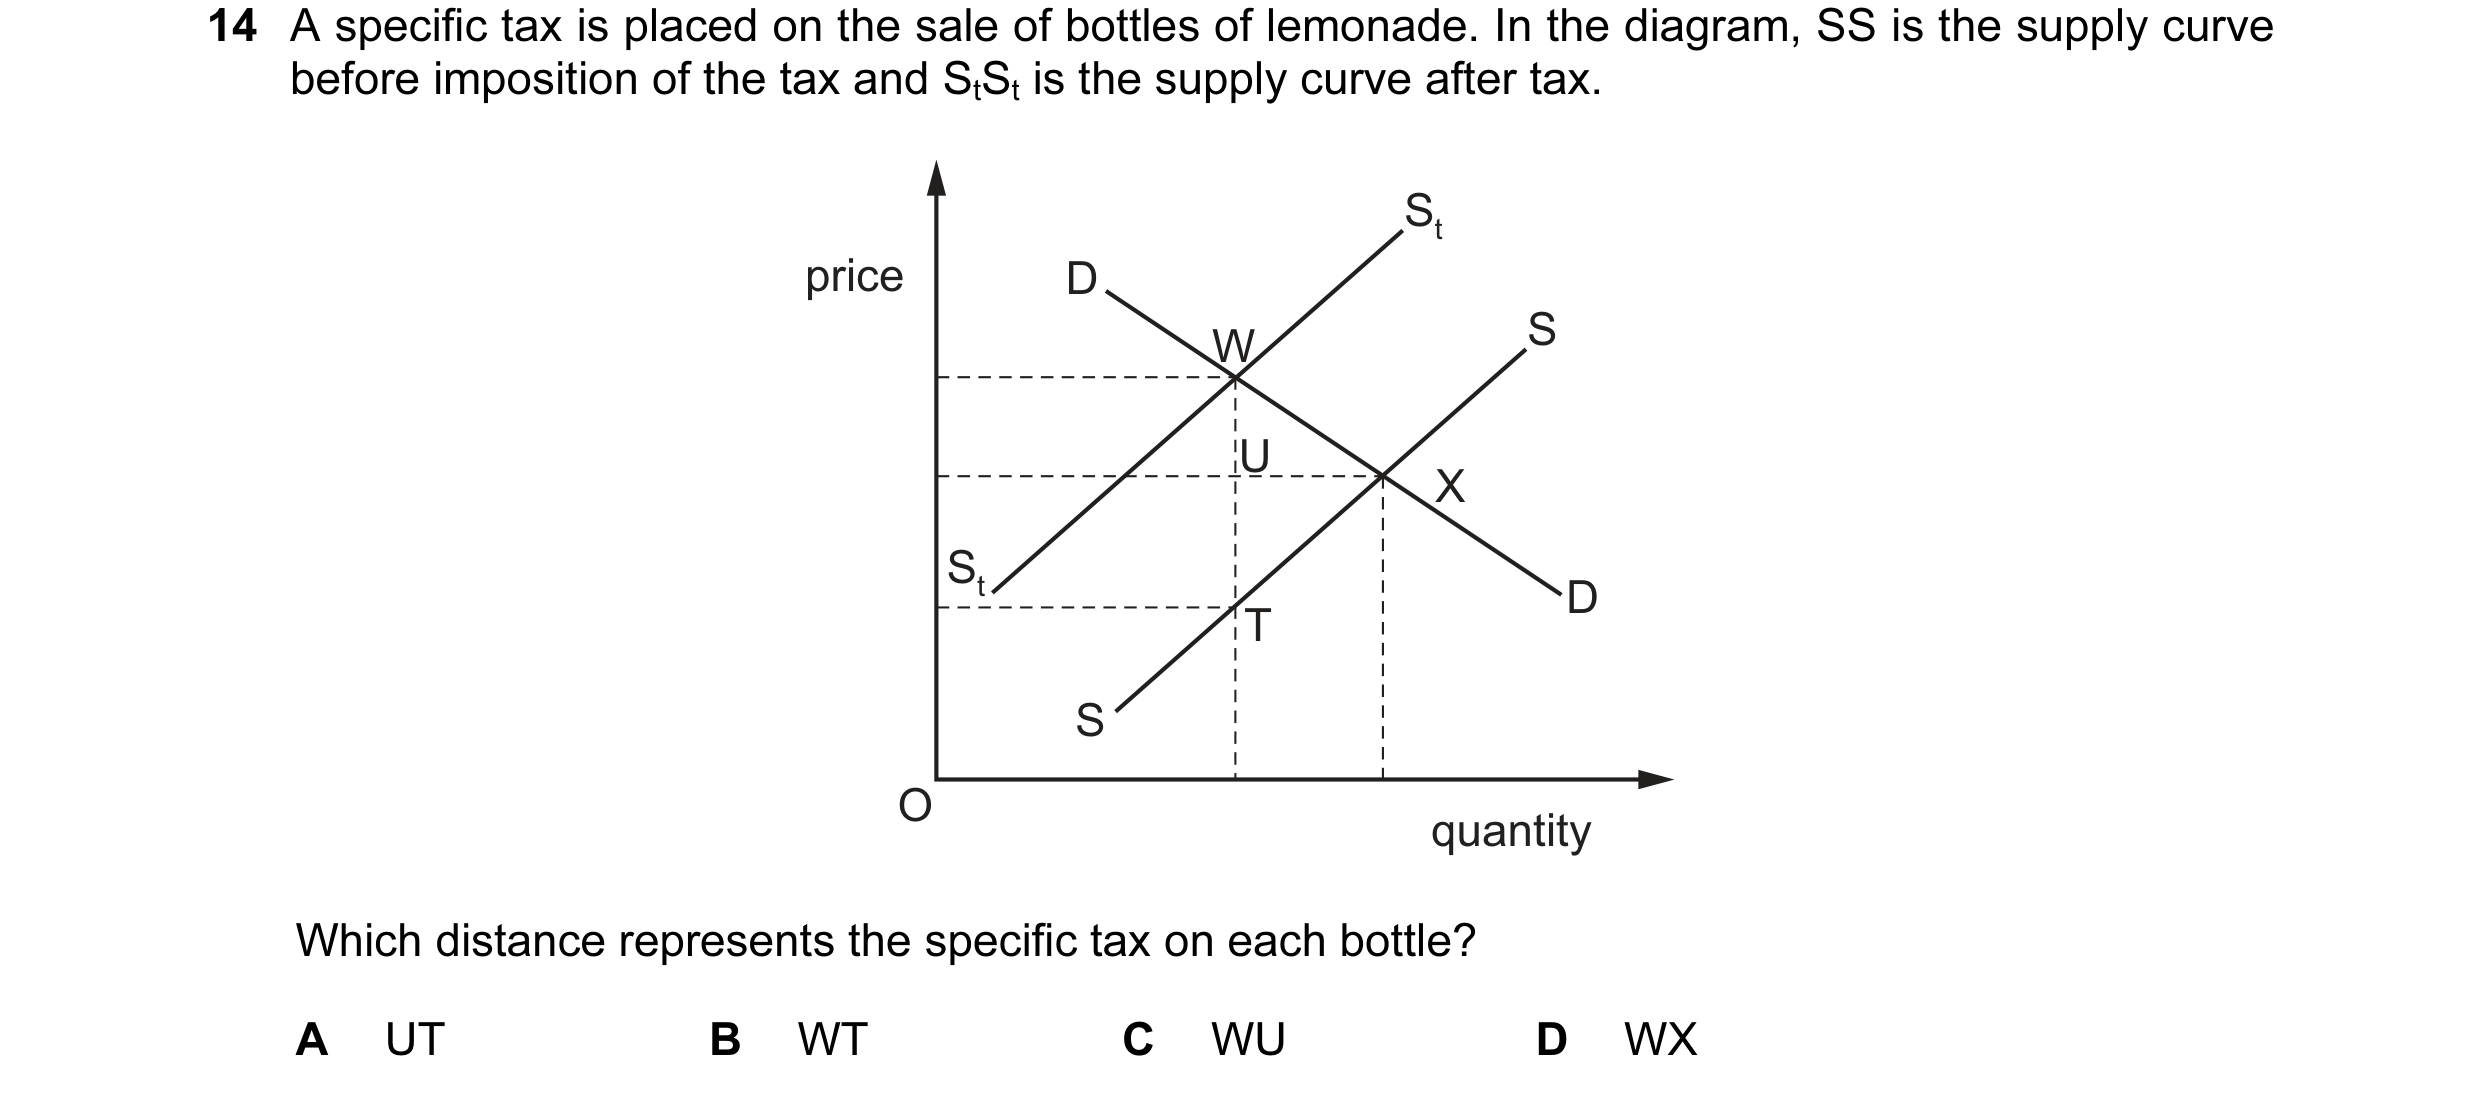
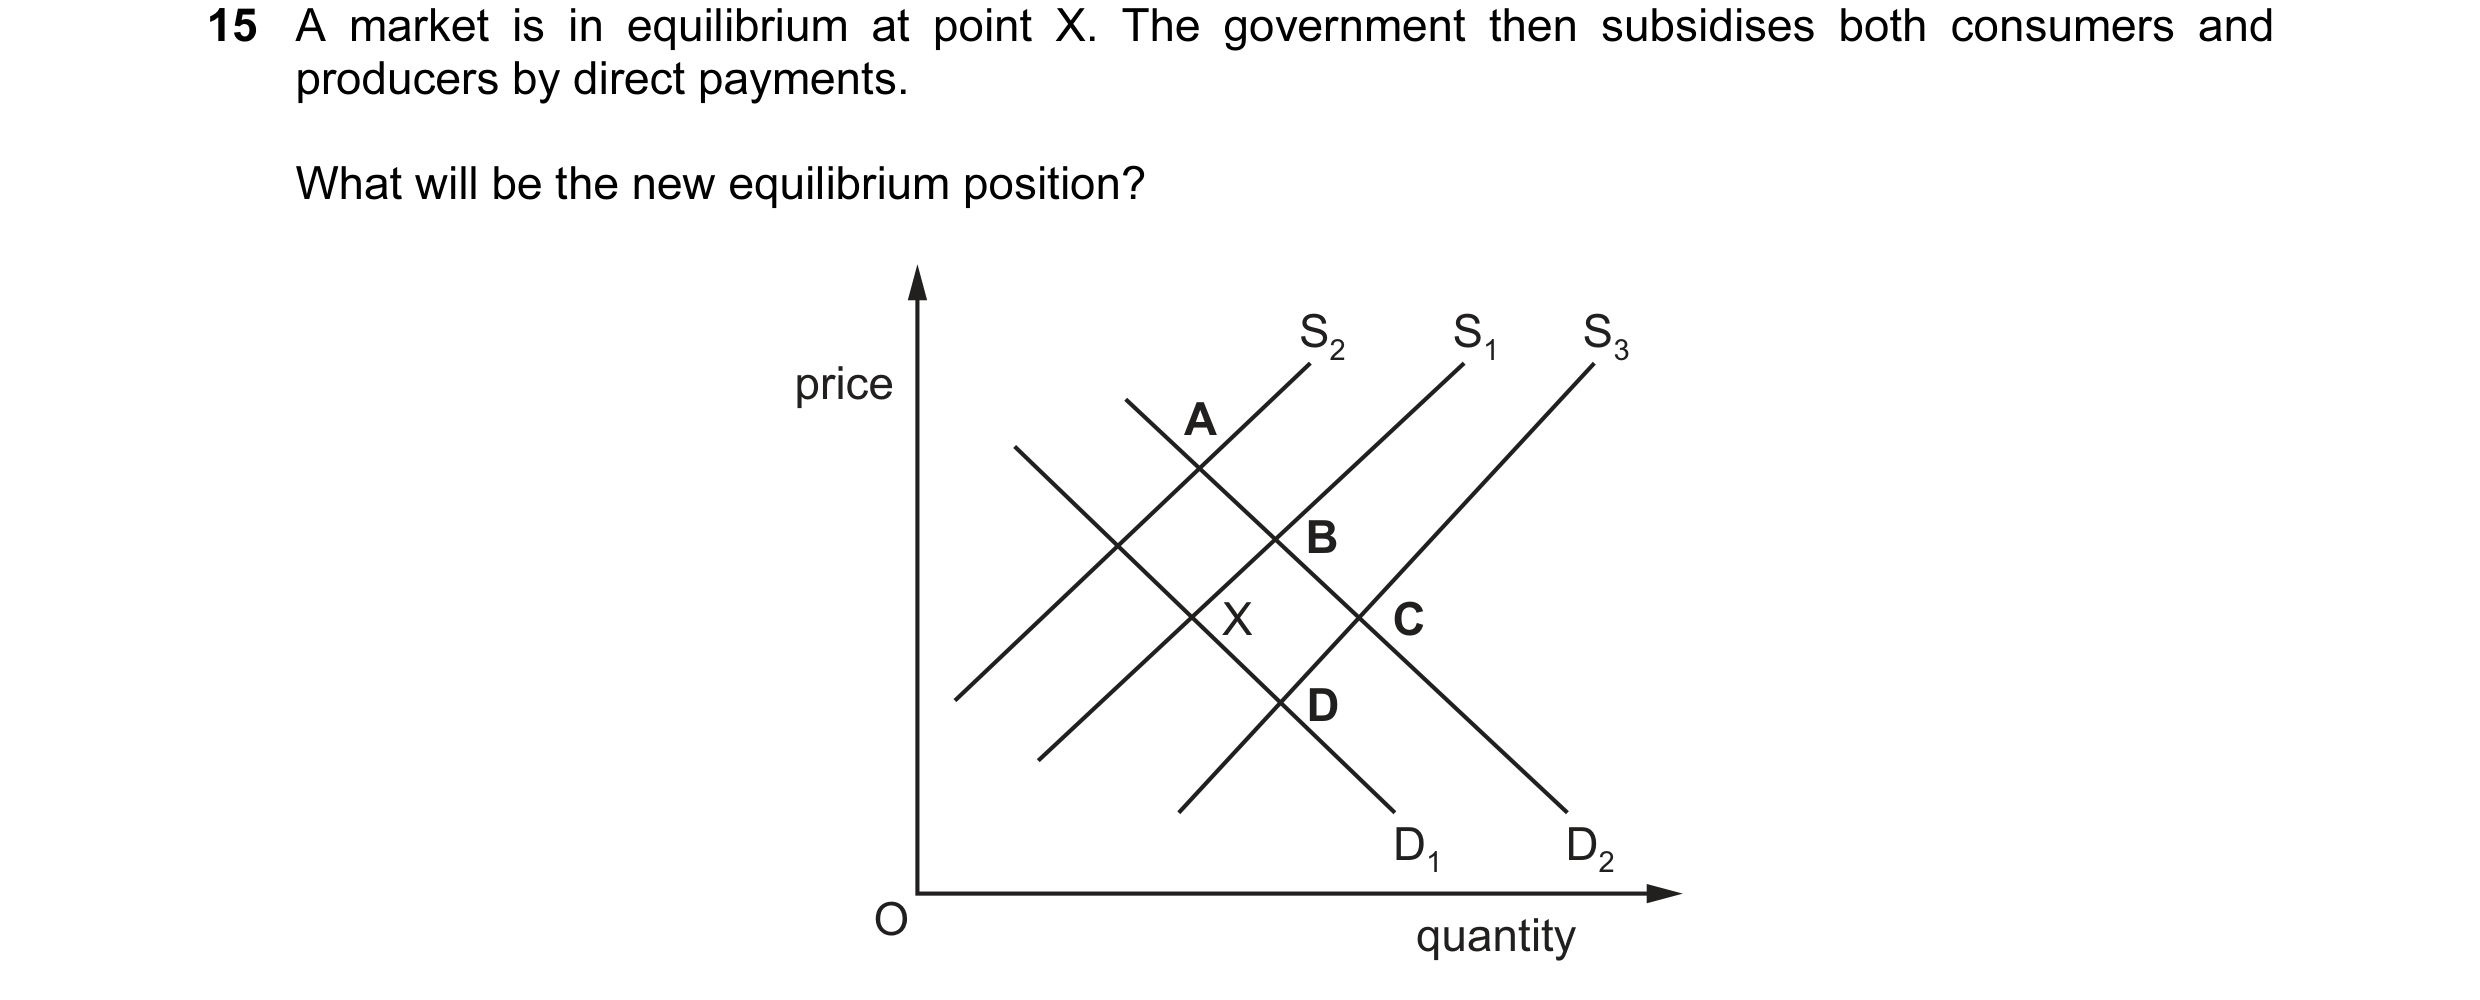

 61 / 119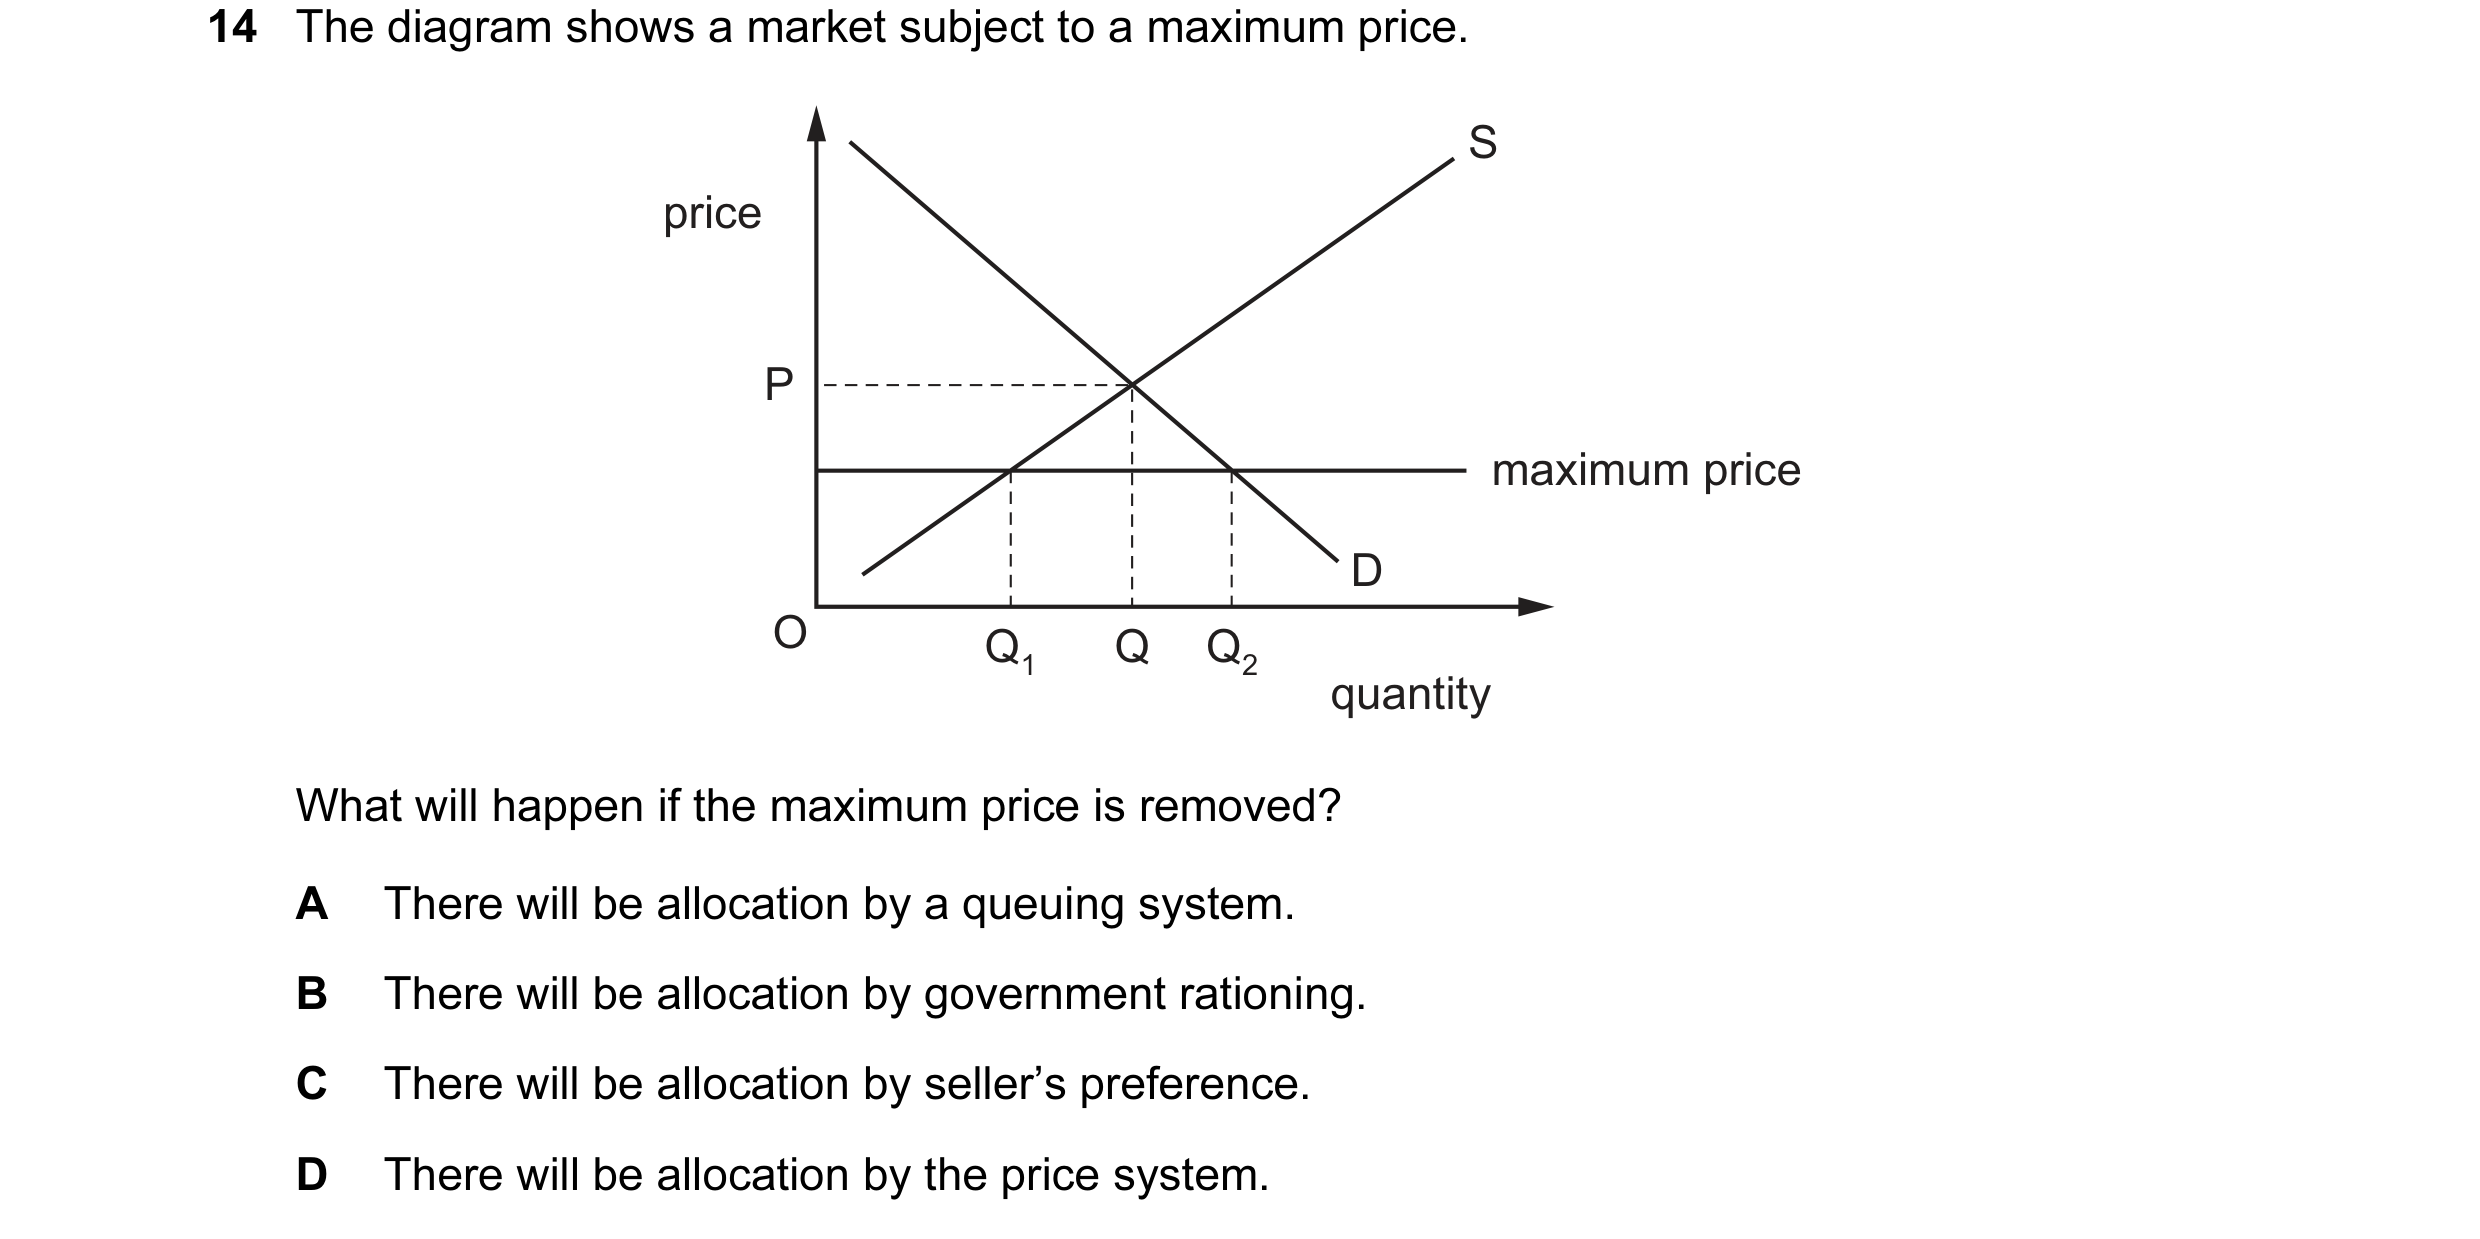
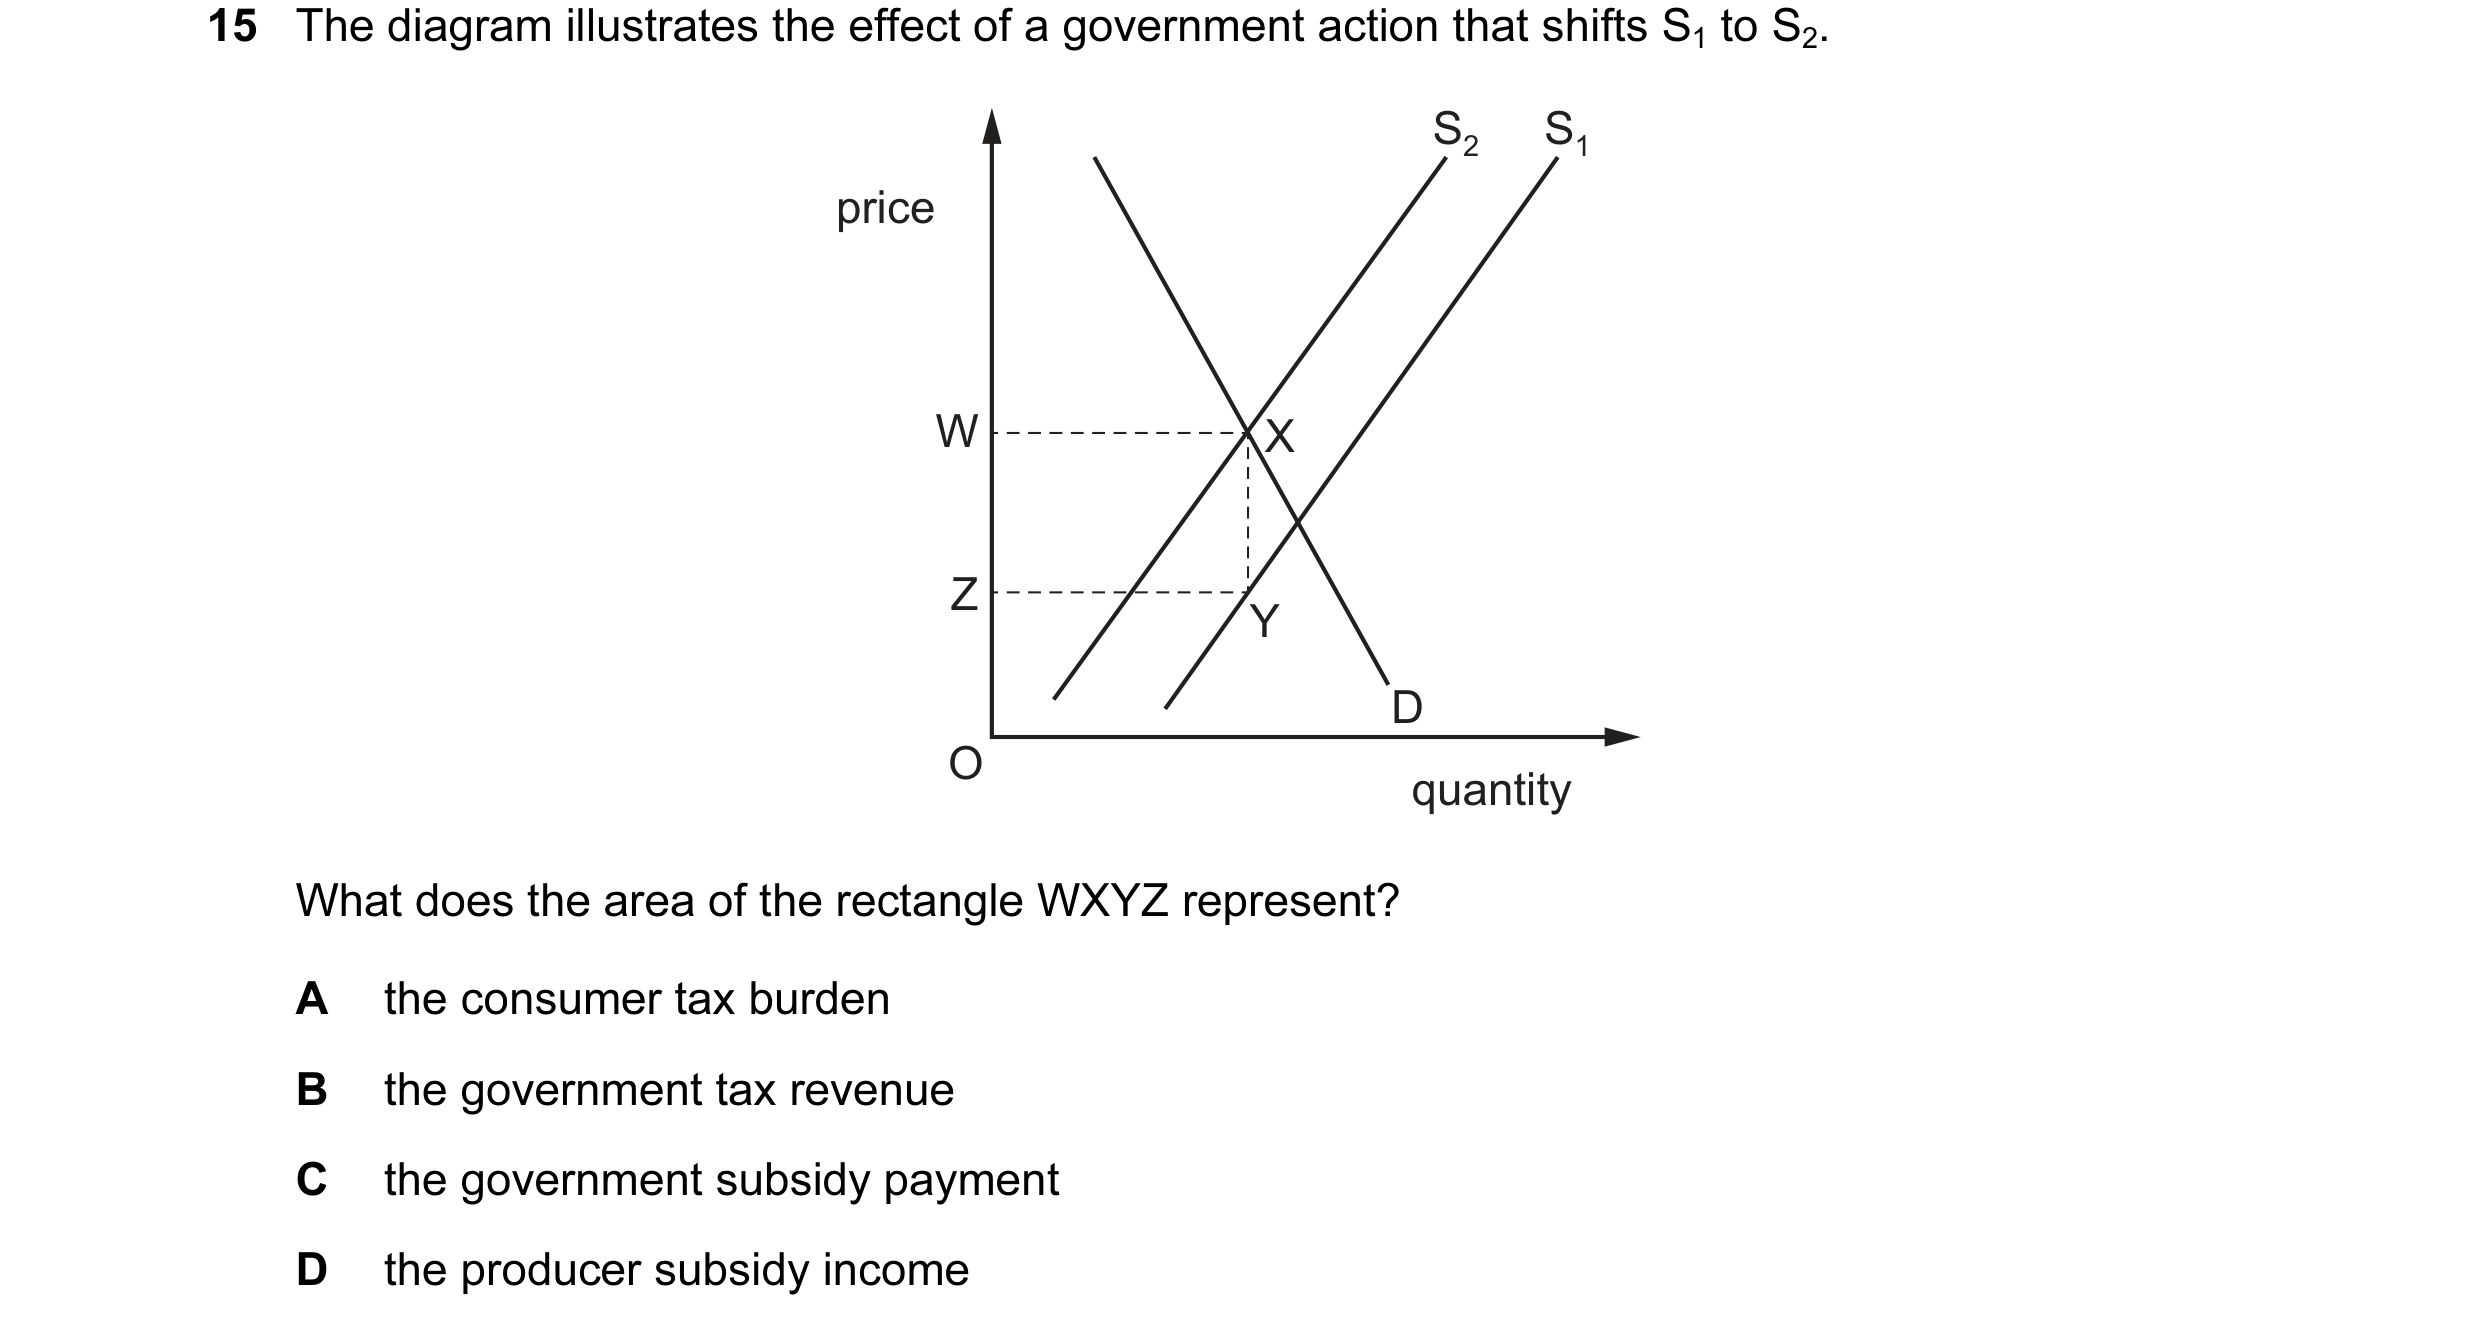 62 / 119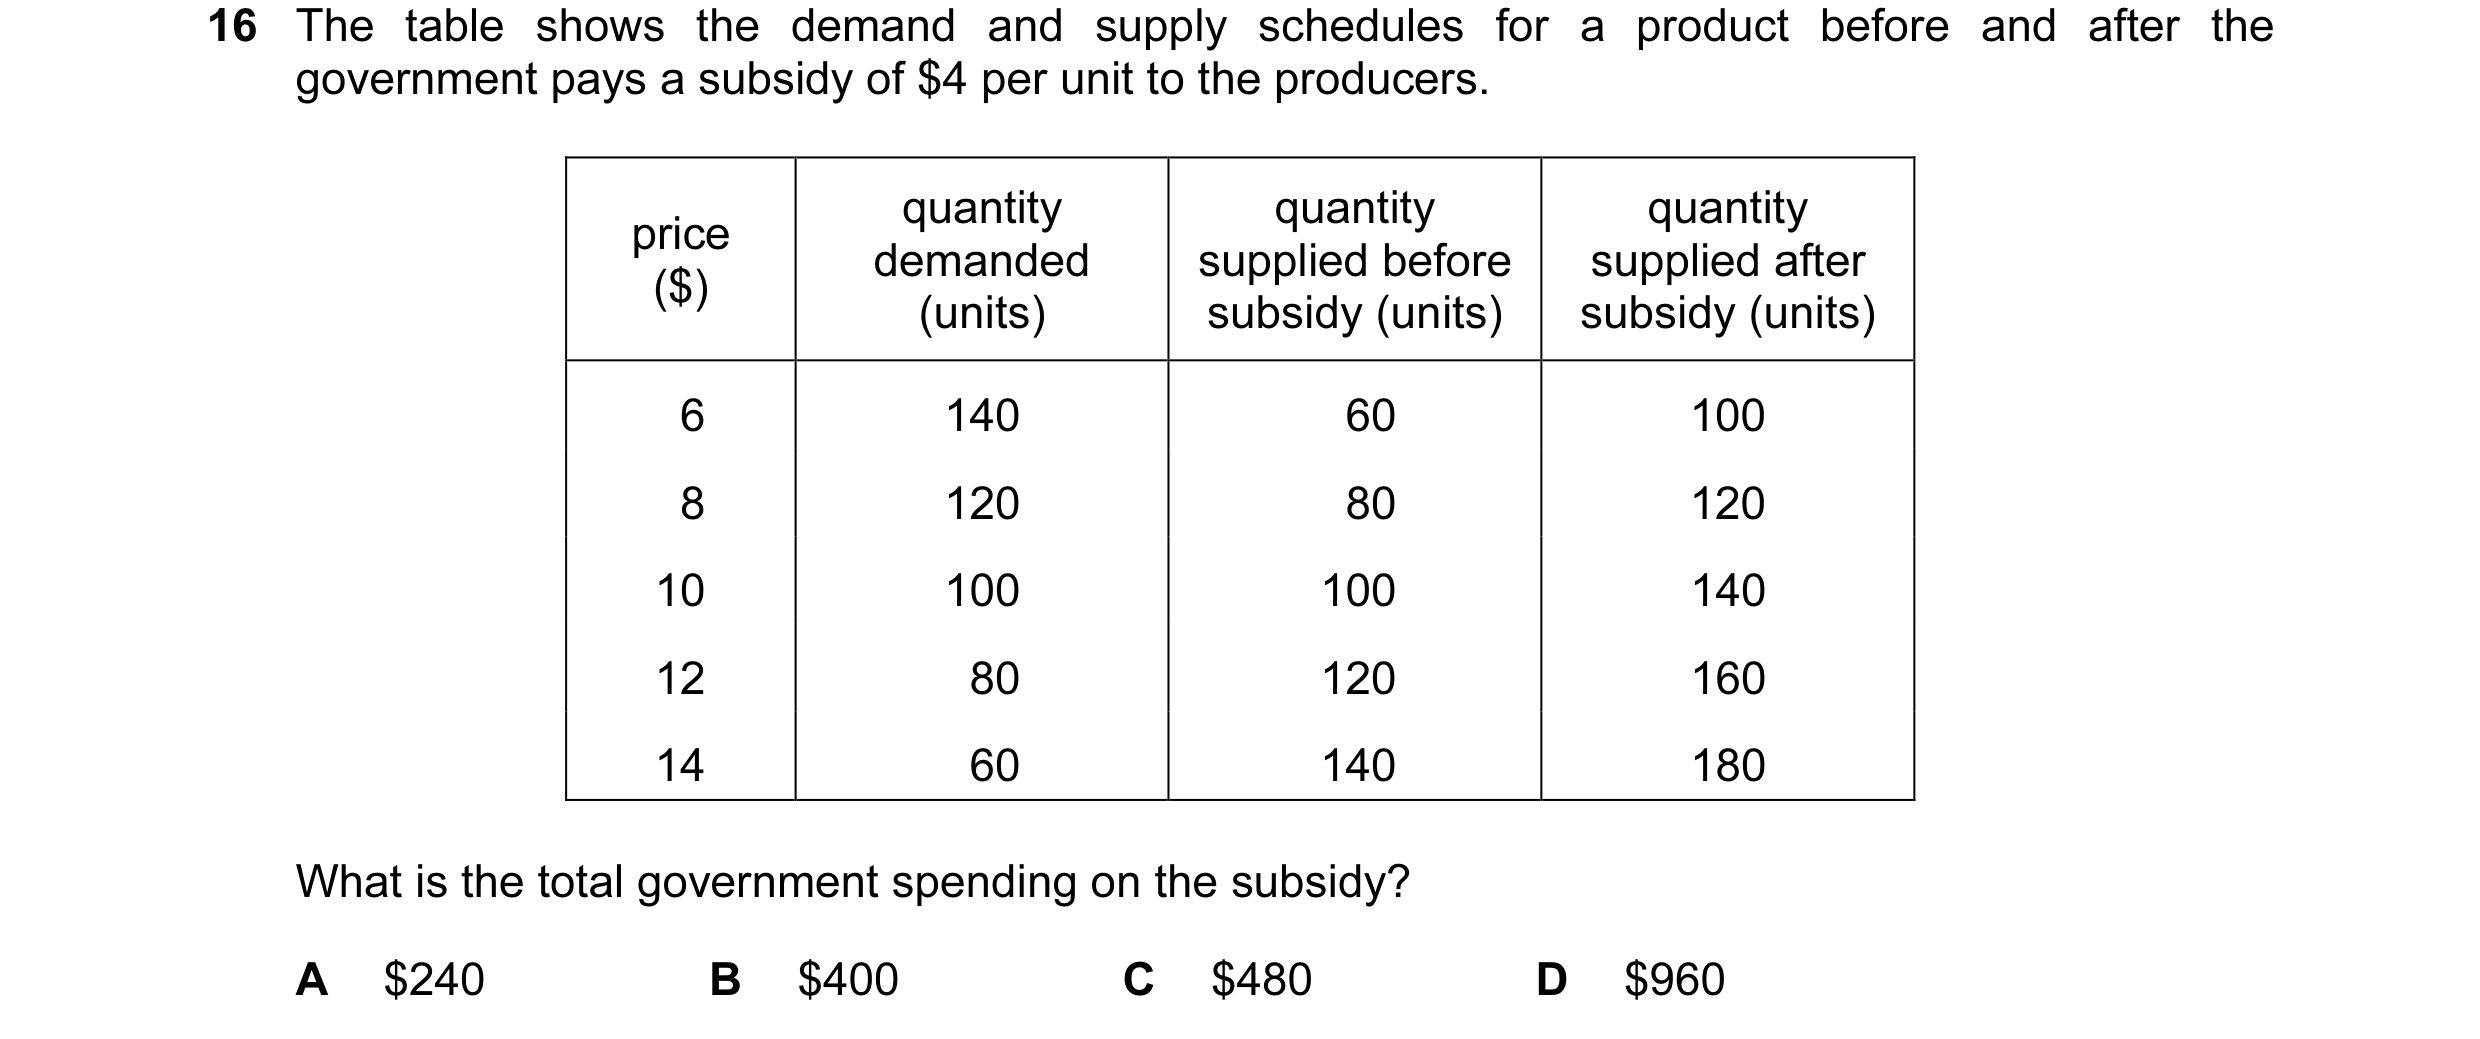
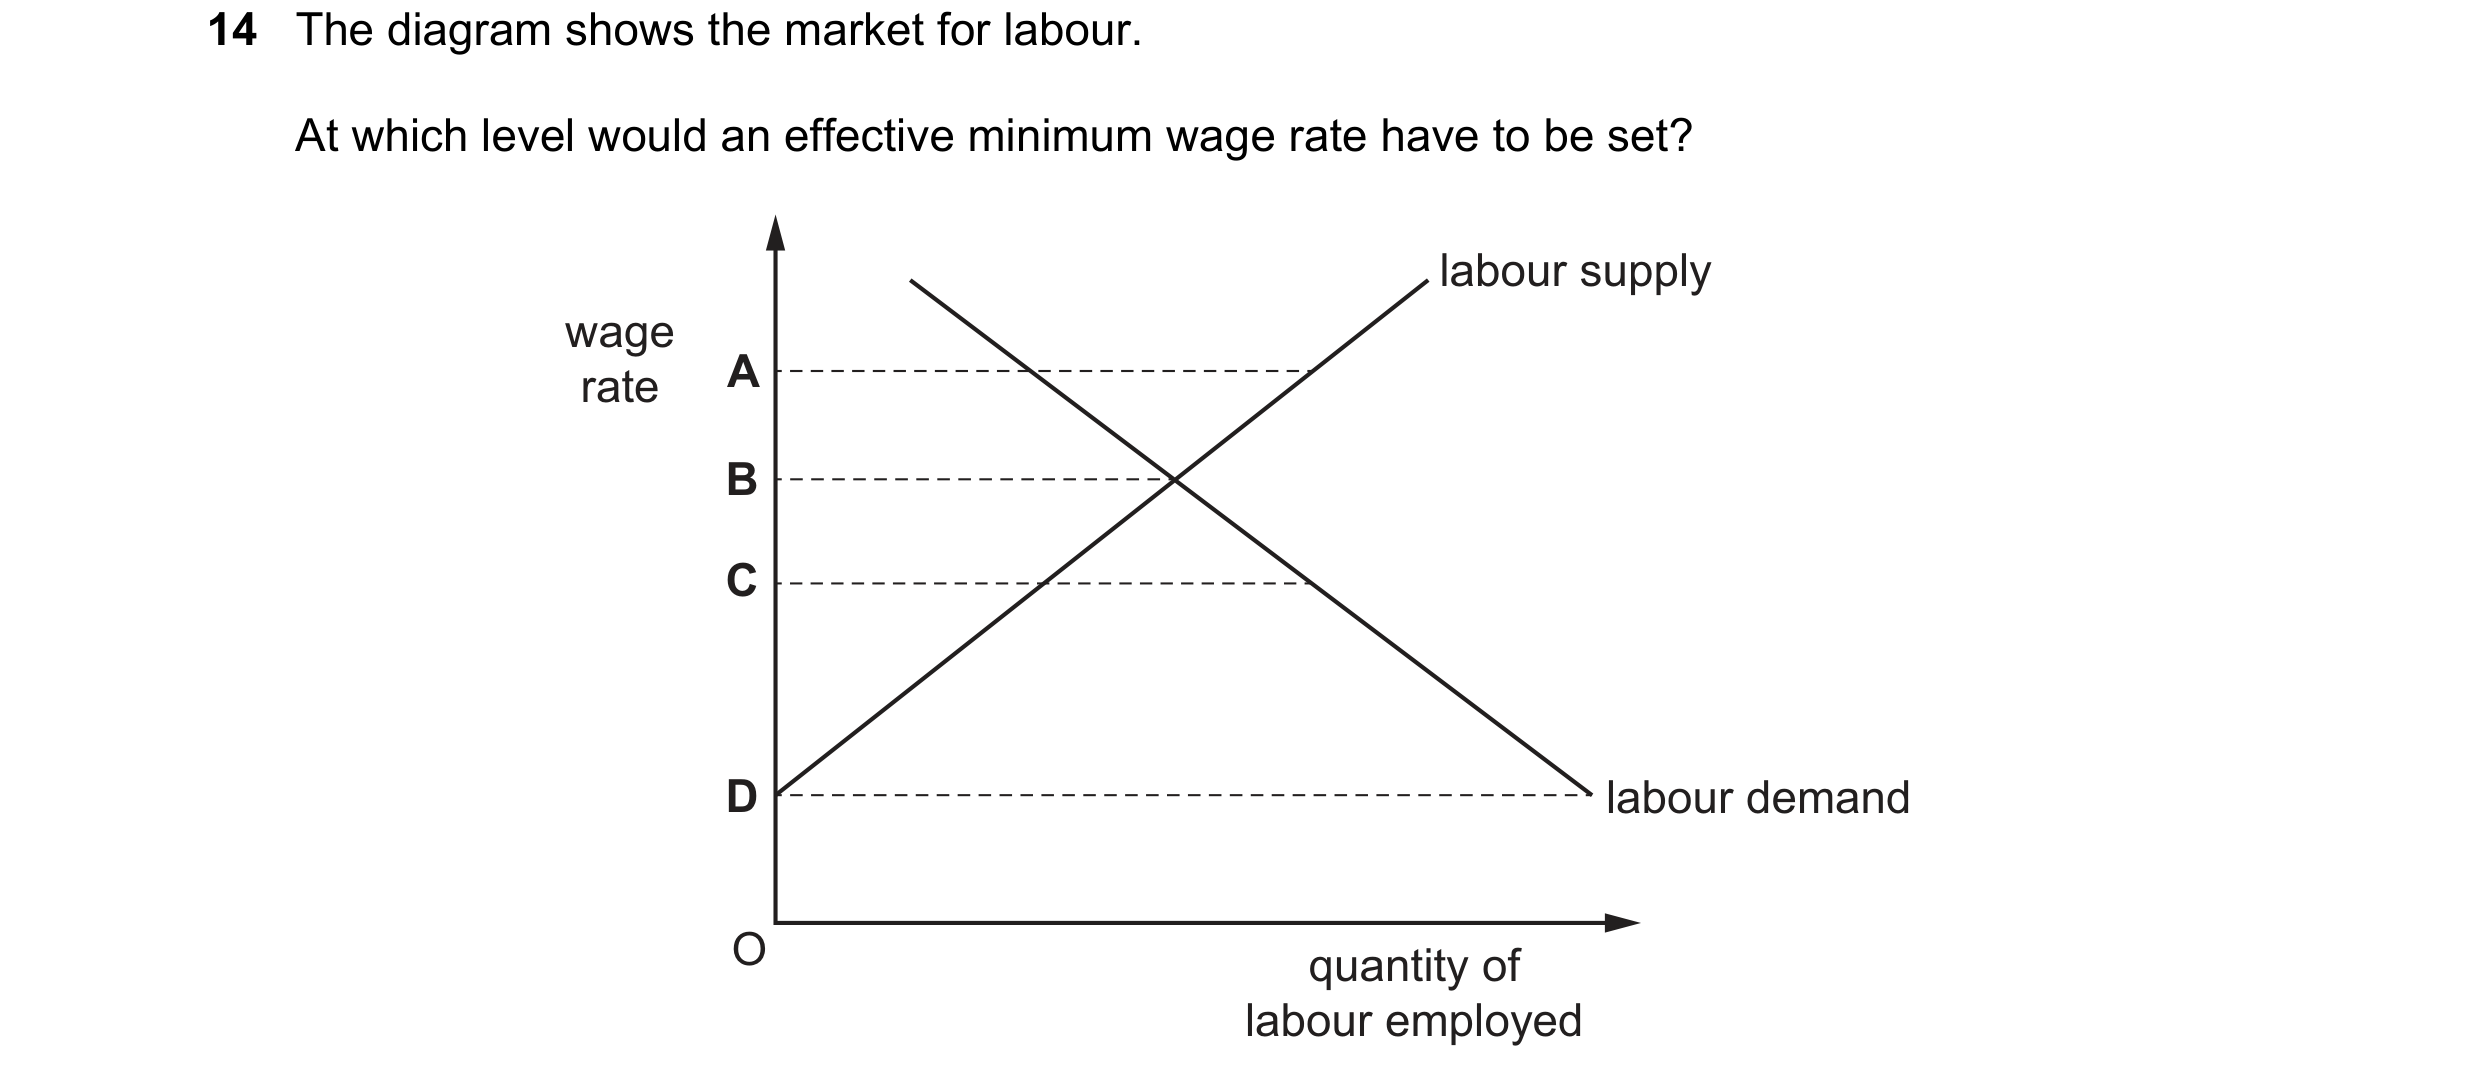
 63 / 119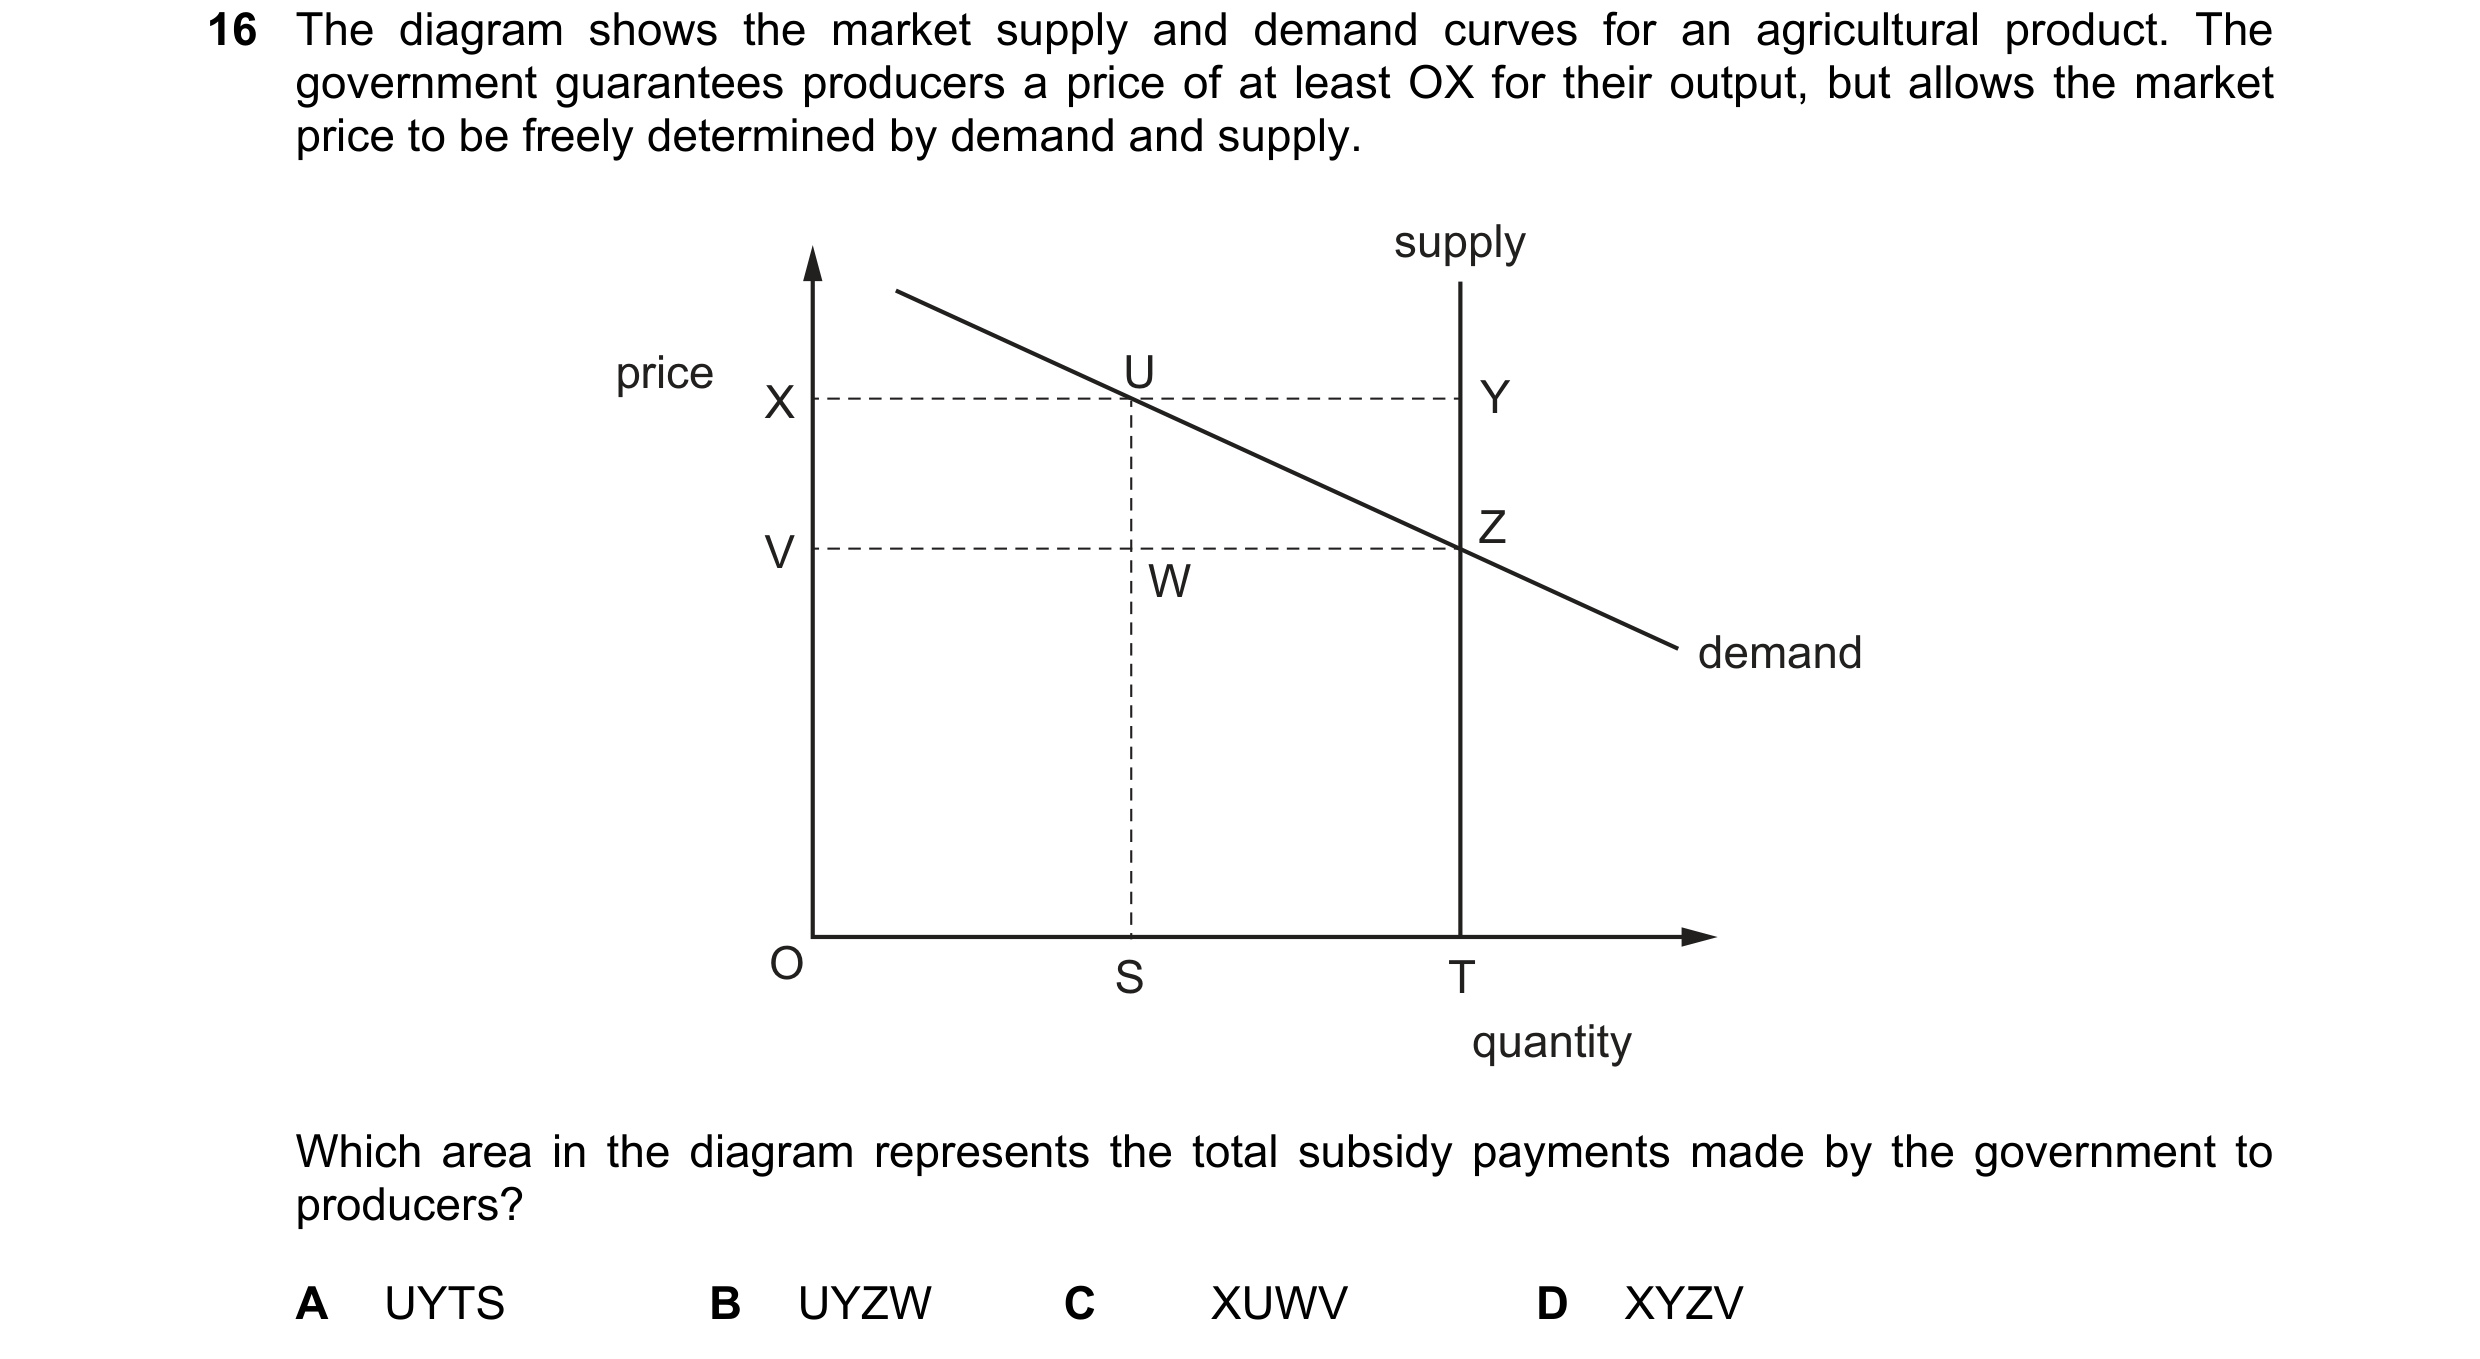

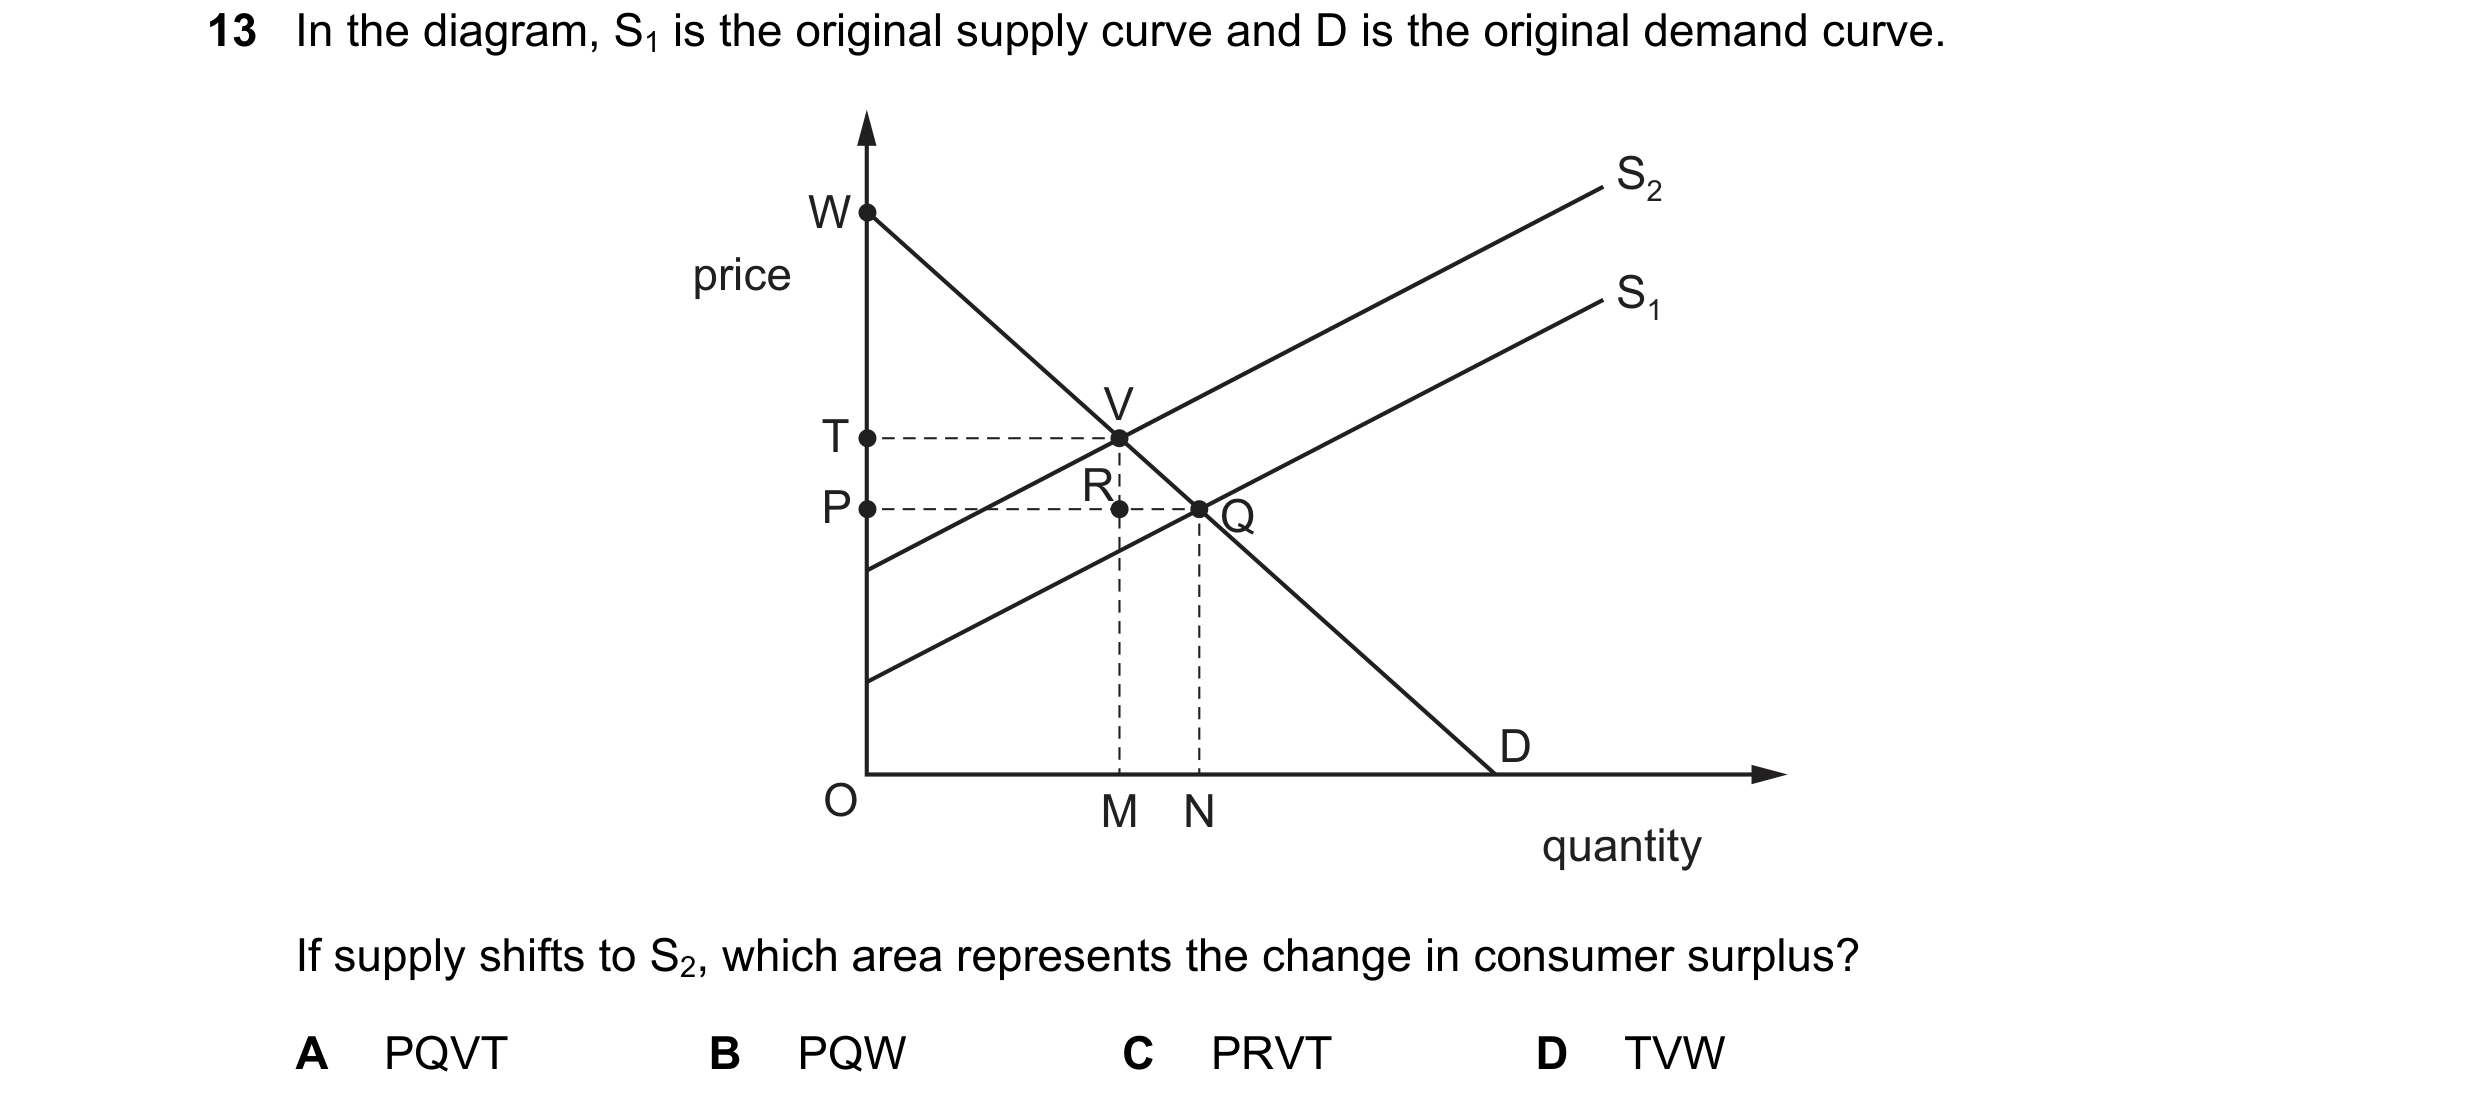 64 / 119
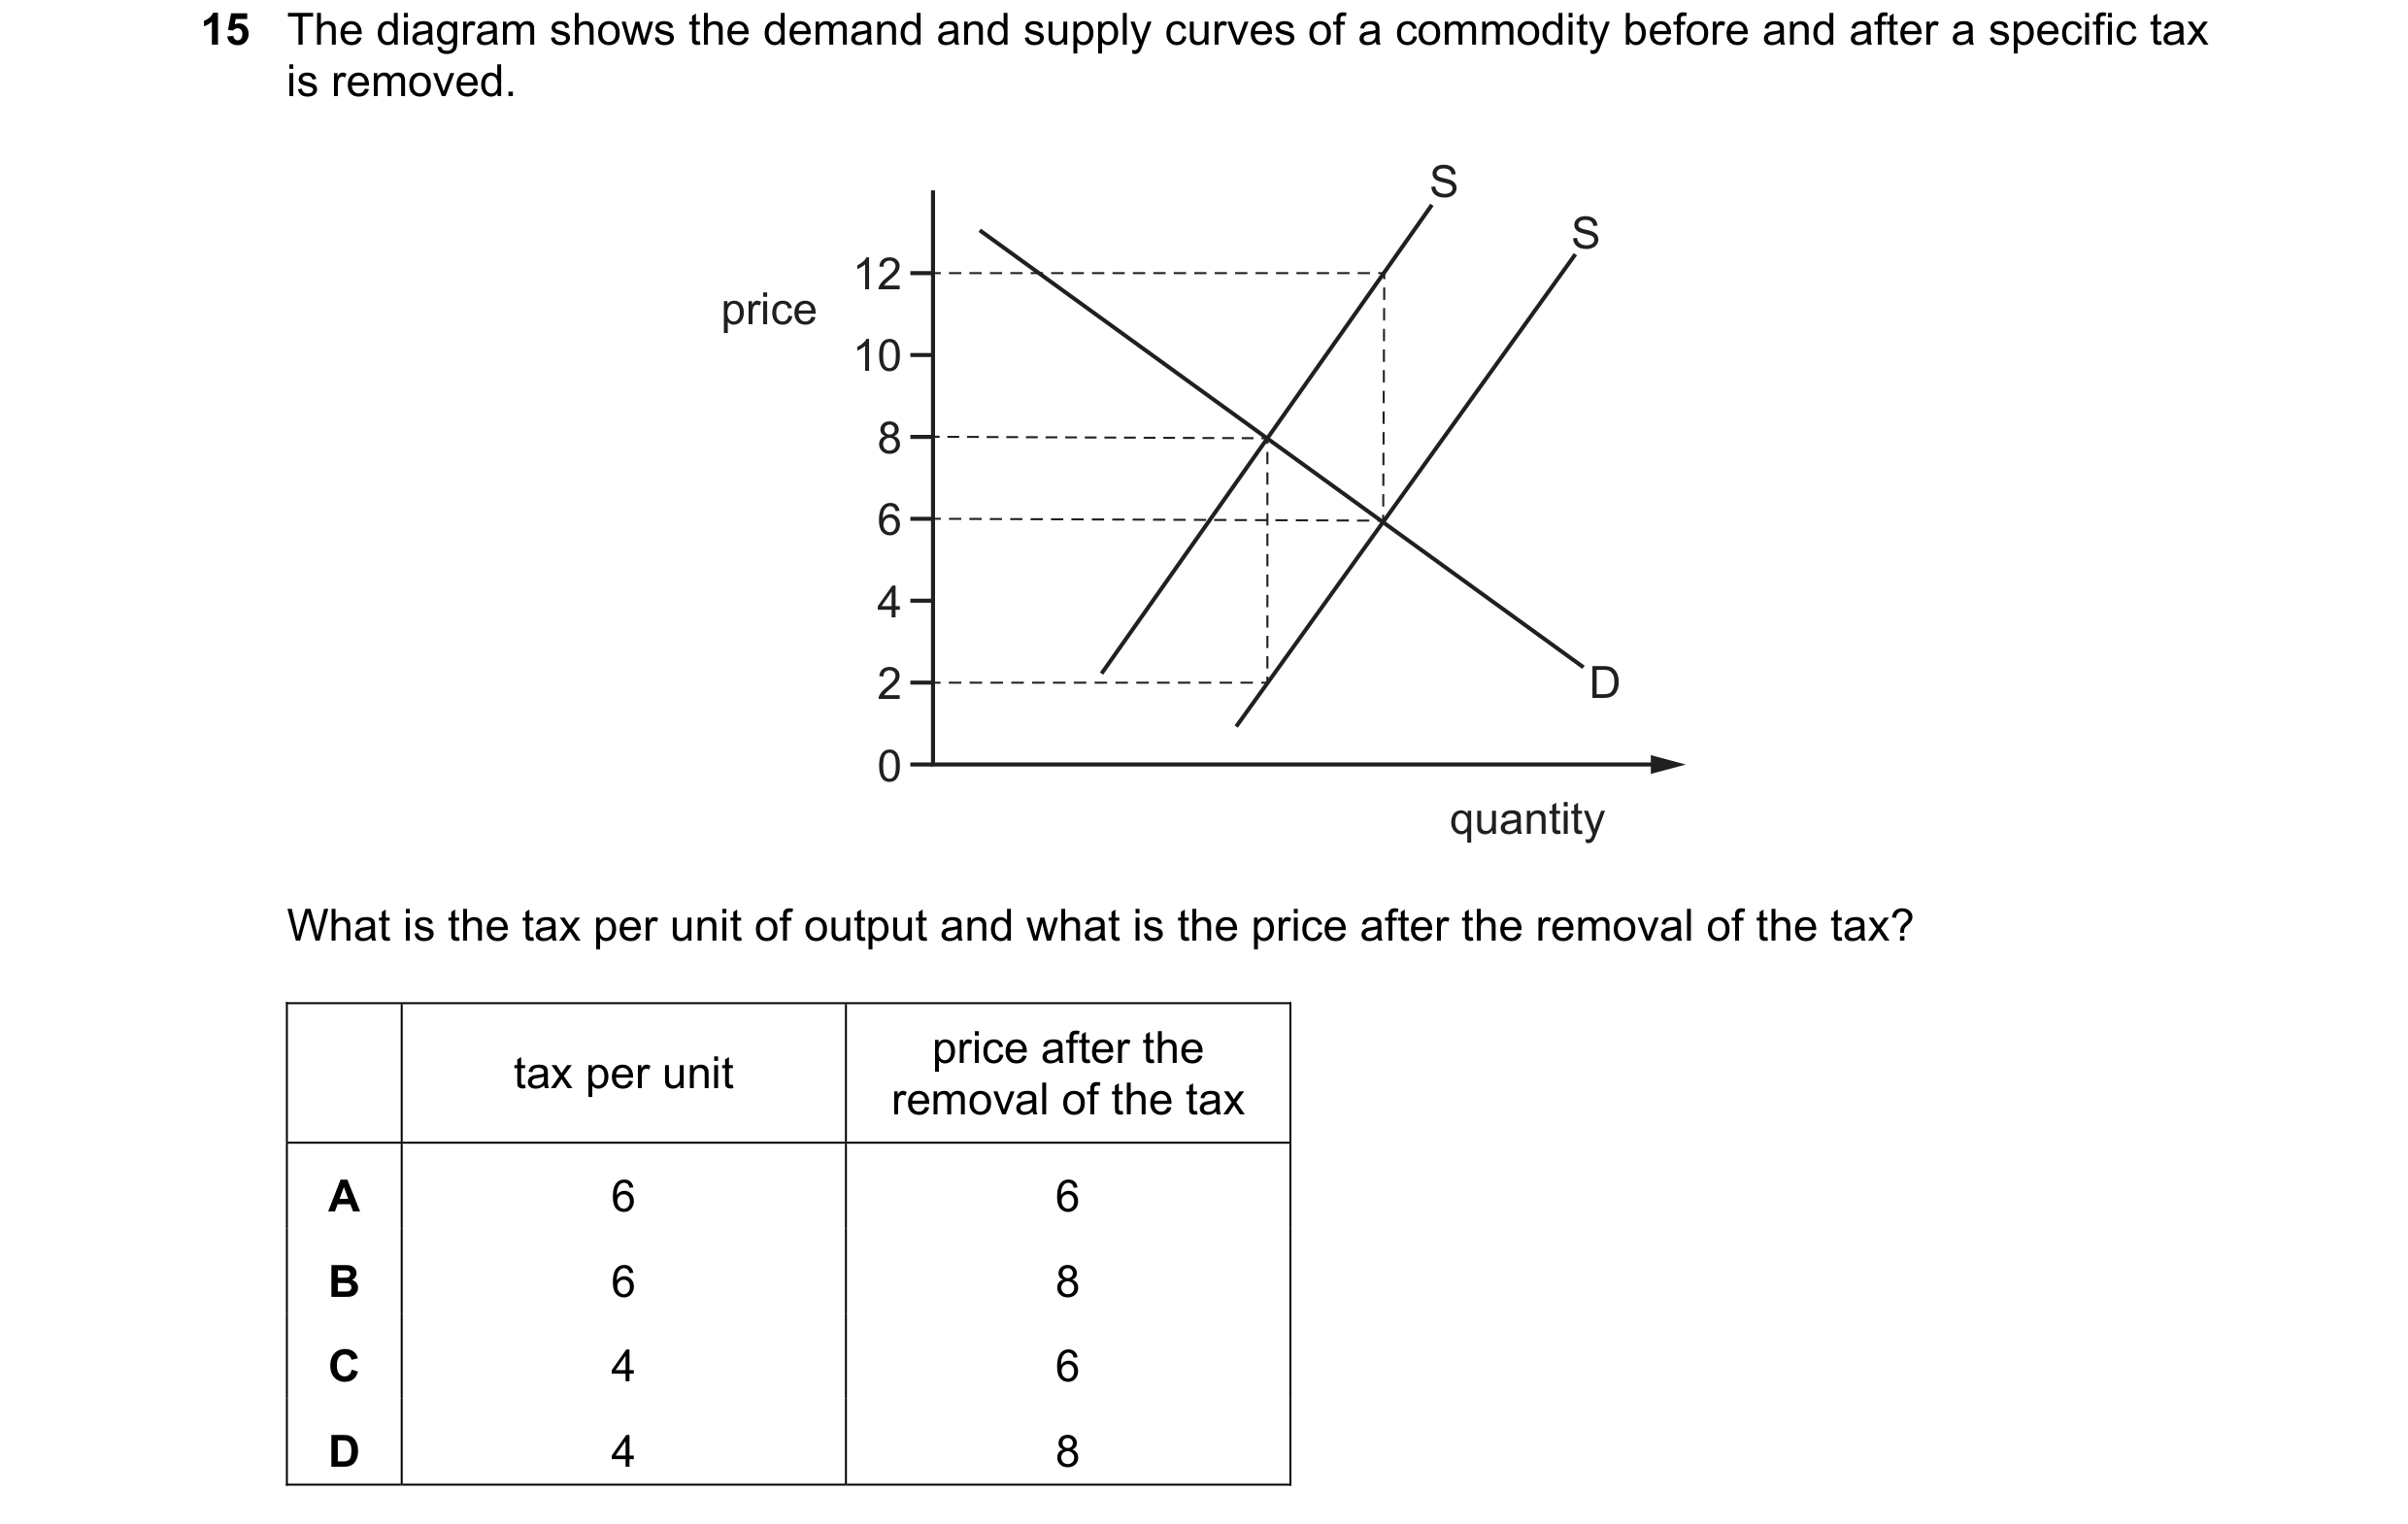
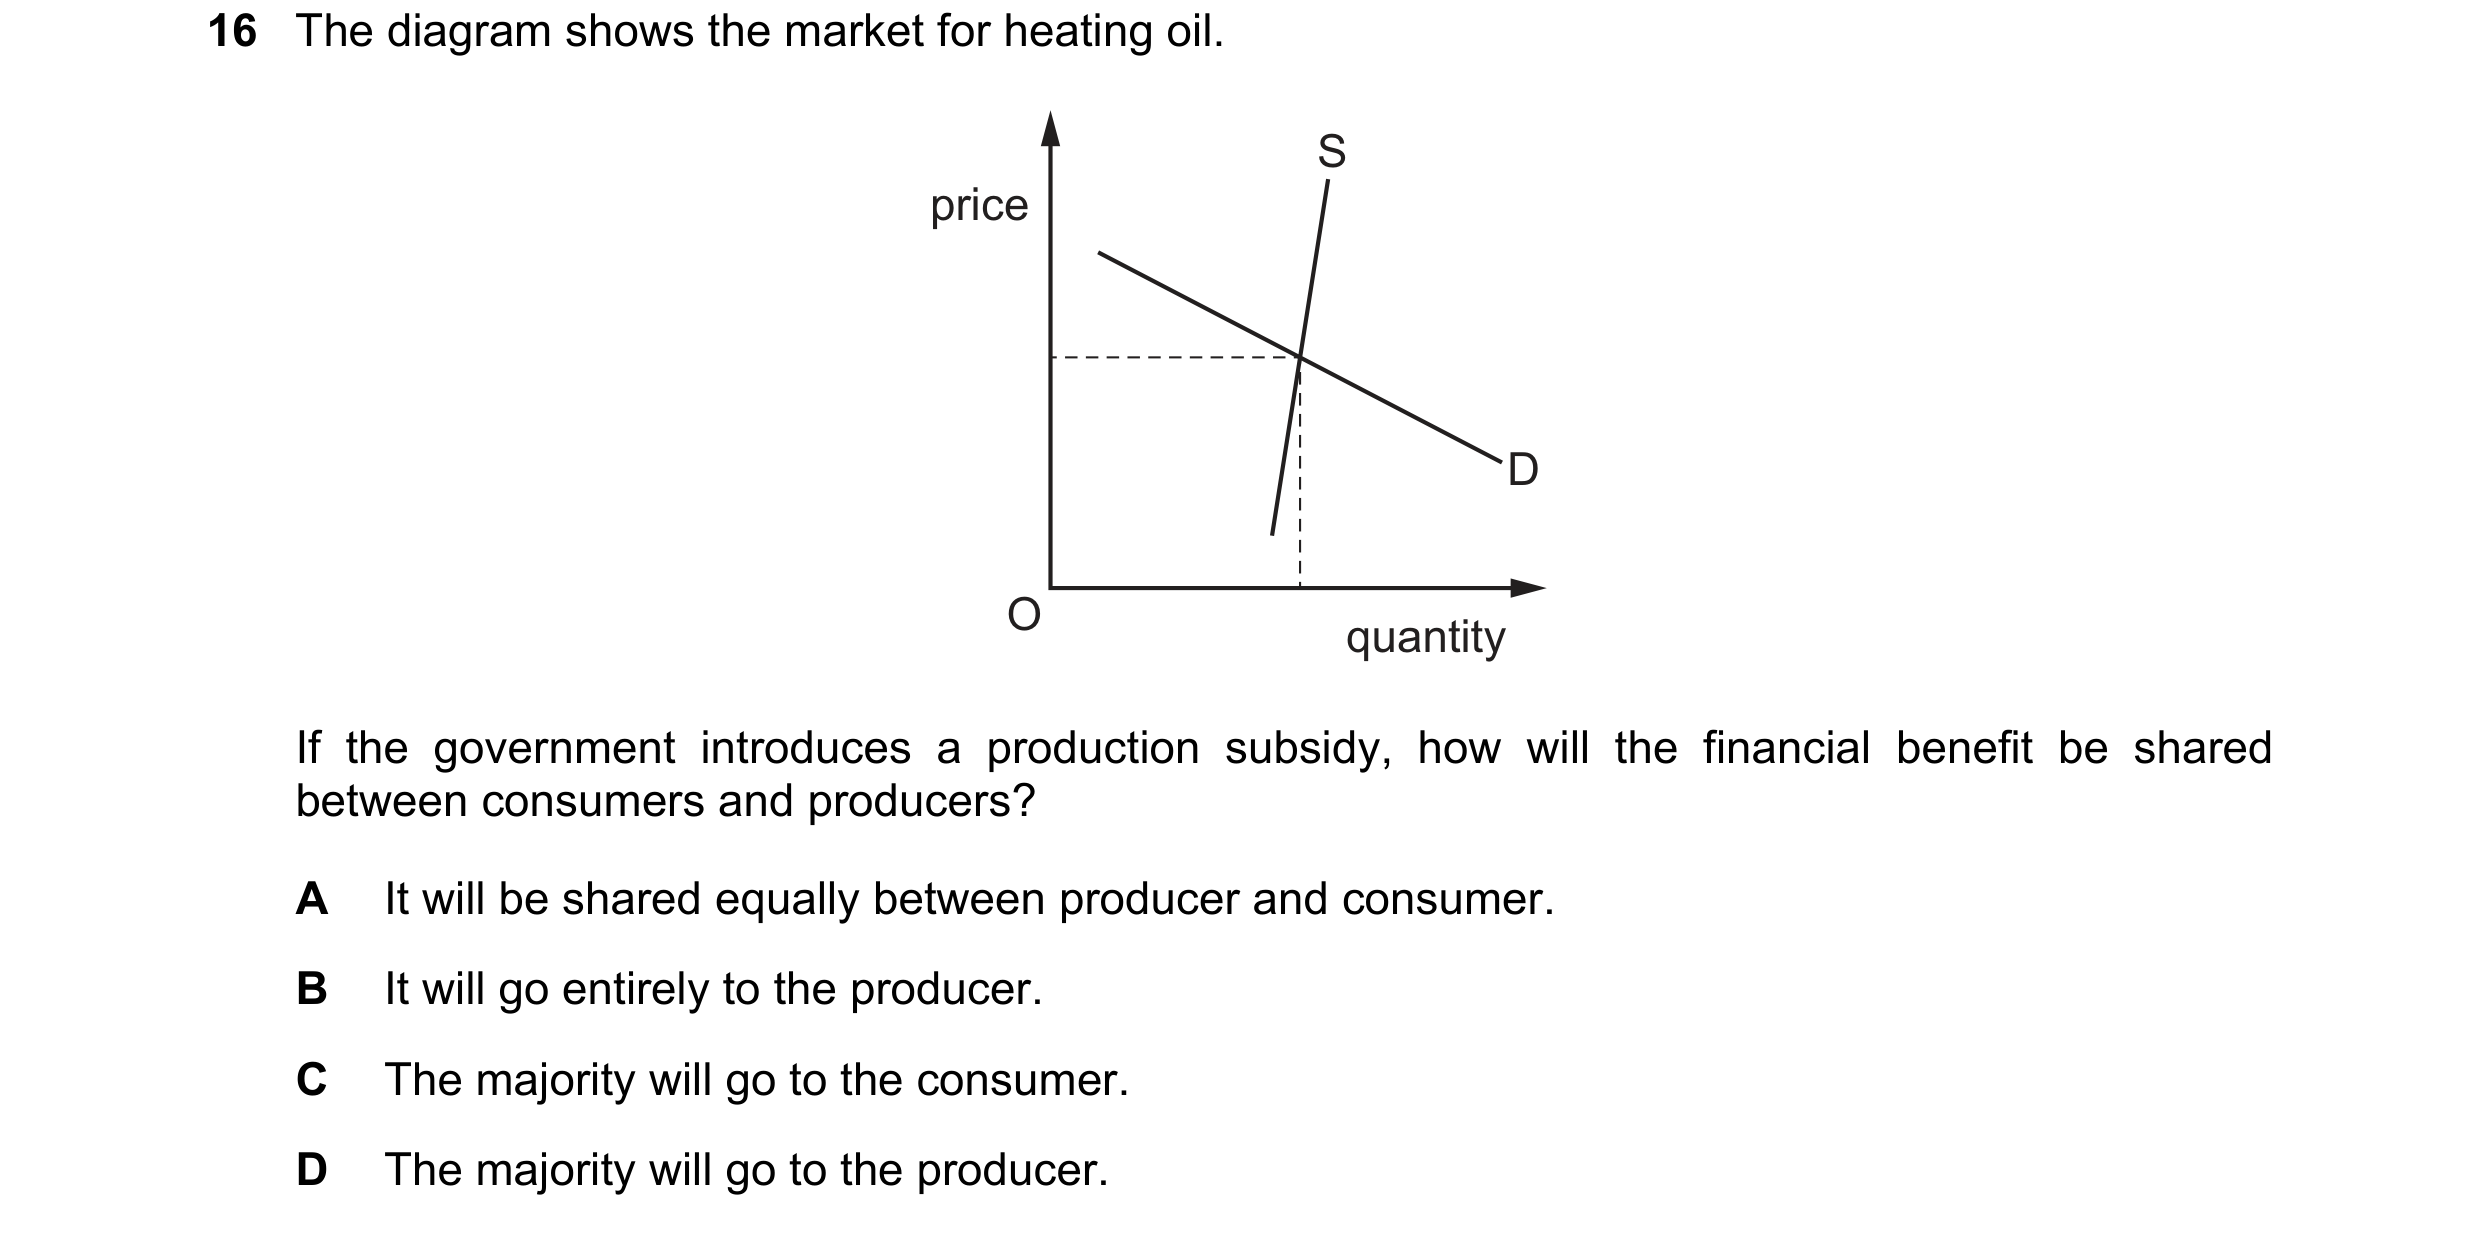 65 / 119
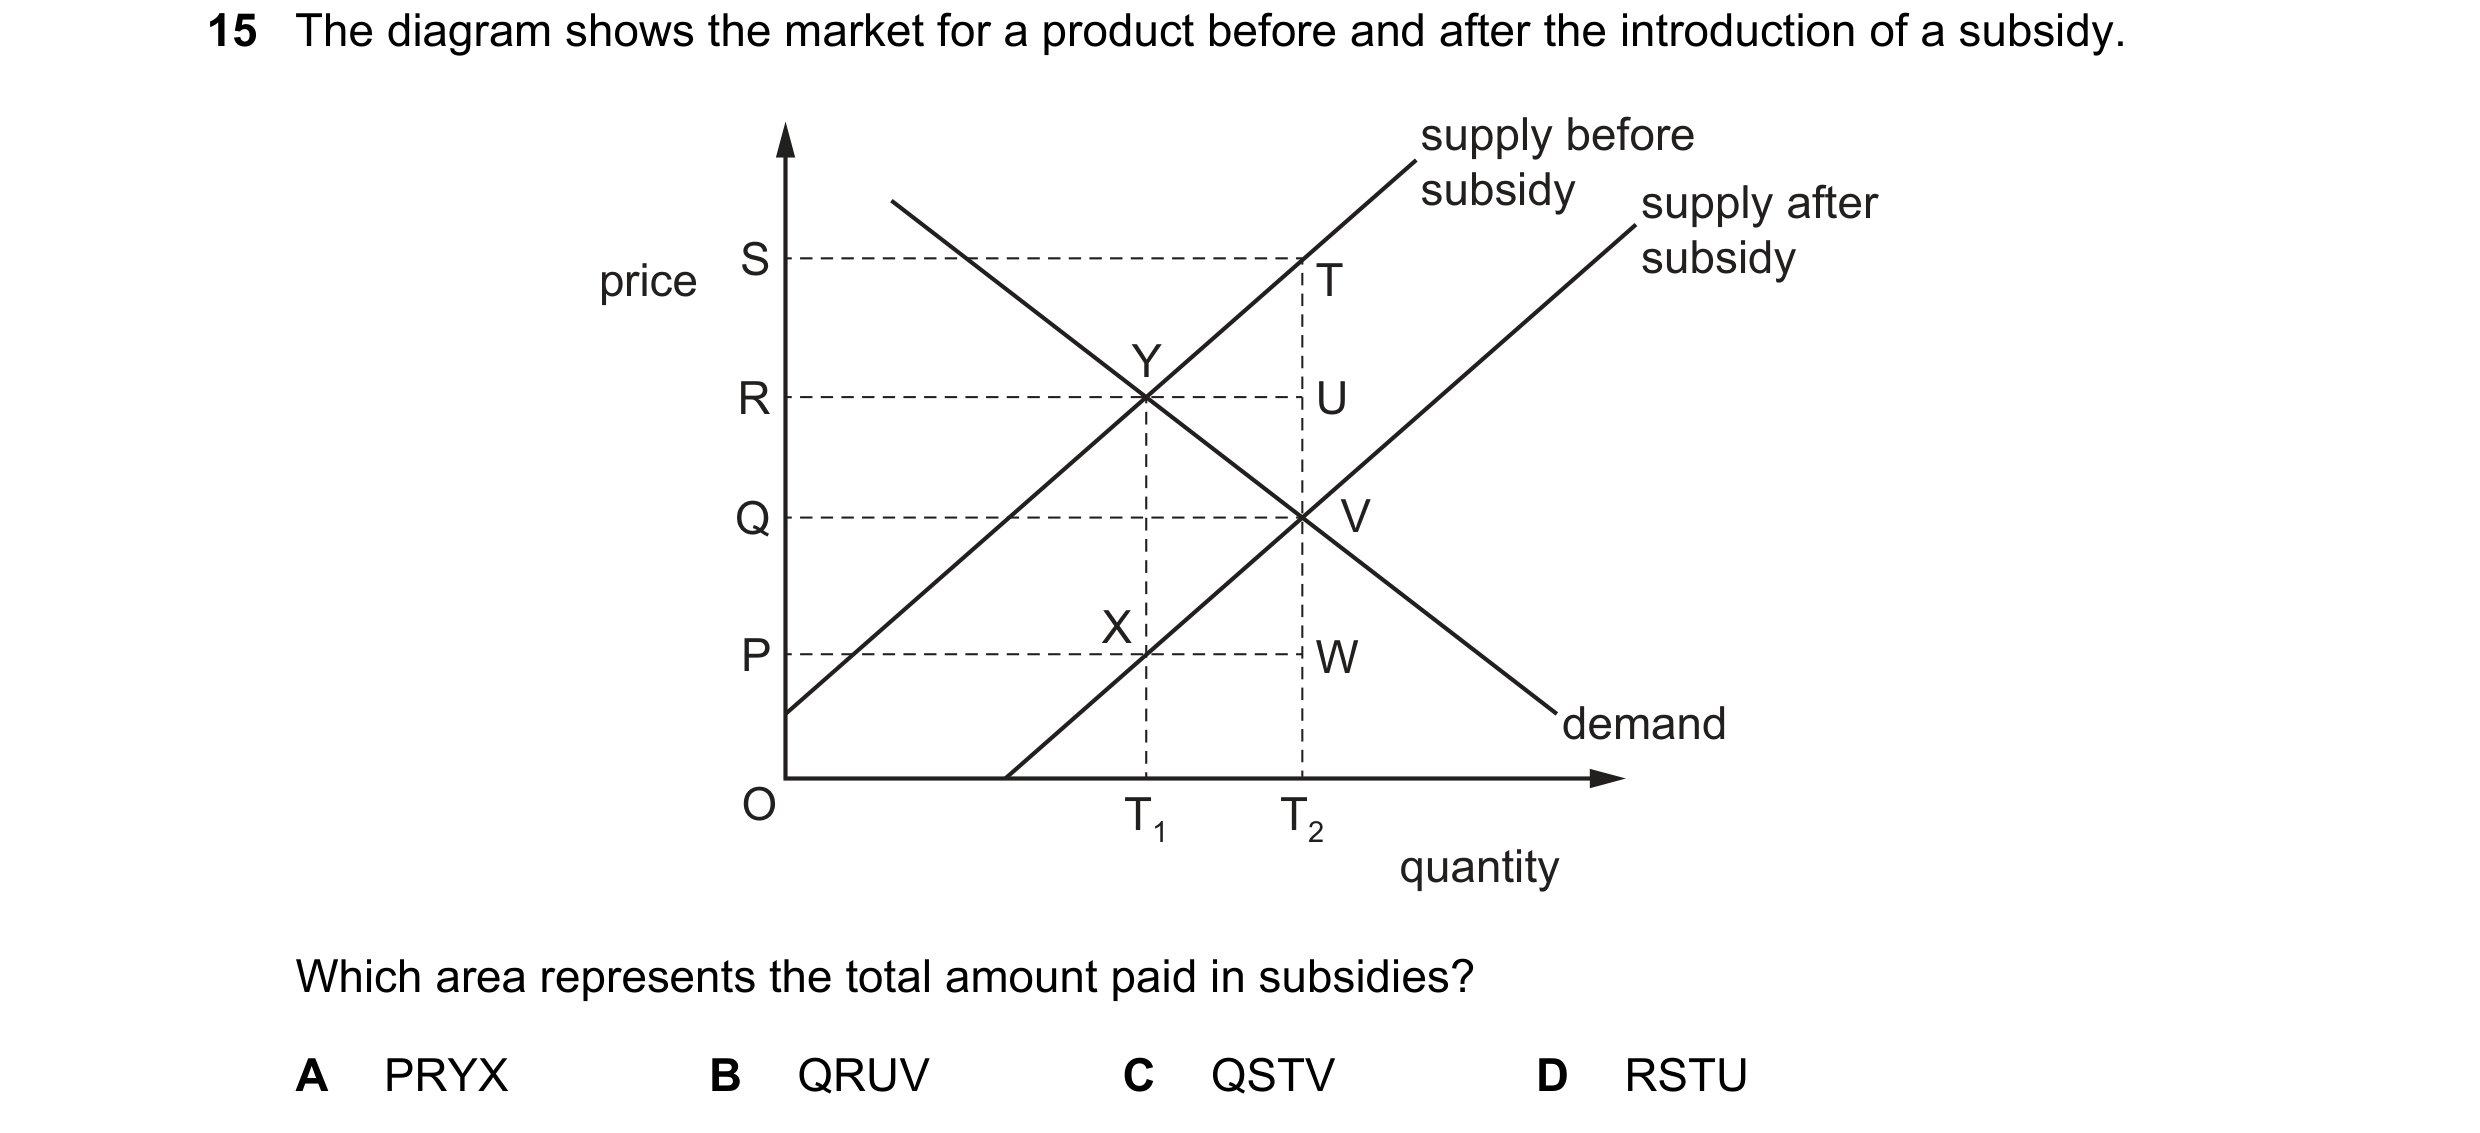 66 / 119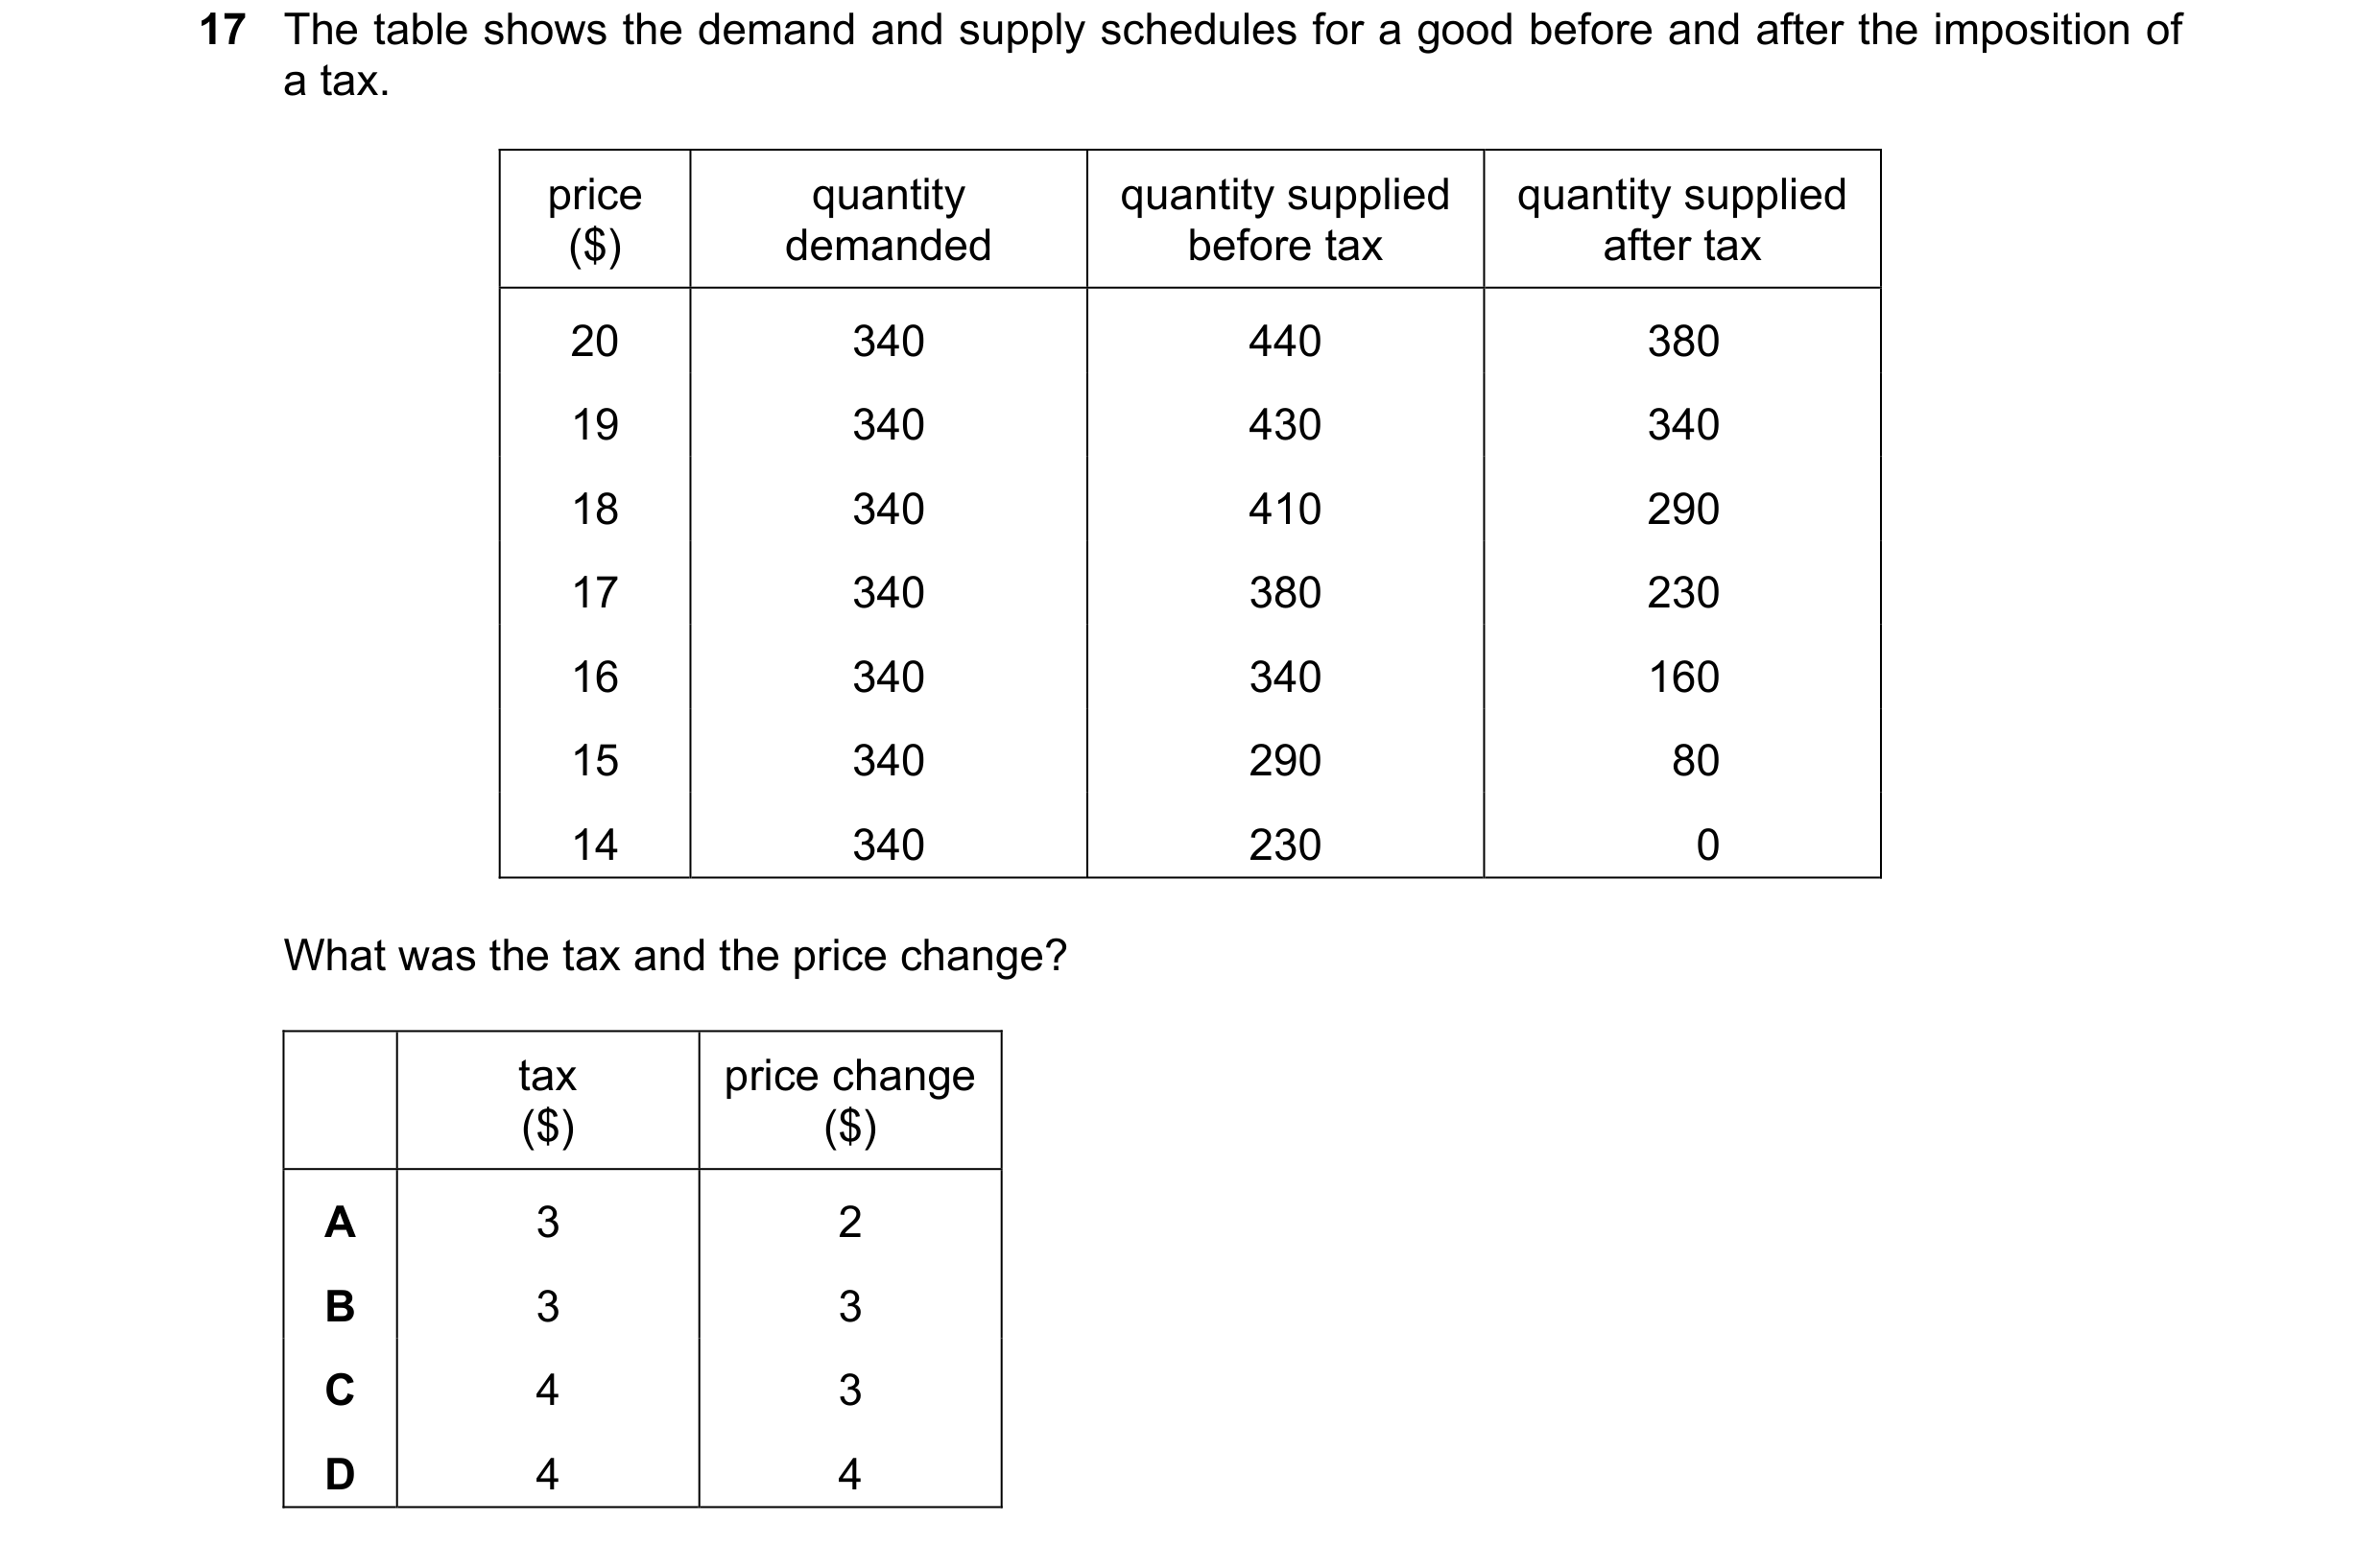

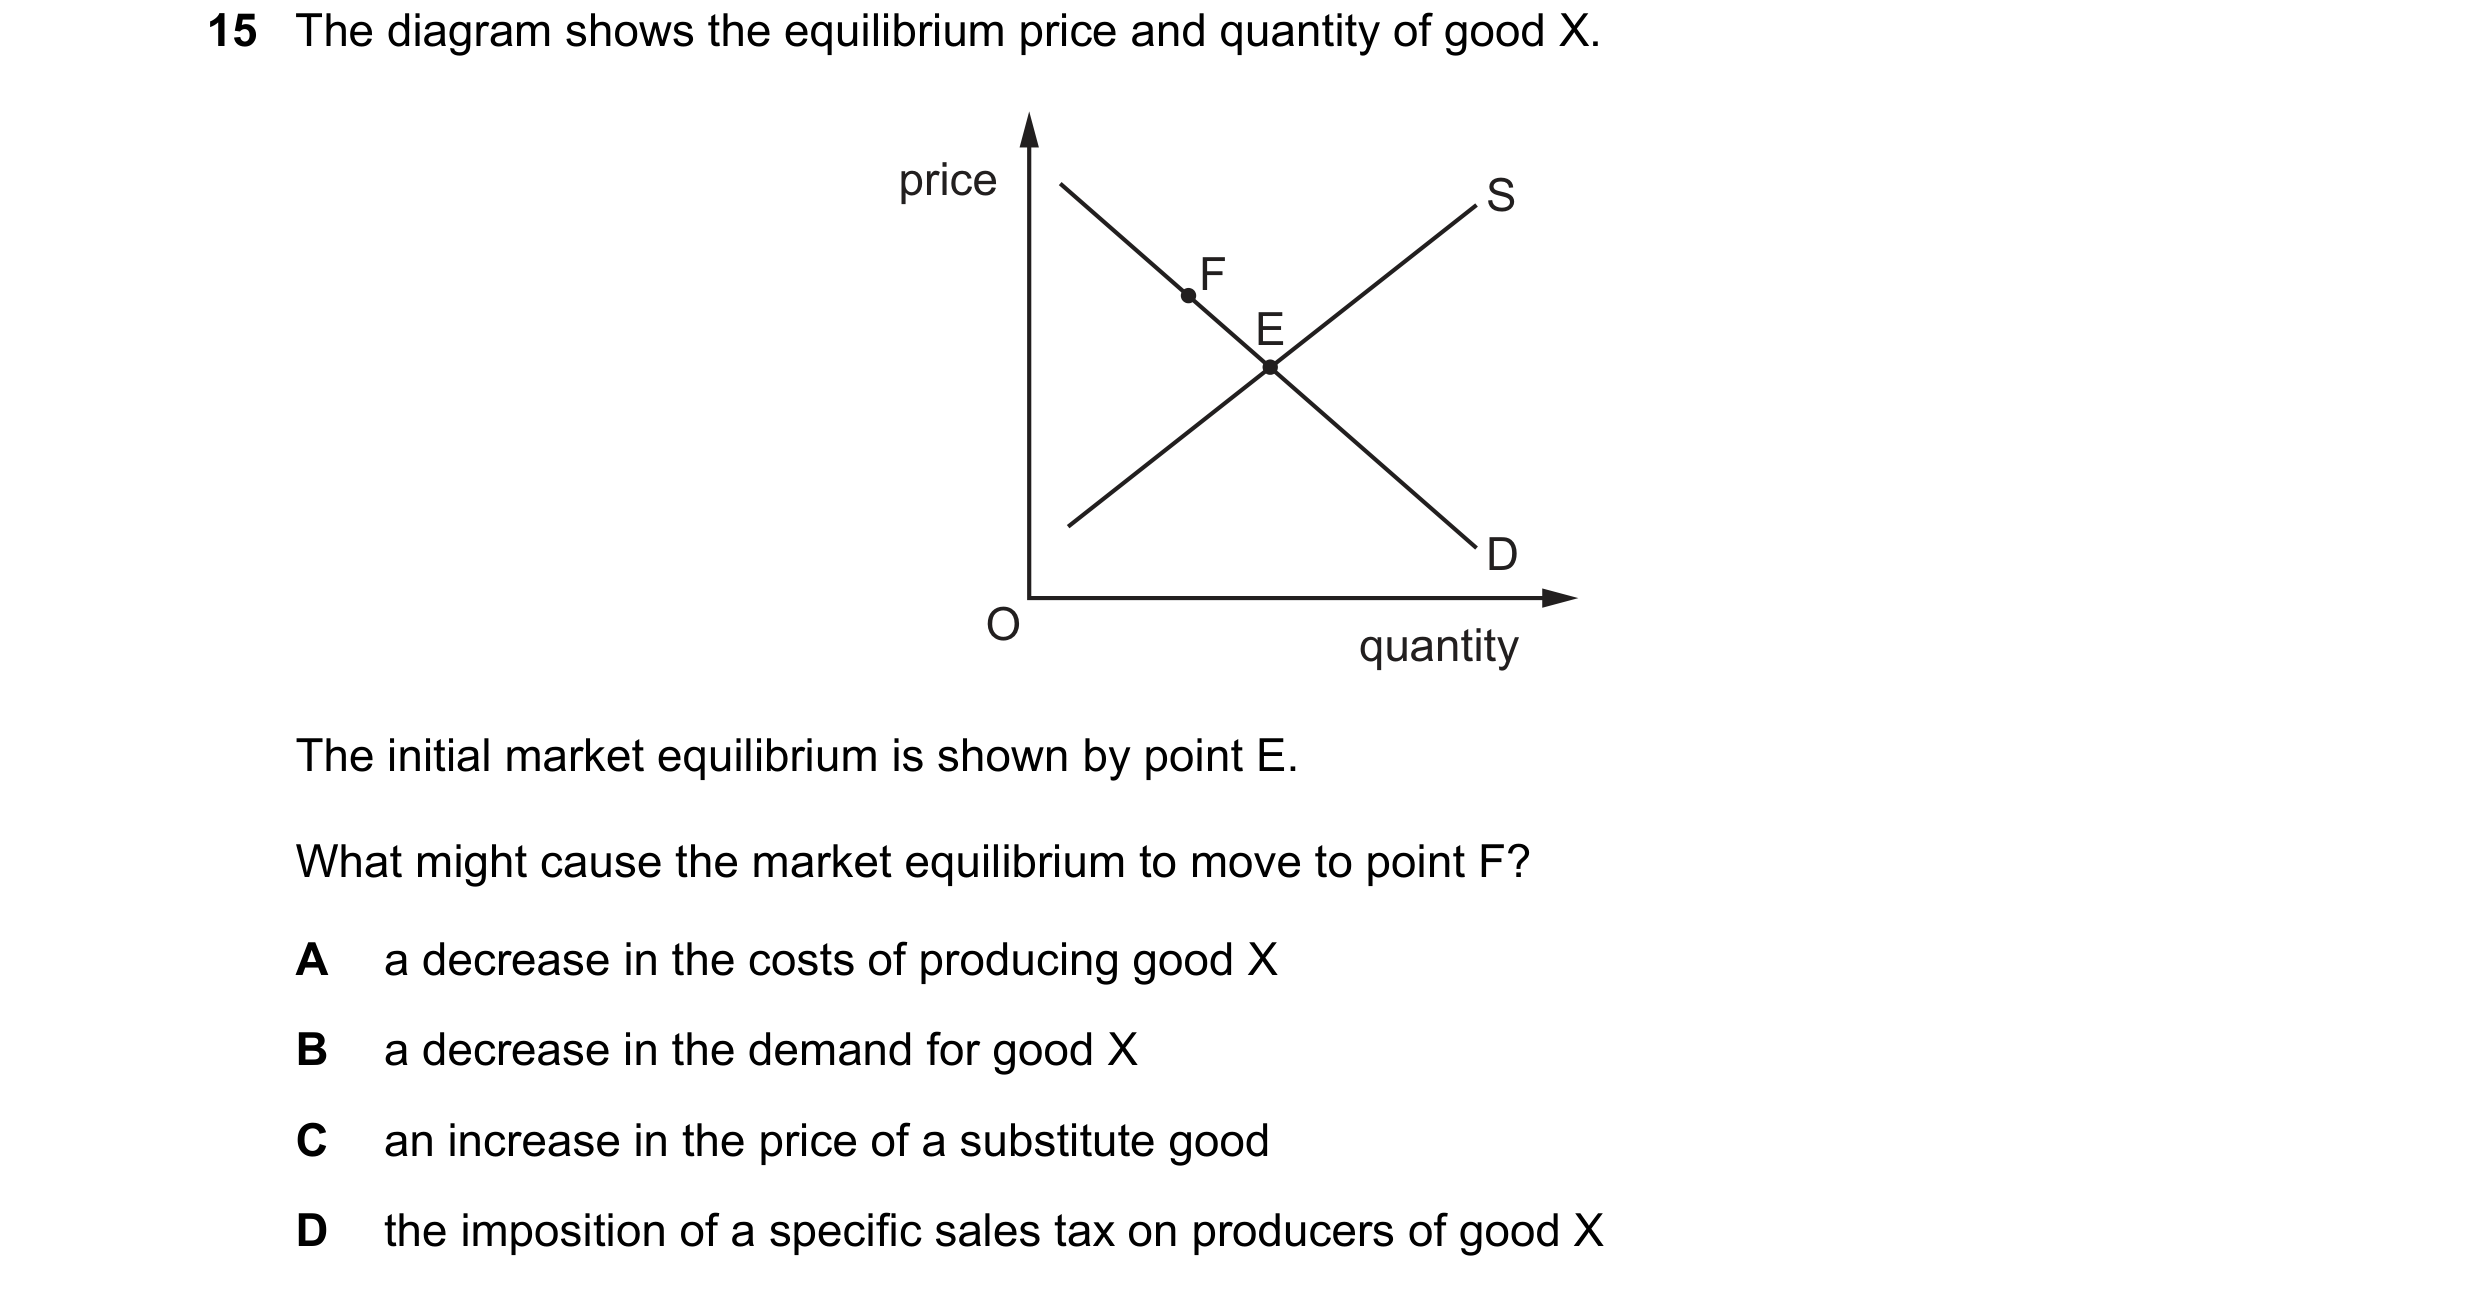 67 / 119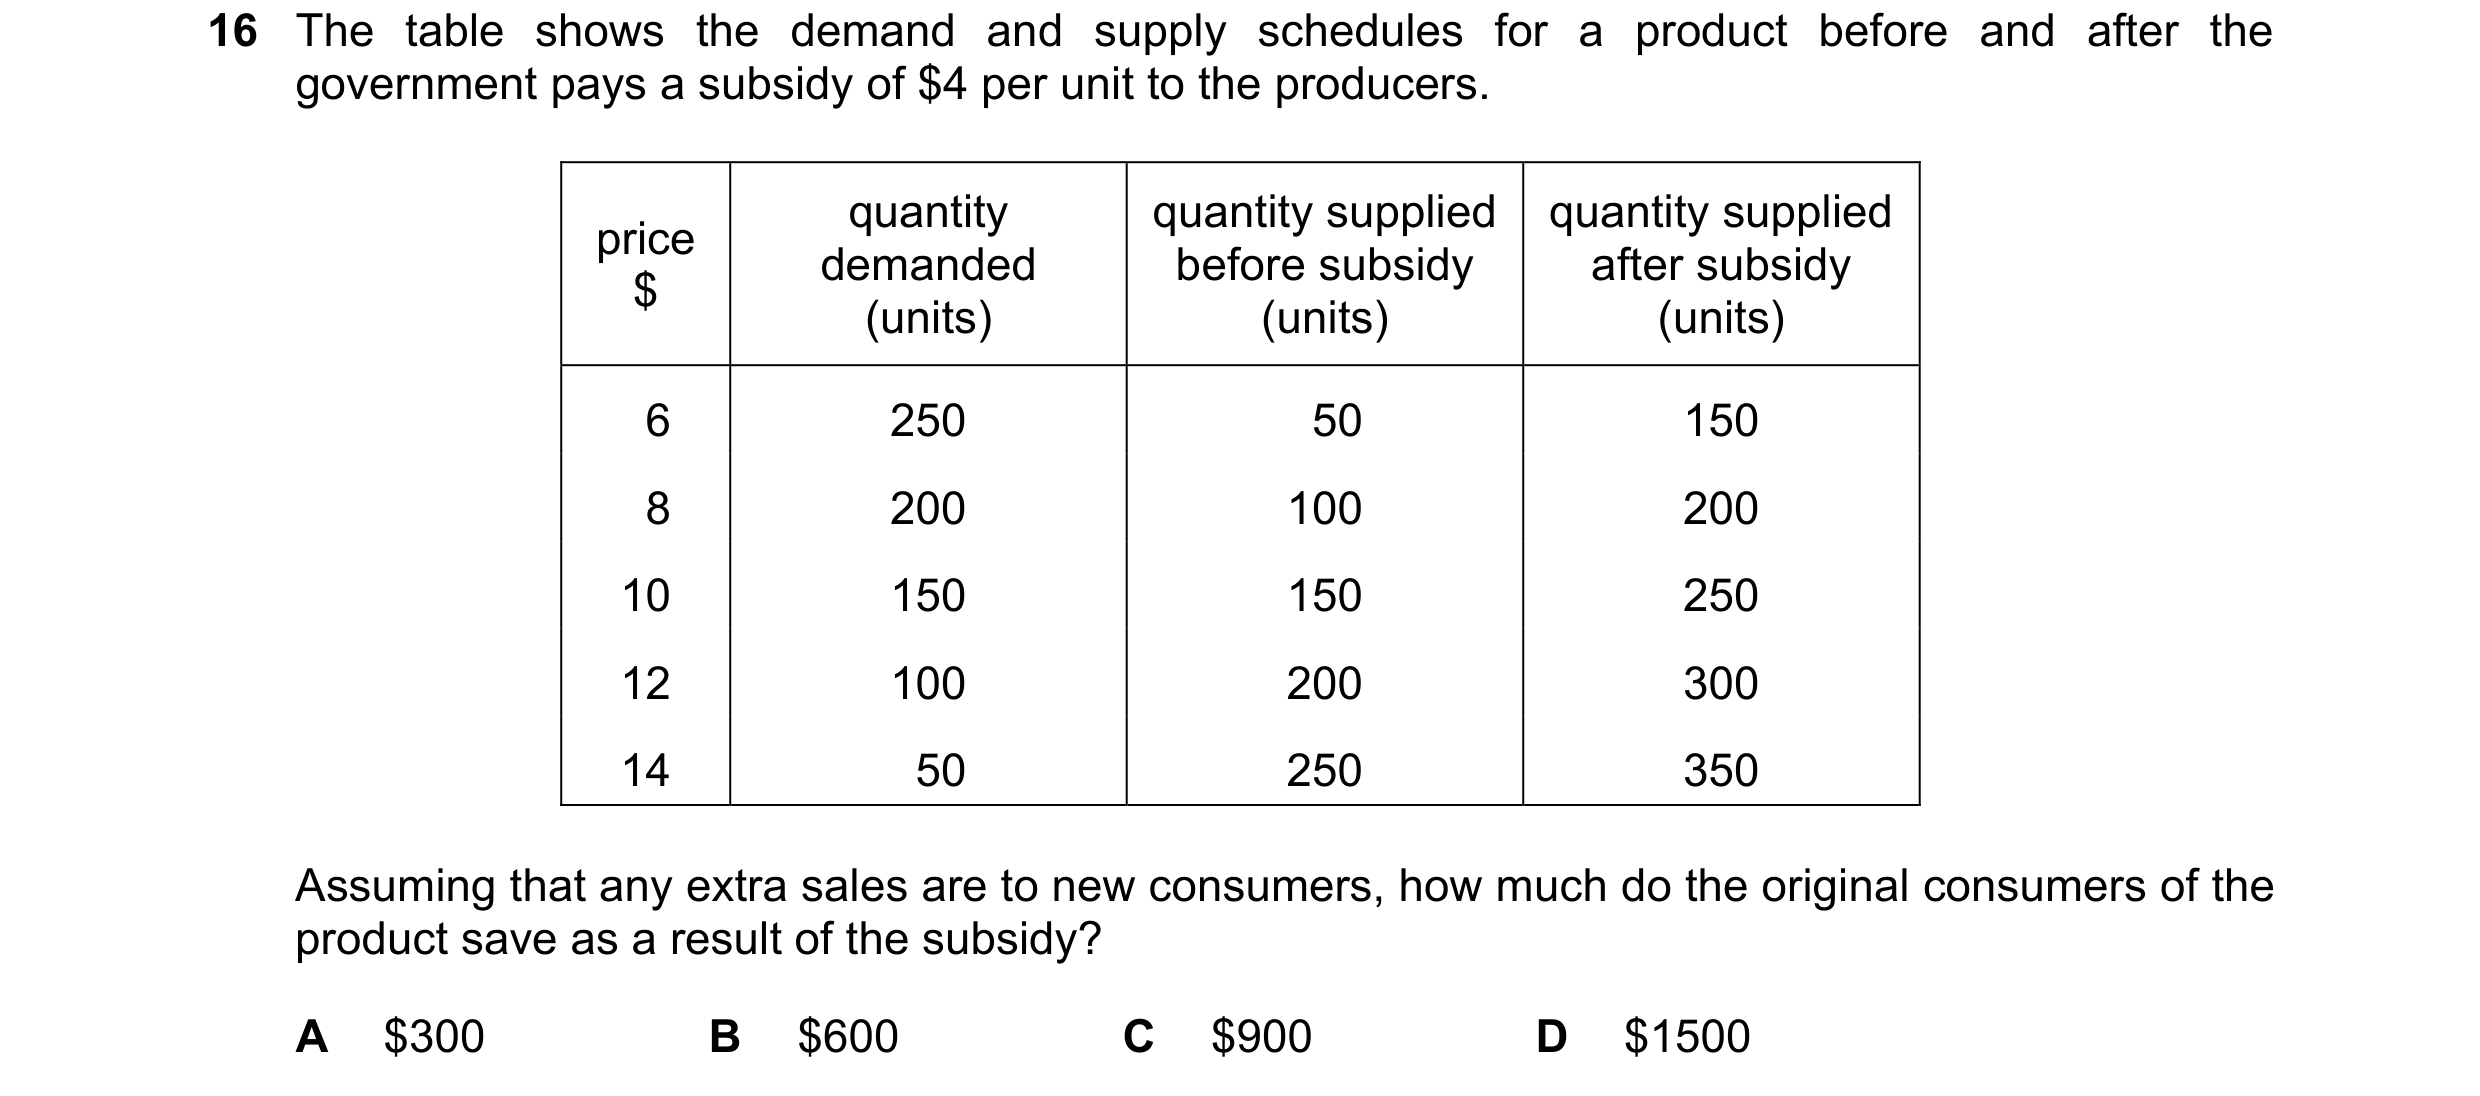
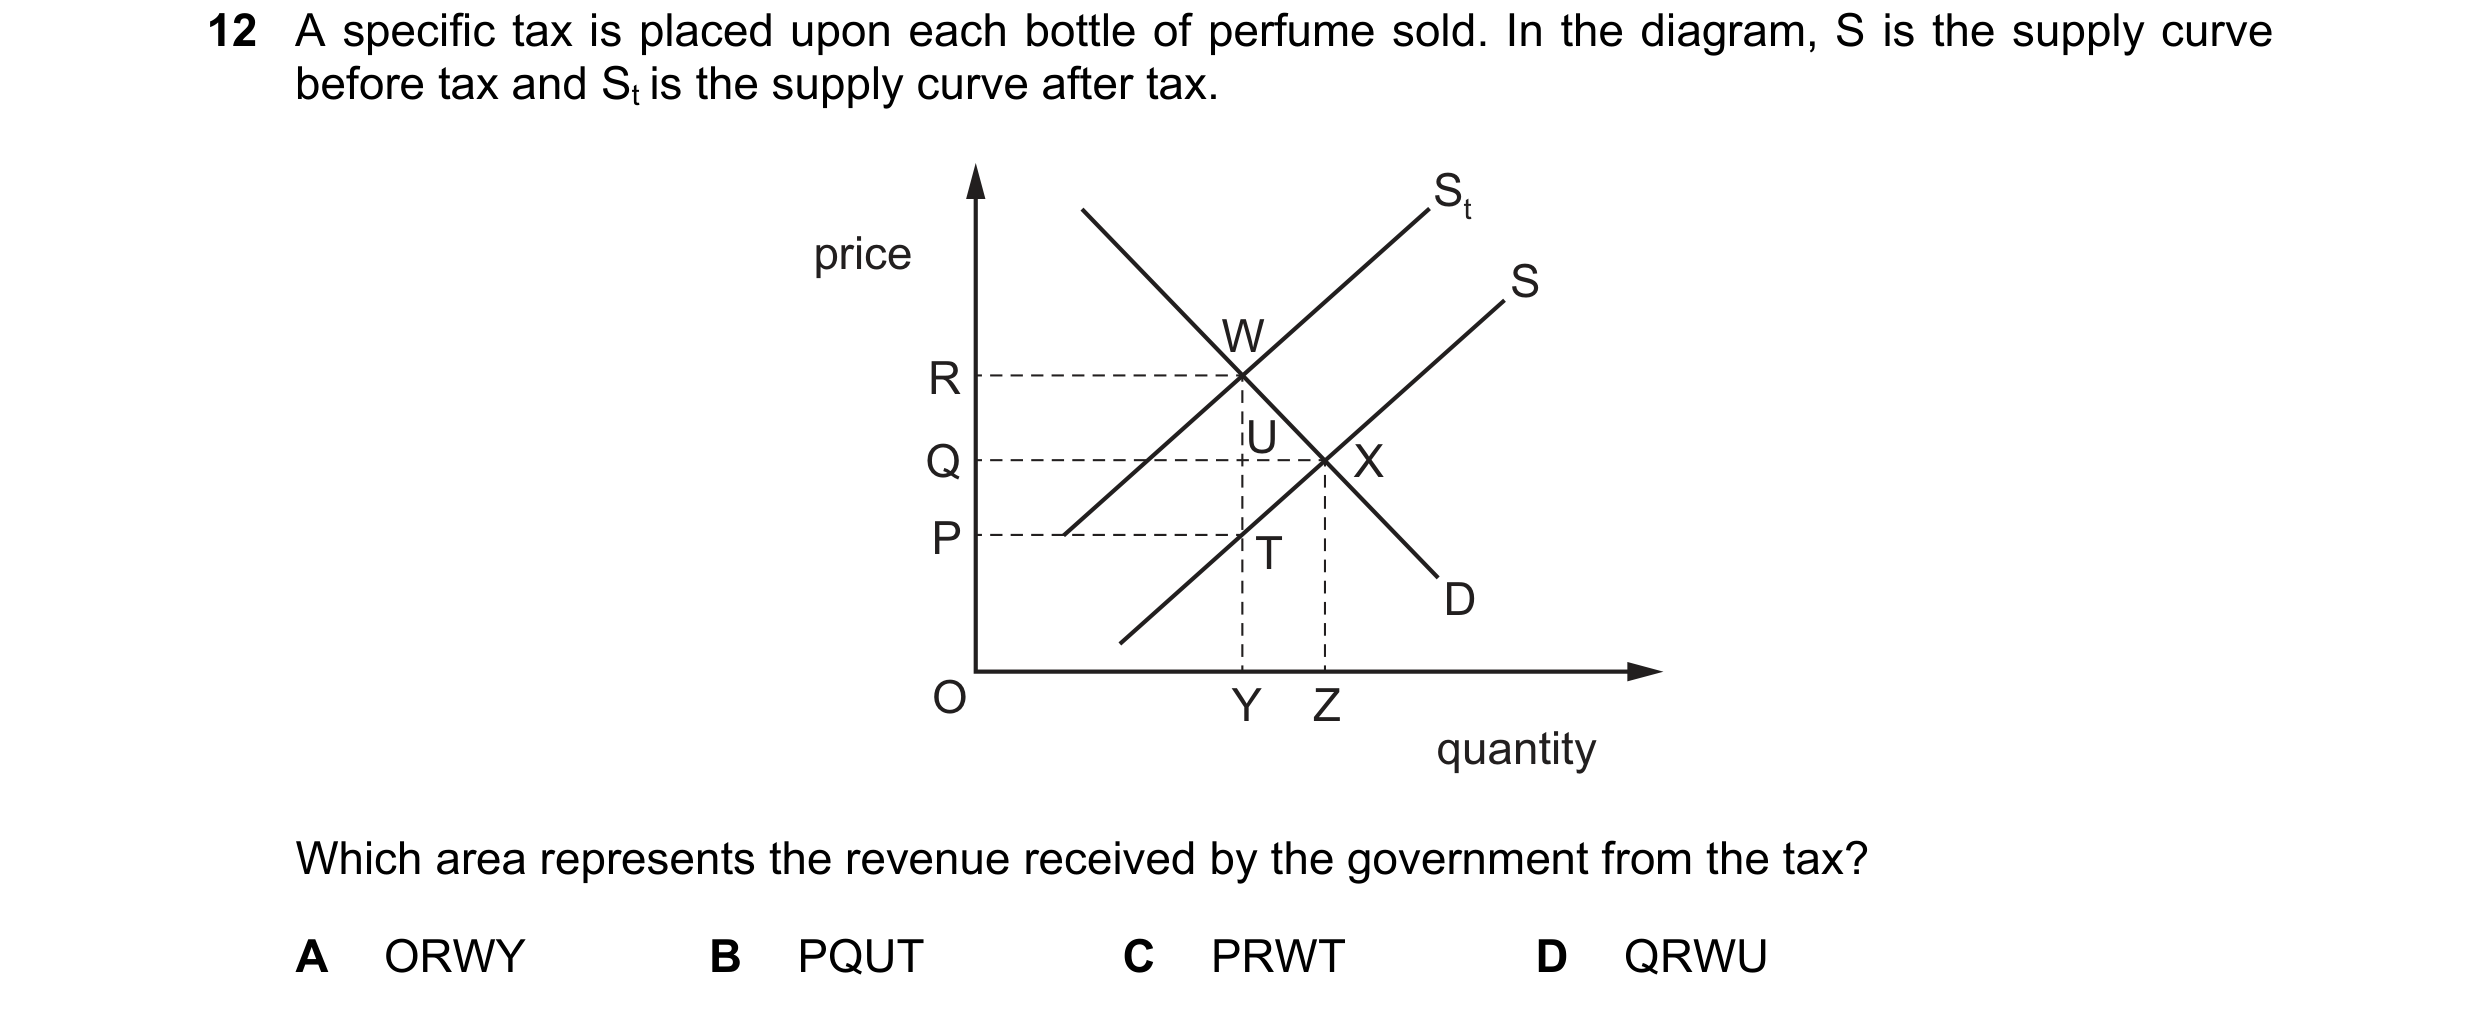
 68 / 119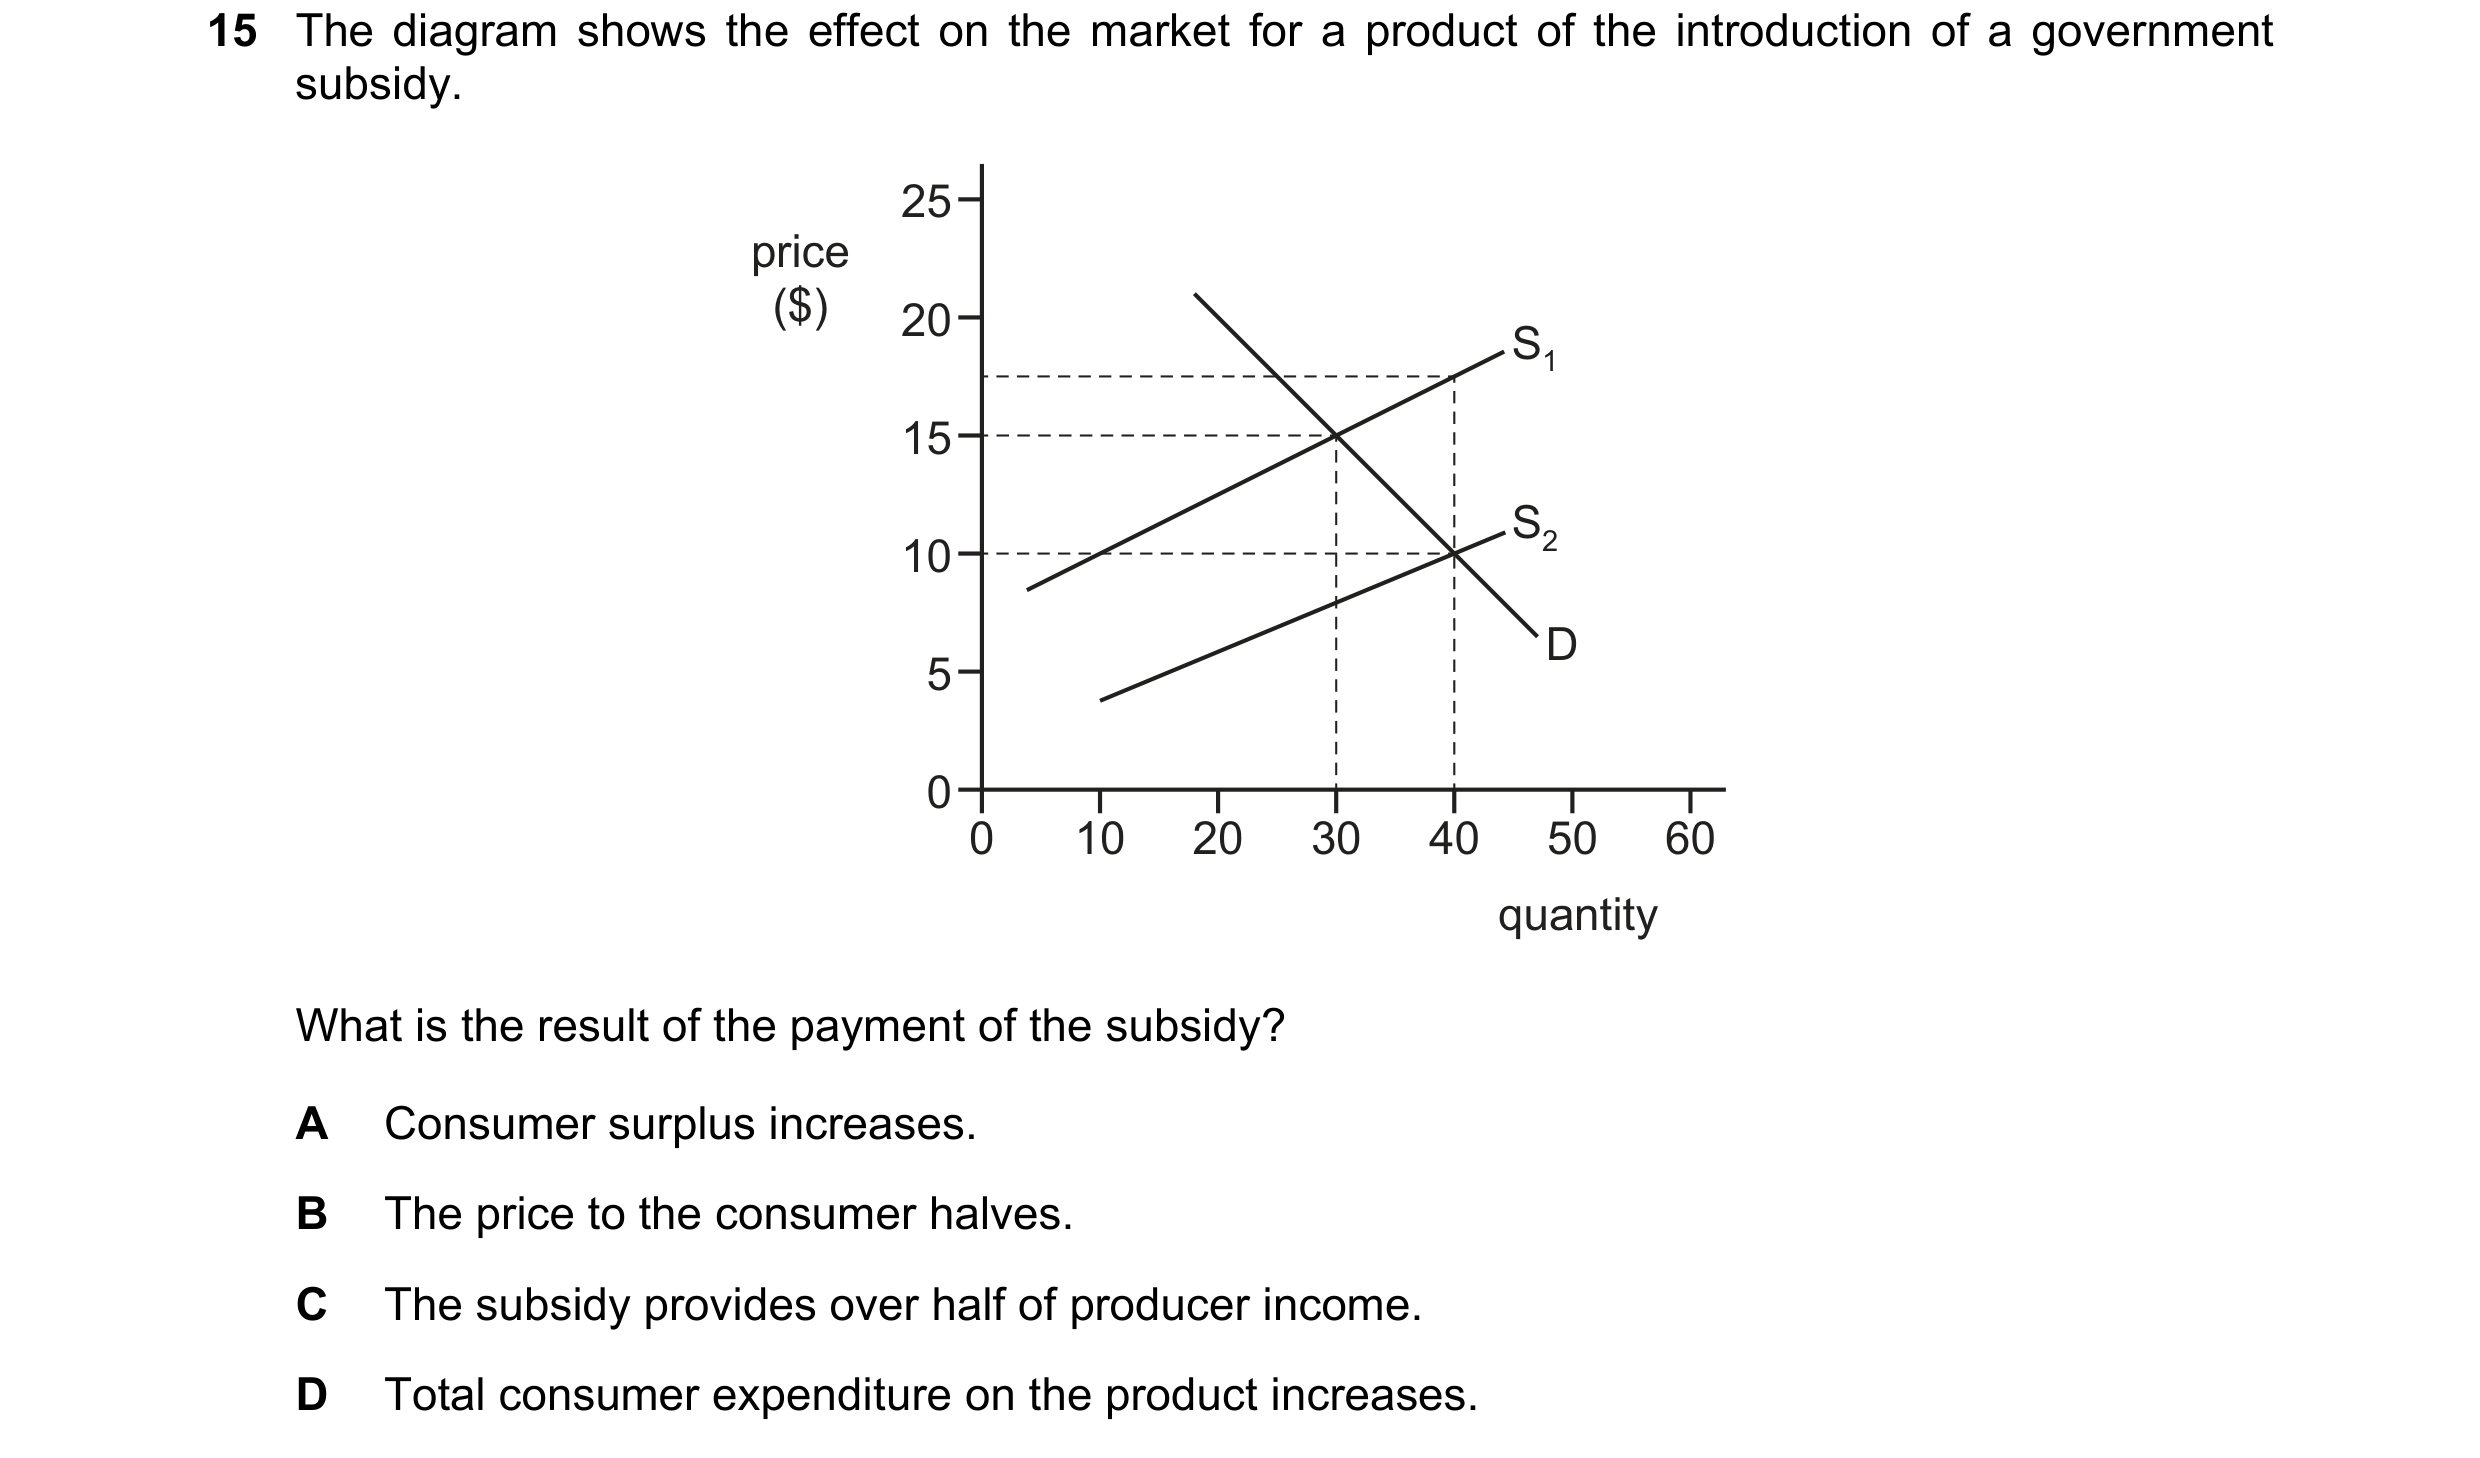

 69 / 119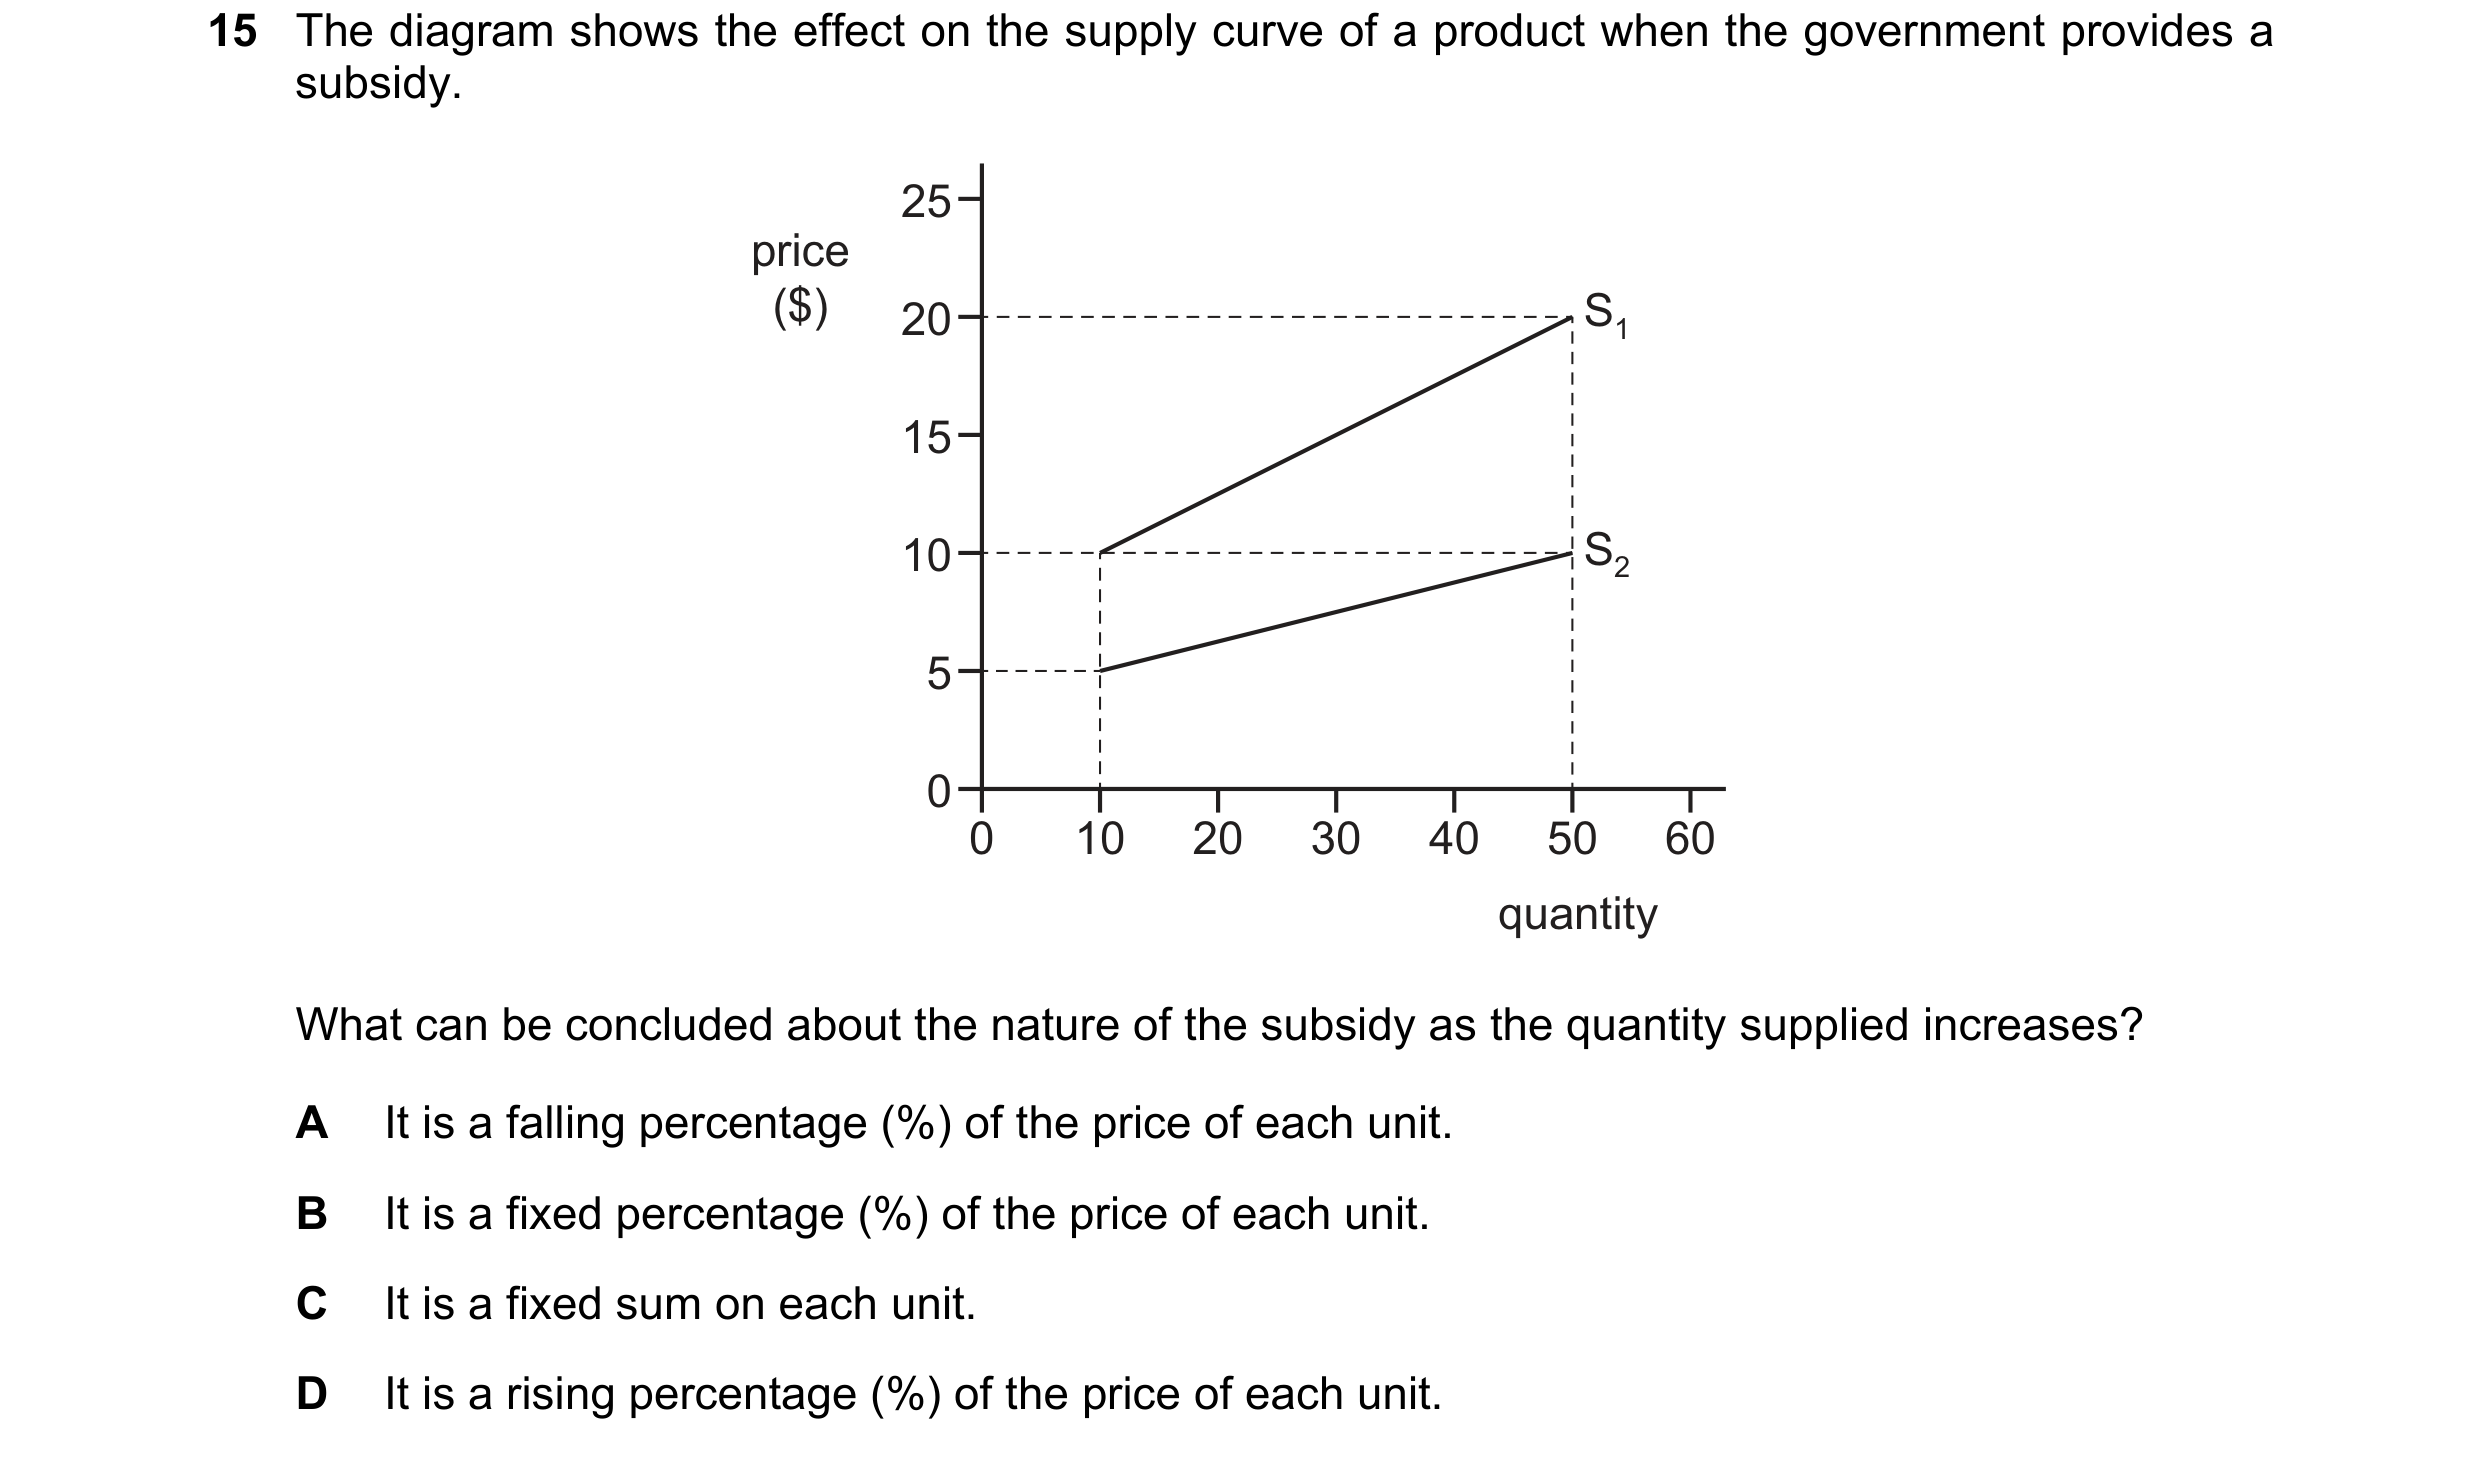
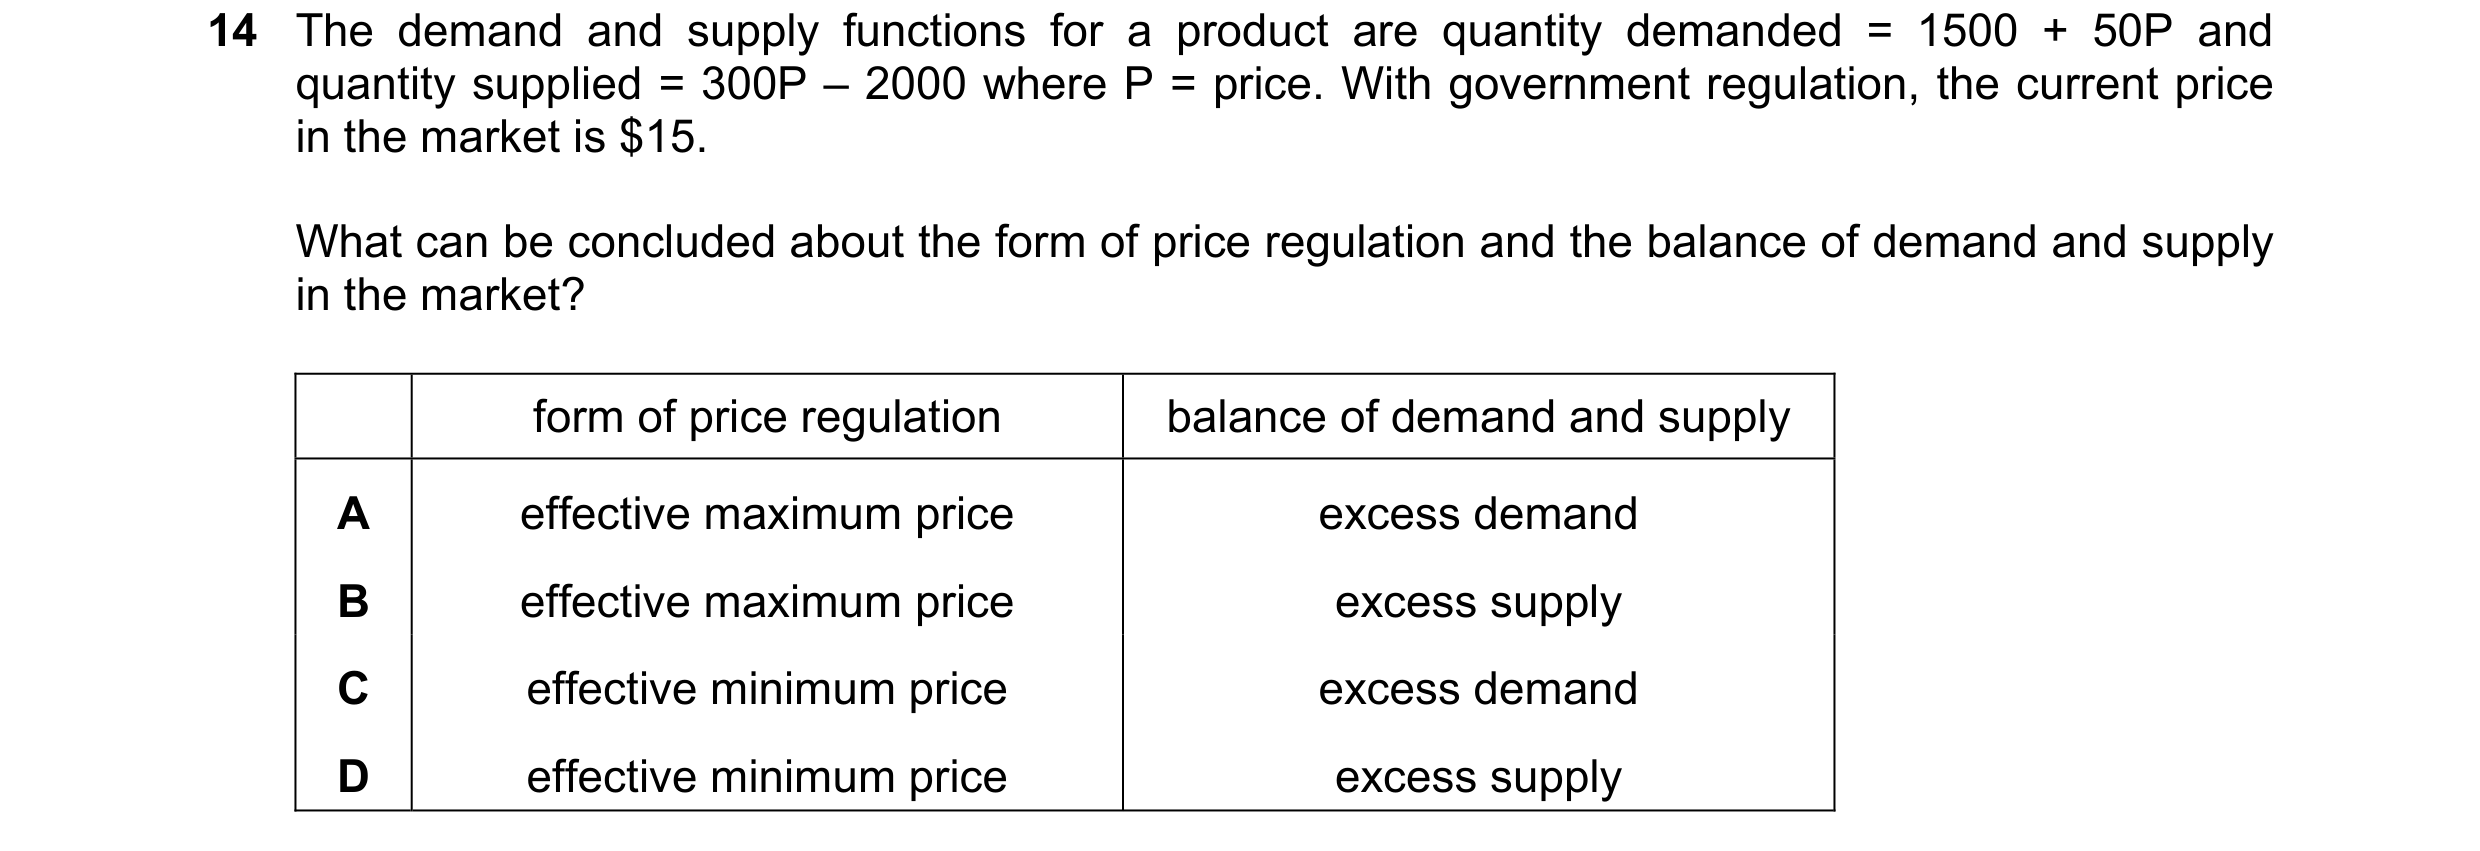
 70 / 119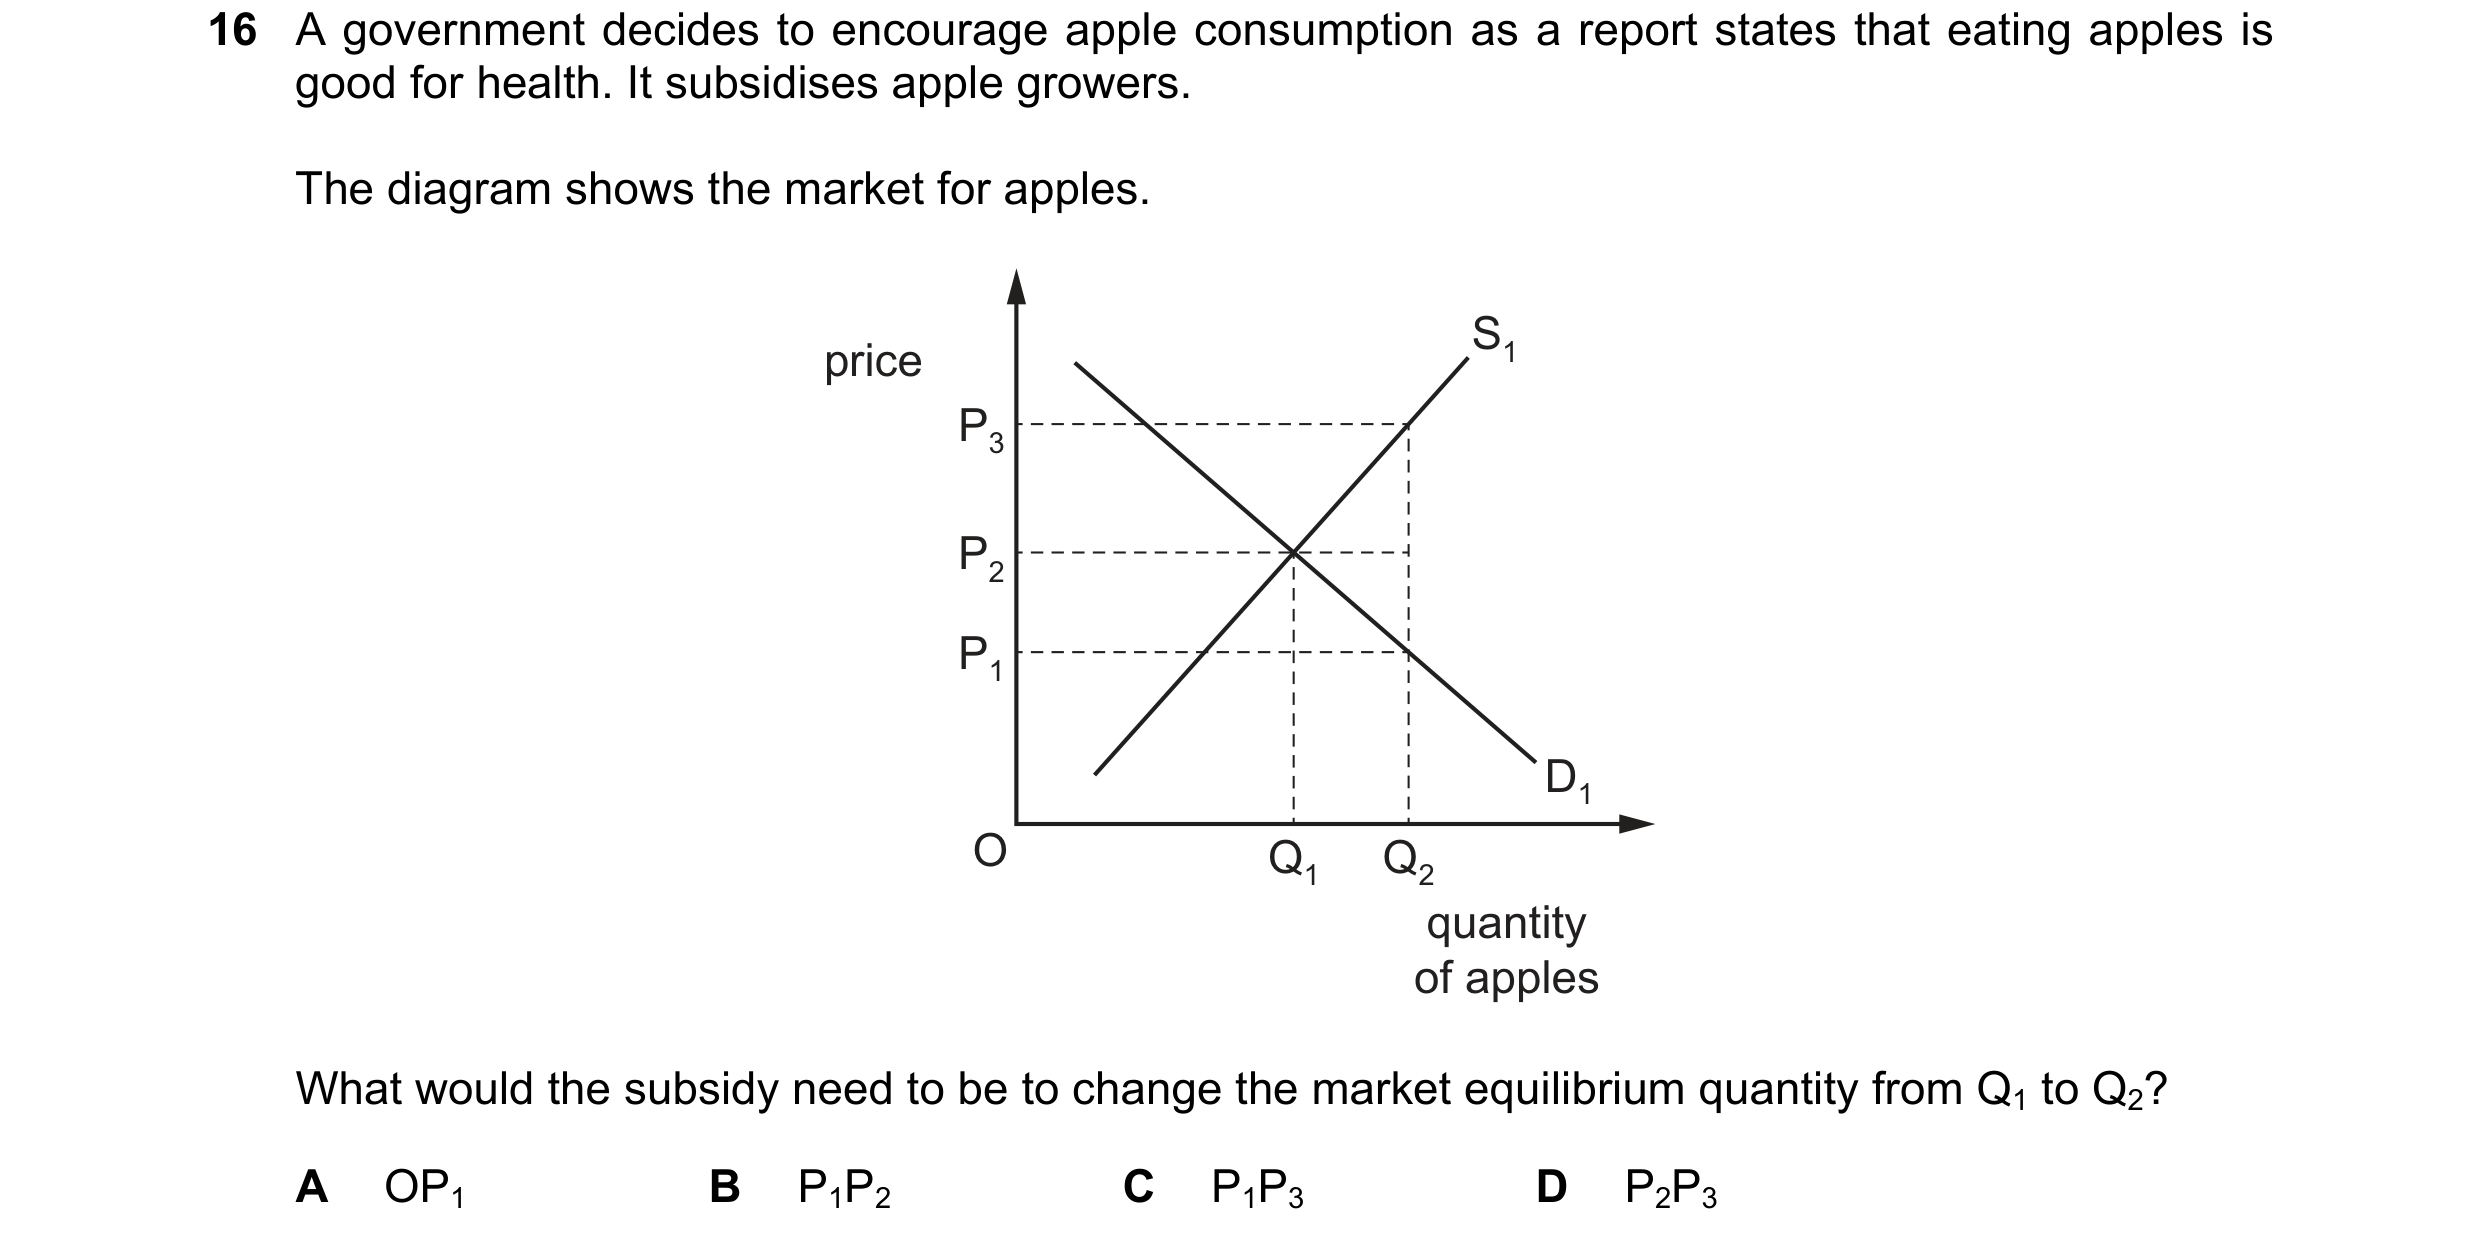
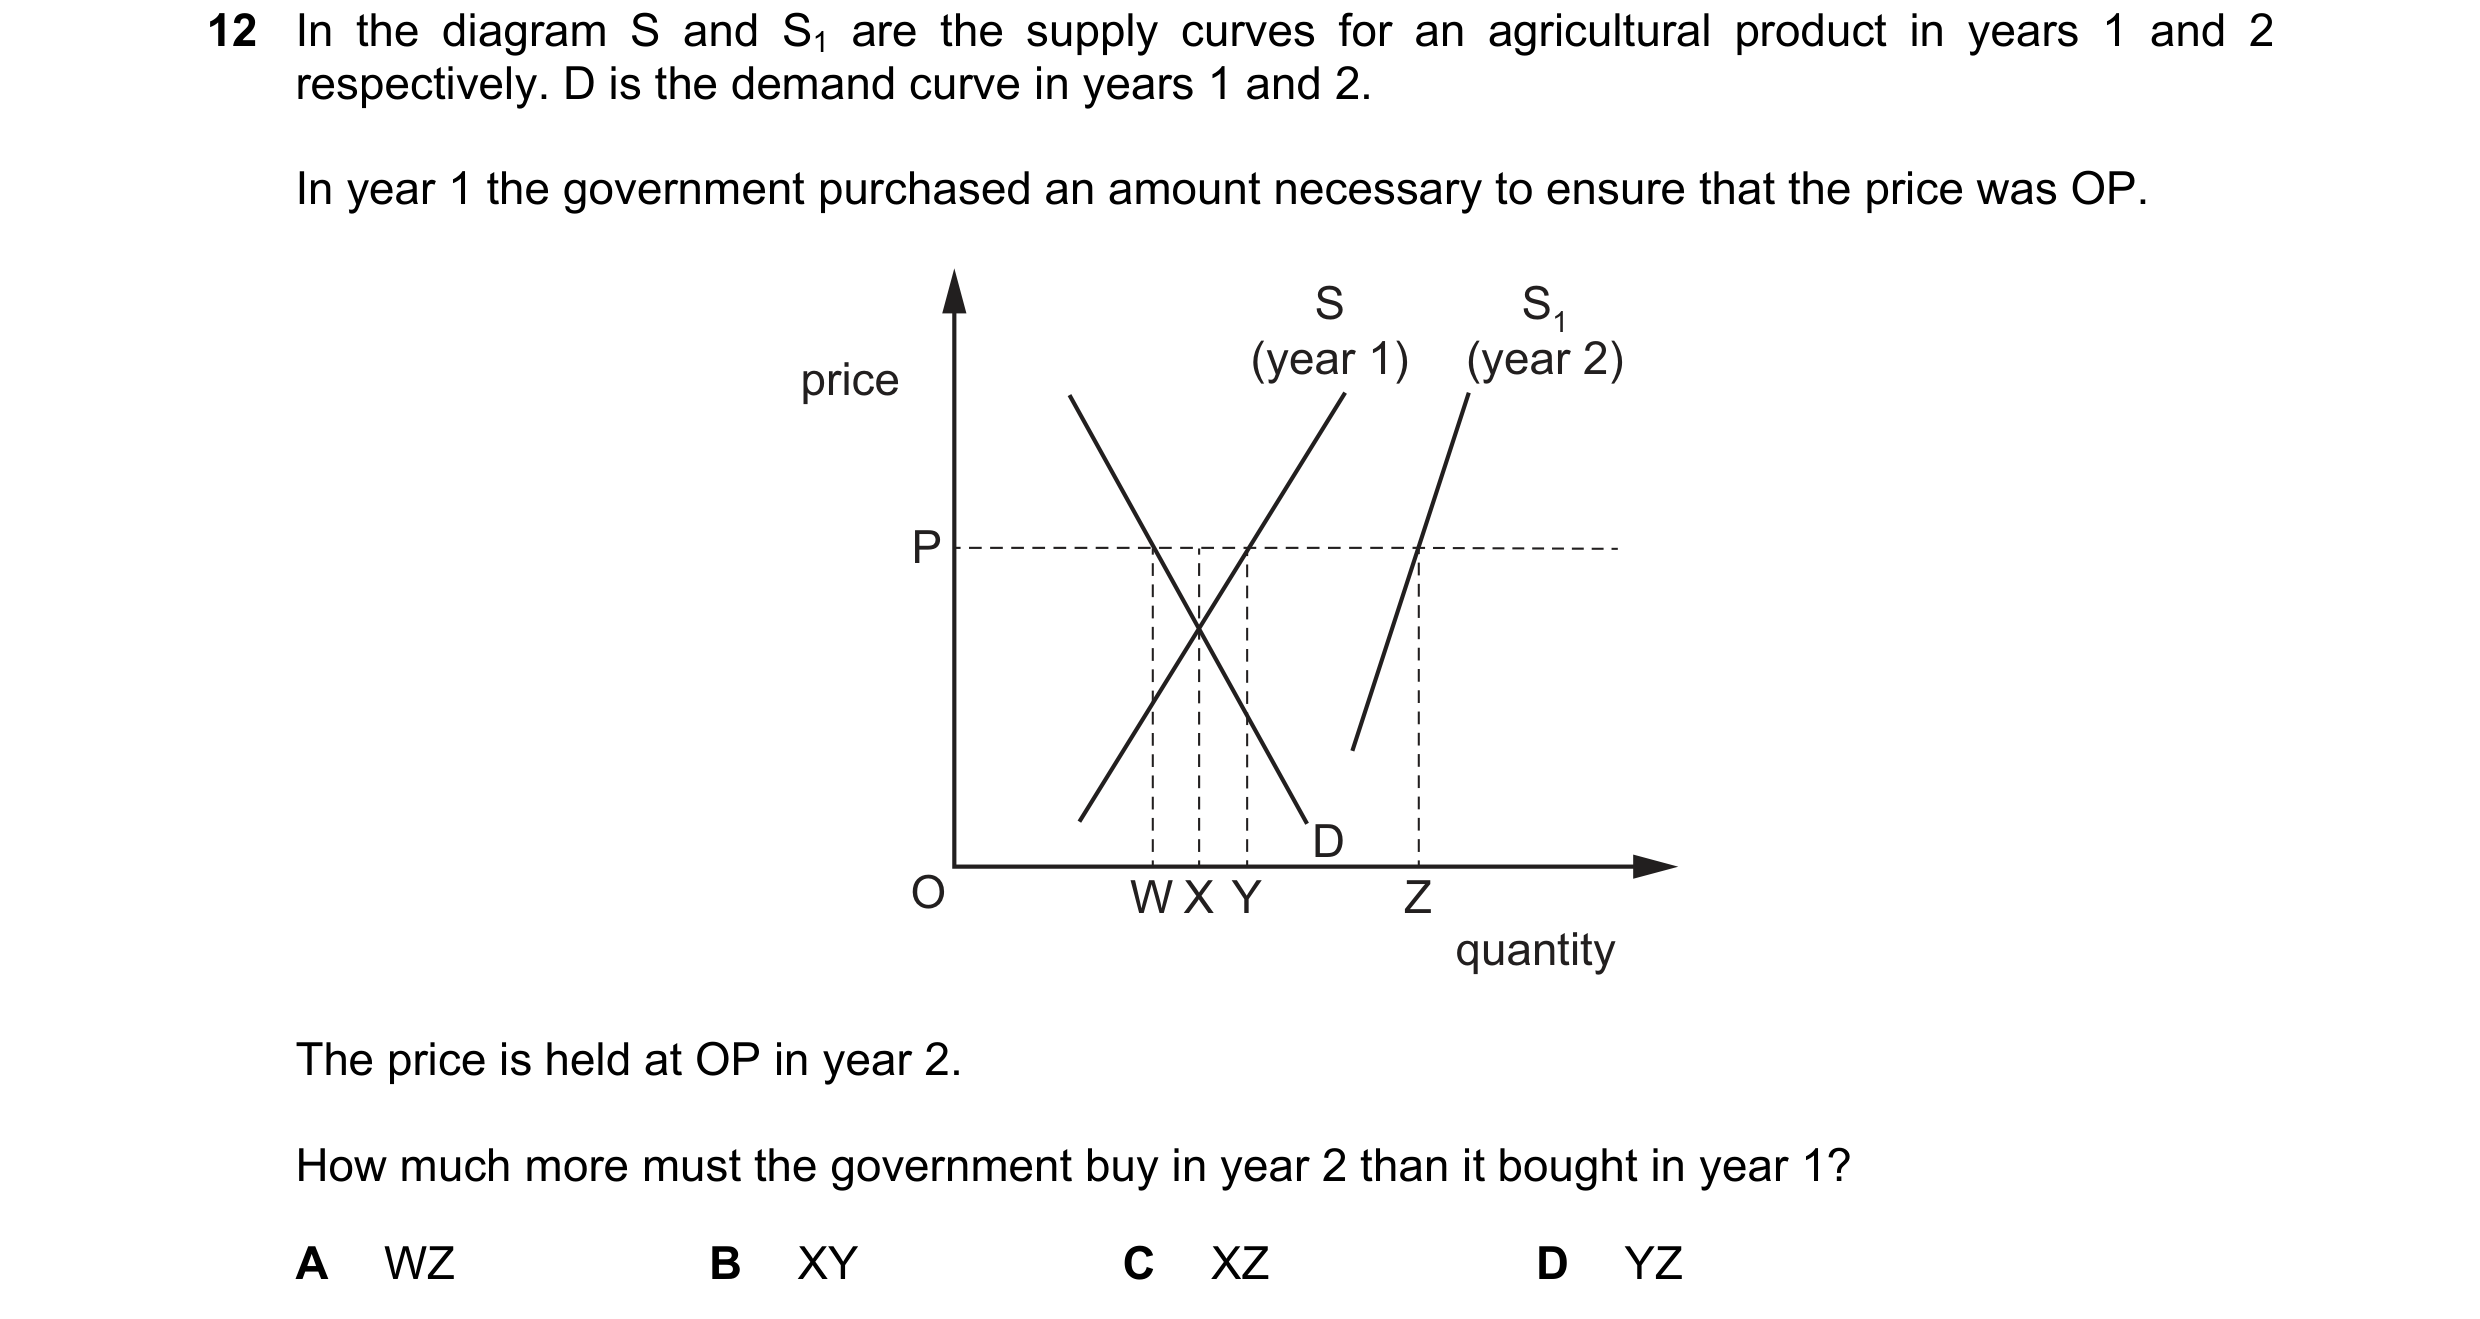 71 / 119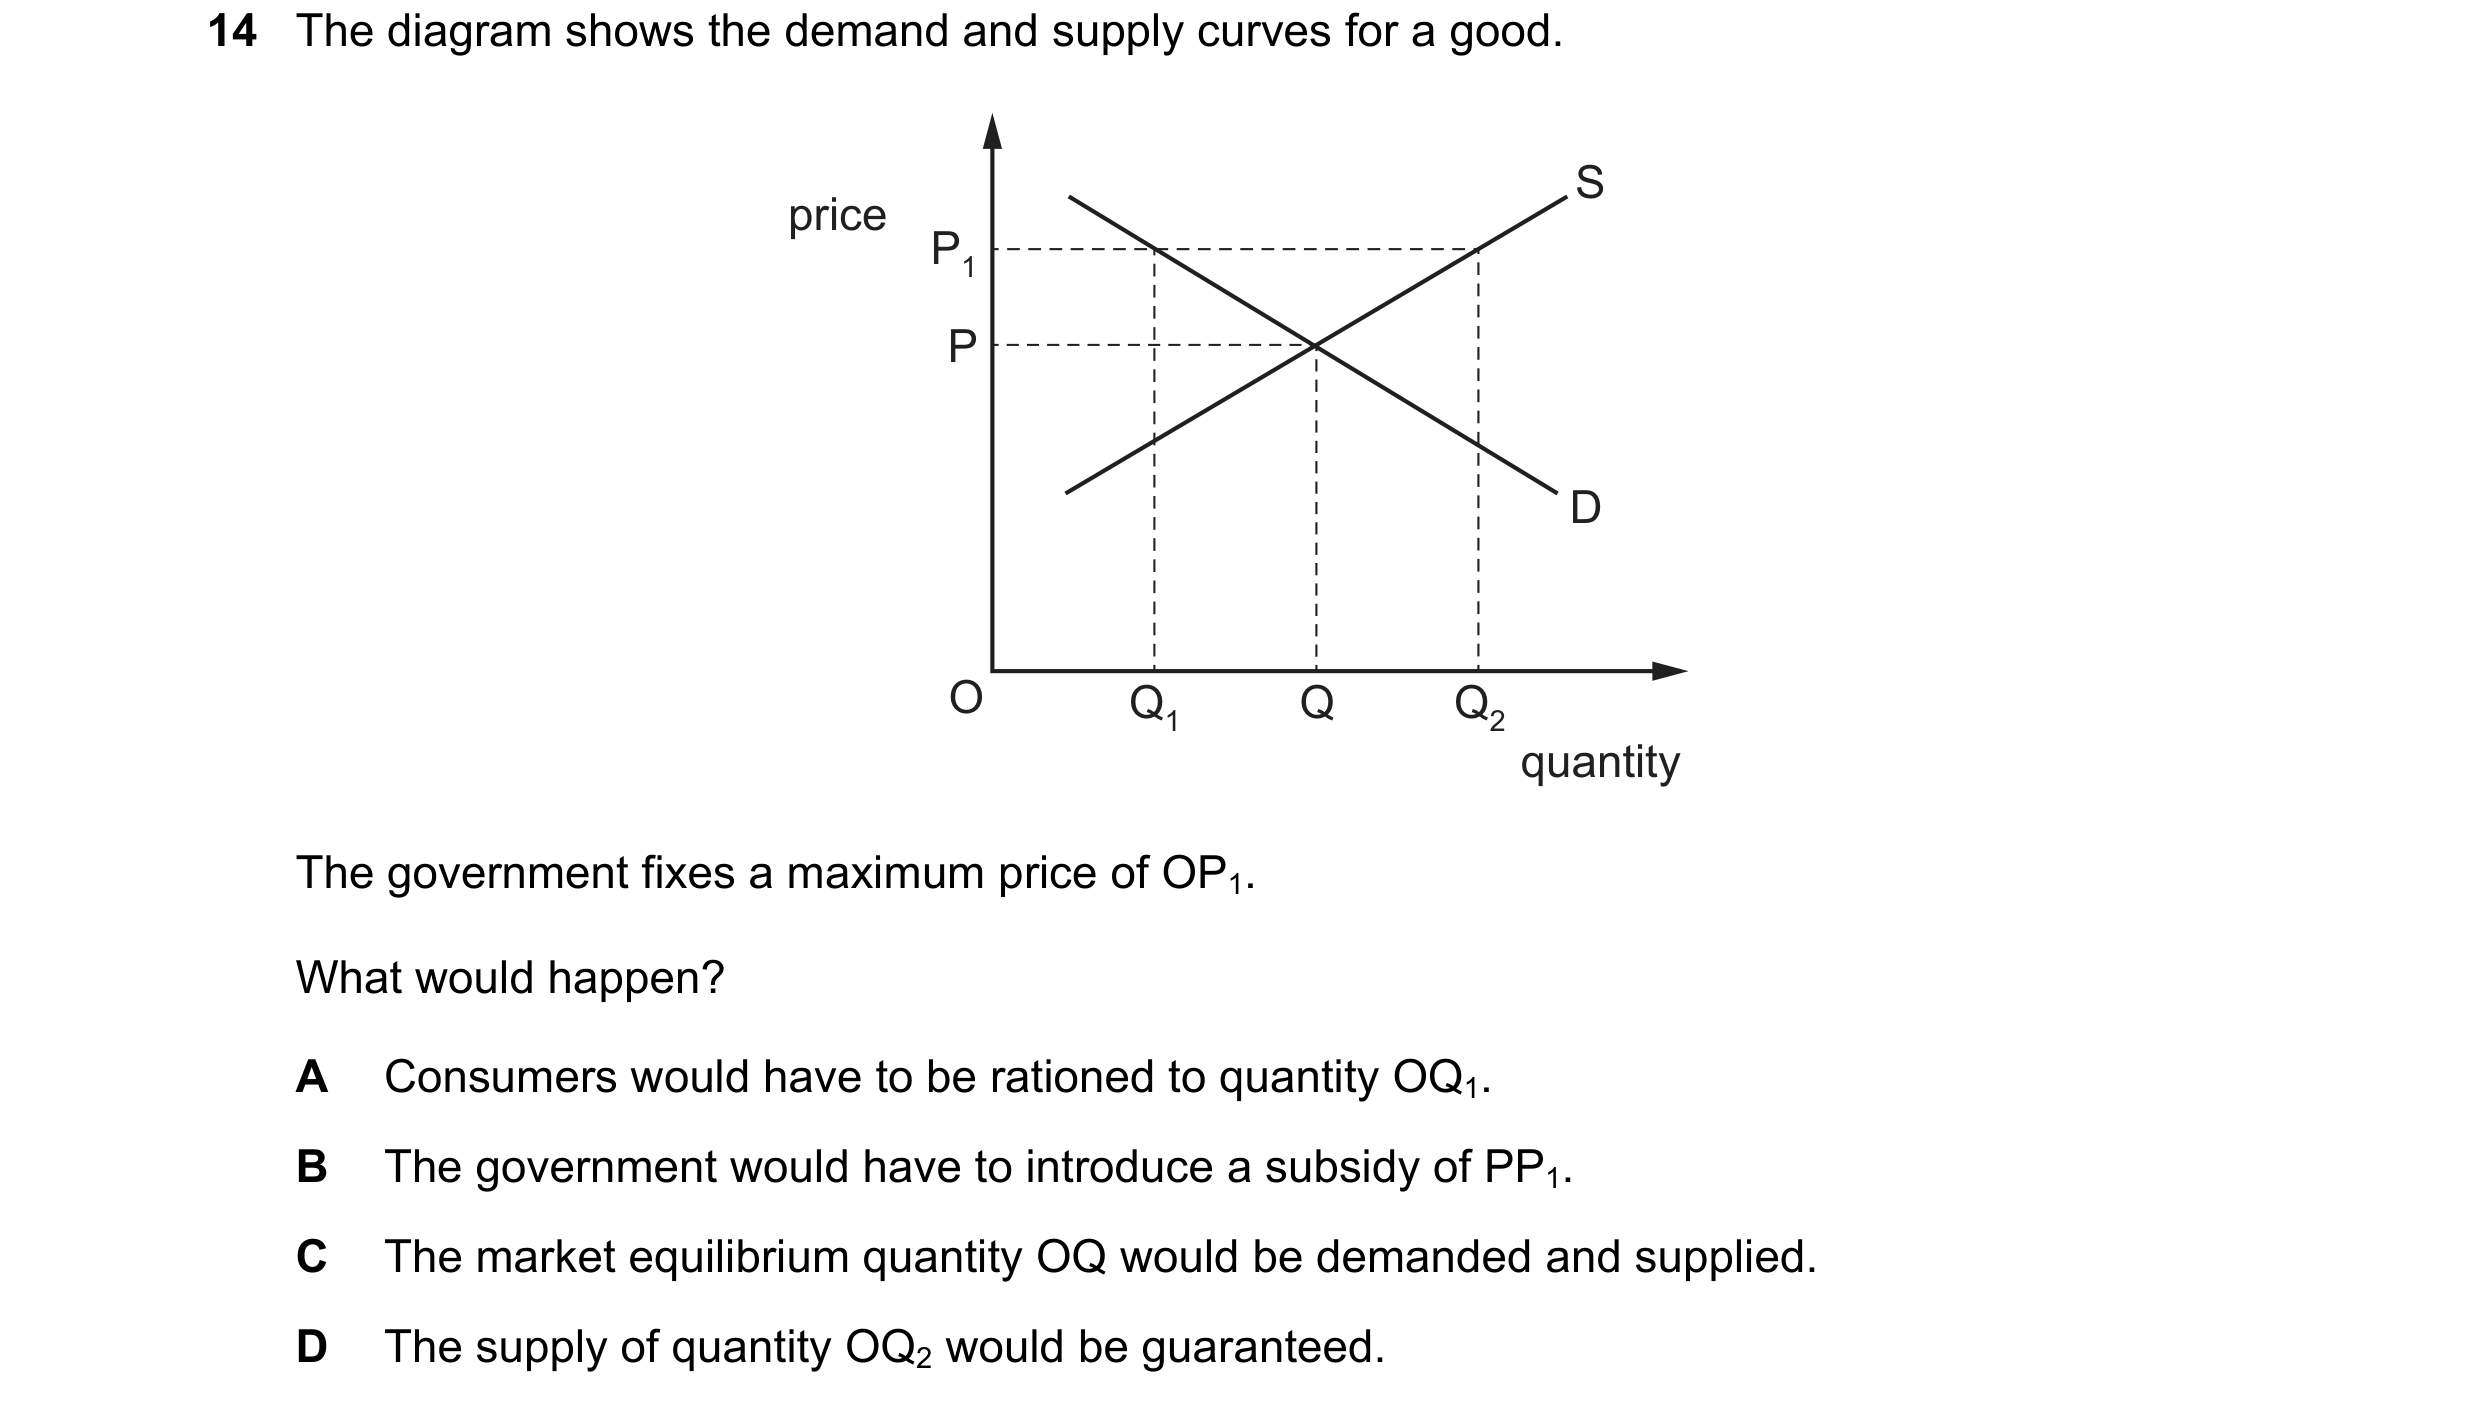
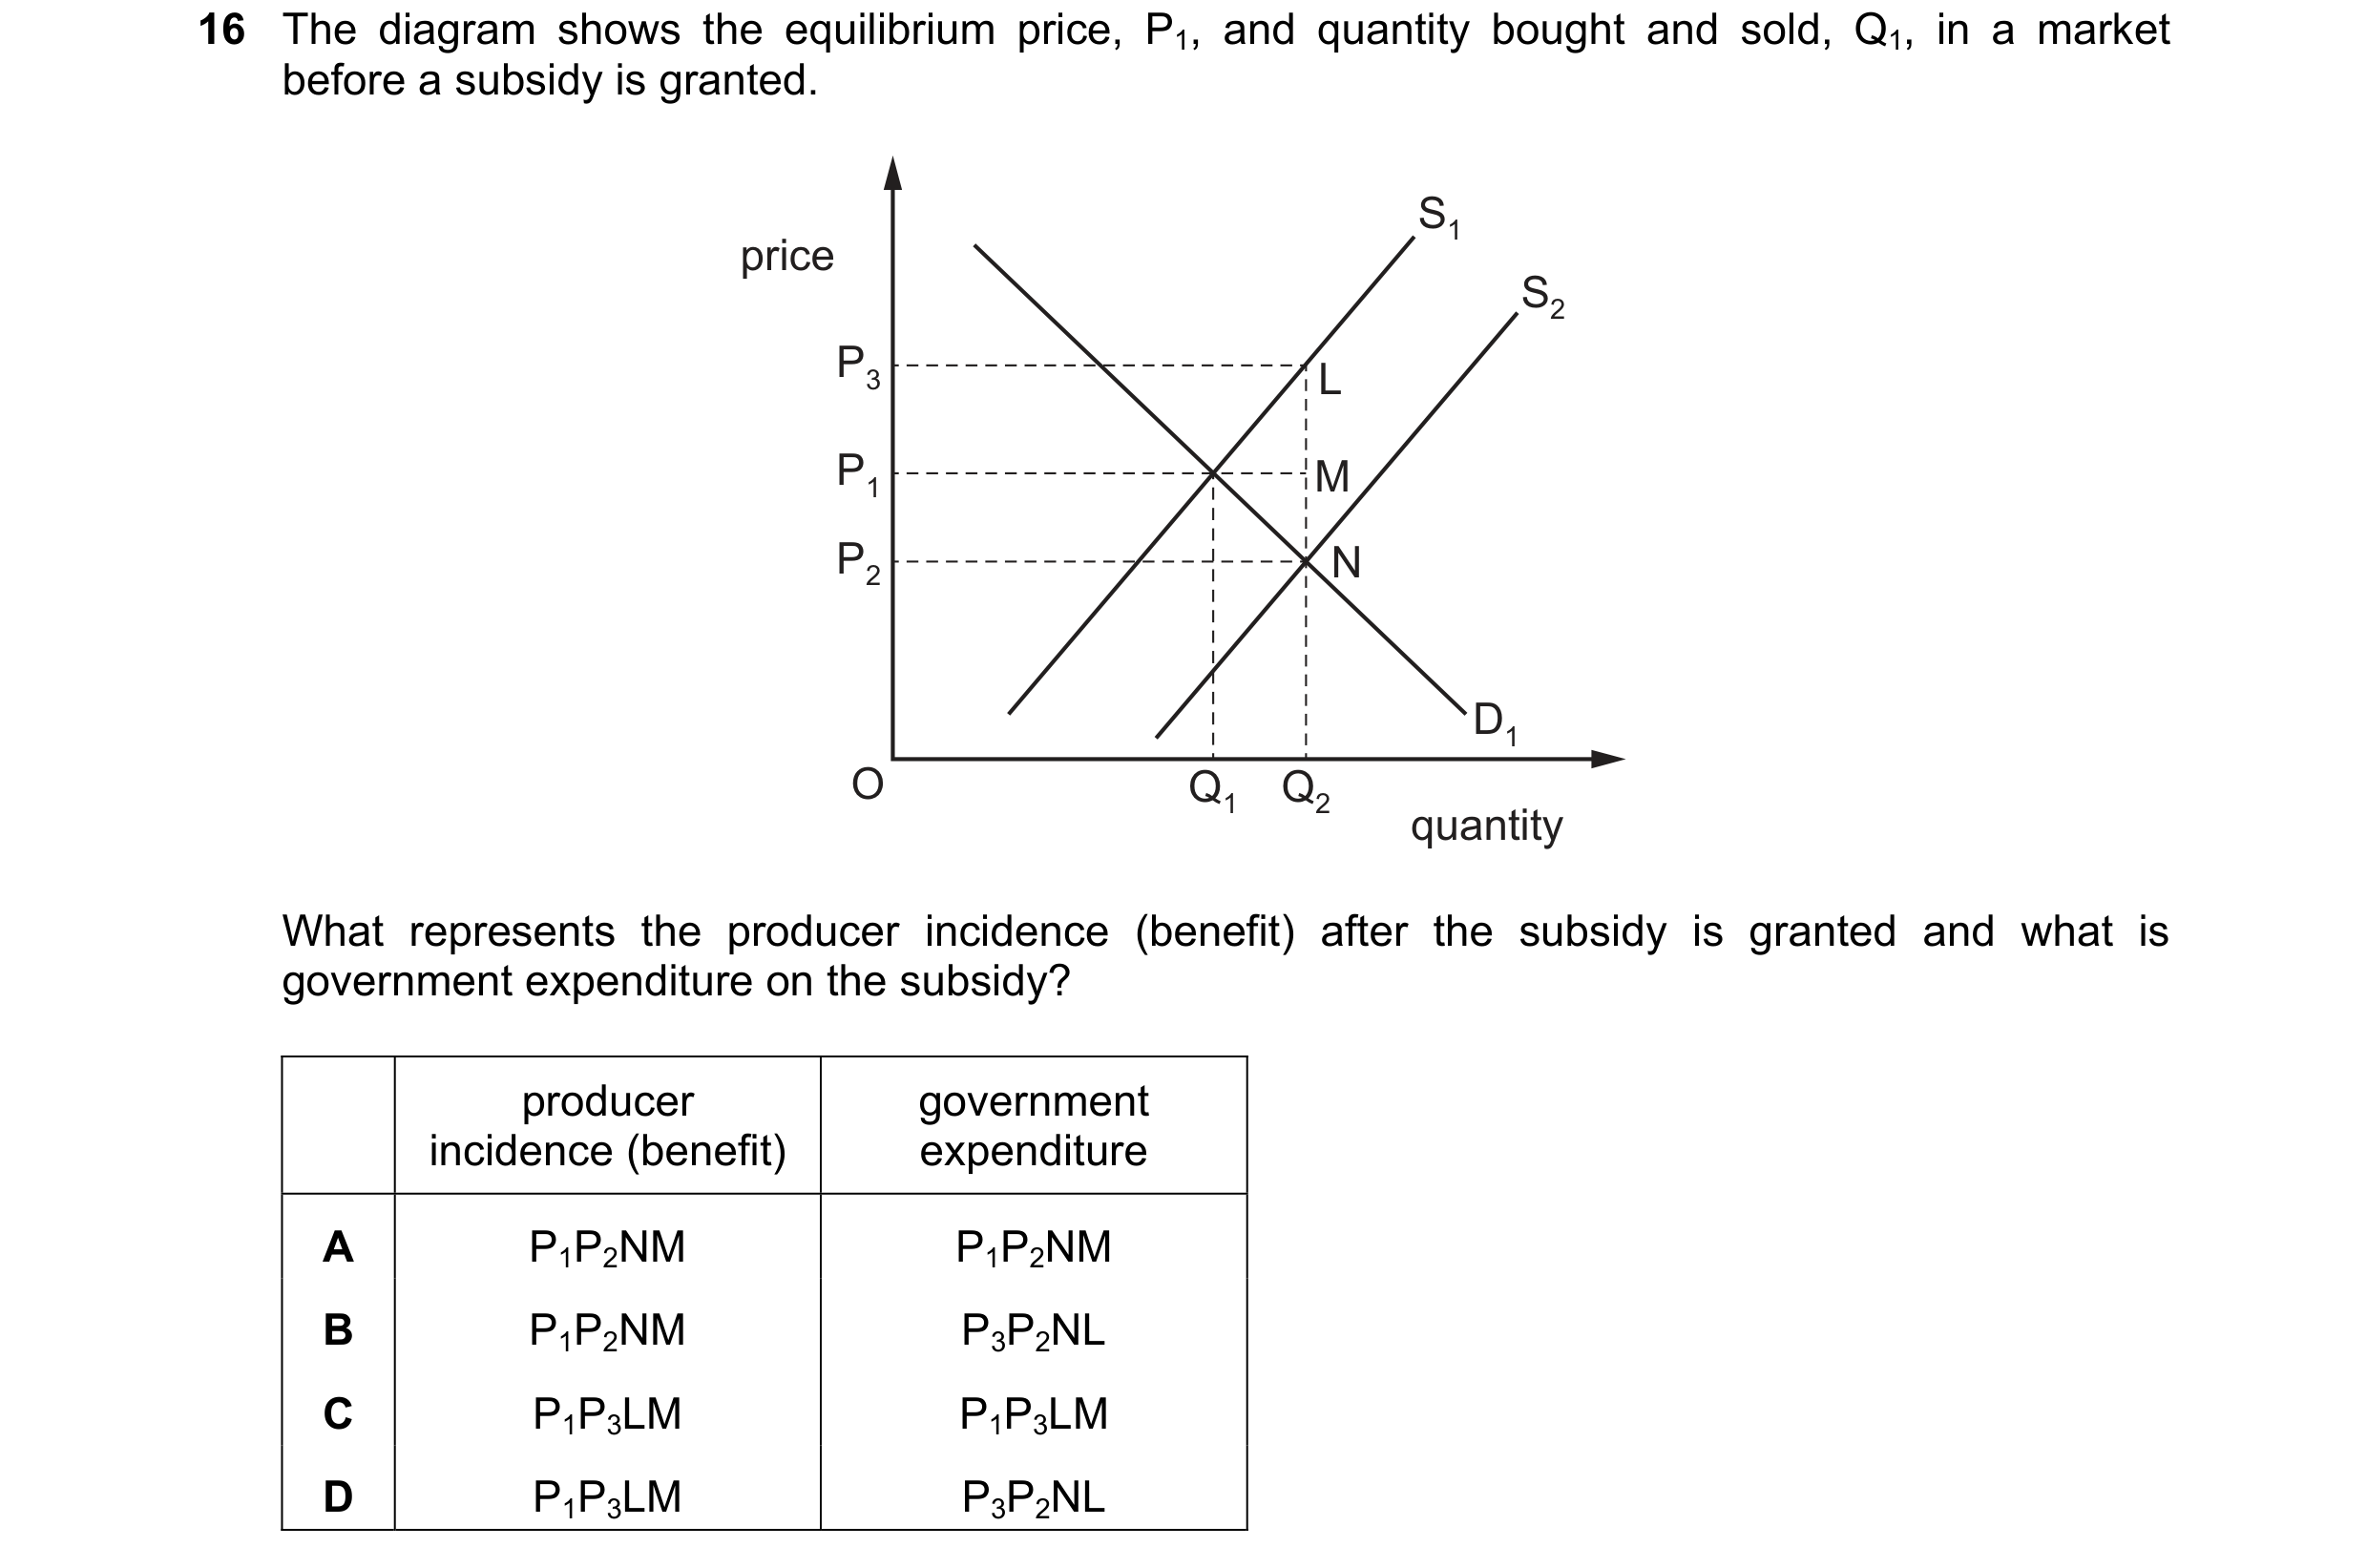 72 / 119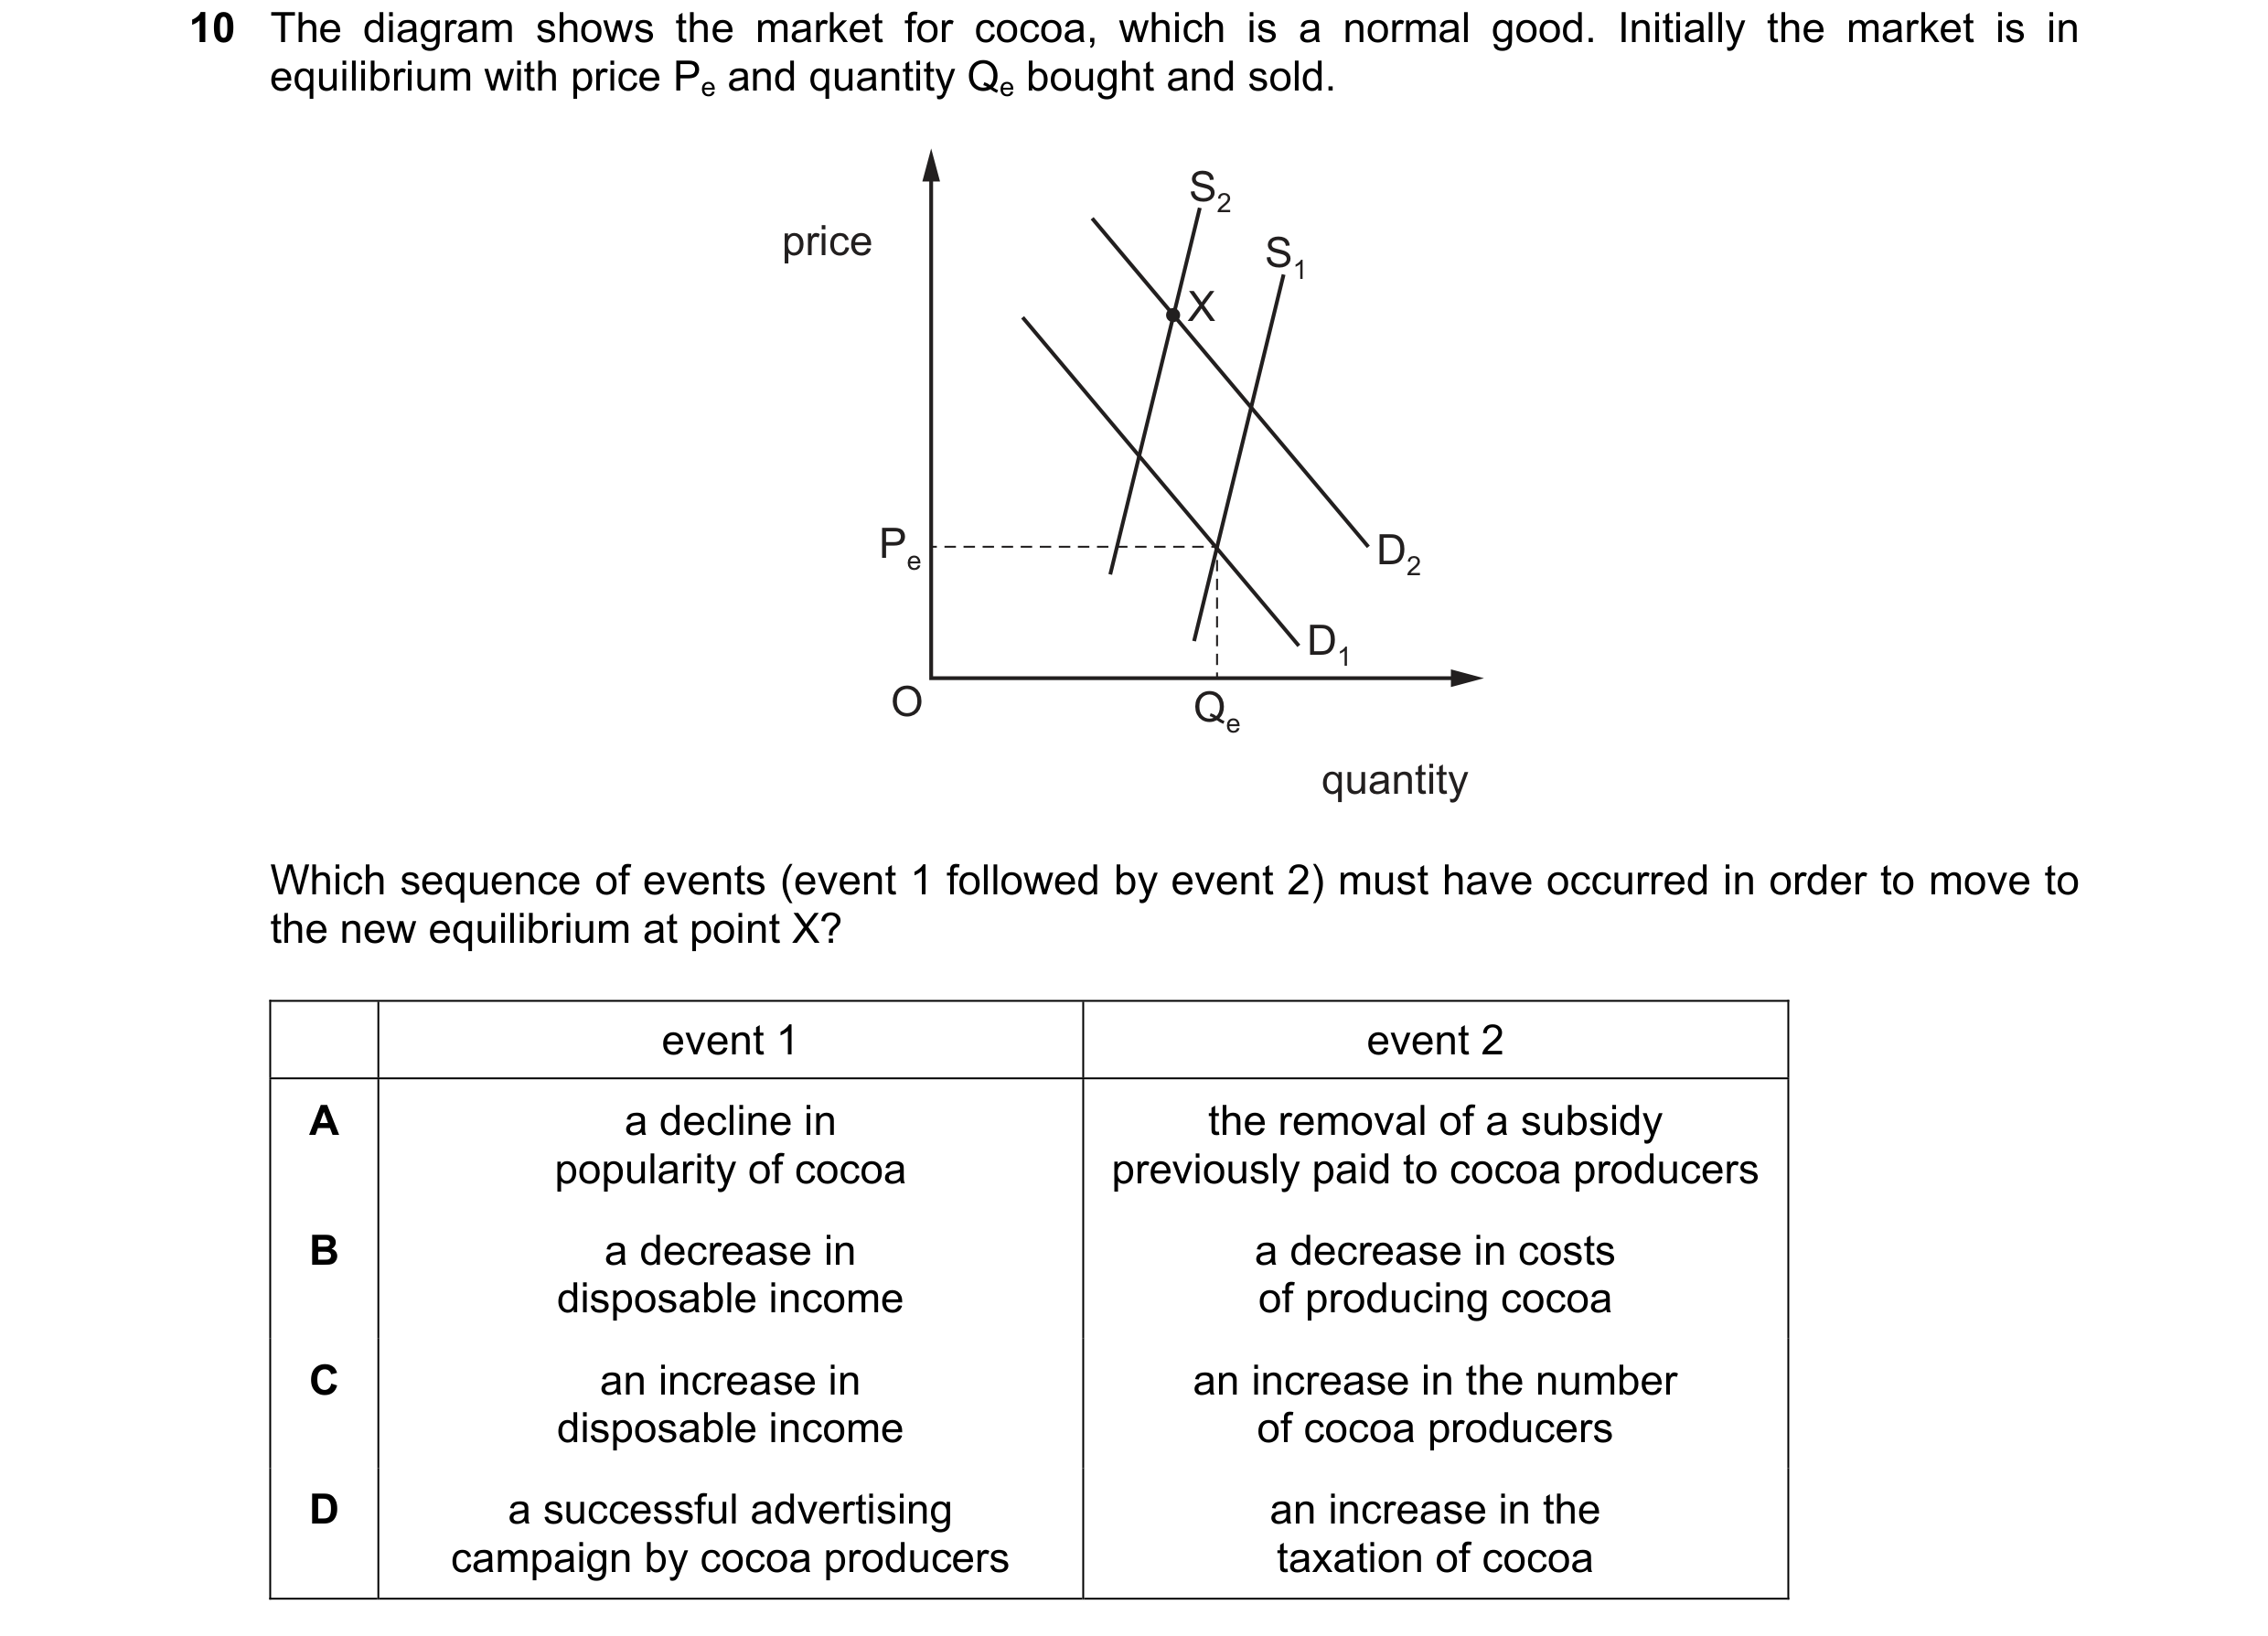
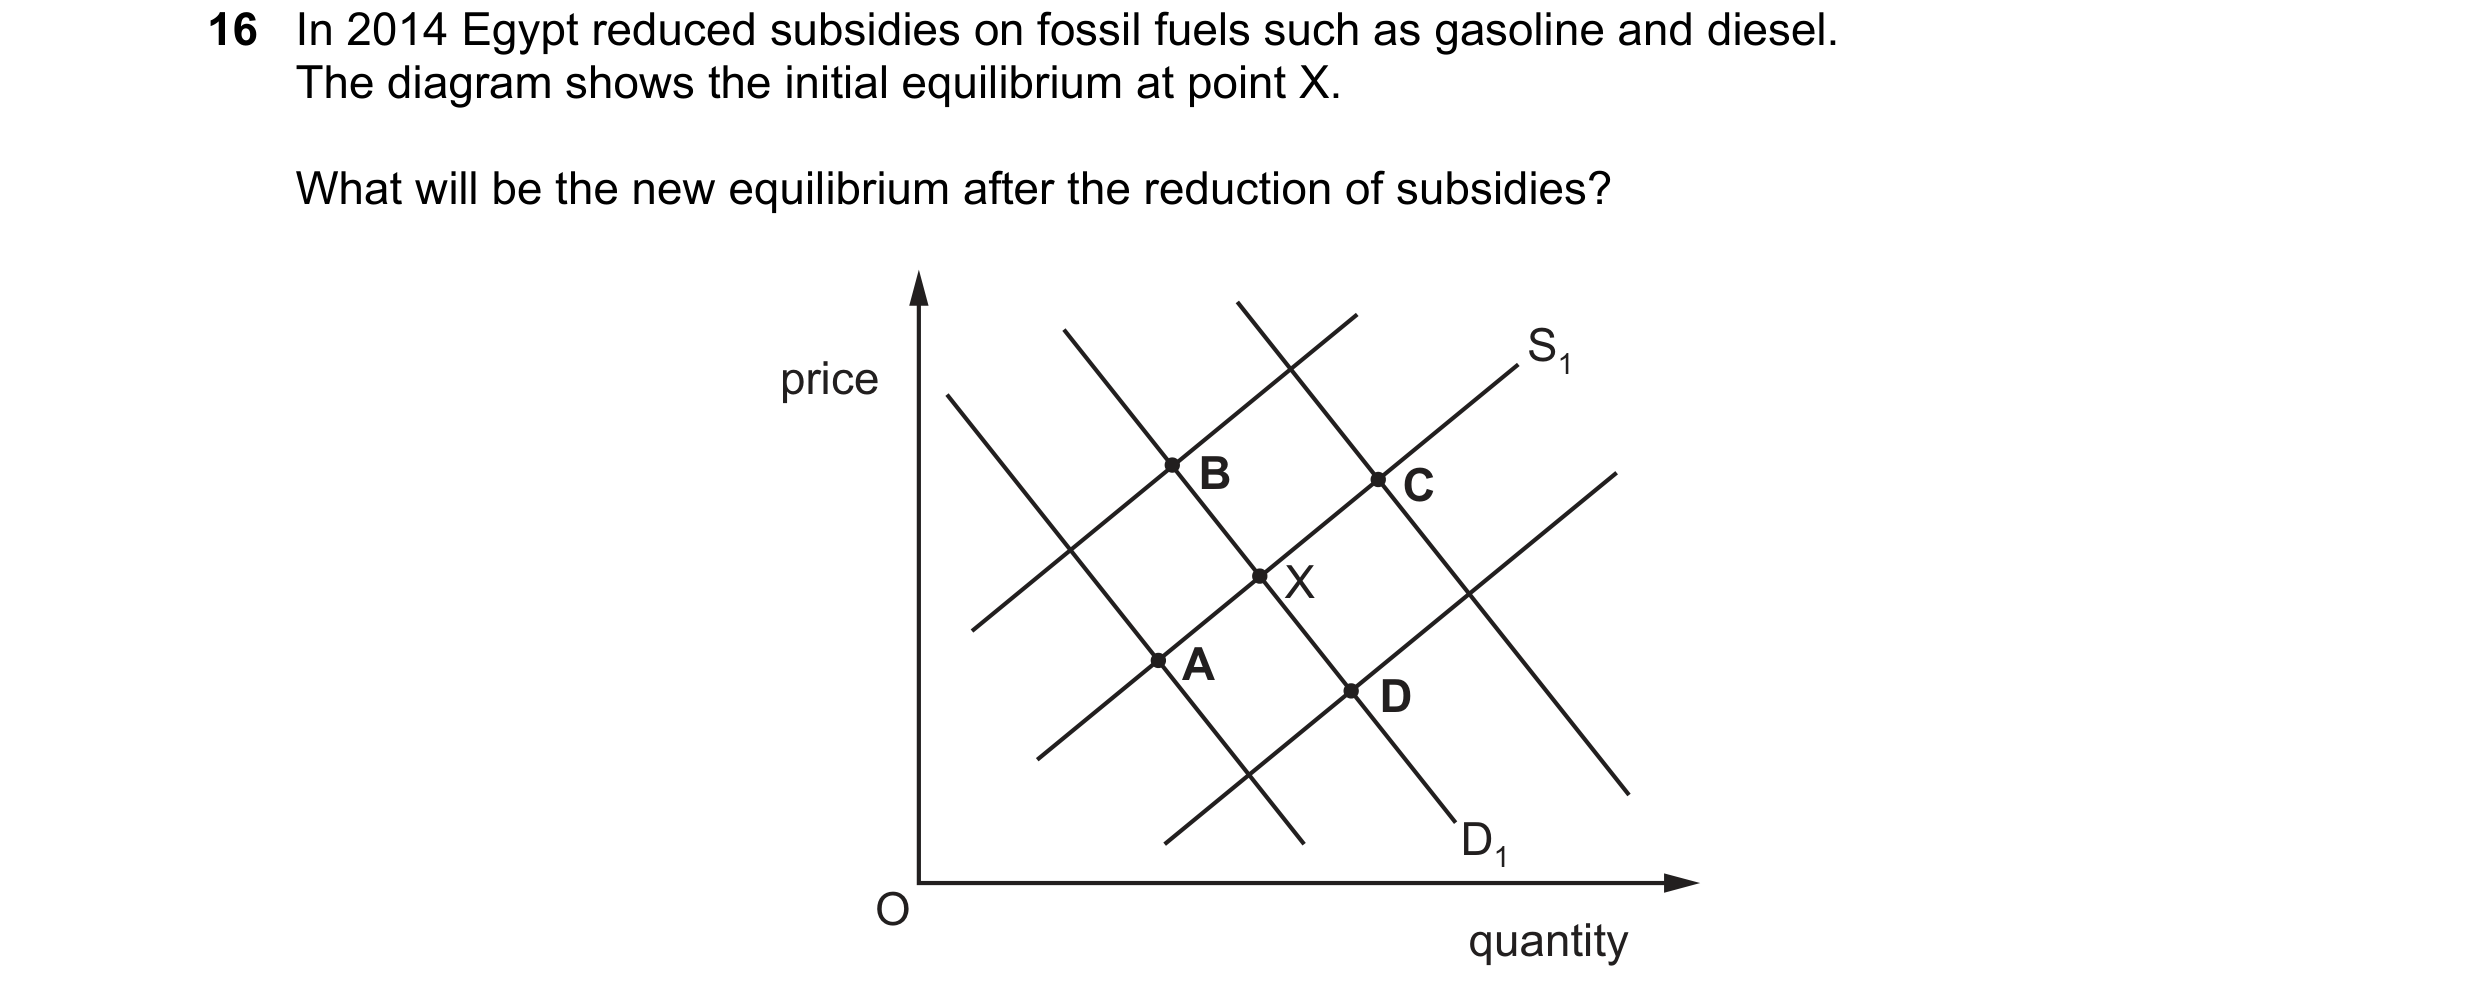 73 / 119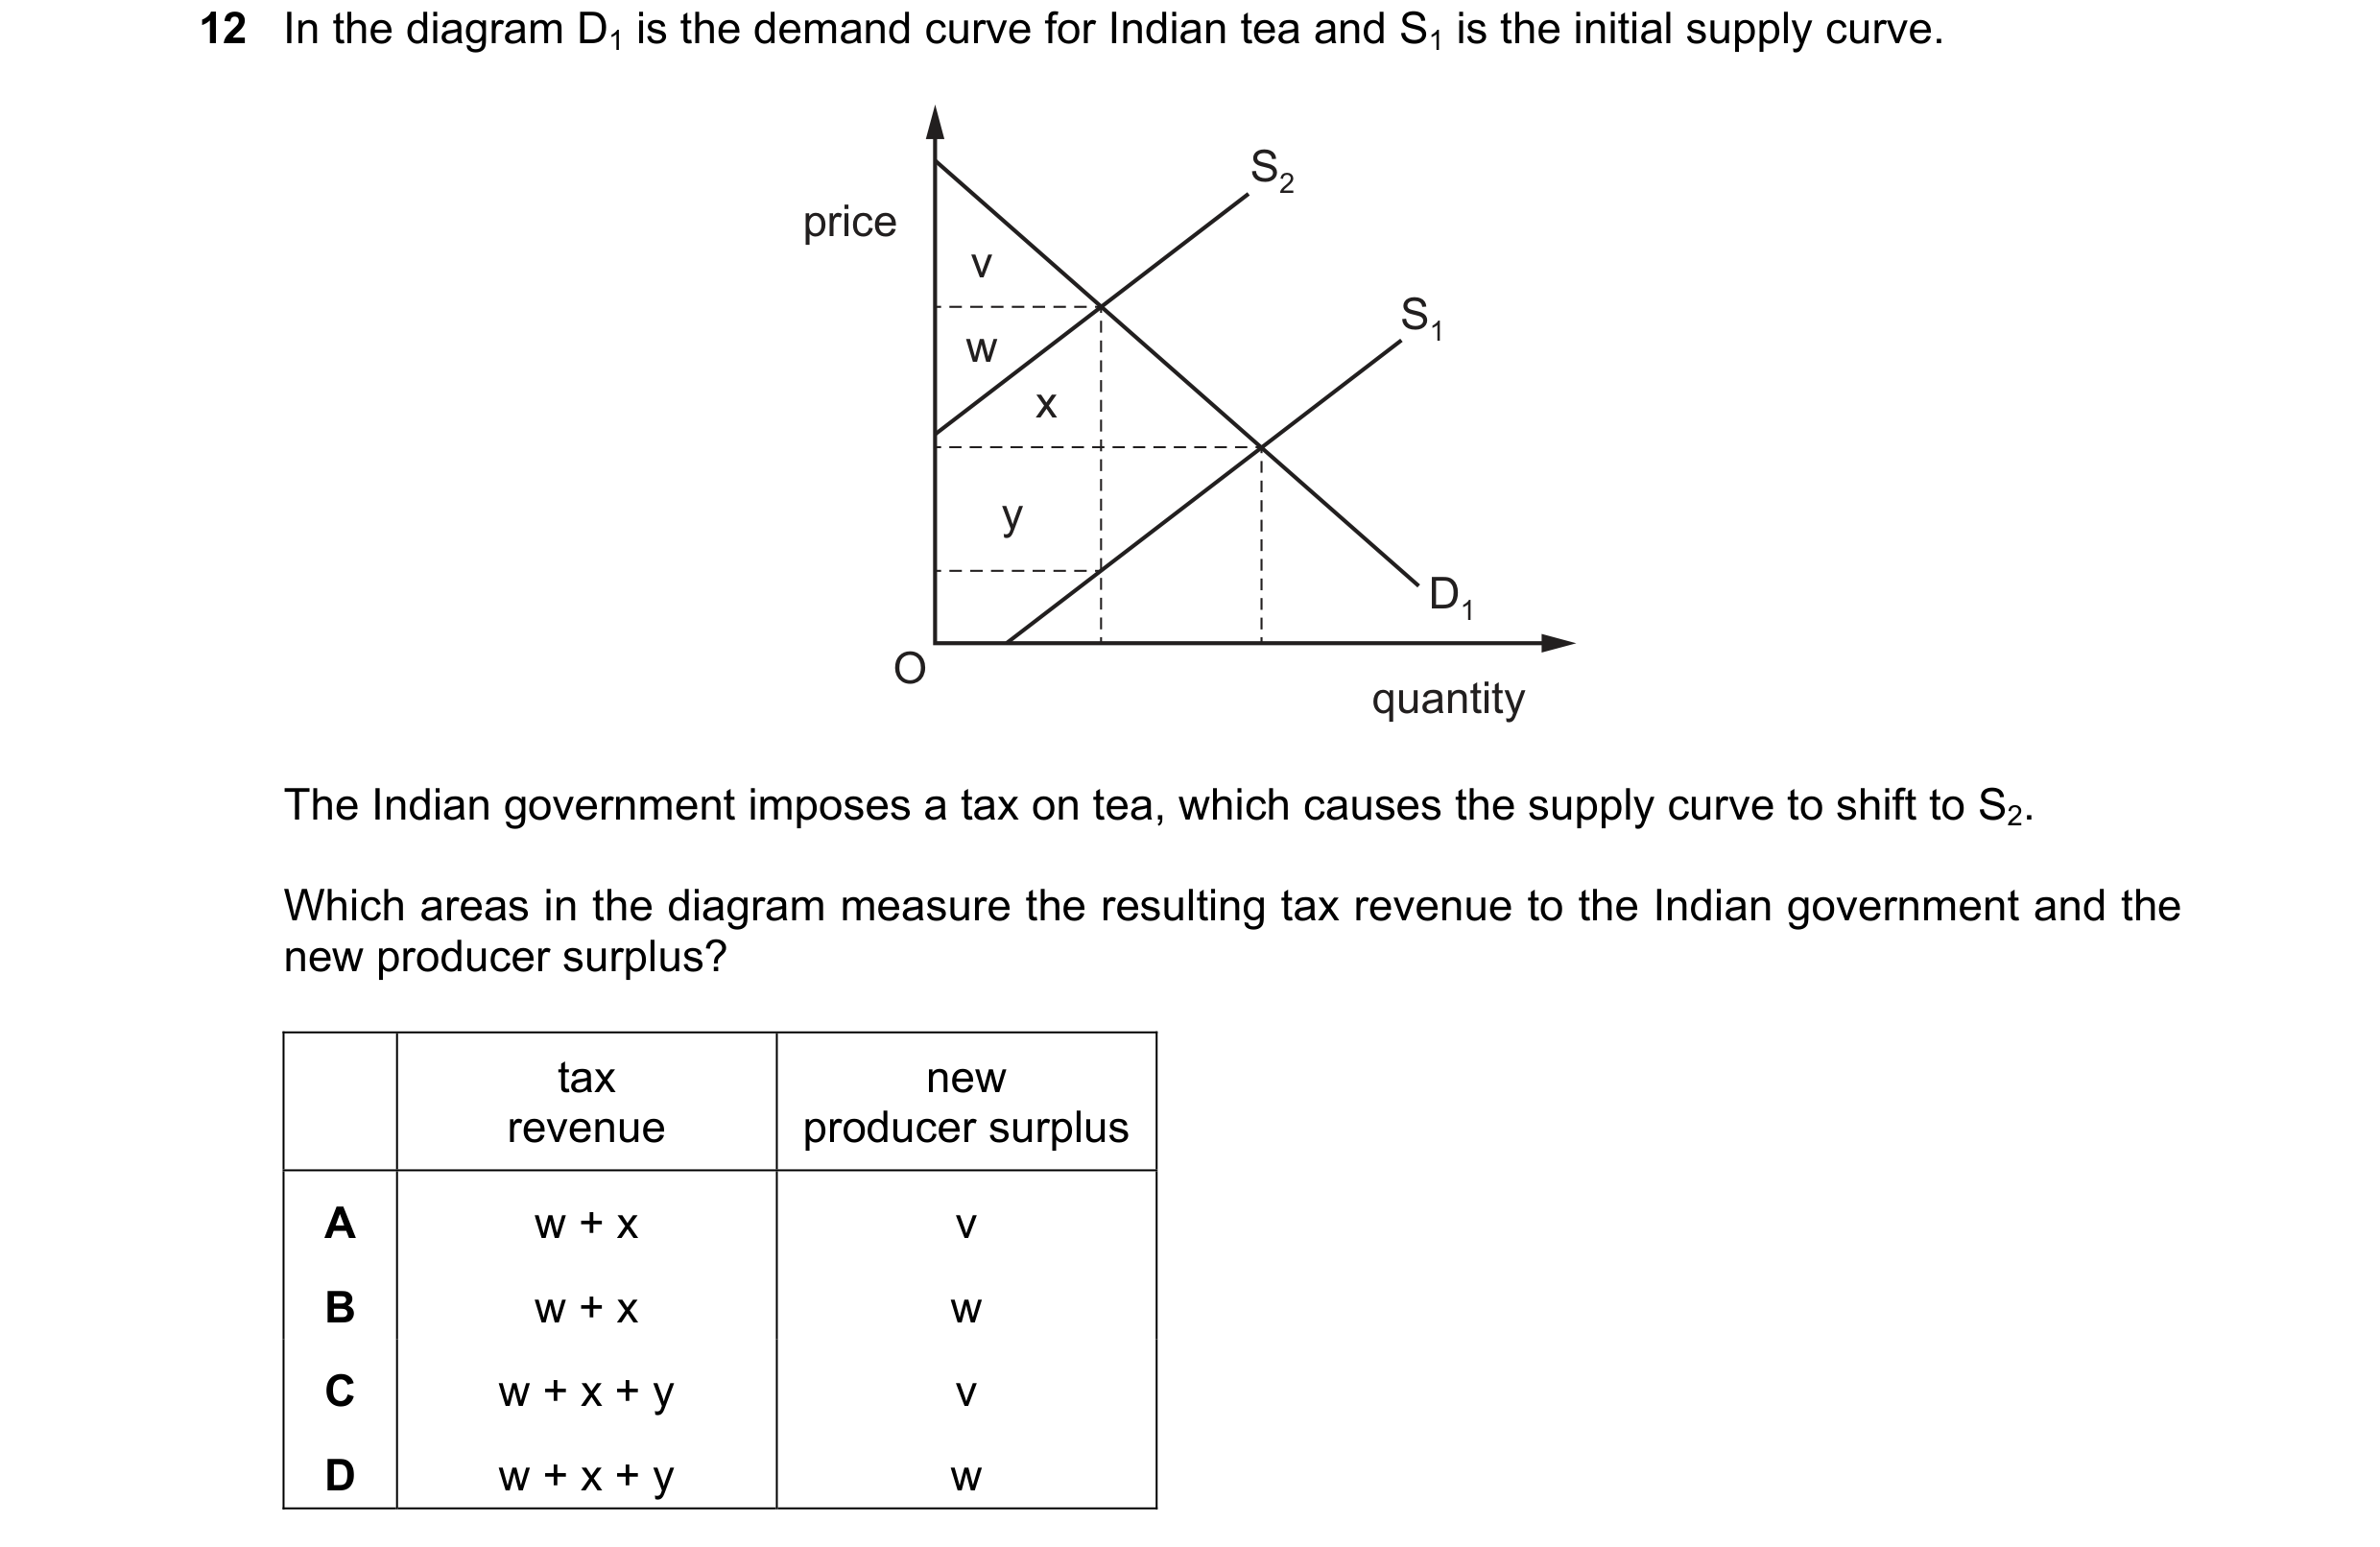
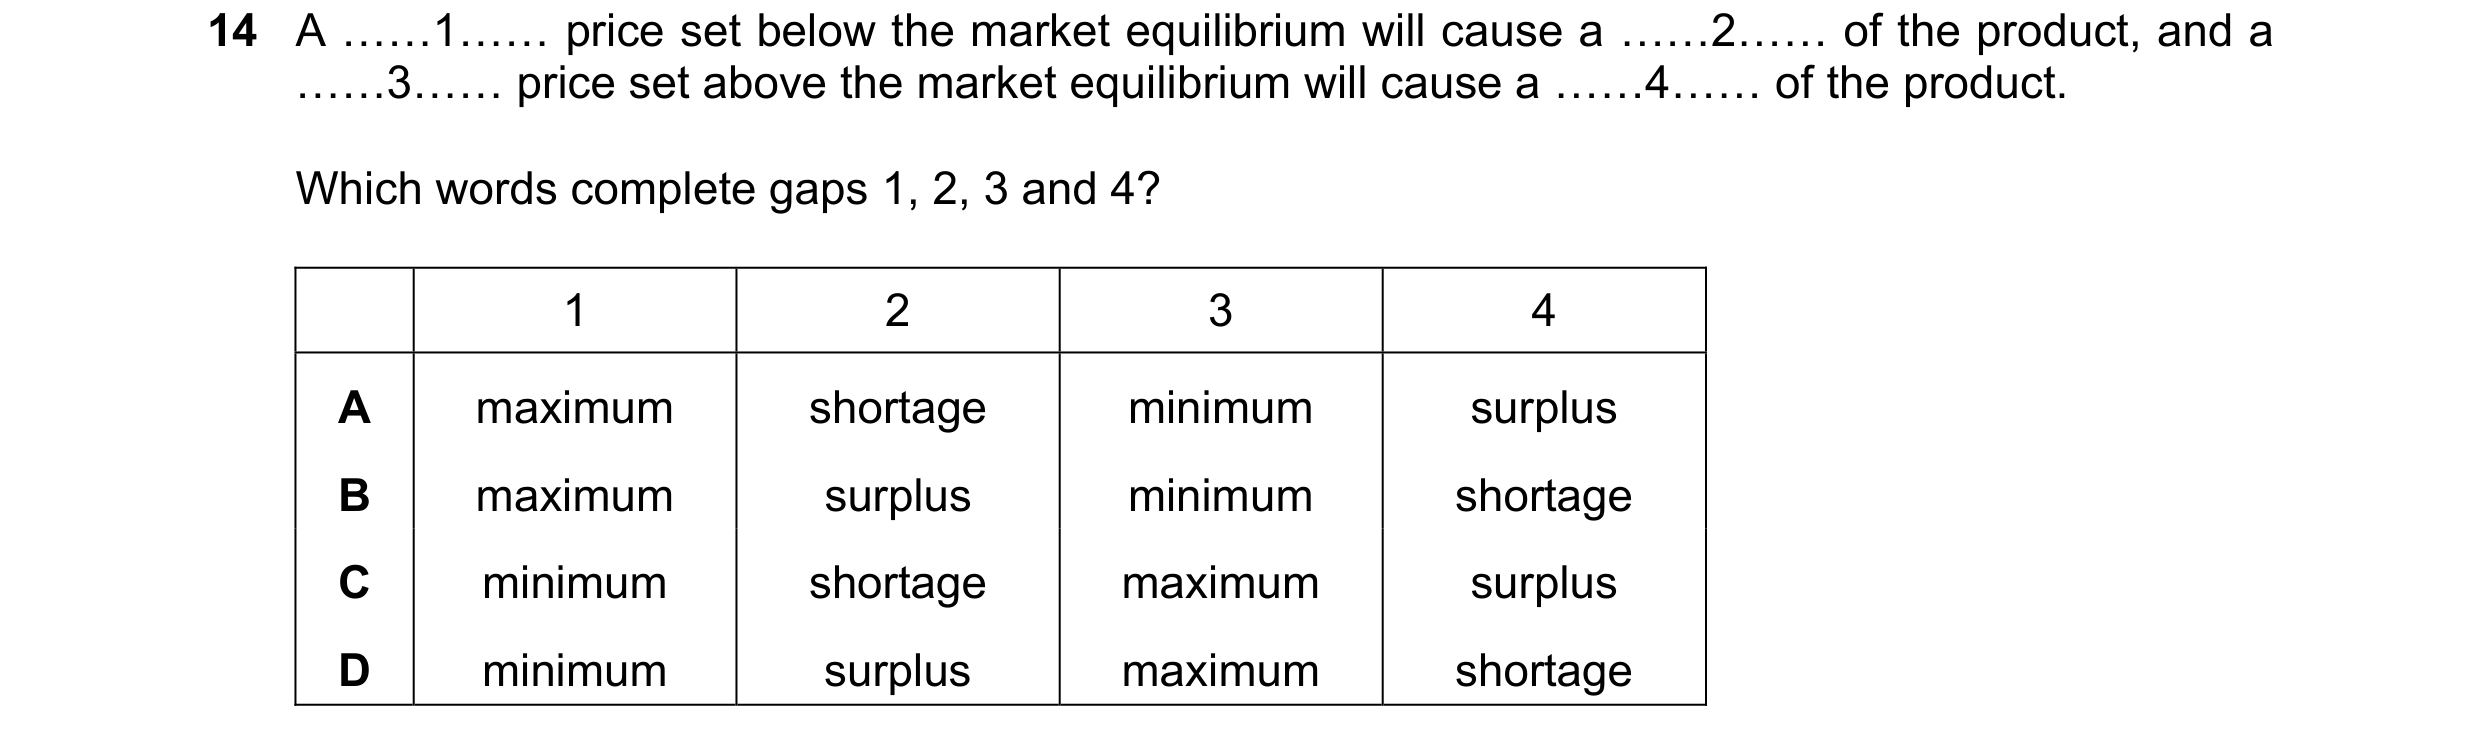 74 / 119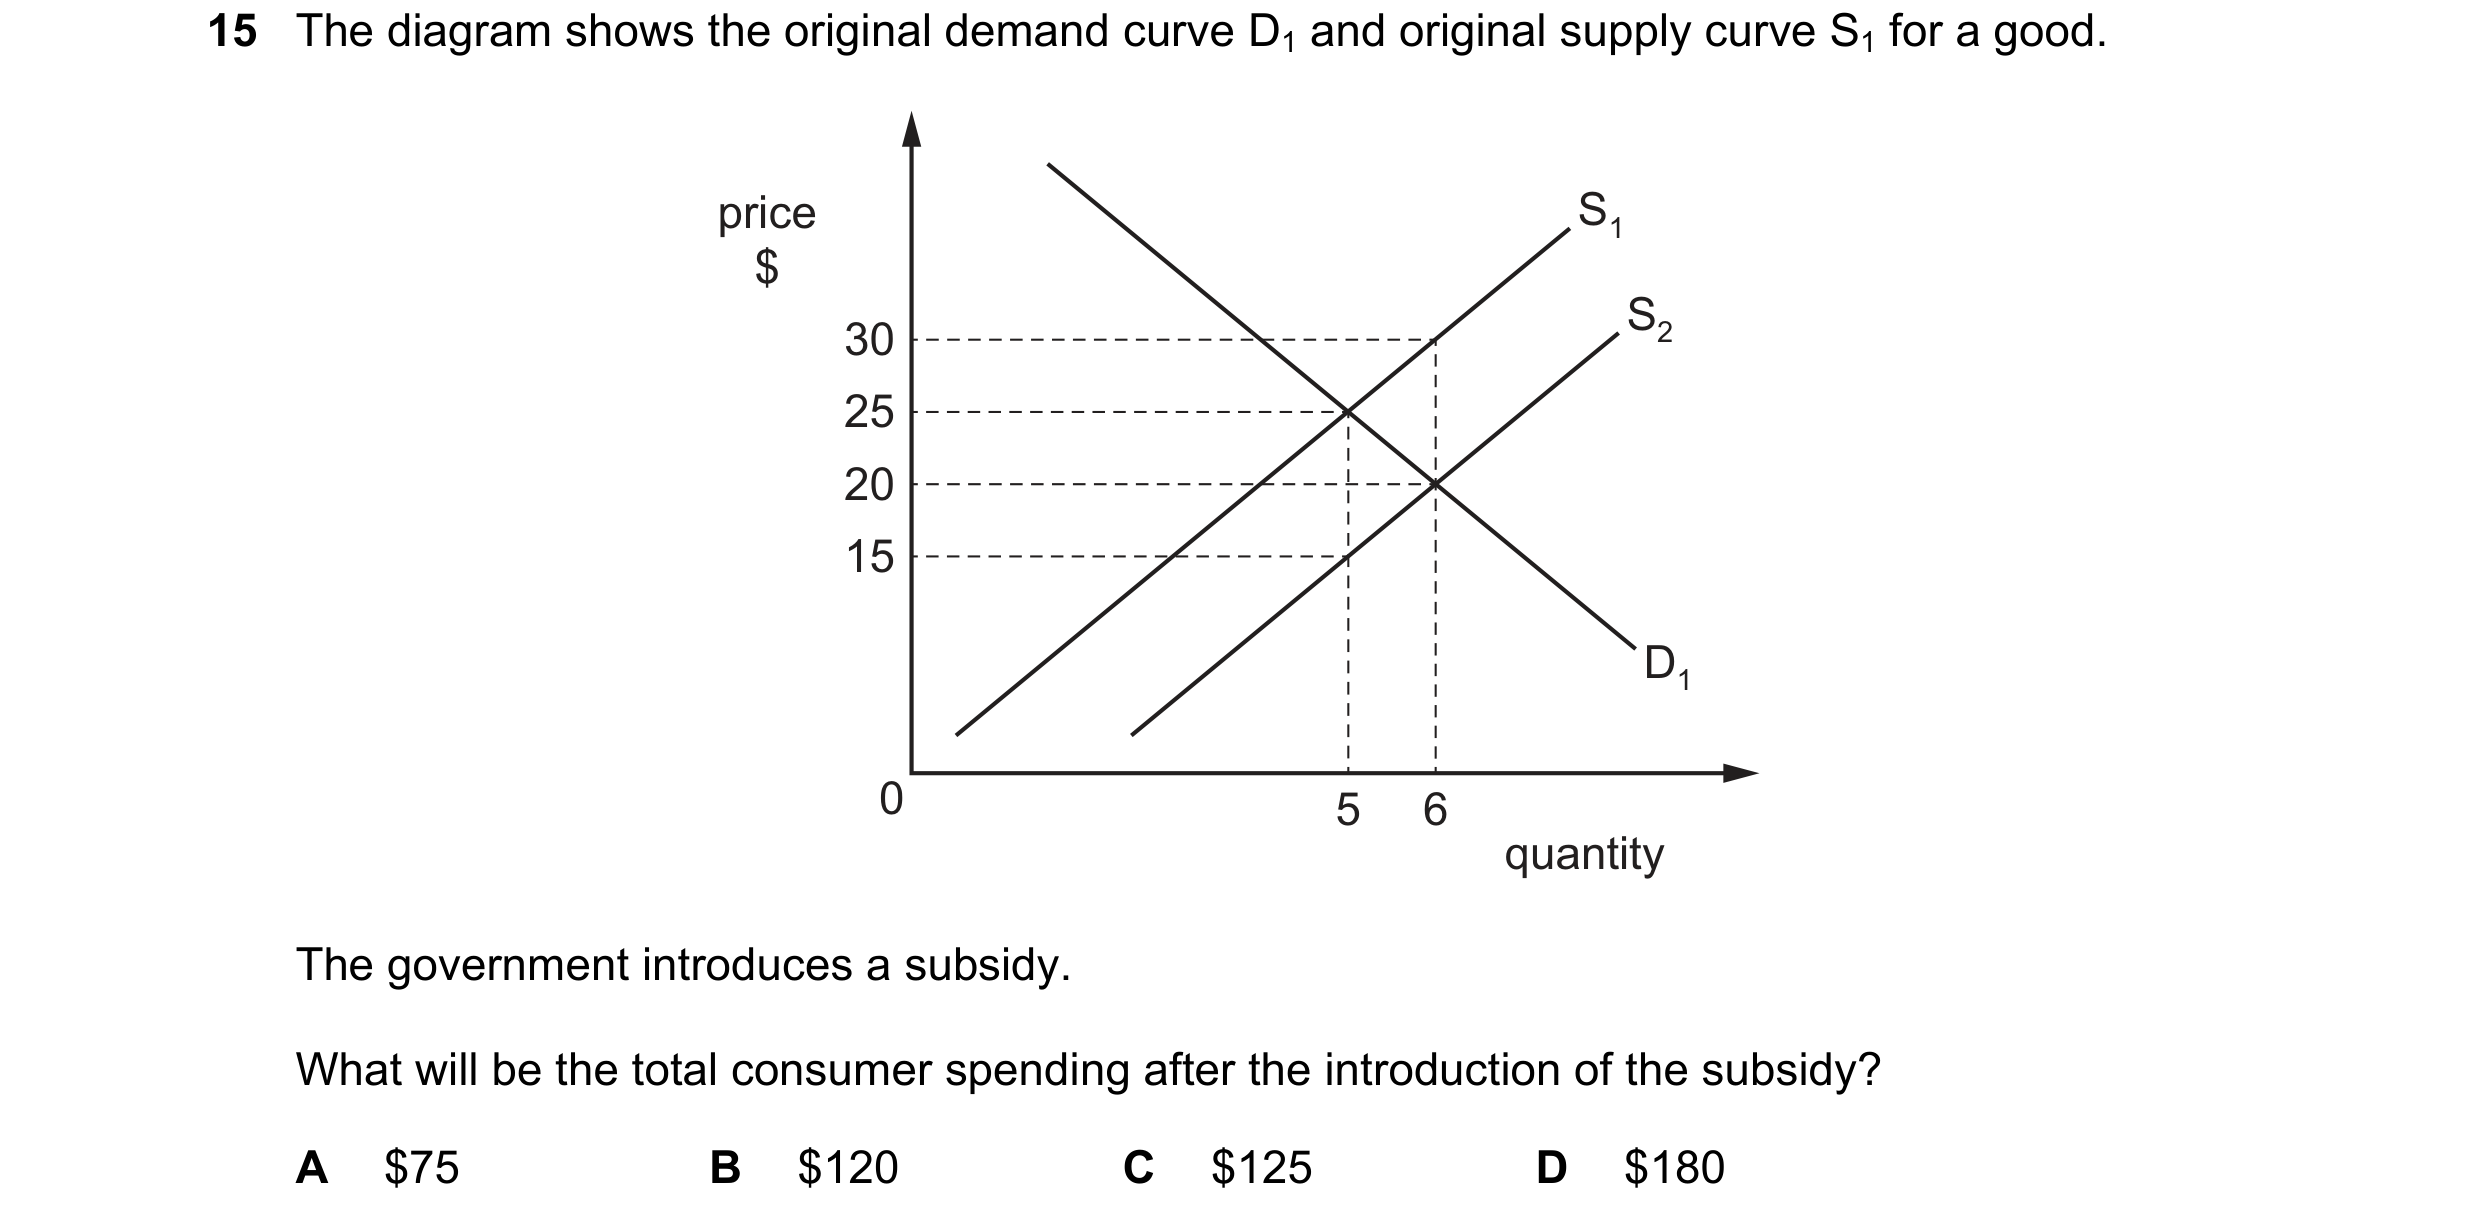
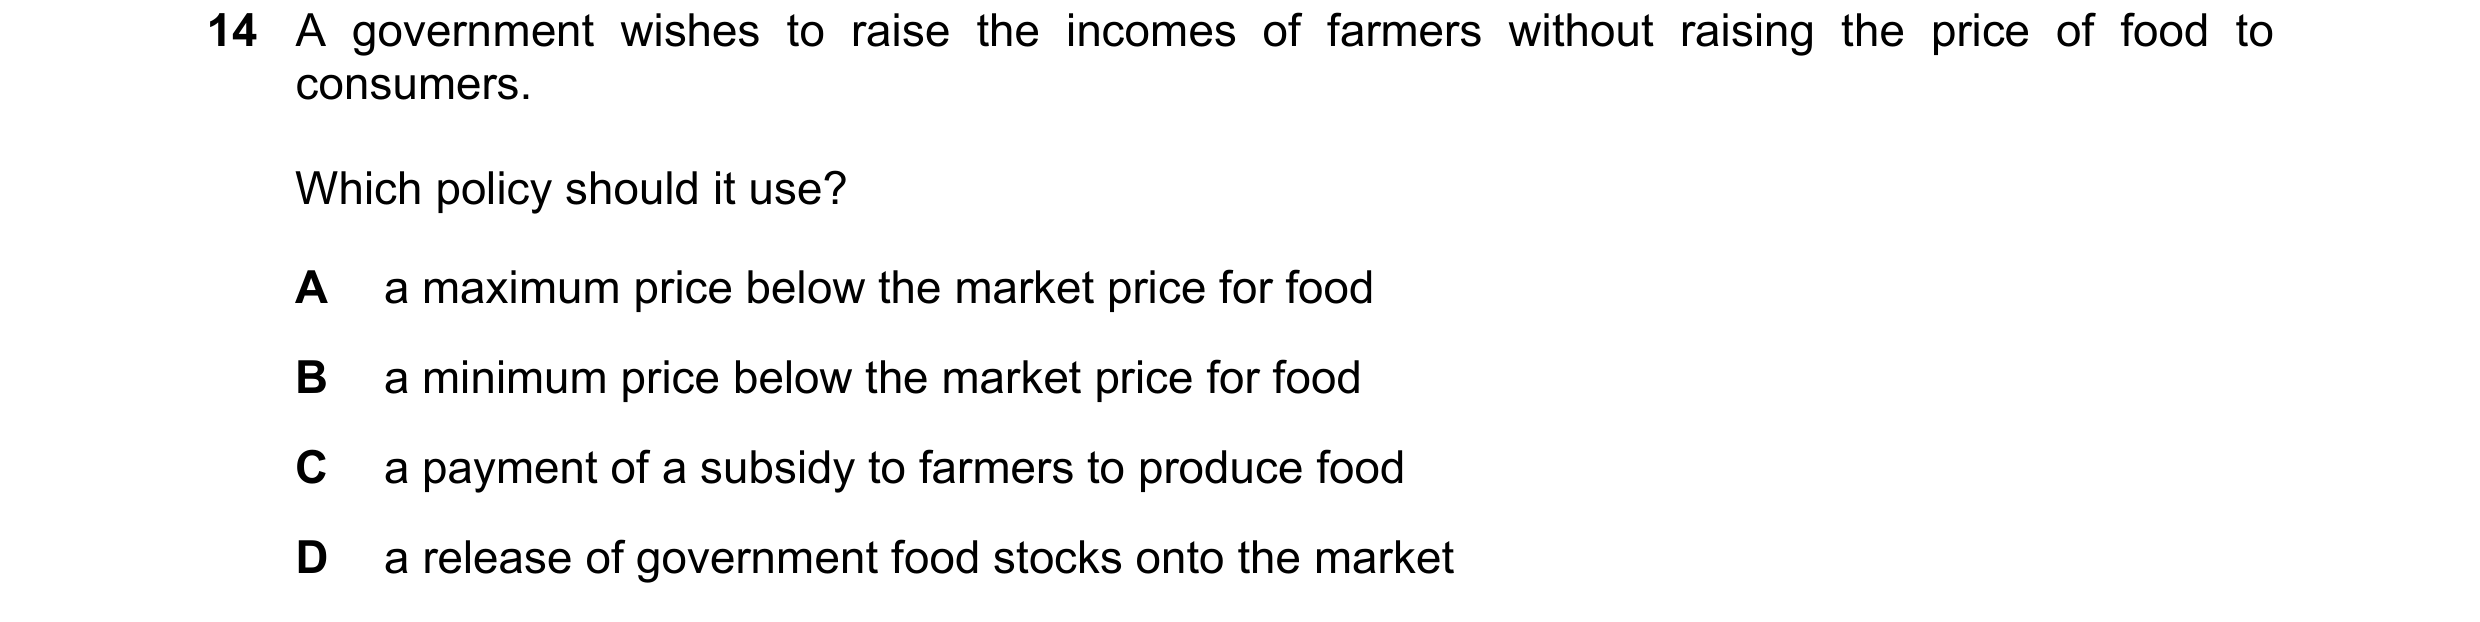
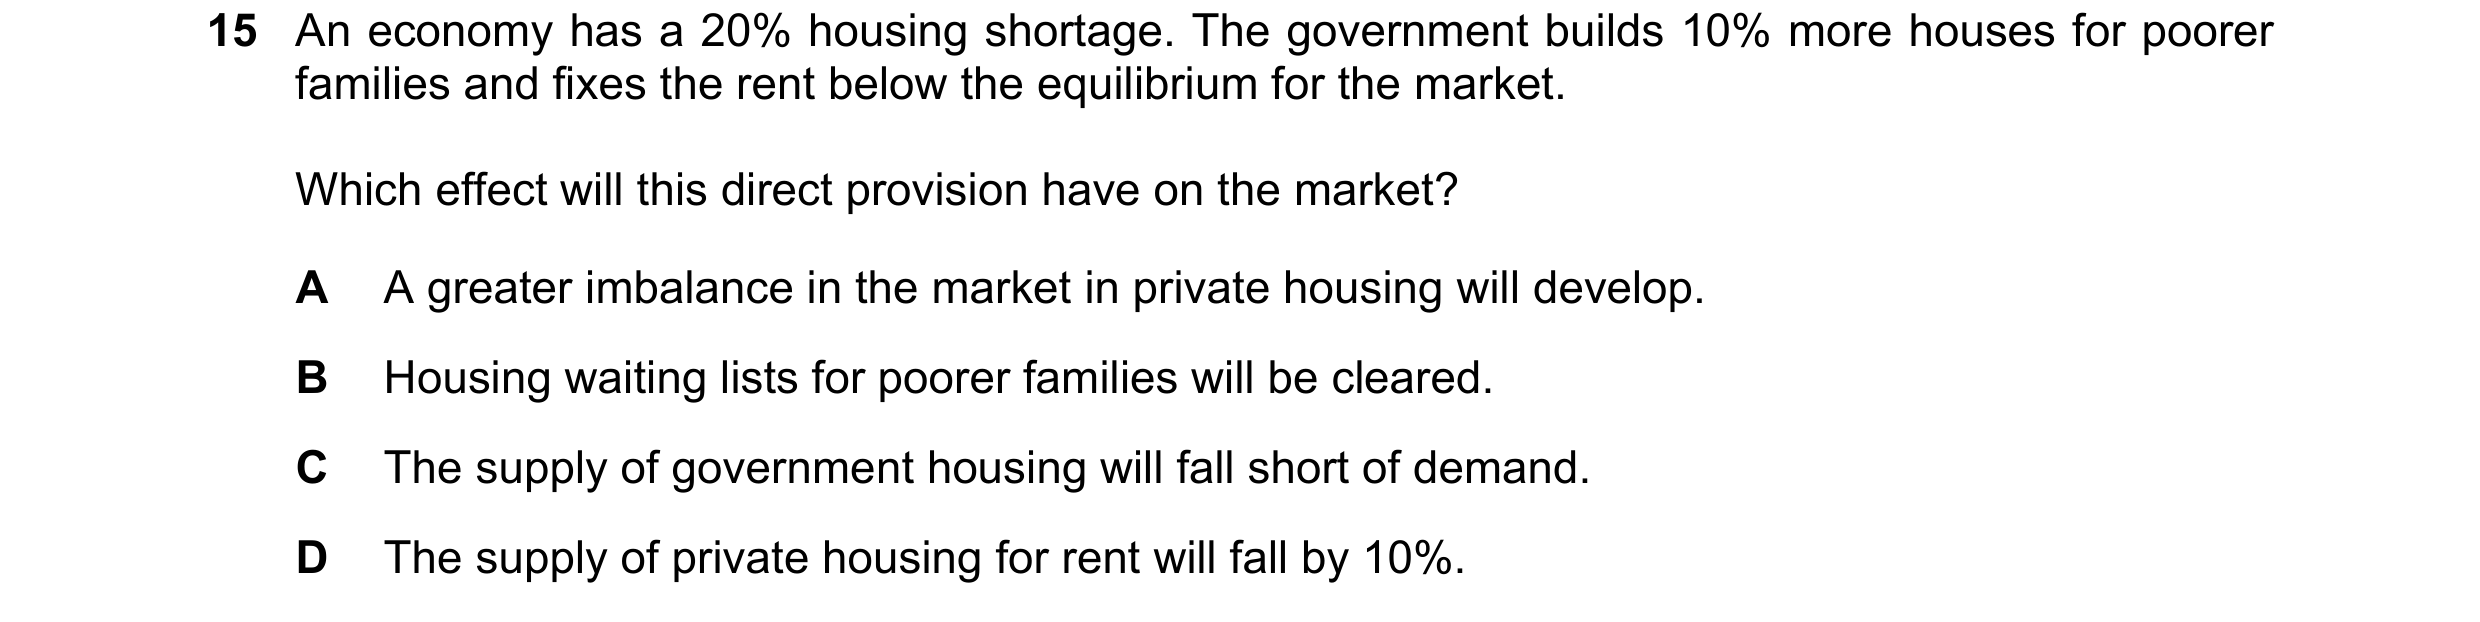
 75 / 119
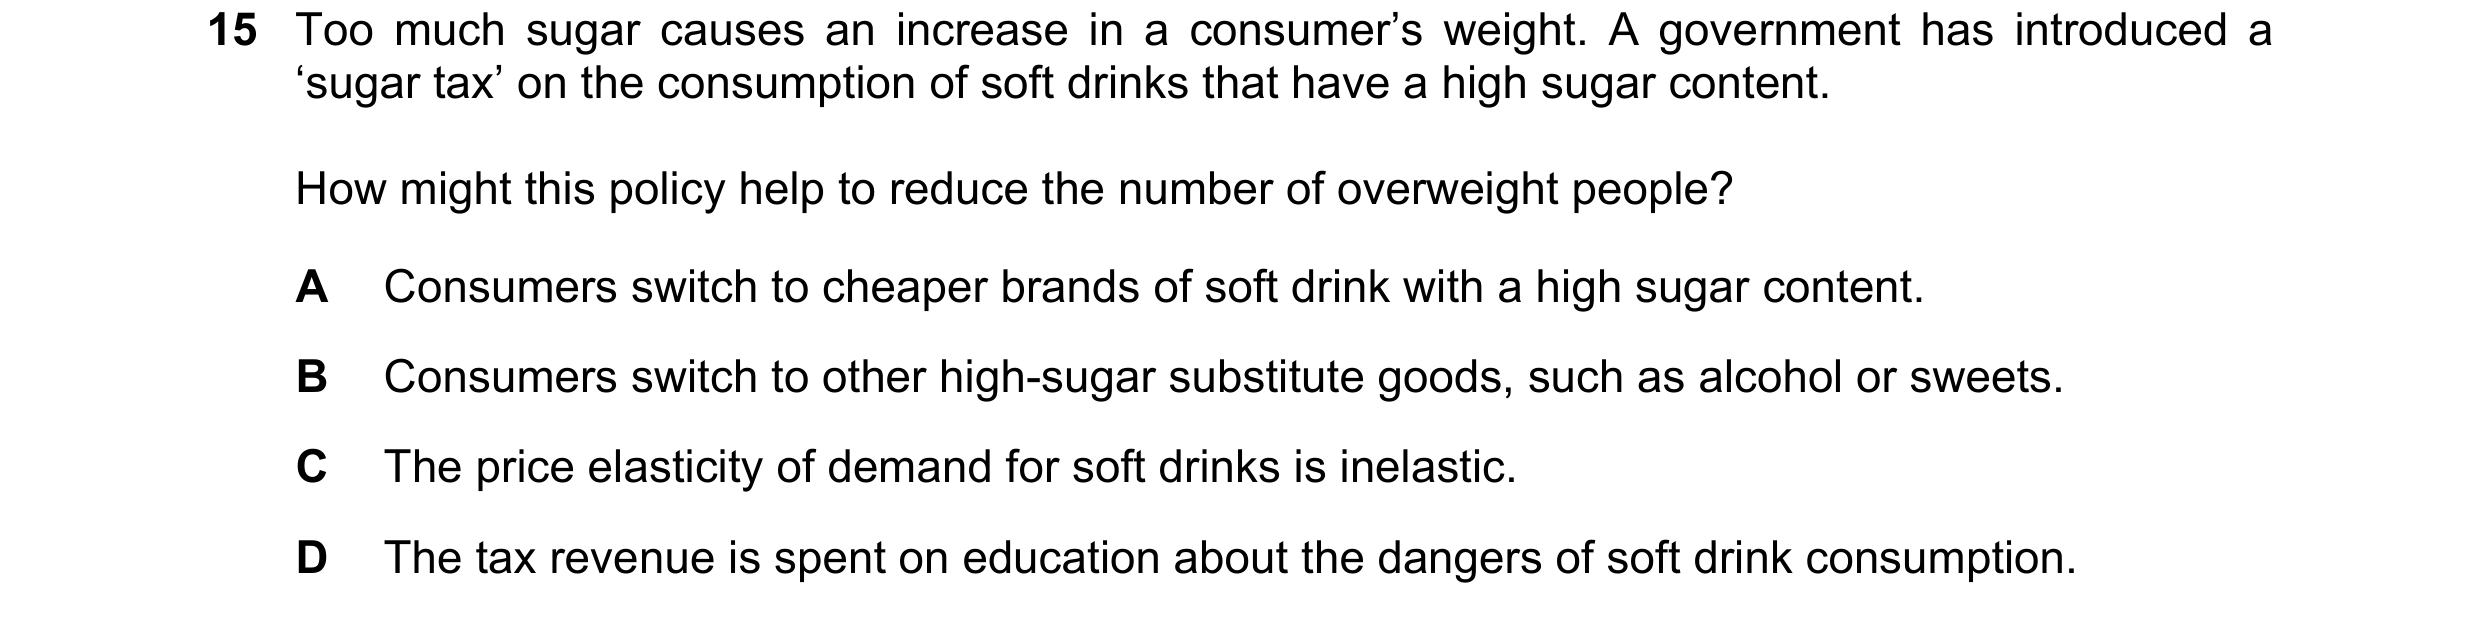
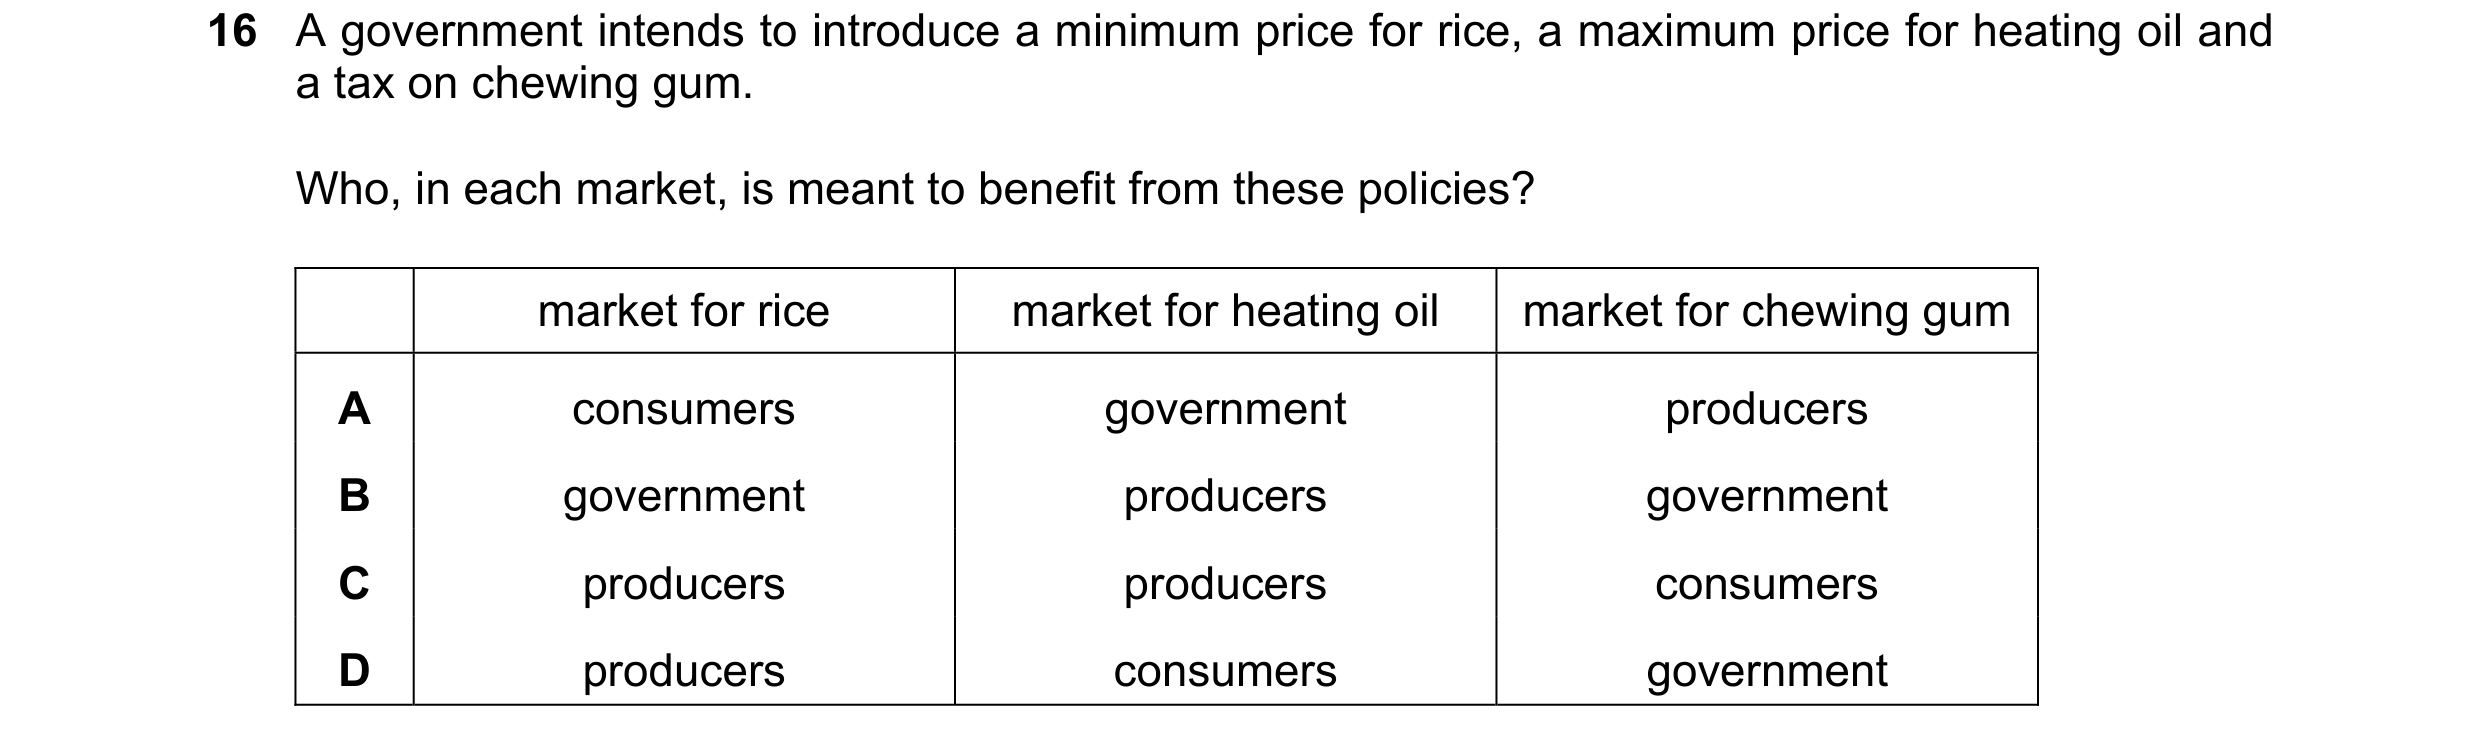
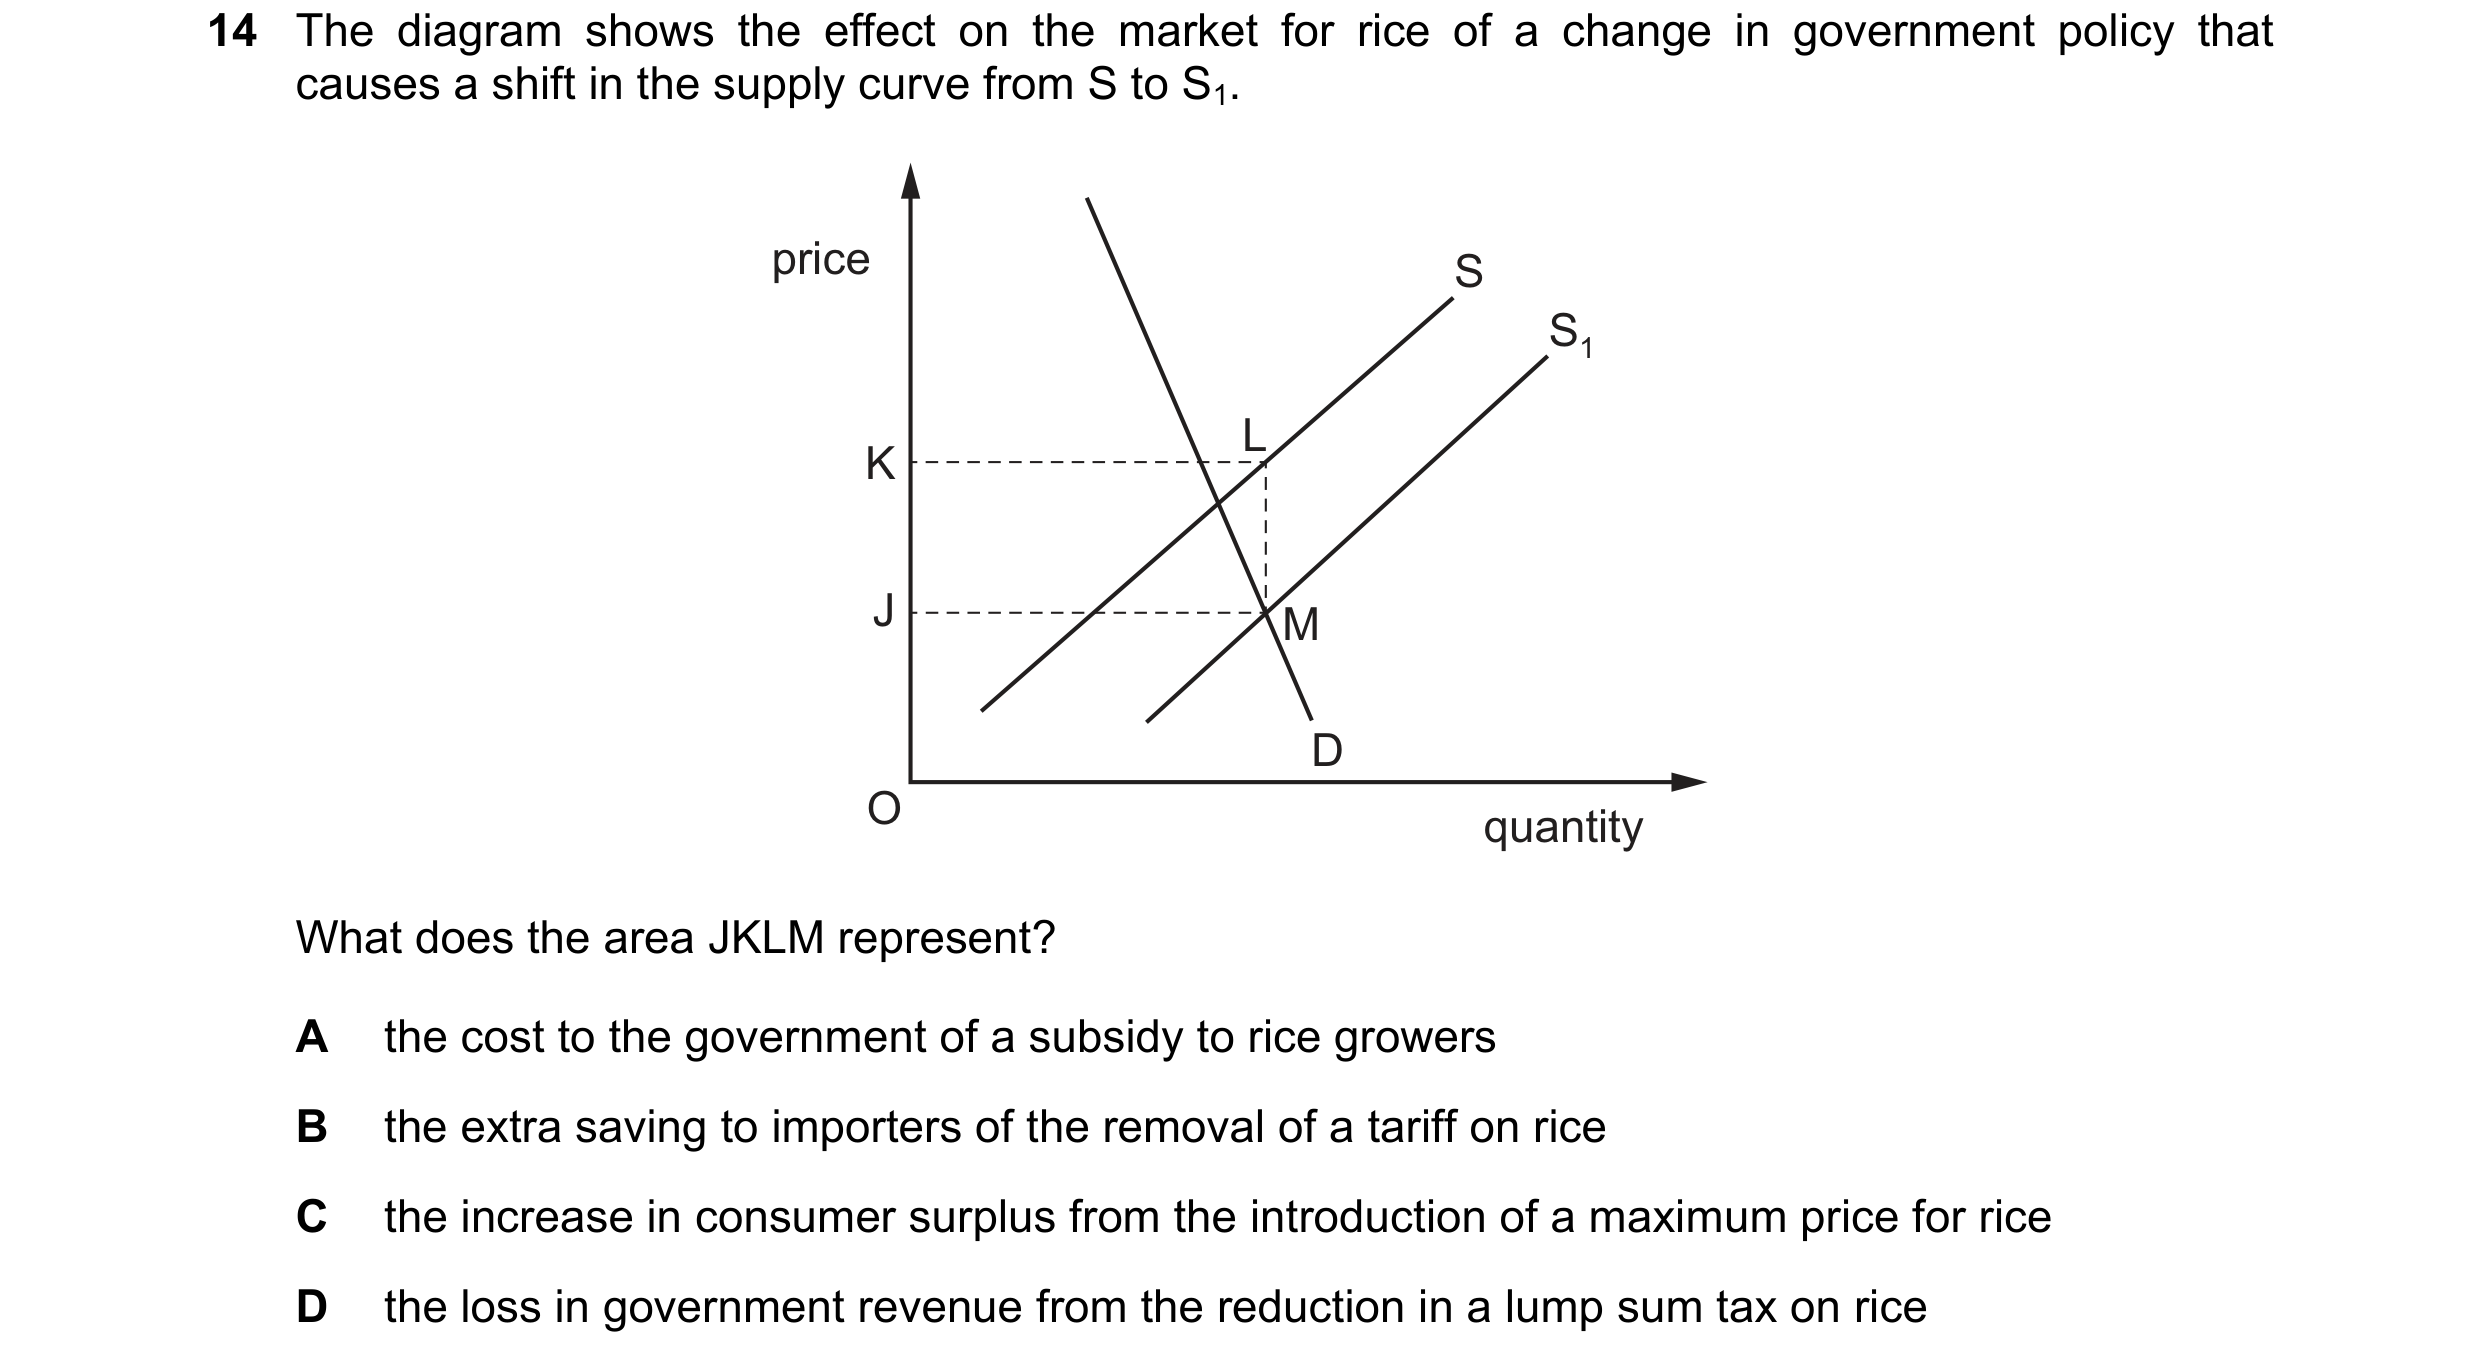 76 / 119
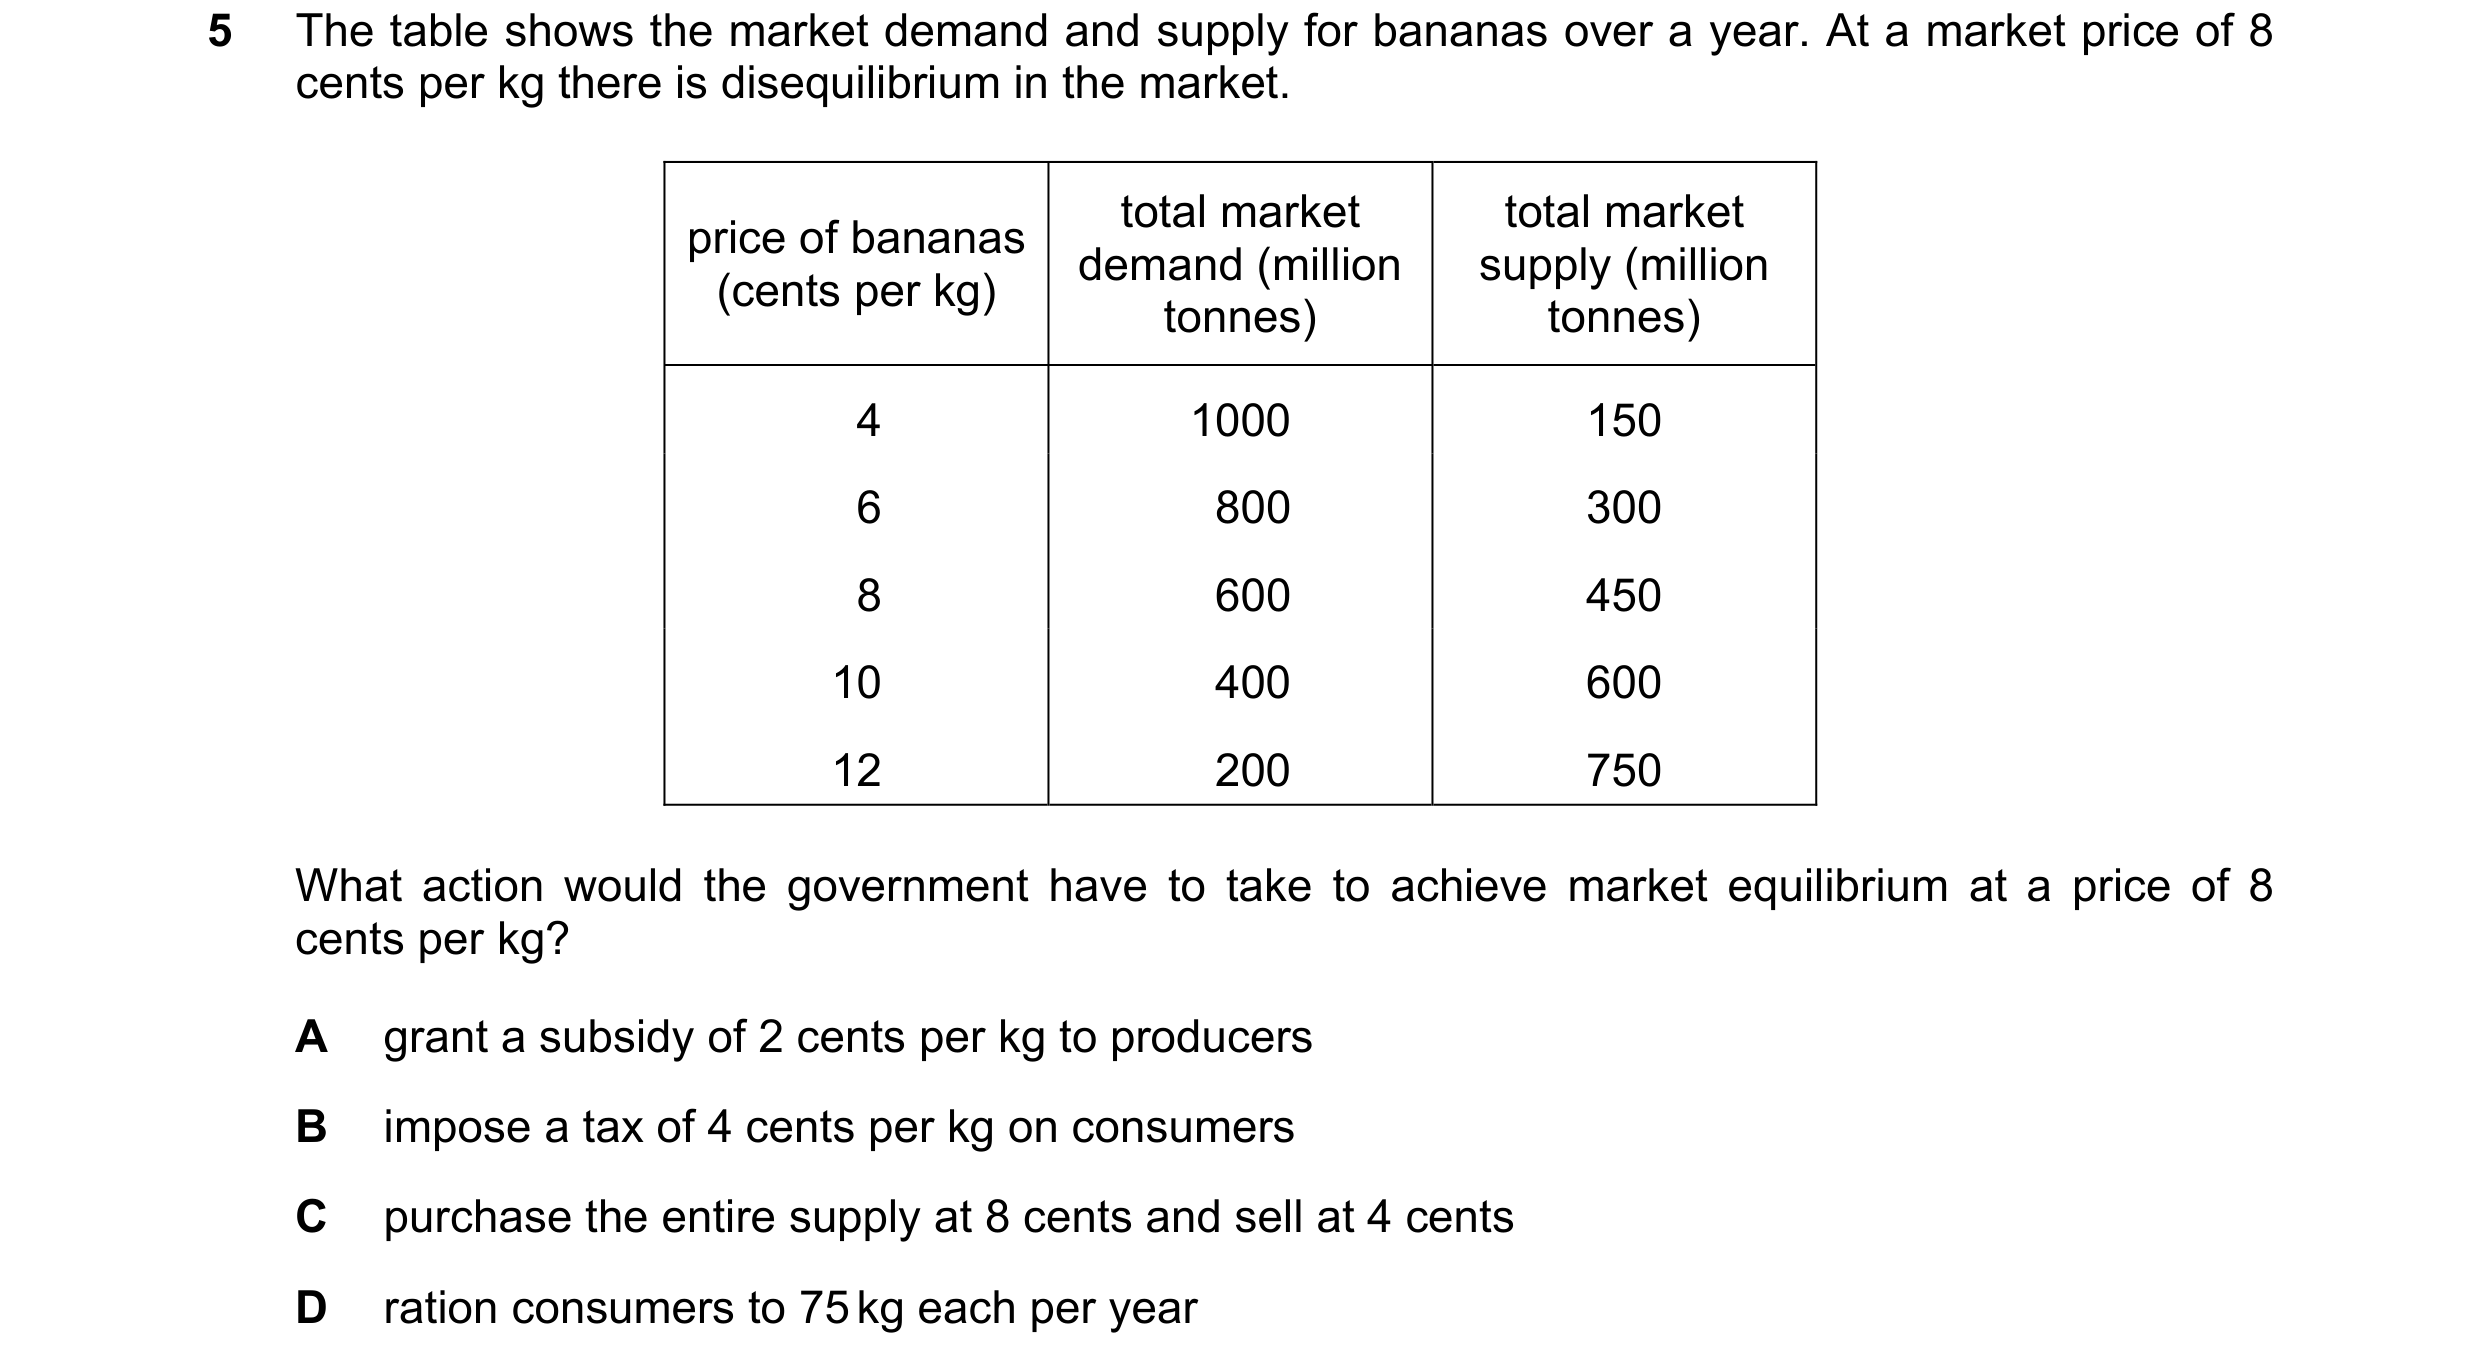
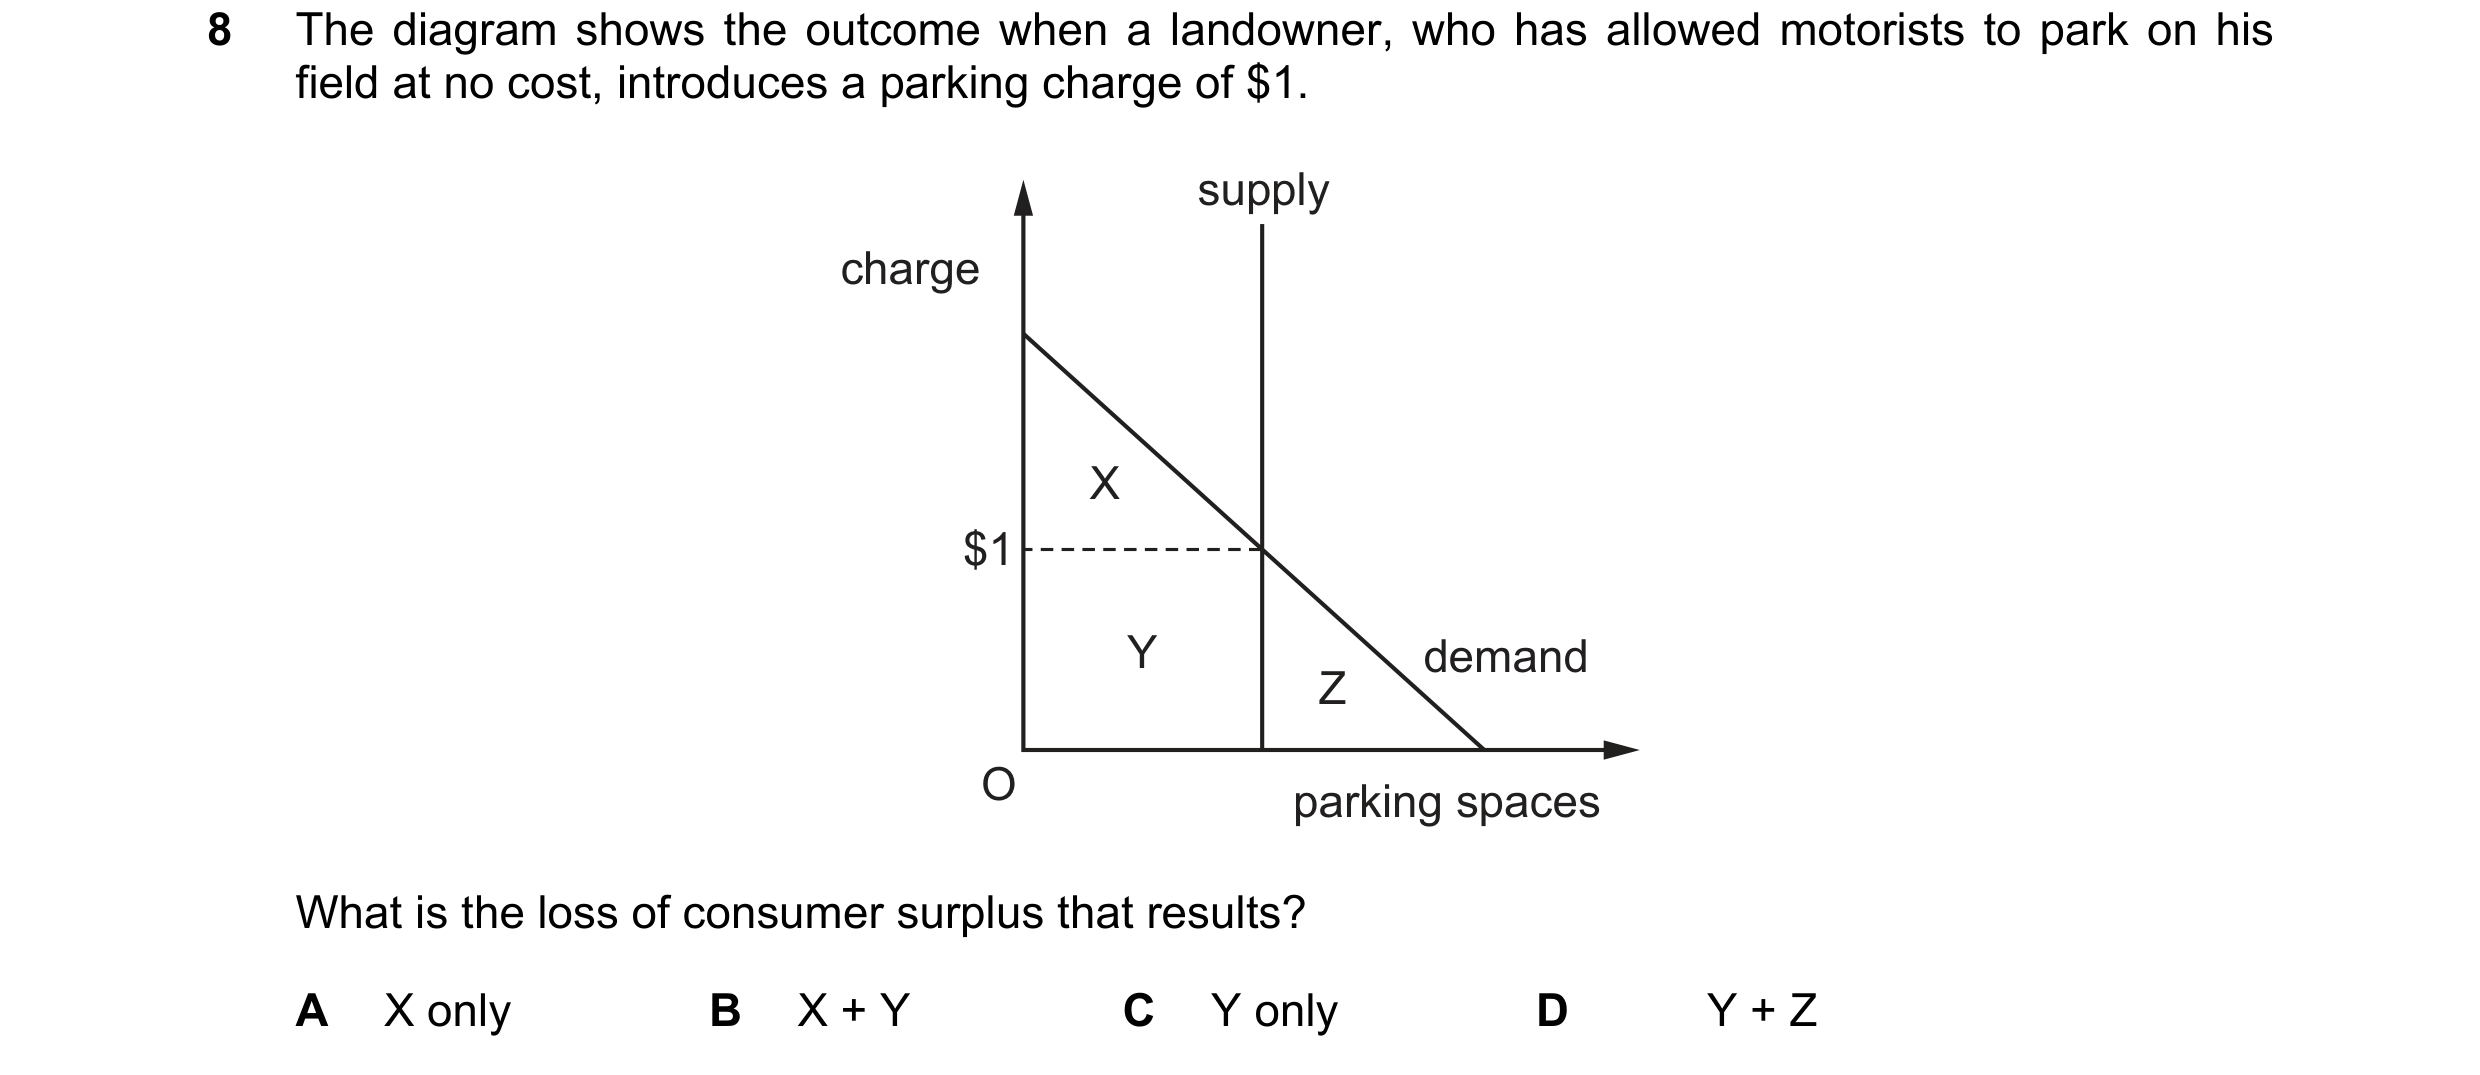 77 / 119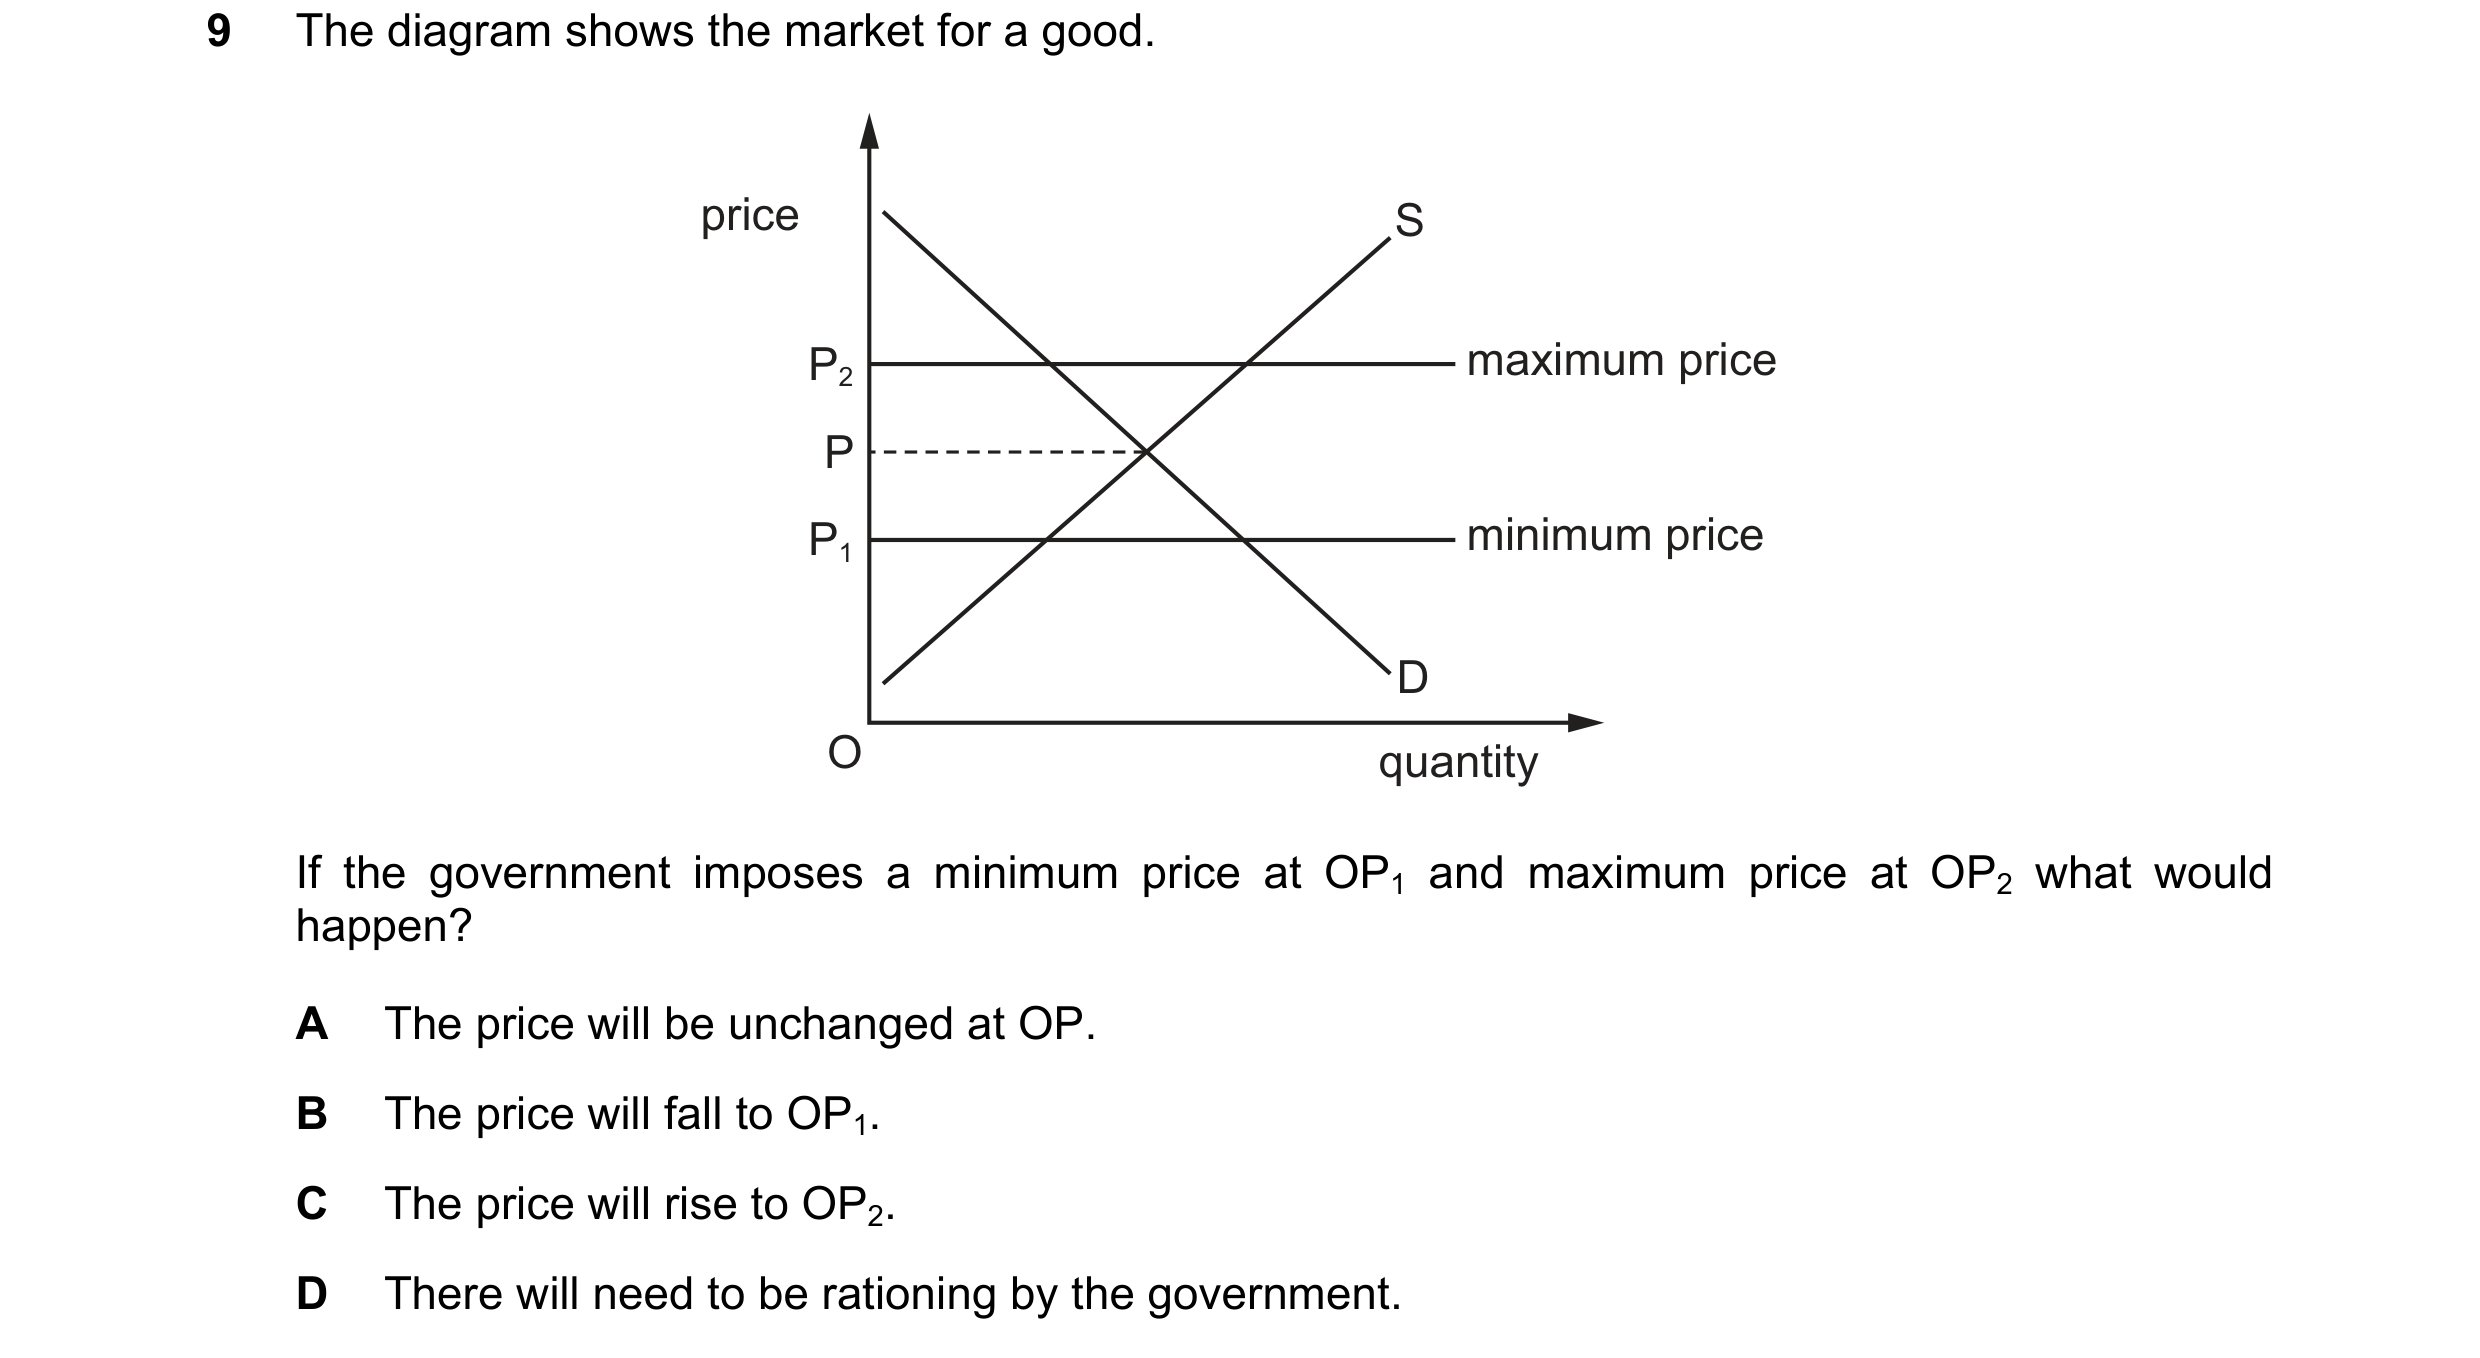
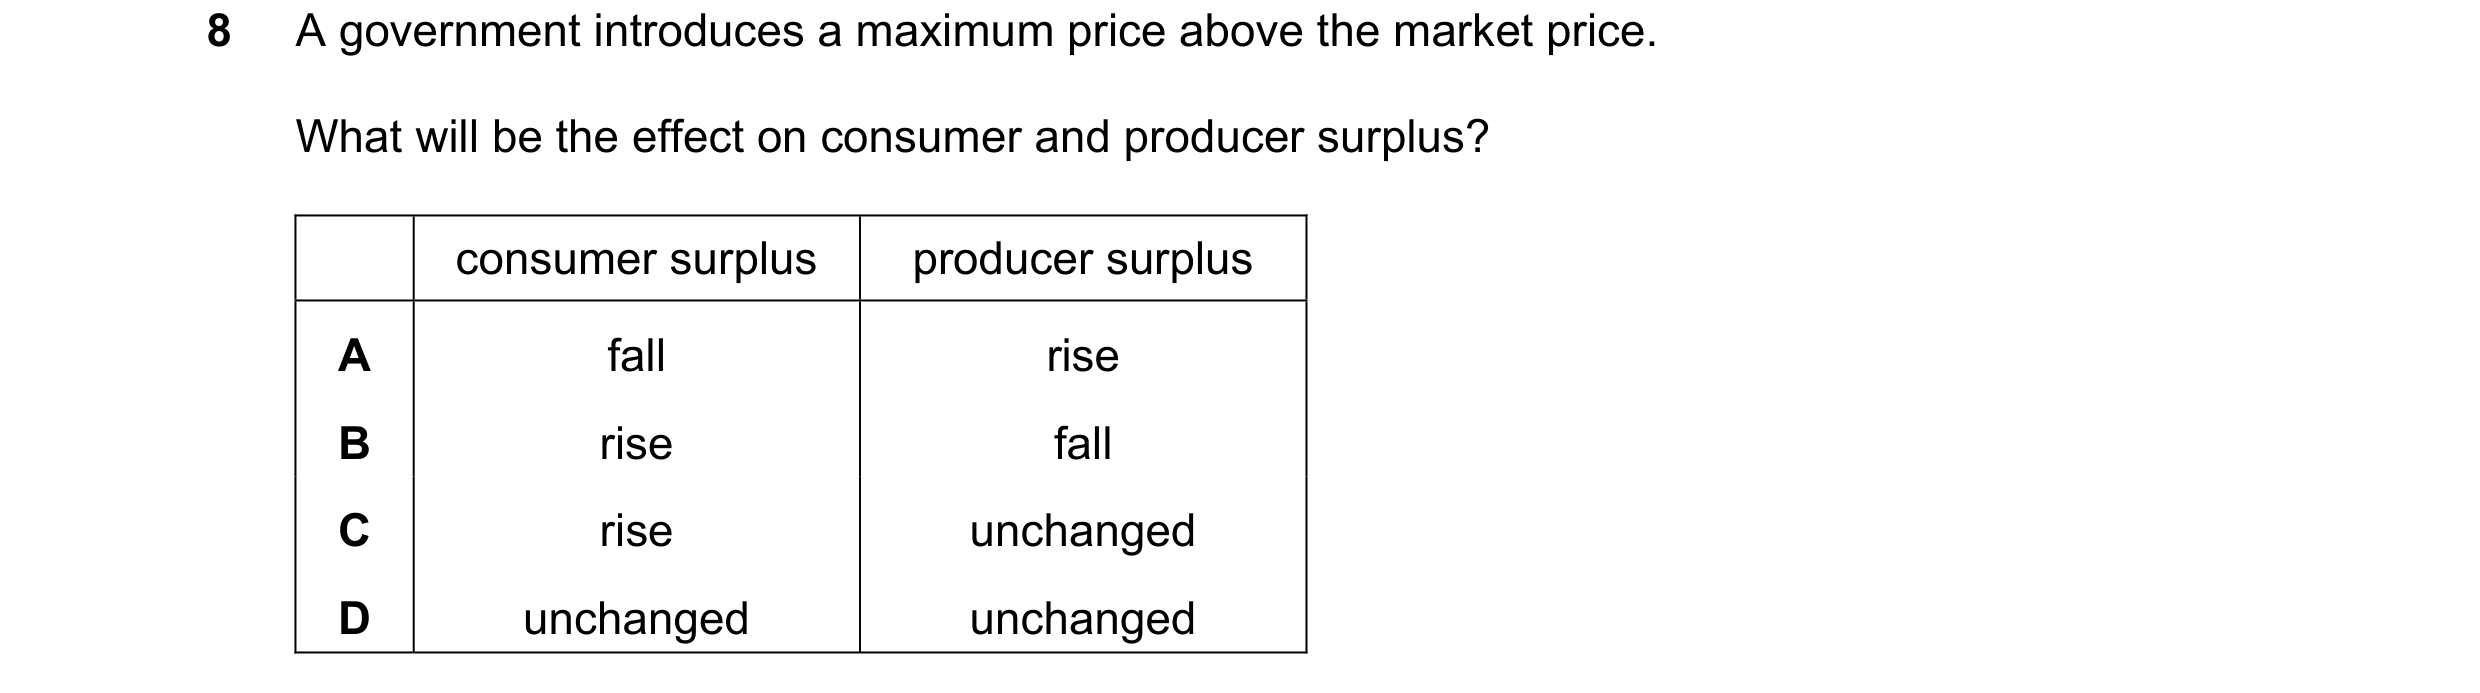 78 / 119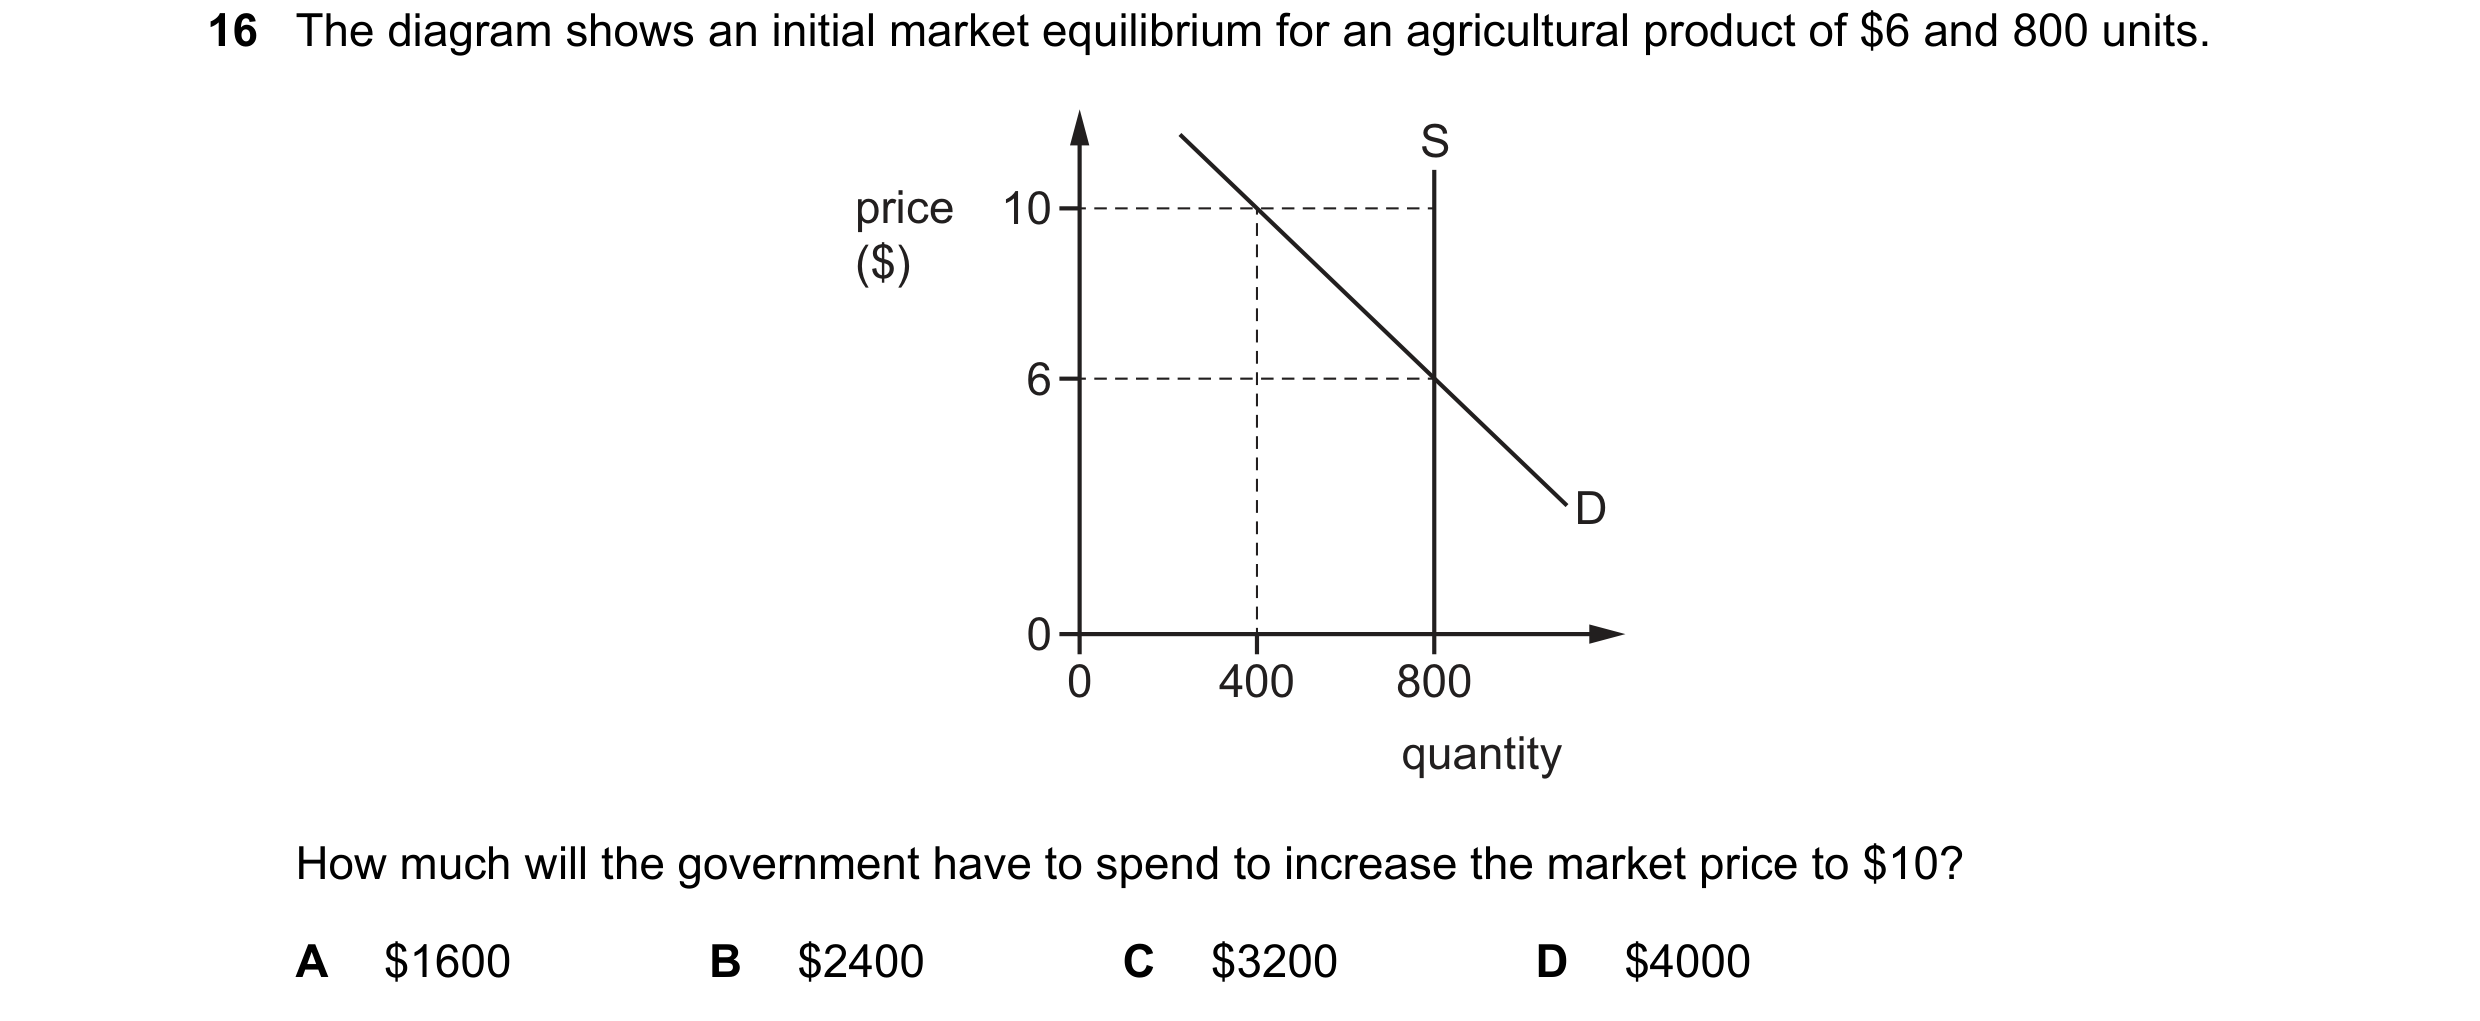
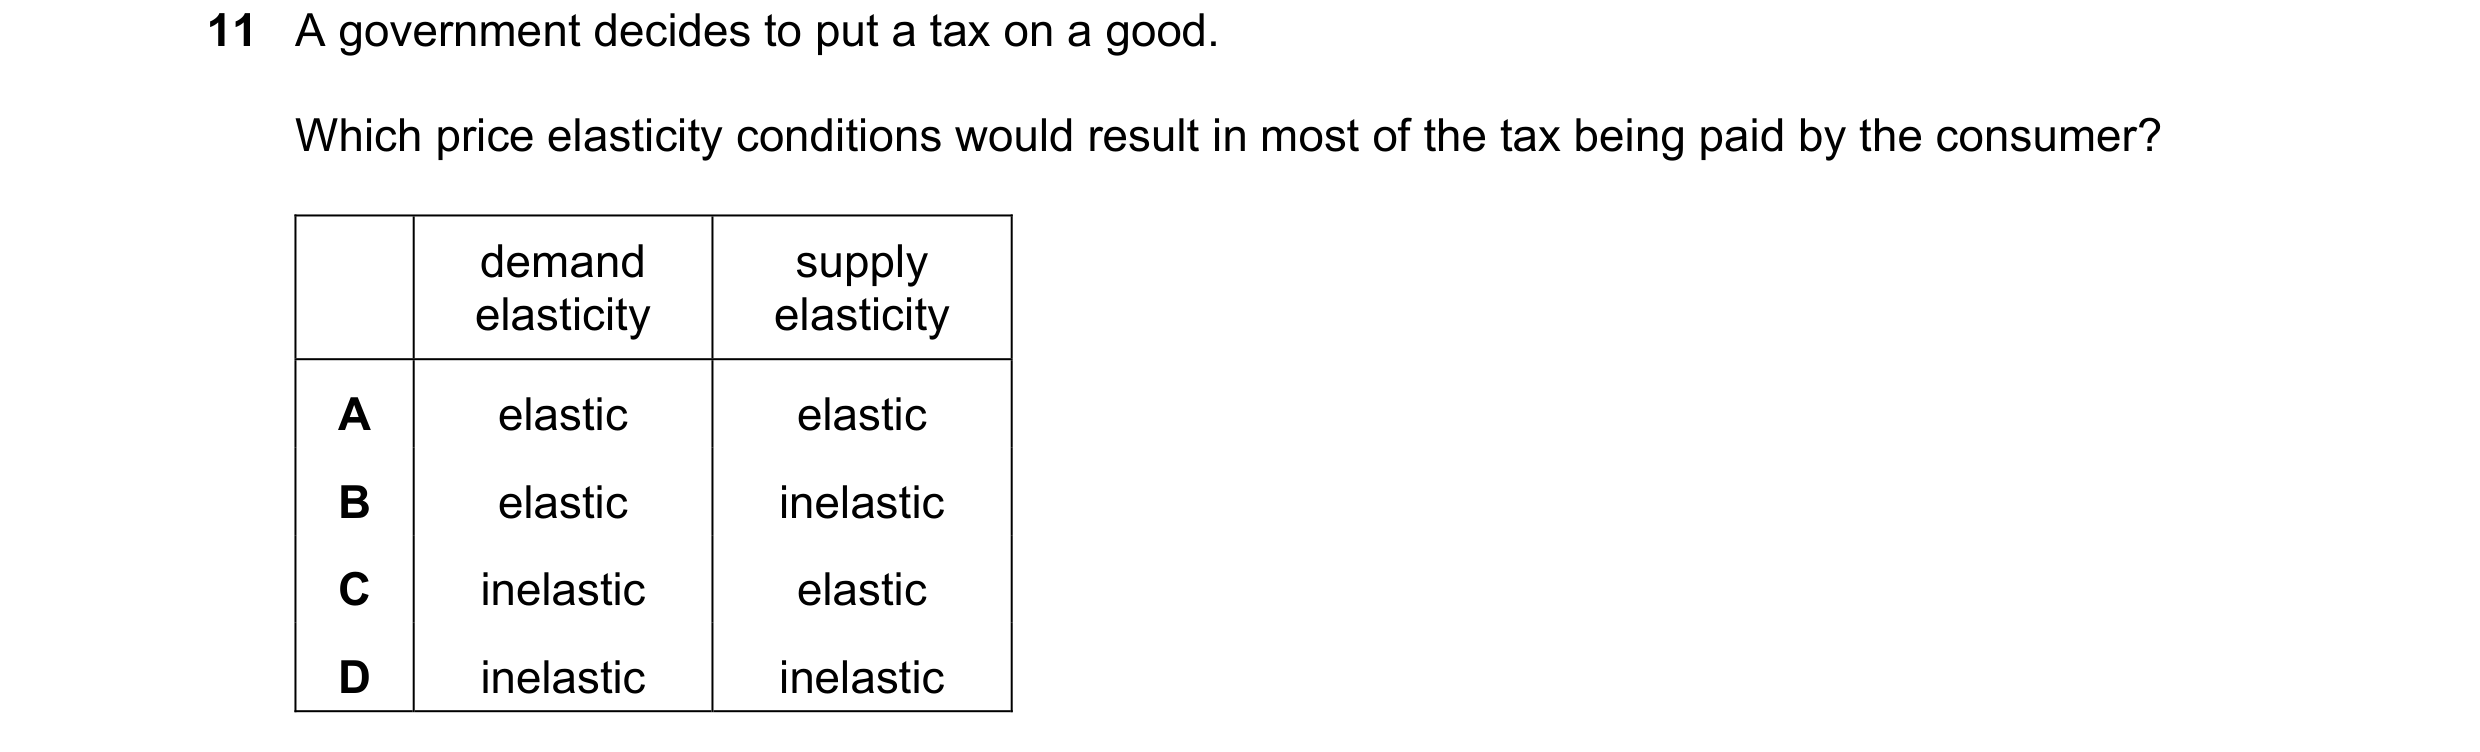
 79 / 119
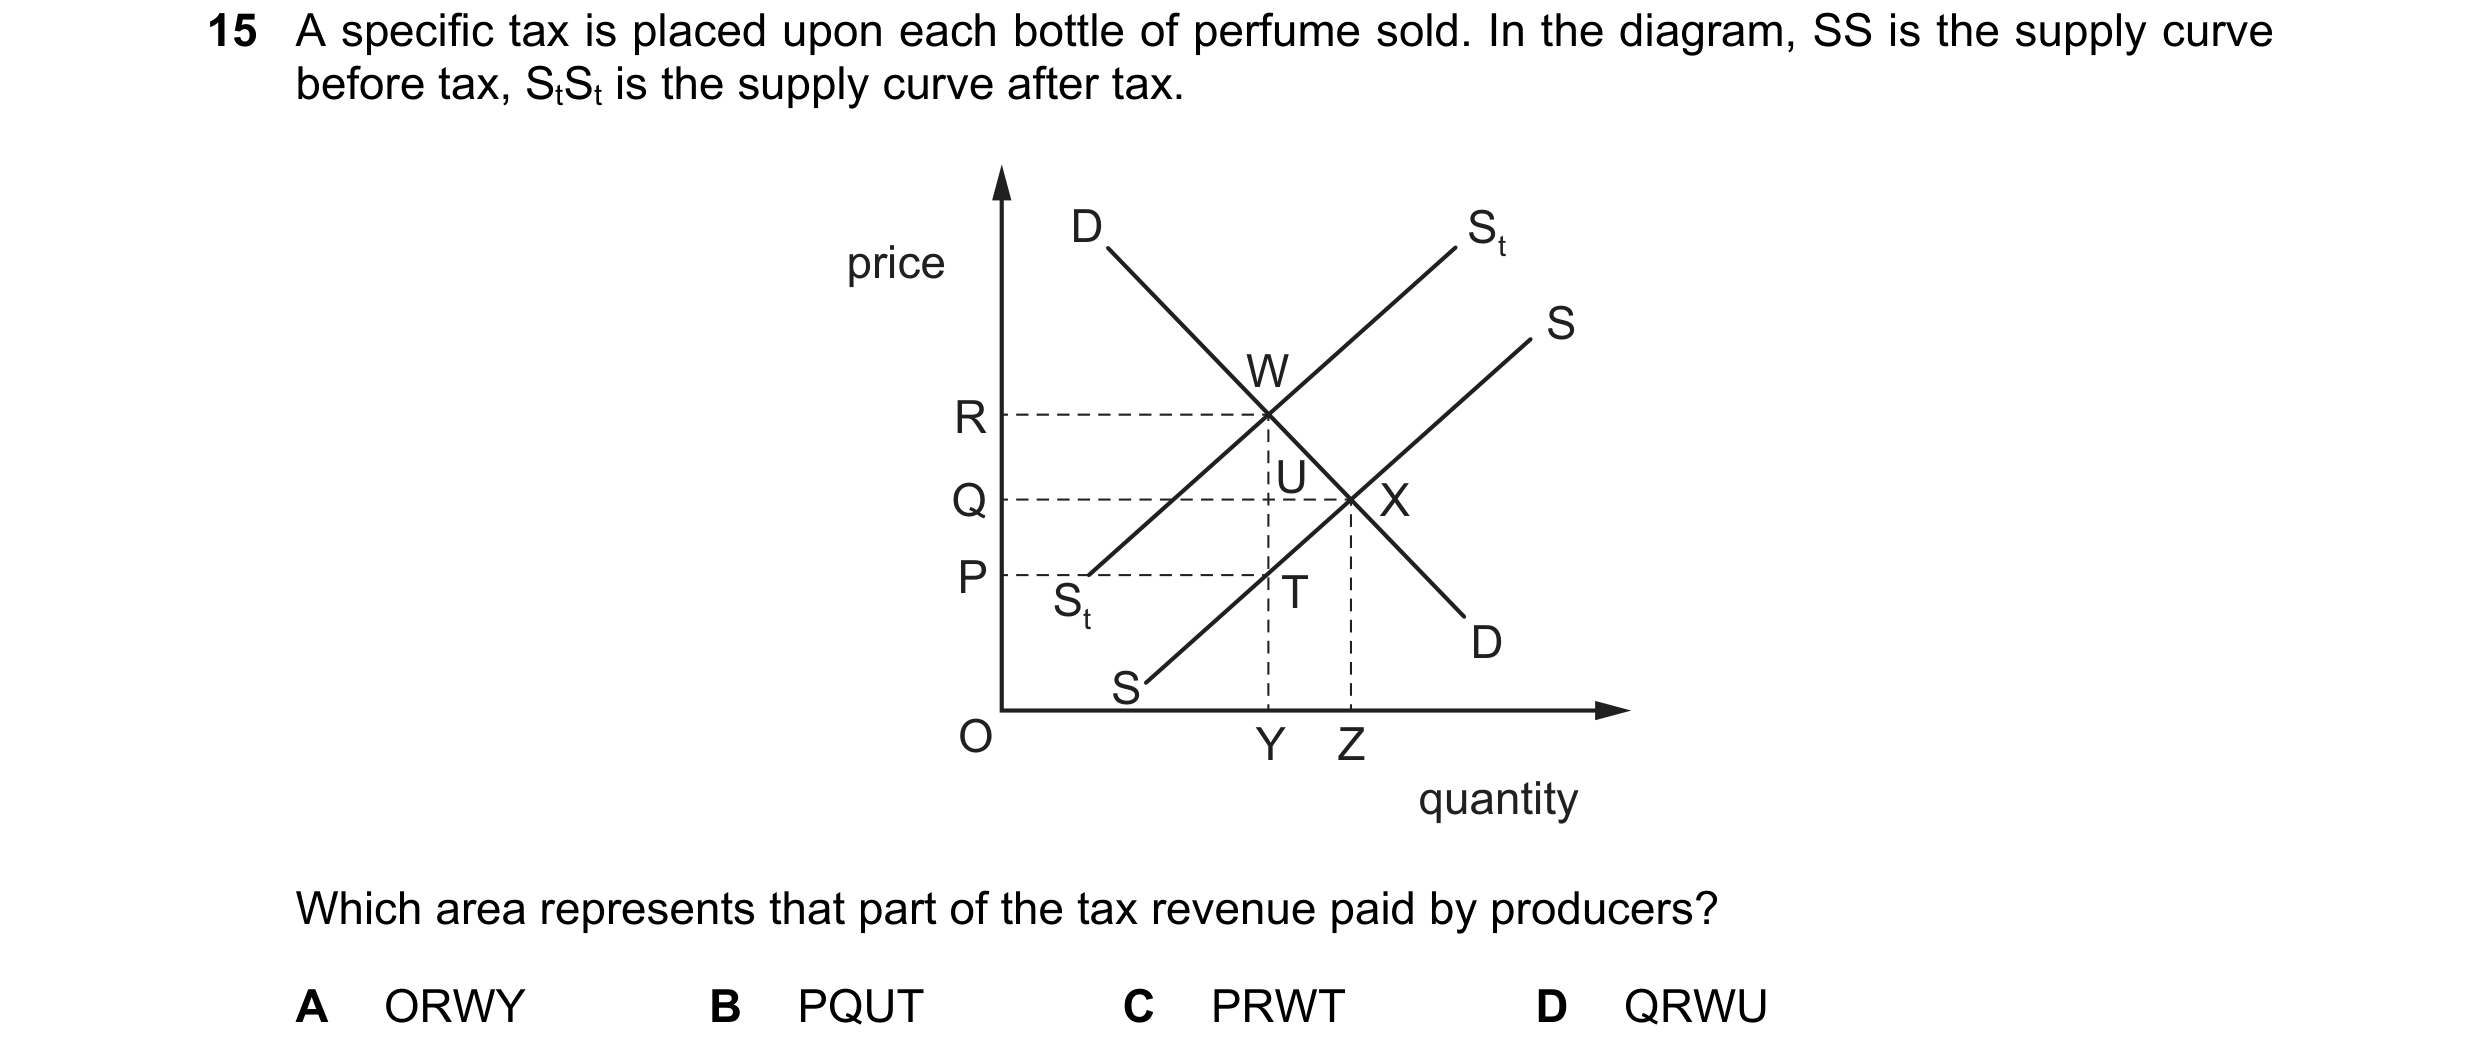 80 / 119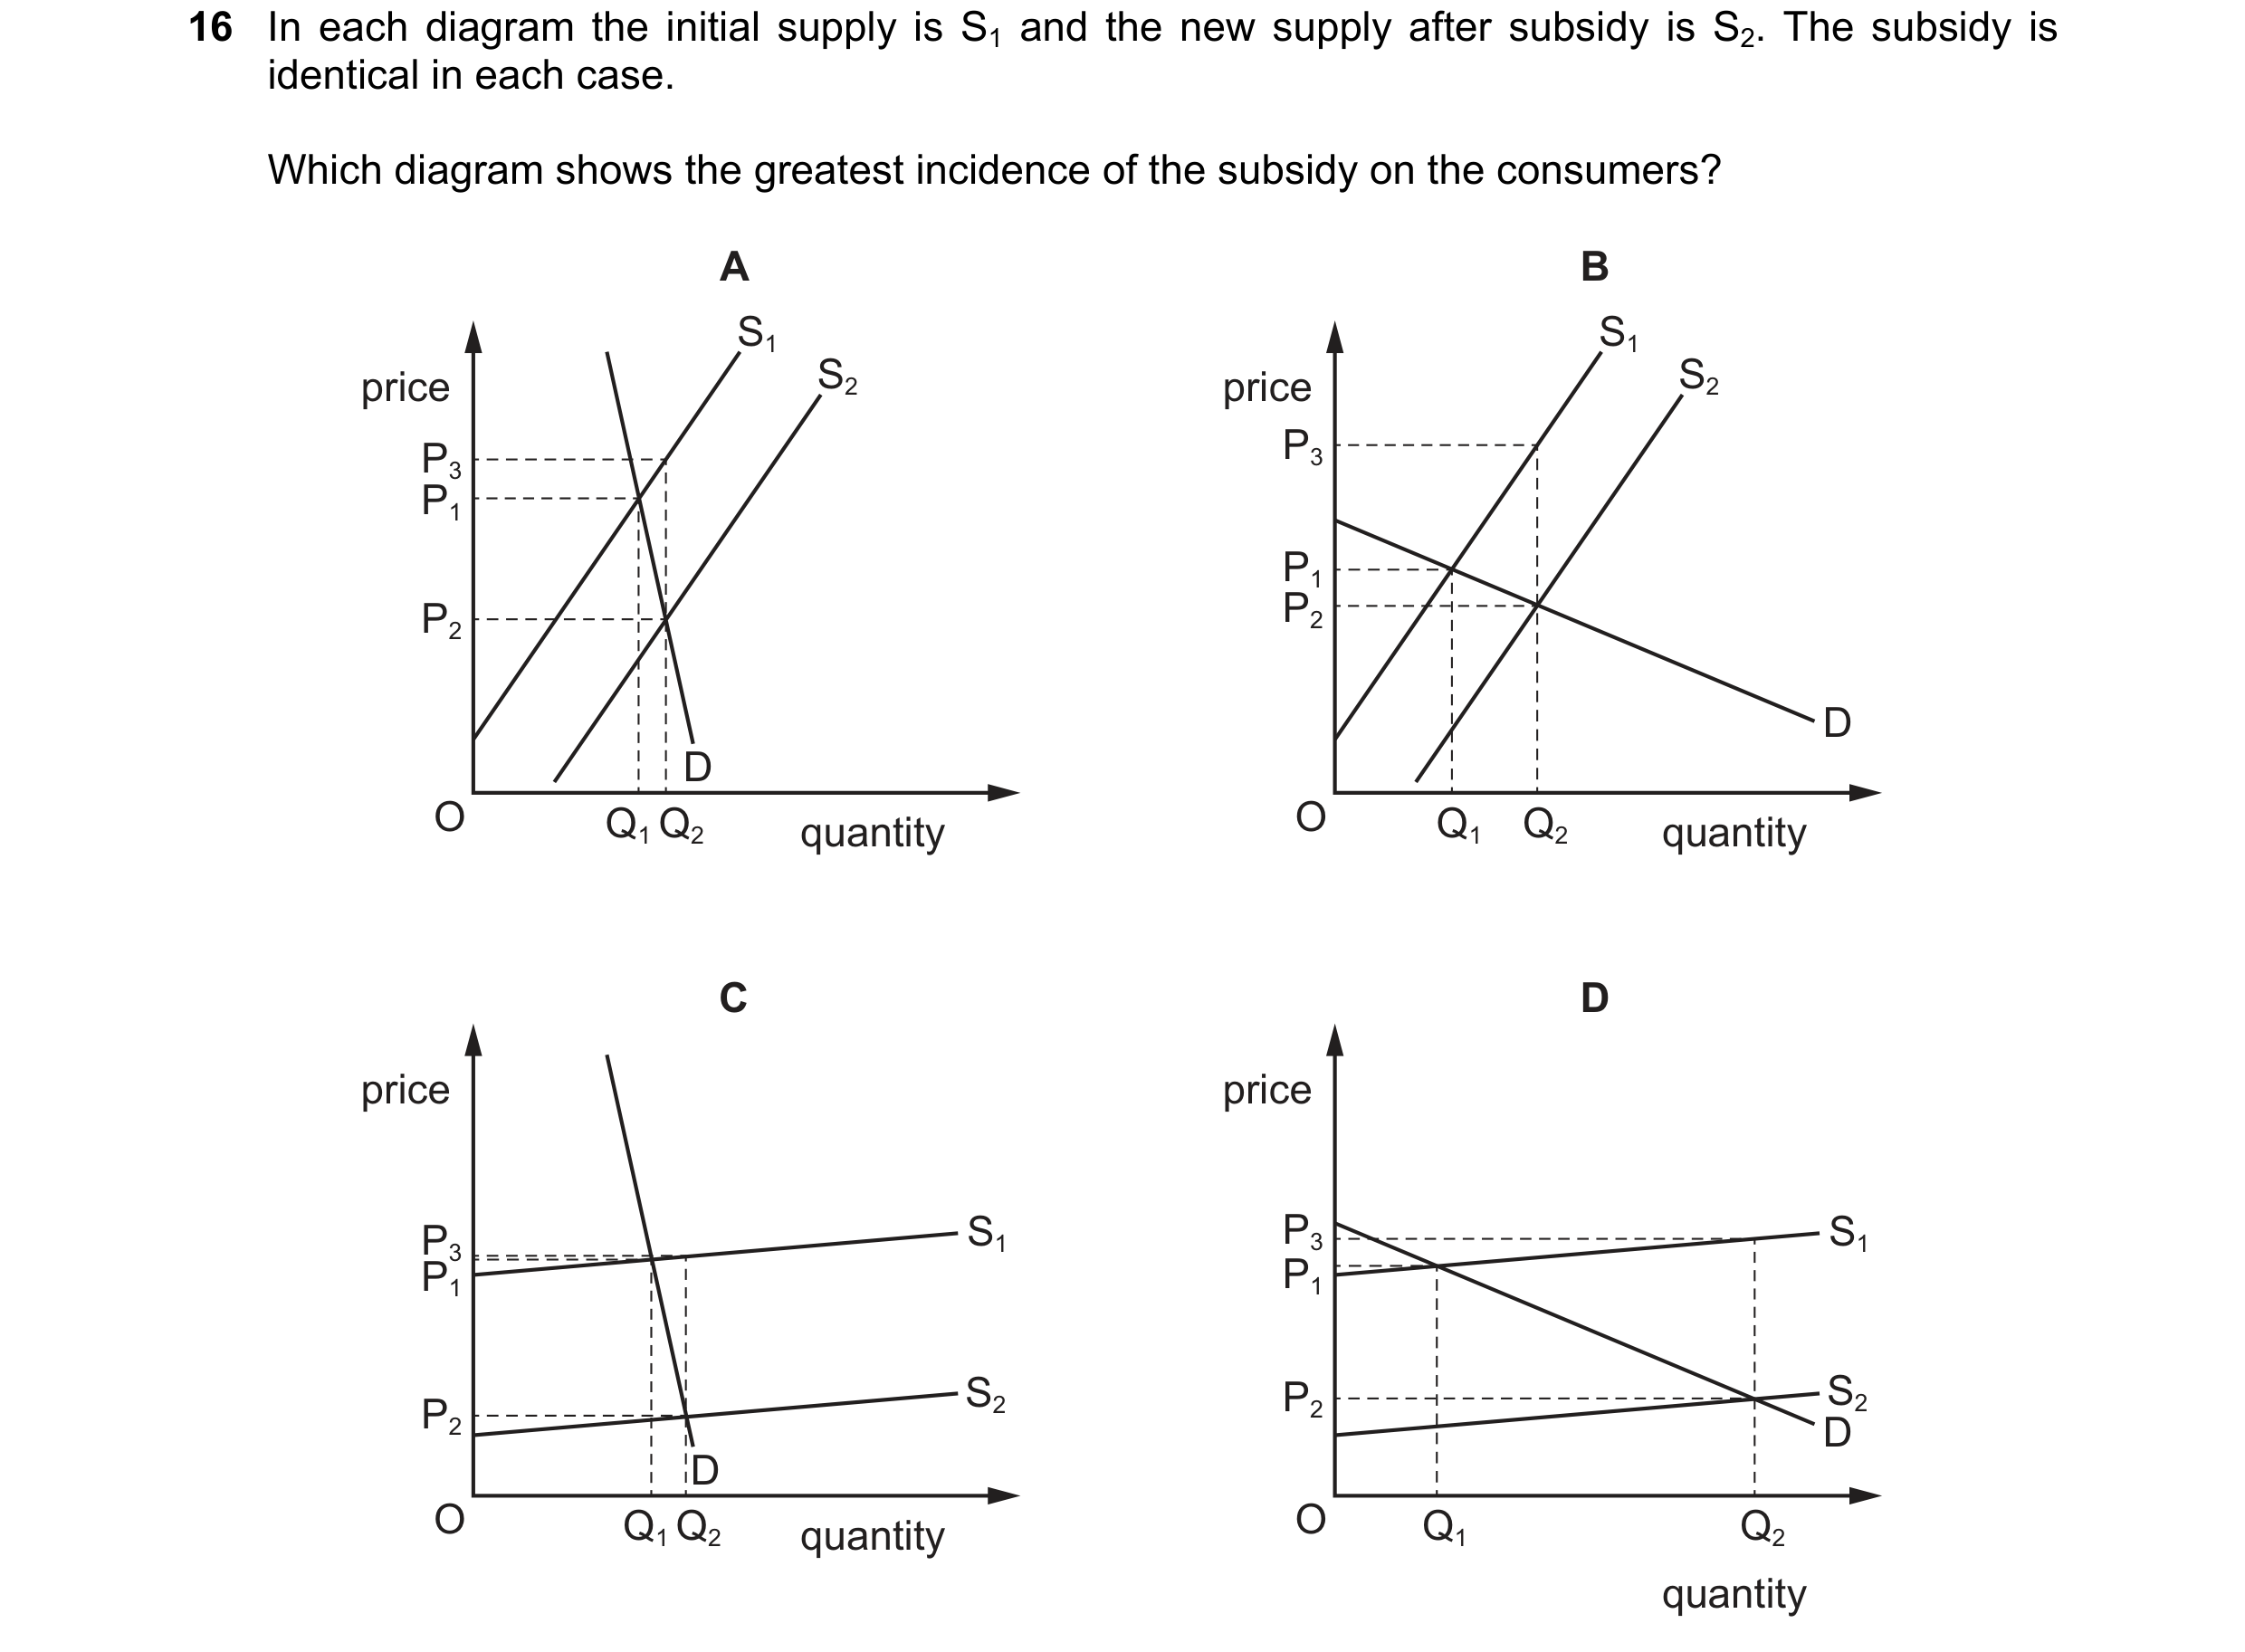
 81 / 119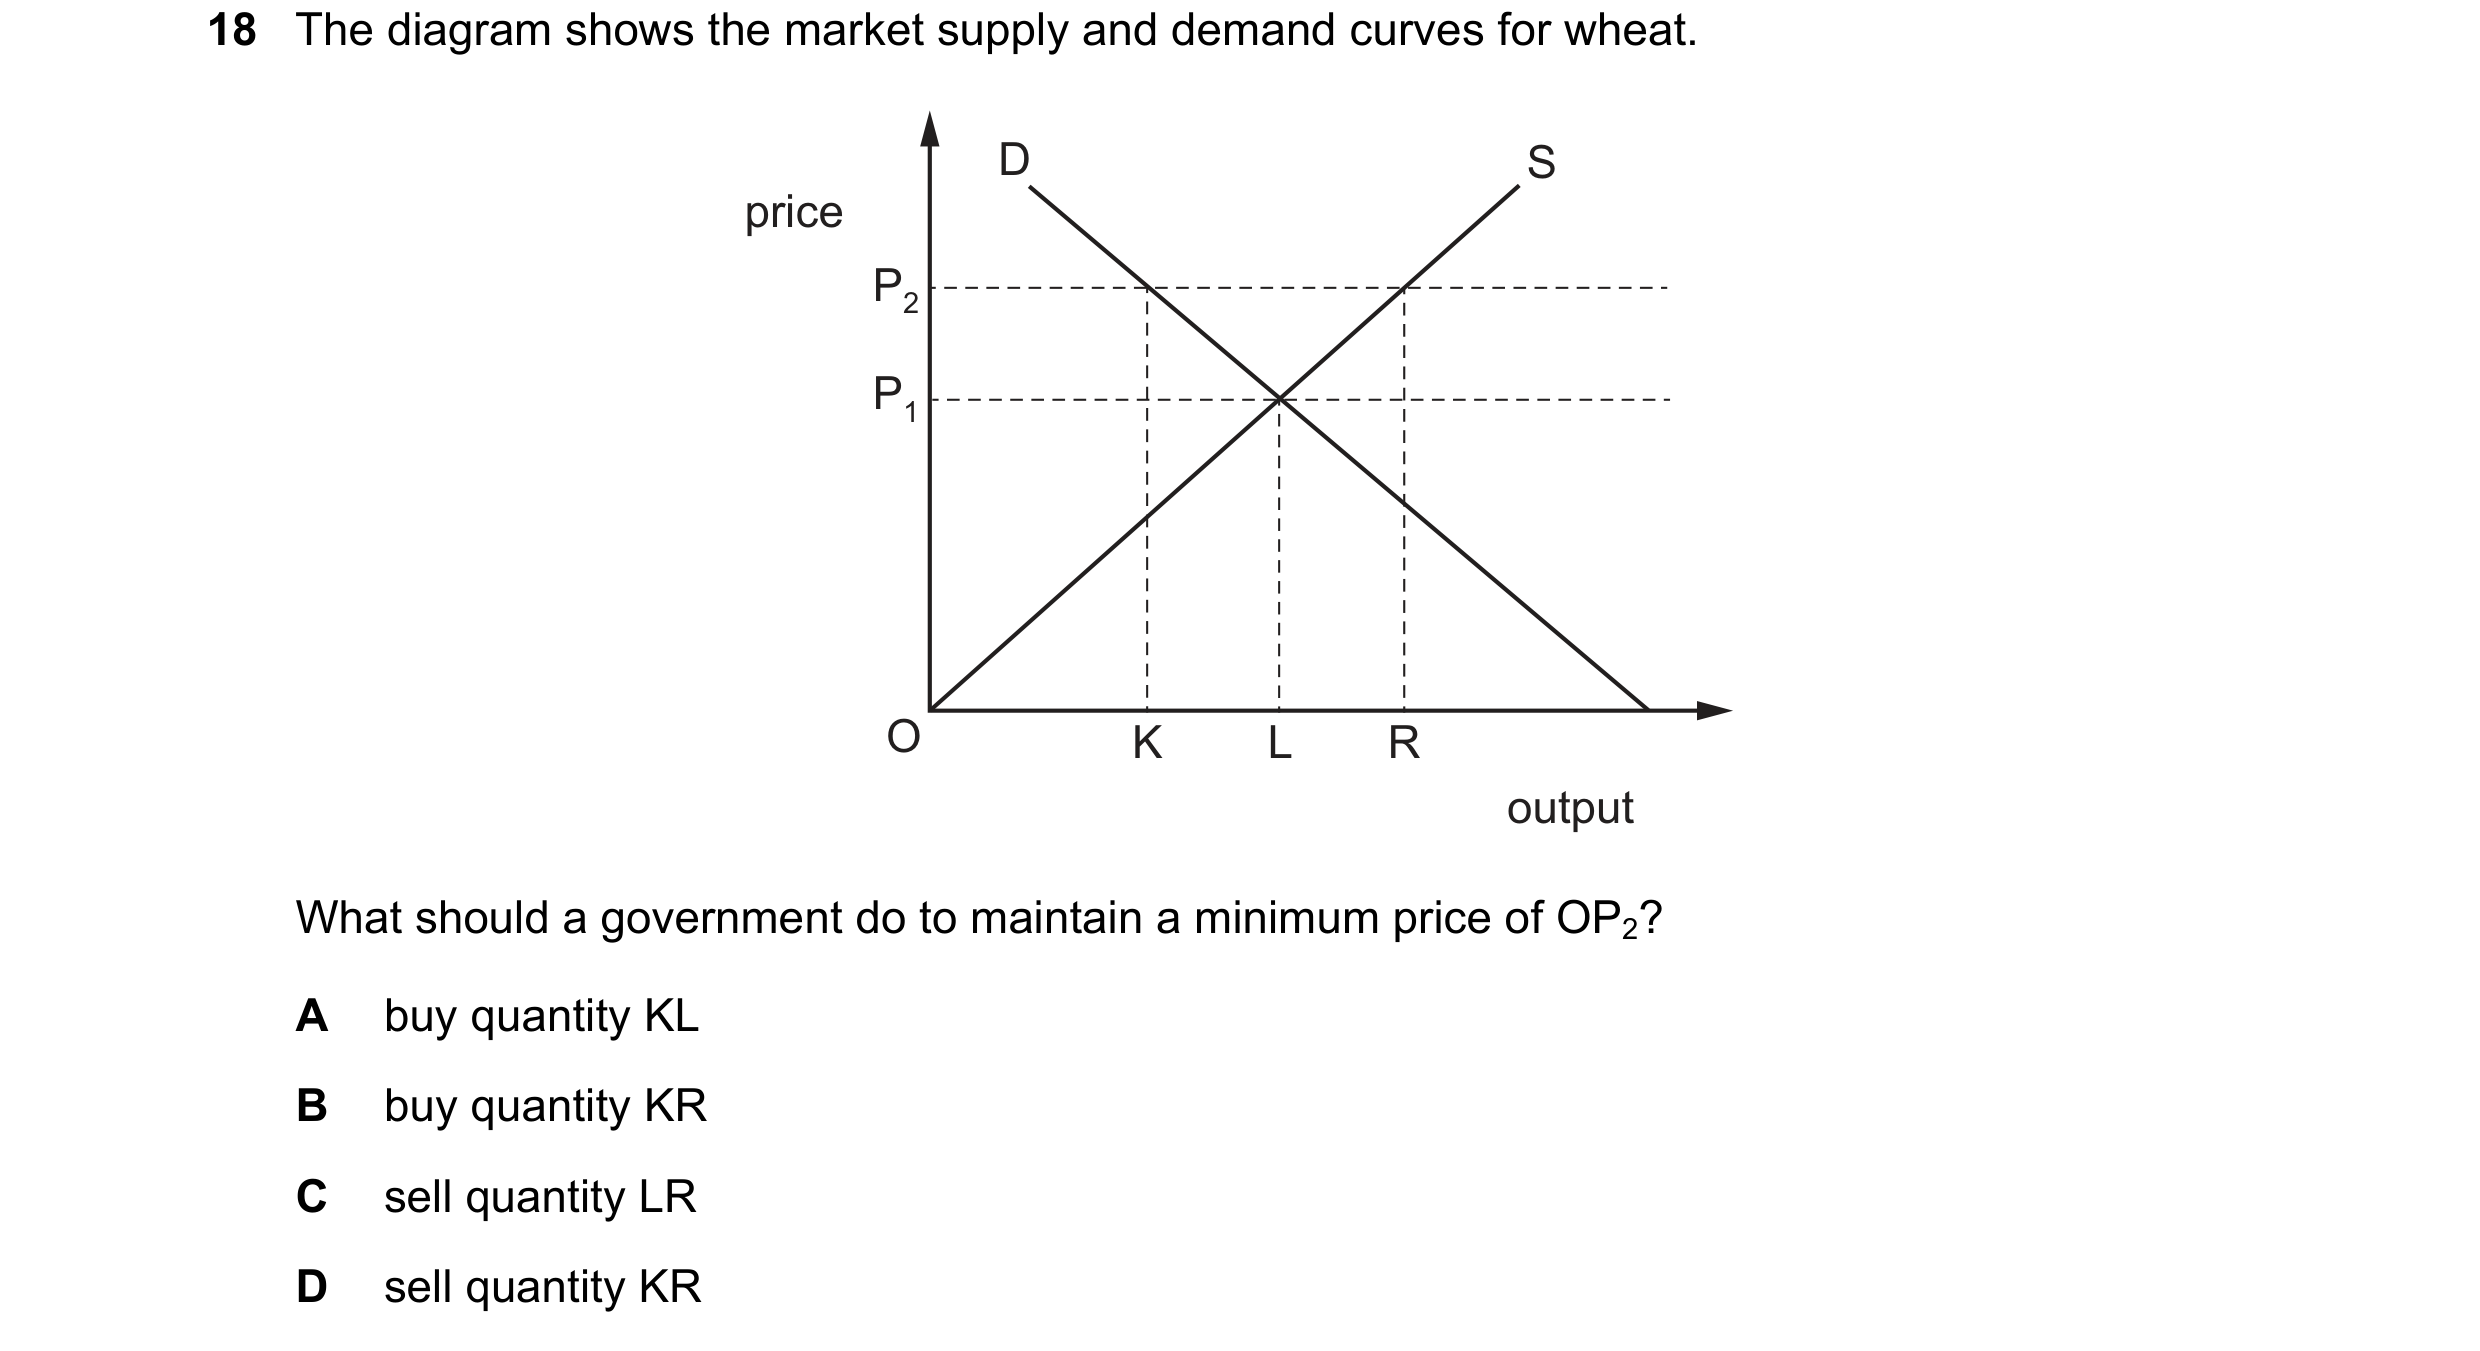

 82 / 119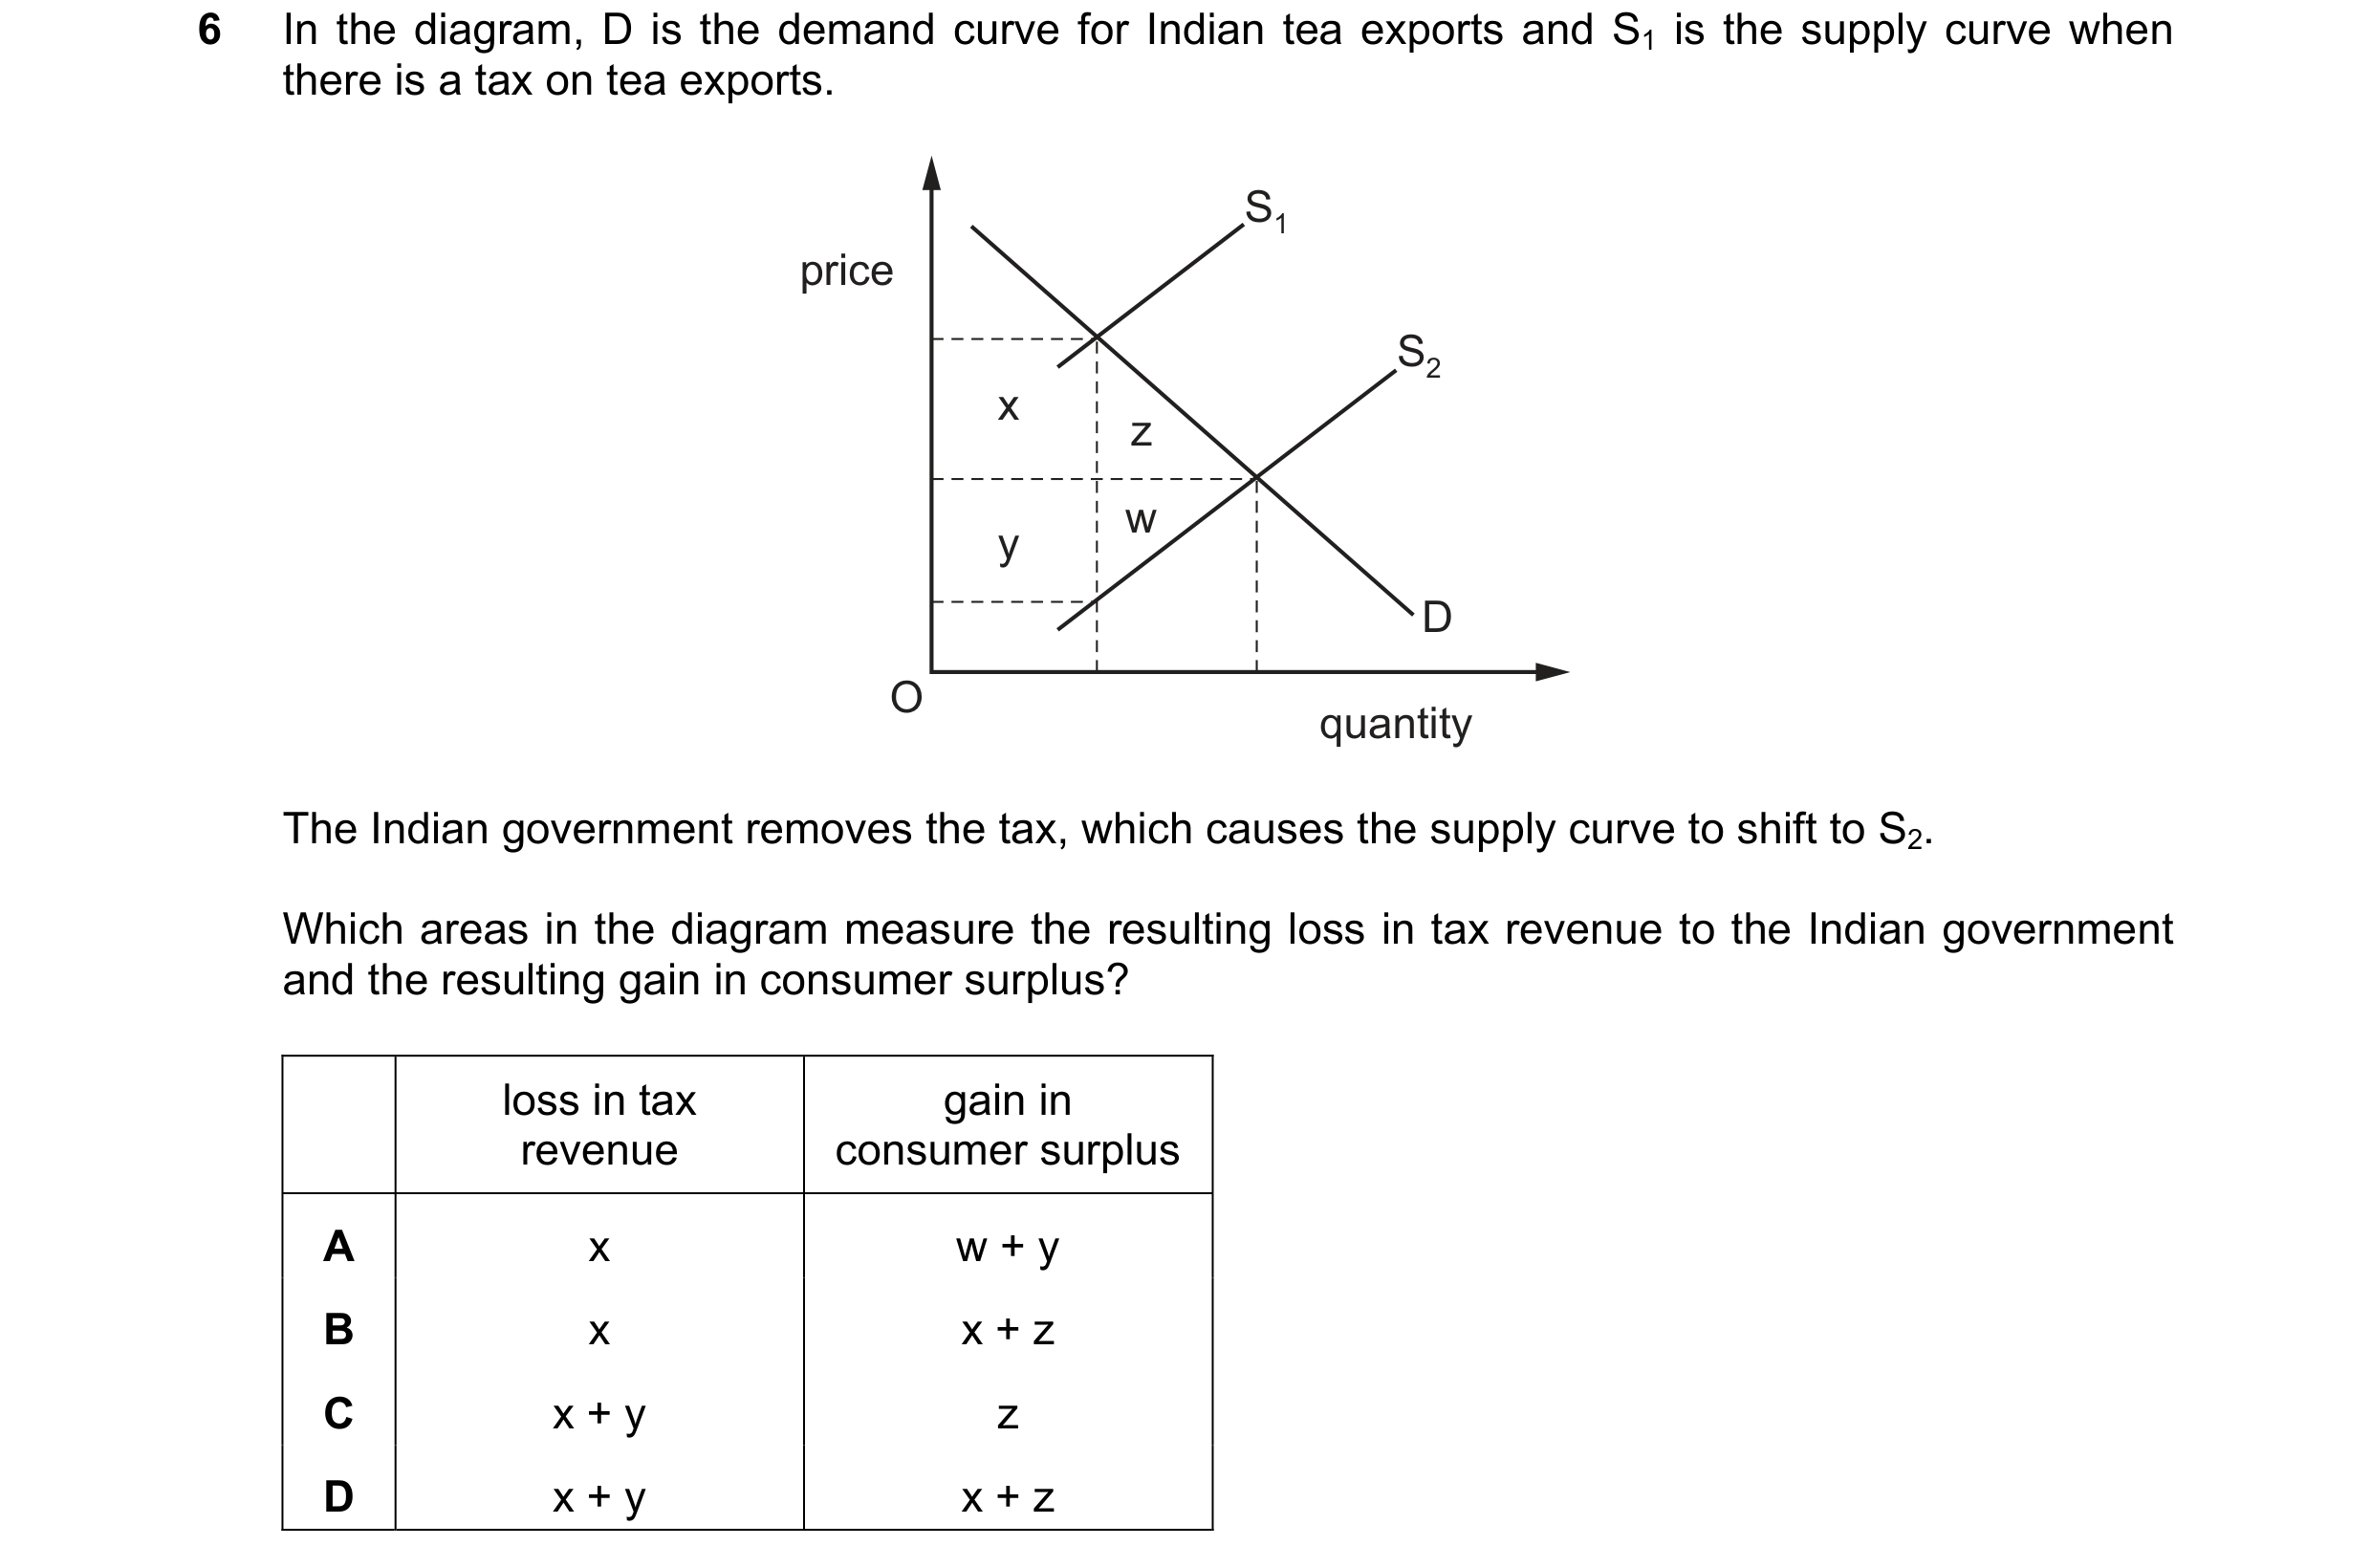
 83 / 119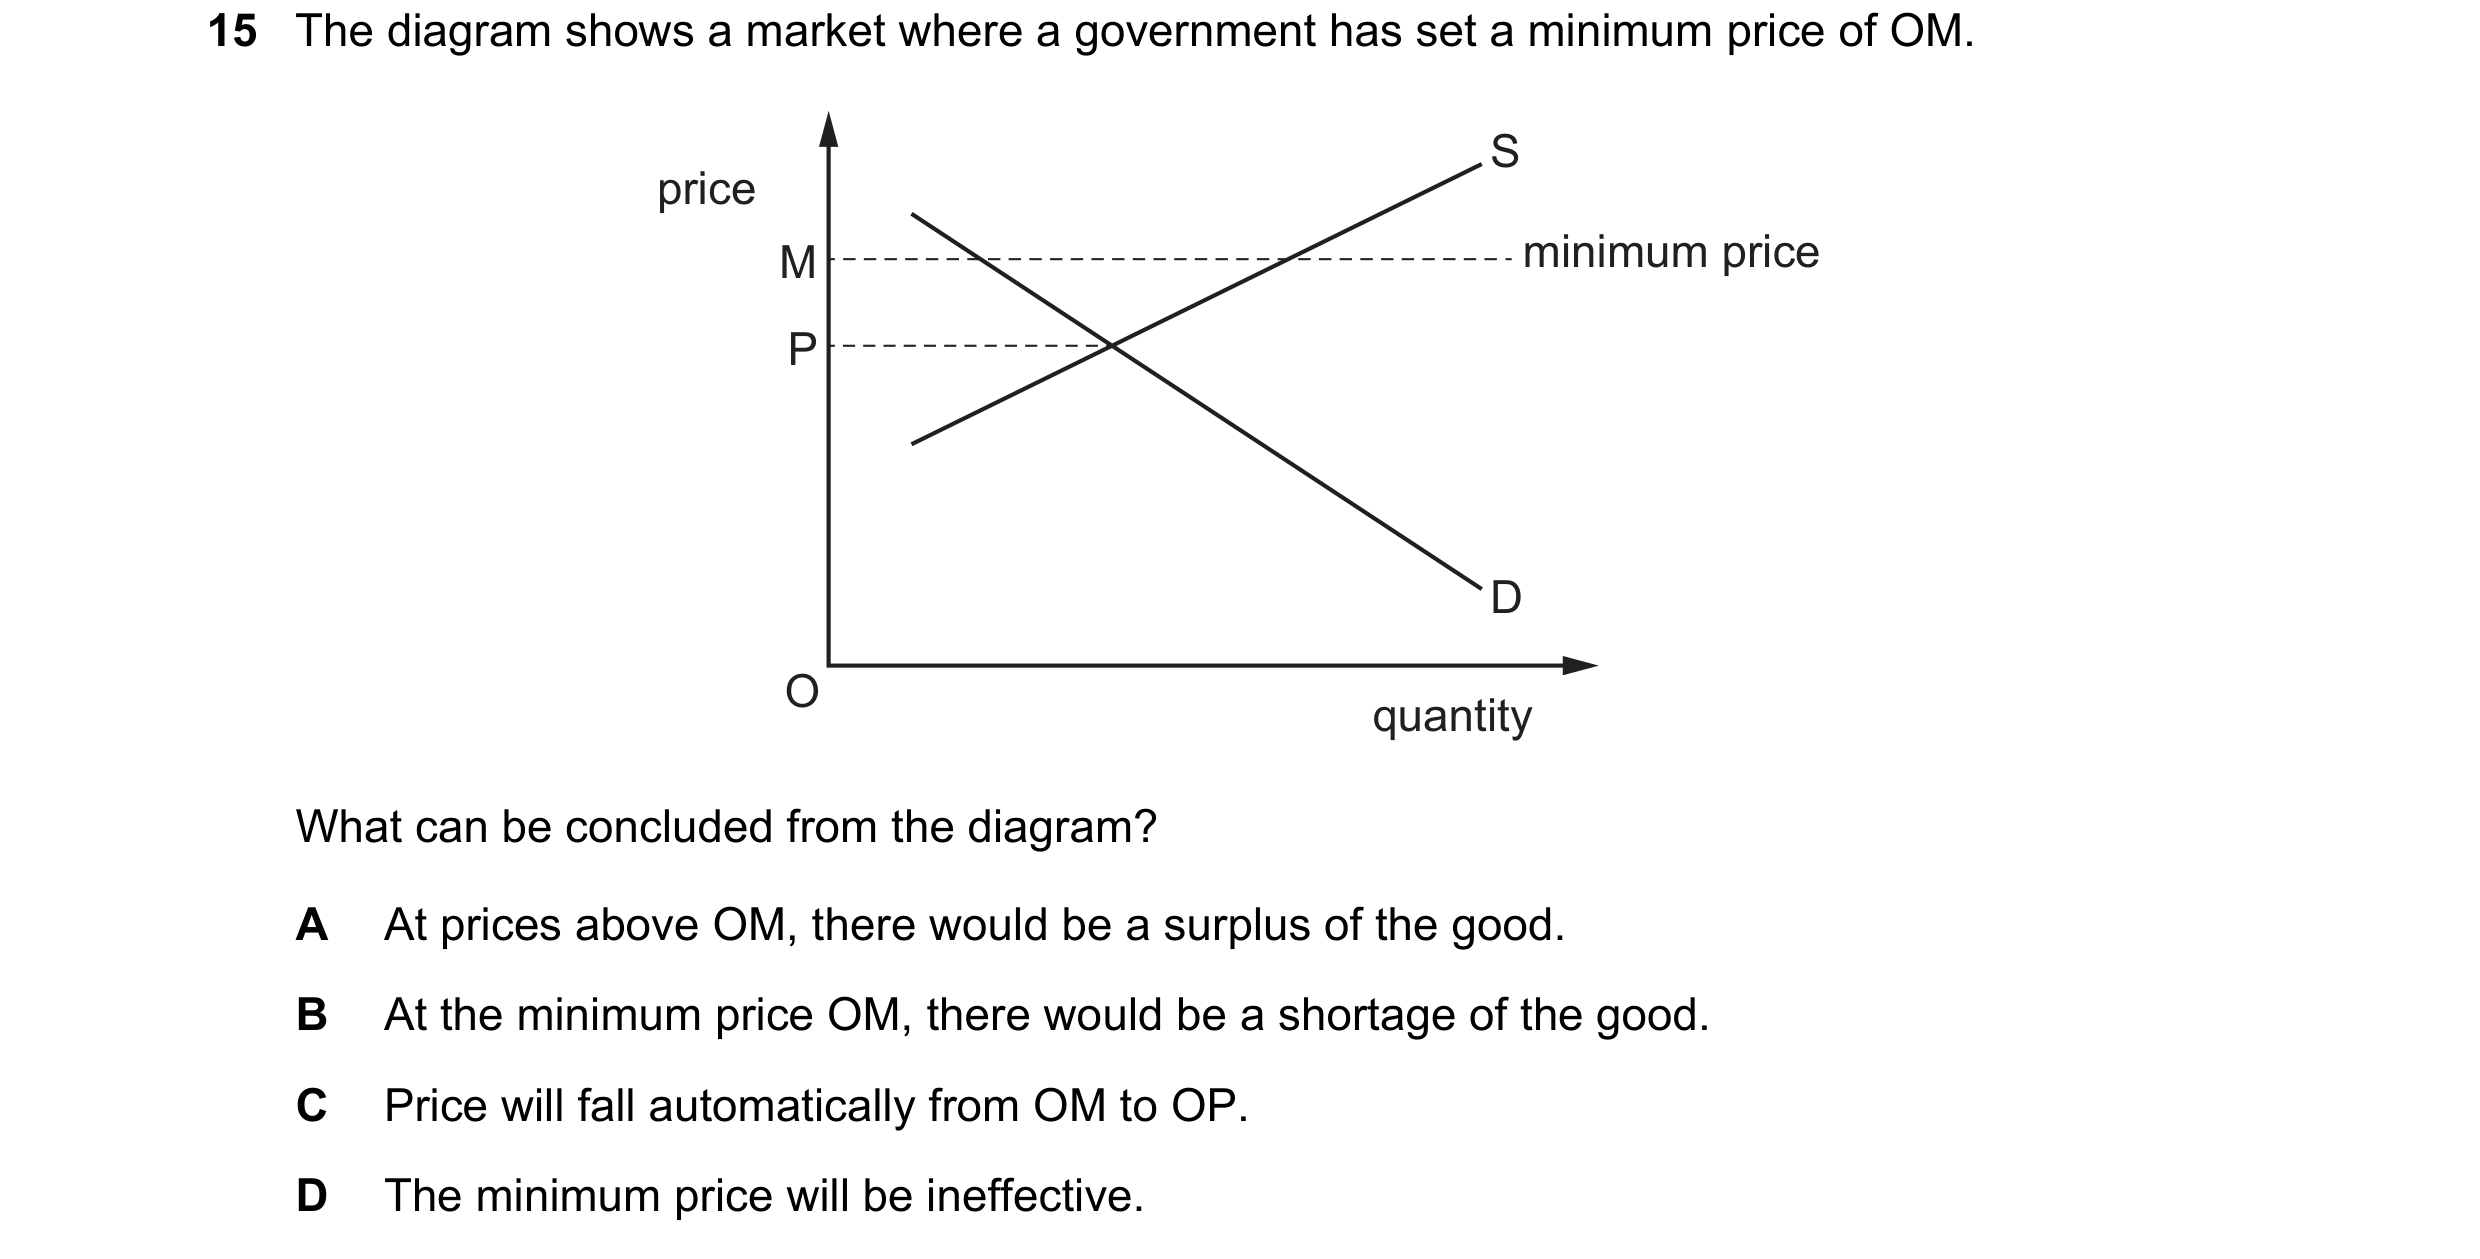
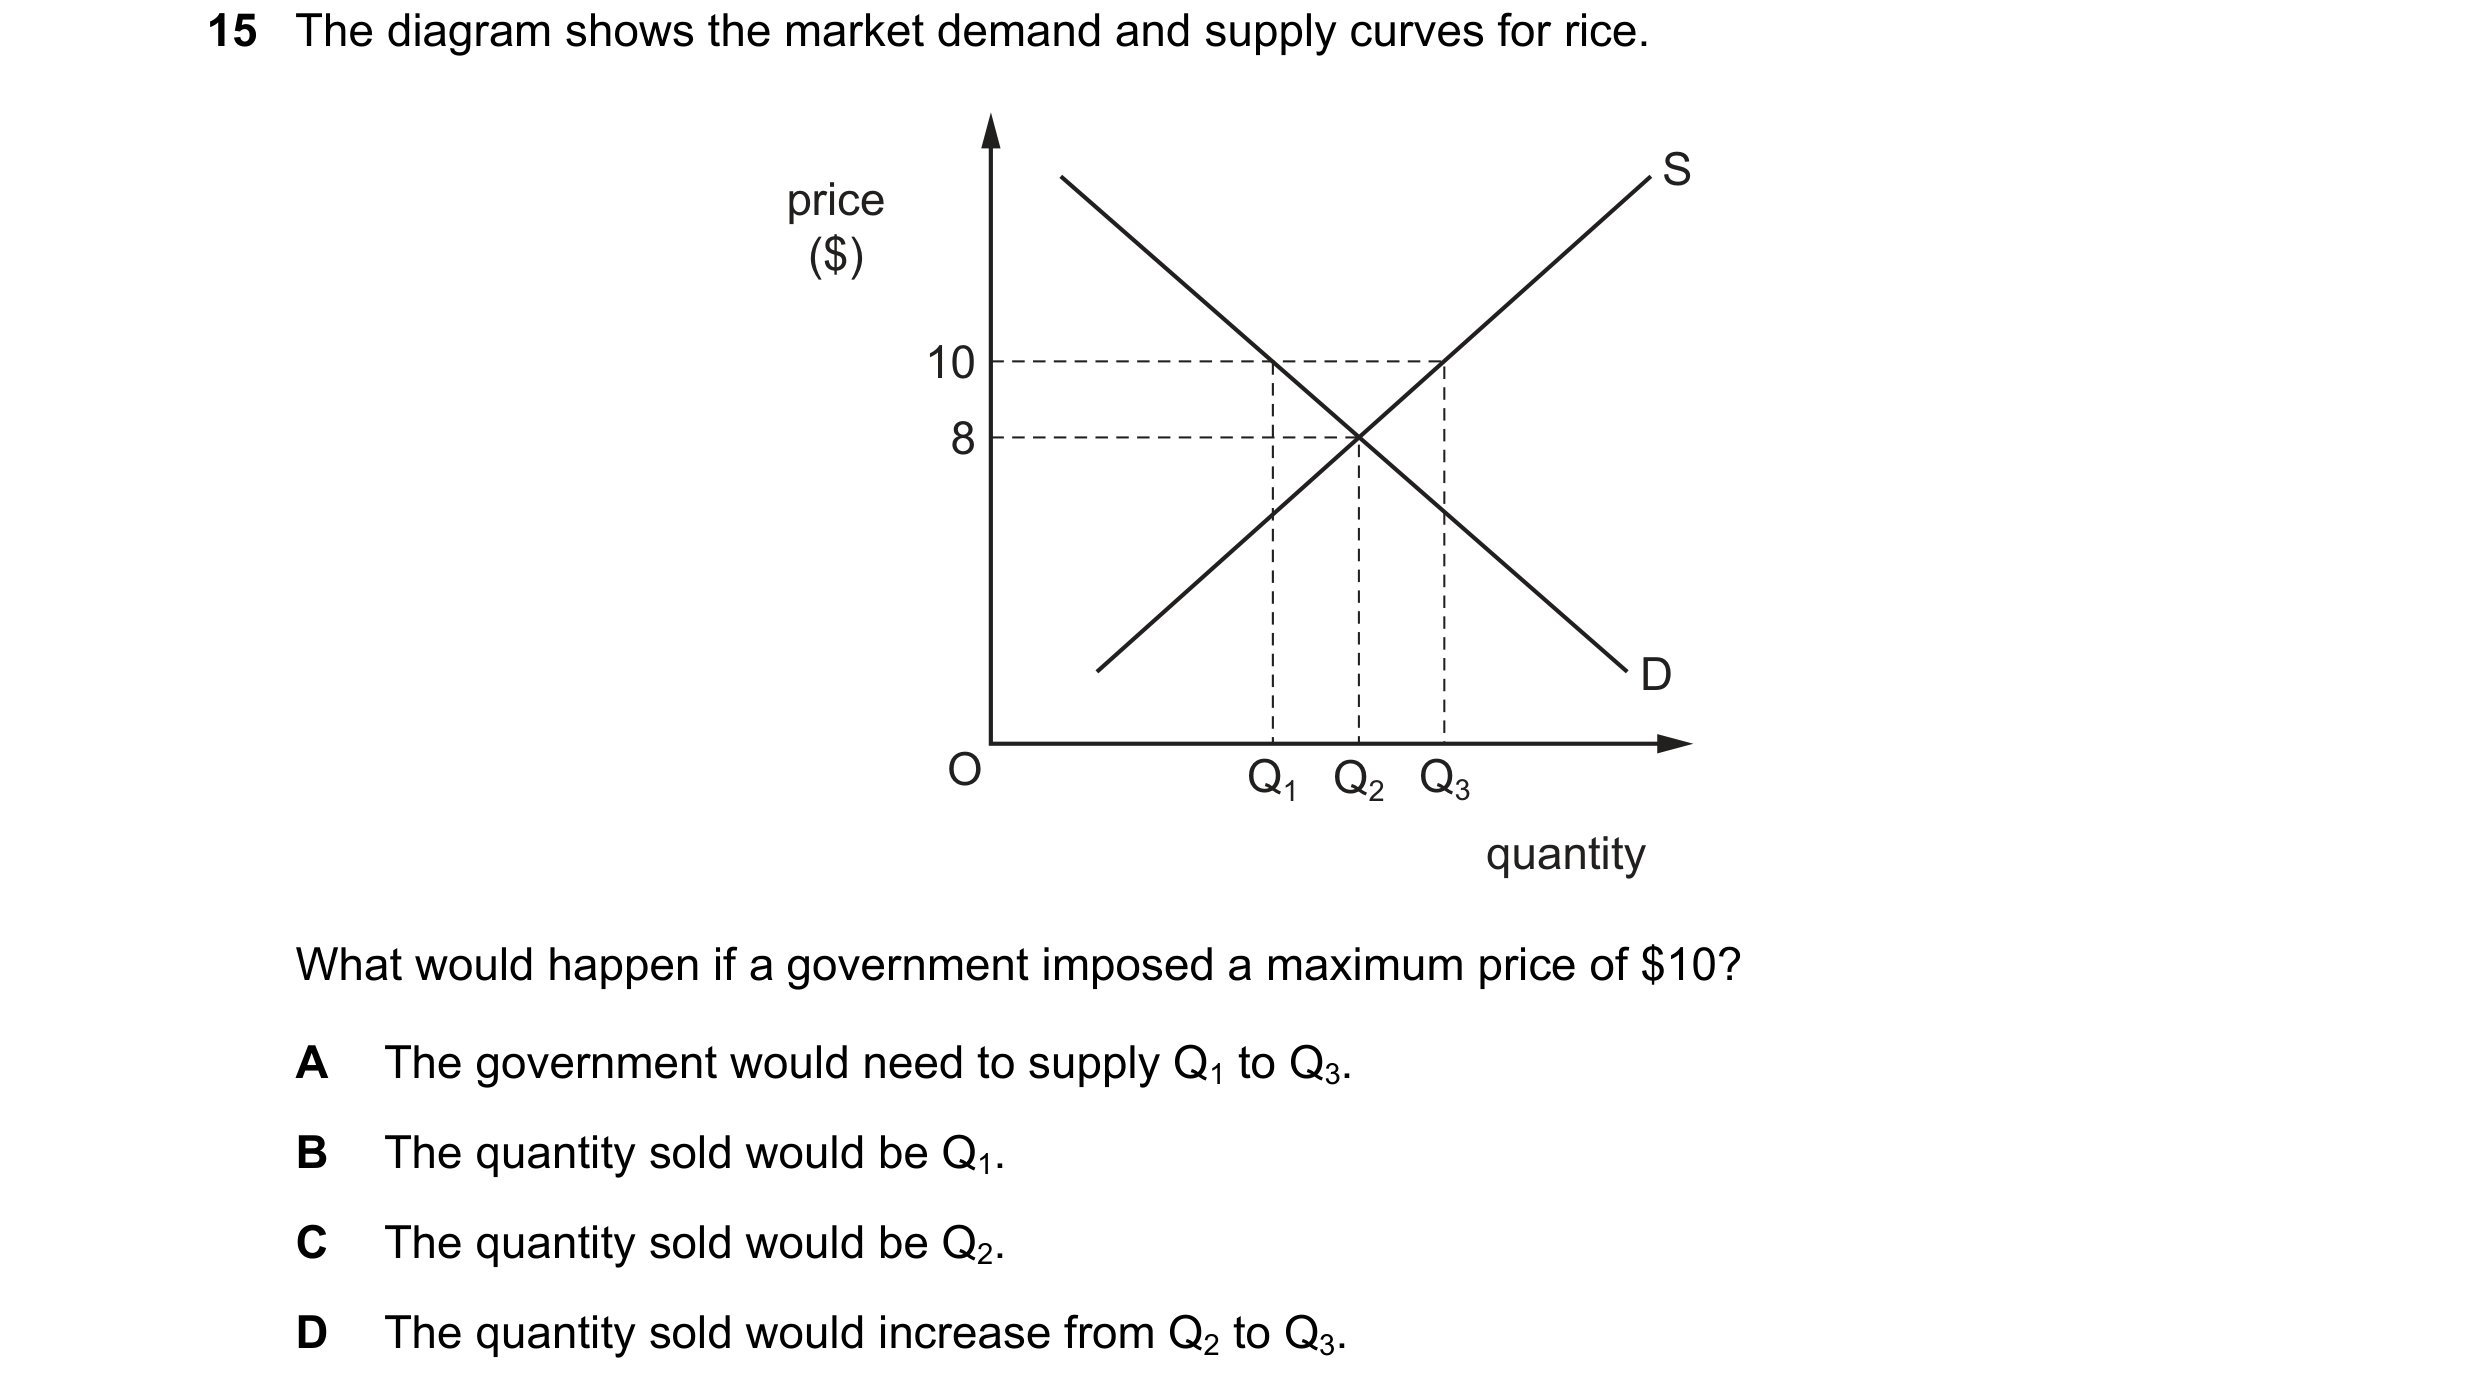 84 / 119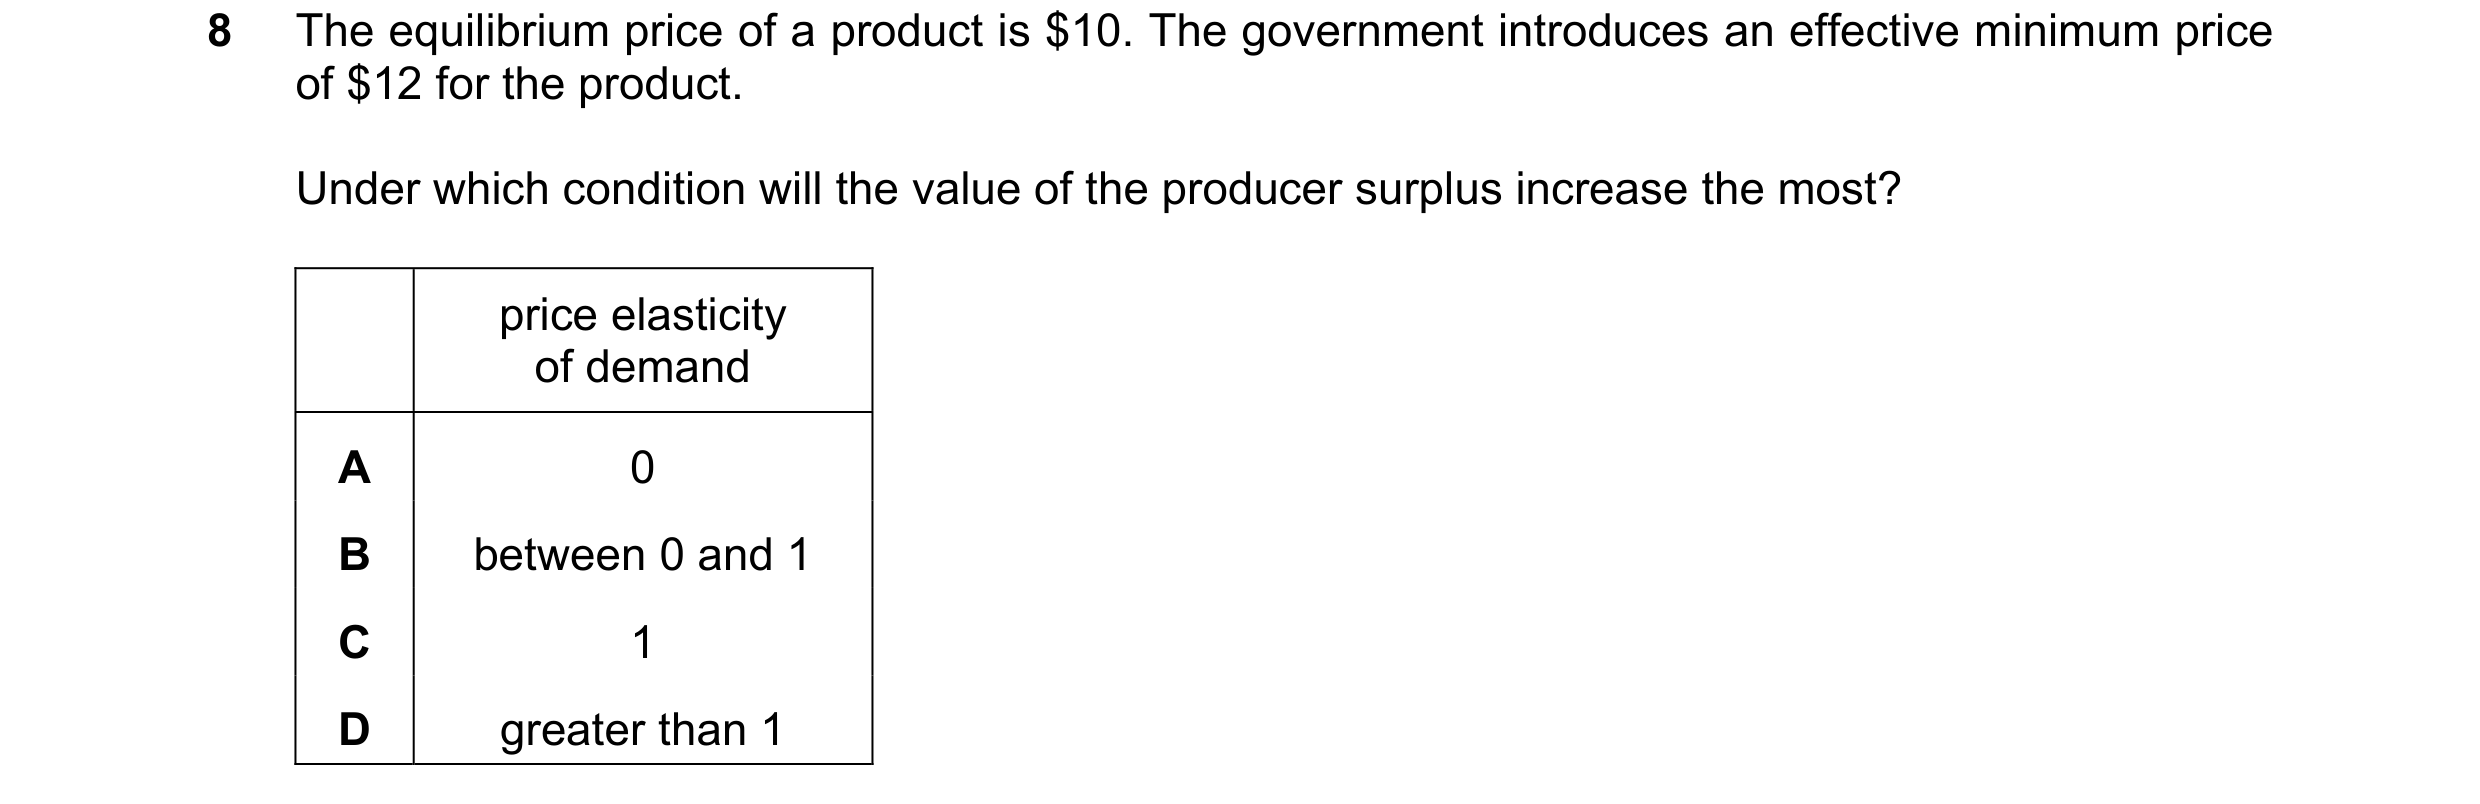
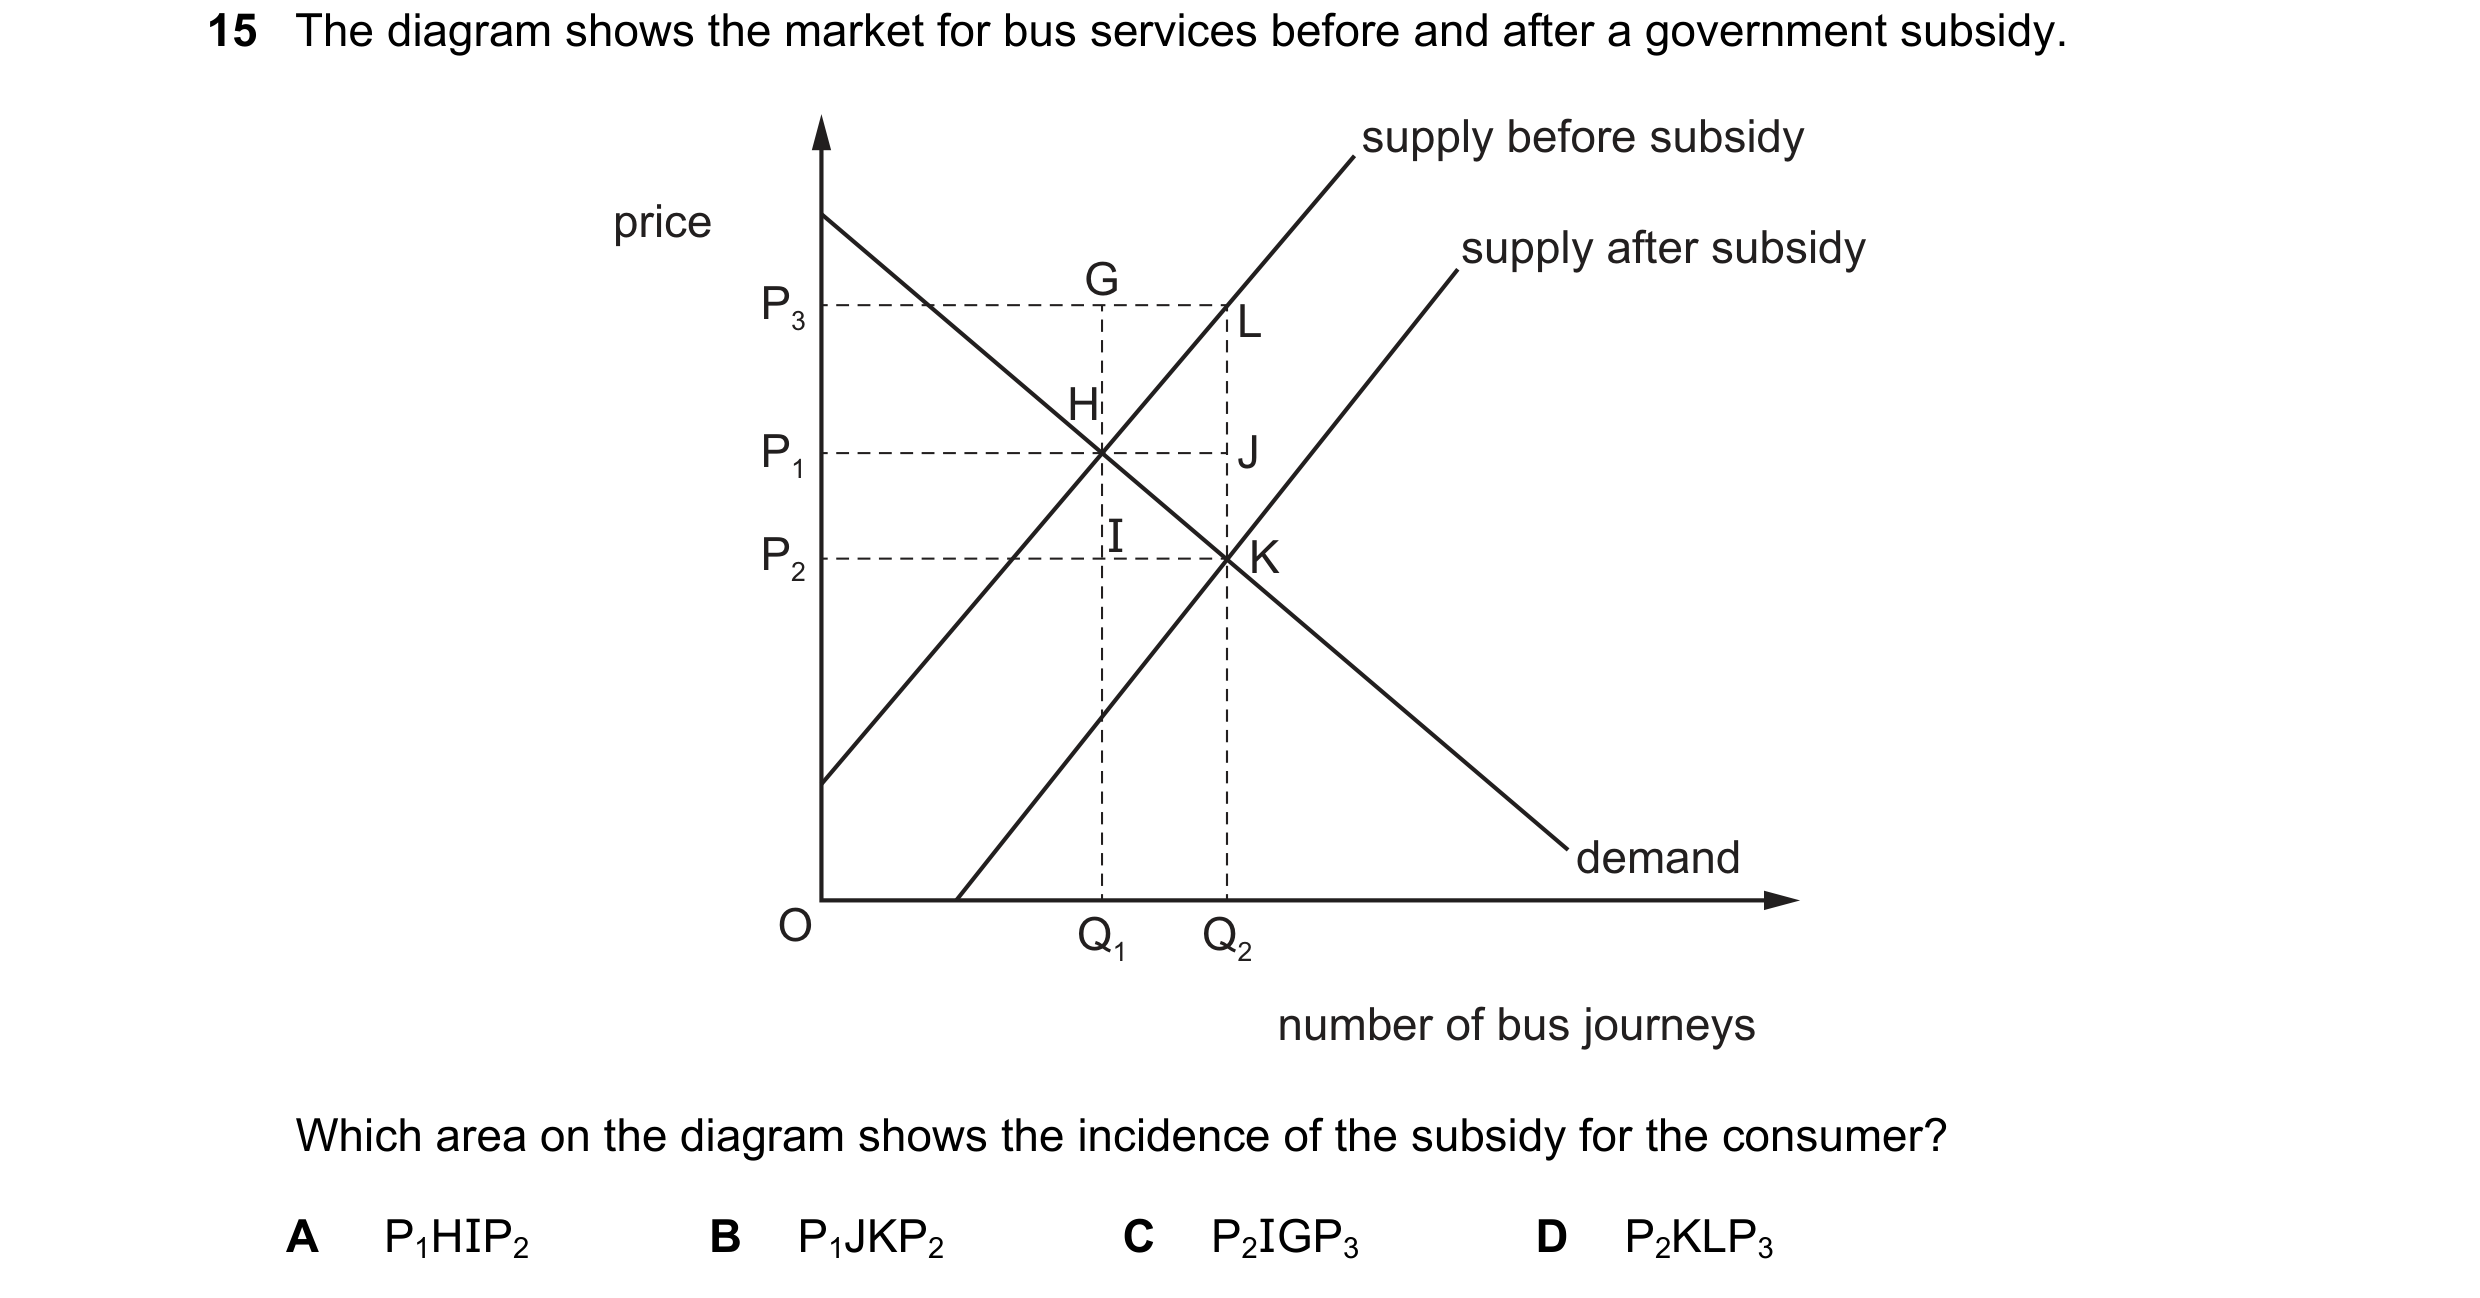 85 / 119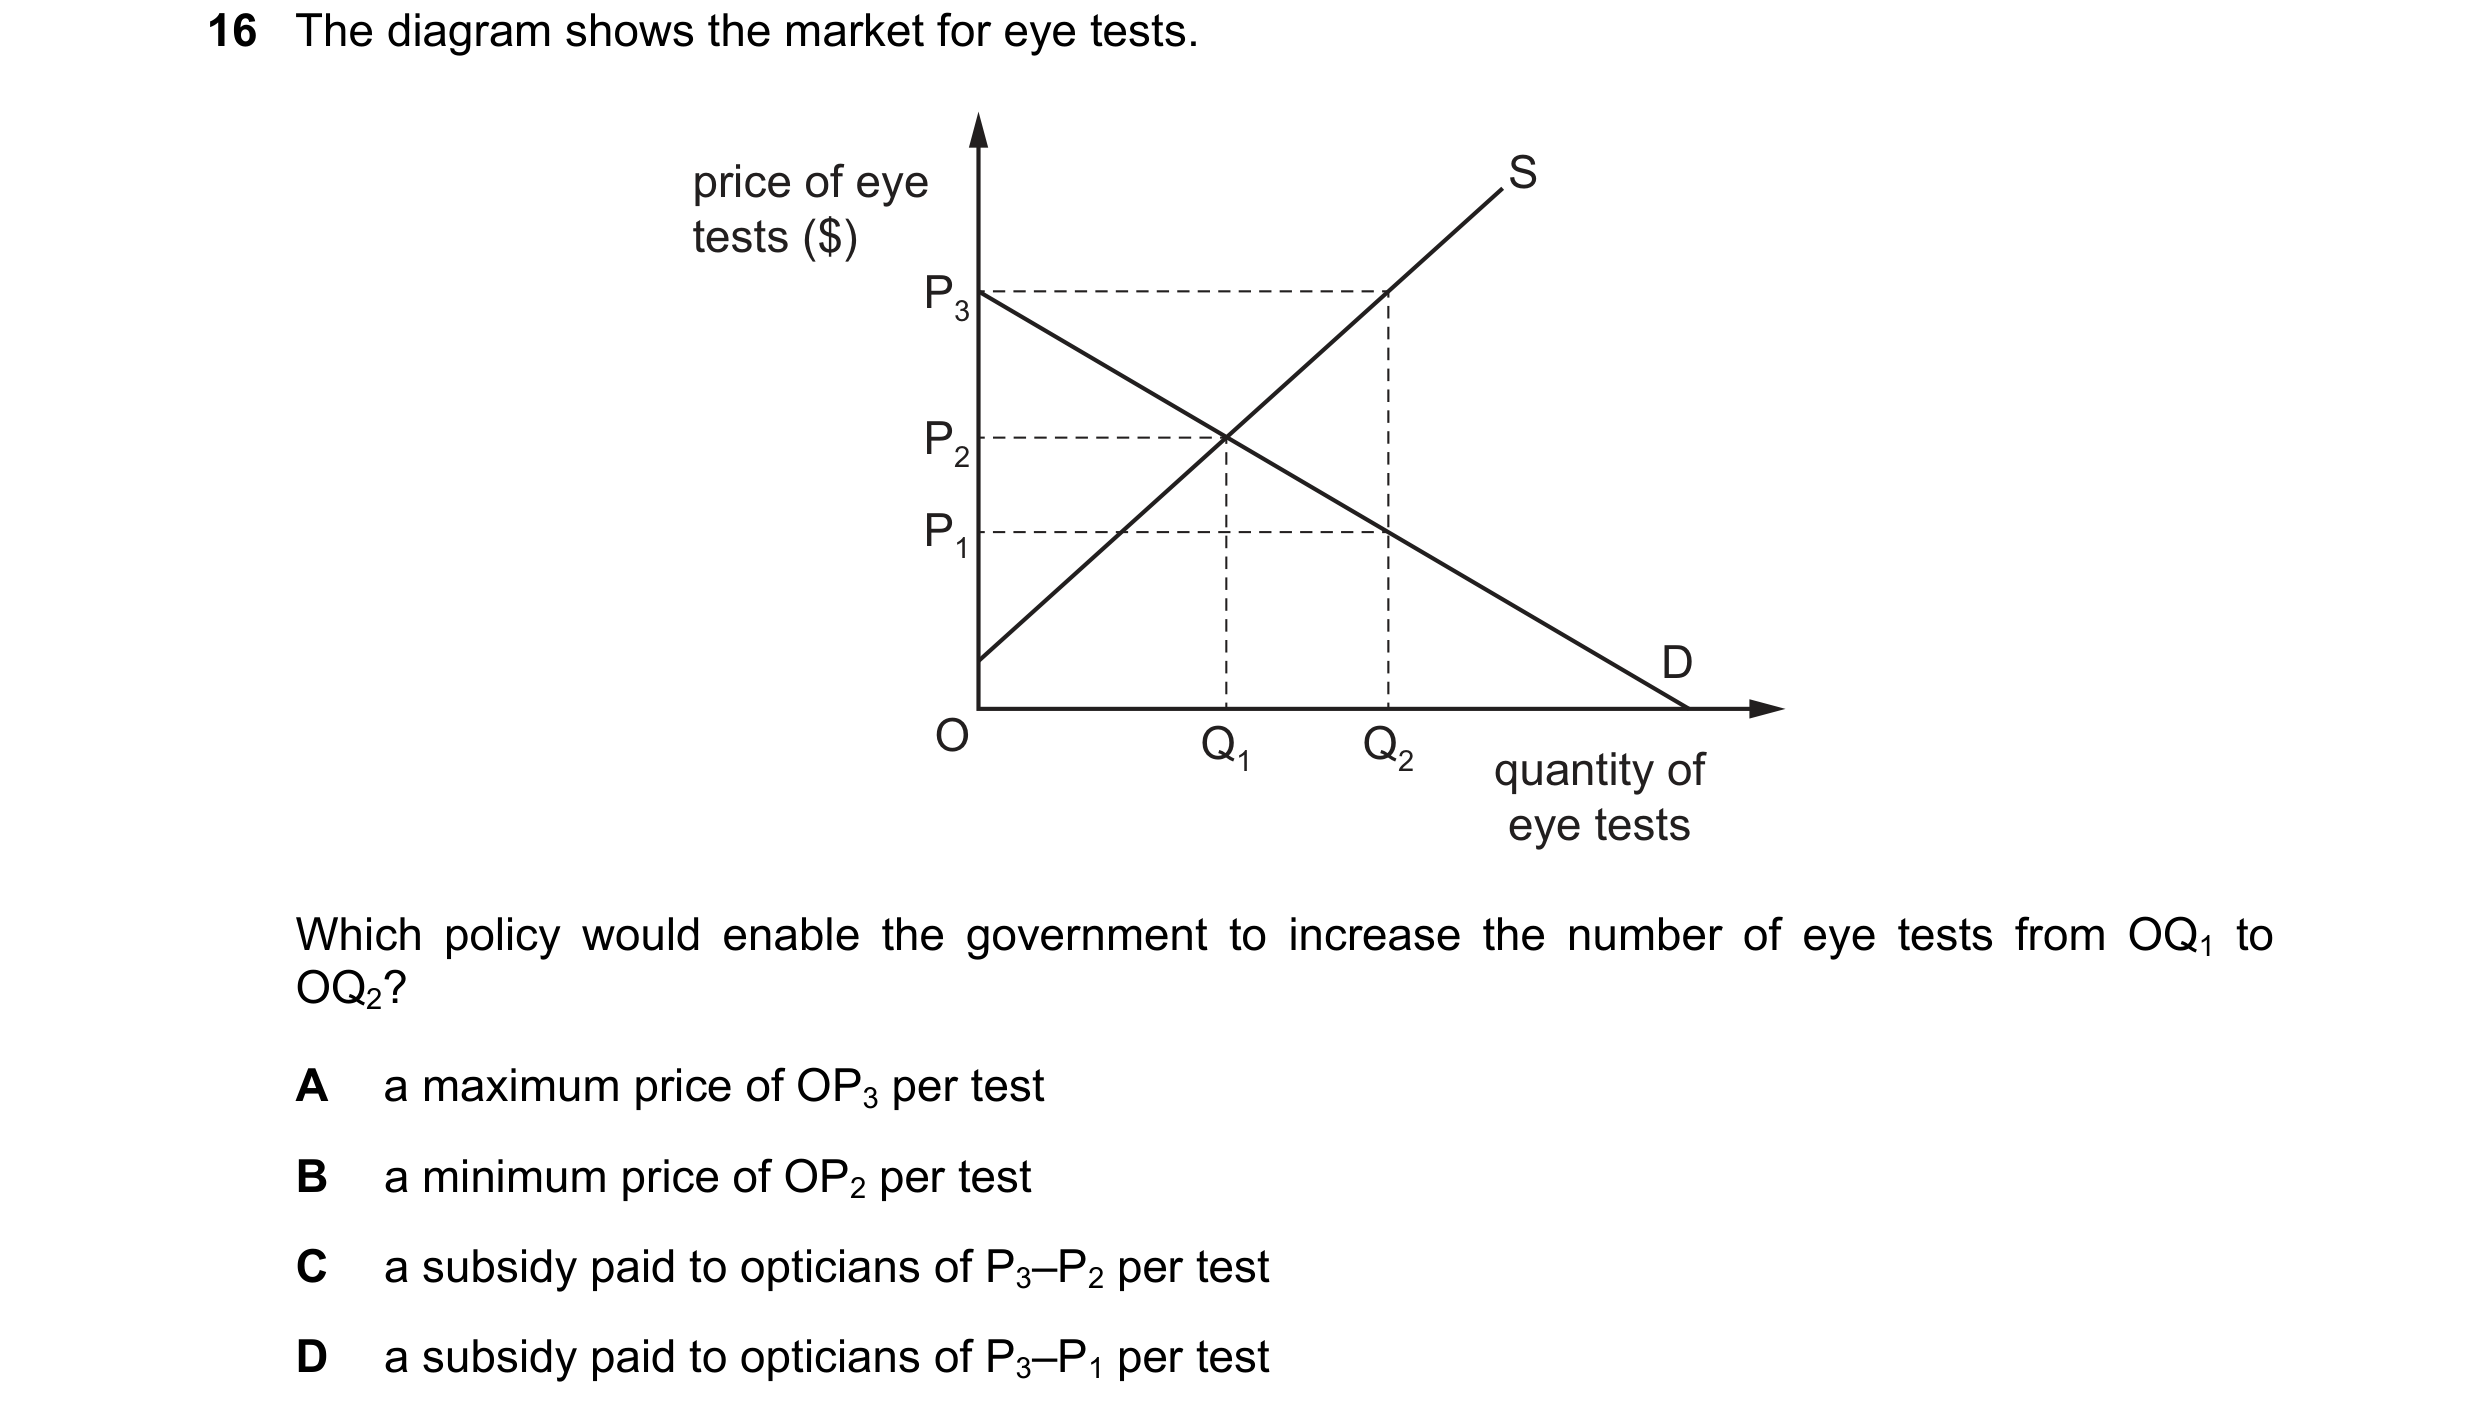
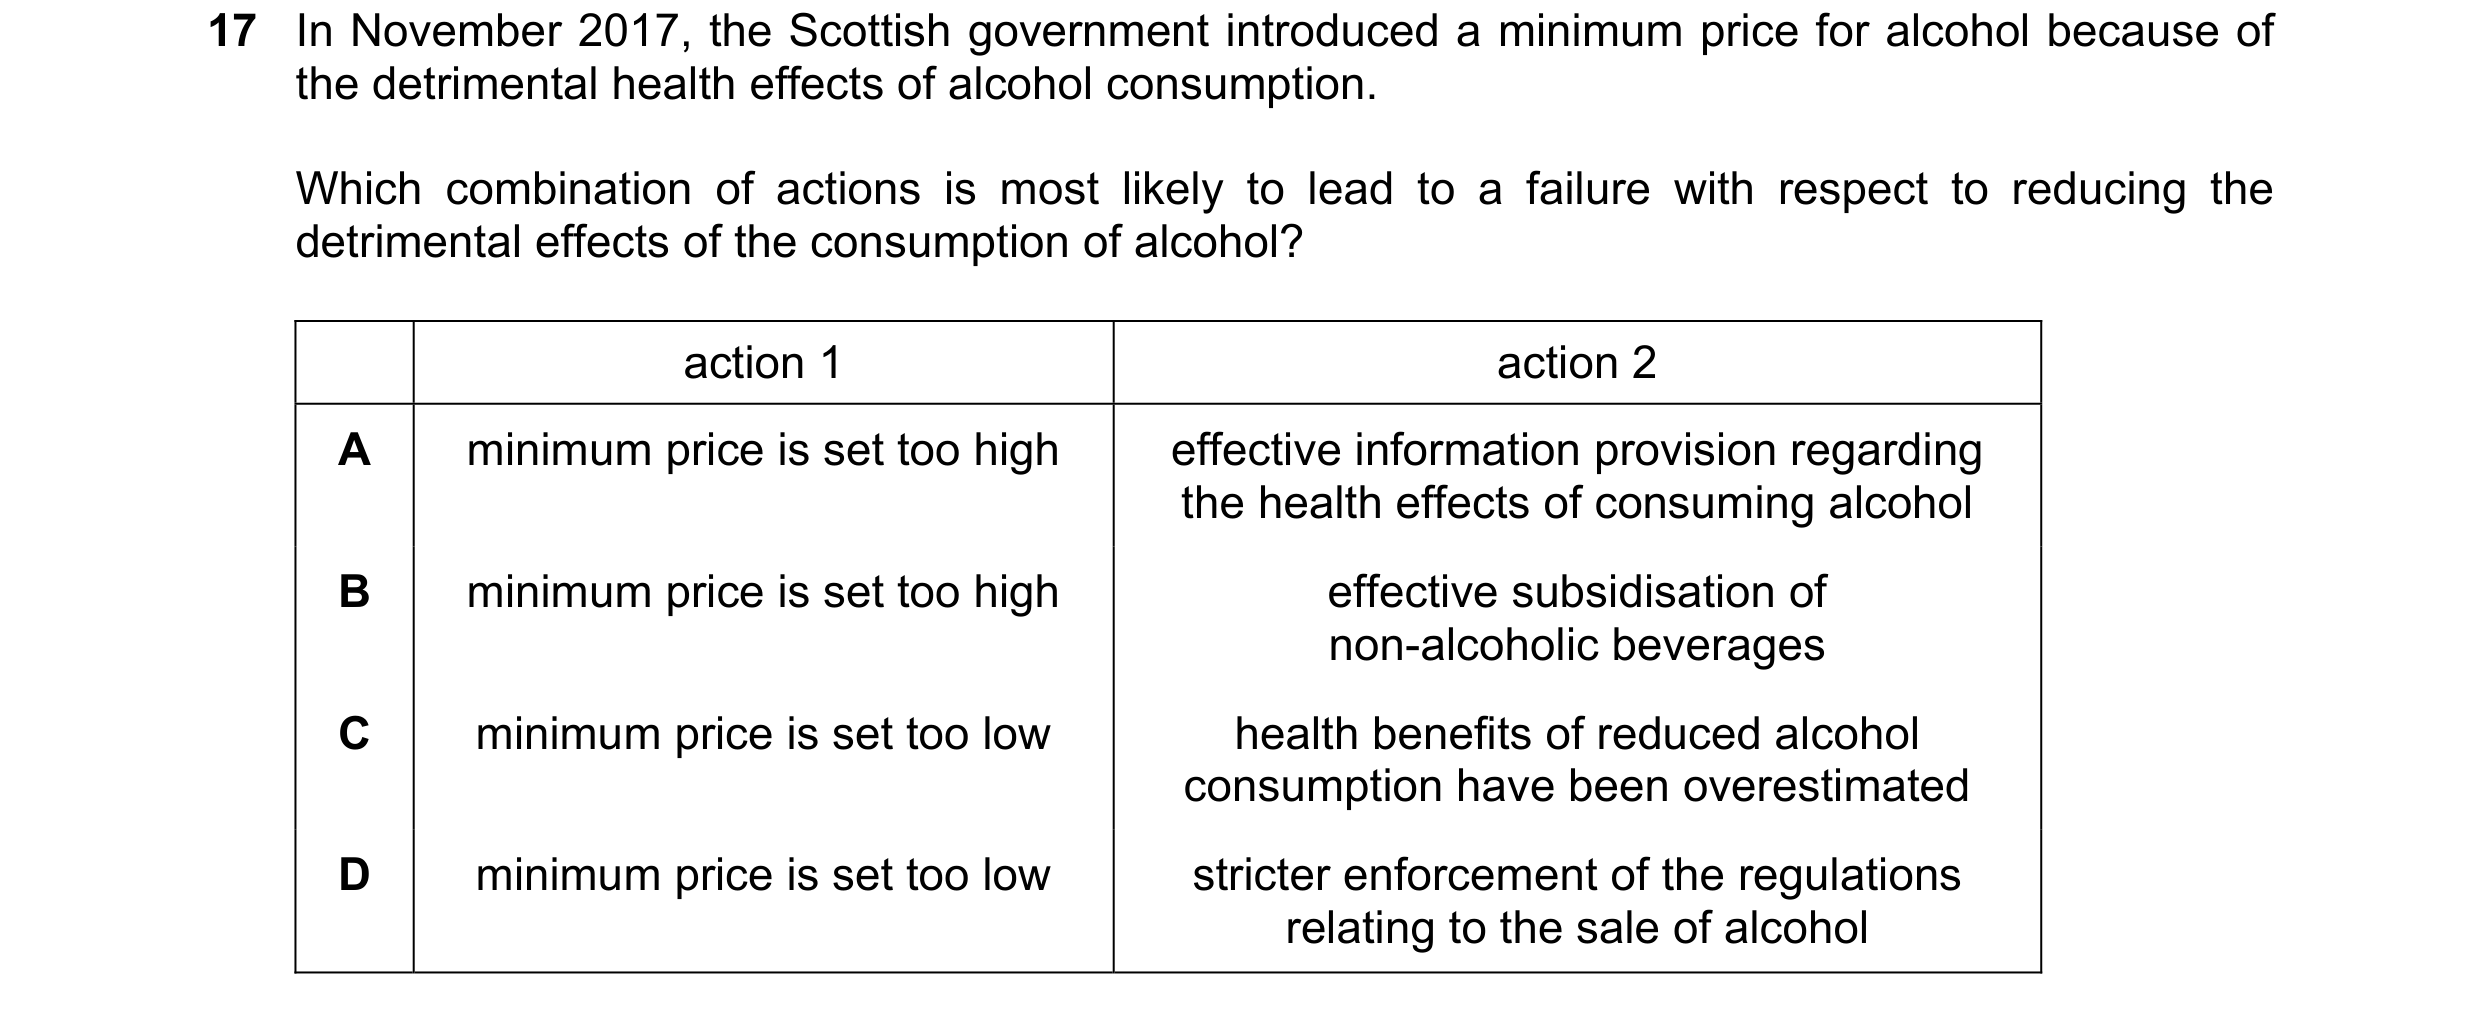
 86 / 119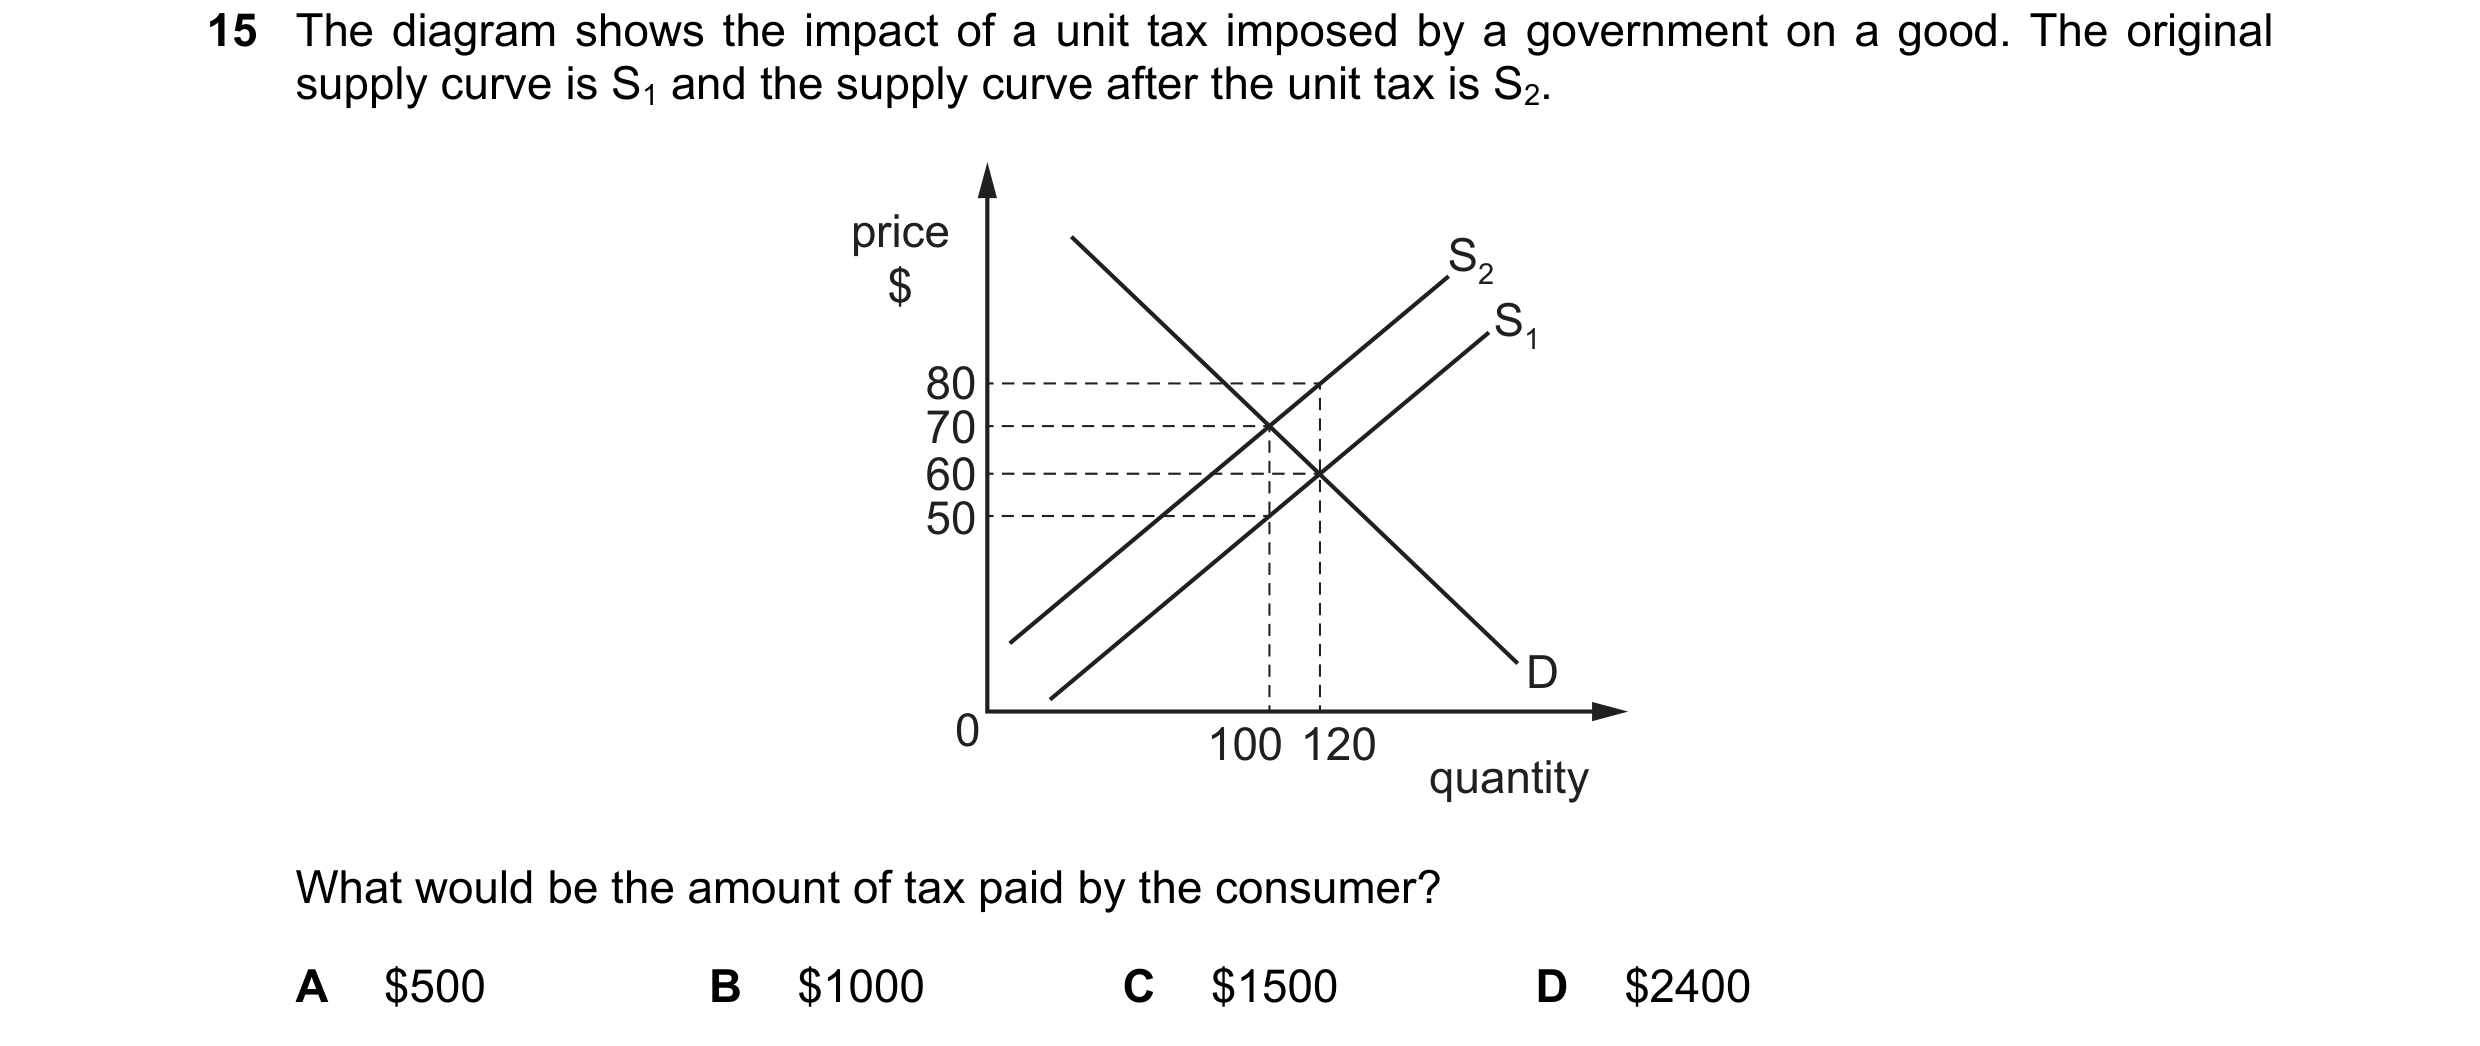
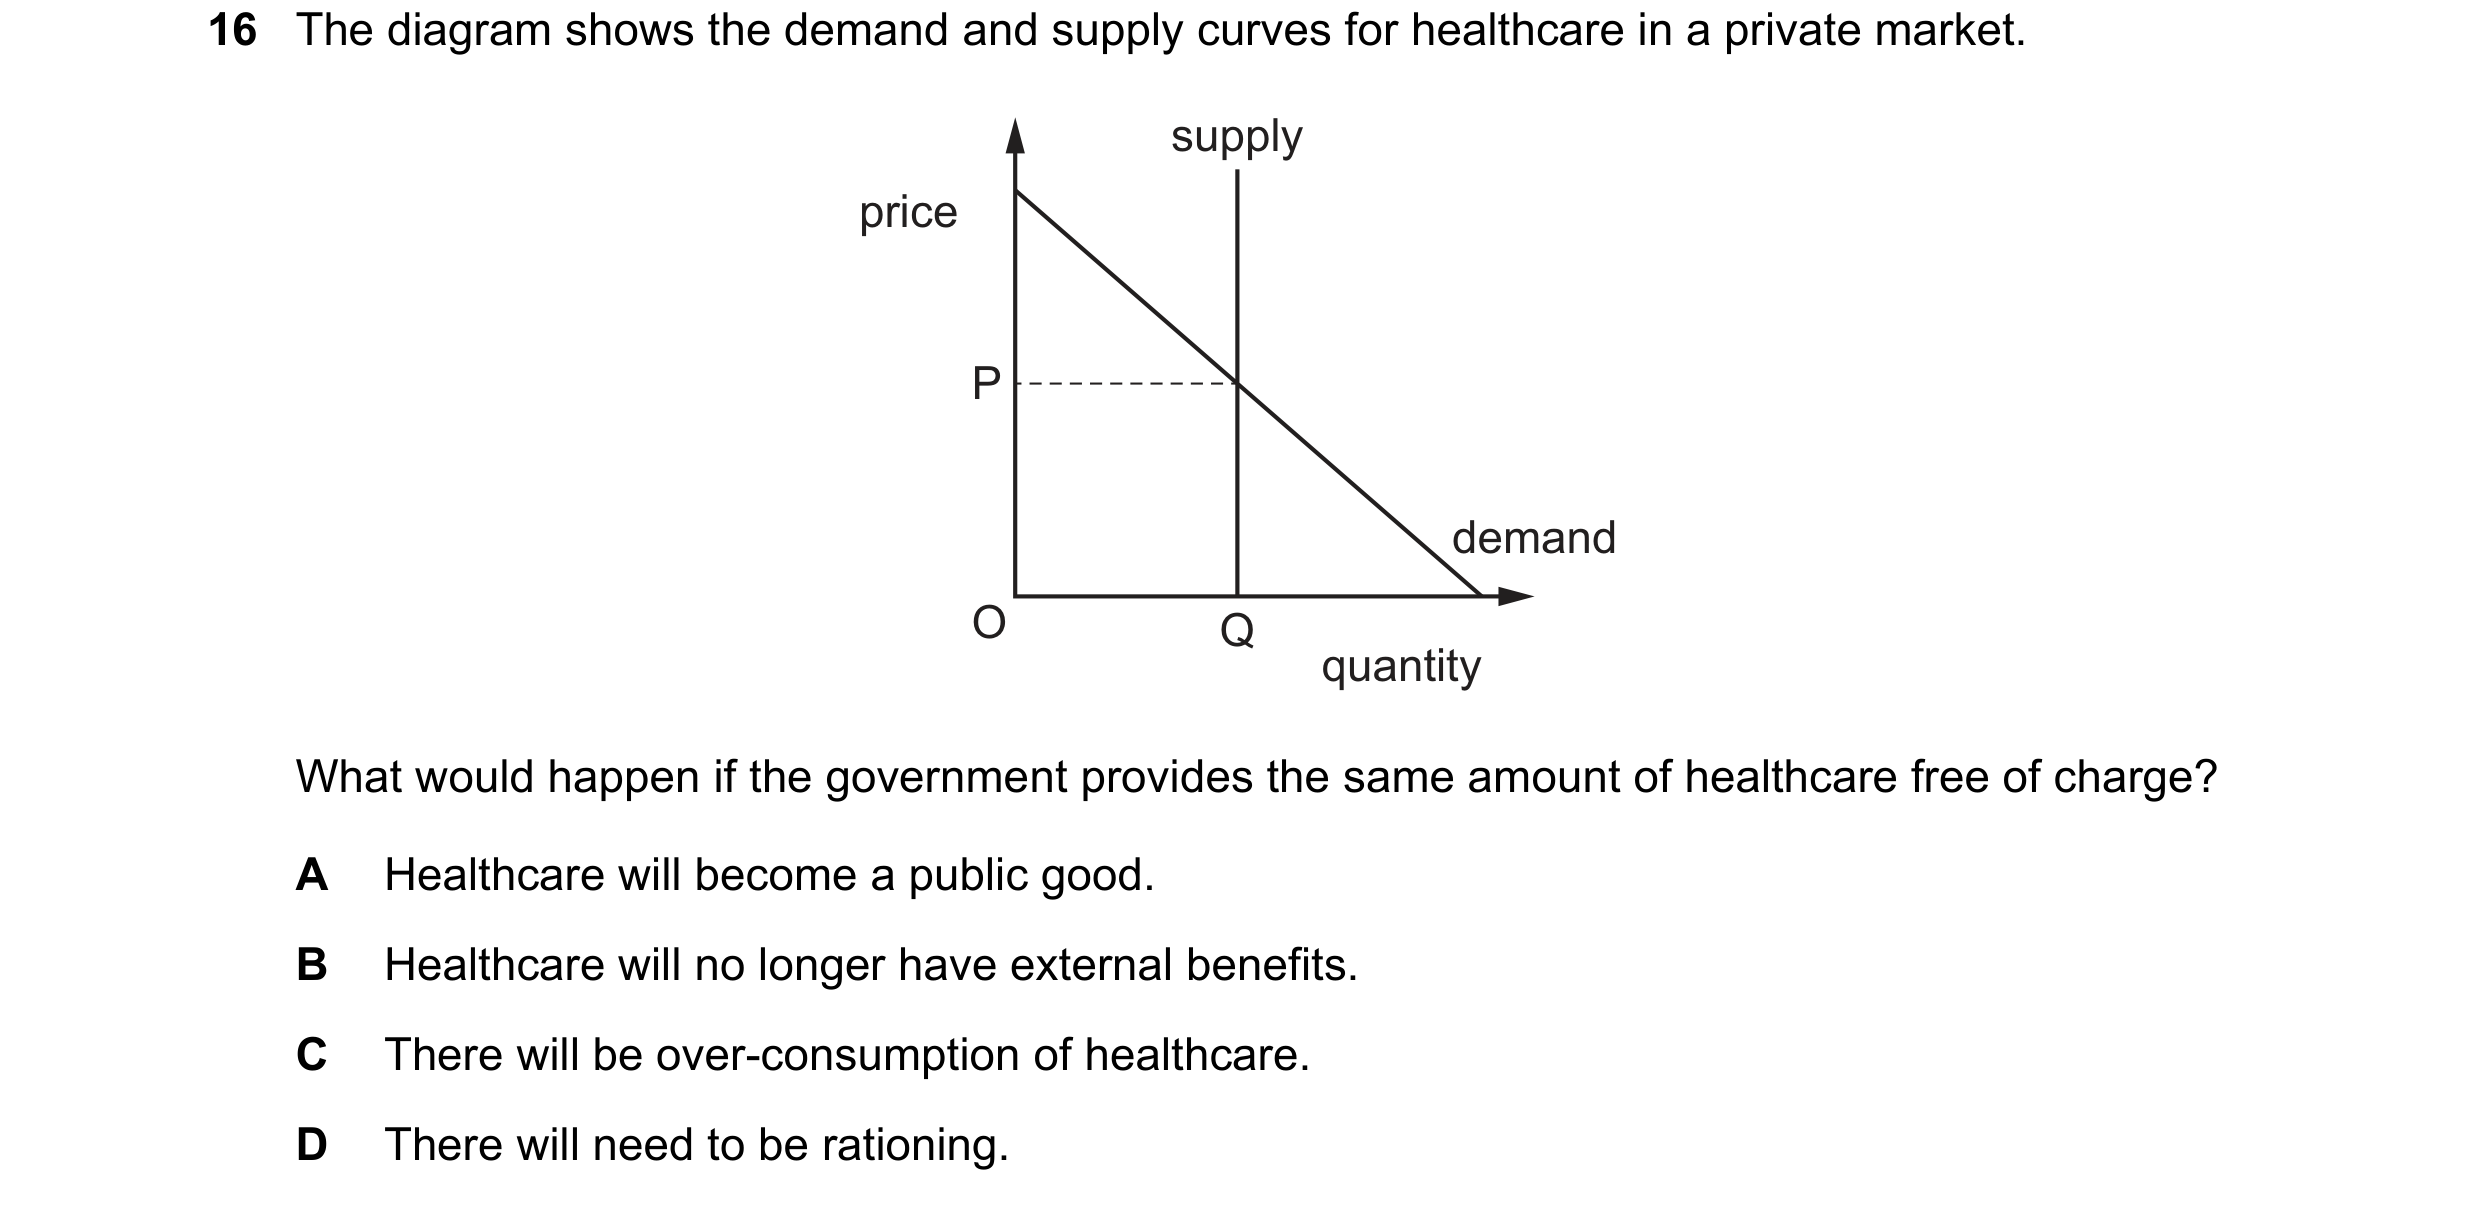 87 / 119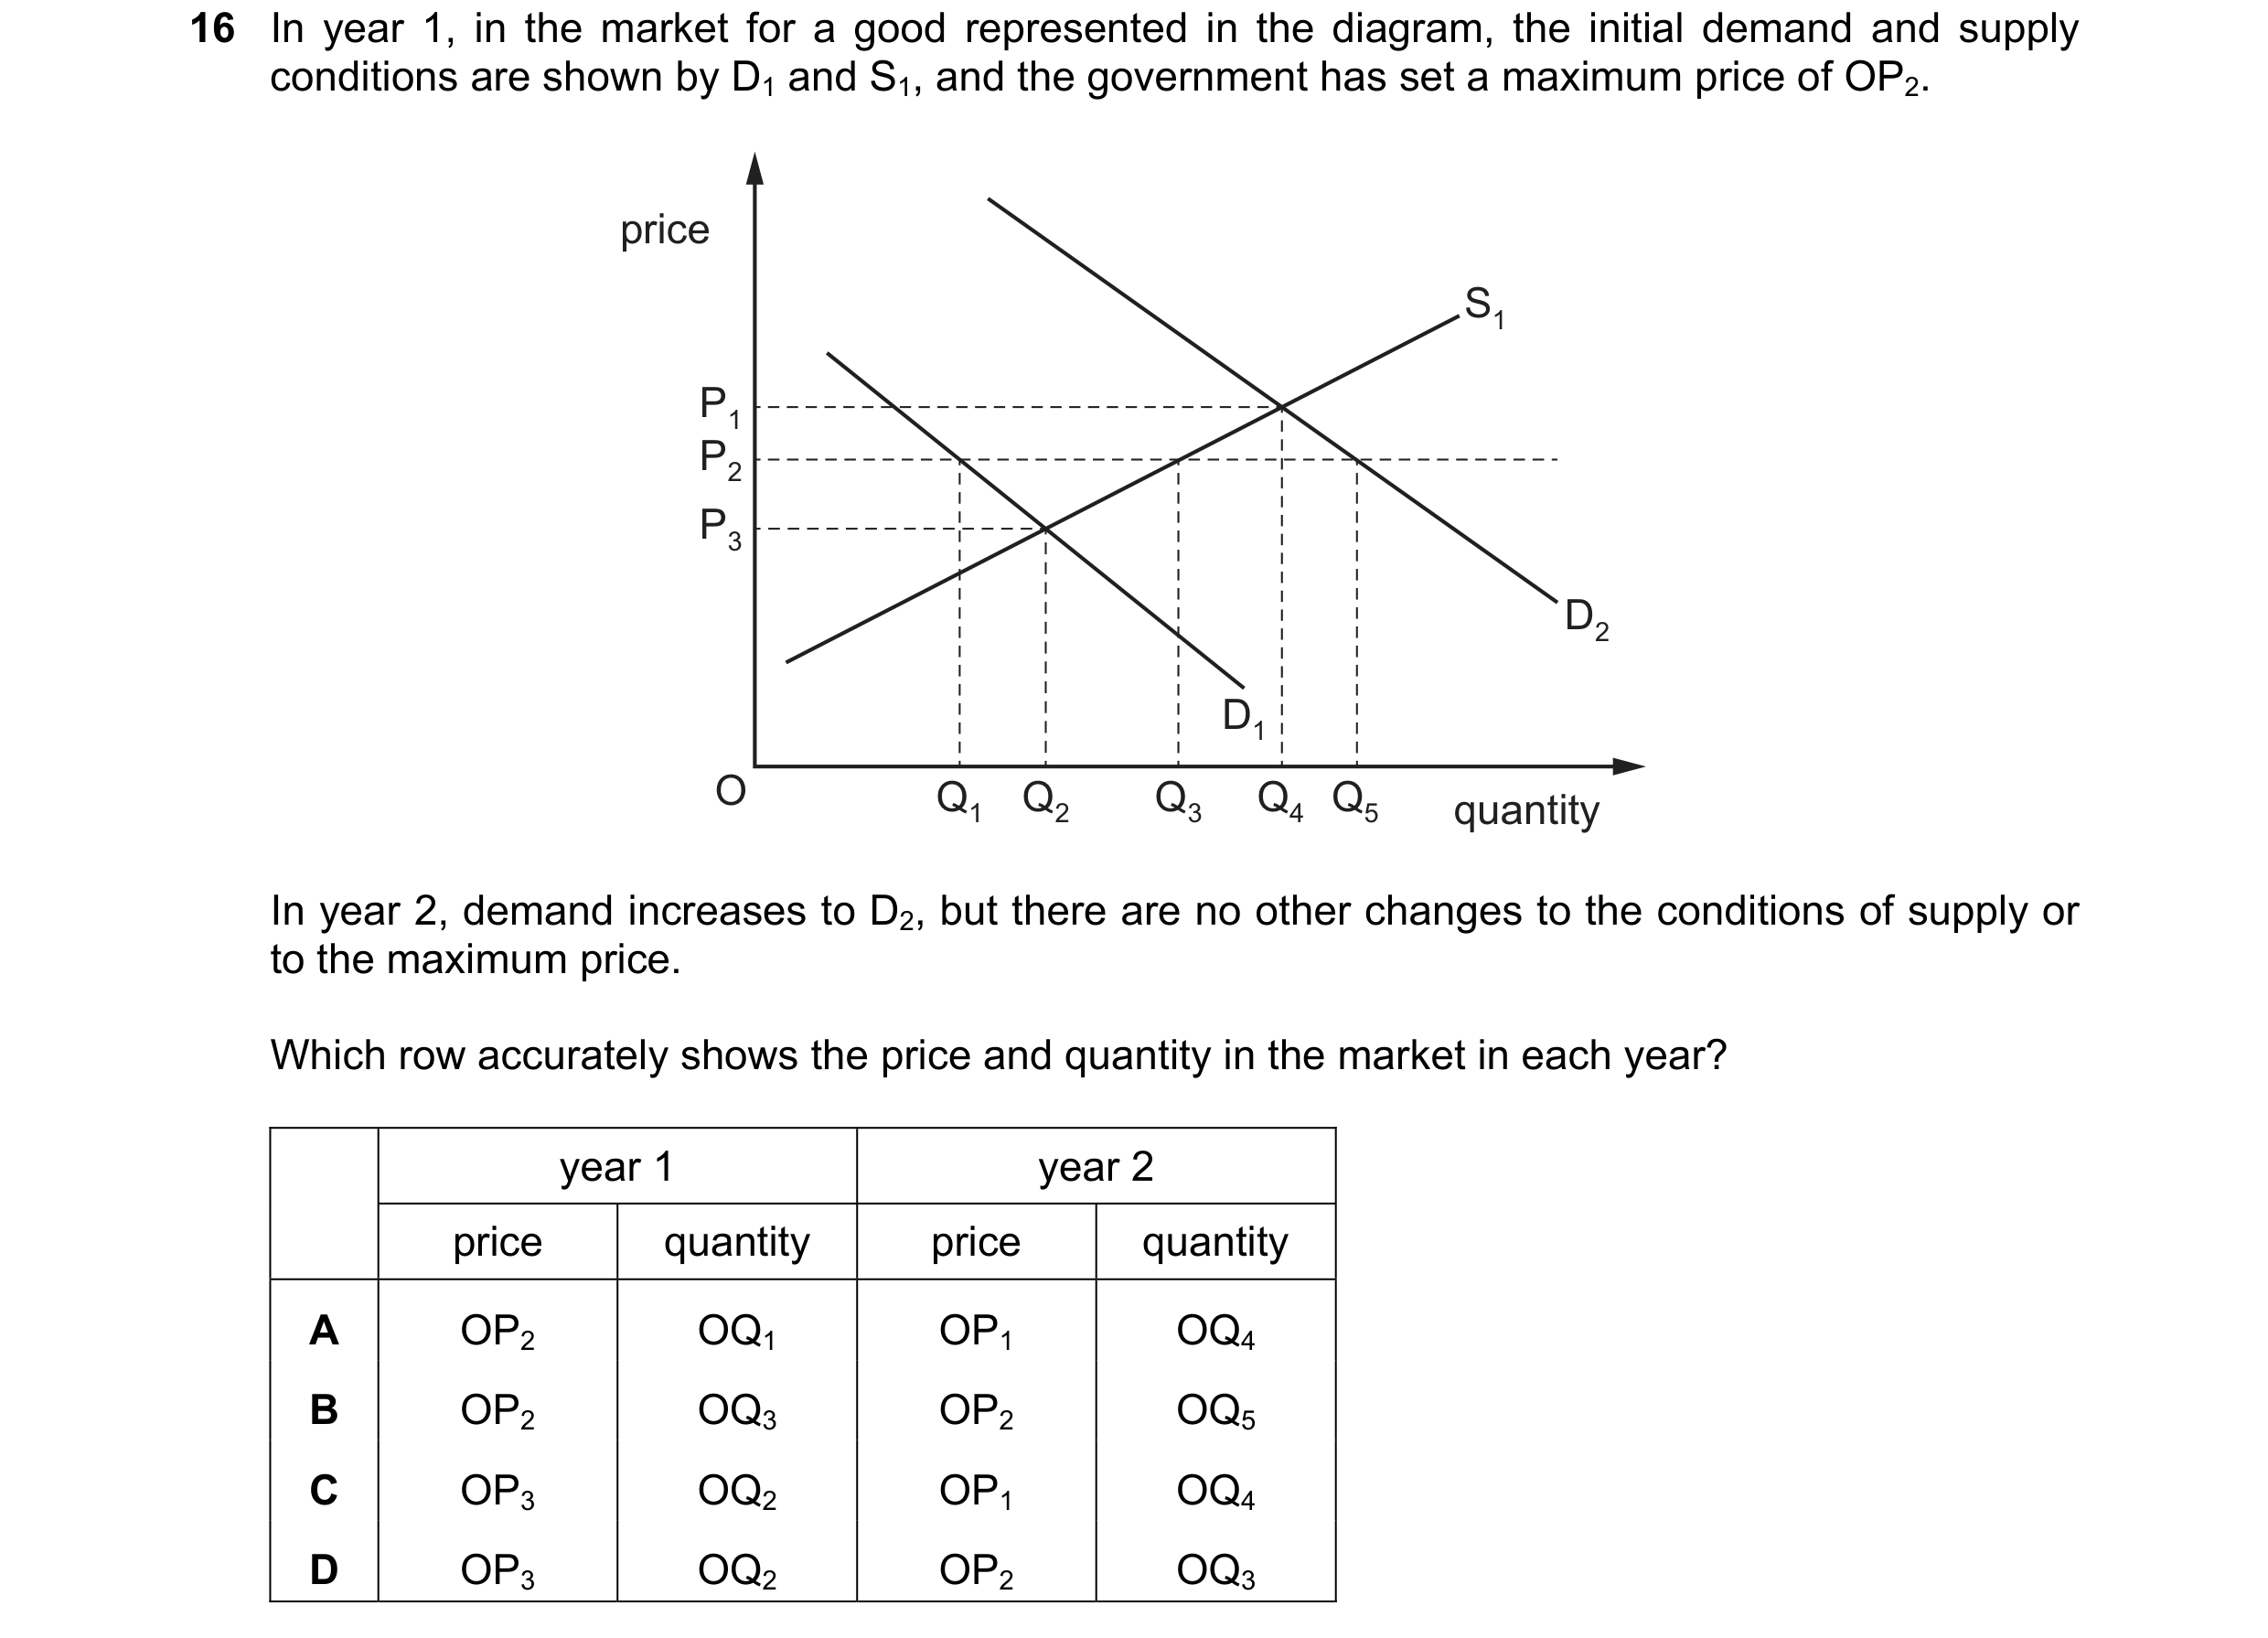
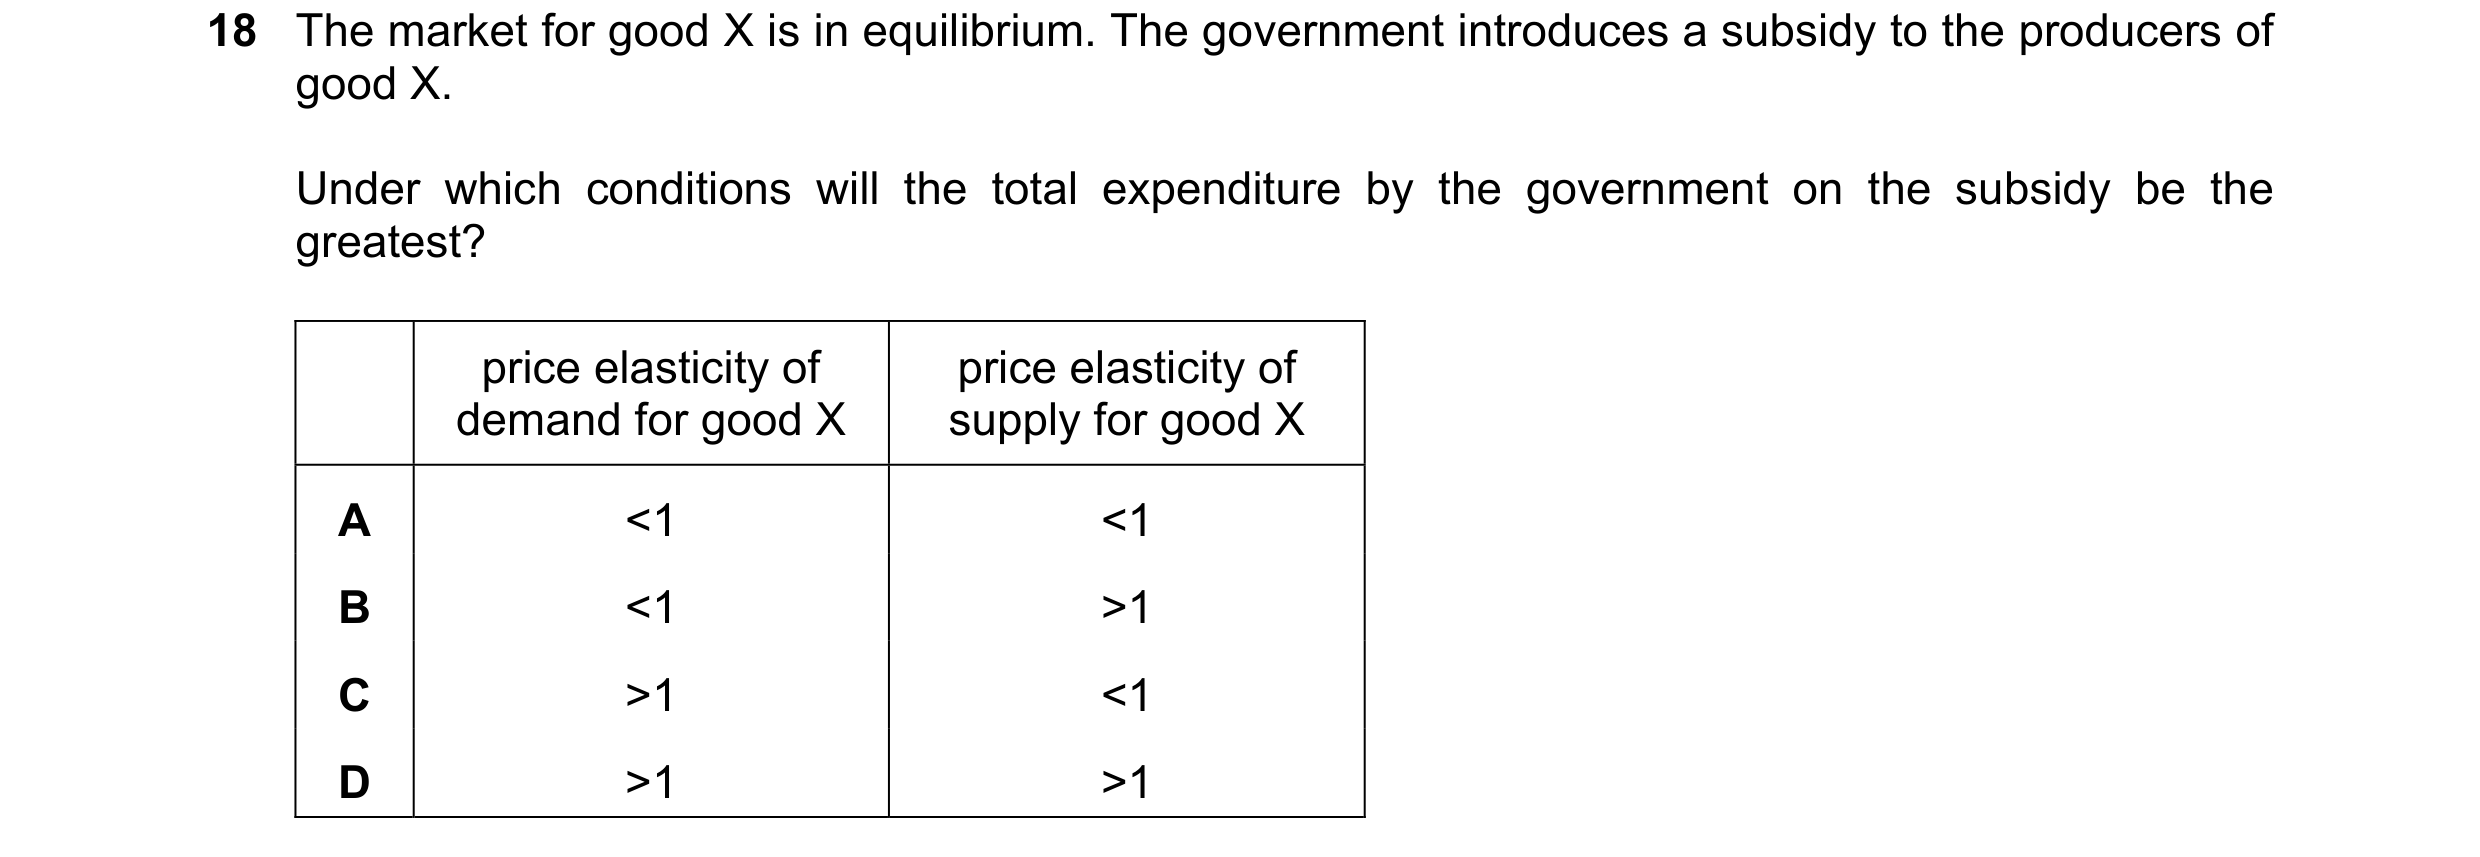 88 / 119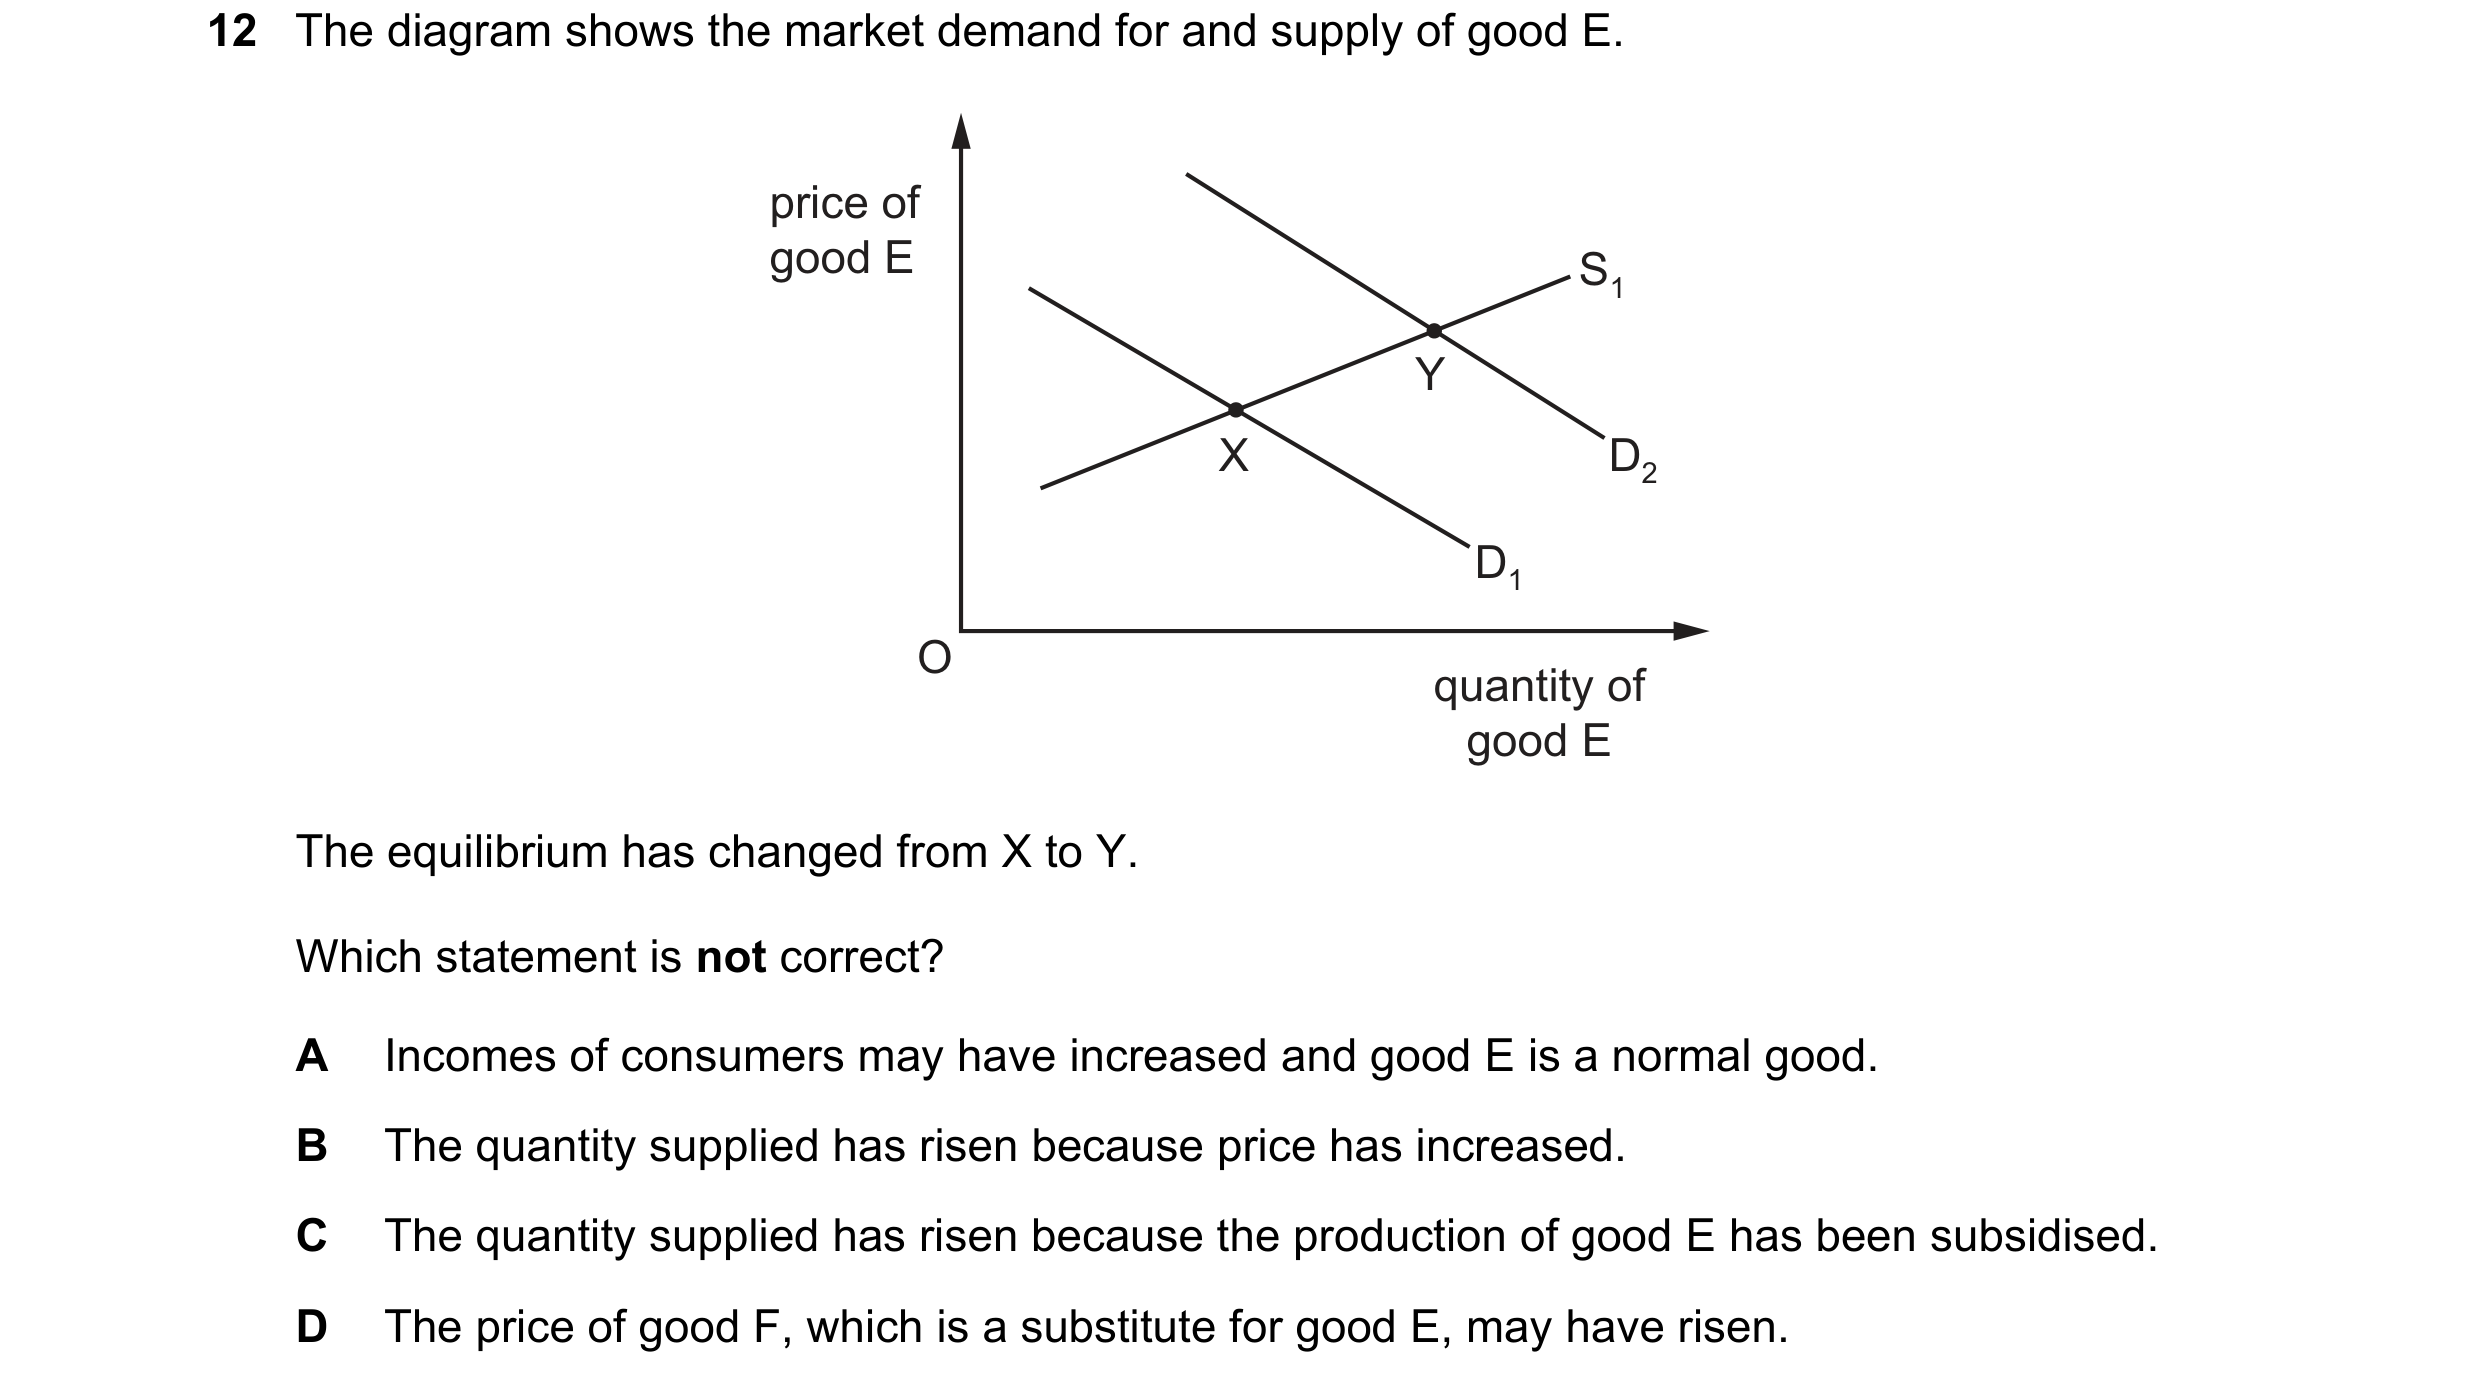
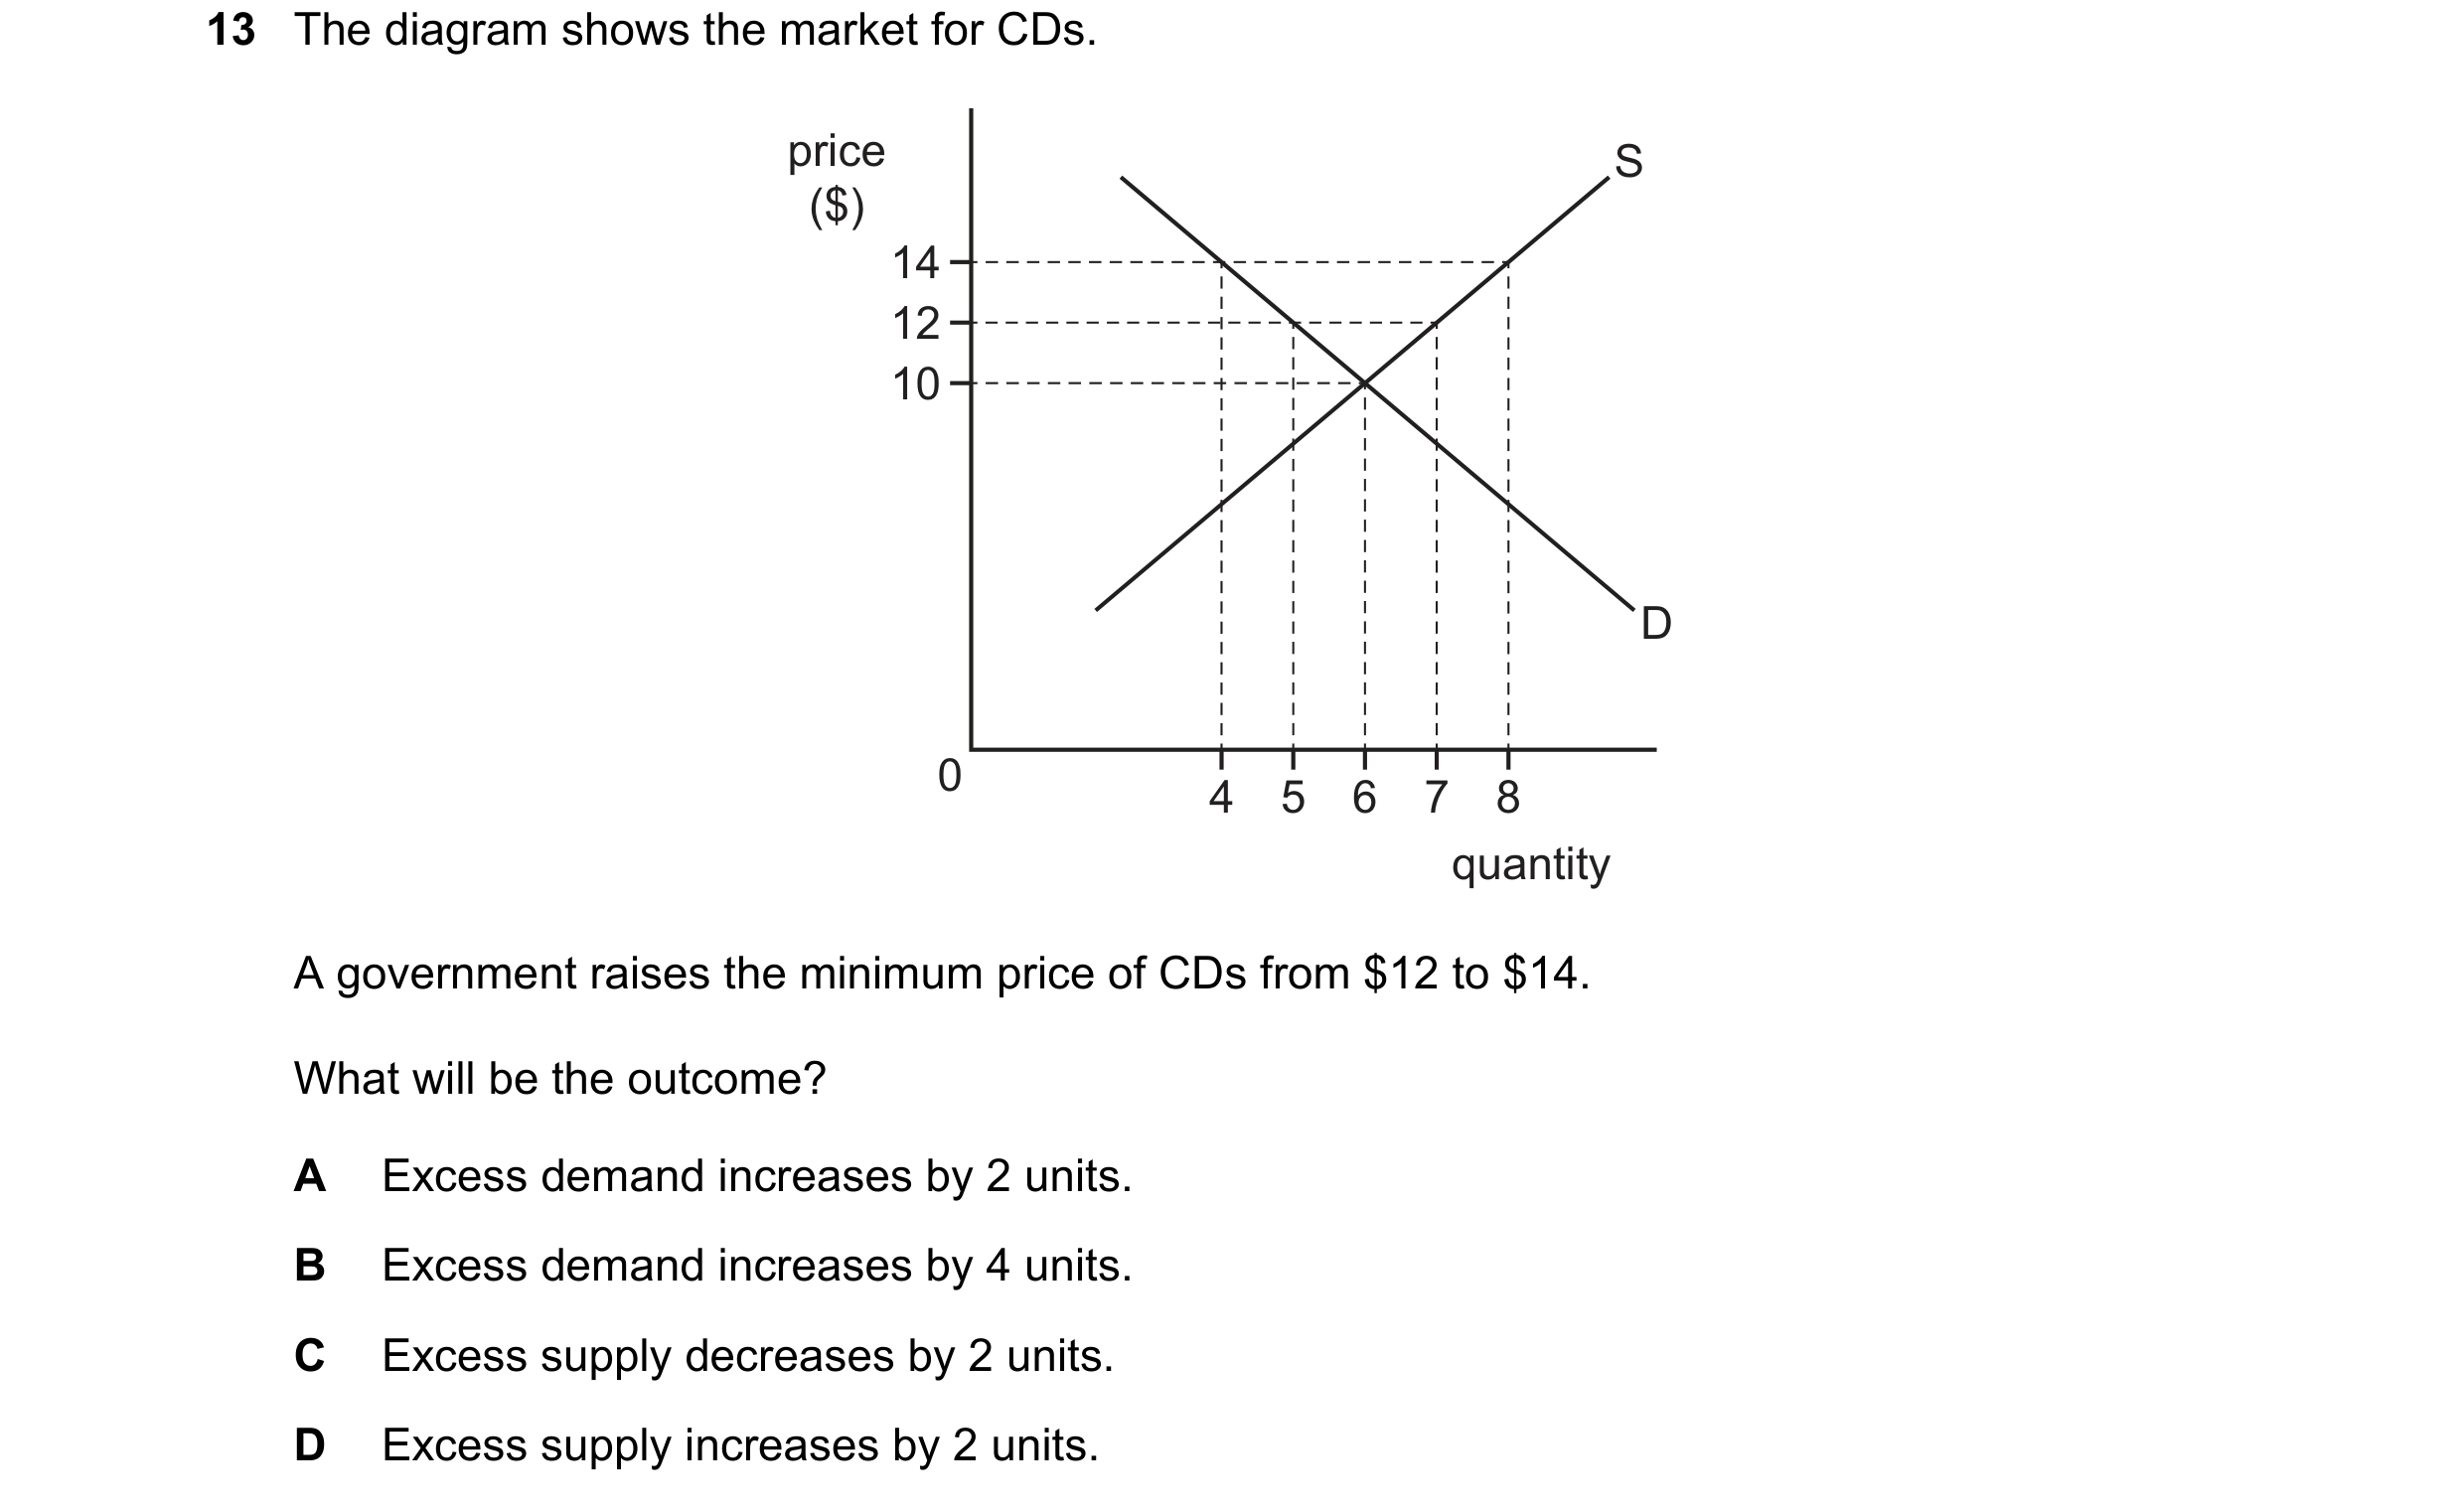 89 / 119
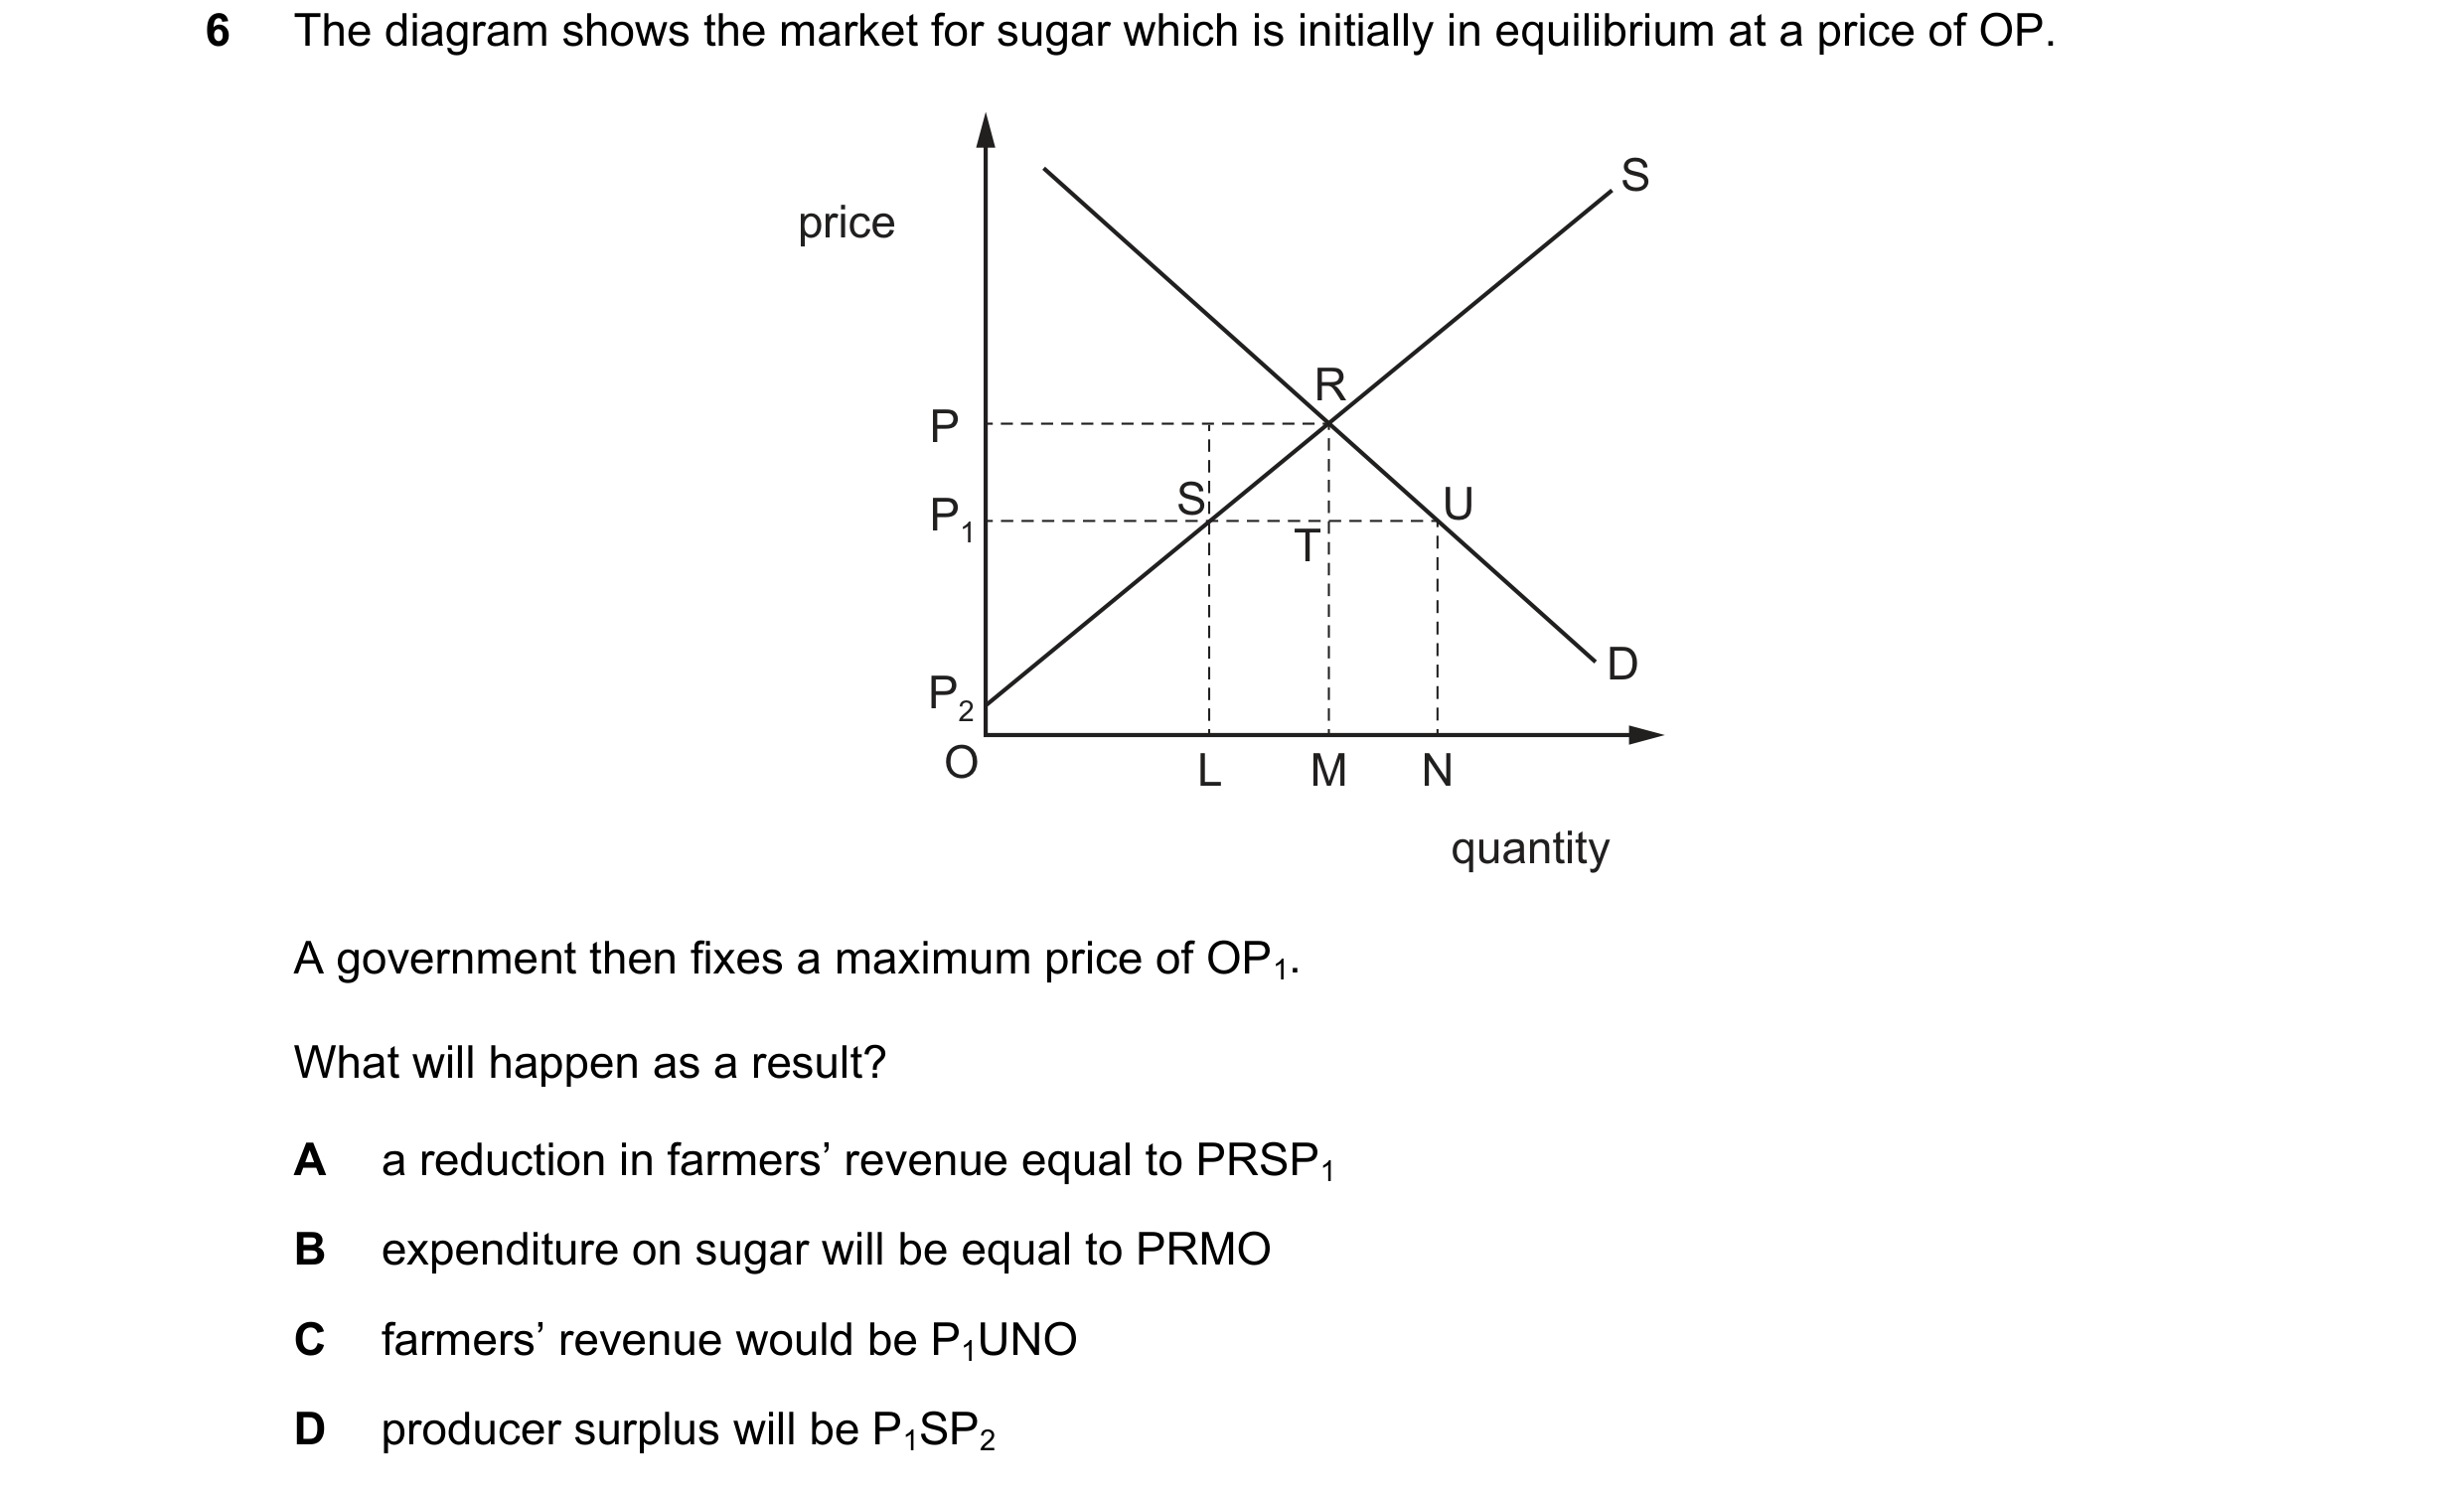
 90 / 119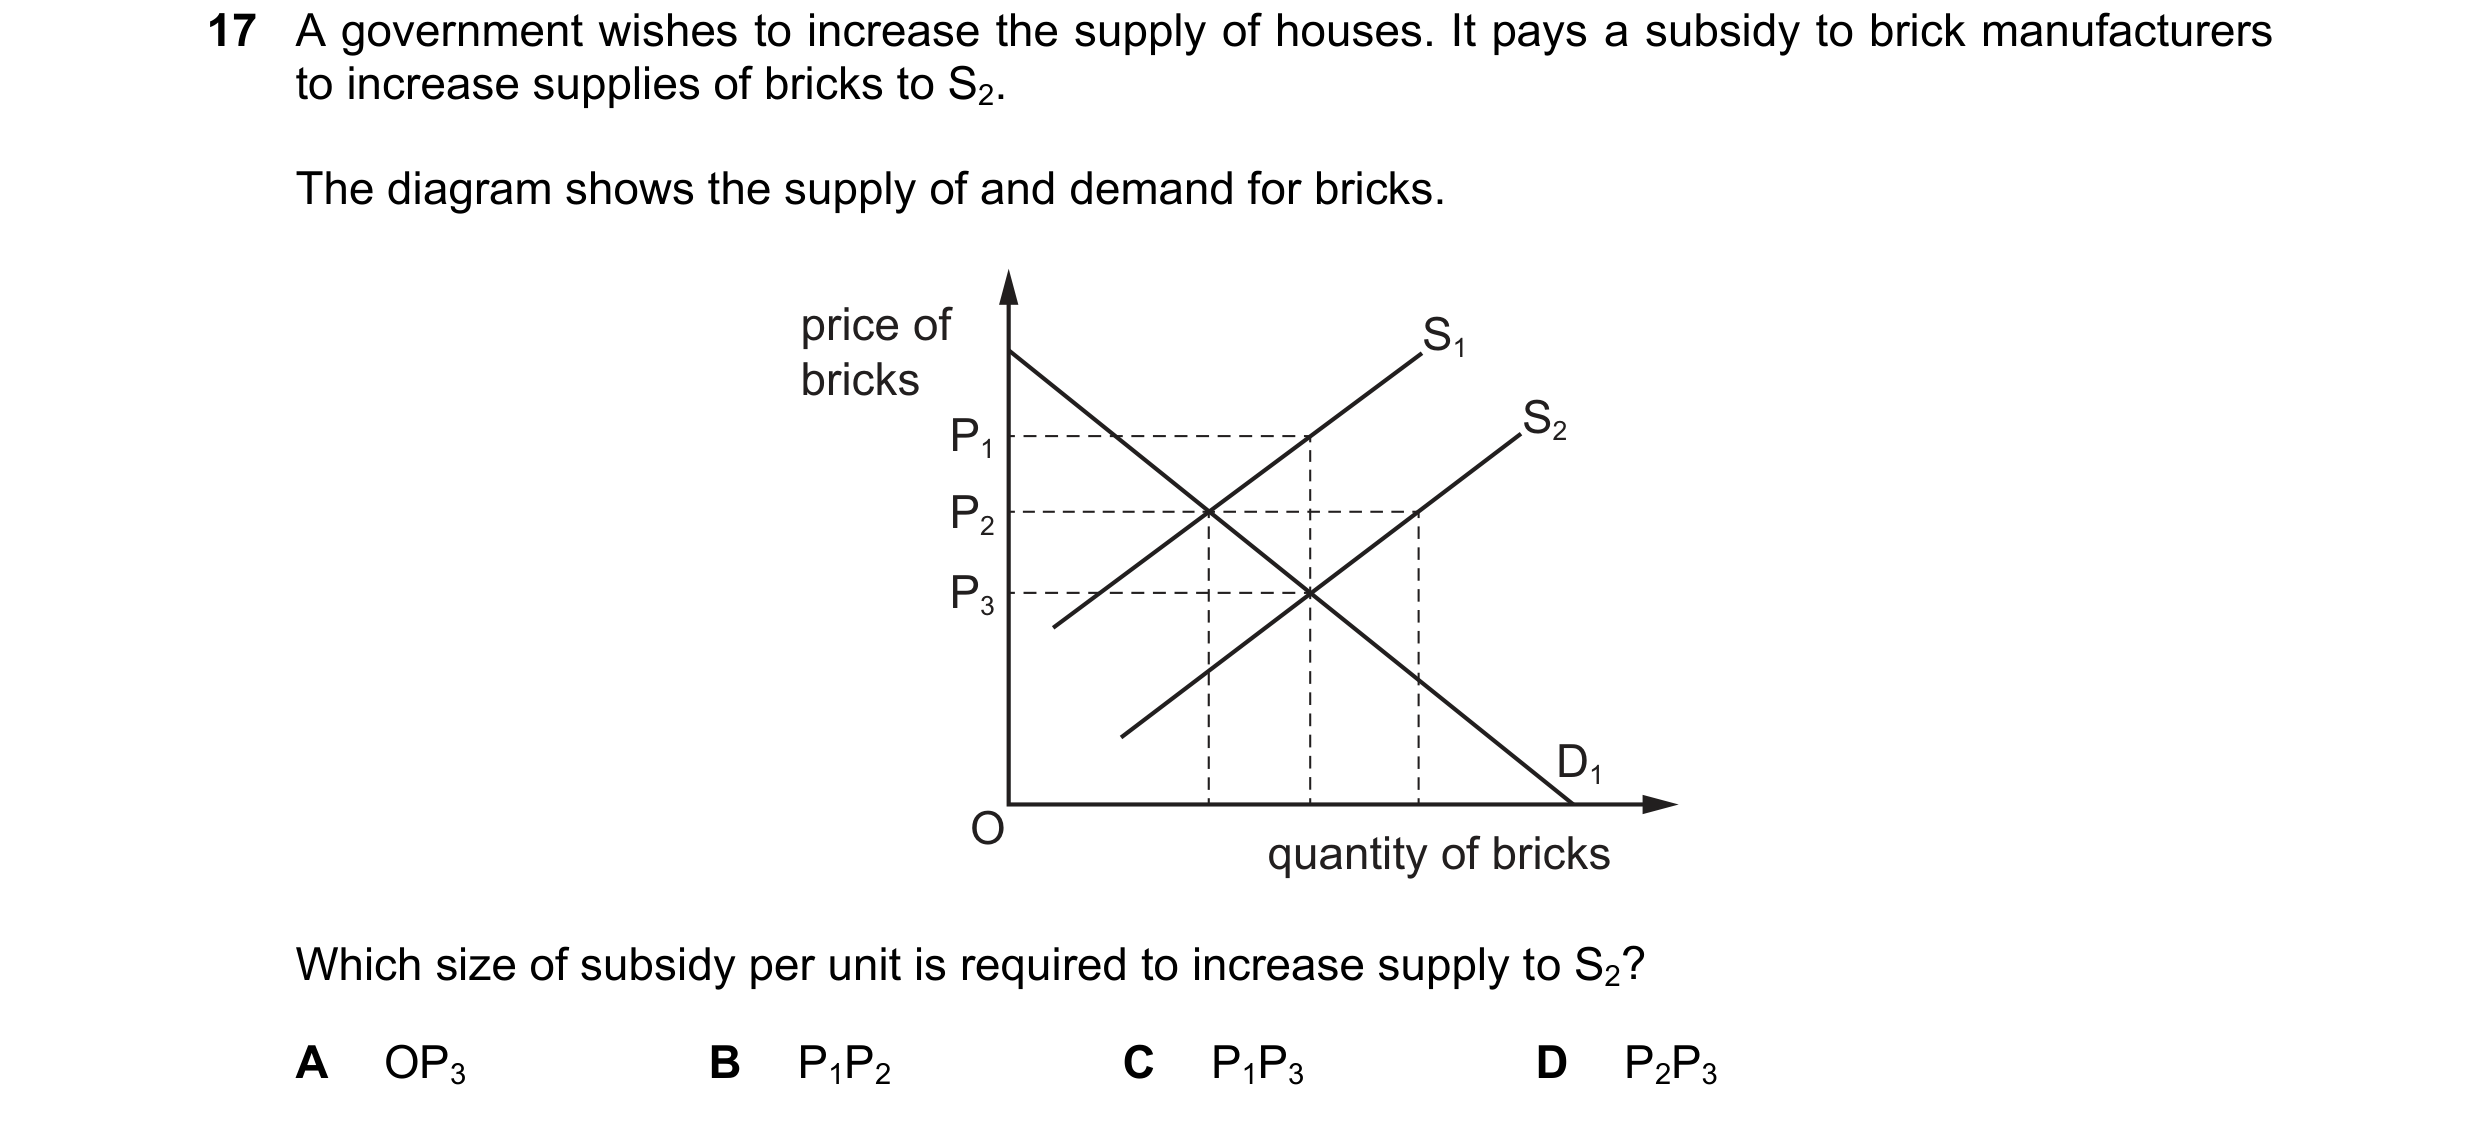
 91 / 119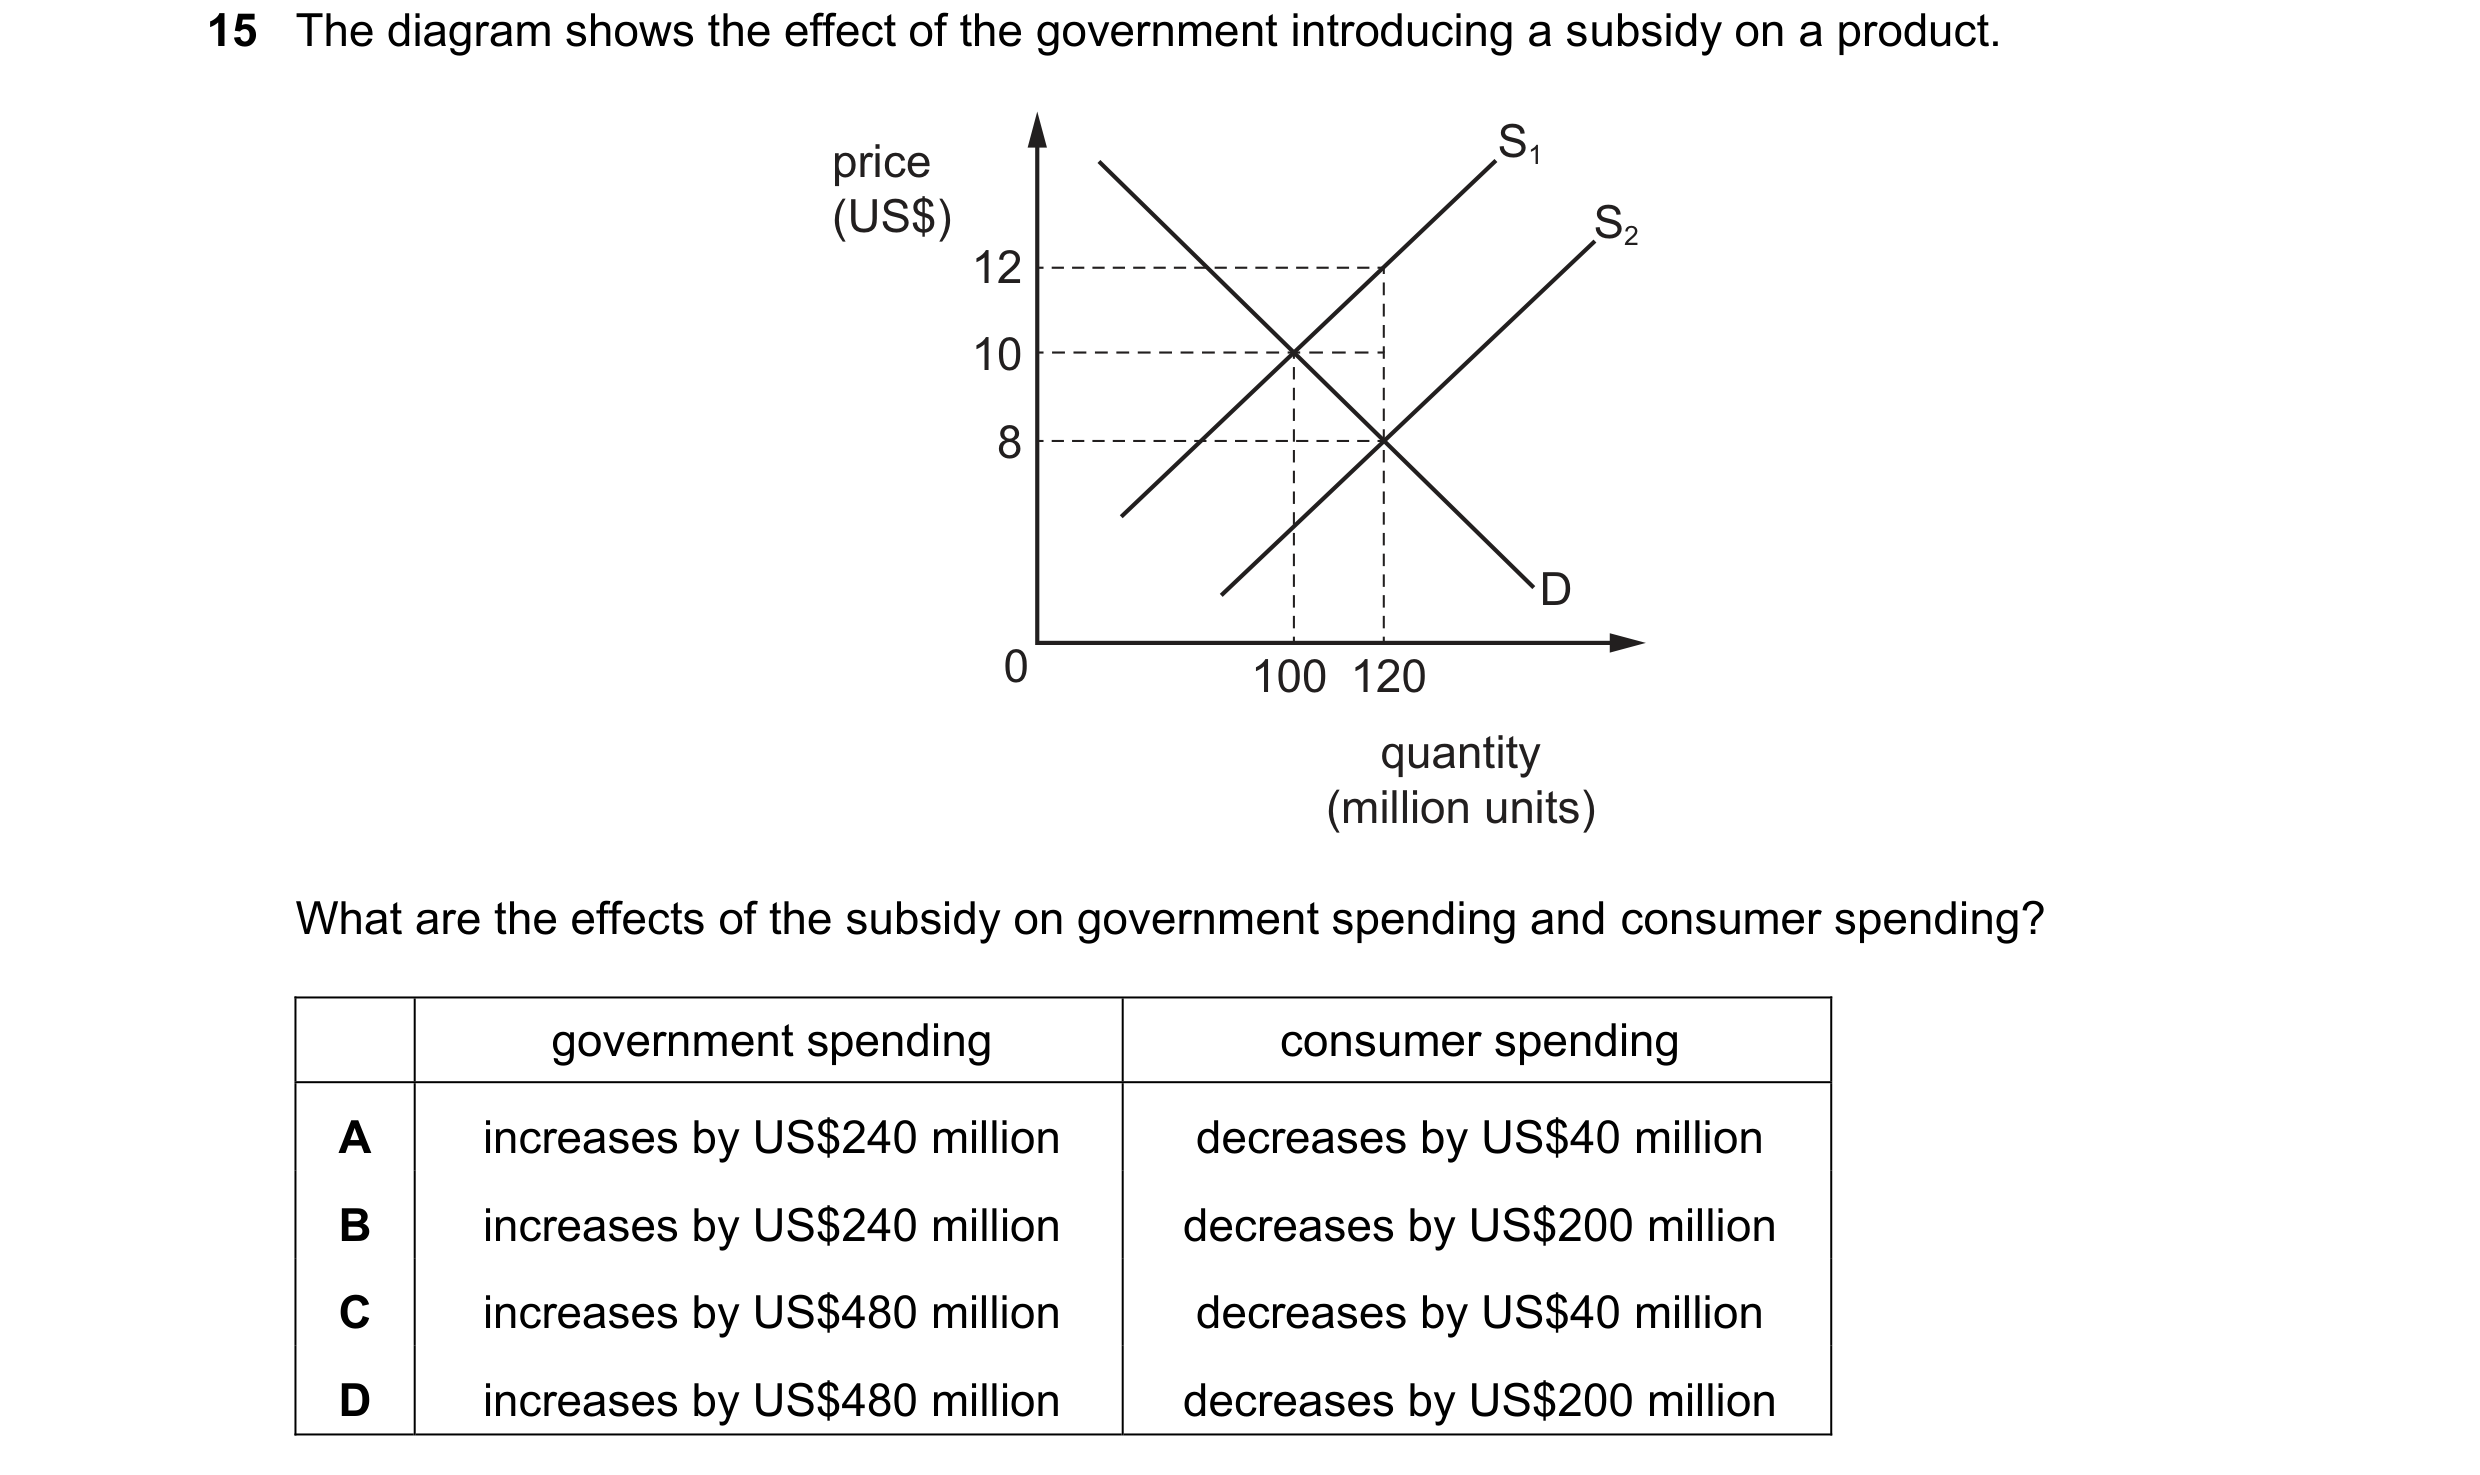
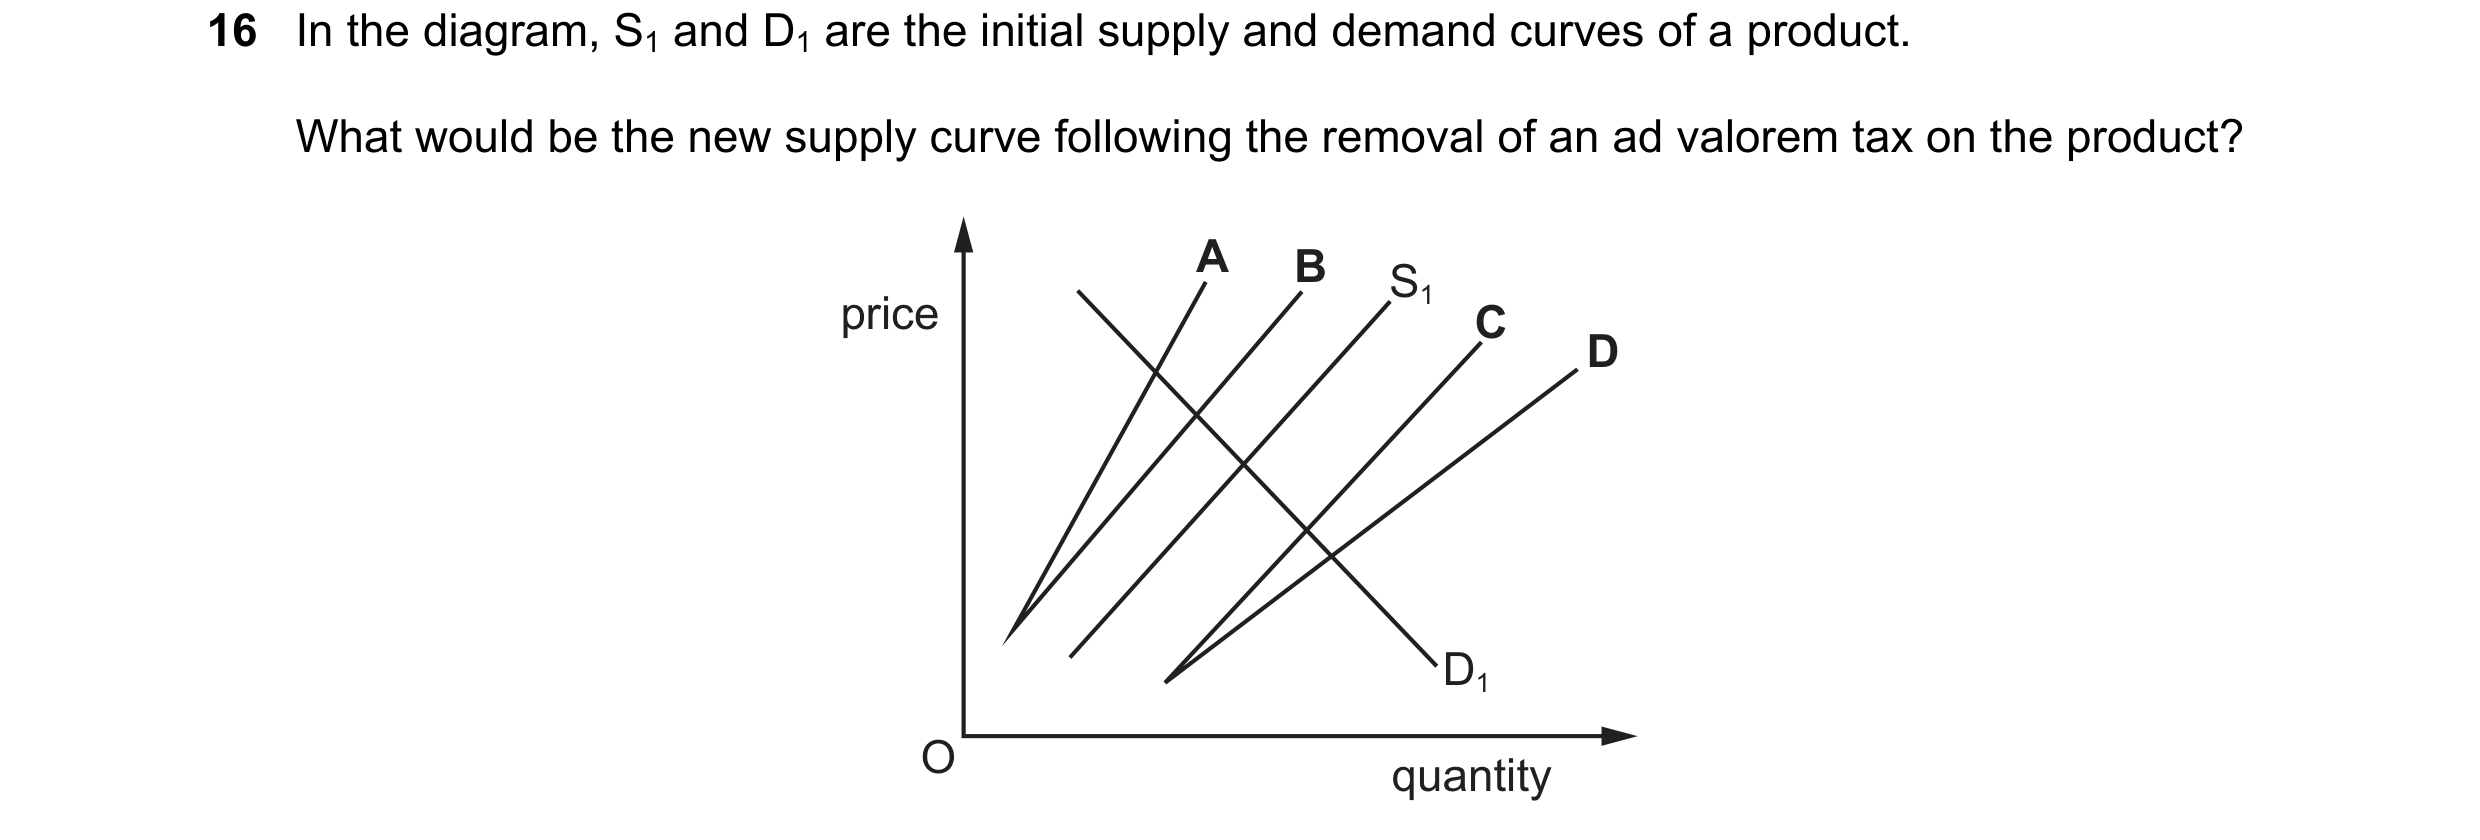
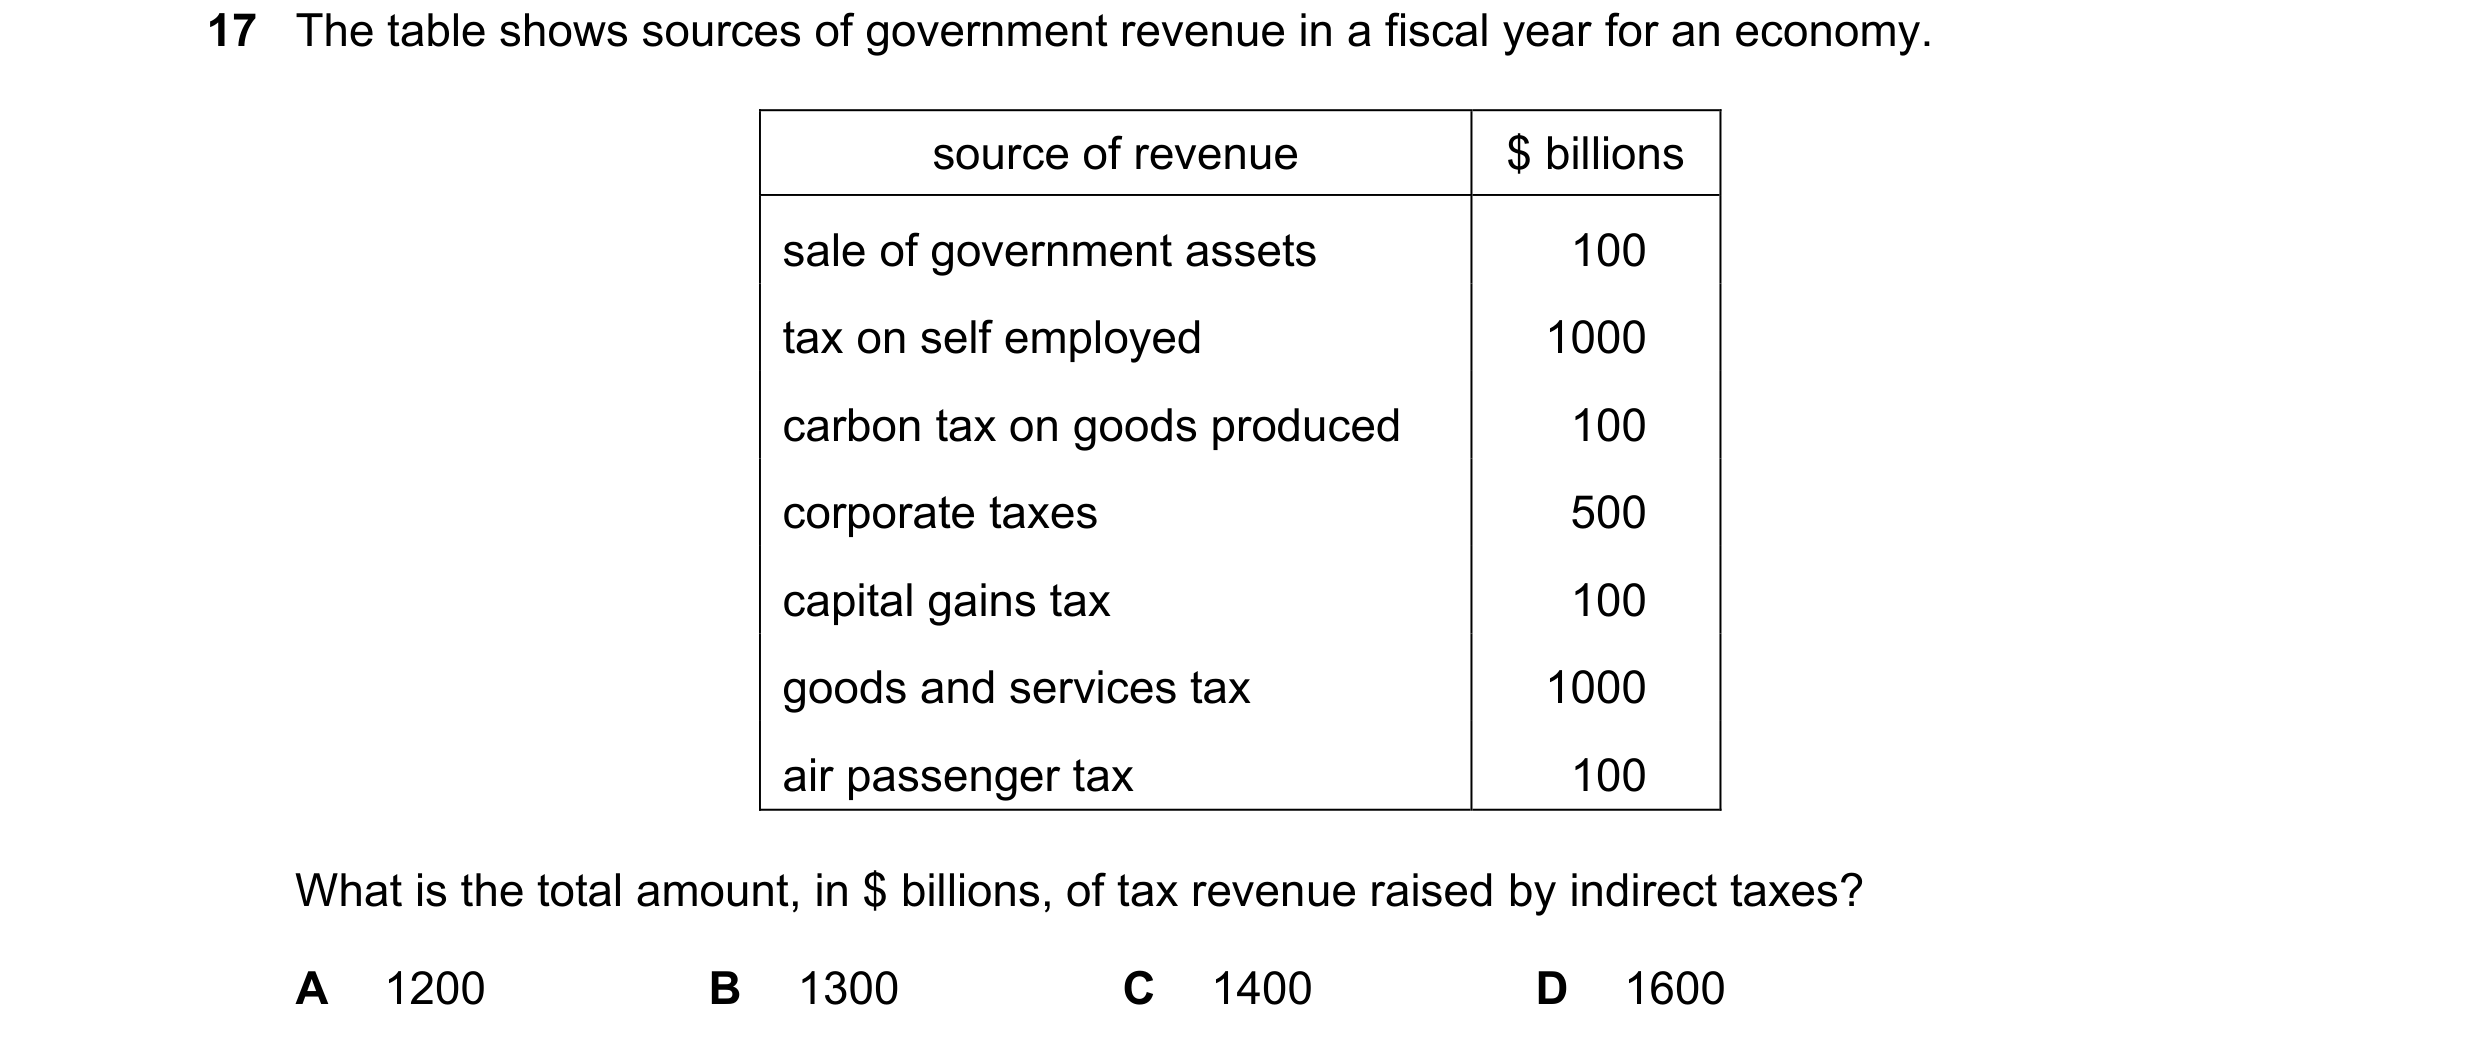 92 / 119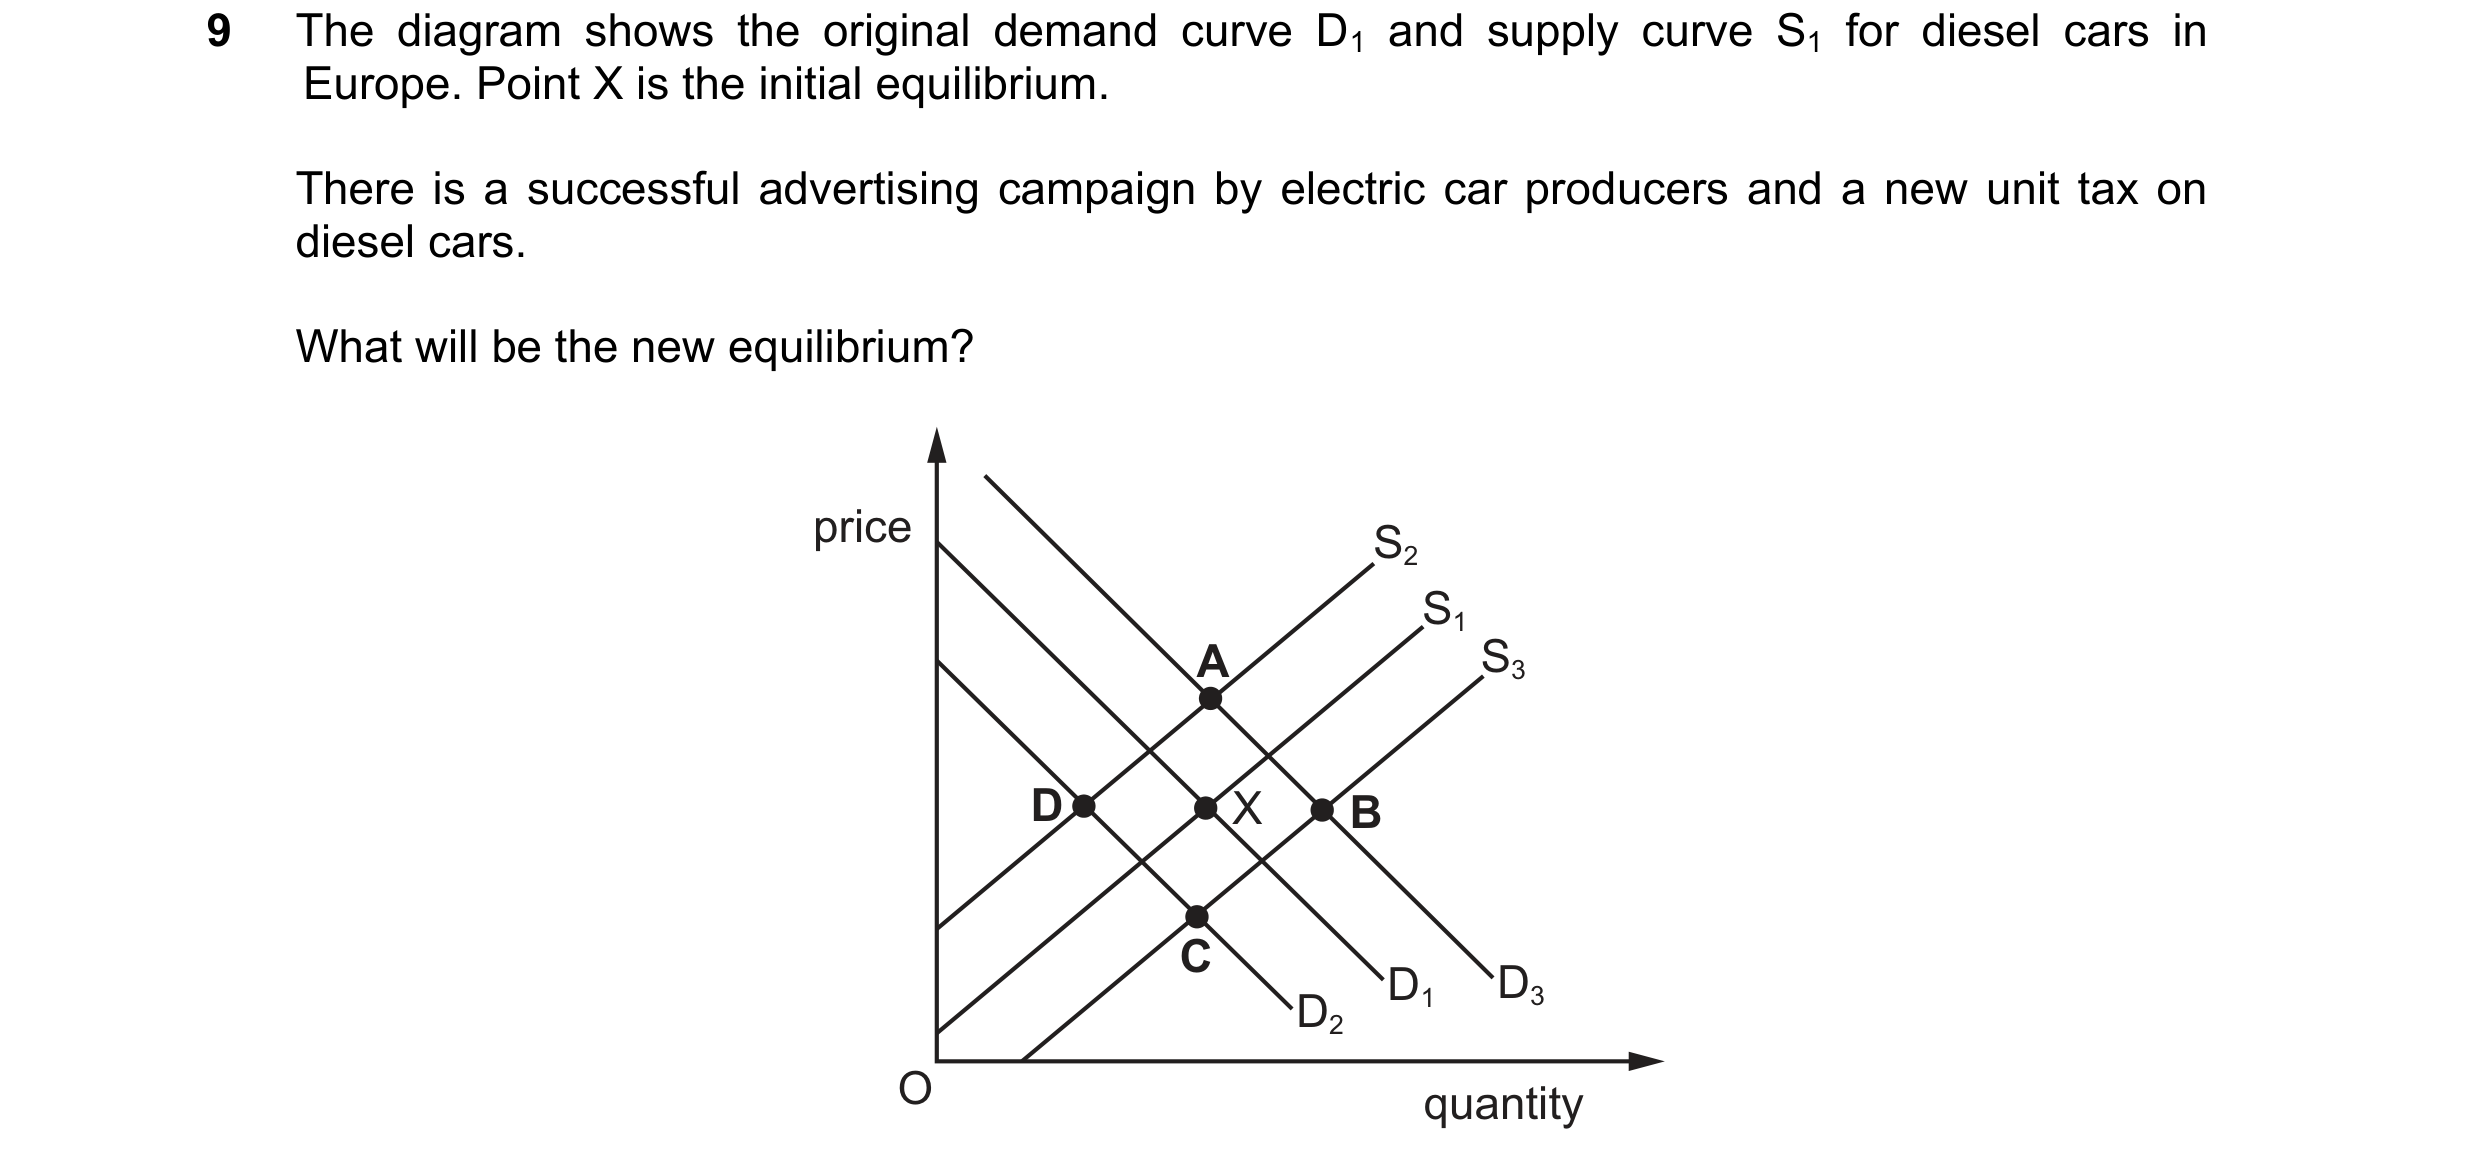
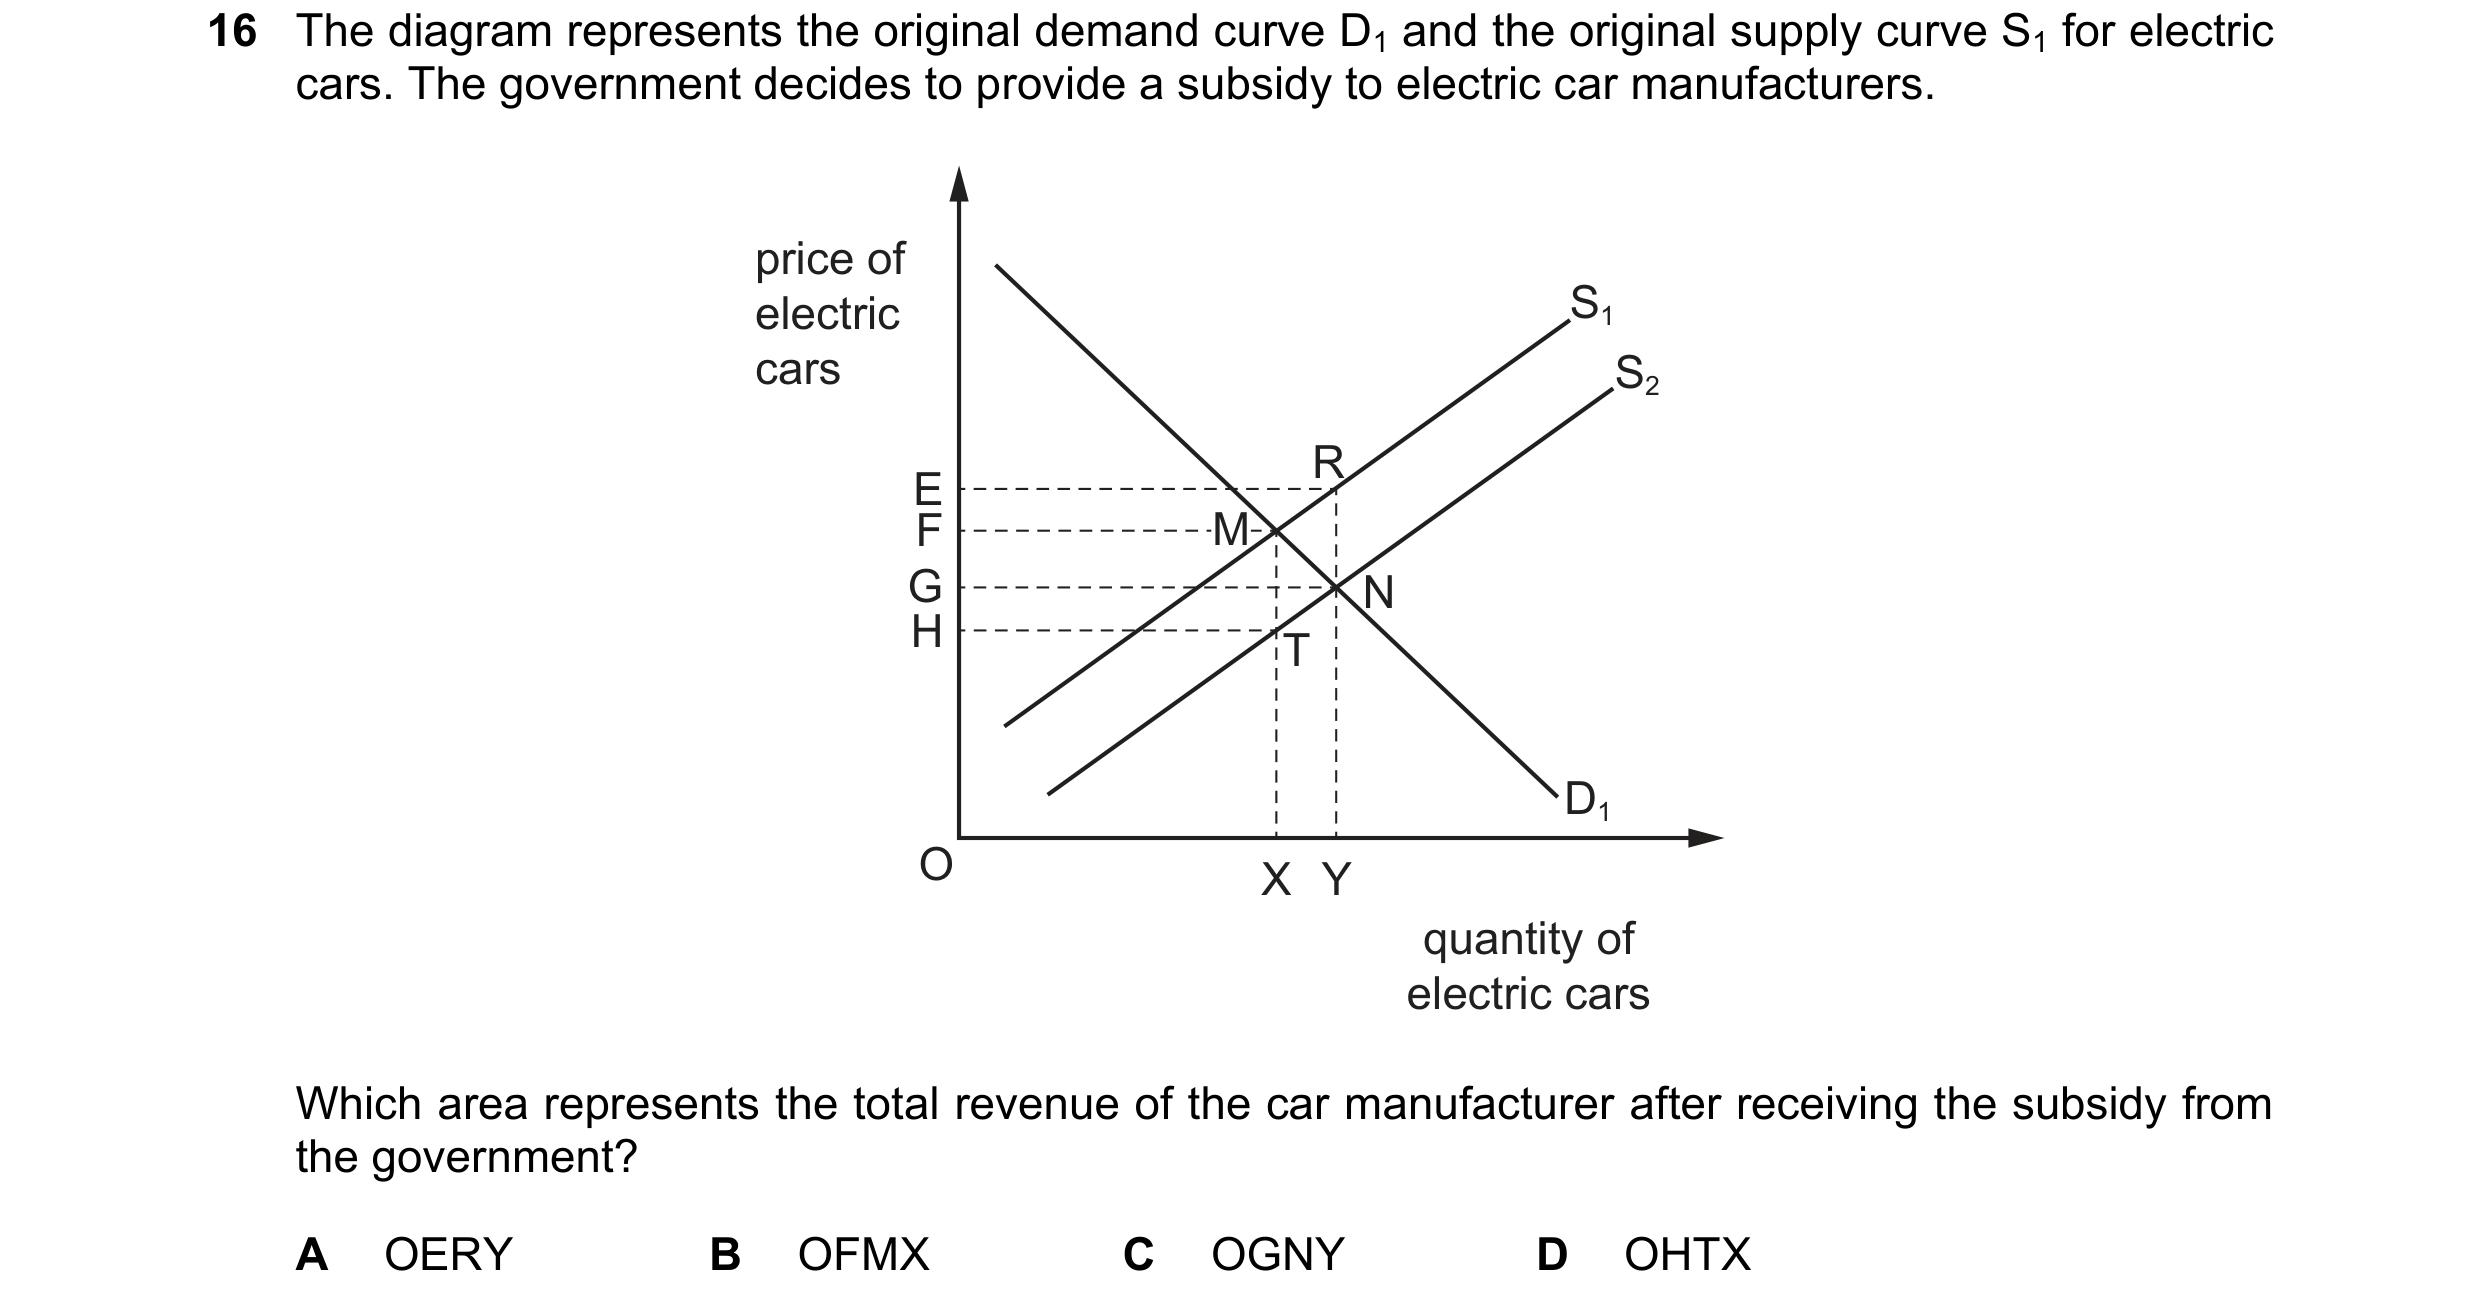
 93 / 119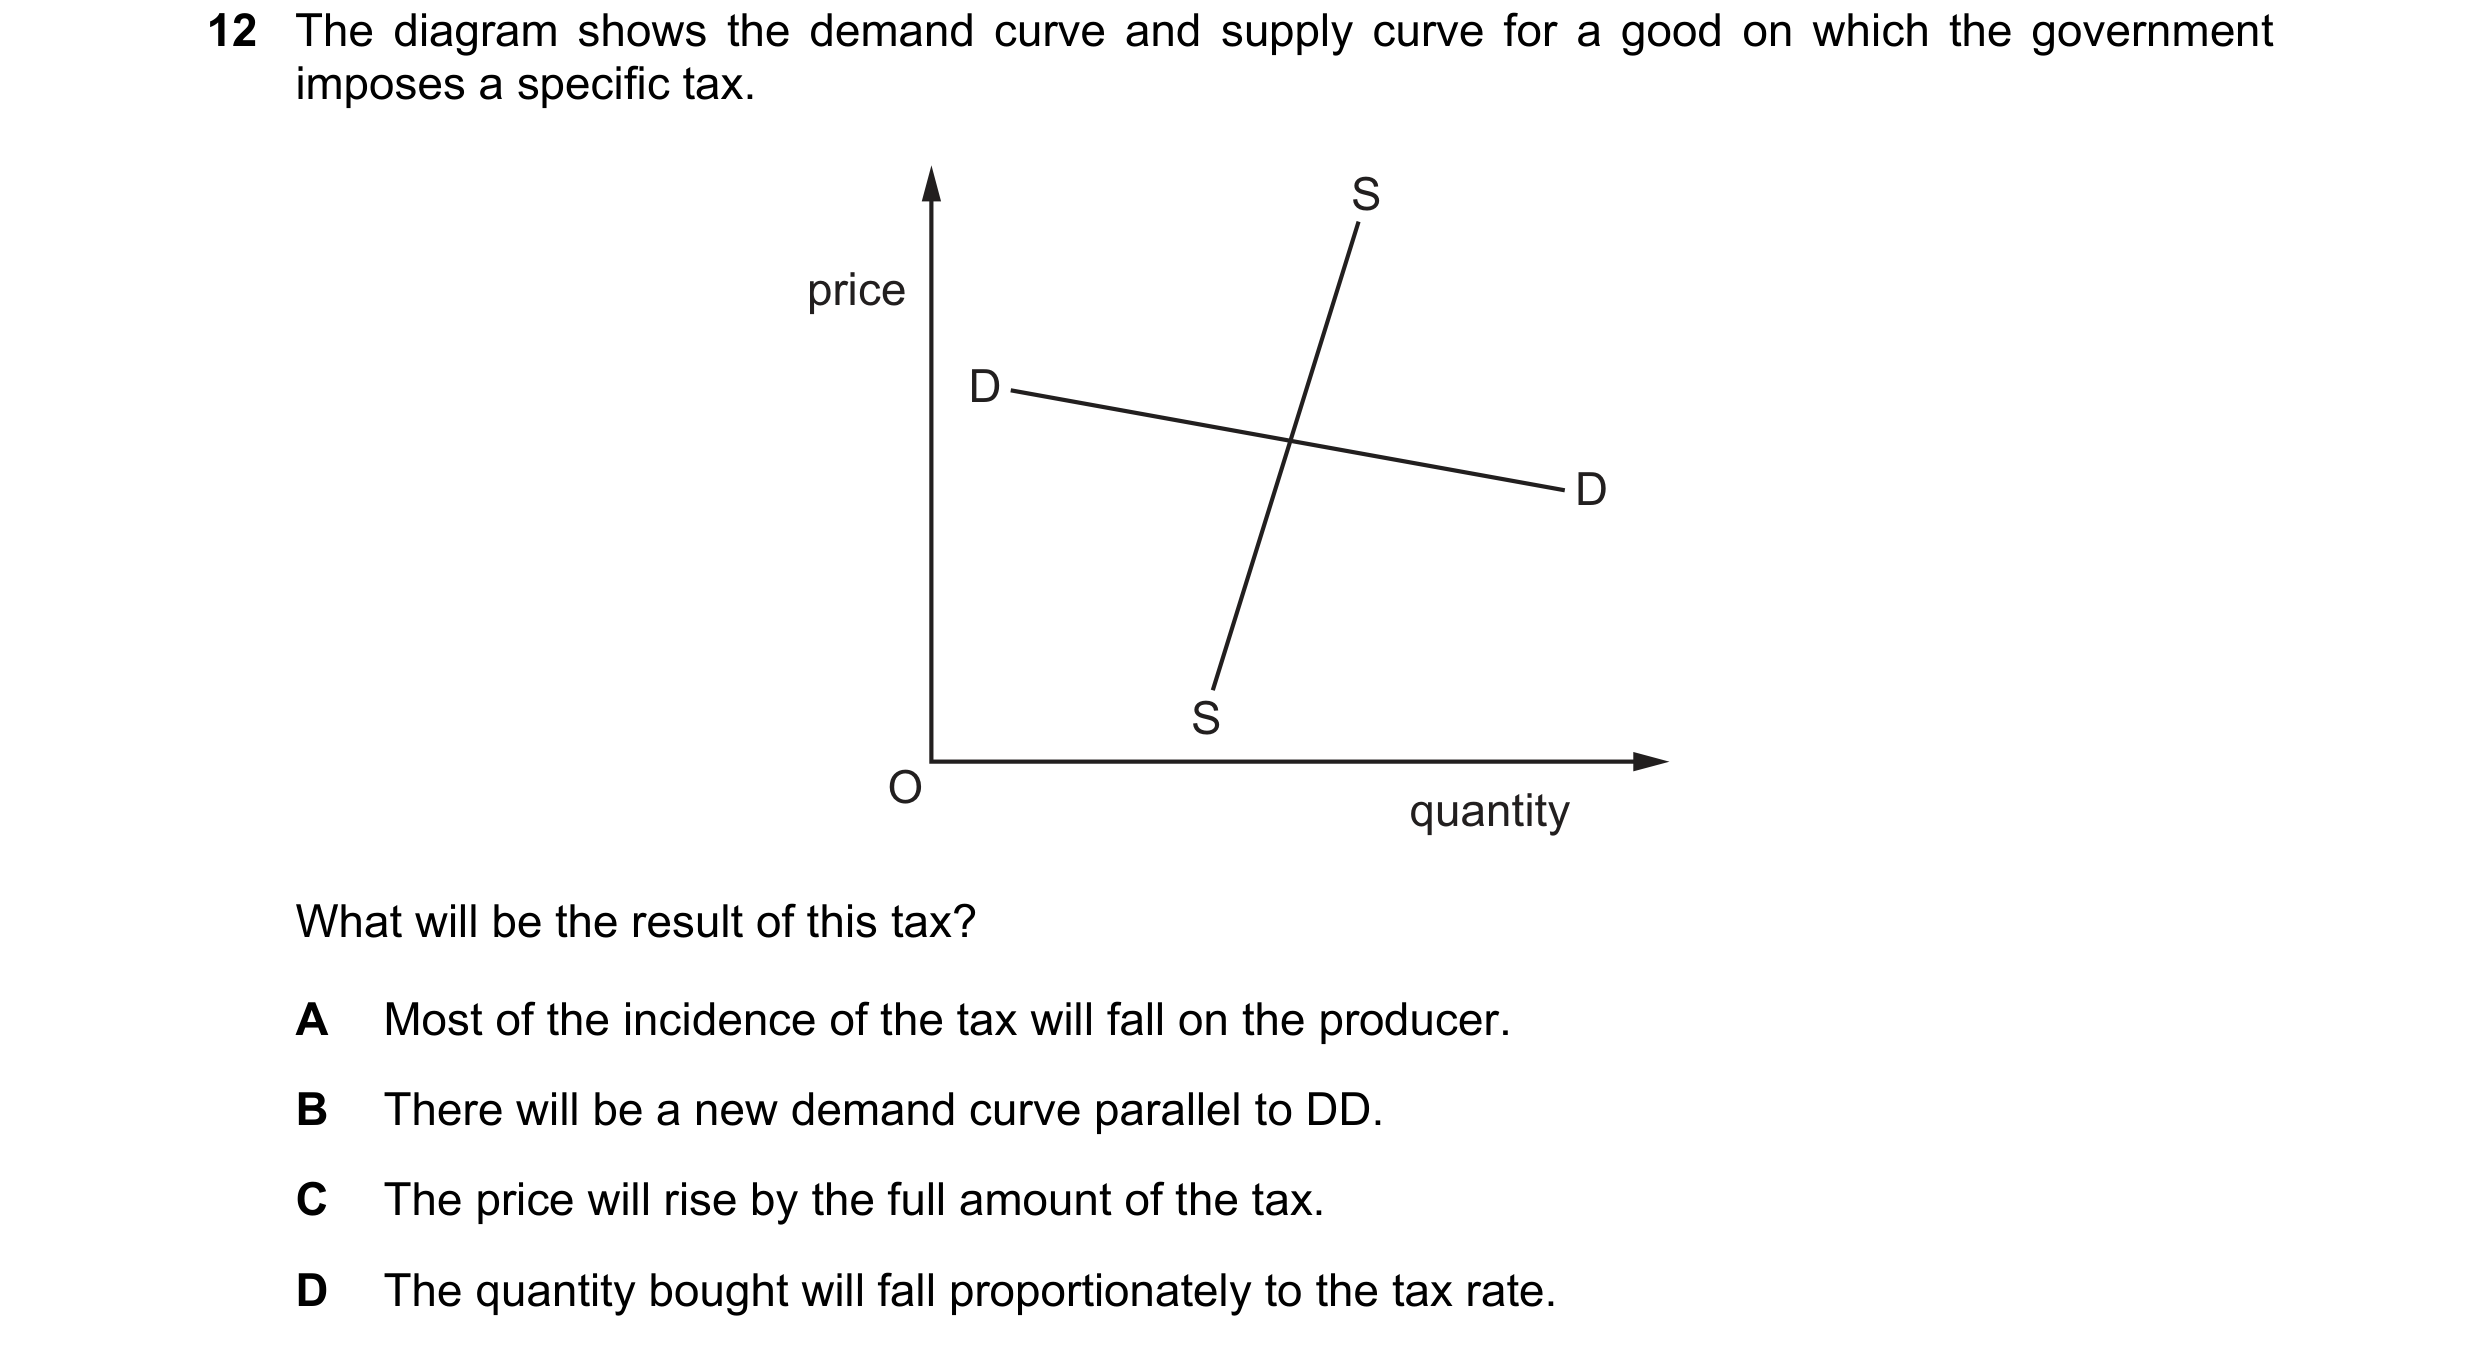

 94 / 119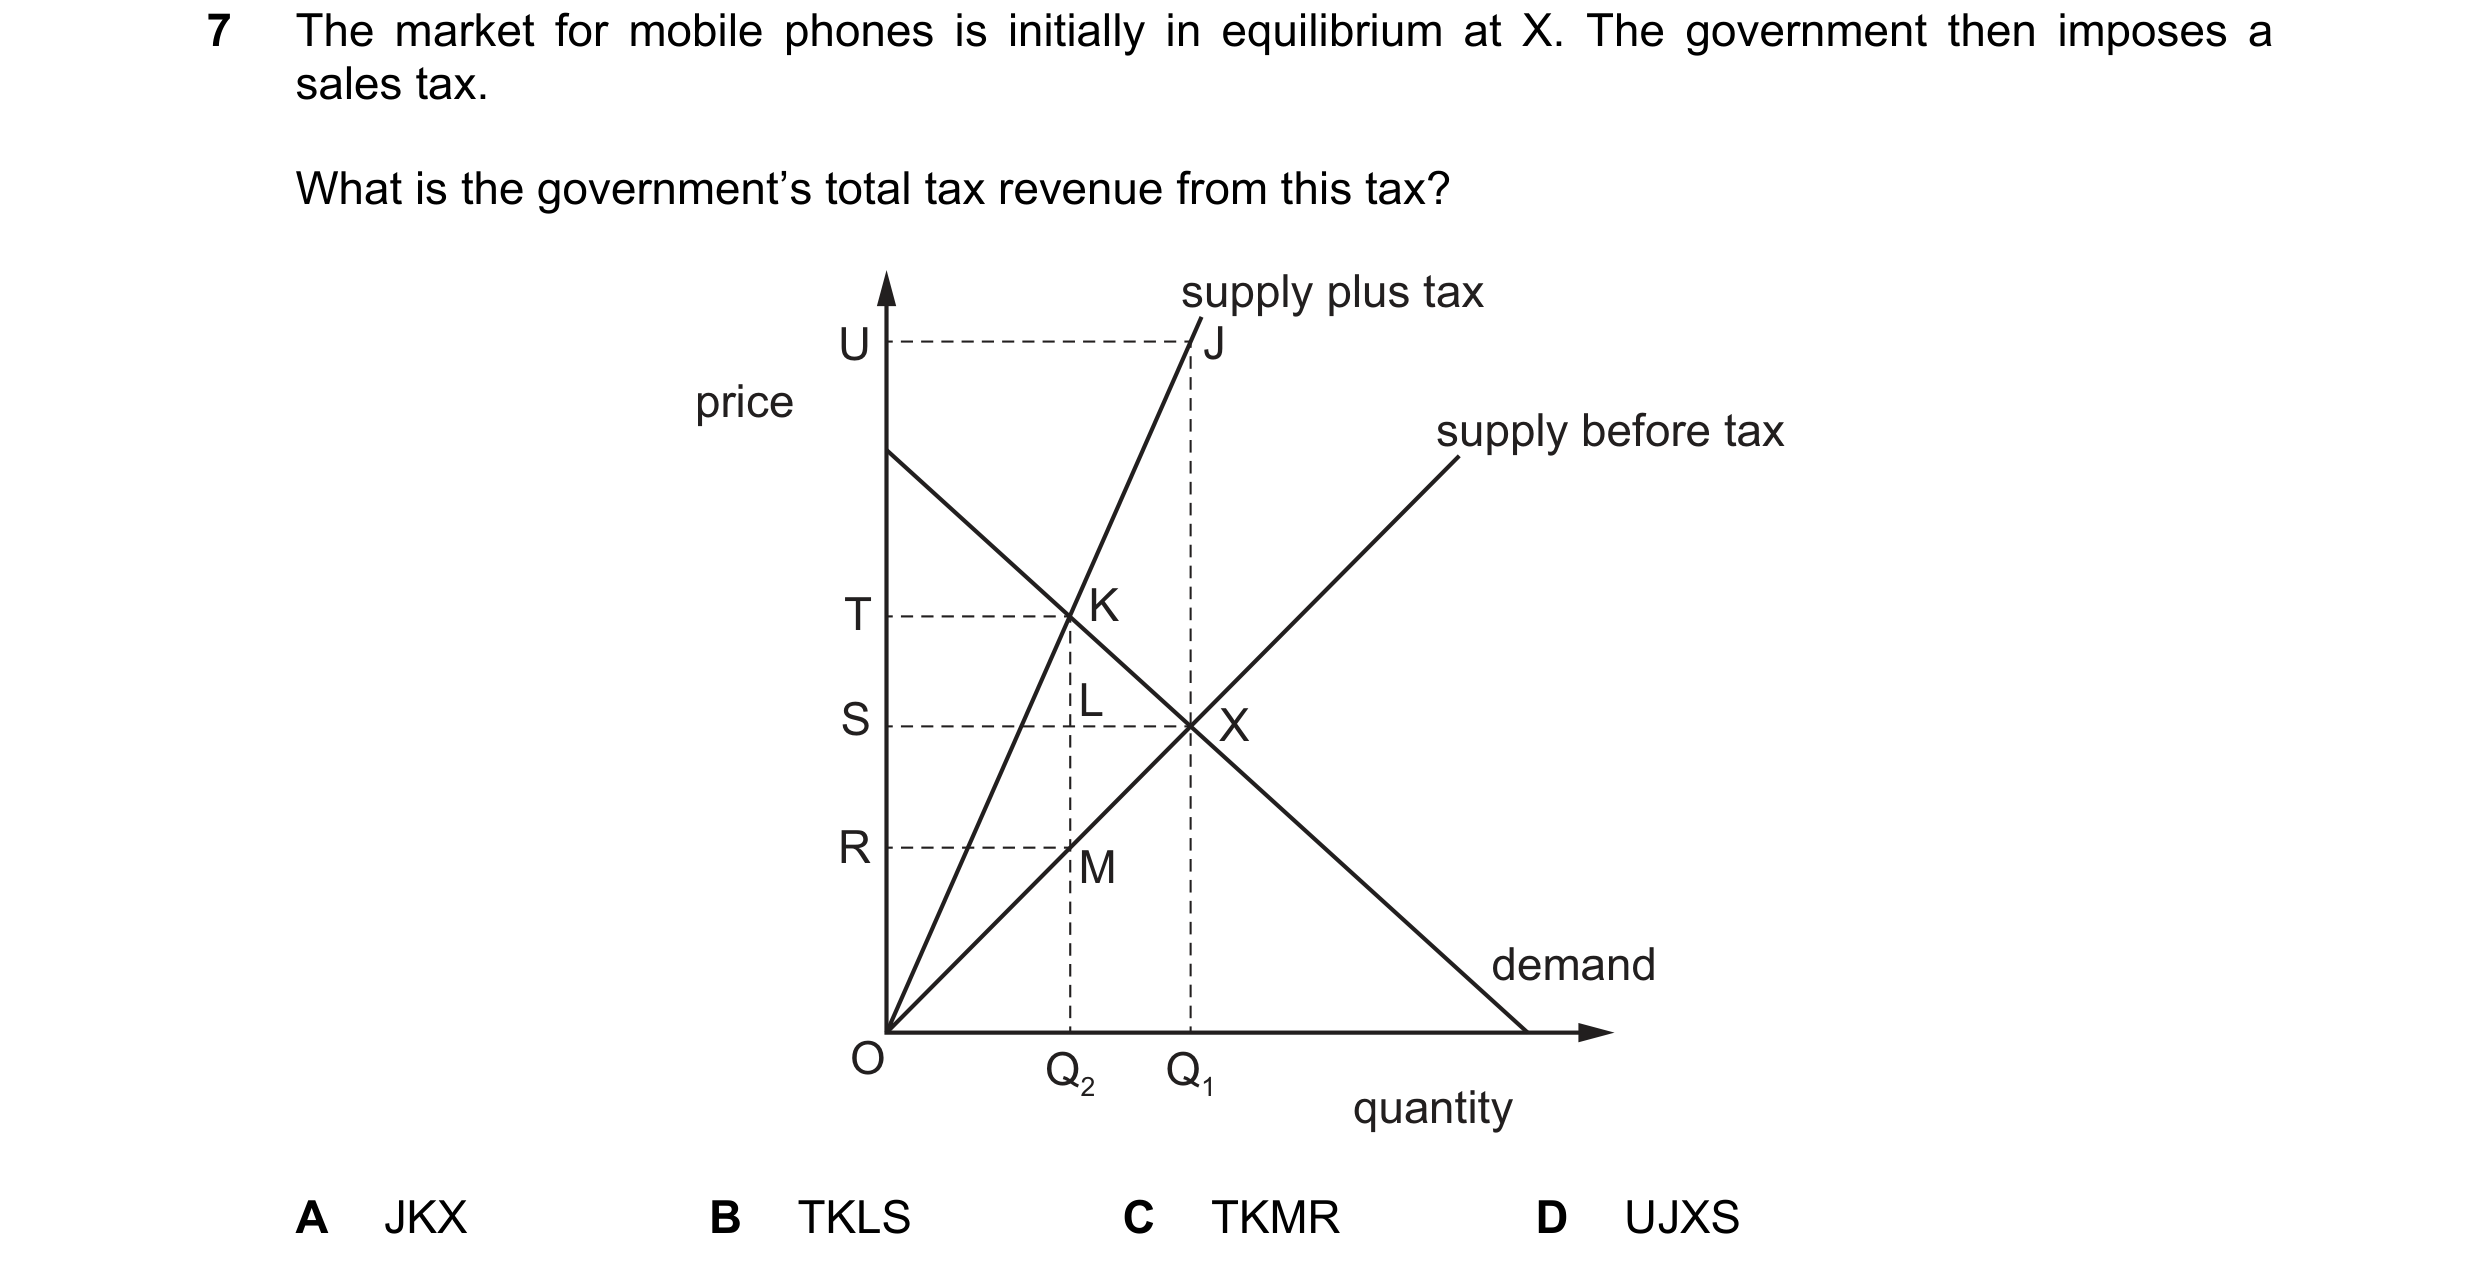
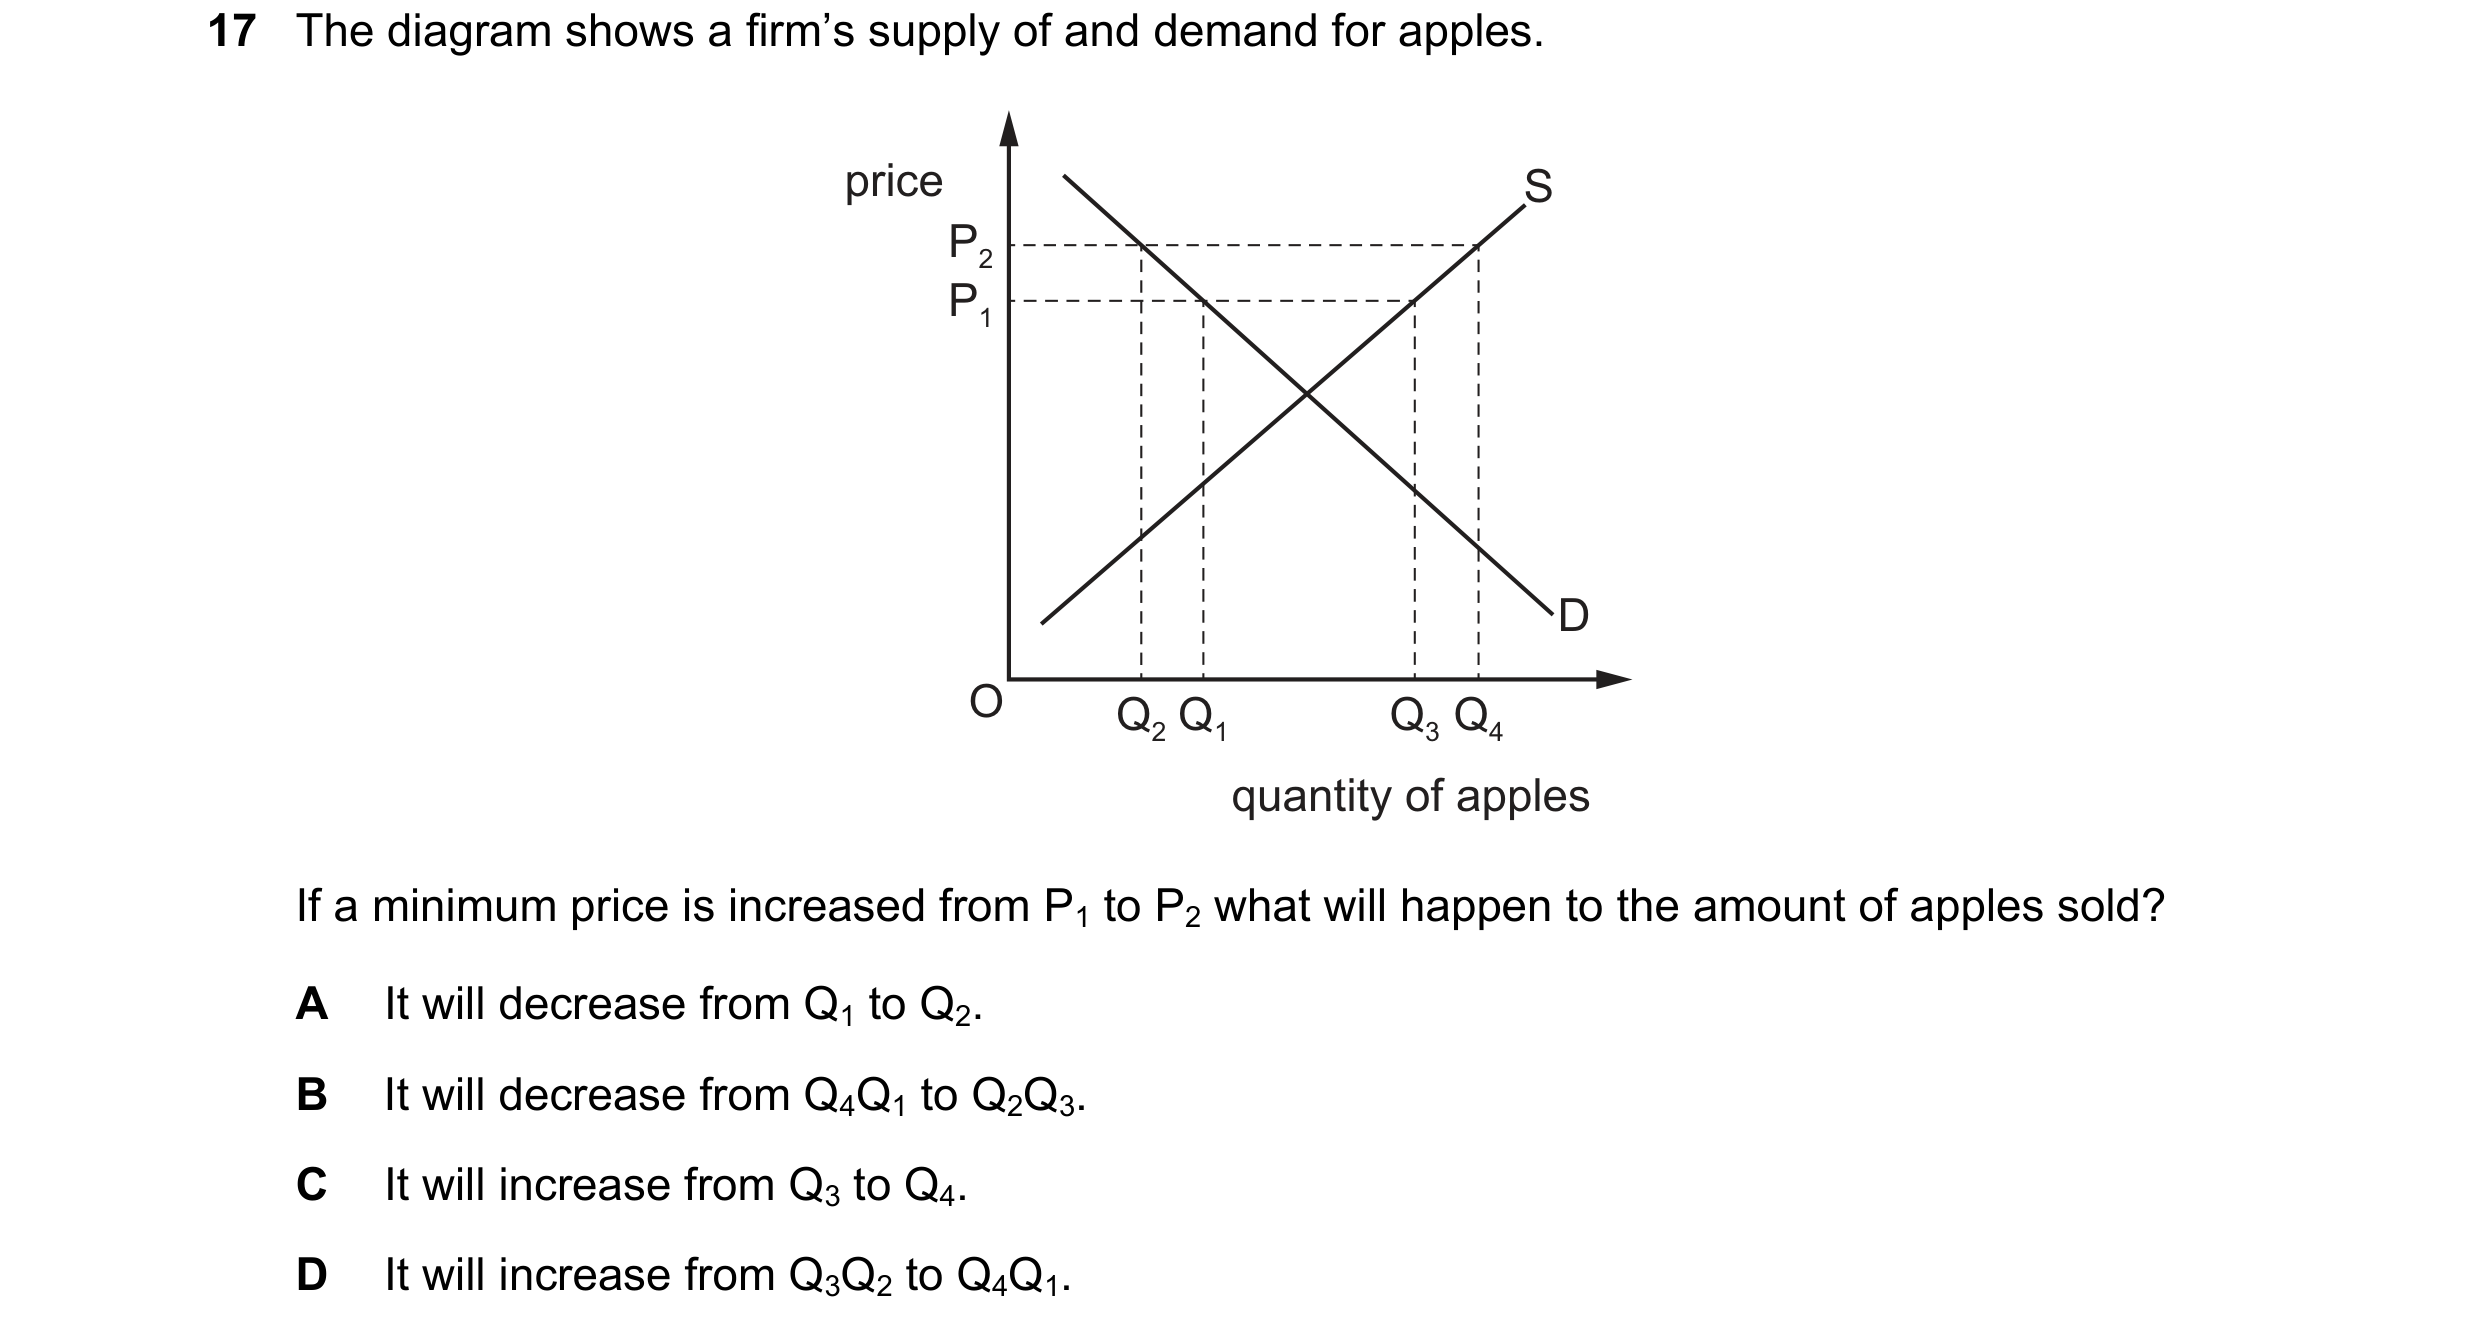
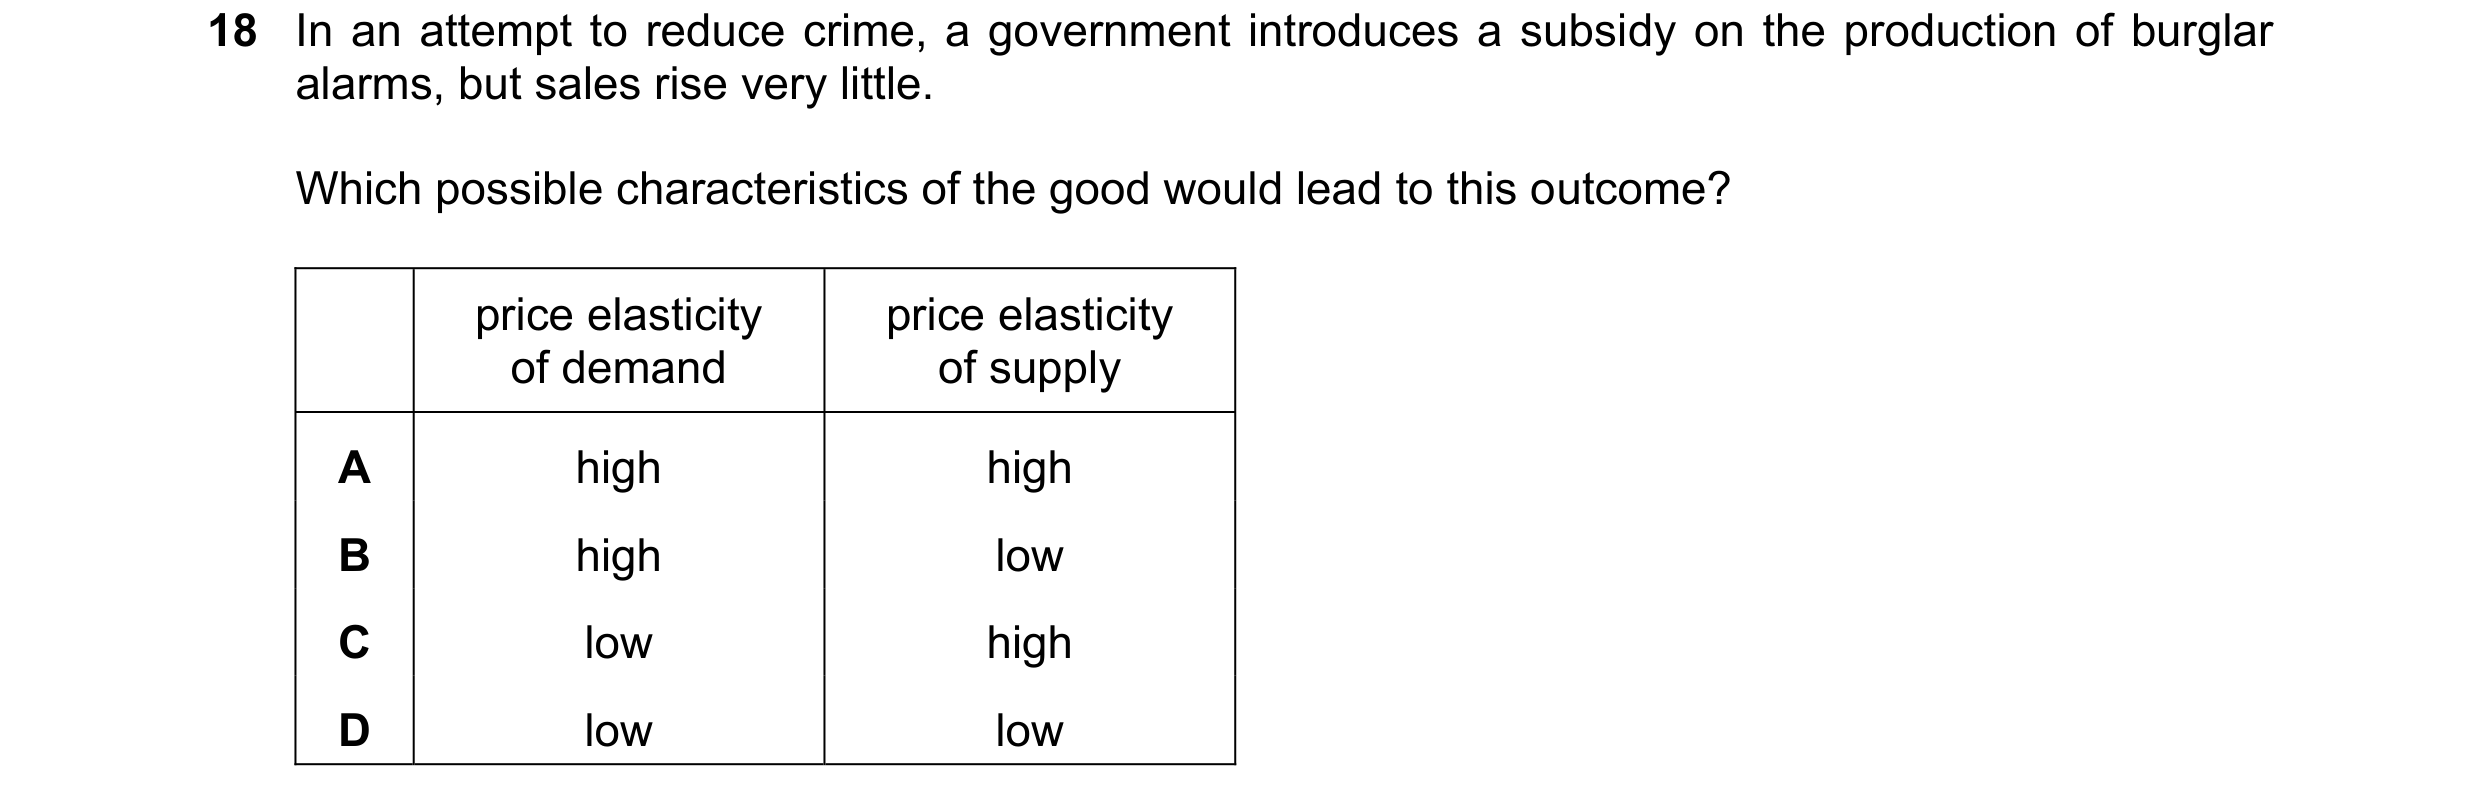 95 / 119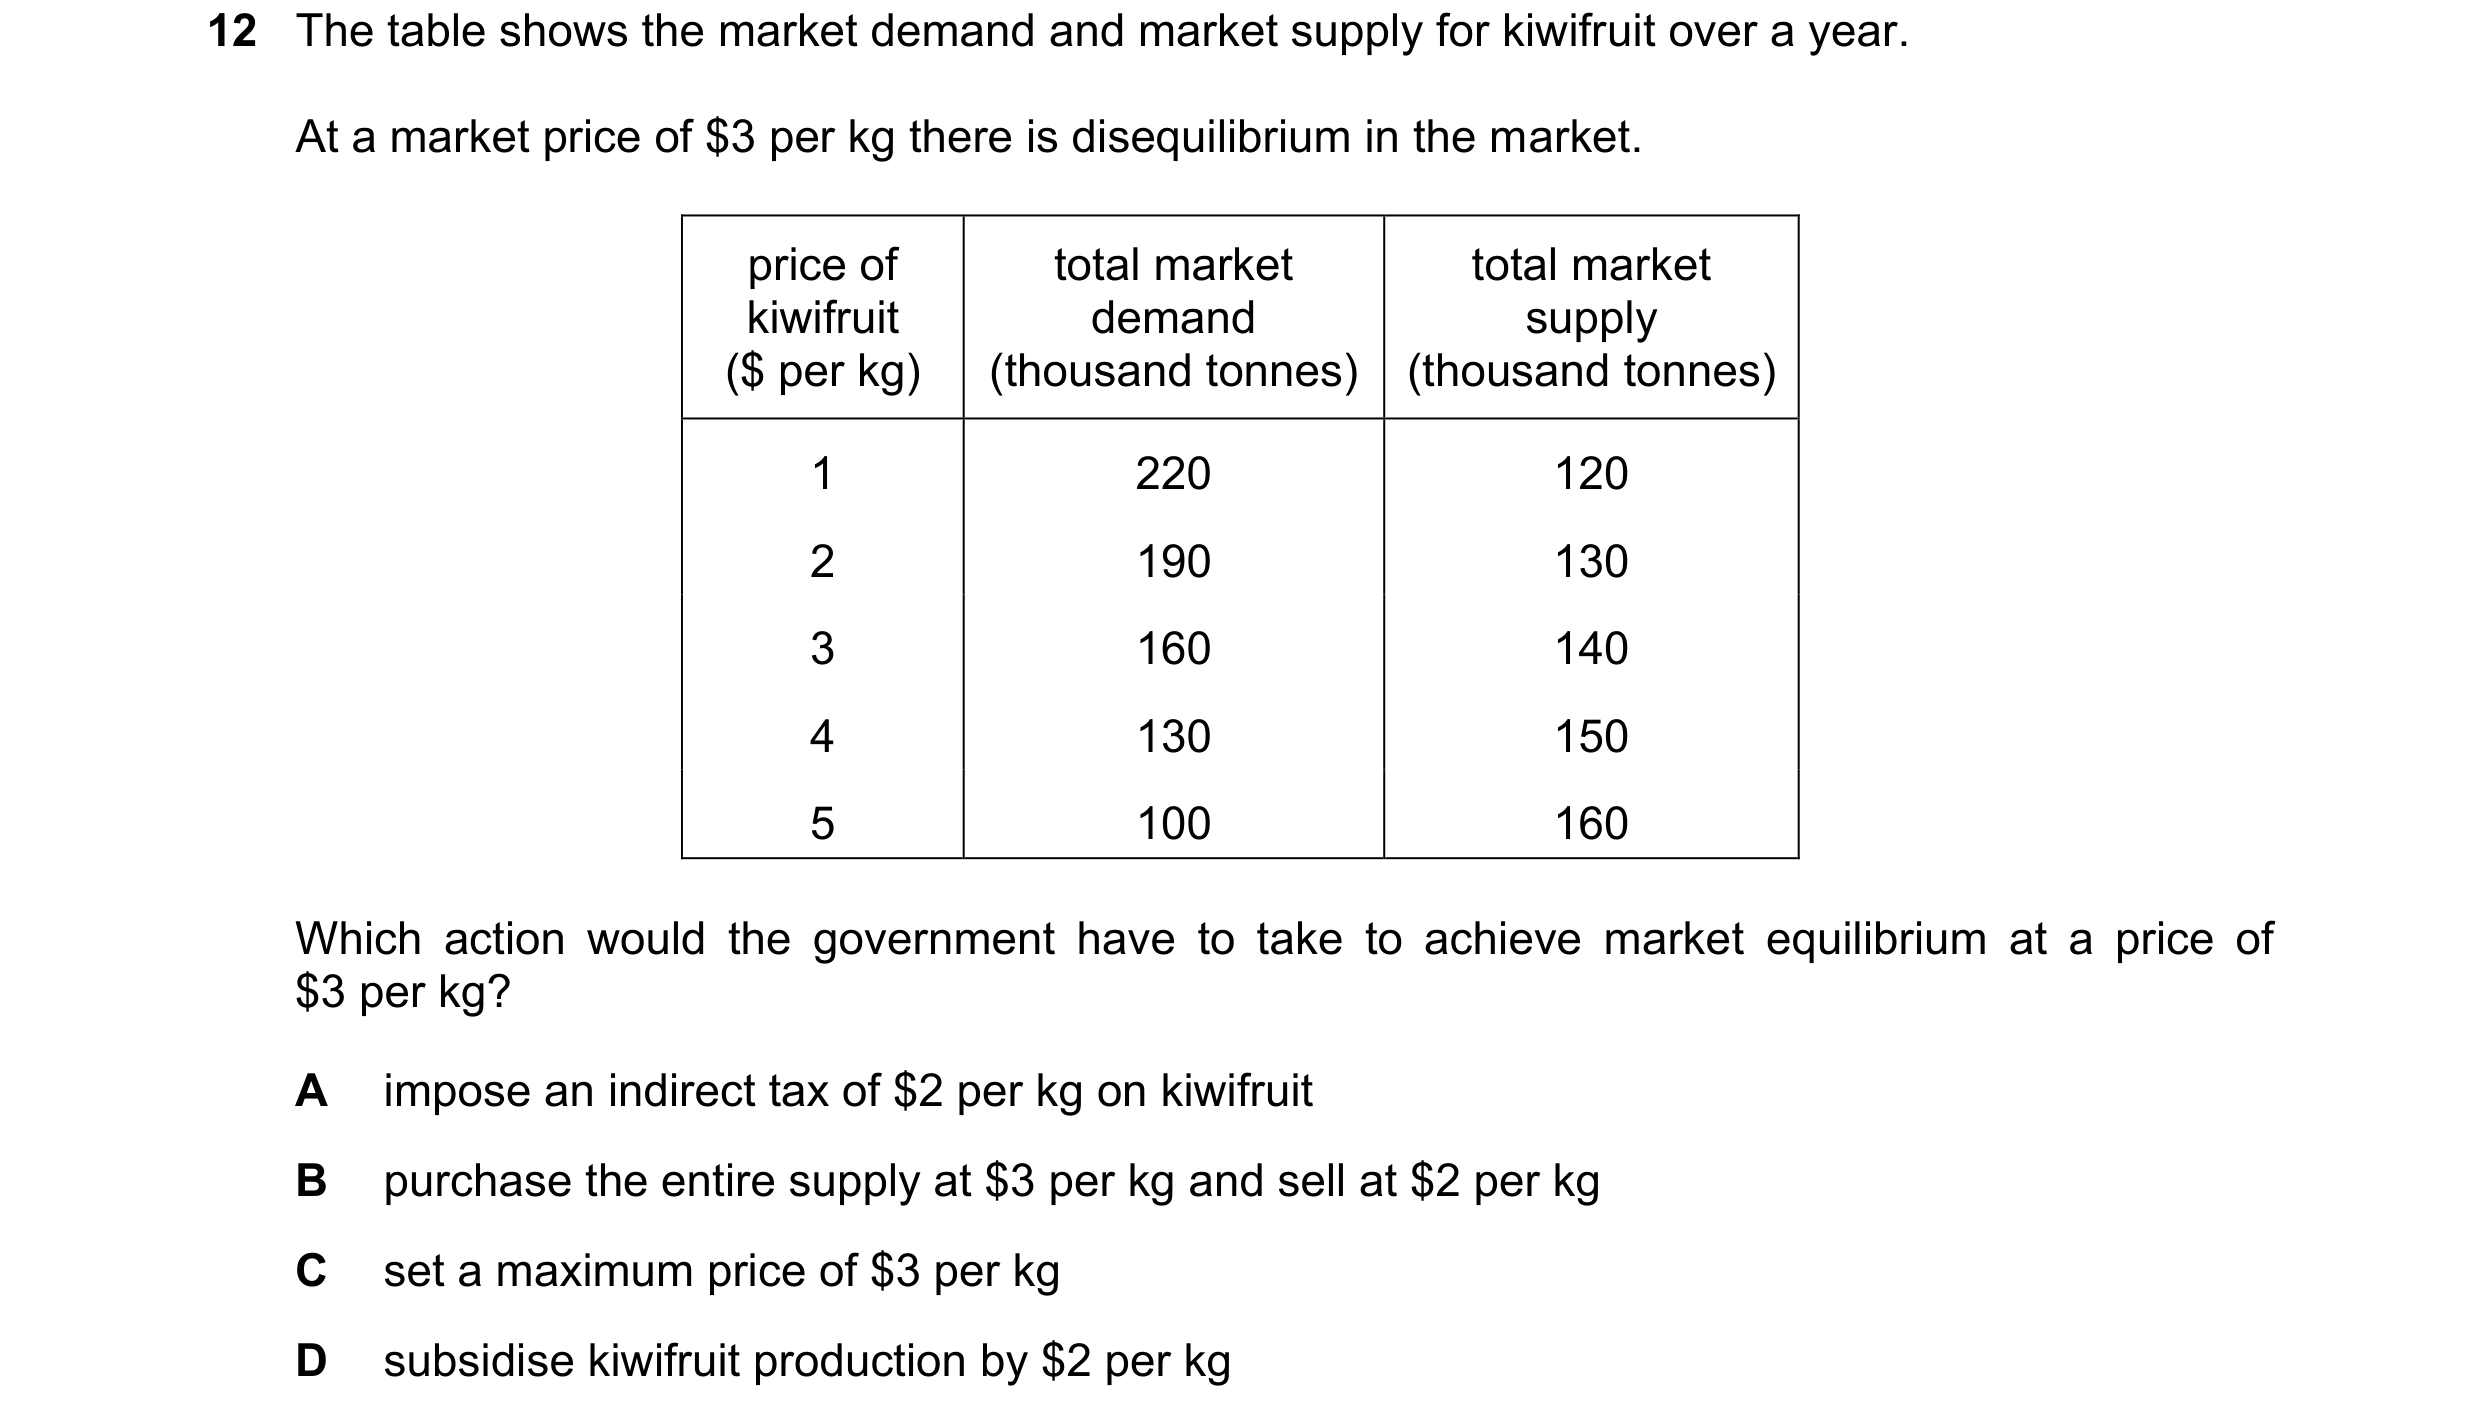
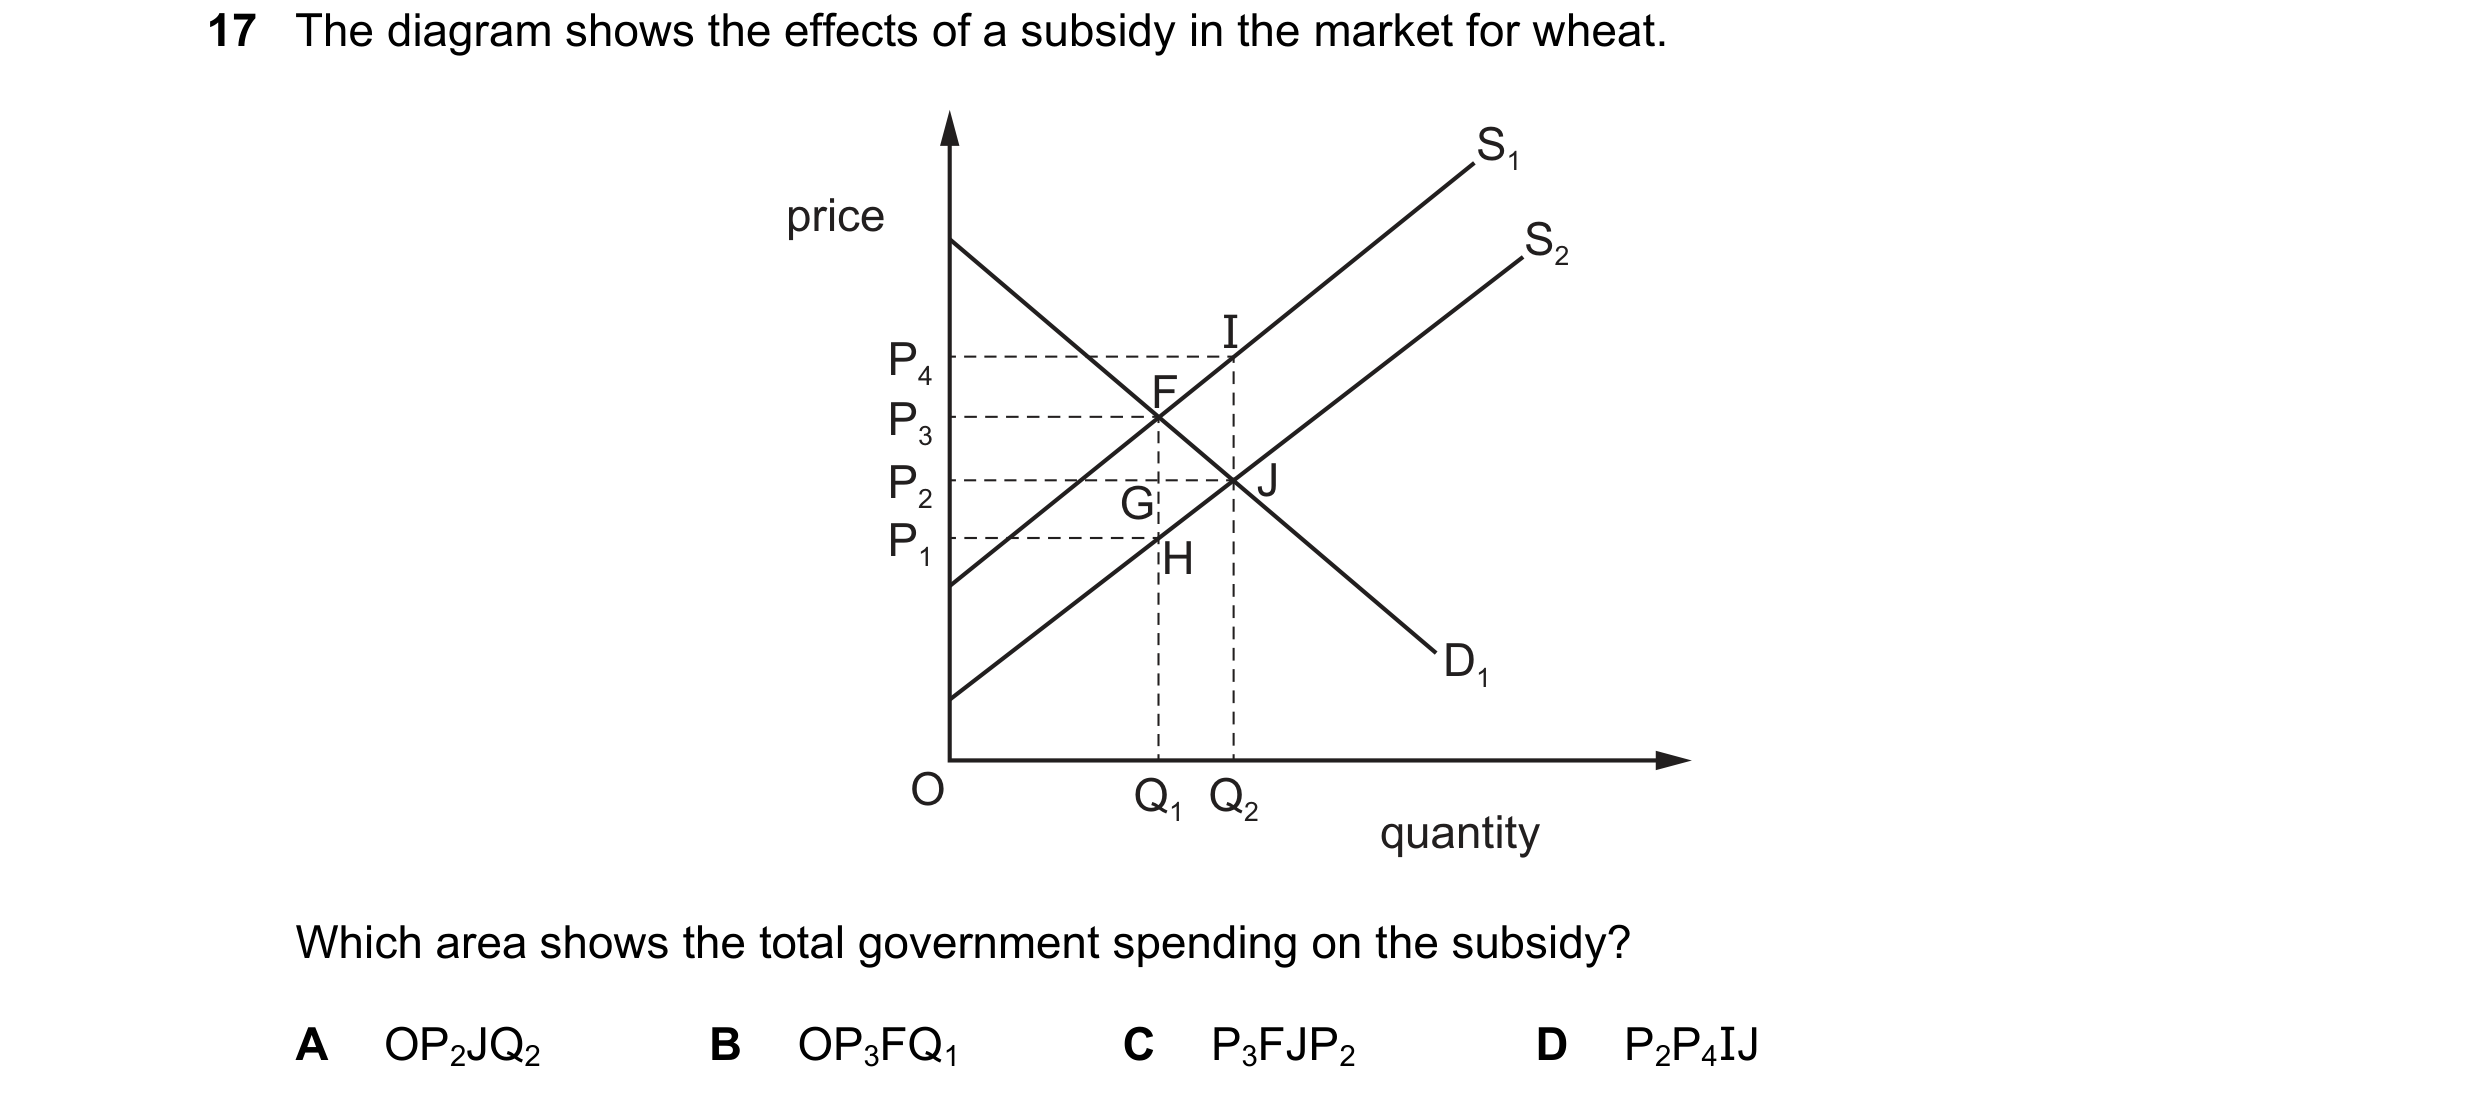
 96 / 119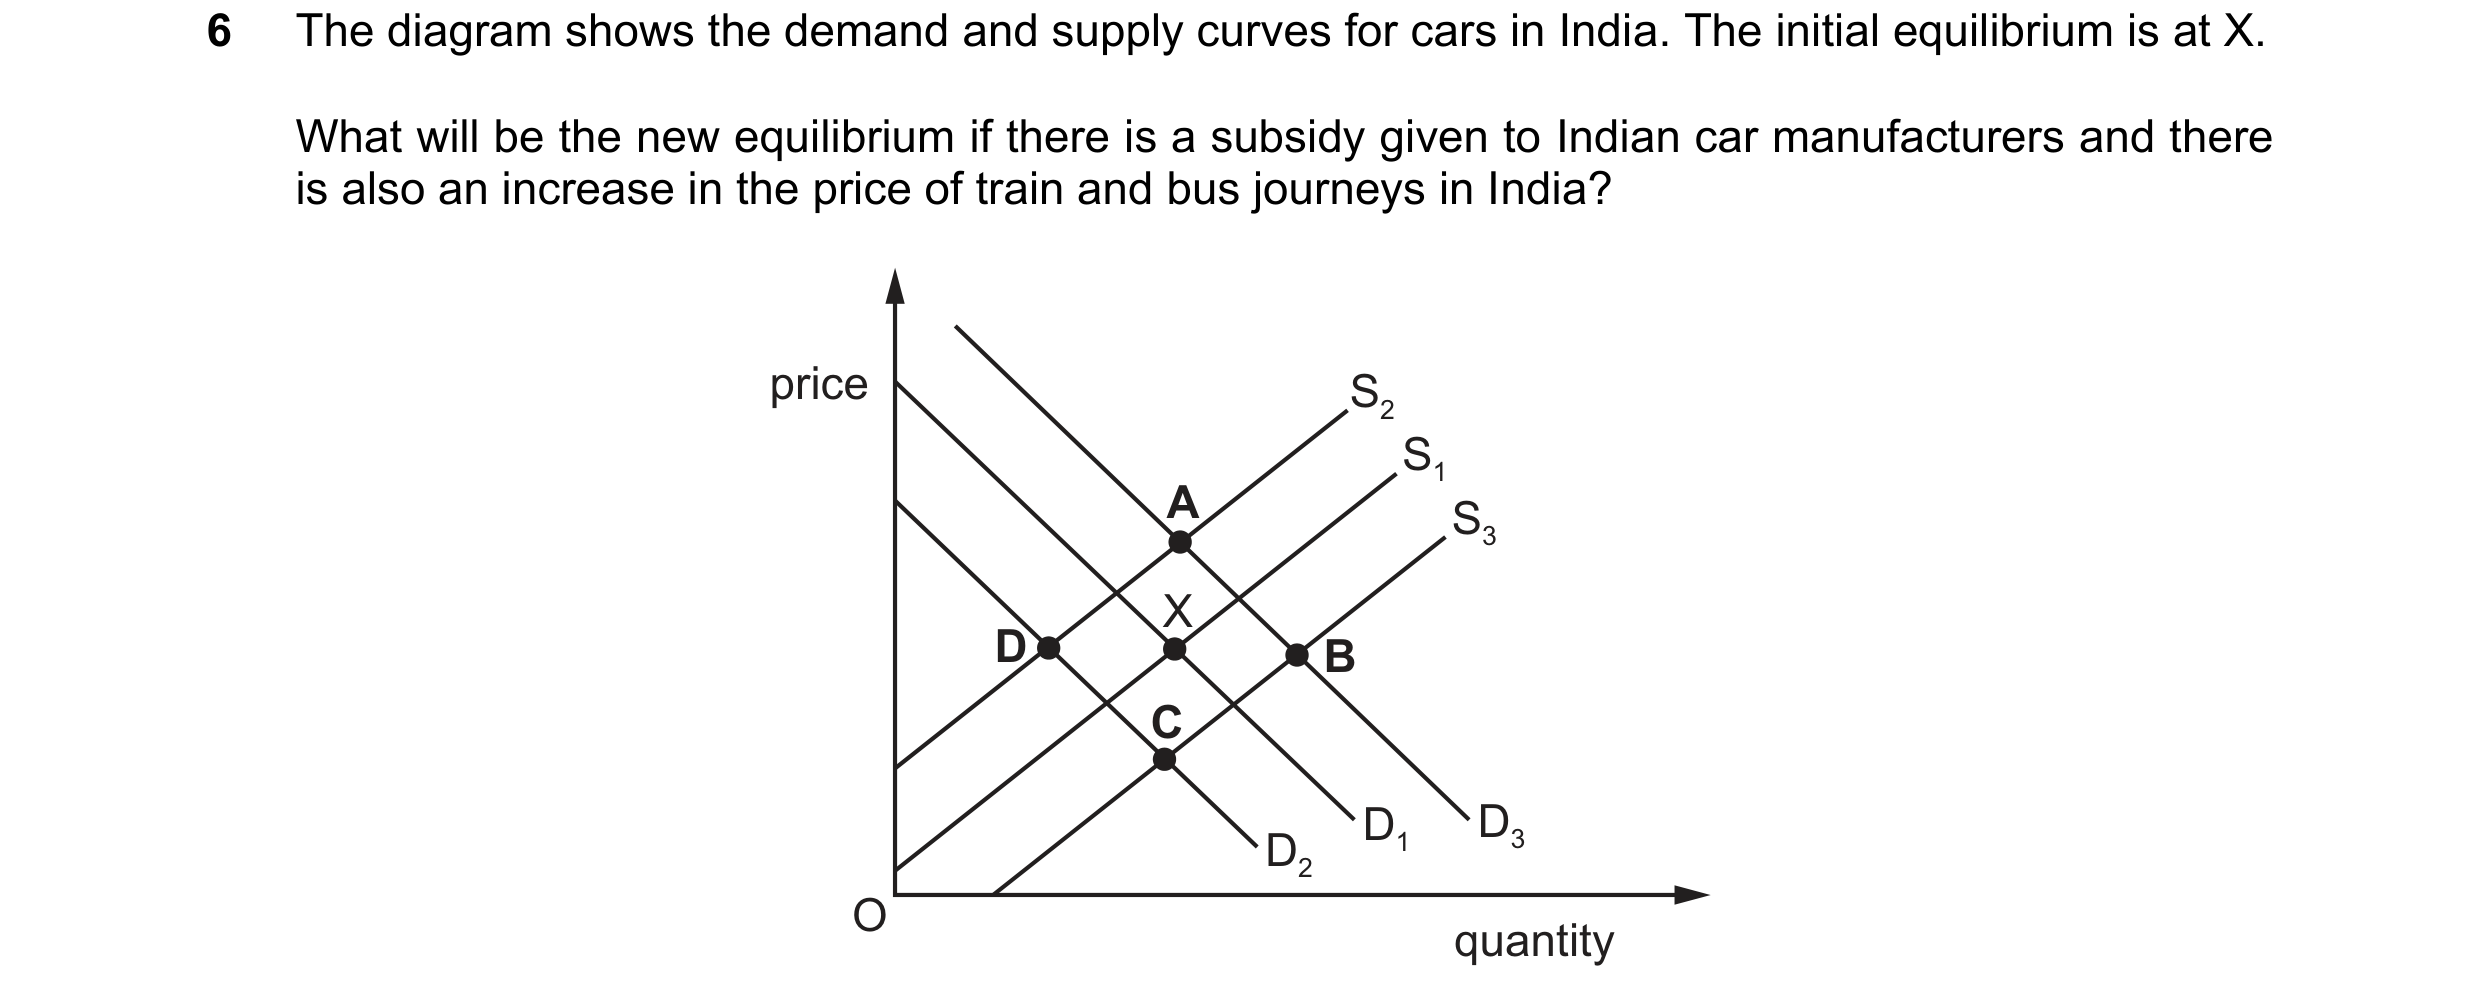
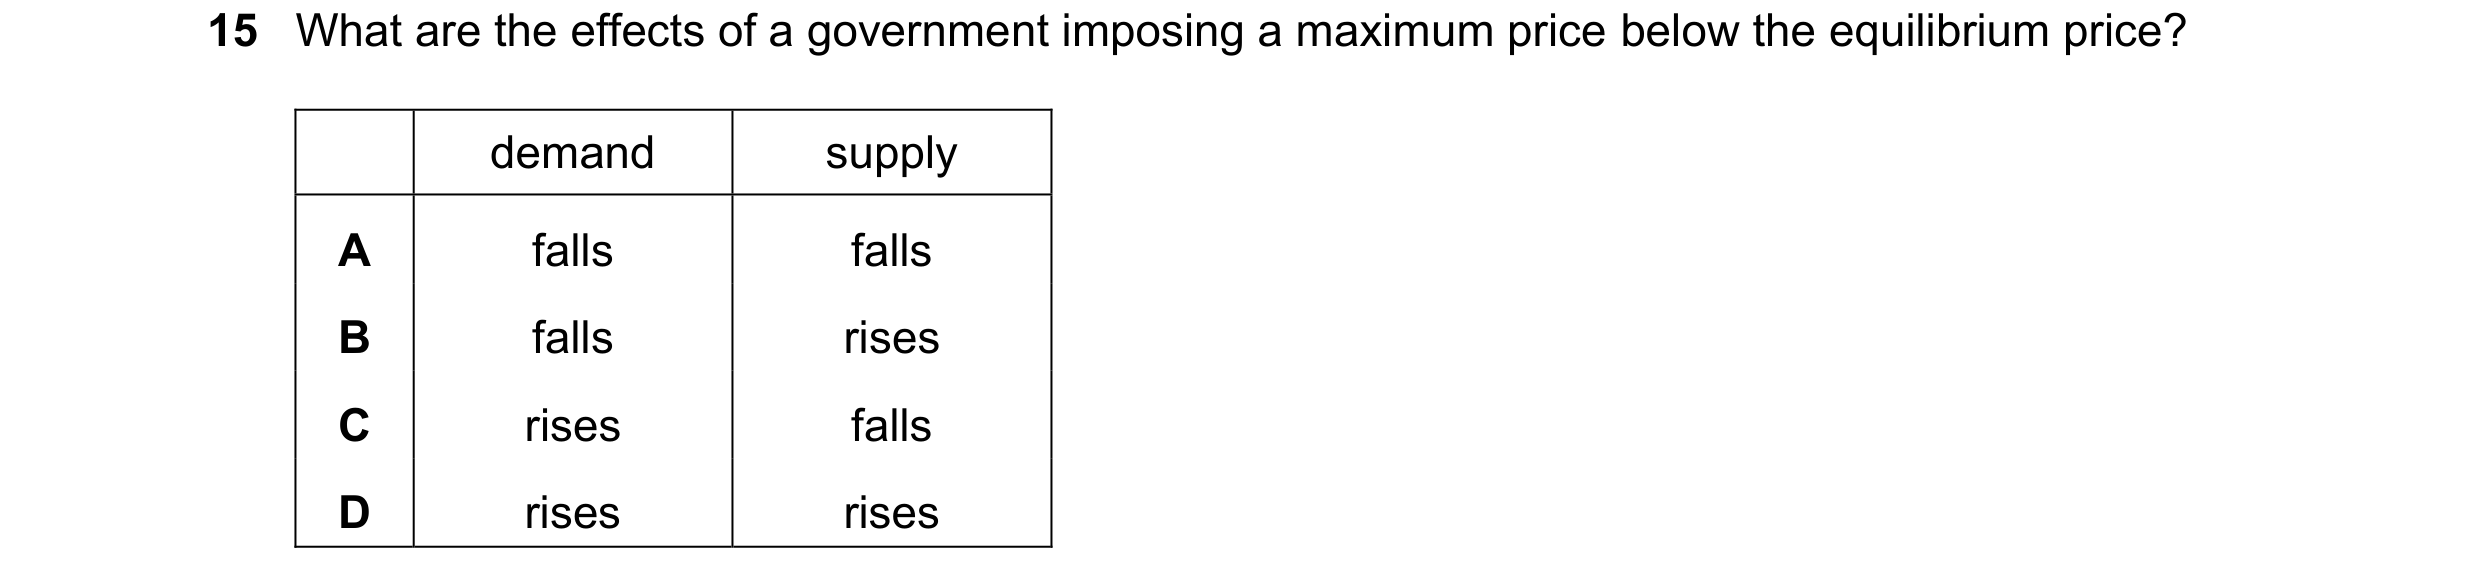
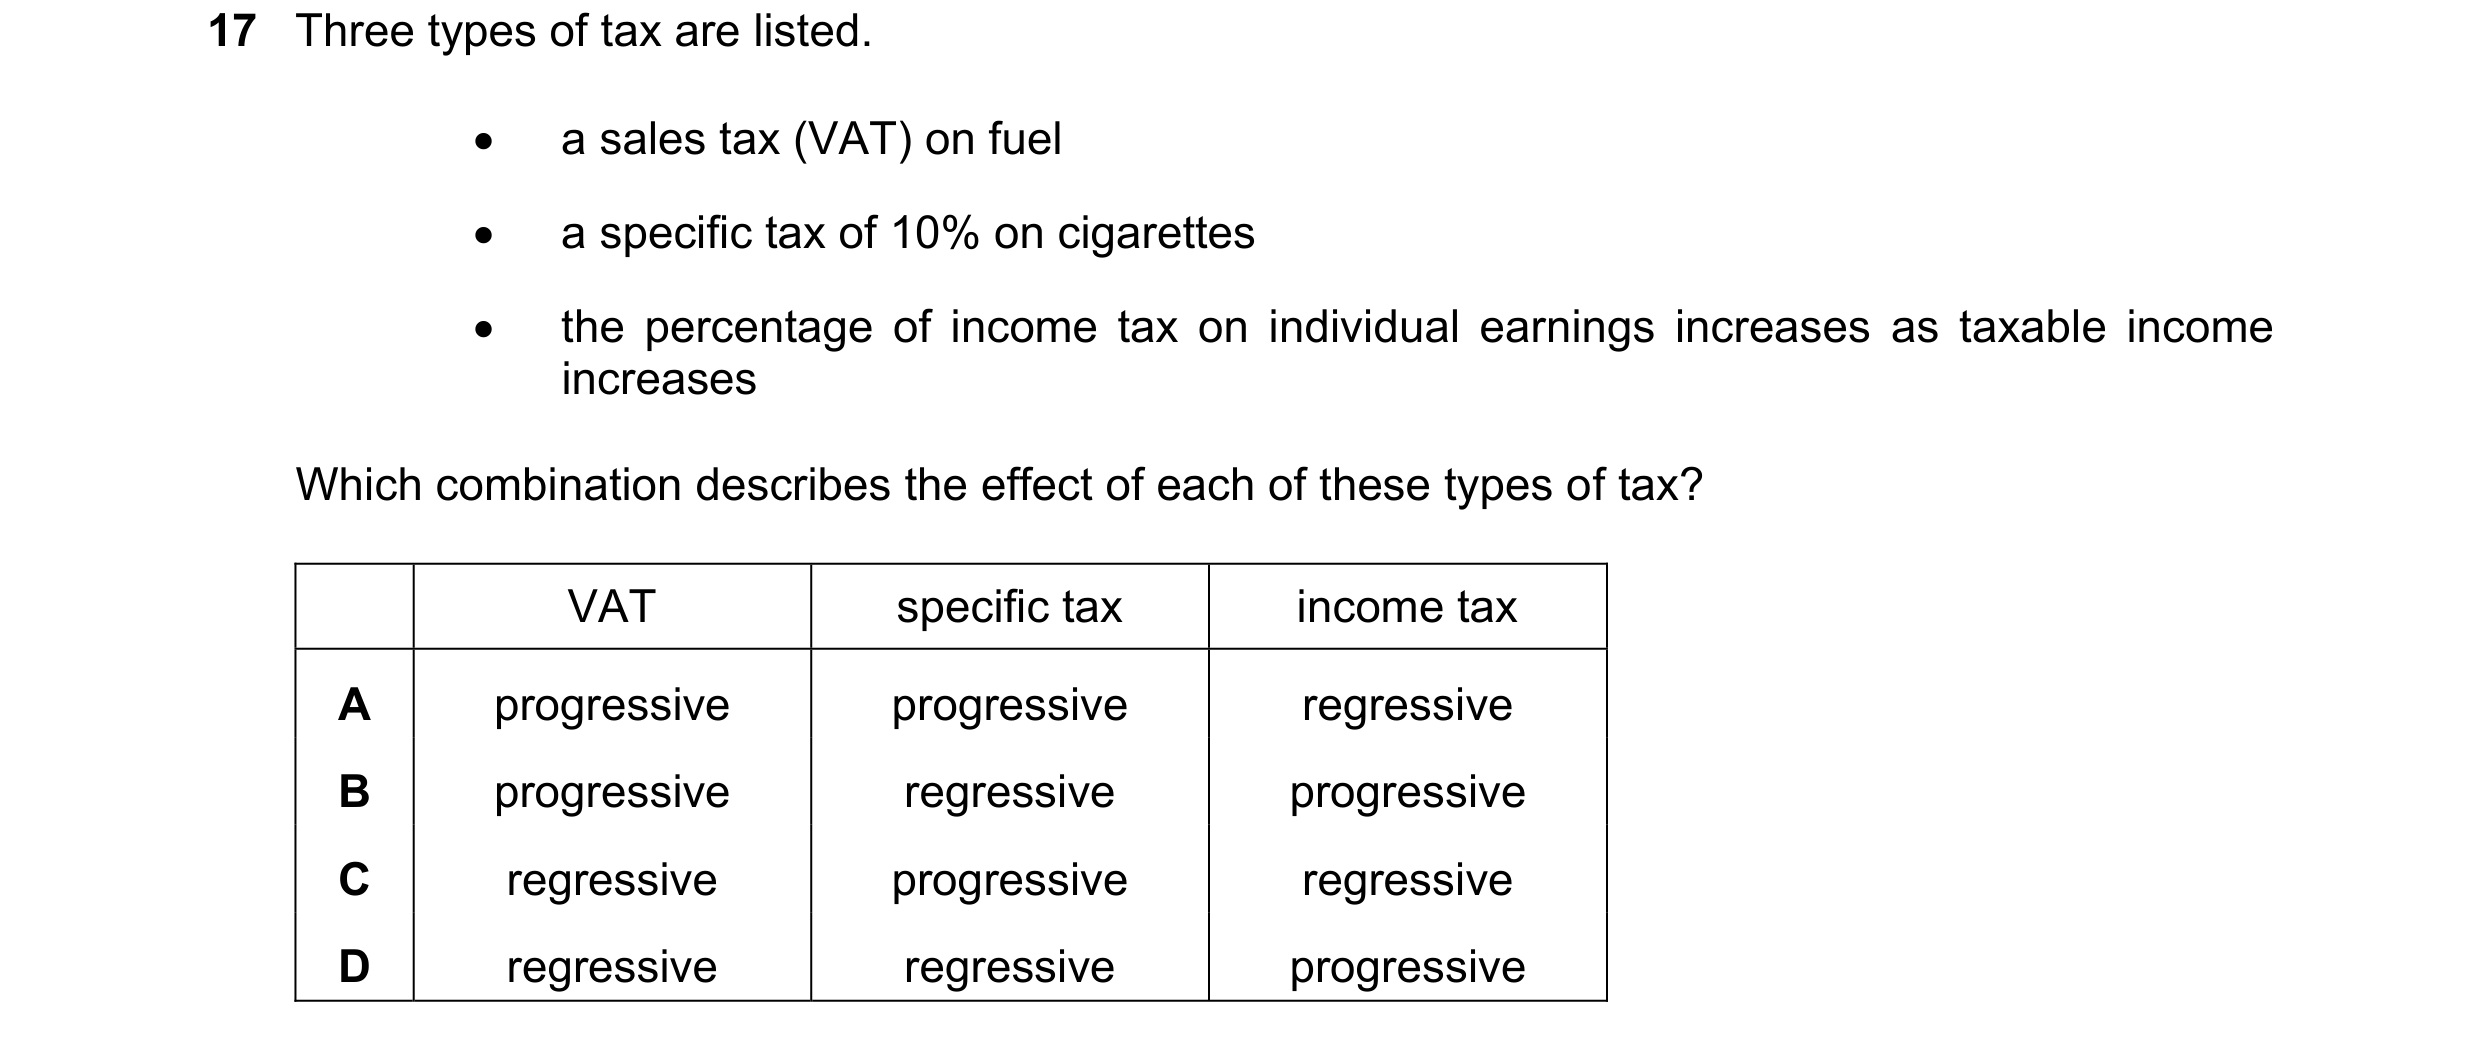 97 / 119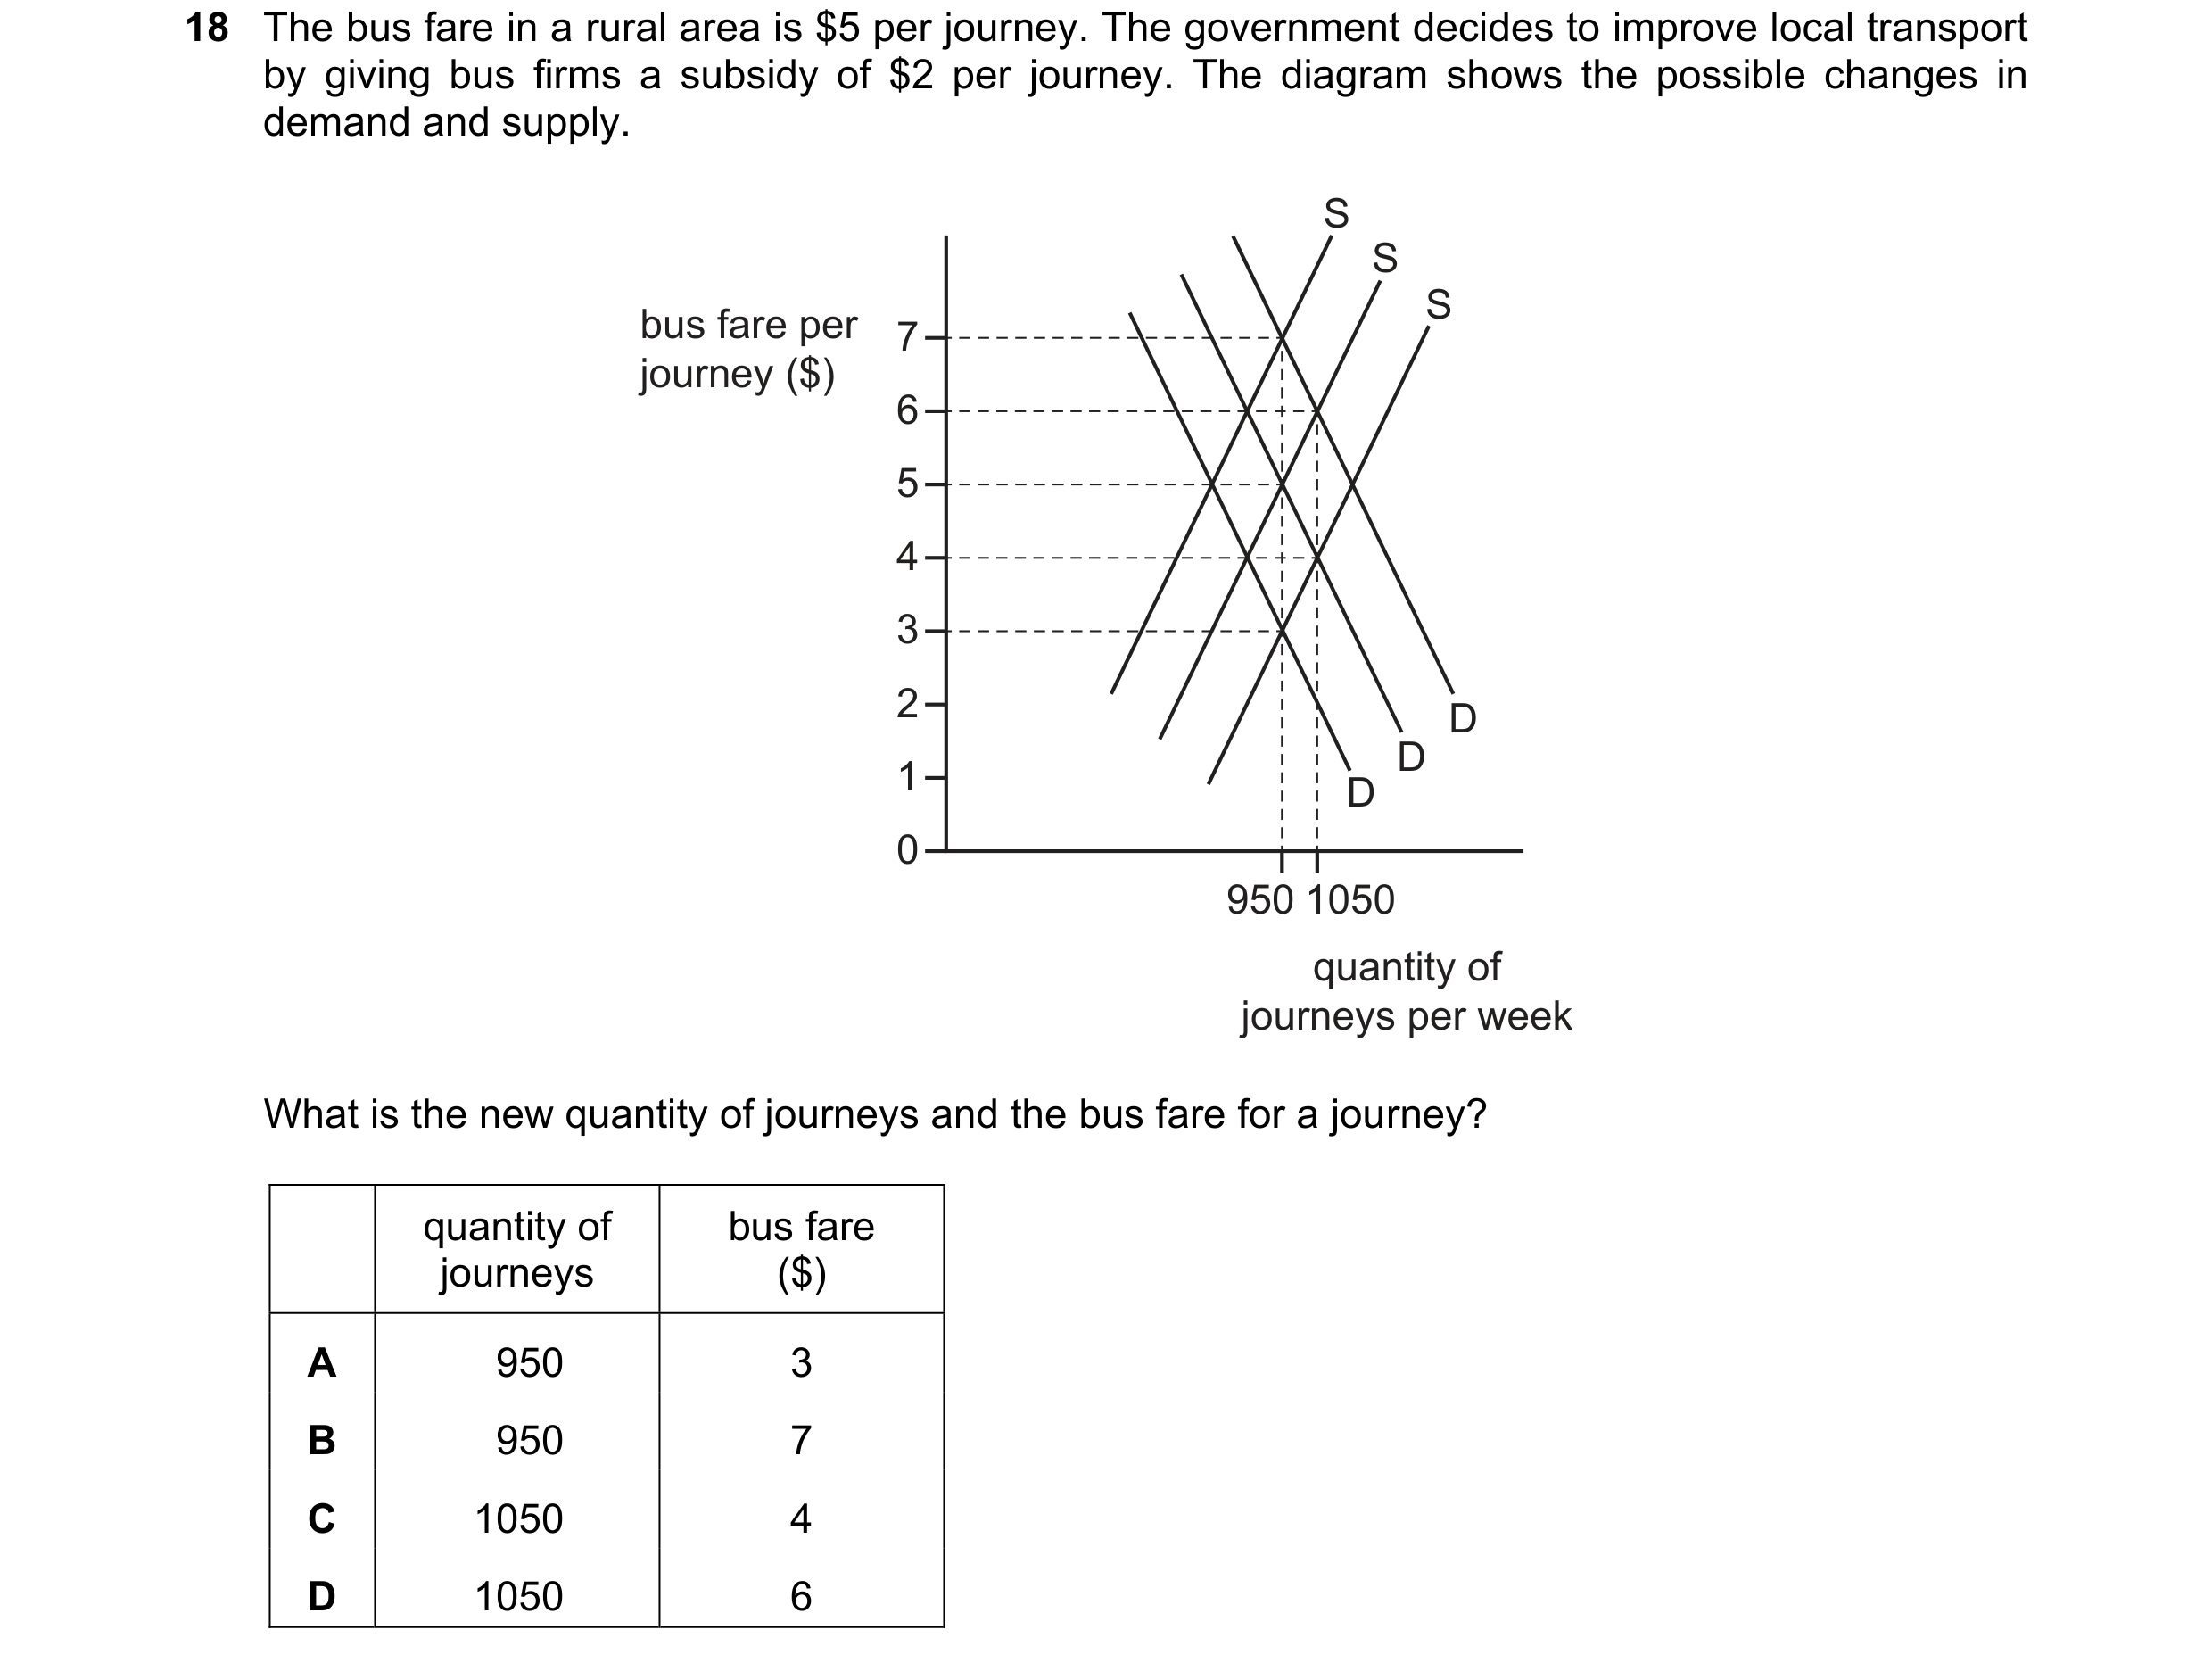

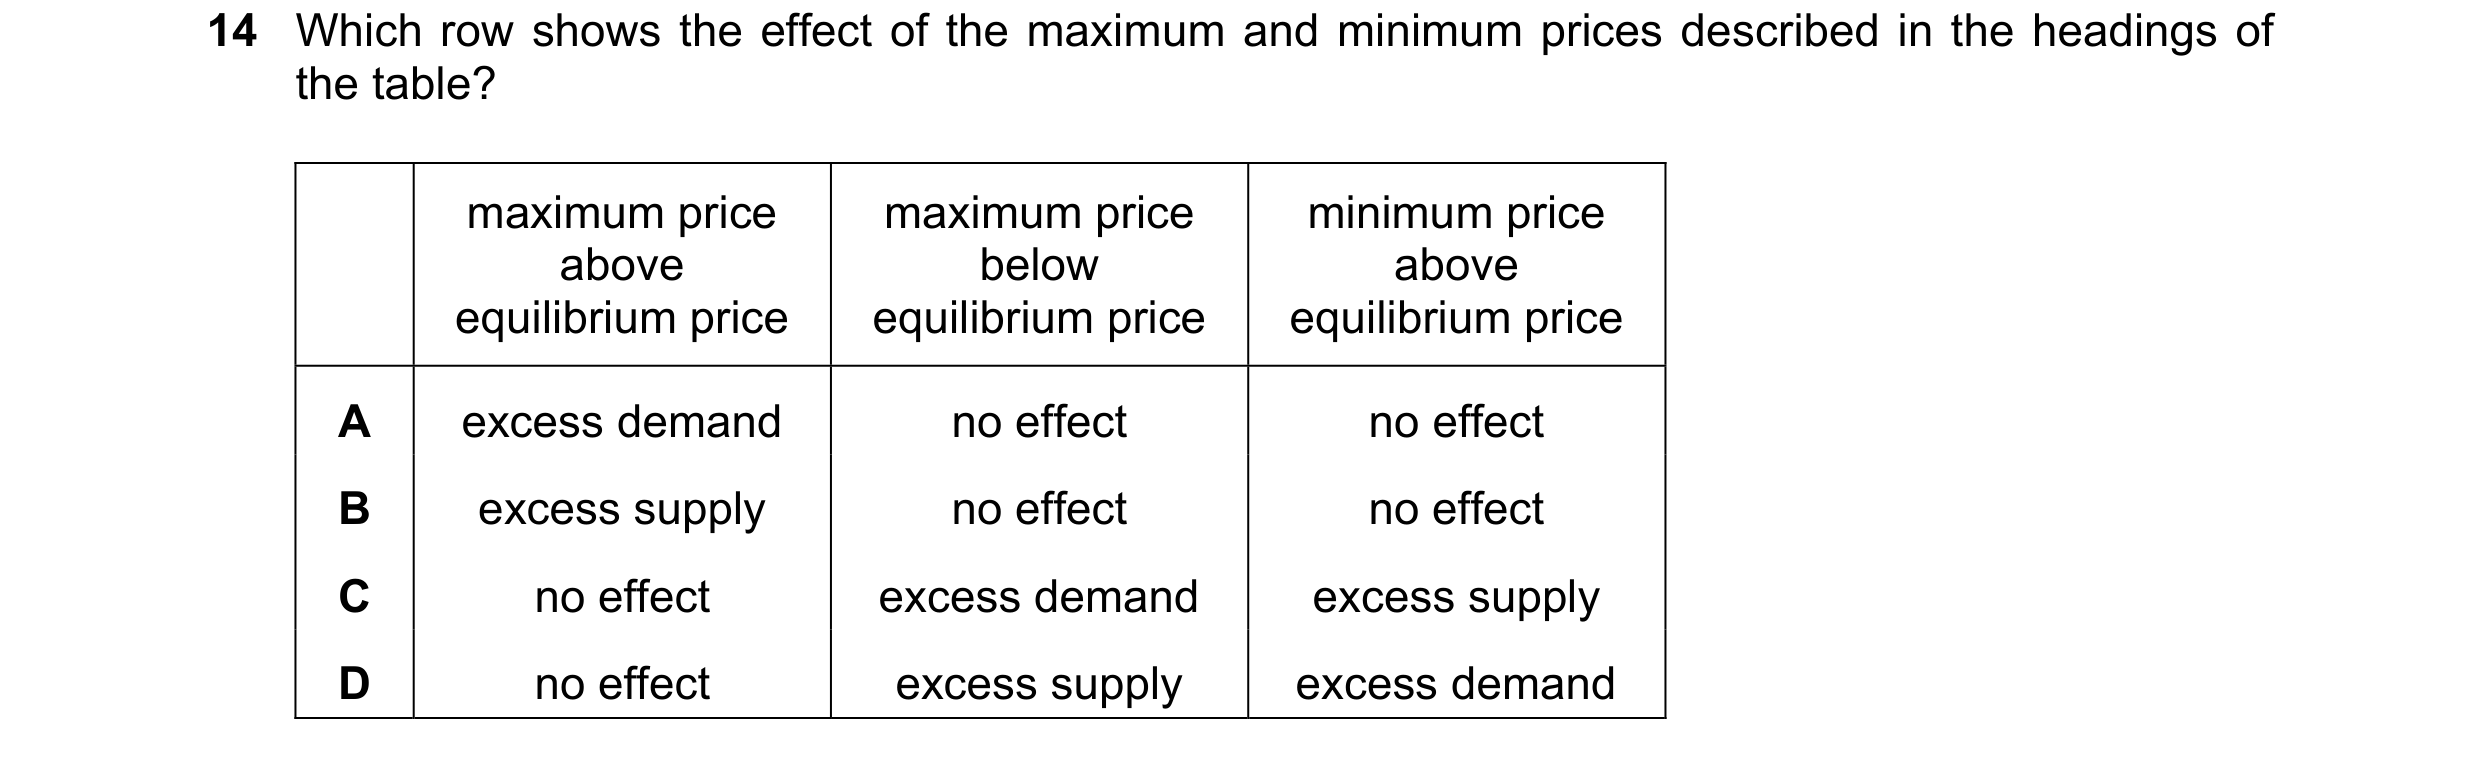 98 / 119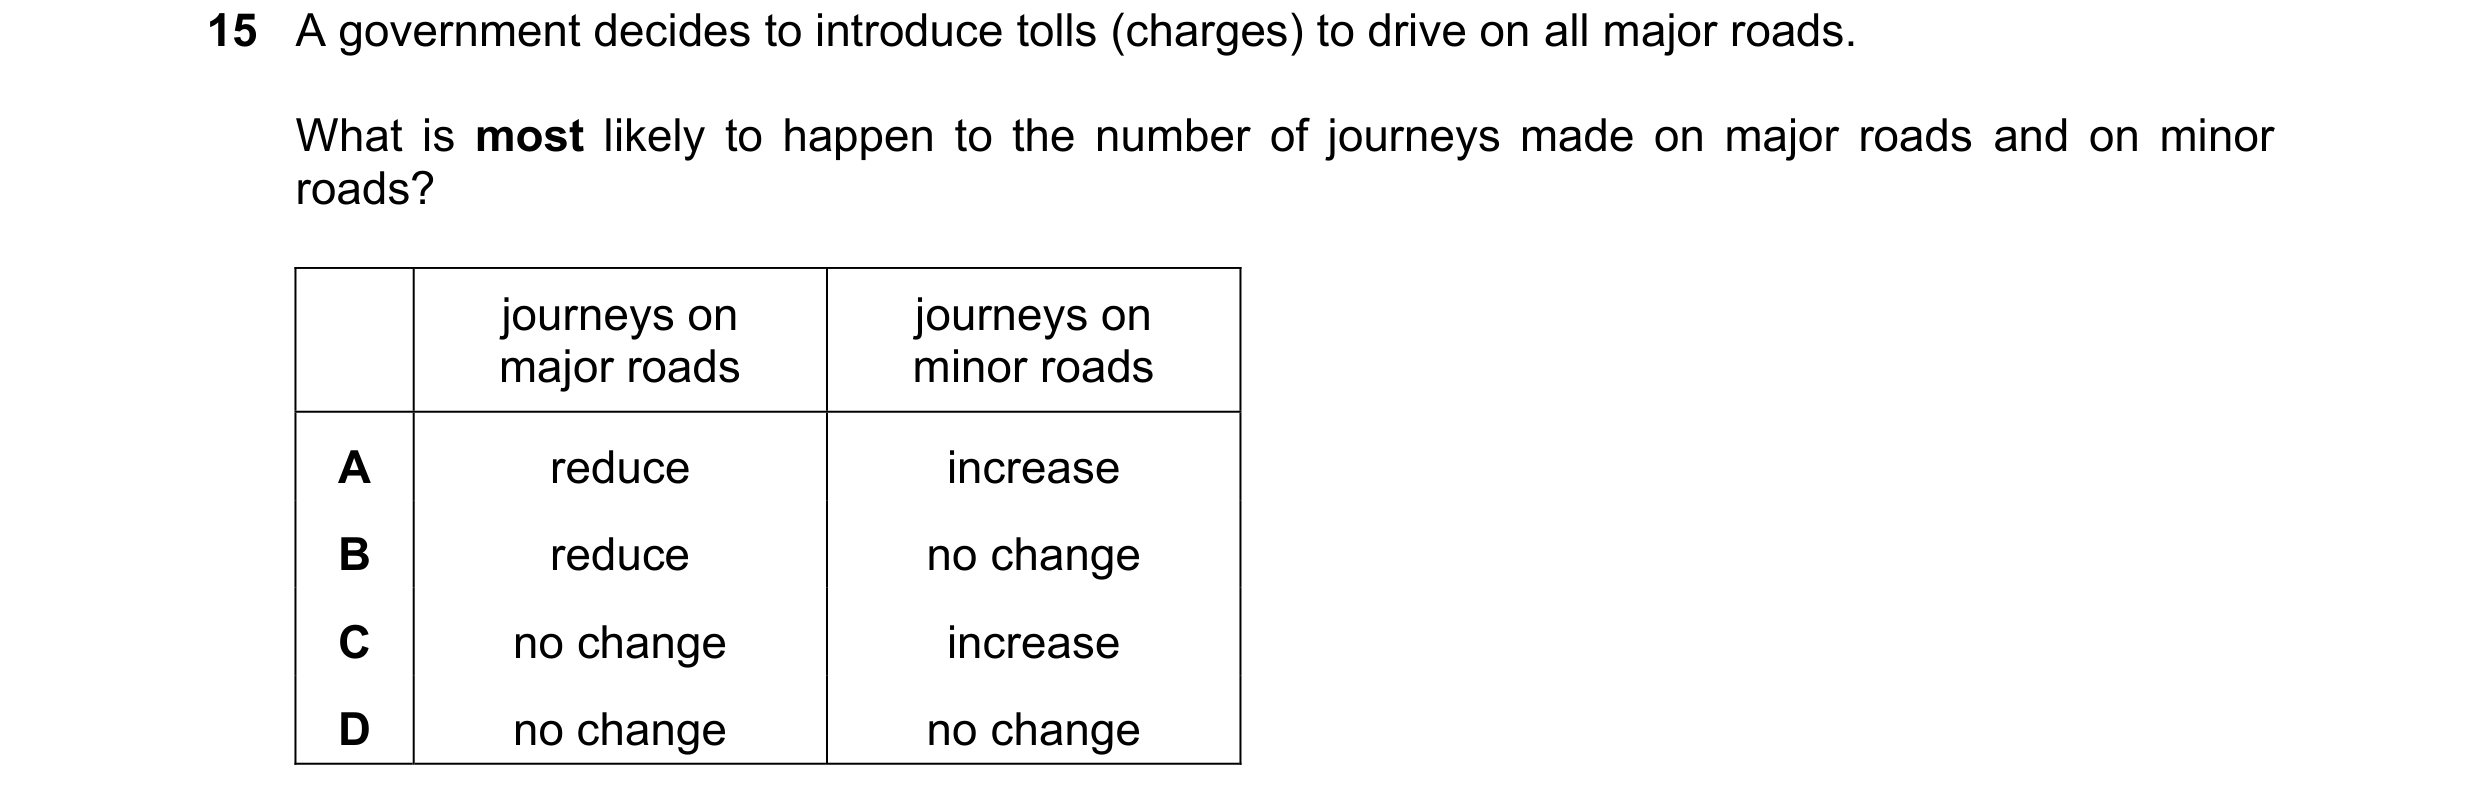
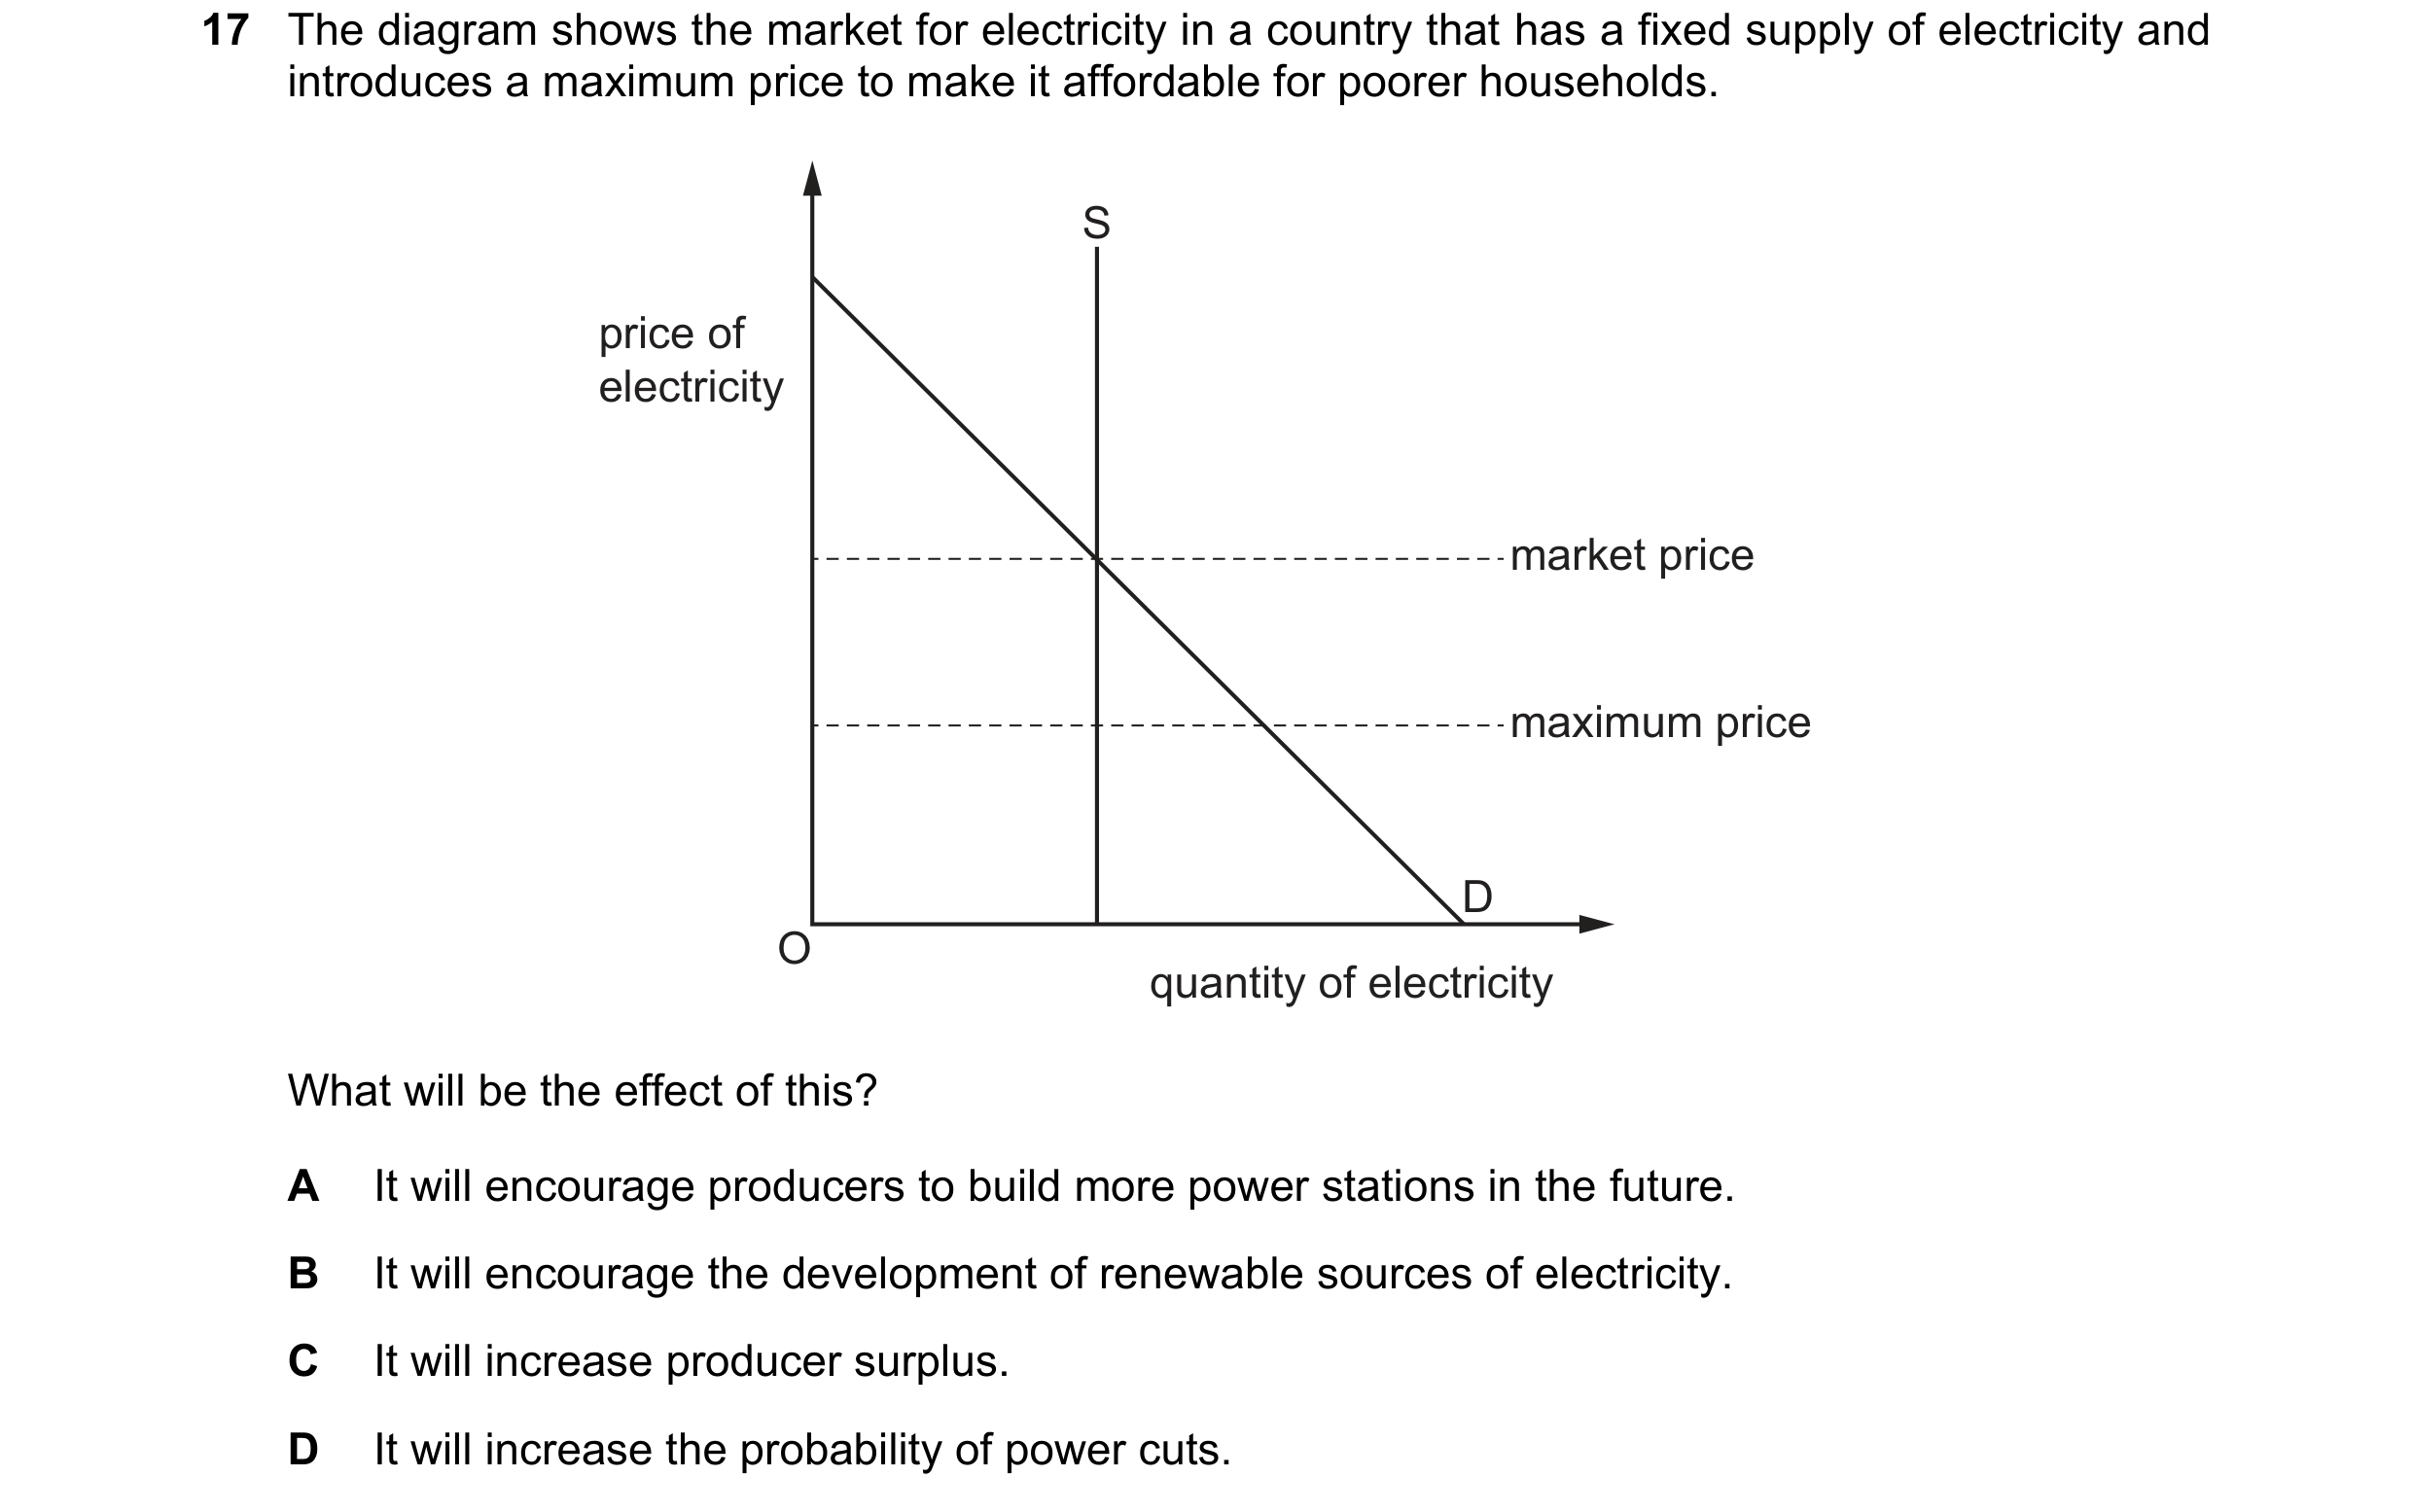
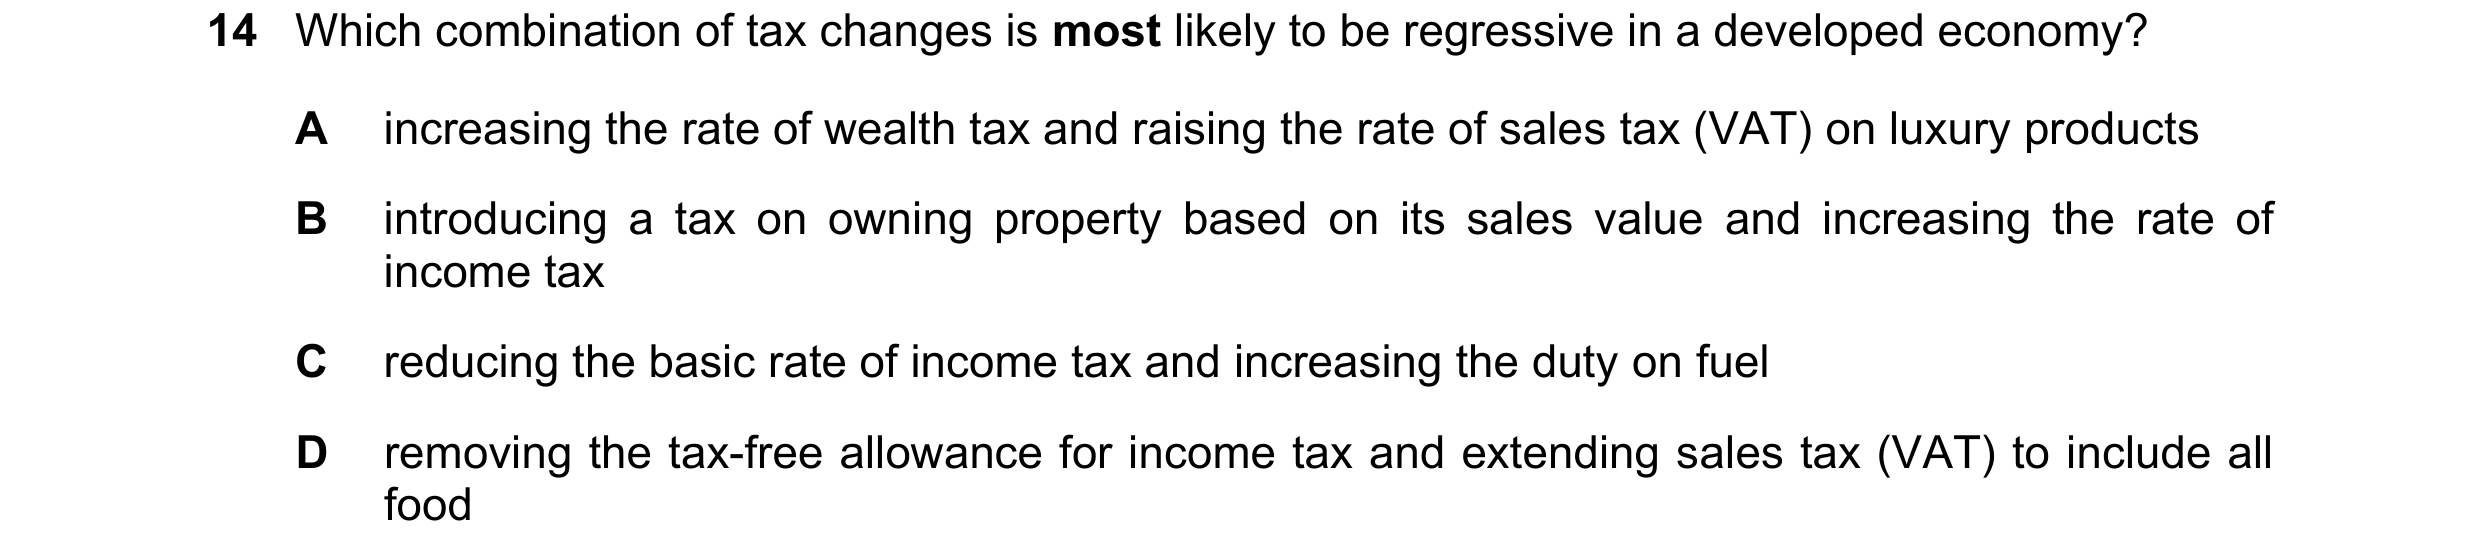 99 / 119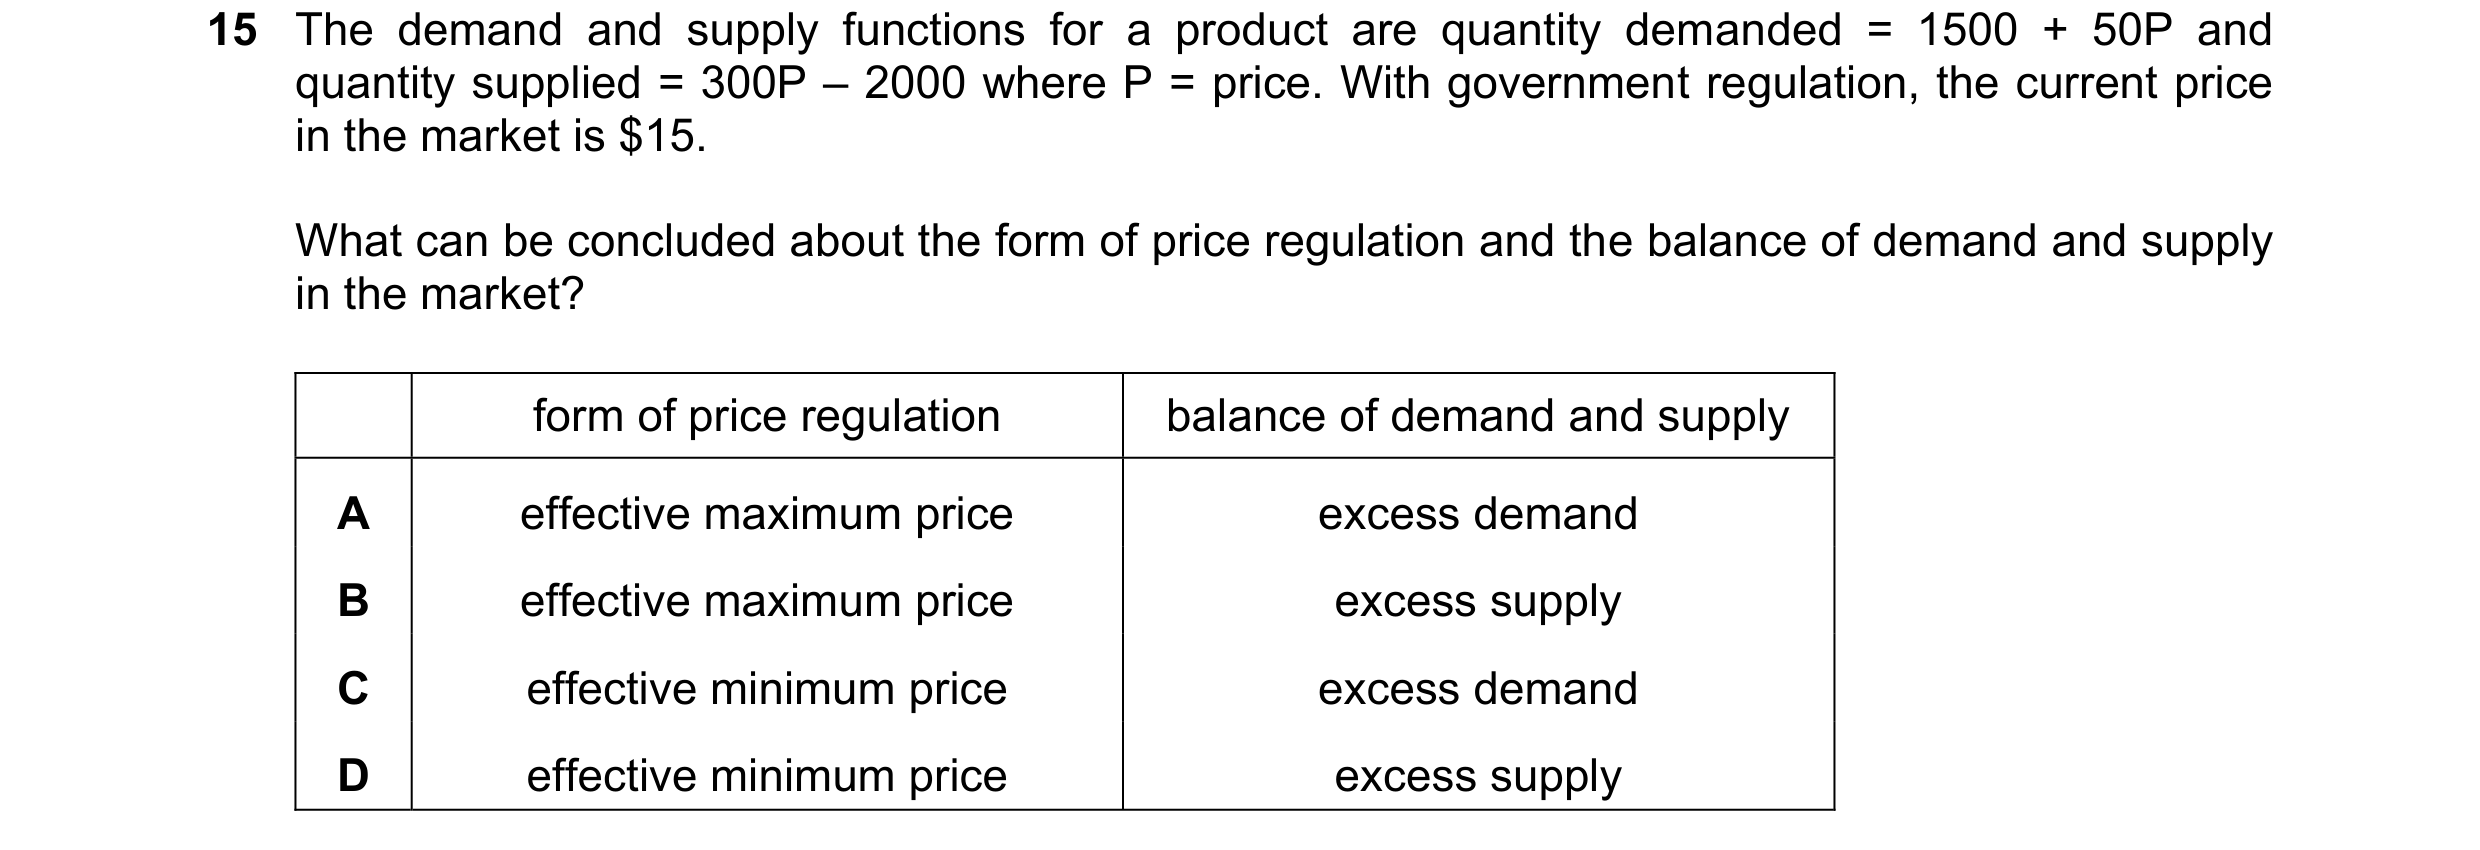
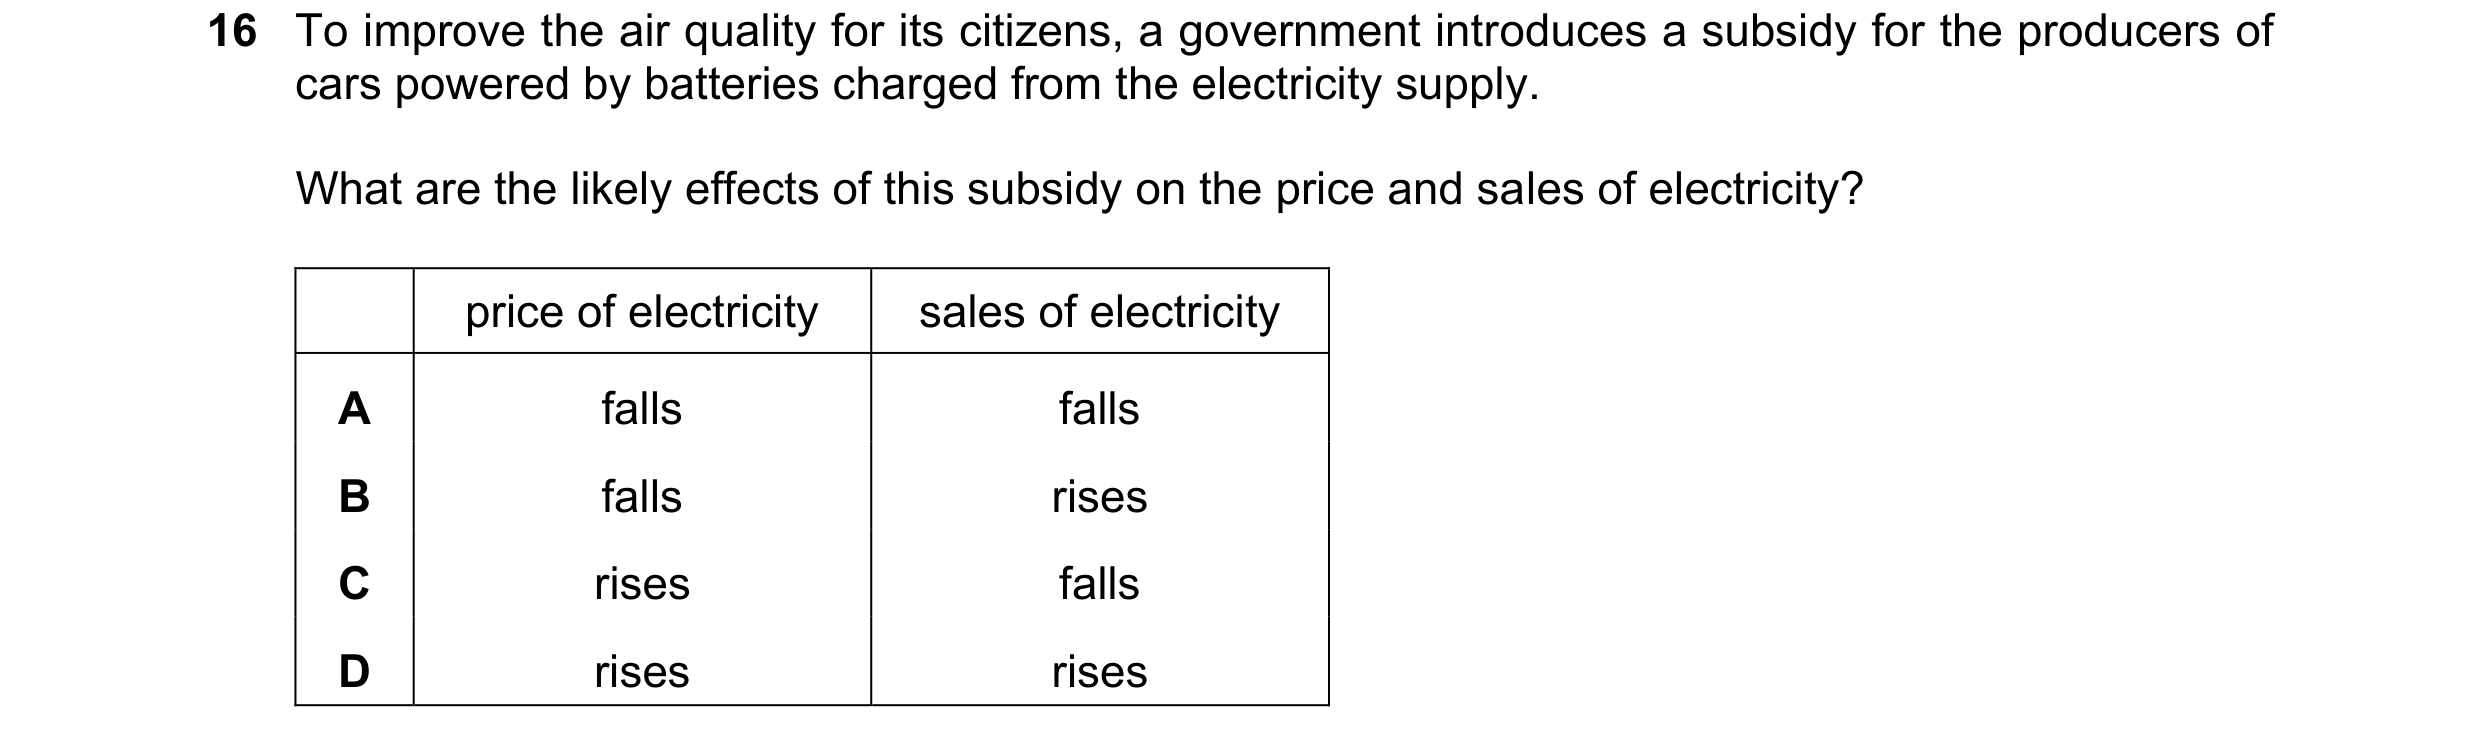
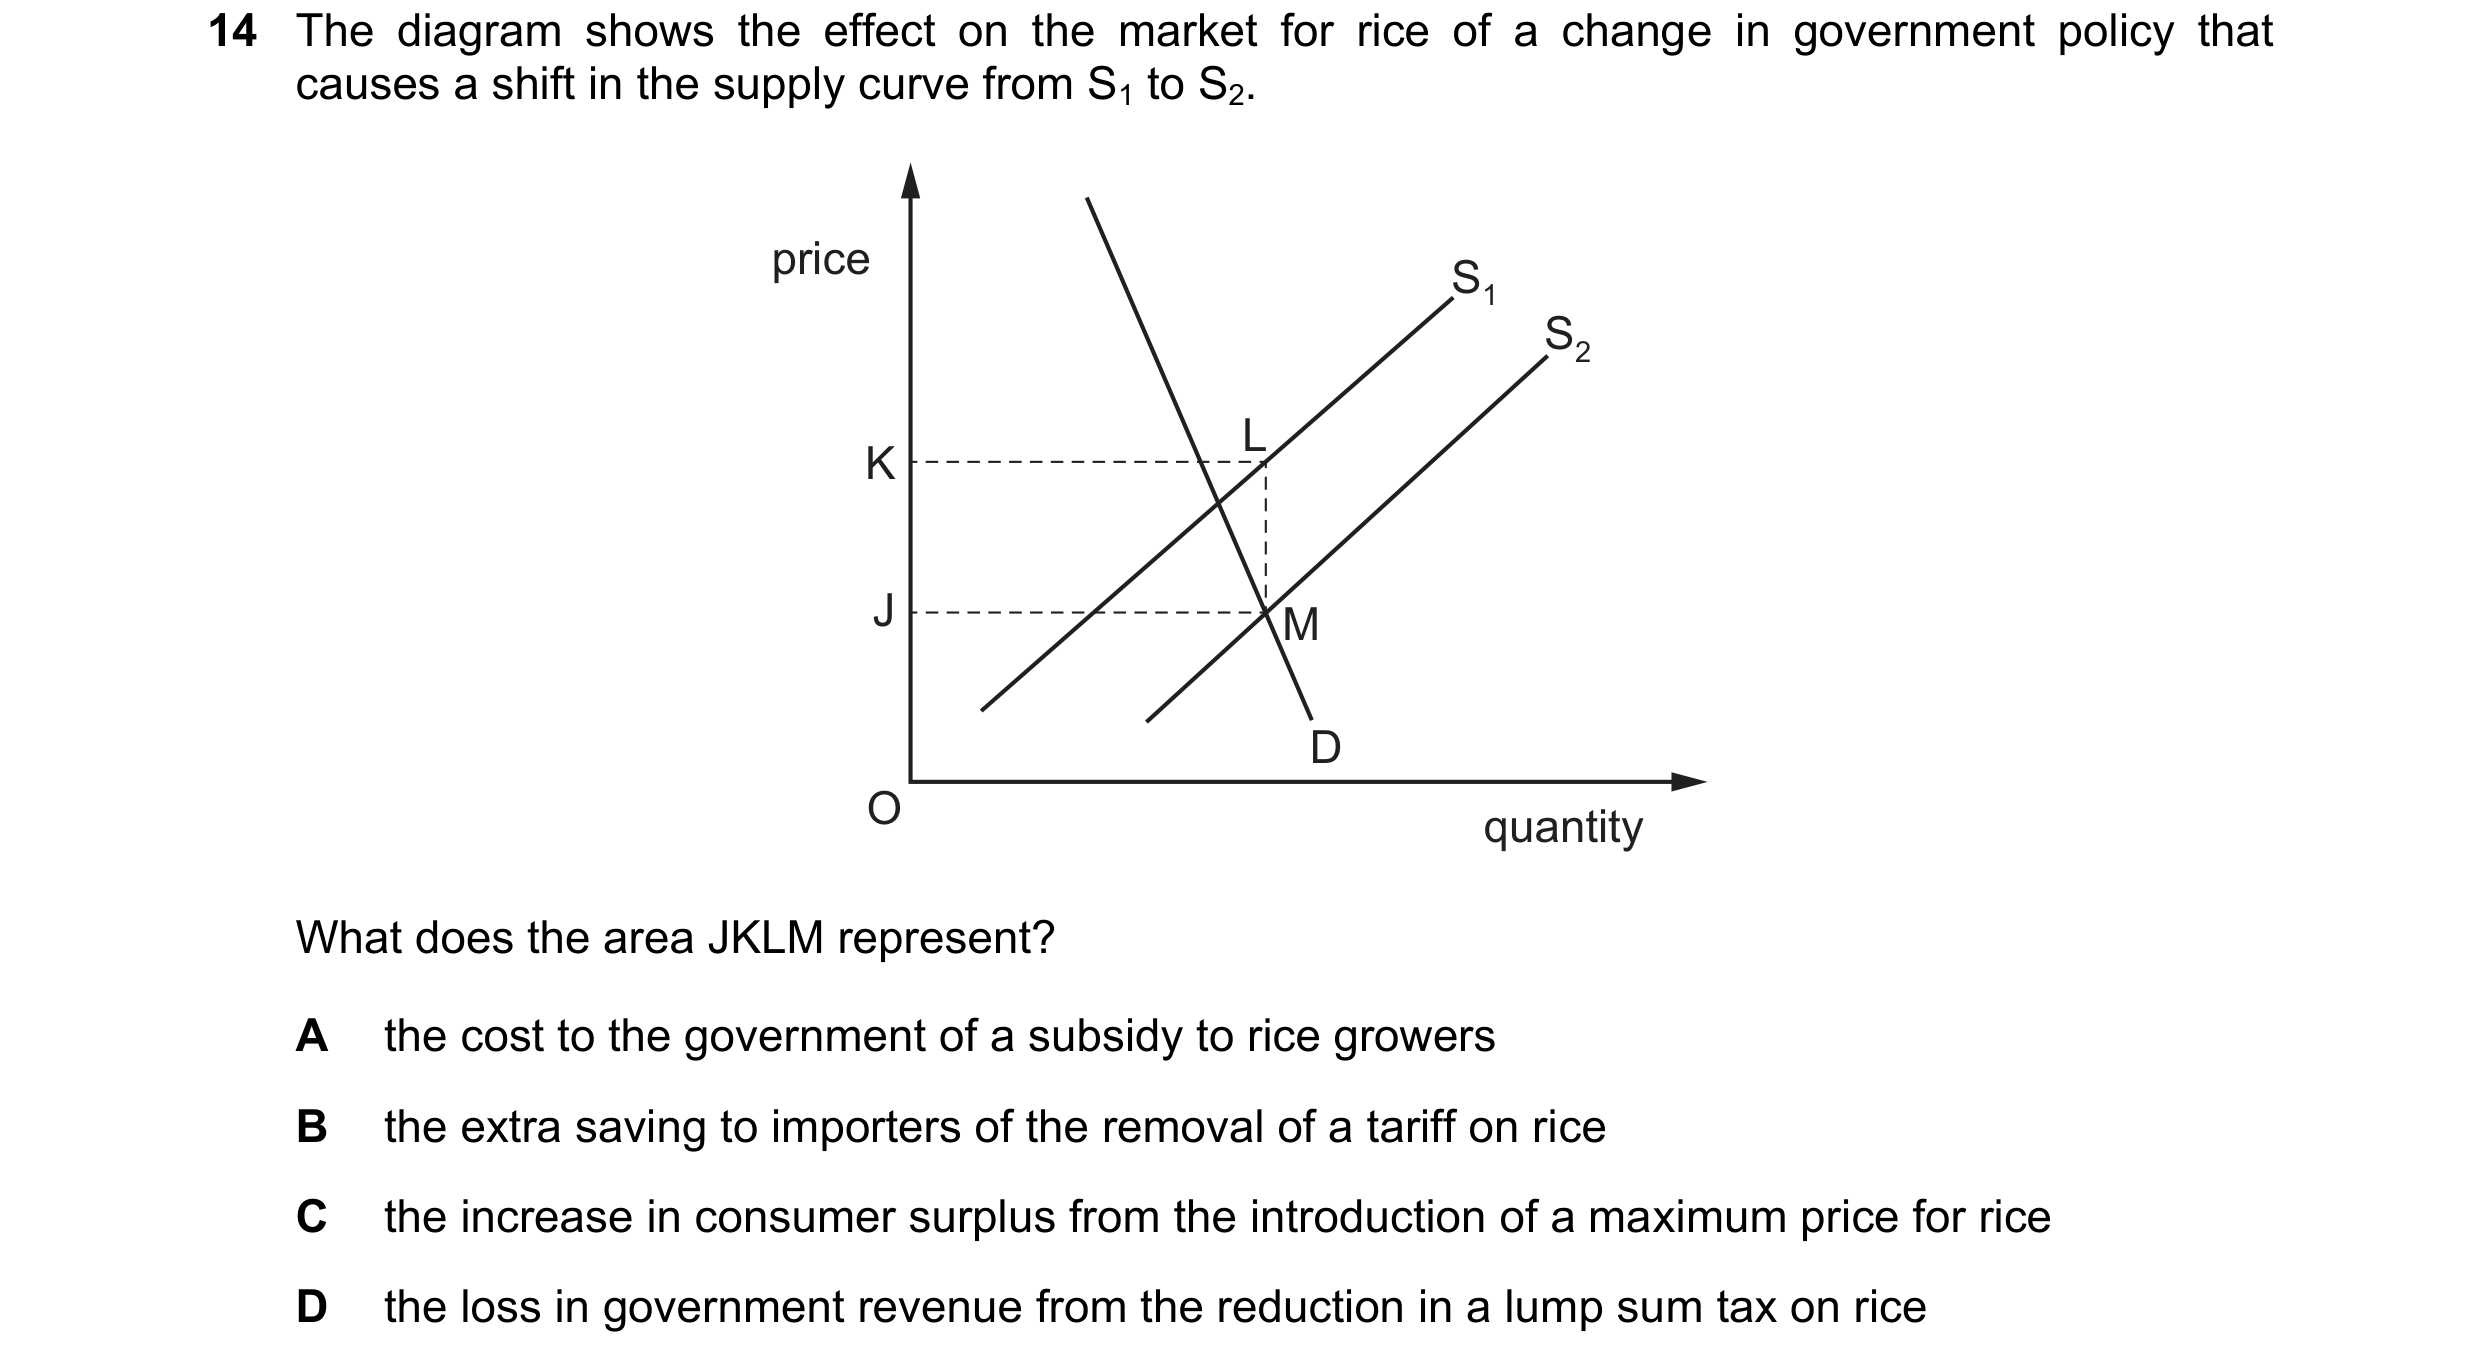 100 / 119


 101 / 119
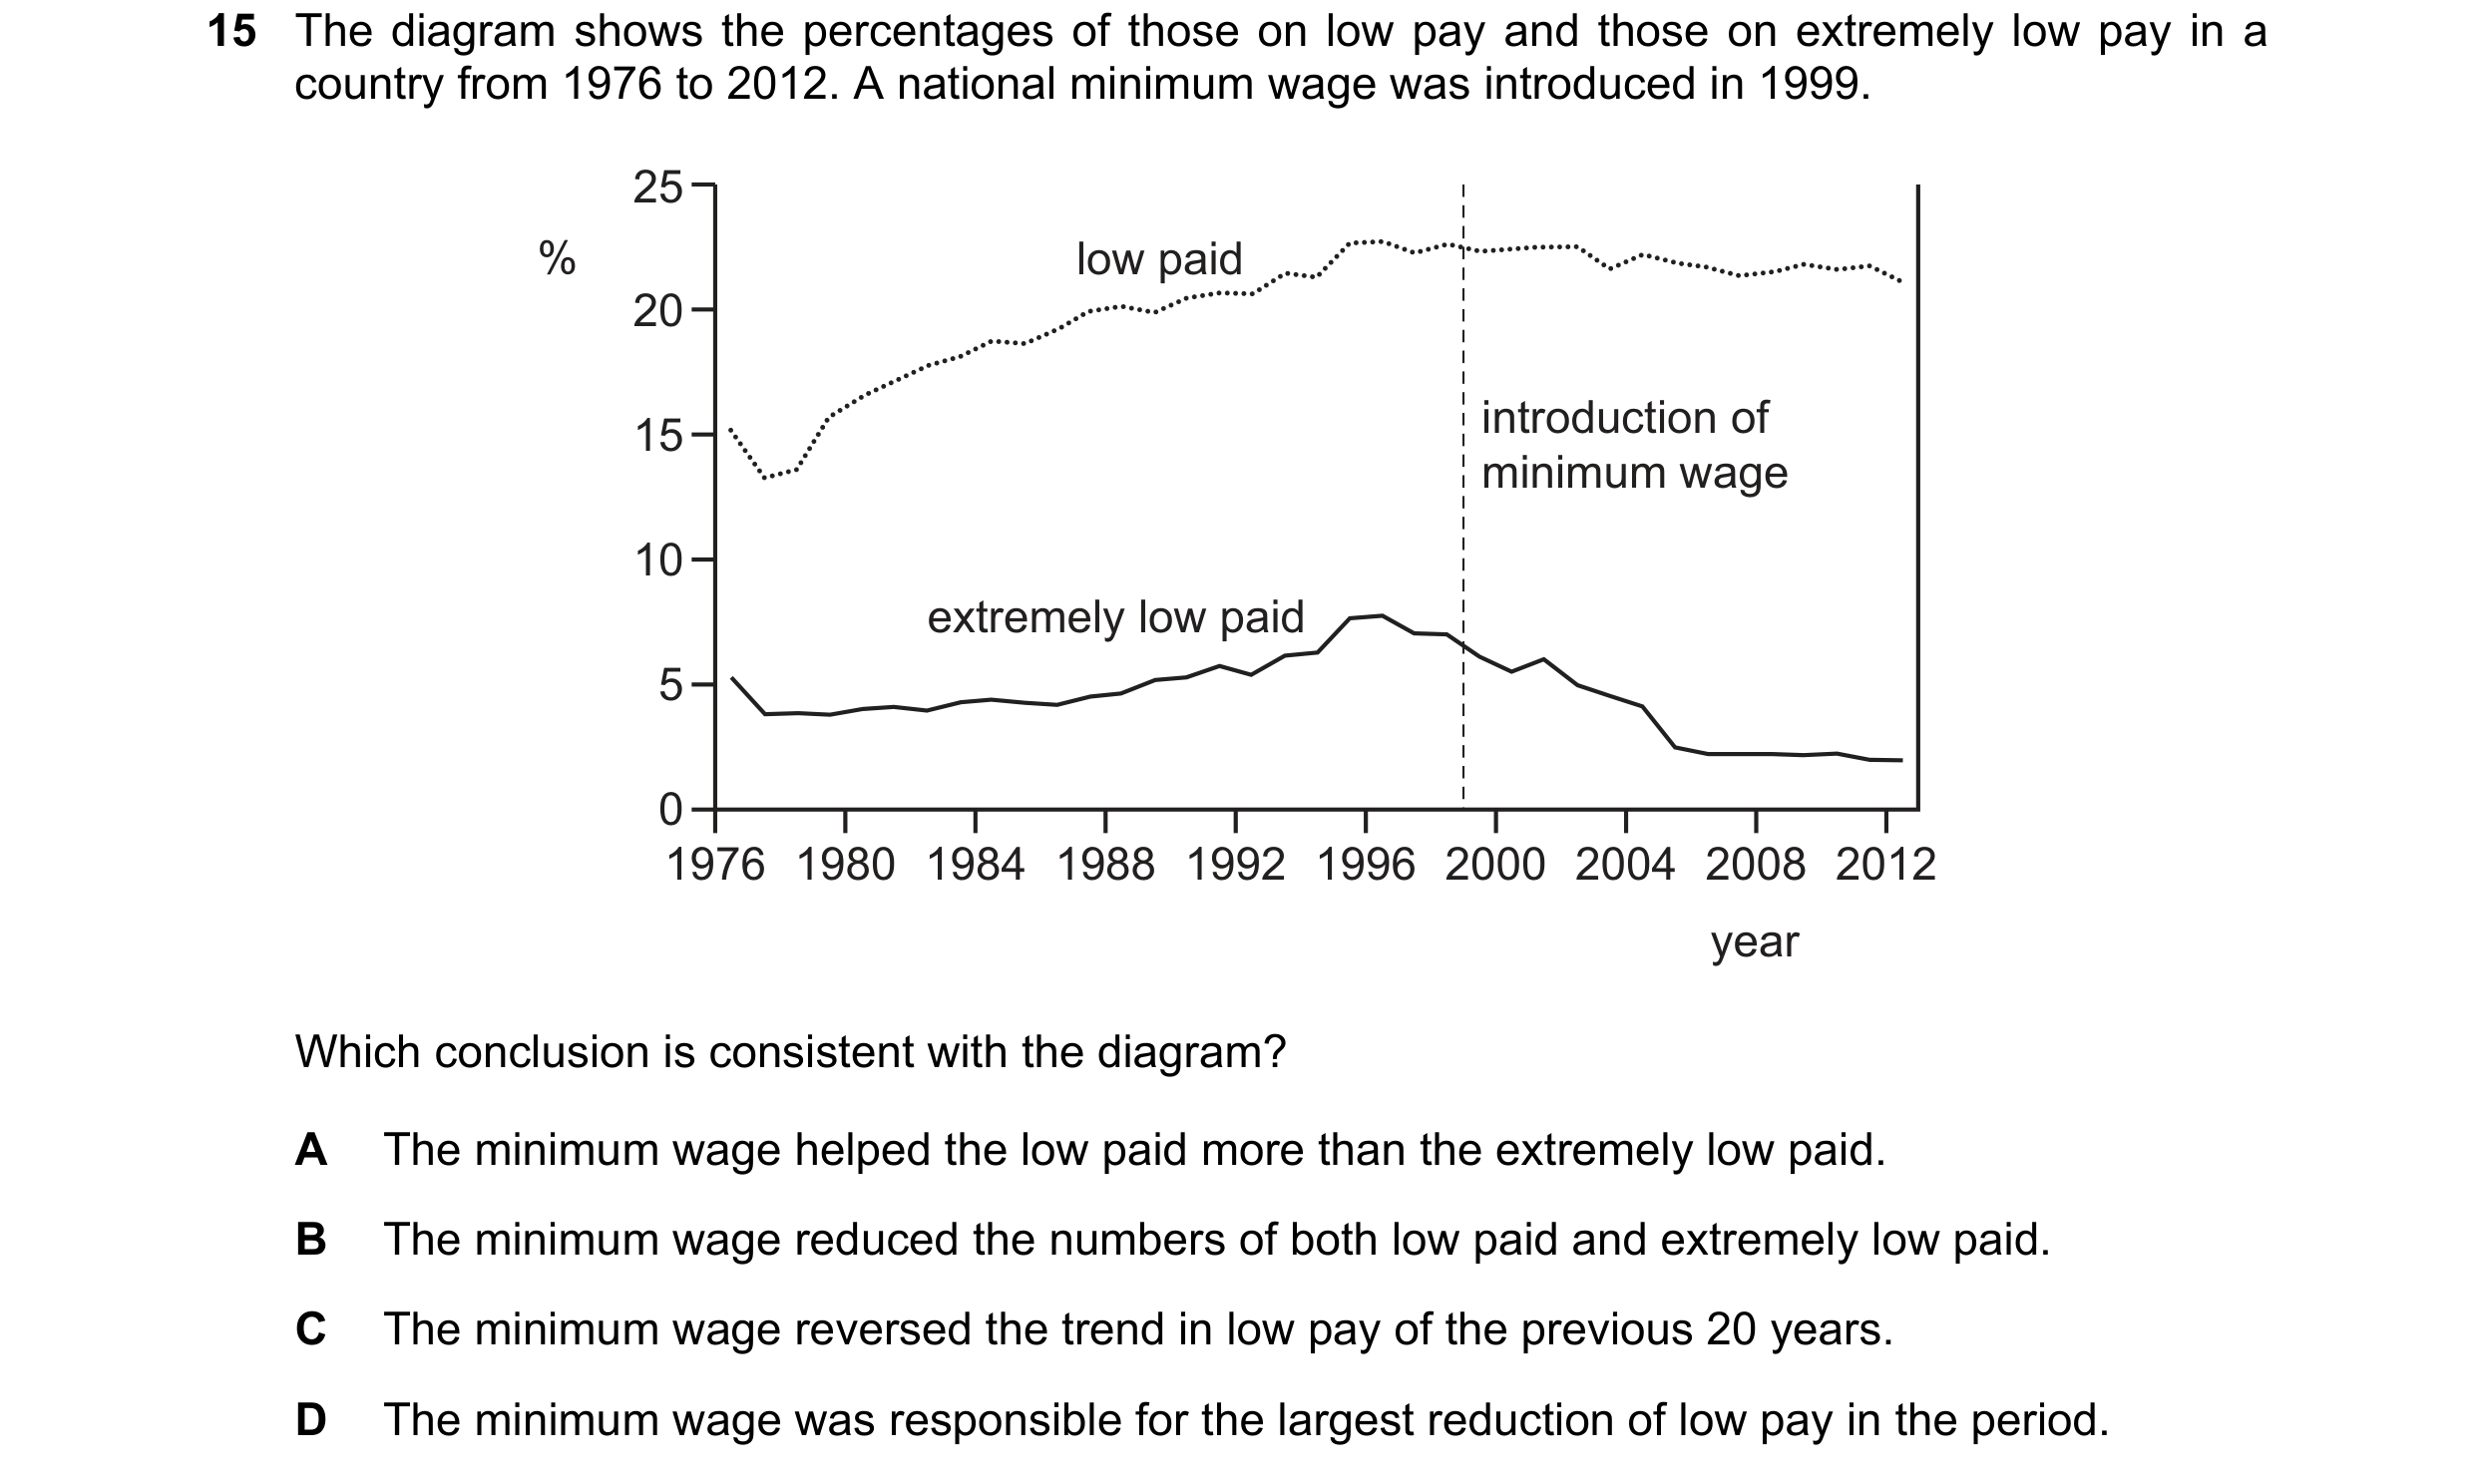
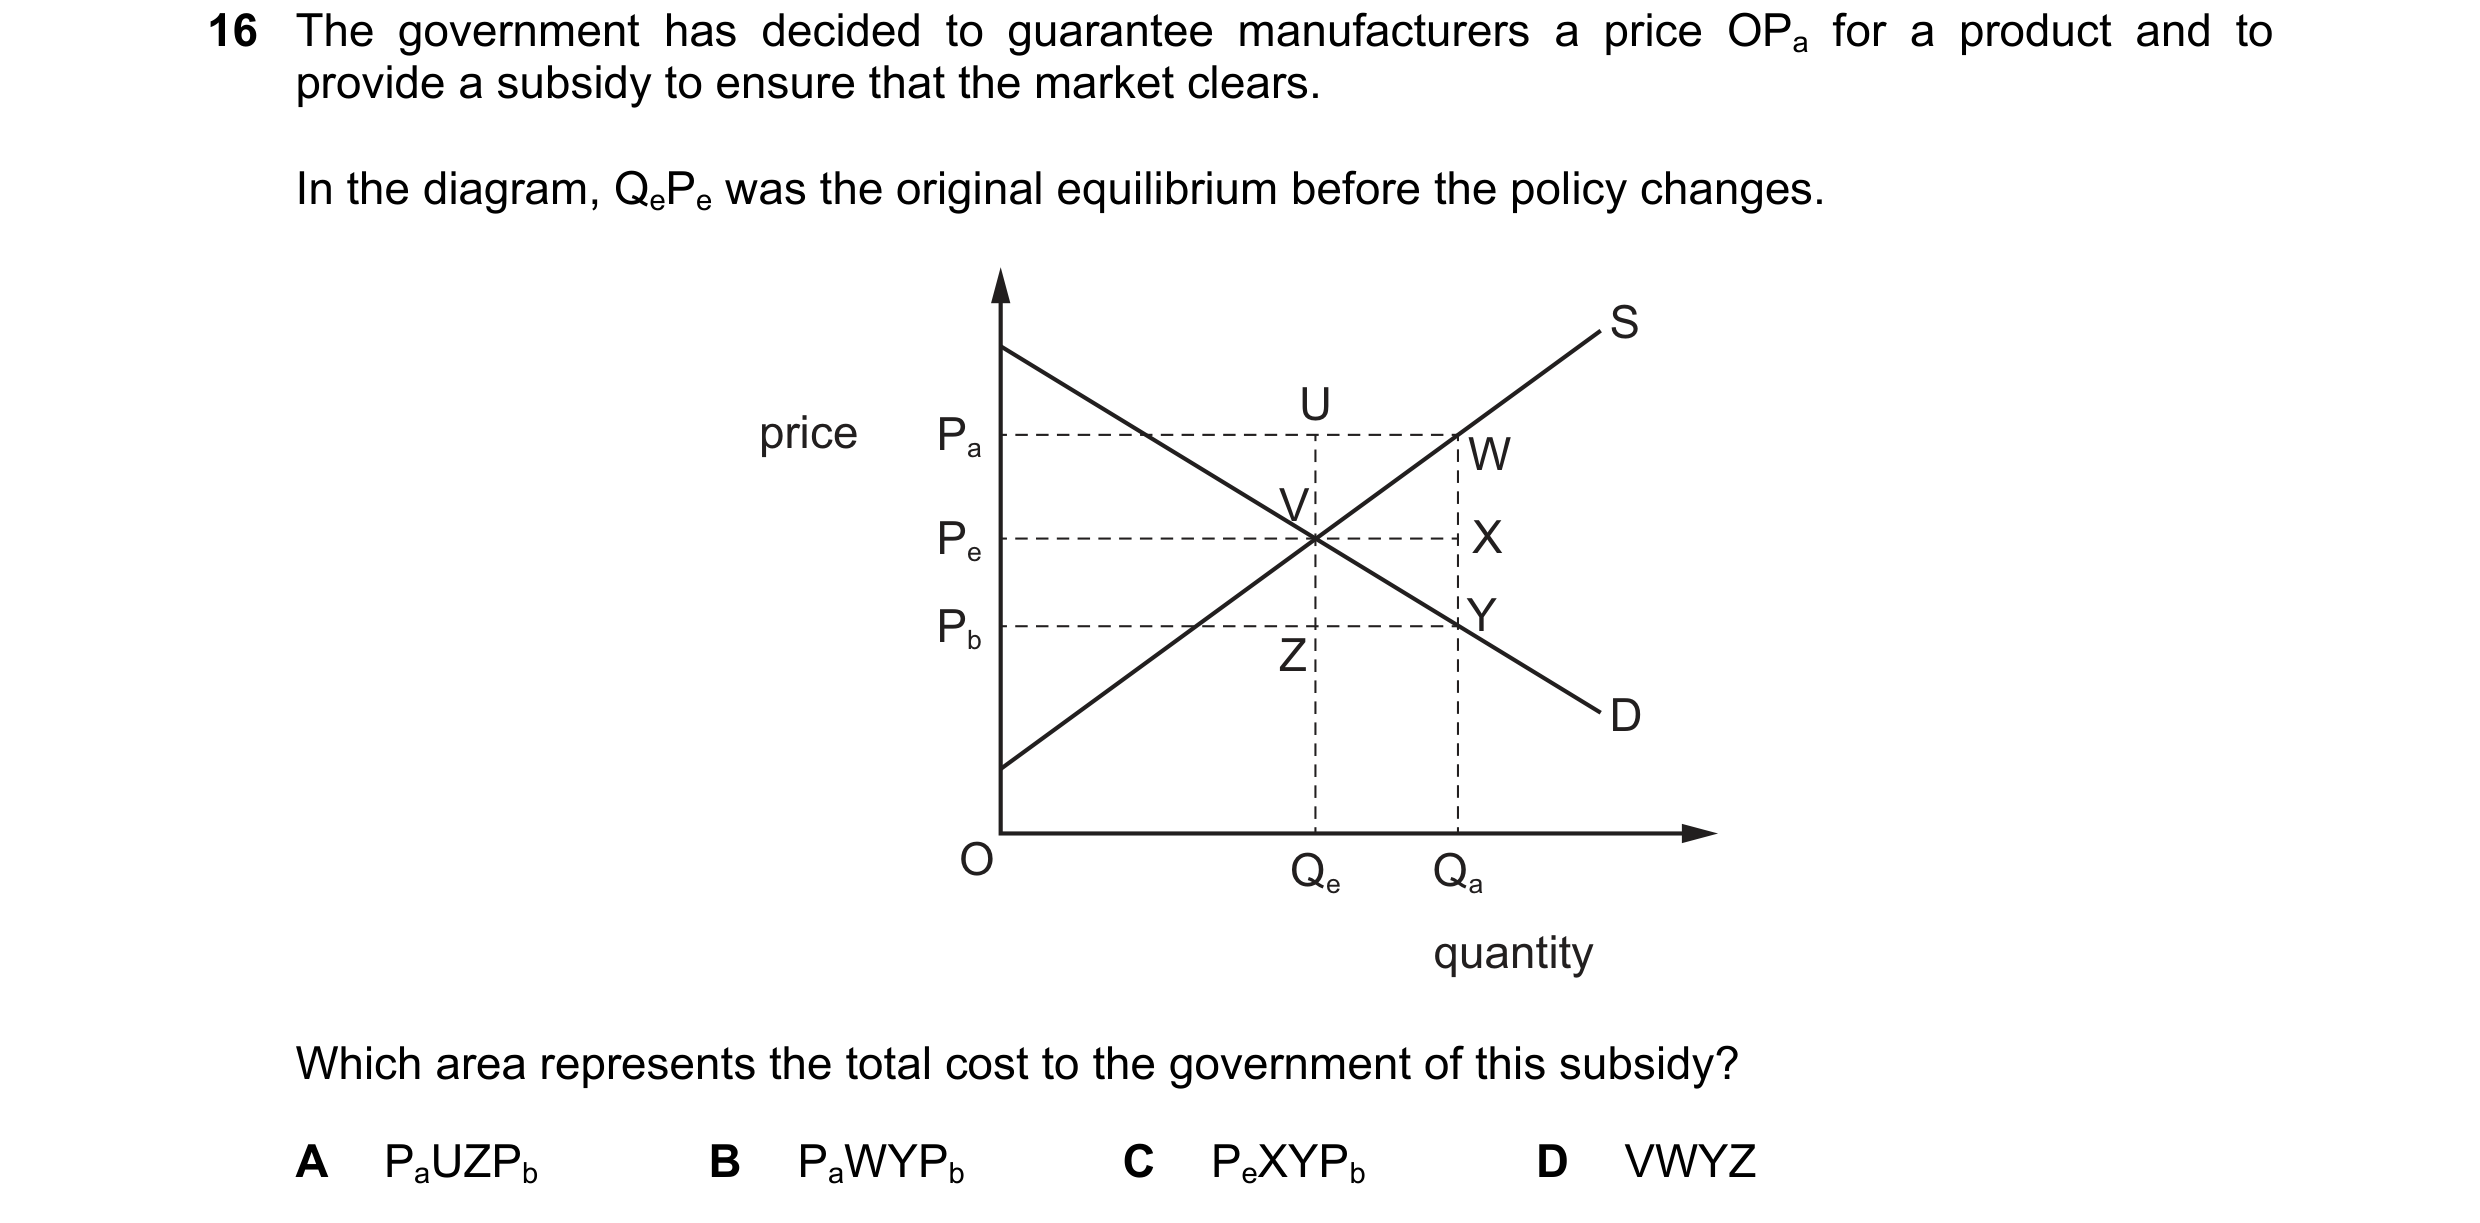 102 / 119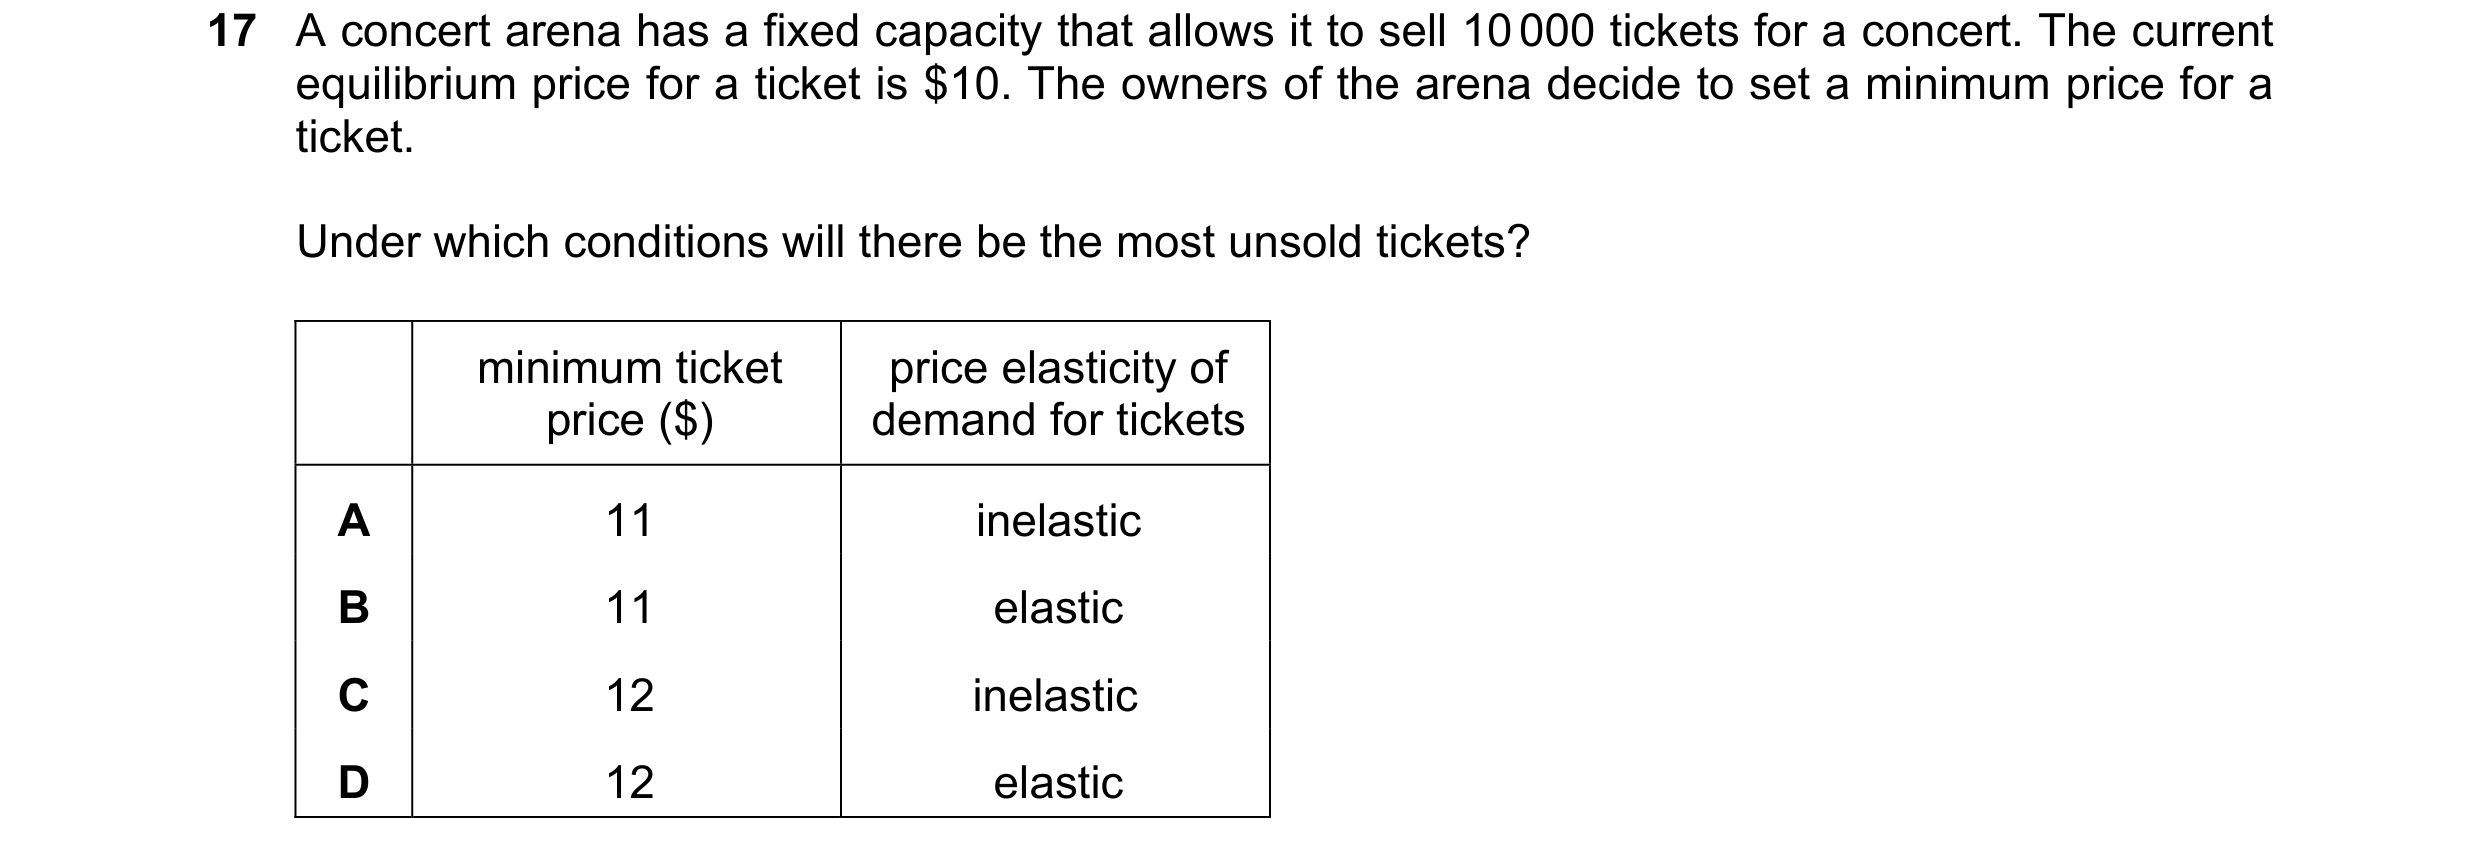
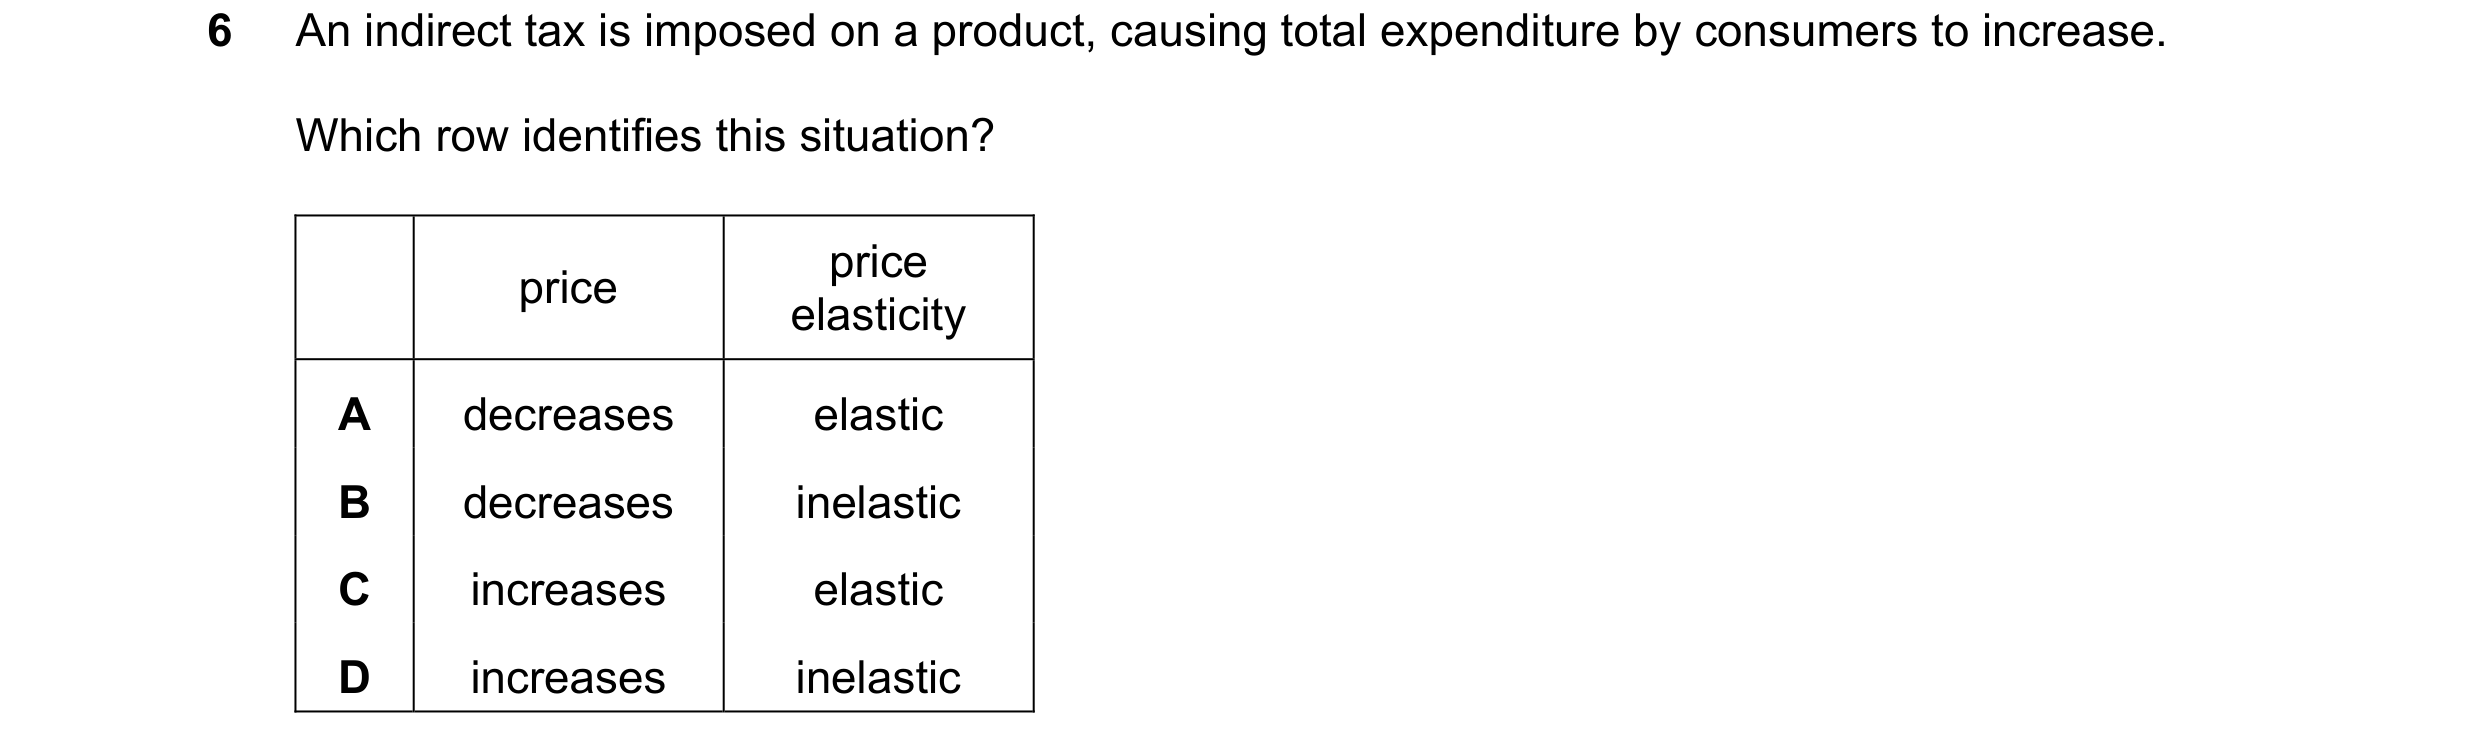
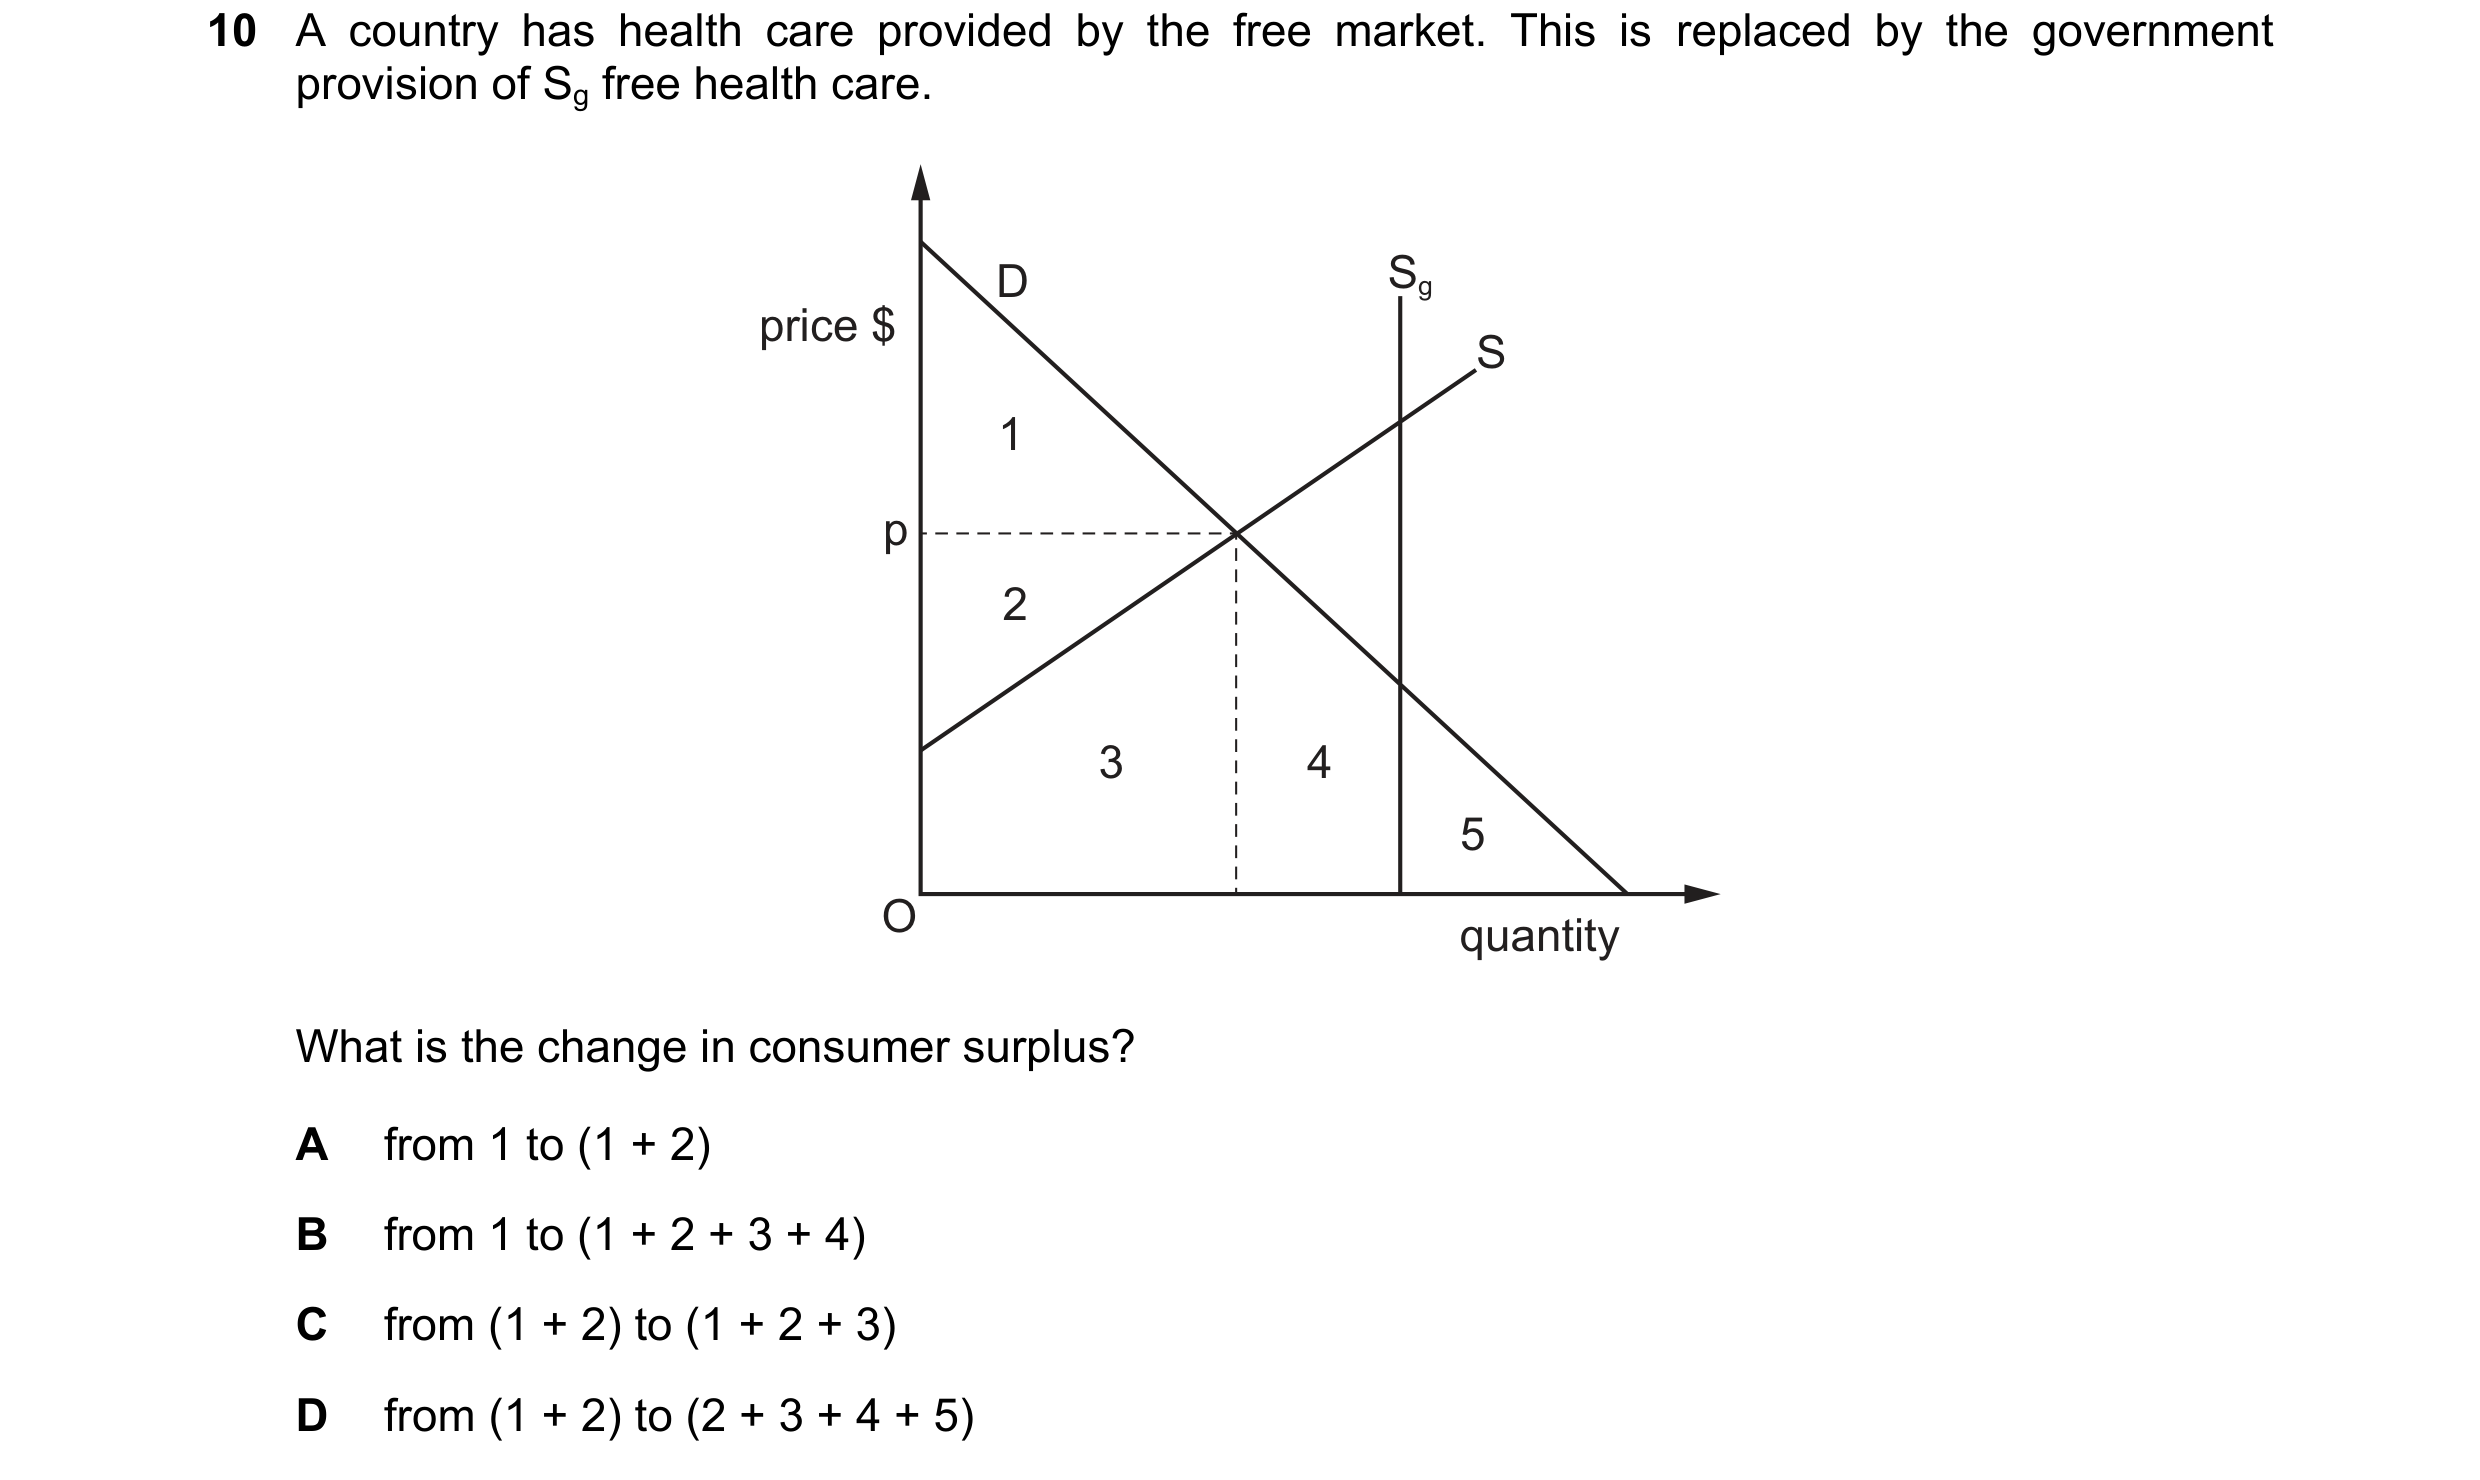 103 / 119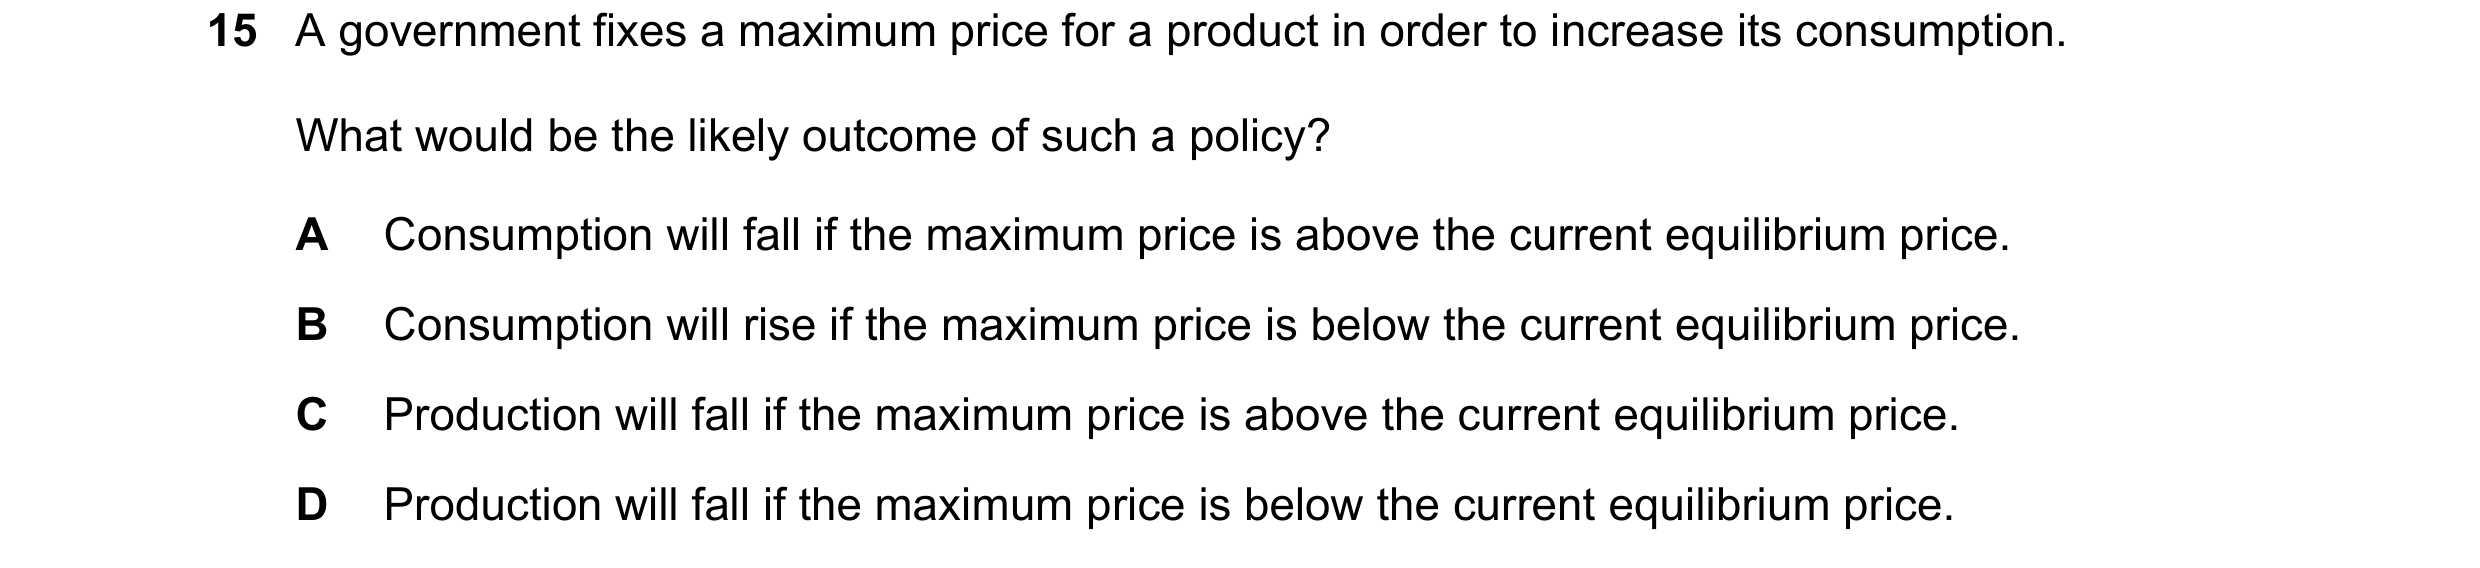
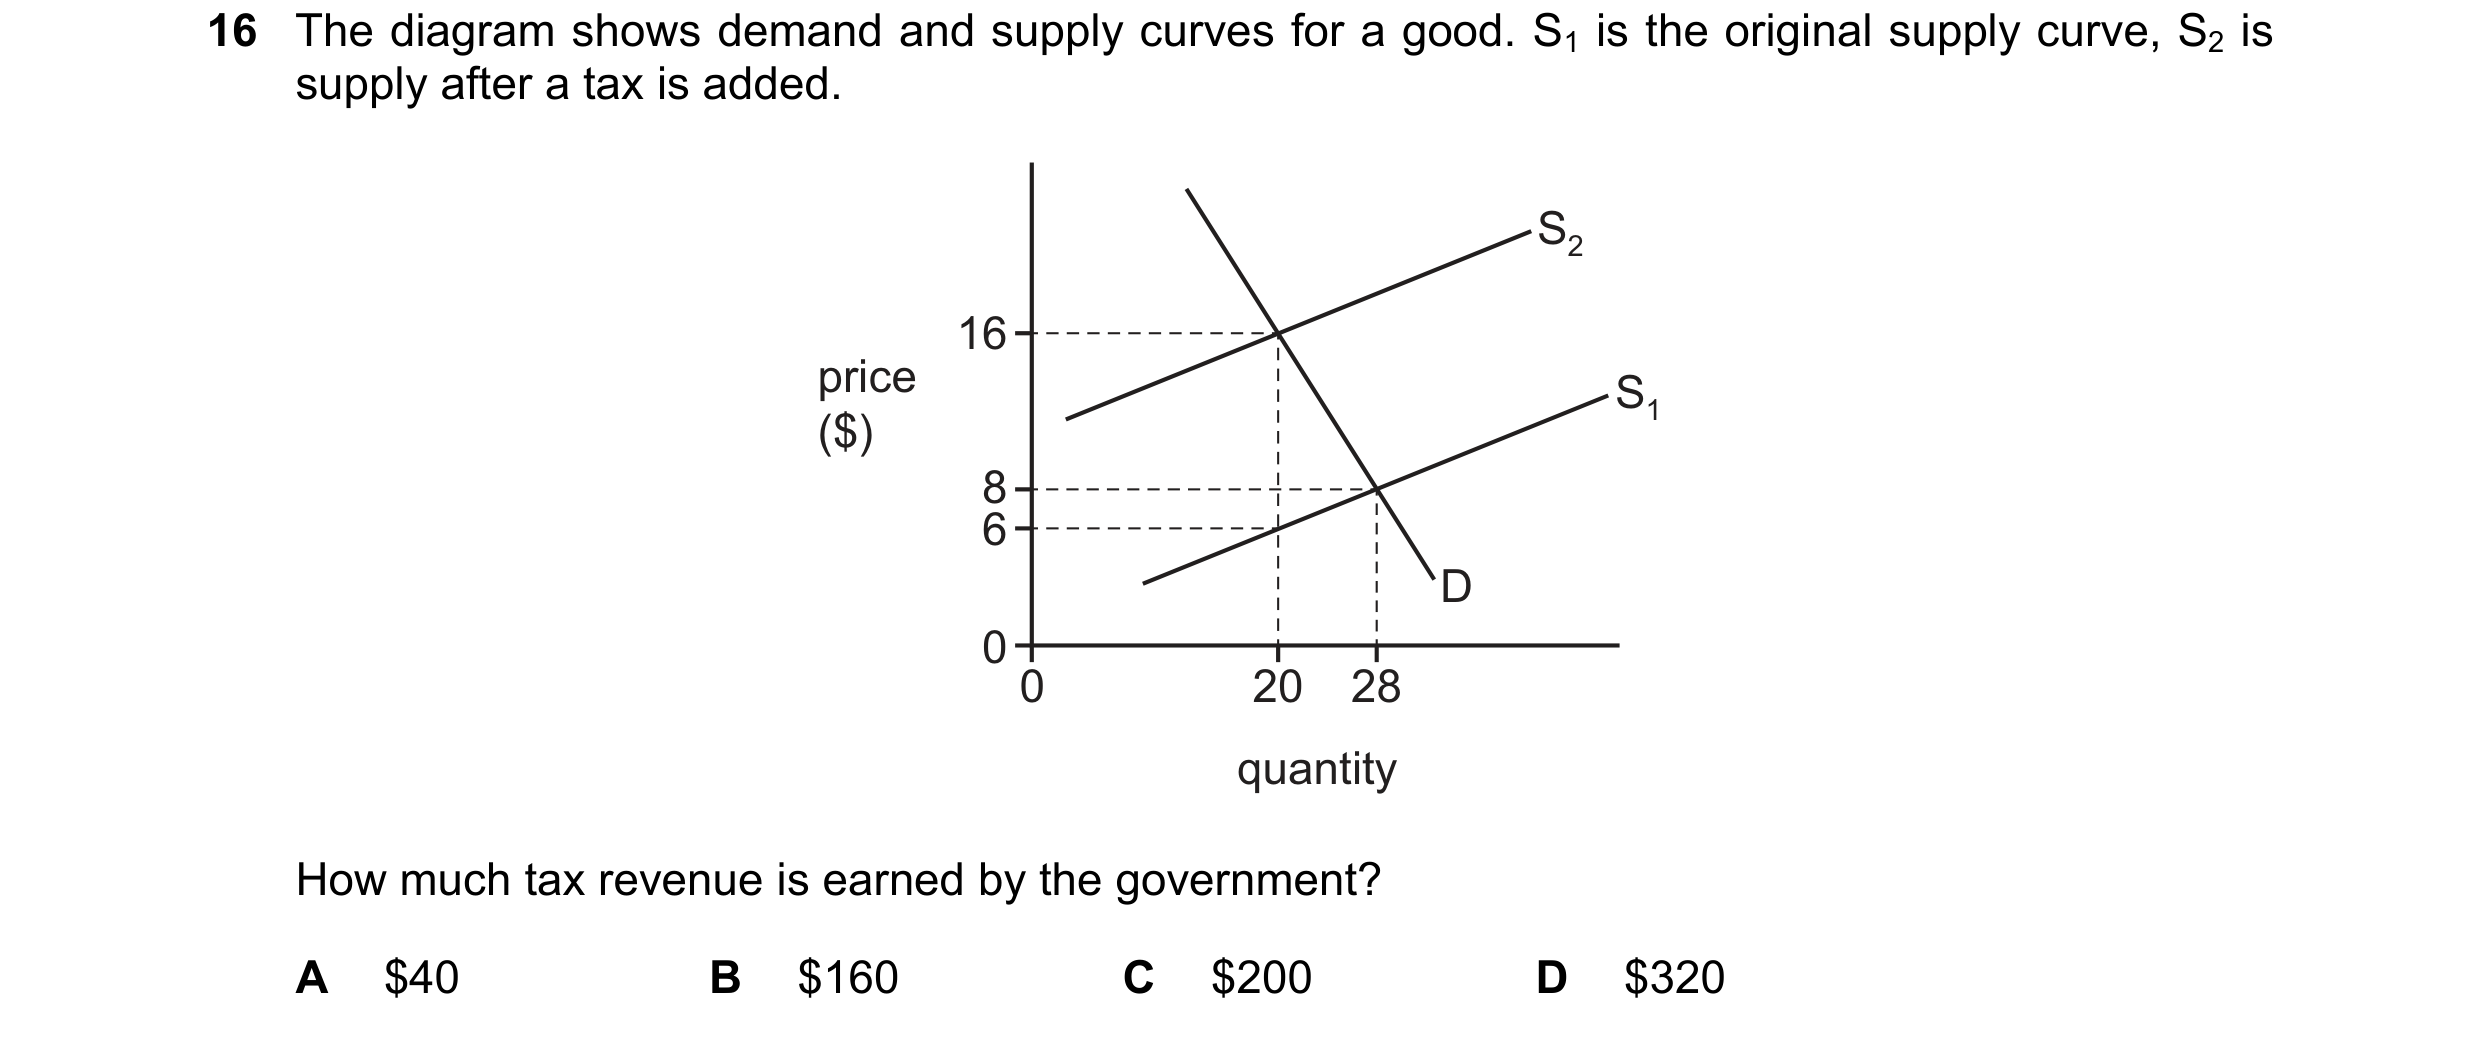
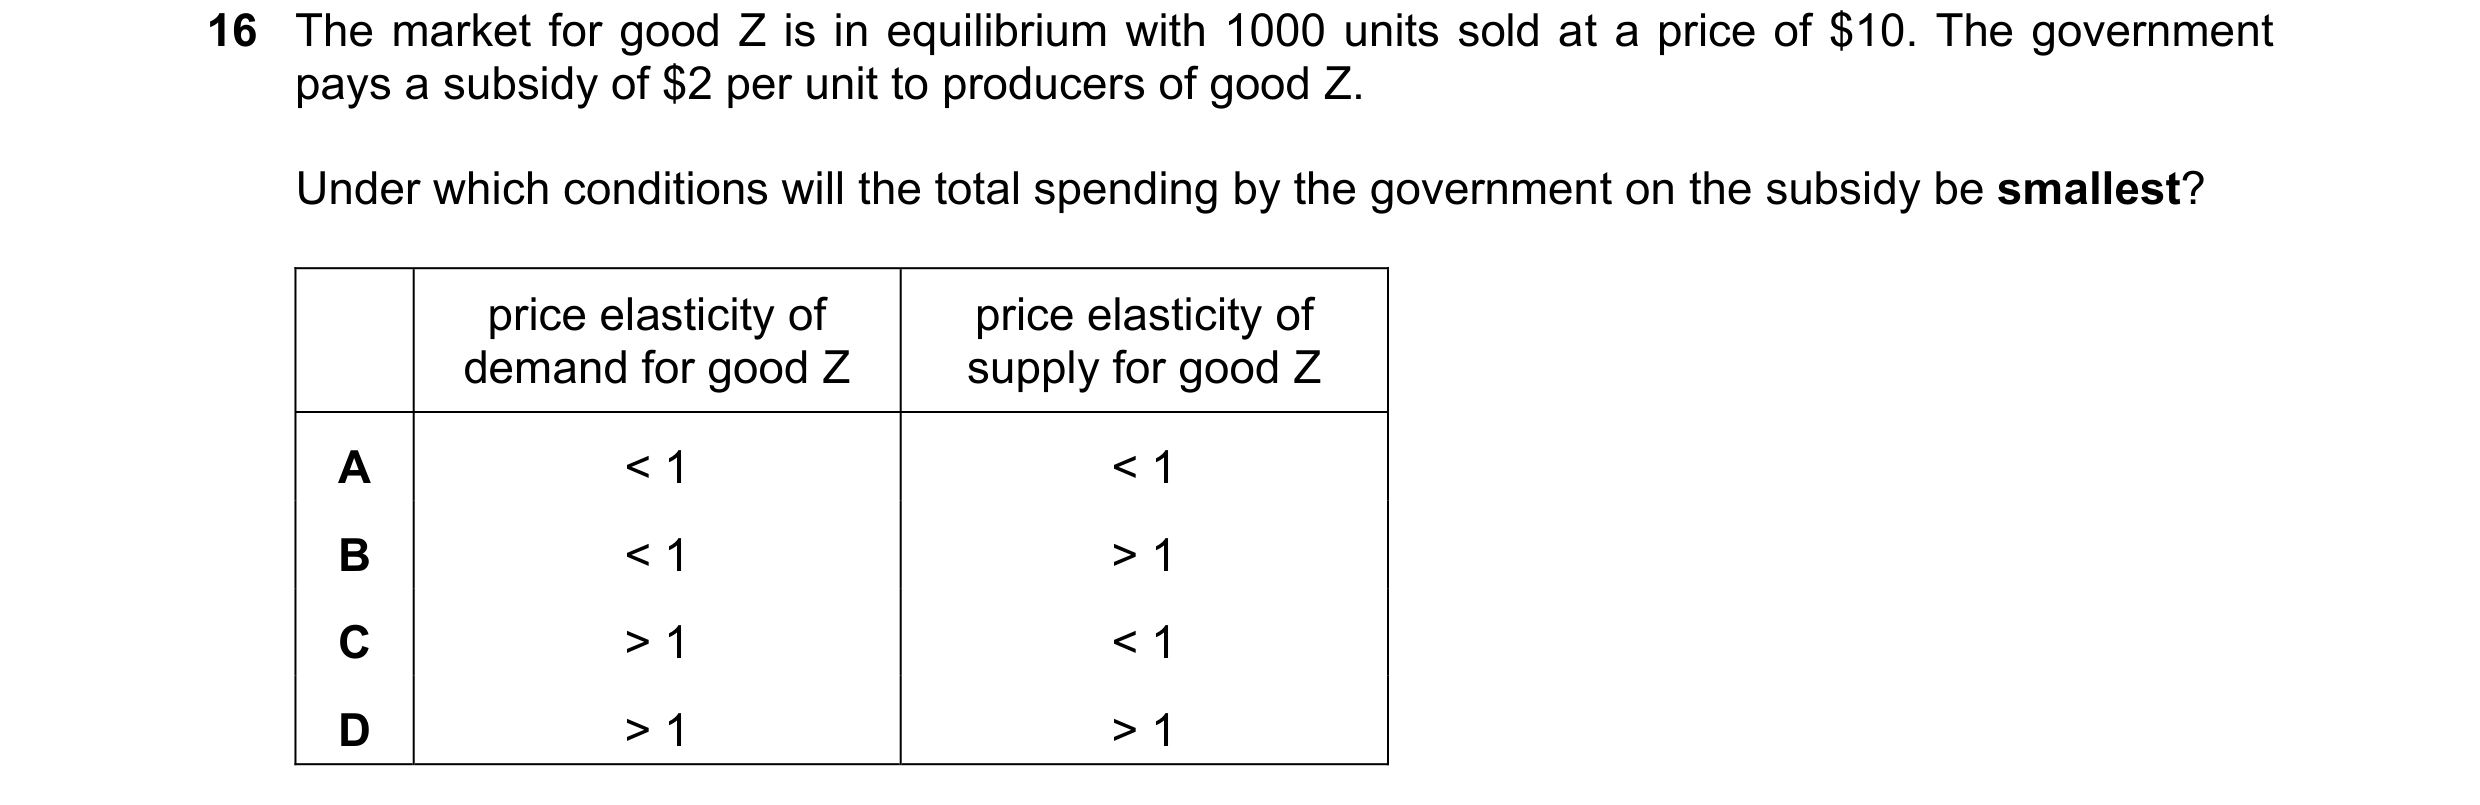
 104 / 119
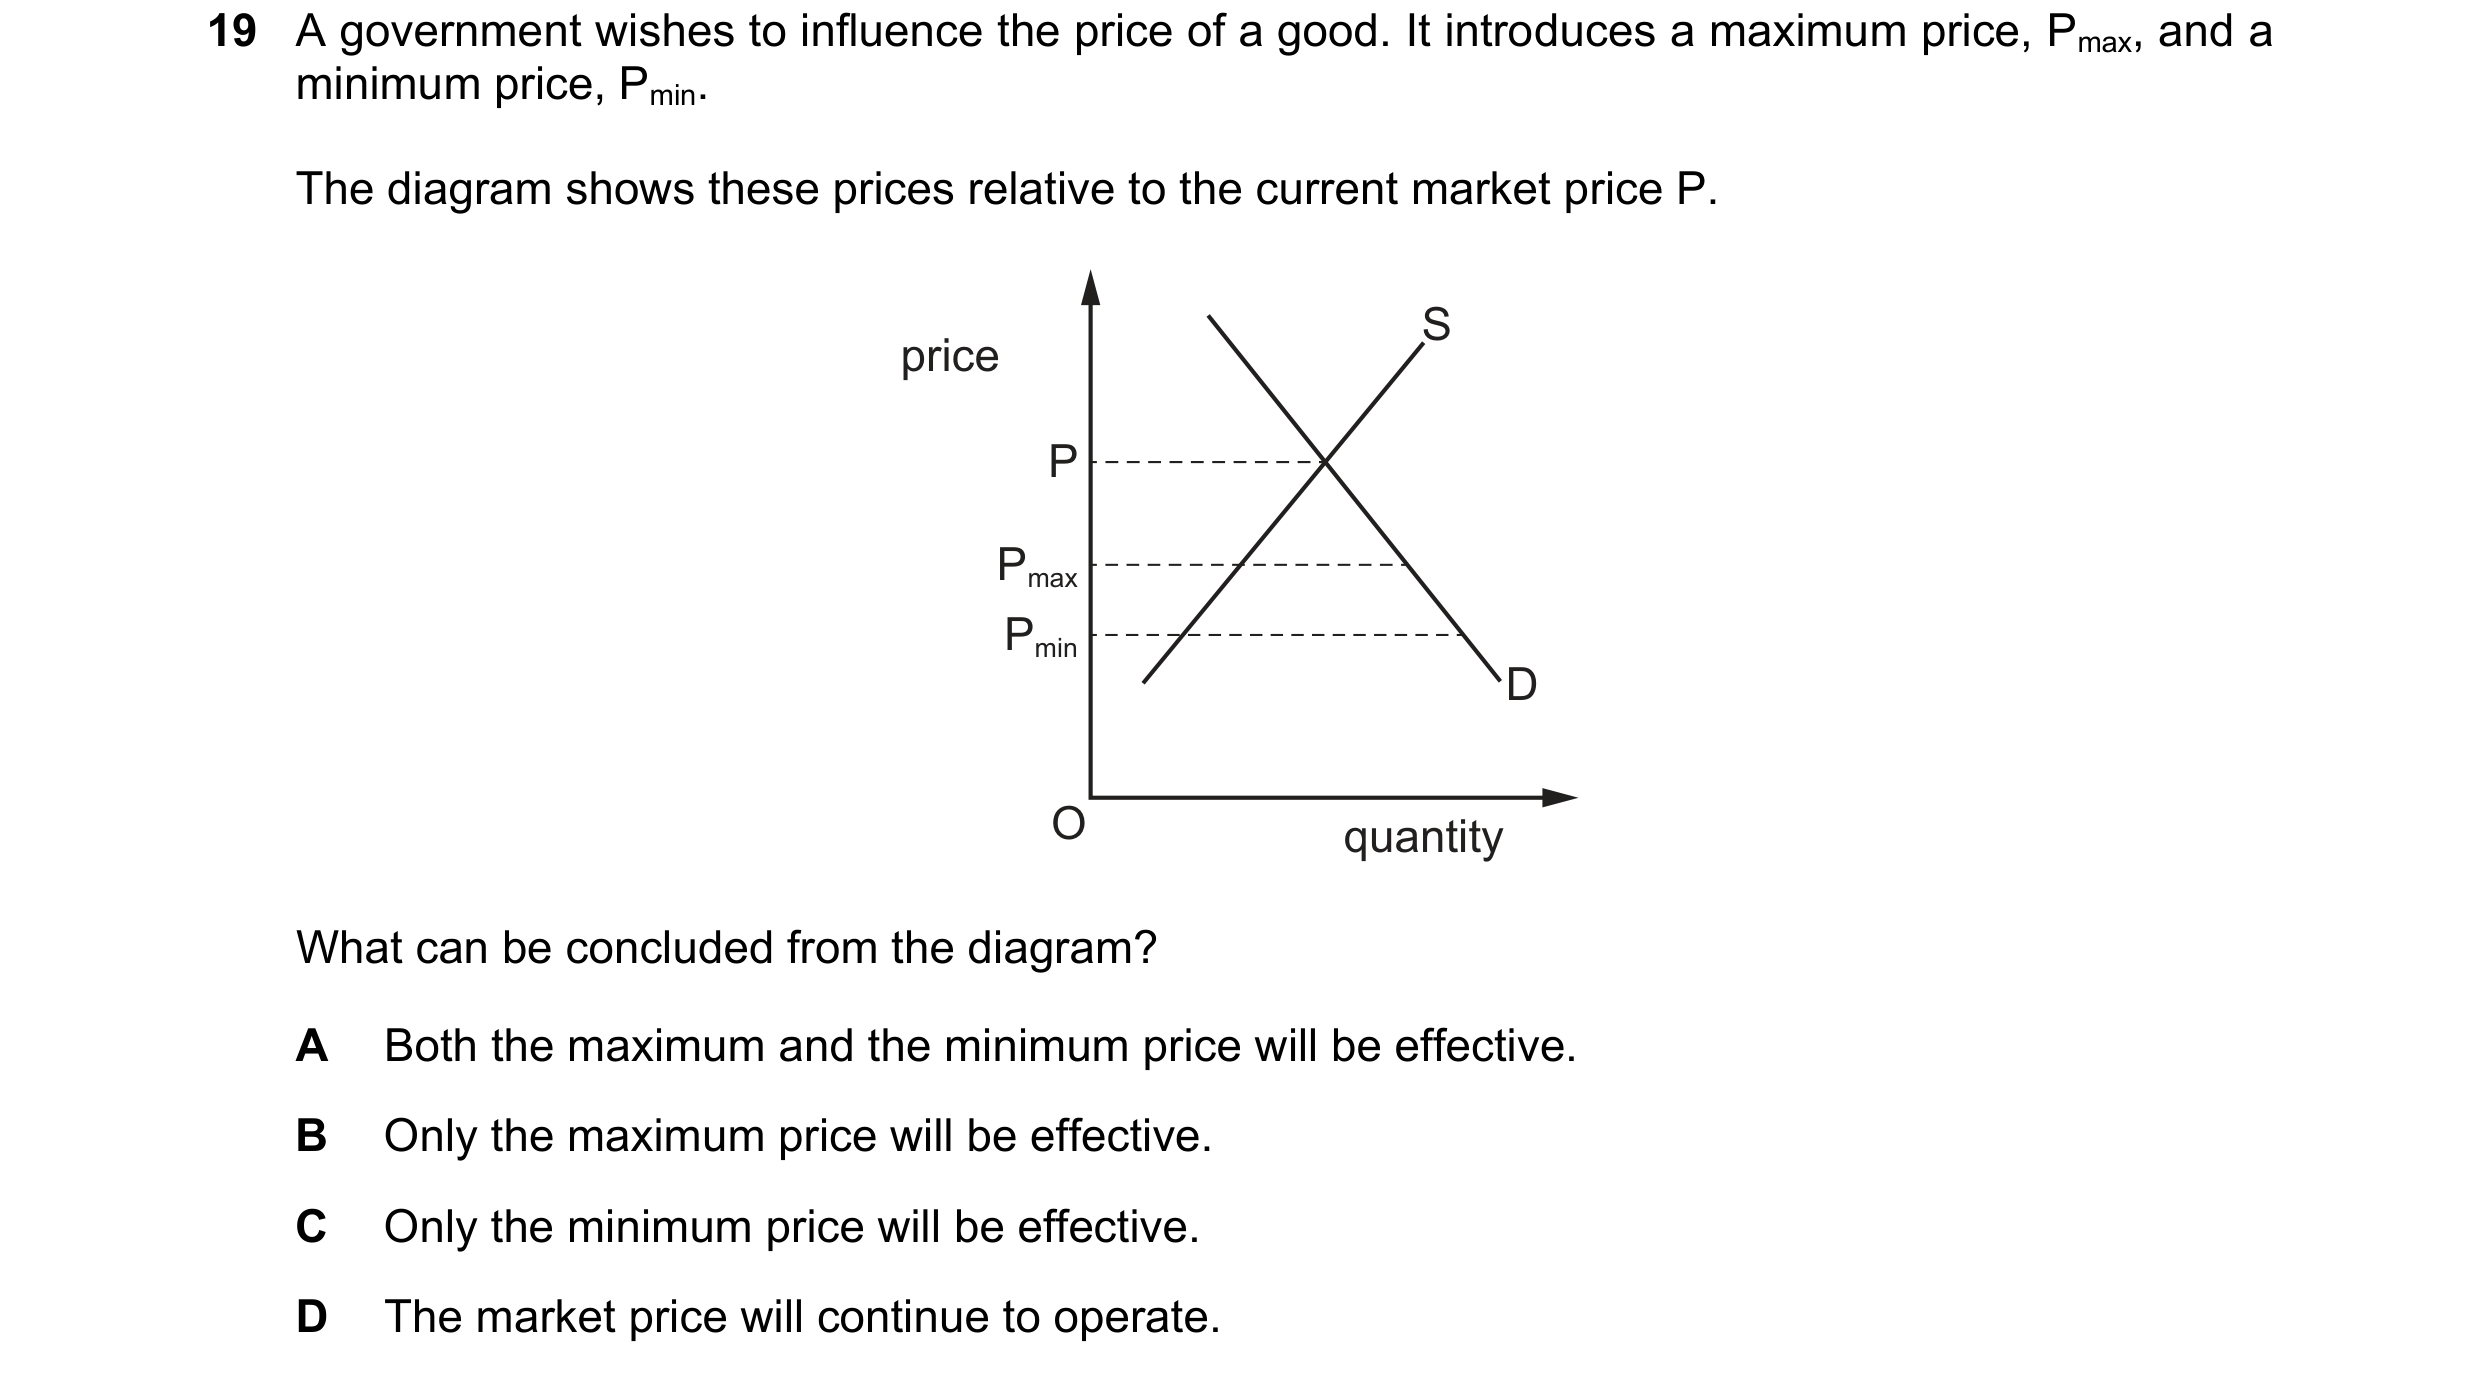
 105 / 119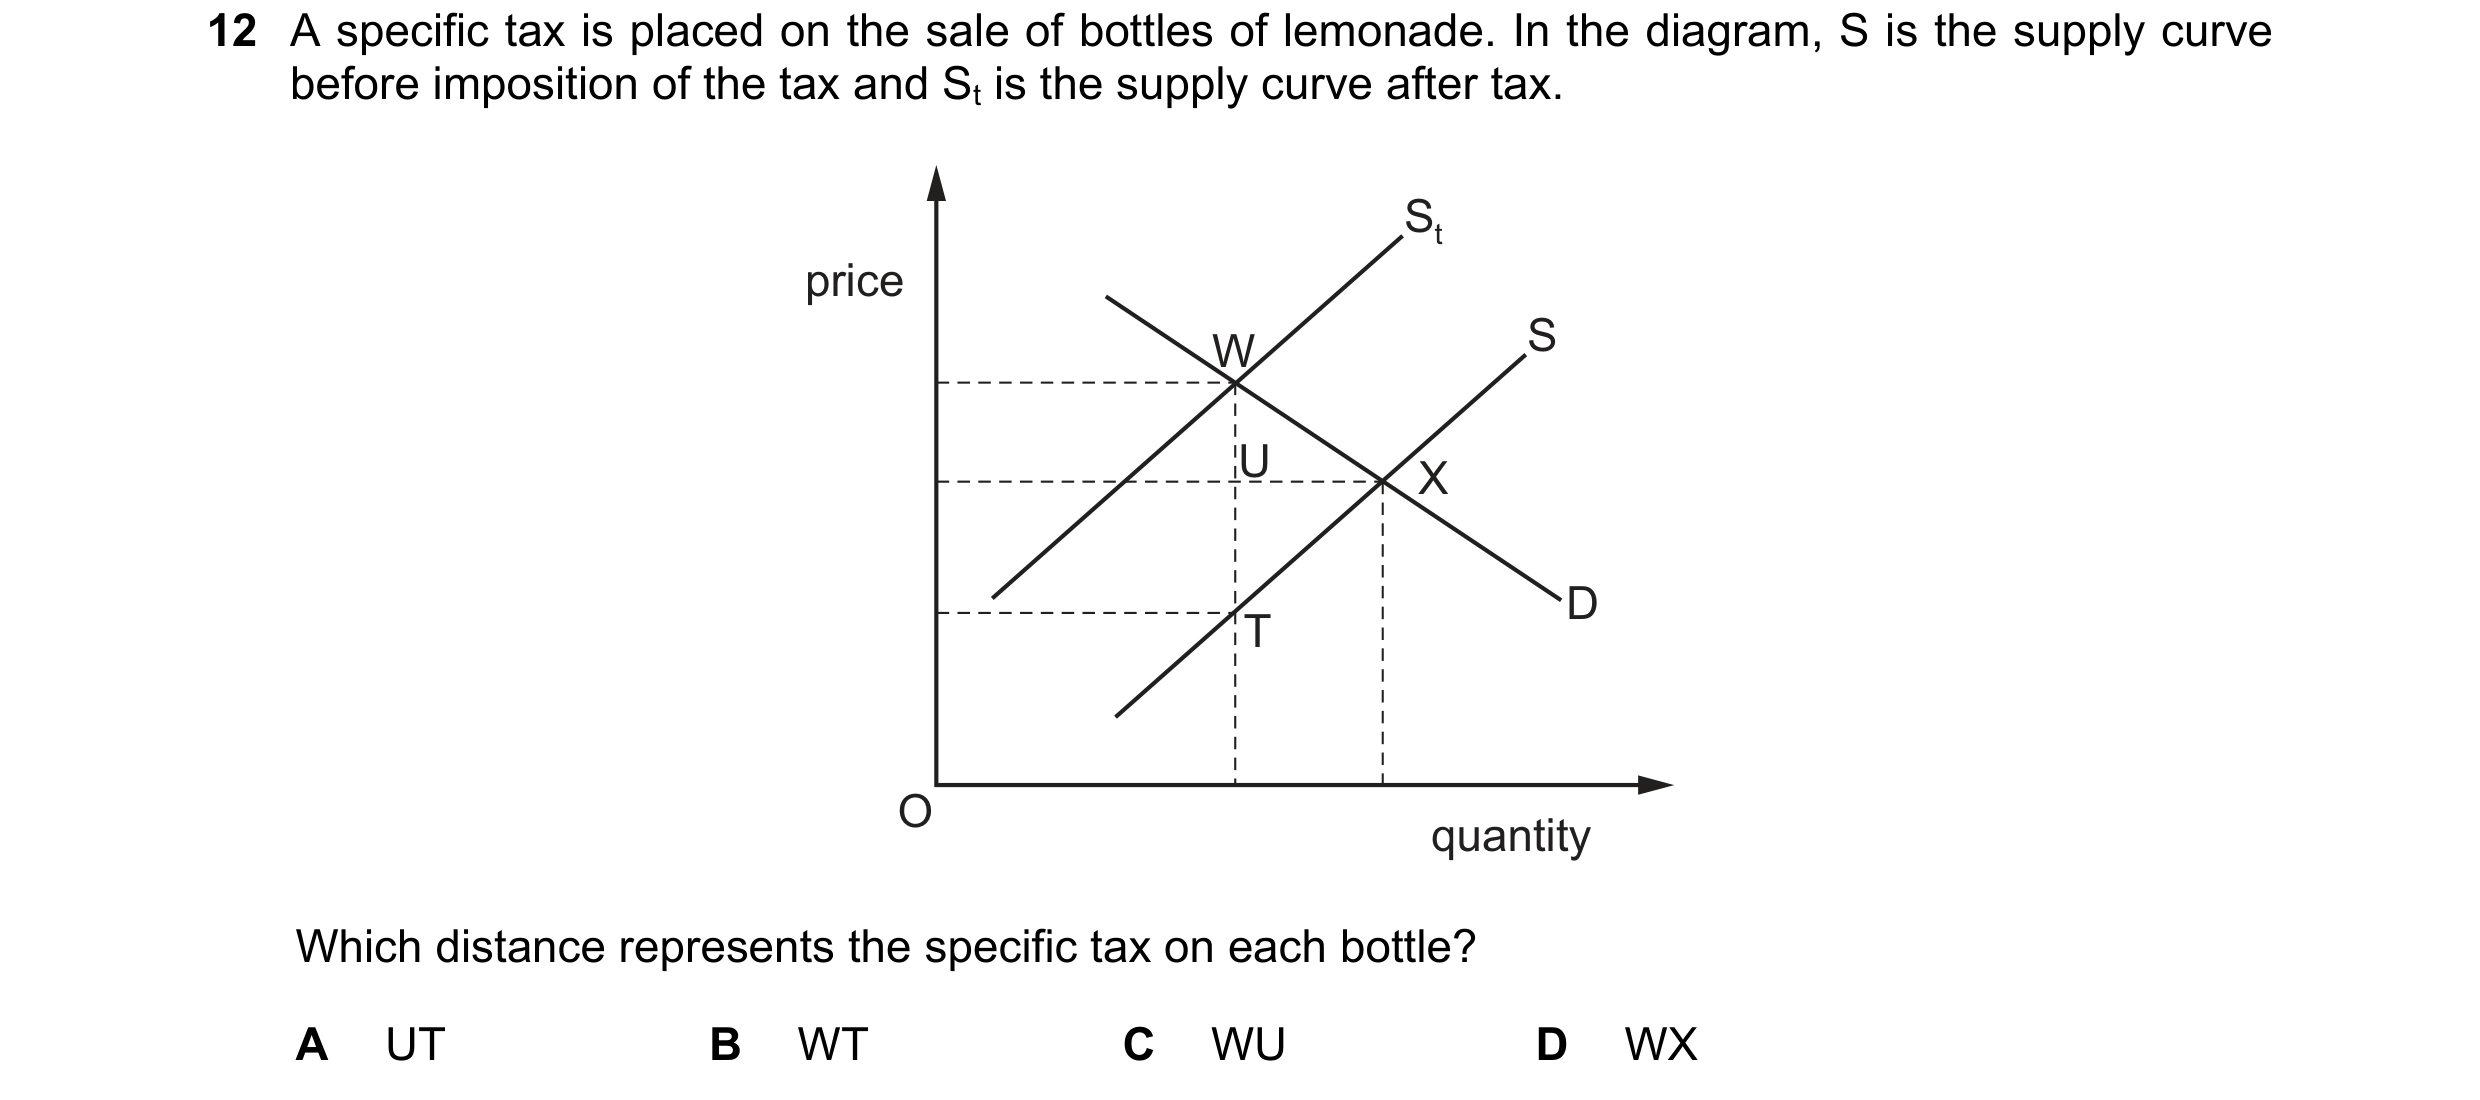
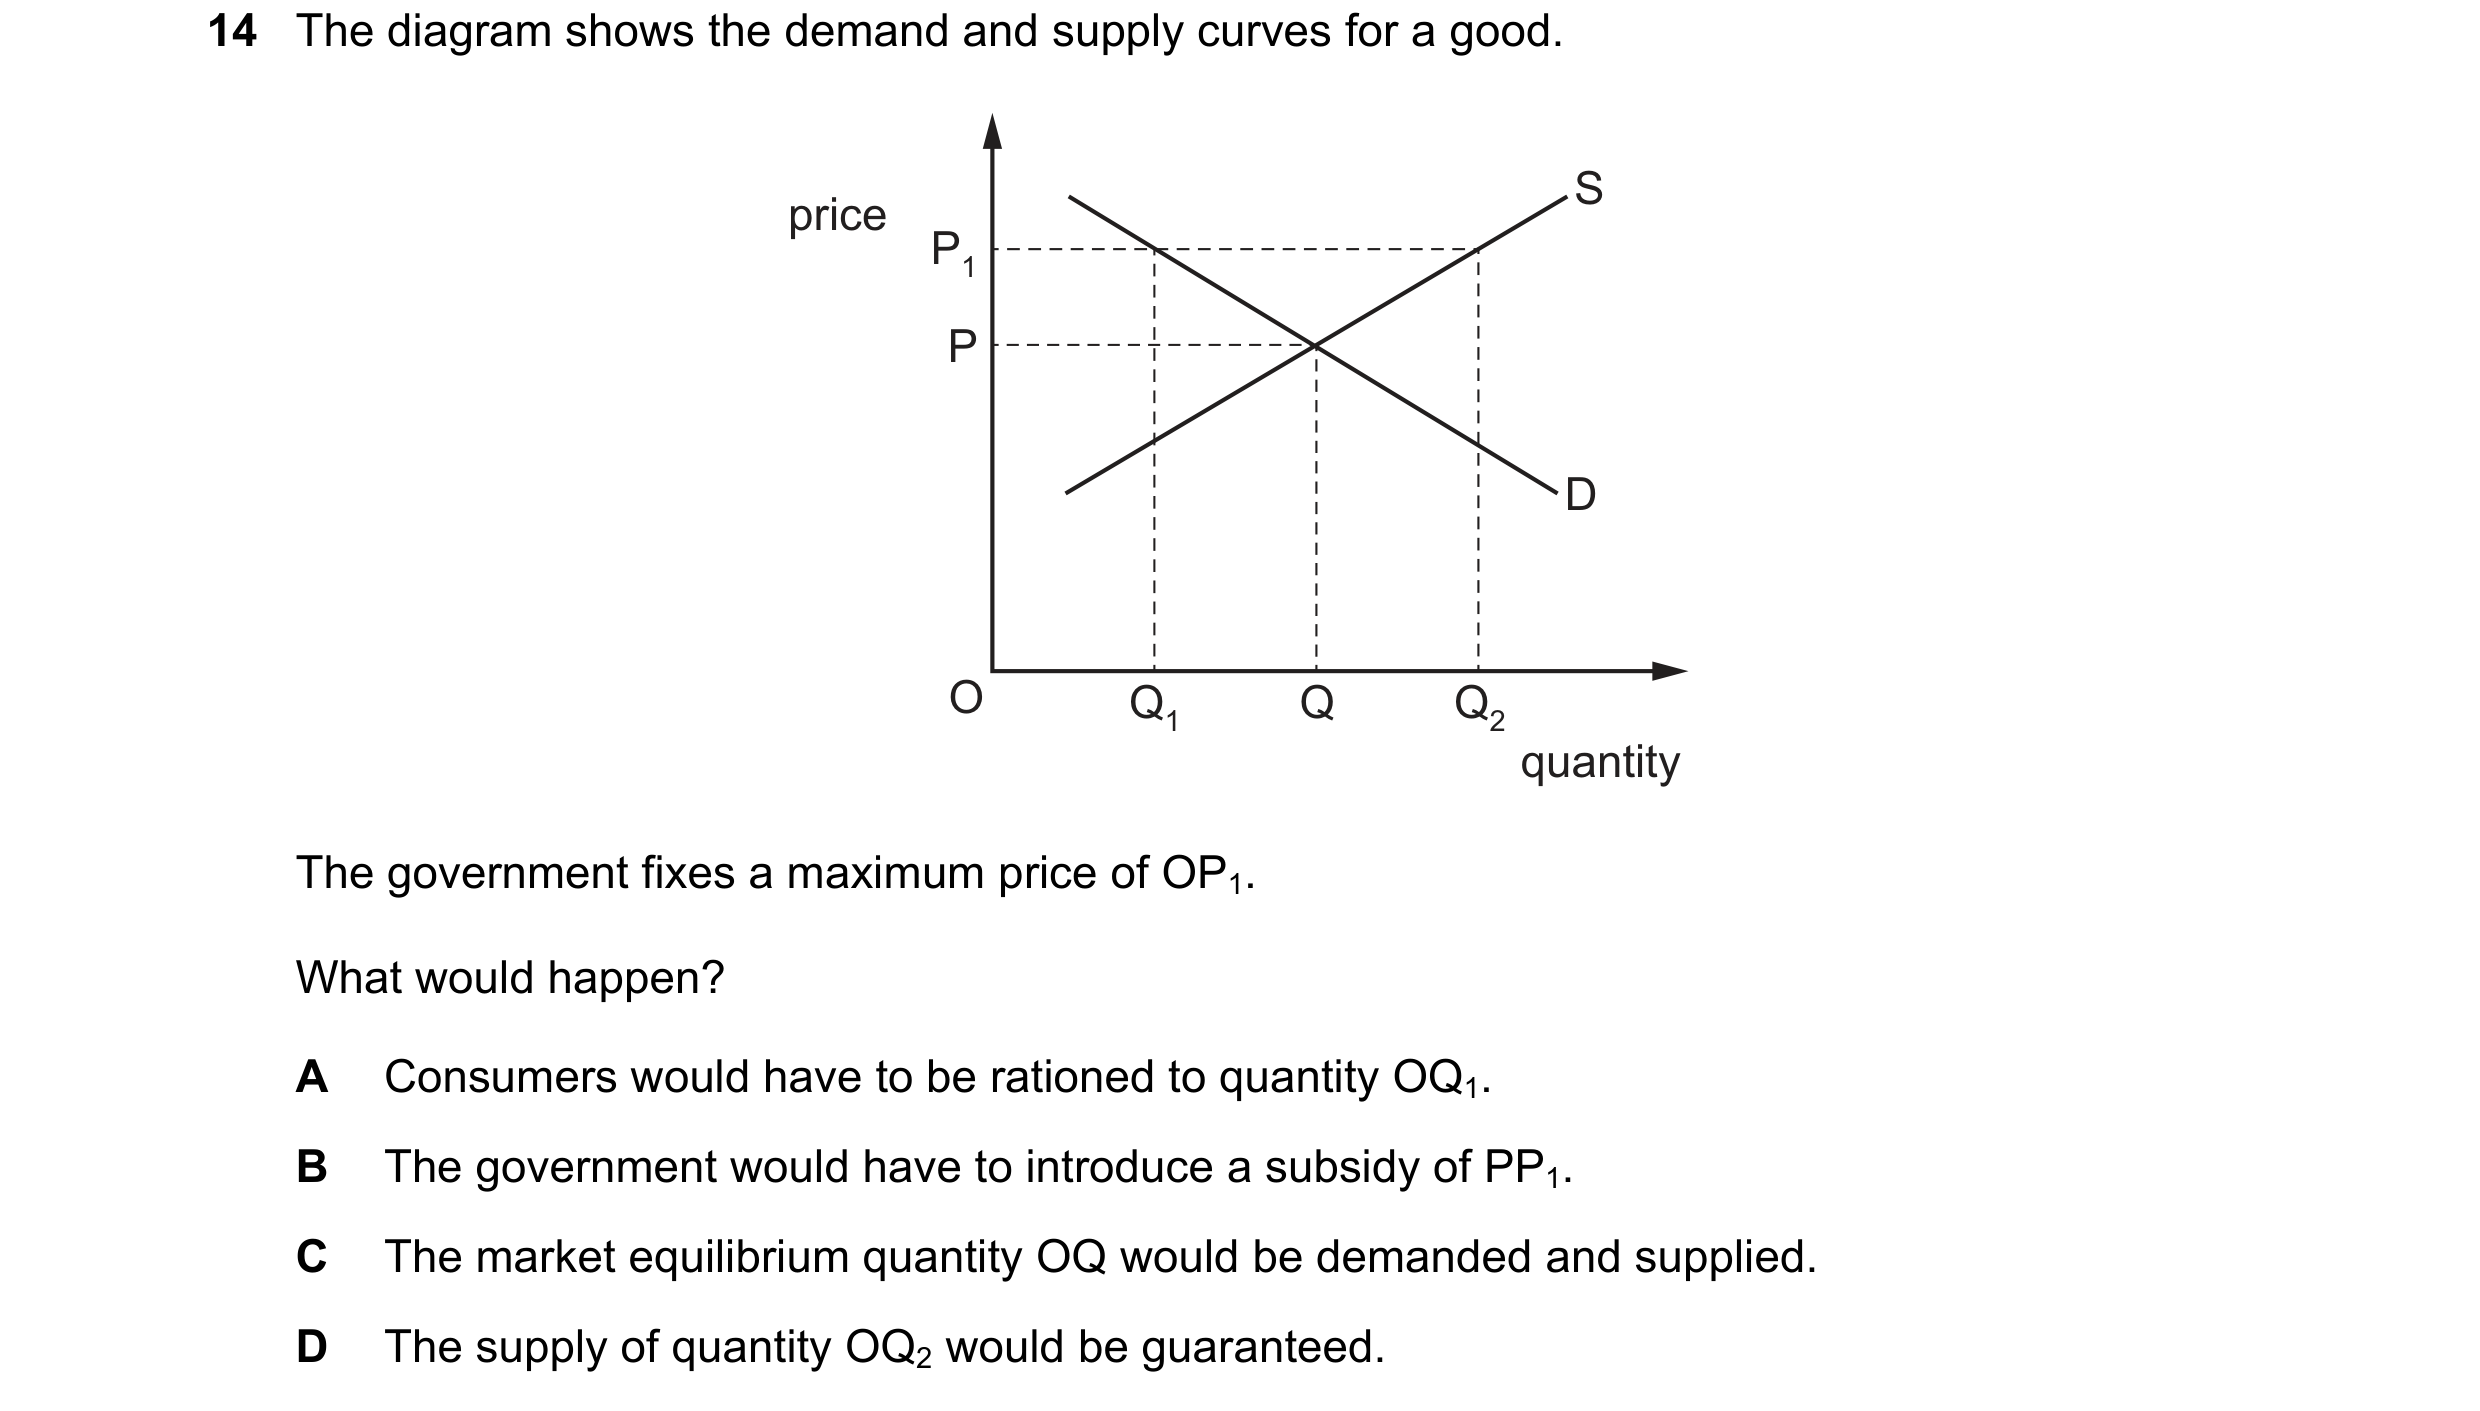 106 / 119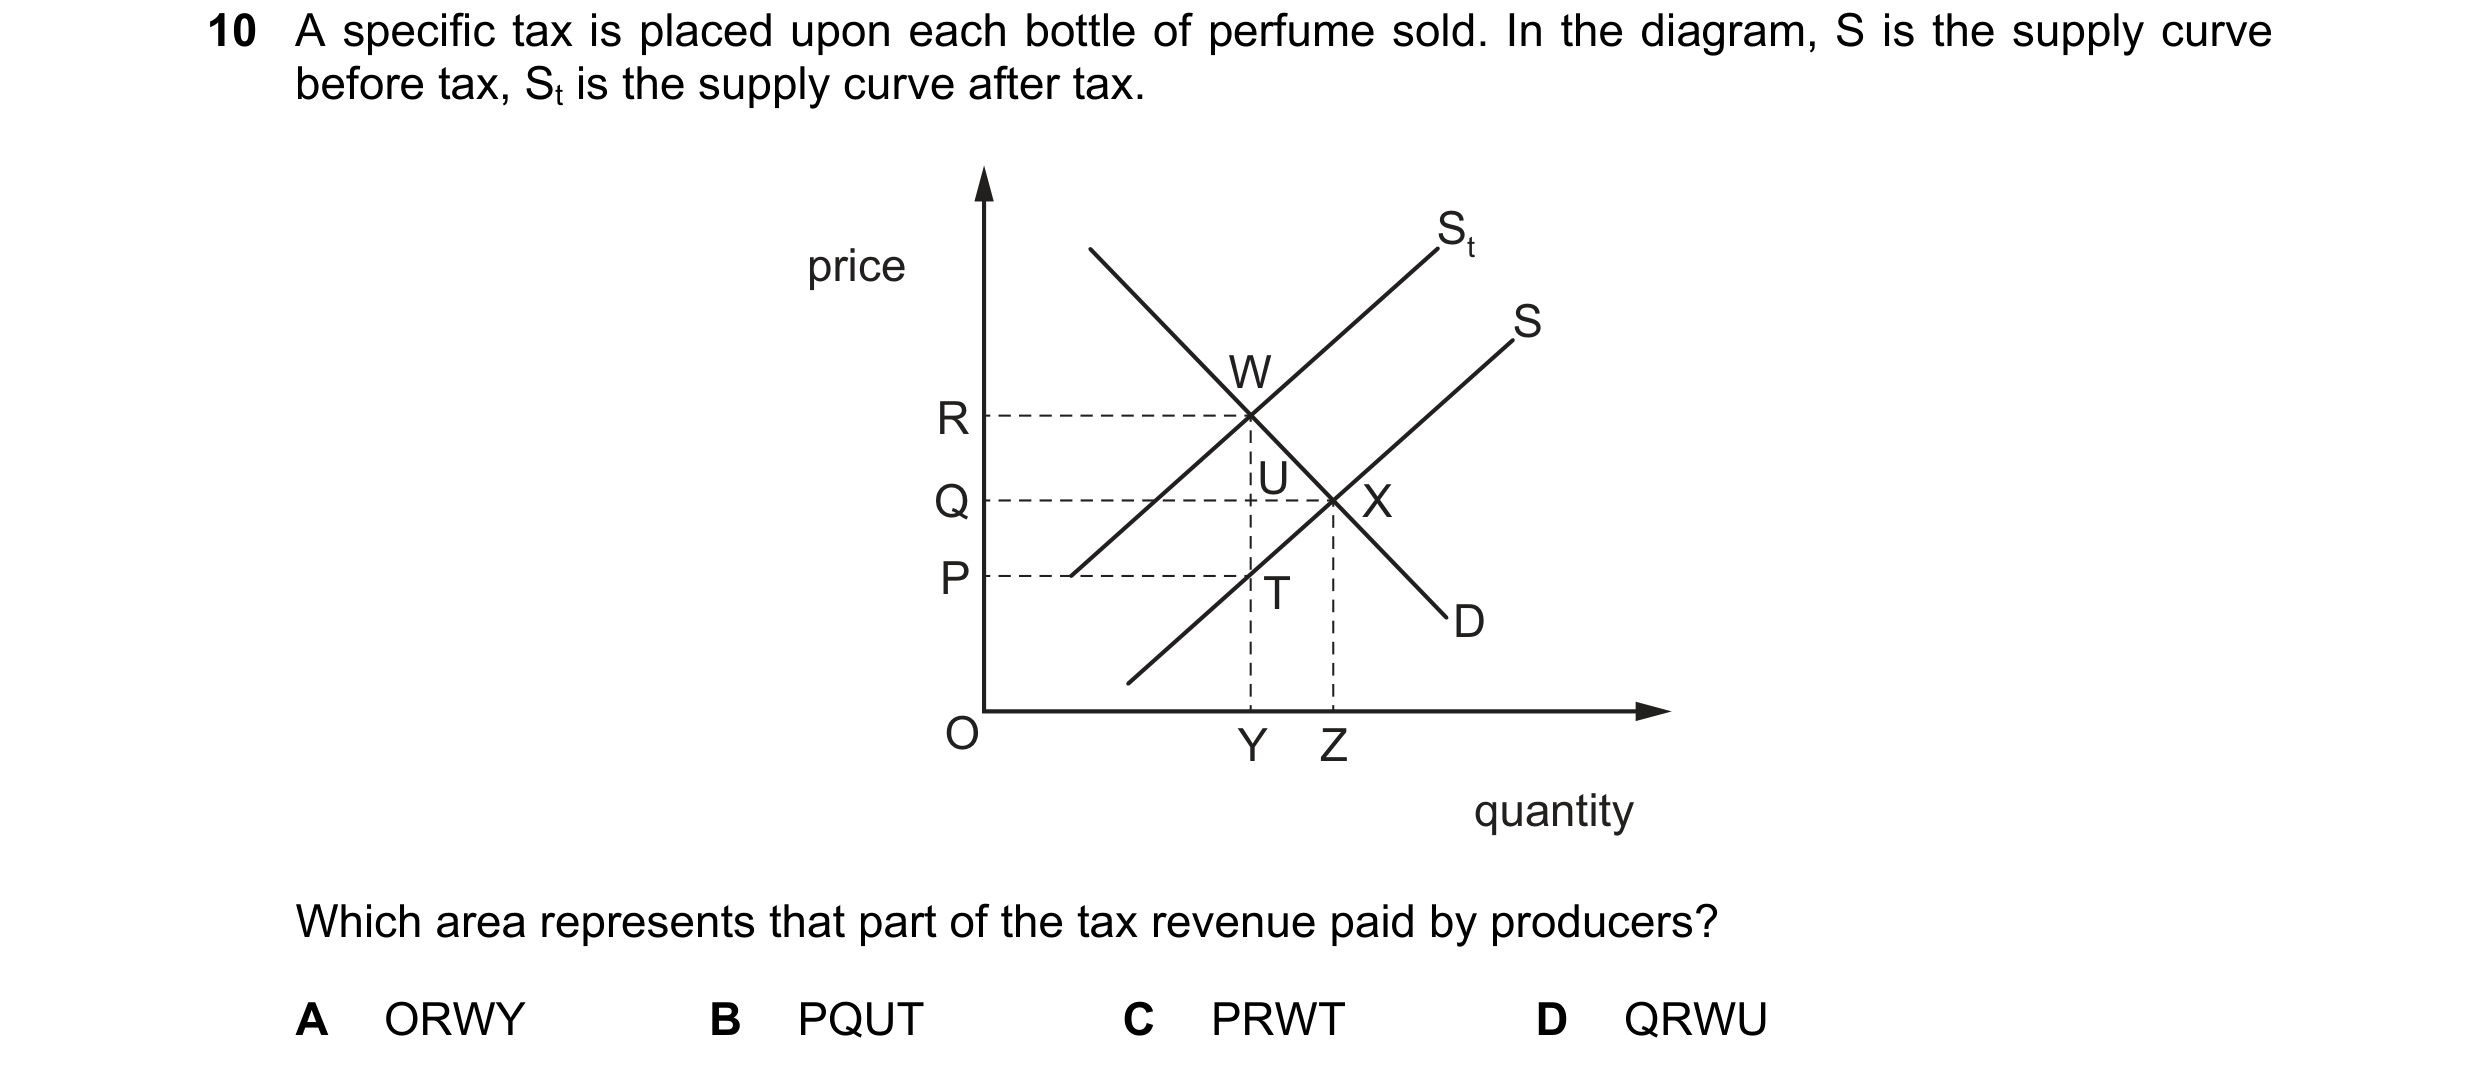
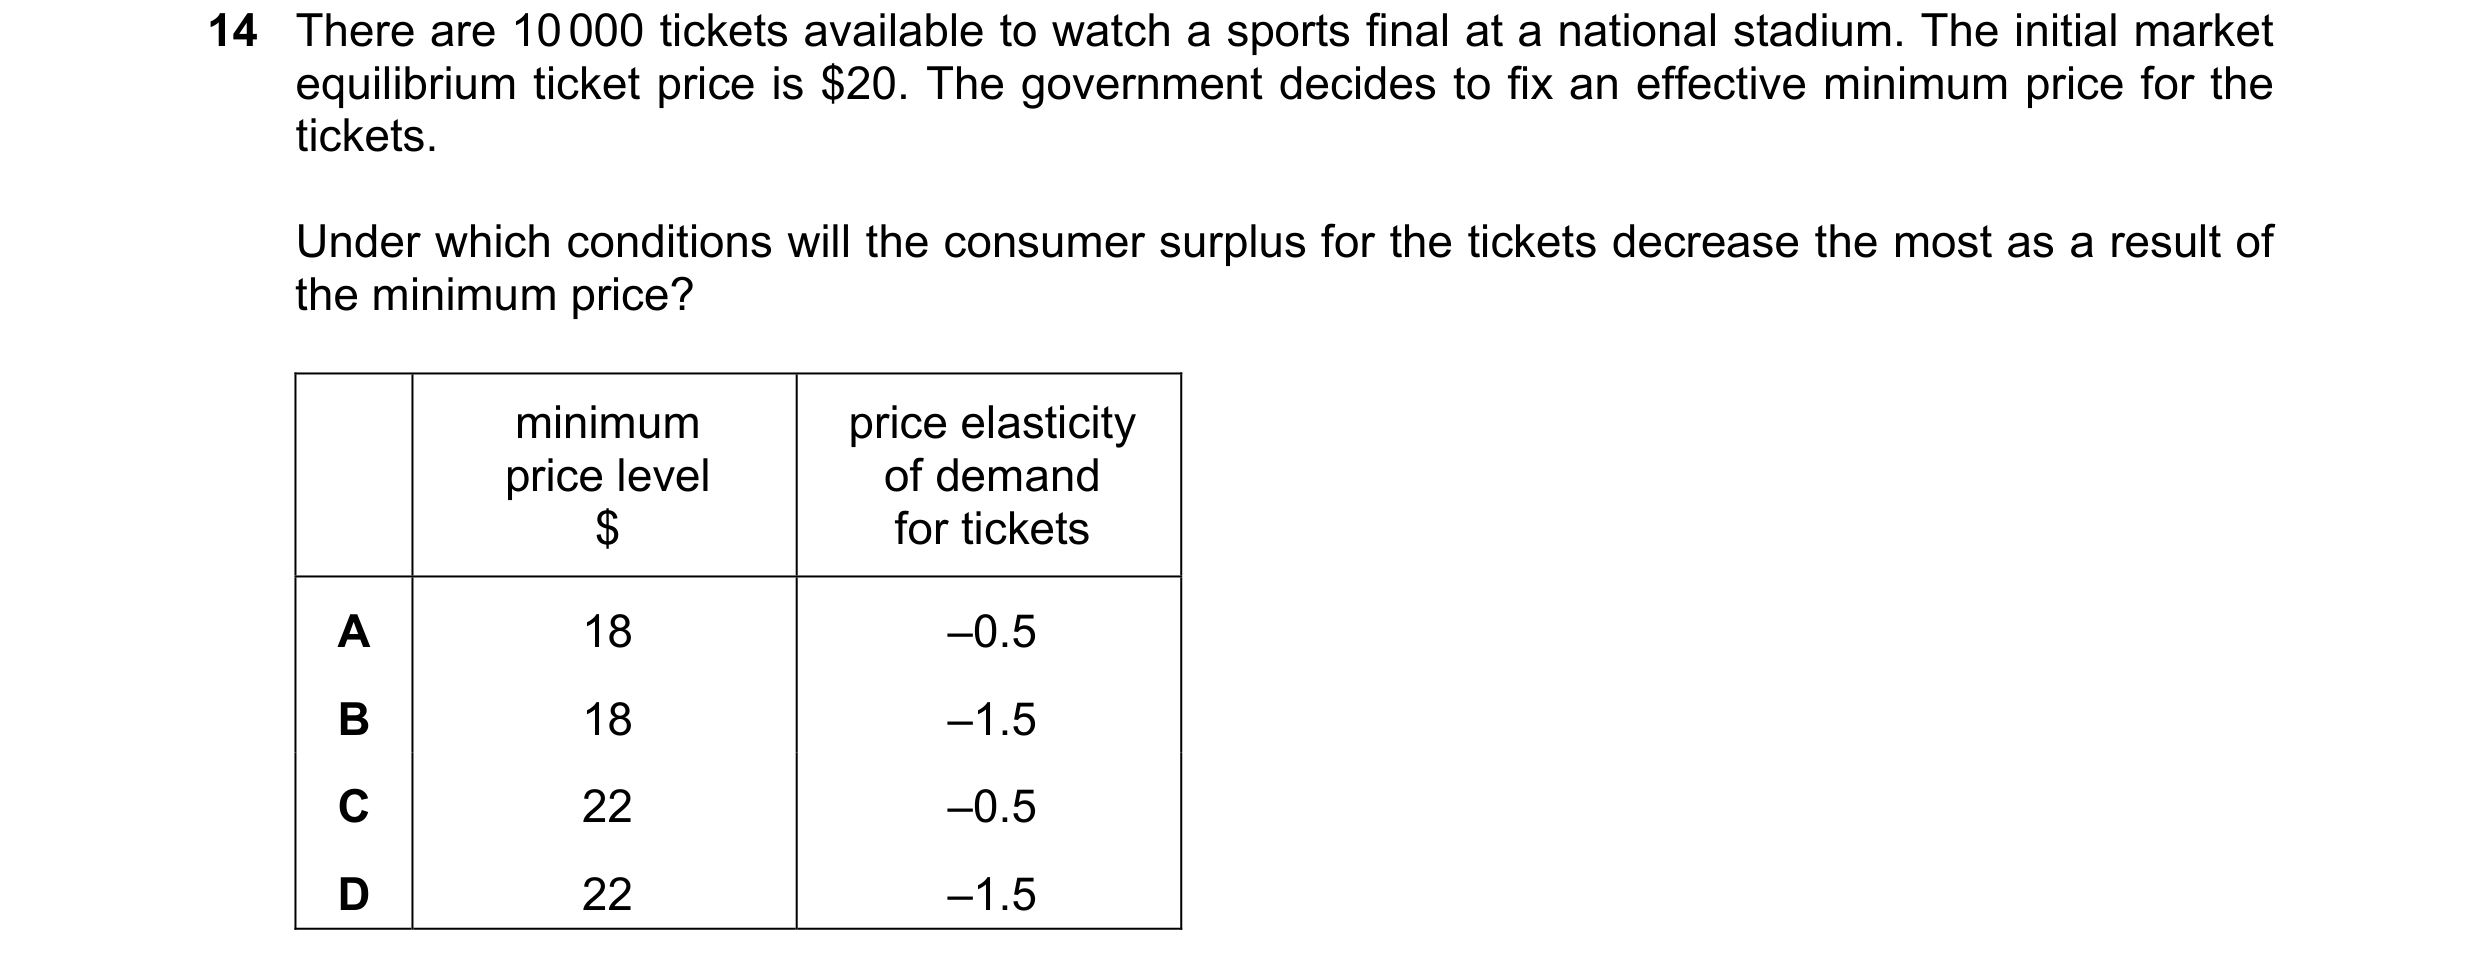 107 / 119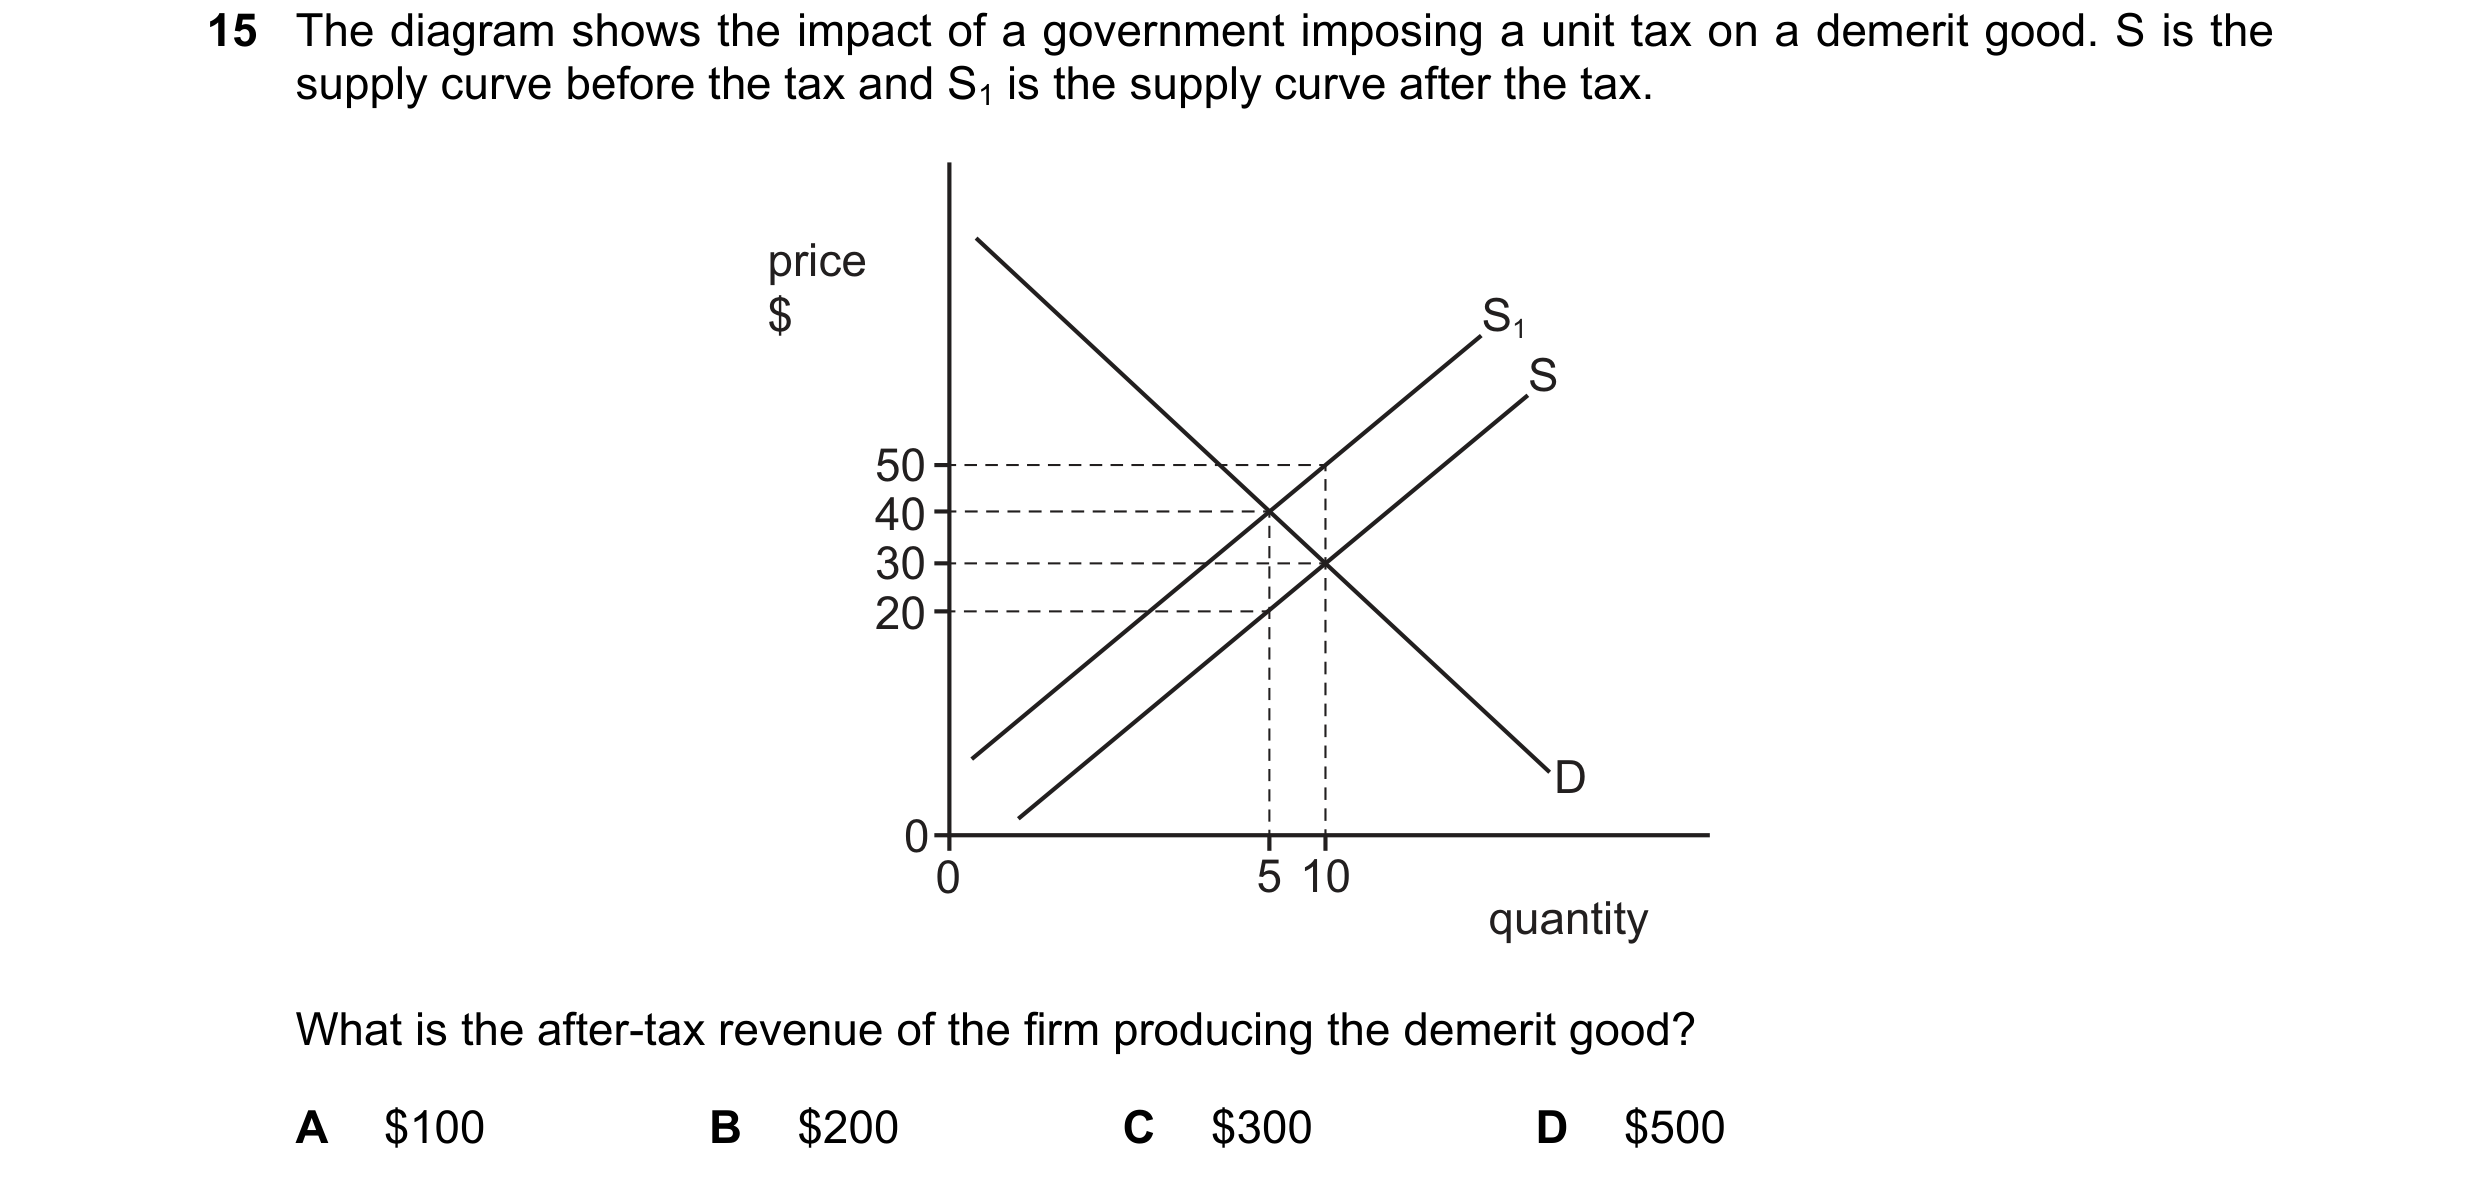
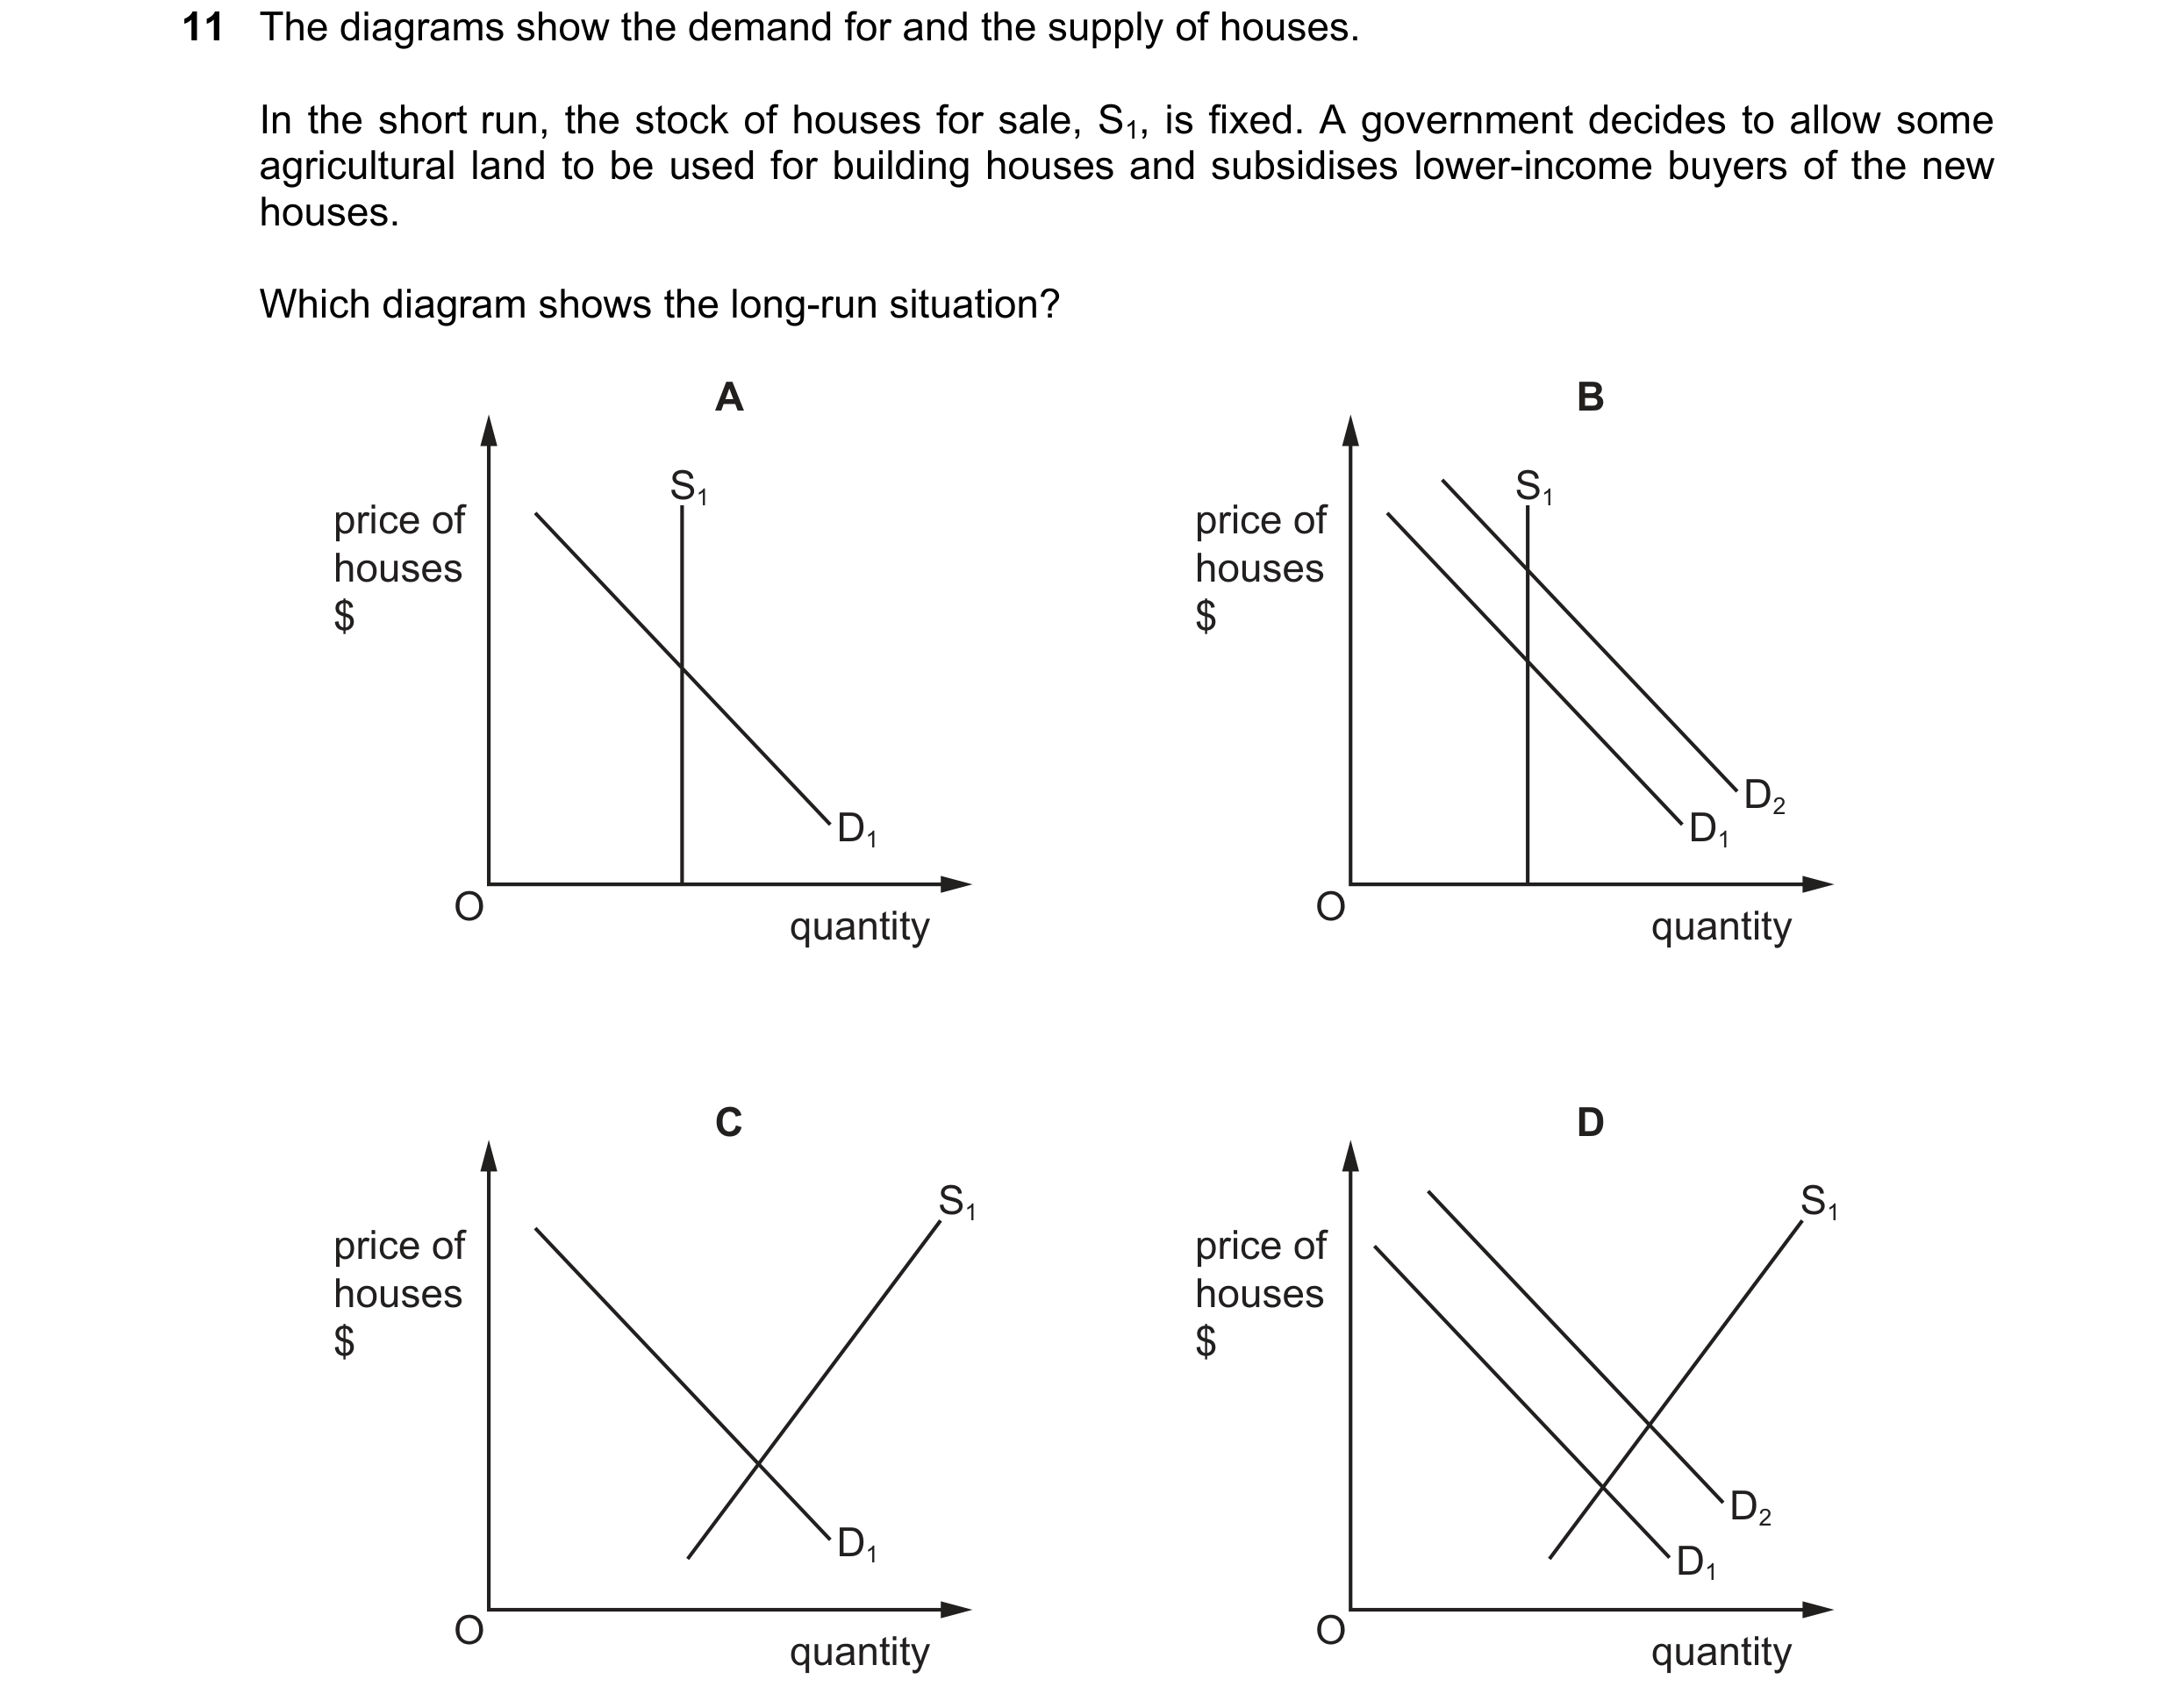 108 / 119
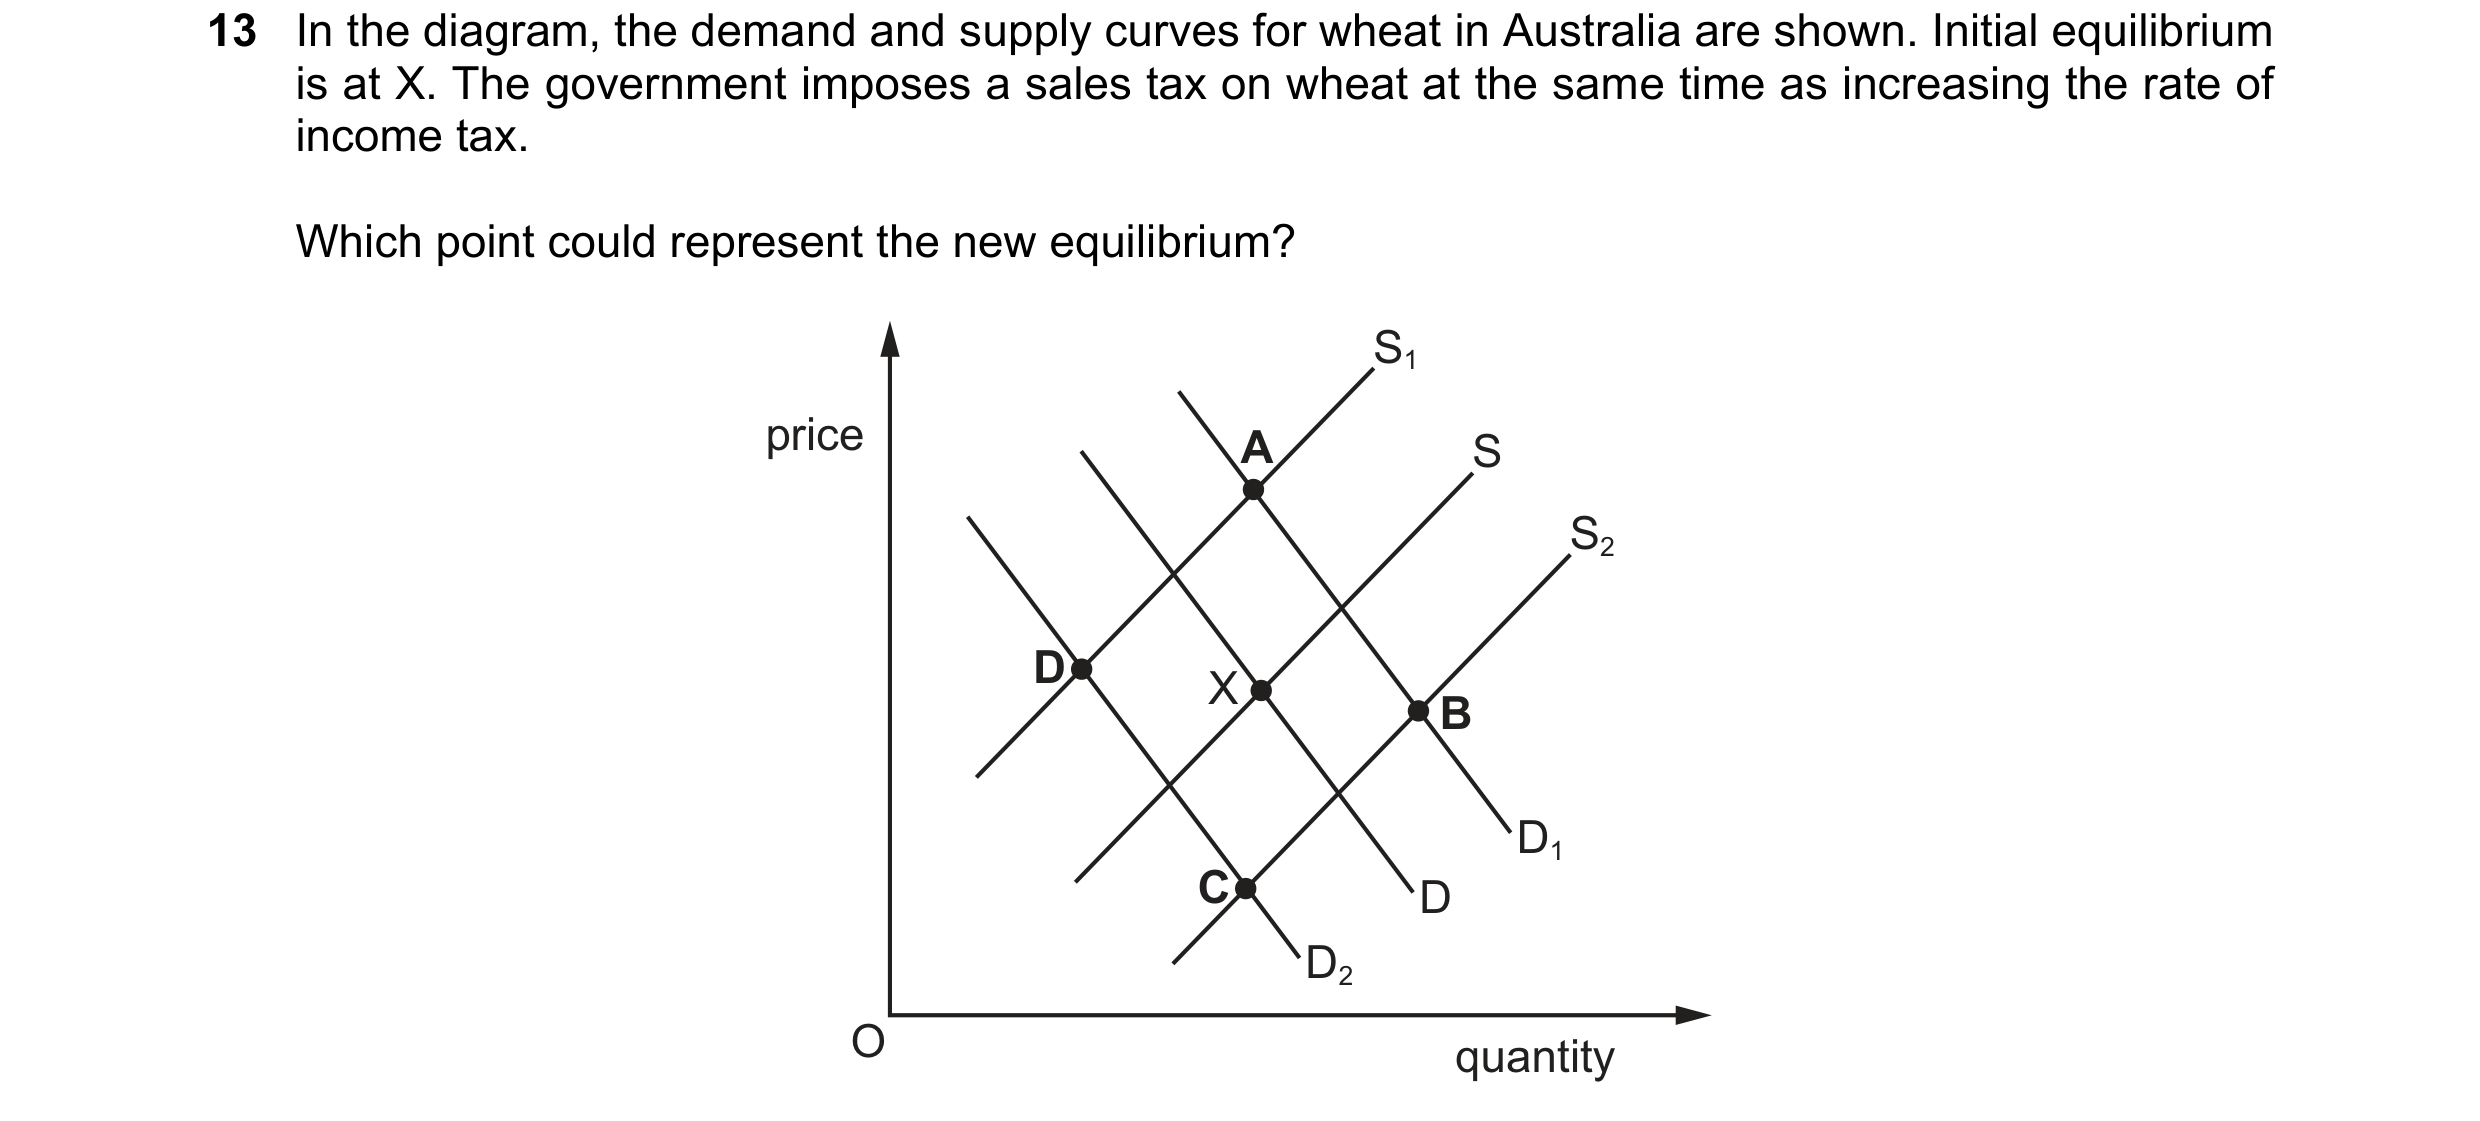
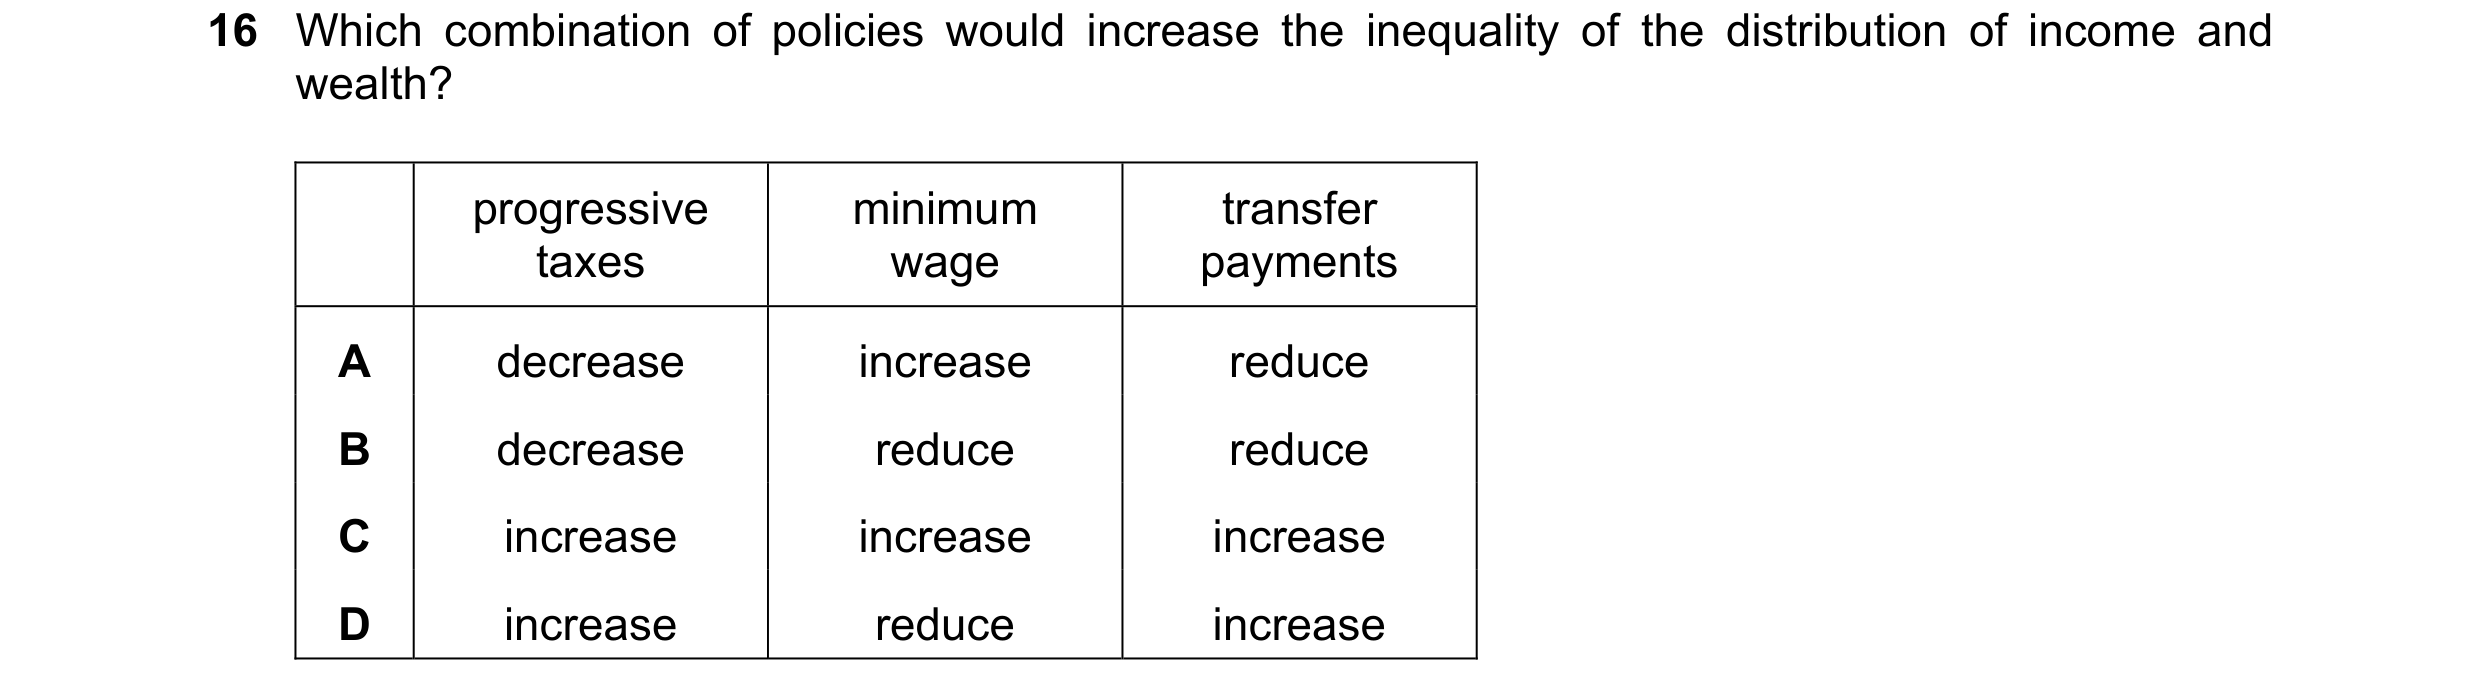 109 / 119
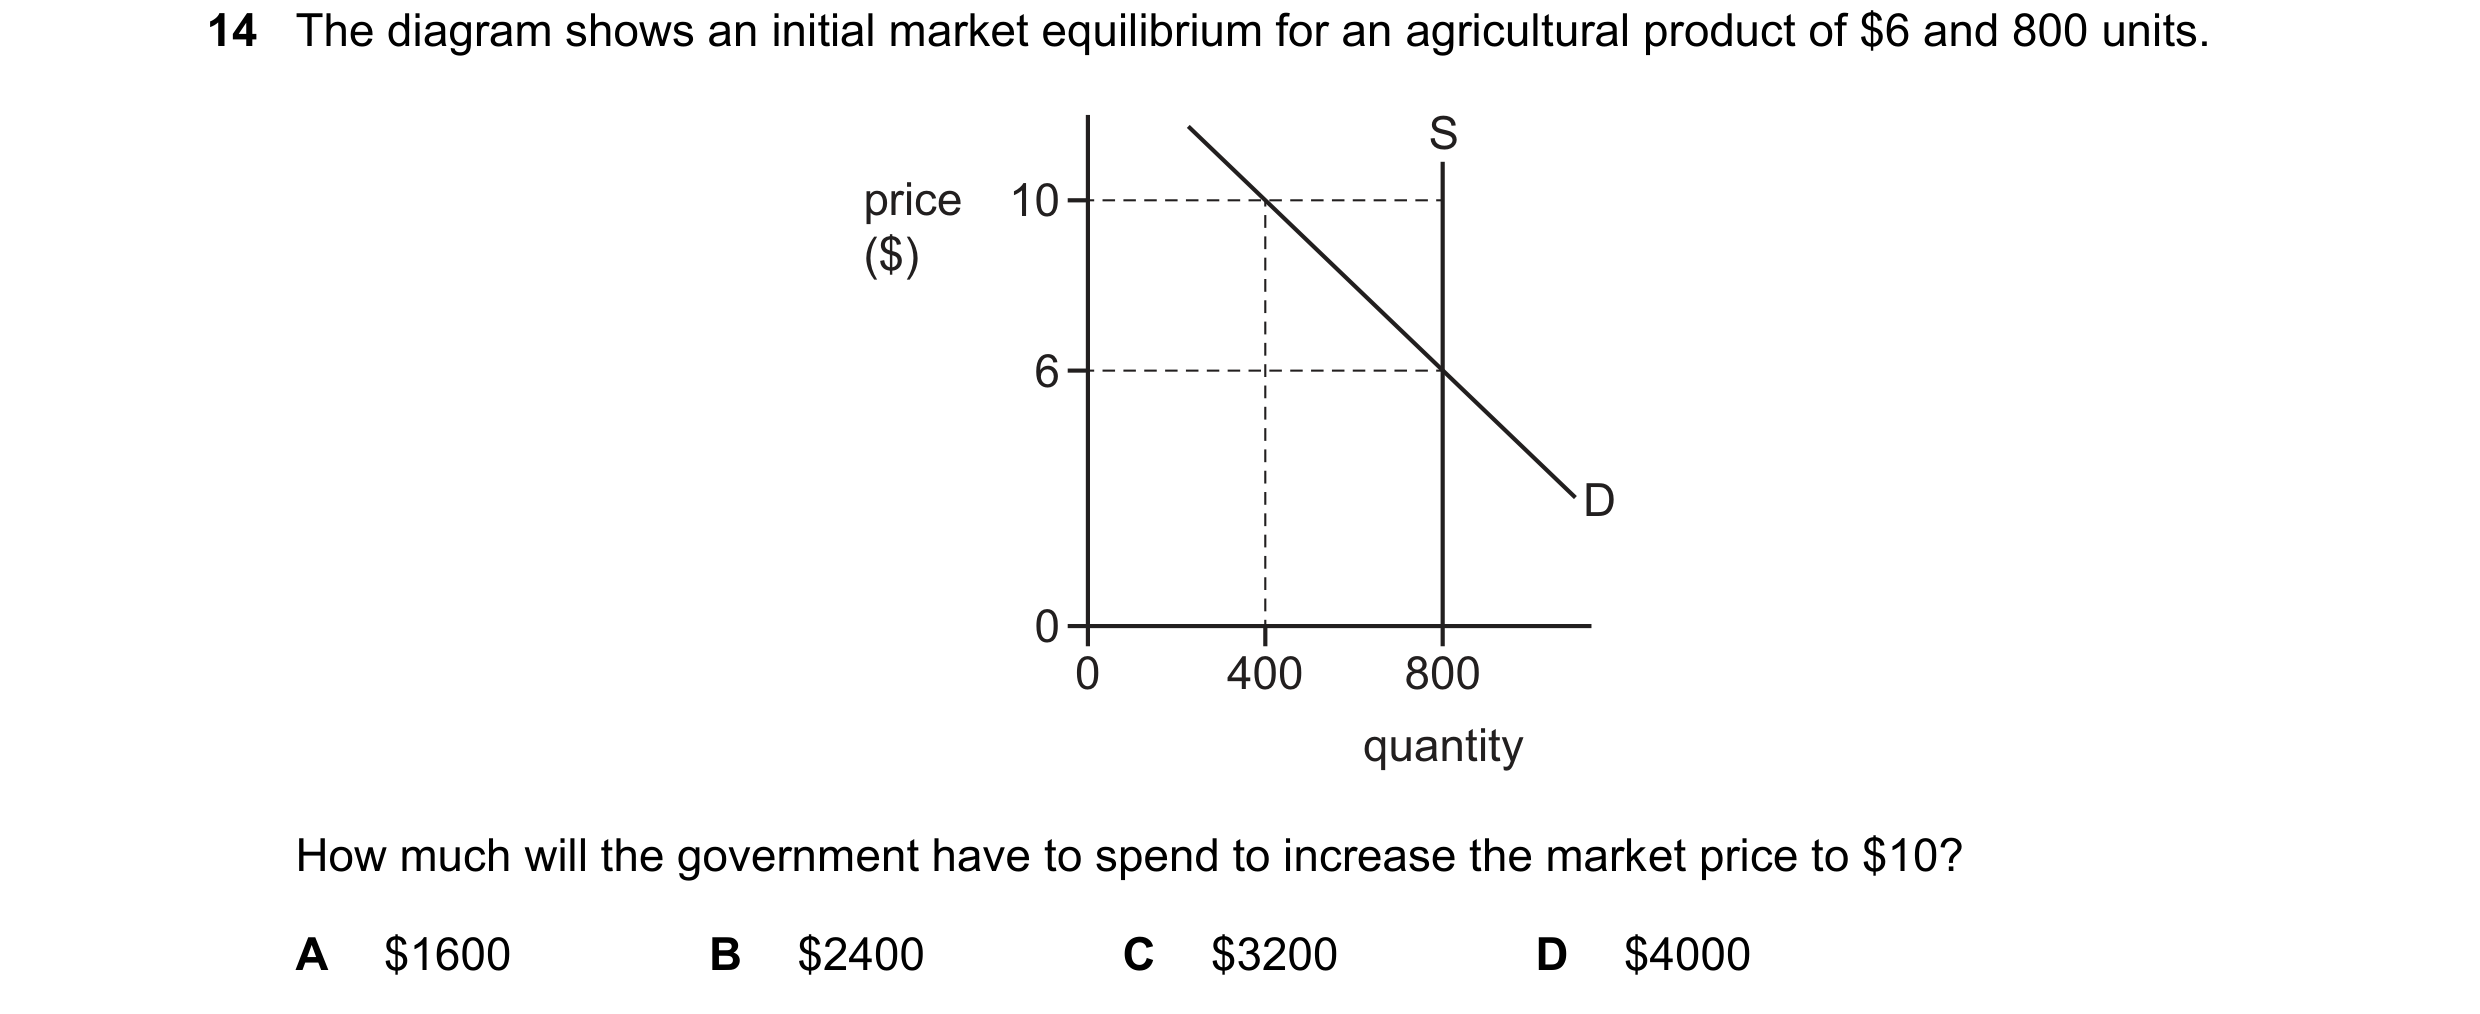
 110 / 119
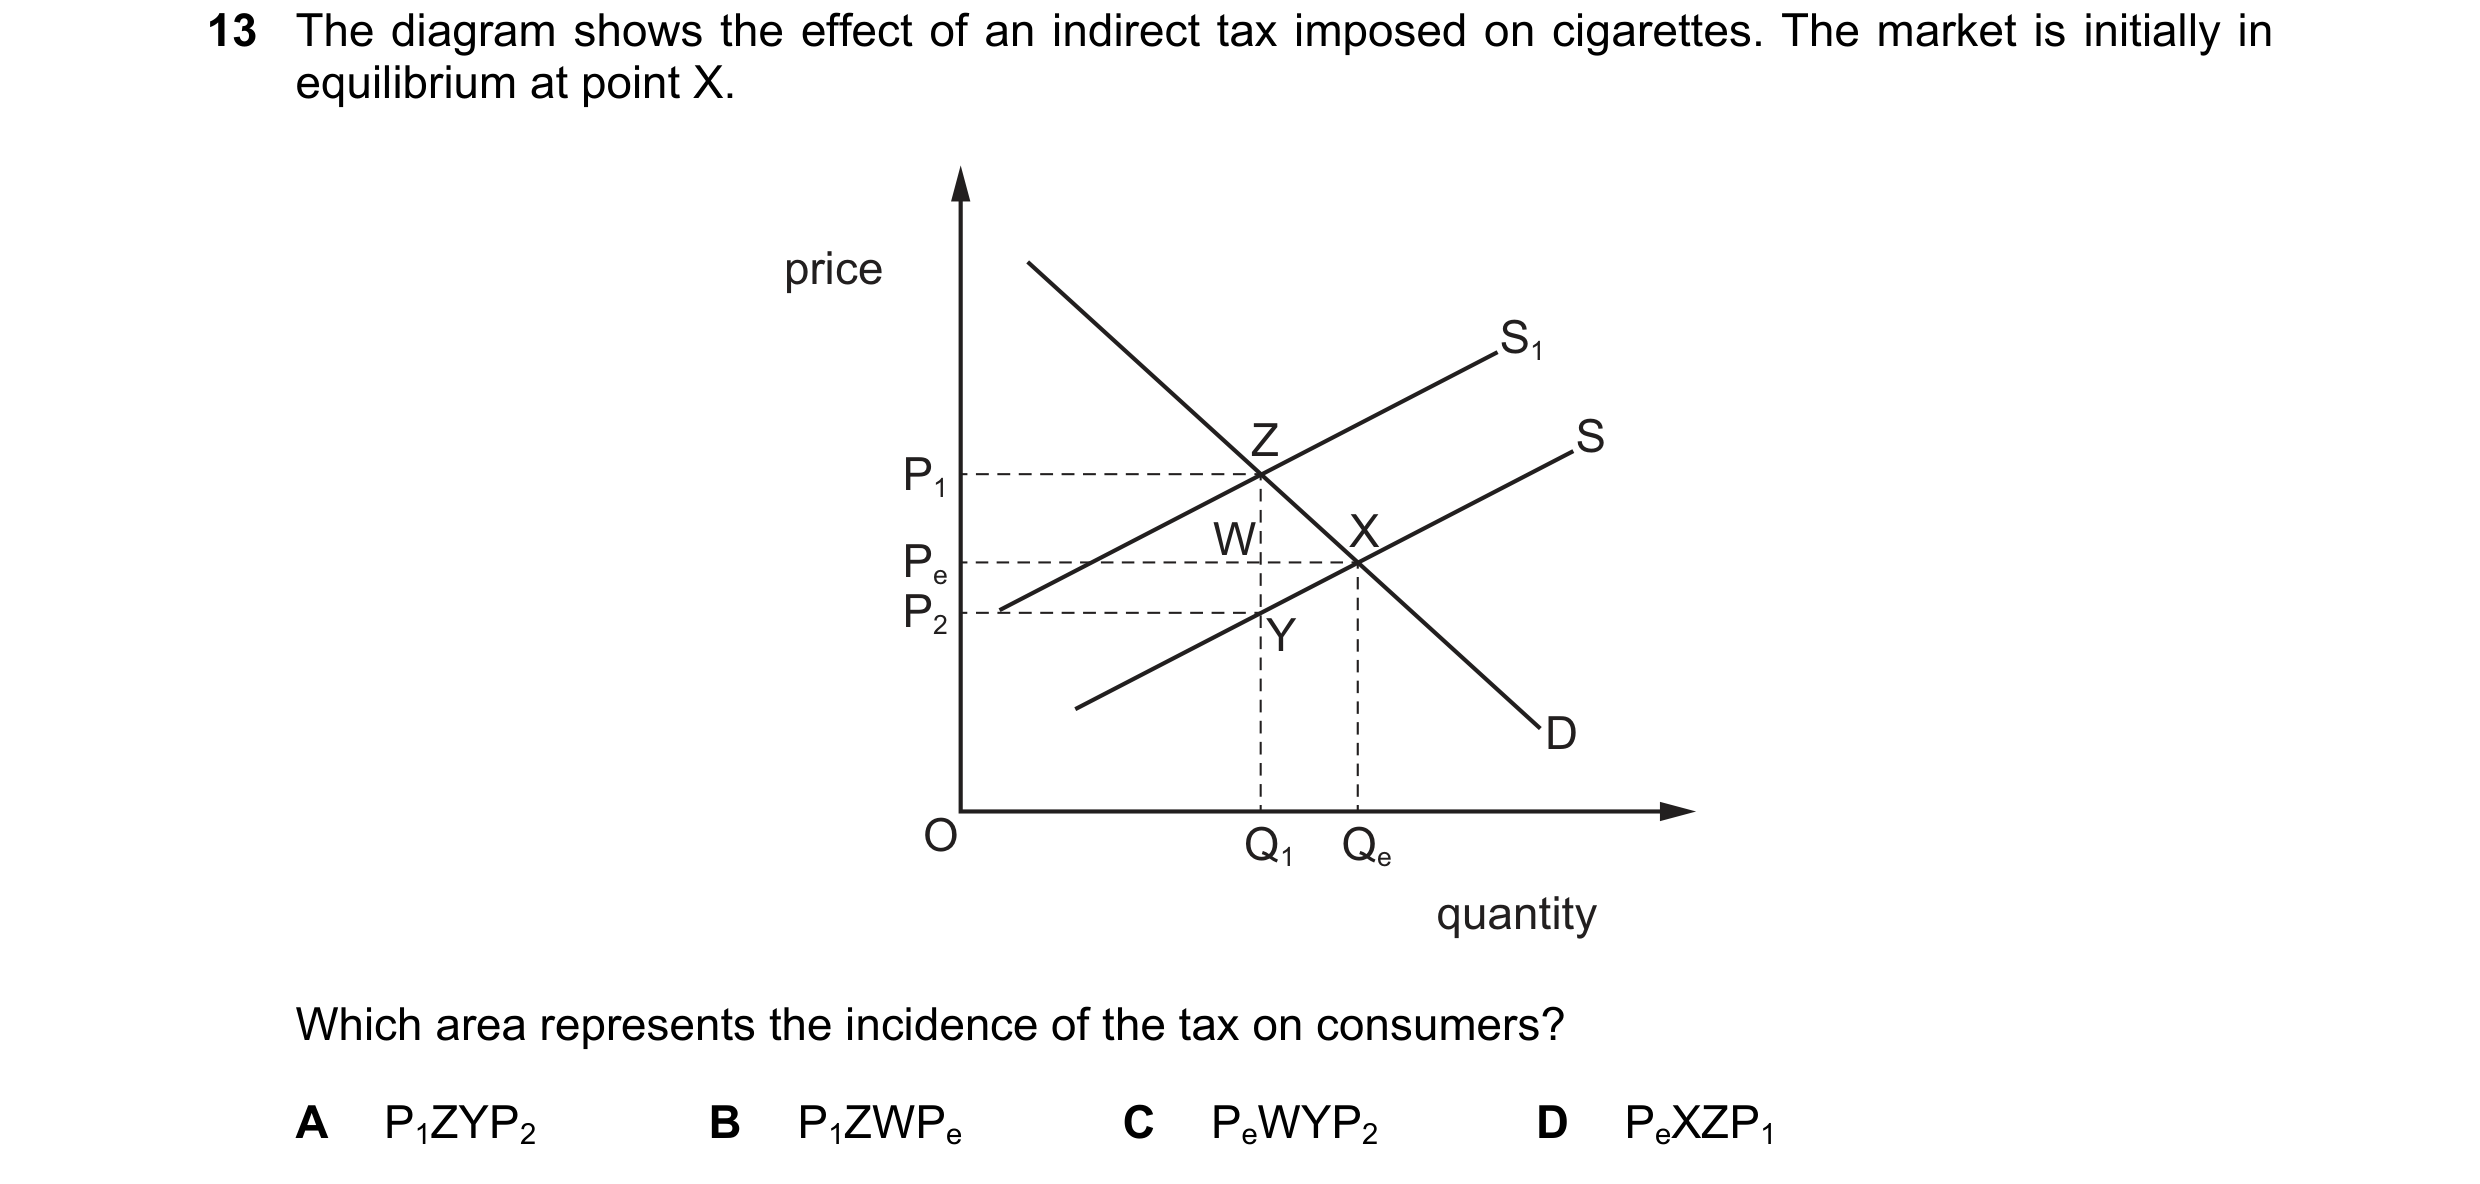
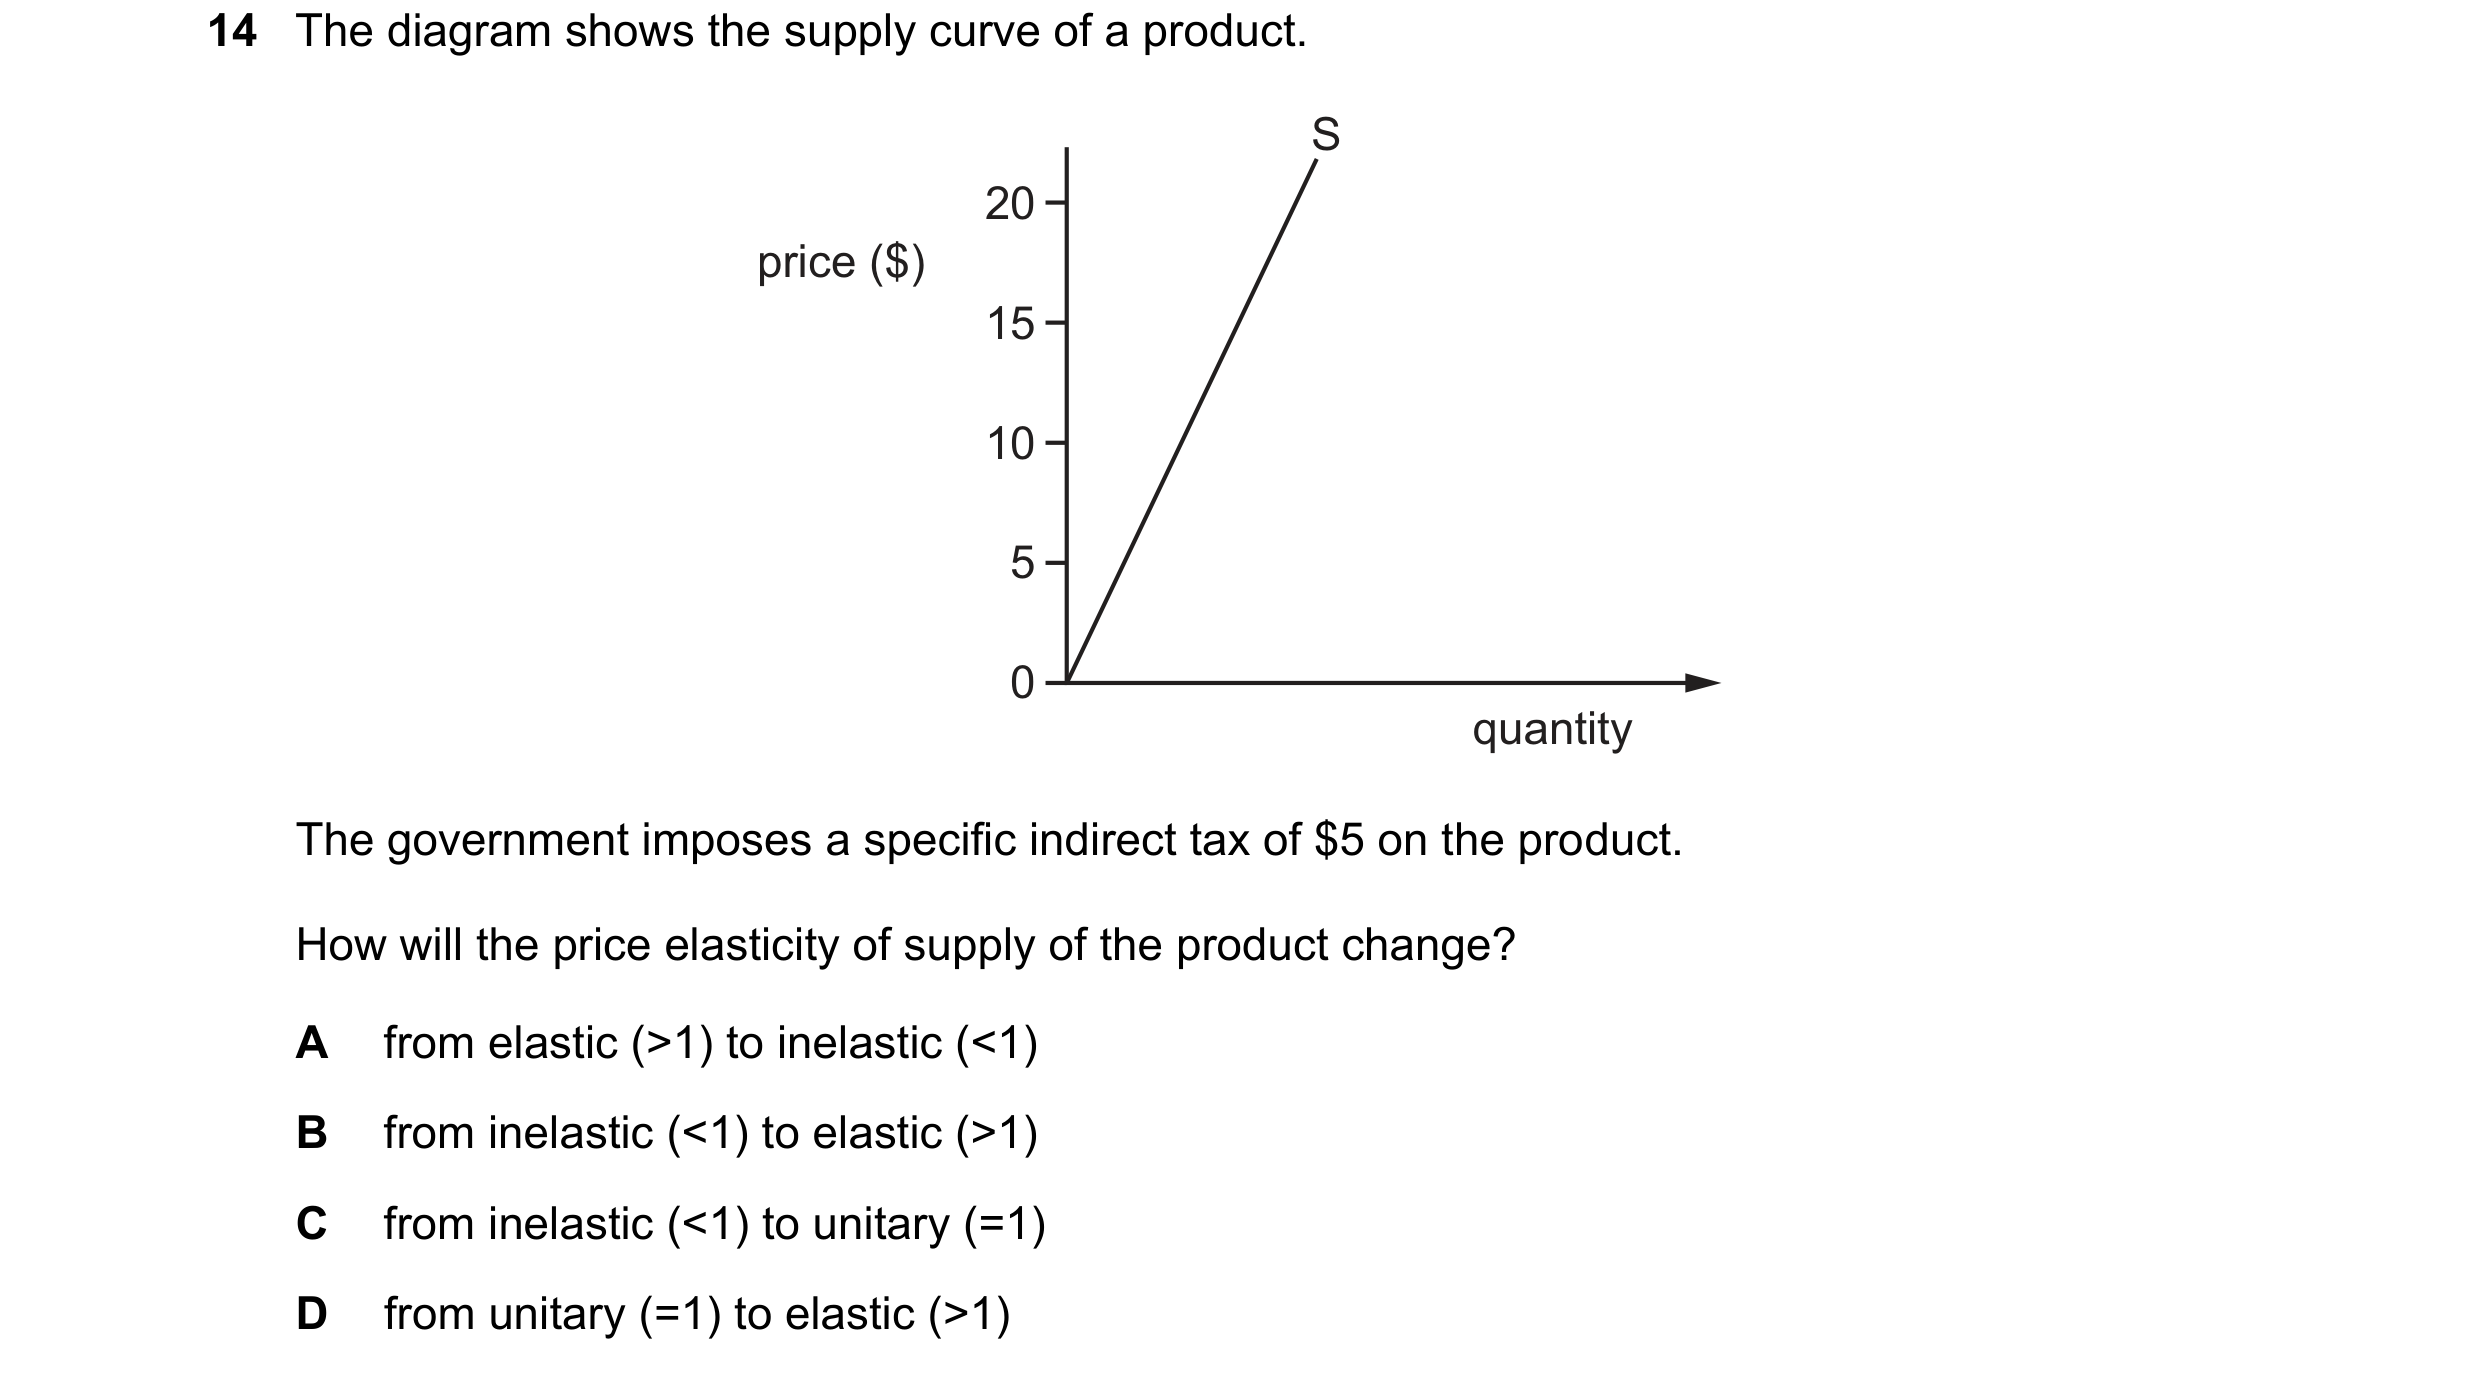 111 / 119
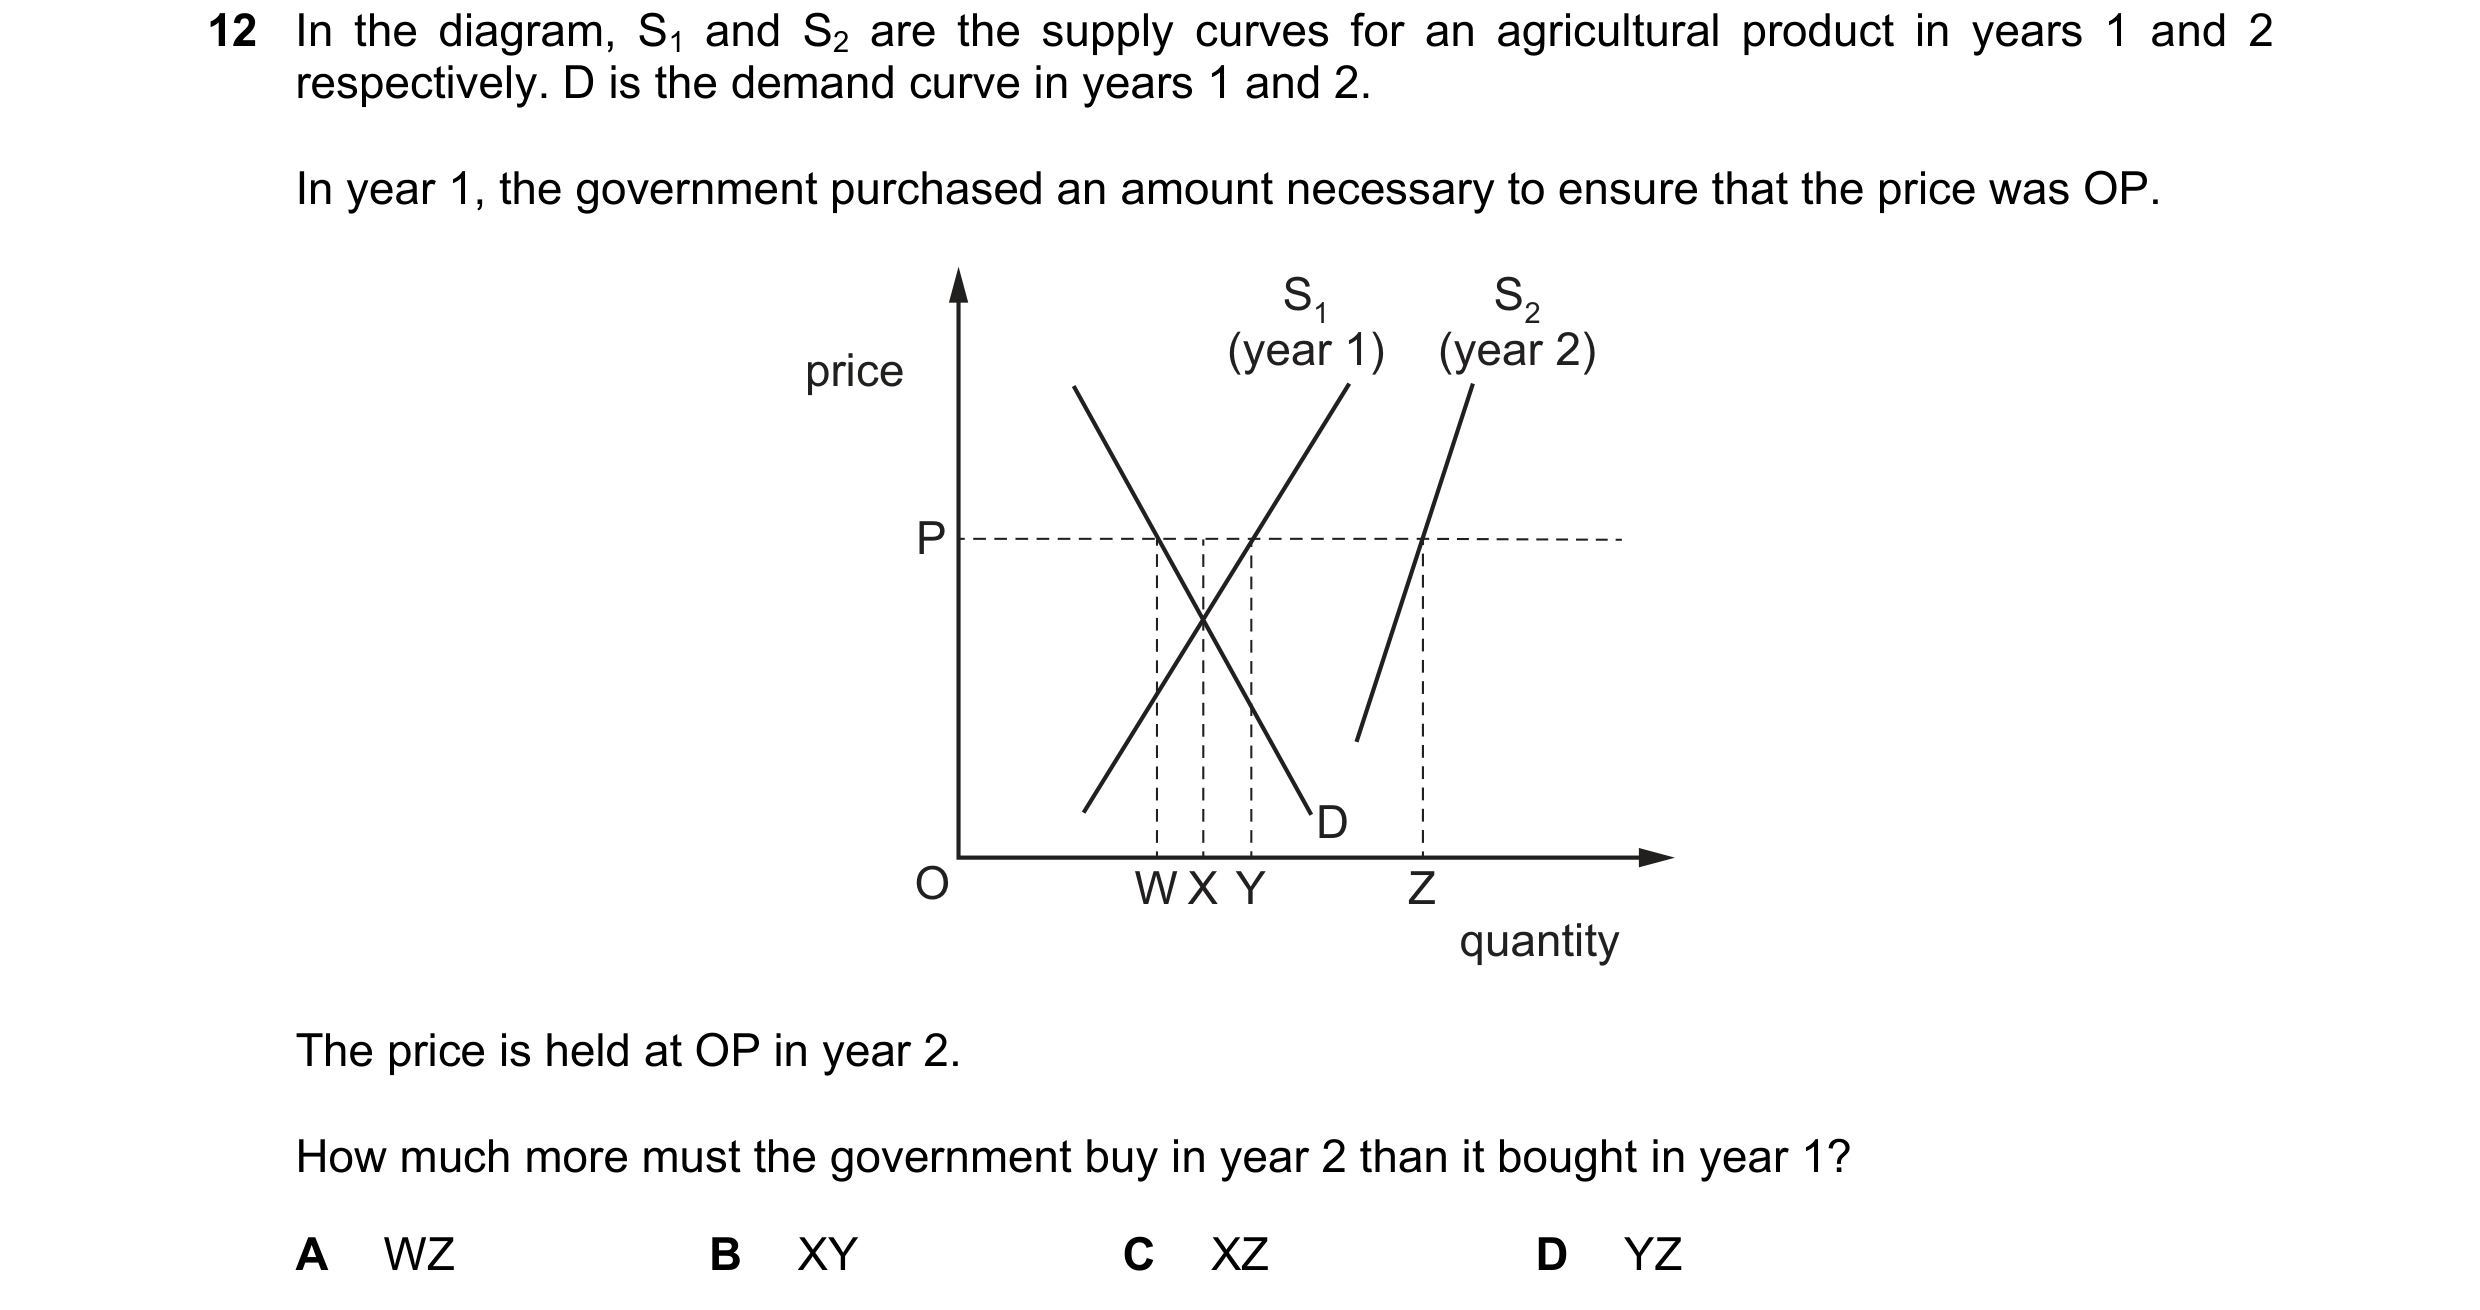
 112 / 119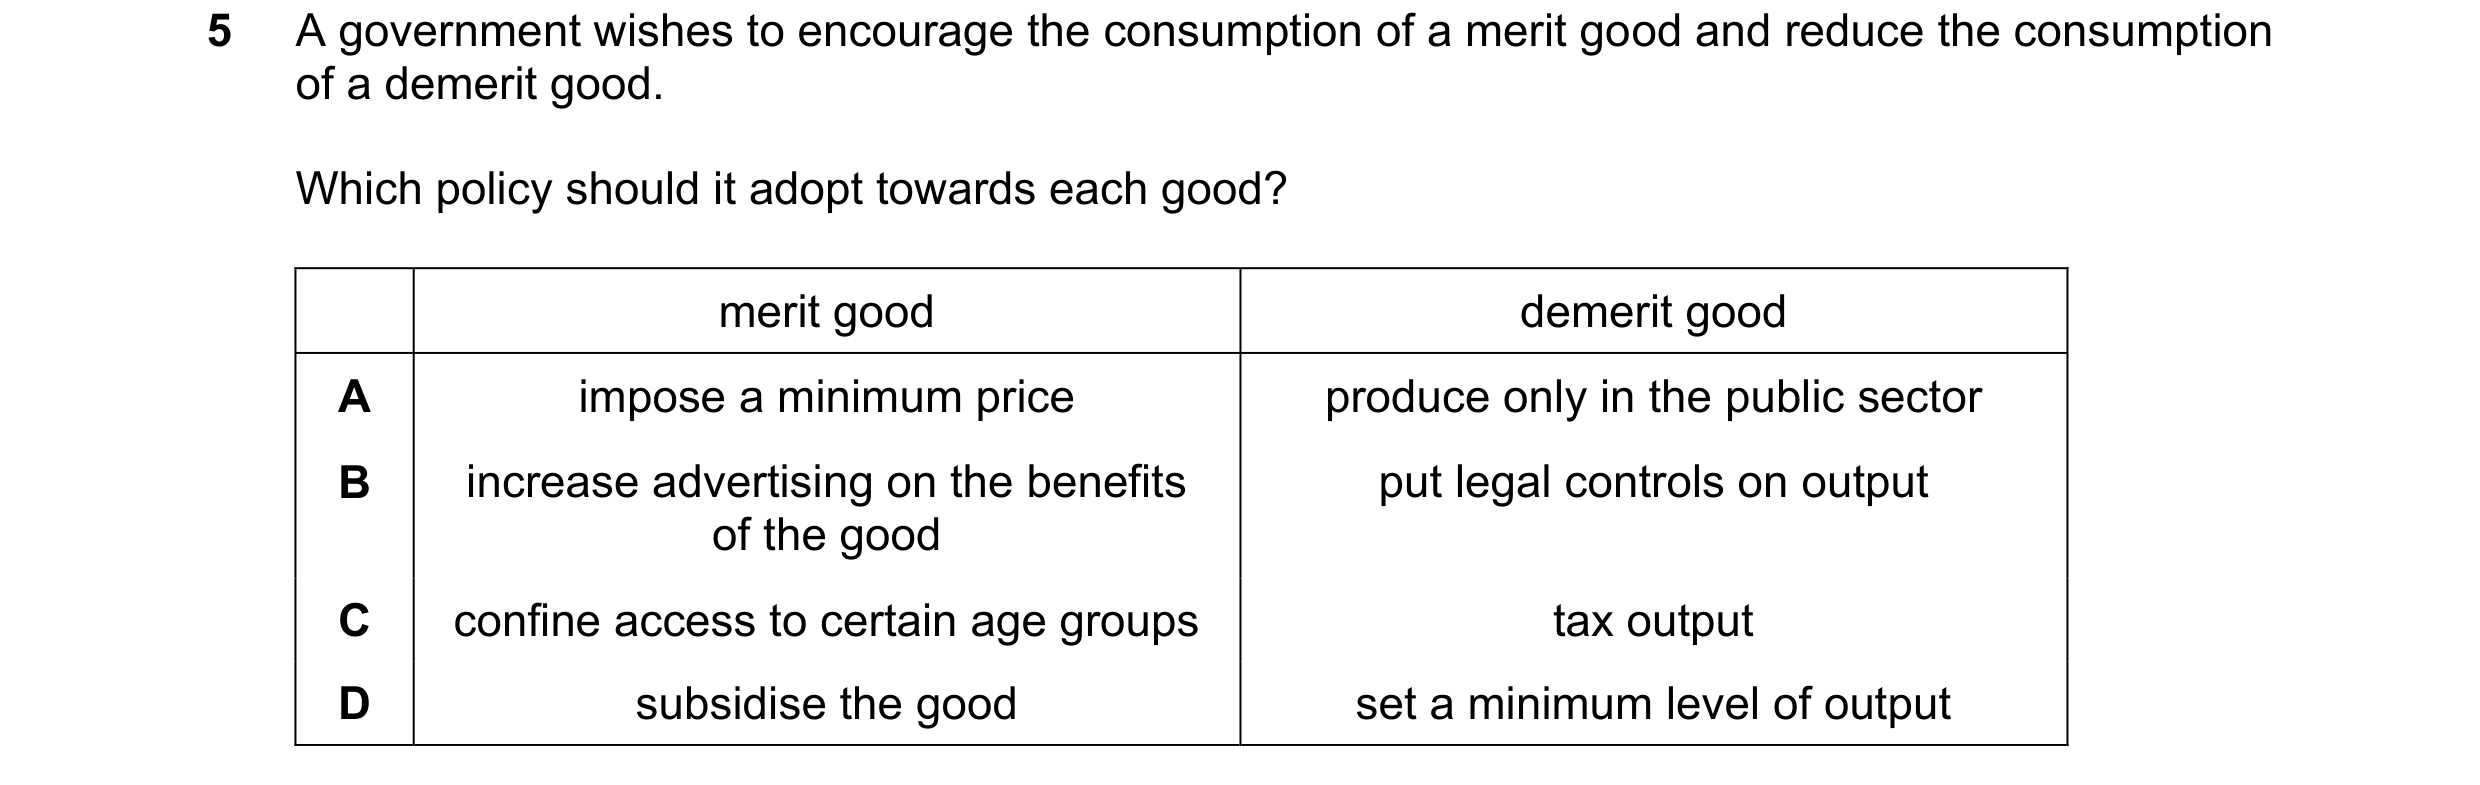
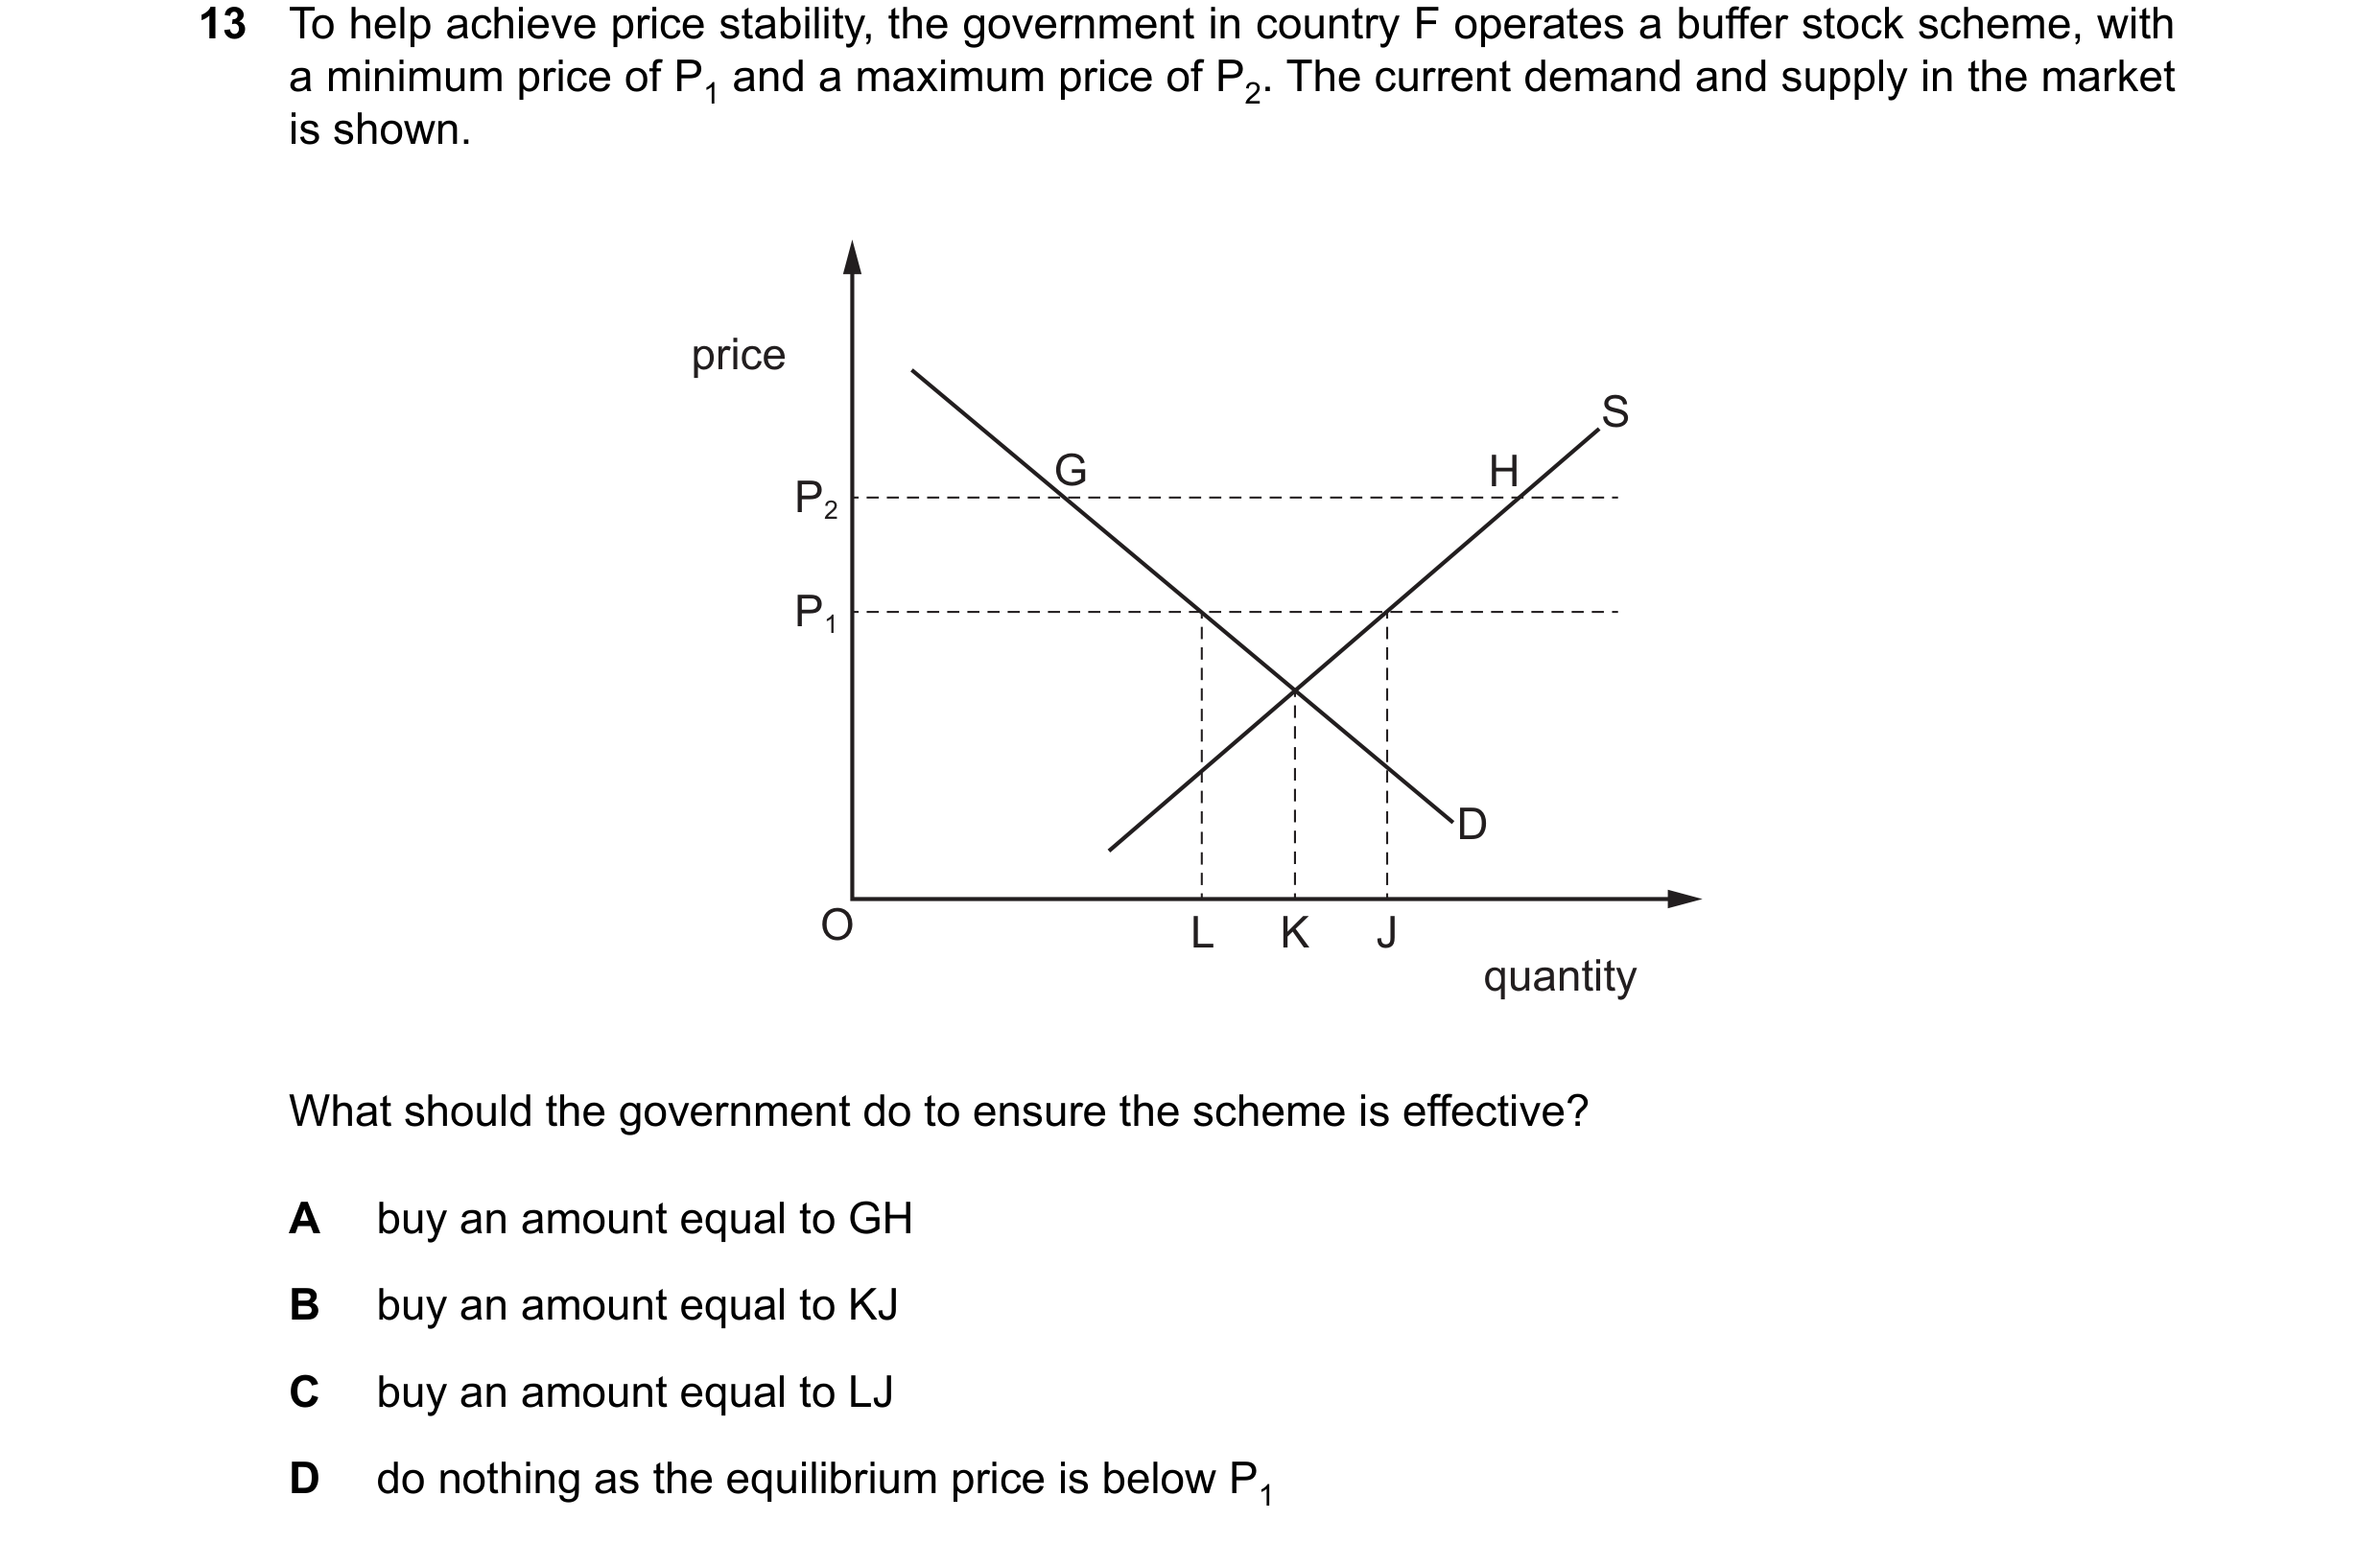 113 / 119
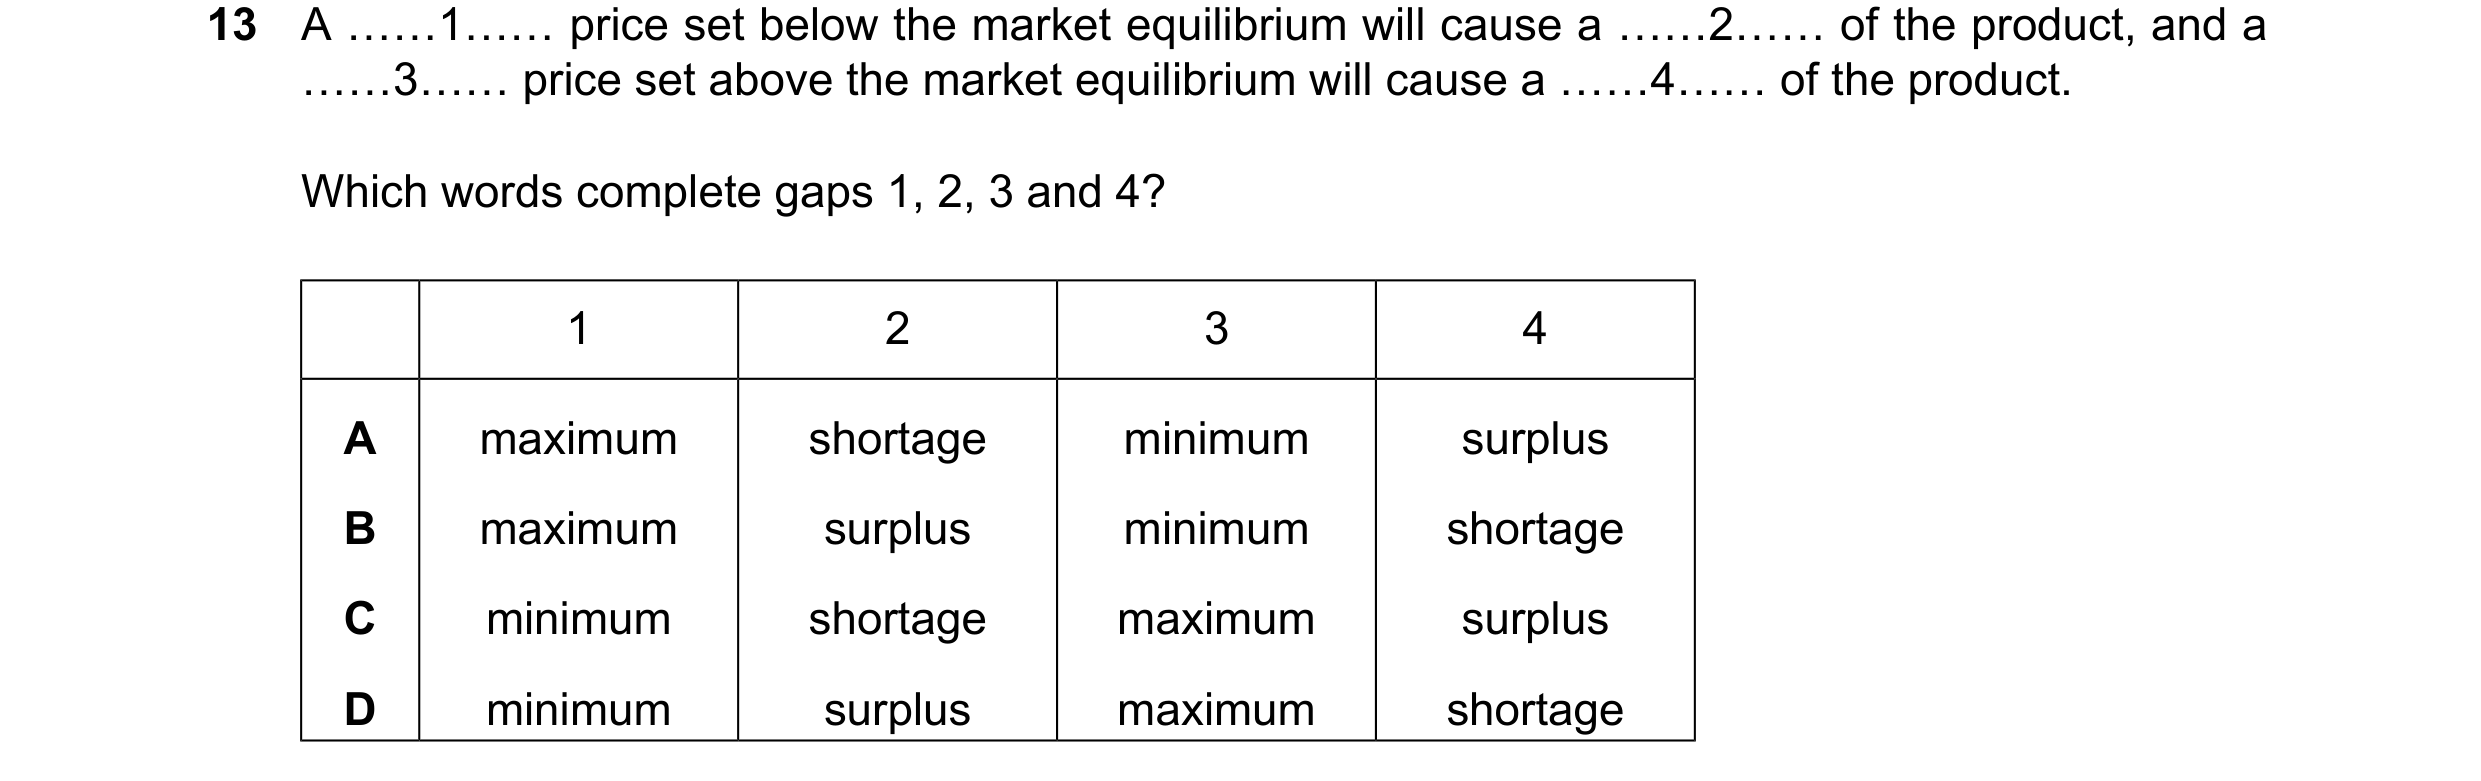
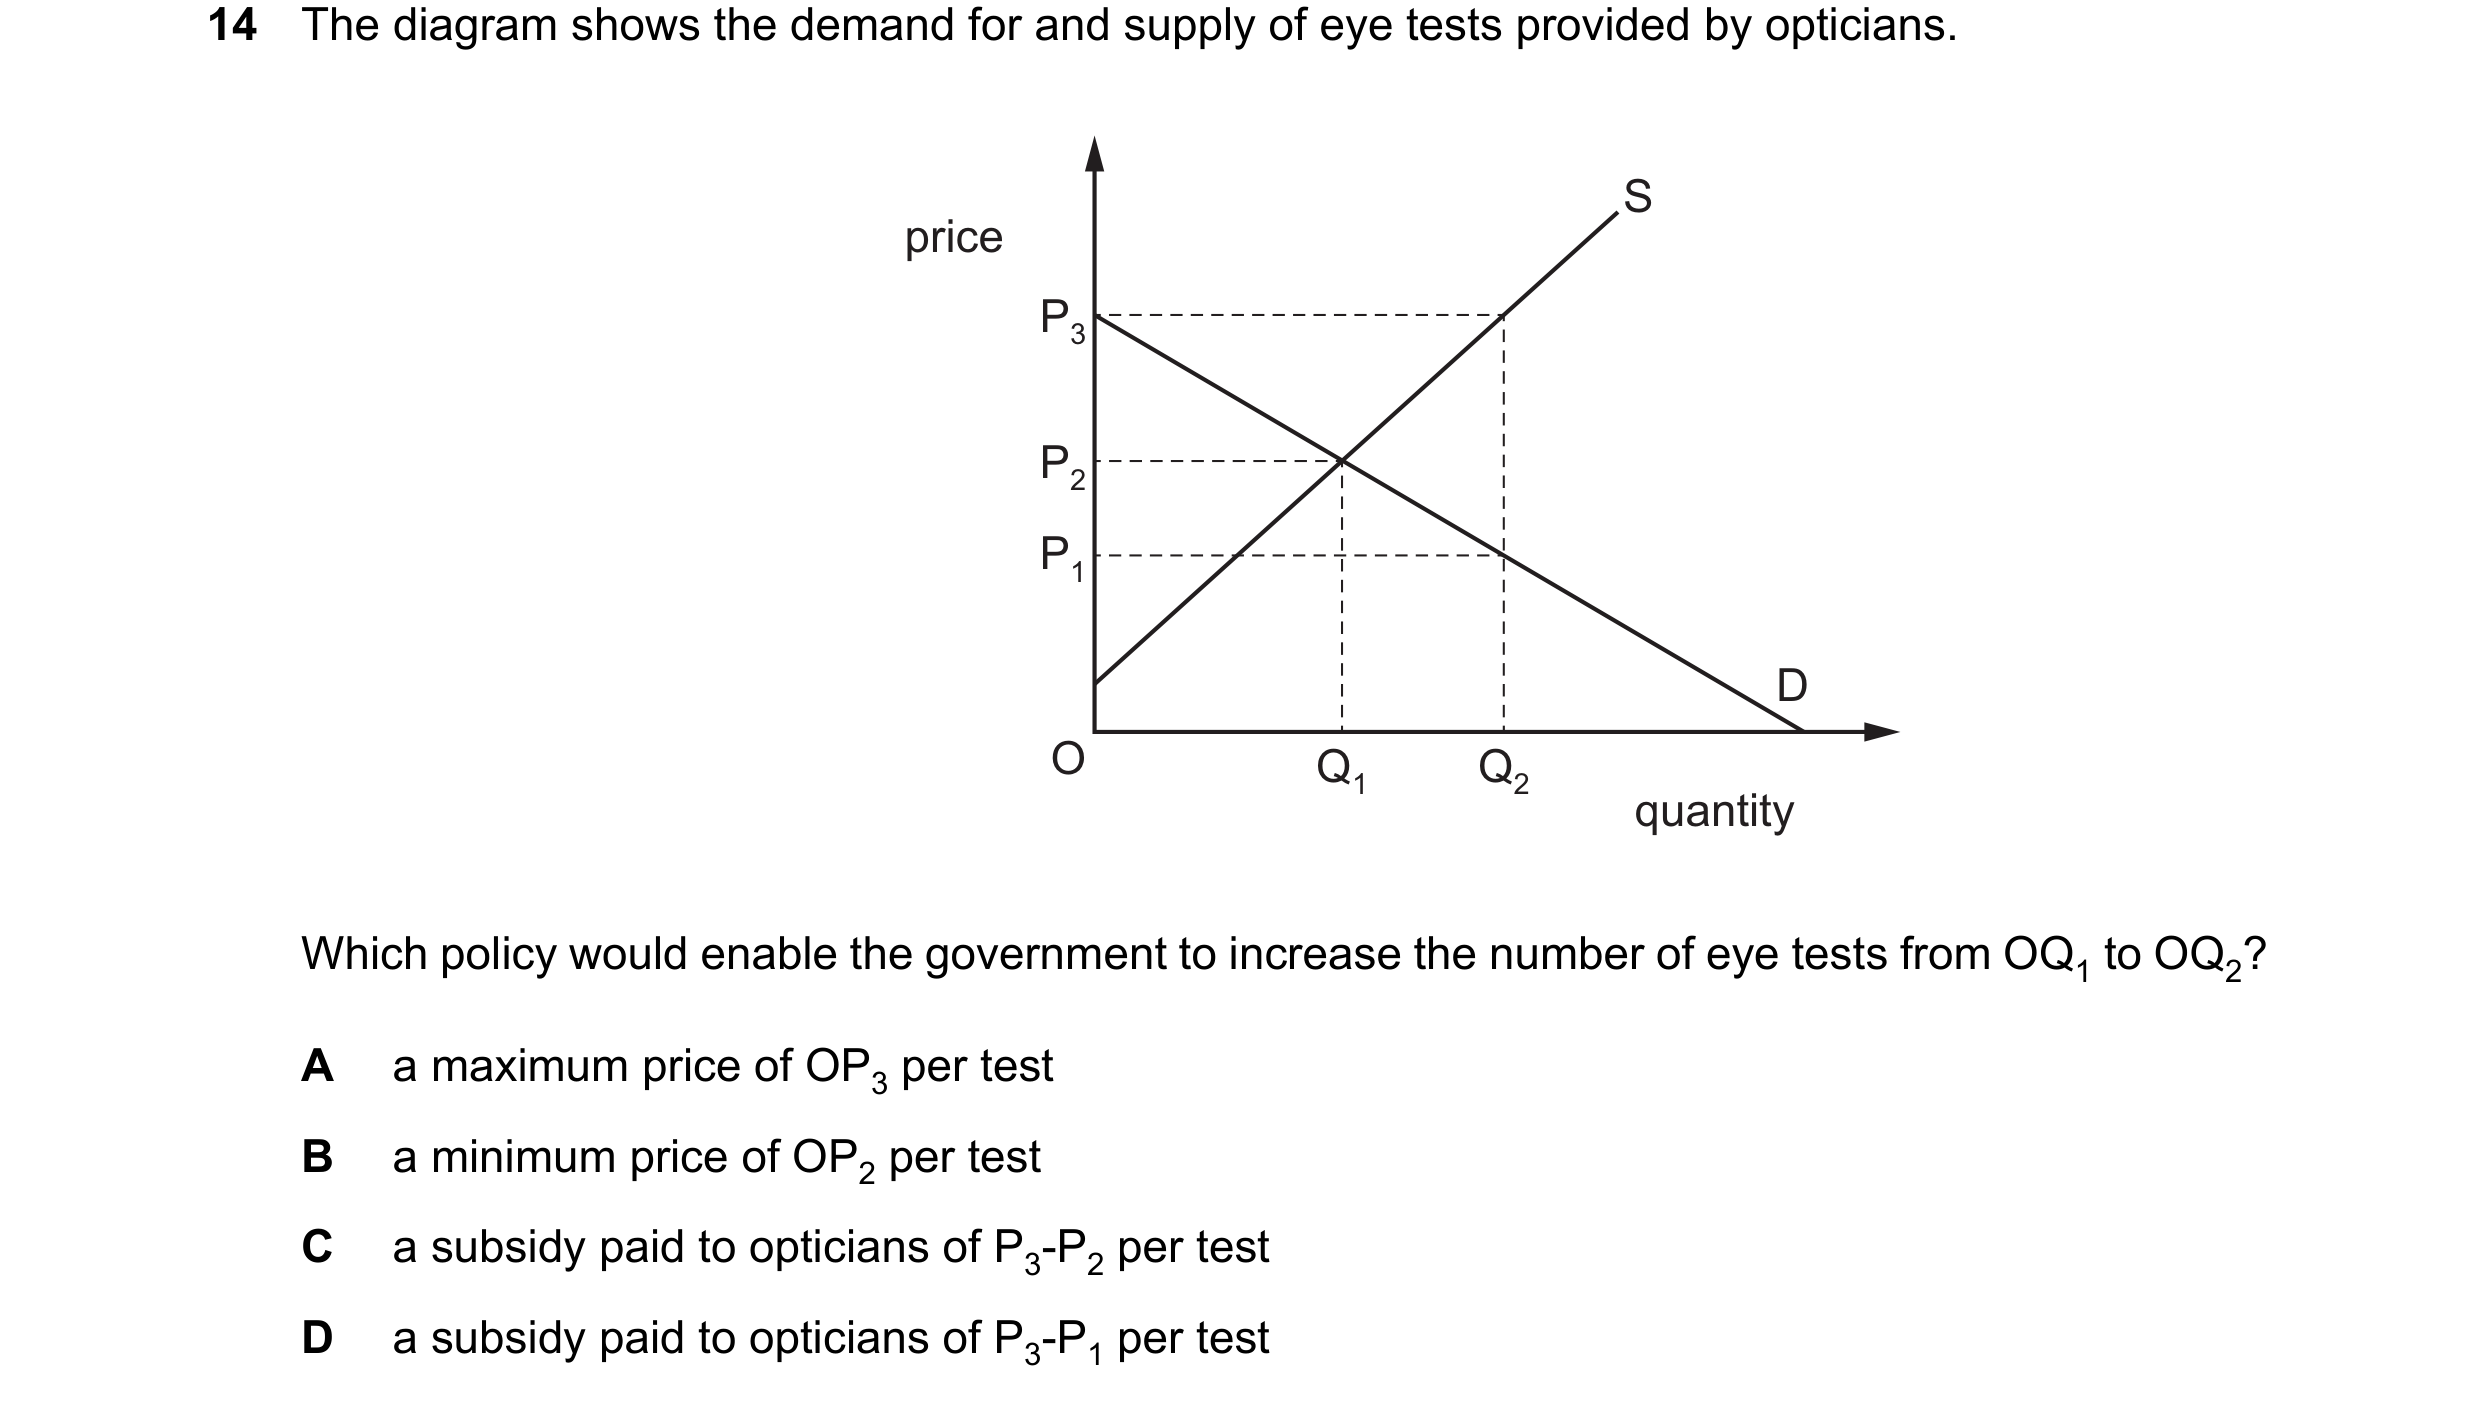 114 / 119
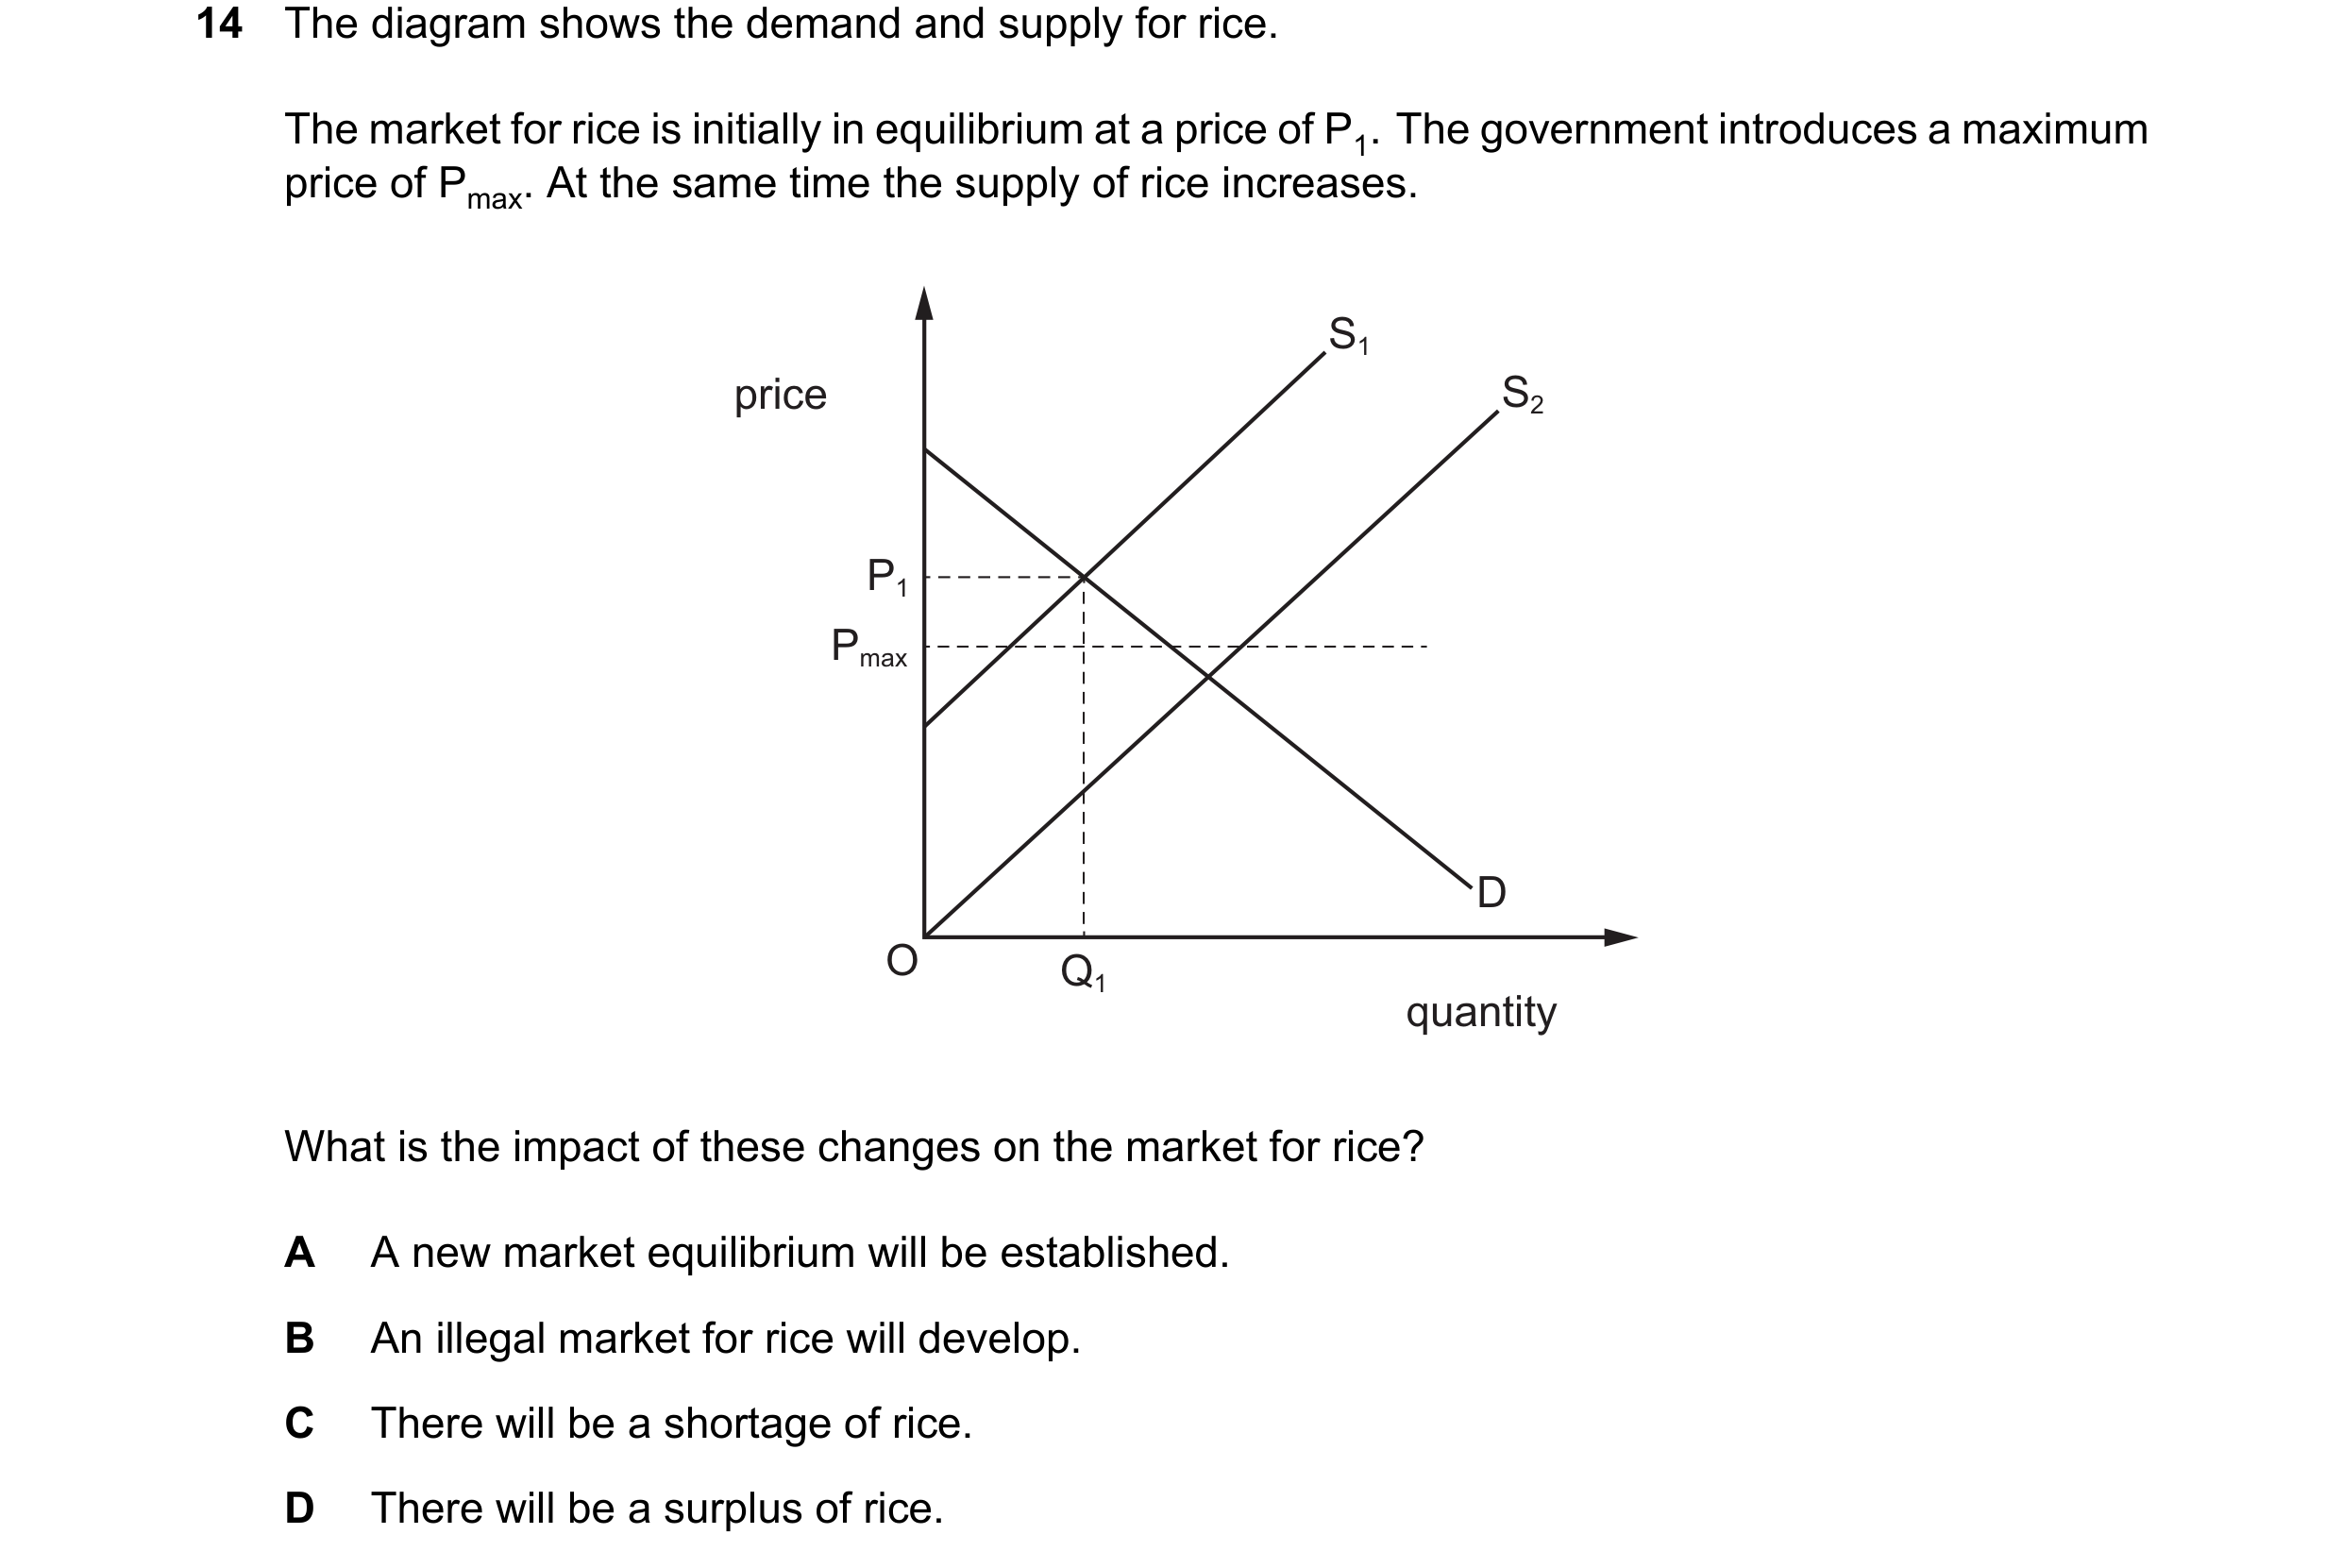 115 / 119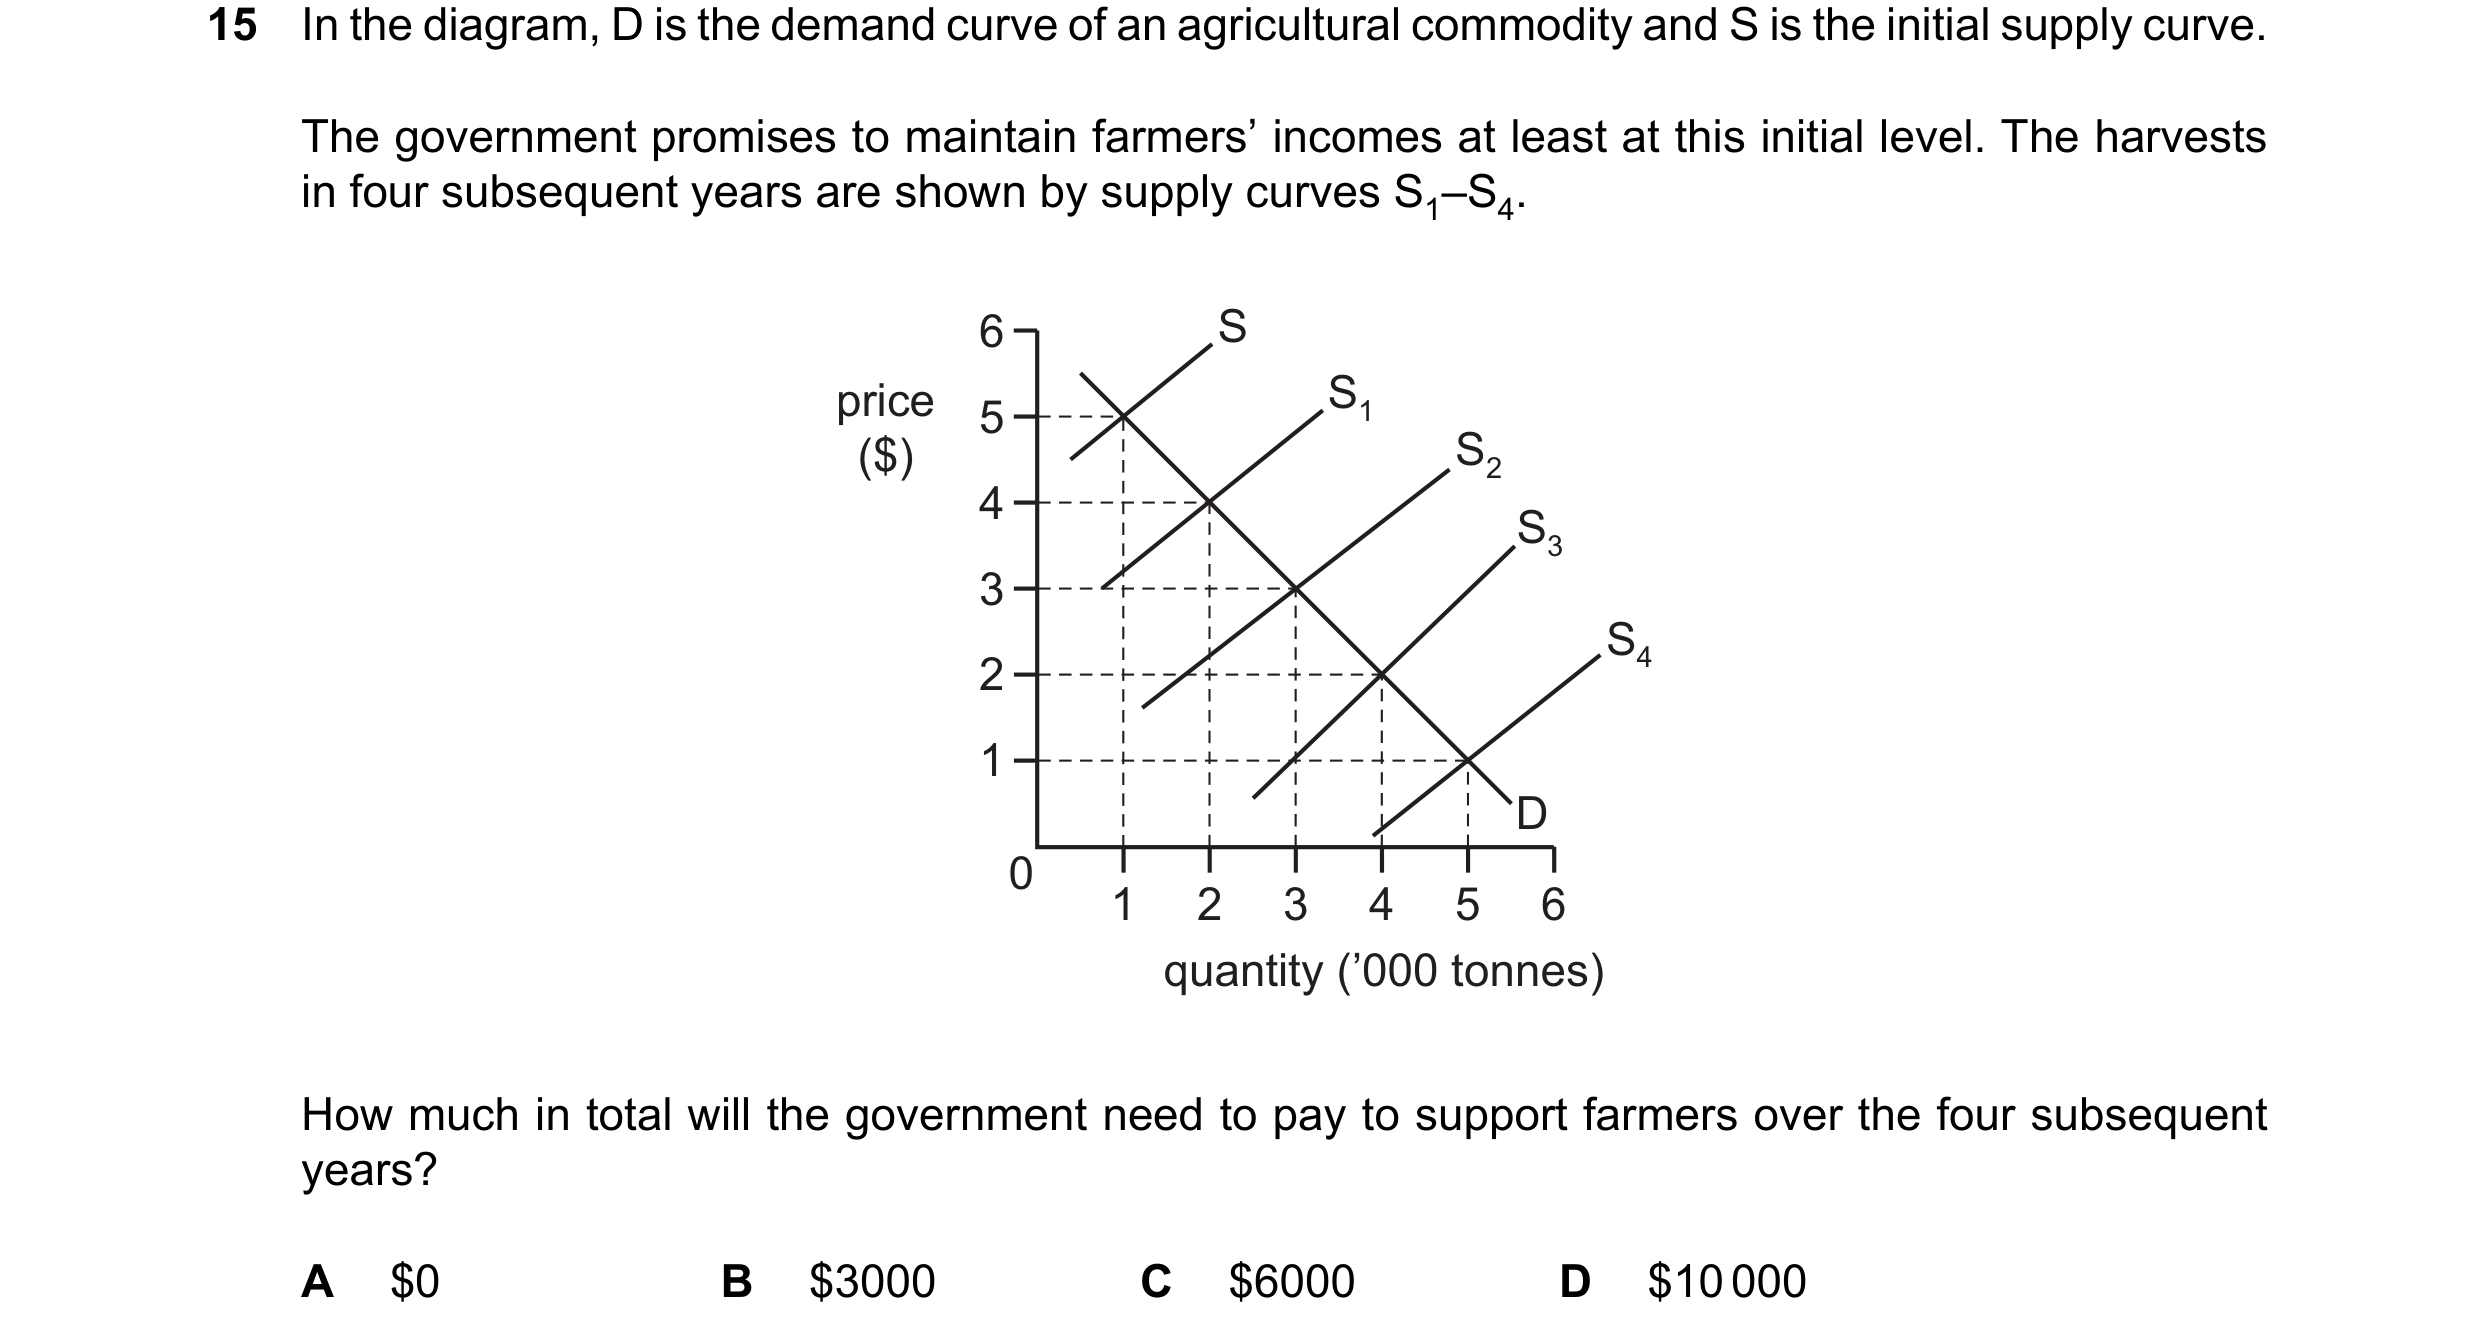

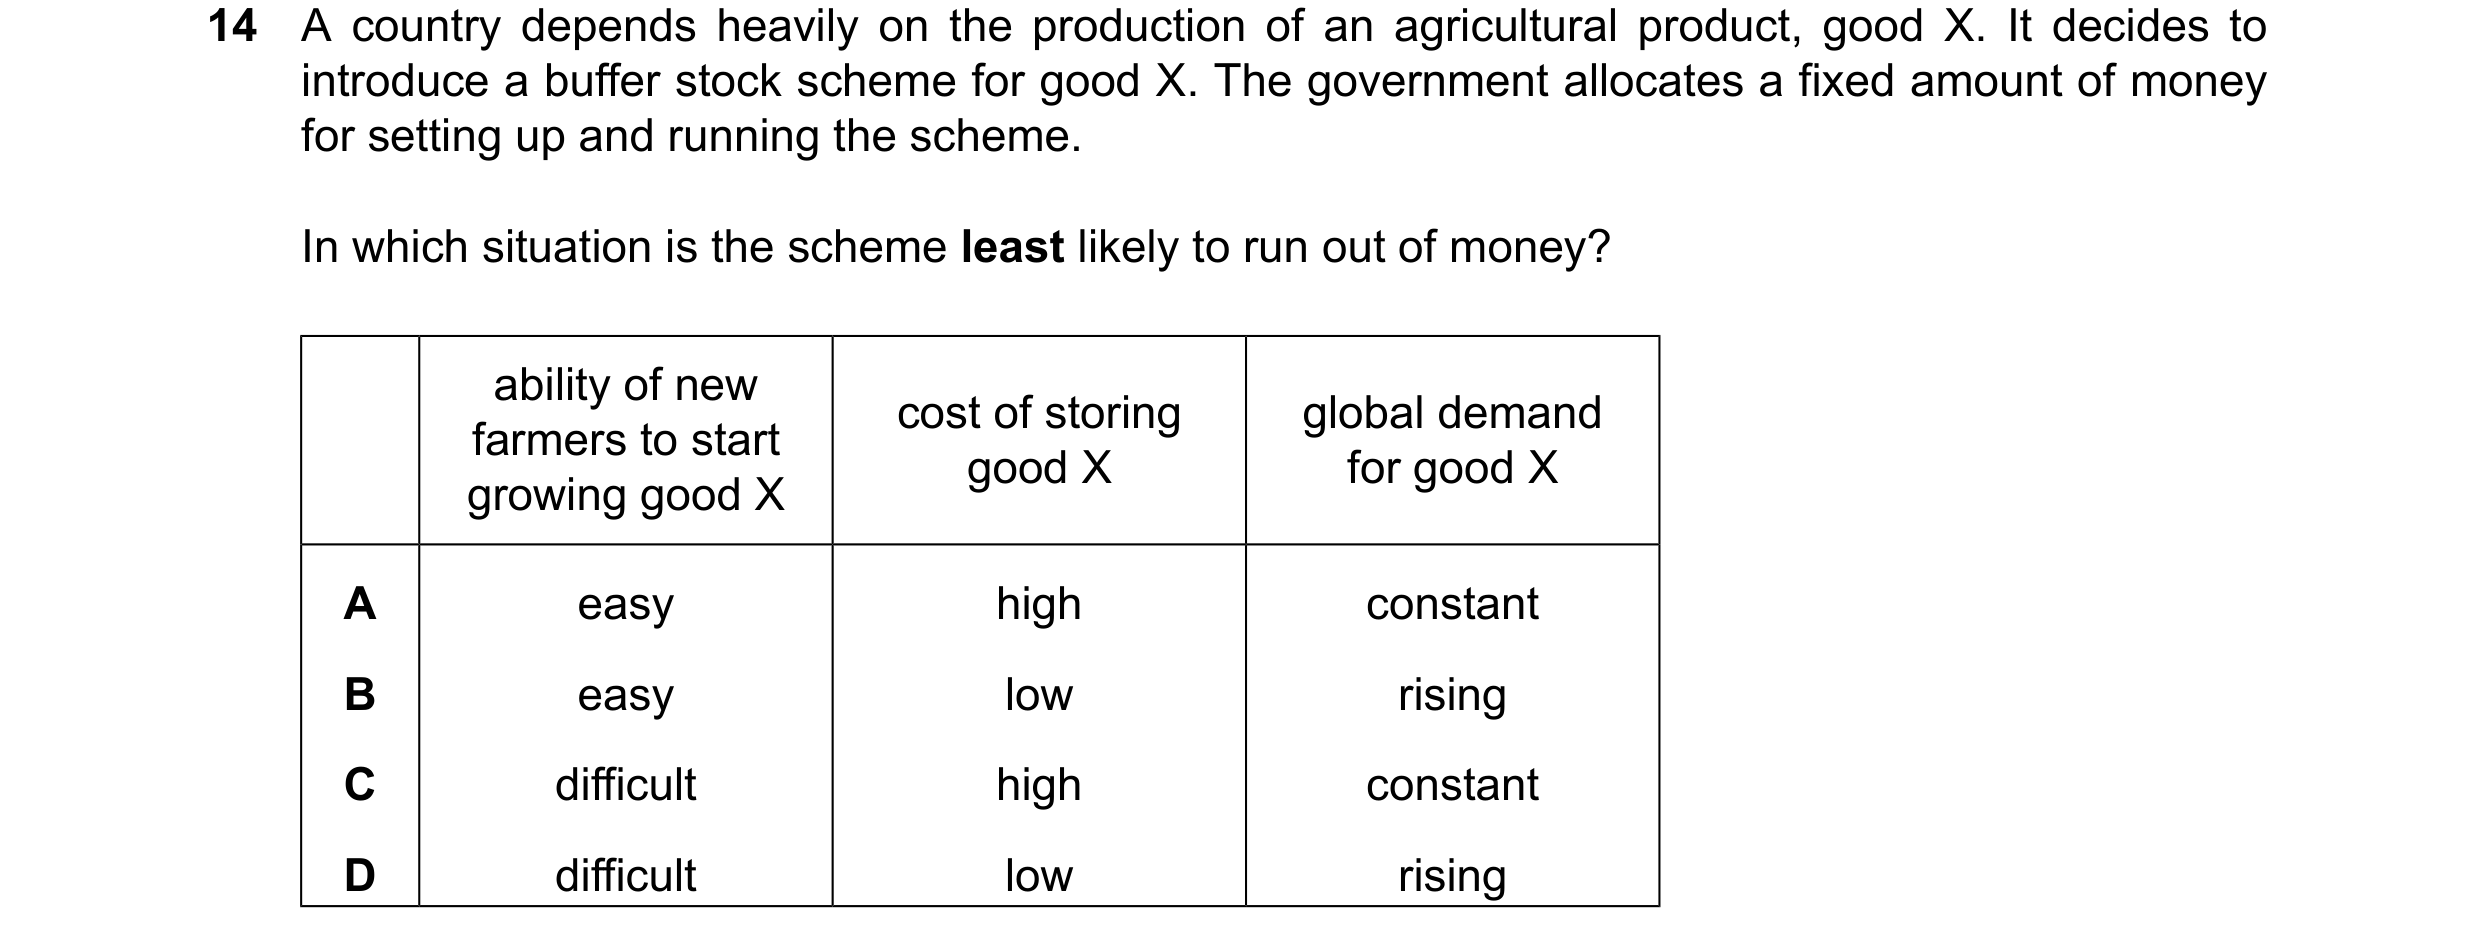
 116 / 119

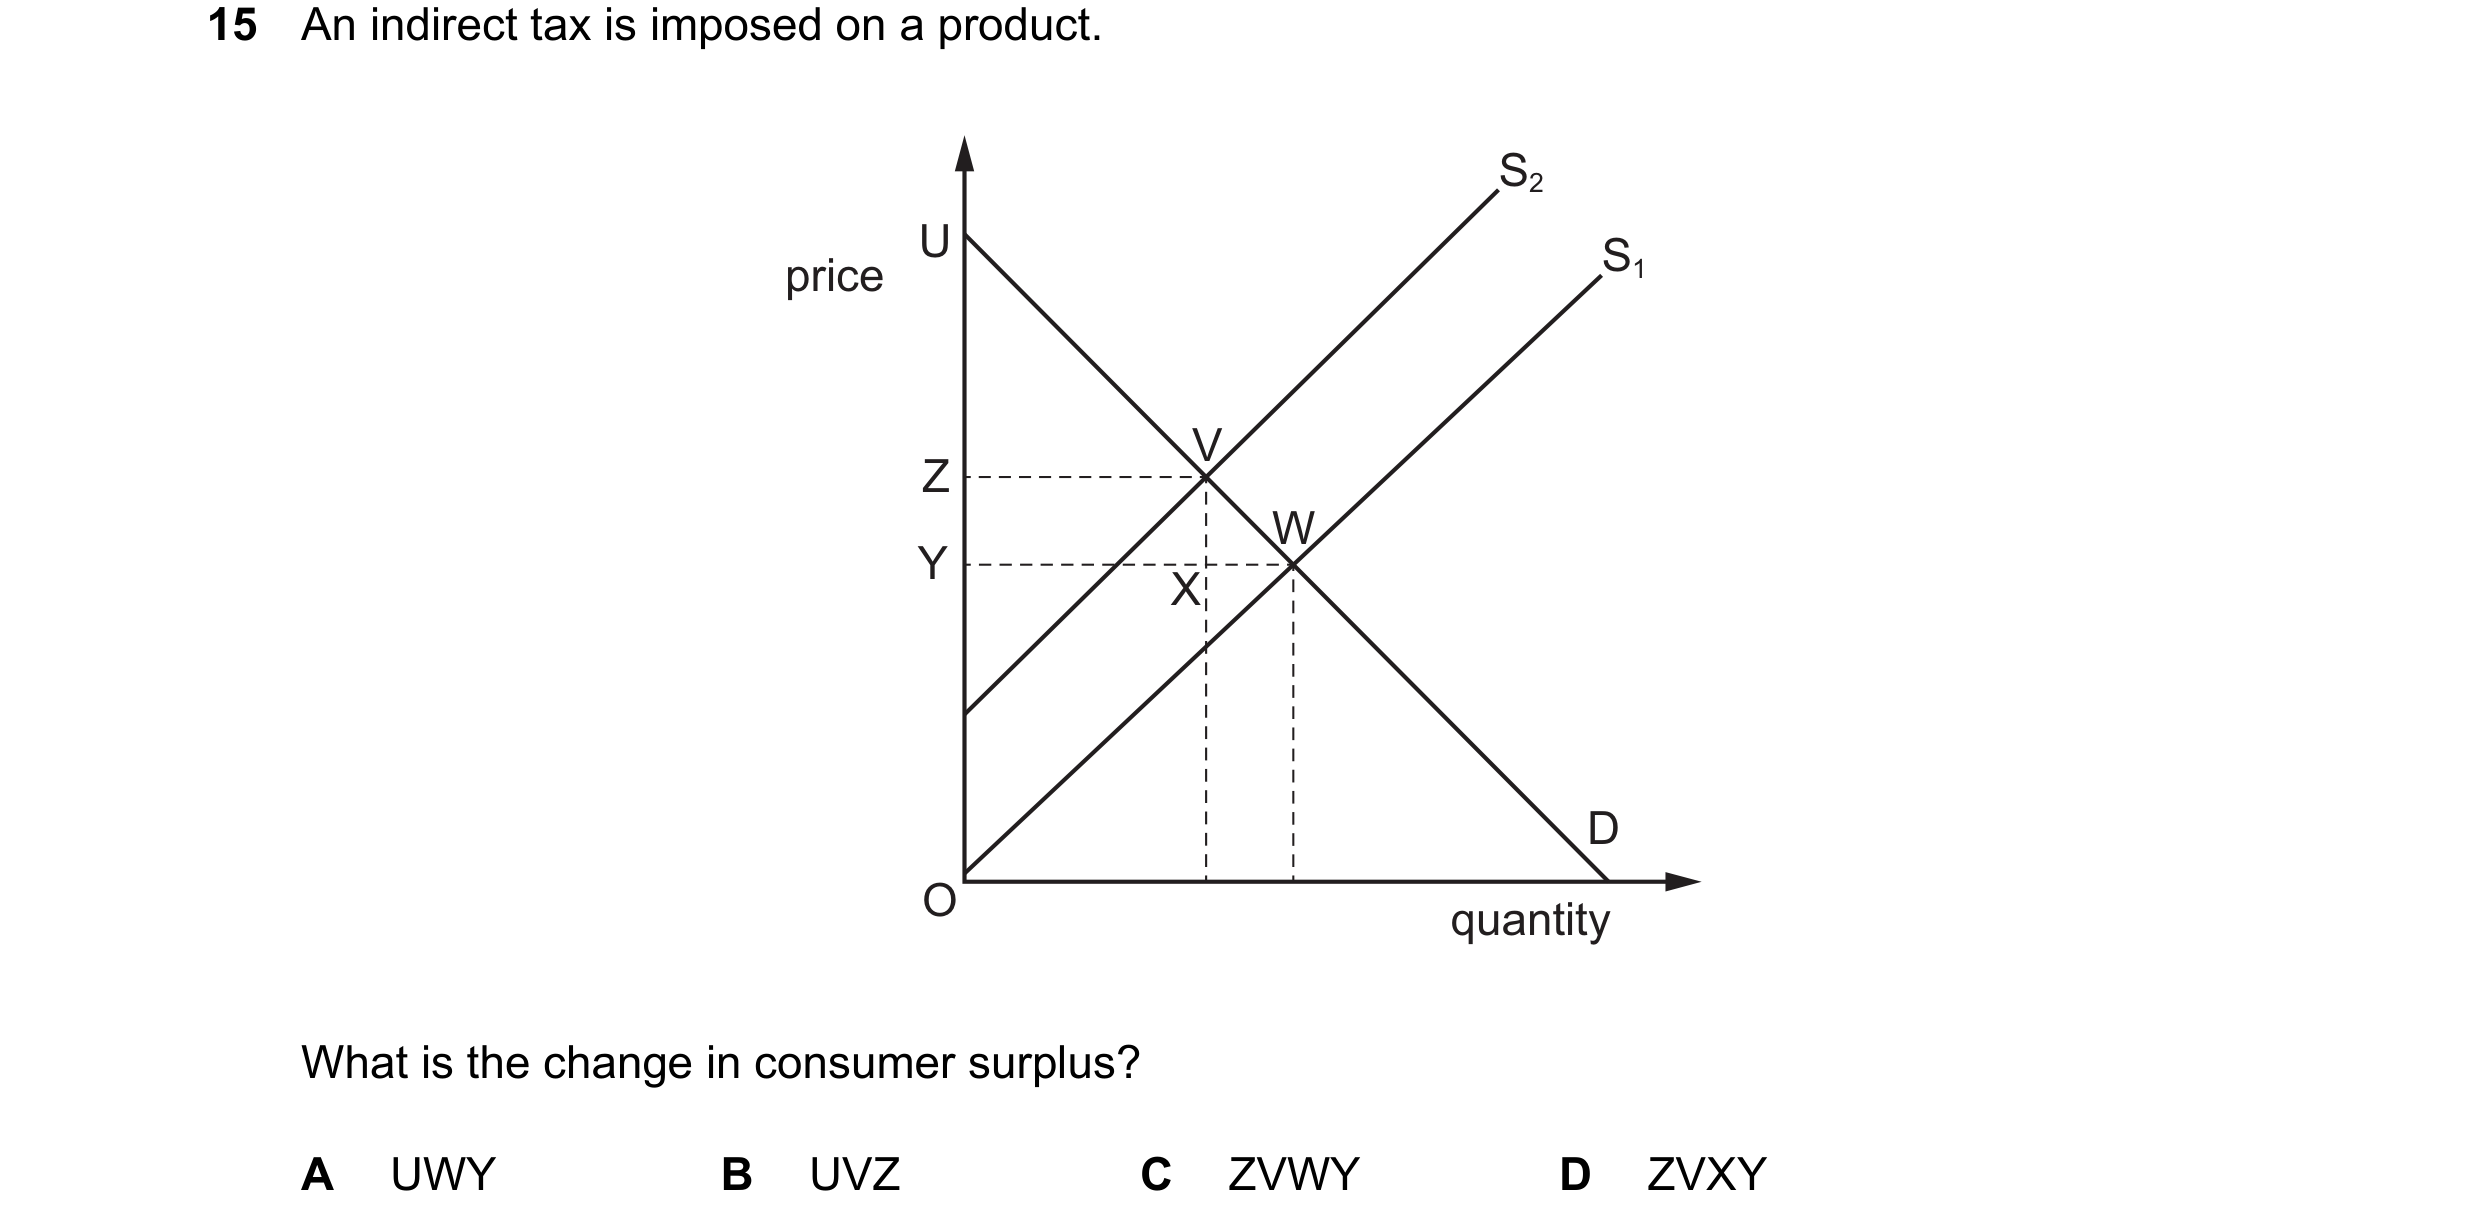
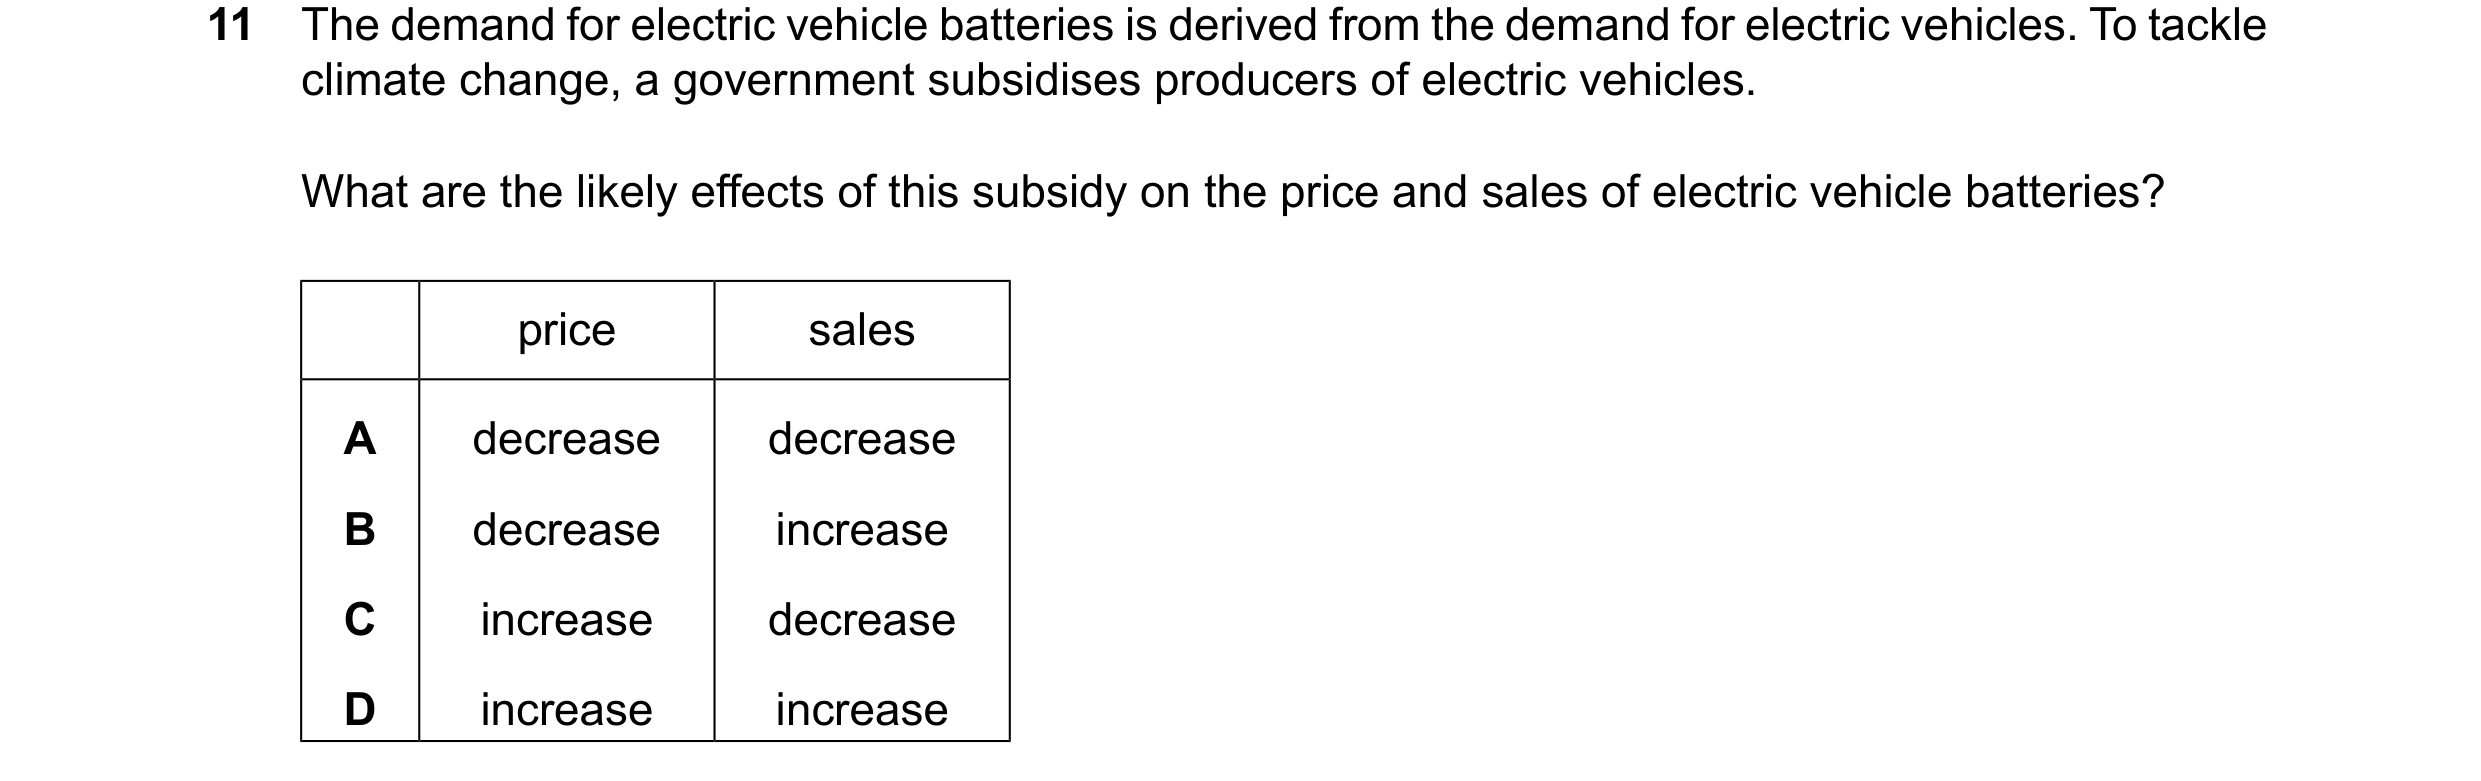 117 / 119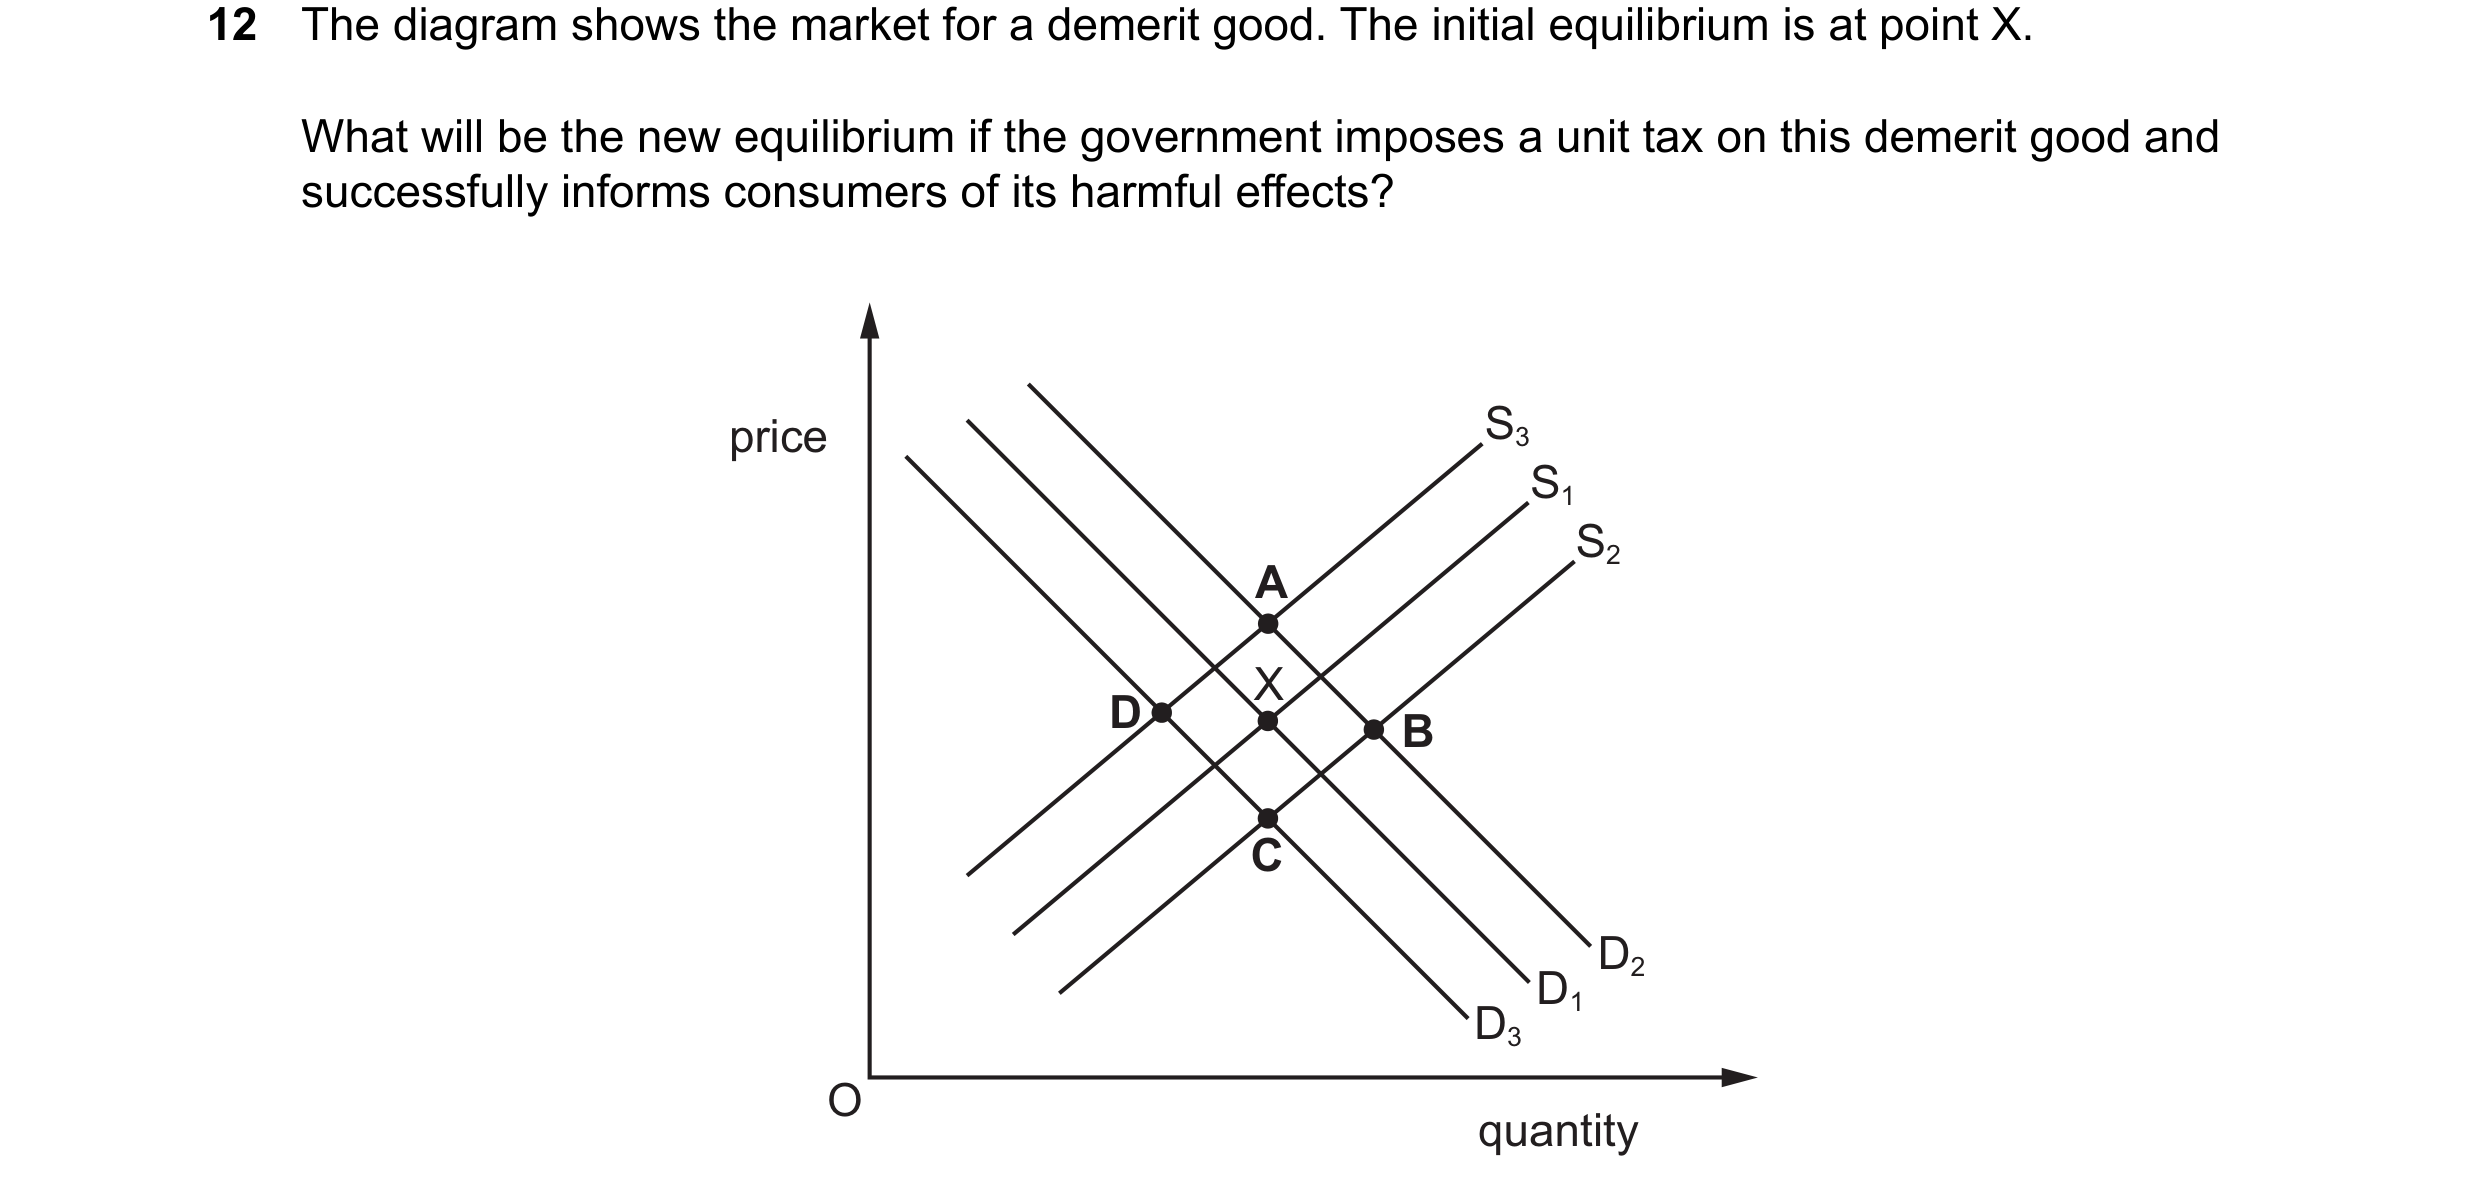
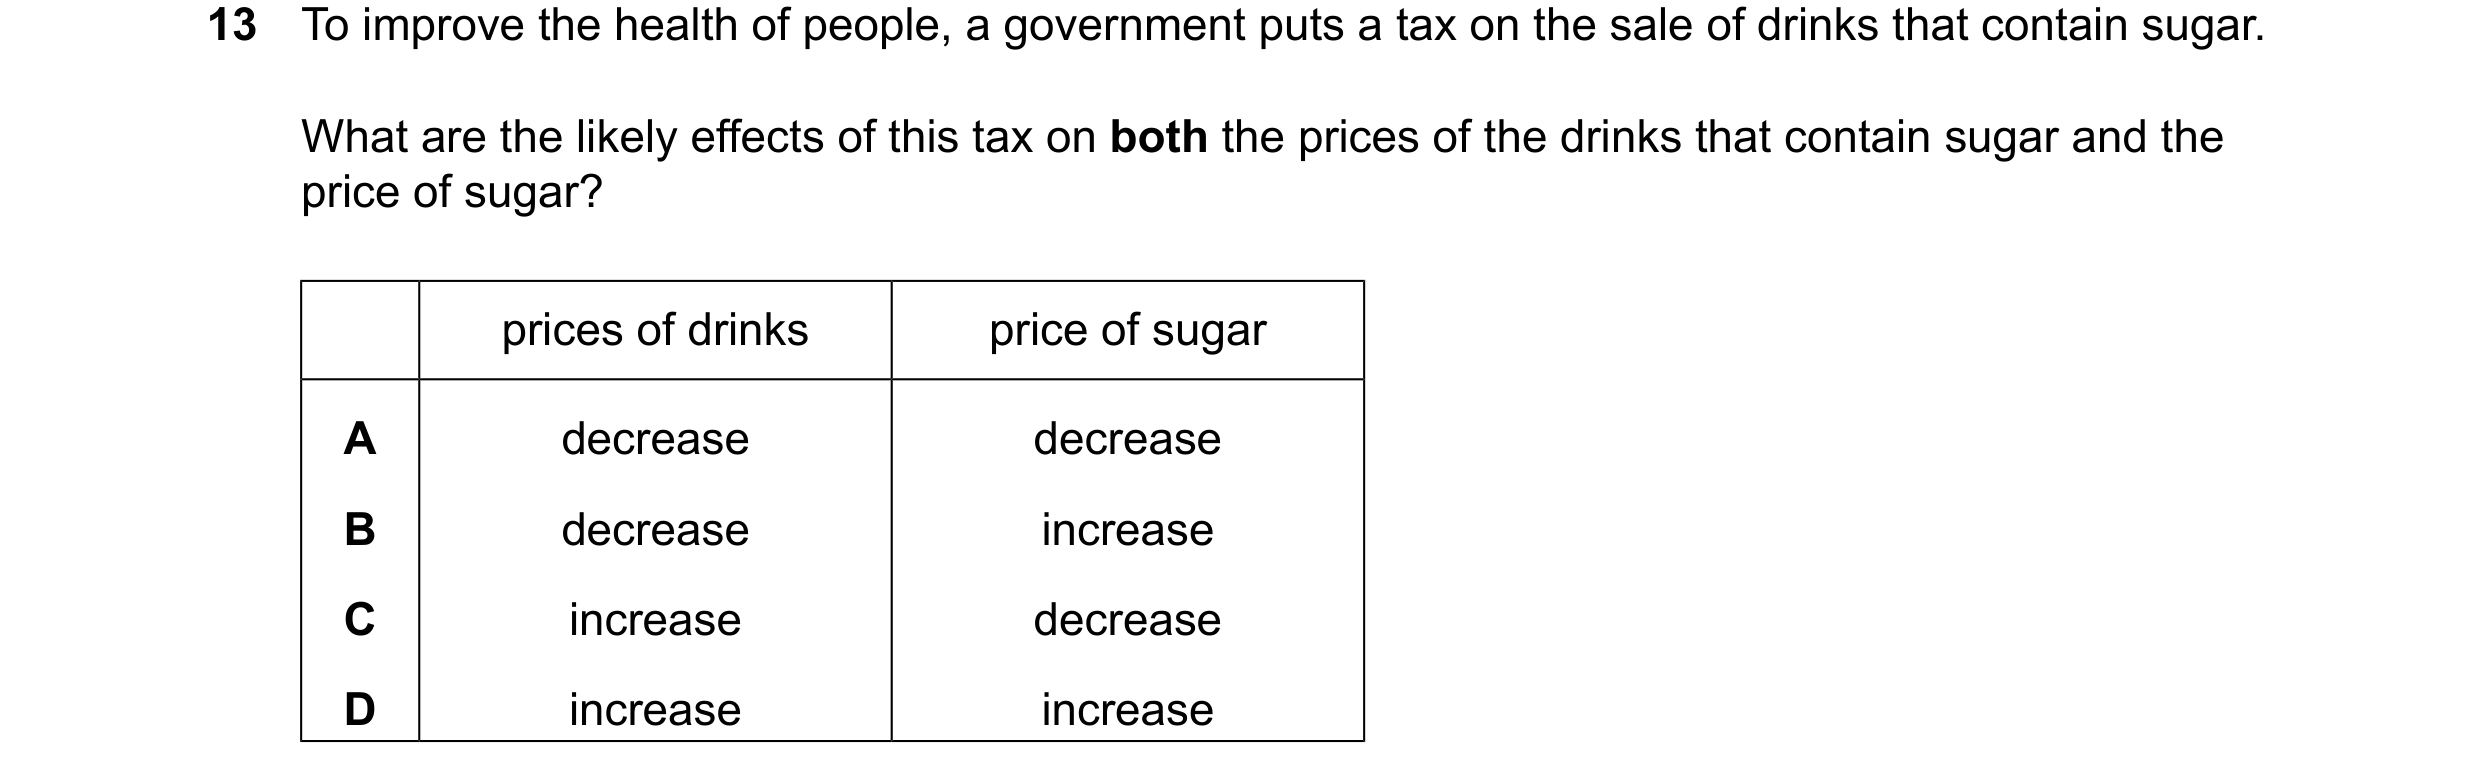
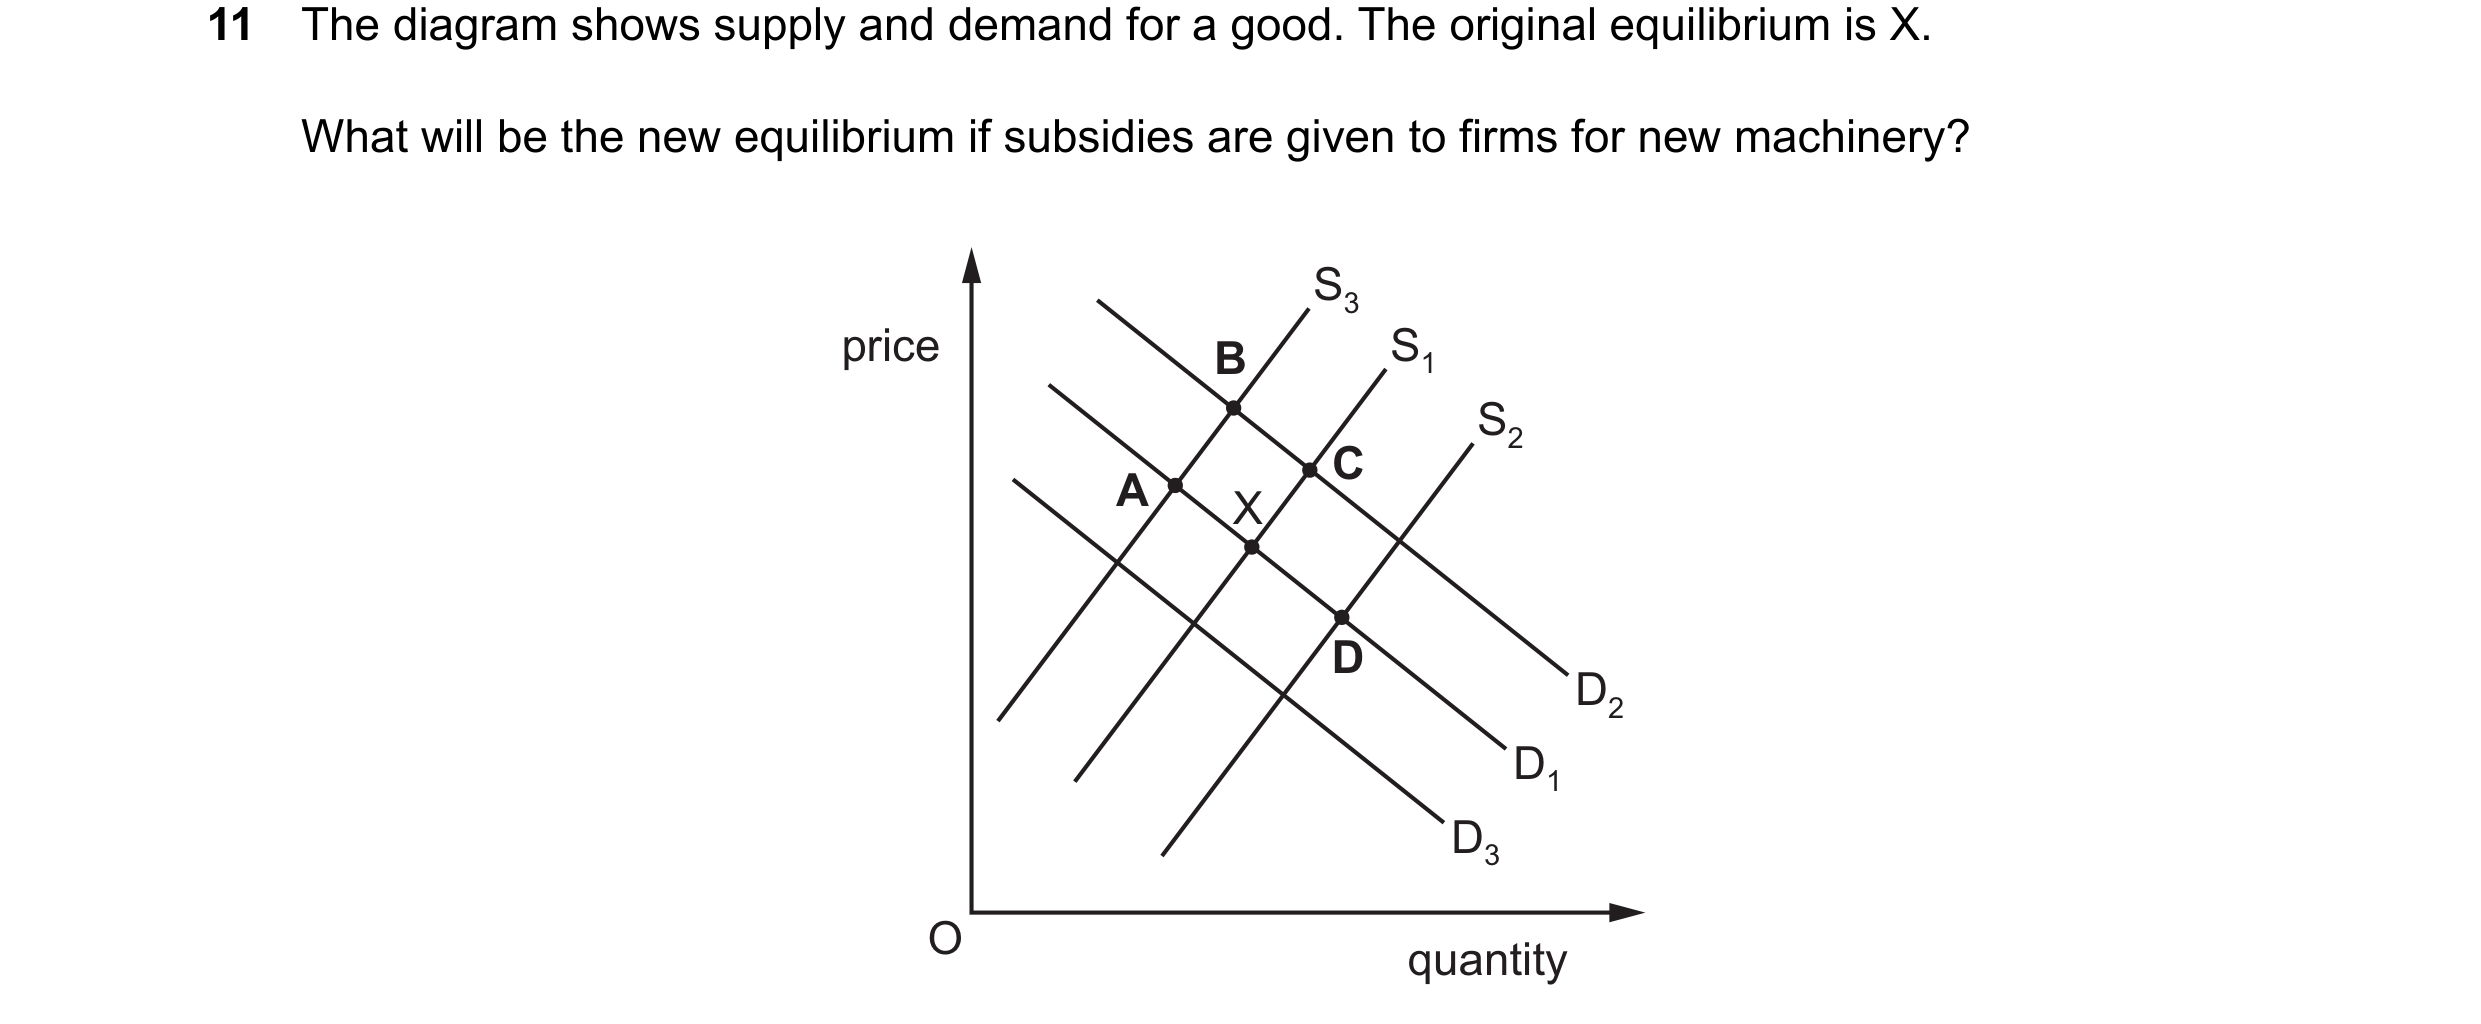 118 / 119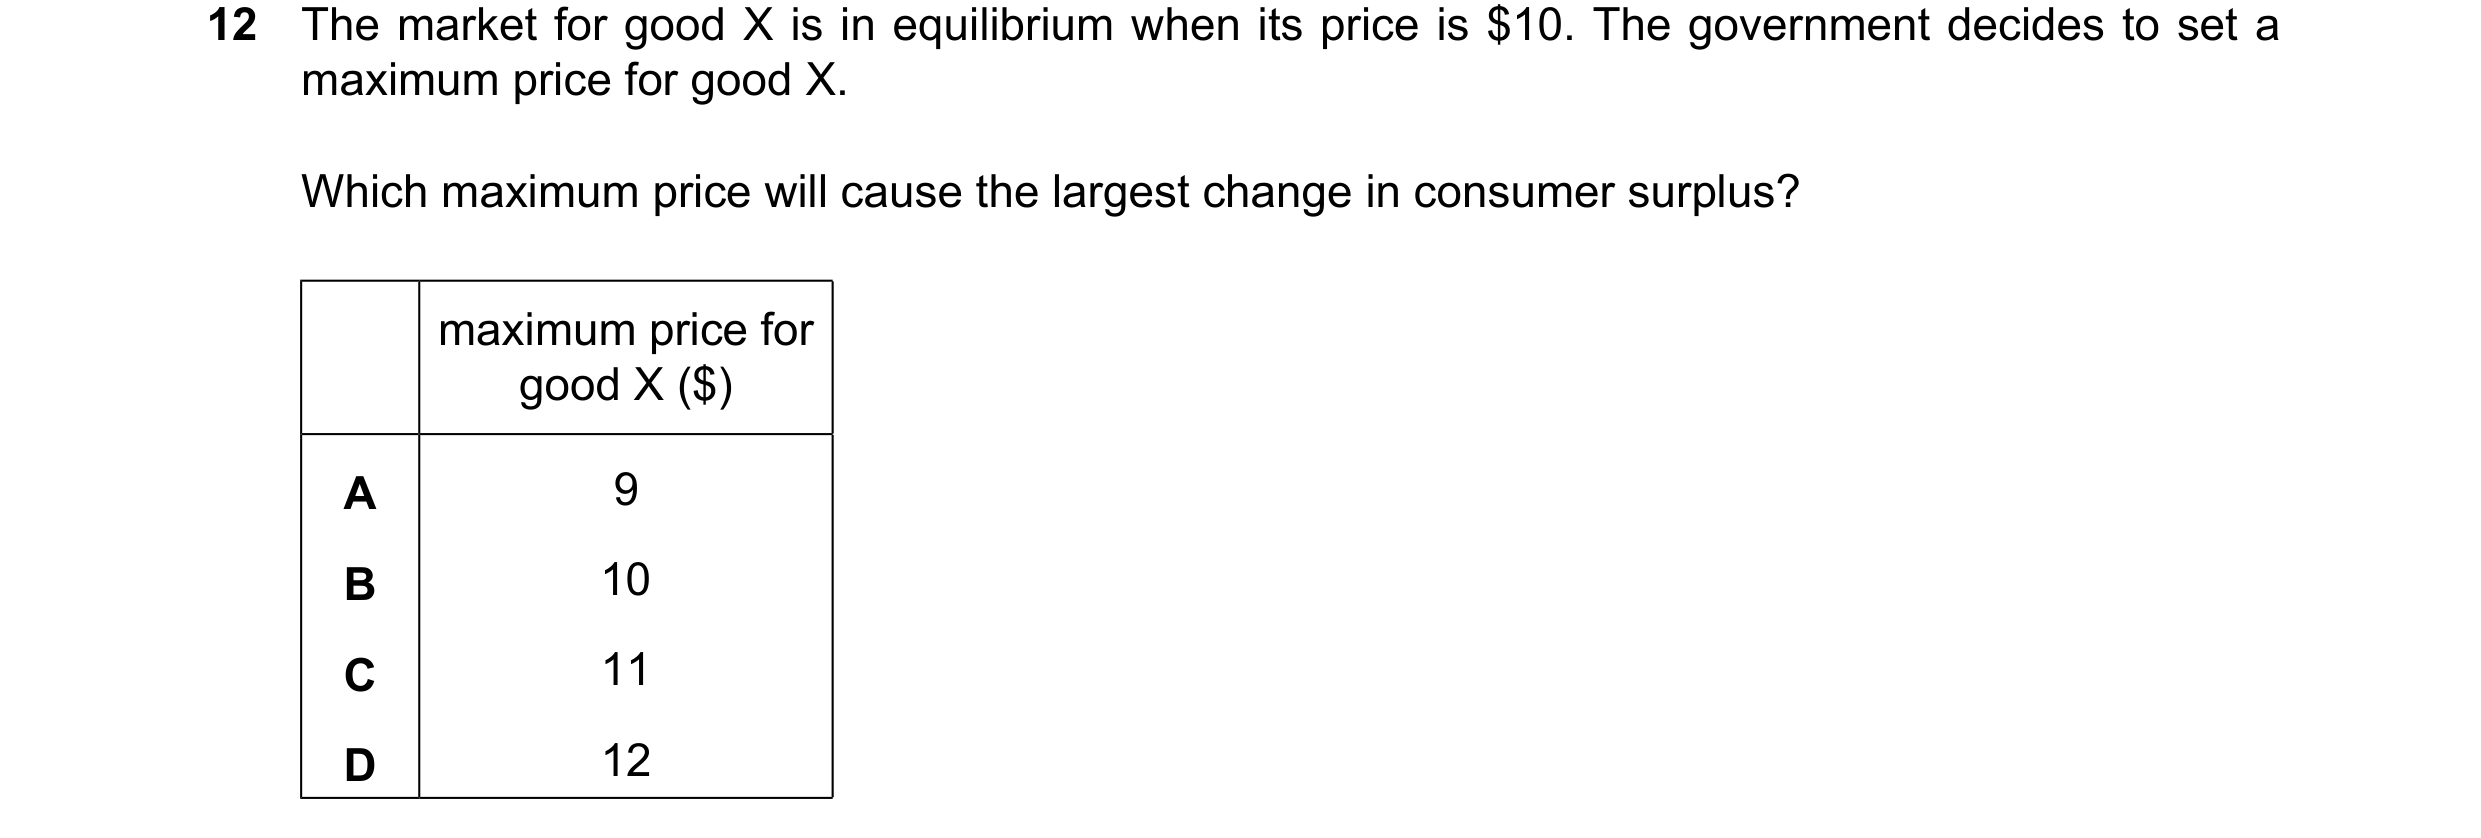

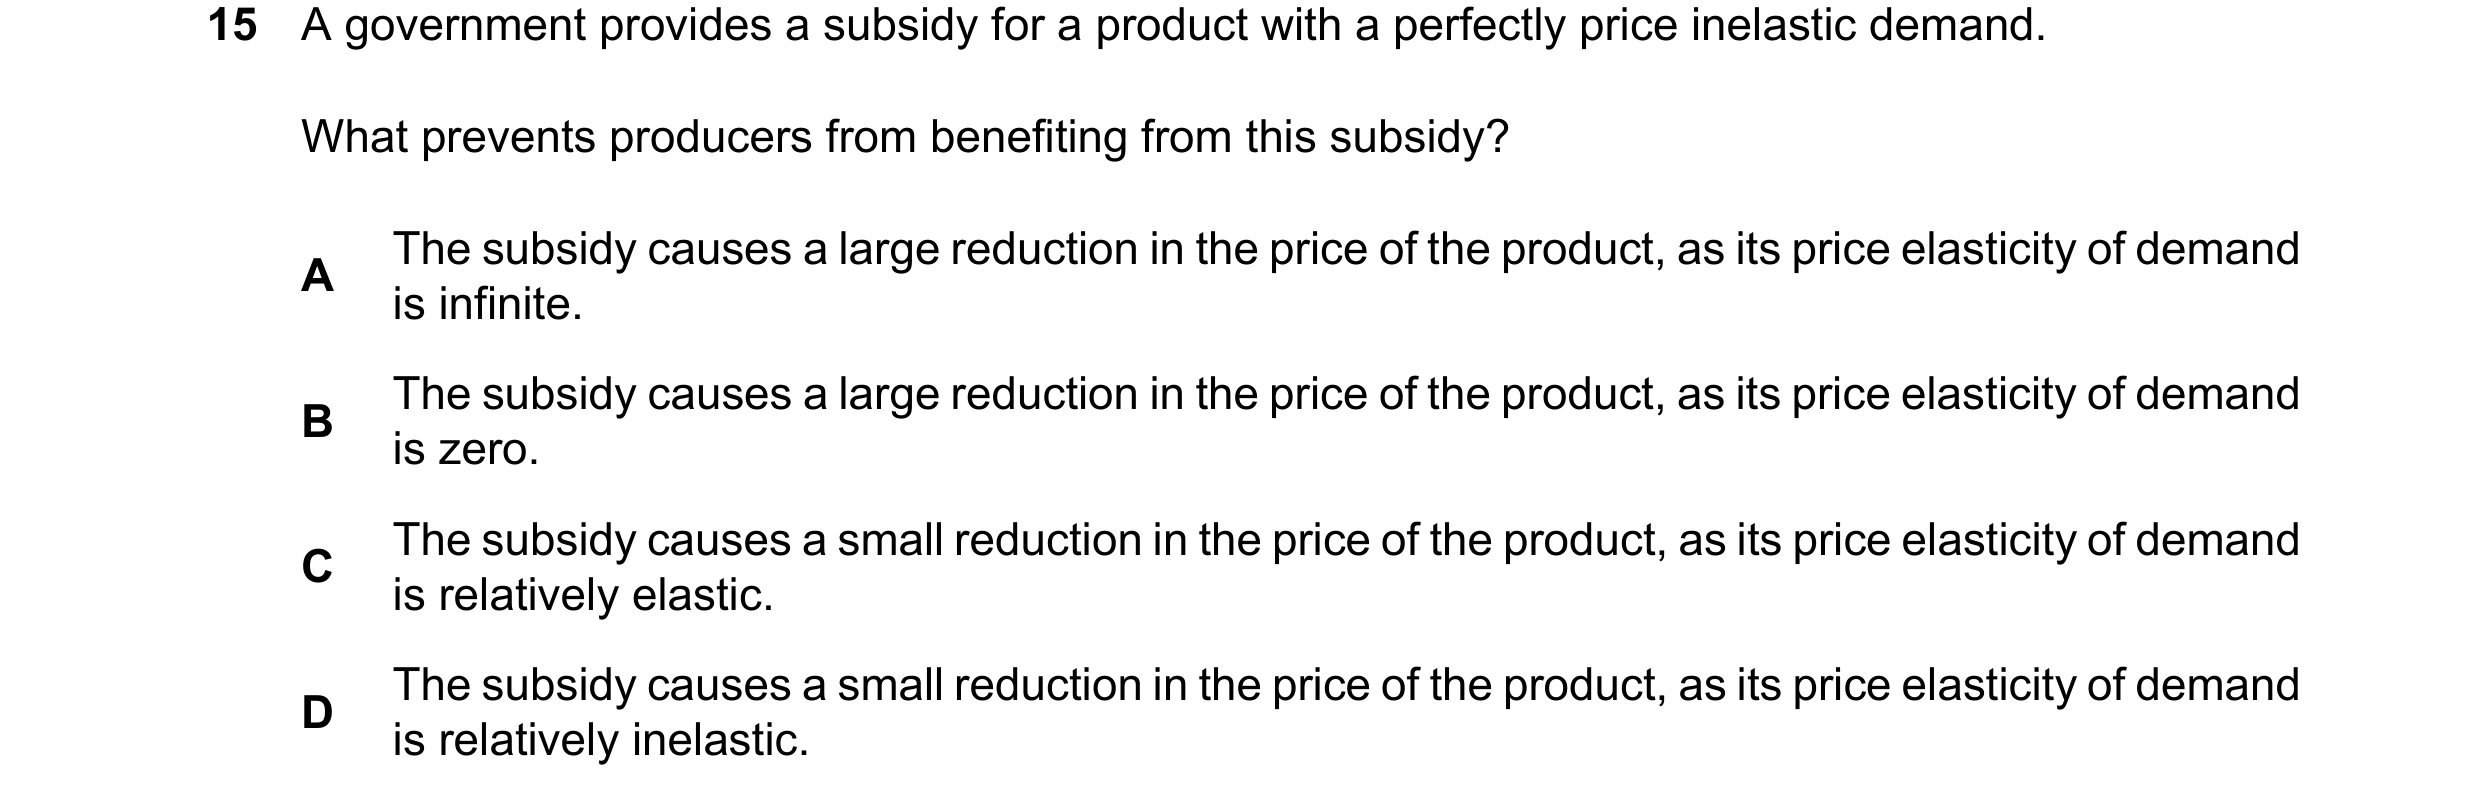
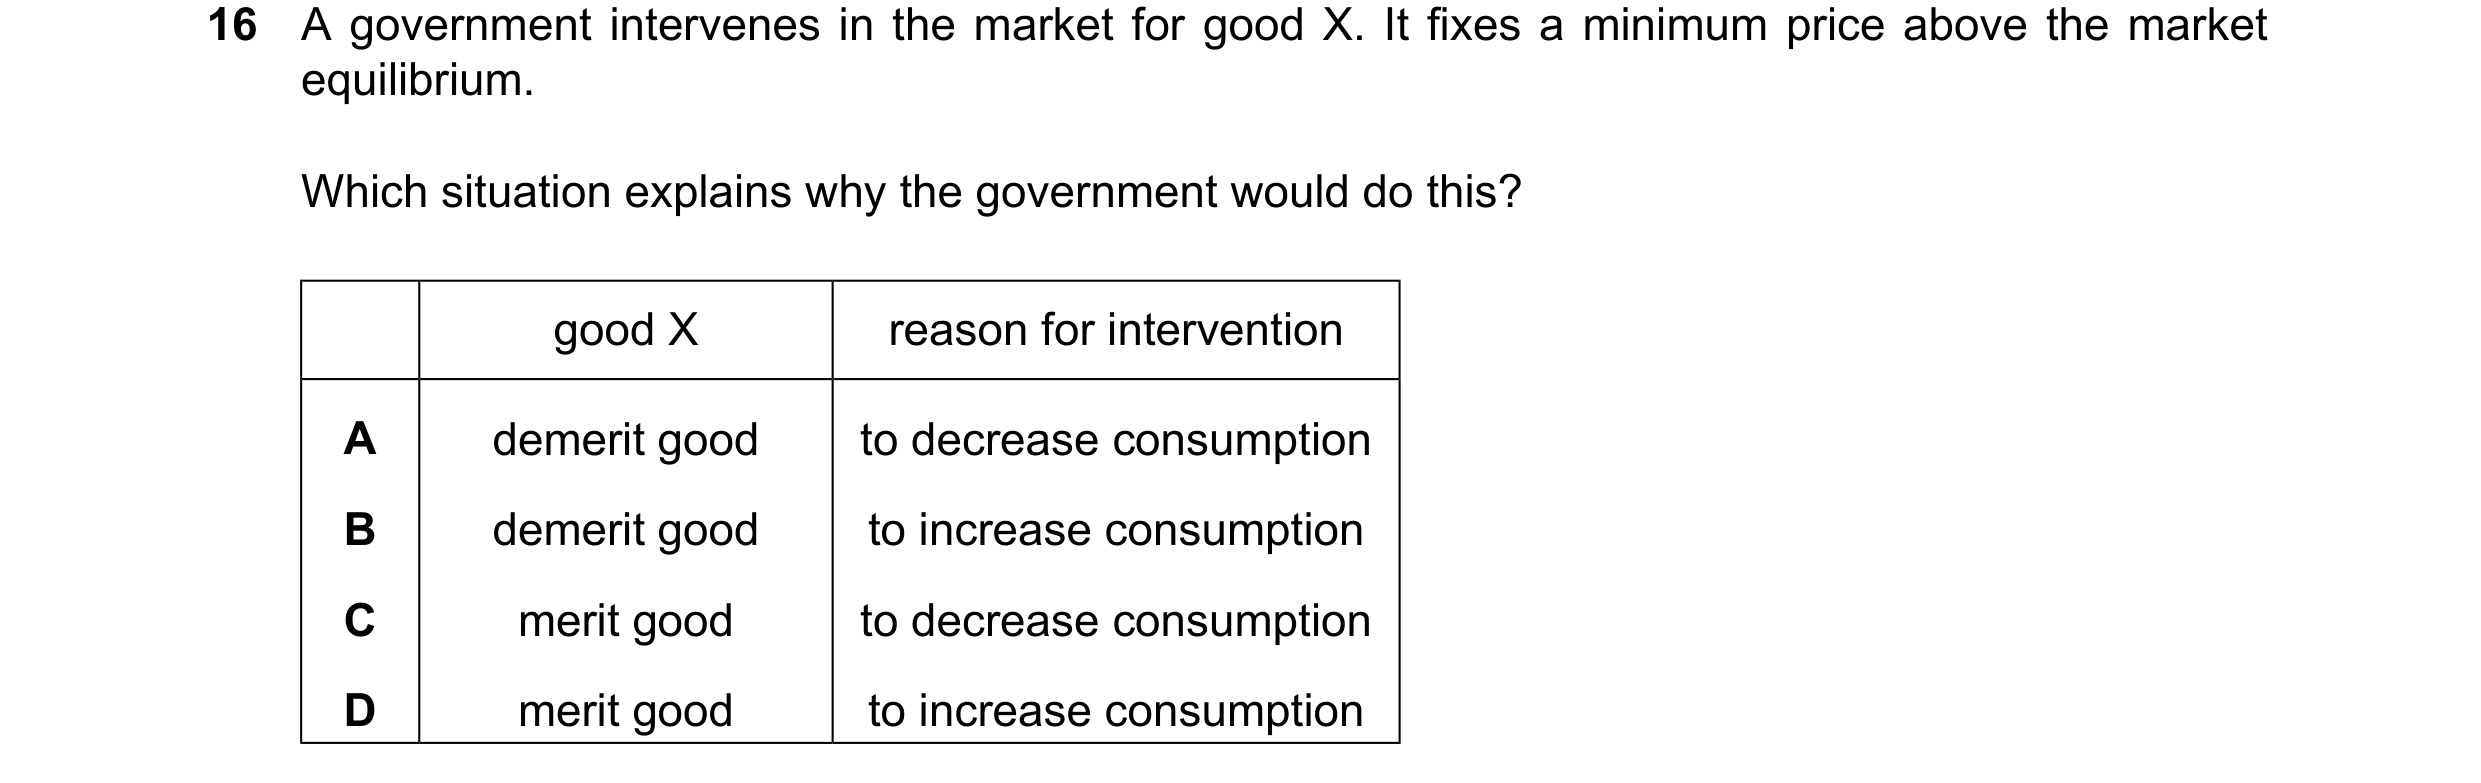 119 / 119