Questions as text
Q1 · Low-cost airlines For several decades, low-cost airlines have been competing on… 0455/22 Feb/March 2017
1 Low-cost airlines For several decades, low-cost airlines have been competing on short-distance flights not just with established airlines, but also with train travel and car travel. Now they are starting to compete with established airlines on long-distance flights. In response to this increased competition there have been some horizontal mergers occurring between the established airlines. It is predicted that by 2030 China will become the world’s largest domestic air travel market, with 20% of all global air travel. The USA is currently the dominant market and it is predicted that between 2015 and 2030 the country will order 6160 of the 28 000 passenger aircraft that will be produced. India, which has both state-owned and private-sector airlines, is experiencing a great increase in both internal flights and flights to other countries. More airports are being built in India, with more facilities being provided inside and around the airports. For example, more taxi firms are being set up to take passengers to and from the airports. The rapid expansion of air travel in India and other countries is having an impact on the market for pilots, as shown in Fig. 1. S price of pilots P2 P1 D2 D1 O Q1 Q2 quantity / number of pilots Fig. 1 The market for pilots How rapidly the Indian air travel market will grow will be influenced by a number of factors. These include the extent to which business travel will grow and how rapidly demand for foreign holidays will increase. Demand for these forms of air travel is, in turn, influenced by changes in price. The price elasticity of demand for air travel has been estimated at −1.2. One factor that influences prices, and so the inflation rate, is changes in taxation. (a) Identify, using information from the extract: (i) a substitute for air travel [1] (ii) a complement to air travel. [1] (b) Explain two advantages that firms may gain from a horizontal merger. [4] (c) Calculate, using information from the extract: (i) the percentage of the new passenger aircraft that the USA is predicted to purchase between 2015 and 2030 [2] (ii) the percentage change in demand for air travel if the price of air travel falls by 15%. [2] (d) Analyse why demand for a luxury holiday may be price elastic. [5] (e) Discuss whether airlines should be state-owned or operated by the private sector. [5] (f) Explain, using information from the extract and Fig. 1, what happened to the market for pilots in India in 2015. [4] (g) Discuss whether a cut in taxation will reduce inflation. [6]
30 marks
Mark scheme: 1(a) Using information from the extract, identify (i) a substitute and (ii) a complement to air travel. substitute: train travel/car travel (1) complement: taxi travel/foreign holidays (1). 2 1(b) Explain two advantages that firms may gain from a horizontal merger. 1 mark each for each of two advantages identified: • able to take advantage of economies of scale • increased market share/market power • rationalisation • exchange ideas/technology 1 mark each for each of two explanations: • larger firms may be able to reduce average costs/become more efficient/increase productivity • a direct competitor is eliminated • savings may be made by e.g. operating only one warehouse • increase innovation/better quality • higher profit 4 Not sufficient just to have higher demand on its own. 1(c)(i) Calculate the percentage of the new passenger aircraft that the USA are predicted to purchase between 2015 and 2030. 22% (2) Correct working i.e. 6160/28 000 × 100 (1). 2 1 mark if the final answer is different but 22% is given part way through the answer. 1(c)(ii) Calculate the percentage change in demand for air travel if the price of air travel falls by 15%. 18%/18 (2) Correct working i.e. – 1.2 × 15% or 0.18 (%). Or 1.8 (%) (1). 2 Question Answer Marks Guidance 1(d) Analyse why demand for a luxury holiday may be price-elastic. Price-elastic means a percentage change in price creates a greater percentage change in demand (1). A luxury holiday may have a substitute (1) in the form of another holiday (1) a rise in price will make substitutes relatively cheaper (1) demand will be more elastic the closer the substitute (1). Taking a luxury holiday can be postponed/does not have to be purchased (1) it is not a necessity (1). The purchase of a luxury holiday takes up a large proportion of people’s income (1) this would make the change in price more noticeable/more significant (1) a fall in price may make it affordable to many more people (1). 5 1(e) Discuss whether airlines should be state-owned or operated by the private sector. Up to 3 marks for why they should be state-owned: The government will base decisions on social costs and benefits (1) may try to cut down on pollution (1) may be less chance of market failure occurring (1) may carry out a CBA (1). The government may act in the public interest/aim may be to promote welfare (1) may be safer (1). The government may keep prices low (1) to ensure access to flights (1). The government may have more funds available (1) may be able to operate them on a large scale (1) enjoy economies of scale (1). The government may employ more workers (1) to keep unemployment low (1). If profitable can provide funds for the government (1) increase ability of government to spend on e.g. education (1). Up to 3 marks for why they should be operated by the private sector: Profit motive (1) may make the firm/s more responsive to consumer demand (1) may provide better quality (1). Will not require tax revenue/allow government to concentrate on other areas (1) tax revenue can be used for other purposes/example of what revenue could be spent on (1). State-owned may be a monopoly/may be more competition in the private sector (1) competition may drive down price (1) may provide more choice (1). 5 Question Answer Marks Guidance 1(f) Using information from the extract including Fig. 1, explain what happened to the market for pilots in India in 2015. The diagram shows demand increasing (1) inelastic demand (1) wages / prices rising (1) supply extending / more pilots (1) inelastic supply (1) due to countries wanting to recruit more pilots/increased demand for flights (1). 4 1(g) Discuss whether a cut in taxation will reduce inflation. Up to 4 marks for why it might: A cut in indirect taxes/corporation tax (1) will reduce firms’ costs of production (1) reduce cost-push inflation (1). A cut in tariffs (1) will lower cost of imports (1) reduce price of products consumers buy (1). Lower taxes may increase incentives (1) increase supply (1) reduce costs (1) lower cost-push inflation (1). Up to 4 marks for why it might not: A cut in income tax (1) will increase disposable income/increase purchasing power (1) increase demand (1) firms raise prices to increase profits (1) increase demand-pull inflation (1). Lower indirect taxes (1) may not be passed on to consumers in lower prices (1). 6 Note: maximum of 2 if no link to inflation,
This question in 0455/22 Feb/March 2017
Q2 · The amount that workers earn influences their living standards 0455/22 Feb/March 2017
4 The amount that workers earn influences their living standards. Some workers receive relatively low pay. There are a number of ways a government can help the low-paid. (a) Identify two wage factors that workers take into account when deciding on their occupation. [2] (b) Explain two indicators of living standards. [4] (c) Analyse how fiscal policy can produce a more even distribution of income. [6] (d) Discuss whether a rise in the wages paid to low-paid workers would benefit an economy. [8]
20 marks
Mark scheme: 4(a) Identify two wage factors that workers take into account when deciding on their occupation. 1 mark each for each of two wage factors: • wage rate/pay/income • bonuses • overtime payments • commission 2 4(b) Explain two indicators of living standards. 1 mark each for each of two indicators identified: • GDP per head/average income • HDI • e.g. cars per household 1 mark each for each of two explanations given: • total income divided by population • includes income per head, education and life expectancy • gives an indication of the goods and services households can enjoy. 4 No credit for GDP on its own. If real GDP per head is referred to, credit can be given for explanation of ‘real’. Two of three components of HDI accepted. 4(c) Analyse how fiscal policy can produce a more even distribution of income. An increase in a progressive tax (1) taking a larger percentage of the income of the rich (1). A decrease in a regressive tax (1) reducing the percentage of the income of the poor taken in tax (1). Government spending on benefits (1) e.g. benefits given to the unemployed / pensioners (1). Government spending on education / healthcare (1) may increase the earning potential of the poor (1). Government spending/cut in taxes can increase total (aggregate) demand (1) move people from unemployment to employment (1). 6 Question Answer Marks Guidance 4(d) Discuss whether a rise in the wages paid to low-paid workers would benefit an economy. Up to 5 marks for why it might: May reduce poverty/increase living standards (1) giving access to basic necessities (1). May increase motivation of low-paid workers (1) raise productivity (1) increase output/raise GDP/cause economic growth (1) increase quality of output (1) reduce costs of production (1). May make income more evenly distributed (1). May increase total demand (1) raising employment (1). Greater tax revenue (1) may enable government to spend more on e.g. education/health care (1) greater literacy/longer life expectancy (1). May enable the poor to spend more on the education of their children (1) raise their productivity (1) Up to 5 marks for why it might not: May increase costs of production (1) may cause cost-push inflation (1). To reduce costs of production (1) firms may make workers redundant/increase unemployment (1). May increase total (aggregate) demand (1) cause demand-pull inflation (1). Low-paid workers may spend more on demerit goods (1) reduce health (1). Higher costs may make the country’s products less internationally competitive (1) worsen the current account position (1). 8
This question in 0455/22 Feb/March 2017
Q3 · Japan’s birth rate is falling 0455/21 May/June 2017
6 Japan’s birth rate is falling. Its population is ageing, and declining at a faster rate than any other country’s population. This has an impact on the amount that the Japanese Government spends on pensions. Its government is considering measures to increase the country’s birth rate and to encourage immigration. (a) Identify two causes of a fall in a country’s birth rate. [2] (b) Explain two reasons why more educated people tend to live longer than less educated people. [4] (c) Analyse, using a production possibility curve diagram, what effect net immigration is likely to have on an economy. [6] (d) Discuss whether the government of a country should reduce the pensions it pays to retired people. [8]
20 marks
Mark scheme: 6(a) Identify two causes of a fall in a country’s birth rate. 1 mark each for each of two causes identified: • higher levels of education • better family planning/use of contraceptives • higher proportion of women in the labour force • lower infant mortality rate • increased state provision of state pensions • state support for farmers • war • government policy • drop in standard of living/higher costs • older population • decrease in fertility rates 2 6(b) Explain two reasons why more educated people tend to live longer than less educated people. 1 mark each for each reason identified: • educated people tend to have higher incomes • educated people tend to be better informed • educated people tend to do less physically demanding/dangerous jobs 1 mark each for each of two reasons explained: • can afford a higher standard of living/afford medical care • more likely to lead a healthier lifestyle/smoke less/drink less alcohol • less likely to be worn out/injured at work 4 Opposite wording of the argument is acceptable, i.e. explanations as to why less well educated people might live shorter lives. Question Answer Marks Guidance 6(c) Analyse, using a production possibility curve diagram, what effect net immigration is likely to have on an economy. Up to 4 marks for the diagram: • axes correctly labelled (1) • curve drawn, either bowed out or as a straight downward sloping line, meeting the axes (1) • new curve drawn (1) • position of the new curve to the right of the original indicated either by labelling or an arrow (1) Up to 2 marks for written analysis: • net immigration will increase resources/labour (1) • more resources will increase productive potential/enable countries to produce more (1) 6 6(d) Discuss whether the government of a country should reduce the pensions it pays to retired people. Up to 5 marks for why it should: Ageing population increases the burden of pensions (1) result in higher taxes (1) or lower government spending on another area (1) opportunity cost (1) benefits of spending on alternatives (1). Reducing pensions may encourage some older people to continue to work (1) increase income tax revenue (1) increase output (1) may keep some older people healthier (1). Up to 5 marks for why it should not: May increase poverty/lower standard of living for some (1) with a lower pension some people may not be able to afford basic necessities (1) no other source of income (1). May mean that some older people may have to continue to undertake physically demanding jobs (1) these may harm their health (1). Lower government spending on pensions may reduce total demand (1) may reduce output (1) may increase unemployment (1) lower tax revenue (1). 8 A response may develop a mixture of relevant points to achieve up to 5 marks on either side. Maximum of 2 marks on each side of the discussion for a list-like approach.
This question in 0455/21 May/June 2017
Q4 · More people are becoming billionaires at the same time that other people are living in… 0455/22 May/June 2017
4 More people are becoming billionaires at the same time that other people are living in poverty. While some people enjoy luxuries others lack even basic essentials. To enable more people to achieve a minimum living standard some economists support the redistribution of income. (a) What is meant by ‘redistribution of income’? [2] (b) Explain two reasons why the rich spend more in total than the poor. [4] (c) Analyse why the elimination of absolute poverty would not solve the economic problem. [6] (d) Discuss whether Gross Domestic Product (GDP) per head is the best measure of comparative living standards. [8]
20 marks
Mark scheme: 4(a) What is meant by ‘redistribution of income’? Taking income from one group e.g. from the rich (1) and giving it to another e.g. to the poor (1). Creating greater equality/reducing inequality/reducing gap between rich and poor (1). May be achieved by using progressive taxation/state benefits (1). 2 equally’. 4(b) Explain two reasons why the rich spend more in total than the poor. • greater income (1) means the rich have more purchasing power (1) • greater wealth/savings (1) which generates income to spend/ e.g. interest, dividends, capital gains (1) • greater ability to borrow (1) because banks are more willing to lend to the rich/the rich have more collateral (1) • more confidence (1) because the rich may expect that their purchasing power will continue to be high (1) 4 Vice versa is acceptable. 1 mark each for each of two reasons identified (×2) 1 mark each for each of two explanations given (×2) Maximum of 2 marks for a list- like approach. 4(c) Analyse why the elimination of absolute poverty would not solve the economic problem. • Absolute poverty is lack of access to basic necessities (1) example e.g. food/living below a certain income level e.g. $1.25 (1) • The economic problem is unlimited wants (1) exceeding finite resources/scarce resources/scarcity (1) • Even if everyone had access to basic necessities, people would still want more products (1) e.g. better quality food (1) there would not be enough resources to meet people’s increasing wants (1) relative poverty will still exist/rich will still be able to spend more than the poor (1) • Over time what is considered to be absolute poverty is likely to change (1) 6 Question Answer Marks Guidance 4(d) Discuss whether GDP per head is the best measure of comparative living standards. Up to 5 marks for why it may be: • Income / output is an important influence on living standards (1) income influences the quantity and quality of goods and services people can consume (1) the healthcare and education they can enjoy (1) • Higher GDP per head can increase tax revenue (1) which can be spent on items e.g. education which can increase living standards (1) • GDP per head takes into account the size of the population / it is an average (1) it is GDP divided by population (1) a rise in GDP matched by a rise in population would not mean that people are better off (1) • GDP per head is measured by all countries and so comparisons can be made (1) relatively easy to calculate / understand (1) Up to 5 marks for why it may not be: • There are wider/more accurate measures of living standards (1) e.g. HDI (1) which takes into account education/literacy (1) and health/life expectancy (1) • GDP per head is an average (1) it does not take into account distribution of income (1) GDP per head may be high but some people may be poor (1) • GDP per head does not take into account leisure time (1) GDP per head may be high but if people are working long hours the quality of their lives may be low (1) • Increases in output may increase pollution (1) e.g. lower air quality may reduce living standards (1) • GDP per head may not fully reflect the quality of products produced (1) which may increase even if GDP per head does not change (1) • GDP per head may not fully reflect the quantity of goods produced (1) due to the existence of the informal economy (1) • GDP per head does not include safe drinking water (1) which has a significant influence on health (1) 8 A response may develop a mixture of relevant points to achieve up to 5 marks on either side. Maximum of 2 marks on each side of the discussion for a list- like approach. Reward but do not expect reference to the Multi- Dimensional Poverty Index/Genuine Progress Indicator/real income/etc.
This question in 0455/22 May/June 2017
Q5 · Living standards have risen in a variety of ways in recent decades 0455/23 May/June 2017
6 Living standards have risen in a variety of ways in recent decades. Between 1990 and 2015, more than 2.5 billion people in the world gained access to improved water and the proportion of undernourished people declined from 24% to 13%. Countries have made different rates of progress and these have been reflected in their Human Development Index (HDI) rankings. (a) Define the ‘Human Development Index’. [2] (b) Explain why the concept of opportunity cost is important in deciding how to allocate resources. [4] (c) Analyse how a reduction in the rate of interest could reduce poverty. [6] (d) Discuss whether rapid economic growth always increases living standards. [8]
20 marks
Mark scheme: 6(a) Define the ‘Human Development Index’. A measure of living standards/quality of life (1) includes income per head, education and life expectancy (two of these three) (1) calculated by the UN (1). 2 6(b) Explain why the concept of opportunity cost is important in deciding how to allocate resources. Opportunity cost is the (next) best alternative (1) forgone (1) in deciding to use resources to produce one product (1) not able to produce another product (1) example (1) have to use resources to produce products in high demand (1) in the most efficient way (1). 4 6(c) Analyse how a reduction in the rate of interest could reduce poverty. • A lower cost of borrowing (1) may encourage people to take loans (1) increase consumer spending (1) increase total demand (1) encouraging firms to expand (1) • It may increase employment (1) raise people’s incomes (1) • May lower the burden of debt/make it easier to repay loans (1) may enable the poor to borrow (1) to educate their children (1) set up a business (1) which can provide an income (1). 6 Maximum of 3 marks for a list-like approach. Question Answer Marks Guidance 6(d) Discuss whether rapid economic growth always increases living standards. Up to 5 marks for why it might: • Higher income (1) will enable people to enjoy more goods and services (1) may reduce absolute poverty (1) with people having access to basic necessities (1) • Likely to increase tax revenue (1) enable the government to spend more on healthcare (1) raise life expectancy (1) • spend more on education (1) raise job prospects (1) • may spend more on the environment (1) reduce pollution (1) Up to 5 marks for why it might not: • There are other influences on living standards (1) example (1) • Growth may be unevenly distributed (1) not everyone may benefit (1) • Average living standards may rise but some people may suffer a fall in living standards (1) if income is unevenly distributed (1) it may not benefit those living in poverty (1) • The extra products provided e.g. defence (1) may not provide satisfaction to consumers (1) • Producing more may involve longer working hours (1) reducing leisure hours (1) working longer hours/working more intensely may increase stress (1) endangering people’s health (1) • Increases in output may damage the environment (1) e.g. forests being cut down/pollution created (1) 8 A response may develop a mixture of relevant points to achieve up to 5 marks on either side. Maximum of 2 marks on each side of the discussion for a list- like approach.
This question in 0455/23 May/June 2017
Q6 · Cigarette smoking in China China has recently experienced rapid economic growth and an… 0455/21 Oct/Nov 2017
1 Cigarette smoking in China China has recently experienced rapid economic growth and an improving Human Development Index (HDI) ranking. It is, however, facing a number of health challenges. It is currently the world’s largest cigarette market, with more than 350 million smokers. A higher proportion of men smoke in China than in most other countries, including Russia and the USA. While 50% of Chinese men smoke, only 2% of Chinese women smoke. It has been estimated that nearly 2 million Chinese citizens a year die from smoking-related illnesses. These include smokers and those who have suffered from passive smoking. As well as being the largest consumer of cigarettes, China is also the world’s largest producer of cigarettes. Tobacco is grown in a number of the provinces of China, including the province of Yunnan. Over 3 million workers are employed in the industry, which is increasingly using advanced technological capital equipment. However, between 2009 and 2014 the number of cigarette- producing firms declined from 200 to 40 as firms merged and grew in size. Although revenue from taxes on cigarettes earned the Chinese Government 800 billion yuan in 2014 (5% of the government’s total tax revenue), it recently introduced a number of measures to discourage smoking. It has imposed a ban on smoking in public places, hospitals, schools and public transport. Health campaigns are also being used. Such campaigns are used throughout the world both to discourage the consumption of some products that are thought to be harmful to health and to encourage the consumption of products that are considered to be beneficial to health. For example, an information campaign on the benefits of consuming fruit has met with some success in the UK. Fig. 1 shows the impact it had on the market for fruit in the UK in 2015. price S of fruit P2 P1 D2 D1 O Q1 Q2 quantity of fruit Fig. 1 The market for fruit in the UK in 2015 (a) Identify, from the extract, two factors of production used in producing cigarettes. [2] (b) Explain two reasons why firms merge. [4] (c) Calculate, using information from the extract: (i) the percentage decrease in the number of cigarette firms in China from 2009 to 2014 [2] (ii) the total tax revenue that the Chinese Government received in 2014. [2] (d) Analyse, using a production possibility curve diagram, the effect of moving factors of production from producing cigarettes to producing other products. [5] (e) Discuss whether people in countries with a high HDI always enjoy a high standard of living. [5] (f) Explain, using information from the extract and Fig. 1, what happened to the market for fruit in the UK in 2015. [4] (g) Discuss the arguments for and against the Chinese Government increasing the tax on cigarettes. [6]
30 marks
Mark scheme: Question Answer Mark 1(a) Identify, from the extract, two factors of production employed in 2 producing cigarettes. Workers/labour (1) capital (1). 1(b) Explain two reasons why firms merge. 4 1 mark each for each of two reasons identified: • to take advantage of economies of scale / reduce costs of production • to gain greater market share / market power / reduce competition • to gain access to market outlets • to gain access to raw materials / resources / better methods of production • to diversify • to prevent one firm going out of business • to increase profit • to grow / expand / become larger 1 mark each for each of two explanations: • a merged firm will be larger and due to economies of scale, average costs may be lower, example • a merged firm eliminates a competitor • a vertical merger forwards gives the firm control of the sale of its product • a vertical merger backwards may ensure an adequate supply of a raw material • a conglomerate merger will increase the range of products produced • a combined, larger firm will be able to survive • the combined profit of two merged firms might be greater than the profit of two individual firms • one of the key business goals is growth 1(c)(i) Calculate, using information from the extract, the percentage decrease 2 in the number of cigarette firms in China from 2009 to 2014 80% (2). Correct working e.g. 160/200 × 100 (1). 1(c)(ii) Calculate, using information from the extract, the total tax revenue that 2 the Chinese government received in 2014. 16 000 billion yuan (2). 16 000 billion OR yuan (1). Correct working i.e. 800 billion × 100/5 (1). Note: 16 000 billion = 16 000 000 000 000 or 1.6 × 10¹³ 1(d) Analyse, using a production possibility curve diagram, the effect of 5 moving factors of production from producing cigarettes to producing other products. Up to 3 marks for the diagram: Axes correctly labelled (1). Curve / downward-sloping straight line drawn to the axes (1). Movement along curve from cigarettes to other products (1) shown by an arrow on the curve or by change in combinations. cigarettes A1 A2 O B1 B2 other products Up to 2 marks for explanation: Opportunity cost of producing more other products / devoting more resources to other products (1) means producing fewer cigarettes (1). 1(e) Discuss whether people in countries with a high HDI always enjoy a 5 high standard of living. Up to 3 marks for why they might: Indicates high income per head / high purchasing power / high ability to buy goods (1) high life expectancy / low death rate / good healthcare (1) good education / high literacy (1). 1 mark for a general idea of what the HDI includes. Up to 3 marks for why they might not: May be uneven distribution of income / GDP figure is an average (1) so that not everyone enjoys a high standard of living / there may still be many poor people (1) unemployment may still be high (1) healthcare may still be poor for some (1) literacy levels may be high but there may be no suitable jobs (1). There are other influences on living standards (1) working hours may be long (1) working conditions may be poor (1) there may be high levels of pollution (1). 1(f) Explain, using information from the extract and Fig. 1, what happened 4 to the market for fruit in the UK in 2015. The diagram shows demand increasing (1) price rising (1) revenue increasing (1) supply extending / quantity of fruit consumed increasing (1). This is due to the information campaign / people being better informed about the benefits of fruit (1). Inelastic demand (1) inelastic supply (1). 1(g) Discuss the arguments for and against the Chinese Government 6 increasing the tax on cigarettes. Up to 4 marks for why it should: Demand for cigarettes is price-inelastic (1) so may increase tax revenues (1) which government could spend on public services, e.g. health and education (1). Smoking is harmful (demerit good) (1) tax will raise the price (1) may discourage cigarette smoking / reduce consumption (1) improve smokers’ health (1) prevent early deaths from smoking related diseases (1) reduce external costs (1) e.g. air pollution, passive smoking (1) reduces health costs (1) increases productivity of workers (1). Up to 4 marks for why it should not: May not be very effective in reducing consumption (1) smoking is addictive / demand is price-inelastic (1) and tax will therefore not reduce smoking significantly (1). May reduce output of cigarettes in the country / tobacco firms may close (1) may increase unemployment (1). May lead to an illegal market in cigarettes / cheap alternatives (1) people not paying the tax (1).
This question in 0455/21 Oct/Nov 2017
Q7 · Moldova has a population of 3.5 million 0455/22 Oct/Nov 2017
6 Moldova has a population of 3.5 million. It is one of the poorest countries in Europe, with relatively low living standards. In 2015, the country experienced a recession and a doubling of its inflation rate. Moldova’s central bank increased its interest rate from 8.5% to 15.5%. (a) Identify two influences on the size of a country’s population. [2] (b) Explain two causes of an increase in living standards. [4] (c) Analyse how an increase in the rate of interest could increase unemployment. [6] (d) Discuss whether a government should increase tax rates during a recession. [8]
20 marks
Mark scheme: 6(a) Identify two influences on the size of a country’s population. 1 mark each for each of two influences identified: • birth rate • death rate • migration. 2 influences, factors that would affect size of population. 6(b) Explain two causes of an increase in living standards. 1 mark each for each of two causes identified: • rise in income / fall in poverty / fall in unemployment / rise in employment • improvements in education • improvements in healthcare • increase in leisure time. 1 mark each for each of two causes explained: • higher incomes will enable people to buy more goods and services • improvements in education will enable people to earn higher incomes / make more efficient life choices • improvements in healthcare will increase life expectancy • increase in leisure time will give people the opportunity of follow leisure activities / suffer less pressure. 4 Question Answer Marks Guidance 6(c) Analyse how an increase in the rate of interest could increase unemployment. Rise in the rate of interest may discourage borrowing / increase cost of borrowing (1) increase saving (1) decrease spending (1) decrease total demand (1) lower demand may decrease output (1) encourage firms to make workers redundant (1). Rise in the rate of interest may increase firms’ costs of production (1) this may encourage firms to reduce their output (1). Rise in the rate of interest may increase the exchange rate (1) higher exchange rate may decrease exports and increase imports (1) decrease domestic production (1). 6 Question Answer Marks Guidance 6(d) Discuss whether a government should increase tax rates during a recession. Up to 5 marks for why it should: To prevent tax revenue falling (1) lower output may reduce profits (1) lower revenue from corporation tax (1) a recession will lower incomes (1) reduce income tax revenue (1) reduce revenue from indirect taxes (1). Higher tax revenue could be used to implement policies to stop the recession (1) government may be able to spend on supply-side policy measures (1) example (1). A higher tax on imports / import tariff (1) may encourage some consumers to switch to buying domestic products (1) reverse fall in output/employment (1). May want to redistribute income (1) progressive taxes could be increased (1) and tax revenue used to help the poor (1) who may be particularly harmed by a recession (1). Up to 5 marks for why it should not: Higher tax rates may reduce disposable income (1) reduce consumer expenditure (1) may reduce investment (1) lower consumer expenditure and investment would lower total demand (1) this may reduce output further (1). Higher tax rates may discourage MNCs from setting up in the country (1) this may mean it will take longer to get out of a recession (1). Higher tariffs may provoke retaliation (1) reduce both imports and exports (1). 8 Accept a counterargument i.e. the government should instead reduce tax rates during a recession.
This question in 0455/22 Oct/Nov 2017
Q8 · The Gulf countries, some of which are quite specialised, import a high proportion of the… 0455/22 Oct/Nov 2017
7 The Gulf countries, some of which are quite specialised, import a high proportion of the food their inhabitants eat. For example, the United Arab Emirates imports 83% of all the food that it consumes. The Gulf countries are trying to reduce their reliance on imports of food. (a) Define ‘specialisation’. [2] (b) Explain two disadvantages that workers may experience from specialising. [4] (c) Analyse how a country could reduce its reliance on imports. [6] (d) Discuss whether producing more food will increase living standards. [8]
20 marks
Mark scheme: 7(a) Define ‘specialisation’. The concentration/focus (1) on one task/product / what they are best at (1). 2 7(b) Explain two disadvantages that workers may experience from specialising. 1 mark each for each of two disadvantages identified: • risk may not find another job easily • not finding where key strengths lie • limited skills • boredom • demotivation • increased risk of being replaced by machines • disruption caused by absent fellow workers. 1 mark each for each of two explanations of the disadvantages: • workers may not find it easy to transfer their skills to another job should they lose their jobs / risk of long term unemployment • concentrating on a particular task may mean that workers do not find out what they are best at • performing the same task each day can become tedious • breaking down a process into its separate parts may make it easier to mechanise • workers may feel less appreciated • may have to cover for absent colleagues / example of impact on the workers. 4 Question Answer Marks Guidance 7(c) Analyse how a country could reduce its reliance on imports. Replacing imports with domestic products (1) by producing more domestic products / reducing price of domestic products / raising quality of domestic products (1) It could subsidise domestic producers (1) help infant industries to grow (1) replacing imports with domestic products (1). It could place trade restrictions on imports (1) example: e.g. tariffs (1) reason why restriction could reduce imports e.g. tariff could make imports more expensive (1). It could keep its exchange rate low (1) e.g. by buying the currency (1) keeping import prices high (1). It could use supply-side policy (1) e.g. increase spending on education (1) to improve the quality of output (1) reduce costs of production (1) make domestic products more competitive (1). 6 Question Answer Marks Guidance 7(d) Discuss whether producing more food will increase living standards. Up to 5 marks for why it might: Producing more food may lower the price of food (1) due to economies of scale (1) making it more affordable (1) increasing the availability/quality of food people can consume (1) reducing poverty (1) increasing life expectancy (1). Providing more food may create jobs (1) increase exports / reduce imports (1) increasing output / GDP (1) increasing incomes / GDP per head (1) allowing people to buy more goods and services (1). Up to 5 marks for why it might not: May lead to over-consumption of food (1) obesity (1) healthcare problems caused (1). Intensive farming methods may create external costs (1) e.g. river pollution arising from fertilisers spread on the land (1). Agricultural jobs may be low skilled (1) low paid (1). Those producing more food may lack the appropriate resources to produce it (1) and as a result may produce low quality food (1) high priced food (1). Increased food production may lead to an over-supply of food (1) with the extra output remaining unsold (1) may cause diseconomies of scale (1). There may be an opportunity cost involved (1) relevant example (1) fewer capital goods may be produced (1) which could lower potential economic growth (1) and so living standards in the future (1). Crops may be destroyed / damaged (1) by climate conditions / disease (1). 8
This question in 0455/22 Oct/Nov 2017
Q9 · In 2015, the UK economy experienced an increase in production and relatively low… 0455/23 Oct/Nov 2017
7 In 2015, the UK economy experienced an increase in production and relatively low unemployment. There was, however, little growth in labour productivity and earnings. The government continued to spend more than it was receiving in tax revenue and considered changing some of its monetary policy measures. (a) Identify two causes of inflation. [2] (b) Explain two reasons why government spending may be greater than tax revenue. [4] (c) Analyse how an increase in labour productivity can increase living standards. [6] (d) Discuss whether monetary policy measures can increase economic growth. [8]
20 marks
Mark scheme: 7(a) Identify two causes of inflation. Demand-pull/consumer boom/higher government spending/increase in net exports/ increase in aggregate demand (1). Cost-push inflation/higher wages/higher raw material costs / depreciation or devaluation of domestic currency / imported inflation (1). 2 Question Answer Marks Guidance 7(b) Explain two reasons why government spending may be greater than tax revenue. 1 mark each for each of two causes identified: • low level of economic activity • government desire to increase economic activity • actual government expenditure higher than planned expenditure • ageing population. 1 mark each for each of two explanations of the causes: • if economic activity is low, spending on benefits may be high while, due to low incomes with low spending, tax revenue will be low • a government may be engaging in expansionary fiscal policy to increase total demand and raise revenue • planned expenditure and forecast tax revenue may not be achieved • more pressure on pensions and healthcare, while tax revenues may fall due to fewer workers. 4 Maximum of 2 marks if explanation is restricted to either why there may be high government expenditure, or low tax revenue. 7(c) Analyse how an increase in labour productivity can increase living standards. Higher productivity will lower costs of production (1) may lower prices (1) enabling people to consume more goods and services (1) greater supply (1). It may increase output (1) raise employment (1) increase incomes (1) greater purchasing power (1) e.g. greater access to healthcare / education / leisure (1) live longer (1) higher HDI (1). Increase in government revenue (1) higher spending on education/healthcare (1). 6 Question Answer Marks Guidance 7(d) Discuss whether monetary policy measures can increase economic growth. Up to 5 marks for why they might: A cut in interest rates (1) may discourage saving (1) increase borrowing (1) raise consumer spending (1) raise investment (1) increase total demand (1) increase output (1) higher investment will increase productive capacity (1). A reduction in the value of the exchange rate (1) will lower export prices and raise import prices (1) increasing demand for domestic products (1) increase output (1). An increase in the money supply (1) may stimulate higher spending (1) increasing output (1). Up to 5 marks for why they might not: Lower interest rates may not increase consumer spending and investment if confidence is low (1) households and firms may not spend extra disposable income if they think that incomes will fall in the future (1). A lower exchange rate will not lead to a rise in export revenue and a fall in import expenditure if demand is price-inelastic (1) there is an increase in import restrictions imposed by other countries/fall in incomes abroad (1). An increase in the money supply or other measure may lead to demand-pull inflation (1) the economy may not have the resources to produce more goods and services despite the rise in total demand (1). 8 Accept an argument that contractionary monetary policy leading to higher interest rates and lower domestic demand would reduce economic growth. Do not reward the same argument on both sides (mirror image) without additional relevant analysis.
This question in 0455/23 Oct/Nov 2017
Q10 · Crisis in the ice cream market Vanilla is used in the production of soft drinks, cakes… 0455/22 May/June 2018
1 Crisis in the ice cream market Vanilla is used in the production of soft drinks, cakes and perfumes. Its main use, however, is in the production of ice cream. Fig. 1 shows the different costs of making ice cream for one firm. Fig. 1 The costs of producing ice cream for one firm raw materials including vanilla other wages insurance security lighting rent Madagascar is the world’s largest supplier of vanilla followed by Mexico and Tahiti. At the start of 2016, economists expected the price of ice cream to increase as the price of vanilla had risen by 130% in 2015. This was largely because of the poor harvests in Madagascar which reduced the output of vanilla in 2015. Ice cream is seen as a luxury product in most countries. It has a range of substitutes and this is one reason why producers do not always pass on higher costs to consumers. In 2015, there were a number of other changes in the production of ice cream including a rise in the productivity of the workers. As well as vanilla, Madagascar produces a number of other primary products including coffee and sugar. Nearly 80% of the country’s labour force is employed in the primary sector. The country has a relatively low Gross Domestic Product (GDP) per head and a relatively low Human Development Index (HDI) value as shown in Table 1. This limits the amount that people in Madagascar save. Table 1 GDP per head and HDI in selected countries in 2015 Country GDP per head (US$) HDI Argentina 22 400 0.836 Bangladesh 3 600 0.570 Cuba 10 200 0.769 Egypt 11 500 0.690 Ghana 4 300 0.579 Madagascar 1 500 0.510 Half of Madagascar’s population live in poverty. The government is trying to reduce poverty by introducing a programme of cash benefits. It is hoped that one effect of this will be to increase school enrolment and attendance of the children of poor families. To increase economic growth, the government has sold off a number of state-owned enterprises and is moving the economy towards a market system. (a) Identify two fixed costs of production in Fig. 1. [2] (b) Explain, using information from the extract, two reasons why a rise in the price of vanilla might not cause an increase in the price of ice cream. [4] (c) Analyse, using a demand and supply diagram, the effect of an increase in income on the market for ice cream. [5] (d) Analyse the extent to which the relationship shown in Table 1 between countries’ GDP per head and their HDI value is the expected one. [4] (e) Discuss whether or not a government should encourage people to save more. [5] (f) Explain, using information from the extract, how cash benefits given to the poor can reduce poverty. [4] (g) Discuss whether or not a market system benefits consumers. [6]
30 marks
Mark scheme: 1(a) Identify two fixed costs of production in Fig.1. One mark each for any 2 from: insurance, security, rent, lighting and wages. 2 are given, consider only the first three. 1(b) Explain, using information from the extract, two reasons why a rise in the price of vanilla might not cause an increase in the price of ice cream. Ice cream is a luxury product (1) likely to have elastic demand / producers will be concerned that a rise in price could cause a fall in revenue/profit/demand (1). Ice cream has substitutes (1) likely to have elastic demand / producers will be concerned that a rise in price could cause a fall in revenue / loss of customers / loss of demand (1). Rise in productivity of workers (1) fall in labour costs / lower costs may offset a rise in the price of vanilla (1). Fall in another cost identified in the pie chart (1) may offset a rise in the price of vanilla (1), 4 Question Answer Marks Guidance 1(c) Analyse, using a demand and supply diagram, the effect of an increase in income on the market for ice cream. Up to 4 marks for a diagram: • axes correctly labelled – price and quantity or P and Q (1) • demand and supply curves correctly labelled, S (1) • demand curve D1 shifted to the right D2 (1) • correct equilibriums identified either by lines drawn to both axes or equilibrium prices clearly identified e.g. E1 and E2 (1) 1 mark for written analysis: • an increase in income increases purchasing power (1) • people buy more ice cream when they have more money/income (1) • demand will increase as ice cream is a luxury good • price will rise 5 price of ice cream quantity of ice cream O P2 D1 D1 P1 Q1 Q2 D2 D2 S S Question Answer Marks Guidance 1(d) Analyse the extent to which the relationship shown in Table 1 between countries’ GDP per head and their HDI value is the expected one. Generally, in the same order / positively related / countries with highest GDP per head have the highest HDI (1) countries with high incomes generally spend more on education and healthcare (1) supporting evidence e.g. Argentina has highest GDP per head and highest HDI (1). Egypt higher in terms of GDP per head but lower in terms of HDI than Cuba (1). Cuba may have a high life expectancy (1) indicating good healthcare (1). Cuba may have a high number of mean and expected years of schooling (1) indicating a strong education system / more educated population (1). 4 Reward 1 mark for a supported conclusion that it is generally the expected relationship. Marks may be gained in relation to Cuba by mentioning Egypt may have less good healthcare and education. 1(e) Discuss whether or not a government should encourage people to save more. Up to 3 marks for why it should: More savings can fund investment / enable people to set up a business (1) higher investment can increase economic growth (1) higher economic growth can increase living standards (1). A government may make use of money in government-run saving schemes (1) e.g. to fund infrastructure projects (1). More savings can reduce consumer spending (1) which will lower total (aggregate) demand (1) which can reduce inflation (1). More savings can reduce demand for imports (1) improve the current account position (1). More savings can help people cope with emergencies / increase wealth / for future use (1) prepare for retirement (1) in case of unemployment (1) spend on education (1) reduce need for government expenditure e.g. pensions/education (1) enabling the government to spend on other named area (1). Up to 3 marks for why it should not: More saving may reduce output / cause recession (1) increase unemployment (1) cause deflation (1). More saving will increase deposits at banks (1) this may encourage them to lend to un- creditworthy customers (1) causing banks to collapse (1). 5 Accept response from the perspective of why it should not, by discussing why it would be better for the government to encourage spending, Reward change in consumer spending and total demand in either why it should, or why it should not, but not in both. Question Answer Marks Guidance 1(f) Explain, using information from the extract, how cash benefits given to the poor can reduce poverty. May enable them to send their children to school for longer (1) this may increase their children’s skills (1) qualifications (1) increase their job opportunities / start a business (1) increase their earning potential / living standards (1) enable them to purchase more goods and services (1) including basic necessities (1). 4 Maximum of 1 mark for a way cash benefits may reduce poverty, if not linked to education. Reward but do not expect reference to an implied multiplier effect resulting from the higher spending creating more jobs. 1(g) Discuss whether or not a market system benefits consumers. Up to 4 marks for why it might: In theory there will be consumer sovereignty (1) with firms being responsive to consumer demand (1). The price mechanism allocates resources automatically / profit motive provides an incentive to respond to consumer demand (1) avoiding delays in responding to changes in demand (1). There may be a high level of competition (1) keeping price low (1) increasing efficiency (1) keeping quality high (1) providing choice (1). Up to 4 marks for why it might not: Those with low incomes will lack purchasing power (1) the market will not produce what they want (1). Monopolies may develop (1) driving up price (1) reducing quality (1). Consumers may not always be fully informed (1) e.g. cigarettes (harmful / demerit goods) may be overconsumed (1) e.g. healthcare (beneficial / merit goods) under consumed (1) there may be external costs (1) market failure may occur (1). Some consumers may find too much choice confusing (1) advertising can distort consumer choice (1). 6 Reward but do not expect reference to public goods.
This question in 0455/22 May/June 2018
Q11 · The global water crisis In 2015, the World Economic Forum identified the water crisis as… 0455/23 May/June 2018
1 The global water crisis In 2015, the World Economic Forum identified the water crisis as the world’s biggest risk. Across many Asian and African nations the water supply was at critically low levels, insufficient to meet the rising demand. Demand has risen because of the expansion of cities and population growth requiring much more agricultural production. Water scarcity is a problem shared by many developing countries which have a low life expectancy. A third of all their healthcare facilities are estimated to lack access to safe water and basic sanitation. Water shortages harm public health – 80% of all illnesses in developing countries are caused by poor water and sanitation conditions. Water shortages also restrict the amount of food production. Table 1 shows the risk of water shortage (highest risk is 5) and Gross Domestic Product (GDP) per head measured in US$. Table 1 Risk of water shortage and GDP per head for countries / regions in 2015 Country / region Risk of Water Shortage GDP per head (highest risk = 5) (US$) Algeria 3.4 4 318 Canada 1.2 43 332 Germany 1.9 40 997 Pakistan 4.3 1 450 Saudi Arabia 5.0 20 813 Western Sahara 5.0 2 500 The shortage of water has led various countries and regions to experiment with privatising their supply. However, because water is a necessity, private supply has in some cases resulted in consumers suffering from significant price increases. A 10% increase in the price of water is estimated to result in only a 0.7% decrease in quantity demanded. This means that governments have to regulate water markets to protect consumers. Some economists argue that consistent undervaluing of water has led to it being used inefficiently. This is because prices fail to take into account the long-run consequences of not conserving this valuable resource. With much of the world facing a hotter and drier future as a result of climate change, water will become increasingly scarce. More than 663 million people are estimated to live without access to clean water. The World Bank funds a range of projects designed to tackle this and in doing so reduce levels of absolute poverty. Improving access to natural resources is seen as essential in promoting economic development in some of the world’s poorest nations. (a) Identify, using information from the extract, two causes of low life expectancy in developing countries. [2] (b) (i) Explain, using information from the extract, how the water shortage is an example of the economic problem. [4] (ii) Explain, using information from the extract, why the problem of water shortages is likely to become even worse in the future. [4] (c) Analyse, using Table 1, the extent to which a high risk of water shortage in a country/region causes low GDP per head. [5] (d) Calculate, using the information in the extract, the price elasticity of demand for water. [2] (e) Discuss whether or not private firms supplying water should increase their prices. [5] (f) Explain what is meant by absolute poverty. [2] (g) Discuss whether or not a country’s economic growth rate depends mostly on the availability of its natural resources. [6]
30 marks
Mark scheme: 1(a) Identify, using information from the extract, two causes of low life expectancy in developing countries. • Poor healthcare facilities • lack of access to safe water • lack of basic sanitation • not enough food production • absolute poverty 2 1(b)(i) Explain, using information from the extract, how the water shortage is an example of the economic problem. The economic problem consists of the allocation of scarce resources amongst competing ends (1). Water supply is at critically low levels (1) showing resources are scarce / limited (1). Rising demand from growth of cities (1) and rising agricultural production (1) wants are unlimited (1). 4 1(b)(ii) Explain, using information from the extract, why the problem of water shortages is likely to become even worse in the future. Water is being undervalued (1) this has led to it being wasted (1) and the prices do not reflect scarcity that will arise in the future (1) this means that as demand continues to rise (1) the gap between wants and the amount of the resource will increase (1). Climate change (1) will cause water supplies to become increasingly scarce (1). Population will continue to rise / cities will expand (1) increasing demand (1) and exceeding the ability of supply to match demand (1). 4 Question Answer Mark Guidance 1(c) Analyse, using Table 1, the extent to which a high risk of water shortage in a country / region causes low GDP per head. The data indicates a link (1) the greater the degree of water scarcity (i.e. the higher the water risk score) the lower the GDP per capita. (1) Canada / Germany have the lowest water risk scores and the highest GDP per capita (1). Pakistan / Western Sahara have high water risk scores and low GDP per capita (1). Saudi Arabia illustrates that this relationship is not perfect (1) and demonstrates that other factors contribute towards GDP per capita (1) 5 1(d) Calculate, using the information in the extract, the price elasticity of demand for water. PED = (–) 0.07 (2) Correct working –0.7% / 10% or –0.07% or 0.7 (1) 2 Question Answer Mark Guidance 1(e) Discuss whether or not private firms supplying water should increase their prices. Up to 3 marks for why they should: An increase in price will increase total revenue (1) as demand is price inelastic (1) meaning an increase in price causes a less than proportional decrease in quantity demanded (1) some of the extra funds could be used to increase the supply of water (1) reducing its shortage (1) and improve the quality of water (1). Higher prices may reduce demand (1) helping to eliminate the shortage / achieve market equilibrium (1). As population is increasing (1) rising prices are needed to ration extra demand (1). Current prices do not take account of the long run costs of failing to conserve supplies (1) higher prices will encourage more efficient use of water / less waste (1). Up to 3 marks for why they should not: Water is a necessity / has very inelastic demand (1) raising prices will harm consumers (1) and will fall more heavily on the poor / the poor will be unable to afford water (1) increase absolute poverty (1) increase inequality (1). Higher water prices can reduce health (1) reduce life expectancy (1) as less people will have access to safe water / basic sanitation (1). Higher water prices reduce income available to spend on other necessities e.g. education (1). 5 1(f) Explain what is meant by absolute poverty. Individuals cannot afford the necessities essential for survival (1) such as food, water, shelter, warmth and clothing (1) individuals living on less than a certain amount per day, e.g. $1. 2 Question Answer Mark Guidance 1(g) Discuss whether or not a country’s economic growth rate depends mostly on the availability of its natural resources. Up to 4 marks for why they might: Natural resources are an important factor of production (1) Countries endowed with natural resources have a good productive capacity as a result (1), boosting the growth that they can enjoy (1). A lack of natural resources such as water can cause poverty / ill health (1). This can harm productivity (1). Countries with insufficient natural resources are reliant on other countries to provide them (1) worsening the current account and reducing the economic growth rate (1) and if a country does not have enough other resources to trade it must rely upon its own natural resources (1). Natural resources are important in agriculture (1) countries with a lack of natural resources may not produce enough food (1) leading to poorer nutrition (1) poorer health and lower productivity (1). Natural resources are essential for the construction of infrastructure e.g. roads and schools (1) Other economic sectors (secondary and tertiary) depend upon natural resources (primary) (1). Up to 4 marks for why they might not: Other factors of production are equally / more important e.g. capital investment or education for skills (1). Through trade (1) a country can obtain from other countries the natural resources it lacks (1) It depends upon what countries specialise in (1) and whether they face trade restrictions (1) if they can import raw materials from other countries their growth will not be limited (1). Finding natural resources can take a long time (1) slowing down economic growth (1). There are many countries in the world with significant natural resources but poor economic growth rates / standard of living (1) and many countries with limited resources but high growth rates, such as Singapore (1). 6
This question in 0455/23 May/June 2018
Q12 · In 2016, the trade union representing doctors in the UK was involved in collective… 0455/23 May/June 2018
2 In 2016, the trade union representing doctors in the UK was involved in collective bargaining with the government over proposed changes to doctors’ contracts. The trade union considered that the aim of the changes was to reduce the cost to the government of providing healthcare. It may also result in fewer individuals training to become doctors in the future. (a) Identify two influences on the strength of a trade union’s collective bargaining power. [2] (b) Explain the likely impact of trade unions on the welfare of their members. [4] (c) Analyse the impact of a reduction in government expenditure on healthcare on a country’s unemployment rate. [6] (d) Discuss whether or not a decrease in the number of doctors will reduce living standards. [8]
20 marks
Mark scheme: 2(a) Identify two influences on the strength of a trade union’s collective bargaining power. • size of membership • financial position • level of employment • government legislation • willingness to take industrial action 2 If more than 3 answers given only consider the first three. 2(b) Explain the likely impact of trade unions on the welfare of their members. Increase or maintain wages of members (1) increase or maintain material standard of living (1). Improve or maintain working conditions (1) e.g. improved safety / less stress (1). Protect workers’ rights (1) e.g. working hours / sick pay / paternity leave (1). Protect jobs (1) reduce risk of unemployment (1). Provide training (1) helping employees find better jobs / better paid jobs (1). 4 2(c) Analyse the impact of a reduction in government expenditure on healthcare on a country’s unemployment rate. Less spending on healthcare may result in less employment of doctors and nurses (1) causing structural unemployment (1) but may mean less skilled (cheaper) doctors and nurses employed (1) leaving unemployment rate the same (1). Lower government spending is contractionary fiscal policy (1) this will reduce total (aggregate) demand (1) firms’ output will fall (1) causing demand for labour to fall (1) as derived demand (1) causing cyclical unemployment (1). Quantity / quality of healthcare may decline (1) this may reduce labour productivity (1) international competitiveness (1) reducing demand for the country’s products and labour (1). 6 Question Answer Mark Guidance 2(d) Discuss whether or not a decrease in the number of doctors will reduce living standards. Up to 5 marks for why it might: If there are less doctors patients may receive worse quality healthcare (1) reducing life expectancy (1). The productive capacity of the economy could fall in the long run (1) as a result of life expectancy falling / more sick days as a result of a worse quality health service (1). Worse healthcare can decrease productivity (1) causing wages to fall (1). A shortage of doctors would cause their wages to rise (1) making health care less affordable / less available / poor patients can’t afford it (1). Up to 5 marks for why it might not: Technological advancement (1) could mean the quality of healthcare is improving even though the number of doctors is falling (1) I increased expenditure on facilities / equipment (1) could offset the impact of fewer doctors (1) Access to healthcare is more important in determining living standards in the country (1) – there may be less doctors but if healthcare is now more affordable living standards on the whole may be rising (1). If population is increasing (1) less need for doctors / number of doctors per head may not change (1) 8
This question in 0455/23 May/June 2018
Q13 · Rubber production in Liberia Liberia is a west African country that has faced a number of… 0455/22 Oct/Nov 2018
1 Rubber production in Liberia Liberia is a west African country that has faced a number of serious problems in recent years. These have included a civil war and in 2014 the outbreak of the Ebola epidemic. There have also been improvements. The unemployment rate was 85% in 2004 but had fallen to 4% in 2016. This reduction has influenced both emigration and wages. Workers have received higher wages although some economists think that the higher wages have increased the country’s inflation rate which in 2016 was 8%. The country has a good supply of drinking water and a climate favourable to agriculture. More than 70% of the country’s labour force is currently employed in agriculture. The country’s main exports are rubber, iron ore, timber and gold. A US multinational company (MNC) runs the world’s largest single natural rubber farming operation in Liberia. The price of rubber fell by 75% between 2011 and 2016. The global supply of rubber had exceeded demand as a number of countries imposed import restrictions on rubber. In response to the lower price the US MNC cut its production, but still made a loss. The MNC does not want to go out of business and is trying to survive by cutting its costs. In the long run it hopes to maximise profits. When some of its 7000 workers retire, they will not be replaced. The MNC has introduced new production techniques and diversified into growing cocoa and coffee. The Liberian government is providing subsidies to local rubber farmers to help them buy new equipment and introduce new farming methods. Despite the challenging situation, a number of local Liberian rubber farmers are increasing the size of their operations by buying up more land. Some others are diversifying by using wood from the rubber trees to make furniture. While helping its rubber farmers, the Liberian government is also encouraging the expansion of the secondary and tertiary sectors. Between 2014 and 2016 it increased its expenditure on healthcare but this was at the expense of a number of public sector investment projects. Table 1 compares the infant mortality rate and healthcare expenditure per head in selected countries in 2015. Table 1 Infant mortality rate and healthcare expenditure per head in selected countries in 2015 Infant mortality rate Healthcare expenditure Country (deaths per 1000 per head live births) (US$) Cuba 4.5 459 Hungary 5.0 2 096 India 41.5 248 Liberia 67.5 90 Turkey 18.8 1 148 UK 4.4 3 749 (a) Identify, from the extract, two goals of business organisations. [2] (b) Explain, using information from the extract, two reasons why the price of rubber fell between 2011 and 2016. [4] (c) Analyse how an increase in wages could cause inflation. [5] (d) Analyse to what extent the information in Table 1 suggests that healthcare expenditure per head is an important influence on the infant mortality rate. [4] (e) Discuss whether or not having more of its workers employed in the tertiary sector would benefit the Liberian economy. [5] (f) Explain, using information from the extract, how the concept of opportunity cost affects all rubber farmers in Liberia. [4] (g) Discuss whether or not a high rate of unemployment would always cause emigration. [6]
30 marks
Mark scheme: 1(a) Identify, from the extract, two goals of business organisations. Survival / growth / profit maximisation / diversification 2 1(b) Explain, using information from the extract, two reasons why the price of rubber fell between 2011 and 2016. Supply exceeding demand / diagram showing excess supply (1) the existence of unsold rubber will encourage rubber producers to lower price (1). Improved production methods (1) lowering costs of production / increasing supply (1). The imposition of import restrictions / diagram showing the effect of import reductions (1) lowering demand for rubber / rubber producers may reduce prices to ensure their rubber is still competitive (1). Government subsidies (1) lowering costs of production / increasing supply / diagram showing supply increasing (1). 4 1(c) Analyse how an increase in wages could cause inflation. Higher wages may increase consumer expenditure (1) increasing total (aggregate) demand / diagram showing total (aggregate) demand increasing (1) causing demand-pull inflation (1) if demand rises by more than money supply / the economy is at, or near, full capacity (1). Higher wages may increase costs of production (1) decrease total (aggregate) supply / diagram showing total (aggregate) supply decreasing (1) causes cost- push inflation (1) if wages rise by more than productivity / may cause a wage- price spiral (1). 5 Question Answer Marks Guidance 1(d) Analyse to what extent the information in Table 1 suggests that healthcare expenditure per head is an important influence on the infant mortality rate. Generally, yes, it would be expected that countries spending a higher amount would have a lower infant mortality rate (1) because e.g. they would be able to afford more midwives/doctors (1). Examples of supporting evidence e.g. Liberia spends the least and has the highest (1) UK spends the most and has the lowest (1). There is an exception, Cuba (1) spends the 4th lowest and has the 2nd lowest infant mortality rate (1). 4 Question Answer Marks Guidance 1(e) Discuss whether or not having more of its workers employed in the tertiary sector would benefit the Liberian economy. Up to 3 marks for why it might: Jobs in the tertiary sector tend to be better paid (1) may raise living standards (1) working conditions tend to be better (1) e.g. less dangerous (1) demand for services tend to increase more than demand for primary products (1) imports of services may be reduced (1) exports of services may increase (1) current account position may be improved (1). Productivity/skills may be higher in the tertiary sector (1) which may cause economic growth (1) may make the country more developed (1). A larger healthcare sector could reduce the infant mortality rate / increase life expectancy (1). May attract MNCs/FDI (1) increasing employment (1). Up to 3 marks for why it might not: The country may be better at producing primary or manufactured products (1) the country has a climate suited to agriculture (1) which may reduce economic growth (1). There may be an opportunity cost in terms of less resources being available in the primary and secondary sectors (1). Some jobs in the tertiary sector are low-paid (1) example (1) because they require fewer skills (1). Many tertiary industries are based in cities (1) this may lead to problems of rural-urban migration / overcrowding (1). Liberia’s resources are more suited to producing rubber (1) which can be exported and bring in foreign exchange (1). Imports of manufactured/primary products may increase (1). 5 For all ‘Discuss’ questions Each point may be credited only once, on either side of an argument, but separate development as to how/why the outcome may differ is to be rewarded. Generic example Mark Economic growth will increase 1 because of reason« e.g. demand for services is increasing globally 1 Economic growth will decrease (reverse of 1st argument) 0 because of a different reason / not a reverse argument e.g. a country’s resources may be more suited to producing primary products. 1 Reward but do not expect reference to comparative advantage as equivalent to better at producing. Question Answer Marks Guidance 1(f) Explain, using information from the extract, how the concept of opportunity cost affects all rubber farmers in Liberia. Opportunity cost is the (next) best alternative foregone (1). The US MNC could use its resources to produce rubber (1) or cocoa/coffee (1). The local farmers could sell rubber (1) or rubber wood / make furniture (1). The farmers could use the money to buy more land (1) example, e.g. diversify into other areas / education for their children (1). Subsidies to farmers (1) could be used to help them in other ways e.g. education (1). 4 Question Answer Marks Guidance 1(g) Discuss whether or not a high rate of unemployment would always cause emigration. Up to 4 marks for why it might: People may go to other countries in search of jobs (1). A high rate of unemployment is likely to mean wages are low in the country / there is poverty in the country (1) people may emigrate in search of higher wages (1). A high rate of unemployment may mean poor healthcare / education / other services in the country (1) people and governments not having the income to spend much on these services (1) people may emigrate to get a higher standard of living (1). People may have skills more appropriate to jobs in other countries / in greater demand in other countries (1). Up to 4 marks for why it might not: Jobs may not be available abroad (1) unemployment may be higher in other countries (1) there may be restrictions on immigration (1). People may lack the skills to take up any available jobs in other countries (1). People may have family ties (1) restricting their mobility (1). People may not be aware of jobs in other countries / lack of information (1). There may be generous unemployment benefits in the country (1). The costs of living may be low in the country (1) which may discourage e.g. the retired from emigrating (1). People may be deterred by cost of emigration (1). People may be deterred by cultural differences in other countries (1). Unemployment may be short term / believed to be short term / the unemployed may be optimistic about future economic prospects in the country (1) if seasonal or frictional unemployment (1). 6 Each point may be credited only once, on either side of an argument, but separate development as to how/why the outcome may differ is expected.
This question in 0455/22 Oct/Nov 2018
Q14 · The United Nations (UN) has set out development goals for countries to achieve by 2050 0455/23 Oct/Nov 2018
6 The United Nations (UN) has set out development goals for countries to achieve by 2050. These goals include: • conserve natural resources • ensure education for all • end poverty everywhere • promote sustained economic growth (a) Identify two ways a government could conserve its country’s resources. [2] (b) Explain two external benefits that can arise from education. [4] (c) Analyse how a cut in the rate of interest could reduce poverty. [6] (d) Discuss whether or not economic growth always increases living standards. [8]
20 marks
Mark scheme: 6(a) Identify two ways a government could conserve its country’s resources. One mark for each appropriate action identified. Examples include: Ban/place a limit on the amount of resource consumed. Import resources to reduce consumption of country’s own resources. Reduce exports to reduce consumption of limited resources. Put tax/increase tax on resources to reduce demand. Educate consumers to reduce consumption/conserve resources. Control immigration to reduce consumption of resources. Encourage recycling of resources e.g. metals/plastic. Subsidise firms that conserve natural resources. 2 6(b) Explain two external benefits that can arise from education. Higher output (1) due to more skilled workers (1). Better quality output (1) due to more efficient workers (1). More advanced technology (1) due to ideas/ability to operate new technology (1). Improved health/reduction in spread of diseases (1) more informed population (1). Less pollution (1) if population educated on environmental issues (1). Firms may have to spend less on training (1) due to greater supply of skilled workers (1). 4 6(c) Analyse how a cut in the rate of interest could reduce poverty. A lower interest rate will increase the purchasing power of the poor who have borrowed before (1) will make it easier/cheaper to borrow (1) enabling them to buy more necessities (1) spend on education (1) enabling them to get a job / better paid job (1). A lower rate of interest may encourage a rise in consumer expenditure (1) encouraging firms to expand (1) providing cheaper finance for the expansion (1) increase output (1) raise employment (1) raise income (1). Higher output and spending may increase tax revenue (1) enabling the government to increase its spending to reduce poverty (1). 6 6(d) Discuss whether or not economic growth always increases living standards. Up to 5 marks for why it might: Higher output (1) may enable people to enjoy more goods and services (1) especially if GDP per head rises (1) may increase employment (1) raise incomes (1) Higher output may increase tax revenue (1) more resources/higher quality of resources (1) may enable there to be better healthcare (1) increasing life expectancy (1) more/better education (1). Higher output may enable more resources to be devoted to improving environmental conditions (1) e.g. reduce pollution (1). Up to 5 marks for why it might not: The benefits may not be evenly spread (1) income and wealth may be unevenly distributed (1) there may still be high levels of poverty (1). Higher output may have been achieved by increasing working hours (1) working conditions may have declined (1) there may be greater stress (1) quality of output may be lower (1). Expansion of heavy industries (1) may have created pollution (1) reduce health/life expectancy (1). Non-renewable resources may have been depleted (1) reducing the opportunity to achieve sustainable development (1). Economic growth may not be sustainable (1) increase in supply may not match increase in demand (1) causing inflation (1). Economic growth achieved by exporting goods and services (1) economy producing more investment goods at expense of consumer goods (1) resulting in fewer goods available in domestic market (1). 8 Each point may be credited only once, on either side of an argument, but separate development as to how/why the outcome may differ is to be rewarded.
This question in 0455/23 Oct/Nov 2018
Q15 · Average life expectancy is as short for the poorest Americans as it is for the people of… 0455/22 Feb/March 2019
4 Average life expectancy is as short for the poorest Americans as it is for the people of Sudan, a low-income African country. Low-income individuals tend to live longest in countries with more educated populations. Economic growth can increase education and reduce poverty. In 2017, the US President announced a cut in the tax on firms’ profits. He said the measure would increase employment. (a) Identify two reasons why someone may want to migrate to the USA. [2] (b) Explain two reasons why less-educated people tend to have a shorter life expectancy than people who have received more education. [4] (c) Analyse how economic growth can reduce absolute poverty. [6] (d) Discuss whether or not a cut in the tax on firms’ profits will increase employment. [8]
20 marks
Mark scheme: 4(a) Identify two reasons why someone may want to migrate to the USA. 2 • higher wages • better education • better healthcare • better employment prospects 4(b) Explain two reasons why less-educated people tend to have a shorter 4 life expectancy than people who have received more education. • a lower income (1) worse nutrition/healthcare/housing (1) • less well-informed (1) less likely to eat healthily / more likely to have unhealthy habits e.g. smoking (1) • more likely to be in a more physically demanding / risky job (1) less choice of occupation due to less skills/qualifications (1). 4(c) Analyse how economic growth can reduce absolute poverty. 6 Economic growth is likely to increase employment (1) this may increase the chances of the poor gaining jobs (1) raise income (1) allow them to buy basic necessities / definition of absolute poverty (1). Economic growth can increase tax revenue (1) this may enable the government to spend more to help the poor (1) e.g. improved education for the poor (1) higher state benefits (1). 4(d) Discuss whether or not a cut in the tax on firms’ profits will increase 8 employment. Up to 5 marks for why it might: Firms will be able to keep more of their profits (1) this may increase the incentive for them to expand their output (1) it will provide the funds to spend on expansion (1). To increase their output, firms may take on more workers (1) employment may rise in the private sector (1). Higher profits may attract more shareholders (1) this will also increase the funds for investment (1). Up to 5 marks for why it might not: Firms will not expand if they have spare capacity (1) or they are worried about the future (1). Firms may distribute extra profits to shareholders rather than invest (1). Firms may expand by adopting more capital-intensive methods (1) may actually reduce employment (1). May be lower tax revenue (1) example of what the government may spend less on (1) link to unemployment (1).
This question in 0455/22 Feb/March 2019
Q16 · Universal basic income (UBI) UBI is a scheme where a government provides everyone with a… 0455/21 May/June 2019
1 Universal basic income (UBI) UBI is a scheme where a government provides everyone with a payment, regardless of their circumstances. Such a scheme can help a number of groups including the sick and the old. In 2016, the Indian government was looking at a UBI as an alternative to its existing system of state benefits. A politician in Costa Rica proposed a UBI of $337.5. Finland started a two-year experiment with a version of UBI in 2017. A guaranteed minimum income might help some of the poor who currently do not receive state benefits and may reduce inequality. In a number of countries, income and wealth inequality is increasing. For instance, in Russia 16% of the population live below the official poverty line and 10% of the population own 87% of the country’s wealth. State benefits are relatively low in Russia and the country has one income tax rate of 13%. One cause of the rise in the gap between the rich and the poor in Russia has been the effect on prices and profits arising from the privatisation of a number of state monopolies. Differences in annual average incomes (annual GDP per head) between countries can affect life expectancy as shown in Table 1.1. Table 1.1 Annual GDP per head and life expectancy in selected countries in 2016 Country Annual GDP per head Life expectancy (US$) (years) Costa Rica 16 200 78.8 Finland 42 000 80.8 India 7 400 68.6 Mali 2 300 55.7 Monaco 76 000 89.5 Russia 26 200 70.4 In Finland, a country with an average monthly income per head of $3500, the trial UBI is $600 per month. This does not cover everyone’s needs in a country with high prices, high tax rates and periods of very cold weather. In India, the average monthly income per head is almost the same as Finland’s UBI. A UBI could help the unemployed including the temporary unemployed. Governments welcome a reduction in unemployment. This is because it increases output and enables governments to reduce spending on state benefits for the unemployed. Governments could then increase spending on other areas including education and healthcare. (a) Identify, using information from the extract, two reasons why a person may have a low income. [2] (b) Explain, using information from the extract, whether Russia has a progressive, proportional, or regressive income tax system. [2] (c) Calculate, using Table 1.1, what percentage of annual average income in Costa Rica a person would have if he receives UBI of $337.5 a month. [2] (d) Analyse, using Table 1.1, the relationship between annual GDP per head and life expectancy. [5] (e) Explain an example of opportunity cost in the extract. [4] (f) Discuss whether or not a monopoly will charge high prices. [5] (g) Explain, using information from the extract, two reasons why someone from India with the same income as someone from Finland may enjoy a higher living standard. [4] (h) Discuss whether or not a government paying higher state benefits to the unemployed will reduce unemployment. [6]
30 marks
Mark scheme: 1(a) Identify, using information from the extract, two reasons why a person may have a low income. • old • sick • unemployed • being on state benefits • being in need of, but not receiving state benefits in their country 2 Difference between fourth and fifth bullet point is where a country is not able to fund state benefits, so people remain on low income. 1(b) Explain, using information from the extract, whether Russia has a progressive, proportional or regressive income tax system. Proportional (1) AND the same rate / people with different incomes paying the same % / all paying 13% (1). 2 1(c) Calculate, using Table 1, what percentage of annual average income in Costa Rica, a person would have if he receives UBI of $337.5 a month. 25% (2). Correct working: $337.5 × 12 / $16 200 (1). 2 1(d) Analyse, using Table 1, the relationship between annual GDP per head and life expectancy. Generally, the higher the annual GDP per head, the longer the life expectancy (1) e.g. rich people are likely to have better nutrition / healthcare (1). The two countries, Monaco and Finland, with the highest annual GDP per head have the longest life expectancy (1). The country with the lowest annual GDP per head, Mali, has the lowest life expectancy (1). Russia or Costa Rica is an exception (1) e.g. Costa Rica has a lower annual GDP per head but a higher life expectancy than Russia (1). 5 Countries must be named. Question Answer Marks Guidance 1(e) Explain an example of opportunity cost in the extract. • Opportunity cost is the best alternative (1) foregone (1) plus • The opportunity cost of UBI (1) is the existing system of state benefits (1) or • The opportunity cost of spending on unemployment benefits (1) is spending on education / healthcare (1) 4 1(f) Discuss whether or not a monopoly will charge high prices. Up to 3 marks for why it might: A monopoly is a single seller (1) has high market power (1) is a price maker (1) demand for its product may be inelastic (1) due to lack of substitutes (1) can raise revenue by raising price (1) may be seeking to maximise profit (1). A monopoly may be inefficient (1) due to lack of competition (1) resulting in higher costs and prices (1). Up to 3 marks for why it might not: A monopoly may have low average cost of production (1) due to economies of scale (1) example (1). A monopoly may not be a profit maximiser (1) example of another objective (1). A monopoly may have a product with elastic demand (1) e.g. may be producing a luxury (1). A monopoly may be concerned that charging high prices will encourage new firms to enter the market (1) reducing its market power (1). A monopoly may fear government intervention (1) and keep prices low (1). A monopoly may be government controlled (1) and charge low prices (1). 5 Reward but do not expect reference to price discrimination resulting in low prices for some consumers. Question Answer Marks Guidance 1(g) Explain, using information from the extract, two reasons why someone from India with the same income as someone from Finland may enjoy a higher living standard. Lower prices in India (1) an Indian household may have greater purchasing power / be able to buy more goods and services (1) Colder weather in Finland (1) which is likely to increase people’s willingness to spend / greater need to spend to keep warm (1) Lower tax rates in India (1) greater purchasing power / higher disposable incomes (1) 4 Opposite arguments are also correct e.g. higher tax rates in Finland, etc. Question Answer Marks Guidance 1(h) Discuss whether or not a government paying higher state benefits to the unemployed will reduce unemployment. Up to 4 marks for why it might: The unemployed will have a higher income (1) they may spend more (1) total (aggregate) demand may increase (1) firms may expand (1) take on more workers (1). Enables the unemployed to spend on education and training (1) and improve their chances of getting a job (1). Up to 4 marks for why it might not: Unemployment benefit may become higher than the wages the low paid may receive (1) this may encourage some people to stop working (1) increase voluntary unemployment (1). Higher state benefits may be financed by increased taxation (1) total (aggregate) demand may not rise (1). Government spending money on education and training (1) may have greater impact on reducing unemployment (1). 6 Apply this example to all questions with the command word DISCUSS (1(f), 1(h), 2(d), 3(d), 4(d), 5(d), 6(d) and 7(d)) Each point may be credited only once, on either side of an argument, but separate development as to how/why the outcome may differ is to be rewarded. Generic Example Marks Tax revenue may decrease« (one mark) 1 ...because of reason e.g. incomes may be lower (one mark) 1 Tax revenue may increase because incomes may be higher i.e. reverse of 1st argument (no marks) 0 «because of a different reason that is not the reverse of a previous argument e.g. government spending on subsidies may stimulate the economy more than spending on education 1
This question in 0455/21 May/June 2019
Q17 · In March 2017, Peru was hit by floods and the strongest winds in decades 0455/22 May/June 2019
4 In March 2017, Peru was hit by floods and the strongest winds in decades. Roads, bridges, houses and capital goods were destroyed. It is expected that the damage caused will affect Peru’s Human Development Index (HDI) and economic growth rate. In 2016, Peru experienced a 4% economic growth rate which was higher than the growth rate of the USA. (a) Define a capital good. [2] (b) Explain two causes of an increase in a country’s HDI. [4] (c) Analyse, using a production possibility curve (PPC) diagram, the effect of damaging weather on an economy. [6] (d) Discuss whether countries with a high Gross Domestic Product (GDP) per head will have a faster rate of economic growth than countries with a low GDP per head. [8]
20 marks
Mark scheme: 4(a) Define a capital good. A human-made good (1) used to produce other goods and services (1). 2 4(b) Explain two causes of an increase in a country’s HDI. • an increase in GDP / GNI / income per head (1) raises the goods and services people can consume / due to e.g. higher employment (1) • an increase in life expectancy (1) indicates better healthcare / due to better healthcare / more investment in healthcare (1) • an increase in education / mean and expected years of schooling (1) increases job opportunities / quality of life / due to government investing more in education (1) 4 4(c) Analyse, using a production possibility curve (PPC) diagram, the effect of damaging weather on an economy. Up to 4 marks for the diagram: • axes correctly labelled in terms of two different products or types of products (1) • initial curve or downward sloping line is drawn to the axes (1) • second curve or downward sloping line is drawn to the axes (1) • An indication either by labelling or an arrow that the curve has shifted inwards / left (1) Up to 2 marks for written analysis: Bad weather will reduce the quantity of resources (1). The amount that can be produced with fewer resources will fall (1). 6 O capital goods consumer goods Question Answer Marks Guidance 4(d) Discuss whether countries with a high Gross Domestic Product (GDP) per head will have a faster rate of economic growth than countries with a low GDP per head. Up to 5 marks for why they might: They are likely to have good education (1) good healthcare (1) this will mean skills will be high (1) productivity will be high (1) there may be advances in technology (1) reducing costs of production (1) exports may increase (1). Unemployment may be low (1) with most resources being used (1). MNCs may be attracted to set up in the country (1) contributing to the country’s output (1). Foreign banks may be more willing to lend to the countries’ firms (1) allowing them to expand (1). High incomes are likely to mean high demand / high consumer spending (1) encouraging firms to produce more (1). Up to 5 marks for why they might not: Countries with a low GDP per head may discover raw materials (1) which may be in high world demand (1). People in poorer countries may have more drive to improve their living standards (1) they may work harder (1). Richer countries may have a lower rate of population growth or declining populations (1) this may mean their labour forces are growing more slowly (1) restricting their ability to produce more goods and services (1). Other factors may influence economic growth (1) e.g. type of government policies pursued / deficit on the current account of the balance of payments (1). 8
This question in 0455/22 May/June 2019
Q18 · Iceland’s Economic Structure The people of Iceland once depended on farming and fishing… 0455/23 May/June 2019
1 Iceland’s Economic Structure The people of Iceland once depended on farming and fishing as their main source of income. By 2008, the Icelandic economy was also very heavily dependent on its financial sector. However, the country is now well-known internationally for tourism. Even though the primary sector now only employs a small proportion of the country’s labour force, the influence of this sector in policy-making is very strong. For example, in the fishing industry, there are many government regulations. Regulations that restrict foreign investment in the fishing industry both protect domestic fisherman and the stock of fish in Icelandic waters. Regulation also affects the price elasticity of supply (PES) of fish. The quantity of fish supplied tends to change by a smaller percentage than the change in its price. From 2002 to 2007, Iceland’s annual economic growth rate averaged 5%. In 2006, Iceland’s Gross Domestic Product (GDP) was US$17 billion and in 2007 it grew by 9%. This high growth rate was due to the increased availability of bank loans and also the increasing income of its major trading partners, including the European Union (EU) and Norway. It was during this period of rapid economic growth that the financial sector became an important part of the Icelandic economy. The major commercial banks supported increased consumer spending and major construction projects which improved the standard of living of Icelanders. In addition, commercial banks also expanded into international markets. The international markets were growing rapidly between 2002 and 2007 which brought more money back into the Icelandic financial sector. However, Iceland faced a major financial crisis in 2008 where all three of its major privately-owned commercial banks failed. This led to falling overall levels of output and increased unemployment. Fig. 1.1 shows the economic growth rate and unemployment rate in Iceland from 2002 to 2014. 12 10 8 6 4 2 0 2002 2003 2004 2005 2006 2007 20082008 2009 20102010 2011 2012 2013 2014 –2 –4 –6 Unemployment rate (% of total labour force) Economic growth rate (% change in GDP) Fig. 1.1 Economic growth rate and unemployment rate in Iceland from 2002 to 2014 The recovery from 2010 to 2017 was initially possible due to loans obtained from international organisations. More recently, it was also due to successful tourism campaigns that have made Iceland a ‘must-see’ destination for tourists. (a) Identify, using information from the extract, two industries that are in the primary sector of the Icelandic economy. [2] (b) Explain, using information from the extract, two reasons for government regulation of the fishing industry in Iceland. [4] (c) Explain, using information from the extract, two reasons, apart from changes in employment, for Iceland’s high economic growth rate from 2002 to 2007. [4] (d) Calculate, using information from the extract, Iceland’s GDP in 2007. [2] (e) Analyse, using Fig. 1.1, the relationship between changes in the economic growth rate and the unemployment rate over the period shown. [5] (f) Explain, using information from the extract, whether the supply of Iceland’s fish is price-elastic or price-inelastic. [2] (g) Discuss the advantages and disadvantages of the activities of commercial banks to an economy. [5] (h) Discuss whether or not a growth in tourism is an advantage to a country such as Iceland. [6]
30 marks
Mark scheme: 1(a) Identify, using information from the extract, two industries that are in the primary sector of the Icelandic economy. • farming • fishing 2 1(b) Explain, using information from the extract, two reasons for government regulation of the fishing industry in Iceland. Protect domestic fishermen (1) to ensure they have a stable income (1) to ensure that jobs are preserved (1) can compete with foreign fishermen (1). Protect the stock of fish (1) to ensure sustainability of fish stocks (1) for future generations (1). 4 1(c) Explain, using information from the extract, two reasons, apart from changes in employment, for Iceland’s high growth rate from 2002–2007. • increased availability of bank loans (1) more borrowing (1) to fund consumption (1) and to fund investments (1). • increasing income of its major trading partners, including the European Union and Norway (1) Iceland can now export more to their trading partners (1) increase net exports / external demand / aggregate demand (1) 4 1(d) Calculate, using information from the extract, Iceland’s GDP in 2007. $18.53 billion (2) 18.53 or working e.g. $17bn × 0.09 = $1.53bn (1) 2 Question Answer Marks Guidance 1(e) Analyse, using Fig 1.1, the relationship between changes in the economic growth rate and the unemployment rate over the period shown. They both rose over the period (1) showing a positive relationship (1) unexpected (1) evidence from the data e.g. the unemployment rose from approx. 3.4 to 5% (1) the economic growth rate rose from 0.5 to 1.8% (1) Unemployment rate was relatively constant from 2002 to 2008 (1) while economic growth fluctuated (1). Unemployment was relatively stable from 2009 to 2014 (1). Between 2007 and 2009 the fall in the economic growth rate (1) to a negative value / recession (1) while there was a rise in the rate of unemployment (1). From 2009 to 2014 economic growth increased (1) and unemployment fell (1) the trends are moving in opposite directions (1) as would be expected (1) high economic growth rate should create more jobs (1). Between 2002 and 2004 there’s a significant increase in the economic growth rate (1) while there was only a slight fall in the unemployment rate (1). 5 No marks for a descriptive approach e.g. identifying the growth rate or the unemployment rate for specific years. 1(f) Explain, using information from the extract, whether the supply of Iceland’s fish is price-elastic or price-inelastic. It is price-inelastic (1) because the quantity of fish supplied tends to change by a smaller percentage than the change in its price (1). 2 Question Answer Marks Guidance 1(g) Discuss the advantages and disadvantages of the activities of commercial banks to an economy. Up to 3 marks for advantages to an economy: Lending (1) to consumers (1) enabling them to increase consumption (1) raising their living standards (1) and to firms (1) allowing them to invest (1) increase employment (1) increase output (1) expand into international markets (1) improve the current account of the balance of payments (1). Attract MNCs (1) by providing a range of services to these companies (1). Banks employ many people (1) keeping unemployment low (1) Up to 3 marks for disadvantages to an economy: May encourage saving (1) decreasing consumption/total demand (1) Banks may fail (1) losing customers’ money (1) risking damage to the economy / recession (1). May lend to risky businesses (1) which may cause fluctuations in output (1). May lend to individuals who cannot repay (1) pushing them into debt (1). May charge high interest rates (1) to gain high profits (1) which will increase firms’ costs of production (1) and make it difficult for individuals to repay (1). May lend for purchase of imports (1) worsening the current account (1) Risk of inflation (1) if banks lend too much (1). 5 Question Answer Marks Guidance 1(h) Discuss whether or not a growth in tourism is an advantage to a country such as Iceland. Up to 4 marks for why it might be: Tourism is an export of services (1) bringing in foreign currency (1) improving the current account balance (1). Tourism may increase government tax revenue (1) this could be spent on e.g. education (1). Tourism increases the demand for goods and services (1) creating employment/reducing unemployment (1) e.g. in hotels/restaurants/shops (1) increases output / contributes to economic growth (1). Tourism may attract MNCs/foreign investment (1) e.g. foreign hotel chains may set up in the country (1). More revenue from tourism may result in a rise in the exchange rate (1) this may reduce the price of imports (1) Less reliance on primary / secondary sector (1) benefits of diversification (1). Up to 4 marks for why it might not be: Tourism may create external costs (1) example e.g. pollution (1). Tourism may deplete resources (1) e.g. water (1). Tourism may place a strain on infrastructure, e.g. transport systems (1) Tourism jobs may be low-paid (1) low skilled (1) seasonal (1). Foreign firms may send profits home (1) foreign hotels may bring own employees (1). A high exchange rate may reduce exports / international competitiveness (1). Tourism may increase demand in the economy (1) pushing up the prices the local population have to pay / creating inflation (1). 6
This question in 0455/23 May/June 2019
Q19 · A local manufacturer of medicines (pharmaceuticals) in Nigeria wants to expand which will… 0455/21 Oct/Nov 2019
6 A local manufacturer of medicines (pharmaceuticals) in Nigeria wants to expand which will increase the contribution of this industry to the Gross Domestic Product (GDP) of the country. This firm’s expansion may enable Nigeria to reduce its dependence on imports of medicines and may make medicines more affordable. To ensure success, however, the firm will need to increase its investment in research and development. (a) Define Gross Domestic Product (GDP). [2] (b) Explain two ways in which more affordable medicines can improve standards of living. [4] (c) Analyse how investment in research and development (R&D) can help a firm to grow in size. [6] (d) Discuss whether or not a reduction in imports is beneficial to an economy. [8]
20 marks
Mark scheme: 6(a) Define Gross Domestic Product. GDP measures the (total) output/income/expenditure (1) of a country/economy (1). 2 6(b) Explain two ways in which more affordable medicines can improve standards of living. • more people can have medicines (1) improve health (1) raise productivity / enable people to work / not off work sick (1) • different choice of medicines (1) consumers can find what suits them best (1) • hospitals will have more medicines (1) easier to treat those who are ill/reduce death rate (1) • less spent on healthcare (1) can spend more on other things that can improve standard of living such as education, holidays (1) • higher productivity (1) higher incomes (1) 4 Accept higher HDI if linked to improved life expectancy (1). Do not accept birth control or birth rate explanation. 6(c) Analyse how investment in research and development can help a firm to grow in size. More innovation (1) e.g. Faster machines (1) increase productivity (1) decrease cost of production (1) decrease price of products (1) increase demand (1) increase market share (1) increase profits (1) more reinvestments (1). New products produced (1) larger exports (1) enter new markets (1) at start no direct competition (1) may be high demand (1). More skilled workers needed (1) creating a bigger workforce (1) Provide information (1) influence what is produced (1). 6 Question Answer Marks Guidance 6(d) Discuss whether or not a reduction in imports is beneficial to an economy. Up to 5 marks for why it might be: Reduction in imports may improve the trade in goods / trade in goods and services balance (1) this will improve the current account position / reduce a current account deficit (1) this may reduce a country’s debts (1) avoid downward pressure on the exchange rate (1). Spending on imports may be replaced by spending on domestically produced products (1) this would increase the country’s output / cause economic growth (1) this would increase demand for labour (1) raise employment / reduce unemployment (1) increase incomes and living standards (1). Fewer imports may enable infant industries to grow (1) may protect declining strategic industries (1). May prevent dumping (1) explanation of what is meant by dumping (1) Imports may be harmful products (1) might affect people’s health (1). Up to 5 marks for why it might not be: Imports of capital goods / raw materials may decline (1) these might be cheaper / lower quality than domestically produced capital goods and/or raw materials (1) this will raise costs of production (1) make the country’s products less internationally competitive (1) lower output/reduce economic growth (1) worsen the current account position (1) raise unemployment (1). Fewer imports may reduce choice (1) reduce competition (1) may raise prices (1) lower quality of people’s lives (1). Exports may be falling by more than imports (1) so current account position may be worsening (1). Quantity of imports may be falling but value of imports may be rising (1). 8 Question Answer Marks Guidance 6(d) If the reduction is caused by protectionist measures (1) this would reduce benefits of free trade (1). Loss of tariff revenue (1) may be a major source of tax revenue/reduce amount that can be spent on e.g. education (1). Imports may be of beneficial products (1) not produced in the country (1).
This question in 0455/21 Oct/Nov 2019
Q20 · Driverless cars and advances in technology It is predicted that driverless cars, powered… 0455/22 Oct/Nov 2019
1 Driverless cars and advances in technology It is predicted that driverless cars, powered by electricity, will be on the roads by 2030. Driverless cars have already been tried out on the roads in some cities, including Pittsburgh in the USA. It is thought that driverless cars will reduce accidents, will have lower repair costs and will create less pollution. At first, the supply of driverless cars may exceed the demand, but it is expected that they will soon grow in popularity. As more driverless cars come into use, the demand for bus travel and petrol stations may decline, and some taxi drivers may be made redundant. In contrast, the increased access to transport that driverless cars will give to people, including the elderly, is likely to increase demand for out of town restaurants and places of entertainment. It has been forecast that the technology being developed in connection with driverless cars will make the supply of them elastic. It is predicted that an 8% rise in the price of driverless cars would cause a 20% rise in the quantity supplied. Advances in technology and the replacement of workers by machines are forecast to destroy 80 million jobs in the USA. Job losses are also forecast in other countries and trade unions are likely to be less able to resist these due to a fall in membership and governments reducing the power of trade unions. Among the jobs thought to be at risk are accountants, train drivers and financial advisers. Demand for workers in other occupations, including doctors and dentists, may increase but there is a risk that unemployment may rise. The more educated workers are, the more easily they can move from one occupation to another. Table 1.1 shows education spending as a percentage (%) of GDP and the unemployment rate in selected countries. Table 1.1 Education spending and the unemployment rate in selected countries Education spending Unemployment rate Country as a % of GDP (%) Argentina 5.3 8.0 Brazil 5.8 13.5 Ghana 6.5 12.0 New Zealand 7.3 4.8 South Africa 6.0 26.0 USA 8.2 4.7 Jobs selling houses and flats may decline but it is expected that the demand for building workers may increase. Some people welcome house building in their area but others oppose it. (a) Identify, from the extract, two pairs of substitutes. [2] (b) Explain, using information from the extract, whether the market for driverless cars is expected to be in equilibrium in 2030. [2] (c) Calculate, using information from the extract, the price elasticity of supply (PES) of driverless cars. [2] (d) Explain, using information from the extract, two external costs that driverless cars could reduce. [4] (e) Analyse, using Table 1.1, the relationship between educational spending and the unemployment rate. [5] (f) Discuss whether or not an increase in house building will benefit the people who live in the area. [5] (g) Explain, using information from the extract, two reasons why the power of trade unions may decline in the future. [4] (h) Discuss whether or not a rise in unemployment is harmful. [6]
30 marks
Mark scheme: 1(a) Identify, from the extract, two pairs of substitutes. • Driverless cars and bus travel • Driverless cars and taxi travel • Bus travel and taxi travel • Machines / advanced technology and workers 2 1(b) Explain, using information form the extract, whether the market for driverless cars is expected to be in equilibrium in 2030. No (1) supply is expected to exceed demand (1). 2 1(c) Calculate, using information from the extract, the price elasticity of supply (PES) of driverless cars. 2.5 (2). Correct working: 20% / 8% OR 20 / 8 (1). 2 1(d) Explain, using information from the extract, two external costs that driverless cars could reduce. • accidents (1) people are injured and killed as a result of other people’s driving / accidents impose costs on hospitals and healthcare / less human error / driverless cars reduce the death rate / accidents can cause traffic congestion / fewer accidents may reduce cost of repairs (1) • pollution (1) cars emit carbon dioxide / pollution causes health problems / driverless cars are more environmentally friendly / use electricity which causes less pollution (1) • lower cost of insurance to (other) drivers (1) as a result of less accidents / lower cost of repairs (1) 4 Question Answer Marks Guidance 1(e) Analyse, using Table 1.1, the relationship between educational spending and the unemployment rate. Expected relationship – a country that spends more (a high proportion) of their GDP on education would have a low unemployment rate / a country with a higher unemployment rate is likely to spend less on education / it is an inverse relationship (1). Reasons for expected relationship – workers would be likely to be more skilled and productive / higher unemployment may result in less tax revenue to spend on education (1). Evidence in support of expected relationship – e.g. New Zealand or US (1) highest spenders and lowest unemployment rates (1). Evidence against expected relationship – e.g. Argentina or South Africa (1) Argentina spends a lower proportion than Ghana and Brazil but has a lower unemployment rate / South Africa spends more a higher proportion than Argentina and Brazil but has a higher unemployment rate (1). 5 A pattern of analysis is expected in response to this type of question. If there is no expected pattern of analysis, the following may be worthy of some reward, e.g.: • it is not a consistent relationship (1) • there are other influences on the unemployment rate (1) However, do not reward simple statements (repetition) of the figures given in the table. For example, USA spends 8.2% on education and has an unemployment rate of 4.7%, is not to be rewarded. Question Answer Marks Guidance 1(f) Discuss whether or not an increase in house building will benefit the people who live in the area. Up to 3 marks for why it might: House building may create jobs (1) lower unemployment (1) generate income / raise wages / raise living standards (1). House building will increase the supply of housing (1) the lower price of housing (1) makes houses more affordable (1) fewer homeless (1). May attract more firms to set up in the area (1) more services may be provided (1) due to more people living in the area / larger labour force (1). May save travel time for those working nearby (1) reduce pollution / congestion (1). Up to 3 marks for why it might not: House building may cause external costs (1) examples (2). More houses may reduce the value of people’s homes (1) reduce their wealth (1). There is an opportunity cost (1) the area used could have been used for e.g. school buildings (1). Demand for extra services may not be met (1). Jobs may only be temporary / seasonal unemployment (1). More housing may create overcrowding in the area. (1). 5 Apply this example to all questions with the command word DISCUSS (1(g), 1(h), 2(d), 3(d), 4(d) and 5(d)) Each point may be credited only once, on either side of an argument, but separate development as to how/why the outcome may differ is rewarded. Generic example Mark Tax revenue may decrease « 1 ... because of reason e.g. incomes may be lower. 1 Tax revenue may increase because incomes may be higher i.e. reverse of a previous argument. 0 Tax revenue may increase because of a different reason i.e. not the reverse of a previous argument e.g. government spending on subsidies may stimulate the economy more than spending on education. 1 Question Answer Marks Guidance 1(g) Explain, using information from the extract, two reasons why the power of trade unions may decline in the future. Fall in membership (1) lower funds / less bargaining power (1). Rise in unemployment / workers being replaced by machines (1) trade unions may be reluctant to take industrial action for fear that members will be replaced by unemployed / non-member workers (1). Government may reduce the power of trade unions (1) making it harder for trade unions to protect workers’ rights (1). Movement from primary to tertiary sector (1) which may be less unionised / better working conditions (1). 4 Some points may be interchangeable e.g. rise in unemployment (1) resulting in fall in membership (1). Question Answer Marks Guidance 1(h) Discuss whether or not a rise in unemployment is harmful. Up to 4 marks for why it is: Output is likely to fall (1) incomes will decline / poverty increase (1) living standards will fall (1) lower total (aggregate) demand (1). Tax revenue will fall (1) government may have to cut spending on e.g. education and healthcare (1). Government may increase tax rates (1) which may create disincentive effect (1). The government will have to spend more on unemployment benefit (1) this will involve an opportunity cost (1) may result in a budget deficit (1). Unemployed workers may lose skills / become out of date (1) may need retraining (1). May increase emigration (1) lose skilled workers (1). May cause social problems e.g. crime / mental health problems (1). Up to 4 marks for why it is not: Inflation may fall (1) due to lower total (aggregate) demand (1). Firms may find it easier to recruit new workers (1) this will make it easier to expand (1) at lower wage costs (1). Productivity may be higher (1) more skilled workers kept (1). Unemployment may give the unemployed time to search for a better job (1) eventually raises their incomes (1). Rise may only be temporary (1). May reduce demand for imports (1) improve current account of the balance of payments (1). May be less pollution with lower output (1). 6 Reward but do not expect reference to a downward multiplier effect and/or not reaching productive capacity.
This question in 0455/22 Oct/Nov 2019
Q21 · It is predicted that the UK economy will avoid another recession in the next two decades… 0455/22 Oct/Nov 2019
2 It is predicted that the UK economy will avoid another recession in the next two decades and that its population will increase significantly by 2040. Most of this predicted increase will come from immigration. By 2040, it is also expected that one in twelve people will be aged over 80. A number of countries, including some low-income countries, may have a more rapid population growth rate than high-income countries. (a) Identify two reasons why people are living longer. [2] (b) Explain two reasons why net immigration may increase the standard of living in a country. [4] (c) Analyse how fiscal policy could be used to stop a recession. [6] (d) Discuss whether or not low-income countries have a faster rate of population growth than high-income countries. [8]
20 marks
Mark scheme: 2(a) Identify two reasons why people are living longer. • better healthcare • improved nutrition • better housing • better living standards • higher incomes 2 2(b) Explain two reasons why net immigration may increase the standard of living in a country. May increase the size of the labour force (1) increase the number of goods and services available / increase output / increase GDP / economic growth (1). May bring in new skills (1) raise productivity (1) increase the quality of products produced (1). Fill jobs that local workers do not want to do (1) reduce shortages (1). Fill jobs that local workers do not have the qualifications to do (1) reduce shortages (1). Increase total (aggregate) demand (1) which will encourage firms to increase their output (1). Make better use of other resources (1) if the country lacks labour / is underpopulated (1). Increase tax revenue (1) enabling government to spend more on e.g. education (1). Immigrants may set up firms (1) creating jobs / reducing unemployment (1) / purchasing power (1). May lower costs of production (1) make products more affordable (1). 4 Reward but do not expect reference to optimum population. Do not reward lower wages because the effect on the standard of living is uncertain. Question Answer Marks Guidance 2(c) Analyse how fiscal policy could be used to stop a recession. The government could cut taxes (1) this could raise disposable income / purchasing power (1) which may increase consumer spending (1) cuts in corporate tax may provide more funds for firms (1) raise investment (1) encourage firms to expand their output (1) increase employment / reduce unemployment (1). A government could increase its own spending (1) example e.g. healthcare (1) this would increase total (aggregate) demand (1) encouraging an increase in output (1). Spending on infrastructure (1) may reduce firms costs and so encourage higher output (1). 6 2(d) Discuss whether or not low-income countries have a faster rate of population growth than high-income countries. Up to 5 marks for why some do: Some have a high birth rate (1) reasons e.g. low number of women working, (1) need for children to support parents in old age (1) lack of education (1) falling death rate (1) natural increase (1) due to improved healthcare (1) rise in incomes (1). Up to 5 marks for why some do not: Some high-income countries experience a high rate of net immigration (1) factors attracting immigrants e.g. job opportunities, high income (2). Some low-income countries experience net emigration (1). Some low-income countries experience natural disasters and wars (1) poor health care (1) which increase the death rate (1). Some high-income countries are experiencing a fall in the death rate (1) causes e.g. improved living standards, advances in medicines (2) although birth rates falling (1) governments may provide incentives to try to raise the birth rate (1) including financial aid / free child care (1). 8 Some points may be interchangeable e.g. factors attracting immigrants may encourage emigration from poorer countries, but do not reward on both sides of the discussion. Maximum of 4 marks for a list-like approach.
This question in 0455/22 Oct/Nov 2019
Q22 · Australia’s economic growth rate has fallen in recent years 0455/23 Oct/Nov 2019
4 Australia’s economic growth rate has fallen in recent years. Its Human Development Index (HDI), however, is high and in 2016, Australia had the second highest HDI in the world. The Australian government hopes that the country’s birth rate will rise from a low of 12.1 in 2016. An increasing proportion of Australian children are going to private sector schools. Their parents have to pay a fee for them to attend these schools. (a) Identify the difference between economic growth and recession. [2] (b) Explain how the HDI compares living standards between countries. [4] (c) Analyse the effects of a rise in a country’s birth rate. [6] (d) Discuss whether or not parents should have to pay a fee to send their children to school. [8]
20 marks
Mark scheme: 4(a) Identify the difference between economic growth and recession. • Economic growth is an increase in GDP/output (1). • Recession is a fall in GDP/output / negative economic growth (1). 2 4(b) Explain how the HDI compares living standards between countries. • Measures output/income/material standard of living (1) GDP/GNI per head (1). • Measures healthcare (1) life expectancy (1). • Measures education (1) mean and expected years of schooling / literacy rate (1). • Provides an index figure for each country (1) from 0 to 1 / divides countries into very high, high, medium and low (1). • Higher HDI means higher standard of living (1). 4 4(c) Analyse the effects of a rise in a country’s birth rate. • In the short run, fewer women may be able to work (1) which will decrease the size of the labour force (1) more children (1) increases the dependency ratio (1) putting pressure on the working population (1). • In the longer run there will be more workers (1) this may decrease the dependency ratio (1) population size may increase (1) increase output (1) encourage investment (1). • Government will have to devote more resources e.g. to primary education / childcare / support families (1) this may mean fewer resources can be devoted to e.g. improving living standards (1). • Higher demand for industries related to young children e.g. baby clothes, child minding (1) may reduce unemployment (1). • Increase in population/ overpopulation (1) causes a strain on resources (1) fall in living standards (1). • If birth rate still lower than death rate (1) will still have an ageing population (1). 6 Reward but do not expect reference to the optimum population. Question Answer Marks Guidance 4(d) Discuss whether or not parents should have to pay a fee to send their children to school. Up to 5 marks for why they should: • Some parents can afford to pay (1) some parents will work hard to pay (1) paying may make them more prepared to demand good standards (1) would see themselves as consumers (1). • May result in more resources being devoted to education (1) teachers reive higher pay (1) and motivated to work harder (1) parents demand high standards for their money (1) improving outcomes (1). • Education provides private benefits (1) in the form of higher pay (1) more career choice (1). • The government paying for education (1) involves an opportunity cost (1) e.g. spending on healthcare (1). • A fee may be charged for secondary education but not primary education (1) if it is considered a basic level of education should be available to all (1) parents may choose to pay for education if they think it will be of high quality (1). Up to 5 marks for why they should not: • Some parents may not send their children to school (1) some will not be able to afford to (1) some may undervalue education (1) may reduce desire to have children (1). • Opportunity cost to parents (1) e.g. less spending on other goods / services (1). • It would increase income inequality (1) price would take a higher percentage of the income of the poor (1) less educated workforce (1) lower standard of living (1). • Education provides external benefits (1) higher productivity (1) higher output/GDP (1) these could be lost (1) • The government may need to provide education free to ensure the right quantity of education is consumed (1) that the poor have access to education (1). 8 Reward but do not expect reference to education being a merit good.
This question in 0455/23 Oct/Nov 2019
Q23 · In 2016, France had a trade in services deficit 0455/23 Oct/Nov 2019
7 In 2016, France had a trade in services deficit. France is a rich, developed country with a high standard of living. The country is, however, facing several challenges including population problems. Also, after elections in 2017, politicians and economists debated whether the country should try to move towards freer international trade. (a) Define a trade in services deficit. [2] (b) Explain two population problems a rich, developed country may experience. [4] (c) Analyse how a move to freer international trade may benefit a country’s producers. [6] (d) Discuss whether or not the standard of living is higher in developed countries than in developing countries. [8]
20 marks
Mark scheme: 7(a) Define a trade in services deficit. • Imports of services being greater than exports of services (2). • A deficit on a section of the balance of payments (1). 2 7(b) Explain two population problems a rich, developed country may experience. • an ageing population (1) due to a falling death rate and birth rate / increasing dependency / increasing the cost of healthcare and/or pensions (1). • A decreasing population (1) a declining labour force (1) due to a falling birth rate / increasing dependency (1). • net immigration (1) putting pressure on schools/hospitals/housing (1). 4 7(c) Analyse how a move to freer international trade may benefit a country’s producers. • With lower tariffs (1) their exports will be cheaper (1) the volume of exports will not be restricted by quotas (1). • If producers are efficient (1) they will sell more abroad (1). • Producers will be able to buy imported raw materials more cheaply (1) this will reduce their costs of production (1) increase their profits (1). 6 Question Answer Marks Guidance 7(d) Discuss whether or not the standard of living is higher in developed countries than in developing countries. Up to 5 marks for why it might be: • Higher average income (1) enabling people to buy more goods and services (1) spend money on healthcare (1) education (1) enabling people to live longer / be more productive (1). • Government tax revenue is likely to be higher (1) enabling the government to spend more on e.g. pensions, healthcare (1). Up to 5 marks for why it might not be: • Some people’s living standards in developed countries are low/some people’s living standards in developing countries are high (1) income is not evenly distributed (1). • Working hours in some developed countries are high (1) leading to stress (1) less leisure time (1). • Environmental conditions are better in some developing countries (1) with less pollution (1). 8 Reward answers from the opposite perspective - developing countries have a lower standard of living than developed countries.
This question in 0455/23 Oct/Nov 2019
Q24 · The Chinese government reformed the Chinese tax system in 2016 0455/22 Feb/March 2020
5 The Chinese government reformed the Chinese tax system in 2016. It extended VAT (sales tax) from the sale of goods to the sale of services enabling it to cut the corporation tax rate. Taxes on goods and services are usually regressive. The Chinese government wanted to raise living standards and hoped that a cut in the tax rate firms pay would attract multinational companies (MNCs) to the country. (a) State two reasons for levying taxes. [2] (b) Explain the difference between a progressive tax and a regressive tax. [4] (c) Analyse how a cut in the rates of corporation tax and income tax may influence the number of MNCs setting up in the country. [6] (d) Discuss whether or not people in a high-income country always enjoy a higher living standard than those in a low-income country. [8]
20 marks
Mark scheme: 5(a) State two reasons for levying taxes. One mark each for any two from: • raise revenue • redistribute income • discourage consumption of demerit goods • reduce imports • reduce / influence total demand / influence economic activity / reduce inflation. 2 5(b) Explain the difference between a progressive tax and a regressive tax. Logical explanation which might include: A progressive tax takes a larger proportion (1) of the income of the rich / of income as it rises (1) falls more heavily on the rich (1) make income more evenly distributed (1) direct taxes are often progressive (1) example (1). A regressive tax takes a larger proportion (1) of the income of those on low income / falls as income rises (1) falls more heavily on those on low income (1) make income less evenly distributed (1) indirect taxes are often regressive (1) example (1). 4 One mark for each difference identified and one mark for each explanation. Maximum of 2 marks for progressive tax and maximum of 2 marks for regressive tax. Question Answer Marks Guidance 5(c) Analyse how a cut in in the rates of corporation tax and income tax may influence the number of MNCs setting up in the country. Coherent analysis which might include: Firms will be able to keep more of their profits (1) firms may be profit motivated/seeking to maximise profits (1) MNCs will compare the profits they can earn in a number of countries (1) lower corporation tax will enable them to invest more / expand (1) pay higher dividends (1). Lower income tax will increase disposable income (1) may increase demand for consumer goods (1) increase the market for the MNCs products (1) may reduce pressure for wage rises (1) may make workers more motivated and so more productive (1). Lower tax revenue may reduce a government’s ability to spend (1) on e.g. education and healthcare (1) this may reduce labour productivity (1) which may increase MNCs’ costs (1). 6 A maximum of 4 marks if only corporation tax or income tax is considered. Question Answer Marks Guidance 5(d) Discuss whether or not people in a high income country always enjoy a higher living standard than those in a low income country. In assessing each answer, use the table opposite. Why they might: • may be able to enjoy more / better quality goods and services • may receive good healthcare and so enjoy long life expectancy • may enjoy good education and so have more choices • working conditions may be better with less workers in jobs involving hard physical labour / more people working in the tertiary sector • may be able to save, providing security for the future. Why they might not: • income may be unevenly distributed and some people in the population may be living in poverty, some may be unemployed • pollution levels may be higher in the country • people may be working longer hours, having less leisure time, more stressed • some of the products produced in high income countries may be demerit goods • may be high cost of living • may have high tax rate Example of a Level 1 answer: Yes because people living in high income area will enjoy luxuries of life and those living in low income country will get less opportunity to enjoy their life. Principal Examiner comment: This answer is a maximum of L1. It only identifies that people in high income countries are more likely to enjoy luxury products. There is no development of links (analytical or evaluative discussion) in response to either side of the question. 8 Level Description Marks 3 A reasoned discussion which accurately examines both sides of the economic argument, making use of economic information and clear and logical analysis to evaluate economic issues and situations. One side of the argument may have more depth than the other, but overall both sides of the argument are considered and developed. There is thoughtful evaluation of economic concepts, terminology, information and/or data appropriate to the question. The discussion may also point out the possible uncertainties of alternative decisions and outcomes. 6–8 Question Answer Marks Guidance 5(d) Level Description Marks 2 A reasoned discussion which makes use of economic information and clear analysis to evaluate economic issues and situations. The answer may lack some depth and development may be one- sided. There is relevant use of economic concepts, terminology, information and data appropriate to the question. 3–5 1 There is a simple attempt at using economic definitions and terminology. Some reference may be made to economic theory, with occasional understanding. 1–2 0 A mark of zero should be awarded for no creditable content. 0
This question in 0455/22 Feb/March 2020
Q25 · Calculate Vietnam’s GDP per head in 2017 0455/21 May/June 2020
1 (a) Calculate Vietnam’s GDP per head in 2017. [1] (b) Identify two rewards to factors of production. [2] (c) Explain what happened to Vietnam’s foreign exchange rate between 2010 and 2017. [2] (d) Explain two benefits an economy may gain from having a young labour force. [4] (e) Analyse why Vietnam’s budget deficit may decline in the future. [4] (f) Analyse the relationship between government spending on education and the percentage of the labour force employed in the tertiary sector. [5] (g) Discuss whether or not an increase in competition is likely to benefit Vietnamese consumers. [6] (h) Discuss whether or not the increase in borrowing is likely to have caused inflation in Vietnam in 2017. [6]
30 marks
Mark scheme: Question Answer Marks 1(a) Calculate Vietnam’s GDP per head in 2017. 1 $6900 (1). 1(b) Identify two rewards to factors of production. 2 Wages (1) profits (1). 1(c) Explain what happened to Vietnam’s foreign exchange rate between 2 2010 and 2017. Logical explanation which might include: It fell/depreciated (1) more dong had to be given to buy one dollar (1). 1(d) Explain two benefits an economy may gain from having a young 4 labour force. Logical explanation which might include: May be more flexible (1) switch from doing different tasks (1). May be more mobile (1) able to switch from one job to another or from one place to another place (1). May be more up to date with advances in technology (1) more productive/able to use advanced technology (1). 1(e) Analyse why Vietnam’s budget deficit may decline in the future. 4 Coherent analysis which might include: High economic growth will raise incomes/wages rising (1) higher profits (1) more revenue from direct taxes (1) higher incomes is likely to result in more spending (1) more revenue from indirect taxes (1). Tax rates may be increased (1) reducing the gap between tax revenue and government spending (1). Deregulation / privatisation may increase profits (1) resulting in higher revenue from direct taxes /corporation tax (1). 1(f) Analyse the relationship between government spending on education 5 and the percentage of the labour force employed in the tertiary sector. Coherent analysis which might include: Generally the countries with the highest % spending on education have the highest percentage employed in the tertiary sector and vice versa (1) up to two examples e.g. Norway has the highest % spending and the highest % employed in the tertiary sector, Bangladesh has the lowest % spending and the lowest % employed in the tertiary sector (2) the main exception is Vietnam – second highest % spending but lowest % employed in the tertiary sector (1) there may be a time lag in this case (1). It is the expected relationship as some tertiary jobs require high skills (1) countries that can afford to devote a high percentage of resources to education may have achieved a relatively high level of development (1) a higher percent spent will create jobs in education (1). 1(g) Discuss whether or not an increase in competition is likely to benefit 6 Vietnamese consumers. Apply this example to all questions with the command word DISCUSS (1g, 1h, 2d, 3d, 4d and 5d) Each point may be credited only once, on either side of an argument, but separate development as to how/why the outcome may differ is rewarded. Generic example mark Tax revenue may decrease… 1 ...because of reason e.g. incomes may be lower. 1 Tax revenue may increase because incomes may be higher i.e. 0 reverse of a previous argument. Tax revenue may increase because of a different reason i.e. not the reverse of a previous argument e.g. government spending on 1 subsidies may stimulate the economy more than spending on education. Award up to 4 marks for logical reasons why it might, which may include: • prices may be reduced to attract more consumers (1) making them more affordable to consumers (1) • choice will be increased in terms of sellers (1) and possibly in terms of a greater range of products (1) • quality may rise (1) with pressure being put on producers to produce good products to attract consumers (1) • producers may respond more fully to changes in consumer demand (1) Award up to 4 marks for logical reasons why it might not, which may include: • firms may be smaller (1), less able to take advantage of economies of scale (1), so prices may be higher (1) • firms may have less profit (1) and so spend less improving the quality of the product (1) • some firms may be MNCs (1), less concerned about causing external costs (1) 1(h) Discuss whether or not the increase in borrowing is likely to have 6 caused inflation in Vietnam in 2017. Award up to 4 marks for logical reasons why it might, which may include: • higher consumer demand (1) and investment (1) will increase total (aggregate) demand (1) • higher total demand may cause demand-pull inflation/cause producers to raise prices (1) • government spending may rise, further adding to total (aggregate) demand (1) • the economy has very low unemployment/full employment (1) making it difficult for supply to respond to higher demand (1) • tax rates may rise (1) which may increase costs of production (1) causing cost-push inflation (1) Award up to 4 marks for logical reasons why it might not, which may include: • higher investment may reduce costs of production (1) lowering cost- push inflation (1) • higher consumer spending may enable firms to grow (1) and take greater advantage of economies of scale (1) • increased education (1) may raise labour productivity (1), reduce costs of production (1) and lower cost-push inflation (1) • privatised firms may be more efficient (1) • more competition may reduce price rises (1)
This question in 0455/21 May/June 2020
Q26 · Calculate Pakistan’s trade in goods balance in 2017 0455/22 May/June 2020
1 (a) Calculate Pakistan’s trade in goods balance in 2017. [1] (b) Identify two possible causes of demand-pull inflation in Pakistan in 2017. [2] (c) Explain the opportunity cost to Pakistan of producing consumer goods. [2] (d) Explain two reasons why education is a merit good. [4] (e) Analyse why the children of poor families tend to receive less education than the children of rich families. [4] (f) Analyse the relationship between GDP per head and imports per head. [5] (g) Discuss whether or not the supply of teachers in Pakistan is likely to increase in the future. [6] (h) Discuss whether or not an increase in its import tariffs would be likely to benefit the Pakistani economy. [6]
30 marks
Mark scheme: Question Answer Marks 1(a) Calculate Pakistan’s trade in goods balance in 2017. 1 –$36.5bn (1). 1(b) Identify two possible causes of demand-pull inflation in Pakistan in 2 2017. Any two from: Higher government spending (1) higher consumer spending / rising population (1) increased investment (1). 1(c) Explain the opportunity cost to Pakistan of producing consumer 2 goods. Logical explanation which might include: Capital goods (1) resources that could have been used to produce capital goods are being used to produce consumer goods / (next) best alternative forgone (1). 1(d) Explain two reasons why education is a merit good. 4 Logical explanation which might include: People underestimate full benefit / private benefit (1) not appreciating health and job opportunity benefits (1). People not taking into account external benefits (1) e.g. better quality products/larger quantity of products or economic growth (1). 1(e) Analyse why the children of poor families tend to receive less 4 education than the children of rich families. Coherent analysis which might include: The children of the poor may not attend school (1) they may have to work (1) to help support their families (1). Poor families are likely to have difficulty paying to have their children educated (1) some schools in Pakistan are in the private sector (1) there seems to be a lack of low-cost schools (1). The children of the poor may leave school at a younger age (1) may miss more school days due to ill health (1). 1(f) Analyse the relationship between GDP per head and imports per head. 5 Coherent analysis which might include: Generally the countries with the highest GDP per head spend the most per head on imports (1) examples e.g. Norway has the highest income per head and the highest spending on imports per head and Haiti has the lowest income and the lowest spending on imports (up to 2) exception: Russia has a higher income per head than Mexico but a lower spending per head on imports (1). Expected relationship as income rises (1) people can afford more imports (1). The four countries with above average GDP per head spend above the global average on imports (1). The two countries with below average GDP per head spend more on imports (1). 1(g) Discuss whether or not the supply of teachers in Pakistan is likely to 6 increase in the future. Generic example mark Tax revenue may decrease… 1 ...because of reason e.g. incomes may be lower. 1 Tax revenue may increase because incomes may be higher i.e. 0 reverse of a previous argument. Tax revenue may increase because of a different reason i.e. not the reverse of a previous argument e.g. government spending on 1 subsidies may stimulate the economy more than spending on education. Award up to 4 marks for logical reasons why it might, which may include: • education standards may rise (1) which may increase those qualified to be teachers (1) • working conditions may improve (1) with better buildings (1) • population is increasing (1) which may increase the size of the labour force (1). Award up to 4 marks for logical reasons why it might not, which may include: • wages may not rise (1) teachers may switch to other jobs (1) • teachers may emigrate to other countries (1) • the qualifications required to be a teacher may increase (1) by more than educational standards rise (1). 1(h) Discuss whether or not an increase in its import tariffs would be likely 6 to benefit the Pakistani economy. Award up to 4 marks for logical reasons why it might, which may include: • may reduce the trade deficit (1) by reducing demand for imports (1) • tax revenue may increase (1) enabling the government to increase its spending (1) • may help protect infant industries (1) until they can take advantage of economies of scale (1). Award up to 4 marks for logical reasons why it might not, which may include: • demand for some finished imports may be price inelastic (1) • demand for capital goods / raw materials may be inelastic (1) • incomes may rise (1), leading to higher spending on imports (1) • other countries may impose trade restrictions (1) reducing Pakistan’s ability to export (1).
This question in 0455/22 May/June 2020
Q27 · Calculate the total number of people over 60 years old in Greece in 2015 0455/23 May/June 2020
1 (a) Calculate the total number of people over 60 years old in Greece in 2015. [1] (b) Explain what is meant by an unemployment rate of 24%. [2] (c) Identify two reasons for the recovery of the European economies, other than Greece. [2] (d) Explain the two supply-side policy measures being used by the Greek government. [4] (e) Analyse how two of Greece’s population trends may have affected its economy. [4] (f) Analyse the relationship between Greece’s GDP per head and its HDI value. [5] (g) Discuss whether or not having a strong foreign exchange rate is a problem for Greece’s economy. [6] (h) Discuss whether or not a market economic system improves living standards. [6]
30 marks
Mark scheme: Question Answer Marks 1(a) Calculate the total number of people over 60 years old in Greece in 1 2015. 27% × 10.8 million = 2.92 million 1(b) Explain what is meant by an unemployment rate of 24%. 2 Logical explanation which might include: 24% of the total labour force (1) is actively searching for jobs (willing and able to work) but cannot find work/job (1) 1(c) Identify two reasons for the recovery of the European economies, 2 other than Greece. successful supply-side policy measures (1) improving global economy (1) 1(d) Explain the two supply-side policy measures being used by the Greek 4 government. Logical explanation which might include: labour market reforms (1) making it easier to hire and fire workers / giving workers more skills to enable them to take various jobs / making it easier for workers to move from one place to another or one job to another (1) Privatisation (1) increasing efficiency due to the profit-maximising motive (1) 1(e) Analyse how two of Greece’s population trends may have affected its 4 economy. Coherent analysis which might include: The Greek population has been falling ever since 2010 (1) resulting in a smaller labour force (1). Ageing population (1) increase in dependency ratio (1). Emigration (1) loss of skilled workers (1). 1(f) Analyse the relationship between Greece’s GDP per head and its HDI 5 value. Coherent analysis which might include: Greece’s GDP per head has been falling from 2010–2015 (1) but HDI has been increasing (1) negative relationship (1) data for GDP per head (1) data for HDI value (1). This could be because of improving education (1) and healthcare (1). HDI consists of GDP per head / education / health (1) hence even though GDP per head is falling this is more than offset by rise in education / health (1). 1(g) Discuss whether or not having a strong foreign exchange rate is a 6 problem for Greece’s economy. Generic example mark Tax revenue may decrease… 1 ...because of reason e.g. incomes may be lower. 1 Tax revenue may increase because incomes may be higher i.e. 0 reverse of a previous argument. Tax revenue may increase because of a different reason i.e. not the reverse of a previous argument e.g. government spending on 1 subsidies may stimulate the economy more than spending on education. Up to 4 marks for why it might be a problem: Strong foreign exchange rate will lead to high price of exports (1) decreasing the quantity demanded for exports (1) decreasing value of exports (1) strong foreign exchange rate will lead to low price of imports (1) increasing the quantity demanded for import (1) increasing value of imports (1) decreasing net exports (1) decreasing total demand (1) decreasing economic growth (1) decreasing employment (1). Up to 4 marks for why it might not be a problem: Strong foreign exchange rate will lead to low price of imported raw materials, machines / capital, or semi manufactured goods (1) this could decrease cost of production (1) decreasing the price of domestically produced goods (1) increasing demand / consumption / exports (1) increasing total demand (1) increasing economic growth (1) increasing employment (1) 1(h) Discuss whether or not a market economic system improves living 6 standards. Up to 4 marks for why it does improve living standards: Economic freedom (1) consumers and producers can make their own decisions on what to consume and produce (1) no government intervention enables more efficient allocation of resources (1) firms react to the wants of consumers to gain profits for themselves then consumers are fairly likely to get what they want and gain high levels of satisfaction from their income (1) costs are lower and prices are lower (1) more affordable (1). Up to 4 marks for why it does not improve living standards: Instability and uncertainty (1) Unemployment especially when there is a recession (1) high inflation could decrease affordability (1) monopolies exploit consumers (1) workers paid low wages (1) pollution and other external costs (1) Unequal distribution of income and wealth (1) under provision of public goods (1).
This question in 0455/23 May/June 2020
Q28 · Calculate the percentage of total world output of palm oil produced by Indonesia in 2017 0455/22 Oct/Nov 2020
1 (a) Calculate the percentage of total world output of palm oil produced by Indonesia in 2017. [1] (b) Identify two variable costs of producing palm oil. [2] (c) Explain one opportunity cost of conserving forests in Indonesia. [2] (d) Explain two external costs of the destruction of forests in Indonesia. [4] (e) Draw a demand and supply diagram to show the effect of a ban on burning stubble on the market for rice. [4] (f) Analyse the relationship between countries’ GDP per head ranking and HDI ranking. [5] (g) Discuss whether or not the immigration of workers would be likely to benefit the Indonesian economy. [6] (h) Discuss whether or not the Indonesian tourism industry will increase in the future. [6]
30 marks
Mark scheme: 1(a) Calculate the percentage of total world output of palm oil produced by Indonesia in 2017. 60% (1). 1 Accept 60. 1(b) Identify two variable costs of producing palm oil. • fertilisers • palm oil seeds • casual labour 2 If more than two are given, consider the first two only. Accept ‘labour’, ‘workers’ or ‘wages’ for ‘casual labour’. 1(c) Explain one opportunity cost of conserving forests in Indonesia. Logical explanation which might include: Palm oil not produced / rice not produced / tourism lost as a result of building fewer hotels / lost opportunity to Norwegian government to spend on e.g. education (1) (next) best alternative forgone (1). 2 1(d) Explain two external costs of the destruction of forests in Indonesia. Logical explanation which might include: Loss of wildlife habitats (1) extinction of species / harmful effect on animals not involved in the economic decision (1). Harmful gases/air pollution/pollution (1) unpleasant atmosphere for local residents / illnesses / global warming (1). 4 One mark for each of two costs identified and one mark for each of two explanations. Question Answer Marks Guidance 1(e) Draw a demand and supply diagram to show the effect of a ban on burning stubble on the market for rice. Axes correctly labelled – price and quantity or p and q (1). Demand and supply curves correctly labelled (1). Supply curve shifted to the left (1). Equilibriums – shown by lines P1 and Q1 and P2 and Q2, or by labelling equilibrium points as E1 and E2 (1). 4 For quantity label accept Q, quantity demanded, quantity supplied. Do not reward a completely macro diagram. O S2 P2 Q2 Q1 P1 S1 D1 price of rice quantity of rice Question Answer Marks Guidance 1(f) Analyse the relationship between countries’ GDP per head ranking and HDI ranking. Coherent analysis which might include: Expected relationship: Generally, the higher the GDP per head ranking, the higher the HDI ranking / positive relationship / direct relationship (1). Supporting evidence: The top country, the top two or top three countries with the highest GDP per head ranking have the highest HDI ranking (1) the country, two countries with the lowest GDP per head ranking have the lowest HDI ranking (1). Exception: Cuba or Indonesia (1) supportive data – Cuba has a lower GDP per head ranking than Indonesia but a higher HDI ranking than Indonesia (1). Analysis: It is the expected relationship (1). GDP is a component of HDI / HDI ranking influenced by additional factors – education and/or life expectancy / higher GDP per head enables more to be spent on education and healthcare (1). 5 HDI now includes years of schooling but accept an idea that it includes education - adult literacy rate was included in the old measure. Responses do not have to be in the format suggested but they should address the expected/normal relationship, offer supporting evidence of that, highlight any exceptions to that, and analyse the overall data. Question Answer Marks Guidance 1(g) Discuss whether or not the immigration of workers would be likely to benefit the Indonesian economy. Up to 4 marks why it might: • may be skilled workers (1) who may be more productive (1) • may be motivated to work harder (1) to improve quality of life (1) • bring in new ideas (1) improving production methods / use advanced technology (1) • may pay taxes (1) enabling the government to spend more (1) • fill vacancies left by Indonesians going to work abroad (1) • increase size of labour force (1) increase productive capacity (1) reduce dependency ratio (1) • may increase exports / total (aggregate) demand (1) may result in economic growth / increase output (1). Up to 4 marks why it might not: • population is already increasing (1) immigration may take it above the optimum level / lead to overpopulation / put pressure on resources (1) • pressure may be put on housing / education / food (1) • may put downward pressure on wages (1) may replace Indonesian workers / cause unemployment (1) lowering living standards (1) • may need training (1) increasing firms’ costs (1) • may increase pollution (1) • may send money home to relatives (1) may have to import more e.g. rice (1) negative impact on the current account of the balance of payments (1). 6 For an answer that examines the effects of migration of workers from Indonesia, a maximum of 2 marks. Apply this example to all questions with the command word DISCUSS (1(g), 1(h), 2(d), 3(d), 4(d) and 5(d)). Each point may be credited only once, on either side of an argument, but separate development as to how/why the outcome may differ is rewarded. Generic example mark Tax revenue may decrease … 1 ... because of reason e.g. incomes may be lower. 1 Tax revenue may increase because incomes may be higher i.e. reverse of a previous argument. 0 Tax revenue may increase because of a different reason i.e. not the reverse of a previous argument e.g. government spending on subsidies may stimulate the economy more than spending on education. 1 Question Answer Marks Guidance 1(h) Discuss whether or not the Indonesian tourism industry will increase in the future. Up to 4 marks for why it might: • it is currently price competitive (1) • if the exchange rate continues to fall (1), price of tourism for foreign visitors will fall (1) • it has natural tourist attractions (1) may preserve forests (1) • global economy is growing (1), incomes are rising (1) enabling foreigners to afford more holidays (1) • people coming from abroad to work in high paid jobs may be skilled / highly motivated (1) raise quality of tourism (1). • Indonesian government may subsidise the tourism industry (1) lowering costs of production (1). • the industry may be promoted /advertised (1) • air travel is falling in price (1) air travel is a complement to holidays (1) • foreign investment may be attracted into the industry (1) Up to 4 marks for why it might not: • pollution may discourage visitors (1) worried about health (1) • there are substitutes (1) Indonesia has competition from neighbouring countries (1) • natural areas of beauty may be destroyed (1) by e.g. new palm oil plantations / natural disasters (1) • net emigration (1) may mean there are not enough workers (1). • Covid-19 may continue to reduce tourism (1). 6
This question in 0455/22 Oct/Nov 2020
Q29 · Calculate the number of Germans aged over 65 in 2017 0455/22 Feb/March 2021
1 (a) Calculate the number of Germans aged over 65 in 2017. [1] (b) Identify two measures of living standards. [2] (c) Explain one cause of globalisation. [2] (d) Explain two advantages of an increase in the occupational mobility of labour. [4] (e) Analyse why the price of German luxury cars may have increased in 2018. [4] (f) Analyse whether the strength of German trade unions increased from 2013–2016. [5] (g) Discuss whether or not an ageing labour force will reduce productivity. [6] (h) Discuss whether or not immigration will increase a country’s budget surplus. [6]
30 marks
Mark scheme: 1(a) Calculate the number of Germans aged over 65 in 2017. 17.82m / 17 820 000 (1). 1 Accept 17.8 m and 18 m. 1(b) Identify two measures of living standards. Two from: • GDP per head / average income • HDI • quality of education / education 2 If more than two are given, consider the first two. 1(c) Explain one cause of globalisation. Fall in transport costs (1) reducing costs of exporting and importing / increasing international trade (1). Improvement in communications (1) due to advances in technology / increasing growth in MNCs / encouraging consumers to buy from other countries / enabling branches in different countries to keep in touch (1). 2 One mark for the cause identified and one mark for the explanation. 1(d) Explain two advantages of an increase in the occupational mobility of labour. Logical explanation which might include: Lower unemployment / increase employment (1) workers losing one job will find another job more quickly / find another job more easily / maybe more skilled / reduce frictional unemployment / reduce structural unemployment (1). Higher output / higher GDP / economic growth (1) firms experiencing higher demand will be able to expand more quickly / more elastic supply / quicker adjustment to changes in market conditions / workers may be able to multitask / change roles / may be more skilled / fewer unfilled vacancies / greater use of resources / fewer idle resources (1). 4 One mark each for each of two advantages identified and one mark each for each of two explanations. Do not credit ‘more skilled’ more than once. Question Answer Marks Guidance 1(e) Analyse why the price of German luxury cars may have increased in 2018. Coherent analysis which might include: Increase in demand (1) rise in incomes (1) people buy more luxury cars as they get richer / luxury cars become more affordable (1). rise in price of US luxury cars (1) these are substitutes to German luxury cars (1). Fall in the price of petrol / gas (1) petrol / gas is a complement to cars (1) firms can raise revenue / profits by increasing price (1). Decrease in supply (1) rise in wages (1) increasing costs of production (1). 4 Question Answer Marks Guidance 1(f) Analyse whether the strength of German trade unions increased from 2013–2016. Coherent analysis which might include: Overview Trade union membership fell (1) unemployment fell and / or wages rose (1). Analysis of why trade union strength may have fallen Trade union members represented a smaller proportion of labour force / proportion fell from 42.7% to 39.3% / number of members fell by approx. 5.6% (1). Fewer members so funds of / subscriptions to trade unions may have fallen (1) reduces ability to take industrial action / reduces collective bargaining strength (1). Lower unemployment / higher wages may mean workers feel less need to join a union (1). Analysis of why trade union strength may have increased Lower unemployment / higher wages may be the result of successful collective bargaining (1) firms would have found it more difficult to replace members asking for better wages / better working conditions / firms may be reluctant to dismiss staff (1) industrial action would have more effect / collective bargaining power may be stronger (1). Output / profits / demand for products may have increased (1) Comments. Other factors may have influenced trade union power e.g. government trade union legislation (1). Other factors may have influenced wages / unemployment e.g. national minimum wage / higher output /more skilled labour force (1). 5 Question Answer Marks Guidance 1(g) Discuss whether or not an ageing labour force will reduce productivity. Award up to 4 marks for why it might: • May discourage investment (1) workers will have less capital equipment to work with (1). • Older workers may find it more difficult to adapt to new technology (1) may resist change (1) there may not be the time to train them (1) may be less mobile (1). • Older workers may be less fit (1) less able to do manual work (1) may have time off sick (1) may have less energy / get tired (1) work slower (1). Award up to 4 marks for why it might not: • May encourage investment because of shortage of workers / desire to rely less on labour / help workers (1). • Older workers may have more experience (1) built up more skills / qualifications (1) may need less training / have received more training (1) may train young workers (1) make fewer mistakes / produce better quality output (1). • May be more reliable (1) e.g. better punctuality (1). • May stay with the employer longer / lower rate of labour turnover (1). 6 Apply this example to all questions with the command word DISCUSS (1g, 1h, 2d, 3d, 4d and 5d) Each point may be credited only once, on either side of an argument, but separate development as to how/why the outcome may differ is rewarded. Generic example Mark Tax revenue may decrease… 1 ...because of reason e.g. incomes may be lower. 1 Tax revenue may increase because incomes may be higher i.e. reverse of a previous argument. 0 Tax revenue may increase because of a different reason i.e. not the reverse of a previous argument e.g. government spending on subsidies may stimulate the economy more than spending on education. 1 Question Answer Marks Guidance 1(h) Discuss whether or not immigration will increase a country’s budget surplus. Award up to 4 marks for reasons why it might: • May increase size of the labour force (1) quality of the labour force may rise (1) employment may rise (1) more people with incomes (1) higher tax revenue (1) more income tax / direct tax revenue (1) more spending / higher total demand (1) more indirect tax revenue (1) higher profits may increase corporate tax revenue (1). Award up to 4 marks for reasons why it might not: • Some immigrants may be dependents (1) some may be unemployed (1) increase government spending on state benefits / unemployment benefits (1) pensions (1). • The government may have to spend more on education (1) healthcare (1) housing / infrastructure (1). • Labour force / population may not increase if matched by emigration (1), • Larger population size may result in the government having to spend more on measures to reduce pollution (1). 6 Increase in the size of the labour force linked to why it might.
This question in 0455/22 Feb/March 2021
Q30 · Calculate the value of Nigeria’s exports of goods in 2017 0455/21 May/June 2021
1 (a) Calculate the value of Nigeria’s exports of goods in 2017. [1] (b) Identify two examples of capital goods. [2] (c) Explain whether Nigeria had a budget deficit or a budget surplus in 2017. [2] (d) Explain how government spending on training may increase tax revenue in the long run. [4] (e) Analyse how living standards in Nigeria compare with living standards in Ethiopia in 2017. [4] (f) Analyse how a government could encourage firms to increase their investment. [5] (g) Discuss whether or not an increase in Nigeria’s population will benefit its economy. [6] (h) Discuss whether or not an increase in Nigeria’s import tariff on rice would increase the output of Nigerian rice. [6]
30 marks
Mark scheme: 1(a) Calculate the value of Nigeria’s exports of goods in 2017. $43.1bn 1 $ is not essential. 1(b) Identify two examples of capital goods. Two from: • [delivery] vehicles • machines • [office] equipment 2 1(c) Explain whether Nigeria had a budget deficit or a budget surplus in 2017. • budget deficit (1) • government spending exceeded tax revenue (1) • government spending was $19.5bn and tax revenue was $12.9bn (1) 2 1(d) Explain how government spending on training may increase tax revenue in the long run. Logical explanation which might include: • Training may increase skills of workers (1) raise productivity (1) raise wages / incomes (1) increase job opportunities / employment / reduce unemployment (1) increase income tax revenue (1). • Higher wages may increase spending / demand (1) increase indirect tax revenue (1). • A more productive labour force may reduce costs of production (1) raise profits (1) increase corporation tax revenue (1). 4 Question Answer Marks Guidance 1(e) Analyse how living standards in Nigeria compare with the living standards in Ethiopia in 2017. Coherent analysis which might include: • Nigeria’s higher GDP per head (income) (1) suggests Nigerians may have been able to enjoy more goods and services (1). • Nigeria has a lower life expectancy (1) suggesting poorer healthcare (1). • Nigeria has a higher average number of years spent at school (1) suggesting the labour force may be more educated (1). • Nigeria has a higher percentage of underweight five-year olds (1) suggesting poor nutrition / income inequality (1). • Overall comment: Nigeria’s income per head and average years spent at school suggests a higher living standard but life expectancy and percentage of five years underweight suggests a lower living standard (1). 4 Question Answer Marks Guidance 1(f) Analyse how a government could encourage firms to increase their investment. Coherent analysis which might include: • Reduce the rate of interest (1) making it cheaper to borrow (1) encouraging borrowing as consumer spending is likely to rise (1). • Lower corporation tax (1) increasing the funds available to invest (1) increasing the incentive to invest as return from investment would rise (1). • Create greater economic certainty / confidence (1) by e.g. keeping inflation low and stable / not changing government spending and taxation frequently (1) making it easier for firms to plan / it can take time to get a return from investment (1). • Provide subsidies/grants/loans (1) decreasing cost of investments (1) encouraging MNCs (1). • Raise tariffs (1) increasing demand for home produced goods (1). • Less government regulation/policies (1) reduces costs for firms (1) more willing to invest (1). 5 Question Answer Marks Guidance 1(g) Discuss whether or not an increase in Nigeria’s population will benefit its economy. Award up to 4 marks for why it might: • Fall in death rate (1) may indicate improved healthcare (1). • Total (aggregate) demand will increase (1) may enable existing firms to expand / increase output (1) new firms to set up (1) attract MNCs (1). • Labour force may increase (1) causing total (aggregate) supply to increase / raise productive capacity (1) increase output / GDP (1). • May move country towards optimum population (1) if there are unused resources (1). • Net immigration will increase labour force (1) and reduce dependency ratio (1) • More tax revenue (1) can be spent on improving e.g., public services (1). Award up to 4 marks for why it might not: • Birth rate is rising (1) will increase dependency (1) resources which may have increased economic growth may have to be devoted to rearing the children (1). • Labour force may fall in the short run (1) to look after the children (1). • Pressure will be put on the environment (1) there may be more pollution (1) causing overcrowding / poor health (1). • If food output cannot be increased (1) may be more malnourishment/famine / poverty (1) more food is required / food may have to be imported (1) food prices may increase (1). 6 Apply this example to all questions with the command word DISCUSS (1(g), 1(h), 2(d), 3(d), 4(d) and 5(d)) Each point may be credited only once, on either side of an argument, but separate development as to how/why the outcome may differ is rewarded. Generic example Mark Tax revenue may decrease… 1 ...because of reason e.g. incomes may be lower. 1 Tax revenue may increase because incomes may be higher i.e. reverse of a previous argument. 0 Tax revenue may increase because of a different reason i.e. not the reverse of a previous argument e.g. government spending on subsidies may stimulate the economy more than spending on education. 1 Question Answer Marks Guidance 1(g) • Population is rising but age structure may be changing (1) as there is net emigration of young people (1) may result in reduction in labour force (1). • [Opportunity] cost for government (1) which has to spend on health/education rather than infrastructure (1). • Increase in output to meet demand (1) results in faster usage of resources in country (1) and shortages (1). Question Answer Marks Guidance 1(h) Discuss whether or not an increase in Nigeria’s import tariff on rice would increase the output of Nigerian rice. Award up to 4 marks for why it might: • A higher tariff may raise the price of imported rice (1) may reduce demand for / consumption of imported rice (1) may cause Nigerians to demand more home- produced rice as it is cheaper (1) effect would be greater, the greater the elasticity of demand for the import of rice (1) may enable Nigerian rice farmers to raise their price / make more profit (1). • A tariff may raise government tax revenue (1) some of this could be used to subsidise Nigerian rice farmers / modernise farming methods and so raise productivity (1). Award up to 4 marks for why it might not: • Nigerian farmers are less productive than Asian competitors (1) have high(er) costs of production (1) Nigerian price may still be higher even with the higher import tariff (1). • The supply of Nigerian rice may be price-inelastic (1) so even if Nigerian farmers could sell their rice for more, they may have difficulties adjusting supply (1). • More Nigerian rice will not be sold if quality is poor (1) consumers my prefer the varieties of rice produced in other countries (1) other countries retaliate by imposing higher tariffs (1) current account surplus may be reduced (1). • Increase in import tariffs may be small (1) making little difference to import prices and consumption (1). • Not enough resources/ factors of production e.g., farmers (1) to produce more rice in Nigeria (1). 6
This question in 0455/21 May/June 2021
Q31 · Latvia is one of the fastest growing economies in Europe 0455/23 May/June 2021
2 Latvia is one of the fastest growing economies in Europe. Although its GDP per head is below the European average, it is quickly catching up. Living standards are improving. At the same time, a decrease in borrowing has reduced the chance of high inflation. The job market is also improving as the unemployment rate is falling. However, there are concerns that there might be less balance of payments stability. (a) Identify two indicators of living standards. [2] (b) Explain how a decrease in borrowing could reduce the chance of high inflation. [4] (c) Analyse how economic growth conflicts with balance of payments stability. [6] (d) Discuss whether or not having a lower GDP will be a disadvantage to an economy. [8]
20 marks
Mark scheme: 2(a) Identify two indicators of living standards. Two from e.g.: Real GDP per head Human Development Index (HDI) healthcare education Accept GDP per head. 2(b) Explain how a decrease in borrowing could reduce the chance of high inflation. Logical explanation which might include: Decrease in borrowing means people’s purchasing power would reduce / less money to spend (1) would lead to less consumption / less spending (1) or investment (1) this could lead to a decrease in total demand (1). Bank lending would be reduced (1) the money supply may be reduced / less money in circulation / less money in the economy. (1) price of goods and services will remain low / stop prices rising (1) less demand-pull inflation (1). 4 Question Answer Mark Guidance 2(c) Analyse how economic growth conflicts with balance of payments stability. Coherent analysis which might include: Economic growth may benefit from higher spending (1) whereas balance of payments stability does not (1). Less balance of payment stability because economic growth leads to higher income (1) higher employment (1) increases spending/consumption (1) increase the demand for goods and services (1) including imported goods (1) reducing net exports (1) increase trade deficit / reduce trade surplus (1). Economic growth could increase demand for imported raw materials (1) imported capital goods (1). Economic growth could lead to demand-pull inflation (1) wage rises (1) increase price of exports (1) reduce competitiveness of exports (1). 6 Question Answer Mark Guidance 2(d) Discuss whether or not having a lower GDP will be a disadvantage to an economy. In assessing each answer, use the table opposite. Why it might be a disadvantage: • lower income and lower purchasing power, lower standards of living • lower investment as less demand for goods and services, less production • lower healthcare and education standards • lower levels of employment • may be lower exports • lower tax revenue • may result in deflation Why it might be an advantage: • less production leads to less environmental problems • less work could lead to less stress • less income leads to less imports, better current account balance • less income leads to less inflation • GDP per head could rise if population fallen more than GDP 8 Accept discussion of low GDP. Level Description Marks 3 A reasoned discussion which accurately examines both sides of the economic argument, making use of economic information and clear and logical analysis to evaluate economic issues and situations. One side of the argument may have more depth than the other, but overall both sides of the argument are considered and developed. There is thoughtful evaluation of economic concepts, terminology, information and/or data appropriate to the question. The discussion may also point out the possible uncertainties of alternative decisions and outcomes. 6–8 2 A reasoned discussion which makes use of economic information and clear analysis to evaluate economic issues and situations. The answer may lack some depth and development may be one- sided. There is relevant use of economic concepts, terminology, information and data appropriate to the question. 3–5 Question Answer Mark Guidance 2(d) Level Description Marks 1 There is a simple attempt at using economic definitions and terminology. Some reference may be made to economic theory, with occasional understanding. 1–2 0 A mark of zero should be awarded for no creditable content. 0
This question in 0455/23 May/June 2021
Q32 · Calculate, in $, the total exports of Laos to China in 2017 0455/21 Oct/Nov 2021
1 (a) Calculate, in $, the total exports of Laos to China in 2017. [1] (b) Identify two roles of commercial banks. [2] (c) Explain how access to seaports may benefit an economy. [2] (d) Explain two benefits of the free market reforms introduced by the government of Laos. [4] (e) Analyse the impact of improved education on the economy of Laos. [4] (f) Analyse the relationship between a country’s Ease of Doing Business ranking and its GDP per head. [5] (g) Discuss whether or not strict rules and regulations benefit an economy. [6] (h) Discuss whether or not a slowdown of China’s economy will be harmful to the economy of Laos. [6]
30 marks
Mark scheme: 1(a) Calculate, in $, the total exports of Laos to China in 2017. 1.1832 billion / 1 183 200 000. 1 Accept 1.18 or 1.2 billion. 1(b) Identify two roles of commercial banks. Helps local entrepreneurs to borrow money (1). Encourages households to save / enables households to save (1). 2 Accept loan / lending 1(c) Explain how access to seaports may benefit an economy. Enables an economy to take full advantage of international trade / take greater advantage of international trading opportunities (1) enables immigration of skilled workers (1) Can export and import goods (1) goods can be transported more cheaply (than by rail or air / over longer distances) / may encourage specialisation (1) increases consumer choice (1). May encourage investment (1) attract MNCs (1) create economic growth (1) 2 1(d) Explain two benefits of the free market reforms introduced by the government of Laos. The free market reforms have enabled Laos to sell their abundant raw materials internationally (1) increases export revenue / improves current account balance / creates employment / encourages firms to expand / increases GDP (1). Encourages foreign investment (1) may lower costs of production / increases total demand / improves current account balance / creates employment / increase tax revenue (1). 4 One mark each for each of two benefits identified and one mark each for each of two explanations. Accept improved infrastructure. Question Answer Marks Guidance 1(e) Analyse the impact of improved education on the economy of Laos. Increased adult literacy rate (1) better skills/qualifications (1) increase productivity (1) / increase productive capacity / total supply (1) increase demand for labour (1) reduce unemployment / raise employment (1) raise wages (1) reduce poverty (1). More attractive for entrepreneurs / new businesses / investment (1) increase output / GDP (1) leading to higher living standards (1). Improvements in technology (1) due to workers having higher IT skills (1) Increase the consumption of merit goods / decrease the consumption of demerit goods (1) 4 1(f) Analyse the relationship between a country’s Ease of Doing Business ranking and its GDP per head. Expected relationship: Positive / direct (1) if ease of doing business (EDB) rank is high, GDP per capita is high (1). Supporting evidence: Singapore has the highest EDB rank and GDP per capita is highest (1) Timor-Leste has the lowest EDB rank and GDP per capita is the lowest (1). Exception: Brunei / Malaysia (1) has lower EDB rank than Malaysia but higher GDP per head (1). Alternatively South Korea / Brunei (1) Brunel has lower EDB rank but higher GDP per head (1). Analysis: The greater the ease of doing business, the more investment there is likely to be (1) higher investment is likely to increase GDP (1). 5 Question Answer Marks Guidance 1(g) Discuss whether or not strict rules and regulations benefit an economy. Award up to 4 marks for logical reasons why they might, which could include: • Environmental rules (1) e.g. cap on carbon emission, tax on polluting industries (1) reduce market failure (1) reduce external costs (1) e.g. could decrease pollution / protect natural resources (1) less health problems for the society (1) better standards of living (1). • Anti-competition rules (1) e.g. restrictions on monopoly power (1) improved consumer choice / lower prices / better quality (1) foreign companies will not dominate the market (1) opportunities for domestic firms to develop (1) increased future economic growth (1). • Restrictions on imports (1) may protect domestic industries / allow growth of domestic industries (1). • Bans e.g. prohibiting smoking in public places (1) may reduce market failure / reduce external costs (1). • Labour market legislation (1) protecting workers’ rights (1). Award up to 4 marks for logical reasons why they might not, which could include: • Strict regulation discourages business (1) Laos ranks one of the lowest in the World Bank’s Ease of Doing Business index (1) lack of investment / MNCs discouraged (1) lower productivity (1) lack of competition (1) lack of employment opportunities (1) decreased total demand (1) decreased economic growth / lower GDP (1) lower standards of living (1). 6 Apply this example to all questions with the command word Discuss (1(g), 1(h), 2(d), 3(d), 4(d) and 5(d)) Each point may be credited only once, on either side of an argument, but separate development as to how/why the outcome may differ is rewarded. Generic example mark Tax revenue may decrease… 1 ...because of reason e.g. incomes may be lower. 1 Tax revenue may increase because incomes may be higher i.e. reverse of a previous argument. 0 Tax revenue may increase because of a different reason i.e. not the reverse of a previous argument e.g. government spending on subsidies may stimulate the economy more than spending on education. 1 Question Answer Marks Guidance 1(g) • Bureaucracy / red tape increases the time and effort of doing business (1) increases cost of production (1) lowers profit (1). • Rules and regulations may lack clarity (1) causing them to be implemented incorrectly (1) • Takes time for the government to administer rules and regulations (1) opportunity cost of government spending (1). • Import restrictions reduce competition (1) may result in higher prices (1) lower quality (1) 1(h) Discuss whether or not a slowdown of China’s economy will be harmful to the economy of Laos. Award up to 4 marks for logical reasons why it might, which might include: • China is Laos’s largest trading partner / 58% of Laos’s exports are sold to China (1) China slowing down will lead to less demand for Laos’s exports (1) less export revenue / worsen current account (1) less total demand (1) less economic growth (1) may not be able to buy more, irreplaceable imports (1). • China is the largest source of foreign investment into Laos (1) less foreign investments will lead to less job creation (1) less employment / higher unemployment (1) lower standards of living (1). Award up to 4 marks for logical reasons why it might not, which might include: • Reduce dependence on China (1) find new markets and investors (1) other countries’ economies could be expanding (1) which could generate more exports (1) and jobs (1). • May lead to fewer environmental problems (1) less pollution (1) higher standard of living (1). • Domestic investors and firms could fill the gap (1) more employment (1) higher GDP (1). 6
This question in 0455/21 Oct/Nov 2021
Q33 · The US operates a mainly market economic system 0455/22 Oct/Nov 2021
5 The US operates a mainly market economic system. Life expectancy in the US fell in 2017, for the third year in a row. Although the US has a high GDP per head, it also has a high level of income inequality. The poor benefited from the US’s low and stable inflation rate. The government’s supply-side policy measures were partly responsible for reducing inflationary pressure. (a) Identify two ways a government could reduce income inequality. [2] (b) Explain two advantages of a market economic system. [4] (c) Analyse why life expectancy may decrease. [6] (d) Discuss whether or not supply-side policy measures can reduce inflation. [8]
20 marks
Mark scheme: 5(a) Identify two ways a government could reduce income inequality. Two from: • progressive taxation • state benefits • spending on state education / training • spending on state healthcare • equal pay legislation • minimum wage 2 Accept higher taxes on high incomes and lower taxes on low incomes but do not accept increasing taxes on incomes as this is TV. Redistributing income is TV – could be redistributing from the poor to the rich. 5(b) Explain two advantages of a market economic system. Logical explanation which might include: Consumer sovereignty (1) with consumers deciding what goods and services are produced (1). Low prices (1) due to competition (1). High quality (1) due to innovation (1). Consumer choice (1) variety of products produced (1). Greater efficiency (1) due to the profit motive (1). Automatic adjustment to changes in demand and supply / quick response to changes in demand and supply (1) via changes in price / with use of the price mechanism / increase consumer satisfaction (1). 4 One mark each for each of two advantages identified and one mark each for each of two explanations. Nothing for no taxes. Question Answer Marks Guidance 5(c) Analyse why life expectancy may decrease. Coherent analysis which might include: Incomes may fall (1) lowering living standards / reducing access to basic necessities (1). Reduction in healthcare (1) e.g limited access to medication (1). Reduction in education (1) people may lead less healthy lives (1) more smoking (1) more ‘junk food’ (1) less exercise (1). Rise in poor nutrition / malnutrition (1) eating more low-quality food / people not having enough food (1). More pollution (1) making people more susceptible to diseases (1). May be spread of new diseases / pandemics (1) wars / civil unrest (1). Climate change (1) may result in more natural disasters (1). More people employed in jobs with poor working conditions / more dangerous jobs (1) resulting in more sickness / accidents (1). 6 Question Answer Marks Guidance 5(d) Discuss whether or not supply-side policy measures can reduce inflation. In assessing each answer, use the table opposite. Why they might: • they may increase total (aggregate) supply, reducing cost-push inflation • they can allow total (aggregate) demand to increase without causing inflation • education and training can increase labour productivity, reducing labour costs • a cut in direct taxes may increase the incentive to be more productive and more innovative • labour market reforms may reduce power of trade unions and reduce rise in wages • subsidies can lower costs of production Why they might not: • privatisation does not always increase competition and so does not always lower prices • education and training can be expensive, may be in areas that are not in demand and will have a time lag • cuts in income tax may increase total (aggregate) demand as well as total (aggregate) supply • resource limitations / unable to increase productive capacity due to e.g. limited land available • inflation may be caused by rise in price of raw materials which have no domestic substitute e.g. oil 8 Only accept lower interest rates, if linked to increasing total supply. Level Description Marks 3 A reasoned discussion which accurately examines both sides of the economic argument, making use of economic information and clear and logical analysis to evaluate economic issues and situations. One side of the argument may have more depth than the other, but overall, both sides of the argument are considered and developed. There is thoughtful evaluation of economic concepts, terminology, information and/or data appropriate to the question. The discussion may also point out the possible uncertainties of alternative decisions and outcomes. 6–8 2 A reasoned discussion which makes use of economic information and clear analysis to evaluate economic issues and situations. The answer may lack some depth and development may be one-sided. There is relevant use of economic concepts, terminology, information and data appropriate to the question. 3–5 Question Answer Marks Guidance 5(d) Level Description Marks 1 There is a simple attempt at using economic definitions and terminology. Some reference may be made to economic theory, with occasional understanding. 1–2 0 A mark of zero should be awarded for no creditable content. 0
This question in 0455/22 Oct/Nov 2021
Q34 · Calculate the number of obese people in the UK in 2016 0455/23 Oct/Nov 2021
1 (a) Calculate the number of obese people in the UK in 2016. [1] (b) Identify two reasons why the demand for vegan food has increased in the UK. [2] (c) Explain one external benefit that may arise from eating less meat. [2] (d) Explain how food consumption in Senegal differed from the US in 2015. [4] (e) Analyse how an increase in labour mobility could improve the performance of a country’s trade in goods. [4] (f) Analyse how an increase in meat consumption could benefit African economies. [5] (g) Discuss whether or not an increase in Senegalese government spending will stop the country experiencing a recession. [6] (h) Discuss whether or not emigration would reduce poverty in Senegal. [6]
30 marks
Mark scheme: 1(a) Calculate the number of obese people in the UK in 2016. 18.2 million/18 200 000/18.2 × 106 1 Accept 18 million. 1(b) Identify two reasons why the demand for vegan food has increased in the UK. Two from: • (concerns about) health • (concerns about) obesity • (compassion for) animal welfare • rise in income/getting richer/higher standard of living • advertising of vegan products • less consumption of meat 2 One mark each for each of two reasons. 1(c) Explain one external benefit that may arise from eating less meat. Healthy/less obese people (1) are more productive/higher output/live longer/government can spend more on education and raise skills (1). Improved environment/air/water quality (1) less greenhouse gases/pollution/people sick (1). 2 One mark for the external benefit identified and one mark for the explanation. Question Answer Marks Guidance 1(d) Explain how food consumption in Senegal differed from the US in 2015. Senegalese citizens consumed fewer calories (1) consumed less than the recommended amount/US consumed more than the recommended amount (1). Senegalese may have suffered malnourishment (1) US may have suffered from obesity (1). Senegalese had a healthier diet (1) e.g. more fruit and vegetables (1). A higher proportion of the Senegalese diet consisted of cereals/grains (1) because it was cheap (1). Senegalese citizens consumed less meat (1) because it was expensive/low incomes (1). Senegalese citizens consumed less sugar and/or sweeteners (1). Senegalese consumed a higher proportion of fruit and/or vegetables (1). Senegalese consumed less added fats and/or oils (1). 4 Accept a response from the viewpoint of the US e.g. US citizens ate more meat. Question Answer Marks Guidance 1(e) Analyse how an increase in labour mobility could improve the performance of a country’s trade in goods. Coherent analysis which might include: Labour markets will become more efficient (1) workers become more skilled (1) workers will move more easily between industries/become more occupationally mobile/respond quickly to changes in demand (1). Workers can move more easily from one place to another/become more geographically mobile (1). If demand for a product rises (1) it will be easier to recruit new workers/fill vacancies (1) more can be produced/supplied (1) less need for imports (1) import expenditure could fall (1) more can be exported (1) export revenue could rise (1). 4 Question Answer Marks Guidance 1(f) Analyse how an increase in meat consumption could benefit African economies. Coherent analysis which might include: May reduce malnutrition/make people healthier (1) make workers more productive/efficient (1) improve quantity/quality of output (1) lower costs of production (1) more competitive internationally (1) exports increase/imports reduce (1) economic growth (1). Increase demand for vets and transport firms (1) increase number of meat processing firms (1) greater investment by firms (1) will increase output (1) raise employment (1) raise incomes/standard of living (1). Reduces government spending on health care (1) can spend more on education/unemployment benefits/infrastructure increasing skill levels/productivity (1). 5 Question Answer Marks Guidance 1(g) Discuss whether or not an increase in Senegalese government spending will stop the country experiencing a recession. Award 1 mark for explanation of recession. Award up to 4 marks for logical reasons for why it might, which might include: • Government spending part of total (aggregate) demand (1) may increase total (aggregate) demand (1) may offset fall in consumer expenditure (1) this may encourage firms to produce more/attract new firms to set up (1) employ more staff/lower (cyclical) unemployment (1) earn more income (1) purchase more goods and services (1). • Government spending on education/training/healthcare infrastructure (1) improves productivity (1) make products more internationally competitive (1) increasing total (aggregate) demand (1) raising output (1). • Government subsidies (1) will lower costs of production (1) encouraging firms to produce more (1). Award up to 4 marks for logical reasons for why it might not, which might include: • May not be great enough to offset fall in investment (1) business confidence may be low (1). firms may not increase output after being given government subsidies (1) 6 Apply this example to all questions with the command word DISCUSS (1g, 1h, 2d, 3d, 4d and 5d) Each point may be credited only once, on either side of an argument, but separate development as to how/why the outcome may differ is rewarded. Generic example Mar k Tax revenue may decrease 1 because of reason e.g. incomes may be lower. 1 Tax revenue may increase because incomes may be higher i.e. reverse of a previous argument. 0 Tax revenue may increase because of a different reason i.e. not the reverse of a previous argument e.g. government spending on subsidies may stimulate the economy more than spending on education. 1 Question Answer Marks Guidance 1(g) • Consumer expenditure may fall (1) investment may not rise (1) exports may fall (1) • if consumer confidence is low (1). • May be global recession (1) exports may fall (1). • If taxes are raised to pay for the increase in government spending (1) government borrows (1) effect on total (aggregate) demand may be small (1). Higher spending on education/health/infrastructure may not result in increased workforce/greater productivity (1). Question Answer Marks Guidance 1(h) Discuss whether or not emigration would reduce poverty in Senegal. Award up to 4 marks for logical reasons for why it might, which might include: • Workers’ remittances may increase/emigrants may send money home to Senegal (1) working abroad may enable them to provide more financial support for their families (1) than working at home (1) if wages are higher abroad (1) • Unemployment may fall (1) if potential emigrants could not gain work at home (1) • Increase ability of people to gain skills/work experience (1) increasing their ability to earn more (1) can share those skills with workers when they return to Senegal (1) • Emigration may move the country towards the optimum population (1) if the country lacks resources (1) this could increase income per head (1) increasing ability to purchase basic necessities (1) Award up to 4 marks for logical reasons for why it might not, which might include: • Skilled workers may leave the country (1) reducing output (1) discouraging MNCs (1) reducing jobs (1) reducing income (1) • There will be fewer people to pay taxes (1) lower tax revenue available to spend to reduce poverty (1) e.g. on education (1) • May be more dependents on the government (1) if parents leave children and elderly relatives behind (1) • Fewer workers in the population (1) will make it harder to finance state pensions (1) may reduce income of pensioners (1) 6
This question in 0455/23 Oct/Nov 2021
Q35 · Calculate the number of Bermudian workers who were unemployed in 2018 0455/22 Feb/March 2022
1 (a) Calculate the number of Bermudian workers who were unemployed in 2018. [1] (b) Identify two reasons why demand for holidays in Bermuda may be price-elastic. [2] (c) State two reasons why a foreign MNC may want to operate in Bermuda. [2] (d) Explain two reasons why Bermuda has a higher level of economic development than many other countries. [4] (e) Analyse the role of the Bermudian Monetary Authority (BMA). [4] (f) Analyse the relationship between GDP per head and life expectancy. [5] (g) Discuss whether or not Bermudian government policy measures designed to reduce unemployment would increase the inflation rate. [6] (h) Discuss whether or not higher indirect taxes can reduce the market failure caused by demerit goods. [6]
30 marks
Mark scheme: 1(a) Calculate the number of Bermudian workers who were unemployed in 2018. 2345 (1). 1 1(b) Identify two reasons why demand for holidays in Bermuda may be price-elastic. Luxury (not a necessity) (1) expensive / high price (1). 2 If more than two reasons are given, consider the first three, 1(c) State two reasons why a foreign MNC may want to operate in Bermuda. Any two from: Tax haven / no corporation tax (1) High GDP per head (1) High import tariffs (1) High literacy rate / skilled workers / educated workers (1) Low inflation (1). 2 If more than two reasons are given, consider the first three, Question Answer Marks Guidance 1(d) Explain two reasons why Bermuda has higher level of economic development than many other countries. Logical explanation which might include: Large tertiary sector (1) jobs in the tertiary sector tend to be better paid / have better working conditions (1). High literacy rate (1) a higher literacy rate will tend to increase employability / provide more choices / increase quality of jobs obtained / increase pay / increase skills / produce better quality products / may suggest a good level of education / raise productivity / increase output (1). Low population growth (1) a lower population growth may mean that dependency ratio may be low / less stress on resources / more resources can be devoted to e.g. investment (1). High GDP per head (1) a higher GDP per head can increase living standards / result in high consumer expenditure (1). High life expectancy (1) which can reflect good health care / may mean high quality labour (1). 4 One mark each for each of two reasons identified and one mark for each of two explanations. If more than two relevant reasons are identified, consider the first three and take the two which gain the highest marks. Note: no mark for high GDP, low unemployment or just e.g. population growth. 1(e) Analyse the role of the Bermudian Monetary Authority (BMA). Coherent analysis which might include: Carries out (most) of the functions of a central bank (1). Acts as banker to the government (1) receives tax payments / enables government to make payments / manages national debt / allows government to borrow and lend (1). Holds the country’s reserves of foreign currency (1) may use reserves to influence the value of Bermuda’s currency / buy / sell currency (1). Carries out the government’s monetary policy / keeps inflation low (1) by changing interest rate / money supply (1). 4 Maximum of 2 marks for recognising functions (including carrying out the functions of a central bank) from the source material. Question Answer Marks Guidance 1(f) Analyse the relationship between GDP per head and life expectancy. Coherent analysis which might include: Overview Generally, a positive relationship / the higher the GDP per head, the longer the life expectancy (1). Supporting evidence Evidence in terms of an individual country or group of countries e.g. Monaco has the highest GDP per head and the longest life expectancy or e.g. the three countries with the highest GDP per head have the longest life expectancy (1) evidence in terms of another country or group of countries e.g. Eswatini has the lowest GDP per head and the lowest life expectancy or e.g. Argentina, Bahamas and Eswatini have the lowest GDP per head and the lowest life expectancy (1). Exception Argentina or Bahamas (1) not in same order / reason for why difference may exist (1). Comments Higher income allows more to be spent on healthcare (1) better healthcare reduces illness / reduces death rate (1). 5 No marks for just stating the figures e.g. Monaco has a GDP per head of approximately $185 000 and a life expectancy of 90 years and Eswatini has a GDP per head of approximately $4000 and a life expectancy of 58. Question Answer Marks Guidance 1(g) Discuss whether or not Bermudian government policy measures designed to reduce unemployment would increase the inflation rate. Award up to 4 marks for logical reasons why they might, which may include: Expansionary fiscal and/or monetary policy measures (1) example of a measure (1) could increase total demand / increase spending (1) higher total demand could cause demand-pull inflation (1) if total (aggregate) demand exceeds total (aggregate) supply / there is limited or no spare capacity (1). Shortage of unemployed workers / lower unemployment could push up wage rates / incomes (1) higher output could push up costs of raw materials (1) and cost of capital goods (1) higher costs of production (1) could cause cost-push inflation (1). Award up to 4 marks for logical reasons why they might not, which may include: Supply-side policy measures (1) could raise productivity (1) example of a measure (1) higher productivity could reduce costs of production (1) total supply could increase to match higher total demand / productive potential/capacity could increase (1) avoid / reduce cost-push inflation (1). Expectations of future inflation could be low (1) resulting in e.g. lower wage claims (1). Unemployment rate is at 7% (1) not at full employment (1) unemployed workers may be willing to work at existing wage rates (1) there is some spare capacity (1). Inflation rate is low (1) and so expectations of inflation may be low (1). Expansionary demand-side policy measures may just result in higher savings (1). 6 Apply this example to all questions with the command word DISCUSS (1g, 1h, 2d, 3d, 4d and 5d) Each point may be credited only once, on either side of an argument, but separate development as to how/why the outcome may differ is rewarded. Generic example Mark Tax revenue may decrease… 1 ...because of reason e.g. incomes may be lower. 1 Tax revenue may increase because incomes may be higher i.e. reverse of a previous argument. 0 Tax revenue may increase because of a different reason i.e. not the reverse of a previous argument e.g. government spending on subsidies may stimulate the economy more than spending on education. 1 Question Answer Marks Guidance 1(h) Discuss whether or not higher indirect taxes can reduce the market failure caused by demerit goods. Award up to 4 marks for logical reasons why they might, which may include: Demerit goods are more harmful than consumers realise / are harmful / consuming less would make people healthier (1) they usually have negative external costs (1) examples include fast food, alcohol and tobacco (1). Demerit goods are overconsumed (1) and overproduced (1) higher indirect taxes will impose an extra cost / raise cost of production (1) which may lower output / supply (1) be likely to raise price (1) which is likely to reduce consumption (1) lower consumption/lower output/lower supply may move output to a point where social costs equal social benefits (1). May raise tax revenue (1) which can be spent on campaigns to reduce e.g. smoking (1). Award up to 4 marks for logical reasons why it might not, which may include: It may be difficult to change consumers’ behaviour / spending patterns (1) some demerit goods are addictive (1) those with high incomes may not be affected by a rise in price (1) demand for demerit goods may be inelastic (1). Producers may not pass on price rise to consumers / products may be sold on an illegal market (1) to avoid fall in demand (1). It can be difficult to determine the output of demerit goods which will avoid market failure. (1) the output where social cost will equal social benefit (1). 6 Examples of demerit goods may be rewarded in why might or why might not.
This question in 0455/22 Feb/March 2022
Q36 · Calculate the number of births in Cyprus in 2019 0455/21 May/June 2022
1 (a) Calculate the number of births in Cyprus in 2019. [1] (b) Identify two indicators of living standards. [2] (c) State why the global market for grapes was in disequilibrium in 2019. [2] (d) Explain two reasons why more well-educated workers tend to work past retirement age than less-educated workers. [4] (e) Analyse how a rise in a country’s retirement age is likely to affect its government’s budget. [4] (f) Analyse the relationship between inflation rates and current account balances. [5] (g) Discuss whether or not, after 2019, Cyprus’s production possibility curve (PPC) is likely to shift to the right. [6] (h) Discuss whether or not adopting capital-intensive production will benefit consumers. [6]
30 marks
Mark scheme: 1(a) Calculate the number of births in Cyprus in 2019. 12 240 (1) 1 1(b) Identify two indicators of living standards. GDP per head / per capita (1). HDI (1). Life expectancy / healthy people (1). Proportion of people in primary sector (1). Level of education / qualifications (1). 2 Do not reward GDP 1(c) State why the global market for grapes was in disequilibrium in 2019. Bad weather / failure of the grape harvest (1) there was a shortage (1) which means demand exceeded supply (1). 2 1(d) Explain two reasons why more well-educated workers tend to work past retirement age than less-educated workers. Logical explanation which might include: Well-paid / good work benefits (1) which provides an incentive to work for longer / high job satisfaction / enter workforce late (1). Healthy (1) and so more able to work for longer / remain productive (1). Work in jobs which do not require physical strength / less tiring (1) older workers tend to be less strong / allows them to continue working as long as remain fit (1). 4 One mark for each of two reasons identified and one mark for each explanation. Question Answer Marks Guidance 1(e) Analyse how a rise in a country’s retirement age is likely to affect its government’s budget. Coherent analysis which might include: A rise in the retirement age / less people retired will reduce the cost of pensions (1) may reduce government spending / government may spend on alternatives e.g., infrastructure, education or health (1). More people in work will increase incomes / businesses expand production (1) raise direct tax revenue (1) spending will increase (1) raise indirect tax revenue (1). 4 Question Answer Marks Guidance 1(f) Analyse the relationship between inflation rates and current account balances. Coherent analysis which might include: Overview: Generally, an inverse relationship / the lower the inflation rate, the higher the current account surplus or the higher the inflation rate, the higher the current account deficit (1). Supporting evidencemax of 2 marks Mongolia has the highest inflation rate (1) and the largest current account deficit (1) Mongolia / Kenya / Nepal have the highest inflation rates (1) all have a current account deficit (1). Iceland / Slovenia have a low rate of inflation (1) but have a current balance of payments surplus (1) Exception: Cyprus lowest inflation rate (1) but a current account deficit / 3rd highest current account deficit (1). Comments: Most of the table shows the expected relationship. (1) Low inflation rates may make products more price competitive / high inflation rates may make prices less price competitive (1) 5 Do not accept current account balance is high or low. Answers need to refer to size of surplus or deficit. Simply using data without explanation is description rather than analysis. Question Answer Marks Guidance 1(g) Discuss whether or not, after 2019, Cyprus’s production possibility curve (PPC) is to shift to the right. Award up to 4 marks for logical reasons why it might, which may include: Quantity / quality of resources may have increased (1) retirement age may have increased (1) people living longer (1) so labour force is likely to have increased (1). Investment may have increased (1) due to low interest rates (1) more capital goods would increase productive capacity (1). Award up to 4 marks for logical reasons why it might not, which may include: Quantity and quality of resources may have decreased (1) land quality is decreasing (1) which will reduce the productivity of land (1). Entrepreneurs may emigrate (1) reducing the supply of enterprise / skilled workers (1). Birth rate is falling (1) size of workforce may fall in future (1) Covid19 may have reduced productivity (1). For recognising that any of these reasons could result in PPC shifting to the left / stay unchanged (1). 6 Apply this example to all questions with the command word DISCUSS (1g, 1h, 2d, 3d, 4d and 5d) Each point may be credited only once, on either side of an argument, but separate development as to how/why the outcome may differ is rewarded. Generic example Marks Tax revenue may decrease 1 because of reason e.g., incomes may be lower. 1 Tax revenue may increase because incomes may be higher i.e., reverse of a previous argument. 0 Tax revenue may increase because of a different reason i.e., not the reverse of a previous argument e.g., government spending on subsidies may stimulate the economy more than spending on education. 1 Question Answer Marks Guidance 1(h) Discuss whether or not adopting capital-intensive production will benefit consumers. Award up to 4 marks for logical reasons why it might, which may include: It may reduce costs of production / more efficient / may result in economies of scale (1) lower costs may reduce prices (1). It may avoid disruption to supply (1) as no industrial action / strikes (1). It may be quicker / faster (1) to respond to changes in consumer demand (1) It may raise quality (1) as absence of human error (1). Award up to 4 marks for logical reasons why it might not, which may include: Products may be standardised / lack variety (1) individual wants may not be met (1). Capital equipment may break down / costly to maintain (1) causing delays in production (1). Initial high cost of capital equipment (1) may push up prices (1). 6
This question in 0455/21 May/June 2022
Q37 · Calculate Bhutan’s GDP in 2018 0455/22 May/June 2022
1 (a) Calculate Bhutan’s GDP in 2018. [1] (b) Identify two indicators that are in both the World Happiness Index and the Human Development Index. [2] (c) State why Bhutan’s 2018 government budget is likely to have increased total demand in Bhutan. [2] (d) Explain two reasons why someone may prefer to work in the tertiary sector rather than in the primary sector. [4] (e) Analyse how investment in capital goods and education can increase New Zealand’s productivity. [4] (f) Analyse the relationship between GDP per head and net migration. [5] (g) Discuss whether or not enterprise is likely to have increased in New Zealand after 2019. [6] (h) Discuss whether or not a cut in income tax rates will increase living standards. [6]
30 marks
Mark scheme: 1(a) Calculate Bhutan’s GDP in 2018. $2.6 bn / $2600 m / $2 600 000 000 / 2.6 10⁹ (1). 1(b) Identify two indicators that are in both the World Happiness Index and the Human Development Index. Life expectancy (1) GDP per head (1). 2 If more than two indicators are given, consider the first three. 1(c) State why Bhutan’s 2018 government budget is likely to have increased total demand in Bhutan. Government spending was greater than government revenue (1) there was a budget deficit (1) of $70 m (1) the government may have used expansionary fiscal policy (1). 2 1(d) Explain two reasons why someone may prefer to work in the tertiary sector rather than in the primary sector. Logical explanation which might include: Better working conditions / non-wage factors (1) e.g. working inside / not having to work in wet weather / less stress / more job satisfaction / fringe benefits (1). Shorter working hours (1) permitting more leisure time (1). Type of work / less physically demanding / not manual work (1) less risk to health / less tiring / less dangerous / fewer accidents / may lack physical strength (1). Better paid (1) enabling more goods and services to be purchased / higher standard of living / as may require more qualifications / skills/training / value added may greater in the tertiary sector / tertiary sector may be expanding / primary sector contracting / may be higher demand for tertiary workers (1). 4 One mark for each of two reasons identified and one mark for each explanation. Note there is a degree of ‘mix and match’ here. For example, working hours or manual work can be taken as a development of working conditions. Accept an answer that explains the disadvantages of working in the primary sector e.g. may prefer to work in the tertiary sector as working hours are longer in the primary sector. Question Answer Marks Guidance 1(e) Analyse how investment in capital goods and education can increase New Zealand’s productivity. Coherent analysis which might include: Higher investment in capital goods will enable workers to work with better equipment (1) more output per worker / worker hour (1). New capital goods may incorporate advances in technology / be of higher quality (1) result in innovation (1) can work for long hours (1). Higher investment in education can enable more children to be educated / children to be educated for longer / improve quality of education / increase knowledge (1) increase workers’ skills / qualifications (1) enable workers to use more advanced technology (1). Investment in capital goods and/or education can enable capital goods/ workers to work at a faster rate (1) be more efficient (1) make fewer mistakes / less wastage (1). 4 Up to 3 marks for analysis on investment in capital goods and up to 3 marks for investment in education. Note only credit increase efficiency once. Question Answer Marks Guidance 1(f) Analyse the relationship between GDP per head and net migration. Coherent analysis which might include: Overview Generally, the countries with higher GDP per head have net immigration / net migration / the countries with lower GDP per head tend to have net emigration / positive/direct relationship (1). Supporting evidence Up to 2 marks for two pieces of supporting evidence e.g. New Zealand has the highest GDP per head and the highest net immigration / net migration / highest positive migration (1) Cyprus has the second highest GDP per head and the second highest net immigration / net migration / positive migration (1) the four countries with the highest GDP per head, all have net immigration / positive net migration (1) the two countries with lowest GDP per head both have net emigration / negative net migration (1) Exception Exception is Kenya or Mozambique (1) Kenya has higher GDP per head but higher net emigration than Mozambique (1). Comments Higher GDP per head may encourage people to move to the country to increase their living standards / income / people who migrate into the country may be high skilled / lower GDP per head may encourage people to emigrate to increase their living standards/income (1) other influences e.g. immigration controls / size of population / wars / political instability (1). 5 There may be an implied comparison e.g. generally countries with a high GDP per head have net immigration. New Zealand has a GDP per head of approx. $55 000 and net immigration of about 40,00 whereas Kenya has a GDP per head of $2,000 and net emigration of about 50 000 (1 mark). For explanation of exception, do not accept that Kenya has ‘lower net migration’ / Mozambique has ‘higher net migration’ – a misinterpretation of the figure. Question Answer Marks Guidance 1(g) Discuss whether or not enterprise is likely to have increased in New Zealand after 2019. Award up to 4 marks for logical reasons why it might, which may include: High labour productivity / high-skilled workers (1) may keep costs down (1) and increase profits (1) which will motivate more people to be entrepreneurs (1). Higher investment / better quality capital goods (1) may increase the number of firms / result in expansion of firms (1) and the opportunities to become entrepreneurs (1). Investment in education / better quality education (1) may increase the people with the skills to become entrepreneurs / increase risk taking ability (1). Higher government spending on mental health / child poverty / pollution (1) may increase workers’ skills / increase workers’ health / increase workers’ productivity (1) higher government subsidies (1) reduce firms’ costs of production (1) higher government spending may increase total demand (1). Higher economic growth (1) may have created more opportunities / greater confidence / higher total demand (1). Net immigration may have continued (1) and some immigrants may have been entrepreneurs / may set up new firms (1) more people in the country may raise total demand (1). Cut in income tax rates (1) could increase demand (1) firms’ revenue / profits (1) create greater profit incentive (1). 6 Apply this example to all questions with the command word DISCUSS (1g, 1h, 2d, 3d, 4d and 5d) Each point may be credited only once, on either side of an argument, but separate development as to how/why the outcome may differ is rewarded. Generic example Mark Tax revenue may decrease… 1 ...because of reason e.g., incomes may be lower. 1 Tax revenue may increase because incomes may be higher i.e., reverse of a previous argument. 0 Tax revenue may increase because of a different reason i.e., not the reverse of a previous argument e.g. government spending on subsidies may stimulate the economy more than spending on education. 1 Question Answer Marks Guidance 1(g) Award up to 4 marks for logical reasons why it might not, which may include: Uncertainty / lack of confidence (1) reason e.g. there may have been a recession / negative economic growth / unclear what may happen to GDP (1) which could have resulted in the reward to enterprise declining (1) may think there is a greater risk of running / setting up a firm (1). Corporation tax may have increased / tax may have increased (1) which would reduce retained profits / amount of profit that can be kept (1). Government attempts to reduce pollution / poverty / improve mental health (1) may increase firms’ costs of production and reduce profits (1) may have an opportunity cost (1) less spending on something that could increase enterprise (1) e.g. reduction is spending on education (1). Accept tax revenue may have increased for tax may have increased for why it might not Reward recognition that tax revenue may rise without a rise in tax rates or with a fall in tax rates. Question Answer Marks Guidance 1(h) Discuss whether or not a cut in income tax rates will increase living standards. Award up to 4 marks for logical reasons why it might, which may include: Will increase disposable income (1) increase ability to buy goods and services / increase purchasing power (1) buy basic necessities / reduce absolute poverty (1) may be able to fulfil more wants / buy more luxuries (1). May increase spending (1) increase total demand (1) reduce unemployment / increase employment (1) increase output / increase economic growth (1). May increase saving (1) and so provide a safety net (1). May encourage investment (1) which may lower costs of production (1) reduce prices (1). May be able to buy more merit goods / better quality education/healthcare (1) increase health / life expectancy (1). May increase the incentive to work (1) may earn more in work than on unemployment benefits (1). May enable people to work fewer hours (1) enjoy more leisure time (1). 6 Rise in income is not sufficient – need idea of disposable income. Question Answer Marks Guidance 1(h) Award up to 4 marks for logical reasons why it might not, which may include: Tax revenue may fall (1) may result in a cut in government spending (1) on e.g. education / health care / mental healthcare / child poverty / pollution / unemployment benefit (1) poor may be most reliant on public services (1). It may increase congestion as people buy more cars (1) may lead to pollution (1). It may increase depletion of non-renewable resources as consumption increases (1). It may benefit mostly the rich / poor may not benefit / will not benefit the unemployed (1) and so not everyone may enjoy higher living standards (1). People may spend on demerit goods (1) higher spending which could reduce health / life expectancy (1). Higher spending / demand may increase prices / cause inflation (1) leave purchasing power unchanged / reduce purchasing power (1).
This question in 0455/22 May/June 2022
Q38 · Calculate Europe’s percentage contribution to the global total eSports revenue in 2019 0455/23 May/June 2022
1 (a) Calculate Europe’s percentage contribution to the global total eSports revenue in 2019. [1] (b) Identify two conditions of demand for eSports. [2] (c) Explain how a change in social attitudes would lead to greater participation by women in the labour force. [2] (d) Explain two differences between private sector investment and public sector investment. [4] (e) Analyse how the development of eSports in Malta can help the government achieve its macroeconomic aims. [4] (f) Analyse the relationship between GDP per head and the proportion of females in the labour force. [5] (g) Discuss whether or not specialisation at a national level is harmful to an economy. [6] (h) Discuss whether or not government investment in education and training will help the Maltese economy. [6]
30 marks
Mark scheme: 1(a) Calculate Europe’s percentage contribution to the global total eSports revenue in 2019. 30% 1(b) Identify two conditions of demand for eSports. Increasing incomes Decrease in the price of technology needed to participate in this sport 2 1(c) Explain how a change in social attitudes would lead to greater participation by women in the labour force. Logical explanation which might include: Acceptance that women are equal to men / that it is acceptable for women to work (1) and that their role is not only as a home maker (1) childcare is not just female role (1). It is more acceptable for women to be educated / there is more encouragement for women to study (1) which increases their job opportunities (1). Women feel more comfortable / accepted at work (1) more jobs will be open to women (1.) Wages paid to women may rise (1) eSports are no longer seen as a male-only sport (1). 2 Question Answer Marks Guidance 1(d) Explain two differences between private sector investment and public sector investment. Private sector investments are investments made by firms (1) while the public sector investments are investments made by the government (1). Private sector investments are made to maximise profits (1) while public sector investments are made to maximise welfare of society (e.g. provide employment) (1). Private sector investments made based on private costs and benefits (1) while public sector investments are made based on social costs and benefits (1). Profits from private sector investment go to shareholders (1) profits from public sector investment go to public spending e.g. health care (1) The aim of private sector investment is to be more competitive / gain market share (1) the aim of public sector investment is to improve macroeconomic performance (1). Private sector investment may be financed by retained profits/entrepreneurs (1) public sector investment may be financed by tax revenue (1). 4 For the 2nd mark for public sector investment, accept any of the macroeconomic objectives as the reason why public sector investment is made. Question Answer Marks Guidance 1(e) Analyse how the development of eSports in Malta can help the government achieve its macroeconomic aims. Coherent analysis which might include: Economic growth is indicated (1) as eSports is part of the service sector that contributes 90% of Malta's GDP (1) development of eSports in Malta can increase Malta’s GDP (1) Unemployment may be reduced / employment increased (1) because it will be able to attract investments (1) creating more jobs (1) from building infrastructure (1) and more professional e-sports players (1) Current account may also be improved by more inflow of money (1) from increased expenditure on exports (1) of services / tourism (1). Tax revenues may increase (1) enabling the government to increase spending on e.g. education (1). 4 Question Answer Marks Guidance 1(f) Analyse the relationship between GDP per head and the proportion of females in the labour force. Coherent analysis which might include: Overview: Generally, GDP per head is higher when the proportion of females in the labour force is higher / positive relationship between GDP per head and proportion of females in the labour force (1). Supporting Evidence: (up to 2 marks) Yemen has the lowest female labour force participation rate and also the lowest GDP per head (1) Luxembourg has the highest female labour force participation rate and the highest GDP per head (1) Yemen, Saudi Arabia, and Bangladesh have the 3 lowest figures for both female participation rate and GDP per head (1) Luxembourg, France and Malta have the 3 highest figures for both female participation rate and GDP per head (1) Exception: However, exception is Saudi Arabia / Bangladesh (1) Saudi Arabia has a lower female labour force participation rate but higher GDP per head than Bangladesh (1). Comments: This is because higher female labour force participation rate means there are higher quantities of labour which is a factor of production / more labour is available to contribute to the growth of the economy (1) increased availability of education for women will positively affect GDP (1) 5 Give BOD if answer states GDP alone and not GDP per head. Question Answer Marks Guidance 1(g) Discuss whether or not specialisation at a national level is harmful to an economy. Award up to 4 marks for logical reasons why it might be harmful, which might include: Specialisation could lead to overdependence on a specific industry / danger of over-specialisation (1) if this industry fails (1) e.g. if there is a fall in demand / revenue from eSports, the whole Maltese economy could be adversely affected (1). Specialisation makes it difficult for the workers to retrain to other industries (1) danger of structural (1) unemployment (1). Specialisation might lead to diseconomies of scale (1) where long run average costs increase as output increases (1). Resources may become exhausted (1) making industry unsustainable (1) Award up to 4 marks for logical reasons why it might not be harmful, which might include: Specialisation leads to increase in efficiency (1) increased competitiveness (1) as the economy focuses on what they do best (1), they will be able to produce more (1) and at a better quality (1) lower cost (1). Specialisation enables workers to become highly trained / skilled (1) and increase their productivity (1) leading to higher incomes (1) and demand for their labour (1). Specialisation could help the economy achieve economies of scale (1) where long-run average cost falls as output increases (1). 6 Apply this example to all questions with the command word DISCUSS (1g, 1h, 2d, 3d, 4d and 5d) Each point may be credited only once, on either side of an argument, but separate development as to how/why the outcome may differ is rewarded. Generic example mark Tax revenue may decrease… 1 ...because of reason e.g. incomes may be lower. 1 Tax revenue may increase because incomes may be higher i.e. reverse of a previous argument. 0 Tax revenue may increase because of a different reason i.e. not the reverse of a previous argument e.g. government spending on subsidies may stimulate the economy more than spending on education. 1 Reward but do not expect reference to comparative/absolute advantage. Question Answer Marks Guidance 1(g) Specialisation enables countries to trade more with other countries (1) increased export earnings can enable countries to afford more imports as well (1) leading to increased choices (1) higher standards of living (1). As output increases and trade increases, governments receive more tax revenue (1) Question Answer Marks Guidance 1(h) Discuss whether or not government investment in education and training will help the Maltese economy. Award up to 4 marks for logical reasons why it could, which might include: Government investment in education and training will enable more students to gain access to e.g. higher education / create a more educated labour force (1) which will enable them to increase their skills (1) productivity / efficiency (1) and enable them to get jobs in the future (1) reducing unemployment (1) increase incomes (1) which would increase consumption / total demand (1) and output / GDP (1) Organising work placements for Maltese students will enable students to gain work experience (1) further increasing their skills (1) and help firms develop (1) with new ideas / extra help (1) at low cost (1) increasing output (1) and economic growth (1). Tax from incomes of those employed (1) will improve public finances (1) Bringing in professionals from other countries to train Maltese students could introduce more expertise (1) helping to transfer new skills (1). May contribute to the growth of the tertiary sector (1) increase development (1). A more educated labour force may attract MNCs (1) more efficient production (1). Award up to 4 marks for why it could not, which might include: Investment in education and training is expensive (1) using public finances (1) 6 Question Answer Marks Guidance 1(h) opportunity cost for the government (1) less spending on government projects such as Healthcare (1) could decrease overall productivity of the economy (1) less economic growth (1). Education and training might not be successful (1) work placements might not teach students the right skills needed in the future / scholarship schemes misused or not given out fairly / foreign professionals might not be able to transfer knowledge effectively (1). Education and training can take a very long before it impacts the economy (1) scholarship schemes usually at least 3 years for a degree level course (1). In the short run, it could reduce the size of the labour force (1) reduce output / lower productive potential (1). There may be emigration of skilled workers (1) other countries gaining the benefits (1).
This question in 0455/23 May/June 2022
Q39 · Voralberg, a region in Austria, has the highest income and best healthcare of any region… 0455/23 May/June 2022
2 Voralberg, a region in Austria, has the highest income and best healthcare of any region in Austria. It benefits from its short distance to Germany and Switzerland, and from the free trade between these countries. However, Voralberg hosts only a small number of foreign multinational companies (MNCs) and its inflation is higher than most areas in Europe. (a) Define free trade. [2] (b) Explain two possible causes of better healthcare. [4] (c) Analyse why few MNCs may choose to locate in a particular region. [6] (d) Discuss whether or not inflation is always a disadvantage to an economy. [8]
20 marks
Mark scheme: 2(a) Define free trade. Free trade is when countries export and import between each other / countries exchange goods and services (1) without any restrictions / protection (1) such as tariffs or quotas (1). 2(b) Explain two possible causes of better healthcare. Logical explanation which might include: More government expenditure on healthcare (1) e.g. on hospitals / training / due to higher tax revenue (1) Higher incomes (1) can spend more on healthcare (1) Better / more hospitals (1) better quality service / less waiting time (1) Better (health) training / education (1) more qualified / specialised / doctors (1) Better medical technology (1) better machines / life-saving equipment (1) Easier access to medicine (1) more affordable (1) 4 One mark for each of two causes identified and one mark for each explanation. Question Answer Marks Guidance 2(c) Analyse why few MNCs may choose to locate in a particular region. Coherent analysis which might include: The region may have higher cost of production / inflation (1) than other regions. e.g. higher cost of labour / land (1) reduces potential profit (1). May also be higher taxation e.g. corporation tax (1) which may reduce the incentive of an MNC to locate in the region (1). May be more regulations e.g. labour laws (1) which may make it more difficult for an MNC to locate in that region / which may increase costs (1). May be a lack of skilled workers (1) due to poor education (1) may reduce productivity (1). May be low/lack of demand (1) limiting the revenues and profitability of the MNC (1). May be a lack of subsidies (1) which would reduce the incentive of an MNC to locate in the region (1). May be a lack of resources e.g. raw materials, labour (1) Major competitors may have already located in that region (1) The region may have corrupt government(s) (1) causing political instability / war (1) It may be outside a free trade area, e.g. the EU (1) unable to gain benefits (1) 6 Accept answers that analyse why MNC's may choose to locate in a region (rather than few choosing to locate there). Question Answer Marks Guidance 2(d) Discuss, whether or not, inflation is always a disadvantage to an economy. In assessing each answer, use the table opposite. Why it might be a disadvantage: lower purchasing power for consumers – lower standards of living lower price competitiveness of exports – lower exports / high imports higher cost of production – lower profits lose value of savings and lenders lose value of lending difficult for consumers, firms, and governments to plan for the future. shoe leather costs, menu costs may discourage investment as may be difficult to plan those on fixed incomes may lose Why it might be an advantage: borrowers may benefit – value of debt decreases may encourage investment as may be cheaper to borrow may be a sign that an economy is growing may be demand-pull inflation – increasing firms’ revenue / employment if inflation is low and stable – it is better than prices decreasing (deflation) may be lower than other countries’ inflation rates 8 Level Description Marks 3 A reasoned discussion which accurately examines both sides of the economic argument, making use of economic information and clear and logical analysis to evaluate economic issues and situations. One side of the argument may have more depth than the other, but overall both sides of the argument are considered and developed. There is thoughtful evaluation of economic concepts, terminology, information and/or data appropriate to the question. The discussion may also point out the possible uncertainties of alternative decisions and outcomes. 6–8 Question Answer Marks Guidance 2(d) Level Description Marks 2 A reasoned discussion which makes use of economic information and clear analysis to evaluate economic issues and situations. The answer may lack some depth and development may be one-sided. There is relevant use of economic concepts, terminology, information and data appropriate to the question. 3–5 1 There is a simple attempt at using economic definitions and terminology. Some reference may be made to economic theory, with occasional understanding. 1–2 0 A mark of zero should be awarded for no creditable content. 0
This question in 0455/23 May/June 2022
Q40 · Calculate the total value of the tertiary sector in Mauritius in 2019 0455/21 Oct/Nov 2022
1 (a) Calculate the total value of the tertiary sector in Mauritius in 2019. [1] (b) Explain the meaning of a change from an economy based on the primary sector to one based on the tertiary sector. [2] (c) Identify two indicators of improving healthcare in Mauritius. [2] (d) Explain two reasons why millions of tourists visit Mauritius each year. [4] (e) Explain two advantages of setting up a firm in Mauritius. [4] (f) Analyse the relationship between the percentage of international trade to GDP and GDP per head. [5] (g) Discuss whether or not outward investment might benefit a Mauritian firm. [6] (h) Discuss whether or not government infrastructure spending benefits the Mauritian economy. [6]
30 marks
Mark scheme: Question Answer Marks Guidance 1(a) Calculate the total value of the tertiary sector in Mauritius in 2019. 1 $ sign not essential. $10.79 billion 1(b) Explain the meaning of a change from an economy based on the 2 Accept any examples of primary sector primary sector to one based on the tertiary sector. industry for 1 mark and any examples of tertiary sector-based industry for 1 mark. When an economy moves from mainly primary industries e.g. agriculture / fishing (1) to mainly tertiary industries e.g. tourism. (1) 1(c) Identify two indicators of improving healthcare in Mauritius. 2 Life expectancy increased (1) and infant mortality rate fallen. (1) 1(d) Explain two reasons why millions of tourists visit Mauritius each year. 4 Coherent analysis which might include: Mauritius has tourist attractions (1) such as its beautiful beaches (1). Easy to travel to Mauritius (1) as the government does not require visa / just need passport (1). Good infrastructure (1) such as good airports / ports and public transport around the island (1). 1(e) Explain two advantages of setting up a firm in Mauritius. 4 Fast growth (1) higher incomes which leads to higher consumption of good and services (1). Political stability (1) which reduces risk / increases confidence (1). Low levels of regulations to start and run a business (1) lower cost of start up / easier to register for a business (1). Better infrastructure (1) more efficient / lower cost of production (1). 1(f) Analyse the relationship between the percentage of international trade 5 to GDP and GDP per head. Coherent analysis which might include: Overview Generally, as percentage of international trade to GDP increases, GDP per head is increasing as well / positive relationship between percentage of international trade to GDP and GDP per head (1). Supporting Evidence Kenya has the lowest percentage of international trade to GDP and lowest GDP per head (1) while Luxembourg has the highest percentage of international trade to GDP and highest GDP per head (1). Exception Mauritius (1) where percentage of international trade to GDP is higher than Qatar but GDP per head is lower (1). Comments This is because trade brings gains from specialisation / enables exploitation of economies of scale (1) increases earnings from exports / total demand / economic growth (1) 1(g) Discuss whether or not outward investment might benefit a Mauritian 6 Apply this example to all questions with firm. the command word DISCUSS (1g, 1h, 2d, 3d, 4d and 5d) Award up to 4 marks for logical reasons why it might be beneficial, which might include: Each point may be credited only once, on • Enables firms to enter new markets (1) increase export (1) increase either side of an argument, but separate revenues (1) achieve economies of scale (1) e.g. of economies of scale development as to how/why the outcome (1) increase output (1) increase profits (1). may differ is rewarded. • Import products at a lower cost (1) lower cost of production (1). • Increase access to foreign technology (1) better quality / higher Generic example mark productivity (1) decrease average cost (1). Tax revenue may decreases 1 Award up to 4 marks for logical reasons why it might not be beneficial, which might include: because of reason e.g. incomes 1 • Capital aboard might not be reinvested back (1) to help the firm in the may be lower. home country (1) lower firm’s potential productivity (1) decrease profits (1). Tax revenue may increase 0 • Changes in international economy may affect potential earnings (1) because incomes may be higher recession in another country will affect export earnings (1) may create i.e. reverse of a previous recession domestically as well (1) decrease output (1). argument. • Other countries might impose restrictions on Mauritian investment (1) or Mauritian government could impose restrictions on outward investment Tax revenue may increase 1 (1) cost might be higher (1). because of a different reason i.e. not the reverse of a previous argument e.g. government spending on subsidies may stimulate the economy more than spending on education. 1(h) Discuss whether or not government infrastructure spending benefits 6 the Mauritian economy. Award up to 4 marks for logical reasons why it might be beneficial, which might include: • Increase efficiency / productivity (1) decrease cost of production for firms (1) increase profits (1) increase investment (1) increase output (1). • Decrease factor immobility (1) decrease market failure (1) easier for workers to move from one place to another in the economy (1) decrease structural unemployment (1). • Increase government spending (1) increase total demand (1) increase output (1) economic growth (1). • Increase job opportunities (1) decrease unemployment (1). Award up to 4 marks how why it might not be beneficial, which might include: • Increase total demand (1) could lead to increase demand-pull (1) inflation (1). • Cost of providing infrastructure is very high (1) opportunity cost of the government (1) cannot spend on other projects such as education and healthcare (1) which may be more beneficial than infrastructure spending (1). • Infrastructure such as big new international airports not really needed (1) domestic demand too low (1) white elephant projects (1). • Benefits foreign firms more than the local community (1).
This question in 0455/21 Oct/Nov 2022
Q41 · Calculate the price elasticity of supply of Ecuador’s oil 0455/23 Oct/Nov 2022
1 (a) Calculate the price elasticity of supply of Ecuador’s oil. [1] (b) Identify two key resource allocation questions. [2] (c) State why sunshine has no opportunity cost. [2] (d) Explain two reasons why Ecuador experienced a recession between 2014 and 2016. [4] (e) Analyse how building more roads can increase a country’s economic growth rate. [4] (f) Analyse the relationship between GDP per head and car ownership. [5] (g) Discuss whether or not the profits of Ecuador’s textile firms are likely to have increased between 2016 and 2019. [6] (h) Discuss whether or not Ecuador benefits from the emigration of some of its workers. [6]
30 marks
Mark scheme: Question Answer Marks Guidance 1(a) Calculate the price elasticity of supply of Ecuador’s oil. 1 Do not accept 16% 0.16 (1). 1(b) Identify two key resource allocation questions. 2 Do not accept: How much to produce or for whom to produce What to produce / produce less of one product and more of another product / less oil and more textiles (1). How to produce it / how products are made / using fewer capital goods (1). 1(c) State why sunshine has no opportunity cost. 2 It is a free good (1). In unlimited supply / not scarce / a renewable source of energy (1). Does not take resources to produce it / nothing needs to be sacrificed to use it / no alternative / substitute so no opportunity cost (1). It is there naturally (1). 1(d) Explain two reasons why Ecuador experienced a 4 One mark for each of two reasons identified and one mark recession between 2014 and 2016. for each explanation. Logical explanation which might include: Fall in demand for exports [of oil] (1) lower export revenue / increase current account deficit / lower output of oil / lower total demand / lower GDP (1). Decrease in government spending (1) lower employment / lower output / lower income from benefits / lower total demand / lower GDP (1). 1(e) Analyse how building more roads can increase a 4 country’s economic growth rate. Building more roads would increase employment )1) lower unemployment (1) increase demand for road building materials (1) increase in government spending on roads (1) increase incomes (1) leading to higher demand / expenditure on goods and services e.g. education / cars (1). Less congestion (1) easier to transport goods / better infrastructure (1) quicker to work / increases labour mobility / longer working hours / more productive / efficient workforce (1) output rises (1). Lower transport costs (1) encourage firms to increase output / attract MNCs / foreign investment (1). Lower costs may increase international competitiveness (1) increase demand for country’s exports (1). 1(f) Analyse the relationship between GDP per head and car 5 There must be a comparison between countries and/or GDP ownership. per head and car ownership. Merely describing the data gets no marks as it is not analysis. Coherent analysis which might include: A direct comparison between two countries e.g. GDP per Overview head is higher in Switzerland than Senegal and car Generally, a direct relationship / the higher the income, the ownership is higher in Switzerland than Senegal is worth the higher the car ownership / the lower the income, the lower 2 marks. the car ownership (1). Supporting evidence – two comparison examples Senegal has the lowest GDP per head and the lowest car ownership (1). Ecuador has the second lowest GDP per head and the second lowest car ownership / Spain has higher GDP per head and car ownership than Uruguay (1) Exception New Zealand / Switzerland (1) Switzerland has a higher GDP per head but lower car ownership than New Zealand (1). OR Switzerland has highest GDP per head but only second highest car ownership (1) OR New Zealand has second highest GDP per head but highest car ownership (1). Comments Higher income would increase ability to purchase cars / high income countries often have more than one car per household (1) For exception other influences on demand e.g. cost of public transport / road space / congestions (1). 1(g) Discuss whether or not the profits of Ecuador’s textile 6 Apply this example to all questions with the command firms are likely to have increased between 2016 and word DISCUSS 2019. (1g, 1h, 2d, 3d, 4d and 5d) Award up to 4 marks for logical reasons why they Each point may be credited only once, on either side of an might, which may include: argument, but separate development as to how/why the Incomes / household spending increased in Ecuador (1) outcome may differ is rewarded. increasing demand for textiles (1) revenue increases (1). Generic example Mark Costs of production may have fallen (1) due to lower transport costs (1)’. Tax revenue may decrease… 1 Increase in scale of production (1) increased ability to take ...because of reason e.g. incomes may be lower. 1 advantage of economies of scale (1) average cost falls (1) profits may rise if prices unchanged but costs fall / profit is Tax revenue may increase because incomes 0 revenue – costs (1). may be higher i.e. reverse of a previous argument. Low increase in wage costs (1) revenue may have increased by more than costs (1). Tax revenue may increase because of a 1 different reason i.e. not the reverse of a previous Incomes abroad may have increased (1) increasing demand argument e.g. government spending on for Ecuadorean textiles (1) especially of luxury textiles (1). subsidies may stimulate the economy more than spending on education. Award up to 4 marks for logical reasons why they might not, which may include: The firms may have lost skilled workers abroad (1) which could have reduced productivity (1) increased costs / production falls (1). Strong competition from abroad (1) they may have lost sales to competitors (1) reducing revenue and or prices (1). Low wage increase (1) workers may leave industry / lower productivity (1) trade unions / workers may take action (1) may strike / disrupting the firms’ supply/ lead to higher costs (1). 1(h) Discuss whether or not Ecuador benefits from the 6 emigration of some of its workers. Award up to 4 marks for logical reasons why it might, which may include: Some may be unskilled (1), may have been unemployed (1) others leaving jobs create vacancies to be filled by unemployed (1) and so the government would spend less on unemployment benefit / more for other public spending (1) less poverty as a result (1). Some may be trained abroad (1) and may bring back skills and ideas into the country (1) increasing output (1). Some may send money home (1) improve the current account balance (1) will increase spending / total demand (1) leading to economic growth (1). Net emigration results in lower population / reduces overpopulation (1) less depletion of resources / pollution / shortage of resources e.g. housing (1). Award up to 4 marks for logical reasons why it might not, which may include: May lose skilled workers (1) lower productivity (1) low quality products / reduce output / economic growth (1) a relatively high proportion of people lost (1) makes it more difficult to attract MNCs (1). If some will not support families at home (1) dependency ratio will rise (1) place more burden on the government (1). Large proportion / 3 million already working abroad (1) shortage of workers / large reduction in size of labour force / increase (unit) wage costs (1) less income (1) less government tax revenue (1) less government spending e.g. education, health (1). Younger workers emigrating (1) leads to an ageing population (1).
This question in 0455/23 Oct/Nov 2022
Q42 · Palau is a small island country in the Pacific Ocean 0455/23 Oct/Nov 2022
5 Palau is a small island country in the Pacific Ocean. It has received considerable financial support from the US. Living standards are thought to be lower in Palau than in the US. Palau imposes some of the highest tariffs in the world. These trade tariffs affect Palau’s current account of its balance of payments. In 2019, commercial bank lending to firms and households in Palau increased. (a) Identify two components of the current account of the balance of payments. [2] (b) Explain two reasons for differences in living standards between countries. [4] (c) Analyse the reasons why a country may impose tariffs on imports. [6] (d) Discuss whether or not an increase in commercial bank lending will increase economic growth. [8]
20 marks
Mark scheme: 5(a) Identify two components of the current account of the 2 Also accept visible balance, invisible balance, income and balance of payments. current transfers. Trade in goods (1) In addition, accept exports and imports. Trade in services (1) Primary income (1) Secondary income (1). 5(b) Explain two reasons for differences in living standards 4 One mark for each of two reasons identified and one mark between countries. for each explanation. Logical explanation which might include difference in: Rate of employment /level of income (GDP per head) (i) will influence the ability to buy goods and services (1). Productivity (1) resulting in differences in ability to enjoy a different quantity of goods and services (1). Availability of resources / factors of production (1) resulting in differences in productive capacity (1). Level of technology (1) resulting higher quality of goods and services / better sanitation / clean water (1). Healthcare (1) resulting in differences in life expectancy (1). Education (1) causing differences in skills / job outcomes (1). International trade (1) resulting in differences in GDP per head (1). Cost of living (1) affecting ability to buy goods and services (1). Environment (1) level of pollution / density of housing (1). War/conflict (1) causing reduced welfare / opportunity / diverted resources (1). 5(c) Analyse the reasons why a country may impose tariffs 6 on imports. Coherent analysis which might include: To increase the price of imports (1) may reduce demand for imports (1) reduce import expenditure (1) improve the current account position / balance of payments (1) increase demand for domestic firms (1) reduce unemployment (1) increase economic growth (1). To protect infant industries (1) enabling them to take advantage of economies of scale / stop them from being driven out by foreign firms with much lower costs due to size (1). To protect declining industries (1) prevent unemployment rising (1). To protect strategic industries (1) ensure self-sufficiency (1). To discourage demerit goods (1) to improve health / welfare of consumers (1). To stop dumping of overseas goods (1) where goods sold at below cost price / aimed at driving out domestic firms (1). As a source of government revenue (1) e.g. to use to subsidise domestic producers (1). As a countermeasure / retaliation (1) in response to unilateral imposition of tariffs by another country (1). 5(d) Discuss whether or not an increase in commercial bank 8 Level Description Marks lending will increase economic growth. 3 A reasoned discussion which 6–8 In assessing each answer, use the table opposite. accurately examines both sides of the economic argument, making use of Why it might: economic information and clear and • households may spend more on goods and services logical analysis to evaluate economic • higher total demand may increase output issues and situations. One side of the argument may have more depth than • firms may invest more leading to higher employment the other, but overall both sided of the • higher investment will increase total demand and argument are considered and productive capacity. developed. There is thoughtful evaluation of economic concepts, Why it might not: terminology, information and/or data • economy may already be at full employment appropriate to the question. The • higher total demand may increase prices / rate of discussion may also point out the inflation rather than output possible uncertainties of alternative • households and firms may spend on imports decisions and outcomes. • households and firms may borrow to repay past debts • variable interest rate increase could then affect level of 2 A reasoned discussion which makes 3–5 future consumption and investment use of economic information and clear analysis to evaluate economic issues and situations. The answer may lack some depth and development may be one-sided. There is relevant use of economic concepts, terminology, information and data appropriate to the question. 1 There is a simple attempt at using 1–2 economic definitions and terminology. Some reference may be made to economic theory, with occasional understanding. 0 A mark of zero should be awarded for 0 no creditable content.
This question in 0455/23 Oct/Nov 2022
Q43 · In 2019, India became the world’s largest producer of sugar 0455/22 Feb/March 2023
3 In 2019, India became the world’s largest producer of sugar. Sugar cane is grown in the country by a large number of mainly low‑income farmers. They sell sugar cane to mills which process the sugar cane into sugar. Processing the sugar cane is more capital‑intensive than growing it. The Indian government sets a minimum price for sugar cane and subsidises the export of sugar. (a) Define a minimum price. [2] (b) Explain two advantages of capital‑intensive production. [4] (c) Analyse why low‑income farmers are likely to have low living standards. [6] (d) Discuss whether or not a government subsidy on the export of sugar will help it achieve its macroeconomic aims. [8]
20 marks
Mark scheme: 3(a) Define a minimum price. 2 A price set by e.g. government (1) above the equilibrium price (1). A price floor (1) to encourage higher supply (1) will result in a surplus (1). 3(b) Explain two advantages of capital-intensive 4 One mark each for each of two advantages identified and one production. mark each for each of two explanations. Logical explanation which might include: If more than two advantages are given, consider the first three. Lower costs of production (1) can produce on a large scale / may result in lower prices / higher profits (1). Raise productivity / efficiency (1) higher output / can Accepting lower costs of production as overall lower costs. produce faster (1). Nothing for lower labour costs. Quality may increase / consistency of quality may be greater (1) may increase demand (1). Absence of human error (1) less wastage (1). Capital goods can work long hours (1) need few breaks / no need for holidays (1). Capital goods will not take industrial action (1) will not disrupt production (1). Can eliminate boring / repetitive / physically demanding tasks (1) increase workers’ job satisfaction (1). 3(c) Analyse why low-income farmers are likely to have 6 low living standards. Coherent analysis which might include: May be unable to afford basic necessities / may spend a high proportion of income on basic necessities / low purchasing power / low ability to consume goods and services (1). Unable to save much (1) banks reluctant to lend to them (1) examples of items they may need to borrow to buy which could improve their quality of life (1). Unable to afford good quality housing (1) which can result in poor health / overcrowding (1). Unable to afford good health care (1) good nutrition / food (1) more likely to become ill (1) lower life expectancy (1). Unable to afford good education (1) reduce range of interests (1). Unable to buy good capital equipment for farms (1) making work hard (1). May have to reinvest into their farms giving them less to spend (1). May experience poor working conditions / physically demanding work (1) long hours (1) reducing health (1) Live in rural areas (1) which may lack infrastructure (1). 3(d) Discuss whether or not a government subsidy on 8 Level Description Marks the export of sugar will help it achieve its macroeconomic aims. 3 A reasoned discussion which accurately 6–8 examines both sides of the economic In assessing each answer, use the table opposite. argument, making use of economic information and clear and logical analysis Why it might: to evaluate economic issues and • lower price of exports and increase their supply situations. One side of the argument may • increase export revenue and improve the current have more depth than the other, but account balance overall, both sides of the argument are • higher output of sugar can contribute to economic considered and developed. There is growth thoughtful evaluation of economic • more people may be employed in growing sugar concepts, terminology, information and / and processing sugar cane or data appropriate to the question. The discussion may also point out the Why it might not: possible uncertainties of alternative • other countries’ sugar may still be cheaper decisions and outcomes. • may make farmers and mill owners lazy 2 A reasoned discussion which makes use 3–5 • sugar sellers may not lower their prices of economic information and clear • demand for sugar may be price-inelastic analysis to evaluate economic issues • introduction of capital equipment may lower and situations. The answer may lack employment some depth and development may be • other countries may retaliate against the subsidy one-sided. There is relevant use of and so current account position may not be economic concepts, terminology, improved information and data appropriate to the • higher exports may increase total demand question. resulting in inflation • opportunity cost – e.g. spending on education 1 There is a simple attempt at using 1–2 which may be more effective. economic definitions and terminology. Some reference may be made to economic theory, with occasional understanding. 0 A mark of zero should be awarded for no 0 creditable content.
This question in 0455/22 Feb/March 2023
Q44 · Many people from the Philippines work in another country, often in industries that… 0455/21 May/June 2023
4 Many people from the Philippines work in another country, often in industries that provide merit goods and public goods. In 2020, the Philippine government raised more tax revenue. Some was spent on policy measures to increase life expectancy and some on policy measures to reduce unemployment. The country’s unemployment rate was also affected by a rise in the country’s foreign exchange rate. (a) Identify two influences on which country a person decides to work in. [2] (b) Explain, with examples, the difference between a merit good and a public good. [4] (c) Analyse how an increase in government spending could increase life expectancy. [6] (d) Discuss whether or not a rise in a country’s foreign exchange rate would benefit its economy. [8]
20 marks
Mark scheme: 4(a) Identify two influences on which country a person decides to work in. Two from: wages / GDP per head working conditions job opportunities / job security qualifications required family ties language spoken immigration restrictions personal safety/ freedom from persecution living standards / cost of living better welfare / healthcare / education provision 2 If more than two influences are given, consider the first three. 4(b) Explain, with examples, the difference between a merit good and a public good. Logical explanation which might include: A merit good e.g. education / fruit (1) is beneficial / is under- consumed / people unaware of benefits / so underproduced without government intervention / government encourage consumption (1). A public good e.g. defence / streetlighting / police / sea defences / roads (1) would not be produced by the private sector / needs to be financed by the government/ non-rival/ non-excludable (1). 4 One mark each for each of two differences identified and one mark each for each of two examples Question Answer Marks Guidance 4(c) Analyse how an increase in government spending could increase life expectancy. Coherent analysis which might include increased government spending on: Healthcare (1) could raise quality / accessibility of healthcare (1). Education (1) may result in people leading healthier lives (1) more exercise (1) better nutrition (1). Benefits (1) may increase access to basic necessities / reduce poverty (1). Green energy (1) may reduce pollution (1). Infrastructure (1) could reduce traffic accidents (1) reduce traffic congestion (1) reduce stress (1). Police (1) reduces deaths through crime (1). Increased government spending (in total) (1) may increase employment / raise income / raise standards of living (1). 6 MAX of three marks for just identifying areas of government spending MAX of three marks for analysis of any single area of spending. One item analysed well MAX 4 marks. Question Answer Marks Guidance 4(d) Discuss whether or not a rise in a country’s foreign exchange rate would benefit its economy. In assessing each answer, use the table opposite. Why it might: reduce price of imports this could lower inflation as raw material costs may fall and more competitive pressure for firms to keep price rises low enables a country to buy more imports for any given quantity of exports could reduce a current account surplus which may enable more products to be consumed. Why it might not: increase the price of exports this could reduce exports and export revenue economic growth could fall unemployment could rise could increase a current account deficit. 8 Level Description Marks 3 A reasoned discussion which accurately examines both sides of the economic argument, making use of economic information and clear and logical analysis to evaluate economic issues and situations. One side of the argument may have more depth than the other, but overall, both sides of the argument are considered and developed. There is thoughtful evaluation of economic concepts, terminology, information and/or data appropriate to the question. The discussion may also point out the possible uncertainties of alternative decisions and outcomes. 6–8 2 A reasoned discussion which makes use of economic information and clear analysis to evaluate economic issues and situations. The answer may lack some depth and development may be one-sided. There is relevant use of economic concepts, terminology, information and data appropriate to the question. 3–5 1 There is a simple attempt at using economic definitions and terminology. Some reference may be made to economic theory, with occasional understanding. 1–2 0 A mark of zero should be awarded for no creditable content. 0
This question in 0455/21 May/June 2023
Q45 · Calculate the number of people who were living in poverty in Guyana in 2020 0455/22 May/June 2023
1 (a) Calculate the number of people who were living in poverty in Guyana in 2020. [1] (b) Identify two causes of the decrease in the output of sugar in 2020. [2] (c) Explain how economic growth is measured. [2] (d) Explain two reasons why labour mobility may increase in Guyana in the future. [4] (e) Draw a demand and supply diagram to show the effect of a decrease in the price of rail transport on the market for car transport. [4] (f) Analyse the relationship between GDP per head and internet access. [5] (g) Discuss whether or not the discovery of oil is likely to increase living standards in Guyana. [6] (h) Discuss whether or not Guyana would benefit from an increase in the size of its population. [6]
30 marks
Mark scheme: 1(a) Calculate the number of people who were living in poverty in Guyana in 2020. 276 500 (1). 1 1(b) Identify two causes of the decrease in the output of sugar in 2020. Bad weather (1) falling (global) demand (1). 2 If more than two causes given, consider the first three. 1(c) Explain how economic growth is measured. Real (1) GDP / national / country’s output / income / expenditure (1). 2 If more than two ways given, consider the first three. Not accepting GDP per head for GDP. 1(d) Explain two reasons why labour mobility may increase in Guyana in the future. Logical explanation which might include: Increased government spending on education / improved education (1) improved skills / productivity / occupational mobility (1). Improved / cheaper rail travel / increased spending on infrastructure / improved infrastructure (1) easier to work further away / increased ability to work in other areas / increased geographical mobility (1). Increased government spending on the internet (1) people learn new skills / gain information about job opportunities / increase occupational mobility (1). May be net immigration (1) migrants may be skilled / may be more willing to move to different areas of the country (1). 4 One mark each for each of two reasons identified and one mark each for each of two explanations. If more than two reasons given, consider the first three. Question Answer Marks Guidance 1(e) Draw a demand and supply diagram to show the effect of a decrease in the price of rail transport on the market for car transport. Demand and supply diagram: Axes correctly labelled – price and quantity or p and q (1). Original demand and supply curves correctly labelled (1). Demand curve shifted to the left (1). Equilibriums – shown by lines P1 and Q1 and P2 and Q2 or equilibrium points marked as E1 and E2 (1). 4 Question Answer Marks Guidance 1(f) Analyse the relationship between GDP per head and internet access. Coherent analysis which might include: Expected relationship: Direct / positive (1) the higher the GDP per head, the higher the internet access (1) Supporting evidence: Up to two marks E.g. Iceland with the highest GDP per head had the highest % of the population with internet access Eritrea with the lowest GDP per head had the least internet access France with the second highest GDP per head has the second highest % of population with internet access Analysis of expected relationship: Higher GDP per head increases household’s ability to pay for internet access / higher internet access may increase productivity/efficiency / increase job opportunities (1) higher GDP per head increases tax revenue, some of which can be spent on the provision of internet access / higher productivity/efficiency could increase wages (1). Exception: Guyana / Morocco (1) Guyana had a higher GDP per head but low internet access (1). Analysis of exception: Internet access is determined by other influences e.g. education levels (1). 5 Responses do not have to be in the format suggested but they should address the expected / normal relationship, offer supporting evidence of that, highlight any exceptions to that, and analyse the overall data. In terms of supporting evidence: no marks for just description of the figures e.g. Brazil had a GDP per head of $8717and 72% of the population with internet access / Eritrea had a GDP per head of $643 and 2% of population with internet access. France had a GDP of $40 494 and 83% of the population with internet access etc. In terms of supporting evidence one mark maximum for an indirect comparison e.g. Iceland had a GDP per head of $66 945 and 99% population with internet access whereas in Zambia with a GDP per head of $1,305, only 29% of the population had access to the internet. Question Answer Marks Guidance 1(g) Discuss whether or not the discovery of oil is likely to increase living standards in Guyana. Award up to 4 marks for logical reasons why it might, which may include: increase exports (1) increase economic growth / higher national output (1) and raise incomes / increase GDP per head (1) increase purchasing power / able to buy more goods and services / able to buy basic necessities (1) could reduce poverty (1) create jobs / reduce unemployment / increase employment (1) discourage emigration / encourage immigration (1). raise tax revenue (1) allowing the government to spend more on e.g. education and healthcare (1) MNCs may spend on e.g. improving infrastructure / training (1). Award up to 4 marks for logical reasons why it might not, which may include: may create pollution (1) create external costs / damage the environment (1) which will harm people’s health / reduce life expectancy (1) may be poor working conditions in the industry (1) affecting health of workers (1) the foreign MNC may send much of the profit back to its country (1) it may drive domestic oil firms out of business (1) may deplete the country’s oil reserves (1) the foreign MNC may employ workers from its own country (1) global demand for oil may fall /may be overdependence on oil / other countries may impose trade restrictions on oil. (1) 6 3rd bullet point: increase in government spending should be linked to a form of spending that could increase living standards. Apply this example to all questions with the command word DISCUSS (1g, 1h, 2d, 3d, 4d and 5d) Each point may be credited only once, on either side of an argument, but separate development as to how/why the outcome may differ is rewarded. Generic example Mark Tax revenue may decrease … 1 ... because of reason e.g. incomes may be lower. 1 Tax revenue may increase because incomes may be higher i.e. reverse of a previous argument. 0 Tax revenue may increase because of a different reason i.e. not the reverse of a previous argument e.g. government spending on subsidies may stimulate the economy more than spending on education. 1 Question Answer Marks Guidance 1(h) Discuss whether or not Guyana would benefit from an increase in the size of its population. Award up to 4 marks for logical reasons why it might, which may include: population is below the optimum level / move to the optimum level (1), could make better use of resources (1) if rise due to immigration (1) may bring in new ideas / new production methods / new skills / new technology (1) an increase in the size of the labour force (1) if the number of people of working age increases (1) rise in tax revenue (1) allowing the government to spend more on e.g. education and healthcare (1) consumer expenditure may increase (1) total (aggregate) demand may increase (1) output could increase / cause economic growth / increase productive potential (1) dependency ratio could fall (1) Award up to 4 marks for logical reasons why it might not, which may include: larger population could result in pollution / congestion / overcrowding (1) damage the environment / increase external costs (1) if rise due to fall in death rate or rise in the birth rate / increase in young / old population (1), the dependency ratio will increase (1) some of the extra population may be unemployed (1) 6 Question Answer Marks Guidance 1(h) pressure may be put on e.g. housing / welfare payments (1) increasing need for government expenditure (1) there may be inflation (1) population may increase to the extent that there is overpopulation (1) resources may be depleted (more quickly) (1). 6
This question in 0455/22 May/June 2023
Q46 · Calculate New Zealand’s GDP per head in 2020 0455/23 May/June 2023
1 (a) Calculate New Zealand’s GDP per head in 2020. [1] (b) Identify two external costs arising from the milk and car industries. [2] (c) Explain the impact on a cow farmer’s profits if they are unable to find a different source of revenue. [2] (d) Explain the two plans that the New Zealand government has to reduce external costs to the environment. [4] (e) Draw a demand and supply diagram to show the effect of a cheaper substitute on the market for petrol‑powered cars. [4] (f) Analyse the relationship between a country’s share of world GDP (%) and its share of world carbon dioxide emissions (%). [5] (g) Discuss whether or not an increase in exports of clean and green products will help the New Zealand government achieve its macroeconomic aims. [6] (h) Discuss whether or not job losses caused by a change to a carbon‑neutral economy will be harmful. [6]
30 marks
Mark scheme: 1(a) Calculate New Zealand’s GDP per head in 2020. $39 000 (1) 1 Accept the correct figure without the $ sign. 1(b) Identify two external costs arising from the milk and car industries. Air pollution (1). Damages the environment (where wild animals live) (1). 2 If more than two costs given, consider the first three. 1(c) Explain the impact on a cow farmer’s profits if they are unable to find a different source of revenue. Profit is revenue minus costs (1) Profits will fall (1) due to reduction in quantity sold / decrease in supply (1). Less revenue (1) less income for farmers (1) farmers may become unemployed (1). 2 1(d) Explain the two plans that the New Zealand government has to reduce external costs to the environment. Logical explanation which might include: End imports of petrol-powered cars by 2032 (1) decreasing the number of petrol−powered cars in New Zealand / reduce use of fossil fuels / by imposing an embargo/increasing the price of petrol-power cars / increasing usage of greener / electric cars (1). Limit the number of cows that each farmer can have (1) decreasing the amount of air pollution emitted by cows / less habitat damaged by cows / government fines to those who have more cows than permitted/ imposing regulations (1). 4 One mark each for each of two plans identified and one mark each for each of two explanations. Accept milk production for keeping cows. Question Answer Mark Guidance 1(e) Draw a demand and supply diagram, to show the effect of a cheaper substitute on the market for petrol- powered cars. Demand and supply diagram: Axes correctly labelled – price and quantity or P and Q (1). Original demand and supply curves correctly labelled (1). New demand curve shifted to the left (1). Equilibriums – shown by lines P1 and Q1 and P2 and Q2 or equilibrium points marked as E1 and E2 (1). 4 Question Answer Mark Guidance 1(f) Analyse the relationship between a country’s share of world GDP (%) and its share of world carbon dioxide emissions (%). Coherent analysis which might include: Expected relationship: Positive relationship (1) – the lower / higher total GDP as a % of world GDP, the lower / higher the carbon dioxide emission as a % of world GDP (1). Supporting evidence: up to 2 marks for relevant evidence e.g. New Zealand has the lowest total GDP as a % of world GDP and lowest level of carbon dioxide emission as a % of world carbon dioxide emissions Thailand has the second lowest total GDP as a % of world GDP and second lowest level of carbon emissions as % of world carbon dioxide emissions China and USA have the two highest total GDP as a % of world GDP and highest level of carbon emissions as a % of world carbon dioxide emissions. Analysis of expected relationship: As countries produce more goods and services which increases their GDP (1), their carbon emissions also increase as more factories / energy / transport needed for production (1). Exception: China/United States (1) China has 2nd highest GDP as a % of world GDP after the US but China has the highest carbon dioxide emission as a % of world GDP (1). Analysis of exception: e.g. China has a larger secondary sector / higher percentage of heavy industries / larger population (1). 5 Responses do not have to be in the format suggested but they should address the expected/normal relationship, offer supporting evidence of that, highlight any exceptions to that, and analyse the overall data. Question Answer Mark Guidance 1(g) Discuss whether or not an increase in exports of clean and green products will help the New Zealand government achieve its macroeconomic aims. Award up to 4 marks for logical reasons why it might, which may include: Increase economic growth / GDP (1) as increased exports lead to increased total demand (1) clean and green products may have higher demand (1) and higher prices (1) Reduce its current account of the balance of payment deficit (1) as value of exports will increase (1) increasing net exports (1) more inflow into the current account / increase in trade in goods inflow (1) Decrease unemployment (1) as more goods produced (1) requires more workers (1) reduce poverty (1) Improved HDI (1). Award up to 4 marks for logical reasons why it might not, which may include: Not all firms benefit (1) as some firms which are less clean / green will lose revenues / profits (1) cut costs (1) hire less workers (1) increase unemployment (1) Increased total demand (1) will lead to inflation (1) firms increase the price of their products since demand is higher (1) lower purchasing power of consumers / lower real income (1). 6 Apply this example to all questions with the command word DISCUSS (1g, 1h, 2d, 3d, 4d and 5d) Each point may be credited only once, on either side of an argument, but separate development as to how/why the outcome may differ is rewarded. Generic example mark Tax revenue may decrease … 1 ... because of reason e.g. incomes may be lower. 1 Tax revenue may increase because incomes may be higher i.e. reverse of a previous argument. 0 Tax revenue may increase because of a different reason i.e. not the reverse of a previous argument e.g. government spending on subsidies may stimulate the economy more than spending on education. 1 Question Answer Mark Guidance 1(h) Discuss whether or not job losses caused by a change to a carbon−neutral economy will be harmful. Award up to 4 marks for logical reasons why there might be negative economic consequences, which may include: increased poverty (1) as fewer jobs means less income (1) can’t afford basic necessities (1) such as shelter / clothes / food (1) possibility of increased crime (1) huge losses in the other firms that serve these communities (1) less spending in local shops (1) less revenue / profit (1) may have to shut down (1) lost output (1) economy not producing at its full capacity (1) unused resources (1) actual output lower than maximum output (1) inefficient allocation of resources due to the existence of labour who wants to work but can’t find work (1) lost skills / lost motivation (1) occupational immobility /can't find new jobs (1) cost of retraining workers (1) double effect on government finances (1) unemployed don’t pay taxes (1) but get benefits (1) reduce government revenue (1) may decrease government expenditure on other areas (1) Unequal burden (1) structural unemployment (1) increases inequality (1) youth and older individuals more likely to be unemployed (1). Award up to 4 marks for logical reasons why negative economic consequences above may not occur: temporary (1) frictional unemployment (1) as other jobs in carbon−neutral economy are available (1) 6 Question Answer Mark Guidance 1(h) an economy with a high mobility of factors of production could avoid such problems (1) workers can move to other industries (1) develop skills for jobs in the carbon−neutral economy (1) if education / training is provided (1). new jobs may be higher paid (1) boosting total demand (1) better air quality leads to better health (1) improving productivity (1) government spends less on health care (1) allowing more to be spent elsewhere e.g. on education and training (1).
This question in 0455/23 May/June 2023
Q47 · Calculate the total number of people in Cambridge aged 18–29 in 2019 0455/21 Oct/Nov 2023
1 (a) Calculate the total number of people in Cambridge aged 18–29 in 2019. [1] (b) Identify two types of industries in Cambridge that operate in the tertiary sector. [2] (c) Identify two benefits of having highly knowledge‑intensive exports. [2] (d) Explain how having a more educated labour force can reduce poverty. [4] (e) Draw a demand and supply diagram to show the effects of increased global income on the market for education in Cambridge. [4] (f) Analyse the relationship between the percentage of population aged 25–64 with a university degree and GDP per head. [5] (g) Discuss whether or not free trade is beneficial for a city such as Cambridge. [6] (h) Discuss whether or not firms in Cambridge will continue to grow. [6]
30 marks
Mark scheme: Question Answer Marks Guidance 1(a) Calculate the total number of people in Cambridge aged 18– 1 29 in 2019. 37 440 (1) 1(b) Identify two types of industries in Cambridge that operate in 2 If more than two types are given, consider the first three. the tertiary sector. Education (1). Healthcare (1). Research and development (1). 1(c) Identify two benefits of having highly knowledge-intensive 2 If more than two benefits are given, consider the first exports. three. Exports highly priced (1). Accept high value for highly priced. Price inelastic in demand (1). Increased demand for exports (due to increased global incomes) (1). 1(d) Explain how having a more educated labour force can 4 reduce poverty. Logical explanation which might include: a more educated labour force will be more skilled / more productive (1) enabling them to earn higher wages (1) able to afford basic necessities (1). a more educated labour force may have more job opportunities / less unemployment (1) wages may be higher than unemployment benefits (1). a more educated labour force has access to more information on health (1) increasing the ability to work (1) have access to better healthcare (1). 1(e) Draw a demand and supply diagram to show the effects of 4 increased global income on the market for education in Cambridge. D&S diagram: Axes correctly labelled – price and quantity or p and q (1). Original demand and supply curves correctly labelled (1). New curve shifted to the right (1). Equilibriums – shown by lines P1 and Q1 and P2 and Q2 or equilibrium points marked as E1 and E2 (1). 1(f) Analyse the relationship between the percentage of 5 Responses do not have to be in the format suggested population with a university degree and GDP per head. but they should address the expected / normal relationship, offer supporting evidence of that, highlight Coherent analysis which might include: any exceptions to that, and analyse the overall data. Expected relationship: Positive / direct relationship (1) the higher percentage of population with a university degree, the higher the GDP per head (1). Analysis of expected relationship: as percentage of population with a university degree increases, the more skills / qualification they will have (1) therefore, they have higher productivity and can earn more (1). Supporting evidence: e.g. Indonesia lowest percentage of population with a university degree, lowest GDP per head ; Canada, Switzerland and UK have the highest three in each category; Colombia has the second lowest percentage of population with a university degree and the second lowest GDP per head (2). Exception: Switzerland (1) has lower percentage of population with a university degree than Canada or the UK, but higher GDP per head (1). Analysis of the exception: Other influences, e.g. quality of secondary education, proportion of the population employed in banking (1). 1(g) Discuss whether or not free trade is beneficial for a city 6 Apply this example to all questions with the such as Cambridge. command word DISCUSS (1g, 1h, 2d, 3d, 4d and 5d) Award up to 4 marks for logical reasons why it might, which may include: Each point may be credited only once, on either side of an argument, but separate development as to how / why • easier to export (1) increased export revenues (1) increased the outcome may differ is rewarded. revenue / profits for producers (1) higher growth in the city (1). Generic example mark • easier to import / more imports (1) cheaper imports of goods and materials / lower costs for firms (1) lower prices (of Tax revenue may decrease… 1 exports) (1). • more jobs created (1) reducing the level of unemployment ...because of reason e.g. incomes may be 1 (1). lower. • increase size of the market (1) economies of scale (1) e.g. purchasing / technical / marketing / managerial / financial Tax revenue may increase because 0 (1). incomes may be higher i.e. reverse of a • increased choice for consumers (1) from increased imports previous argument. (1) higher quality goods / variety of goods (1). • more competition (1) or more transfer of ideas and Tax revenue may increase because of a 1 knowledge (1) leads to more innovation (1) lower prices (1) different reason i.e. not the reverse of a • encourage entrepreneurship / investment (1) profit incentive previous argument e.g. government (1) spending on subsidies may stimulate the economy more than spending on education. 1(g) Award up to 4 marks for logical reasons why it might not, which may include: • overdependence on foreign markets (1) economic shocks in other countries can negatively affect revenues of firms (1) reduce economic growth and development in the city (1). • free trade could reduce competitiveness of firms (1) other economies might have relatively lower costs (1) cheap imports / more imports (1) stop development of infant industries (1) may lead to job losses in the city (1). • free trade only affects certain producers / firms / workers (1) leads to increased inequality / uneven distribution of income (1). • free trade leads to more environmental degradation (1) due to more production / more need for cross-border transport (1) creating external costs / negative externalities (1). • may increase consumption of demerit goods (1) reduce health (1). • free trade could lead to the creation of global monopolies (1). reducing the ability of smaller domestic firms to compete (1). 1(h) Discuss whether or not firms in Cambridge will continue to 6 grow. Award up to 4 marks for logical reasons why it might, which may include: • ease of access to a large amount of highly-skilled and educated workers, from all over the world (1) easy to find workers (1) to produce goods and services (1) or lower cost of labour (1) • skilled workers are more productive (1) more innovation / new ideas / high quality products (1) • young workers (1) may be up-to-date with modern technology (1) • good infrastructure (1) such as access to ultra-fast broadband (1) productivity is higher (1) faster production / less delays (1) • good transport links to other cities and international airports (1) easy to export / high demand for their exports (1) easy to reach customers (1) faster deliveries (1) increased demand for goods and services (1). Award up to 4 marks for logical reasons why it might not, which may include: • high land and office costs (1) high cost of production (1) higher capital start-up costs (1) lower profits (1) • high house prices (1) poor air quality (1) may discourage workers from locating in Cambridge (1) difficult for firms to find workers (1) • small population (1) small market (1) limited demand (1) limited scope for revenue / profits for Cambridge firms (1) • overdependence on one sector (e.g. education) (1) limits potential growth from other sectors (1) • skilled workers are available in other cities (1).
This question in 0455/21 Oct/Nov 2023
Q48 · Calculate what percentage of Honduran people did not have access to electricity in 2020 0455/22 Oct/Nov 2023
1 (a) Calculate what percentage of Honduran people did not have access to electricity in 2020. [1] (b) Identify two benefits the Honduran economy could gain from a growth in the US economy. [2] (c) Explain one advantage of an economy specialising. [2] (d) Explain two ways a government could redistribute income. [4] (e) Draw a demand and supply diagram to show how a report stating that bananas are good for health would affect the market for bananas. [4] (f) Analyse the relationship between the percentage of population living in poverty and life expectancy. [5] (g) Discuss whether or not the cost of producing clothes in Honduras will fall in the future. [6] (h) Discuss whether or not a fall in unemployment in Honduras is likely to cause inflation. [6]
30 marks
Mark scheme: Question Answer Marks Guidance 1(a) Calculate what percentage of Honduran people did not 1 Accept 8.0 or 8.3. have access to electricity in 2020. 8.3%. 1(b) Identify two benefits the Honduran economy could gain 2 If more than two benefits are given, consider the first three. from a growth in the US economy. Accept increase trade for more exports. Sell more exports to the US (1). Receive more money from Honduran workers in the US (1). Accept increase employment / lower unemployment for More job opportunities for Honduran workers in the US (1). more job opportunities. 1(c) Explain one advantage of an economy specialising. 2 One mark for an advantage identified and one mark an explanation. Gain skills (1) raise productivity / raise efficiency / ‘practice Identification mark must come directly from the source makes perfect’ / lower costs of production / raise quality / material. increase output / supply / less waste (1). A relevant explanation mark can be given even in the Gain a good reputation (1) increase demand (1). absence of an identification. 1(d) Explain two ways a government could redistribute 4 One mark each for each of two ways identified and one income. mark each for each of two explanations. Logical explanation which might include: If more than two reasons given, consider the first three. Provision of unemployment benefit / state benefit / welfare benefit / benefits (1) raise income of those on low or no One mark for taxing the rich and giving to the poor. income / enable the unemployed to buy basic necessities / reduce absolute poverty (1). Progressive income tax system (1) takes a higher proportion of the income of the rich / use some of tax revenue raised to increase spending to help those on low incomes (1). 1(e) Draw a demand and supply diagram to show how a 4 report stating that bananas are good for health would affect the market for bananas. Coherent analysis which might include: Demand and supply diagram: Axes correctly labelled – price and quantity or p and q (1). Original demand and supply curves correctly labelled (1). Demand curve shifted to the right (1). Equilibriums – shown by lines P1 and Q1 and P2 and Q2 or equilibrium points marked as E1 and E2 (1). If a candidate draws two diagrams, they may be able to get 3 marks: 1 mark for axes 1 mark for D & S labelled correctly 1 mark for the demand curve shifted to the right. They would not get the mark for the equilibriums as the two diagrams are likely to conflict on this. 1(f) Analyse the relationship between the percentage of 5 Responses do not have to be in the format suggested but population living in poverty and life expectancy. they should address the expected/normal relationship, offer supporting evidence of that, highlight any exceptions to that, Coherent analysis which might include: and analyse the overall data. Expected relationship: Inverse / negative (1) the higher the level of poverty, the lower the life expectancy / the lower the level of poverty, the higher the life expectancy (1). Supporting evidence: Sweden has the lowest % of population living in poverty and the highest life expectancy / The country / two countries / three countries / four countries with the lowest levels of poverty head had the longest life expectancy (1) the two countries, Chad and South Sudan, with the highest level of poverty had the lowest life expectancy (1). Analysis of expected relationship: A high level of poverty is likely to mean poor healthcare (1) low nutrition / poor housing / poor sanitation / low levels of education (1). Exception: Chad / South Sudan (1) Chad had a lower level of poverty but also a lower level of life expectancy than South Sudan (1) Analysis of exception: Life expectancy is determined by other influences e.g. wars (1). 1(g) Discuss whether or not the cost of producing clothes in 6 Allow higher productivity / efficiency once either in Honduras will fall in the future. connection with labour or capital. Some points may be given in reverse e.g. price of raw Award up to 4 marks for logical reasons why it might, which materials may fall. may include: Not accepting subsidising the clothes industry as the source • more training (1) better working conditions (1) may material indicates that it is a successful industry. increase labour productivity / efficiency / skills (1) reduce labour costs (1) Apply this example to all questions with the command • more use of capital goods (1) may reduce disruption to word DISCUSS production / make fewer mistakes / less waste (1) speed (1(g), 1(h), 2(d), 3(d), 4(d) and 5(d)) up production / increase productivity / efficiency (1) • improved working conditions (1) may reduce industrial Each point may be credited only once, on either side of an action (1) more motivation (1) argument, but separate development as to how/why the • successful clothes industry so firms may grow in size (1) outcome may differ is rewarded. more able to take advantage of economies of scale (1). Generic example Mark Award up to 4 marks for logical reasons why it might not, which may include: Tax revenue may decrease… 1 • price of raw materials may rise (1) may be subject to bad weather (1) exchange rate may fall / tariffs may be ...because of reason e.g. incomes 1 imposed on imported raw materials (1) reduce supply may be lower. (1) country has experience of inflation (1) • unemployment may fall (1) making it more difficult for Tax revenue may increase 0 the clothes industry to recruit labour (1) strengthening because incomes may be higher the bargaining power of workers (1) raising wages / i.e. reverse of a previous increasing labour costs (1) argument. • providing training (1) and better working conditions will involve a cost (1) Tax revenue may increase 1 • more use of capital goods may involve initial high because of a different reason i.e. not the reverse of a previous spending on equipment (1) firms may experience argument e.g. government diseconomies of scale (1) • higher indirect tax / tax may be imposed (on clothes / spending on subsidies may stimulate the economy more than clothes firms) (1). spending on education. 1(h) Discuss whether or not a fall in unemployment in 6 Honduras is likely to cause inflation. Award up to 4 marks for logical reasons why it might, which may include: • unemployment is already low (1) may move towards full employment (1) may push up wages (1) increase (average) costs (1) cause cost-push inflation / total supply less than total demand (1) • lower unemployment may increase incomes (1) causing a rise in consumer spending / purchasing power (1) increasing total demand (1) causing demand-pull inflation / total demand higher than total supply (1). • inflation already exists (1) which may lead workers to expect it to continue (1) increasing wage claims (1). Award up to 4 marks for logical reasons why it might not, which may include: • may be higher investment (1) could increase total supply / total supply may rise in line with total demand (1) reducing cost-push inflation (1) • lower unemployment could reduce spending on unemployment benefit (1) increase tax revenue (1) reduce the budget deficit (1) reduce the growth in total demand (1) some of higher tax revenue could be spent on supply-side policy / unemployment may have fallen due to supply-side policy (1) • the extra income may be saved / spent on imports (1) due to uncertainty about the future (1) • A fall in unemployment does not necessarily mean a rise in employment (1) the unemployed could have e.g. retired / emigrated (1).
This question in 0455/22 Oct/Nov 2023
Q49 · In the US, the supply of meat from emus, a large bird, is price-elastic 0455/22 Oct/Nov 2023
4 In the US, the supply of meat from emus, a large bird, is price-elastic. Recently, US farmers have switched to keeping other livestock and growing crops that changed their demand for labour. US farmers are influenced by the subsidies the government provides for the production of selected food items. Some people are reluctant to become farm workers as they think living standards are low in rural areas. (a) Define elastic supply. [2] (b) Explain two reasons why a government may subsidise food production. [4] (c) Analyse what influences a farmer’s demand for labour. [6] (d) Discuss whether or not people living in cities have a higher living standard than those living in rural areas. [8]
20 marks
Mark scheme: 4(a) Define elastic supply. 2 The percentage change in quantity supplied is greater than the percentage change in price (2). Change in supply is greater than the change in price / PES > 1 (1). 4(b) Explain two reasons why a government may subsidise 4 One mark each for each of two reasons identified and one food production. mark each for each of two explanations. Logical explanation which might include: Increase output (1) overcome a shortage (1). Reduce price / cost (1) help consumers / reduce poverty / give access to a basic necessity / make food more affordable (1). Increase quality (1) improve nutrition / increase health of population / raise life expectancy (1). Increase incomes of farmers / farm workers (1) raise their living standards of farmers / stop farmers going out of business (1). Reduce imports of food / increase exports of food (1) improve the current account of the balance of payments / agriculture is a strategic industry / reduce dependency on other countries for an essential good (1). Increase employment / reduce unemployment (1) help in rural areas (1). 4(c) Analyse what influences a farmer’s demand for labour. 6 Coherent analysis which might include: Demand for the food they produce (1) derived demand / a higher demand for food will encourage farmers to expand their output / employ more workers (1) more profits earned (1). Wage rates (1) the lower the wage rate, the less it will cost to employ workers (1). Skills of workers (1) the more skilled workers are, the more productive they will be (1). Price of other factors of production / costs of production (1) if the price of e.g. agricultural drones falls, demand for labour may fall (1). Productivity of other factors of production (1) advances in technology may result in farm workers being replaced by machinery (1). Type of farming (1) some farming is more labour-intensive / capital-intensive (1). Size of farm (1) large farms likely to employ more (1). Subsidies (1) subsides may encourage a farmer to expand output and employ more workers (1). Seasons (1) demand for labour is likely to be higher during harvesting (1). 4(d) Discuss whether or not people living in cities have a 8 The answer may be from the view of why people living in higher living standard than those living in rural areas. rural areas may have a higher living standard. In assessing each answer, use the table opposite. Level Description Marks Why they might: 3 A reasoned discussion which 6–8 • may be more job opportunities accurately examines both sides of the • may be higher incomes economic argument, making use of • may be more forms of entertainment economic information and clear and • may be shorter distance to schools and shops logical analysis to evaluate economic • may be more access to healthcare facilities issues and situations. One side of the • may be better quality education/ healthcare. argument may have more depth than the other, but overall, both sides of the Why they might not: argument are considered and • may be more traffic congestion developed. There is thoughtful • may be overcrowding evaluation of economic concepts, • air and noise pollution levels may be higher terminology, information and/or data • stress may be high appropriate to the question. The • higher cost of living in cities. discussion may also point out the possible uncertainties of alternative decisions and outcomes. 2 A reasoned discussion which makes 3–5 use of economic information and clear analysis to evaluate economic issues and situations. The answer may lack some depth and development may be one-sided. There is relevant use of economic concepts, terminology, information and data appropriate to the question. 4(d) Level Description Marks 1 There is a simple attempt at using 1–2 economic definitions and terminology. Some reference may be made to economic theory, with occasional understanding. 0 A mark of zero should be awarded for 0 no creditable content.
This question in 0455/22 Oct/Nov 2023
Q50 · Calculate the average wage paid in Denmark in 2020 0455/22 Feb/March 2024
1 (a) Calculate the average wage paid in Denmark in 2020. [1] (b) Identify two possible opportunity costs of a Danish person using their leisure time to cycle. [2] (c) Explain one way that living standards are measured in Denmark. [2] (d) Explain two reasons why the supply of ships is price-inelastic. [4] (e) Analyse the relationship between government spending and GDP in Denmark. [4] (f) Analyse, using a demand and supply diagram, how an increase in the birth rate would affect the market for toys. [5] (g) Discuss whether or not a surplus on the current account of its balance of payments would benefit the Danish economy. [6] (h) Discuss whether or not more people working from home will benefit an economy. [6]
30 marks
Mark scheme: Question Answer Marks Guidance 1(a) Calculate the average wage paid in Denmark. 1 Accept 84 000. $84 000 (1). 1(b) Identify two opportunity costs of a Danish person using 2 their leisure time to cycle. Playing golf (1) jogging (1). 1(c) Explain one way that living standards are measured in 2 One mark for a way identified and one mark for an Denmark. explanation. Identification Do not accept GDP. HDI / average wages / income / GDP per head leisure hours (1). Explanation HDI includes GDP per head / income / education / health/life expectancy / average wages / income / GDP per head influences the goods and services which can be purchased / leisure hours may affect physical / mental health (1). 1(d) Explain two reasons why the supply of ships is price- 4 One mark each for each of two reasons identified and one inelastic. mark for each of two explanations. Logical explanation which might include: Ignore comments on PED. They take a long time to produce (1) so supply cannot be adjusted quickly (1). They are expensive to store (1) take up a large space / likely to be few or no spare ships to sell / low inventories / difficult to keep for future sales / if prices fall will have to sell ships as nowhere to store them (1). 1(e) Analyse the relationship between government spending 4 Responses do not have to be in the format suggested but and GDP in Denmark. they should address the expected/normal relationship, offer supporting evidence of that, highlight any exceptions to that, Coherent analysis which might include: and analyse the overall data. Expected relationship: Higher government spending would be expected to be associated with a higher GDP / move in the same direction / Government spending will always be lower than GDP (1) positive relationship / direct relationship (1). Supporting evidence up to 2 marks: 2015 – 2018 government spending and GDP rose / (1) 2019 – 2021 government spending and GDP rose (1). Government spending and GDP rose over the period / government spending and GDP was lowest at the start of the period / 2015 and was highest at the end of the period 2021 (1). Analysis of expected relationship up to 2 marks: Higher government spending will increase total (aggregate) demand which will add to GDP (1) may be higher government spending on education/training/healthcare/subsidies which can raise productivity and output (1) higher GDP may increase tax revenue which can be used to increase government spending (1). Exception: 2018 – 2019 / 2018 / 2019 (1) government spending rose but GDP fell (1). Analysis of exception: A government may spend more when GDP falls in a bid to stimulate an increase in GDP (1). 1(f) Analyse, using a demand and supply diagram, how an 5 increase in the birth rate would affect the market for toys. Coherent analysis which might include: D&S diagram up to 4 marks: Axes correctly labelled – price and quantity or p and q (1). Original demand and supply curves correctly labelled (1). New demand curve shifted to the right (1). Equilibriums – shown by lines P1 and Q1 and P2 and Q2 or equilibrium points marked as E1 and E2 (1). Written analysis up to 1 mark: An increase in the birth rate would increase the number of children who parents may buy toys for / more consumers / higher demand (1) the higher demand will raise price / increase quantity (traded) (1). 1(g) Discuss whether or not a surplus on the current 6 Apply this example to all questions with the command account of its balance of payments would benefit the word DISCUSS Danish economy. (1g, 1h, 2d, 3d, 4d and 5d) Award up to 4 marks for logical reasons why it might, which Each point may be credited only once, on either side of an may include: argument, but separate development as to how/why the • exports exceed imports / credit items have a higher outcome may differ is rewarded. value than debit items (1) and so adds to total (aggregate) demand (1) which may increase GDP (1) Generic example Mark • it can increase employment (1) which may increase incomes (1) Tax revenue may decrease… 1 • may attract foreign investment (1) as may be taken to be a sign of a strong economy (1) ...because of reason e.g. incomes may be lower. 1 • may raise the exchange rate (1) which can enable exports to exchange for more imports (1). Tax revenue may increase because incomes 0 may be higher i.e. reverse of a previous Award up to 4 marks for logical reasons why it might not, argument. which may include: • it means more products are produced than consumed / Tax revenue may increase because of a 1 reduces availability of products / reduces consumer different reason i.e. not the reverse of a previous choice (1) reduce potential living standards (1) may argument e.g. government spending on contribute to resource depletion (1) subsidies may stimulate the economy more than • it may add to inflationary pressure (1) especially if the spending on education. economy is close to full employment (1). • demand for the currency will exceed the supply of the currency (1) this may raise the exchange rate (1) make exports less internationally competitive (1) which can reduce the surplus / cause a deficit in the long run (1). 1(h) Discuss whether or not more people working from home 6 Note 1 mark for recognising productivity may change. So, if will benefit an economy. a candidate writes productivity may increase and may decrease, award 1 mark. Two further marks could be gained Award up to 4 marks for logical reasons why it might, which if a candidate explains why productivity may increase and may include: why it may decrease. • may raise productivity / efficiency / quality of output (1) as workers may be less tired / less stressed / saves Note: 1 mark for productivity increase or decrease and 1 transport costs as a result of not having to travel to work mark for GDP increase or decrease. (1) may work longer hours (1) increase GDP (1) • may increase the quantity of labour (1) more people e.g. those with dependents may be able to work / more flexible hours (1) as save time travelling (1) • workers may be happier (1) and so may stay with firms longer (1) which would reduce the cost of recruiting workers (1) • pollution may be reduced (1) traffic congestion may be reduced (1) less need for transport infrastructure (1) reduce external costs (1) improve health (1) • firms’ costs may fall (1) as less need for office space (1) • may reduce conflict between workers (1) may reduce chances of industrial action (1). Award up to 4 marks for logical reasons why it might not, which may include: • transport firms may experience a fall in demand / revenue / less people travelling (1) which may create unemployment of e.g. bus drivers (1) • restaurants/cafes may have to close down in city centres (1) which may create unemployment of e.g. waiters (1) reduce tax revenue (1) 1(h) • may reduce productivity / efficiency/ quality of output (1) reduce GDP (1) as workers may be distracted by e.g. small children / become lazy / may work fewer hours / may have poor internet connection (1) may not be supervised (1) may not co-ordinate with other workers / communication problems (1).
This question in 0455/22 Feb/March 2024
Q51 · In recent years, the mobility of labour, the number of women in the labour force and GDP… 0455/21 May/June 2024
2 In recent years, the mobility of labour, the number of women in the labour force and GDP have increased in Bangladesh. In 2019, the central bank of Bangladesh approved three new commercial banks. In that year, women on average earned 77% of the pay of men in Bangladesh. The country’s economy experienced the world’s seventh highest economic growth rate, with an increase in GDP of 7.4%. (a) Identify two influences on the mobility of labour. [2] (b) Explain two benefits that consumers may gain from having more commercial banks. [4] (c) Analyse why women may be paid less than men. [6] (d) Discuss whether or not people living in countries with a high GDP enjoy higher living standards than people in countries with a low GDP. [8]
20 marks
Mark scheme: 2(a) Identify two influences on the mobility of labour. Two from: age skills / training qualifications / level of education price / availability of housing cost of living /level of income family ties information on vacancies disabilities / access quality / cost of transport distance to place of work discrimination 2 Only accept these answers if within the first three influences mentioned. 2(b) Explain two benefits that consumers may gain from having more commercial banks. Logical explanation which might include: More choice / competition (1) greater range of services / better quality of services / lower bank charges (1). Lower interest rate charged on loans / higher interest paid on savings (1) due to higher competition (1). May be easier to obtain a loan (1) which may increase the products consumes can buy (1). May be more convenient (1) closer to home / less time travelling / more likely to be able to speak to a person (1). 4 One mark each for each of two benefits identified and one mark for each of two explanations. Question Answer Mark Guidance 2(c) Analyse why women may be paid less than men. Coherent analysis which might include: Women may be less skilled (1) have fewer qualifications (1) and so be less productive (1) if they have received less education / training (1) may have less bargaining strength than men (1). Fewer women may be in promoted posts (1) if they have taken time off to raise children / maternity leave / may have less experience (1). Women may be concentrated in low paying occupations / industries (1) example e.g. clothes manufacture (1) may only want part-time jobs (1) because of family commitments (1). Discrimination (1) some employers may underestimate / undervalue the productivity of women (1) there may be no law or an ineffective law against discrimination (1) example e.g. tv presenters / football (1). Lower demand / higher supply in some occupations (1) due to lower revenue / value of product (1). 6 Allow the counter argument on why men may be paid more than women. Question Answer Mark Guidance 2(d) Discuss whether or not people living in countries with a high GDP enjoy higher living standards than people in countries with a low GDP. In assessing each answer, use the table opposite. Why they might: may be able to afford better standard of housing may be able to afford better nutrition and healthcare which can increase life expectancy higher incomes enable more and greater quality of products to be purchased may be able to afford better education which may enable them to gain more interesting jobs with better working conditions. Why they might not: high GDP does not necessarily mean that GDP per head is high and so incomes could be low income may be unevenly distributed, and some people may be living in poverty may have a large informal sector so GDP under-records income countries with higher GDP may also have higher price levels people may work long hours and so enjoy little leisure and may be stressed there may be pollution and traffic congestion people’s wants for goods and services may grow at a faster rate than their income – the more people have, the more they may want. 8 See Guidance table at the end of the mark scheme.
This question in 0455/21 May/June 2024
Q52 · Calculate the percentage contribution of Jakarta to Indonesia’s GDP in 2021 0455/23 May/June 2024
1 (a) Calculate the percentage contribution of Jakarta to Indonesia’s GDP in 2021. [1] (b) Identify two examples of external costs ignored by the free market. [2] (c) Explain how real GDP per head can be an indicator of living standards. [2] (d) Explain two ways climate change can lead to a fall in the Human Development Index (HDI) of Indonesia. [4] (e) Draw a production possibility curve (PPC) diagram to show the impact of climate change on an economy such as Indonesia. [4] (f) Analyse the relationship between GDP and government spending on the environment. [5] (g) Discuss whether or not internal migration benefits an economy such as Indonesia. [6] (h) Discuss whether or not relocating the capital city from Jakarta will benefit the Indonesian economy. [6]
30 marks
Mark scheme: 1(a) Calculate the percentage contribution of Jakarta to Indonesia’s GDP in 2021. 27.3%, 27.27%, 27.2%, 27% 1 Accept without the percentage sign. 1(b) Identify two examples of external costs ignored by the free market. air pollution (1) rising sea levels/floods (1) disease / mosquitoes (1) climate change (1) 2 1(c) Explain how real GDP per head can be an indicator of living standards. Real GDP per head has been adjusted for population / inflation / takes account of the cost of living (1). Low real GDP per head leads to a fall in living standards (1) because lower GDP per head would mean lower income / real GDP per head is average income (1) reducing consumption / material wellbeing / influencing how much people can spend / whether they can buy basic necessities (1). 2 Accept answers based on either higher or lower GDP per head. Question Answer Mark Guidance 1(d) Explain two ways climate change can lead to a fall in the Human Development Index (HDI) of Indonesia. Logical explanation which might include: Schools have been flooded (1) reducing education levels / mean years of schooling / expected years of schooling (1). Floods have led to an increase in diseases (transmitted through water and mosquitoes which breed in water) (1) reducing health level / life expectancy / increasing death rate (1). Farmland has been submerged, (cutting off a vital source of income of many farmers) / roads have been destroyed (1) reducing income levels / GNI per capita / GDP per capita / living standards (1). 4 One mark each for each of two ways identified and one mark for each of two explanations. Accept an explanation combining two different ways, e.g. increase in diseases reducing education levels. 1(e) Draw a production possibility curve (PPC) diagram to show the impact of climate change on an economy such as Indonesia. PPC diagram: Axes correctly with different outputs (1). Initial curve drawn as a curve/line sloping downward to the axes (1). New curve drawn as a curve/line sloping downward to the axes (1). Shift to the left indicated by arrow(s) or letters or numbers e.g. PPC1 to PPC2 (1). 4 Question Answer Mark Guidance 1(f) Analyse the relationship between GDP and government spending on the environment. Coherent analysis which might include: Expected relationship: direct relationship / move in the same direction (1) higher GDP may lead to higher government spending on the environment / higher government spending on the environment may increase GDP (1). Supporting evidence: Japan has highest GDP and highest spending on environment (1) France has second highest GDP and second highest spending on environment (1) Thailand has lowest GDP and lowest spending on environment (1). Analysis: Higher GDP may create more pollution, therefore countries have more to spend on environment / high government spending on the environment can reduce pollution/climate change (1). Higher tax revenue / more education and so more concern for the environment / a cleaner environment can raise productivity (1). Higher GDP therefore more developed and can spend more on other objectives such as protection of the environment (1). Exception: Switzerland/Indonesia (1) Switzerland has lower GDP than Indonesia but higher expenditure on environment/ Indonesia has higher GDP and lower expenditure on environment than Switzerland (1). Analysis of the exception: These countries may be facing different pressures on government spending e.g. higher level of poverty (1). 5 Responses do not have to be in the format suggested but they should address the expected/normal relationship, offer supporting evidence of that, highlight any exceptions to that, and analyse the overall data. Question Answer Mark Guidance 1(g) Discuss whether or not internal migration benefits an economy such as Indonesia. Award up to 4 marks for logical reasons why it might, which may include: higher production of different crops (1) more income / higher living standards (for farmers) (1) less pressure on government resources / natural resources (1) e.g., less overcrowding (1) less spending on healthcare if people move away from areas of flooding/ mosquitoes (1) labour force may increase in some areas (1) moving from low productivity areas to high productivity areas(1) increasing output (1) housing may be cheaper / more available in some areas (1) reducing cost of living for workers (1) migration may be to high wage areas (1) boosting total demand (1) fewer resources may be wasted (1) if migration is to an area where they are under-used e.g. schools, hospitals (1). Award up to 4 marks for logical reasons why it might not, which may include: as workers migrate, it could also lead to the collapse of entire communities (1) without workers (1) less demand for goods and services in the area (1) increased inequality between more mobile labour and less mobile labour (1) as some workers who cannot move will not be able to find jobs (1) and gain higher income (1) more pressure on government resources in areas they move to (1) more overcrowding in those areas / housing shortages (1) external costs (1) more pollution / congestion (1). 6 Apply this example to all questions with the command word DISCUSS (1g, 1h, 2d, 3d, 4d and 5d) Accept the reverse argument, (e.g. for Q1g internal migration may be to a less polluted area) but recognise that each point may be credited only once, on either side of an argument, but separate development as to how/why the outcome may differ is rewarded. Generic example mark Tax revenue may decrease… 1 ...because of reason e.g. incomes may be lower. 1 Tax revenue may increase because incomes may be higher i.e. reverse of a previous argument. 0 Tax revenue may increase because of a different reason i.e. not the reverse of a previous argument e.g. government spending on subsidies may stimulate the economy more than spending on education. 1 Question Answer Mark Guidance 1(h) Discuss whether or not relocating the capital city from Jakarta will benefit the Indonesian economy. Award up to 4 marks for logical reasons why it might, which may include: the new city will provide new job opportunities (1) decreasing unemployment in Indonesia (1) increasing incomes / economic growth (1) reduce inequality between the different regions of Indonesia (1) reducing social dissatisfaction / increase standards of living of everyone in Indonesia (1) better environment as new city is carbon-neutral / less pollution (1) reduced external costs (1) better health for population of Indonesia (1) higher productivity (1) fewer floods that require expenditure to repair the damage (1) foreign investors may be more willing to relocate to Indonesia (1). Award up to 4 marks for logical reasons why it might not, which may include: cost of the move may be too high (1) opportunity cost in terms of other areas of government spending (1) e.g. education / healthcare in other regions (1) could result in higher taxes / government budget deficit (1) the relocation is expected to benefit only a small number of people who already have the financial capital / connection to the government (1) inequality could rise (1) people may be reluctant to leave Jakarta (1) causing the resources invested in the new city to be wasted (1). 6
This question in 0455/23 May/June 2024
Q53 · Unemployment in the United Kingdom (UK) fell in December 2021 to 4.1% 0455/21 Oct/Nov 2024
2 Unemployment in the United Kingdom (UK) fell in December 2021 to 4.1%. Market forces would usually mean that wages would increase due to this lower unemployment. However, workers’ living standards did not increase. New international trade deals were not made fast enough to offset the decreasing trade between the UK and the European Union. (a) Identify two ways of measuring unemployment. [2] (b) Explain two factors that could influence living standards, apart from unemployment rates. [4] (c) Analyse how market forces can increase wages. [6] (d) Discuss whether or not free trade between countries increases economic growth. [8]
20 marks
Mark scheme: 2(a) Identify two ways of measuring unemployment. 2 claimant count (1) (labour force) survey (1) 2(b) Explain two factors that could influence living standards 4 One mark for each factor identified and one mark for each apart from unemployment rates. explanation. Logical explanation which might include: Accept arguments which describe reasons for either • income / wage levels (1) higher wages allow people to low / high living standards. afford more goods and services (1) • education (1) high education levels lead greater skills Accept answers that give HDI (1) with reference to either and to better paid jobs / lead to high human GDP per head, education or health. development index (1) • health standards / healthcare (1) high health standards lead to better enjoyment of life / less illness / better well- being (1) • cost of living / inflation rate (1) affecting purchasing power (1) • working hours (1) lower working hours gives more leisure time (1) • hygiene / sanitation (1) good water quality prevents diseases (1) • environmental standards (1) e.g. pollution reduces quality of life (1) • availability of public / merit goods (1) e.g. street lights / parks (1) • crime rates (1) low crime rates improve safety / quality of life (1) 2(c) Analyse how market forces can increase wages. 6 Reward, but do not expect, answers that analyse this question using elasticity of demand and supply. Coherent analysis which might include: • an increase in demand (1) for labour (1) may increase wages if the demand for a product increases (1) i.e. derived demand (1), there will be an increase in demand for workers producing that product (1) for example, if price of substitutes such as robots increases, there will be an increase in the demand for human labour (1) • a decrease in supply (1) of labour (1) may increase wages if it is caused by a decrease in the labour force (1) or a decrease in number of people qualified / having skills in that occupation (1). 2(d) Discuss whether or not free trade will increase 8 Level Description Marks economic growth. 3 A reasoned discussion which 6–8 In assessing each answer, use the table opposite. accurately examines both sides of the economic argument, making Why it might: use of economic information and • may enable countries to specialise on what they are clear and logical analysis to best at producing evaluate economic issues and • higher competition may increase productivity and lower situations. One side of the costs of production, increasing demand for their argument may have more depth products than the other, but overall both • may enable firms to buy raw materials and capital sides of the argument are goods at a lower price considered and developed. There • may give firms access to larger markets, enabling them is thoughtful evaluation of to expand output. economic concepts, terminology, information and / or data Why it might not: appropriate to the question. The • may prevent infant industry from growing discussion may also point out the • may speed up the closure of declining industries possible uncertainties of • may replace domestic output with imports alternative decisions and • may reduce tax revenue outcomes. • firms may gain monopoly power and may restrict output • firms may engage in unfair competition e.g. dumping. 2(d) 2 A reasoned discussion which 3–5 makes use of economic information and clear analysis to evaluate economic issues and situations. The answer may lack some depth and development may be one-sided. There is relevant use of economic concepts, terminology, information and data appropriate to the question. 1 There is a simple attempt at using 1–2 economic definitions and terminology. Some reference may be made to economic theory, with occasional understanding. 0 A mark of zero should be awarded 0 for no creditable content.
This question in 0455/21 Oct/Nov 2024
Q54 · In 2021, there were extensions and contractions in demand for a number of South African… 0455/22 Oct/Nov 2024
4 In 2021, there were extensions and contractions in demand for a number of South African products. In that year, a South African court stopped a multinational company (MNC) exploring for oil along South Africa’s coastline. South Africa experienced an increase in output, driven largely by the growth in its tertiary sector. However, its unemployment rate was 35%, a long way from full employment. (a) Define an extension in demand. [2] (b) Explain two external costs that may be caused by exploring for oil. [4] (c) Analyse how growth in a country’s tertiary sector can increase its living standards. [6] (d) Discuss whether or not workers who lose their jobs are likely to stay unemployed for a long time. [8]
20 marks
Mark scheme: 4(a) Define an extension in demand. 2 May be shown by a movement down a demand curve caused by a fall in price. A movement along a demand curve (1) higher demand (1) caused by a fall (1) in price (1). Not accepting: an increase in demand but accepting: an increase in quantity demanded. 4(b) Explain two external costs that may be caused by 4 One mark each for each of two costs identified and one exploring for oil. mark for each of two explanations. Logical explanation which might include: Reduce tourism may be given as an identification or as an explanation of e.g. ‘Damage to the natural environment’ Air pollution / pollution (1) those living nearby may experience a reduction in air quality / contribute to climate change/global warming / reduced health (1). Noise pollution (1) disturbing sleep (1). Water pollution / oil spillage (1) damage health (1). Damage to the natural environment / land / deforestation (1) destroy wildlife habitats / cause global warming / climate change (1). Reduce tourism (1) lower employment (1). Congestion (1) increasing transport costs (1). 4(c) Analyse how growth in a country’s tertiary sector can 6 increase its living standards. Coherent analysis which might include: May have high productivity (1) increase output (1) increase employment / reduce unemployment (1). May pay higher wages (1) allowing workers to consume more goods and services / afford education / afford healthcare / reduce poverty / buy more necessities / buy some luxuries/wants (1). May provide good working conditions (1) less tiring / less physically demanding (1) resulting in good health of workers (1) few accidents (1). May involve expansion of education (1) increasing future employment / workers’ skills (1) earning prospects (1) increase quality of output (1) increase HDI value (1). More transport services (1) could reduce prices / lower congestion / reduce stress (1). Growth of entertainment industry (1) improve leisure time (1). May involve expansion of healthcare (1) increase life expectancy / better health (1). May increase tax revenue (1) enabling the government to spend more on e.g. education (1). Less pollution (1) less environmental damage / less climate change / less global warming (1). 4(d) Discuss whether or not workers who lose their jobs are 8 Reward but do not expect reference to hysteresis. likely to stay unemployed for a long time. Level Description Marks In assessing each answer, use the table opposite. 3 A reasoned discussion which 6–8 Why they might: accurately examines both sides of the • may lose skills / unskilled workers may have greater economic argument, making use of difficulty than skilled workers in finding another job economic information and clear and • may become out of date with advances in technology / logical analysis to evaluate economic working practices issues and situations. One side of the • may be expensive for firms to employ as may need argument may have more depth than extra training the other, but overall both sides of the • may lose confidence argument are considered and • may become less attractive to employers developed. There is thoughtful • more likely to stay unemployed if a result of evaluation of economic concepts, cyclical/structural rather than frictional unemployment terminology, information and/or data • may be high unemployment benefits. appropriate to the question. The discussion may also point out the Why they might not: possible uncertainties of alternative • may receive government training decisions and outcomes. • may be geographically/occupationally mobile • gap between wages and state benefits may encourage 2 A reasoned discussion which makes 3–5 the unemployed to seek work use of economic information and clear • economy may grow, expanding employment analysis to evaluate economic issues and situations. The answer may lack opportunities some depth and development may be • may leave the labour force, e.g. retire / emigrate one-sided. There is relevant use of • may be seasonally unemployed. economic concepts, terminology, information and data appropriate to the question. 4(d) Level Description Marks 1 There is a simple attempt at using 1–2 economic definitions and terminology. Some reference may be made to economic theory, with occasional understanding. 0 A mark of zero should be awarded for 0 no creditable content.
This question in 0455/22 Oct/Nov 2024
Q55 · Calculate the average cost of producing a car in Belarus in 2021 0455/23 Oct/Nov 2024
1 (a) Calculate the average cost of producing a car in Belarus in 2021. [1] (b) Identify two reasons why Belarus is described as a mixed economy. [2] (c) Explain the type of inflation experienced by Belarus. [2] (d) Explain two reasons why the production possibility curve (PPC) of Belarus may have shifted to the left between 2011 and 2021. [4] (e) Analyse the relationship between life expectancy and HDI value. [4] (f) Analyse, using a demand and supply diagram, how subsidising the production of milk would affect the market for milk. [5] (g) Discuss whether or not the construction of electric vehicle charging stations would benefit an economy. [6] (h) Discuss whether or not people should be fined for being unemployed. [6]
30 marks
Mark scheme: Question Answer Marks Guidance 1(a) Calculate the average cost of producing a car in Belarus 1 Accept 10 650 or 0.010650million or 0.1065m. in 2021. Needs to be to at least 2 dp e.g. 0.011m $10 650 (1). 1(b) Identify two reasons why Belarus is described as a 2 mixed economy. • There is a public sector / some people work in the public sector / there are state-owned firms / there is government intervention e.g. fining the unemployed (1). • There is a private sector (1). 1(c) Explain the type of inflation experienced by Belarus. 2 Cost-push (1) due to a rise in the price of energy / increase in costs of production of firms (1). 1(d) Explain two reasons why the production possibility 4 One mark each for each of two reasons identified and one curve (PPC) of Belarus may have shifted to the left mark for each of two explanations. between 2011 and 2021. No marks for drawing a PPC diagram. Logical explanation which might include: • a decline in the size of the country’s labour force (1) reduction in the quantity of resources / fewer workers will be likely to reduce country’s ability to produce products (1) • a decrease in the number of students going to university (1) reduce quality of resources / labour skills / productivity / (1). 1(e) Analyse the relationship between life expectancy and 4 Responses do not have to be in the format suggested but HDI value. they should address the expected/normal relationship, offer supporting evidence of that, highlight any exceptions to that, Coherent analysis which might include: and analyse the overall data. Expected relationship: Note: simply repeating the data is not enough for a mark as • a high life expectancy would be expected to be it is only description whereas the skill being tested is associated with a high HDI value (1) analysis. • positive relationship / direct relationship / move in the same direction (1). Supporting evidence: • two countries with the longest life expectancy have the highest HDI value OR two countries with the lowest life expectancy also have the lowest HDI value (1) • specific reference to a country e.g. Norway had the longest life expectancy and the highest HDI value (1). Analysis of expected relationship: • life expectancy is one of the components of HDI (1) accounts for a third of its value / explanation of how better health / life expectancy raises standard of living (1). Exception: • Belarus / Thailand (1) Belarus has a shorter life expectancy but a higher HDI value (1). Analysis of exception: • there are other components of the HDI: education / GDP (GNI) per head (1). 1(f) Analyse, using a demand and supply diagram, how 5 subsidising the production of milk would affect the market for milk. Coherent analysis which might include: D&S diagram: • axes correctly labelled – price and quantity or P and Q (1) • original demand and supply curves correctly labelled (1) • new supply curve shifted to the right (1) • equilibriums – shown by lines P1 and Q1 and P2 and Q2 or equilibrium points marked as E1 and E2 (1). Written analysis: • reduction in cost of production / increase in supply / increase in quantity traded / reduction in price (1). 1(g) Discuss whether or not the construction of electric 6 Apply this example to all questions with the command vehicle charging stations would benefit an economy. word DISCUSS (1(g), 1(h), 2(d), 3(d), 4(d) and 5(d) Award up to 4 marks for logical reasons why it might benefit, which may include: Each point may be credited only once, on either side of an • likely to encourage use of electric vehicles (1) stations argument, but separate development as to how/why the and vehicles are complements (1) outcome may differ is rewarded. • improve the environment (1) reduce external costs (1) including air / noise pollution (1) reduce healthcare Generic example Mark costs / improve health of workers (1) • building the stations / building more electric cars may Tax revenue may decrease… 1 create employment (1) • government / private sector investment / purchase of ...because of reason e.g. incomes 1 electric vehicles may raise total (aggregate) demand (1) may be lower. causing higher output / economic growth (1). Tax revenue may increase 0 Award up to 4 marks for logical reasons why it might not because incomes may be higher benefit, which may include: i.e. reverse of a previous • other forms of transport may have more beneficial argument. effects on the environment (1) e.g. cycling / buses (1) • some people may be reluctant to switch (1) price of Tax revenue may increase 1 electric cars may be too high (1) resources are wasted because of a different reason i.e. (1) not the reverse of a previous • if people do switch, it may cause unemployment (1) in argument e.g. government e.g. oil firms / production of diesel and petrol cars / less spending on subsidies may public transport (1) stimulate the economy more than • Increase in electric vehicles on road (1) causes road spending on education. congestion (1) • Opportunity cost of government investment (1) monies could have been spent e.g. education /health / infrastructure (1) • If economy at full employment (1) investment may lead to demand-pull inflation (1). 1(h) Discuss whether or not people should be fined for being 6 unemployed. Award up to 4 marks for logical reasons why they should be fined, which may include: • if frictional unemployment (1) a fine would encourage workers to put more effort into finding a job (1) spend less time between jobs (1) help move economy towards full employment (1) higher output (1) and economic growth (1) • fines may increase government revenue (1) which could be spent on e.g. healthcare / support to find a job (1) • may not be seeking a job as receive benefits (1) fines may encourage them to find work and reduce government spending on unemployment benefits (1). Award up to 4 marks for logical reasons why they should not be fined, which may include: • may be a lack of suitable jobs available (1) the unemployed may have lacked the skills required (1) may not have been able to move to other areas of the country (1) may have disabilities / ill-health (1) providing support may reduce unemployment more quickly (1) • unemployment may be structural / cyclical (1) it would have been more effective to increase training (1) increase total demand (1) • unemployed may have little income to pay the fine (1) may increase their debt (1) lead to greater poverty / unable to pay for basic necessities (1) affect their mental health / wellbeing / causes depression (1) • may encourage the growth of the shadow/unofficial/informal economy (1) as not registered as unemployed (1) • may reduce wages (1) workers may be forced to accept low-paid jobs (1).
This question in 0455/23 Oct/Nov 2024
Q56 · Calculate Romania’s current account deficit on its balance of payments in $s 0455/22 Feb/March 2025
1 (a) Calculate Romania’s current account deficit on its balance of payments in $s. [1] (b) Identify two reasons why Romania’s population fell between 1990 and 2022. [2] (c) Explain why immigration into Romania may increase in the future. [2] (d) Explain two reasons why household spending has increased in Romania. [4] (e) Draw a demand and supply diagram to show the effect of setting a maximum price on electricity. [4] (f) Analyse the relationship between GDP per head and average spending on food as a percentage of total household spending. [5] (g) Discuss whether or not foreign MNCs reduce poverty in their host countries. [6] (h) Discuss whether or not a higher proportion of women is likely to enter Romania’s labour force in the future. [6]
30 marks
Mark scheme: Question Answer Marks Guidance 1(a) Calculate Romania’s current account deficit on its balance of 1 Accept 27bn without $. payments in $s. $27 000 000 000. $27 10⁹ $27bn (1). $2.7 10 to the power 10. 1(b) Identify two reasons why Romania’s population fell between 1990 2 and 2022. Fall in birth rate (1) emigration / net emigration / people leaving the country (1). 1(c) Explain why immigration into Romania may increase in the future. 2 1 mark for identification of high economic growth rate, and 1 mark for explanation. High economic growth rate / economic growth (1) higher wages / higher income / more chance of employment / more job opportunities / higher living standards (1). 1(d) Explain two reasons why household spending has increased in 4 Romania. Logical explanation which might include: • Romanians have become wealthier (1) more money to spend / greater purchasing power / higher income / higher GDP per head / can sell assets to get money to spend / more able to borrow / greater confidence (1). • More confident about the future / increased optimism (1) about future job prospects / higher earning / job security / may encourage more borrowing / less saving (1). • Low interest rates (1) encourage borrowing / reduce cost of borrowing / discourage saving (1). • High rate of inflation (1) spending more to maintain living standards (1). 1(e) Draw a demand and supply diagram to show the effect of setting a 4 maximum price on electricity. Coherent analysis which might include: D&S diagram: Axes correctly labelled – price and quantity or p and q (1). Demand and supply curves correctly labelled (1). Maximum price set below the equilibrium price – labelled as max price, P1, PX or any other P. (1). Quantity demanded and quantity supplied at the maximum price identified (1). 1(f) Analyse the relationship between GDP per head and average 5 Responses do not have to be in the format spending on food as a percentage of total household spending. suggested but they should address the expected/normal relationship, offer supporting Relationship (up to 2 marks): evidence of that, highlight any exceptions to Generally, an inverse relationship / negative relationship (1) the higher that, and analyse the overall data. the GDP per head, the lower the average household spending on food as a % of household spending (1). Supporting evidence (up to 2 marks): E.g. the five countries with the lowest GDP per head had the highest % Supporting evidence should involve average household spending on food (1). Ethiopia had the lowest GDP interpretation, not just description but note: per head and the highest average household spending on food as a % of A mark can be given for an implied comparison total spending (1) Cambodia had the second lowest GDP per head and e.g. the second highest spending on food as a % of total spending (1) Egypt after stating that there is a negative relationship had the third lowest GDP per head and the third highest spending on (1): food as a % of total spending (1). e.g. Belgium had a GDP per head of $52 100 and only spent 13% of their total spending on food whereas Romania had a GDP per head of Analysis of relationship (up to 2 marks): $15 000 and spent 26% of their spending on As households get richer, they can afford to spend more in total on food / food (1), higher quality food (1) but can afford to buy more of other items / buy more luxury items / spend less on necessities (1). Rewarding GDP per head (income) but not just GDP. Exception (up to 2 marks): Norway / USA (1) Norway had a higher GDP per head but also a higher % of household spending on food (1). Analysis of exception (up to 1 mark): Food may be more expensive in Norway / Norwegians may have a different diet / buy a higher proportion of high quality food (1). 1(g) Discuss whether or not foreign MNCs reduce poverty in their host 6 Apply this example to all questions with the countries. command word DISCUSS (1g, 1h, 2d, 3d, 4d and 5d) Award up to 4 marks for logical reasons why they might, which may include: Each point may be credited only once, on either • they may increase employment / reduce unemployment (1) which side of an argument, but separate development may increase incomes / increase wages (1) cause economic growth / as to how/why the outcome may differ is raise GDP (1) enabling people to buy more basic necessities / raise rewarded. purchasing power (1). • may train workers (1) increase skills (1). Generic example Mark • they may have lower costs of production / more efficient (1) use more advanced technology (1) may take advantage of economies of Tax revenue may decrease… 1 scale (1) able to charge lower prices (1). • they may pay tax / less may be spent on unemployment benefit (1) ...because of reason e.g. incomes 1 some of this could be spent on e.g. education / healthcare / training may be lower. unemployed (1) income could be redistributed (1). Tax revenue may increase because 0 Award up to 4 marks for logical reasons why it might not, which may incomes may be higher i.e. reverse include: of a previous argument. • they may replace domestic firms / drive domestic firms out of business (1) may employ workers from their own countries (1) Tax revenue may increase because 1 leaving employment / unemployment unchanged (1). of a different reason i.e. not the • they may use capital-intensive methods (1) reducing demand for reverse of a previous argument e.g. unskilled workers (1). government spending on subsidies • they may use up non-renewable resources (1) reducing incomes in may stimulate the economy more the future / raising prices (1). than spending on education. • they may send profits back home (1) making them unavailable for re- investment in the host country (1). Extract from the source material: • may increase relative poverty / not reduce relative poverty (1) may More MNCs may affect poverty because of the widen gap in pay between e.g. skilled and unskilled workers (1). possible effects on unemployment and prices. • may become a monopoly (1) charge high prices (1). 1(h) Discuss whether or not a higher proportion of women is likely to 6 Extract from the source material: enter Romania’s labour force in the future. There is a range of influences on whether women enter the labour force. These include Award up to 4 marks for logical reasons why it might, which may include: social attitudes, female education and whether • there may be an increase in childcare facilities (1) making it easier childcare facilities and part-time work are for women who are parents to work (1) available. • more part-time work / more job opportunities for women / shortage of No marks for just reproducing these words. labour / higher demand for labour (1) lower birth rate (1) which may Interpretation needed e.g. more part-time work. enable women to combine work and child rearing (1) • increase in female education / qualifications / training (1) which may Many of the influences can be given either way increase skills / productivity (1) which may increase wages (1). but only reward identification of the influence • increase in healthcare / family planning (1) reduce size of families (1) once e.g., one mark for there may be increase • may seek to reduce poverty / improve living standards (1) by earning in childcare facilities or a decrease in childcare facilities. an income (1). Award up to 4 marks for logical reasons why it might not, which may include: • discrimination may occur (1) in terms of jobs available / wages (1). • negative social attitudes may continue (1) e.g. other workers may make the working environment uncomfortable for women (1). • women may emigrate (1) leaving the labour force (1) • working hours may increase (1) making it more difficult for women to combine work and home life (1). • An increase in income / higher household income (1) may enable women to work fewer hours / reduce need to work (1).
This question in 0455/22 Feb/March 2025
Q57 · The shape of Colombia’s population pyramid is changing 0455/21 May/June 2025
2 The shape of Colombia’s population pyramid is changing. The income distribution of this South American country, however, is not changing significantly. The country has one of the most unequal income distributions in the world. Some Colombians work in its footwear industry which produces shoes, sandals and boots. Although footwear is produced in the private sector, Colombia has a mixed economic system. (a) Define population pyramid. [2] (b) Explain two reasons why income may become more unevenly distributed. [4] (c) Analyse the influences on whether demand for shoes is elastic or inelastic. [6] (d) Discuss whether or not a mixed economic system will benefit the people who live in that economy. [8]
20 marks
Mark scheme: 2(a) Define population pyramid. 2 If more than two factors given, consider the first three. age (1) gender (1) 2(b) Explain two reasons why income may become more 4 One mark each for each of two reasons identified and one unevenly distributed. mark each for each of two explanations. Logical explanation which might include: If more than two reasons given, consider the first three. A rise in: MAX of two marks if not identifying what changes. • Unemployment (1) those who lose their jobs are likely to experience a fall in their income (1). • Illness (1) the sick may not be able to earn an income (1). • Profits (1) benefitting entrepreneurs (1). • Interest rates (1) benefitting those with a high value of savings (1). • Wealth (1) with rich people gaining more interest/profit (1). • Regressive taxation (1) reducing the income of the poor/placing greater burden on poor (1). • Discrimination of workers (1) example e.g. reducing income of women • Education provision / attainment (1) but only for some (1). A fall in: • National minimum wage (1) the low-paid experience a fall in income (1). • Progressive taxation (1) increases the income of the rich (1). • Welfare / state benefits (1) reduce the income of the poor (1). 2(b) Growth: 4 • Economic growth (1) benefits go more to skilled than to unskilled workers (1). • Changes in growth rate of different industries (1). workers in expanding industries may earn more in wages than workers in declining industries (1). • Changes in growth rate of different regions (1) workers in high growth areas may earn higher wages than in low growth / declining regions (1). • Changes in growth rate of private and public sector (1) private sector earn higher increase in wages (1). 2(c) Analyse the influences on whether demand for shoes is 6 elastic or inelastic. Coherent analysis which might include: • Shoes have substitutes in the form of sandals and boots (1) may make demand (price) elastic (1) as a change in price will cause consumers to switch between different forms of footwear (1) especially if the types are close substitutes / close in price (1). • PED of particular brands of shoes will be more elastic than demand for shoes as a whole (1) • Proportion of income spent on the shoes (1) the lower the proportion, the more inelastic the demand (1) as a change in price will not have such a significant impact on demand (1). • Whether shoes are considered to be a necessity or a luxury (1) shoes are likely to be considered a necessity (1) and therefore inelastic (1). • It may not be possible to delay the purchase of shoes (1) making demand inelastic (1). • Durability of shoes (1) the more durable the more inelastic (1). • Demand for some shoe may be addictive (1) making demand inelastic (1). 2(d) Discuss whether or not a mixed economic system will 8 Level Description Marks benefit the people who live in that economy. 3 A reasoned discussion which 6–8 In assessing each answer, use the table opposite. accurately examines both sides of the economic argument, making use of Why it might: economic information and clear and • public goods may be provided logical analysis to evaluate economic • production of demerit goods may be discouraged issues and situations. One side of the • production of merit goods may be encouraged argument may have more depth than • state benefits may be provided the other, but overall both sides of the • income may be redistributed to help the poor argument are considered and • unemployment may be kept low by government policies developed. There is thoughtful • private sector benefits e.g. generate high incomes / evaluation of economic concepts, lower prices terminology, information and/or data appropriate to the question. The Why it might not: discussion may also point out the • may be market failure in the private sector possible uncertainties of alternative • rich may lose if there is high progressive taxation decisions and outcomes. • high taxation may discourage enterprise • state-owned enterprises may be inefficient 2 A reasoned discussion which makes 3–5 • may be less choice in the public sector. use of economic information and clear analysis to evaluate economic issues and situations. The answer may lack some depth and development may be one-sided. There is relevant use of economic concepts, terminology, information and data appropriate to the question. 2(d) 8 Level Description Marks 1 There is a simple attempt at using 1–2 economic definitions and terminology. Some reference may be made to economic theory, with occasional understanding. 0 A mark of zero should be awarded for 0 no creditable content.
This question in 0455/21 May/June 2025
Q58 · Australia has a number of firms that operate in other countries 0455/21 May/June 2025
5 Australia has a number of firms that operate in other countries. These multinational companies (MNCs) provide several benefits for their home country of Australia. The Australian Government imposes relatively low import tariffs and the country has a floating exchange rate. In recent years, Australia has experienced an increase in investment and a higher Human Development Index (HDI) value. (a) Identify two benefits an MNC may provide for its home country. [2] (b) Explain two disadvantages of import tariffs. [4] (c) Analyse how an increase in investment can result in a rise in a country’s HDI value. [6] (d) Discuss whether or not having a floating exchange rate benefits an economy. [8]
20 marks
Mark scheme: 5(a) Identify two benefits an MNC may provide for its home 2 If more than two benefits given, consider the first three. country. Identify means that the benefit does not have to be Two from: explained. • profits • (increased) exports • raw materials • job opportunity / wages for workers • raise country’s income 5(b) Explain two disadvantages of import tariffs. 4 One mark each for each of two disadvantages identified and one mark each for each of two explanations. Logical explanation which might include: If more than two disadvantages given, consider the first • Reduce (free) trade (1) lower competition (1) . three. • Risk of retaliation (1) resulting in trade war / unemployment (1). Only allow one mark for reference to lower competition. • Raise price of imports (1) which may raise price of domestically produced goods (because of the lack of competition) (1) . • Raise the price of imported raw materials / capital goods (1) cause cost-push inflation (1) . • Reduce quality (1) due to lower competition (1) • Protected industries / infant industries / declining industries may become inefficient (1) if become reliant on tariff (protection) (1). • Reduce output / consumption / less quality / less choice (1) lower living standards (1). • Reduce ability of countries to specialise (1) less efficient use of resources / loss of potential economies of scale (1). 5(c) Analyse how an increase in investment can result in a 6 rise in a country’s HDI value. Coherent analysis which might include: • Investment can increase GDP / GNI (1) employment (1) which may increase GDP/ GNI per head (1) higher GDP/ GNI may raise tax revenue (1) enabling the government to spend more on education and healthcare (1). • Higher personal income / wages (1) enabling families to afford sending children to school (1) pay for private healthcare (1). • An increase in investment in healthcare facilities (1) can increase life expectancy (1). • An increase in investment in education (1) will increase mean / expected and expected years of schooling (1) increase skills/productivity (1) which may increase GDP per head (1) raise awareness about nutrition (1) increase life expectancy (1). • An increase in investment may introduce more advanced technology (1) which can make work less physically demanding (1) improving health / life expectancy (1). 5(d) Discuss whether or not having a floating exchange rate 8 Level Description Marks benefits an economy. 3 A reasoned discussion which accurately 6–8 In assessing each answer, use the table opposite. examines both sides of the economic argument, making use of economic Why it might: information and clear and logical • may eliminate a current account imbalance analysis to evaluate economic issues • if there is a current account deficit, exchange rate may and situations. One side of the fall making exports fall in price and imports rise in price argument may have more depth than • no need to keep reserves of foreign exchange the other, but overall both sided of the • no need to change interest rates to influence the argument are considered and exchange rate developed. There is thoughtful • enable government to concentrate on other aims as evaluation of economic concepts, does not have to keep the exchange rate fixed. terminology, information and/or data appropriate to the question. The Why it might not: discussion may also point out the • may make it difficult for firms to plan, not knowing how possible uncertainties of alternative much they will have to pay for imports and earn from decisions and outcomes. exports • may create uncertainty 2 A reasoned discussion which makes 3–5 • discourage investment use of economic information and clear • speculation can cause (significant) destabilising analysis to evaluate economic issues changes in the exchange rate. and situations. The answer may lack some depth and development may be one-sided. There is relevant use of economic concepts, terminology, information and data appropriate to the question. 5(d) 8 Level Description Marks 1 There is a simple attempt at using 1–2 economic definitions and terminology. Some reference may be made to economic theory, with occasional understanding. 0 A mark of zero should be awarded for 0 no creditable content. Note: reward candidates if they refer to the impact of appreciation and depreciation of the currency in their answers.
This question in 0455/21 May/June 2025
Question 59 0455/22 May/June 2025
1 (a) Calculate St. Kitts and Nevis’s government budget deficit in 2022. [1] (b) Identify two examples of the factor of production ‘land’ in St. Kitts and Nevis. [2] (c) Explain how tourism causes external costs in St. Kitts and Nevis. [2] (d) Explain two reasons why a foreign bank may open a branch in St. Kitts and Nevis. [4] (e) Draw a demand and supply diagram to show the effect of an increase in the productivity of onion farmers on the market for onions. [4] (f) Analyse the relationship between healthcare spending as a percentage of GDP and life expectancy. [5] (g) Discuss whether or not an increase in the size of its fishing industry would benefit St. Kitts and Nevis. [6] (h) Discuss whether or not deflation is likely to have harmed St. Kitts and Nevis. [6]
30 marks
Mark scheme: Question Answer Mark Guidance 1(a) Calculate St. Kitts and Nevis’s Government budget 1 Accept 18m. deficit in 2022. ($)18 000 000 / – ($)18 000 000. $18 m / – $18 m (1). 1(b) Identify two examples of the factor of production land in 2 If more than two examples given, consider the first three. St. Kitts and Nevis. Two from: beaches (1), (coral) reefs (1), marine life / fish (1) rainforests (1) and soil (1). 1(c) Explain how tourism causes external costs in St. Kitts 2 One mark for explanation of external costs. and Nevis. One mark for example based on tourism. • Social costs are greater than private costs / social costs include private costs and external costs / harmful effects on third parties / those not directly involved in producing or consuming the product (1). • Example of an external cost caused by tourism in St Kitts and Nevis e.g. pollution / environmental damage / death of wildlife / death of marine life / overcrowding (1). 1(d) Explain two reasons why a foreign bank may open a 4 One mark each for each of two reasons identified and one branch in St. Kitts and Nevis. mark each for each of two explanations. Logical explanation which might include: If more than two reasons given, consider the first three. • High incomes in the country (1) high demand for Most of the explanation points e.g. high profit could be banking services / high demand for loans / may save linked to any of the three identification points except high more / borrowers likely to be able to repay loans / high disposable income should be linked to absence of personal profit / high revenue (1). income tax. • Absence (low) of personal income tax (1) workers would be able to keep all of their income / more disposable Do not give two explanation marks for one identification. income / firms may be able to pay lower wages / increase workers’ motivation (1). Explanation marks here are dependent on the • Relatively high literacy rates (1) awareness of benefits identifications. of having a bank account / saving / skilled workers / high productivity (1). 1(e) Draw a demand and supply diagram to show the effect 4 of an increase in the productivity of onion farmers on the market for onions. D&S diagram: Axes correctly labelled – price and quantity or p and q (1). Original demand and supply curves correctly labelled (1). New supply curve shifted to the right (1). Equilibriums – shown by lines P1 and Q1 and P2 and Q2 or equilibrium points marked as E1 and E2 (1). 1(f) Analyse the relationship between healthcare spending 5 Responses do not have to be in the format suggested but as a percentage of GDP and life expectancy. they should address the expected/normal relationship, offer supporting evidence of that, highlight any exceptions to that, Expected relationship: and analyse the overall data. Direct / positive relationship (1). Generally, the higher healthcare spending, the higher the life expectancy (1). Supporting evidence should involve interpretation, not just description. Supporting evidence: E.g.: Haiti has the second lowest % healthcare spending and the shortest life expectancy (1) Canada spends a higher % on healthcare than Egypt and has a longer life expectancy / Canada spends the highest percentage on health care and has the second highest longest life expectancy / Canada and Sweden spend a high % on healthcare and have long life expectancy (1). Analysis of the supporting information: Higher spending on healthcare would be expected to raise the health of the population / provide better quality healthcare (1) increase awareness of need for healthy living / provide more check-ups / preventative medical care / reduce the death rate (1). Exception: Monaco (1) spends the lowest % on healthcare but has the longest life expectancy (1). Analysis of exception: 1.9% of a very high GDP can mean higher spending than e.g. 12.9% of a lower GDP / Monaco may have a high GDP (1). There are other influences on life expectancy e.g. nutrition / education/housing/war (1). 1(g) Discuss whether or not an increase in the size of its 6 Award one mark in total for higher / lower average costs, fishing industry would benefit St. Kitts and Nevis. one mark for lower / higher fish prices, one mark for higher / lower profits (1). Award up to 4 marks for logical reasons why it might, which may include: Higher / lower profits should be linked to the fishing industry. • may reduce imports of fish (1) reduce risk of supply-side shocks / imports being cut off (1) enable fish to be Apply this example to all questions with the command exported (1) may improve the current account word DISCUSS balance / improve the balance of payments (1) (1(g), 1(h), 2(d), 3(d), 4(d) and 5(d)) • may increase employment / increase job opportunities / reduce unemployment (1) raise incomes Each point may be credited only once, on either side of an (1) increase living standards (1) increase argument, but separate development as to how/why the GDP / increase output / cause economic growth (1) outcome may differ is rewarded. higher tax revenue (1) • may enable greater advantage to be taken of Generic example Mark economies of scale (1) example (1) lower average cost (1) lower fish prices (1) Tax revenue may decrease … 1 • (larger boats) may be more efficient / more productive (1) make the industry more profitable / increase profits ... because of reason e.g. incomes may be 1 from fishing (1). lower. Tax revenue may increase because incomes 0 may be higher i.e. reverse of a previous argument. Tax revenue may increase because of a different 1 reason i.e. not the reverse of a previous argument e.g. government spending on subsidies may stimulate the economy more than spending on education. 1(g) Award up to 4 marks for logical reasons why it might not, which may include: • opportunity cost (1) could use resources in other industries / government can spend more on e.g. education / increase budget deficit (1) • over-fishing (1) deplete fish stocks / lose marine life / deplete resources (1) raise fish prices in the long run (1) • may experience diseconomies of scale (1) example (1) higher average cost (1) reduce profit (1) • may cause external costs / environmental harm (1) may damage coral reefs / cause pollution (1) harm tourism (1) • may be a dangerous occupation (1) may be low-paid (1) low-skilled (1) may experience seasonal unemployment (1) • risk of over specialisation / too great a dependency on the industry (1) may be harmed by a fall in demand for fish / rise in competition from other countries (1). 1(h) Discuss whether or not deflation is likely to have 6 Award one mark for malign (bad) deflation is harmful harmed St. Kitts and Nevis. whereas benign (good) deflation is beneficial. Award up to 4 marks for logical reasons why it might, which Mark for higher employment and mark for higher GDP can may include: only be awarded if come from higher total supply. • may have increased real value of debt (1) may default (1) may have decreased investment (1) ‘save more’ may be credited on either side but only once. • may have resulted in a deflationary spiral (1) may have resulted from lower total demand (1) lower GDP / lower output / reduce economic growth / may cause a recession (1) lower employment / increased unemployment (1) lowered wages / income (1) • may reduce confidence (1) may discourage MNCs (1) • may reduce consumer expenditure / save more / create uncertainty (1) delay buying goods and services (until price is lower) (1). Award up to 4 marks for logical reasons why it might not, which may include: • may have increased purchasing power / real income / with the same income more goods and services can be purchased (1) (some) people may spend / consume more (1) • value of saving may have increased (1) increasing wealth (1) • may be the result of higher total supply (1) due to advances in technology / lower costs of production (1) higher output / economic growth (1) higher employment (1) • may have increased international competitiveness of its products / lower export prices (1) increased exports / export revenue (1) reduced imports / import expenditure (1) improve current account balance (1).
This question in 0455/22 May/June 2025
Q60 · In 2022, more than a quarter of a million workers, including doctors, left Sri Lanka to… 0455/22 May/June 2025
4 In 2022, more than a quarter of a million workers, including doctors, left Sri Lanka to work in other countries. This was largely due to economic problems, including an inflation rate of 50% and a concern that unemployment might rise. The Sri Lankan Government increased direct taxation. It also encouraged some public sector workers to work abroad temporarily. People who work abroad often send money home to relatives. (a) Identify two types of unemployment. [2] (b) Explain two ways that money received from relatives working abroad could raise their families’ living standards. [4] (c) Analyse how an increase in direct taxation could increase unemployment. [6] (d) Discuss whether or not a doctor would benefit from working in another country. [8]
20 marks
Mark scheme: 4(a) Identify two types of unemployment. 2 If more than two types given, consider the first three. Two from: Also accept voluntary unemployment, involuntary Frictional (1) structural (1) cyclical / demand deficient (1) unemployment, seasonal, classical, casual, regional, technological. Accept demand-deficient as an alternative to cyclical. 4(b) Explain two ways that money received from relatives 4 One mark each for each of two ways identified and one working abroad could raise their families’ living mark each for each of two explanations. standards. If more than two ways given, consider the first three. Logical explanation which might include: No marks for why the money received may be large due to Could spend more on food / buy more products / buy more e.g. lower tax rates abroad, high exchange rate. basic necessities have higher purchasing power / more income / could increase overall spending (1) reduce poverty (1). Could spend more on better quality food (1) improve nutrition / improve health (1). Could spend money on education / training (1) increase earning potential / wages (1). Could spend on healthcare (1) raise life expectancy (1). Could spend on housing (1) reduce illness (1). May be able to afford luxuries (1) e.g. may be able to afford a holiday / car (1). Could set up a small business (1) which could earn them an income (1) Could pay off debts / reduce need to borrow / reduce cost of borrowing (1) reduce stress (1). Could save more (1) earn interest / pay for e.g. healthcare/education of children in the future (1) Could work fewer hours / fewer jobs (1) less stress (1). 4(c) Analyse how an increase in direct taxation could 6 increase unemployment. Coherent analysis which might include: • (Increase in) (personal) income tax (1) (increase in) tax on wealth (1) would reduce disposable income / purchasing power / money available / the amount of their wages they can keep (1) reduce consumer spending (1) lower total demand (1) lower demand for workers (1) as demand for workers depends on demand for goods and services / derived demand (1) increase cyclical unemployment (1). • Reduce incentive to work / encourage workers to leave their jobs (1) may now rely on unemployment benefit / as may receive more from unemployment benefit than from a now lower paid job (1) increase frictional/voluntary unemployment (1). • (Increase in) corporation (corporate income) tax (1) will reduce the amount of profit that can be kept / reduce profit (1) firms may reduce output / reduce economic growth / may cause a recession / reduce supply / less incentive to expand (1) reduce investment (1) result in cyclical unemployment (1) may reduce employment to cut costs (to maintain profit) (1). 4(d) Discuss whether or not a doctor would benefit from 8 Maximum of 4 marks if discussing working in another city working in another country. rather than country. In assessing each answer, use the table opposite. Level Description Marks Why they might: 3 A reasoned discussion which accurately 6–8 • may be higher paid, higher living standards examines both sides of the economic • may benefit from lower inflation argument, making use of economic • may benefit from lower taxes information and clear and logical • may be more chances of gaining a job or gaining a analysis to evaluate economic issues promoted post and situations. One side of the argument • may have better working conditions may have more depth than the other, but • may have more fringe benefits overall both sides of the argument are • may gain new skills and experience considered and developed. There is • may be safer environment thoughtful evaluation of economic • may be able to send money home to family concepts, terminology, information • may provide better opportunities for their children. and/or data appropriate to the question. The discussion may also point out the Why they might not: possible uncertainties of alternative • may have longer working hours decisions and outcomes. • may have less holidays 2 A reasoned discussion which makes use 3–5 • may have less job security of economic information and clear • may miss friends / relatives analysis to evaluate economic issues • may face discrimination and situations. The answer may lack • may face language problems/ cultural differences. some depth and development may be one-sided. There is relevant use of economic concepts, terminology, information and data appropriate to the question. 4(d) Level Description Marks 1 There is a simple attempt at using 1–2 economic definitions and terminology. Some reference may be made to economic theory, with occasional understanding. 0 A mark of zero should be awarded for no 0 creditable content.
This question in 0455/22 May/June 2025
Q61 · Calculate the number of people who are in poverty in Egypt 0455/23 May/June 2025
1 (a) Calculate the number of people who are in poverty in Egypt. [1] (b) Identify two of Egypt’s primary sector exports. [2] (c) Explain how building a new city can reduce unemployment. [2] (d) Explain why tourism is a good source of economic growth for Egypt. [4] (e) Draw a demand and supply diagram to show the likely effect of falling incomes on the market for housing in the new city. [4] (f) Analyse the relationship between investment (as a % of GDP) and economic growth rates for Egypt. [5] (g) Discuss whether or not deregulation in education in Egypt will increase living standards. [6] (h) Discuss whether or not a fall in the value of the Egyptian currency would harm the Egyptian economy. [6]
30 marks
Mark scheme: Question Answer Mark Guidance 1(a) Calculate the number of people who are in poverty in 1 30 690 000 Egypt. Accept 30.7 million. 30.69 million 1(b) Identify two of Egypt’s primary sector exports. 2 Accept any two Two from: oil (1), citrus fruits (1), gold (1) 1(c) Explain how building a new city can reduce 2 Only one mark if not linked to building. unemployment. Building a new city requires labour / creates job opportunities / increases demand for labour (1) to work in construction / build new buildings (1). 1(d) Explain why tourism is a good source of economic 4 Award a maximum of 2 marks for just identification of points growth for Egypt. without explanation. Logical explanation which might include: Egypt has many ancient / human-made attractions and buildings (1) not found in many parts of the world / that tourists want to visit (1) creating more employment / tax revenue (1). Egypt has natural attractions, such as beautiful beaches / warm climate / good weather (1) these attract tourists / low government spending required / low investments required (1). Egypt has good infrastructure (1) this can attract tourists as its easier to travel to the country or attractions / can attract investors with lower cost of production (1). Egypt has good security (1) tourists feel safe / investors are confident in the security of their investments (1). Egypt has experienced a fall its currency value (1) making holidays more affordable (1). 1(e) Draw a demand and supply diagram to show the likely 4 effect of falling incomes on the market for housing in the new city. D&S diagram: Axes correctly labelled – price and quantity or p and q (1). Original demand and supply curves correctly labelled (1). New demand curve shifted to the left (1). Equilibriums – shown by lines P1 and Q1 and P2 and Q2 or equilibrium points marked as E1 and E2 (1). 1(f) Analyse the relationship between investment (as a % of 5 Responses do not have to be in the format suggested but GDP) and economic growth rates for Egypt. they should address the expected / normal relationship, offer supporting evidence of that, highlight any exceptions to that, Coherent analysis which might include: and analyse the overall data. Expected relationship: Positive / direct (1) higher / lower investment should lead to higher / lower economic growth rates (1). Supporting evidence: From 2017–2019, Investment rising and economic growth also rising (1) From 2019–2020, investment falling and economic growth also falling (1). Analysis: Higher investment leads to higher economic growth due to higher total demand / investment is a component of total demand (1) and increased productivity / lower cost of production (1). Exception: identification of an exception 2015–2017 or 2020–21 (1), 2015–2017, investment rising but economic growth falling slightly / relatively stable / largely unchanged (1), 2020–2021, investment falling but economic growth rate rising (1). Analysis of the exception: Current investment increase now could lead to a delayed response in economic growth rates (1) data shows percentage not total investment (1). 1(g) Discuss whether or not deregulation in education in 6 Answers not referring to education, max 3 marks. Egypt will increase living standards. Apply this example to all questions with the command Award up to 4 marks for logical reasons why it might, which word DISCUSS may include: (1(g), 1(h), 2(d), 3(d), 4(d) and 5(d)) • deregulation has led to an increased number of schools / universities in Egypt (1) may increase competition Each point may be credited only once, on either side of an between private schools / universities (1) may lower argument, but separate development as to how/why the fees (1) raise quality (1) outcome may differ is rewarded. • more people have opportunities for education and training (1) making people more educated / skilled / Generic example mark qualified / literate / productive (1) easier to find jobs (1) earn an income (1) increasing affordability of goods and Tax revenue may decrease 1 services (1) more educated people tend to enjoy better health / spend more on healthcare (1) longer life because of reason e.g. incomes may be lower. 1 expectancy (1) increase HDI (1) • more school buildings will increase employment (1) of Tax revenue may increase because incomes 0 builders (1) teachers (1) may be higher i.e. reverse of a previous • may reduce government spending on education (1) argument. allowing the government to spend more on items that could increase living standards e.g. healthcare (1). Tax revenue may increase because of a different 1 reason i.e. not the reverse of a previous Award up to 4 marks for logical reasons why it might not: argument e.g. government spending on • opening more private schools and universities in Egypt subsidies may stimulate the economy more than might increase the level of inequality (1) as private spending on education. education remains unaffordable to lower income groups (1) restricting their employment opportunities (1) as private education is usually more expensive than state- provided education (1) • standards of living only improve for those from higher income groups (1) lower income groups remain in relative poverty (1) widen gap between rich and poor / increase relative poverty (1) • private schools and universities may prioritise profits (1) over the quality / standards of education provided (1). 1(h) Discuss whether or not a fall in the value of the 6 One mark for identifying increase or decrease in investment. Egyptian currency would harm the Egyptian economy. Award up to 4 marks for logical reasons why it might, which may include: • fall in the value of the Egyptian currency may cause cost push (1) inflation (1) reducing the purchasing power of Egyptians (1) as imported goods become more expensive (1) standards of living could decrease (1) • cost of production could increase (1) increasing the price of domestically produced goods (1) some firms may try to cut cost by reducing jobs (1) increase unemployment (1) • may create uncertainty / reduce confidence (1) discourage investment (1). Award up to 4 marks for logical reasons why it might not, which may include: • Egyptian exports become cheaper (1) increasing demand for exports / increasing revenues of domestic producers / incomes (1) causing economic growth (1) demand may switch from imports to domestically produced products (1) may reduce current account deficit (1) • industries such as the tourism industry may benefit (1) as holidays in Egypt become more affordable for non- Egyptians (1) • workers also have more job opportunities (1) since there is more demand for domestically produced goods and services (1) • may increase investment / hot money flows (1) reduced cost to set up an MNC / may expect profit if currency value rises later (1).
This question in 0455/23 May/June 2025
Q62 · As cities experience economic growth, the buildings in the city become taller 0455/23 May/June 2025
4 As cities experience economic growth, the buildings in the city become taller. This is driven by an increase in the willingness and ability of consumers to live in tall buildings. Changes in the conditions of supply have also increased the number of tall buildings being constructed. However, there is a limit to the height of buildings – above a certain height, the total cost of constructing the building will exceed the total revenue generated. (a) Define total cost. [2] (b) Explain two causes of an increase in the supply of a product. [4] (c) Analyse factors that can increase the willingness and ability of consumers to buy a certain product. [6] (d) Discuss whether or not economic growth will improve living standards in a city. [8]
20 marks
Mark scheme: 4(a) Define total cost. 2 Total cost is addition of all costs / overall costs (1) fixed cost (1) plus variable cost (1). 4(b) Explain two causes of an increase in the supply of a 4 One mark each for each of two reasons identified and one product. mark each for each of two explanations. Logical explanation which might include: If more than two causes given, consider the first three. • lower costs (1) e.g. cost of raw materials / greater potential profitability (1) • increased productivity (1) e.g. due to better technology (1) • reduced regulations (1) easier / cheaper to produce more (1) • reduced taxes (1) reducing cost of production (1) • increased subsidies (1) enabling producers to be able to produce more with the same amount of financial capital / money / cover some costs / provide additional revenue (1) • better weather / more suitable season (1) increasing crop yield / less destruction or damage to crops(1) • increases in stocks / inventories (1). 4(c) Analyse factors that can increase the willingness and 6 Maximum of two marks for just listing different reasons for ability of consumers to buy a certain product. increase in willingness and ability of consumers to buy a certain product. Coherent analysis which might include: Reward increase in demand only once and reward decrease • decrease in the price of the product itself / subsidy (1) in demand only once. makes the product more affordable (1) increasing demand (1) • increase in the price of substitutes (1) which are goods that provide the similar levels of satisfaction / example of substitutes (1) increasing demand (1) • decrease in the price of complements (1) goods that are in joint demand / example of complements (1) increasing demand (1) • increase in expected price in future (1) consumers willing to buy more now when prices are lower (1) instead of the future when prices go up (1) • increase in incomes (1) consumers more able to buy the product now (1) since affordability / purchasing power increase (1) • change in trends / popularity (1) some products become more fashionable / more popular (1) • increase in quality (1) making the product more desirable (1) • increase in or more effective advertising / marketing (1) informing consumers about the product (1) persuading consumers to buy the product (1) • increased peer pressure to buy the product (1) e.g. conspicuous consumption / to keep in with friends (1) • government health campaigns (1) encouraging consumption of merit goods (1) • change in seasons / weather (1) some products become more needed / desired at certain times (1) relevant example (1). 4(d) Discuss whether or not economic growth will improve 8 Maximum of four marks if no reference to a city. living standards in a city. Level Description Marks In assessing each answer, use the table opposite. 3 A reasoned discussion which accurately 6–8 Why it might: examines both sides of the economic • increase job opportunities in the city – increase income argument, making use of economic • increase government revenue – more public and merit information and clear and logical goods for the city analysis to evaluate economic issues • increase amount of investment in the city – more choice and situations. One side of the argument of goods and services may have more depth than the other, but overall both sides of the argument are Why it might not: considered and developed. There is • increase negative externalities such as pollution and thoughtful evaluation of economic congestion concepts, terminology, information • overcrowding as more people attracted to come to cities and/or data appropriate to the question. • increase inequality The discussion may also point out the • may produce inflationary pressures – reducing possible uncertainties of alternative affordability decisions and outcomes. 2 A reasoned discussion which makes use 3–5 of economic information and clear analysis to evaluate economic issues and situations. The answer may lack some depth and development may be one-sided. There is relevant use of economic concepts, terminology, information and data appropriate to the question. 4(d) 8 Level Description Marks 1 There is a simple attempt at using 1–2 economic definitions and terminology. Some reference may be made to economic theory, with occasional understanding. 0 A mark of zero should be awarded for no 0 creditable content.
This question in 0455/23 May/June 2025
Q63 · Calculate the total financial sector contribution (in $) to Switzerland’s GDP 0455/21 Oct/Nov 2025
1 (a) Calculate the total financial sector contribution (in $) to Switzerland’s GDP. [1] (b) Identify two microeconomic policy measures. [2] (c) Explain one reason why overdependence on foreign markets is a disadvantage to the Swiss economy. [2] (d) Draw a demand and supply diagram to show how a subsidy to solar energy producers would affect the market for solar energy. [4] (e) Explain two reasons why Switzerland had a current account surplus. [4] (f) Analyse the relationship between the global GDP growth rate and the change in the value of the Swiss franc. [5] (g) Discuss whether or not an increase in interest rates will harm the Swiss economy. [6] (h) Discuss whether or not a bank merger will benefit Swiss consumers and workers. [6]
30 marks
Mark scheme: Question Answer Marks Guidance 1(a) Calculate the total financial sector contribution (in $) to 1 Accept $73 billion or 73 billion. Switzerland’s GDP. $72 720 000 000. 7.27 1010 $72.7 billion 1(b) Identify two microeconomic policy measures. 2 Accept organising mergers. maximum prices (1) If more than two suggested measures are given, consider subsidies (1) the first three. 1(c) Explain one reason why overdependence on foreign 2 One mark for the reason and one mark for an explanation. markets is a disadvantage to the Swiss economy. Makes it more exposed to external shocks (1) as anything that happens in other countries could also affect the Swiss economy, for example reduced exports / increased import prices / potential shortages (1). 1(d) Draw a demand and supply diagram to show how a 4 subsidy to solar energy producers would affect the market for solar energy. D&S diagram: Axes correctly labelled – price and quantity or p and q (1). Original demand and supply curves correctly labelled (1). New supply curve shifted to the right (1). Equilibriums – shown by lines P1 and Q1 and P2 and Q2 or equilibrium points marked as E1 and E2 (1). 1(e) Explain two reasons why Switzerland had a current 4 One mark each for each of two reasons identified and one account surplus. mark each for each of two explanations. Logical explanation which might include: If more than two reasons are given, consider the first three. • low inflation (1) price of Swiss exports relatively lower, leading to increased exports / price of domestically produced goods relatively lower leading to decreased imports (1) • high-quality products (1) demand for Swiss exports higher, leading to increased exports / demand for domestically produced goods higher, leading to decreased imports (1) • strong currency (1) has kept cost of imported raw materials in Switzerland low, reducing costs of production (1). 1(f) Analyse the relationship between the global GDP 5 Responses do not have to be in the format suggested but growth rate and the change in the value of the Swiss they should address the expected / normal relationship, offer Franc. supporting evidence of that, highlight any exceptions to that, and analyse the overall data. Coherent analysis which might include the following. Expected relationship: generally negative / inverse relationship (1) as the global growth rate falls, the value of the Swiss Franc rises / as the global growth rate rises, the value of the Swiss Franc falls (1). Supporting evidence: fall in global growth rate led to rise in the value of Swiss Franc from 2018–2019 or 2019–2020 (1), rise in global growth rate led to fall in the value of Swiss Franc from 2020–2021 (1). Analysis: Swiss Franc’s status as a “safe haven” currency (1) when investors are unsure about the economy, they usually keep their money in Swiss francs (1). Exception: 2021–2022 (1) where global growth was falling but Swiss Franc was stable / rising only slightly (1). Analysis for exception: Other reasons could affect the value of Swiss Franc (1), for example Switzerland was also affected by the Covid–19 pandemic (1). 1(g) Discuss whether or not an increase in interest rates will 6 Falling profits can only be rewarded once. harm the Swiss economy. Apply this example to all questions with the command Award up to 4 marks for logical reasons why it might, which word DISCUSS (1g, 1h, 2d, 3d, 4d and 5d). may include: Each point may be credited only once, on either side of an • cost of borrowing increases for firms (1) increasing total argument, but separate development as to how / why the costs (1) reducing profits (1) outcome may differ is rewarded. • firms may invest less (1) may have to shut down (1) • unemployment rises (1) decreasing incomes Generic example Mark (1)decreasing total demand (1) decreasing economic growth (1) Tax revenue may decrease… 1 • consumers may borrow less (1) save more (1) less spending (1) demand for goods and services decreases ...because of reason e.g. incomes may be 1 (1) as returns from savings increase (1) decreasing lower. revenues of firms (1) decreasing profits (1) • Government borrowing costs more (1) leaving less Tax revenue may increase because 0 funding available for e.g. education / health (1). incomes may be higher i.e. reverse of a previous argument. Award up to 4 marks for logical reasons why it might not, which may include: Tax revenue may increase because of a 1 different reason i.e. not the reverse of a • hot money inflows strengthen the Swiss Franc (1) previous argument e.g. government reduce cost of e.g. imported raw materials (1) reducing spending on subsidies may stimulate the inflation (1) increasing export competitiveness (1) economy more than spending on education. • reduced demand-pull inflationary pressures (1) as cost of borrowing increases (1) decreasing demand for loans (1) increasing saving / decreasing consumption (1) investment (1) decreasing total demand (1) firms may reduce prices (1) increasing affordability of goods and services for consumers (1). • costs of production may decrease (1) reducing cost- push inflationary pressures (1). 1(h) Discuss whether or not a bank merger will benefit Swiss 6 Award a maximum of 4 marks if candidates only mention consumers and workers. one of consumers or workers. Award up to 4 marks for logical reasons why it might, which Reward, but do not expect reference to inelasticity of may include: demand in monopoly. • to avoid one of them collapsing (1) reducing confidence in the whole banking system (1) greater job security (1) less chance of bank customers losing their savings (1) • economies of scale (1) as output increases (average) costs fall (1) prices may decrease (1) goods and services more affordable for consumers (1) • the merged firm may make higher profits (1) able to pay higher wages to workers who remain employed (1) • workers in merged firm can share skills (1) improving efficiency (1). Award up to 4 marks for logical reasons why it might not, which may include: • monopoly power may increase (1) restricting supply (1) decreasing consumer choice (1) increasing prices (1) decreasing quality (1) • workers may lose their jobs (1) as the bank might shut down some operations / reduce duplication (1) increasing unemployment (1) • the merged firm may be too large / experience diseconomies of scale (1) example (1) reducing efficiency (1).
This question in 0455/21 Oct/Nov 2025
Q64 · In the first half of 2022, Guyana’s GDP grew by 36.4% 0455/21 Oct/Nov 2025
2 In the first half of 2022, Guyana’s GDP grew by 36.4%. Most of this growth was due to higher output in the primary sector. The government used some of the tax revenue generated from this growth to fund long‑run development projects such as infrastructure and education. However, in the short run, there was a rise in house prices. (a) Identify two examples of primary sector industries. [2] (b) Explain two causes of rising GDP. [4] (c) Analyse why house prices may increase. [6] (d) Discuss whether or not increased government spending on education will lead to economic development. [8]
20 marks
Mark scheme: 2(a) Identify two examples of primary sector industries. 2 If more than two primary industries are given, consider the first three. Two from: Accept two specific examples, e.g. growing wheat, catching • farming / agriculture tuna, but not from the same industry. • mining • fishing • forestry 2(b) Explain two causes of rising GDP. 4 One mark each for two causes identified and one each for two explanations. Logical explanation which might include: Only reward increase in total demand once. • increased consumption (1) decrease in taxes (1) such as income tax / corporation tax (1) increased disposable income /profits (1) • increase in investment (1) leading to increase in total demand (1) • increase in government spending (1) e.g. spending on infrastructure (1) increasing total (aggregate) demand in the economy (1) • improvements in technology (1) increase in productivity (1) • increase in the quantity (1) and quality of factors of production (1) e.g. increase in size of labour force (1) improved labour skills (1) increase in productive capacity of the economy (1) • decrease in interest rates (1) cost of borrowing falls (1) borrowing increases (1) • decreases in exchange rate (1) price of exports falls / price of imports rises (1) increase exports / decrease imports / increase net exports (1). 2(c) Analyse why house prices may increase. 6 MAXIMUM 4 MARKS for identification of reasons without analysis in terms of demand and / or supply. Coherent analysis which might include the following. Increase in demand (1) due to lower interest rates (1) increasing borrowing for house purchases (1) higher population (1) higher incomes (1) increasing ability to purchase houses (1) higher confidence (1) increasing willingness to buy houses (1). Decrease in supply (1) reduction in subsidies on new house building (1) increased taxation on housing (1) government building fewer houses (1) stricter planning regulation (1) land is used for other things e.g. infrastructure (1). Increasing cost of production of new houses (1) cost of labour (1) cost of raw materials (1) cost of land (1) increased costs passed on to buyers of houses as higher prices (1). Less government intervention (1) removal of price controls (1). 2(d) Discuss whether or not increased government spending 8 Level Description Marks on education will lead to economic development. 3 A reasoned discussion which 6–8 In assessing each answer, use the table opposite. accurately examines both sides of the economic argument, making use Why it might: of economic information and clear and logical analysis to evaluate • increase skills / qualifications / knowledge economic issues and situations. One • increase job opportunities side of the argument may have more • encourage more investments depth than the other, but overall, • increase productive capacity both sides of the argument are • reduce consumption of demerit goods considered and developed. There is • improved health / life expectancy thoughtful evaluation of economic • higher HDI concepts, terminology, information and/or data appropriate to the question. The discussion may also point out the possible uncertainties of alternative decisions and outcomes. 2 A reasoned discussion which makes 3–5 use of economic information and clear analysis to evaluate economic issues and situations. The answer may lack some depth and development may be one-sided. There is relevant use of economic concepts, terminology, information and data appropriate to the question. 2(d) Why it might not: Level Description Marks • takes a long time to have an impact on the economy 1 There is a simple attempt at using 1–2 • financial cost of government spending e.g. taxation / economic definitions and borrowing terminology. Some reference may be • opportunity cost e.g. health spending made to economic theory, with occasional understanding. • reduced benefit to the economy if there is emigration of skilled workers / net migration is negative 0 A mark of zero should be awarded 0 • government might spend the money inefficiently for no creditable content. • education programmes may be ineffective.
This question in 0455/21 Oct/Nov 2025
Q65 · Calculate foreign workers as a percentage of Japan’s labour force in 2022 0455/22 Oct/Nov 2025
1 (a) Calculate foreign workers as a percentage of Japan’s labour force in 2022. [1] (b) Identify two reasons why Japan has a high average age of population. [2] (c) Explain why some young Japanese people emigrate. [2] (d) Explain two ways Japan could attract more foreign workers. [4] (e) Draw a demand and supply diagram to show the effect of a decrease in population on the market for furniture. [4] (f) Analyse the relationship between global GDP per head and global air passenger numbers. [5] (g) Discuss whether or not a high savings rate is likely to benefit Japan. [6] (h) Discuss whether or not labour mobility in Japan is likely to increase in the future. [6]
30 marks
Mark scheme: Question Answer Marks Guidance 1(a) Calculate foreign workers as a percentage of Japan’s 1 Accept 2.5 without %. labour force in 2022. 2.5% (1). 1(b) Identify two reasons why Japan has a high average age 2 If more than two reasons are given, consider the first three. of population. Low birth rate (1) high life expectancy (1) good healthcare (1) young adults moving abroad (1). 1(c) Explain why some young Japanese people emigrate. 2 One mark for identification and one mark for explanation. To gain high wages (1) enjoy a better living standard / able to purchase more goods and services (1). 1(d) Explain two ways Japan could attract more foreign 4 One mark each for two ways identified and one mark each workers. for two explanations. Logical explanation which might include: If more than two ways are given, consider the first three. Only the 3 listed identifications can be credited, and • remove the Japanese language test (1) more foreigners explanation marks can only be awarded if applied to a valid would be able to work in the country (1) identification. • allow foreign workers to bring their families with them (1) foreign workers are more likely to settle in the country if they are not separated from their families (1) • allow unskilled workers to stay for more than five years (1) if gain high wages / enjoy living in the country would not want to leave / attract workers who want to live permanently in the country / give workers the opportunity to stay permanently / increase international mobility of labour (1). 1(e) Draw a demand and supply diagram to show the effect 4 of a decrease in population on the market for furniture. Coherent analysis which might include the following. D&S diagram: Axes correctly labelled – price and quantity or p and q (1). Original demand and supply curves correctly labelled (1). New demand curve shifted to the left (1). OR New supply curve shifted to the left (1). OR New demand curve shifted to the left AND new supply curve shifted to the left. Equilibriums – shown by lines P1 and Q1 and P2 and Q2 or equilibrium points marked as E1 and E2 (1). 1(f) Analyse the relationship between global GDP per head 5 Responses do not have to be in the format suggested but and global air passenger numbers. they should address the expected / normal relationship, offer supporting evidence of that, highlight any exceptions to that, Coherent analysis which might include the following. and analyse the overall data. Expected relationship: Supporting evidence should involve interpretation, not just Generally, a positive relationship (1) the higher the global description. GDP head, the higher the air passenger numbers (1). Supporting evidence: 2016–2019 GDP per head rose and air passenger numbers increased (1). Analysis of expected relationship: Higher GDP per head increases purchasing power / ability to pay for air travel (1) as people get richer, they travel more for leisure and business (1). Exception: 2021 (1) GDP per head rose but air passenger numbers decreased (1). Analysis of exception: May have been a time delay in people gaining confidence in flying after COVID-19 pandemic / other influences on demand e.g. air fares (1). 1(g) Discuss whether or not a high savings rate is likely to 6 Reference to AD / total demand falling can be credited on benefit Japan. either side of the argument, but only once. Award up to 4 marks for logical reasons why it might, which Apply this example to all questions with the command may include: word DISCUSS (1g, 1h, 2d, 3d, 4d and 5d) • may keep inflation low (1) as spending will not be high (1) reduce (total) demand (1) reduce demand-pull Each point may be credited only once, on either side of an inflation (1) argument, but separate development as to how / why the • may reduce imports (1) improve the current account of outcome may differ is rewarded. the balance of payments (1) • provide finance for investment (1) firms able to borrow Generic example mark from banks (1) • may enable households to finance future expenditure Tax revenue may decrease… 1 (1) on e.g. healthcare / education / provide for retirement / provide support for individuals in difficult ...because of reason e.g. incomes may be lower. 1 times (1) • may enable government to cut benefits, e.g. pensions Tax revenue may increase because incomes 0 (1) spend money saved on other priorities, e.g. may be higher i.e. reverse of a previous healthcare (1). argument. Award up to 4 marks for logical reasons why it might not, Tax revenue may increase because of a different 1 which may include: reason i.e. not the reverse of a previous argument e.g. government spending on subsidies • may lower total demand (1) reduce GDP (1) increase may stimulate the economy more than spending unemployment (1) cyclical unemployment (1) could on education. cause a recession (1) • may reduce investment as demand is low (1) reduce improvements in technology (1) • Less indirect tax raised (1) may lead to reduced government spending (1). 1(h) Discuss whether or not labour mobility in Japan is likely 6 Reference to occupational and geographical mobility can be to increase in the future. credited on either side of the argument, but only once. Award up to 4 marks for logical reasons why it might, which Reference to falling house prices or improved transport must may include: be linked to improved mobility for credit and vice versa. • Improvements in education and training (1) could increase skills / qualifications (1) increase occupational mobility (1) • Improvements in transport / subsidised travel (1) could enable people to move to different areas (1) raise geographical mobility (1). Award up to 4 marks for logical reasons why it might not, which may include: • Ageing population (1) may have out-of-date skills (1) more difficult to change jobs (1) reduce occupational mobility (1) may be more reluctant to move to a different area (1) reason (1) reduce geographical mobility (1) • House prices may rise (1) making it difficult to move from areas with low house prices to areas with high prices (1).
This question in 0455/22 Oct/Nov 2025
Q66 · There are several policy measures a central bank or government can use to reduce… 0455/22 Oct/Nov 2025
4 There are several policy measures a central bank or government can use to reduce unemployment. One policy measure a government could use to reduce unemployment is to increase its spending on building houses. The Federal Reserve, the central bank of the US, has two main aims. One is to maintain price stability and the other is to achieve full employment. Some central banks also have economic growth as a target, but none have HDI value as a target. (a) Identify two policy measures a central bank could use to maintain price stability. [2] (b) Explain two benefits to an economy of full employment. [4] (c) Analyse how an increase in government spending on building houses could reduce unemployment. [6] (d) Discuss whether or not an increase in a country’s economic growth rate will increase its HDI value. [8]
20 marks
Mark scheme: 4(a) Identify two policy measures a central bank could use to 2 If more than two measures are given, consider the first maintain price stability. three. Two from: the rate of interest (1) the money supply (1) the exchange rate (1) quantitative easing / tightening (1). 4(b) Explain two benefits to an economy of full employment. 4 One mark each for two benefits identified and one mark each for two explanations. Logical explanation which might include the following. • High output / GDP (1) maximum use of labour resource. • High tax revenue (1) government could spend on e.g. education / healthcare (1). • Low spending on state benefits (1) can keep taxes low / money saved can be spent on other things (1). • Low poverty / increase incomes (1) enable people to purchase basic necessities / which could increase living standards (1). 4(c) Analyse how an increase in government spending on 6 Reward, but do not expect reference to multiplier / multiplier building houses could reduce unemployment. effects. Coherent analysis which might include the following. An increase in government spending on building homes may increase demand for building workers (1) may increase demand for building materials (1) demand for building materials workers / other workers related to building industry (1) labour is a derived demand (1) reduce structural unemployment (1) increase incomes (1) increase consumer expenditure (1) increase total demand (1) reduce cyclical unemployment (1) increase GDP / economic growth (1) may increase quality of homes (1) improve health (1) fewer workers may lose their jobs because of illness (1) increase labour productivity which may increase demand for labour (1) increase supply of houses (1) reduce price of houses (1) improve mobility of labour (1). 4(d) Discuss whether or not an increase in a country’s 8 Level Description Marks economic growth rate will increase its HDI value. 3 A reasoned discussion which accurately 6–8 In assessing each answer, use the table opposite. examines both sides of the economic argument, making use of economic Why it might: information and clear and logical • increase in GDP may increase GDP per head if analysis to evaluate economic issues increase in GDP is greater than any rise in population and situations. One side of the • higher GDP per head may increase spending on good argument may have more depth than nutrition / good housing and as a result increase life the other, but overall, both sides of the expectancy argument are considered and • higher GDP per head may increase tax revenue, developed. There is thoughtful enabling a government to spend on education and evaluation of economic concepts, healthcare terminology, information and/or data • higher GDP per head may enable families to keep their appropriate to the question. The children in education for longer. discussion may also point out the possible uncertainties of alternative Why it might not: decisions and outcomes. • higher GDP per head may result in more spending on demerit goods, lowering life expectancy 2 A reasoned discussion which makes 3–5 • may lead to inflation hindering access to healthcare and use of economic information and clear education and increase inequality in the distribution of analysis to evaluate economic issues income and situations. The answer may lack • may be the result of higher military expenditure which some depth and development may be will not increase HDI one-sided. There is relevant use of • income may become more unevenly distributed, economic concepts, terminology, meaning life expectancy and years of education of the information and data appropriate to the poor may fall question. • more pollution may be created, lowering life expectancy • working hours and stress may increase, lowering life expectancy. 4(d) Level Description Marks 1 There is a simple attempt at using 1–2 economic definitions and terminology. Some reference may be made to economic theory, with occasional understanding. 0 A mark of zero should be awarded for 0 no creditable content.
This question in 0455/22 Oct/Nov 2025
Q67 · Calculate the number of Malawians who had access to electricity in 2022 0455/23 Oct/Nov 2025
1 (a) Calculate the number of Malawians who had access to electricity in 2022. [1] (b) Identify two capital goods used in Malawi. [2] (c) Explain what is likely to have happened to Malawi’s production possibility curve (PPC) in January 2022. [2] (d) Explain two reasons why the supply of Malawian tea may increase. [4] (e) Draw a demand and supply diagram to show the effect of a report stating the health risks of consuming sugar on the market for sugar. [4] (f) Analyse the relationship between GDP per head and the percentage of children who complete primary education. [5] (g) Discuss whether or not Malawi should develop a solar energy industry. [6] (h) Discuss whether or not a government should try to stop its country’s foreign exchange rate falling in value. [6]
30 marks
Mark scheme: Question Answer Marks Guidance 1(a) Calculate the number of Malawians who had access to 1 Accept 3.3 106. electricity in 2022. 3.3 m or 3 300 000. 1(b) Identify two capital goods used in Malawi. 2 If more than two capital goods are given, consider the first three. Two from: Factories (1) power stations (1) solar panels (1) electricity (1) fertilisers (1). 1(c) Explain what is likely to have happened to Malawi’s 2 Accept an accurate and fully labelled PPC diagram showing production possibility curve (PPC) in January 2022. the PPC shifting to the left for the first mark. • It is likely to have shifted to the left / inside / inwards / Second mark for any relevant reason from the source contract (1). material. • due to natural disasters / Storm (Ana) / resources destroyed / productive capacity (or land) reduced / less labour (1). 1(d) Explain two reasons why the supply of Malawian tea 4 One mark each for two reasons identified and one mark may increase. each for two explanations. Logical explanation which might include: If more than two reasons are given, consider the first three. • good weather conditions (1) would increase crop yields / Do not accept an answer that links tea with sugar. prevent crops being destroyed (1). • government subsidies (1) provide a financial incentive / additional payment to that received from consumers / reduce costs of production (1). • fall in price of fertiliser (1) which reduces cost of production / increase crop yields / allows farmers to purchase more fertiliser (1). • fall in exchange rate (1) higher demand for Malawian tea (1). 1(e) Draw a demand and supply diagram to show the effect 4 of a report stating the health risks of consuming sugar on the market for sugar. Coherent analysis which might include the following. D&S diagram: • Axes correctly labelled – price and quantity or p and q (1). • Original demand and supply curves correctly labelled (1). • New labelled demand curve shifted to the left (1). • Equilibriums – shown by lines P1 and Q1 and P2 and Q2 or equilibrium points marked as E1 and E2 (1). 1(f) Analyse the relationship between GDP per head and the 5 Responses do not have to be in the format suggested but percentage of children who complete primary they should address the expected / normal relationship, offer education. supporting evidence of that, highlight any exceptions to that, and analyse the overall data. Coherent analysis which might include the following. Supporting evidence should involve interpretation, not just Expected relationship: description e.g. simply quoting data without reference to Generally, a direct / positive relationship (1) the higher the high or low. GDP per head, the higher the percentage of children who complete primary education (1). 1(f) Supporting evidence: Four countries with the highest GDP per head had the highest percentage of children who complete primary education / Malawi / Uganda have the lowest of both (1). South Africa had the highest GDP per head and the highest percentage of children who complete primary education (1). Comparison of two countries (e.g. Namibia and Senegal where GDP falls as does percentage of children completing primary education). Analysis of the expected relationship: Parents in countries with high incomes are more likely to be able to afford to keep their children in primary education (1). Government tax revenue is likely to be higher in countries with high incomes and so will be able to spend more on primary education (1). Completing primary education may increase the chance of skilled / occupationally mobile high income earning workers (1). Exception: Malawi / Uganda (1) Malawi has a lower GDP per head but a higher percentage of children who complete primary education than Uganda (1). Analysis of exception: A higher percentage of children may complete primary education but the quality of the education may be low leading to a low GDP per head / GDP per head may be high but there may be a high degree of inequality with a relatively high proportion of the population unable to keep their children in primary education (1). 1(g) Discuss whether or not Malawi should develop a solar 6 Apply this example to all questions with the command energy industry. word DISCUSS (1g, 1h, 2d, 3d, 4d and 5d) Award up to 4 marks for logical reasons why it might, which may include: Each point may be credited only once, on either side of an • a sustainable source of energy (1) enables future argument, but separate development as to how / why the generations to access energy (1) outcome may differ is rewarded. • would create less pollution / external costs than burning wood and charcoal / improve air quality (1) reduce Generic example mark deforestation (1) improve health (1) • may enable more Malawian households to gain access Tax revenue may decrease… 1 to electricity (1) increase living standards / reduce inequality (1) ...because of reason e.g. incomes may be lower. 1 • setting up solar panels creates jobs (1) leads to increased output / economic growth / access to Tax revenue may increase because incomes 0 electricity for Malawian firms (1) may be higher i.e. reverse of a previous • long hours / 3000 hours of sunshine (1) a good / viable argument. source of energy (1) • less need to import energy (1) reduce current account Tax revenue may increase because of a different 1 deficit (1) reason i.e. not the reverse of a previous • develops employment opportunities (1) raising incomes argument e.g. government spending on subsidies (1). may stimulate the economy more than spending on education. 1(g) Award up to 4 marks for logical reasons why it might not, which may include: • opportunity cost of installing (1) example (1) • opportunity cost of land use (1) reduced agricultural output (1) • dependent on weather / sunshine and days lost (1) unstable supply (1) may experience storm damage / natural disasters (1) • visual pollution (1) might reduce tourism / reduce house prices (1) • cost of developing an electricity distribution network may be prohibitive • cost of switching from fossil-fuel burning domestic appliances to electrical ones may not be affordable to households (1) limiting the impact of the switch (1) • expensive to install (1) worsen government budget position (1) • visual pollution (1) might reduce tourism / reduce house prices (1) • solar panels could be damaged by storms (1) making them inefficient (1). 1(h) Discuss whether or not a government should try to stop 6 Note: many candidates provide incorrect analysis e.g. its country’s foreign exchange rate falling in value. wrong way around. Award up to 4 marks for logical reasons why it should try to Maximum of 3 marks if there is no development / evaluation stop it falling in value e.g. the disadvantages of the fall, of reasons given. including: • will increase import prices (1) reducing imports (1) may increase cost of imported raw materials and capital goods cost (1) cause cost-push inflation (1) cause slow economic growth (1) • may reduce pressure on domestic firms to keep prices low (1) quality high (1) • may reduce confidence in the economy (1) reduce investment (1) increase debt (1). Award up to 4 marks for logical reasons why it should allow a fall in value e.g. the advantages of the fall, including: • will reduce export prices (1) increase exports (1) reduce imports (1) • make domestic goods more competitive (1) reduce a current account deficit / improve the balance of payments (1) • may increase economic growth (1) reduce unemployment (1) attract MNCs / attract investment (1) increase tourism (1) • opportunity cost / costly for government to intervene (1) e.g. less funding for education / healthcare / housing (1) • may increase government tax revenue (1).
This question in 0455/23 Oct/Nov 2025
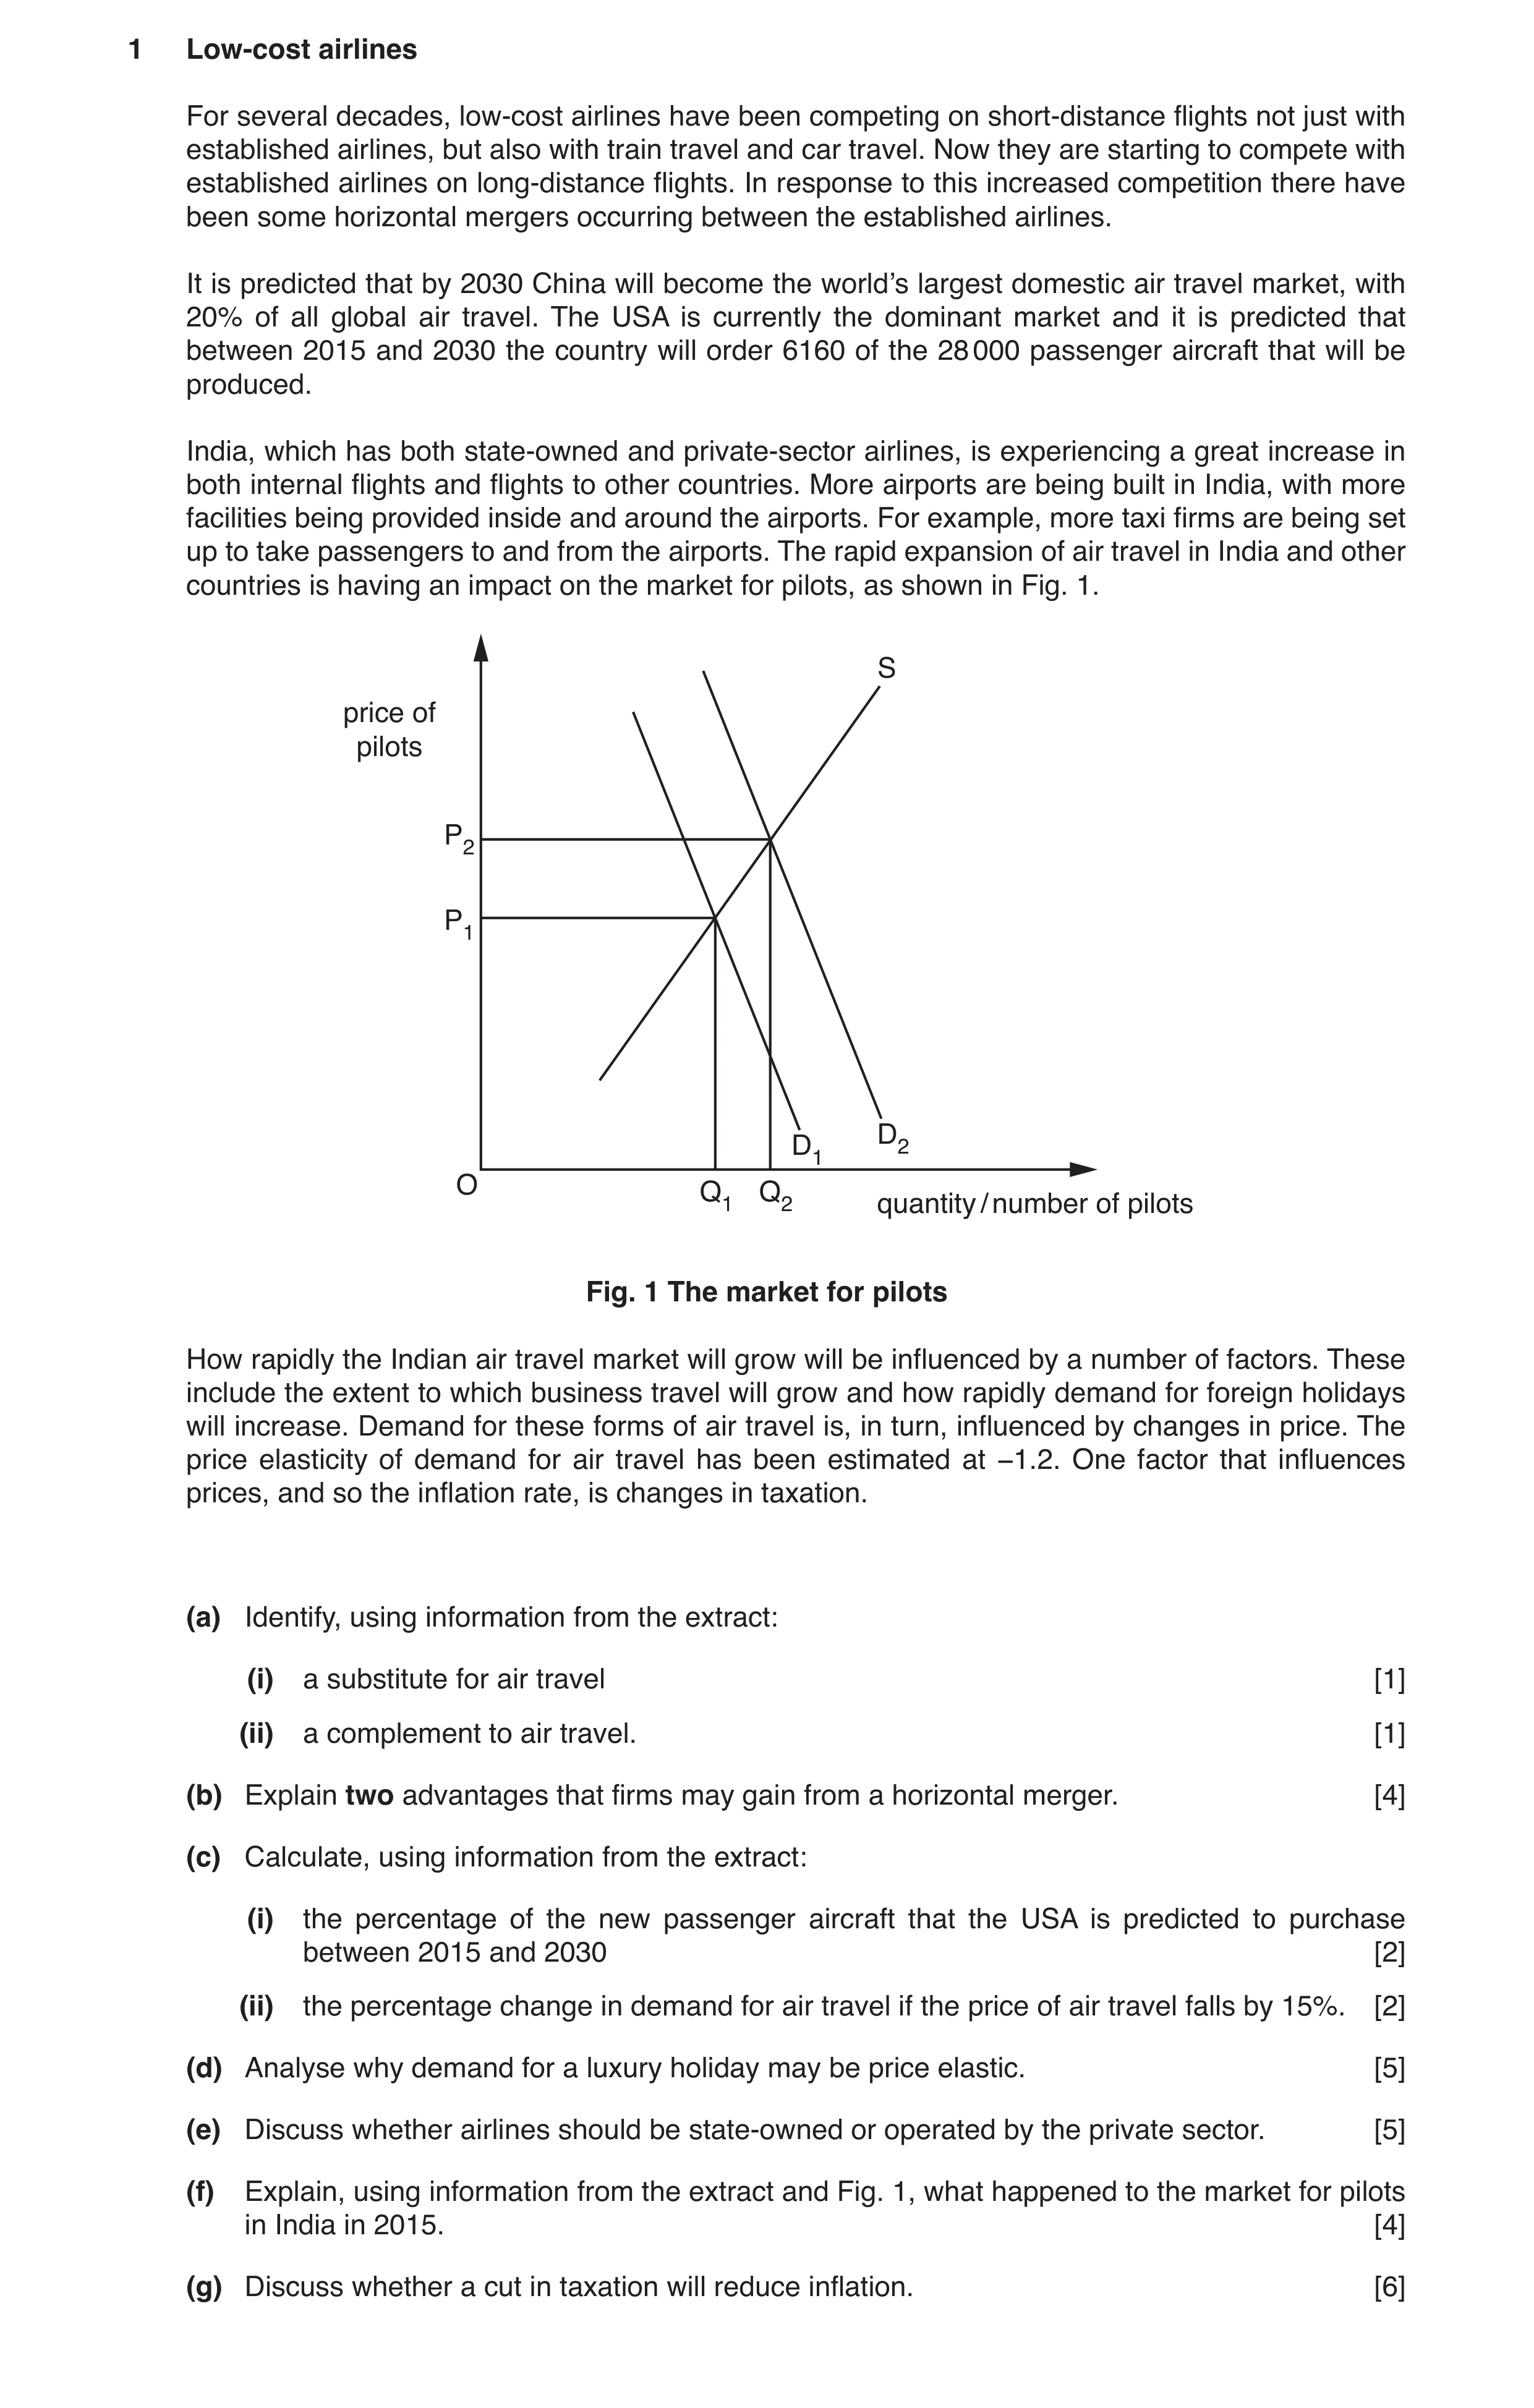
 2 / 29
 3 / 29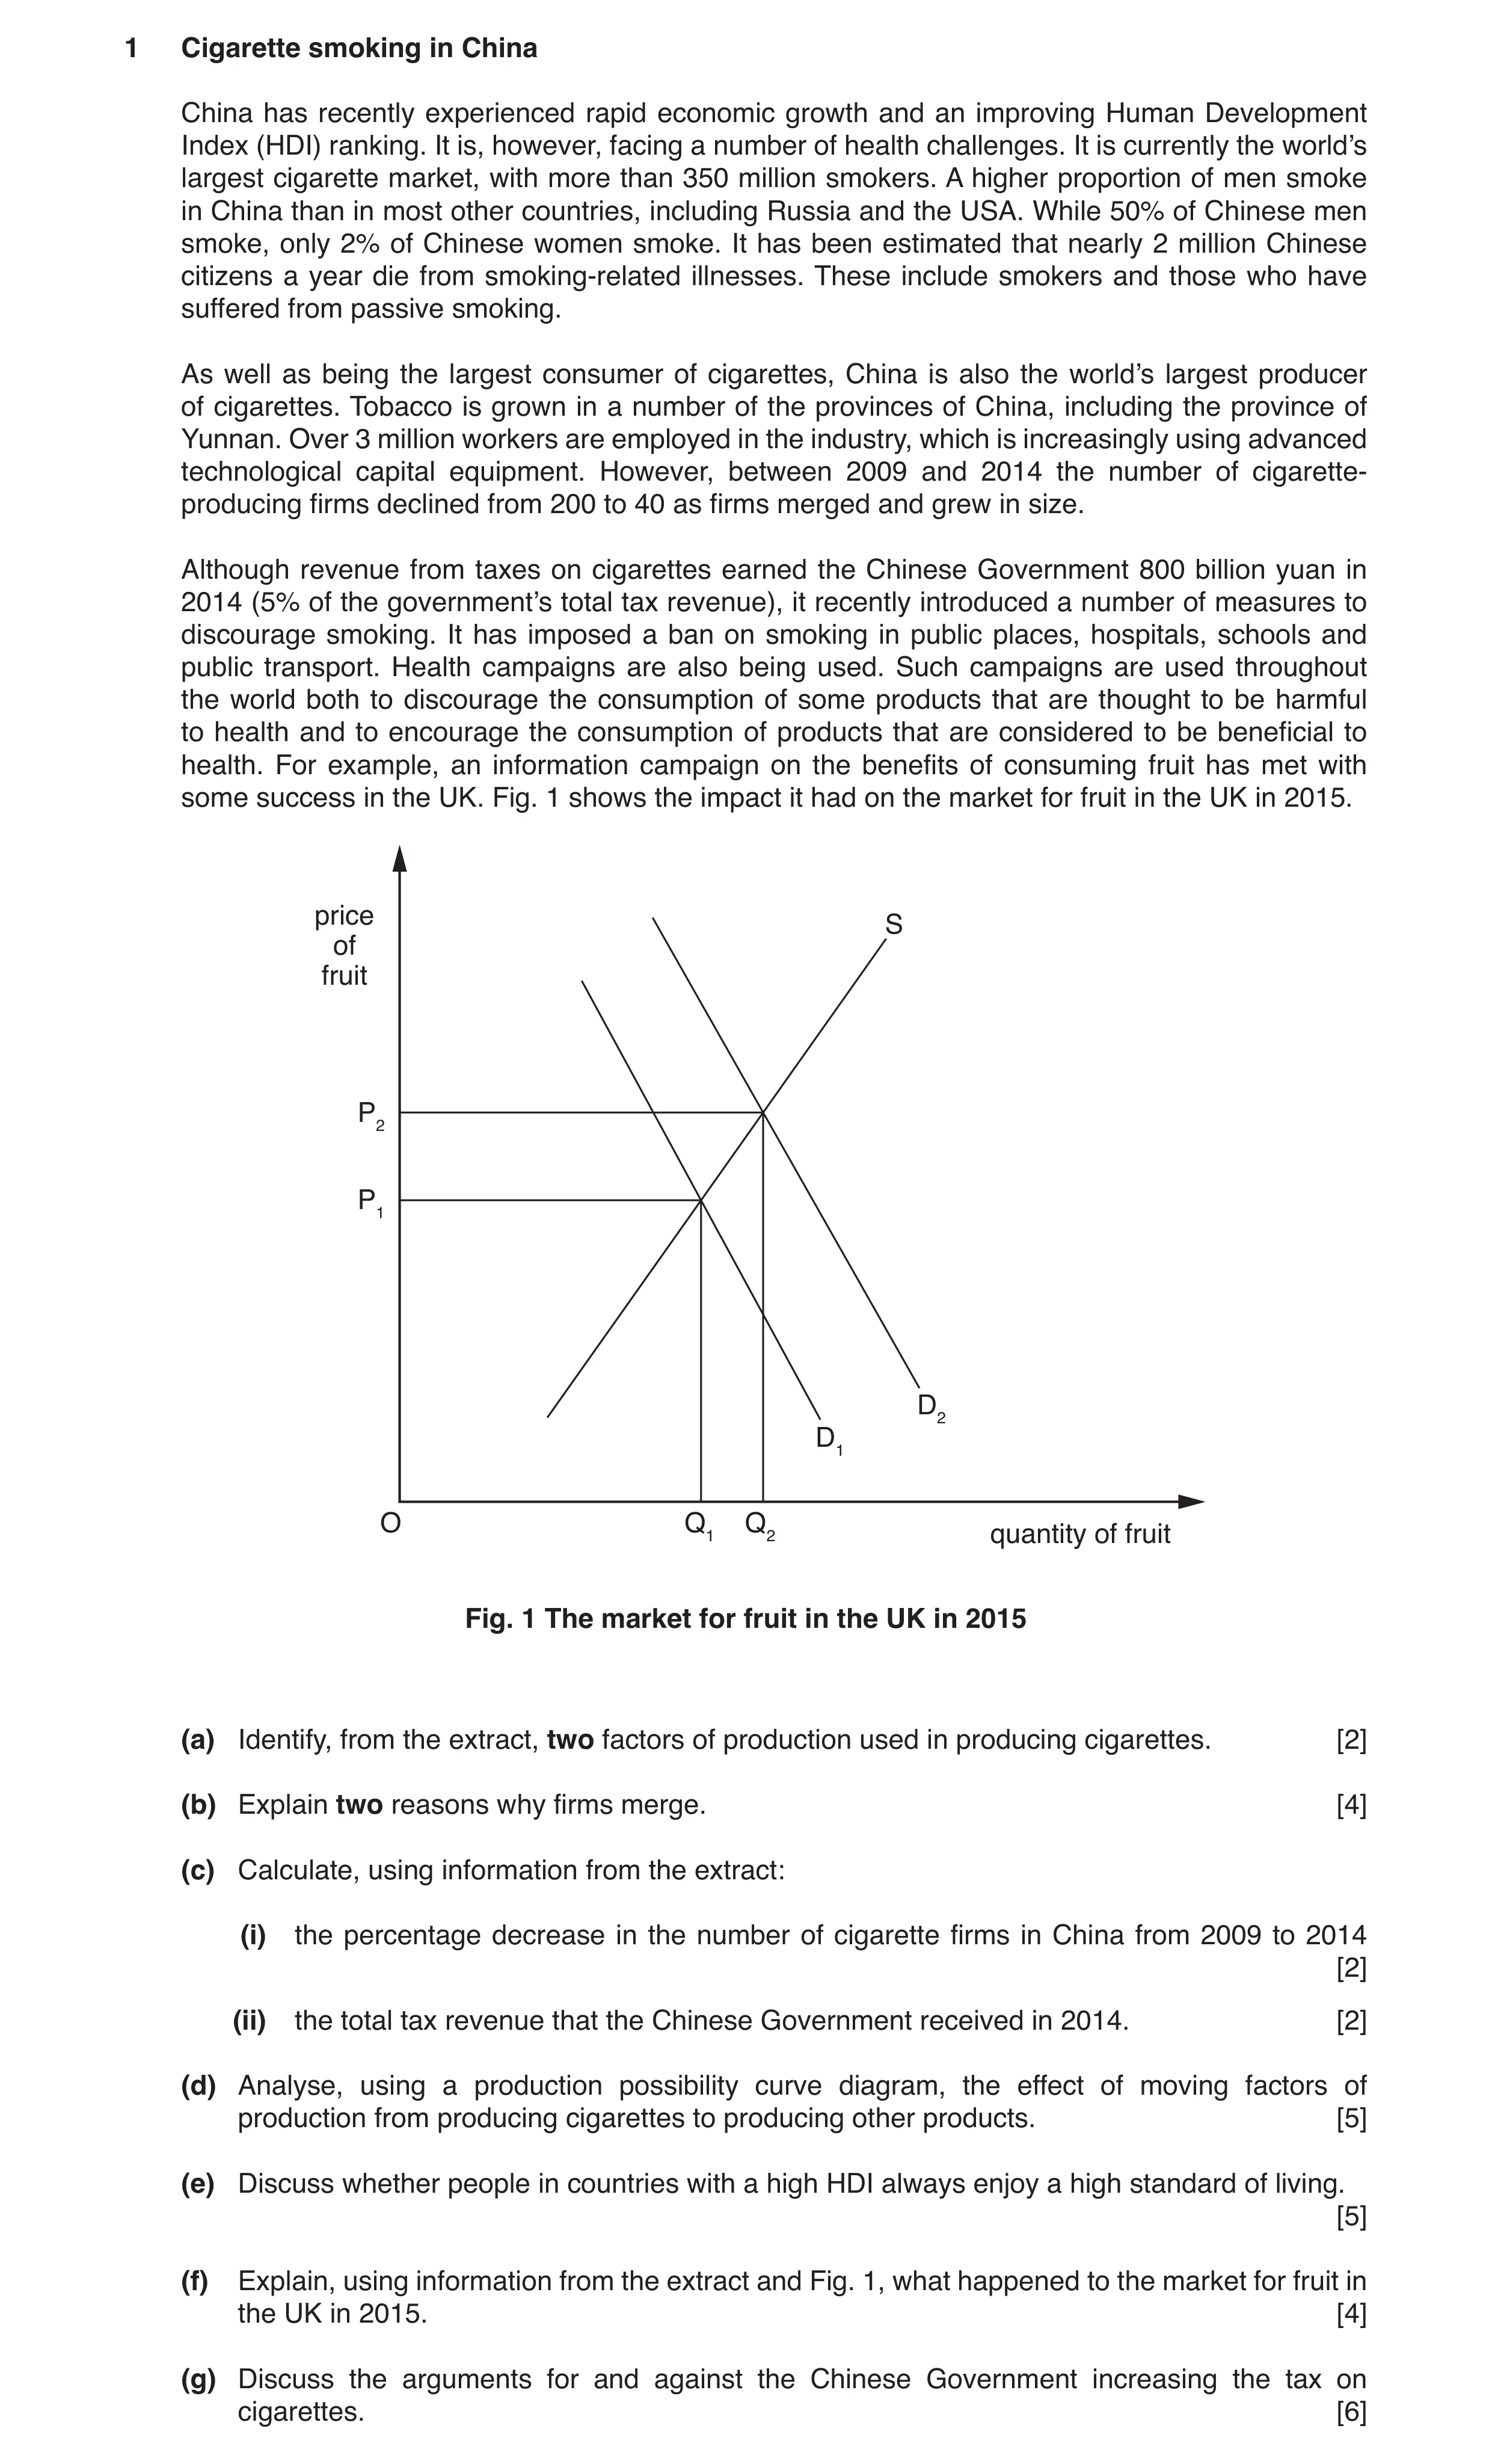
 4 / 29
 5 / 29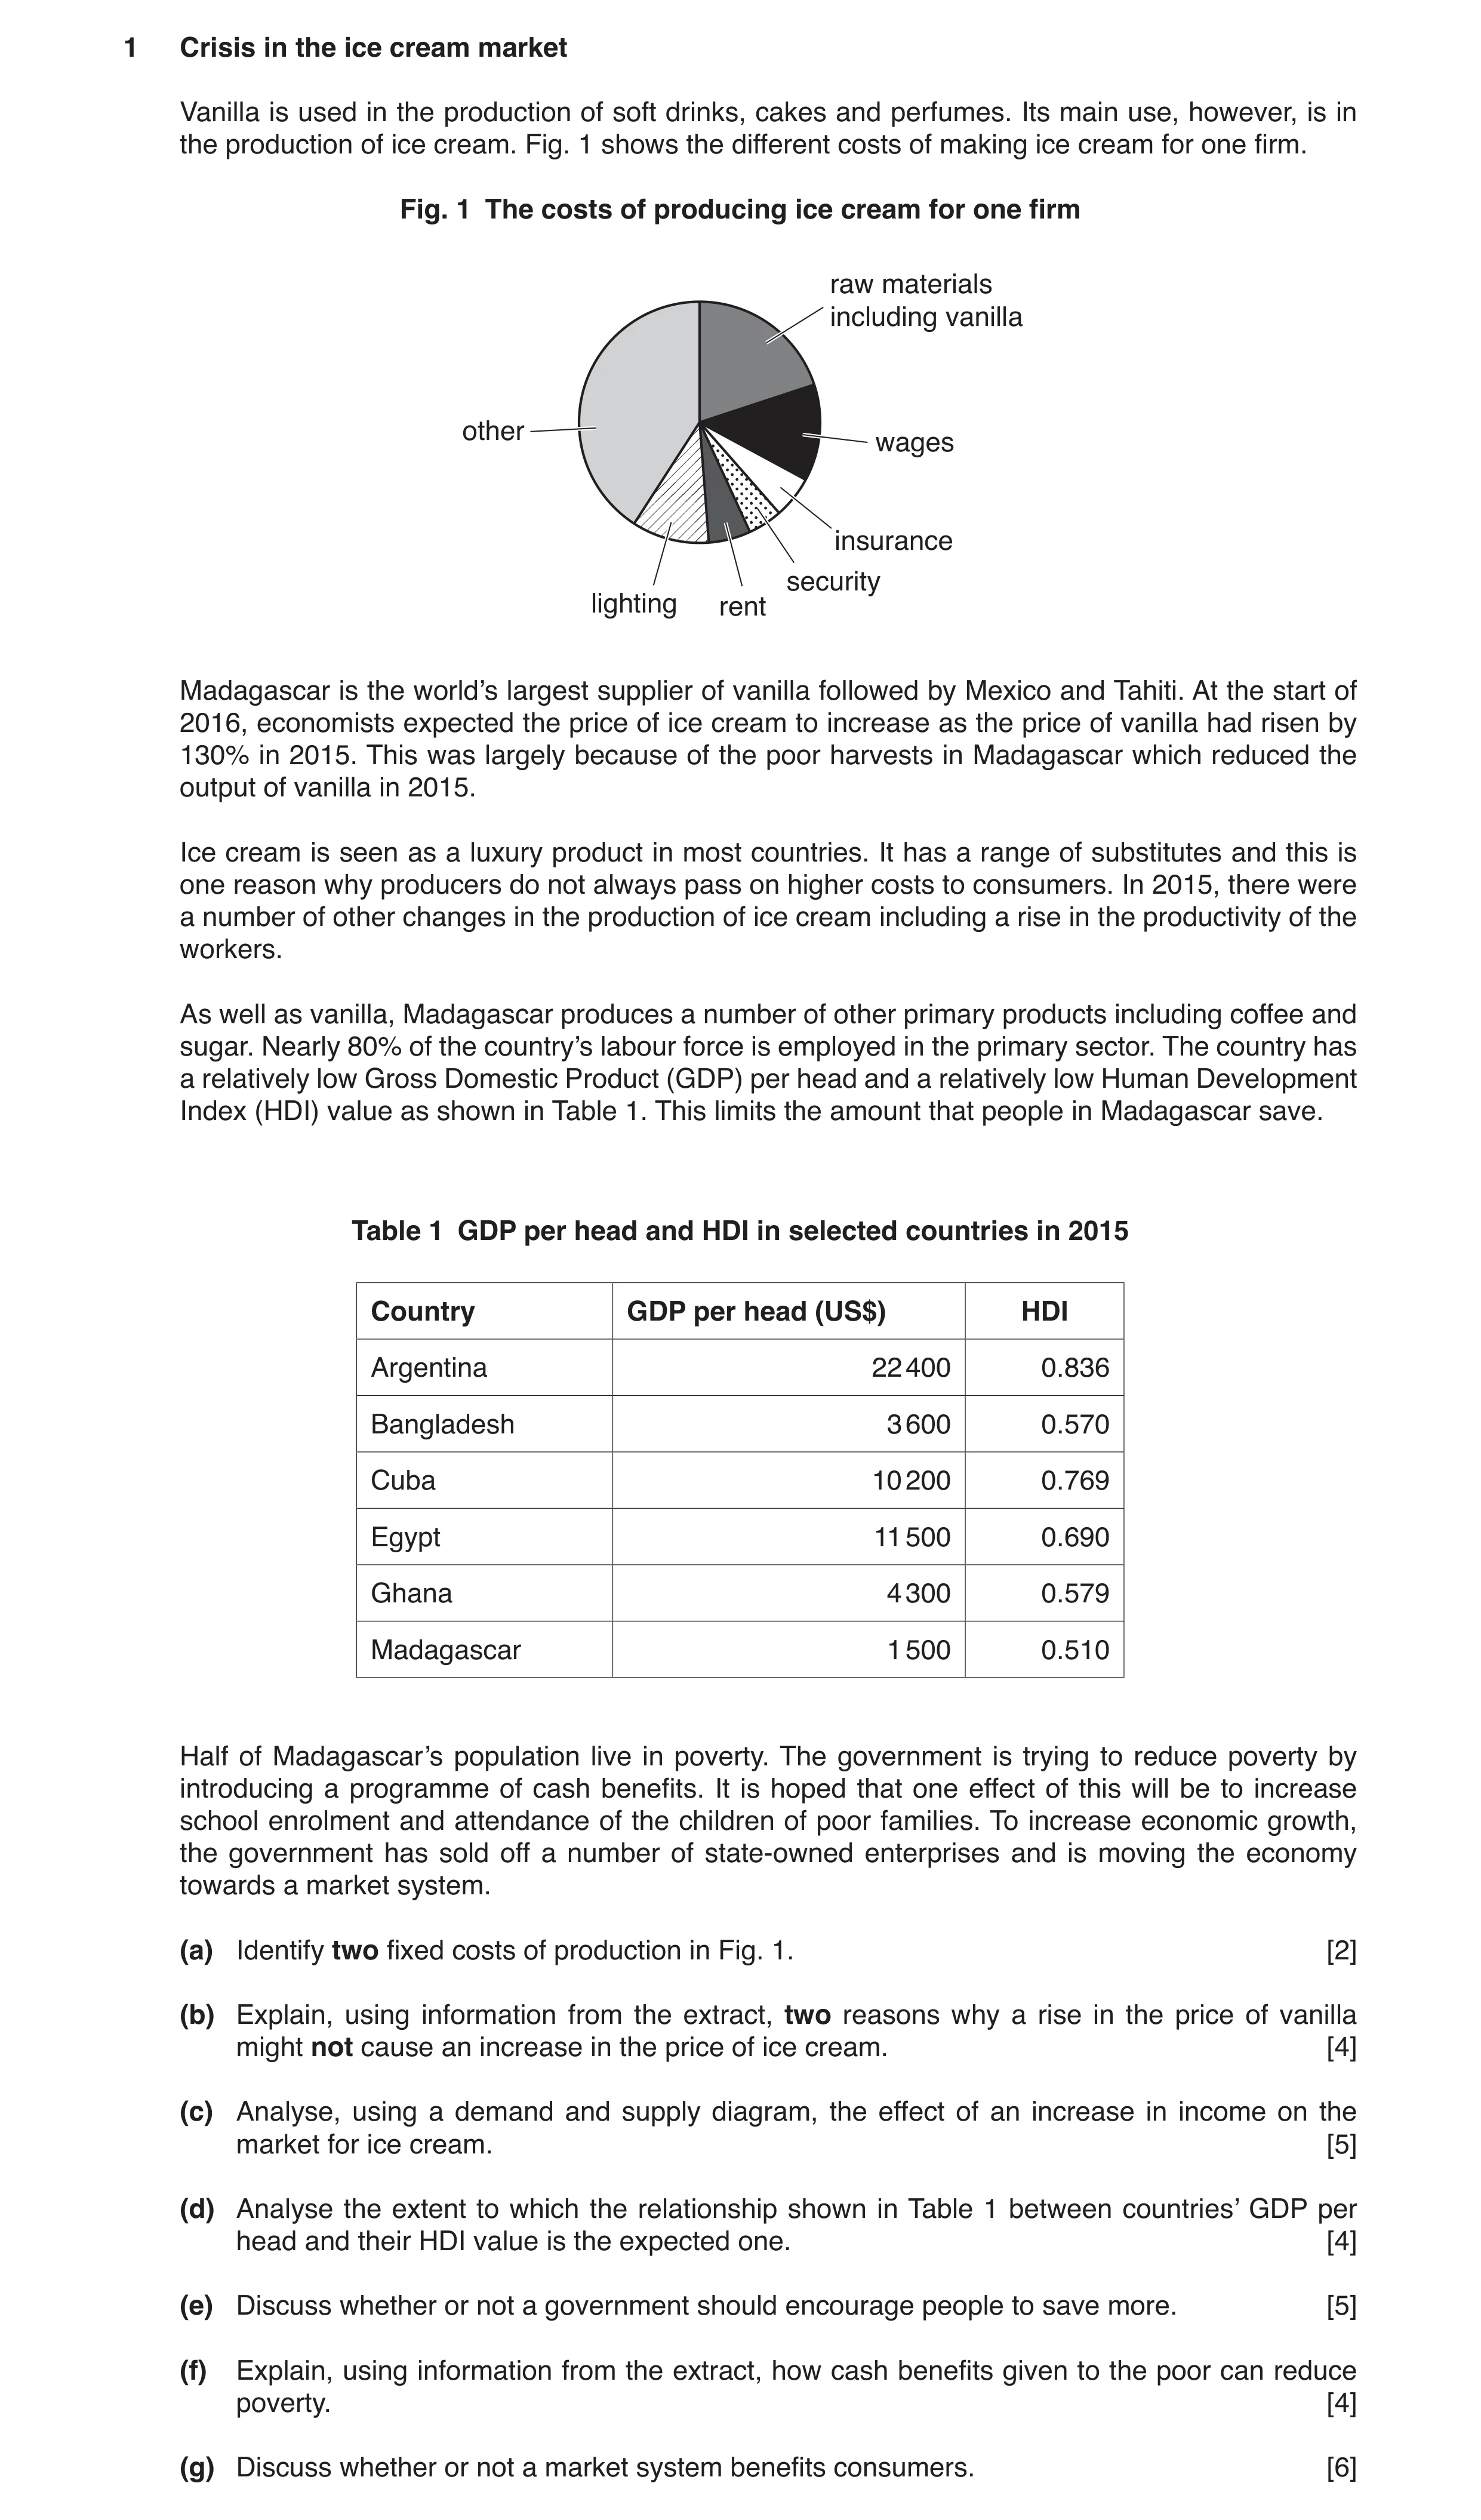
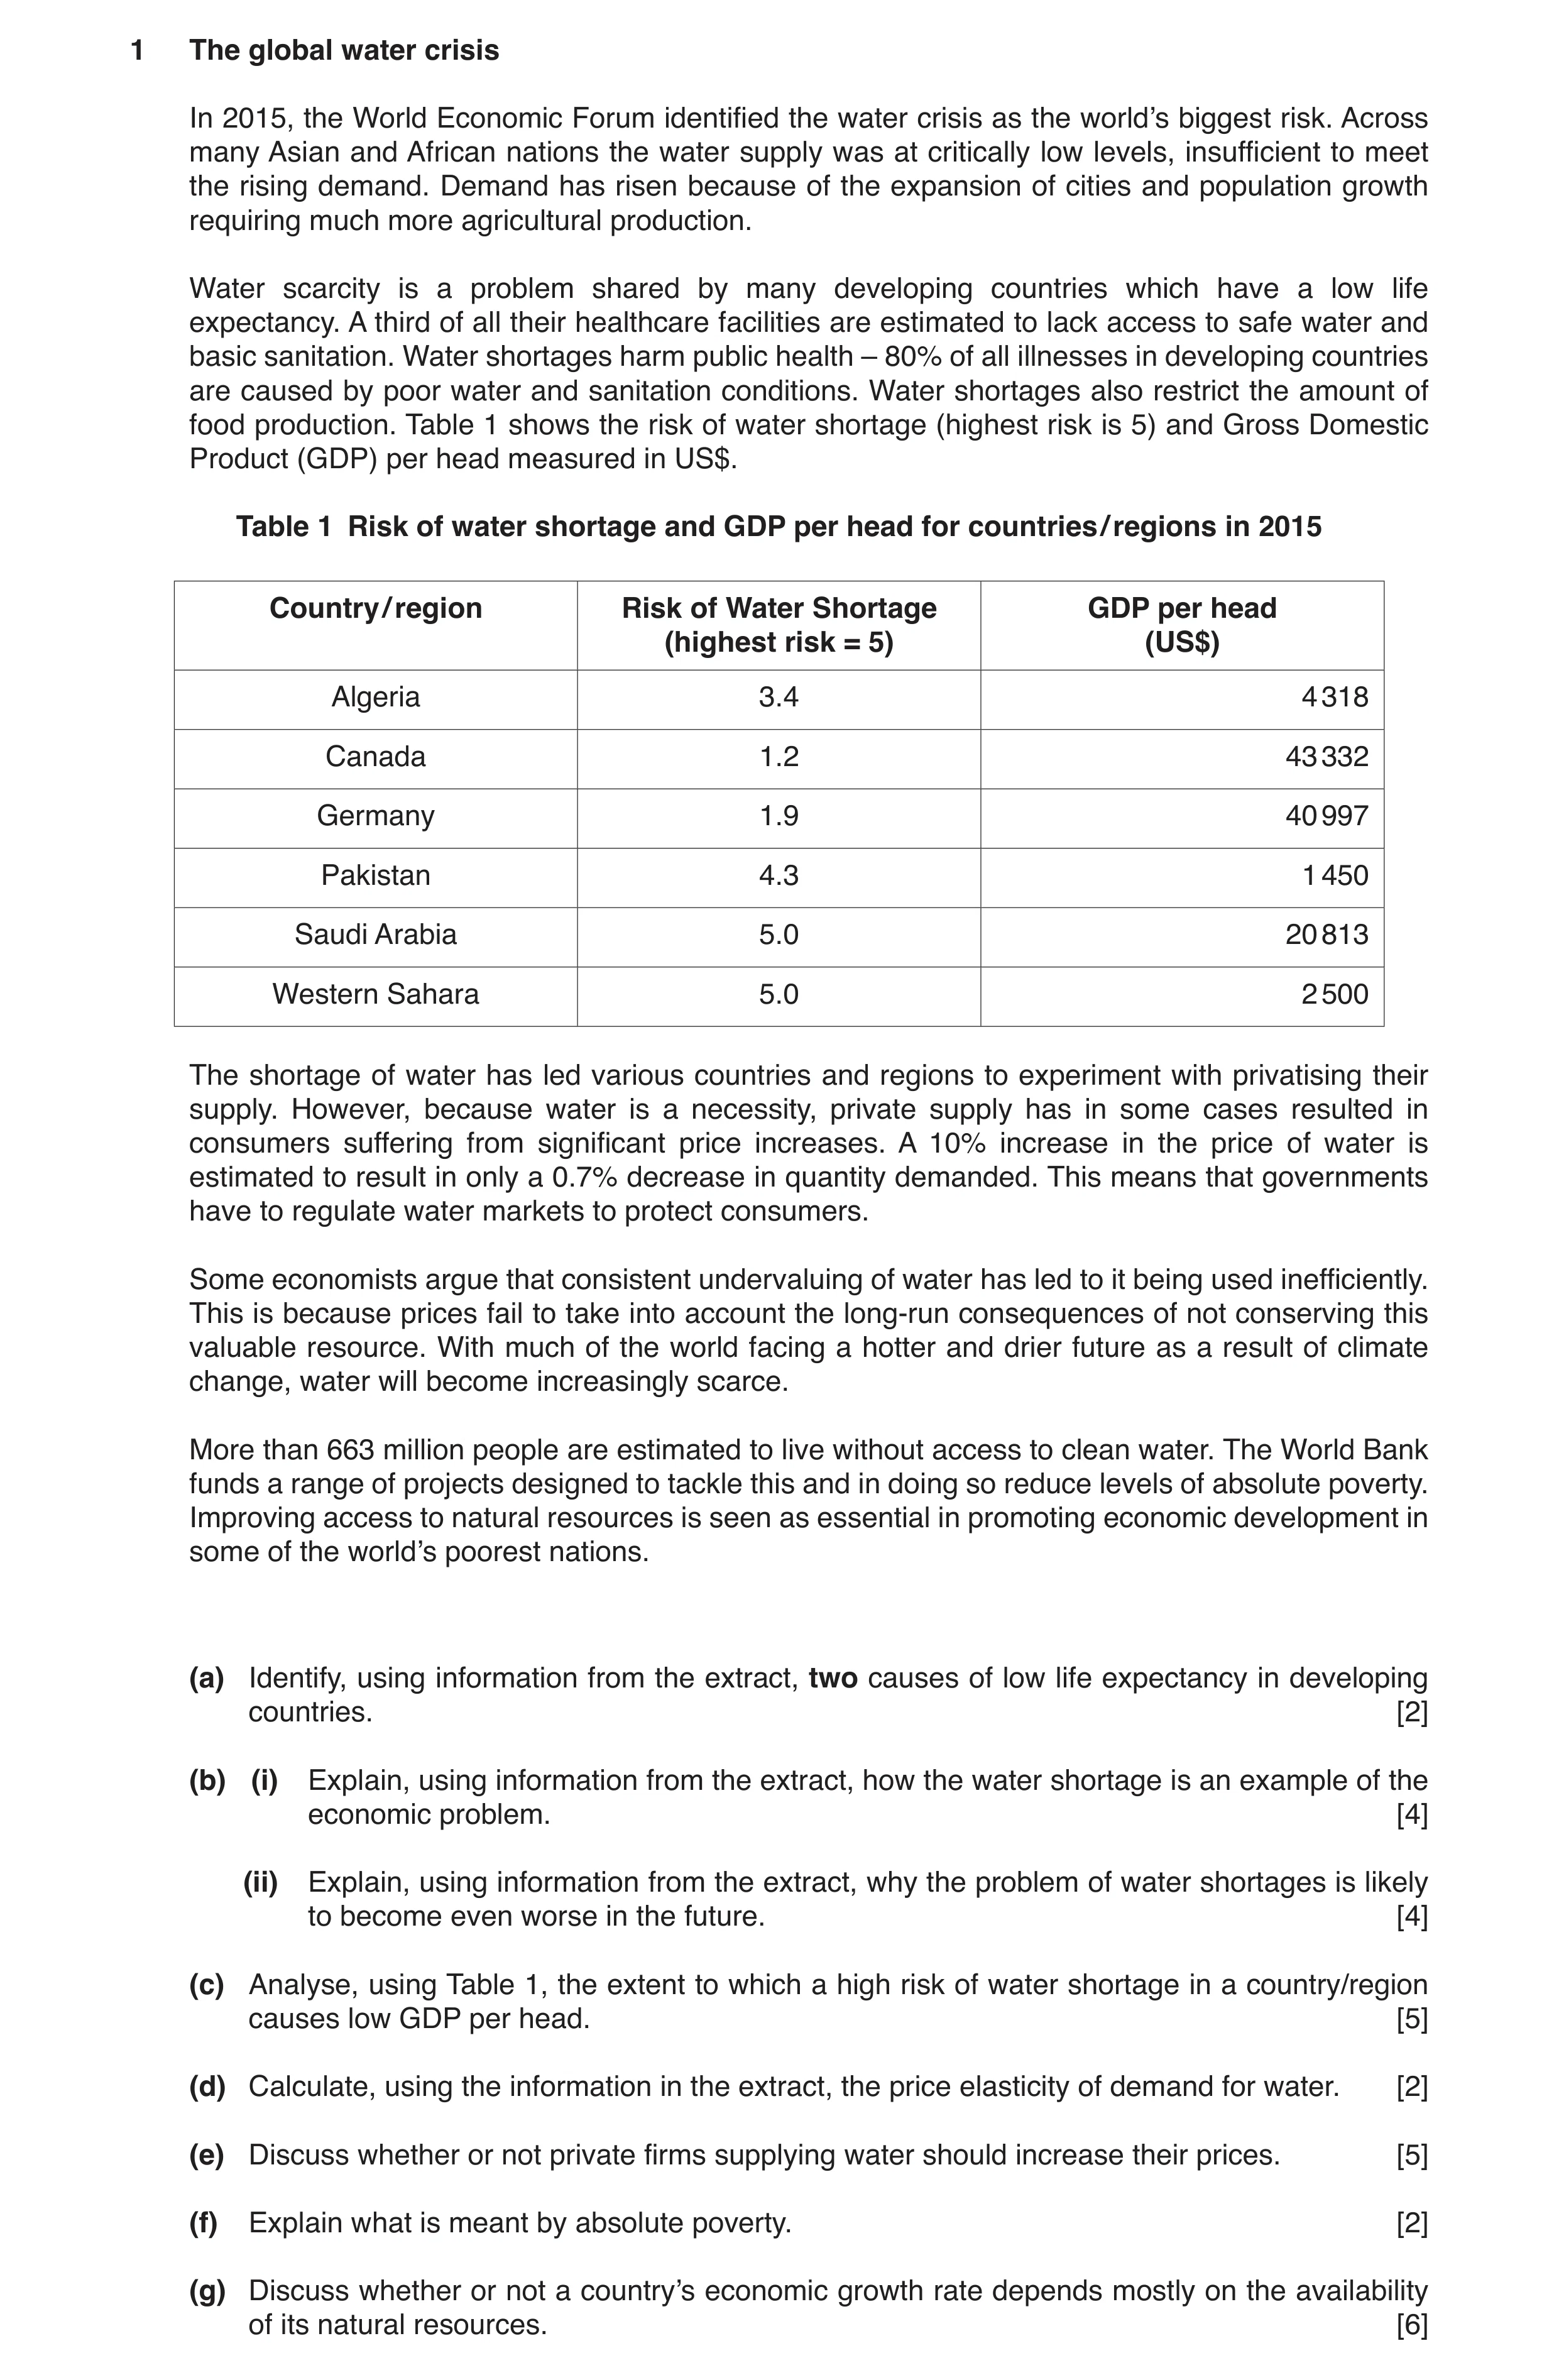
 8 / 29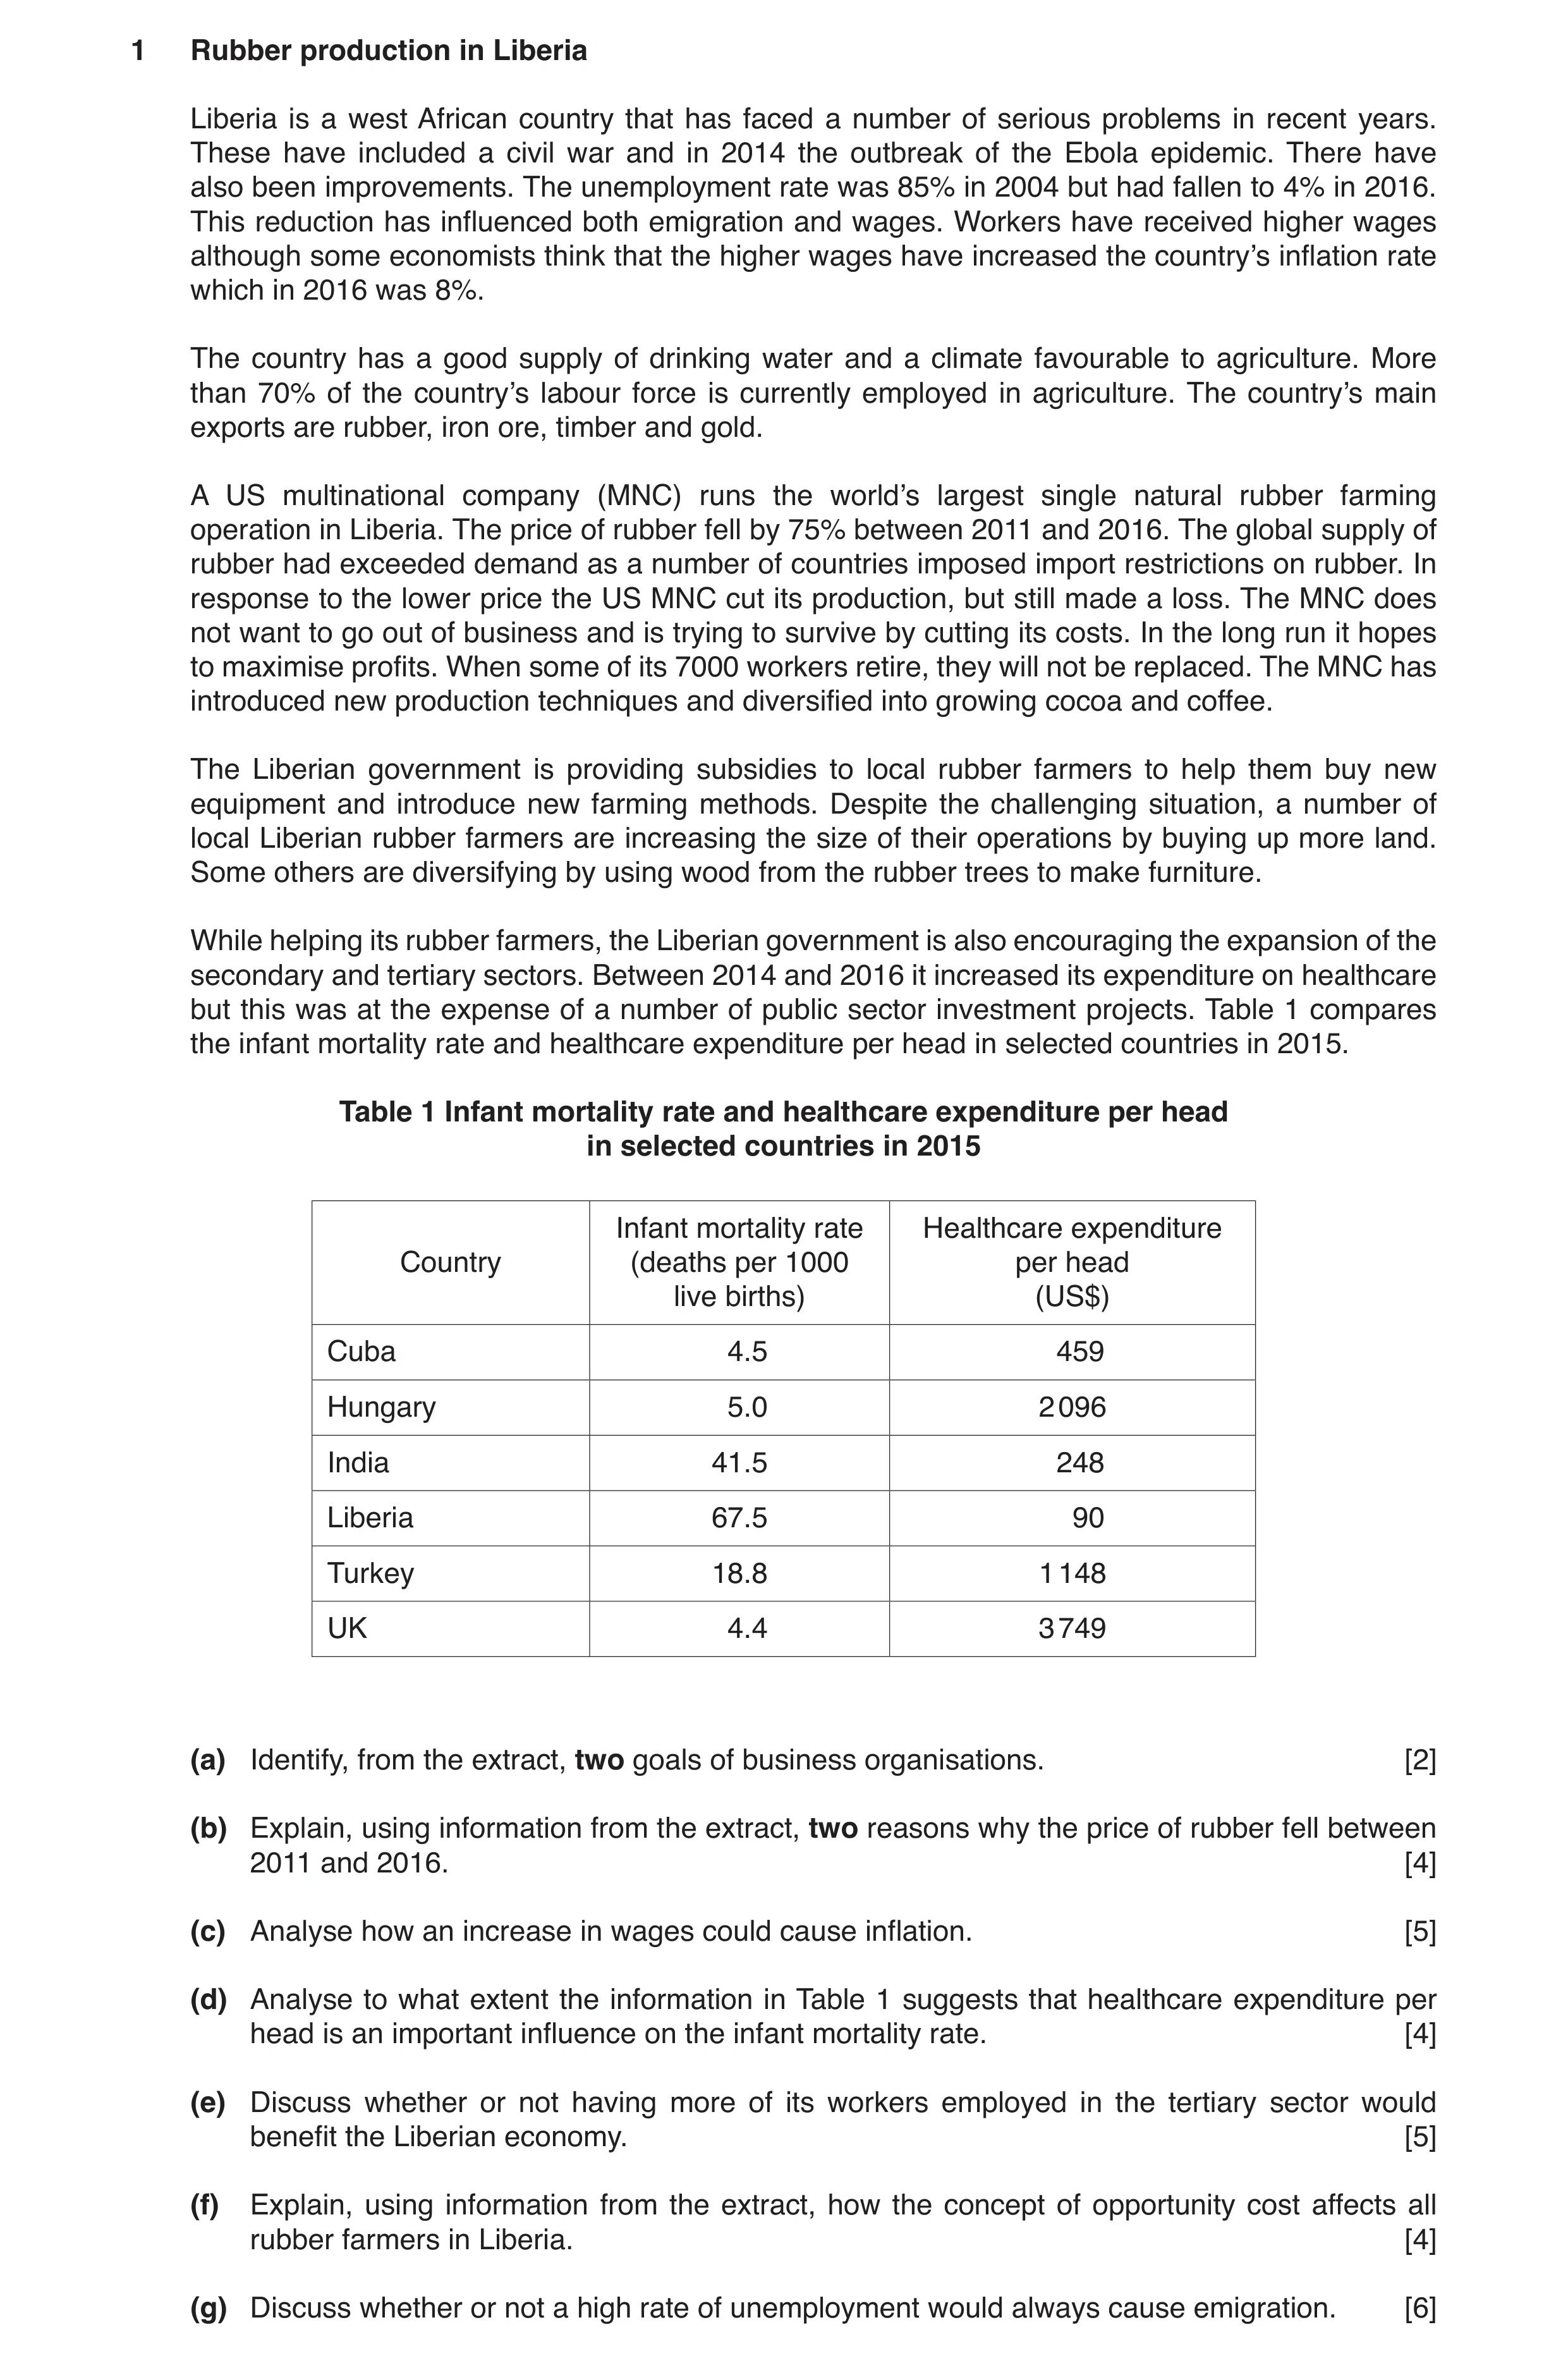
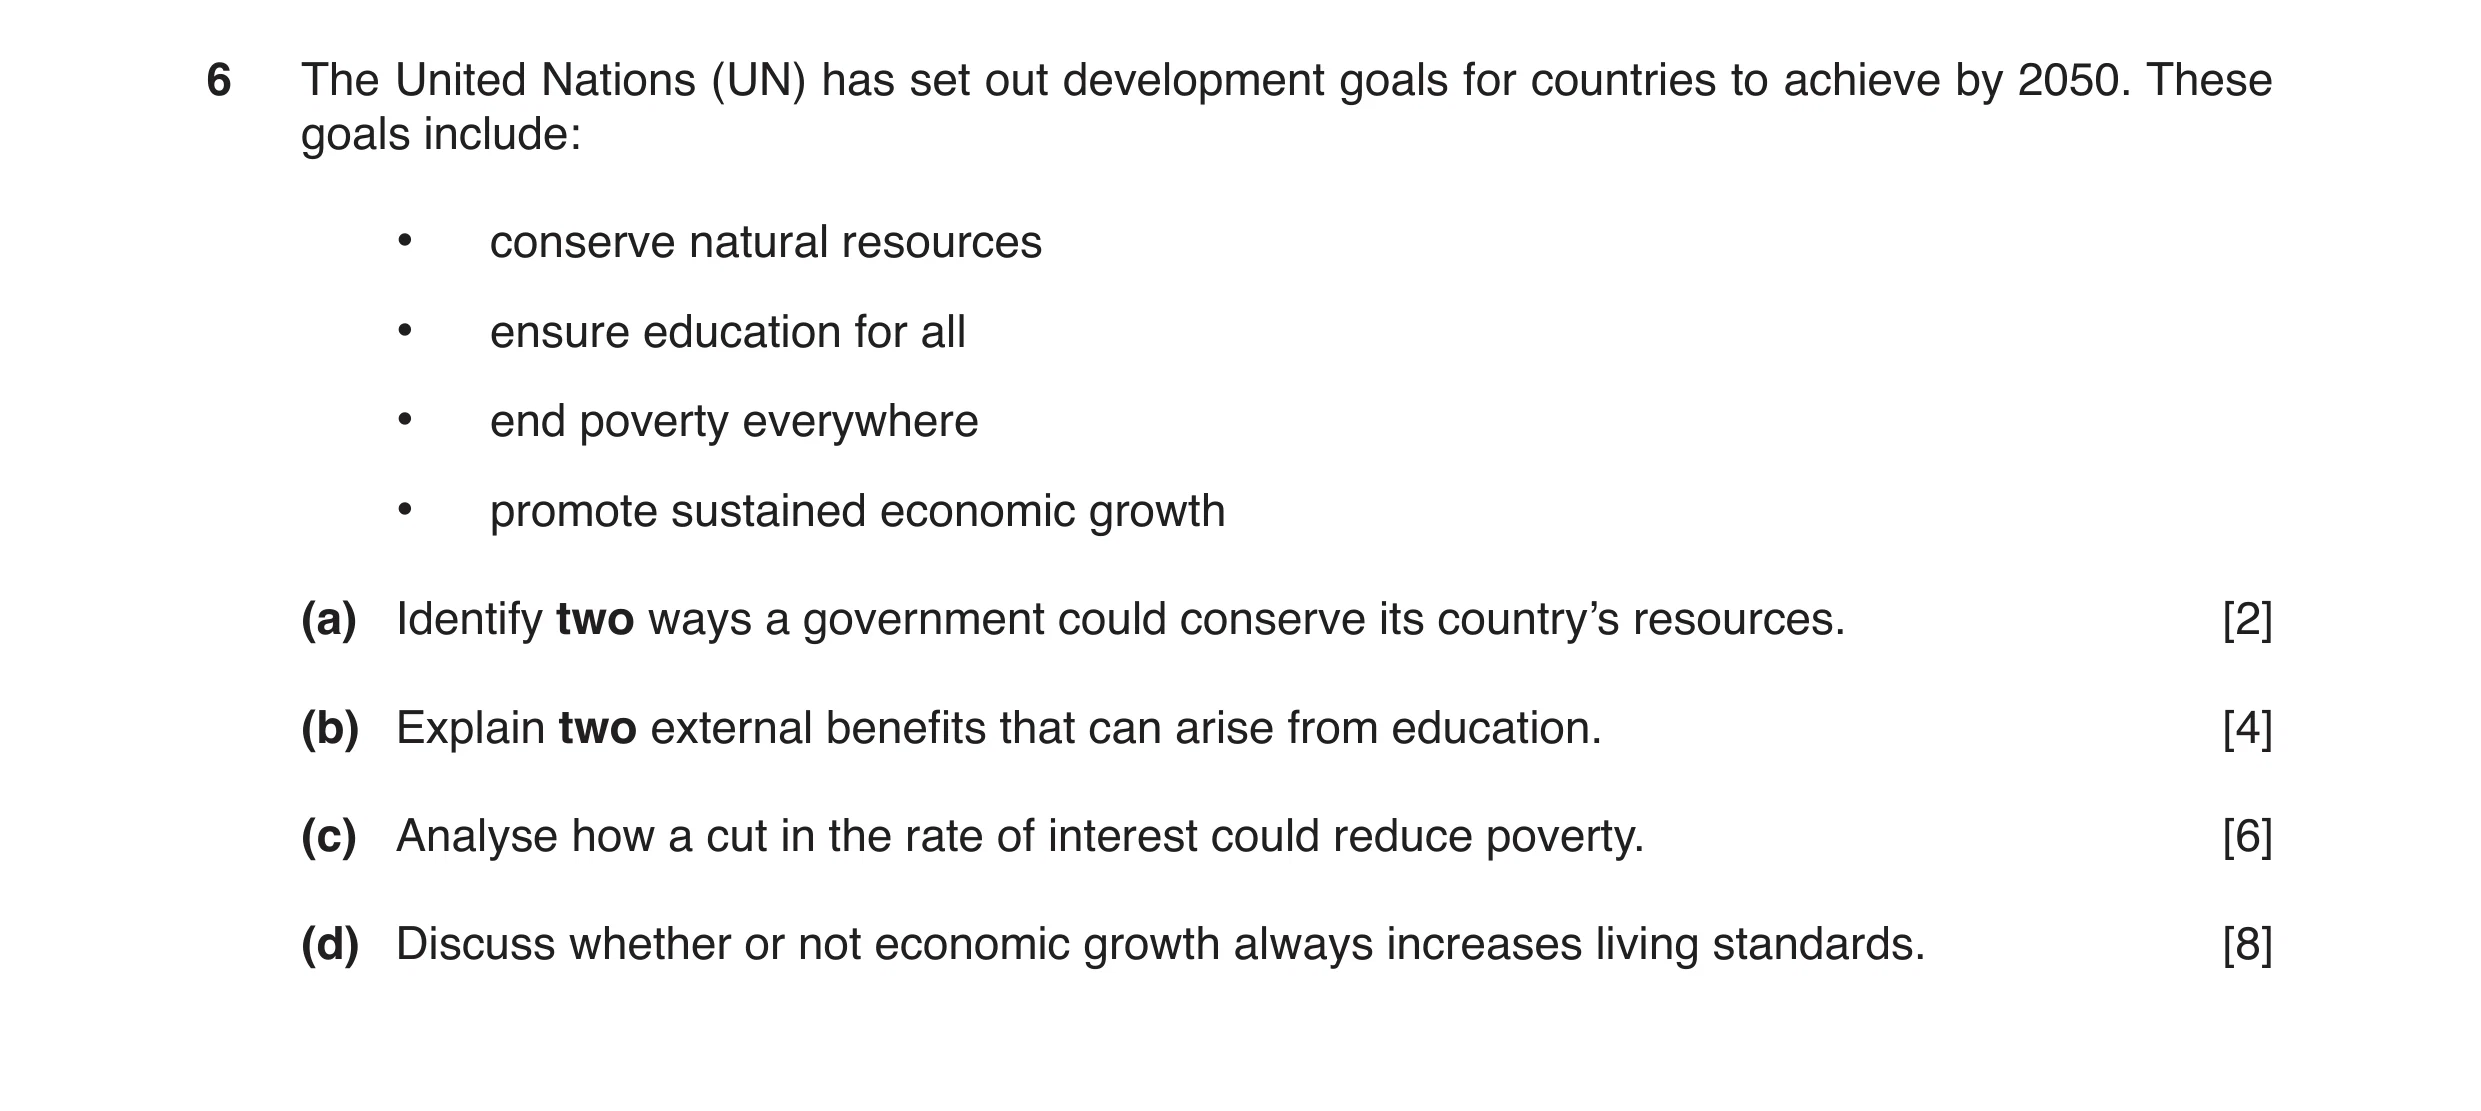 9 / 29
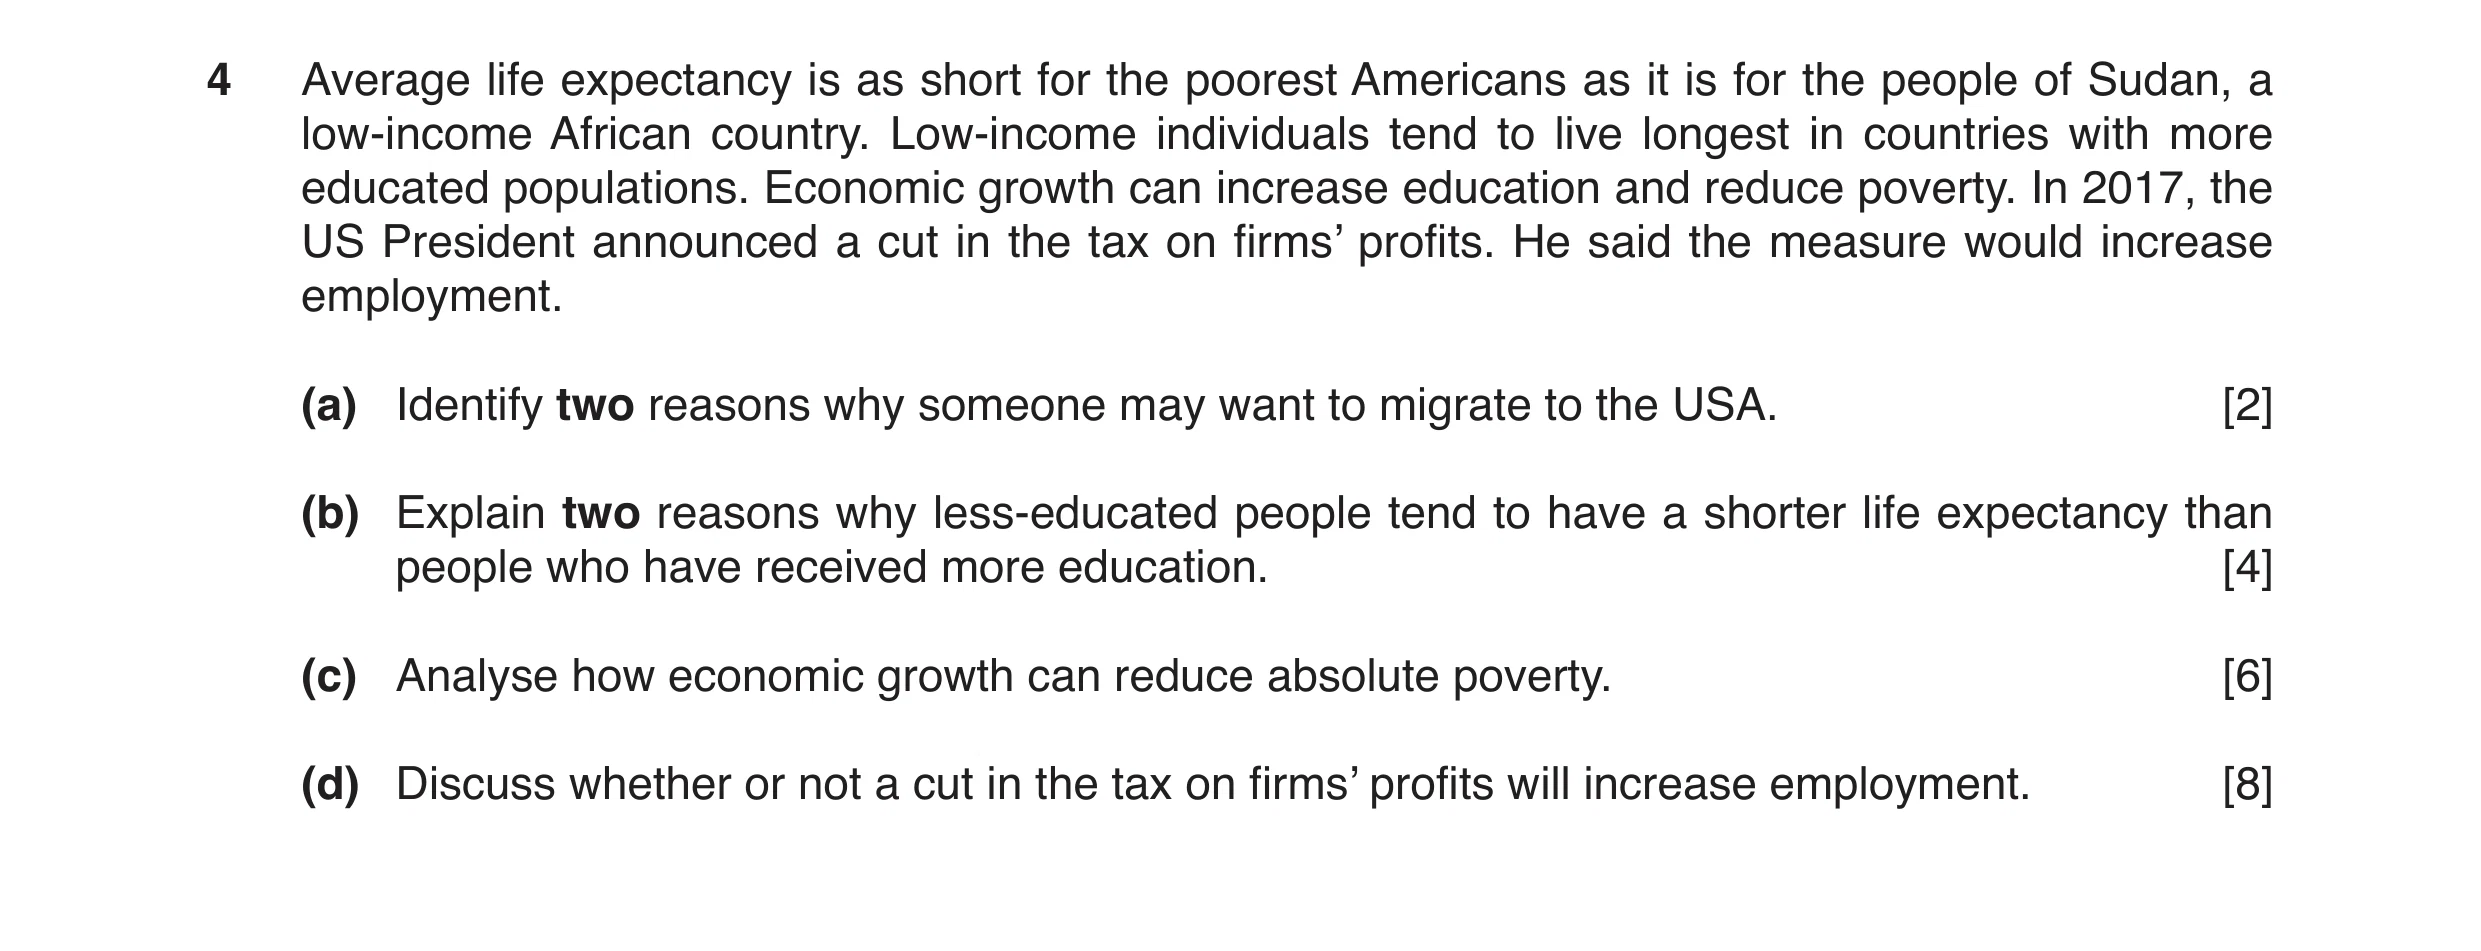 10 / 29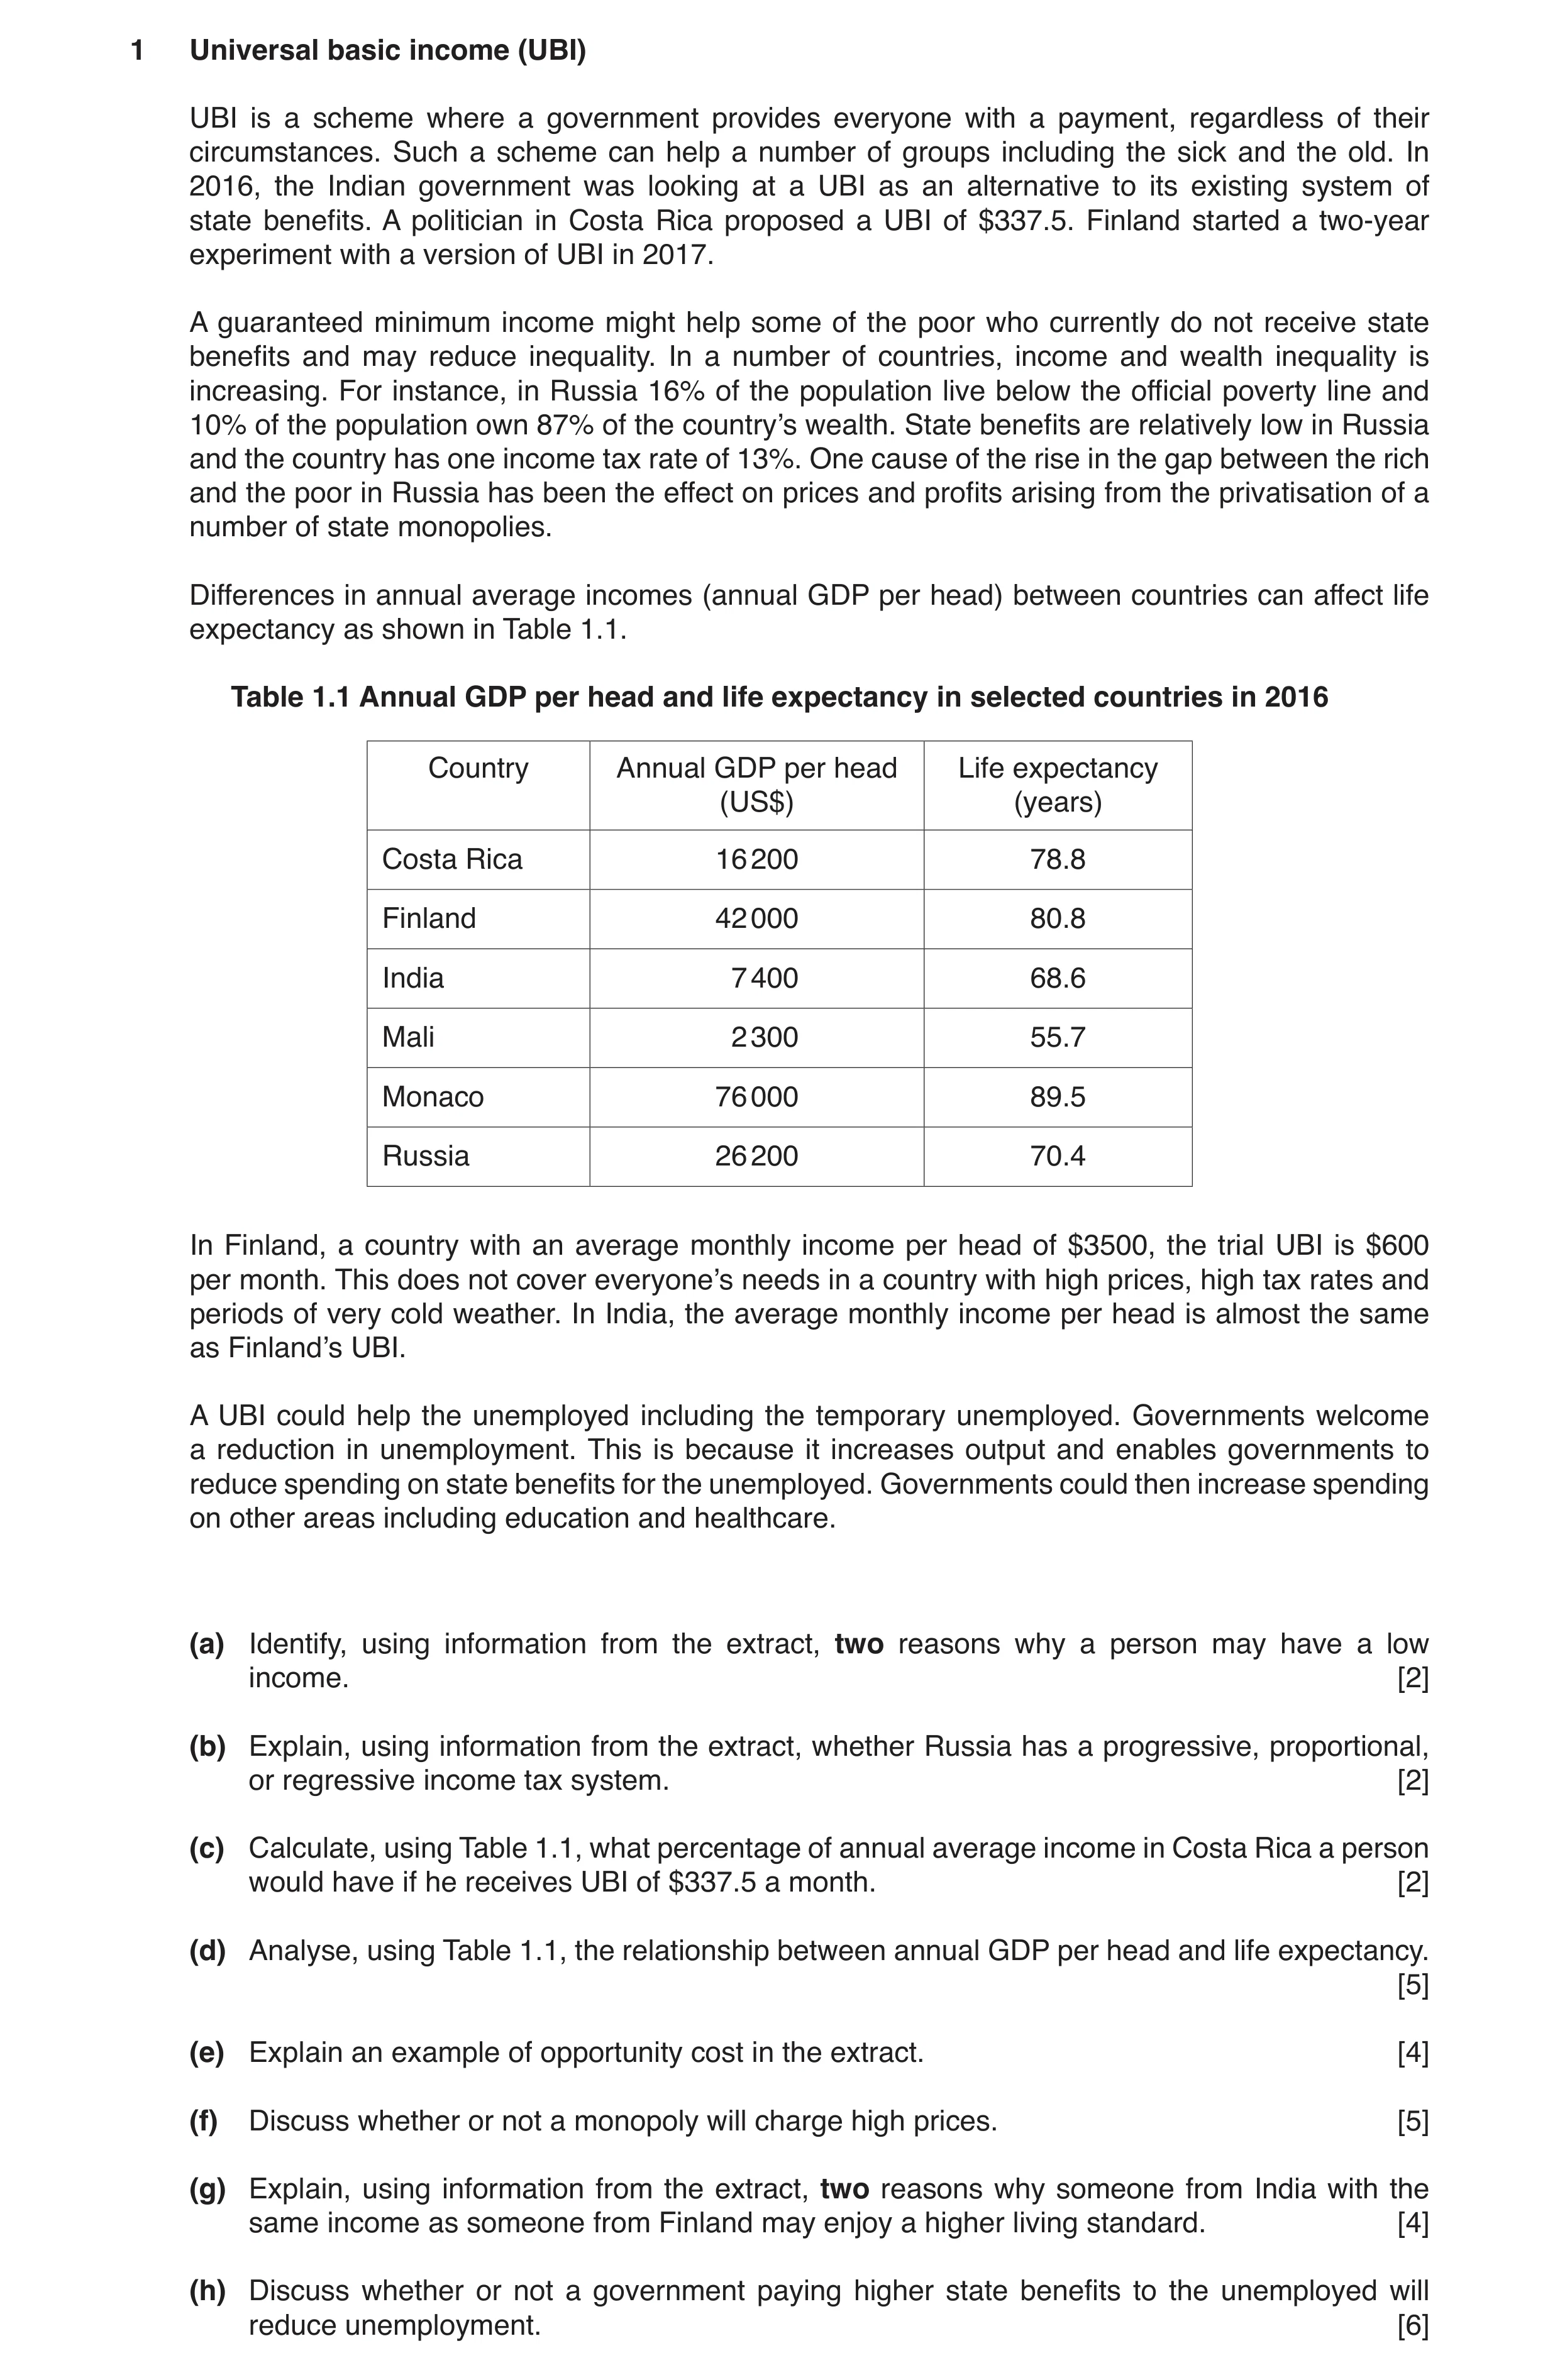
 11 / 29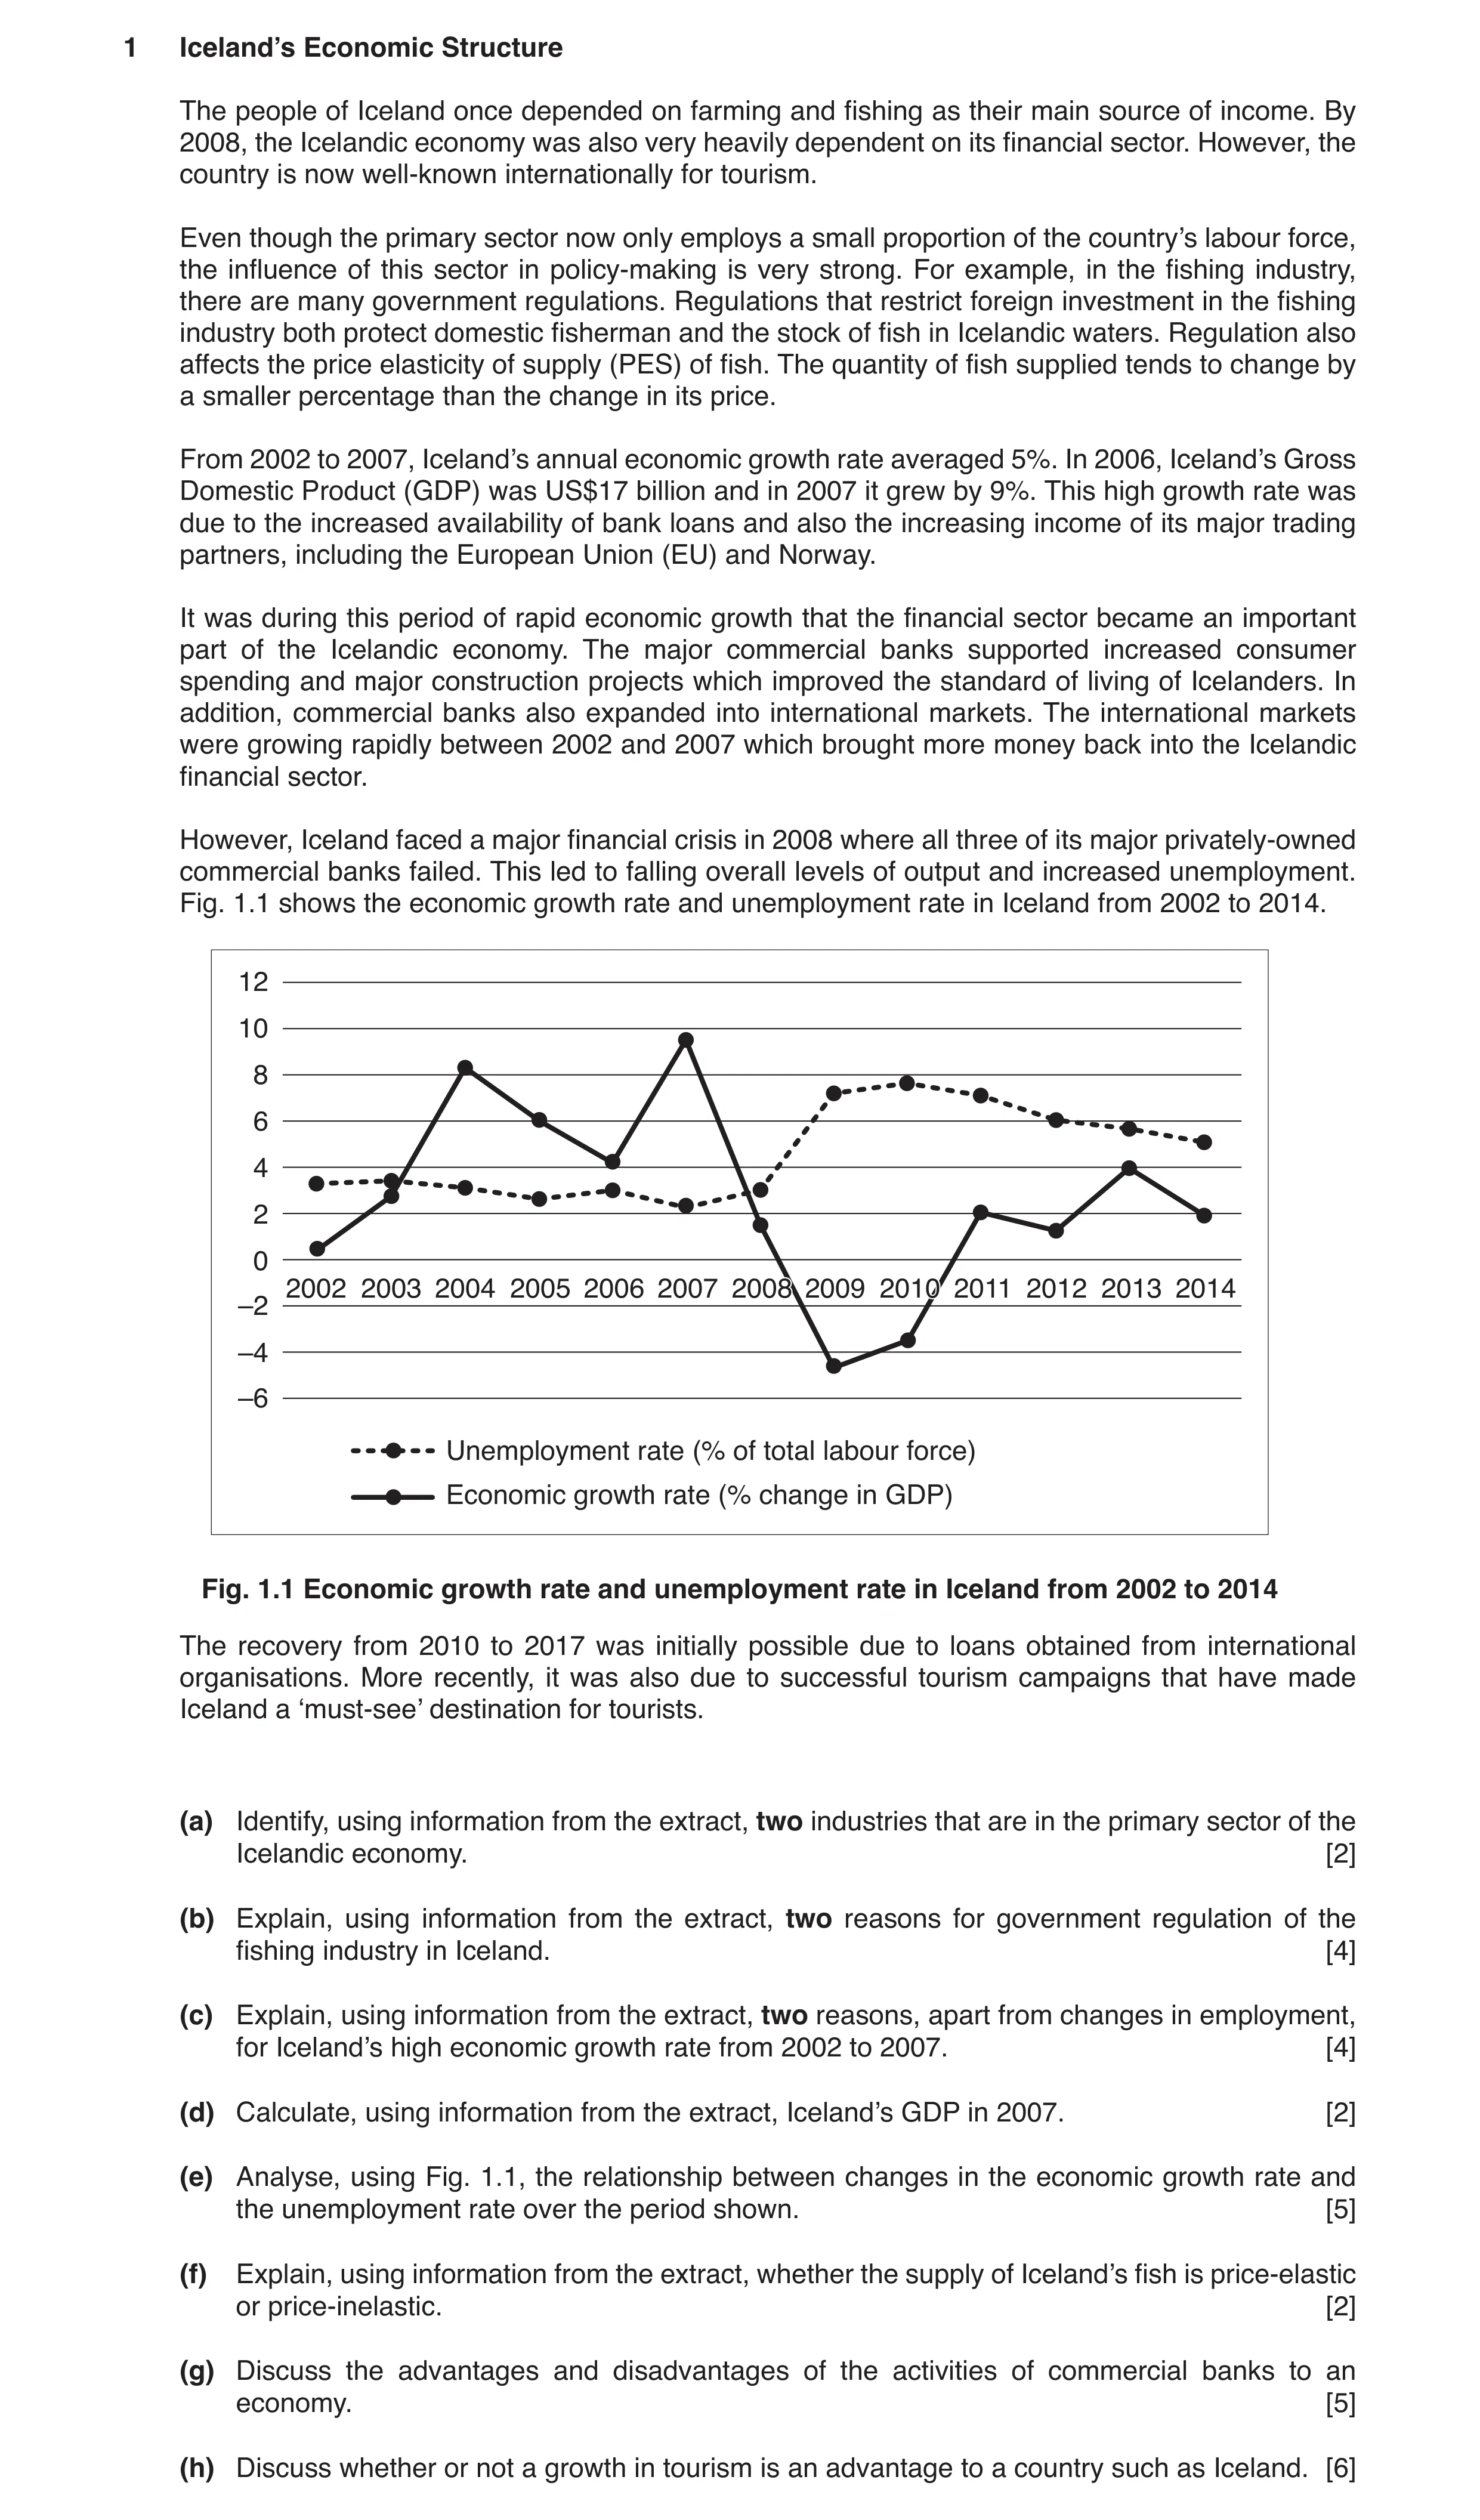
 13 / 29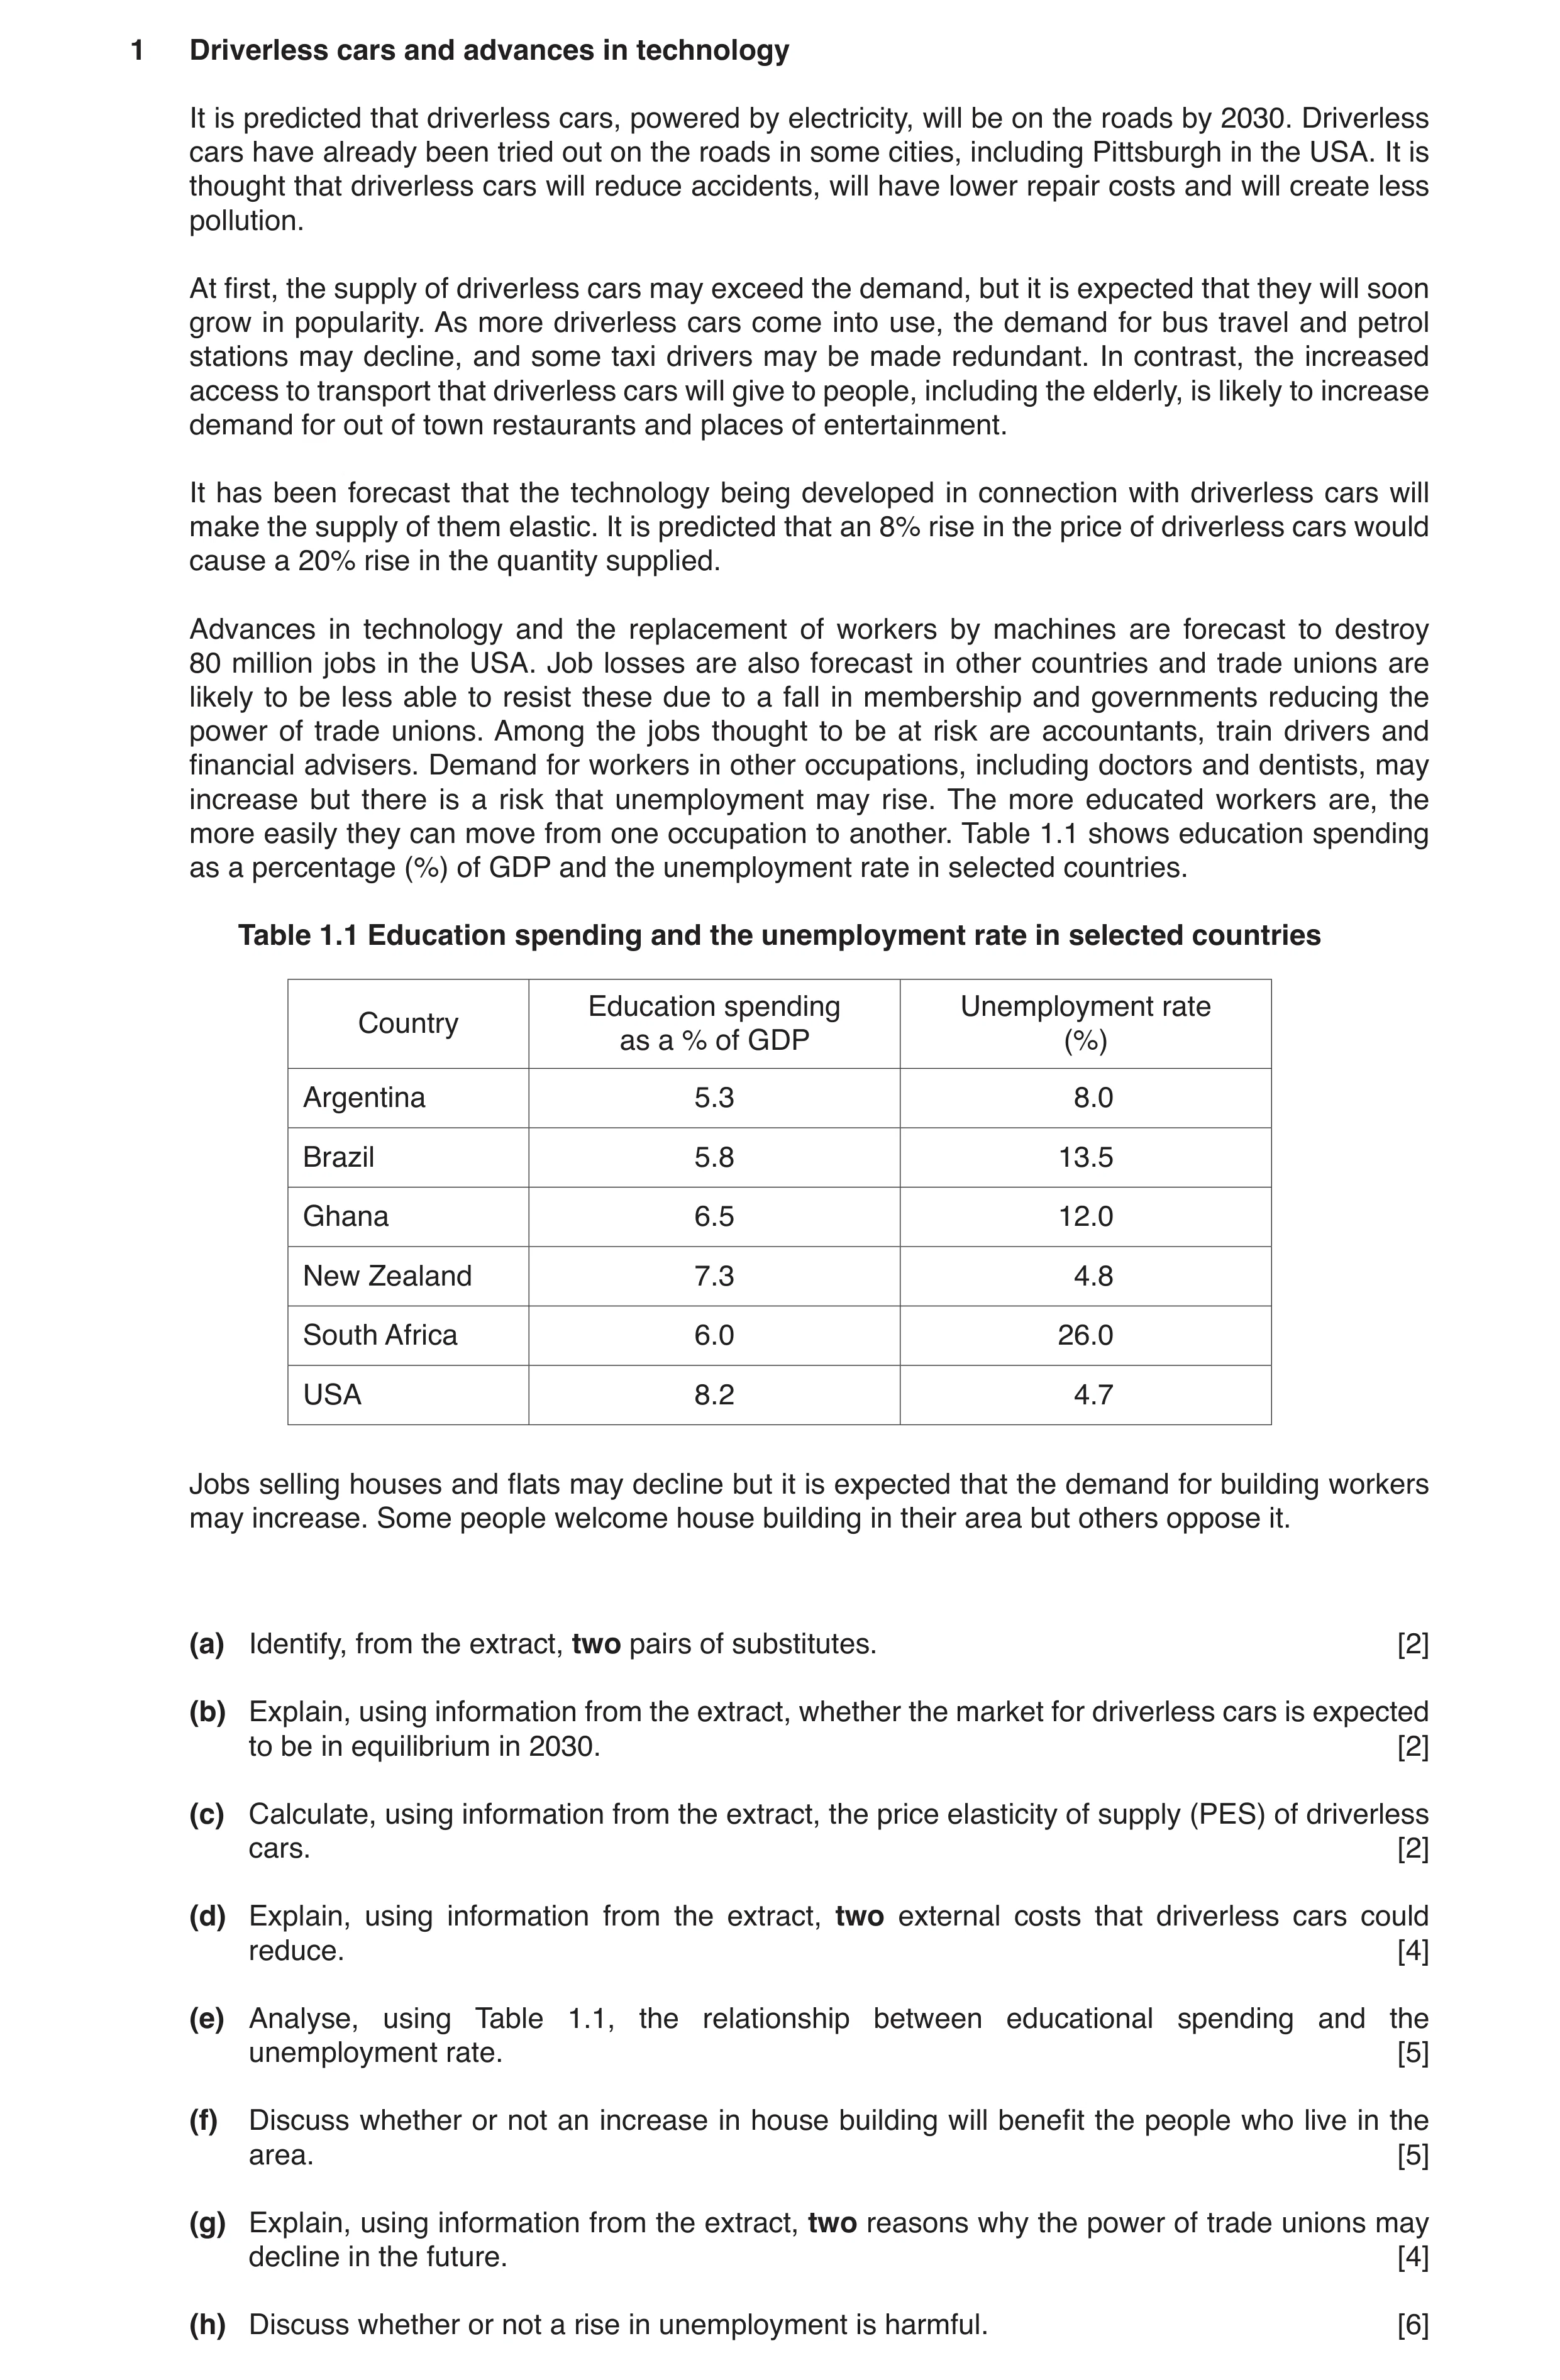
 14 / 29
![Question 25: (a) Calculate Vietnam’s GDP per head in 2017. [1] (b) Identify two rewards to factors of production. [2] (c) Explain what happened to Vietn…](https://img.pastlit.com/crops/339f5c2b-98fa-4dba-9866-bf03ddb49b01/q1.webp) 15 / 29
15 / 29![Question 26: (a) Calculate Pakistan’s trade in goods balance in 2017. [1] (b) Identify two possible causes of demand-pull inflation in Pakistan in 2017.…](https://img.pastlit.com/crops/2896b476-b4ce-4993-888b-69b5f9ebceba/q1.webp)
![Question 27: (a) Calculate the total number of people over 60 years old in Greece in 2015. [1] (b) Explain what is meant by an unemployment rate of 24%.…](https://img.pastlit.com/crops/7071ffa7-db29-414f-a3b4-ea04bddb8fea/q1.webp)
![Question 28: (a) Calculate the percentage of total world output of palm oil produced by Indonesia in 2017. [1] (b) Identify two variable costs of produc…](https://img.pastlit.com/crops/5a673893-06b0-42f3-86c9-97cce6ecfc5a/q1.webp) 16 / 29
16 / 29![Question 29: (a) Calculate the number of Germans aged over 65 in 2017. [1] (b) Identify two measures of living standards. [2] (c) Explain one cause of g…](https://img.pastlit.com/crops/4285558b-8258-4228-a407-9d8cc03545cd/q1.webp)
![Question 30: (a) Calculate the value of Nigeria’s exports of goods in 2017. [1] (b) Identify two examples of capital goods. [2] (c) Explain whether Nige…](https://img.pastlit.com/crops/6aa3845e-8639-4e3b-9743-f54dba7fffef/q1.webp)
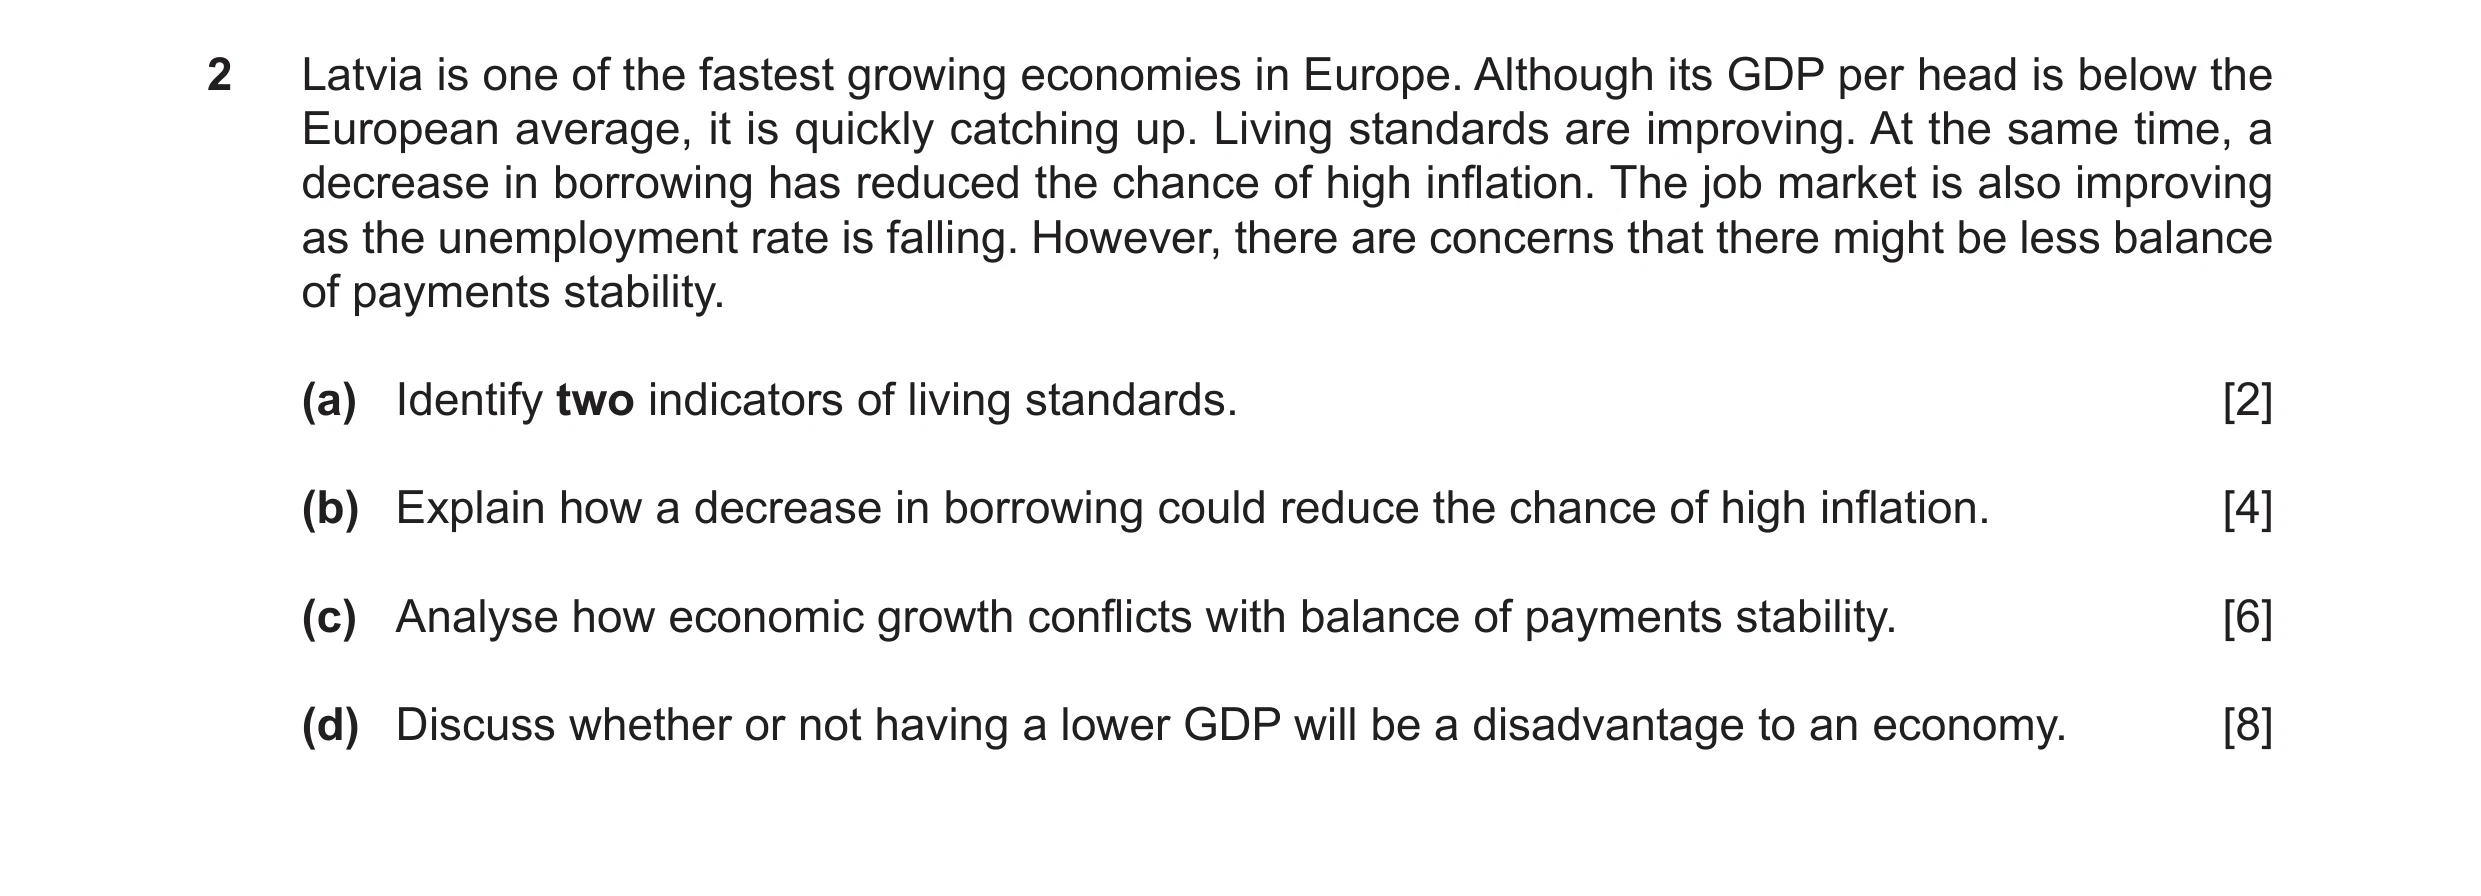 17 / 29
![Question 32: (a) Calculate, in $, the total exports of Laos to China in 2017. [1] (b) Identify two roles of commercial banks. [2] (c) Explain how access…](https://img.pastlit.com/crops/a138a325-fbab-43b5-954f-0ca0669cd196/q1.webp)
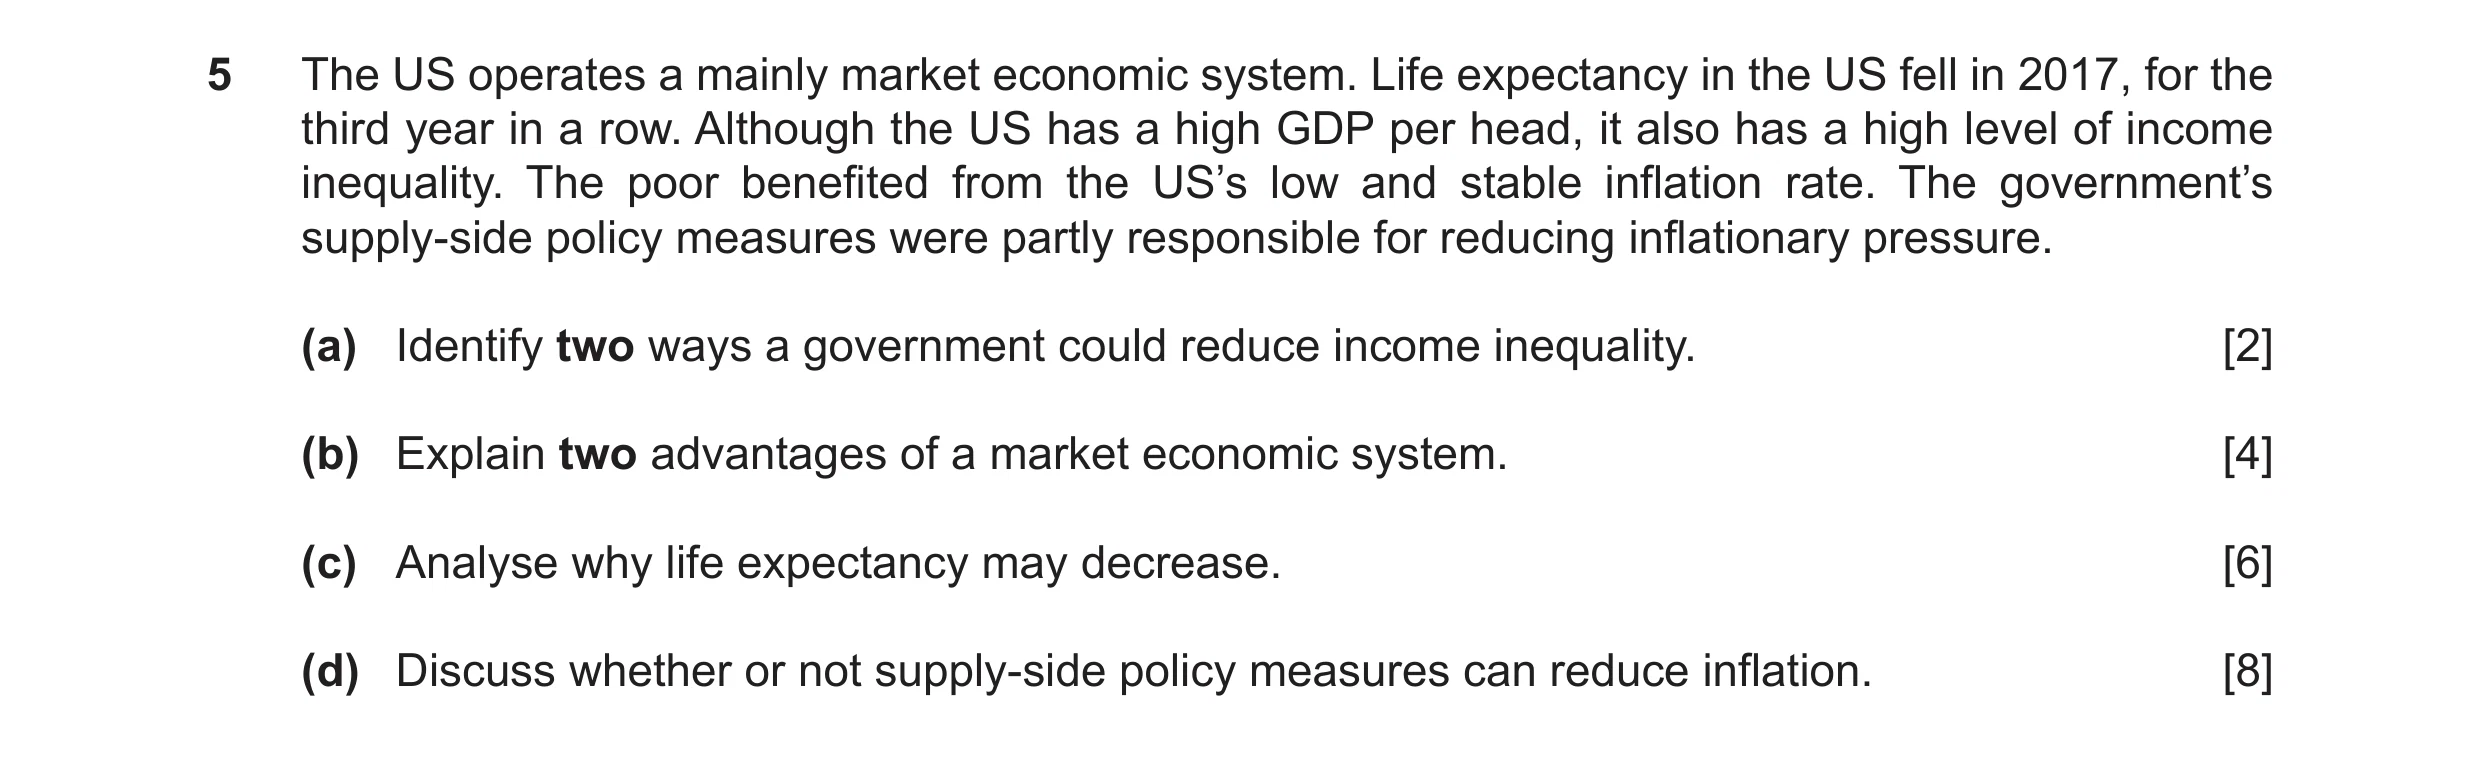
![Question 34: (a) Calculate the number of obese people in the UK in 2016. [1] (b) Identify two reasons why the demand for vegan food has increased in the…](https://img.pastlit.com/crops/9d40d6ae-d629-493e-ae3a-4d28fdc0f6b2/q1.webp) 18 / 29
18 / 29![Question 35: (a) Calculate the number of Bermudian workers who were unemployed in 2018. [1] (b) Identify two reasons why demand for holidays in Bermuda …](https://img.pastlit.com/crops/c0e68d91-70be-408e-9dd5-92967753d3fe/q1.webp)
![Question 36: (a) Calculate the number of births in Cyprus in 2019. [1] (b) Identify two indicators of living standards. [2] (c) State why the global mar…](https://img.pastlit.com/crops/24be1e6c-3827-42eb-a1e9-48859ec14012/q1.webp)
![Question 37: (a) Calculate Bhutan’s GDP in 2018. [1] (b) Identify two indicators that are in both the World Happiness Index and the Human Development In…](https://img.pastlit.com/crops/55b0c3c1-42fd-4e52-a0fd-ce34744b12d3/q1.webp) 19 / 29
19 / 29![Question 38: (a) Calculate Europe’s percentage contribution to the global total eSports revenue in 2019. [1] (b) Identify two conditions of demand for e…](https://img.pastlit.com/crops/55724c26-a8be-463d-9a87-4549a55a1e45/q1.webp)
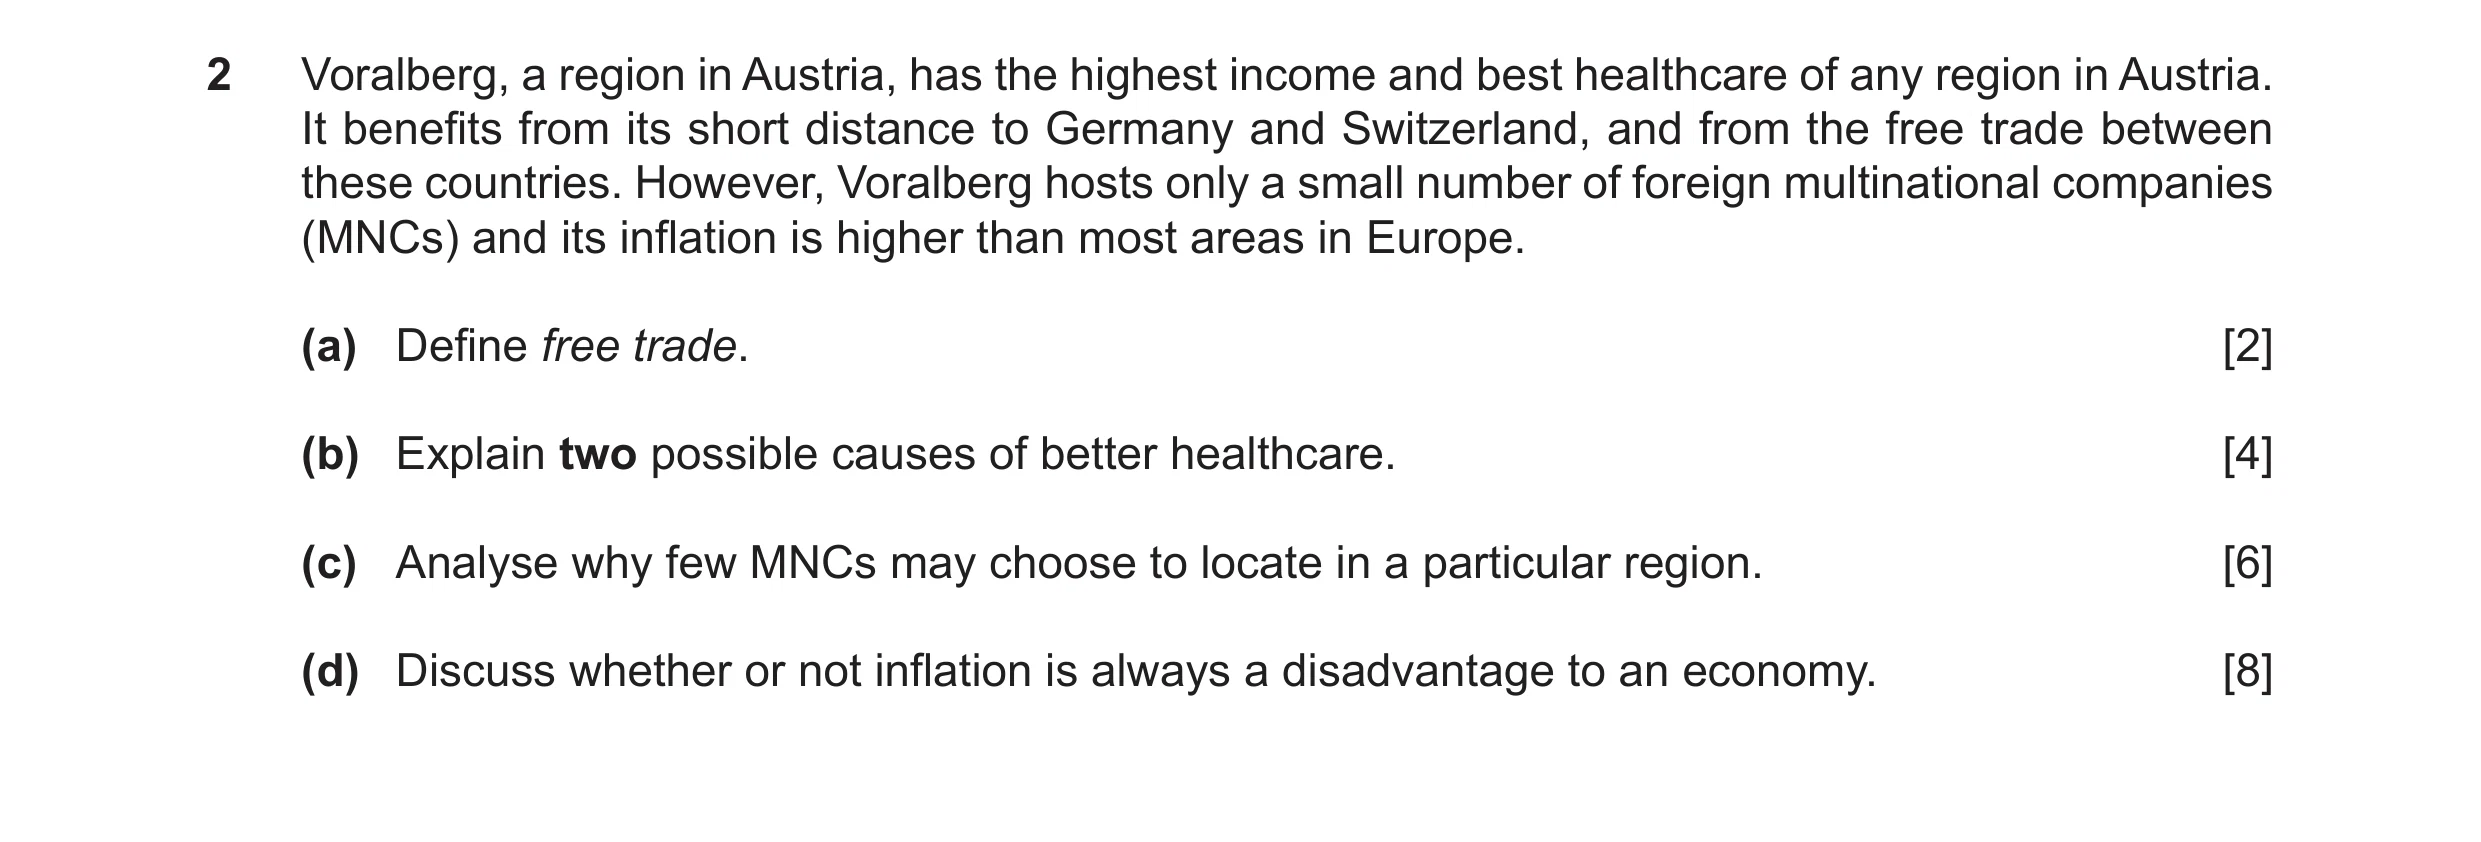
![Question 40: (a) Calculate the total value of the tertiary sector in Mauritius in 2019. [1] (b) Explain the meaning of a change from an economy based on…](https://img.pastlit.com/crops/ebd0627f-2c7a-4d68-94cb-219507b37bc2/q1.webp) 20 / 29
20 / 29![Question 41: (a) Calculate the price elasticity of supply of Ecuador’s oil. [1] (b) Identify two key resource allocation questions. [2] (c) State why su…](https://img.pastlit.com/crops/23ae5604-fbfe-4bc2-8158-2b705635eae3/q1.webp)
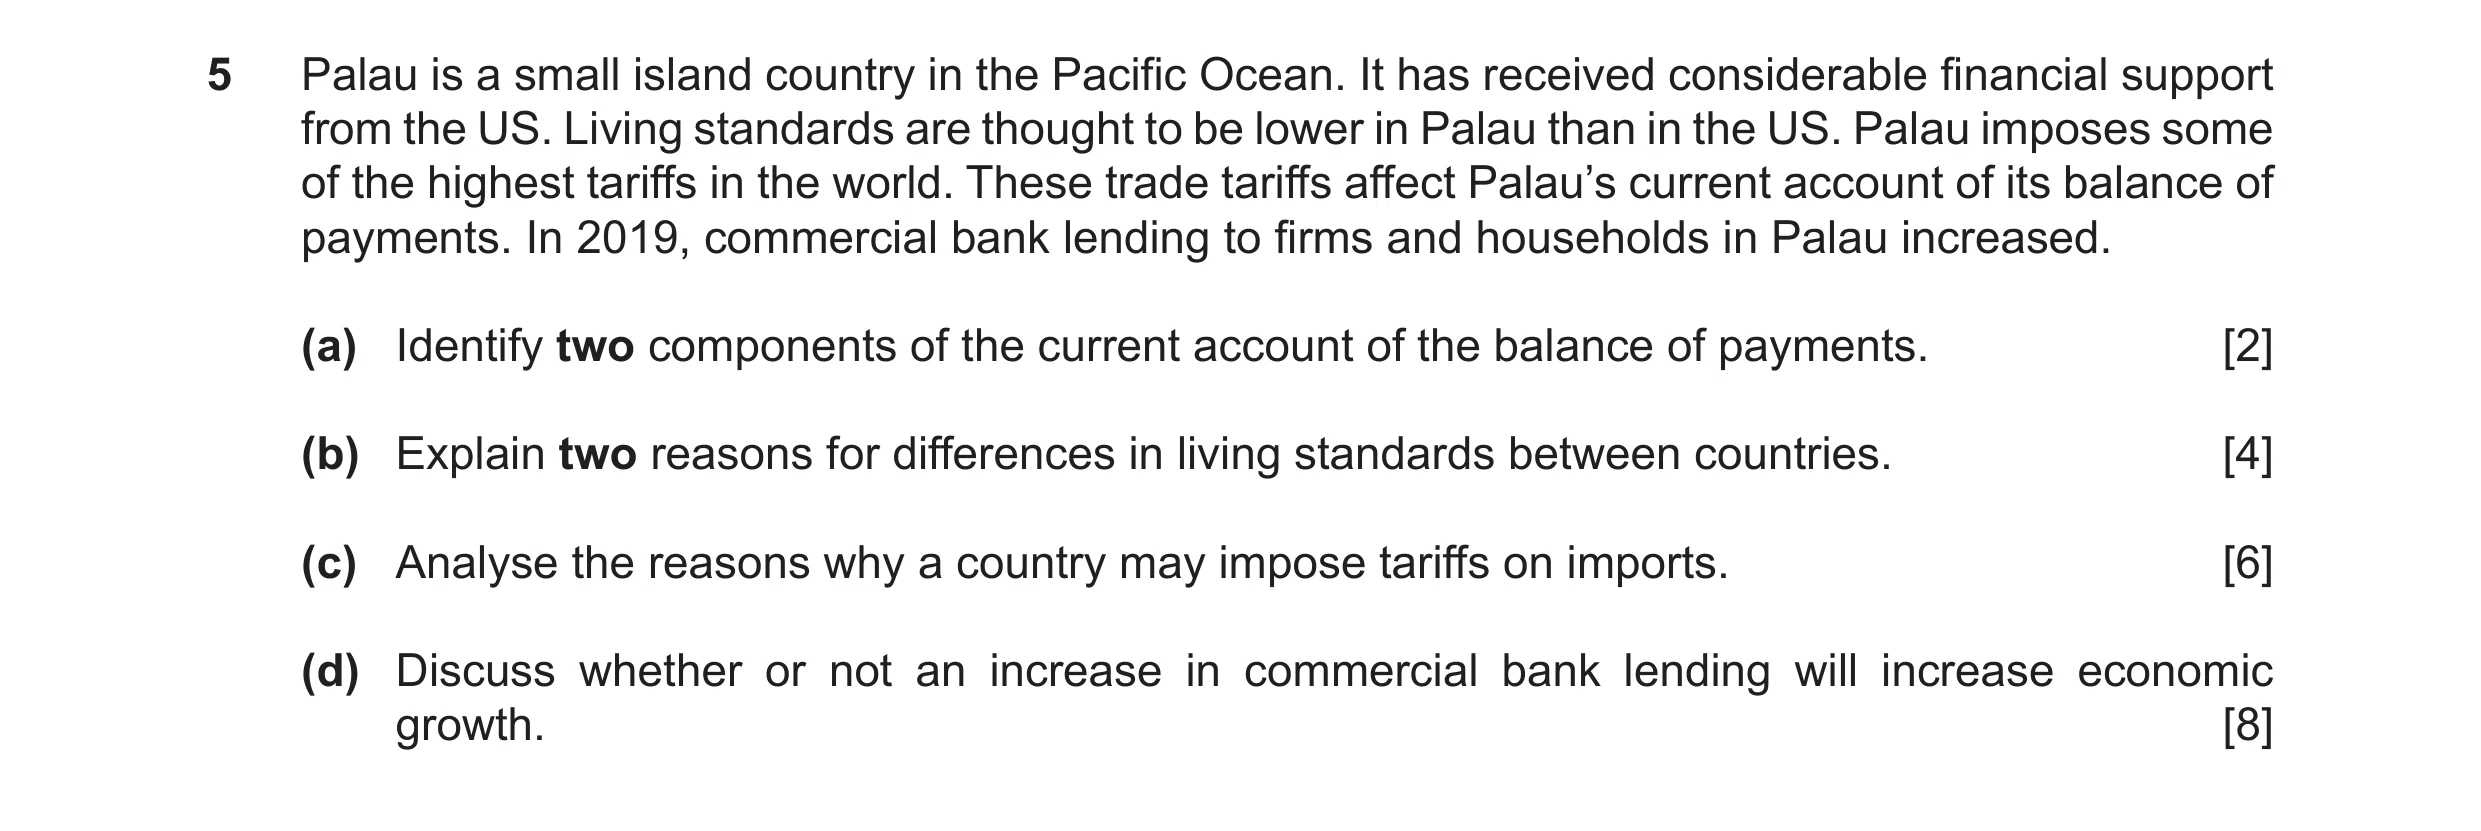
 21 / 29
![Question 45: (a) Calculate the number of people who were living in poverty in Guyana in 2020. [1] (b) Identify two causes of the decrease in the output …](https://img.pastlit.com/crops/ccee09ab-d362-48c3-8aed-fd6dbfc44b0c/q1.webp)
![Question 46: (a) Calculate New Zealand’s GDP per head in 2020. [1] (b) Identify two external costs arising from the milk and car industries. [2] (c) Exp…](https://img.pastlit.com/crops/8d5f5060-3ec7-4f3b-bb31-99b8340193d4/q1.webp) 22 / 29
22 / 29![Question 47: (a) Calculate the total number of people in Cambridge aged 18–29 in 2019. [1] (b) Identify two types of industries in Cambridge that operat…](https://img.pastlit.com/crops/c116d3dd-bfe8-4182-b029-588b408c7b8e/q1.webp)
![Question 48: (a) Calculate what percentage of Honduran people did not have access to electricity in 2020. [1] (b) Identify two benefits the Honduran eco…](https://img.pastlit.com/crops/b0ce6645-10d4-4e42-ae8e-572115058aa7/q1.webp)
 23 / 29
![Question 50: (a) Calculate the average wage paid in Denmark in 2020. [1] (b) Identify two possible opportunity costs of a Danish person using their leis…](https://img.pastlit.com/crops/aeaa1c35-3314-4a56-8d2d-0e647b3282e2/q1.webp)
![Question 52: (a) Calculate the percentage contribution of Jakarta to Indonesia’s GDP in 2021. [1] (b) Identify two examples of external costs ignored by…](https://img.pastlit.com/crops/409e44c7-deac-4652-a187-f046d8960843/q1.webp) 24 / 29
24 / 29
![Question 55: (a) Calculate the average cost of producing a car in Belarus in 2021. [1] (b) Identify two reasons why Belarus is described as a mixed econ…](https://img.pastlit.com/crops/694c5e96-092a-4fd5-aadb-0306b621e45b/q1.webp) 25 / 29
25 / 29![Question 56: (a) Calculate Romania’s current account deficit on its balance of payments in $s. [1] (b) Identify two reasons why Romania’s population fel…](https://img.pastlit.com/crops/c00dd8c3-df8a-45c1-8b40-cb09b15b7421/q1.webp)
 26 / 29
![Question 59: (a) Calculate St. Kitts and Nevis’s government budget deficit in 2022. [1] (b) Identify two examples of the factor of production ‘land’ in …](https://img.pastlit.com/crops/b22807ab-7c1a-4326-a6ef-7ec4f298b82a/q1.webp)
![Question 61: (a) Calculate the number of people who are in poverty in Egypt. [1] (b) Identify two of Egypt’s primary sector exports. [2] (c) Explain how…](https://img.pastlit.com/crops/f345e47f-9ea3-4d9e-a01f-8a2b5580df46/q1.webp) 27 / 29
27 / 29
![Question 63: (a) Calculate the total financial sector contribution (in $) to Switzerland’s GDP. [1] (b) Identify two microeconomic policy measures. [2] …](https://img.pastlit.com/crops/b38e75ad-fcd4-44cf-951d-3089d4177a8a/q1.webp)
 28 / 29
![Question 65: (a) Calculate foreign workers as a percentage of Japan’s labour force in 2022. [1] (b) Identify two reasons why Japan has a high average ag…](https://img.pastlit.com/crops/3b8dcead-b6d7-428b-80a7-5ffdb0605bbf/q1.webp)
![Question 67: (a) Calculate the number of Malawians who had access to electricity in 2022. [1] (b) Identify two capital goods used in Malawi. [2] (c) Exp…](https://img.pastlit.com/crops/b205f8e6-b286-4d23-b321-d74a5c411a28/q1.webp) 29 / 29
29 / 29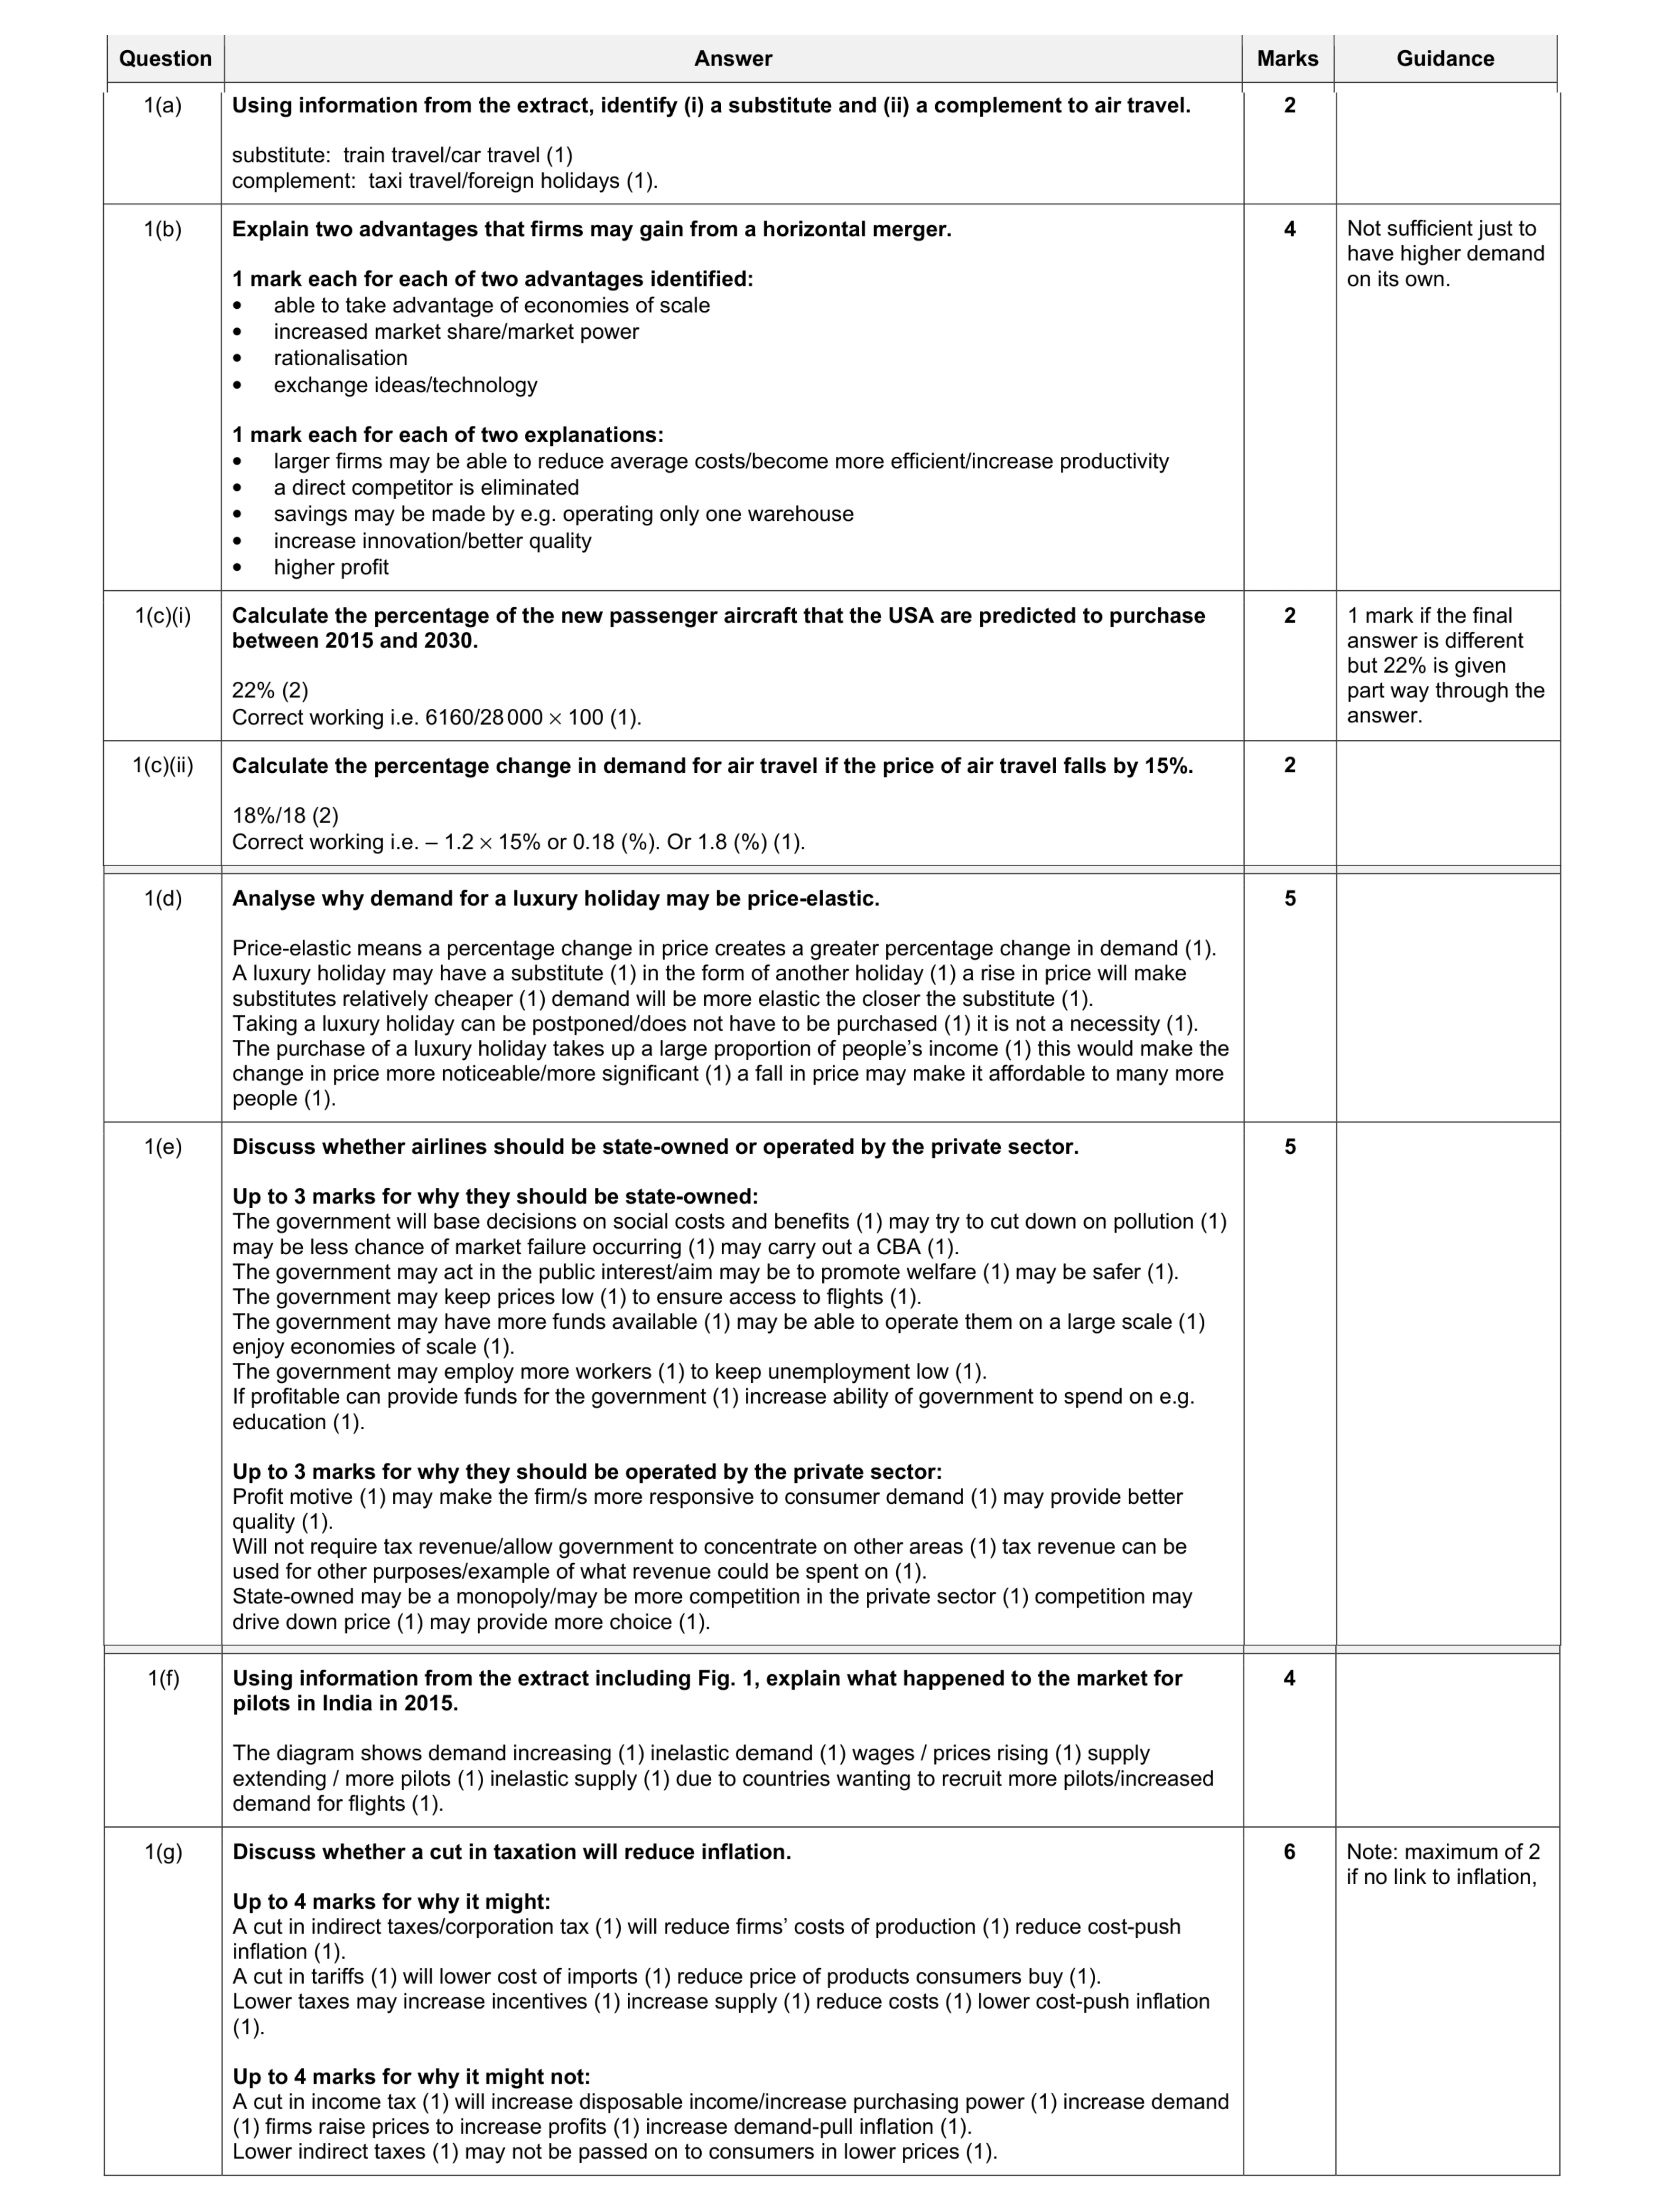 30
30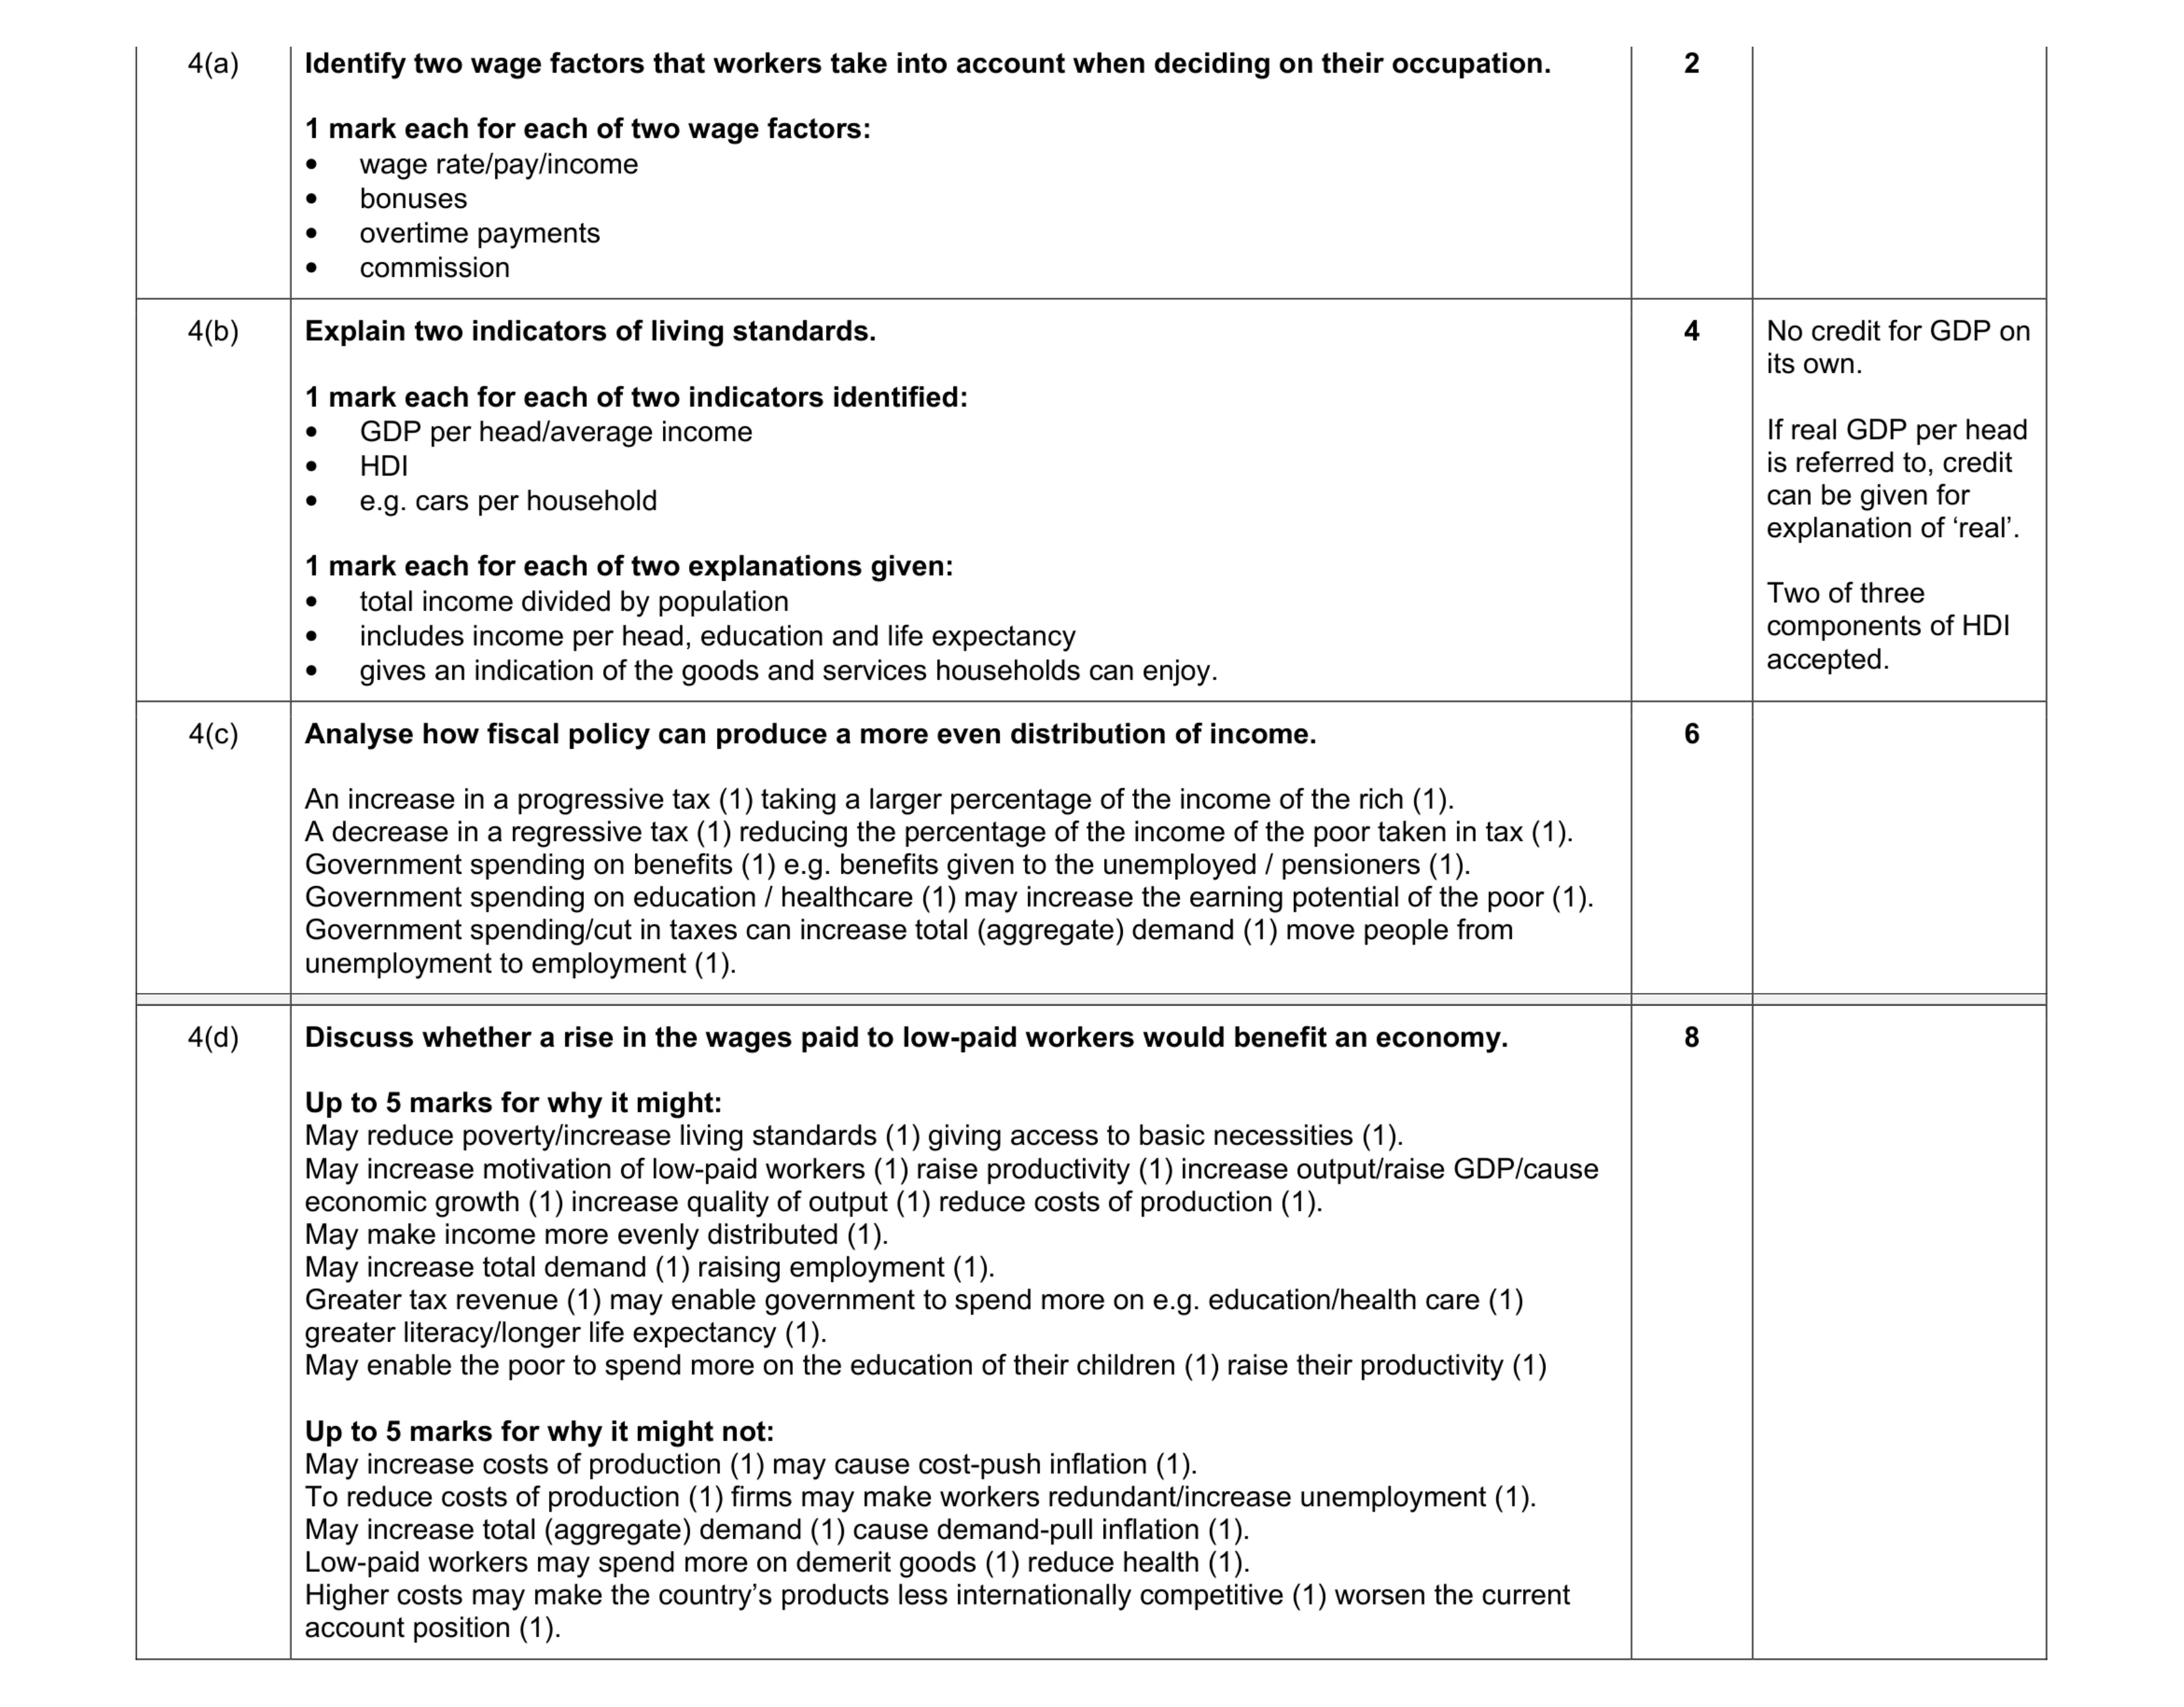 20
20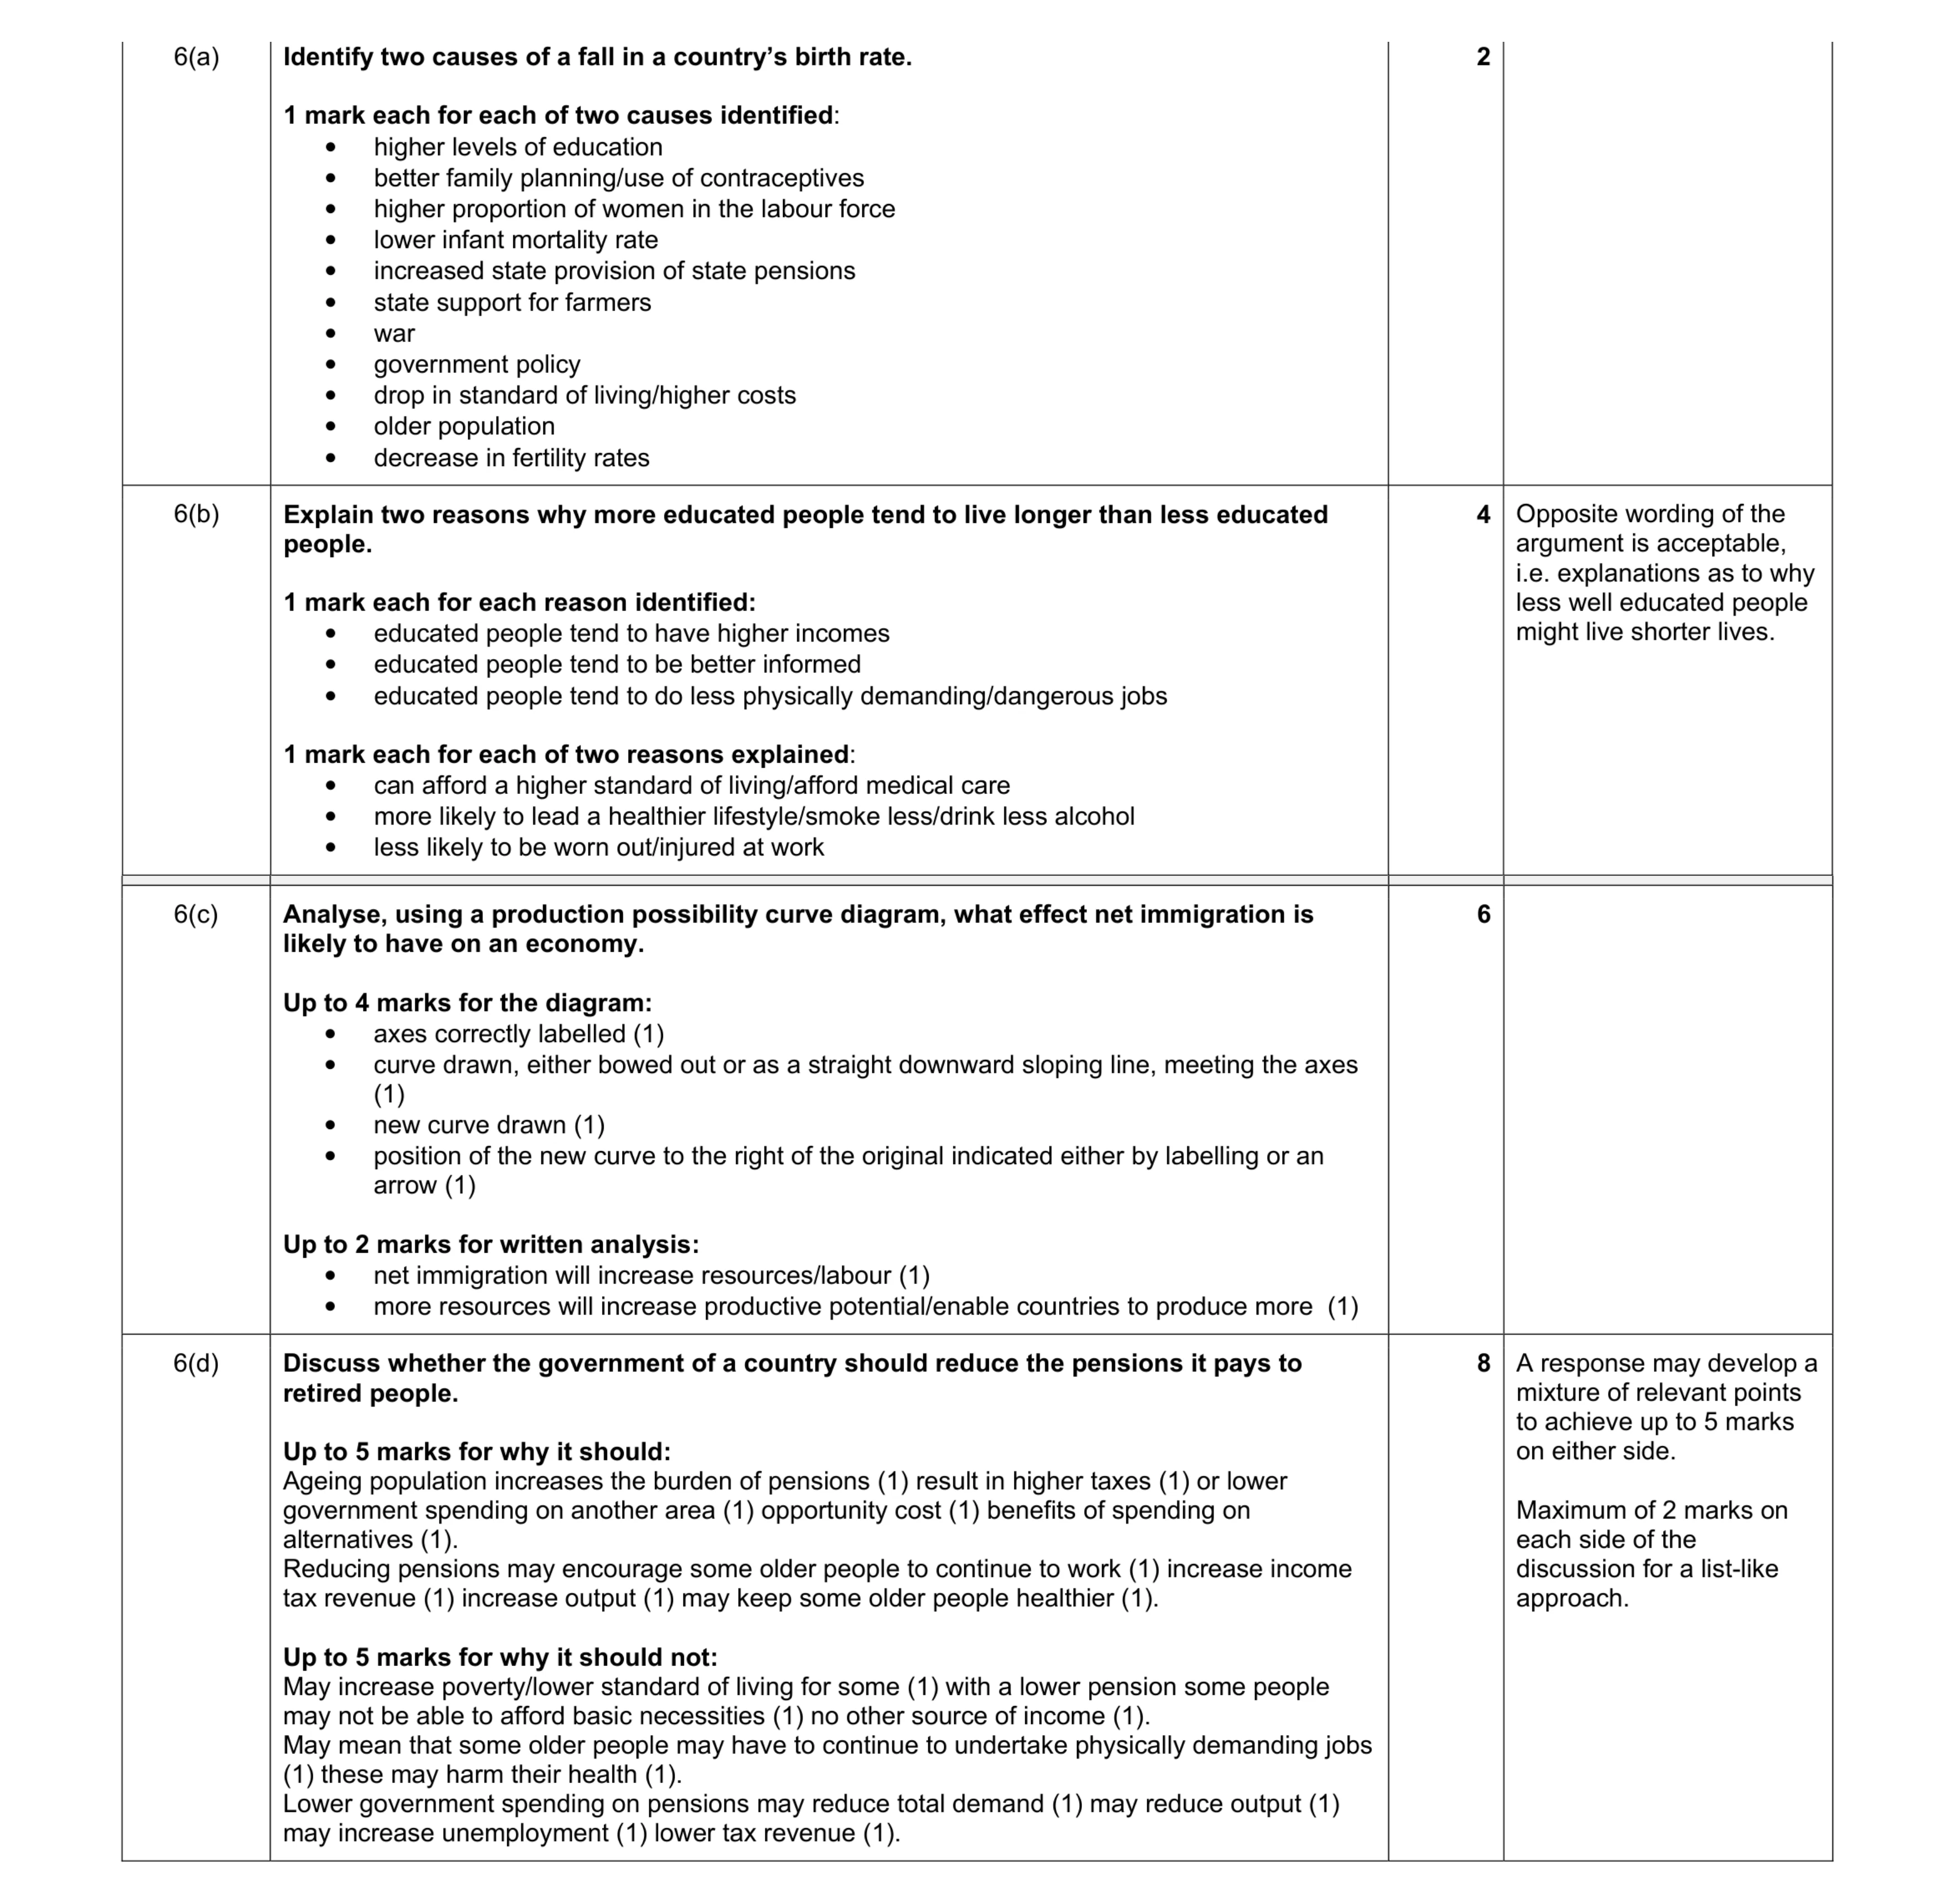 20
20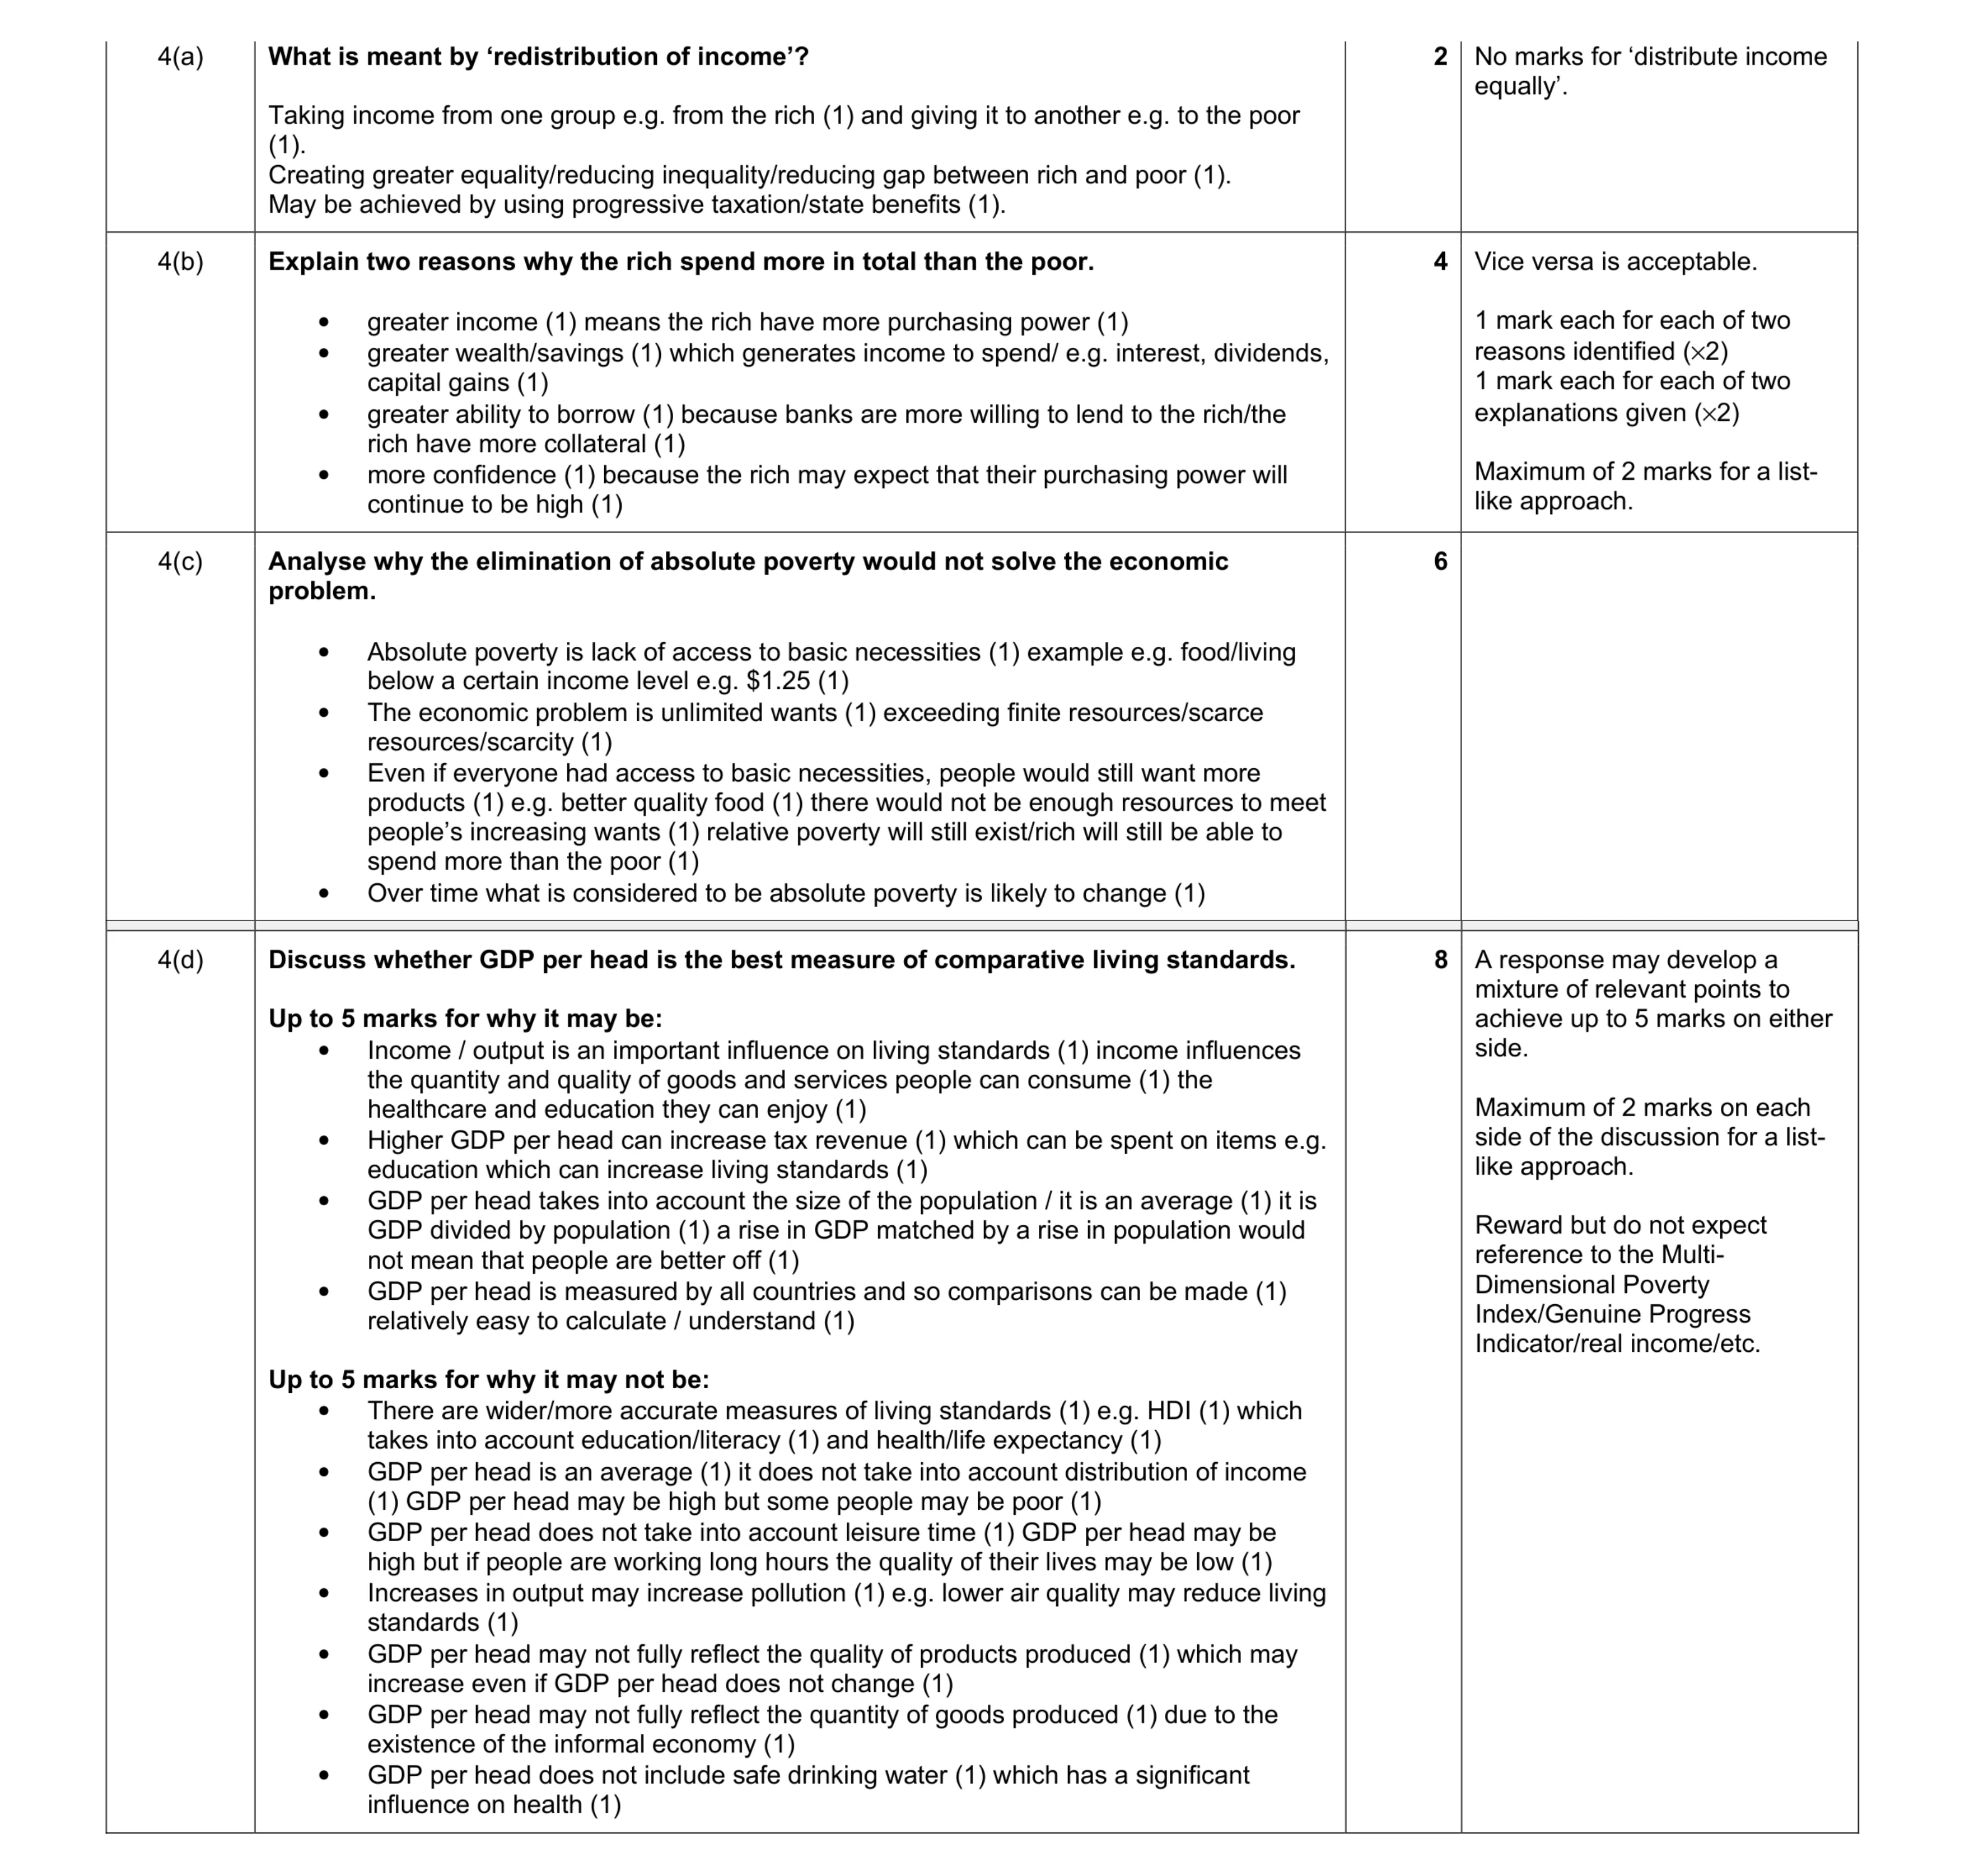 20
20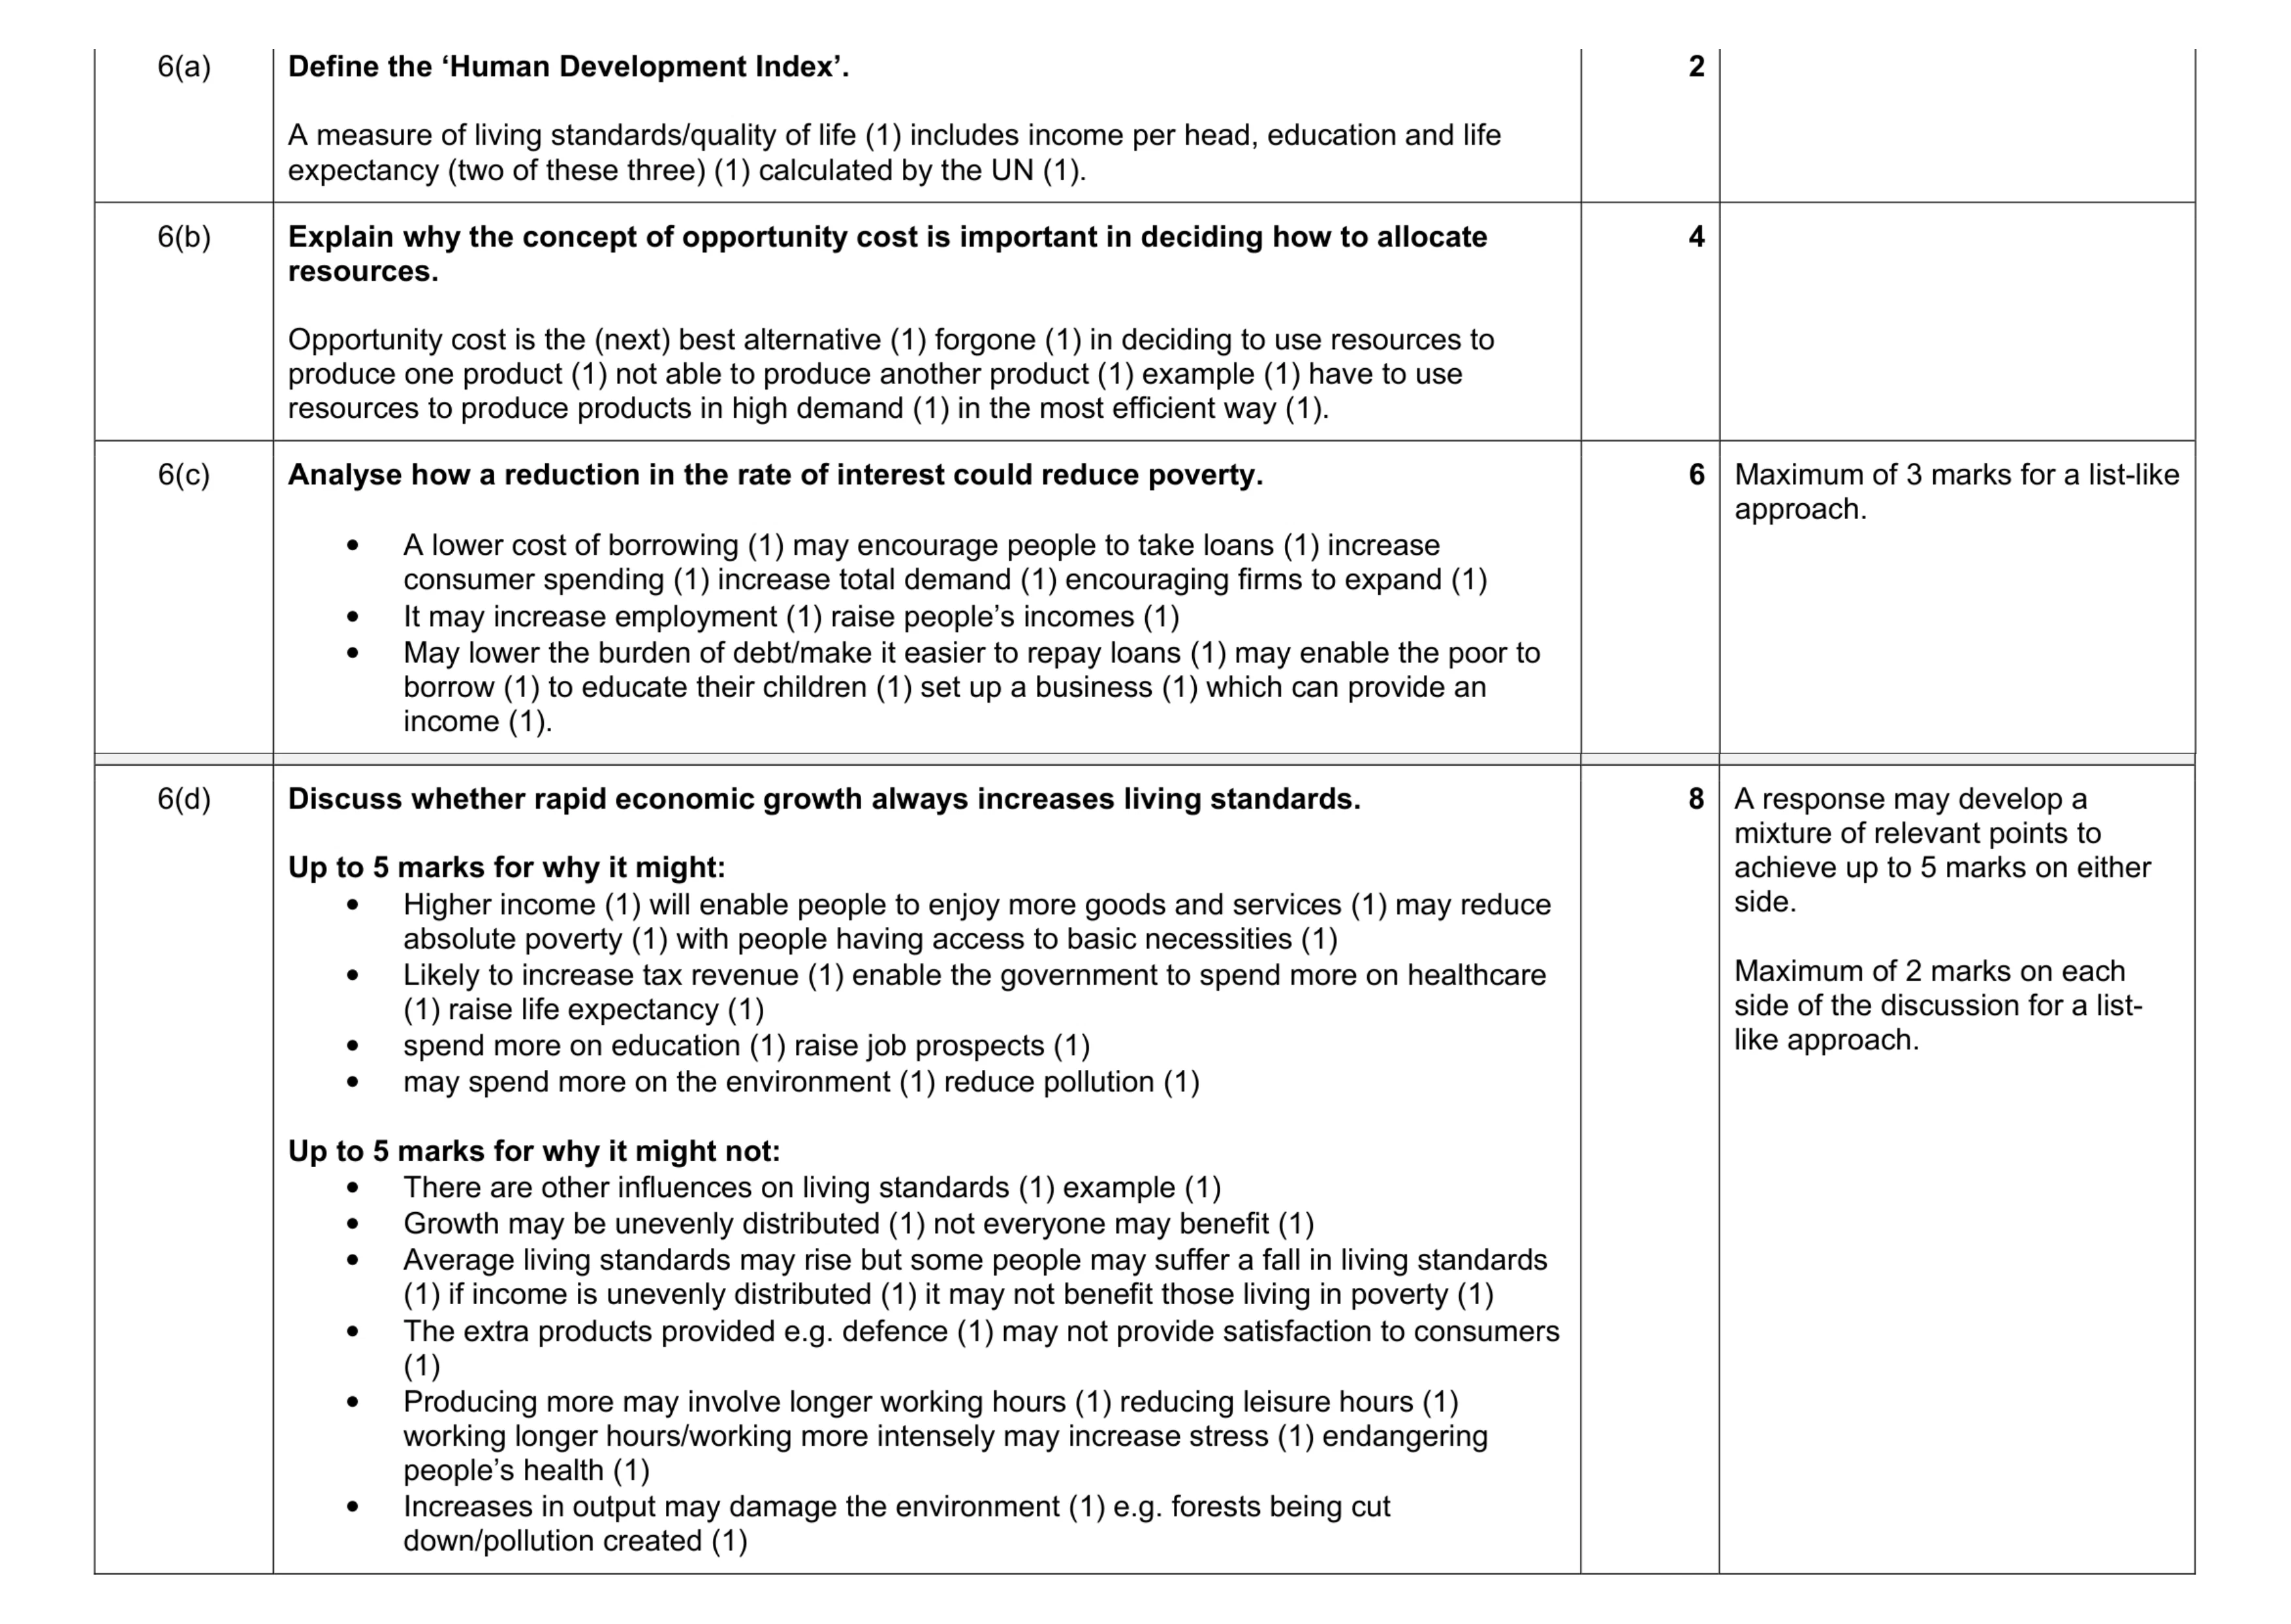 20
20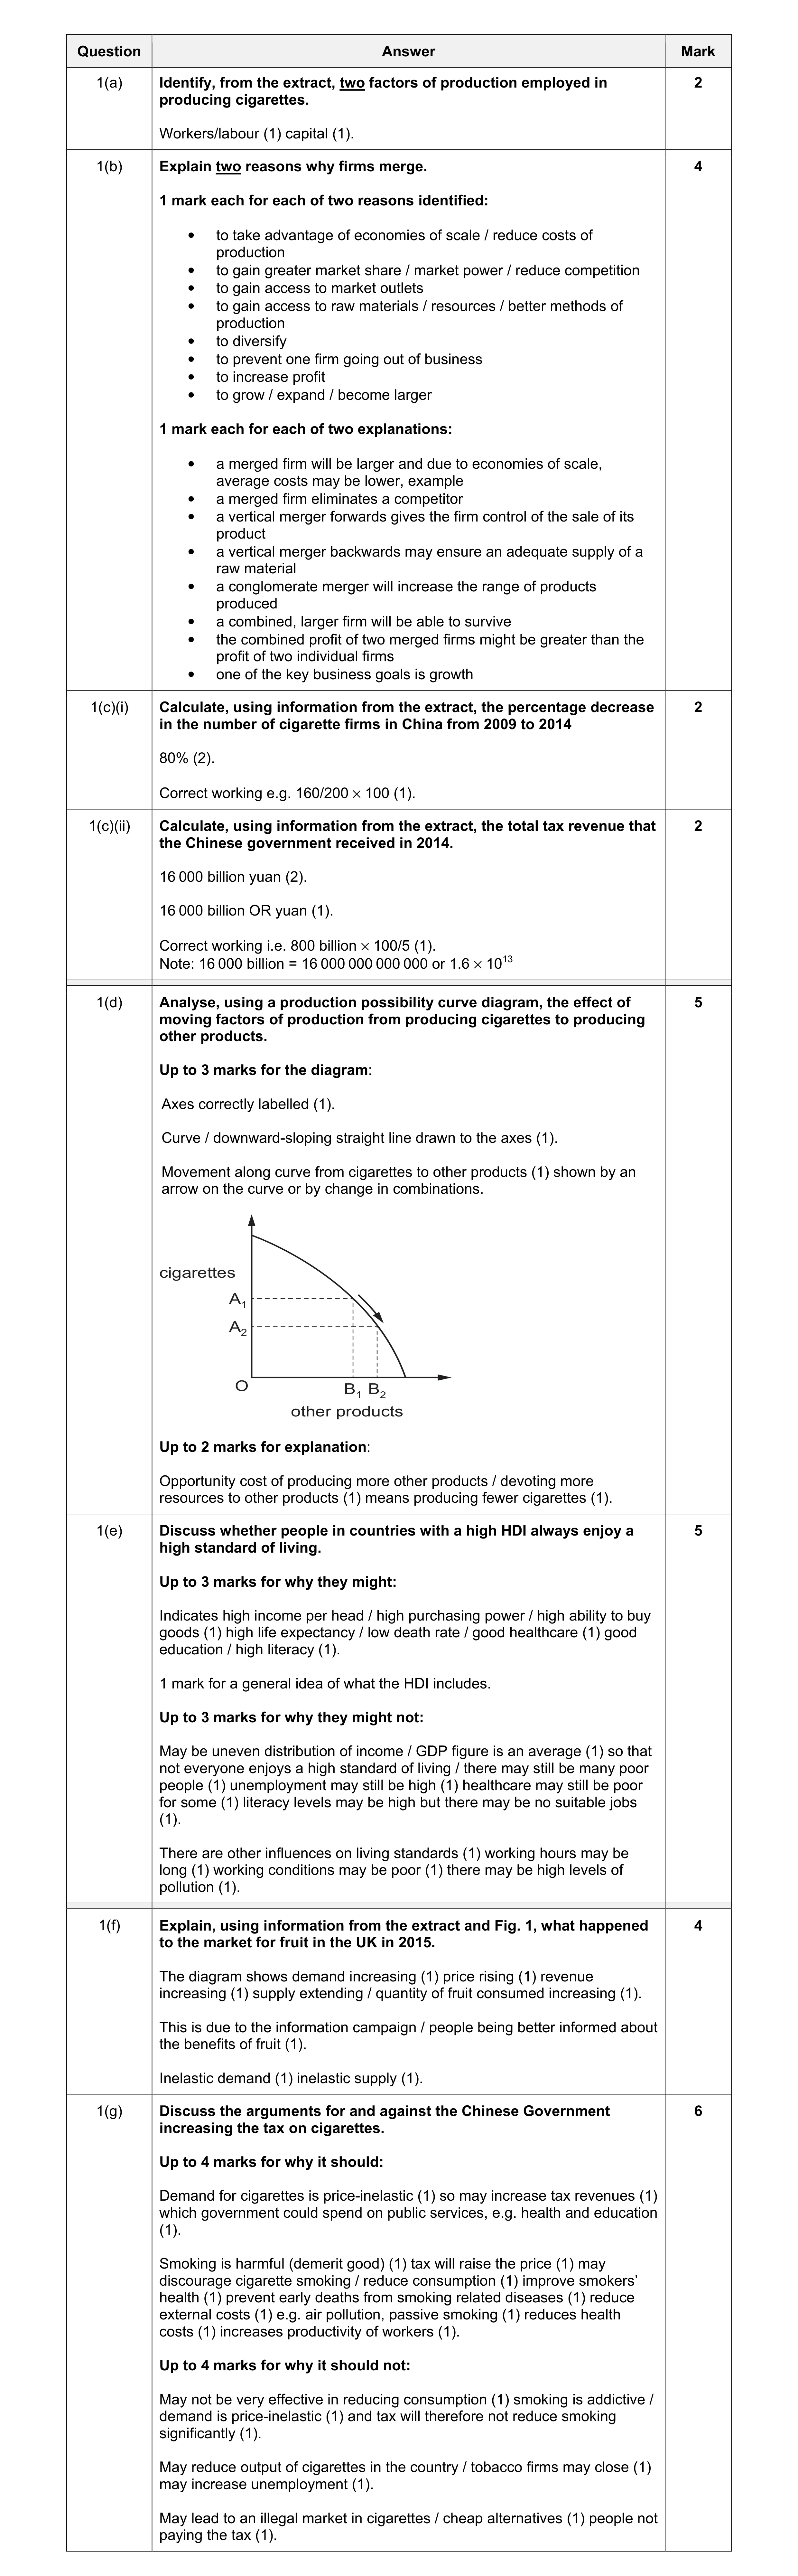 30
30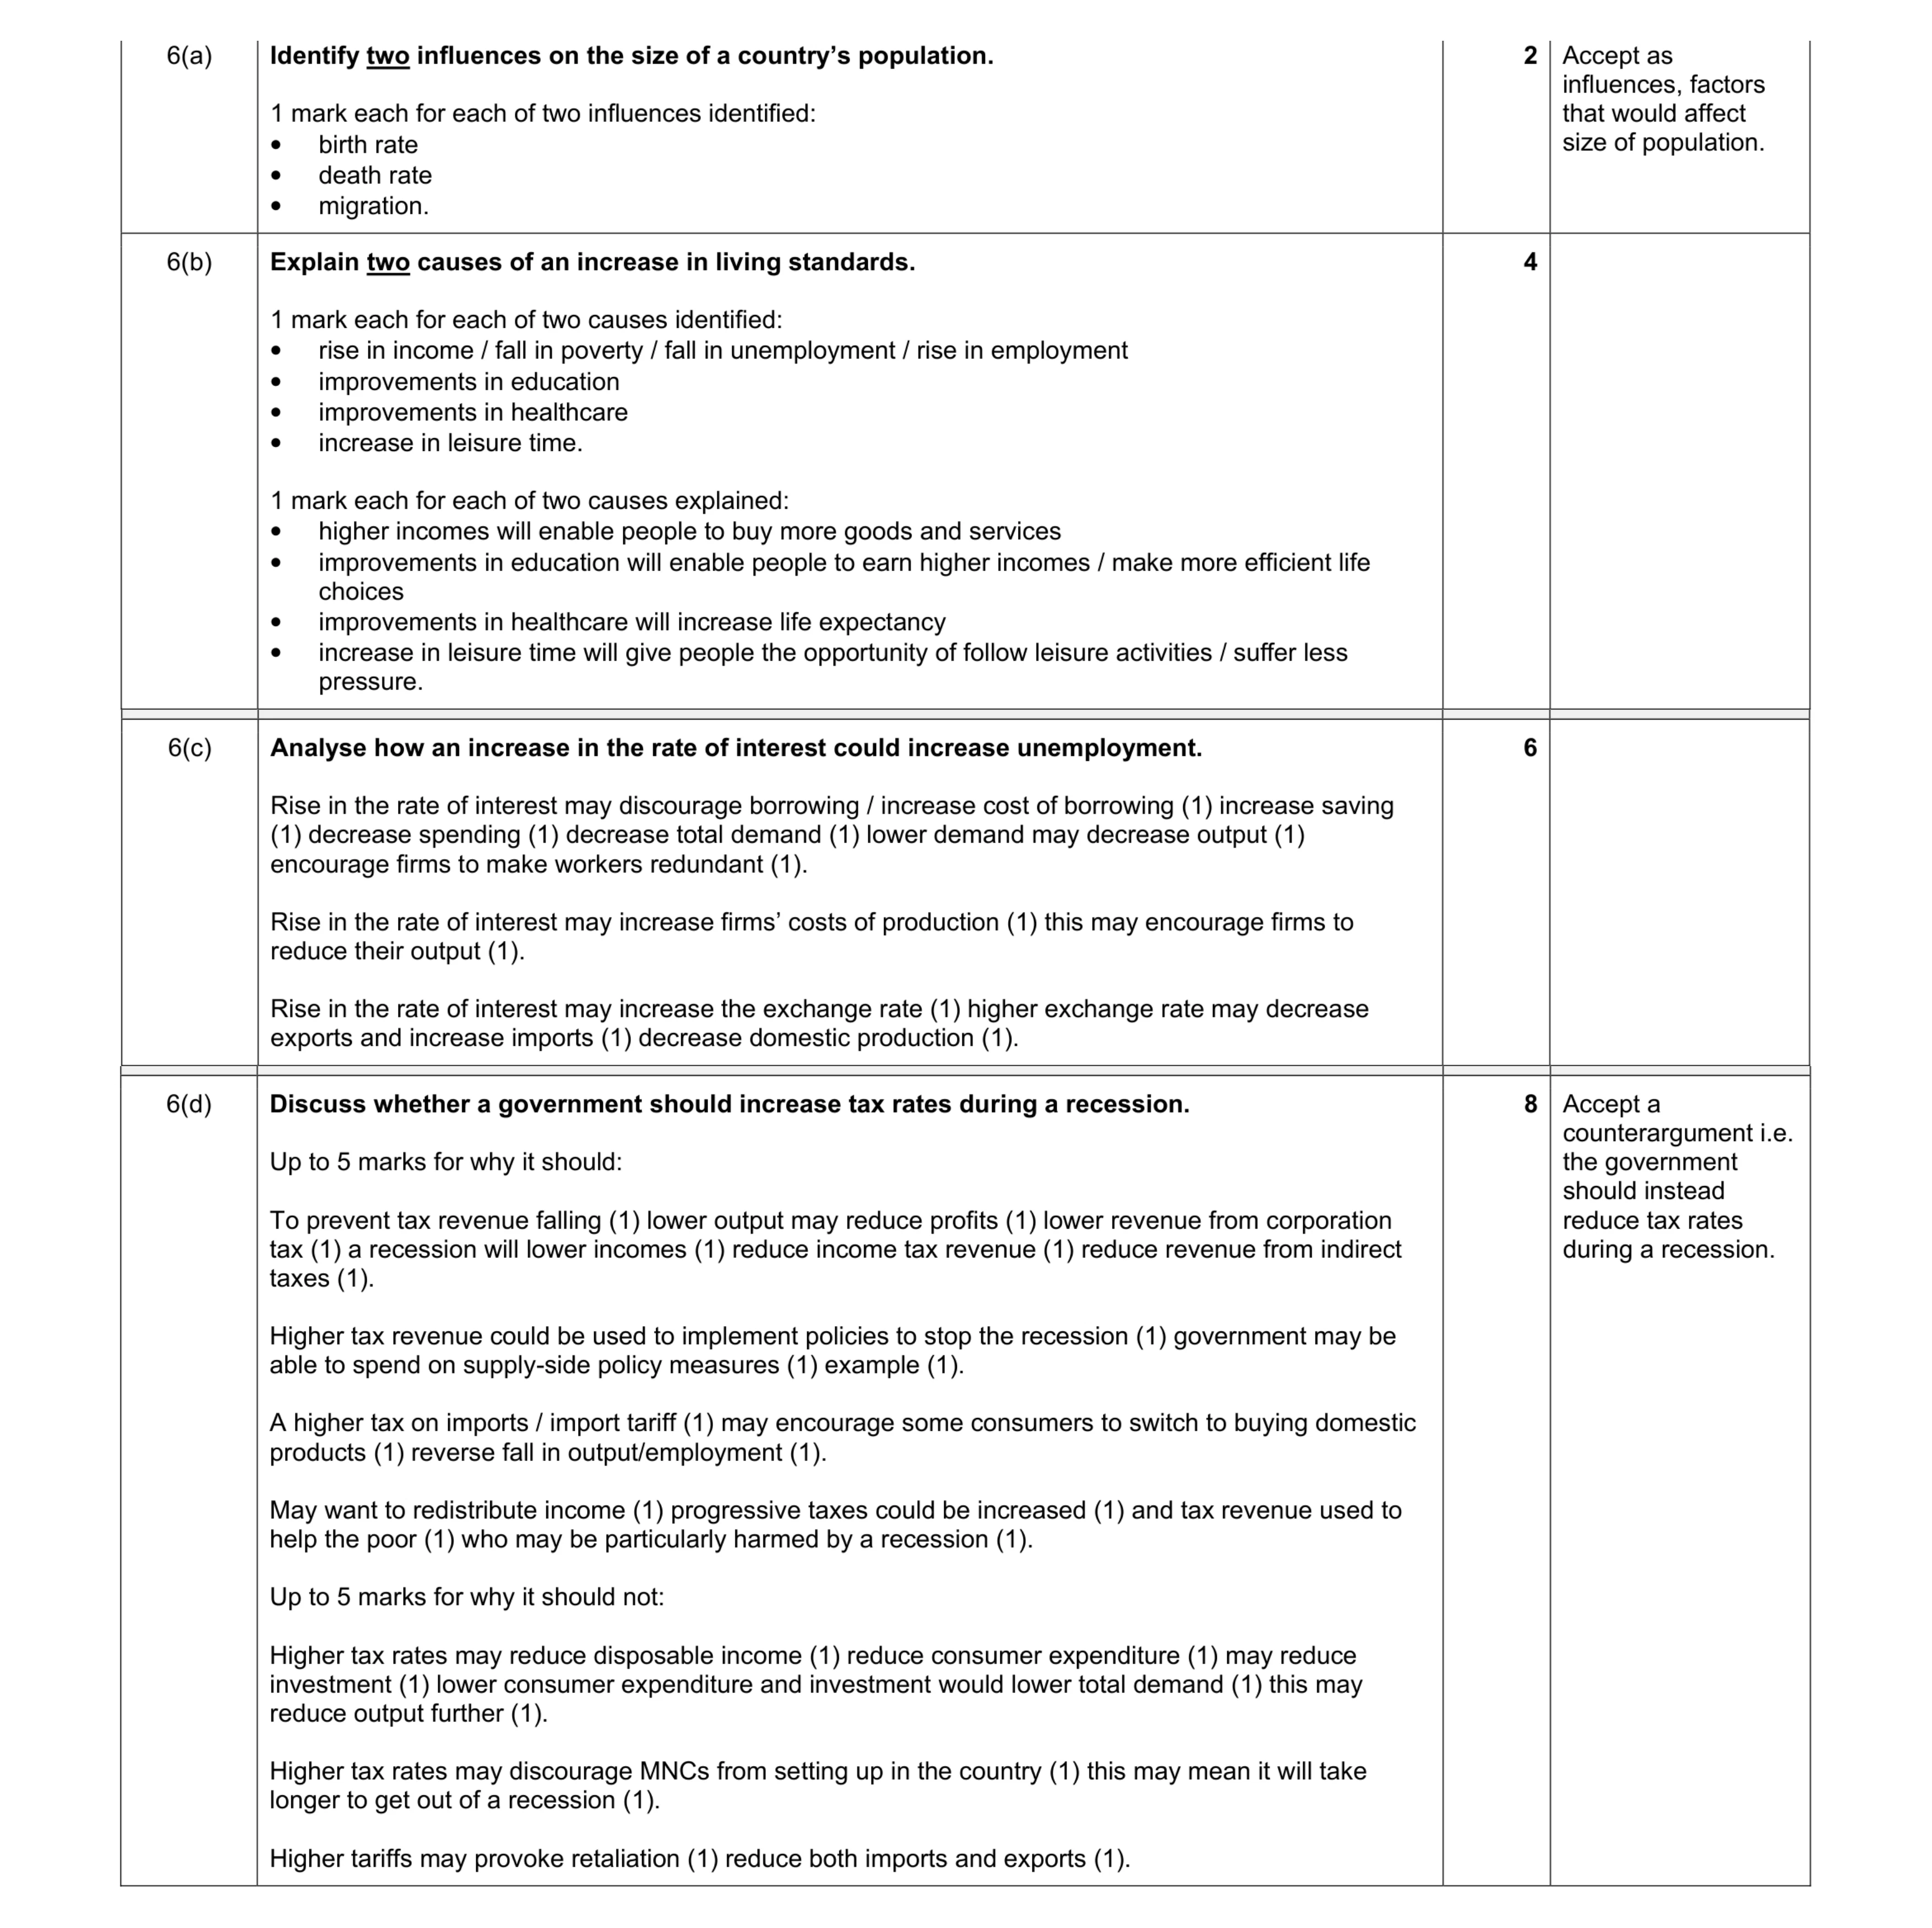 20
20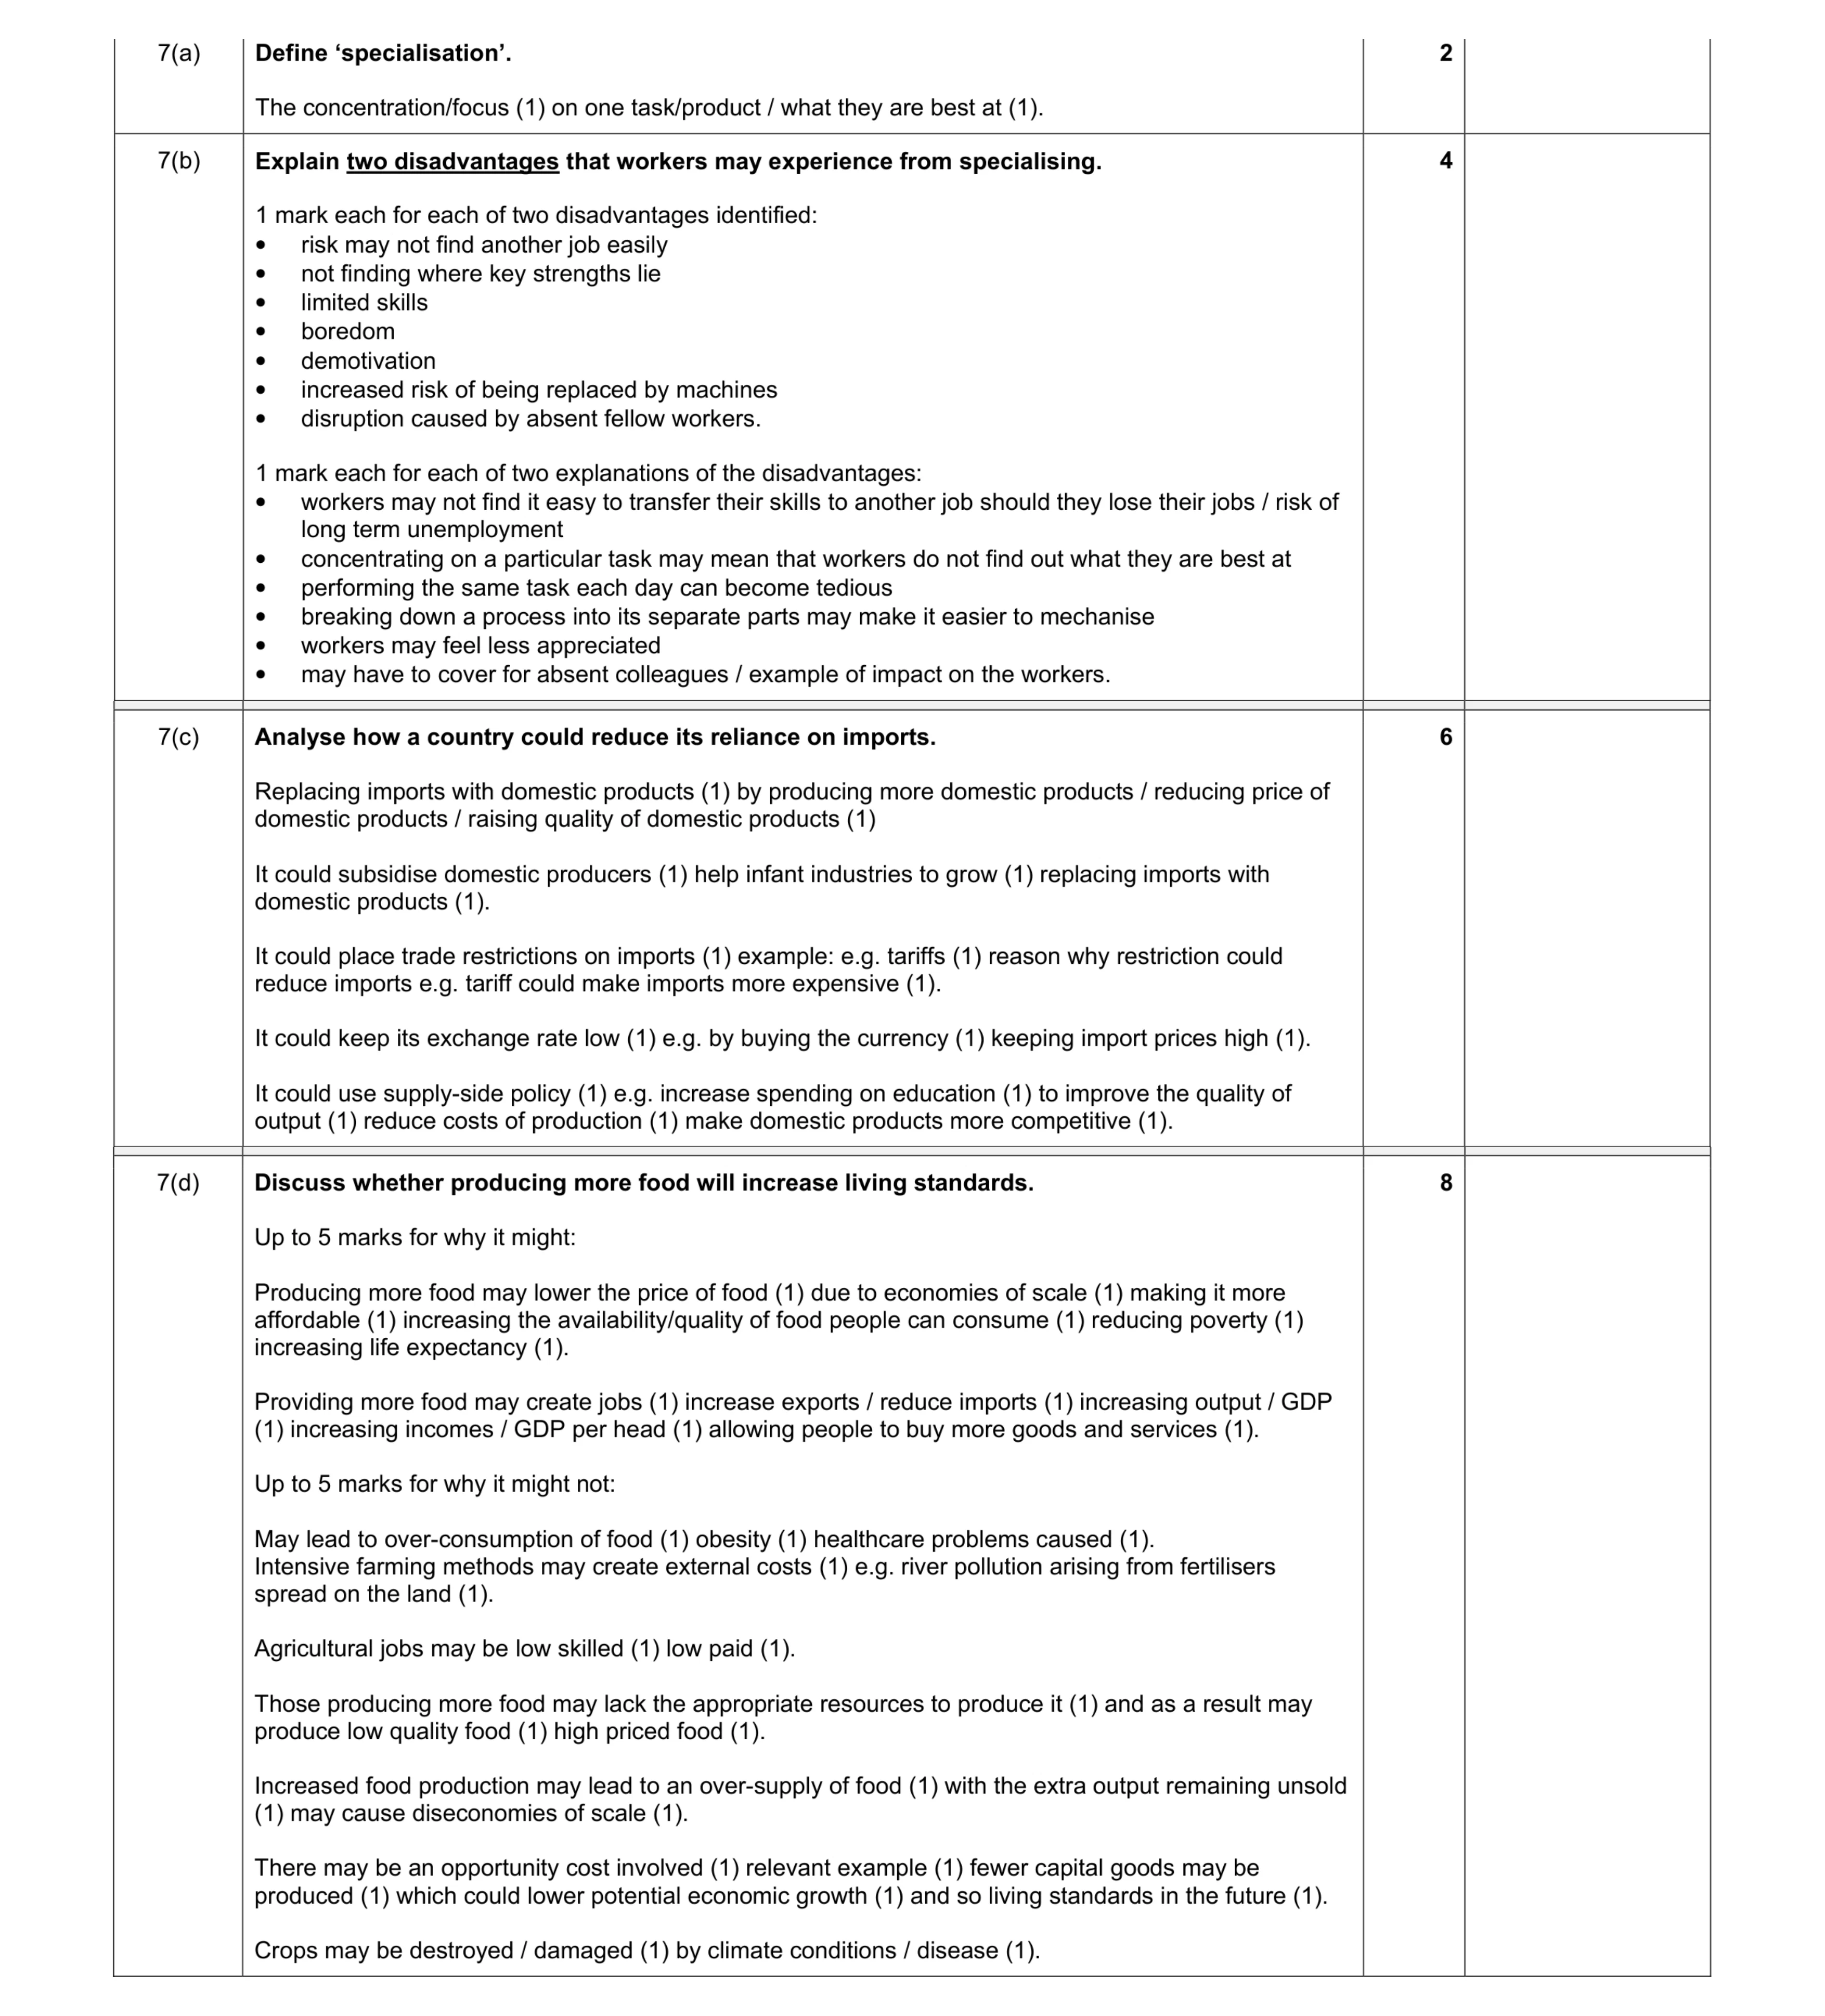 20
20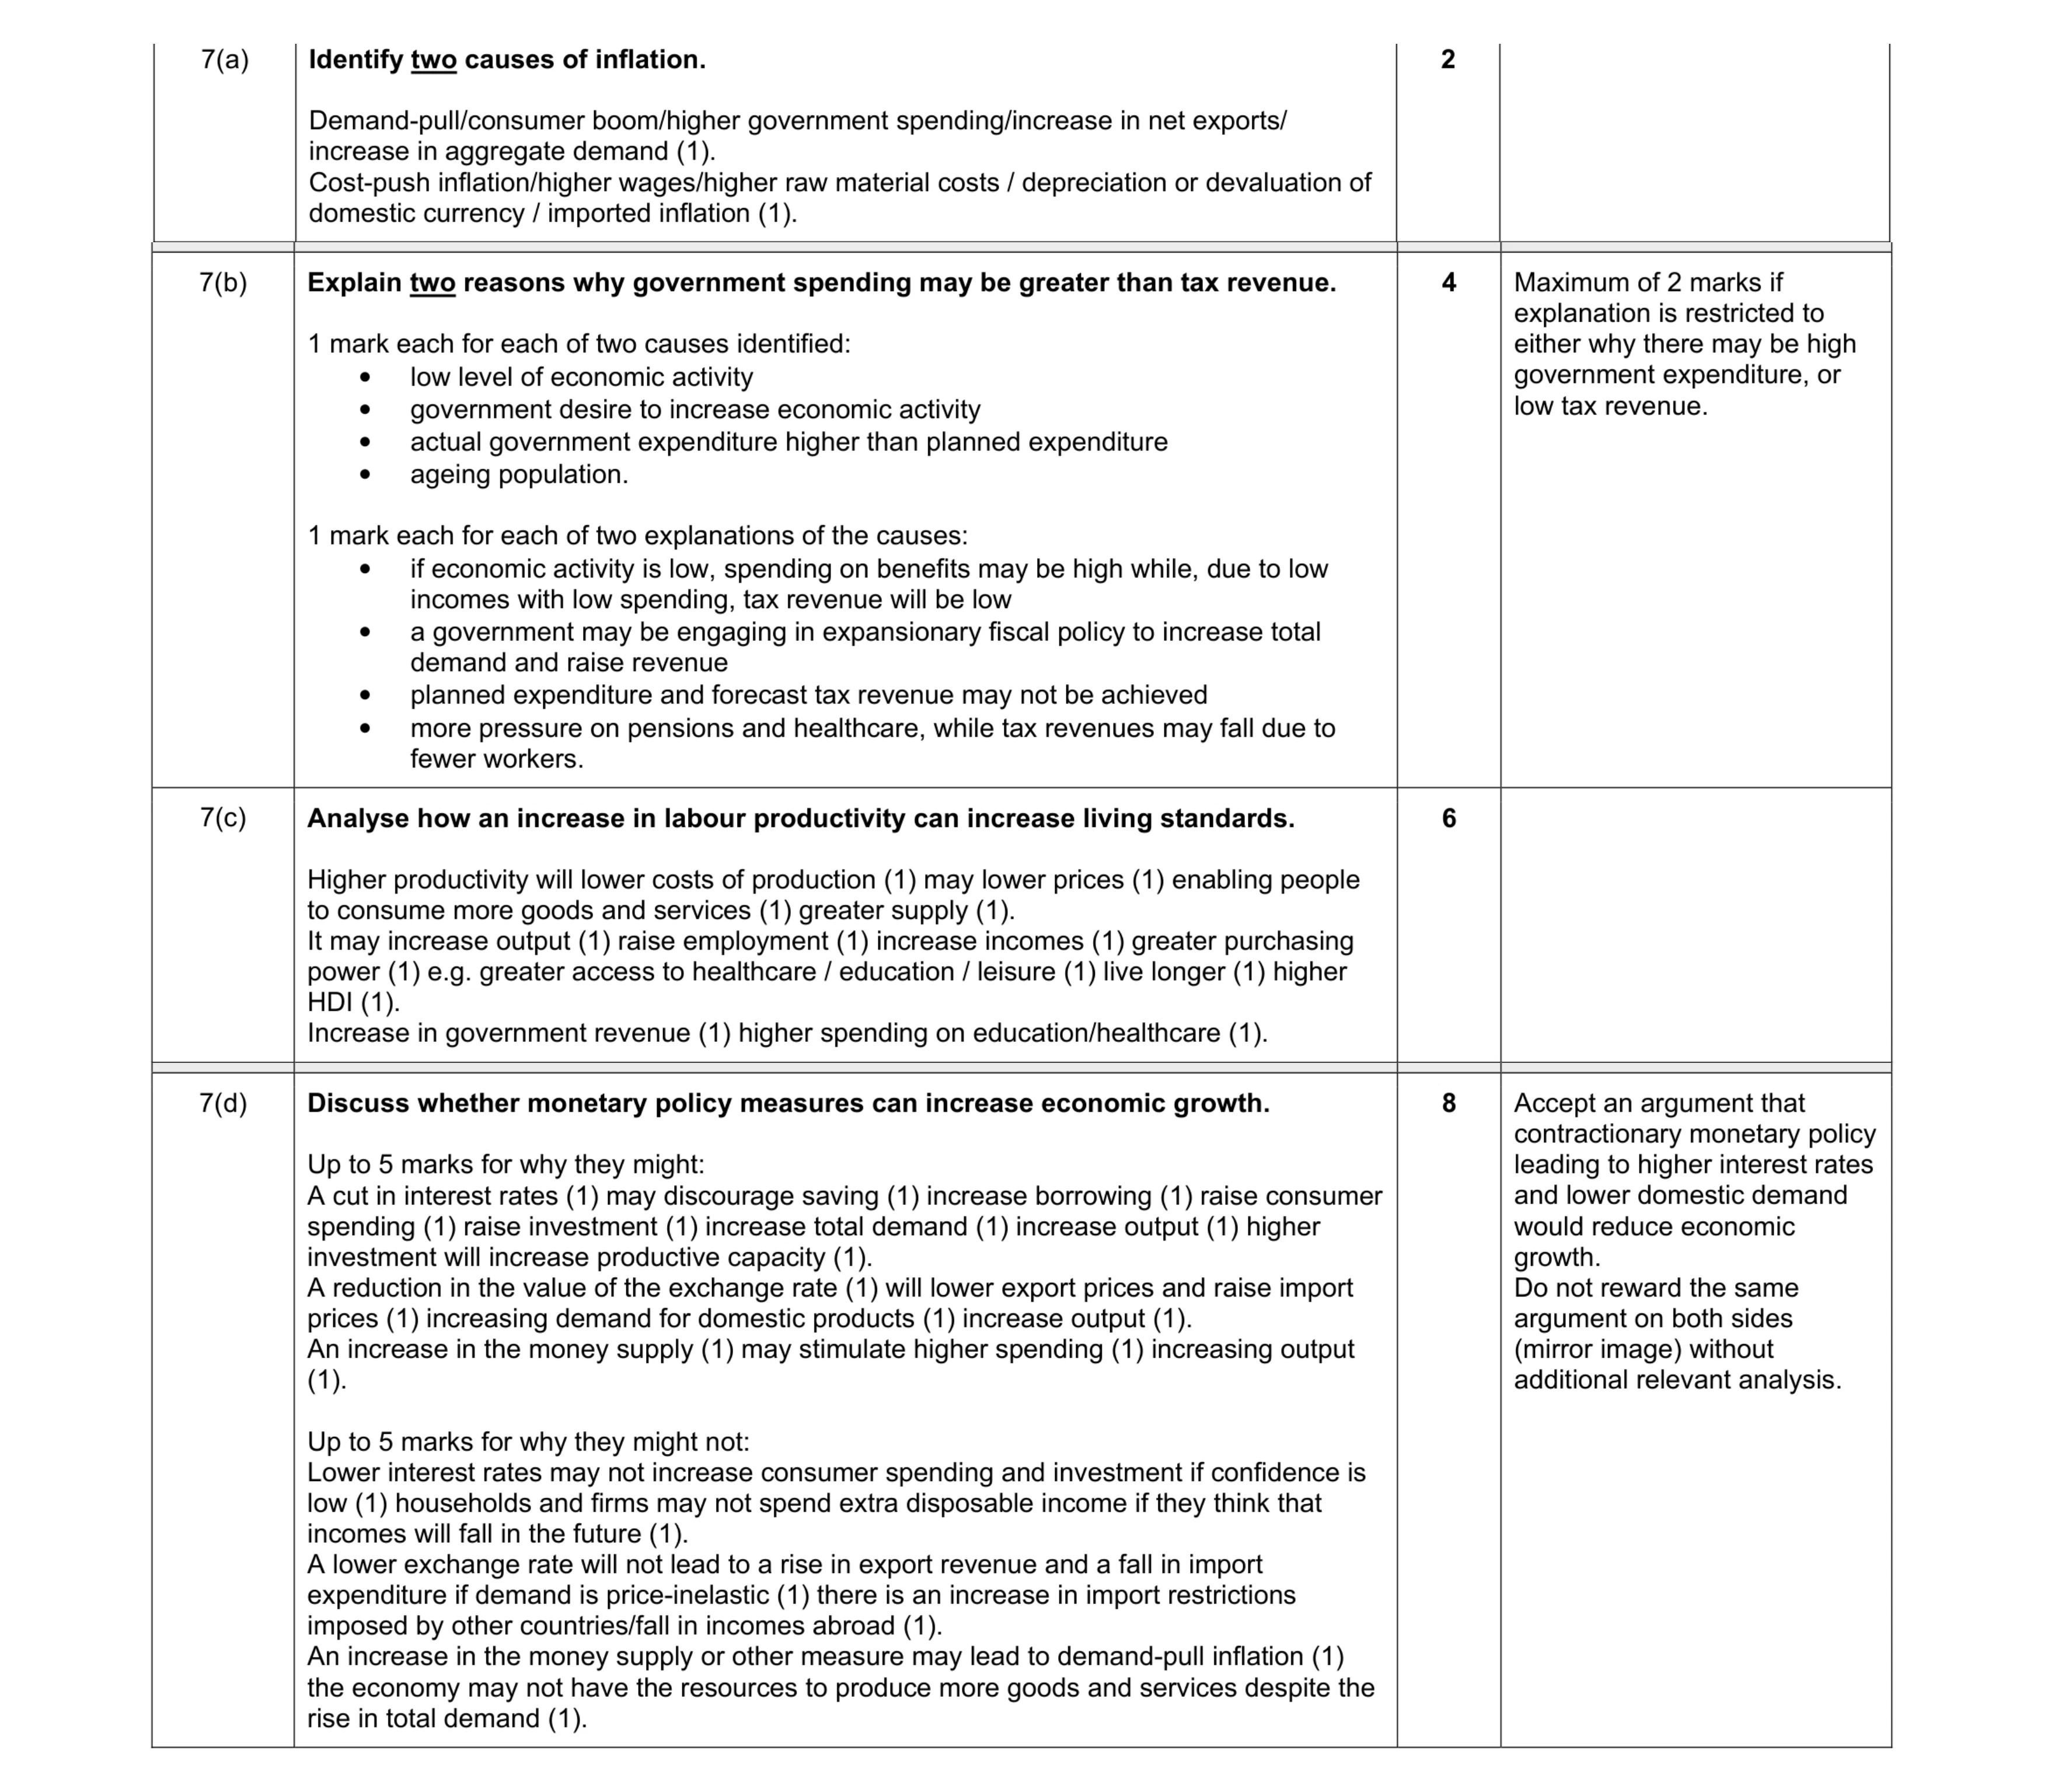 20
20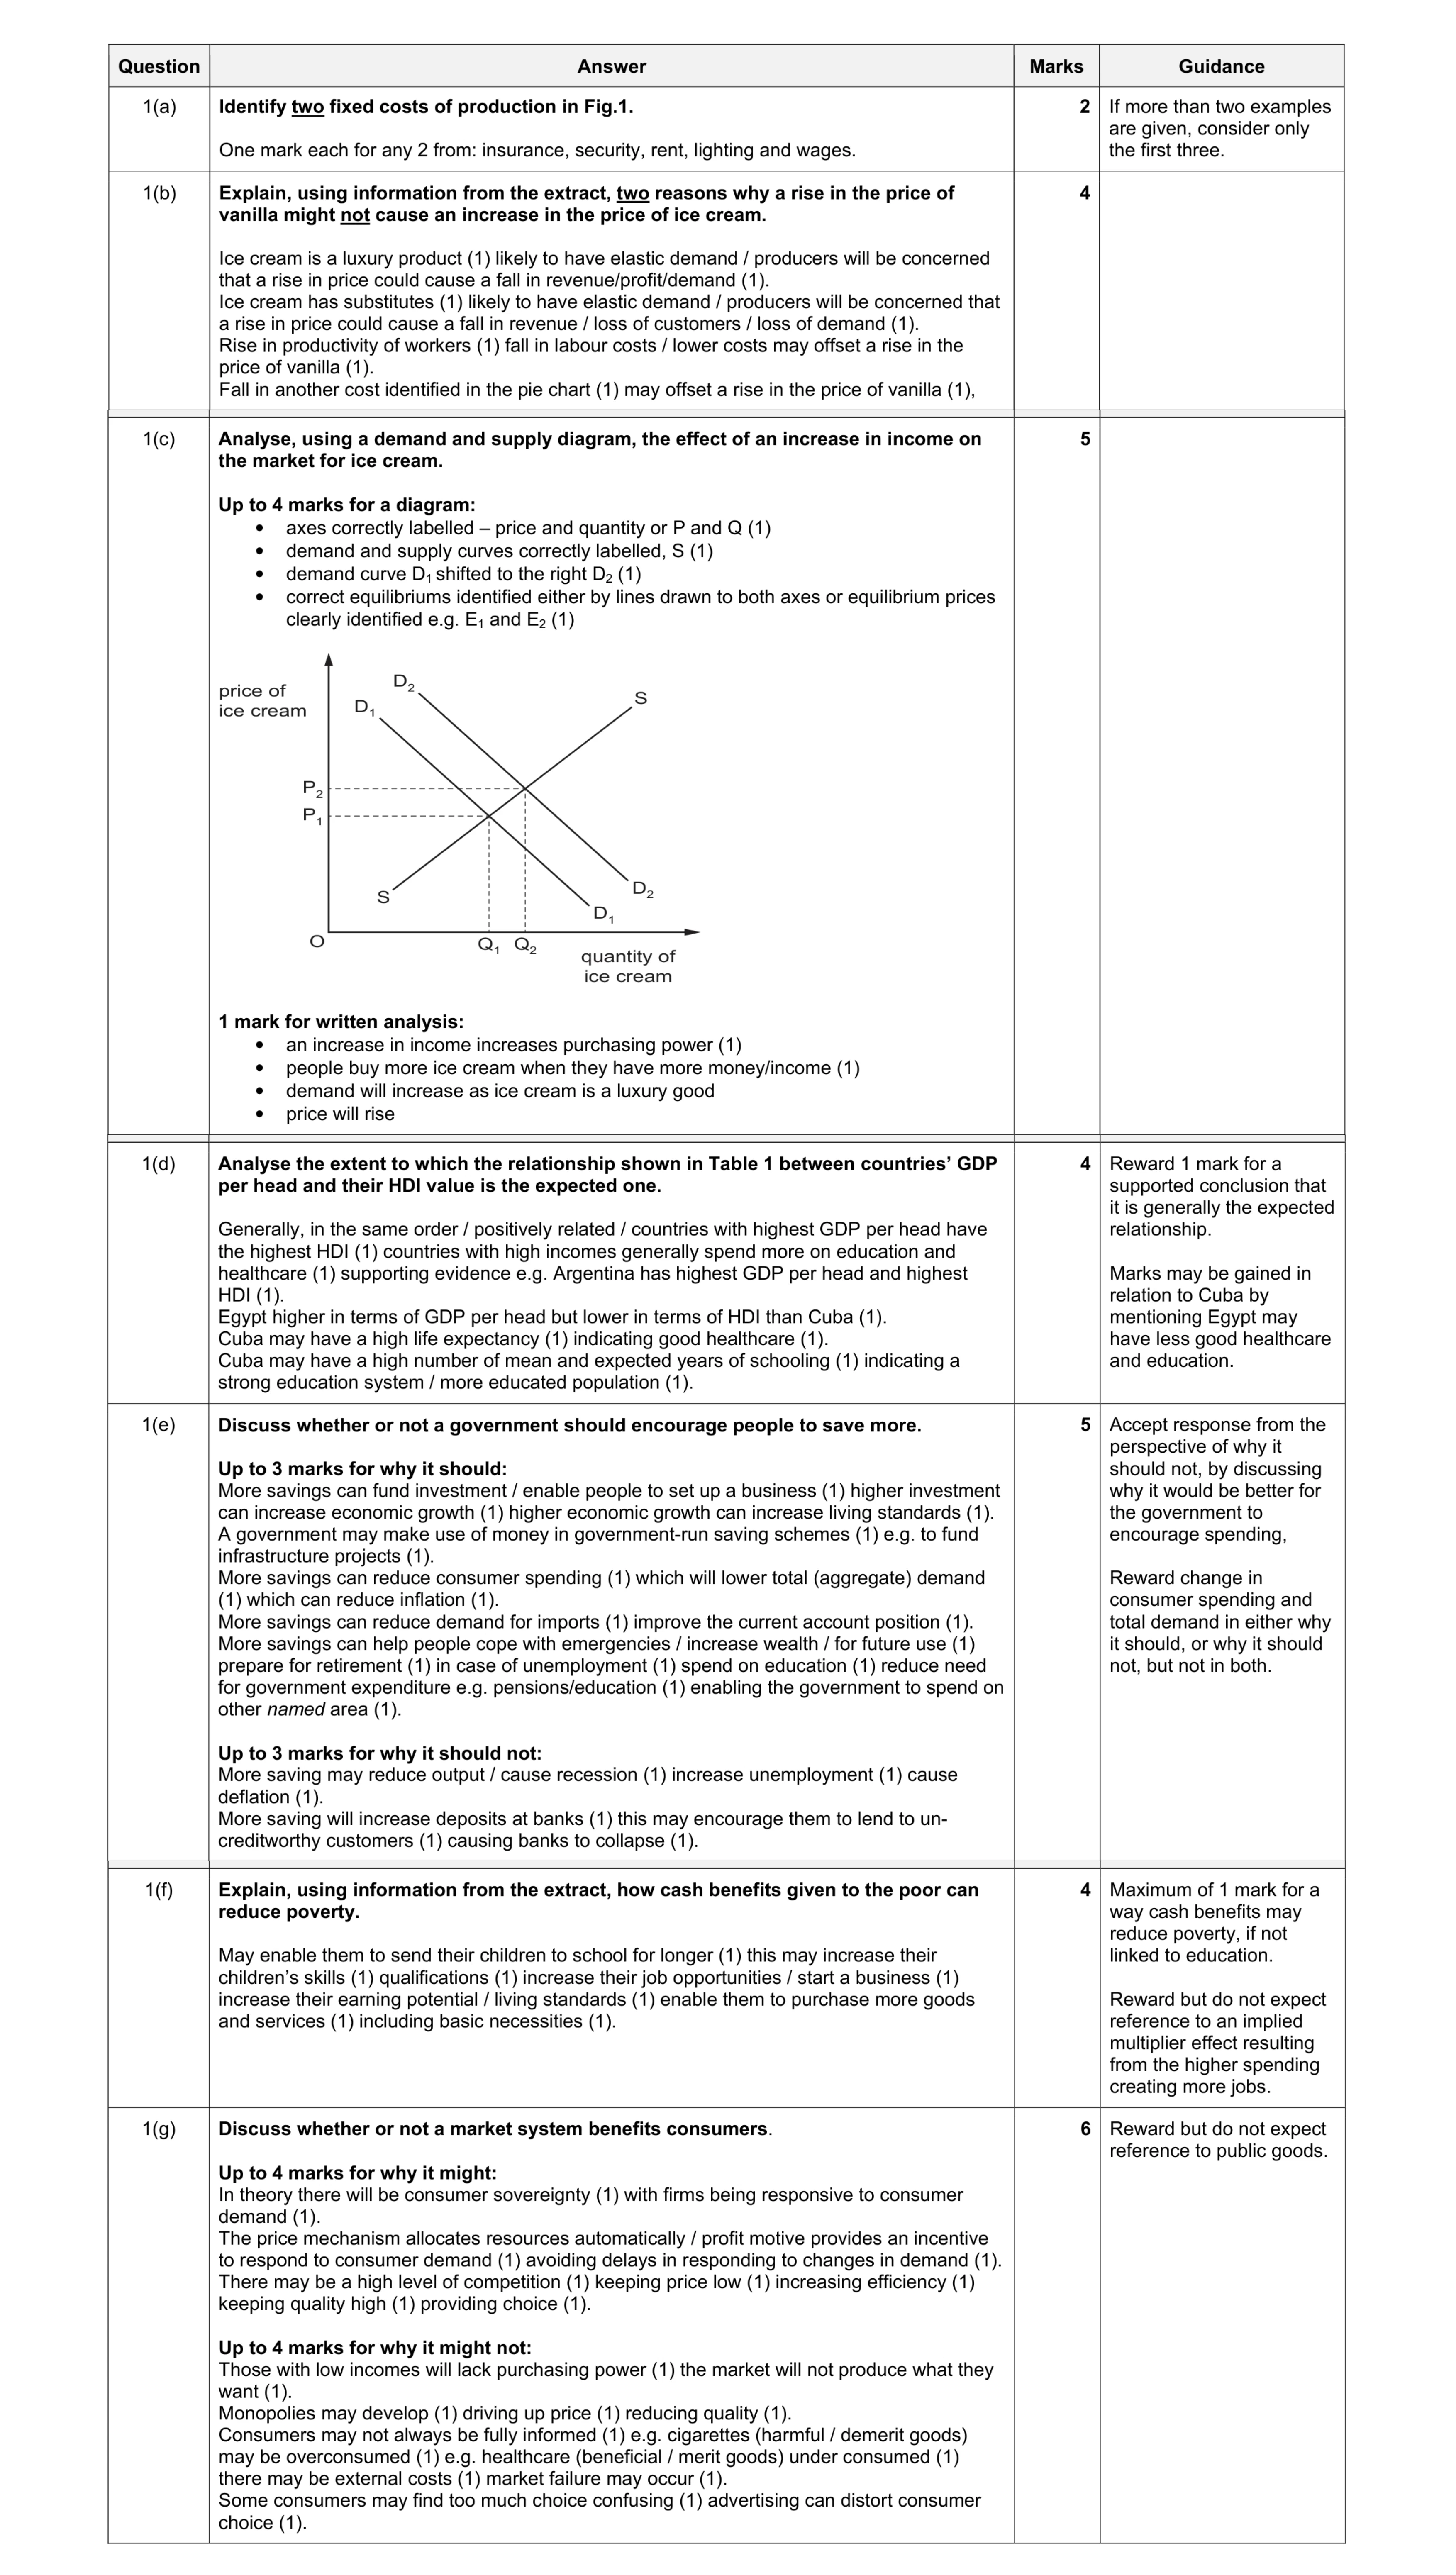 30
30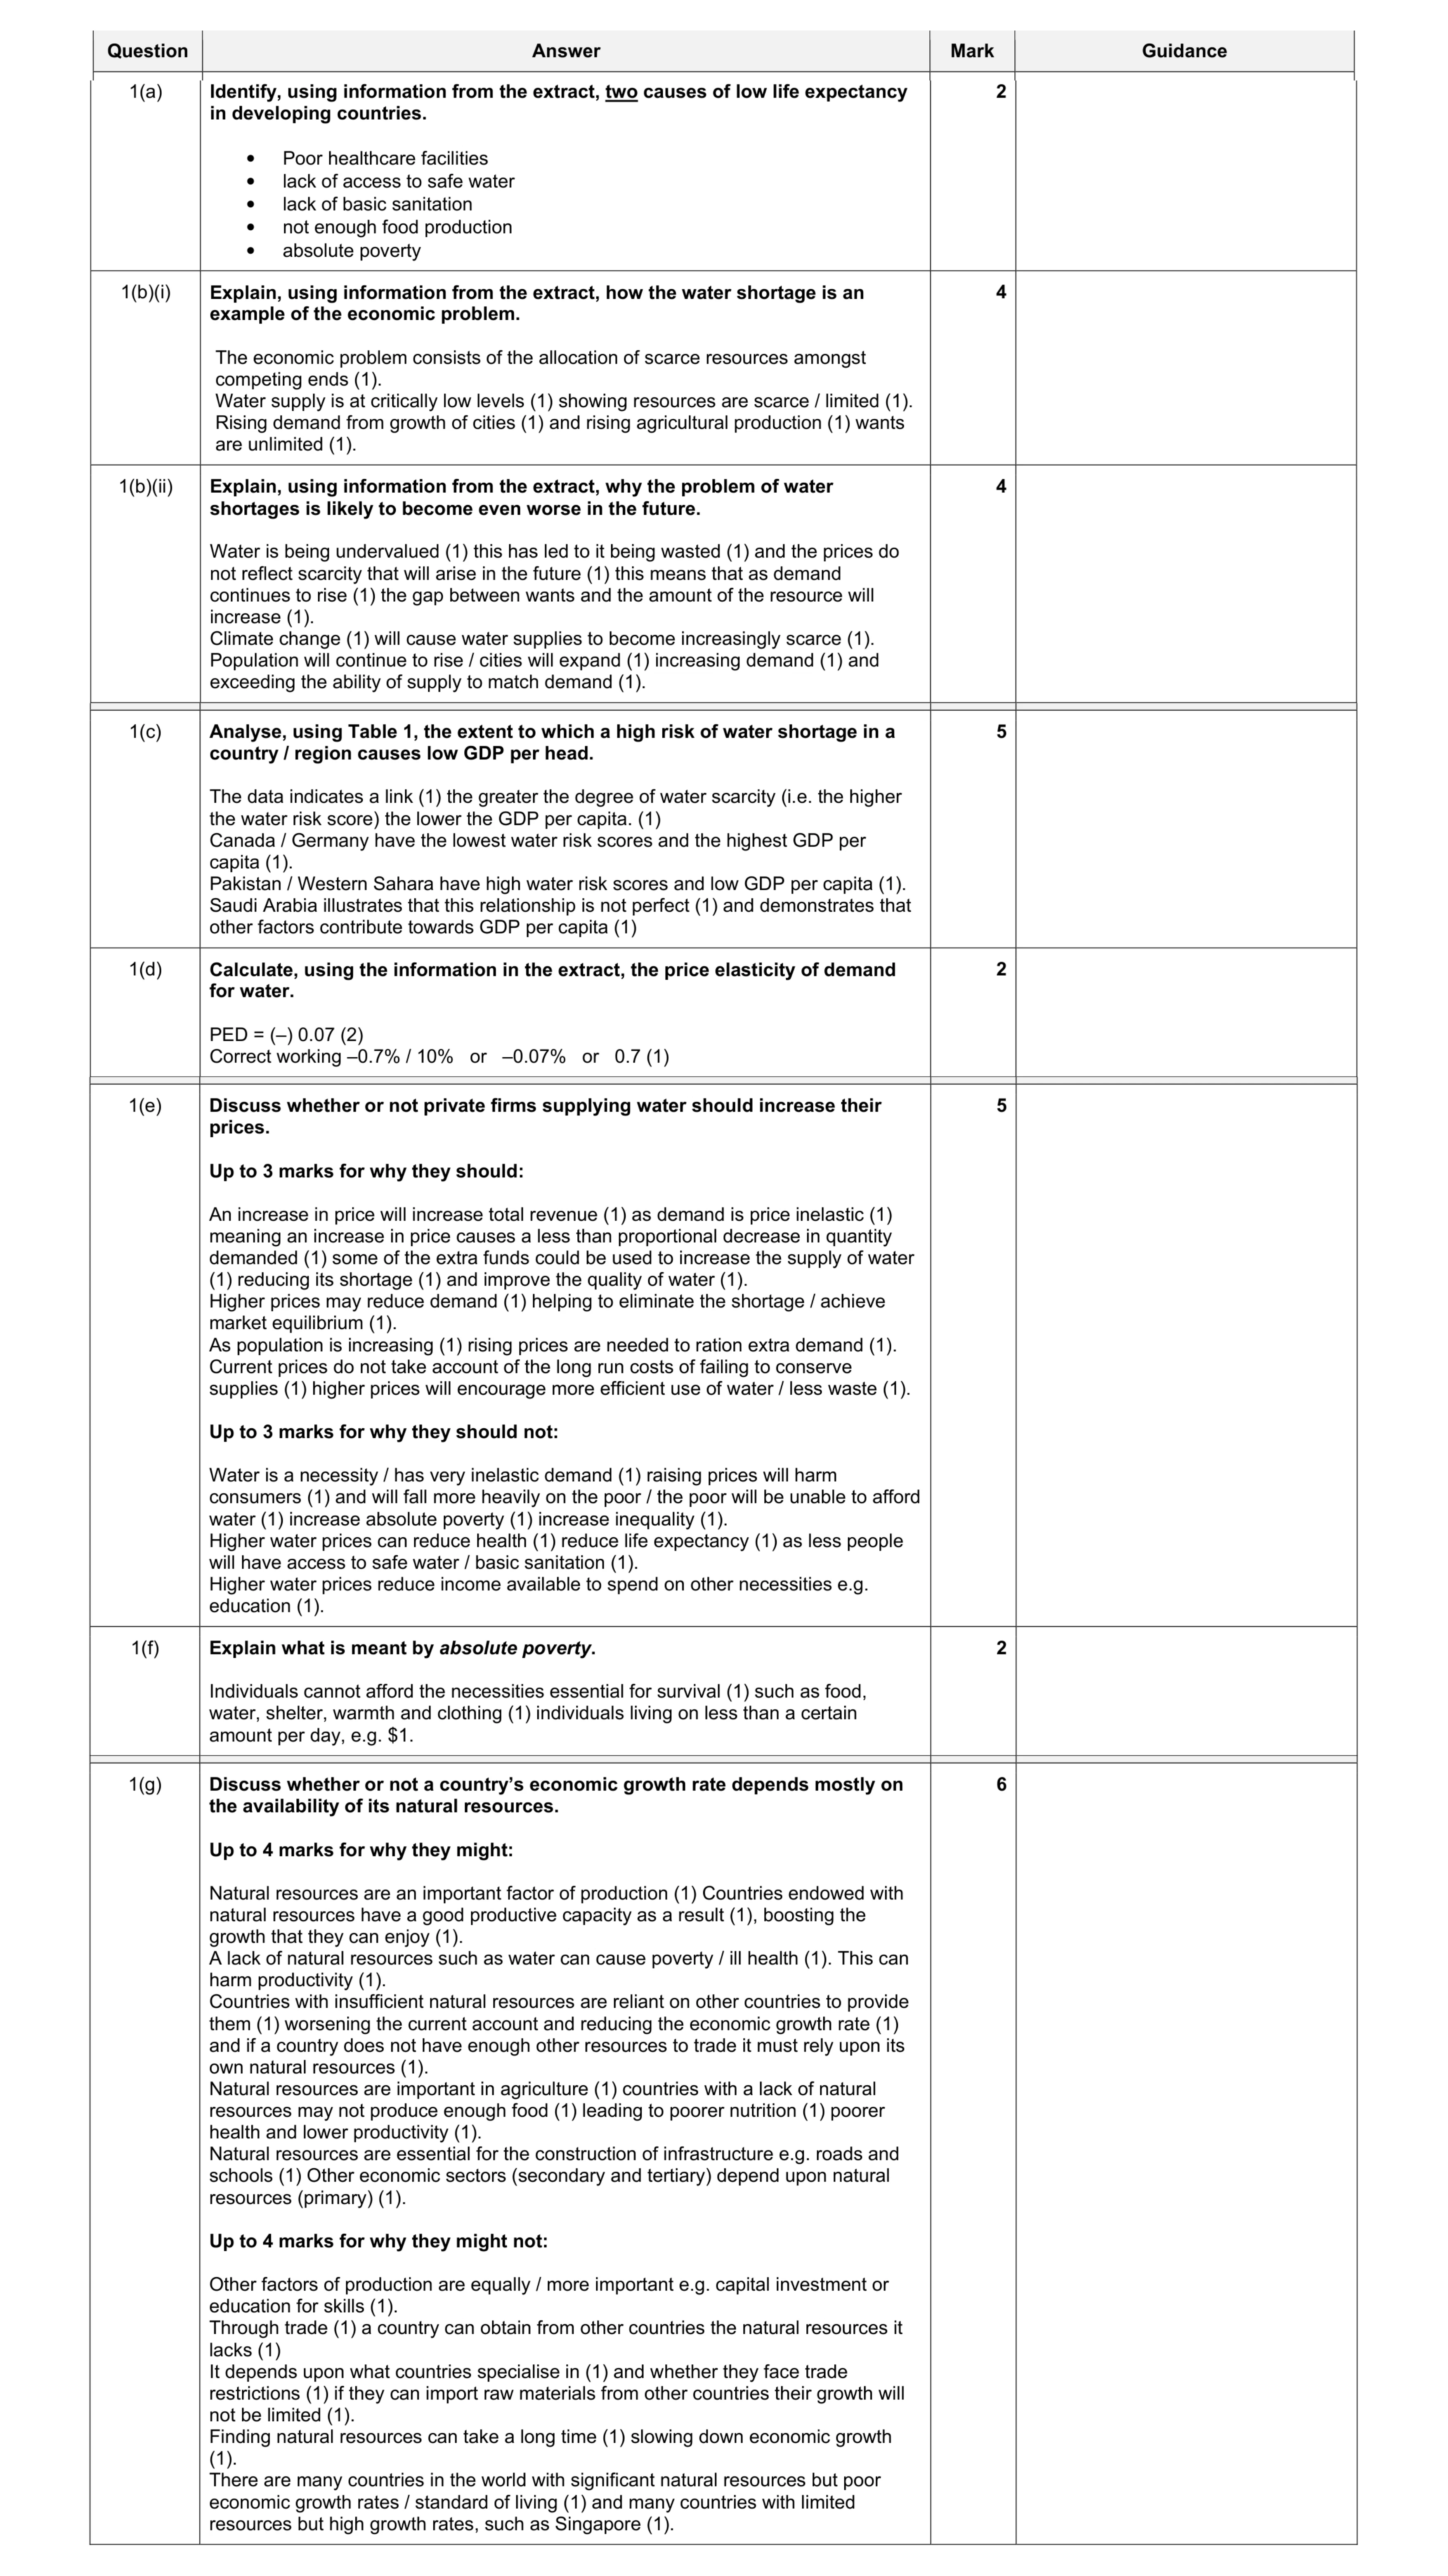 30
30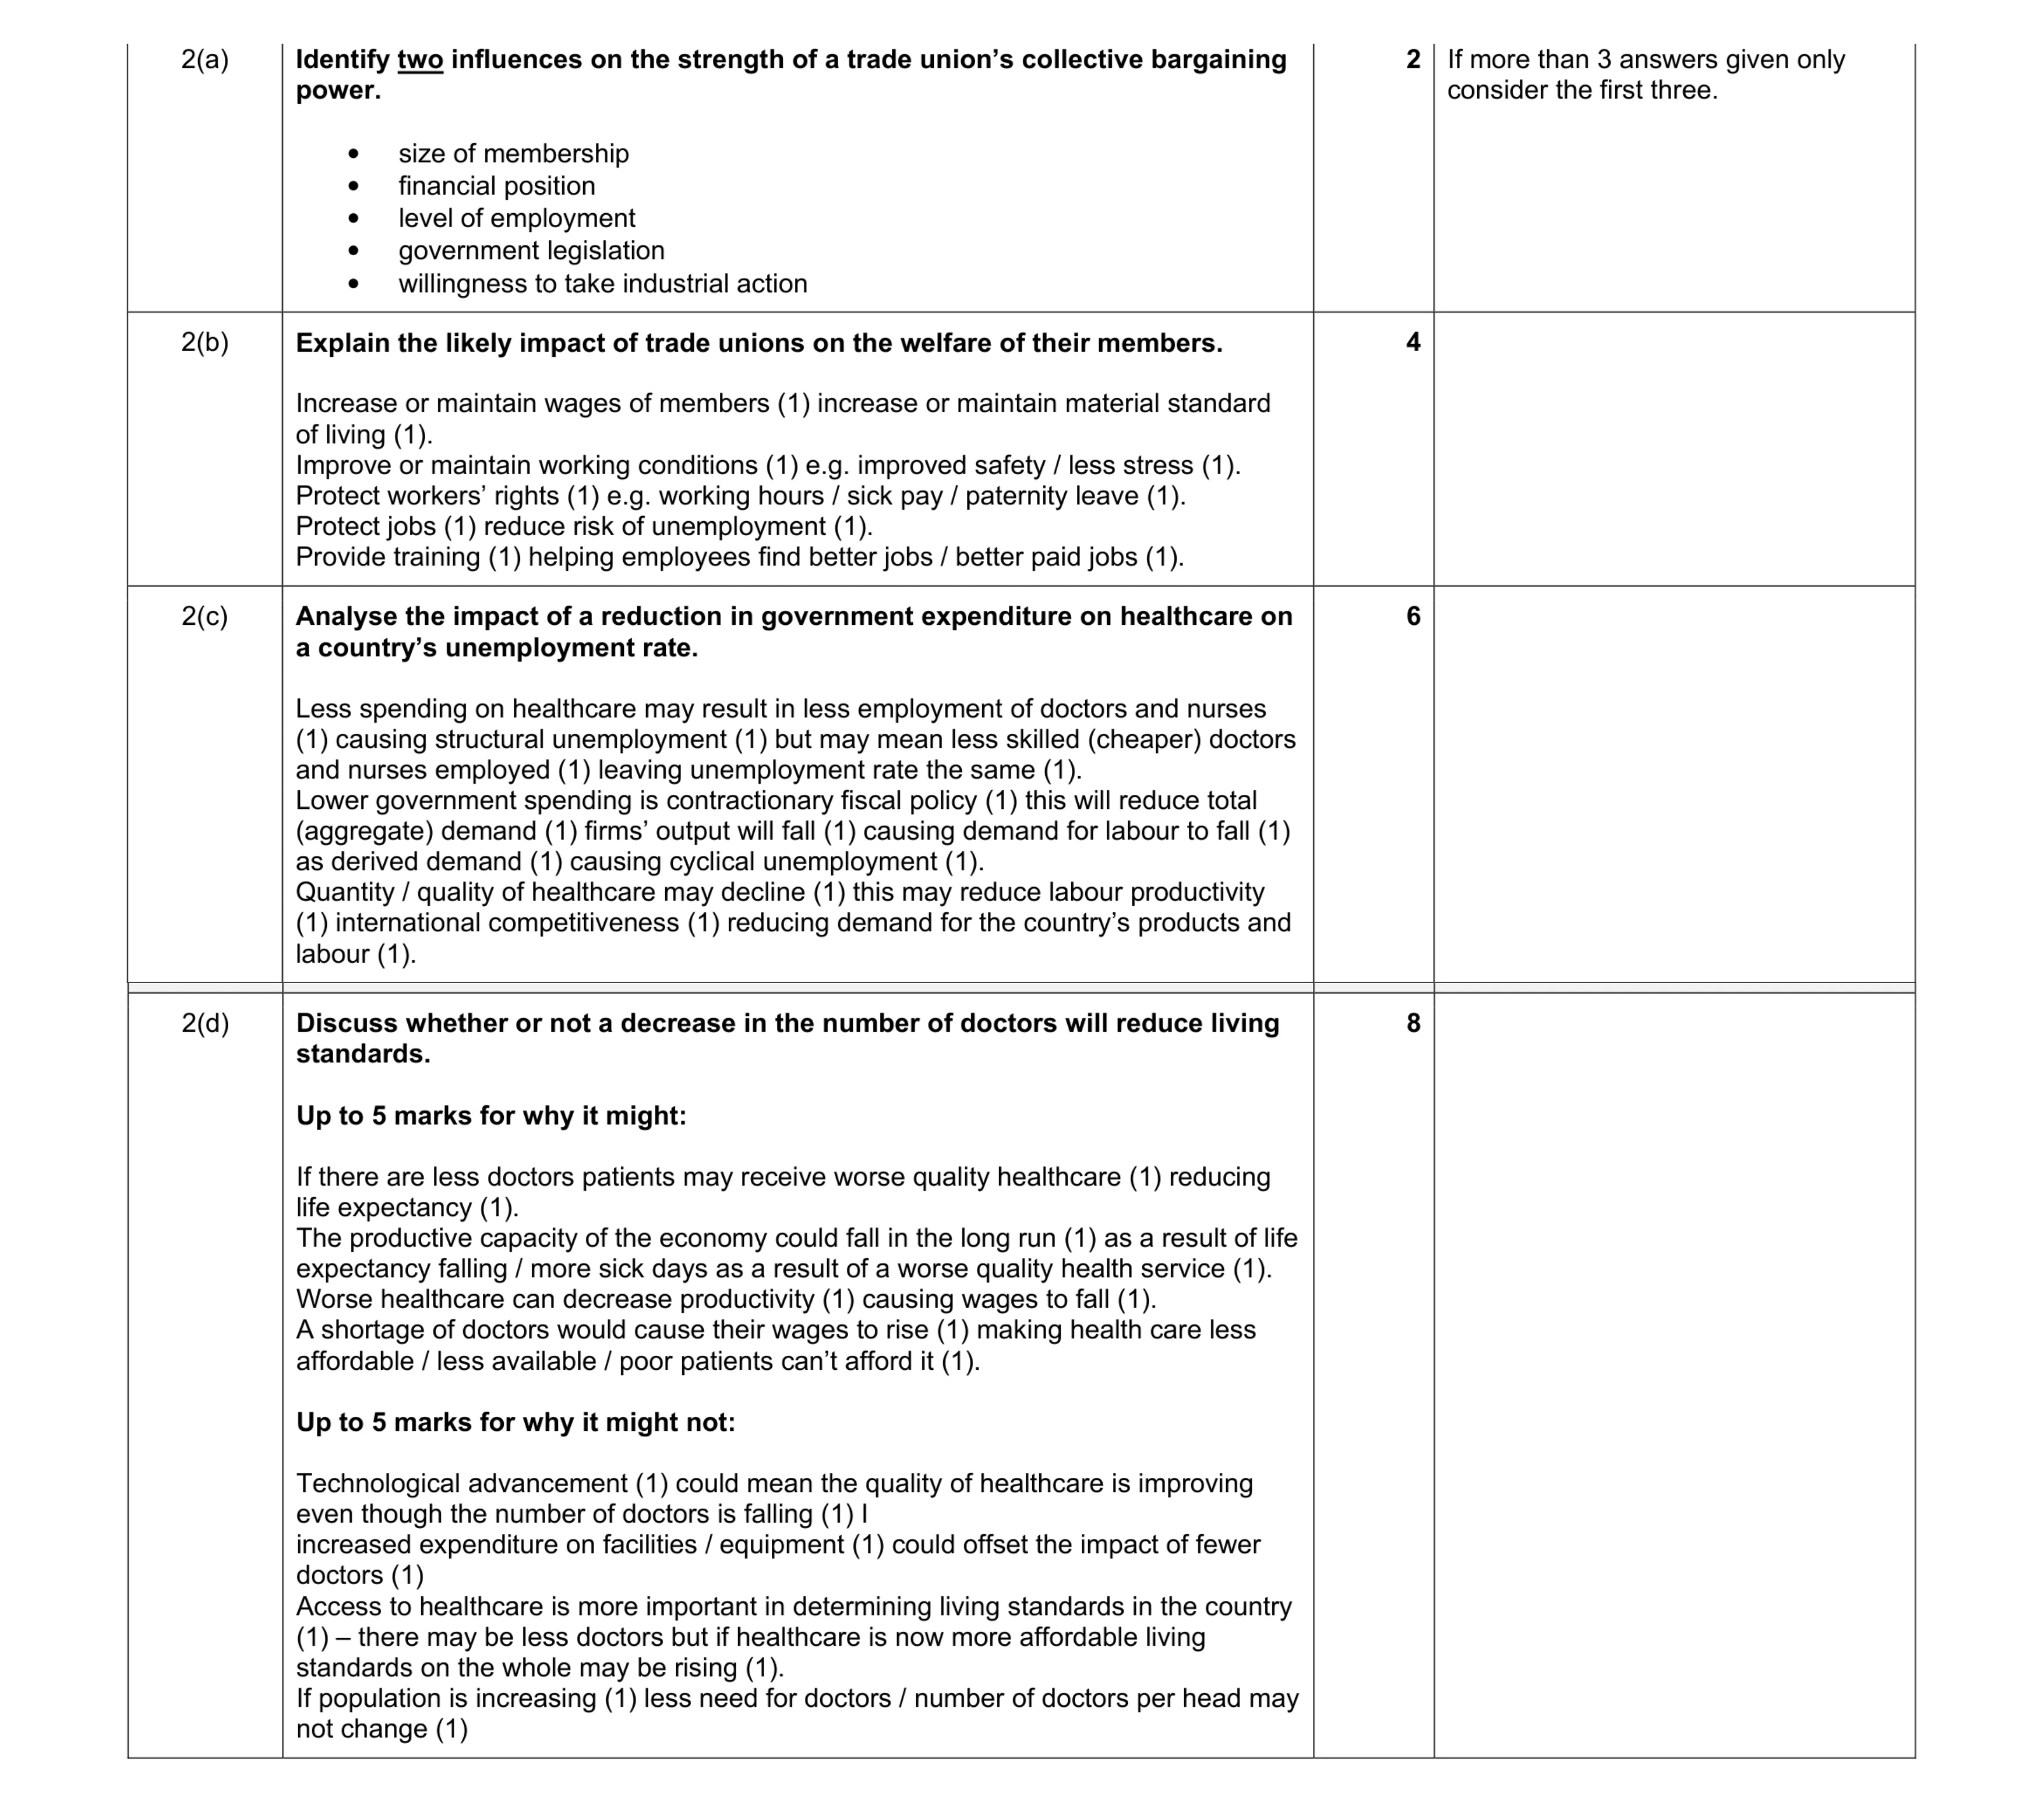 20
20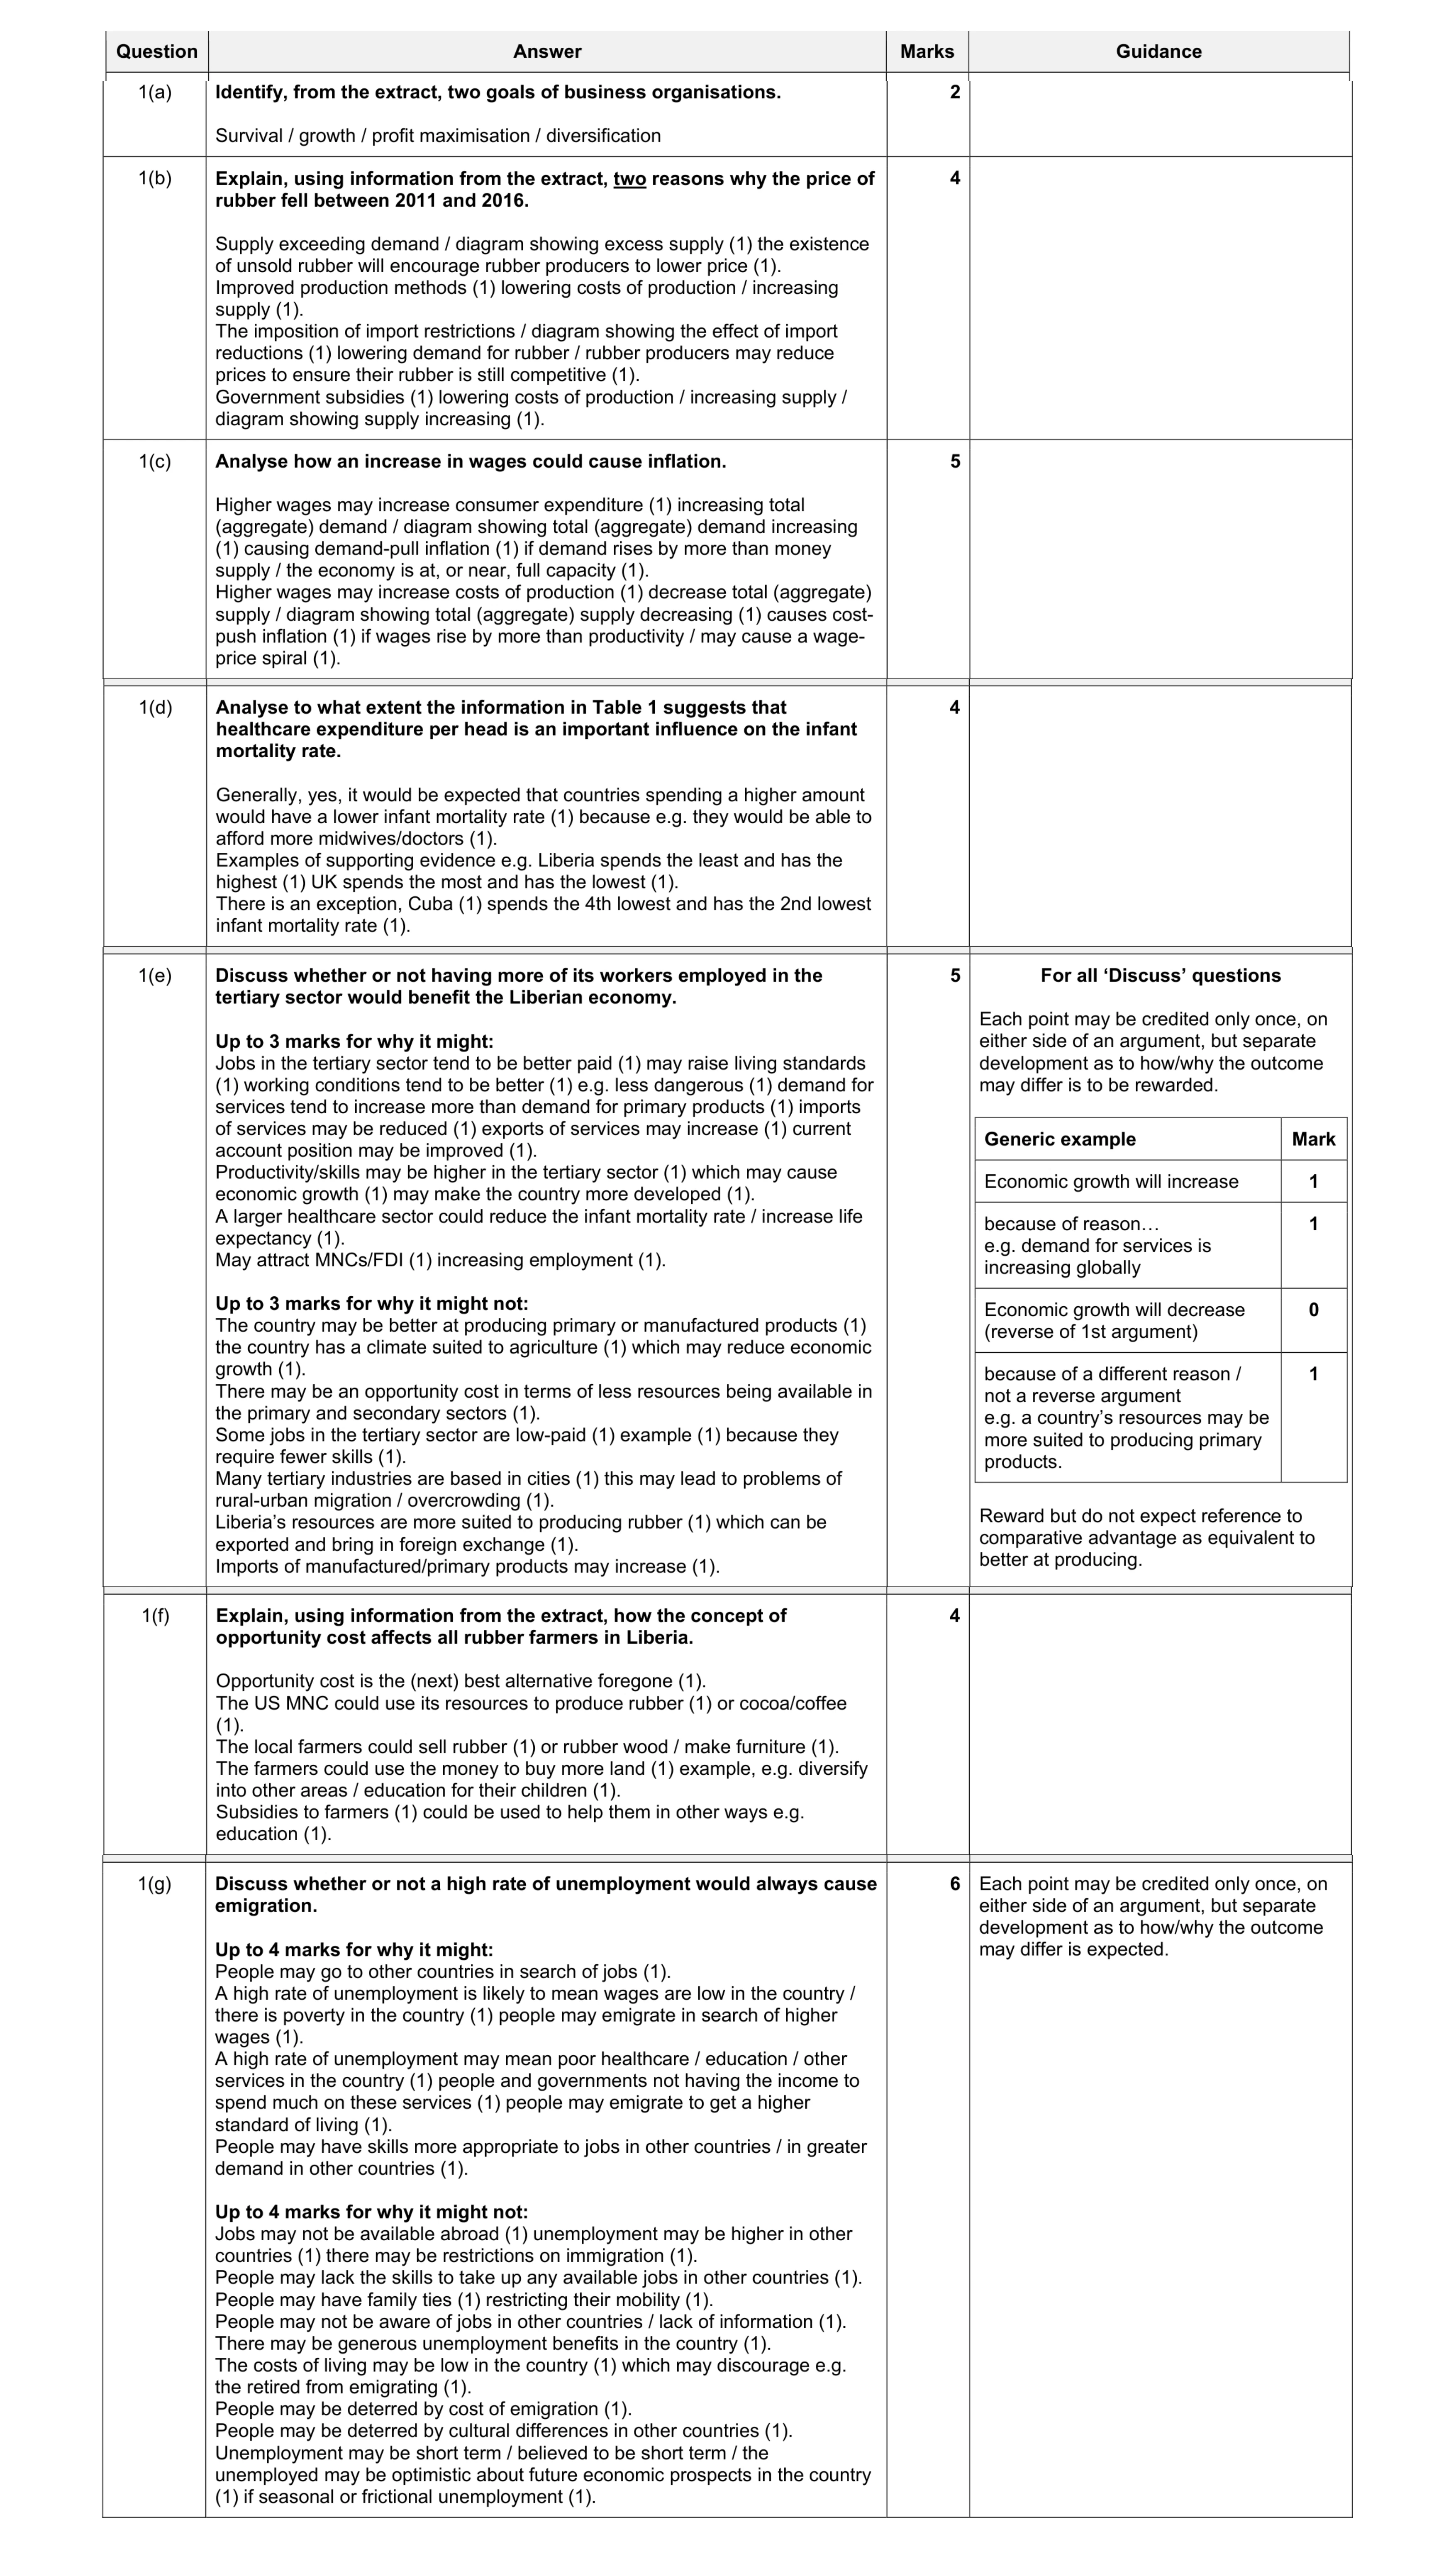 30
30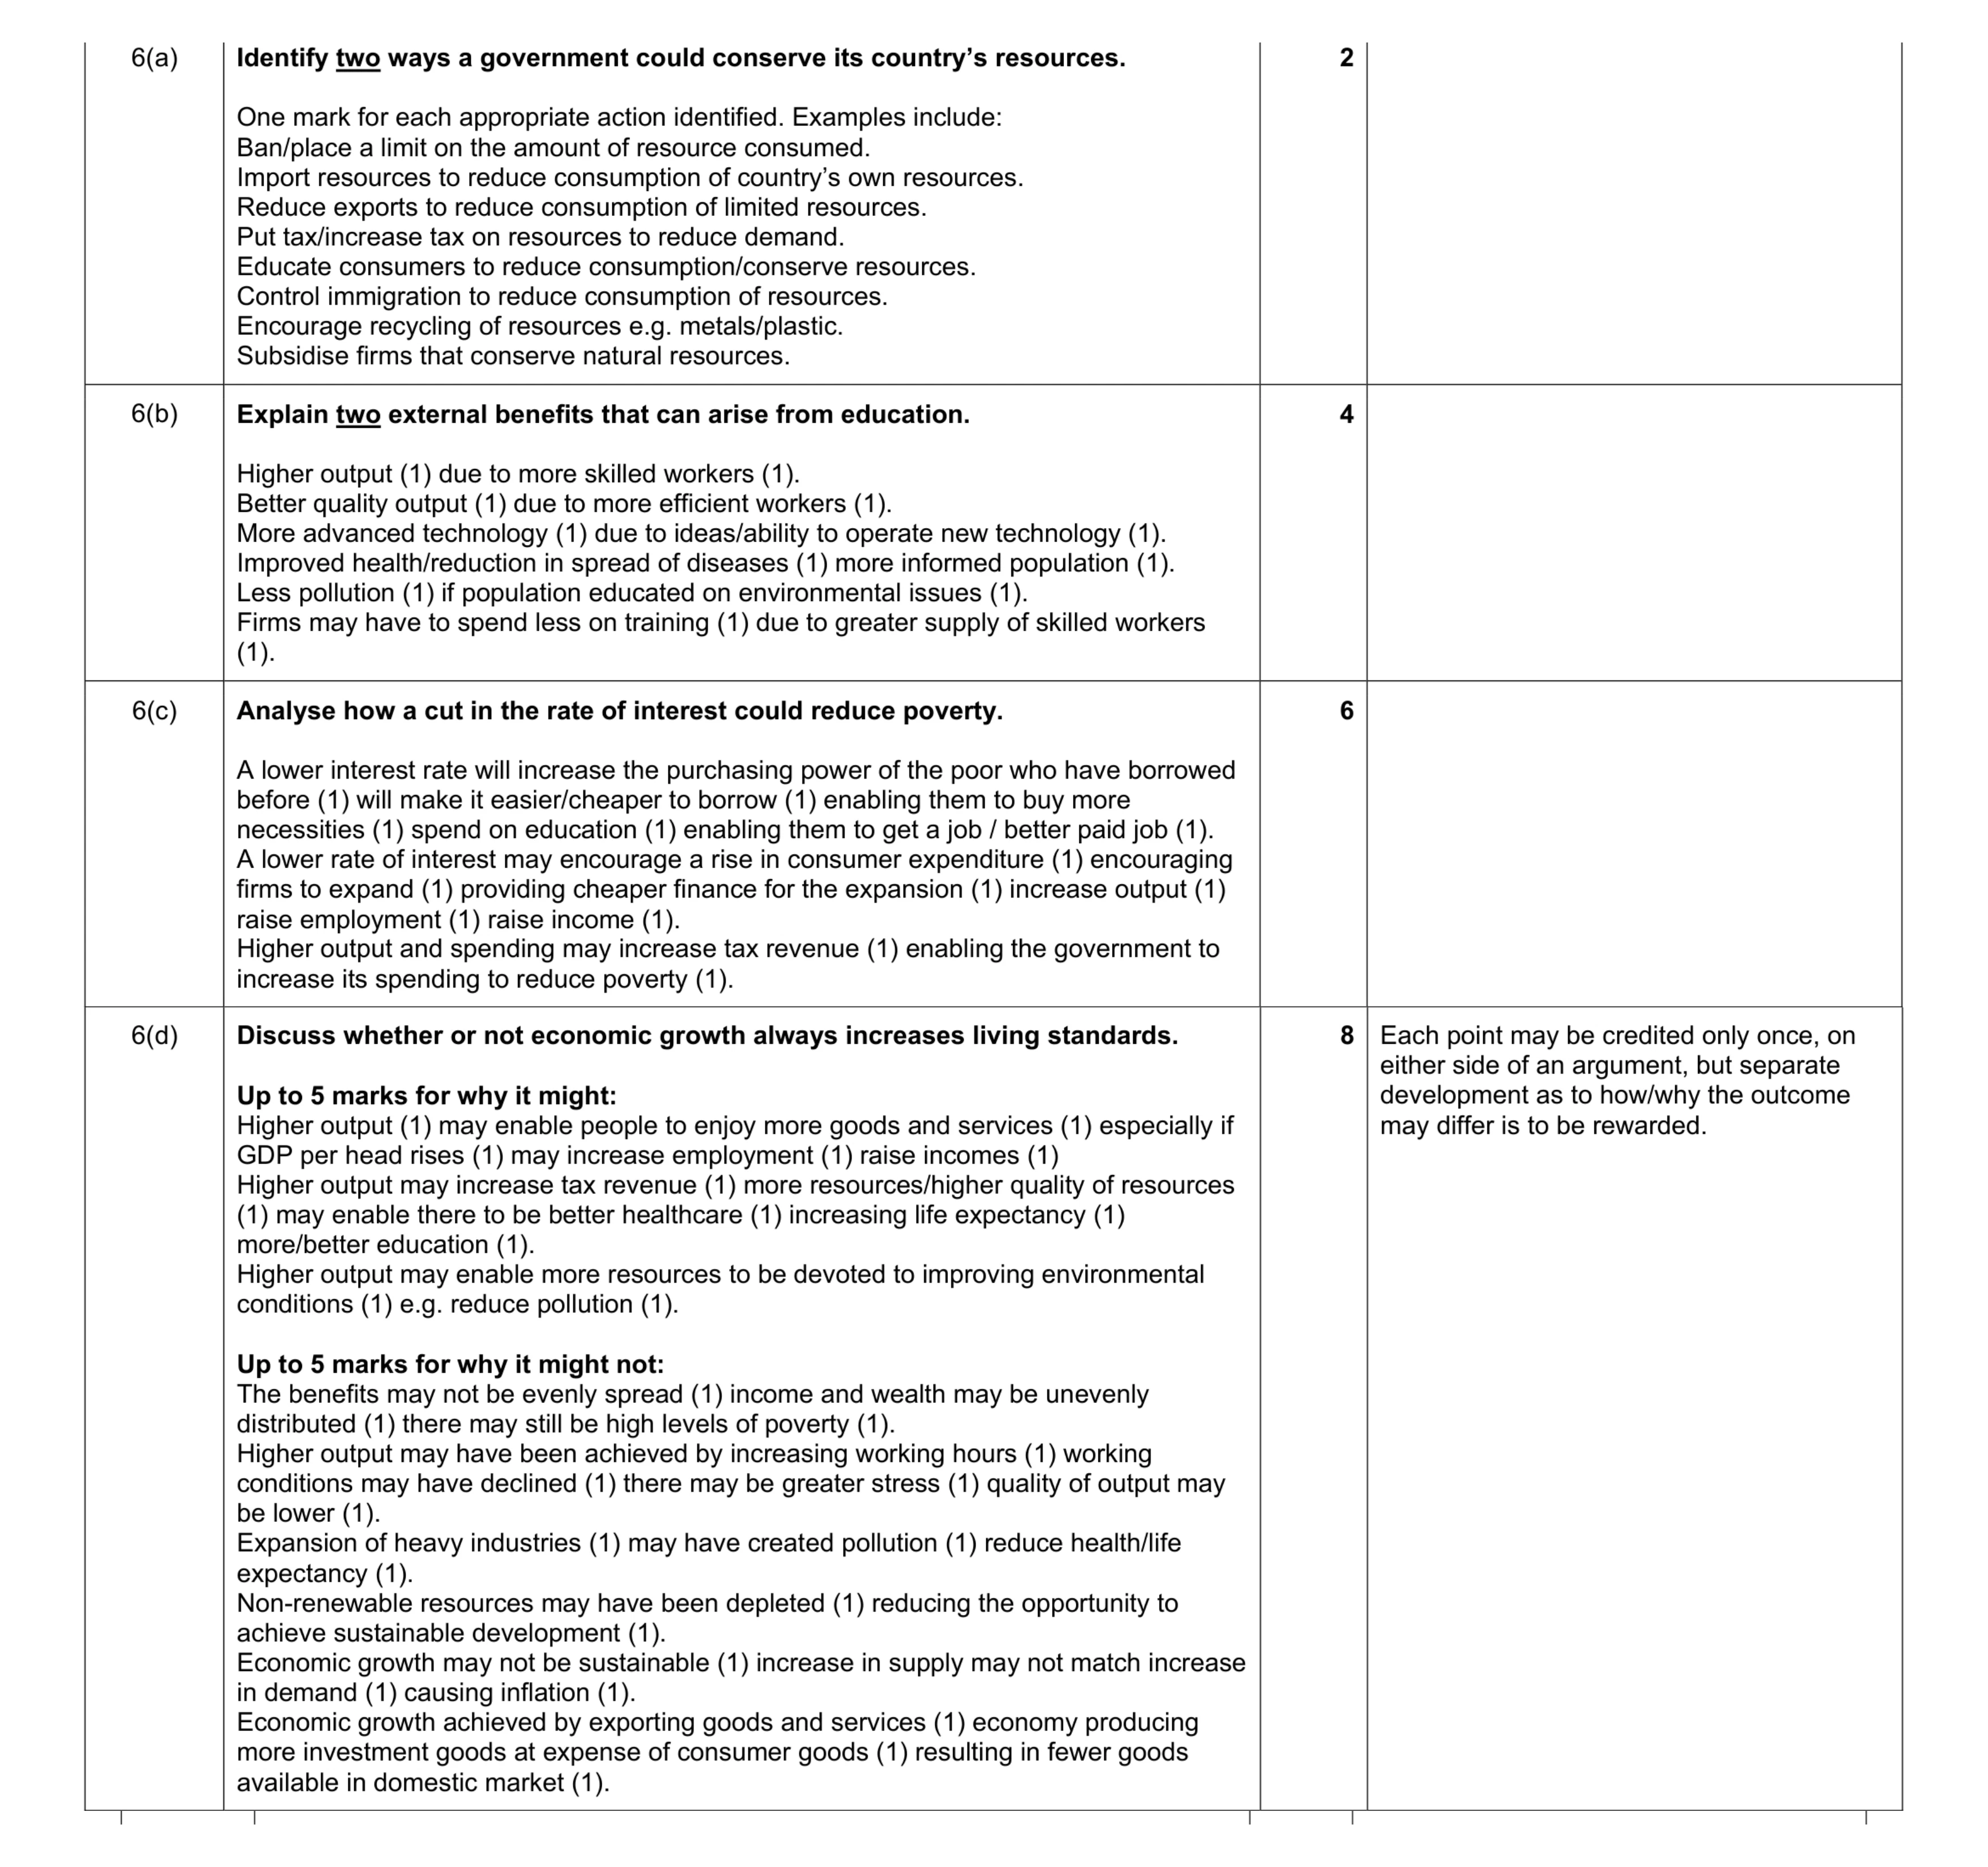 20
20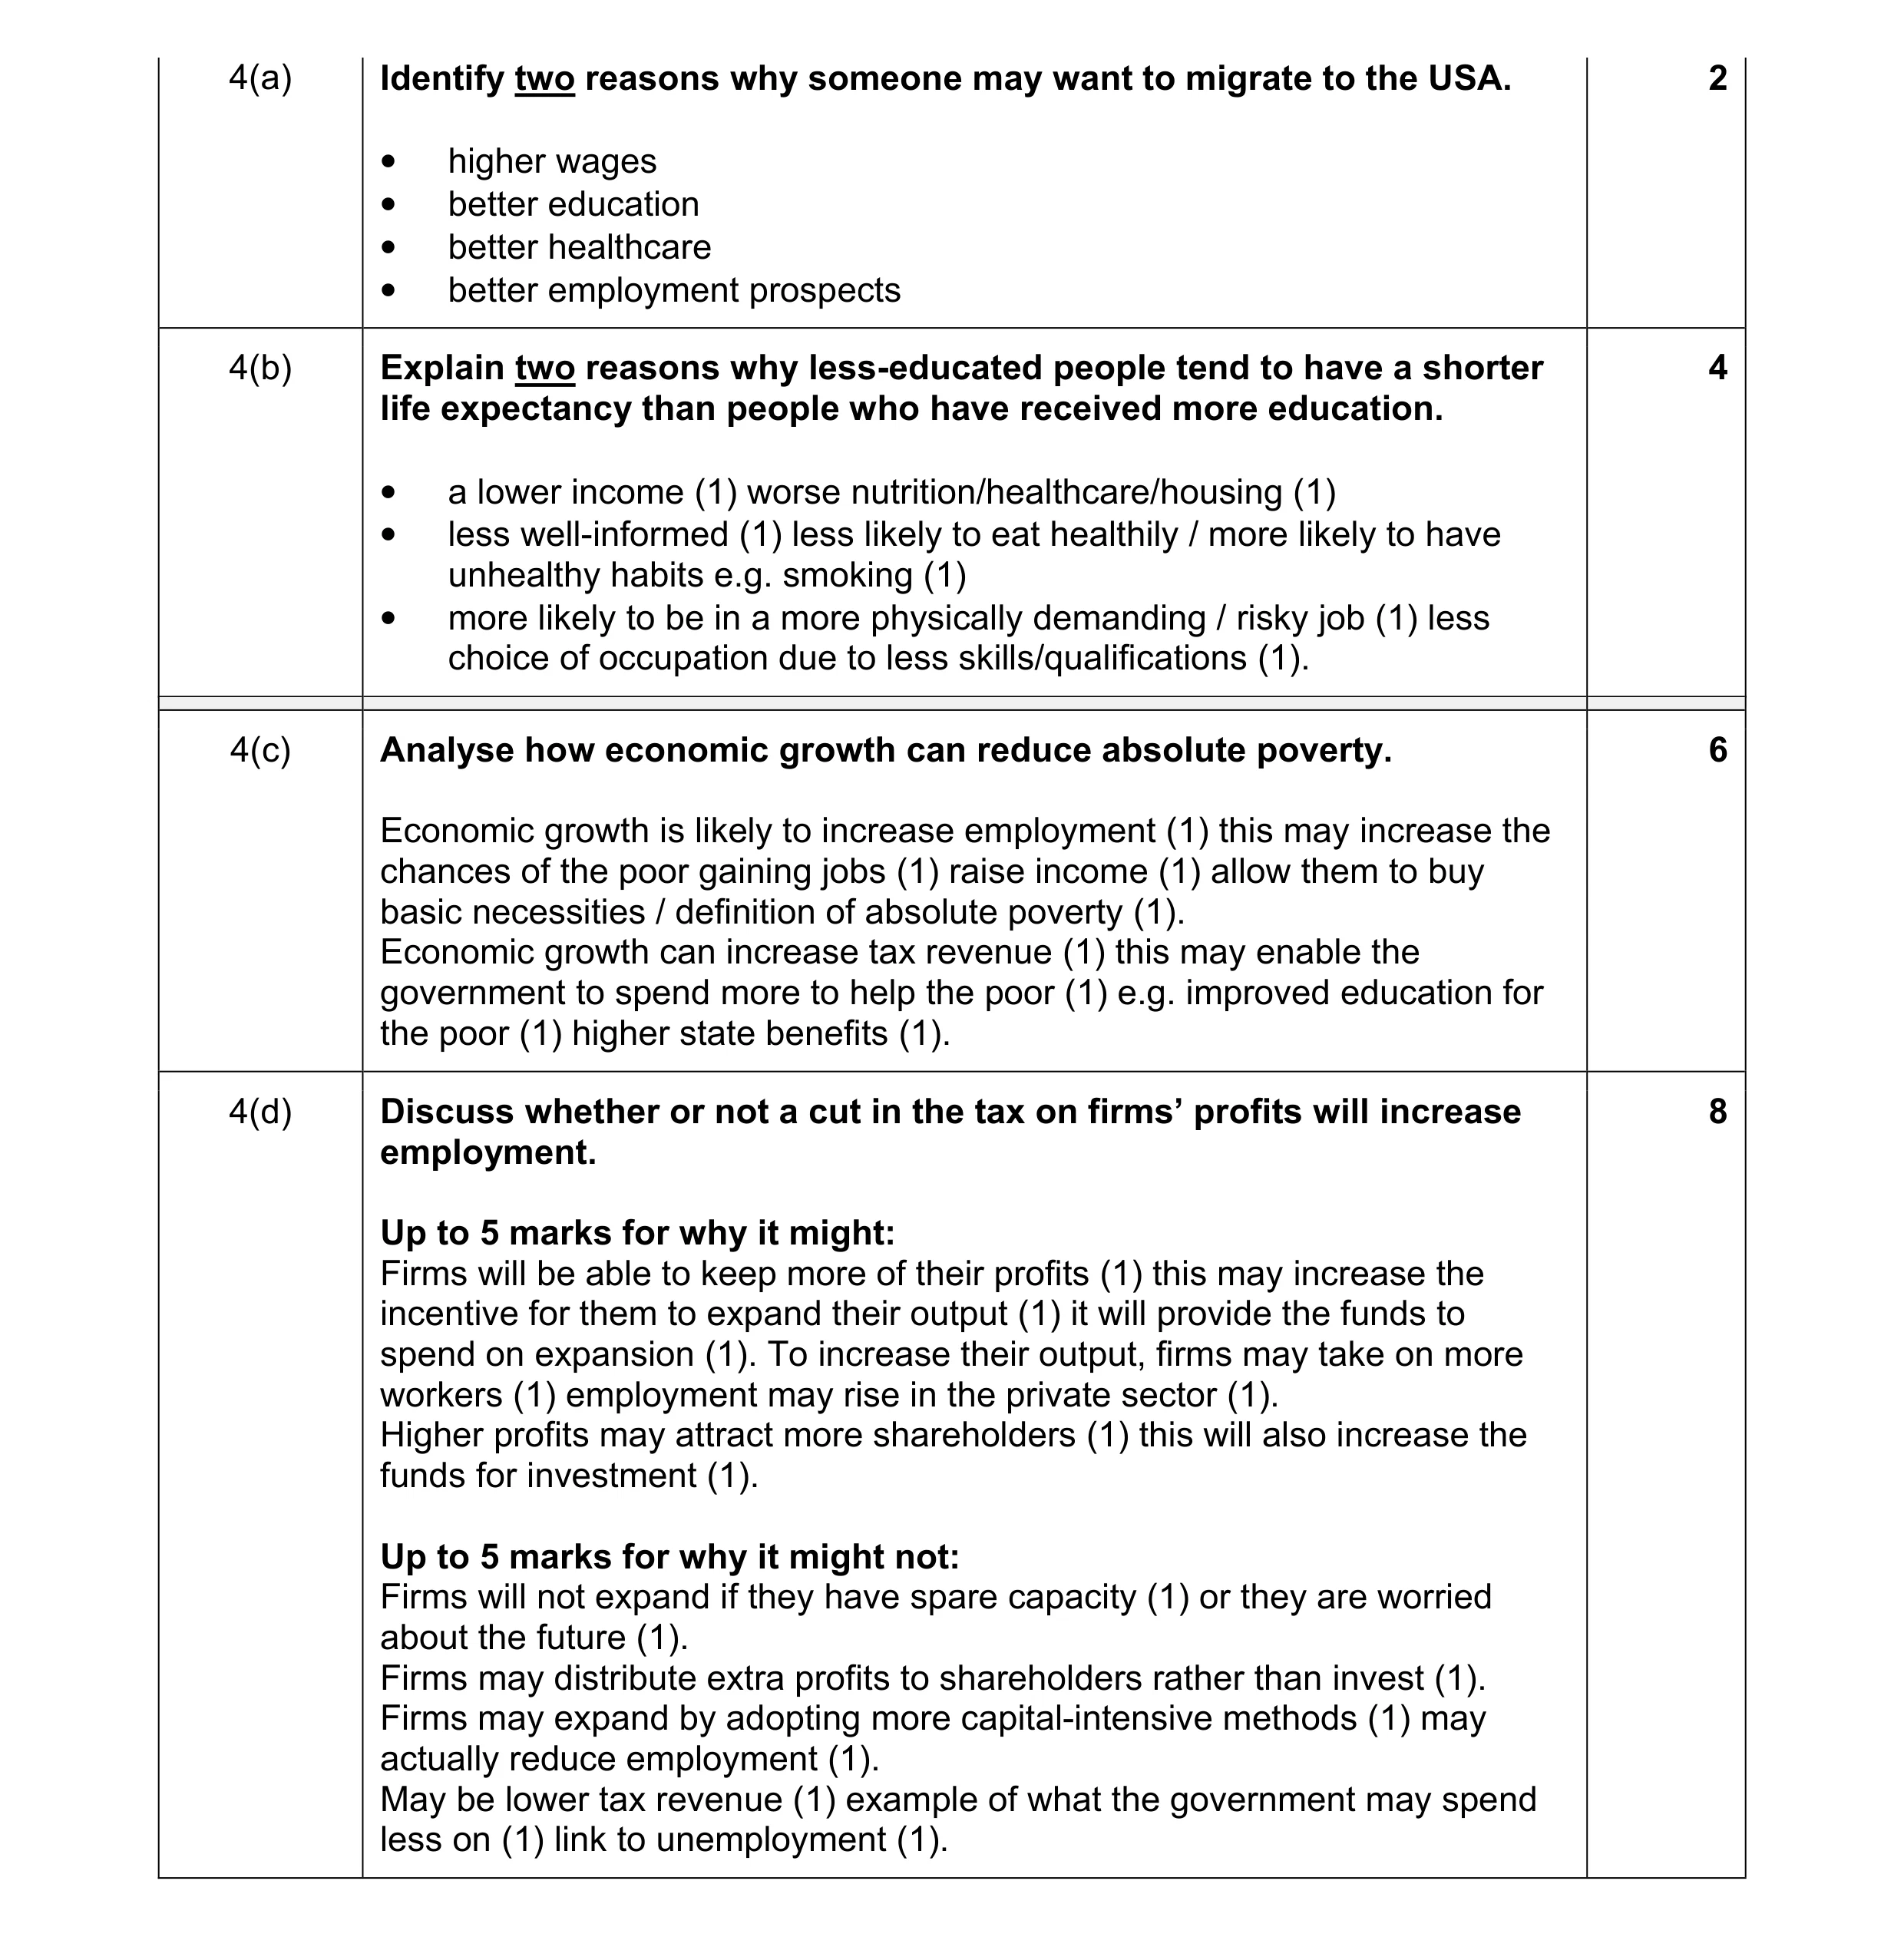 20
20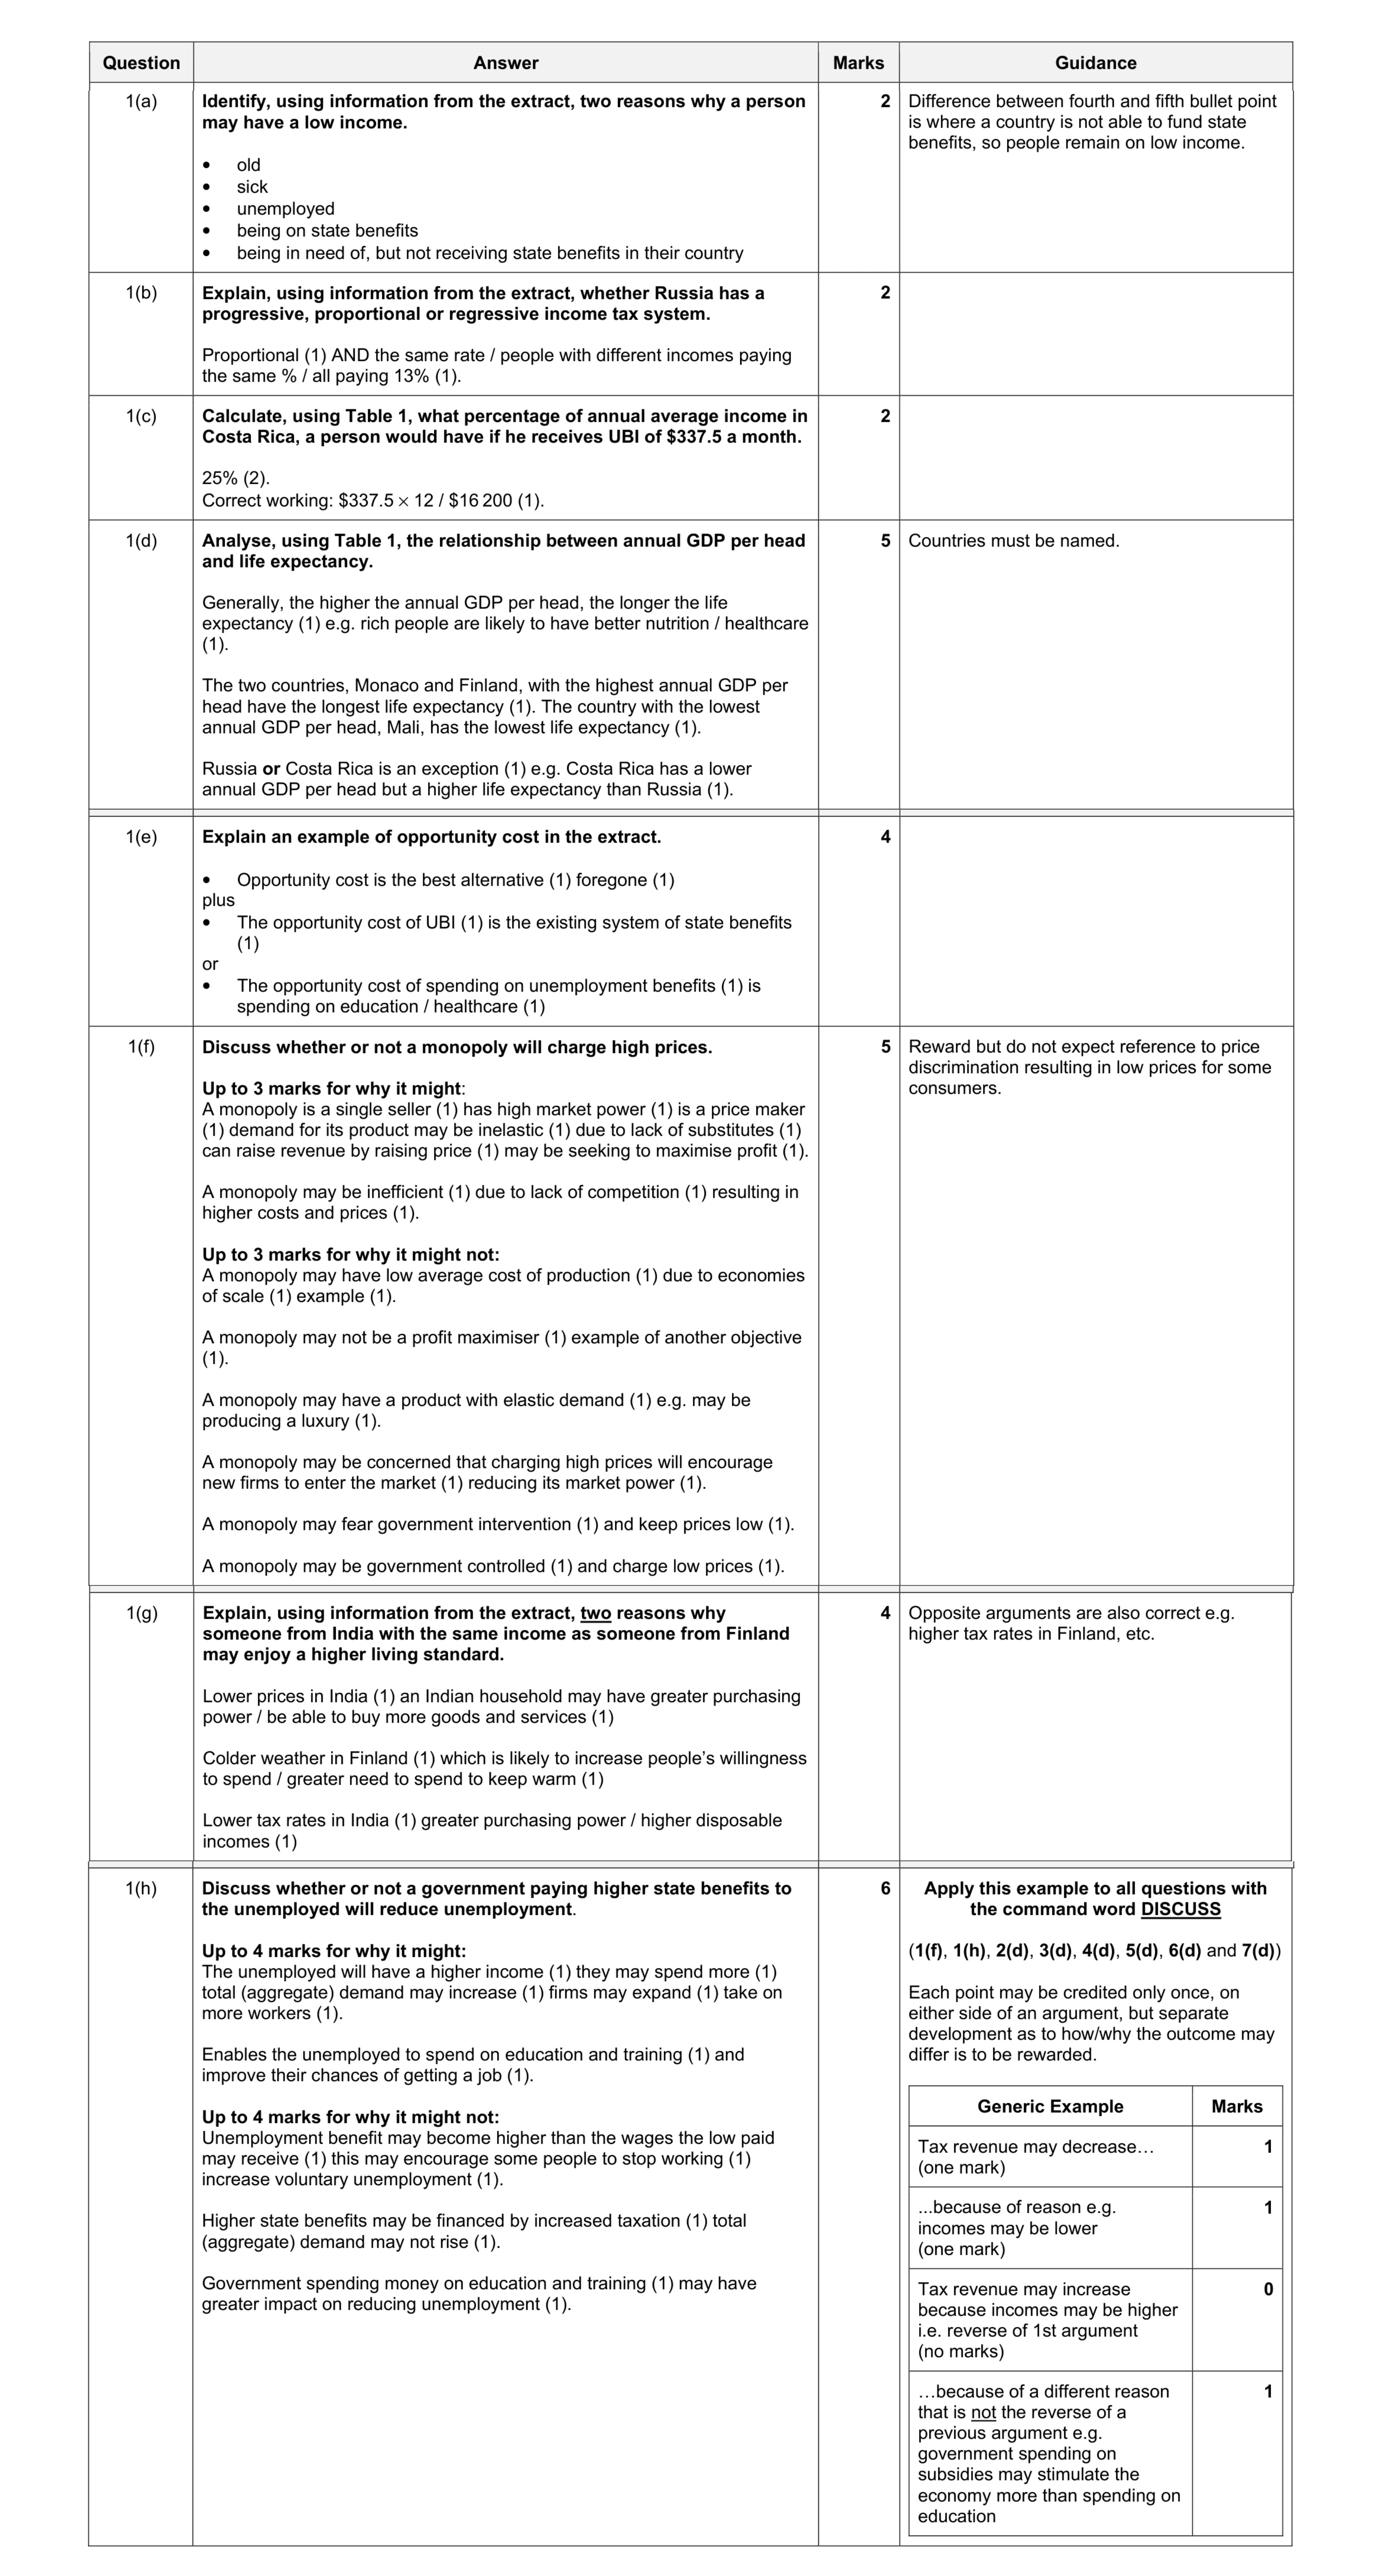 30
30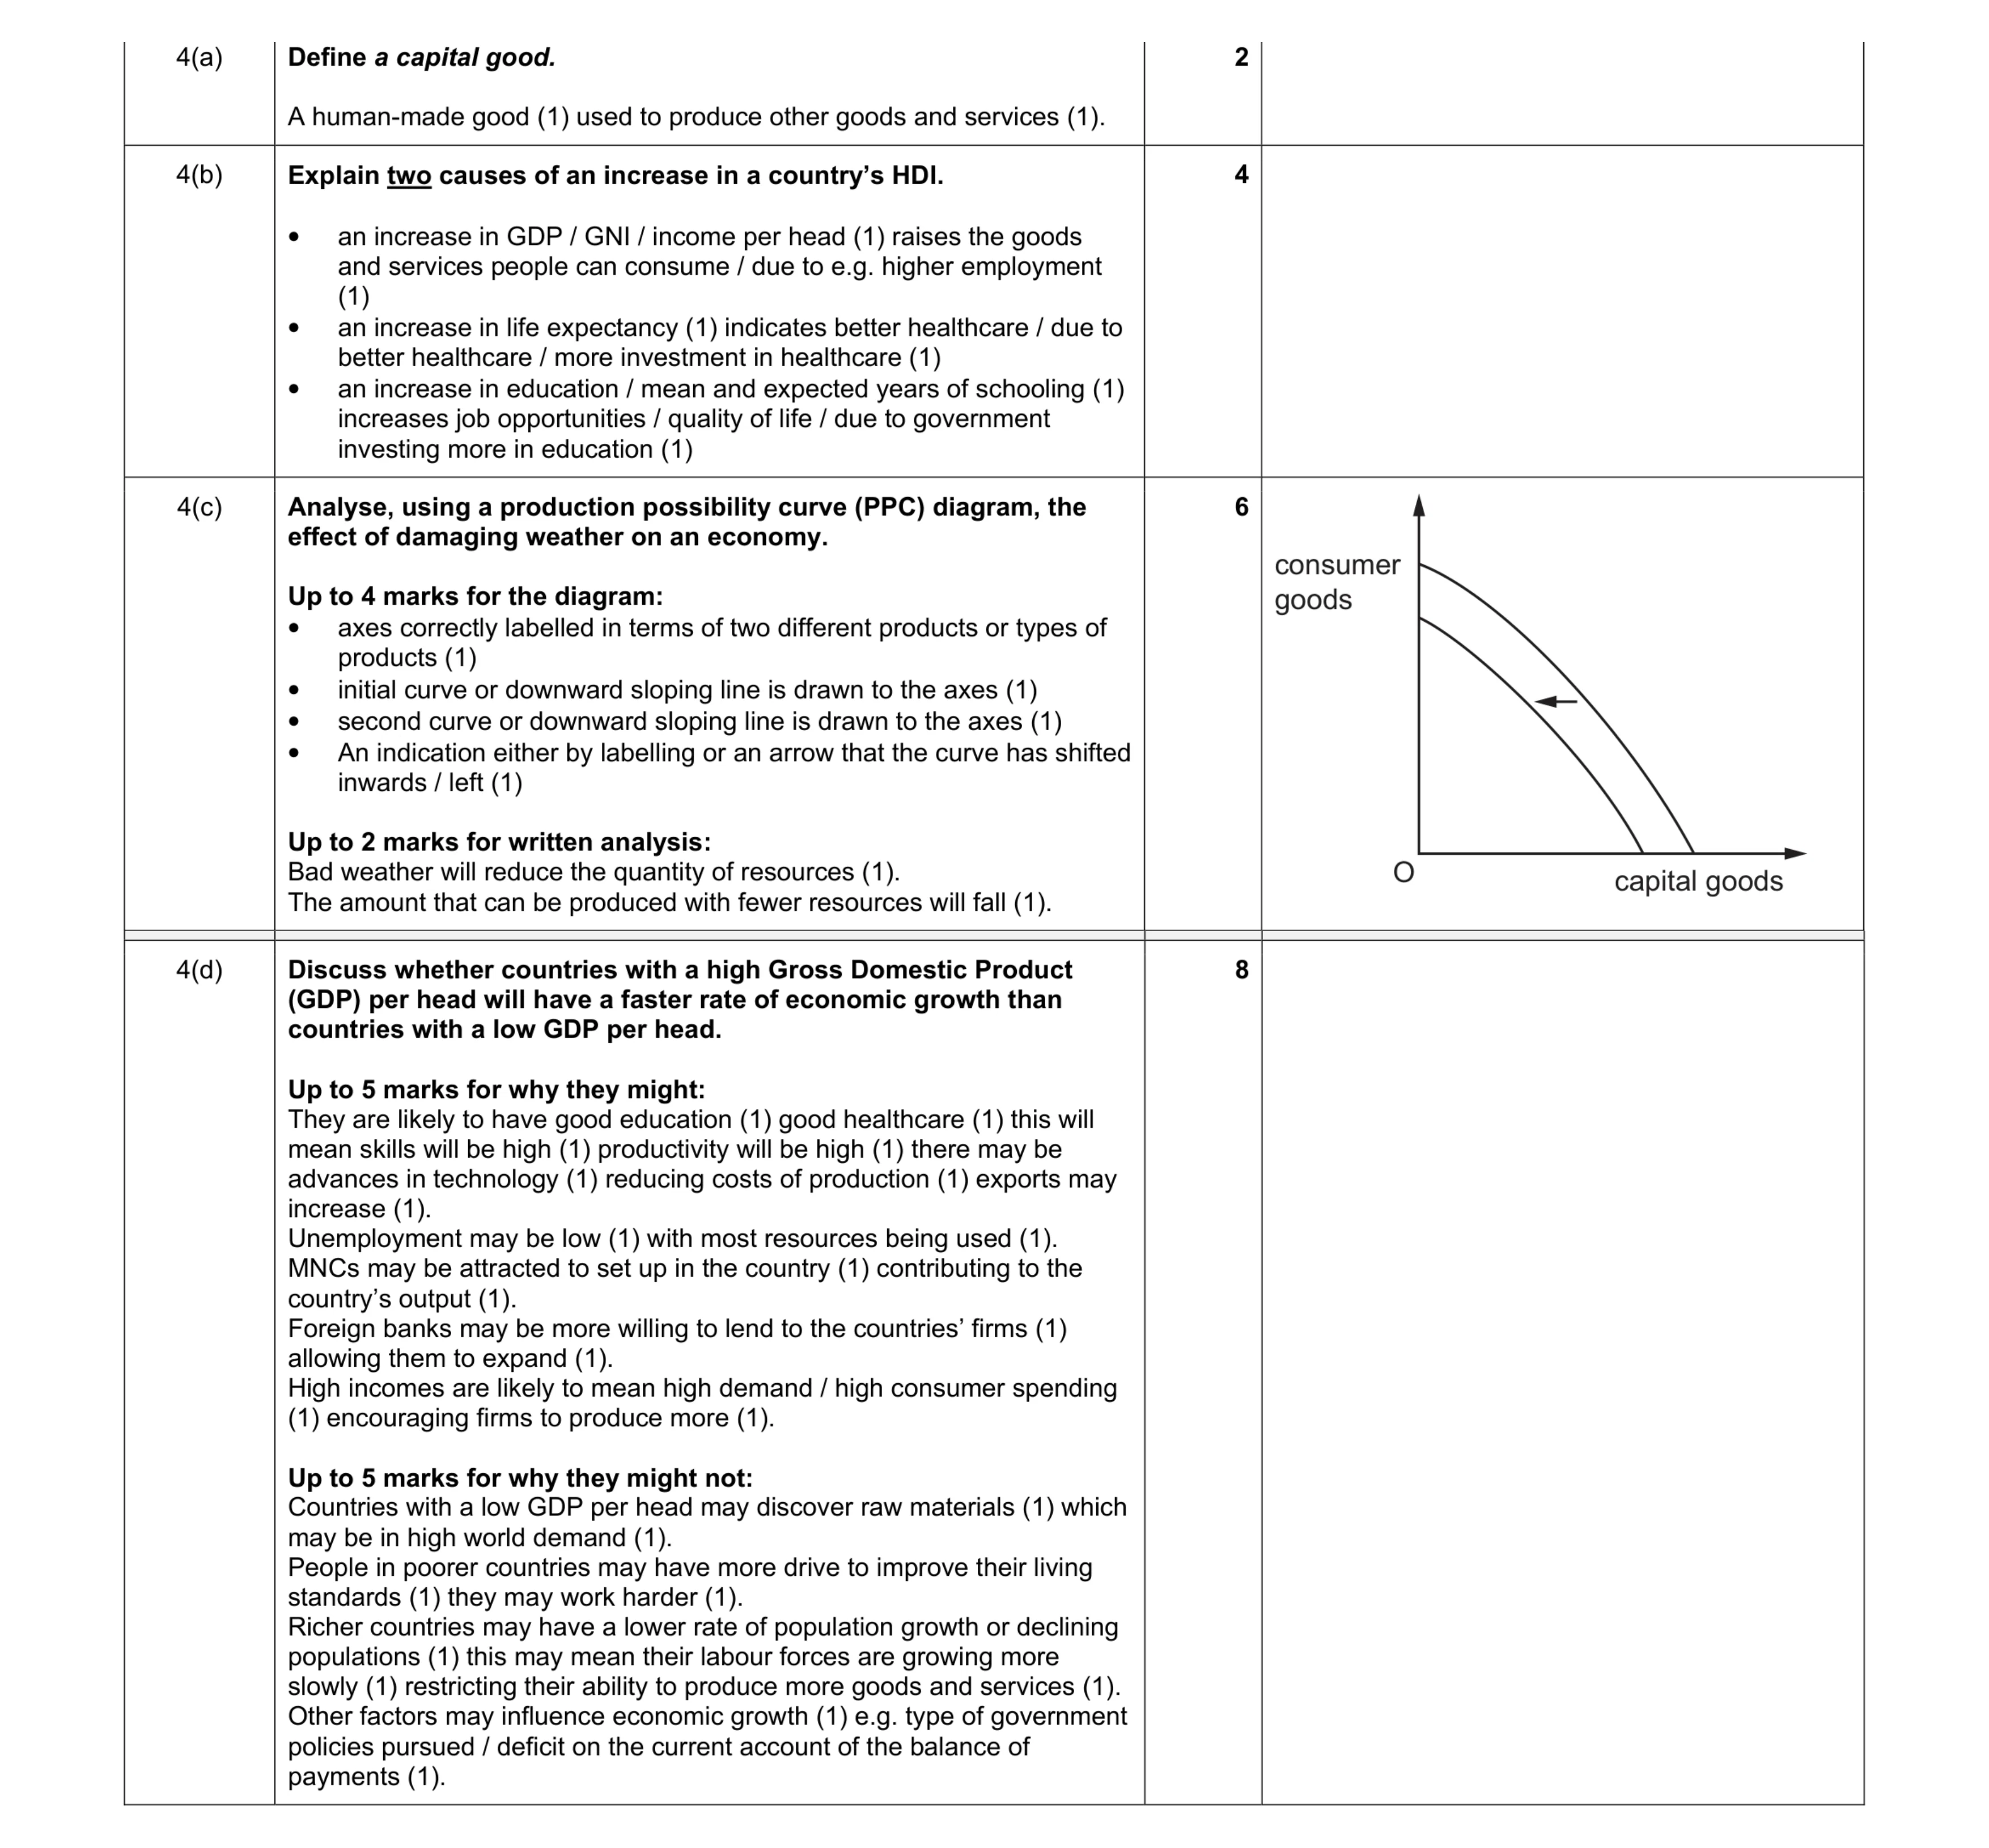 20
20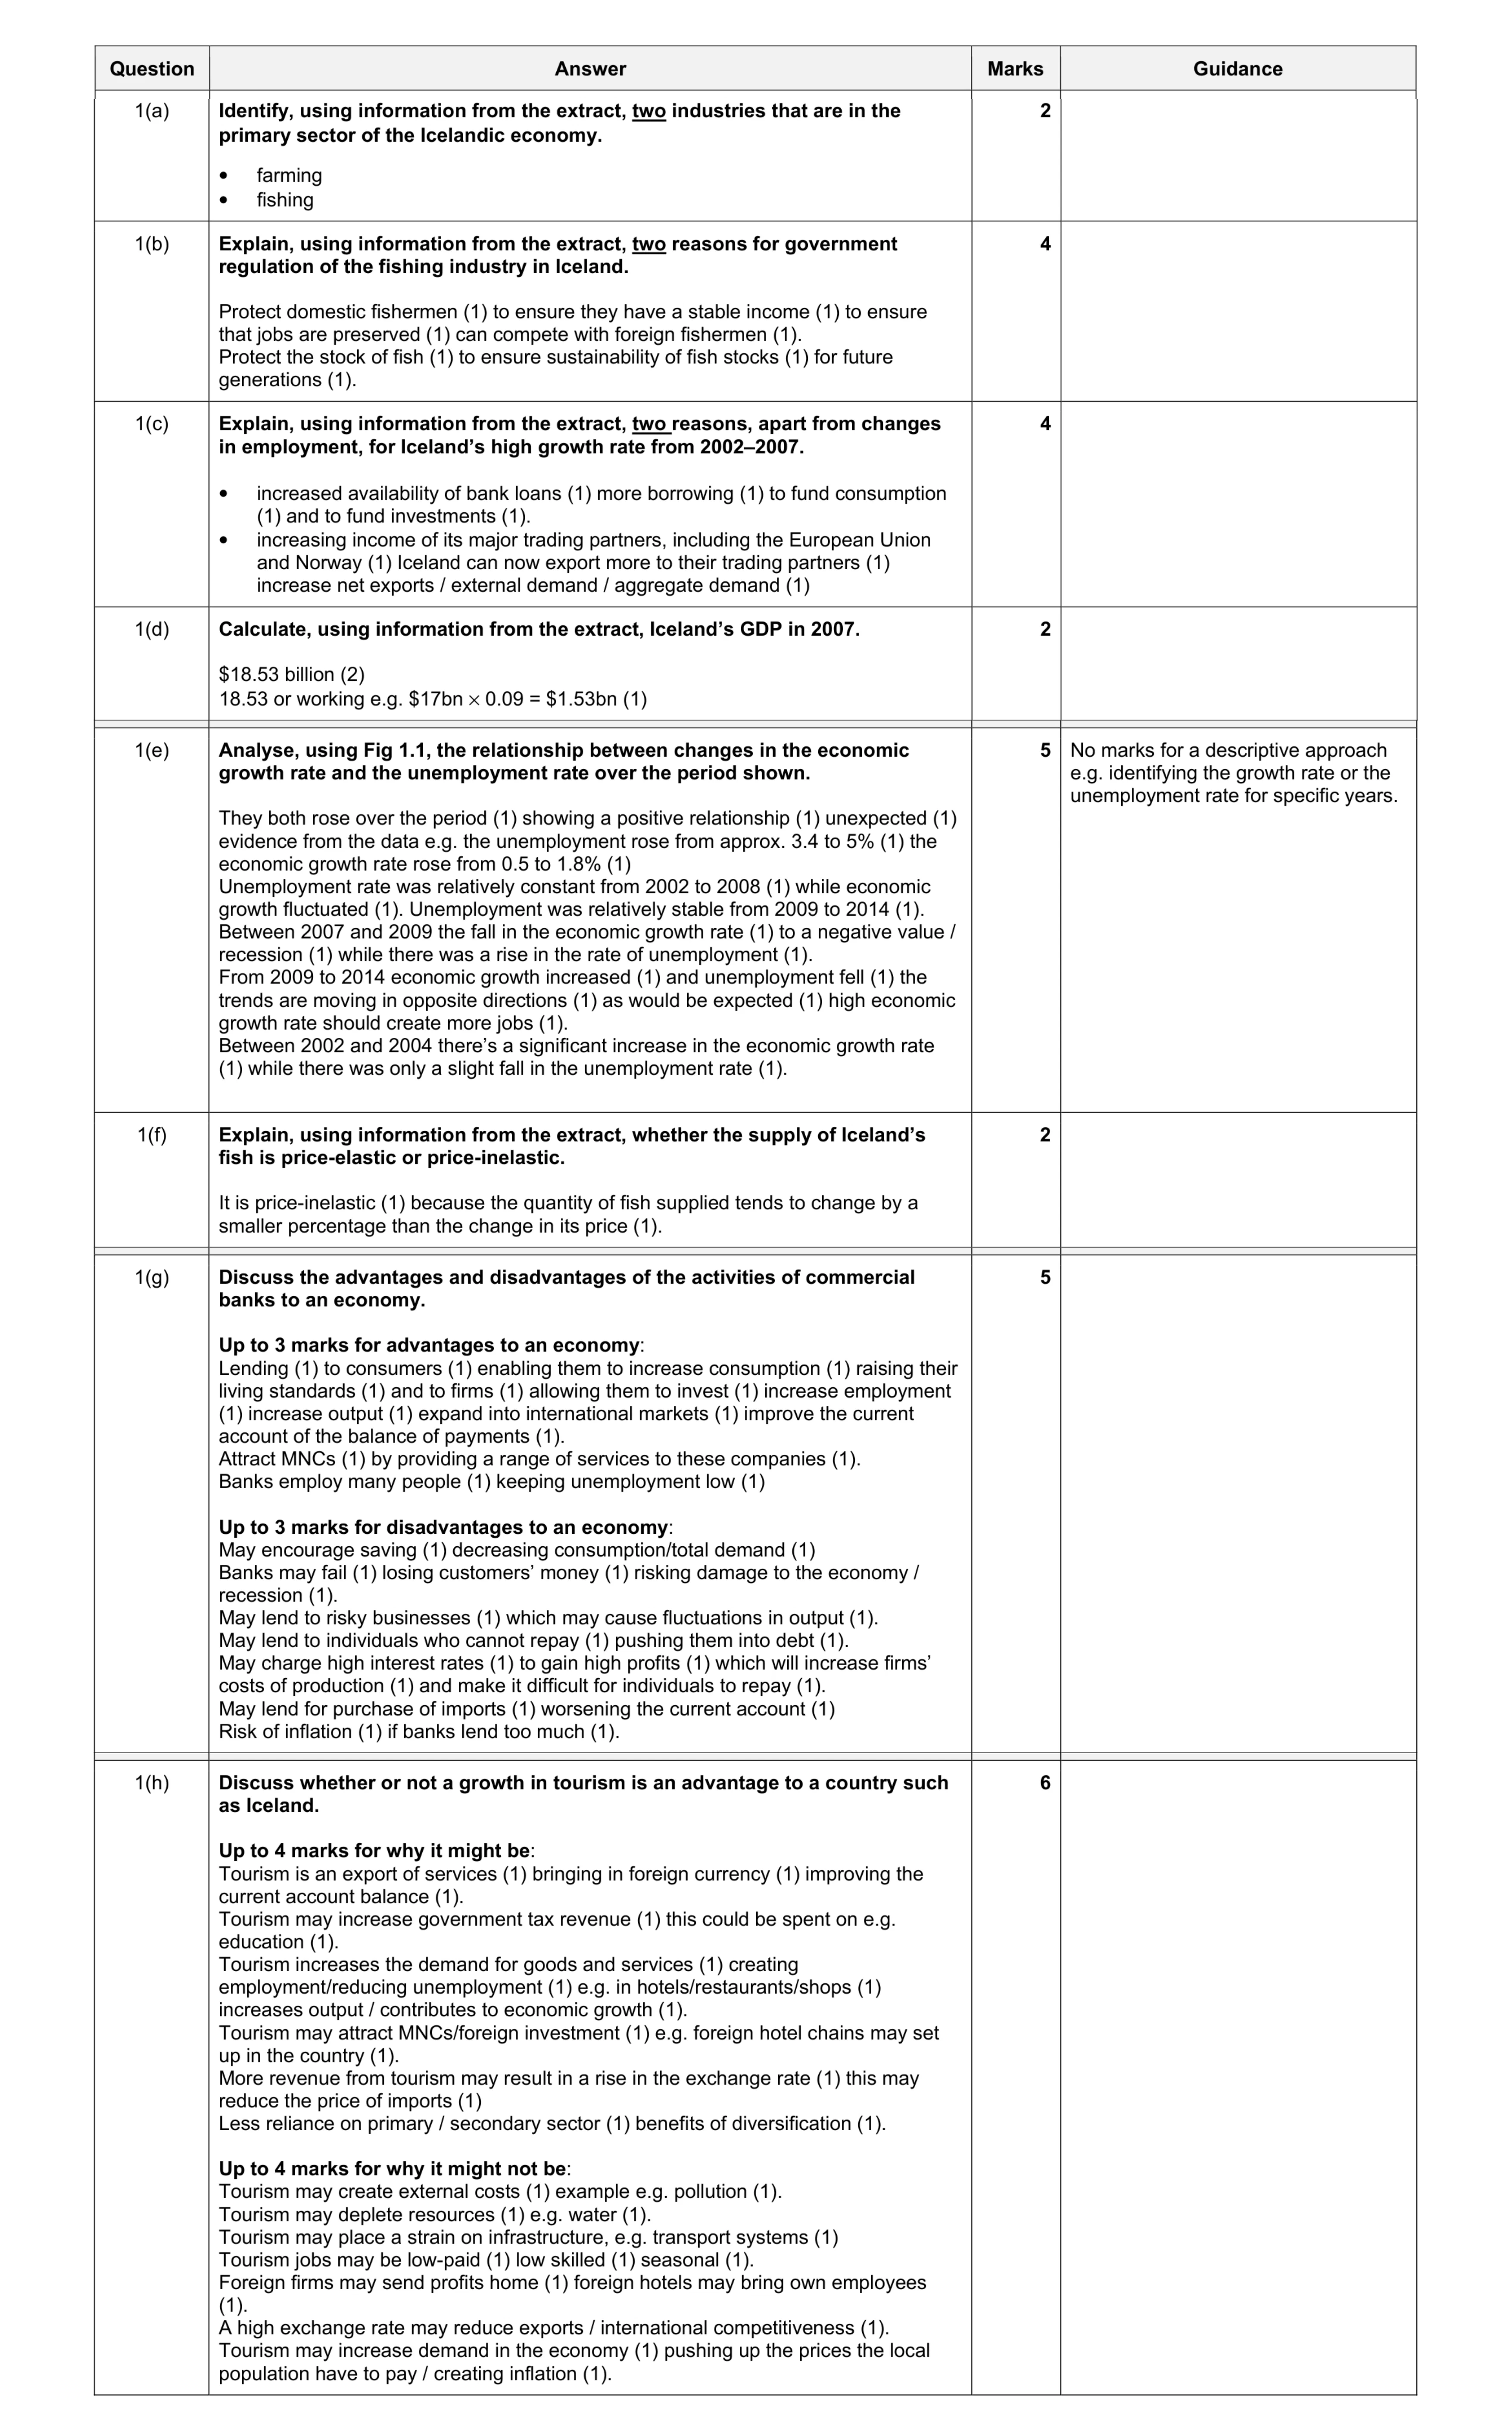 30
30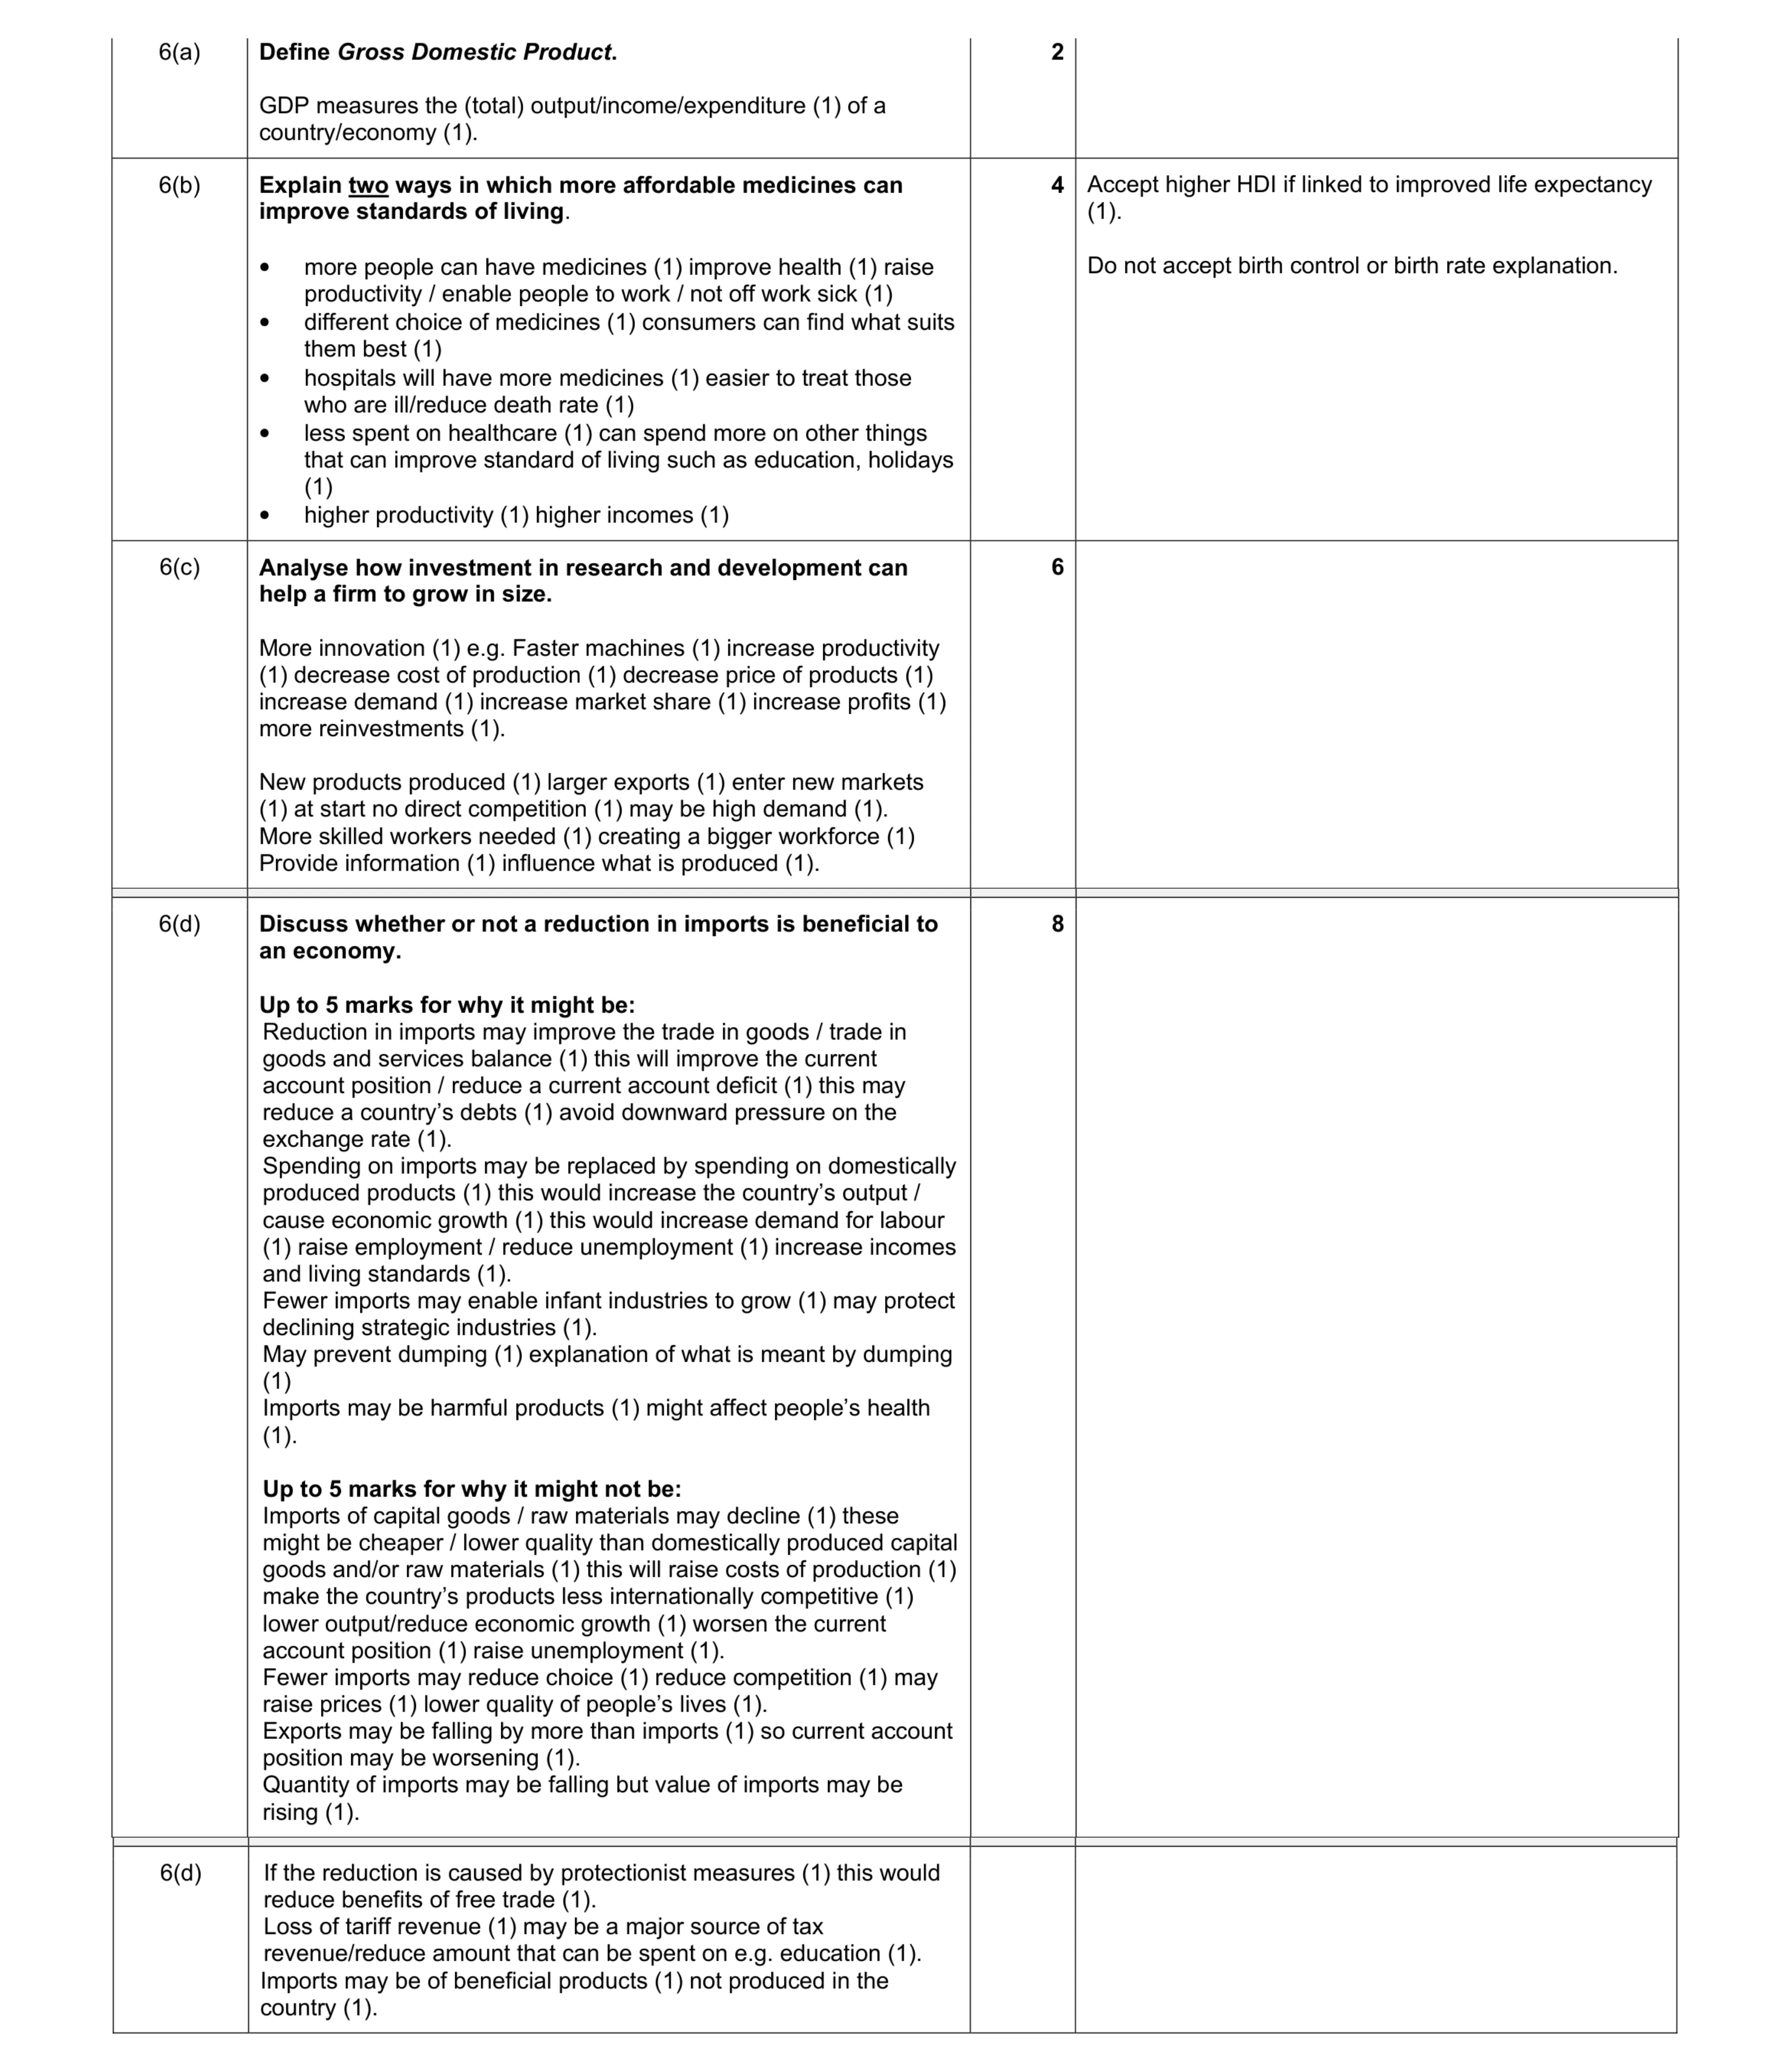 20
20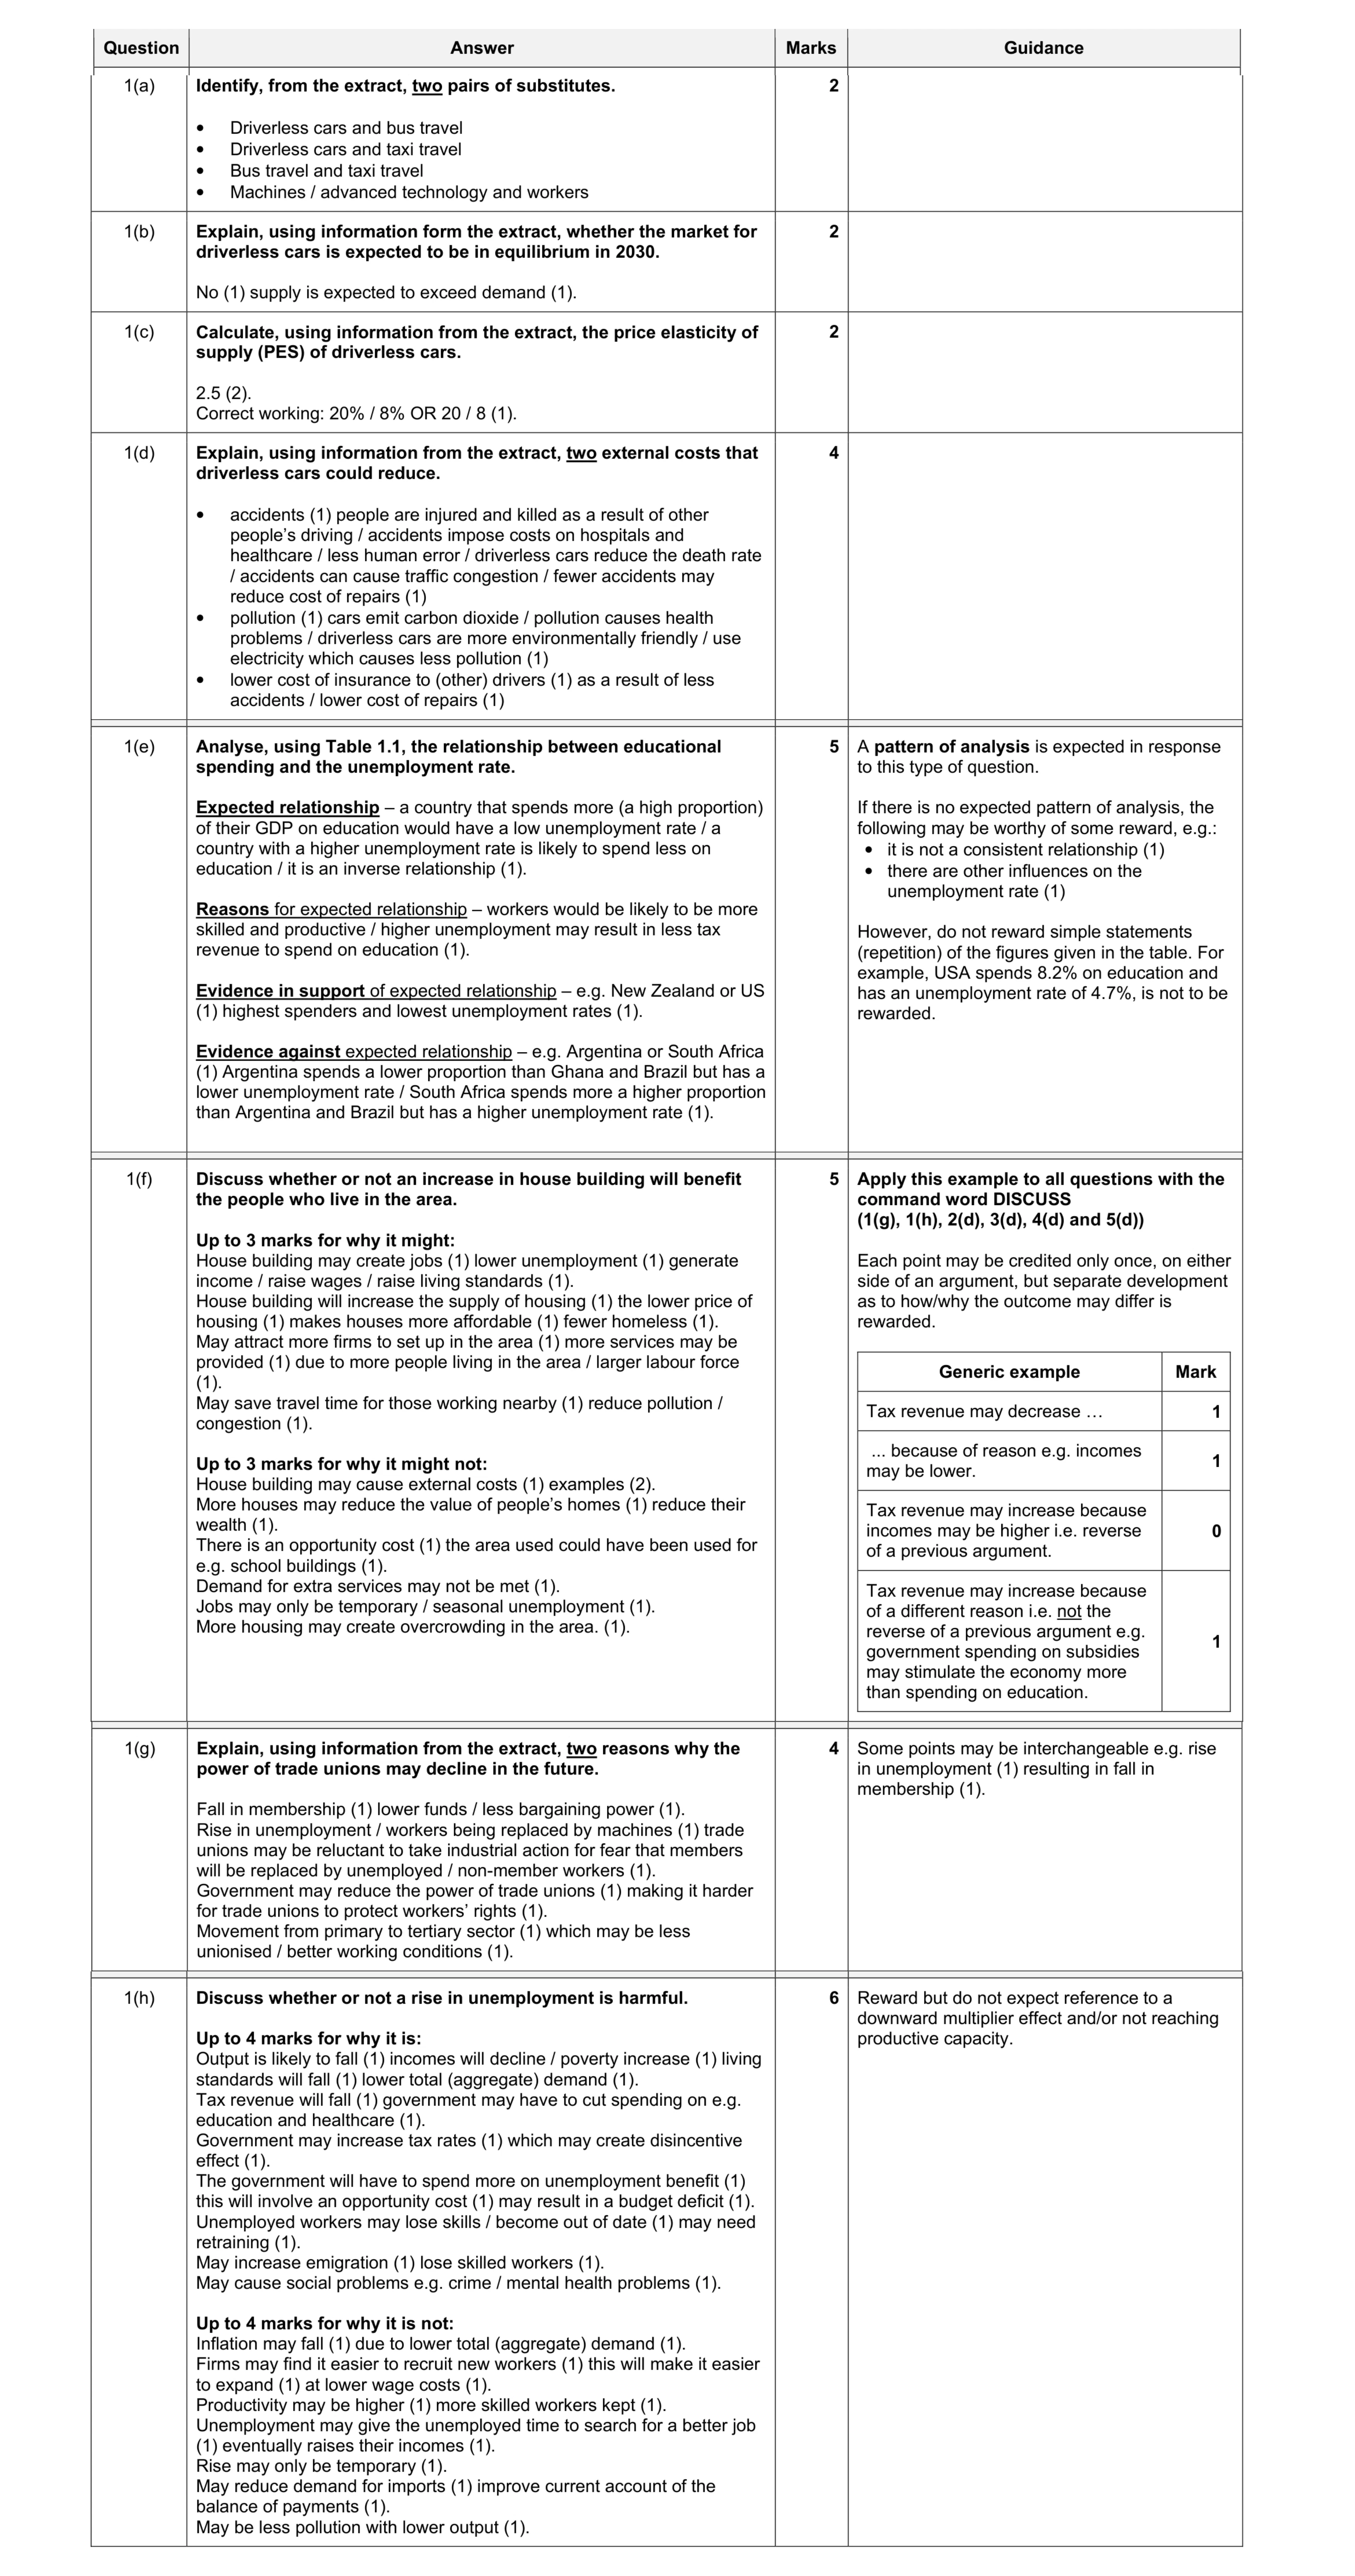 30
30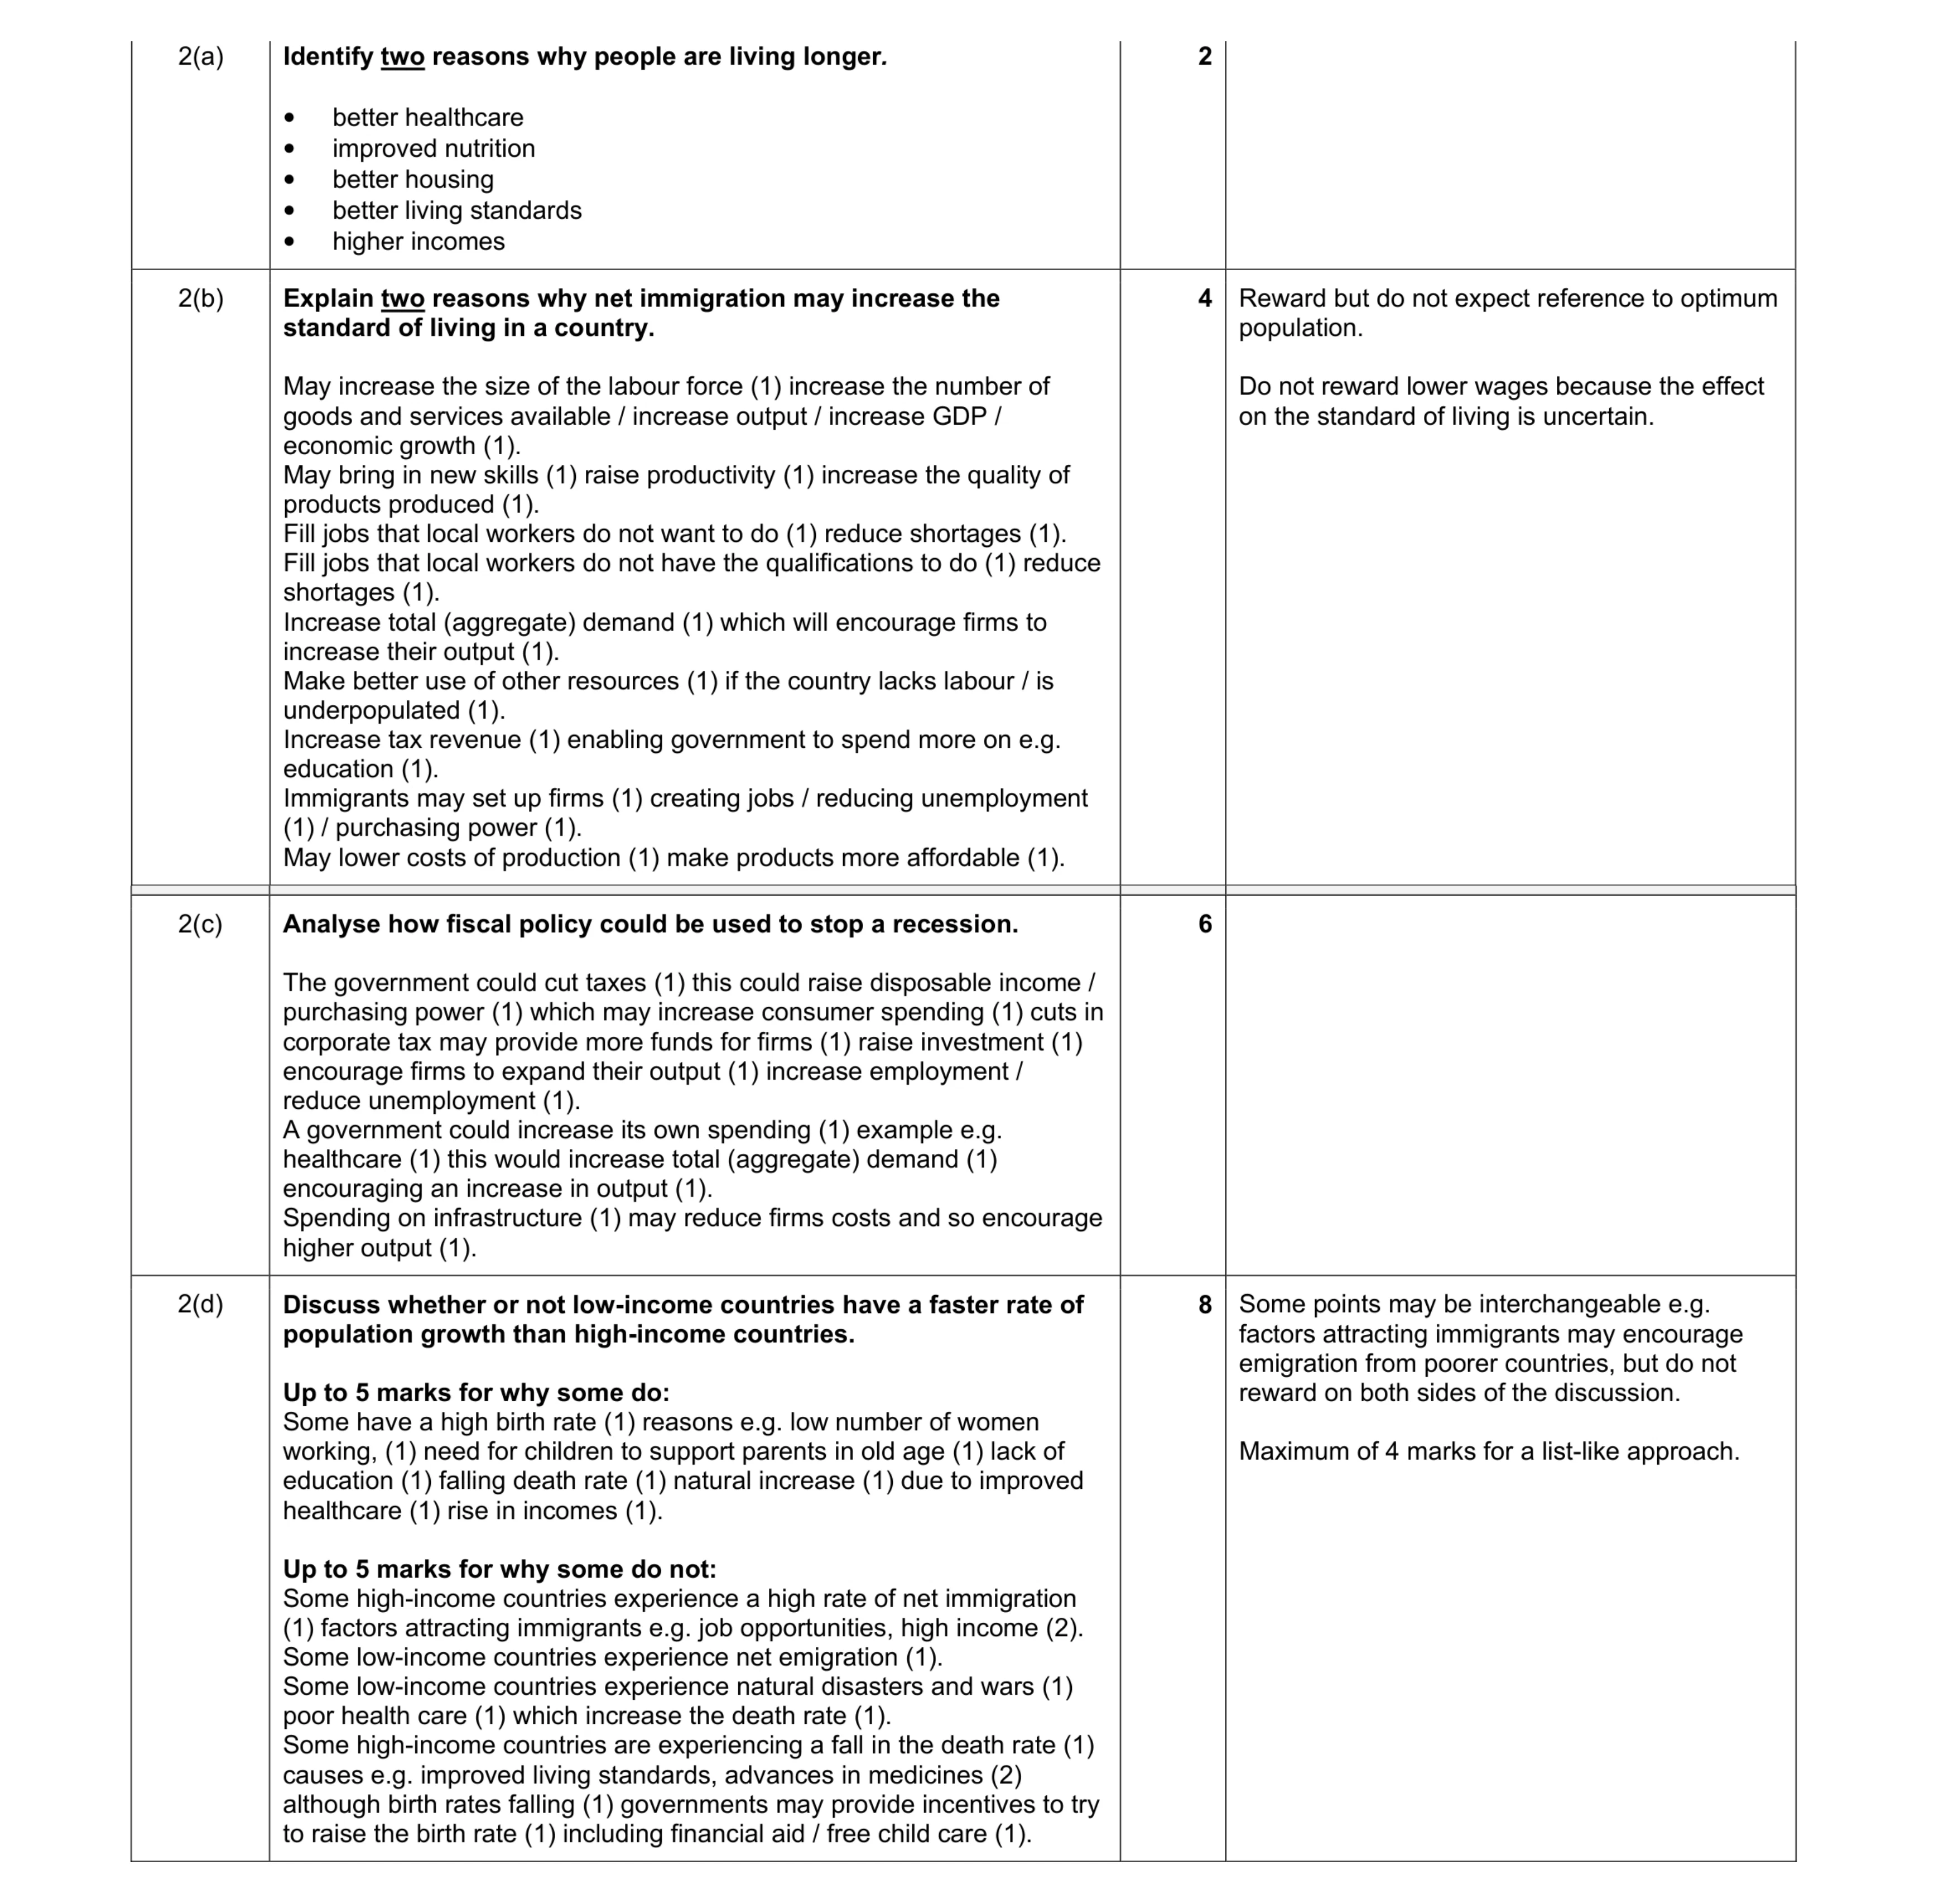 20
20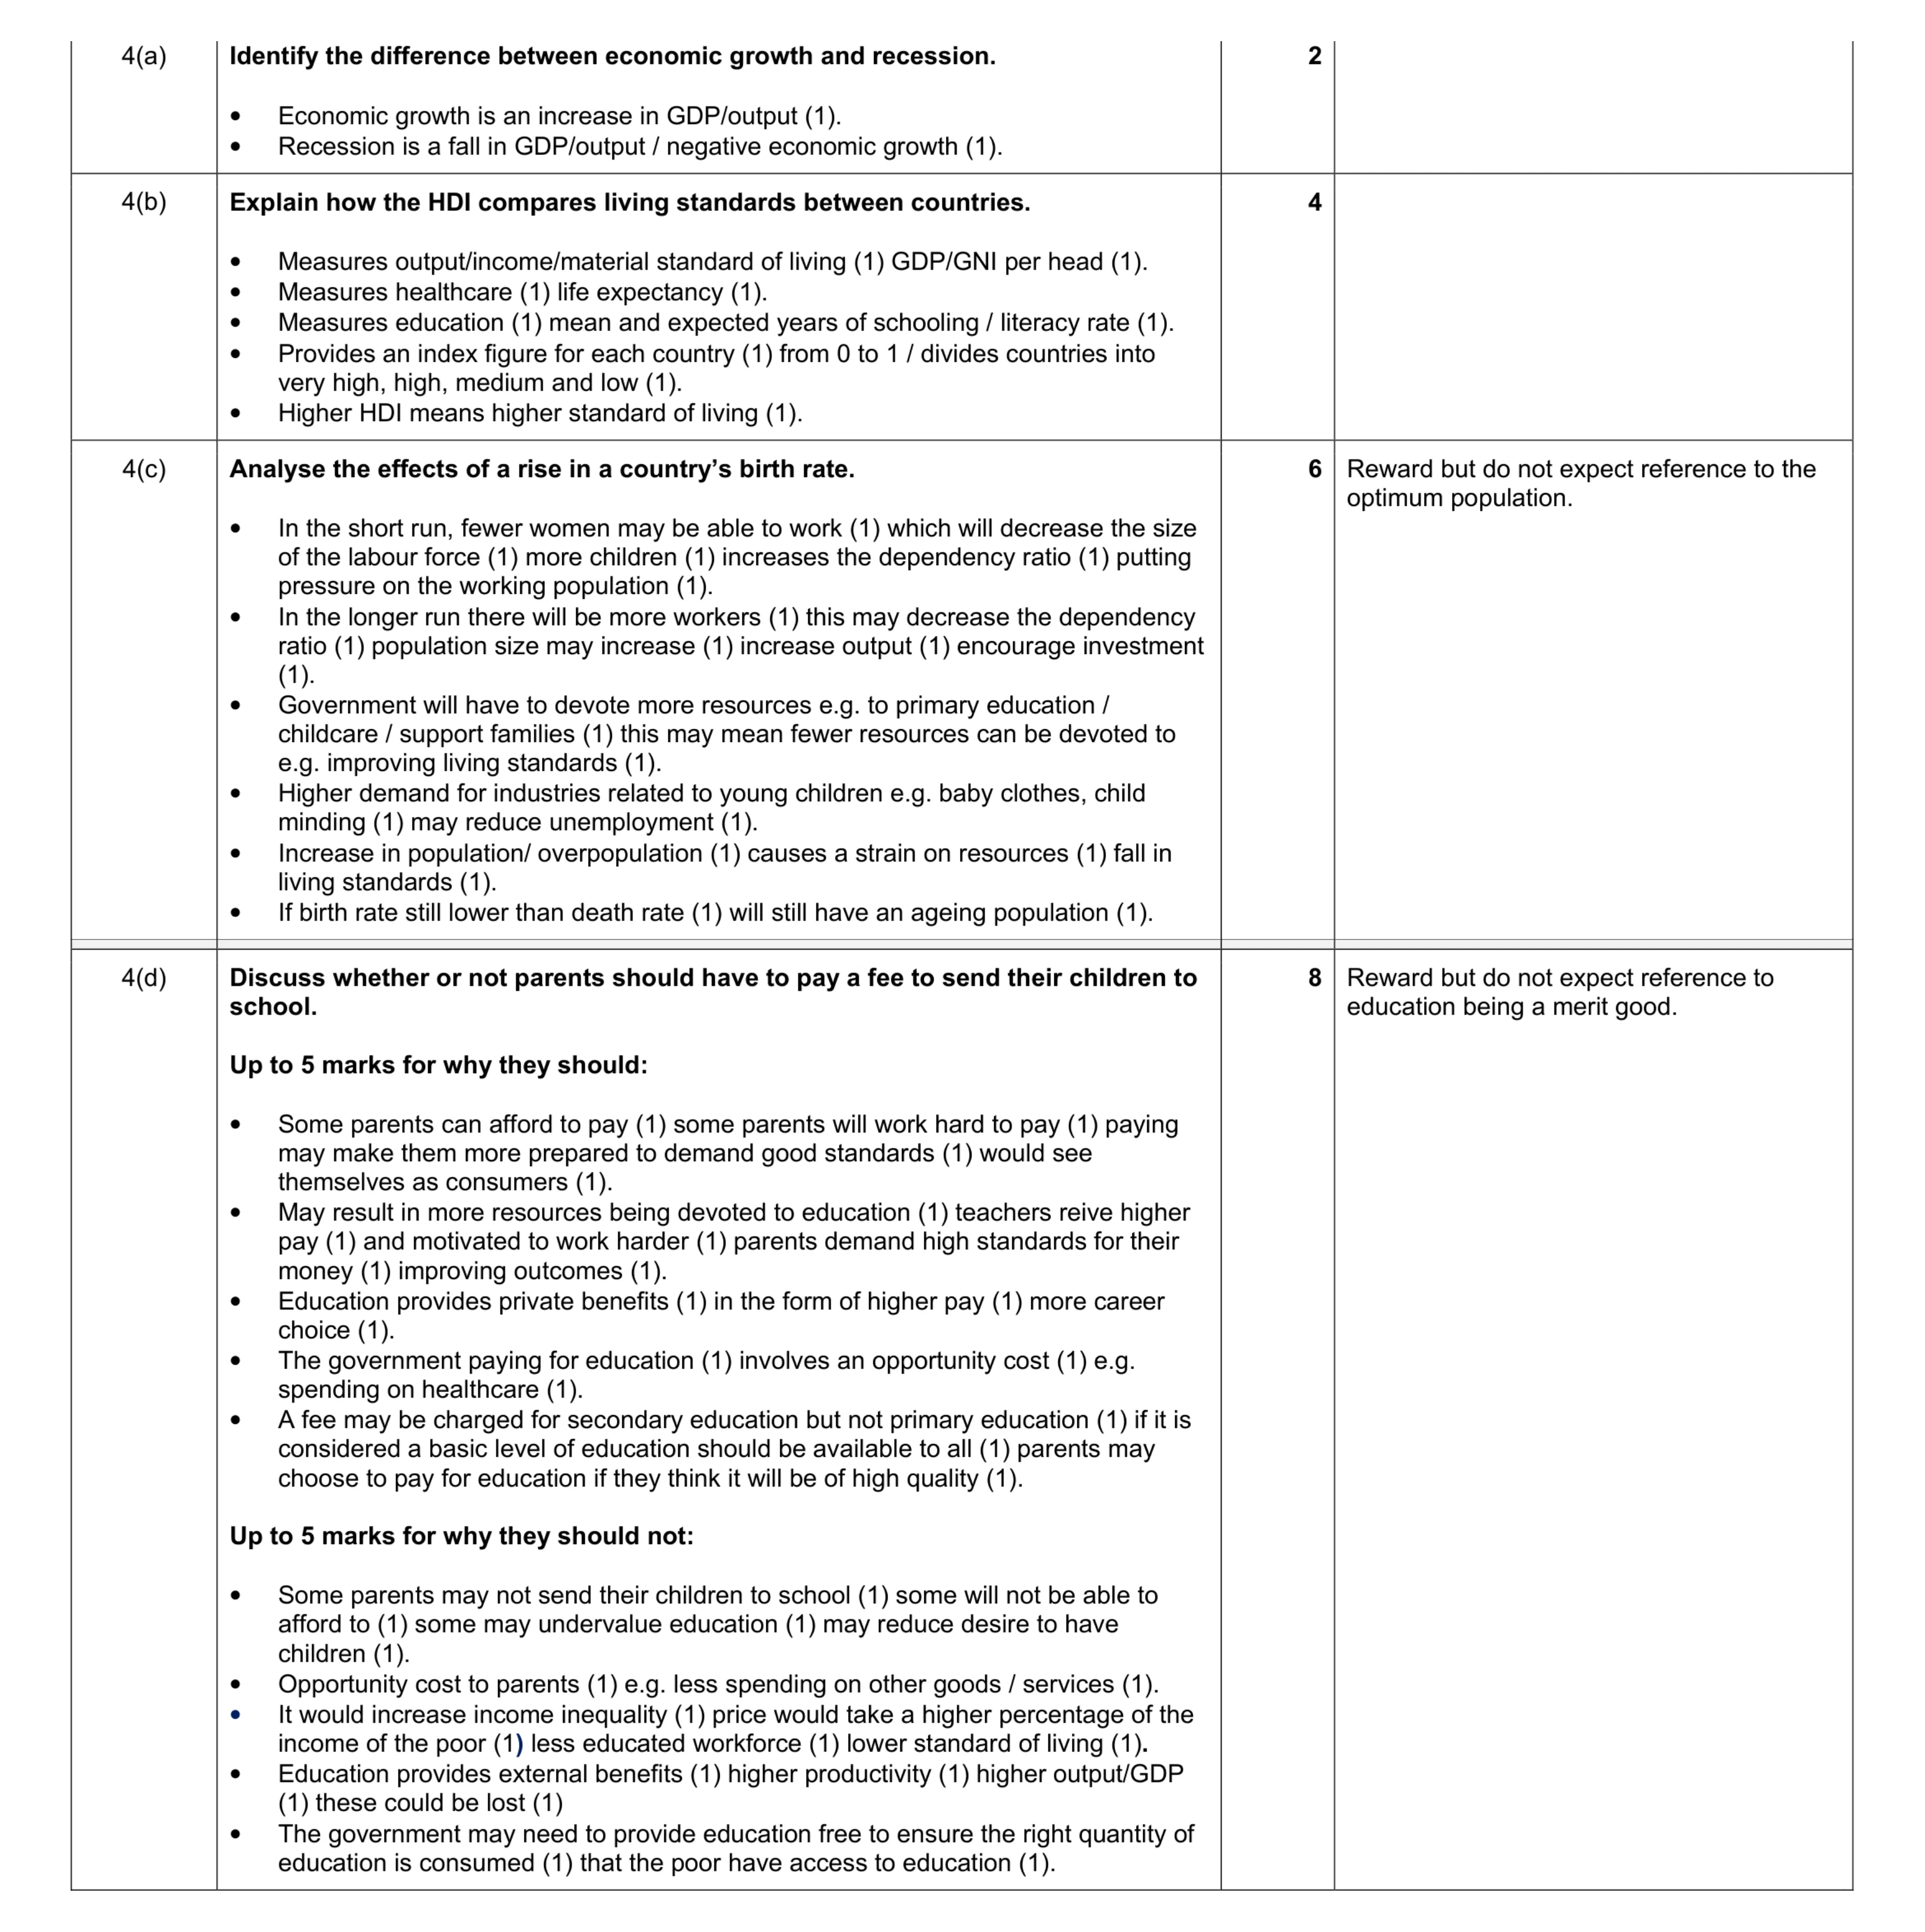 20
20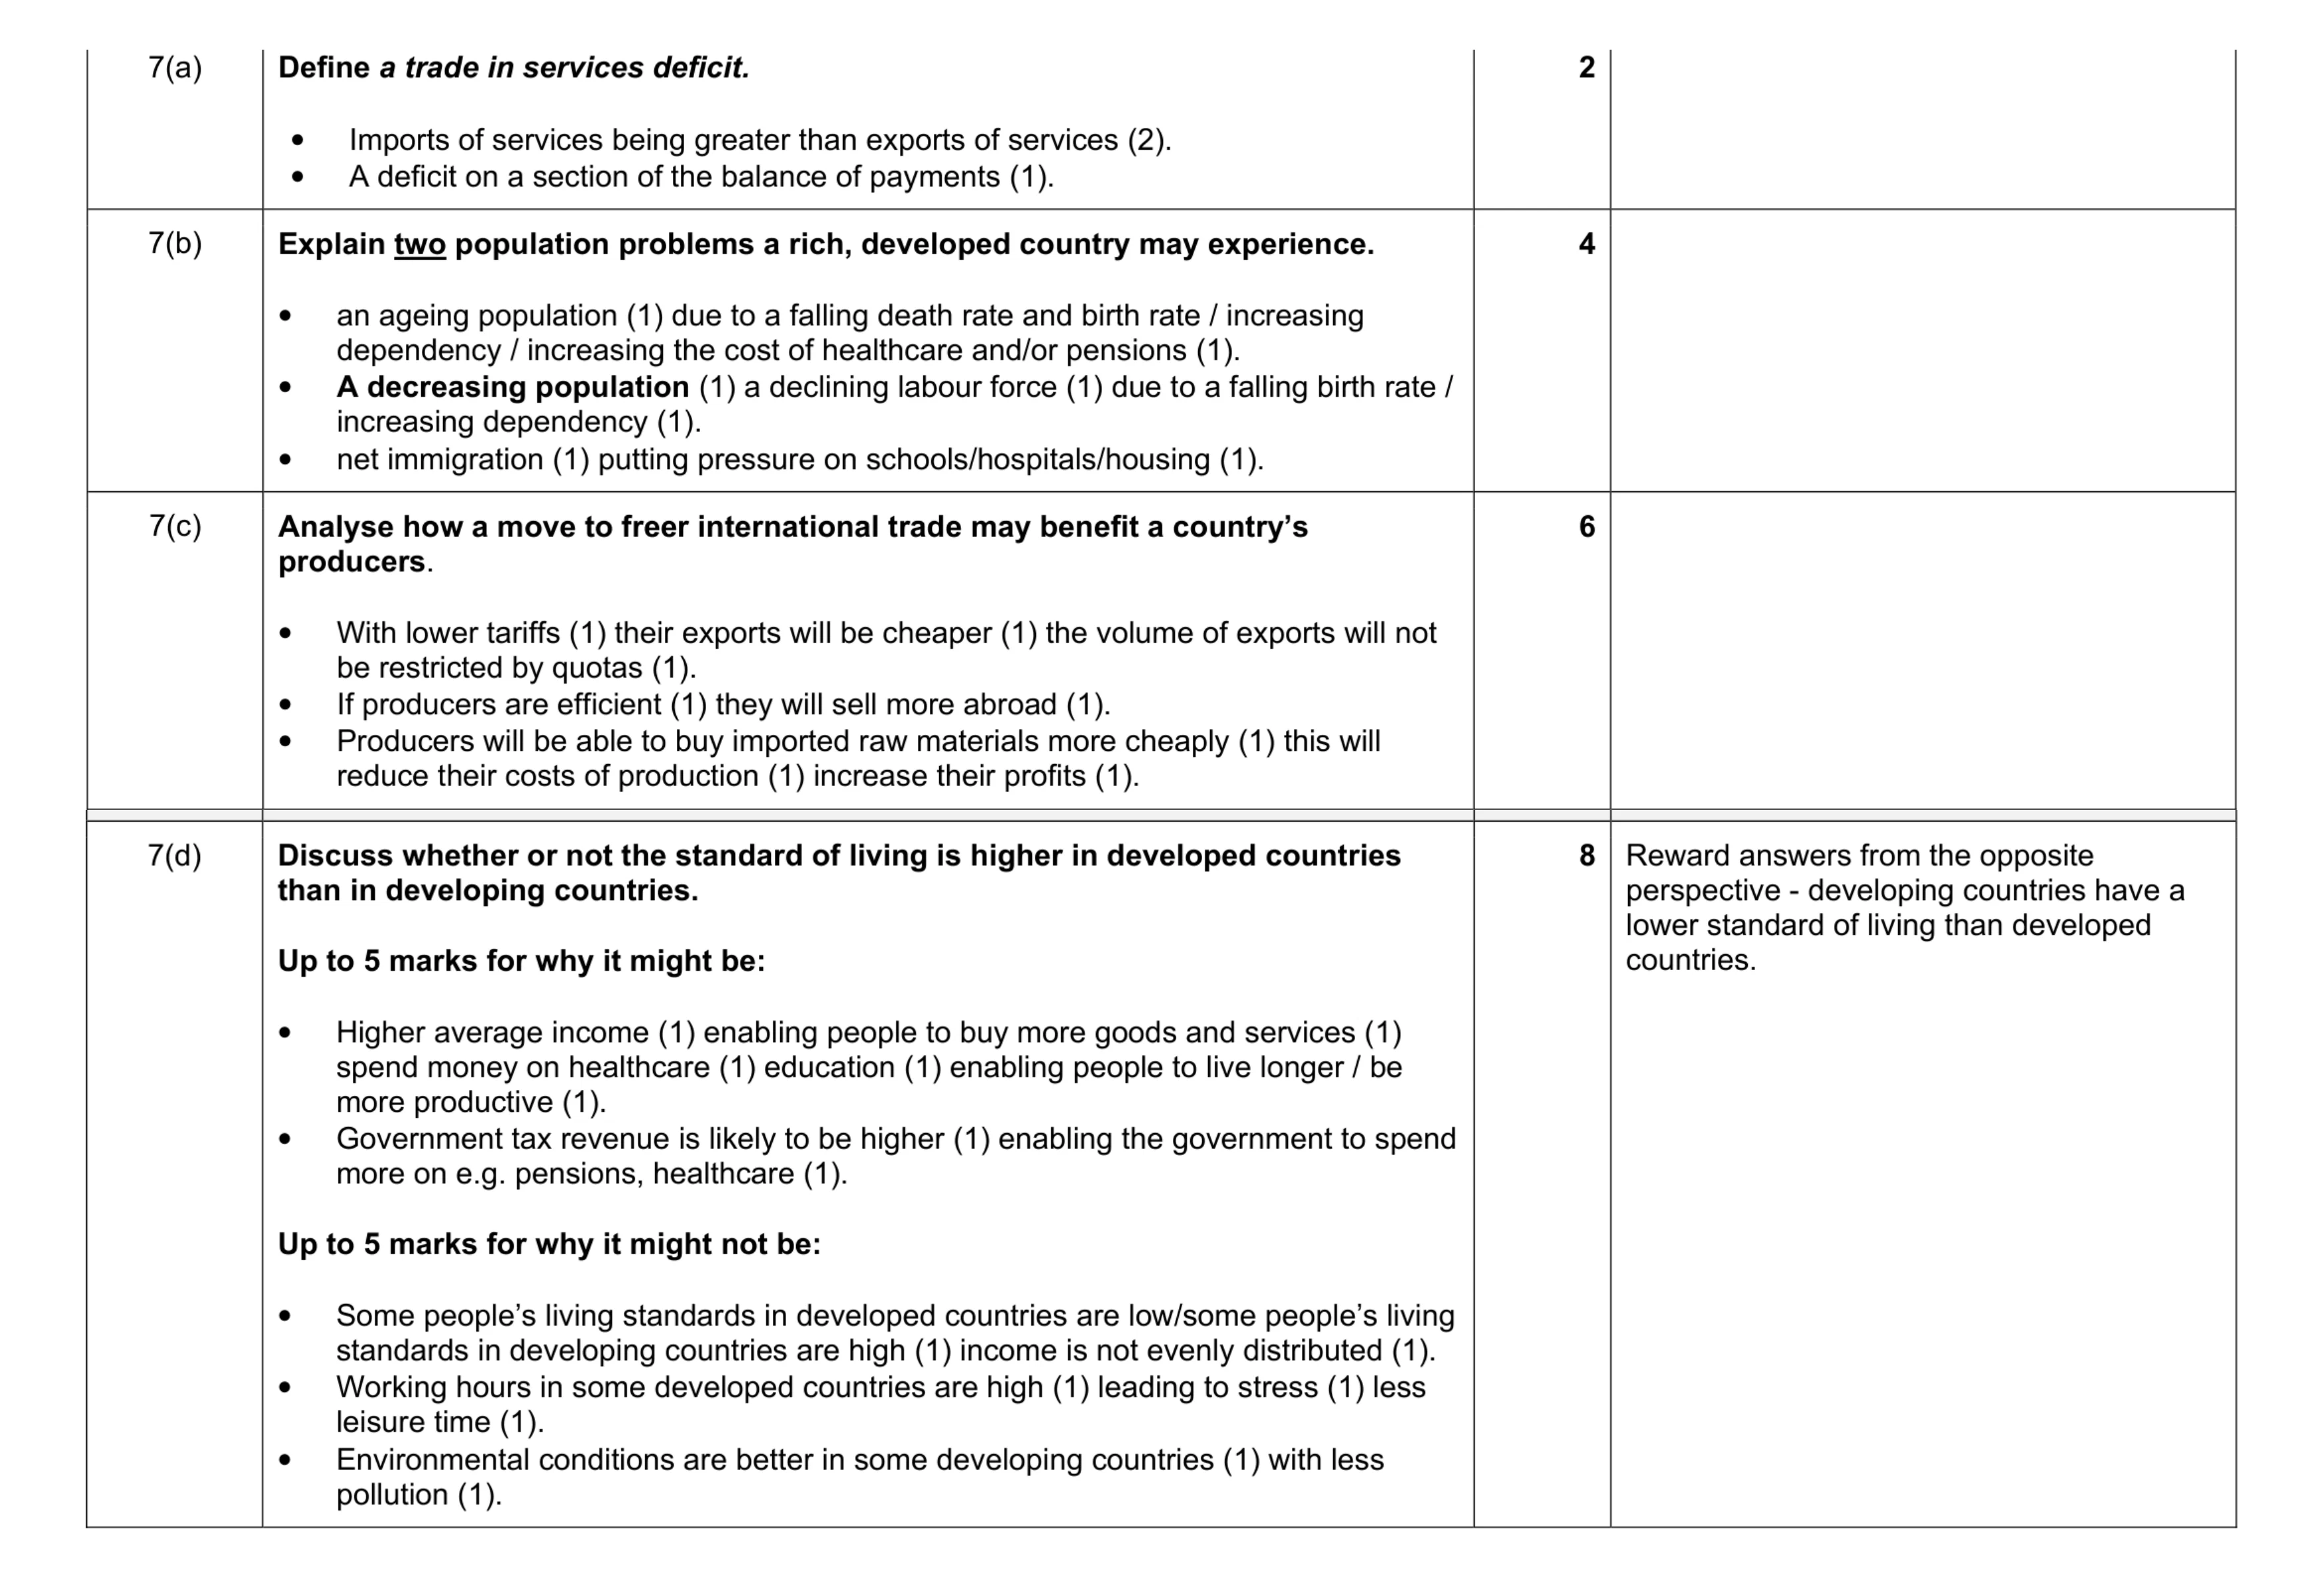 20
20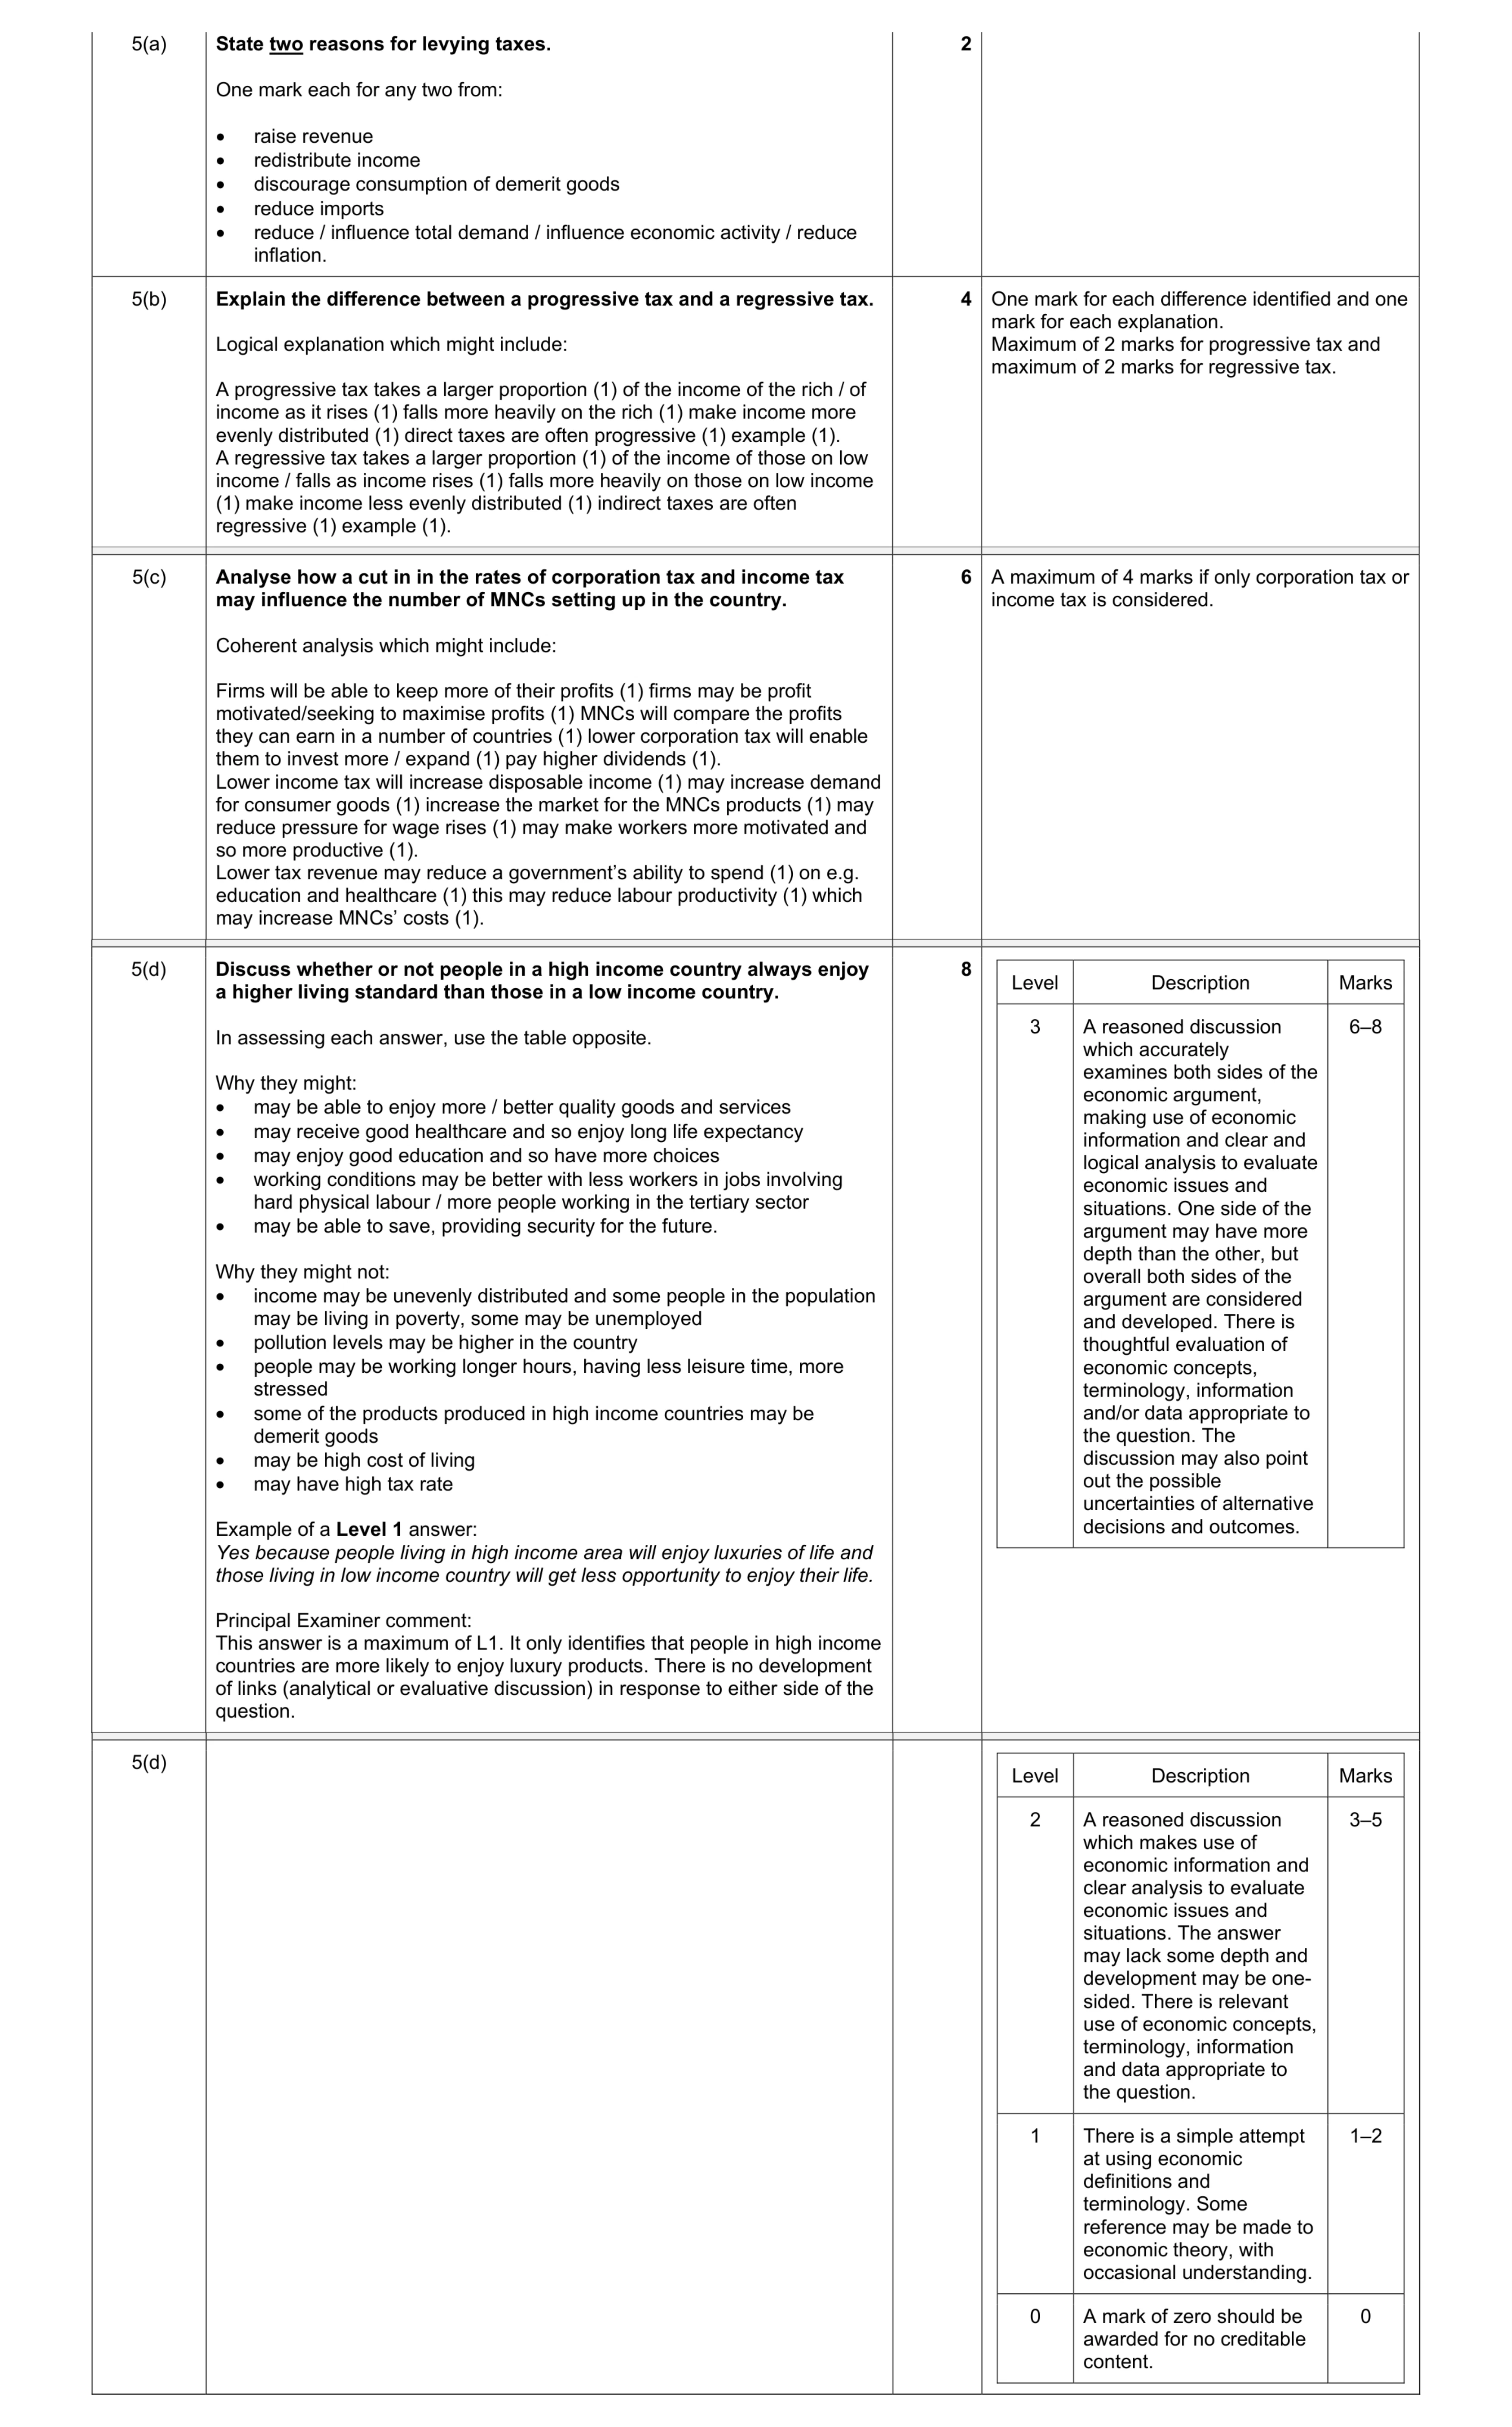 20
20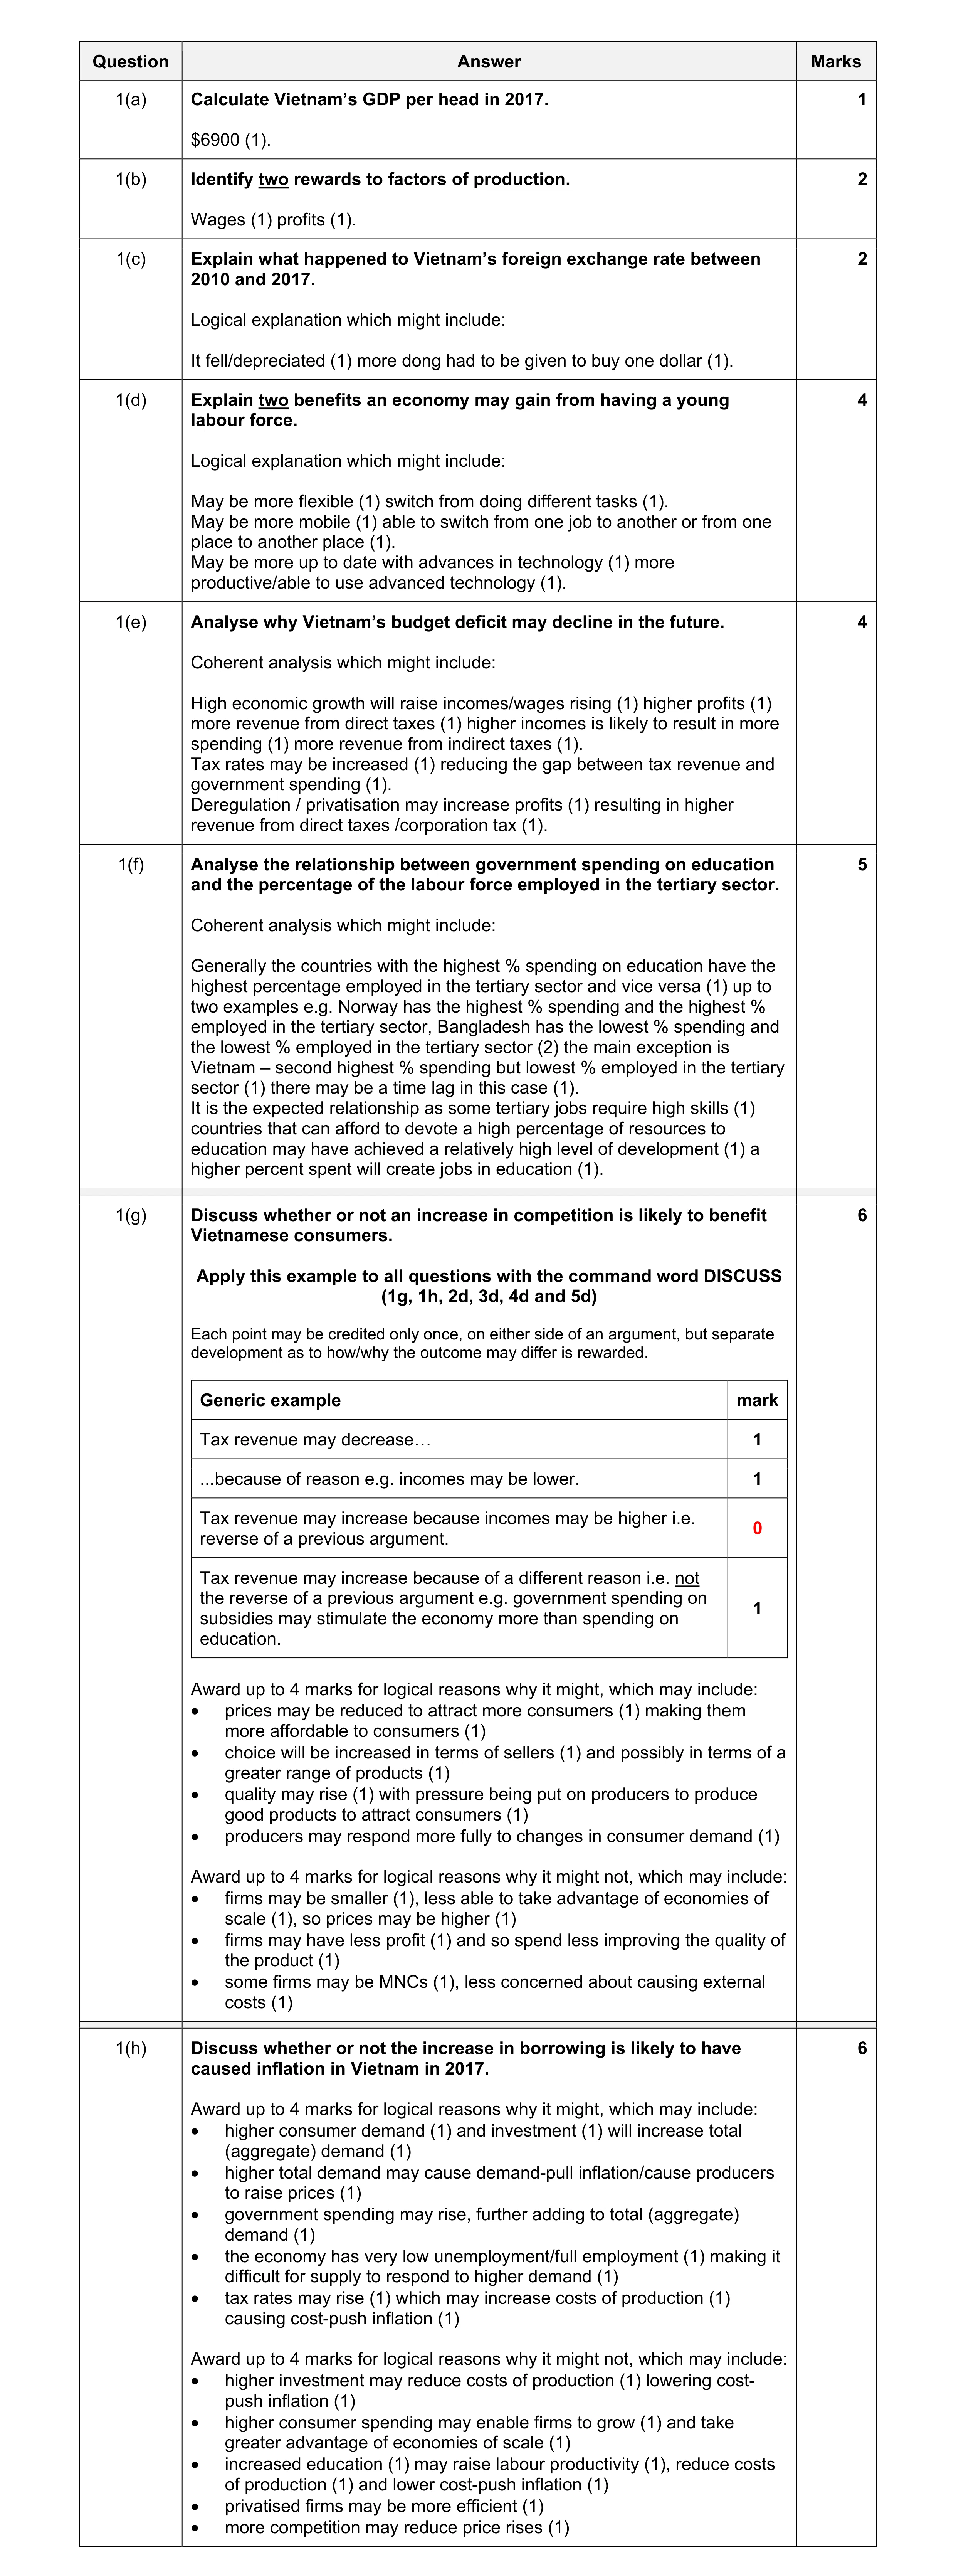 30
30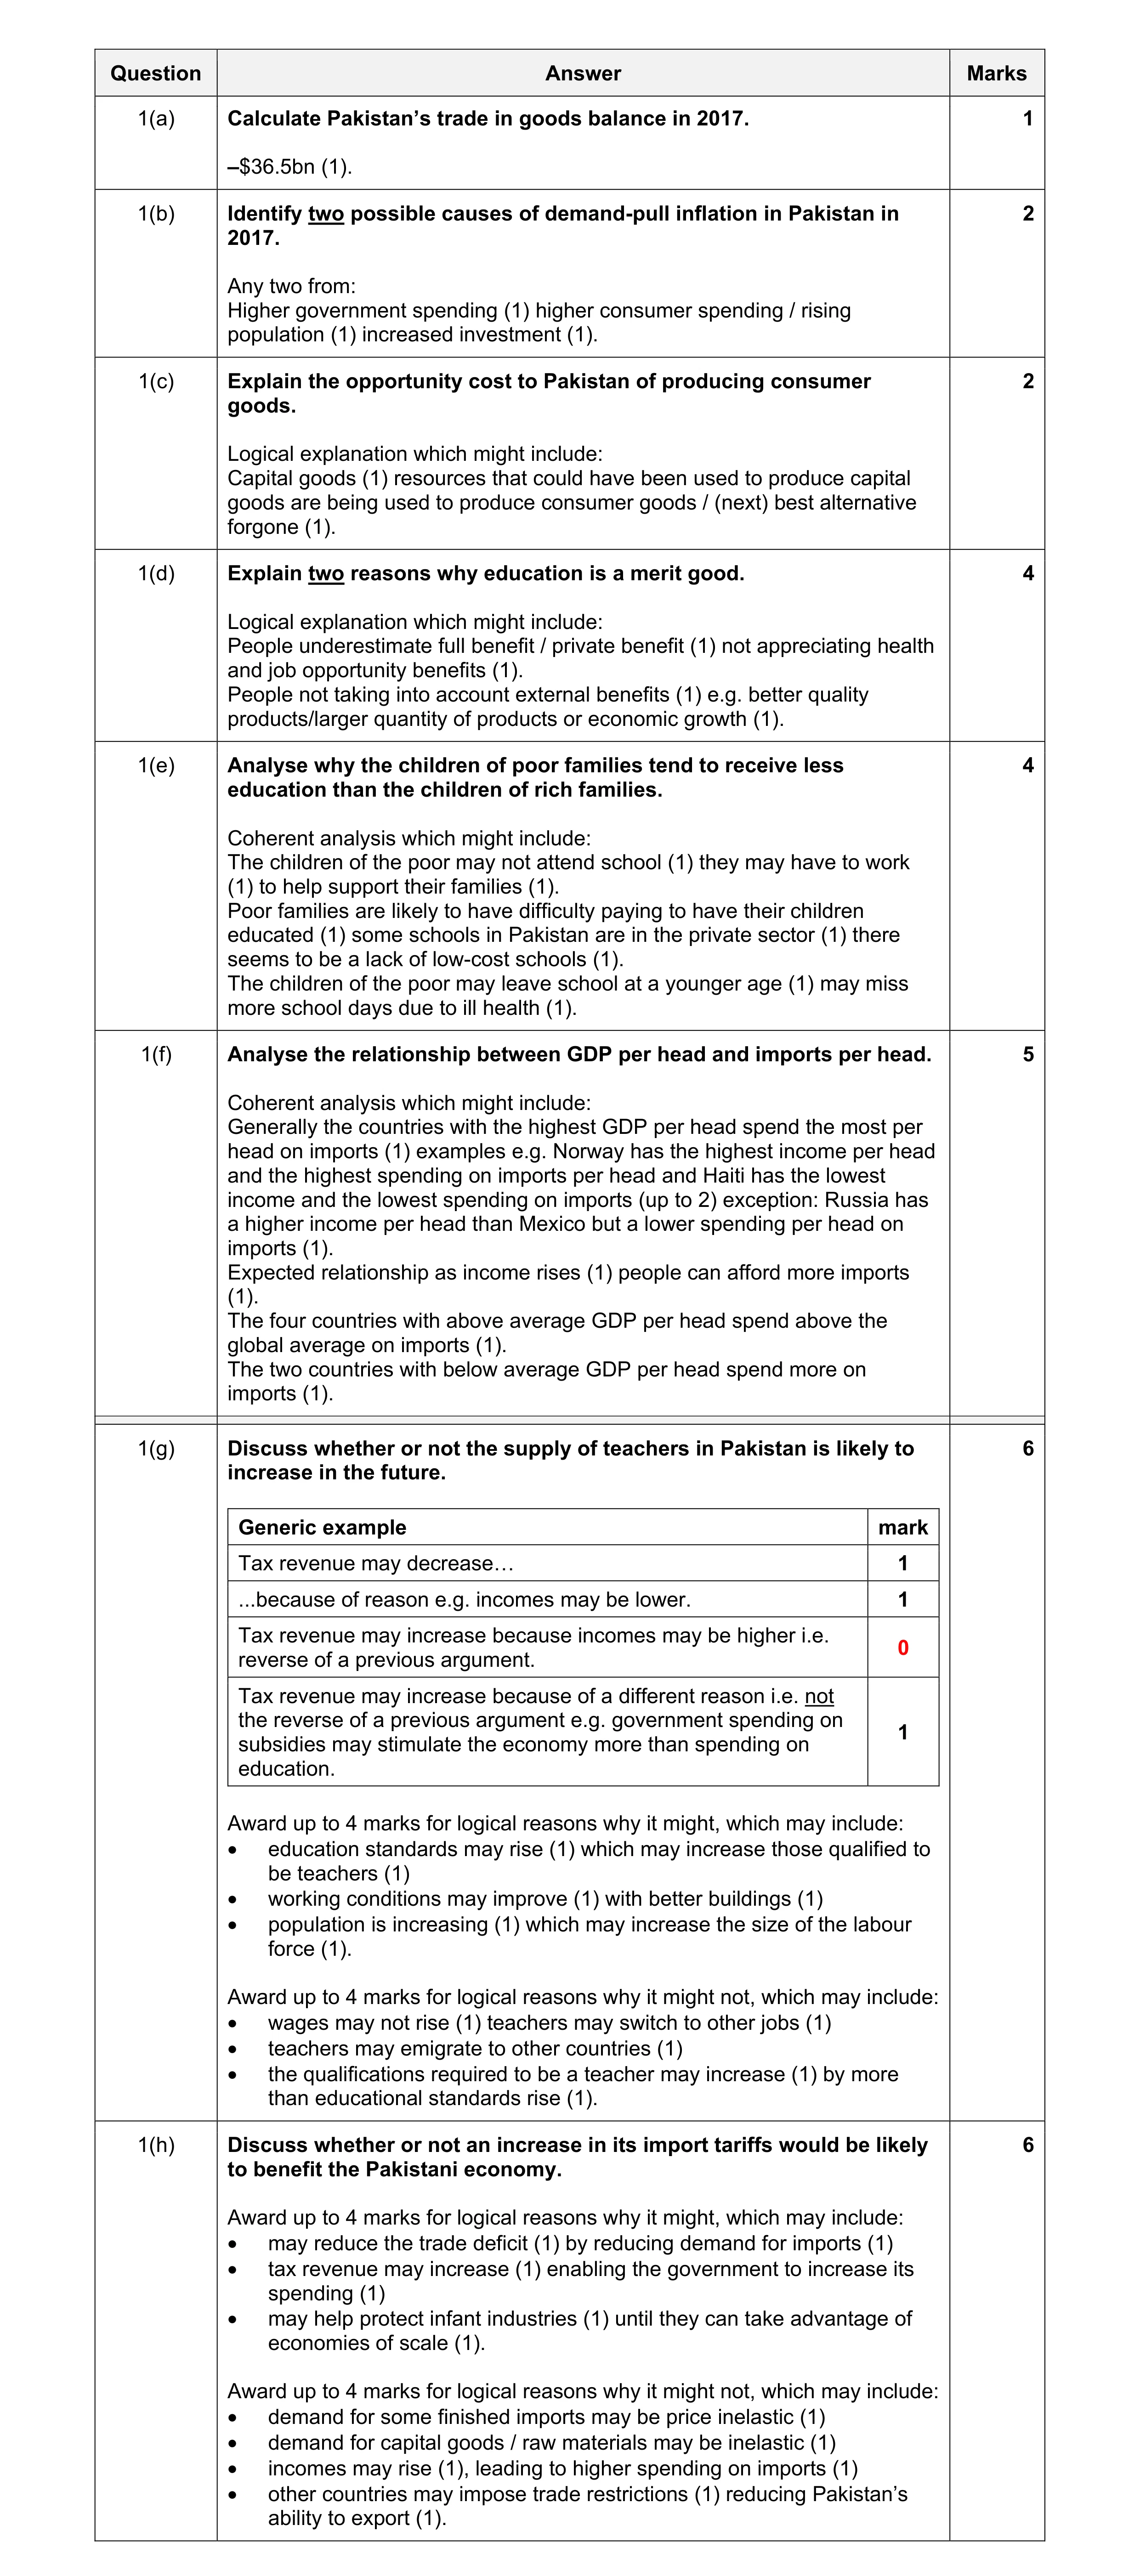 30
30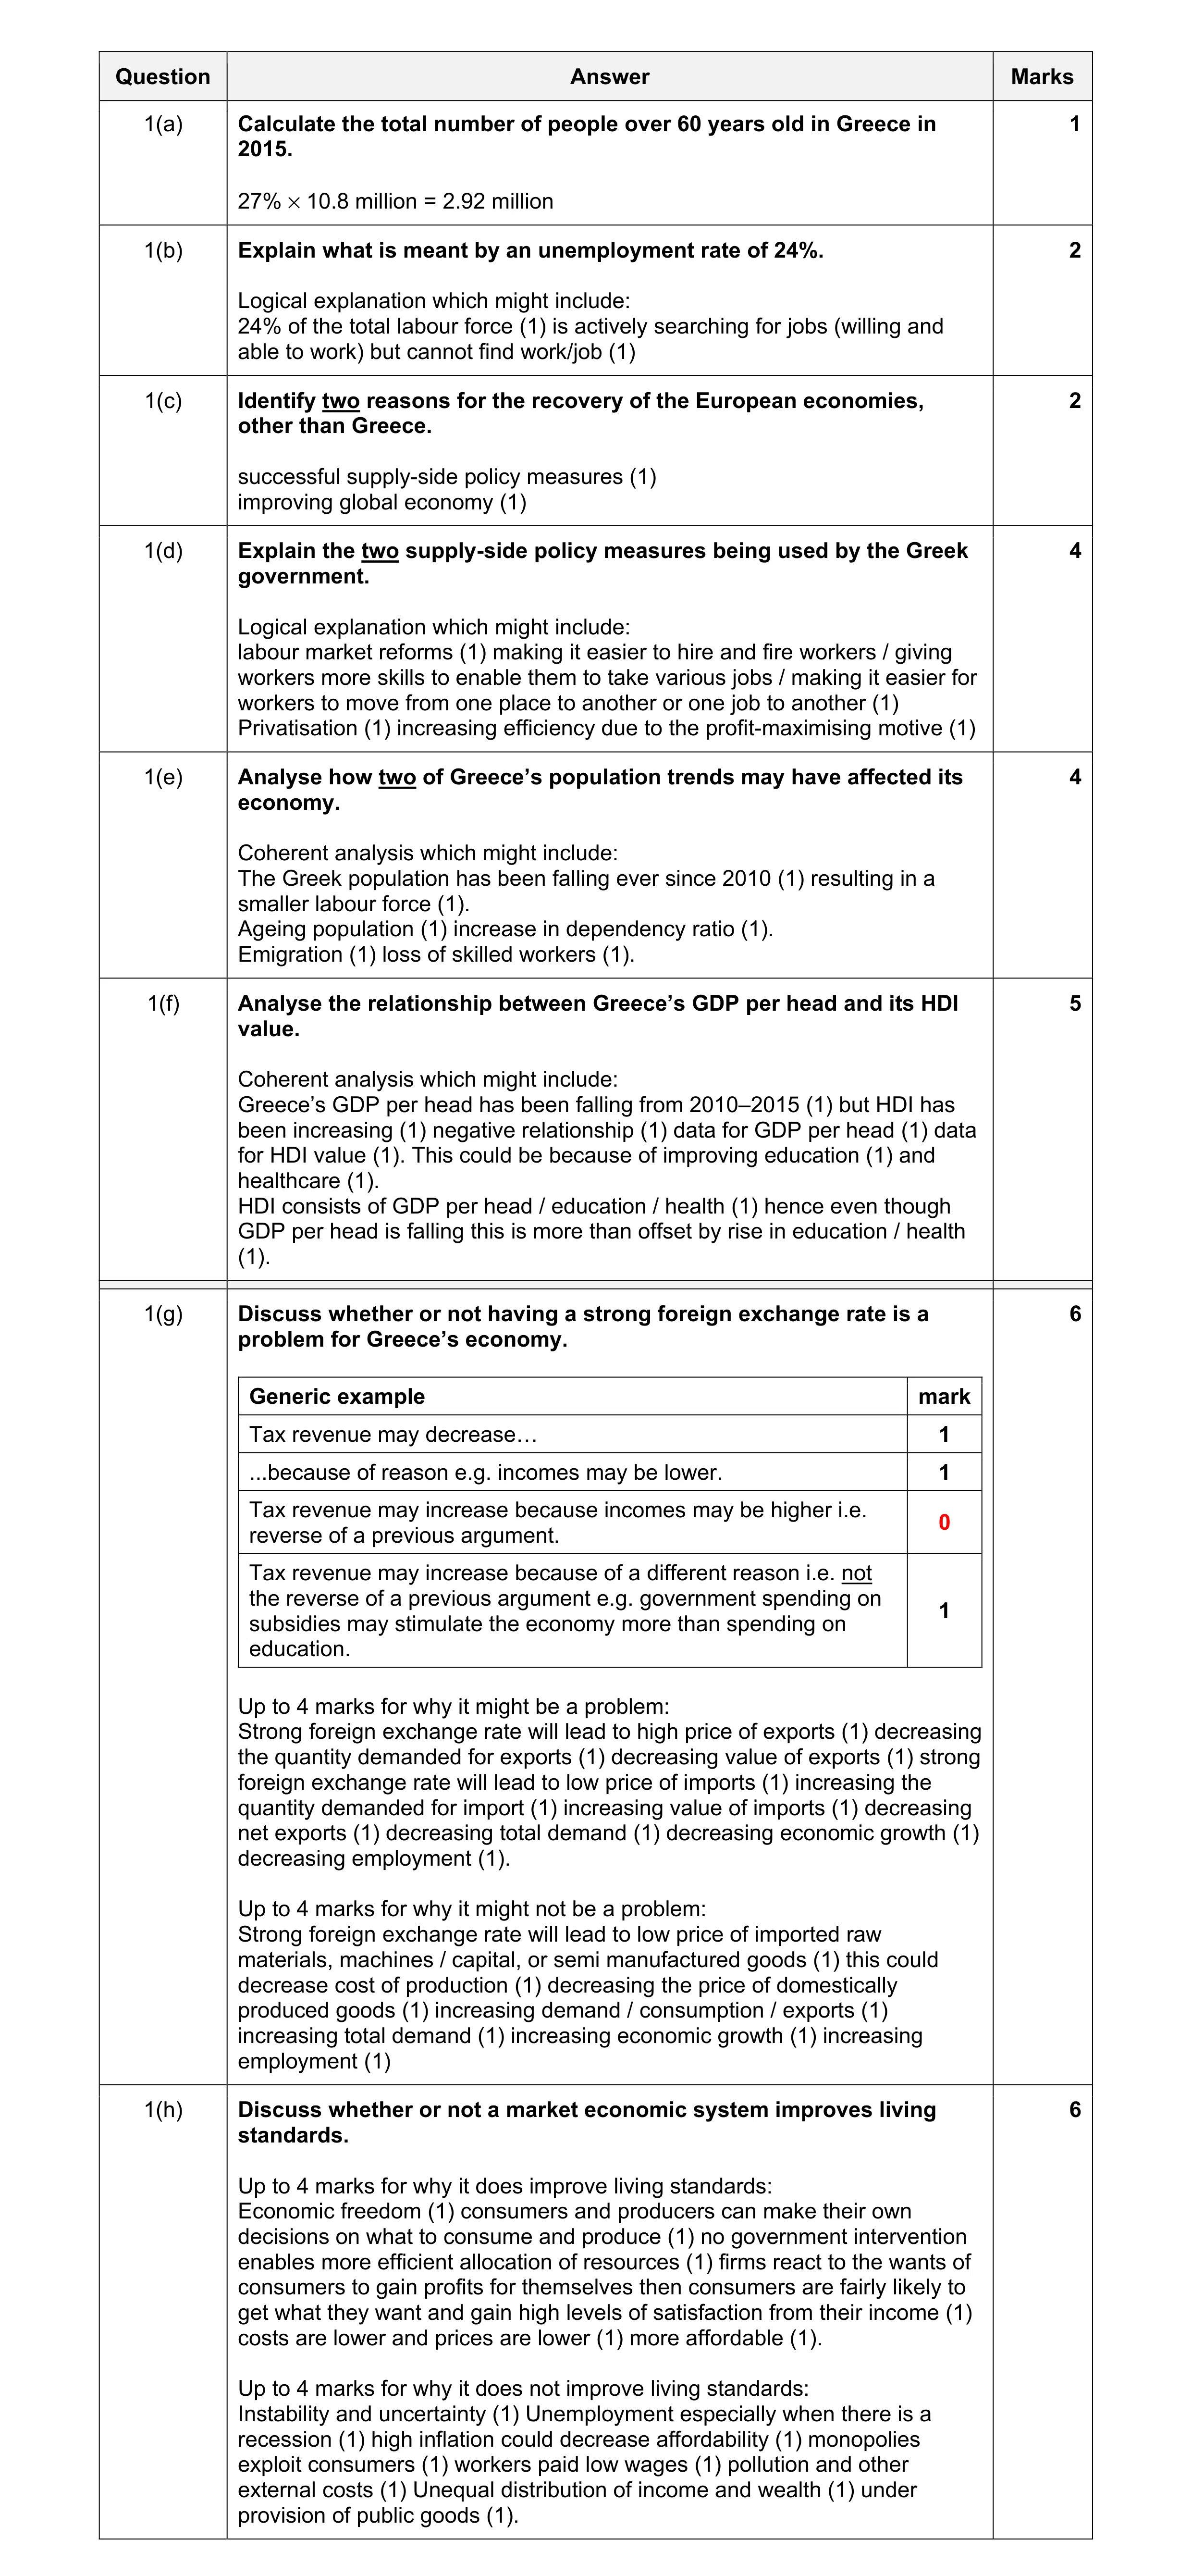 30
30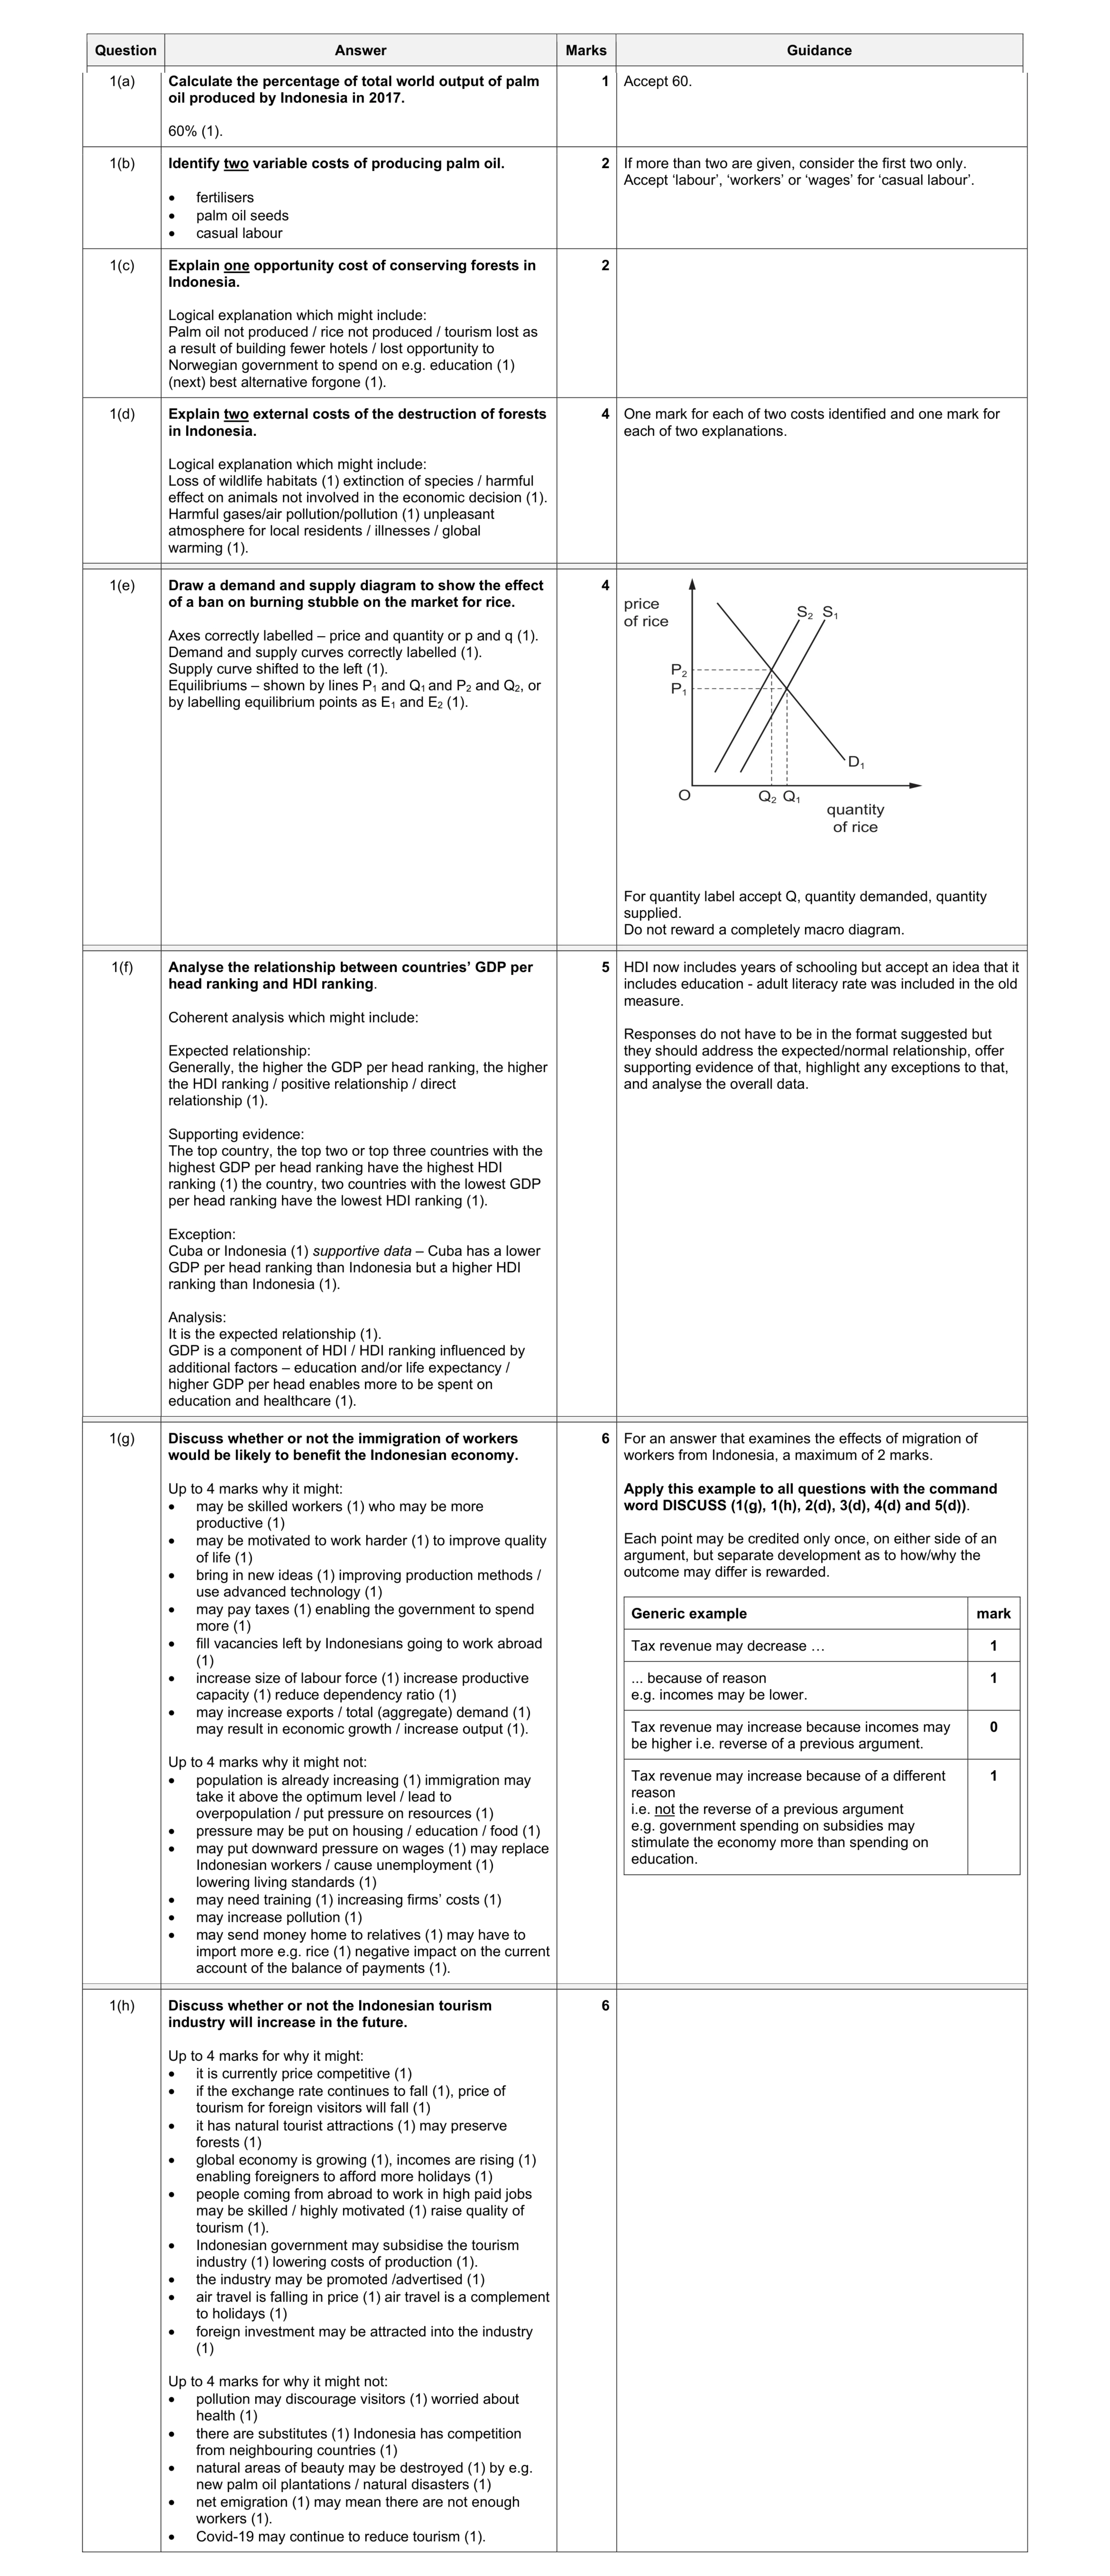 30
30 30
30 30
30 20
20 30
30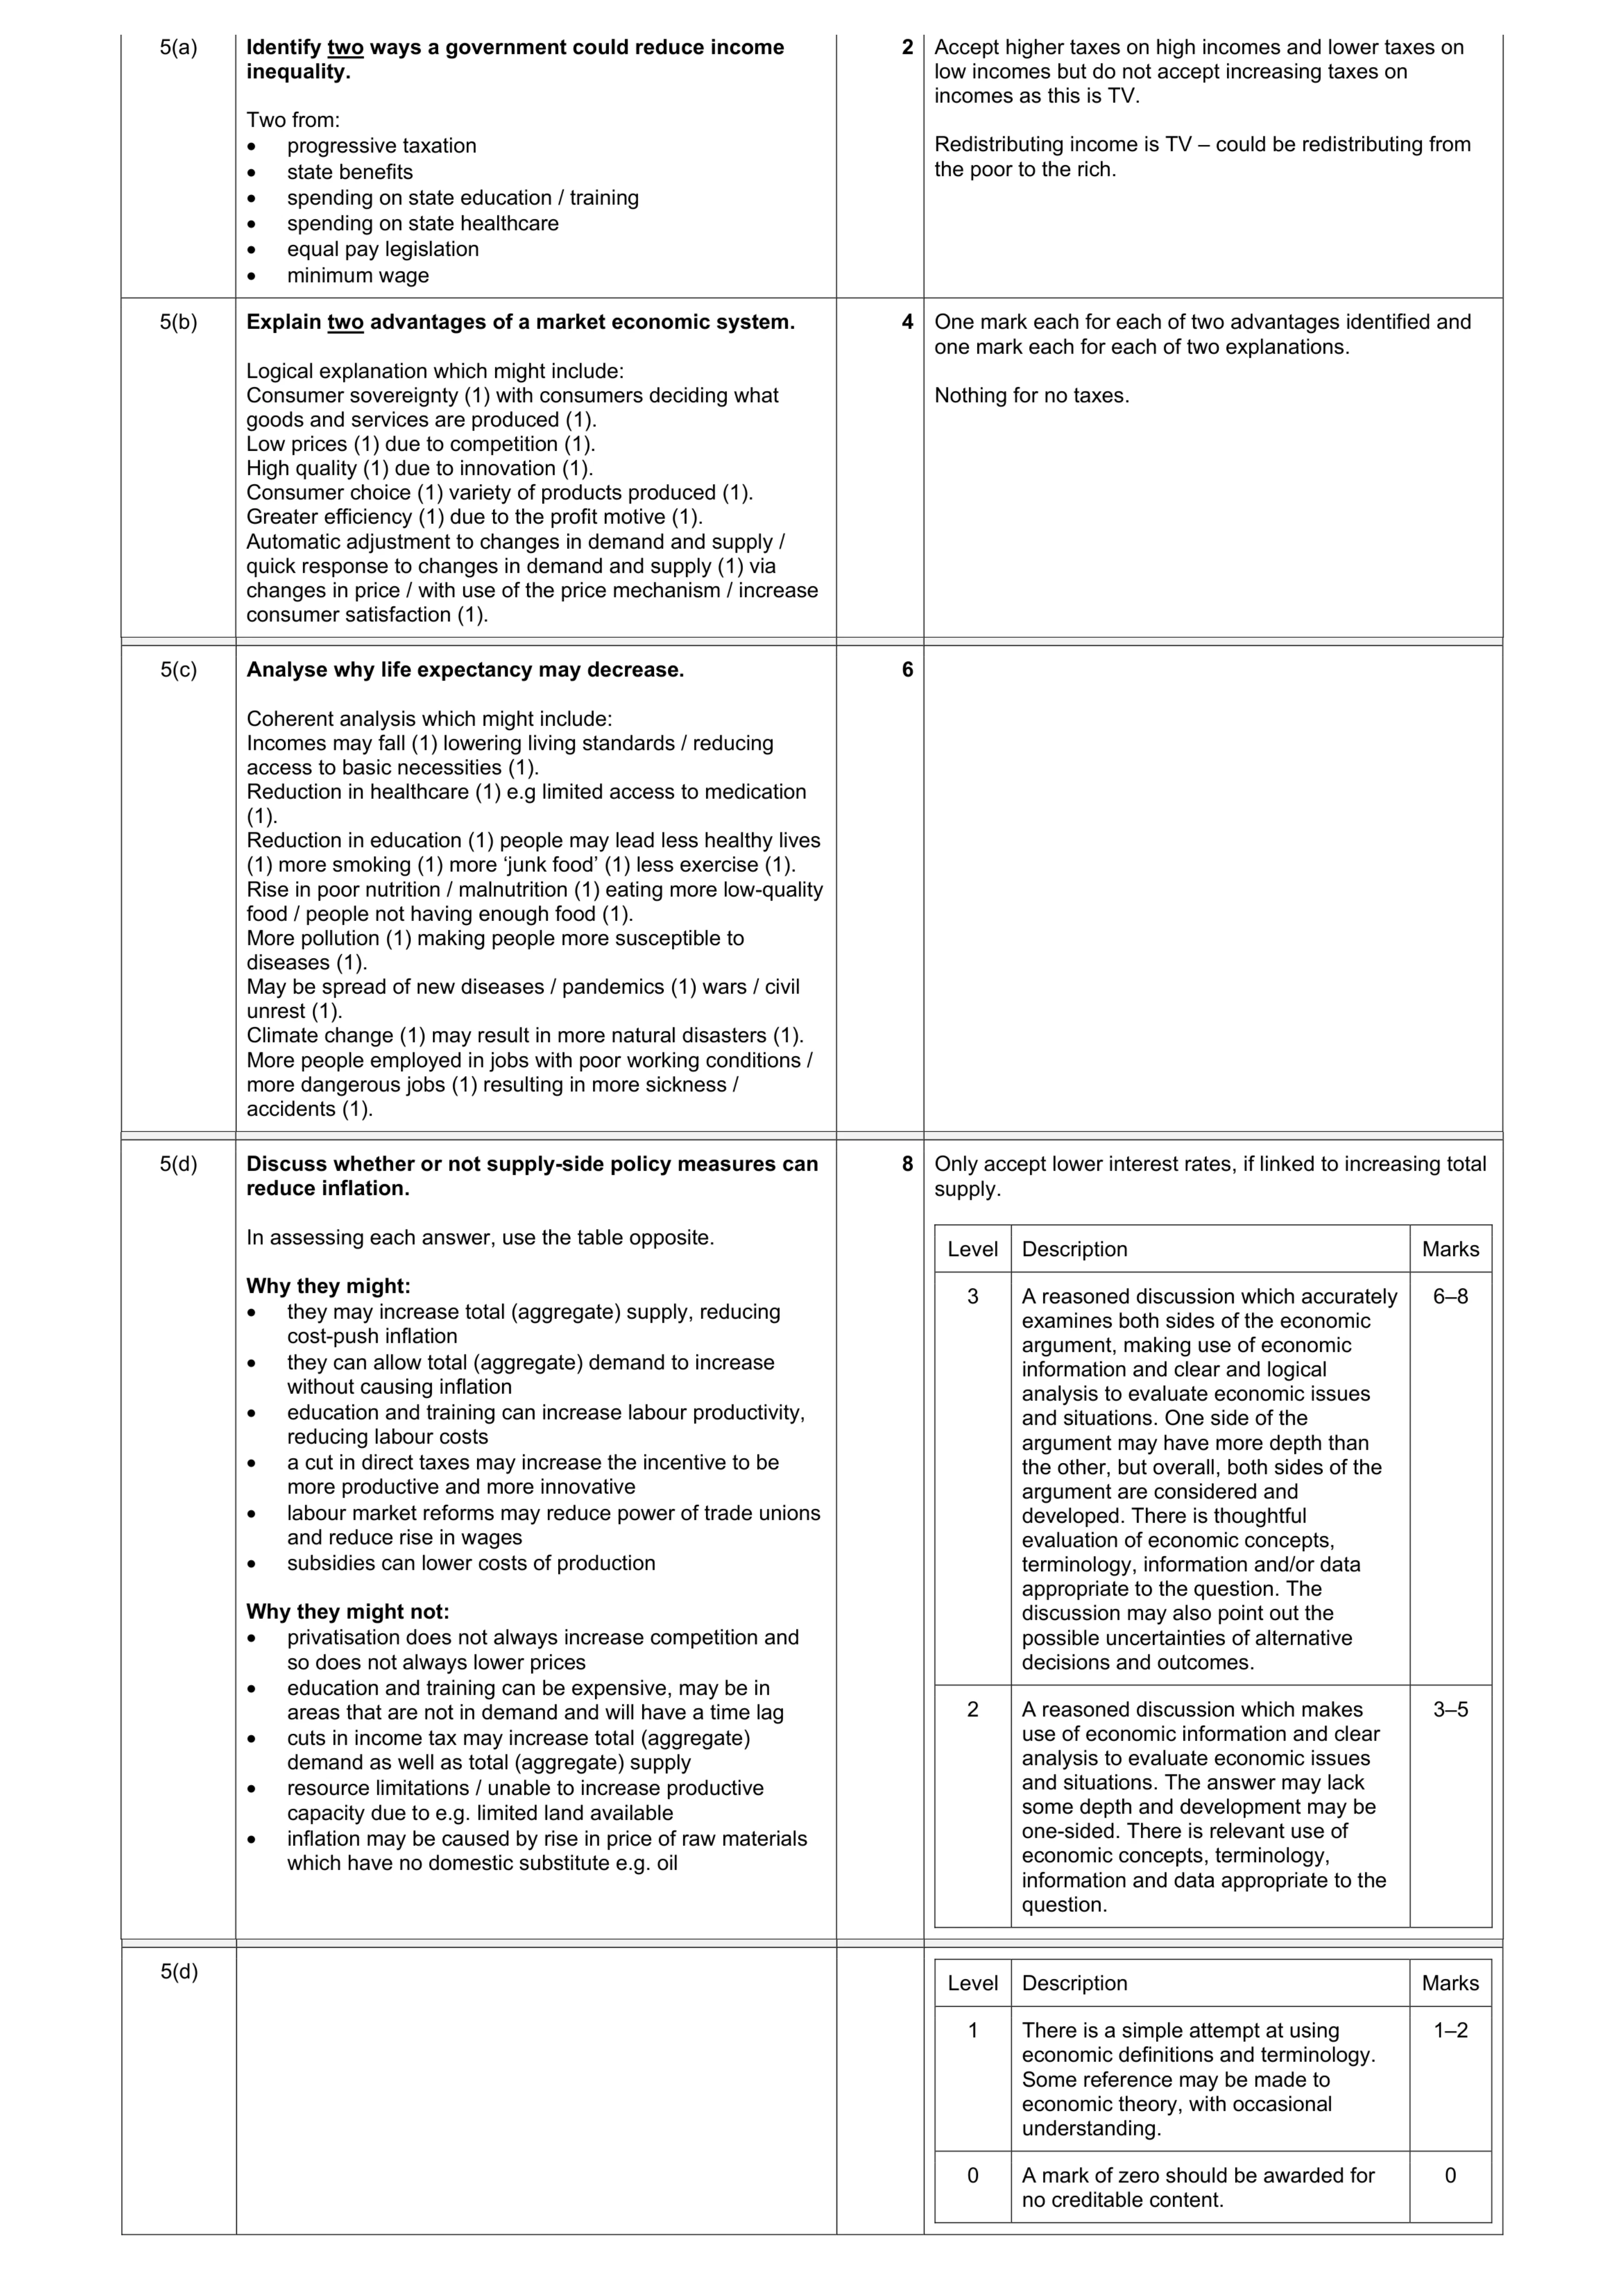 20
20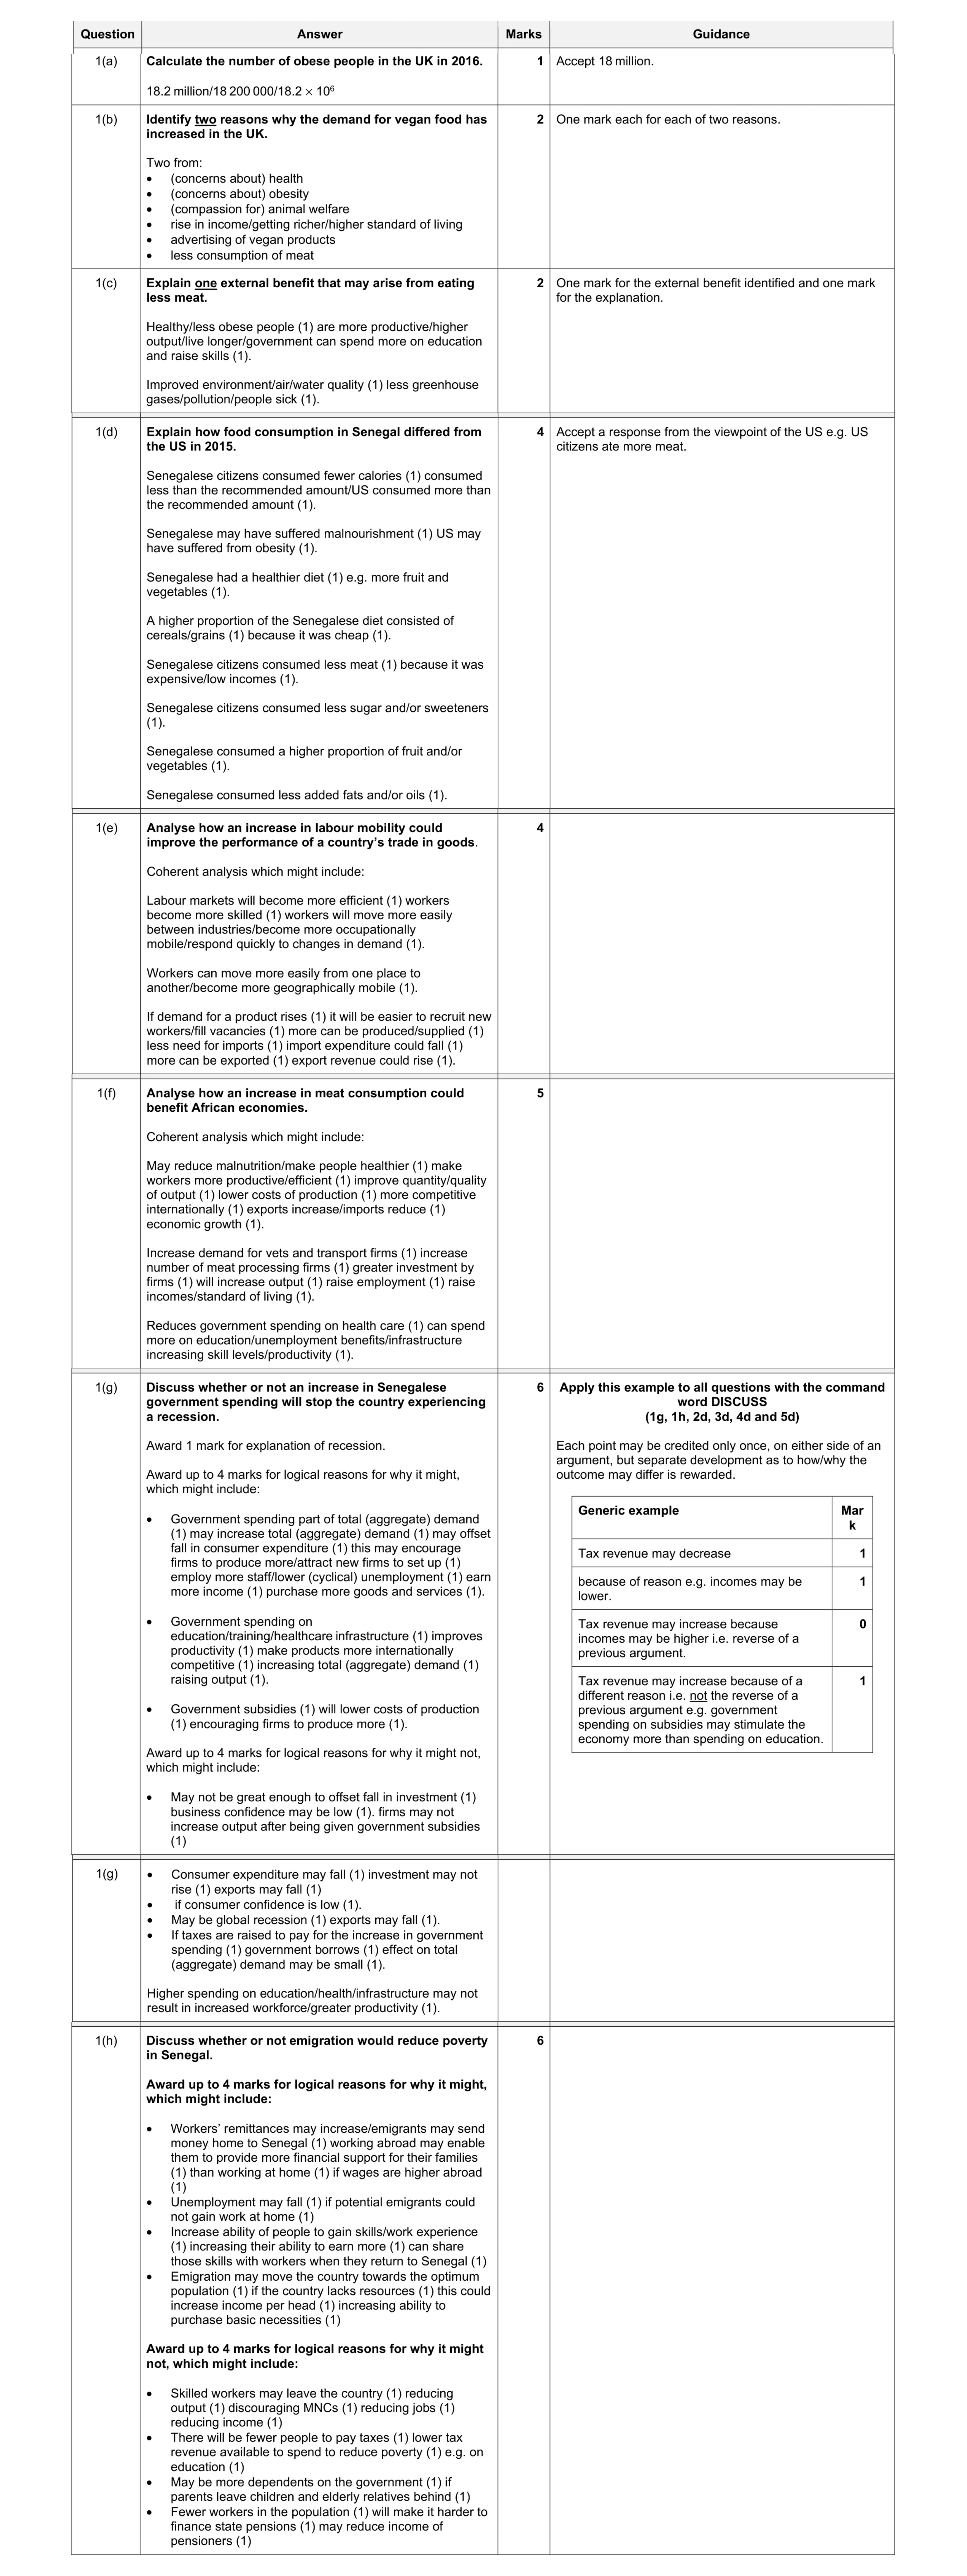 30
30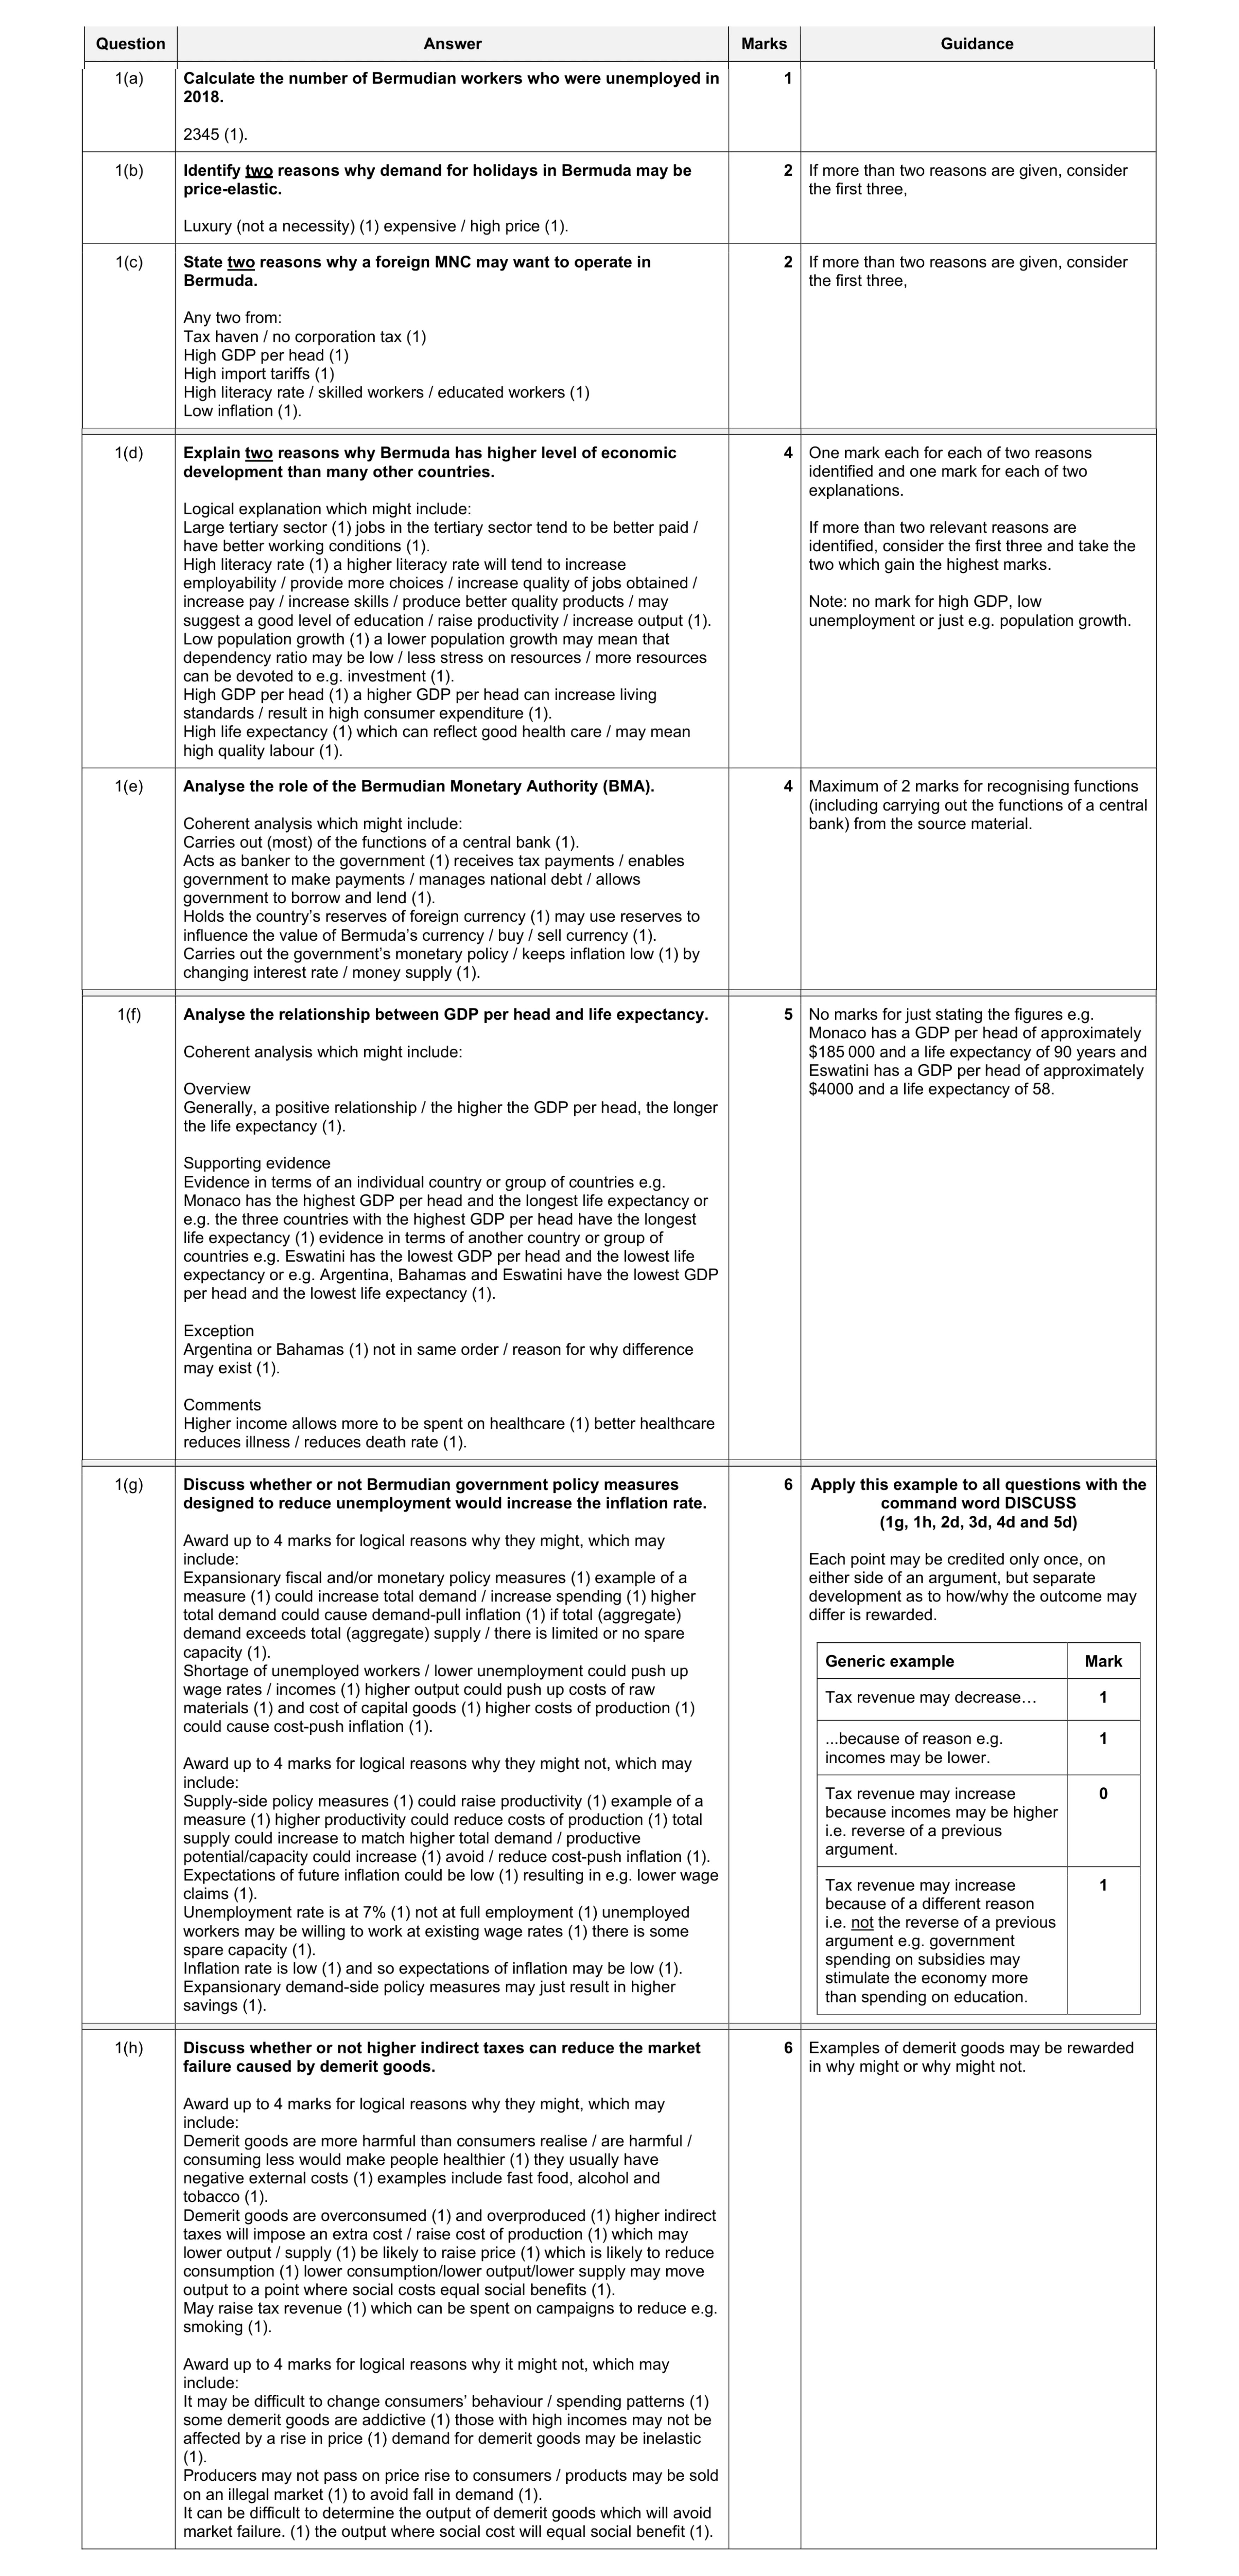 30
30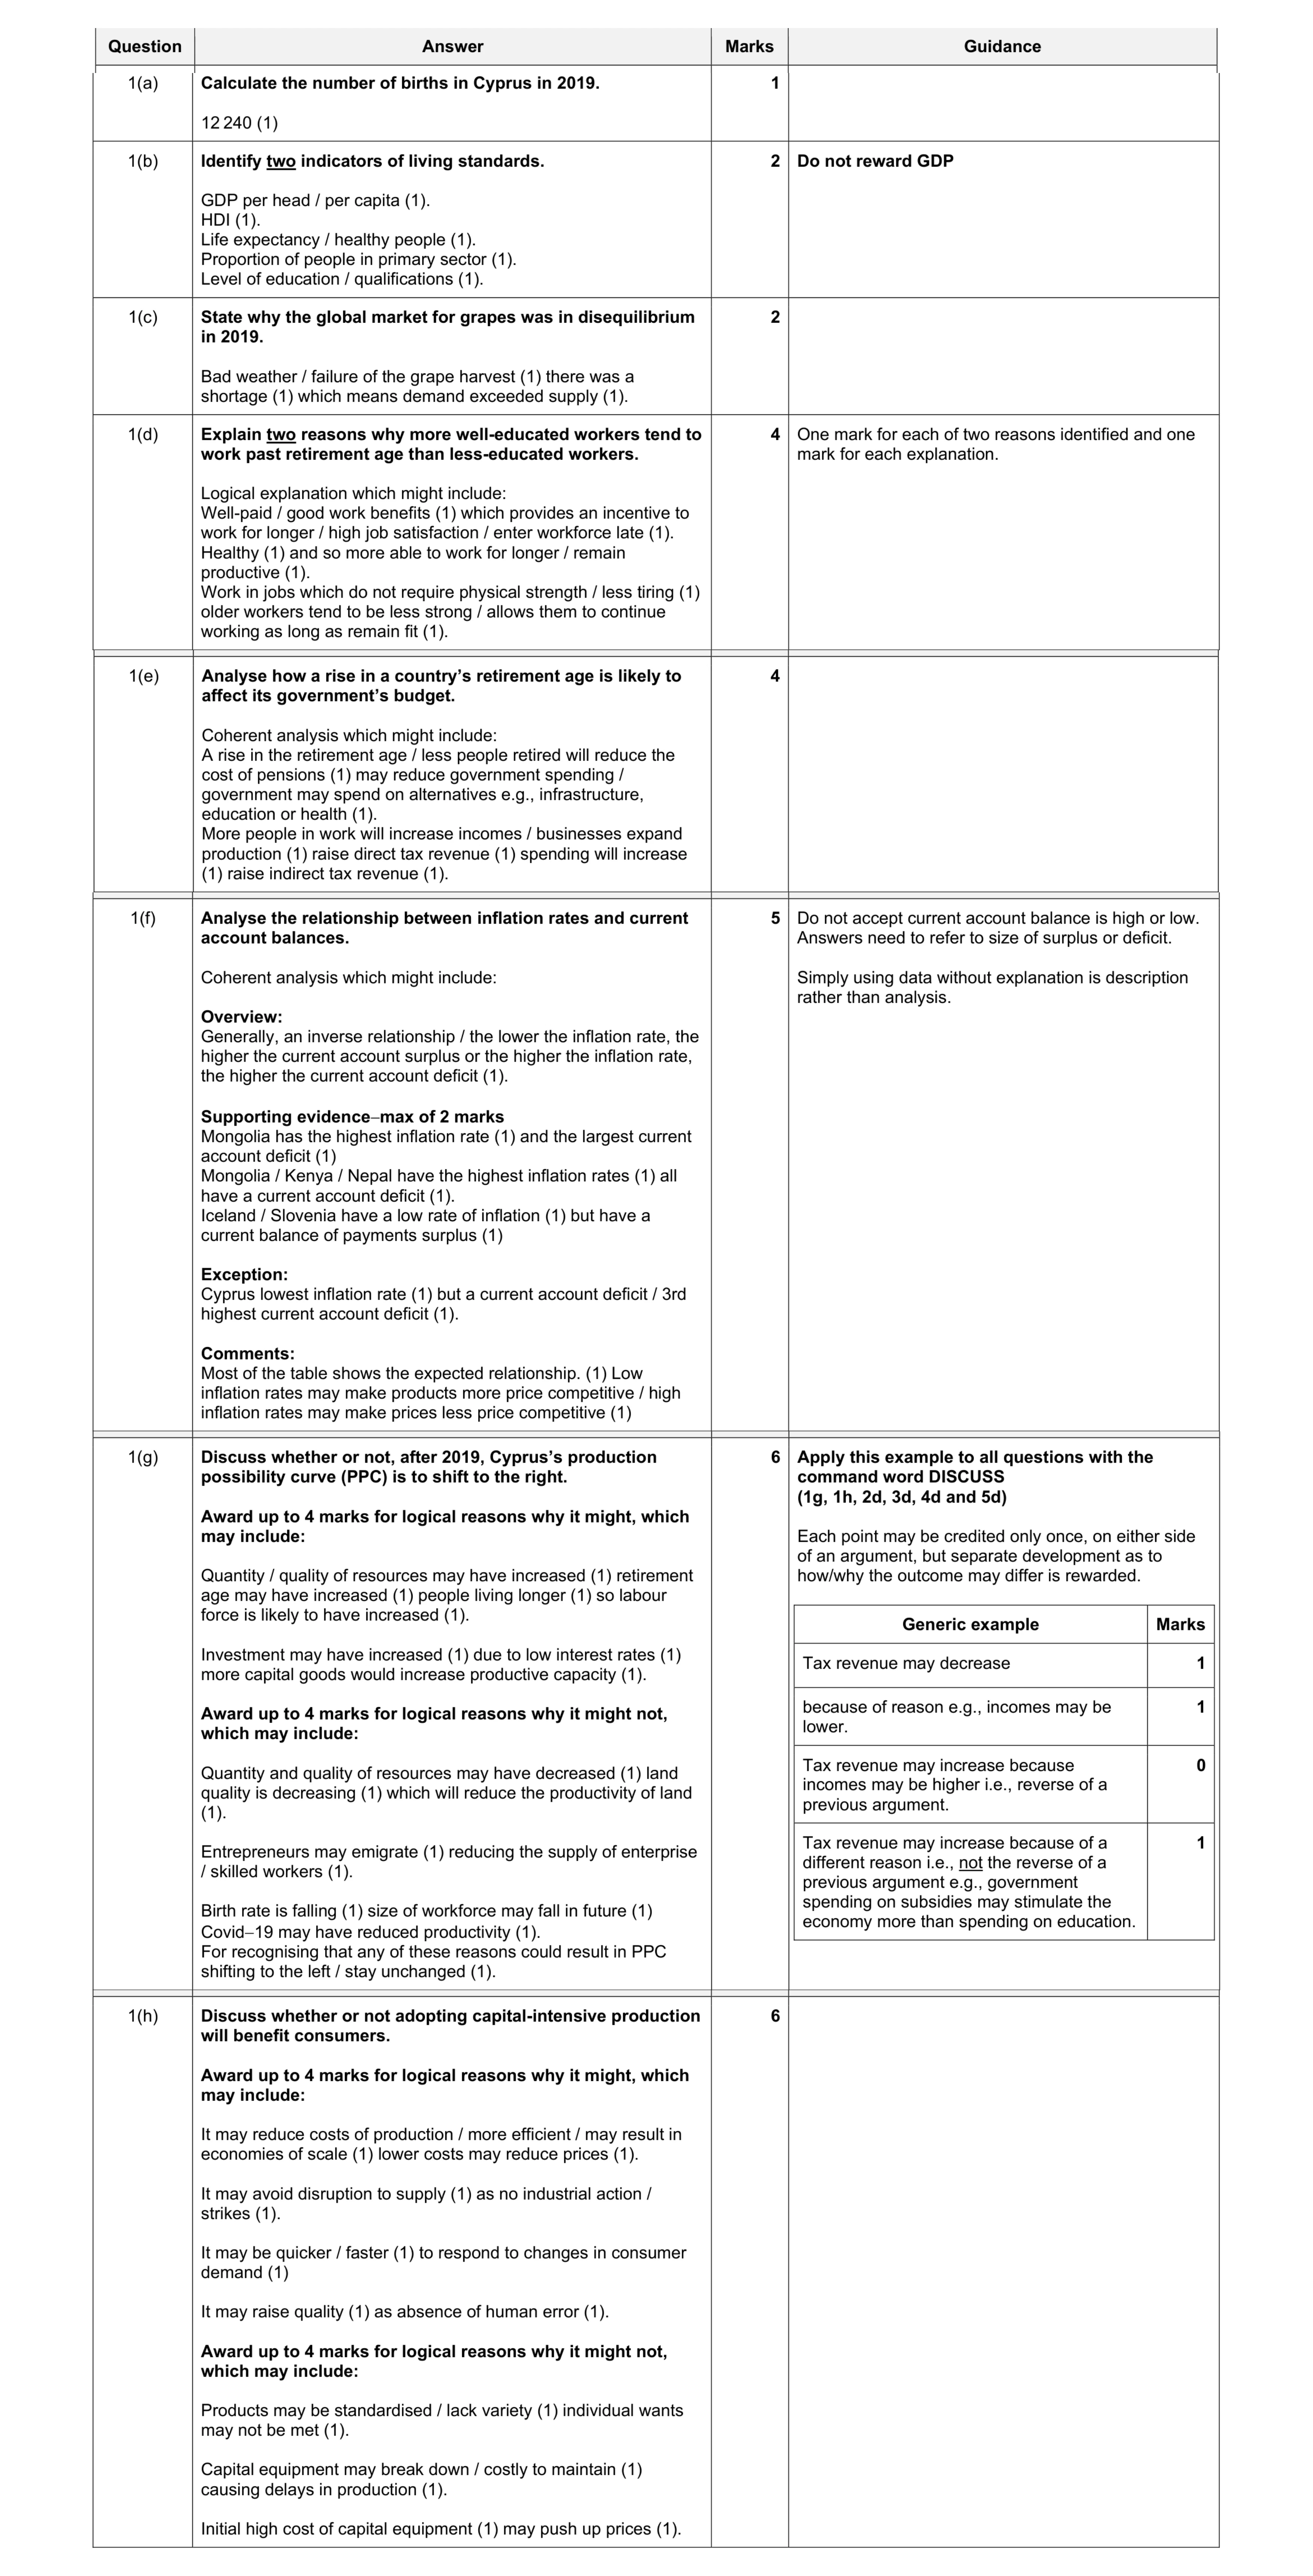 30
30 30
30 30
30 20
20 30
30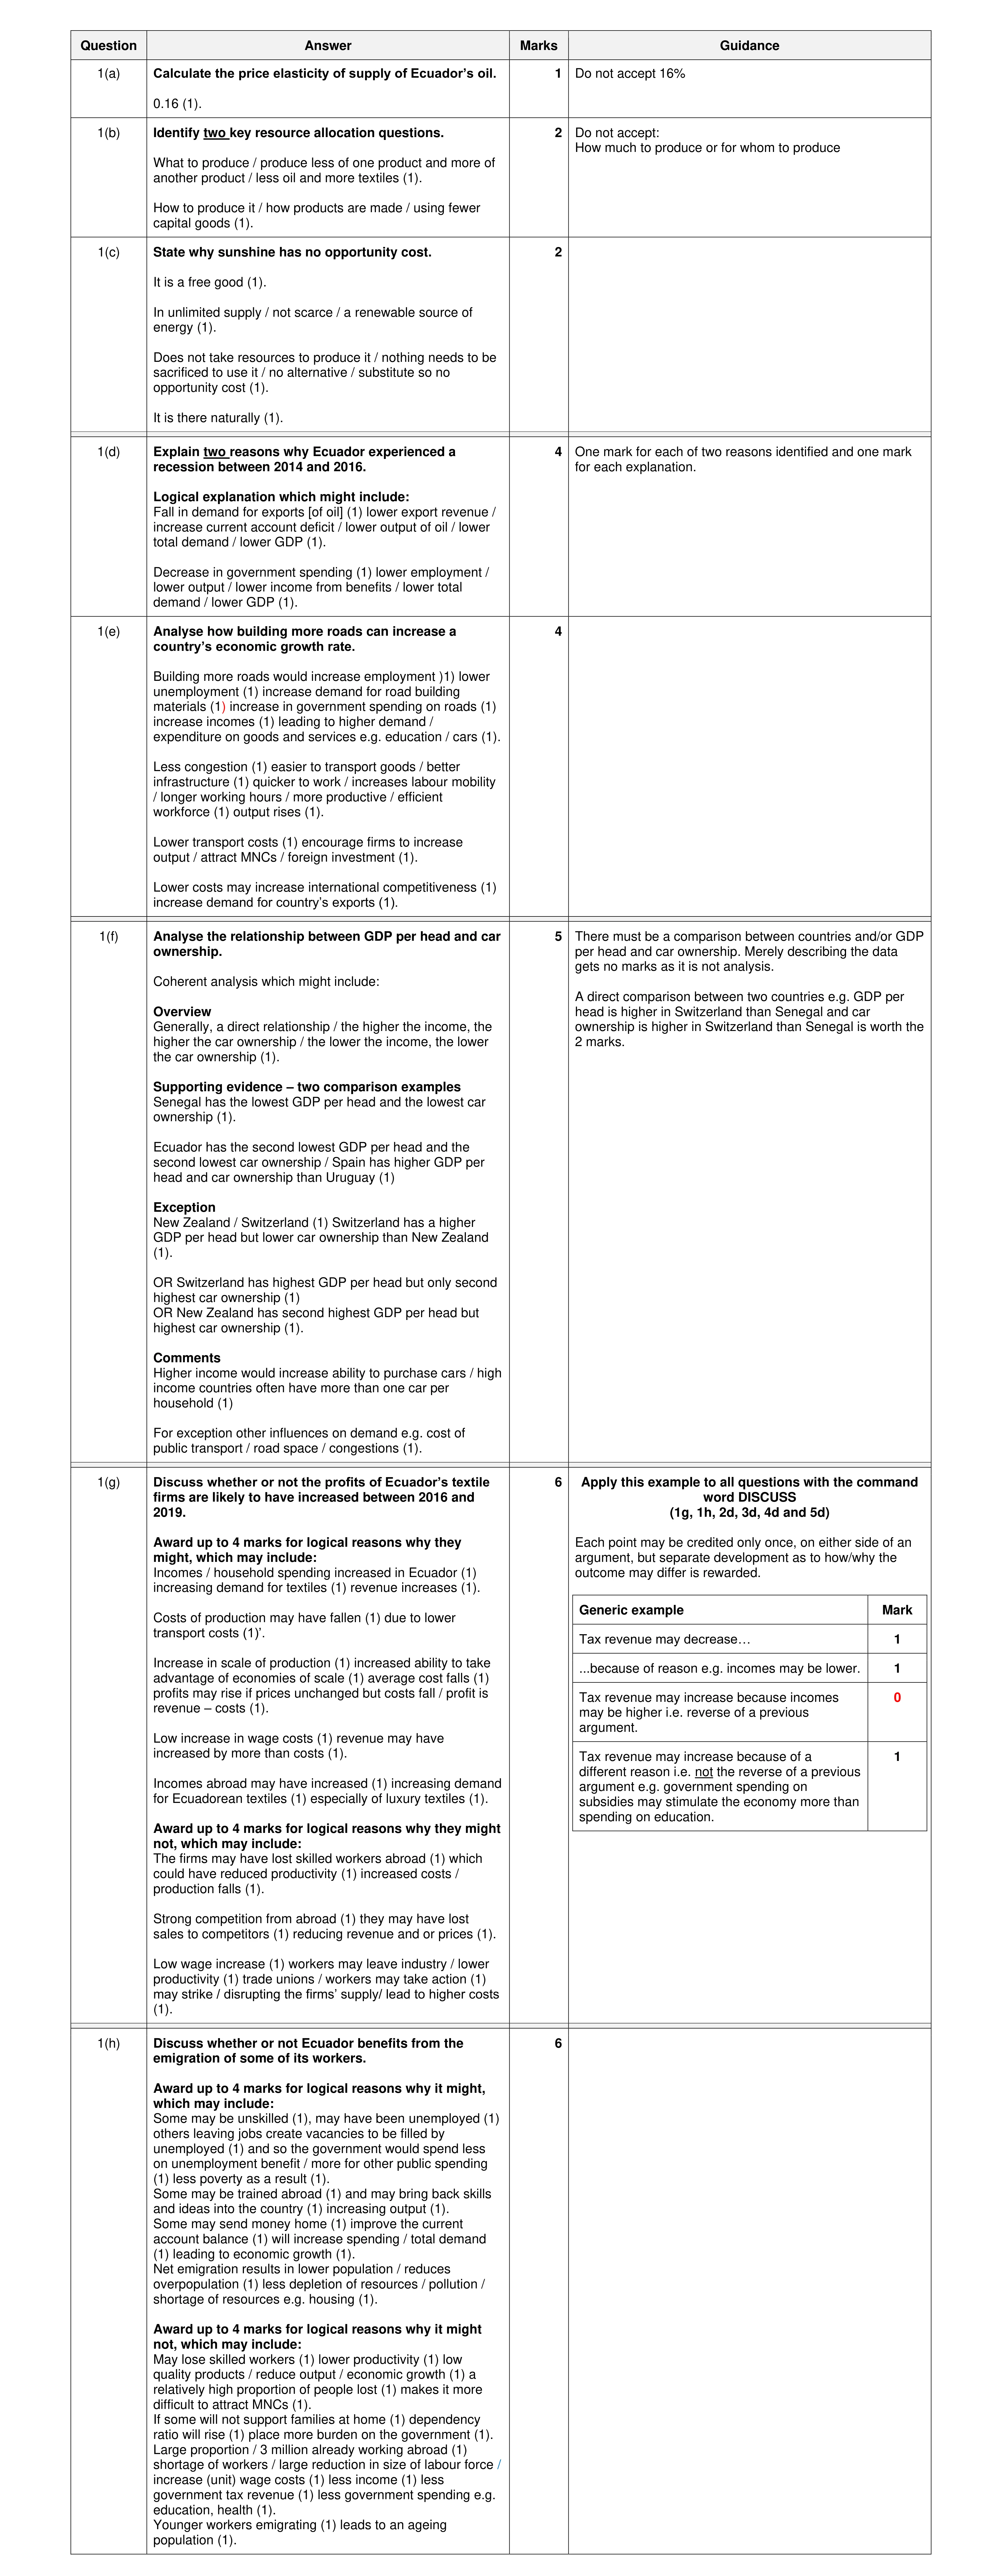 30
30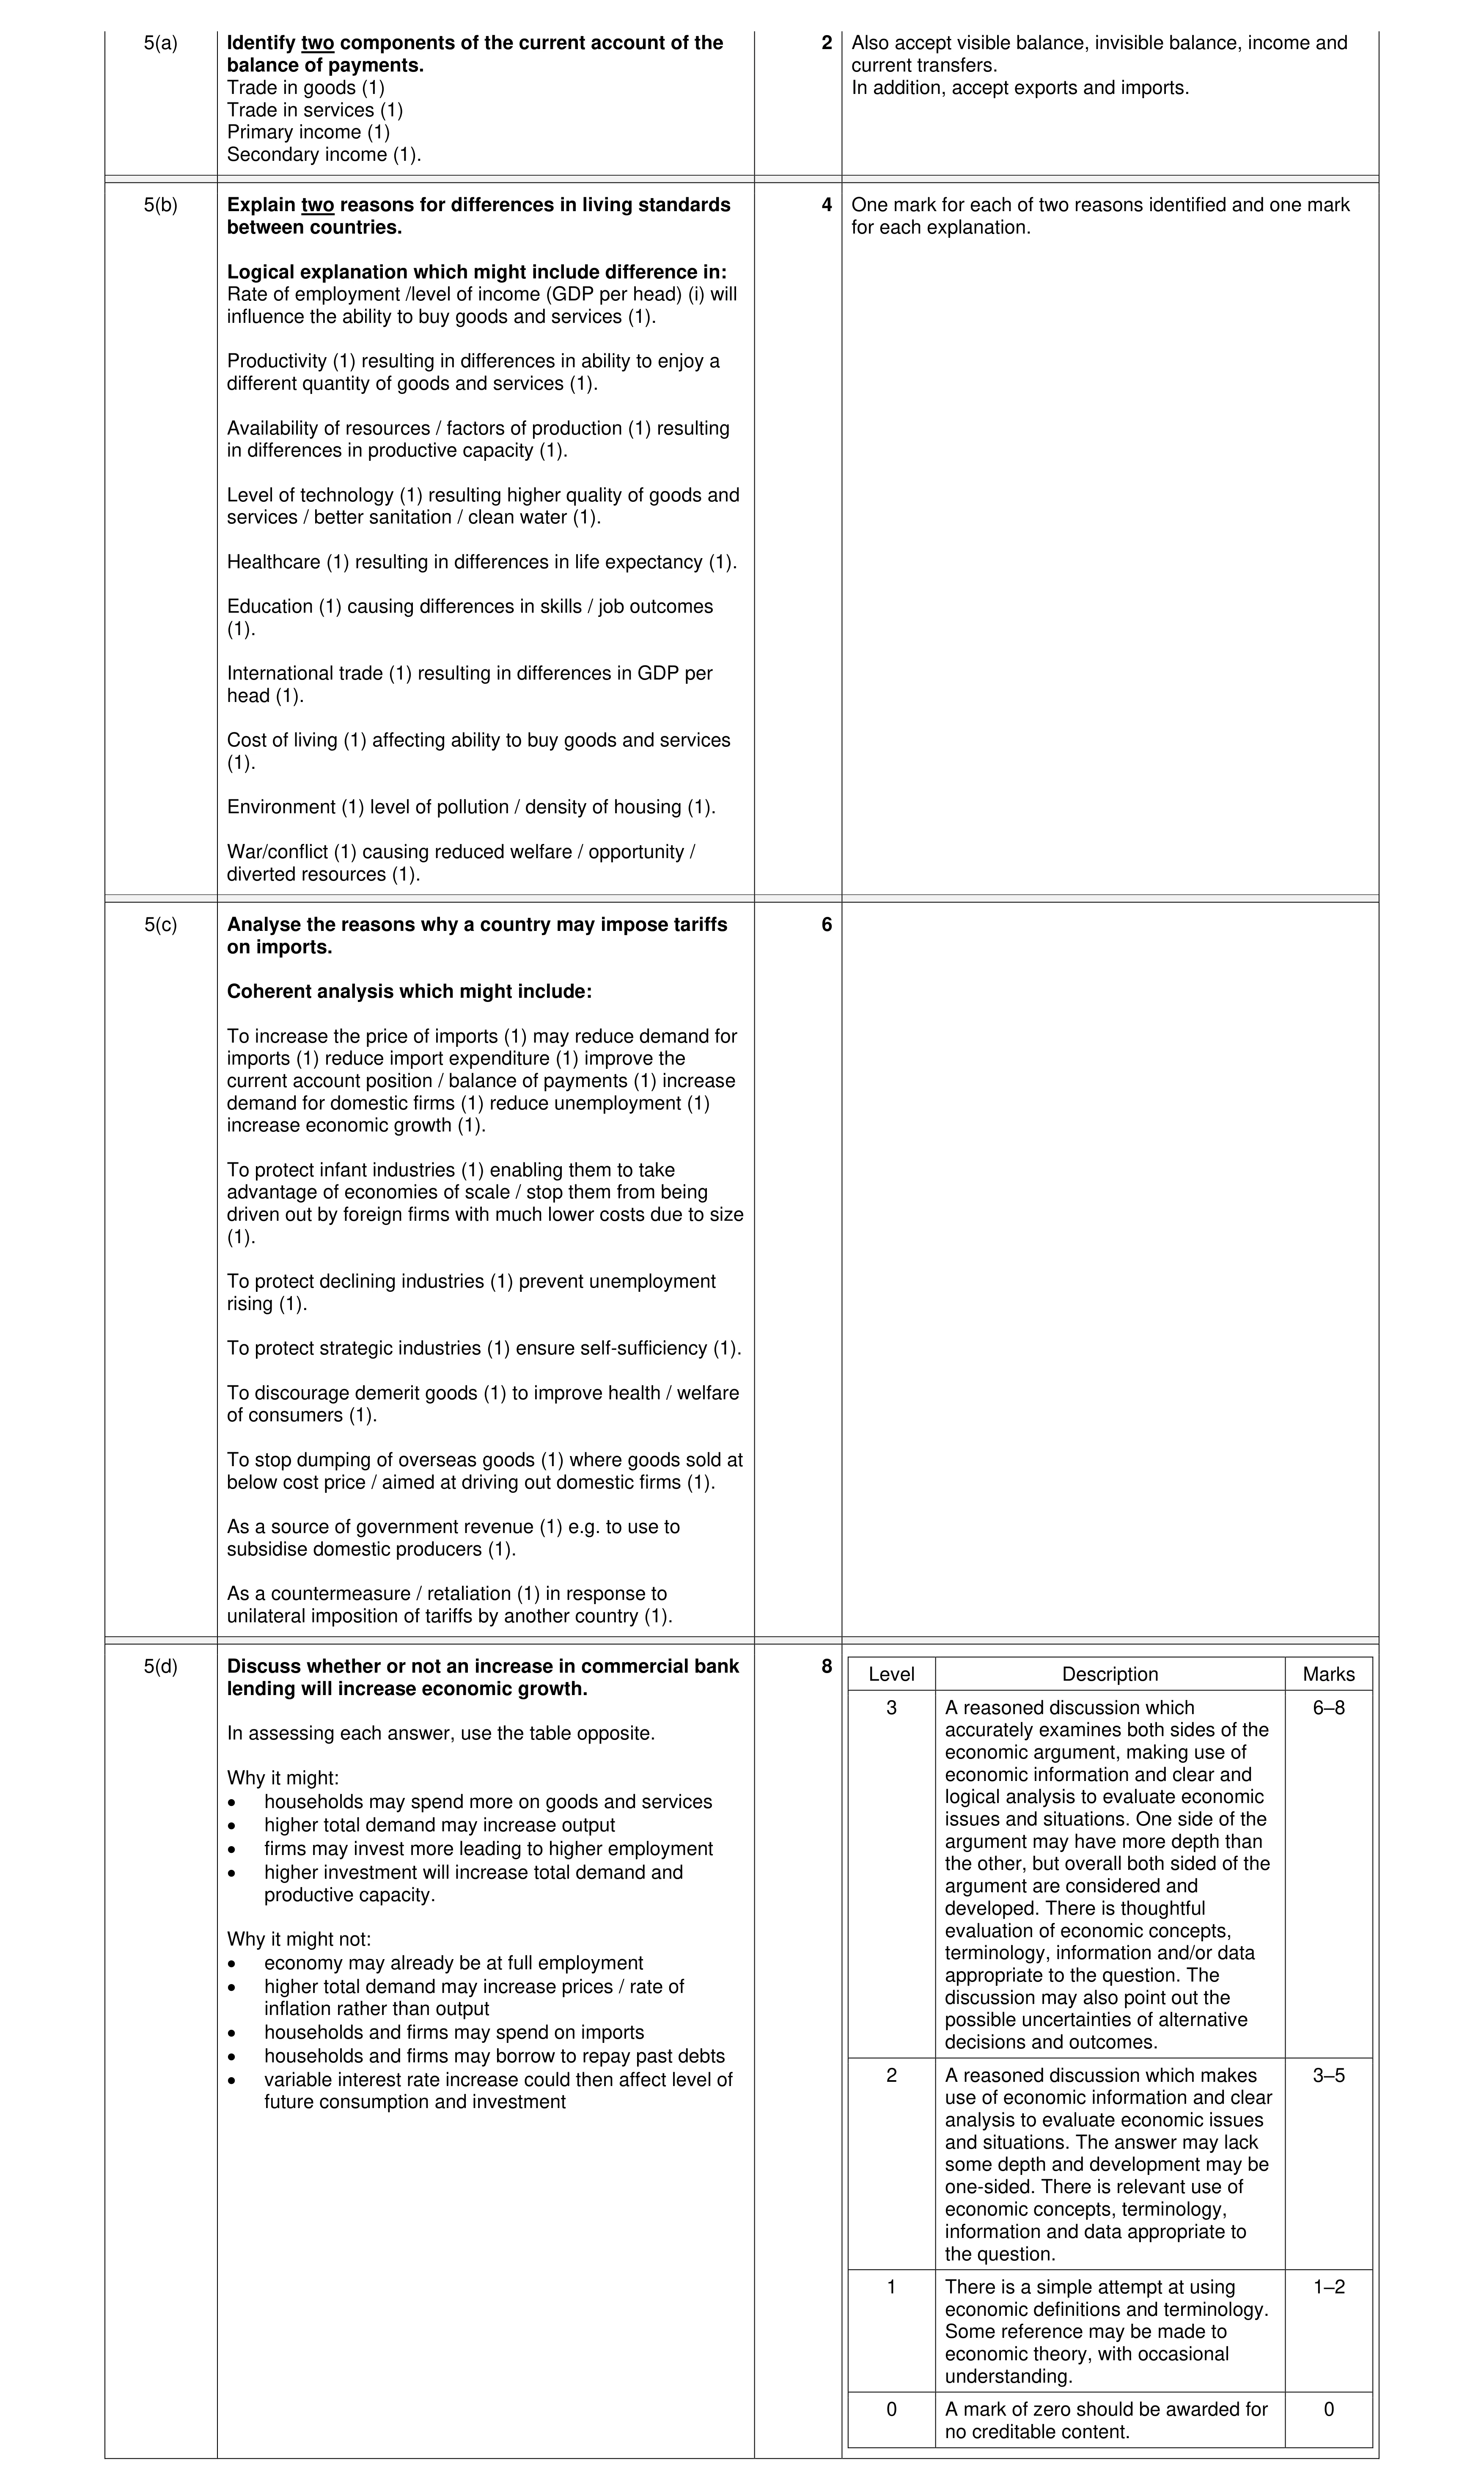 20
20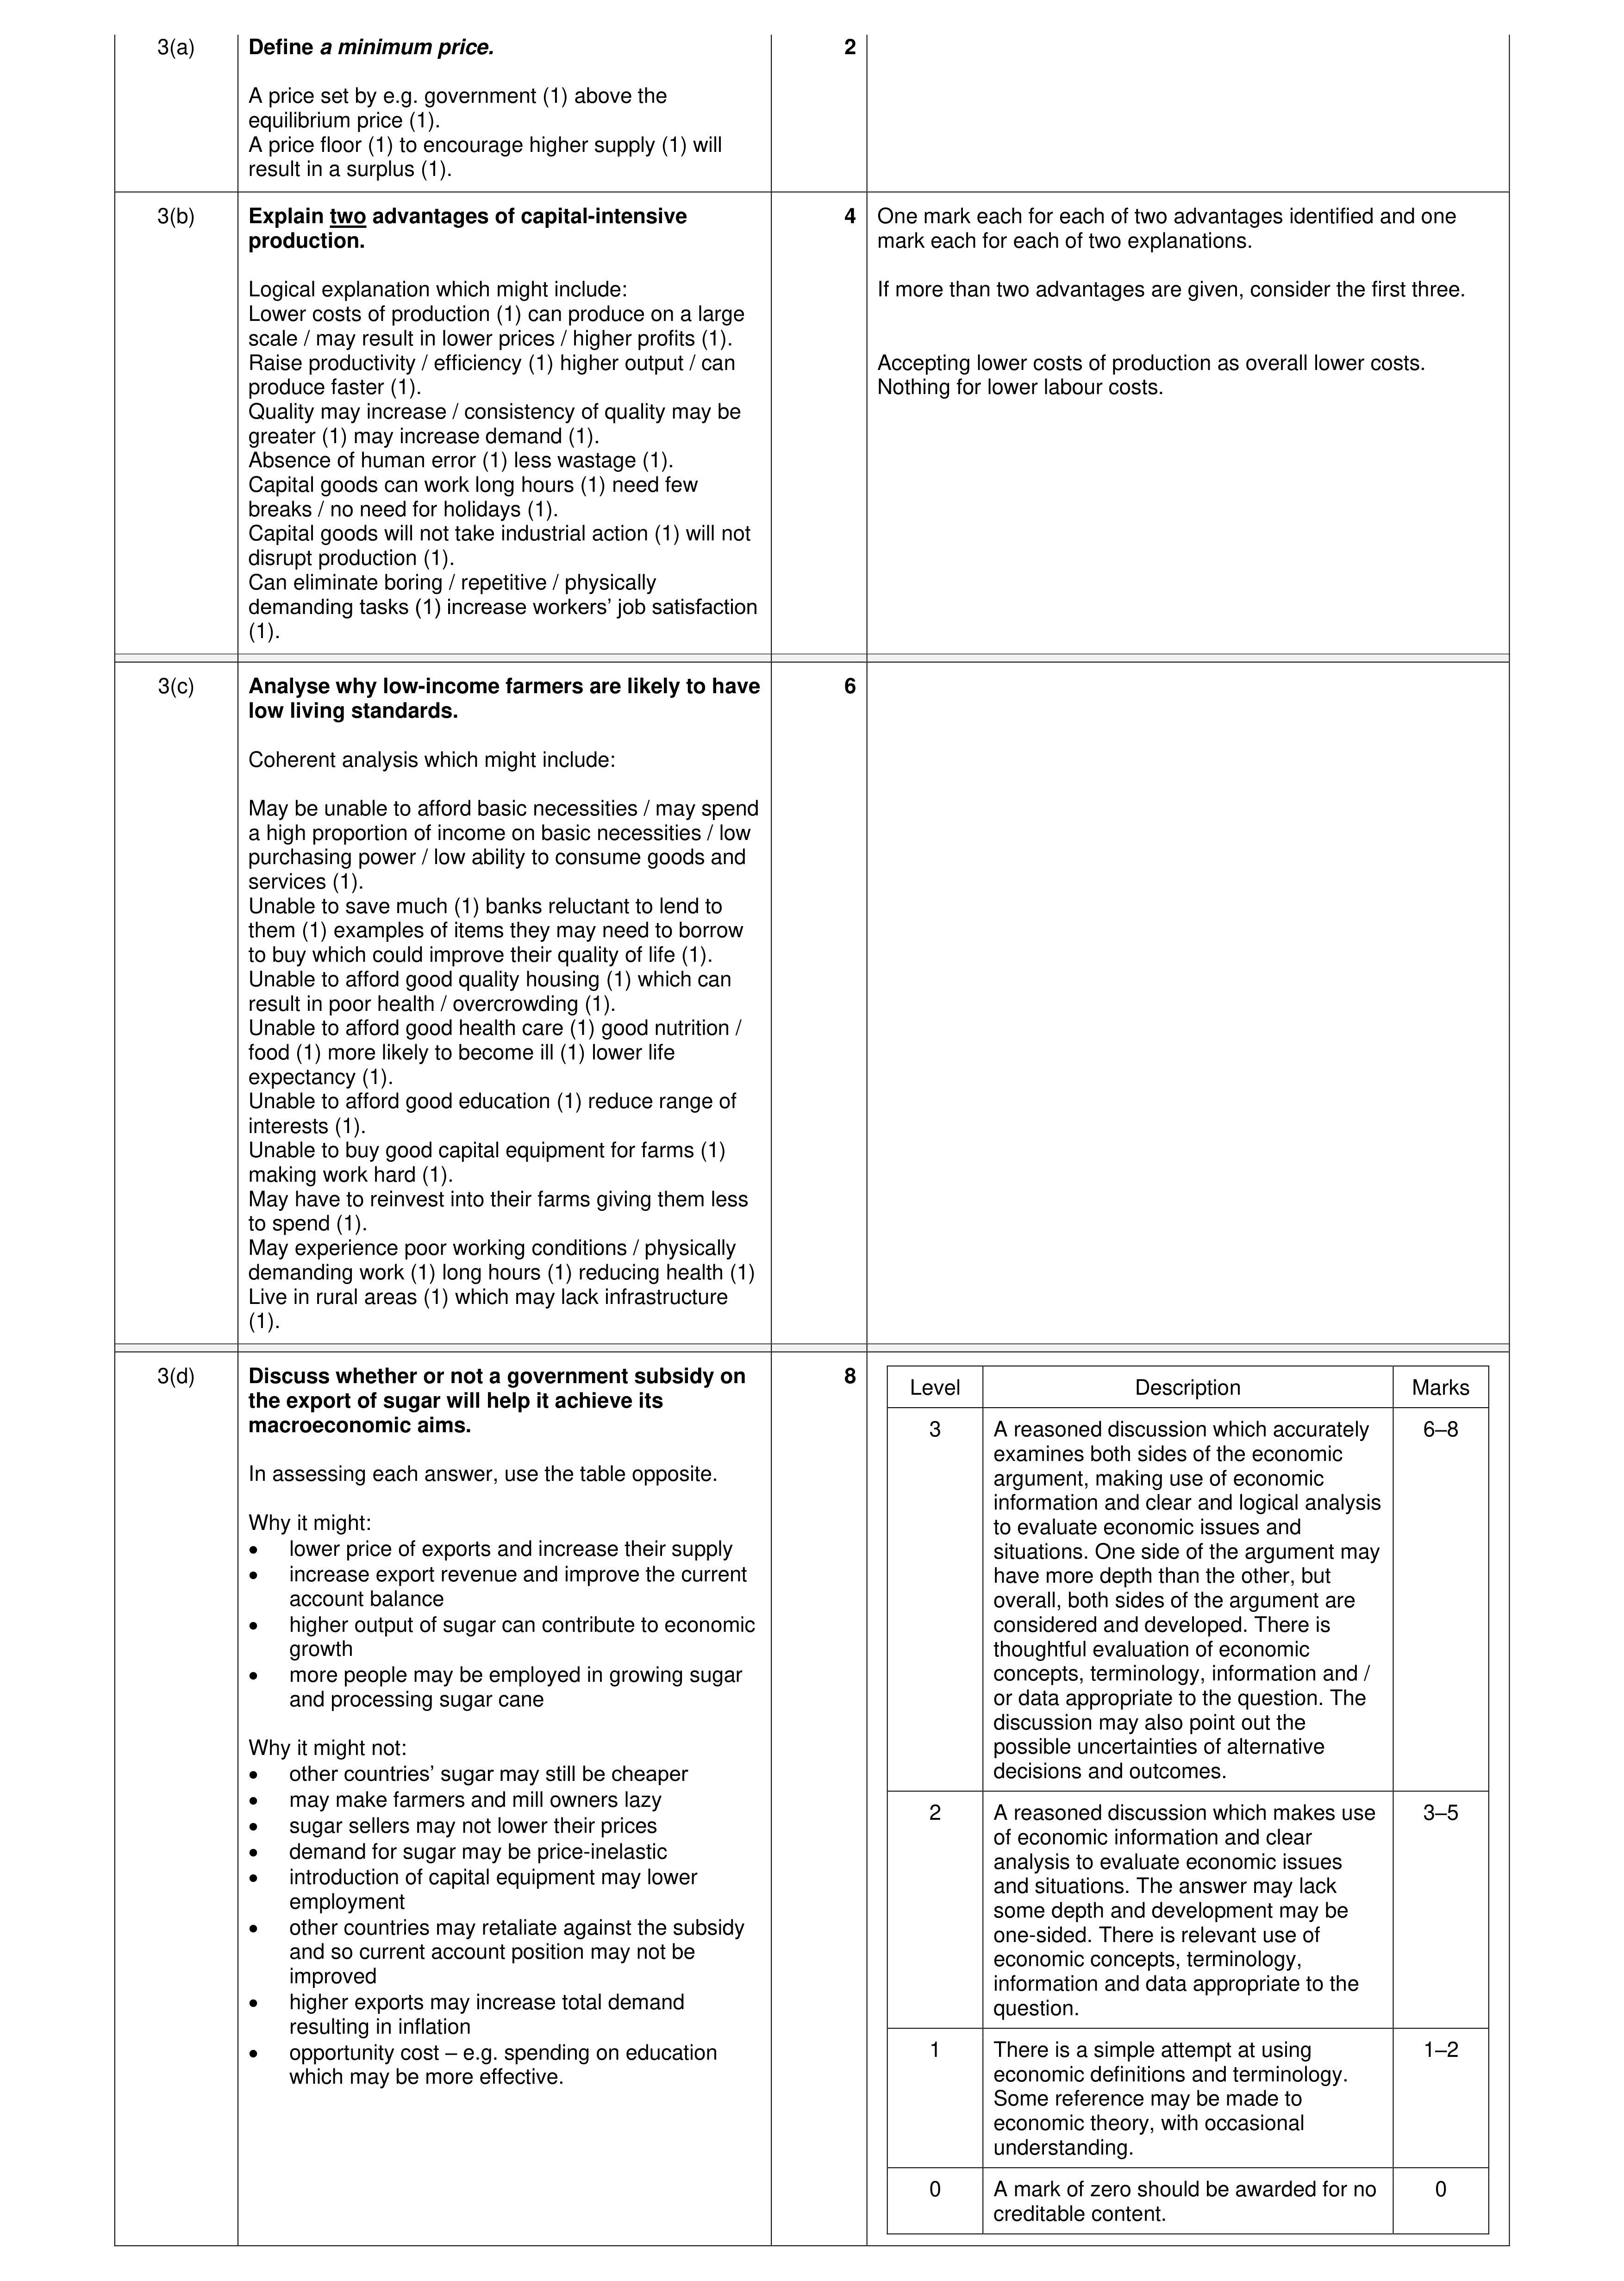 20
20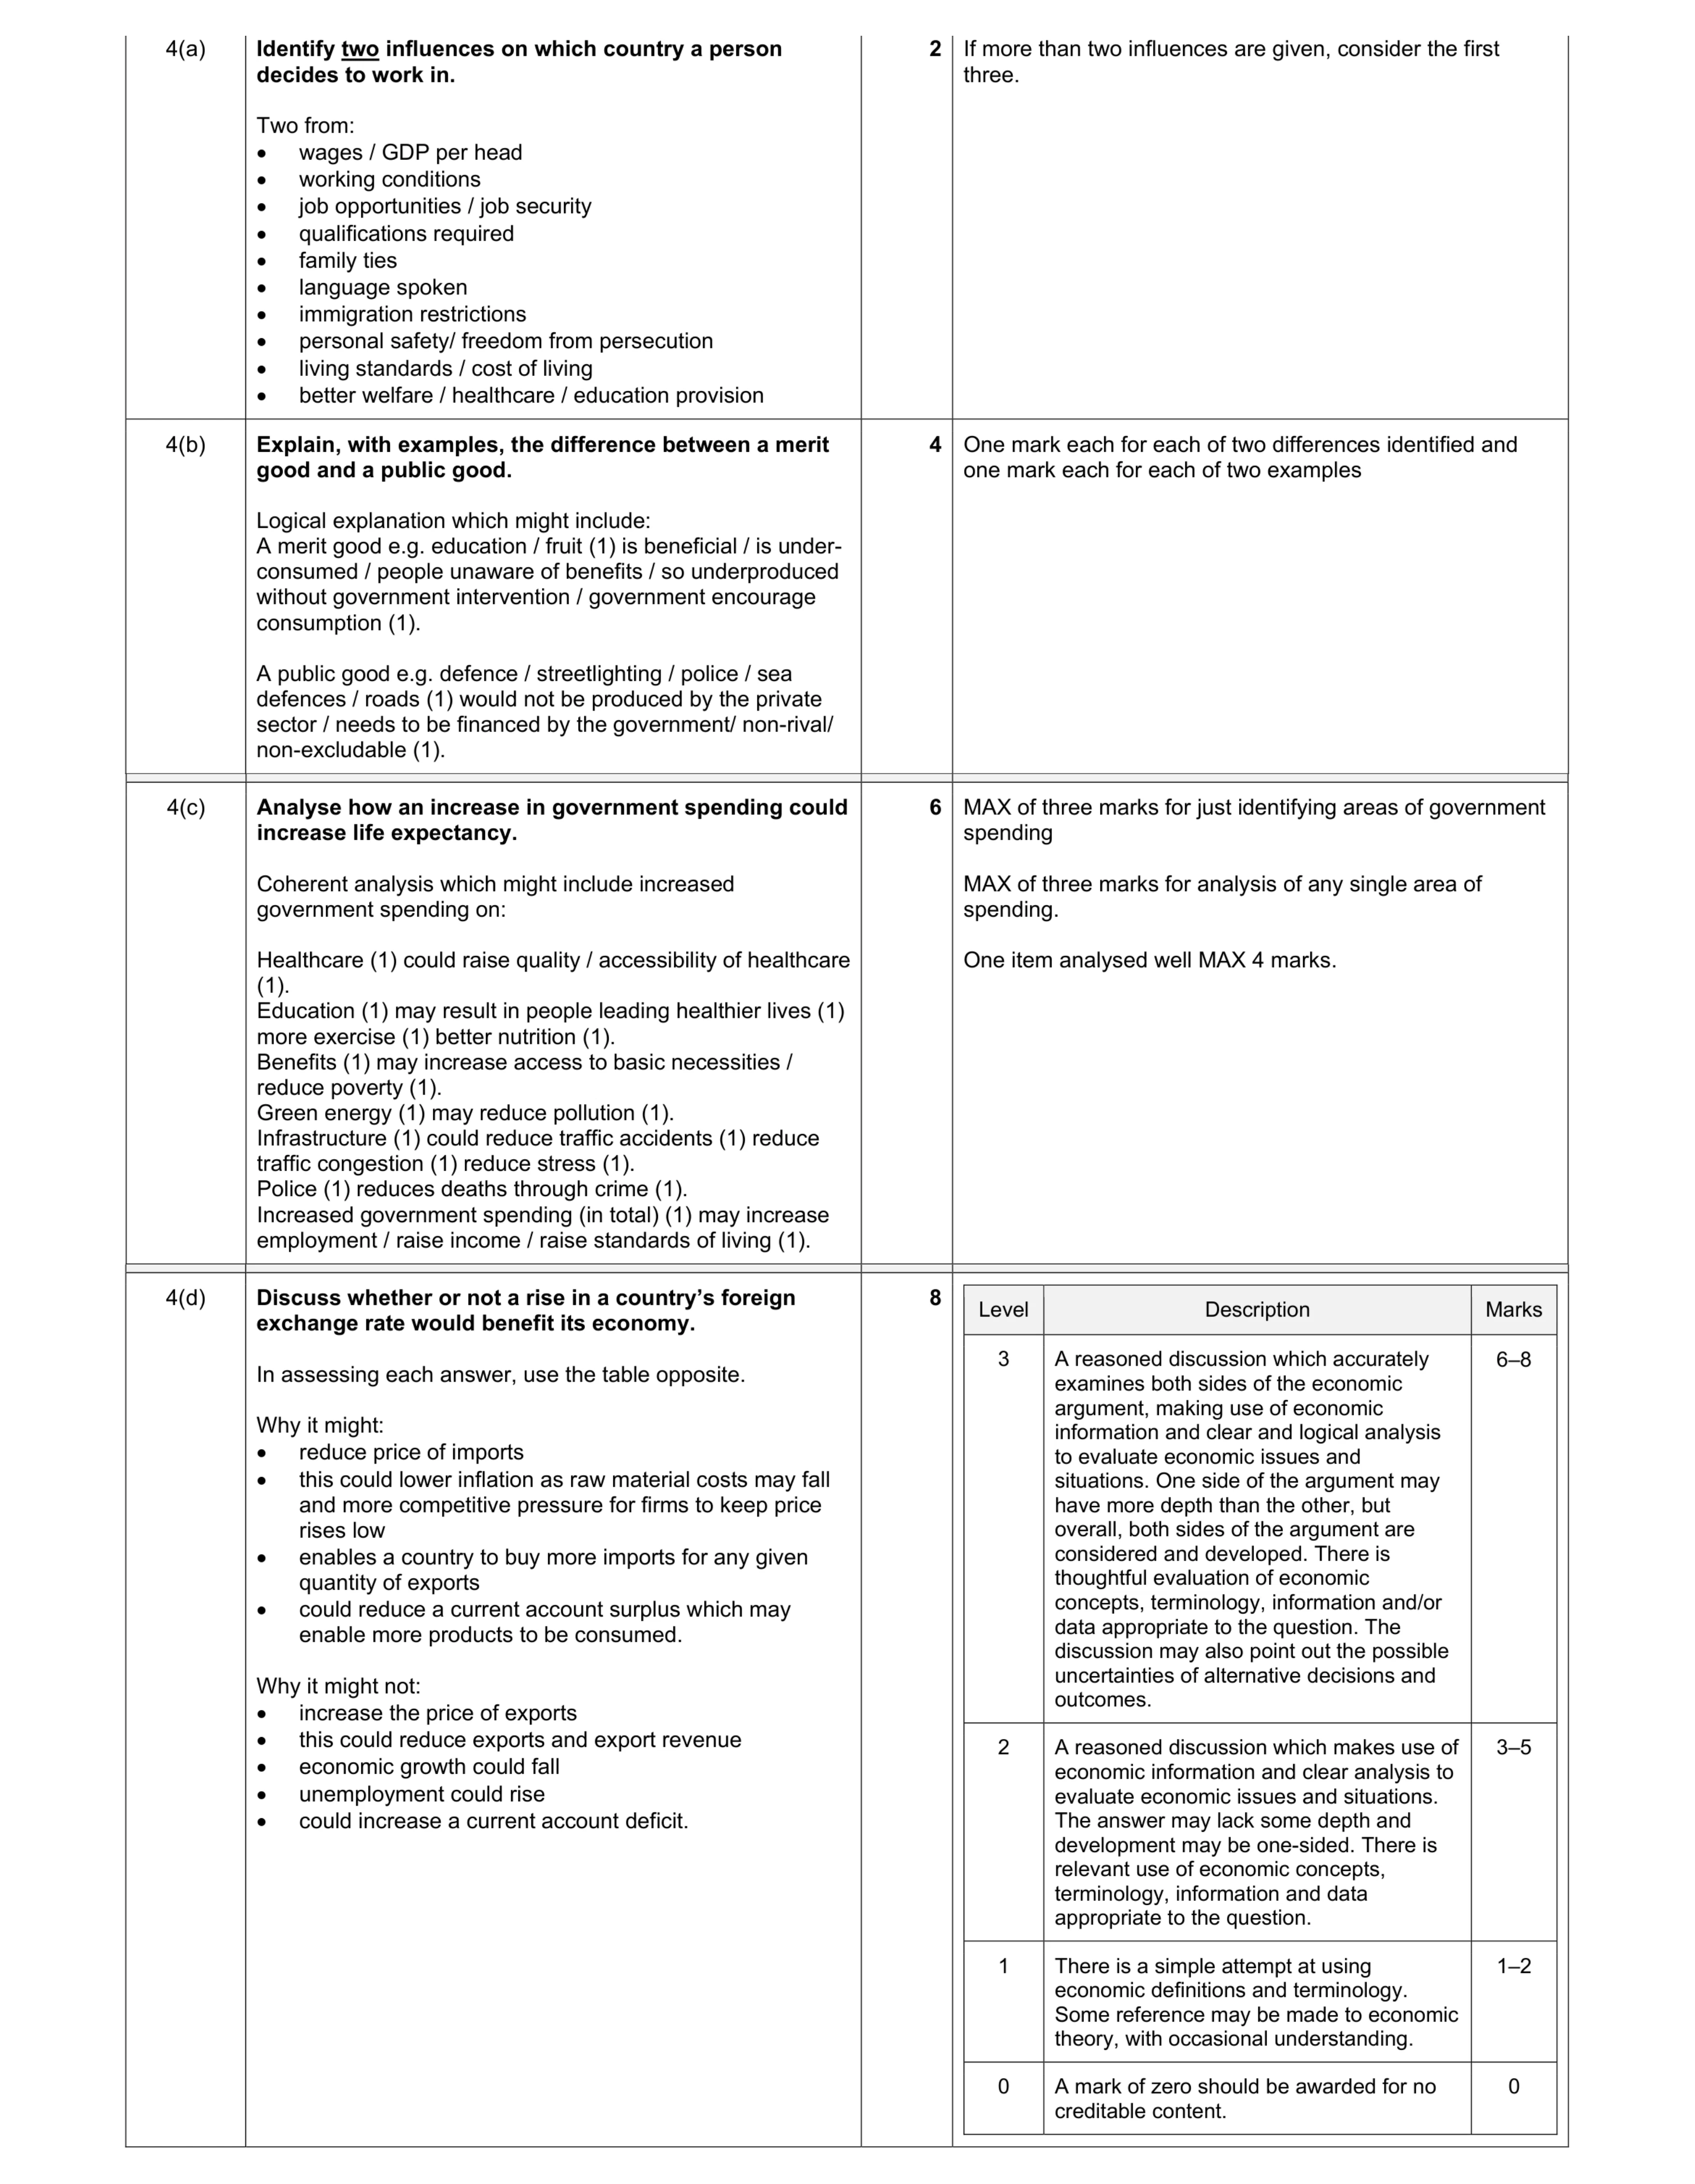 20
20 30
30 30
30 30
30 30
30 20
20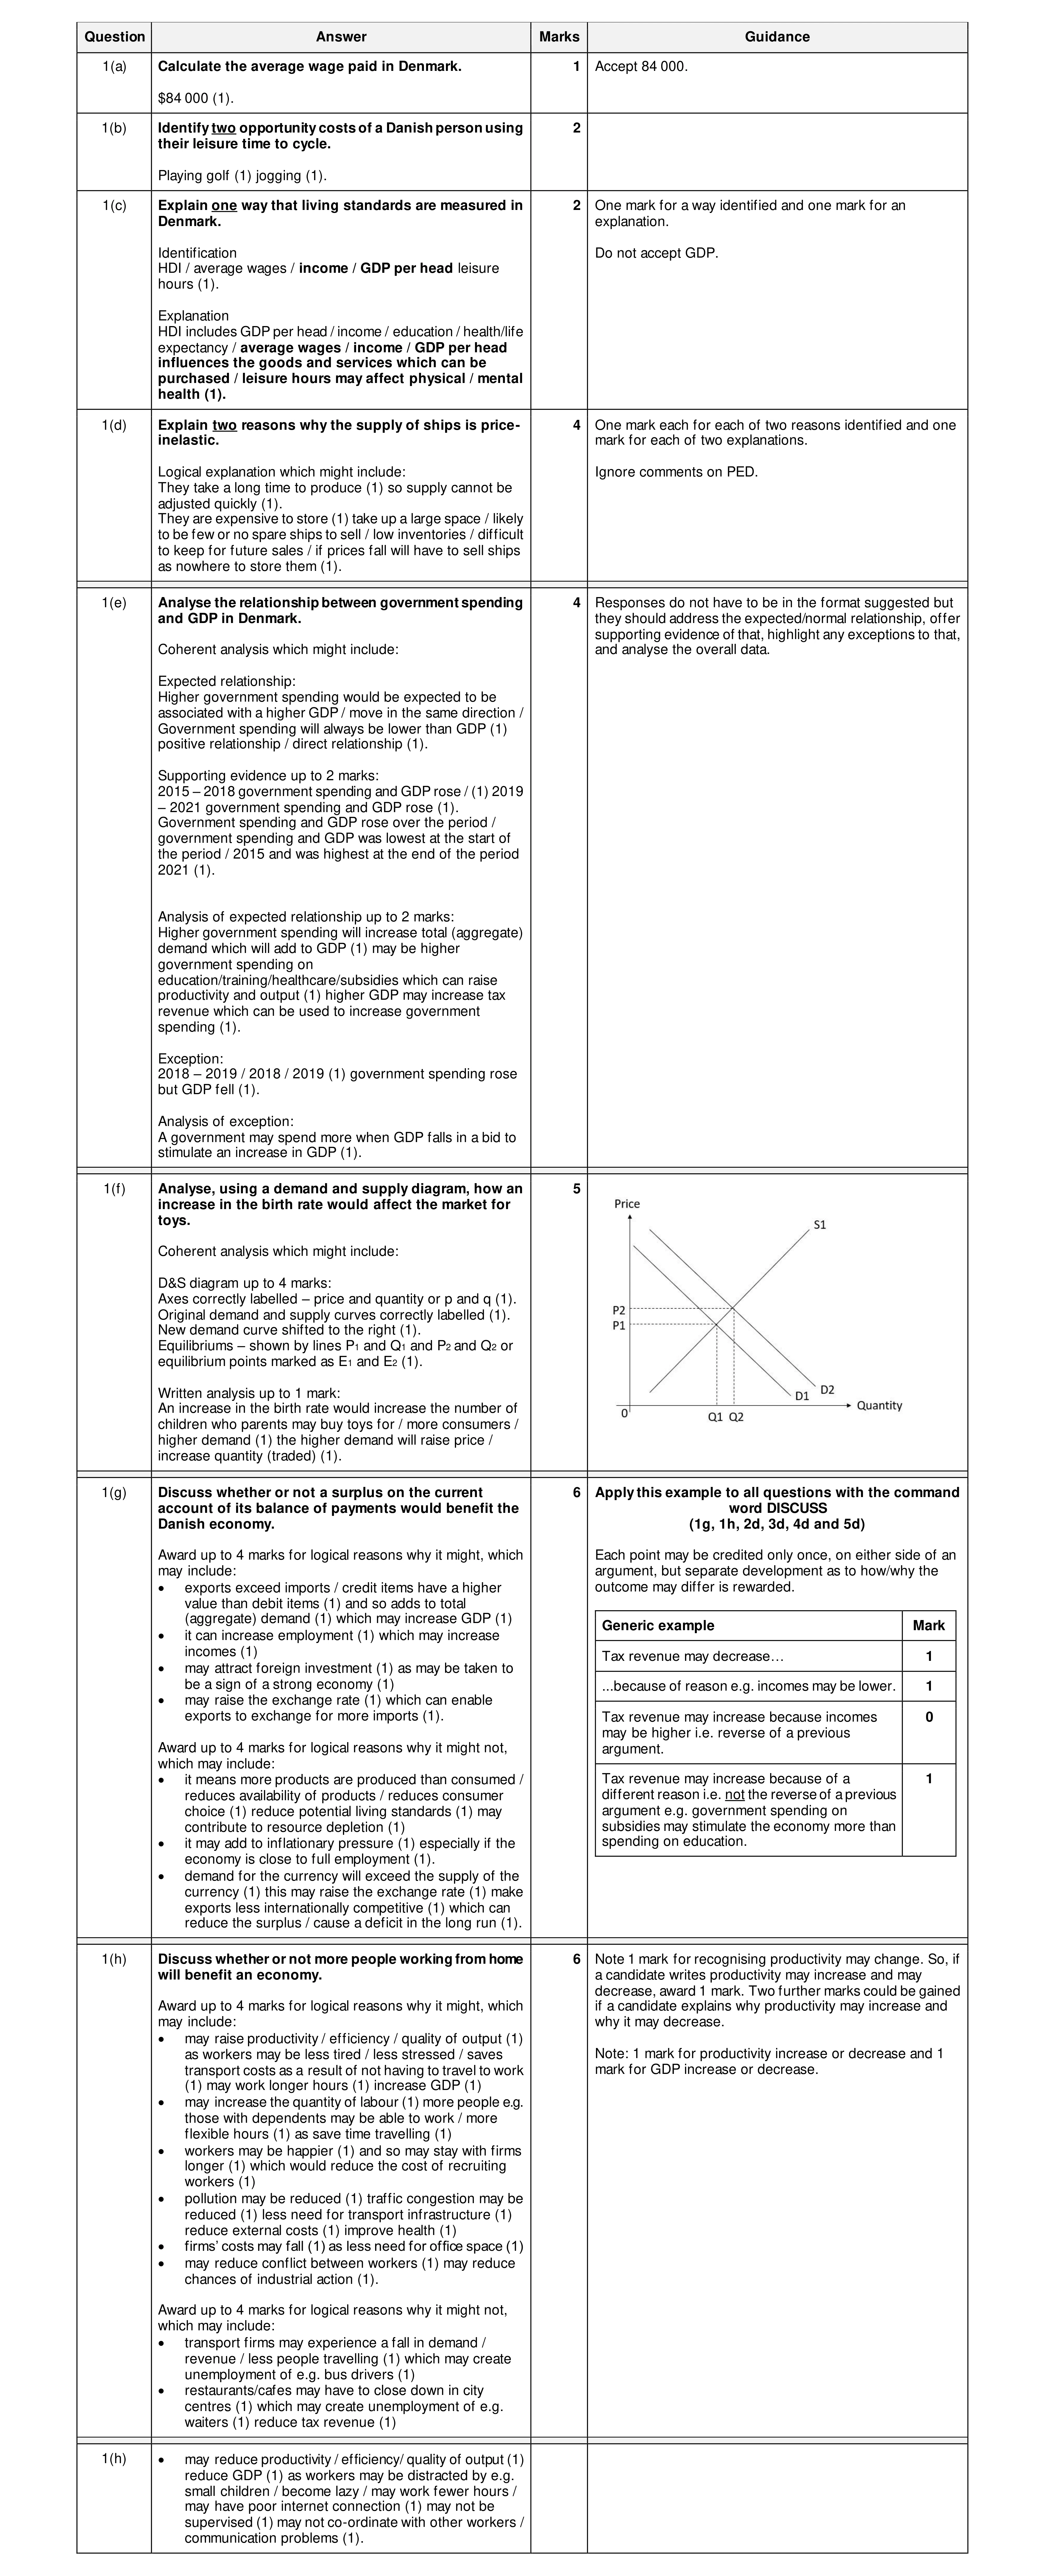 30
30 20
20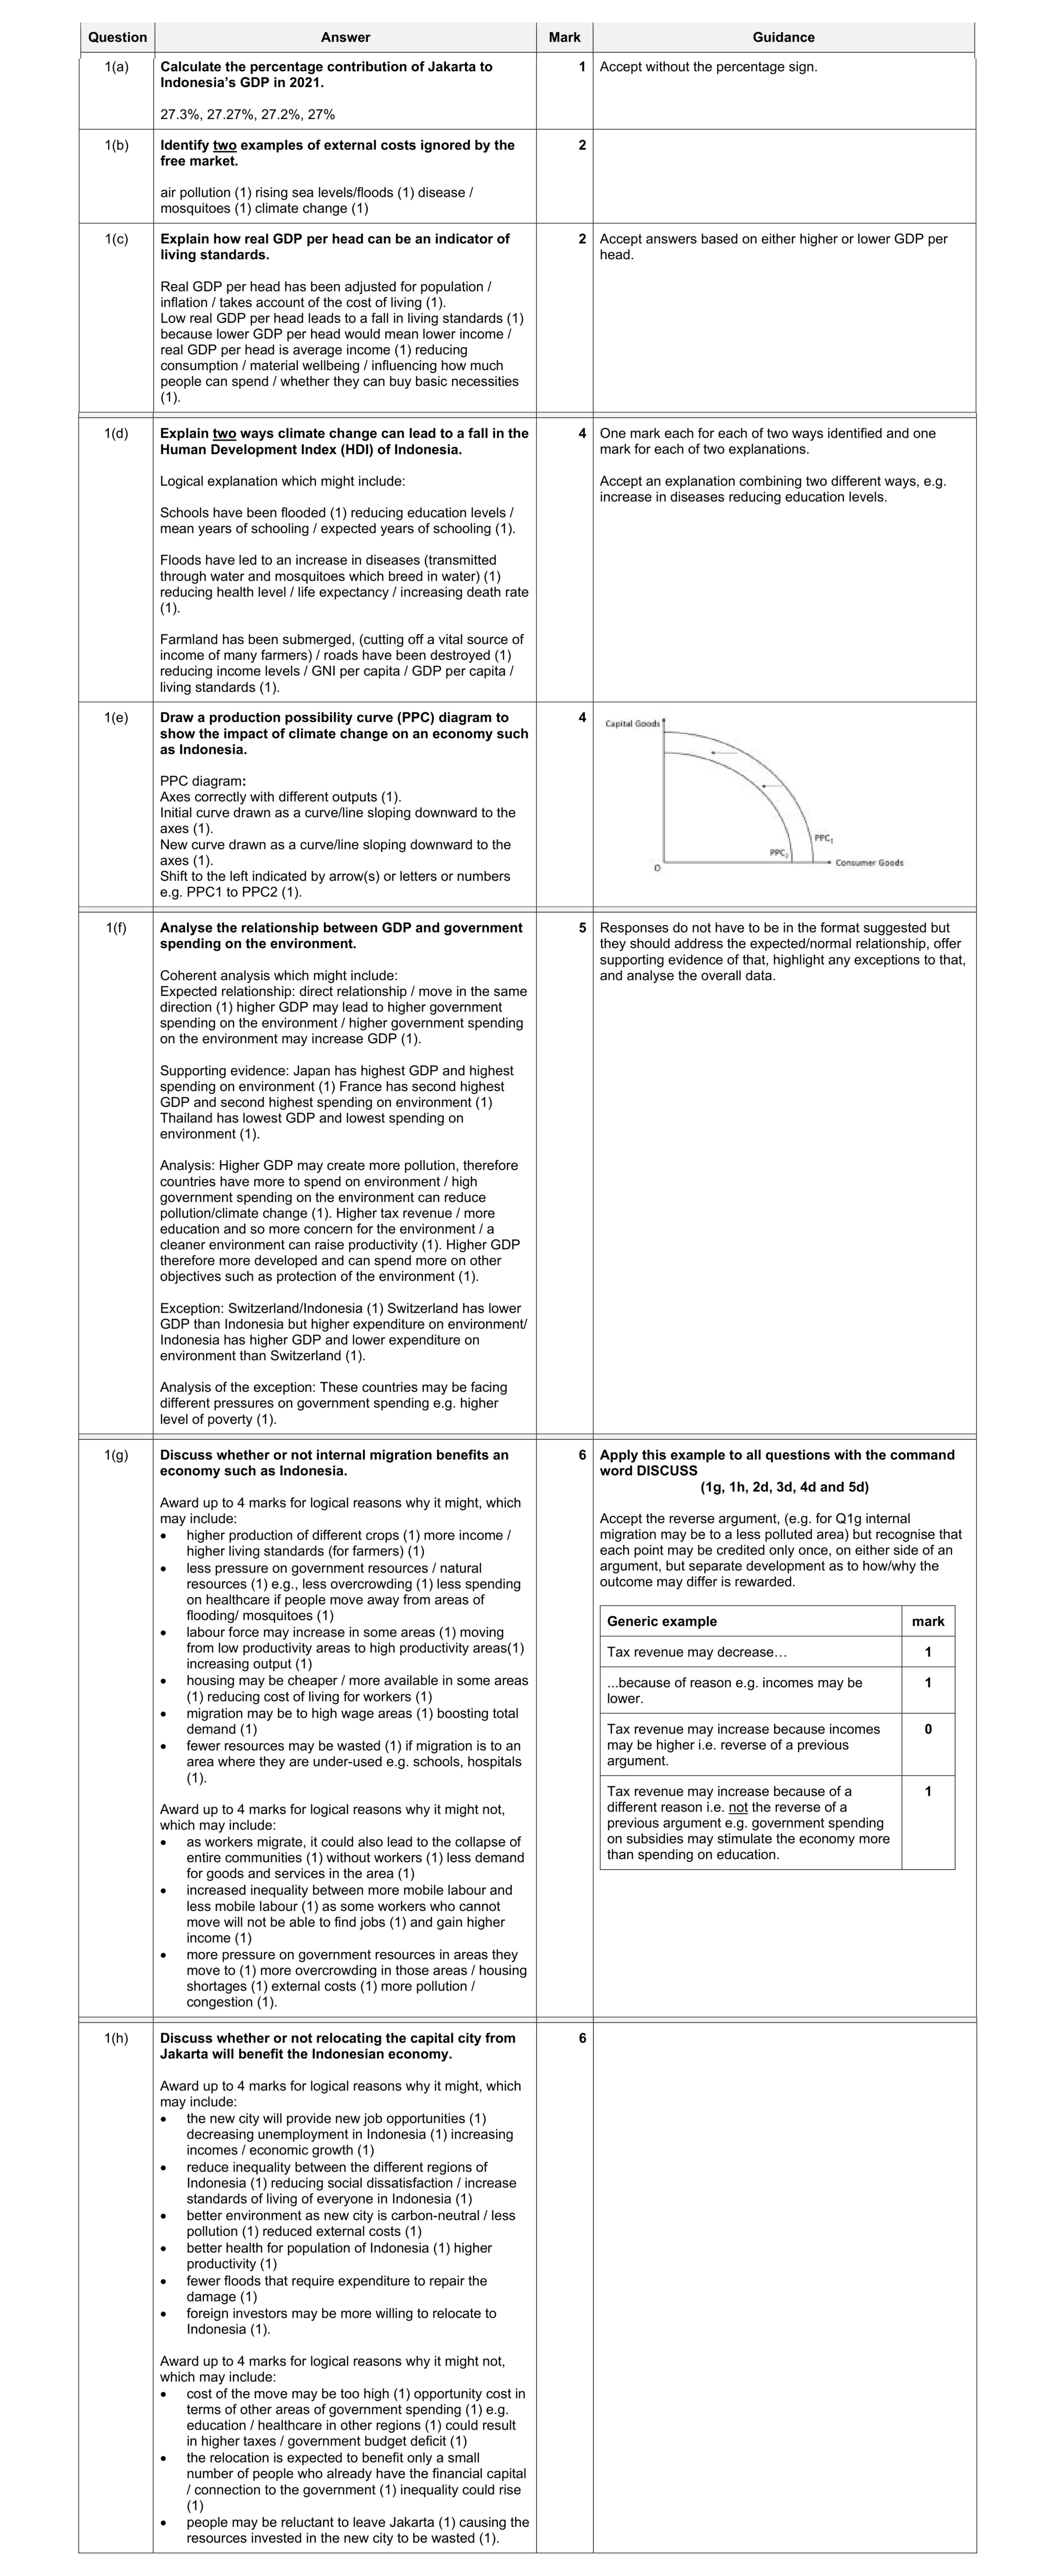 30
30 20
20 20
20 30
30 30
30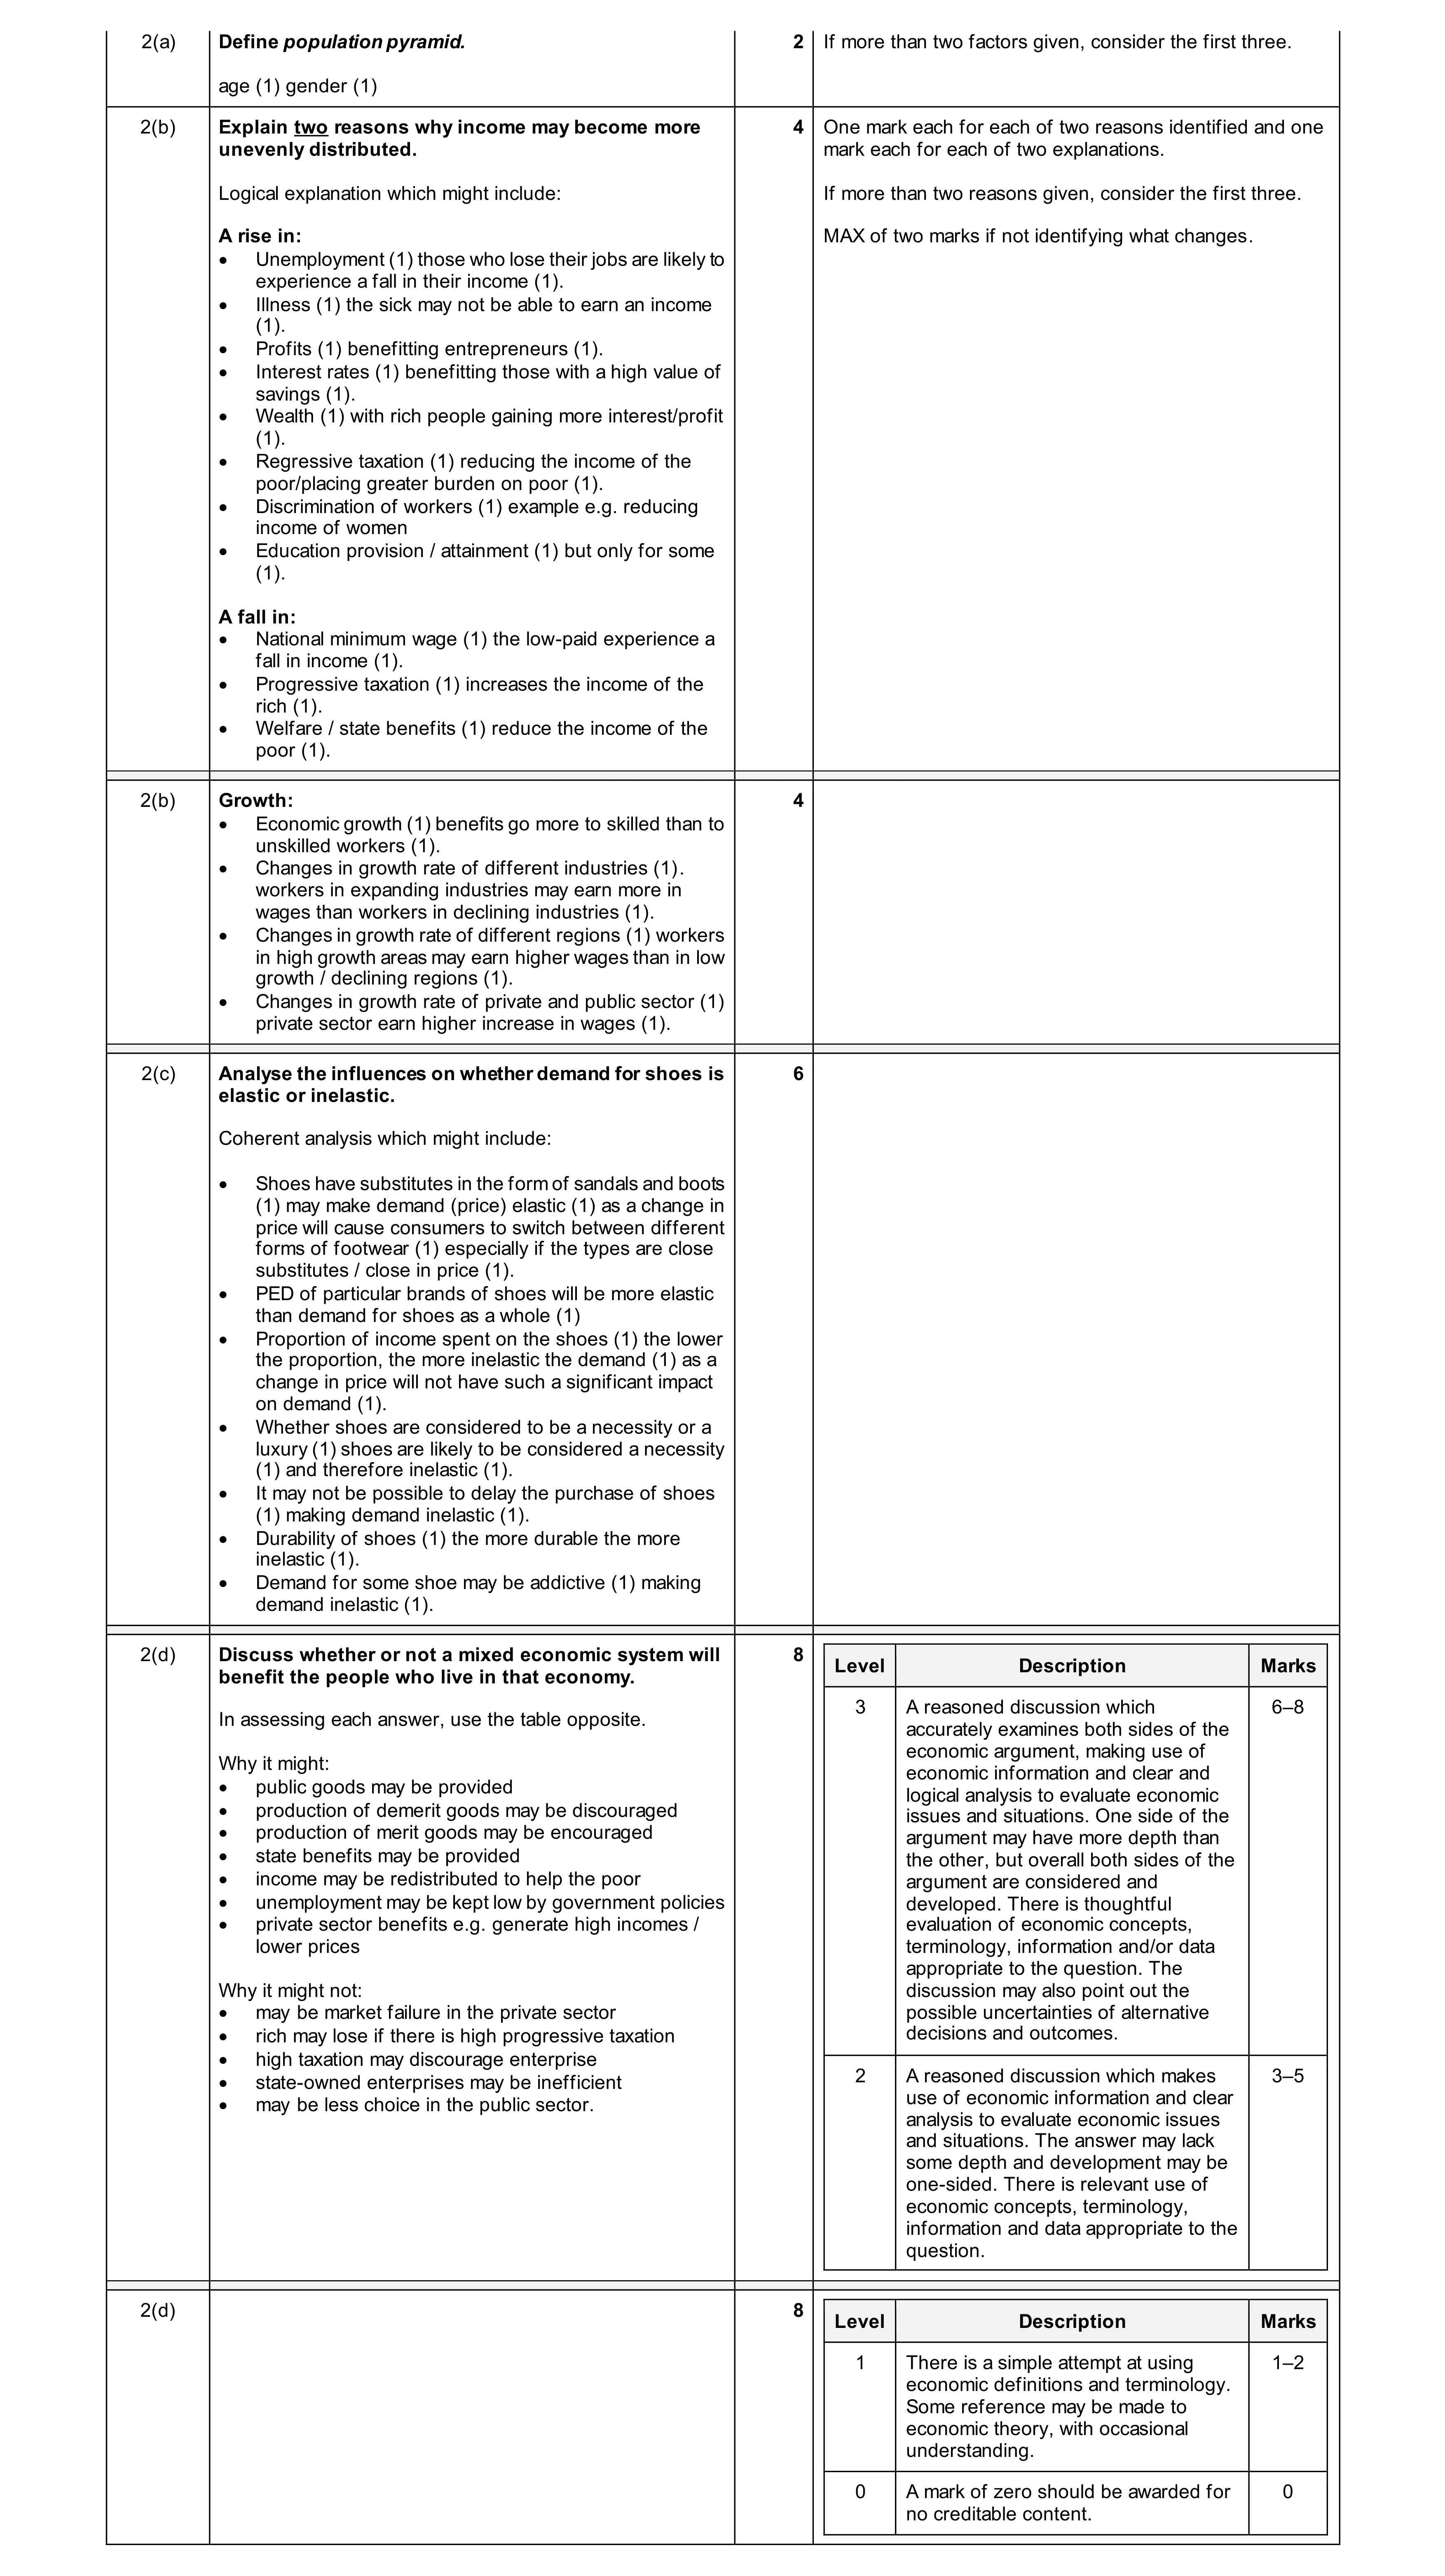 20
20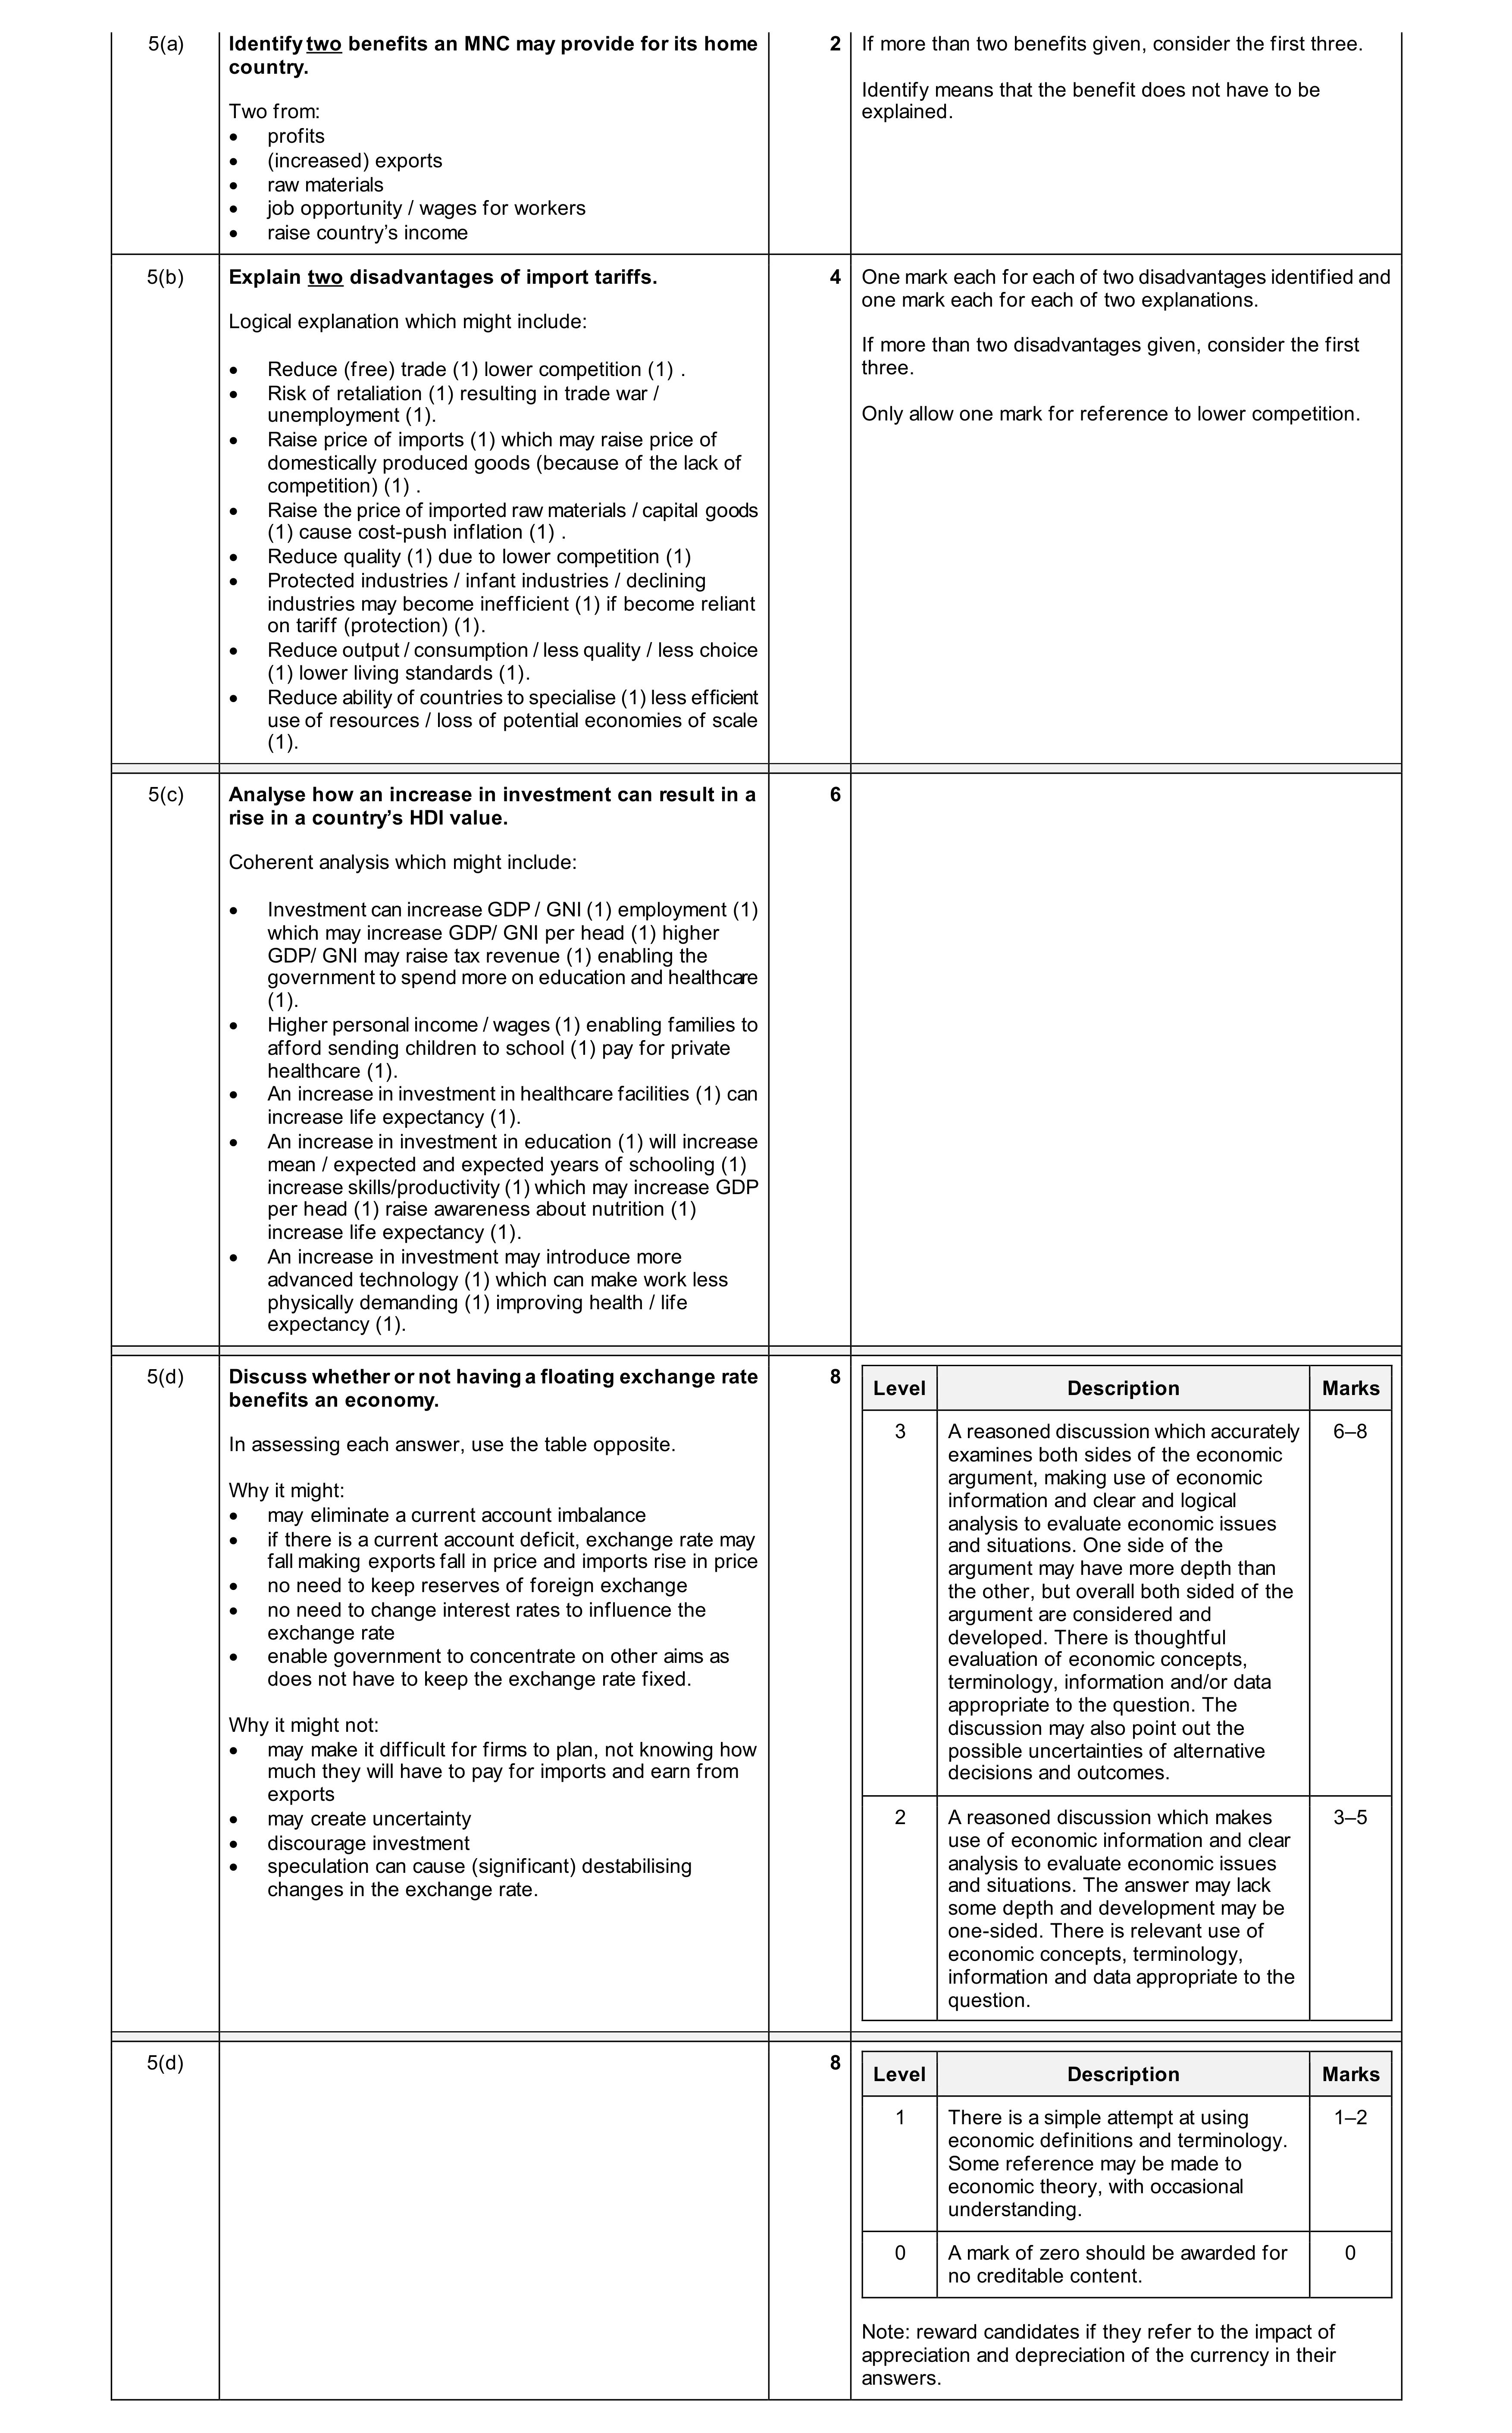 20
20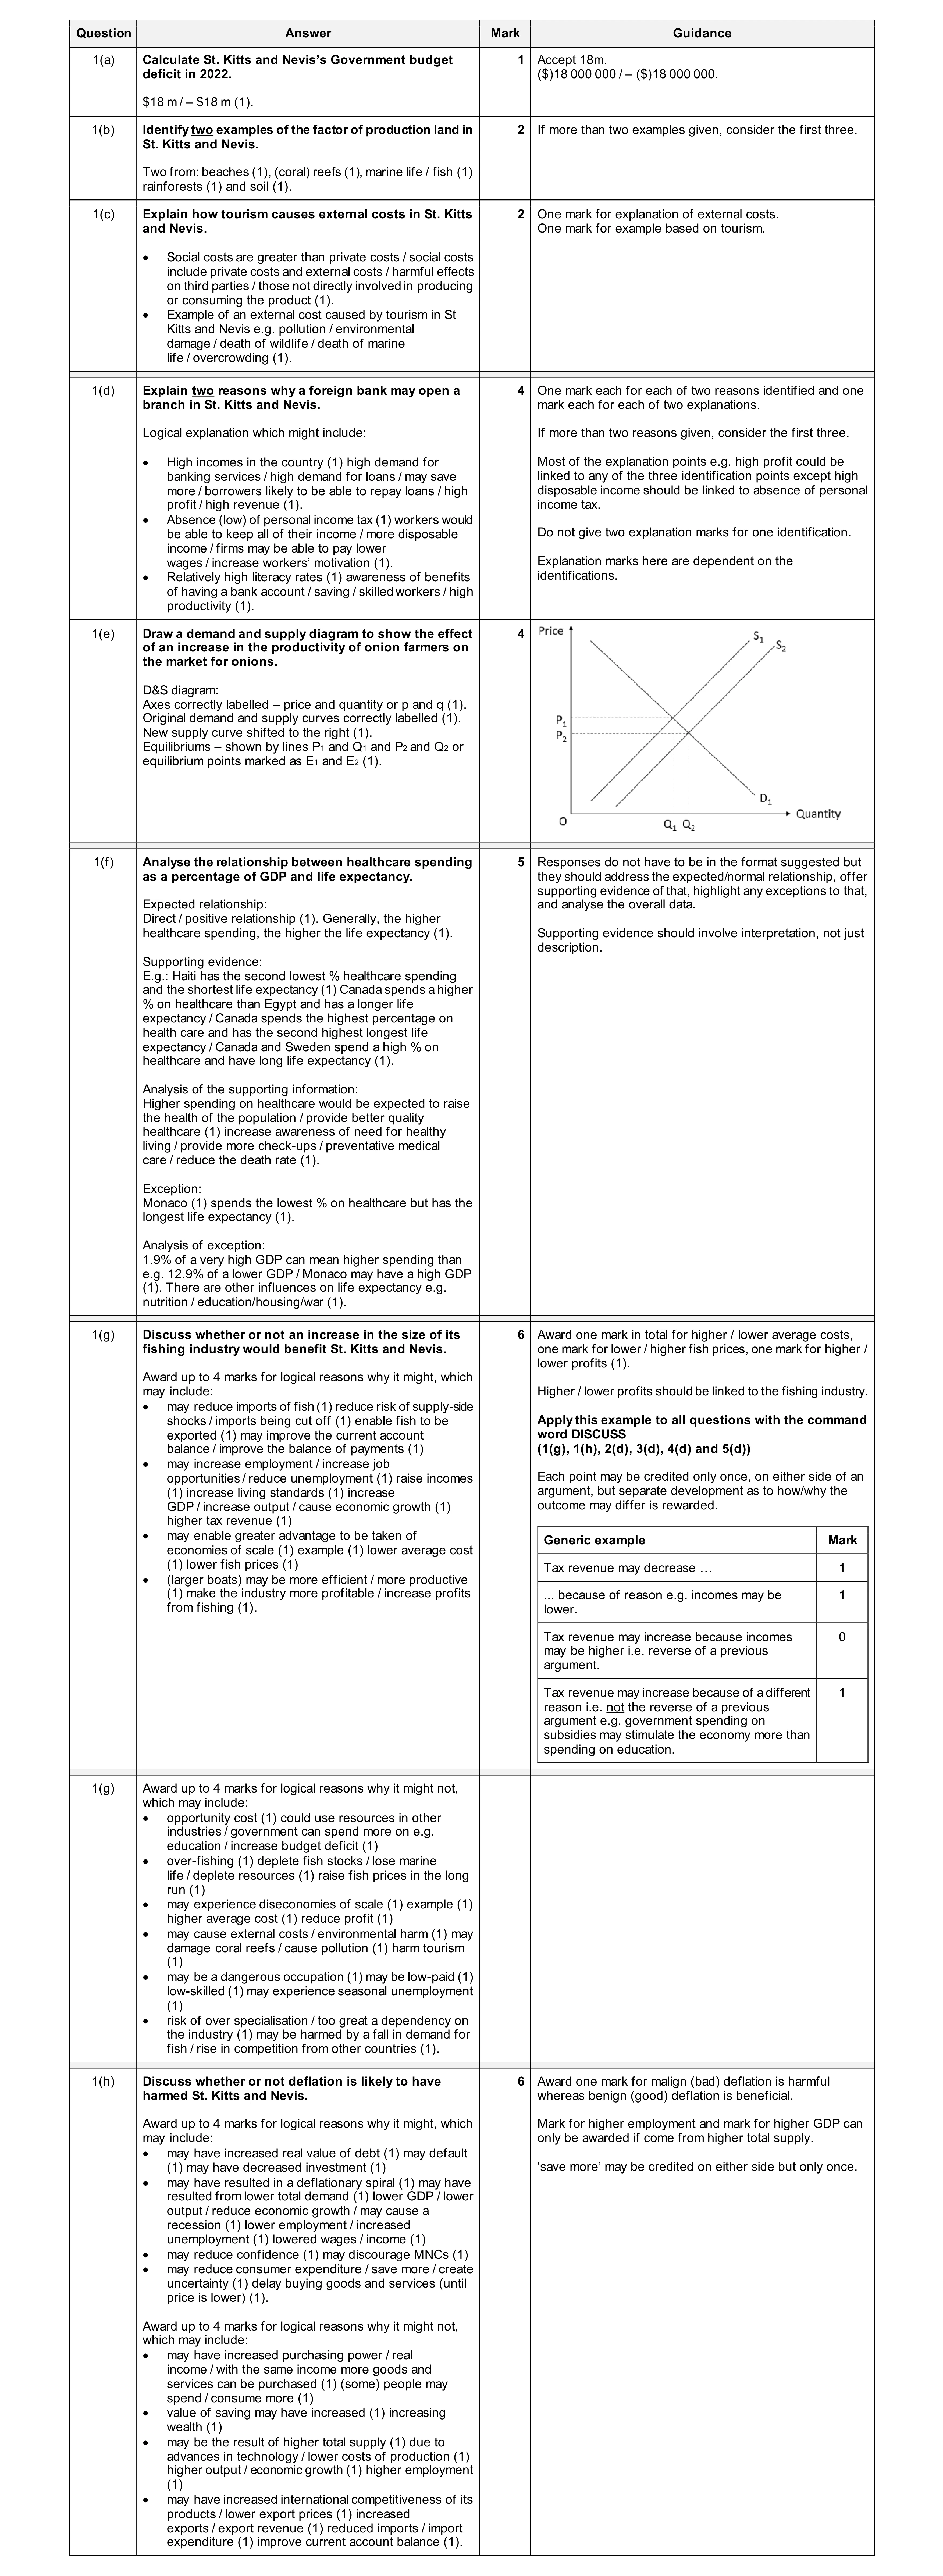 30
30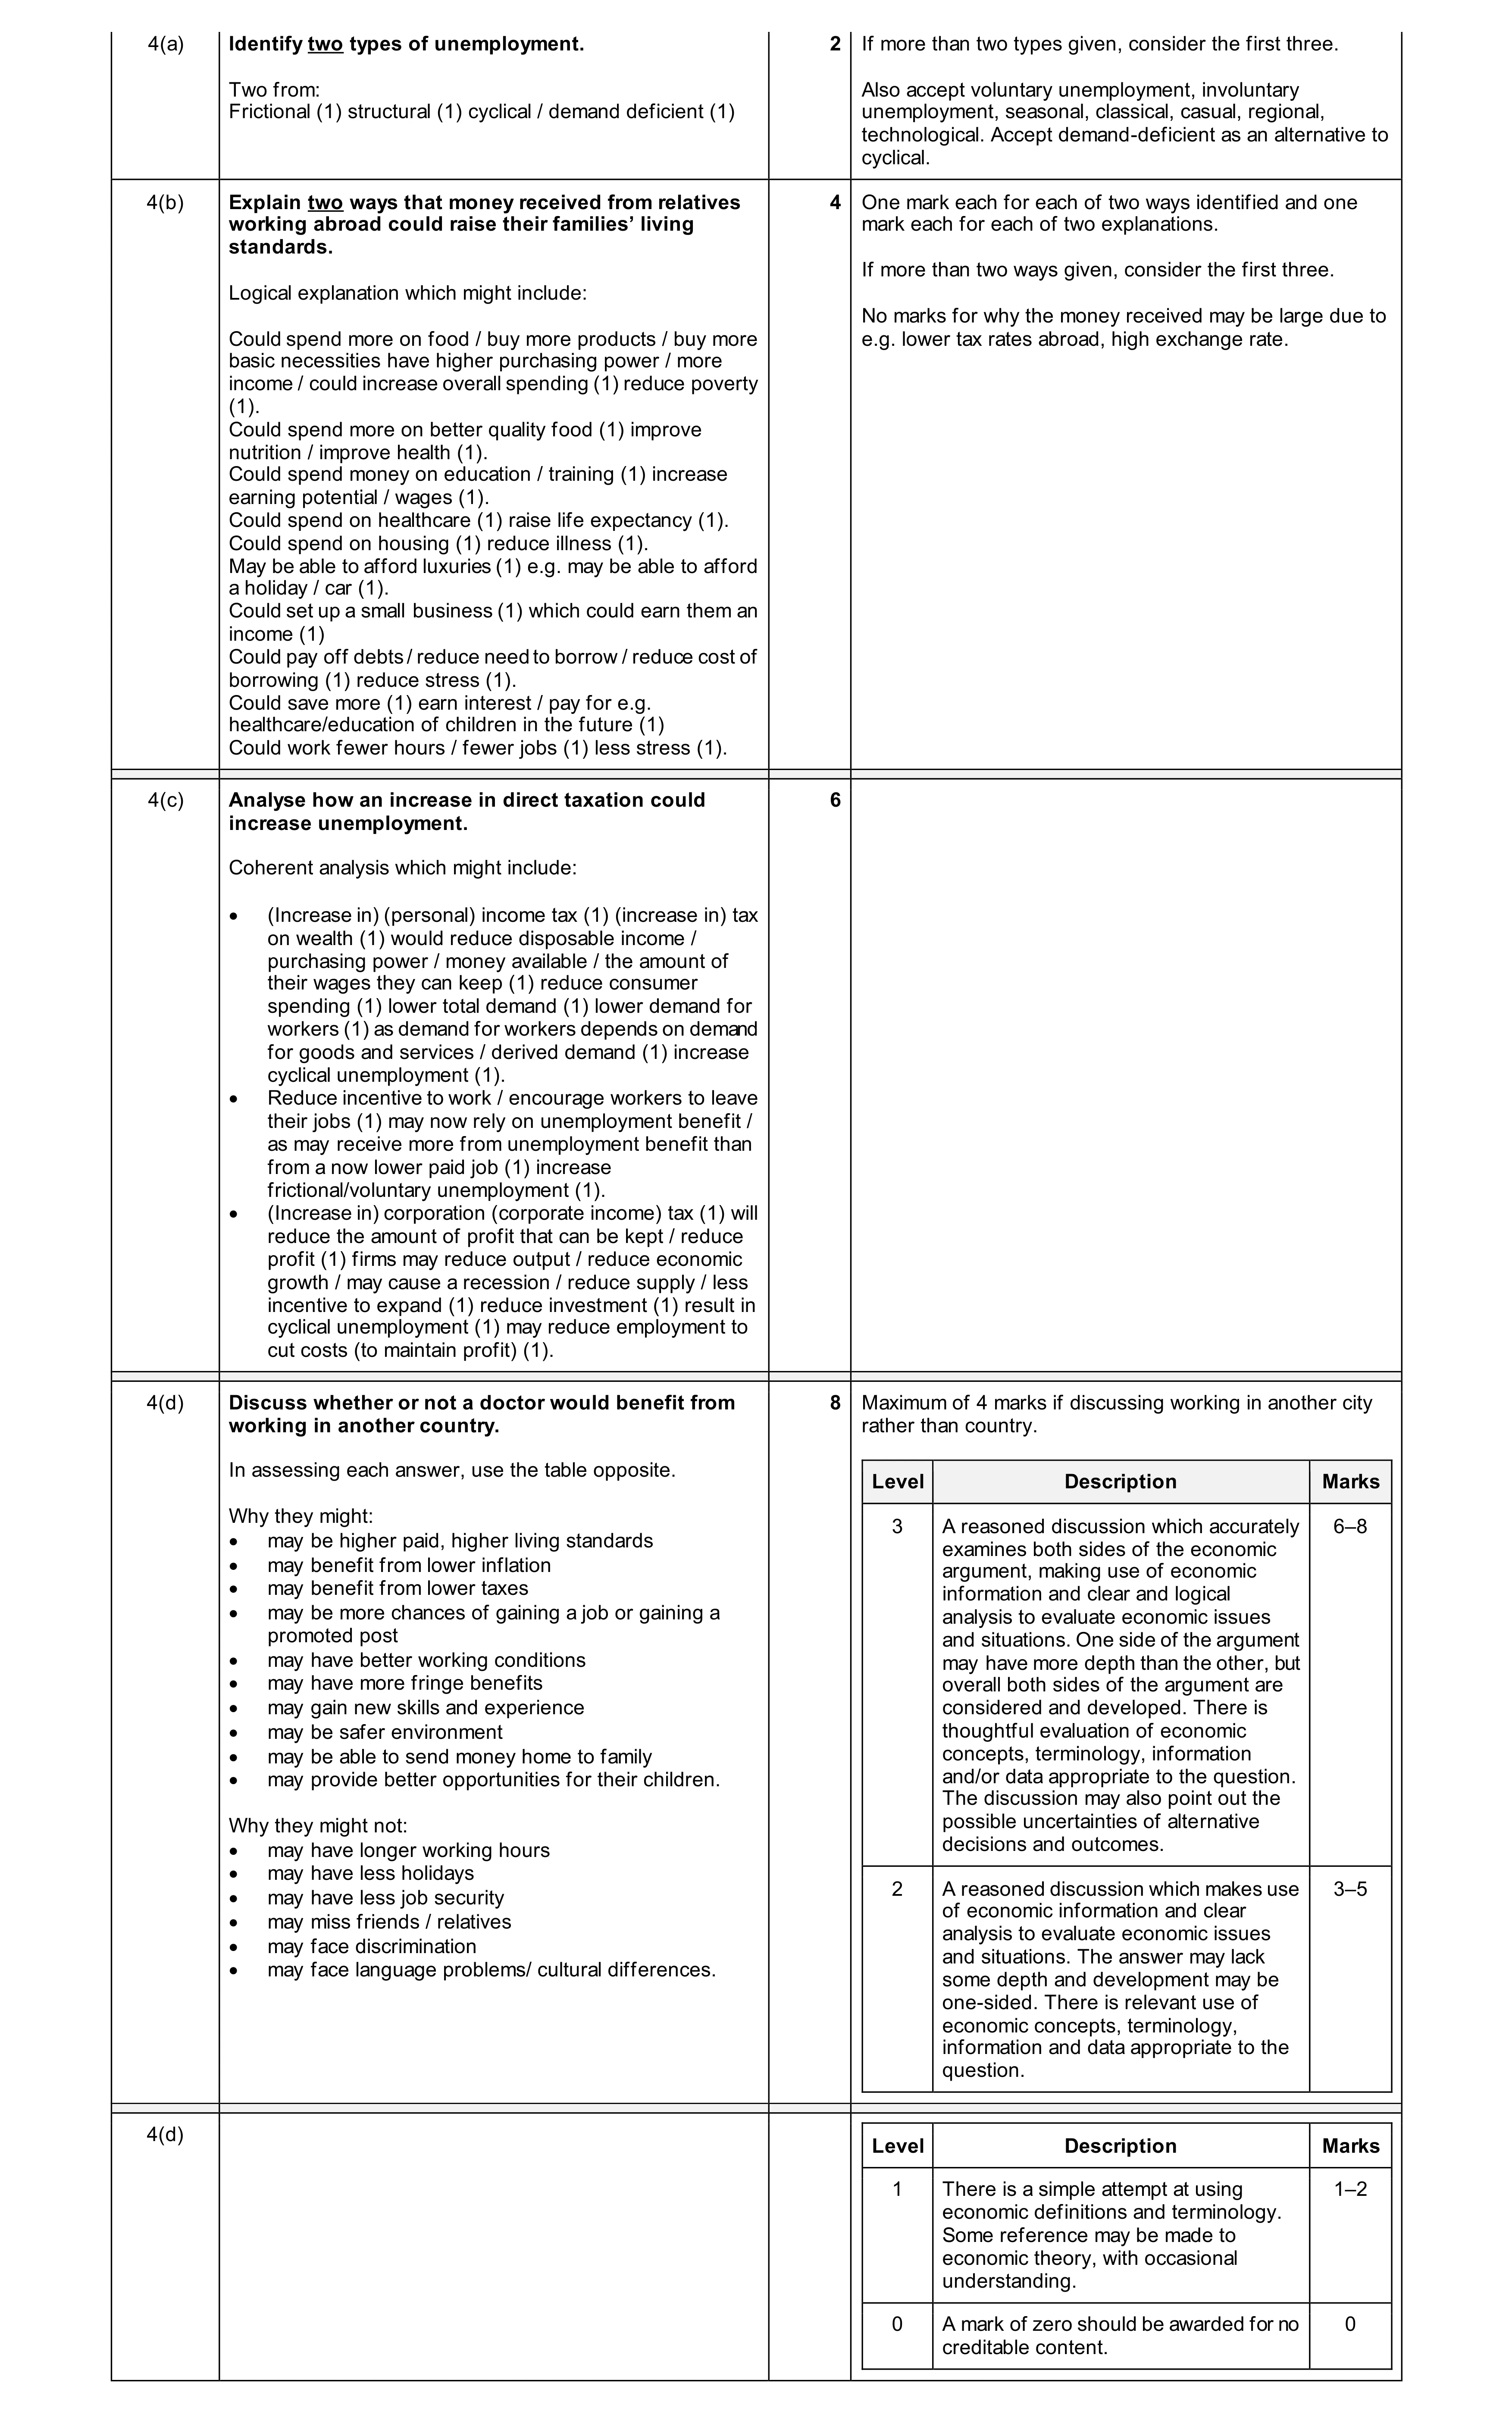 20
20 30
30 20
20 30
30 20
20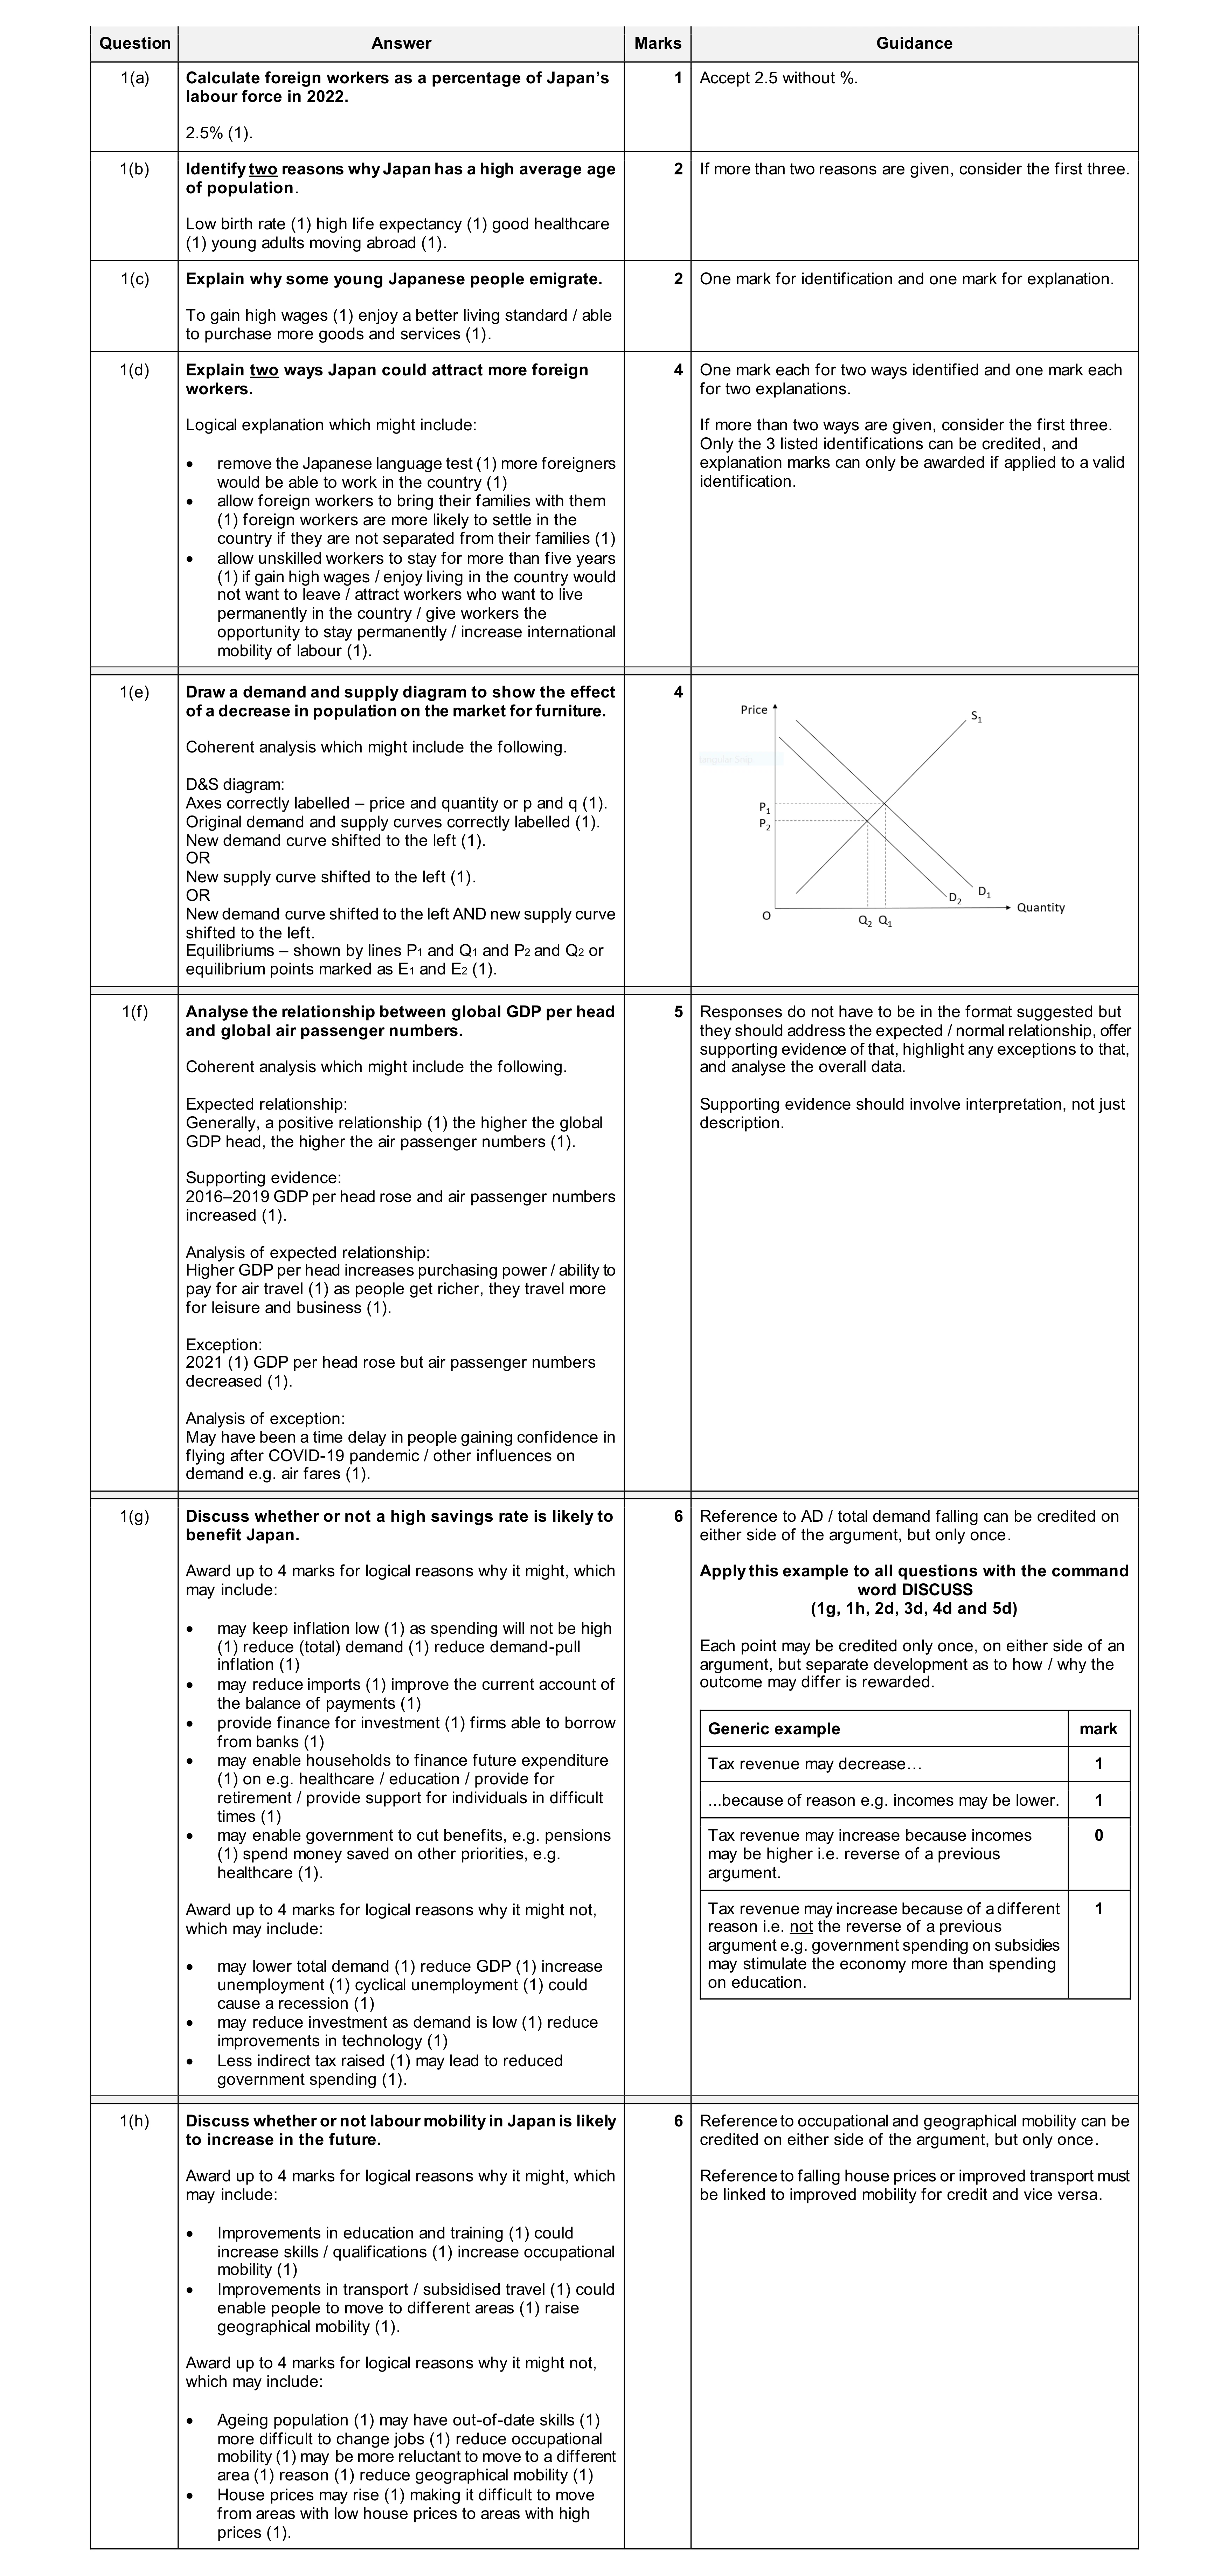 30
30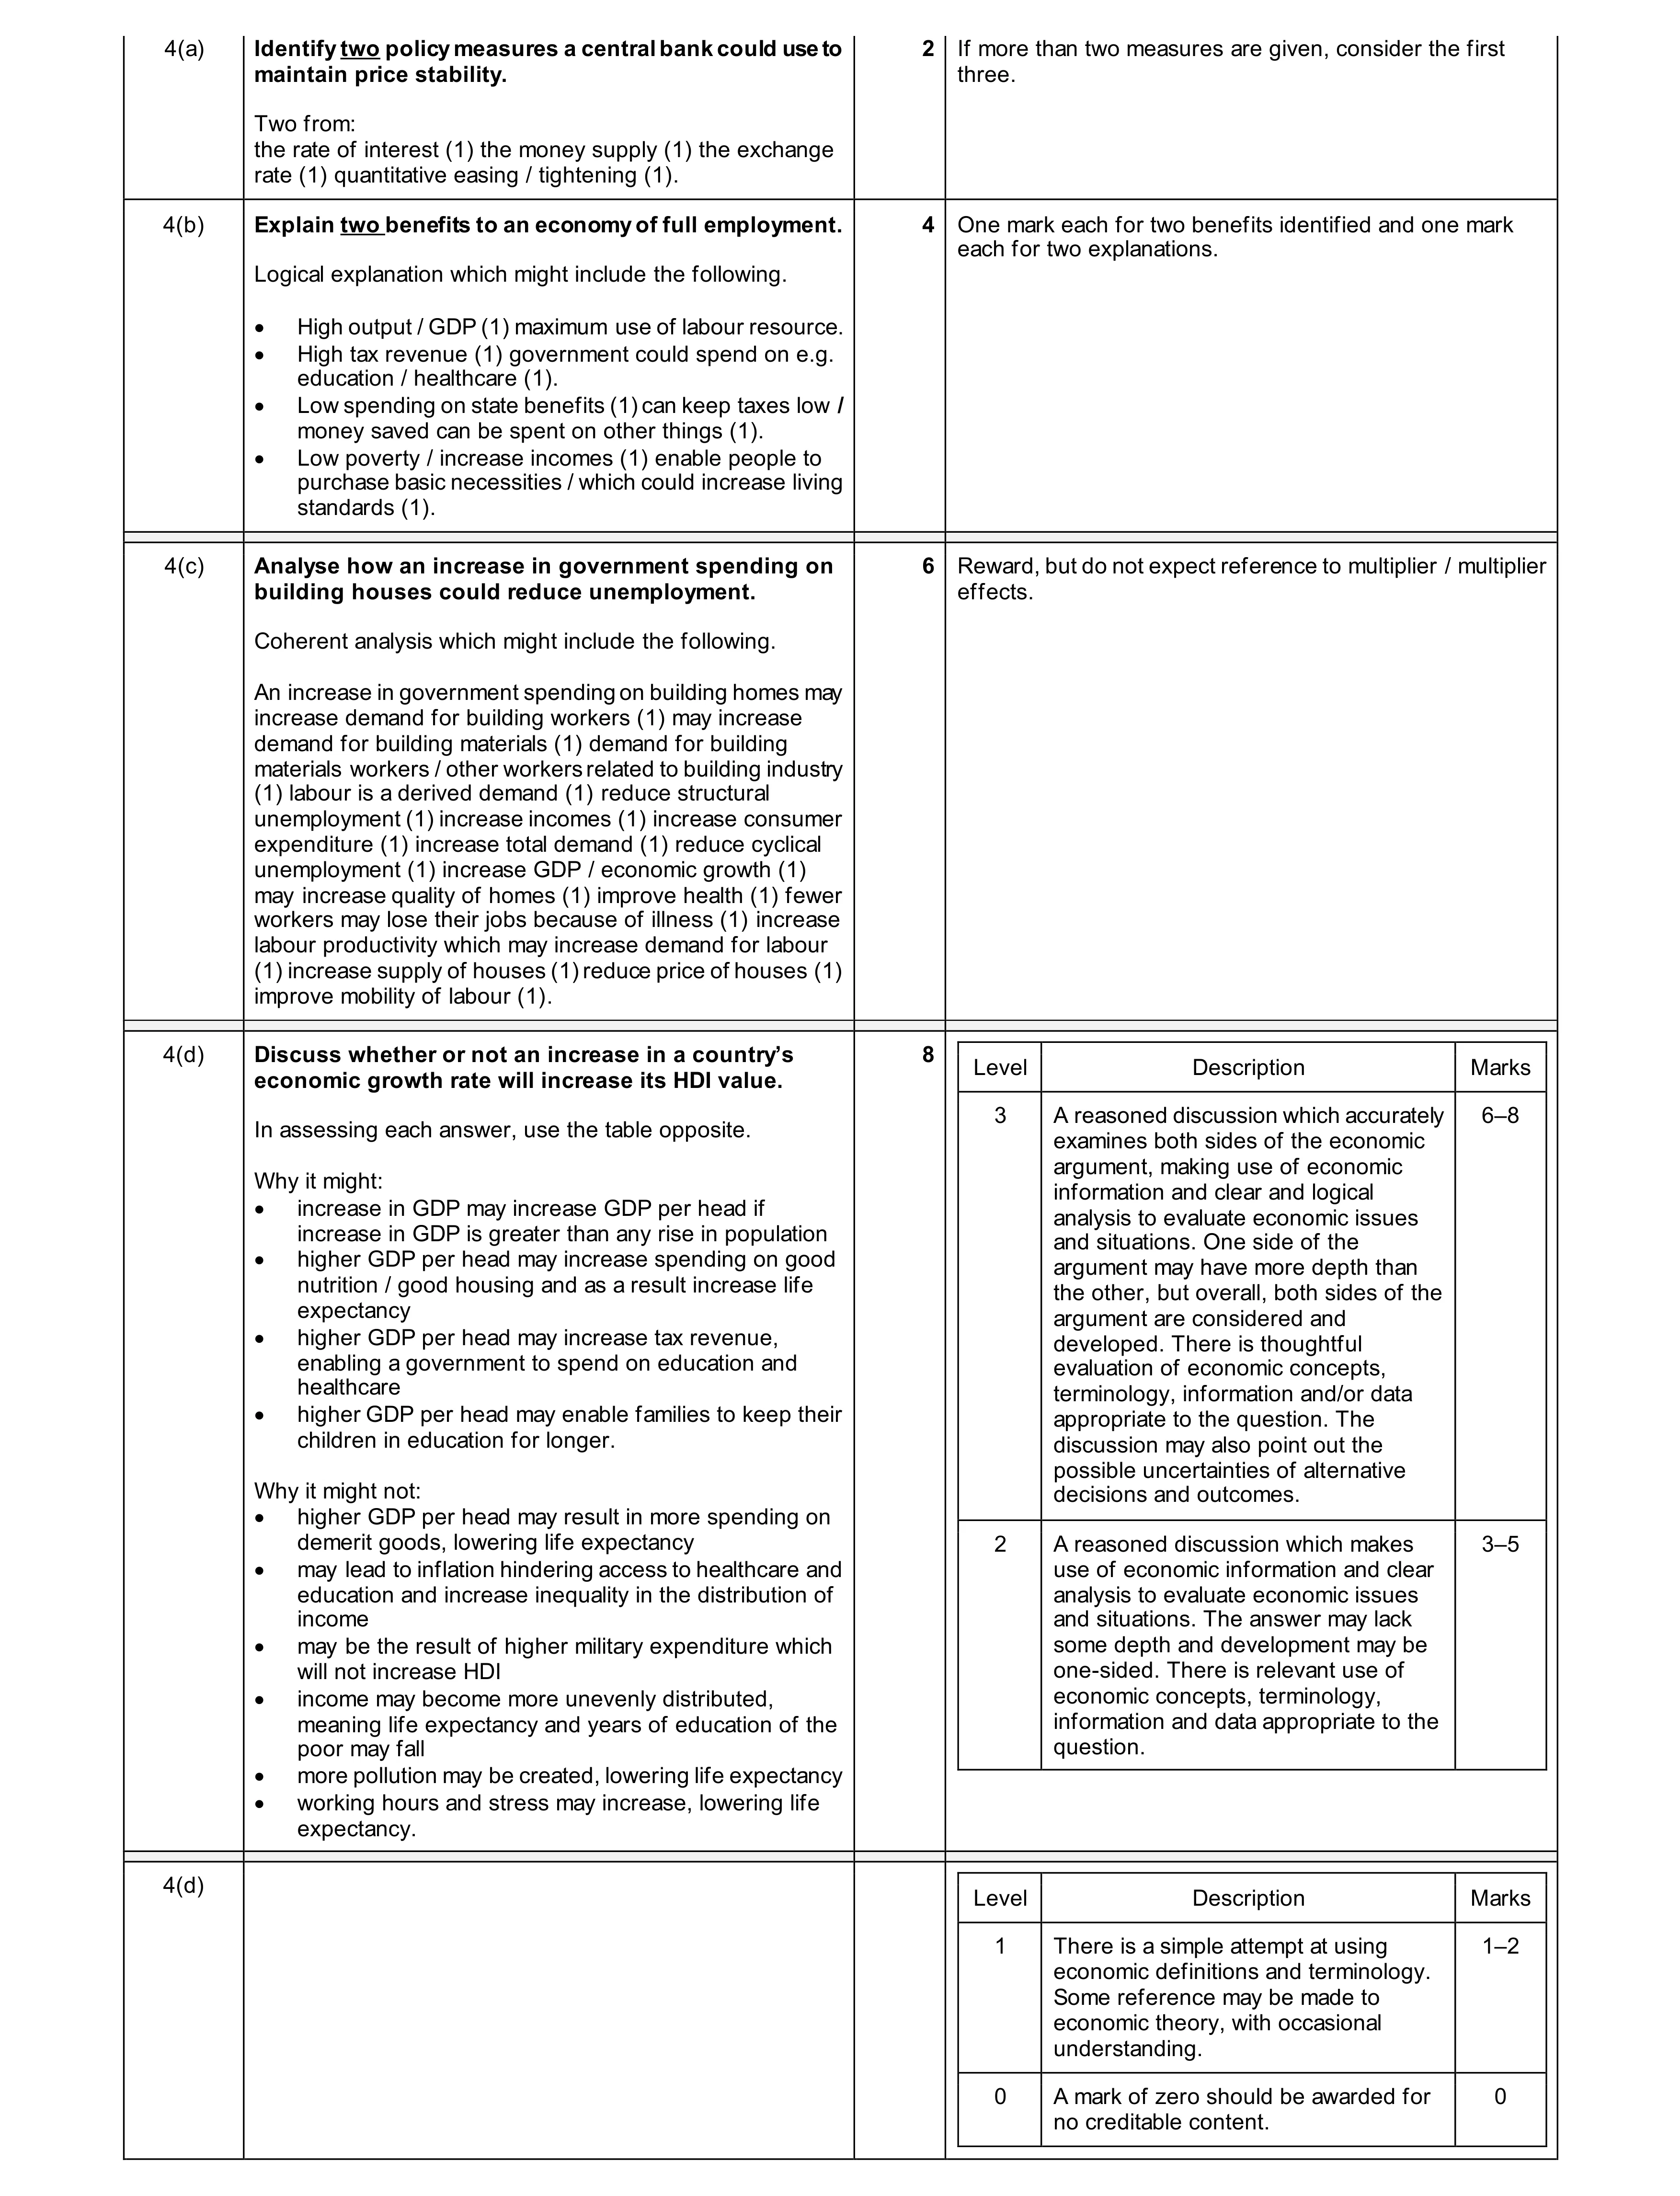 20
20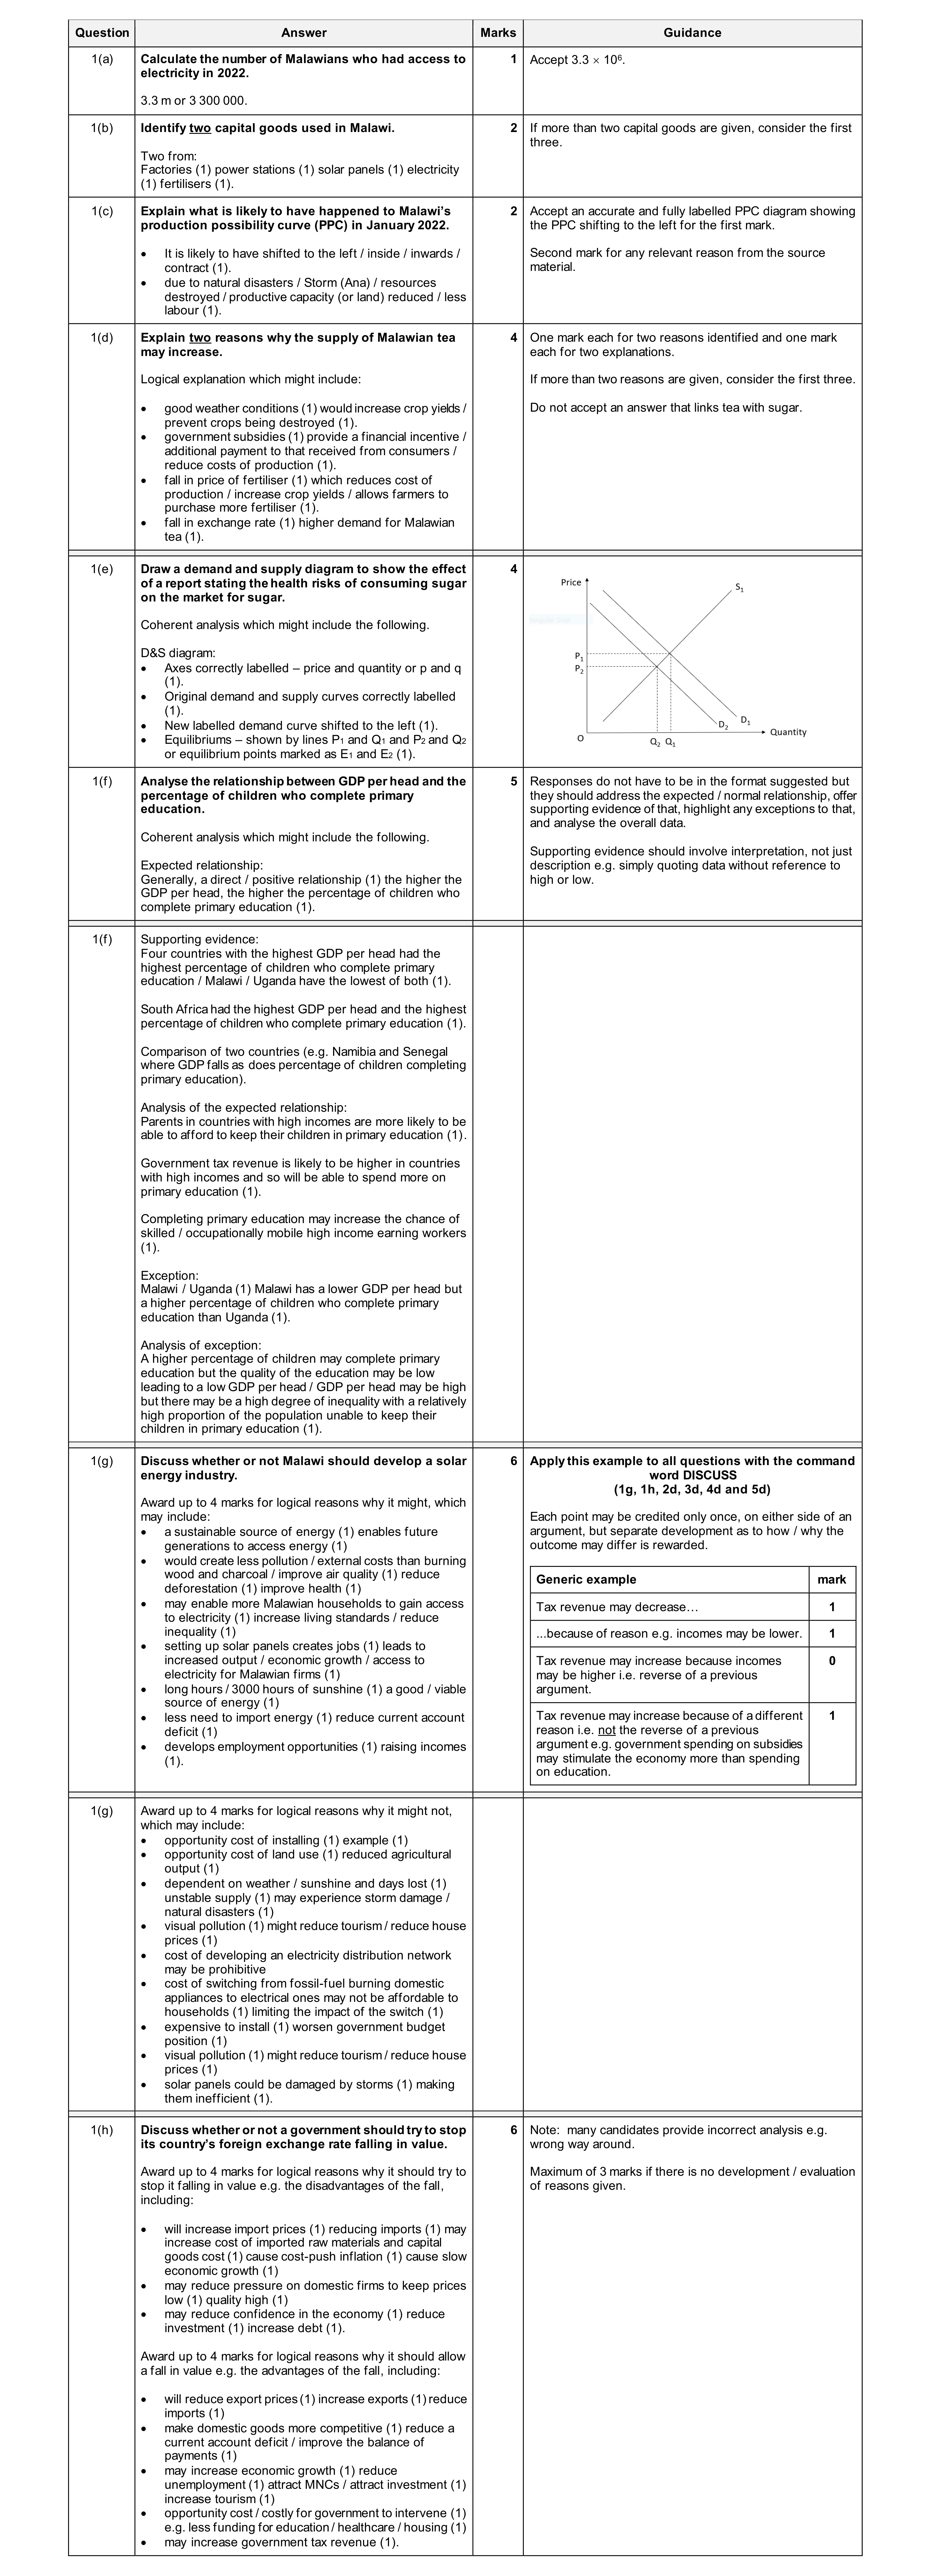 30
30