Cambridge IGCSE Economics 0455 — 2025 Feb/March Paper 2 · Variant 2
0455/22/F/M/25 · 5 questions · 90 marks · ≈101 min
The question paper and its mark scheme, free to read here and free to download. This is Cambridge’s own paper, exactly as it was sat.
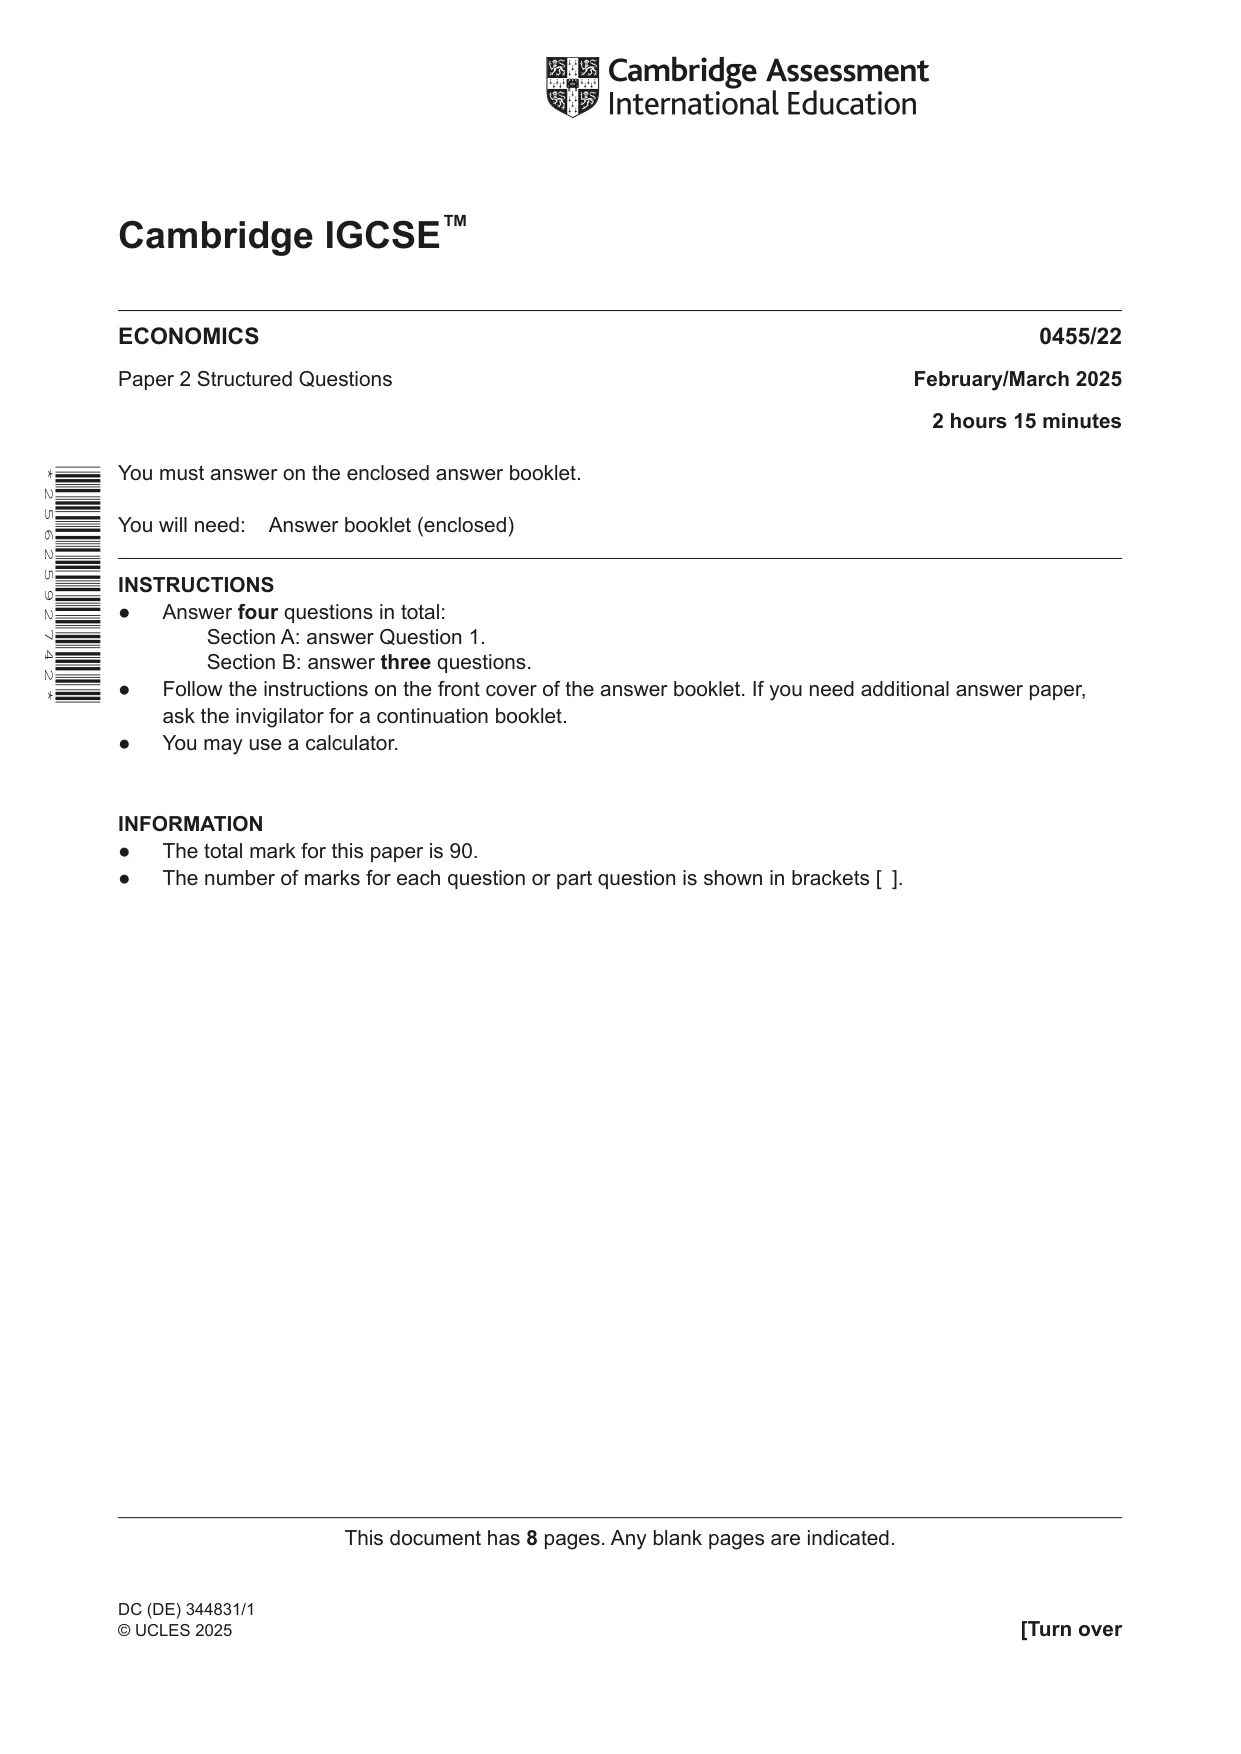
Question paper8 pages


Mark scheme28 pages
Answers below. Sit the paper first if you are practising.
Questions as text
Q1 · Calculate Romania’s current account deficit on its balance of payments in $s
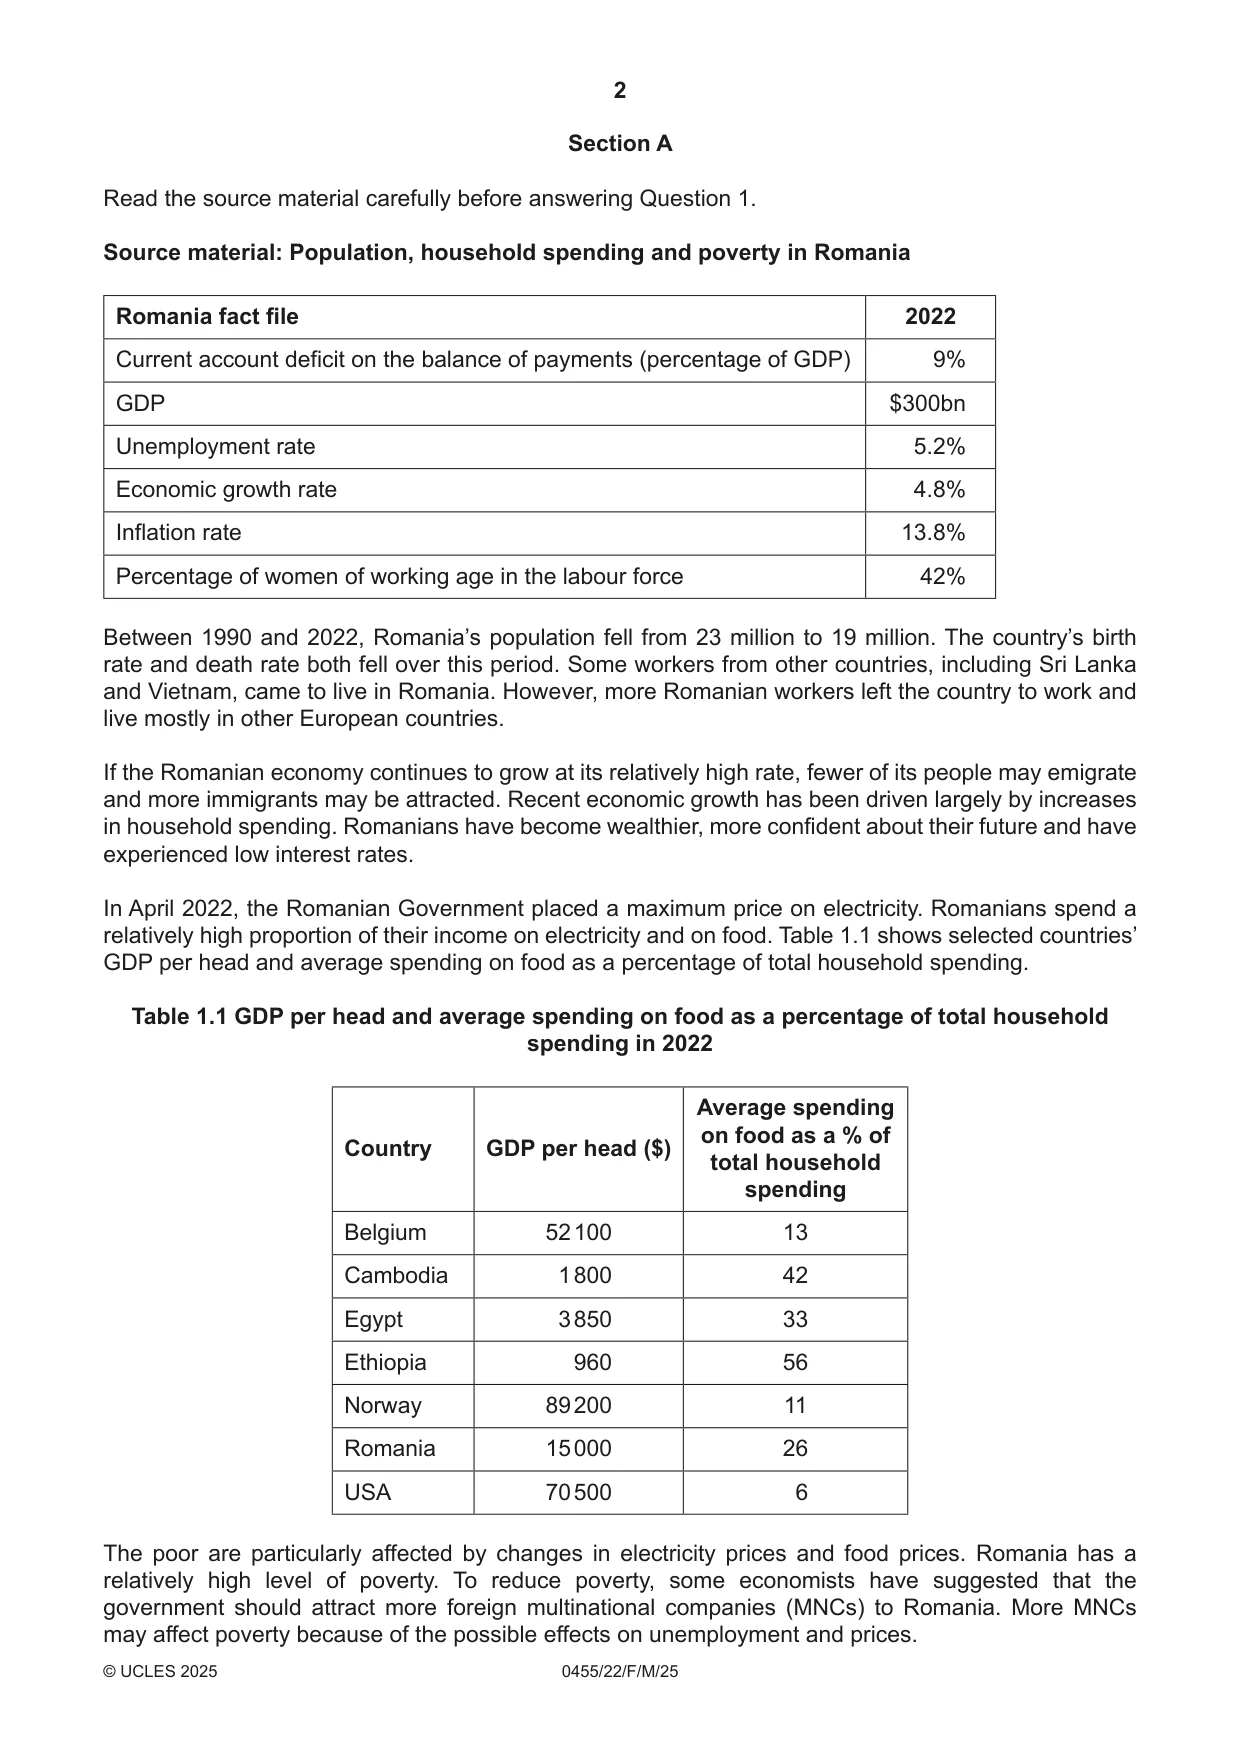
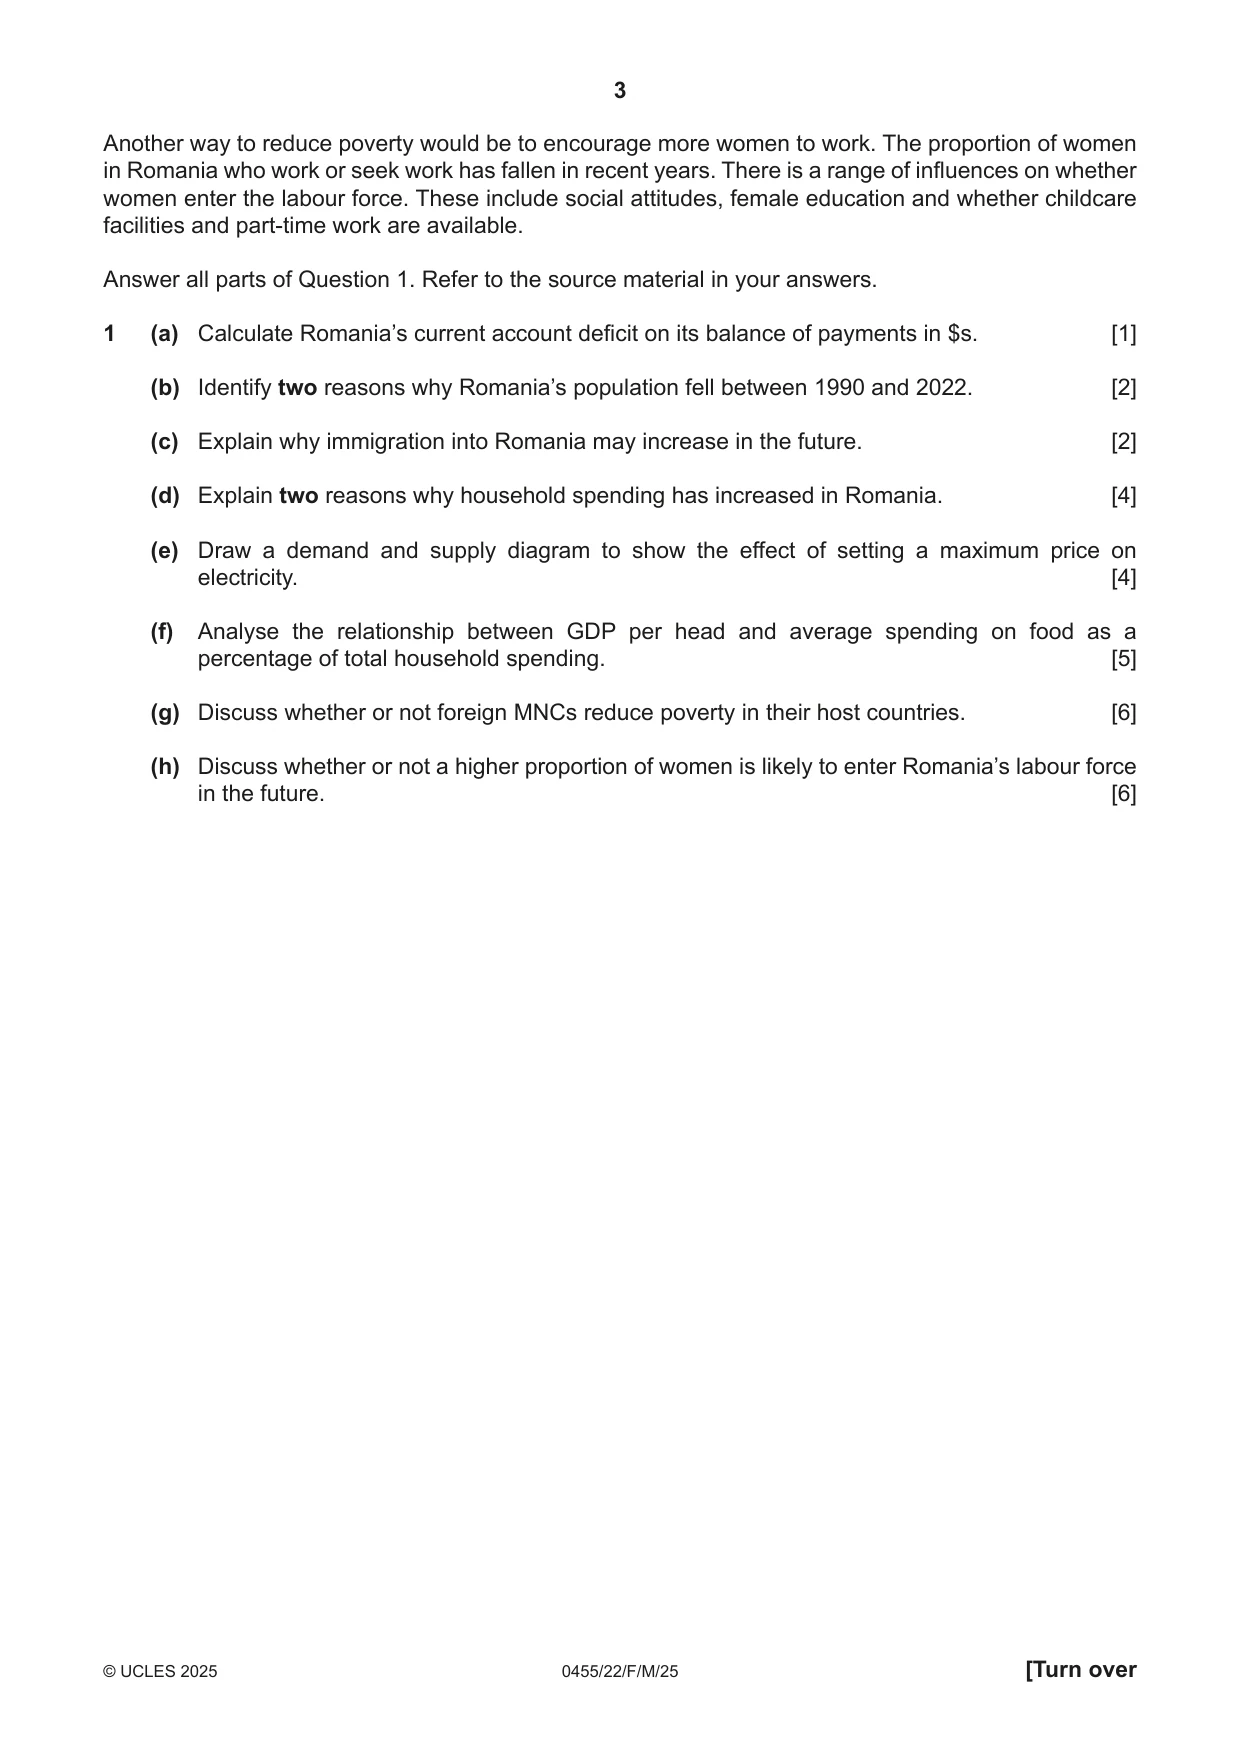
1 (a) Calculate Romania’s current account deficit on its balance of payments in $s. [1] (b) Identify two reasons why Romania’s population fell between 1990 and 2022. [2] (c) Explain why immigration into Romania may increase in the future. [2] (d) Explain two reasons why household spending has increased in Romania. [4] (e) Draw a demand and supply diagram to show the effect of setting a maximum price on electricity. [4] (f) Analyse the relationship between GDP per head and average spending on food as a percentage of total household spending. [5] (g) Discuss whether or not foreign MNCs reduce poverty in their host countries. [6] (h) Discuss whether or not a higher proportion of women is likely to enter Romania’s labour force in the future. [6]
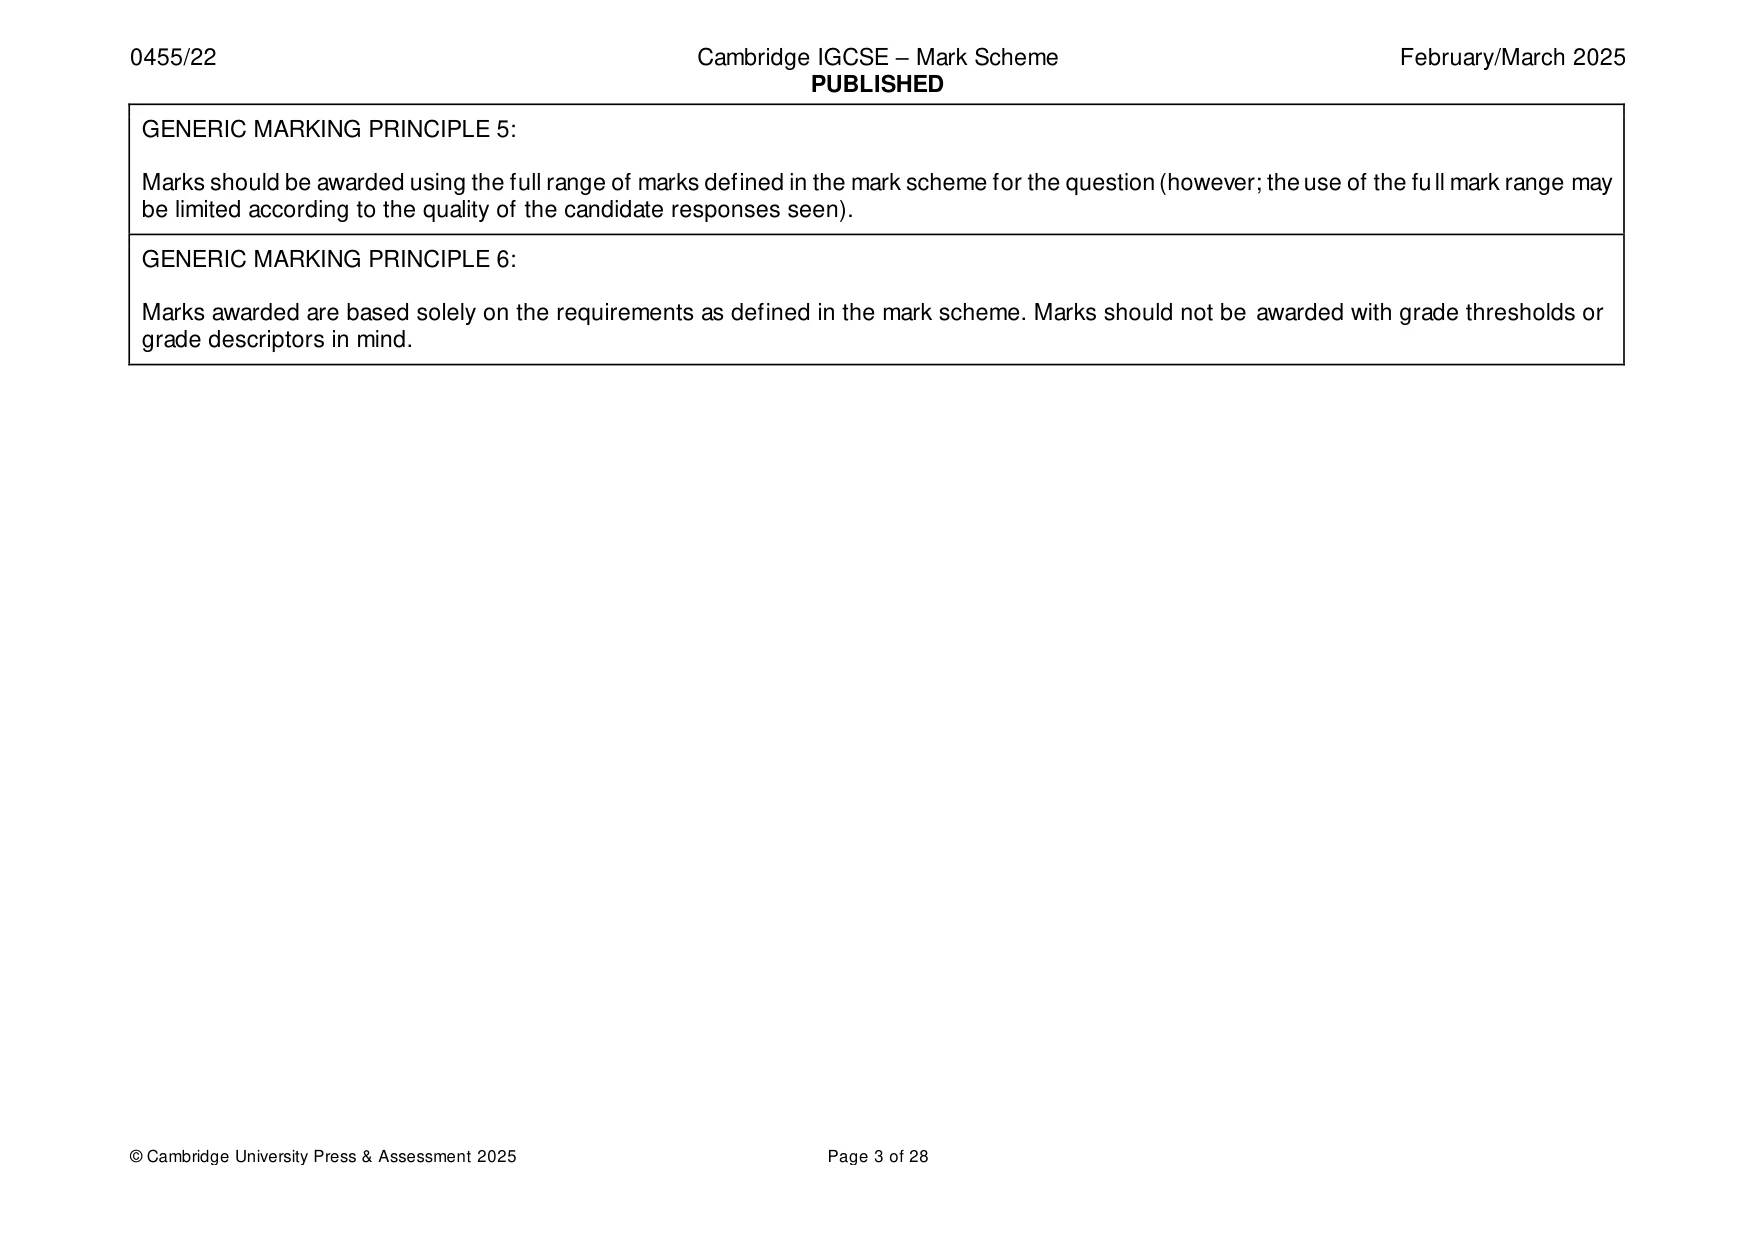
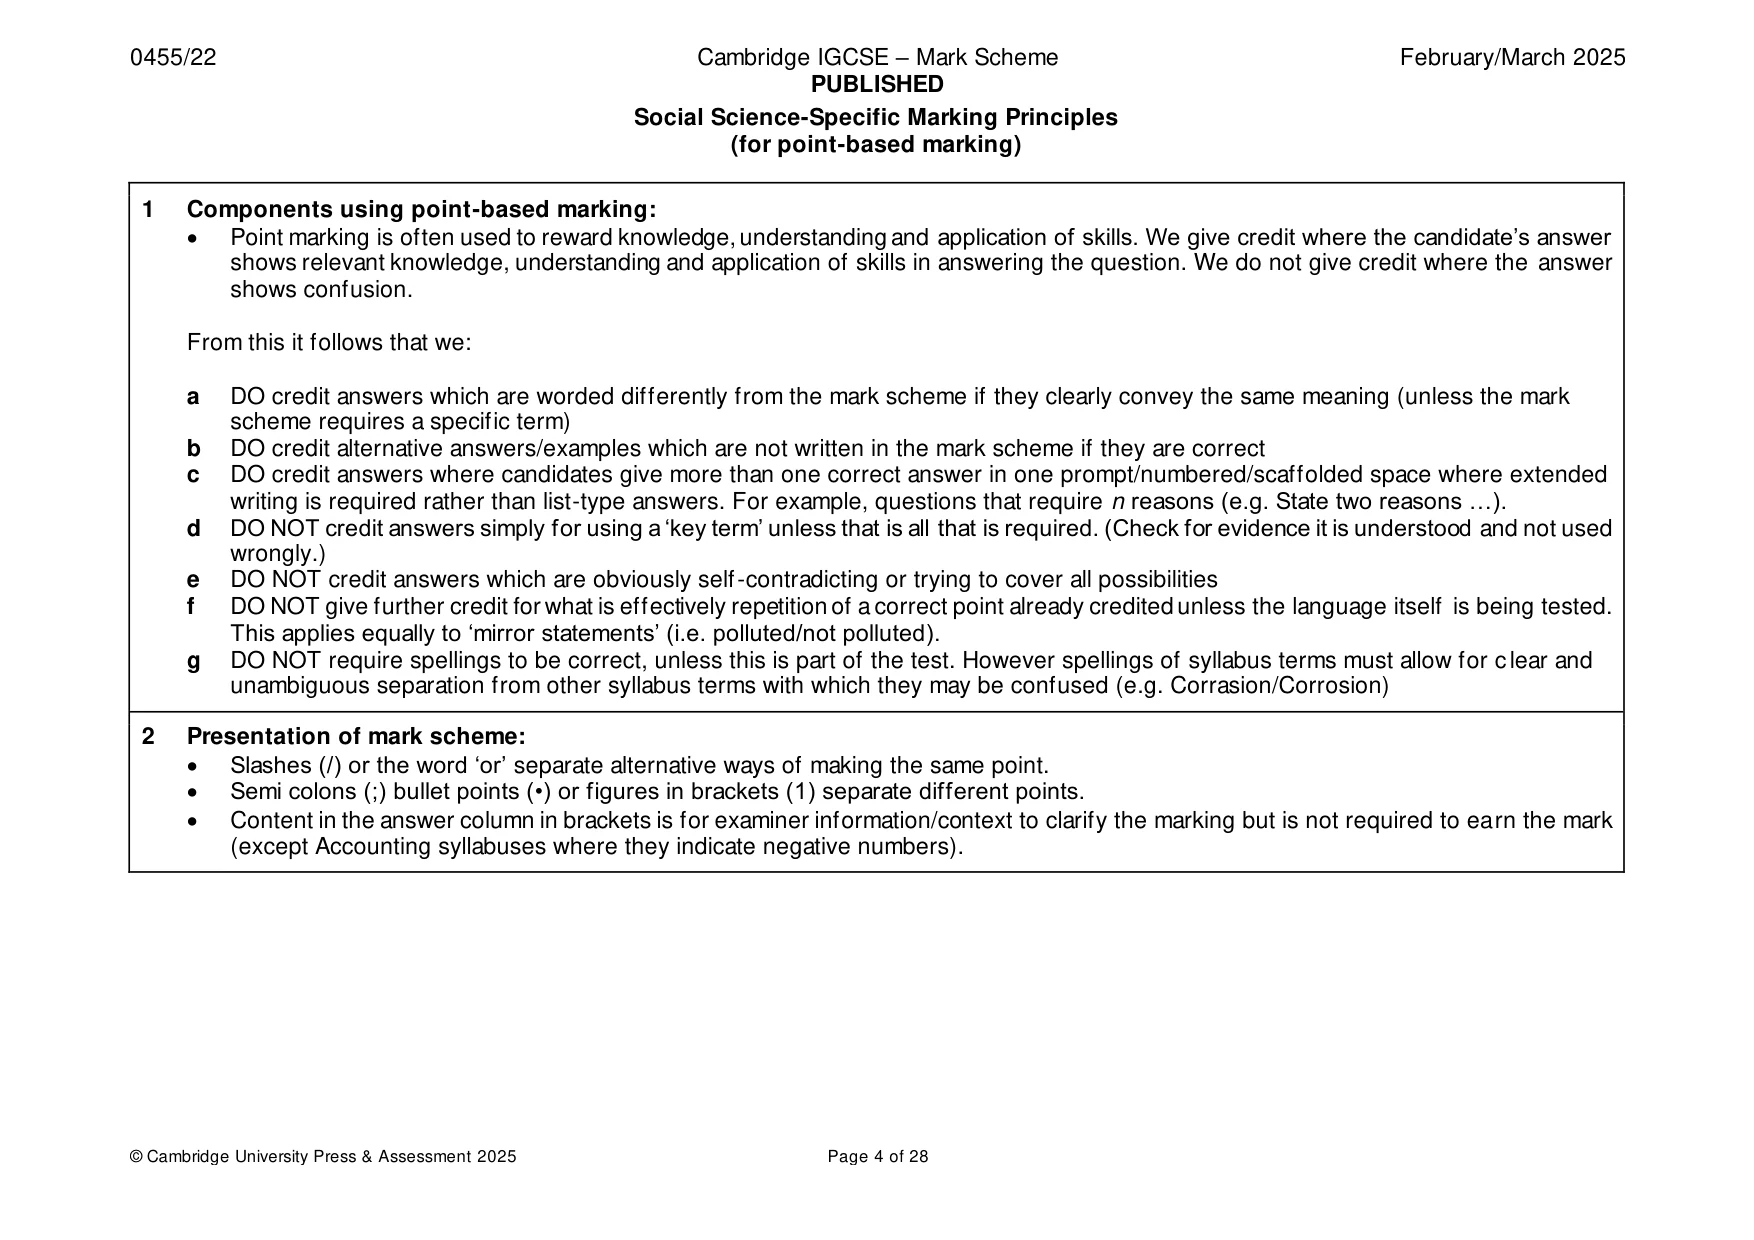
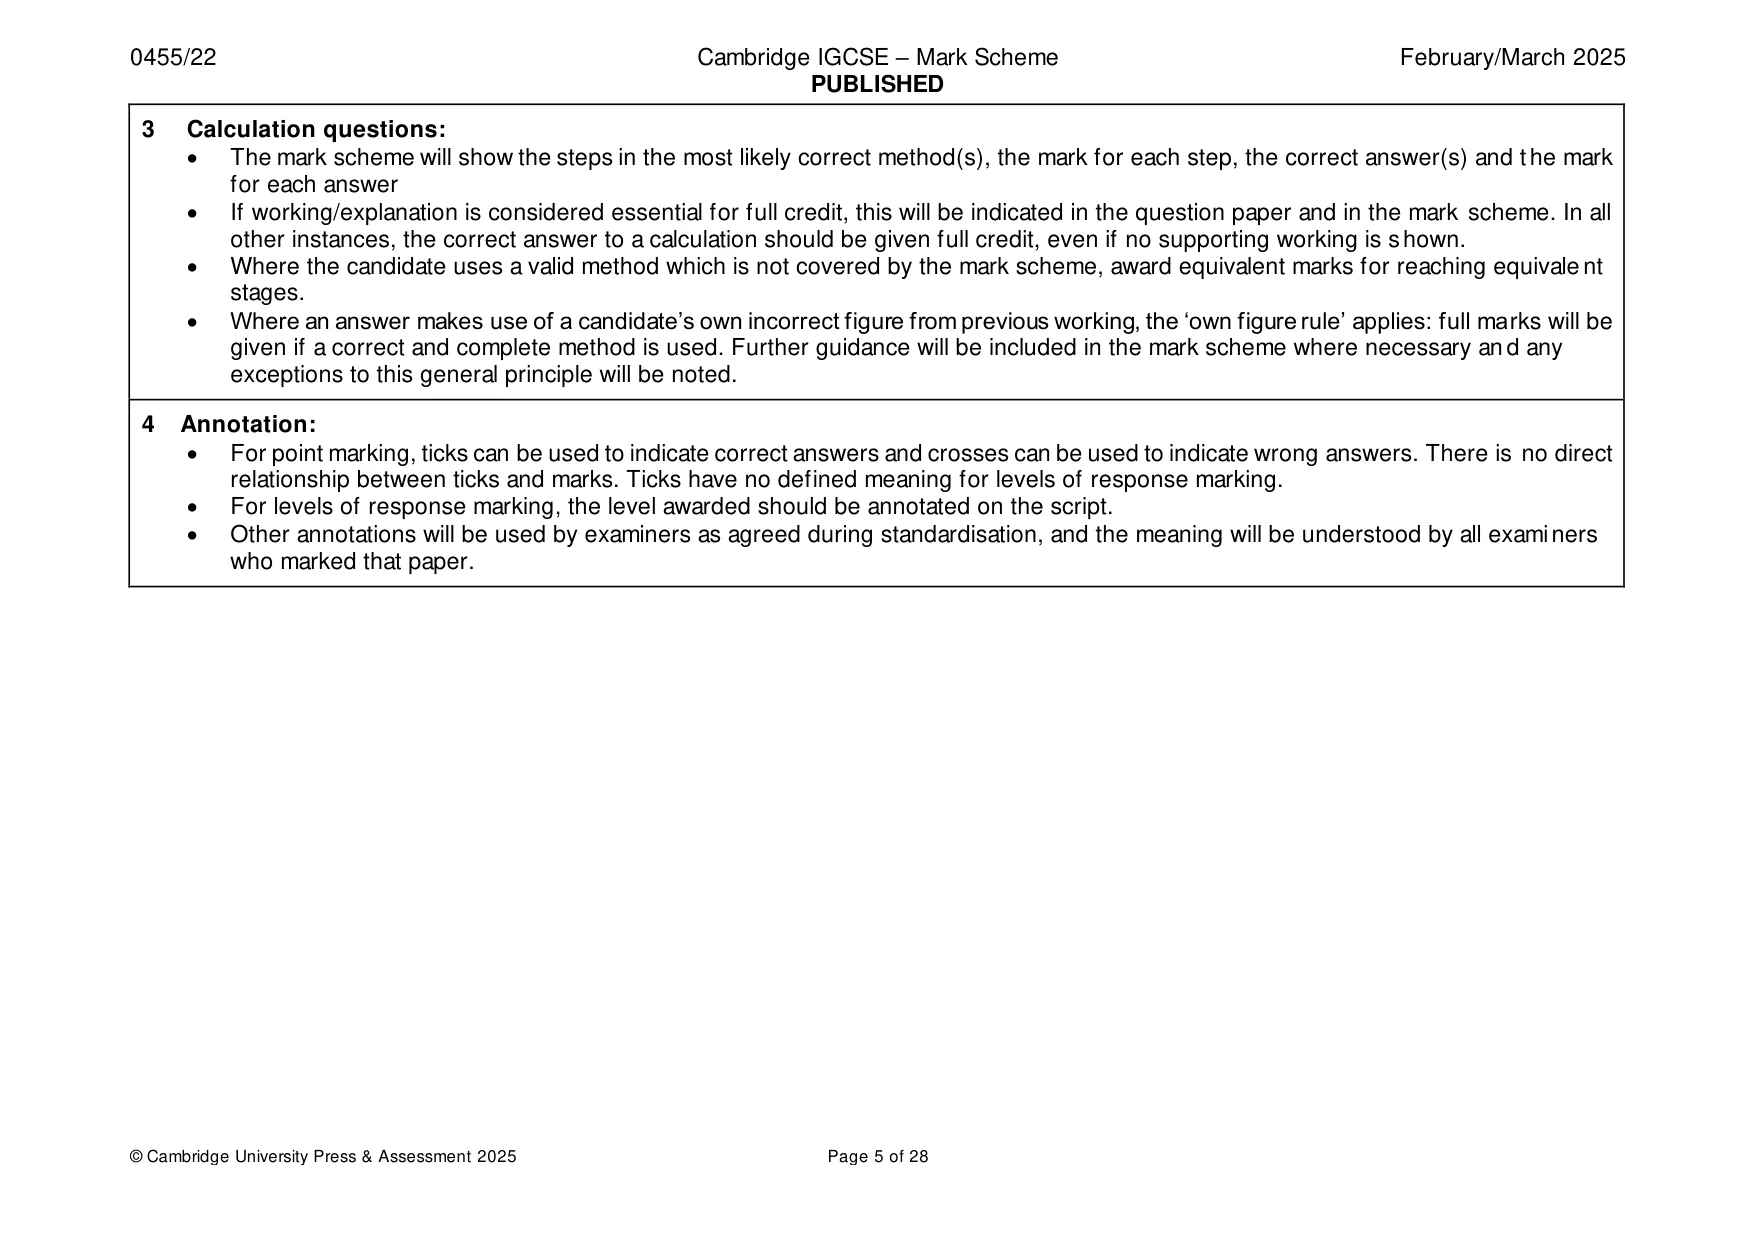
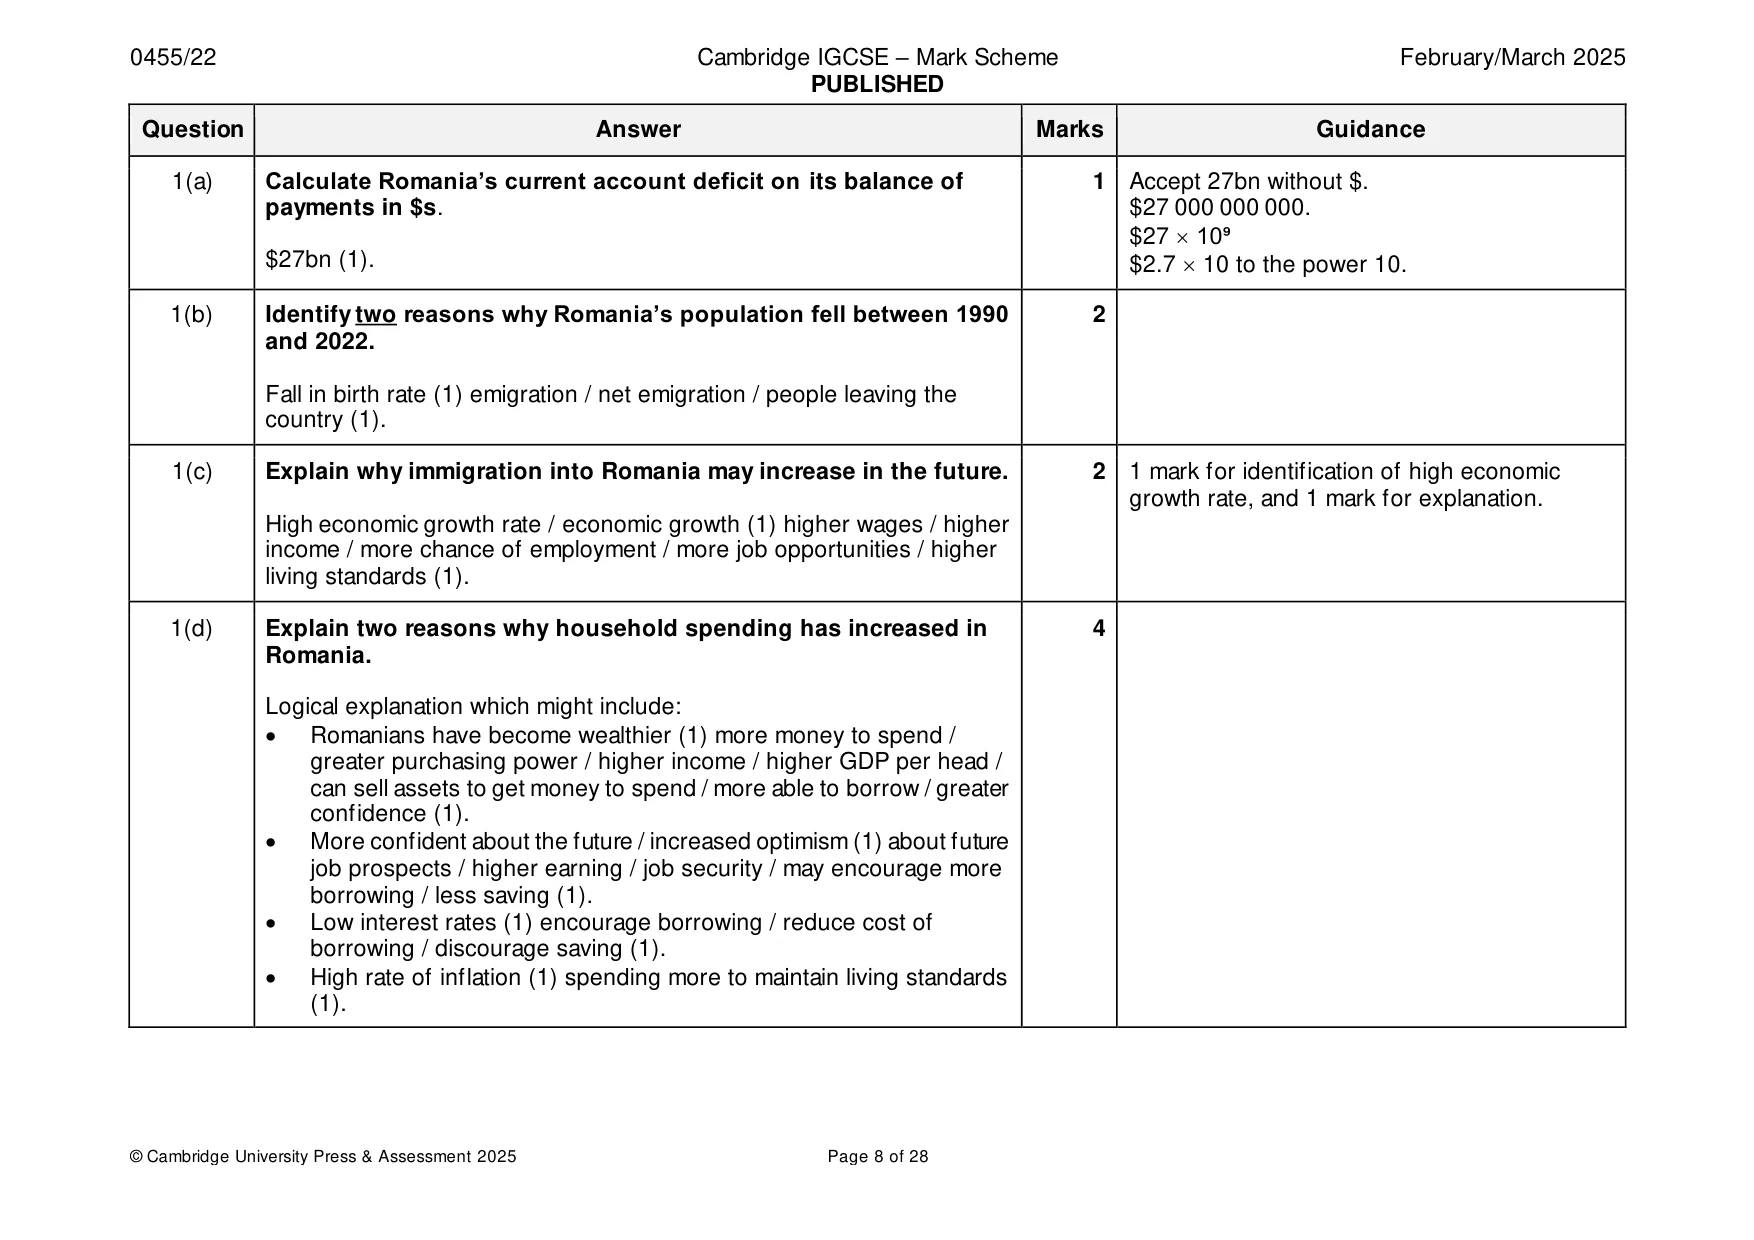
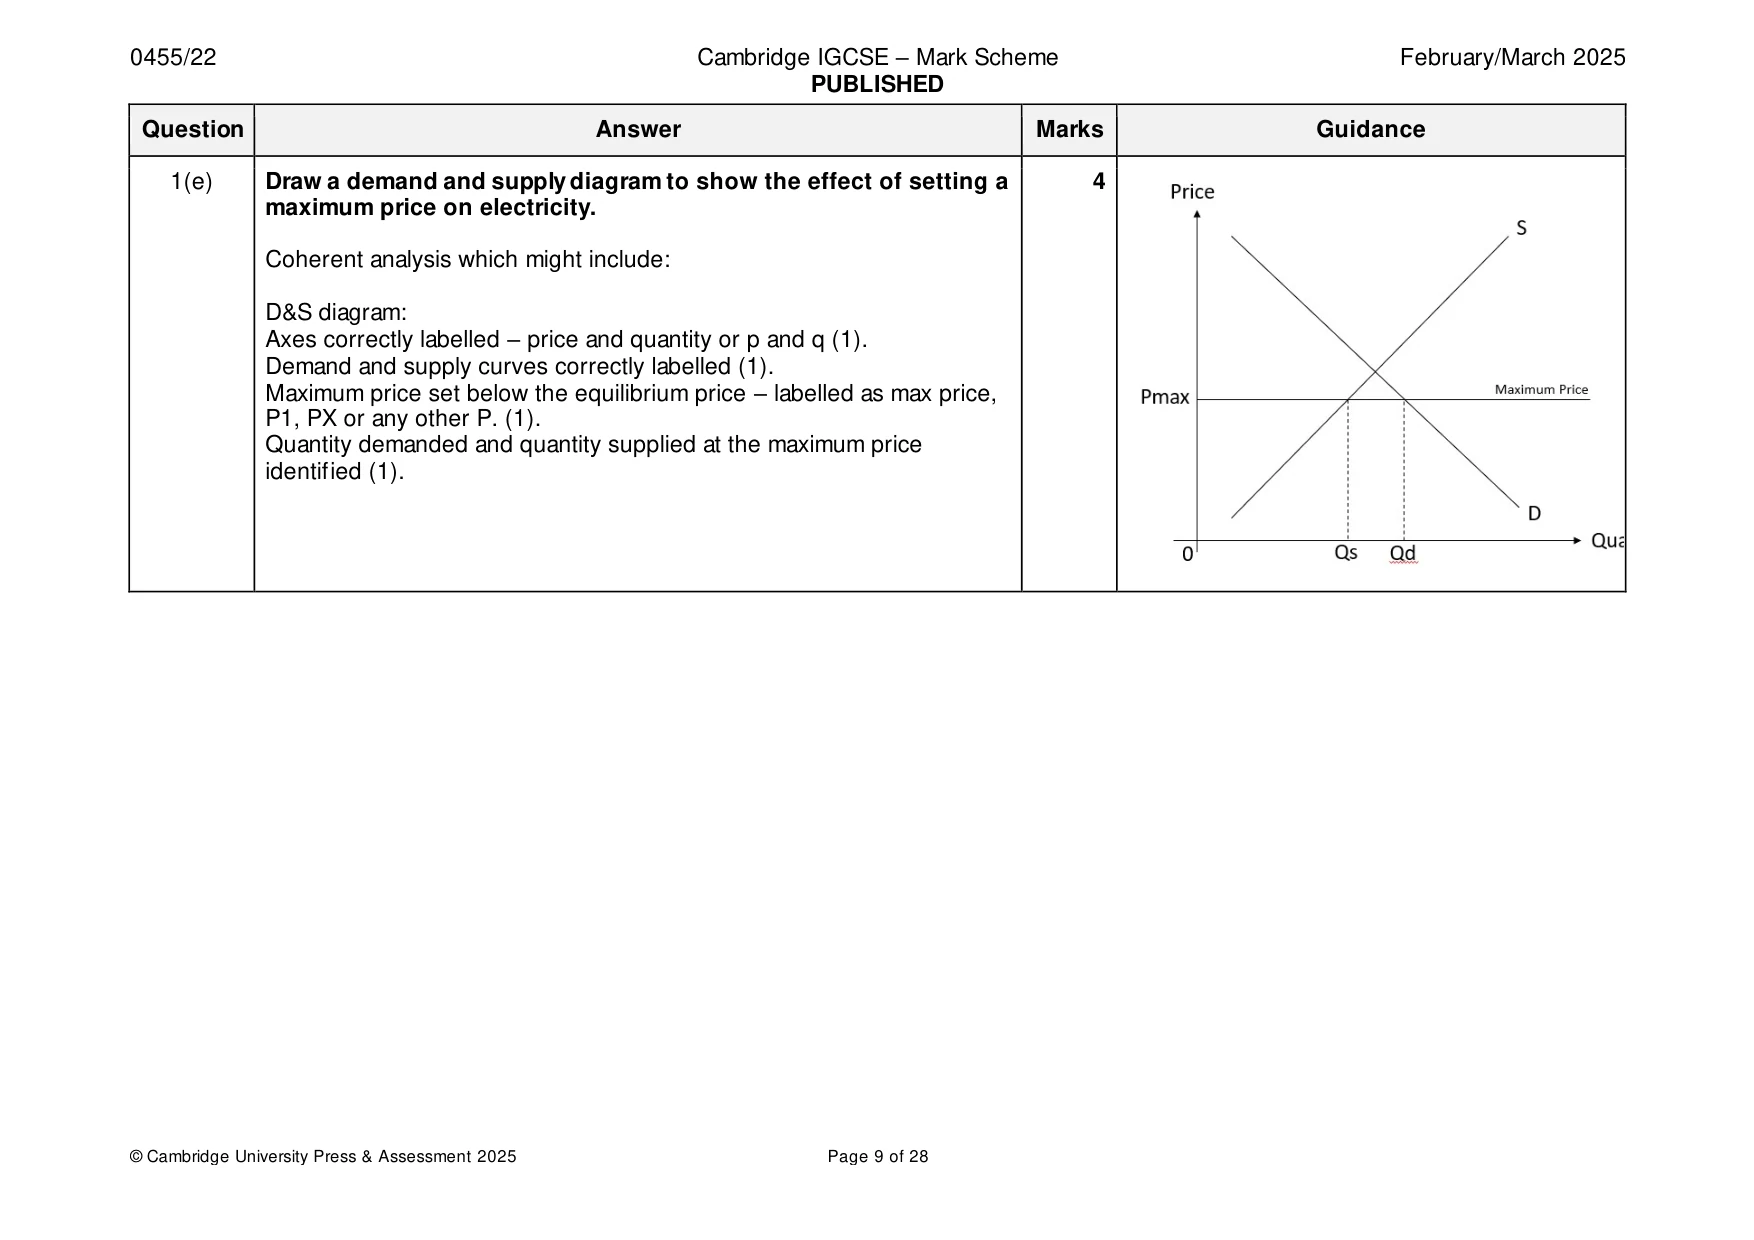
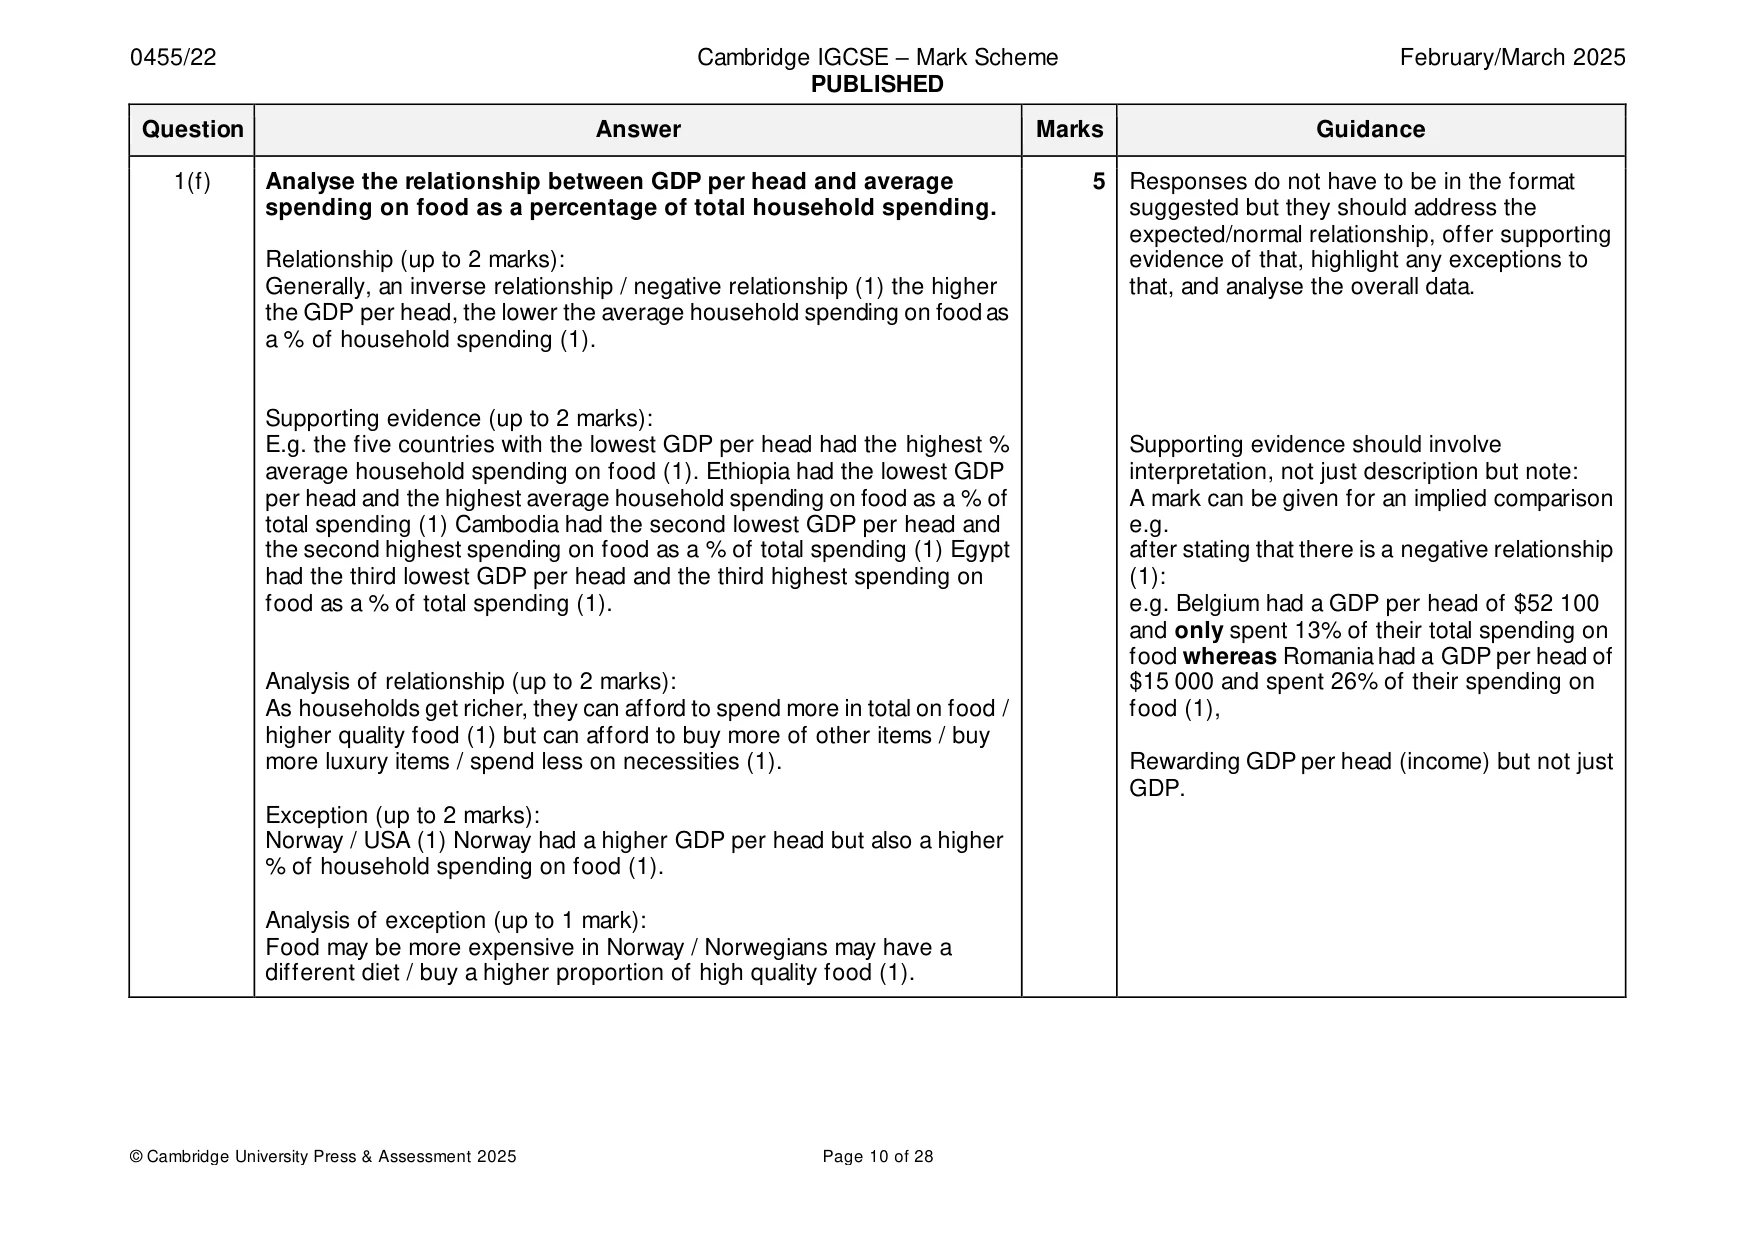
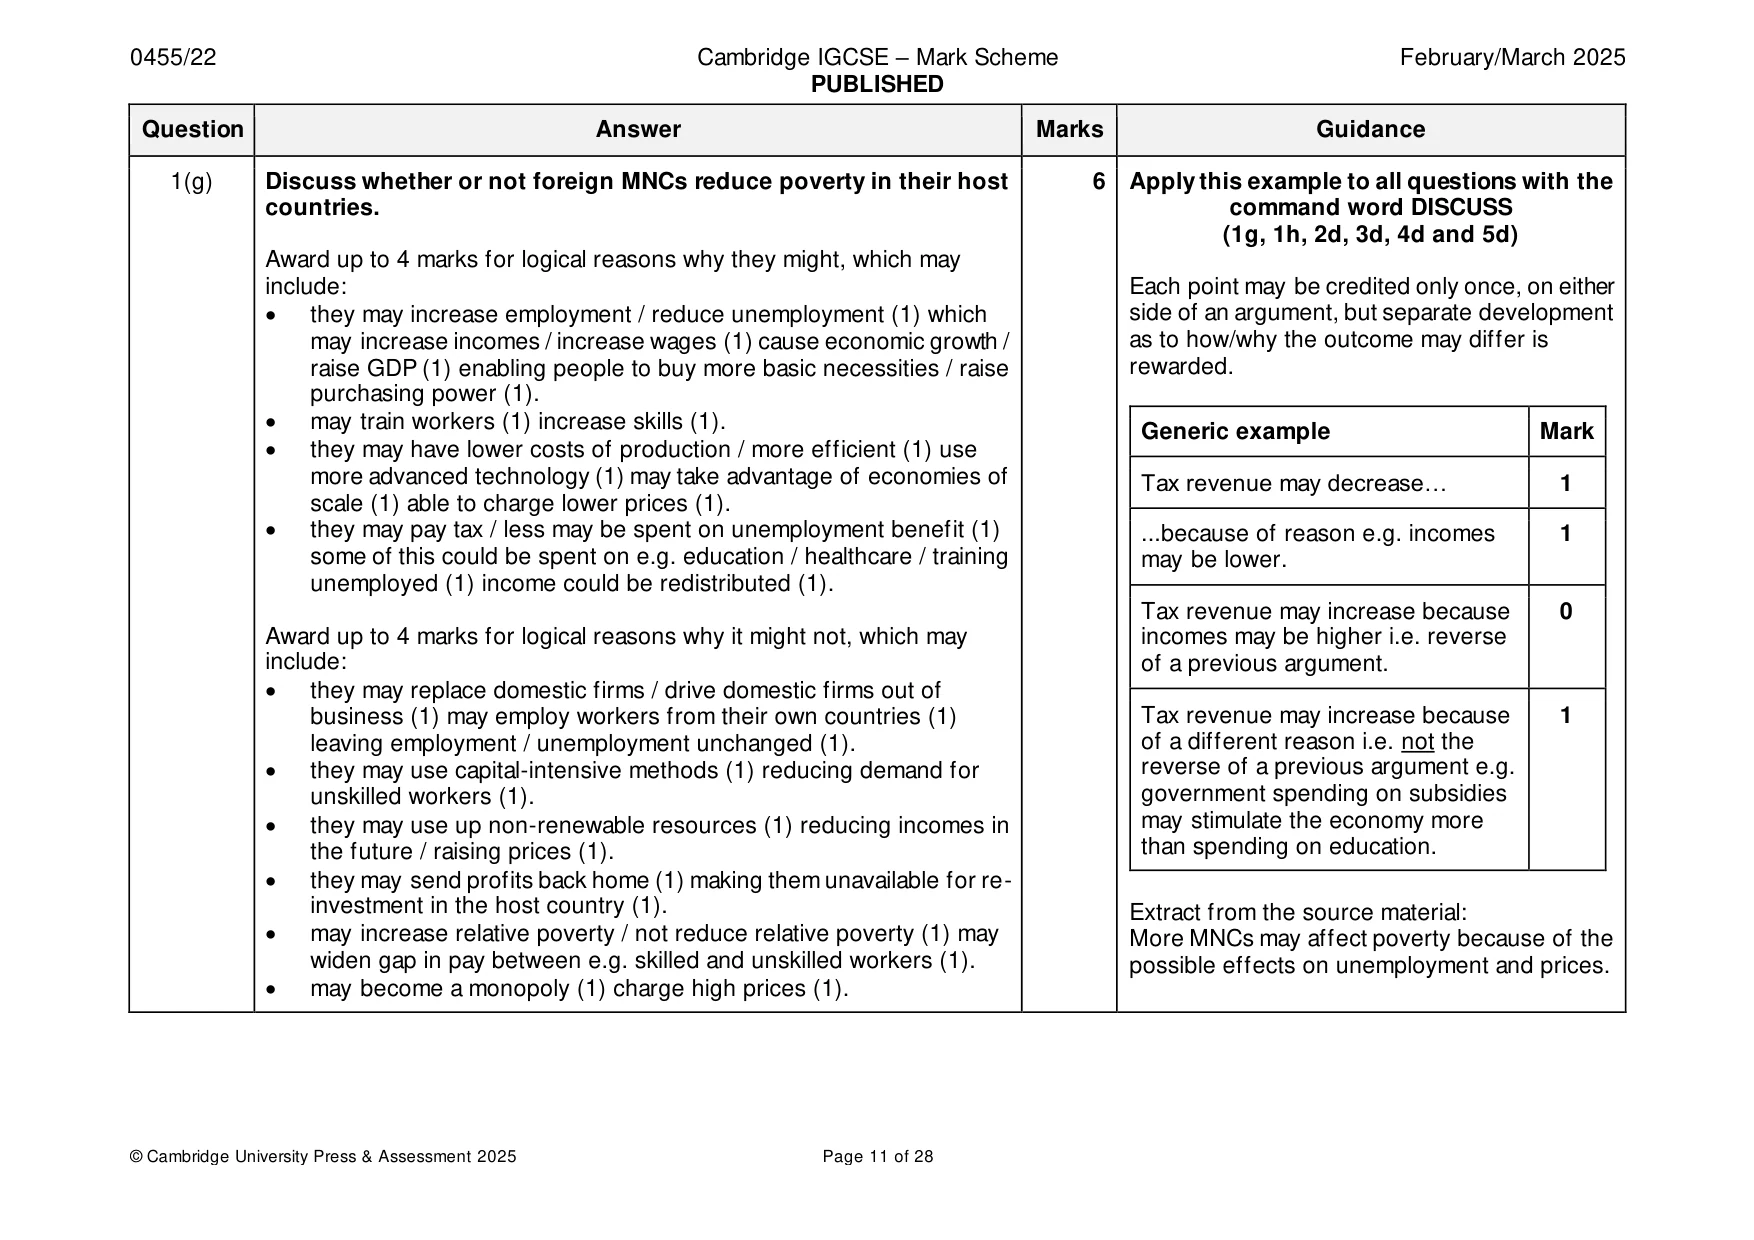
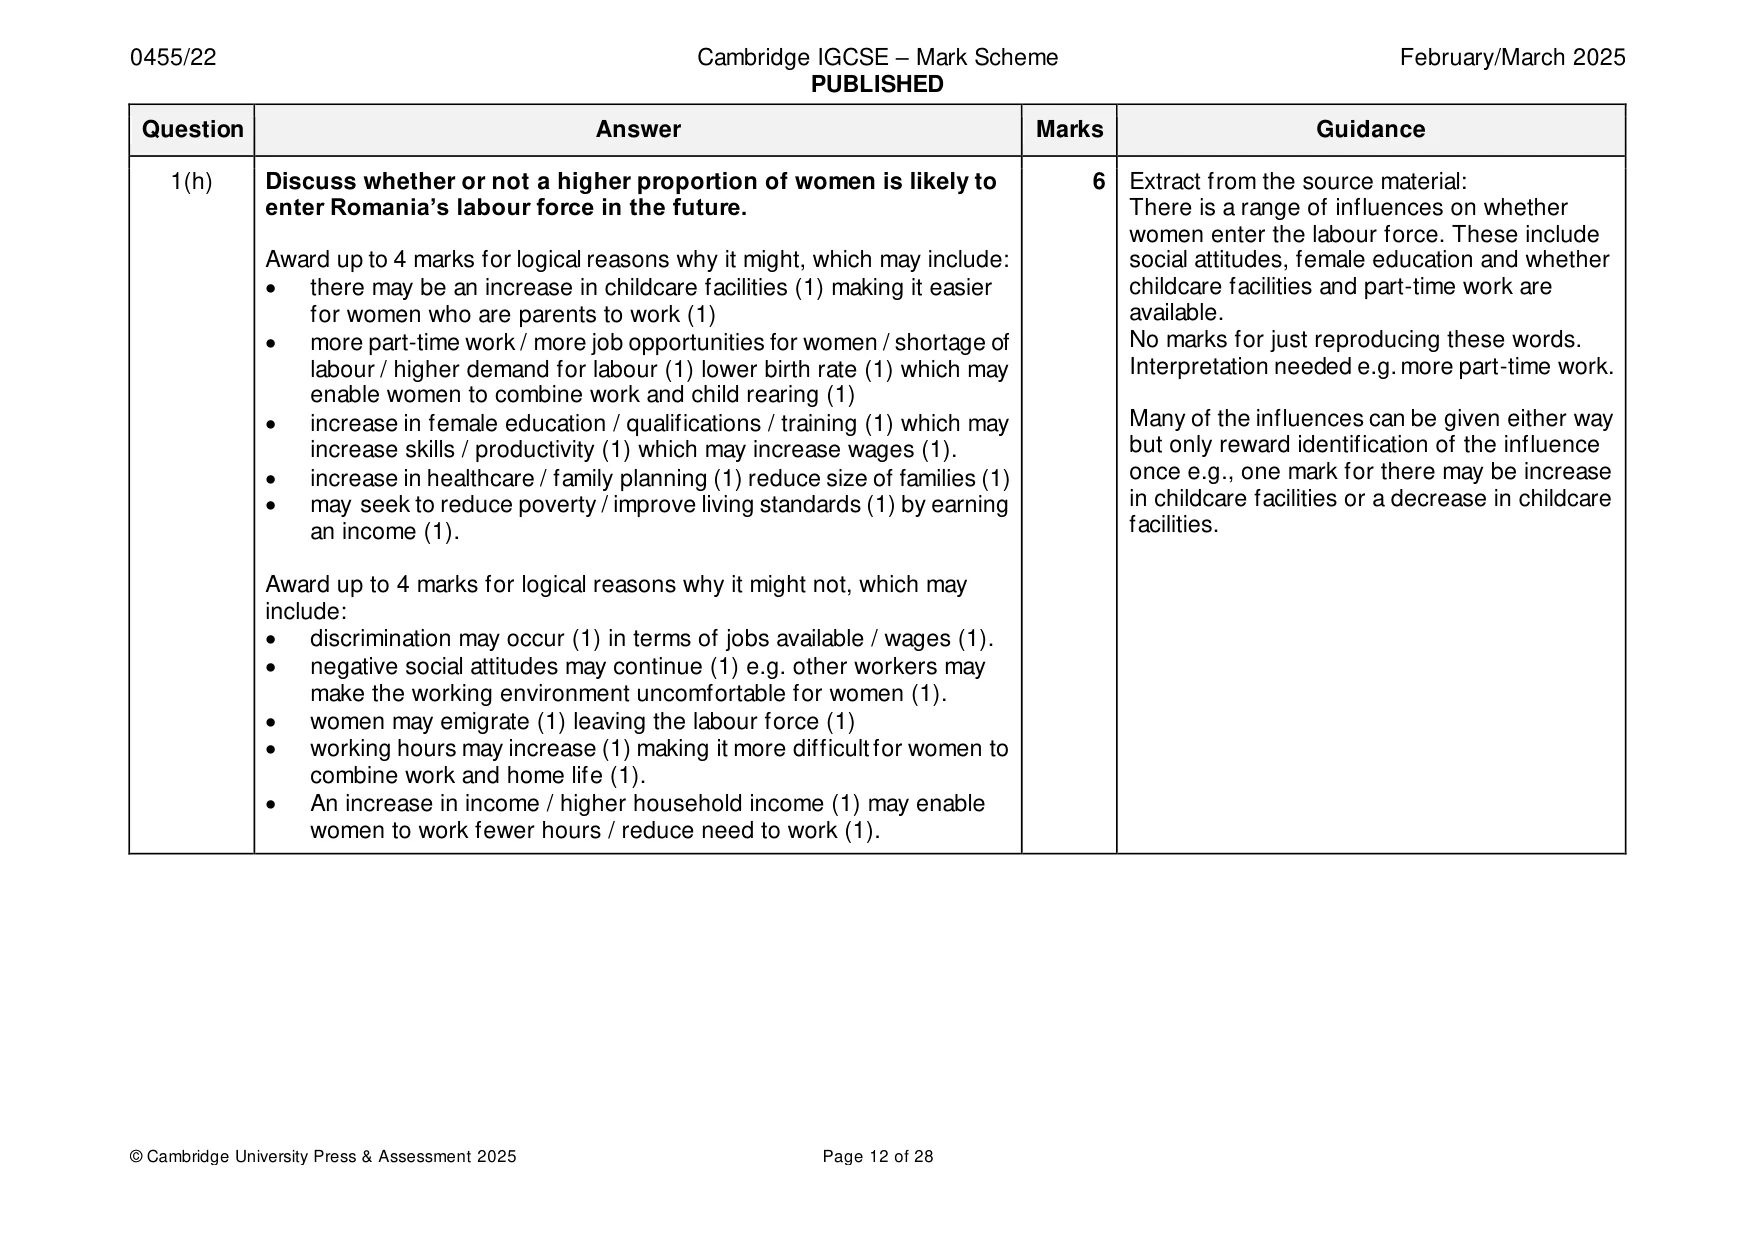
Mark scheme: Question Answer Marks Guidance 1(a) Calculate Romania’s current account deficit on its balance of 1 Accept 27bn without $. payments in $s. $27 000 000 000. $27 10⁹ $27bn (1). $2.7 10 to the power 10. 1(b) Identify two reasons why Romania’s population fell between 1990 2 and 2022. Fall in birth rate (1) emigration / net emigration / people leaving the country (1). 1(c) Explain why immigration into Romania may increase in the future. 2 1 mark for identification of high economic growth rate, and 1 mark for explanation. High economic growth rate / economic growth (1) higher wages / higher income / more chance of employment / more job opportunities / higher living standards (1). 1(d) Explain two reasons why household spending has increased in 4 Romania. Logical explanation which might include: • Romanians have become wealthier (1) more money to spend / greater purchasing power / higher income / higher GDP per head / can sell assets to get money to spend / more able to borrow / greater confidence (1). • More confident about the future / increased optimism (1) about future job prospects / higher earning / job security / may encourage more borrowing / less saving (1). • Low interest rates (1) encourage borrowing / reduce cost of borrowing / discourage saving (1). • High rate of inflation (1) spending more to maintain living standards (1). 1(e) Draw a demand and supply diagram to show the effect of setting a 4 maximum price on electricity. Coherent analysis which might include: D&S diagram: Axes correctly labelled – price and quantity or p and q (1). Demand and supply curves correctly labelled (1). Maximum price set below the equilibrium price – labelled as max price, P1, PX or any other P. (1). Quantity demanded and quantity supplied at the maximum price identified (1). 1(f) Analyse the relationship between GDP per head and average 5 Responses do not have to be in the format spending on food as a percentage of total household spending. suggested but they should address the expected/normal relationship, offer supporting Relationship (up to 2 marks): evidence of that, highlight any exceptions to Generally, an inverse relationship / negative relationship (1) the higher that, and analyse the overall data. the GDP per head, the lower the average household spending on food as a % of household spending (1). Supporting evidence (up to 2 marks): E.g. the five countries with the lowest GDP per head had the highest % Supporting evidence should involve average household spending on food (1). Ethiopia had the lowest GDP interpretation, not just description but note: per head and the highest average household spending on food as a % of A mark can be given for an implied comparison total spending (1) Cambodia had the second lowest GDP per head and e.g. the second highest spending on food as a % of total spending (1) Egypt after stating that there is a negative relationship had the third lowest GDP per head and the third highest spending on (1): food as a % of total spending (1). e.g. Belgium had a GDP per head of $52 100 and only spent 13% of their total spending on food whereas Romania had a GDP per head of Analysis of relationship (up to 2 marks): $15 000 and spent 26% of their spending on As households get richer, they can afford to spend more in total on food / food (1), higher quality food (1) but can afford to buy more of other items / buy more luxury items / spend less on necessities (1). Rewarding GDP per head (income) but not just GDP. Exception (up to 2 marks): Norway / USA (1) Norway had a higher GDP per head but also a higher % of household spending on food (1). Analysis of exception (up to 1 mark): Food may be more expensive in Norway / Norwegians may have a different diet / buy a higher proportion of high quality food (1). 1(g) Discuss whether or not foreign MNCs reduce poverty in their host 6 Apply this example to all questions with the countries. command word DISCUSS (1g, 1h, 2d, 3d, 4d and 5d) Award up to 4 marks for logical reasons why they might, which may include: Each point may be credited only once, on either • they may increase employment / reduce unemployment (1) which side of an argument, but separate development may increase incomes / increase wages (1) cause economic growth / as to how/why the outcome may differ is raise GDP (1) enabling people to buy more basic necessities / raise rewarded. purchasing power (1). • may train workers (1) increase skills (1). Generic example Mark • they may have lower costs of production / more efficient (1) use more advanced technology (1) may take advantage of economies of Tax revenue may decrease… 1 scale (1) able to charge lower prices (1). • they may pay tax / less may be spent on unemployment benefit (1) ...because of reason e.g. incomes 1 some of this could be spent on e.g. education / healthcare / training may be lower. unemployed (1) income could be redistributed (1). Tax revenue may increase because 0 Award up to 4 marks for logical reasons why it might not, which may incomes may be higher i.e. reverse include: of a previous argument. • they may replace domestic firms / drive domestic firms out of business (1) may employ workers from their own countries (1) Tax revenue may increase because 1 leaving employment / unemployment unchanged (1). of a different reason i.e. not the • they may use capital-intensive methods (1) reducing demand for reverse of a previous argument e.g. unskilled workers (1). government spending on subsidies • they may use up non-renewable resources (1) reducing incomes in may stimulate the economy more the future / raising prices (1). than spending on education. • they may send profits back home (1) making them unavailable for re- investment in the host country (1). Extract from the source material: • may increase relative poverty / not reduce relative poverty (1) may More MNCs may affect poverty because of the widen gap in pay between e.g. skilled and unskilled workers (1). possible effects on unemployment and prices. • may become a monopoly (1) charge high prices (1). 1(h) Discuss whether or not a higher proportion of women is likely to 6 Extract from the source material: enter Romania’s labour force in the future. There is a range of influences on whether women enter the labour force. These include Award up to 4 marks for logical reasons why it might, which may include: social attitudes, female education and whether • there may be an increase in childcare facilities (1) making it easier childcare facilities and part-time work are for women who are parents to work (1) available. • more part-time work / more job opportunities for women / shortage of No marks for just reproducing these words. labour / higher demand for labour (1) lower birth rate (1) which may Interpretation needed e.g. more part-time work. enable women to combine work and child rearing (1) • increase in female education / qualifications / training (1) which may Many of the influences can be given either way increase skills / productivity (1) which may increase wages (1). but only reward identification of the influence • increase in healthcare / family planning (1) reduce size of families (1) once e.g., one mark for there may be increase • may seek to reduce poverty / improve living standards (1) by earning in childcare facilities or a decrease in childcare facilities. an income (1). Award up to 4 marks for logical reasons why it might not, which may include: • discrimination may occur (1) in terms of jobs available / wages (1). • negative social attitudes may continue (1) e.g. other workers may make the working environment uncomfortable for women (1). • women may emigrate (1) leaving the labour force (1) • working hours may increase (1) making it more difficult for women to combine work and home life (1). • An increase in income / higher household income (1) may enable women to work fewer hours / reduce need to work (1).
Q2 · South Korea makes use of both economic goods and free goods
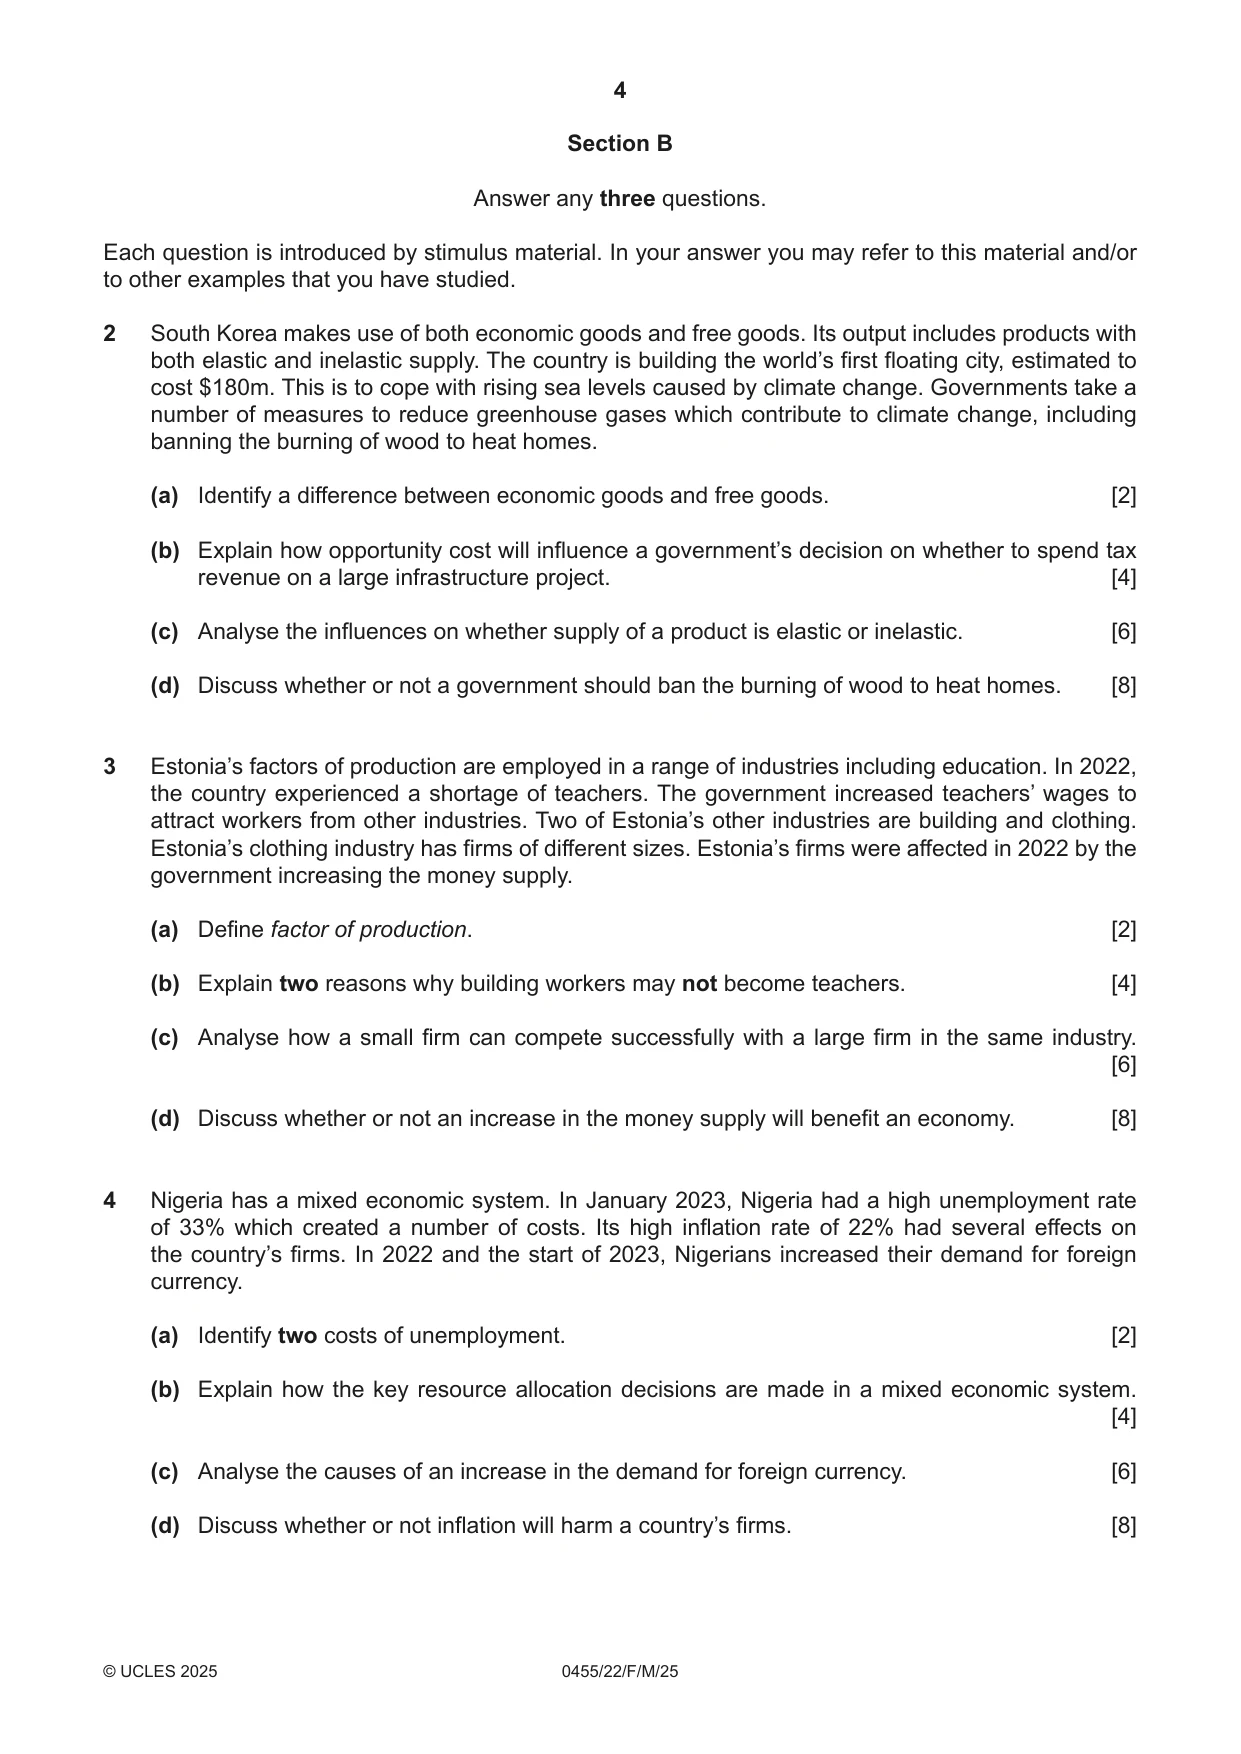
2 South Korea makes use of both economic goods and free goods. Its output includes products with both elastic and inelastic supply. The country is building the world’s first floating city, estimated to cost $180m. This is to cope with rising sea levels caused by climate change. Governments take a number of measures to reduce greenhouse gases which contribute to climate change, including banning the burning of wood to heat homes. (a) Identify a difference between economic goods and free goods. [2] (b) Explain how opportunity cost will influence a government’s decision on whether to spend tax revenue on a large infrastructure project. [4] (c) Analyse the influences on whether supply of a product is elastic or inelastic. [6] (d) Discuss whether or not a government should ban the burning of wood to heat homes. [8]
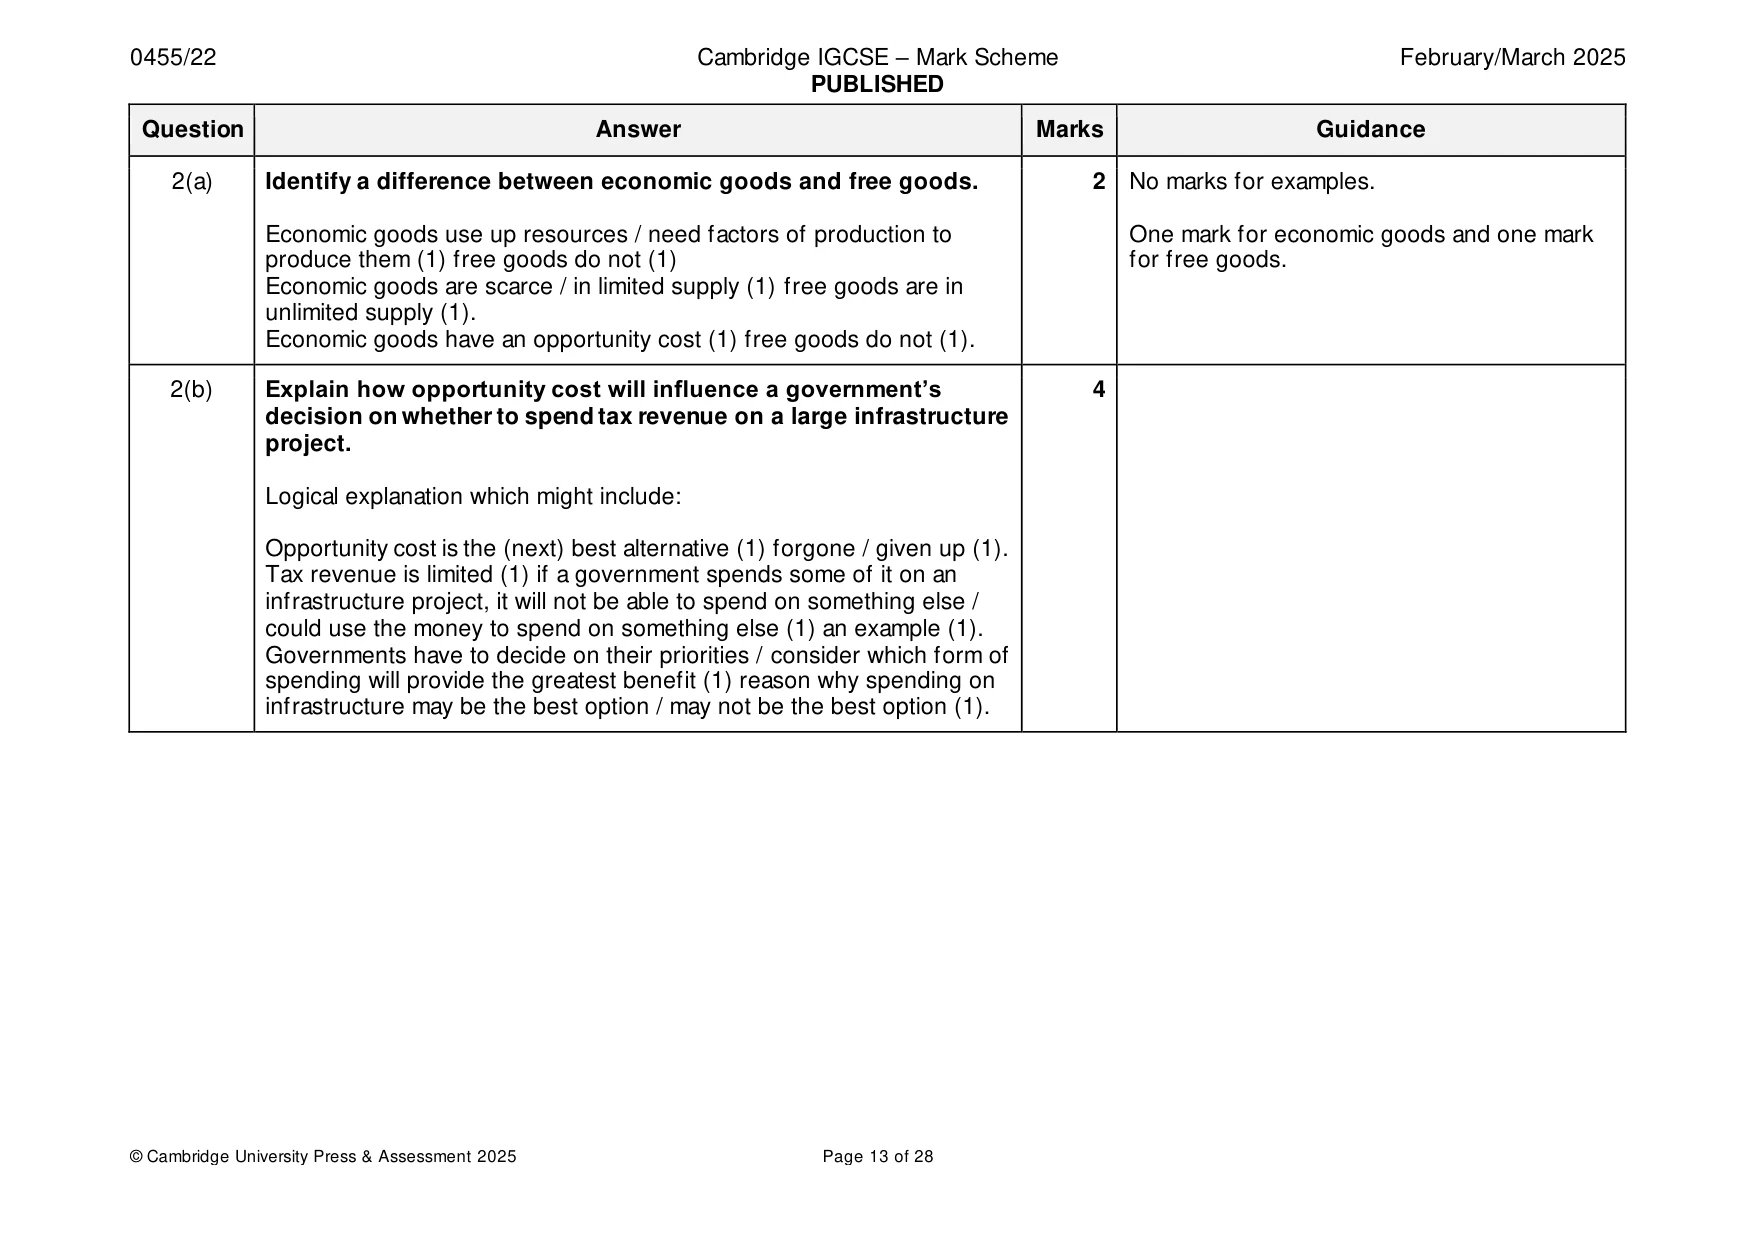
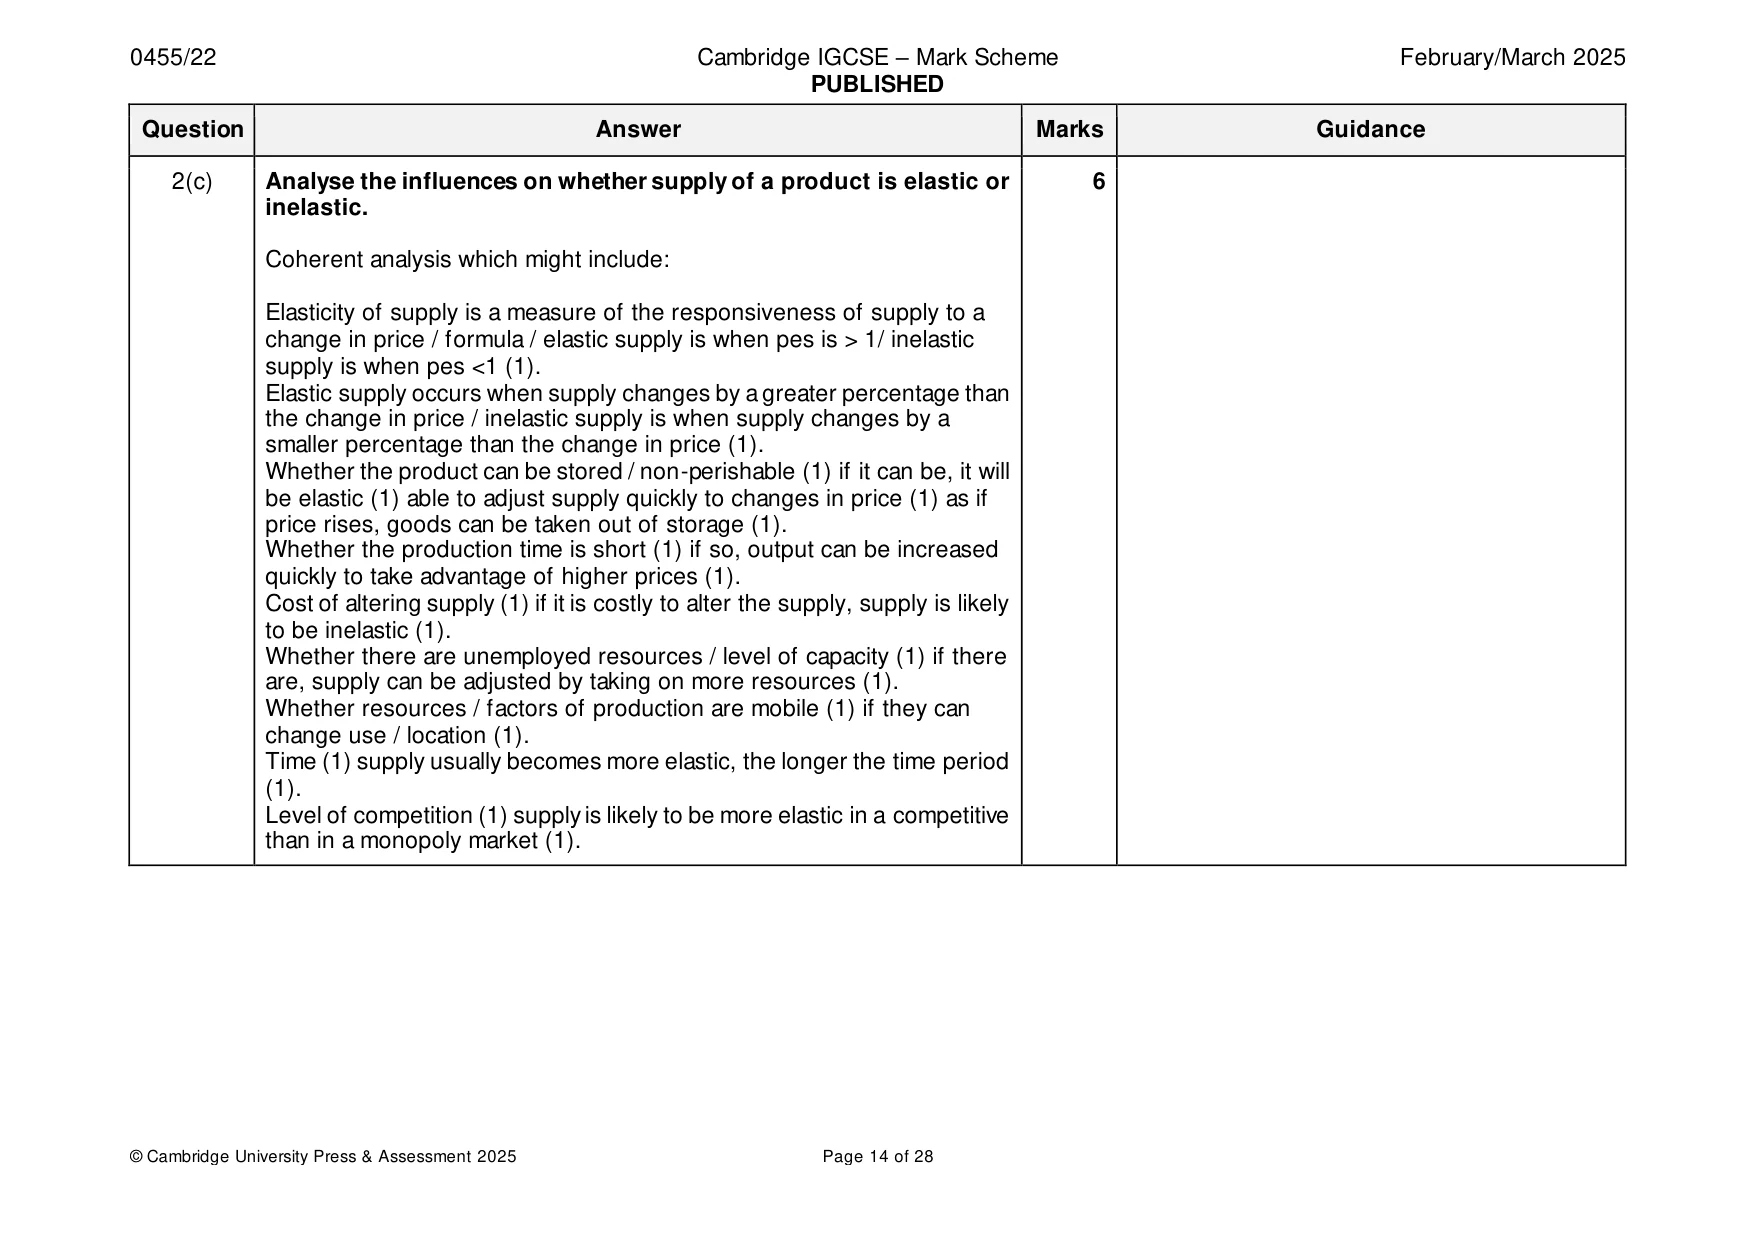
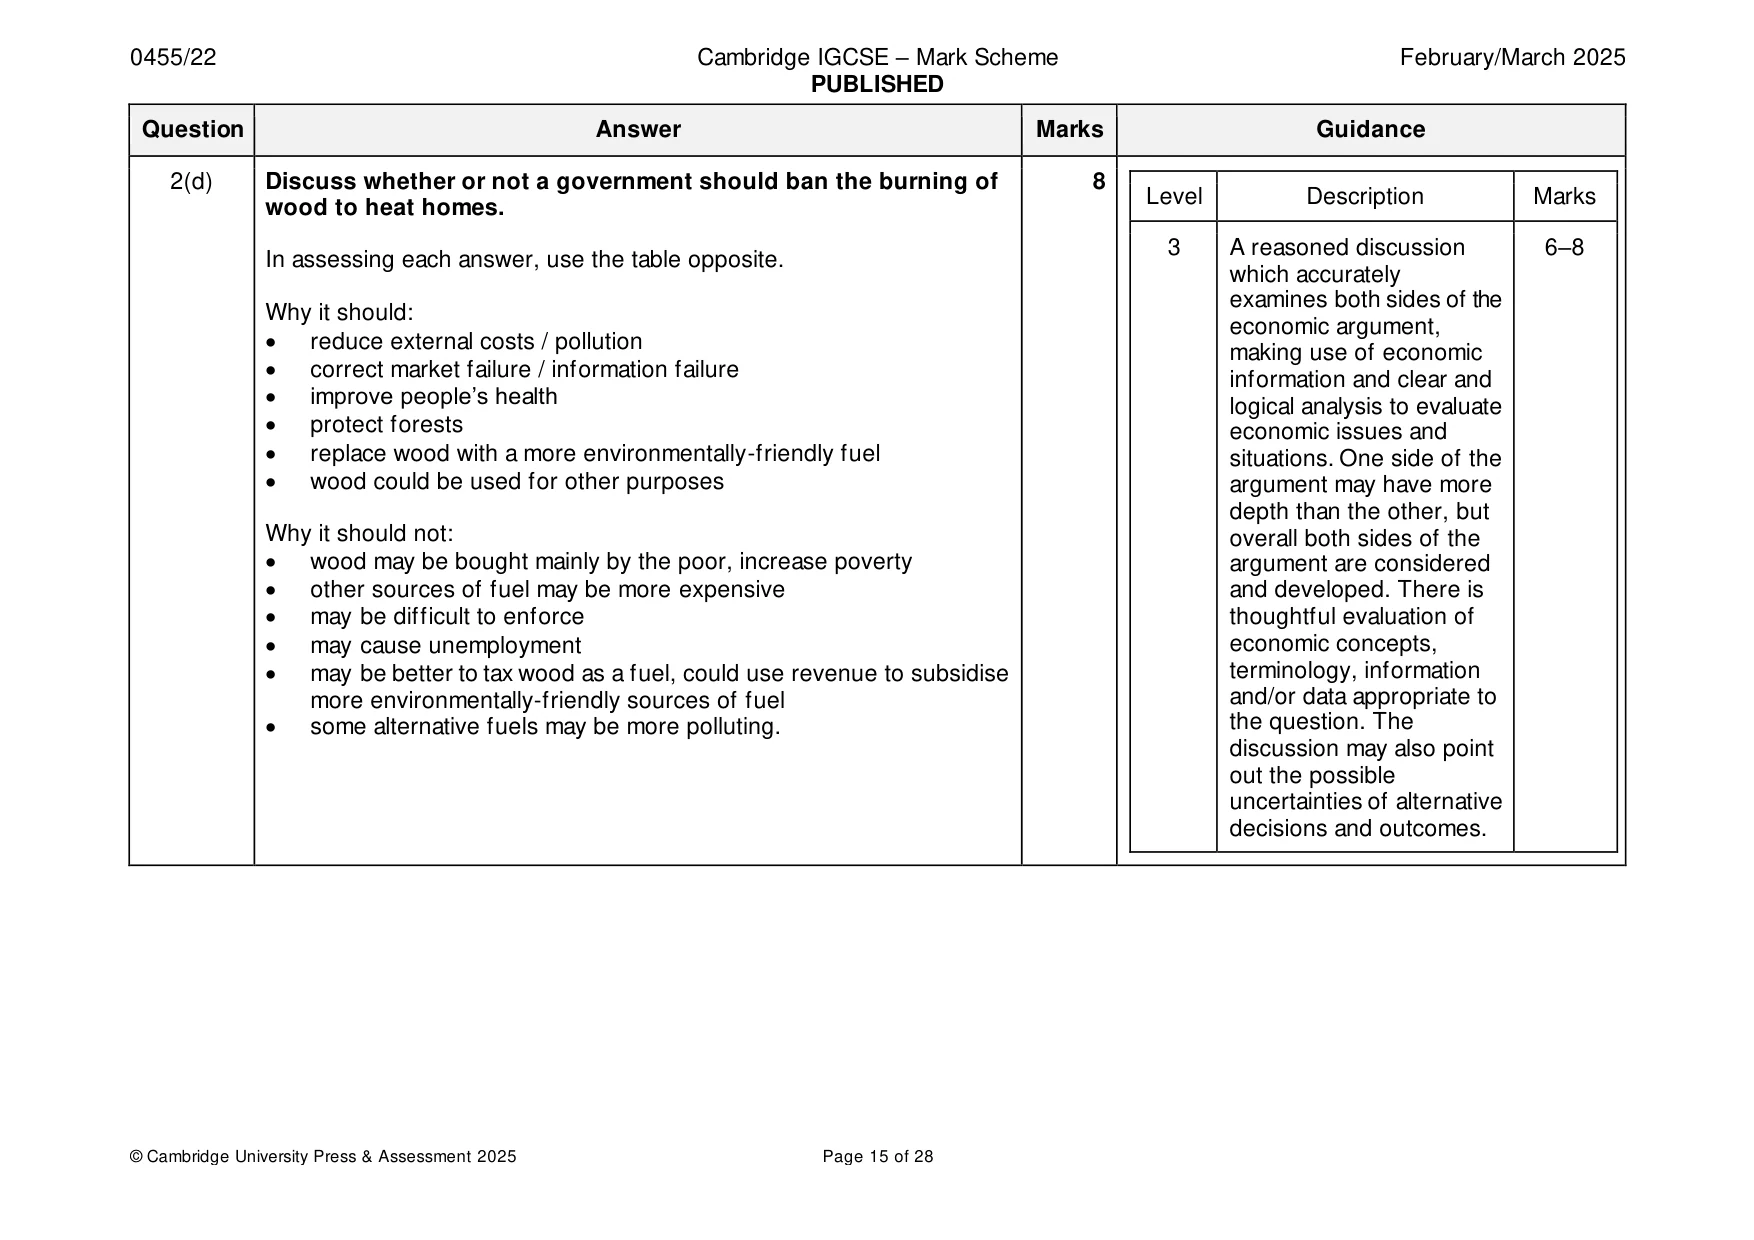
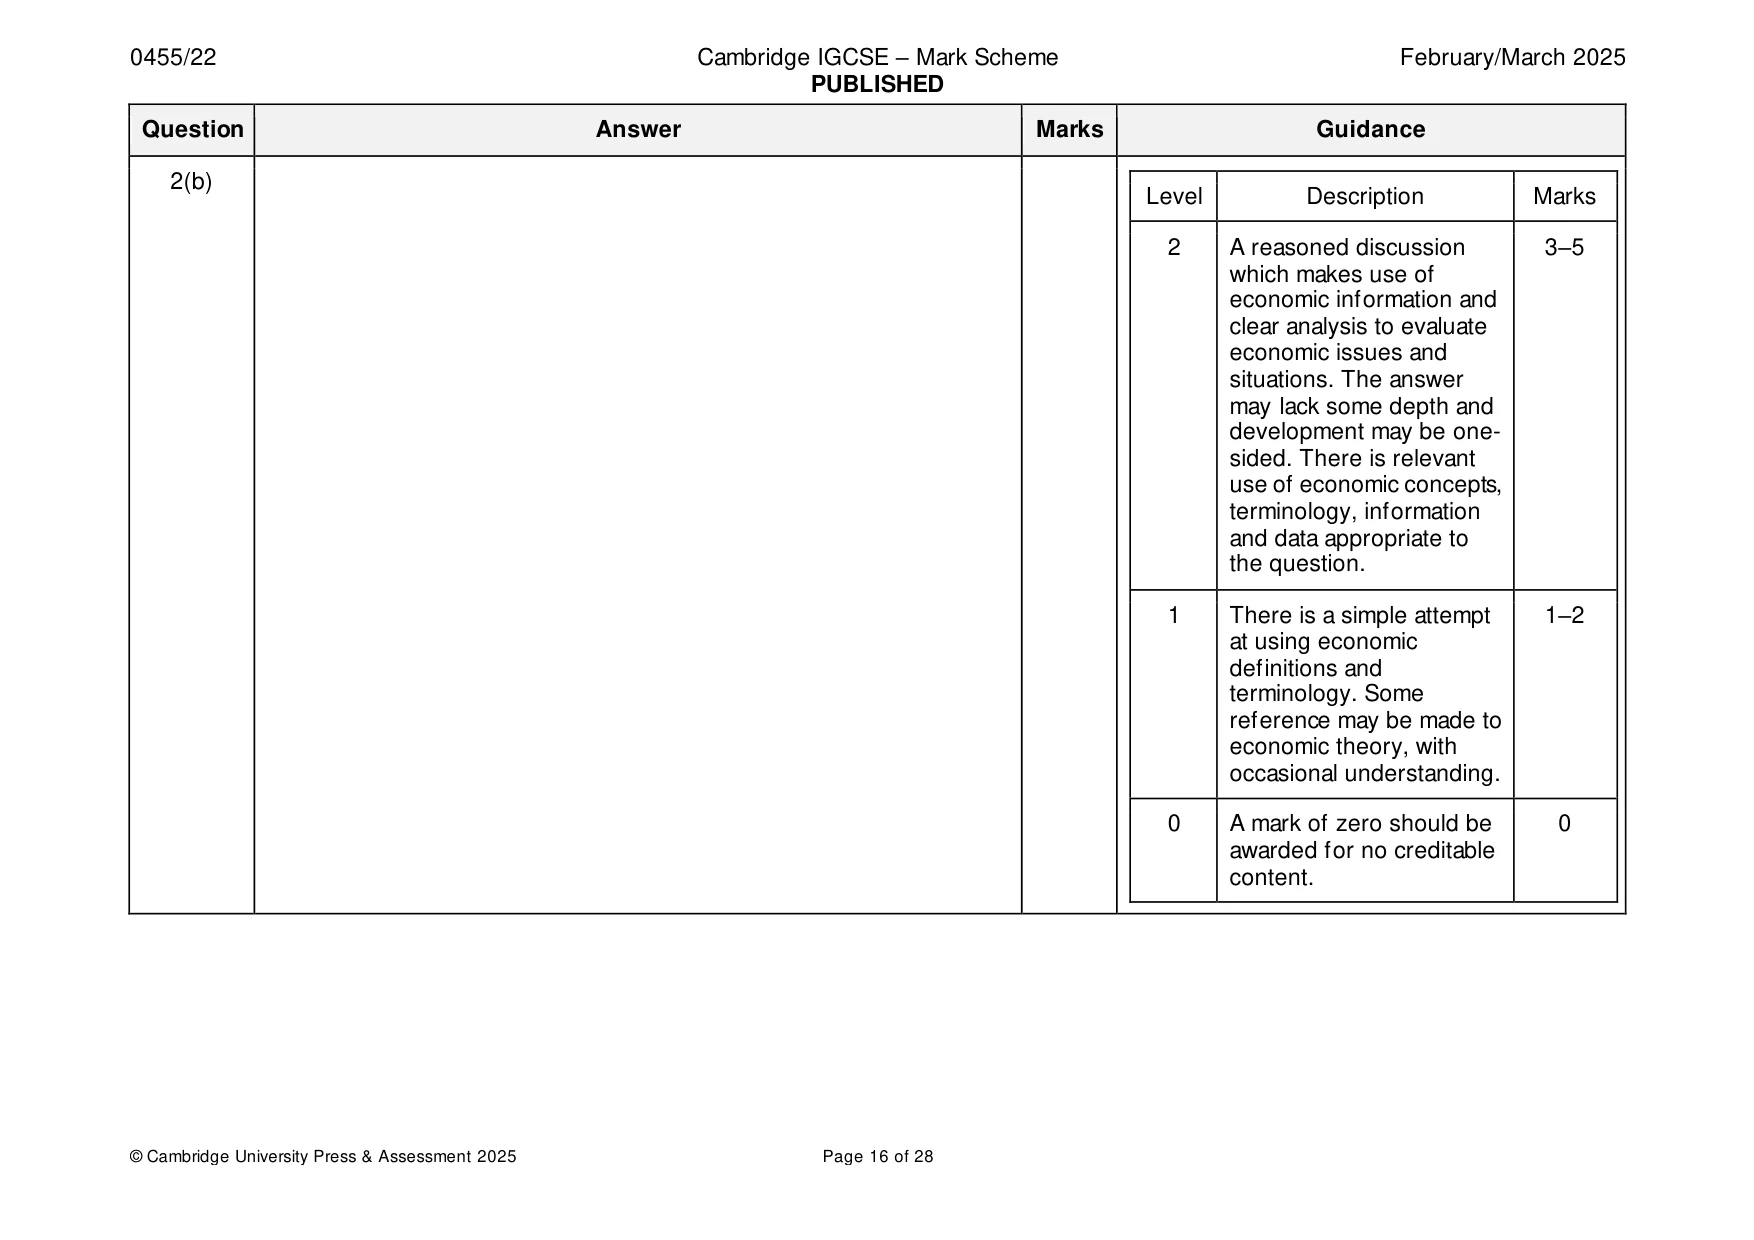
Mark scheme: 2(a) Identify a difference between economic goods and free goods. 2 No marks for examples. Economic goods use up resources / need factors of production to One mark for economic goods and one mark produce them (1) free goods do not (1) for free goods. Economic goods are scarce / in limited supply (1) free goods are in unlimited supply (1). Economic goods have an opportunity cost (1) free goods do not (1). 2(b) Explain how opportunity cost will influence a government’s 4 decision on whether to spend tax revenue on a large infrastructure project. Logical explanation which might include: Opportunity cost is the (next) best alternative (1) forgone / given up (1). Tax revenue is limited (1) if a government spends some of it on an infrastructure project, it will not be able to spend on something else / could use the money to spend on something else (1) an example (1). Governments have to decide on their priorities / consider which form of spending will provide the greatest benefit (1) reason why spending on infrastructure may be the best option / may not be the best option (1). 2(c) Analyse the influences on whether supply of a product is elastic or 6 inelastic. Coherent analysis which might include: Elasticity of supply is a measure of the responsiveness of supply to a change in price / formula / elastic supply is when pes is > 1/ inelastic supply is when pes <1 (1). Elastic supply occurs when supply changes by a greater percentage than the change in price / inelastic supply is when supply changes by a smaller percentage than the change in price (1). Whether the product can be stored / non-perishable (1) if it can be, it will be elastic (1) able to adjust supply quickly to changes in price (1) as if price rises, goods can be taken out of storage (1). Whether the production time is short (1) if so, output can be increased quickly to take advantage of higher prices (1). Cost of altering supply (1) if it is costly to alter the supply, supply is likely to be inelastic (1). Whether there are unemployed resources / level of capacity (1) if there are, supply can be adjusted by taking on more resources (1). Whether resources / factors of production are mobile (1) if they can change use / location (1). Time (1) supply usually becomes more elastic, the longer the time period (1). Level of competition (1) supply is likely to be more elastic in a competitive than in a monopoly market (1). 2(d) Discuss whether or not a government should ban the burning of 8 Level Description Marks wood to heat homes. 3 A reasoned discussion 6–8 In assessing each answer, use the table opposite. which accurately examines both sides of the Why it should: economic argument, • reduce external costs / pollution making use of economic • correct market failure / information failure information and clear and • improve people’s health logical analysis to evaluate • protect forests economic issues and • replace wood with a more environmentally-friendly fuel situations. One side of the • wood could be used for other purposes argument may have more depth than the other, but Why it should not: overall both sides of the • wood may be bought mainly by the poor, increase poverty argument are considered • other sources of fuel may be more expensive and developed. There is • may be difficult to enforce thoughtful evaluation of • may cause unemployment economic concepts, • may be better to tax wood as a fuel, could use revenue to subsidise terminology, information more environmentally-friendly sources of fuel and/or data appropriate to • some alternative fuels may be more polluting. the question. The discussion may also point out the possible uncertainties of alternative decisions and outcomes. 2(b) Level Description Marks 2 A reasoned discussion 3–5 which makes use of economic information and clear analysis to evaluate economic issues and situations. The answer may lack some depth and development may be one- sided. There is relevant use of economic concepts, terminology, information and data appropriate to the question. 1 There is a simple attempt 1–2 at using economic definitions and terminology. Some reference may be made to economic theory, with occasional understanding. 0 A mark of zero should be 0 awarded for no creditable content.
Q3 · Estonia’s factors of production are employed in a range of industries including education
3 Estonia’s factors of production are employed in a range of industries including education. In 2022, the country experienced a shortage of teachers. The government increased teachers’ wages to attract workers from other industries. Two of Estonia’s other industries are building and clothing. Estonia’s clothing industry has firms of different sizes. Estonia’s firms were affected in 2022 by the government increasing the money supply. (a) Define factor of production. [2] (b) Explain two reasons why building workers may not become teachers. [4] (c) Analyse how a small firm can compete successfully with a large firm in the same industry. [6] (d) Discuss whether or not an increase in the money supply will benefit an economy. [8]
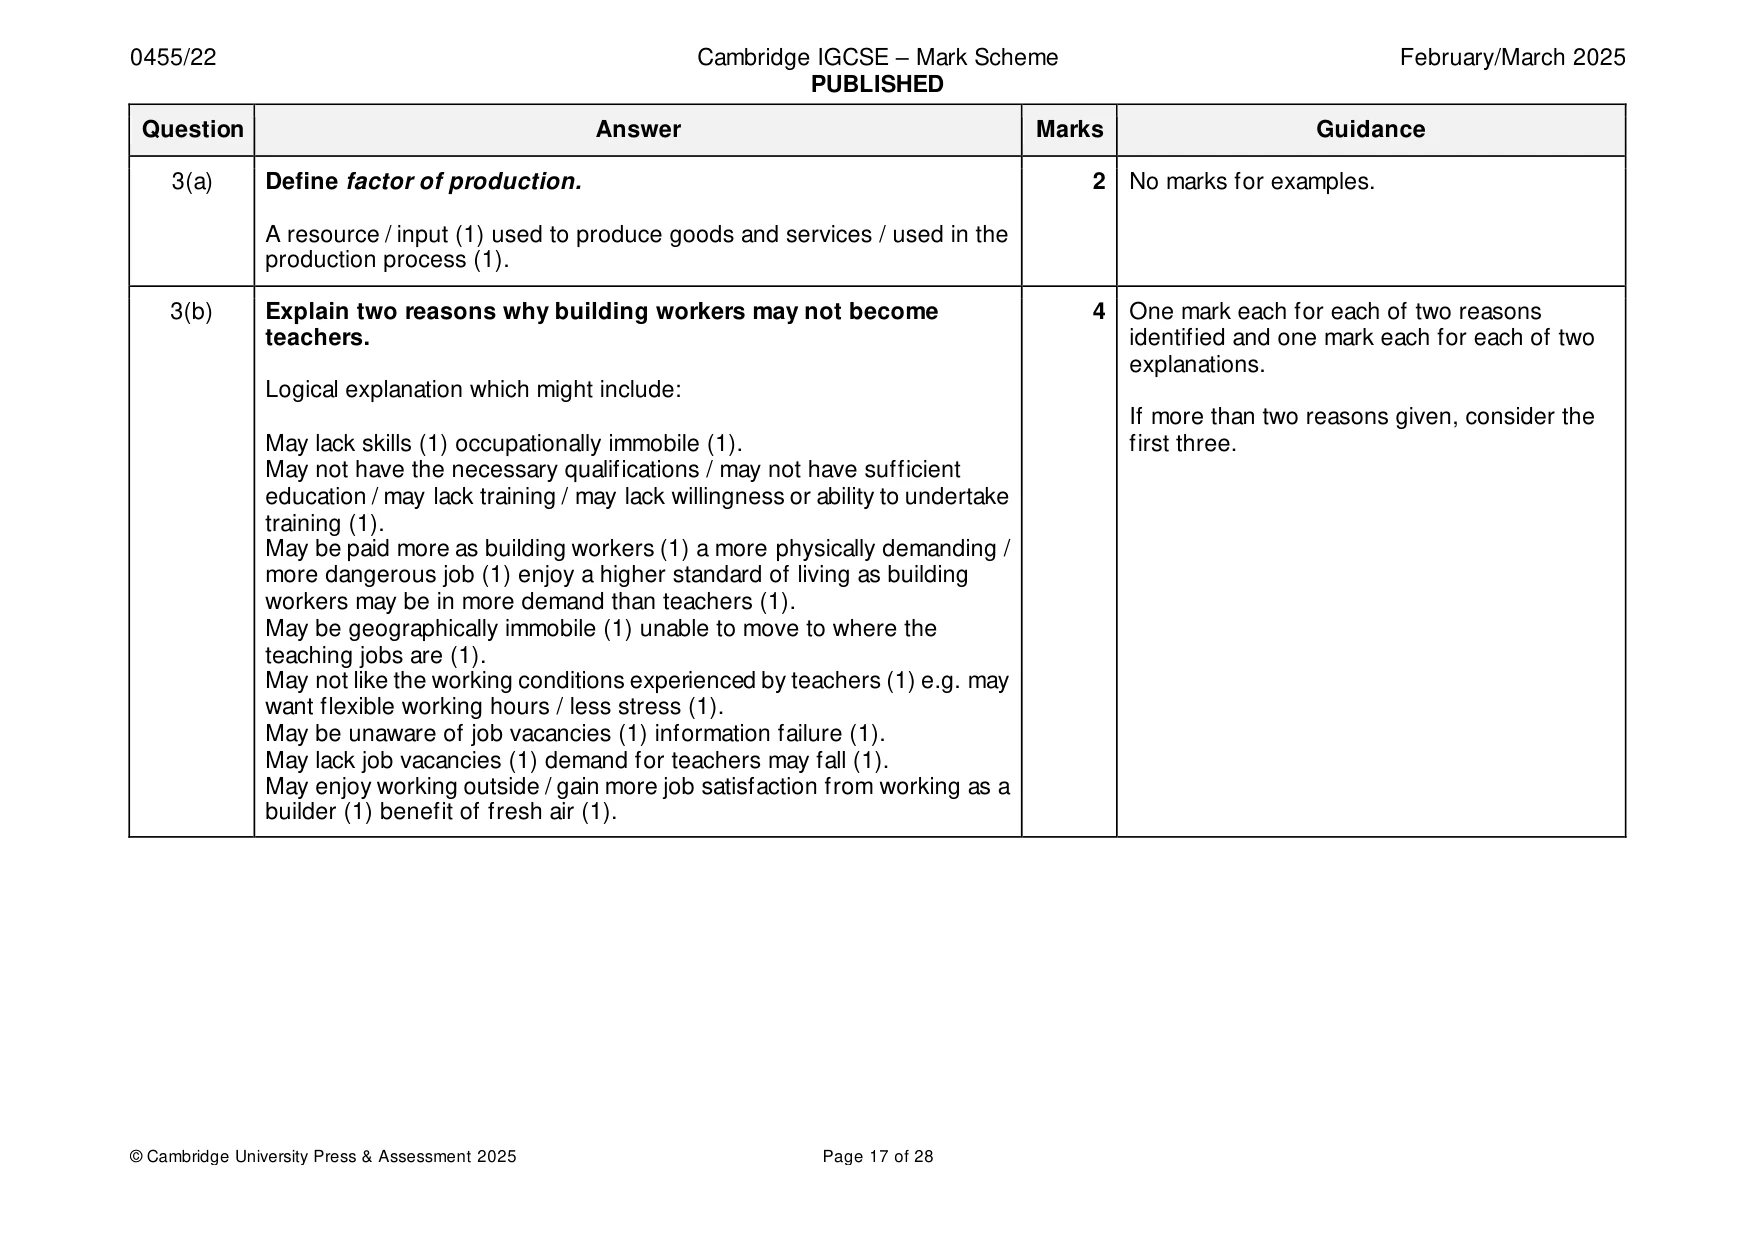
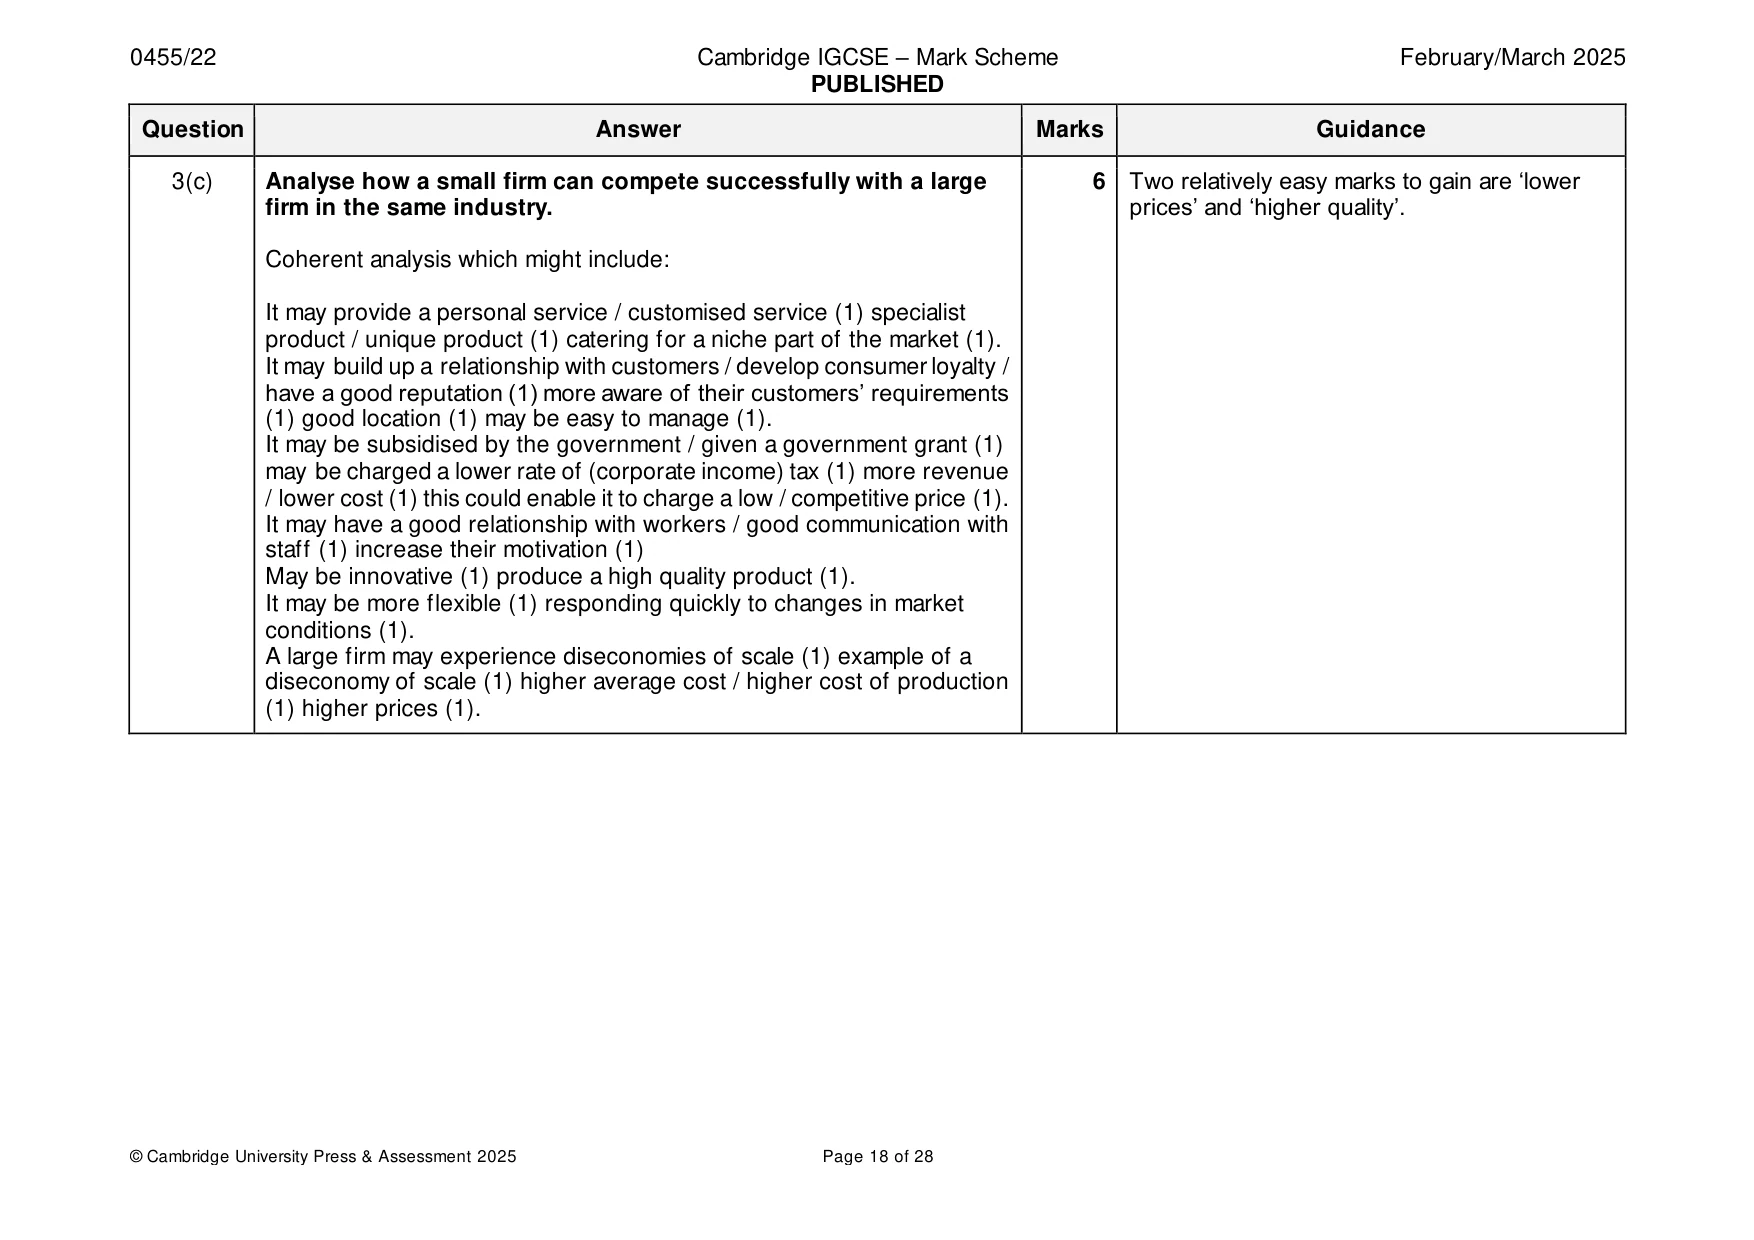
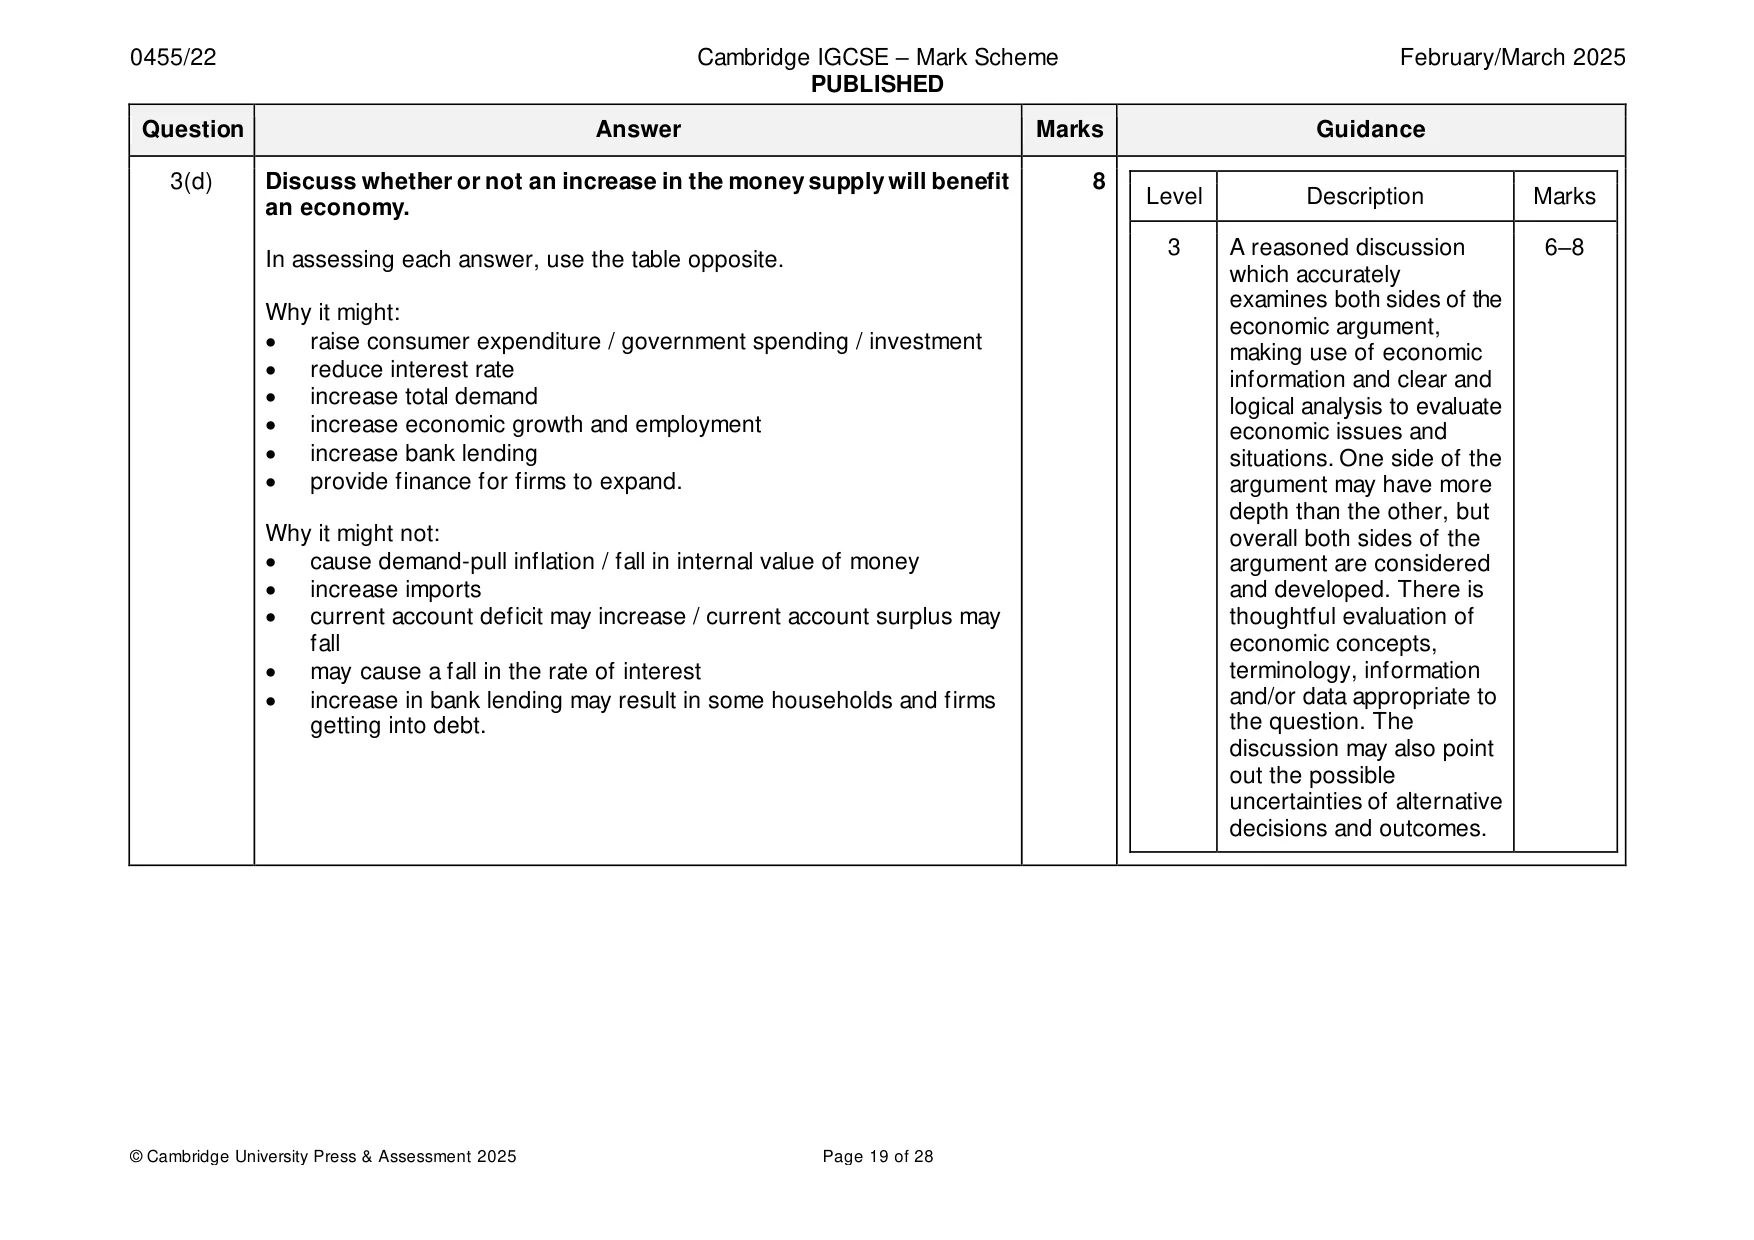
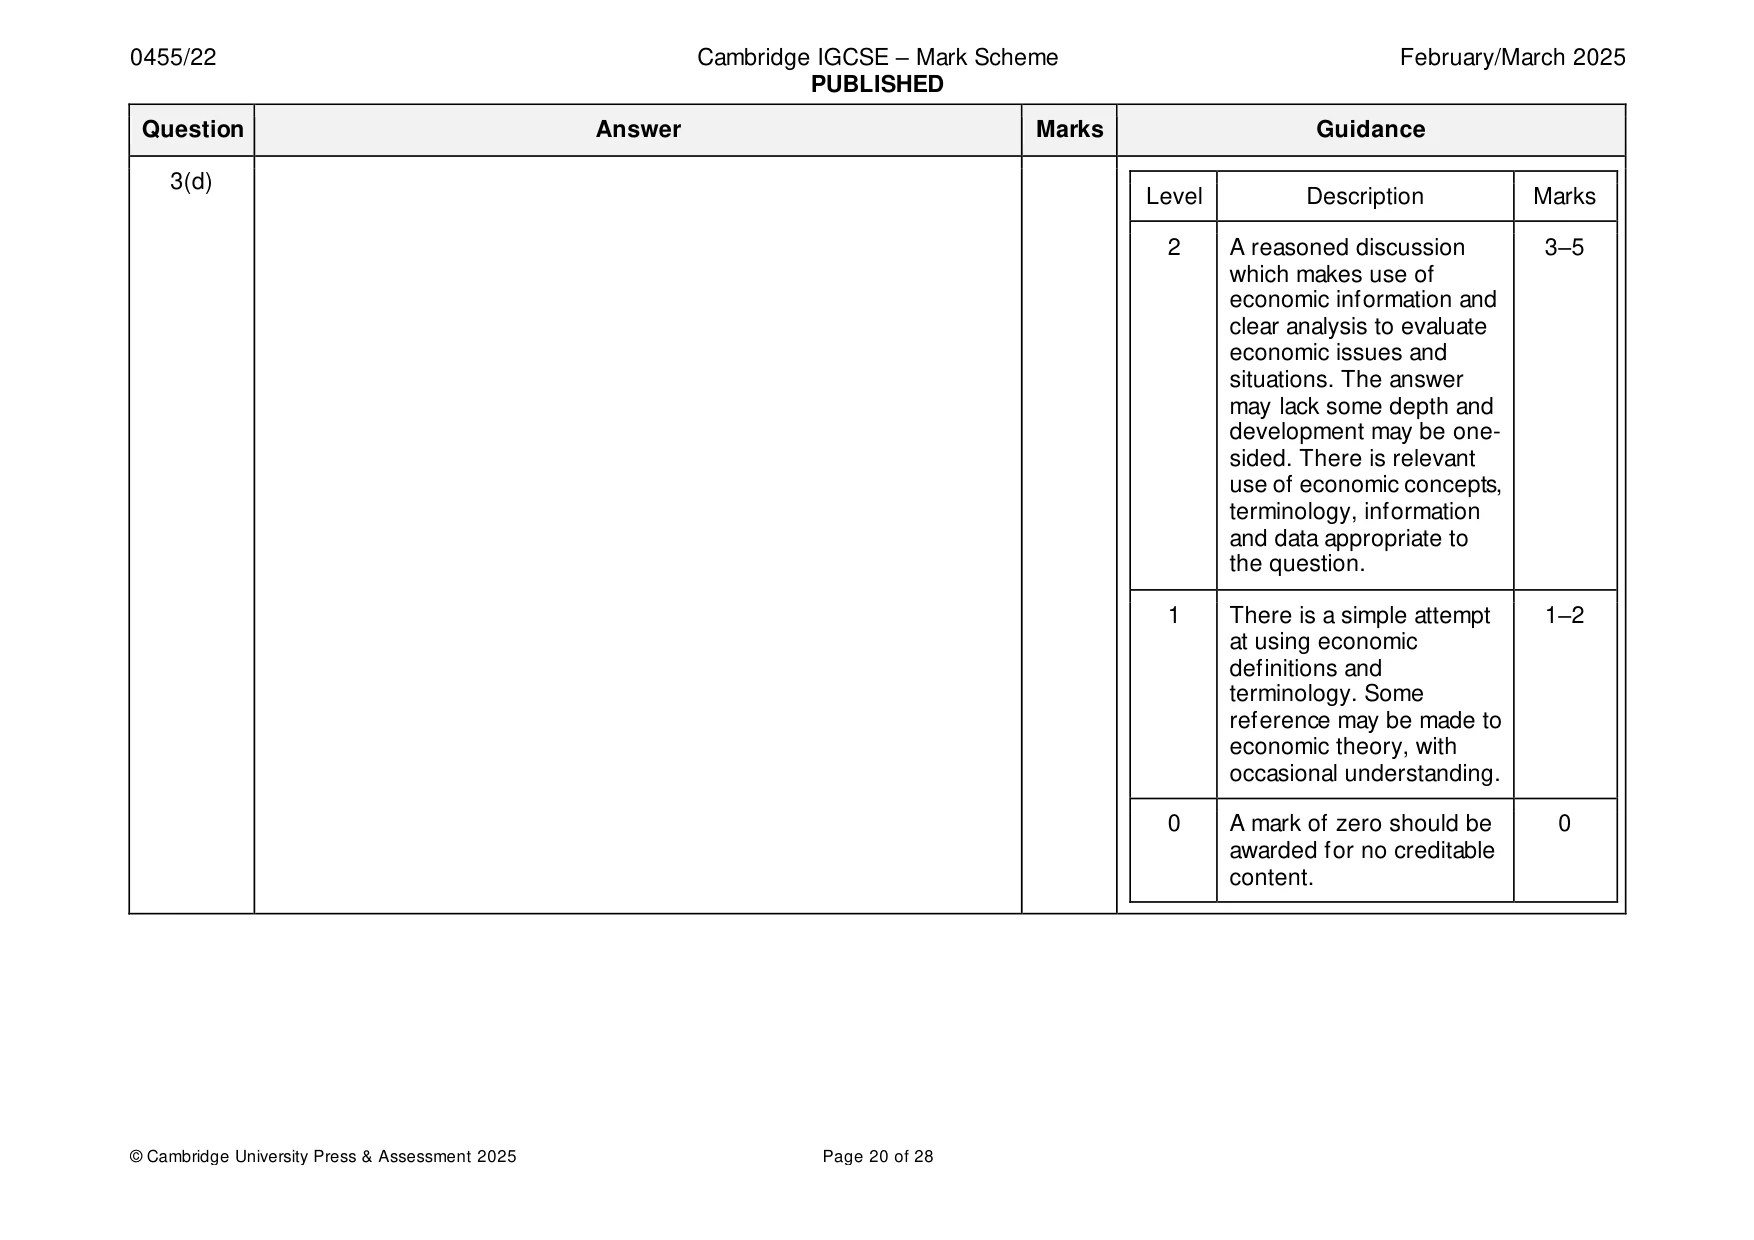
Mark scheme: 3(a) Define factor of production. 2 No marks for examples. A resource / input (1) used to produce goods and services / used in the production process (1). 3(b) Explain two reasons why building workers may not become 4 One mark each for each of two reasons teachers. identified and one mark each for each of two explanations. Logical explanation which might include: If more than two reasons given, consider the May lack skills (1) occupationally immobile (1). first three. May not have the necessary qualifications / may not have sufficient education / may lack training / may lack willingness or ability to undertake training (1). May be paid more as building workers (1) a more physically demanding / more dangerous job (1) enjoy a higher standard of living as building workers may be in more demand than teachers (1). May be geographically immobile (1) unable to move to where the teaching jobs are (1). May not like the working conditions experienced by teachers (1) e.g. may want flexible working hours / less stress (1). May be unaware of job vacancies (1) information failure (1). May lack job vacancies (1) demand for teachers may fall (1). May enjoy working outside / gain more job satisfaction from working as a builder (1) benefit of fresh air (1). 3(c) Analyse how a small firm can compete successfully with a large 6 Two relatively easy marks to gain are ‘lower firm in the same industry. prices’ and ‘higher quality’. Coherent analysis which might include: It may provide a personal service / customised service (1) specialist product / unique product (1) catering for a niche part of the market (1). It may build up a relationship with customers / develop consumer loyalty / have a good reputation (1) more aware of their customers’ requirements (1) good location (1) may be easy to manage (1). It may be subsidised by the government / given a government grant (1) may be charged a lower rate of (corporate income) tax (1) more revenue / lower cost (1) this could enable it to charge a low / competitive price (1). It may have a good relationship with workers / good communication with staff (1) increase their motivation (1) May be innovative (1) produce a high quality product (1). It may be more flexible (1) responding quickly to changes in market conditions (1). A large firm may experience diseconomies of scale (1) example of a diseconomy of scale (1) higher average cost / higher cost of production (1) higher prices (1). 3(d) Discuss whether or not an increase in the money supply will benefit 8 Level Description Marks an economy. 3 A reasoned discussion 6–8 In assessing each answer, use the table opposite. which accurately examines both sides of the Why it might: economic argument, • raise consumer expenditure / government spending / investment making use of economic • reduce interest rate information and clear and • increase total demand logical analysis to evaluate • increase economic growth and employment economic issues and • increase bank lending situations. One side of the • provide finance for firms to expand. argument may have more depth than the other, but Why it might not: overall both sides of the • cause demand-pull inflation / fall in internal value of money argument are considered • increase imports and developed. There is • current account deficit may increase / current account surplus may thoughtful evaluation of fall economic concepts, • may cause a fall in the rate of interest terminology, information • increase in bank lending may result in some households and firms and/or data appropriate to getting into debt. the question. The discussion may also point out the possible uncertainties of alternative decisions and outcomes. 3(d) Level Description Marks 2 A reasoned discussion 3–5 which makes use of economic information and clear analysis to evaluate economic issues and situations. The answer may lack some depth and development may be one- sided. There is relevant use of economic concepts, terminology, information and data appropriate to the question. 1 There is a simple attempt 1–2 at using economic definitions and terminology. Some reference may be made to economic theory, with occasional understanding. 0 A mark of zero should be 0 awarded for no creditable content.
Q4 · Nigeria has a mixed economic system
4 Nigeria has a mixed economic system. In January 2023, Nigeria had a high unemployment rate of 33% which created a number of costs. Its high inflation rate of 22% had several effects on the country’s firms. In 2022 and the start of 2023, Nigerians increased their demand for foreign currency. (a) Identify two costs of unemployment. [2] (b) Explain how the key resource allocation decisions are made in a mixed economic system. [4] (c) Analyse the causes of an increase in the demand for foreign currency. [6] (d) Discuss whether or not inflation will harm a country’s firms. [8]
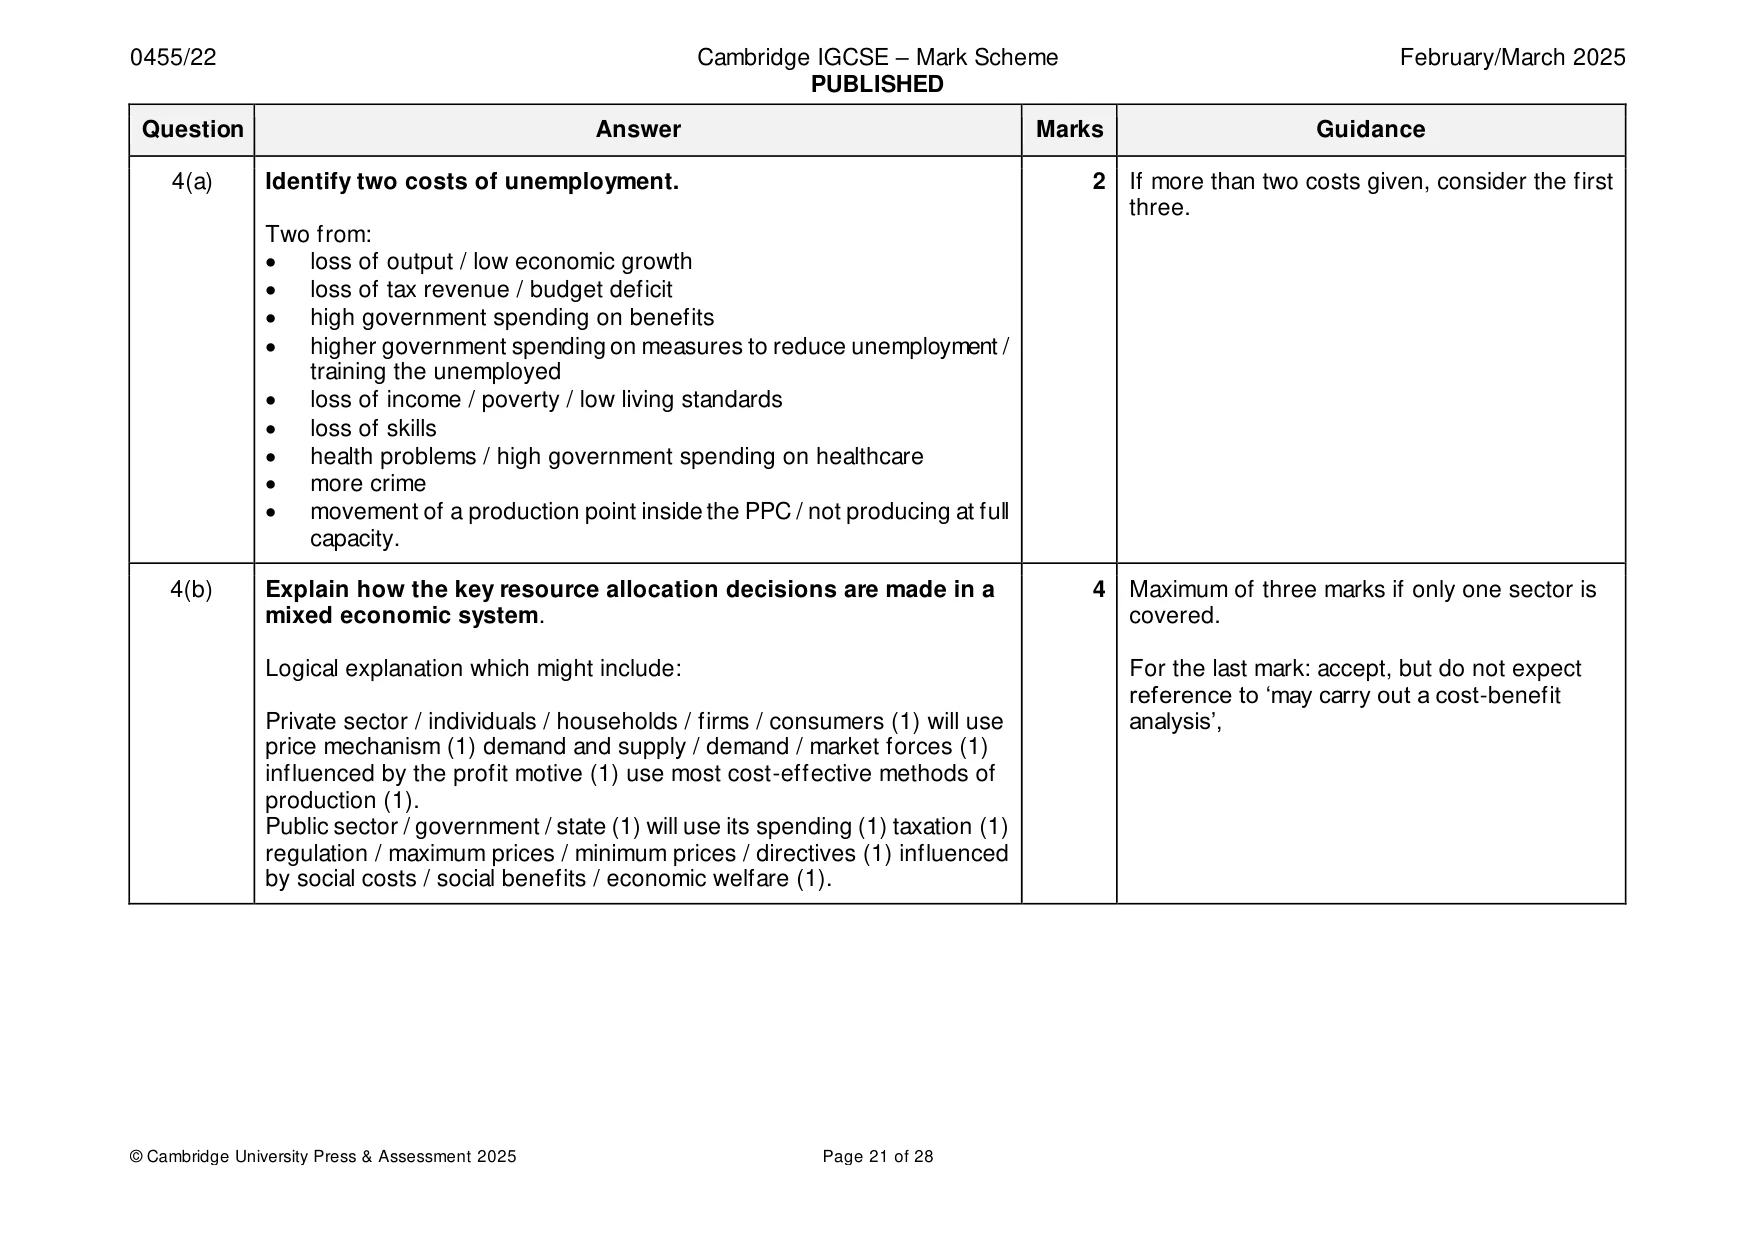
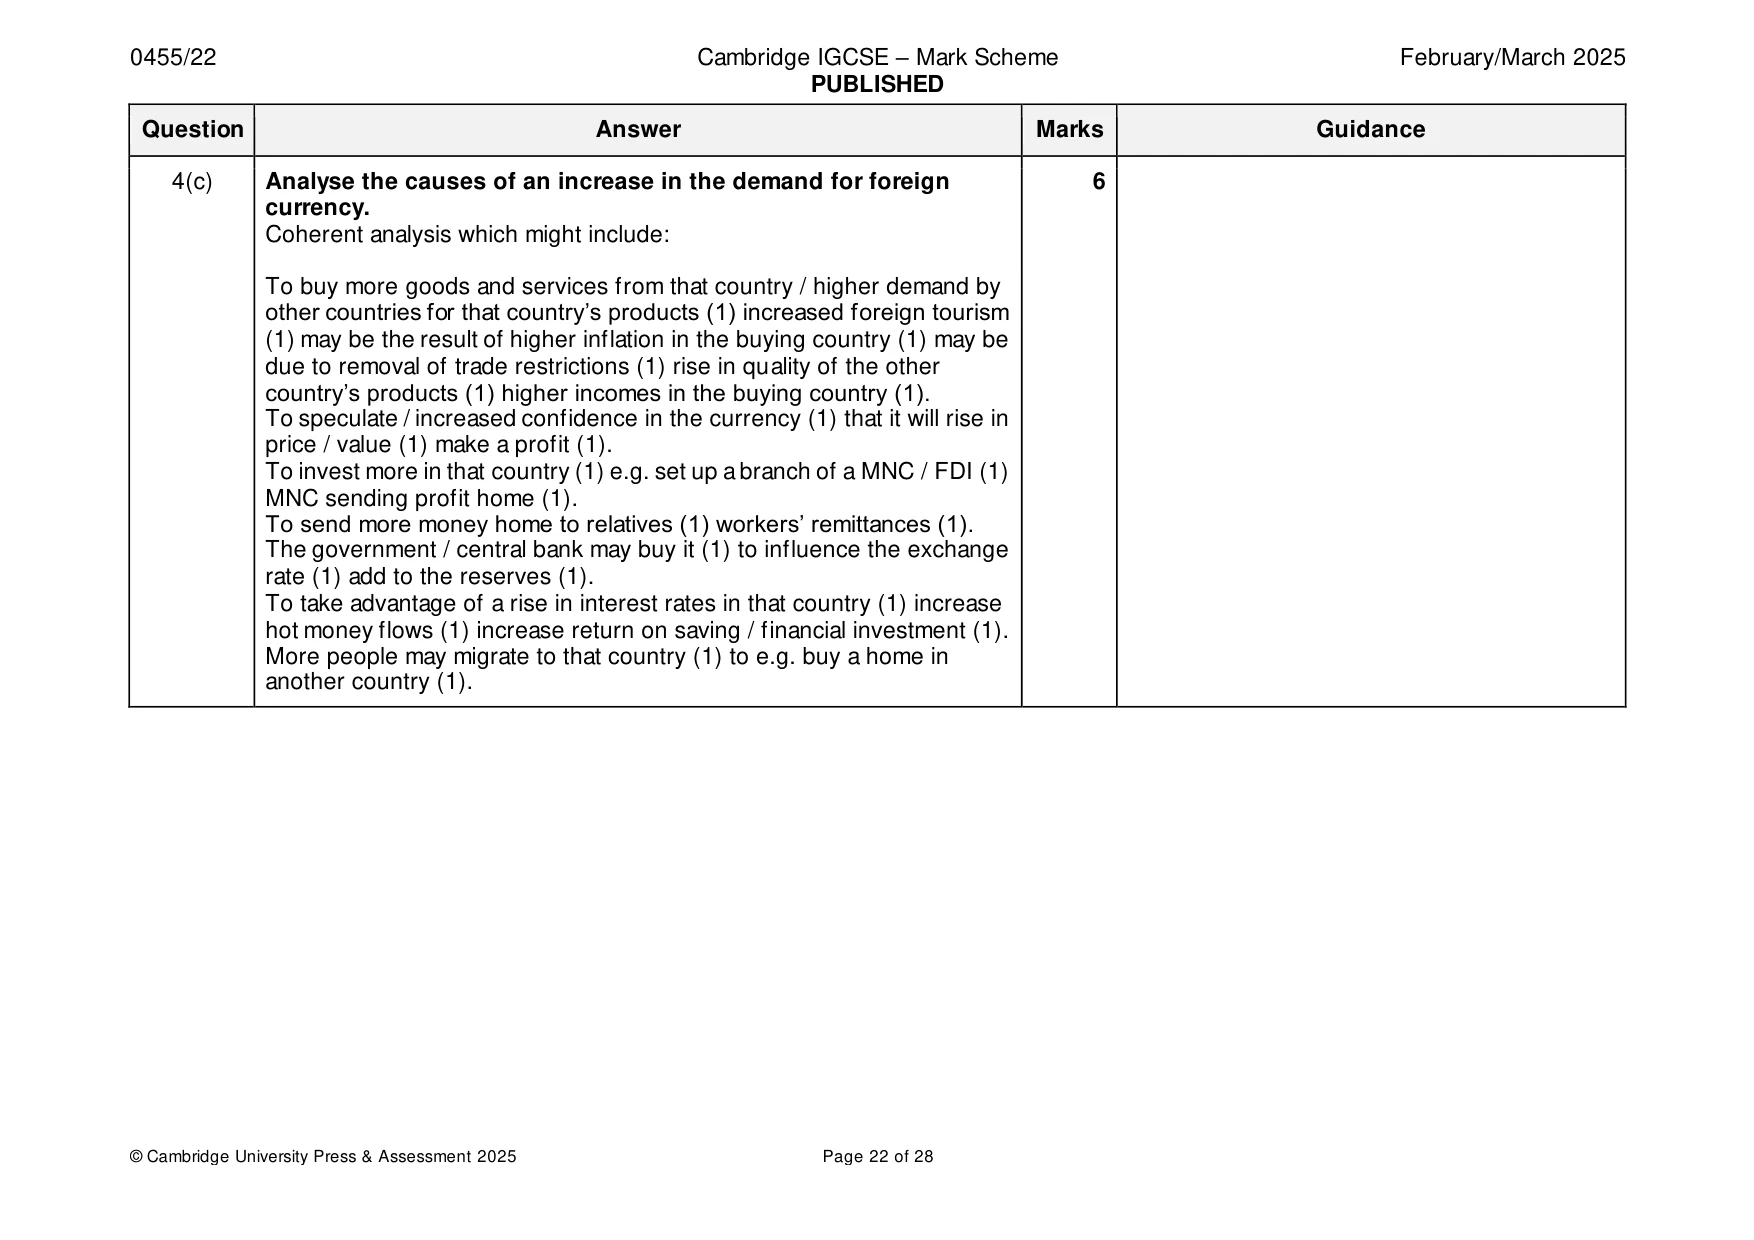
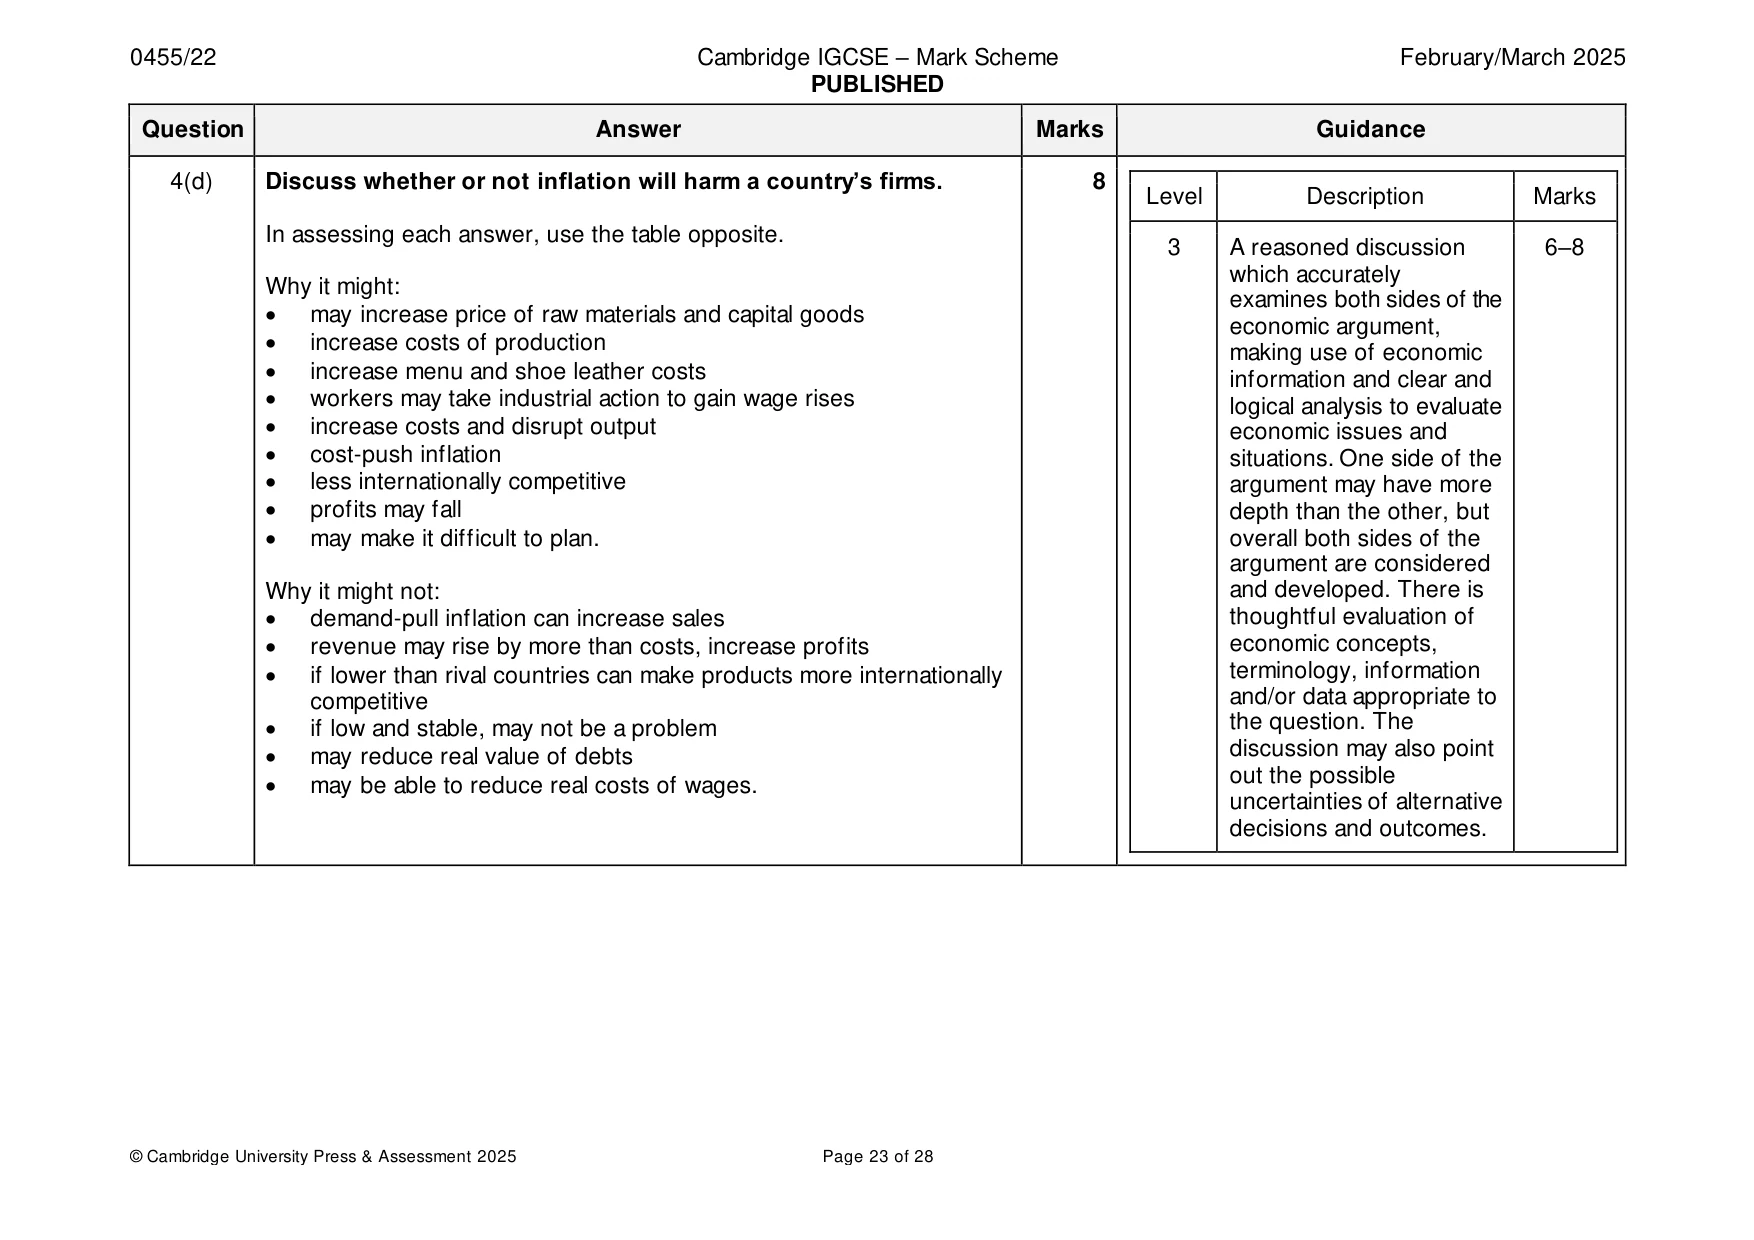
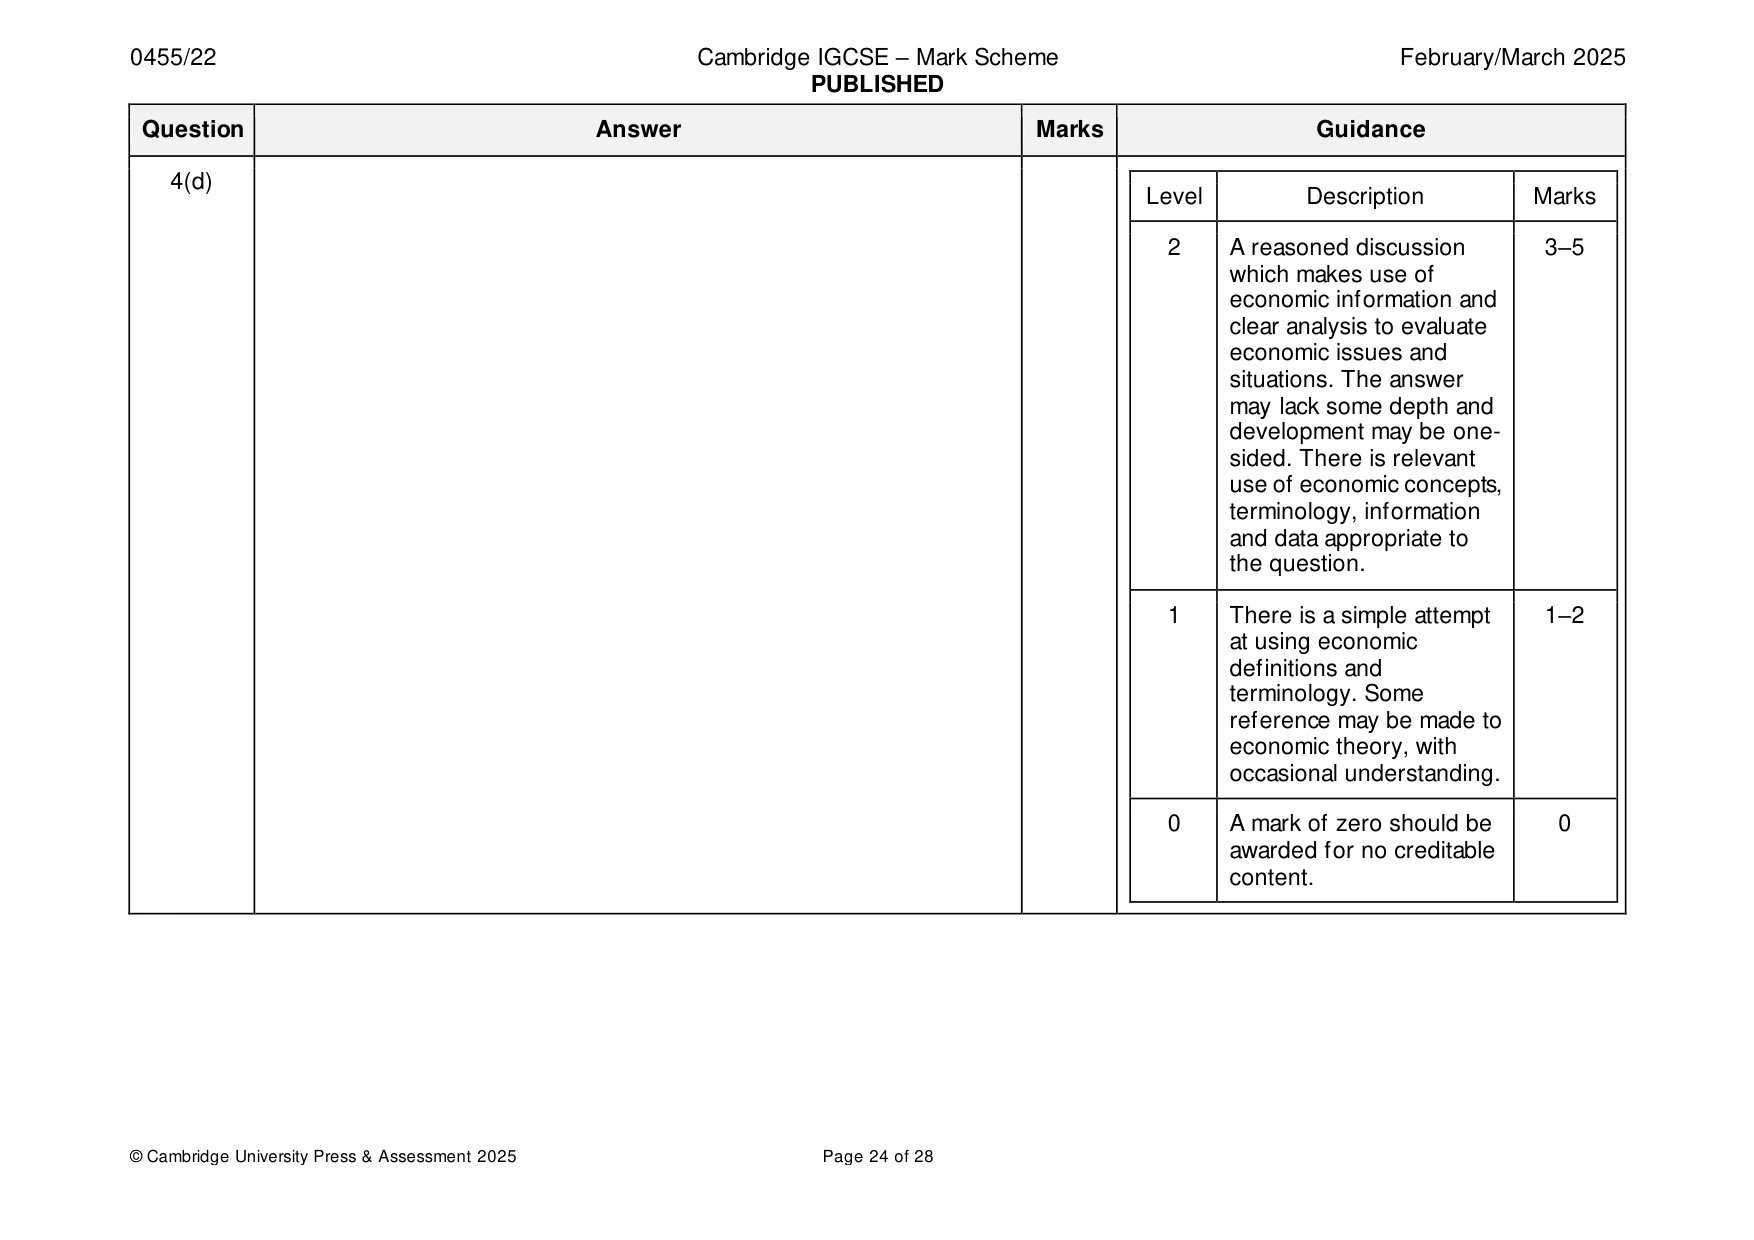
Mark scheme: 4(a) Identify two costs of unemployment. 2 If more than two costs given, consider the first three. Two from: • loss of output / low economic growth • loss of tax revenue / budget deficit • high government spending on benefits • higher government spending on measures to reduce unemployment / training the unemployed • loss of income / poverty / low living standards • loss of skills • health problems / high government spending on healthcare • more crime • movement of a production point inside the PPC / not producing at full capacity. 4(b) Explain how the key resource allocation decisions are made in a 4 Maximum of three marks if only one sector is mixed economic system. covered. Logical explanation which might include: For the last mark: accept, but do not expect reference to ‘may carry out a cost-benefit Private sector / individuals / households / firms / consumers (1) will use analysis’, price mechanism (1) demand and supply / demand / market forces (1) influenced by the profit motive (1) use most cost-effective methods of production (1). Public sector / government / state (1) will use its spending (1) taxation (1) regulation / maximum prices / minimum prices / directives (1) influenced by social costs / social benefits / economic welfare (1). 4(c) Analyse the causes of an increase in the demand for foreign 6 currency. Coherent analysis which might include: To buy more goods and services from that country / higher demand by other countries for that country’s products (1) increased foreign tourism (1) may be the result of higher inflation in the buying country (1) may be due to removal of trade restrictions (1) rise in quality of the other country’s products (1) higher incomes in the buying country (1). To speculate / increased confidence in the currency (1) that it will rise in price / value (1) make a profit (1). To invest more in that country (1) e.g. set up a branch of a MNC / FDI (1) MNC sending profit home (1). To send more money home to relatives (1) workers’ remittances (1). The government / central bank may buy it (1) to influence the exchange rate (1) add to the reserves (1). To take advantage of a rise in interest rates in that country (1) increase hot money flows (1) increase return on saving / financial investment (1). More people may migrate to that country (1) to e.g. buy a home in another country (1). 4(d) Discuss whether or not inflation will harm a country’s firms. 8 Level Description Marks In assessing each answer, use the table opposite. 3 A reasoned discussion 6–8 which accurately Why it might: examines both sides of the • may increase price of raw materials and capital goods economic argument, • increase costs of production making use of economic • increase menu and shoe leather costs information and clear and • workers may take industrial action to gain wage rises logical analysis to evaluate • increase costs and disrupt output economic issues and • cost-push inflation situations. One side of the • less internationally competitive argument may have more • profits may fall depth than the other, but • may make it difficult to plan. overall both sides of the argument are considered Why it might not: and developed. There is • demand-pull inflation can increase sales thoughtful evaluation of • revenue may rise by more than costs, increase profits economic concepts, • if lower than rival countries can make products more internationally terminology, information competitive and/or data appropriate to • if low and stable, may not be a problem the question. The • may reduce real value of debts discussion may also point out the possible • may be able to reduce real costs of wages. uncertainties of alternative decisions and outcomes. 4(d) Level Description Marks 2 A reasoned discussion 3–5 which makes use of economic information and clear analysis to evaluate economic issues and situations. The answer may lack some depth and development may be one- sided. There is relevant use of economic concepts, terminology, information and data appropriate to the question. 1 There is a simple attempt 1–2 at using economic definitions and terminology. Some reference may be made to economic theory, with occasional understanding. 0 A mark of zero should be 0 awarded for no creditable content.
Q5 · Finland is a high-income country that usually has a higher value of exports than imports
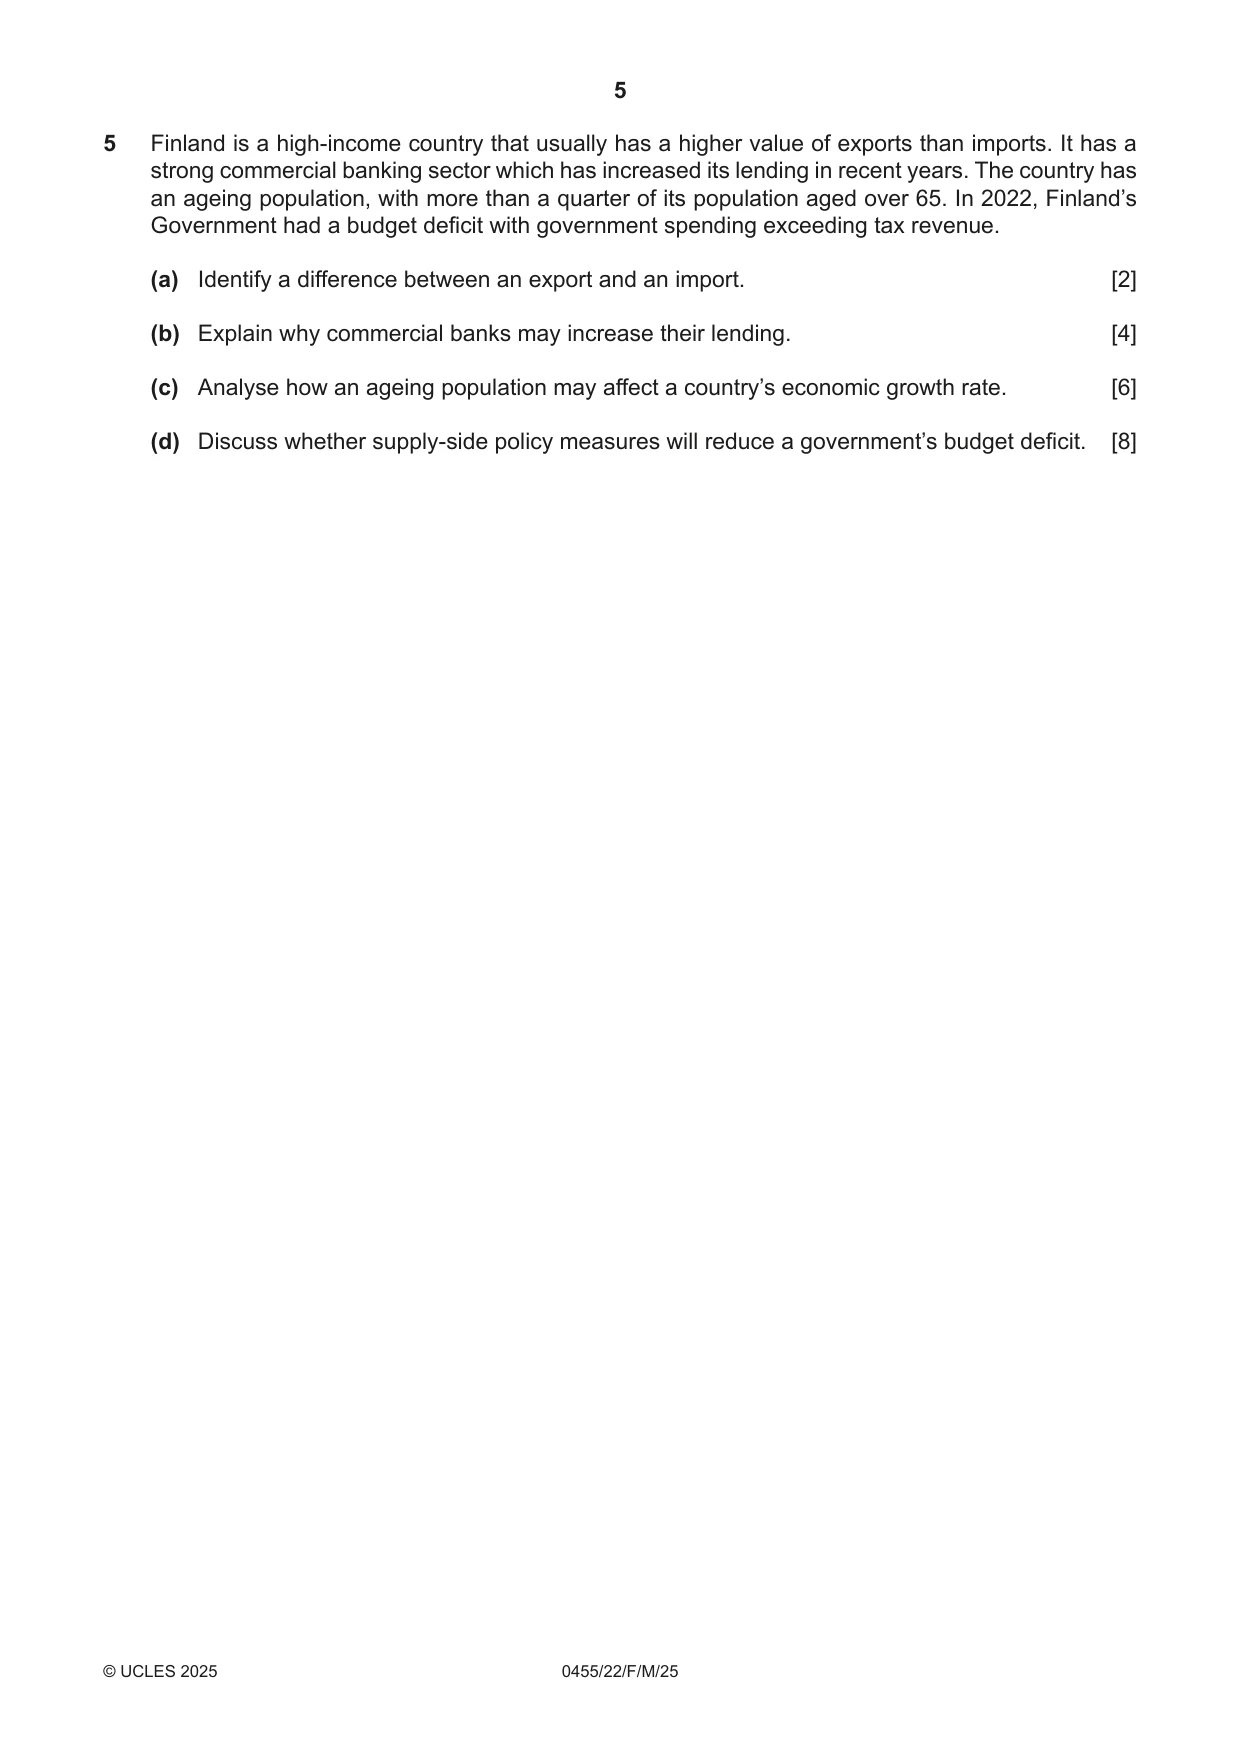
5 Finland is a high-income country that usually has a higher value of exports than imports. It has a strong commercial banking sector which has increased its lending in recent years. The country has an ageing population, with more than a quarter of its population aged over 65. In 2022, Finland’s Government had a budget deficit with government spending exceeding tax revenue. (a) Identify a difference between an export and an import. [2] (b) Explain why commercial banks may increase their lending. [4] (c) Analyse how an ageing population may affect a country’s economic growth rate. [6] (d) Discuss whether supply-side policy measures will reduce a government’s budget deficit. [8]
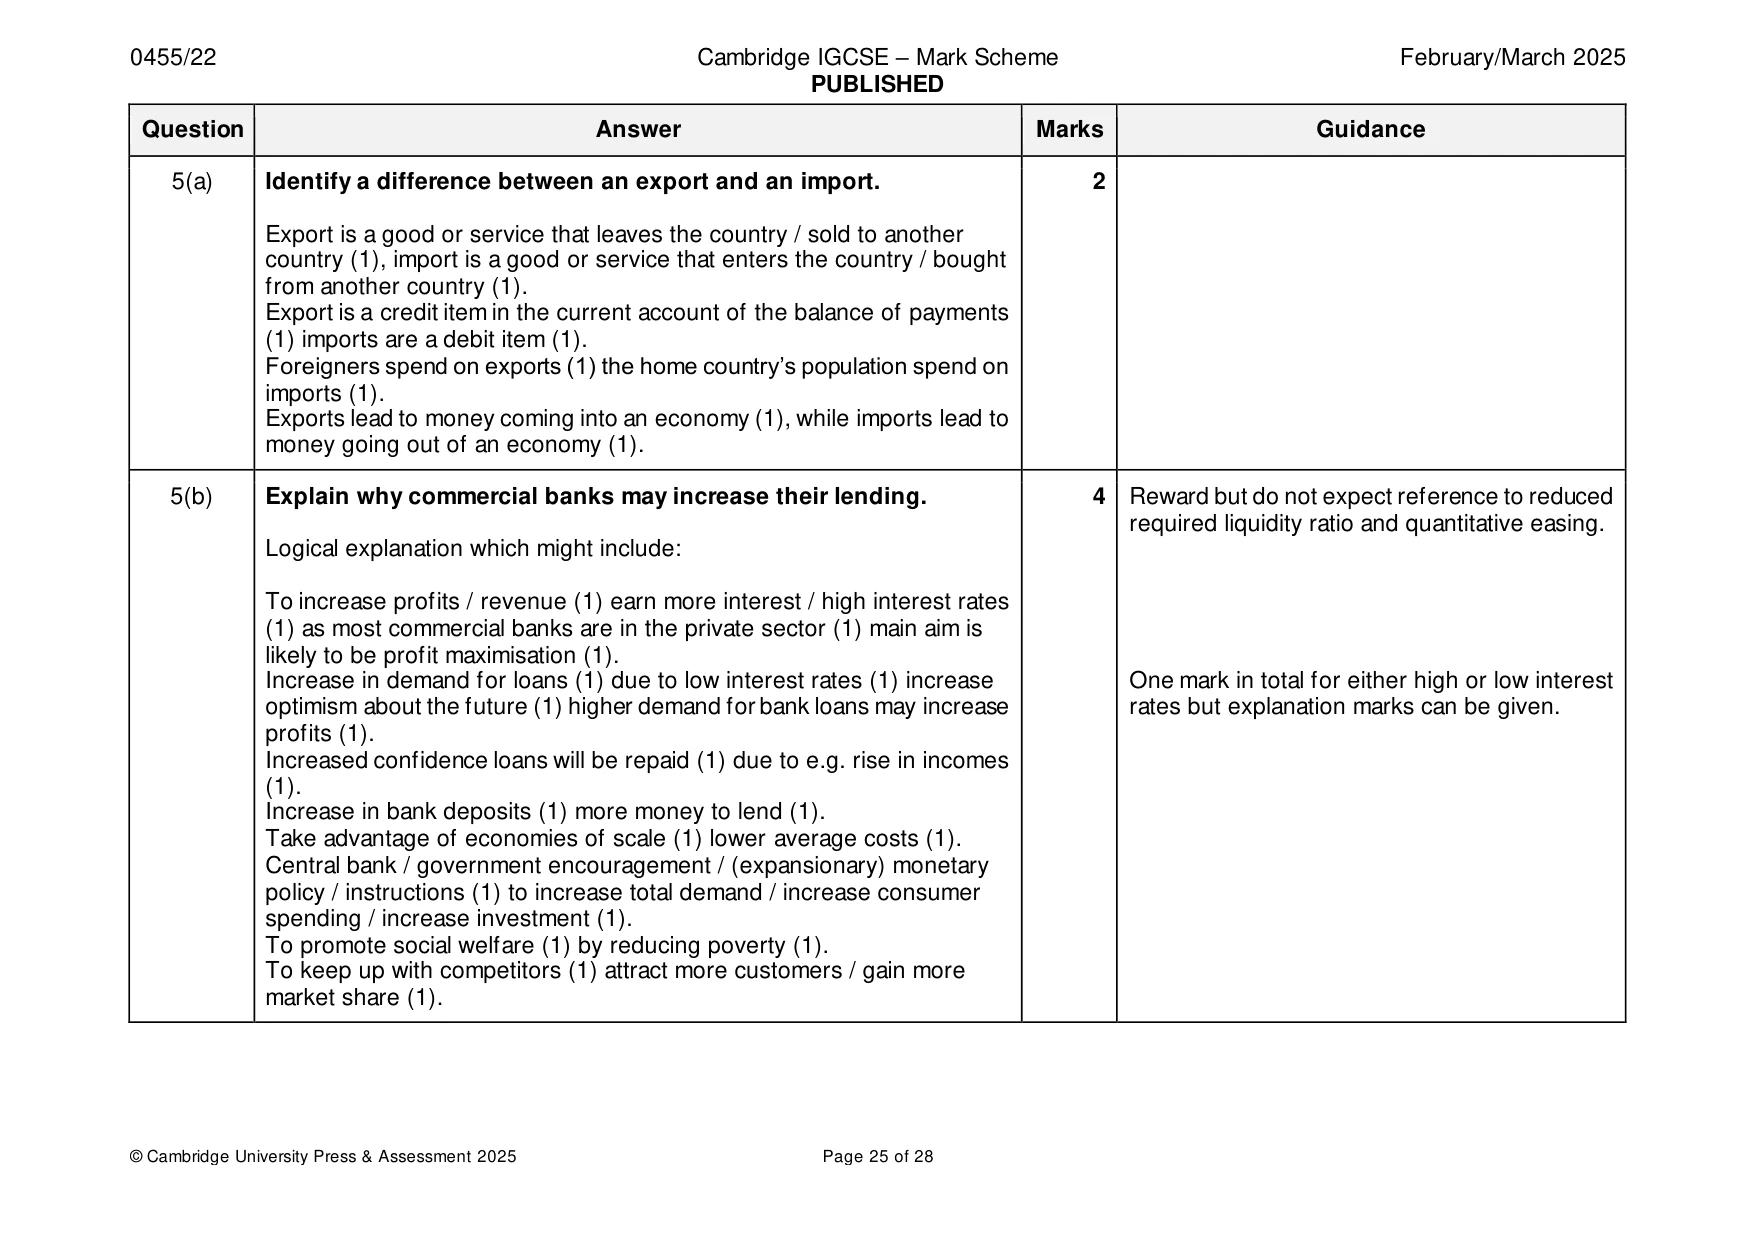
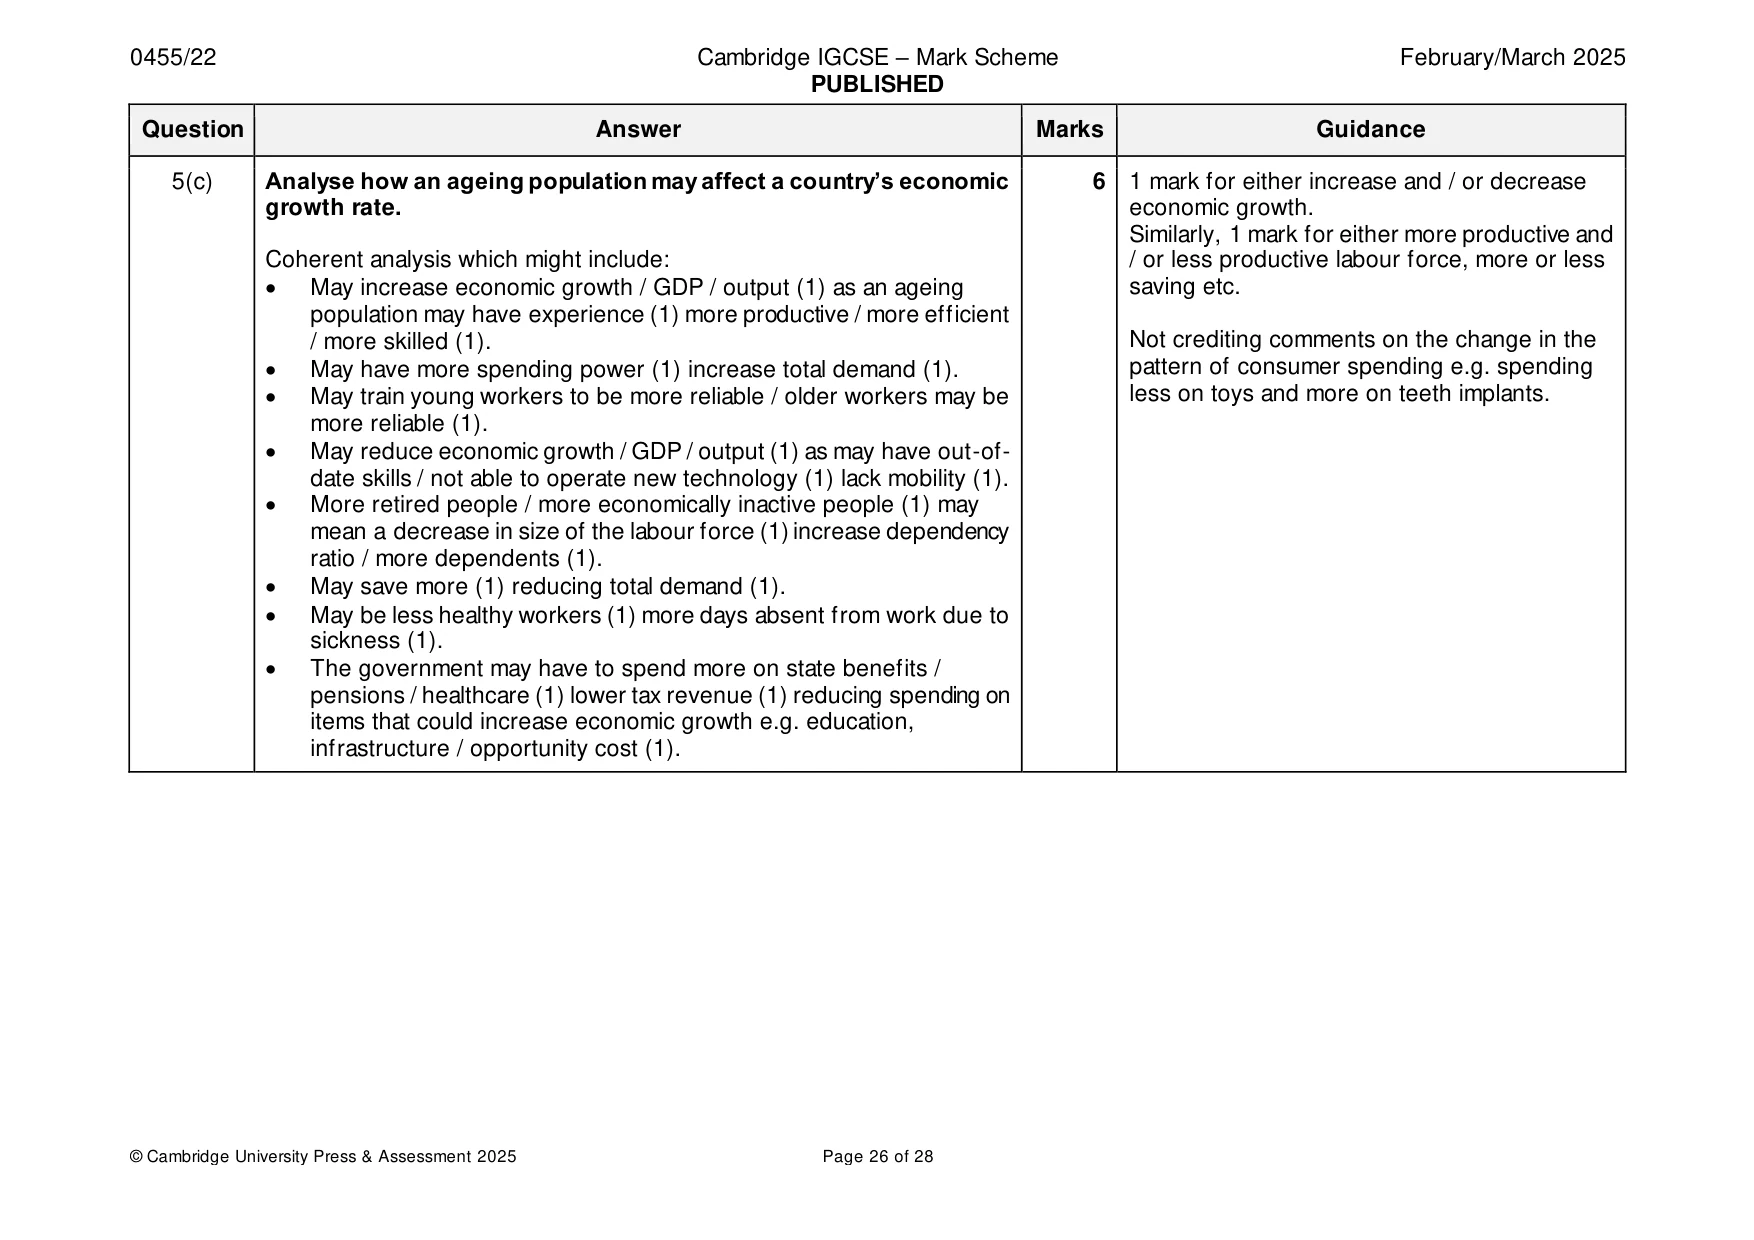
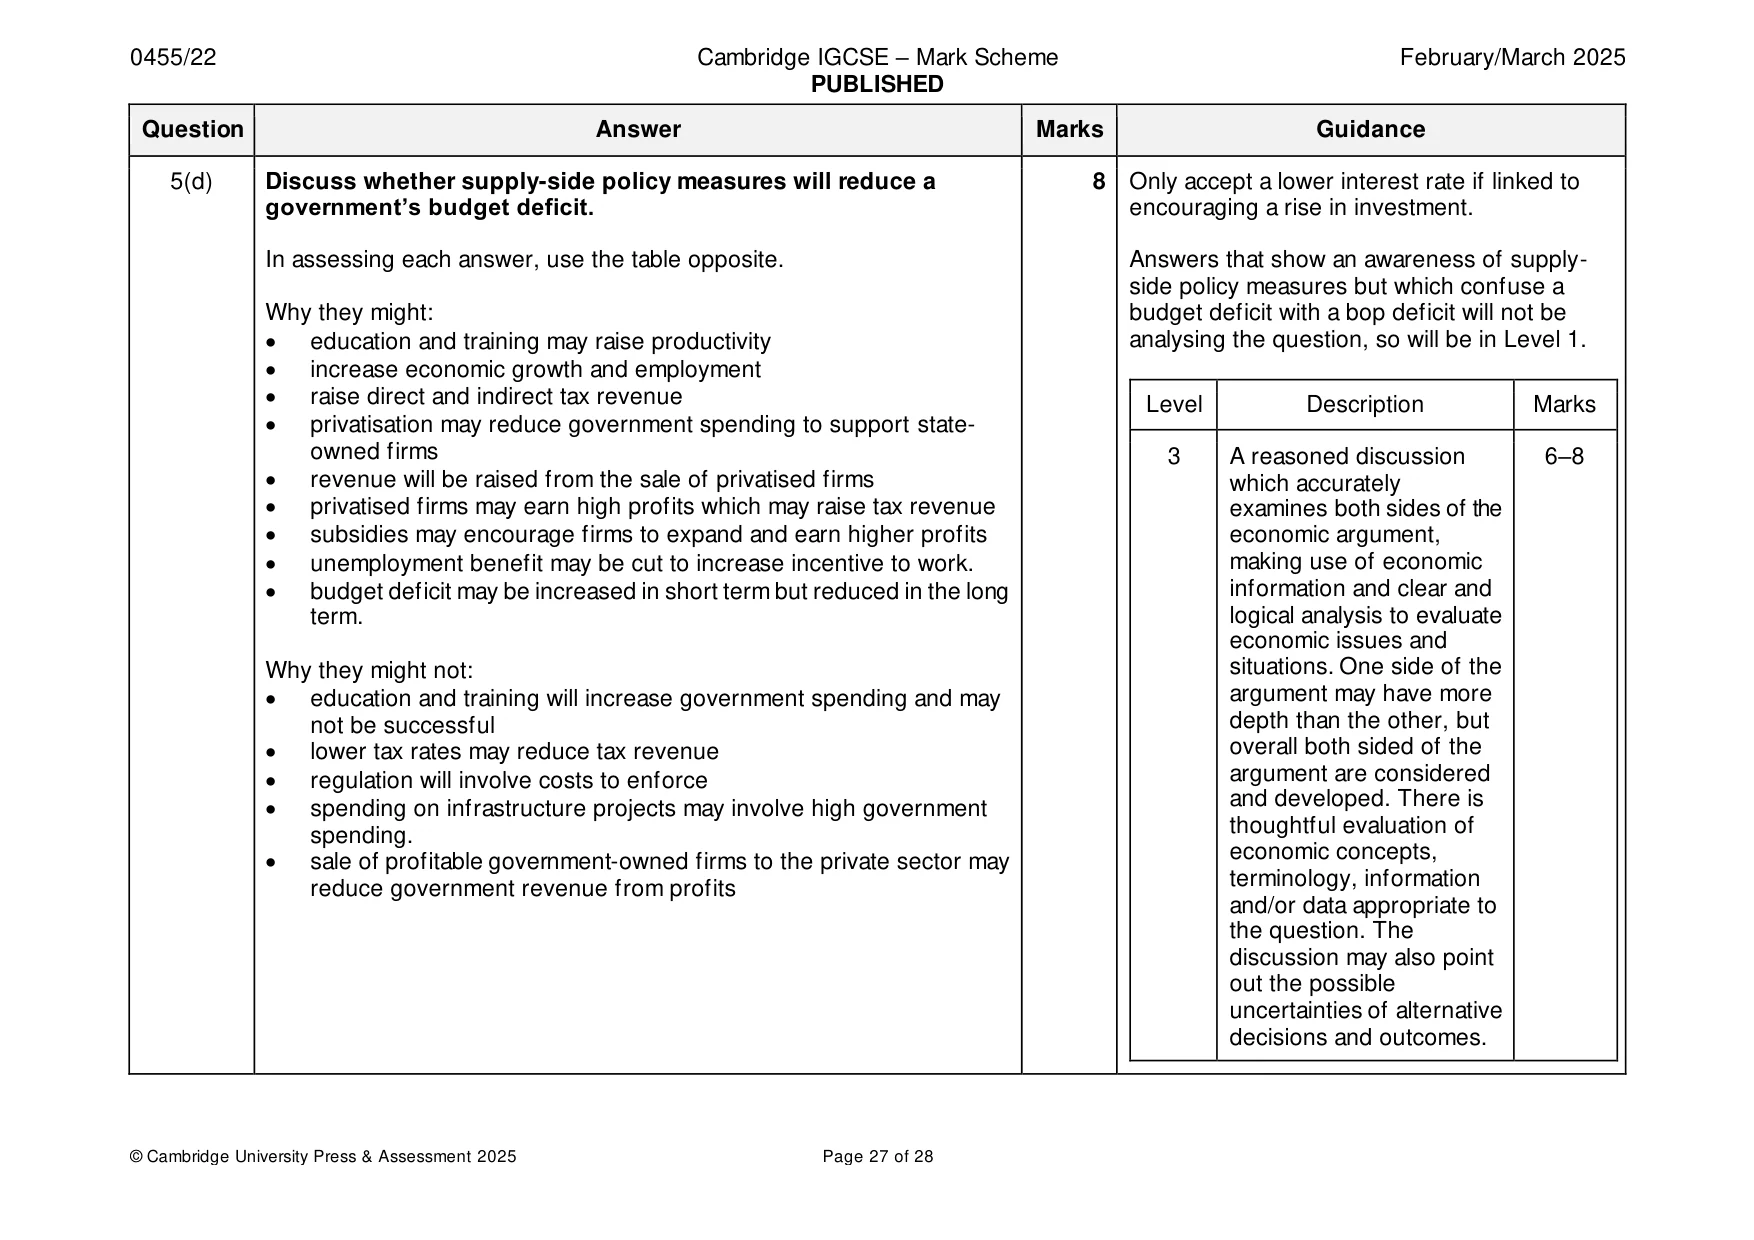
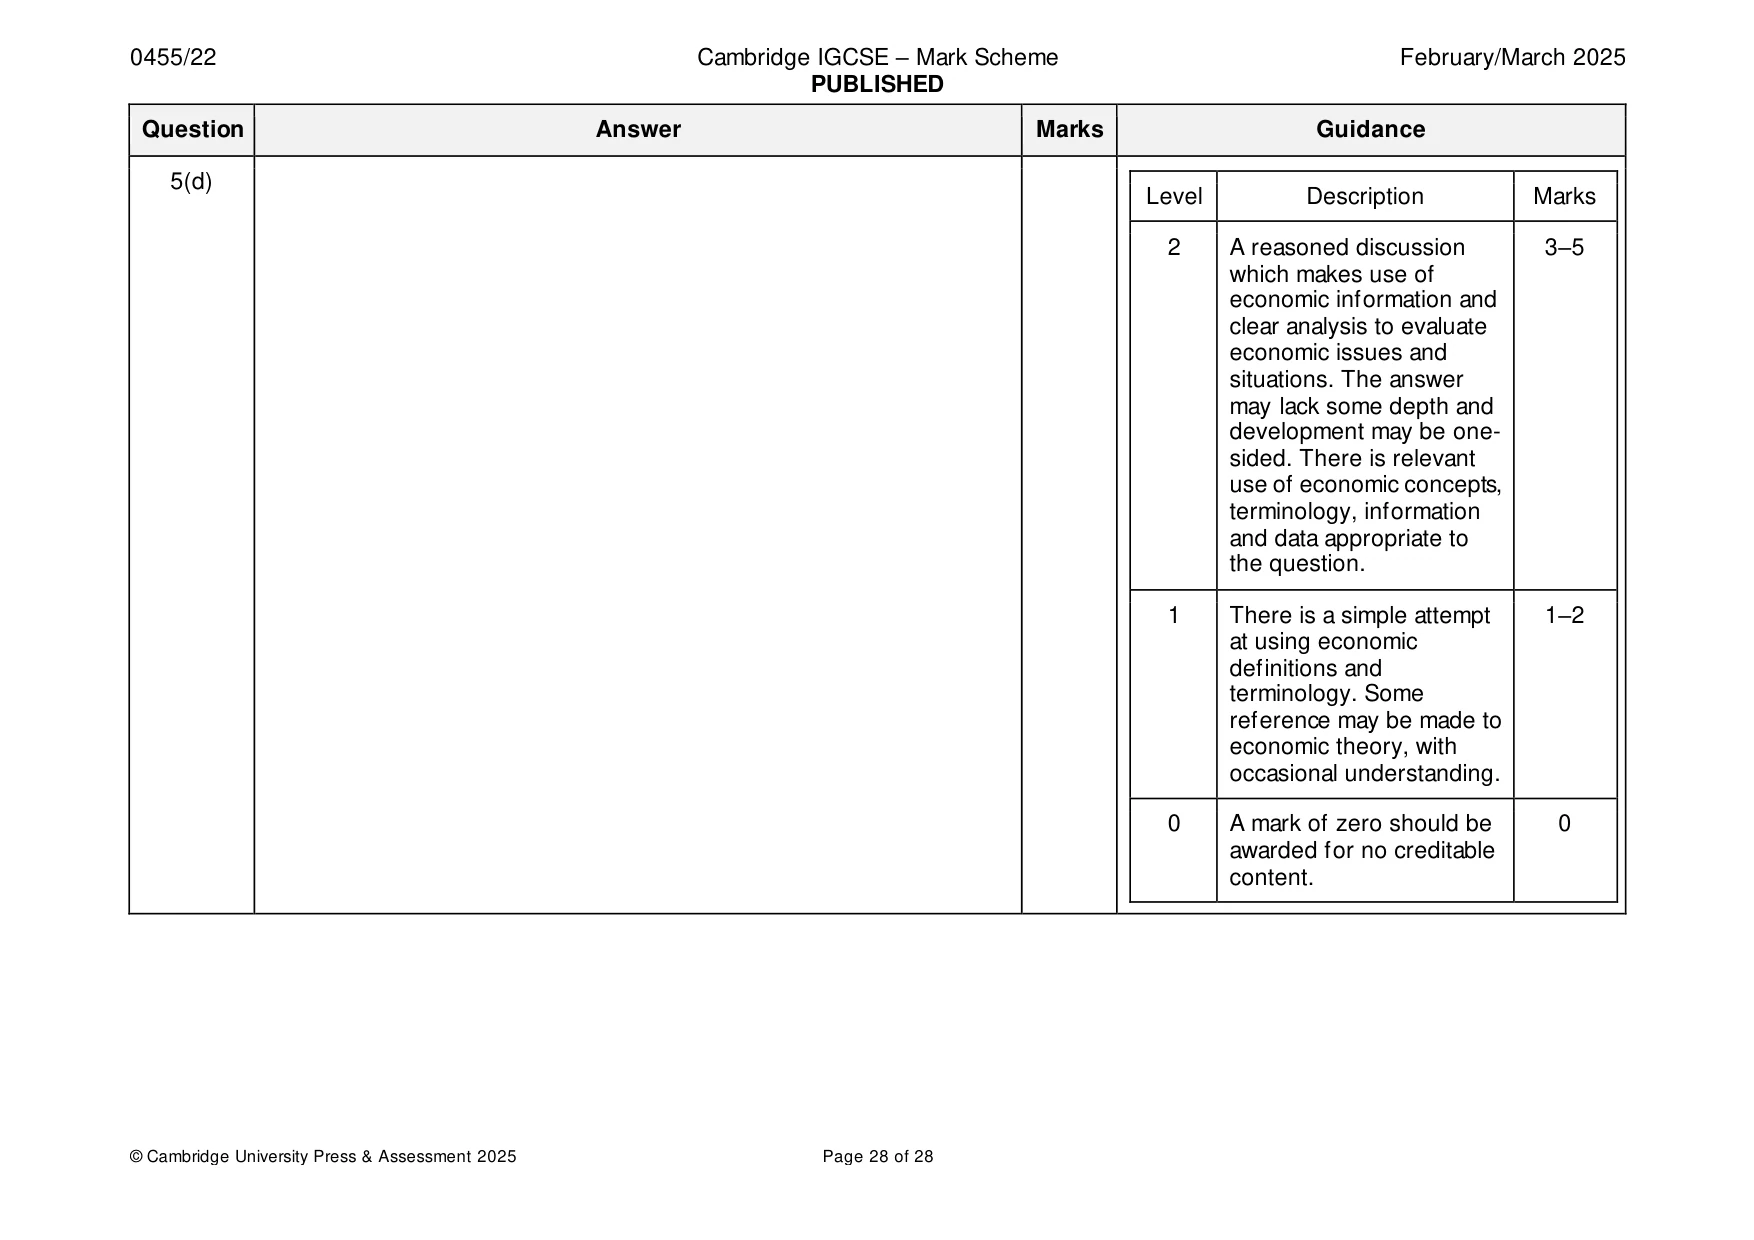
Mark scheme: 5(a) Identify a difference between an export and an import. 2 Export is a good or service that leaves the country / sold to another country (1), import is a good or service that enters the country / bought from another country (1). Export is a credit item in the current account of the balance of payments (1) imports are a debit item (1). Foreigners spend on exports (1) the home country’s population spend on imports (1). Exports lead to money coming into an economy (1), while imports lead to money going out of an economy (1). 5(b) Explain why commercial banks may increase their lending. 4 Reward but do not expect reference to reduced required liquidity ratio and quantitative easing. Logical explanation which might include: To increase profits / revenue (1) earn more interest / high interest rates (1) as most commercial banks are in the private sector (1) main aim is likely to be profit maximisation (1). Increase in demand for loans (1) due to low interest rates (1) increase One mark in total for either high or low interest optimism about the future (1) higher demand for bank loans may increase rates but explanation marks can be given. profits (1). Increased confidence loans will be repaid (1) due to e.g. rise in incomes (1). Increase in bank deposits (1) more money to lend (1). Take advantage of economies of scale (1) lower average costs (1). Central bank / government encouragement / (expansionary) monetary policy / instructions (1) to increase total demand / increase consumer spending / increase investment (1). To promote social welfare (1) by reducing poverty (1). To keep up with competitors (1) attract more customers / gain more market share (1). 5(c) Analyse how an ageing population may affect a country’s economic 6 1 mark for either increase and / or decrease growth rate. economic growth. Similarly, 1 mark for either more productive and Coherent analysis which might include: / or less productive labour force, more or less • May increase economic growth / GDP / output (1) as an ageing saving etc. population may have experience (1) more productive / more efficient / more skilled (1). Not crediting comments on the change in the • May have more spending power (1) increase total demand (1). pattern of consumer spending e.g. spending • May train young workers to be more reliable / older workers may be less on toys and more on teeth implants. more reliable (1). • May reduce economic growth / GDP / output (1) as may have out-of- date skills / not able to operate new technology (1) lack mobility (1). • More retired people / more economically inactive people (1) may mean a decrease in size of the labour force (1) increase dependency ratio / more dependents (1). • May save more (1) reducing total demand (1). • May be less healthy workers (1) more days absent from work due to sickness (1). • The government may have to spend more on state benefits / pensions / healthcare (1) lower tax revenue (1) reducing spending on items that could increase economic growth e.g. education, infrastructure / opportunity cost (1). 5(d) Discuss whether supply-side policy measures will reduce a 8 Only accept a lower interest rate if linked to government’s budget deficit. encouraging a rise in investment. In assessing each answer, use the table opposite. Answers that show an awareness of supply- side policy measures but which confuse a Why they might: budget deficit with a bop deficit will not be • education and training may raise productivity analysing the question, so will be in Level 1. • increase economic growth and employment • raise direct and indirect tax revenue Level Description Marks • privatisation may reduce government spending to support state- owned firms 3 A reasoned discussion 6–8 • revenue will be raised from the sale of privatised firms which accurately • privatised firms may earn high profits which may raise tax revenue examines both sides of the • subsidies may encourage firms to expand and earn higher profits economic argument, • unemployment benefit may be cut to increase incentive to work. making use of economic • budget deficit may be increased in short term but reduced in the long information and clear and term. logical analysis to evaluate economic issues and Why they might not: situations. One side of the • education and training will increase government spending and may argument may have more not be successful depth than the other, but • lower tax rates may reduce tax revenue overall both sided of the • regulation will involve costs to enforce argument are considered and developed. There is • spending on infrastructure projects may involve high government thoughtful evaluation of spending. economic concepts, • sale of profitable government-owned firms to the private sector may terminology, information reduce government revenue from profits and/or data appropriate to the question. The discussion may also point out the possible uncertainties of alternative decisions and outcomes. 5(d) Level Description Marks 2 A reasoned discussion 3–5 which makes use of economic information and clear analysis to evaluate economic issues and situations. The answer may lack some depth and development may be one- sided. There is relevant use of economic concepts, terminology, information and data appropriate to the question. 1 There is a simple attempt 1–2 at using economic definitions and terminology. Some reference may be made to economic theory, with occasional understanding. 0 A mark of zero should be 0 awarded for no creditable content.
What was in this paper
The subtopics covered by these 5 questions, and how many questions each got. Open one in a new tab to see every Cambridge question on it.
What you needed in this session
Cambridge’s own grade thresholds for 2025 Feb/March, Paper 2 · Variant 2. A higher threshold means an easier paper — the bar moves with how the cohort did.