Cambridge IGCSE Economics 0455 — 2023 May/June Paper 2 · Variant 3
0455/23/M/J/23 · 5 questions · 90 marks · ≈101 min
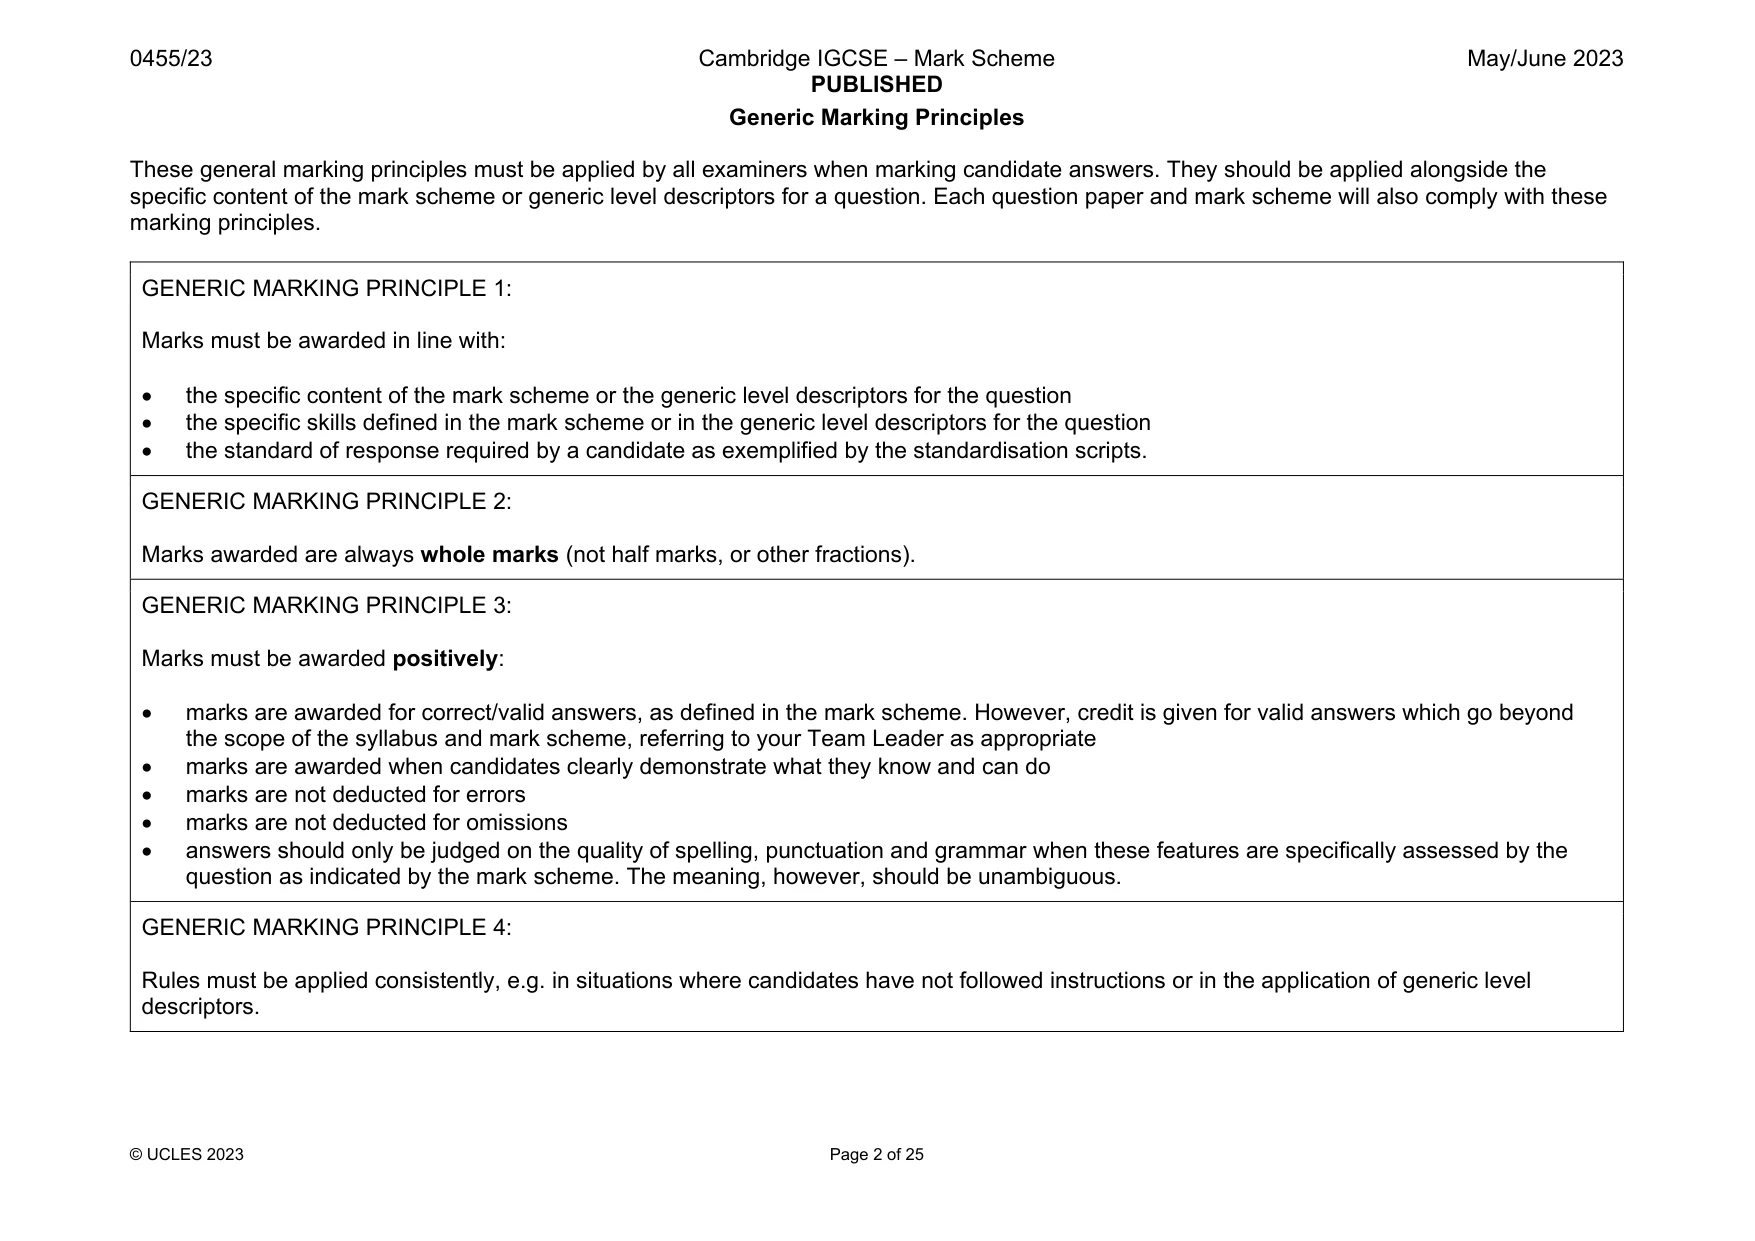
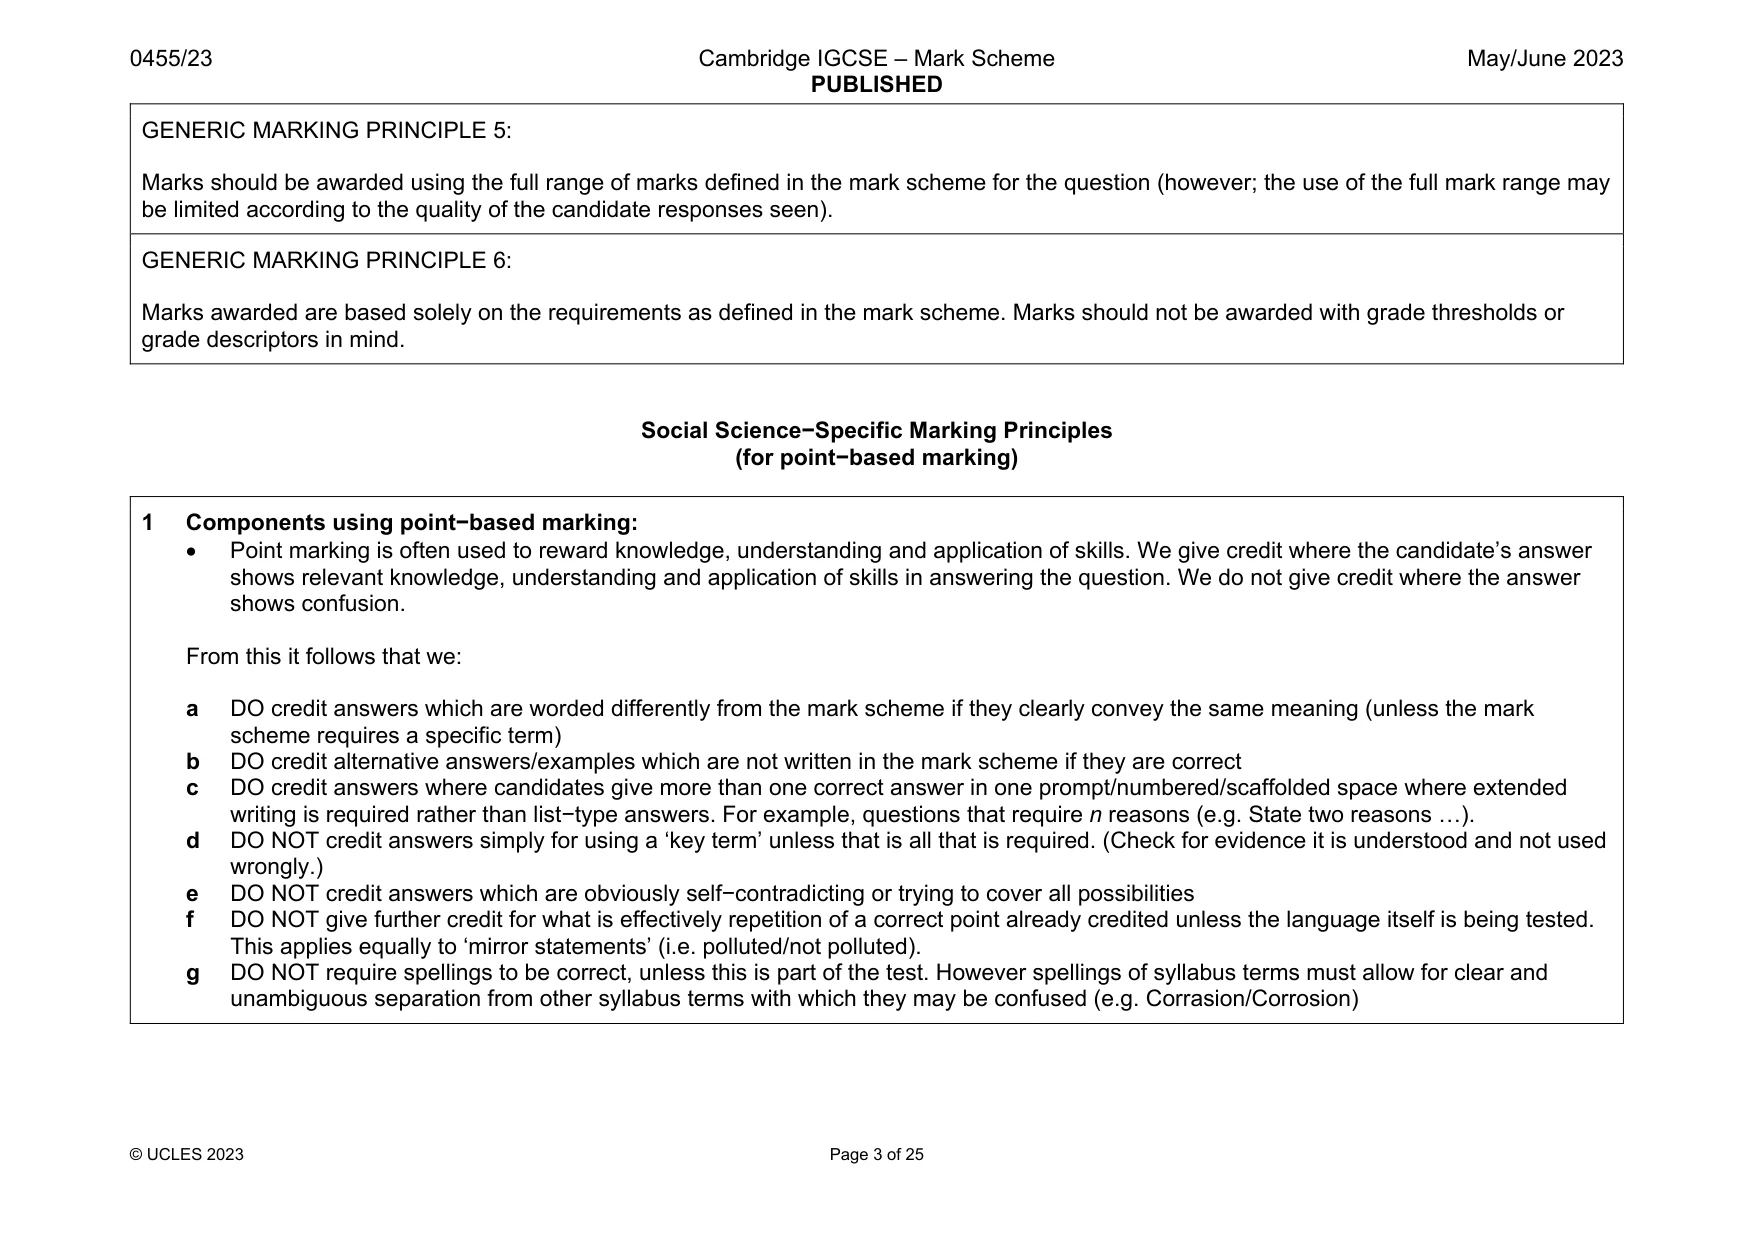
The question paper and its mark scheme, free to read here and free to download. This is Cambridge’s own paper, exactly as it was sat.
Question paper8 pages




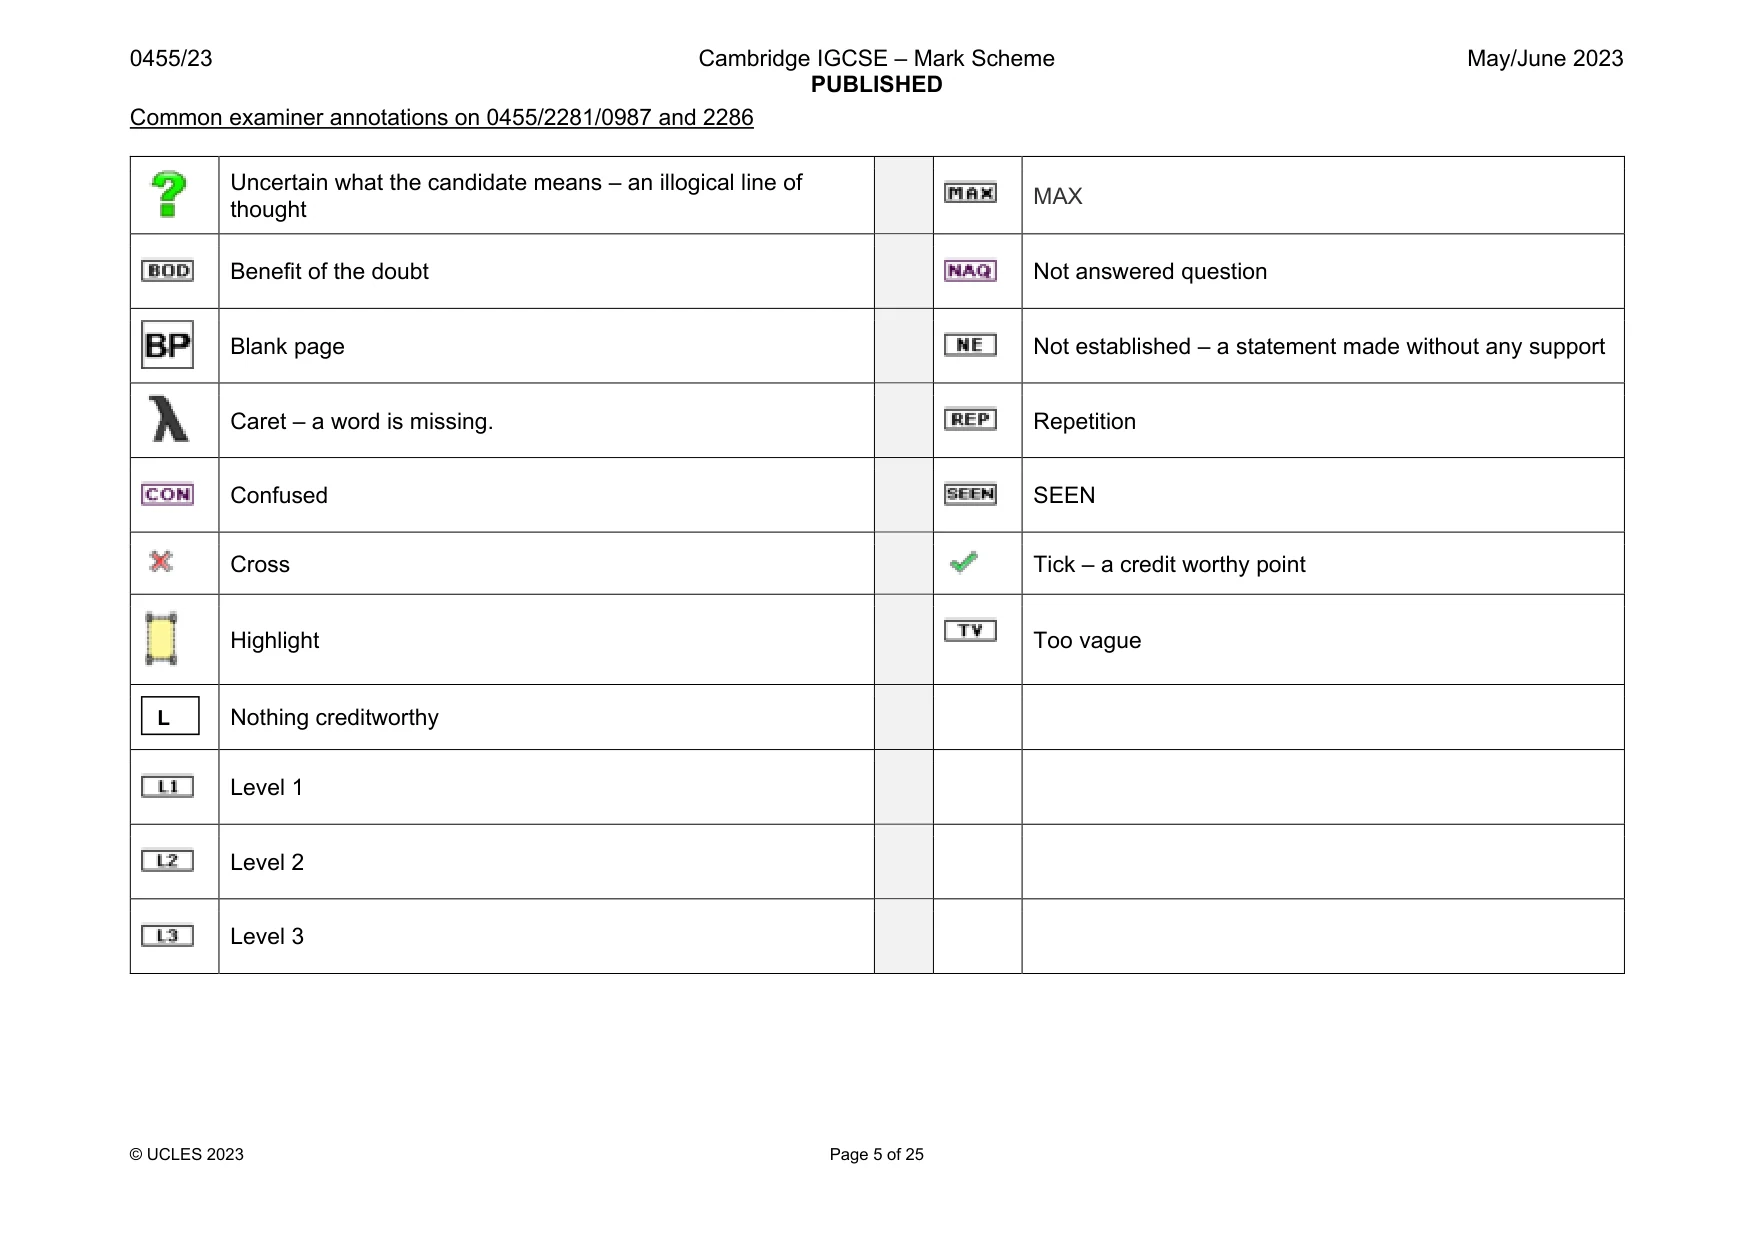
Mark scheme25 pages
Answers below. Sit the paper first if you are practising.


Questions as text
Q1 · Calculate New Zealand’s GDP per head in 2020
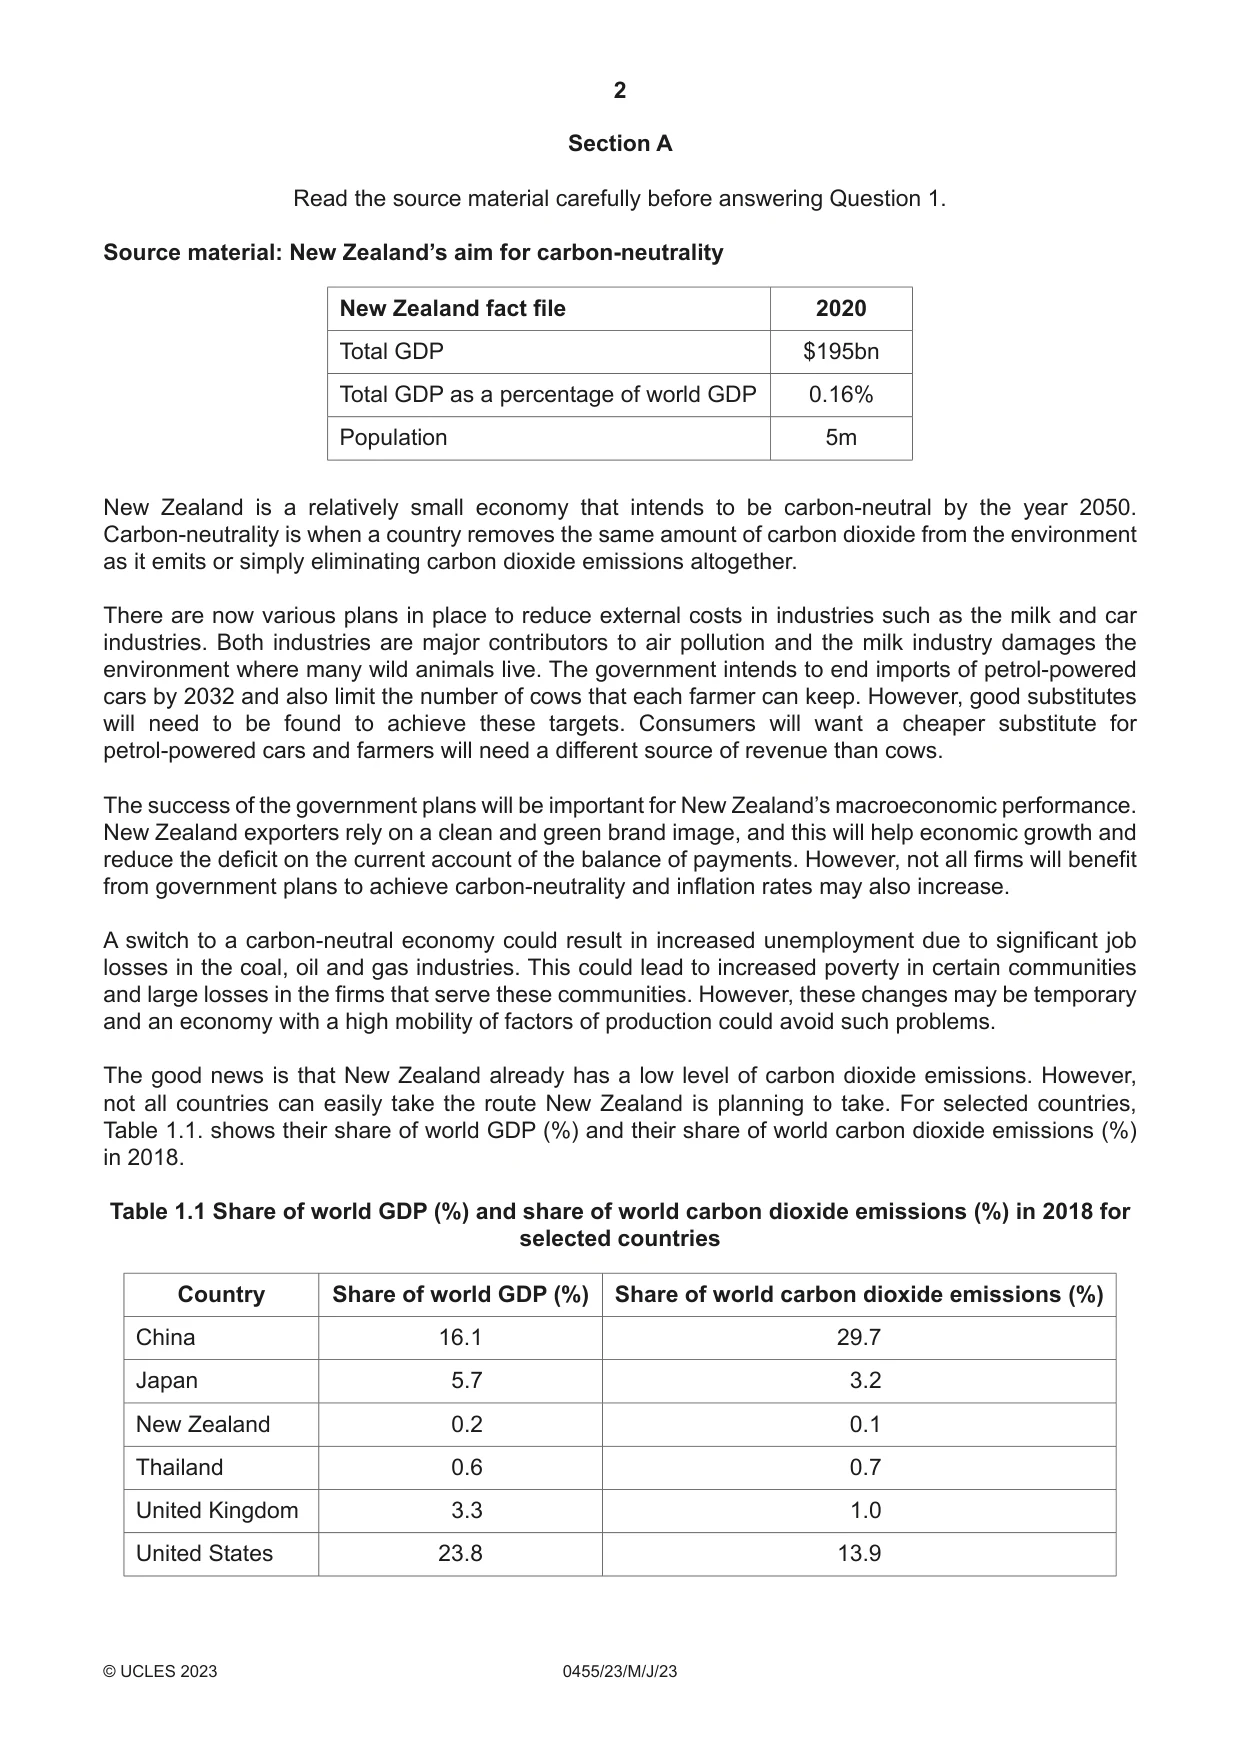
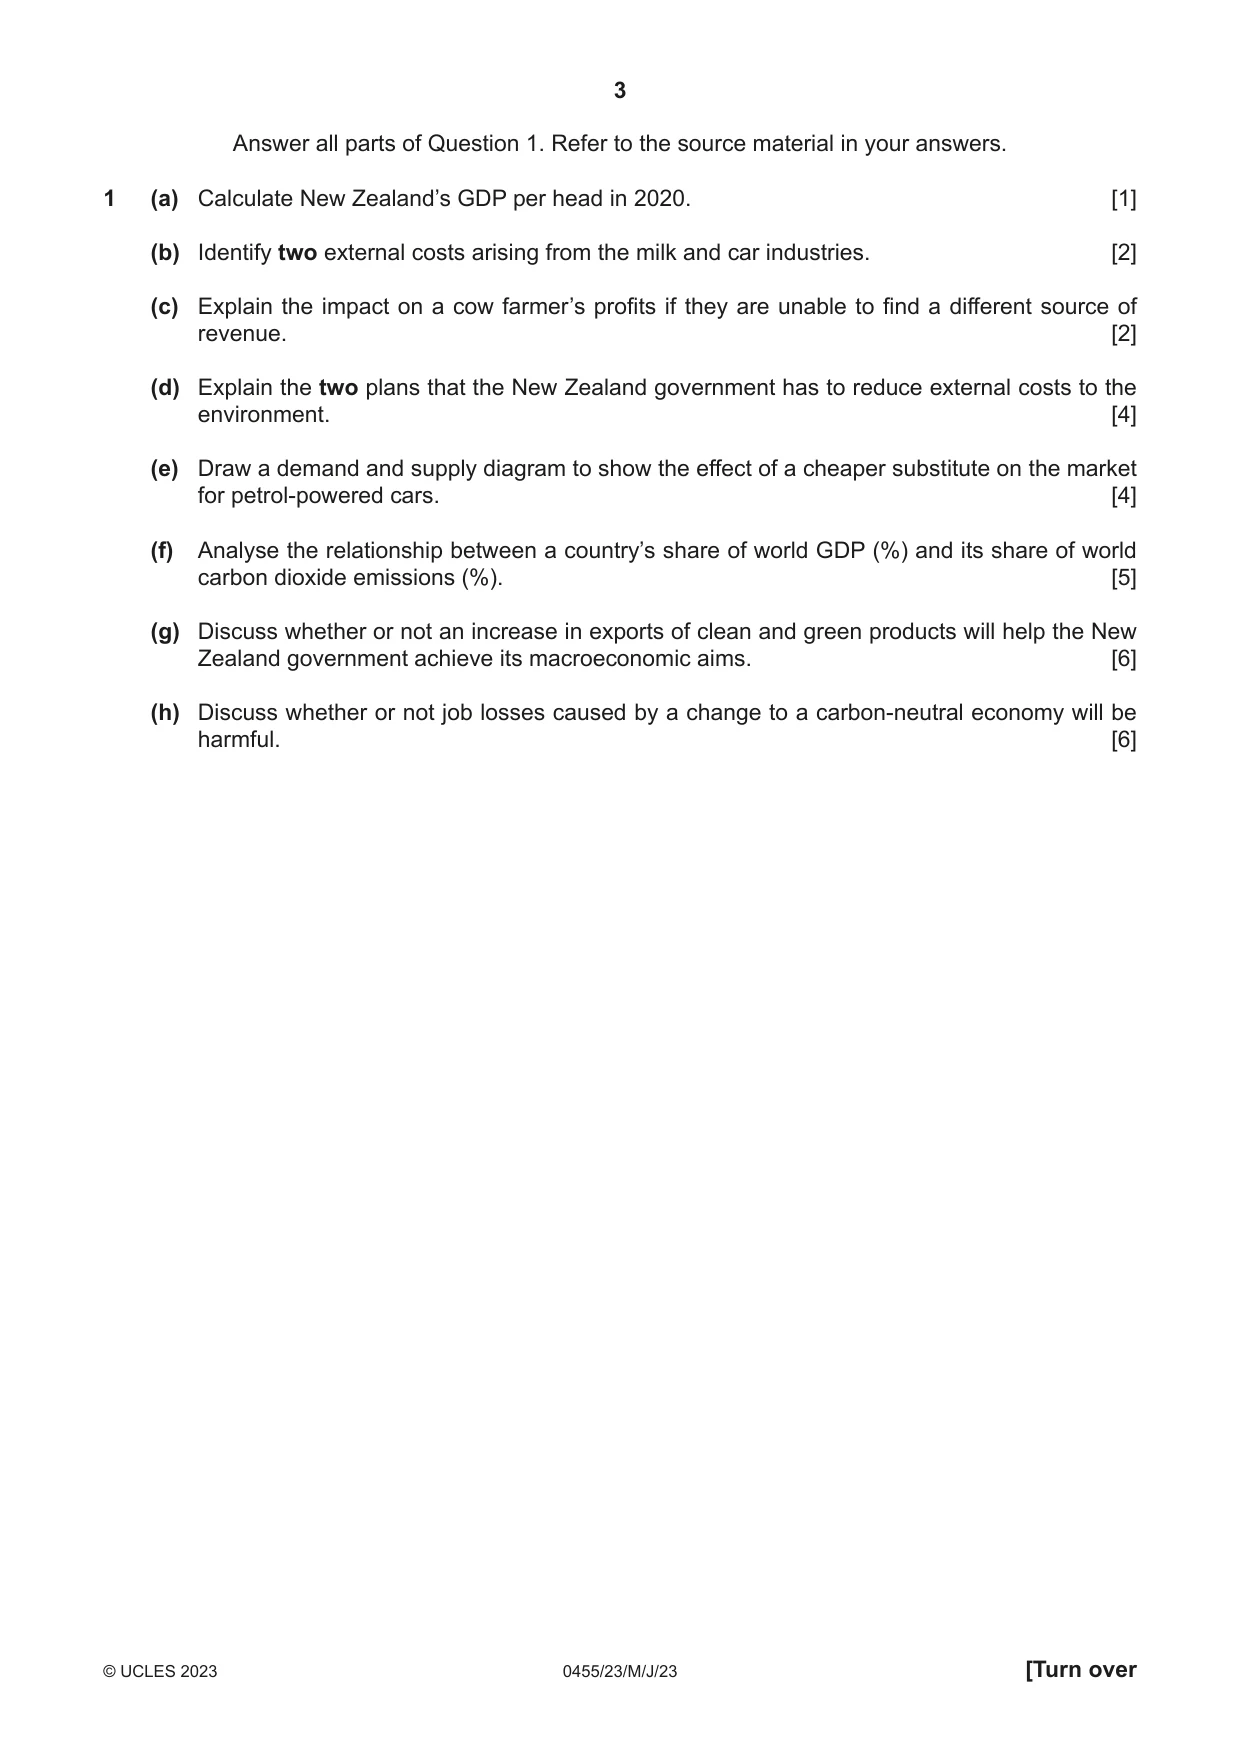
1 (a) Calculate New Zealand’s GDP per head in 2020. [1] (b) Identify two external costs arising from the milk and car industries. [2] (c) Explain the impact on a cow farmer’s profits if they are unable to find a different source of revenue. [2] (d) Explain the two plans that the New Zealand government has to reduce external costs to the environment. [4] (e) Draw a demand and supply diagram to show the effect of a cheaper substitute on the market for petrol‑powered cars. [4] (f) Analyse the relationship between a country’s share of world GDP (%) and its share of world carbon dioxide emissions (%). [5] (g) Discuss whether or not an increase in exports of clean and green products will help the New Zealand government achieve its macroeconomic aims. [6] (h) Discuss whether or not job losses caused by a change to a carbon‑neutral economy will be harmful. [6]
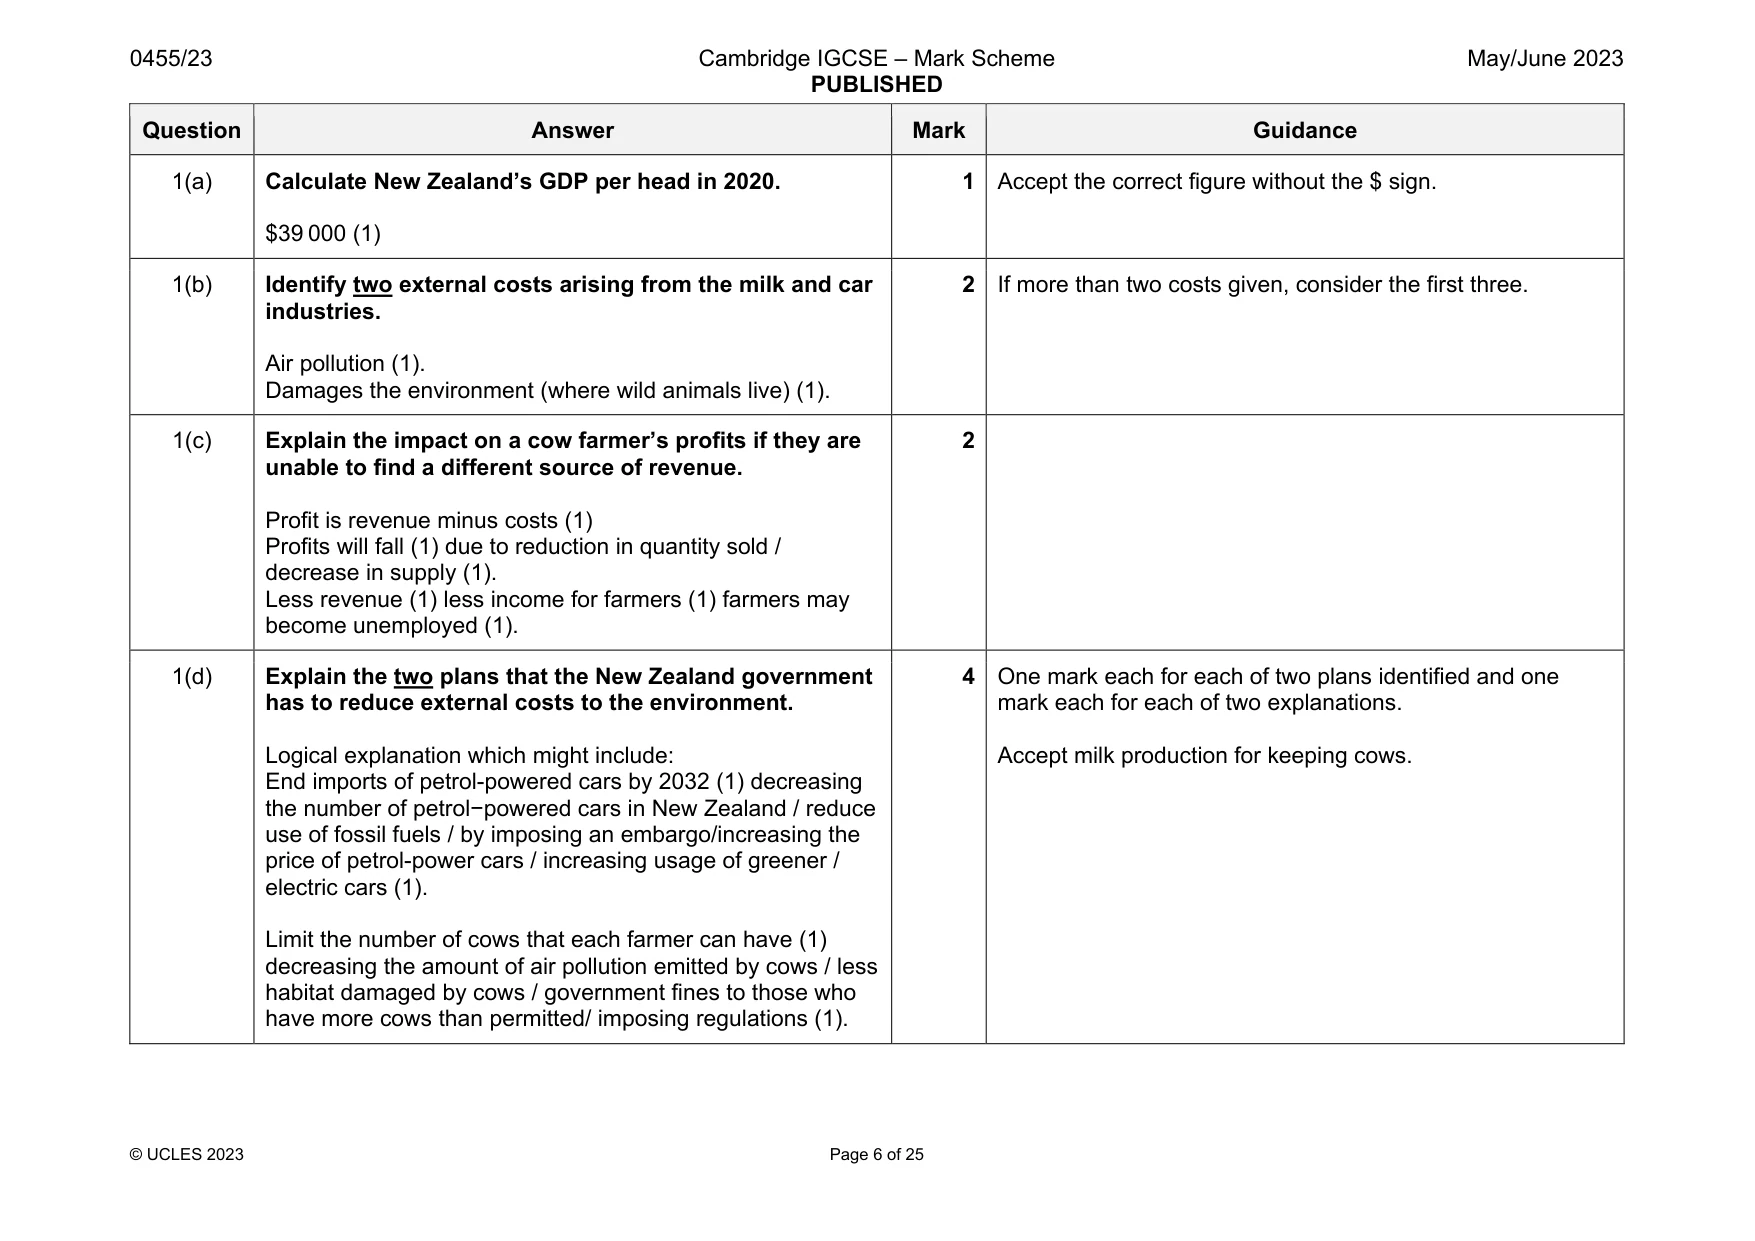
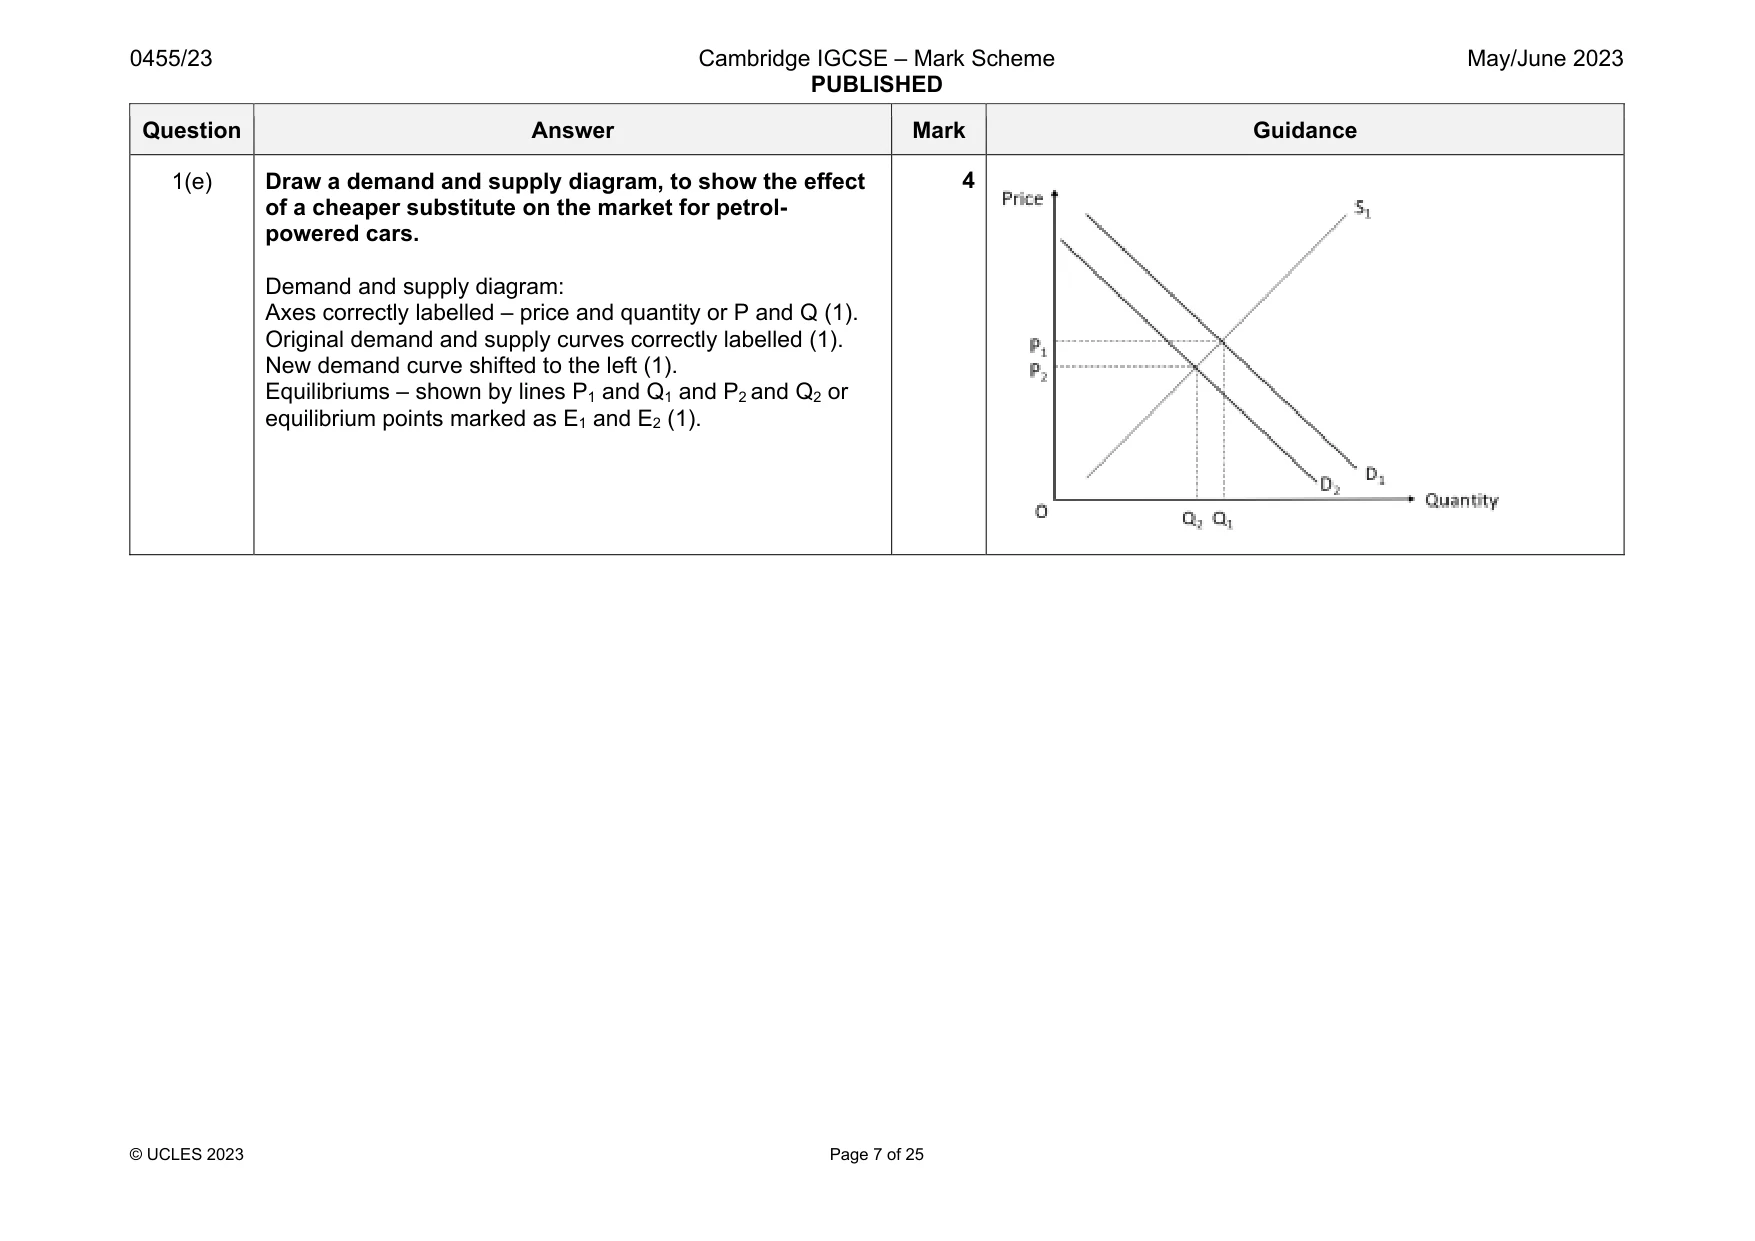
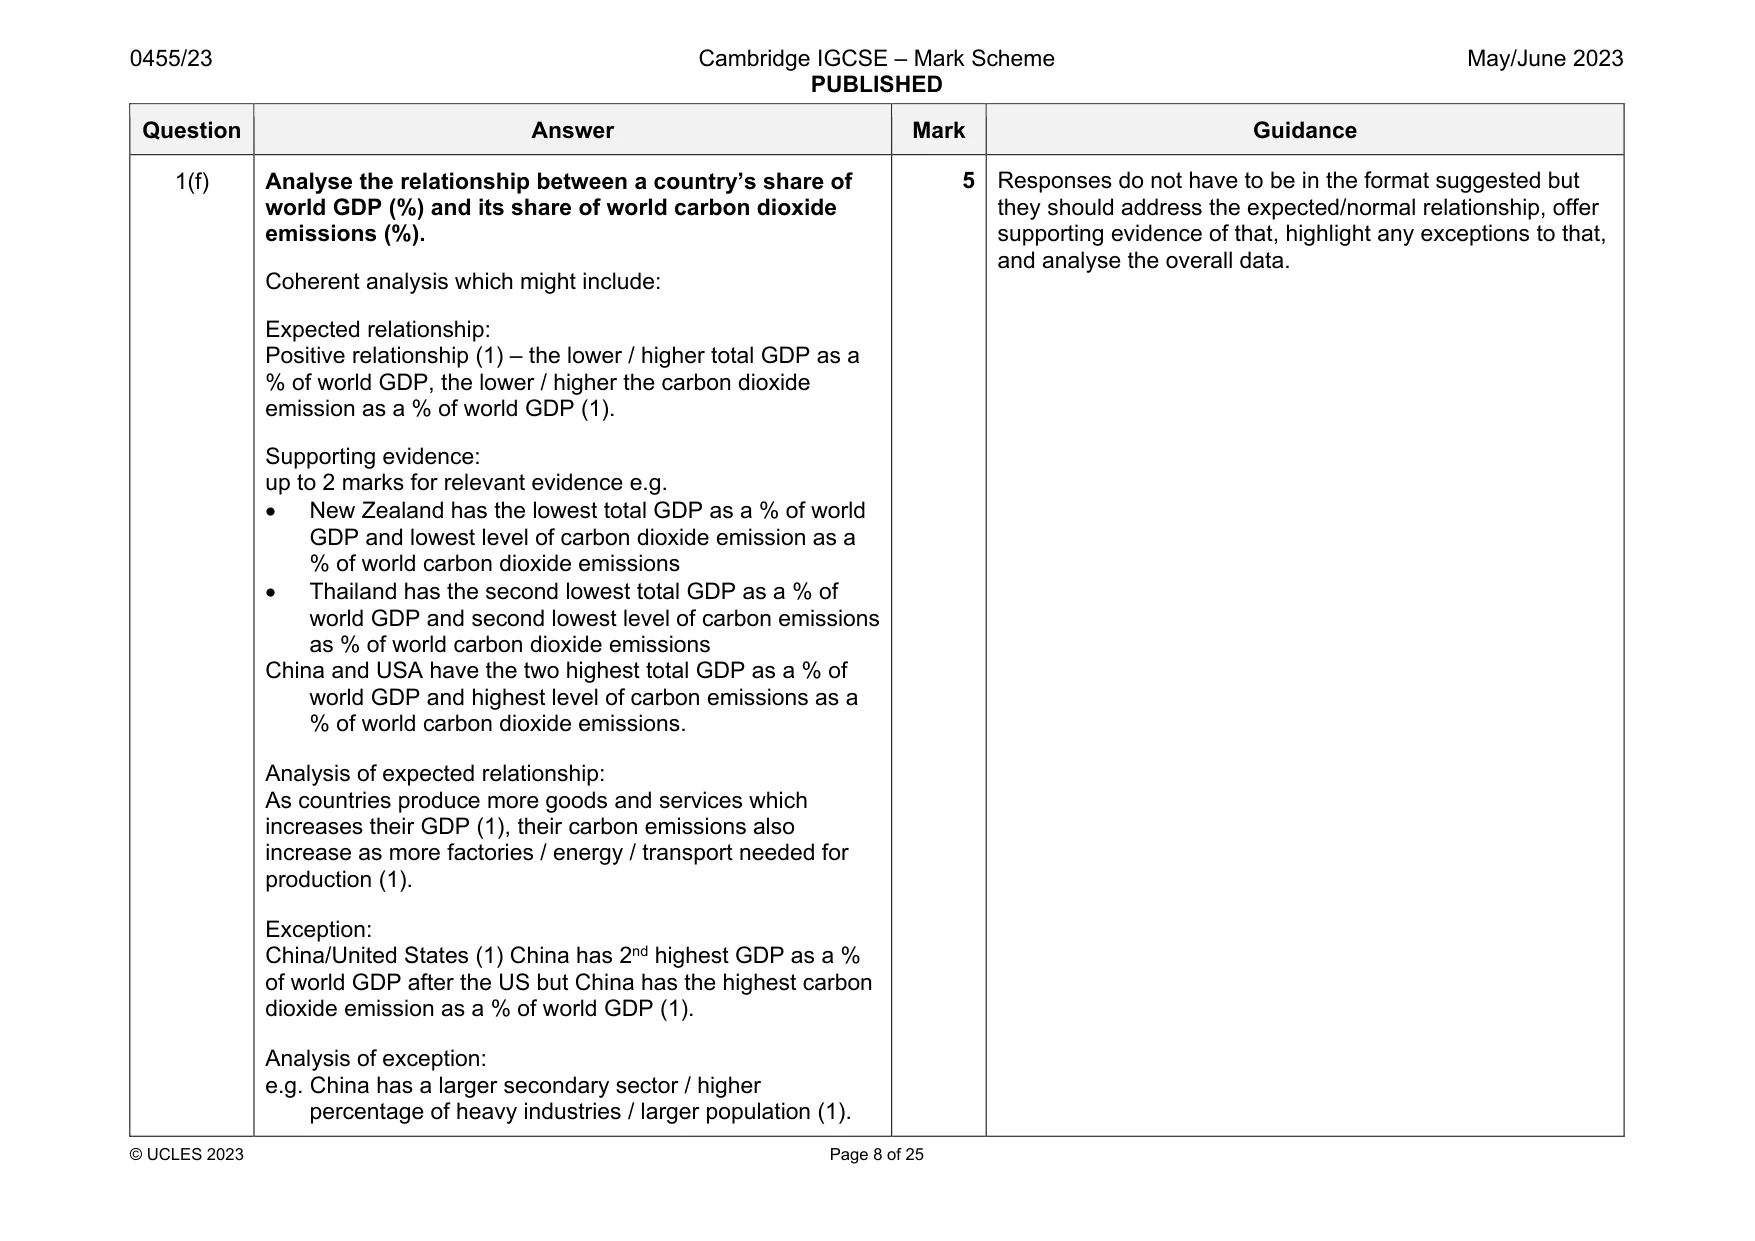
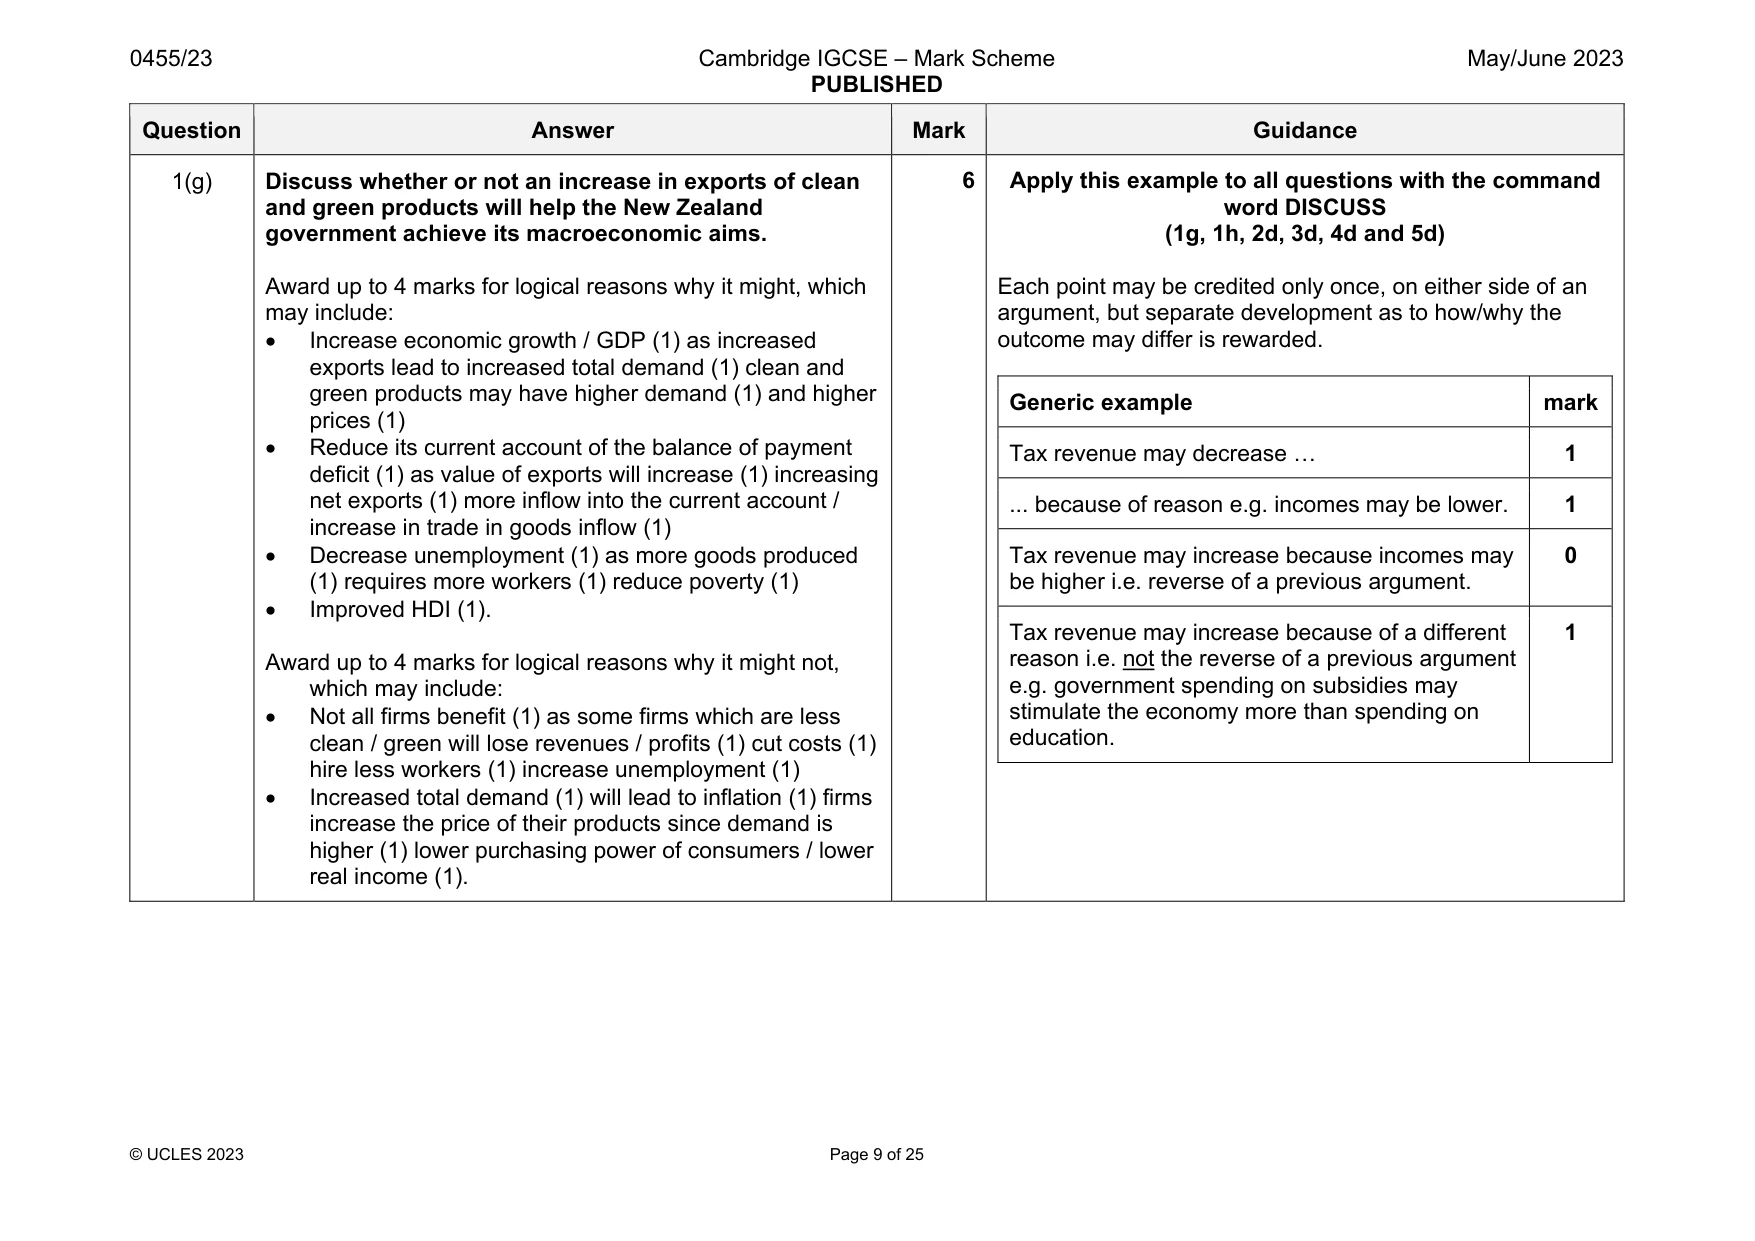
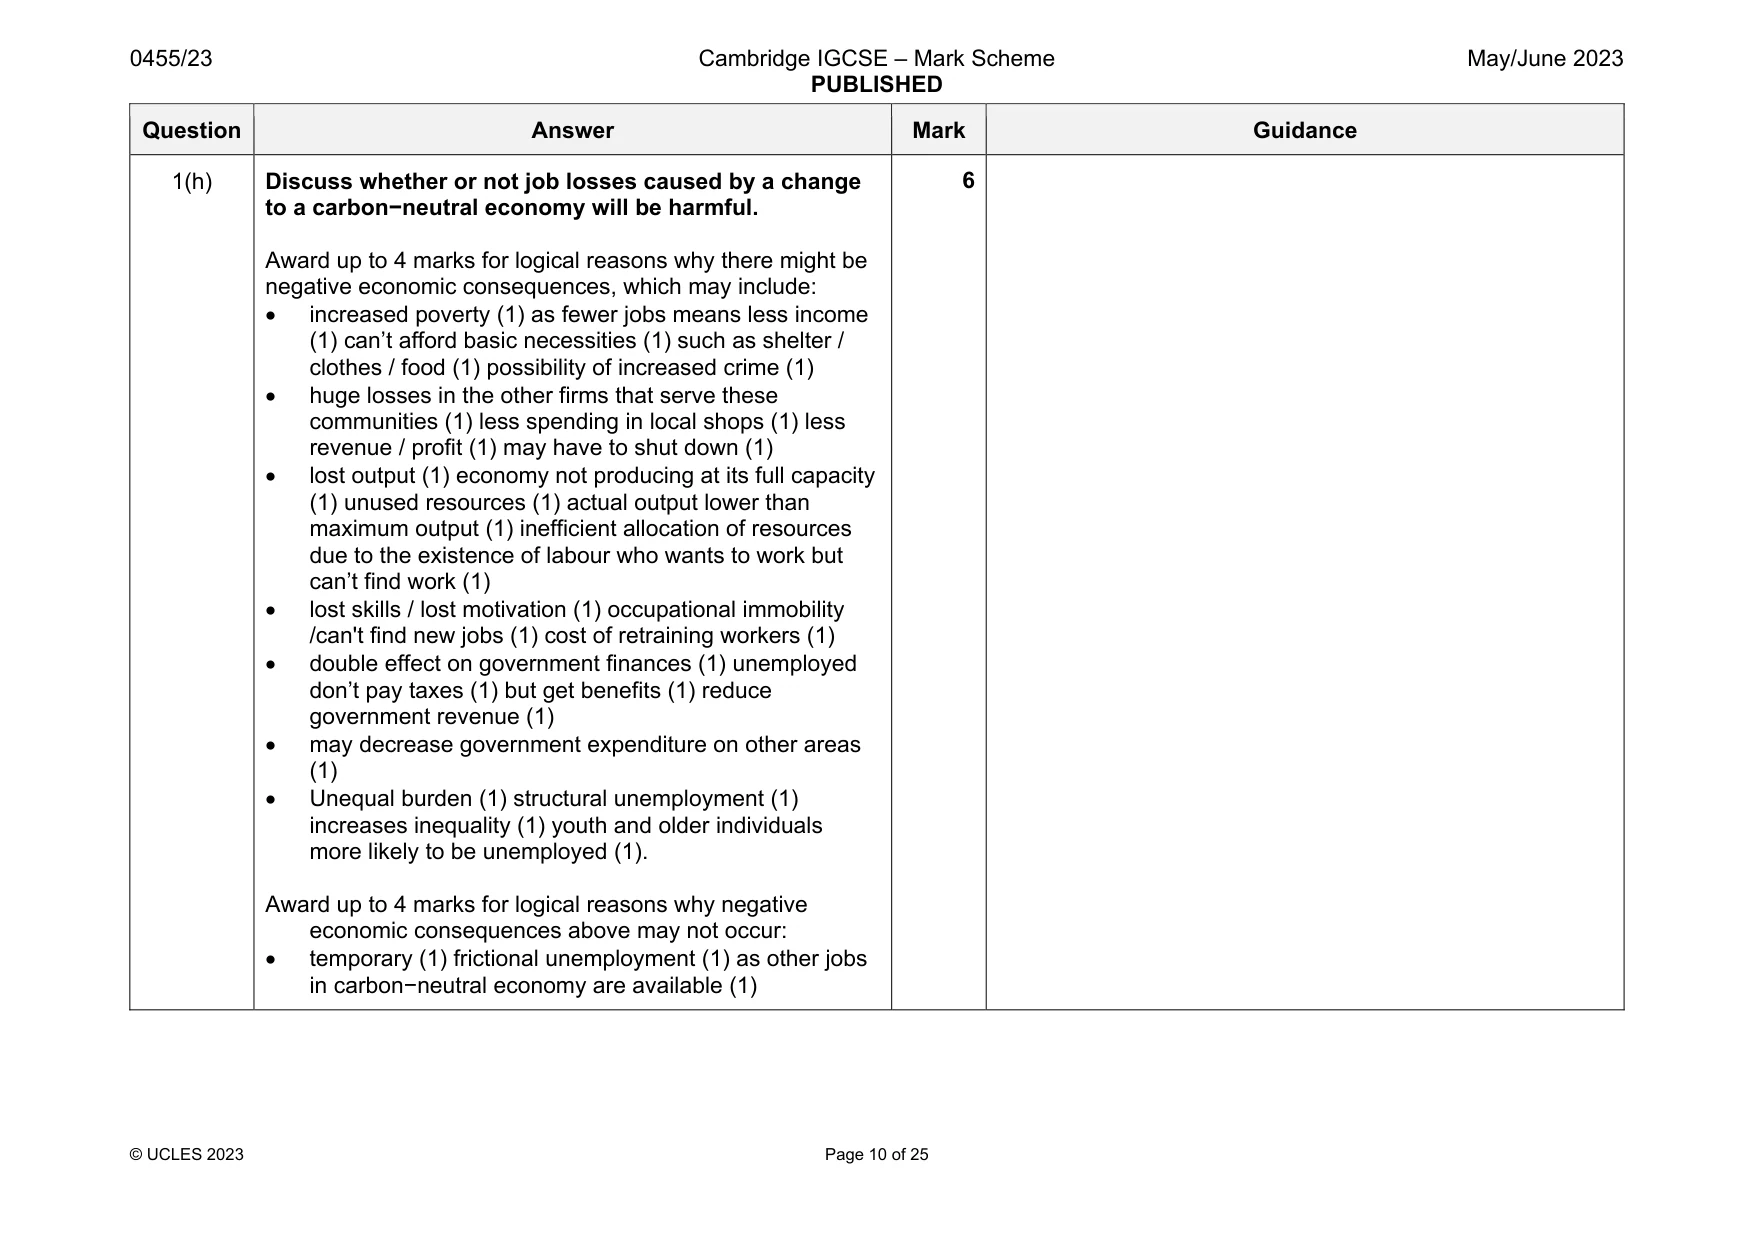
Mark scheme: 1(a) Calculate New Zealand’s GDP per head in 2020. $39 000 (1) 1 Accept the correct figure without the $ sign. 1(b) Identify two external costs arising from the milk and car industries. Air pollution (1). Damages the environment (where wild animals live) (1). 2 If more than two costs given, consider the first three. 1(c) Explain the impact on a cow farmer’s profits if they are unable to find a different source of revenue. Profit is revenue minus costs (1) Profits will fall (1) due to reduction in quantity sold / decrease in supply (1). Less revenue (1) less income for farmers (1) farmers may become unemployed (1). 2 1(d) Explain the two plans that the New Zealand government has to reduce external costs to the environment. Logical explanation which might include: End imports of petrol-powered cars by 2032 (1) decreasing the number of petrol−powered cars in New Zealand / reduce use of fossil fuels / by imposing an embargo/increasing the price of petrol-power cars / increasing usage of greener / electric cars (1). Limit the number of cows that each farmer can have (1) decreasing the amount of air pollution emitted by cows / less habitat damaged by cows / government fines to those who have more cows than permitted/ imposing regulations (1). 4 One mark each for each of two plans identified and one mark each for each of two explanations. Accept milk production for keeping cows. Question Answer Mark Guidance 1(e) Draw a demand and supply diagram, to show the effect of a cheaper substitute on the market for petrol- powered cars. Demand and supply diagram: Axes correctly labelled – price and quantity or P and Q (1). Original demand and supply curves correctly labelled (1). New demand curve shifted to the left (1). Equilibriums – shown by lines P1 and Q1 and P2 and Q2 or equilibrium points marked as E1 and E2 (1). 4 Question Answer Mark Guidance 1(f) Analyse the relationship between a country’s share of world GDP (%) and its share of world carbon dioxide emissions (%). Coherent analysis which might include: Expected relationship: Positive relationship (1) – the lower / higher total GDP as a % of world GDP, the lower / higher the carbon dioxide emission as a % of world GDP (1). Supporting evidence: up to 2 marks for relevant evidence e.g. New Zealand has the lowest total GDP as a % of world GDP and lowest level of carbon dioxide emission as a % of world carbon dioxide emissions Thailand has the second lowest total GDP as a % of world GDP and second lowest level of carbon emissions as % of world carbon dioxide emissions China and USA have the two highest total GDP as a % of world GDP and highest level of carbon emissions as a % of world carbon dioxide emissions. Analysis of expected relationship: As countries produce more goods and services which increases their GDP (1), their carbon emissions also increase as more factories / energy / transport needed for production (1). Exception: China/United States (1) China has 2nd highest GDP as a % of world GDP after the US but China has the highest carbon dioxide emission as a % of world GDP (1). Analysis of exception: e.g. China has a larger secondary sector / higher percentage of heavy industries / larger population (1). 5 Responses do not have to be in the format suggested but they should address the expected/normal relationship, offer supporting evidence of that, highlight any exceptions to that, and analyse the overall data. Question Answer Mark Guidance 1(g) Discuss whether or not an increase in exports of clean and green products will help the New Zealand government achieve its macroeconomic aims. Award up to 4 marks for logical reasons why it might, which may include: Increase economic growth / GDP (1) as increased exports lead to increased total demand (1) clean and green products may have higher demand (1) and higher prices (1) Reduce its current account of the balance of payment deficit (1) as value of exports will increase (1) increasing net exports (1) more inflow into the current account / increase in trade in goods inflow (1) Decrease unemployment (1) as more goods produced (1) requires more workers (1) reduce poverty (1) Improved HDI (1). Award up to 4 marks for logical reasons why it might not, which may include: Not all firms benefit (1) as some firms which are less clean / green will lose revenues / profits (1) cut costs (1) hire less workers (1) increase unemployment (1) Increased total demand (1) will lead to inflation (1) firms increase the price of their products since demand is higher (1) lower purchasing power of consumers / lower real income (1). 6 Apply this example to all questions with the command word DISCUSS (1g, 1h, 2d, 3d, 4d and 5d) Each point may be credited only once, on either side of an argument, but separate development as to how/why the outcome may differ is rewarded. Generic example mark Tax revenue may decrease … 1 ... because of reason e.g. incomes may be lower. 1 Tax revenue may increase because incomes may be higher i.e. reverse of a previous argument. 0 Tax revenue may increase because of a different reason i.e. not the reverse of a previous argument e.g. government spending on subsidies may stimulate the economy more than spending on education. 1 Question Answer Mark Guidance 1(h) Discuss whether or not job losses caused by a change to a carbon−neutral economy will be harmful. Award up to 4 marks for logical reasons why there might be negative economic consequences, which may include: increased poverty (1) as fewer jobs means less income (1) can’t afford basic necessities (1) such as shelter / clothes / food (1) possibility of increased crime (1) huge losses in the other firms that serve these communities (1) less spending in local shops (1) less revenue / profit (1) may have to shut down (1) lost output (1) economy not producing at its full capacity (1) unused resources (1) actual output lower than maximum output (1) inefficient allocation of resources due to the existence of labour who wants to work but can’t find work (1) lost skills / lost motivation (1) occupational immobility /can't find new jobs (1) cost of retraining workers (1) double effect on government finances (1) unemployed don’t pay taxes (1) but get benefits (1) reduce government revenue (1) may decrease government expenditure on other areas (1) Unequal burden (1) structural unemployment (1) increases inequality (1) youth and older individuals more likely to be unemployed (1). Award up to 4 marks for logical reasons why negative economic consequences above may not occur: temporary (1) frictional unemployment (1) as other jobs in carbon−neutral economy are available (1) 6 Question Answer Mark Guidance 1(h) an economy with a high mobility of factors of production could avoid such problems (1) workers can move to other industries (1) develop skills for jobs in the carbon−neutral economy (1) if education / training is provided (1). new jobs may be higher paid (1) boosting total demand (1) better air quality leads to better health (1) improving productivity (1) government spends less on health care (1) allowing more to be spent elsewhere e.g. on education and training (1).
Q2 · Liechtenstein is a high‑income economy in the middle of Europe
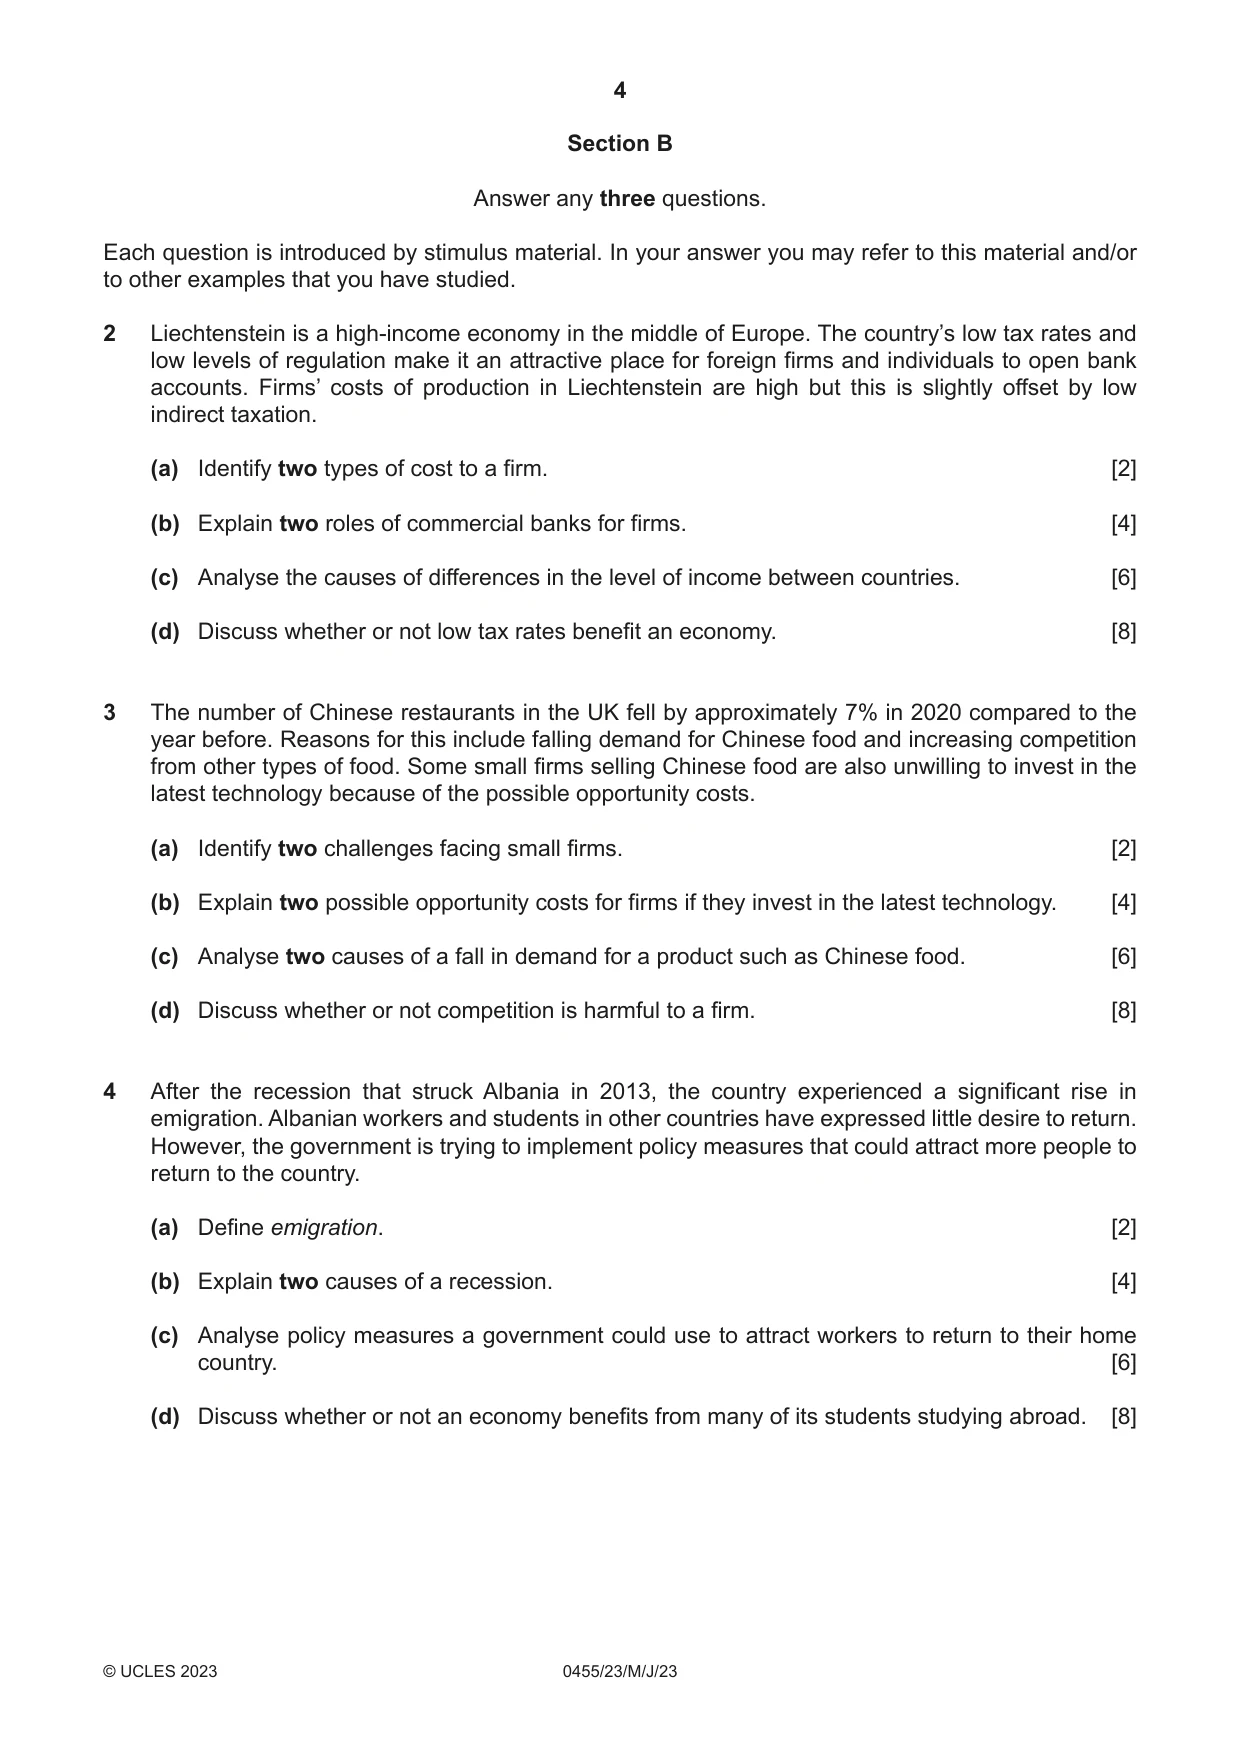
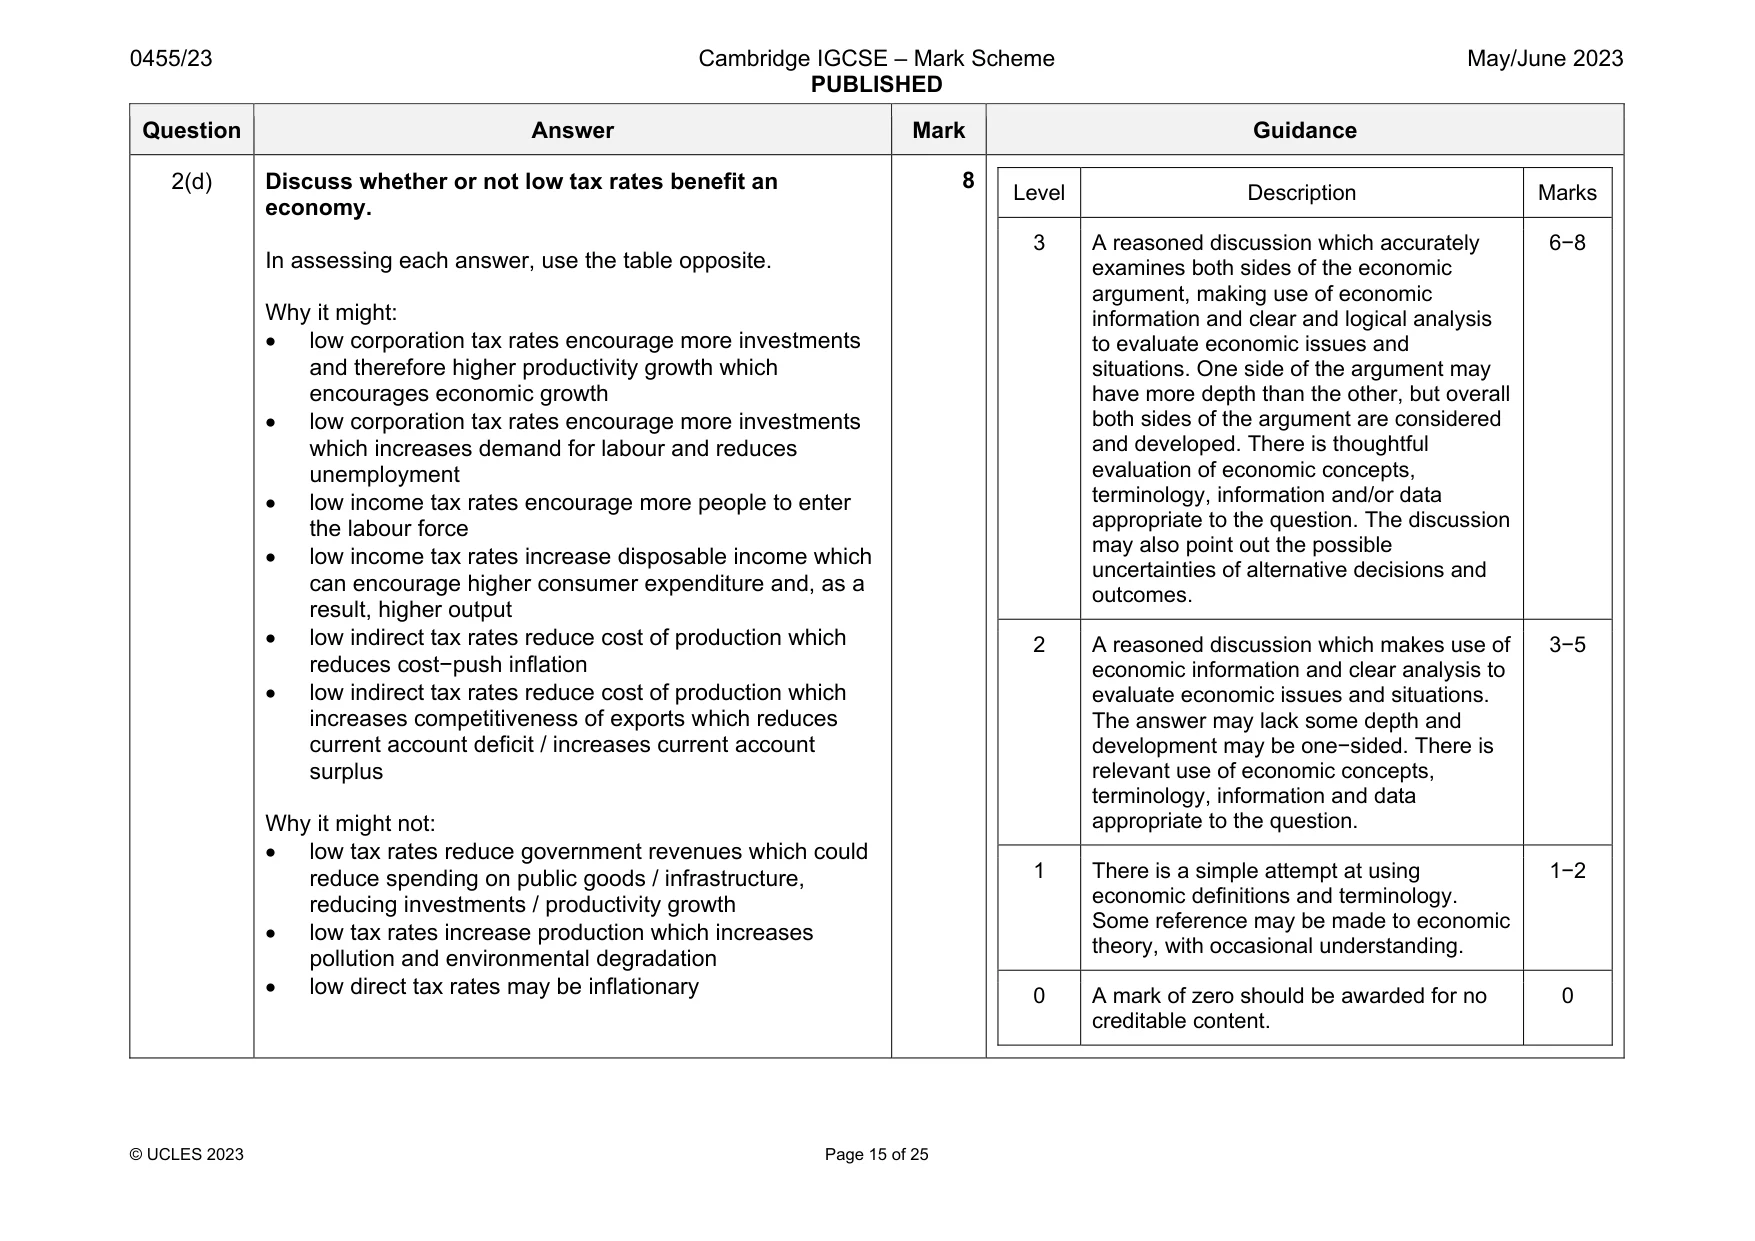
2 Liechtenstein is a high‑income economy in the middle of Europe. The country’s low tax rates and low levels of regulation make it an attractive place for foreign firms and individuals to open bank accounts. Firms’ costs of production in Liechtenstein are high but this is slightly offset by low indirect taxation. (a) Identify two types of cost to a firm. [2] (b) Explain two roles of commercial banks for firms. [4] (c) Analyse the causes of differences in the level of income between countries. [6] (d) Discuss whether or not low tax rates benefit an economy. [8]
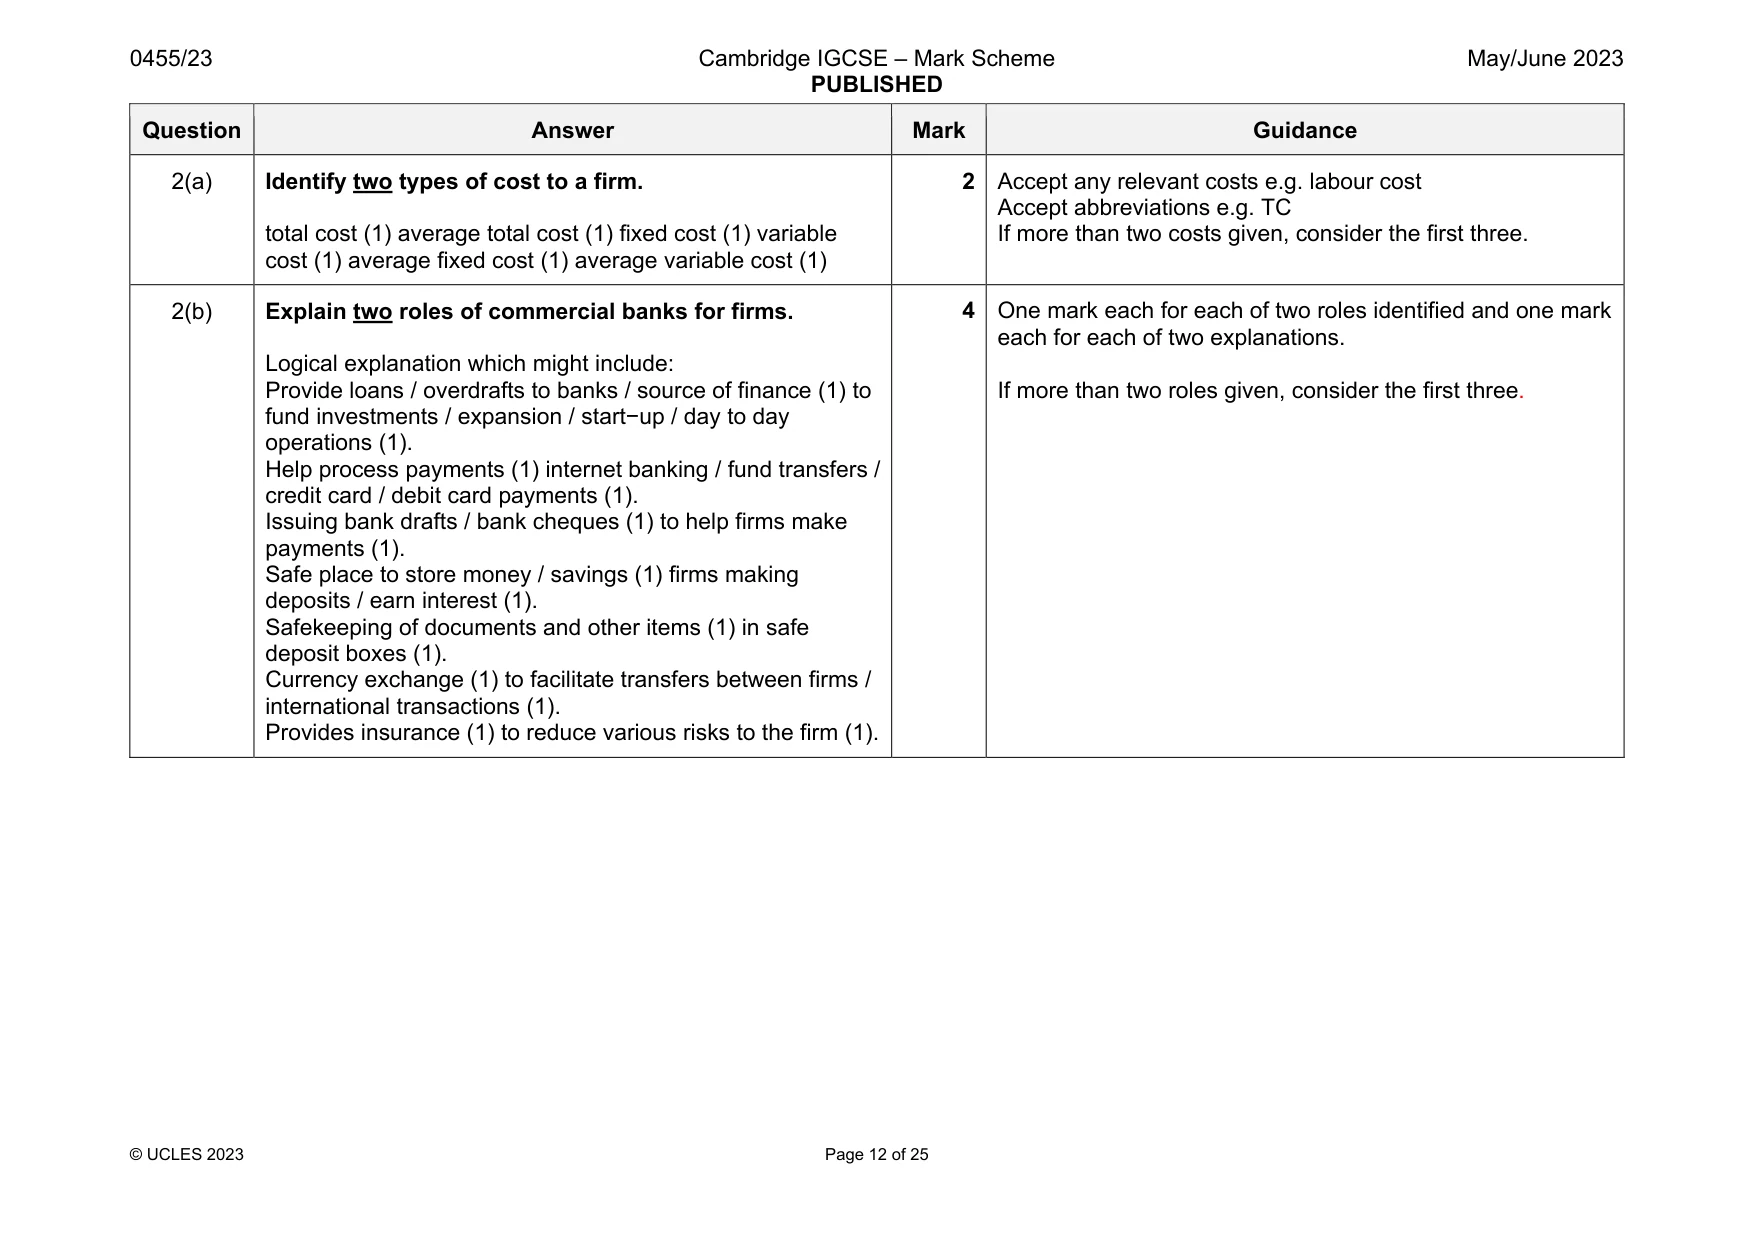
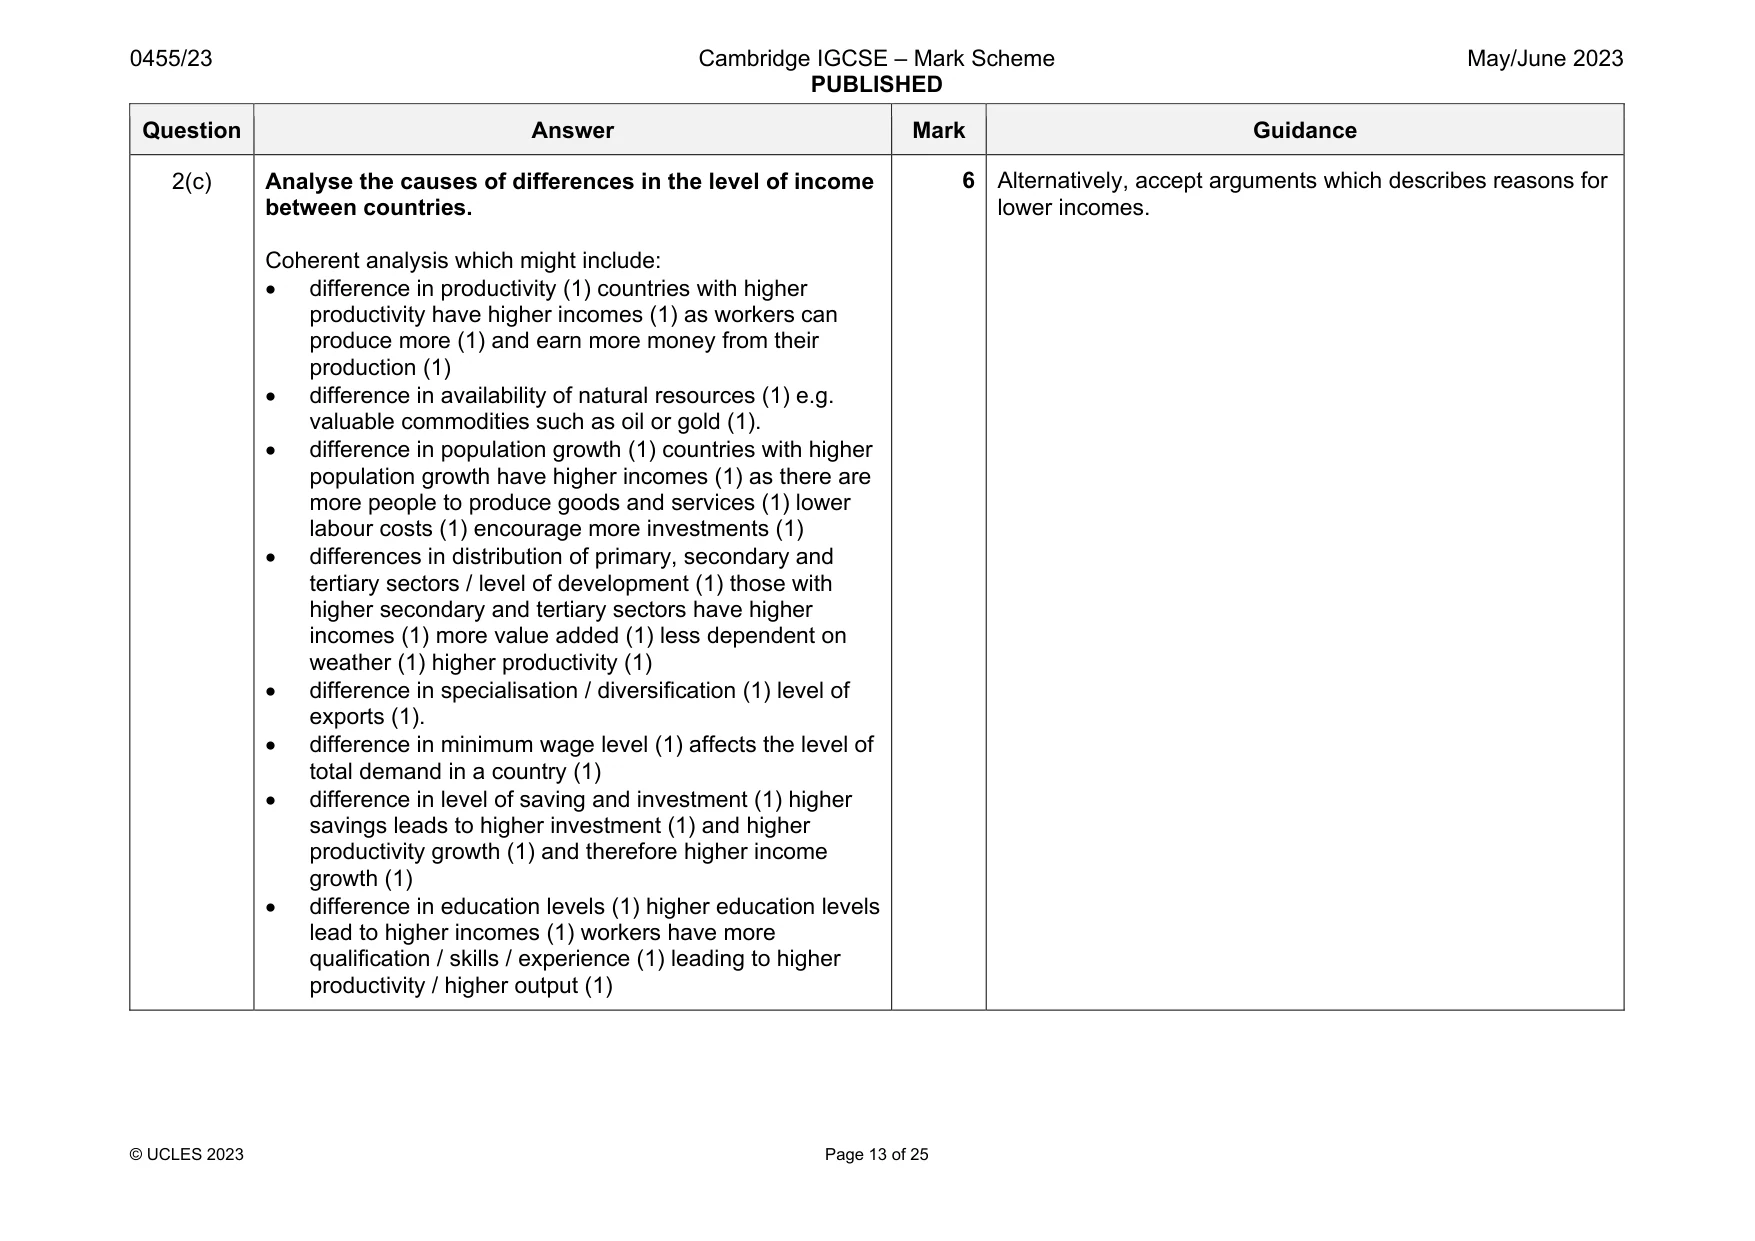
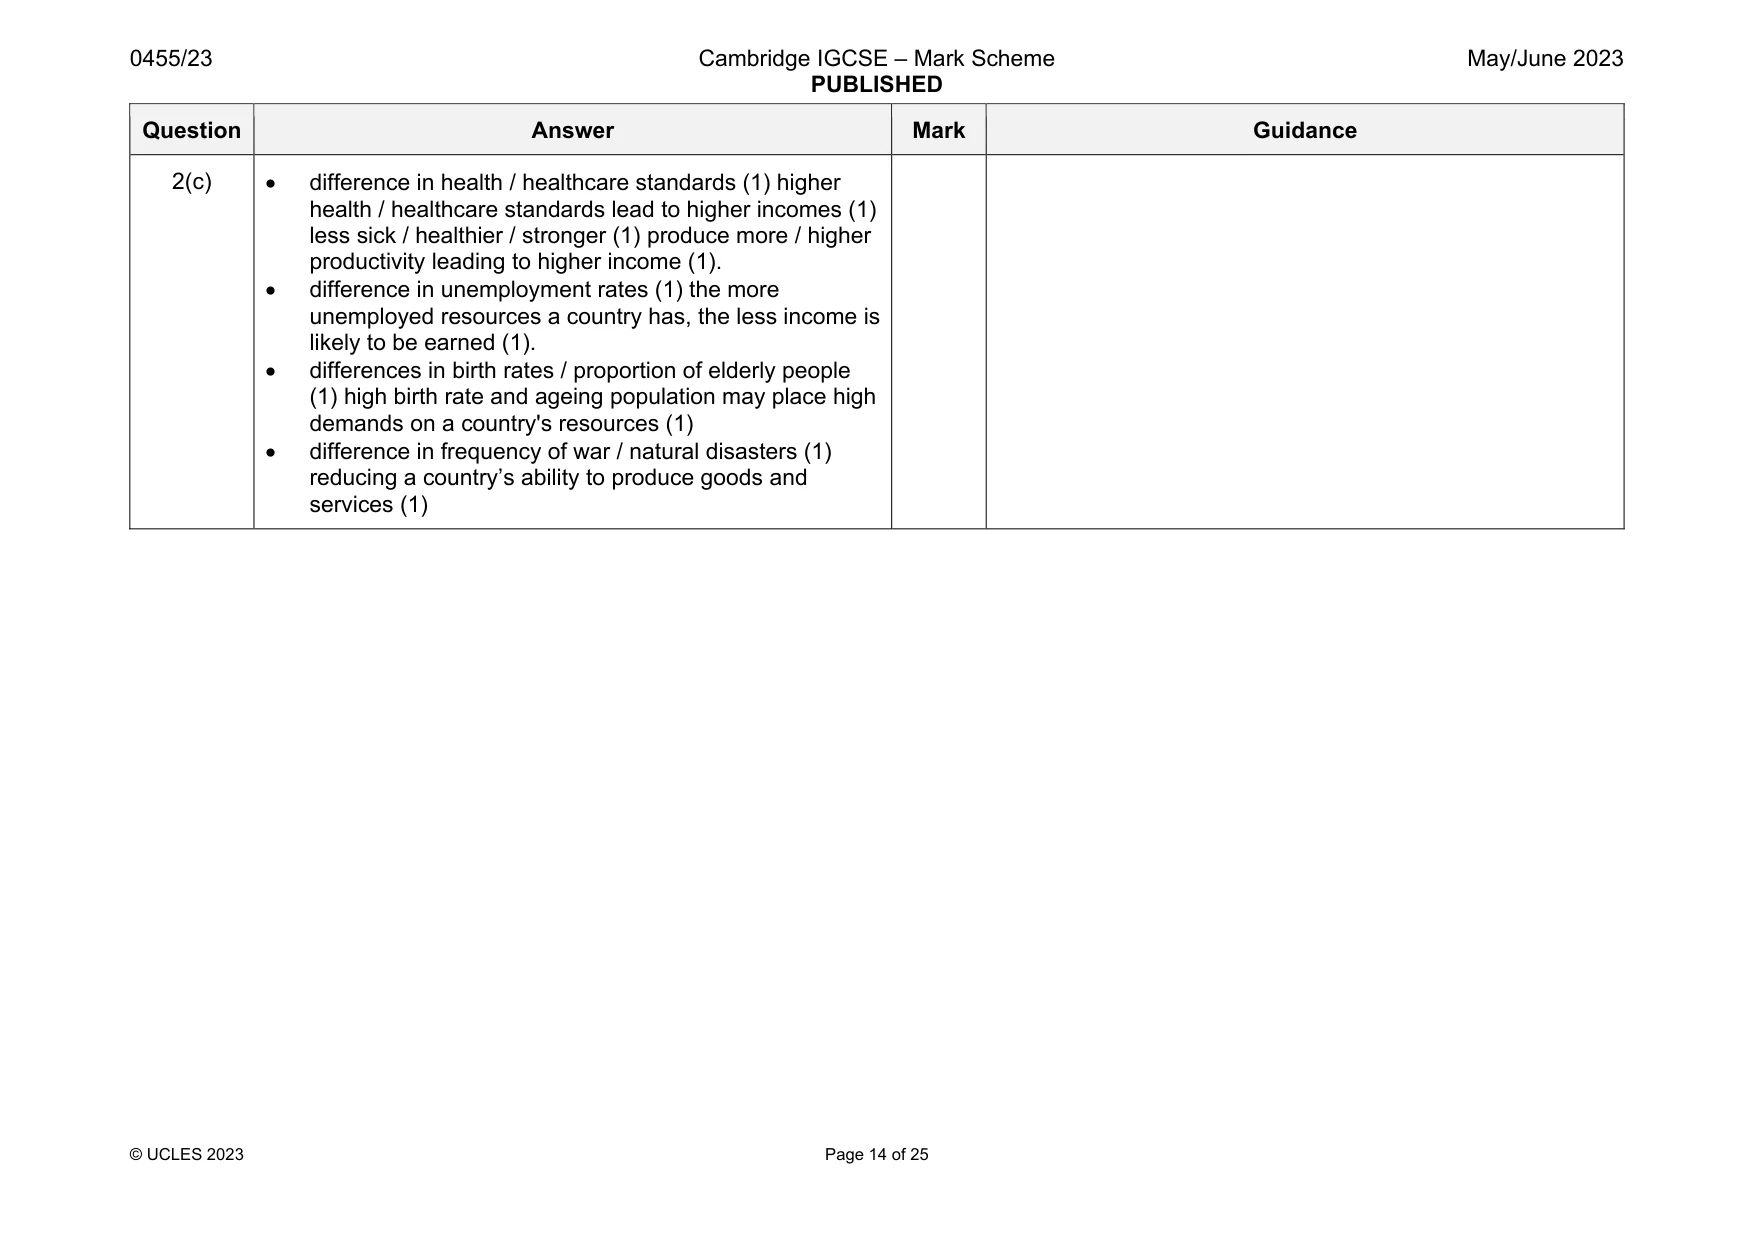
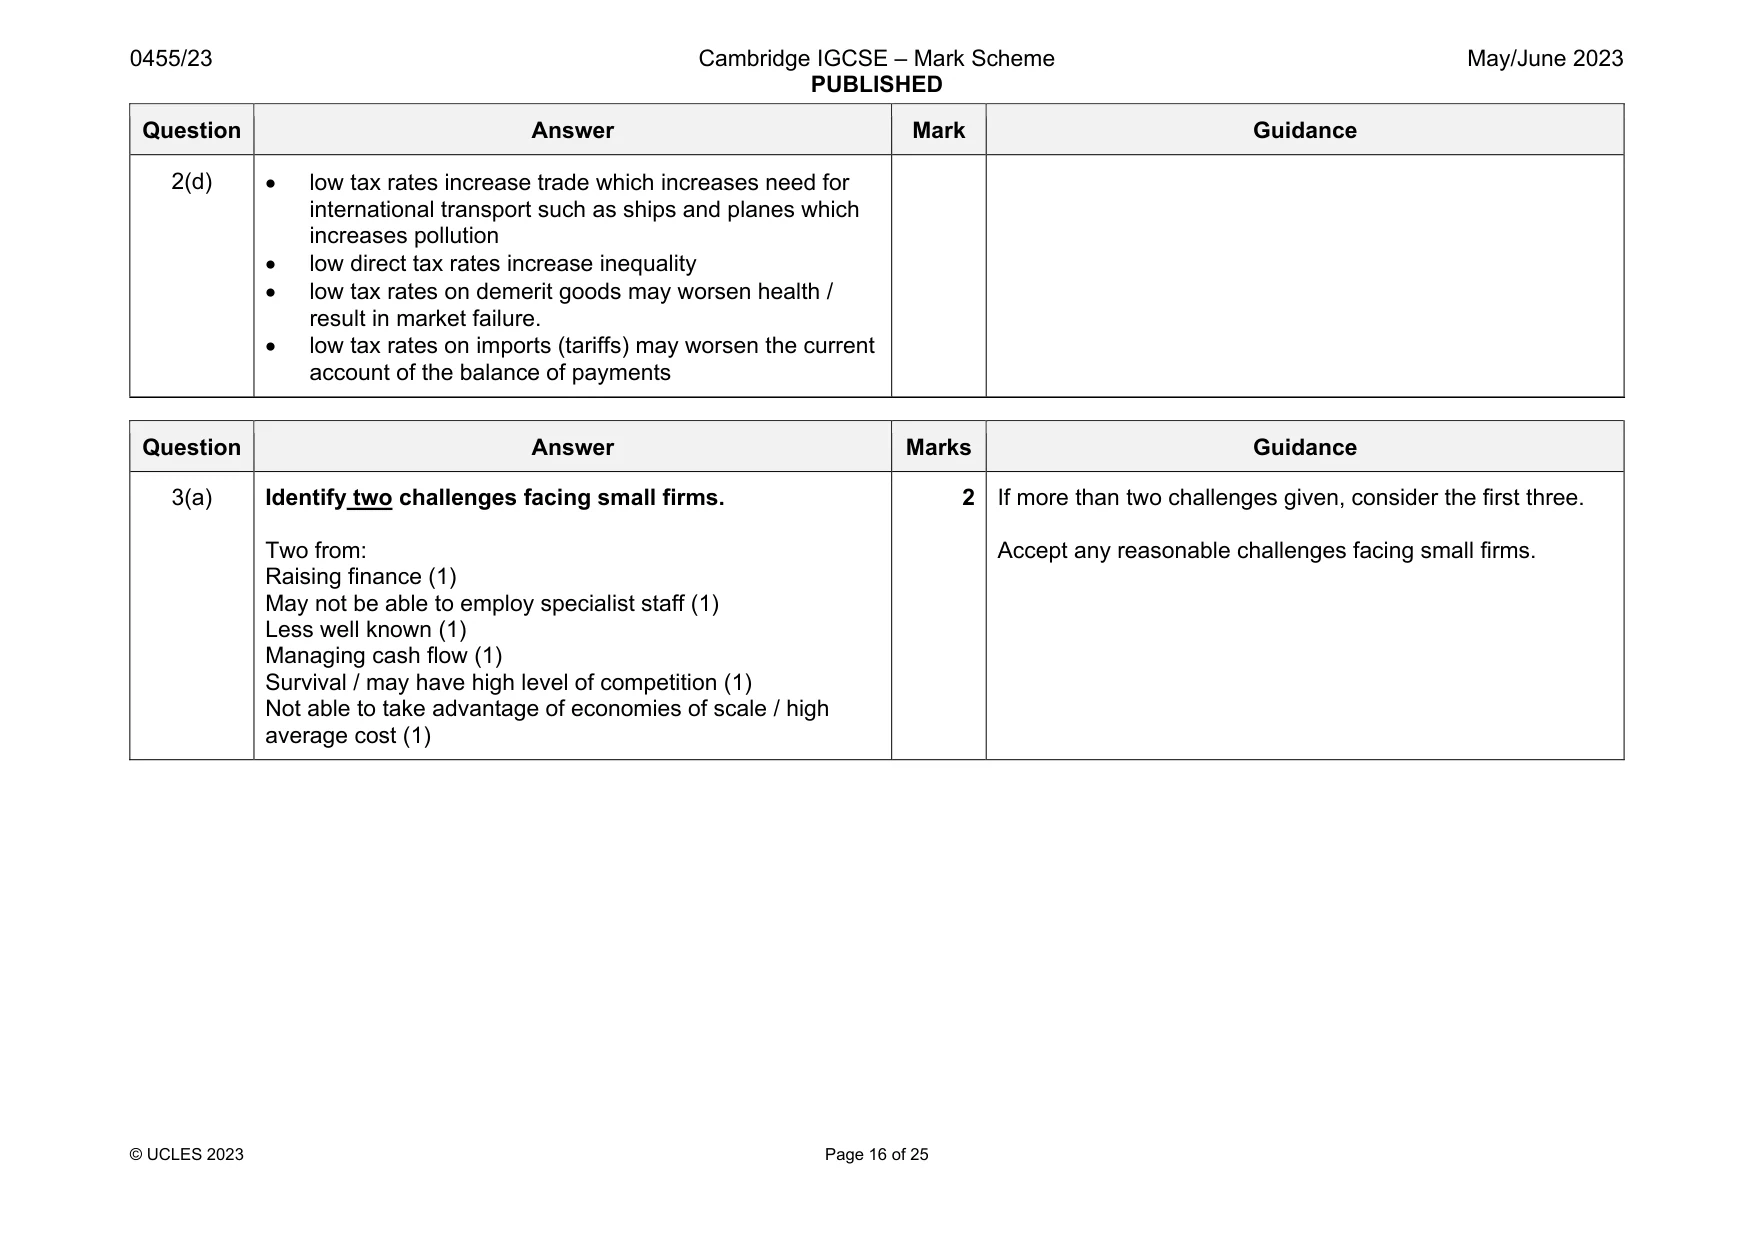
Mark scheme: 2(a) Identify two types of cost to a firm. total cost (1) average total cost (1) fixed cost (1) variable cost (1) average fixed cost (1) average variable cost (1) 2 Accept any relevant costs e.g. labour cost Accept abbreviations e.g. TC If more than two costs given, consider the first three. 2(b) Explain two roles of commercial banks for firms. Logical explanation which might include: Provide loans / overdrafts to banks / source of finance (1) to fund investments / expansion / start−up / day to day operations (1). Help process payments (1) internet banking / fund transfers / credit card / debit card payments (1). Issuing bank drafts / bank cheques (1) to help firms make payments (1). Safe place to store money / savings (1) firms making deposits / earn interest (1). Safekeeping of documents and other items (1) in safe deposit boxes (1). Currency exchange (1) to facilitate transfers between firms / international transactions (1). Provides insurance (1) to reduce various risks to the firm (1). 4 One mark each for each of two roles identified and one mark each for each of two explanations. If more than two roles given, consider the first three. Question Answer Mark Guidance 2(c) Analyse the causes of differences in the level of income between countries. Coherent analysis which might include: difference in productivity (1) countries with higher productivity have higher incomes (1) as workers can produce more (1) and earn more money from their production (1) difference in availability of natural resources (1) e.g. valuable commodities such as oil or gold (1). difference in population growth (1) countries with higher population growth have higher incomes (1) as there are more people to produce goods and services (1) lower labour costs (1) encourage more investments (1) differences in distribution of primary, secondary and tertiary sectors / level of development (1) those with higher secondary and tertiary sectors have higher incomes (1) more value added (1) less dependent on weather (1) higher productivity (1) difference in specialisation / diversification (1) level of exports (1). difference in minimum wage level (1) affects the level of total demand in a country (1) difference in level of saving and investment (1) higher savings leads to higher investment (1) and higher productivity growth (1) and therefore higher income growth (1) difference in education levels (1) higher education levels lead to higher incomes (1) workers have more qualification / skills / experience (1) leading to higher productivity / higher output (1) 6 Alternatively, accept arguments which describes reasons for lower incomes. Question Answer Mark Guidance 2(c) difference in health / healthcare standards (1) higher health / healthcare standards lead to higher incomes (1) less sick / healthier / stronger (1) produce more / higher productivity leading to higher income (1). difference in unemployment rates (1) the more unemployed resources a country has, the less income is likely to be earned (1). differences in birth rates / proportion of elderly people (1) high birth rate and ageing population may place high demands on a country's resources (1) difference in frequency of war / natural disasters (1) reducing a country’s ability to produce goods and services (1) Question Answer Mark Guidance 2(d) Discuss whether or not low tax rates benefit an economy. In assessing each answer, use the table opposite. Why it might: low corporation tax rates encourage more investments and therefore higher productivity growth which encourages economic growth low corporation tax rates encourage more investments which increases demand for labour and reduces unemployment low income tax rates encourage more people to enter the labour force low income tax rates increase disposable income which can encourage higher consumer expenditure and, as a result, higher output low indirect tax rates reduce cost of production which reduces cost−push inflation low indirect tax rates reduce cost of production which increases competitiveness of exports which reduces current account deficit / increases current account surplus Why it might not: low tax rates reduce government revenues which could reduce spending on public goods / infrastructure, reducing investments / productivity growth low tax rates increase production which increases pollution and environmental degradation low direct tax rates may be inflationary 8 Level Description Marks 3 A reasoned discussion which accurately examines both sides of the economic argument, making use of economic information and clear and logical analysis to evaluate economic issues and situations. One side of the argument may have more depth than the other, but overall both sides of the argument are considered and developed. There is thoughtful evaluation of economic concepts, terminology, information and/or data appropriate to the question. The discussion may also point out the possible uncertainties of alternative decisions and outcomes. 6−8 2 A reasoned discussion which makes use of economic information and clear analysis to evaluate economic issues and situations. The answer may lack some depth and development may be one−sided. There is relevant use of economic concepts, terminology, information and data appropriate to the question. 3−5 1 There is a simple attempt at using economic definitions and terminology. Some reference may be made to economic theory, with occasional understanding. 1−2 0 A mark of zero should be awarded for no creditable content. 0 Question Answer Mark Guidance 2(d) low tax rates increase trade which increases need for international transport such as ships and planes which increases pollution low direct tax rates increase inequality low tax rates on demerit goods may worsen health / result in market failure. low tax rates on imports (tariffs) may worsen the current account of the balance of payments
Q3 · The number of Chinese restaurants in the UK fell by approximately 7% in 2020 compared to…
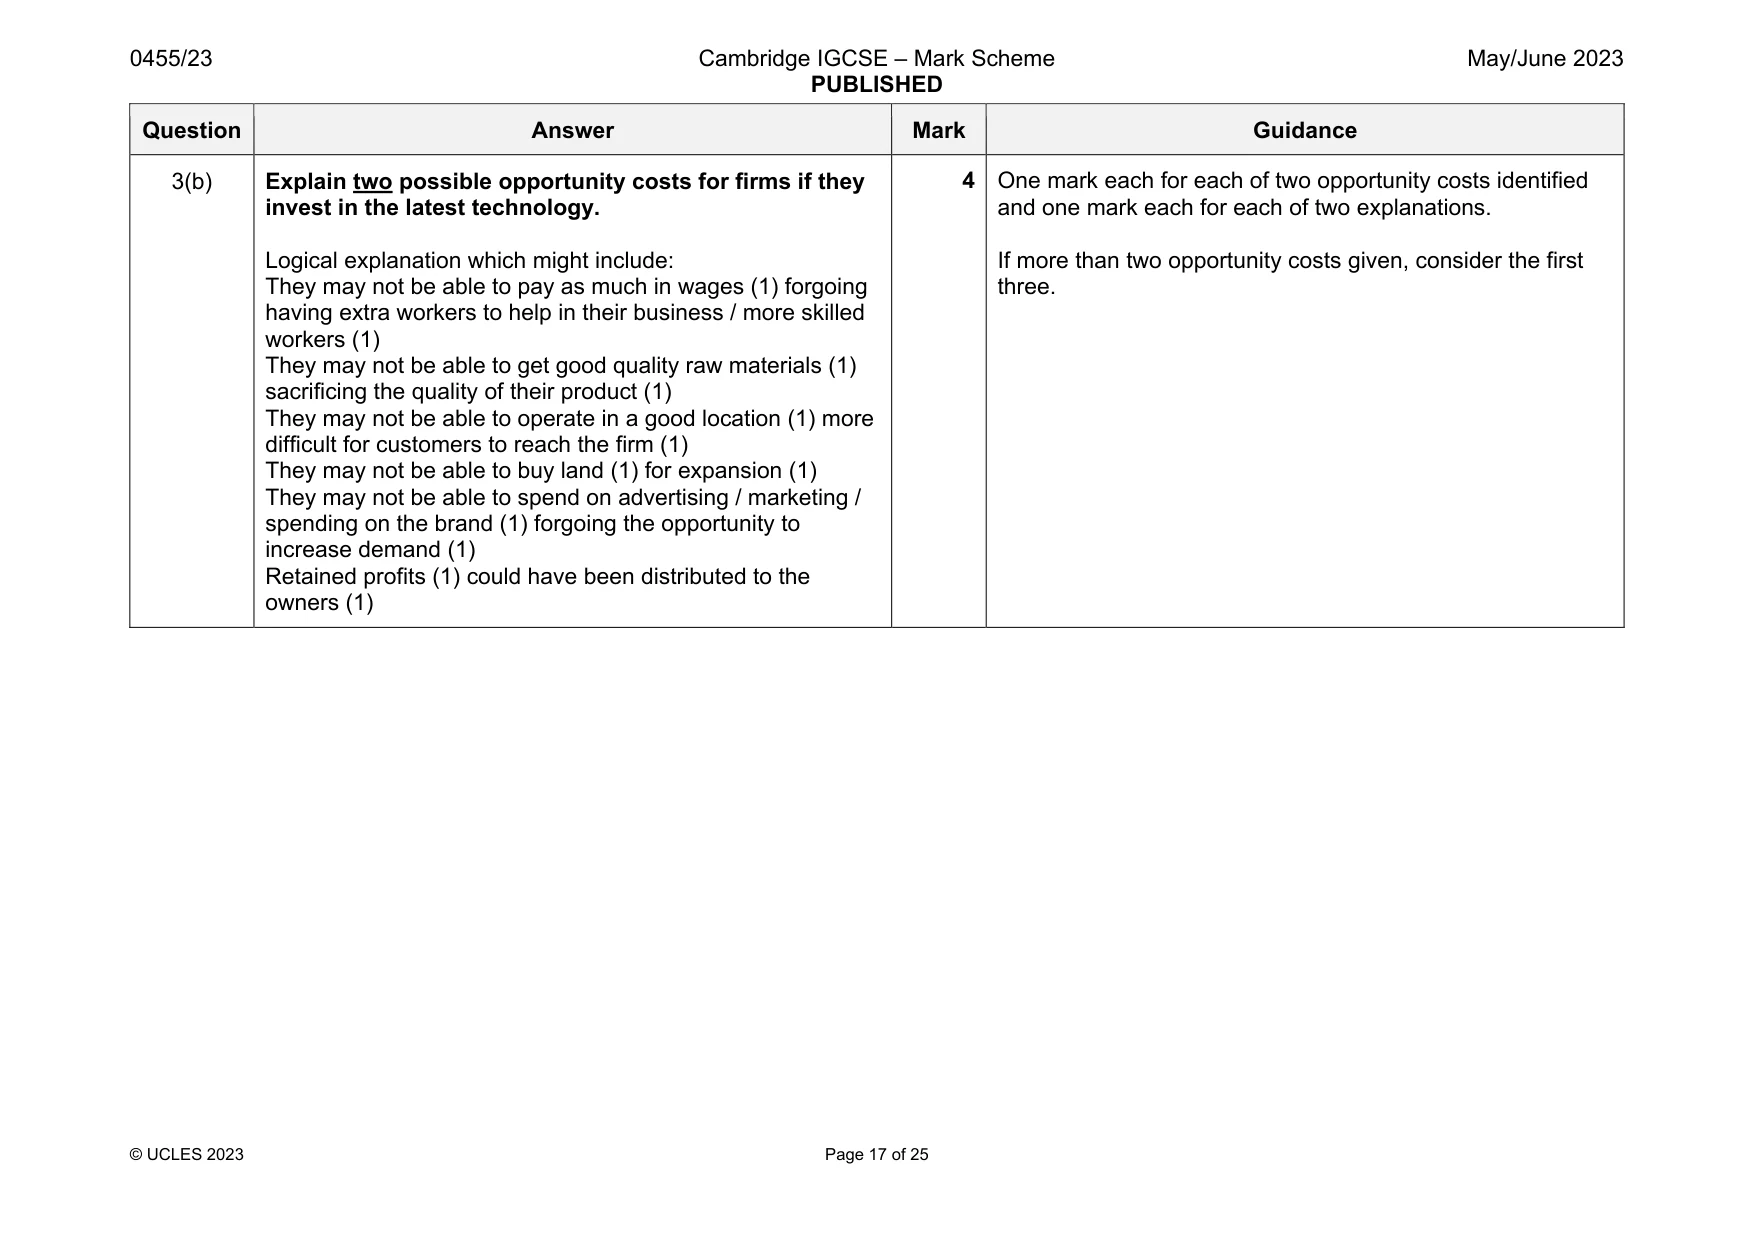
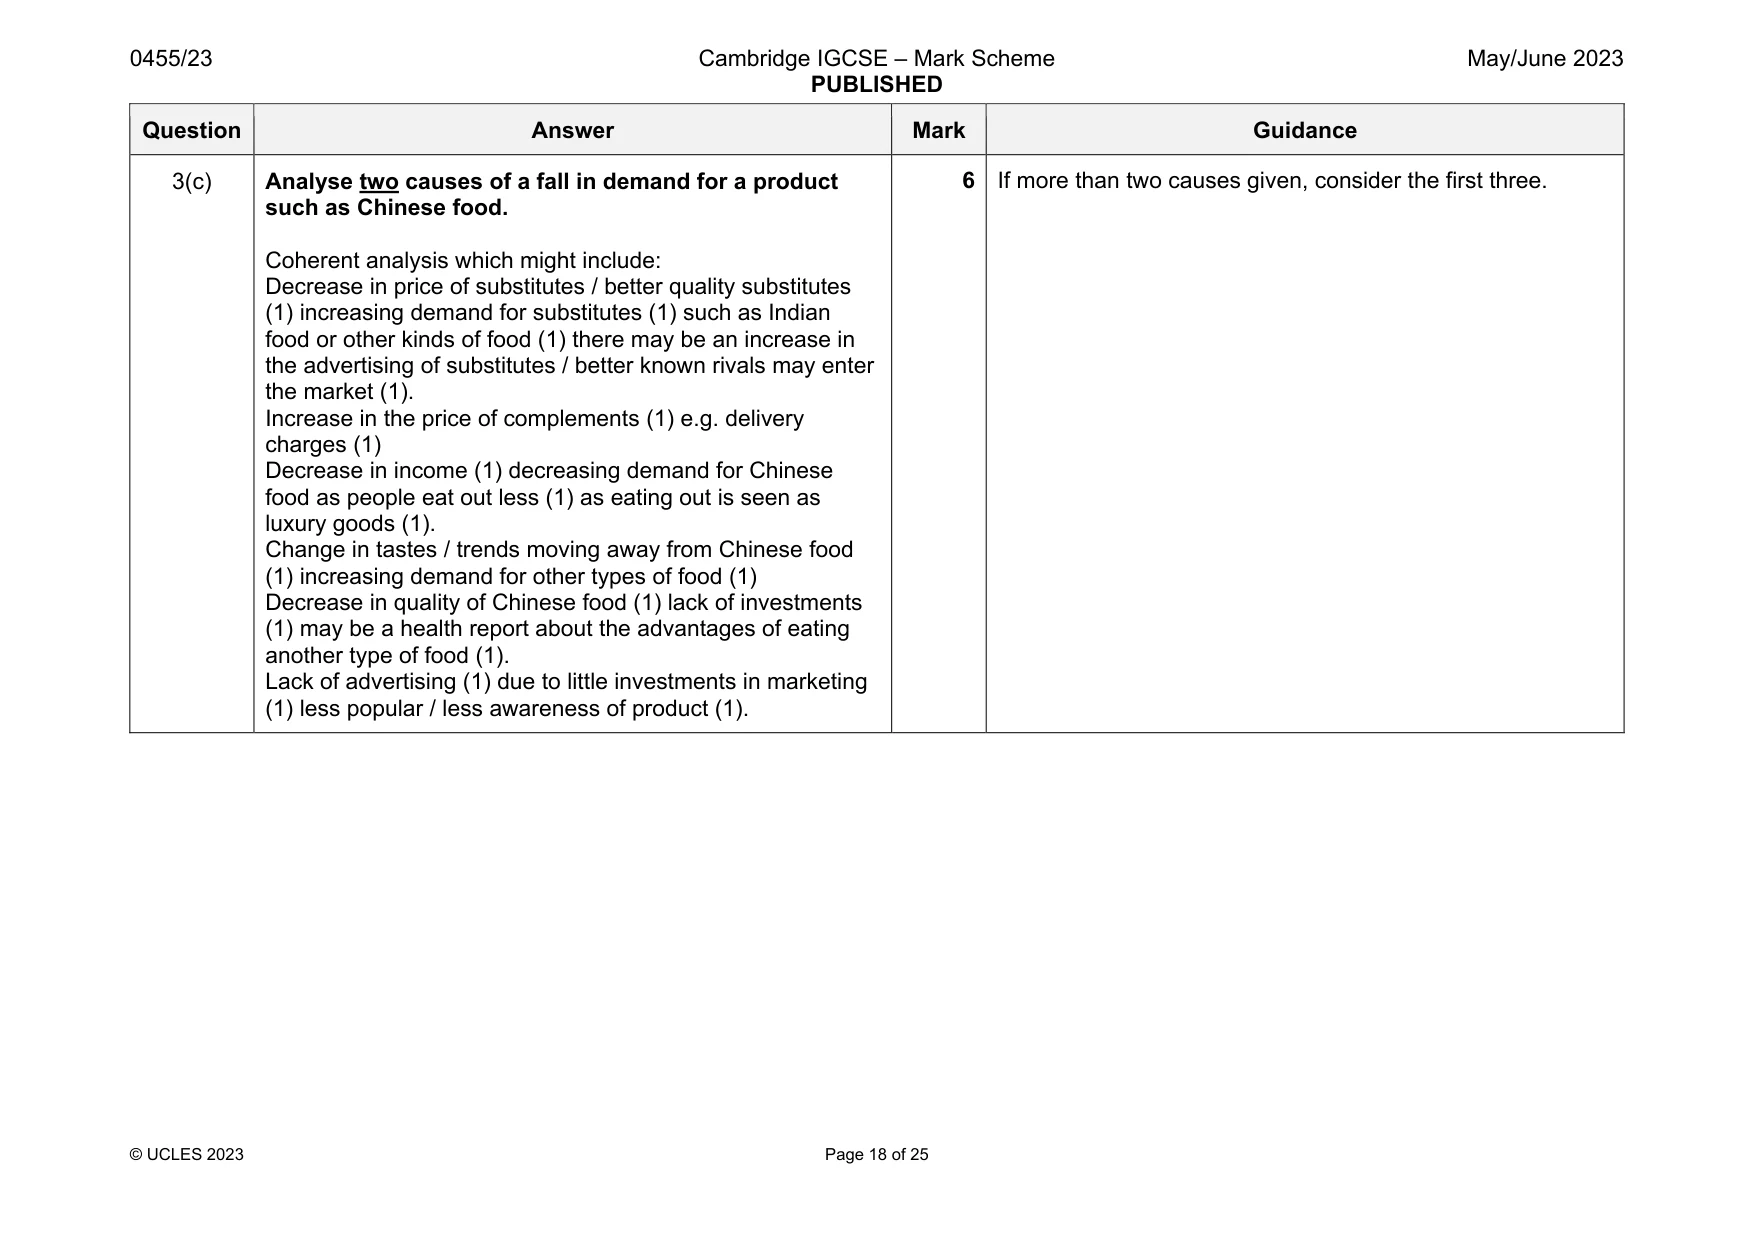
3 The number of Chinese restaurants in the UK fell by approximately 7% in 2020 compared to the year before. Reasons for this include falling demand for Chinese food and increasing competition from other types of food. Some small firms selling Chinese food are also unwilling to invest in the latest technology because of the possible opportunity costs. (a) Identify two challenges facing small firms. [2] (b) Explain two possible opportunity costs for firms if they invest in the latest technology. [4] (c) Analyse two causes of a fall in demand for a product such as Chinese food. [6] (d) Discuss whether or not competition is harmful to a firm. [8]
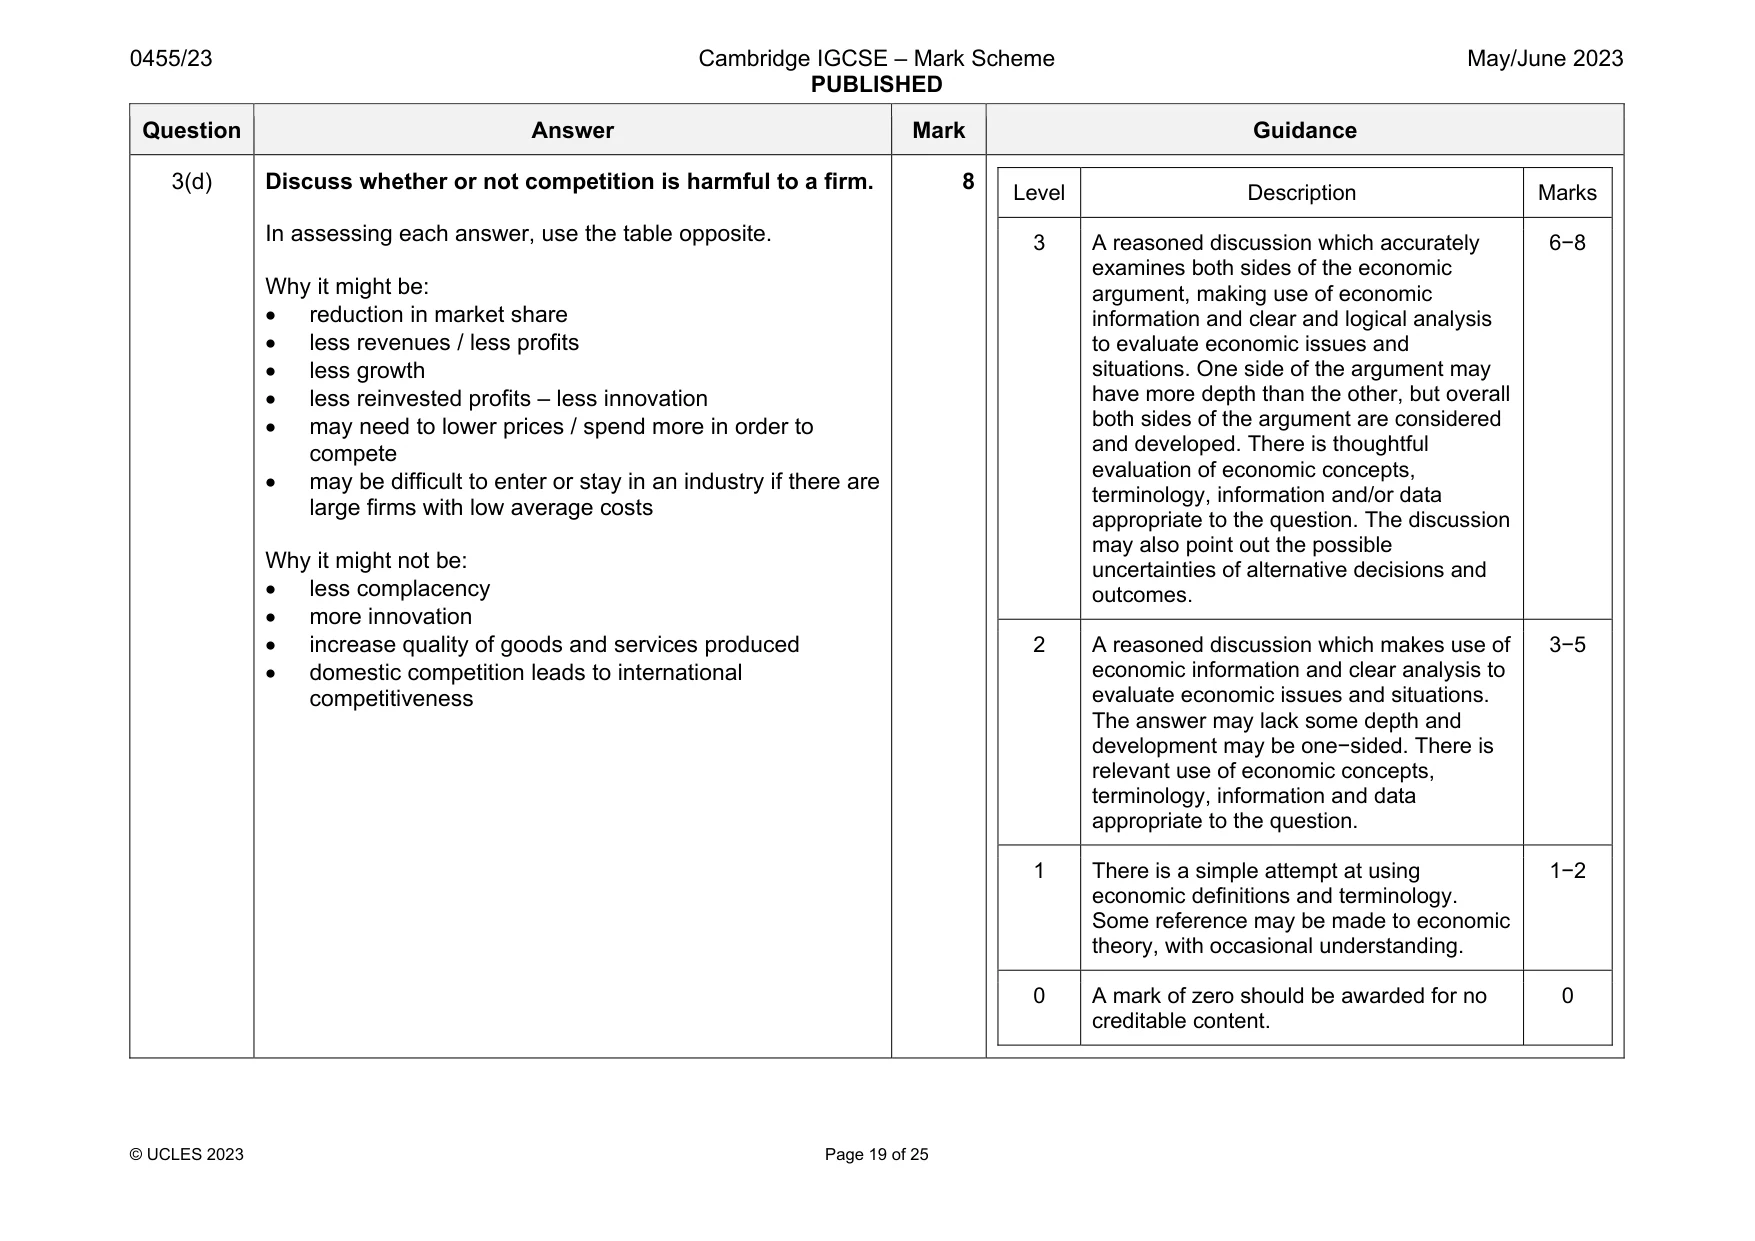
Mark scheme: 3(a) Identify two challenges facing small firms. Two from: Raising finance (1) May not be able to employ specialist staff (1) Less well known (1) Managing cash flow (1) Survival / may have high level of competition (1) Not able to take advantage of economies of scale / high average cost (1) Accept any reasonable challenges facing small firms. Question Answer Mark Guidance 3(b) Explain two possible opportunity costs for firms if they invest in the latest technology. Logical explanation which might include: They may not be able to pay as much in wages (1) forgoing having extra workers to help in their business / more skilled workers (1) They may not be able to get good quality raw materials (1) sacrificing the quality of their product (1) They may not be able to operate in a good location (1) more difficult for customers to reach the firm (1) They may not be able to buy land (1) for expansion (1) They may not be able to spend on advertising / marketing / spending on the brand (1) forgoing the opportunity to increase demand (1) Retained profits (1) could have been distributed to the owners (1) 4 One mark each for each of two opportunity costs identified and one mark each for each of two explanations. If more than two opportunity costs given, consider the first three. Question Answer Mark Guidance 3(c) Analyse two causes of a fall in demand for a product such as Chinese food. Coherent analysis which might include: Decrease in price of substitutes / better quality substitutes (1) increasing demand for substitutes (1) such as Indian food or other kinds of food (1) there may be an increase in the advertising of substitutes / better known rivals may enter the market (1). Increase in the price of complements (1) e.g. delivery charges (1) Decrease in income (1) decreasing demand for Chinese food as people eat out less (1) as eating out is seen as luxury goods (1). Change in tastes / trends moving away from Chinese food (1) increasing demand for other types of food (1) Decrease in quality of Chinese food (1) lack of investments (1) may be a health report about the advantages of eating another type of food (1). Lack of advertising (1) due to little investments in marketing (1) less popular / less awareness of product (1). 6 If more than two causes given, consider the first three. Question Answer Mark Guidance 3(d) Discuss whether or not competition is harmful to a firm. In assessing each answer, use the table opposite. Why it might be: reduction in market share less revenues / less profits less growth less reinvested profits – less innovation may need to lower prices / spend more in order to compete may be difficult to enter or stay in an industry if there are large firms with low average costs Why it might not be: less complacency more innovation increase quality of goods and services produced domestic competition leads to international competitiveness 8 Level Description Marks 3 A reasoned discussion which accurately examines both sides of the economic argument, making use of economic information and clear and logical analysis to evaluate economic issues and situations. One side of the argument may have more depth than the other, but overall both sides of the argument are considered and developed. There is thoughtful evaluation of economic concepts, terminology, information and/or data appropriate to the question. The discussion may also point out the possible uncertainties of alternative decisions and outcomes. 6−8 2 A reasoned discussion which makes use of economic information and clear analysis to evaluate economic issues and situations. The answer may lack some depth and development may be one−sided. There is relevant use of economic concepts, terminology, information and data appropriate to the question. 3−5 1 There is a simple attempt at using economic definitions and terminology. Some reference may be made to economic theory, with occasional understanding. 1−2 0 A mark of zero should be awarded for no creditable content. 0
Q4 · After the recession that struck Albania in 2013, the country experienced a significant…
4 After the recession that struck Albania in 2013, the country experienced a significant rise in emigration. Albanian workers and students in other countries have expressed little desire to return. However, the government is trying to implement policy measures that could attract more people to return to the country. (a) Define emigration. [2] (b) Explain two causes of a recession. [4] (c) Analyse policy measures a government could use to attract workers to return to their home country. [6] (d) Discuss whether or not an economy benefits from many of its students studying abroad. [8]
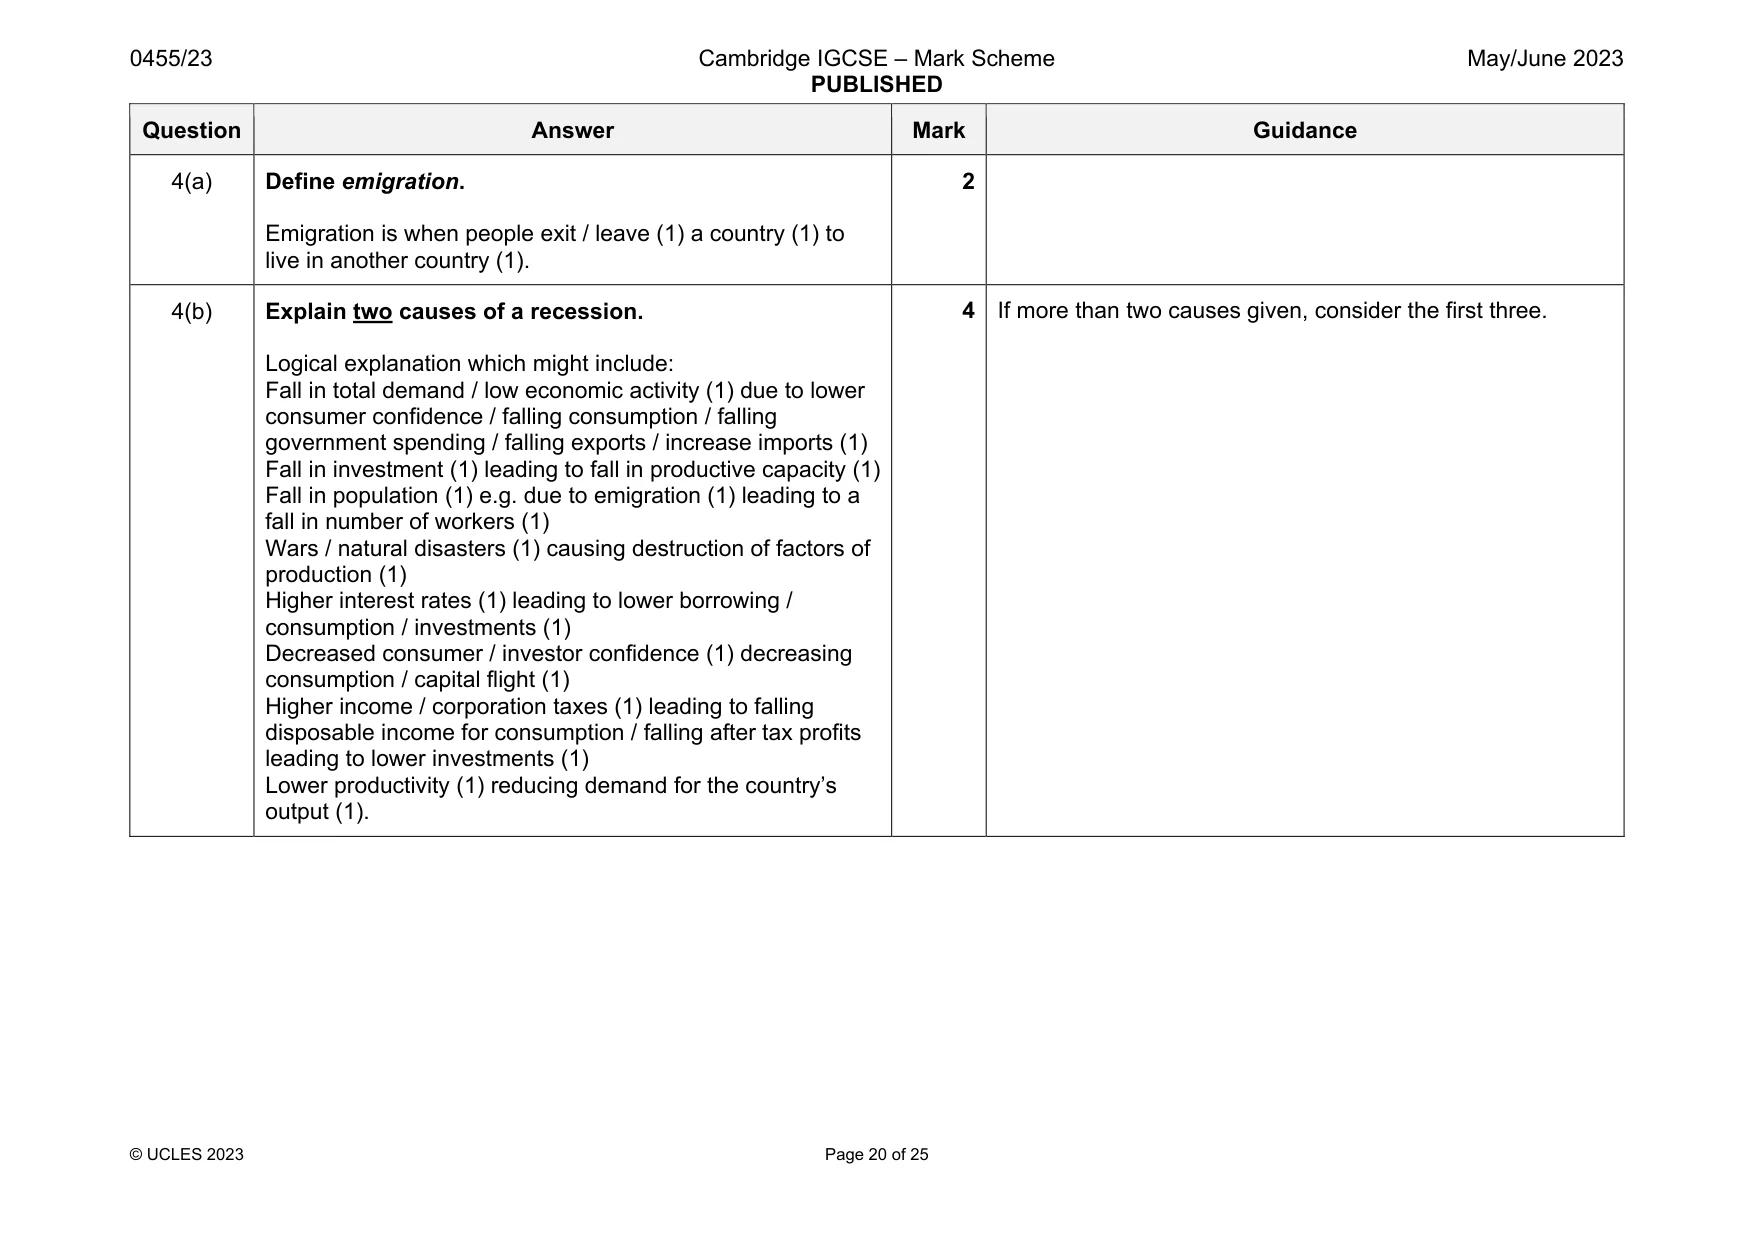
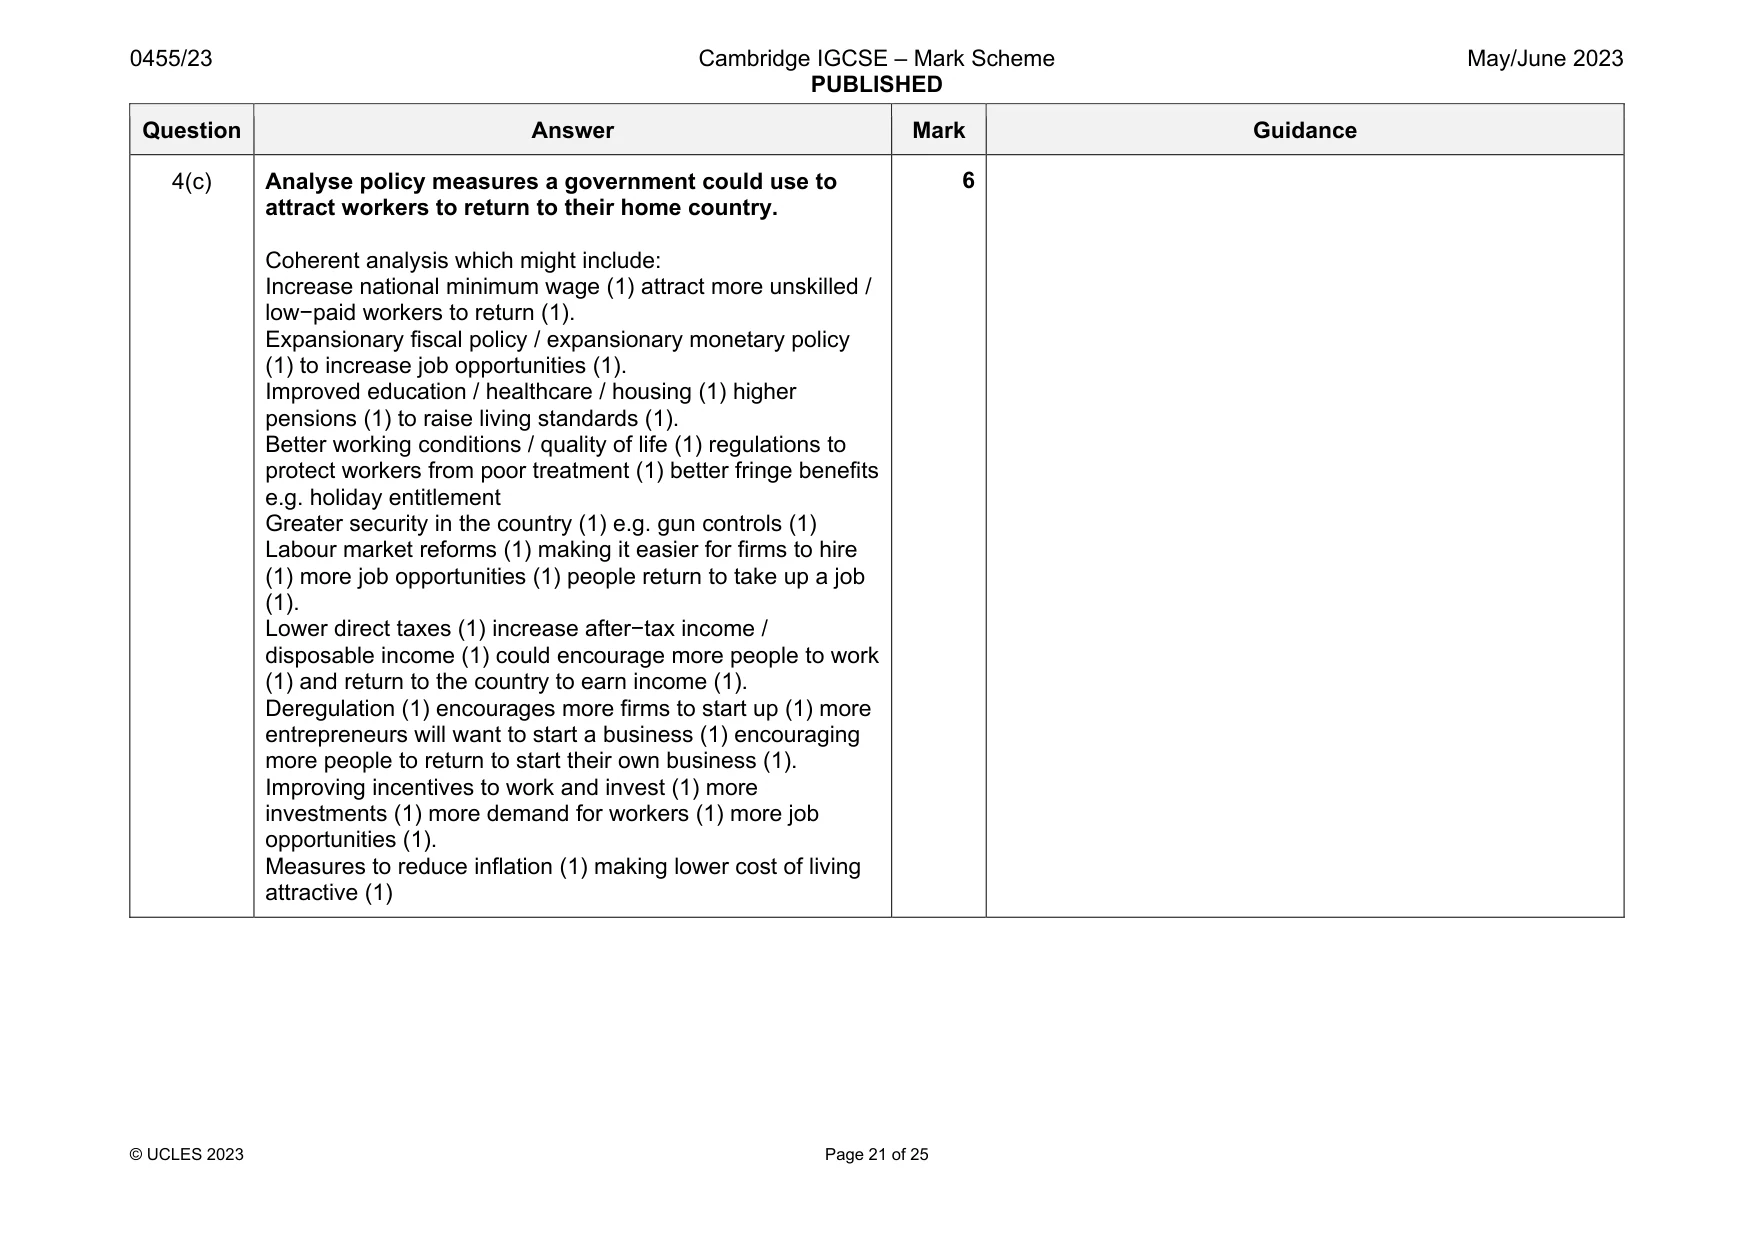
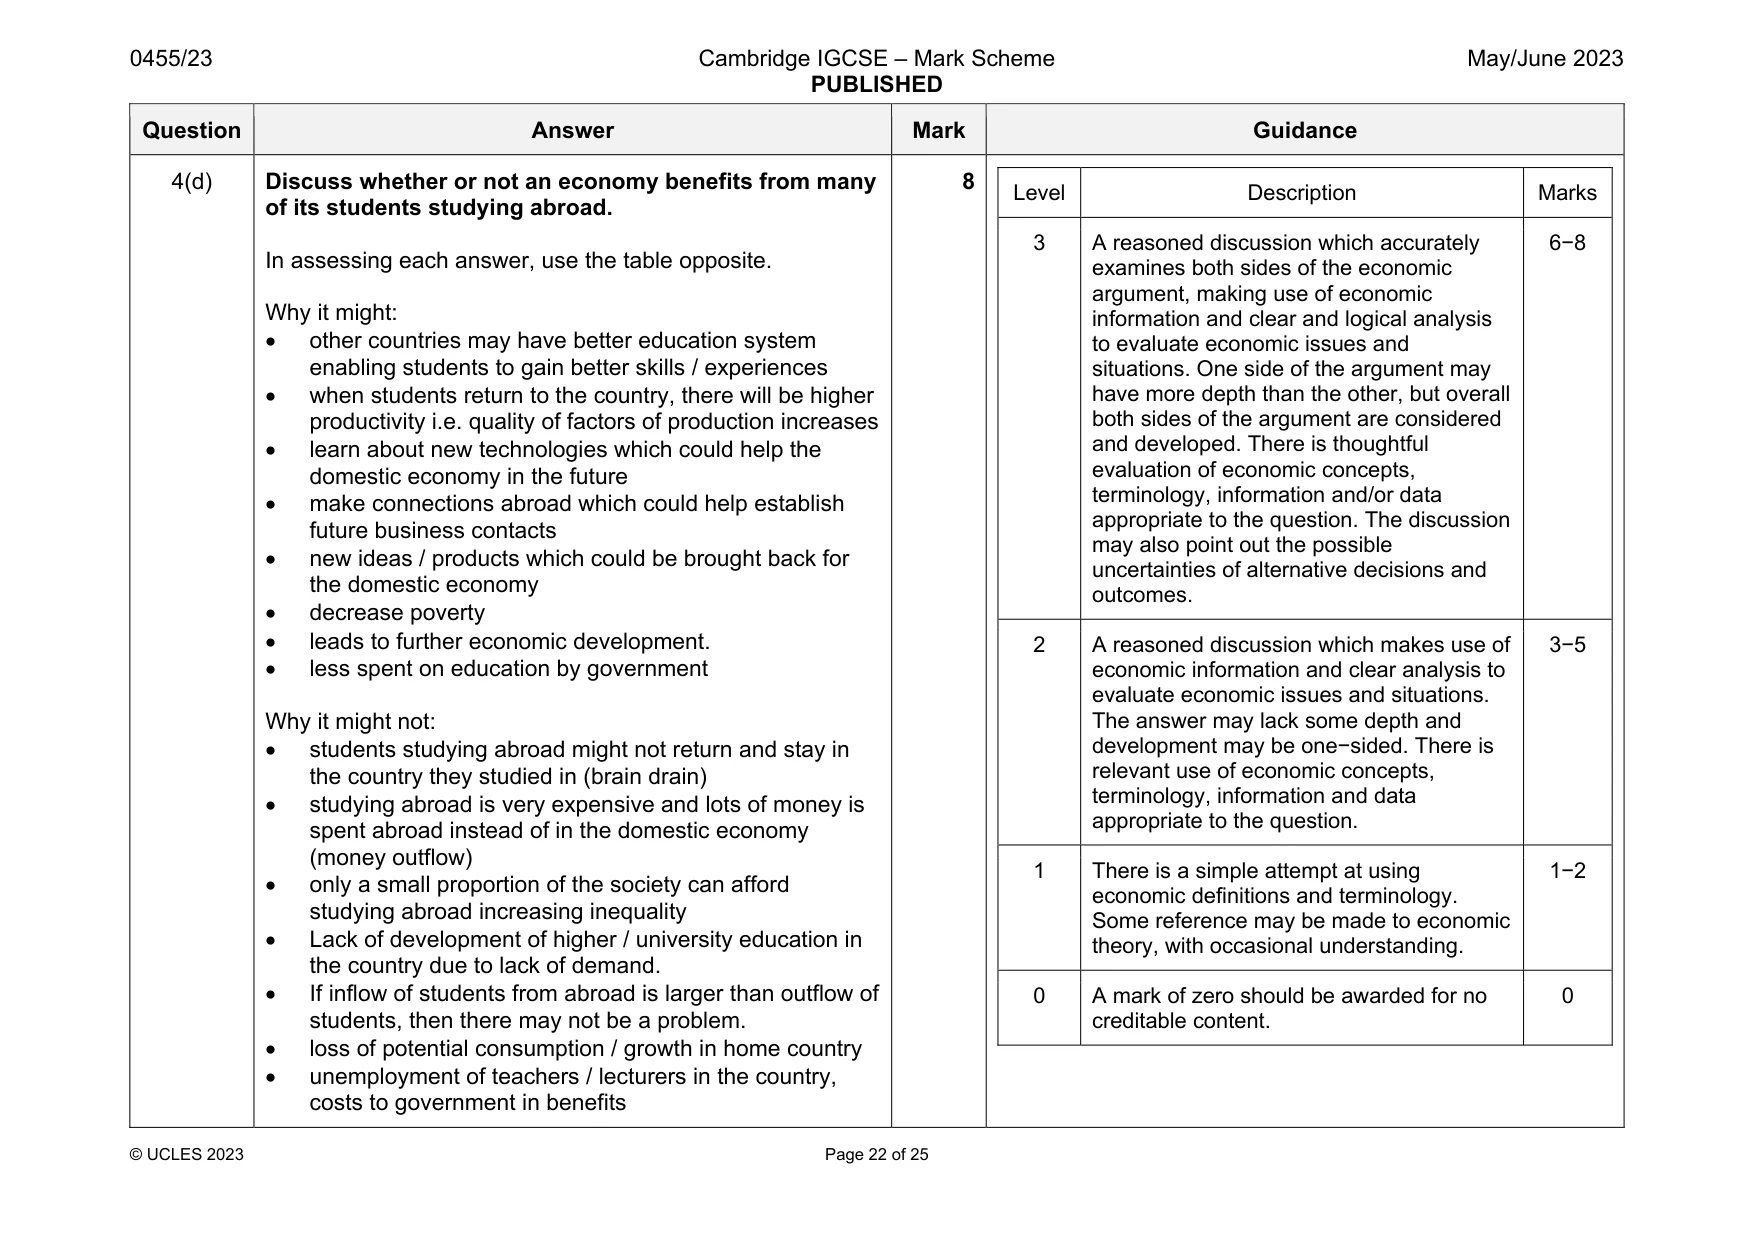
Mark scheme: 4(a) Define emigration. Emigration is when people exit / leave (1) a country (1) to live in another country (1). 2 4(b) Explain two causes of a recession. Logical explanation which might include: Fall in total demand / low economic activity (1) due to lower consumer confidence / falling consumption / falling government spending / falling exports / increase imports (1) Fall in investment (1) leading to fall in productive capacity (1) Fall in population (1) e.g. due to emigration (1) leading to a fall in number of workers (1) Wars / natural disasters (1) causing destruction of factors of production (1) Higher interest rates (1) leading to lower borrowing / consumption / investments (1) Decreased consumer / investor confidence (1) decreasing consumption / capital flight (1) Higher income / corporation taxes (1) leading to falling disposable income for consumption / falling after tax profits leading to lower investments (1) Lower productivity (1) reducing demand for the country’s output (1). 4 If more than two causes given, consider the first three. Question Answer Mark Guidance 4(c) Analyse policy measures a government could use to attract workers to return to their home country. Coherent analysis which might include: Increase national minimum wage (1) attract more unskilled / low−paid workers to return (1). Expansionary fiscal policy / expansionary monetary policy (1) to increase job opportunities (1). Improved education / healthcare / housing (1) higher pensions (1) to raise living standards (1). Better working conditions / quality of life (1) regulations to protect workers from poor treatment (1) better fringe benefits e.g. holiday entitlement Greater security in the country (1) e.g. gun controls (1) Labour market reforms (1) making it easier for firms to hire (1) more job opportunities (1) people return to take up a job (1). Lower direct taxes (1) increase after−tax income / disposable income (1) could encourage more people to work (1) and return to the country to earn income (1). Deregulation (1) encourages more firms to start up (1) more entrepreneurs will want to start a business (1) encouraging more people to return to start their own business (1). Improving incentives to work and invest (1) more investments (1) more demand for workers (1) more job opportunities (1). Measures to reduce inflation (1) making lower cost of living attractive (1) 6 Question Answer Mark Guidance 4(d) Discuss whether or not an economy benefits from many of its students studying abroad. In assessing each answer, use the table opposite. Why it might: other countries may have better education system enabling students to gain better skills / experiences when students return to the country, there will be higher productivity i.e. quality of factors of production increases learn about new technologies which could help the domestic economy in the future make connections abroad which could help establish future business contacts new ideas / products which could be brought back for the domestic economy decrease poverty leads to further economic development. less spent on education by government Why it might not: students studying abroad might not return and stay in the country they studied in (brain drain) studying abroad is very expensive and lots of money is spent abroad instead of in the domestic economy (money outflow) only a small proportion of the society can afford studying abroad increasing inequality Lack of development of higher / university education in the country due to lack of demand. If inflow of students from abroad is larger than outflow of students, then there may not be a problem. loss of potential consumption / growth in home country unemployment of teachers / lecturers in the country, costs to government in benefits 8 Level Description Marks 3 A reasoned discussion which accurately examines both sides of the economic argument, making use of economic information and clear and logical analysis to evaluate economic issues and situations. One side of the argument may have more depth than the other, but overall both sides of the argument are considered and developed. There is thoughtful evaluation of economic concepts, terminology, information and/or data appropriate to the question. The discussion may also point out the possible uncertainties of alternative decisions and outcomes. 6−8 2 A reasoned discussion which makes use of economic information and clear analysis to evaluate economic issues and situations. The answer may lack some depth and development may be one−sided. There is relevant use of economic concepts, terminology, information and data appropriate to the question. 3−5 1 There is a simple attempt at using economic definitions and terminology. Some reference may be made to economic theory, with occasional understanding. 1−2 0 A mark of zero should be awarded for no creditable content. 0
Q5 · The food processing, tourism, and education industries all contribute significantly to…
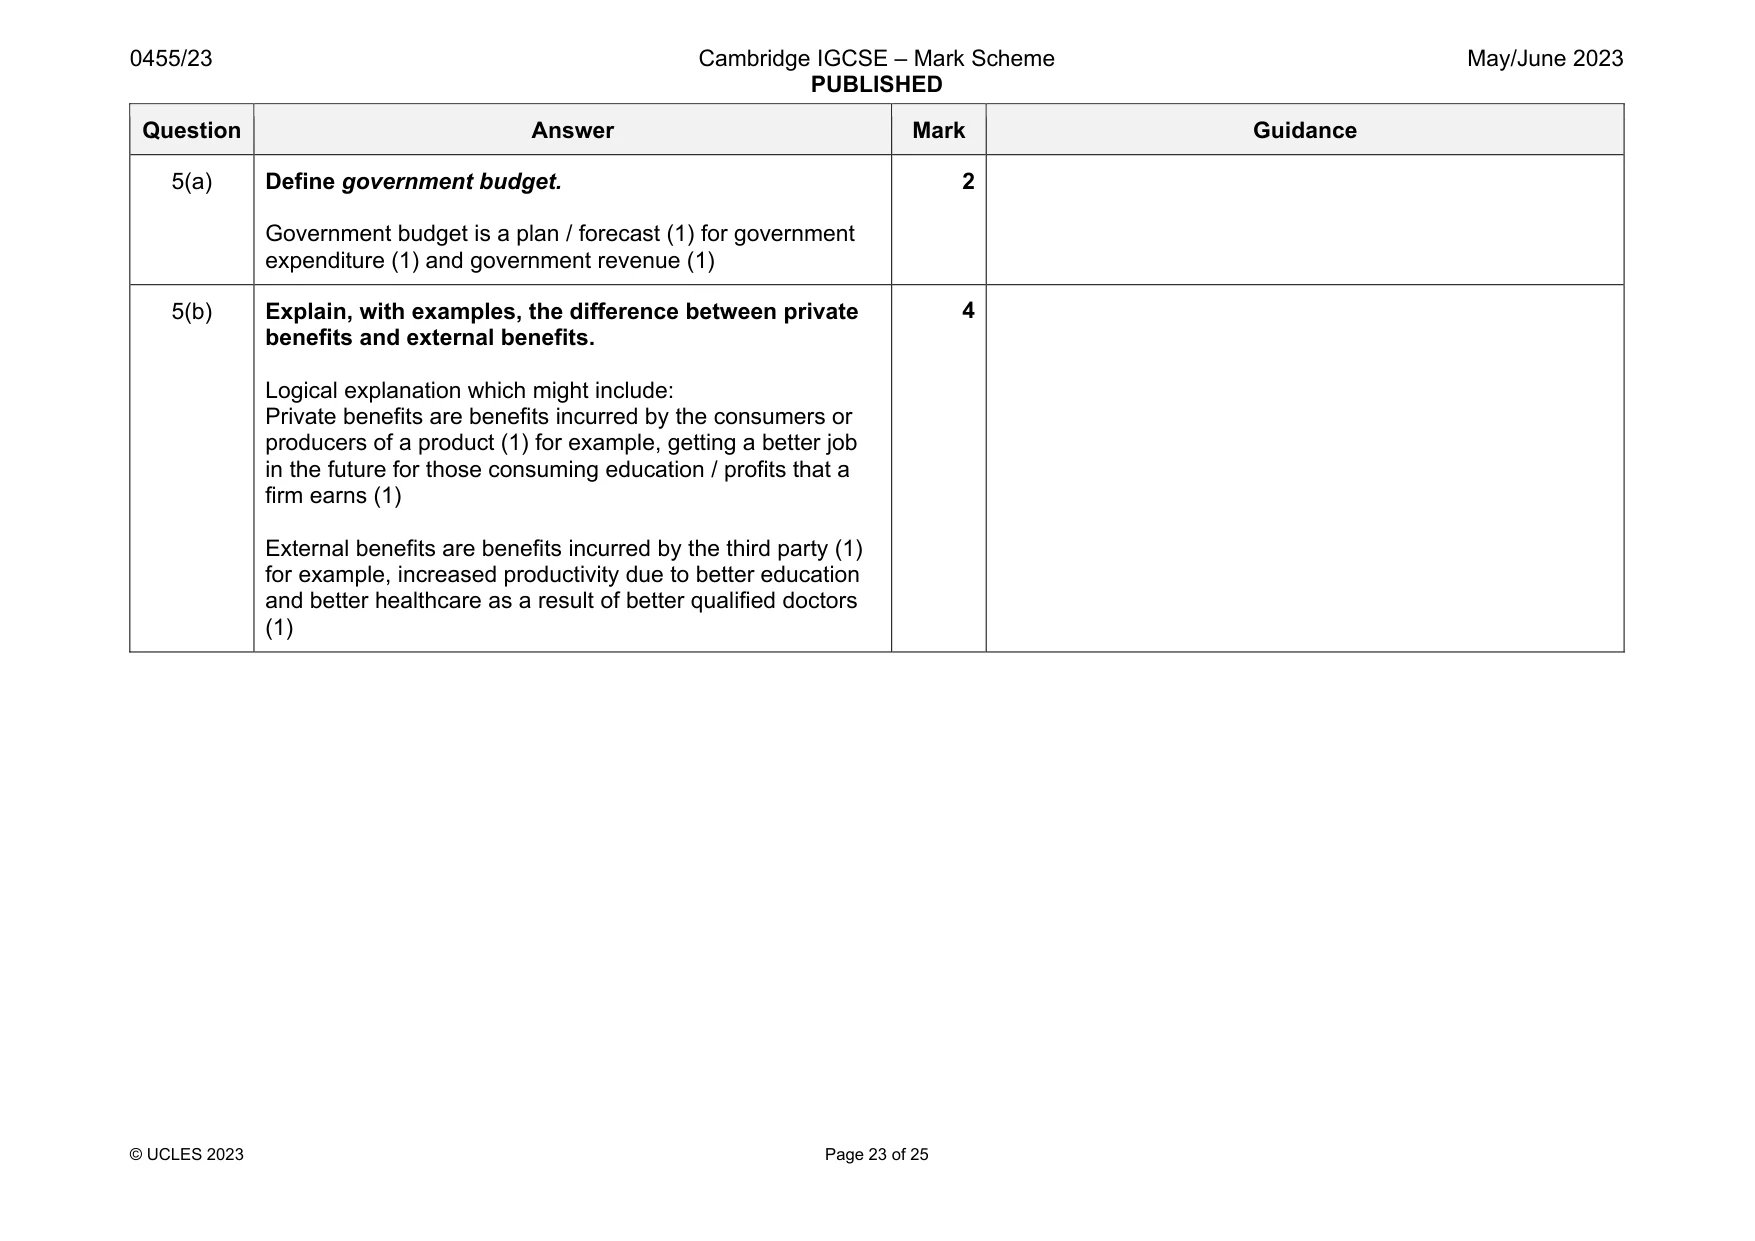
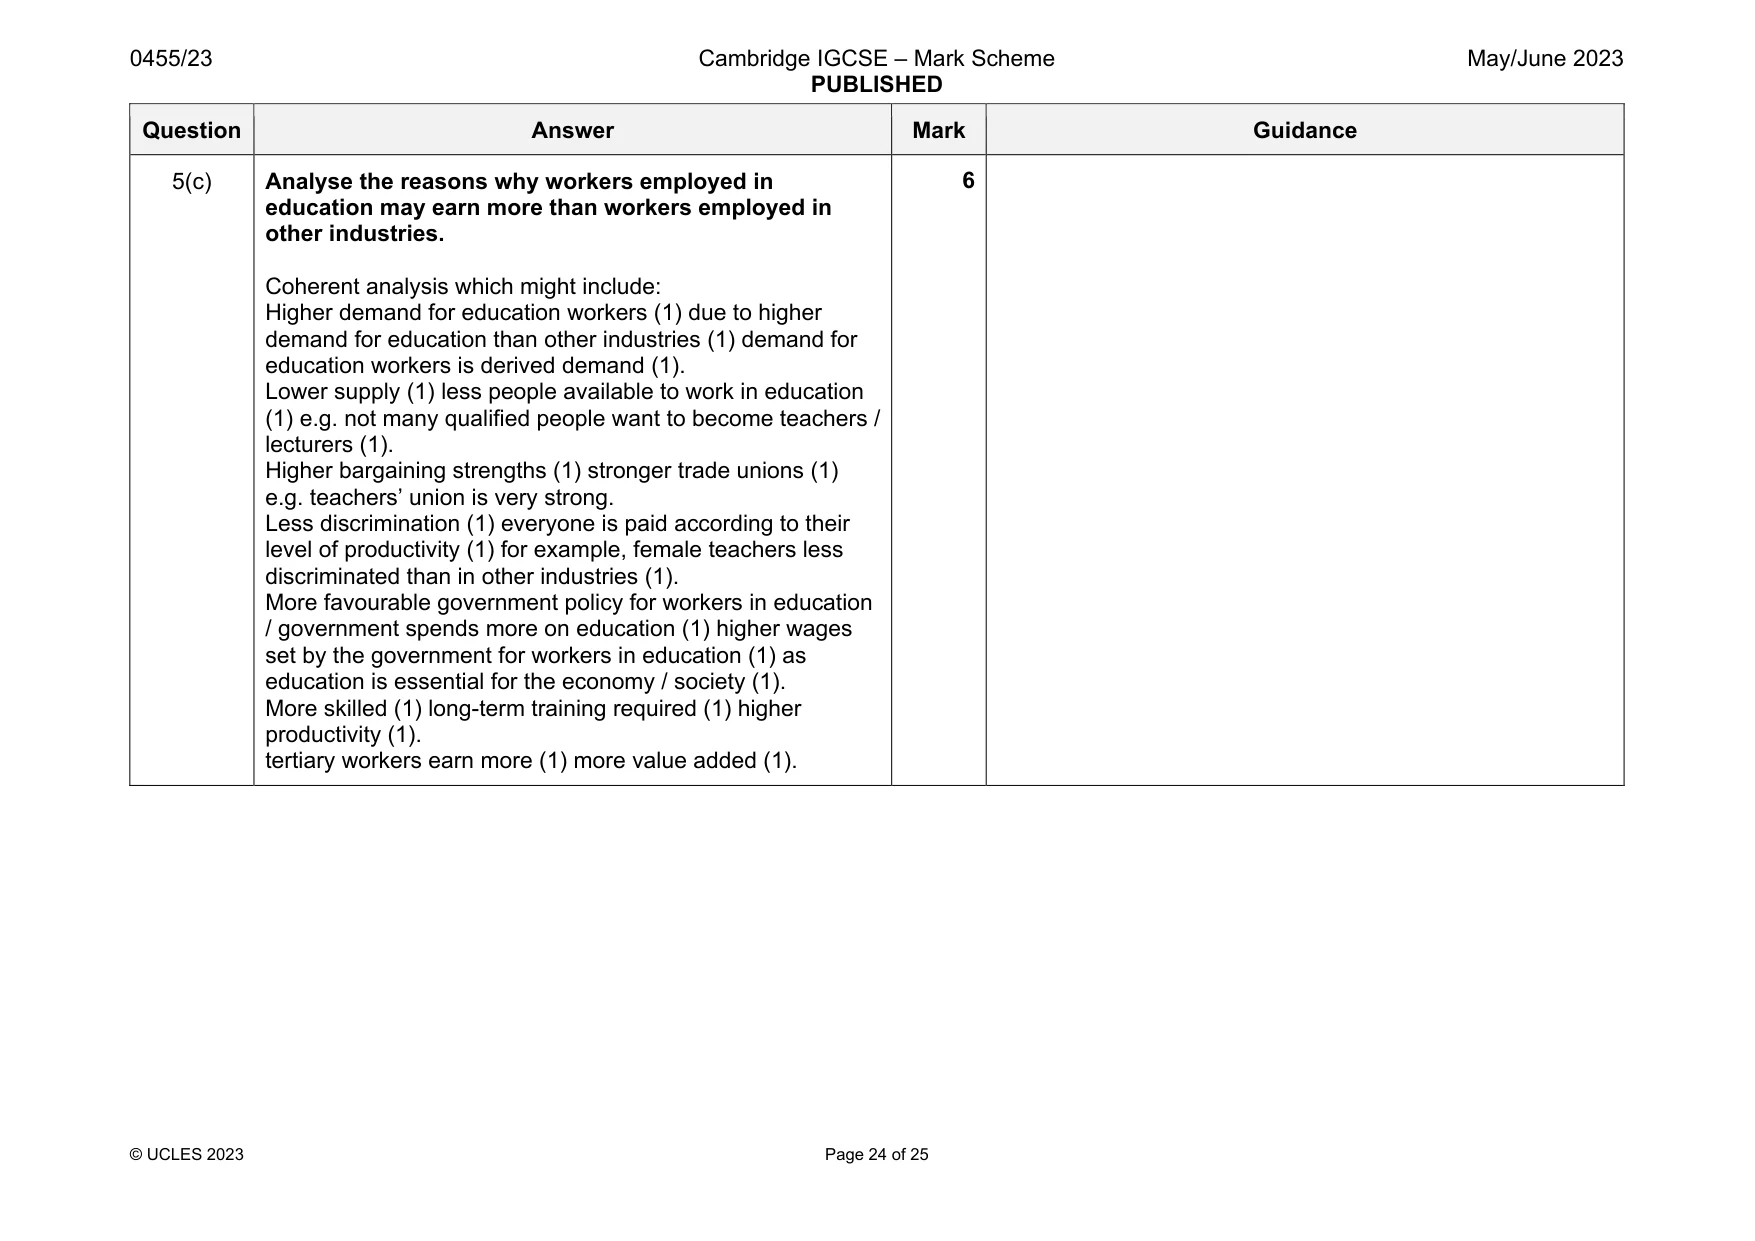
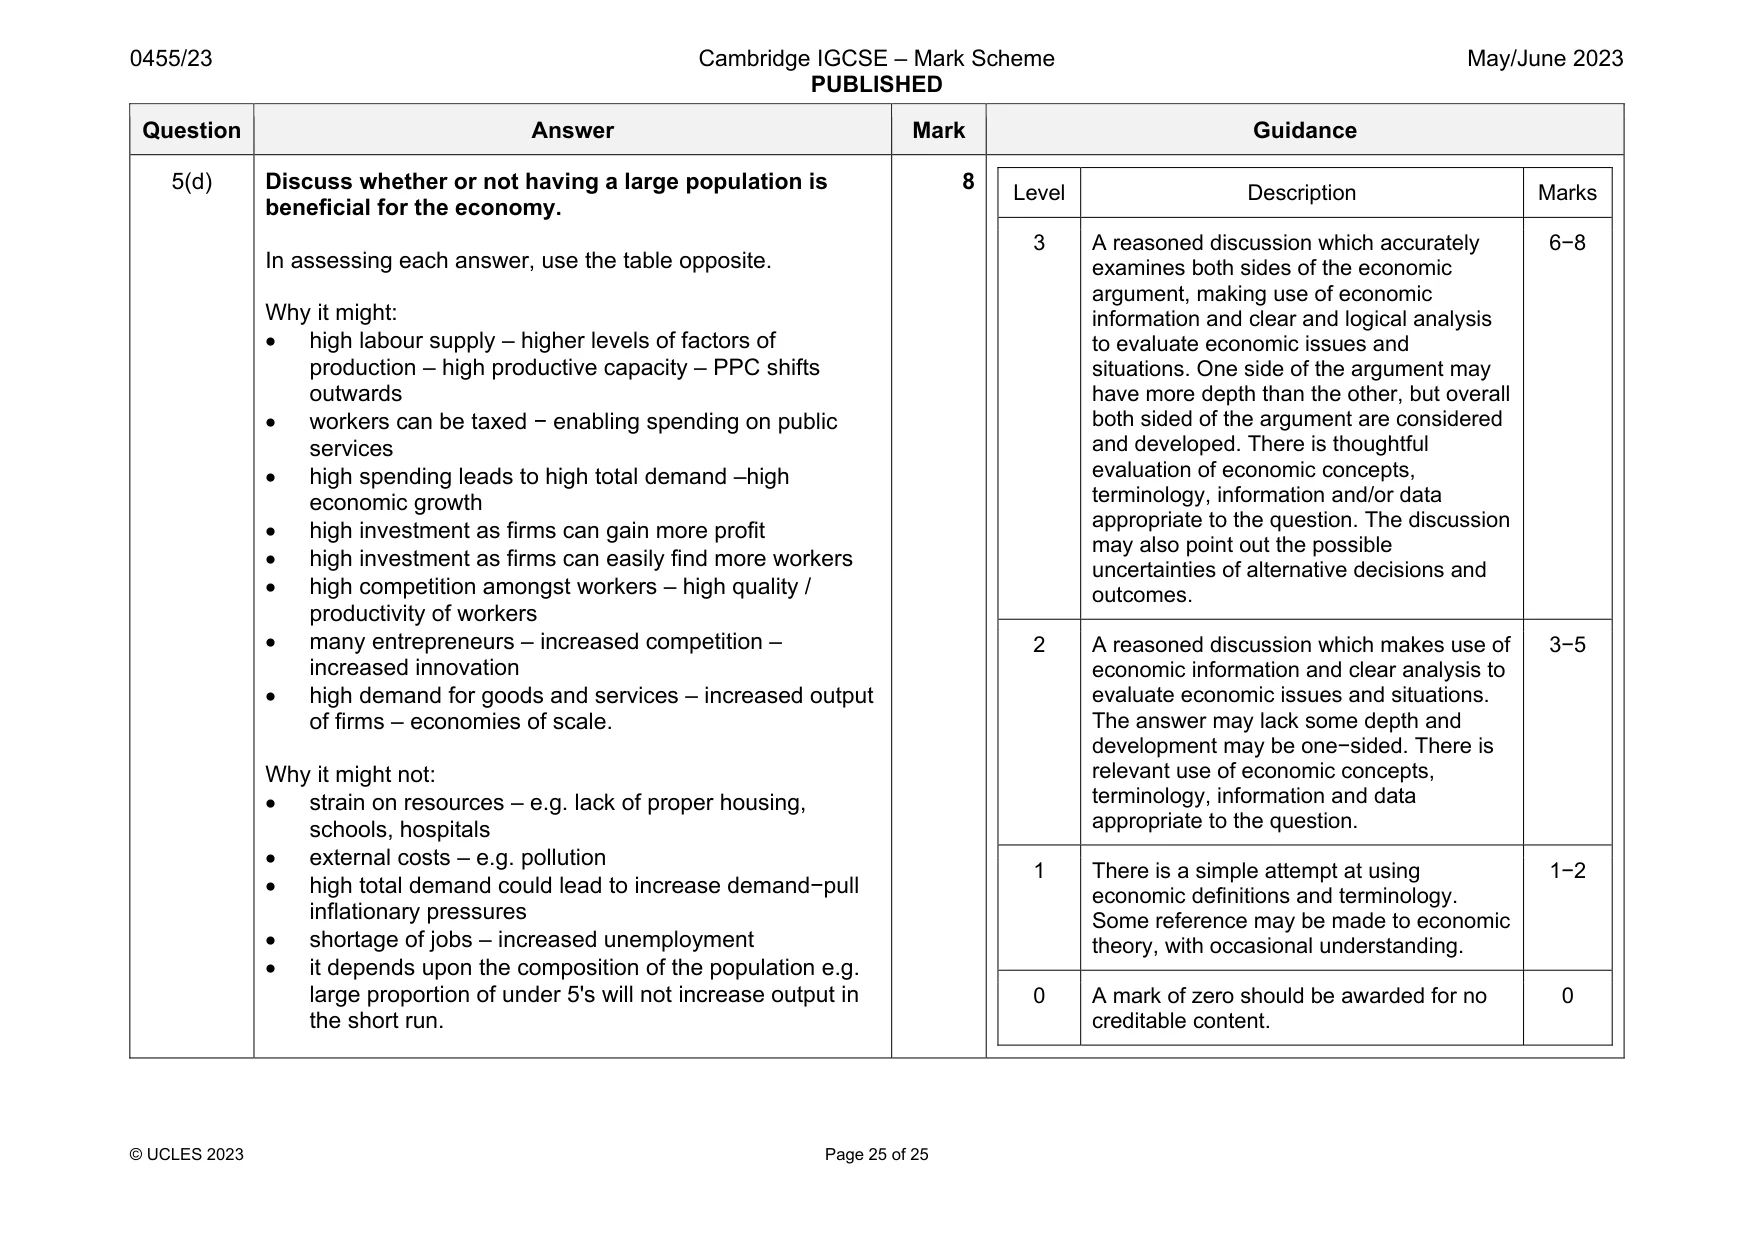
5 The food processing, tourism, and education industries all contribute significantly to the government budget for the US state of Wisconsin. The contribution of the education industry is higher than that of other industries due to the higher wages earned in education. This industry also contributes to the population growth of the state. This not only creates private benefits but also external benefits. (a) Define government budget. [2] (b) Explain, with examples, the difference between private benefits and external benefits. [4] (c) Analyse the reasons why workers employed in education may earn more than workers employed in other industries. [6] (d) Discuss whether or not having a large population is beneficial for the economy. [8]
Mark scheme: 5(a) Define government budget. Government budget is a plan / forecast (1) for government expenditure (1) and government revenue (1) 2 5(b) Explain, with examples, the difference between private benefits and external benefits. Logical explanation which might include: Private benefits are benefits incurred by the consumers or producers of a product (1) for example, getting a better job in the future for those consuming education / profits that a firm earns (1) External benefits are benefits incurred by the third party (1) for example, increased productivity due to better education and better healthcare as a result of better qualified doctors (1) 4 Question Answer Mark Guidance 5(c) Analyse the reasons why workers employed in education may earn more than workers employed in other industries. Coherent analysis which might include: Higher demand for education workers (1) due to higher demand for education than other industries (1) demand for education workers is derived demand (1). Lower supply (1) less people available to work in education (1) e.g. not many qualified people want to become teachers / lecturers (1). Higher bargaining strengths (1) stronger trade unions (1) e.g. teachers’ union is very strong. Less discrimination (1) everyone is paid according to their level of productivity (1) for example, female teachers less discriminated than in other industries (1). More favourable government policy for workers in education / government spends more on education (1) higher wages set by the government for workers in education (1) as education is essential for the economy / society (1). More skilled (1) long-term training required (1) higher productivity (1). tertiary workers earn more (1) more value added (1). 6 Question Answer Mark Guidance 5(d) Discuss whether or not having a large population is beneficial for the economy. In assessing each answer, use the table opposite. Why it might: high labour supply – higher levels of factors of production – high productive capacity – PPC shifts outwards workers can be taxed − enabling spending on public services high spending leads to high total demand –high economic growth high investment as firms can gain more profit high investment as firms can easily find more workers high competition amongst workers – high quality / productivity of workers many entrepreneurs – increased competition – increased innovation high demand for goods and services – increased output of firms – economies of scale. Why it might not: strain on resources – e.g. lack of proper housing, schools, hospitals external costs – e.g. pollution high total demand could lead to increase demand−pull inflationary pressures shortage of jobs – increased unemployment it depends upon the composition of the population e.g. large proportion of under 5's will not increase output in the short run. 8 Level Description Marks 3 A reasoned discussion which accurately examines both sides of the economic argument, making use of economic information and clear and logical analysis to evaluate economic issues and situations. One side of the argument may have more depth than the other, but overall both sided of the argument are considered and developed. There is thoughtful evaluation of economic concepts, terminology, information and/or data appropriate to the question. The discussion may also point out the possible uncertainties of alternative decisions and outcomes. 6−8 2 A reasoned discussion which makes use of economic information and clear analysis to evaluate economic issues and situations. The answer may lack some depth and development may be one−sided. There is relevant use of economic concepts, terminology, information and data appropriate to the question. 3−5 1 There is a simple attempt at using economic definitions and terminology. Some reference may be made to economic theory, with occasional understanding. 1−2 0 A mark of zero should be awarded for no creditable content. 0
What was in this paper
The subtopics covered by these 5 questions, and how many questions each got. Open one in a new tab to see every Cambridge question on it.
What you needed in this session
Cambridge’s own grade thresholds for 2023 May/June, Paper 2 · Variant 3. A higher threshold means an easier paper — the bar moves with how the cohort did.