Questions as text
Q1 · The table gives information on standards of living in four countries 0455/11 May/June 2006
34 The table gives information on standards of living in four countries. life expectancy at birth adult literacy % labour force in (years) rate % agriculture Brazil 66.5 82.4 23 India 60.7 50.6 64 Rwanda 47.2 58.0 92 Uganda 44.7 59.7 85 On the basis of this information which country has the highest standard of living? A Brazil B India C Rwanda D Uganda
1 marks
Answer: A
This question in 0455/11 May/June 2006
Q2 · The table shows the Gross Domestic Product (GDP) and population of four countries 0455/11 Oct/Nov 2006
33 The table shows the Gross Domestic Product (GDP) and population of four countries. Which country is likely to have the lowest standard of living? GDP population ($ millions) (millions) A 2 000 1 B 10 000 10 C 80 000 20 D 90 000 30
1 marks
Answer: B
This question in 0455/11 Oct/Nov 2006
Q3 · What is a reason for collecting national income statistics? 0455/11 May/June 2007
27 What is a reason for collecting national income statistics? A to calculate population changes B to compare standards of living C to fix exchange rates D to keep inflation low
1 marks
Answer: B
This question in 0455/11 May/June 2007
Q4 · In rural areas in developing countries women often do unpaid work on traditional… 0455/11 May/June 2007
29 In rural areas in developing countries women often do unpaid work on traditional activities. Why might this mean that the GDP is not a good measure of the standard of living in those countries? A The GDP does not include international trade. B The GDP only refers to companies in urban areas. C The work is not counted in GDP statistics. D The work is not economically important.
1 marks
Answer: C
This question in 0455/11 May/June 2007
Q5 · In developed economies, as a person’s real income rises, a lower proportion of that… 0455/11 Oct/Nov 2007
15 In developed economies, as a person’s real income rises, a lower proportion of that income is usually spent on A food. B holidays. C leisure activities. D personal transport.
1 marks
Answer: A
This question in 0455/11 Oct/Nov 2007
Q6 · Which situation would definitely cause a fall in real incomes? 0455/11 Oct/Nov 2007
27 Which situation would definitely cause a fall in real incomes? price level money income level A falls rises B falls unchanged C rises rises D rises unchanged
1 marks
Answer: D
This question in 0455/11 Oct/Nov 2007
Q7 · Changes in the standard of living of a country are best measured by changes in A national… 0455/11 Oct/Nov 2007
34 Changes in the standard of living of a country are best measured by changes in A national income. B national income per head. C real national income. D real national income per head.
1 marks
Answer: D
This question in 0455/11 Oct/Nov 2007
Q8 · What is likely to be an advantage of economic growth? 0455/11 May/June 2008
29 What is likely to be an advantage of economic growth? A The country’s resources will be depleted. B The price level will increase. C The rate of employment will fall. D The standard of living will increase.
1 marks
Answer: D
This question in 0455/11 May/June 2008
Q9 · Which of the following is most likely to be used as a measure of living standards? 0455/11 May/June 2008
33 Which of the following is most likely to be used as a measure of living standards? A the balance of trade B the consumer price index C the government’s budget position D the real GDP per head
1 marks
Answer: D
This question in 0455/11 May/June 2008
Q10 · Real Gross Domestic Product per head is often used as a measure of the change in average… 0455/11 Oct/Nov 2008
34 Real Gross Domestic Product per head is often used as a measure of the change in average living standards. What reduces its effectiveness in representing this change? A It omits increases in the cost of living. B It omits increases in the general price level. C It omits increases in the hours people work. D It omits increases in the size of the population.
1 marks
Answer: C
This question in 0455/11 Oct/Nov 2008
Q11 · What is likely to increase with economic growth? 0455/11 May/June 2009
18 What is likely to increase with economic growth? A cyclical unemployment B income per head C the budget deficit D the conservation of natural resources
1 marks
Answer: B
This question in 0455/11 May/June 2009
Q12 · The table shows the percentage changes in earnings and consumer prices for four countries… 0455/11 May/June 2009
22 The table shows the percentage changes in earnings and consumer prices for four countries for one year. Which country is likely to have experienced the greatest increase in real income during the year? country earnings consumer prices A France +12.5 +9.5 B Japan +4.0 +2.0 C UK +8.5 +5.0 D Germany +4.0 +4.0
1 marks
Answer: C
This question in 0455/11 May/June 2009
Q13 · Which statement about economic development is correct? 0455/11 May/June 2009
27 Which statement about economic development is correct? A A country needs more than a high GDP to be considered developed. B A country which has rich reserves of raw materials is classed as developed. C A country will have no people living in poverty when it is developed. D A country with a trade surplus is considered to be developed.
1 marks
Answer: A
This question in 0455/11 May/June 2009
Q14 · Why is the Human Development Index (HDI) a better indicator of comparative living… 0455/11 May/June 2010
25 Why is the Human Development Index (HDI) a better indicator of comparative living standards than Gross Domestic Product (GDP) per head? A It includes international trade. B It includes more measures of living standards. C It is measured in money terms. D It is more directly linked to economic growth.
1 marks
Answer: B
This question in 0455/11 May/June 2010
Q15 · Why is the Human Development Index (HDI) a better indicator of comparative living… 0455/12 May/June 2010
26 Why is the Human Development Index (HDI) a better indicator of comparative living standards than Gross Domestic Product (GDP) per head? A It includes international trade. B It includes more measures of living standards. C It is measured in money terms. D It is more directly linked to economic growth.
1 marks
Answer: B
This question in 0455/12 May/June 2010
Q16 · Gross Domestic Product (GDP) per capita is commonly used as an indicator of the… 0455/12 May/June 2010
27 Gross Domestic Product (GDP) per capita is commonly used as an indicator of the comparative level of development in different countries. What does not lead to difficulties when using this as a comparison between countries? A different climatic conditions B different international exchange rates C different population growth rates D different rates of inflation
1 marks
Answer: C
This question in 0455/12 May/June 2010
Q17 · In 2008, the US had a higher GDP per head than Iceland, but a lower Human Development… 0455/11 Oct/Nov 2010
25 In 2008, the US had a higher GDP per head than Iceland, but a lower Human Development Index ranking than Iceland. What could explain this difference? A Average family size is higher in Iceland. B Life expectancy is higher in Iceland. C School enrolments are higher in the US. D The population of the US is larger.
1 marks
Answer: B
This question in 0455/11 Oct/Nov 2010
Q18 · The table shows four countries in 2007 0455/11 Oct/Nov 2010
26 The table shows four countries in 2007. Which country is most likely to have the lowest standard of living? country GDP (US$ billion) population (million) A Bangladesh 206.7 153.5 B India 2989.1 1147.9 C Nigeria 292.7 138.3 D South Africa 467.1 43.8
1 marks
Answer: A
This question in 0455/11 Oct/Nov 2010
Q19 · The table shows four countries in 2007 0455/12 Oct/Nov 2010
27 The table shows four countries in 2007. Which country is most likely to have the lowest standard of living? country GDP (US$ billion) population (million) A Bangladesh 206.7 153.5 B India 2989.1 1147.9 C Nigeria 292.7 138.3 D South Africa 467.1 43.8
1 marks
Answer: A
This question in 0455/12 Oct/Nov 2010
Q20 · The table shows four countries in 2007 0455/13 Oct/Nov 2010
28 The table shows four countries in 2007. Which country is most likely to have the lowest standard of living? country GDP (US$ billion) population (million) A Bangladesh 206.7 153.5 B India 2989.1 1147.9 C Nigeria 292.7 138.3 D South Africa 467.1 43.8
1 marks
Answer: A
This question in 0455/13 Oct/Nov 2010
Q21 · A musician has a choice of playing for an orchestra in either England or Germany 0455/11 May/June 2011
14 A musician has a choice of playing for an orchestra in either England or Germany. Which combination of incomes and cost of living is most likely to cause her to choose the German orchestra? Incomes and cost of living in Germany compared with those in England pre-tax (gross) income after-tax (net) income cost of living A higher higher higher B higher lower lower C lower higher higher D lower higher lower
1 marks
Answer: D
This question in 0455/11 May/June 2011
Q22 · Why may GDP not be a good measure to compare the standard of living of two countries? 0455/11 May/June 2011
25 Why may GDP not be a good measure to compare the standard of living of two countries? A It does not include government expenditure. B It does not take account of population size. C It is based on a sample ‘basket of goods’. D It only compares export prices with import prices.
1 marks
Answer: B
This question in 0455/11 May/June 2011
Q23 · The table shows statistics for four countries in southern Africa 0455/11 May/June 2011
28 The table shows statistics for four countries in southern Africa. From the information given, which country has the lowest standard of living? average annual population density real GDP life growth rate of per square per capita expectancy population (%) kilometre (US$) A 1.9 19 46 190 B 2.7 2 58 1700 C 3.7 45 59 210 D 4.2 89 44 190
1 marks
Answer: D
This question in 0455/11 May/June 2011
Q24 · Why may GDP not be a good measure to compare the standard of living of two countries? 0455/12 May/June 2011
24 Why may GDP not be a good measure to compare the standard of living of two countries? A It does not include government expenditure. B It does not take account of population size. C It is based on a sample ‘basket of goods’. D It only compares export prices with import prices.
1 marks
Answer: B
This question in 0455/12 May/June 2011
Q25 · The table shows statistics for four countries in southern Africa 0455/12 May/June 2011
27 The table shows statistics for four countries in southern Africa. From the information given, which country has the lowest standard of living? average annual population density real GDP life growth rate of per square per capita expectancy population (%) kilometre (US$) A 1.9 19 46 190 B 2.7 2 58 1700 C 3.7 45 59 210 D 4.2 89 44 190
1 marks
Answer: D
This question in 0455/12 May/June 2011
Q26 · A musician has a choice of playing for an orchestra in either England or Germany 0455/13 May/June 2011
13 A musician has a choice of playing for an orchestra in either England or Germany. Which combination of incomes and cost of living is most likely to cause her to choose the German orchestra? Incomes and cost of living in Germany compared with those in England pre-tax (gross) income after-tax (net) income cost of living A higher higher higher B higher lower lower C lower higher higher D lower higher lower
1 marks
Answer: D
This question in 0455/13 May/June 2011
Q27 · Why may GDP not be a good measure to compare the standard of living of two countries? 0455/13 May/June 2011
24 Why may GDP not be a good measure to compare the standard of living of two countries? A It does not include government expenditure. B It does not take account of population size. C It is based on a sample ‘basket of goods’. D It only compares export prices with import prices.
1 marks
Answer: B
This question in 0455/13 May/June 2011
Q28 · The table shows statistics for four countries in southern Africa 0455/13 May/June 2011
27 The table shows statistics for four countries in southern Africa. From the information given, which country has the lowest standard of living? average annual population density real GDP life growth rate of per square per capita expectancy population (%) kilometre (US$) A 1.9 19 46 190 B 2.7 2 58 1700 C 3.7 45 59 210 D 4.2 89 44 190
1 marks
Answer: D
This question in 0455/13 May/June 2011
Q29 · What is likely to happen as a developing country becomes more developed? 0455/13 May/June 2011
28 What is likely to happen as a developing country becomes more developed? A A higher percentage of children will attend school. B Infant mortality will rise. C Life expectancy will fall. D The agricultural sector will increase in importance.
1 marks
Answer: A
This question in 0455/13 May/June 2011
Q30 · What is a long-term advantage of economic growth? 0455/11 Oct/Nov 2011
20 What is a long-term advantage of economic growth? A employment falls B incomes rise C prices rise D savings fall
1 marks
Answer: B
This question in 0455/11 Oct/Nov 2011
Q31 · The table gives information about four countries 0455/11 Oct/Nov 2011
26 The table gives information about four countries. Which country is likely to have the lowest standard of living? life expectancy GNP per head adult literacy country at birth (years) ($) (%) A Ethiopia 43 110 66 B India 59 350 43 C Nigeria 51 290 43 D Mozambique 45 80 39
1 marks
Answer: D
This question in 0455/11 Oct/Nov 2011
Q32 · The table gives information about four countries 0455/12 Oct/Nov 2011
28 The table gives information about four countries. Which country is likely to have the lowest standard of living? life expectancy GNP per head adult literacy country at birth (years) ($) (%) A Ethiopia 43 110 66 B India 59 350 43 C Nigeria 51 290 43 D Mozambique 45 80 39
1 marks
Answer: D
This question in 0455/12 Oct/Nov 2011
Q33 · What is a long-term advantage of economic growth? 0455/13 Oct/Nov 2011
25 What is a long-term advantage of economic growth? A employment falls B incomes rise C prices rise D savings fall
1 marks
Answer: B
This question in 0455/13 Oct/Nov 2011
Q34 · The table gives information about four countries 0455/13 Oct/Nov 2011
29 The table gives information about four countries. Which country is likely to have the lowest standard of living? life expectancy GNP per head adult literacy country at birth (years) ($) (%) A Ethiopia 43 110 66 B India 59 350 43 C Nigeria 51 290 43 D Mozambique 45 80 39
1 marks
Answer: D
This question in 0455/13 Oct/Nov 2011
Q35 · The inhabitants of an economy experience an increase in their cost of living, their… 0455/12 May/June 2012
24 The inhabitants of an economy experience an increase in their cost of living, their living standards and their leisure time. Which combination of events could explain these changes? average price level real GDP working week A decrease decrease increase B decrease increase decrease C increase decrease increase D increase increase decrease
1 marks
Answer: D
This question in 0455/12 May/June 2012
Q36 · The table shows the percentages of consumer spending on different items in four… 0455/11 Oct/Nov 2012
22 The table shows the percentages of consumer spending on different items in four countries, which have similar geographical conditions and climate. Which country is likely to have the highest standard of living? percentage of consumer spending on each item country food housing transport A 20 30 30 B 40 25 15 C 50 20 10 D 45 20 15
1 marks
Answer: A
This question in 0455/11 Oct/Nov 2012
Q37 · The table shows the percentages of consumer spending on different items in four… 0455/12 Oct/Nov 2012
28 The table shows the percentages of consumer spending on different items in four countries, which have similar geographical conditions and climate. Which country is likely to have the highest standard of living? percentage of consumer spending on each item country food housing transport A 20 30 30 B 40 25 15 C 50 20 10 D 45 20 15
1 marks
Answer: A
This question in 0455/12 Oct/Nov 2012
Q38 · In China the government is concerned about the level of poverty and the need for more… 0455/13 Oct/Nov 2012
1 In China the government is concerned about the level of poverty and the need for more resources in the poorer regions of the country. As a result, it is increasing its expenditure there and reducing it in the wealthier regions. Which economic concept does this government policy illustrate best? A diseconomies of scale B market forces C opportunity cost D specialisation
1 marks
Answer: C
This question in 0455/13 Oct/Nov 2012
Q39 · The table shows the percentages of consumer spending on different items in four… 0455/13 Oct/Nov 2012
28 The table shows the percentages of consumer spending on different items in four countries, which have similar geographical conditions and climate. Which country is likely to have the highest standard of living? percentage of consumer spending on each item country food housing transport A 20 30 30 B 40 25 15 C 50 20 10 D 45 20 15
1 marks
Answer: A
This question in 0455/13 Oct/Nov 2012
Q40 · Which combination of changes is most likely to result in a rise in the average living… 0455/12 May/June 2013
28 Which combination of changes is most likely to result in a rise in the average living standard in a country? Gross Domestic general price population Product level A falls falls rises B falls rises falls C rises falls falls D rises rises rises
1 marks
Answer: C
This question in 0455/12 May/June 2013
Q41 · A government wishes to raise the general standard of living in its country 0455/11 Oct/Nov 2013
9 A government wishes to raise the general standard of living in its country. In the short run, which policy would be the most likely to achieve this aim? A preventing the merger of two companies into a monopoly B raising taxation to repay government debts C reducing the rate of income tax while maintaining the services it provides D spending more on roads in rural areas rather than in city centres
1 marks
Answer: C
This question in 0455/11 Oct/Nov 2013
Q42 · The table shows the change in real incomes for a number of occupations between 1978 and… 0455/11 Oct/Nov 2013
22 The table shows the change in real incomes for a number of occupations between 1978 and 2008. change in real income occupation % doctors 153 lawyers 114 accountants 60 bricklayers 37 bus and coach drivers 19 fork-lift truck drivers –5 What can be concluded from the table? A All occupations were better off in 2008 than in 1978. B Fork-lift truck drivers earned the lowest wages in 2008. C Doctors have earned more than lawyers since 1978. D Professionals received higher percentage increases in income than manual workers.
1 marks
Answer: D
This question in 0455/11 Oct/Nov 2013
Q43 · The table shows the change in real incomes for a number of occupations between 1978 and… 0455/12 Oct/Nov 2013
13 The table shows the change in real incomes for a number of occupations between 1978 and 2008. change in real income occupation % doctors 153 lawyers 114 accountants 60 bricklayers 37 bus and coach drivers 19 fork-lift truck drivers –5 What can be concluded from the table? A All occupations were better off in 2008 than in 1978. B Fork-lift truck drivers earned the lowest wages in 2008. C Doctors have earned more than lawyers since 1978. D Professionals received higher percentage increases in income than manual workers.
1 marks
Answer: D
This question in 0455/12 Oct/Nov 2013
Q44 · A government wishes to raise the general standard of living in its country 0455/12 Oct/Nov 2013
23 A government wishes to raise the general standard of living in its country. In the short run, which policy would be the most likely to achieve this aim? A preventing the merger of two companies into a monopoly B raising taxation to repay government debts C reducing the rate of income tax while maintaining the services it provides D spending more on roads in rural areas rather than in city centres
1 marks
Answer: C
This question in 0455/12 Oct/Nov 2013
Q45 · A government wishes to raise the general standard of living in its country 0455/13 Oct/Nov 2013
23 A government wishes to raise the general standard of living in its country. In the short run, which policy would be the most likely to achieve this aim? A preventing the merger of two companies into a monopoly B raising taxation to repay government debts C reducing the rate of income tax while maintaining the services it provides D spending more on roads in rural areas rather than in city centres
1 marks
Answer: C
This question in 0455/13 Oct/Nov 2013
Q46 · Which changes usually result when a country develops and is able to provide free health… 0455/13 Oct/Nov 2013
27 Which changes usually result when a country develops and is able to provide free health care and good living conditions? worker birth rate death rate productivity A falls falls rises B falls rises falls C rises falls falls D rises rises rises
1 marks
Answer: A
This question in 0455/13 Oct/Nov 2013
Q47 · What is not likely to be used to measure the difference in the standard of living between… 0455/13 Oct/Nov 2013
28 What is not likely to be used to measure the difference in the standard of living between countries? A Gross Domestic Product per head B Human Development Index C the rate of poverty D the rate of interest
1 marks
Answer: D
This question in 0455/13 Oct/Nov 2013
Q48 · The table gives information about four countries 0455/11 May/June 2014
27 The table gives information about four countries. Which country has the lowest standard of living? life % of labour GDP per head force in expectancy (US $) agriculture A 48 120 80 B 48 250 70 C 54 350 75 D 60 380 60
1 marks
Answer: A
This question in 0455/11 May/June 2014
Q49 · In South Africa, the rate of consumer spending is relatively high compared with other… 0455/12 May/June 2014
10 In South Africa, the rate of consumer spending is relatively high compared with other developing countries. However, the unemployment rate is high at 25% and only 27% of students complete the 12 years of basic education. As a result, what is also likely to be found in South Africa? A a high average standard of living B a high current rate of savings C a high level of debt among consumers D a high supply of skilled workers
1 marks
Answer: C
This question in 0455/12 May/June 2014
Q50 · Why is the Human Development Index (HDI) often considered to be better than GDP per head… 0455/12 May/June 2014
21 Why is the Human Development Index (HDI) often considered to be better than GDP per head as a measure of living standards? A GDP per head excludes economic growth. B GDP per head ignores population growth. C HDI includes more than the production of goods and services. D HDI is calculated by the national government.
1 marks
Answer: C
This question in 0455/12 May/June 2014
Q51 · The table gives information about four countries 0455/12 May/June 2014
27 The table gives information about four countries. Which country has the lowest standard of living? life % of labour GDP per head force in expectancy (US $) agriculture A 48 120 80 B 48 250 70 C 54 350 75 D 60 380 60
1 marks
Answer: A
This question in 0455/12 May/June 2014
Q52 · The table gives information about four countries 0455/13 May/June 2014
27 The table gives information about four countries. Which country has the lowest standard of living? life % of labour GDP per head force in expectancy (US $) agriculture A 48 120 80 B 48 250 70 C 54 350 75 D 60 380 60
1 marks
Answer: A
This question in 0455/13 May/June 2014
Q53 · The table shows statistics for four countries in southern Africa 0455/11 Oct/Nov 2014
24 The table shows statistics for four countries in southern Africa. From the information given, which country has the lowest standard of living? average annual population density real GDP life growth rate of per square per capita expectancy population (%) kilometre (US$) A 1.9 19 46 190 B 2.7 2 58 1700 C 3.7 45 59 210 D 4.2 89 44 190
1 marks
Answer: D
This question in 0455/11 Oct/Nov 2014
Q54 · The table shows statistics for four countries in southern Africa 0455/12 Oct/Nov 2014
27 The table shows statistics for four countries in southern Africa. From the information given, which country has the lowest standard of living? average annual population density real GDP life growth rate of per square per capita expectancy population (%) kilometre (US$) A 1.9 19 46 190 B 2.7 2 58 1700 C 3.7 45 59 210 D 4.2 89 44 190
1 marks
Answer: D
This question in 0455/12 Oct/Nov 2014
Q55 · As a country develops, its provision of medical care for babies and old people improves 0455/13 Oct/Nov 2014
26 As a country develops, its provision of medical care for babies and old people improves. Why might this cause a problem in raising living standards? A Gross Domestic Product will fall. B The dependency ratio will become higher. C The number of workers will fall. D The size of families in the short run will be smaller.
1 marks
Answer: B
This question in 0455/13 Oct/Nov 2014
Q56 · The table shows statistics for four countries in southern Africa 0455/13 Oct/Nov 2014
27 The table shows statistics for four countries in southern Africa. From the information given, which country has the lowest standard of living? average annual population density real GDP life growth rate of per square per capita expectancy population (%) kilometre (US$) A 1.9 19 46 190 B 2.7 2 58 1700 C 3.7 45 59 210 D 4.2 89 44 190
1 marks
Answer: D
This question in 0455/13 Oct/Nov 2014
Q57 · In rural areas in developing countries, farmers grow food for their own consumption 0455/11 May/June 2015
26 In rural areas in developing countries, farmers grow food for their own consumption. Why might this mean that the GDP is a weak measure of the standard of living in those countries? A The food grown is not exported. B The GDP does not include agricultural production. C The GDP only refers to the public sector. D The value of the food is unknown.
1 marks
Answer: D
This question in 0455/11 May/June 2015
Q58 · The Human Development Index (HDI) measures more than just average incomes 0455/12 May/June 2015
21 The Human Development Index (HDI) measures more than just average incomes. What are two additional measures it includes? A life expectancy years of schooling B percentage unemployed number of hospitals C poverty rate years of schooling D years of schooling access to clean water
1 marks
Answer: A
This question in 0455/12 May/June 2015
Q59 · In 2013, subsistence farming, which involved a large percentage of the population, was a… 0455/12 May/June 2015
24 In 2013, subsistence farming, which involved a large percentage of the population, was a significant activity in the Philippines and Indonesia. What can be concluded about the Philippines and Indonesia from this information? A a good use was being made of natural resources B production was likely to involve skilled labour C the GDP in these countries was likely to be underestimated D there was no need to import food because the population was self-sufficient
1 marks
Answer: C
This question in 0455/12 May/June 2015
Q60 · Which combination of changes is most likely to result in a fall in living standards in a… 0455/12 May/June 2015
27 Which combination of changes is most likely to result in a fall in living standards in a country? GDP inflation population A fall fall rise B fall rise rise C rise fall fall D rise rise fall
1 marks
Answer: B
This question in 0455/12 May/June 2015
Q61 · When elderly people retire from work, they may receive a pension income that is lower… 0455/13 May/June 2015
10 When elderly people retire from work, they may receive a pension income that is lower than their previous income. How is the proportion of their income spent on healthcare and leisure likely to change? healthcare leisure A decrease decrease B decrease increase C increase decrease D increase increase
1 marks
Answer: C
This question in 0455/13 May/June 2015
Q62 · The Human Development Index can be used to measure human development in countries 0455/13 May/June 2015
24 The Human Development Index can be used to measure human development in countries. Which measure would not be part of its calculation? A inequality of incomes B life expectancy C standards of living D years of schooling
1 marks
Answer: A
This question in 0455/13 May/June 2015
Q63 · The table shows how three people spend their income 0455/11 Oct/Nov 2015
11 The table shows how three people spend their income. person R person S person T food and clothing 20% 45% 35% entertainment 40% 35% 40% luxury goods 40% 20% 25% Put the three people in the most likely order of their incomes, from the lowest income to the highest income. A R, S, T B S, T, R C T, R, S D T, S, R
1 marks
Answer: B
This question in 0455/11 Oct/Nov 2015
Q64 · To make Gross Domestic Product a better measure of comparative living standards it needs… 0455/11 Oct/Nov 2015
20 To make Gross Domestic Product a better measure of comparative living standards it needs to be adjusted by A deducting the effects of exports and inflation. B deducting the effects of imports and exports. C deducting the effects of population change and exports. D deducting the effects of population change and inflation.
1 marks
Answer: D
This question in 0455/11 Oct/Nov 2015
Q65 · The table shows the percentage change in earnings and consumer prices for four countries… 0455/11 Oct/Nov 2015
23 The table shows the percentage change in earnings and consumer prices for four countries for one year. Which country will have experienced a constant level of real income during the year? consumer earnings prices A 7.5 6 B 5 4 C 3 3 D 0 2
1 marks
Answer: C
This question in 0455/11 Oct/Nov 2015
Q66 · How is a sharp rise in the price of oil likely to be seen by different oil-consuming… 0455/11 Oct/Nov 2015
26 How is a sharp rise in the price of oil likely to be seen by different oil-consuming countries? oil-consuming countries with oil-consuming countries with a low standard of living a high standard of living A desirable and manageable desirable and unmanageable B desirable and unmanageable desirable and manageable C undesirable and manageable undesirable and unmanageable D undesirable and unmanageable undesirable and manageable
1 marks
Answer: D
This question in 0455/11 Oct/Nov 2015
Q67 · Which item does the Human Development Index (HDI) of a country include, in addition to… 0455/12 Oct/Nov 2015
23 Which item does the Human Development Index (HDI) of a country include, in addition to real GDP per head and life expectancy at birth? A expenditure on law and order B literacy rate among adults C number of doctors D retirement age
1 marks
Answer: B
This question in 0455/12 Oct/Nov 2015
Q68 · Why might real GDP per head not be a good indicator of the standard of living in… 0455/12 Oct/Nov 2015
24 Why might real GDP per head not be a good indicator of the standard of living in developing countries? A It does not account for inflation. B It does not account for population changes. C It does not include primary production. D It does not include unpaid work on farms.
1 marks
Answer: D
This question in 0455/12 Oct/Nov 2015
Q69 · The table shows the percentage changes in earnings and consumer prices for four countries… 0455/12 Feb/March 2016
22 The table shows the percentage changes in earnings and consumer prices for four countries for one year. Which country is likely to have experienced the greatest increase in real income during the year? country earnings consumer prices A France +6.5 +3.5 B Germany +4.0 +4.0 C Japan +4.0 –1.0 D UK +6.5 –2.0
1 marks
Answer: D
This question in 0455/12 Feb/March 2016
Q70 · The table shows how three people spend their income 0455/11 May/June 2016
11 The table shows how three people spend their income. person X person Y person Z food, clothing and housing 30% 25% 50% entertainment and leisure 35% 35% 25% luxury goods 35% 40% 25% For these three people, what is the most likely order of income, from highest income to lowest income? A X → Y → Z B Y → X → Z C Y → Z → X D Z → X → Y
1 marks
Answer: B
This question in 0455/11 May/June 2016
Q71 · A government decides to make two changes to its taxation policies 0455/11 May/June 2016
18 A government decides to make two changes to its taxation policies. It lowers the tax on petrol and raises the tax on food. How do these changes affect the regressive nature of the taxes? lower petrol higher food tax tax A less regressive less regressive B less regressive more regressive C more regressive less regressive D more regressive more regressive
1 marks
Answer: B
This question in 0455/11 May/June 2016
Q72 · What is Gross Domestic Product (GDP) divided by to calculate GDP per head? 0455/11 May/June 2016
20 What is Gross Domestic Product (GDP) divided by to calculate GDP per head? A net migration B the birth rate C the total population D the working population
1 marks
Answer: C
This question in 0455/11 May/June 2016
Q73 · Why may the figure calculated for a developing country’s Gross Domestic Product be… 0455/11 May/June 2016
24 Why may the figure calculated for a developing country’s Gross Domestic Product be inaccurate? A There are unused resources. B There is a high reliance on imports. C There is a large amount of subsistence farming. D There is a small amount of skilled labour.
1 marks
Answer: C
This question in 0455/11 May/June 2016
Q74 · The table gives information on four countries 0455/11 May/June 2016
25 The table gives information on four countries. Which country is likely to be most developed? Gross Domestic life population Product expectancy (m) ($ billion) (years) A 100 800 51 B 200 6000 62 C 300 600 48 D 1000 1600 63
1 marks
Answer: B
This question in 0455/11 May/June 2016
Q75 · The table shows how three people spend their income 0455/12 May/June 2016
11 The table shows how three people spend their income. person X person Y person Z food, clothing and housing 35% 50% 20% entertainment and leisure 25% 20% 40% luxury goods 40% 30% 40% For these three people, what is the most likely order of income, from lowest income to highest income? A X → Y → Z B Y → X → Z C Y → Z → X D Z → X → Y
1 marks
Answer: B
This question in 0455/12 May/June 2016
Q76 · A country has a very high Gross Domestic Product and a small population but has a low… 0455/12 May/June 2016
21 A country has a very high Gross Domestic Product and a small population but has a low standard of living. What may be the cause of this low standard of living? A There is a high inequality of income distribution and a high provision of merit goods. B There is a high inequality of income distribution and a limited provision of merit goods. C There is equality of income distribution and a high provision of merit goods. D There is equality of income distribution and a low provision of merit goods.
1 marks
Answer: B
This question in 0455/12 May/June 2016
Q77 · Which country is likely to have the highest standard of living? 0455/12 May/June 2016
26 Which country is likely to have the highest standard of living? infant mortality birth rate death rate life expectancy rate A 41 20 31 49 B 32 14 29 59 C 25 6 25 79 D 25 5 22 79
1 marks
Answer: D
This question in 0455/12 May/June 2016
Q78 · The table shows how three people spend their income 0455/13 May/June 2016
11 The table shows how three people spend their income. person X person Y person Z food, clothing and housing 30% 25% 50% entertainment and leisure 35% 35% 25% luxury goods 35% 40% 25% For these three people, what is the most likely order of income, from lowest income to highest income? A Y → X → Z B Y → Z → X C Z → X → Y D Z → Y → X
1 marks
Answer: C
This question in 0455/13 May/June 2016
Q79 · Which measures, in addition to Gross Domestic Product per capita, are included in the… 0455/13 May/June 2016
21 Which measures, in addition to Gross Domestic Product per capita, are included in the Human Development Index? A average earnings and inequalities of incomes B balance of trade and balance of payments C life expectancy at birth and expected years of schooling D size of population and age structure of population
1 marks
Answer: C
This question in 0455/13 May/June 2016
Q80 · Why is nominal Gross Domestic Product not a good measure to compare the standard of… 0455/12 Oct/Nov 2016
21 Why is nominal Gross Domestic Product not a good measure to compare the standard of living in a country between two years? A It does not account for inflation. B It does not allow for savings. C It does not include government expenditure. D It only compares export prices with import prices.
1 marks
This question in 0455/12 Oct/Nov 2016
Q81 · Which outcome is least likely to be found with greater economic development? 0455/12 Oct/Nov 2016
24 Which outcome is least likely to be found with greater economic development? A A greater percentage of the population are highly educated. B A greater percentage of the population are homeowners. C A greater percentage of the population are old. D A greater percentage of the population are very poor.
1 marks
This question in 0455/12 Oct/Nov 2016
Q82 · The table shows some economic indicators 0455/13 Oct/Nov 2016
23 The table shows some economic indicators. Which increase in the first indicator is most likely to lead to an increase in the second indicator? first indicator second indicator A budget surplus consumer saving B consumer spending unemployment C inflation trade surplus D productivity living standards
1 marks
Answer: D
This question in 0455/13 Oct/Nov 2016
Q83 · This table shows how three people spend their income 0455/12 Feb/March 2017
10 This table shows how three people spend their income. person X person Y person Z food and housing 60% 20% 30% travel and leisure 20% 40% 30% luxury goods 20% 40% 40% Put the three people in the most likely order of income from the lowest to the highest income. A X, Y, Z B X, Z, Y C Y, Z, X D Z, Y, X
1 marks
Answer: B
This question in 0455/12 Feb/March 2017
Q84 · Which combination of changes in national output and population would cause an increase in… 0455/12 Feb/March 2017
21 Which combination of changes in national output and population would cause an increase in GDP per head? national output population A decrease by 4% unchanged B decrease by 5% decrease by 6% C increase by 3% increase by 5% D unchanged increase by 2%
1 marks
Answer: B
This question in 0455/12 Feb/March 2017
Q85 · A country has a low GDP and a large population but ranks relatively highly on the HDI 0455/11 May/June 2017
21 A country has a low GDP and a large population but ranks relatively highly on the HDI. Which combination may exist in the country? provision of education and income per head healthcare (merit goods) A high high B high low C low low D low high
1 marks
Answer: D
This question in 0455/11 May/June 2017
Q86 · In a developing country real incomes have risen 0455/11 May/June 2017
23 In a developing country real incomes have risen. Which situation would definitely have caused this? money price level incomes A fell fell B fell rose C rose unchanged D rose fell
1 marks
Answer: B
This question in 0455/11 May/June 2017
Q87 · The table gives information about four countries 0455/11 May/June 2017
26 The table gives information about four countries. Which country is likely to have the highest standard of living? % of labour force GDP per head life expectancy in service ($) industries A 51 250 48 B 51 400 52 C 61 450 52 D 61 400 40
1 marks
Answer: C
This question in 0455/11 May/June 2017
Q88 · In South Africa, the number of skilled workers is relatively low 0455/12 May/June 2017
11 In South Africa, the number of skilled workers is relatively low. However, average wages in South Africa are double the average wage in Brazil and Turkey and they are 1.6 times higher than in Malaysia. What may be concluded from this information? A Malaysian workers are more skilled than South African workers. B Prices in South Africa are double those in Brazil. C South Africa’s labour productivity is low. D South African trade union bargaining power is strong.
1 marks
Answer: D
This question in 0455/12 May/June 2017
Q89 · What is the change in GDP per head, after taking account of price increases (real… 0455/12 May/June 2017
23 What is the change in GDP per head, after taking account of price increases (real change), between 2000 and 2013? population consumer prices year GDP $billion million index (CPI) 2000 3 100 4000 2013 4 120 6000 A from $15 to $125 B from $1250 to $1333 C from $1333 to $1250 D from $1333 to $1500
1 marks
Answer: C
This question in 0455/12 May/June 2017
Q90 · What is likely to show that a country has a rising level of economic development? 0455/13 May/June 2017
24 What is likely to show that a country has a rising level of economic development? A a reduced inflation rate B a reduced national income per head C a reduced provision of healthcare (merit good) D a reduced unemployment rate
1 marks
Answer: D
This question in 0455/13 May/June 2017
Q91 · Why is the Human Development Index (HDI) often considered to be better than Gross… 0455/11 Oct/Nov 2017
20 Why is the Human Development Index (HDI) often considered to be better than Gross Domestic Product (GDP) per head as a measure of living standards? A GDP per head excludes economic growth. B GDP per head ignores population growth. C HDI includes more than the production of goods and services. D HDI is calculated by the national government.
1 marks
Answer: C
This question in 0455/11 Oct/Nov 2017
Q92 · Why is the Human Development Index (HDI) often considered to be better than Gross… 0455/12 Oct/Nov 2017
20 Why is the Human Development Index (HDI) often considered to be better than Gross Domestic Product (GDP) per head as a measure of living standards? A GDP per head excludes economic growth. B GDP per head ignores population growth. C HDI includes more than the production of goods and services. D HDI is calculated by the national government.
1 marks
Answer: C
This question in 0455/12 Oct/Nov 2017
Q93 · Why is the Human Development Index (HDI) often considered to be better than Gross… 0455/13 Oct/Nov 2017
20 Why is the Human Development Index (HDI) often considered to be better than Gross Domestic Product (GDP) per head as a measure of living standards? A GDP per head excludes economic growth. B GDP per head ignores population growth. C HDI includes more than the production of goods and services. D HDI is calculated by the national government.
1 marks
Answer: C
This question in 0455/13 Oct/Nov 2017
Q94 · The table shows the rice yield in four countries 0455/11 May/June 2018
30 The table shows the rice yield in four countries. rice yield country (kilos per hectare) Japan 64 China 53 Bangladesh 20 Thailand 20 What may be concluded from this information? A Bangladesh and Thailand produce the same amount of rice. B Japan produces more than three times as much rice as Bangladesh. C Japan produces the largest amount of rice per hectare. D Japan produces the largest amount of rice per person employed.
1 marks
Answer: C
This question in 0455/11 May/June 2018
Q95 · The table shows the rice yield in four countries 0455/12 May/June 2018
30 The table shows the rice yield in four countries. rice yield country (kilos per hectare) Japan 64 China 53 Bangladesh 20 Thailand 20 What may be concluded from this information? A Bangladesh and Thailand produce the same amount of rice. B Japan produces more than three times as much rice as Bangladesh. C Japan produces the largest amount of rice per hectare. D Japan produces the largest amount of rice per person employed.
1 marks
Answer: C
This question in 0455/12 May/June 2018
Q96 · The government of a developing country allows a multinational mining company to mine… 0455/13 May/June 2018
26 The government of a developing country allows a multinational mining company to mine minerals in order to improve the standard of living of the local people. Which action by the multinational company (MNC) will not lead to an improvement in the standard of living of the local people? A building roads to assist transport B exporting mineral ore C providing skills training D returning profits overseas
1 marks
Answer: D
This question in 0455/13 May/June 2018
Q97 · The table shows the rice yield in four countries 0455/13 May/June 2018
30 The table shows the rice yield in four countries. rice yield country (kilos per hectare) Japan 64 China 53 Bangladesh 20 Thailand 20 What may be concluded from this information? A Bangladesh and Thailand produce the same amount of rice. B Japan produces more than three times as much rice as Bangladesh. C Japan produces the largest amount of rice per hectare. D Japan produces the largest amount of rice per person employed.
1 marks
Answer: C
This question in 0455/13 May/June 2018
Q98 · The table shows how three people (X, Y and Z) spend their income 0455/12 Feb/March 2019
10 The table shows how three people (X, Y and Z) spend their income. person X person Y person Z food, clothing and housing 30% 25% 50% entertainment and leisure 35% 35% 25% luxury goods 35% 40% 25% For these three people, what is the most likely order of income, from lowest income to highest income? A Y → X → Z B Y → Z → X C Z → X → Y D Z → Y → X
1 marks
Answer: C
This question in 0455/12 Feb/March 2019
Q99 · A country has the highest GDP per head in the world 0455/12 Feb/March 2019
20 A country has the highest GDP per head in the world. What is this information most likely to suggest about the country? A It has the world’s biggest economy. B It has the world’s fastest economic growth rate. C It has the world’s greatest size of population. D It has the world’s highest standard of living.
1 marks
Answer: D
This question in 0455/12 Feb/March 2019
Q100 · A developing country starts to show increases in economic growth 0455/12 Feb/March 2019
24 A developing country starts to show increases in economic growth. What is most likely to occur? A a reduction in imports B a reduction in the number of doctors per capita C an increase in absolute poverty D an increase in incomes
1 marks
Answer: D
This question in 0455/12 Feb/March 2019
Q101 · What would not increase the Human Development Index (HDI) of a country? 0455/11 May/June 2019
21 What would not increase the Human Development Index (HDI) of a country? A an increase in the level of car ownership B an increase in life expectancy at birth C a rise in the GDP per head D a rise in the number of years of schooling
1 marks
Answer: A
This question in 0455/11 May/June 2019
Q102 · Given the following information, which country is most likely to have the highest… 0455/11 May/June 2019
25 Given the following information, which country is most likely to have the highest standard of living? birth death life infant rate rate expectancy mortality rate A Bangladesh 27 10 58 93 B Bhutan 36 14 53 107 C Botswana 31 21 40 57 D Brunei 25 5 72 22
1 marks
Answer: D
This question in 0455/11 May/June 2019
Q103 · Why is the Human Development Index (HDI) a better measure of living standards than GDP… 0455/12 May/June 2019
21 Why is the Human Development Index (HDI) a better measure of living standards than GDP per head? A It takes into account changes in output. B It takes into account changes in population. C It takes into account health and education data. D It takes into account inflation.
1 marks
Answer: C
This question in 0455/12 May/June 2019
Q104 · Given the following information, which country is most likely to have the highest… 0455/12 May/June 2019
25 Given the following information, which country is most likely to have the highest standard of living? birth death life infant rate rate expectancy mortality rate A Bangladesh 27 10 58 93 B Bhutan 36 14 53 107 C Botswana 31 21 40 57 D Brunei 25 5 72 22
1 marks
Answer: D
This question in 0455/12 May/June 2019
Q105 · The diagram shows percentage (%) changes in prices and wages over time 0455/13 May/June 2019
19 The diagram shows percentage (%) changes in prices and wages over time. 2.0 prices % change in wages 1.5 and prices 1.0 0.5 wages 0 2000 2005 2010 2015 year What does the diagram indicate? A Inflation is proportionately related to wage levels. B The gap between wages and prices is constant. C Wages are highest in 2010. D Wage earners have increasingly less purchasing power.
1 marks
Answer: D
This question in 0455/13 May/June 2019
Q106 · Why might GDP per head be underestimated in a developed economy? 0455/13 May/June 2019
20 Why might GDP per head be underestimated in a developed economy? A It does not account for changes in population. B It does not include financial services output. C It does not include the hidden economy. D It does not take into account the primary sector.
1 marks
Answer: C
This question in 0455/13 May/June 2019
Q107 · What is included in the Human Development Index (HDI)? 0455/13 May/June 2019
21 What is included in the Human Development Index (HDI)? A gender inequality B life expectancy at birth C political freedom D the impact of pollution
1 marks
Answer: B
This question in 0455/13 May/June 2019
Q108 · Given the following information, which country is most likely to have the highest… 0455/13 May/June 2019
25 Given the following information, which country is most likely to have the highest standard of living? birth death life infant rate rate expectancy mortality rate A Bangladesh 27 10 58 93 B Bhutan 36 14 53 107 C Botswana 31 21 40 57 D Brunei 25 5 72 22
1 marks
Answer: D
This question in 0455/13 May/June 2019
Q109 · The table shows how three people (X, Y and Z) spend their income 0455/11 Oct/Nov 2019
10 The table shows how three people (X, Y and Z) spend their income. person X person Y person Z food, clothing and housing 35% 50% 20% entertainment and leisure 25% 20% 40% luxury goods 40% 30% 40% For these three people, what is the most likely order of income, from highest income to lowest income? A X → Y→ Z B Y → Z → X C Z → X → Y D Z → Y → X
1 marks
Answer: C
This question in 0455/11 Oct/Nov 2019
Q110 · What are the components of the Human Development Index (HDI)? 0455/11 Oct/Nov 2019
21 What are the components of the Human Development Index (HDI)? A life expectancy at birth, expected years of schooling, GDP B life expectancy at birth, expected years of schooling, GDP per head C population growth, adult literacy rate, GDP per head D population size, expected years of schooling, number of doctors per head
1 marks
Answer: B
This question in 0455/11 Oct/Nov 2019
Q111 · The table shows how three people (X, Y and Z) spend their income 0455/12 Oct/Nov 2019
10 The table shows how three people (X, Y and Z) spend their income. person X person Y person Z food, clothing and housing 35% 50% 20% entertainment and leisure 25% 20% 40% luxury goods 40% 30% 40% For these three people, what is the most likely order of income, from highest income to lowest income? A X → Y→ Z B Y → Z → X C Z → X → Y D Z → Y → X
1 marks
Answer: C
This question in 0455/12 Oct/Nov 2019
Q112 · A musician has a choice of playing for an orchestra in either Germany or England 0455/12 Oct/Nov 2019
11 A musician has a choice of playing for an orchestra in either Germany or England. Which combination of incomes and cost of living is most likely to cause her to choose the German orchestra? Incomes and cost of living in Germany compared with those in England pre-tax (gross) income after-tax (net) income cost of living A higher higher higher B higher lower lower C lower higher higher D lower higher lower
1 marks
Answer: D
This question in 0455/12 Oct/Nov 2019
Q113 · Why was the Human Development Index (HDI) introduced as a measure of the standard of… 0455/12 Oct/Nov 2019
21 Why was the Human Development Index (HDI) introduced as a measure of the standard of living? A Education and healthcare are important contributors to the standard of living. B GDP per head only measures development. C Inequality can only be measured by HDI. D Literacy rates are not an effective measure of the standard of living.
1 marks
Answer: A
This question in 0455/12 Oct/Nov 2019
Q114 · What is most likely to increase as a country becomes more developed? 0455/12 Oct/Nov 2019
24 What is most likely to increase as a country becomes more developed? A average household income B average size of family C infant mortality rate D the proportion of income spent on food
1 marks
Answer: A
This question in 0455/12 Oct/Nov 2019
Q115 · A musician has a choice of playing for an orchestra in either Germany or England 0455/13 Oct/Nov 2019
11 A musician has a choice of playing for an orchestra in either Germany or England. Which combination of incomes and cost of living is most likely to cause her to choose the German orchestra? Incomes and cost of living in Germany compared with those in England pre-tax (gross) income after-tax (net) income cost of living A higher higher higher B higher lower lower C lower higher higher D lower higher lower
1 marks
Answer: D
This question in 0455/13 Oct/Nov 2019
Q116 · Which indicator would be included in the Human Development Index (HDI) for a country? 0455/13 Oct/Nov 2019
21 Which indicator would be included in the Human Development Index (HDI) for a country? A adult literacy rate B doctors per 1000 people C unemployment rate D years spent in education
1 marks
Answer: D
This question in 0455/13 Oct/Nov 2019
Q117 · The Human Development Index (HDI) ranks human development in countries from 0 (lowest) to… 0455/12 Feb/March 2020
25 The Human Development Index (HDI) ranks human development in countries from 0 (lowest) to 1 (highest). What does the calculation of HDI not take into consideration? A estimate of life expectancy at birth B information on the number of years of schooling C regional inequalities of investments in human capital D standard of living linked to income per head
1 marks
This question in 0455/12 Feb/March 2020
Q118 · Which combination of changes is most likely to result in a fall in living standards in a… 0455/12 Feb/March 2020
26 Which combination of changes is most likely to result in a fall in living standards in a country? GDP inflation population A fall fall rise B fall rise rise C rise fall fall D rise rise fall
1 marks
This question in 0455/12 Feb/March 2020
Q119 · Which changes usually result when a country develops and is able to provide free… 0455/11 May/June 2020
26 Which changes usually result when a country develops and is able to provide free healthcare and good living conditions? labour birth rate death rate productivity A falls falls rises B falls rises falls C rises falls falls D rises rises rises
1 marks
Answer: A
This question in 0455/11 May/June 2020
Question 120 0455/12 May/June 2020
11 People’s income decreases. How is the proportion spent on food and leisure likely to change? food leisure A decrease decrease B decrease increase C increase decrease D increase increase
1 marks
Answer: C
This question in 0455/12 May/June 2020
Q121 · Real incomes have risen in a country 0455/13 May/June 2020
24 Real incomes have risen in a country. Which situation would definitely have caused this? money price level incomes A fell fell B fell rose C rose rose D rose fell
1 marks
Answer: B
This question in 0455/13 May/June 2020
Q122 · Which changes usually result when a country develops and is able to provide free… 0455/13 May/June 2020
26 Which changes usually result when a country develops and is able to provide free healthcare and good living conditions? labour birth rate death rate productivity A falls falls rises B falls rises falls C rises falls falls D rises rises rises
1 marks
Answer: A
This question in 0455/13 May/June 2020
Q123 · One of the indicators of living standards is the Human Development Index (HDI) 0455/13 Oct/Nov 2020
24 One of the indicators of living standards is the Human Development Index (HDI). What is not taken into consideration when calculating the HDI? A education B income per head C level of savings D life expectancy
1 marks
Answer: C
This question in 0455/13 Oct/Nov 2020
Q124 · The table shows the percentage employment in the primary, secondary and service sectors… 0455/13 Oct/Nov 2020
26 The table shows the percentage employment in the primary, secondary and service sectors in four countries. Which country is likely to be the most developed? percentage employment primary secondary service country sector sector sector A 10 35 55 B 20 60 20 C 35 35 30 D 40 40 20
1 marks
Answer: A
This question in 0455/13 Oct/Nov 2020
Q125 · The table shows some data about an economy 0455/12 Feb/March 2021
22 The table shows some data about an economy. year 1 rate of inflation (%) 3.5 change in personal incomes (%) 2.5 What happened in year 1? A Both prices and real incomes fell. B Both prices and real incomes rose. C Prices fell but real incomes rose. D Prices rose but real incomes fell.
1 marks
Answer: D
This question in 0455/12 Feb/March 2021
Q126 · Which country is likely to have the highest standard of living? 0455/12 Feb/March 2021
24 Which country is likely to have the highest standard of living? infant mortality birth rate death rate life expectancy rate A 41 20 31 49 B 32 14 29 59 C 25 6 25 79 D 25 5 22 79
1 marks
Answer: D
This question in 0455/12 Feb/March 2021
Q127 · Gross Domestic Product (GDP) is a better measure of comparative living standards when it… 0455/11 May/June 2021
26 Gross Domestic Product (GDP) is a better measure of comparative living standards when it is adjusted for the effects of A exports and inflation. B imports and exports. C population change and exports. D population change and inflation.
1 marks
Answer: D
This question in 0455/11 May/June 2021
Q128 · Gross Domestic Product (GDP) is a better measure of comparative living standards when it… 0455/12 May/June 2021
26 Gross Domestic Product (GDP) is a better measure of comparative living standards when it is adjusted for the effects of A exports and inflation. B imports and exports. C population change and exports. D population change and inflation.
1 marks
Answer: D
This question in 0455/12 May/June 2021
Q129 · Gross Domestic Product (GDP) is a better measure of comparative living standards when it… 0455/13 May/June 2021
26 Gross Domestic Product (GDP) is a better measure of comparative living standards when it is adjusted for the effects of A exports and inflation. B imports and exports. C population change and exports. D population change and inflation.
1 marks
Answer: D
This question in 0455/13 May/June 2021
Q130 · The table shows statistics for four countries, A–D 0455/11 Oct/Nov 2021
26 The table shows statistics for four countries, A–D. Which country has the lowest standard of living? average annual growth rate of population density life expectancy real GDP per head population (per square kilometre) (years) ($) (%) A 1.9 19 46 190 B 2.7 2 58 1700 C 3.7 45 59 210 D 4.2 89 44 190
1 marks
Answer: D
This question in 0455/11 Oct/Nov 2021
Q131 · What is the consequence of economic growth for individuals and for the economy? 0455/12 Oct/Nov 2021
18 What is the consequence of economic growth for individuals and for the economy? individuals the economy A increase in absolute poverty increase in inflation B increase in average incomes increase in government tax revenue C increase in the variety of goods and services reduction in exports D increase in unemployment reduction in the standard of living
1 marks
Answer: B
This question in 0455/12 Oct/Nov 2021
Q132 · The table shows statistics for four countries, A–D 0455/12 Oct/Nov 2021
26 The table shows statistics for four countries, A–D. Which country has the lowest standard of living? average annual growth rate of population density life expectancy real GDP per head population (per square kilometre) (years) ($) (%) A 1.9 19 46 190 B 2.7 2 58 1700 C 3.7 45 59 210 D 4.2 89 44 190
1 marks
Answer: D
This question in 0455/12 Oct/Nov 2021
Q133 · The table shows statistics for four countries, A–D 0455/13 Oct/Nov 2021
26 The table shows statistics for four countries, A–D. Which country has the lowest standard of living? average annual growth rate of population density life expectancy real GDP per head population (per square kilometre) (years) ($) (%) A 1.9 19 46 190 B 2.7 2 58 1700 C 3.7 45 59 210 D 4.2 89 44 190
1 marks
Answer: D
This question in 0455/13 Oct/Nov 2021
Q134 · Which components, in addition to Gross Domestic Product (GDP) per head, are included in… 0455/11 May/June 2022
3 Which components, in addition to Gross Domestic Product (GDP) per head, are included in the Human Development Index (HDI)? A average earnings and inequalities of incomes B balance of trade and balance of payments C life expectancy at birth and expected years of schooling D size of population and age structure of population
1 marks
Answer: C
This question in 0455/11 May/June 2022
Q135 · Why would standards of living fall when there is a recession? 0455/11 May/June 2022
23 Why would standards of living fall when there is a recession? A The government would increase taxes to combat the recession. B The purchasing power of households would fall. C The value of the domestic currency would increase. D There would be a rise in the level of immigration.
1 marks
Answer: B
This question in 0455/11 May/June 2022
Q136 · The table shows some economic indicators 0455/11 May/June 2022
26 The table shows some economic indicators. Which increase in the first indicator is most likely to lead to an increase in the second indicator? first indicator second indicator A budget surplus consumer saving B consumer spending unemployment C inflation trade surplus D productivity living standards
1 marks
Answer: D
This question in 0455/11 May/June 2022
Q137 · The table shows how three people, X, Y and Z, spend their income 0455/12 May/June 2022
14 The table shows how three people, X, Y and Z, spend their income. person X person Y person Z food, clothing and housing 30% 25% 50% entertainment and leisure 35% 35% 25% luxury goods 35% 40% 25% What is the likely order of income, from lowest income to highest income, for these three people? A Y X Z B Y Z X C Z X Y D Z Y X
1 marks
Answer: C
This question in 0455/12 May/June 2022
Q138 · Which components, in addition to Gross Domestic Product (GDP) per head, are included in… 0455/12 May/June 2022
24 Which components, in addition to Gross Domestic Product (GDP) per head, are included in the Human Development Index (HDI)? A average earnings and inequalities of incomes B balance of trade and balance of payments C life expectancy at birth and expected years of schooling D size of population and age structure of population
1 marks
Answer: C
This question in 0455/12 May/June 2022
Q139 · The table shows some economic indicators 0455/12 May/June 2022
26 The table shows some economic indicators. Which increase in the first indicator is most likely to lead to an increase in the second indicator? first indicator second indicator A budget surplus consumer saving B consumer spending unemployment C inflation trade surplus D productivity living standards
1 marks
Answer: D
This question in 0455/12 May/June 2022
Q140 · The table shows how three people, X, Y and Z, spend their income 0455/13 May/June 2022
14 The table shows how three people, X, Y and Z, spend their income. person X person Y person Z food, clothing and housing 30% 25% 50% entertainment and leisure 35% 35% 25% luxury goods 35% 40% 25% What is the likely order of income, from lowest income to highest income, for these three people? A Y X Z B Y Z X C Z X Y D Z Y X
1 marks
Answer: C
This question in 0455/13 May/June 2022
Q141 · The diagram shows a production possibility curve (PPC) for country Z 0455/11 Oct/Nov 2022
3 The diagram shows a production possibility curve (PPC) for country Z. Government policy is to move the economy from point X to point Y on the PPC. capital X goods Y O consumer goods What is the most likely effect of this policy? A Living standards rise in the short run. B More capital goods are produced. C Prices of consumer goods increase. D Total output increases.
1 marks
Answer: A
This question in 0455/11 Oct/Nov 2022
Q142 · The table shows real GDP and population for four countries 0455/11 Oct/Nov 2022
20 The table shows real GDP and population for four countries. Which country has the highest real GDP per head? real GDP population ($ billions) (millions) A 200 80 B 100 25 C 80 50 D 60 12
1 marks
Answer: D
This question in 0455/11 Oct/Nov 2022
Q143 · The table shows the percentage changes in earnings and consumer prices for four countries… 0455/11 Oct/Nov 2022
24 The table shows the percentage changes in earnings and consumer prices for four countries for one year. Which country is likely to have experienced the greatest increase in real income during the year? country earnings consumer prices A France +6.5 +3.5 B Germany +4.0 +4.0 C Japan +4.0 –1.0 D UK +6.5 –2.0
1 marks
Answer: D
This question in 0455/11 Oct/Nov 2022
Q144 · The table shows the Human Development Index (HDI) for a country in two years 0455/11 Oct/Nov 2022
25 The table shows the Human Development Index (HDI) for a country in two years. year HDI value 1 0.467 2 0.609 What would not explain the changes in the HDI? A an increase in gender equality B an increase in income per head C an increase in life expectancy D an increase in years of schooling
1 marks
Answer: A
This question in 0455/11 Oct/Nov 2022
Q145 · A musician has a choice of playing for an orchestra in either Germany or England 0455/12 Oct/Nov 2022
12 A musician has a choice of playing for an orchestra in either Germany or England. Which combination of incomes and cost of living is most likely to cause her to choose the German orchestra? incomes and cost of living in Germany compared with those in England pre-tax (gross) income after-tax (net) income cost of living A higher higher higher B higher lower lower C lower higher higher D lower higher lower
1 marks
Answer: D
This question in 0455/12 Oct/Nov 2022
Q146 · The table shows the percentage changes in earnings and consumer prices for four countries… 0455/12 Oct/Nov 2022
24 The table shows the percentage changes in earnings and consumer prices for four countries in one year. Which country is likely to have experienced the greatest increase in real income during the year? country earnings consumer prices A France +6.5 +3.5 B Germany +4.0 +4.0 C Japan +4.0 –1.0 D UK +6.5 –2.0
1 marks
Answer: D
This question in 0455/12 Oct/Nov 2022
Q147 · A musician has a choice of playing for an orchestra in either Germany or England 0455/13 Oct/Nov 2022
12 A musician has a choice of playing for an orchestra in either Germany or England. Which combination of incomes and cost of living is most likely to cause her to choose the German orchestra? incomes and cost of living in Germany compared with those in England pre-tax (gross) income after-tax (net) income cost of living A higher higher higher B higher lower lower C lower higher higher D lower higher lower
1 marks
Answer: D
This question in 0455/13 Oct/Nov 2022
Q148 · The table shows the percentage changes in earnings and consumer prices for four countries… 0455/13 Oct/Nov 2022
24 The table shows the percentage changes in earnings and consumer prices for four countries in one year. Which country is likely to have experienced the greatest increase in real income during the year? country earnings consumer prices A France +6.5 +3.5 B Germany +4.0 +4.0 C Japan +4.0 –1.0 D UK +6.5 –2.0
1 marks
Answer: D
This question in 0455/13 Oct/Nov 2022
Q149 · Which combination of government actions is most likely to raise the living standards of… 0455/13 Oct/Nov 2022
25 Which combination of government actions is most likely to raise the living standards of lower income groups in an economy? spending on personal tax-free indirect tax healthcare allowance A increase increase decrease B increase decrease increase C reduce increase decrease D reduce increase increase
1 marks
Answer: D
This question in 0455/13 Oct/Nov 2022
Q150 · Which statement is correct about the Human Development Index (HDI) and real GDP? 0455/11 May/June 2023
24 Which statement is correct about the Human Development Index (HDI) and real GDP? A HDI includes exports and imports while real GDP does not. B HDI includes life expectancy and years of schooling while real GDP does not. C HDI includes the level of output while real GDP does not. D HDI includes the level of unemployment in the population while real GDP does not.
1 marks
Answer: B
This question in 0455/11 May/June 2023
Q151 · The Peruvian government set itself the target of reducing the number of its population in… 0455/12 May/June 2023
25 The Peruvian government set itself the target of reducing the number of its population in poverty. What change does not indicate that the Peruvian government had made progress towards this target? A a rise in employment B a rise in infant mortality C a rise in life expectancy D a rise in the level of adult literacy
1 marks
Answer: B
This question in 0455/12 May/June 2023
Q152 · The table shows the real GDP per head for a country in 2021 and 2022 0455/12 Oct/Nov 2023
21 The table shows the real GDP per head for a country in 2021 and 2022. 2021 2022 $20000 $21000 What is most likely to have changed between 2021 and 2022? A Incomes were distributed more evenly. B There was more activity in the informal economy. C The living standards of some people improved. D The rate of inflation increased.
1 marks
Answer: C
This question in 0455/12 Oct/Nov 2023
Q153 · A small country whose only export is oil decides to reduce substantially the rate at… 0455/12 Oct/Nov 2023
27 A small country whose only export is oil decides to reduce substantially the rate at which it extracts its limited oil reserves. What is the most likely reason for this decision? A to improve the balance of payments in the following year B to increase current government income C to maintain future living standards D to raise the level of employment in the oil industry
1 marks
Answer: C
This question in 0455/12 Oct/Nov 2023
Q154 · The table shows some economic indicators 0455/13 Oct/Nov 2023
24 The table shows some economic indicators. Which increase in the first indicator is most likely to lead to an increase in the second indicator? first indicator second indicator A budget surplus consumer saving B consumer spending unemployment C inflation trade surplus D productivity living standards
1 marks
Answer: D
This question in 0455/13 Oct/Nov 2023
Q155 · What is likely to increase with economic growth? 0455/12 Feb/March 2024
18 What is likely to increase with economic growth? A cyclical unemployment B income per head C the budget deficit D the stock of natural resources
1 marks
Answer: B
This question in 0455/12 Feb/March 2024
Q156 · The table shows statistics for four countries A, B, C and D 0455/12 May/June 2024
24 The table shows statistics for four countries A, B, C and D. According to the data provided, which country has the lowest standard of living? average years of life expectancy GDP per head schooling (years) ($) A 6 45 200 B 7 47 200 C 9 60 220 D 12 59 1500
1 marks
Answer: A
This question in 0455/12 May/June 2024
Q157 · What does the Human Development Index (HDI) indicate? 0455/13 May/June 2024
24 What does the Human Development Index (HDI) indicate? A economic development B level of unemployment C living standards D rate of inflation
1 marks
Answer: C
This question in 0455/13 May/June 2024
Q158 · The table shows the distribution of income as measured by GDP for three countries in a… 0455/11 Oct/Nov 2024
24 The table shows the distribution of income as measured by GDP for three countries in a year. percentage of GDP received by each 20% of households second second highest 20% middle 20% lowest 20% highest 20% lowest 20% Belgium 36.4 22.4 18.0 14.3 8.9 Mexico 51.7 20.0 13.5 9.4 5.4 US 46.9 22.4 15.3 10.3 5.1 What can be concluded from the table? A The lowest 20% of households in the US have lower incomes than the lowest 20% of households in Mexico. B The lowest 40% of households in Belgium receive a larger share of the country’s income than the highest 20% of households. C The distribution of income is most equal in Belgium. D The highest 20% of households in the US receive half of the country’s income.
1 marks
Answer: C
This question in 0455/11 Oct/Nov 2024
Q159 · Workers in Switzerland earn more on average than workers in Mexico 0455/12 Oct/Nov 2024
24 Workers in Switzerland earn more on average than workers in Mexico. What is a likely cause of this? A A greater percentage of workers in Switzerland work part-time than in Mexico. B The average worker in Switzerland is more productive than the average worker in Mexico. C The average worker in Switzerland pays more income tax than the average worker in Mexico. D The unemployment rate is higher in Switzerland than in Mexico.
1 marks
Answer: B
This question in 0455/12 Oct/Nov 2024
Q160 · What is Gross Domestic Product (GDP) divided by in order to calculate GDP per head? 0455/13 Oct/Nov 2024
20 What is Gross Domestic Product (GDP) divided by in order to calculate GDP per head? A the adult population B the dependent population C the total population D the working population
1 marks
Answer: C
This question in 0455/13 Oct/Nov 2024
Q161 · What is the consequence of economic growth for individuals and for the economy? 0455/13 Oct/Nov 2024
21 What is the consequence of economic growth for individuals and for the economy? individuals the economy A increase in absolute poverty increase in inflation B increase in average incomes increase in government tax revenue C increase in the variety of goods and services reduction in exports D increase in unemployment reduction in the standard of living
1 marks
Answer: B
This question in 0455/13 Oct/Nov 2024
Q162 · The table shows the Human Development Index (HDI) values for two countries 0455/12 Feb/March 2025
24 The table shows the Human Development Index (HDI) values for two countries. country HDI value X 0.90 Y 0.45 What might explain the difference in the HDI values? A Country X has double the inflation rate of country Y. B Country X has half the population of country Y. C Country X spends more of its real GDP on foreign aid than country Y. D Country X spends more of its real GDP on schooling than country Y.
1 marks
Answer: D
This question in 0455/12 Feb/March 2025
Q163 · The table shows the Human Development Index (HDI) value for a country in two years 0455/11 May/June 2025
25 The table shows the Human Development Index (HDI) value for a country in two years. year HDI value 1 0.467 2 0.609 What would not explain the change in the HDI value? A an increase in gender equality B an increase in income per head C an increase in life expectancy D an increase in years of schooling
1 marks
Answer: A
This question in 0455/11 May/June 2025
Q164 · In rural areas in developing countries, farmers grow food for their own consumption 0455/12 May/June 2025
25 In rural areas in developing countries, farmers grow food for their own consumption. Why might this mean that the GDP is a weak measure of the standard of living in those countries? A The food grown is not exported. B The GDP does not include agricultural production. C The GDP only refers to the public sector. D The value of the food is unknown.
1 marks
Answer: D
This question in 0455/12 May/June 2025
Q165 · The table shows the proportion of disposable income spent on three different goods by… 0455/12 Oct/Nov 2025
11 The table shows the proportion of disposable income spent on three different goods by four different households. Which household is likely to have the lowest income? food transport holidays % % % A 50 15 5 B 35 18 10 C 30 20 15 D 20 25 20
1 marks
Answer: A
This question in 0455/12 Oct/Nov 2025
Q166 · In one particular year, South Sudan’s population growth was 1.3% while its GDP growth was… 0455/12 Oct/Nov 2025
22 In one particular year, South Sudan’s population growth was 1.3% while its GDP growth was 2%. What is the most likely consequence of this? A GDP per capita will decrease B the rate of inflation will decrease C the standard of living will increase D unemployment will increase
1 marks
Answer: C
This question in 0455/12 Oct/Nov 2025
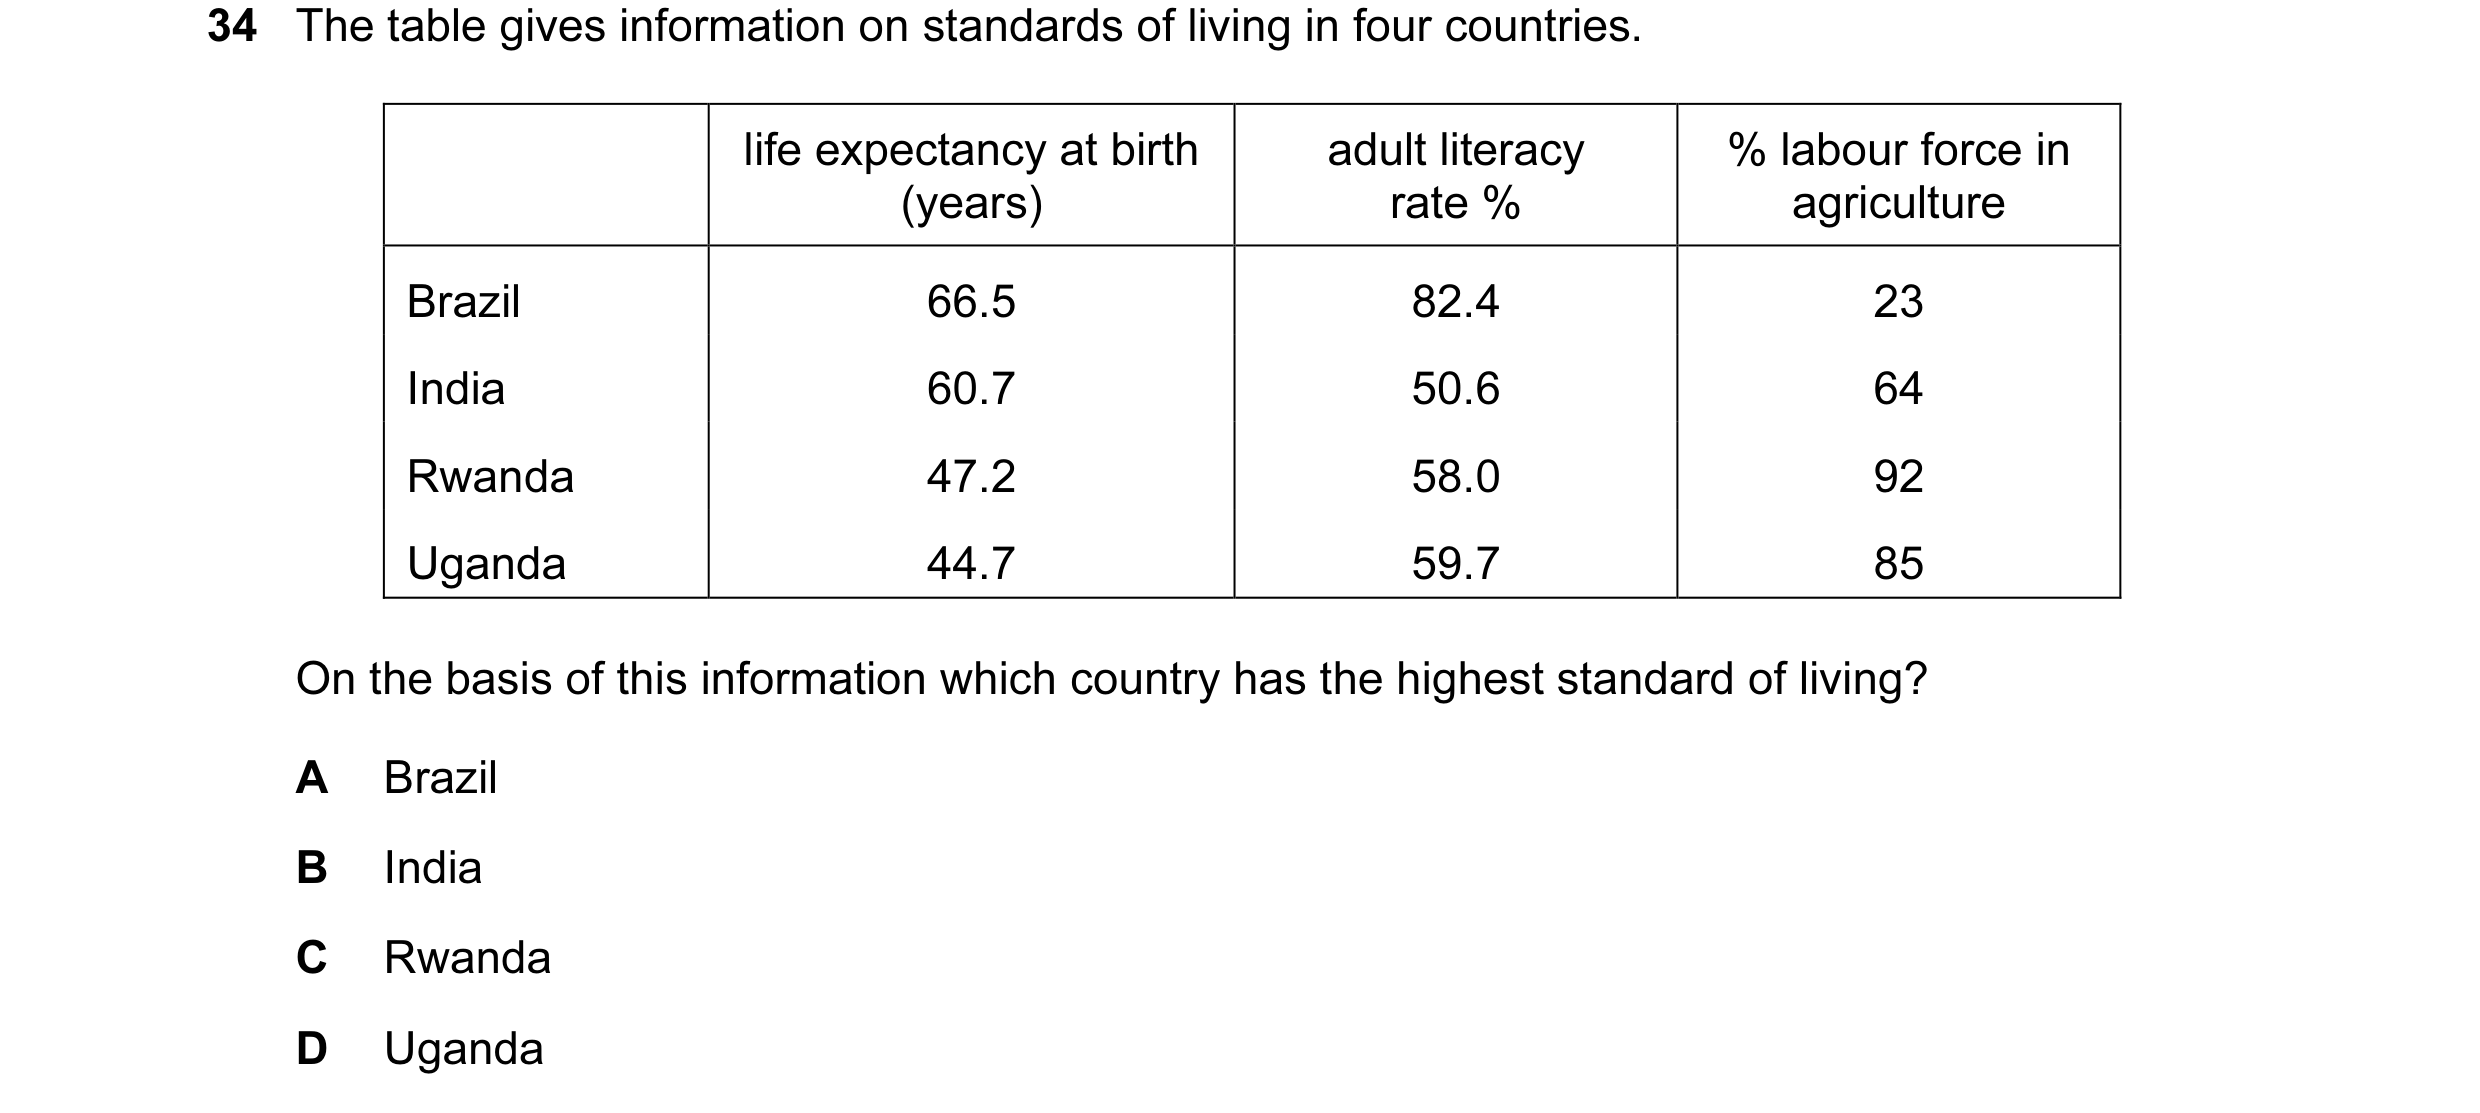
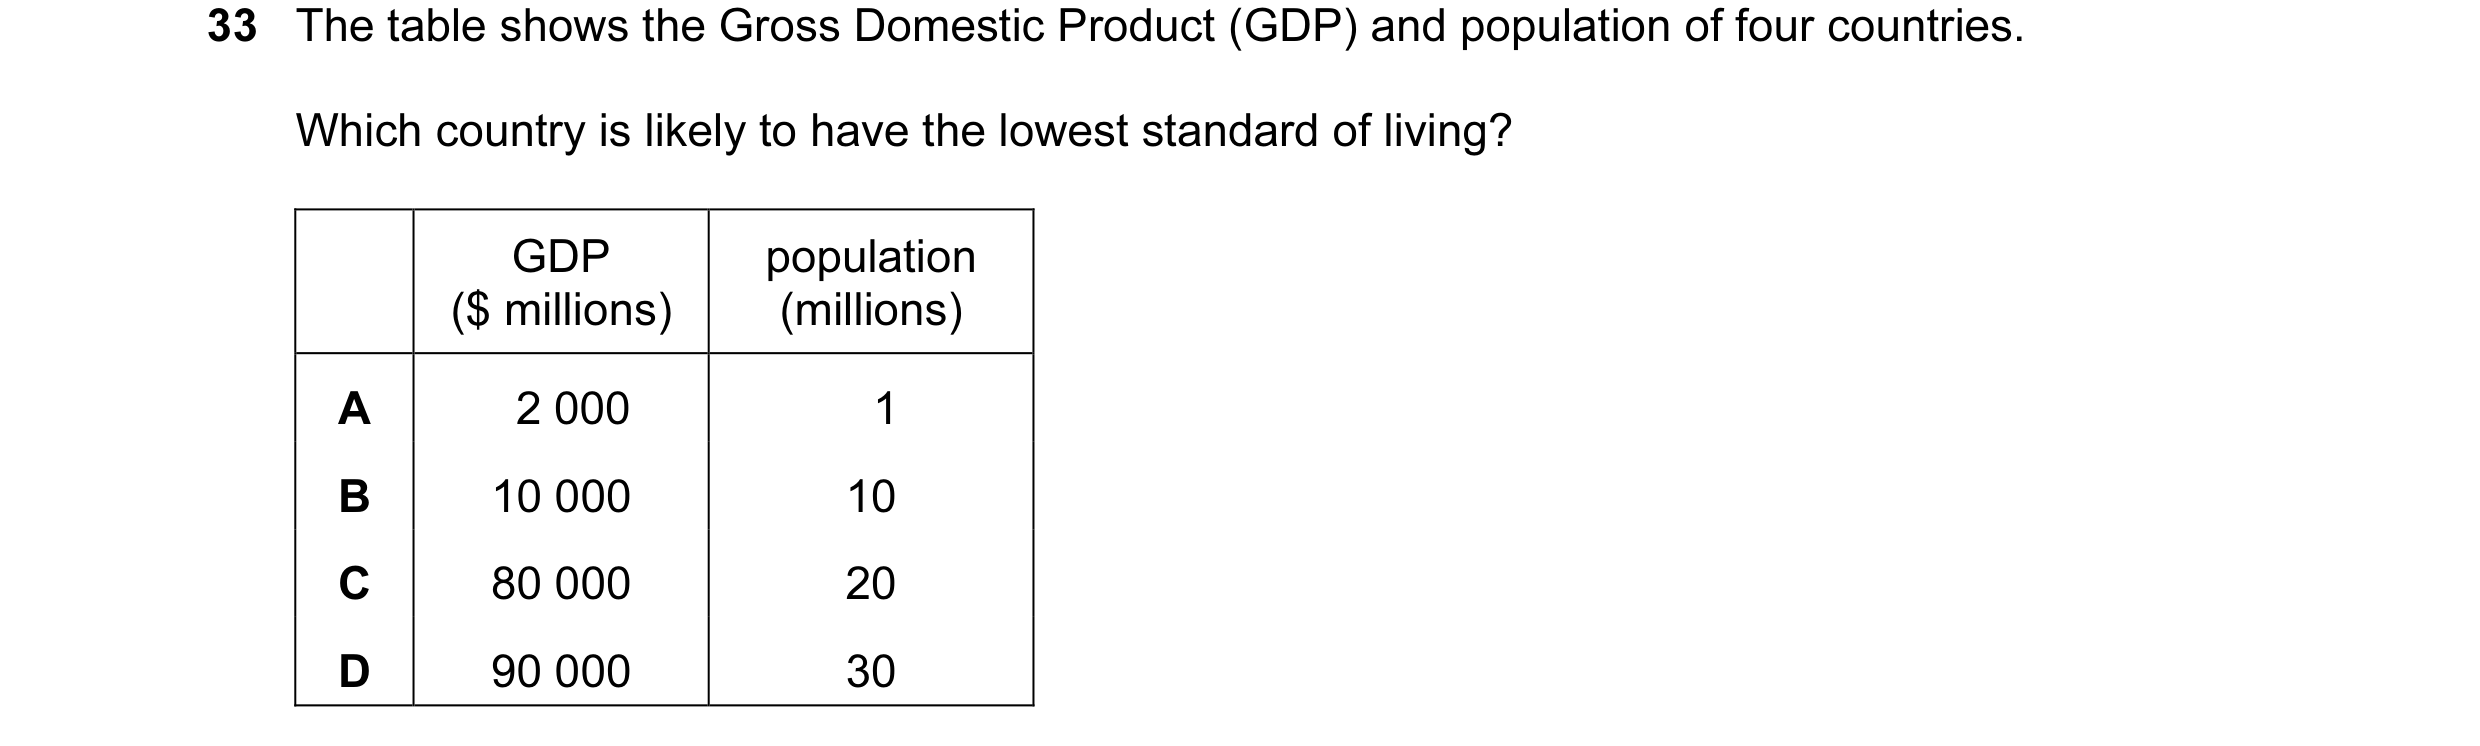

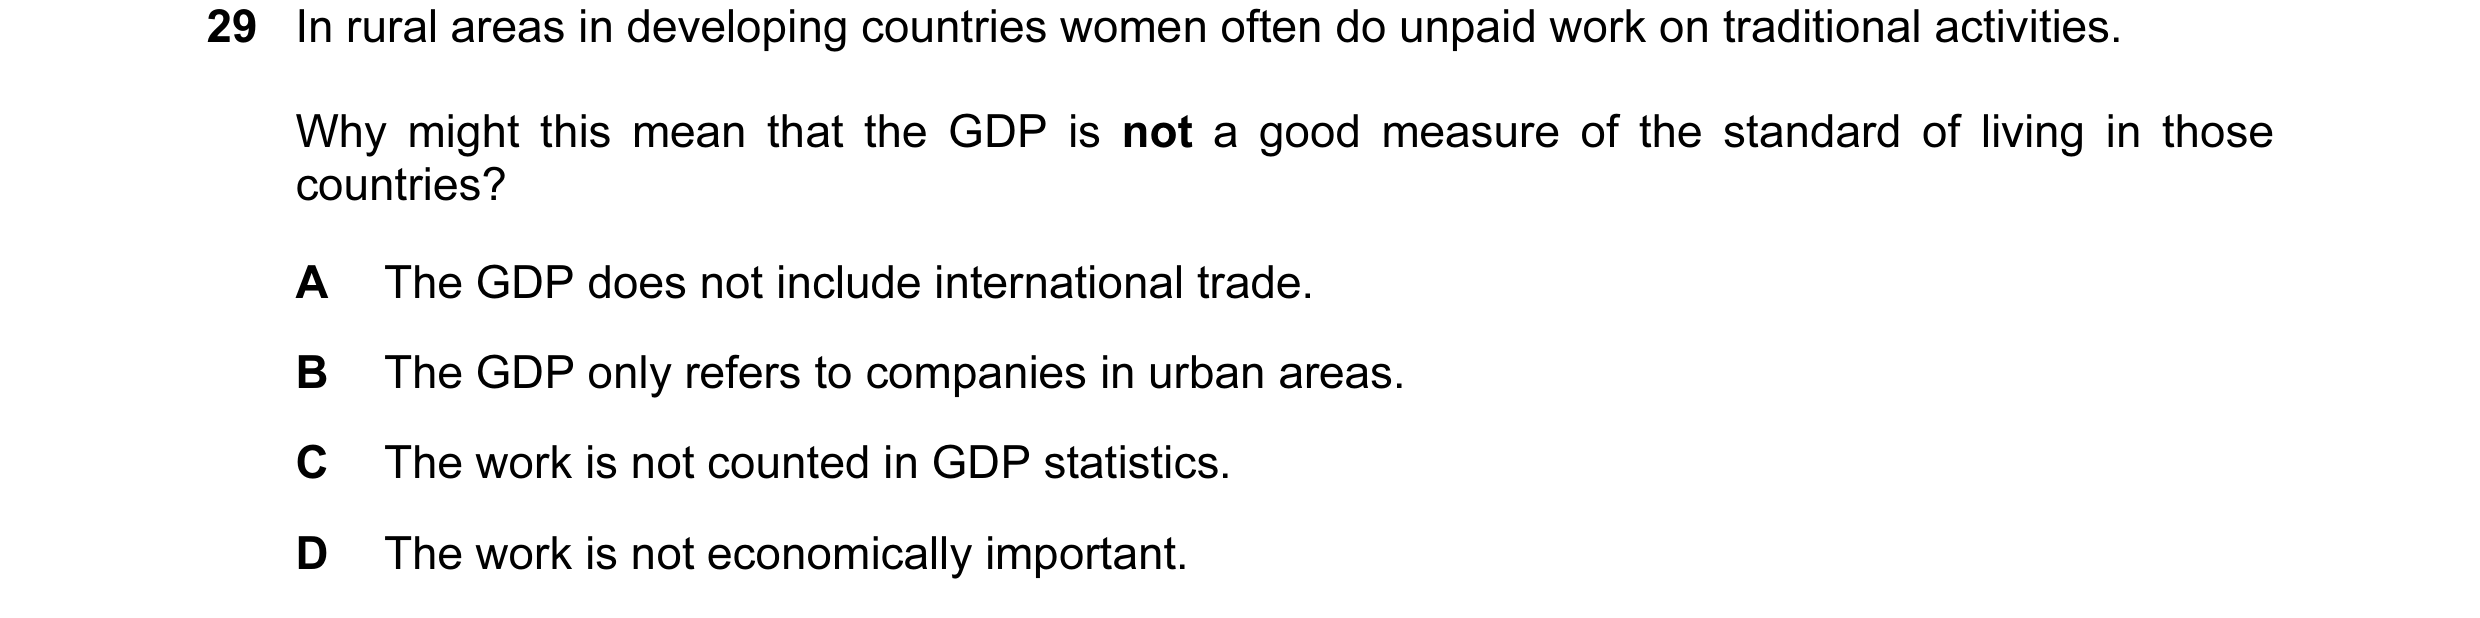 1 / 40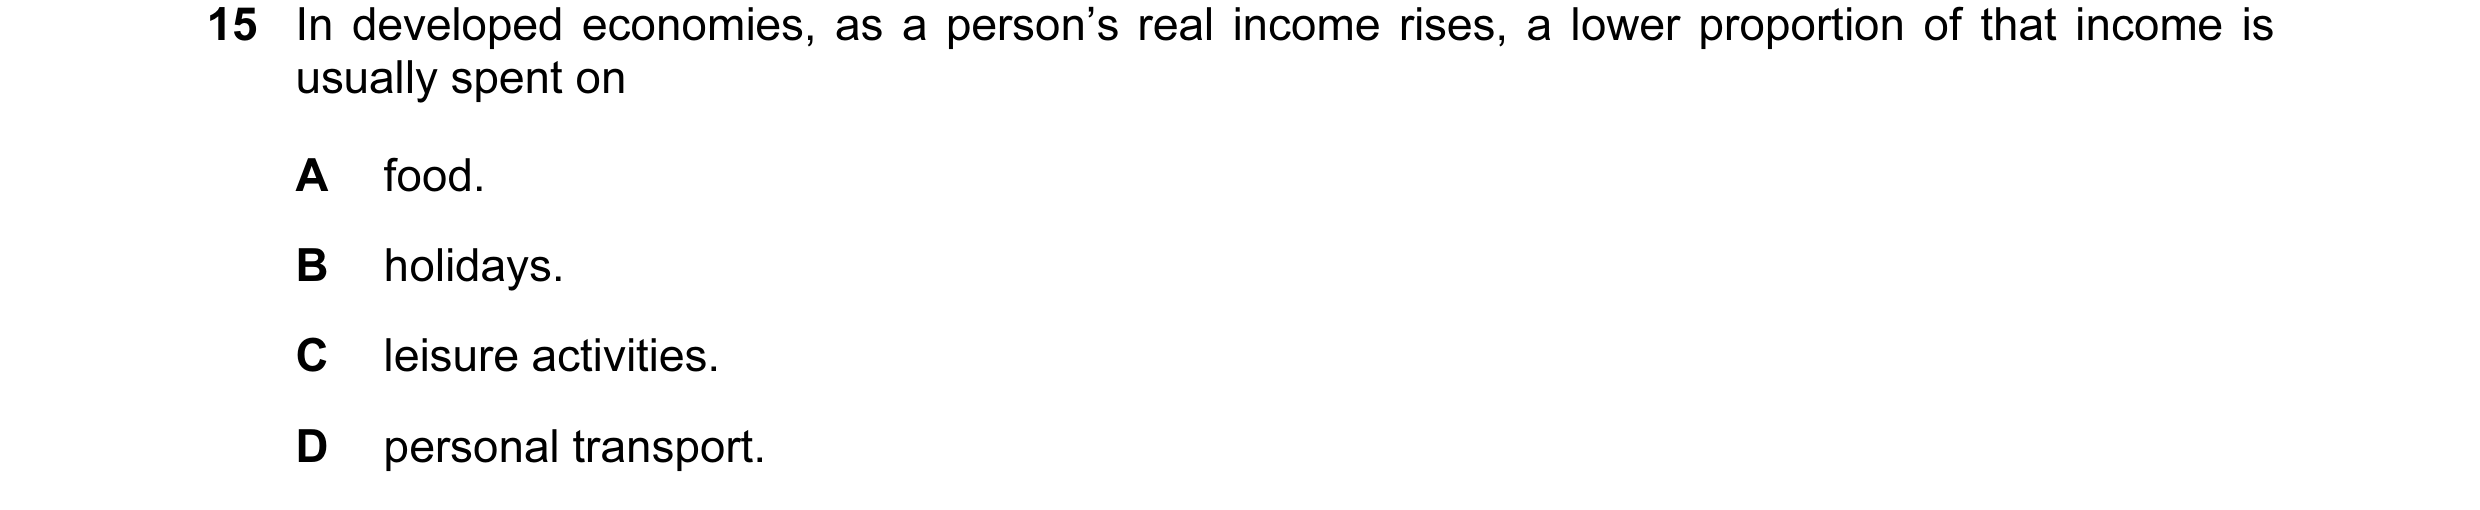
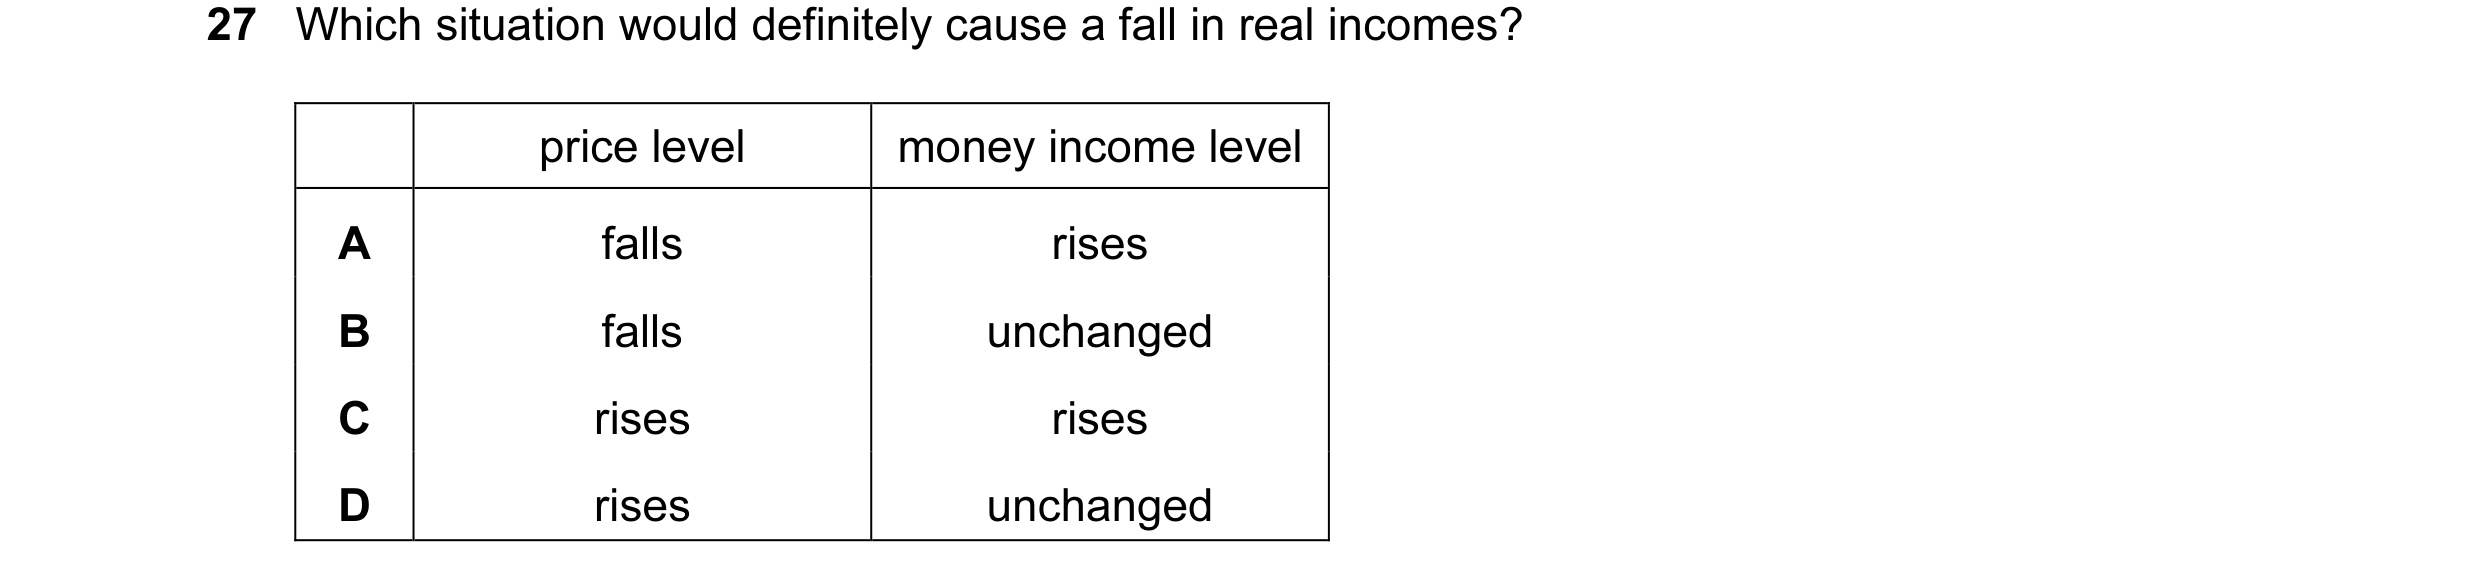



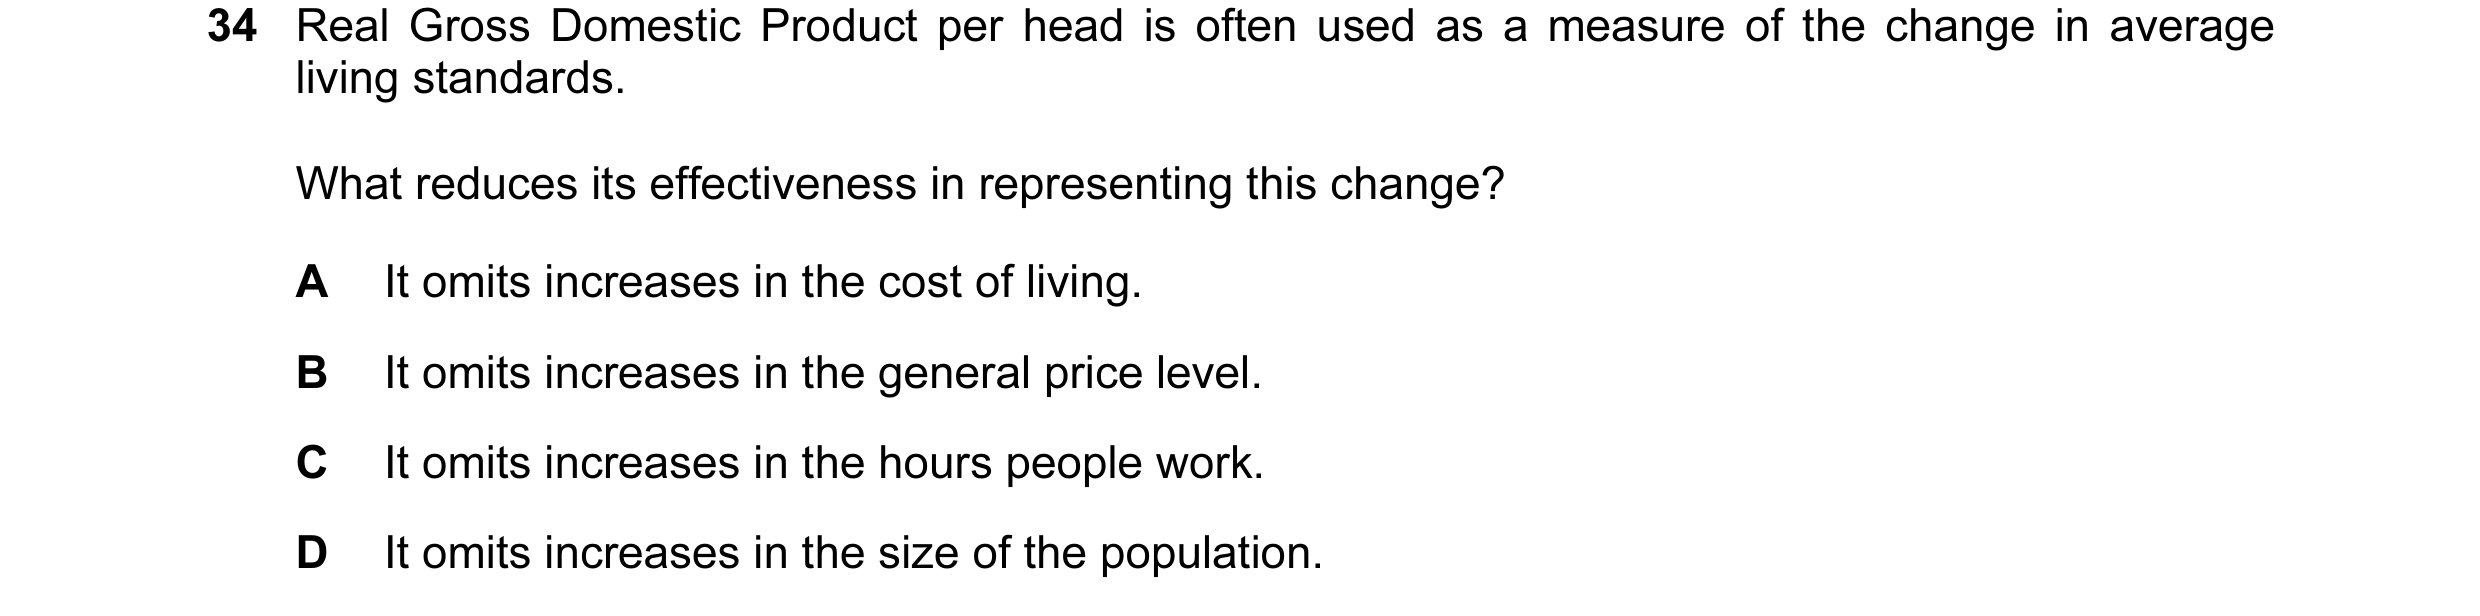 2 / 40
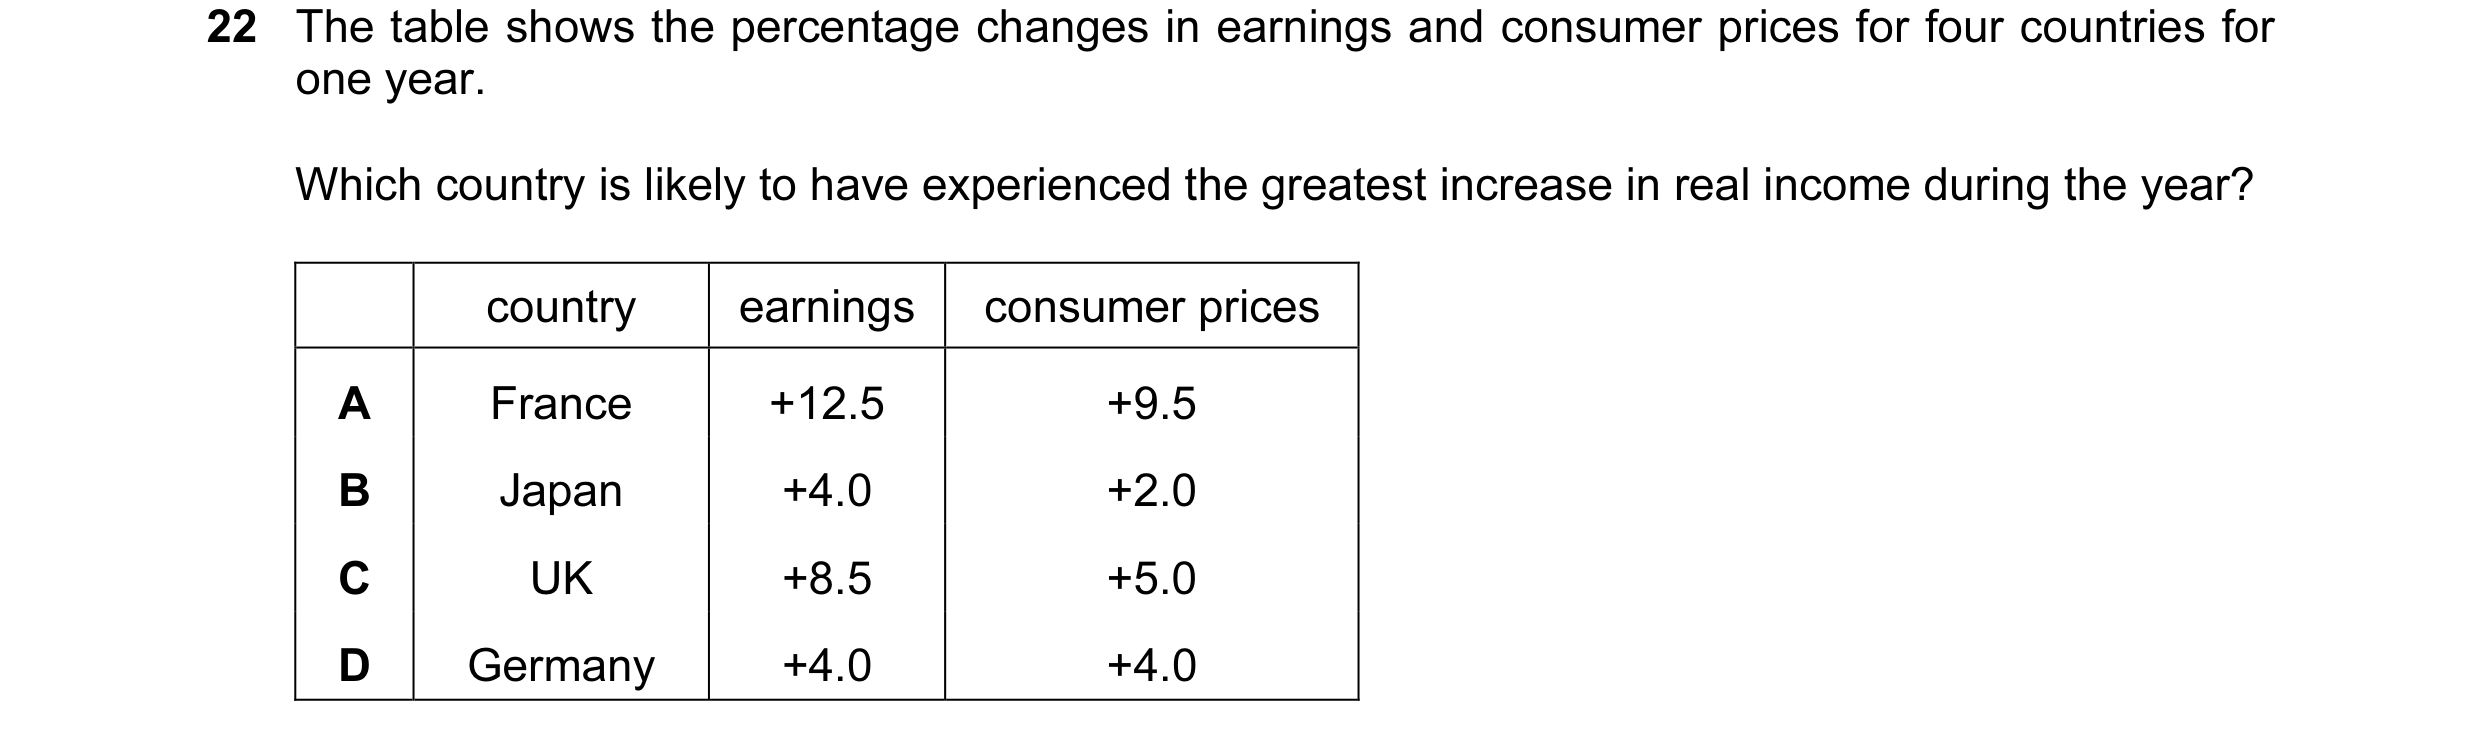

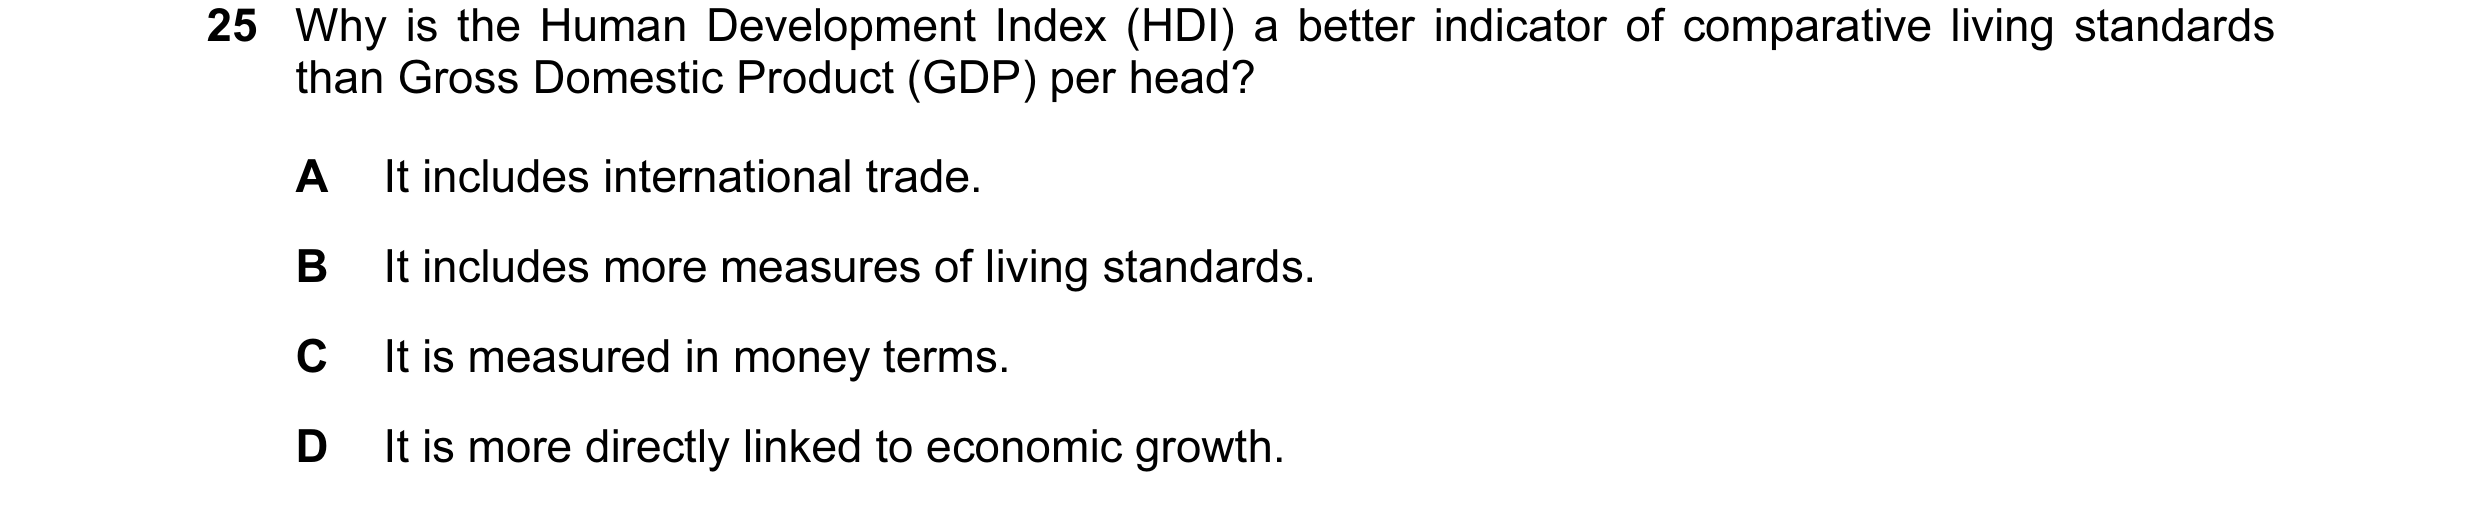
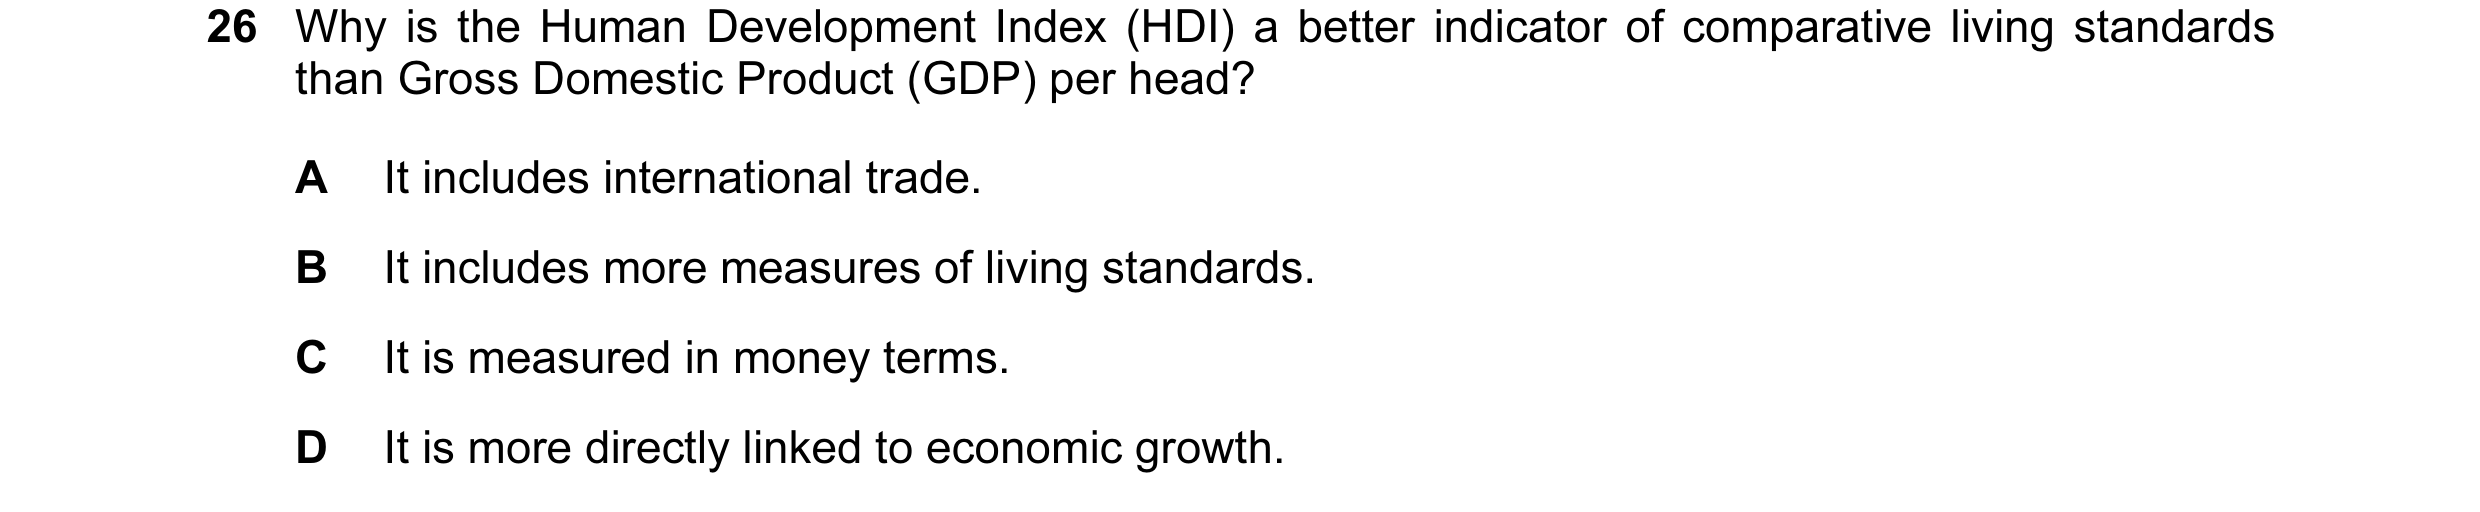 3 / 40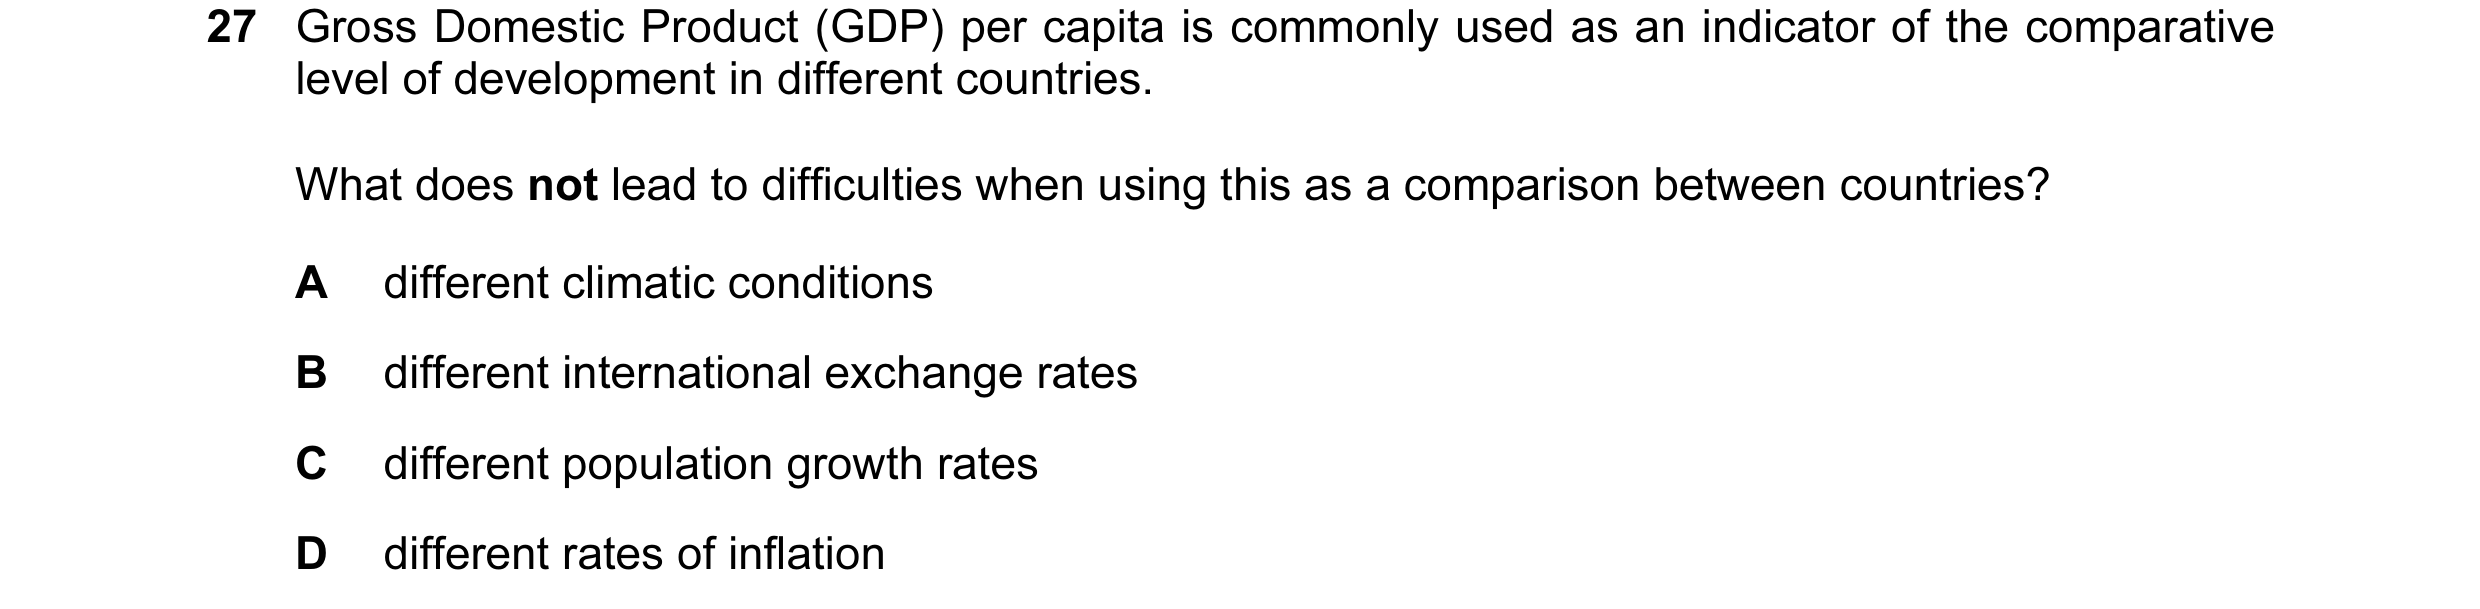
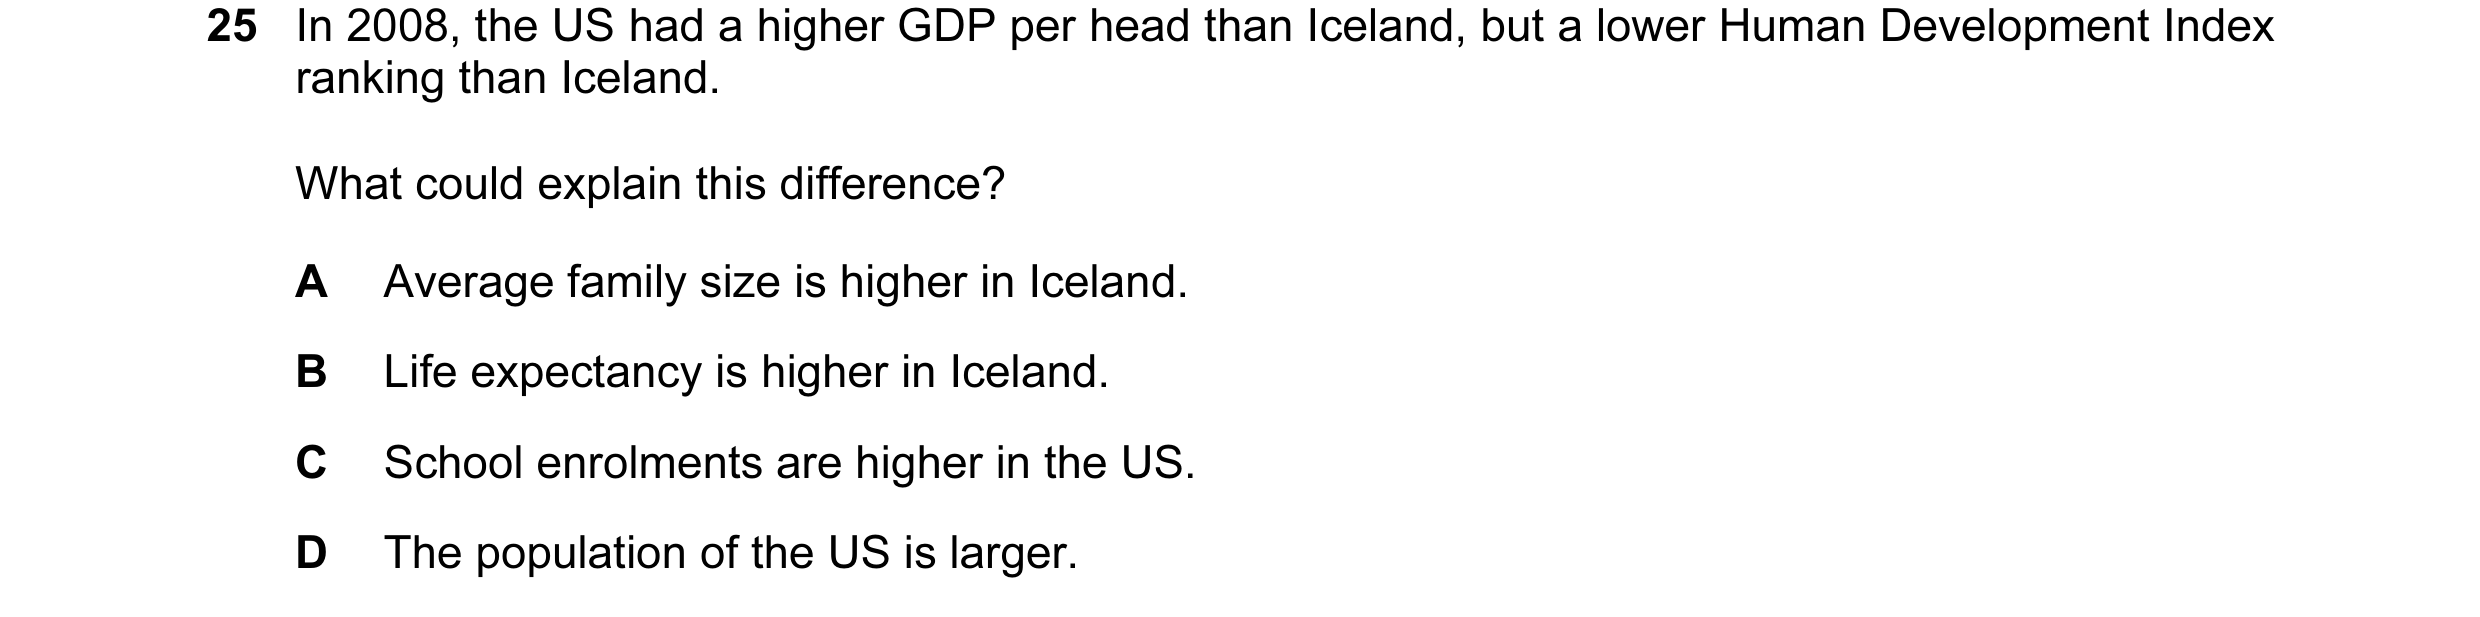
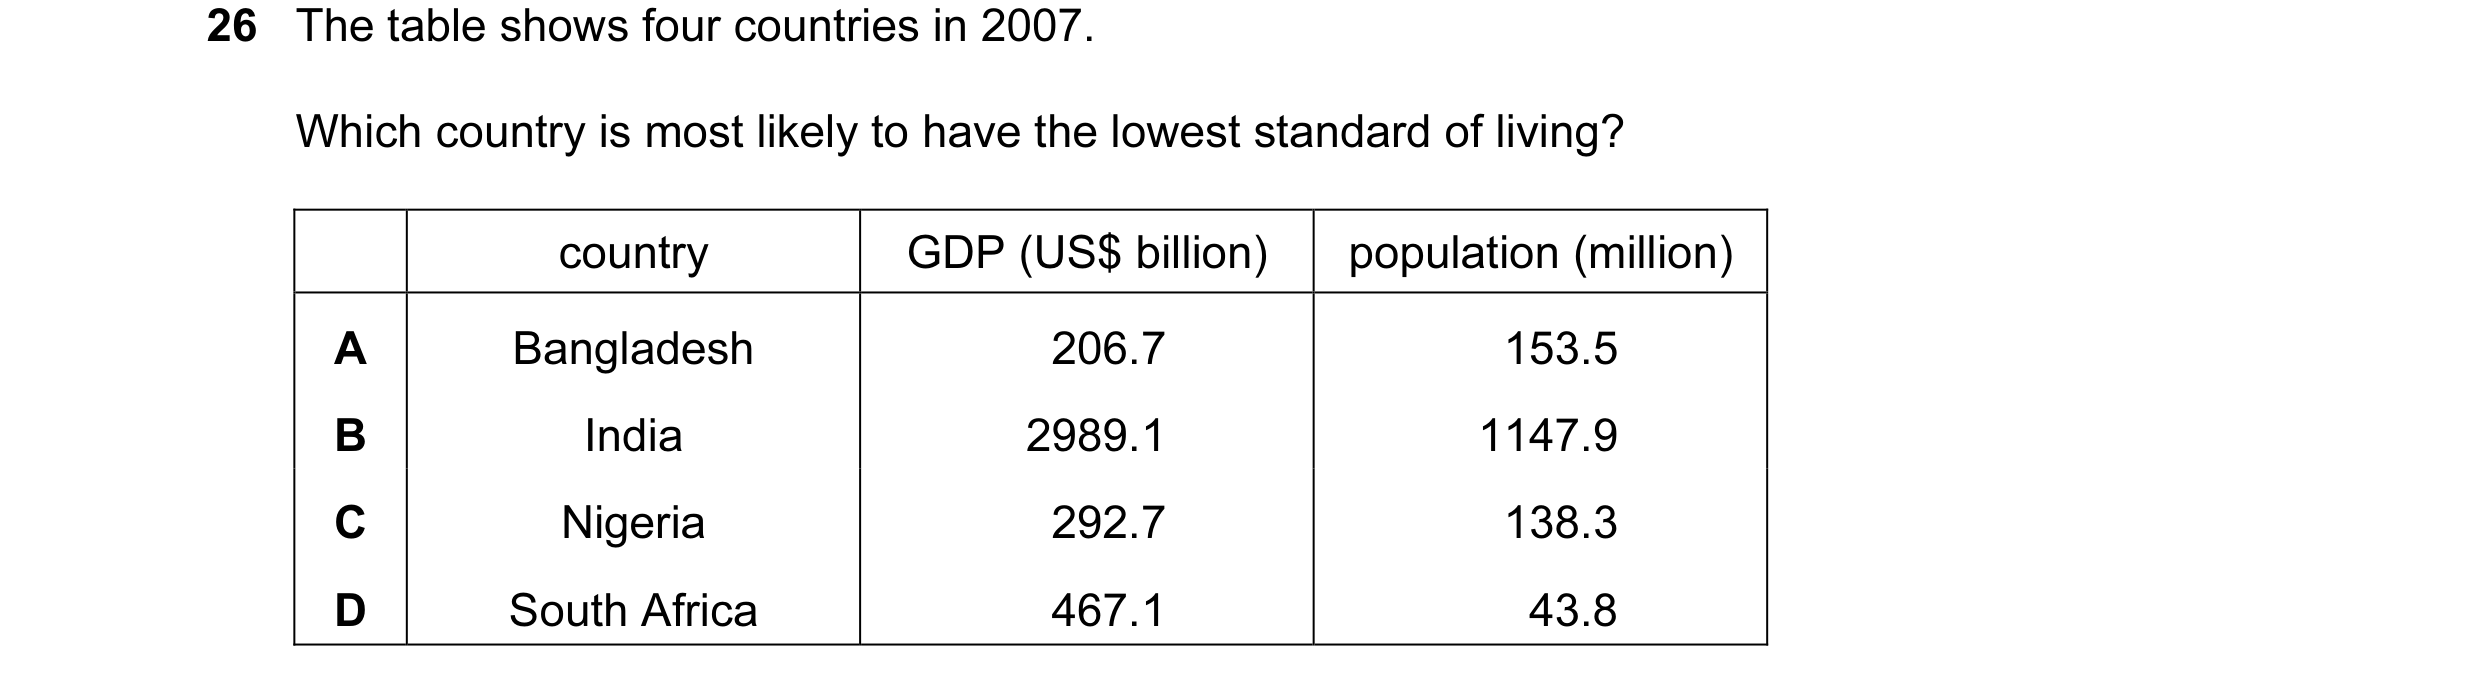
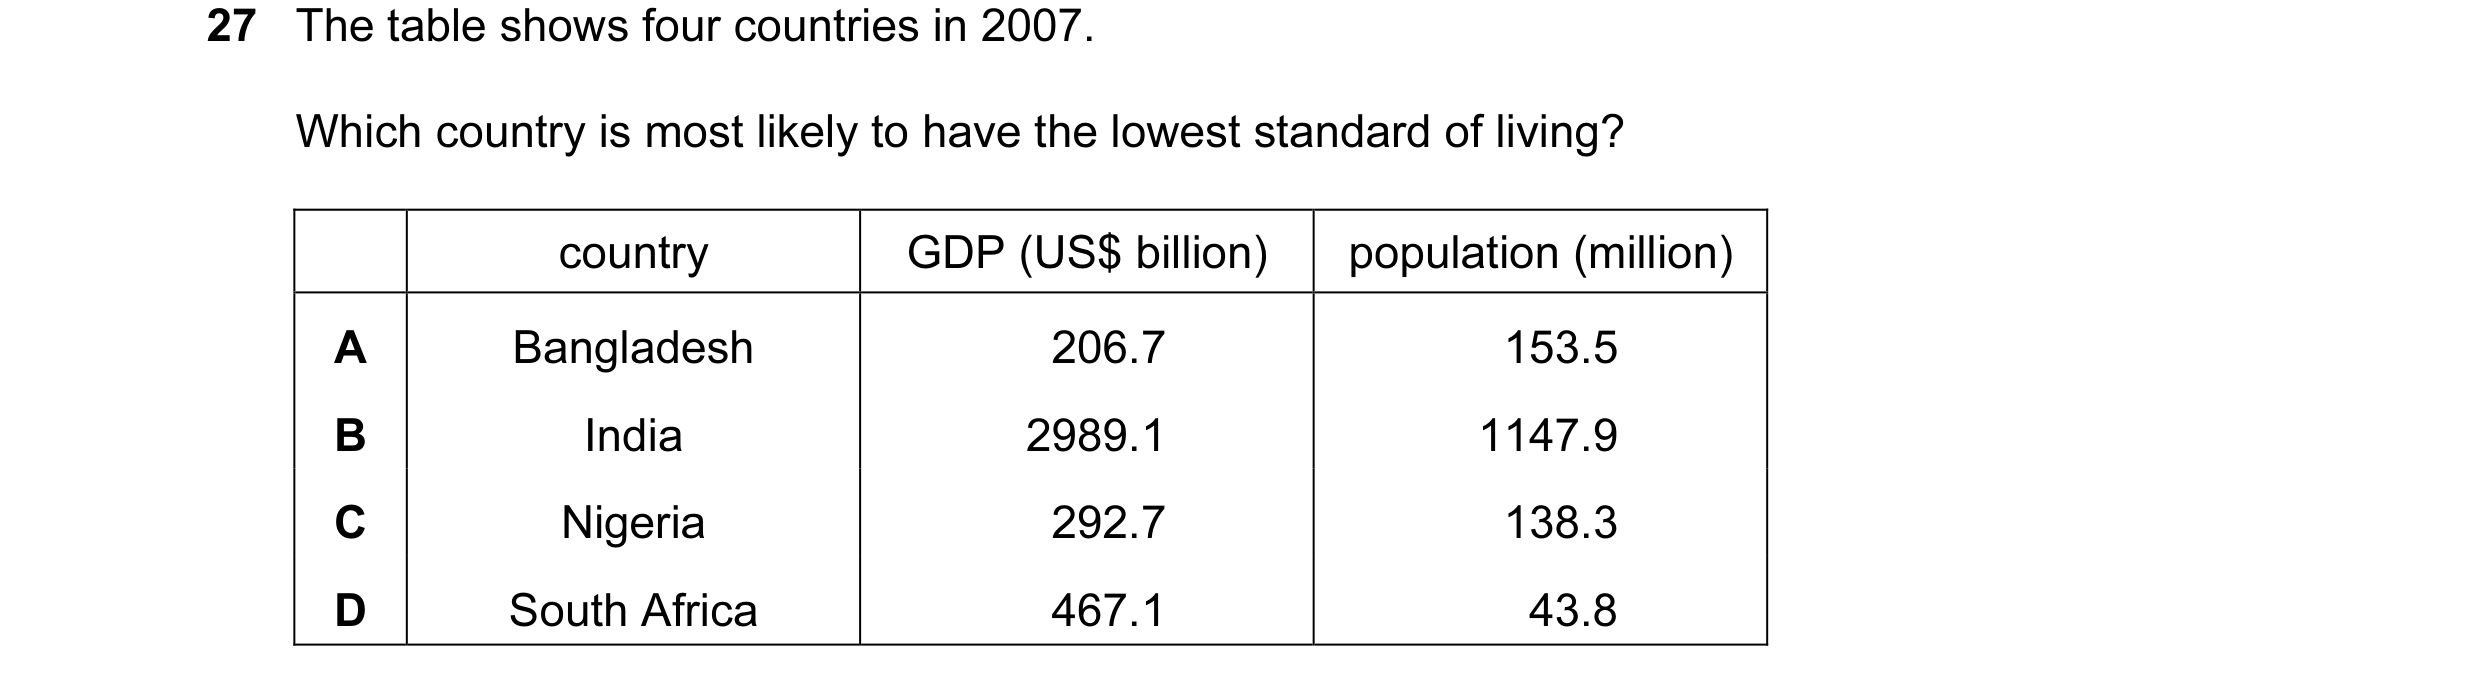
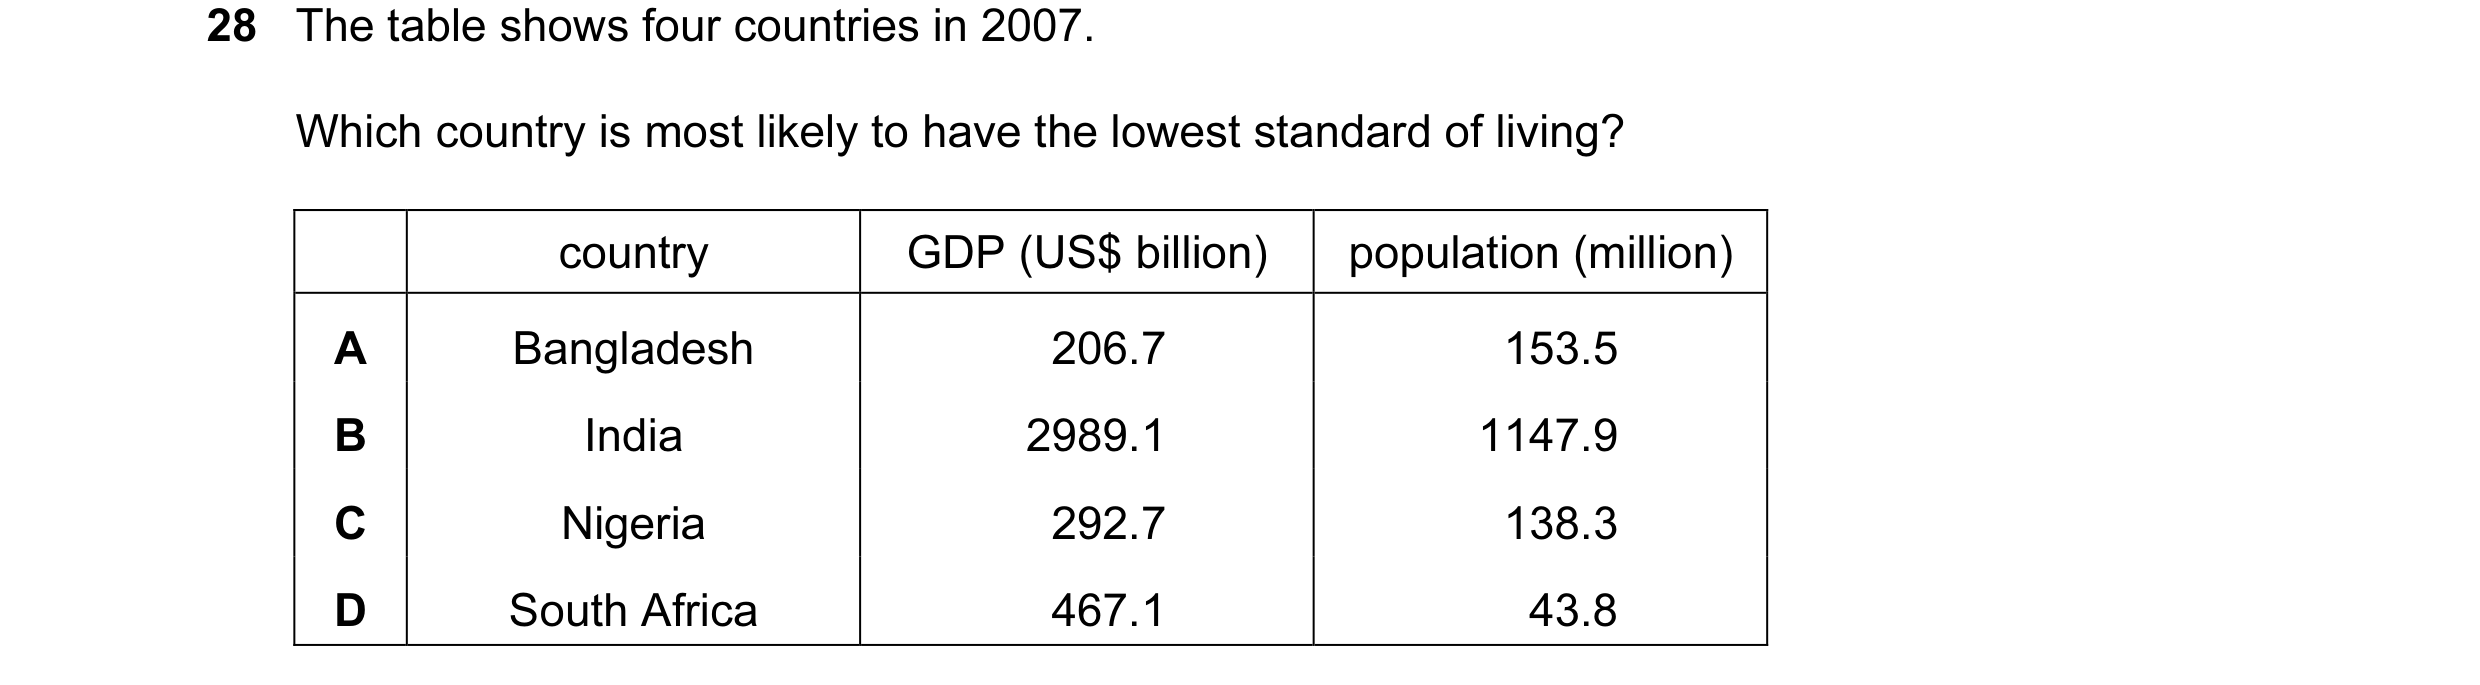 4 / 40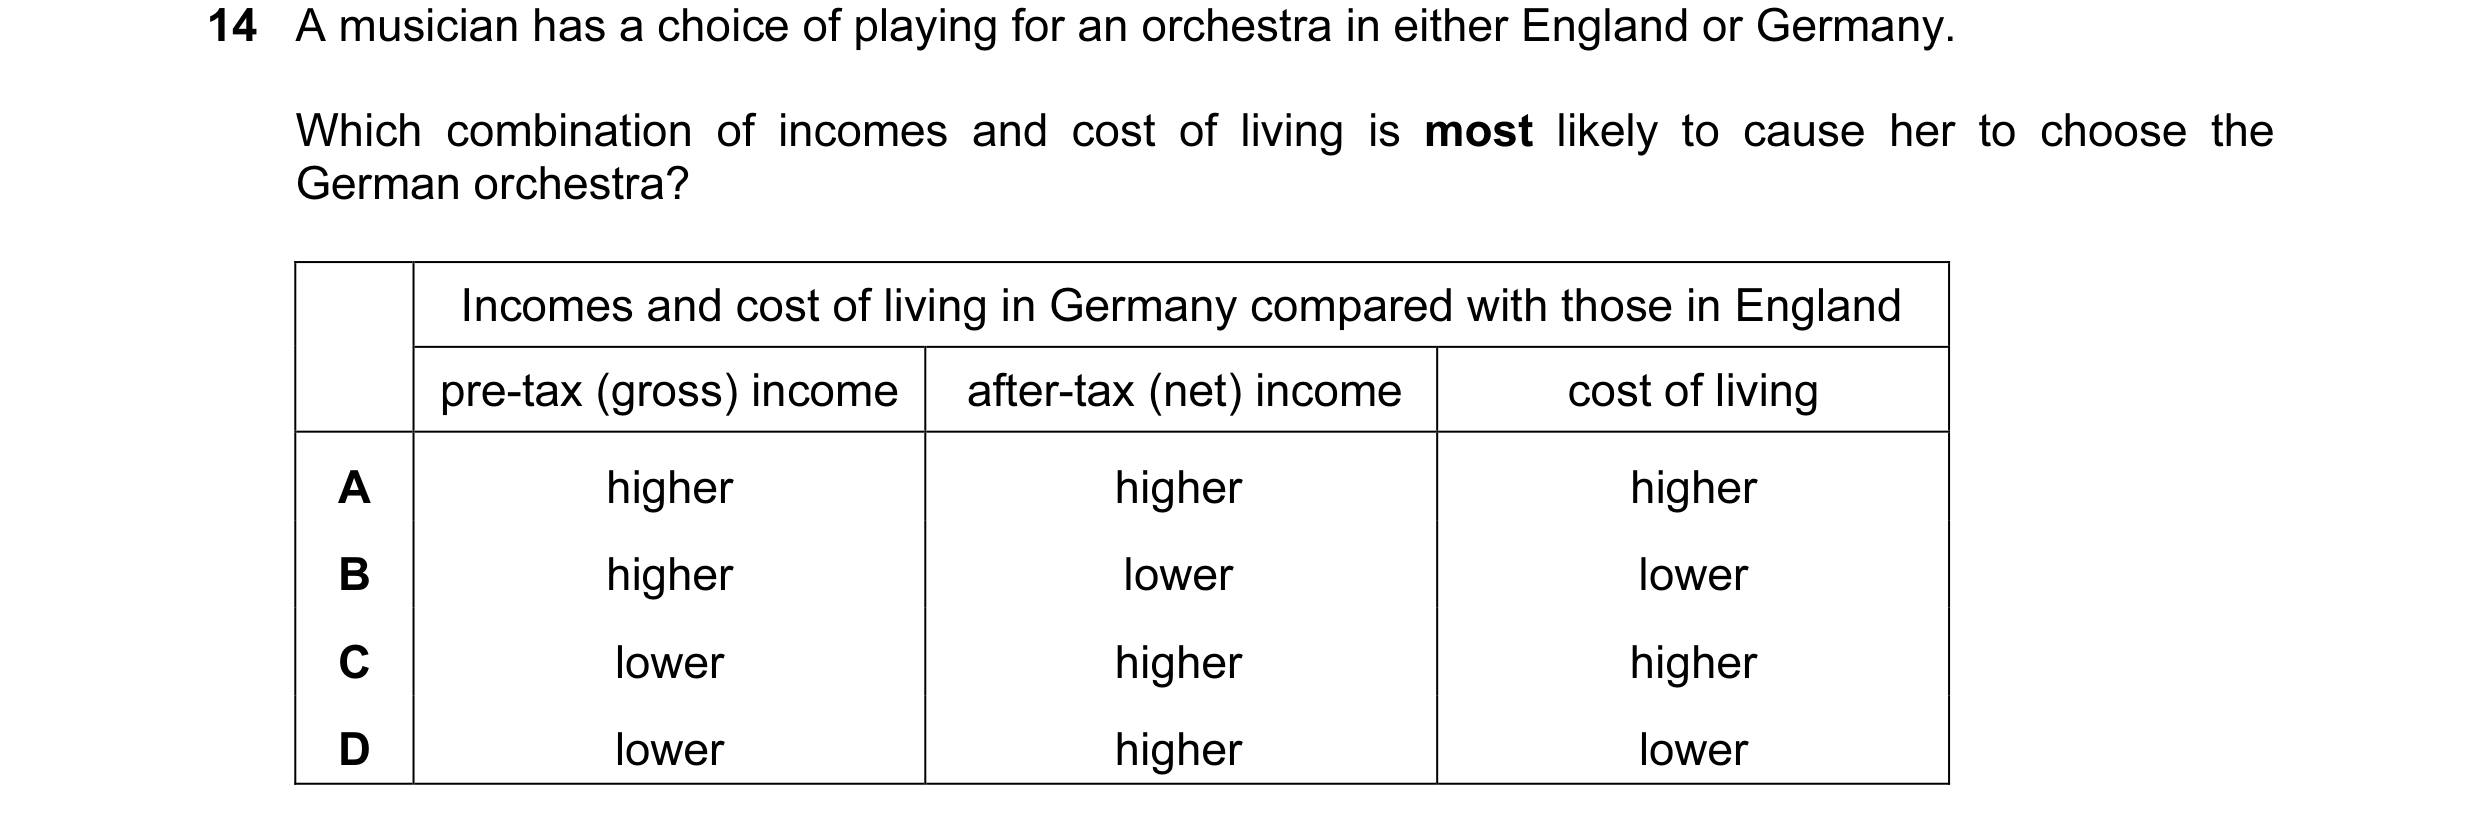

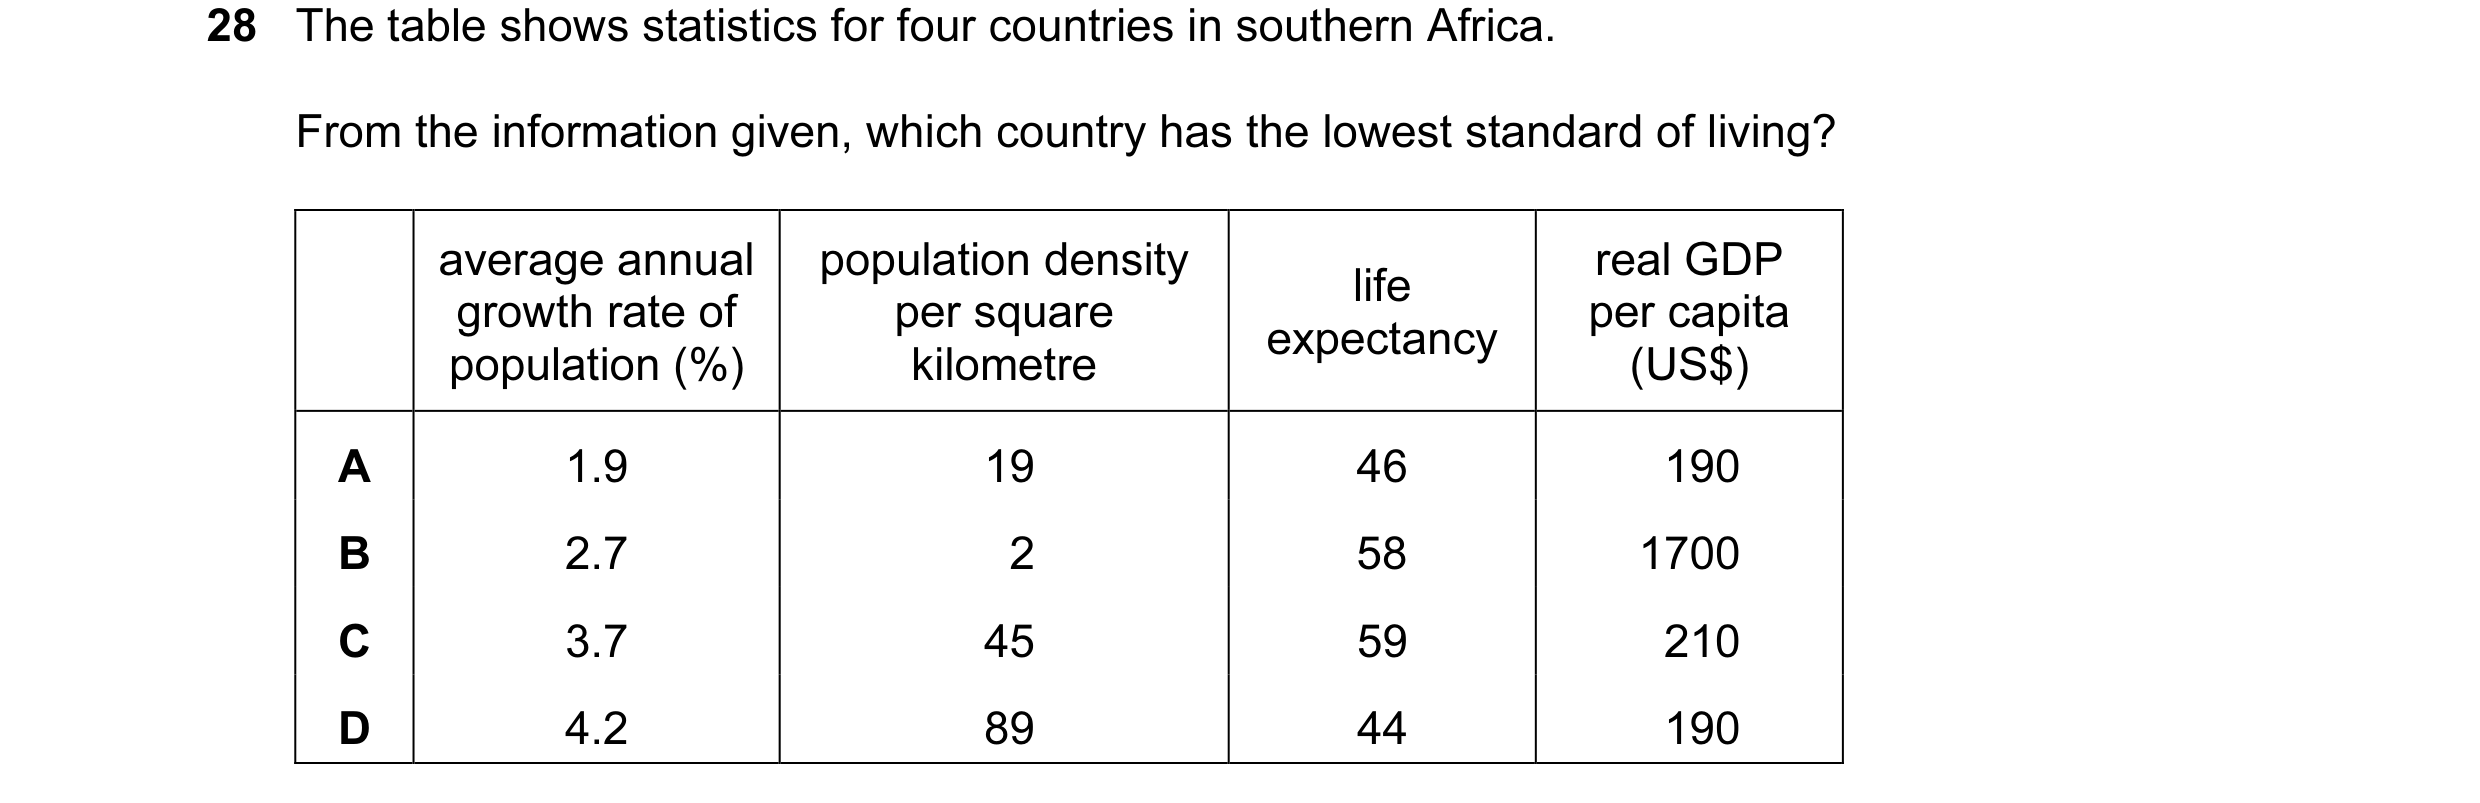
 5 / 40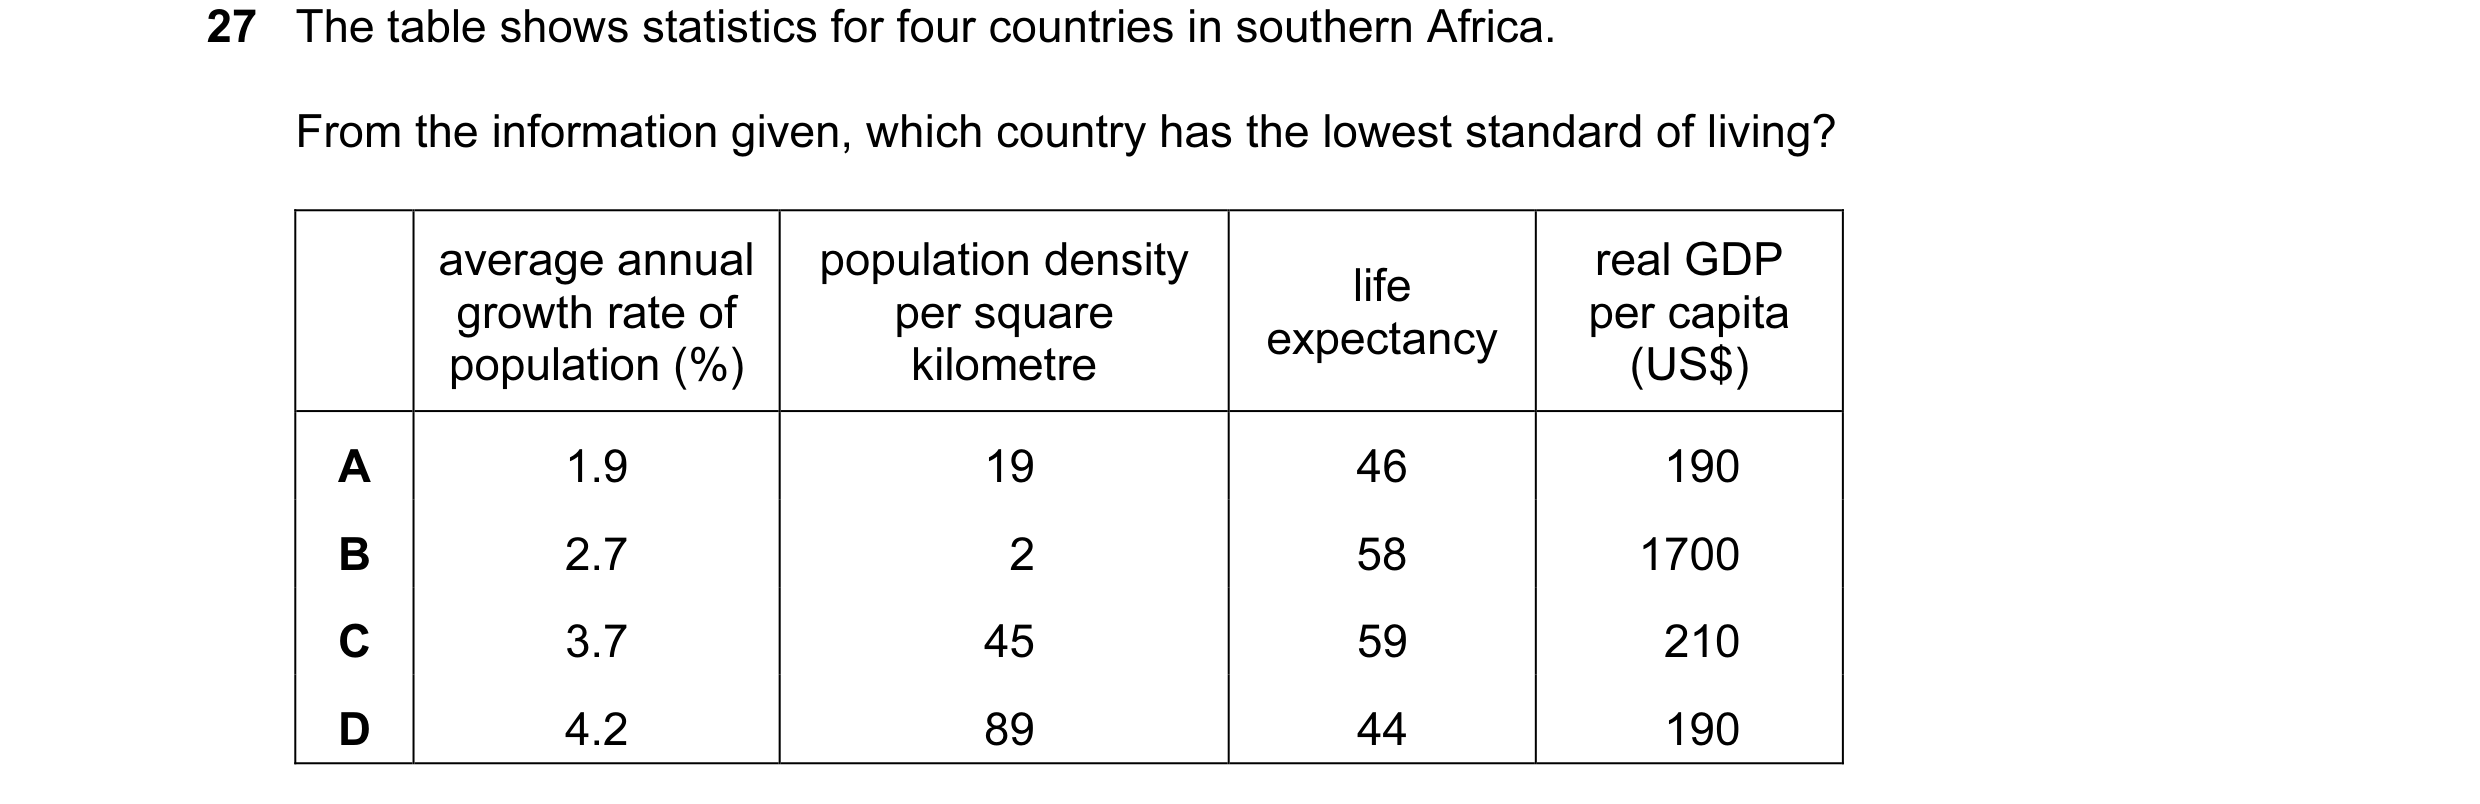
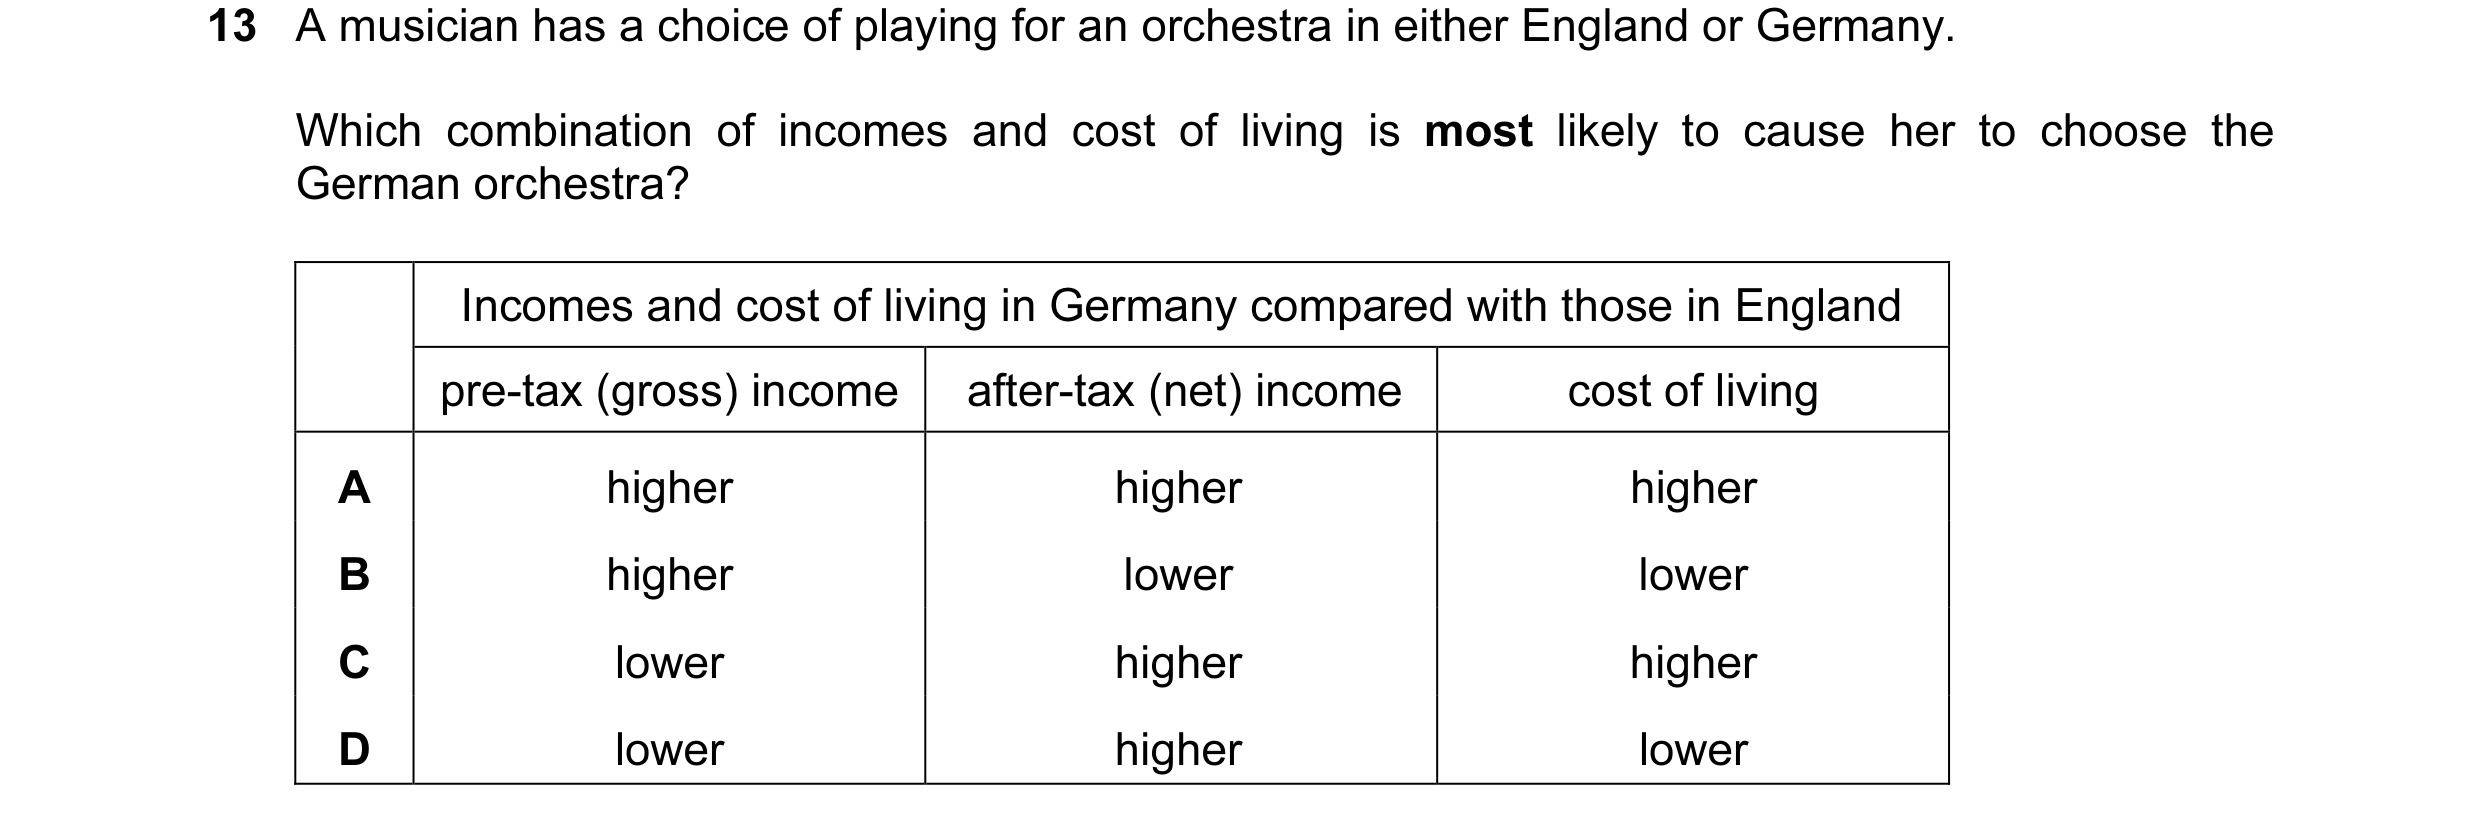

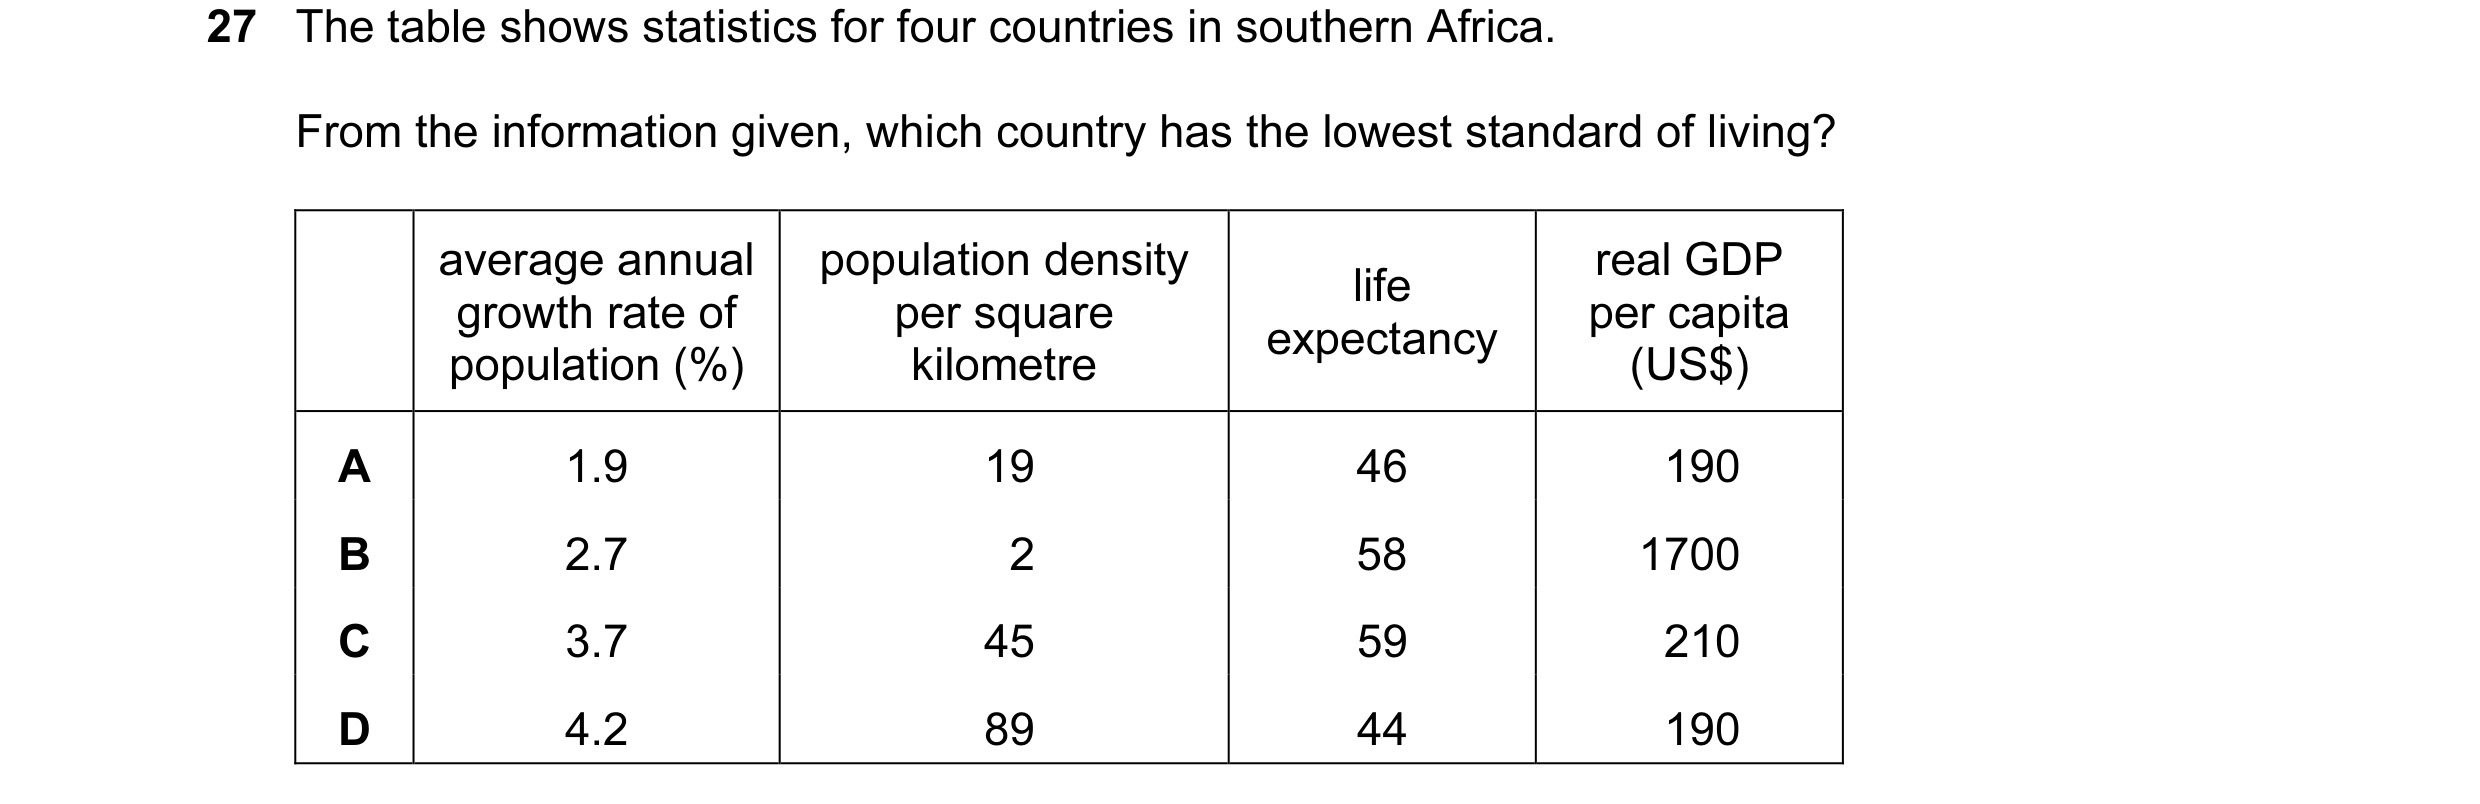 6 / 40

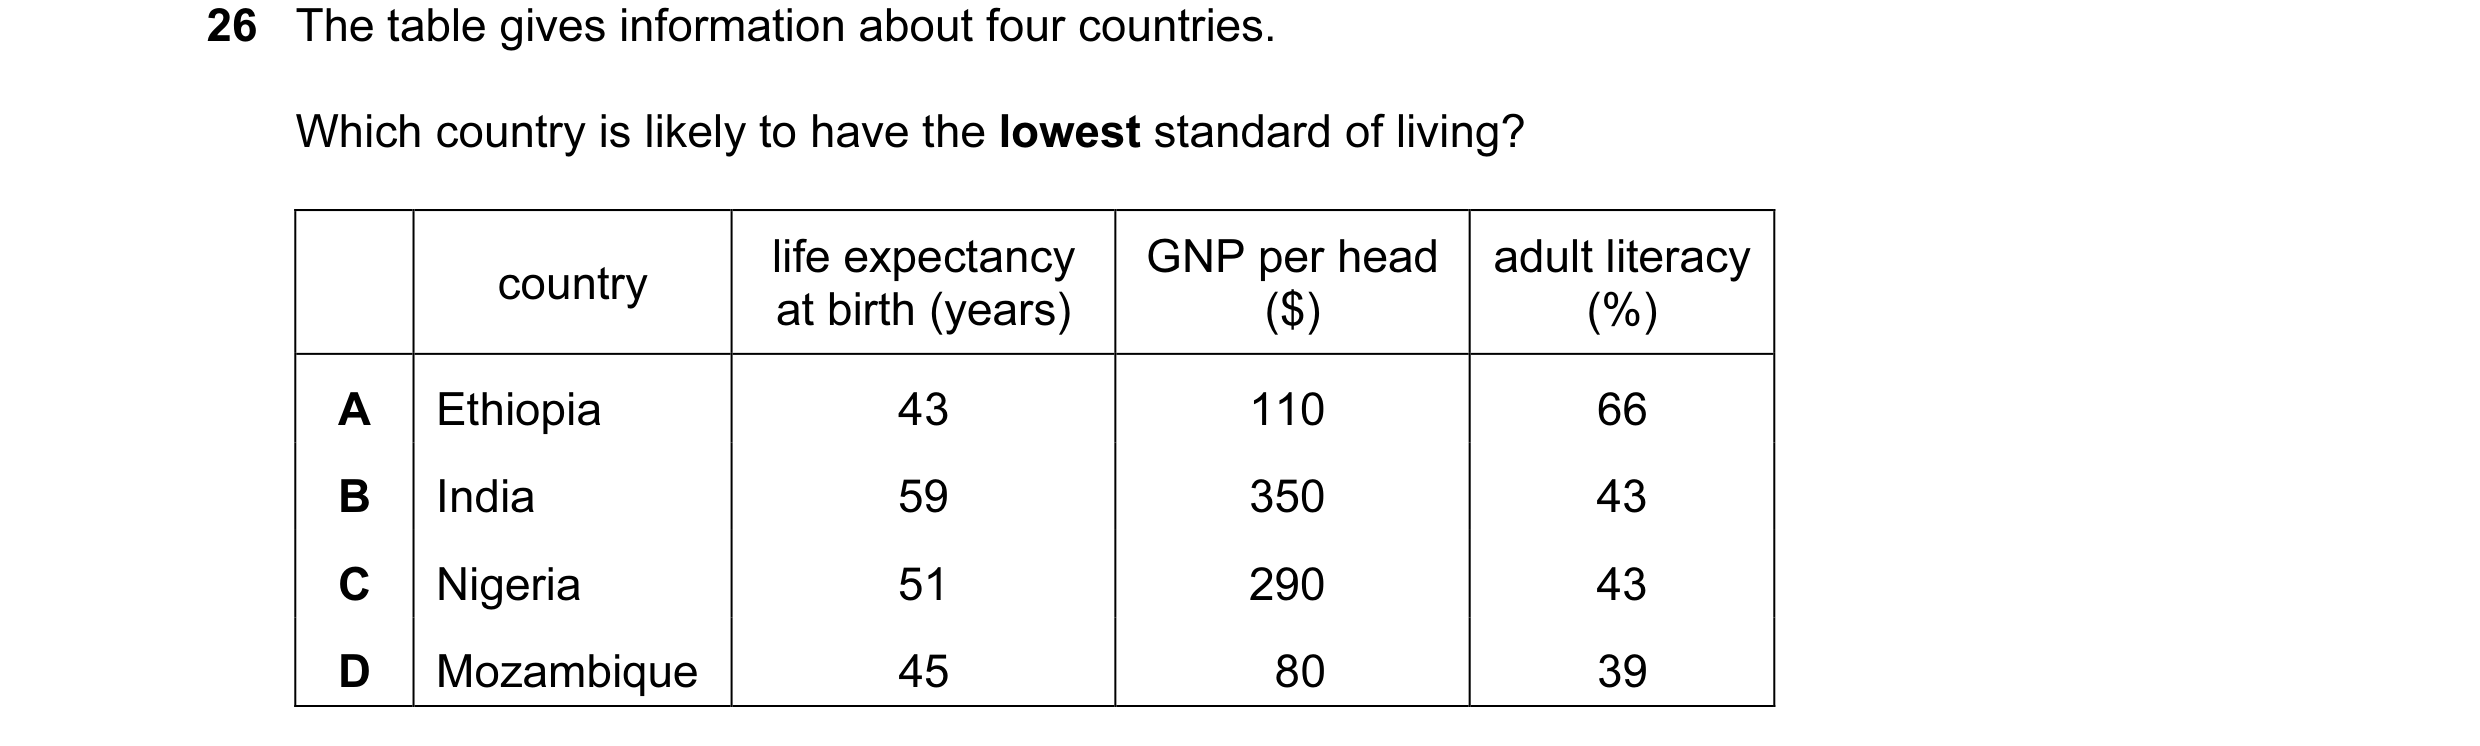
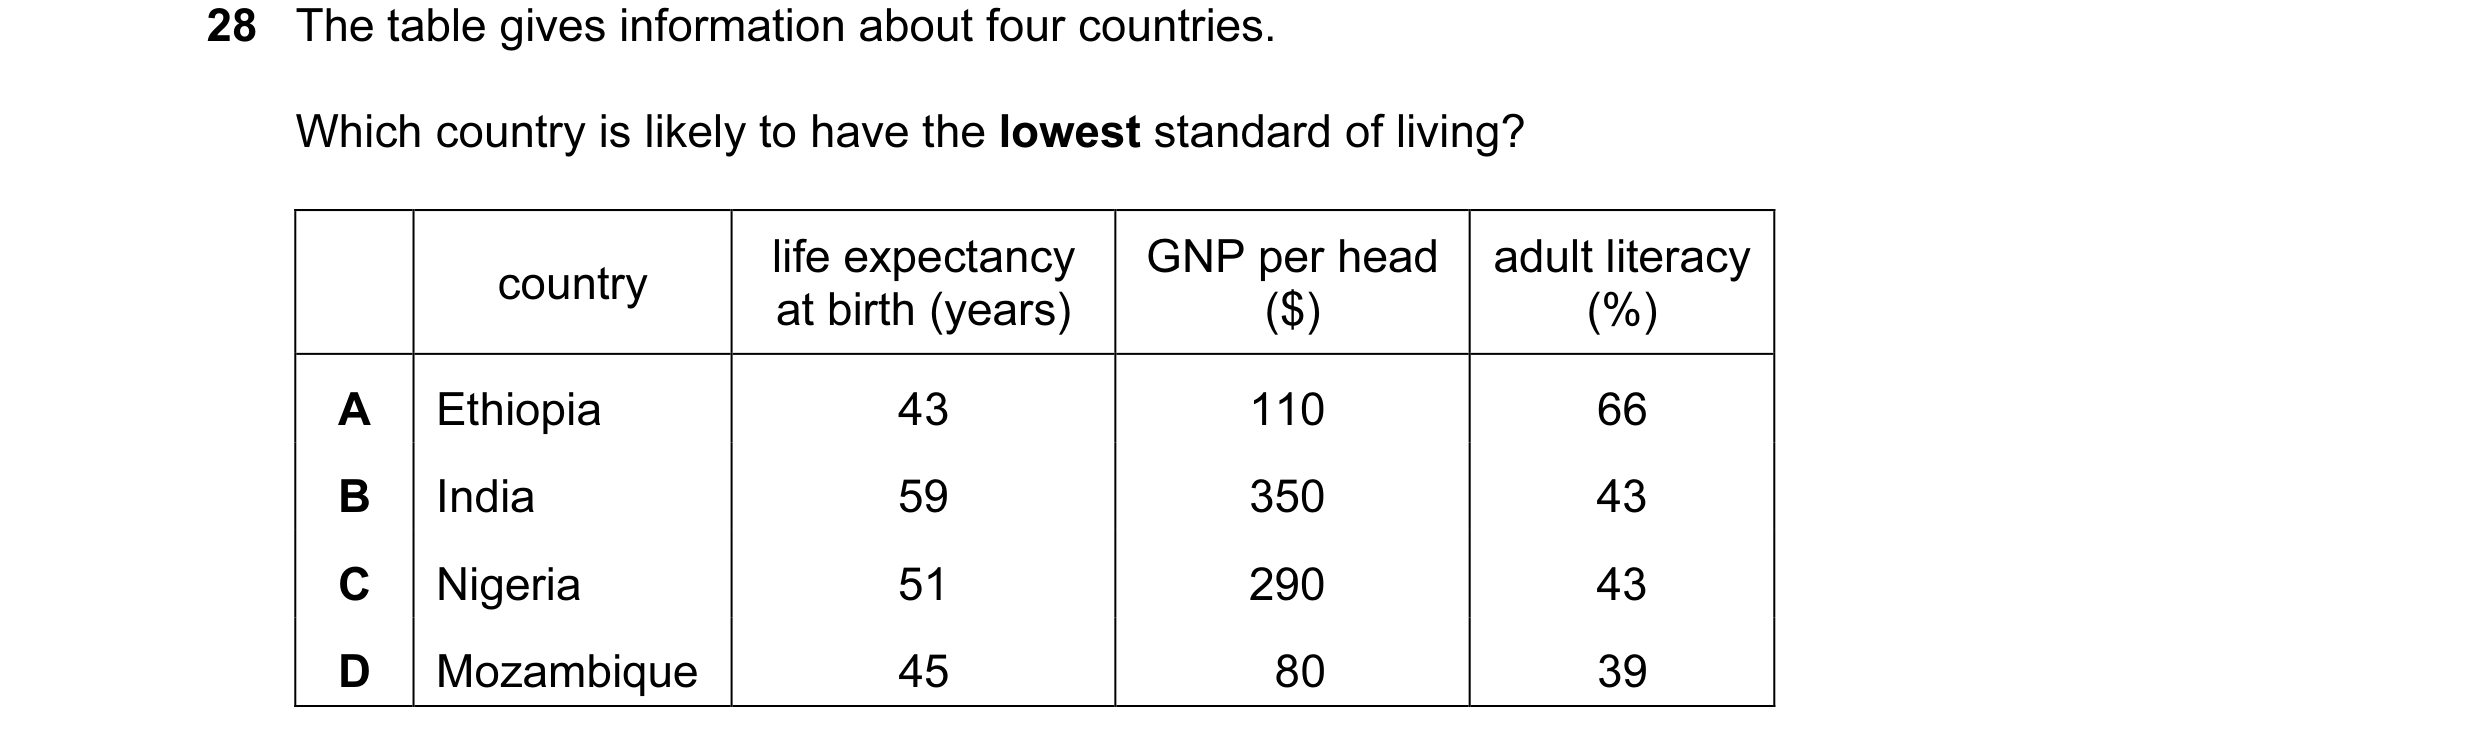
 7 / 40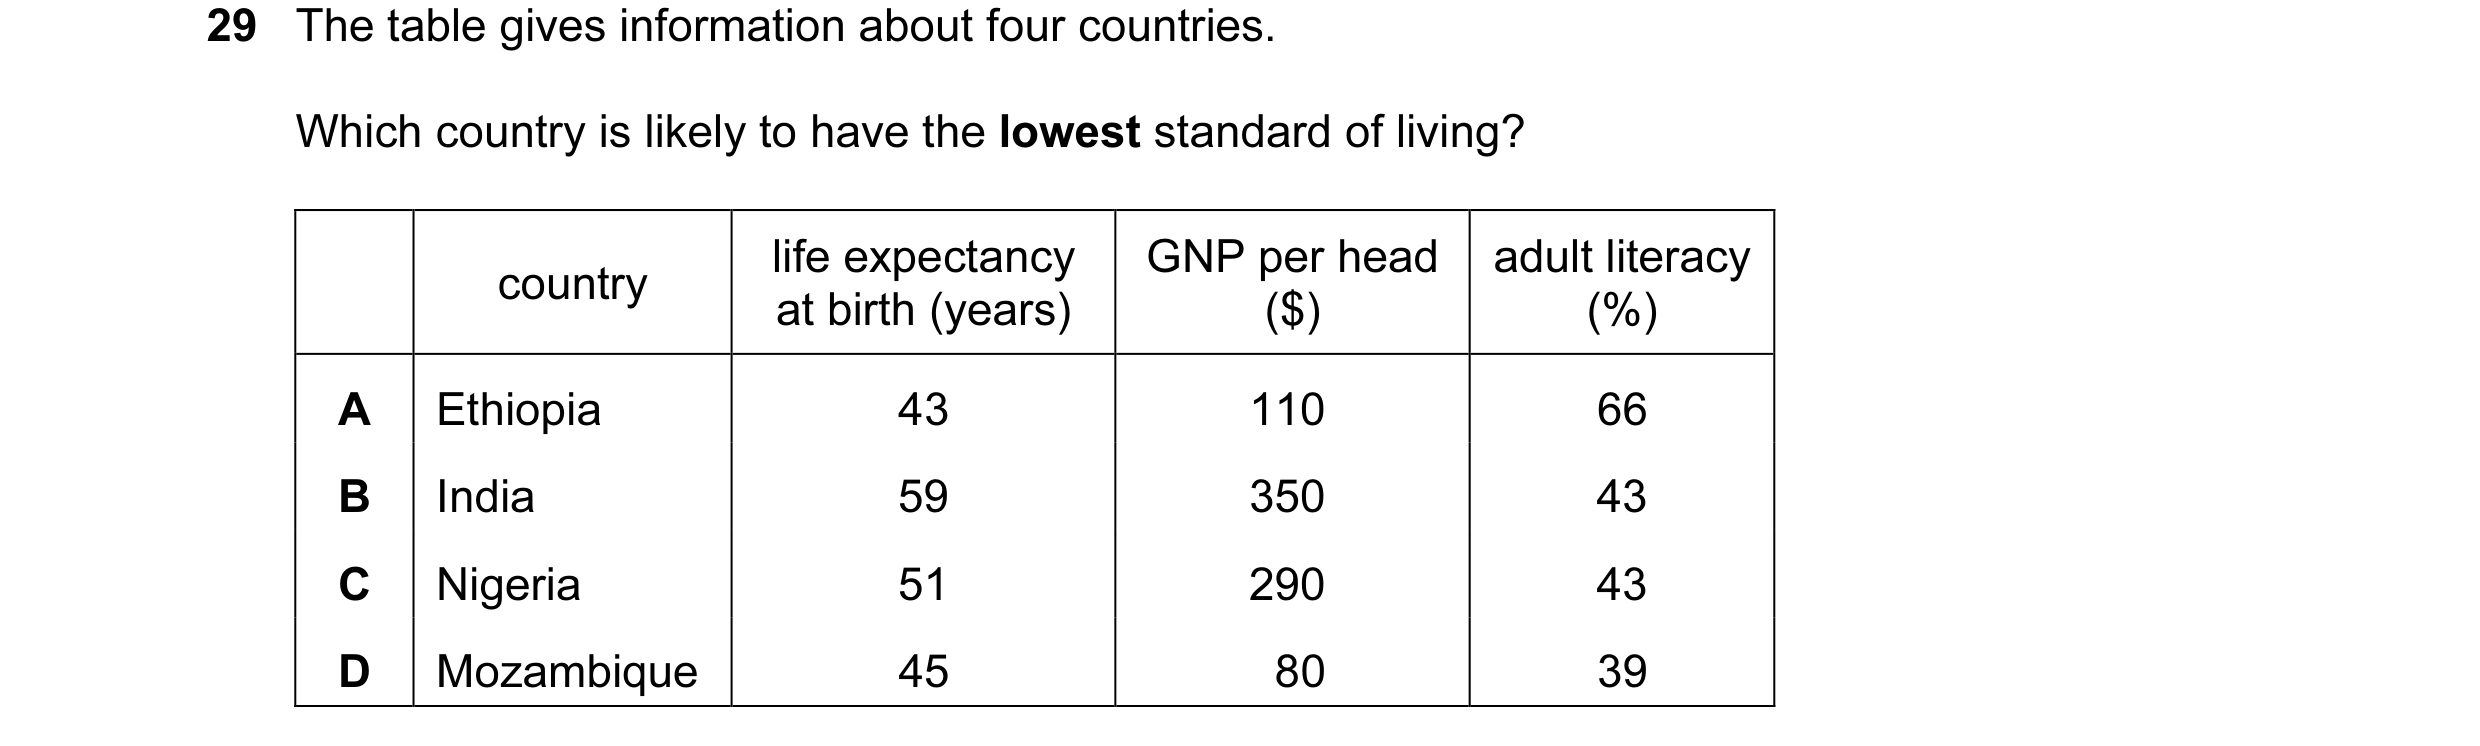
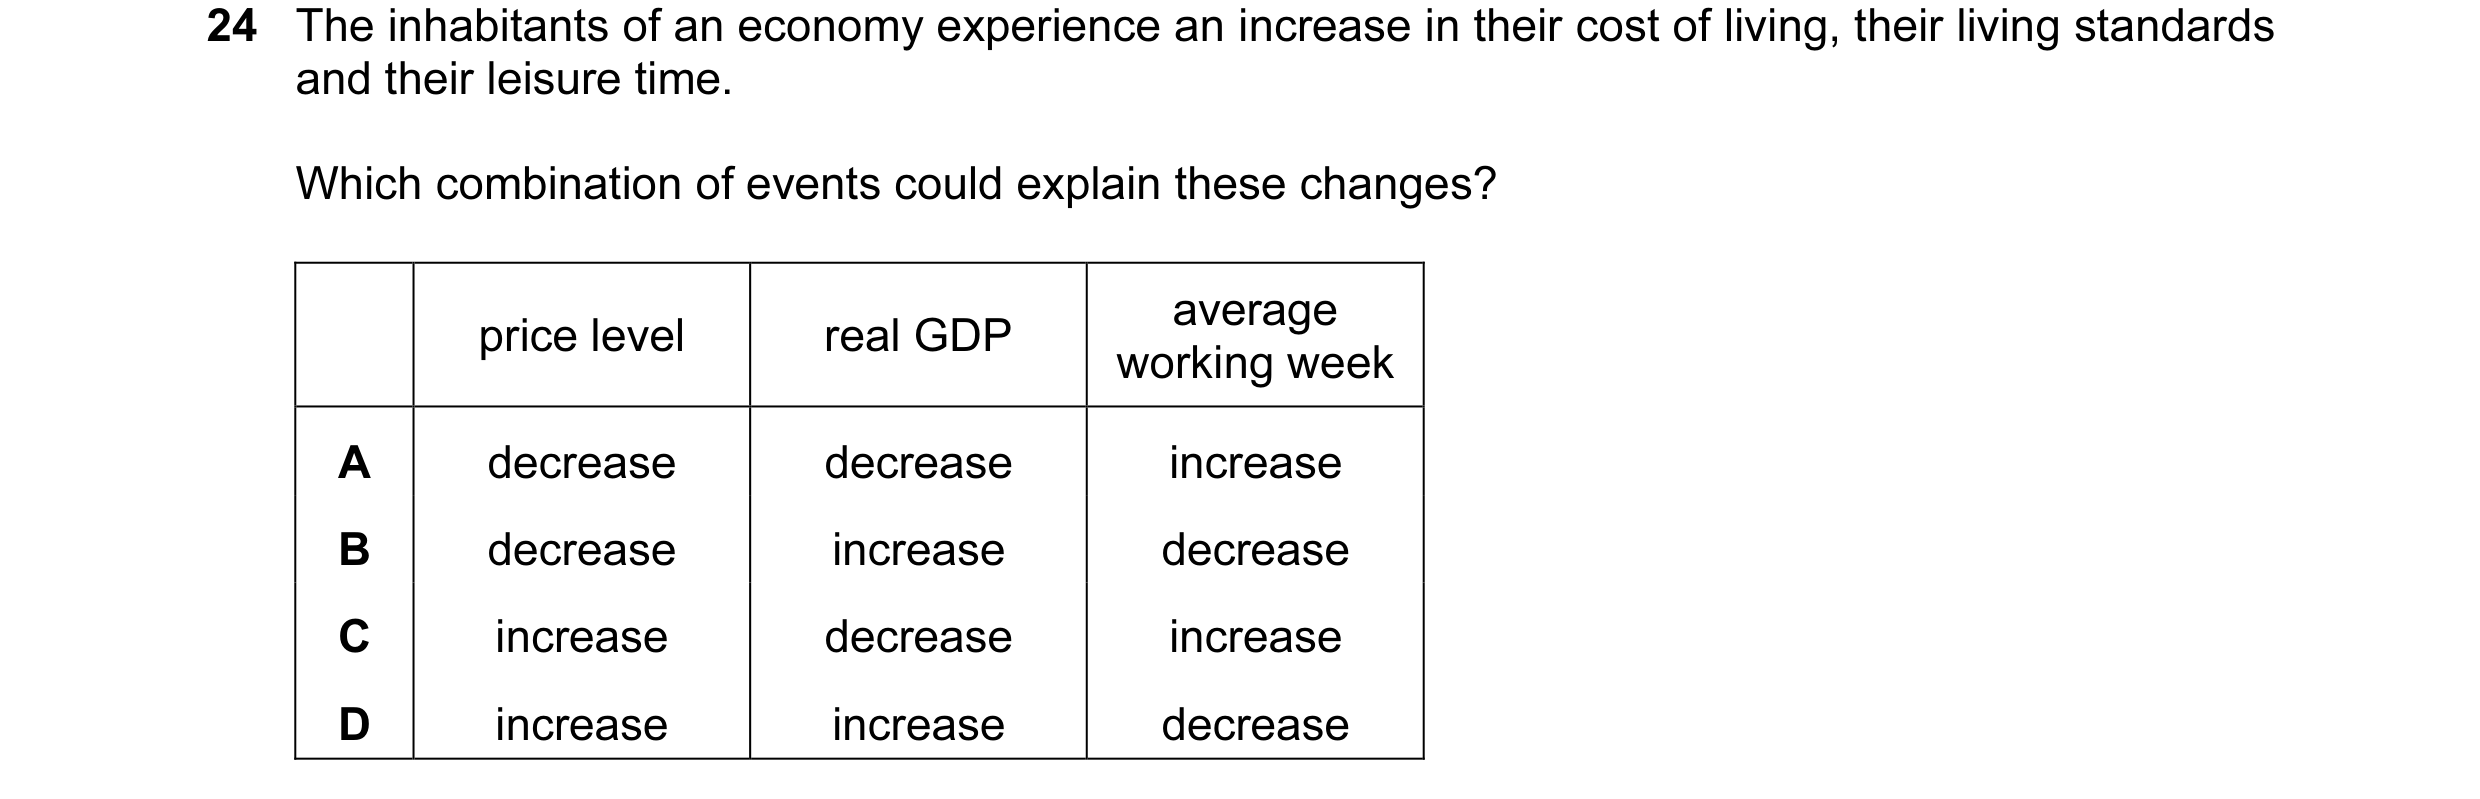
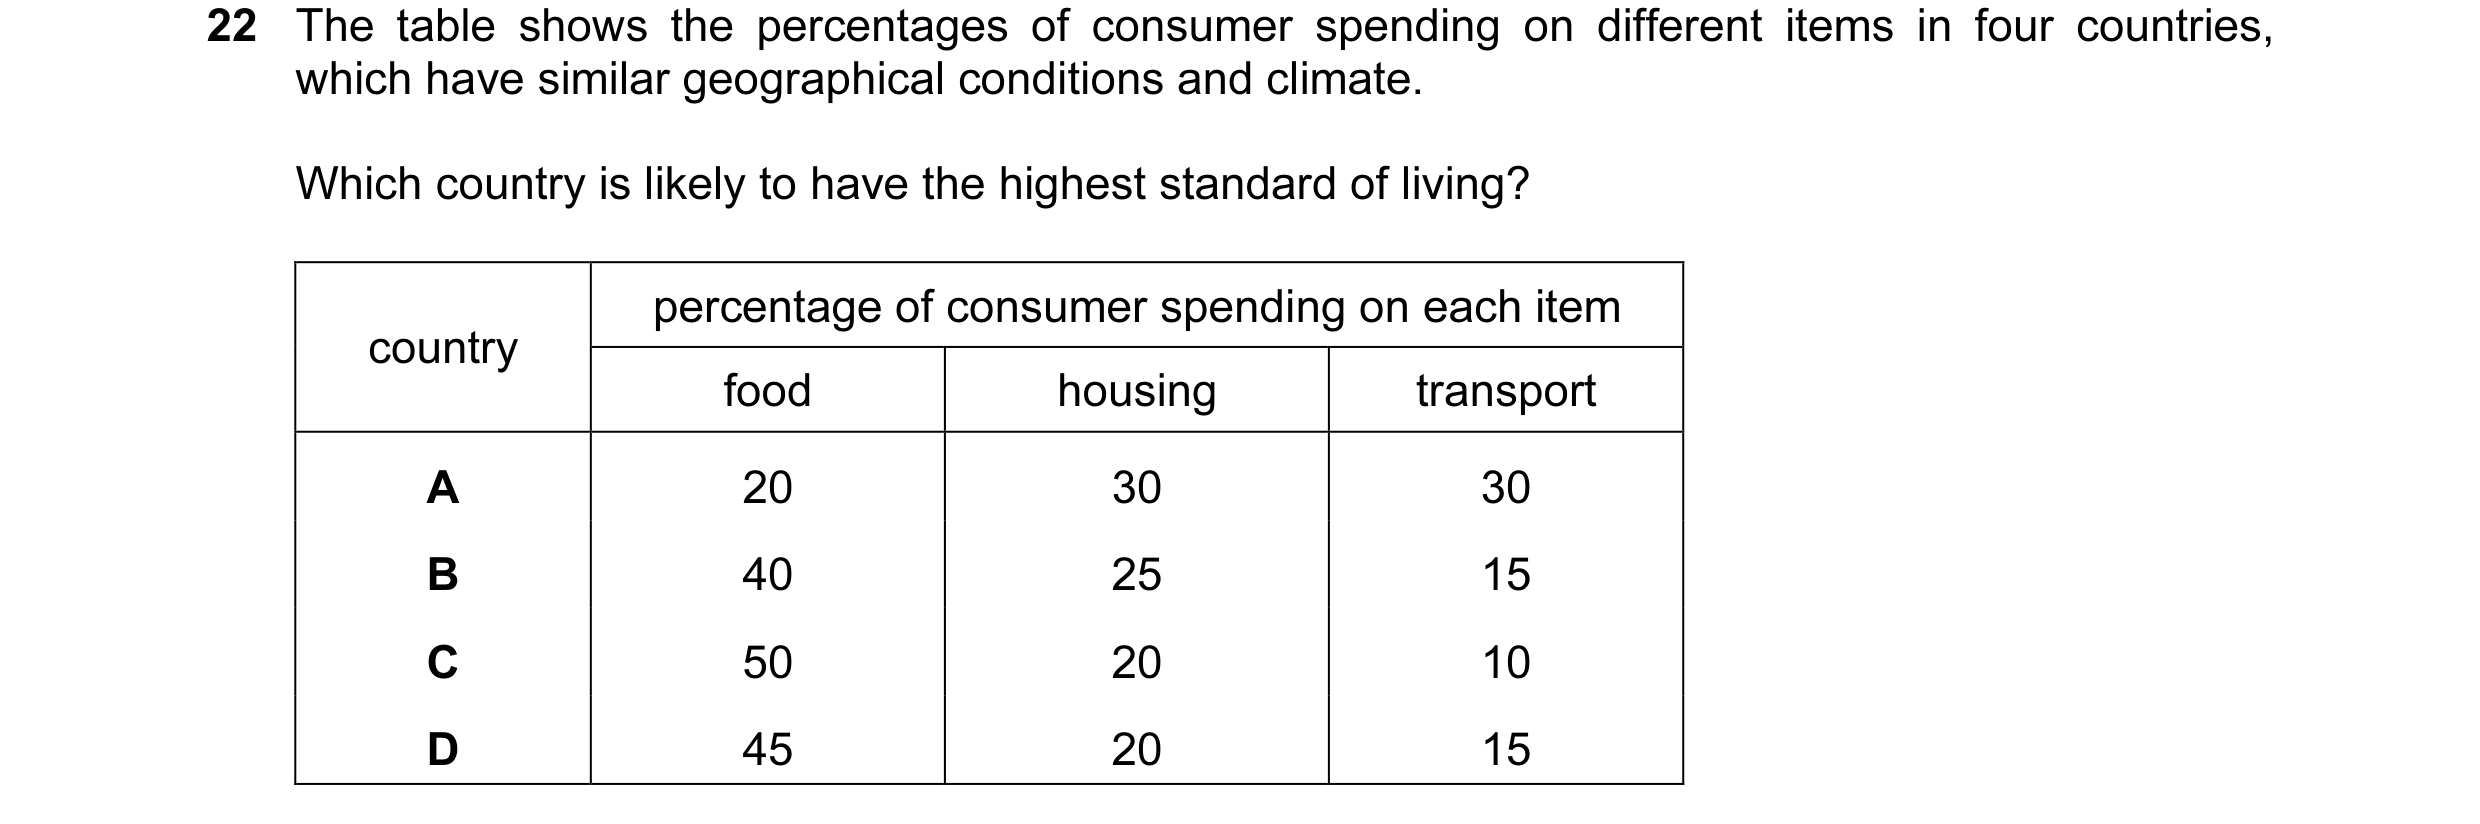
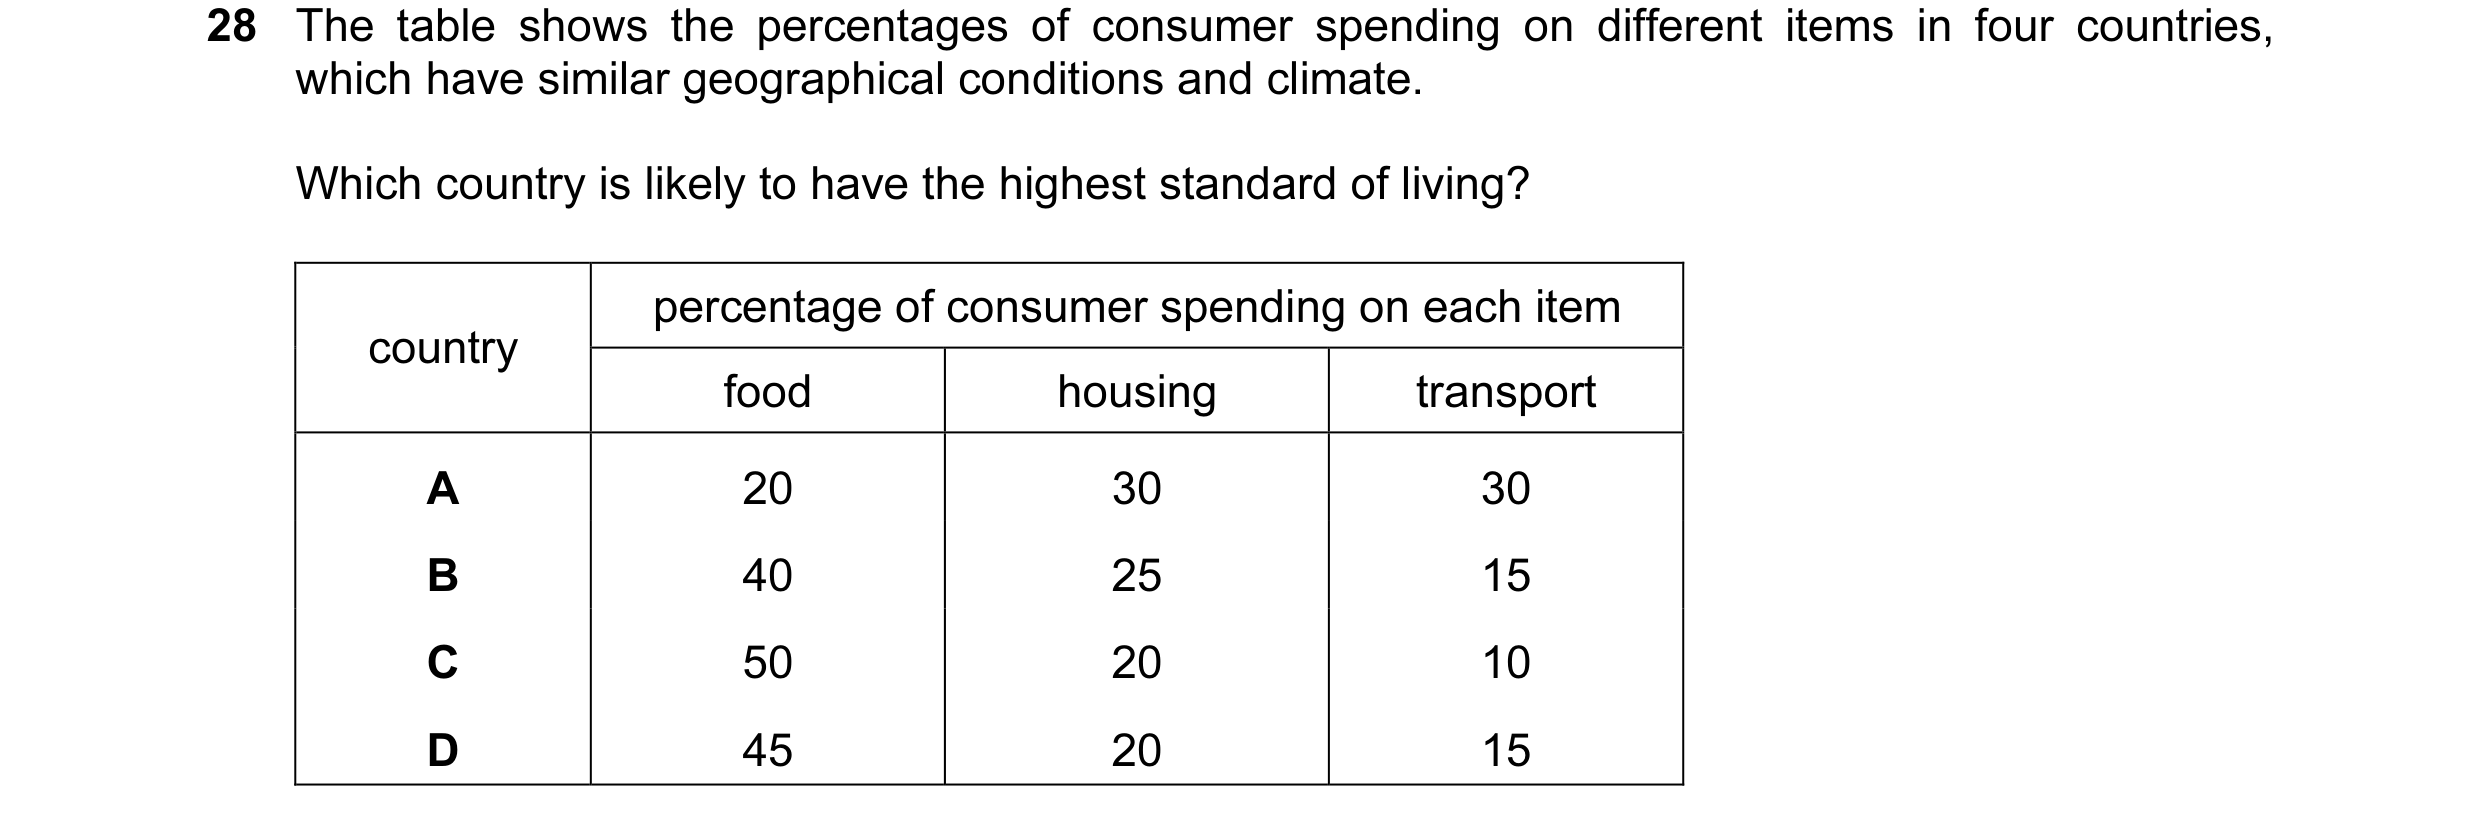 8 / 40
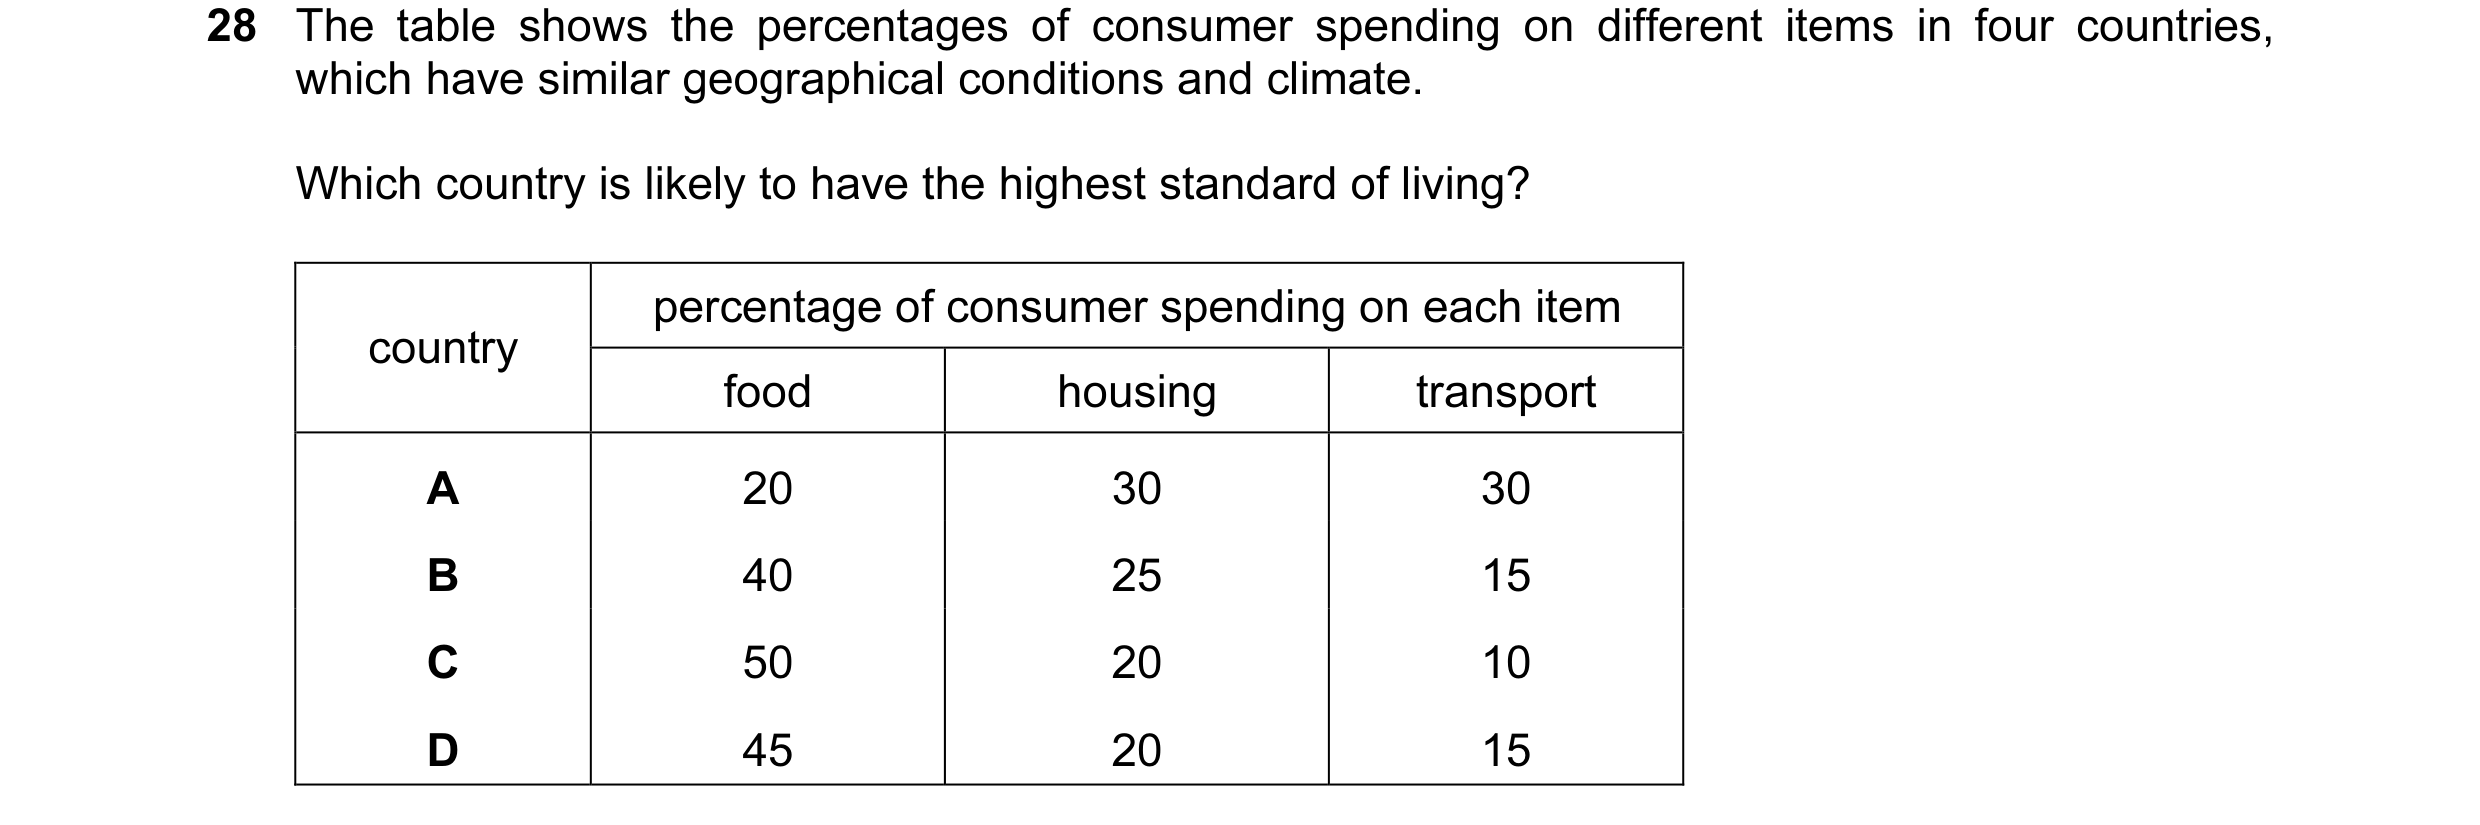
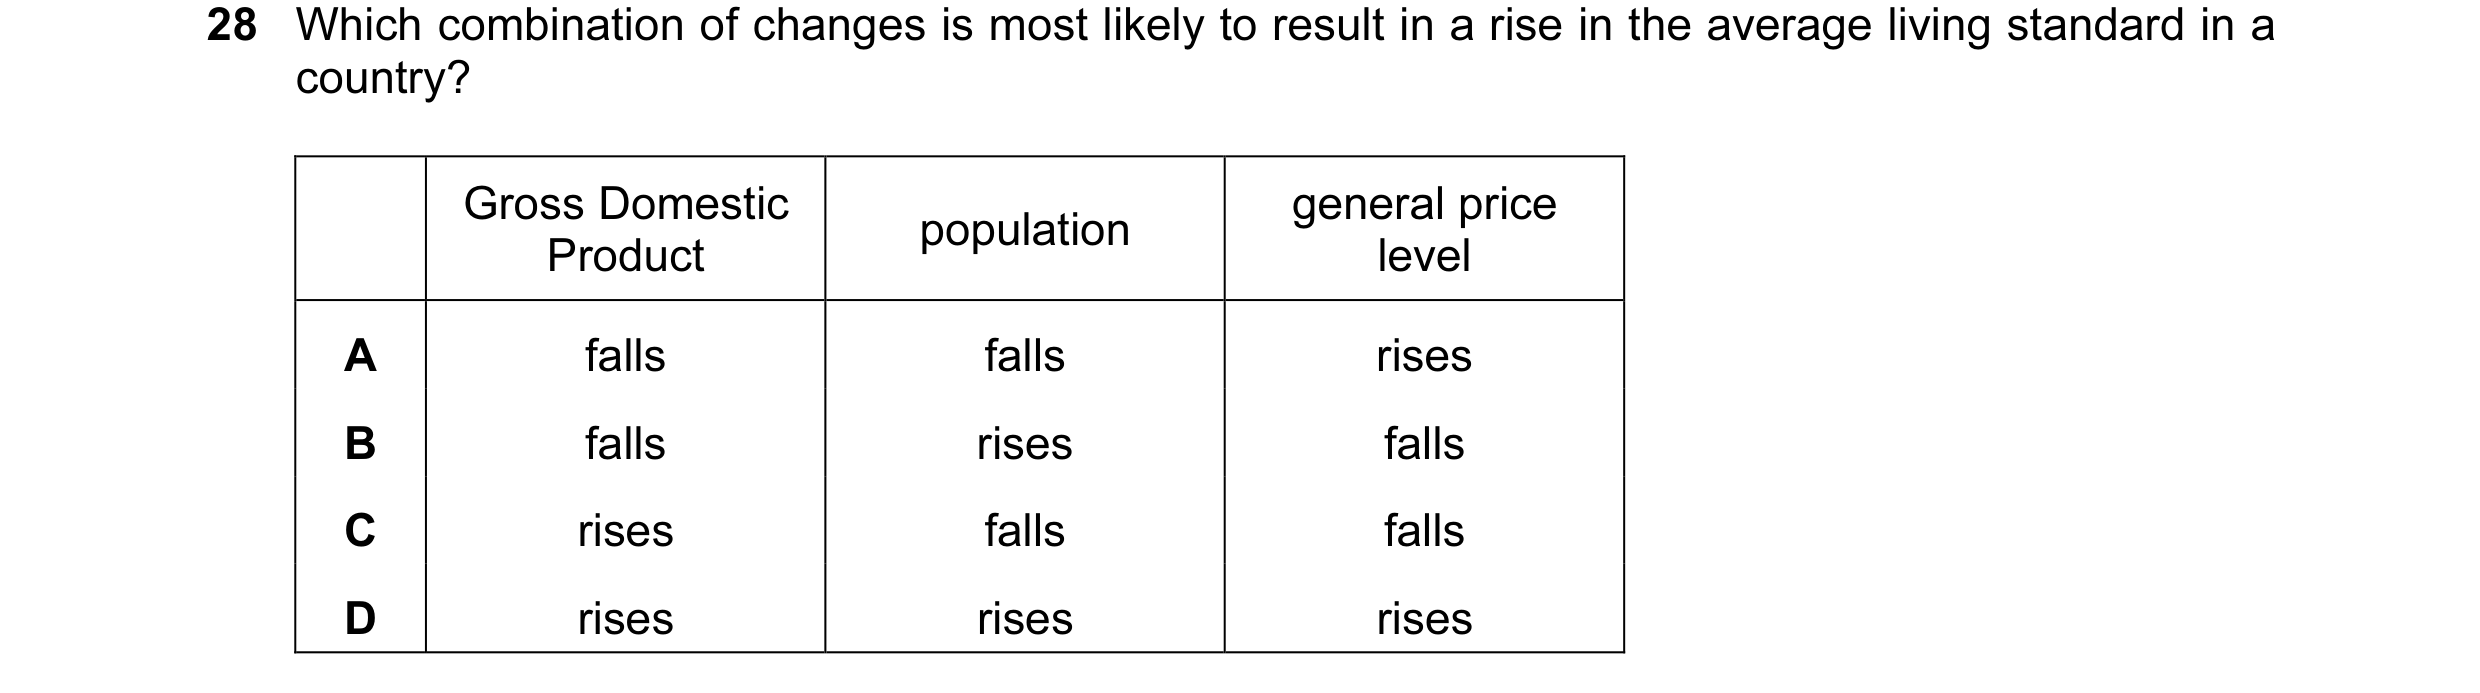
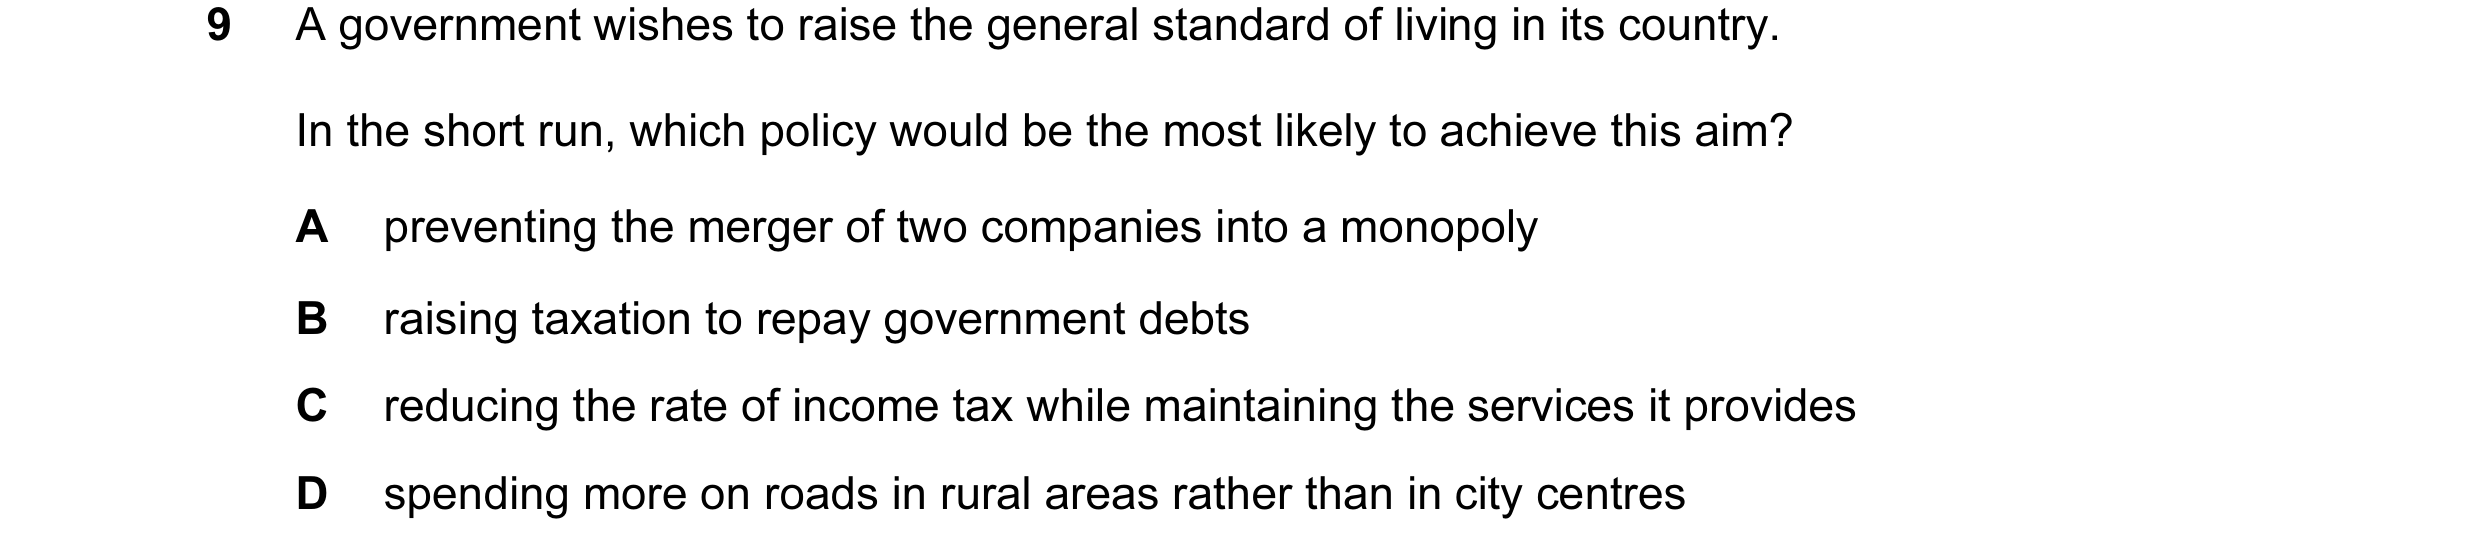 9 / 40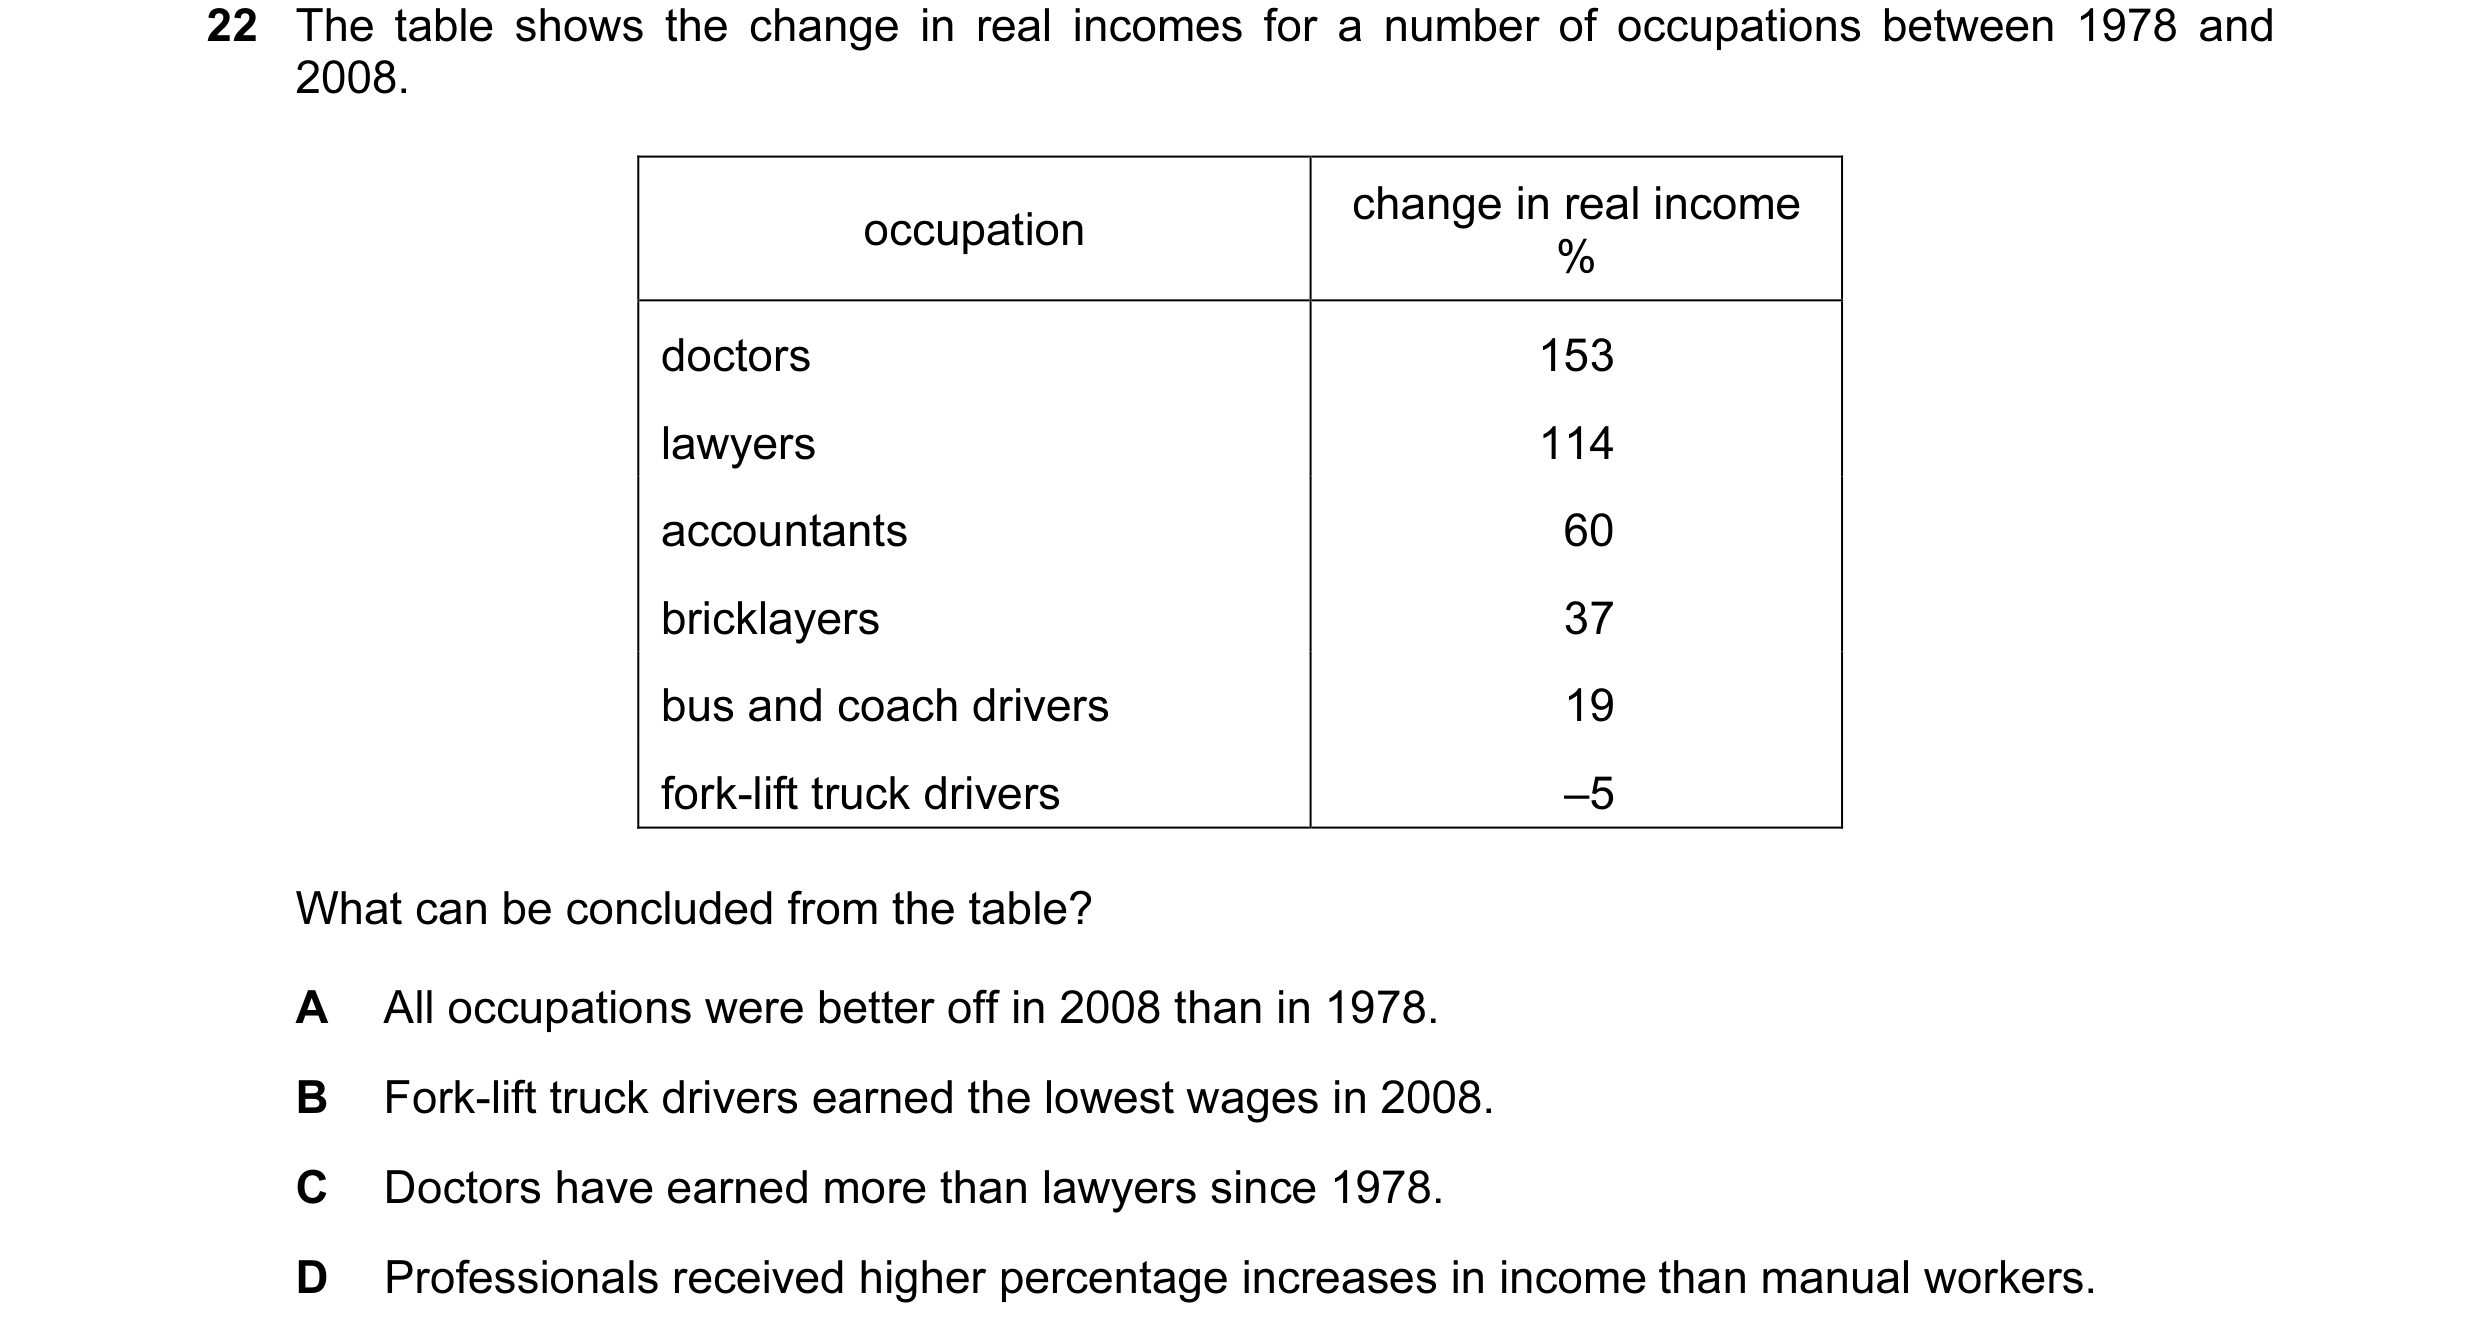
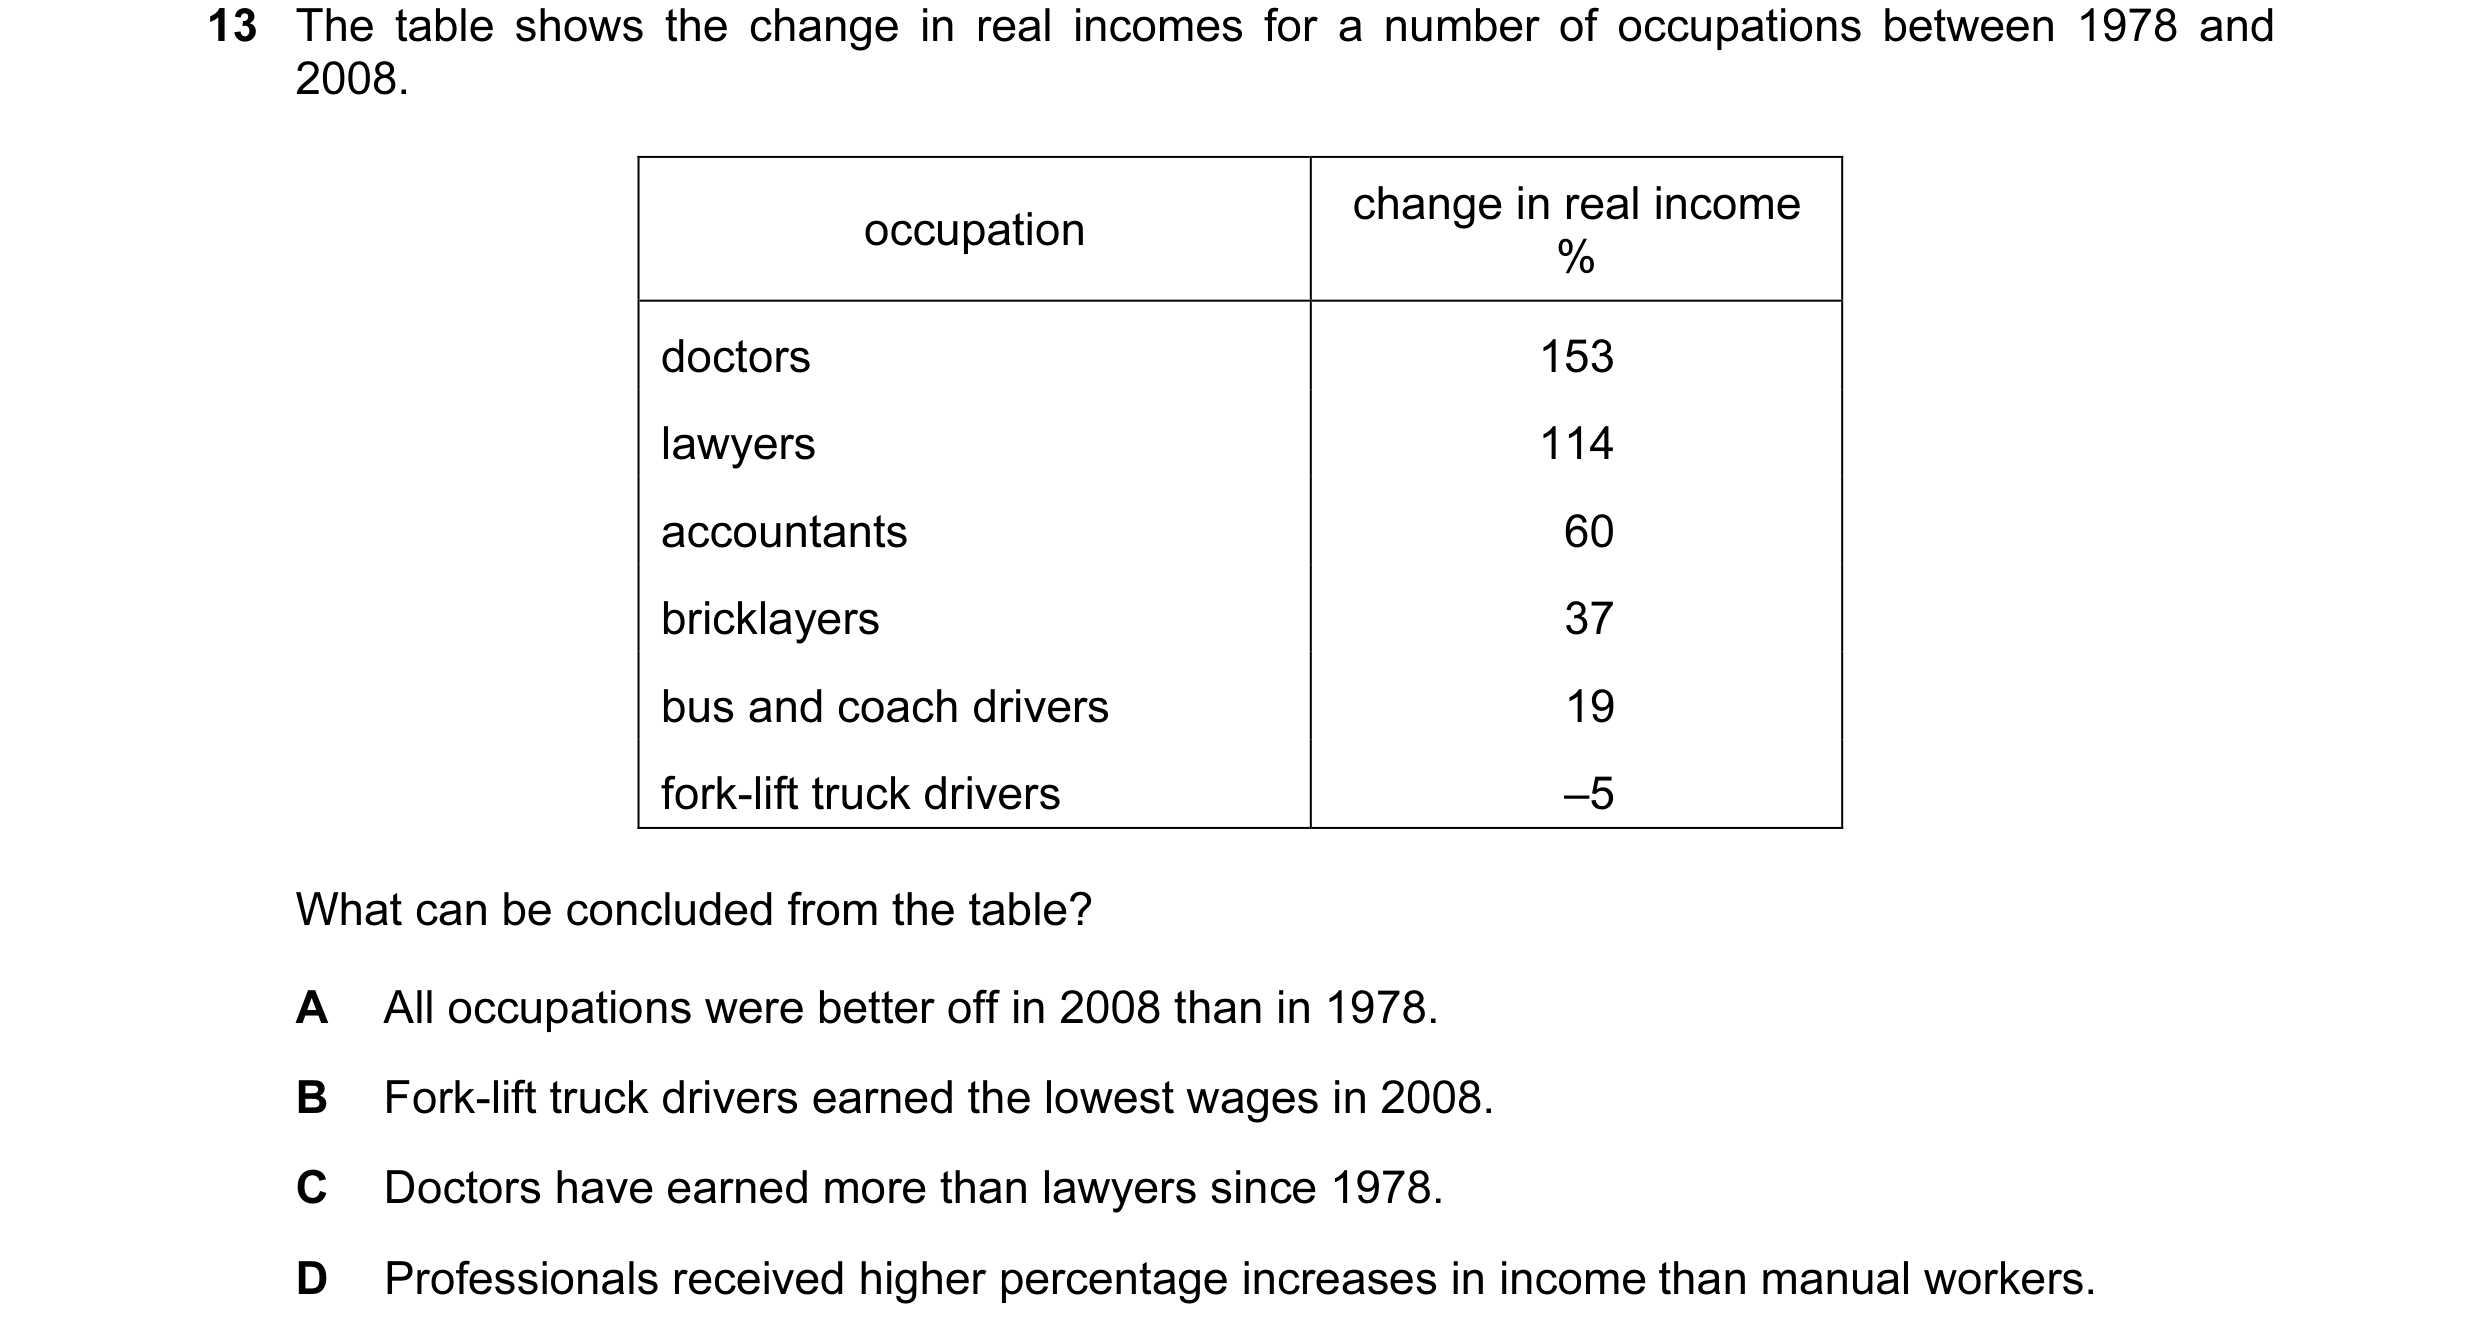
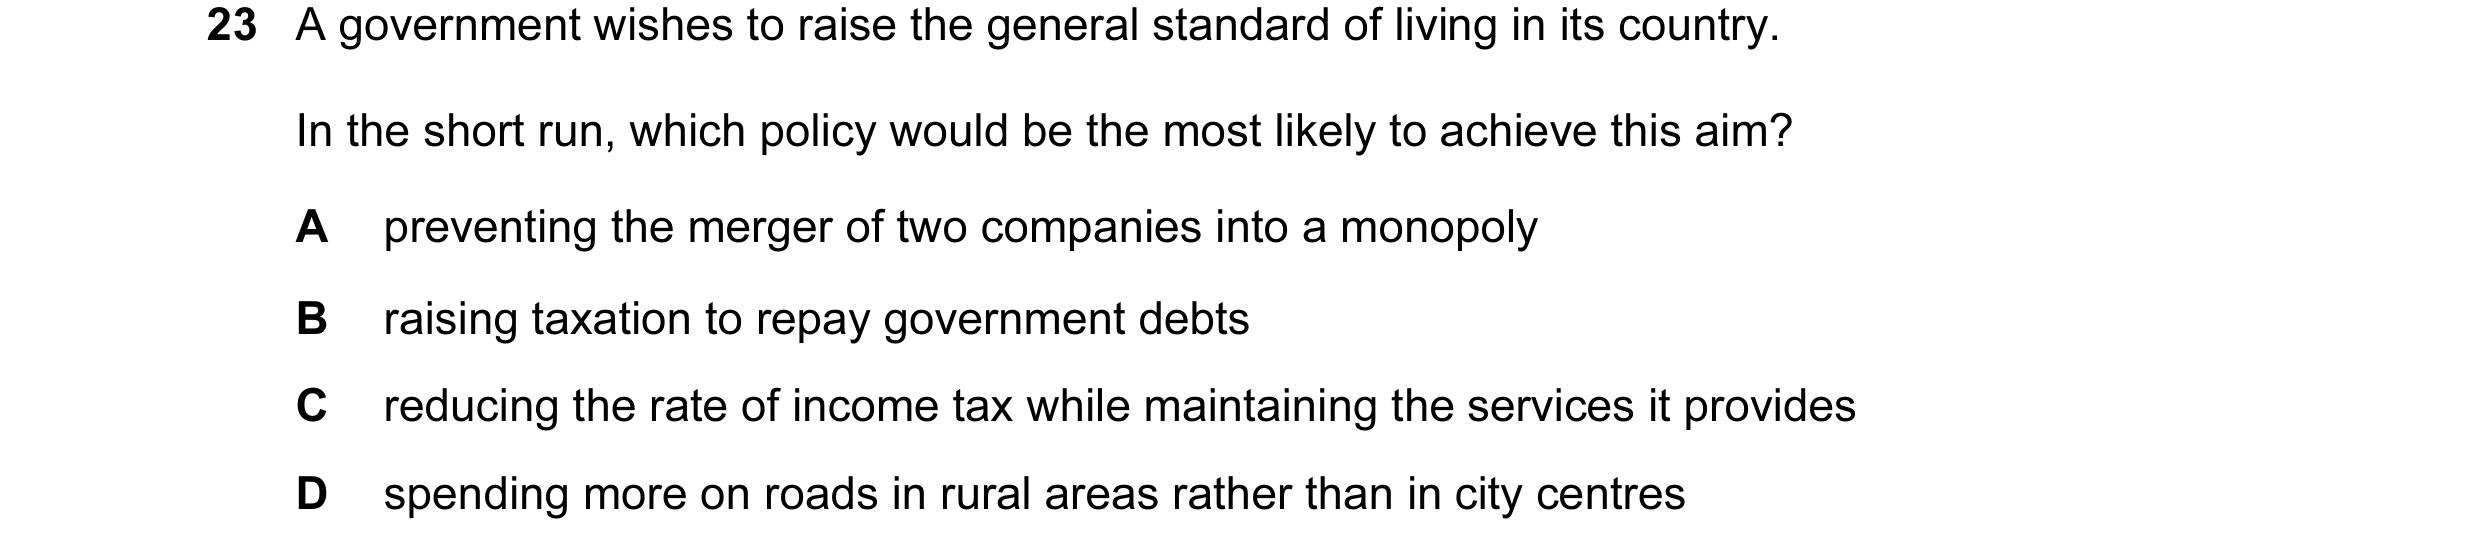 10 / 40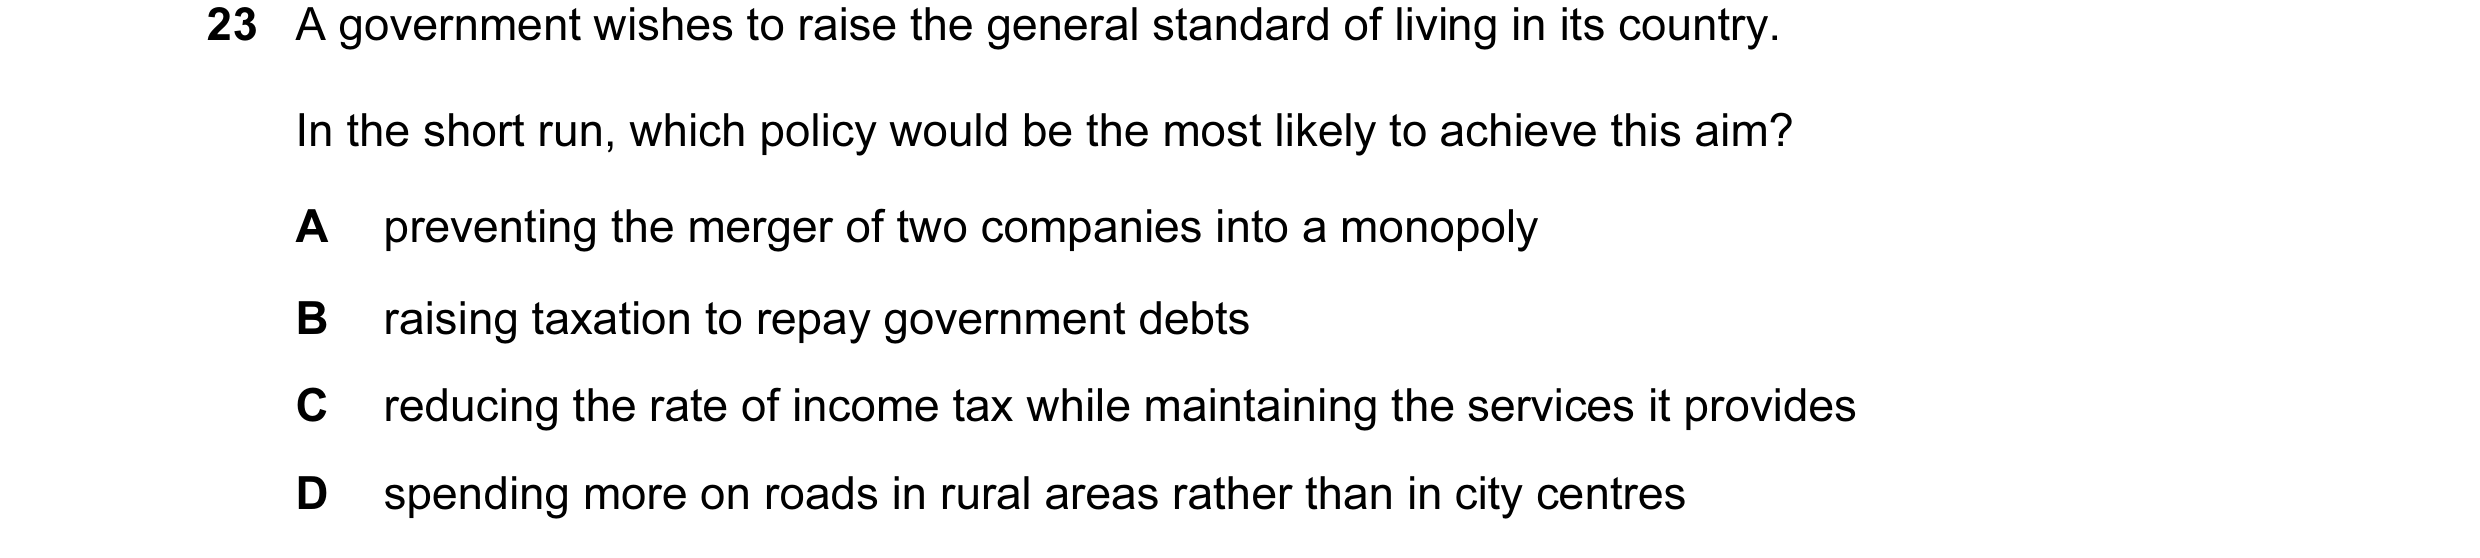
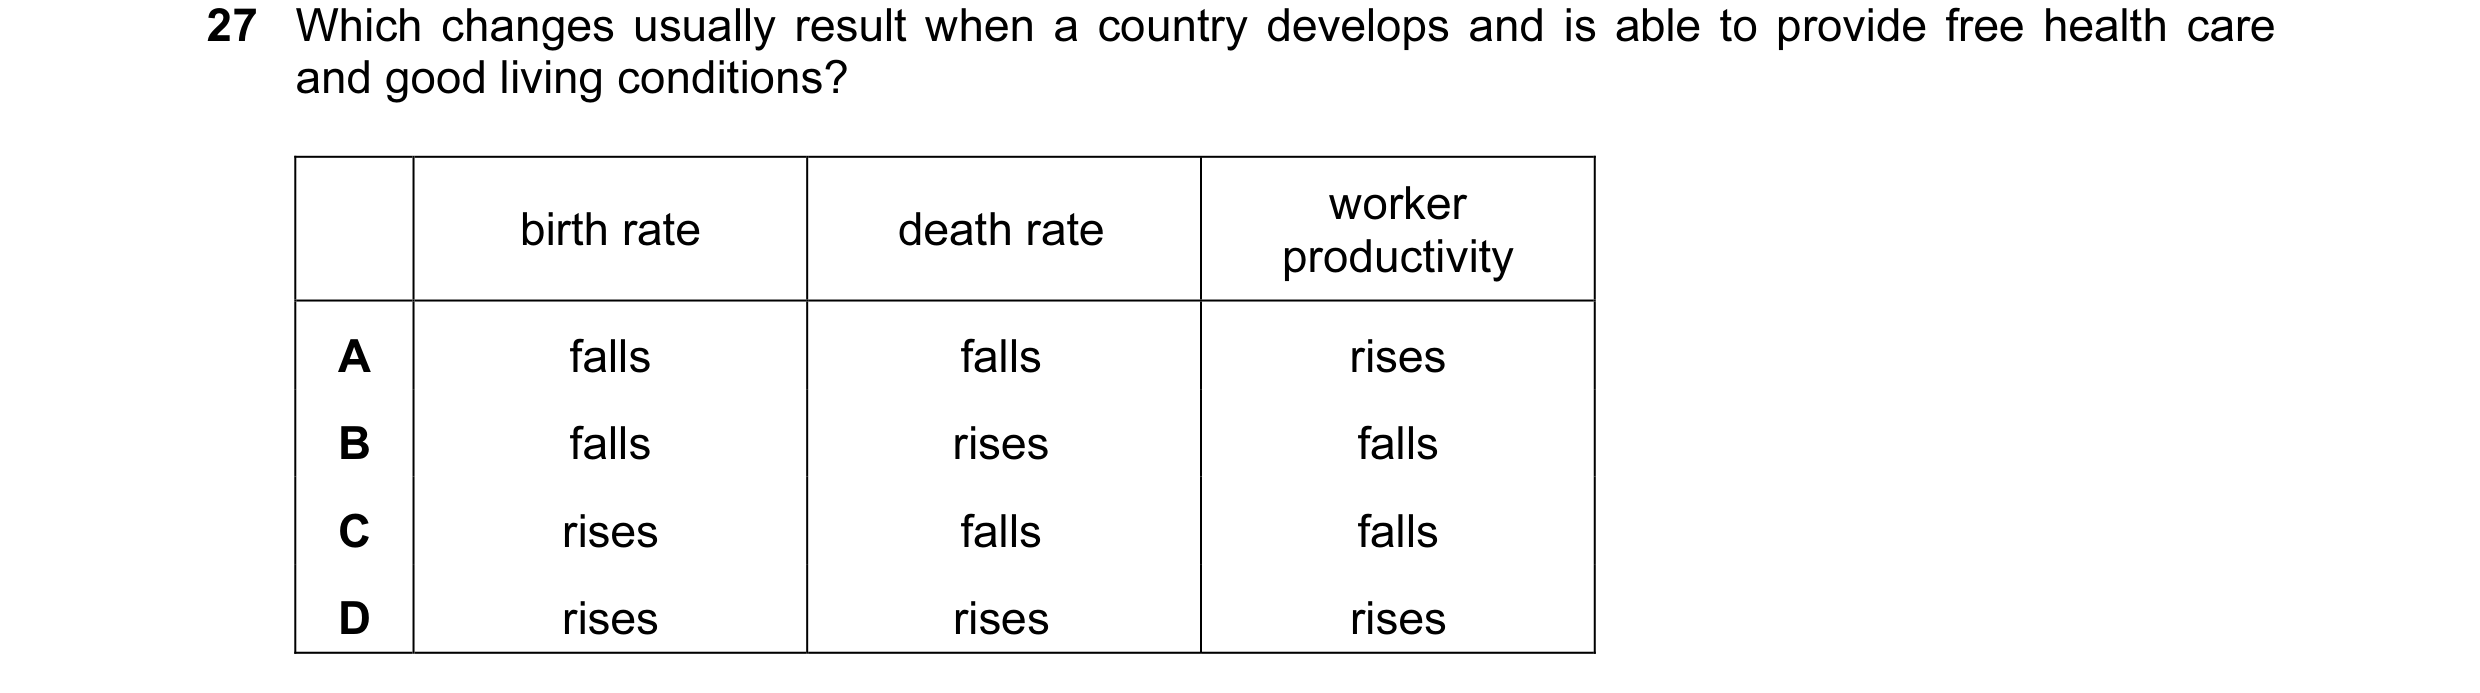
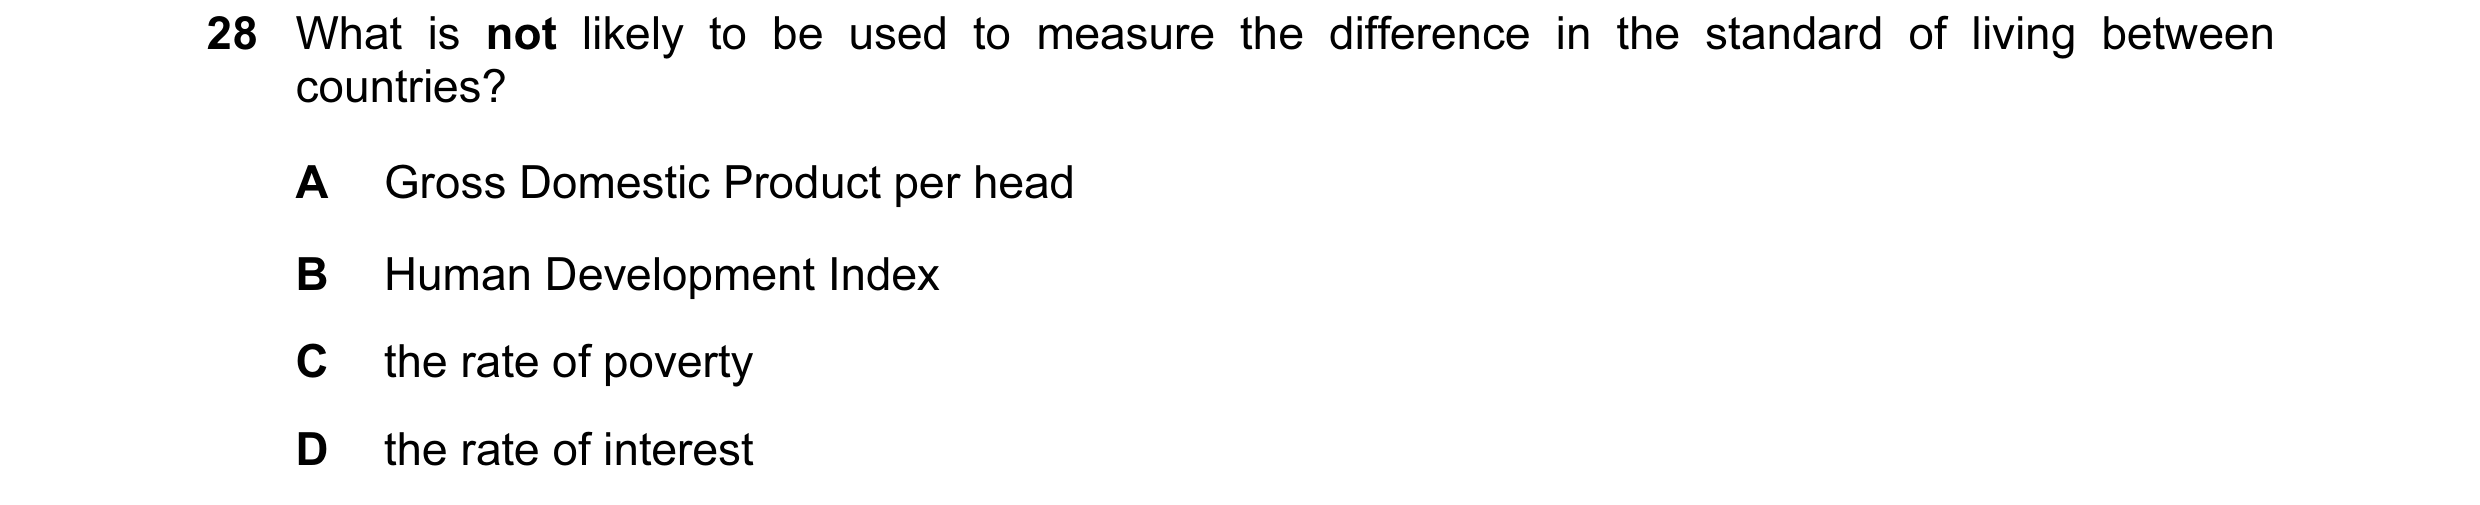
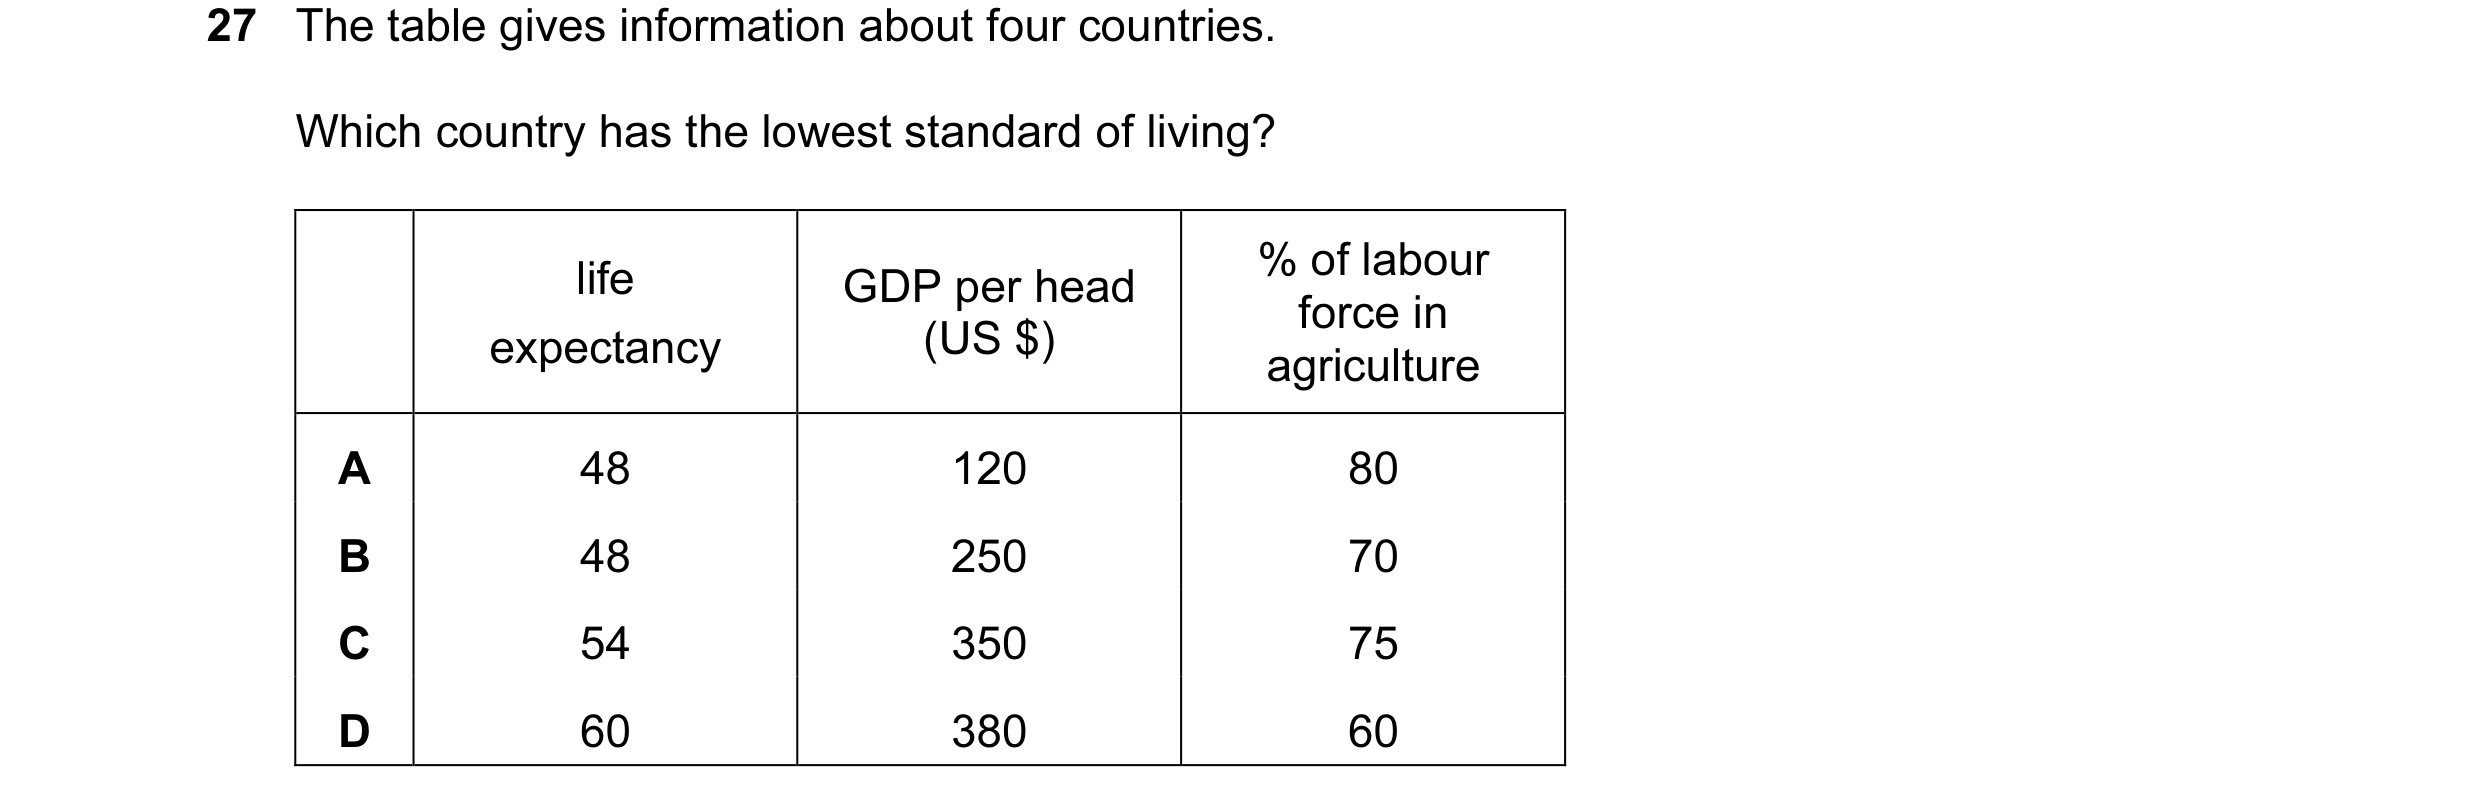
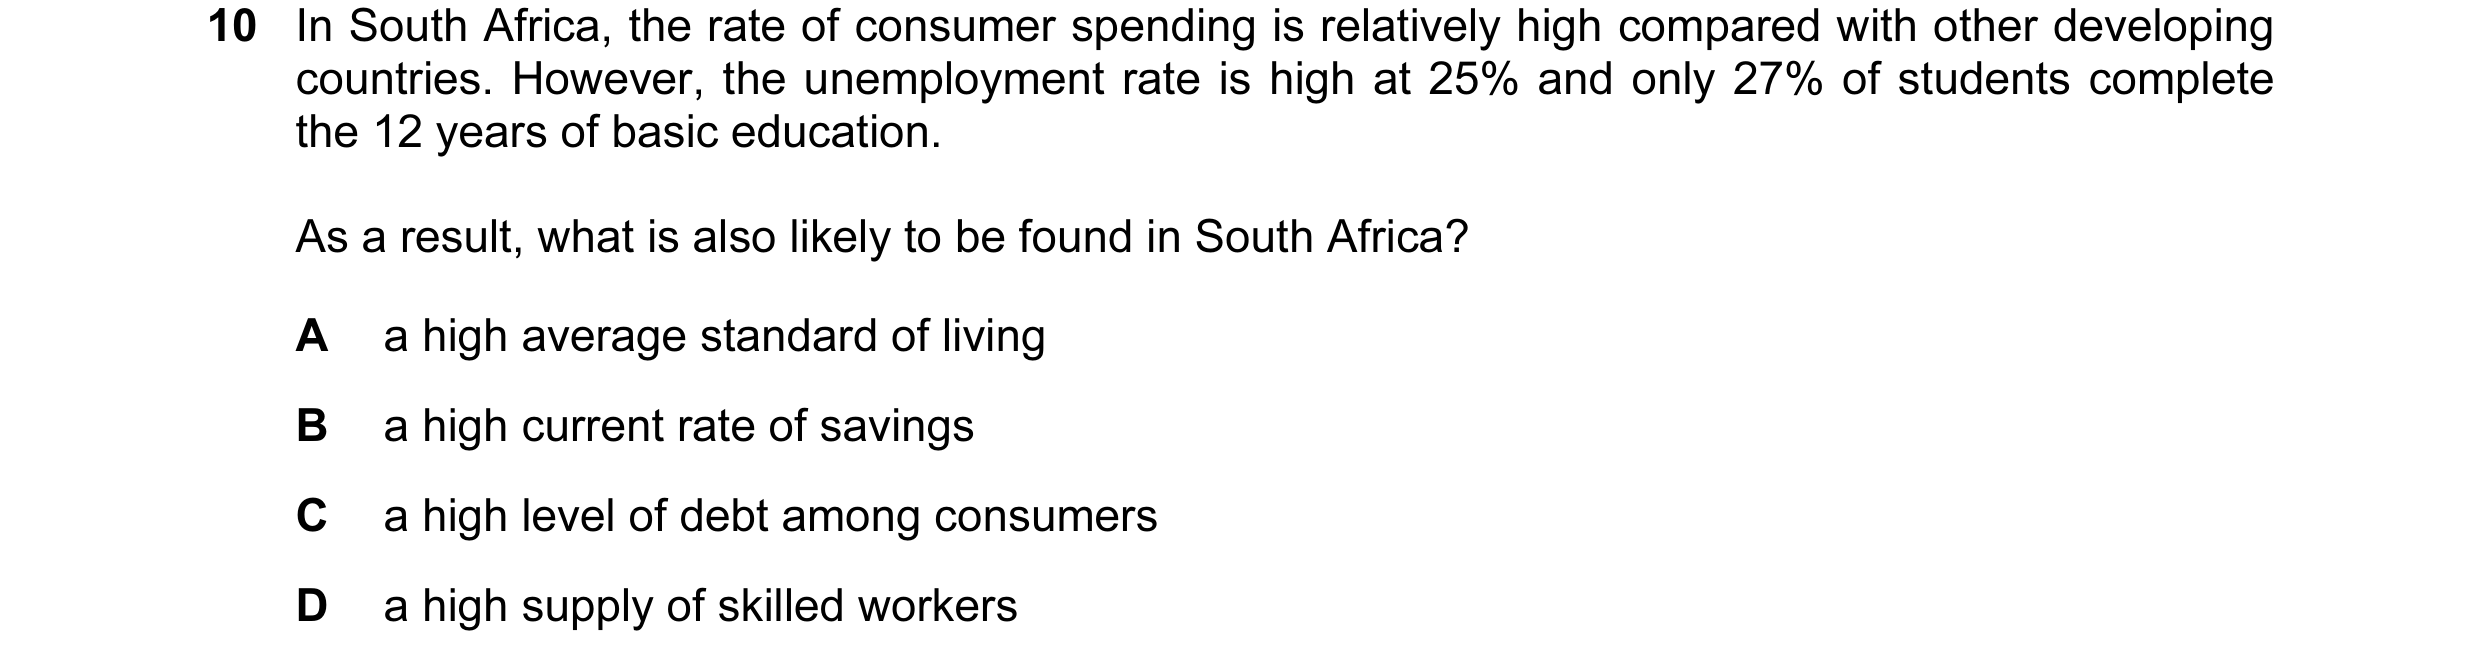 11 / 40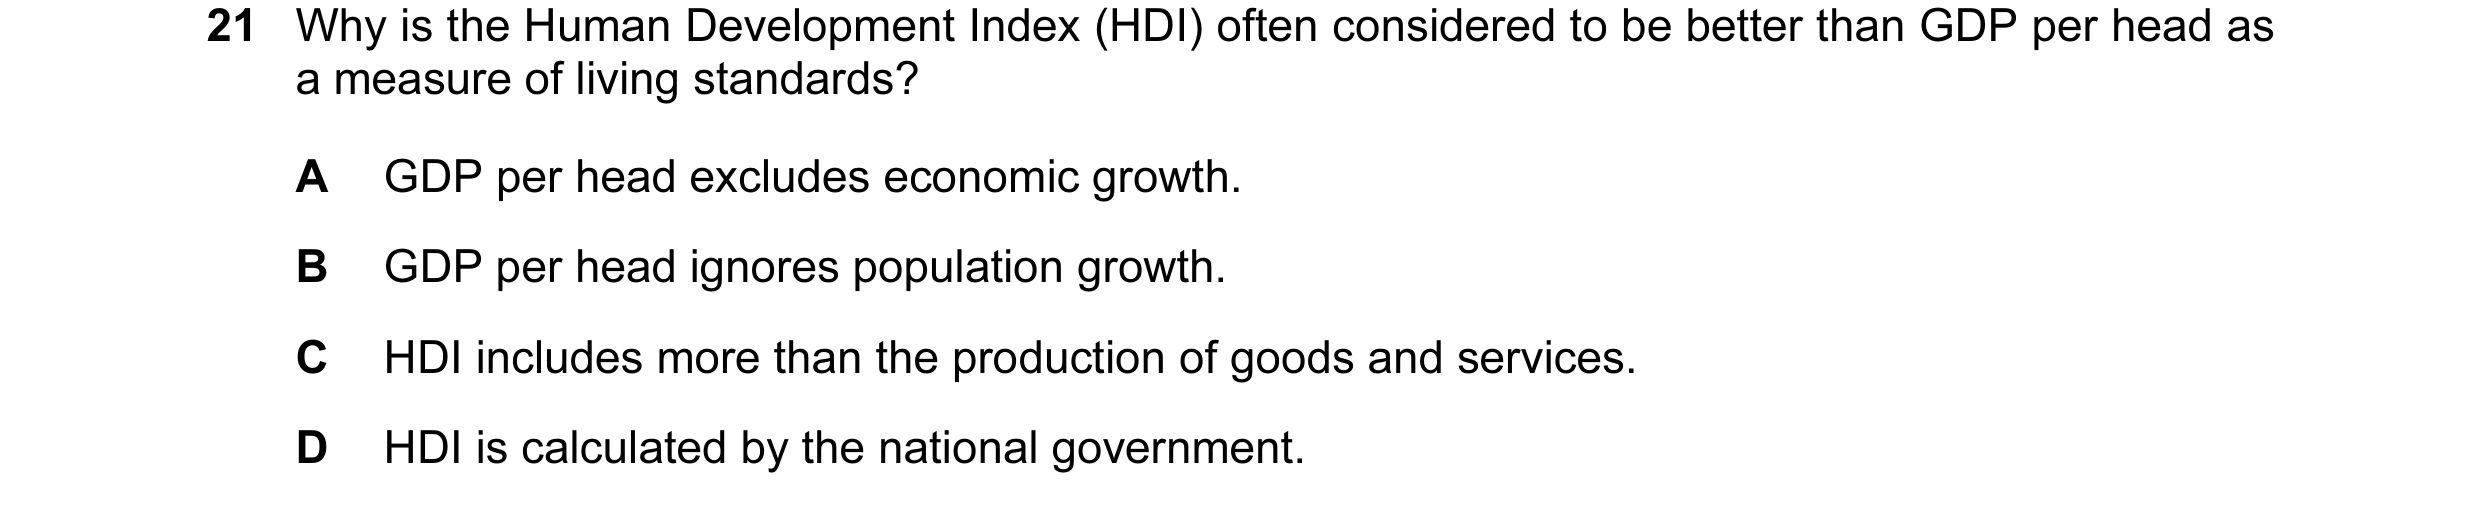
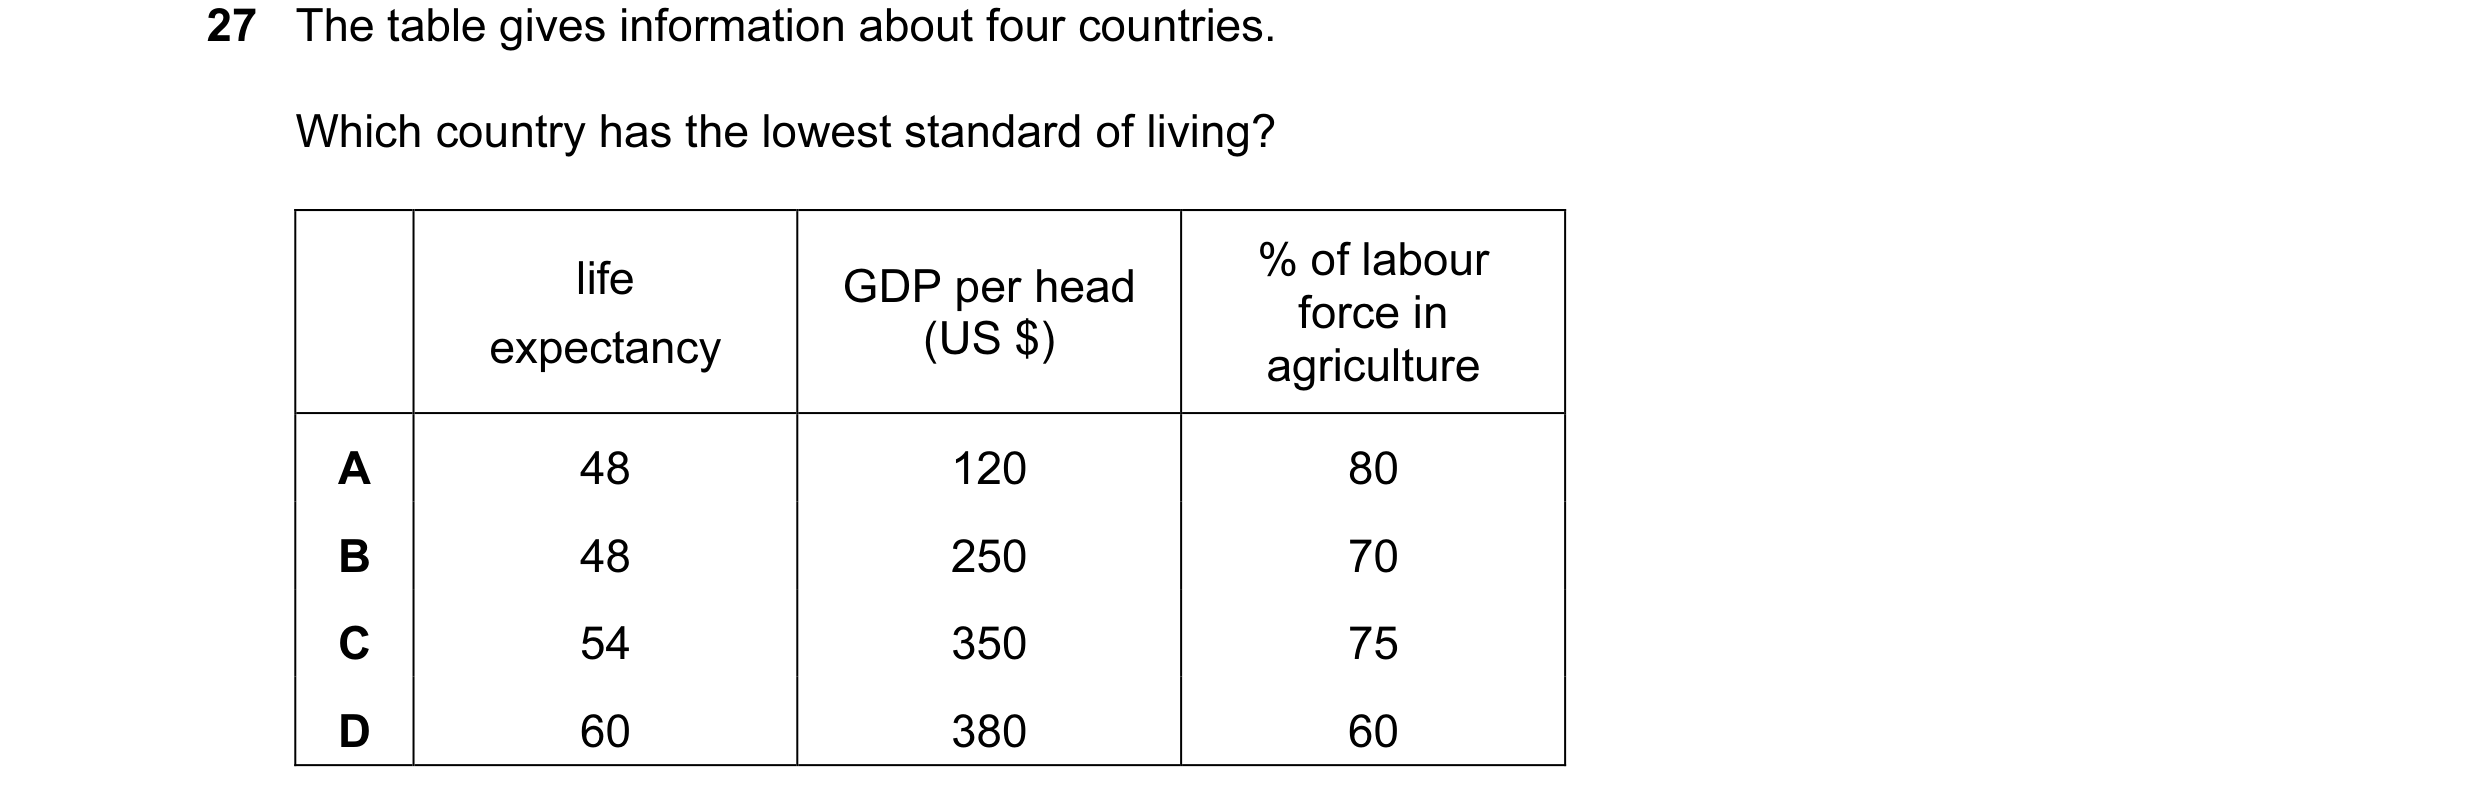
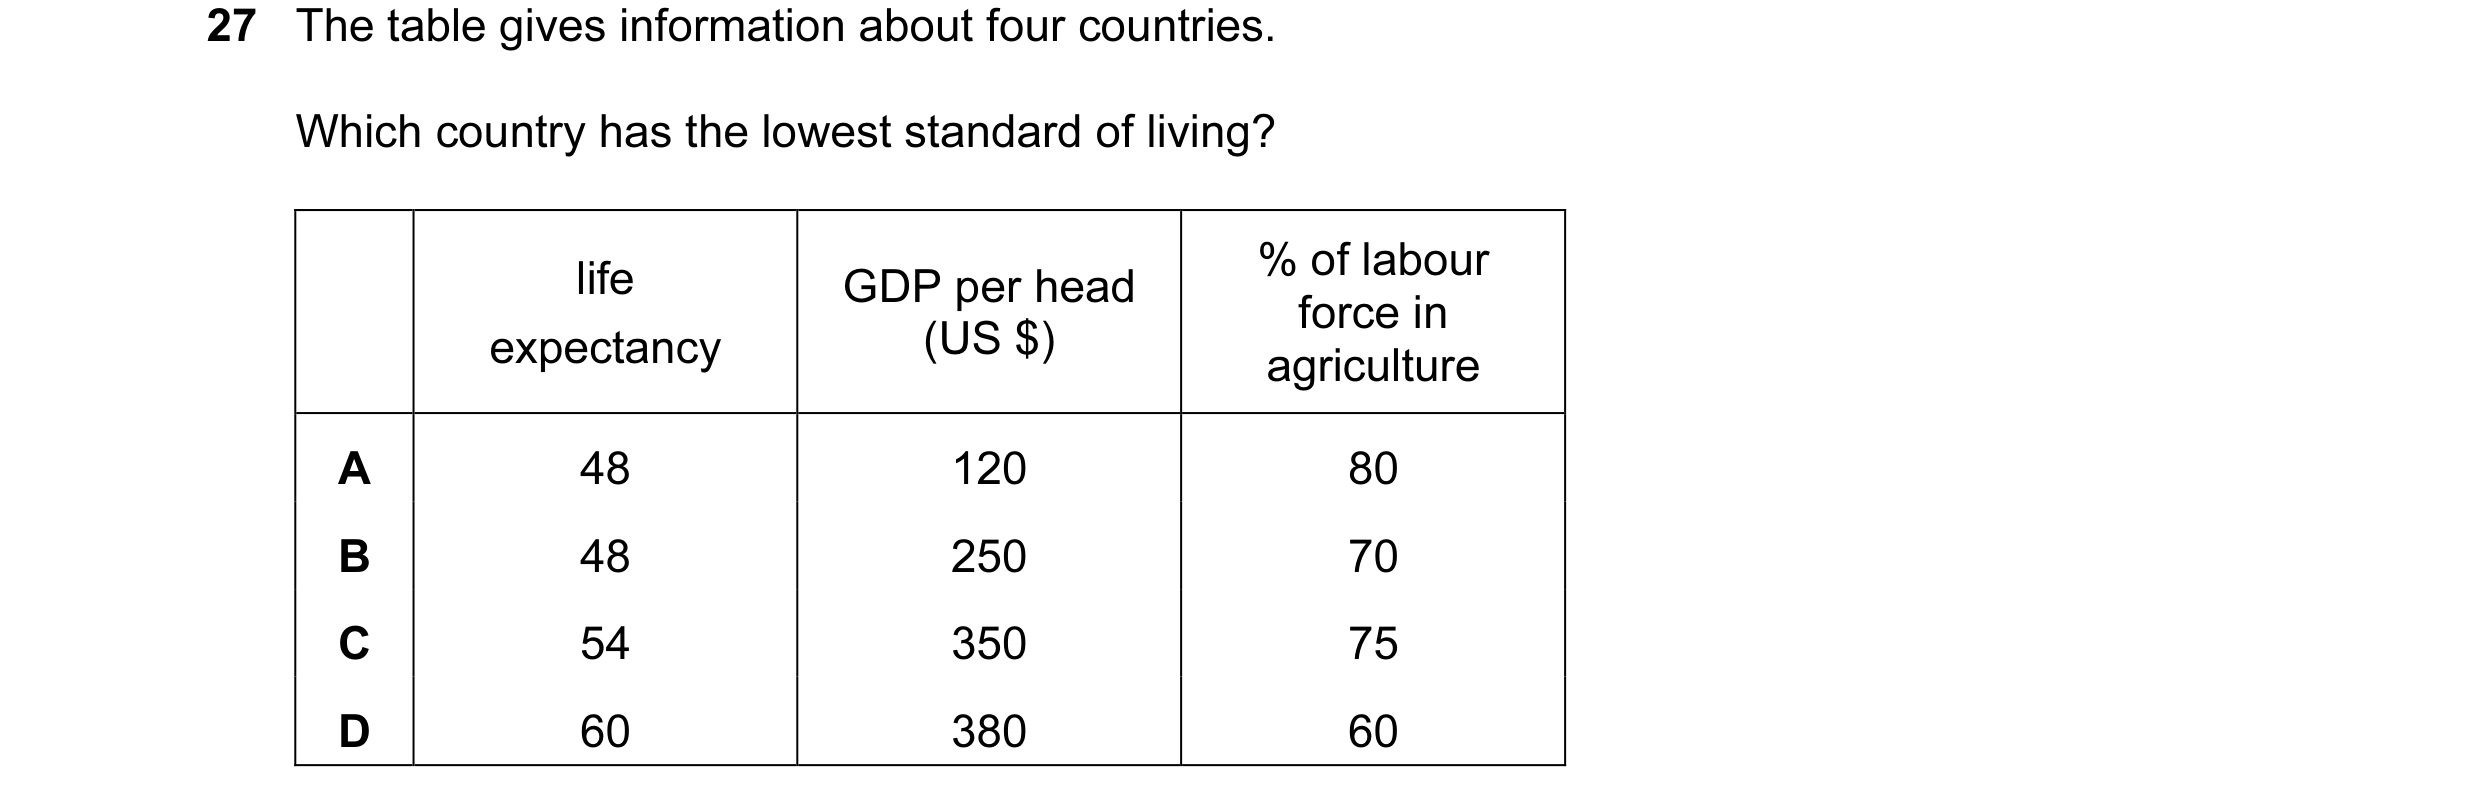
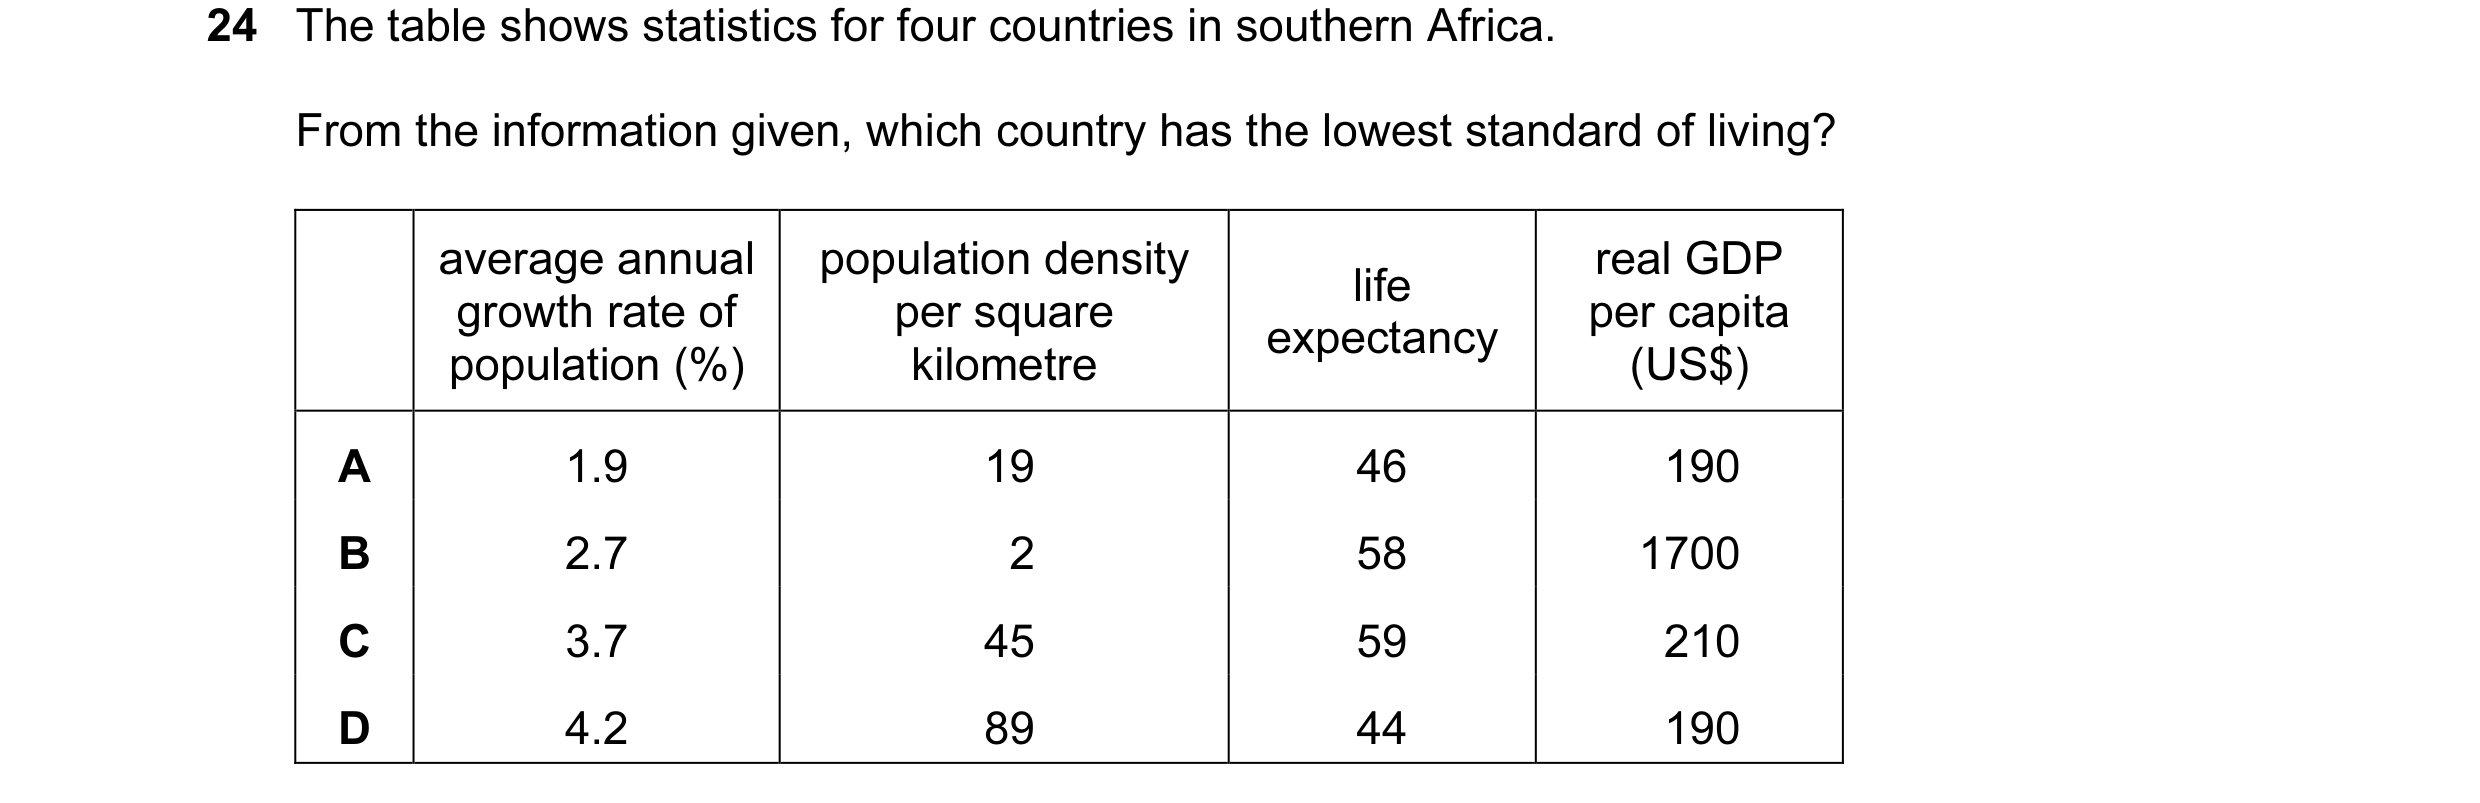 12 / 40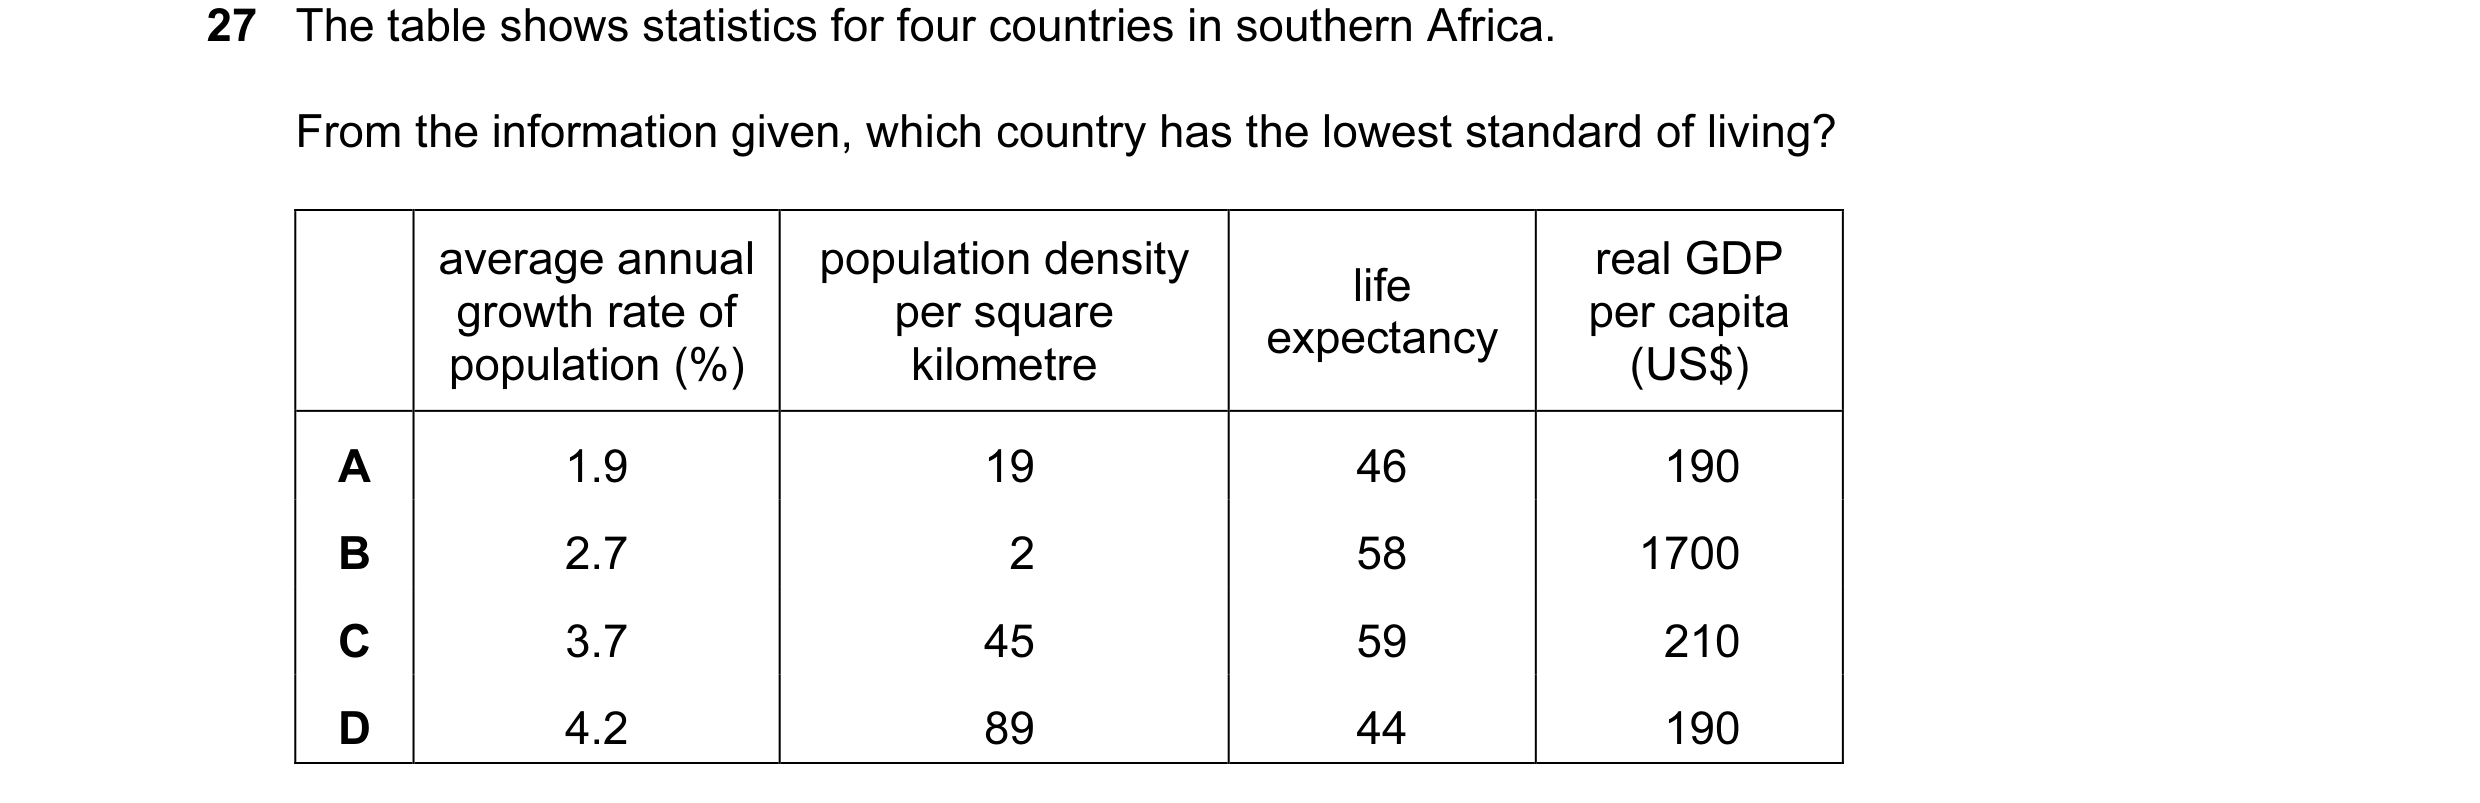
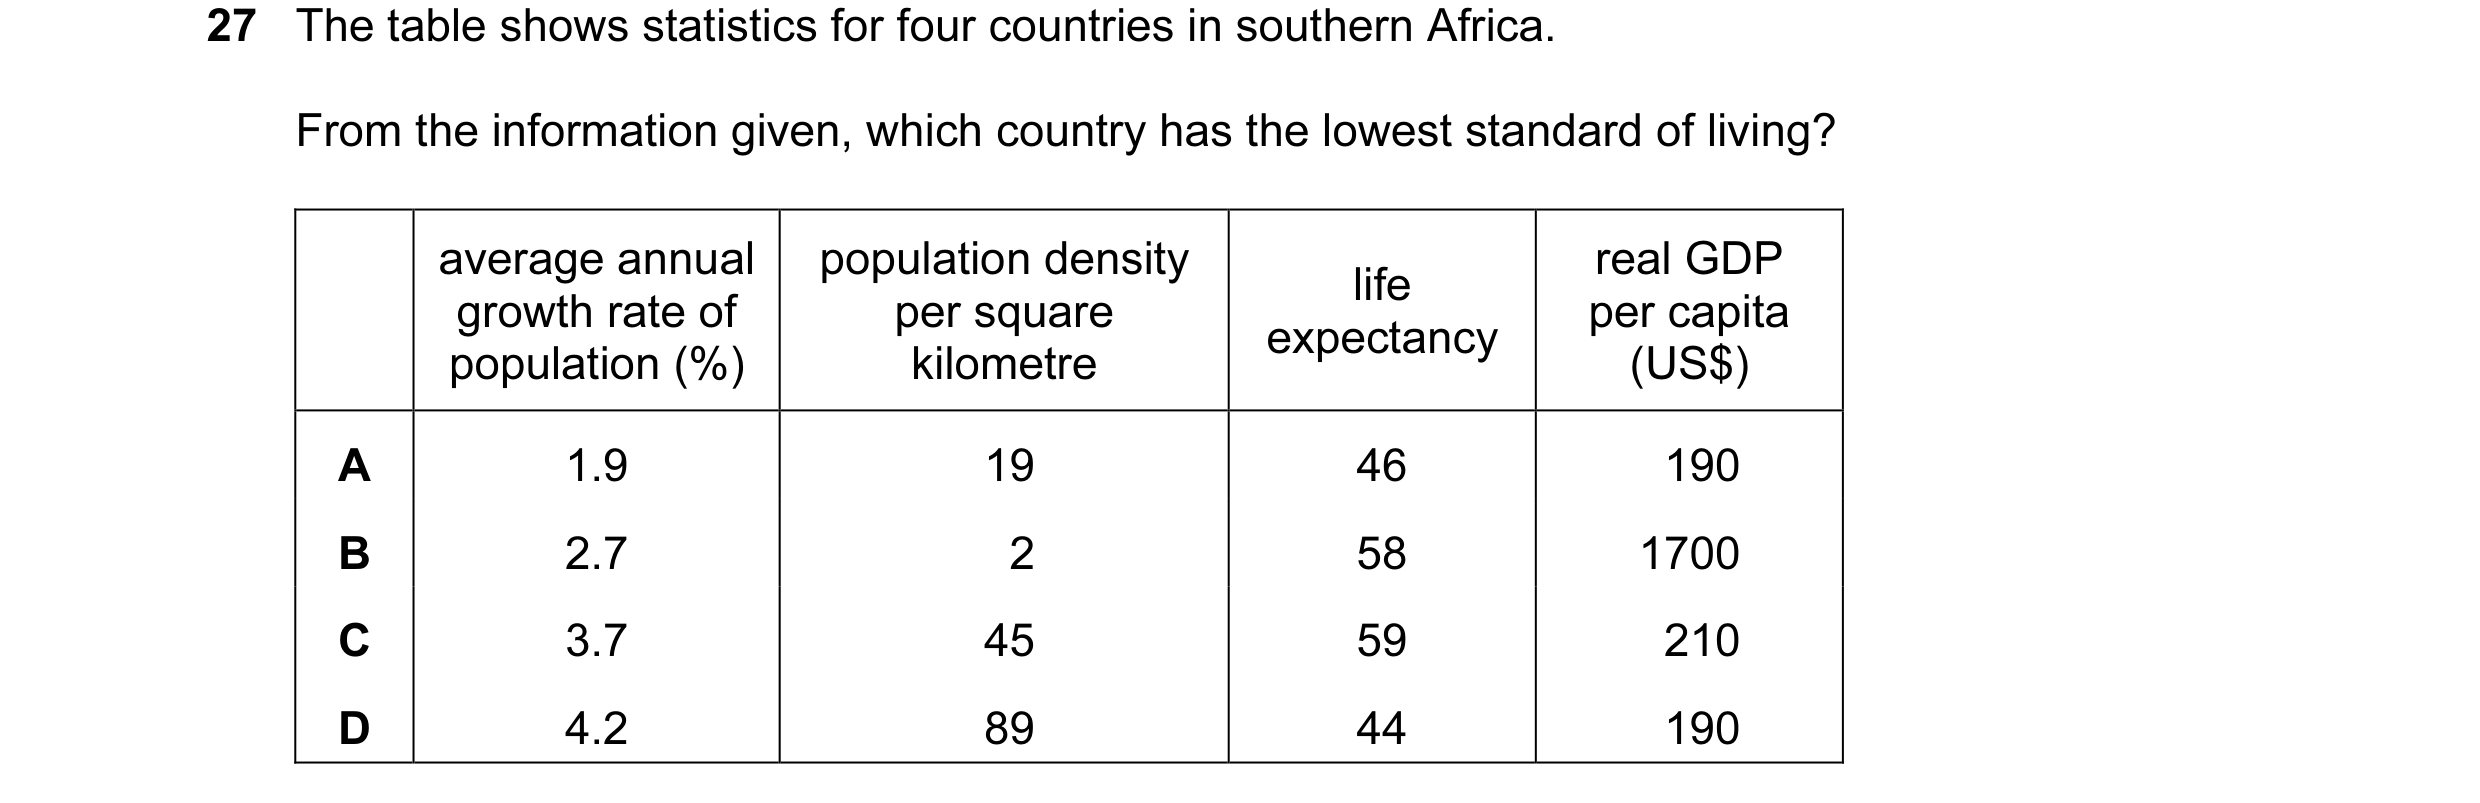
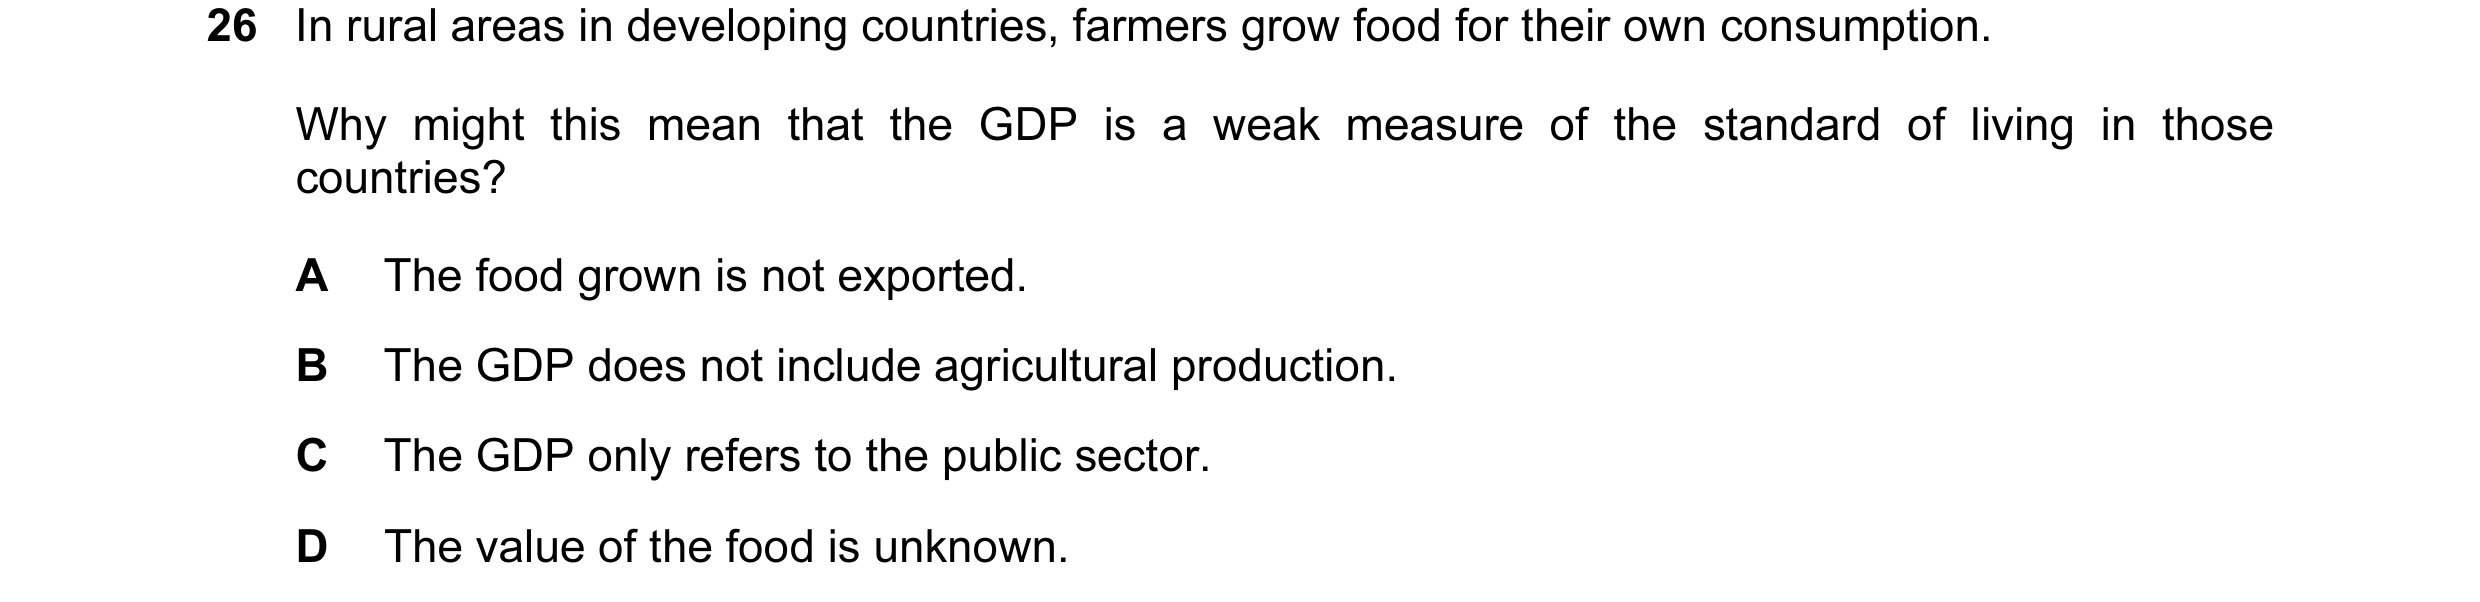 13 / 40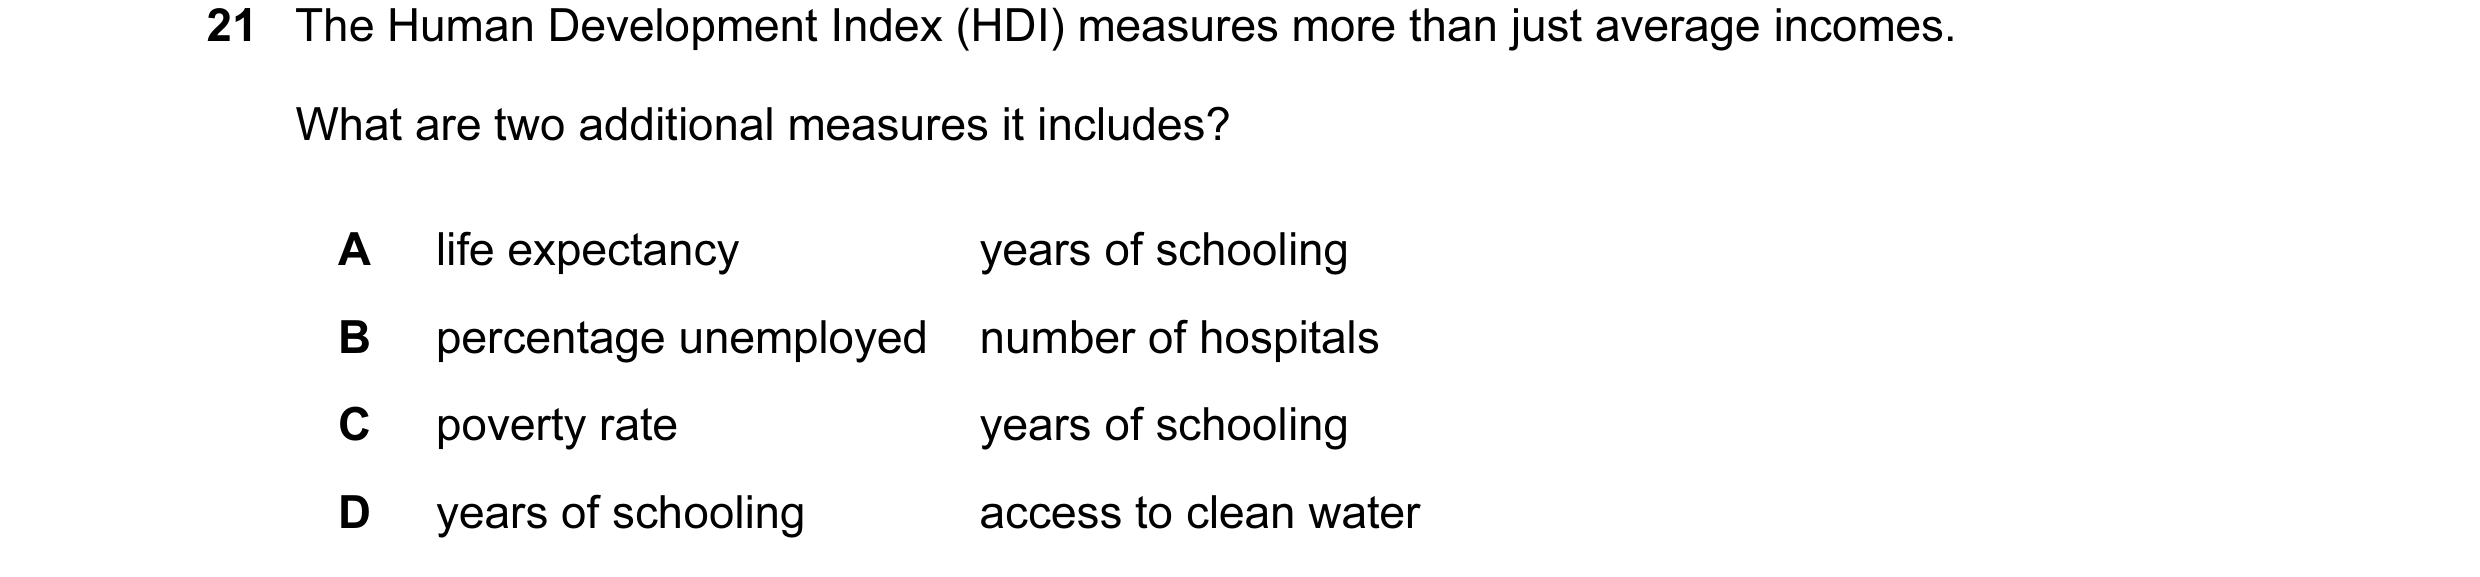
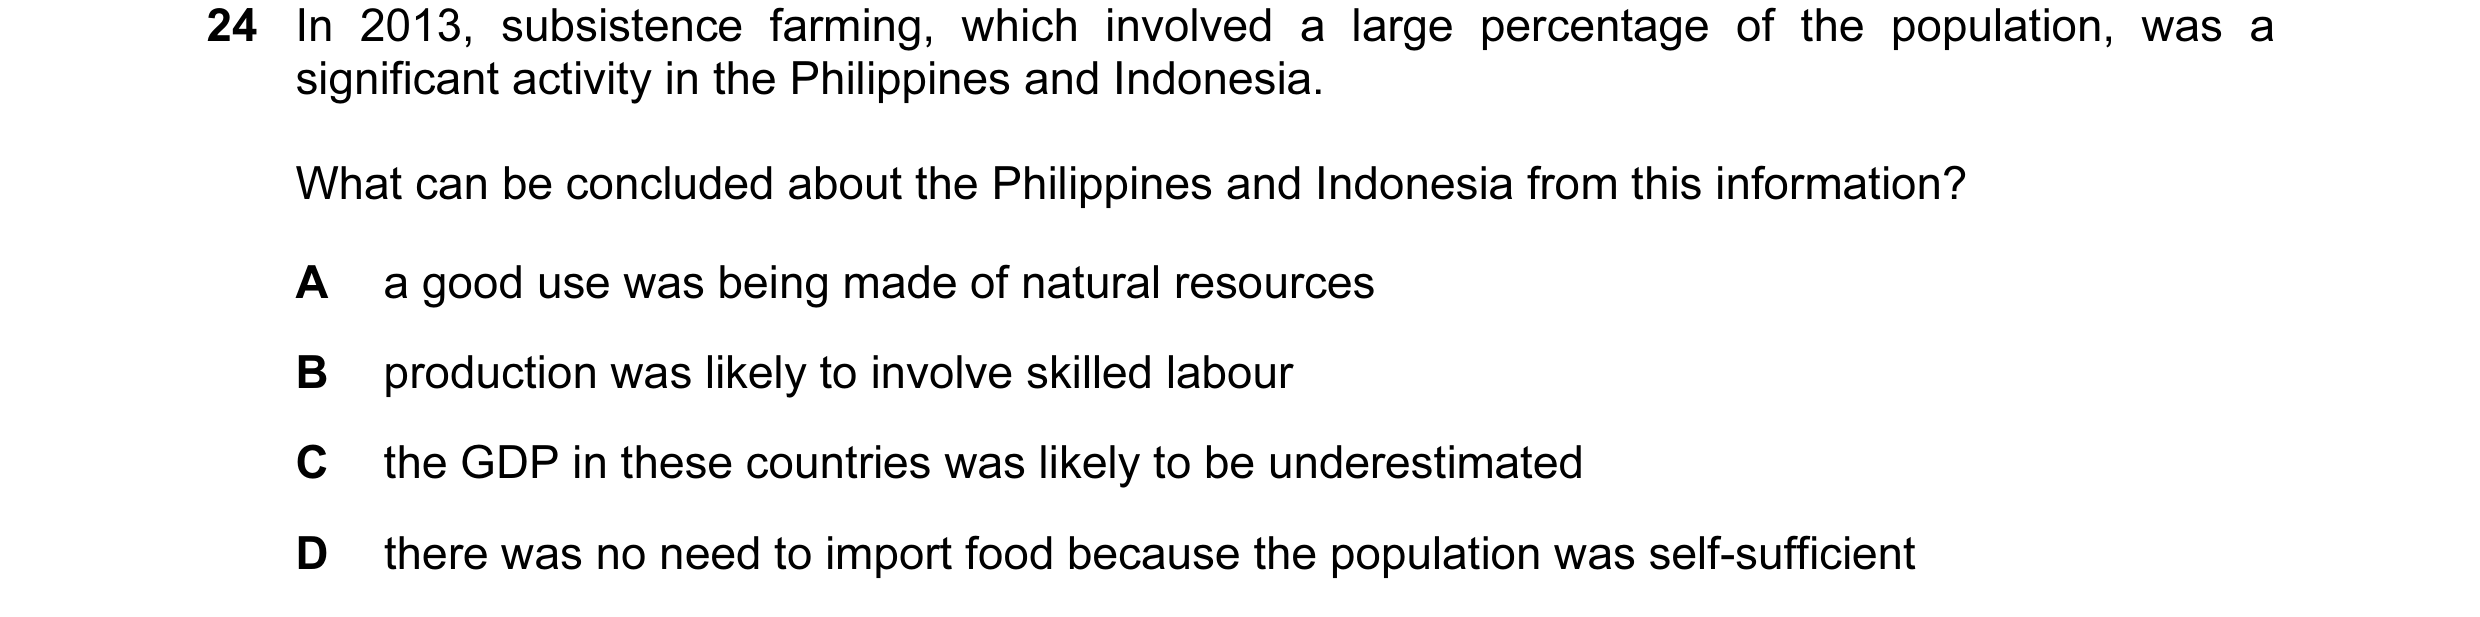
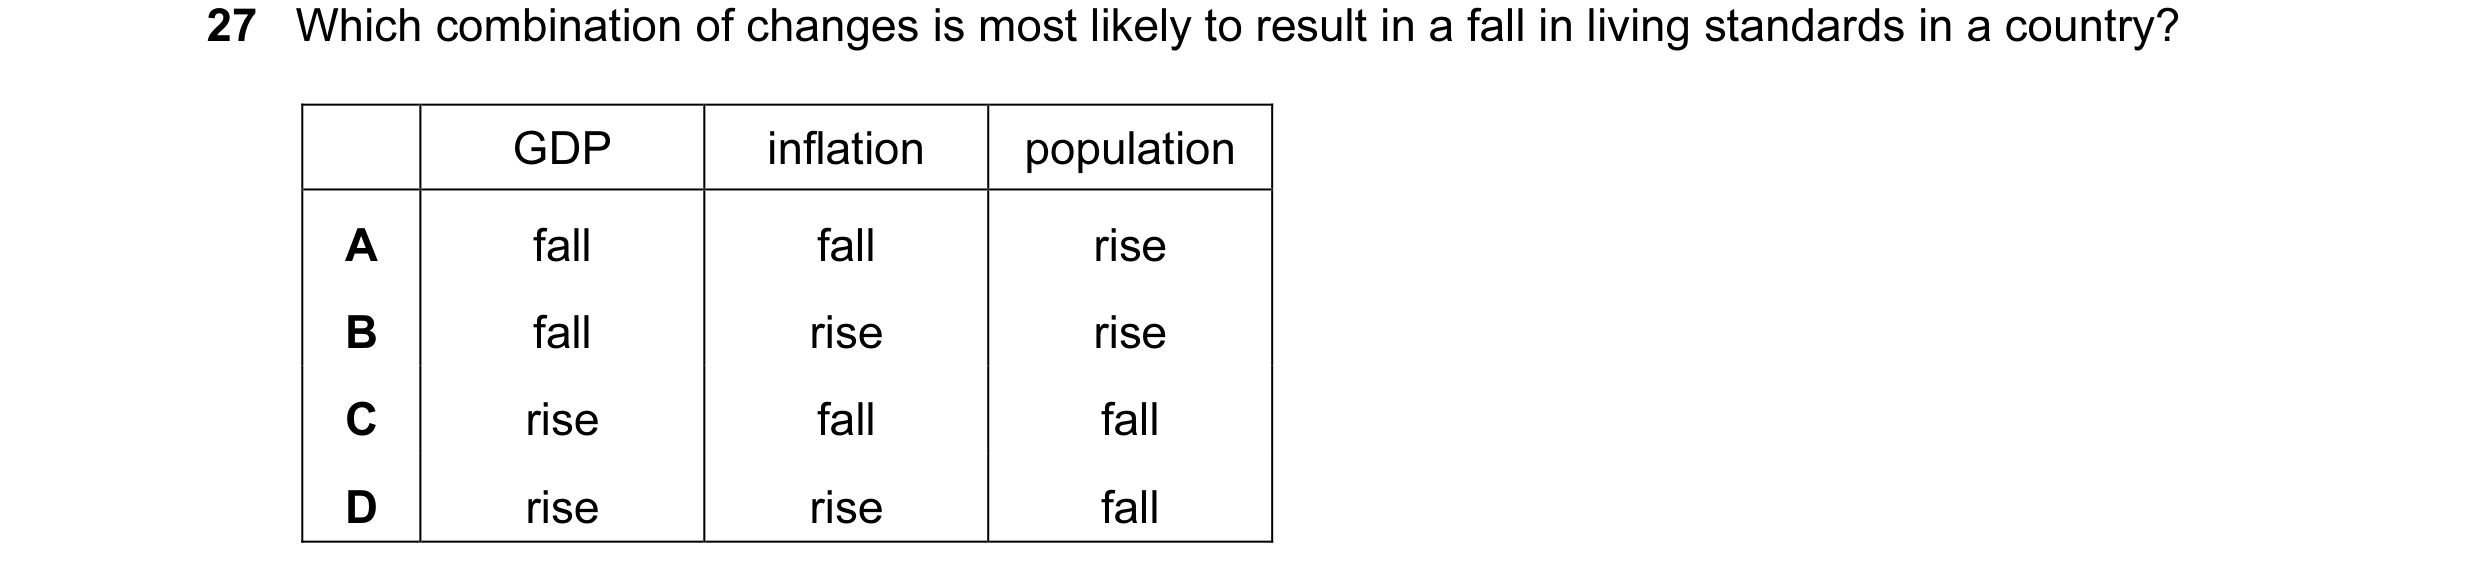
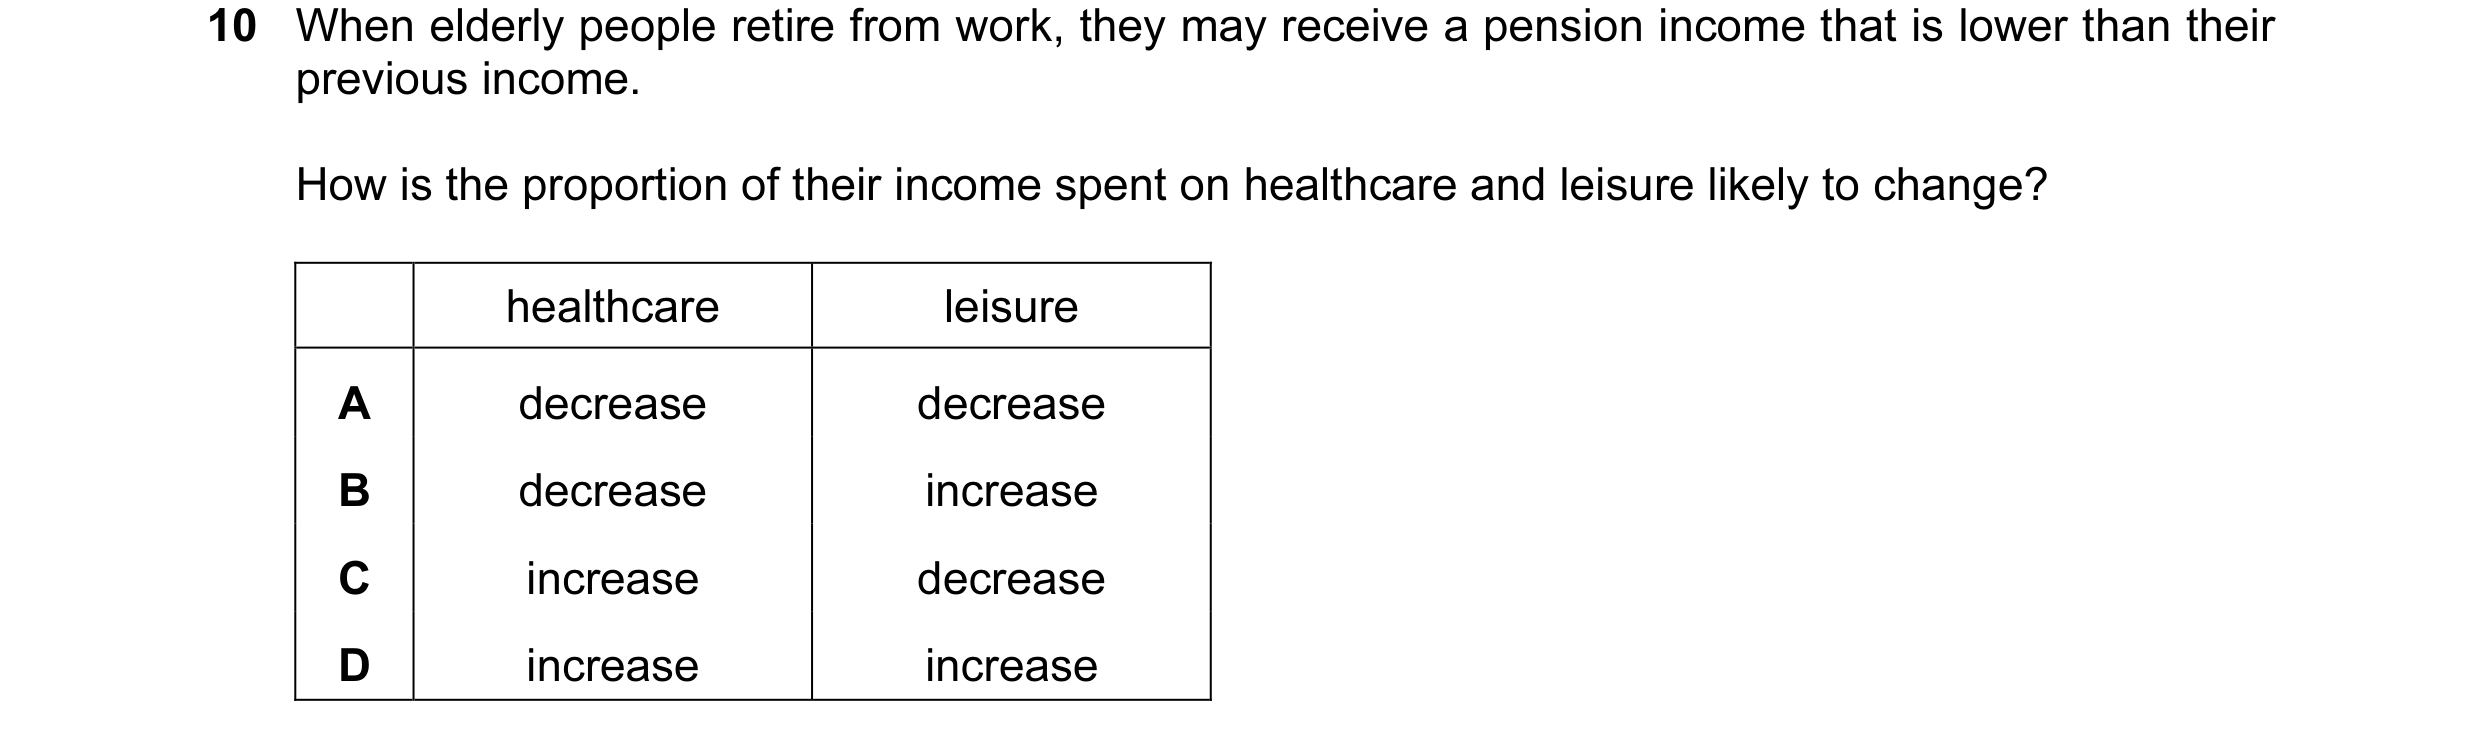
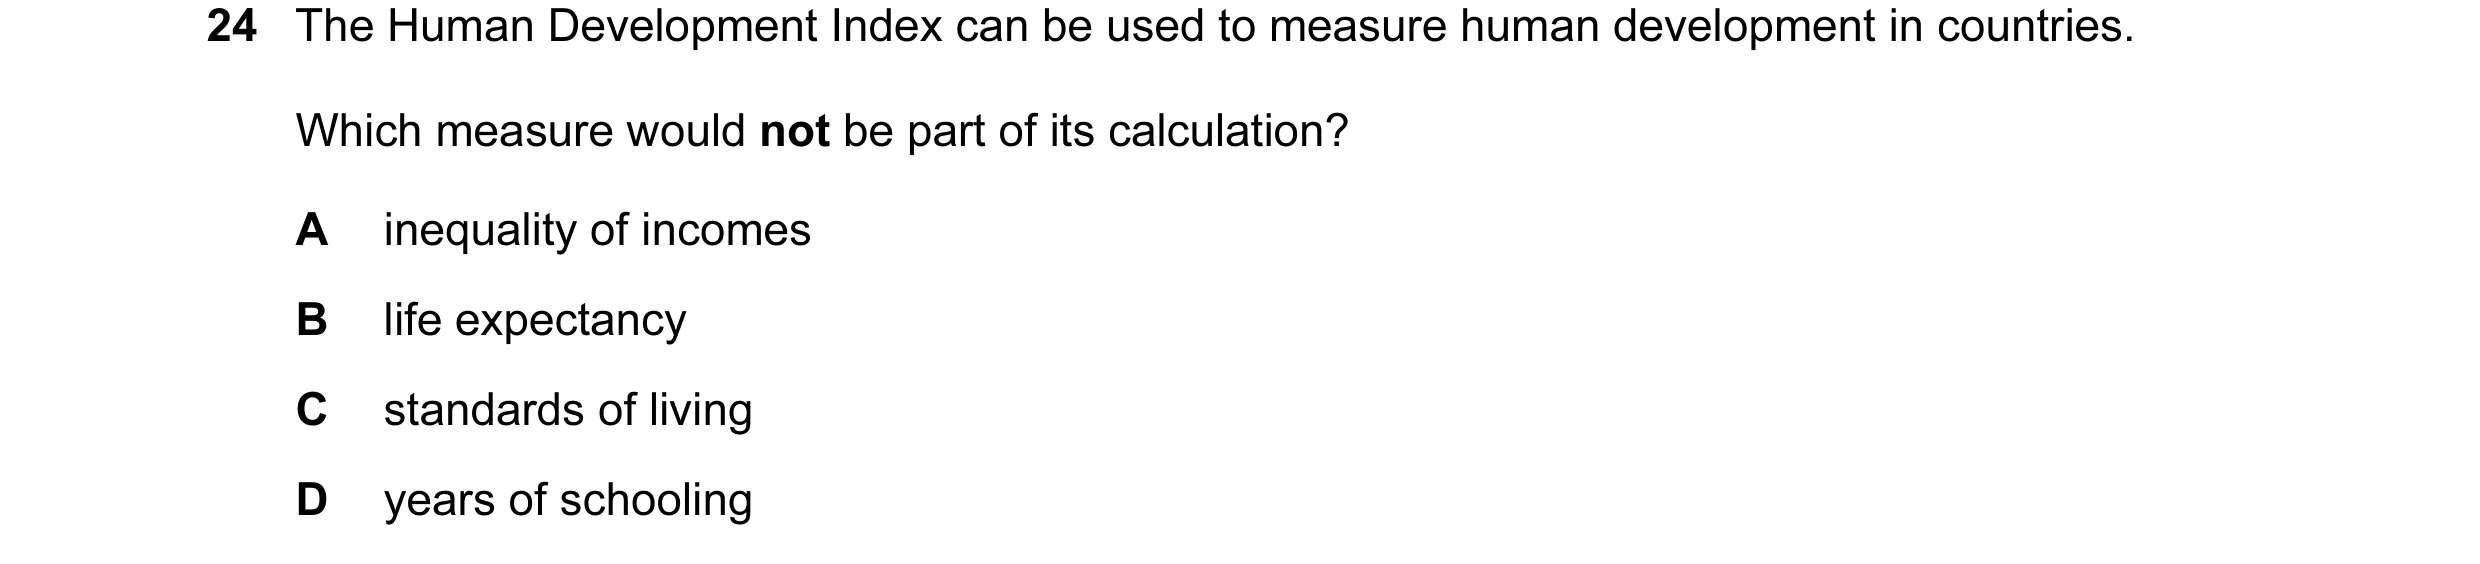 14 / 40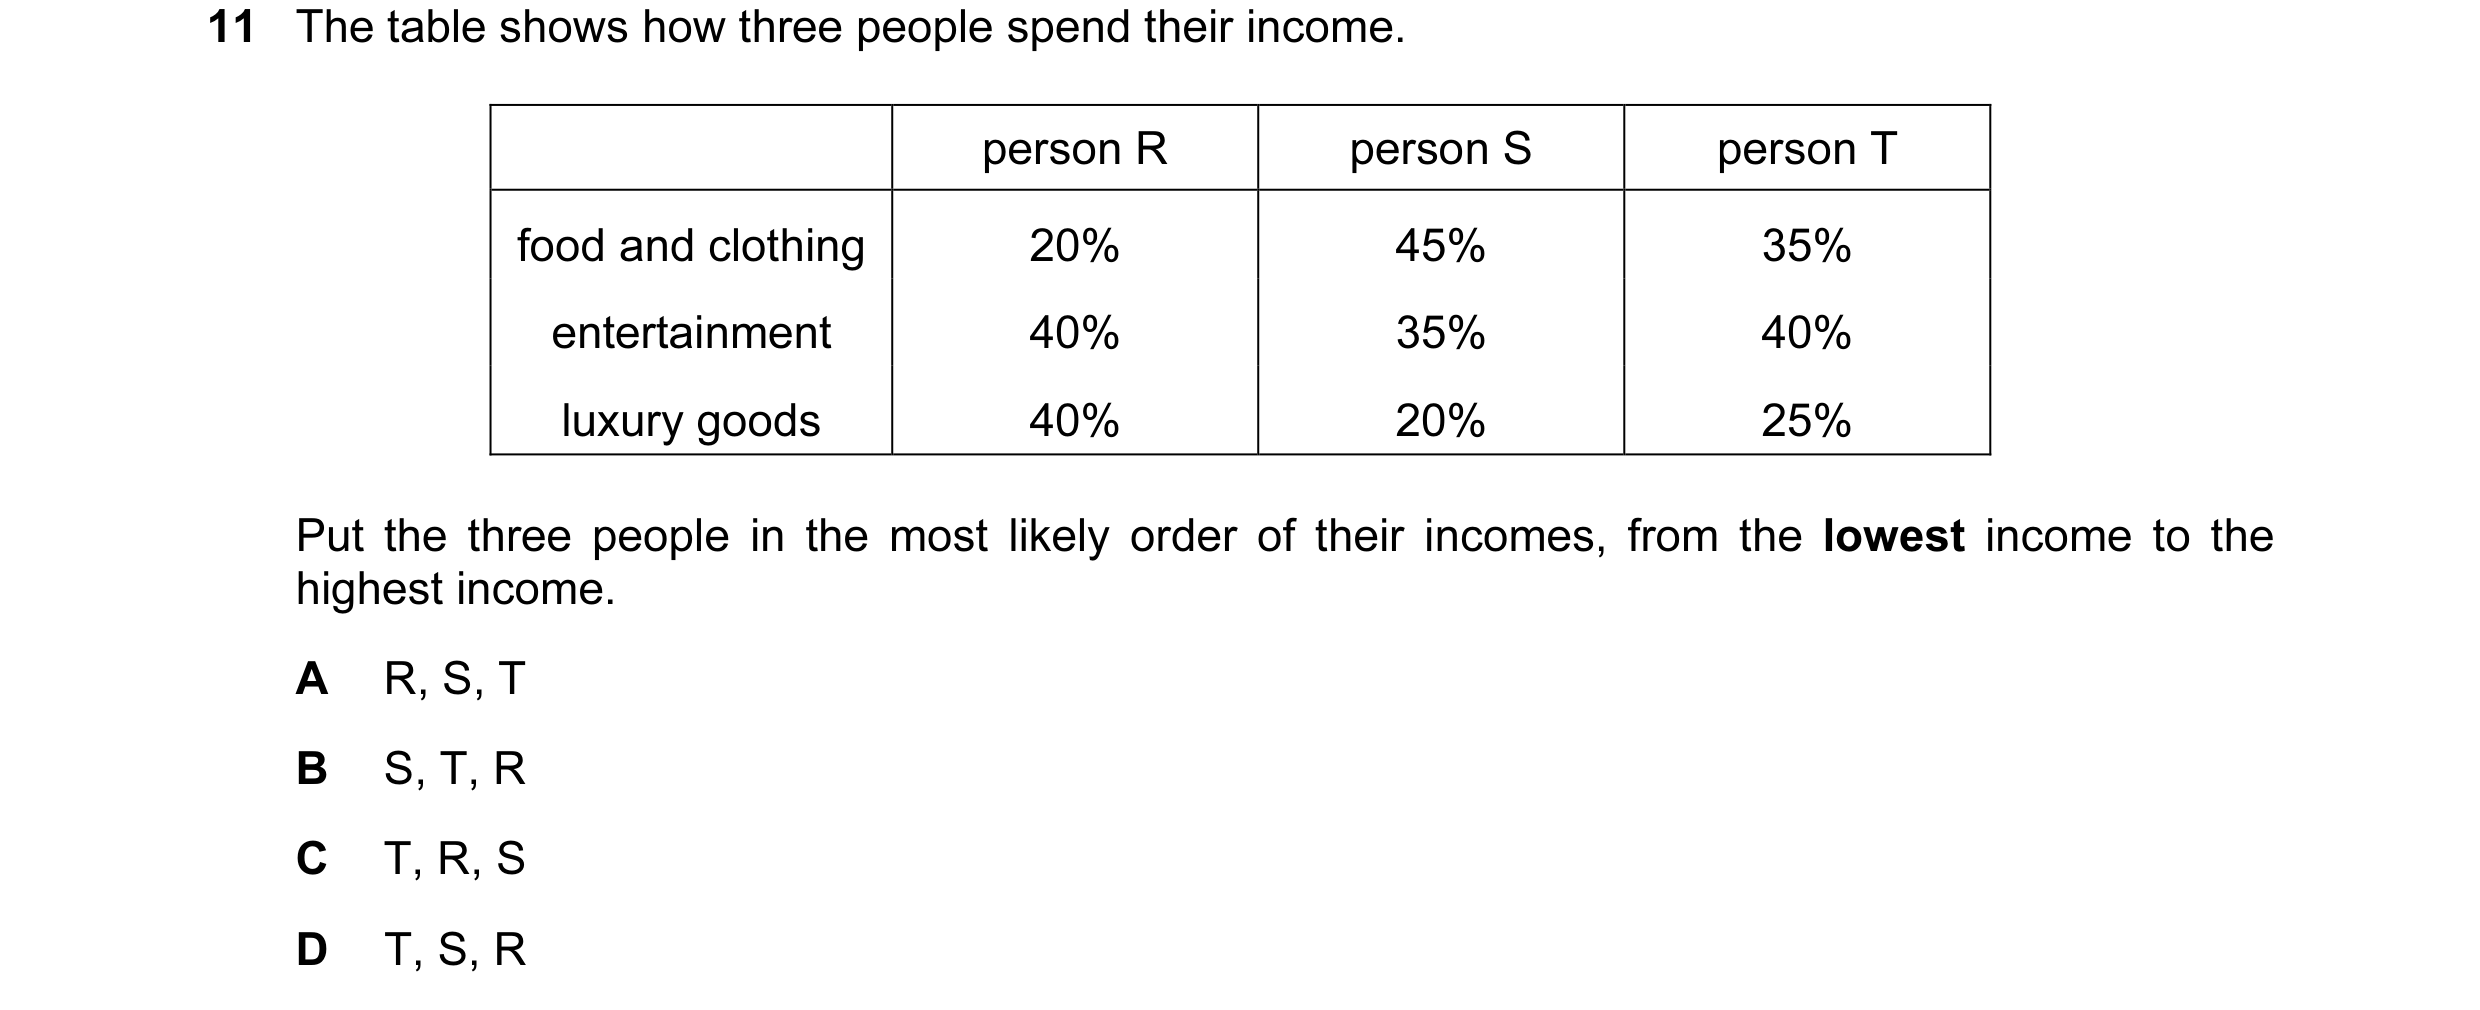
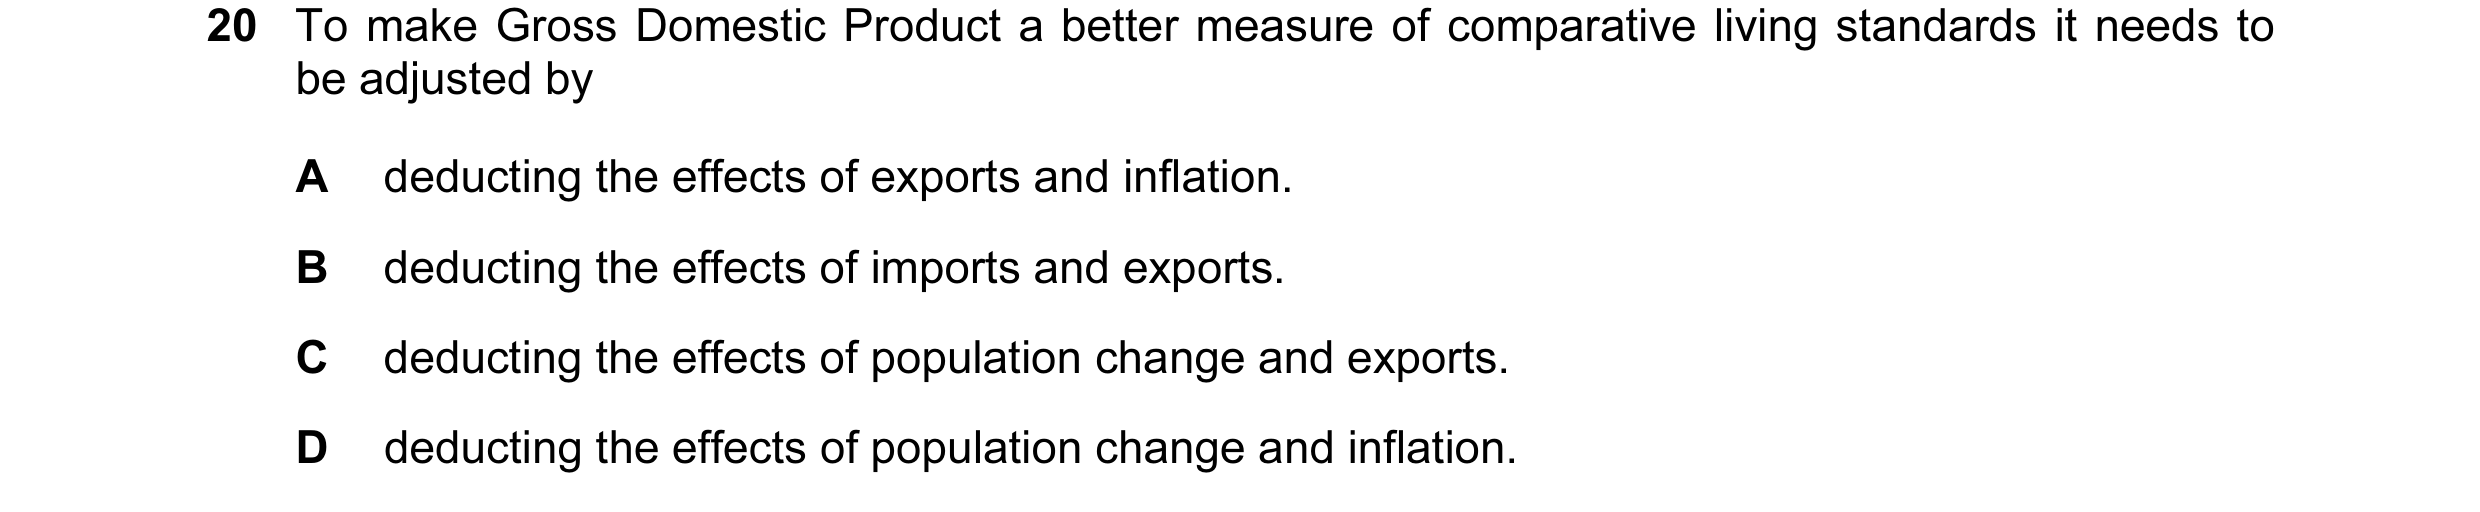
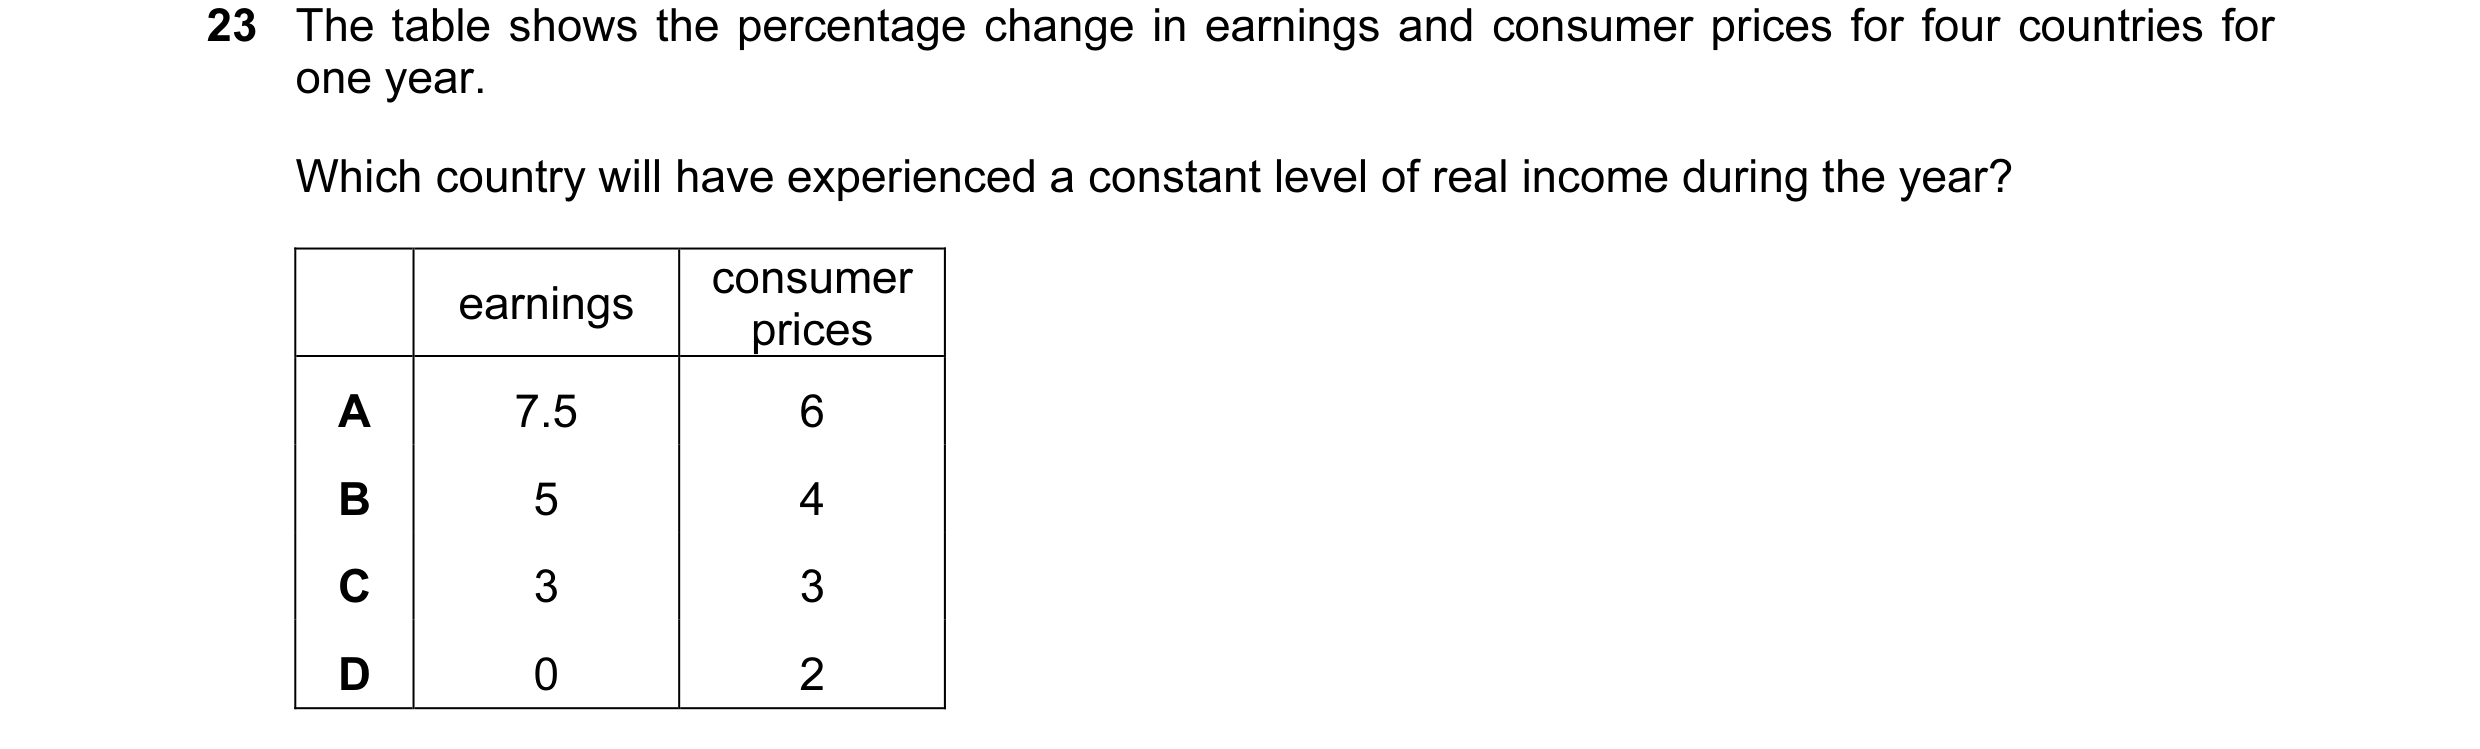
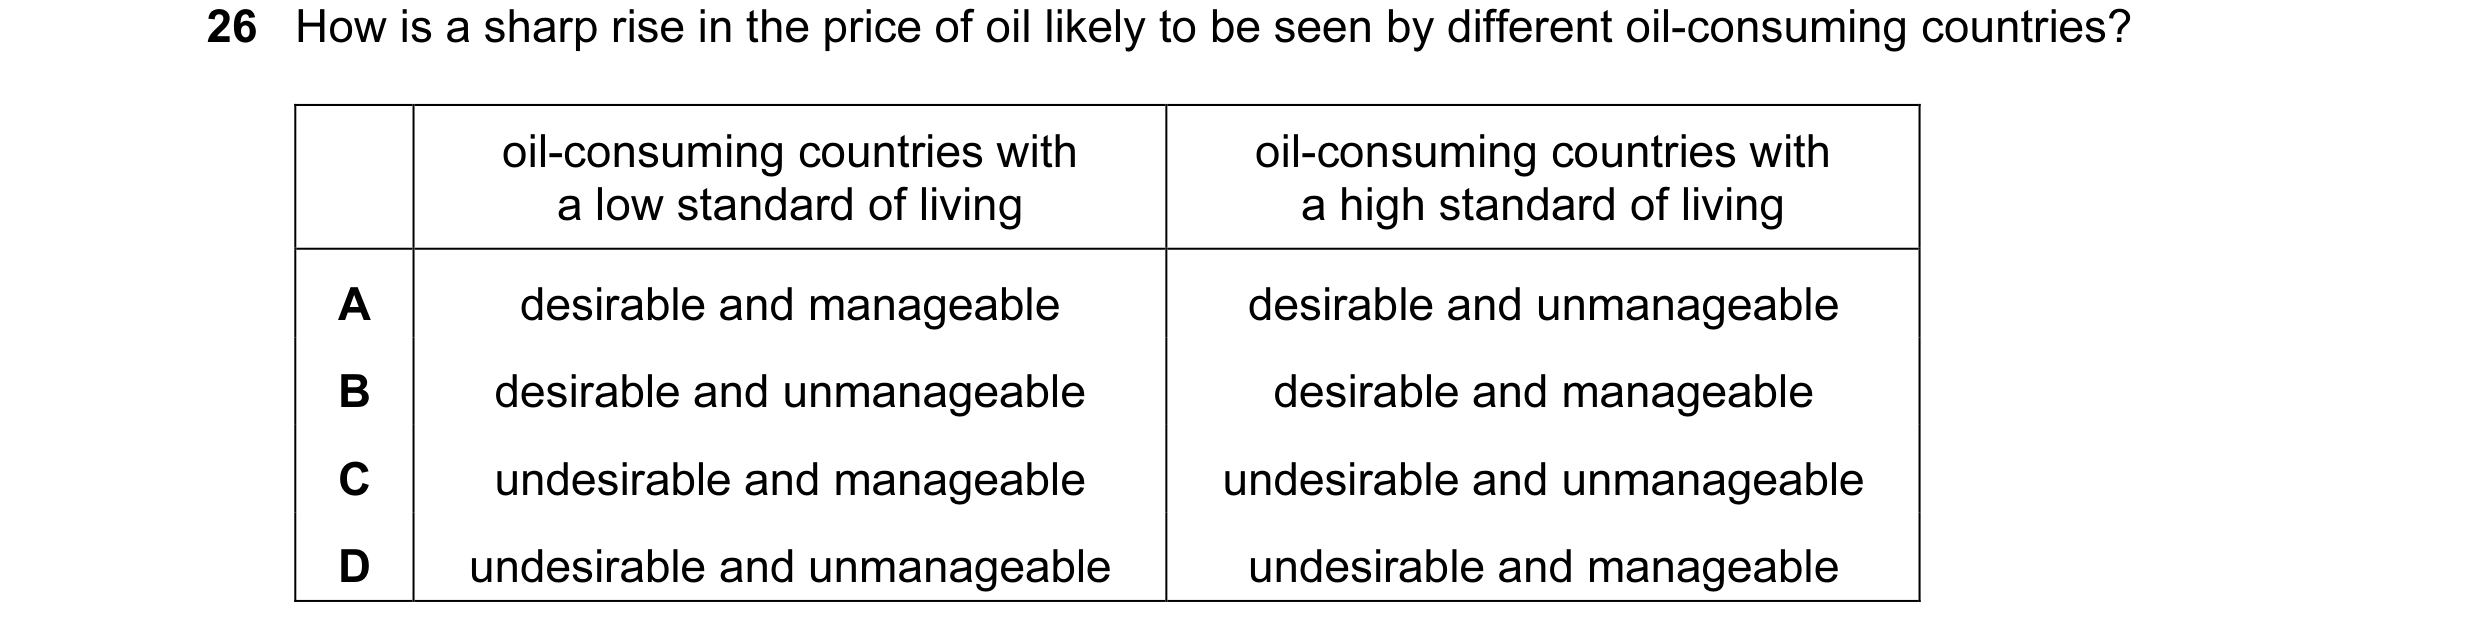 15 / 40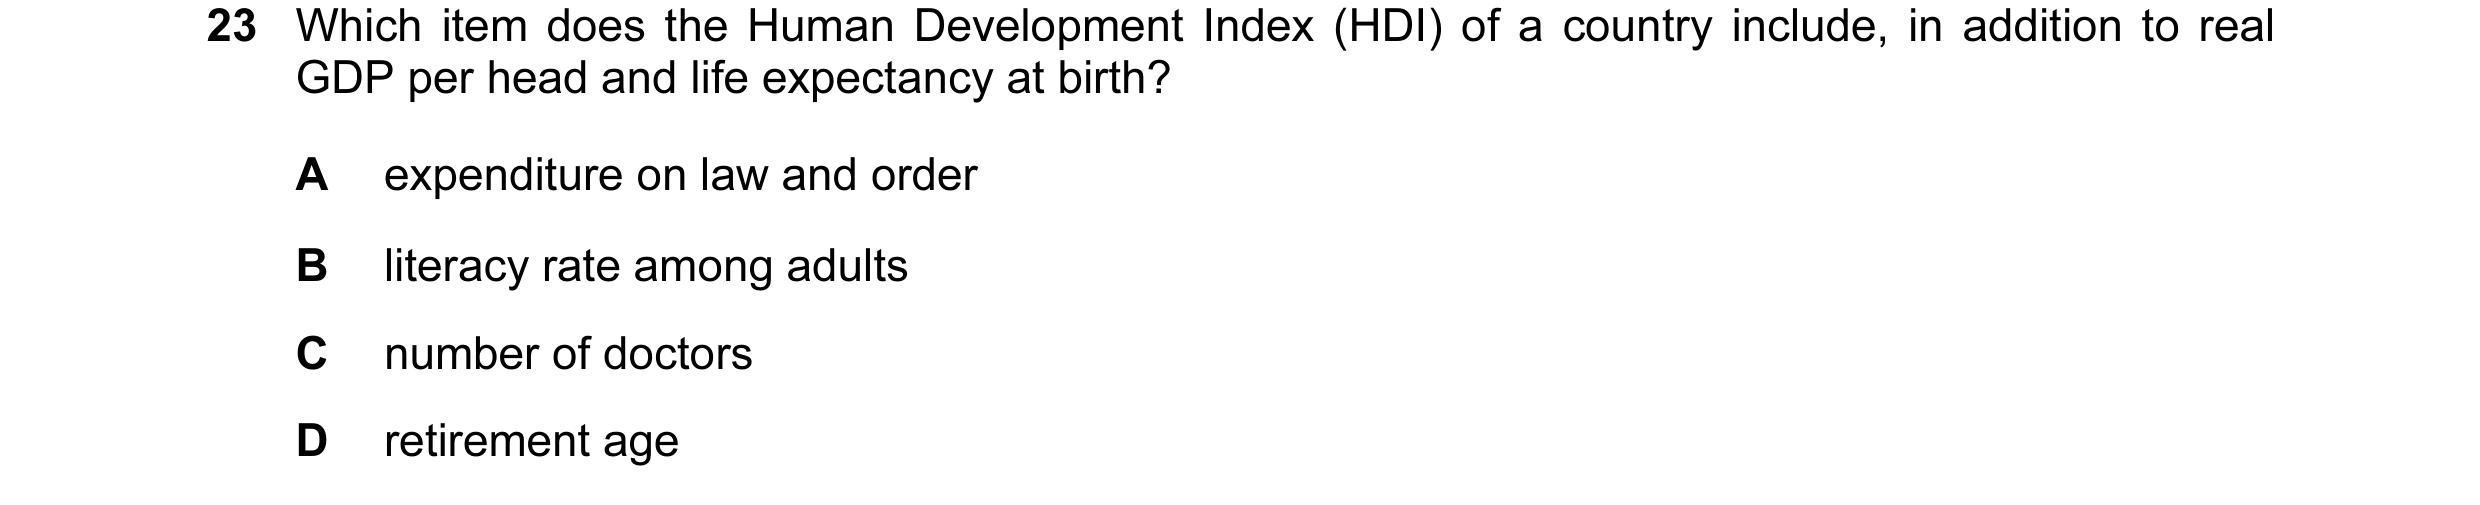
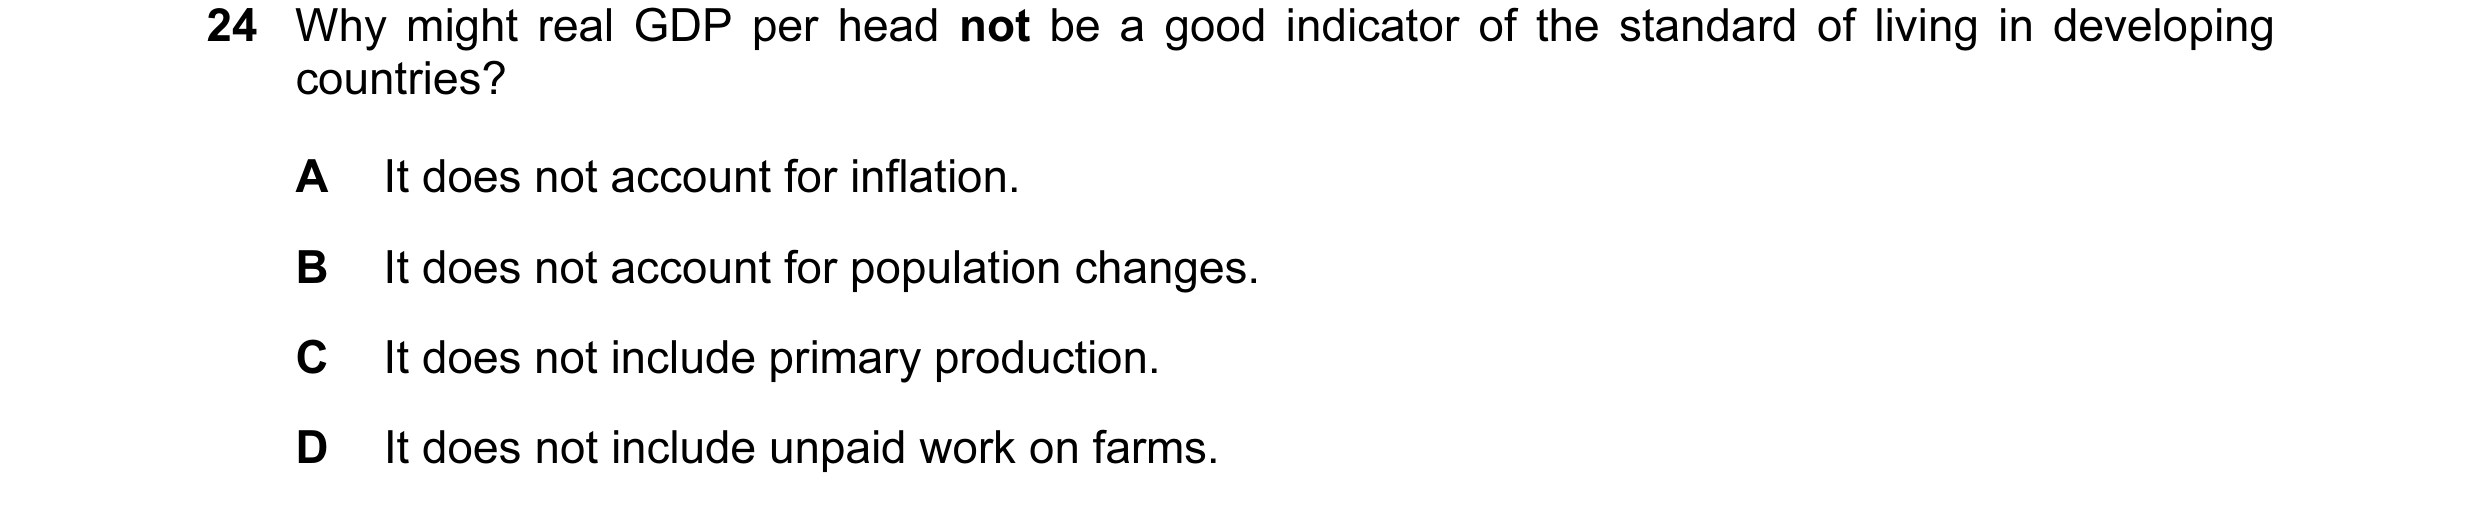
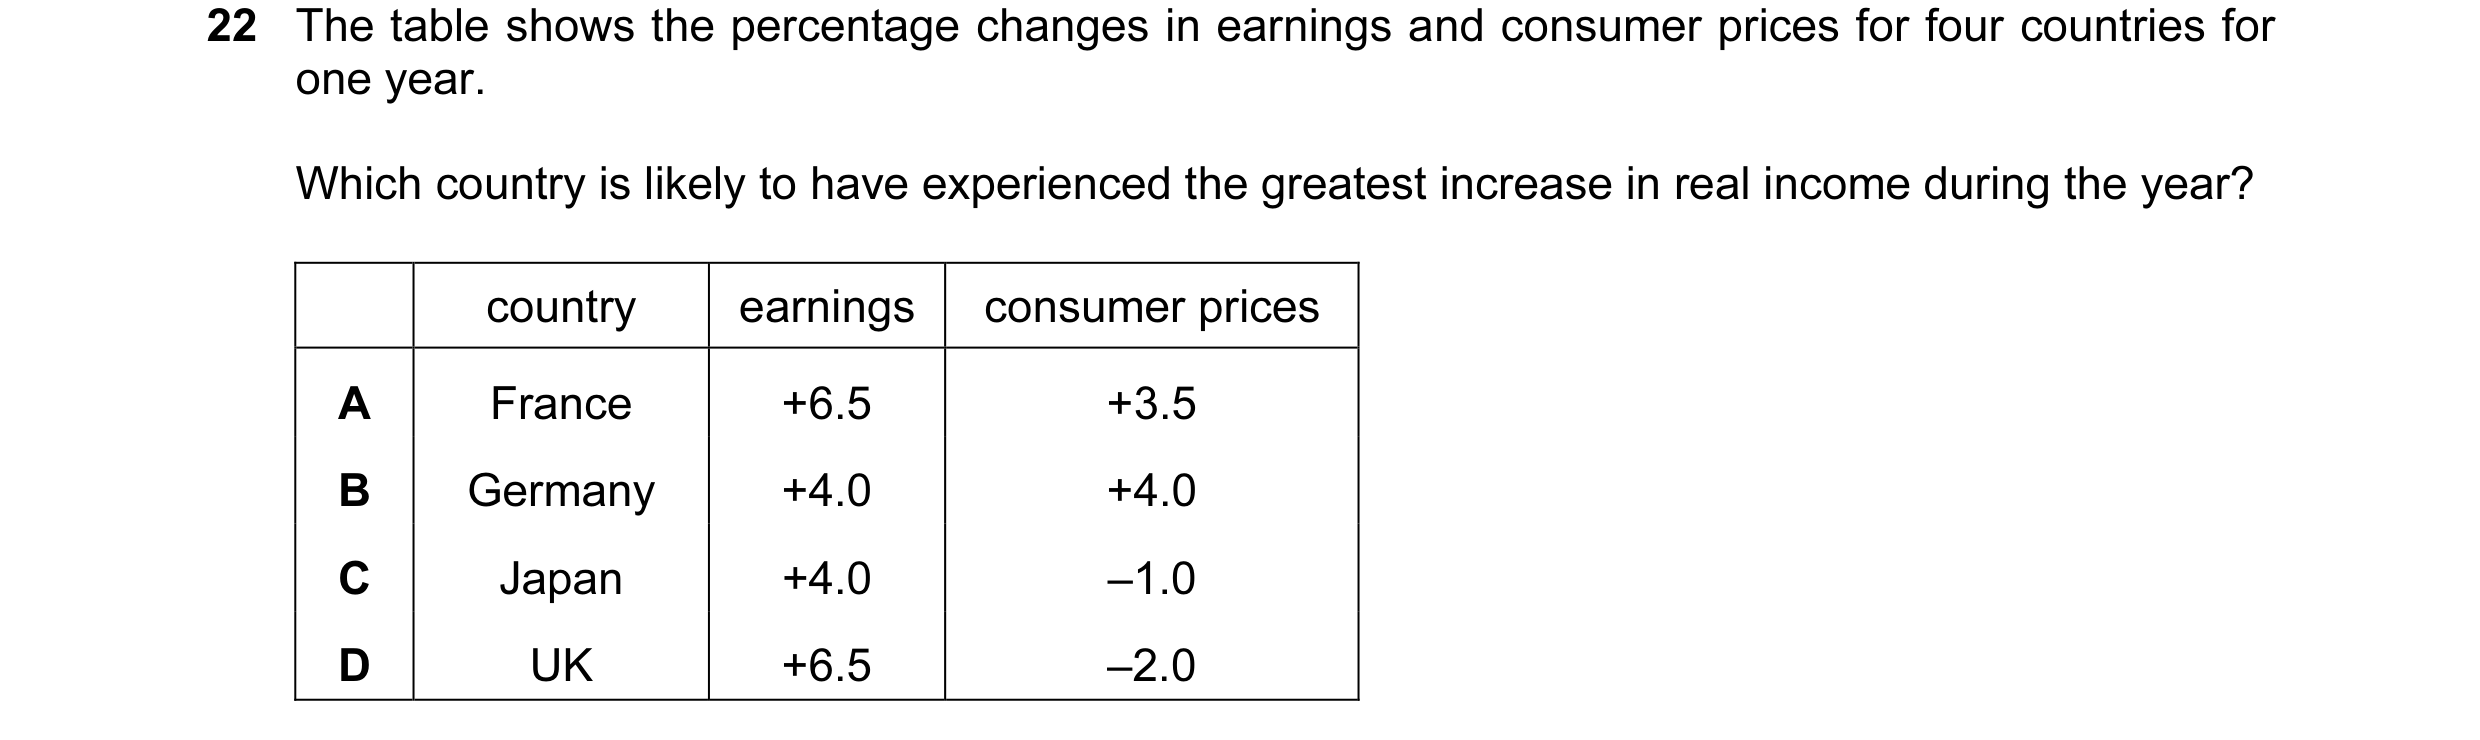
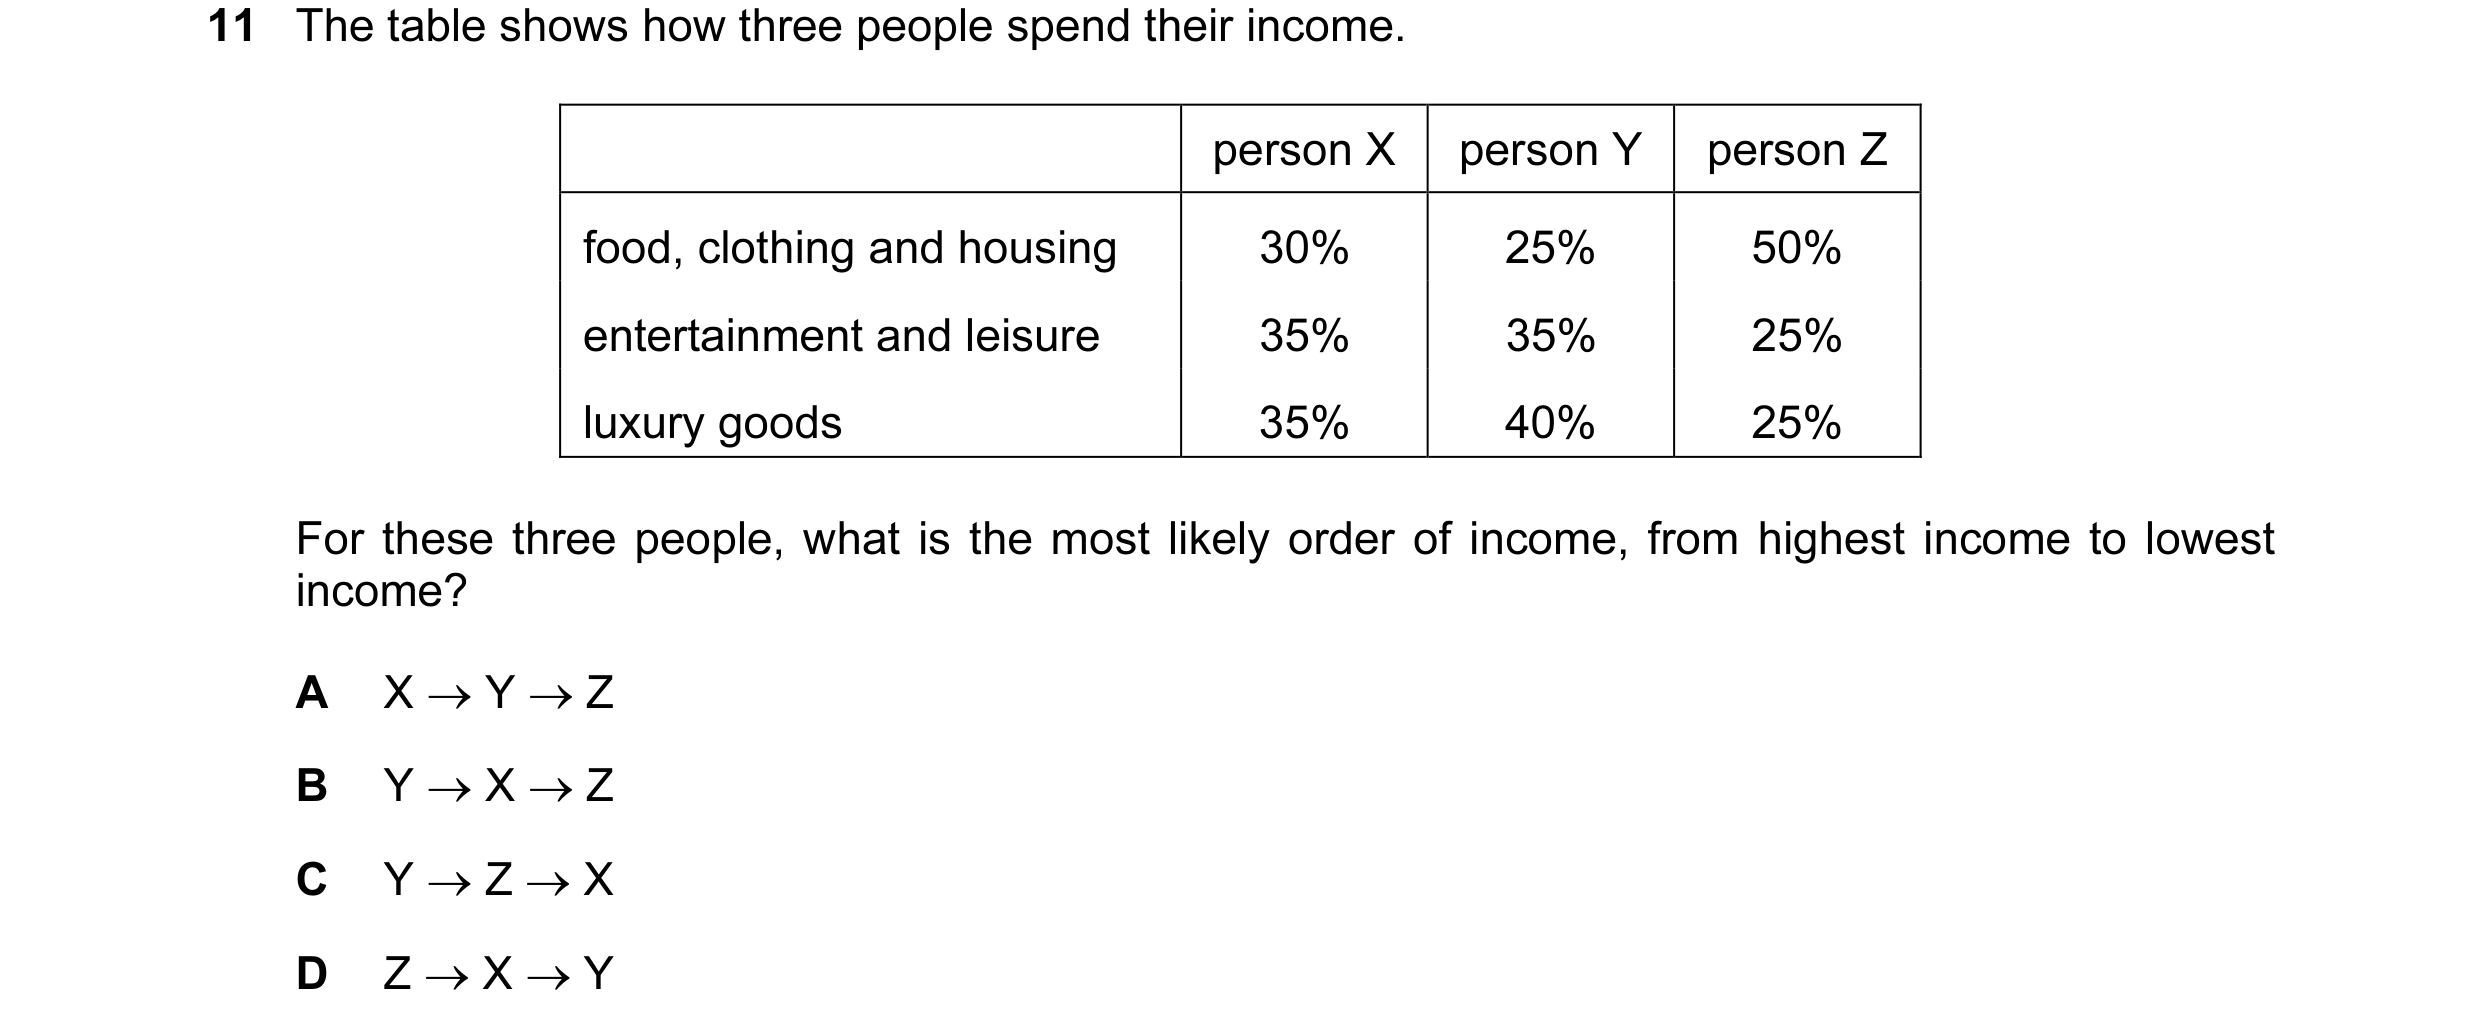 16 / 40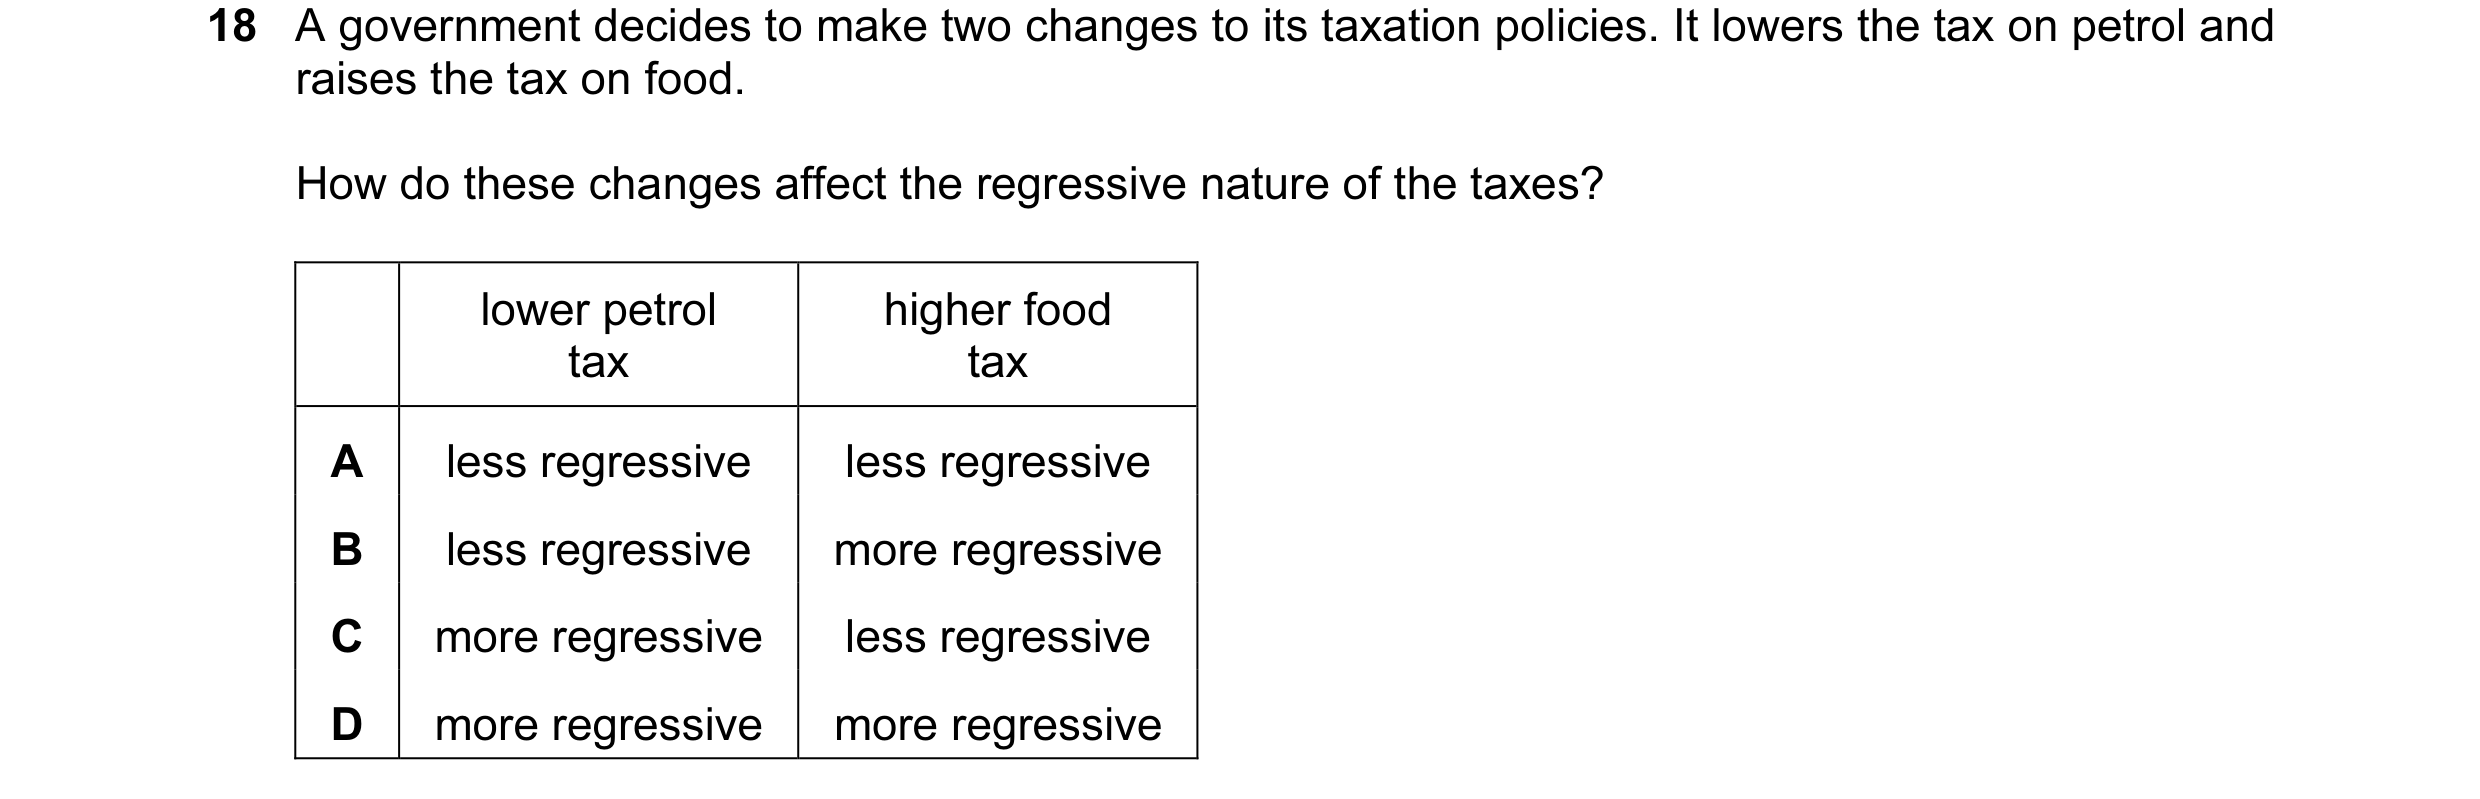


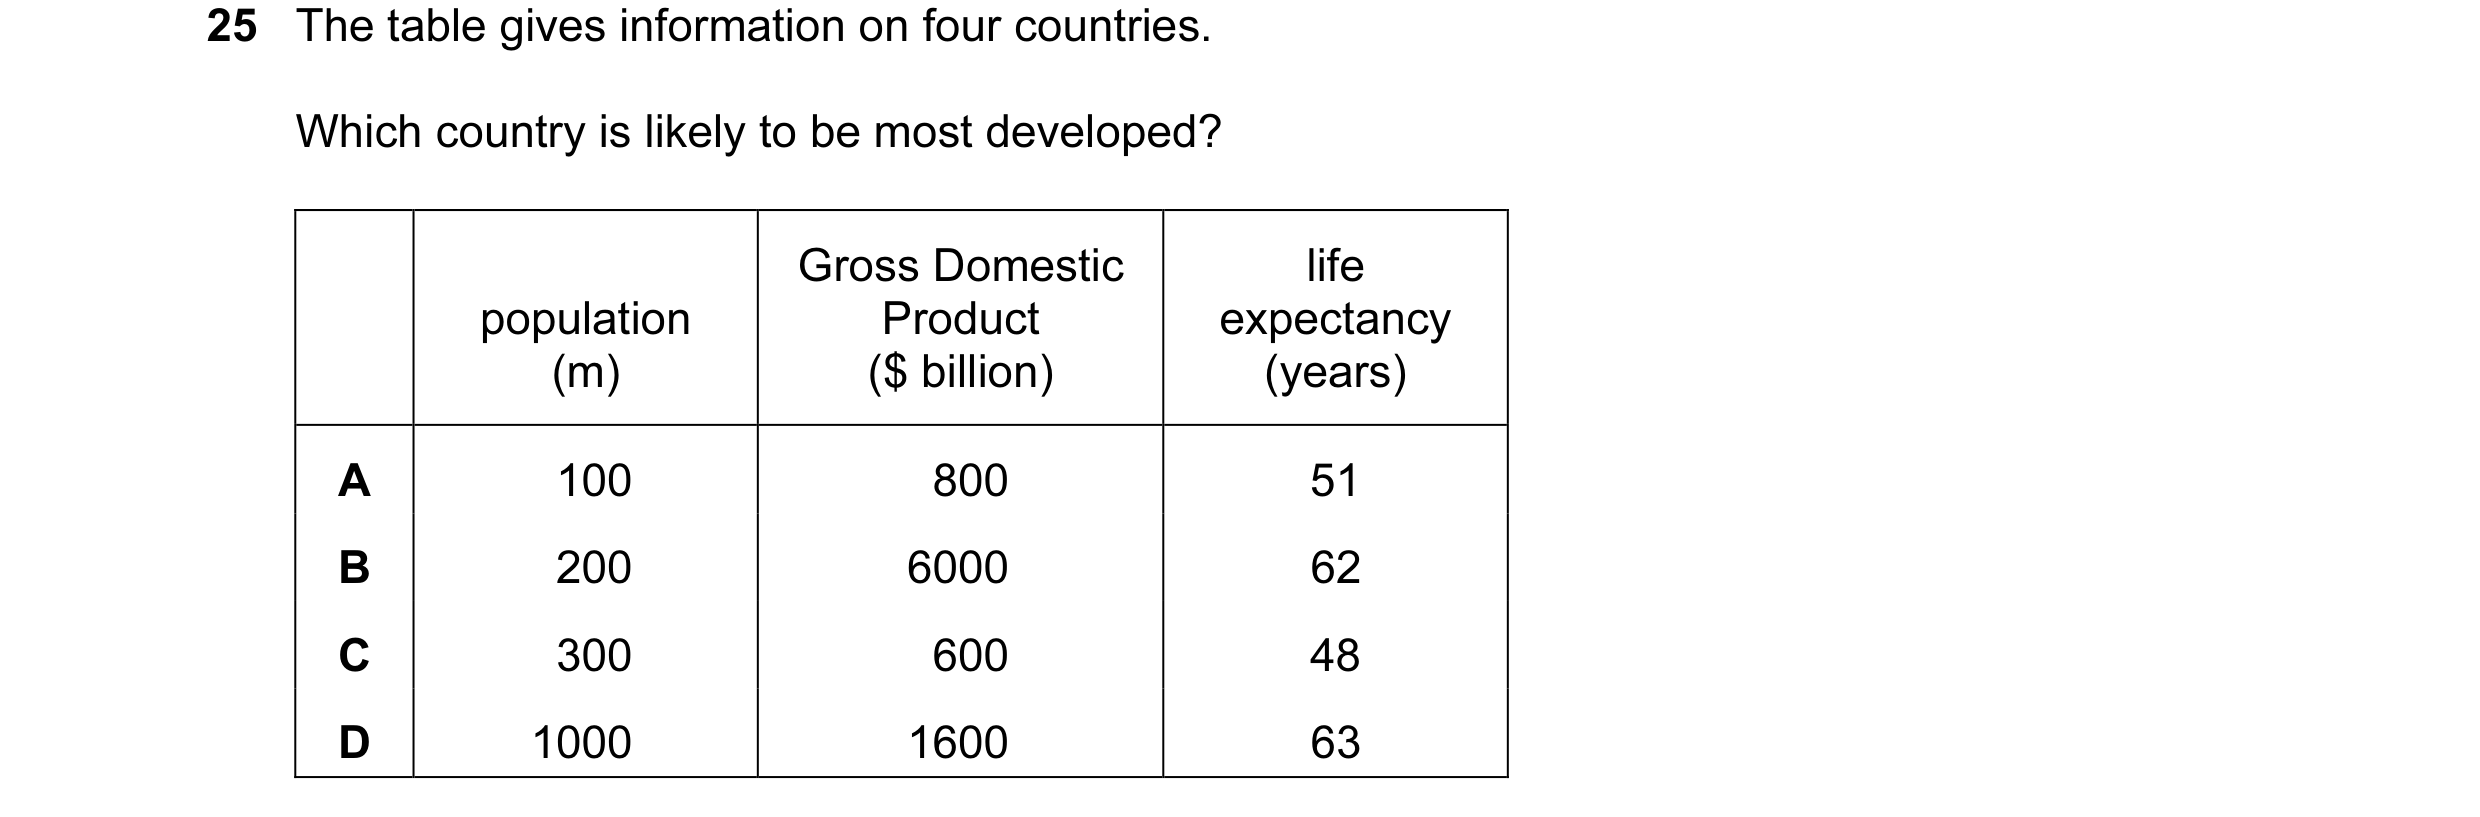 17 / 40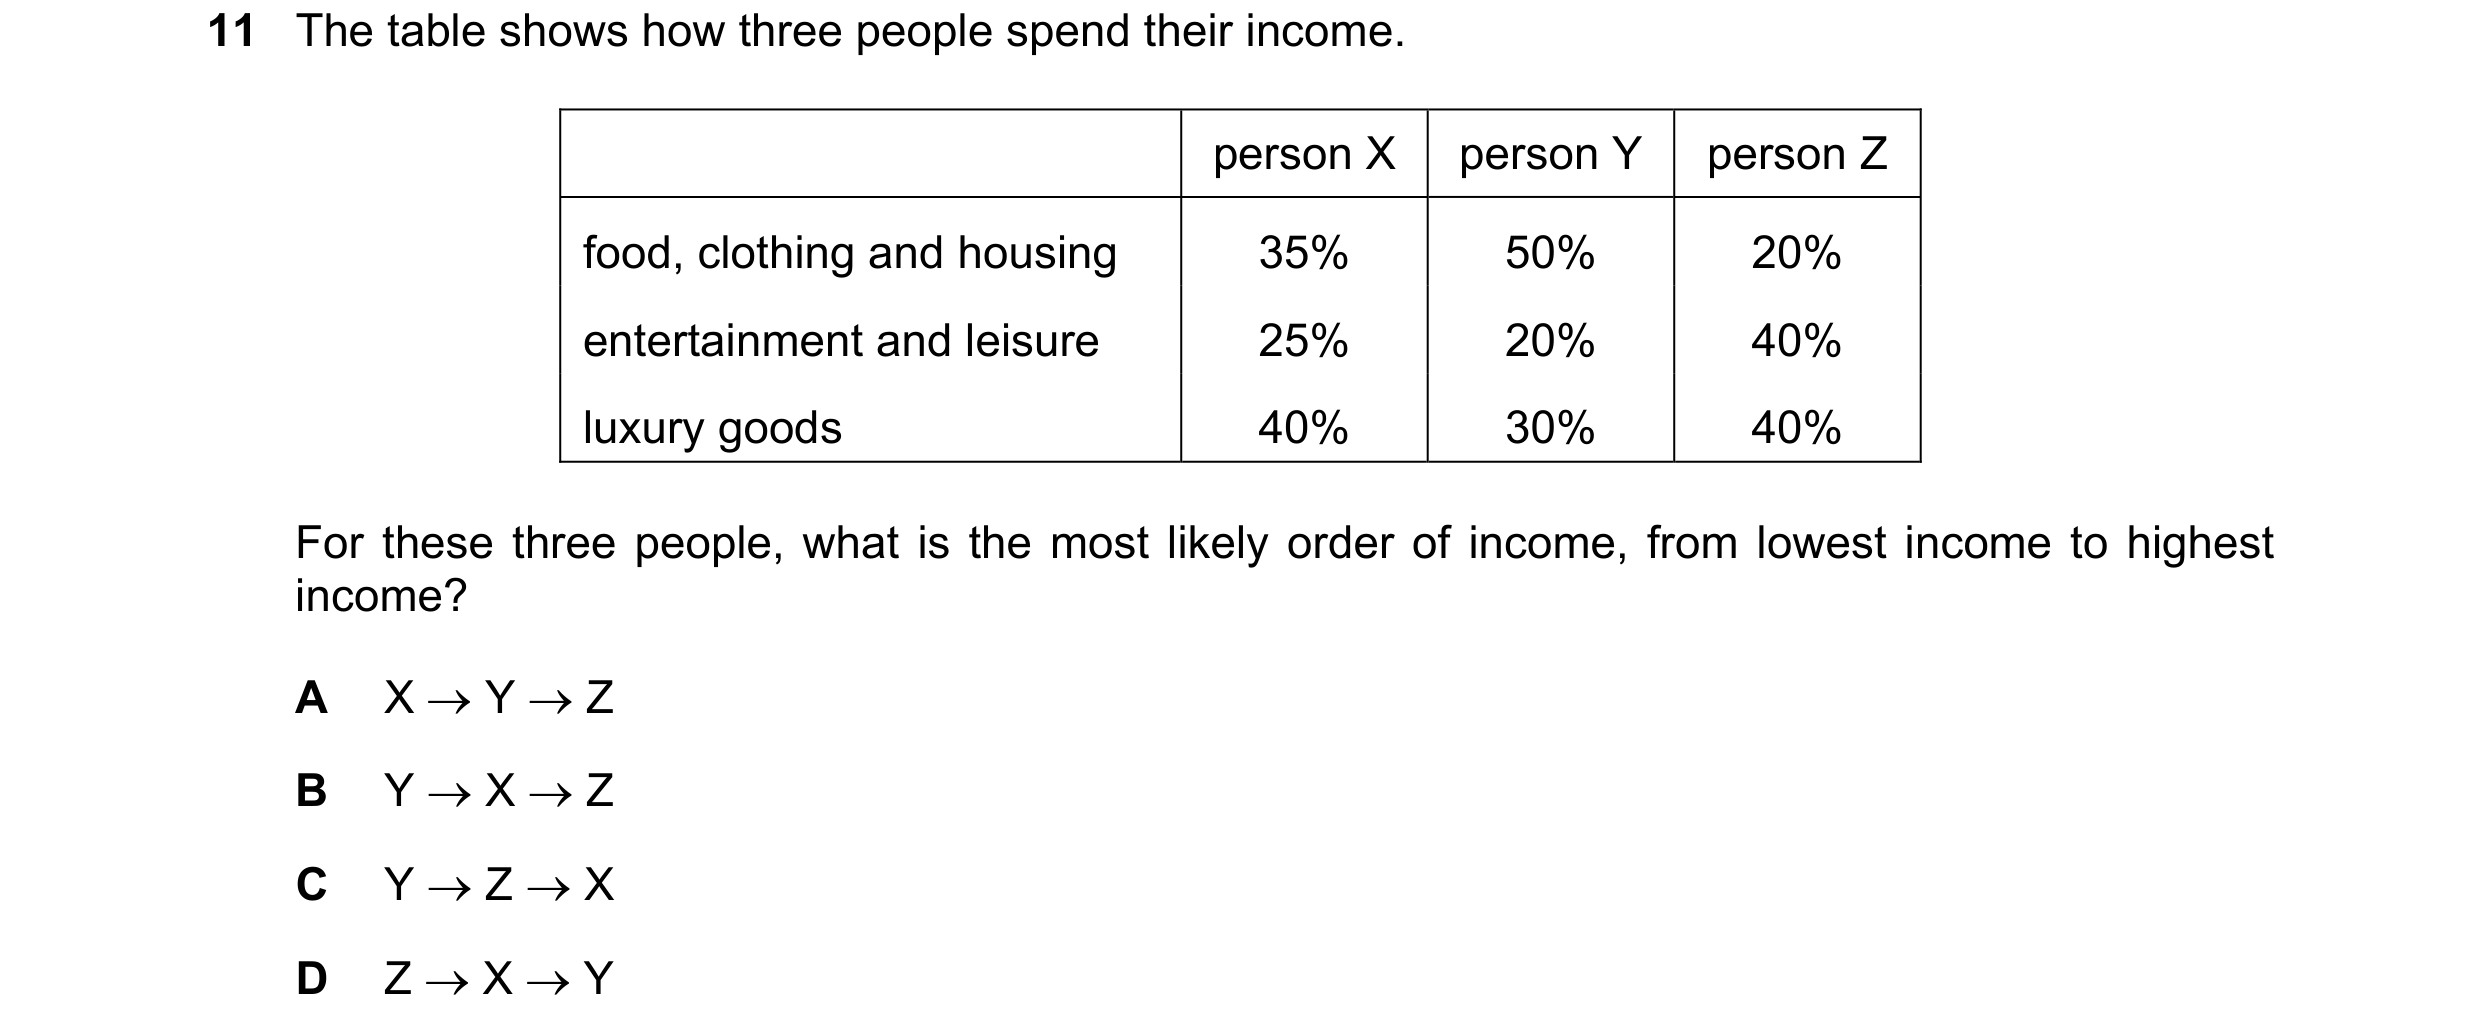
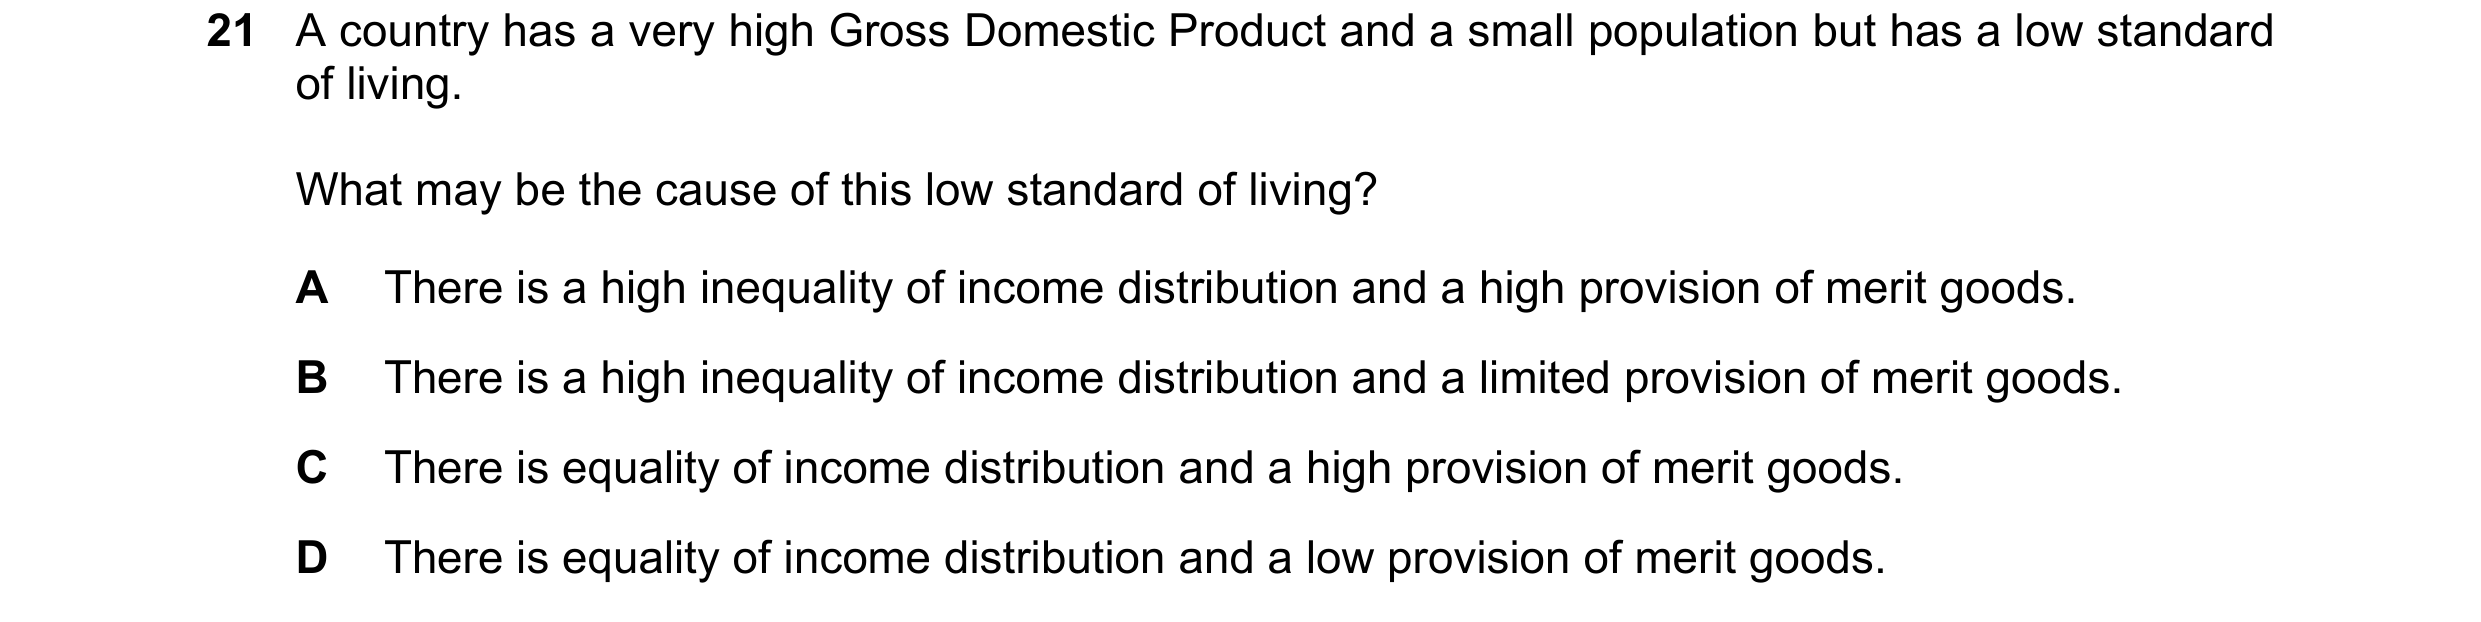
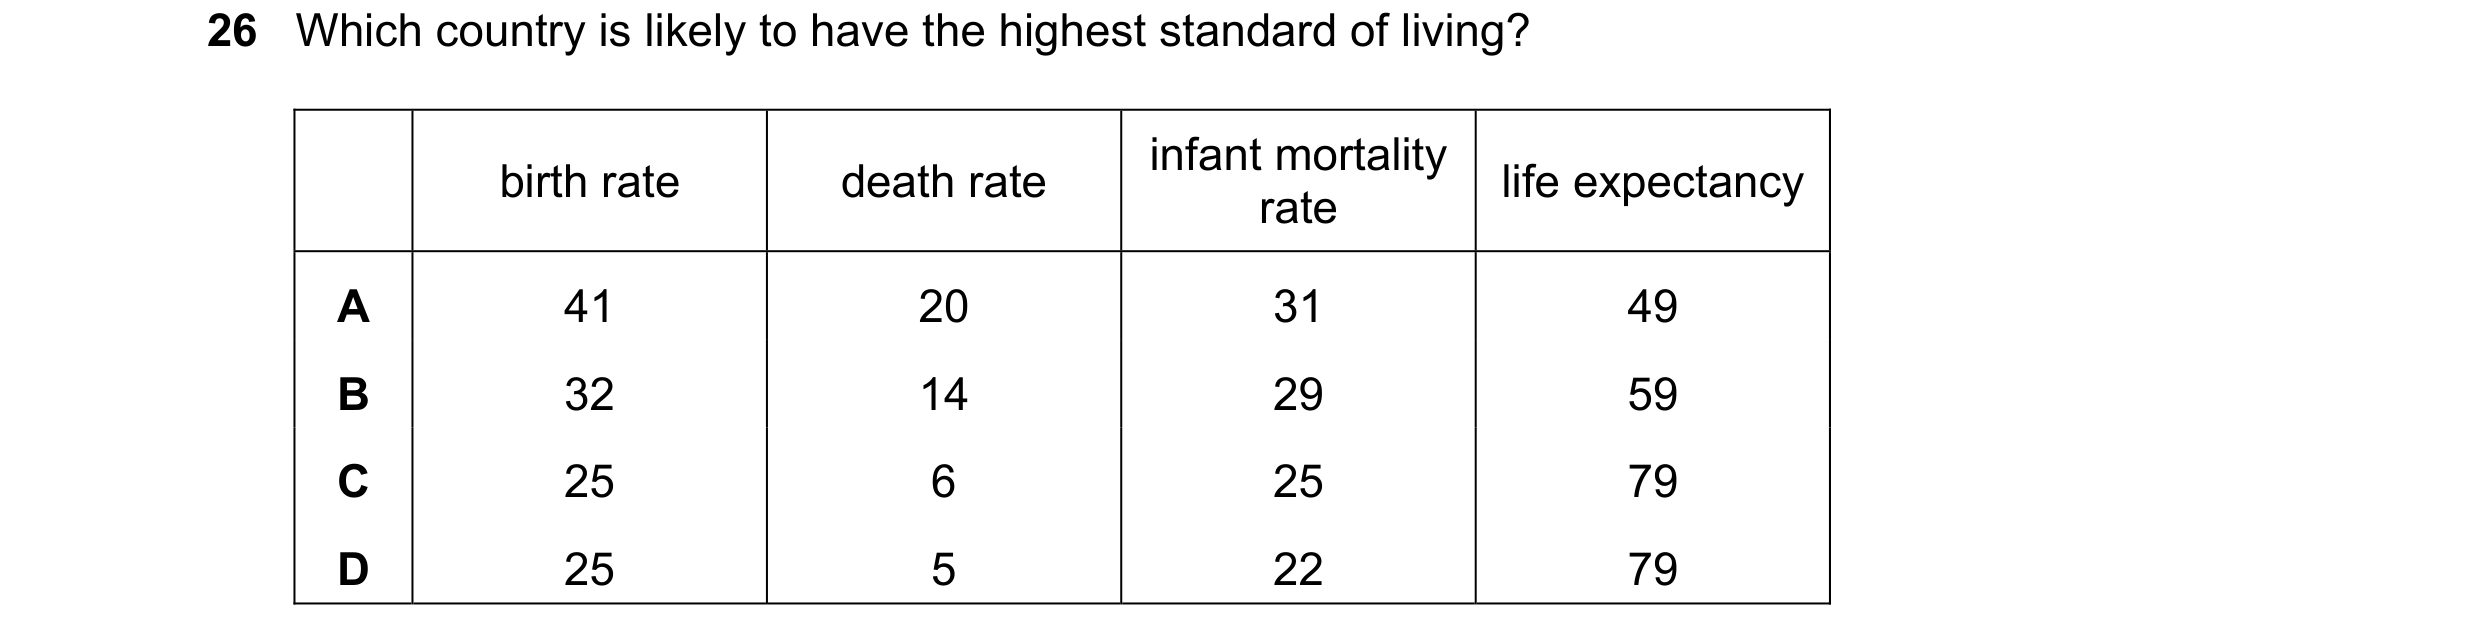
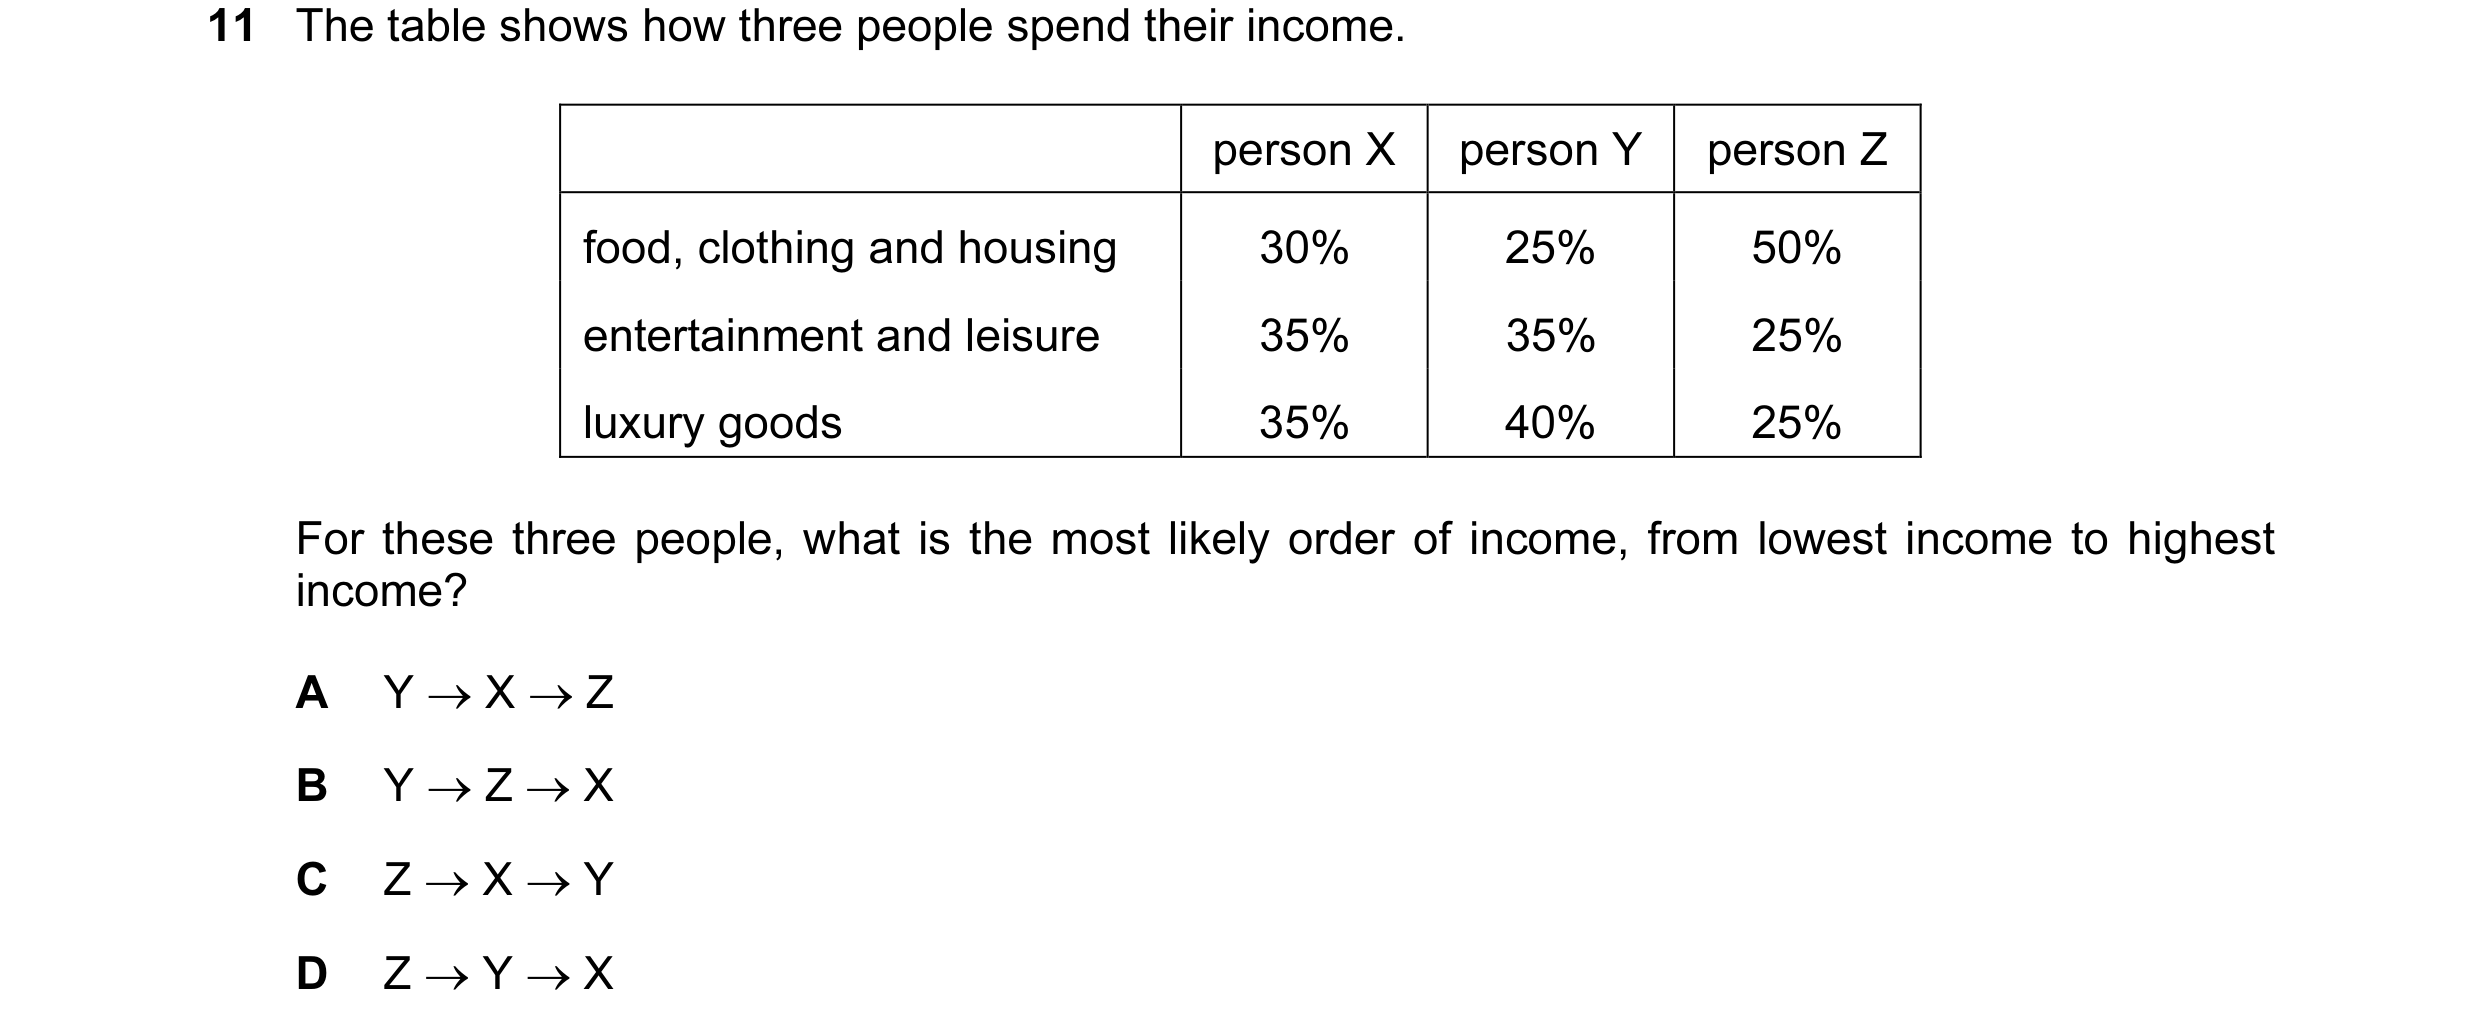 18 / 40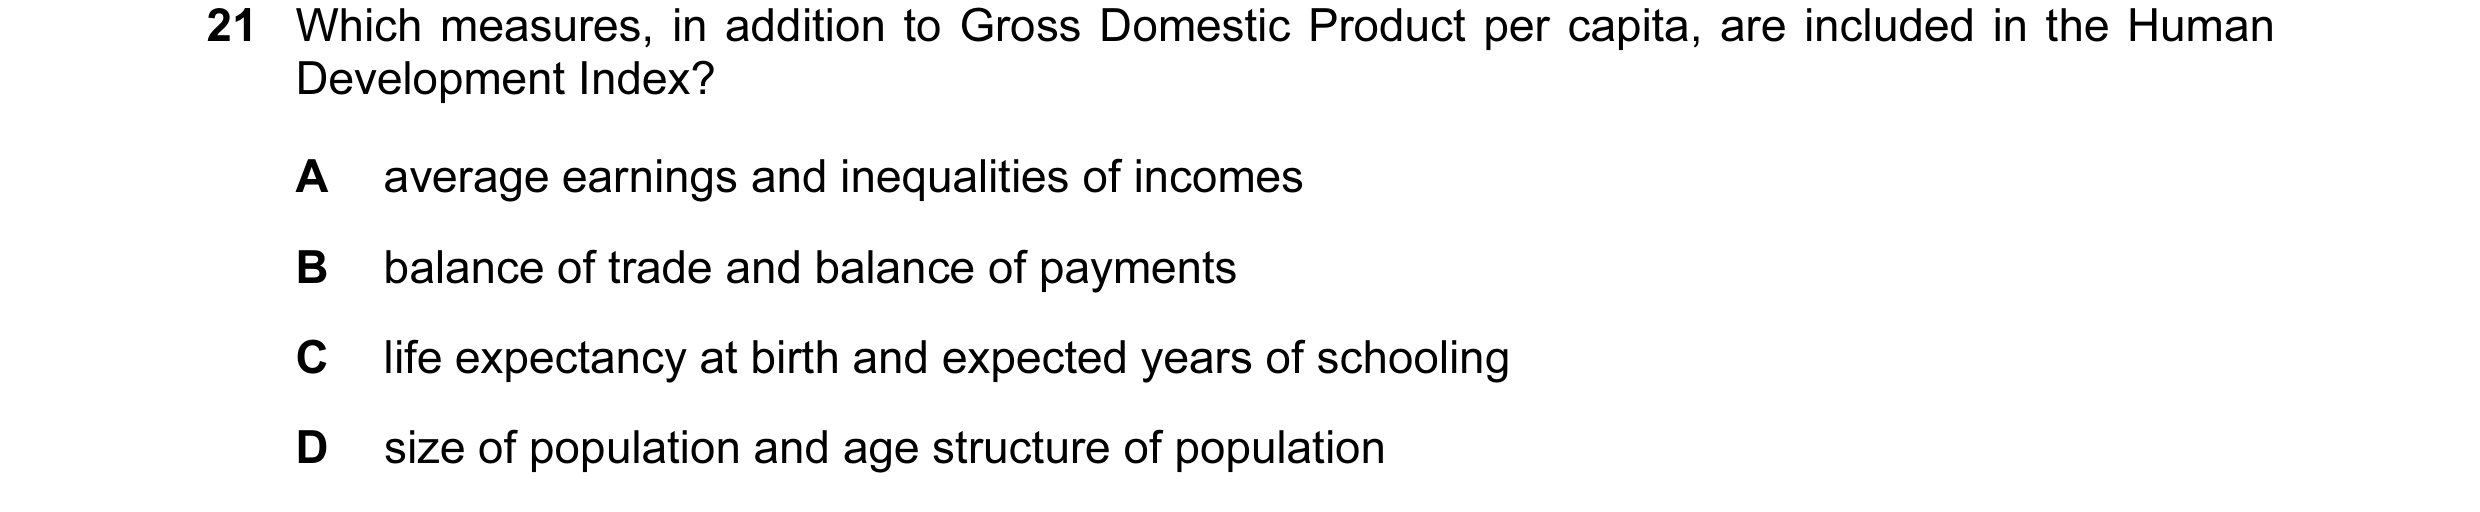
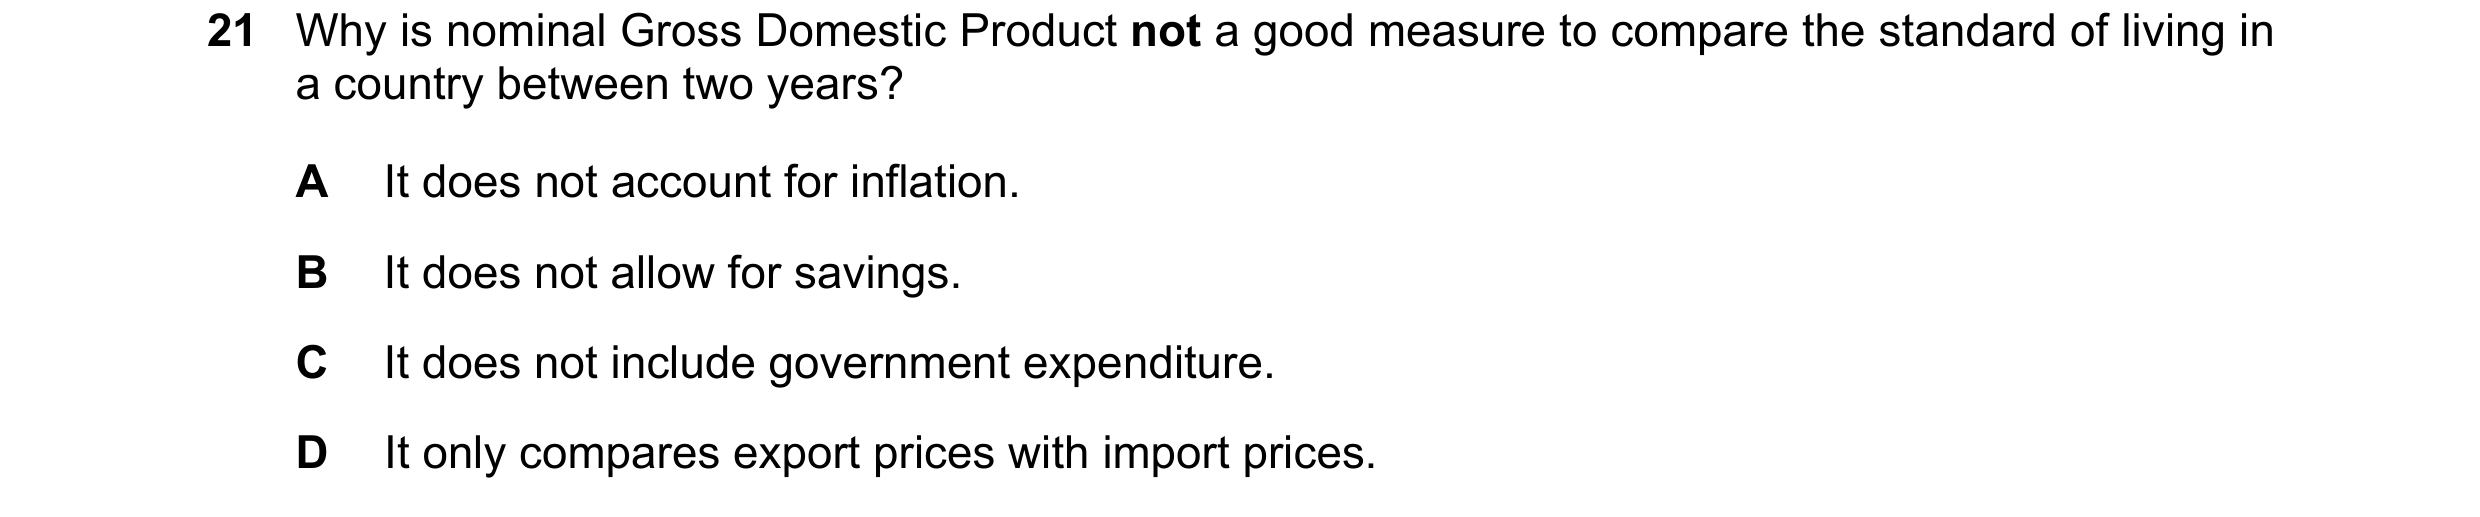

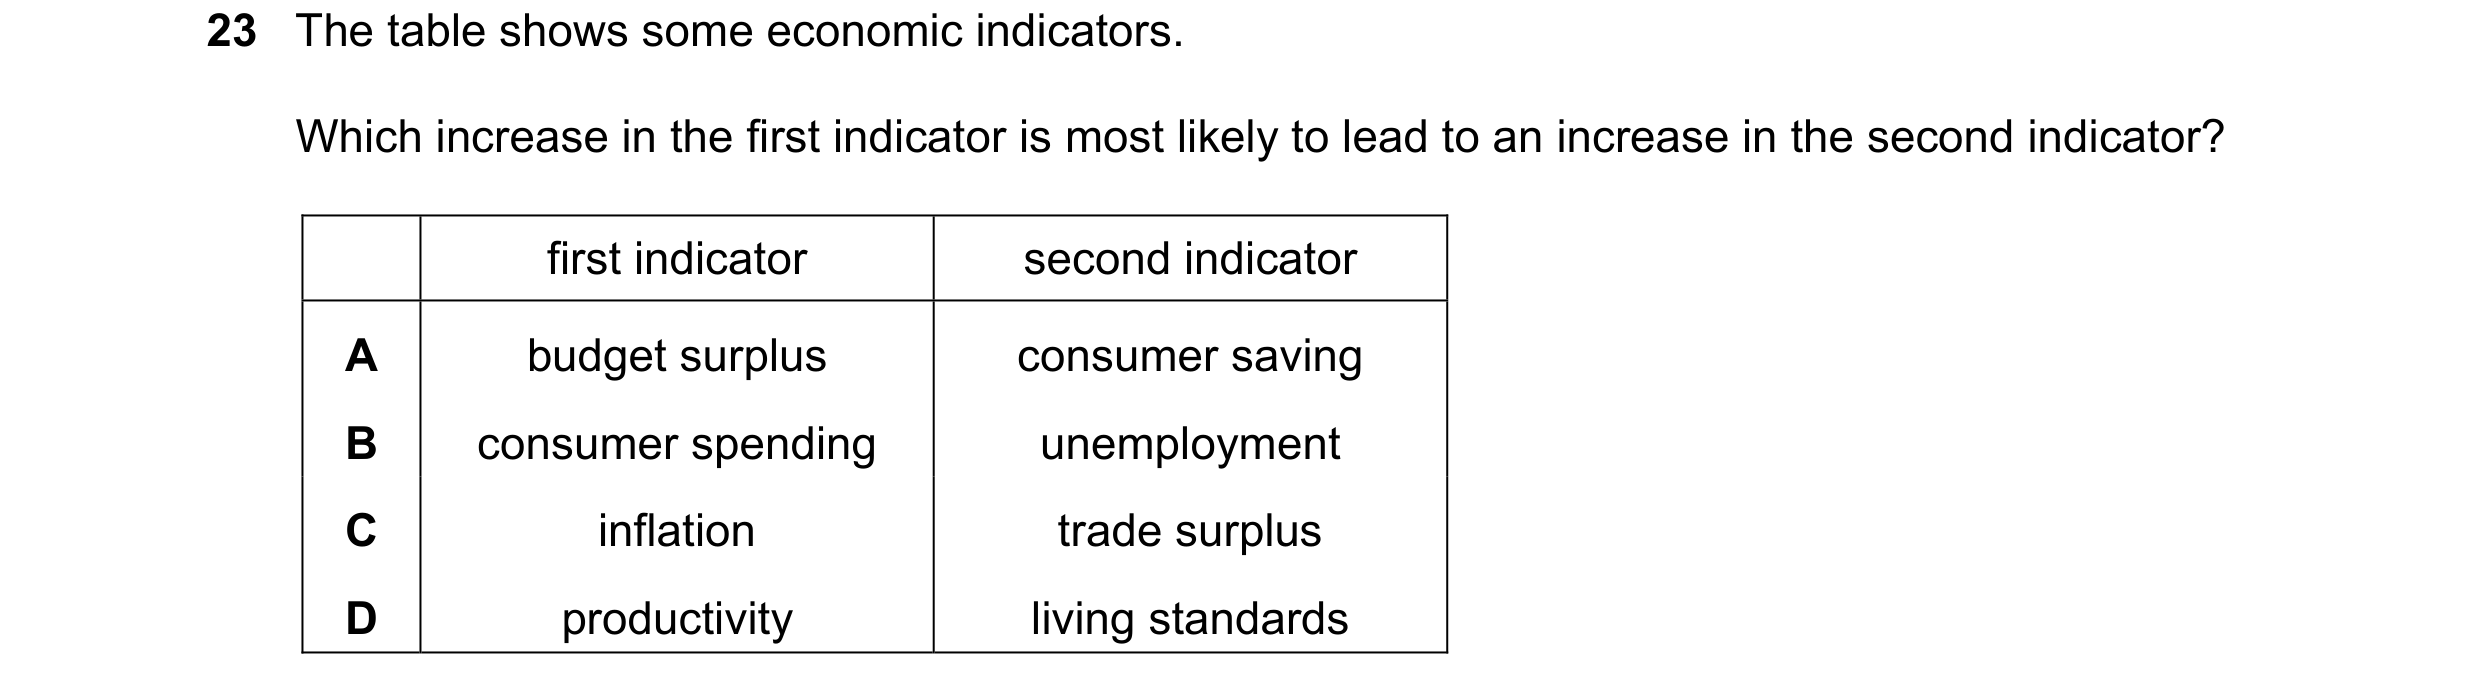
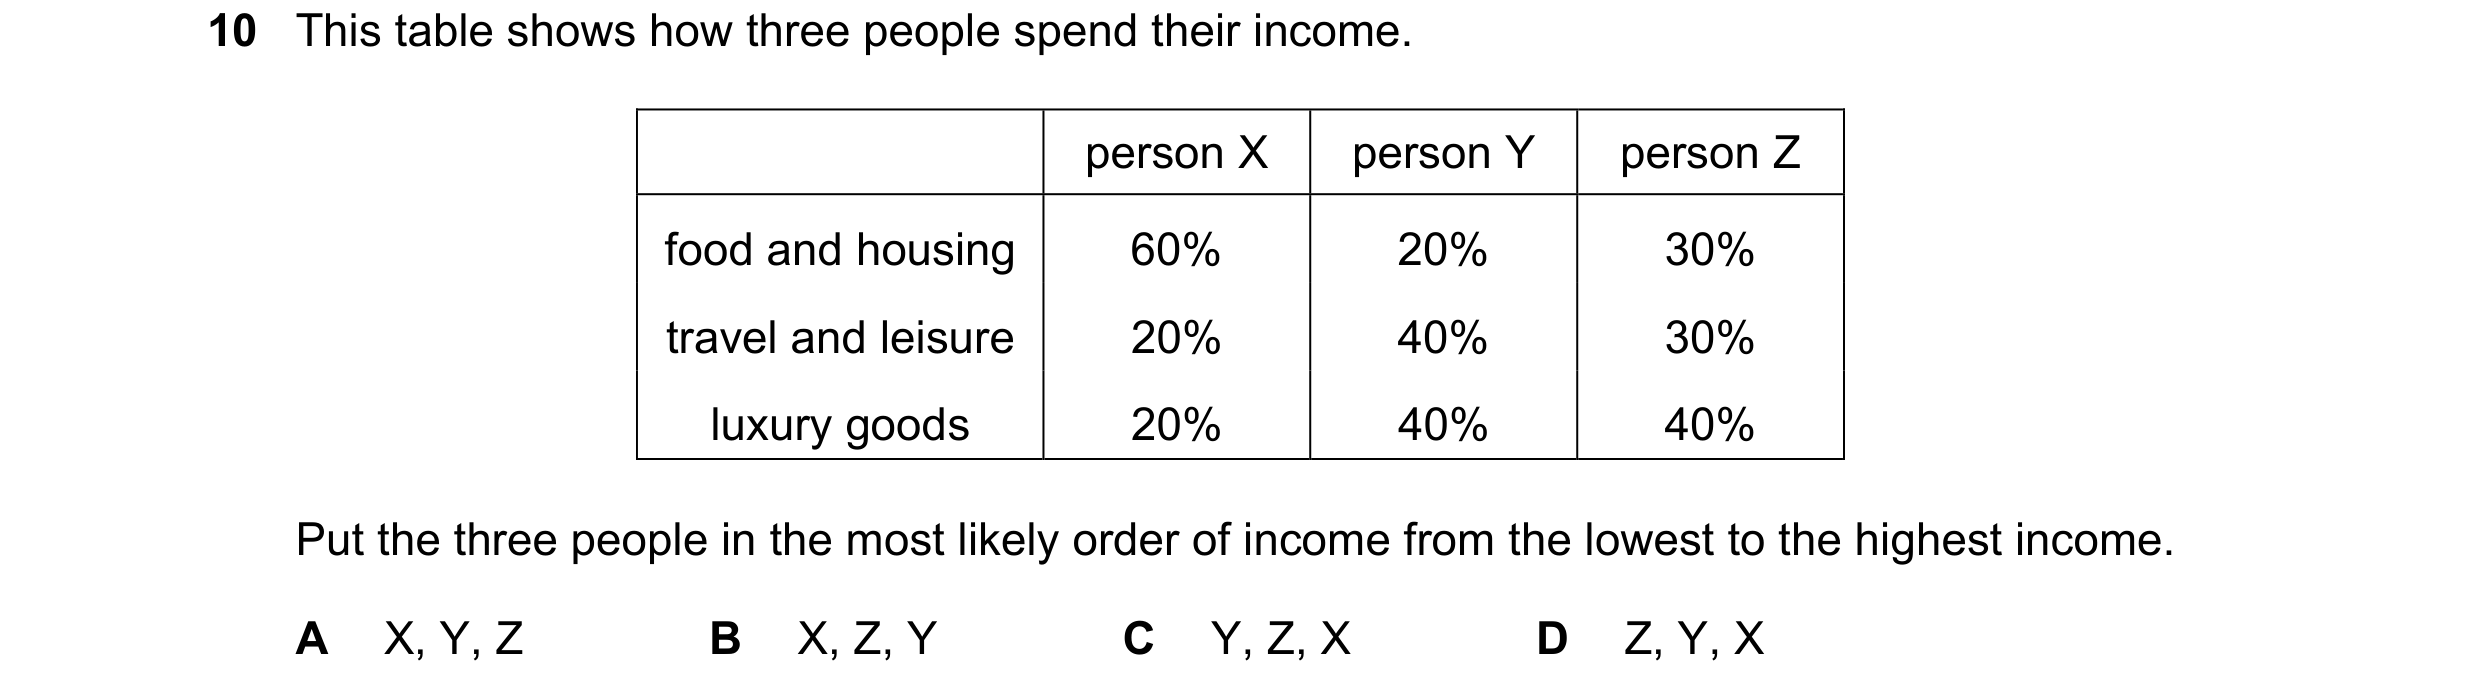 19 / 40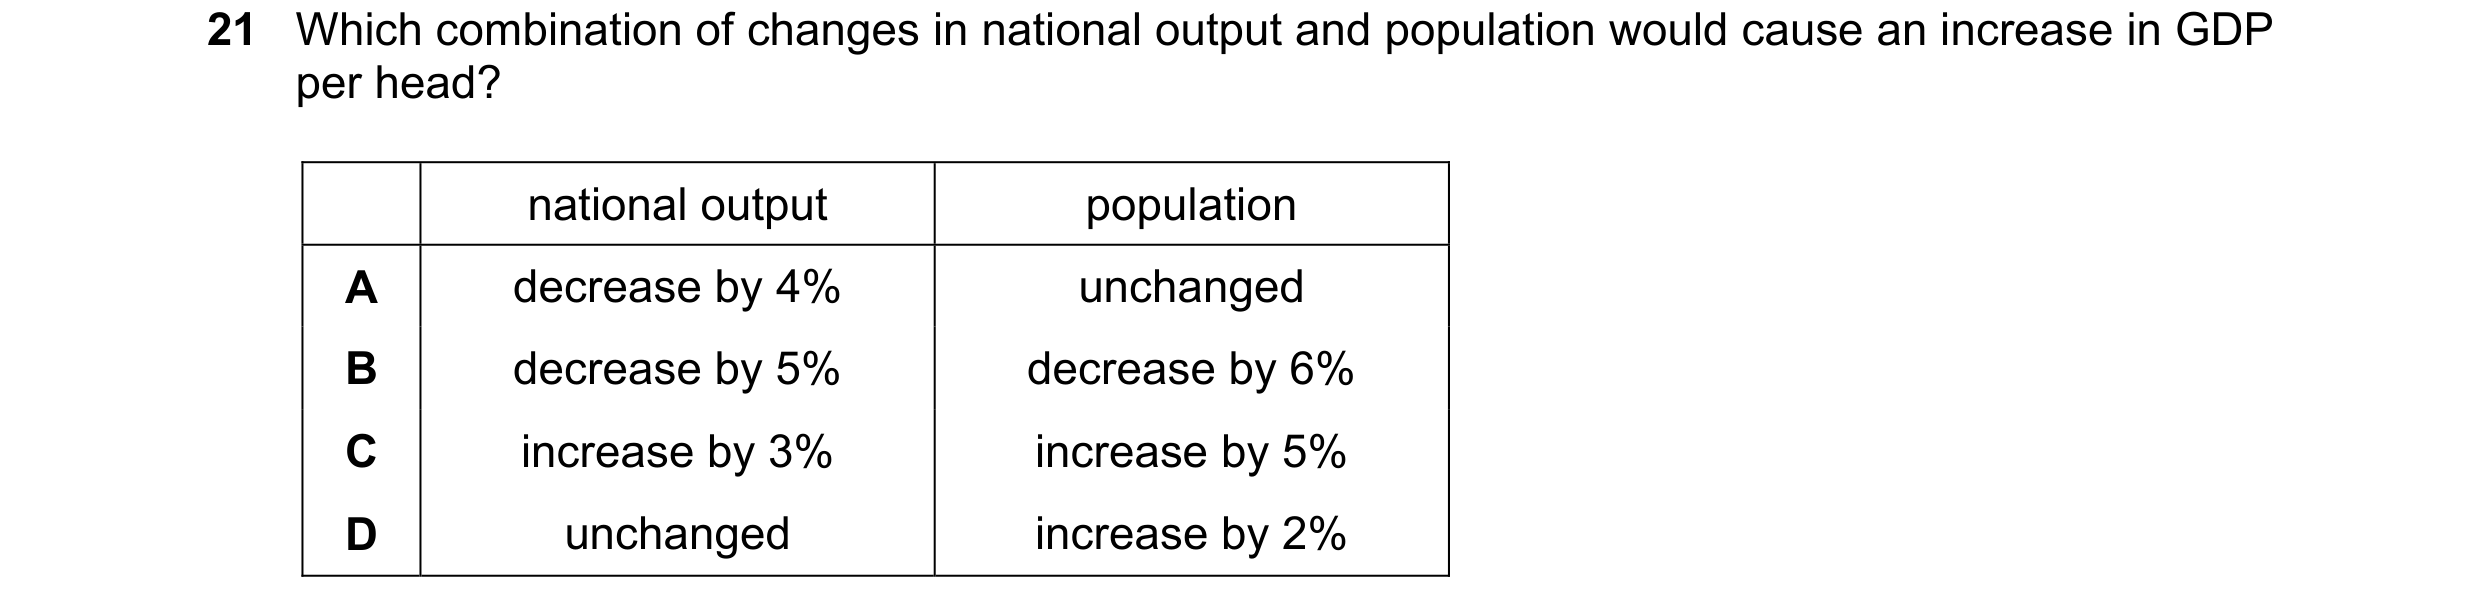
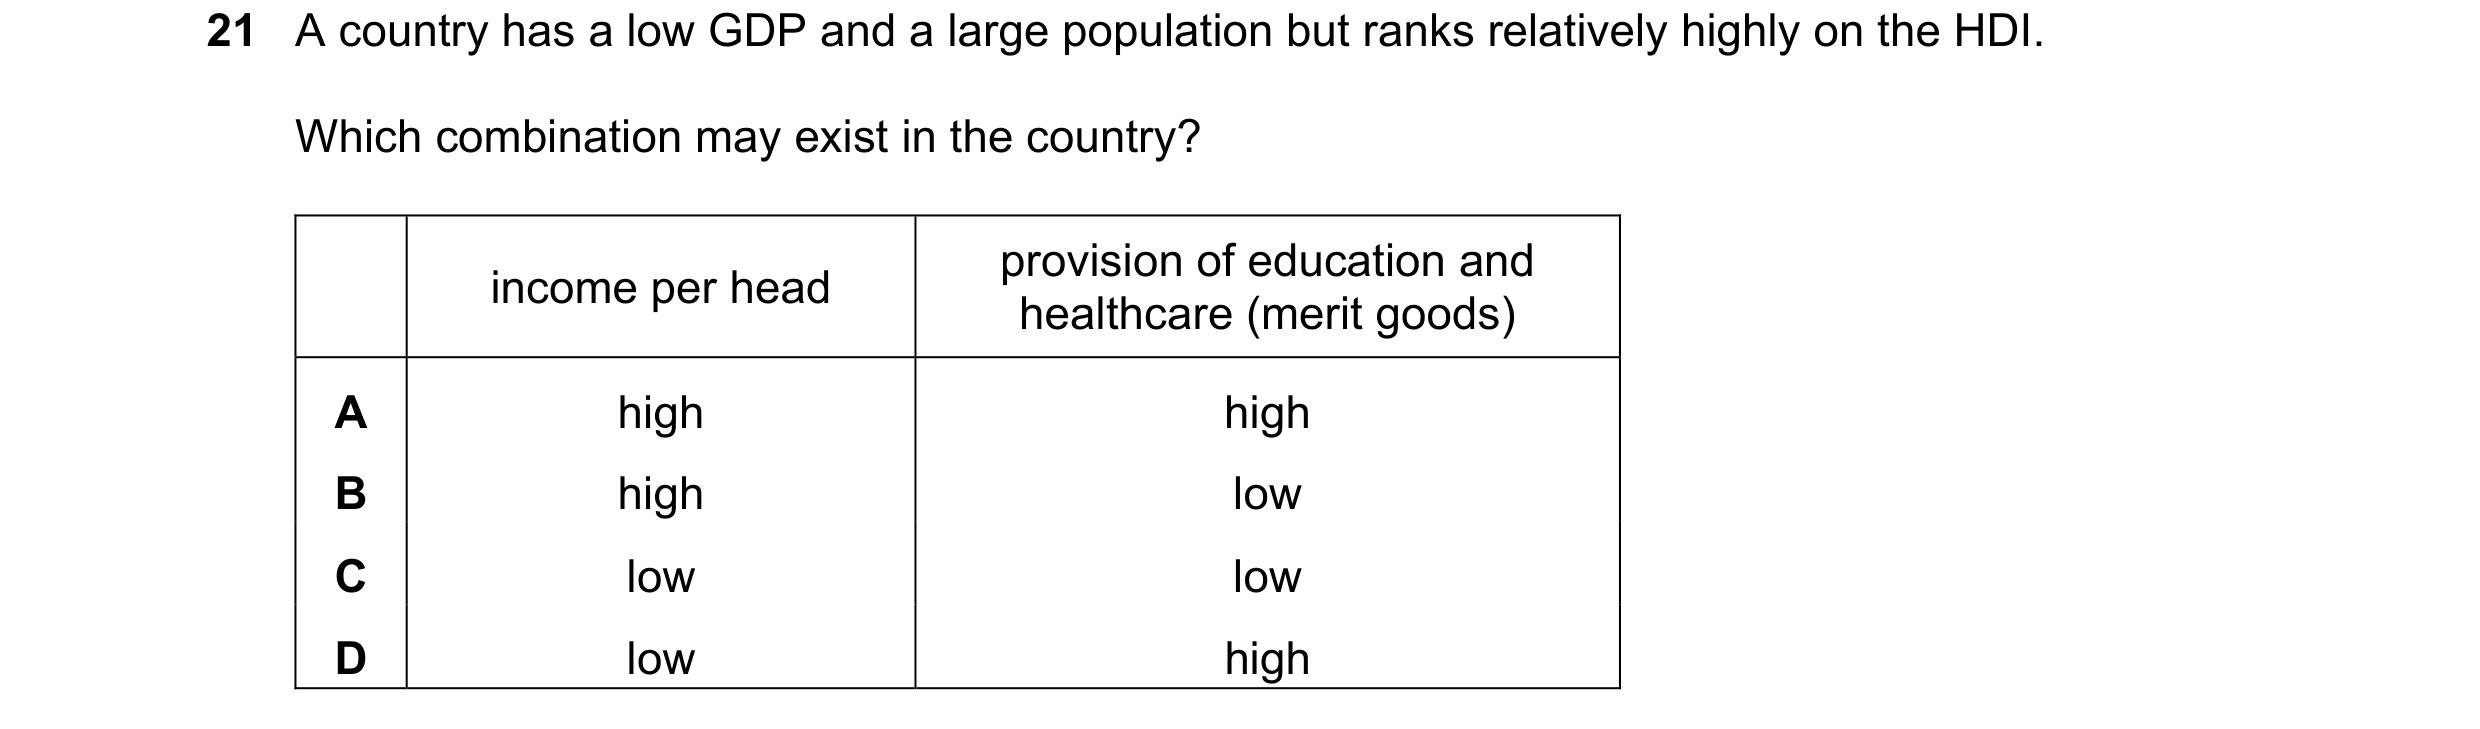
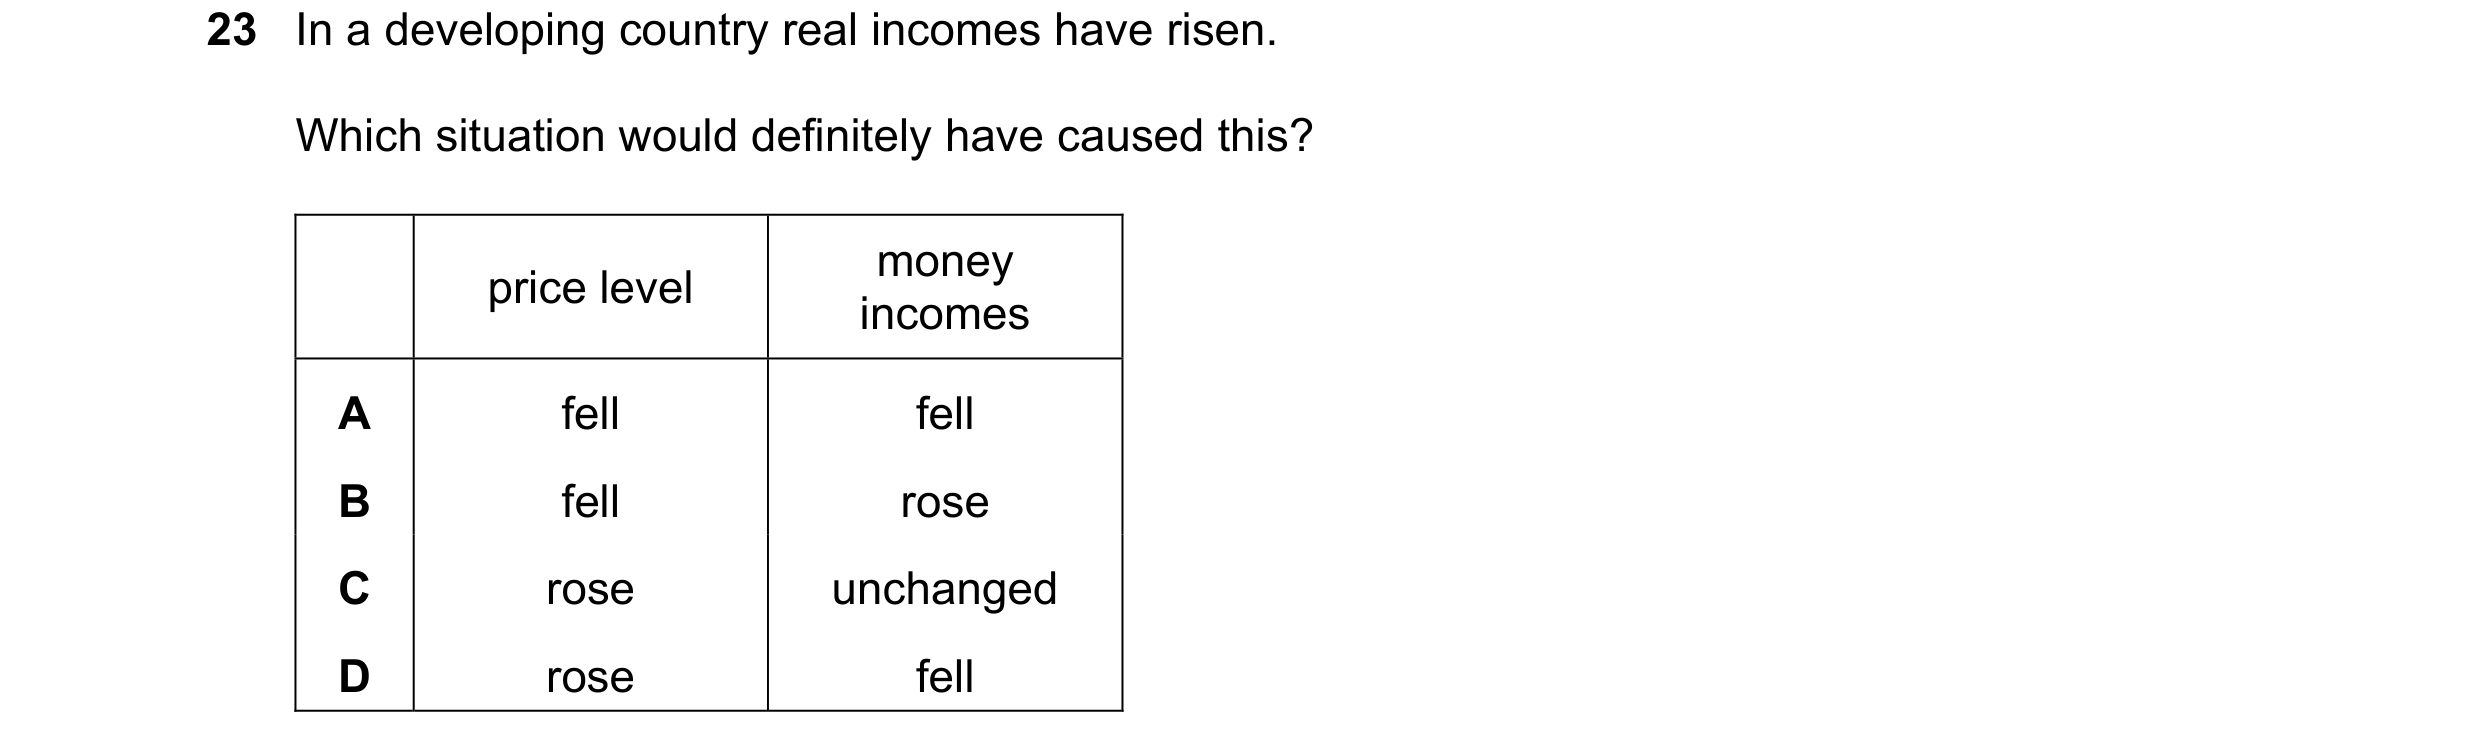
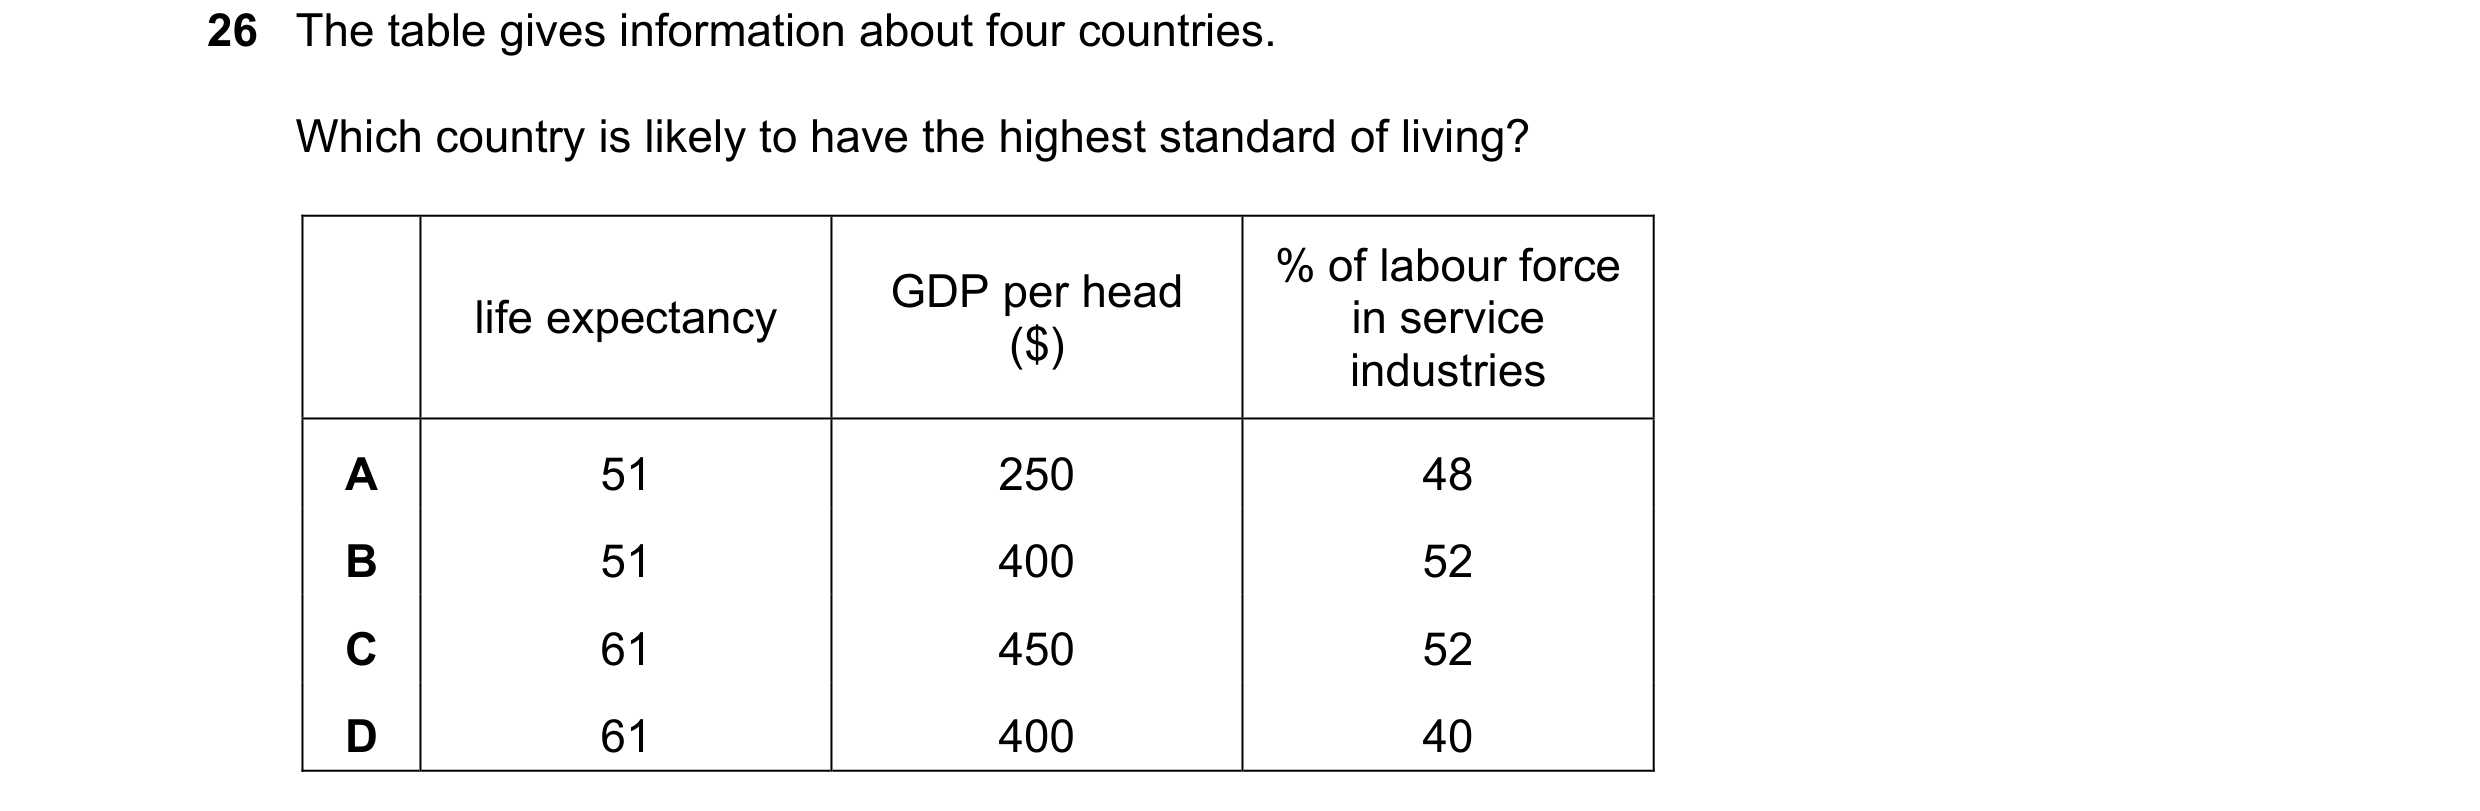 20 / 40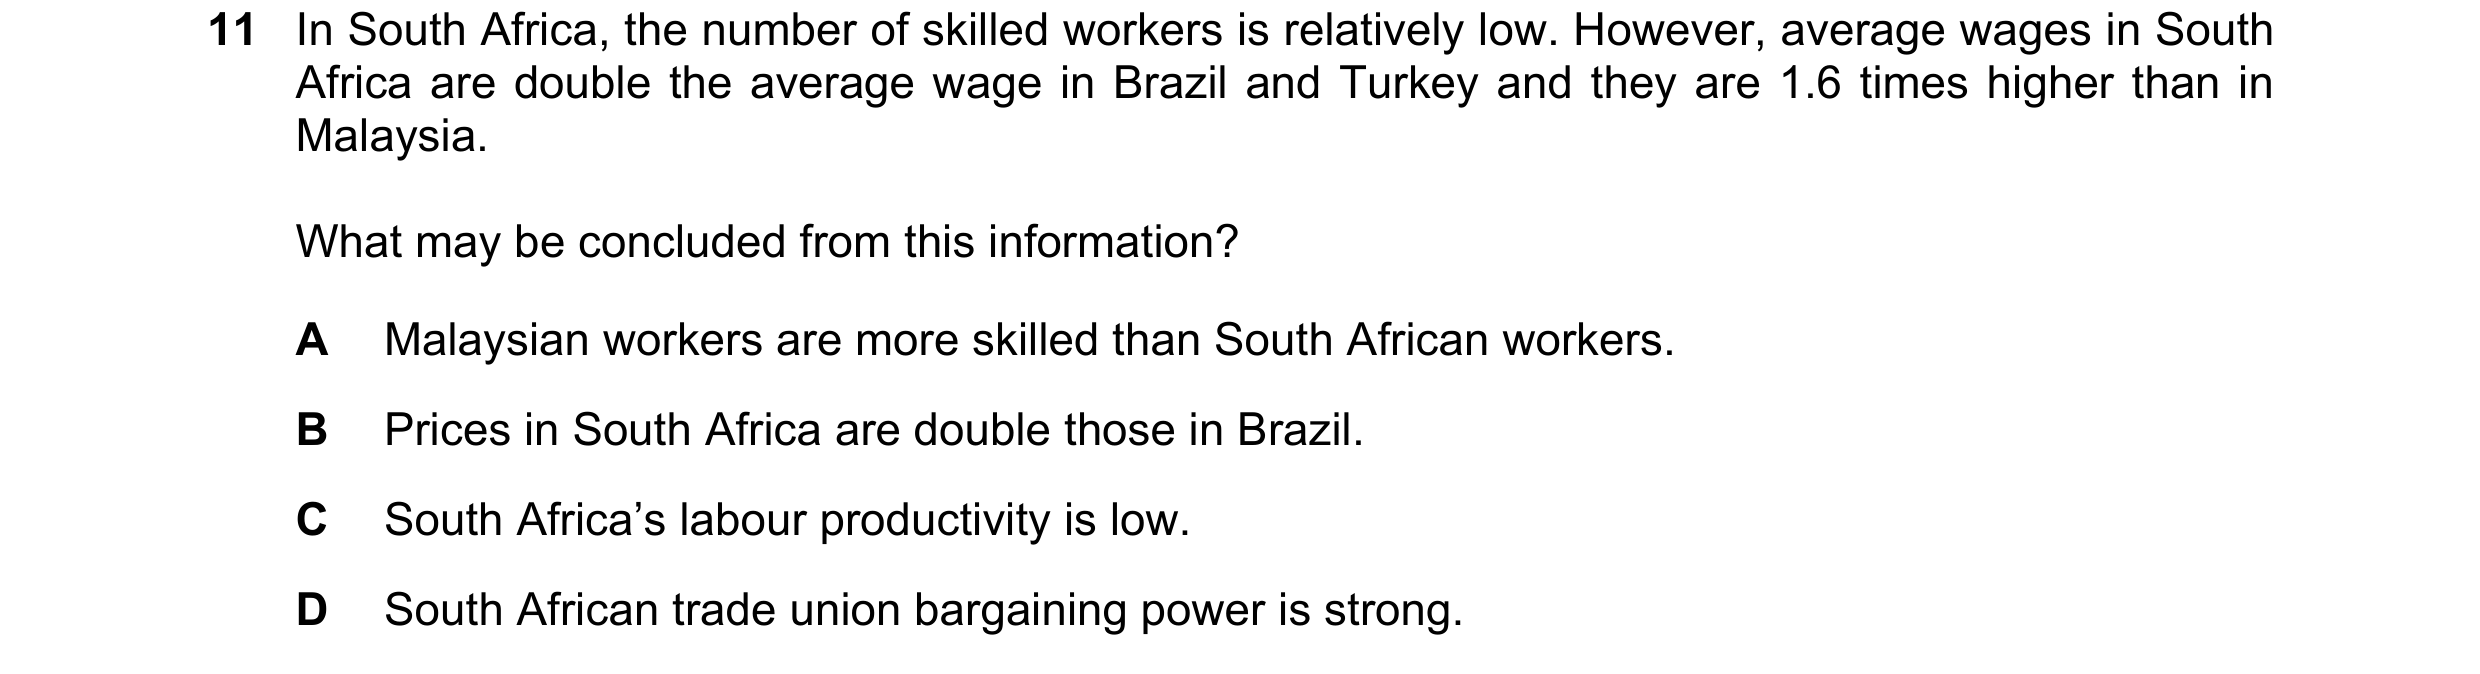
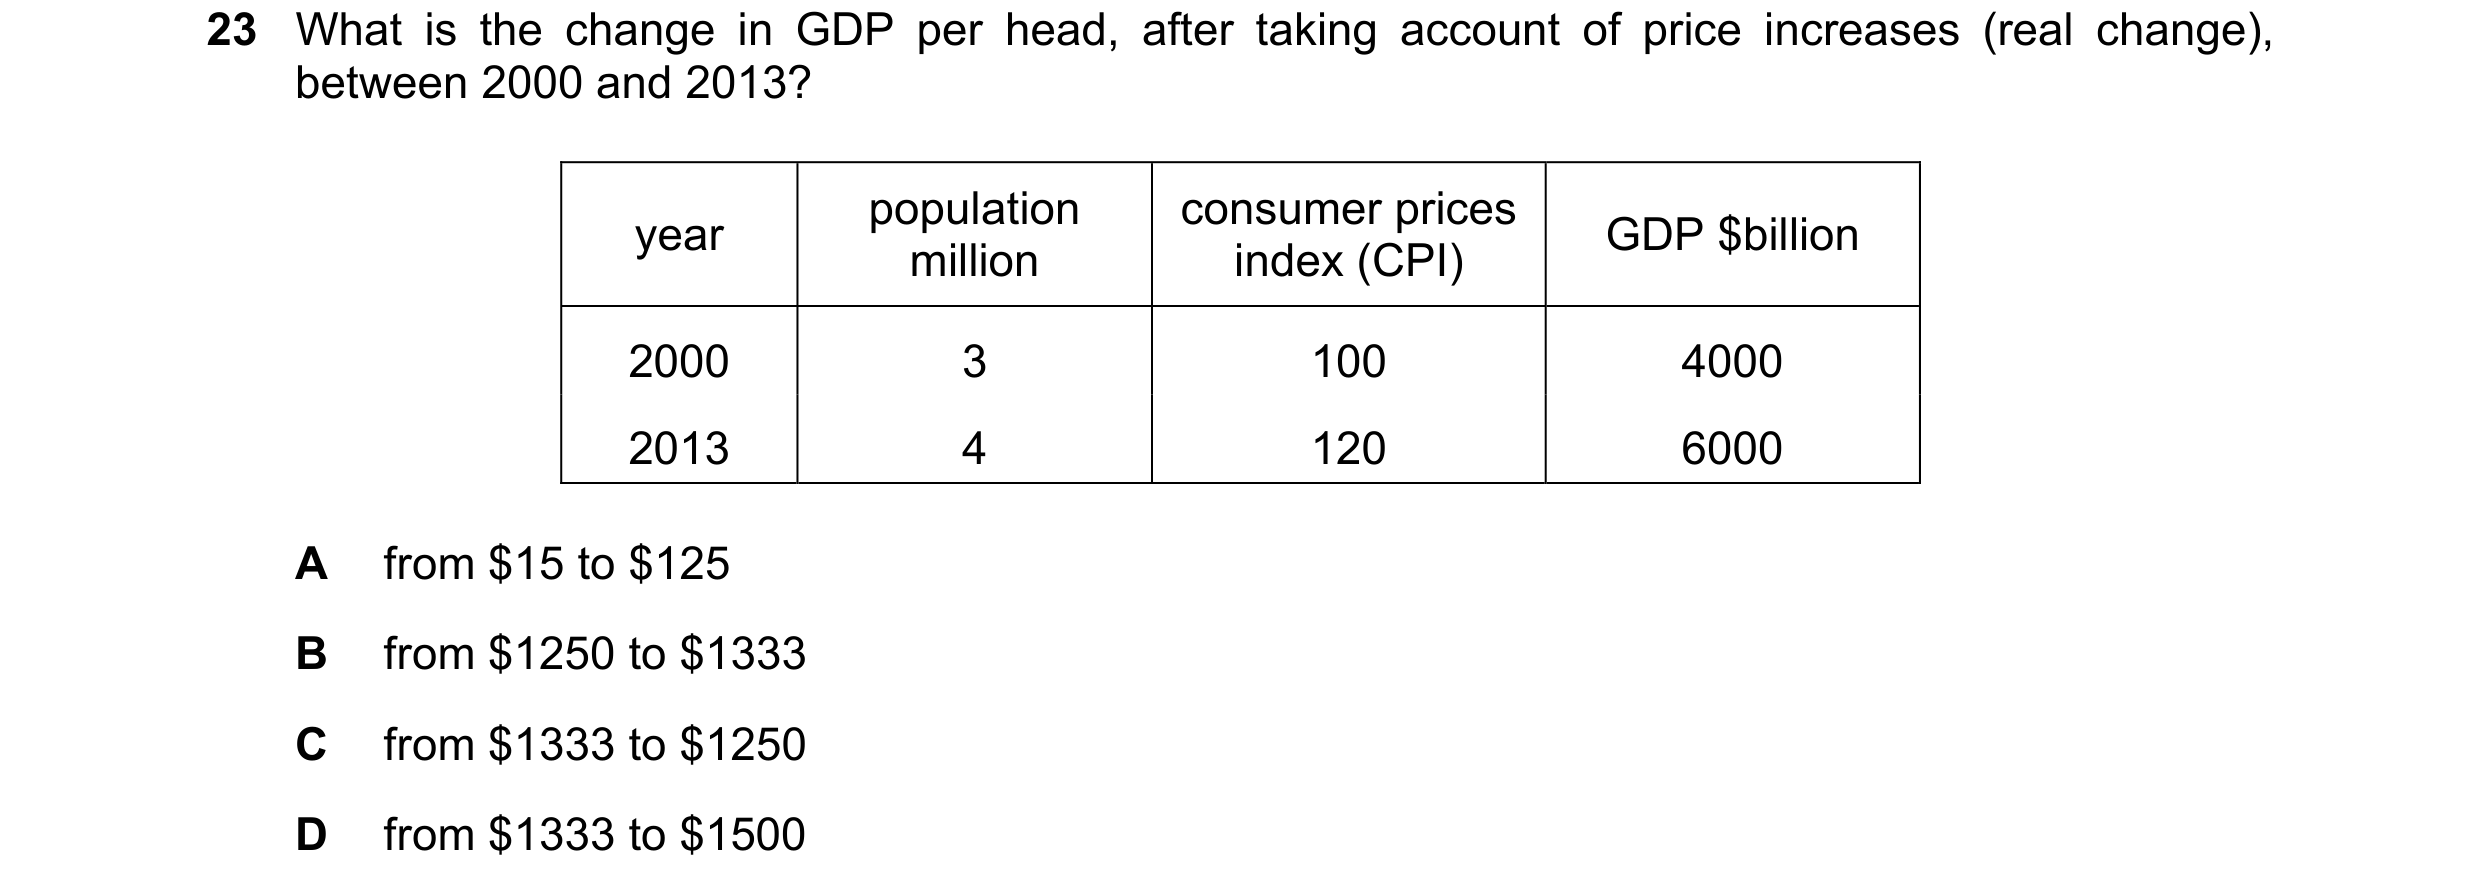

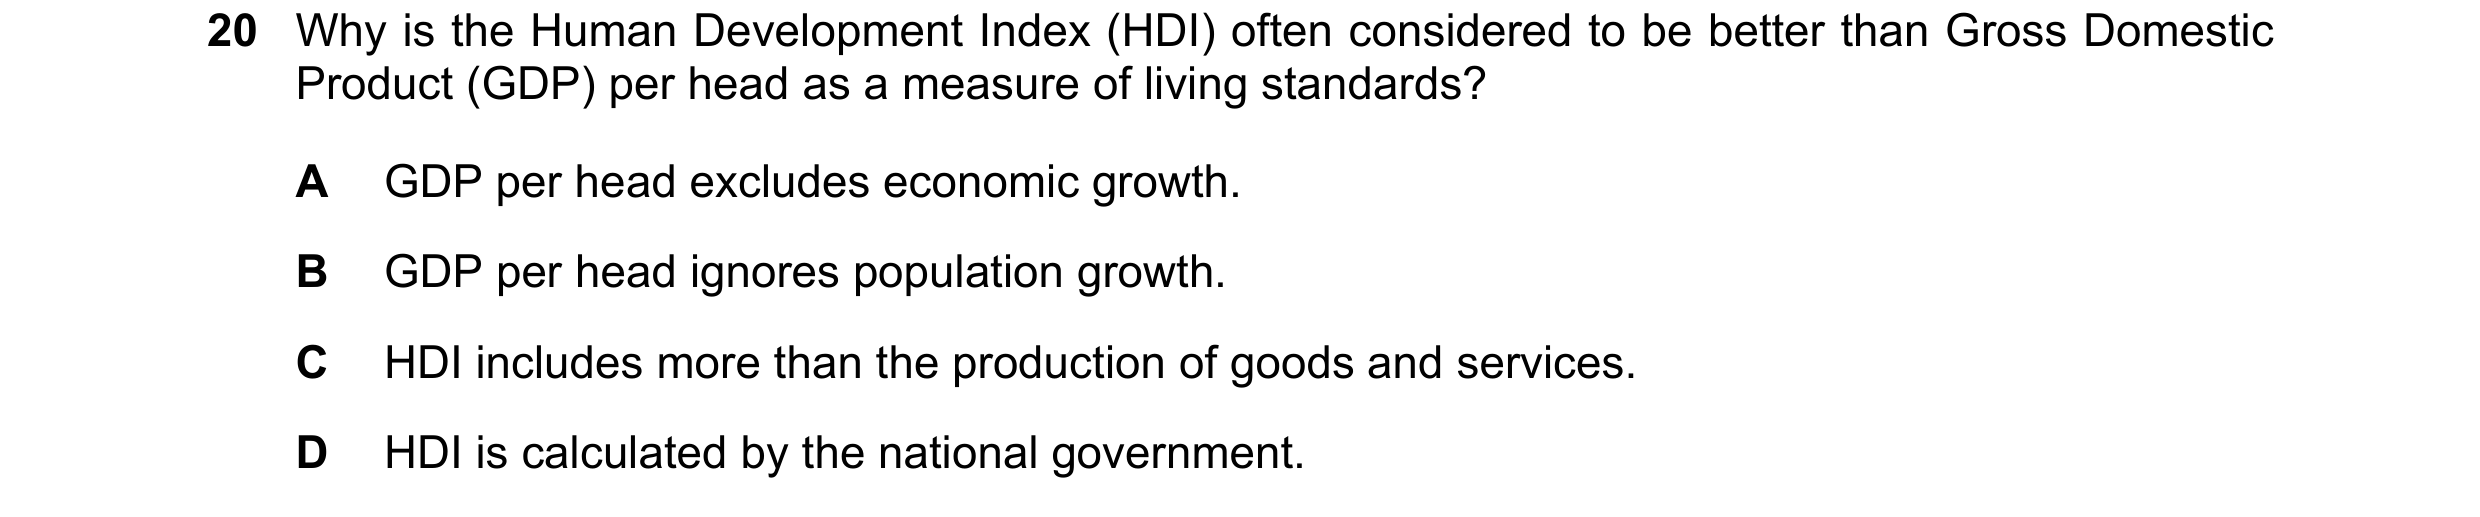
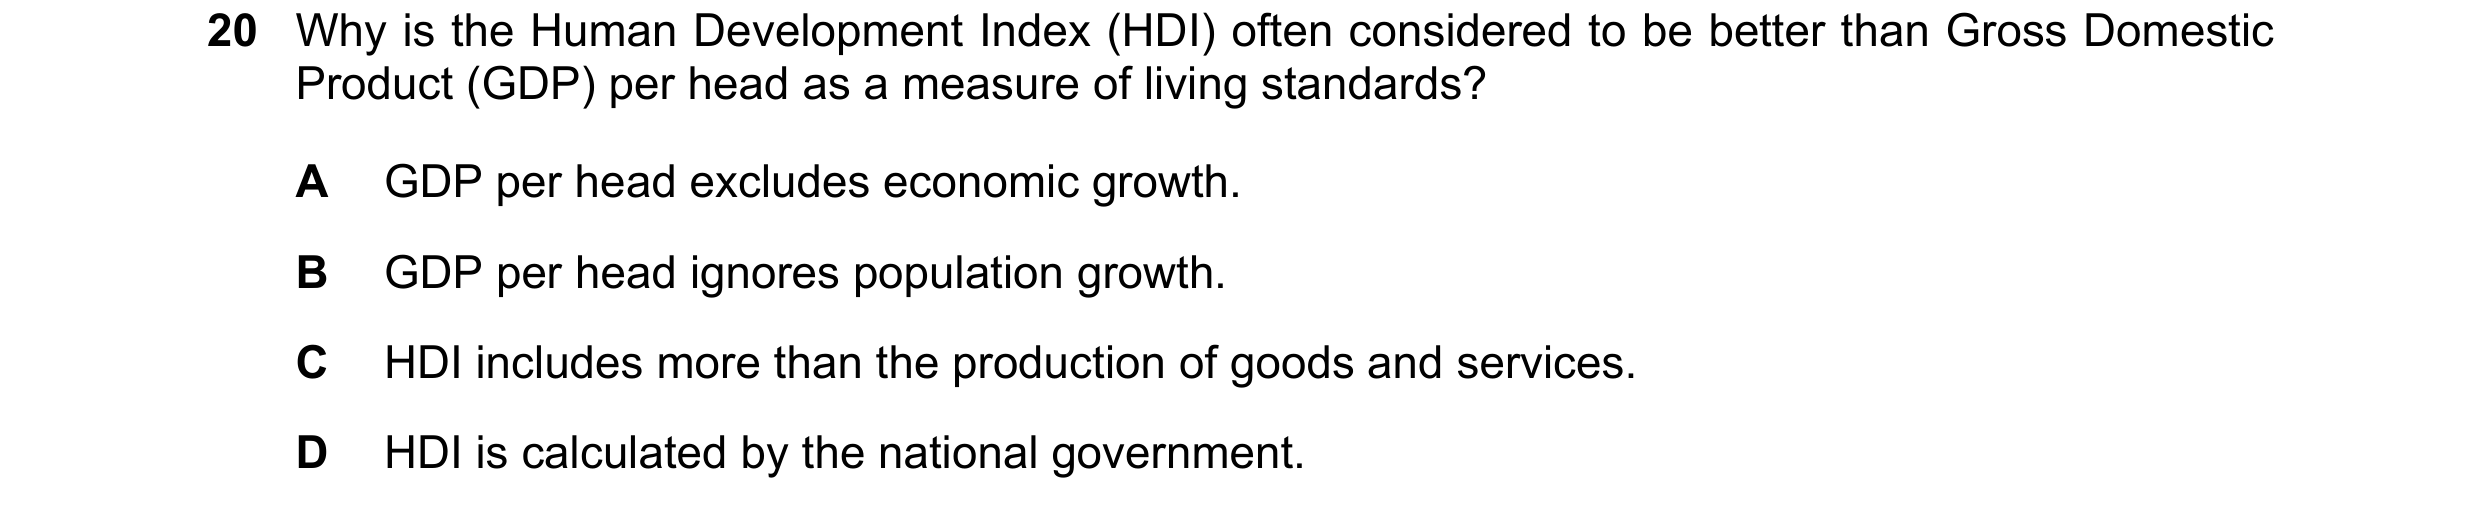 21 / 40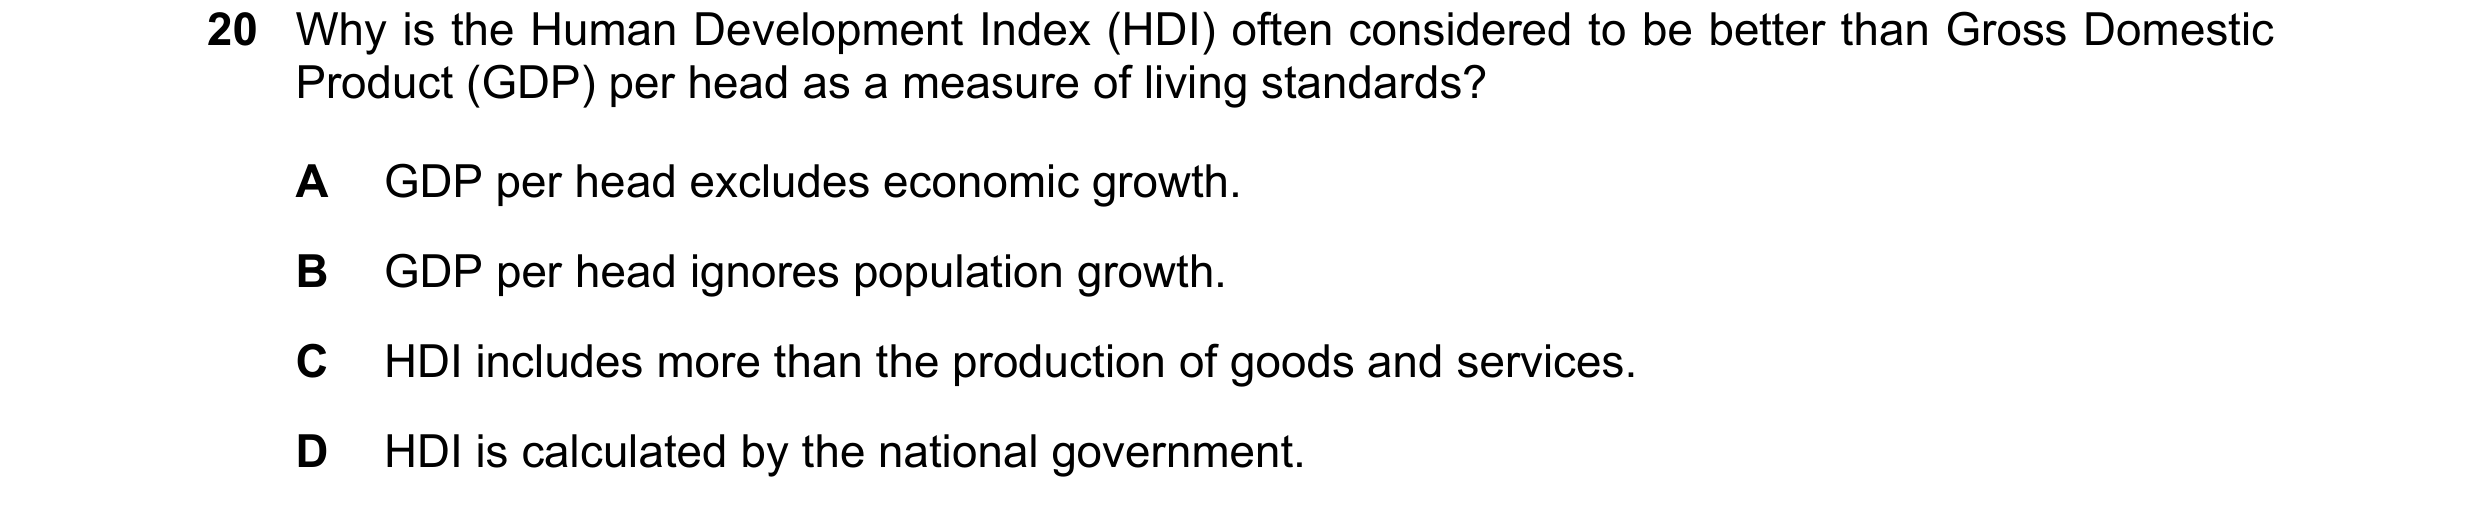
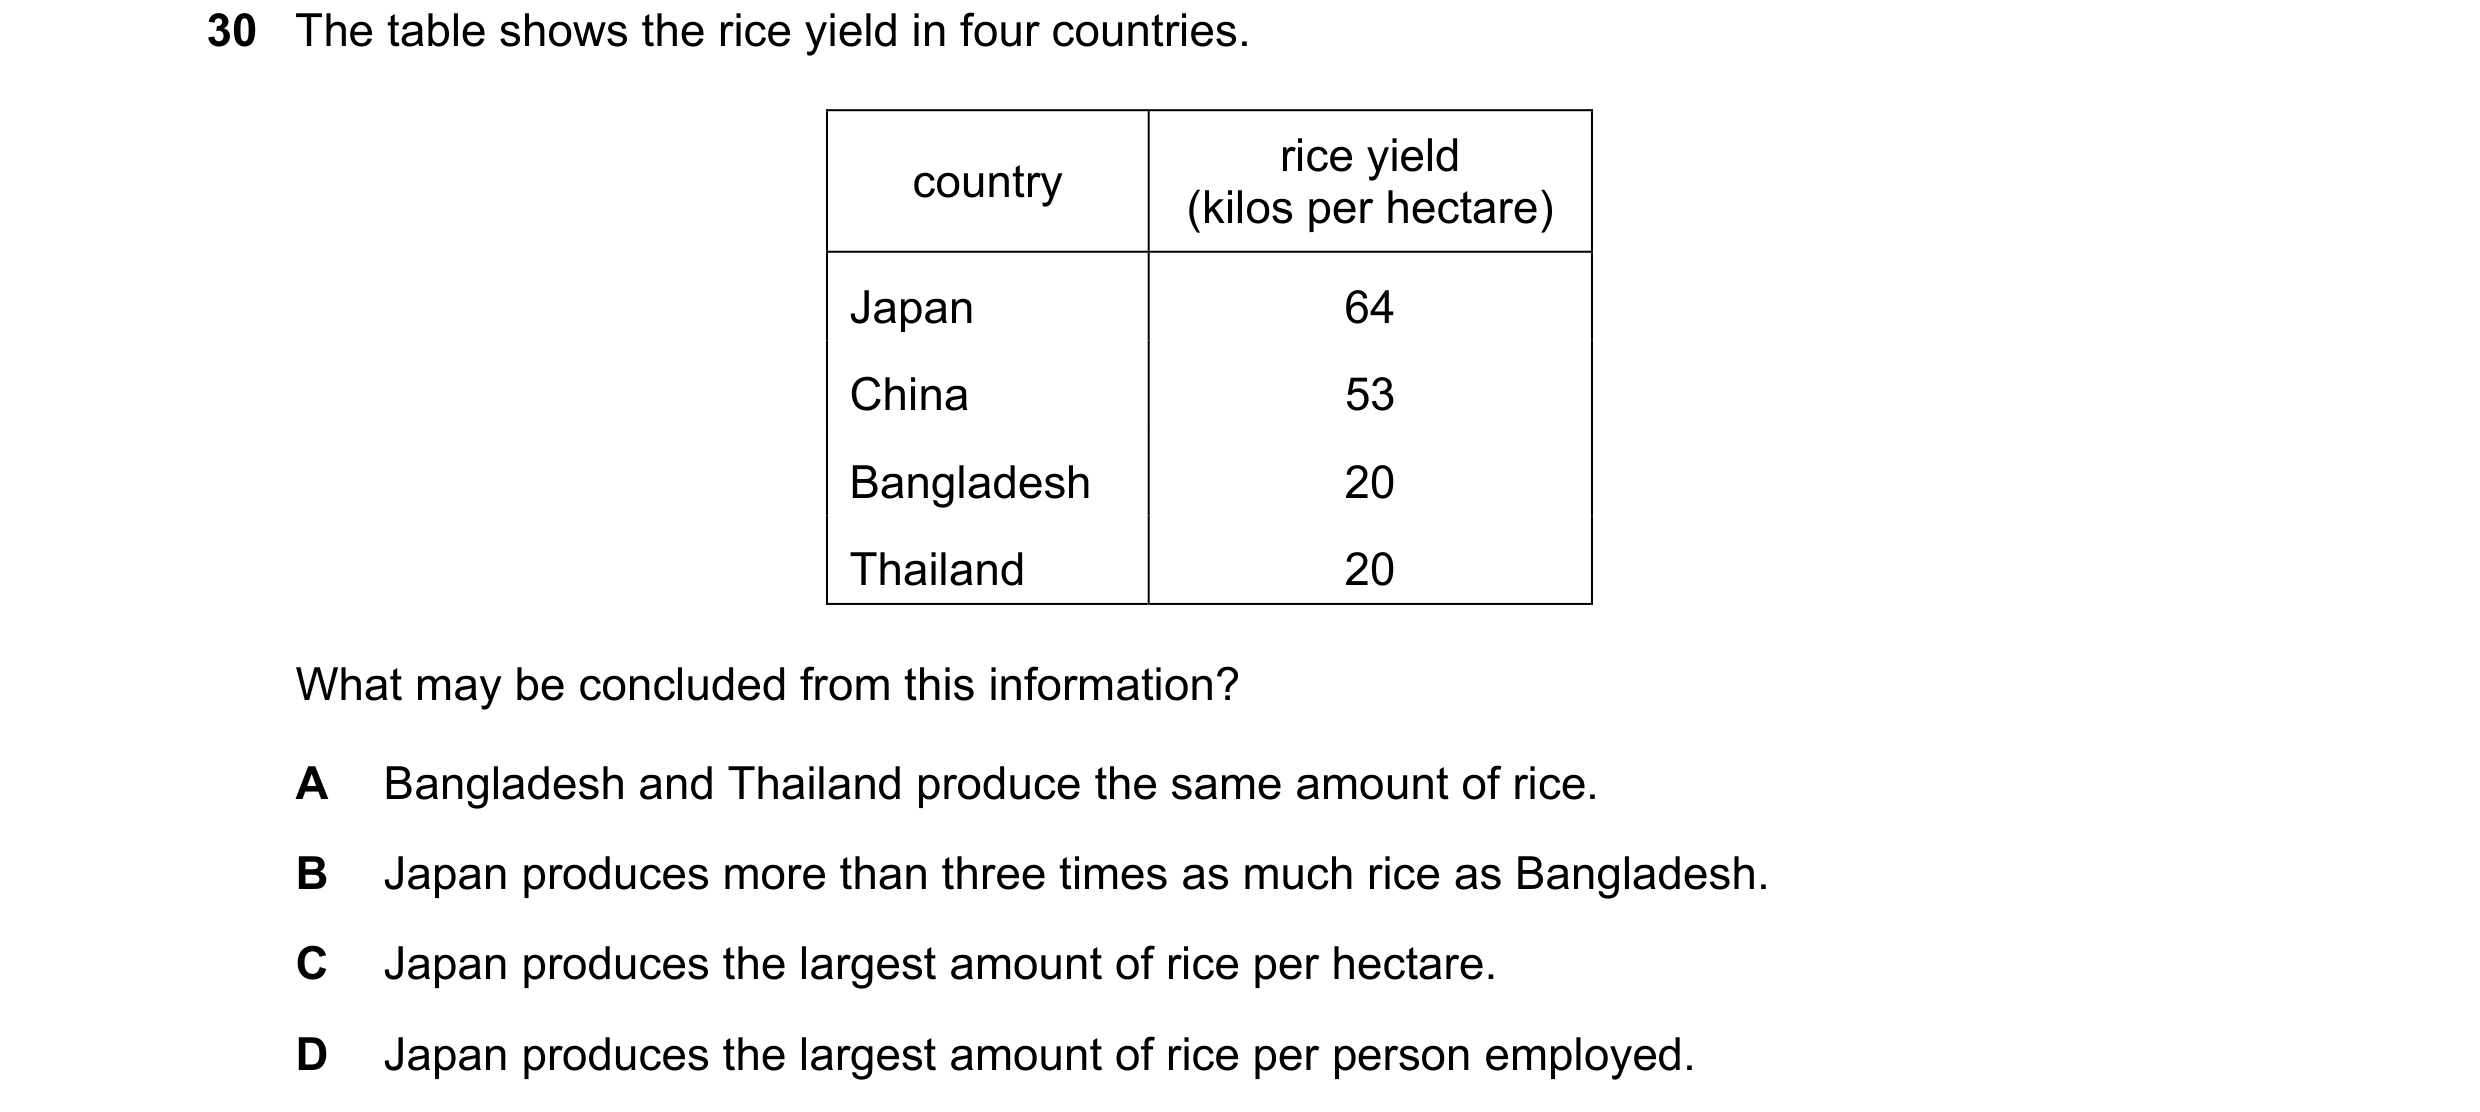
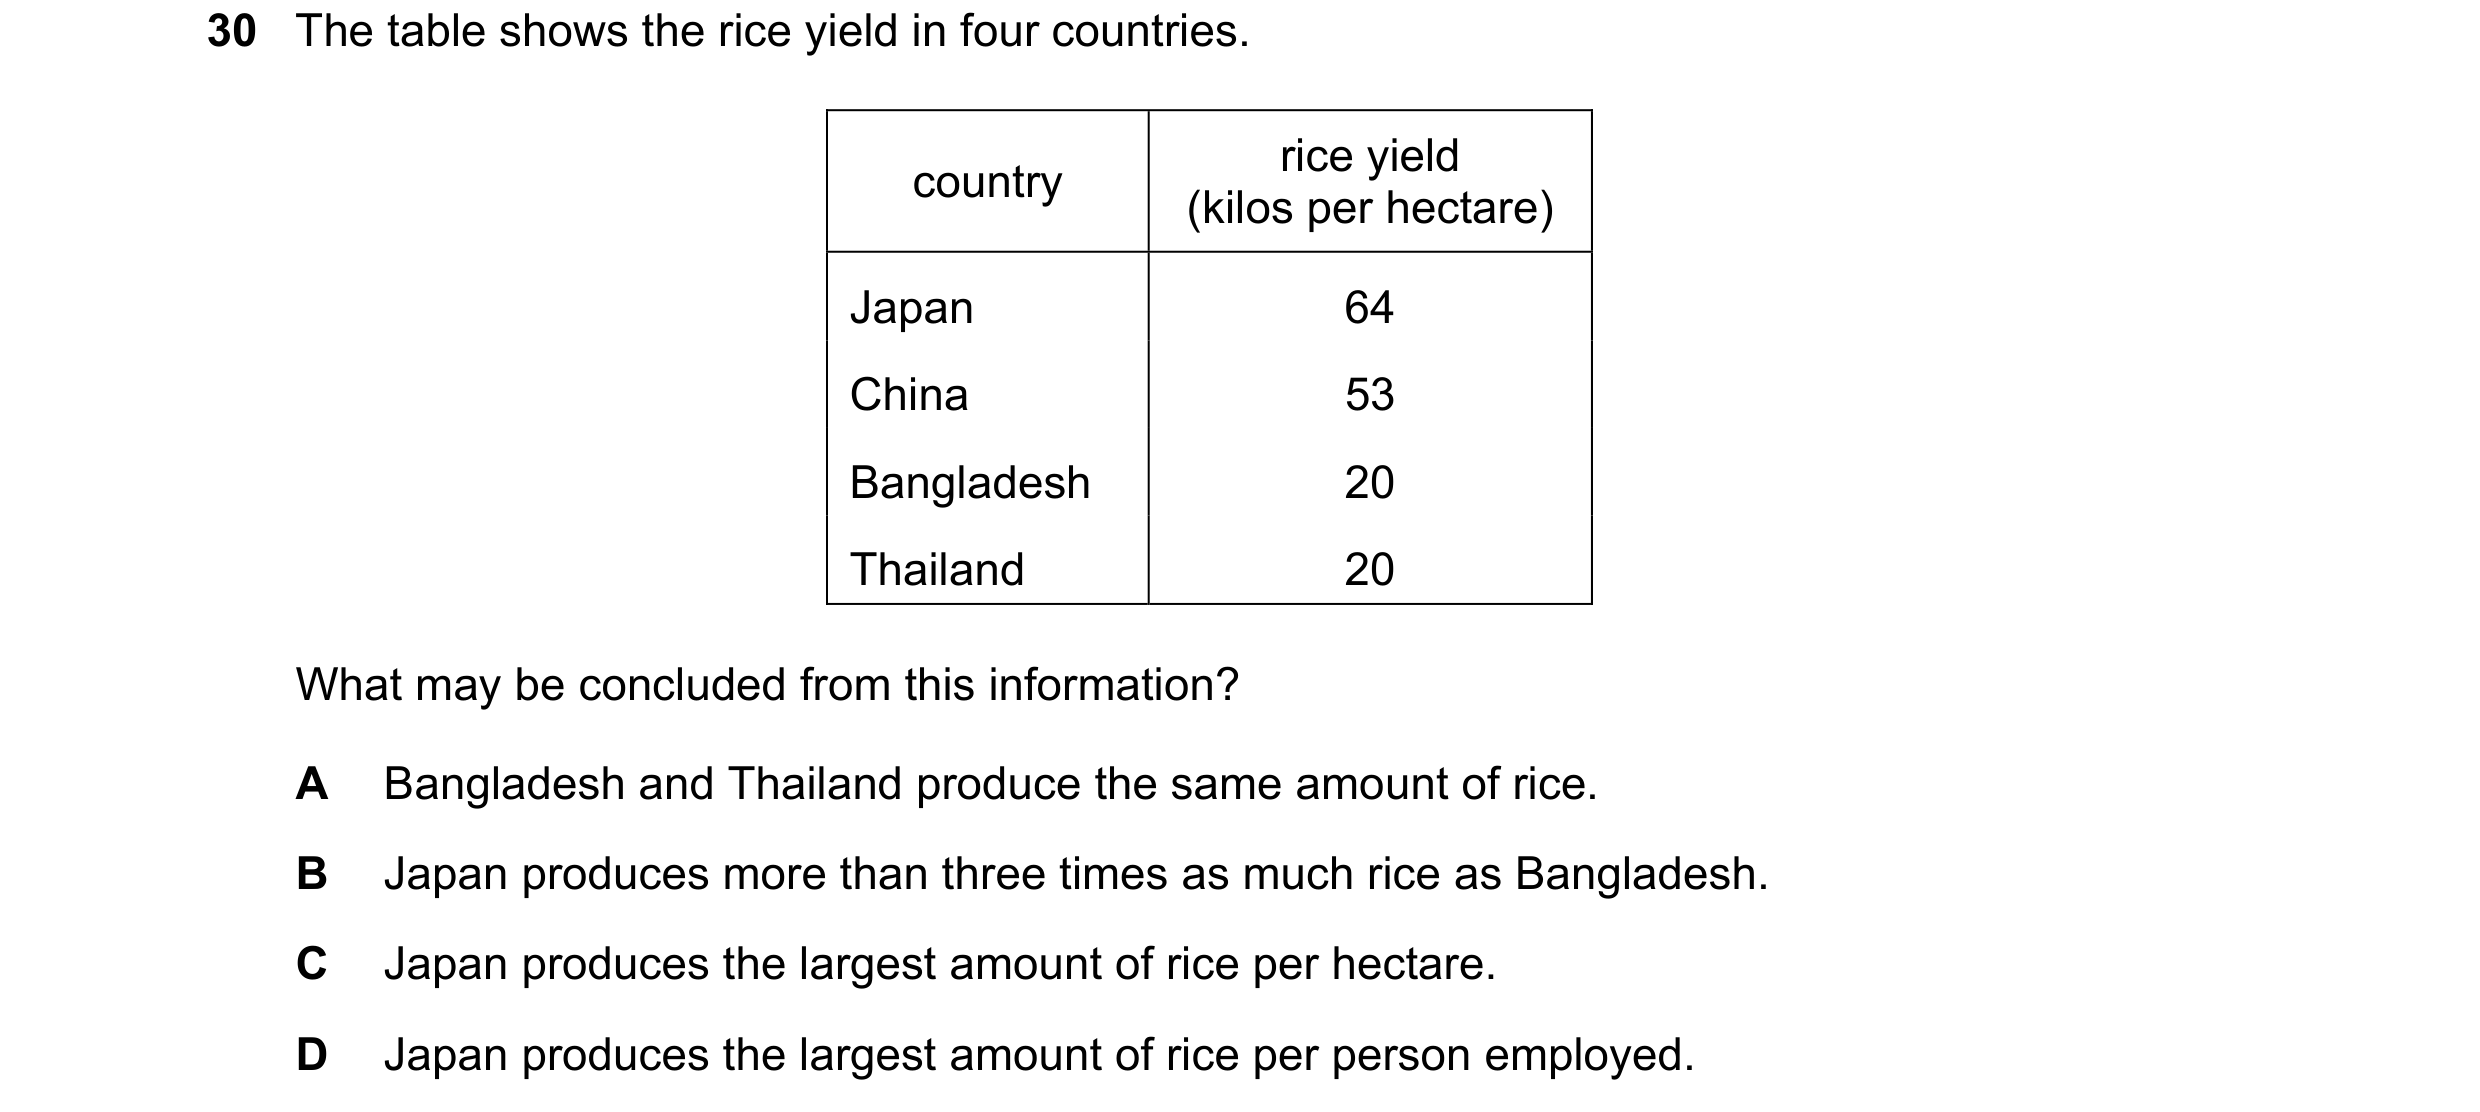 22 / 40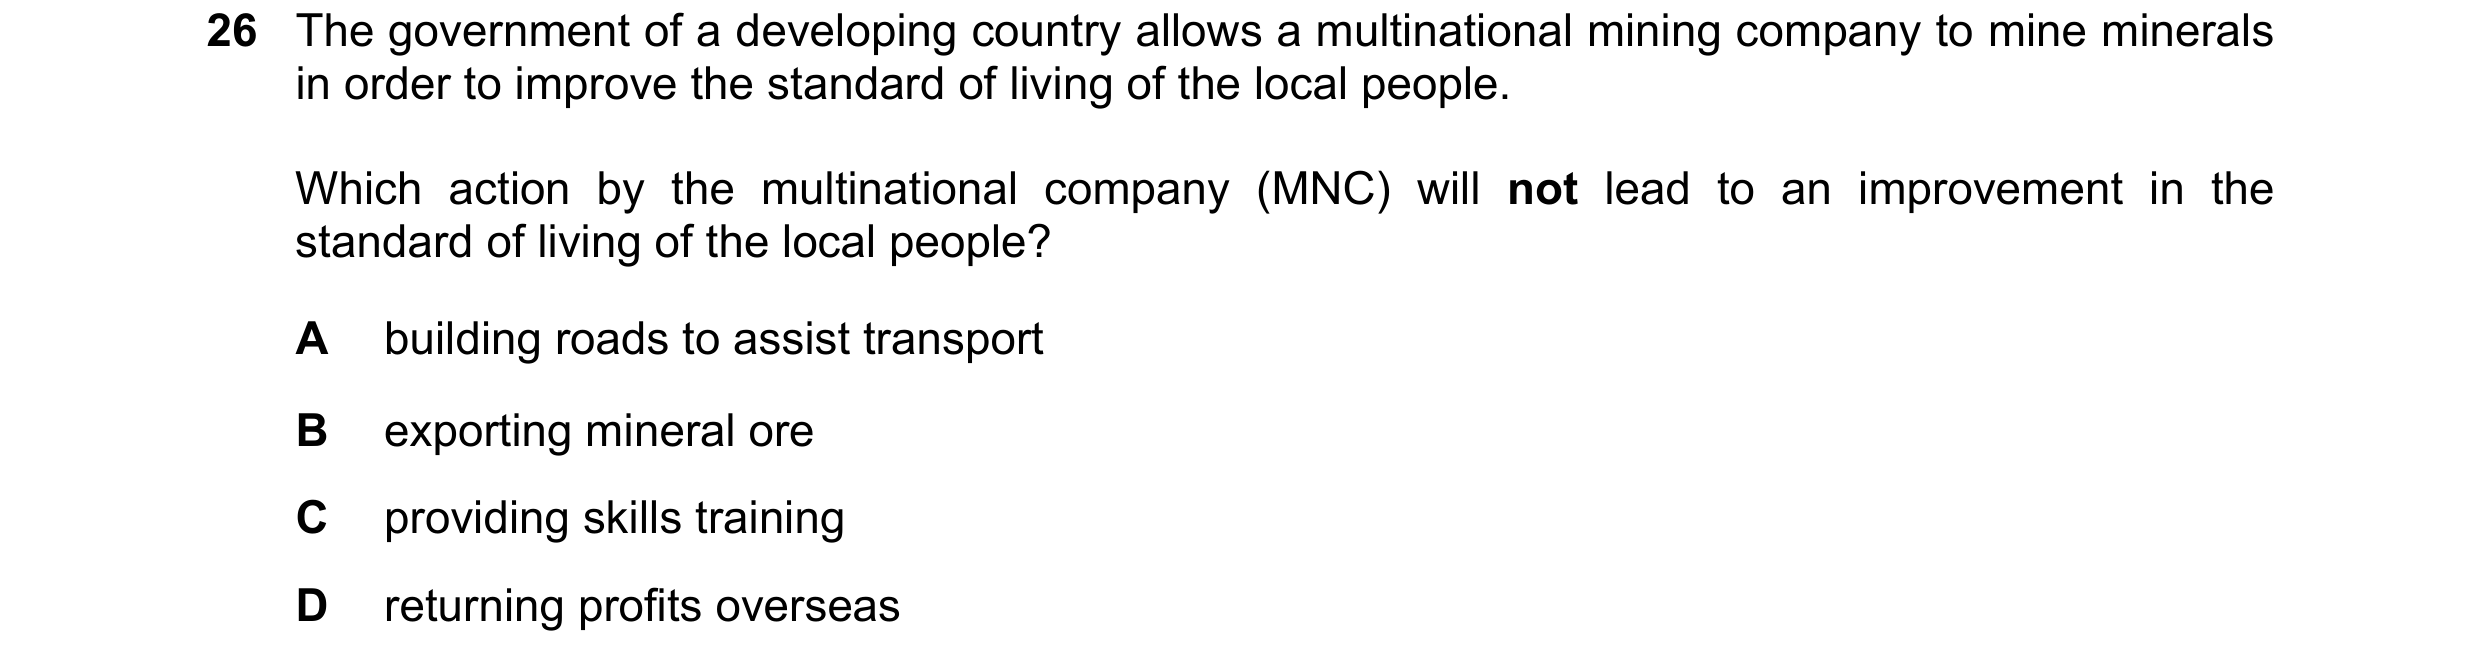
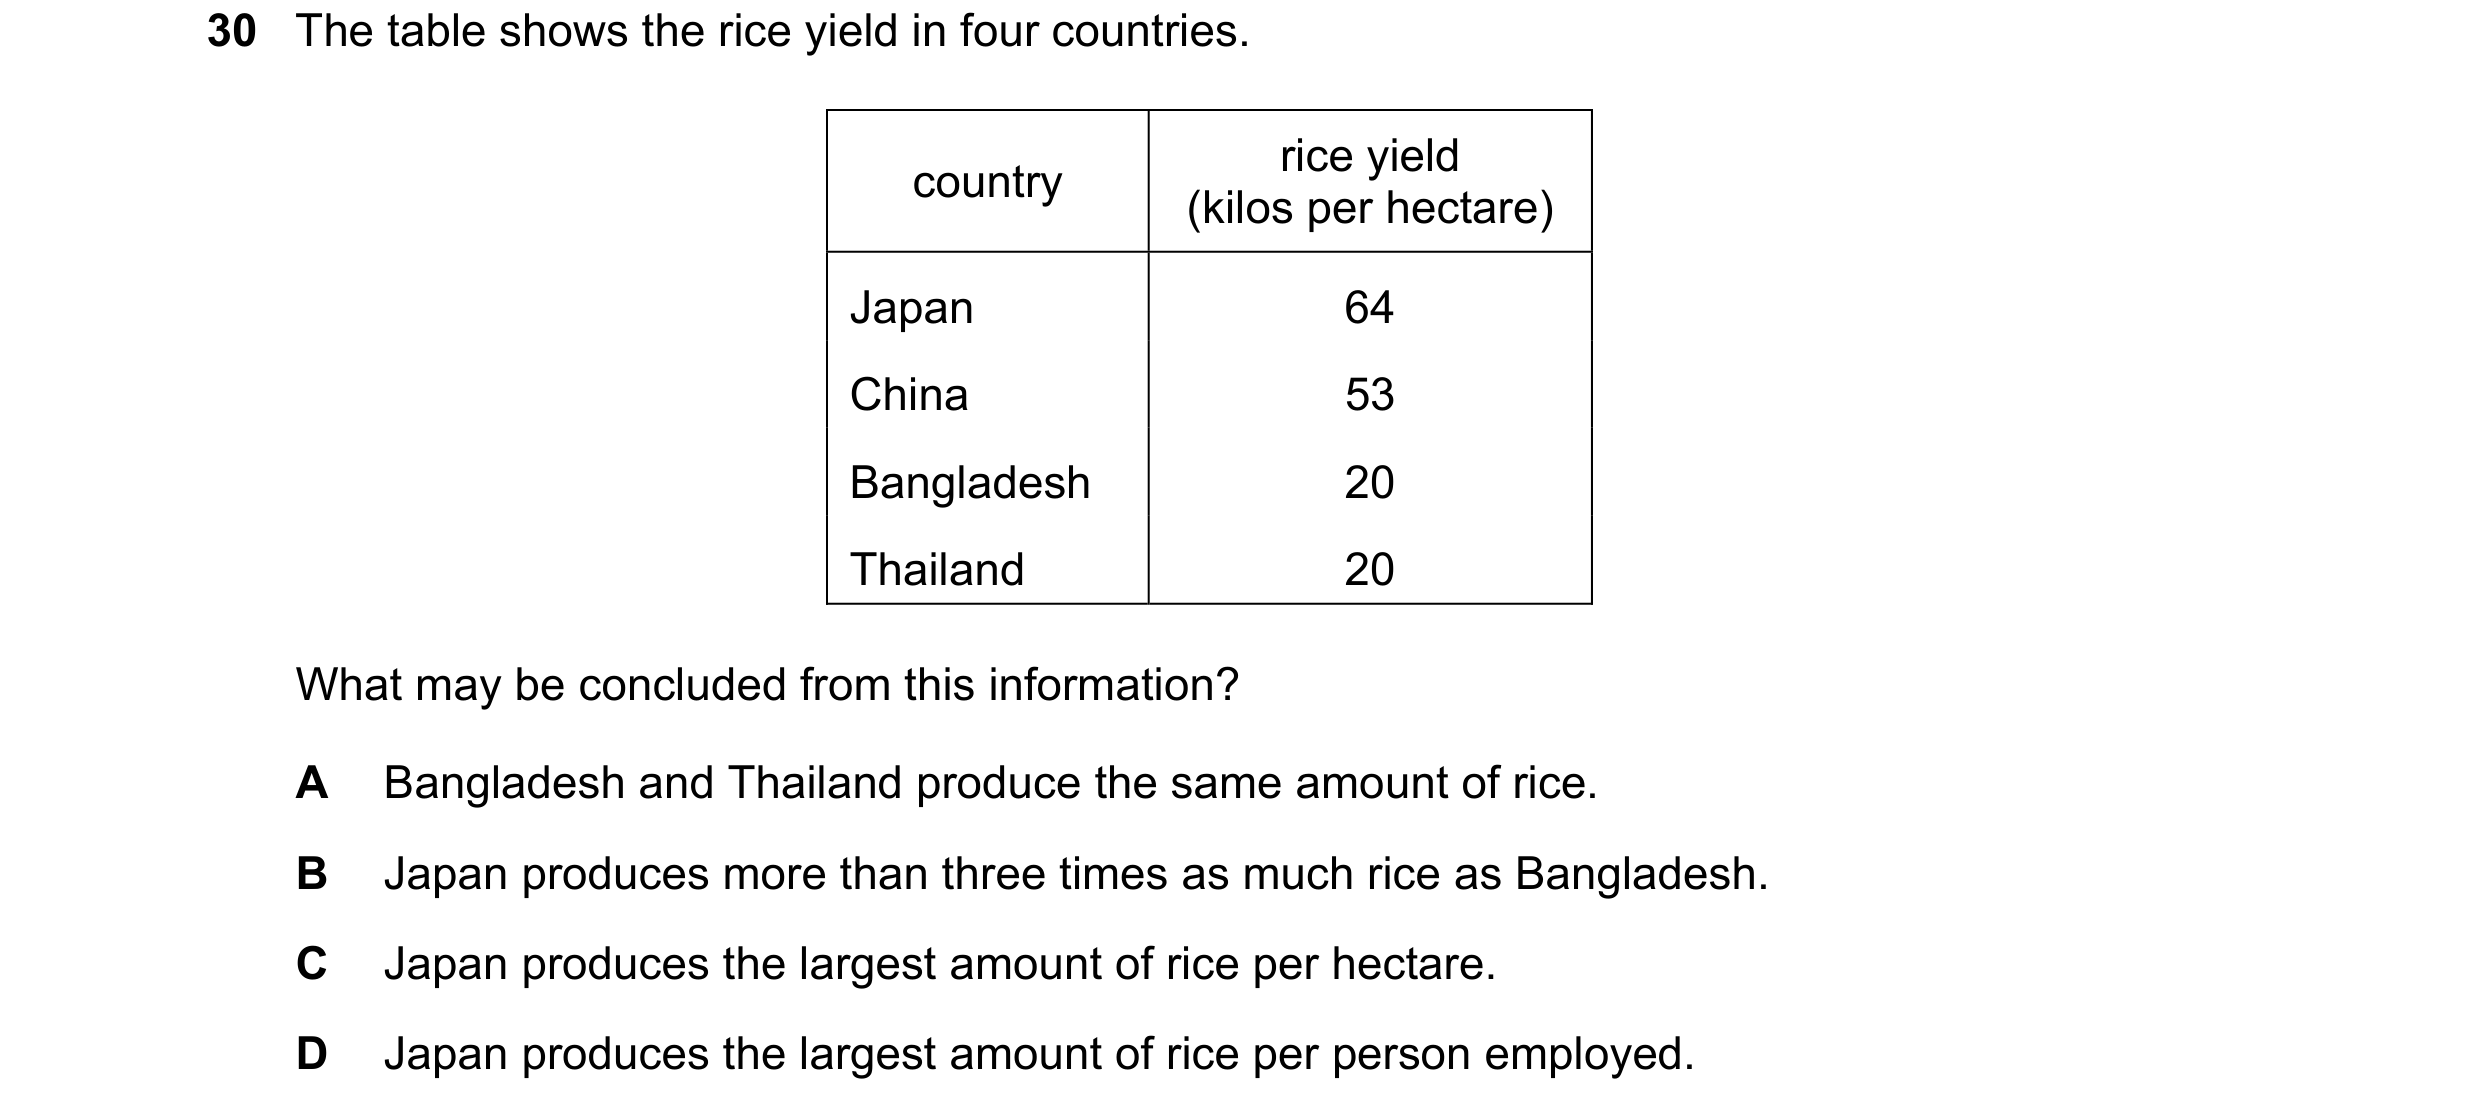
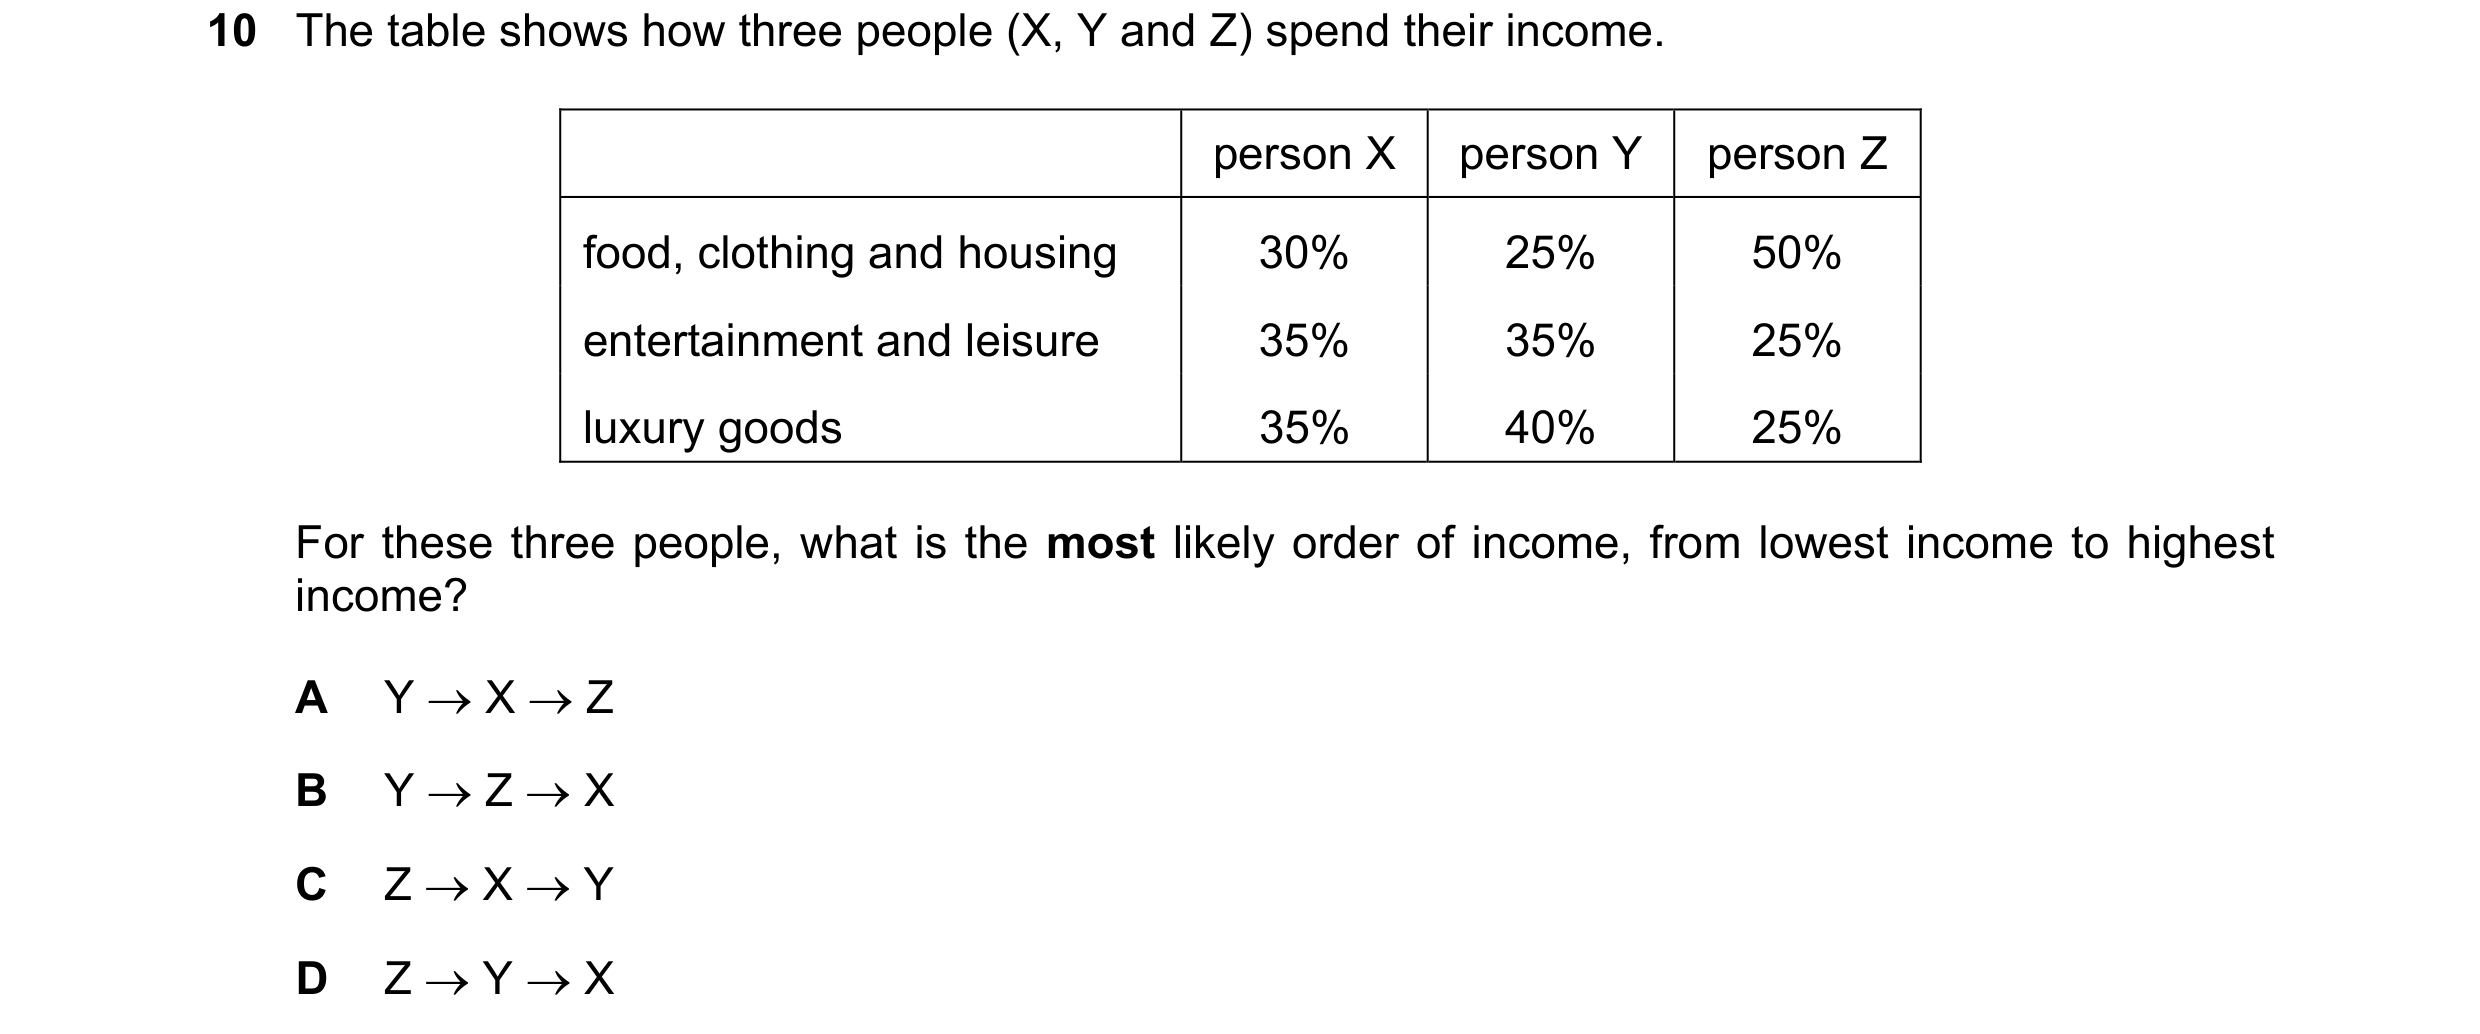 23 / 40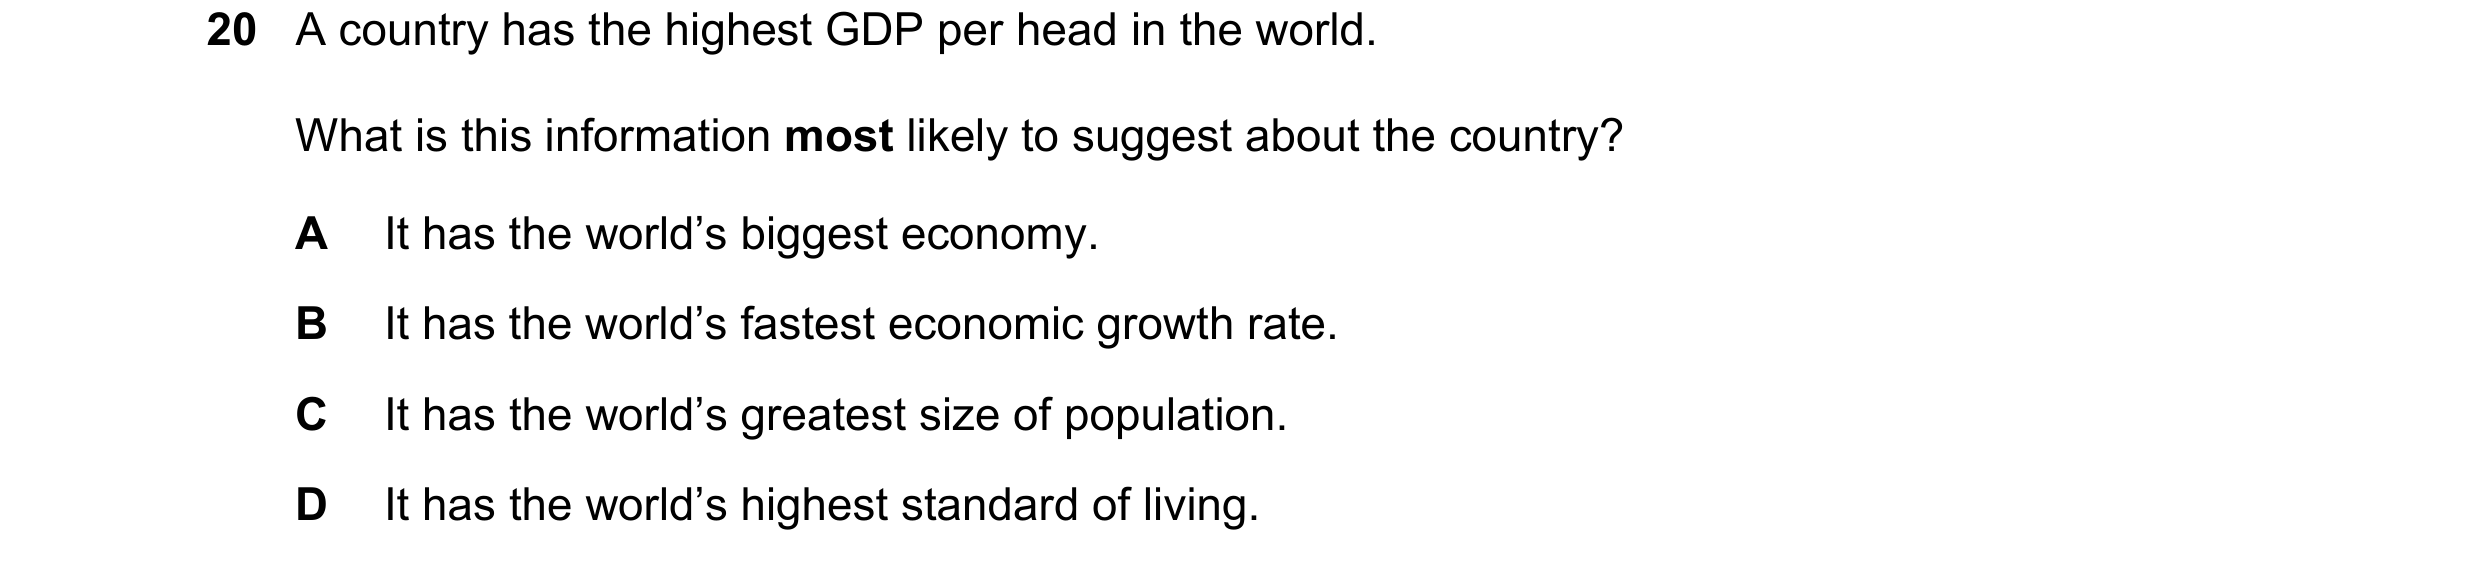
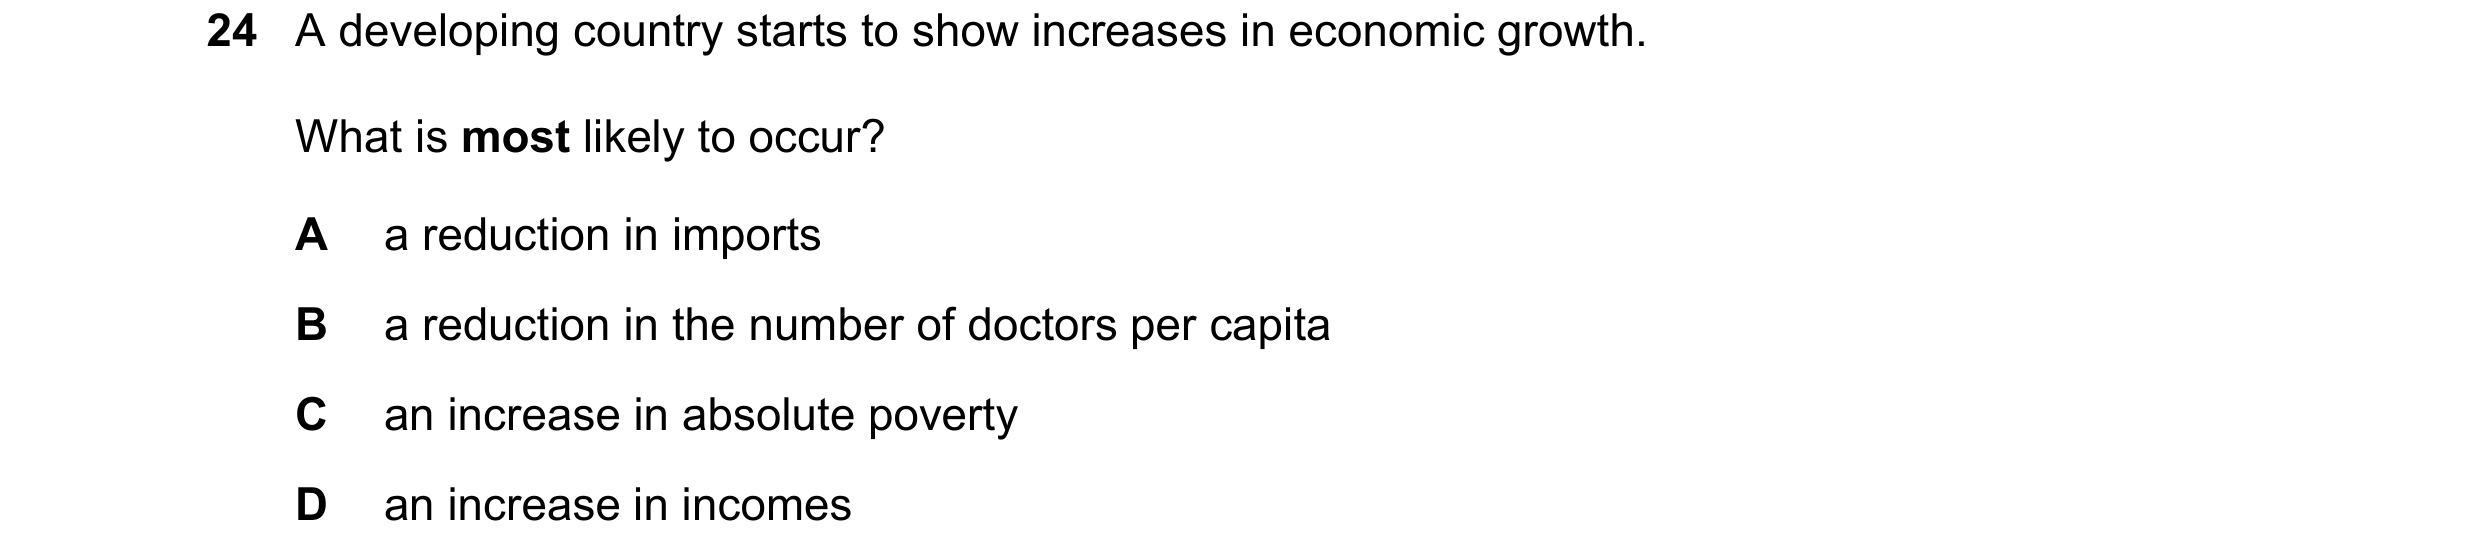

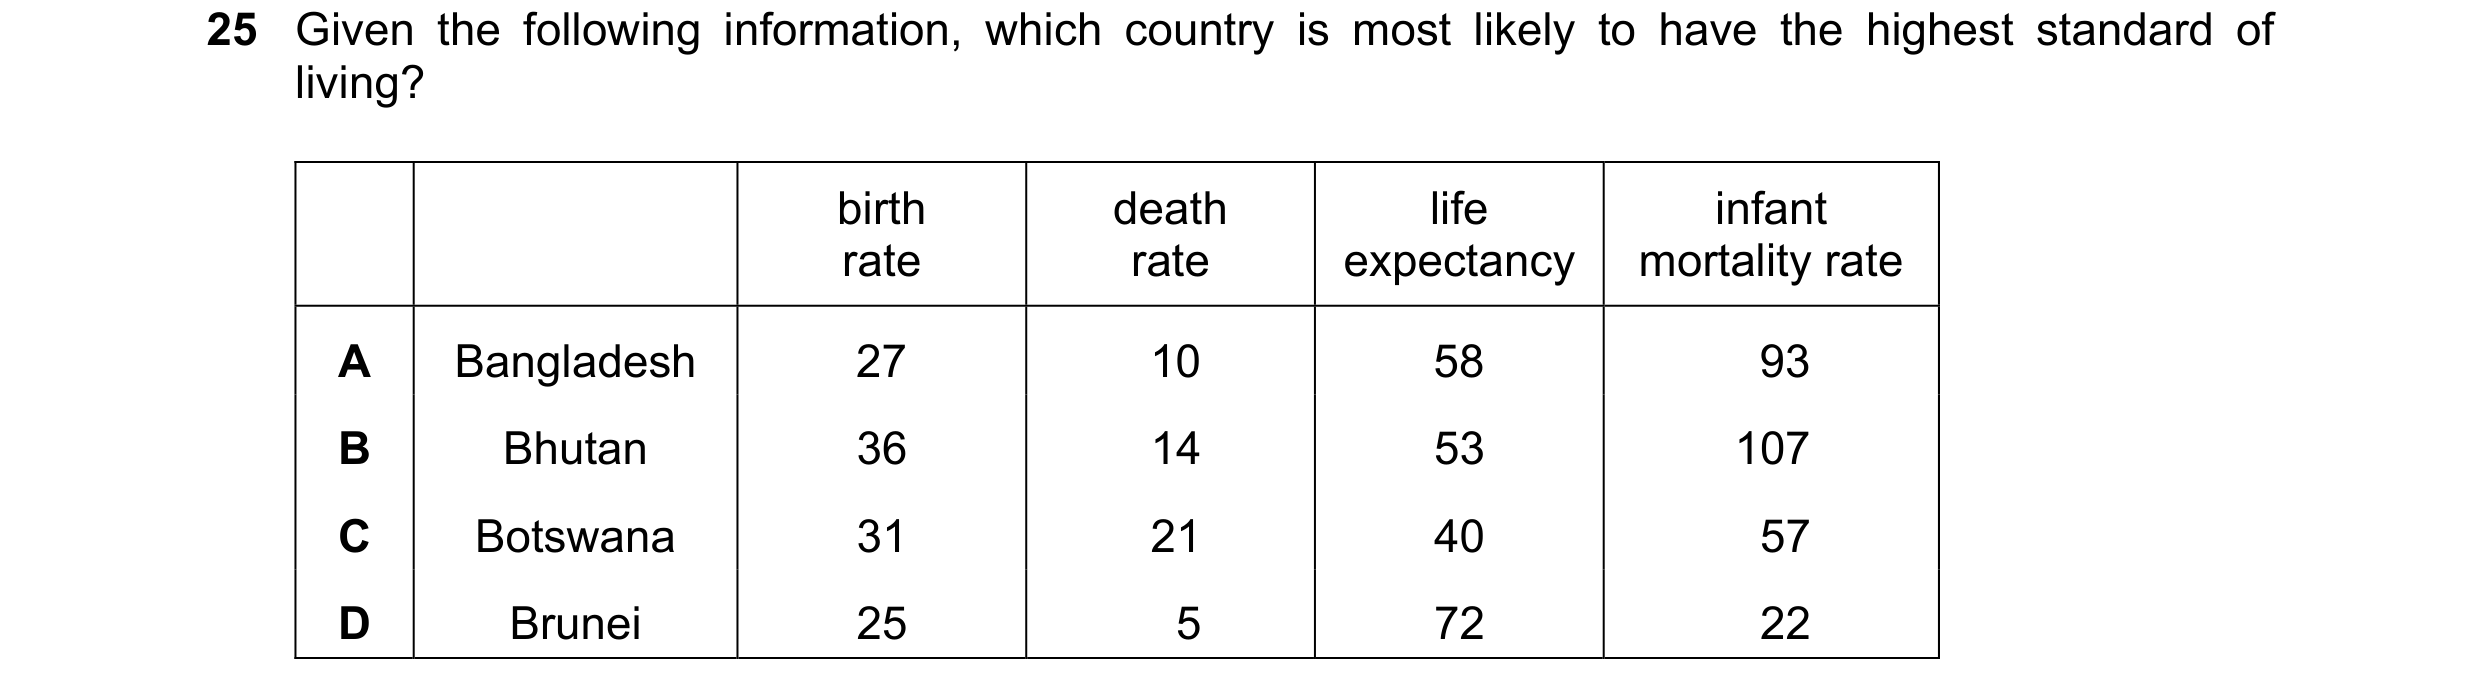
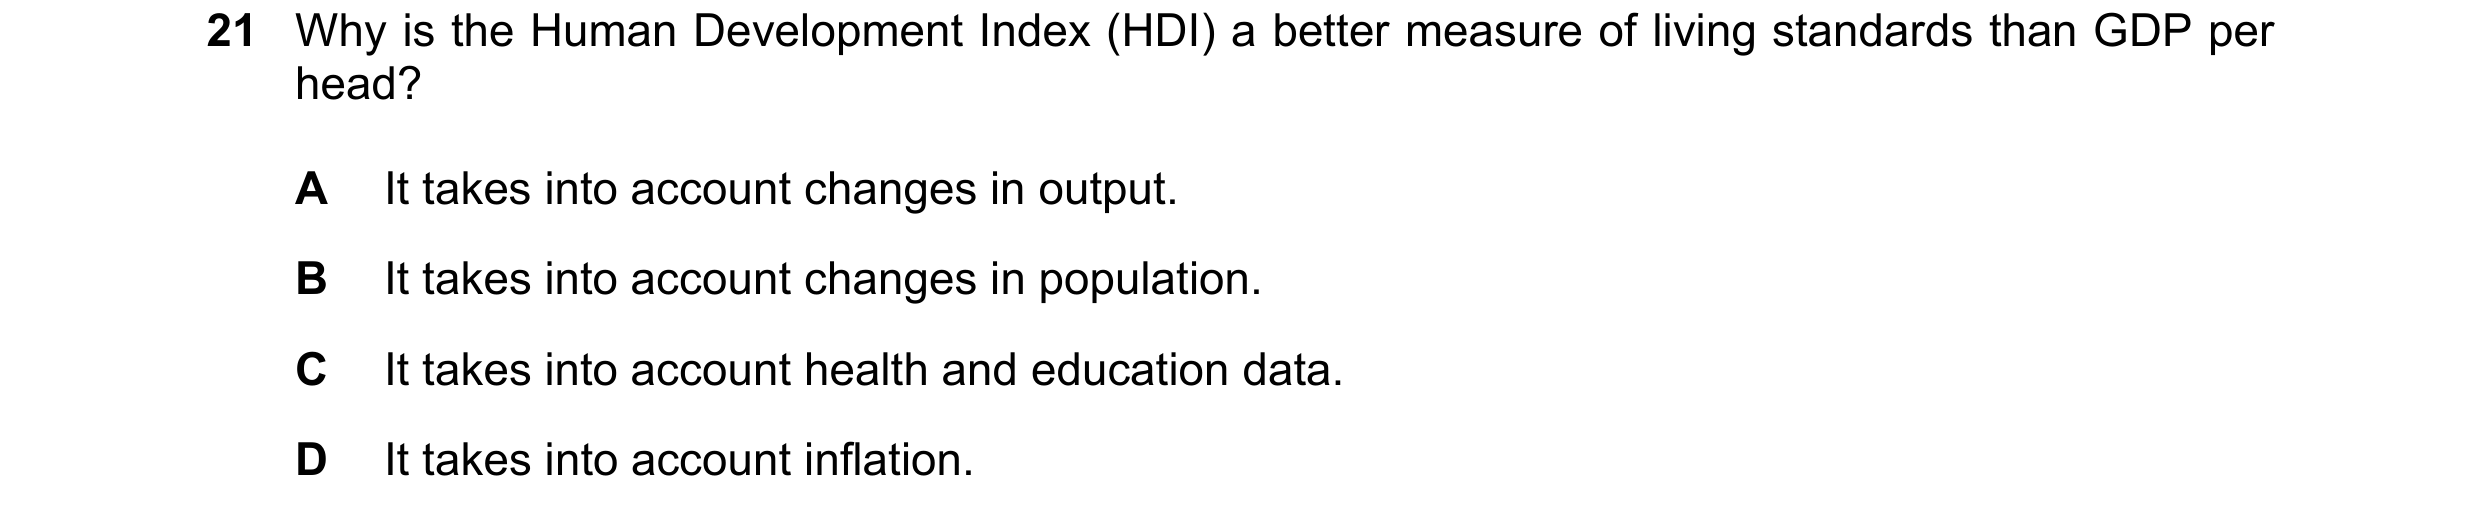 24 / 40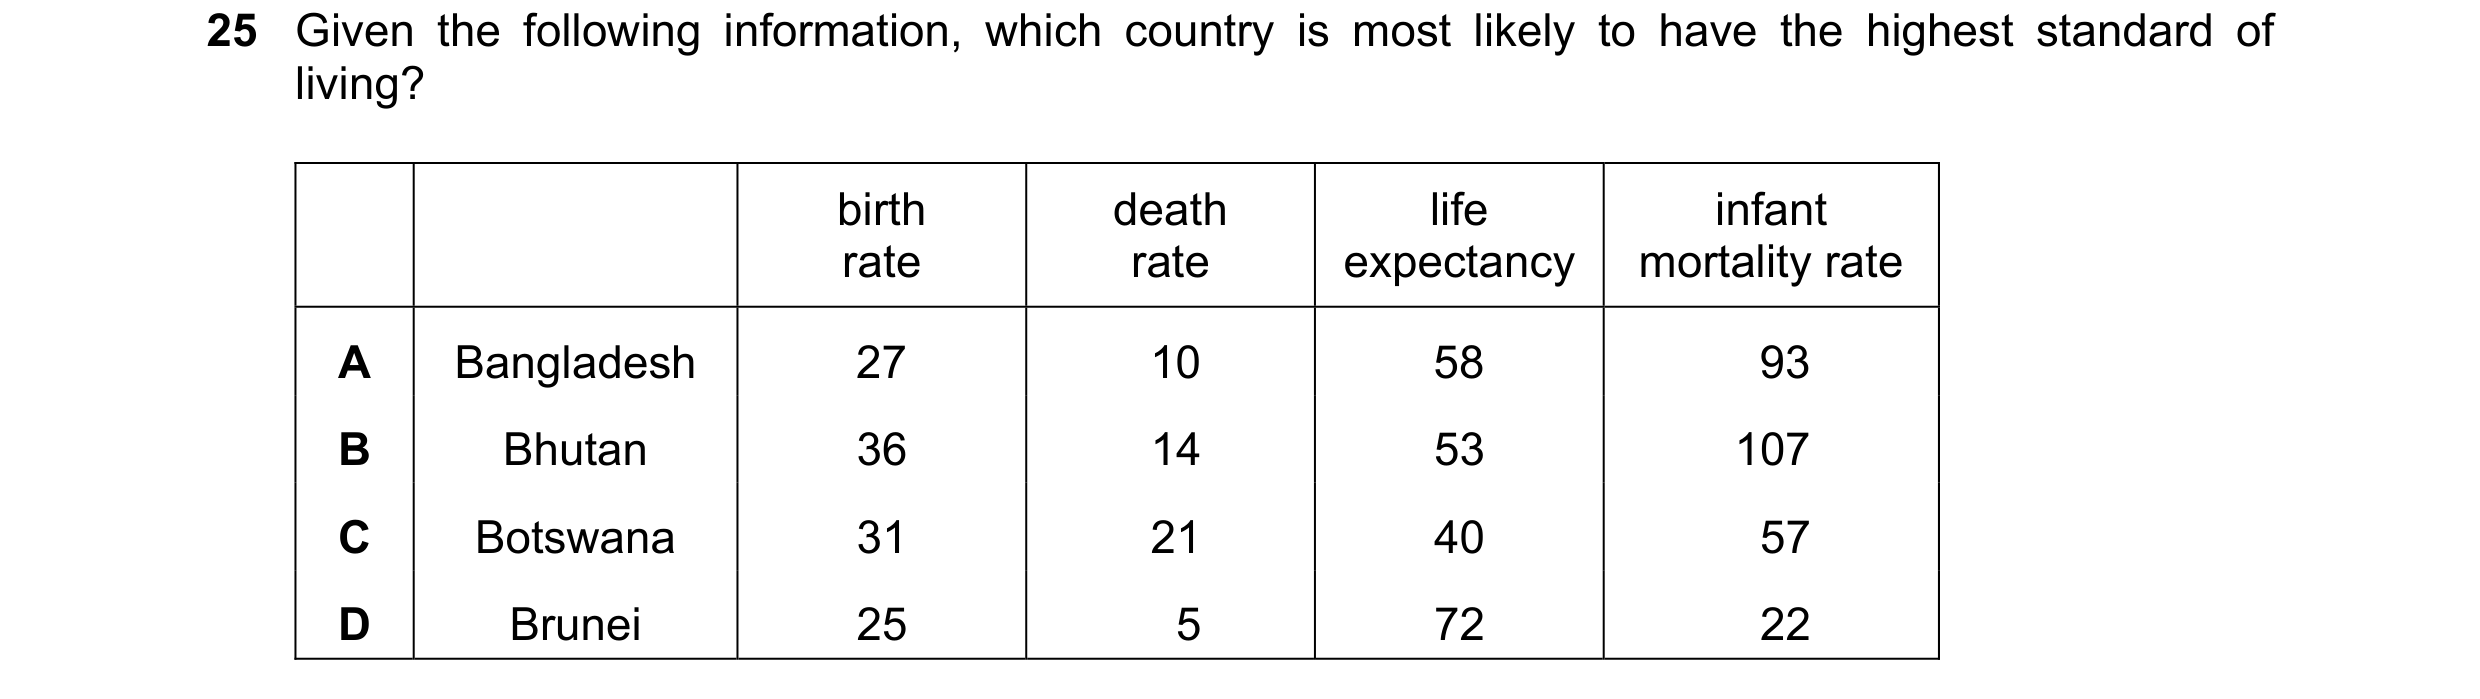
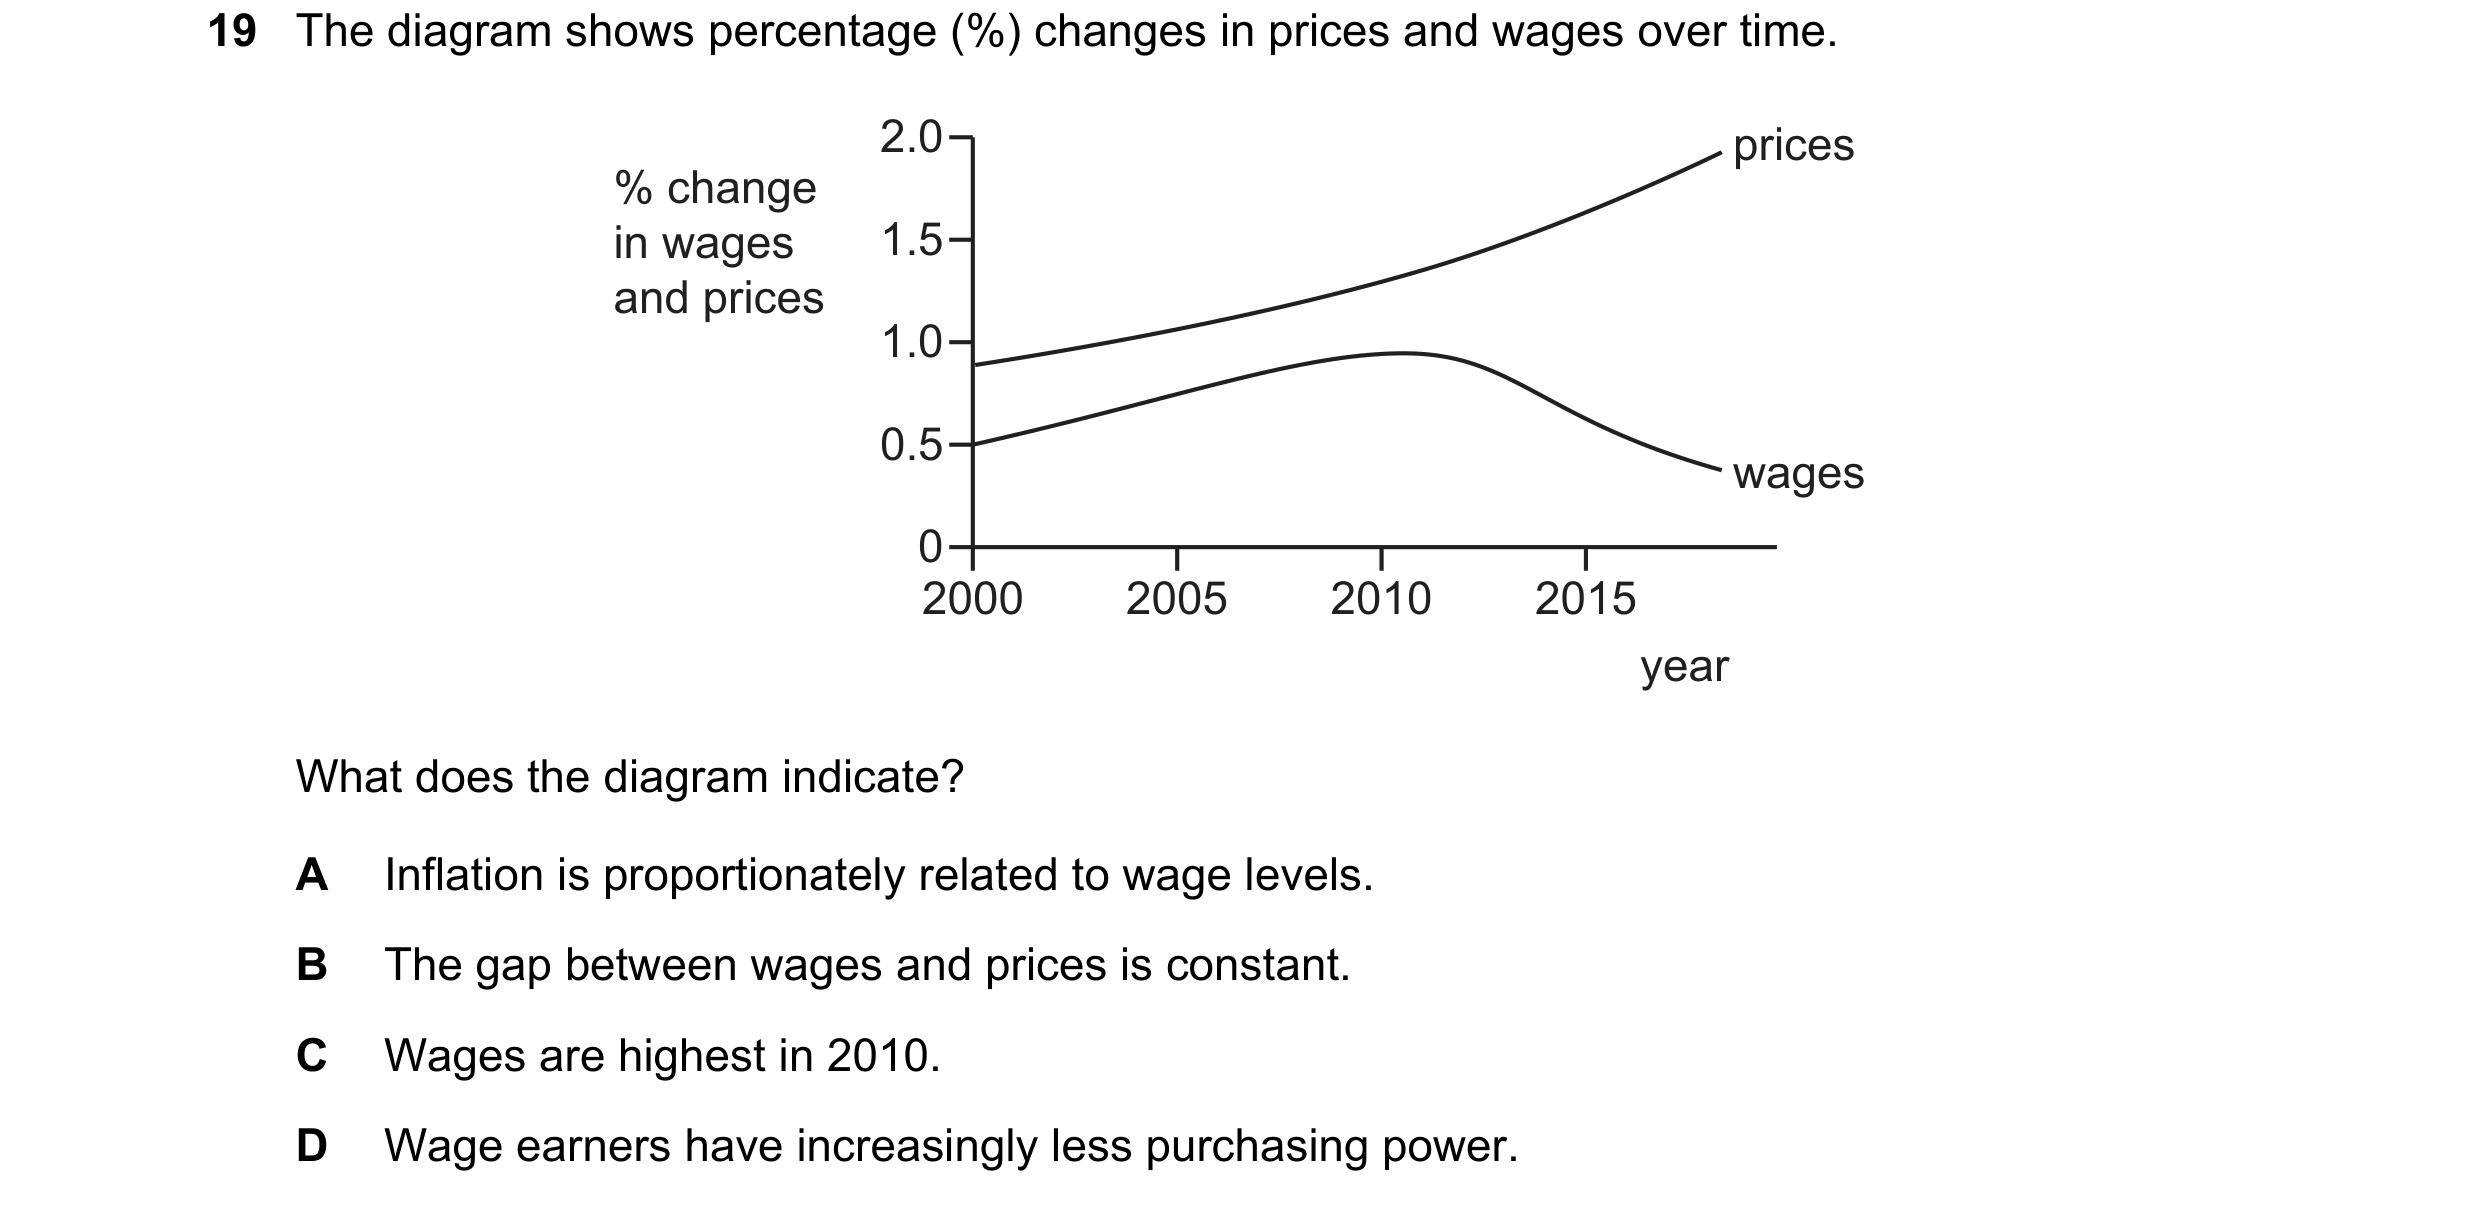

 25 / 40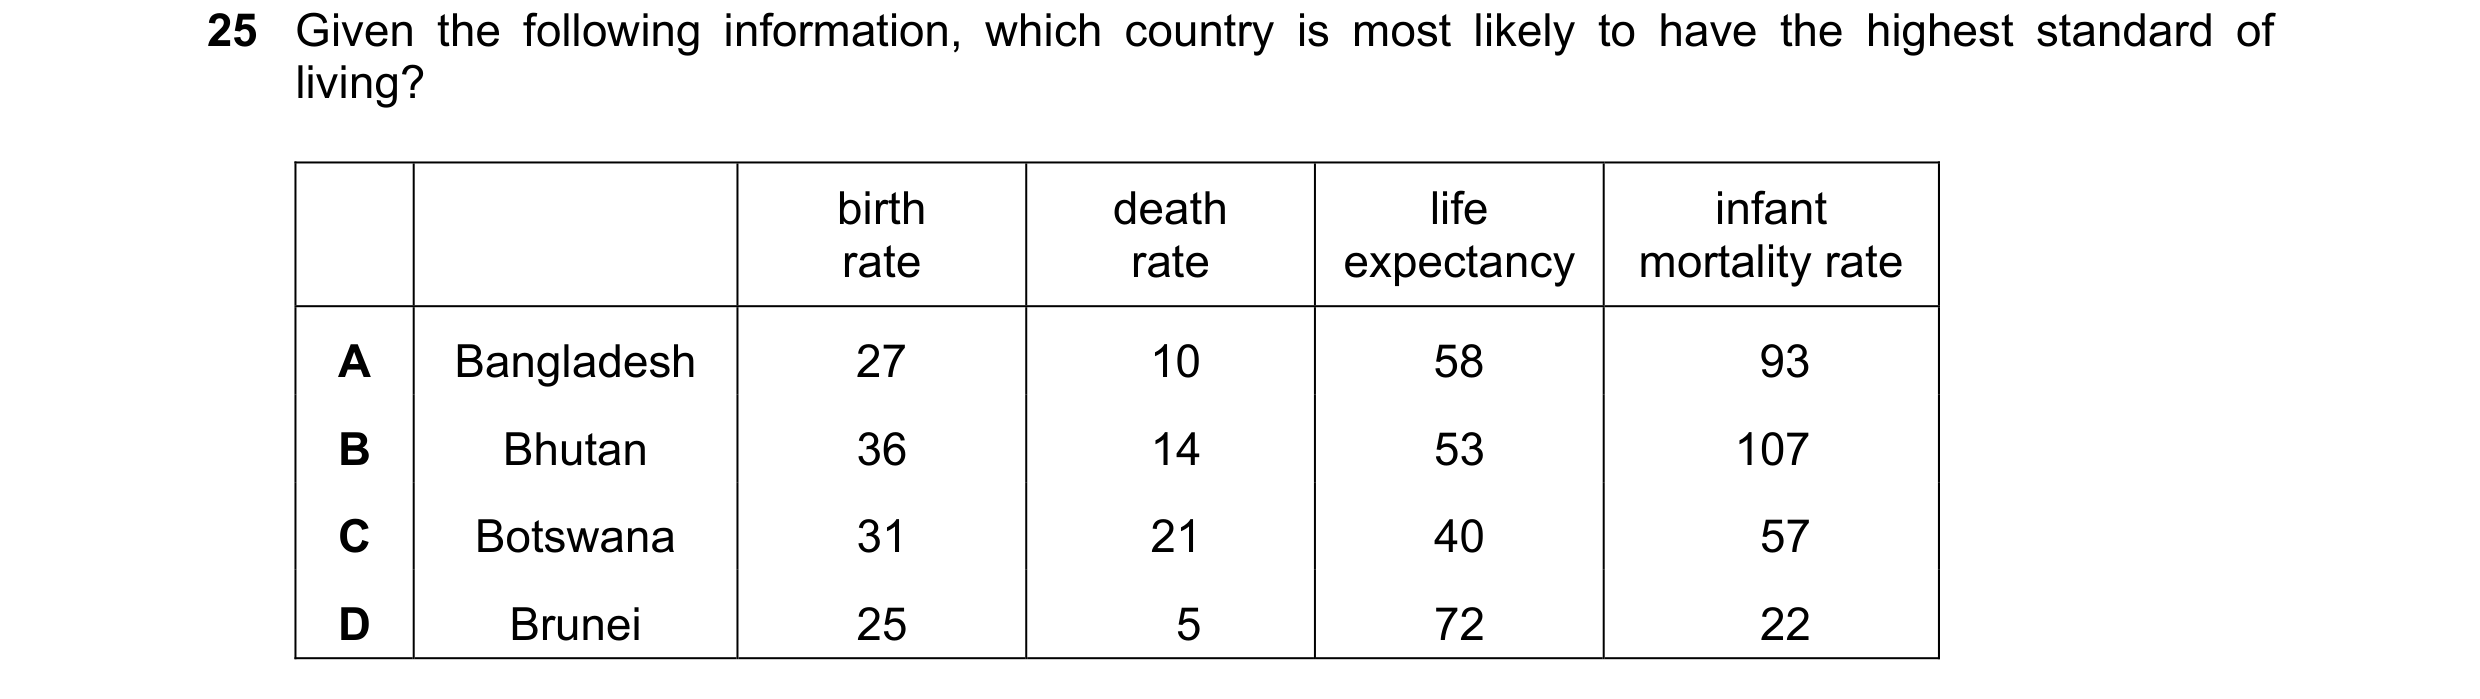
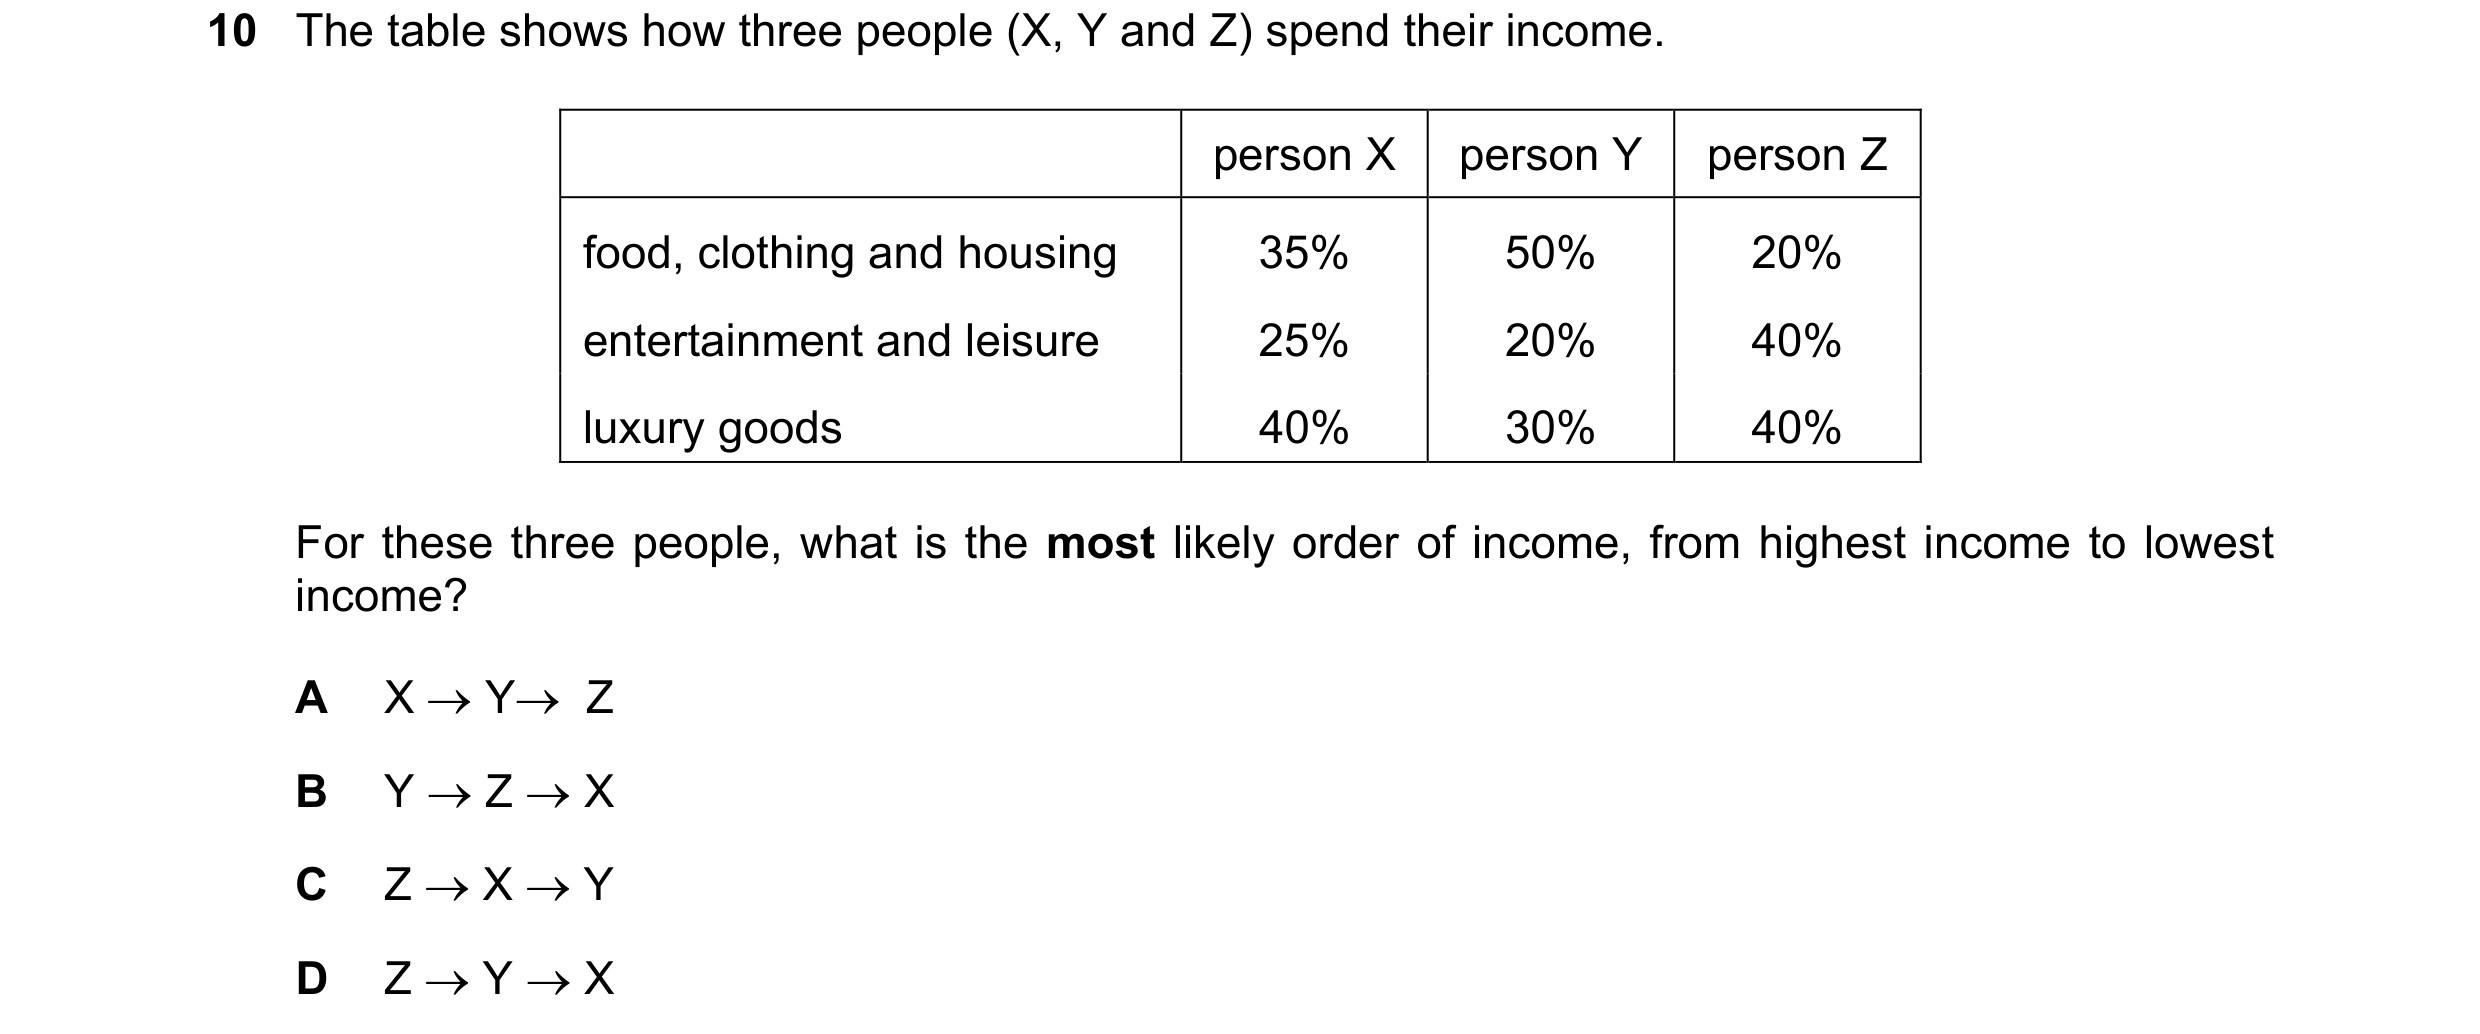

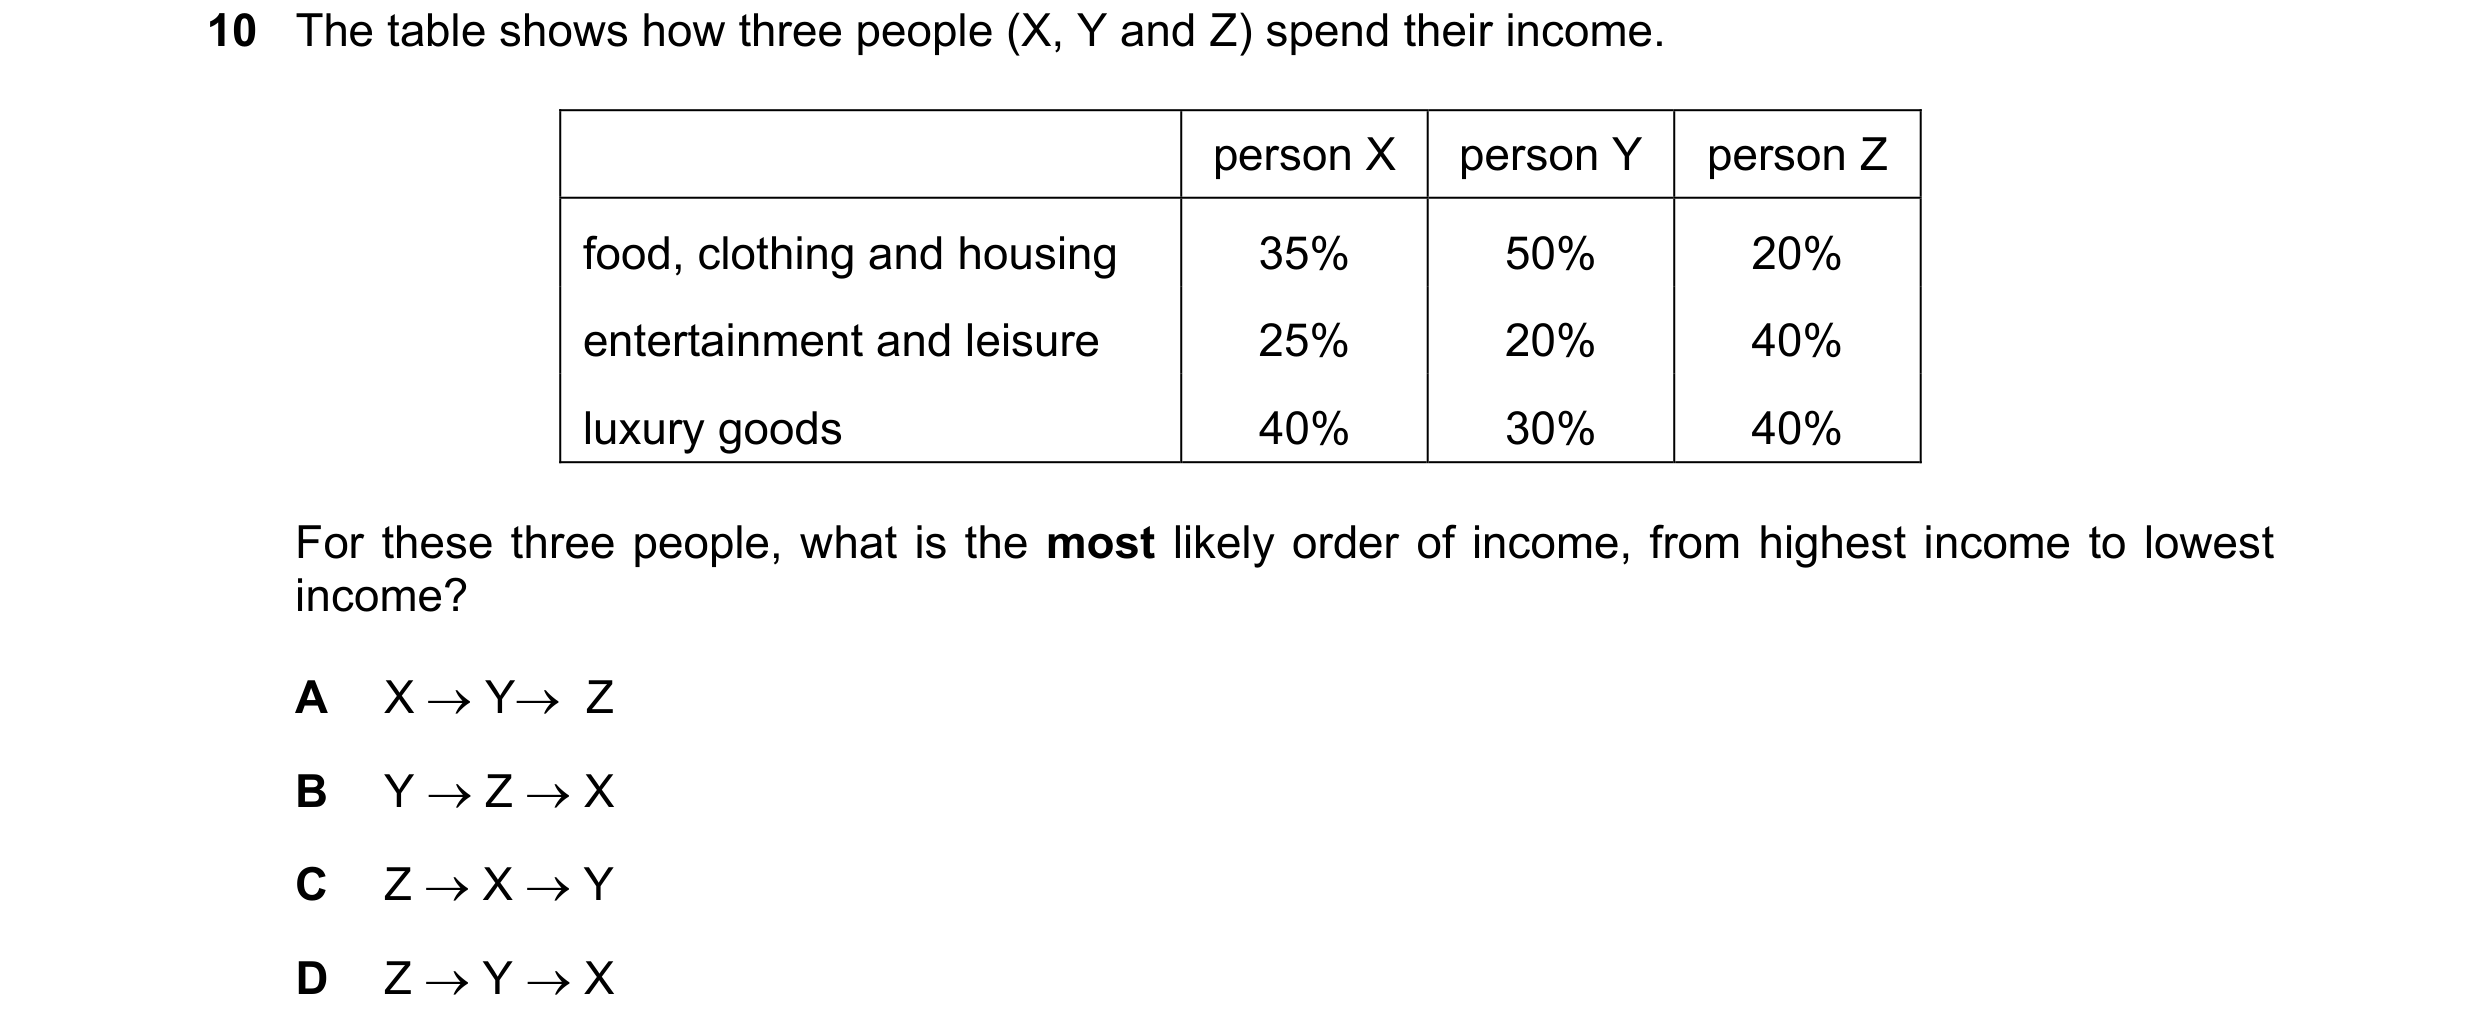 26 / 40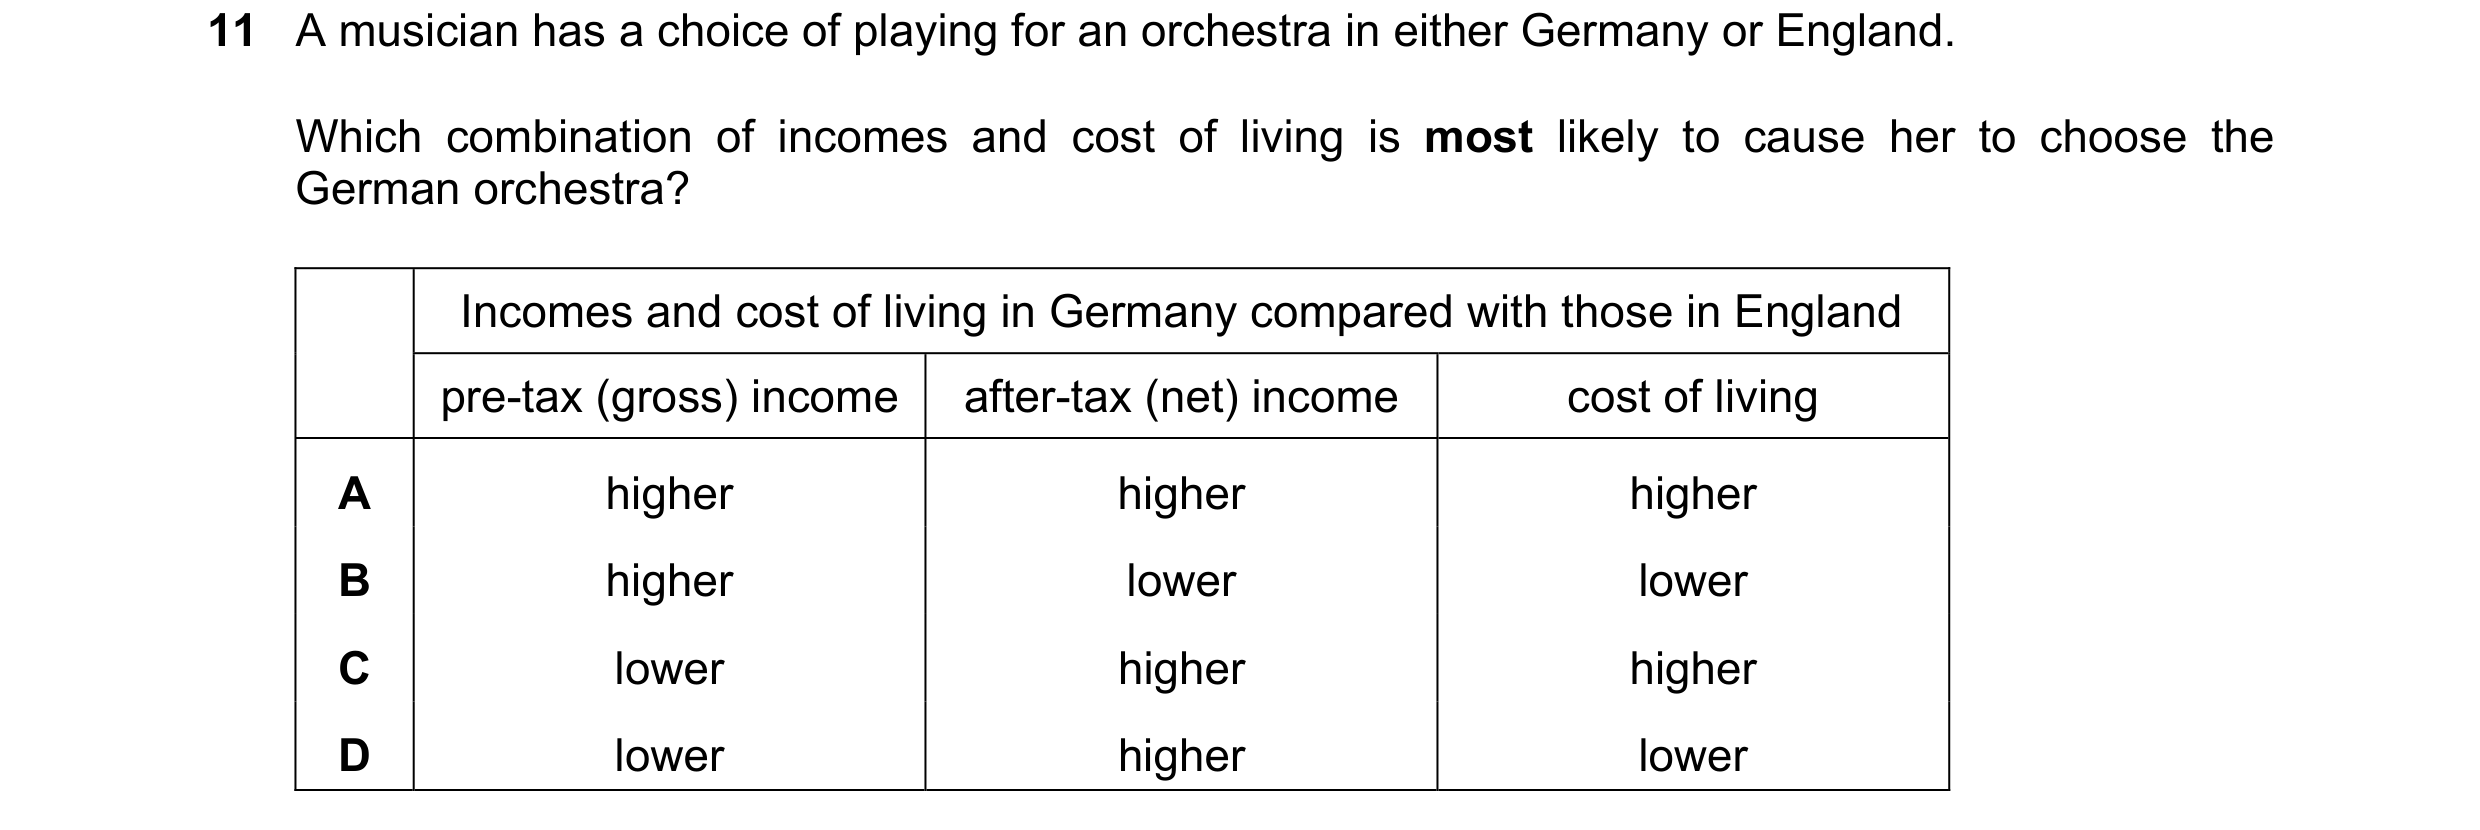
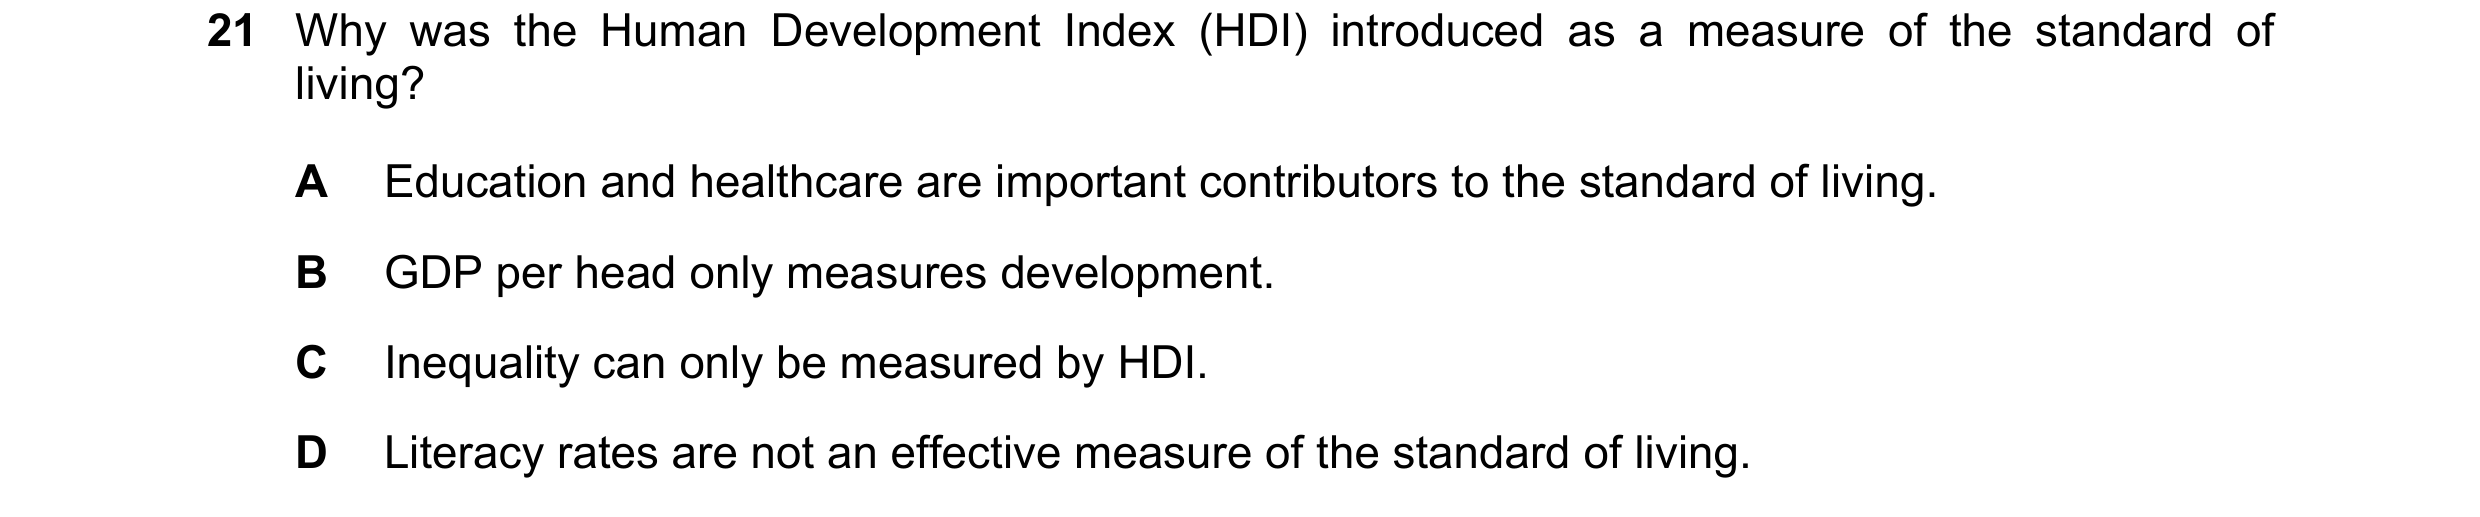

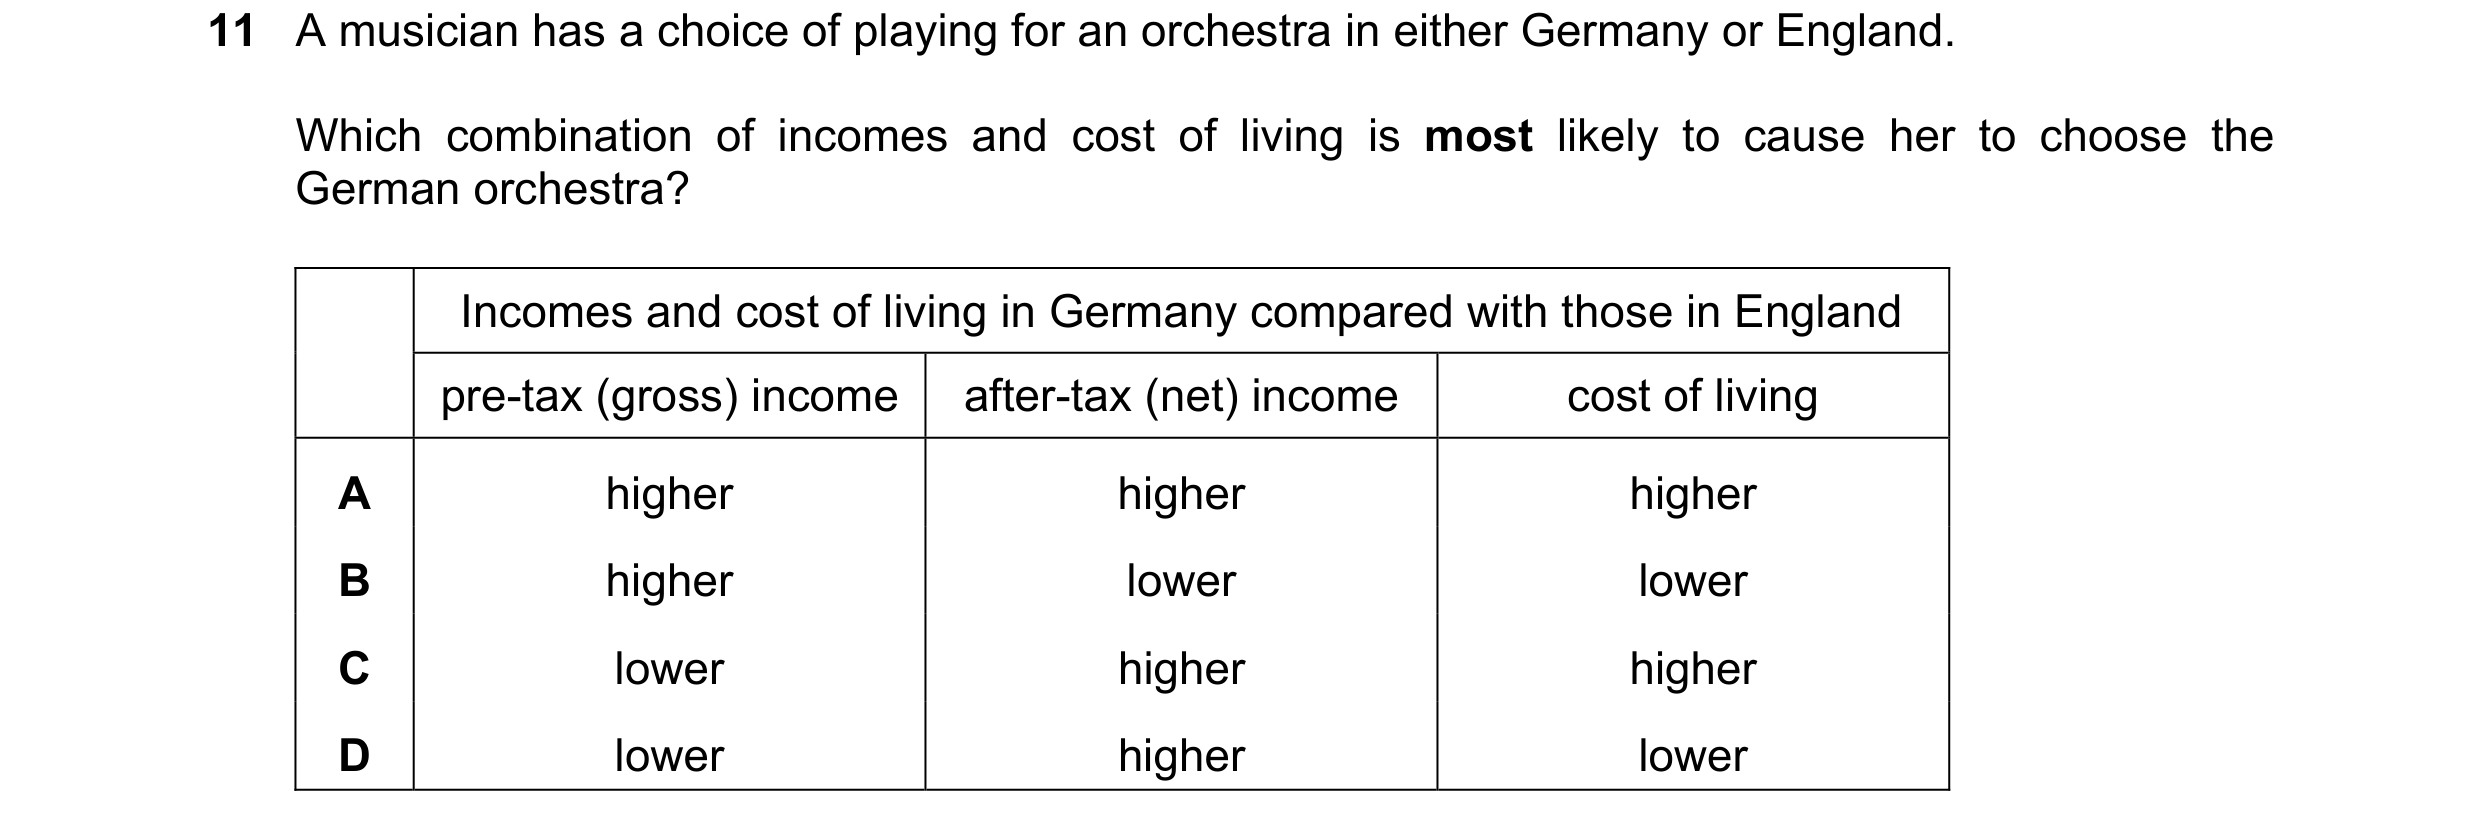
 27 / 40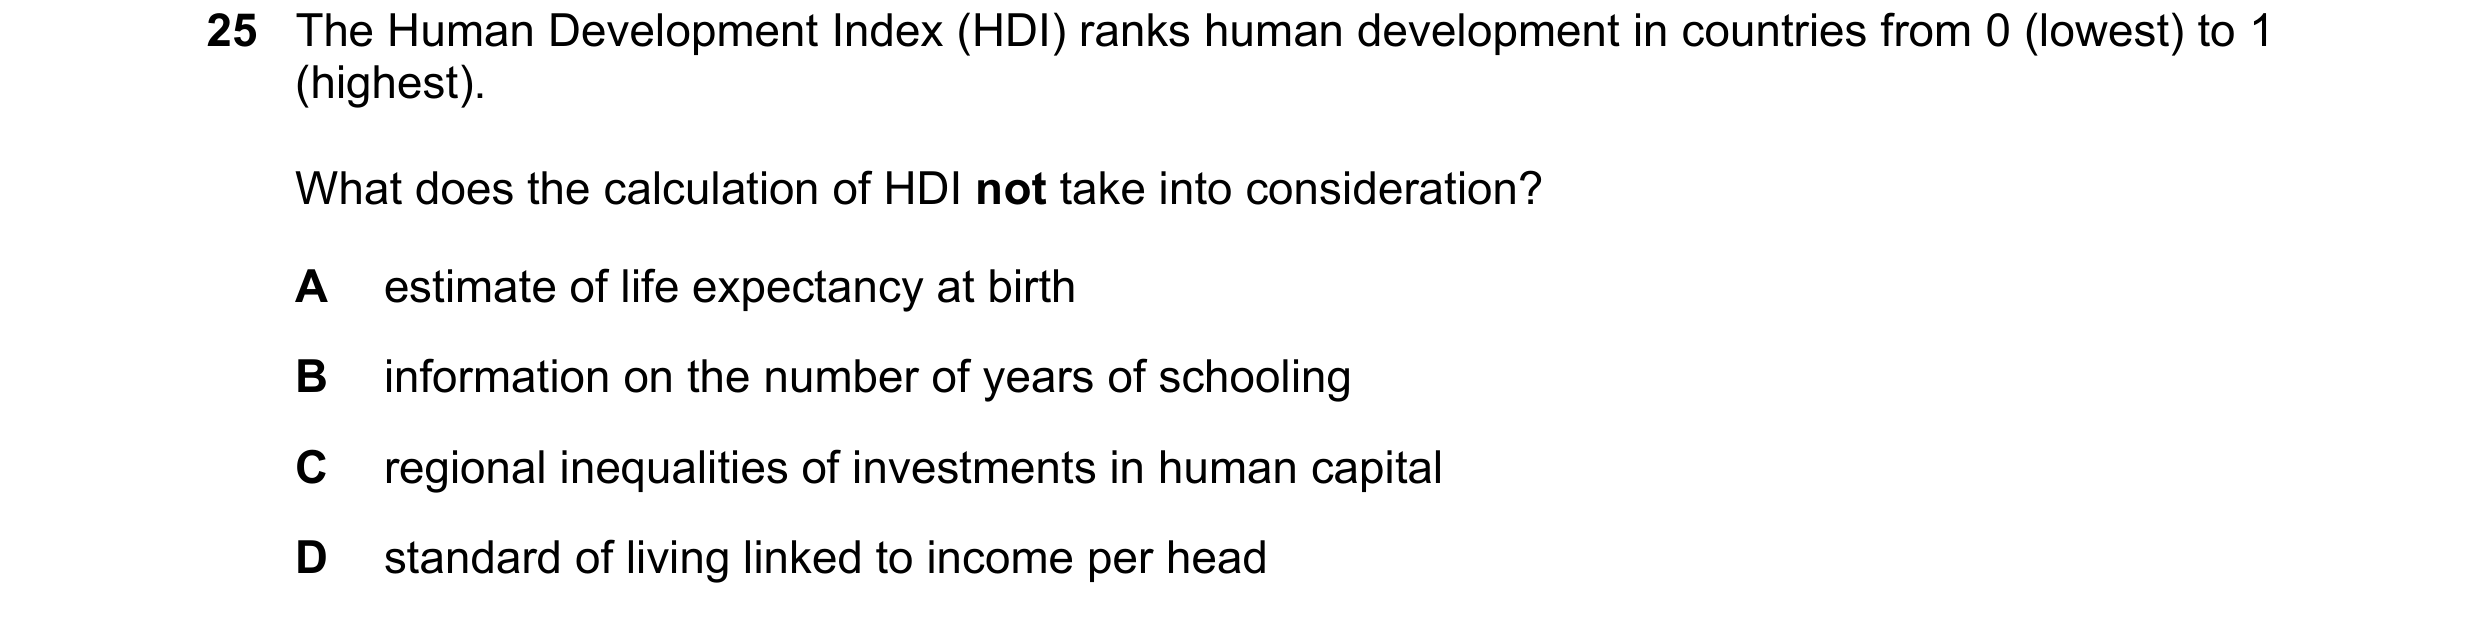
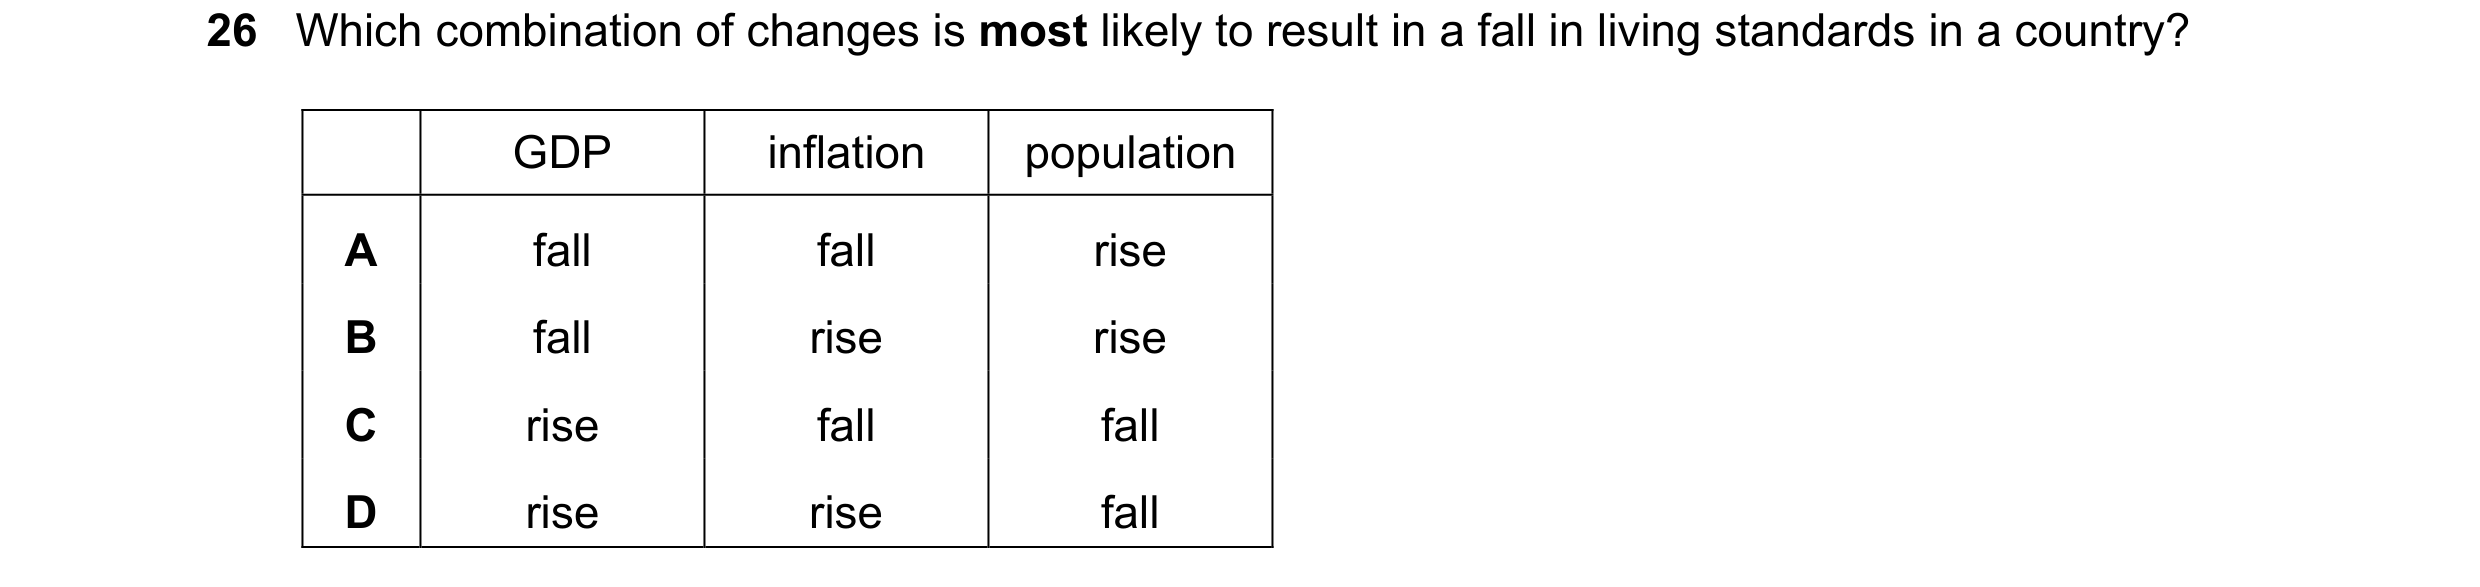
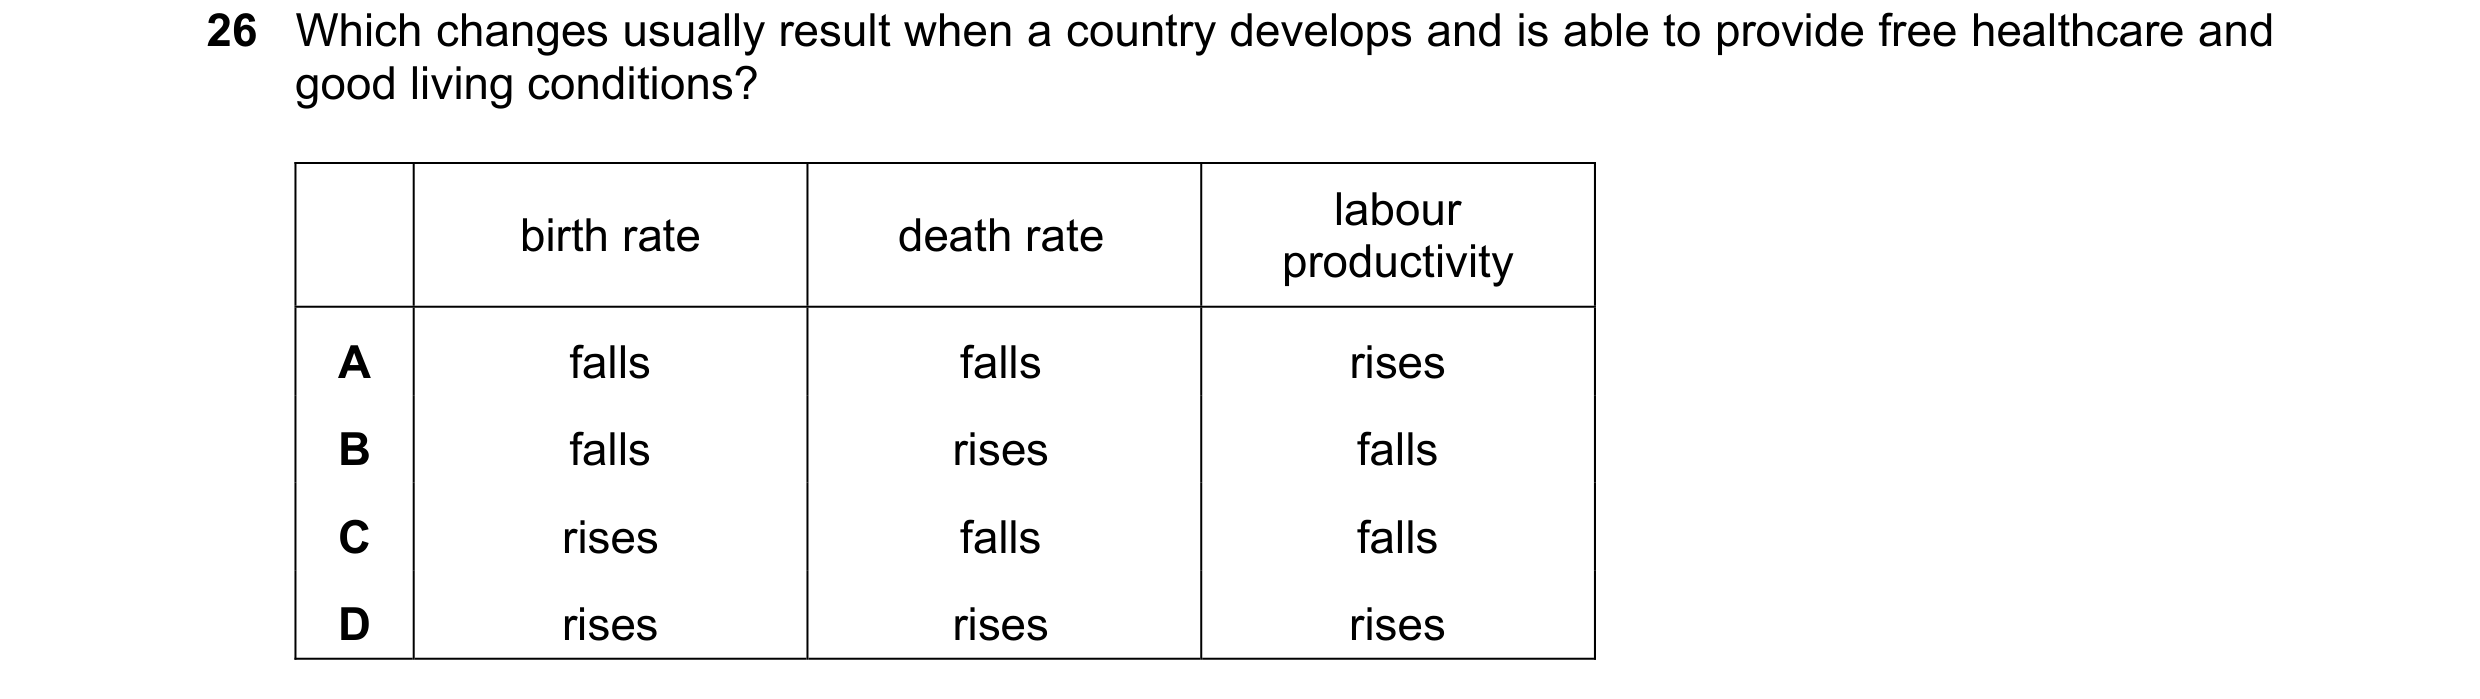
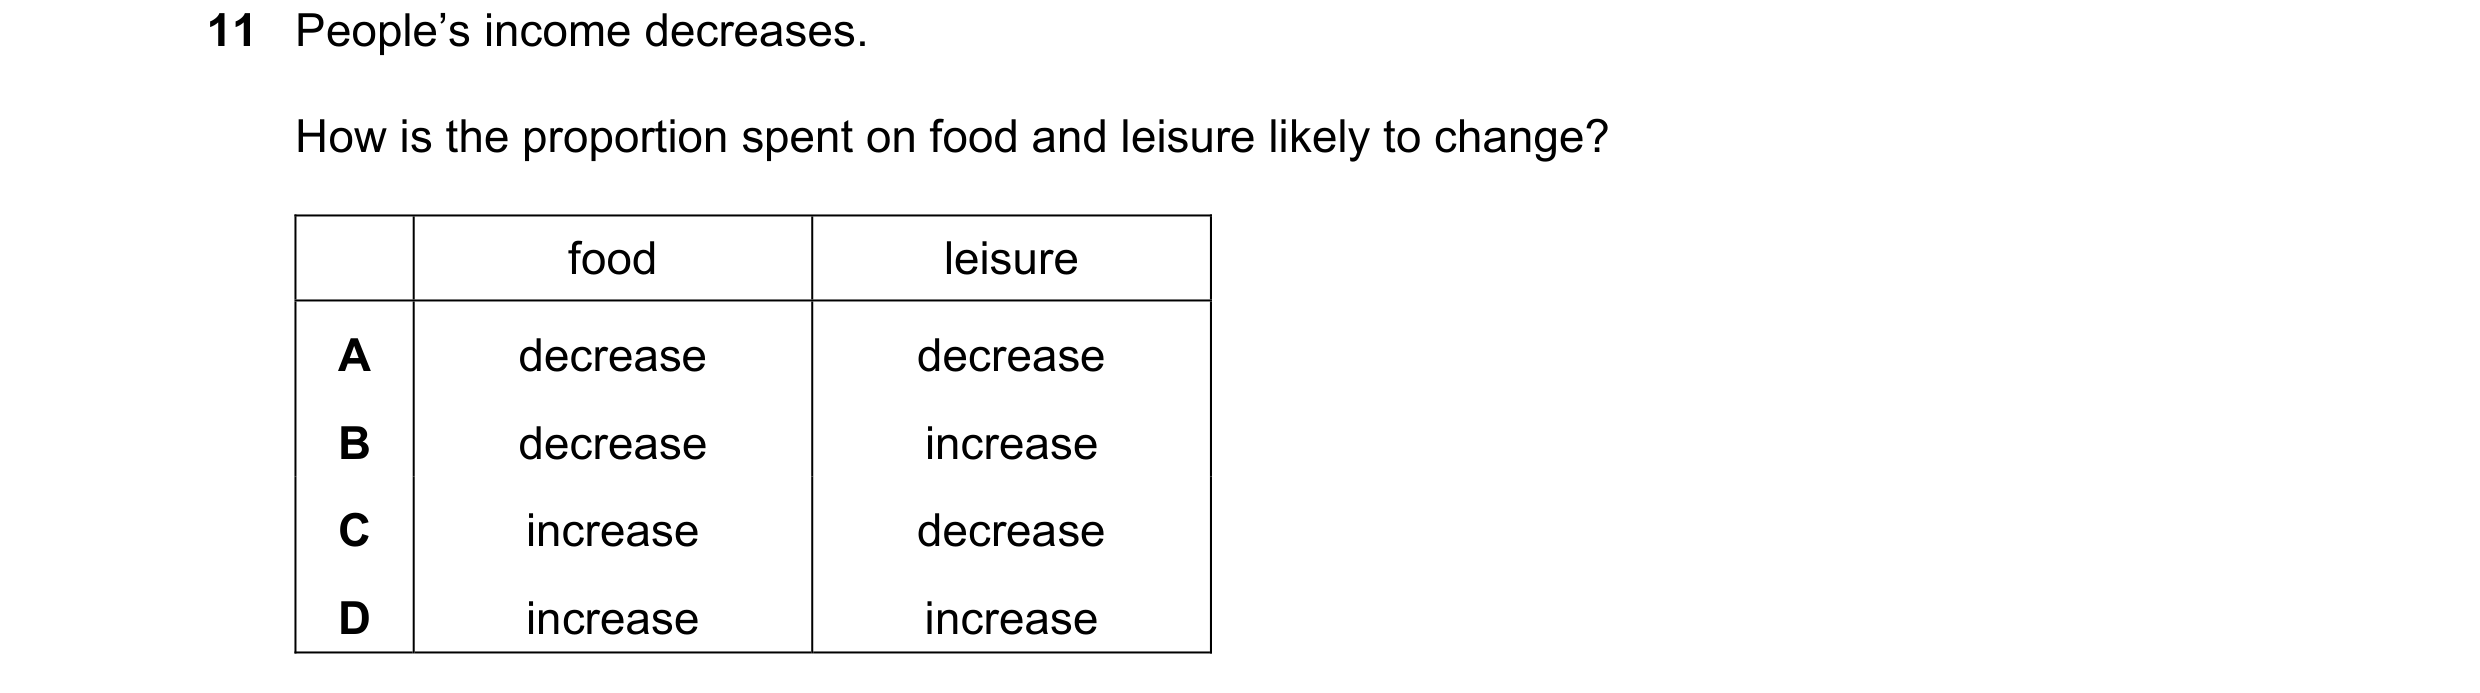 28 / 40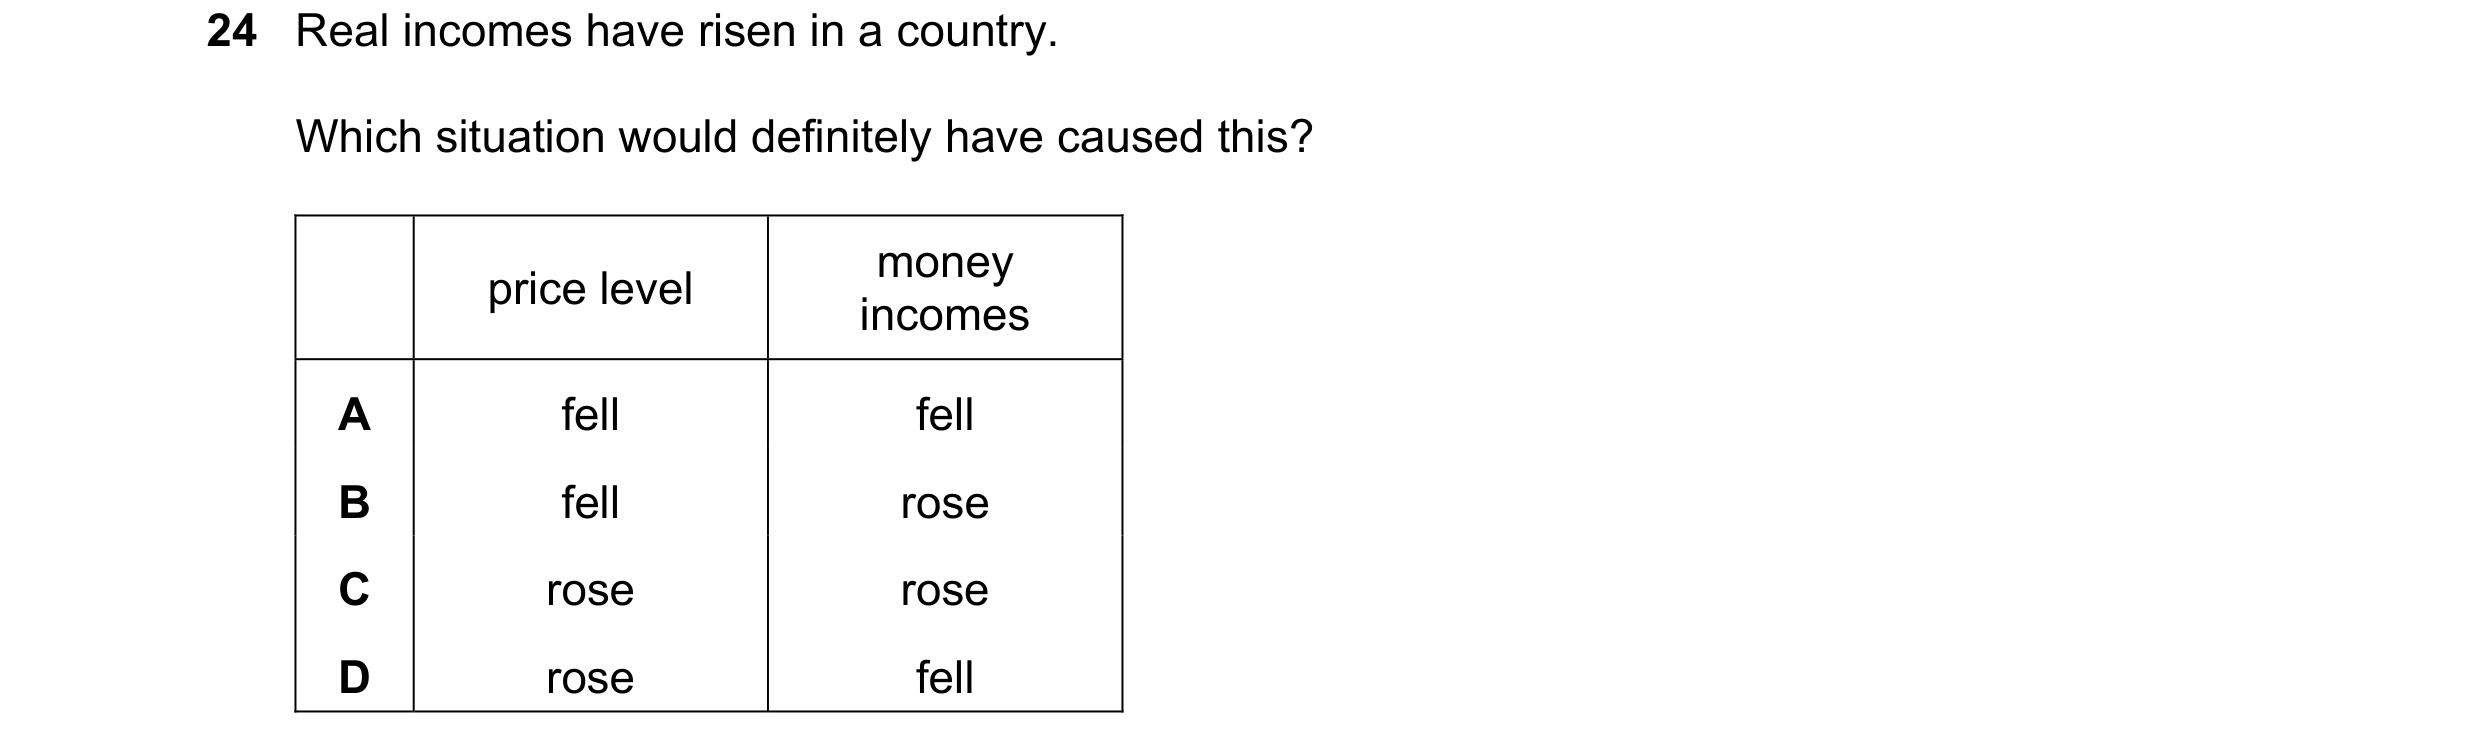
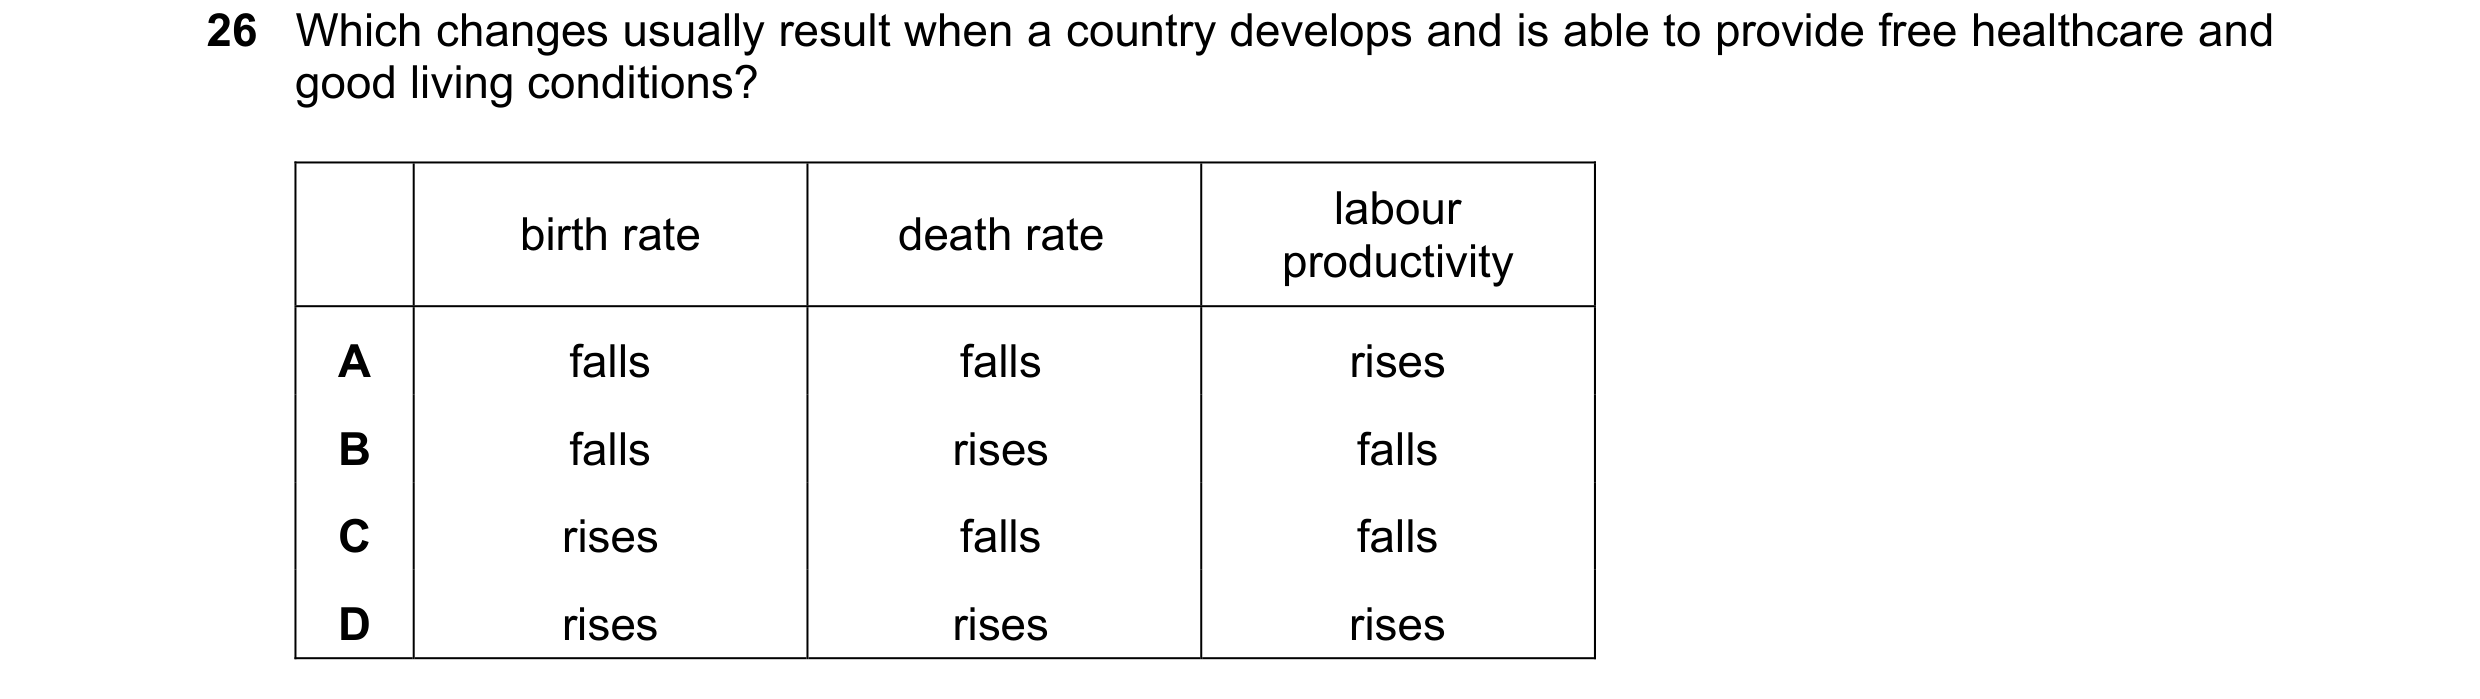
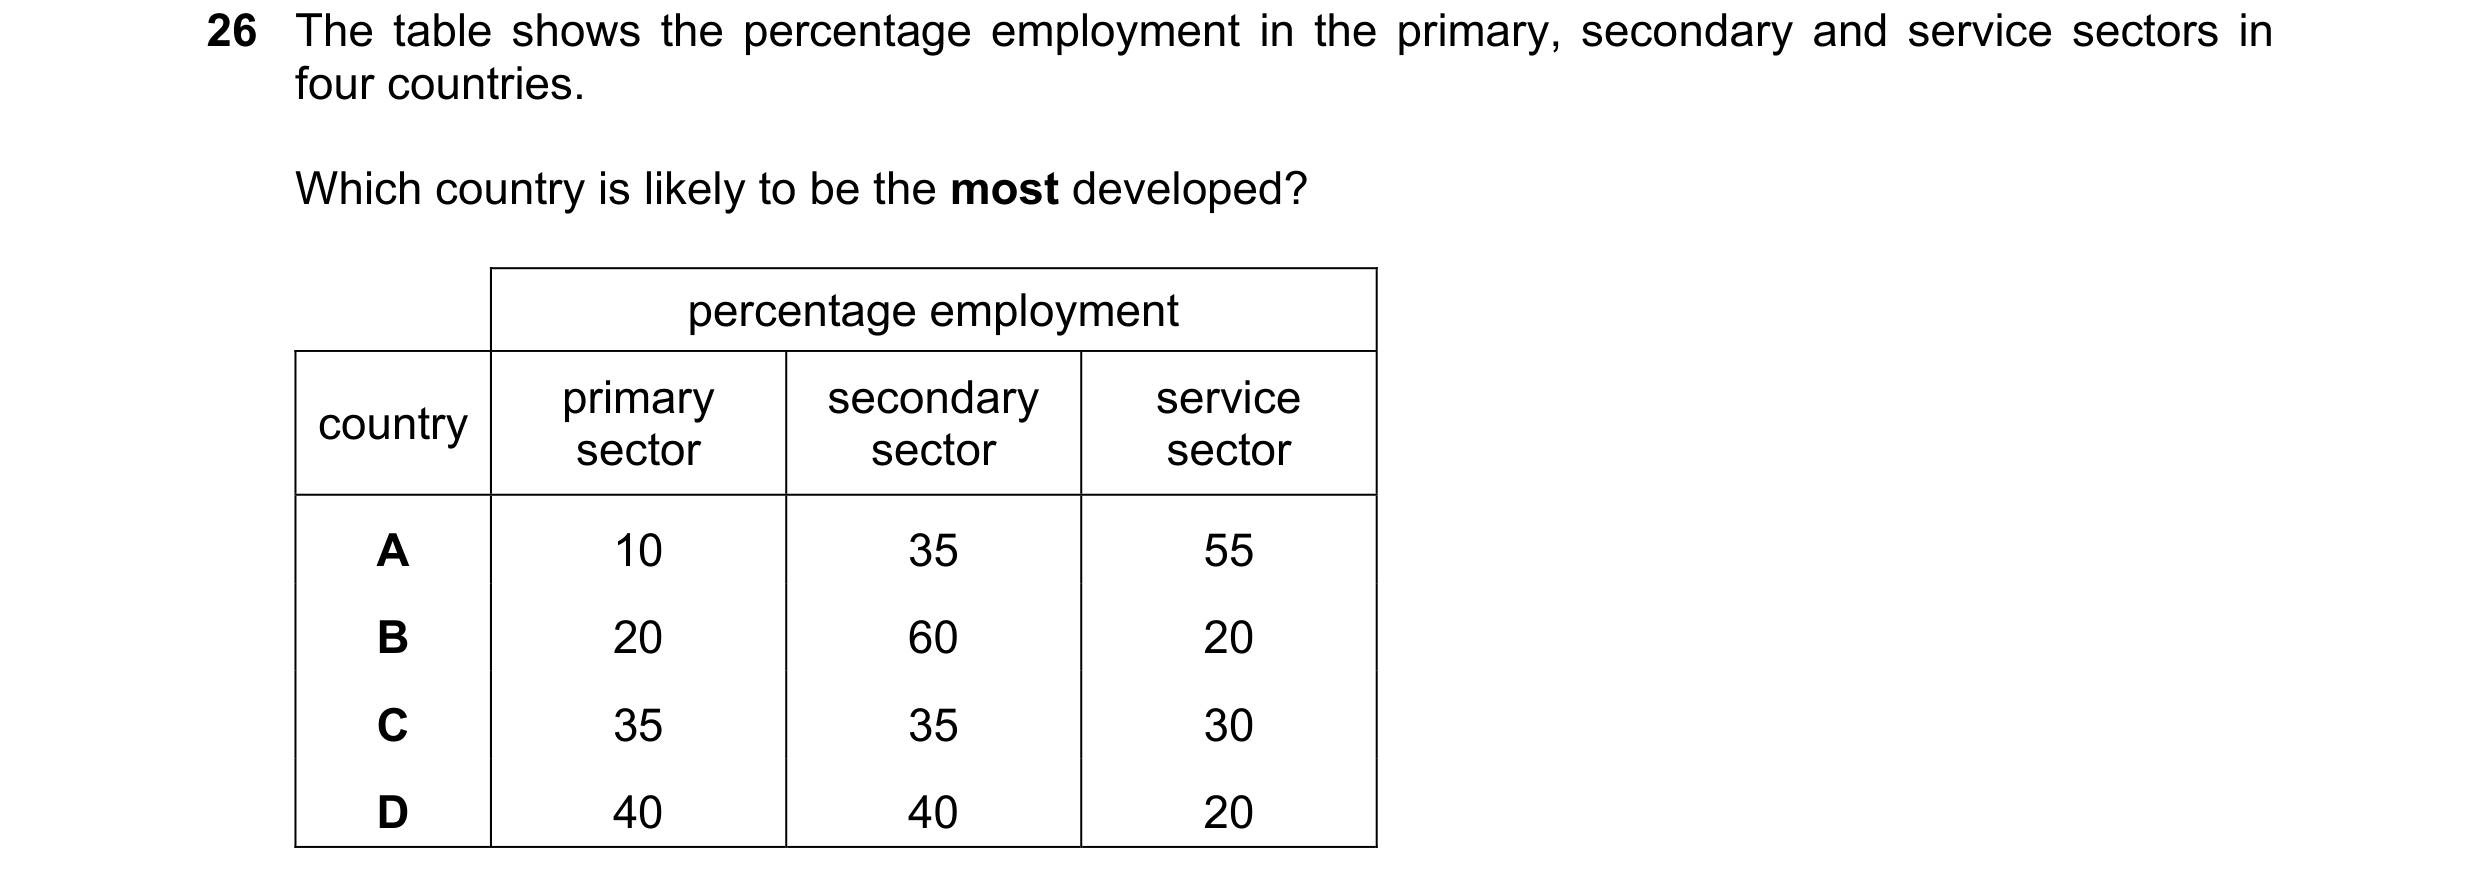 29 / 40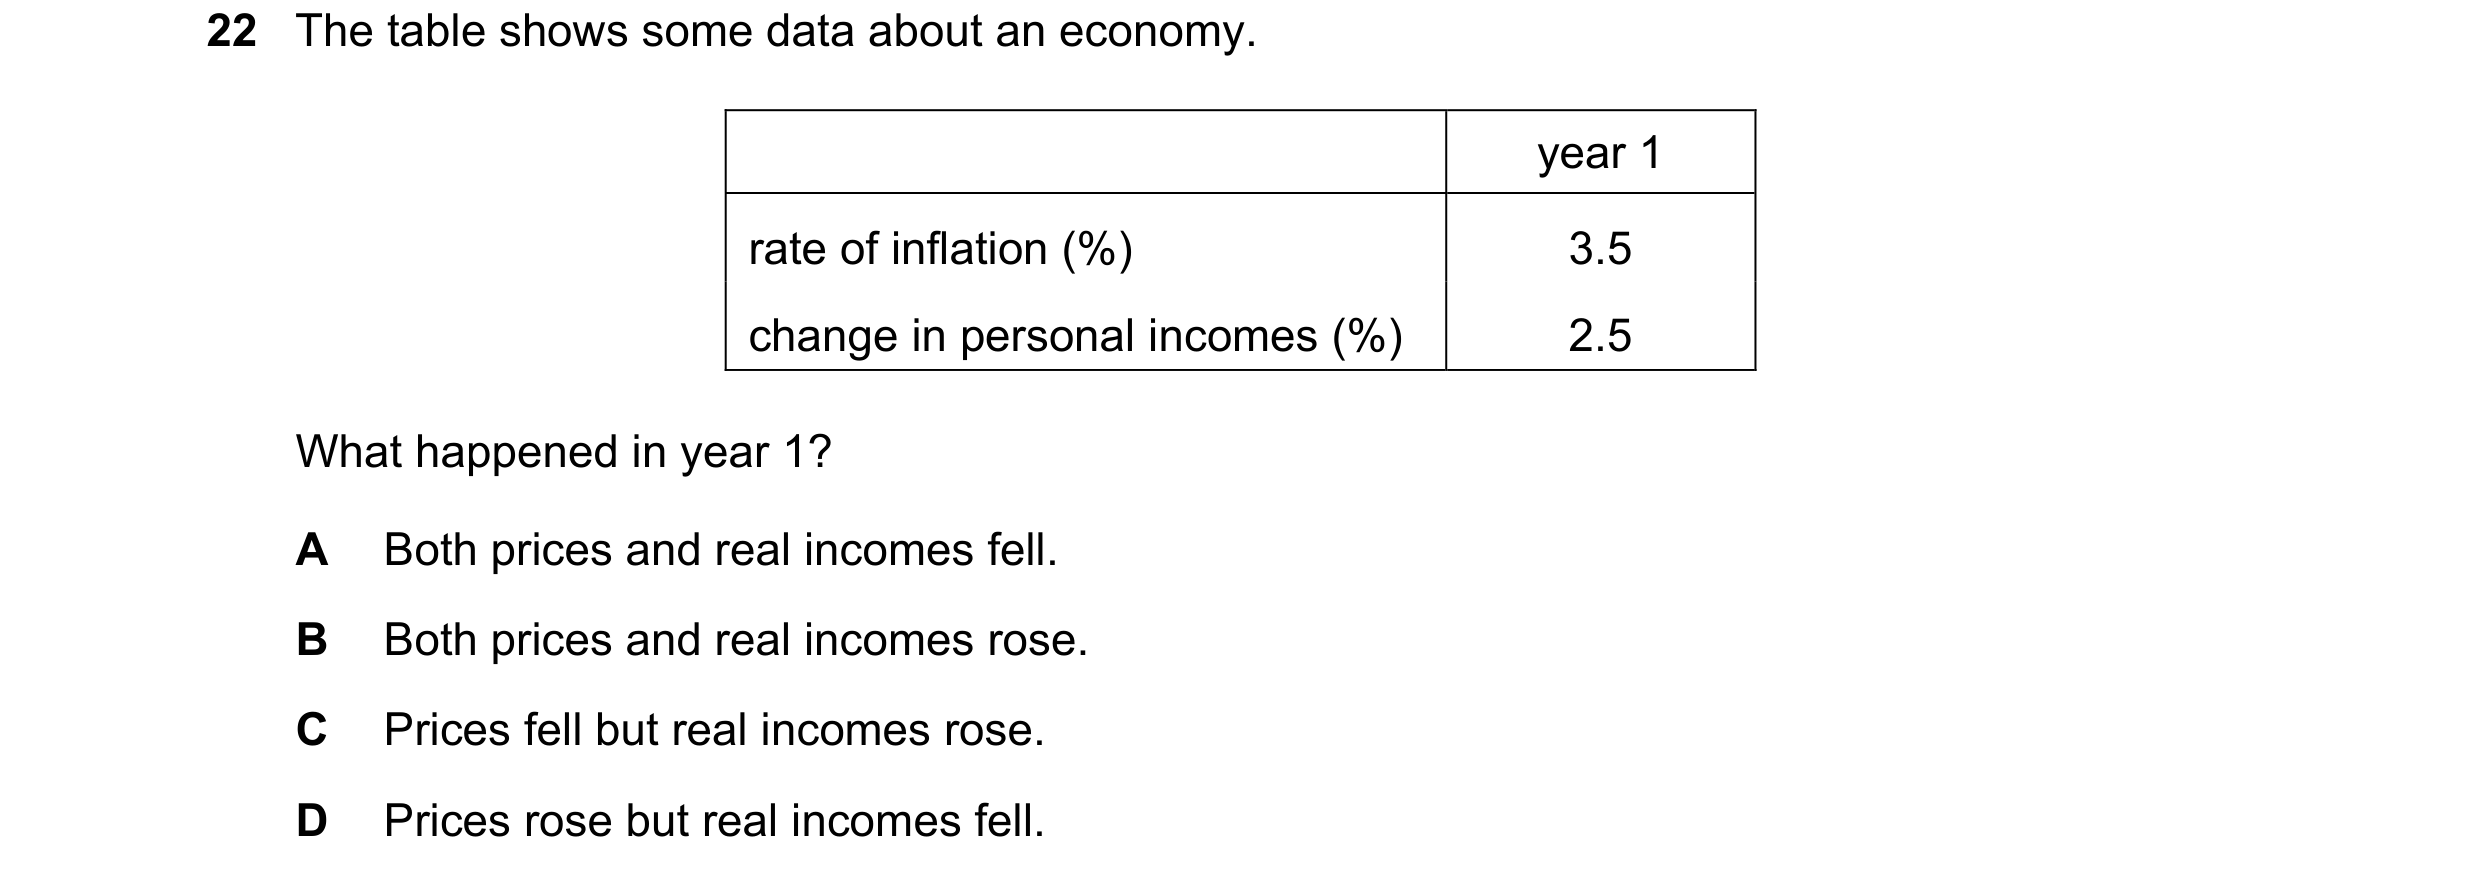
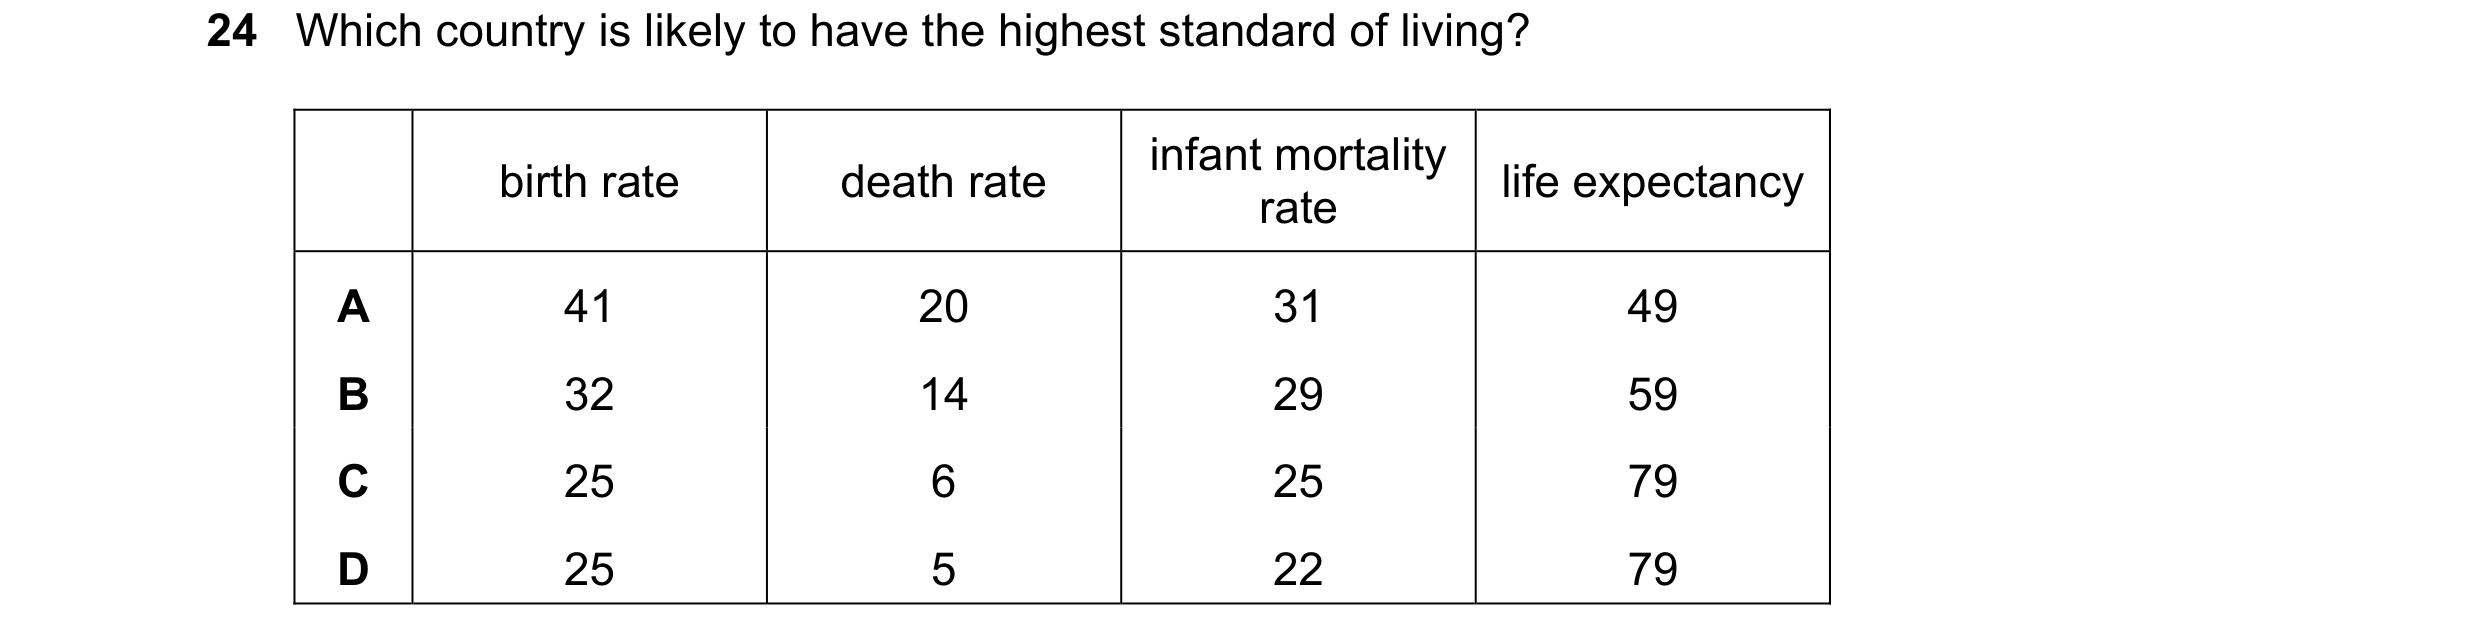
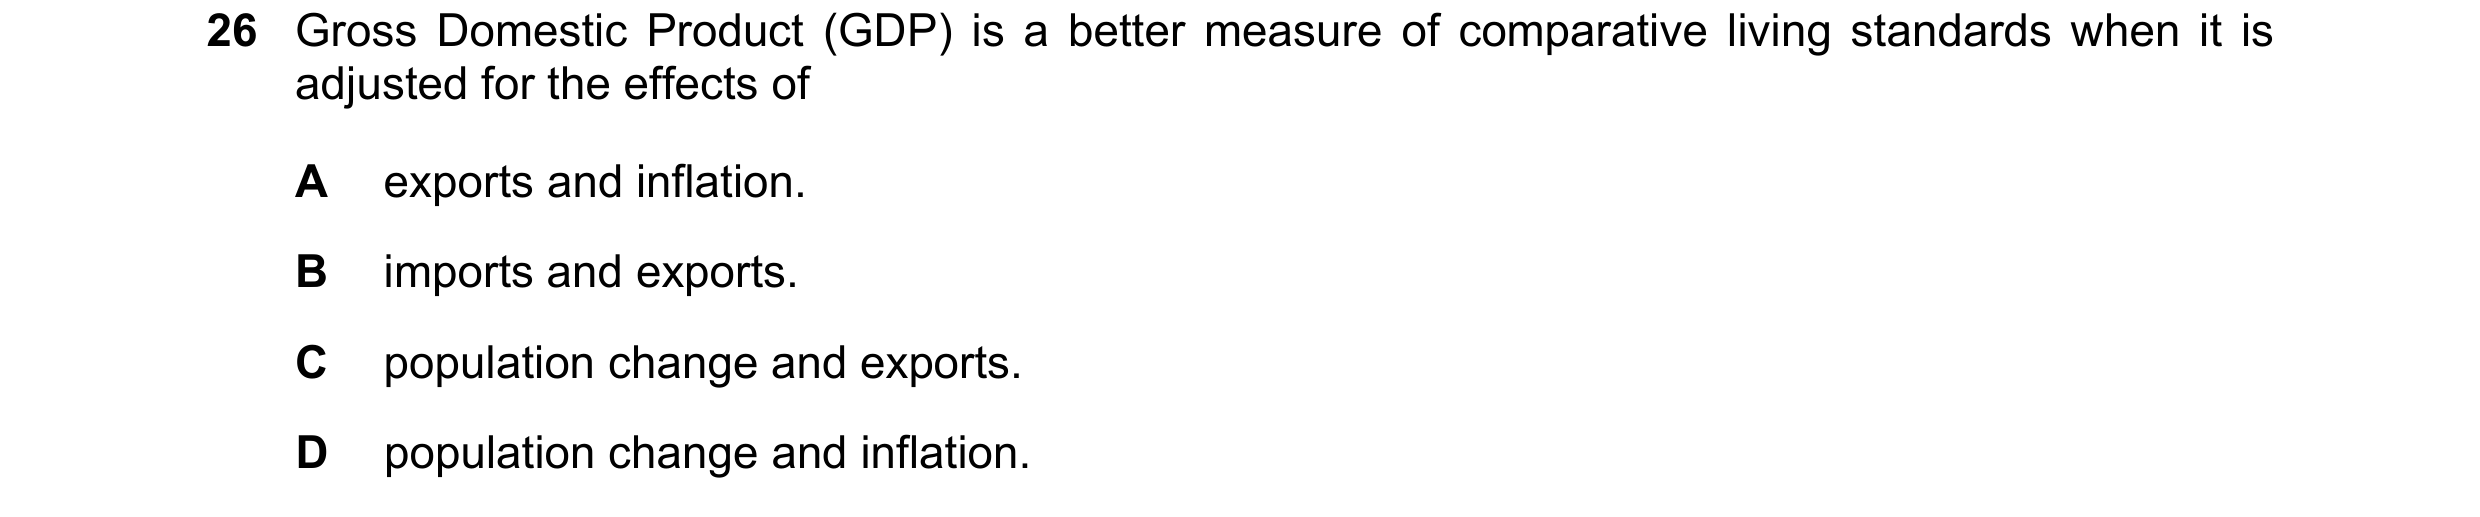
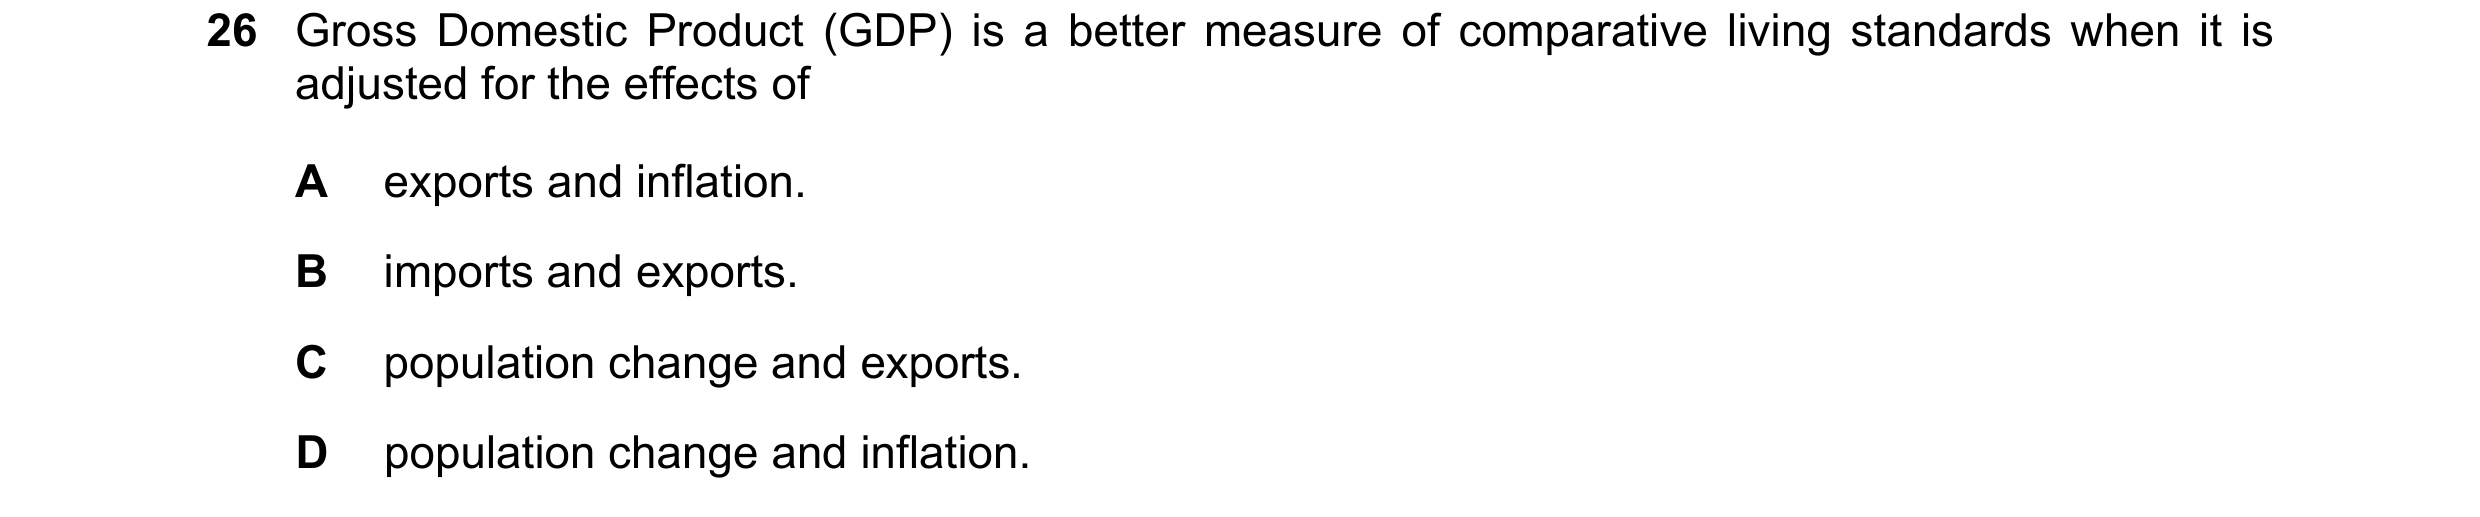
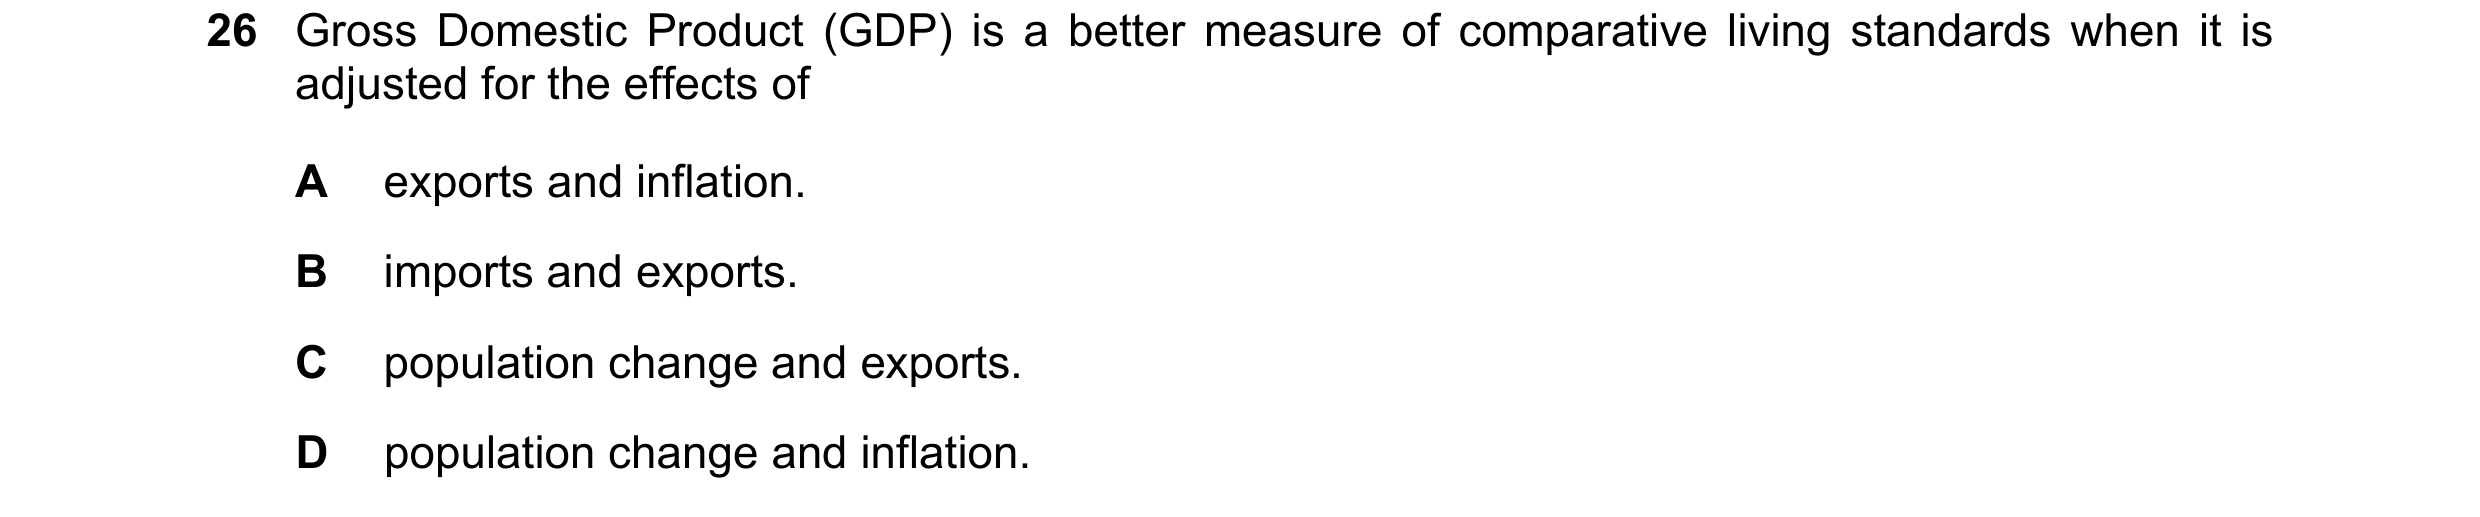 30 / 40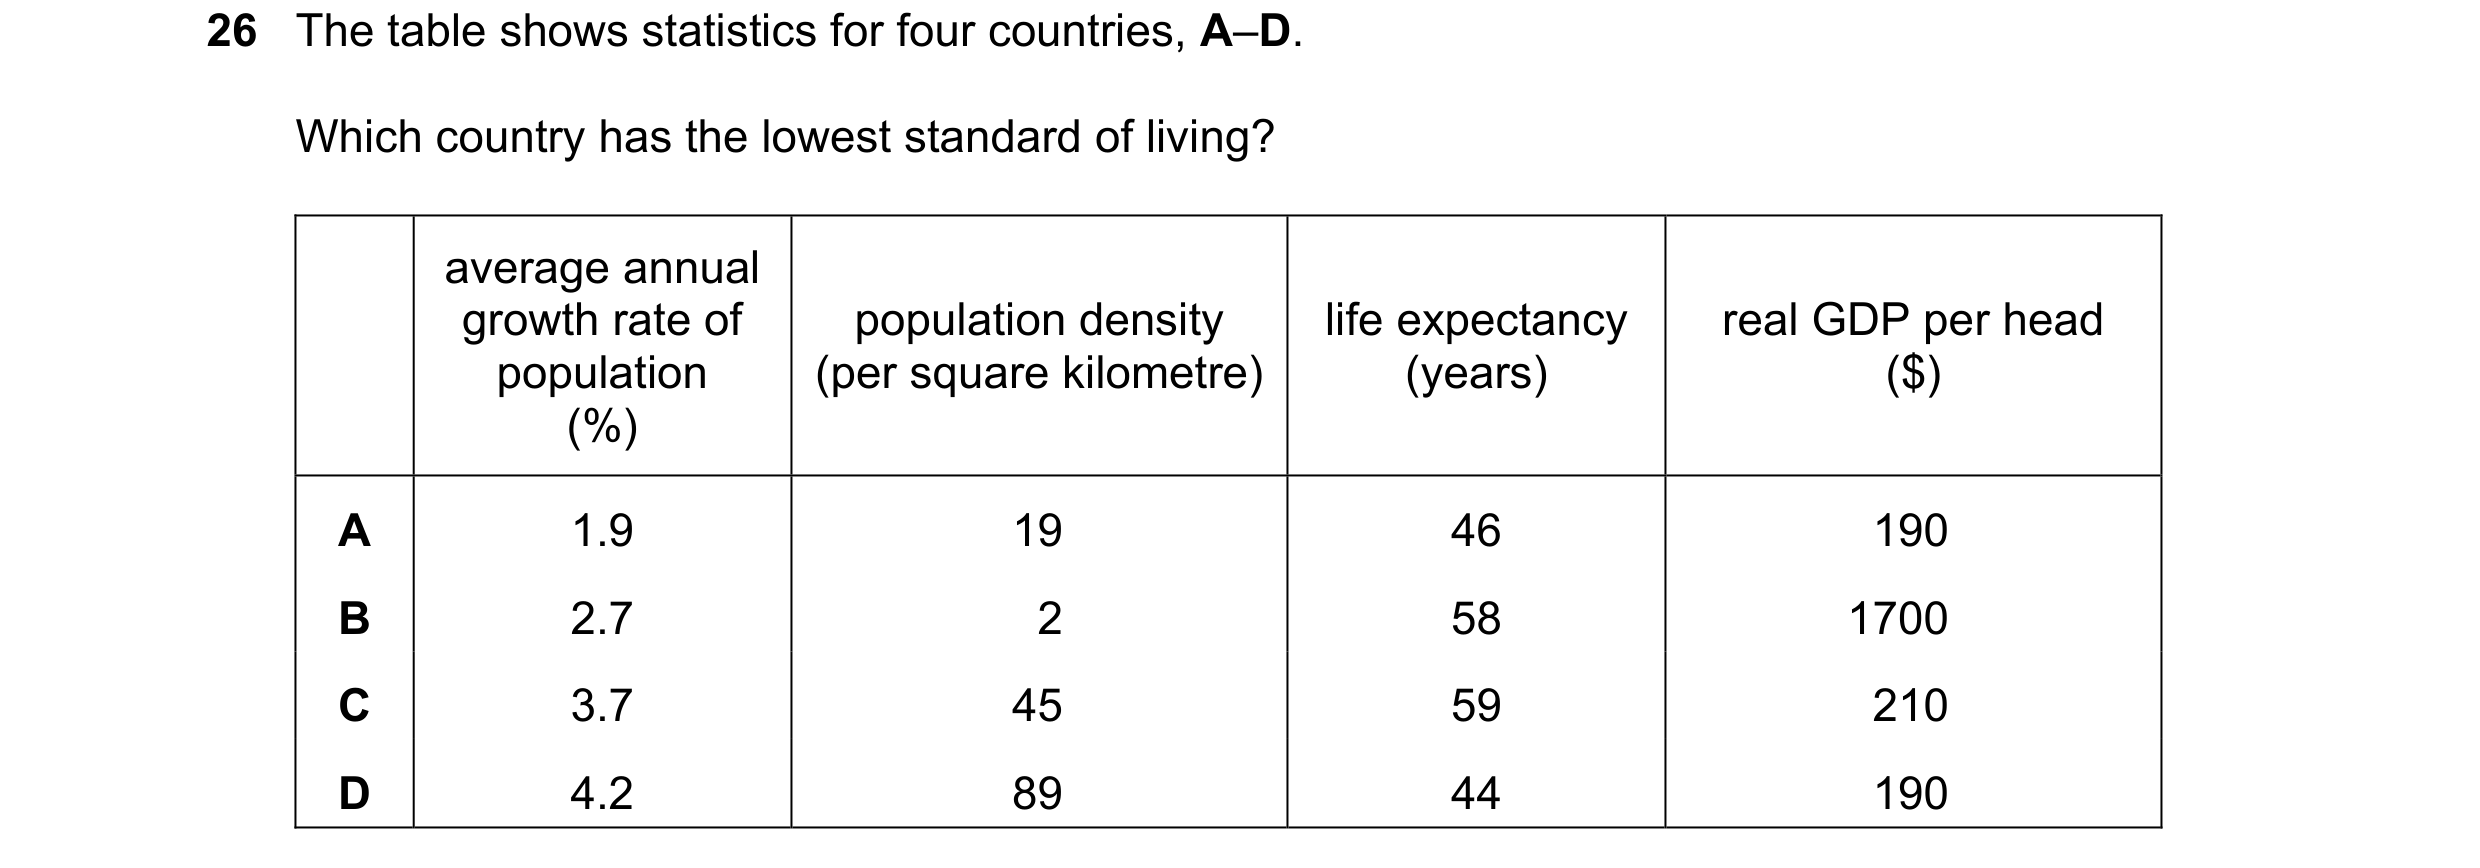
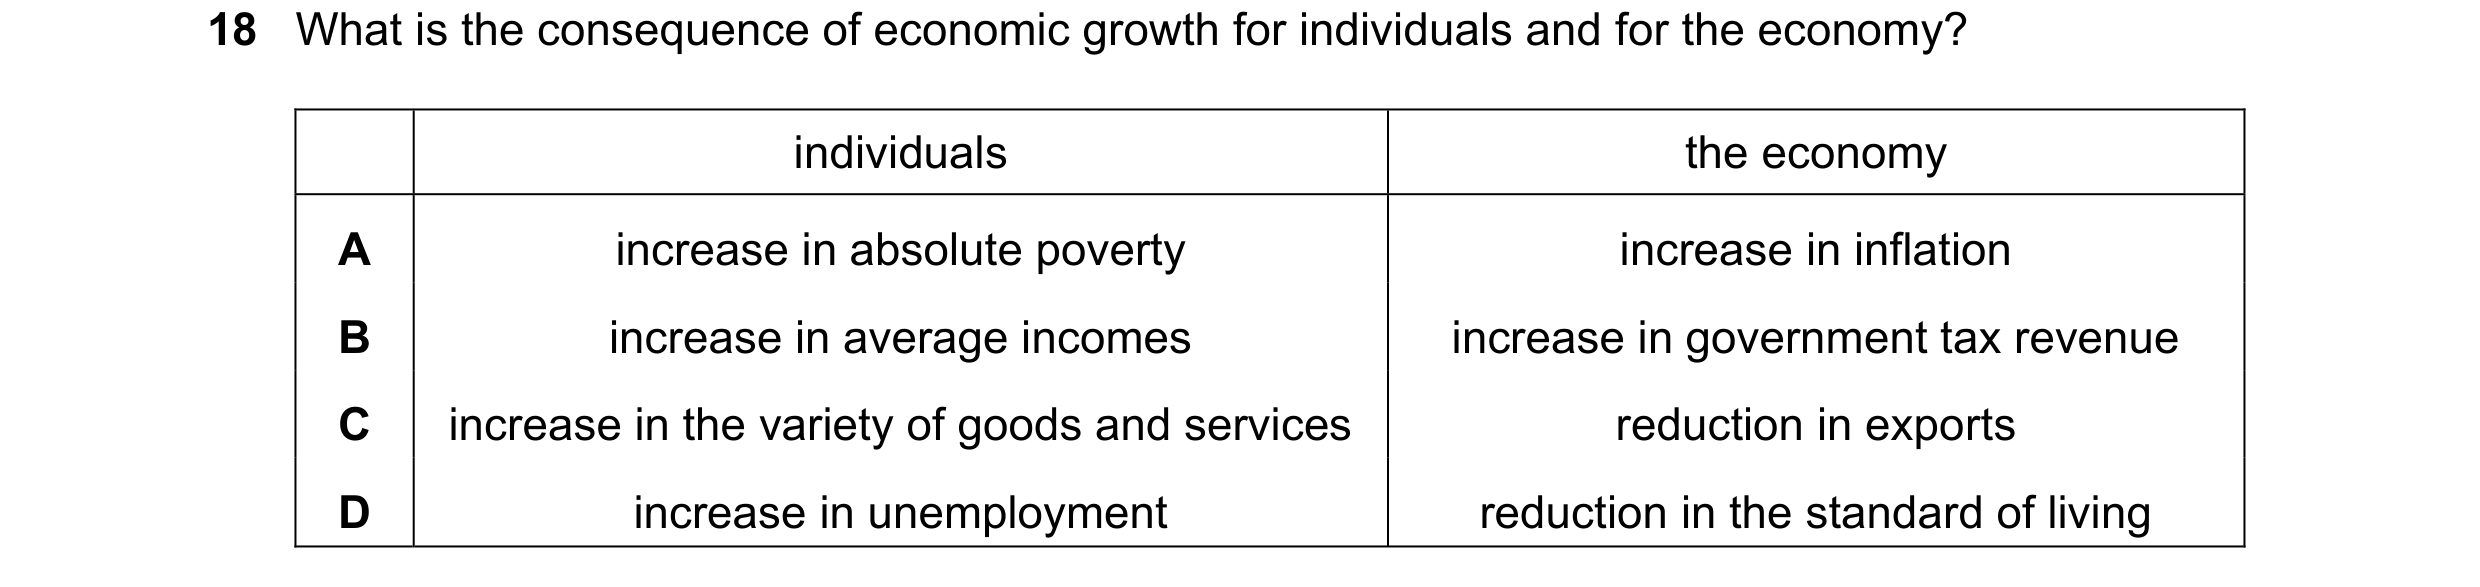
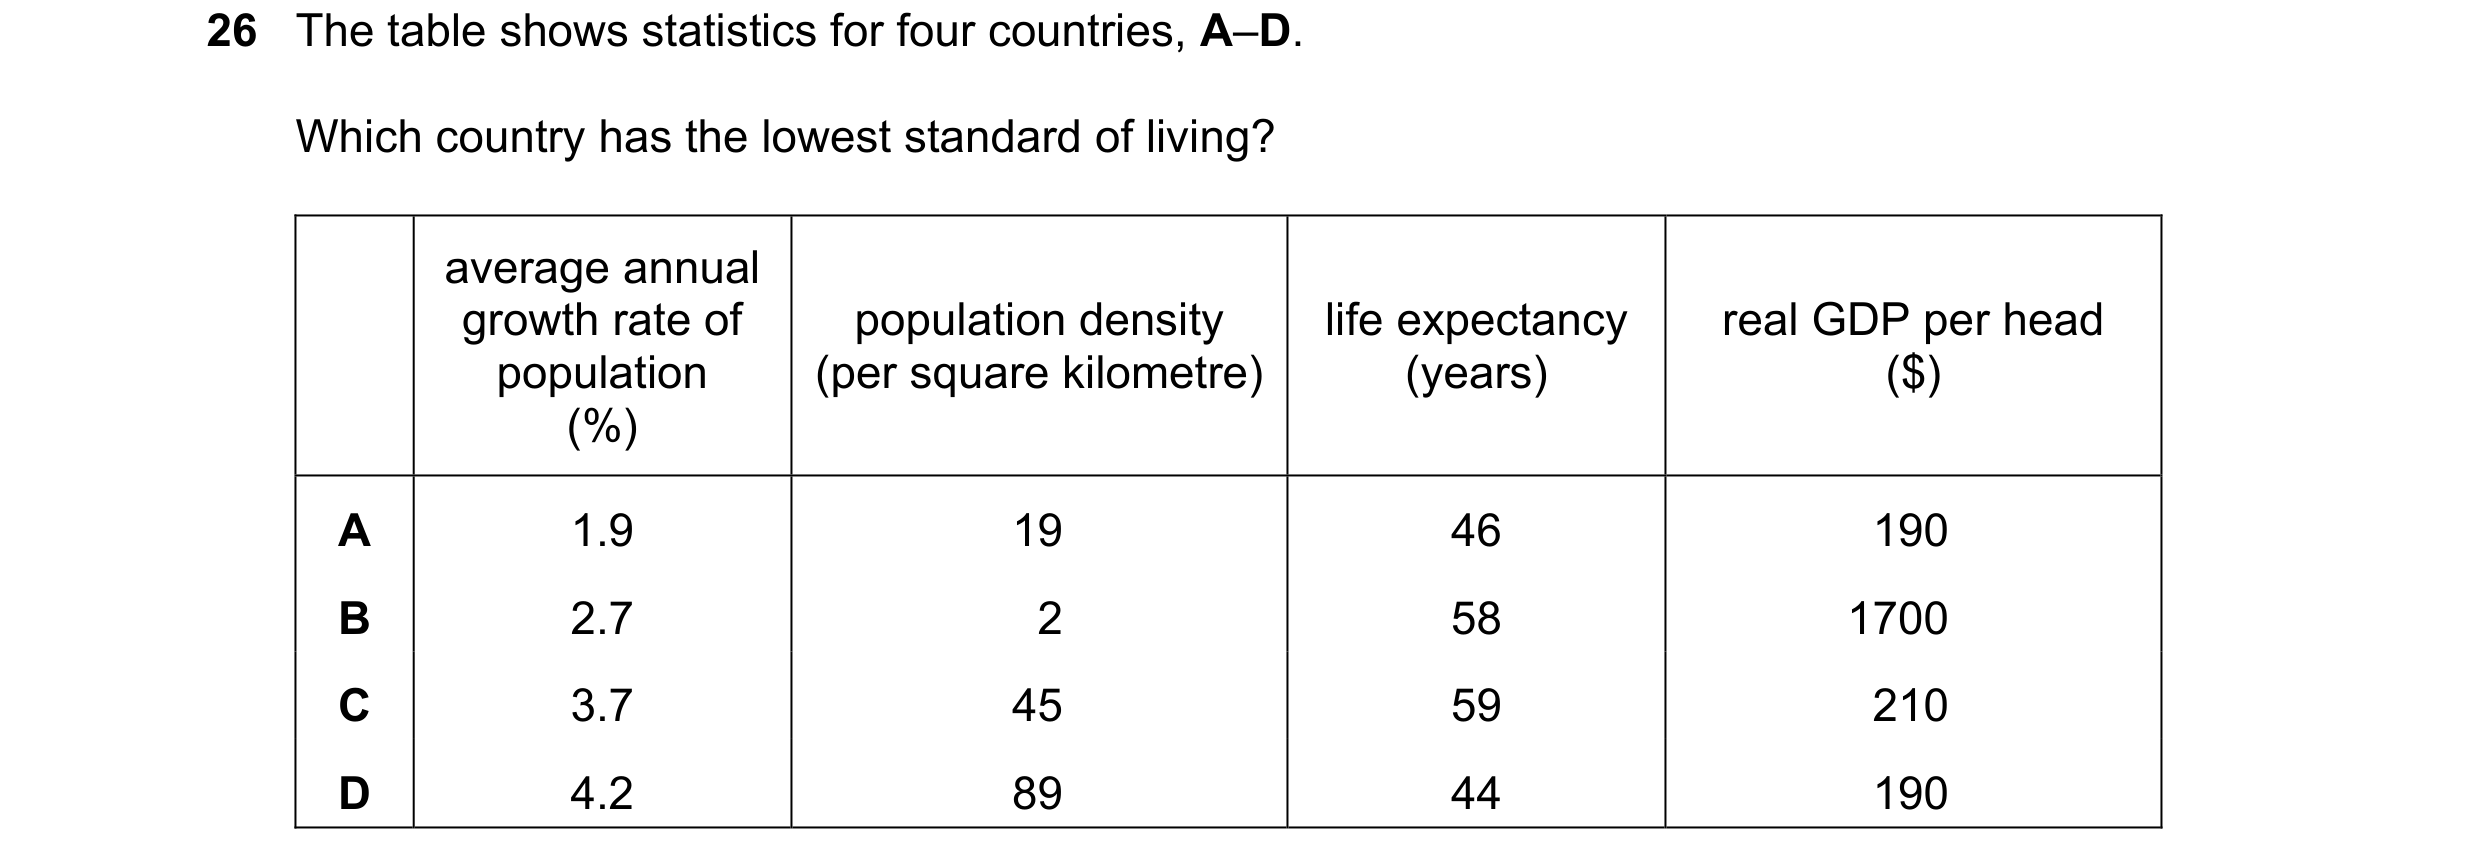
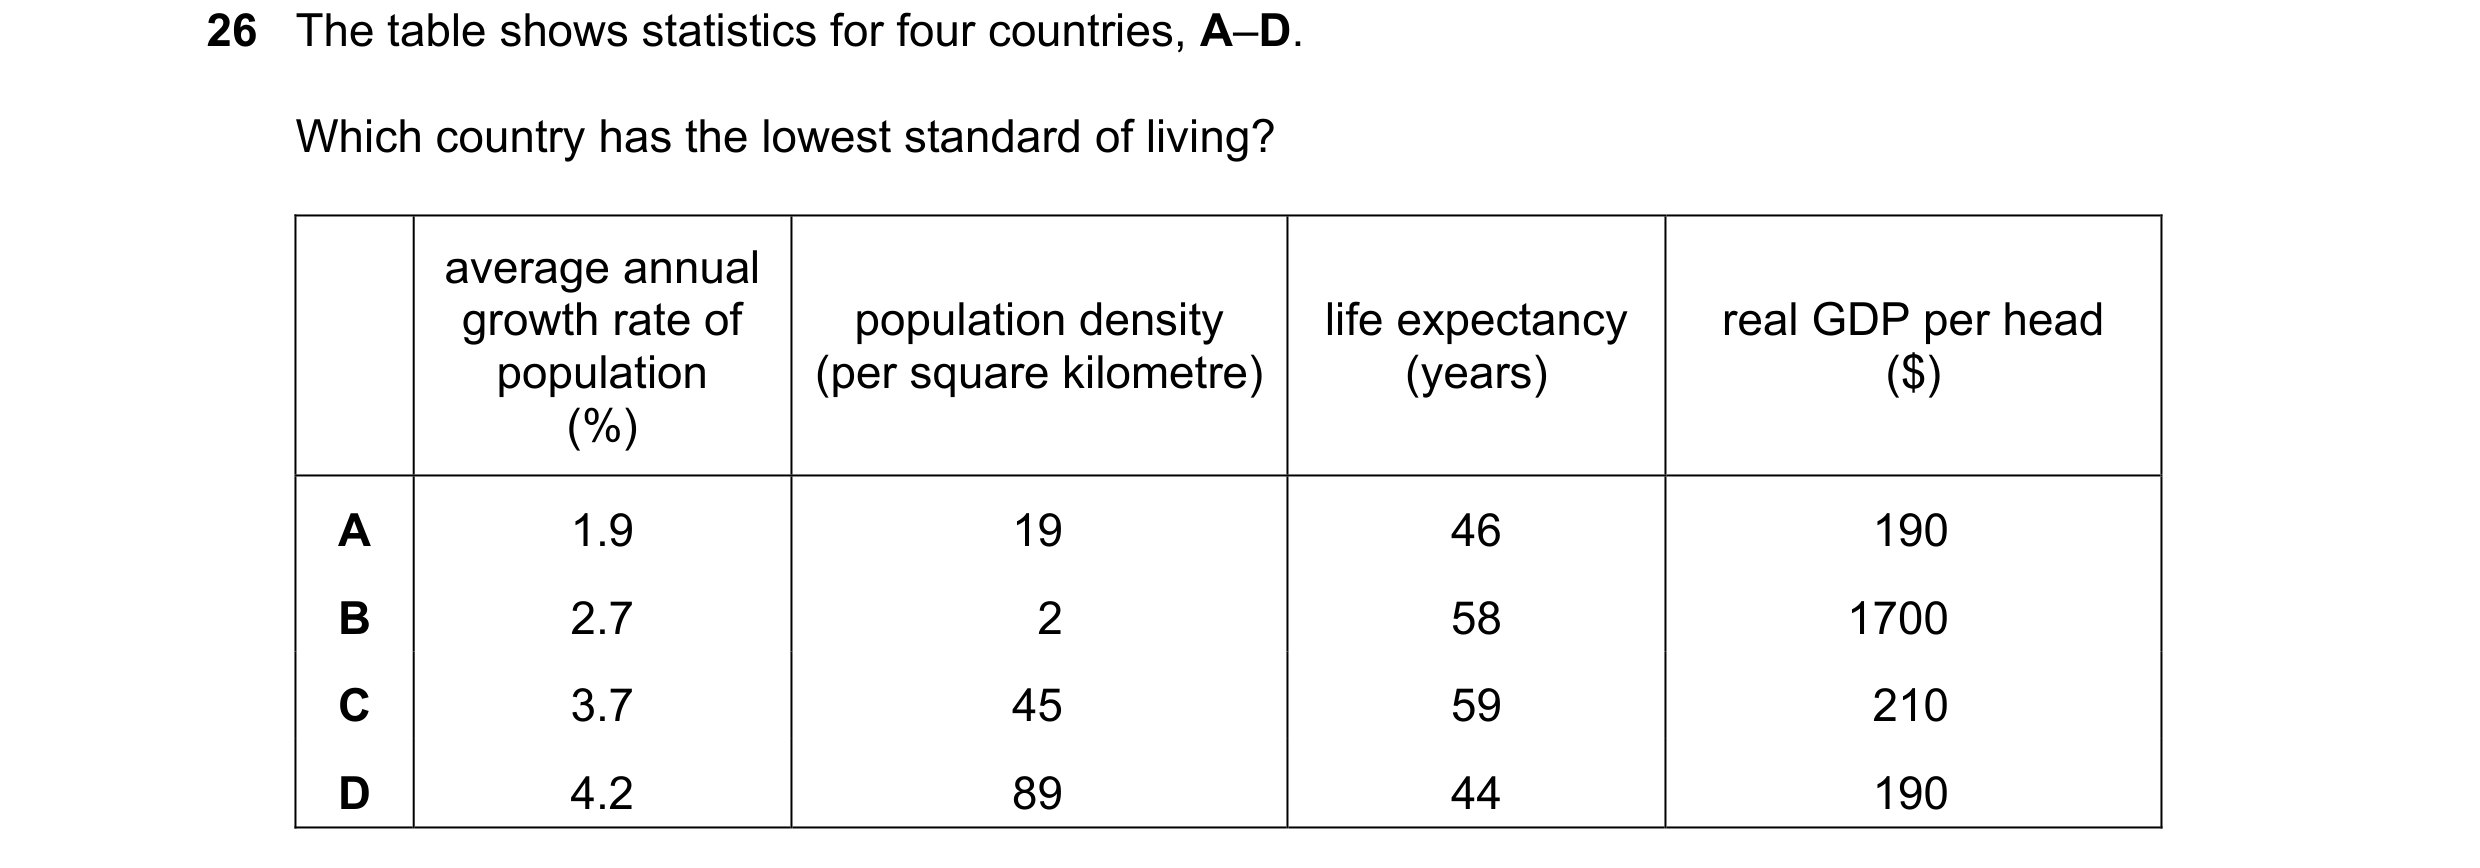 31 / 40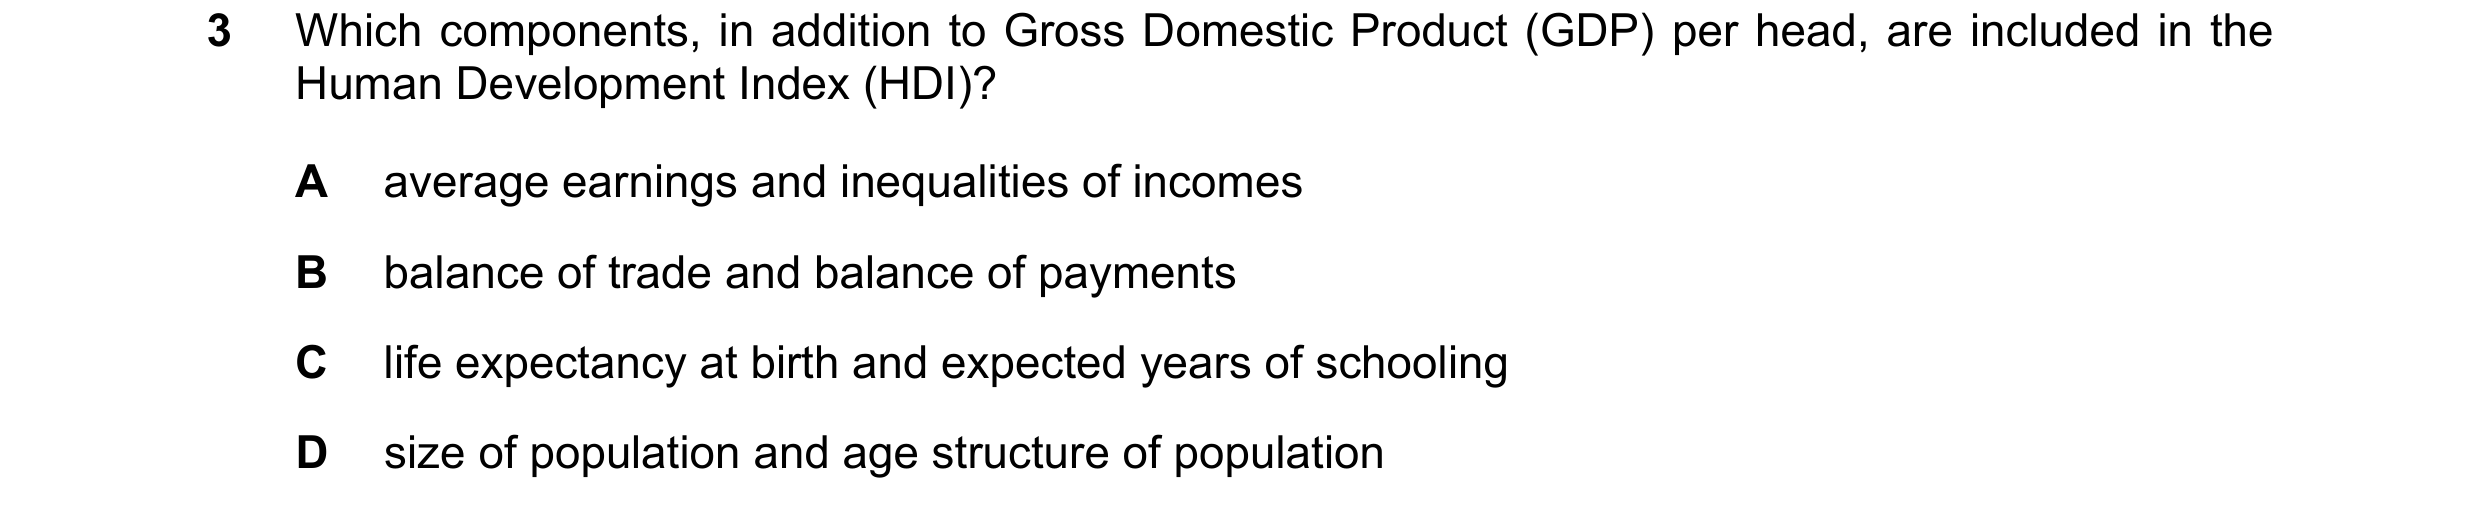

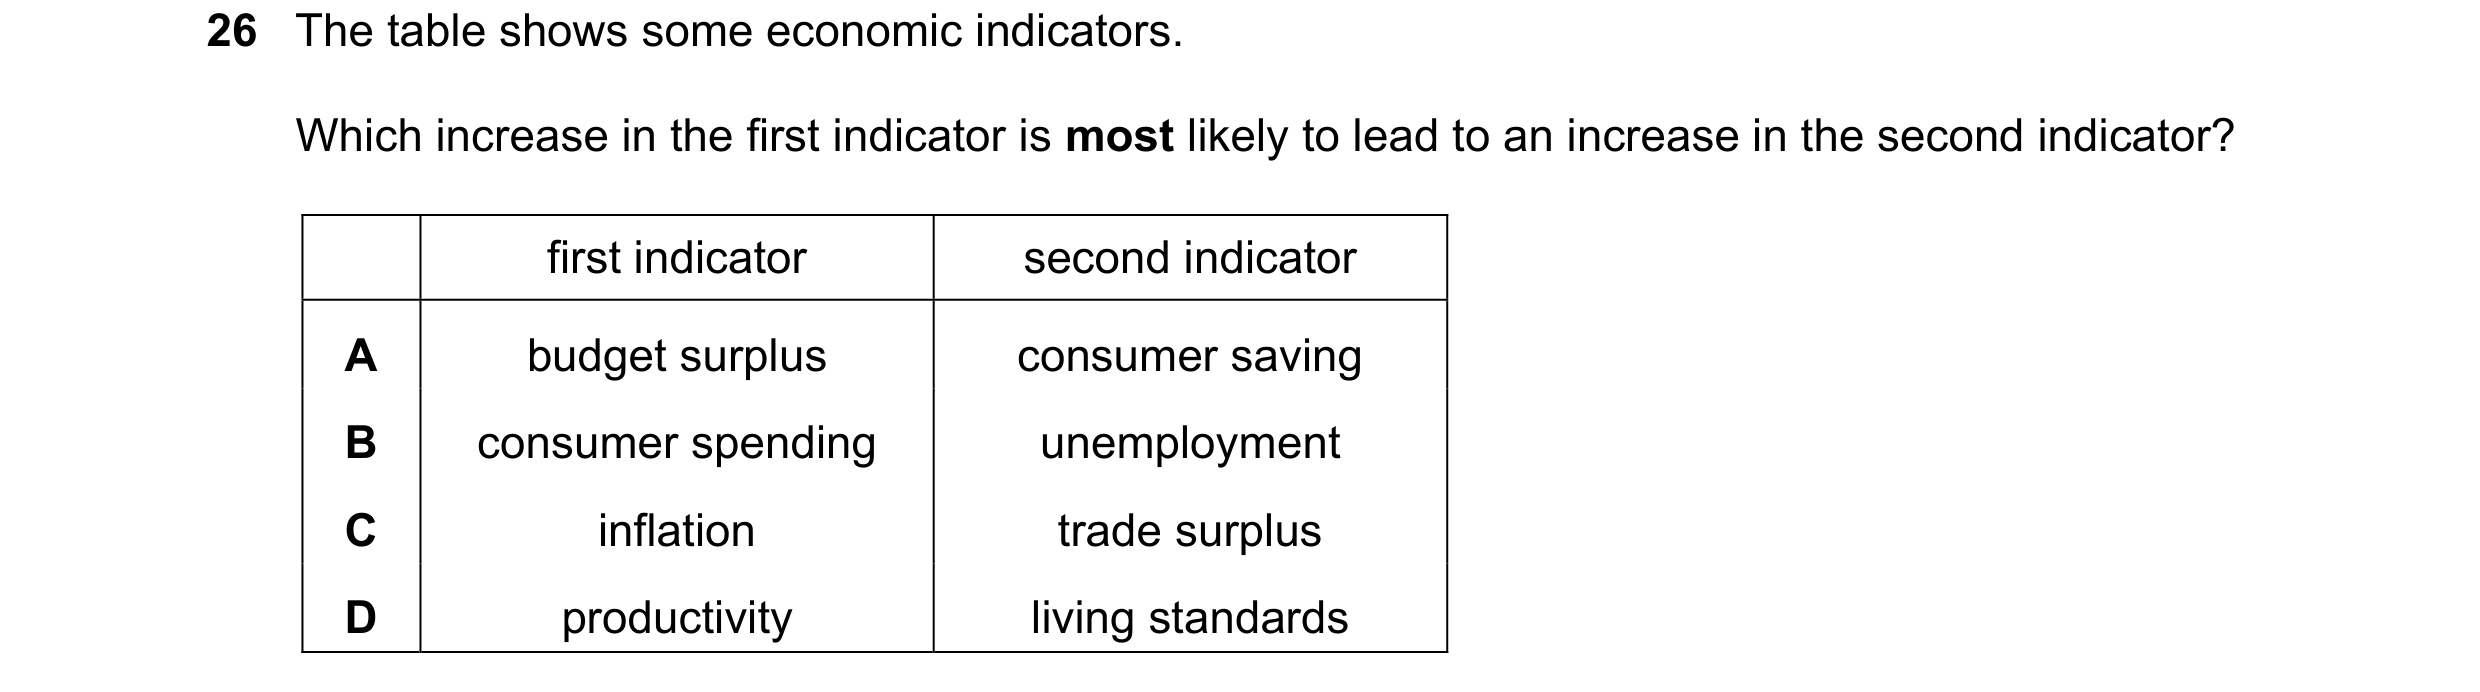
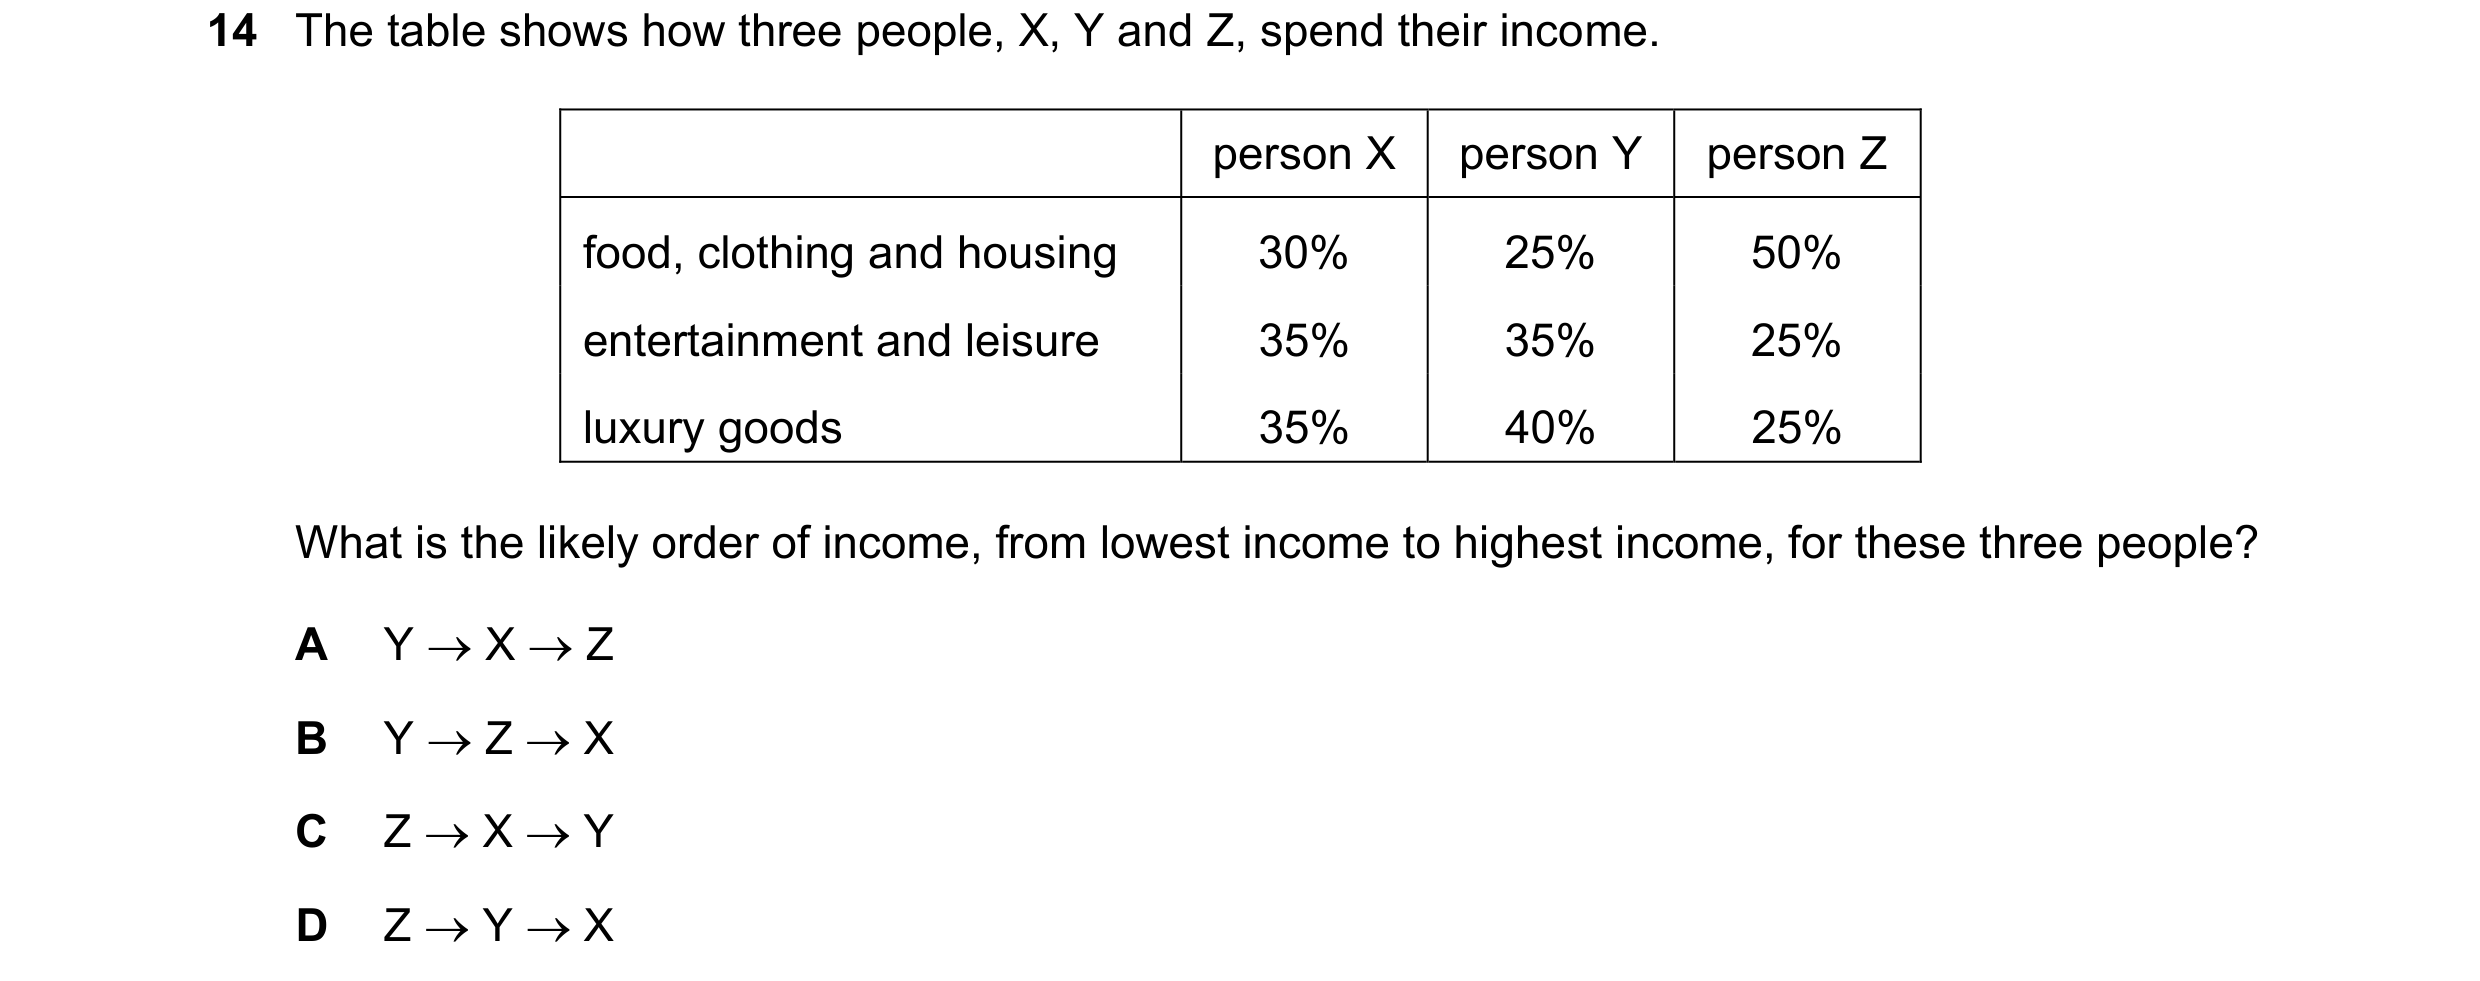
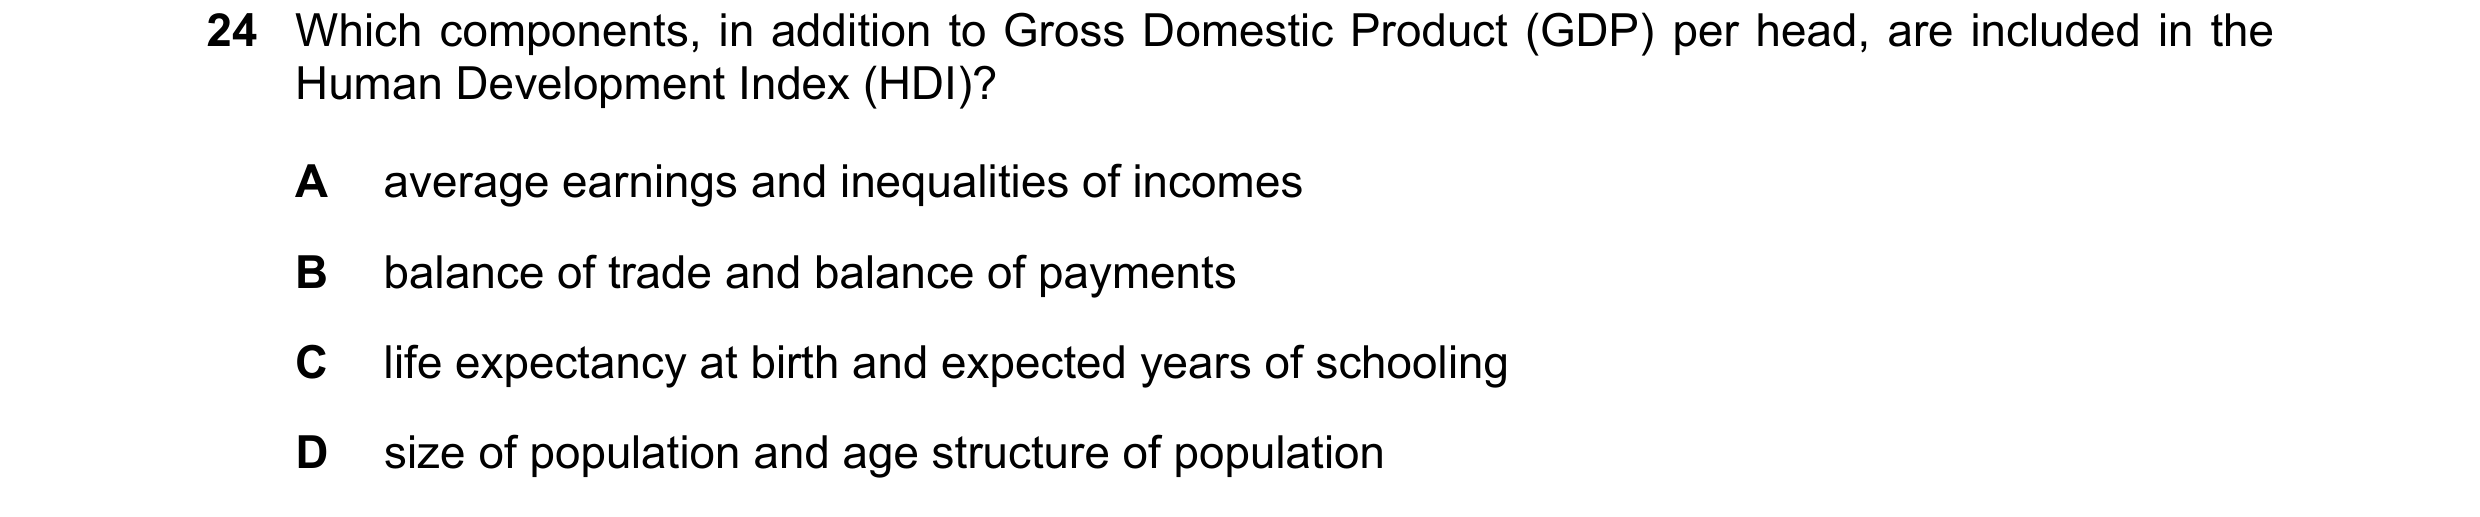 32 / 40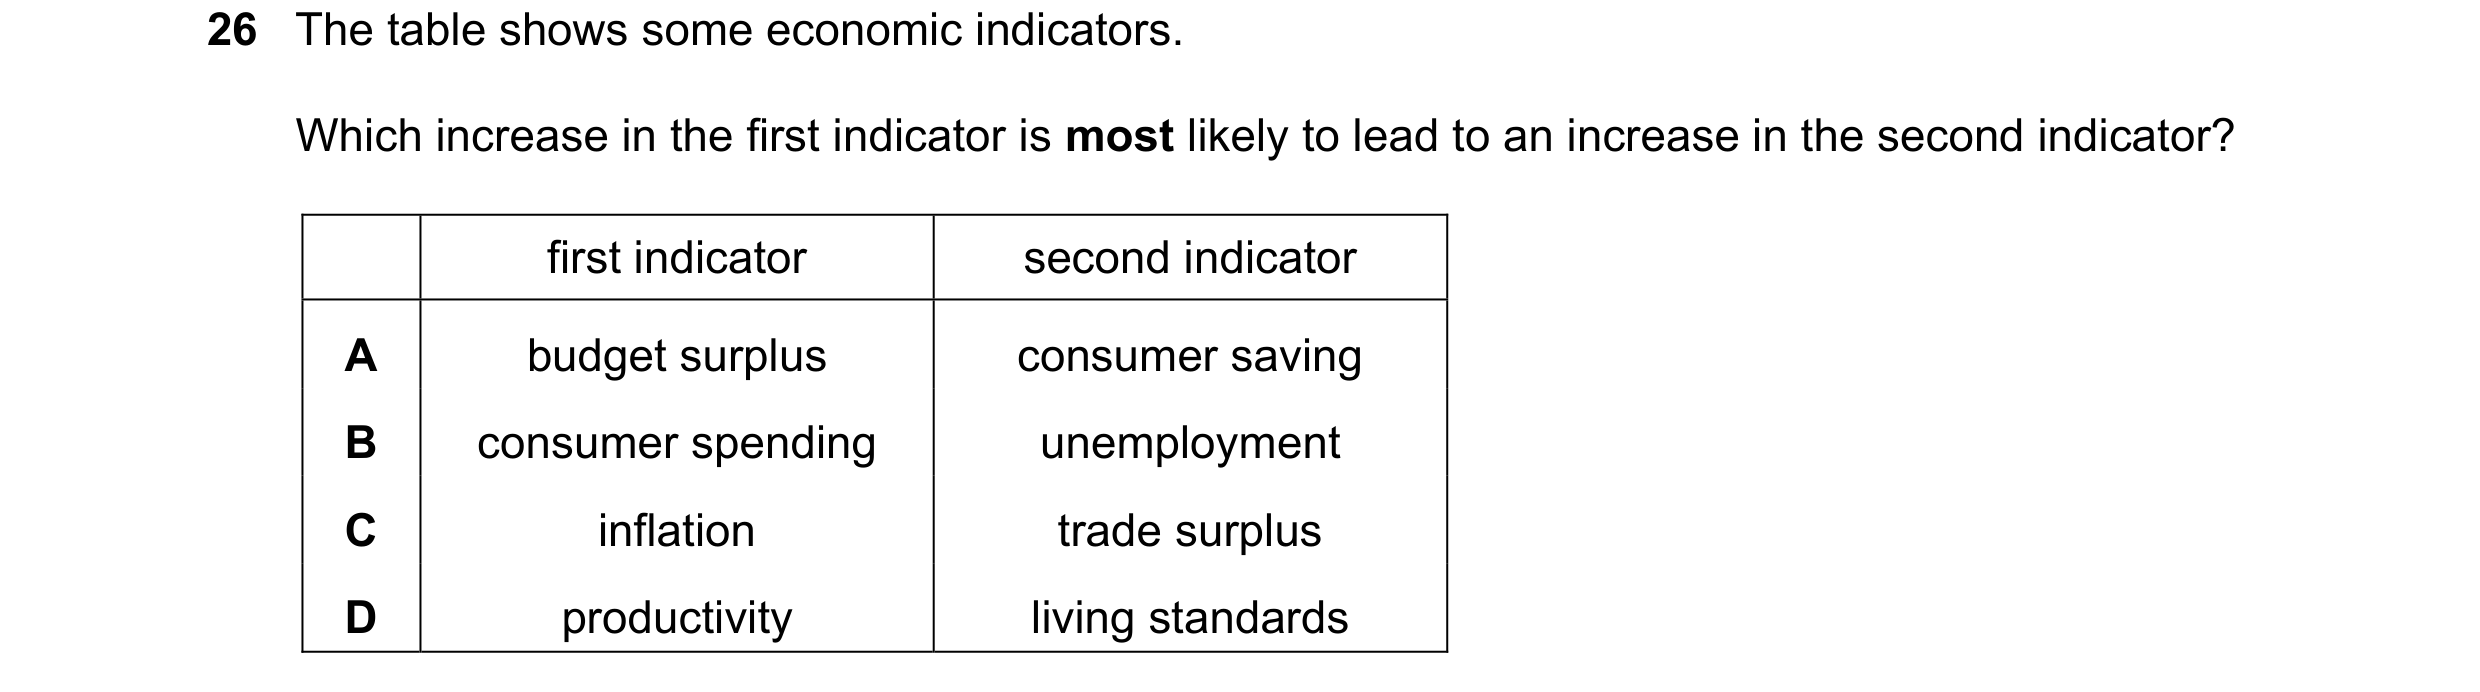
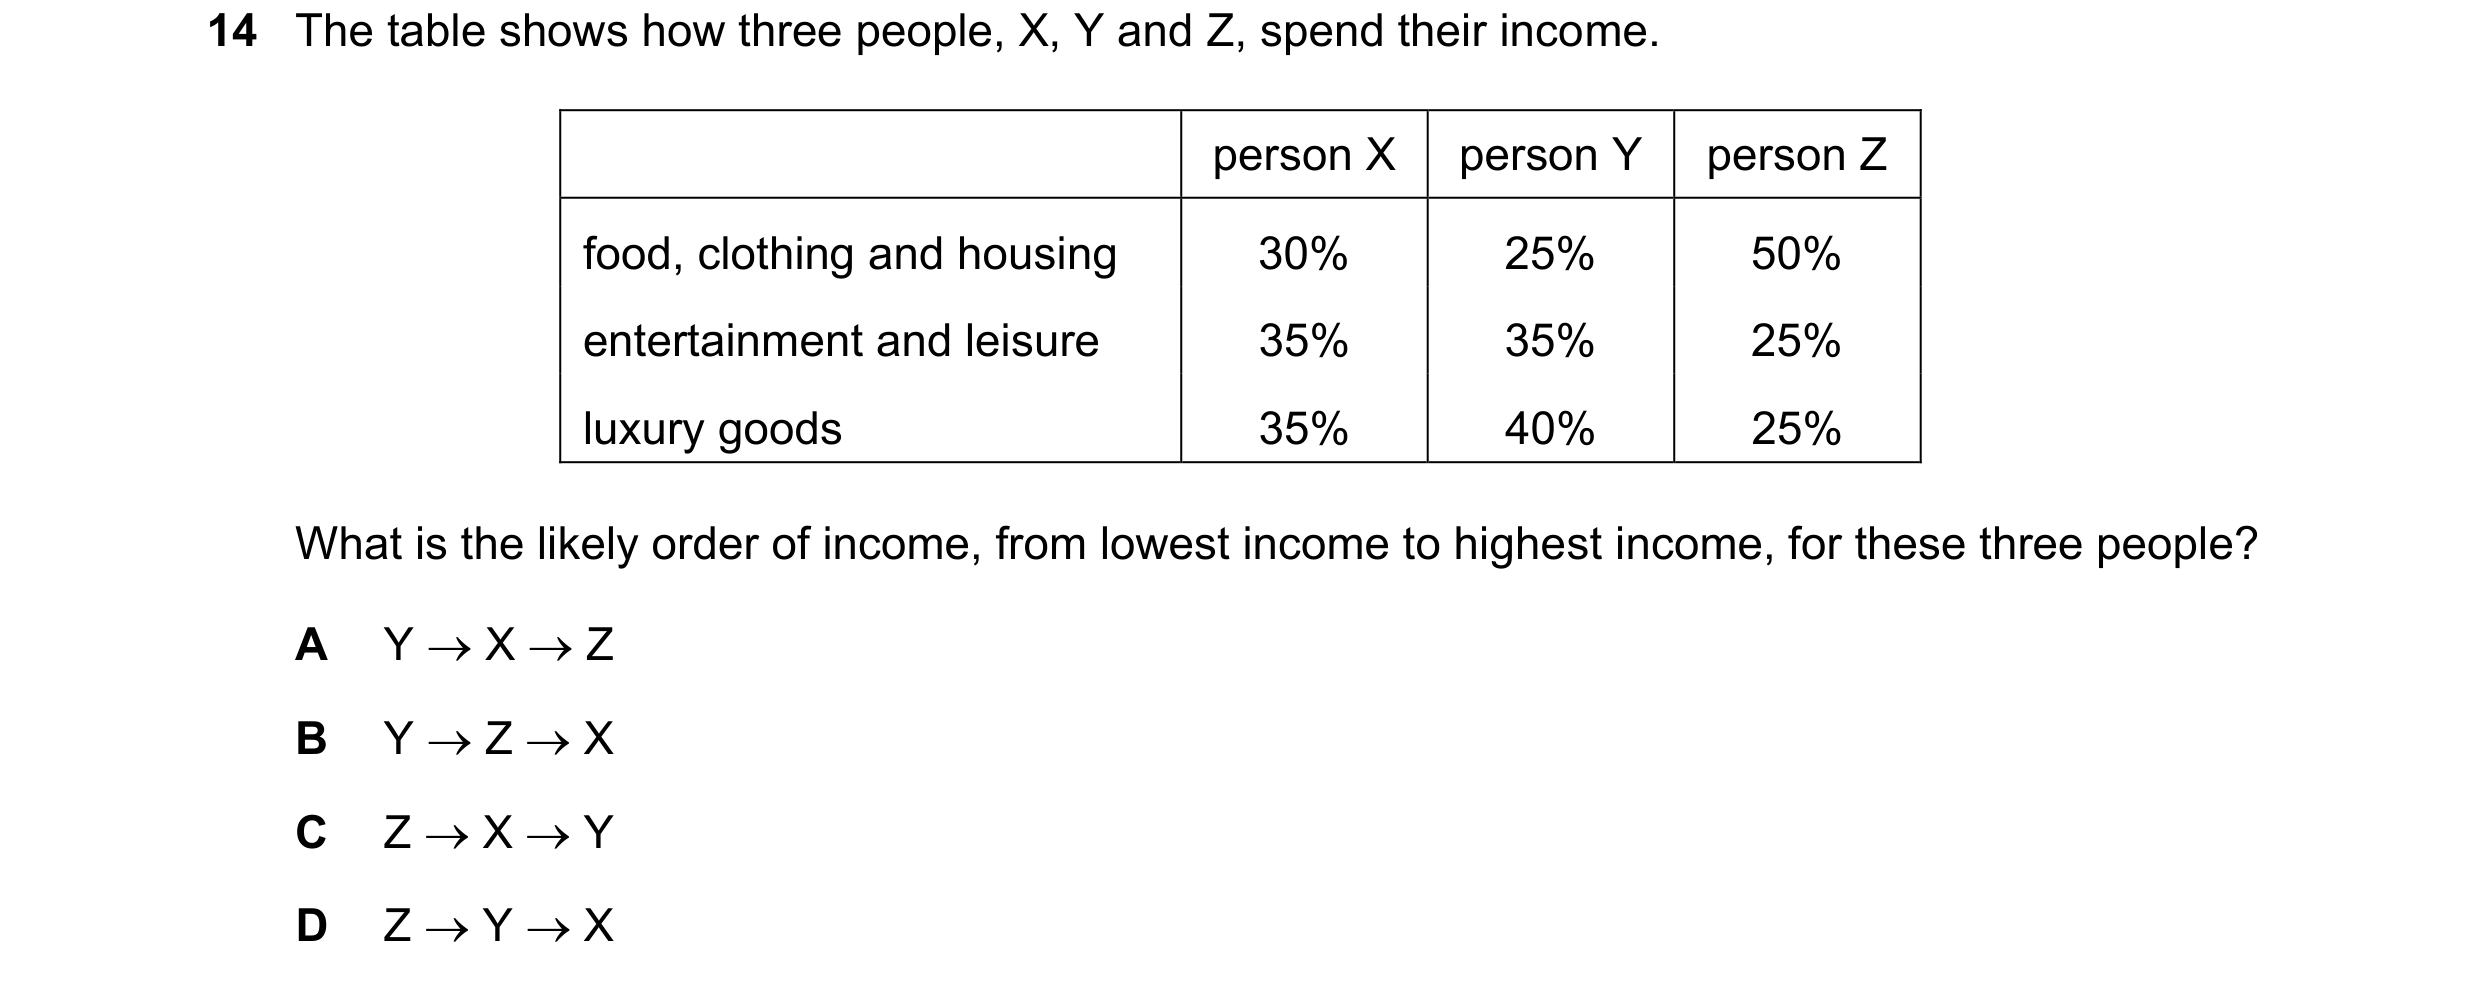
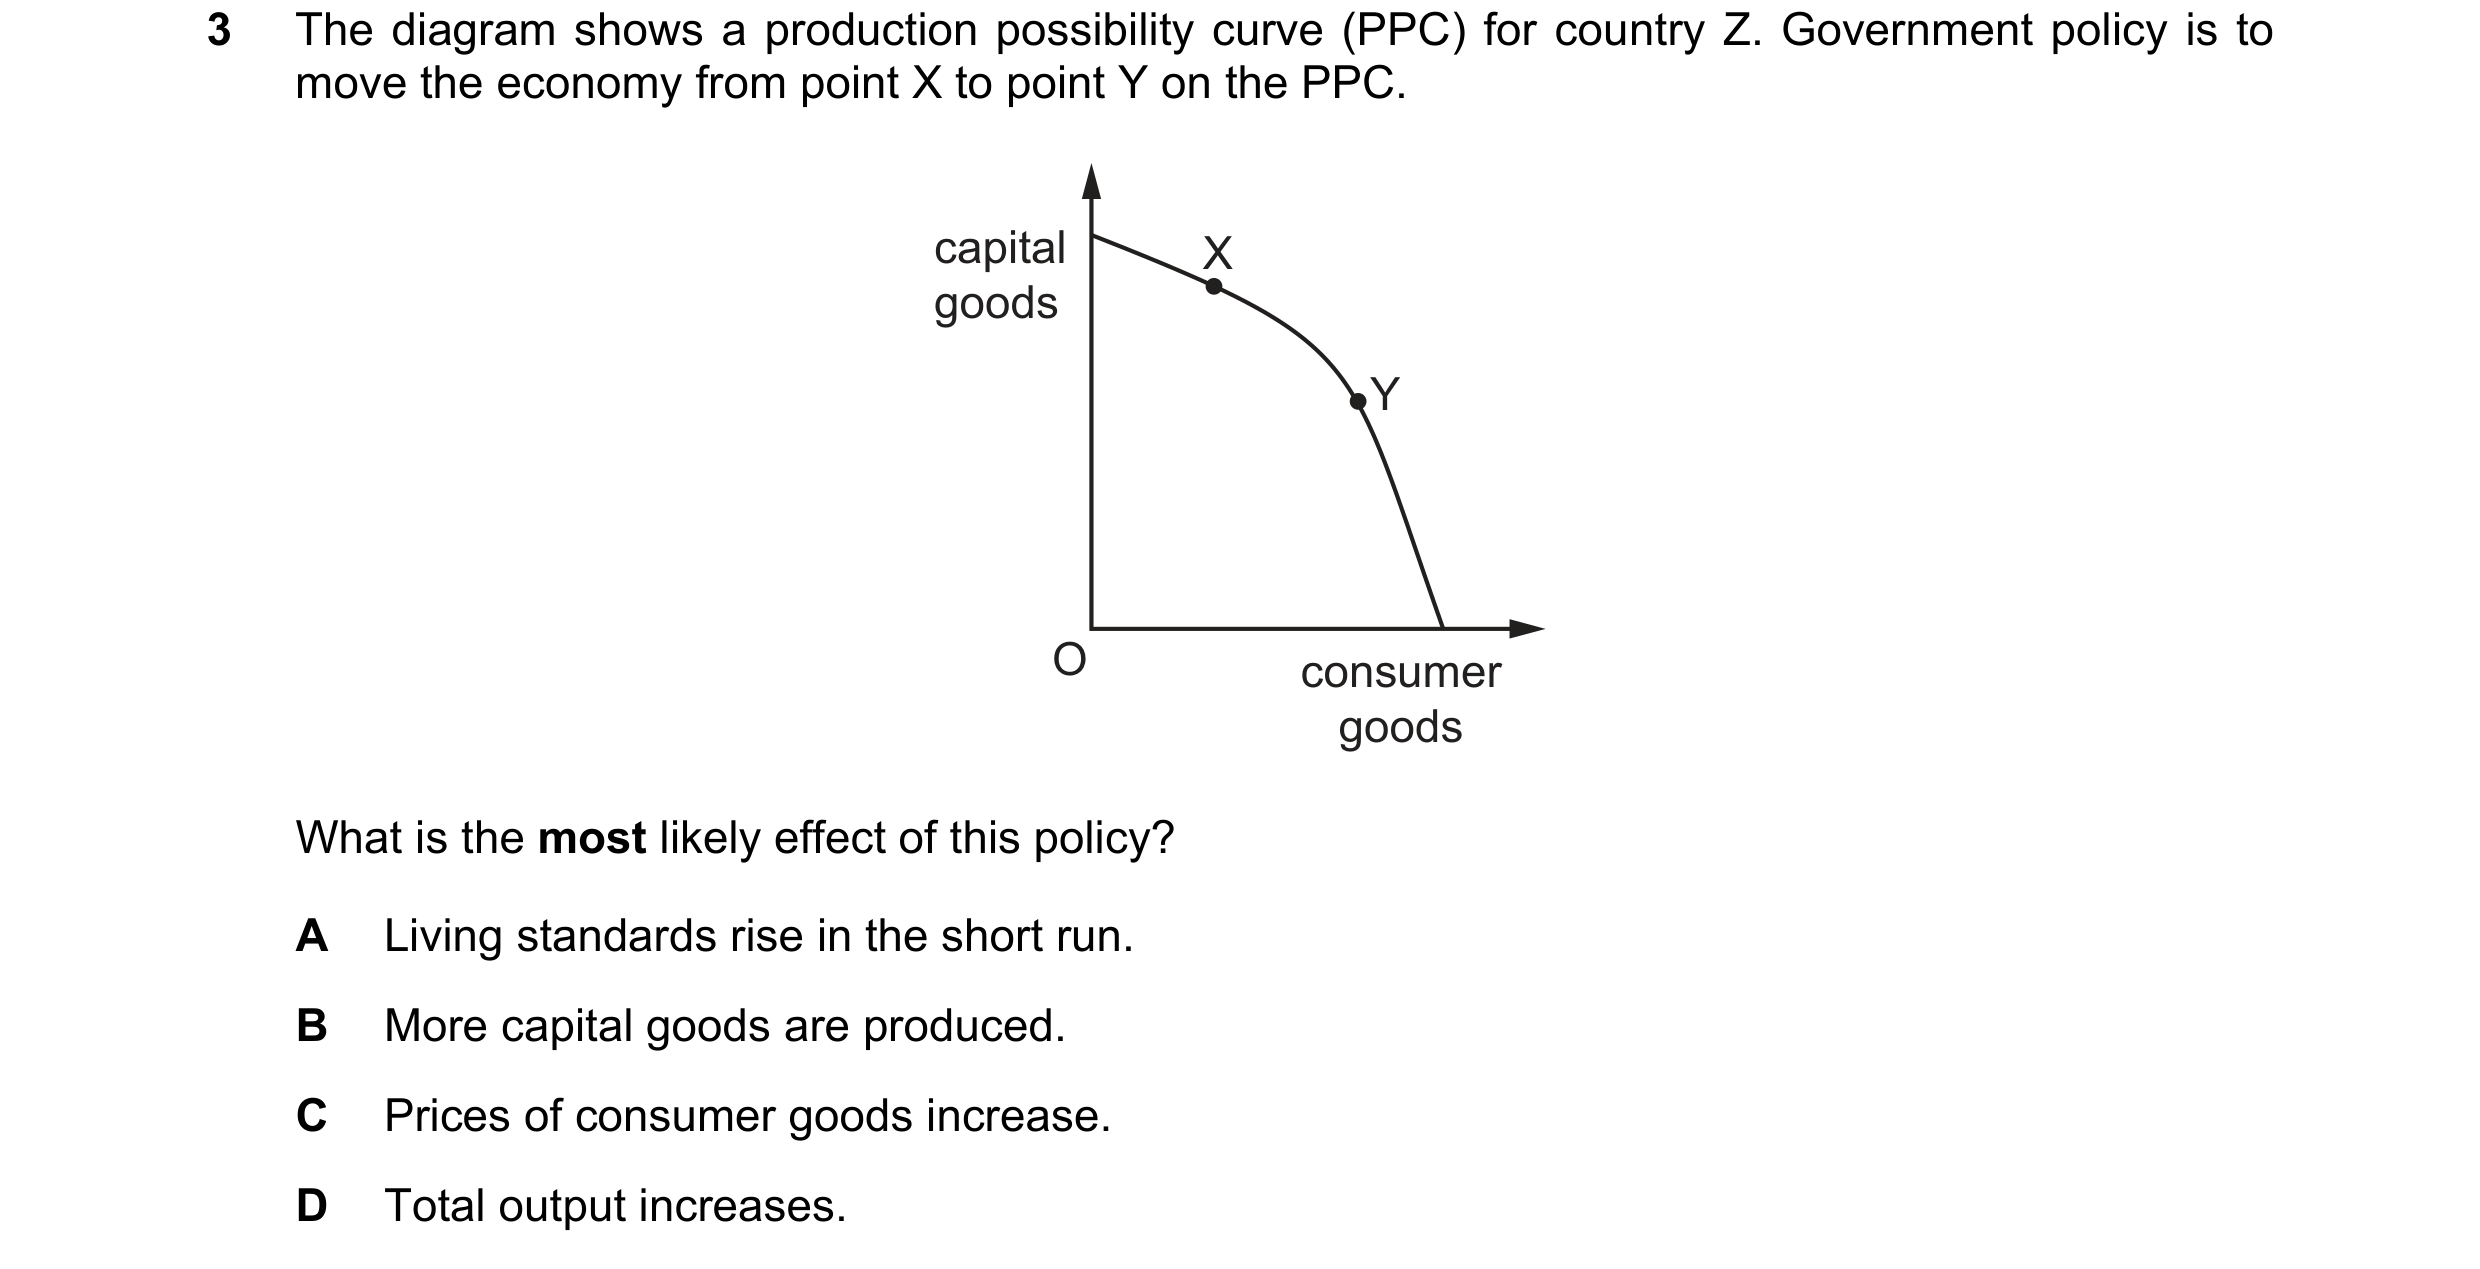 33 / 40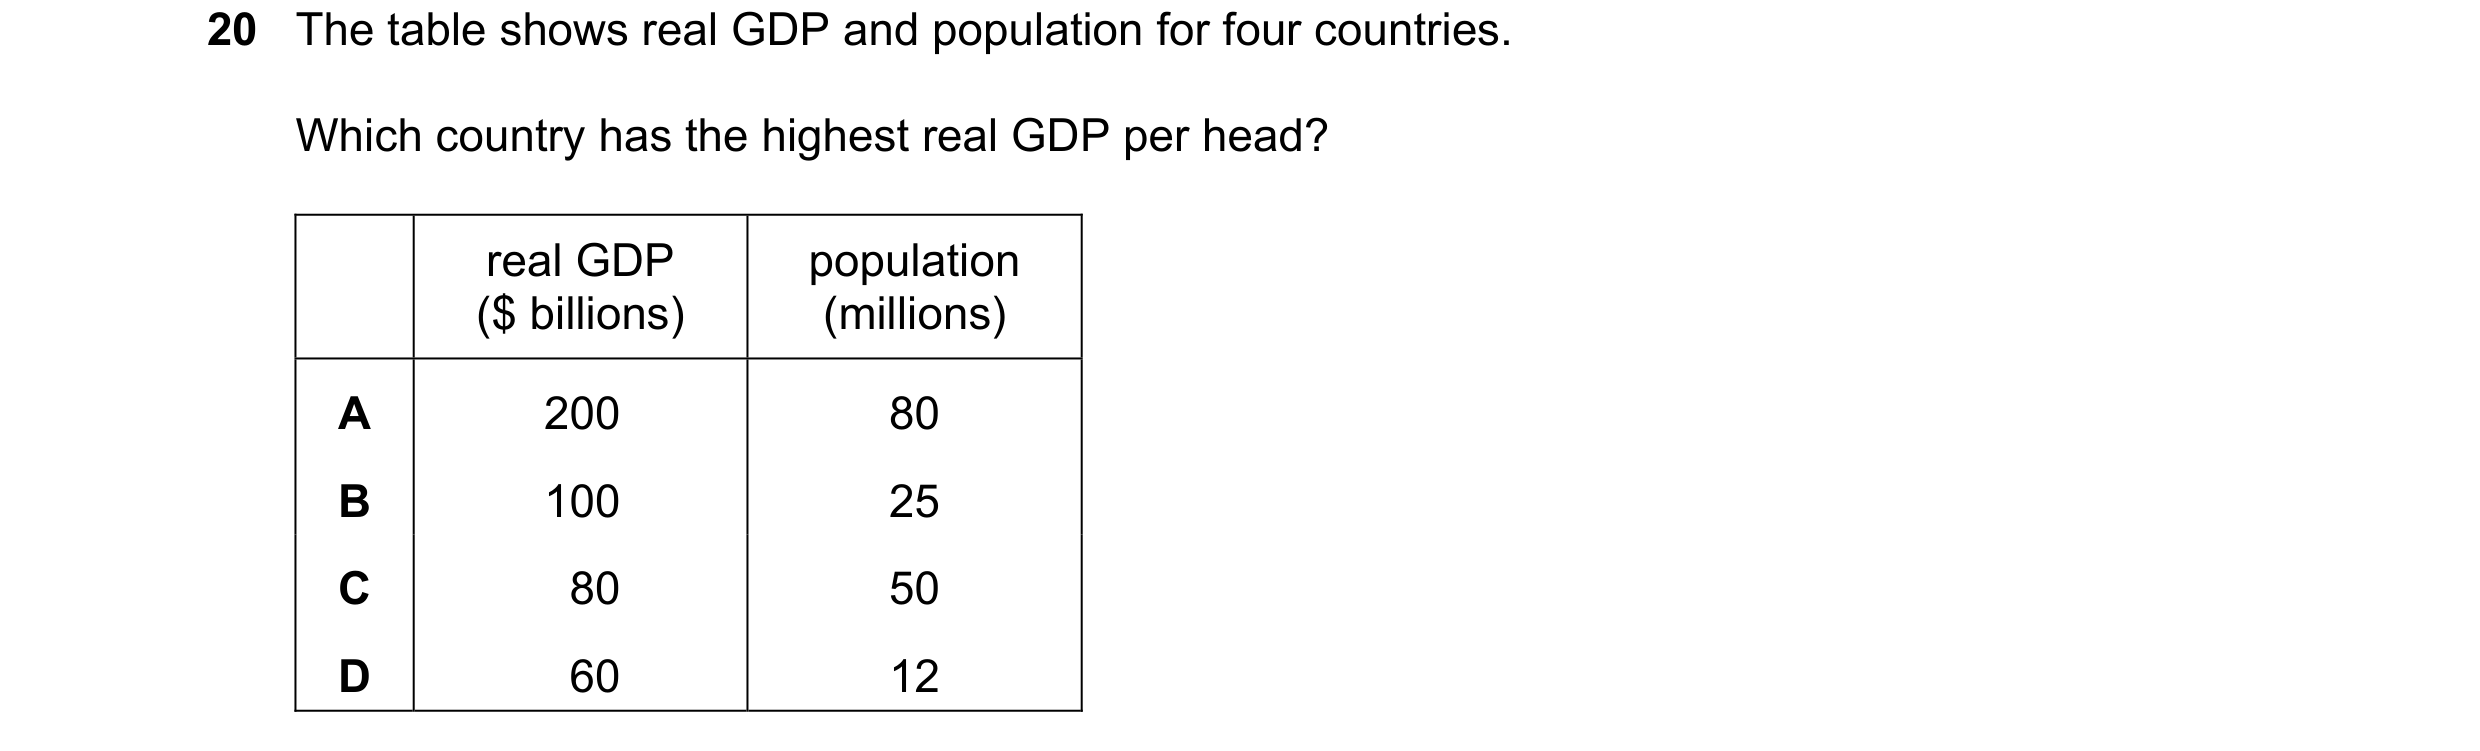
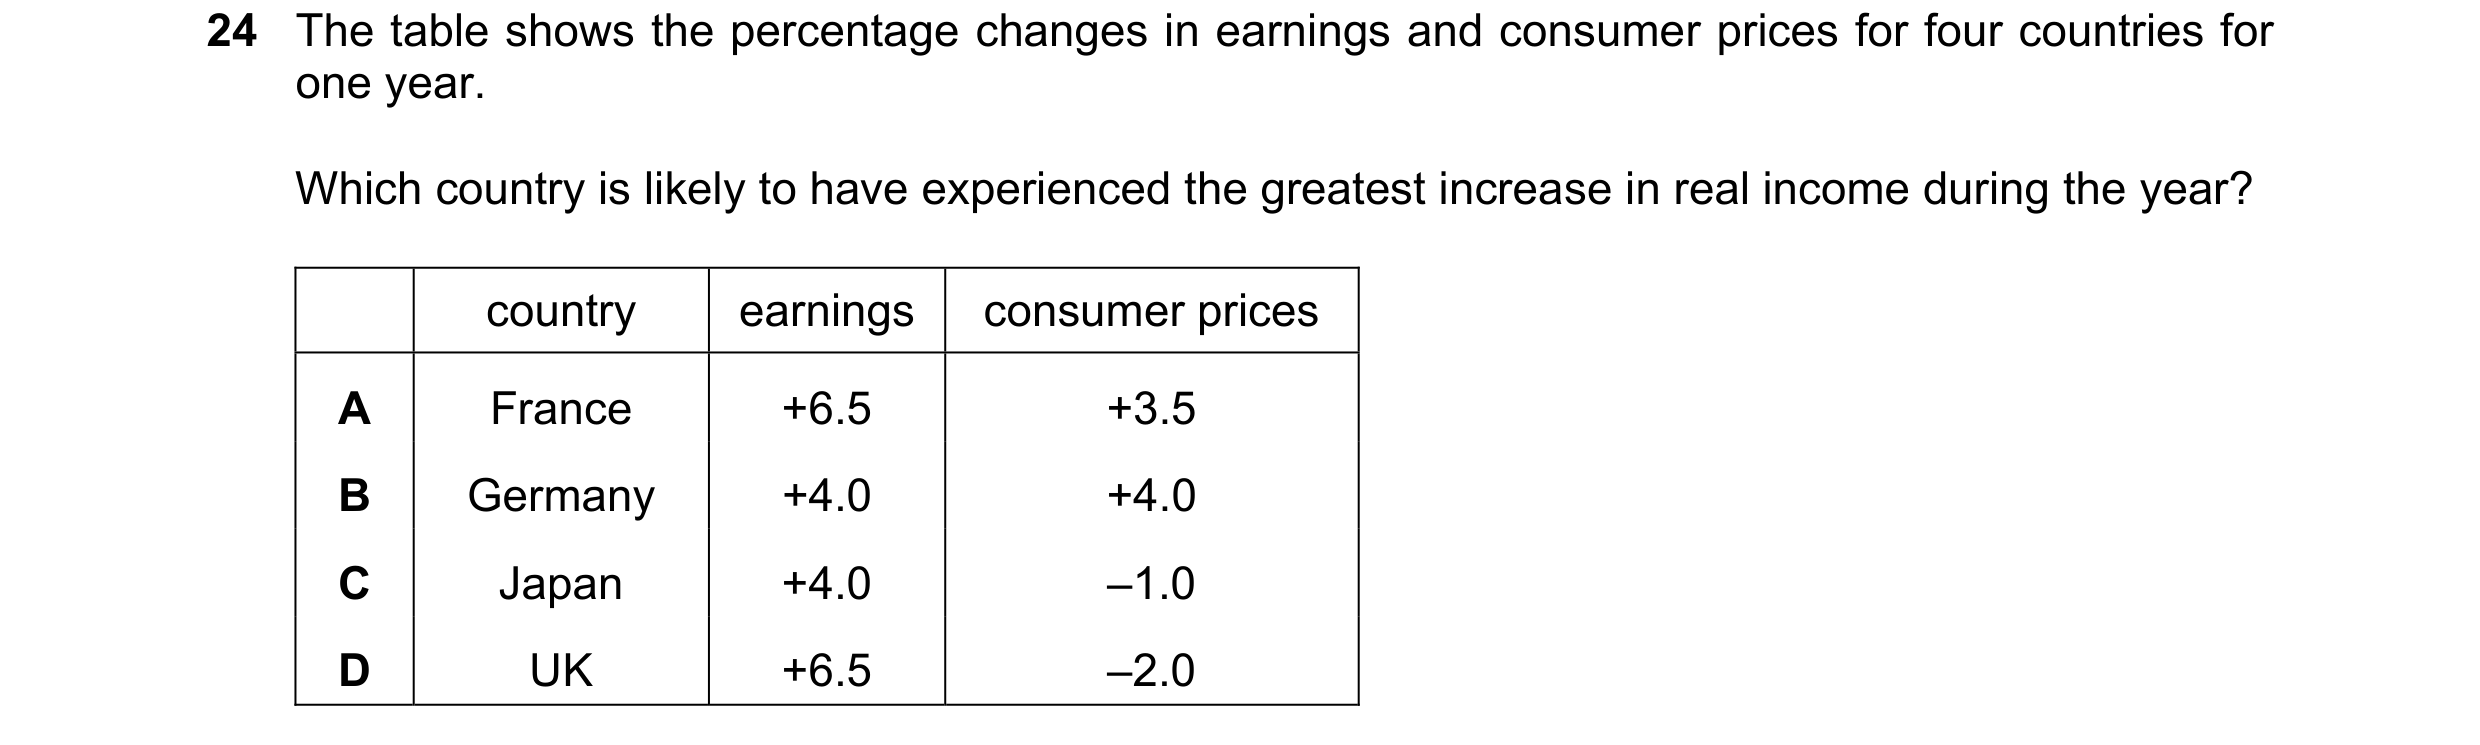
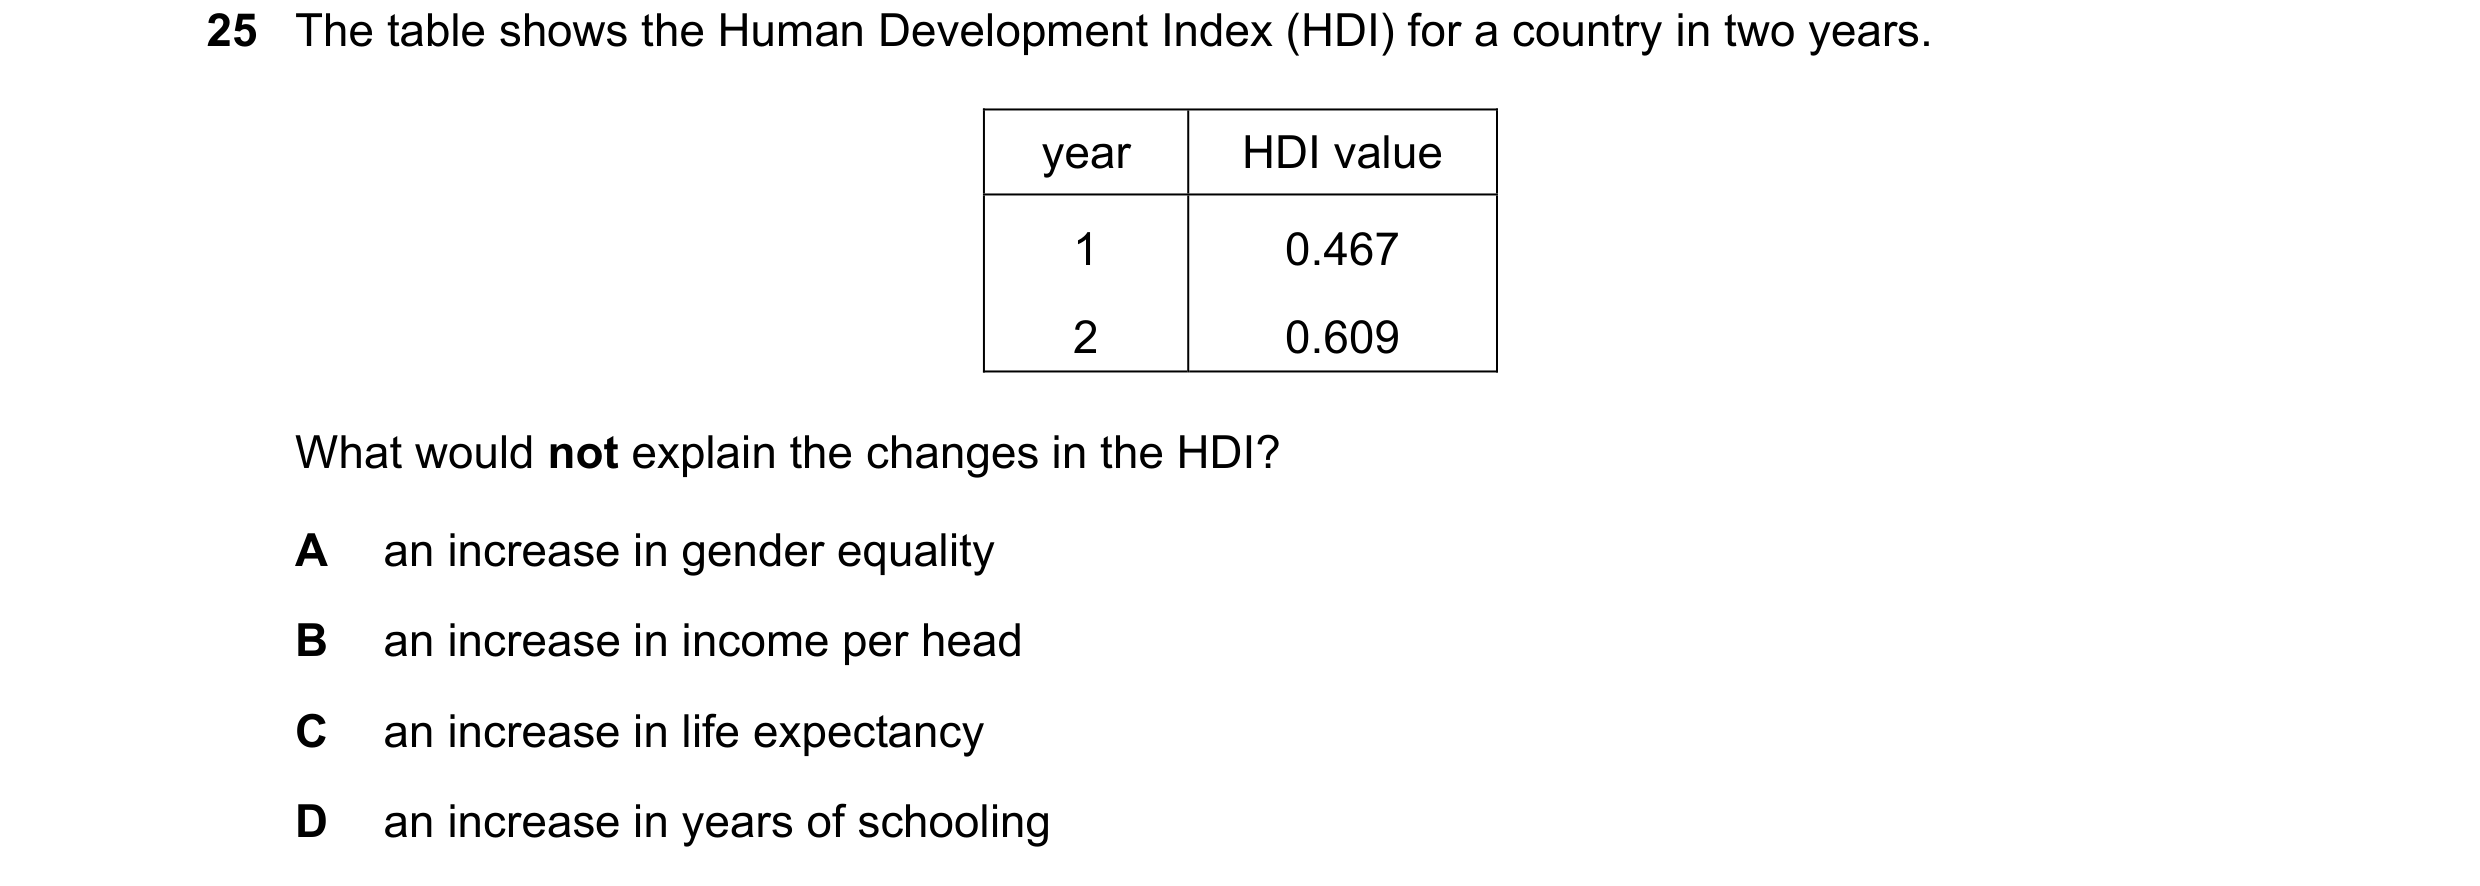
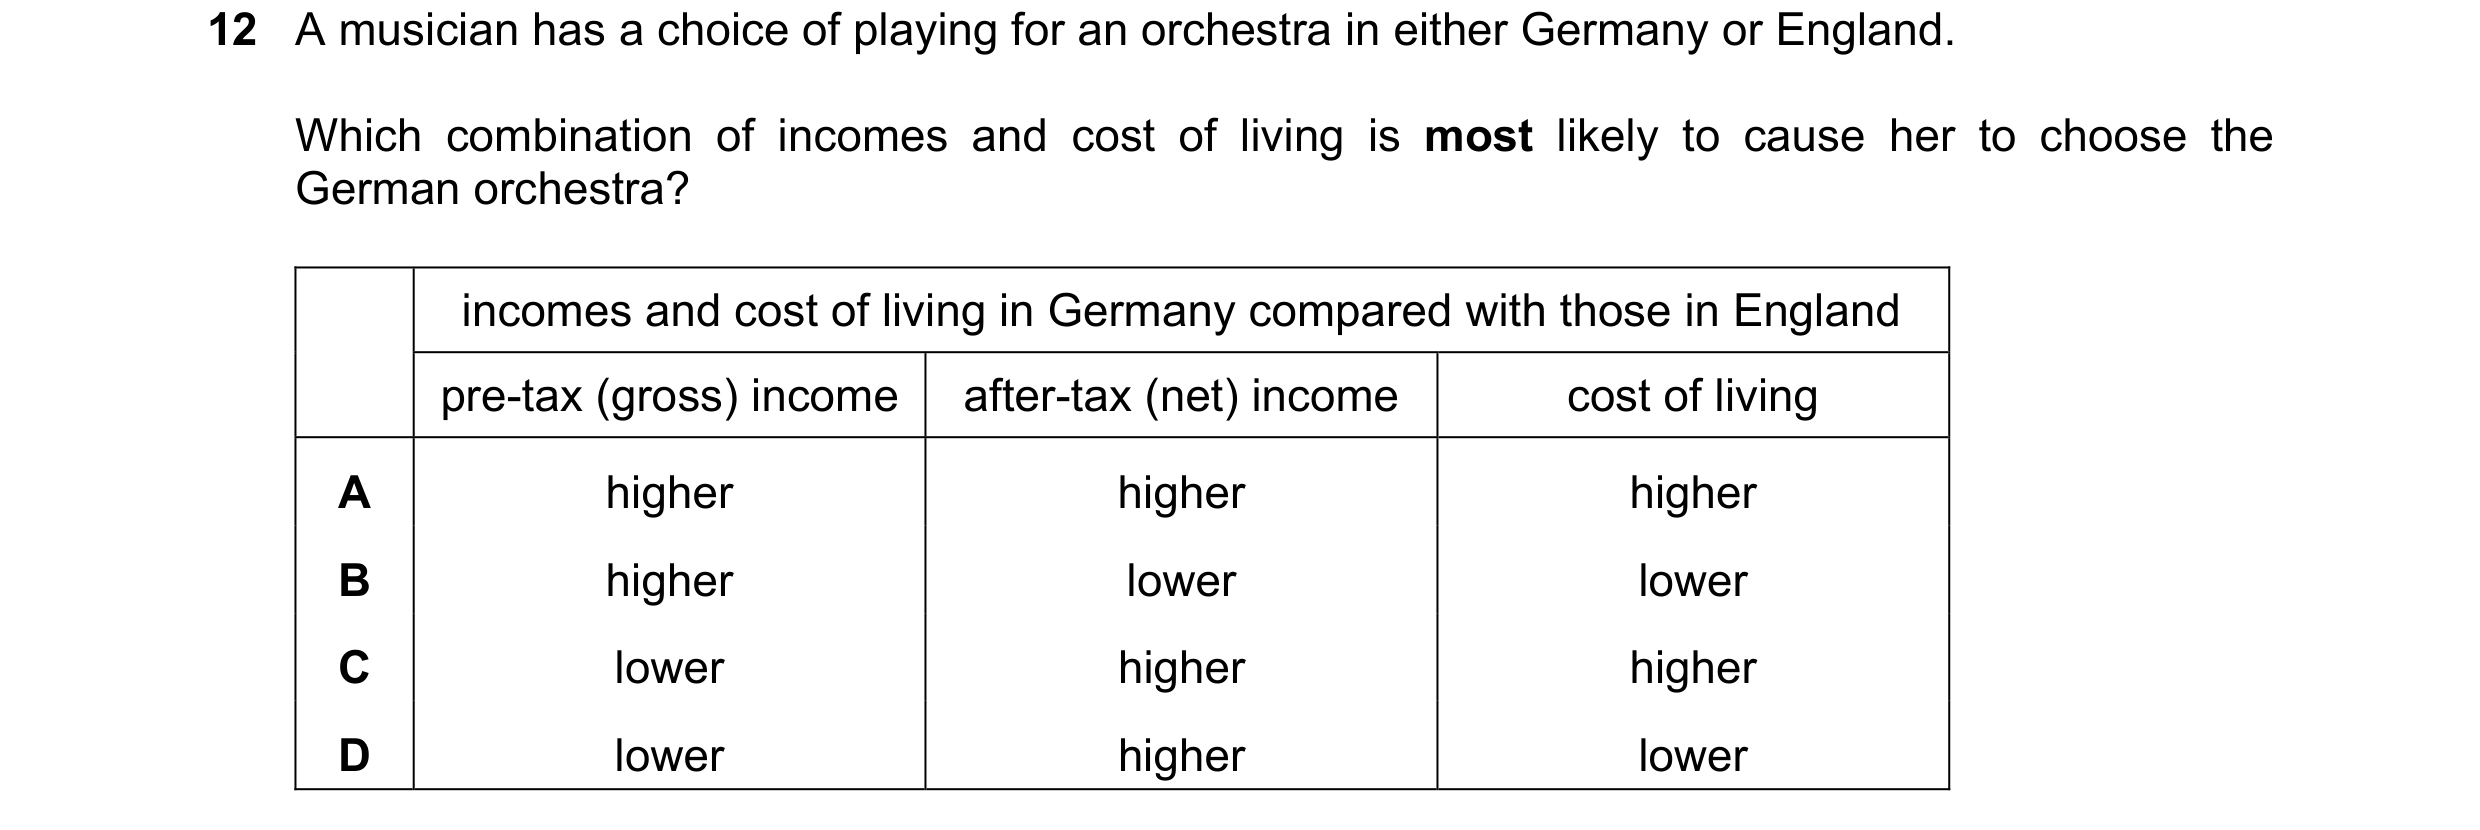 34 / 40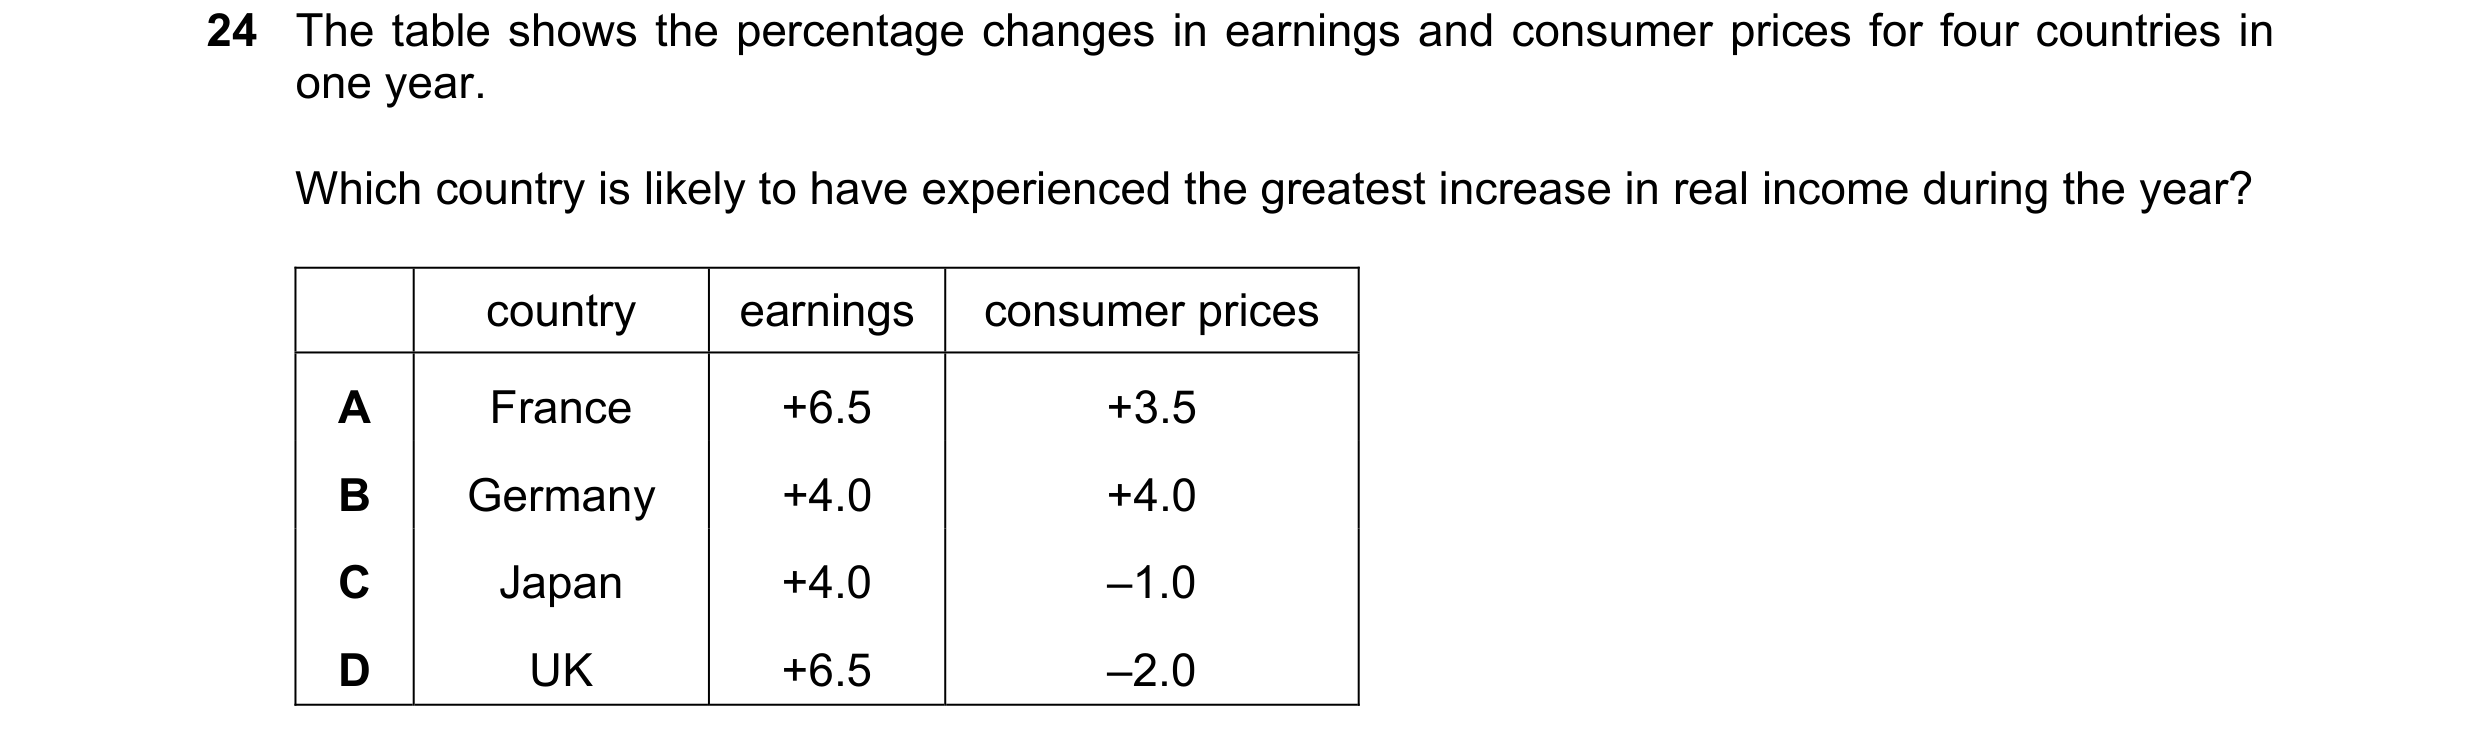
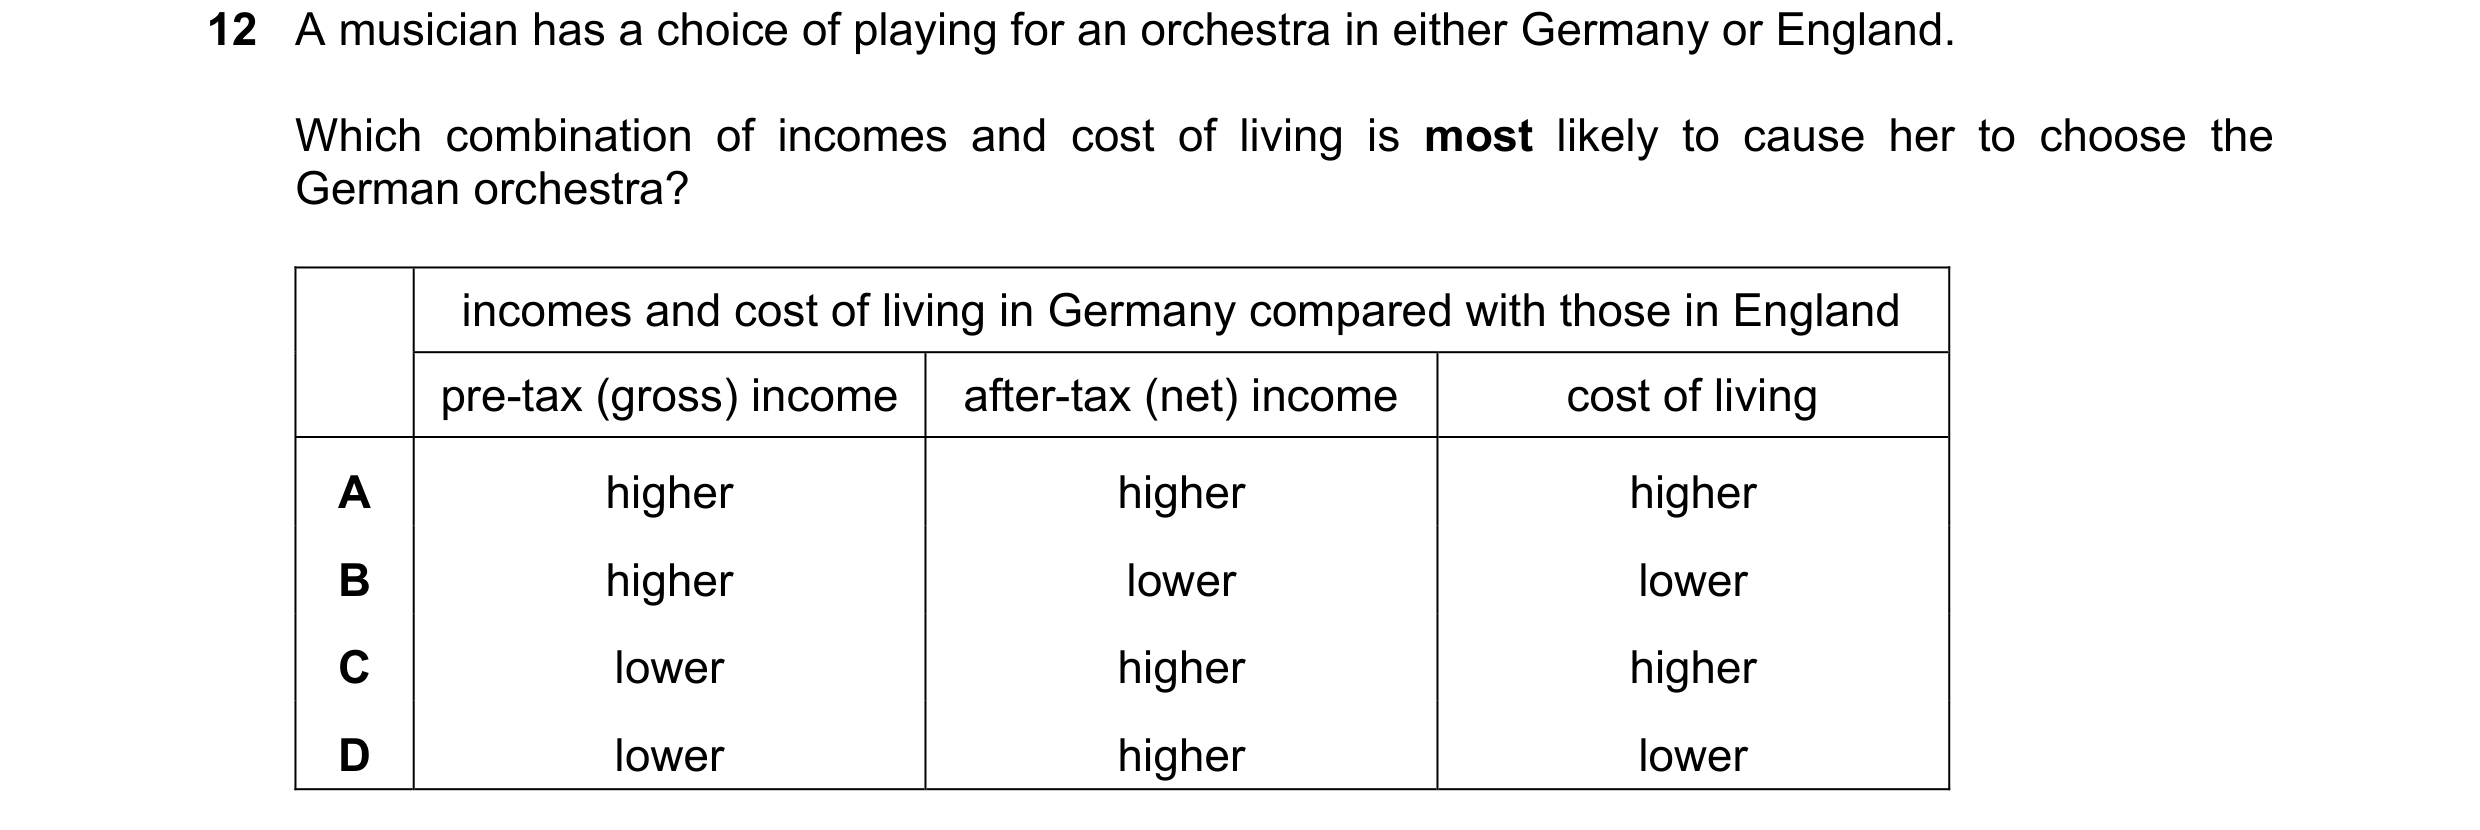
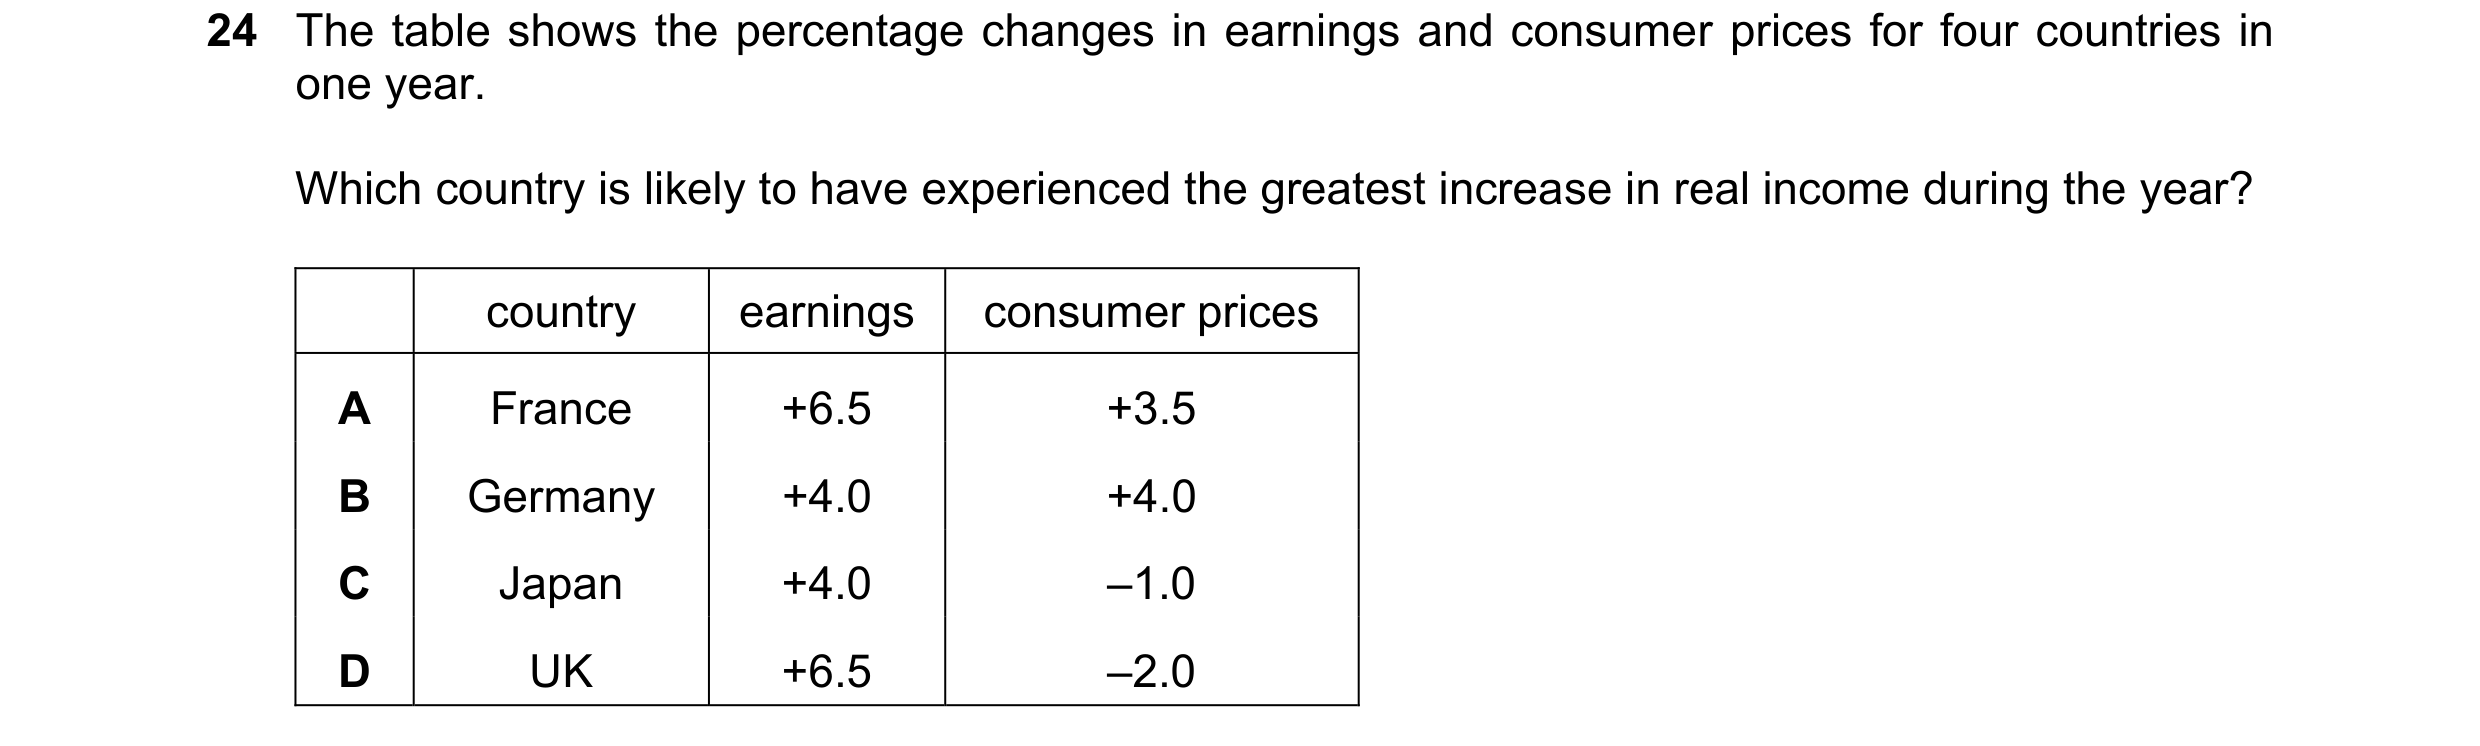
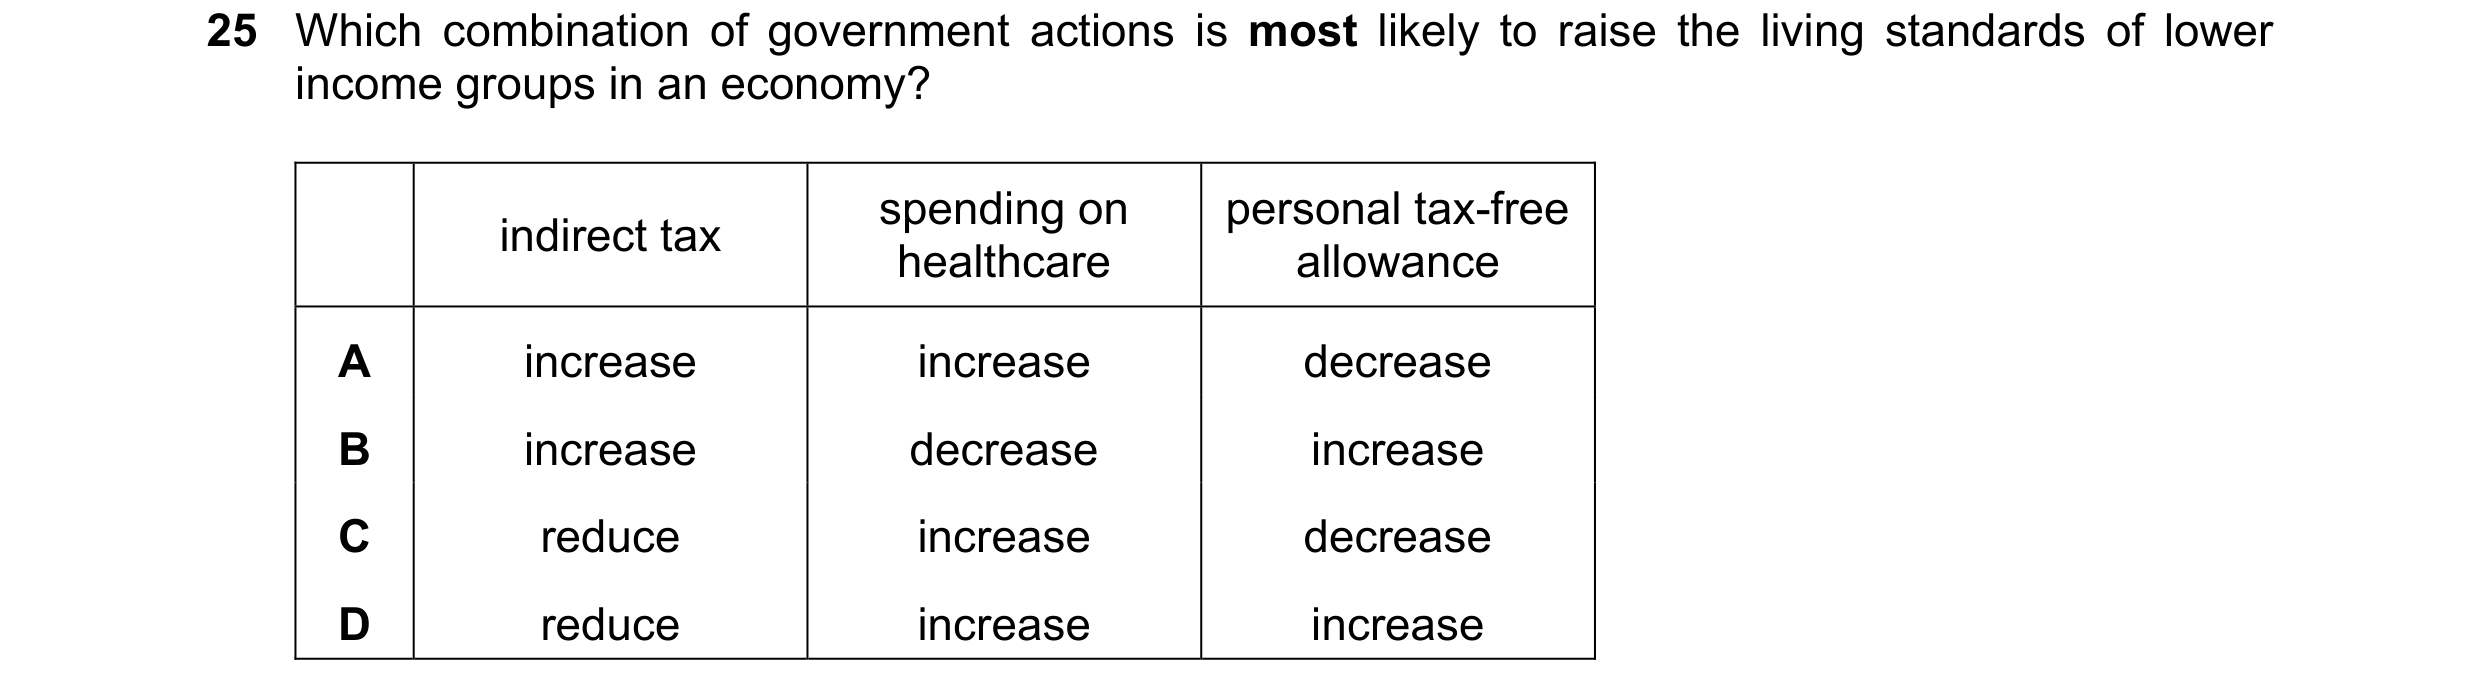 35 / 40
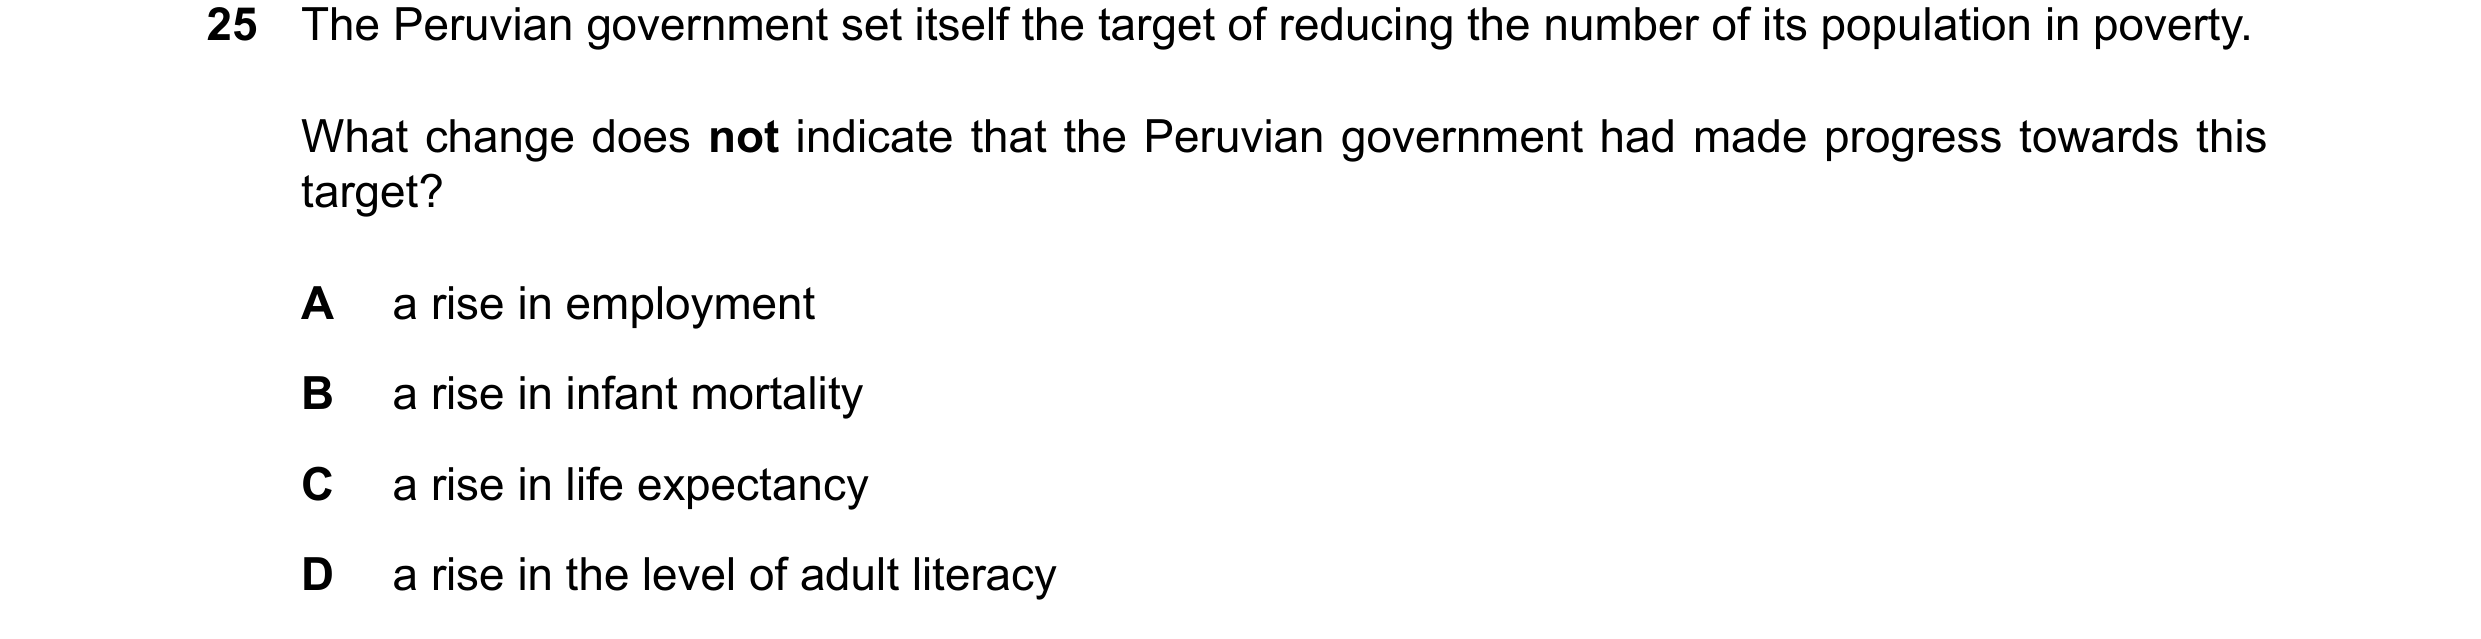
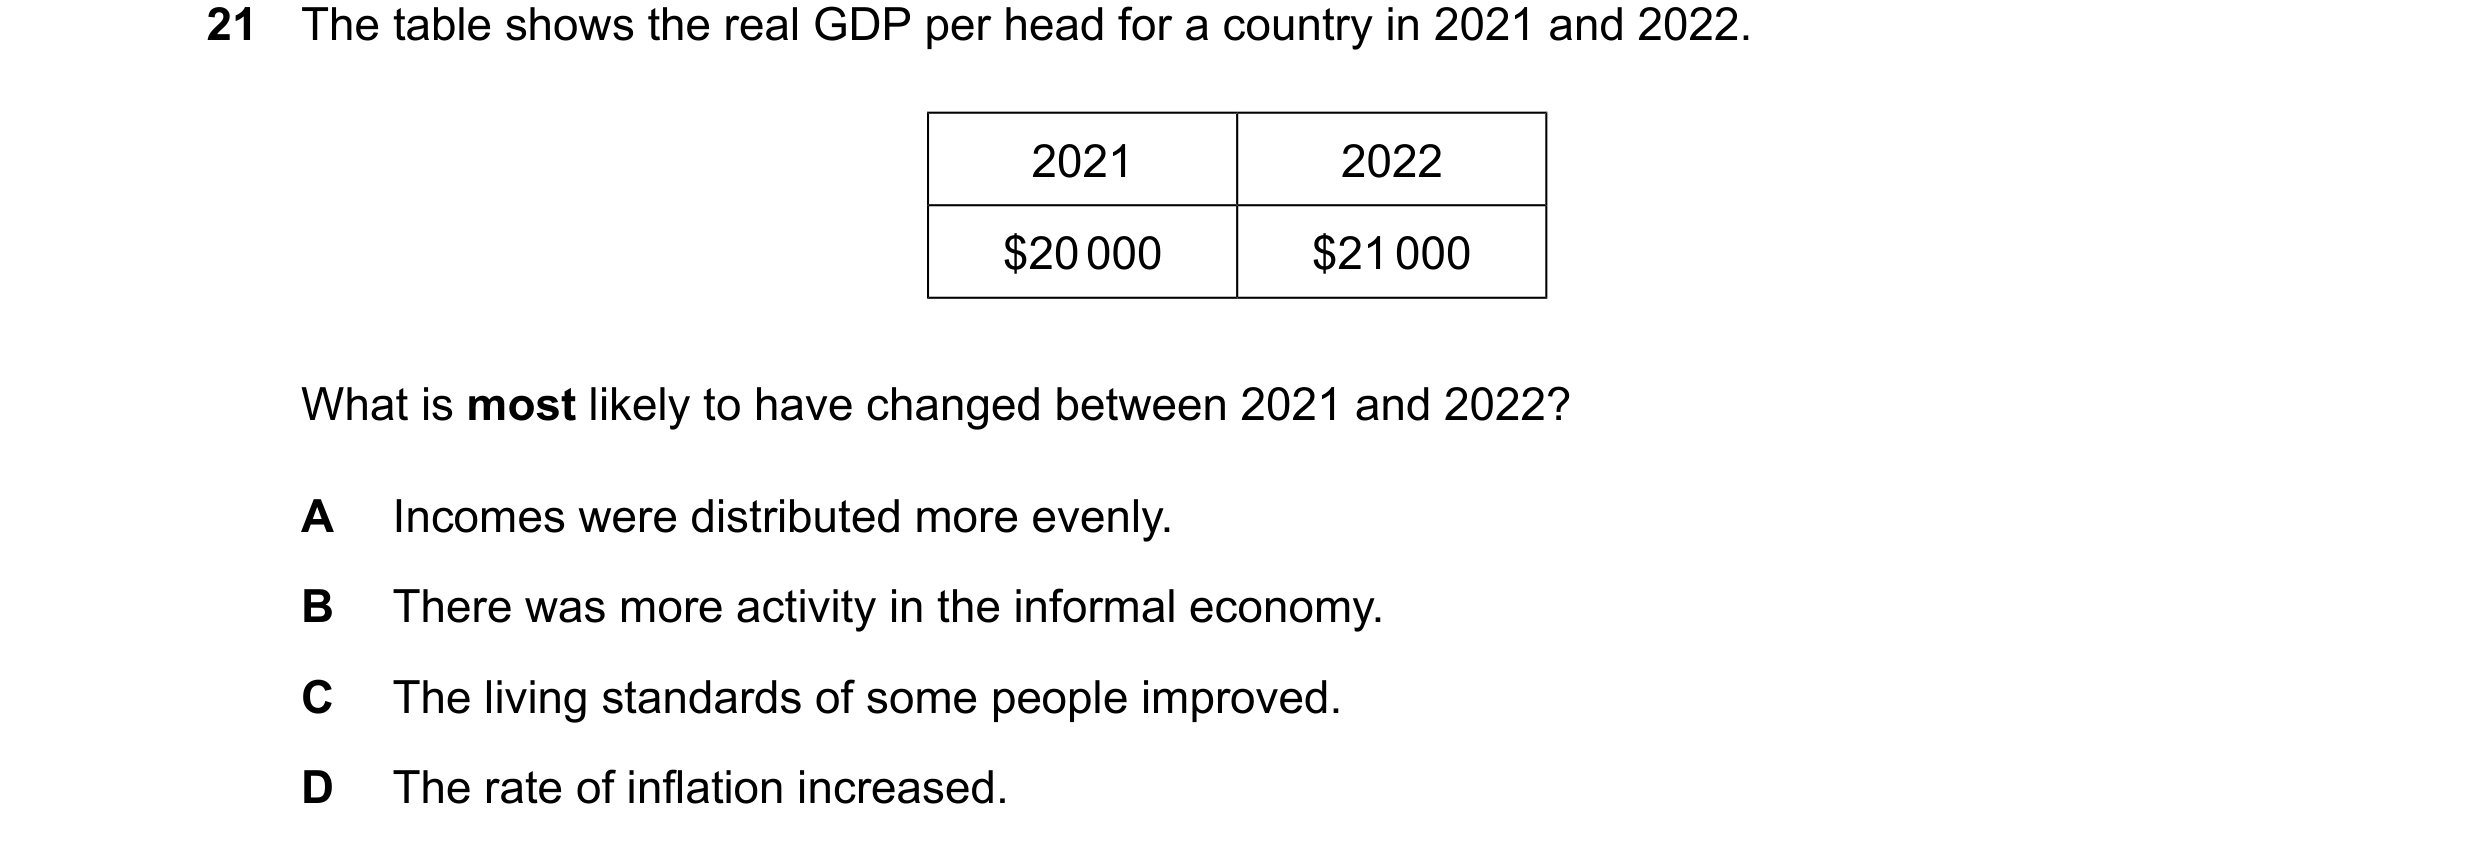
 36 / 40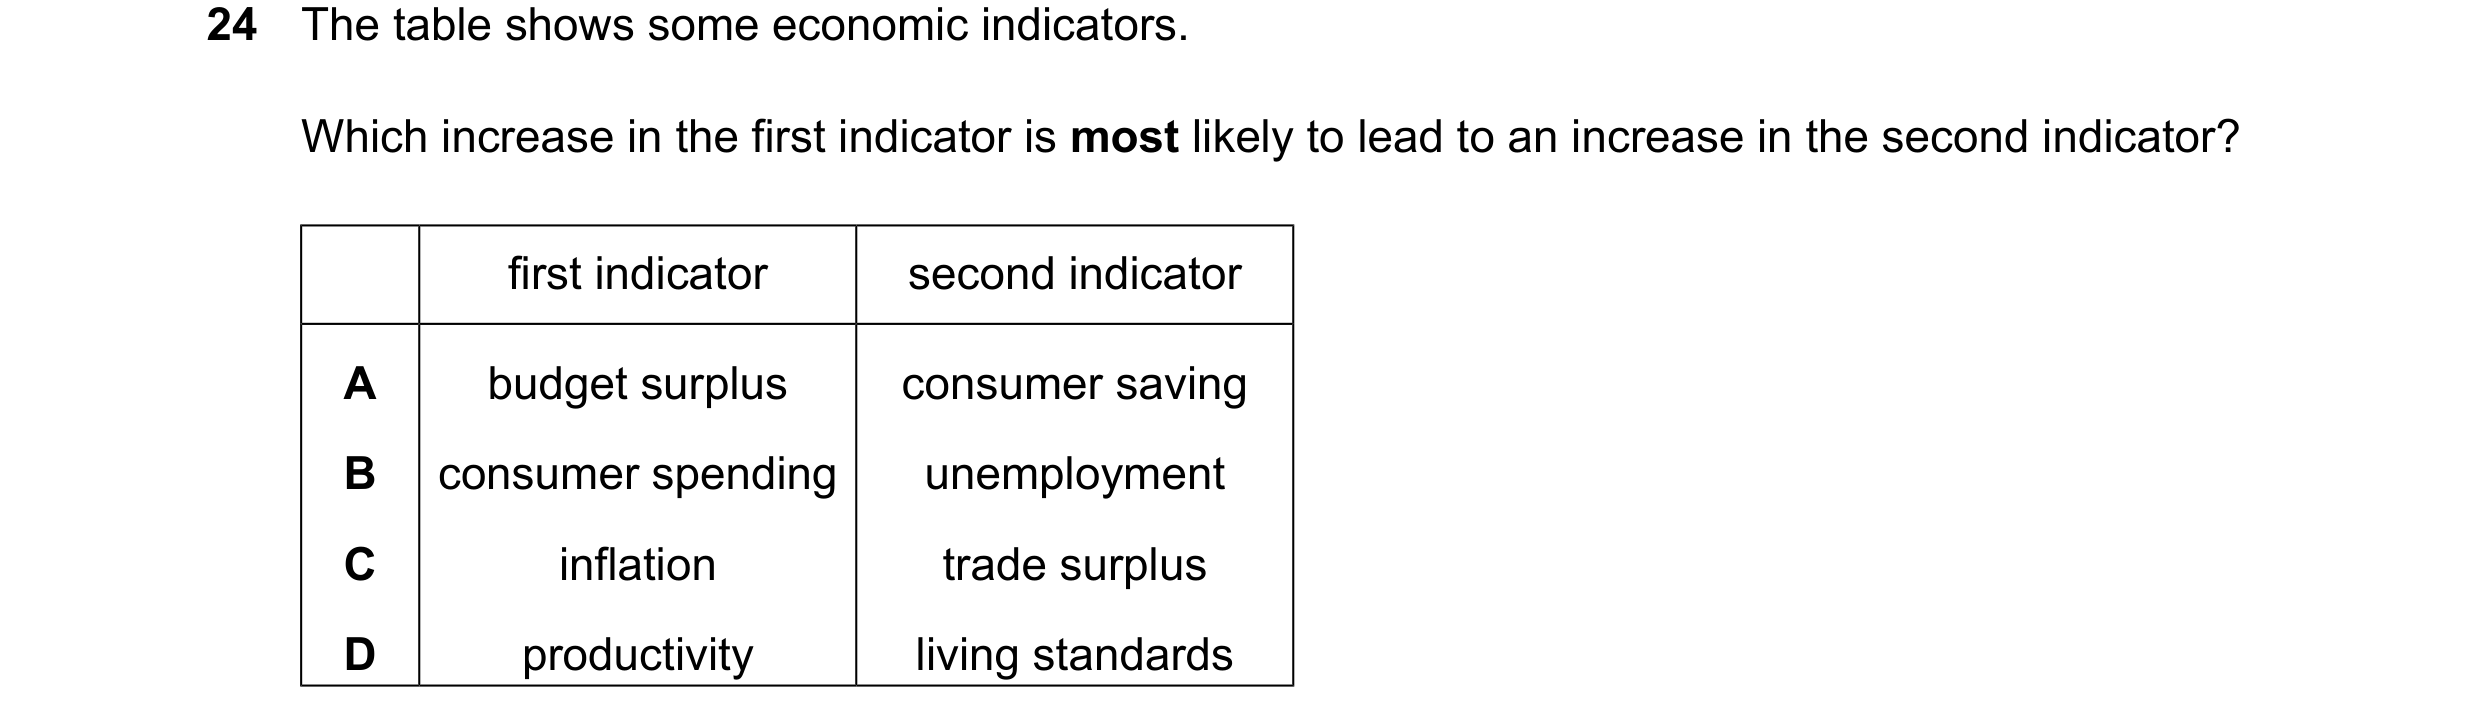

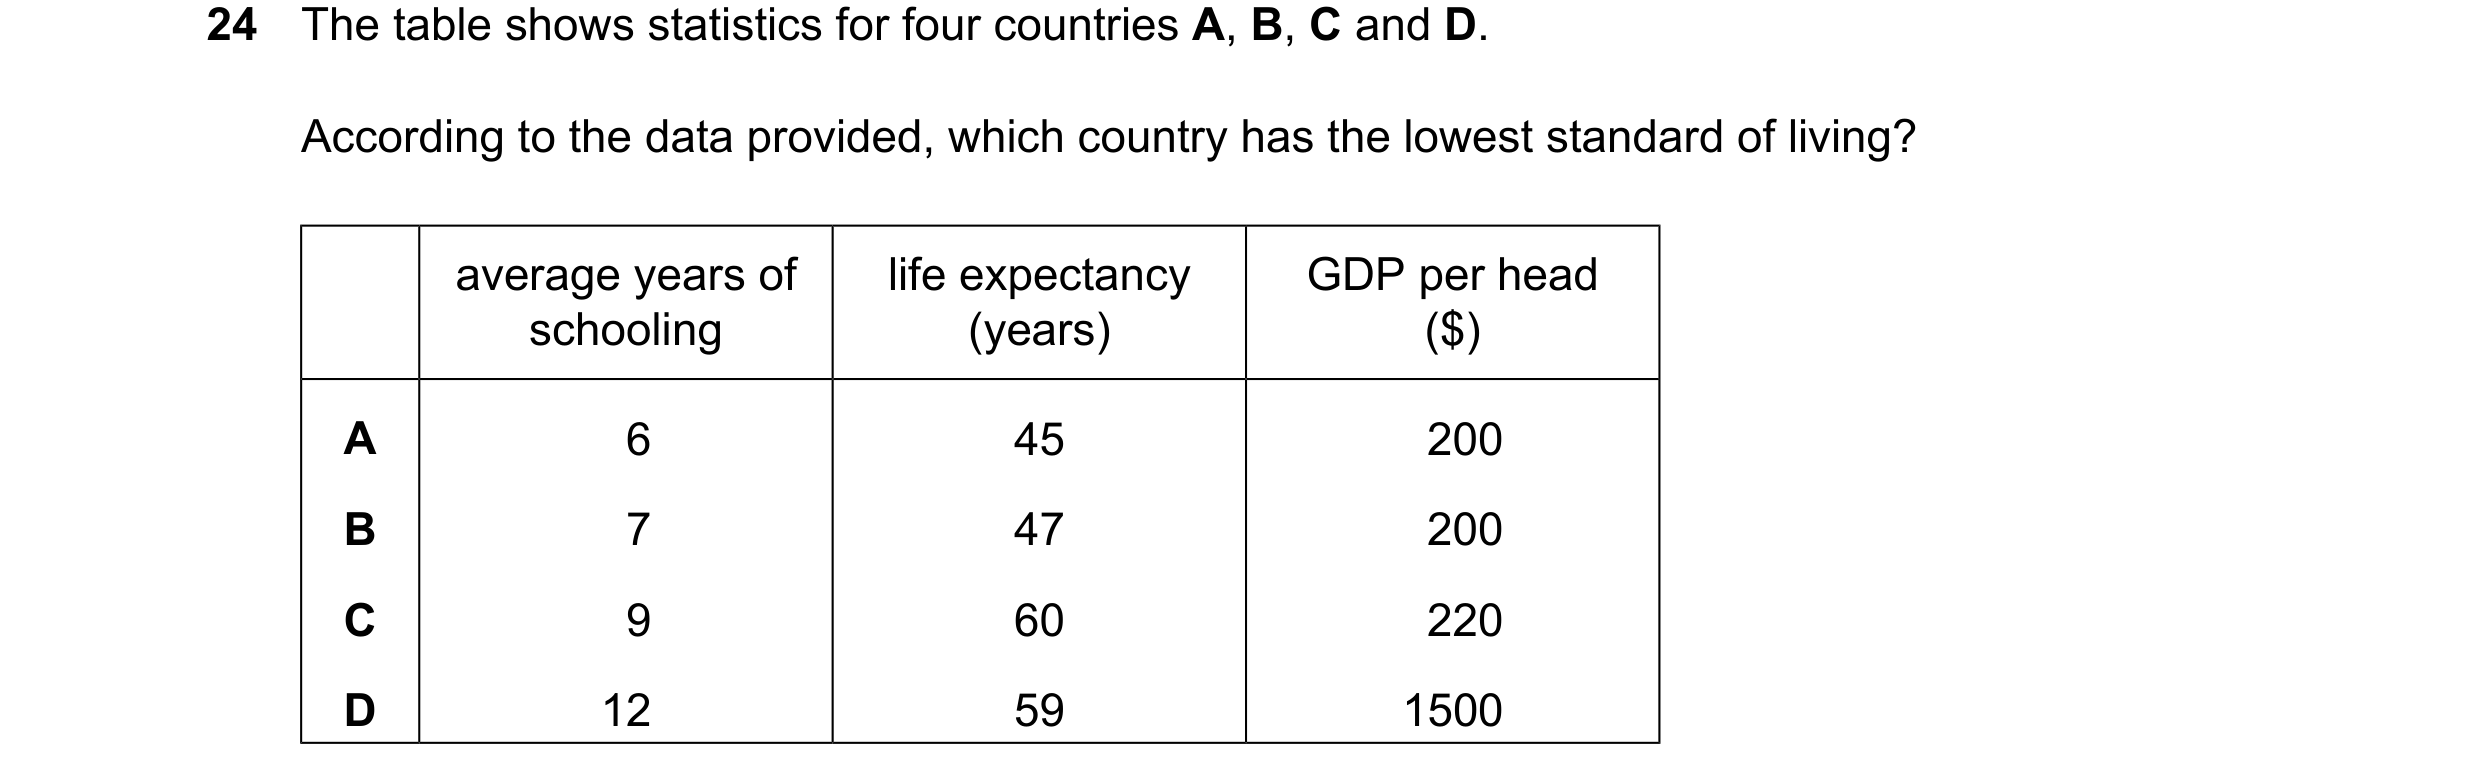
 37 / 40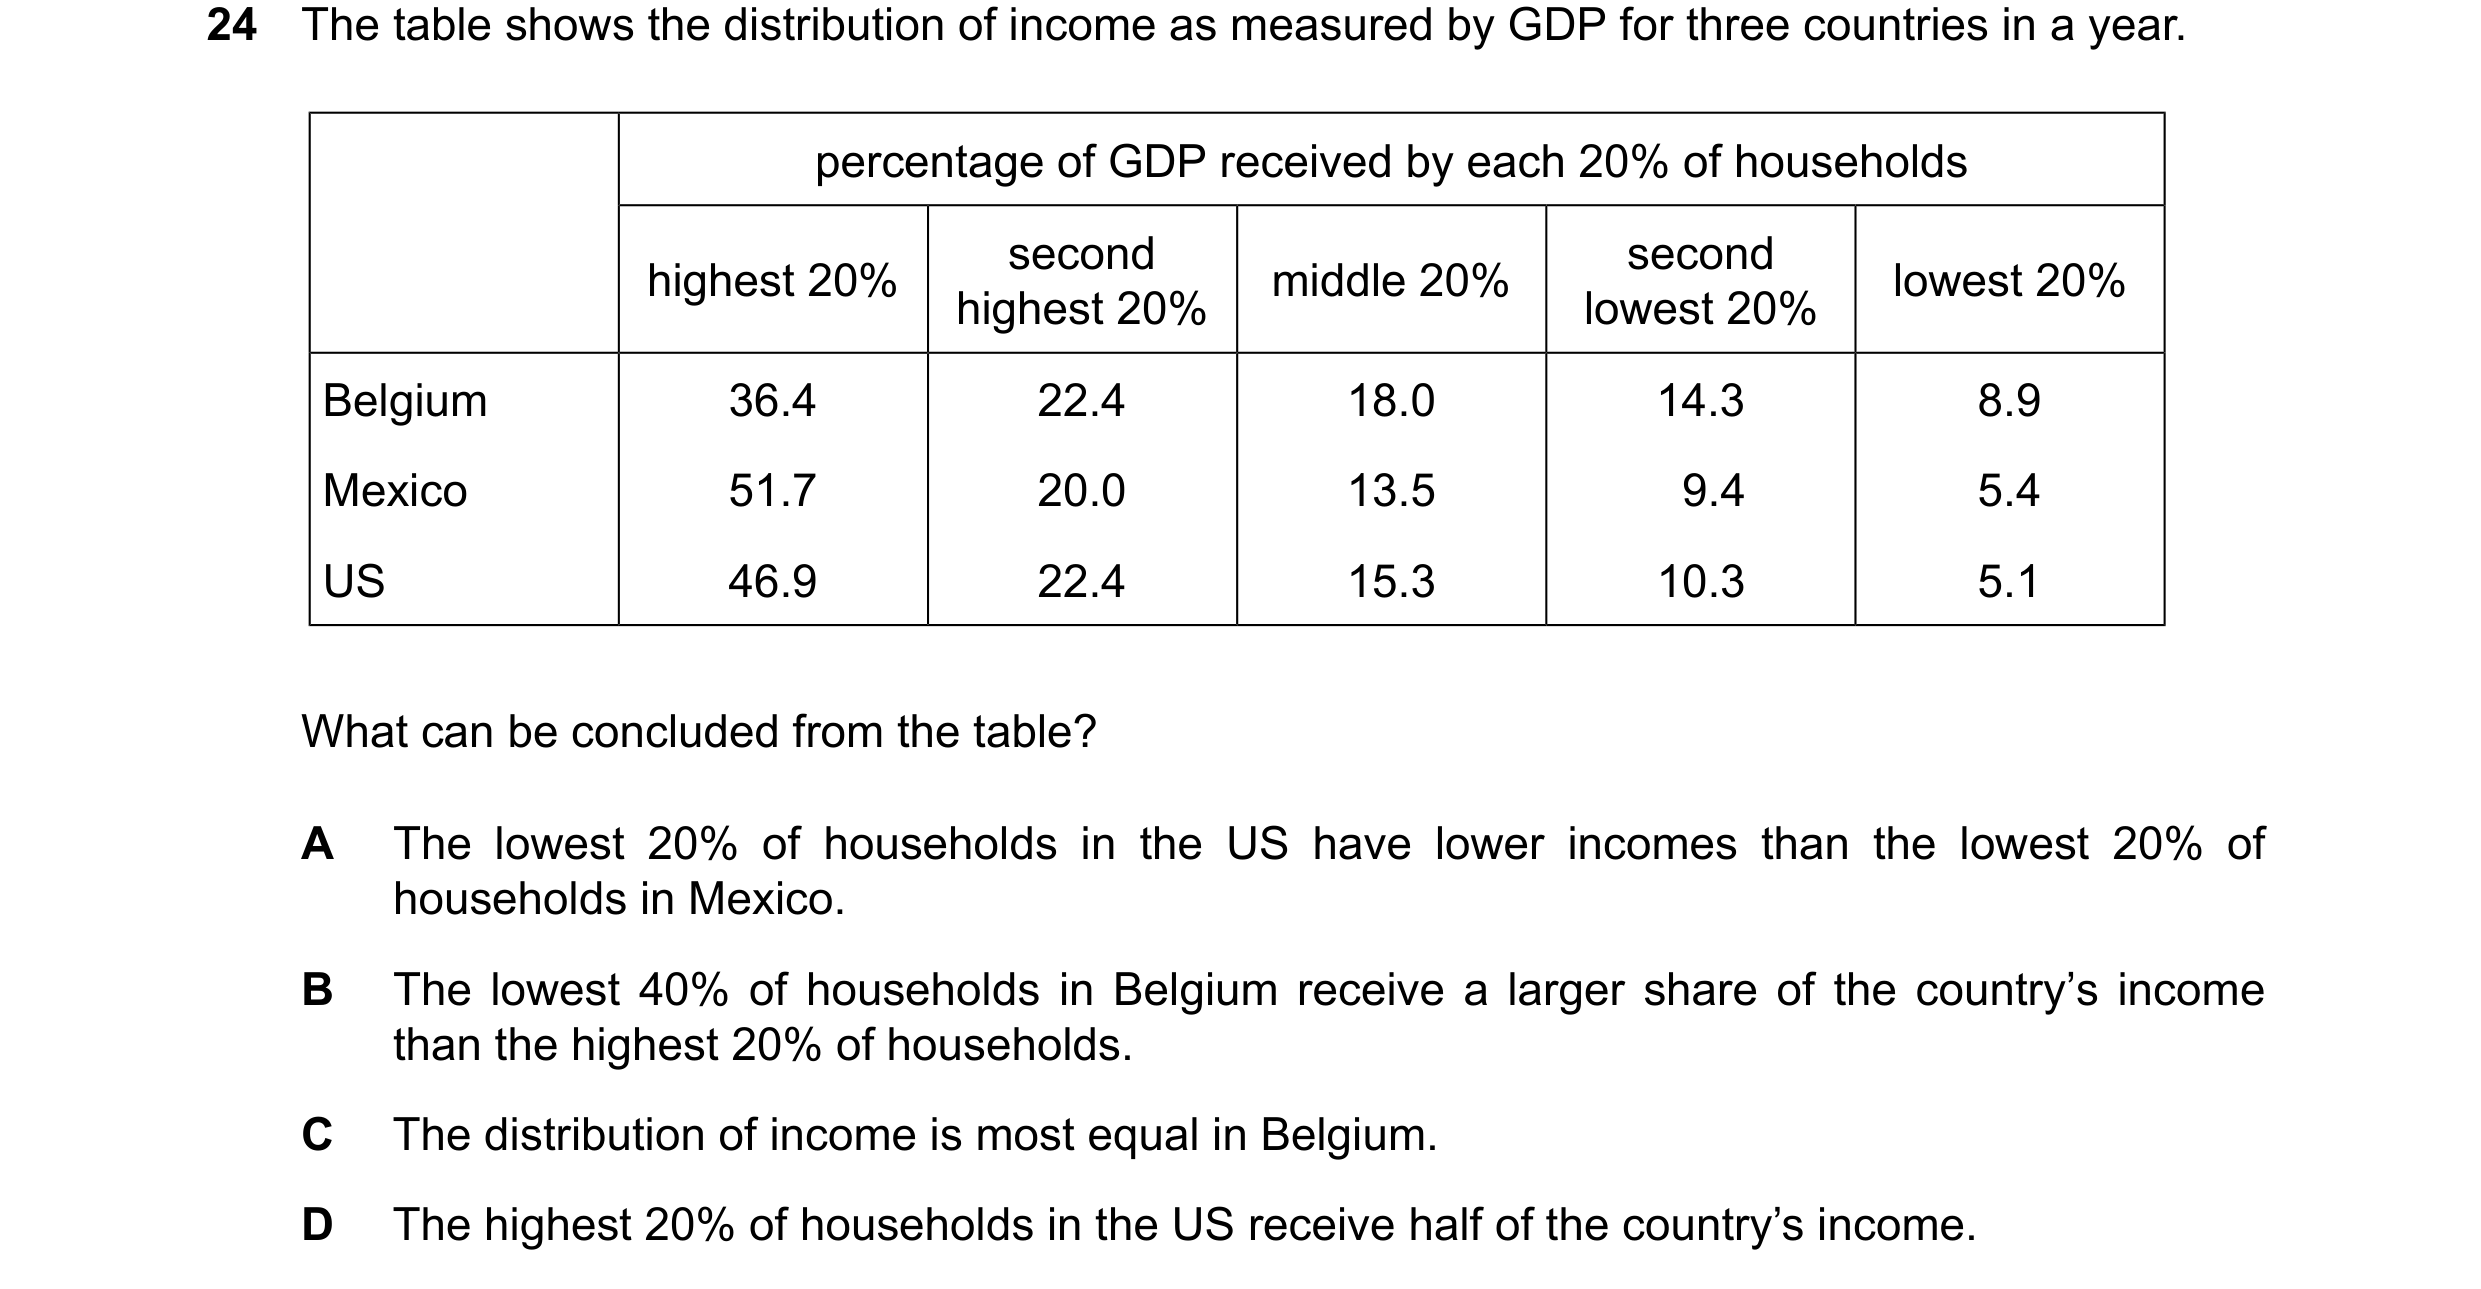
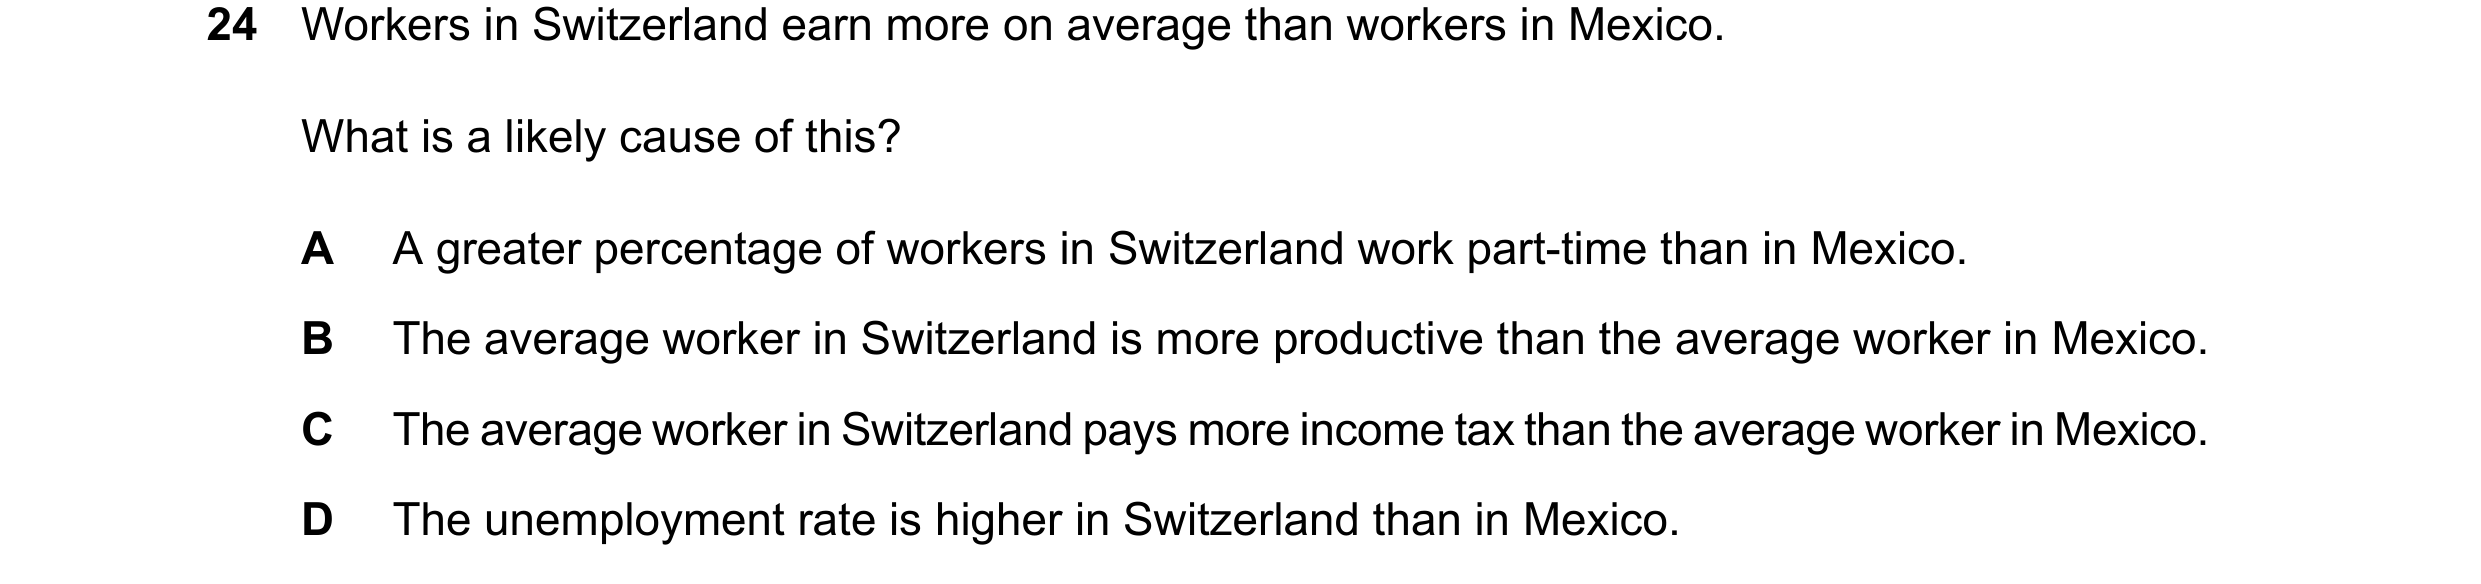

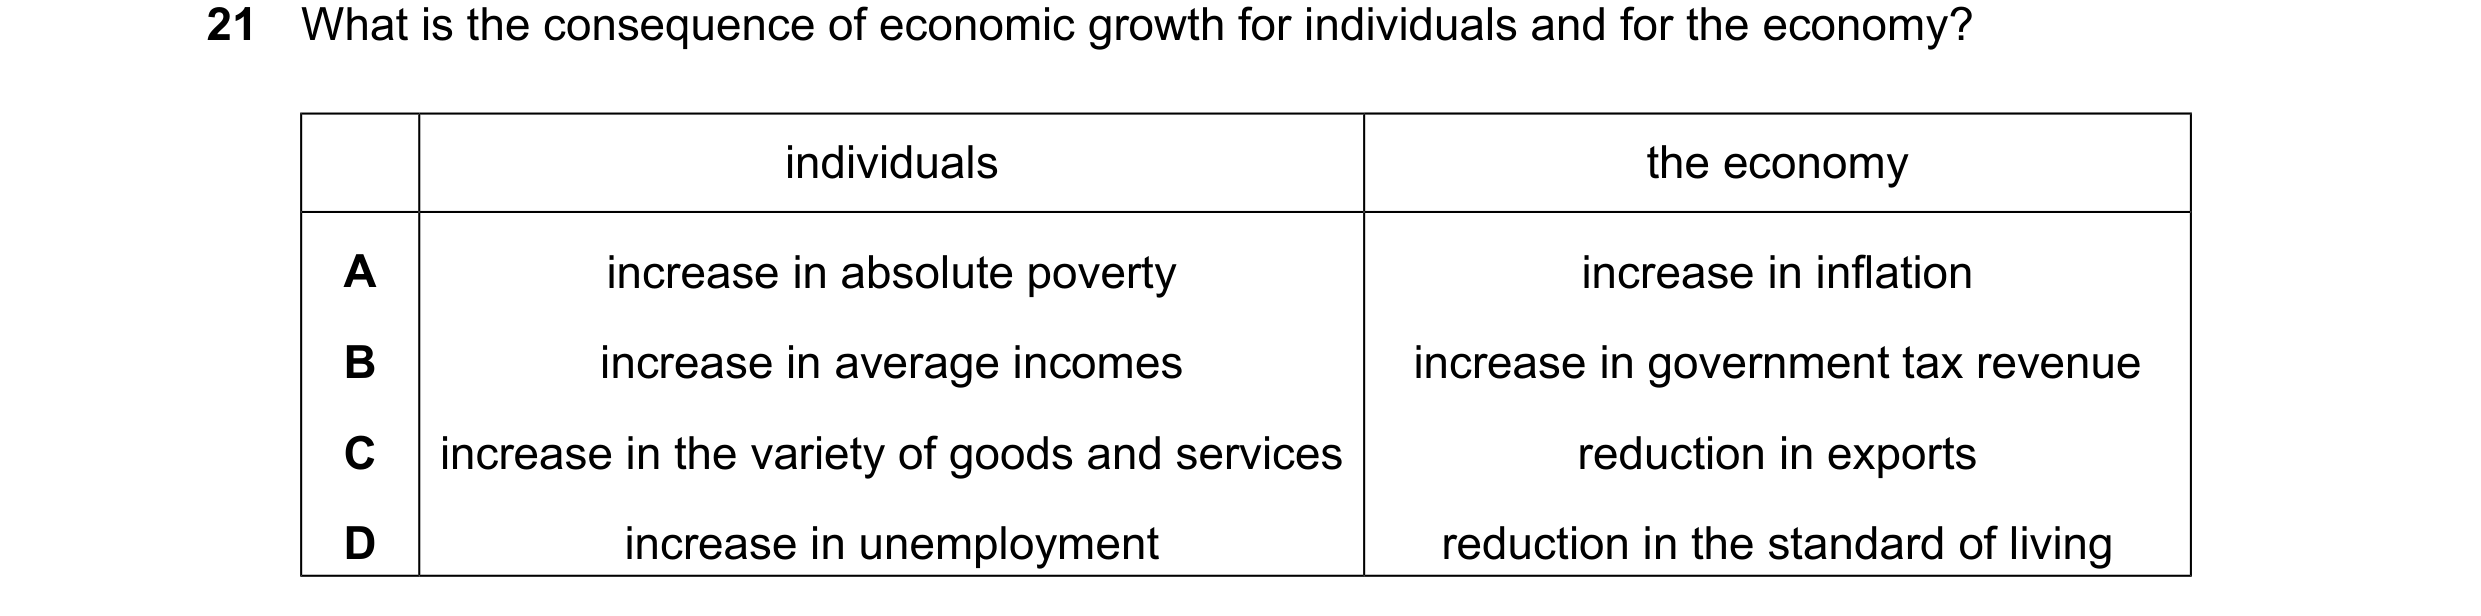 38 / 40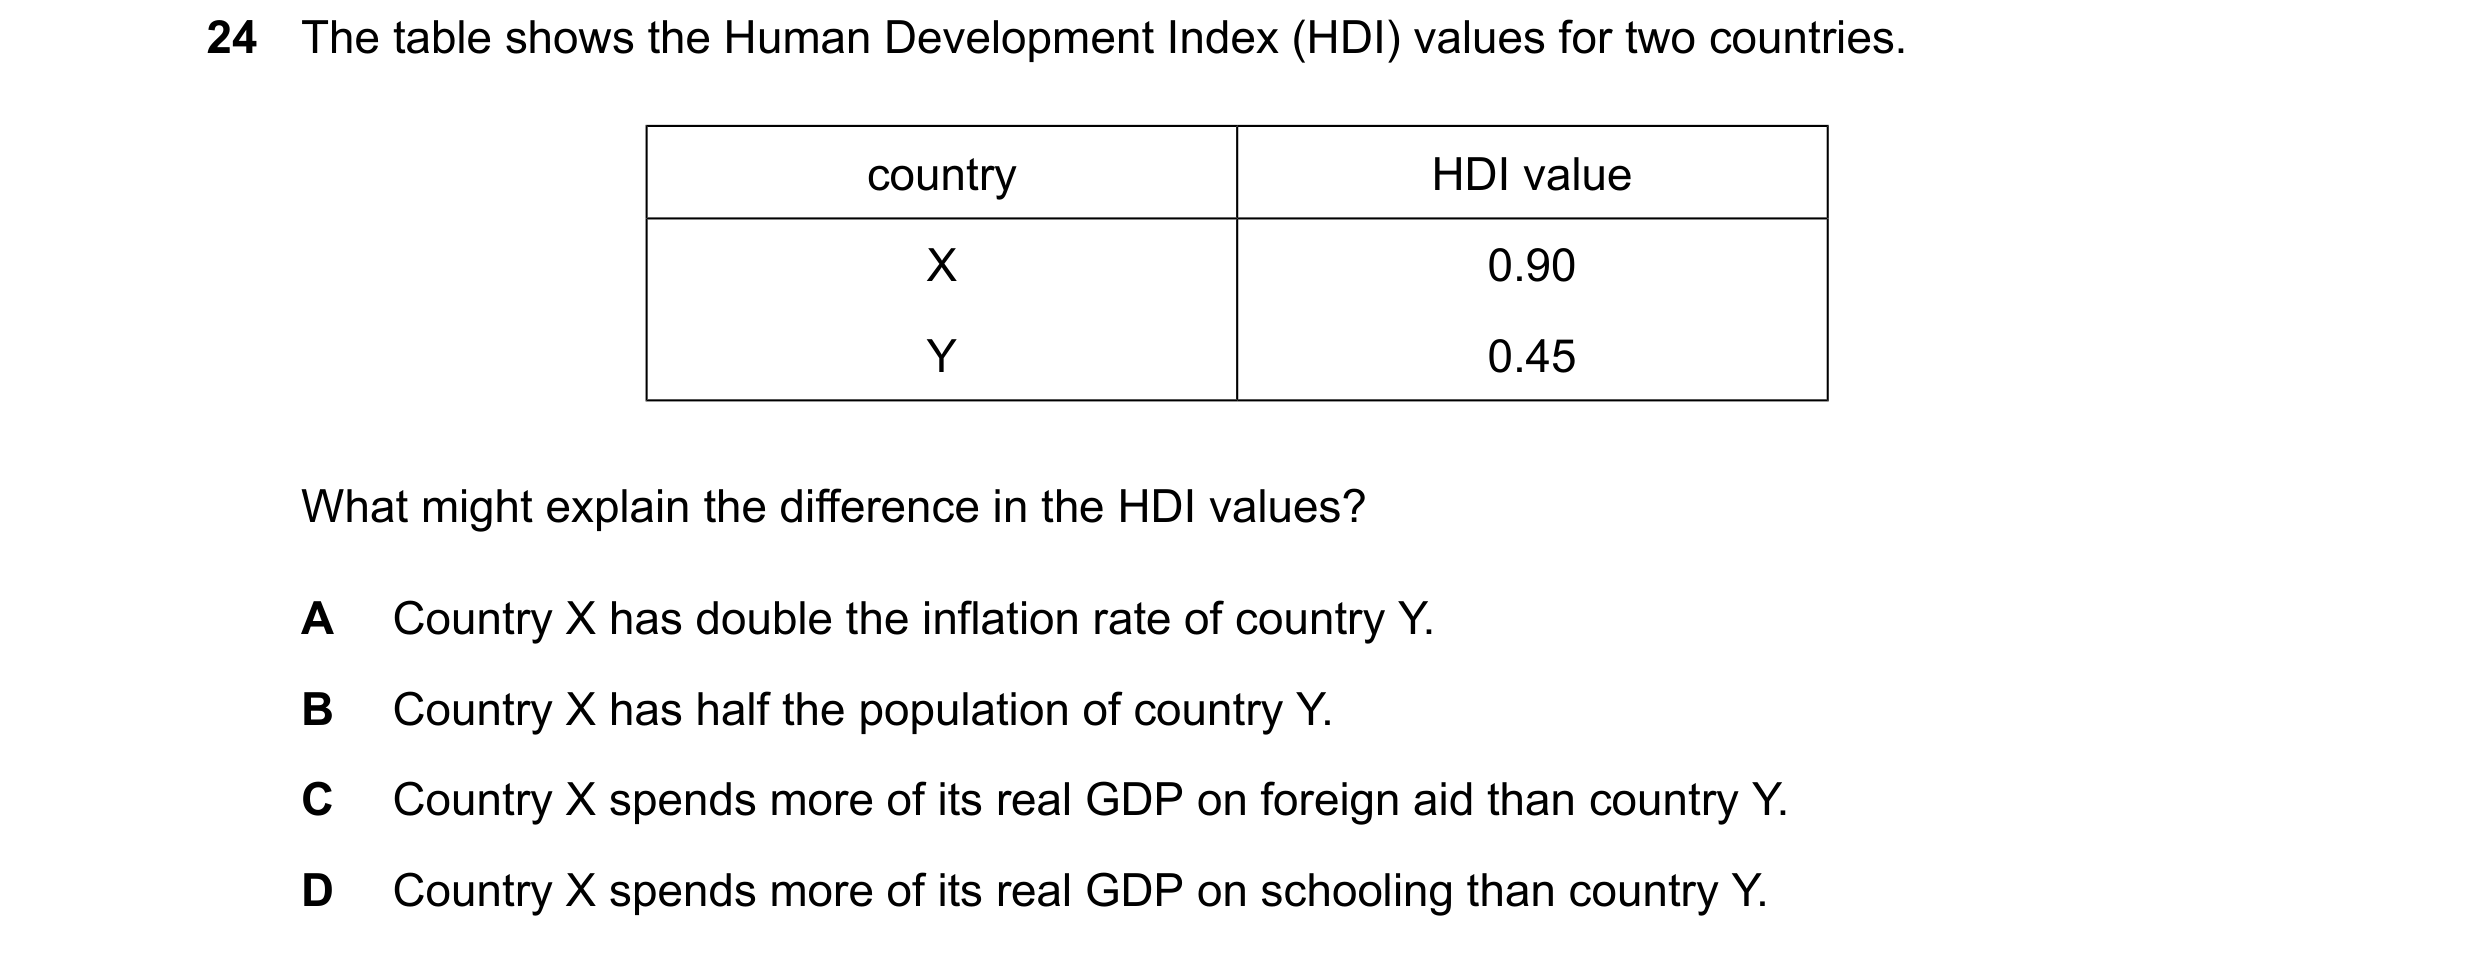
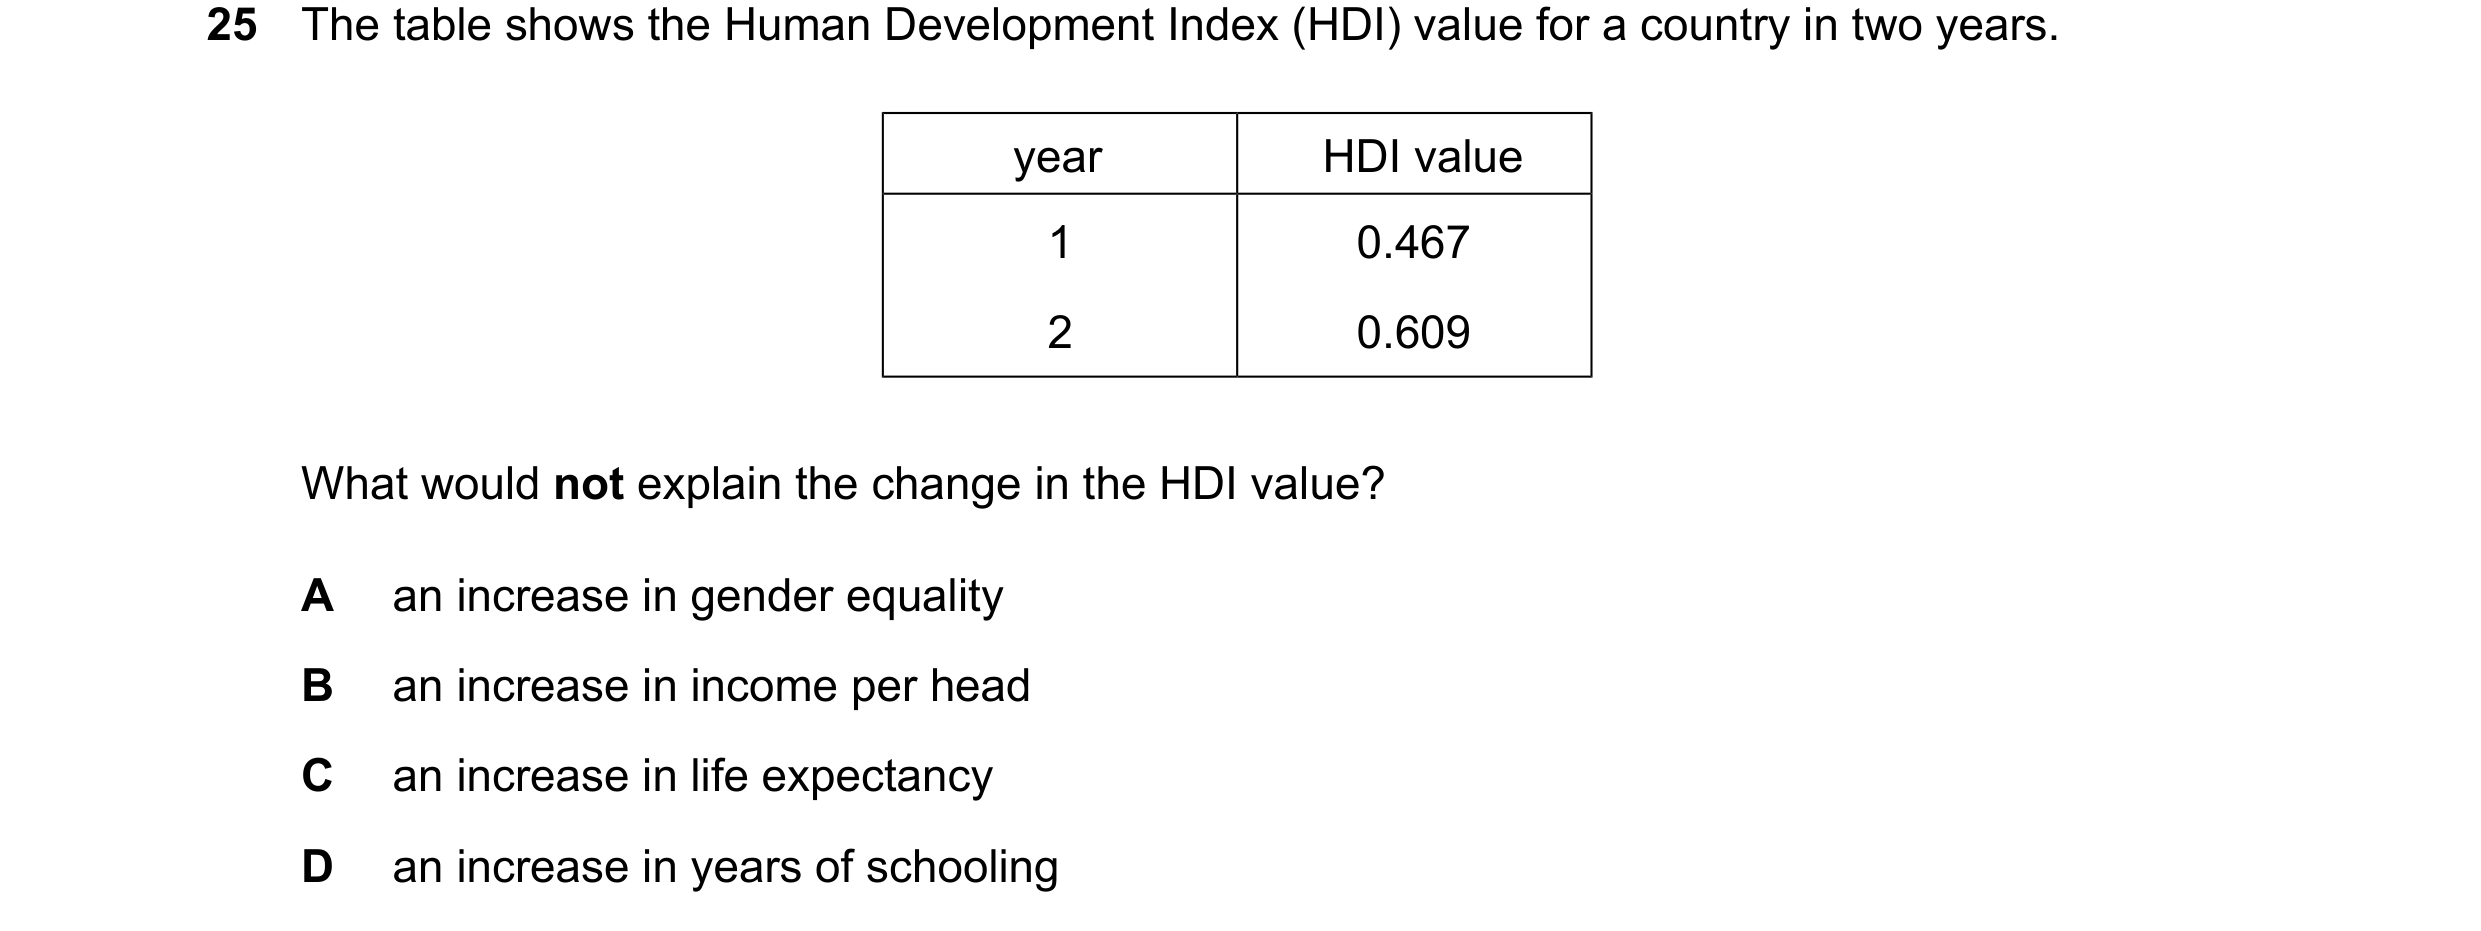
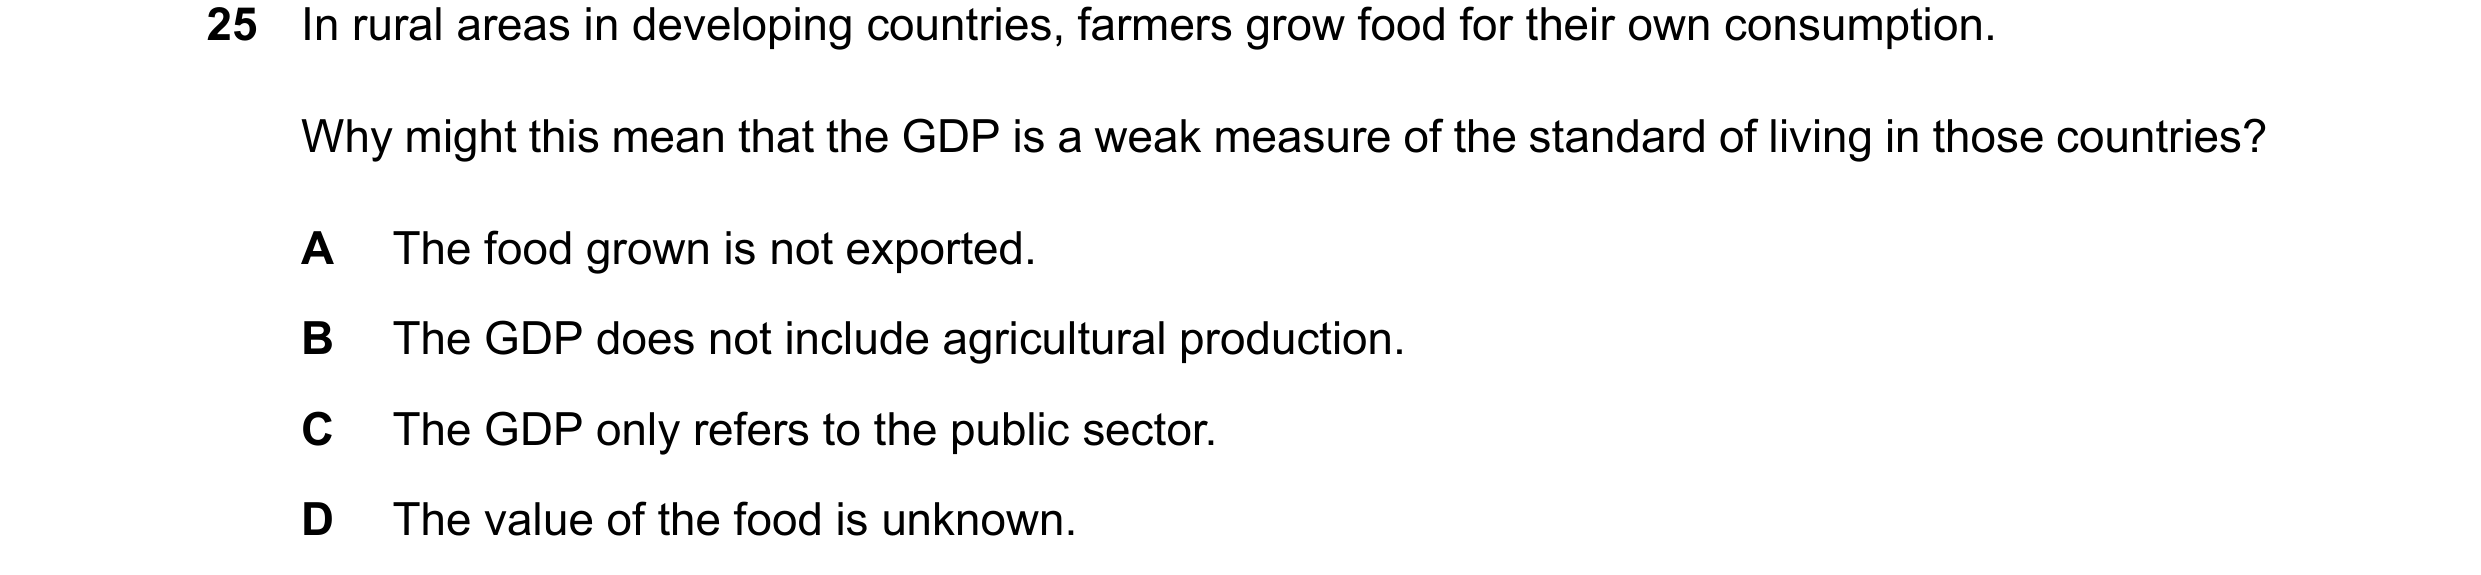
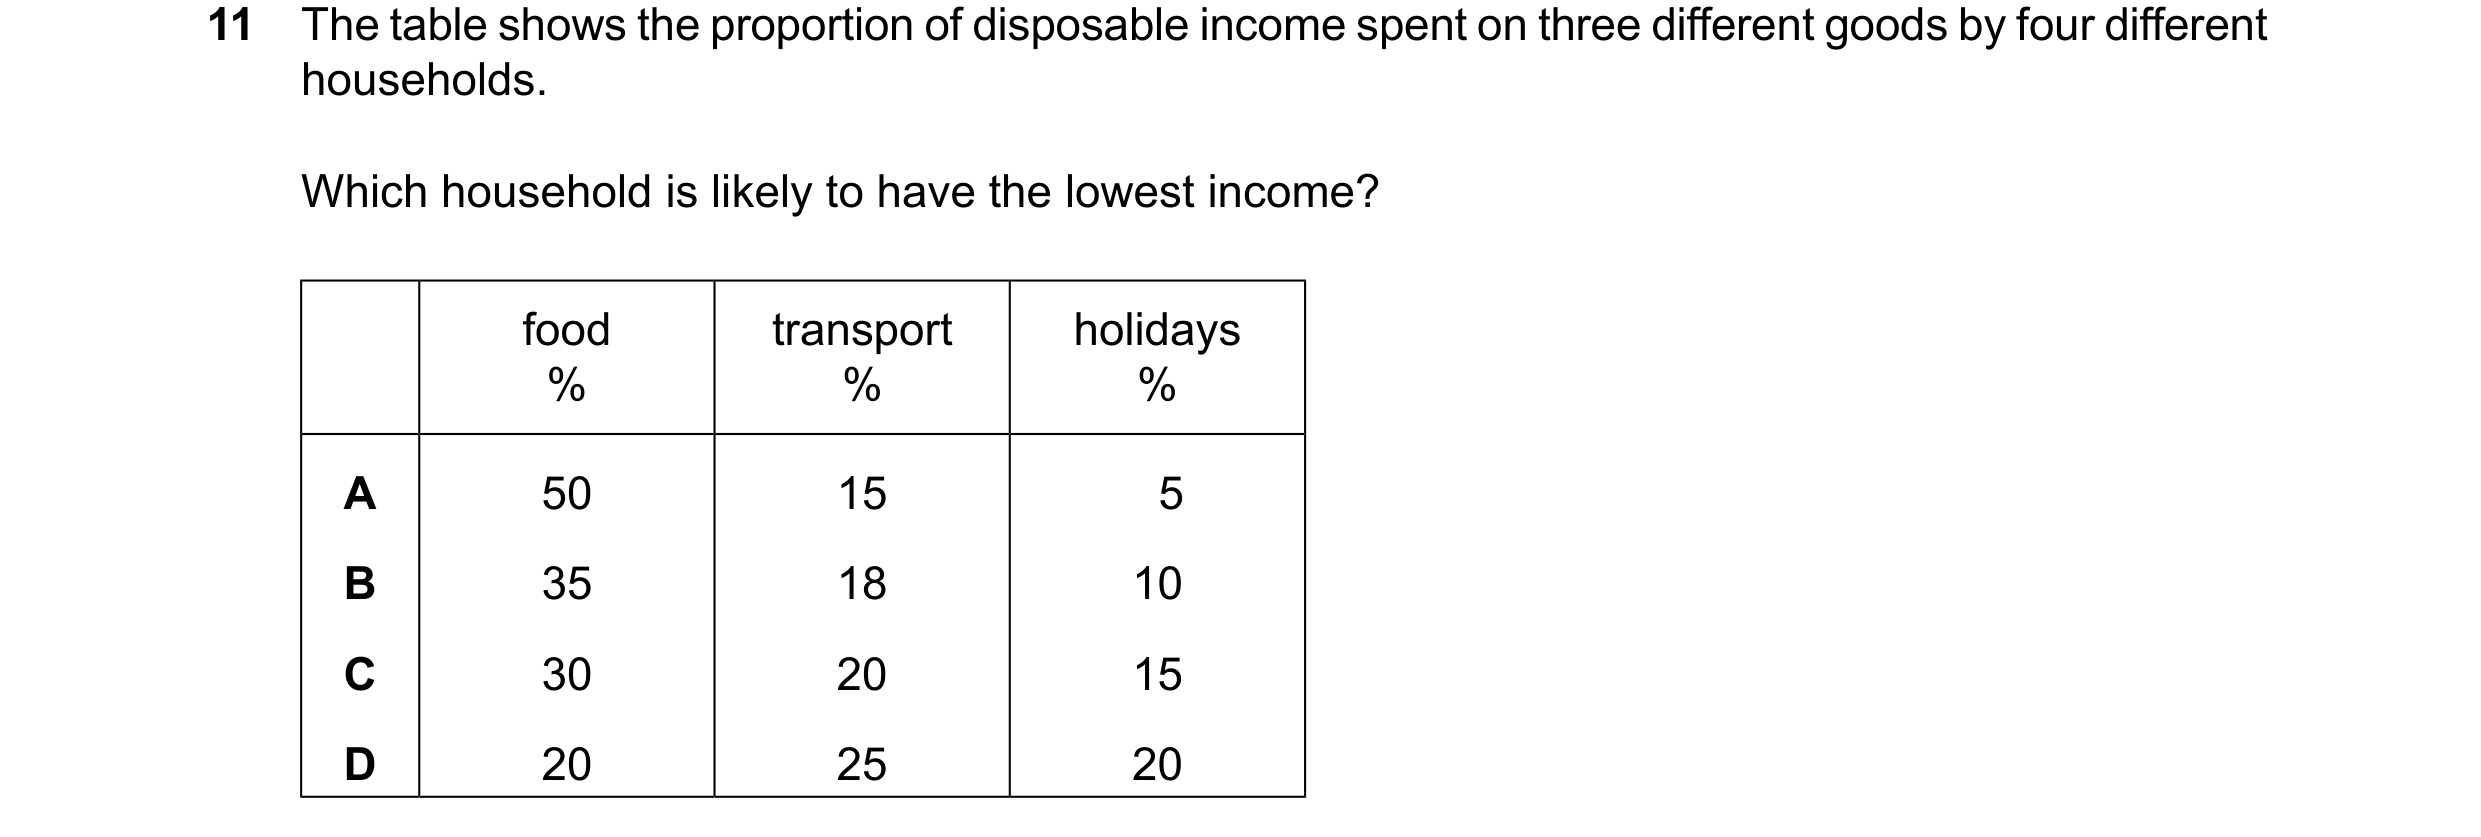 39 / 40
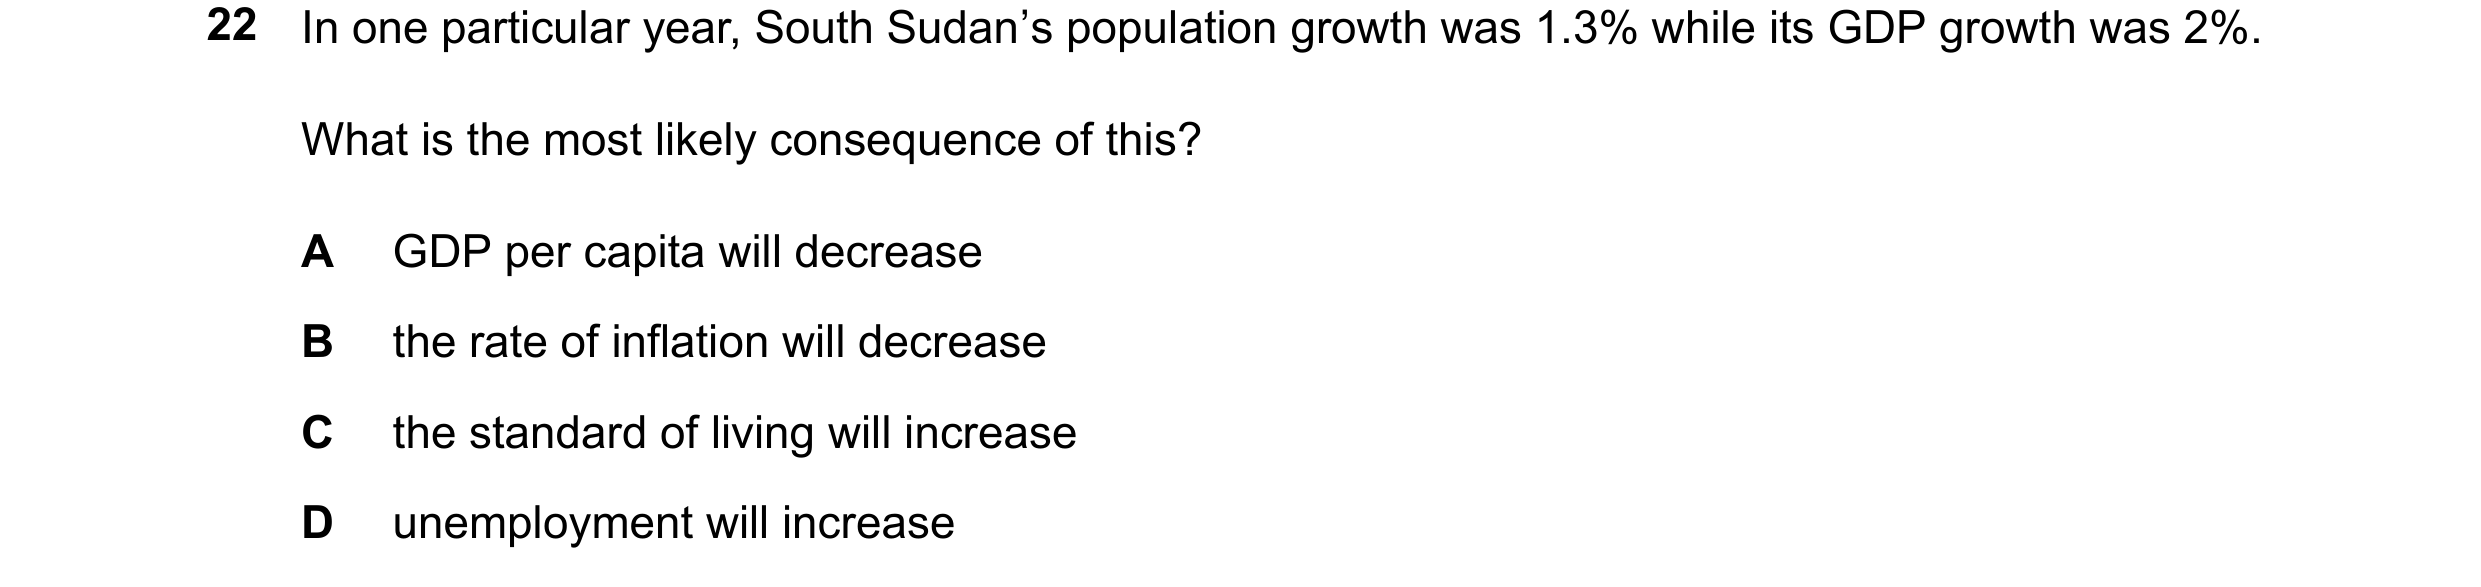 40 / 40