Cambridge IGCSE Economics 0455 — 2020 Feb/March Paper 2 · Variant 2
0455/22/F/M/20 · 5 questions · 90 marks · ≈101 min
The question paper and its mark scheme, free to read here and free to download. This is Cambridge’s own paper, exactly as it was sat.
Question paper8 pages




Mark scheme23 pages
Answers below. Sit the paper first if you are practising.

Questions as text
Q1 · Calculate India’s economic growth rate in 2017
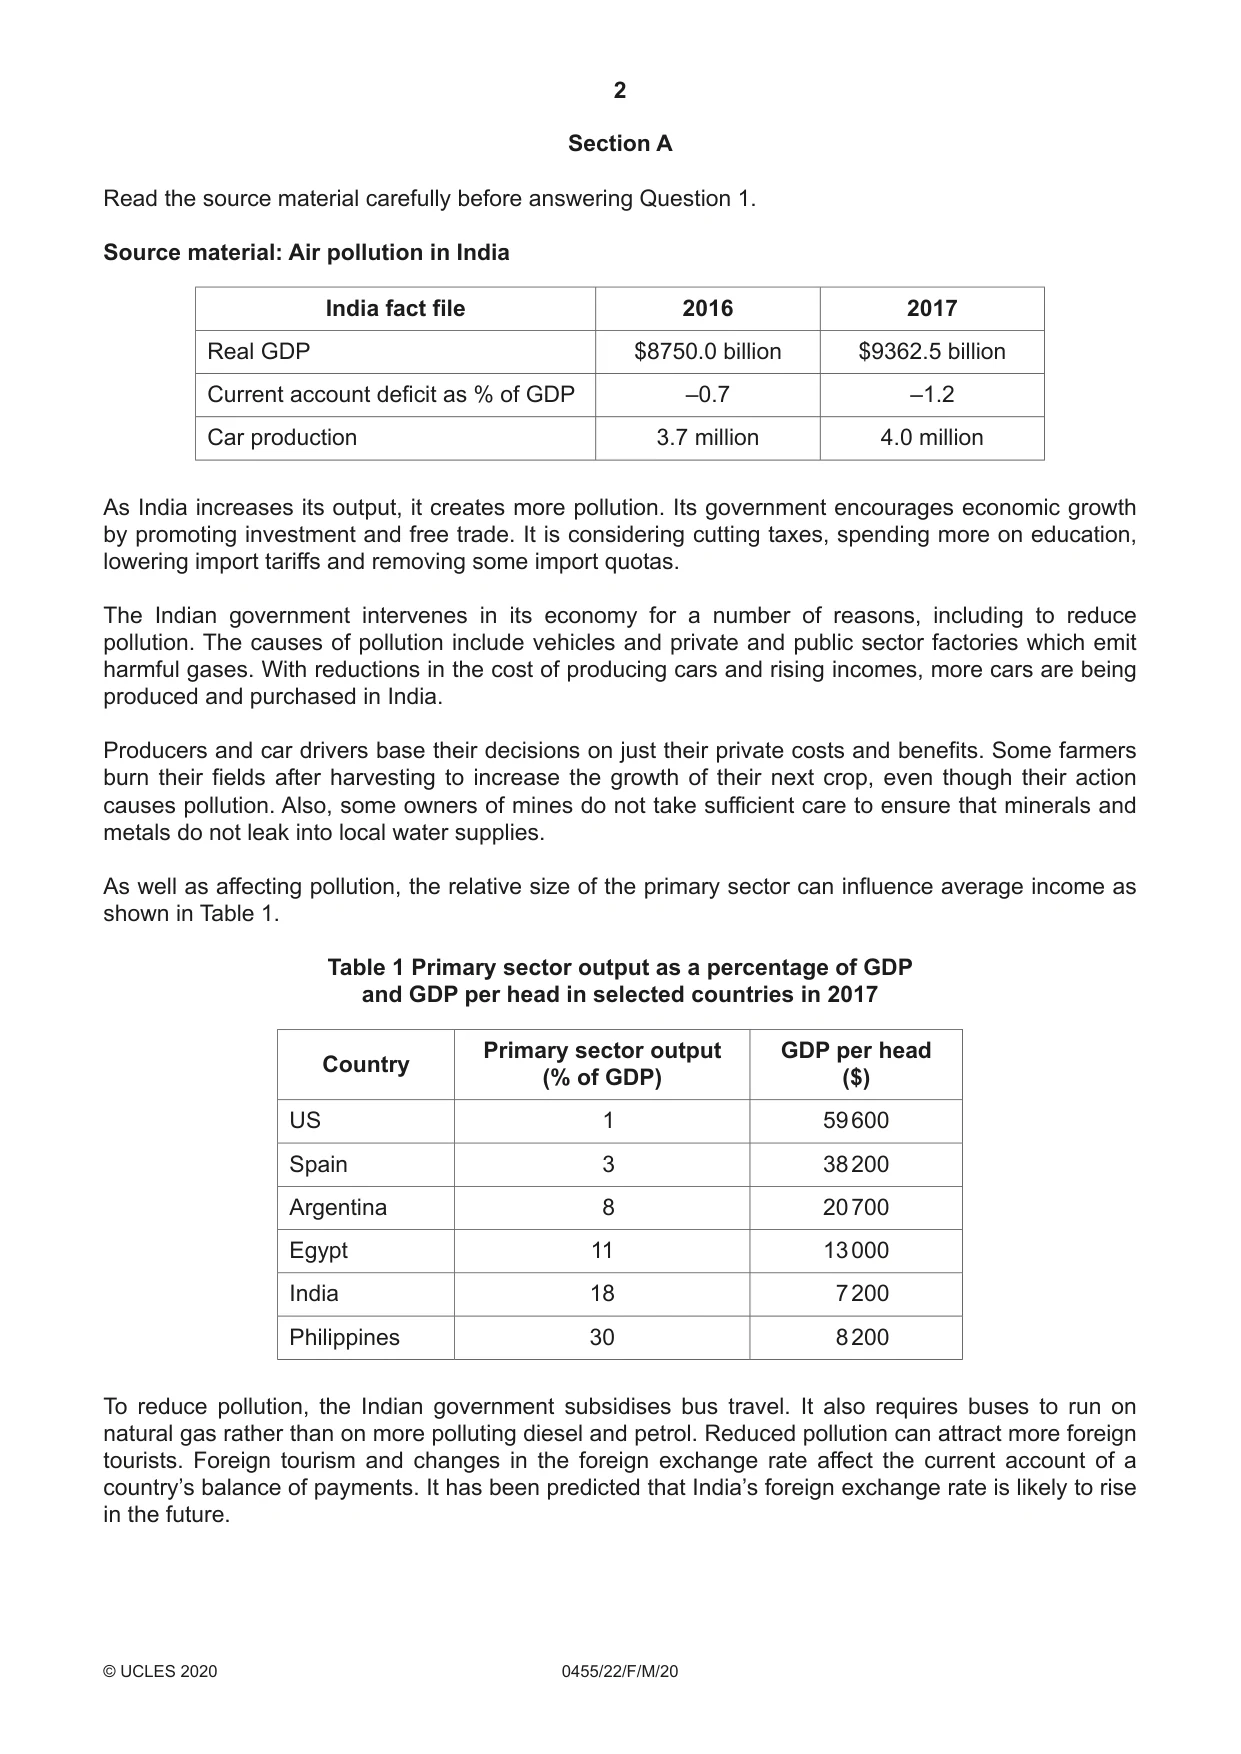
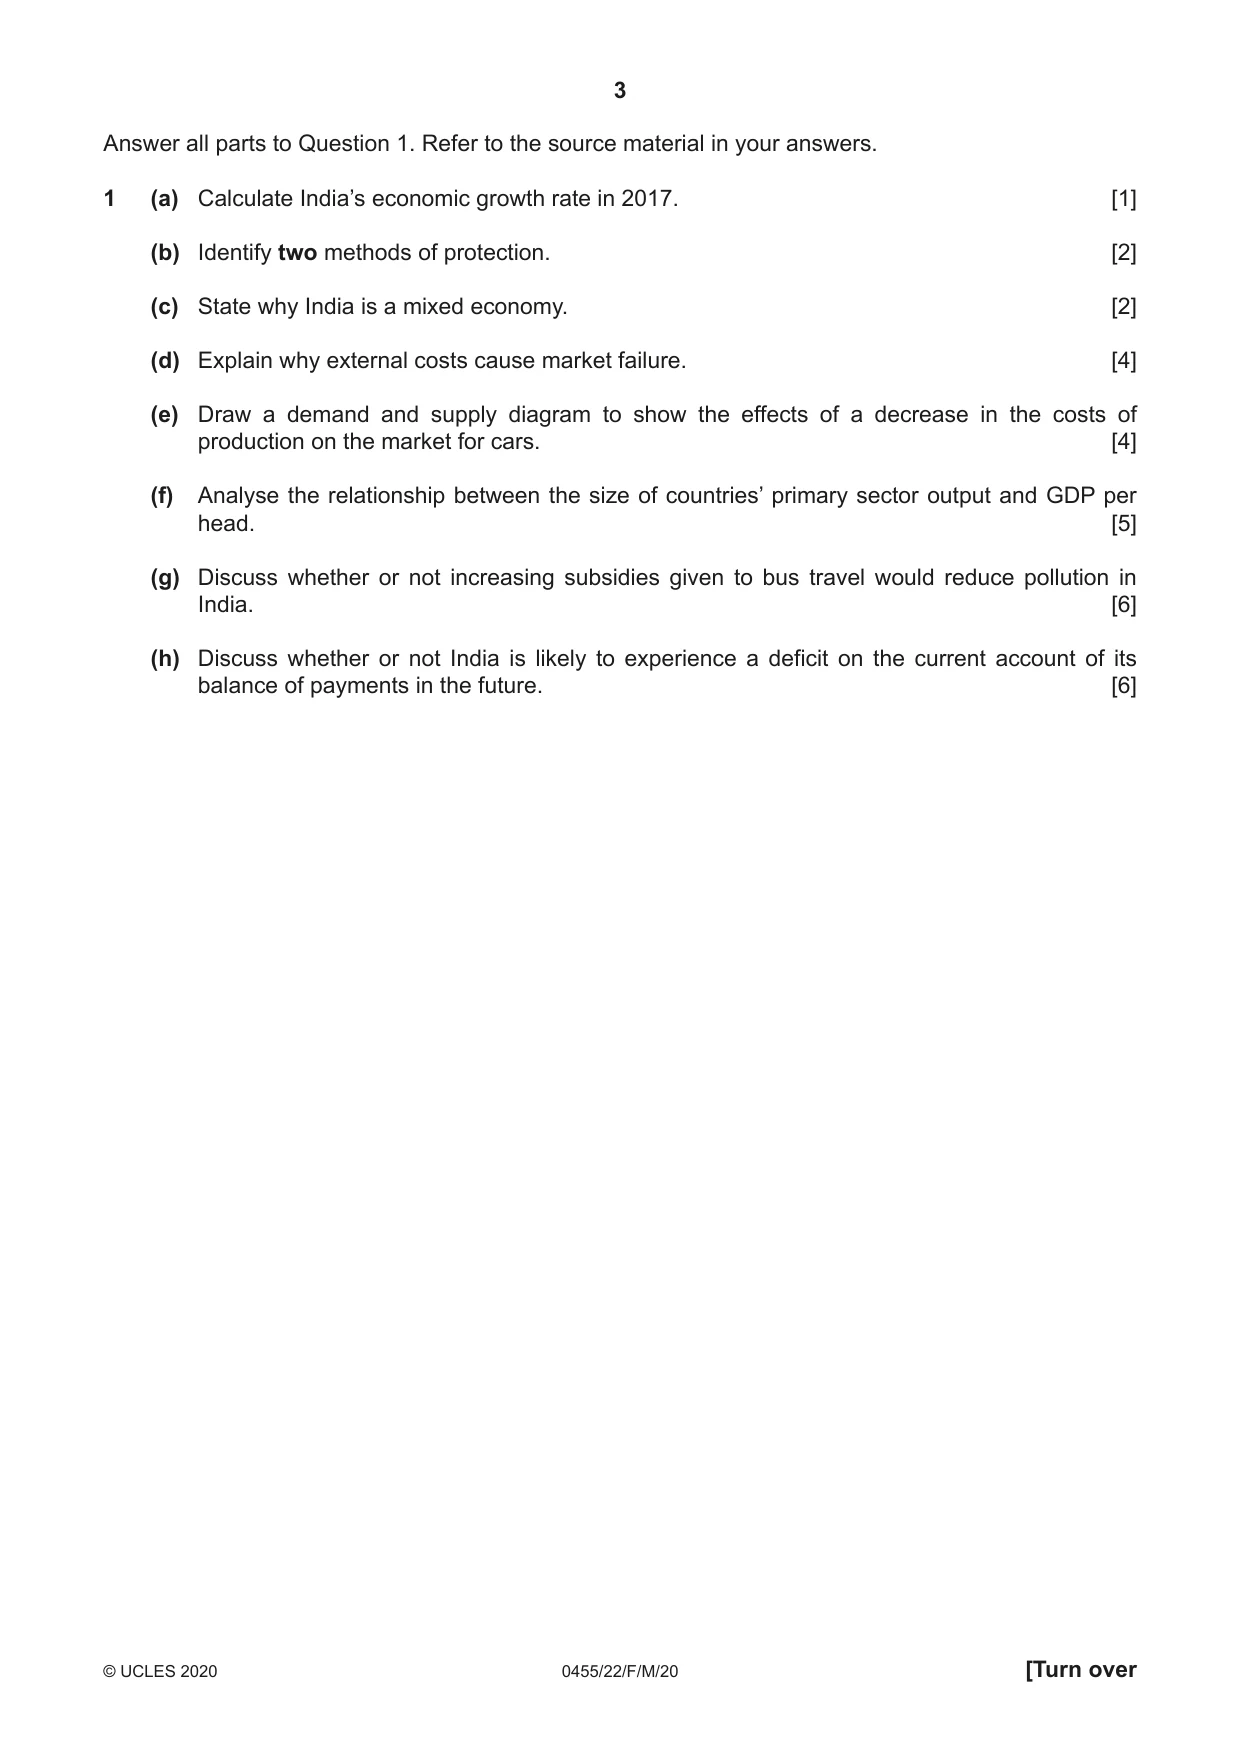
1 (a) Calculate India’s economic growth rate in 2017. [1] (b) Identify two methods of protection. [2] (c) State why India is a mixed economy. [2] (d) Explain why external costs cause market failure. [4] (e) Draw a demand and supply diagram to show the effects of a decrease in the costs of production on the market for cars. [4] (f) Analyse the relationship between the size of countries’ primary sector output and GDP per head. [5] (g) Discuss whether or not increasing subsidies given to bus travel would reduce pollution in India. [6] (h) Discuss whether or not India is likely to experience a deficit on the current account of its balance of payments in the future. [6]
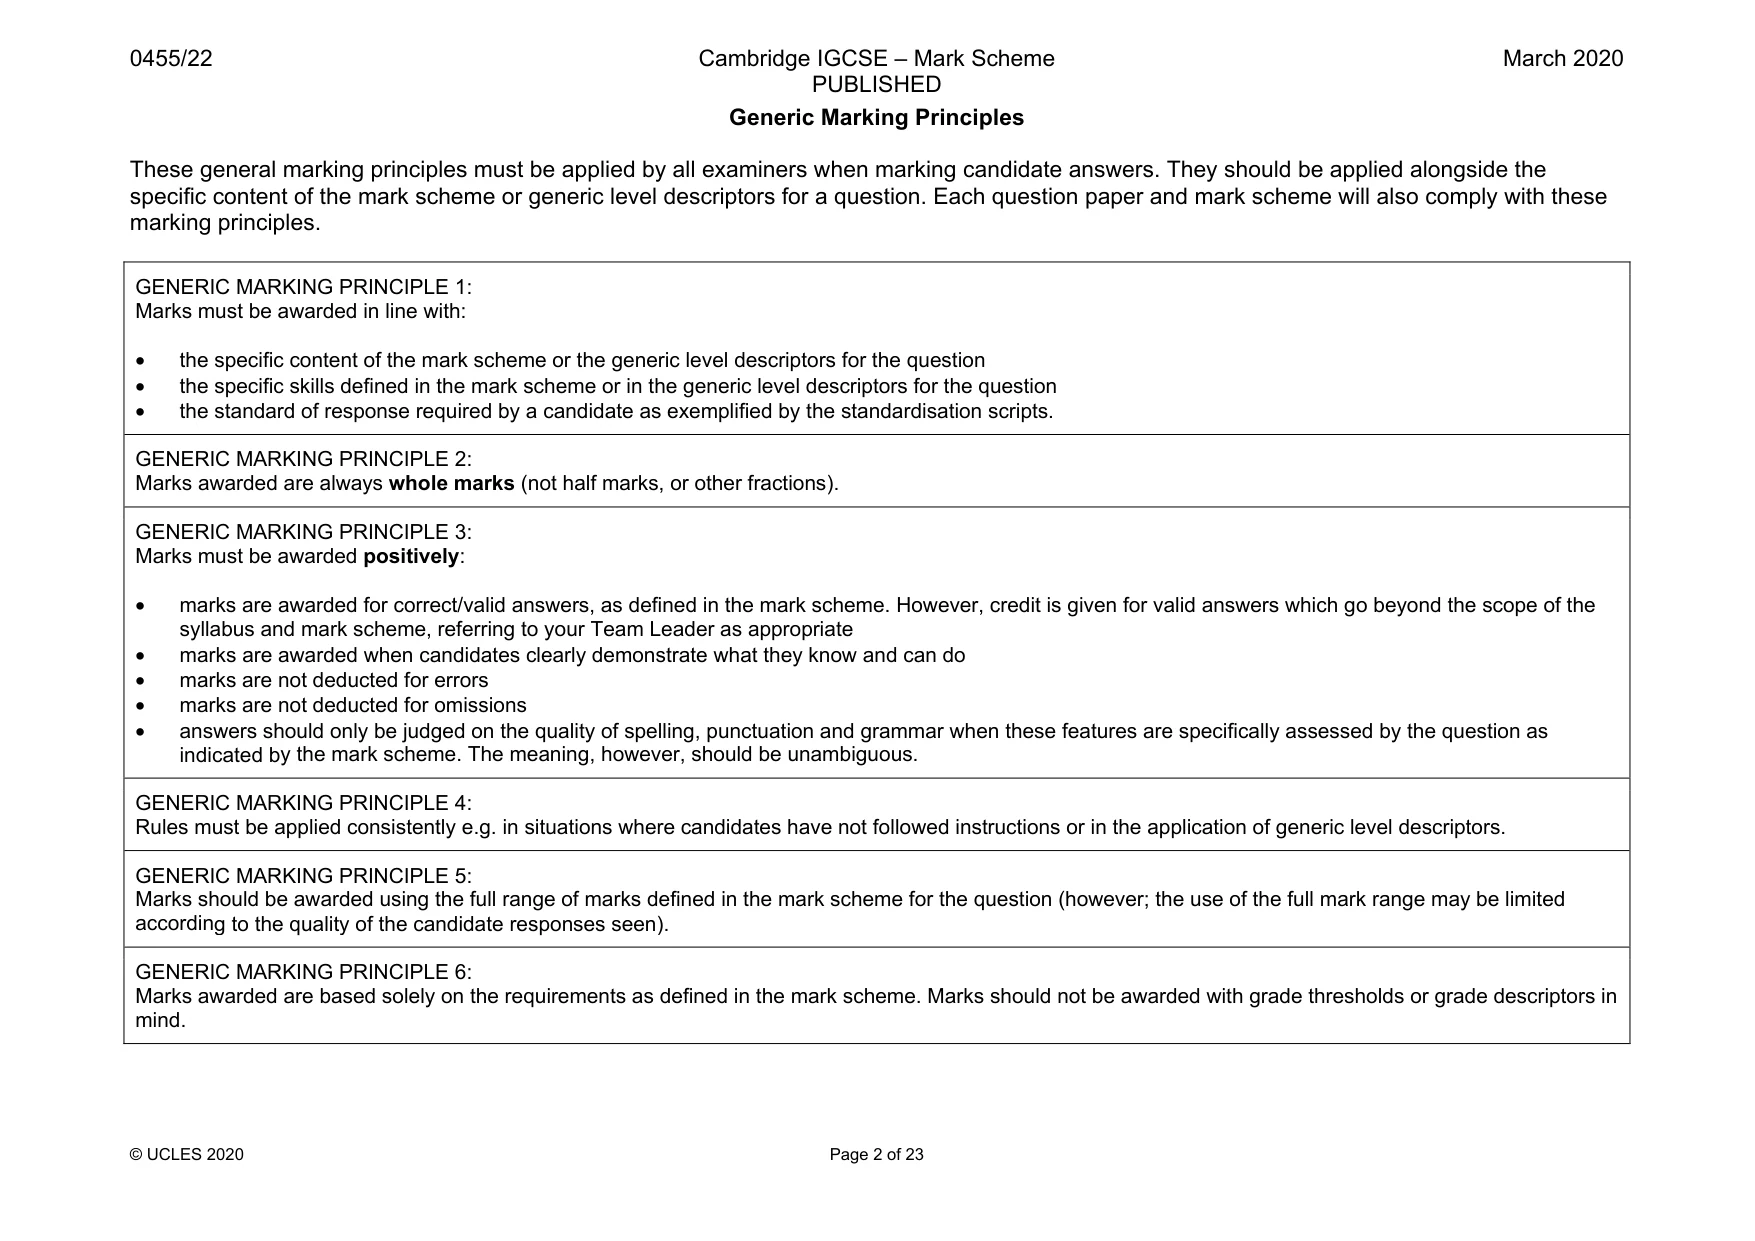
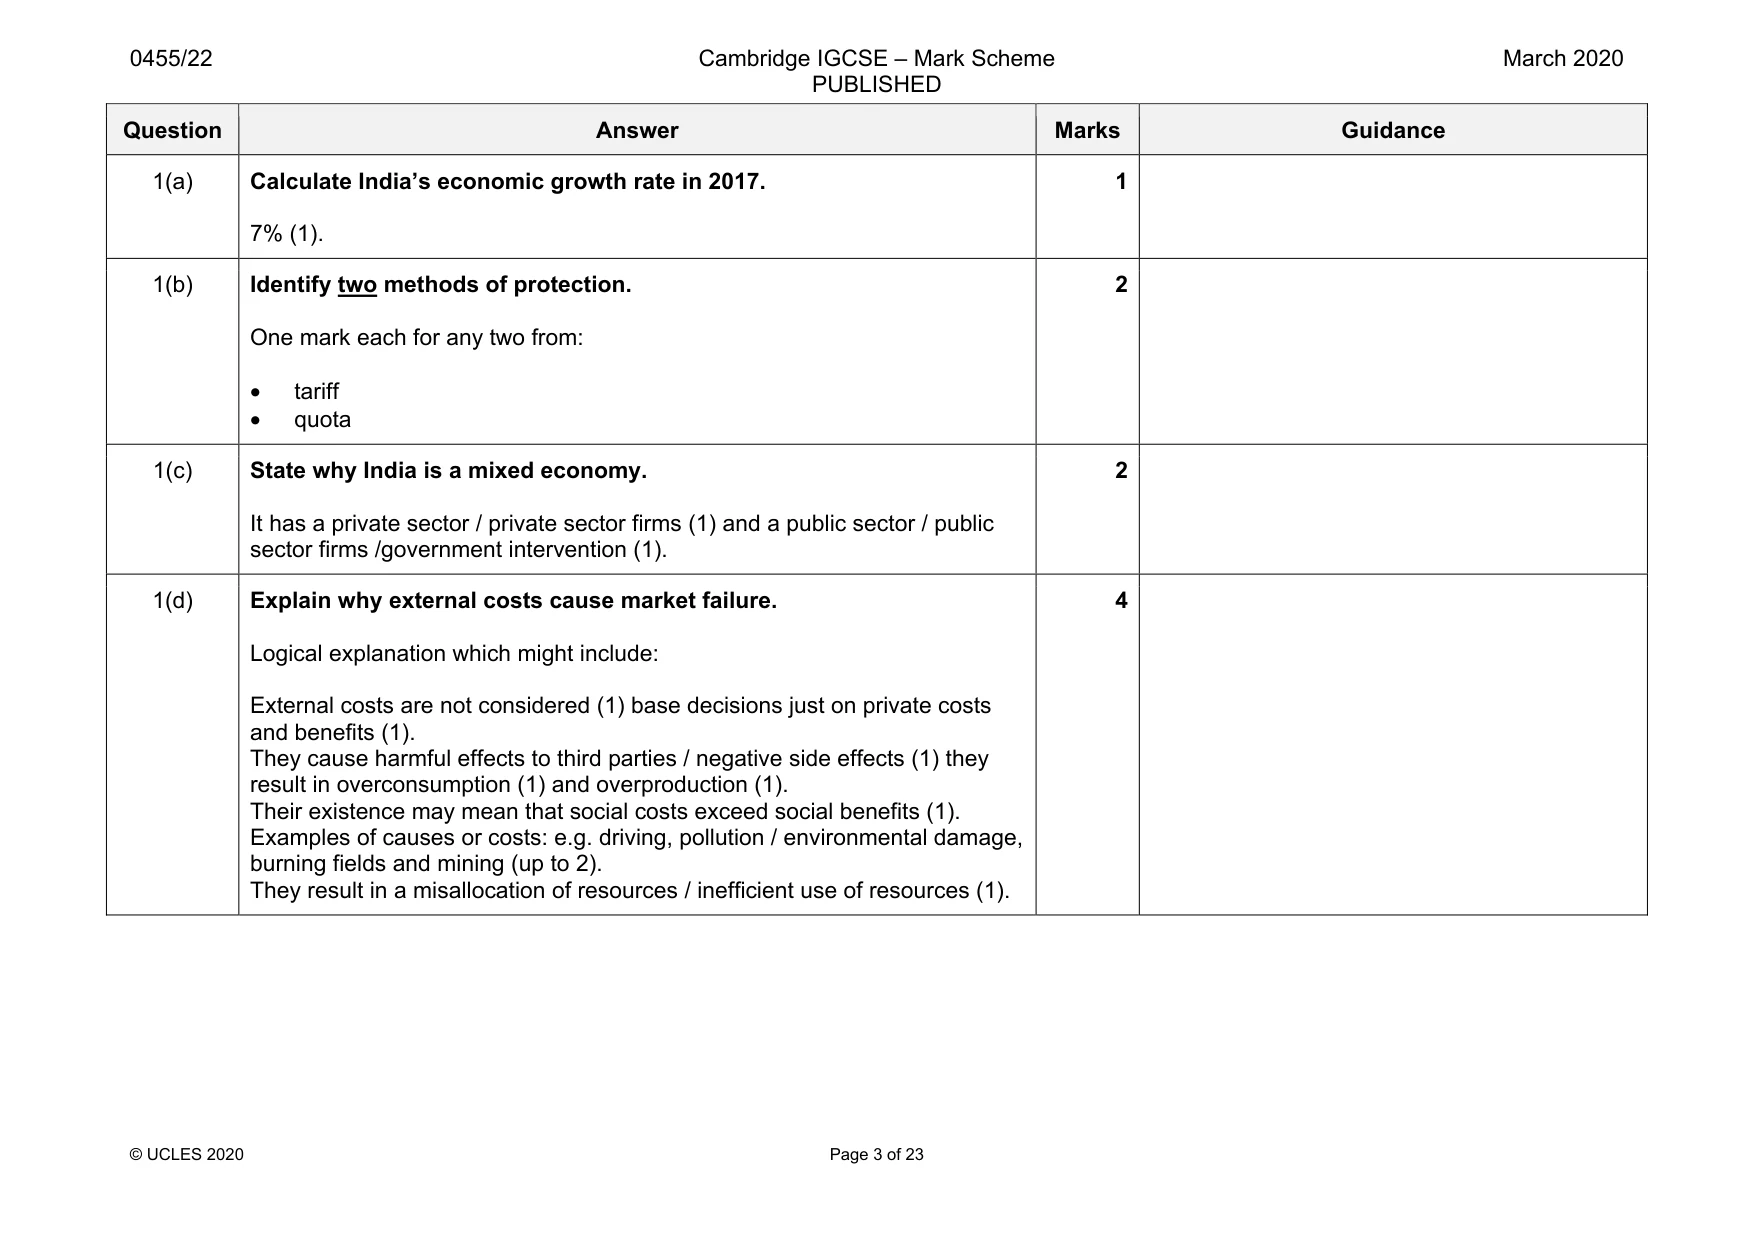
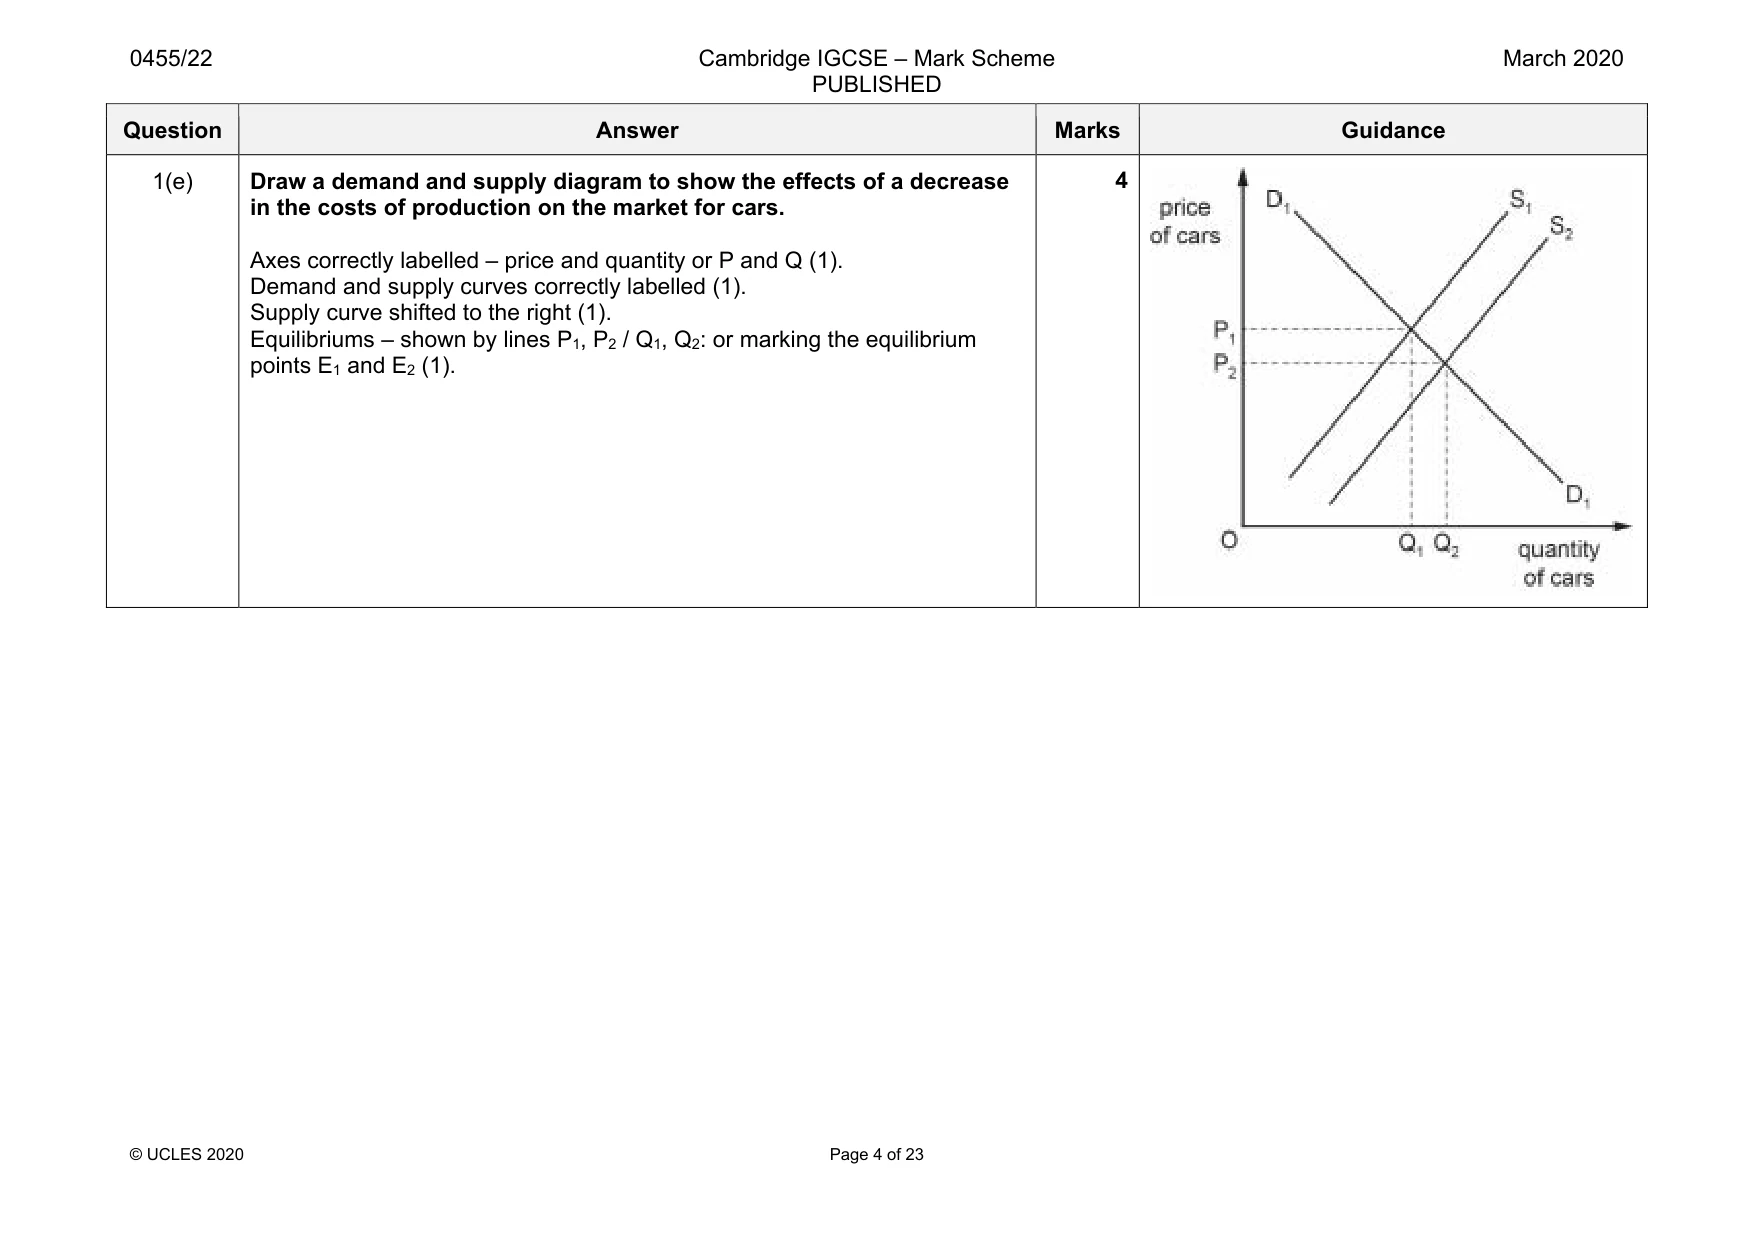
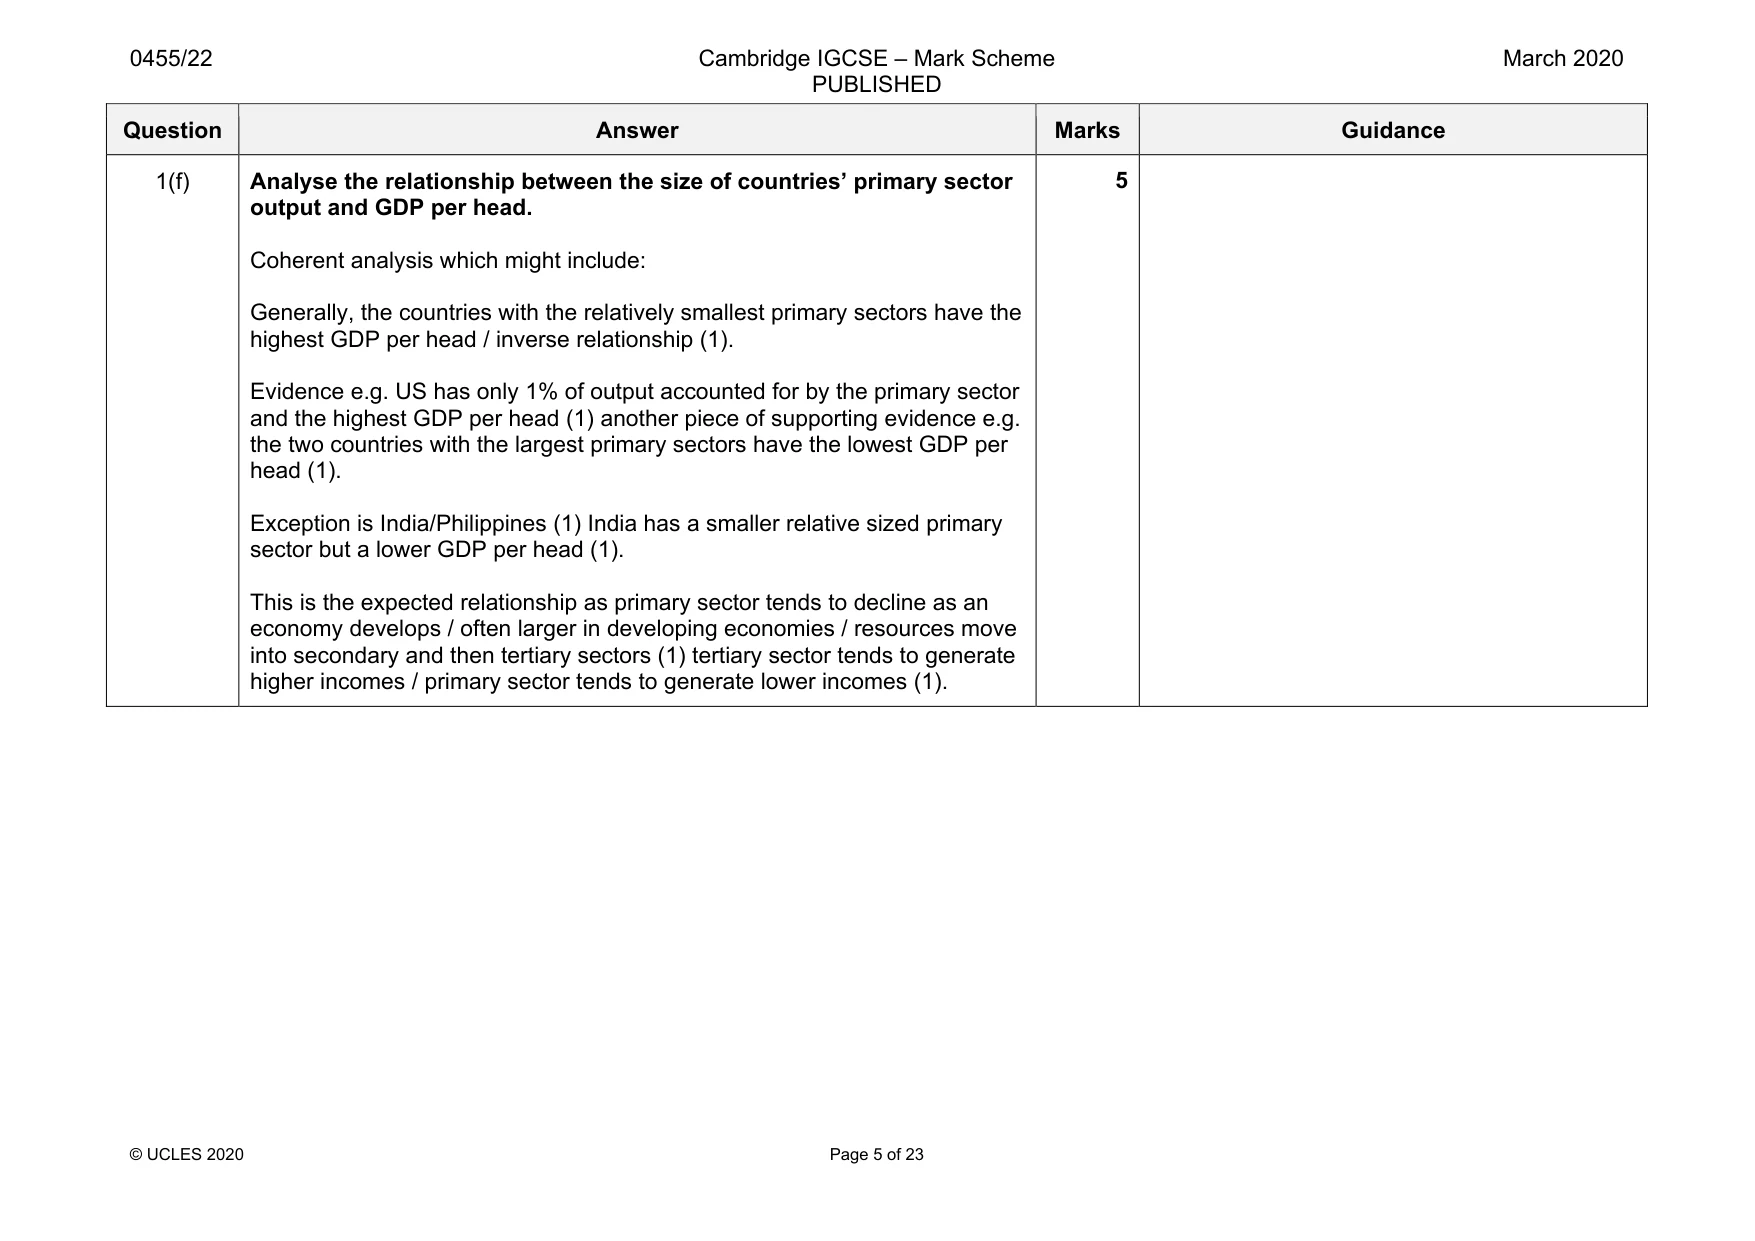
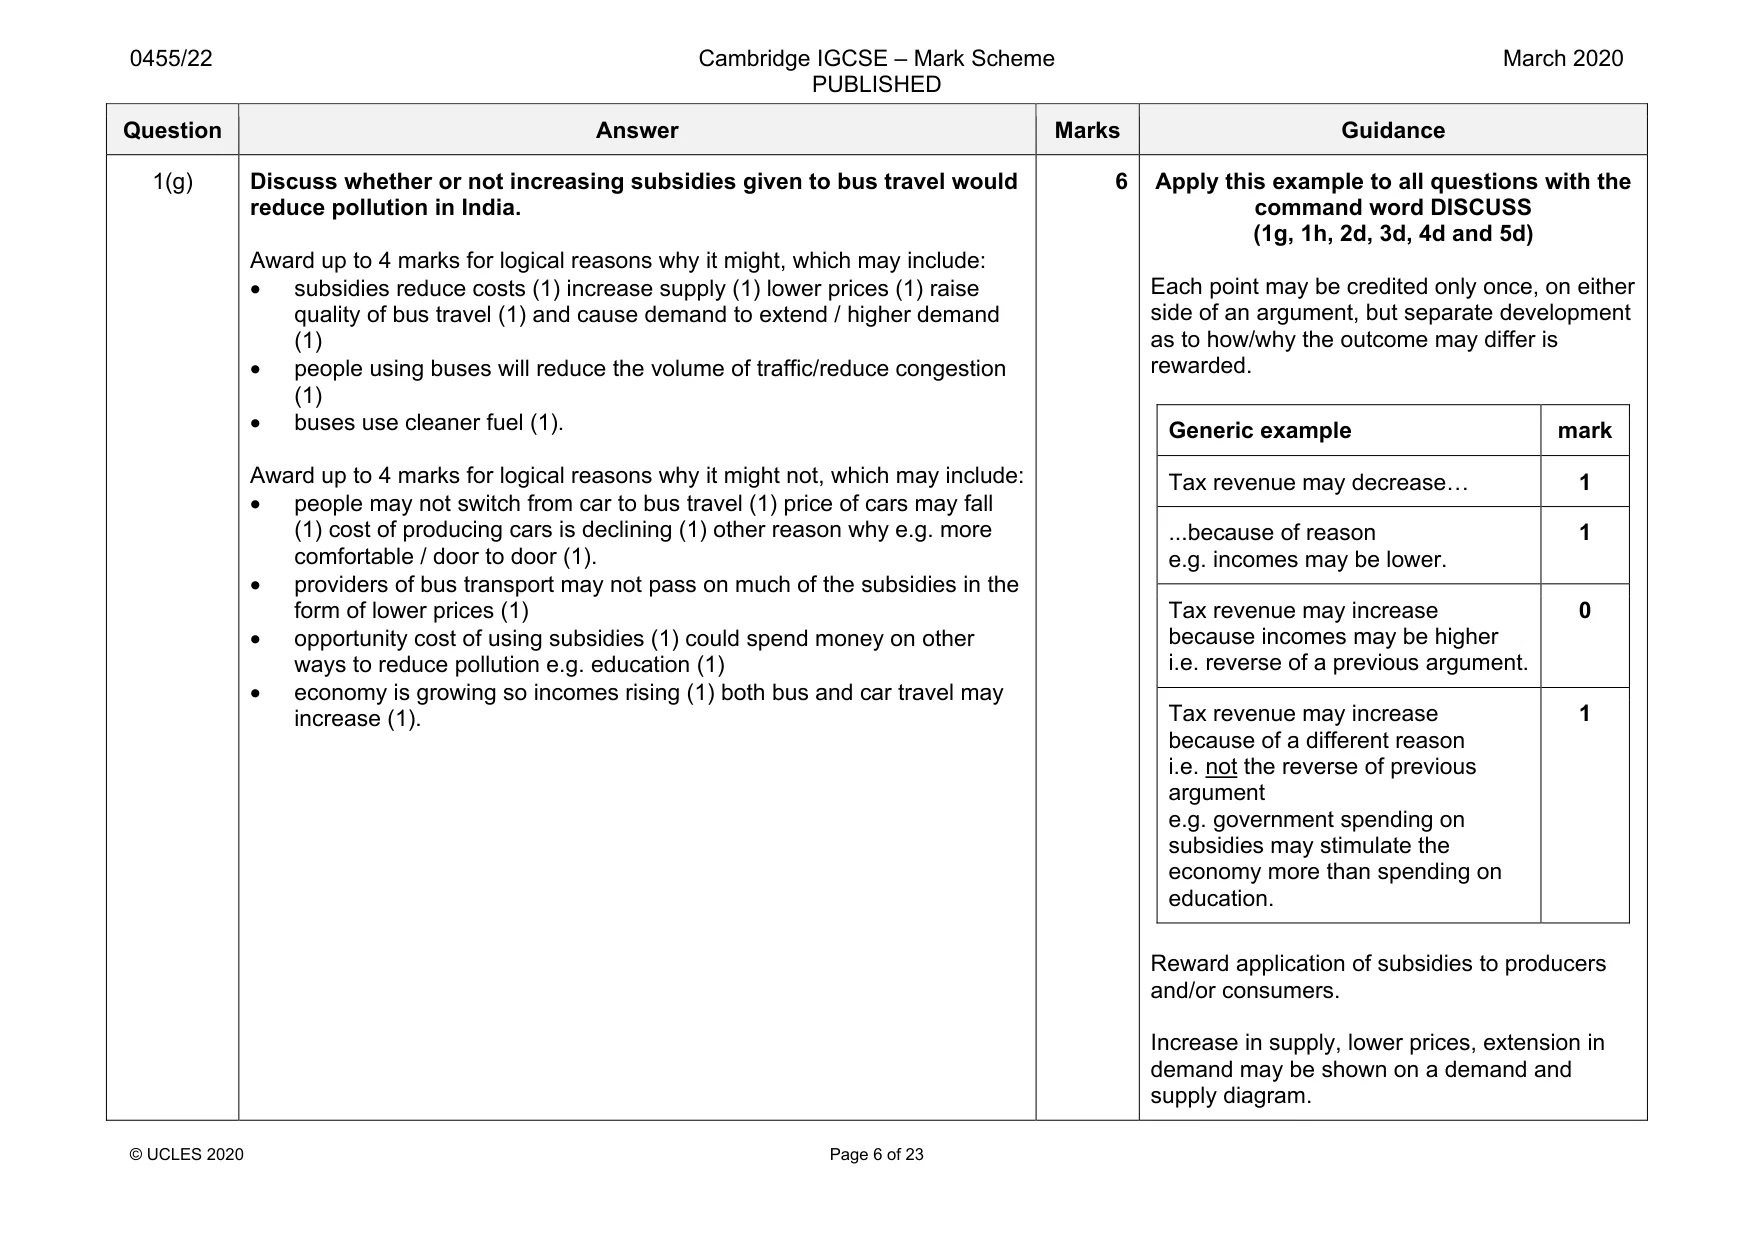
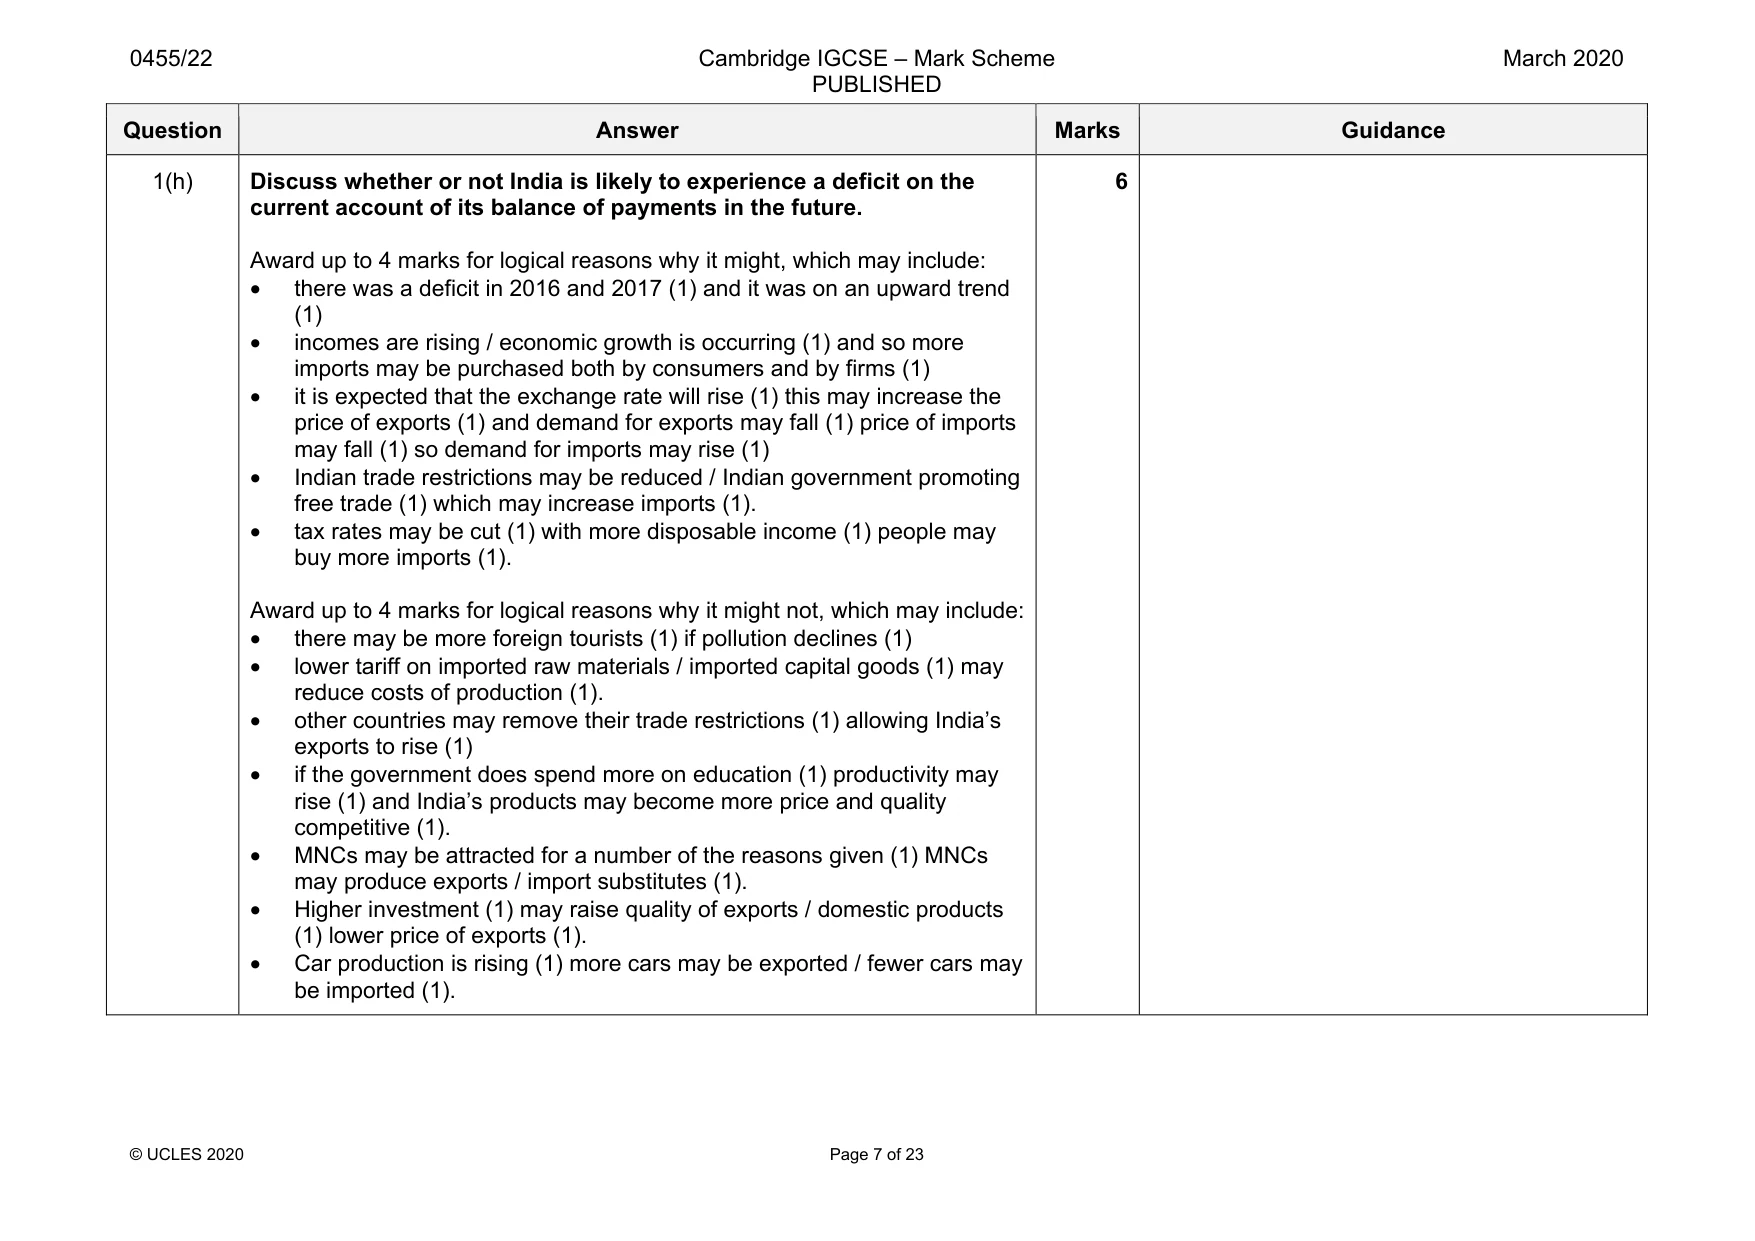
Mark scheme: 1(a) Calculate India’s economic growth rate in 2017. 7% (1). 1 1(b) Identify two methods of protection. One mark each for any two from: • tariff • quota 2 1(c) State why India is a mixed economy. It has a private sector / private sector firms (1) and a public sector / public sector firms /government intervention (1). 2 1(d) Explain why external costs cause market failure. Logical explanation which might include: External costs are not considered (1) base decisions just on private costs and benefits (1). They cause harmful effects to third parties / negative side effects (1) they result in overconsumption (1) and overproduction (1). Their existence may mean that social costs exceed social benefits (1). Examples of causes or costs: e.g. driving, pollution / environmental damage, burning fields and mining (up to 2). They result in a misallocation of resources / inefficient use of resources (1). 4 Question Answer Marks Guidance 1(e) Draw a demand and supply diagram to show the effects of a decrease in the costs of production on the market for cars. Axes correctly labelled – price and quantity or P and Q (1). Demand and supply curves correctly labelled (1). Supply curve shifted to the right (1). Equilibriums – shown by lines P1, P2 / Q1, Q2: or marking the equilibrium points E1 and E2 (1). 4 Question Answer Marks Guidance 1(f) Analyse the relationship between the size of countries’ primary sector output and GDP per head. Coherent analysis which might include: Generally, the countries with the relatively smallest primary sectors have the highest GDP per head / inverse relationship (1). Evidence e.g. US has only 1% of output accounted for by the primary sector and the highest GDP per head (1) another piece of supporting evidence e.g. the two countries with the largest primary sectors have the lowest GDP per head (1). Exception is India/Philippines (1) India has a smaller relative sized primary sector but a lower GDP per head (1). This is the expected relationship as primary sector tends to decline as an economy develops / often larger in developing economies / resources move into secondary and then tertiary sectors (1) tertiary sector tends to generate higher incomes / primary sector tends to generate lower incomes (1). 5 Question Answer Marks Guidance 1(g) Discuss whether or not increasing subsidies given to bus travel would reduce pollution in India. Award up to 4 marks for logical reasons why it might, which may include: • subsidies reduce costs (1) increase supply (1) lower prices (1) raise quality of bus travel (1) and cause demand to extend / higher demand (1) • people using buses will reduce the volume of traffic/reduce congestion (1) • buses use cleaner fuel (1). Award up to 4 marks for logical reasons why it might not, which may include: • people may not switch from car to bus travel (1) price of cars may fall (1) cost of producing cars is declining (1) other reason why e.g. more comfortable / door to door (1). • providers of bus transport may not pass on much of the subsidies in the form of lower prices (1) • opportunity cost of using subsidies (1) could spend money on other ways to reduce pollution e.g. education (1) • economy is growing so incomes rising (1) both bus and car travel may increase (1). 6 Apply this example to all questions with the command word DISCUSS (1g, 1h, 2d, 3d, 4d and 5d) Each point may be credited only once, on either side of an argument, but separate development as to how/why the outcome may differ is rewarded. Generic example mark Tax revenue may decrease… 1 ...because of reason e.g. incomes may be lower. 1 Tax revenue may increase because incomes may be higher i.e. reverse of a previous argument. 0 Tax revenue may increase because of a different reason i.e. not the reverse of previous argument e.g. government spending on subsidies may stimulate the economy more than spending on education. 1 Reward application of subsidies to producers and/or consumers. Increase in supply, lower prices, extension in demand may be shown on a demand and supply diagram. Question Answer Marks Guidance 1(h) Discuss whether or not India is likely to experience a deficit on the current account of its balance of payments in the future. Award up to 4 marks for logical reasons why it might, which may include: • there was a deficit in 2016 and 2017 (1) and it was on an upward trend (1) • incomes are rising / economic growth is occurring (1) and so more imports may be purchased both by consumers and by firms (1) • it is expected that the exchange rate will rise (1) this may increase the price of exports (1) and demand for exports may fall (1) price of imports may fall (1) so demand for imports may rise (1) • Indian trade restrictions may be reduced / Indian government promoting free trade (1) which may increase imports (1). • tax rates may be cut (1) with more disposable income (1) people may buy more imports (1). Award up to 4 marks for logical reasons why it might not, which may include: • there may be more foreign tourists (1) if pollution declines (1) • lower tariff on imported raw materials / imported capital goods (1) may reduce costs of production (1). • other countries may remove their trade restrictions (1) allowing India’s exports to rise (1) • if the government does spend more on education (1) productivity may rise (1) and India’s products may become more price and quality competitive (1). • MNCs may be attracted for a number of the reasons given (1) MNCs may produce exports / import substitutes (1). • Higher investment (1) may raise quality of exports / domestic products (1) lower price of exports (1). • Car production is rising (1) more cars may be exported / fewer cars may be imported (1). 6
Q2 · The main industries in the Seychelles, an island country in the Indian ocean, are tourism…
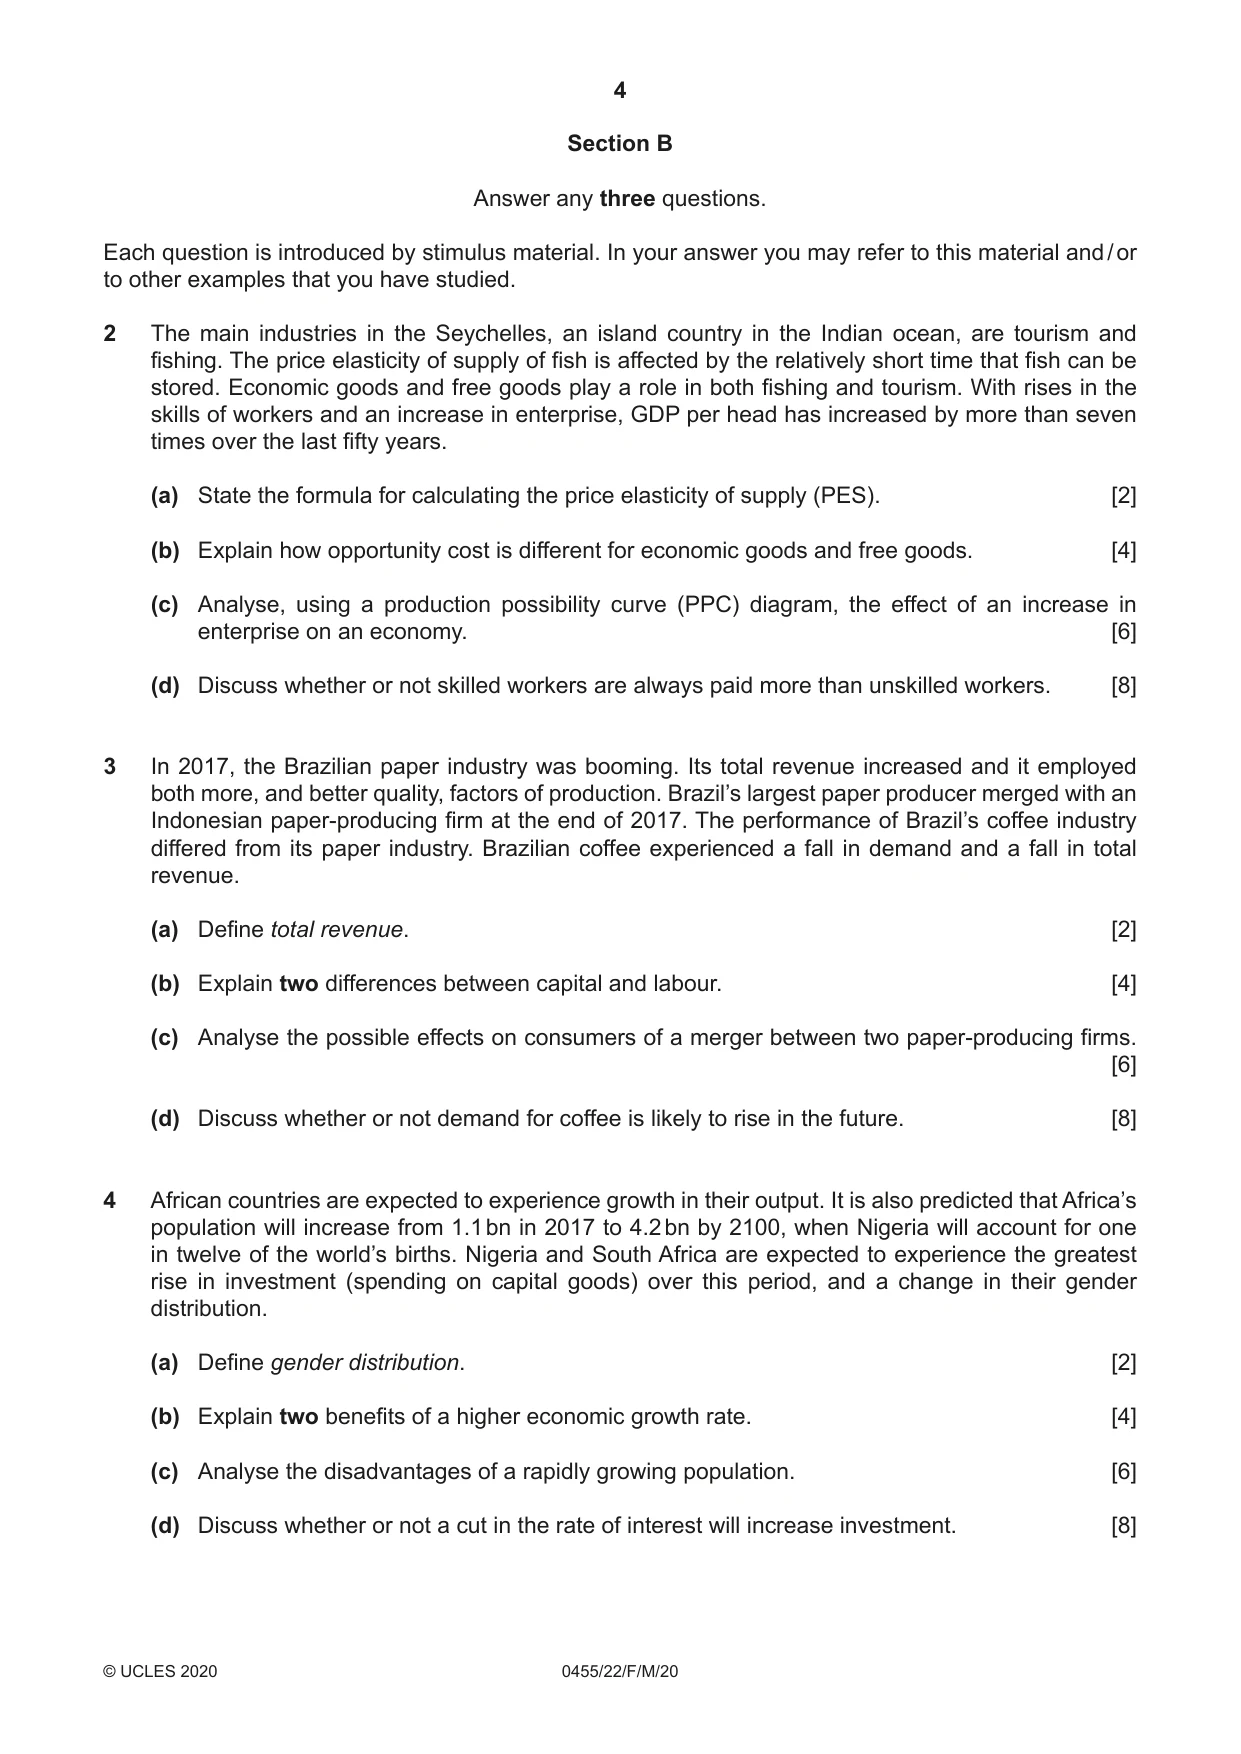
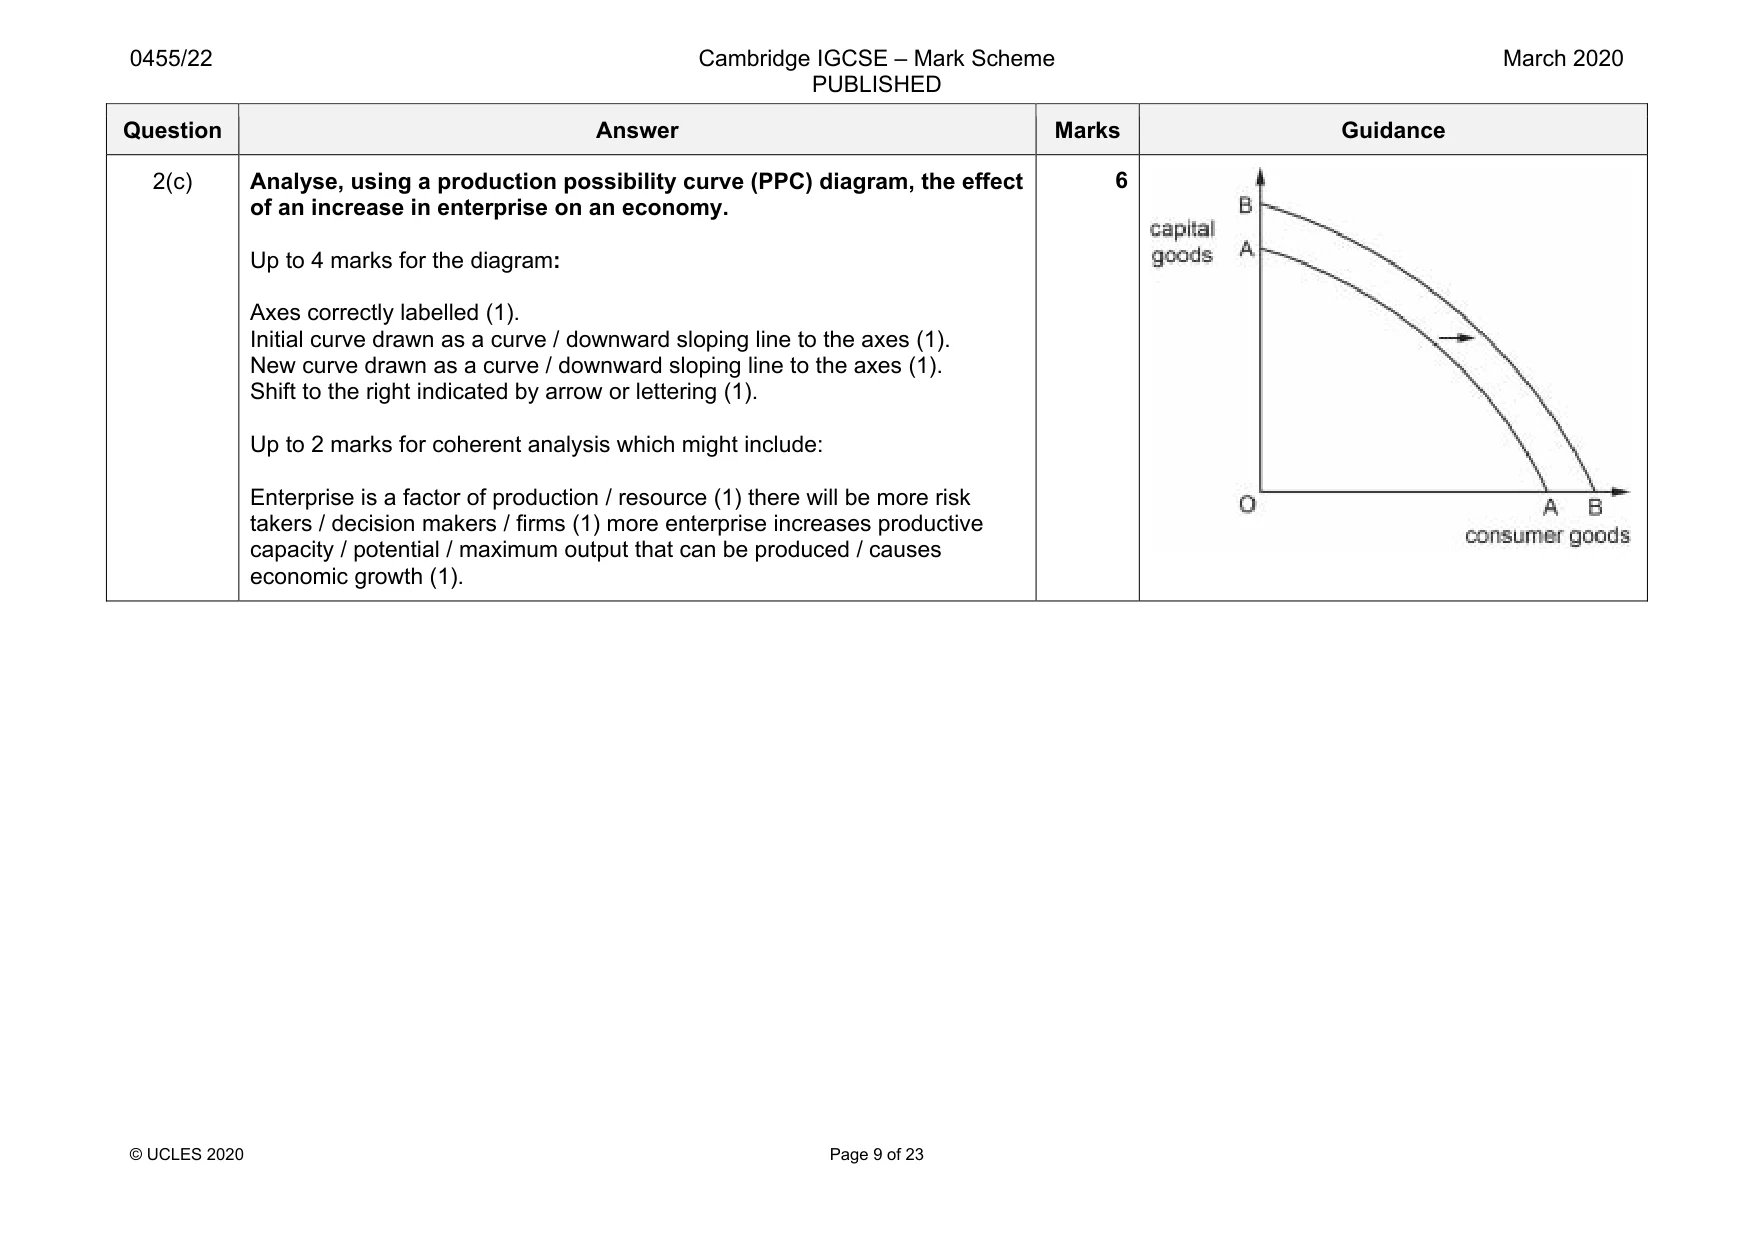
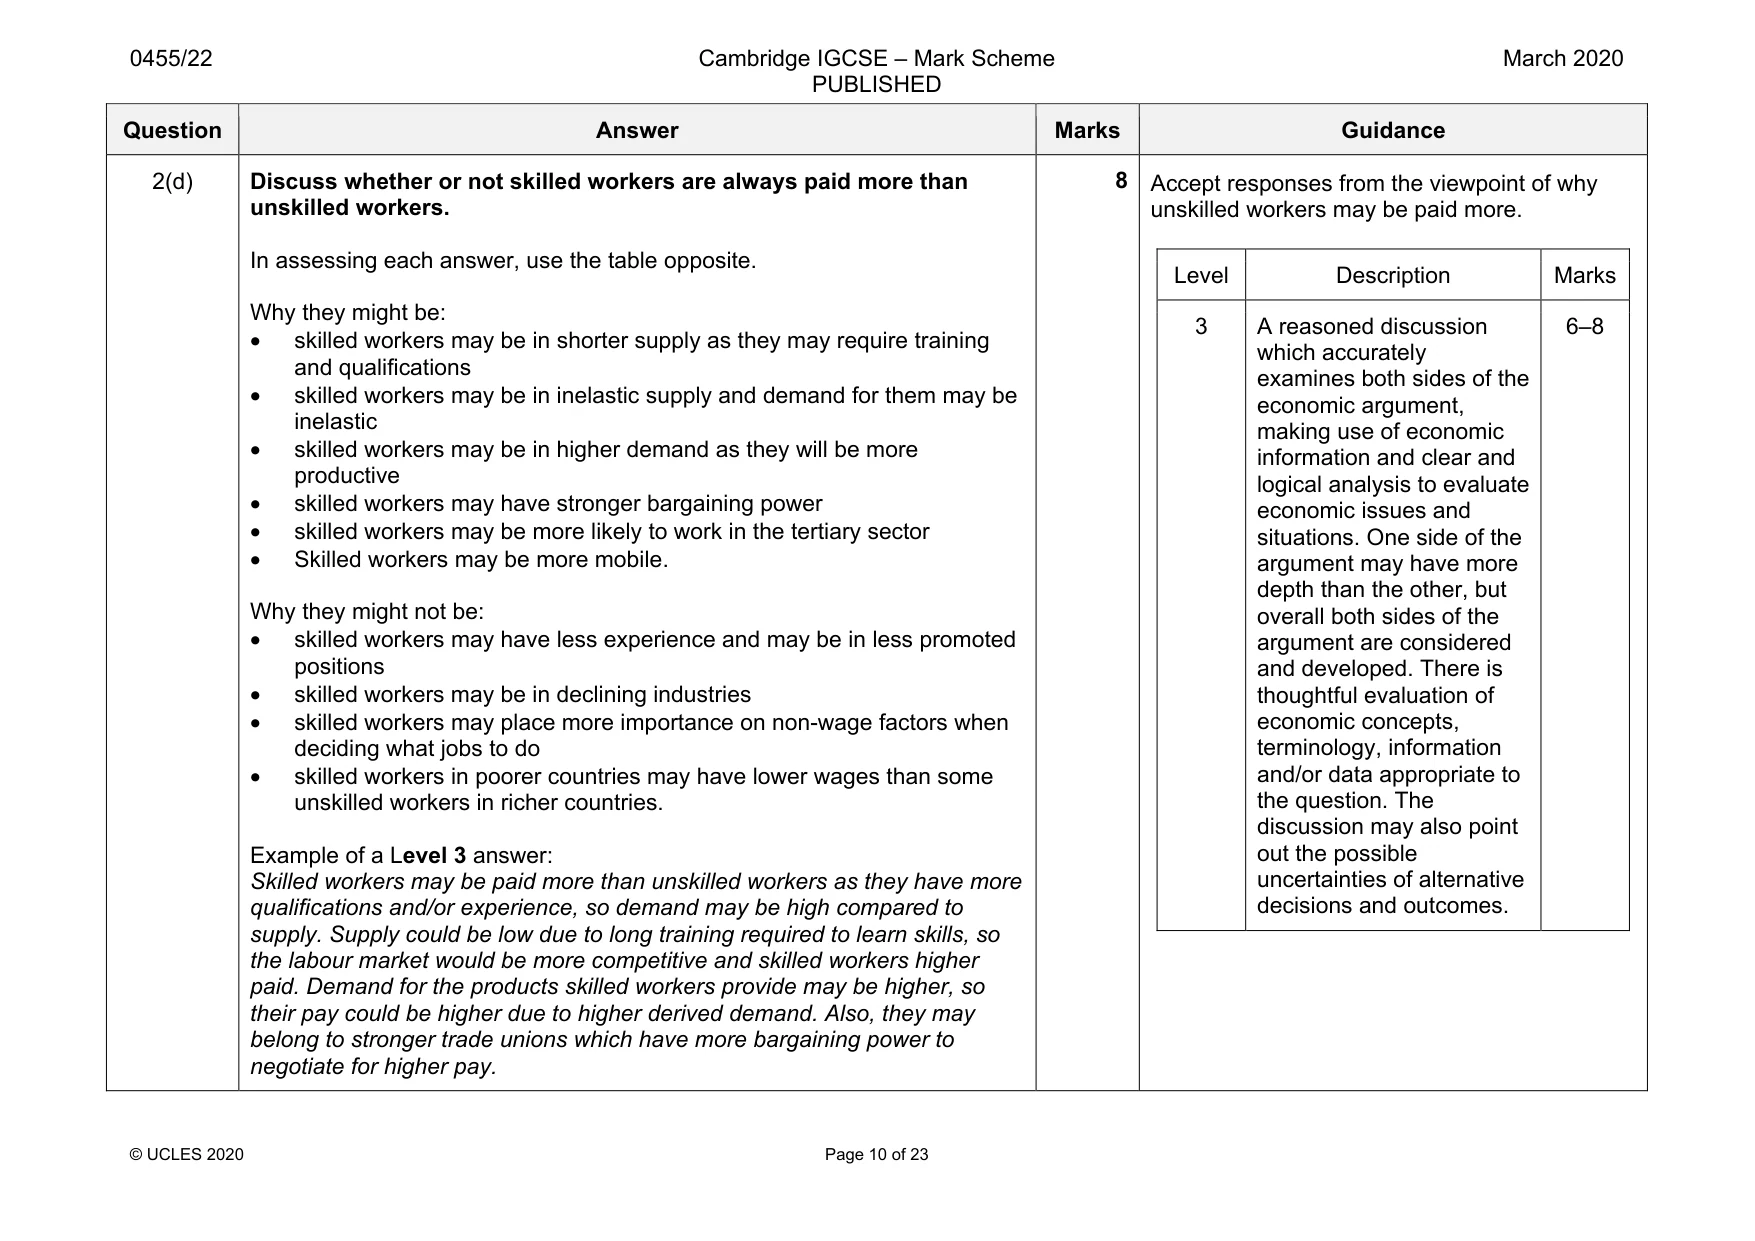
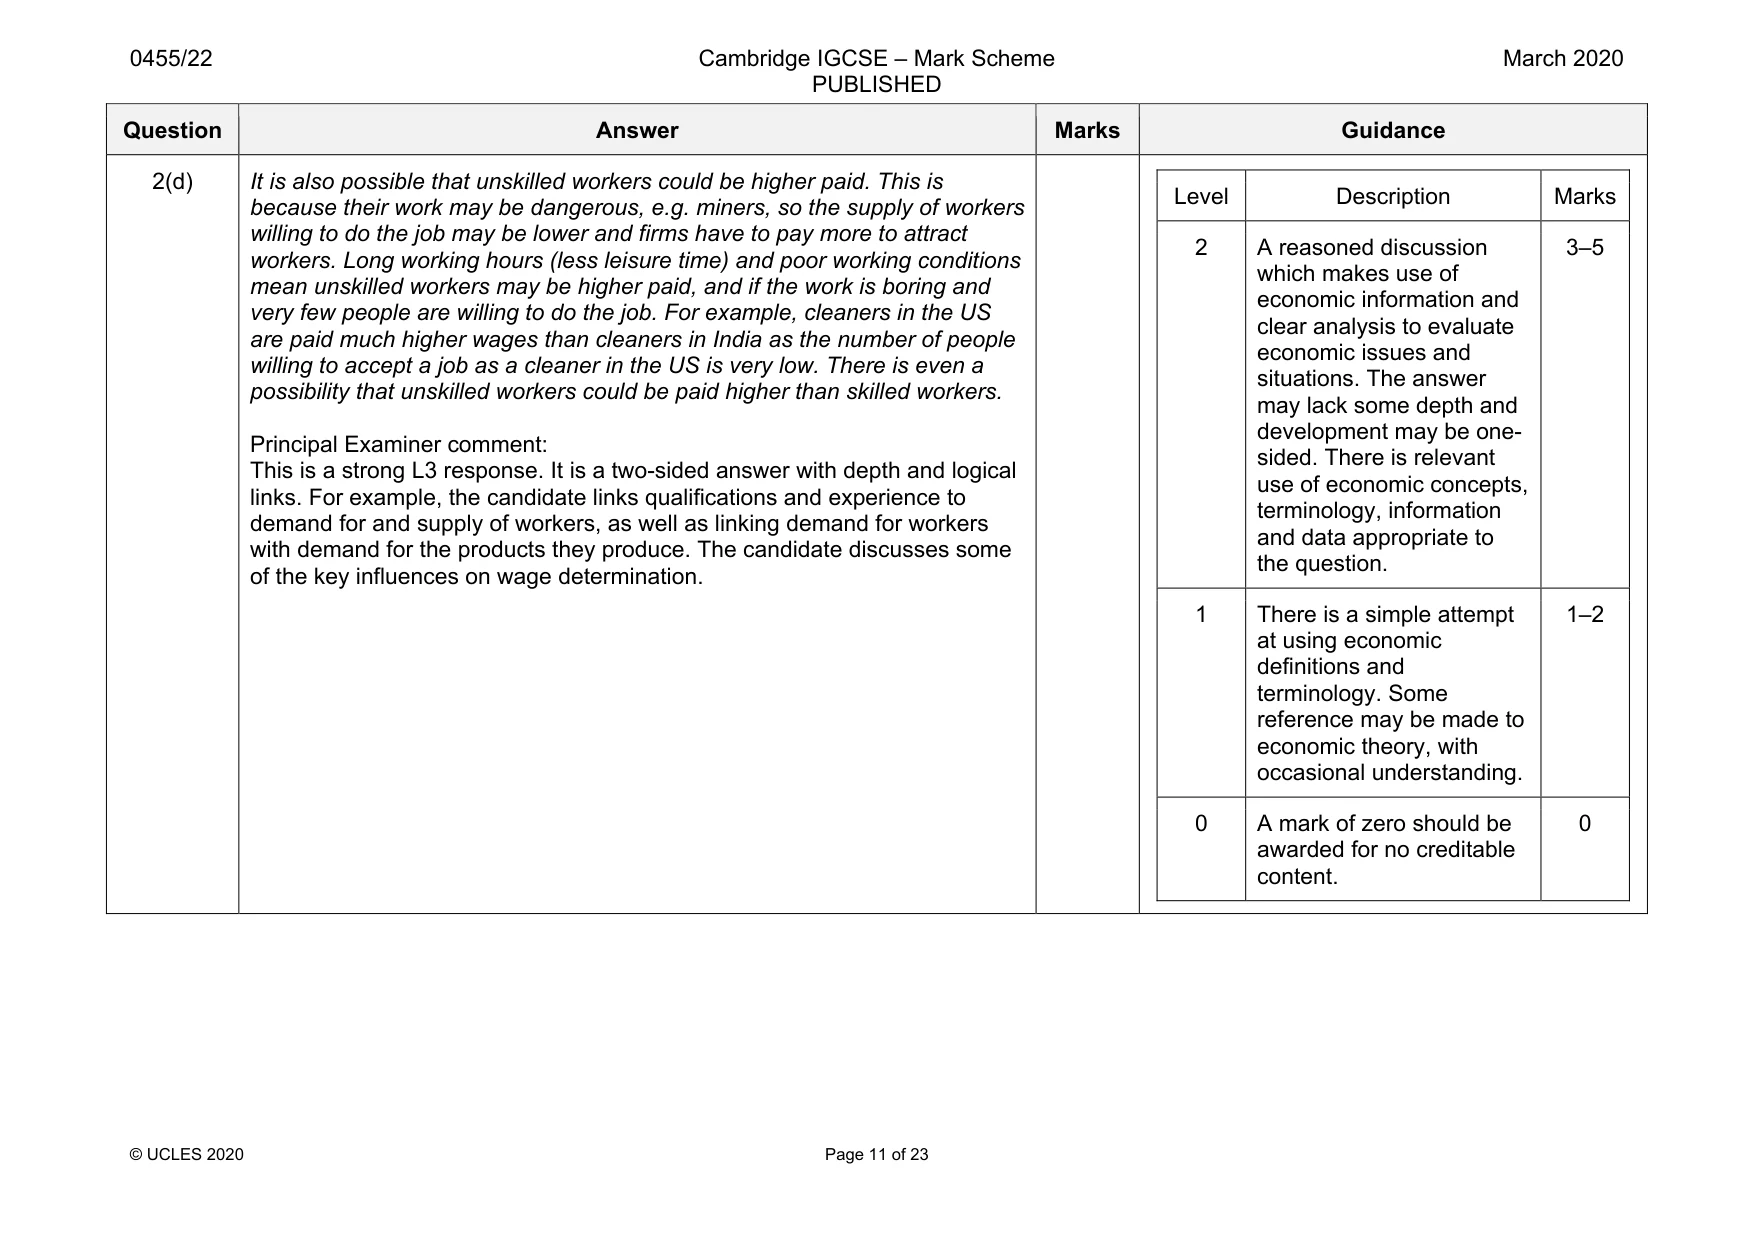
2 The main industries in the Seychelles, an island country in the Indian ocean, are tourism and fishing. The price elasticity of supply of fish is affected by the relatively short time that fish can be stored. Economic goods and free goods play a role in both fishing and tourism. With rises in the skills of workers and an increase in enterprise, GDP per head has increased by more than seven times over the last fifty years. (a) State the formula for calculating the price elasticity of supply (PES). [2] (b) Explain how opportunity cost is different for economic goods and free goods. [4] (c) Analyse, using a production possibility curve (PPC) diagram, the effect of an increase in enterprise on an economy. [6] (d) Discuss whether or not skilled workers are always paid more than unskilled workers. [8]
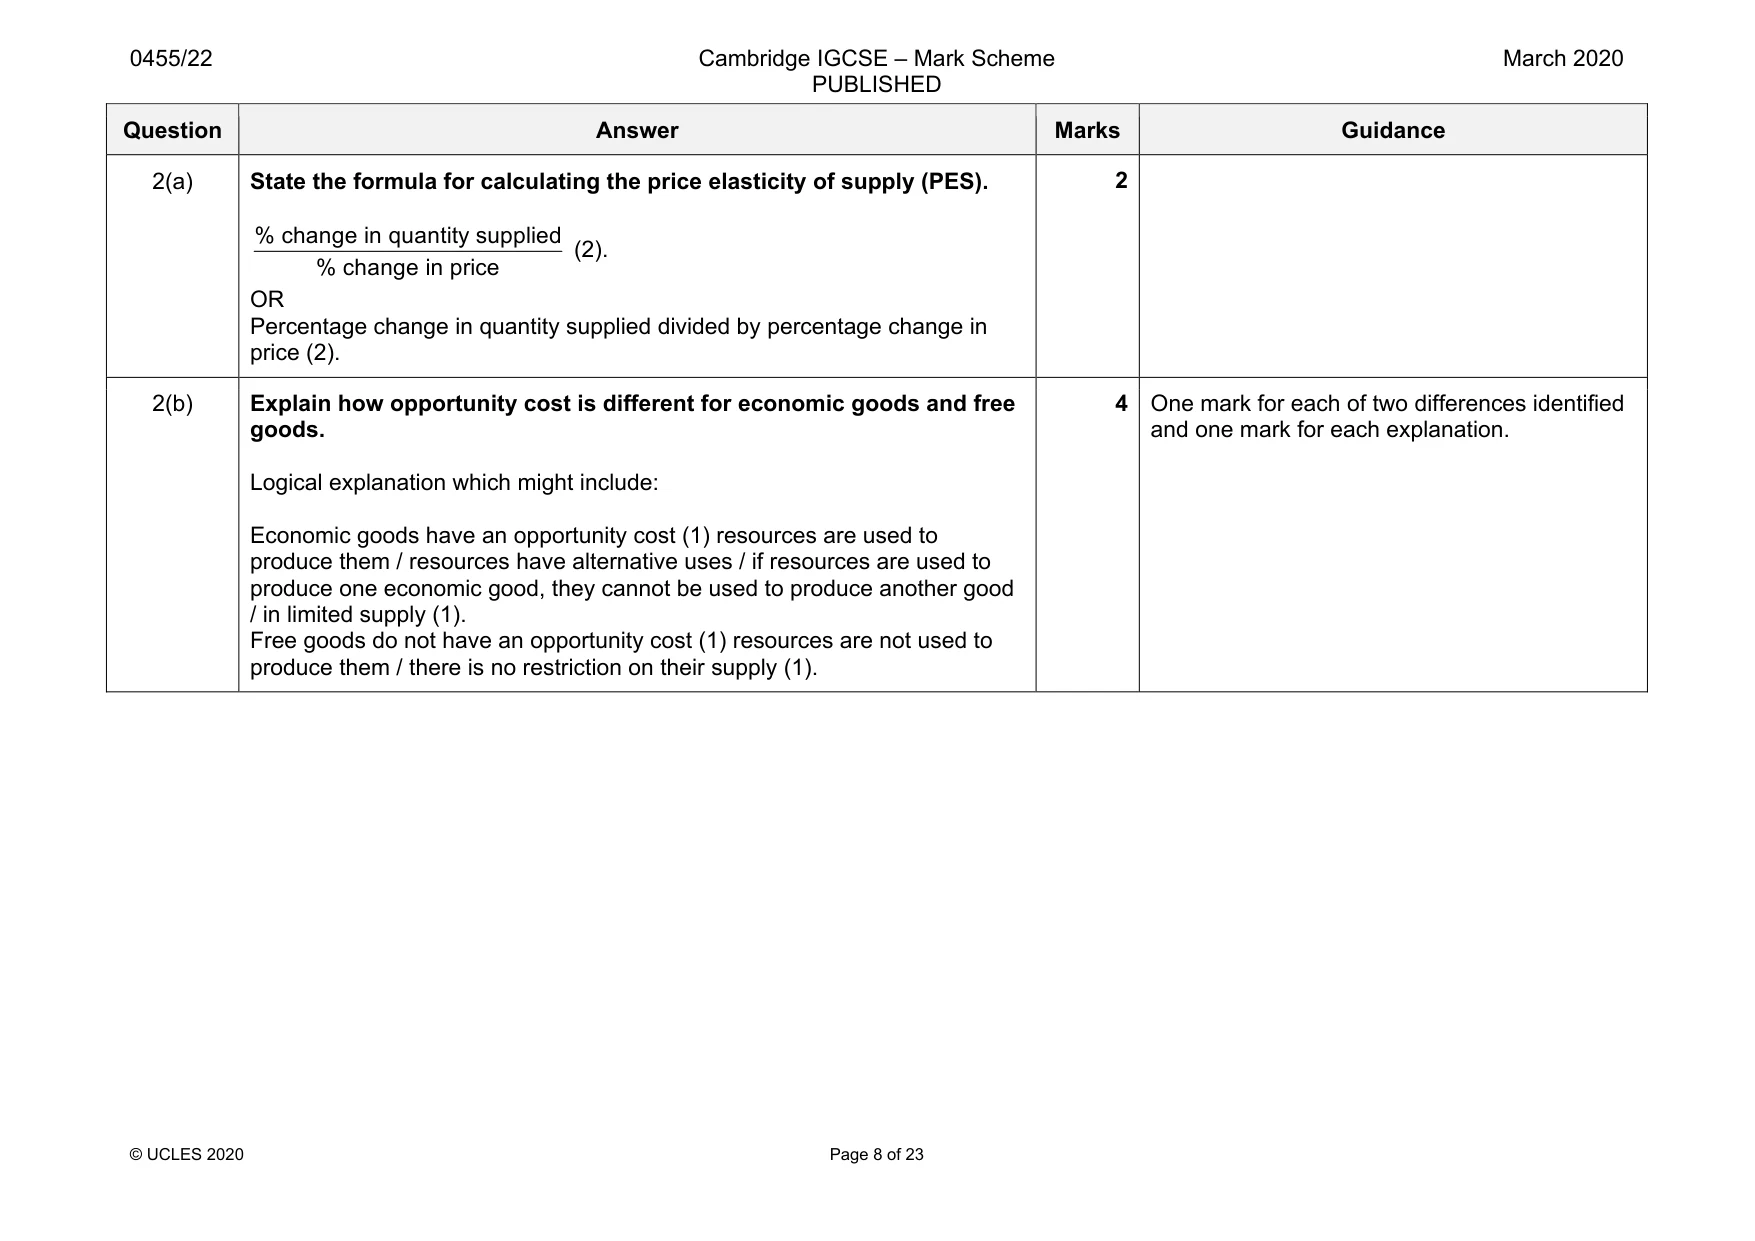
Mark scheme: 2(a) State the formula for calculating the price elasticity of supply (PES). % change in quantity supplied % change in price (2). OR Percentage change in quantity supplied divided by percentage change in price (2). 2(b) Explain how opportunity cost is different for economic goods and free goods. Logical explanation which might include: Economic goods have an opportunity cost (1) resources are used to produce them / resources have alternative uses / if resources are used to produce one economic good, they cannot be used to produce another good / in limited supply (1). Free goods do not have an opportunity cost (1) resources are not used to produce them / there is no restriction on their supply (1). 4 One mark for each of two differences identified and one mark for each explanation. Question Answer Marks Guidance 2(c) Analyse, using a production possibility curve (PPC) diagram, the effect of an increase in enterprise on an economy. Up to 4 marks for the diagram: Axes correctly labelled (1). Initial curve drawn as a curve / downward sloping line to the axes (1). New curve drawn as a curve / downward sloping line to the axes (1). Shift to the right indicated by arrow or lettering (1). Up to 2 marks for coherent analysis which might include: Enterprise is a factor of production / resource (1) there will be more risk takers / decision makers / firms (1) more enterprise increases productive capacity / potential / maximum output that can be produced / causes economic growth (1). 6 Question Answer Marks Guidance 2(d) Discuss whether or not skilled workers are always paid more than unskilled workers. In assessing each answer, use the table opposite. Why they might be: • skilled workers may be in shorter supply as they may require training and qualifications • skilled workers may be in inelastic supply and demand for them may be inelastic • skilled workers may be in higher demand as they will be more productive • skilled workers may have stronger bargaining power • skilled workers may be more likely to work in the tertiary sector • Skilled workers may be more mobile. Why they might not be: • skilled workers may have less experience and may be in less promoted positions • skilled workers may be in declining industries • skilled workers may place more importance on non-wage factors when deciding what jobs to do • skilled workers in poorer countries may have lower wages than some unskilled workers in richer countries. Example of a Level 3 answer: Skilled workers may be paid more than unskilled workers as they have more qualifications and/or experience, so demand may be high compared to supply. Supply could be low due to long training required to learn skills, so the labour market would be more competitive and skilled workers higher paid. Demand for the products skilled workers provide may be higher, so their pay could be higher due to higher derived demand. Also, they may belong to stronger trade unions which have more bargaining power to negotiate for higher pay. 8 Accept responses from the viewpoint of why unskilled workers may be paid more. Level Description Marks 3 A reasoned discussion which accurately examines both sides of the economic argument, making use of economic information and clear and logical analysis to evaluate economic issues and situations. One side of the argument may have more depth than the other, but overall both sides of the argument are considered and developed. There is thoughtful evaluation of economic concepts, terminology, information and/or data appropriate to the question. The discussion may also point out the possible uncertainties of alternative decisions and outcomes. 6–8 Question Answer Marks Guidance 2(d) It is also possible that unskilled workers could be higher paid. This is because their work may be dangerous, e.g. miners, so the supply of workers willing to do the job may be lower and firms have to pay more to attract workers. Long working hours (less leisure time) and poor working conditions mean unskilled workers may be higher paid, and if the work is boring and very few people are willing to do the job. For example, cleaners in the US are paid much higher wages than cleaners in India as the number of people willing to accept a job as a cleaner in the US is very low. There is even a possibility that unskilled workers could be paid higher than skilled workers. Principal Examiner comment: This is a strong L3 response. It is a two-sided answer with depth and logical links. For example, the candidate links qualifications and experience to demand for and supply of workers, as well as linking demand for workers with demand for the products they produce. The candidate discusses some of the key influences on wage determination. Level Description Marks 2 A reasoned discussion which makes use of economic information and clear analysis to evaluate economic issues and situations. The answer may lack some depth and development may be one- sided. There is relevant use of economic concepts, terminology, information and data appropriate to the question. 3–5 1 There is a simple attempt at using economic definitions and terminology. Some reference may be made to economic theory, with occasional understanding. 1–2 0 A mark of zero should be awarded for no creditable content. 0
Q3 · In 2017, the Brazilian paper industry was booming
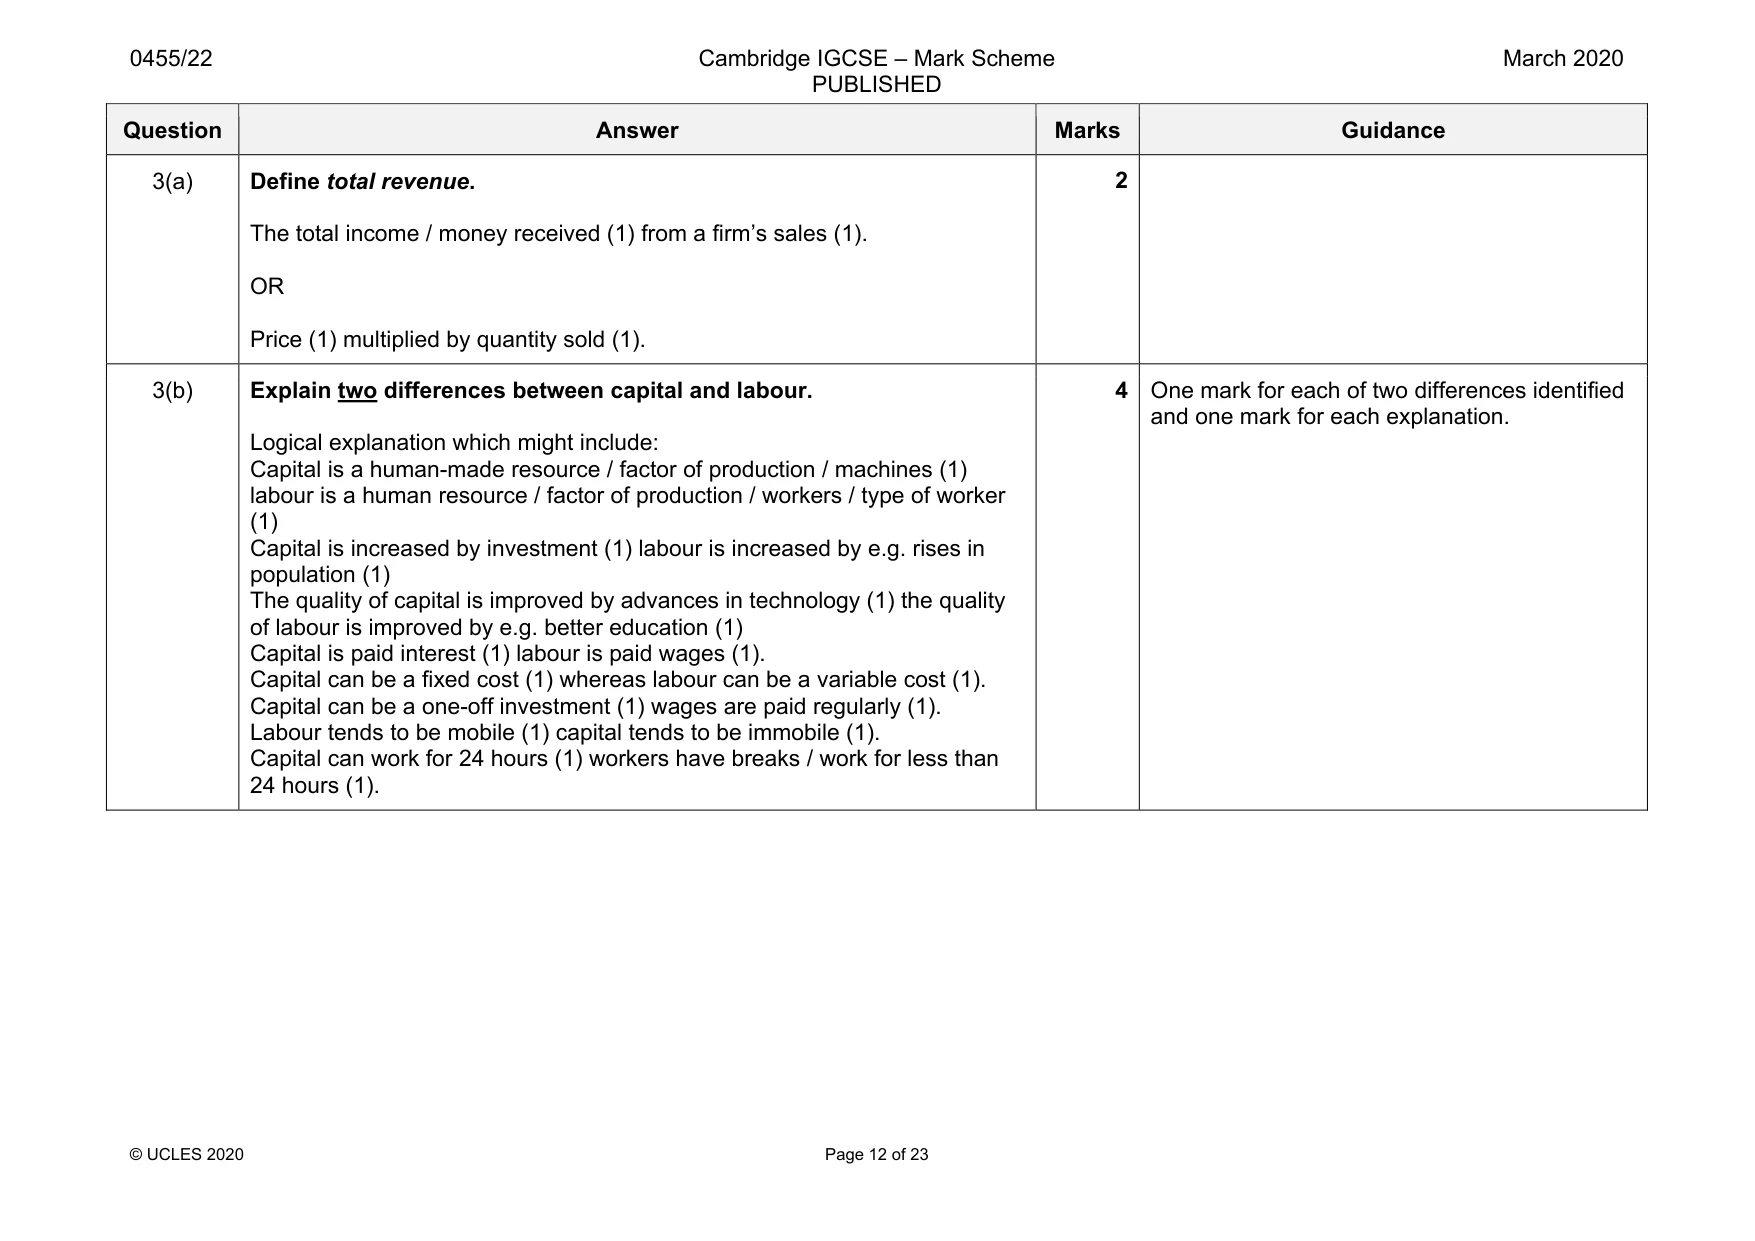
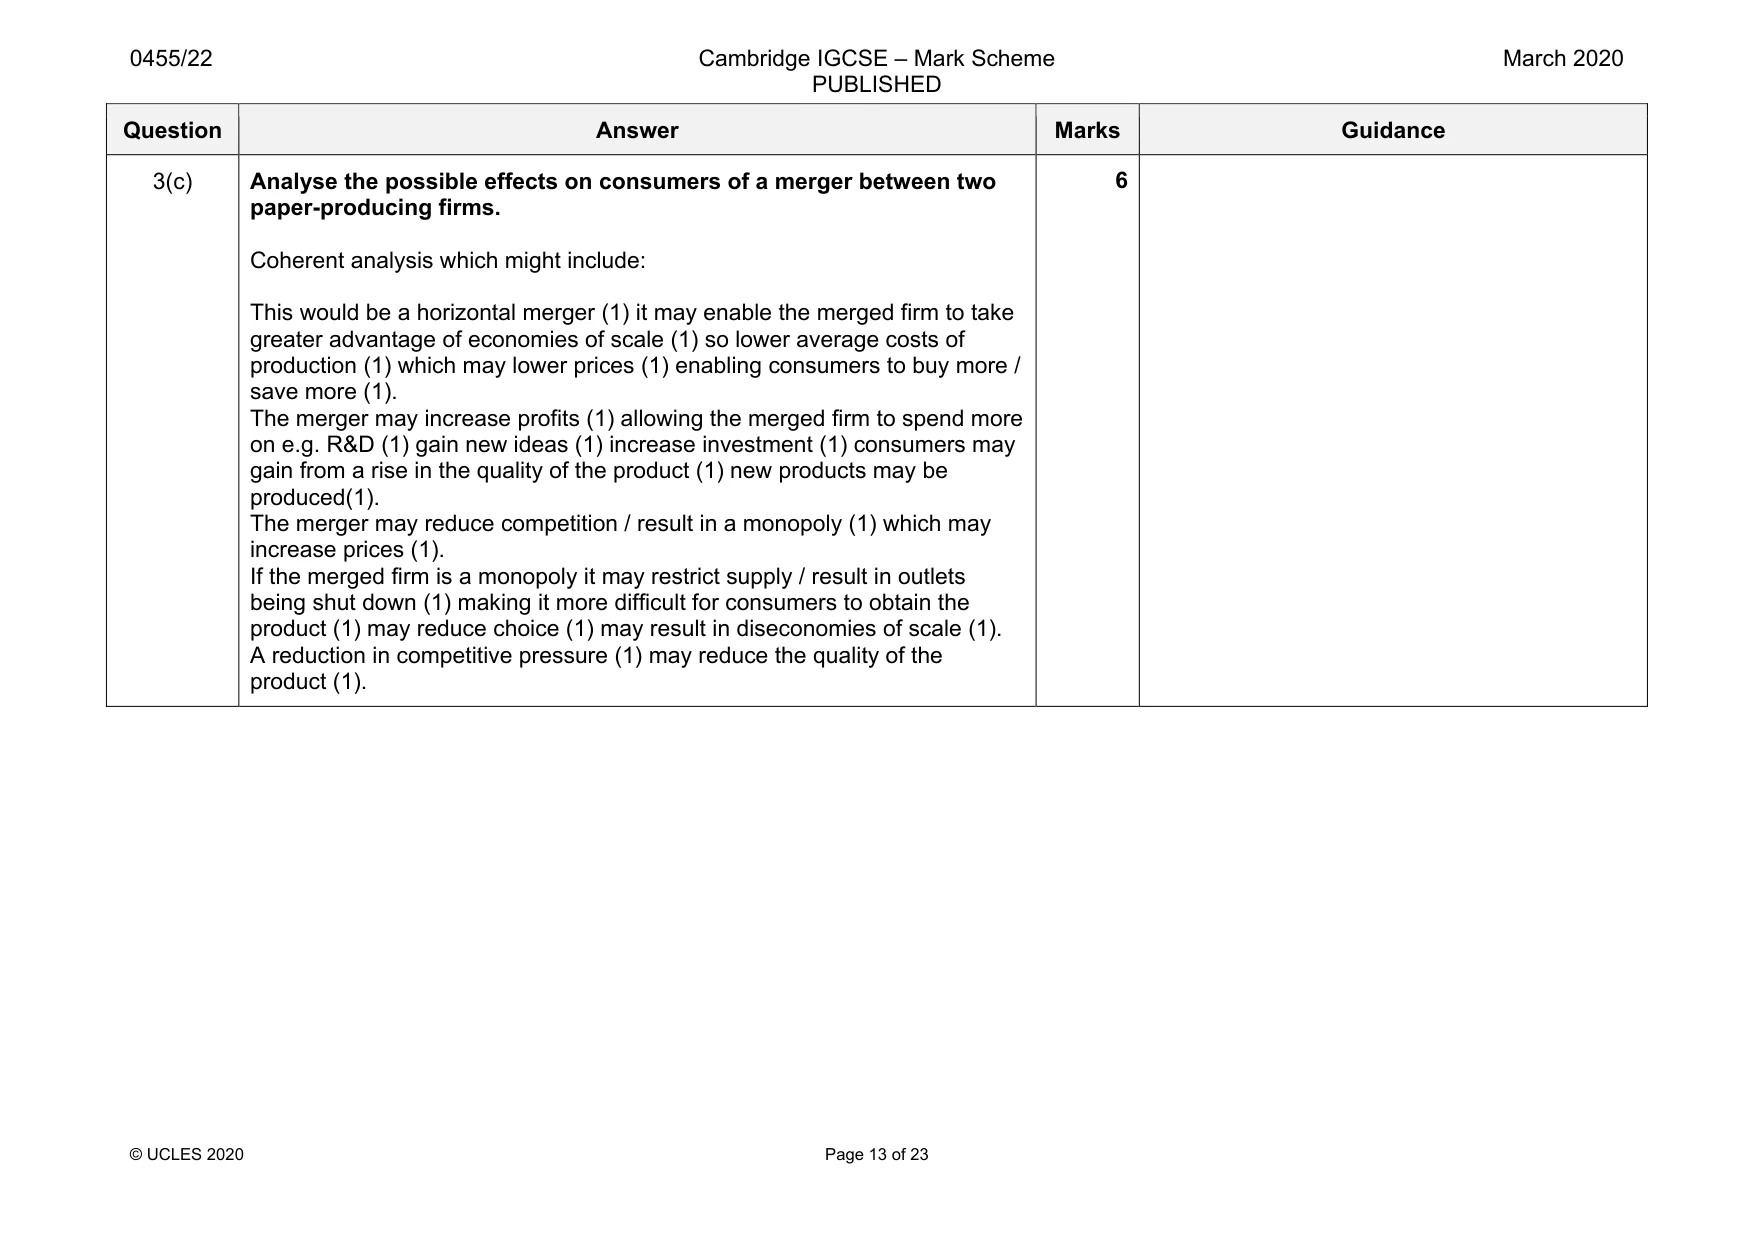
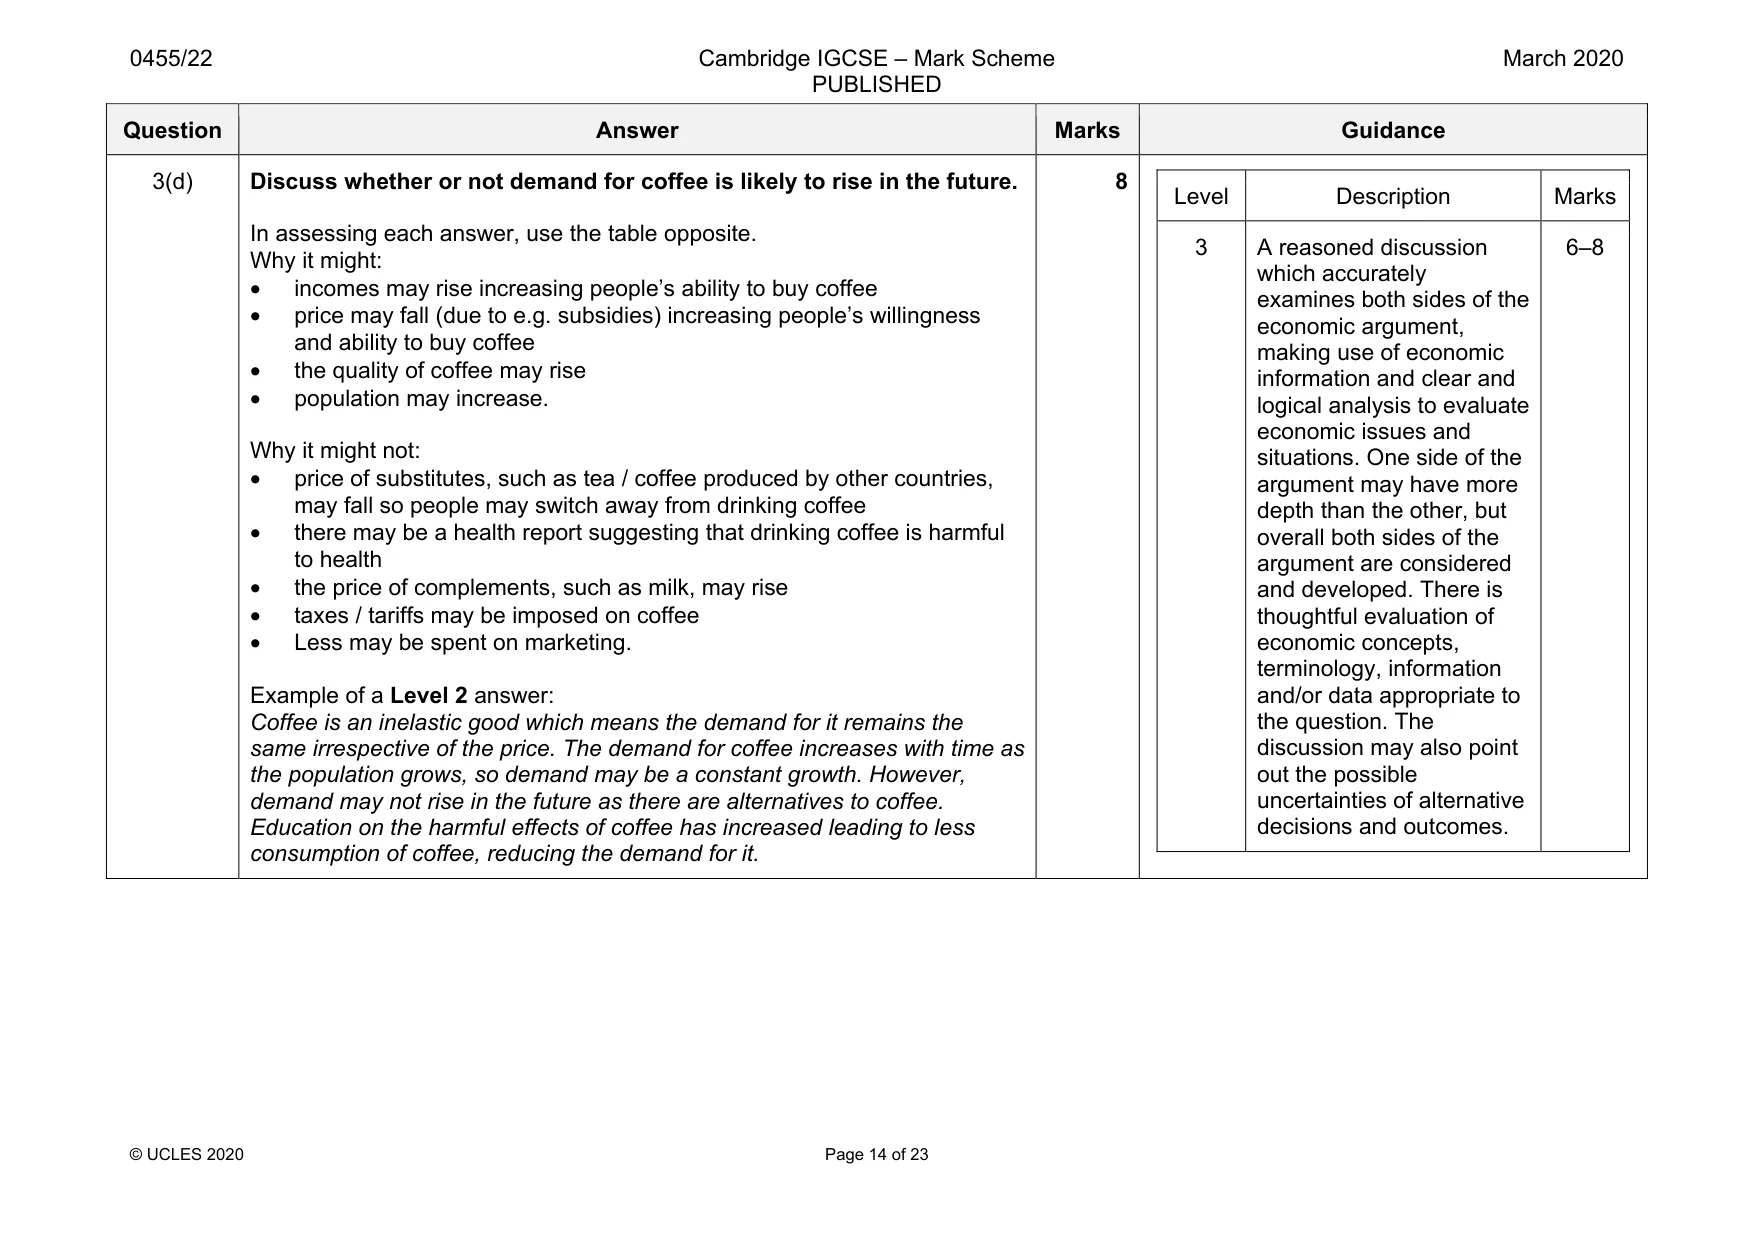
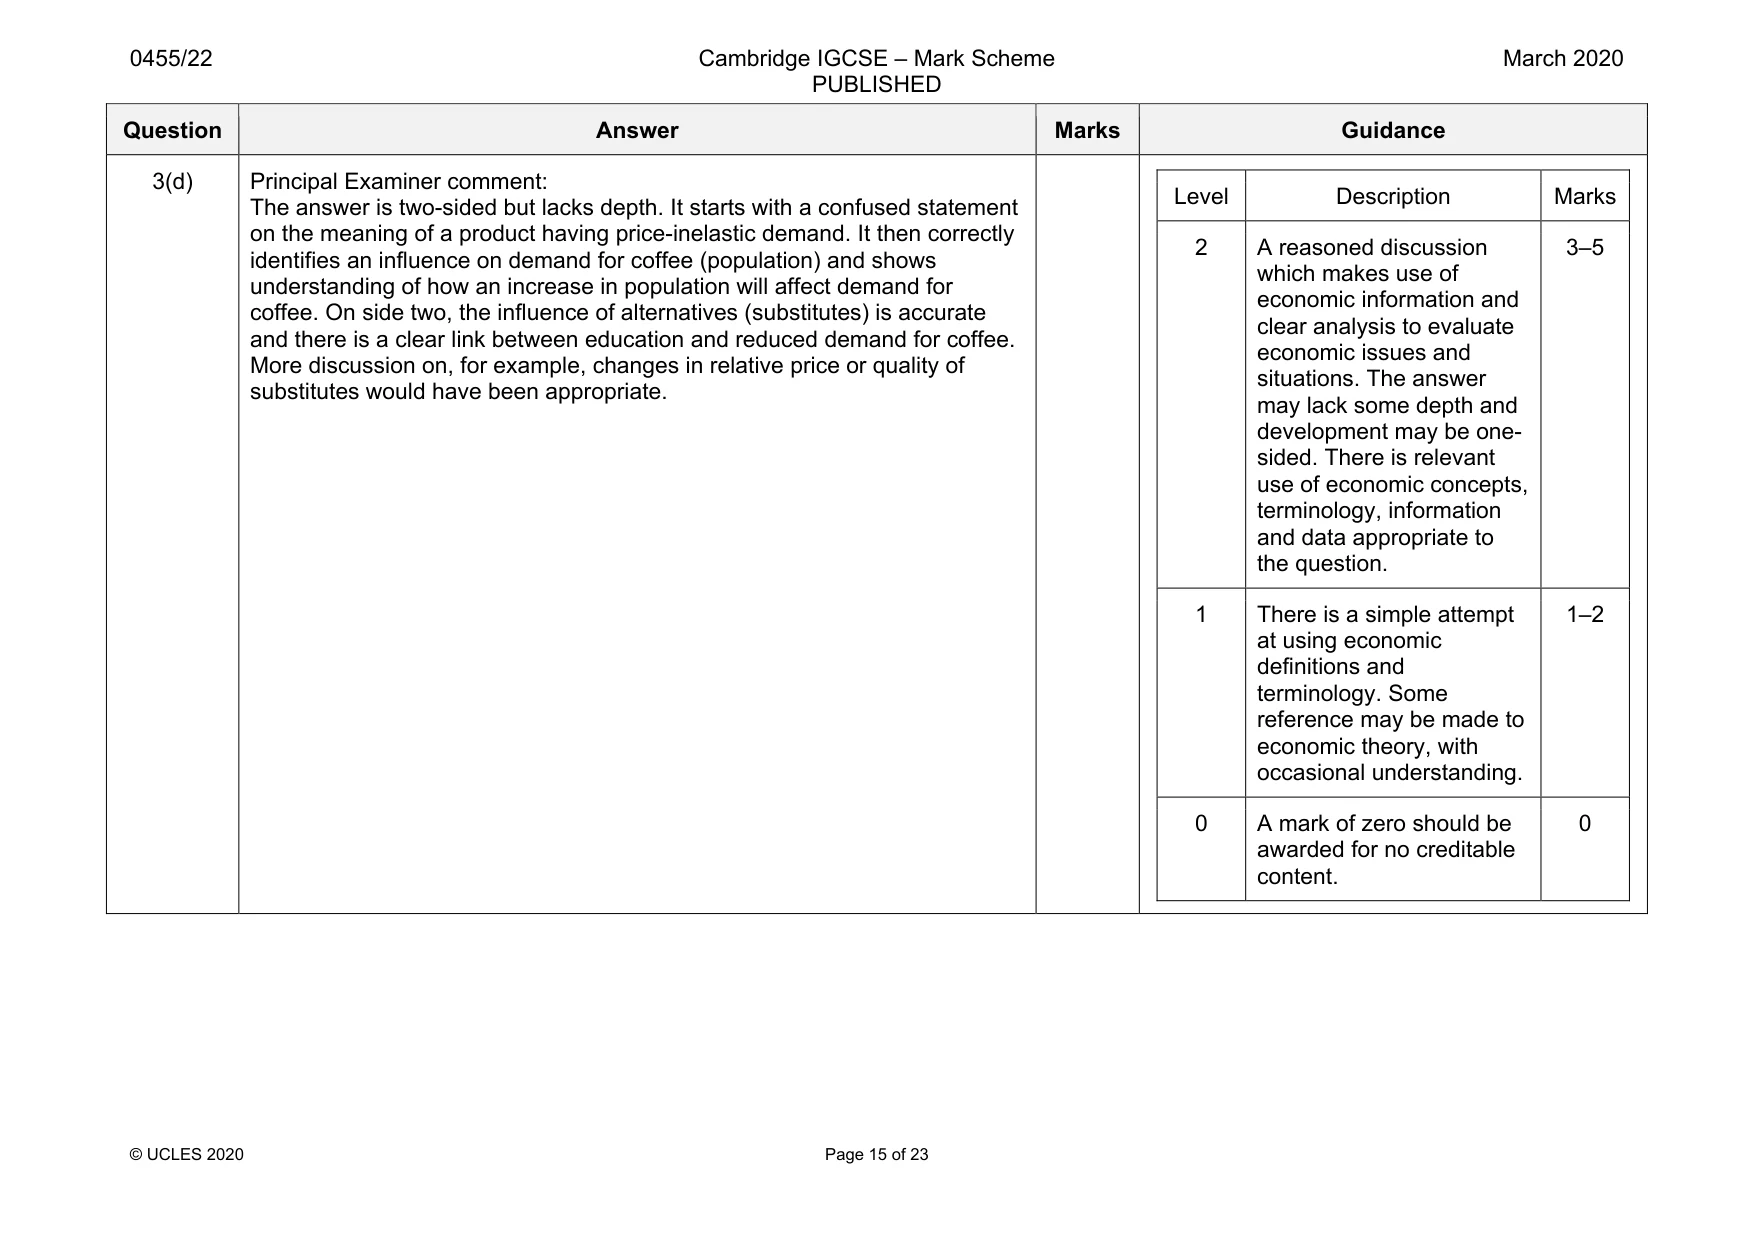
3 In 2017, the Brazilian paper industry was booming. Its total revenue increased and it employed both more, and better quality, factors of production. Brazil’s largest paper producer merged with an Indonesian paper-producing firm at the end of 2017. The performance of Brazil’s coffee industry differed from its paper industry. Brazilian coffee experienced a fall in demand and a fall in total revenue. (a) Define total revenue. [2] (b) Explain two differences between capital and labour. [4] (c) Analyse the possible effects on consumers of a merger between two paper-producing firms. [6] (d) Discuss whether or not demand for coffee is likely to rise in the future. [8]
Mark scheme: 3(a) Define total revenue. The total income / money received (1) from a firm’s sales (1). OR Price (1) multiplied by quantity sold (1). 3(b) Explain two differences between capital and labour. Logical explanation which might include: Capital is a human-made resource / factor of production / machines (1) labour is a human resource / factor of production / workers / type of worker (1) Capital is increased by investment (1) labour is increased by e.g. rises in population (1) The quality of capital is improved by advances in technology (1) the quality of labour is improved by e.g. better education (1) Capital is paid interest (1) labour is paid wages (1). Capital can be a fixed cost (1) whereas labour can be a variable cost (1). Capital can be a one-off investment (1) wages are paid regularly (1). Labour tends to be mobile (1) capital tends to be immobile (1). Capital can work for 24 hours (1) workers have breaks / work for less than 24 hours (1). 4 One mark for each of two differences identified and one mark for each explanation. Question Answer Marks Guidance 3(c) Analyse the possible effects on consumers of a merger between two paper-producing firms. Coherent analysis which might include: This would be a horizontal merger (1) it may enable the merged firm to take greater advantage of economies of scale (1) so lower average costs of production (1) which may lower prices (1) enabling consumers to buy more / save more (1). The merger may increase profits (1) allowing the merged firm to spend more on e.g. R&D (1) gain new ideas (1) increase investment (1) consumers may gain from a rise in the quality of the product (1) new products may be produced(1). The merger may reduce competition / result in a monopoly (1) which may increase prices (1). If the merged firm is a monopoly it may restrict supply / result in outlets being shut down (1) making it more difficult for consumers to obtain the product (1) may reduce choice (1) may result in diseconomies of scale (1). A reduction in competitive pressure (1) may reduce the quality of the product (1). 6 Question Answer Marks Guidance 3(d) Discuss whether or not demand for coffee is likely to rise in the future. In assessing each answer, use the table opposite. Why it might: • incomes may rise increasing people’s ability to buy coffee • price may fall (due to e.g. subsidies) increasing people’s willingness and ability to buy coffee • the quality of coffee may rise • population may increase. Why it might not: • price of substitutes, such as tea / coffee produced by other countries, may fall so people may switch away from drinking coffee • there may be a health report suggesting that drinking coffee is harmful to health • the price of complements, such as milk, may rise • taxes / tariffs may be imposed on coffee • Less may be spent on marketing. Example of a Level 2 answer: Coffee is an inelastic good which means the demand for it remains the same irrespective of the price. The demand for coffee increases with time as the population grows, so demand may be a constant growth. However, demand may not rise in the future as there are alternatives to coffee. Education on the harmful effects of coffee has increased leading to less consumption of coffee, reducing the demand for it. 8 Level Description Marks 3 A reasoned discussion which accurately examines both sides of the economic argument, making use of economic information and clear and logical analysis to evaluate economic issues and situations. One side of the argument may have more depth than the other, but overall both sides of the argument are considered and developed. There is thoughtful evaluation of economic concepts, terminology, information and/or data appropriate to the question. The discussion may also point out the possible uncertainties of alternative decisions and outcomes. 6–8 Question Answer Marks Guidance 3(d) Principal Examiner comment: The answer is two-sided but lacks depth. It starts with a confused statement on the meaning of a product having price-inelastic demand. It then correctly identifies an influence on demand for coffee (population) and shows understanding of how an increase in population will affect demand for coffee. On side two, the influence of alternatives (substitutes) is accurate and there is a clear link between education and reduced demand for coffee. More discussion on, for example, changes in relative price or quality of substitutes would have been appropriate. Level Description Marks 2 A reasoned discussion which makes use of economic information and clear analysis to evaluate economic issues and situations. The answer may lack some depth and development may be one- sided. There is relevant use of economic concepts, terminology, information and data appropriate to the question. 3–5 1 There is a simple attempt at using economic definitions and terminology. Some reference may be made to economic theory, with occasional understanding. 1–2 0 A mark of zero should be awarded for no creditable content. 0
Q4 · African countries are expected to experience growth in their output
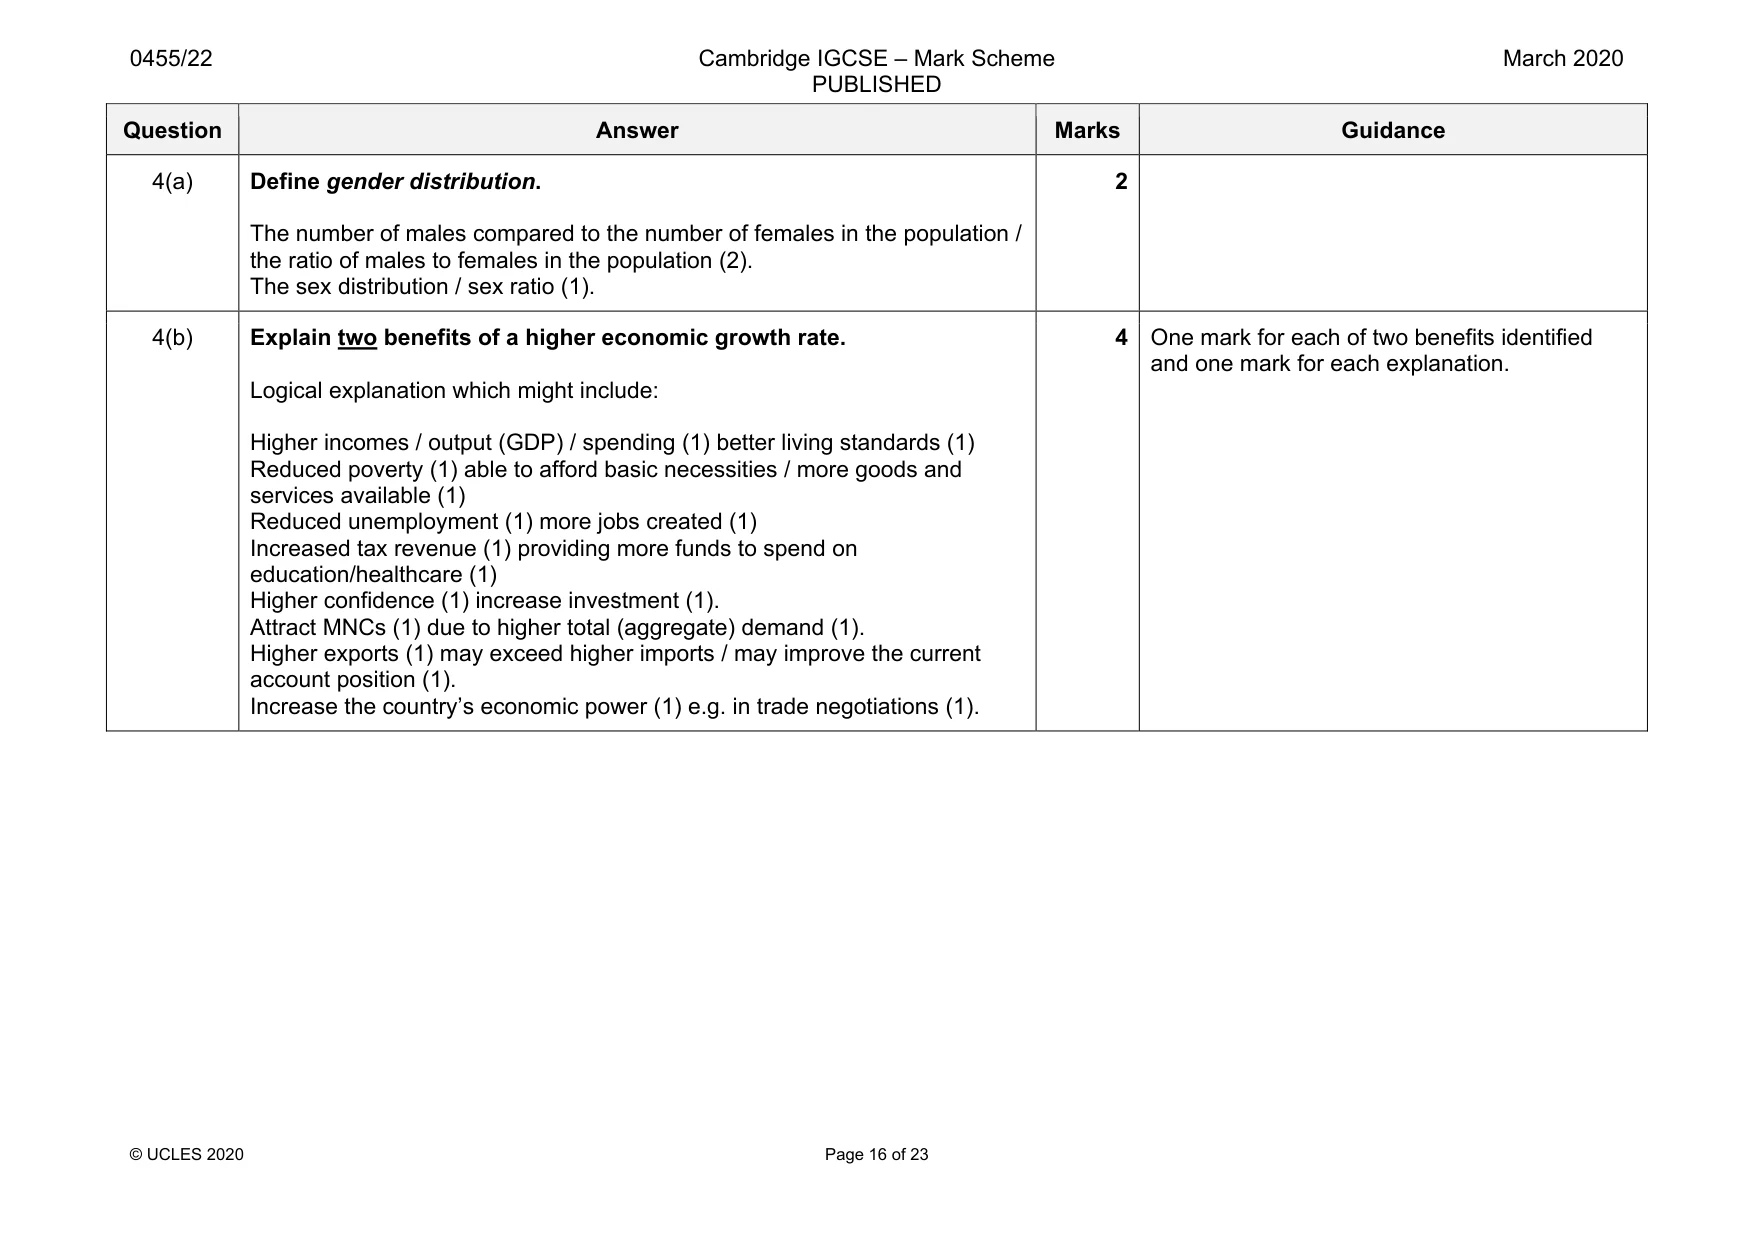
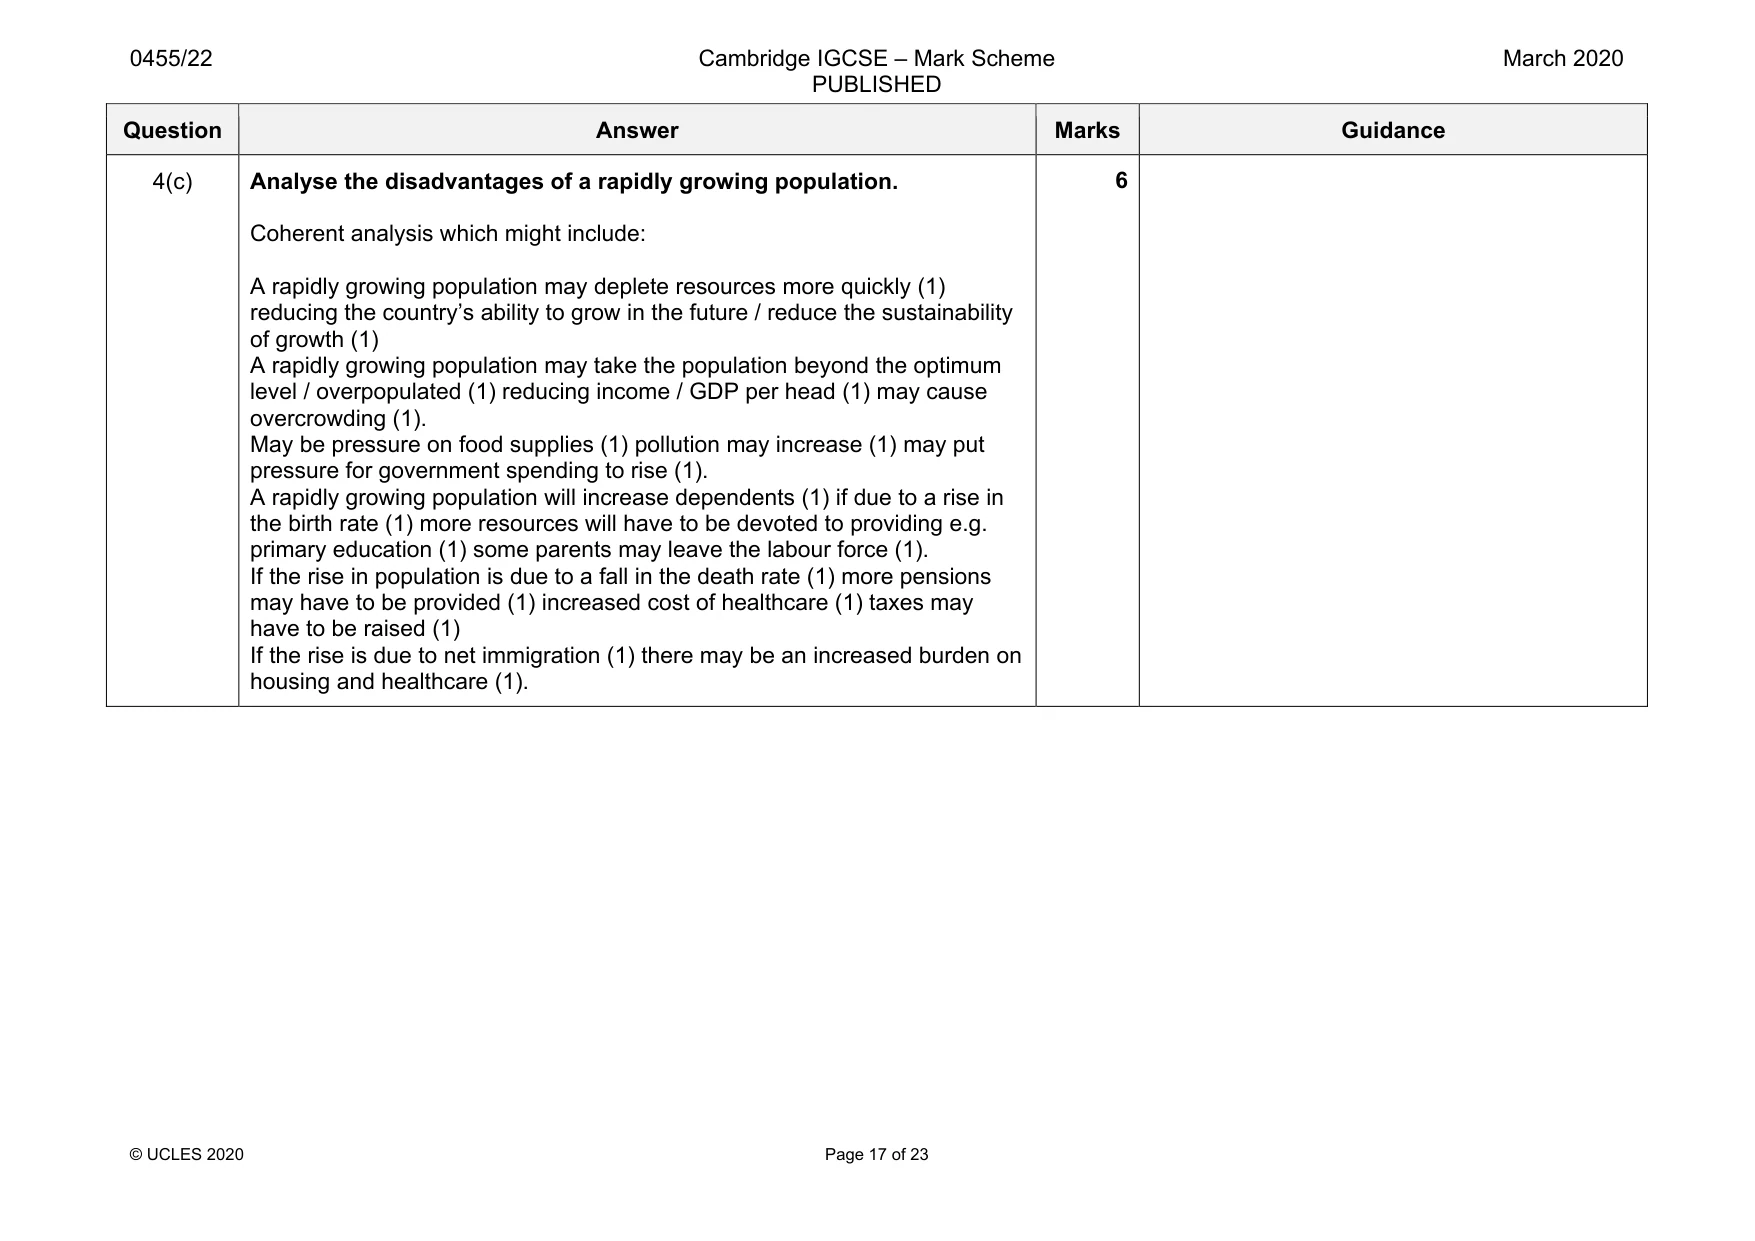
4 African countries are expected to experience growth in their output. It is also predicted that Africa’s population will increase from 1.1 bn in 2017 to 4.2 bn by 2100, when Nigeria will account for one in twelve of the world’s births. Nigeria and South Africa are expected to experience the greatest rise in investment (spending on capital goods) over this period, and a change in their gender distribution. (a) Define gender distribution. [2] (b) Explain two benefits of a higher economic growth rate. [4] (c) Analyse the disadvantages of a rapidly growing population. [6] (d) Discuss whether or not a cut in the rate of interest will increase investment. [8]
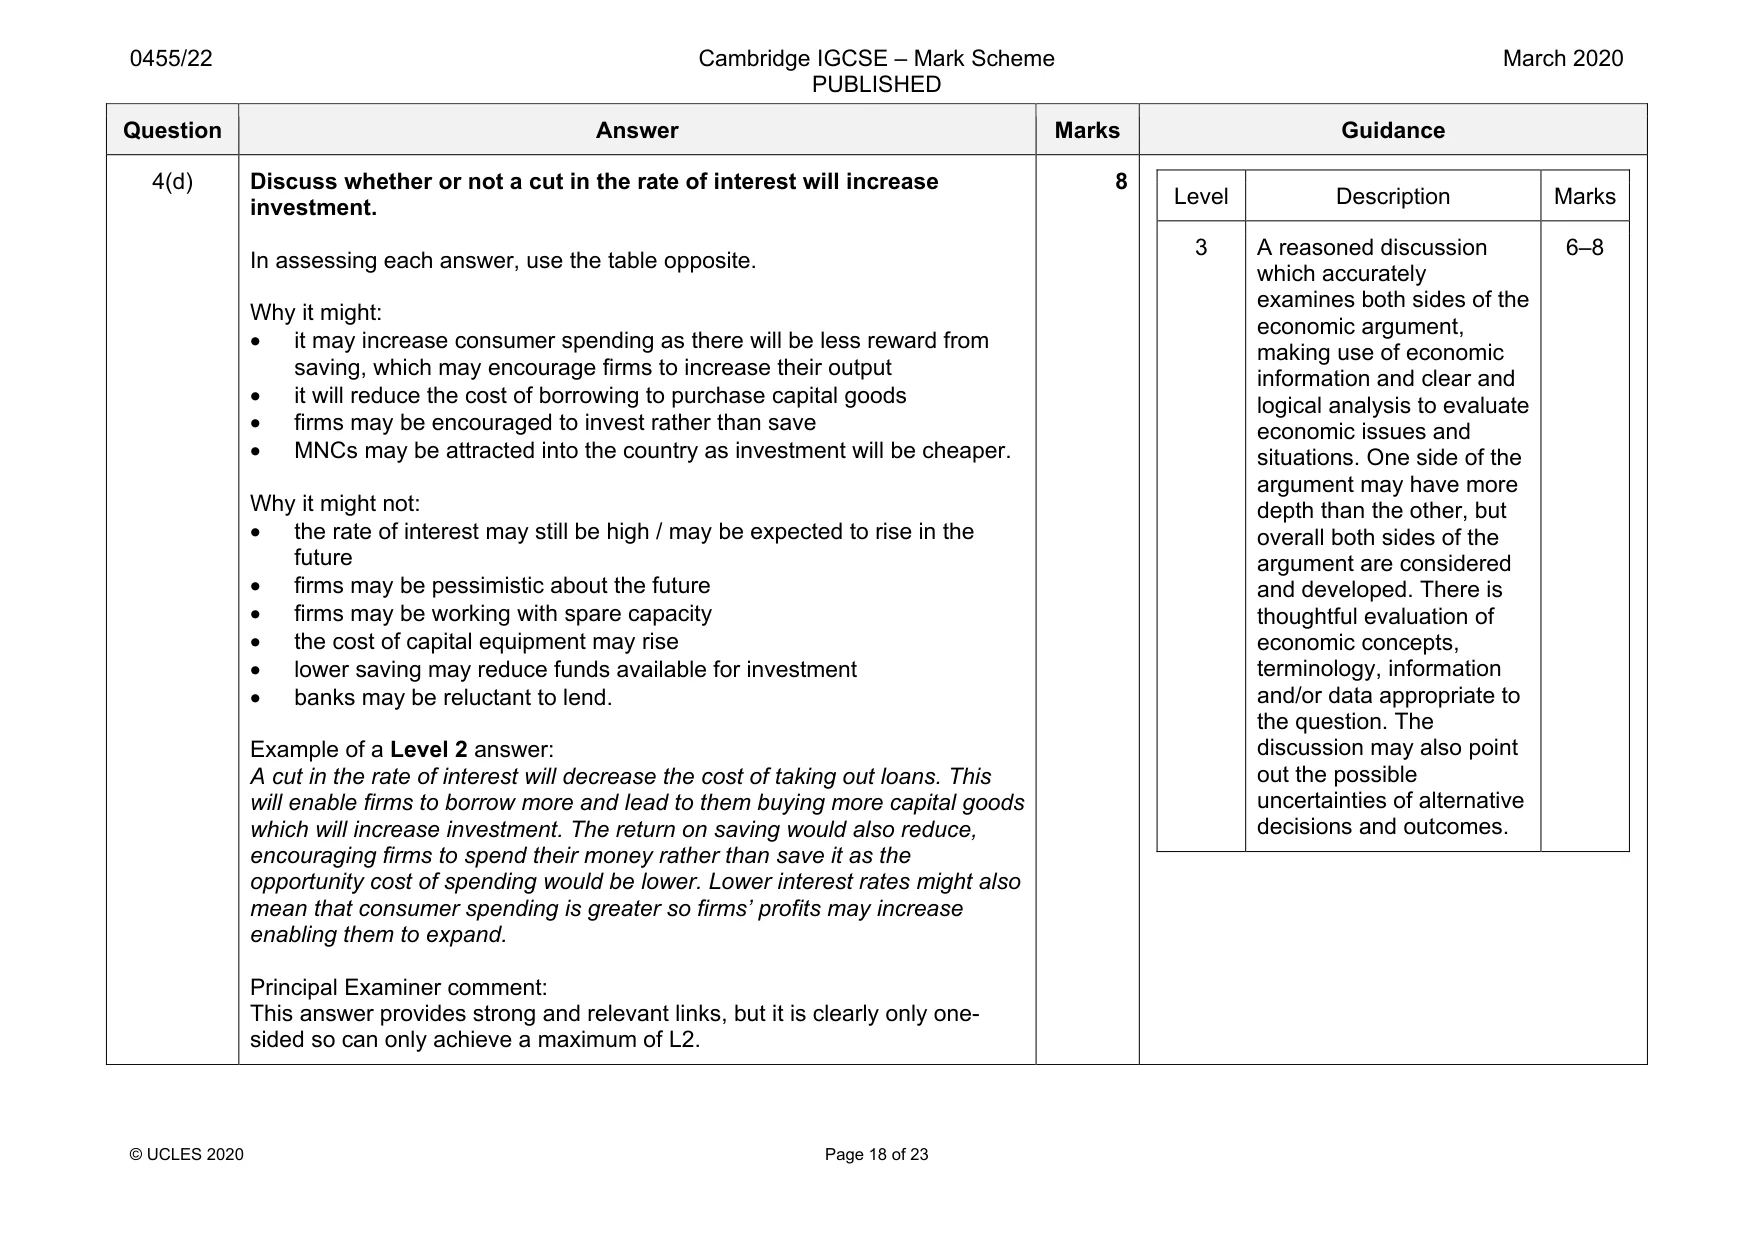
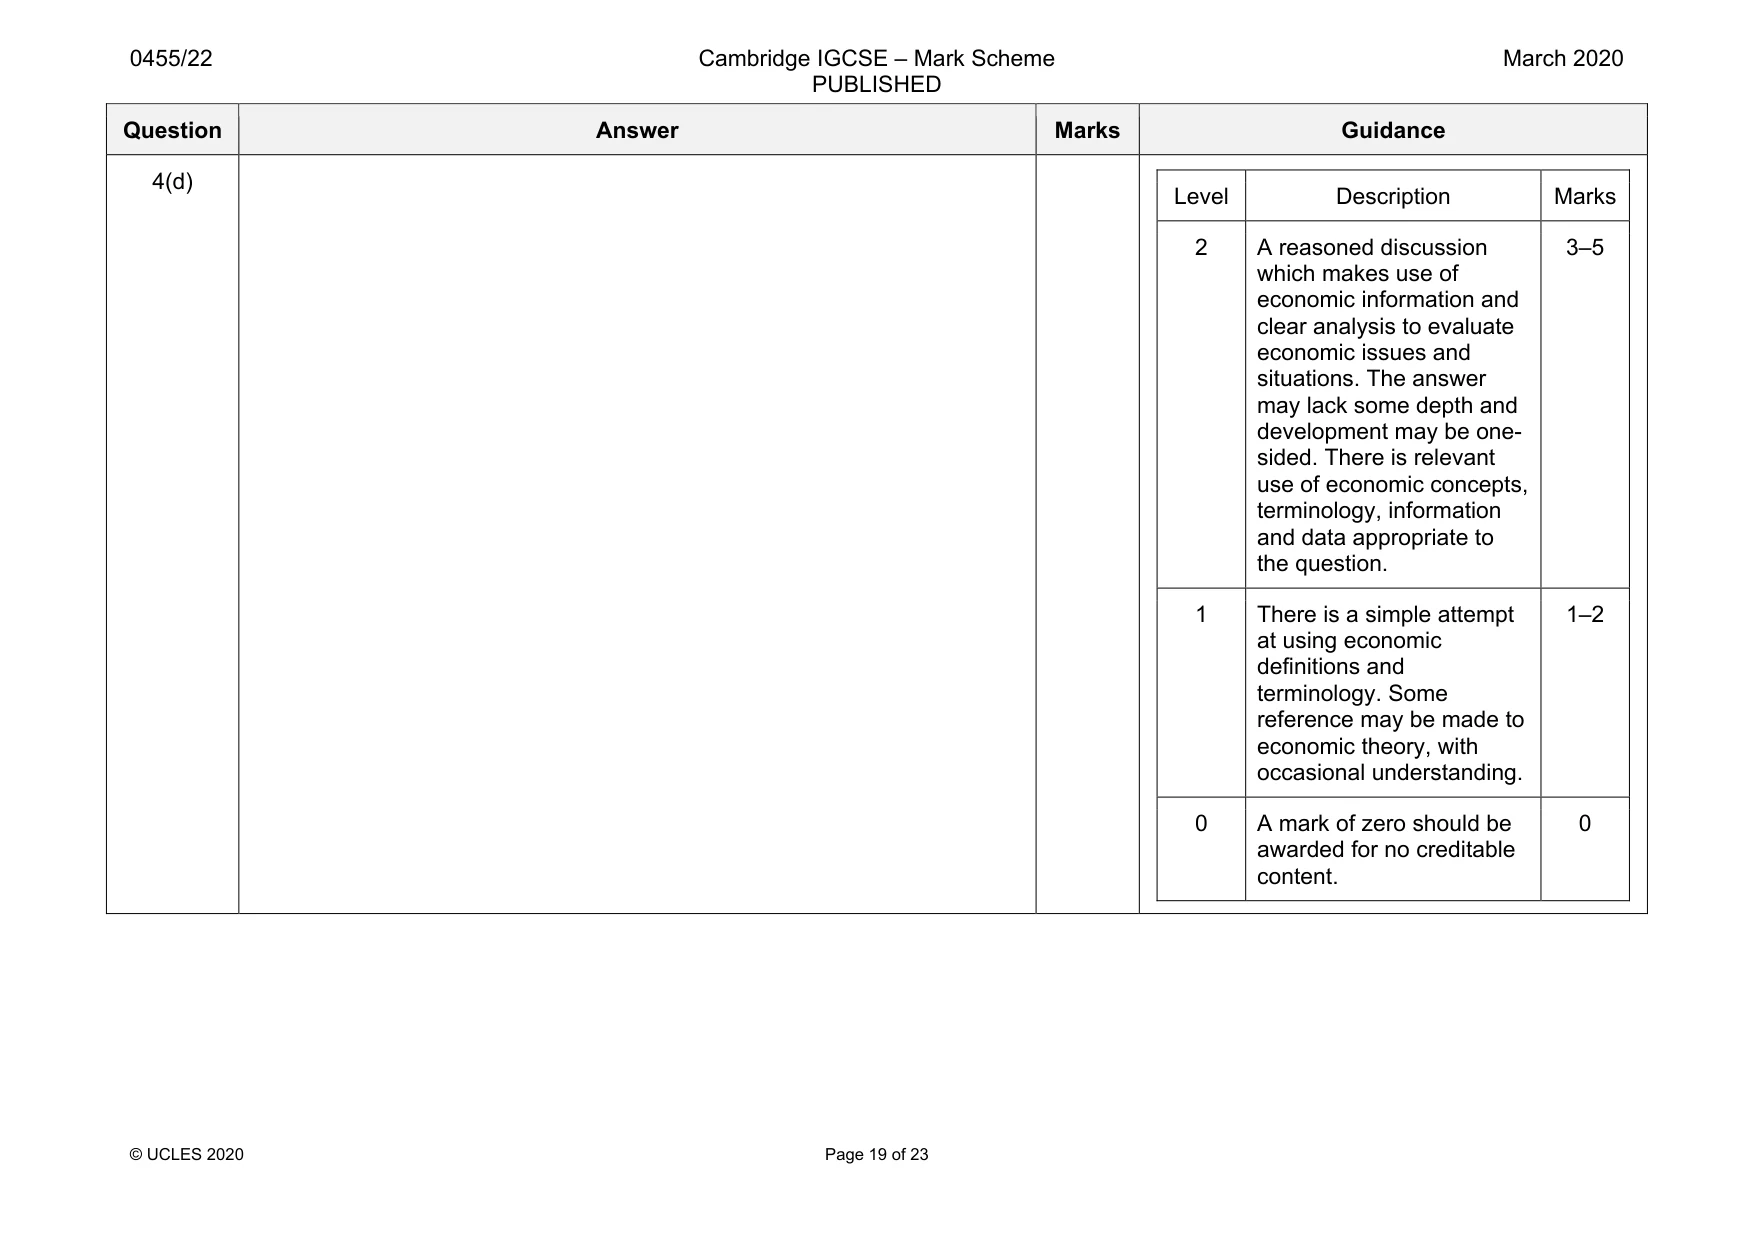
Mark scheme: 4(a) Define gender distribution. The number of males compared to the number of females in the population / the ratio of males to females in the population (2). The sex distribution / sex ratio (1). 2 4(b) Explain two benefits of a higher economic growth rate. Logical explanation which might include: Higher incomes / output (GDP) / spending (1) better living standards (1) Reduced poverty (1) able to afford basic necessities / more goods and services available (1) Reduced unemployment (1) more jobs created (1) Increased tax revenue (1) providing more funds to spend on education/healthcare (1) Higher confidence (1) increase investment (1). Attract MNCs (1) due to higher total (aggregate) demand (1). Higher exports (1) may exceed higher imports / may improve the current account position (1). Increase the country’s economic power (1) e.g. in trade negotiations (1). 4 One mark for each of two benefits identified and one mark for each explanation. Question Answer Marks Guidance 4(c) Analyse the disadvantages of a rapidly growing population. Coherent analysis which might include: A rapidly growing population may deplete resources more quickly (1) reducing the country’s ability to grow in the future / reduce the sustainability of growth (1) A rapidly growing population may take the population beyond the optimum level / overpopulated (1) reducing income / GDP per head (1) may cause overcrowding (1). May be pressure on food supplies (1) pollution may increase (1) may put pressure for government spending to rise (1). A rapidly growing population will increase dependents (1) if due to a rise in the birth rate (1) more resources will have to be devoted to providing e.g. primary education (1) some parents may leave the labour force (1). If the rise in population is due to a fall in the death rate (1) more pensions may have to be provided (1) increased cost of healthcare (1) taxes may have to be raised (1) If the rise is due to net immigration (1) there may be an increased burden on housing and healthcare (1). 6 Question Answer Marks Guidance 4(d) Discuss whether or not a cut in the rate of interest will increase investment. In assessing each answer, use the table opposite. Why it might: • it may increase consumer spending as there will be less reward from saving, which may encourage firms to increase their output • it will reduce the cost of borrowing to purchase capital goods • firms may be encouraged to invest rather than save • MNCs may be attracted into the country as investment will be cheaper. Why it might not: • the rate of interest may still be high / may be expected to rise in the future • firms may be pessimistic about the future • firms may be working with spare capacity • the cost of capital equipment may rise • lower saving may reduce funds available for investment • banks may be reluctant to lend. Example of a Level 2 answer: A cut in the rate of interest will decrease the cost of taking out loans. This will enable firms to borrow more and lead to them buying more capital goods which will increase investment. The return on saving would also reduce, encouraging firms to spend their money rather than save it as the opportunity cost of spending would be lower. Lower interest rates might also mean that consumer spending is greater so firms’ profits may increase enabling them to expand. Principal Examiner comment: This answer provides strong and relevant links, but it is clearly only one- sided so can only achieve a maximum of L2. 8 Level Description Marks 3 A reasoned discussion which accurately examines both sides of the economic argument, making use of economic information and clear and logical analysis to evaluate economic issues and situations. One side of the argument may have more depth than the other, but overall both sides of the argument are considered and developed. There is thoughtful evaluation of economic concepts, terminology, information and/or data appropriate to the question. The discussion may also point out the possible uncertainties of alternative decisions and outcomes. 6–8 Question Answer Marks Guidance 4(d) Level Description Marks 2 A reasoned discussion which makes use of economic information and clear analysis to evaluate economic issues and situations. The answer may lack some depth and development may be one- sided. There is relevant use of economic concepts, terminology, information and data appropriate to the question. 3–5 1 There is a simple attempt at using economic definitions and terminology. Some reference may be made to economic theory, with occasional understanding. 1–2 0 A mark of zero should be awarded for no creditable content. 0
Q5 · The Chinese government reformed the Chinese tax system in 2016
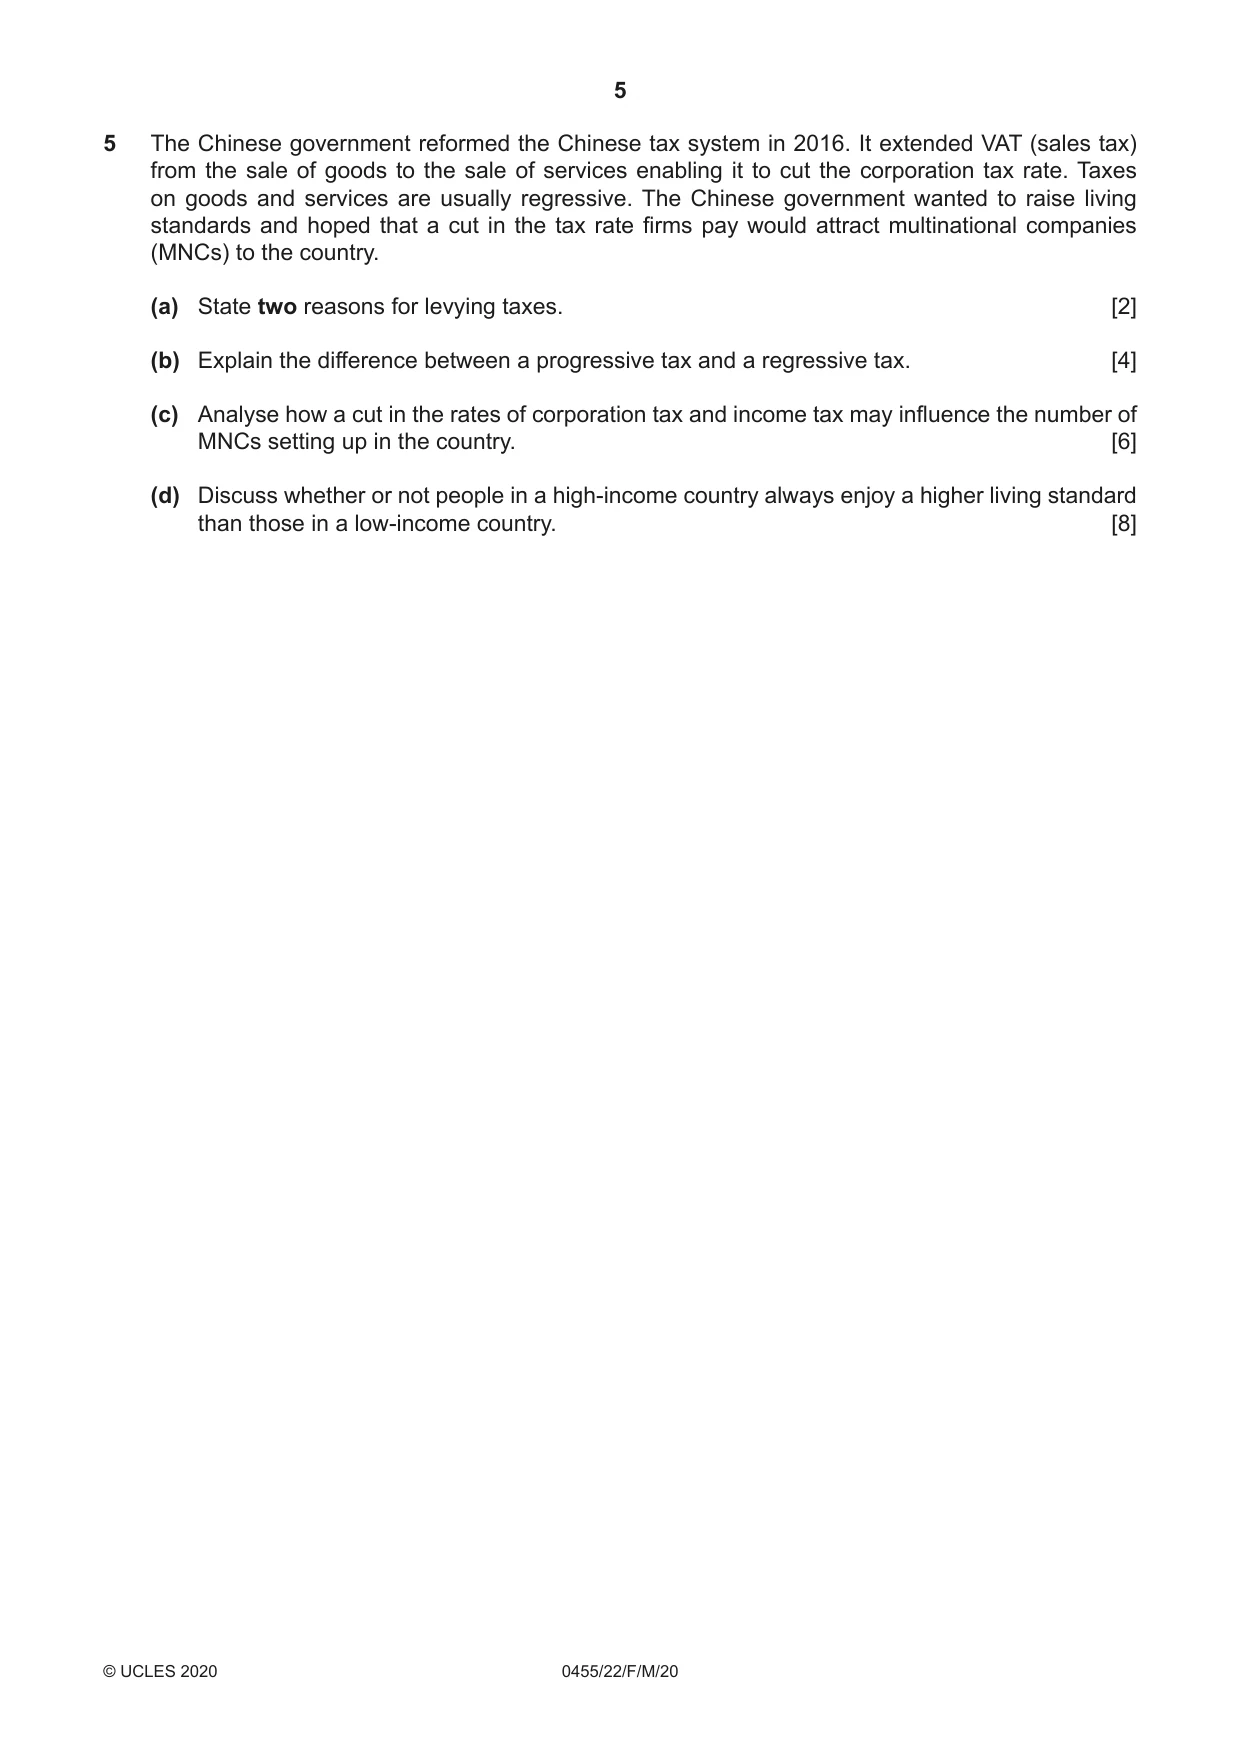
5 The Chinese government reformed the Chinese tax system in 2016. It extended VAT (sales tax) from the sale of goods to the sale of services enabling it to cut the corporation tax rate. Taxes on goods and services are usually regressive. The Chinese government wanted to raise living standards and hoped that a cut in the tax rate firms pay would attract multinational companies (MNCs) to the country. (a) State two reasons for levying taxes. [2] (b) Explain the difference between a progressive tax and a regressive tax. [4] (c) Analyse how a cut in the rates of corporation tax and income tax may influence the number of MNCs setting up in the country. [6] (d) Discuss whether or not people in a high-income country always enjoy a higher living standard than those in a low-income country. [8]
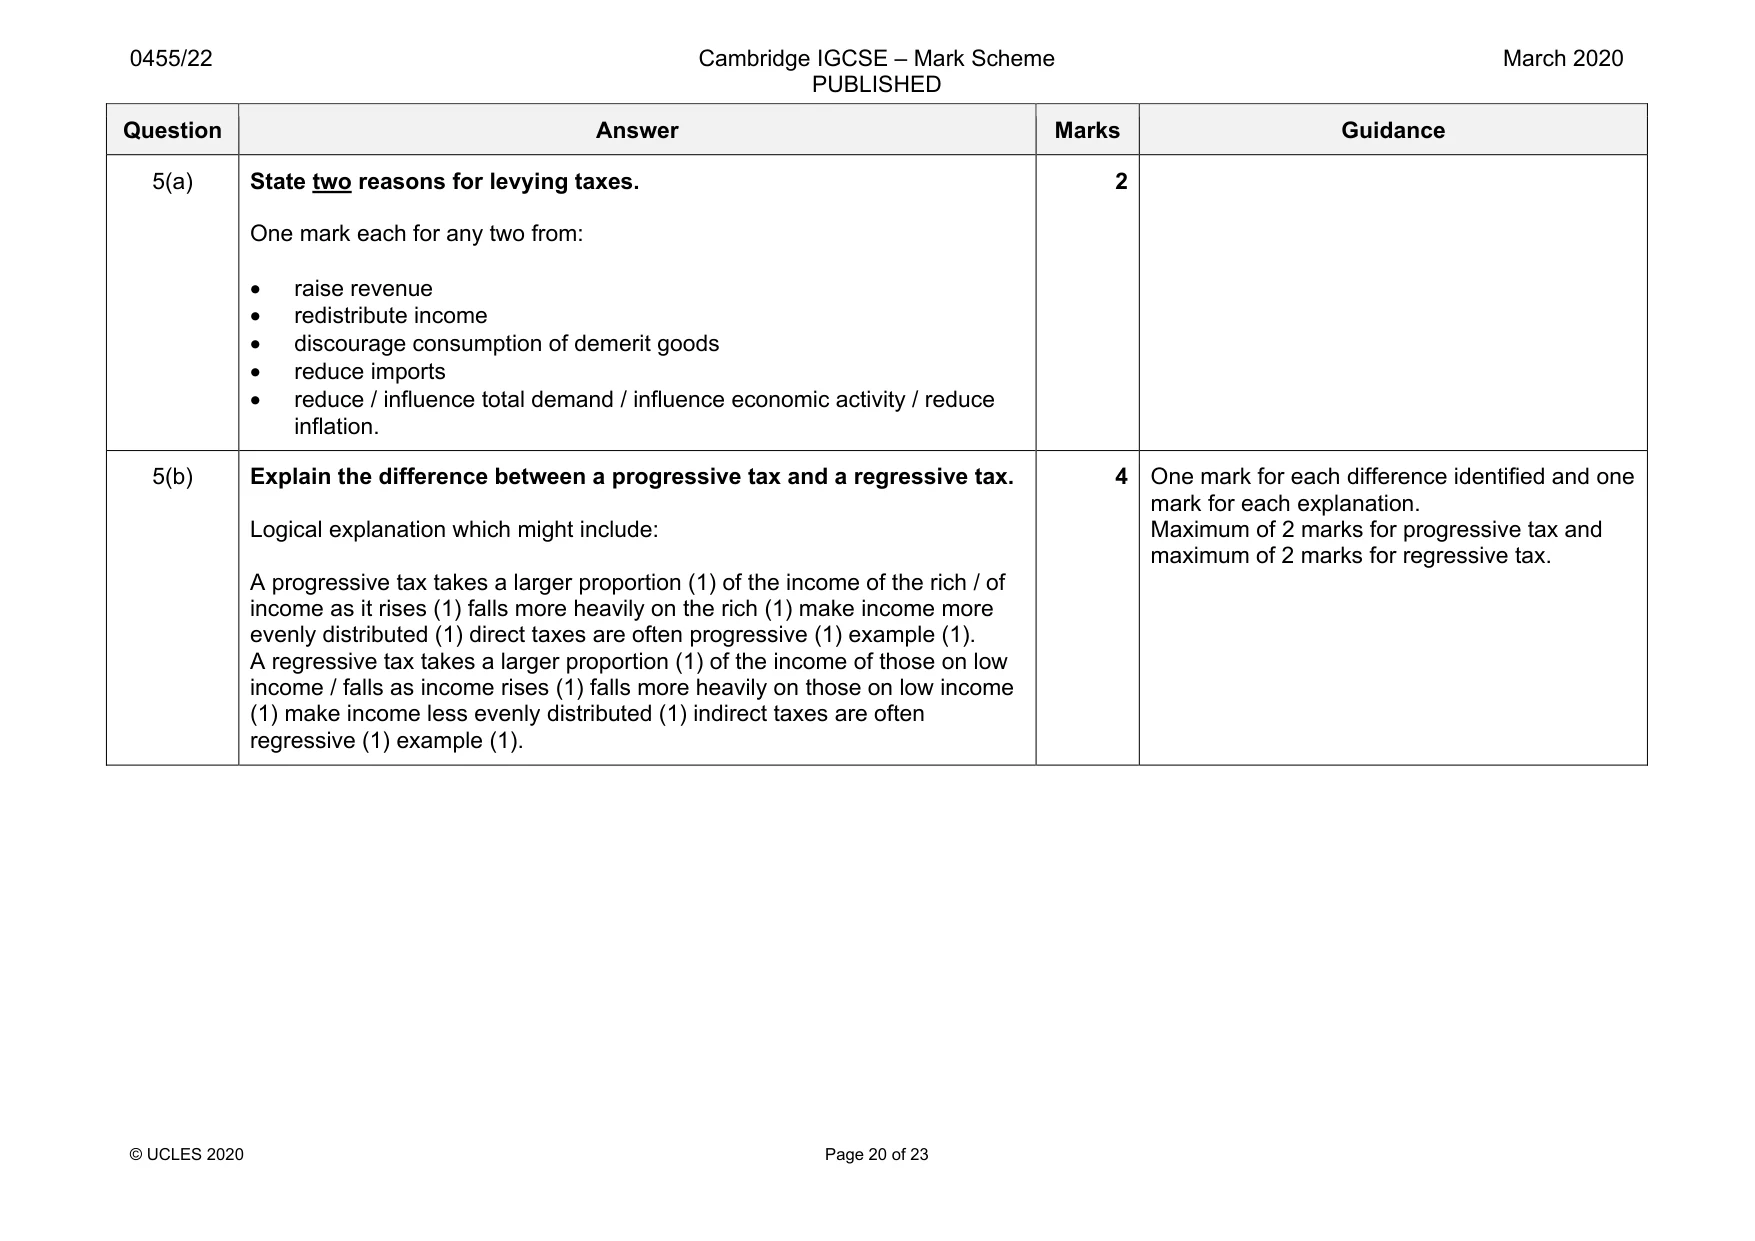
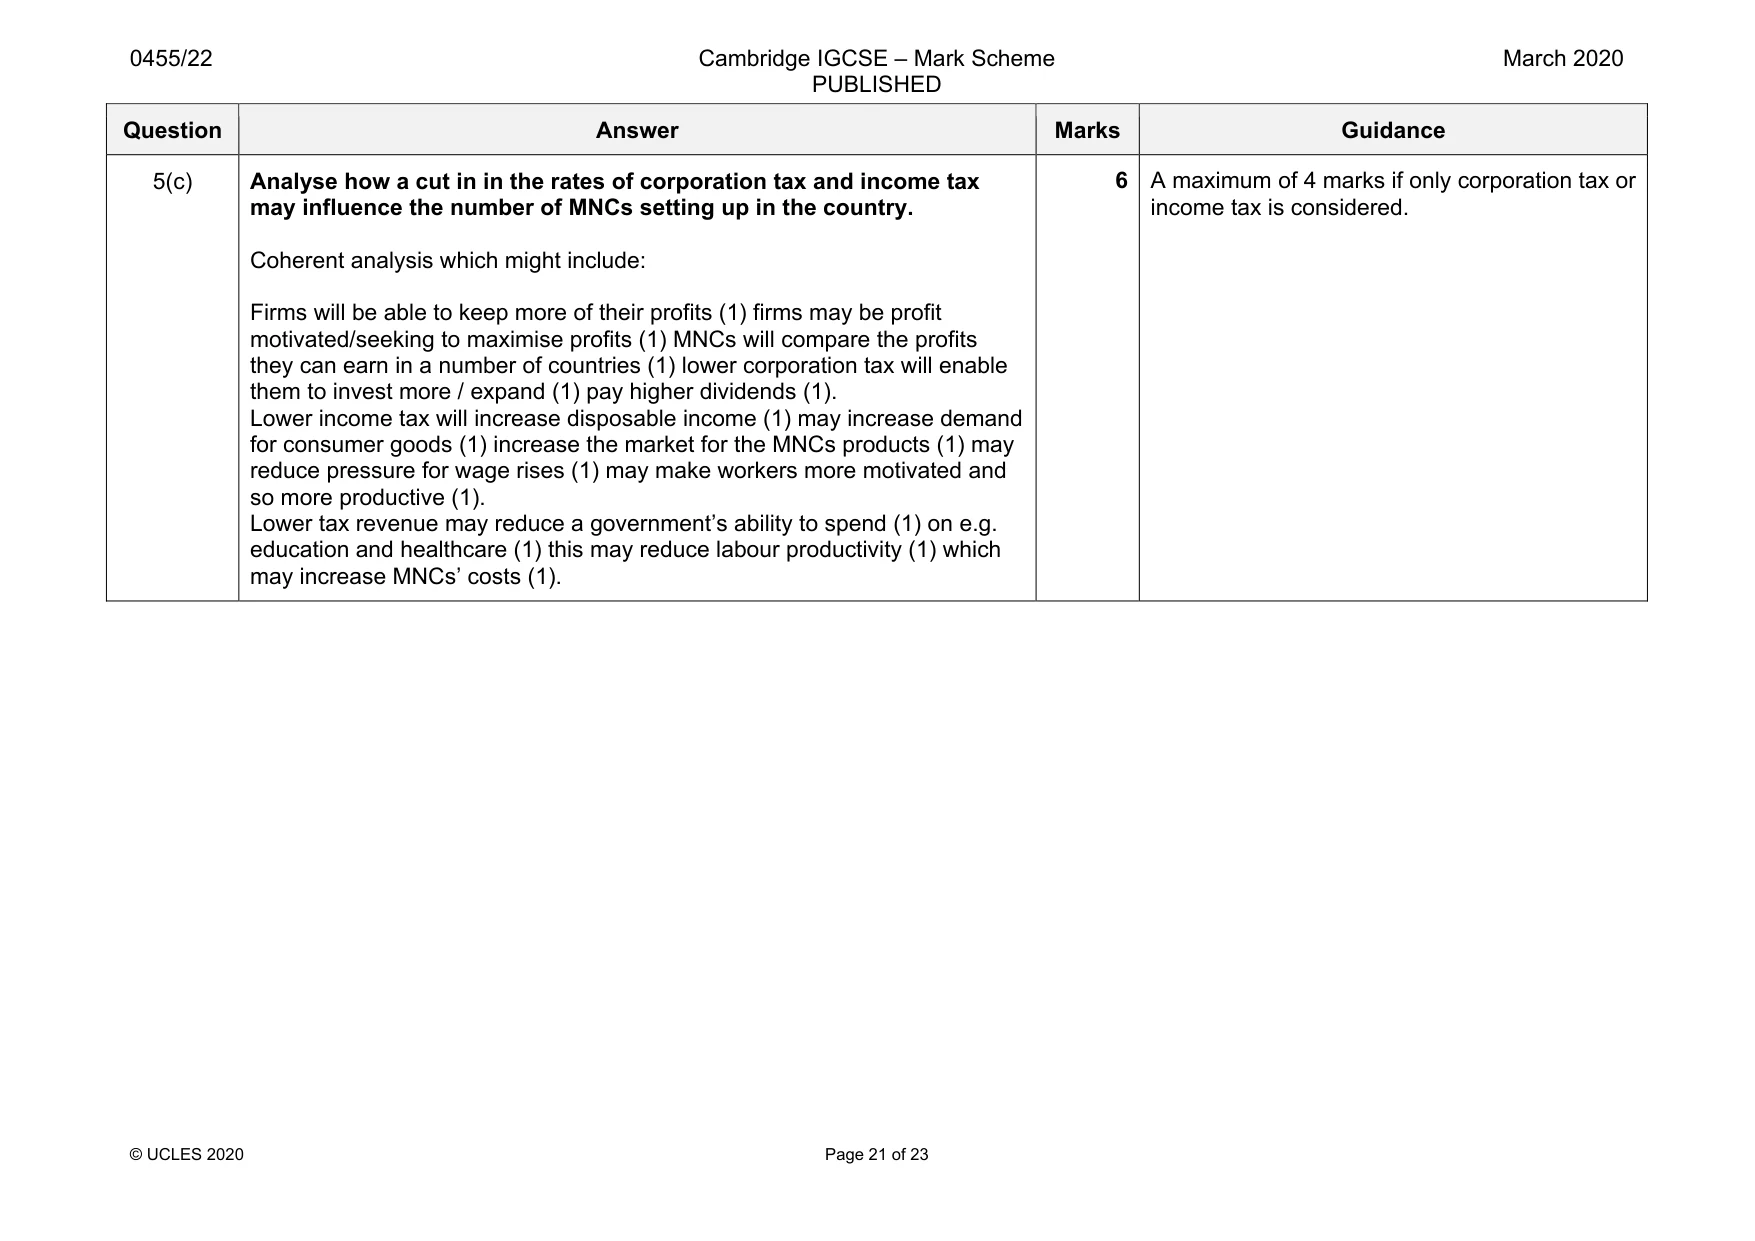
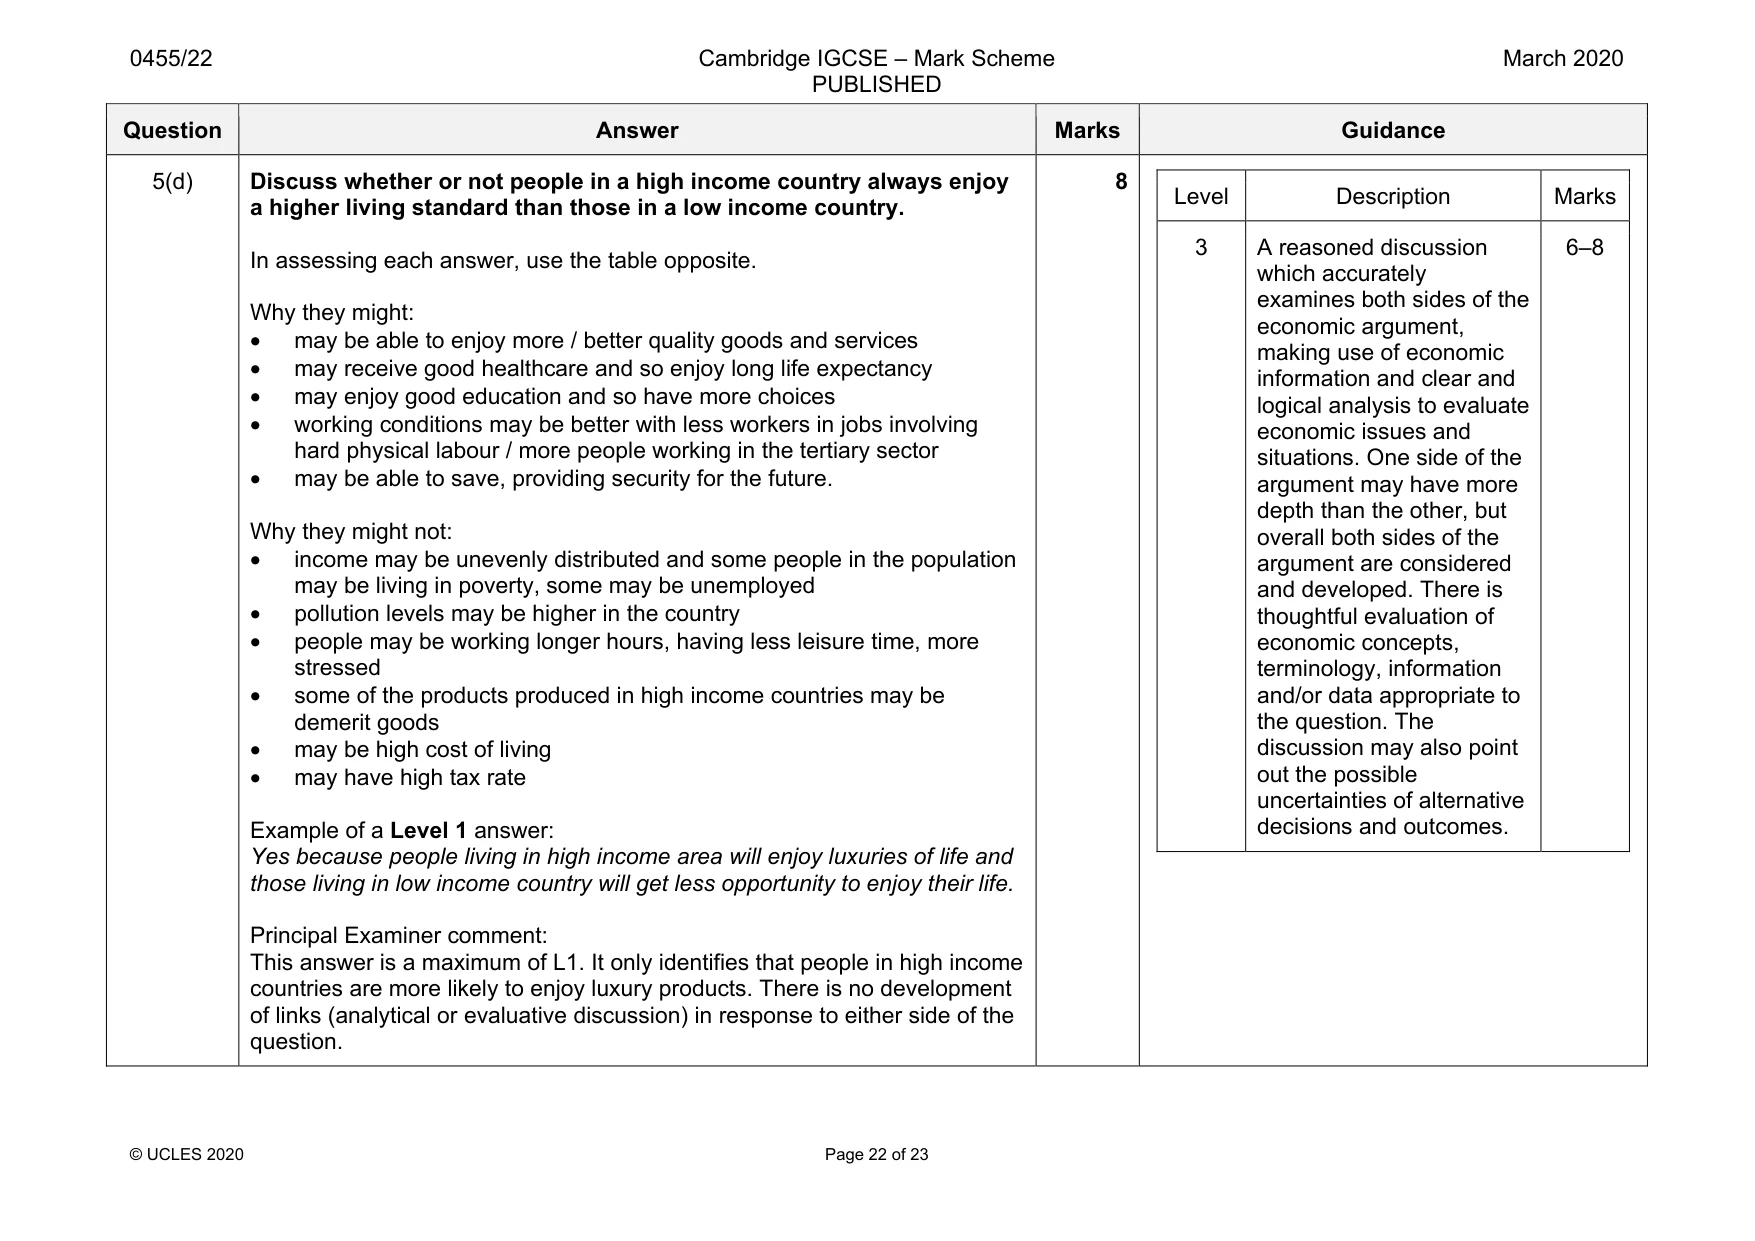
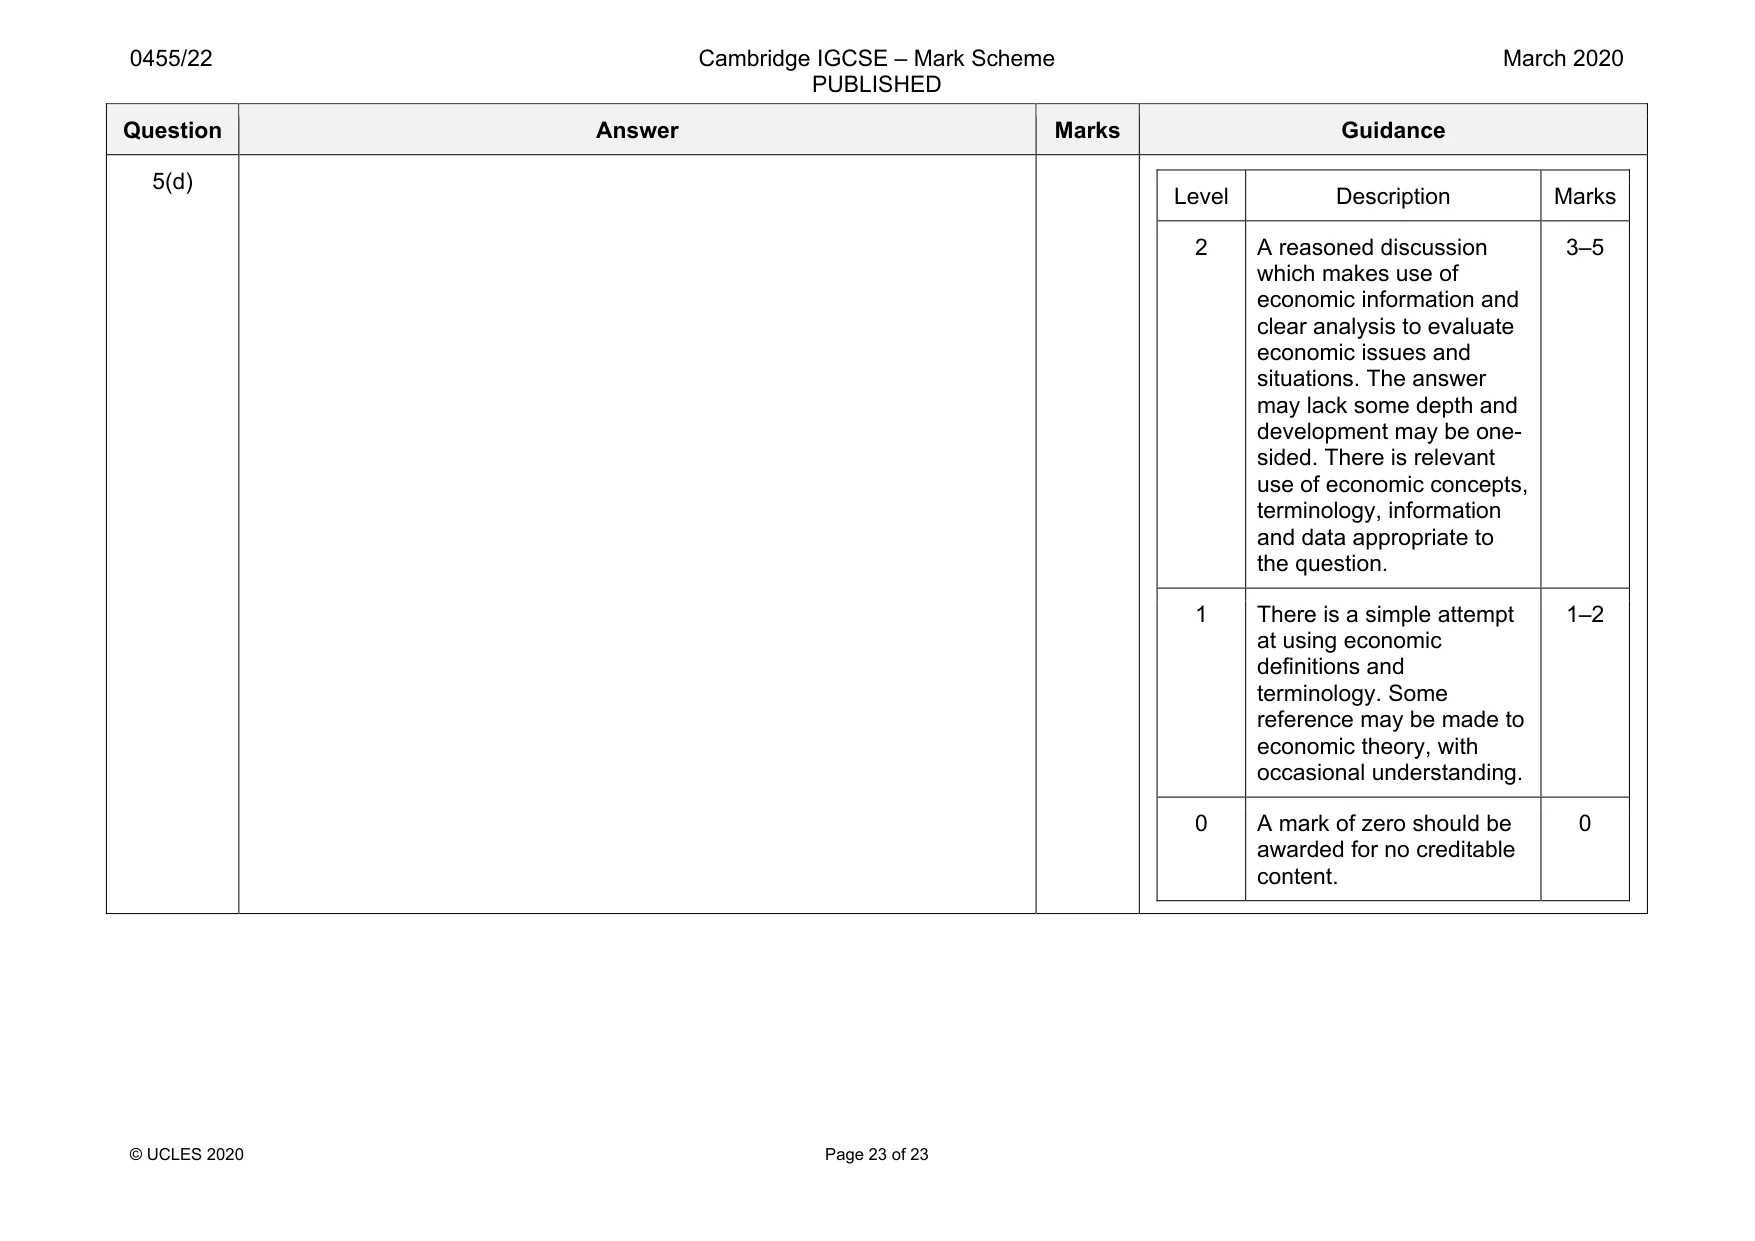
Mark scheme: 5(a) State two reasons for levying taxes. One mark each for any two from: • raise revenue • redistribute income • discourage consumption of demerit goods • reduce imports • reduce / influence total demand / influence economic activity / reduce inflation. 2 5(b) Explain the difference between a progressive tax and a regressive tax. Logical explanation which might include: A progressive tax takes a larger proportion (1) of the income of the rich / of income as it rises (1) falls more heavily on the rich (1) make income more evenly distributed (1) direct taxes are often progressive (1) example (1). A regressive tax takes a larger proportion (1) of the income of those on low income / falls as income rises (1) falls more heavily on those on low income (1) make income less evenly distributed (1) indirect taxes are often regressive (1) example (1). 4 One mark for each difference identified and one mark for each explanation. Maximum of 2 marks for progressive tax and maximum of 2 marks for regressive tax. Question Answer Marks Guidance 5(c) Analyse how a cut in in the rates of corporation tax and income tax may influence the number of MNCs setting up in the country. Coherent analysis which might include: Firms will be able to keep more of their profits (1) firms may be profit motivated/seeking to maximise profits (1) MNCs will compare the profits they can earn in a number of countries (1) lower corporation tax will enable them to invest more / expand (1) pay higher dividends (1). Lower income tax will increase disposable income (1) may increase demand for consumer goods (1) increase the market for the MNCs products (1) may reduce pressure for wage rises (1) may make workers more motivated and so more productive (1). Lower tax revenue may reduce a government’s ability to spend (1) on e.g. education and healthcare (1) this may reduce labour productivity (1) which may increase MNCs’ costs (1). 6 A maximum of 4 marks if only corporation tax or income tax is considered. Question Answer Marks Guidance 5(d) Discuss whether or not people in a high income country always enjoy a higher living standard than those in a low income country. In assessing each answer, use the table opposite. Why they might: • may be able to enjoy more / better quality goods and services • may receive good healthcare and so enjoy long life expectancy • may enjoy good education and so have more choices • working conditions may be better with less workers in jobs involving hard physical labour / more people working in the tertiary sector • may be able to save, providing security for the future. Why they might not: • income may be unevenly distributed and some people in the population may be living in poverty, some may be unemployed • pollution levels may be higher in the country • people may be working longer hours, having less leisure time, more stressed • some of the products produced in high income countries may be demerit goods • may be high cost of living • may have high tax rate Example of a Level 1 answer: Yes because people living in high income area will enjoy luxuries of life and those living in low income country will get less opportunity to enjoy their life. Principal Examiner comment: This answer is a maximum of L1. It only identifies that people in high income countries are more likely to enjoy luxury products. There is no development of links (analytical or evaluative discussion) in response to either side of the question. 8 Level Description Marks 3 A reasoned discussion which accurately examines both sides of the economic argument, making use of economic information and clear and logical analysis to evaluate economic issues and situations. One side of the argument may have more depth than the other, but overall both sides of the argument are considered and developed. There is thoughtful evaluation of economic concepts, terminology, information and/or data appropriate to the question. The discussion may also point out the possible uncertainties of alternative decisions and outcomes. 6–8 Question Answer Marks Guidance 5(d) Level Description Marks 2 A reasoned discussion which makes use of economic information and clear analysis to evaluate economic issues and situations. The answer may lack some depth and development may be one- sided. There is relevant use of economic concepts, terminology, information and data appropriate to the question. 3–5 1 There is a simple attempt at using economic definitions and terminology. Some reference may be made to economic theory, with occasional understanding. 1–2 0 A mark of zero should be awarded for no creditable content. 0
What was in this paper
The subtopics covered by these 5 questions, and how many questions each got. Open one in a new tab to see every Cambridge question on it.
What you needed in this session
Cambridge’s own grade thresholds for 2020 Feb/March, Paper 2 · Variant 2. A higher threshold means an easier paper — the bar moves with how the cohort did.