Questions as text
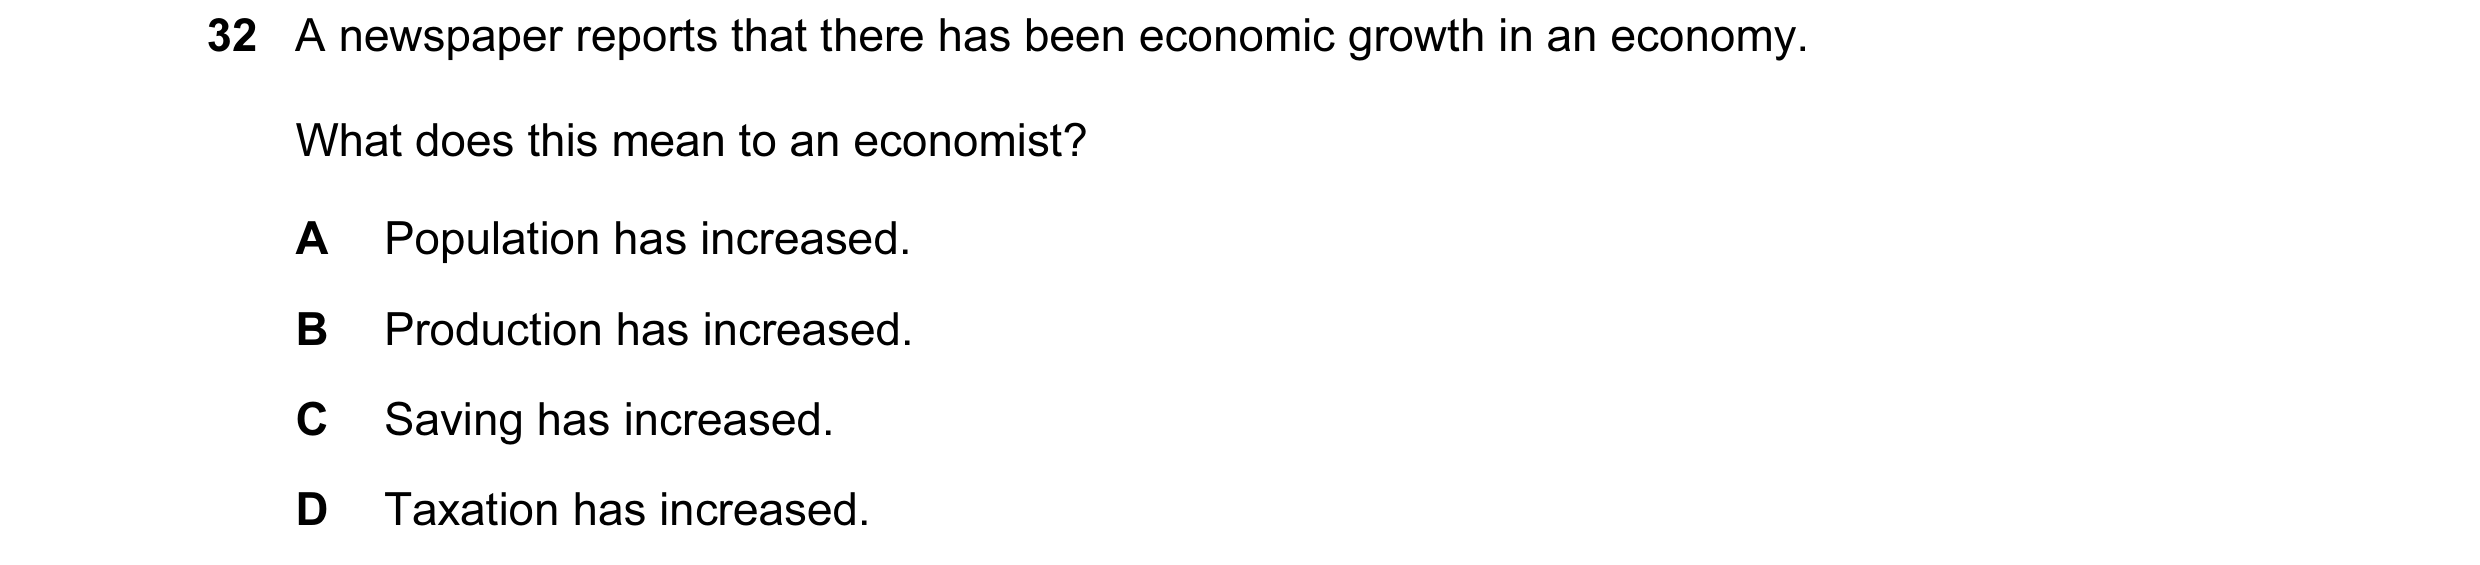
Q1 · A newspaper reports that there has been economic growth in an economy 0455/11 Oct/Nov 2004
32 A newspaper reports that there has been economic growth in an economy. What does this mean to an economist? A Population has increased. B Production has increased. C Saving has increased. D Taxation has increased.
1 marks
Answer: B
This question in 0455/11 Oct/Nov 2004
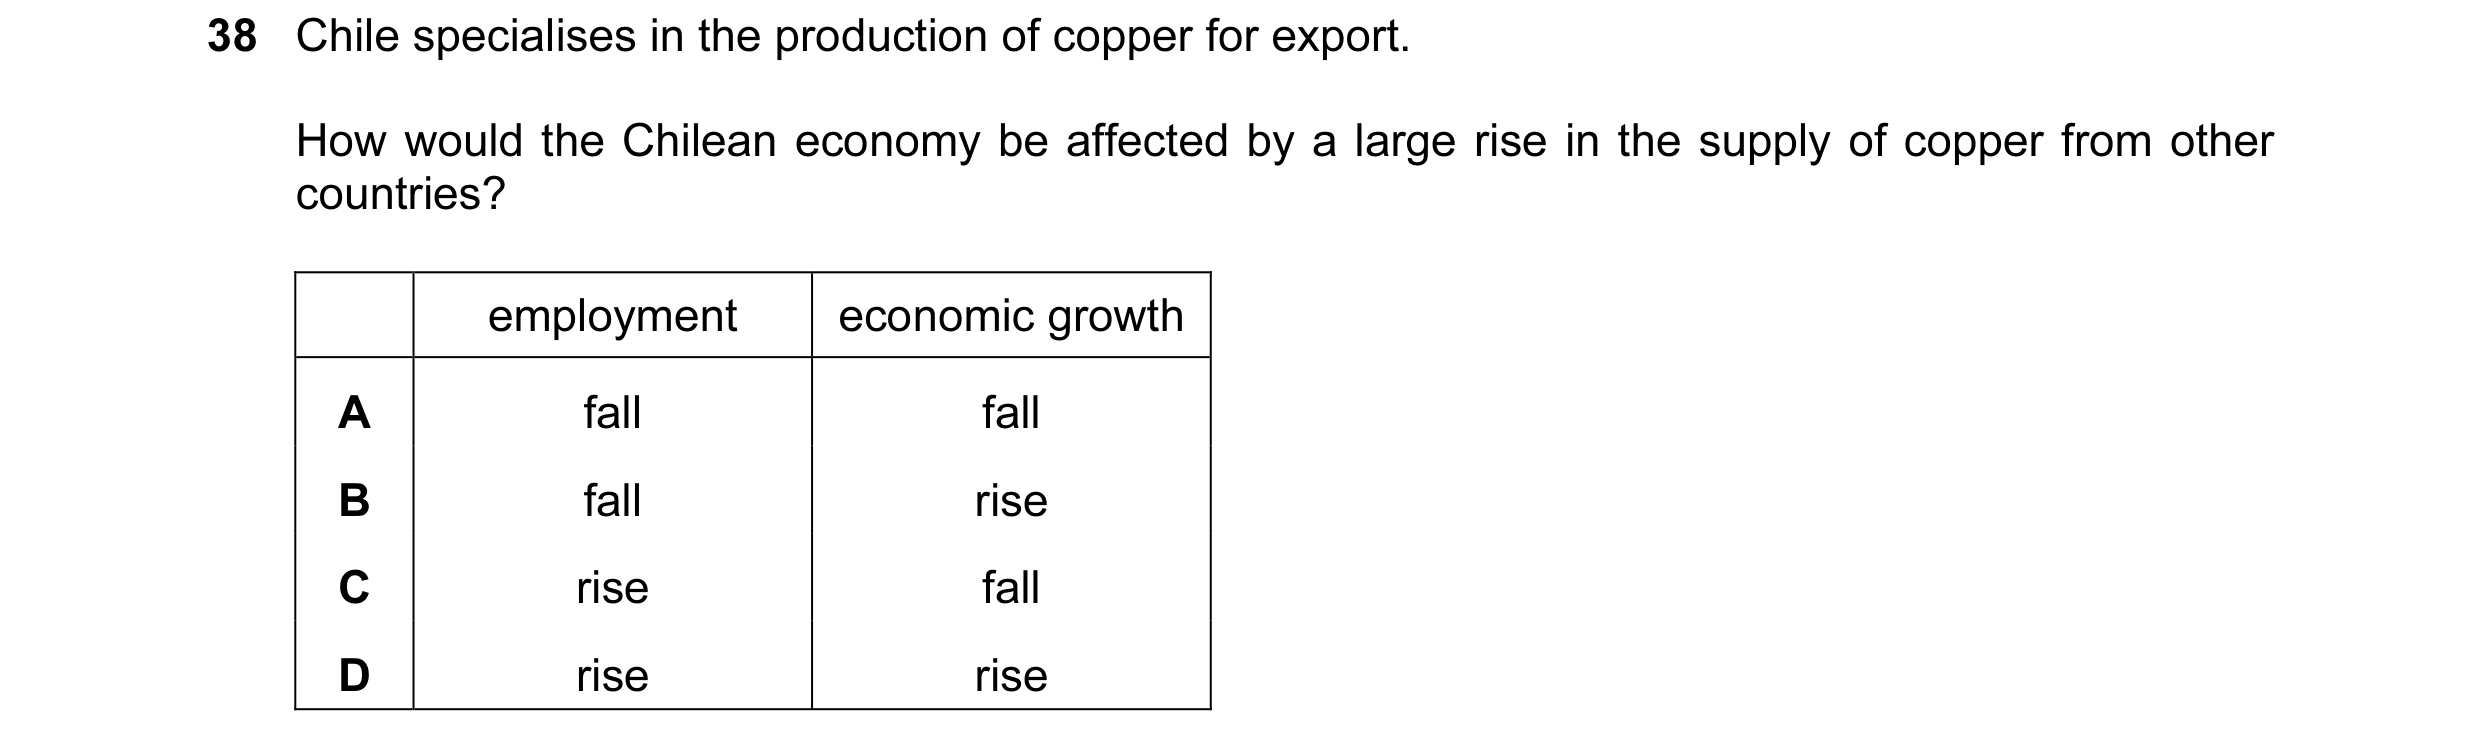
Q2 · Chile specialises in the production of copper for export 0455/11 Oct/Nov 2004
38 Chile specialises in the production of copper for export. How would the Chilean economy be affected by a large rise in the supply of copper from other countries? employment economic growth A fall fall B fall rise C rise fall D rise rise
1 marks
Answer: A
This question in 0455/11 Oct/Nov 2004
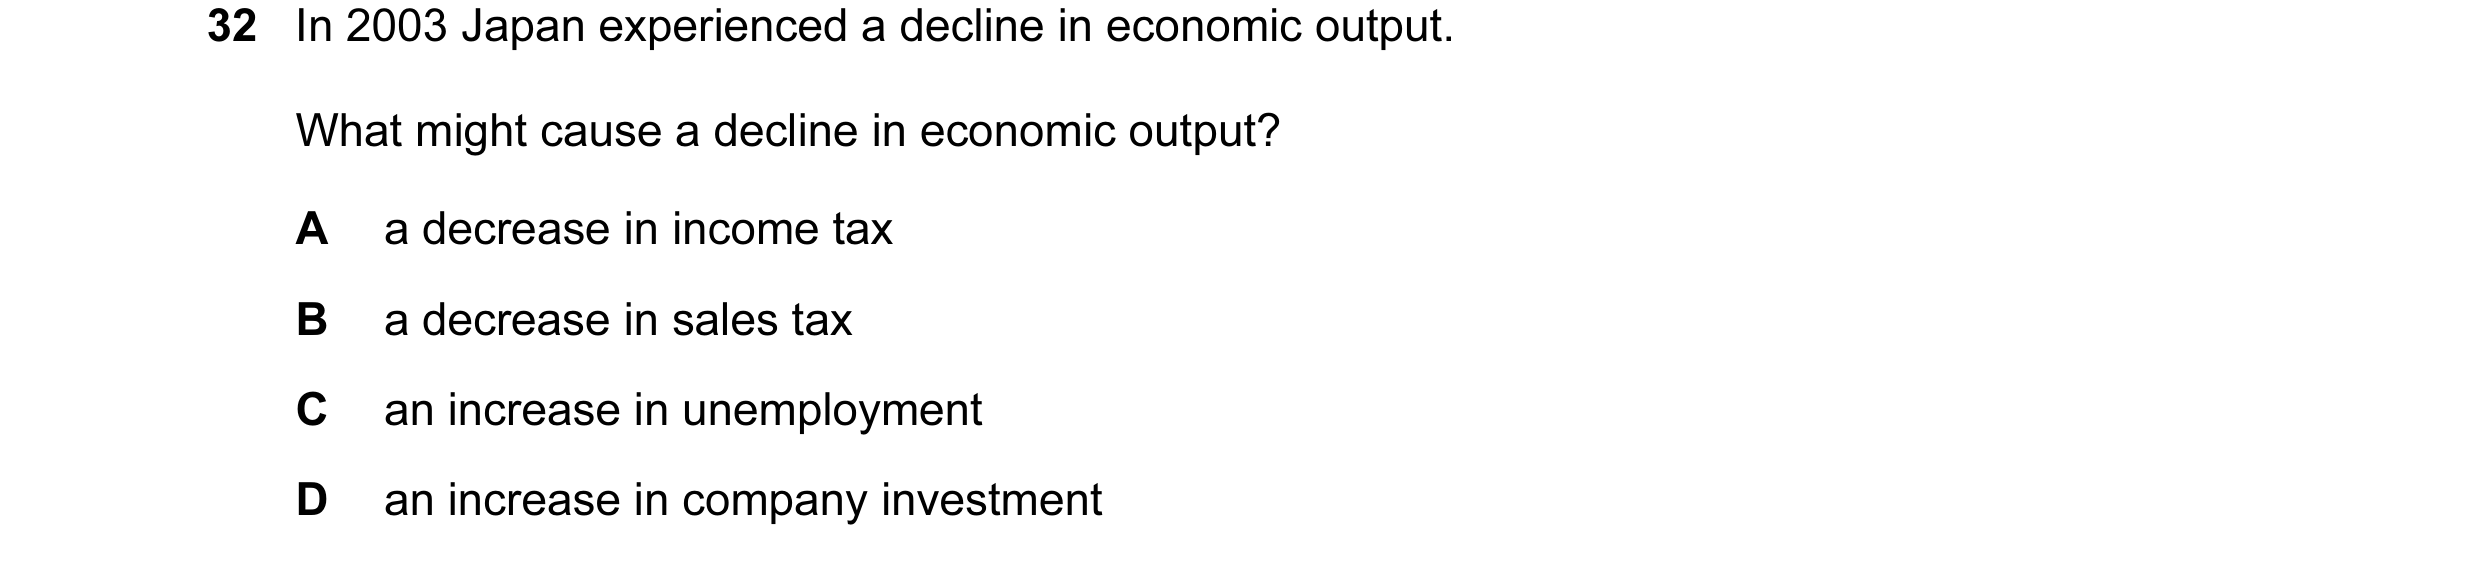
Q3 · In 2003 Japan experienced a decline in economic output 0455/11 May/June 2006
32 In 2003 Japan experienced a decline in economic output. What might cause a decline in economic output? A a decrease in income tax B a decrease in sales tax C an increase in unemployment D an increase in company investment
1 marks
Answer: C
This question in 0455/11 May/June 2006
Q4 · What is a long-term advantage of economic growth? 0455/11 Oct/Nov 2006
24 What is a long-term advantage of economic growth? A Employment falls. B Incomes rise. C Prices rise. D Savings fall.
1 marks
Answer: B
This question in 0455/11 Oct/Nov 2006
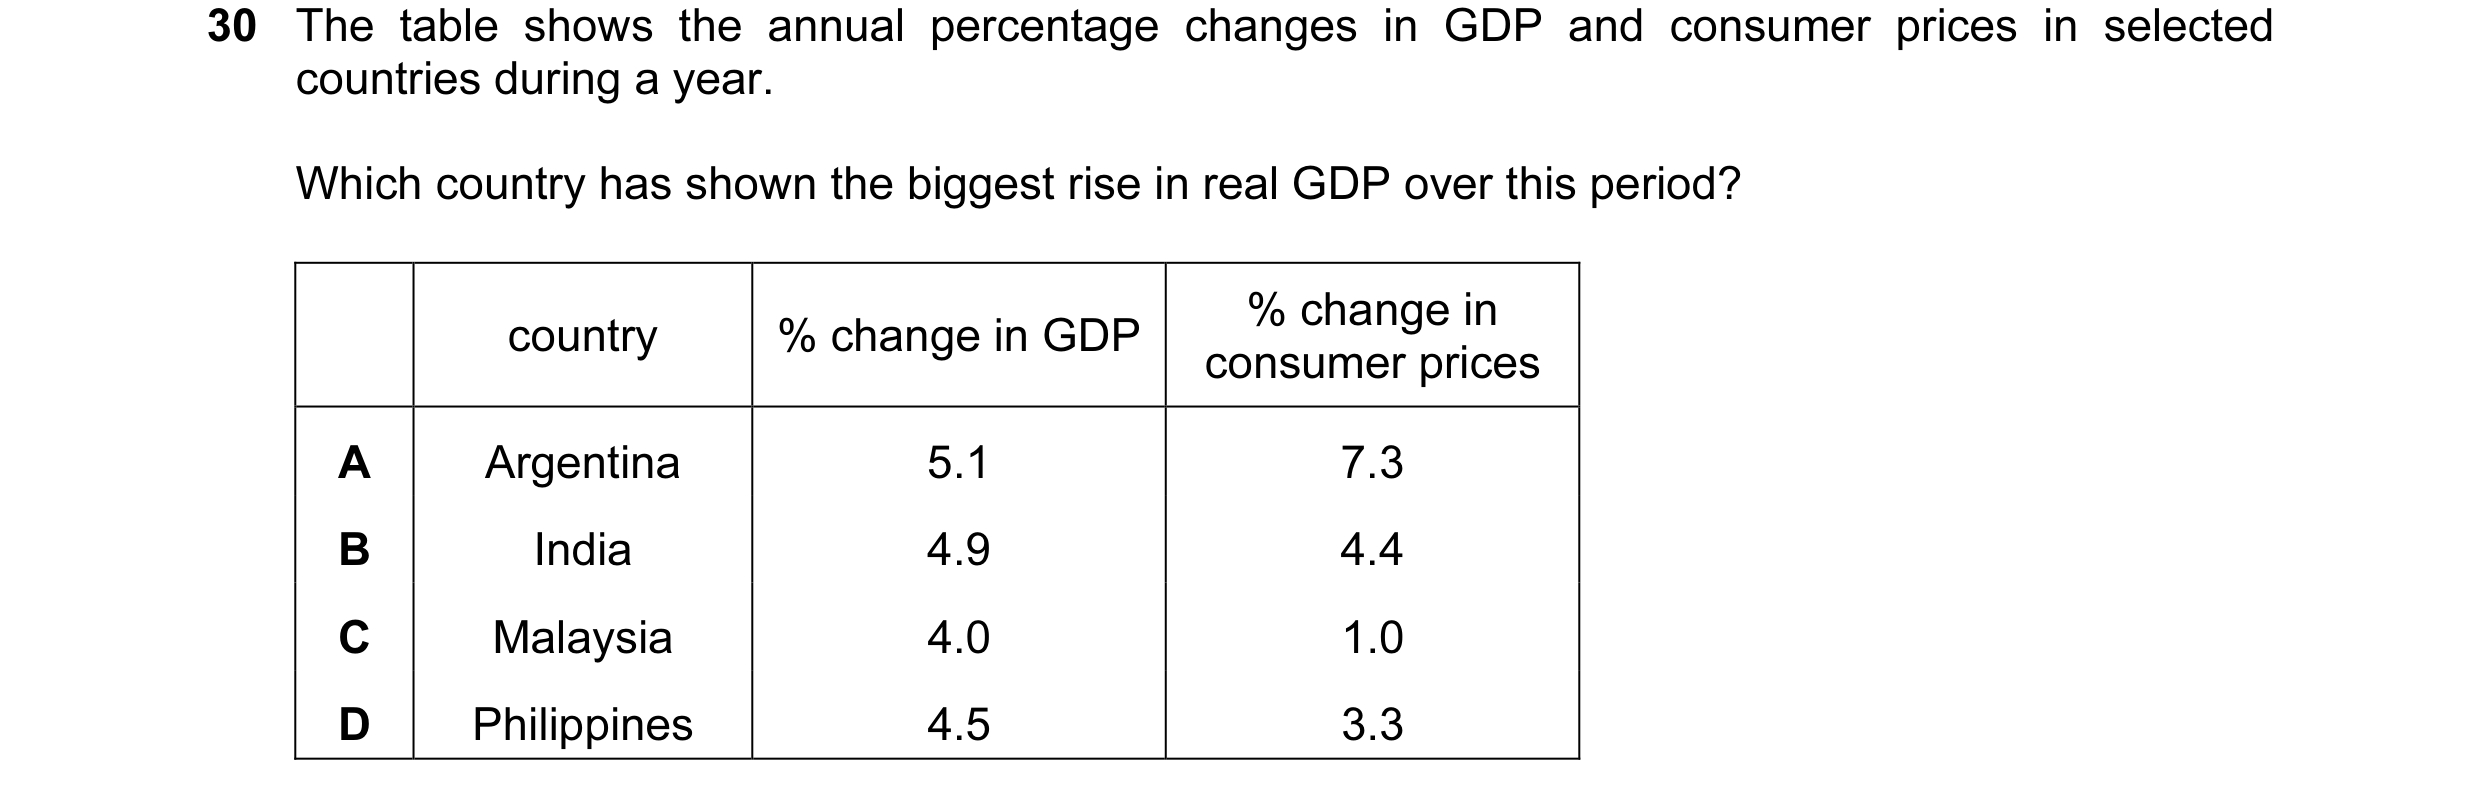
Q5 · The table shows the annual percentage changes in GDP and consumer prices in selected… 0455/11 May/June 2007
30 The table shows the annual percentage changes in GDP and consumer prices in selected countries during a year. Which country has shown the biggest rise in real GDP over this period? % change in country % change in GDP consumer prices A Argentina 5.1 7.3 B India 4.9 4.4 C Malaysia 4.0 1.0 D Philippines 4.5 3.3
1 marks
Answer: C
This question in 0455/11 May/June 2007
Q6 · The graph shows the annual percentage changes in Mexico’s GDP between 1994 and 1999 0455/11 Oct/Nov 2007
29 The graph shows the annual percentage changes in Mexico’s GDP between 1994 and 1999. 10 5 annual % 0 change 1994 1995 1996 1997 1998 1999 in GDP year –5 –10 Which conclusion may be drawn from the graph? A GDP fell between 1998 and 1999. B GDP rose between 1997 and 1998. C GDP was highest in 1997. D Prices fell in 1995.
1 marks
Answer: B
This question in 0455/11 Oct/Nov 2007
Q7 · What might a government increase if it wished to raise the growth rate of an economy? 0455/11 May/June 2008
27 What might a government increase if it wished to raise the growth rate of an economy? A expenditure on road building B goods and services tax (value added tax) C the rate of income tax D the rate of interest
1 marks
Answer: A
This question in 0455/11 May/June 2008
Q8 · What is likely to be an advantage of economic growth? 0455/11 May/June 2008
29 What is likely to be an advantage of economic growth? A The country’s resources will be depleted. B The price level will increase. C The rate of employment will fall. D The standard of living will increase.
1 marks
Answer: D
This question in 0455/11 May/June 2008
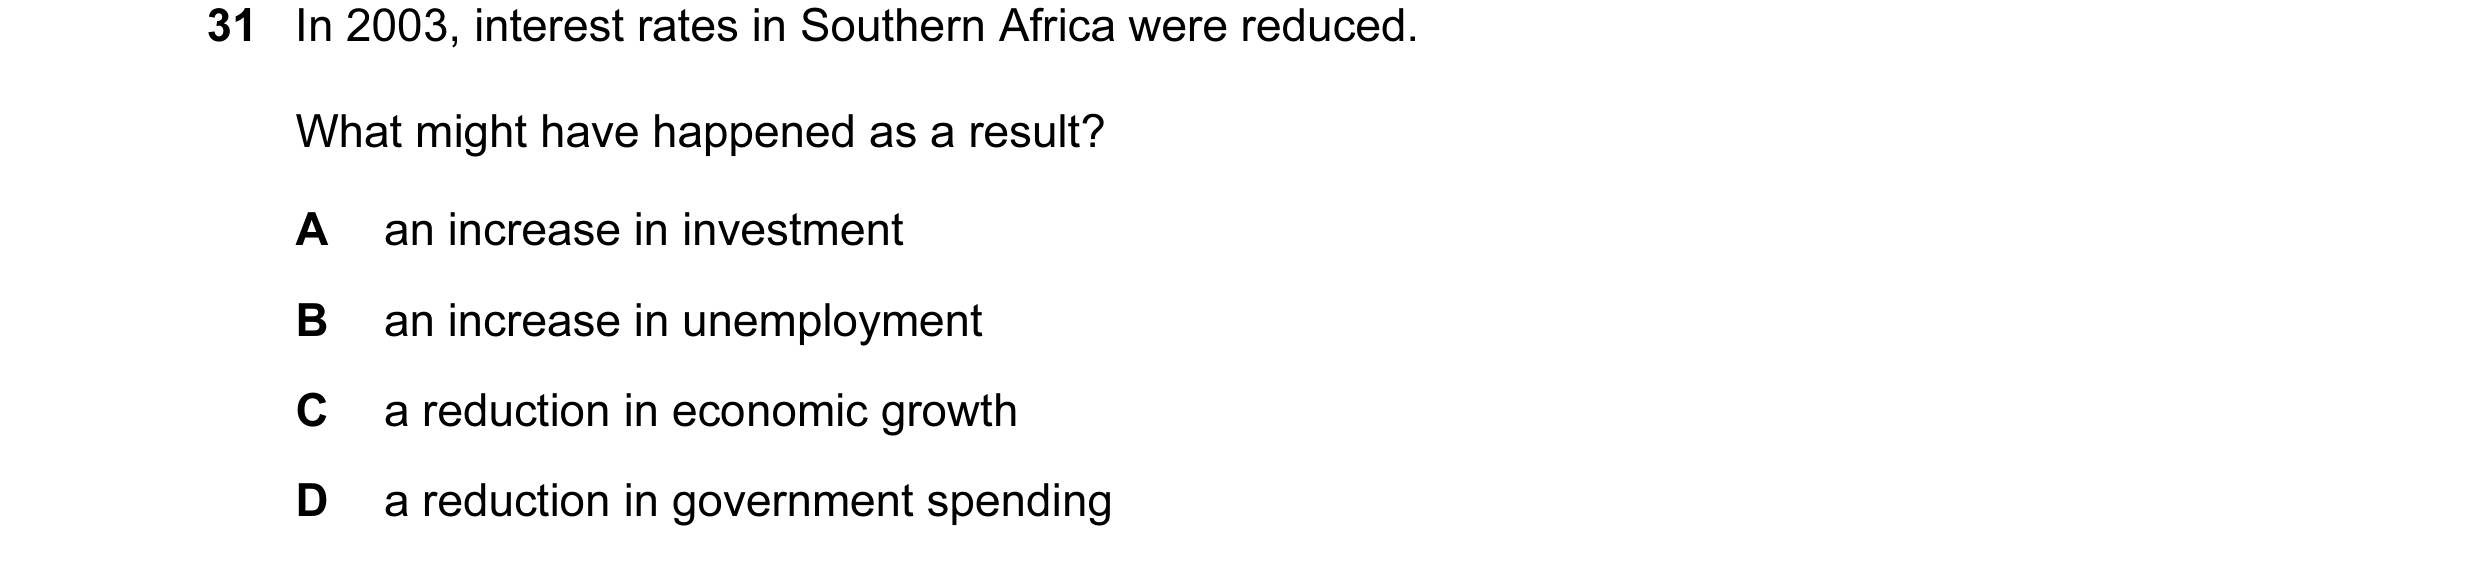
Q9 · In 2003, interest rates in Southern Africa were reduced 0455/11 May/June 2008
31 In 2003, interest rates in Southern Africa were reduced. What might have happened as a result? A an increase in investment B an increase in unemployment C a reduction in economic growth D a reduction in government spending
1 marks
Answer: A
This question in 0455/11 May/June 2008
Q10 · The table gives information on Gross Domestic Product (GDP) growth rates, inflation and… 0455/11 May/June 2008
32 The table gives information on Gross Domestic Product (GDP) growth rates, inflation and the unemployment rates for a number of countries in 2006. country GDP growth inflation unemployment % % rate % Brazil 3.5 4.0 10.4 China 11.3 1.5 4.2 France 1.5 1.9 9.0 India 9.3 7.9 7.3 UK 2.6 2.5 3.0 What can be concluded from the table about 2006? A Any particular product would cost most in India. B Economic growth was highest when unemployment was lowest. C Low inflation always causes low unemployment. D On average, the Chinese people were likely to have had an increase in real income.
1 marks
Answer: D
This question in 0455/11 May/June 2008
Q11 · What is most likely to improve the economic performance of a country in the long run? 0455/11 Oct/Nov 2008
26 What is most likely to improve the economic performance of a country in the long run? A a decrease in investment B a decrease in the school-leaving age C an increase in government spending on education D an increase in the rate of interest
1 marks
Answer: C
This question in 0455/11 Oct/Nov 2008
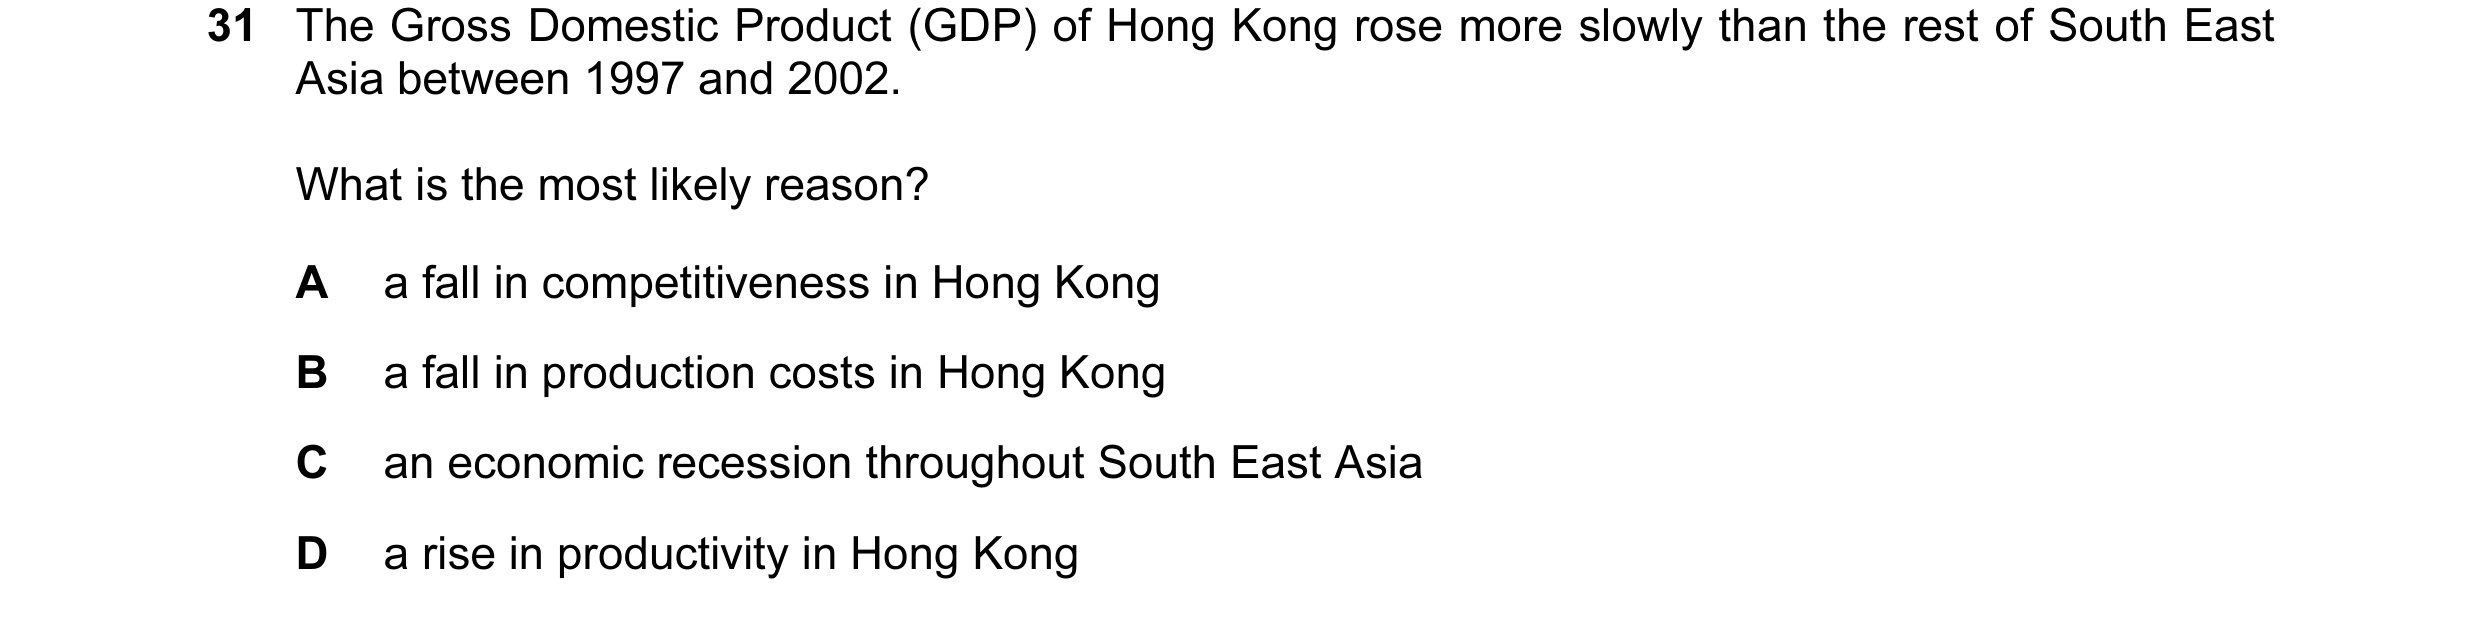
Q12 · The Gross Domestic Product (GDP) of Hong Kong rose more slowly than the rest of South… 0455/11 Oct/Nov 2008
31 The Gross Domestic Product (GDP) of Hong Kong rose more slowly than the rest of South East Asia between 1997 and 2002. What is the most likely reason? A a fall in competitiveness in Hong Kong B a fall in production costs in Hong Kong C an economic recession throughout South East Asia D a rise in productivity in Hong Kong
1 marks
Answer: A
This question in 0455/11 Oct/Nov 2008
Q13 · What is likely to increase with economic growth? 0455/11 May/June 2009
18 What is likely to increase with economic growth? A cyclical unemployment B income per head C the budget deficit D the conservation of natural resources
1 marks
Answer: B
This question in 0455/11 May/June 2009
Q14 · What might cause a decline in economic output? 0455/11 May/June 2009
23 What might cause a decline in economic output? A a decrease in income tax B a decrease in sales tax C an increase in company investment D an increase in unemployment
1 marks
Answer: D
This question in 0455/11 May/June 2009
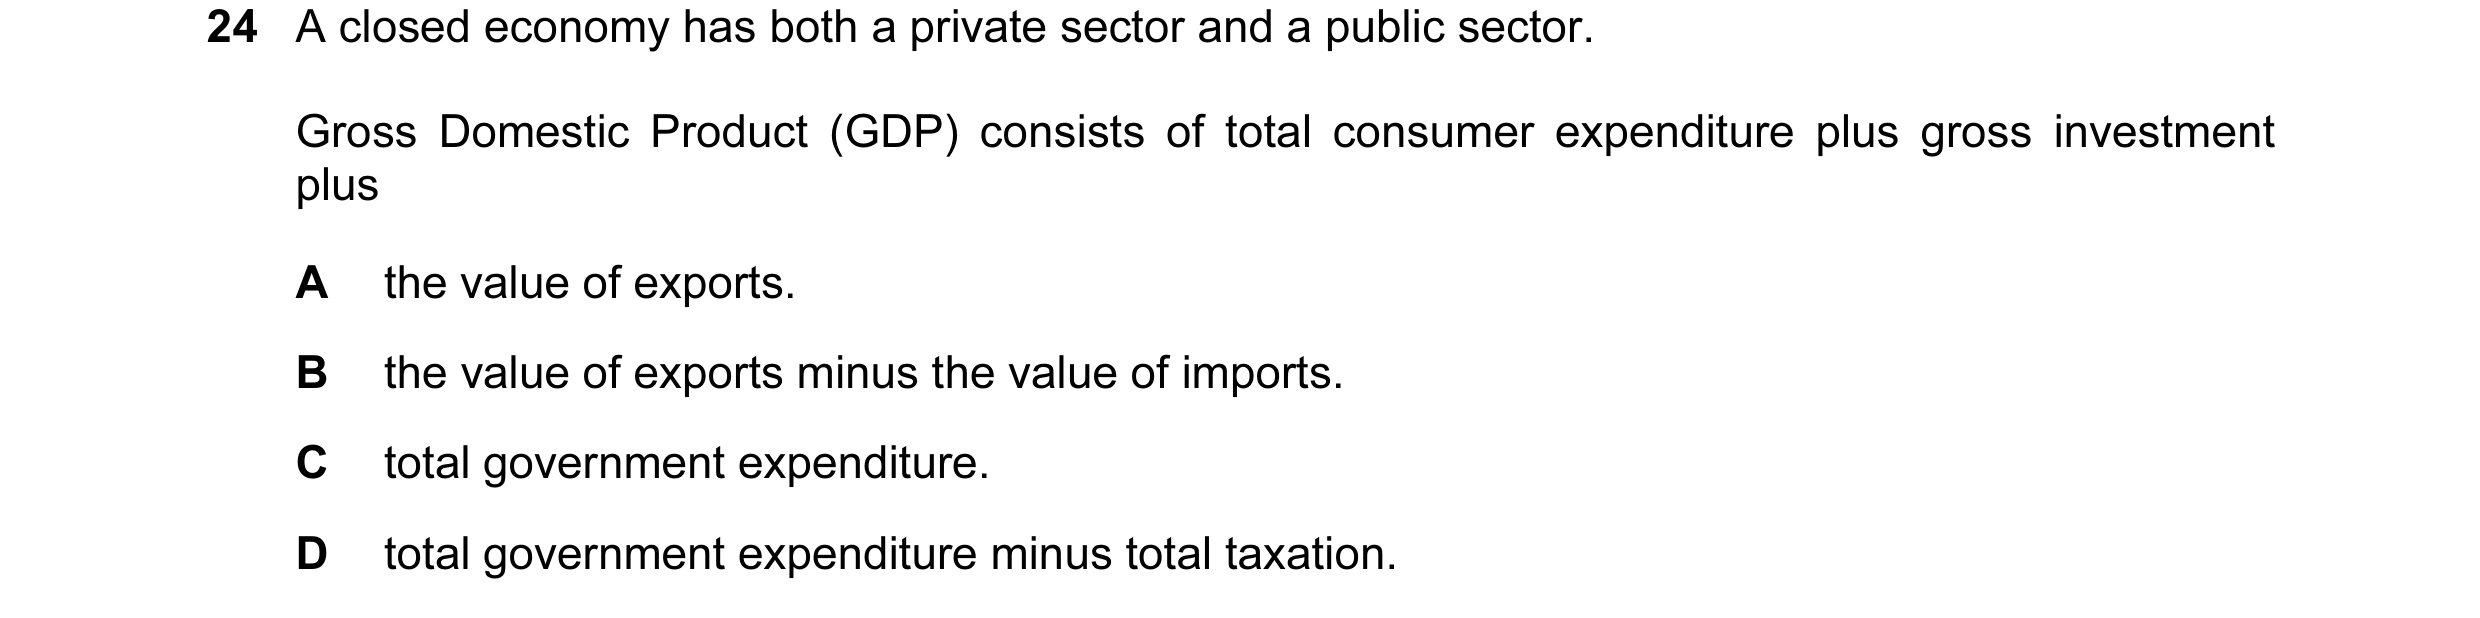
Q15 · A closed economy has both a private sector and a public sector 0455/11 May/June 2009
24 A closed economy has both a private sector and a public sector. Gross Domestic Product (GDP) consists of total consumer expenditure plus gross investment plus A the value of exports. B the value of exports minus the value of imports. C total government expenditure. D total government expenditure minus total taxation.
1 marks
Answer: C
This question in 0455/11 May/June 2009
Q16 · Economic growth can be defined as A an increase in a country’s exports 0455/11 Oct/Nov 2009
18 Economic growth can be defined as A an increase in a country’s exports. B an increase in a country’s population. C an increase in the productive capacity of an economy. D a reduction in inflation.
1 marks
Answer: C
This question in 0455/11 Oct/Nov 2009
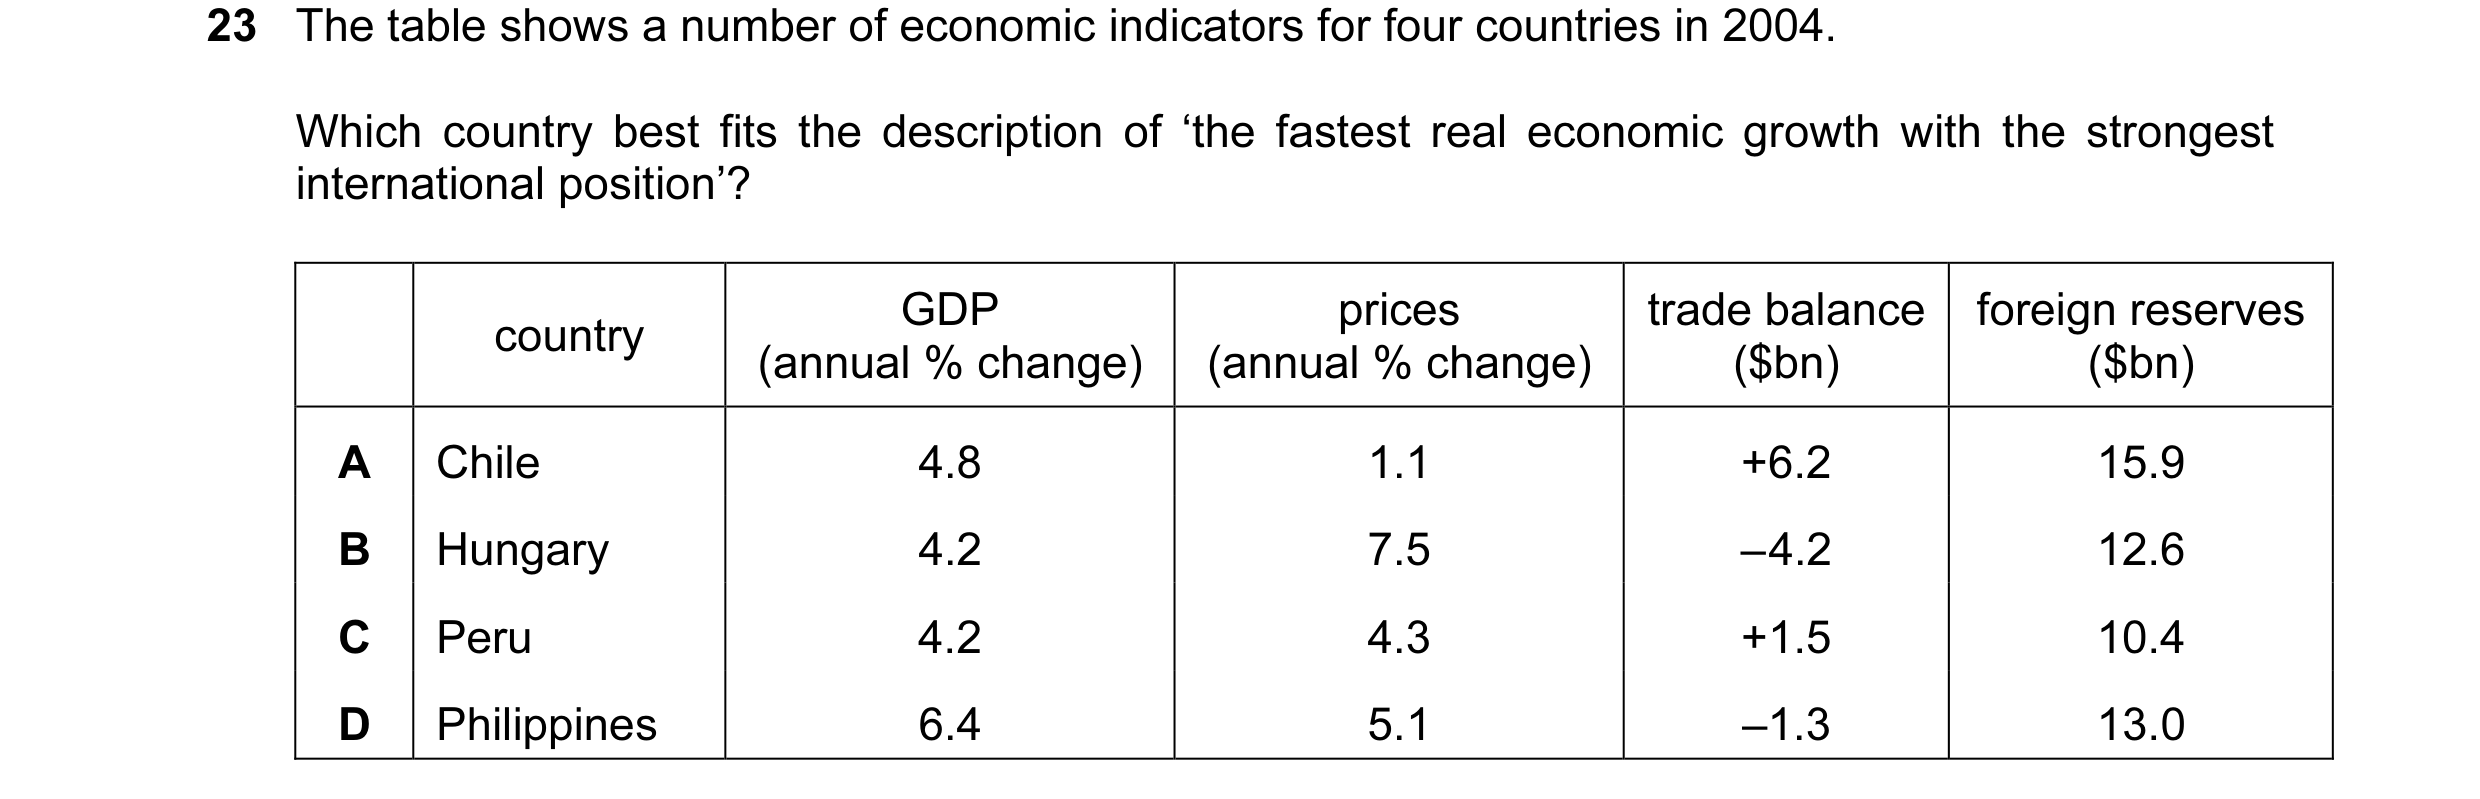
Q17 · The table shows a number of economic indicators for four countries in 2004 0455/11 Oct/Nov 2009
23 The table shows a number of economic indicators for four countries in 2004. Which country best fits the description of ‘the fastest real economic growth with the strongest international position’? GDP prices trade balance foreign reserves country (annual % change) (annual % change) ($bn) ($bn) A Chile 4.8 1.1 +6.2 15.9 B Hungary 4.2 7.5 – 4.2 12.6 C Peru 4.2 4.3 +1.5 10.4 D Philippines 6.4 5.1 –1.3 13.0
1 marks
Answer: A
This question in 0455/11 Oct/Nov 2009
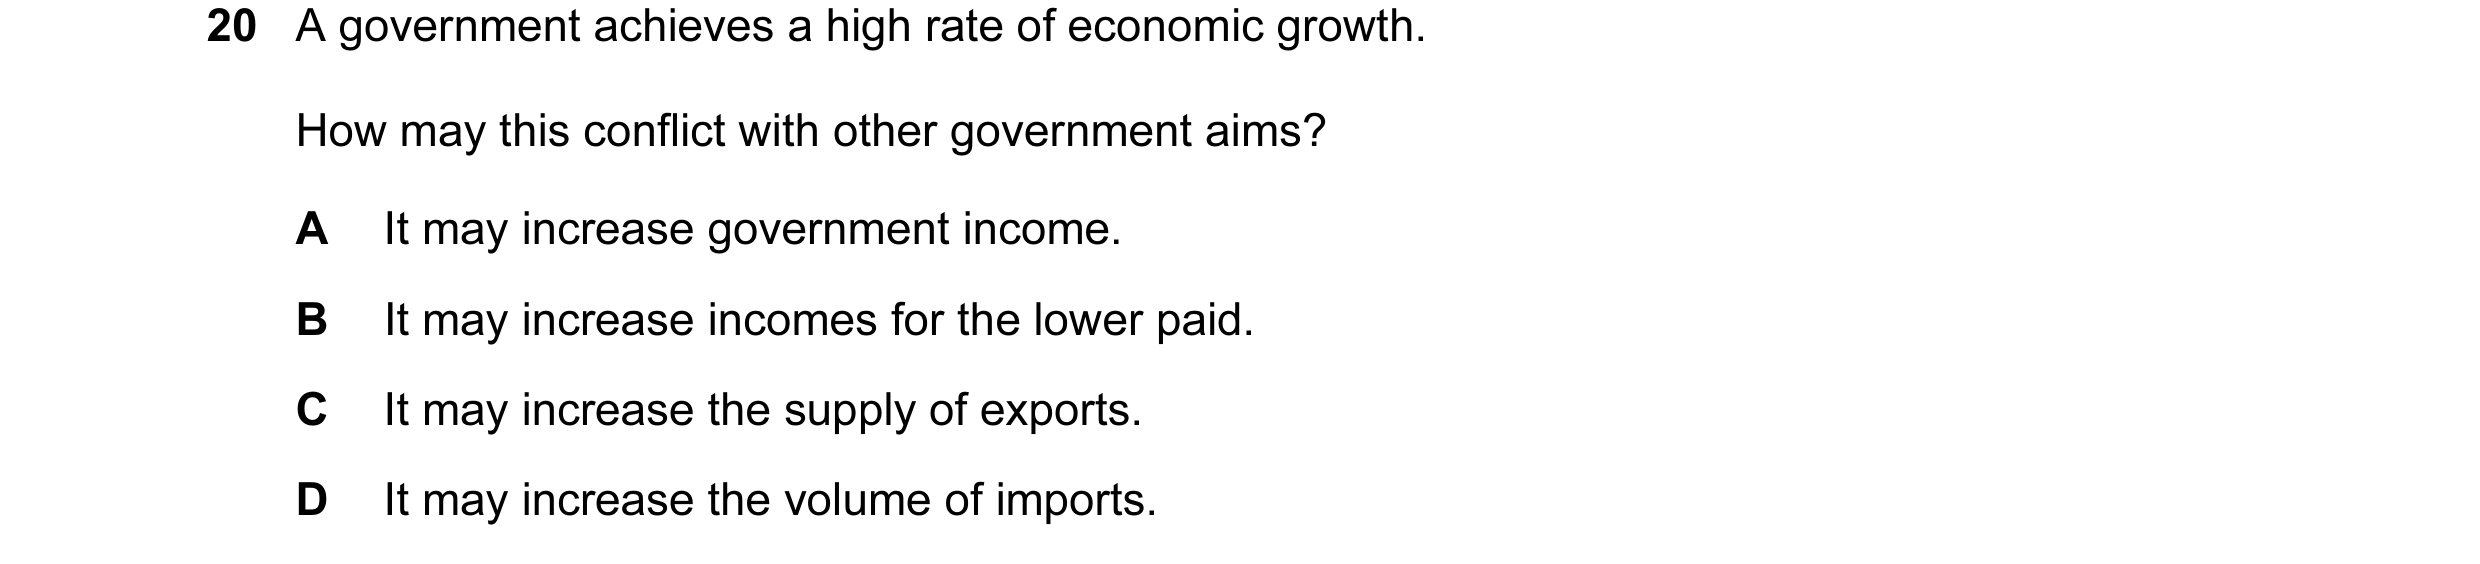
Q18 · A government achieves a high rate of economic growth 0455/11 May/June 2010
20 A government achieves a high rate of economic growth. How may this conflict with other government aims? A It may increase government income. B It may increase incomes for the lower paid. C It may increase the supply of exports. D It may increase the volume of imports.
1 marks
Answer: D
This question in 0455/11 May/June 2010
Q19 · Between 2002 and 2007, approximately 18 million Latin American households moved out of… 0455/11 May/June 2010
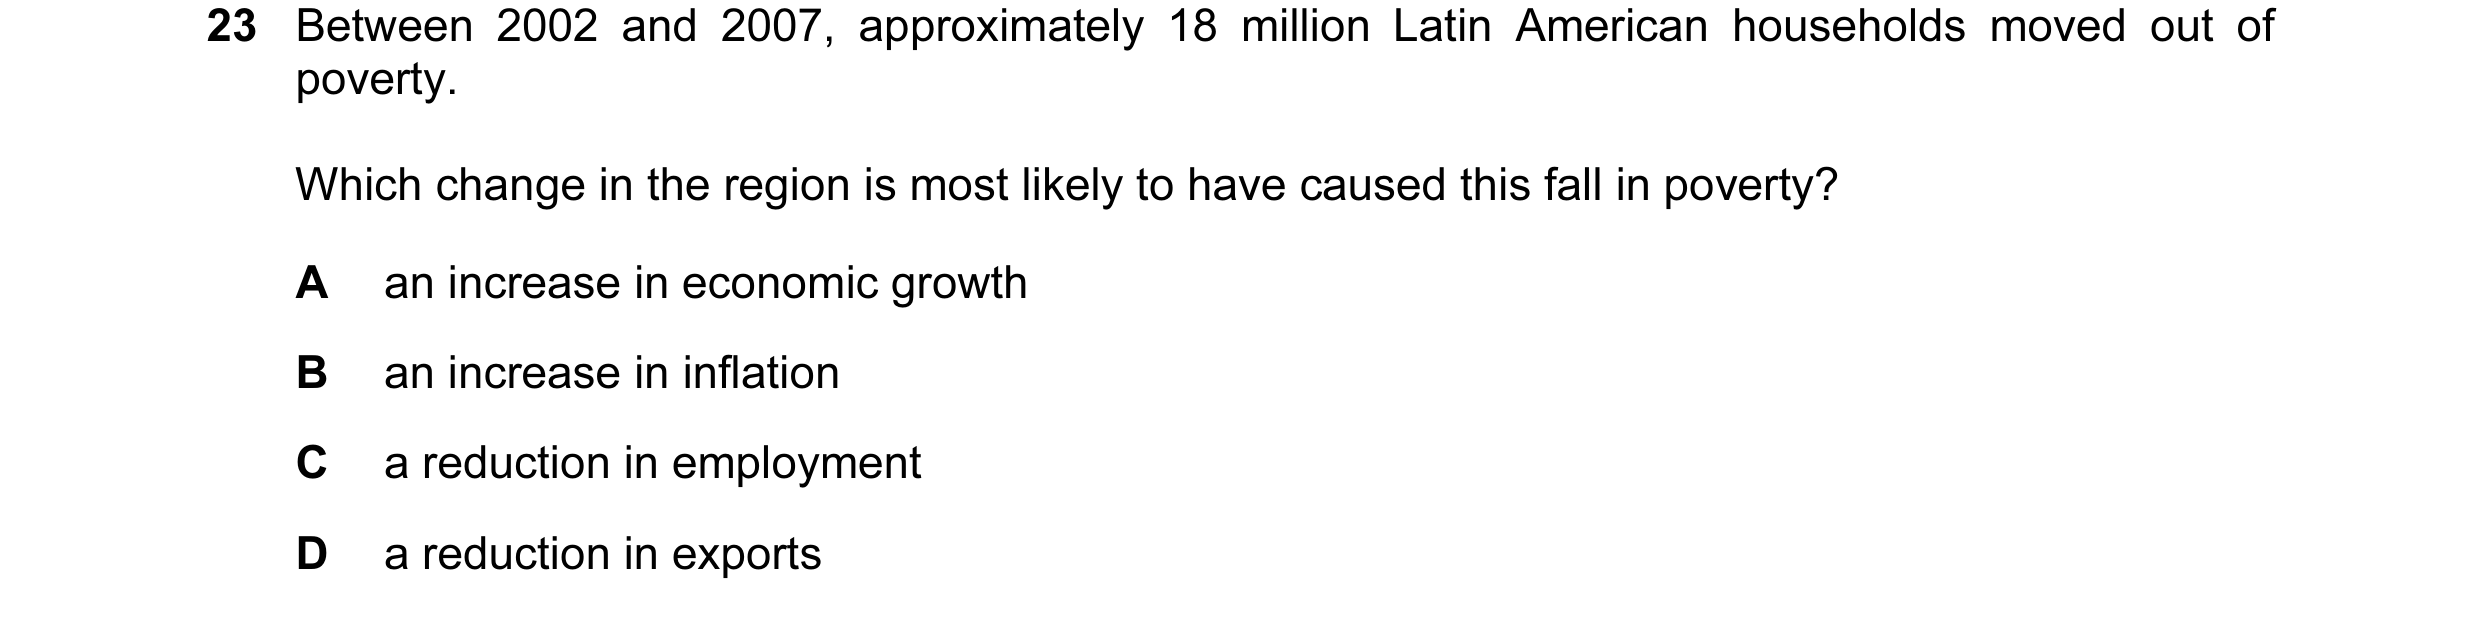
22 Between 2002 and 2007, approximately 18 million Latin American households moved out of poverty. Which change in the region is most likely to have caused this fall in poverty? A an increase in economic growth B an increase in inflation C a reduction in employment D a reduction in exports
1 marks
Answer: A
This question in 0455/11 May/June 2010
Q20 · Between 2002 and 2007, approximately 18 million Latin American households moved out of… 0455/12 May/June 2010
23 Between 2002 and 2007, approximately 18 million Latin American households moved out of poverty. Which change in the region is most likely to have caused this fall in poverty? A an increase in economic growth B an increase in inflation C a reduction in employment D a reduction in exports
1 marks
Answer: A
This question in 0455/12 May/June 2010
Q21 · During 2009 some governments adopted policies to try to end the recession in their… 0455/11 May/June 2011
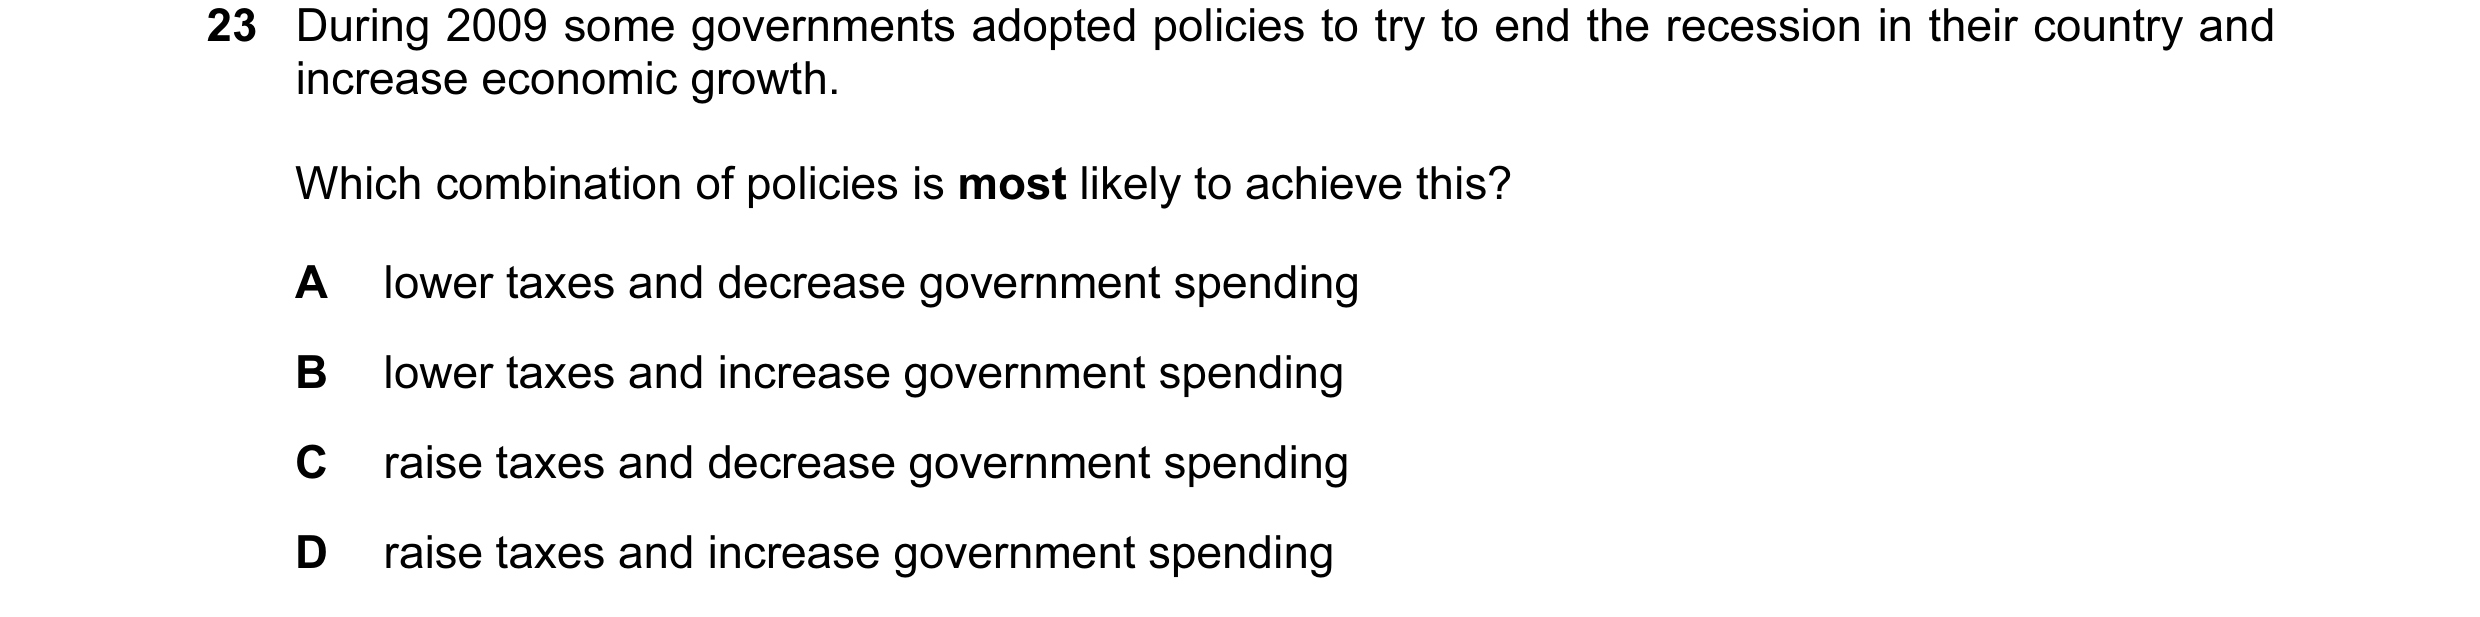
23 During 2009 some governments adopted policies to try to end the recession in their country and increase economic growth. Which combination of policies is most likely to achieve this? A lower taxes and decrease government spending B lower taxes and increase government spending C raise taxes and decrease government spending D raise taxes and increase government spending
1 marks
Answer: B
This question in 0455/11 May/June 2011
Q22 · The table shows the percentage change in employment over a period for a country with… 0455/12 May/June 2011
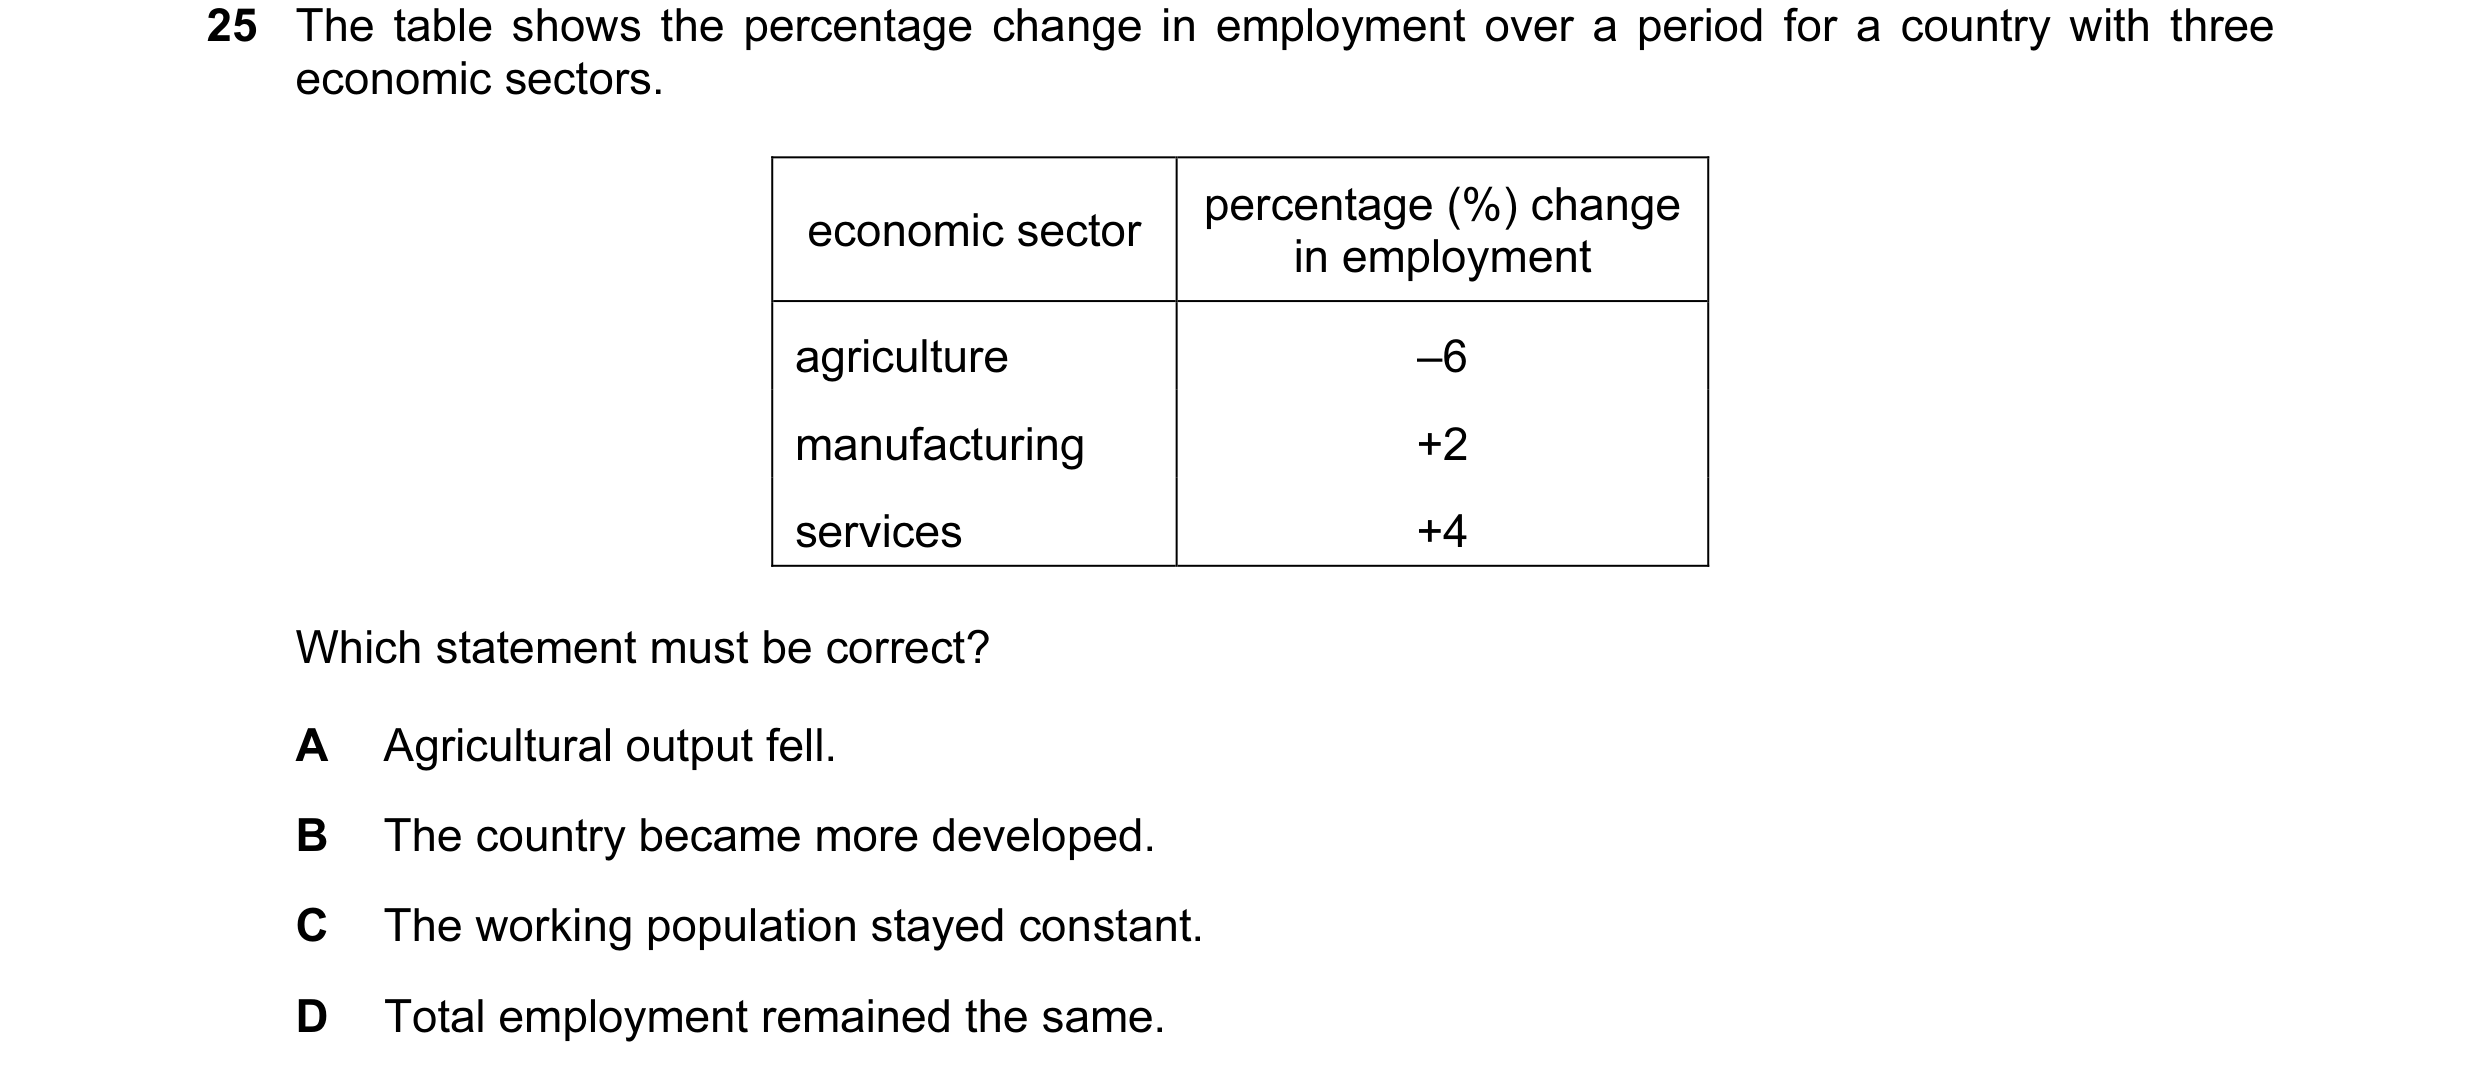
25 The table shows the percentage change in employment over a period for a country with three economic sectors. percentage (%) change economic sector in employment agriculture –6 manufacturing +2 services +4 Which statement must be correct? A Agricultural output fell. B The country became more developed. C The working population stayed constant. D Total employment remained the same.
1 marks
Answer: B
This question in 0455/12 May/June 2011
Q23 · During 2009 some governments adopted policies to try to end the recession in their… 0455/13 May/June 2011
22 During 2009 some governments adopted policies to try to end the recession in their country and increase economic growth. Which combination of policies is most likely to achieve this? A lower taxes and decrease government spending B lower taxes and increase government spending C raise taxes and decrease government spending D raise taxes and increase government spending
1 marks
Answer: B
This question in 0455/13 May/June 2011
Q24 · What is a long-term advantage of economic growth? 0455/11 Oct/Nov 2011
20 What is a long-term advantage of economic growth? A employment falls B incomes rise C prices rise D savings fall
1 marks
Answer: B
This question in 0455/11 Oct/Nov 2011
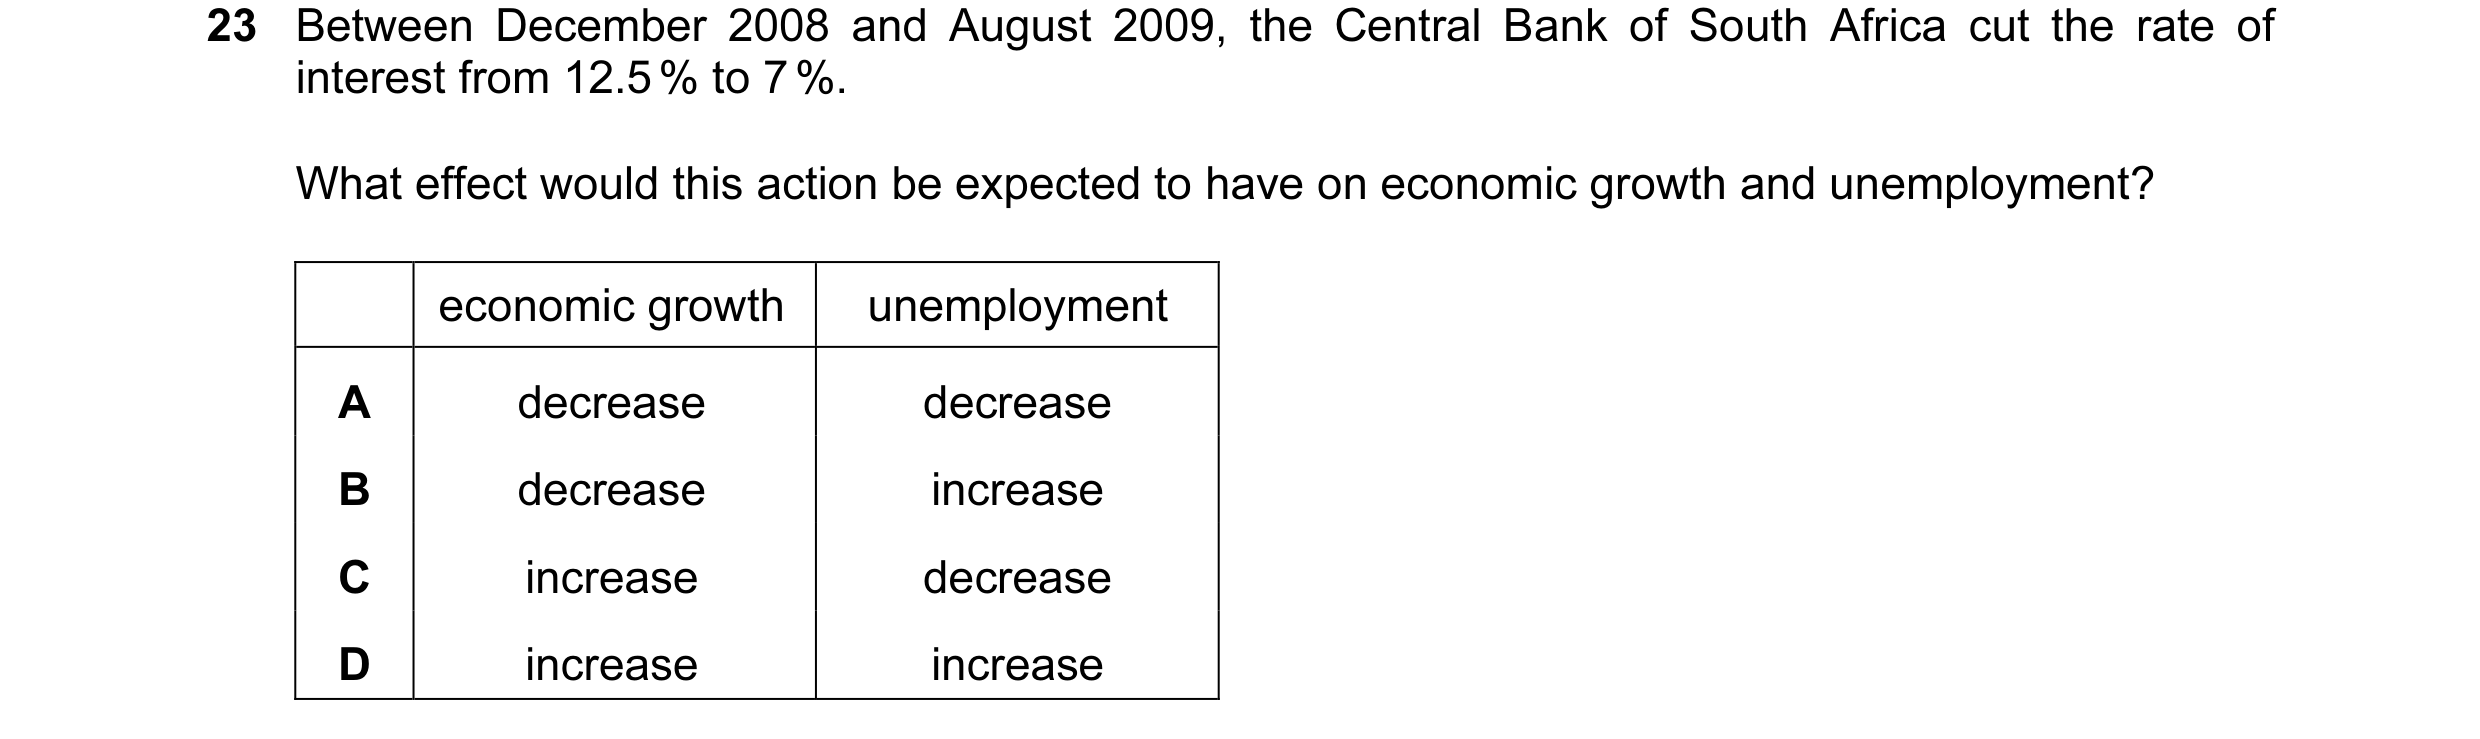
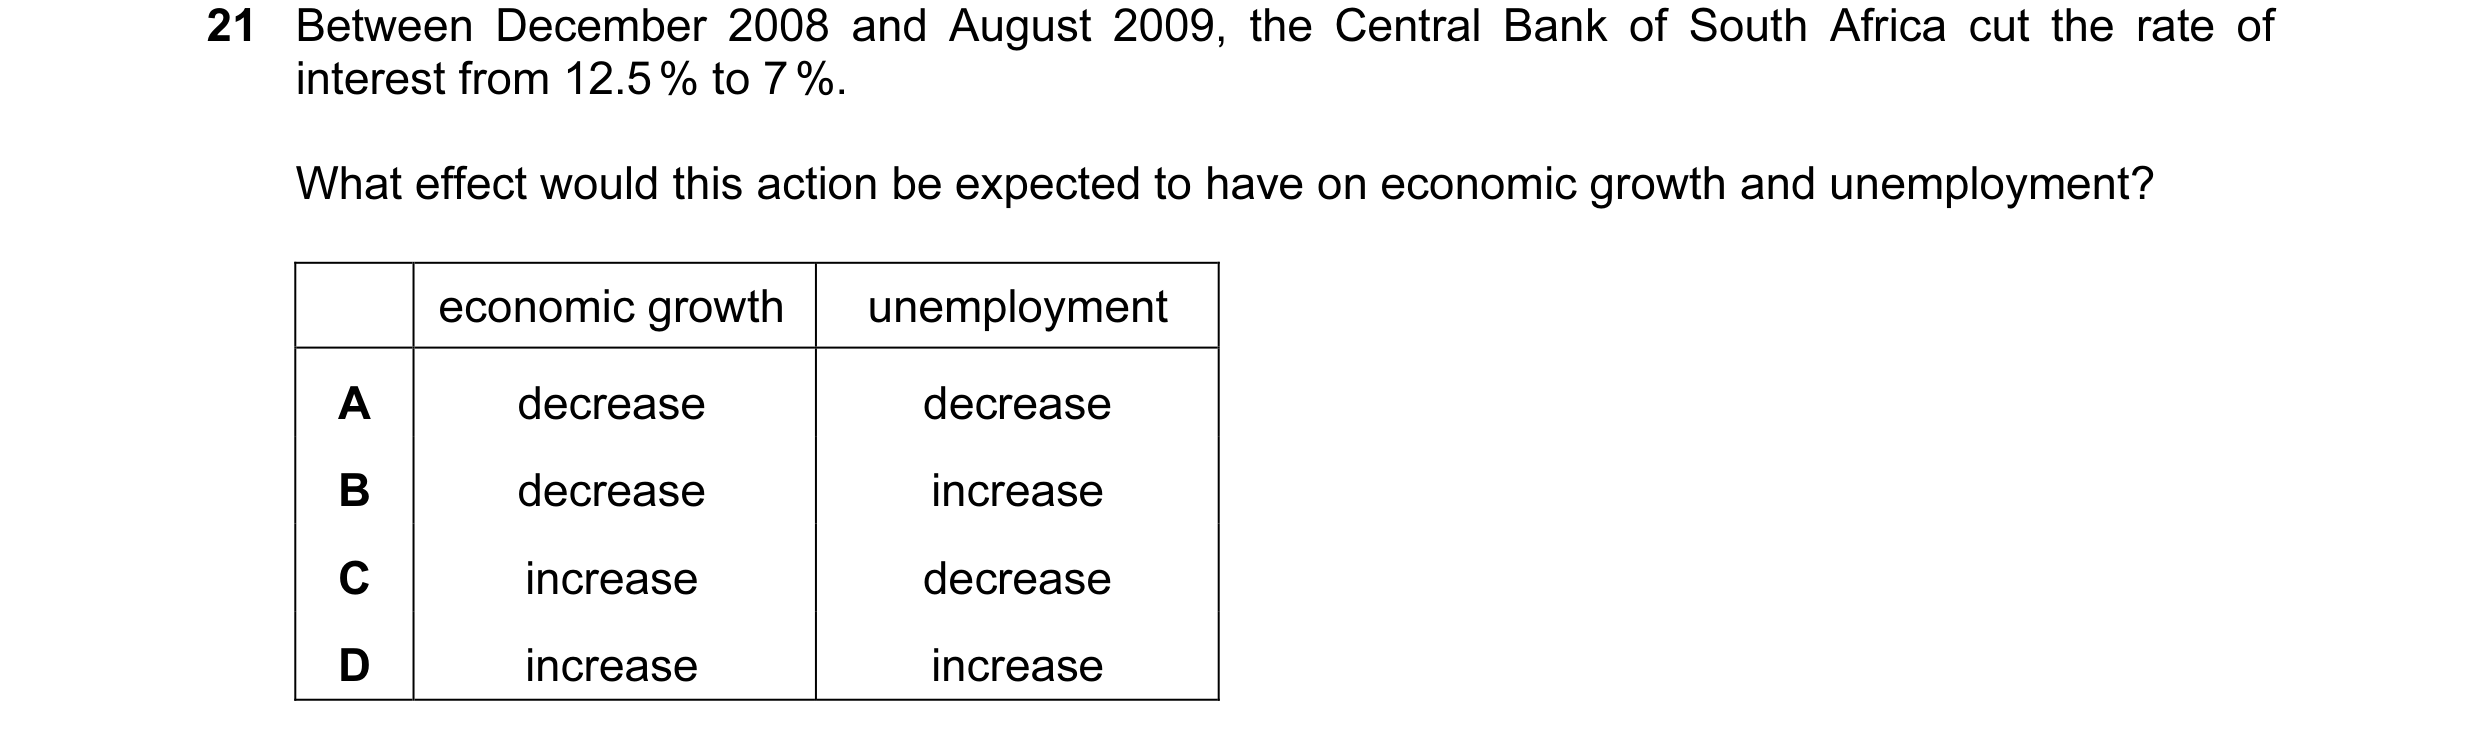
Q25 · Between December 2008 and August 2009, the Central Bank of South Africa cut the rate of… 0455/11 Oct/Nov 2011
23 Between December 2008 and August 2009, the Central Bank of South Africa cut the rate of interest from 12.5 % to 7 %. What effect would this action be expected to have on economic growth and unemployment? economic growth unemployment A decrease decrease B decrease increase C increase decrease D increase increase
1 marks
Answer: C
This question in 0455/11 Oct/Nov 2011
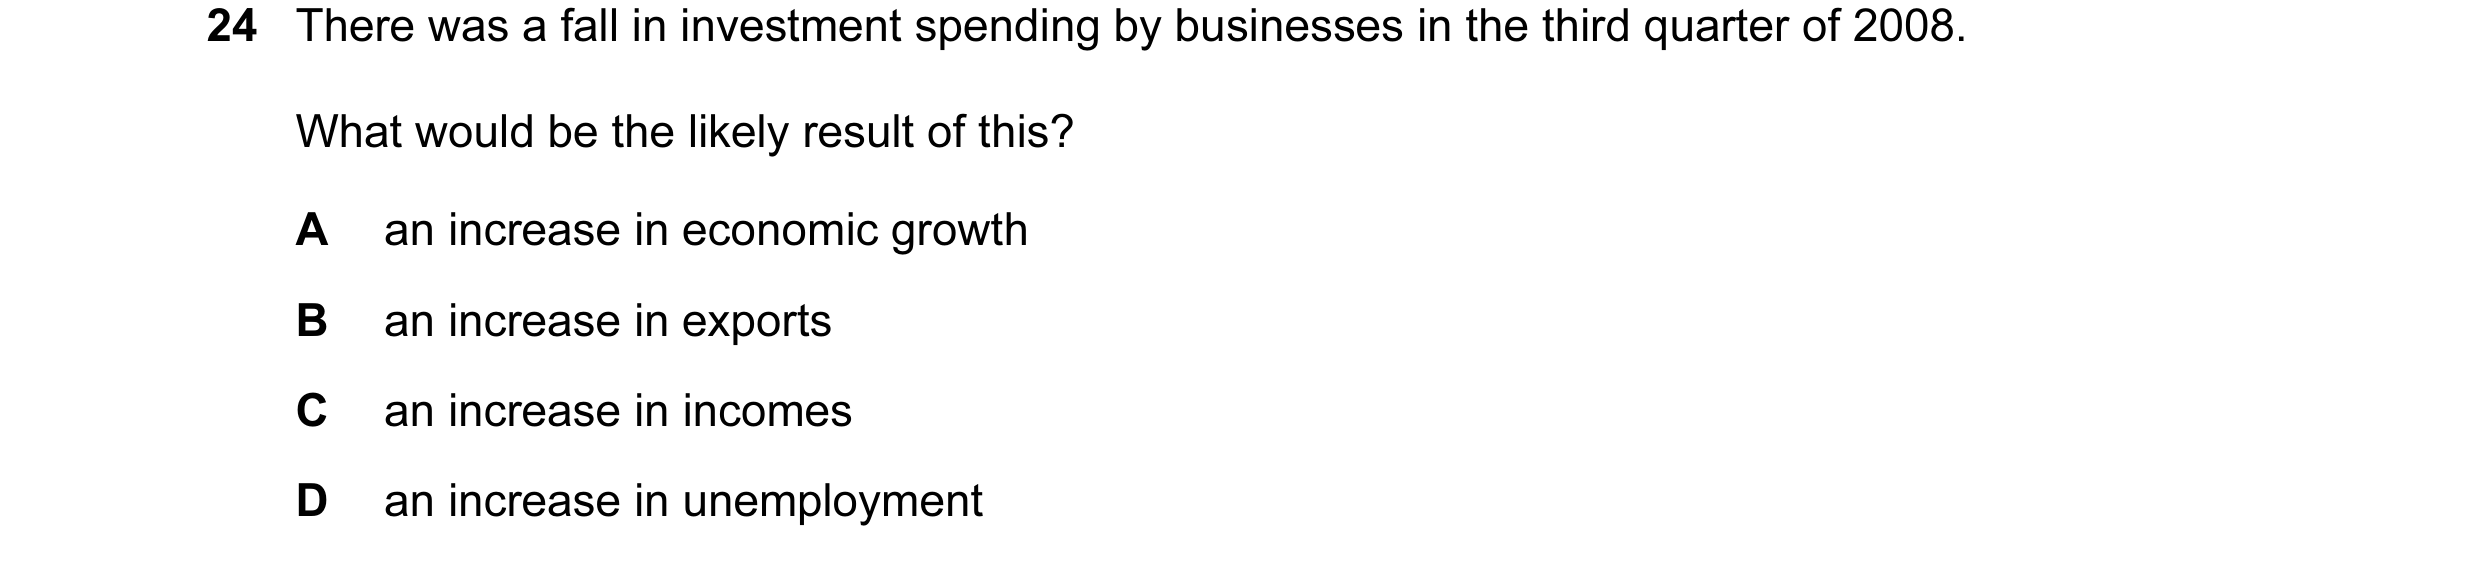
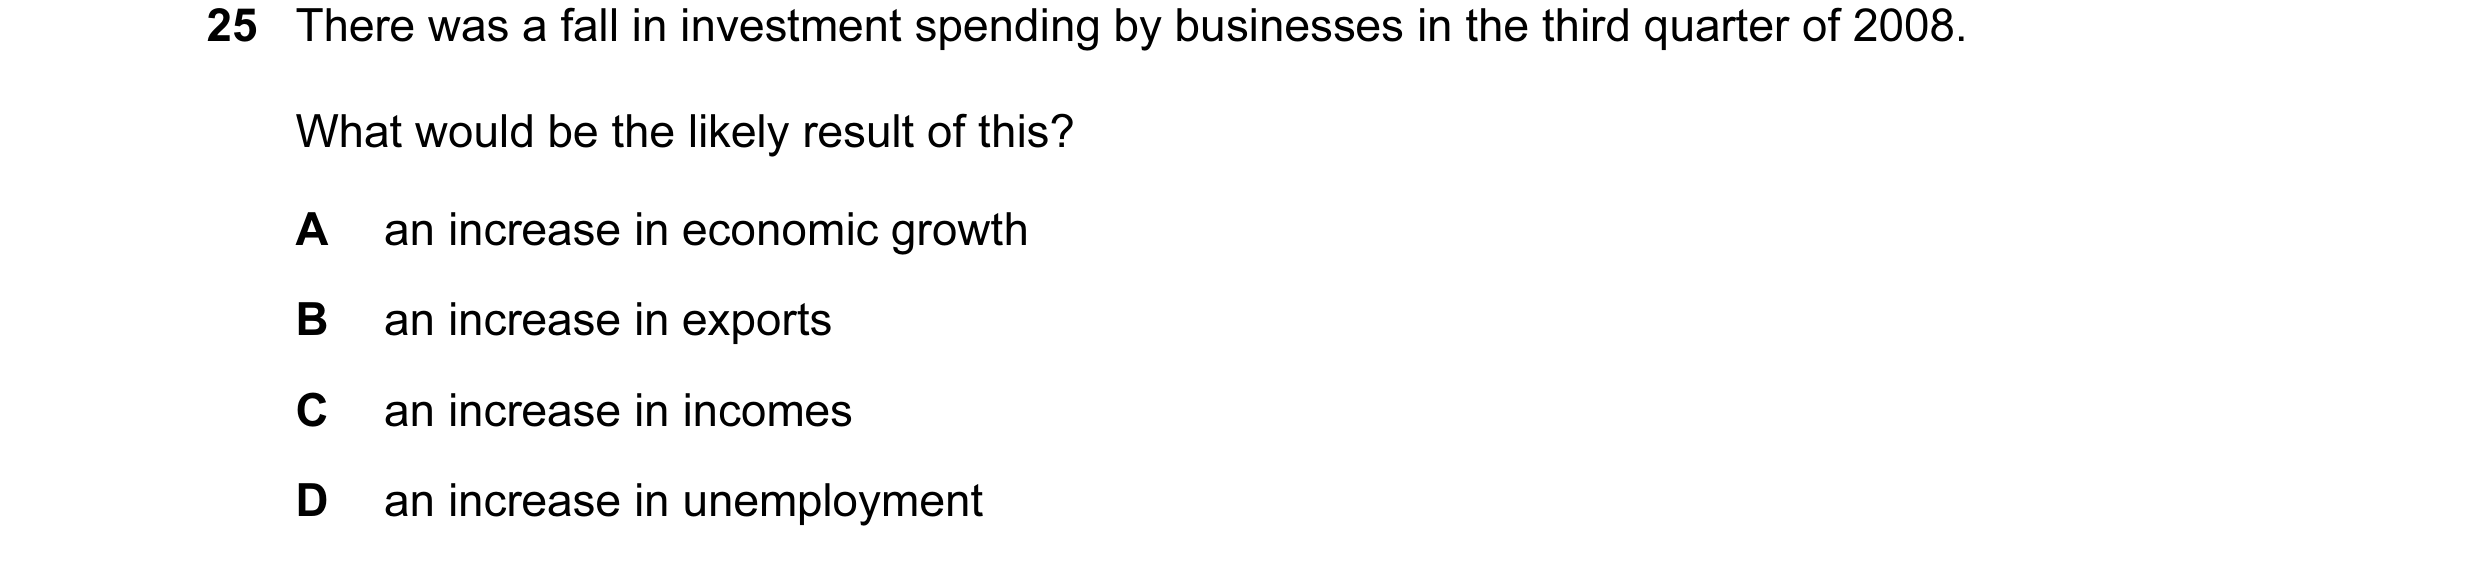
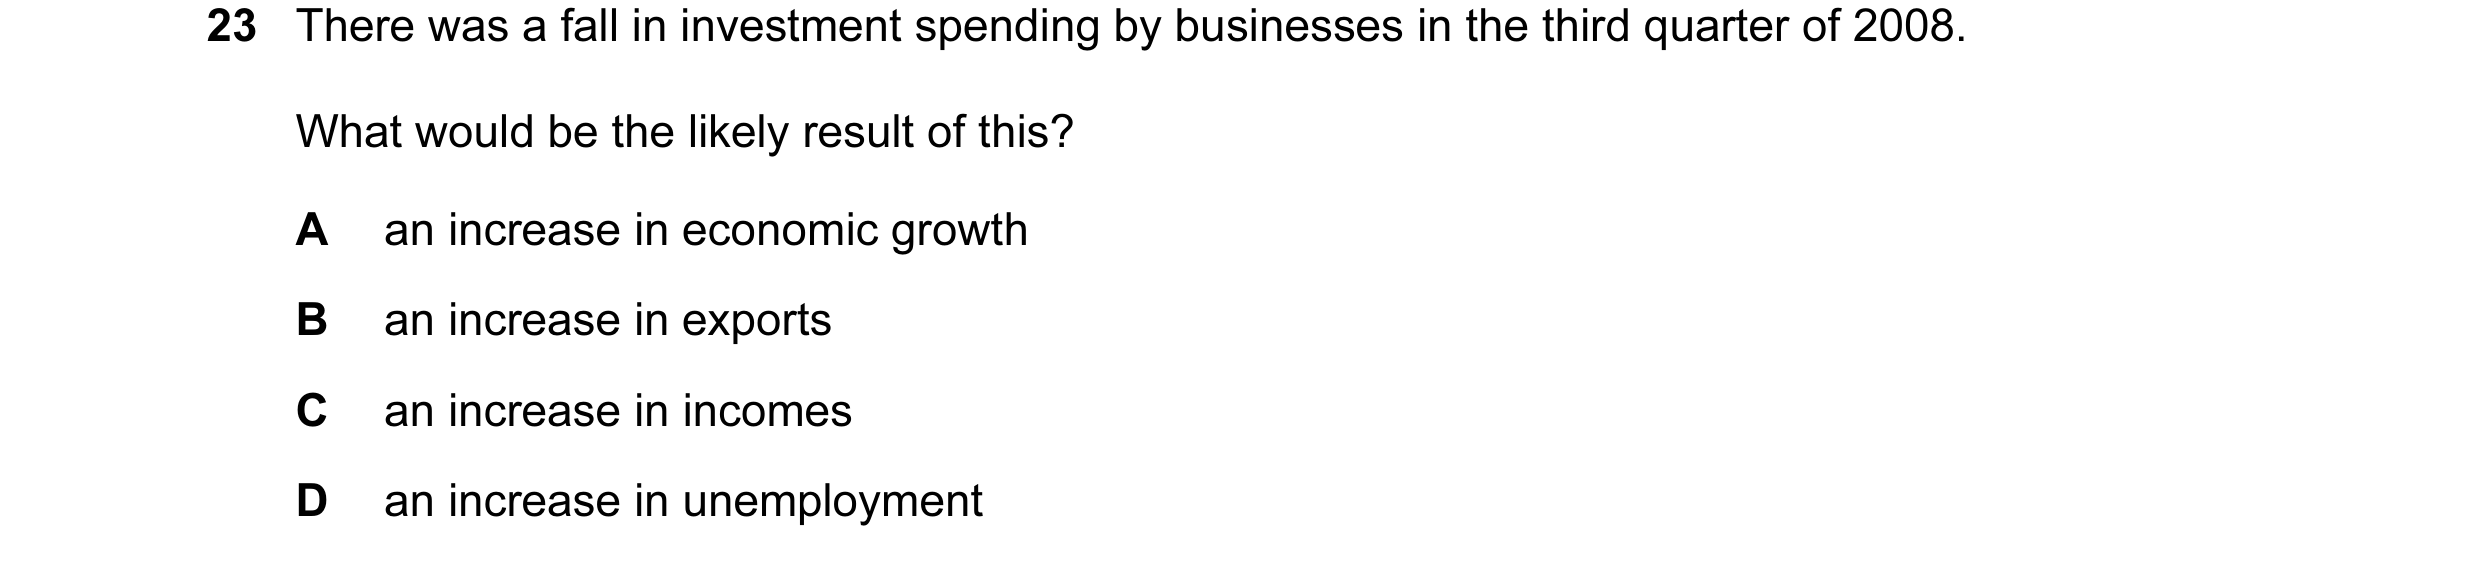
Q26 · There was a fall in investment spending by businesses in the third quarter of 2008 0455/11 Oct/Nov 2011
24 There was a fall in investment spending by businesses in the third quarter of 2008. What would be the likely result of this? A an increase in economic growth B an increase in exports C an increase in incomes D an increase in unemployment
1 marks
Answer: D
This question in 0455/11 Oct/Nov 2011
Q27 · What is typical of a recession (economic downturn)? 0455/11 Oct/Nov 2011
25 What is typical of a recession (economic downturn)? A falling Gross Domestic Product B falling unemployment C rising living standards D rising retail price index
1 marks
Answer: A
This question in 0455/11 Oct/Nov 2011
Q28 · Developing countries are sometimes given aid by charities and foreign governments 0455/11 Oct/Nov 2011
28 Developing countries are sometimes given aid by charities and foreign governments. Which aid programme would be least likely to lead to long-term economic growth? A the building of an irrigation system B the construction of a new airport C the distribution of gifts of food D the training of technical staff
1 marks
Answer: C
This question in 0455/11 Oct/Nov 2011
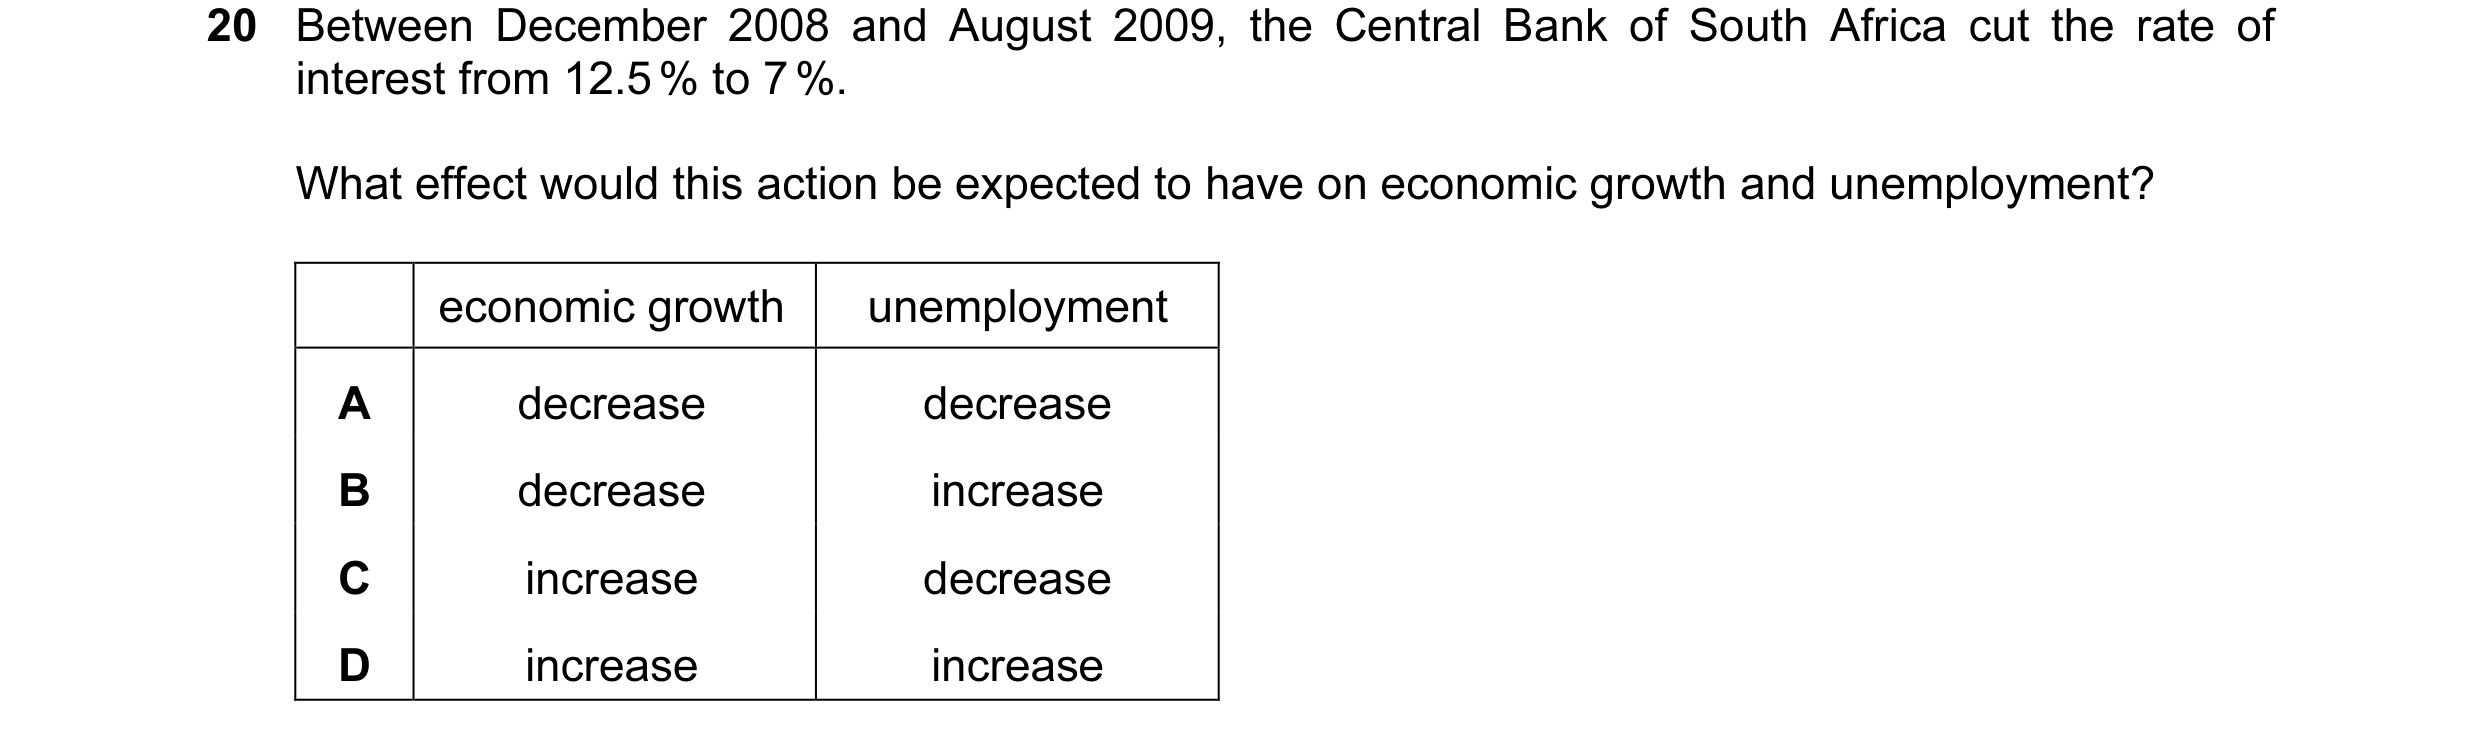
Q29 · Between December 2008 and August 2009, the Central Bank of South Africa cut the rate of… 0455/12 Oct/Nov 2011
20 Between December 2008 and August 2009, the Central Bank of South Africa cut the rate of interest from 12.5 % to 7 %. What effect would this action be expected to have on economic growth and unemployment? economic growth unemployment A decrease decrease B decrease increase C increase decrease D increase increase
1 marks
Answer: C
This question in 0455/12 Oct/Nov 2011
Q30 · What is a long-term advantage of economic growth? 0455/12 Oct/Nov 2011
23 What is a long-term advantage of economic growth? A employment falls B incomes rise C prices rise D savings fall
1 marks
Answer: B
This question in 0455/12 Oct/Nov 2011
Q31 · What is typical of a recession (economic downturn)? 0455/12 Oct/Nov 2011
24 What is typical of a recession (economic downturn)? A falling Gross Domestic Product B falling unemployment C rising living standards D rising retail price index
1 marks
Answer: A
This question in 0455/12 Oct/Nov 2011
Q32 · There was a fall in investment spending by businesses in the third quarter of 2008 0455/12 Oct/Nov 2011
25 There was a fall in investment spending by businesses in the third quarter of 2008. What would be the likely result of this? A an increase in economic growth B an increase in exports C an increase in incomes D an increase in unemployment
1 marks
Answer: D
This question in 0455/12 Oct/Nov 2011
Q33 · Developing countries are sometimes given aid by charities and foreign governments 0455/12 Oct/Nov 2011
29 Developing countries are sometimes given aid by charities and foreign governments. Which aid programme would be least likely to lead to long-term economic growth? A the building of an irrigation system B the construction of a new airport C the distribution of gifts of food D the training of technical staff
1 marks
Answer: C
This question in 0455/12 Oct/Nov 2011
Q34 · Between December 2008 and August 2009, the Central Bank of South Africa cut the rate of… 0455/13 Oct/Nov 2011
21 Between December 2008 and August 2009, the Central Bank of South Africa cut the rate of interest from 12.5 % to 7 %. What effect would this action be expected to have on economic growth and unemployment? economic growth unemployment A decrease decrease B decrease increase C increase decrease D increase increase
1 marks
Answer: C
This question in 0455/13 Oct/Nov 2011
Q35 · There was a fall in investment spending by businesses in the third quarter of 2008 0455/13 Oct/Nov 2011
23 There was a fall in investment spending by businesses in the third quarter of 2008. What would be the likely result of this? A an increase in economic growth B an increase in exports C an increase in incomes D an increase in unemployment
1 marks
Answer: D
This question in 0455/13 Oct/Nov 2011
Q36 · What is typical of a recession (economic downturn)? 0455/13 Oct/Nov 2011
24 What is typical of a recession (economic downturn)? A falling Gross Domestic Product B falling unemployment C rising living standards D rising retail price index
1 marks
Answer: A
This question in 0455/13 Oct/Nov 2011
Q37 · What is a long-term advantage of economic growth? 0455/13 Oct/Nov 2011
25 What is a long-term advantage of economic growth? A employment falls B incomes rise C prices rise D savings fall
1 marks
Answer: B
This question in 0455/13 Oct/Nov 2011
Q38 · Developing countries are sometimes given aid by charities and foreign governments 0455/13 Oct/Nov 2011
30 Developing countries are sometimes given aid by charities and foreign governments. Which aid programme would be least likely to lead to long-term economic growth? A the building of an irrigation system B the construction of a new airport C the distribution of gifts of food D the training of technical staff
1 marks
Answer: C
This question in 0455/13 Oct/Nov 2011
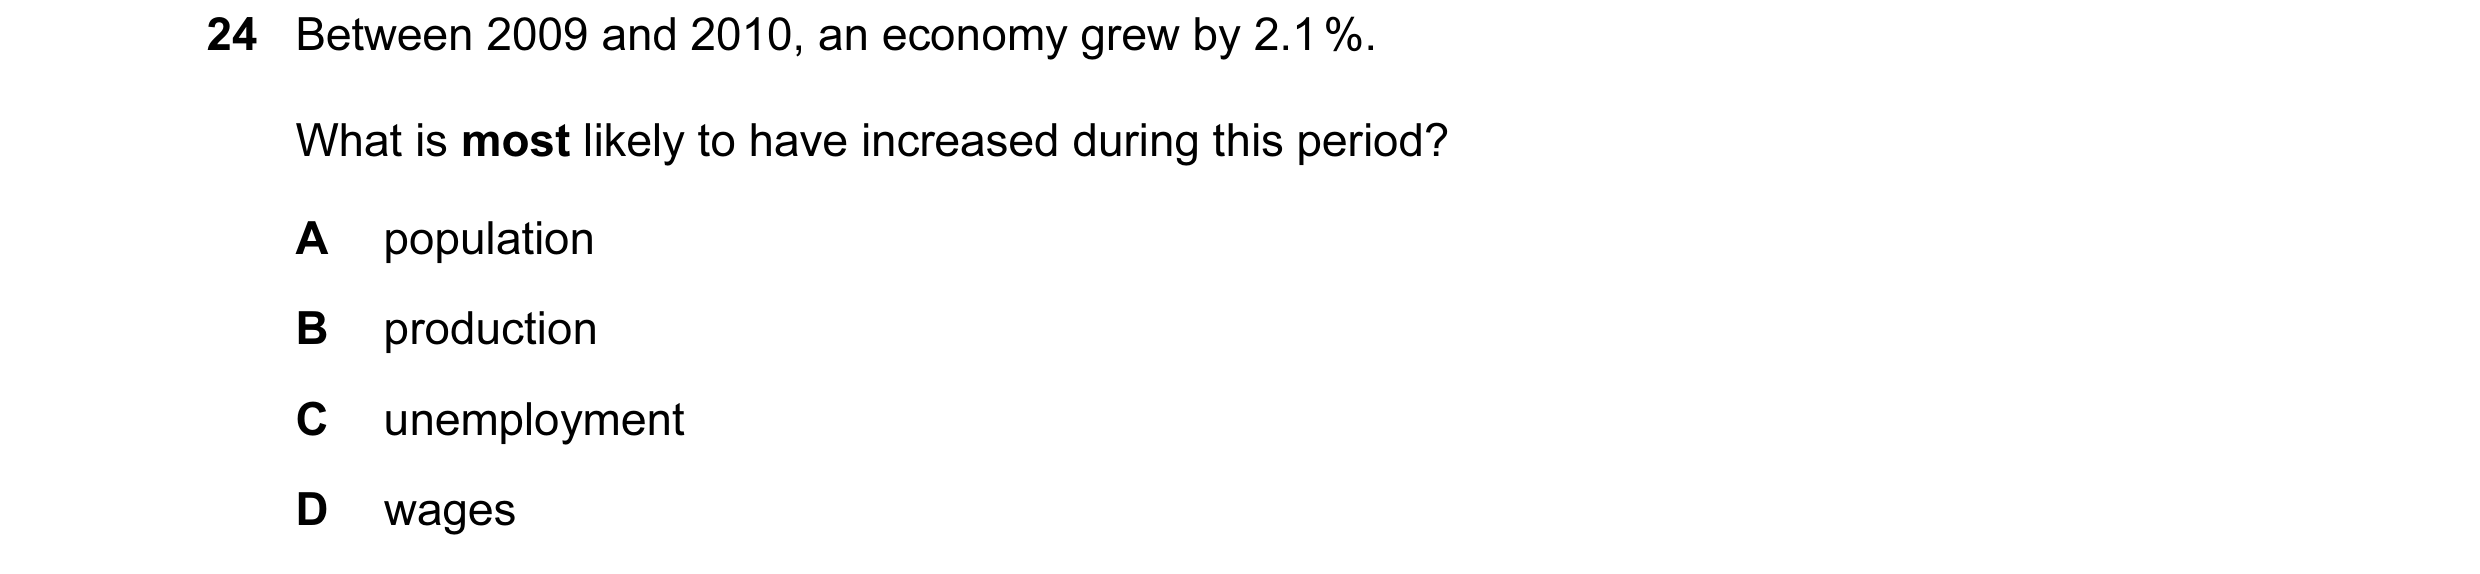
Q39 · Between 2009 and 2010, an economy grew by 2.1 % 0455/11 May/June 2012
24 Between 2009 and 2010, an economy grew by 2.1 %. What is most likely to have increased during this period? A population B production C unemployment D wages
1 marks
Answer: B
This question in 0455/11 May/June 2012
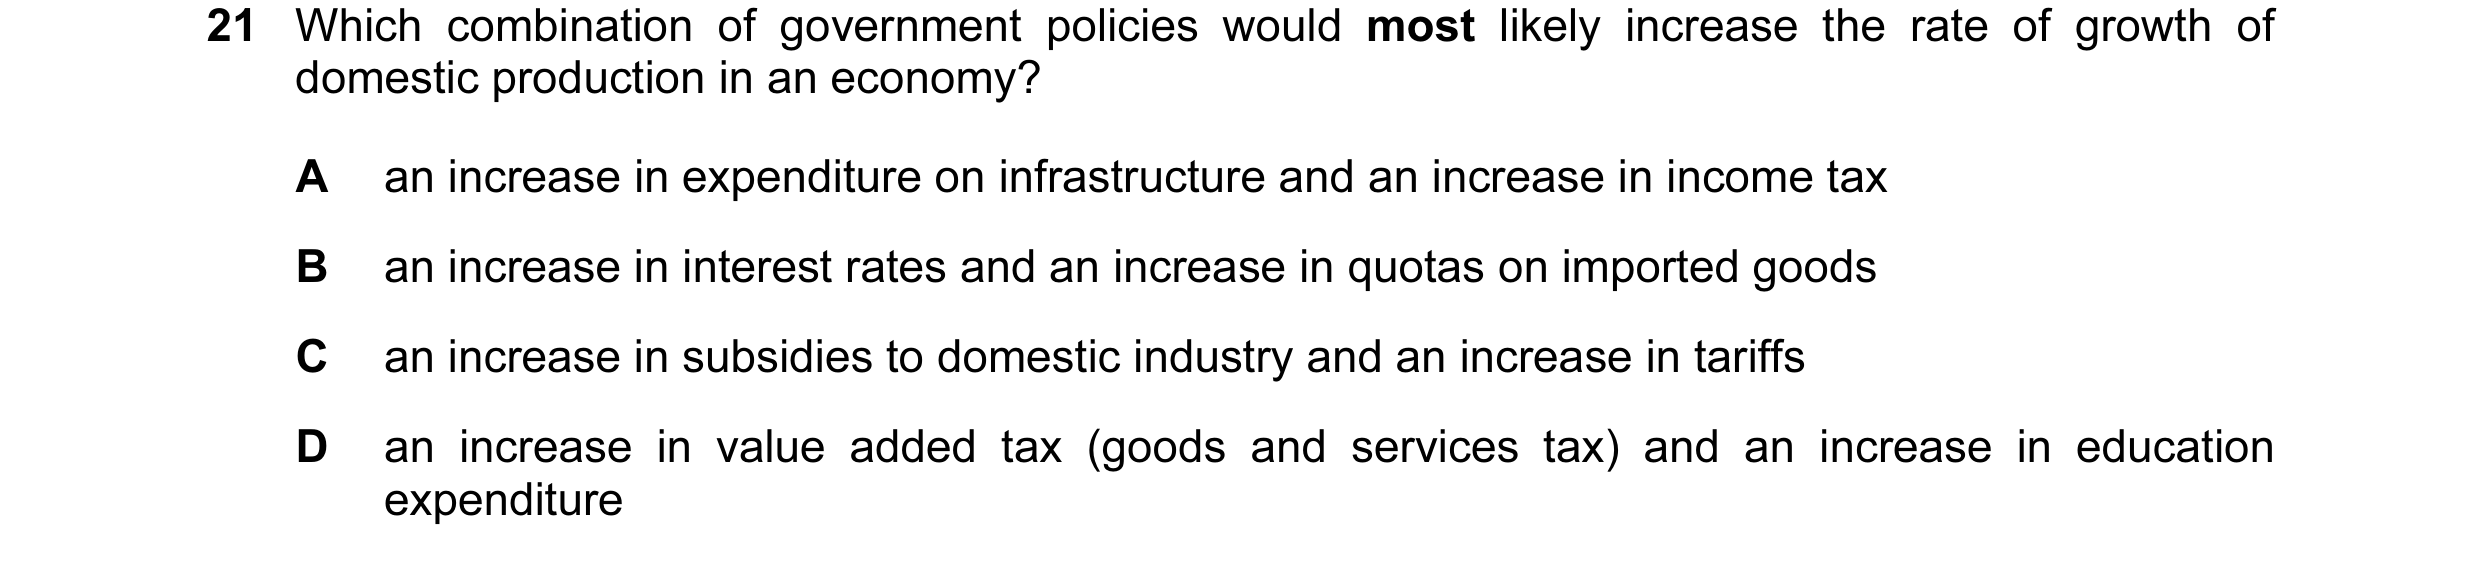
Q40 · Which combination of government policies would most likely increase the rate of growth of… 0455/12 May/June 2012
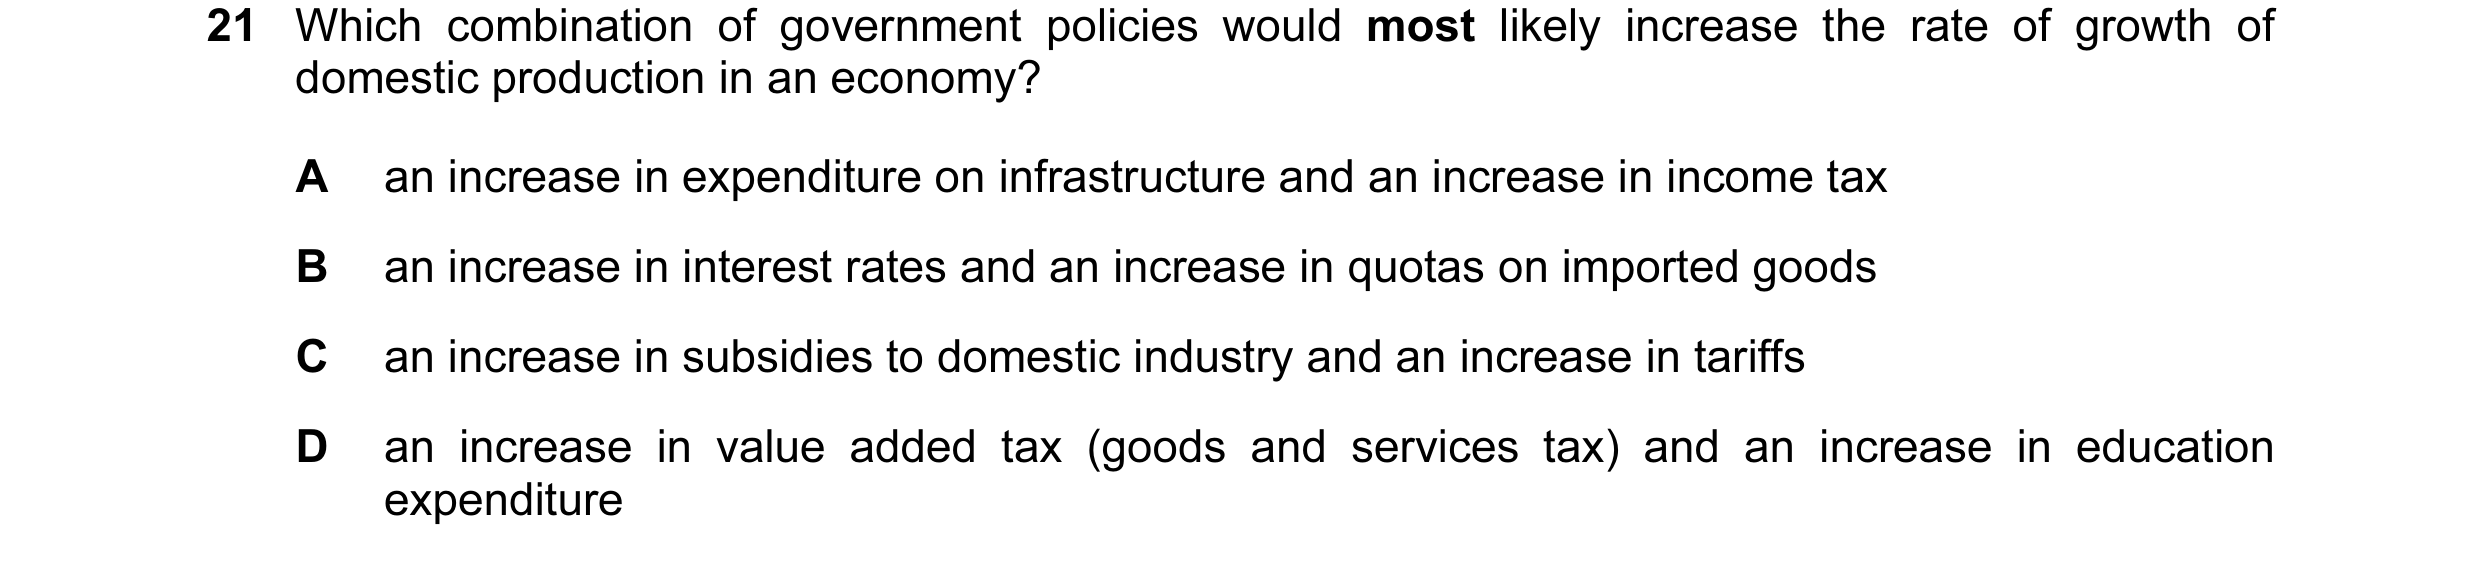
21 Which combination of government policies would most likely increase the rate of growth of domestic production in an economy? A an increase in expenditure on infrastructure and an increase in income tax B an increase in interest rates and an increase in quotas on imported goods C an increase in subsidies to domestic industry and an increase in tariffs D an increase in value added tax (goods and services tax) and an increase in education expenditure
1 marks
Answer: C
This question in 0455/12 May/June 2012
Q41 · Which combination of government policies would most likely increase the rate of growth of… 0455/13 May/June 2012
21 Which combination of government policies would most likely increase the rate of growth of domestic production in an economy? A an increase in expenditure on infrastructure and an increase in income tax B an increase in interest rates and an increase in quotas on imported goods C an increase in subsidies to domestic industry and an increase in tariffs D an increase in value added tax (goods and services tax) and an increase in education expenditure
1 marks
Answer: C
This question in 0455/13 May/June 2012
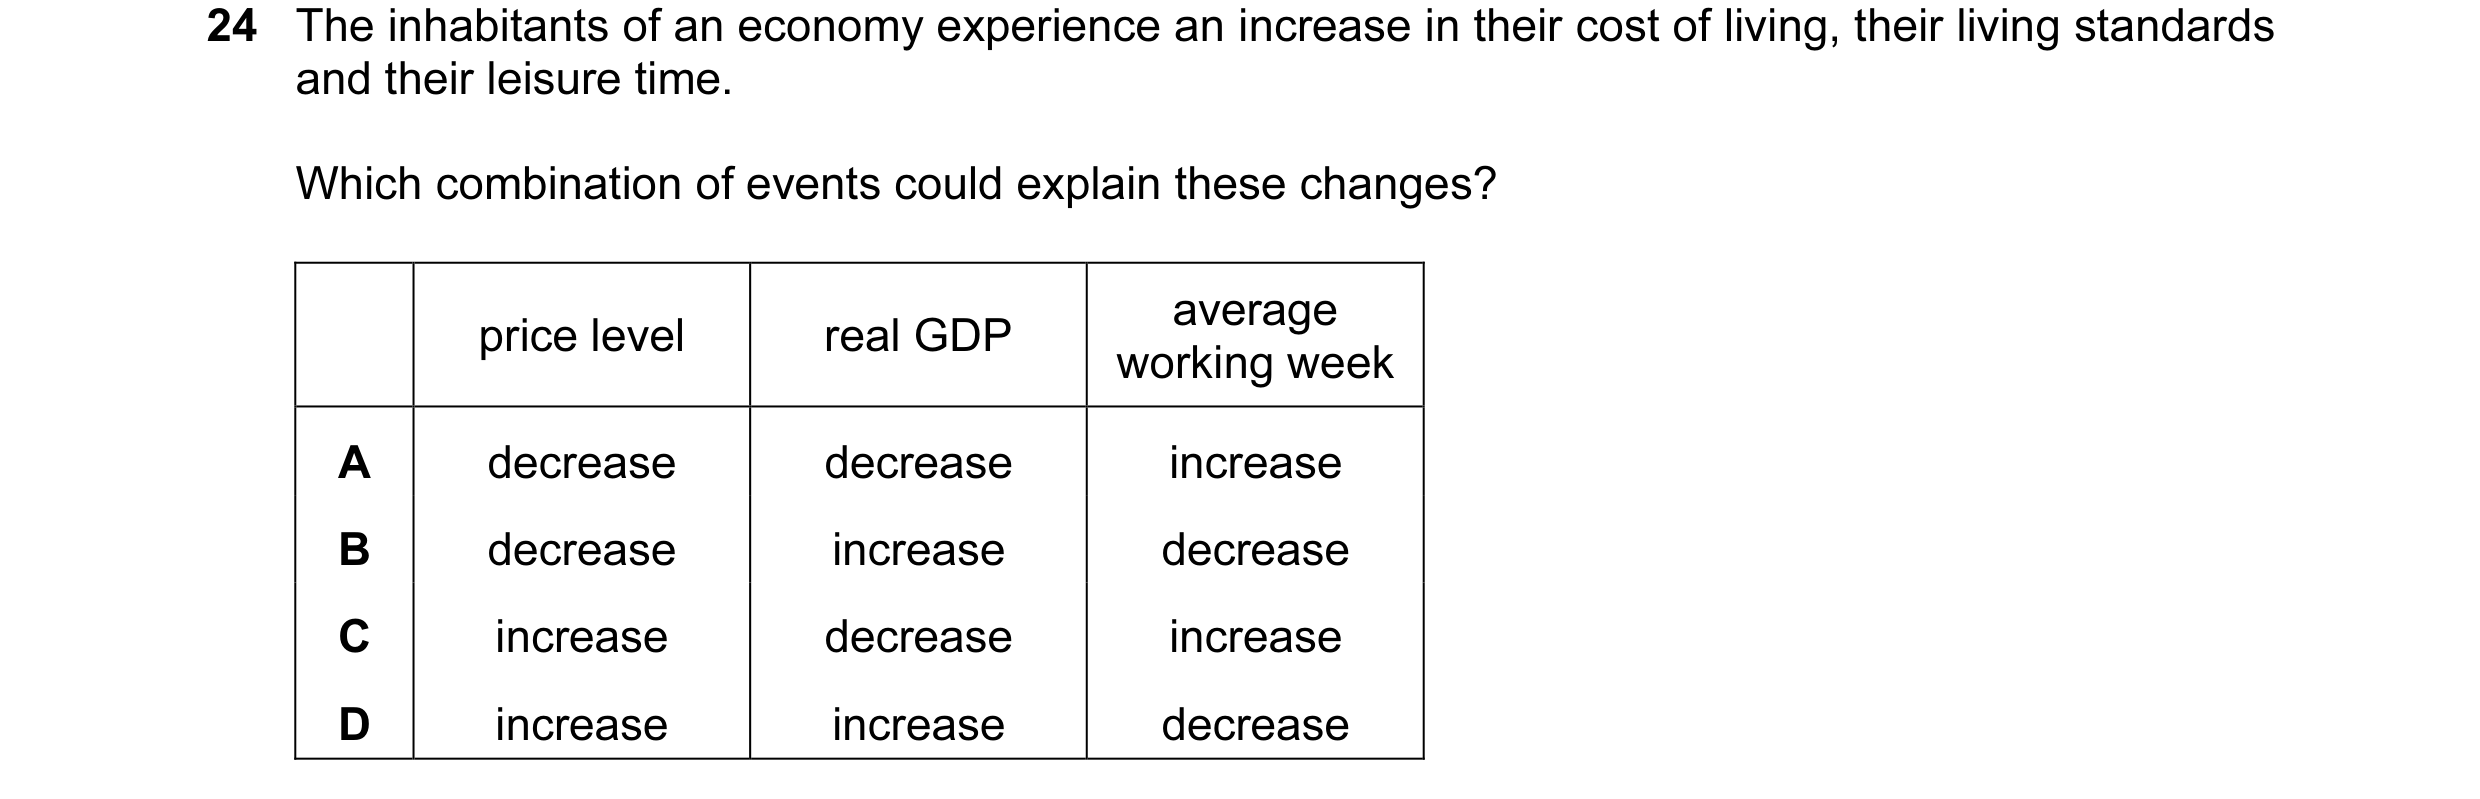
Q42 · The inhabitants of an economy experience an increase in their cost of living, their… 0455/13 May/June 2012
24 The inhabitants of an economy experience an increase in their cost of living, their living standards and their leisure time. Which combination of events could explain these changes? average price level real GDP working week A decrease decrease increase B decrease increase decrease C increase decrease increase D increase increase decrease
1 marks
Answer: D
This question in 0455/13 May/June 2012
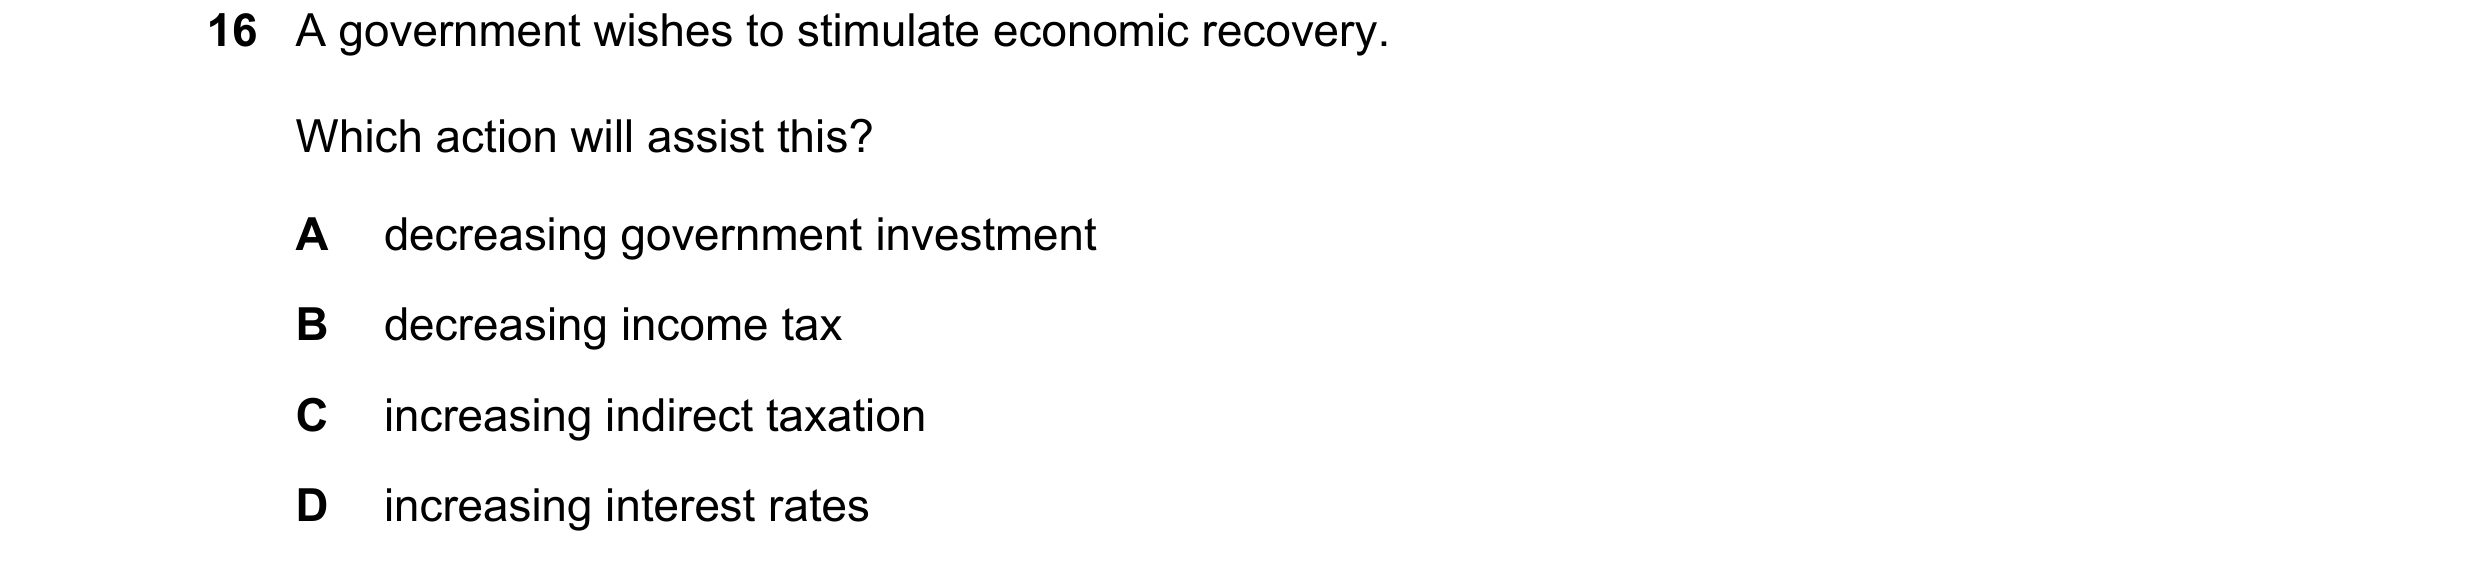
Q43 · A government wishes to stimulate economic recovery 0455/11 Oct/Nov 2012
26 A government wishes to stimulate economic recovery. Which action will assist this? A decreasing government investment B decreasing income tax C increasing indirect taxation D increasing interest rates
1 marks
Answer: B
This question in 0455/11 Oct/Nov 2012
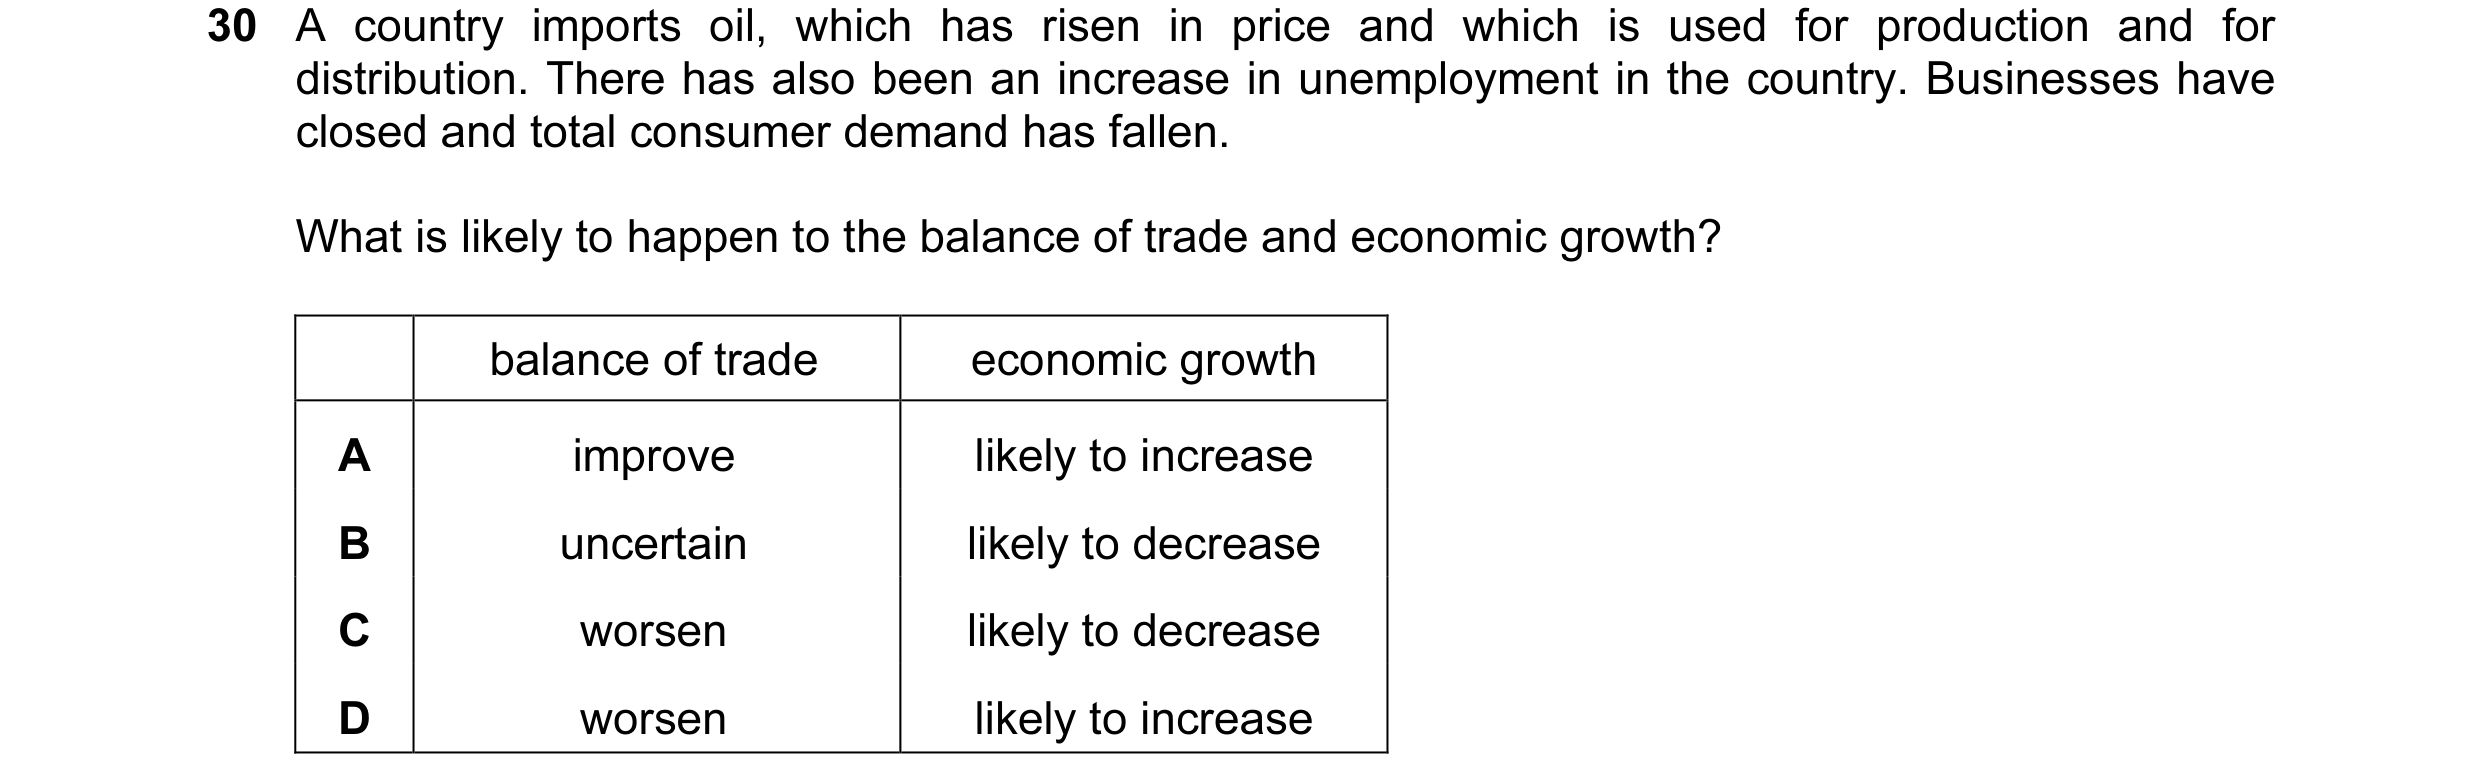
Q44 · A country imports oil, which has risen in price and which is used for production and for… 0455/13 Oct/Nov 2012
30 A country imports oil, which has risen in price and which is used for production and for distribution. There has also been an increase in unemployment in the country. Businesses have closed and total consumer demand has fallen. What is likely to happen to the balance of trade and economic growth? balance of trade economic growth A improve likely to increase B uncertain likely to decrease C worsen likely to decrease D worsen likely to increase
1 marks
Answer: B
This question in 0455/13 Oct/Nov 2012
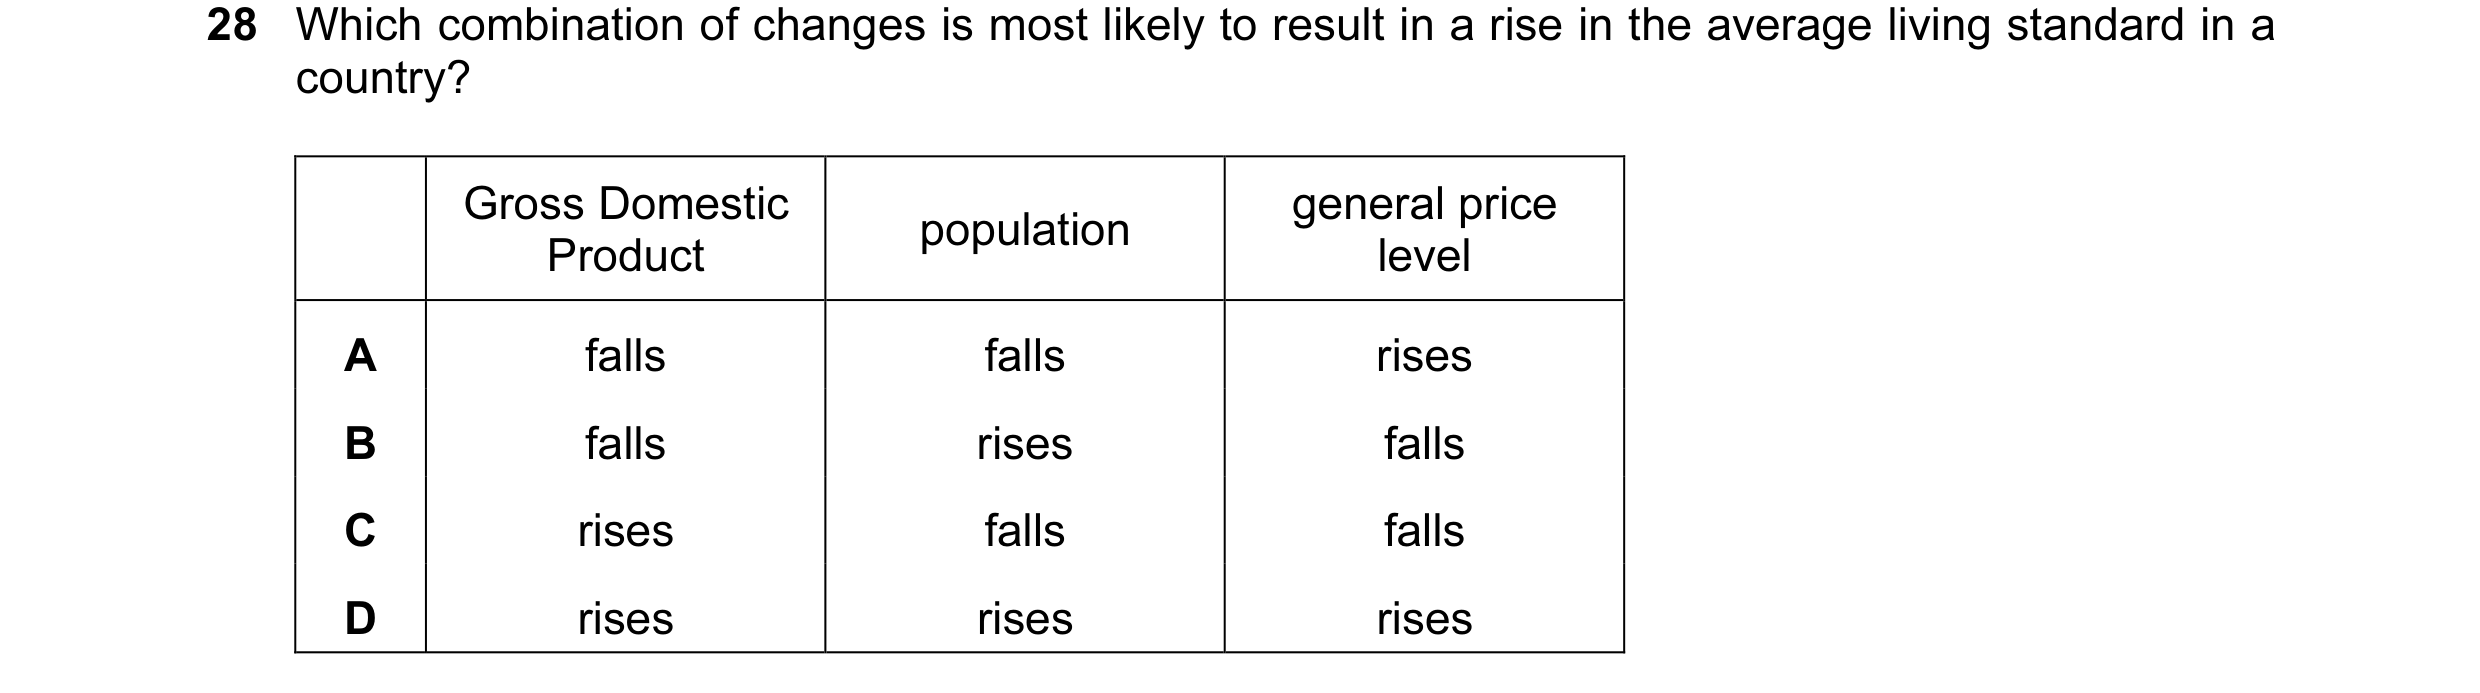
Q45 · Which combination of changes is most likely to result in a rise in the average living… 0455/12 May/June 2013
28 Which combination of changes is most likely to result in a rise in the average living standard in a country? Gross Domestic general price population Product level A falls falls rises B falls rises falls C rises falls falls D rises rises rises
1 marks
Answer: C
This question in 0455/12 May/June 2013
Q46 · Which would best indicate the start of an economic recession? 0455/11 Oct/Nov 2013
29 Which would best indicate the start of an economic recession? A falling interest rates B fluctuating levels of employment C negative growth of GDP D steadily increasing price levels
1 marks
Answer: C
This question in 0455/11 Oct/Nov 2013
Q47 · Which would best indicate the start of an economic recession? 0455/12 Oct/Nov 2013
24 Which would best indicate the start of an economic recession? A falling interest rates B fluctuating levels of employment C negative growth of GDP D steadily increasing price levels
1 marks
Answer: C
This question in 0455/12 Oct/Nov 2013
Q48 · An economy is said to have a high economic growth rate 0455/13 Oct/Nov 2013
24 An economy is said to have a high economic growth rate. What is most likely to be found when this occurs? A a decrease in inflation and a budget deficit B a decrease in the exchange rate and a fall in savings C an increase in GDP and low unemployment D an increase in inflation and a reduction in investment
1 marks
Answer: C
This question in 0455/13 Oct/Nov 2013
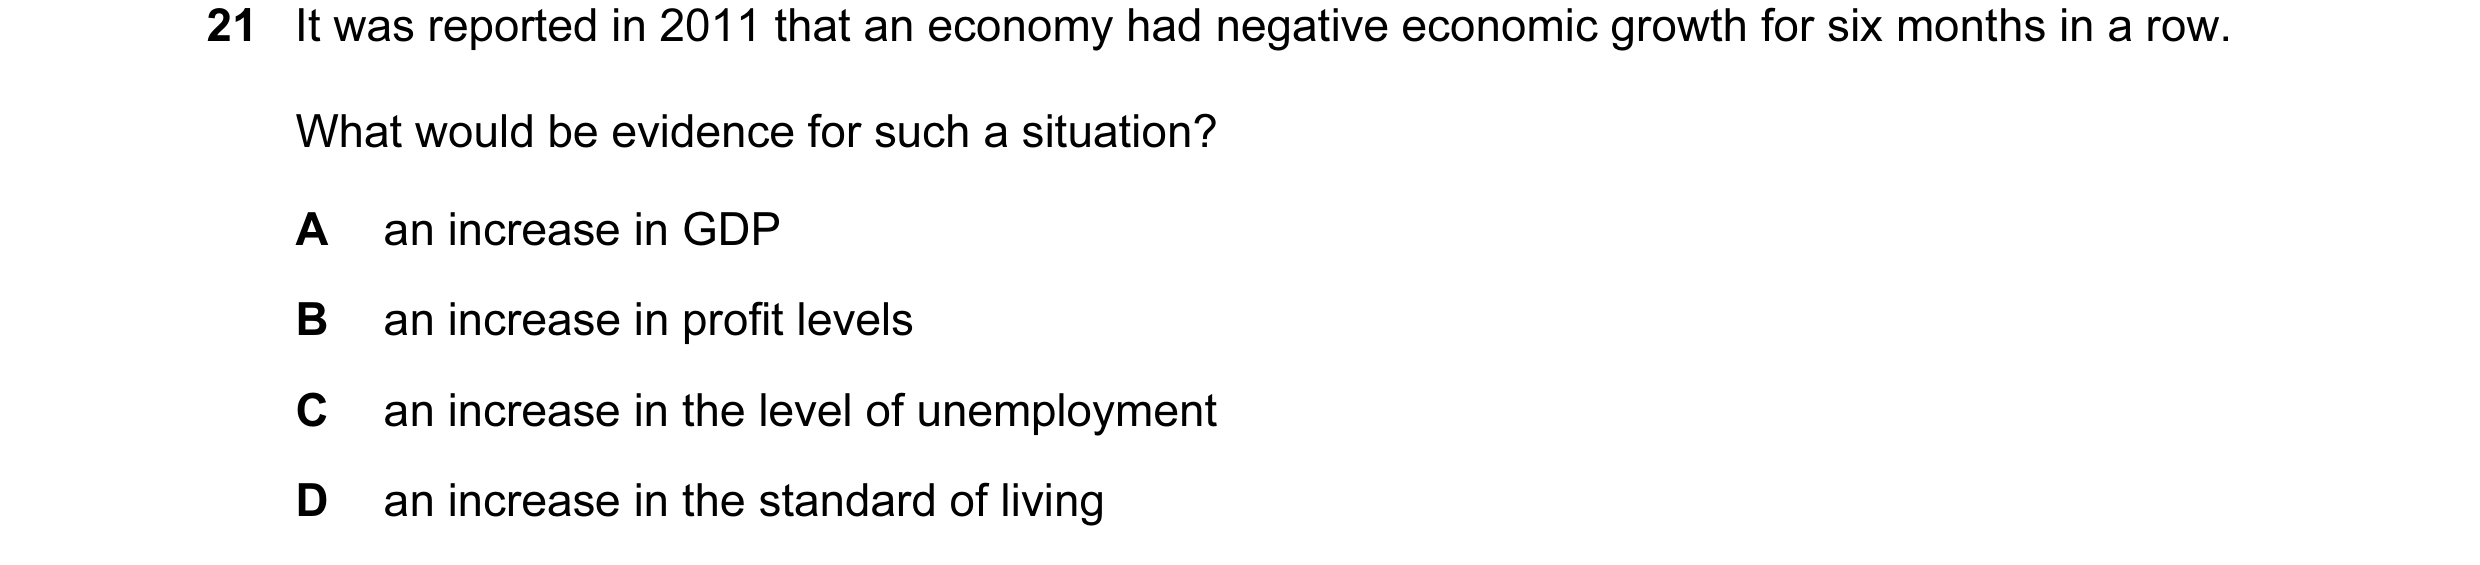
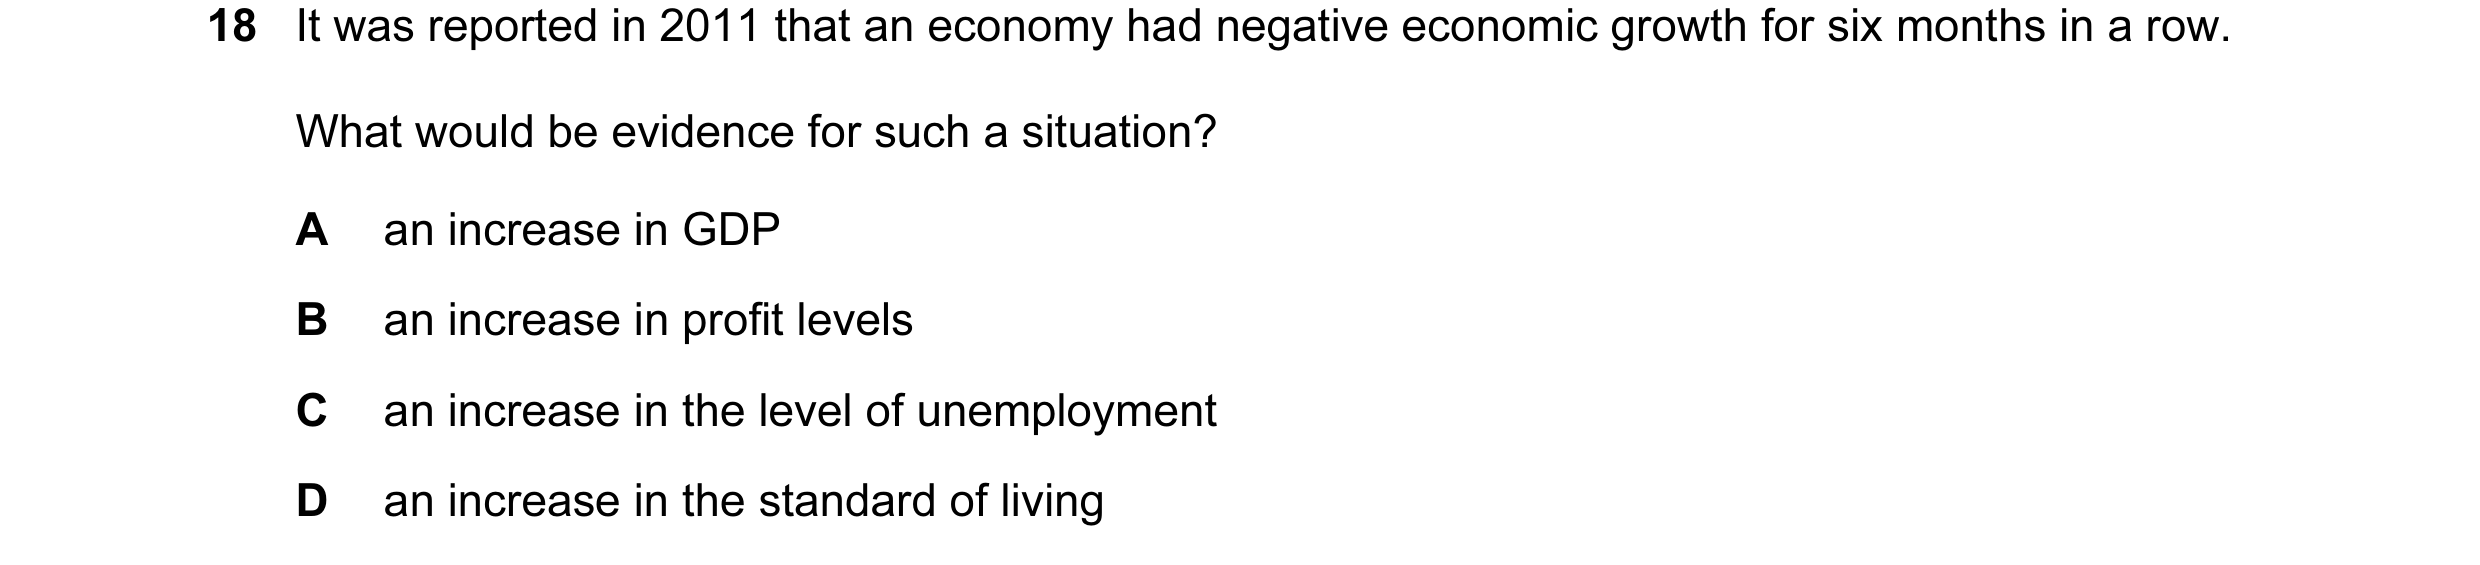
Q49 · It was reported in 2011 that an economy had negative economic growth for six months in a… 0455/11 May/June 2014
21 It was reported in 2011 that an economy had negative economic growth for six months in a row. What would be evidence for such a situation? A an increase in GDP B an increase in profit levels C an increase in the level of unemployment D an increase in the standard of living
1 marks
Answer: C
This question in 0455/11 May/June 2014
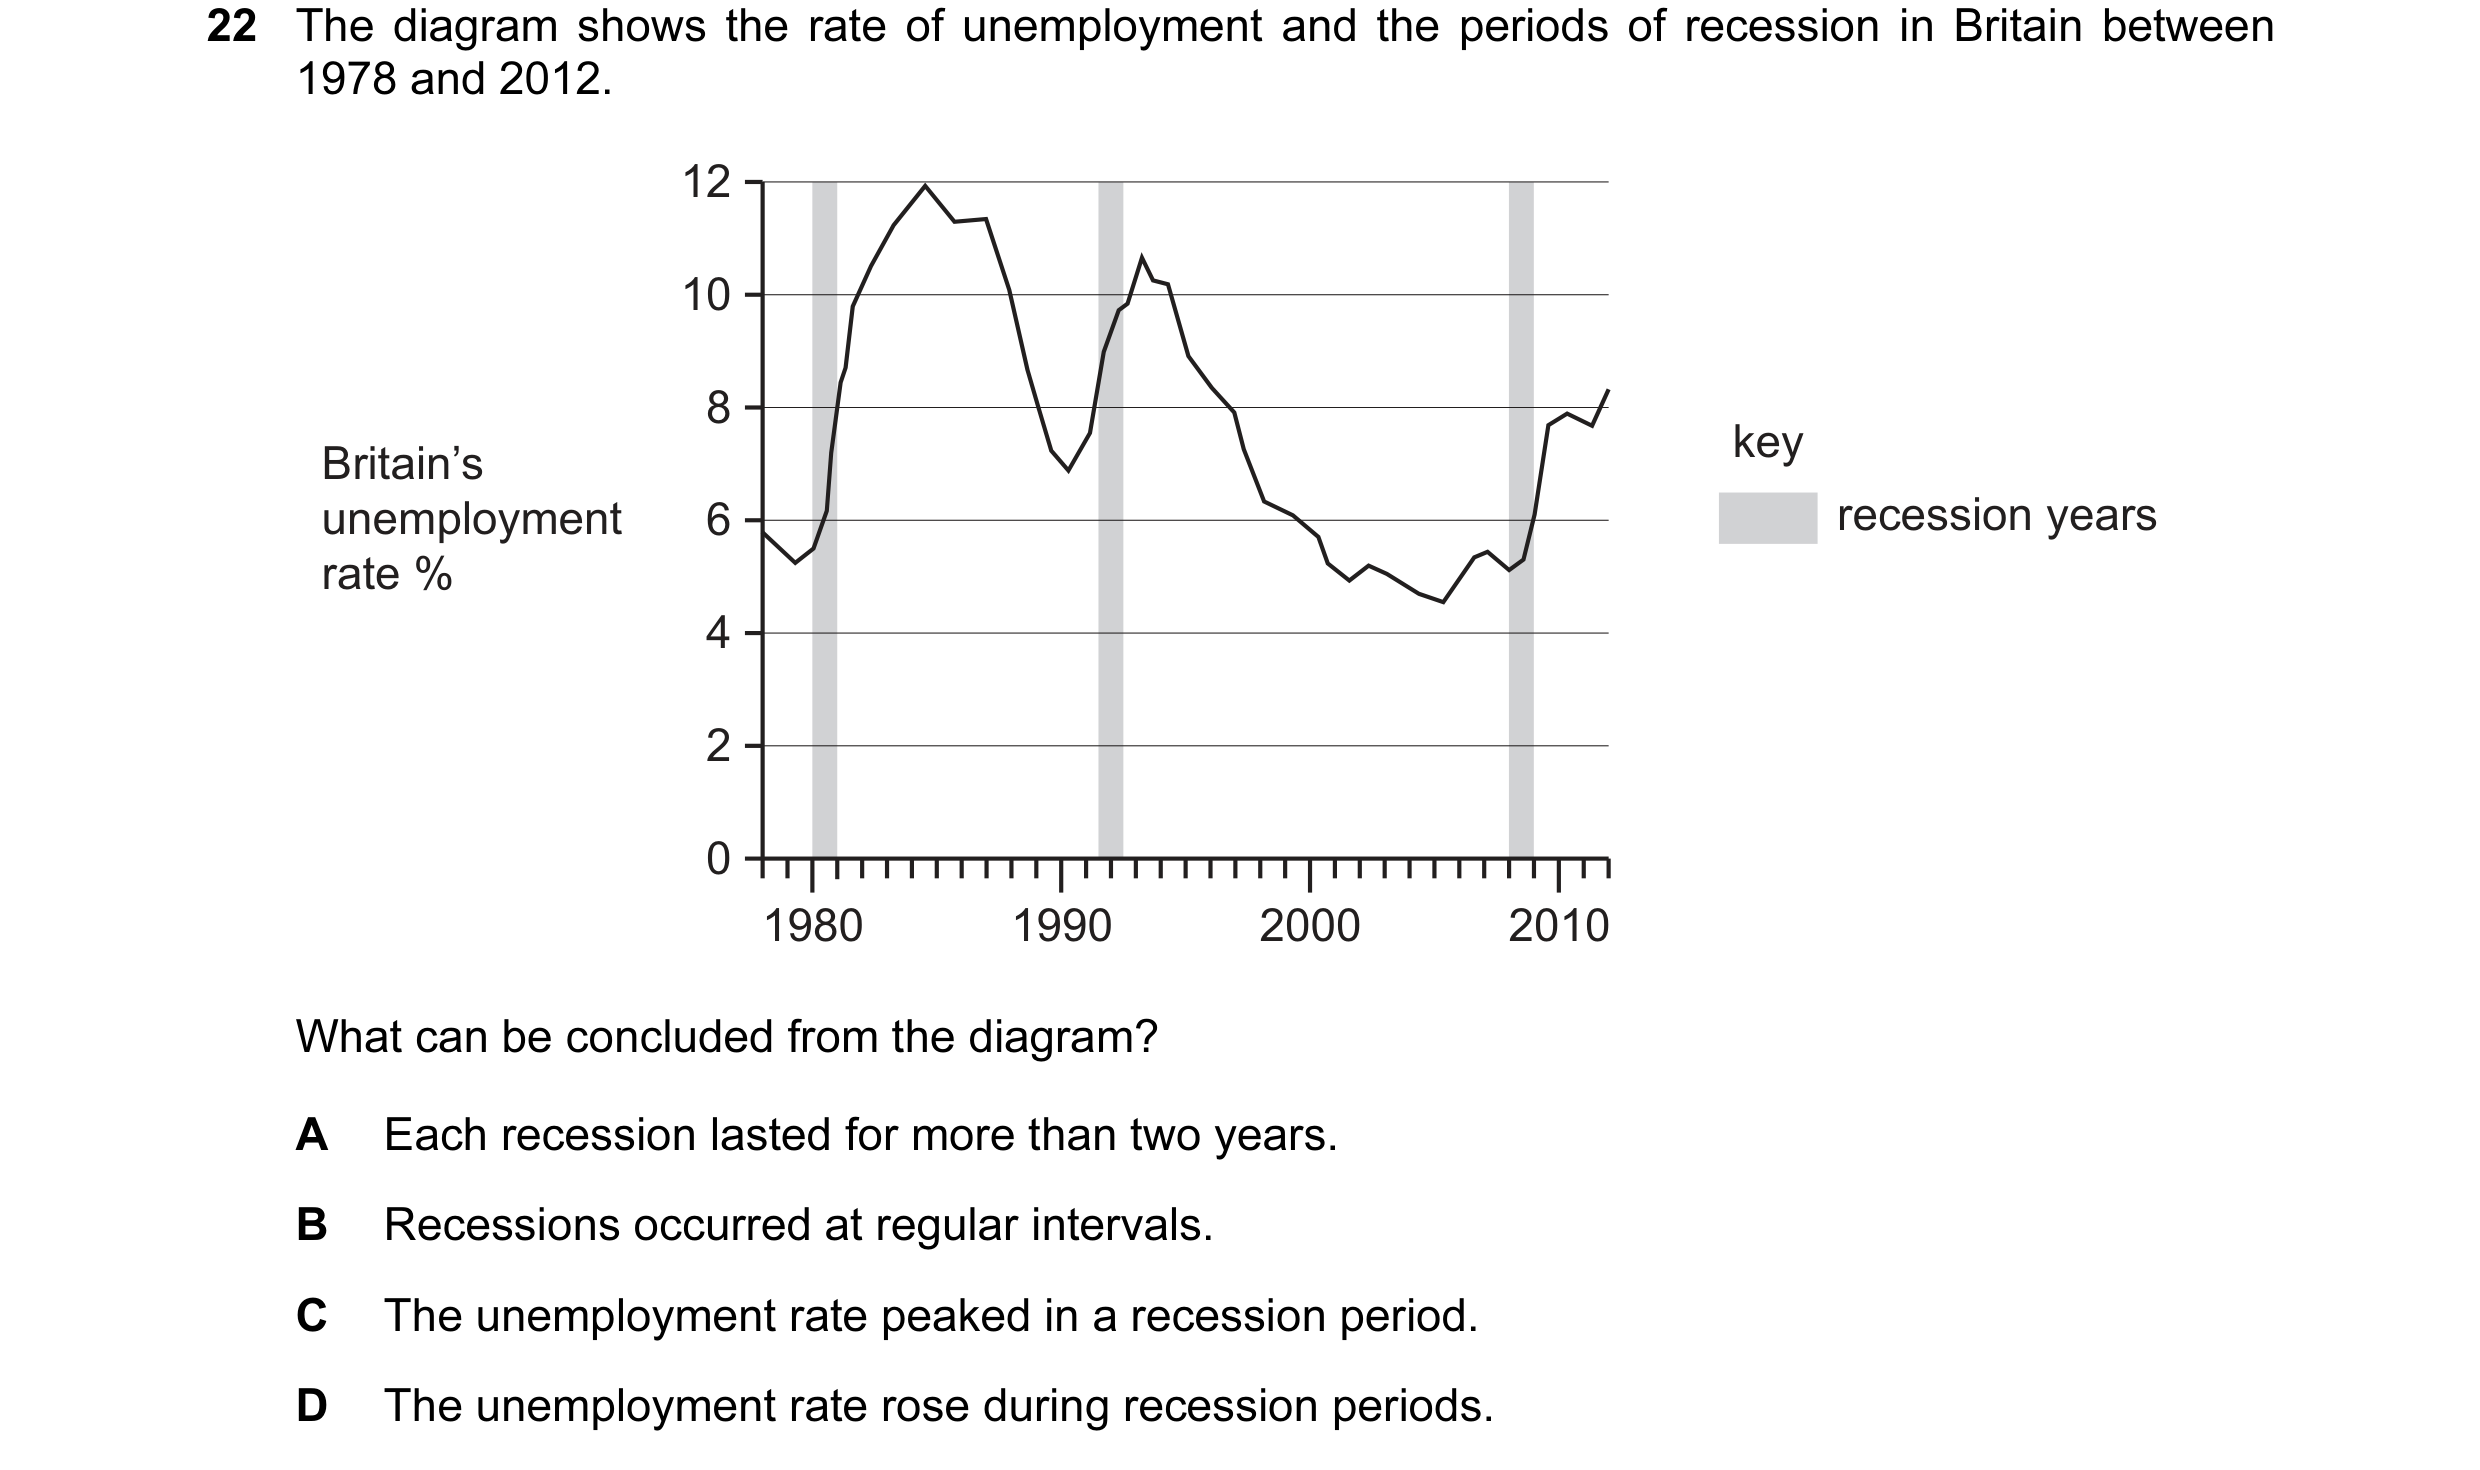
Q50 · The diagram shows the rate of unemployment and the periods of recession in Britain… 0455/11 May/June 2014
22 The diagram shows the rate of unemployment and the periods of recession in Britain between 1978 and 2012. 12 10 8 key Britain’s unemployment 6 recession years rate % 4 2 0 1980 1990 2000 2010 What can be concluded from the diagram? A Each recession lasted for more than two years. B Recessions occurred at regular intervals. C The unemployment rate peaked in a recession period. D The unemployment rate rose during recession periods.
1 marks
Answer: D
This question in 0455/11 May/June 2014
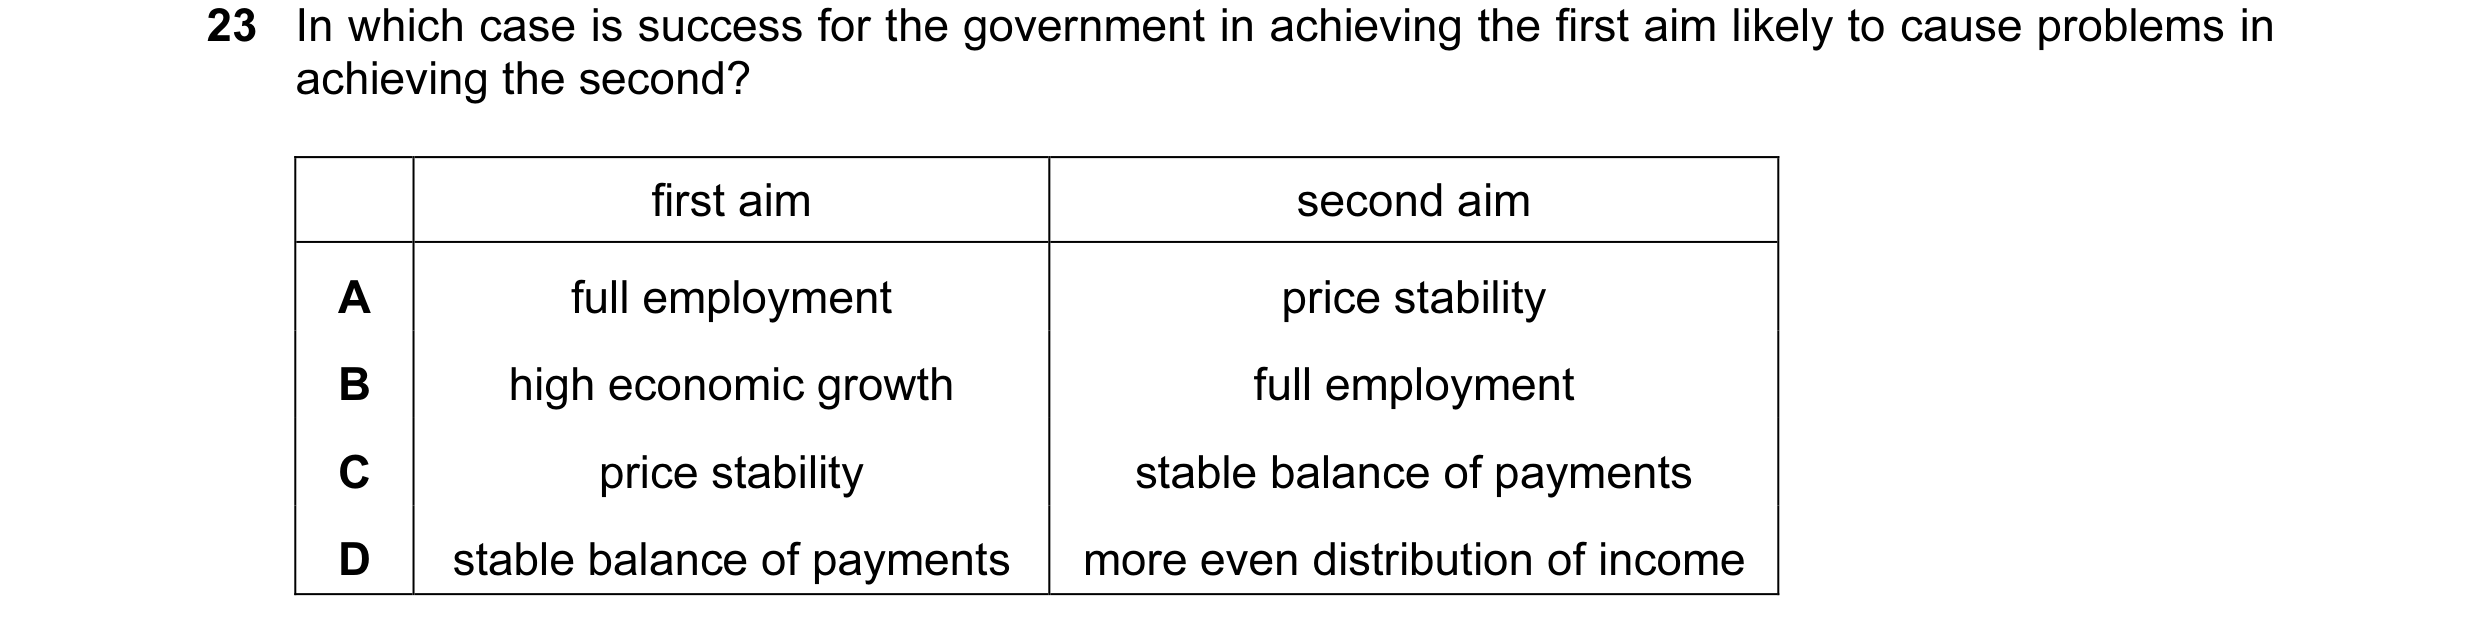
Q51 · In which case is success for the government in achieving the first aim likely to cause… 0455/11 May/June 2014
23 In which case is success for the government in achieving the first aim likely to cause problems in achieving the second? first aim second aim A full employment price stability B high economic growth full employment C price stability stable balance of payments D stable balance of payments more even distribution of income
1 marks
Answer: A
This question in 0455/11 May/June 2014
Q52 · The diagram shows the rate of unemployment and the periods of recession in Britain… 0455/13 May/June 2014
17 The diagram shows the rate of unemployment and the periods of recession in Britain between 1978 and 2012. 12 10 8 key Britain’s unemployment 6 recession years rate % 4 2 0 1980 1990 2000 2010 What can be concluded from the diagram? A Each recession lasted for more than two years. B Recessions occurred at regular intervals. C The unemployment rate peaked in a recession period. D The unemployment rate rose during recession periods.
1 marks
Answer: D
This question in 0455/13 May/June 2014
Q53 · It was reported in 2011 that an economy had negative economic growth for six months in a… 0455/13 May/June 2014
18 It was reported in 2011 that an economy had negative economic growth for six months in a row. What would be evidence for such a situation? A an increase in GDP B an increase in profit levels C an increase in the level of unemployment D an increase in the standard of living
1 marks
Answer: C
This question in 0455/13 May/June 2014
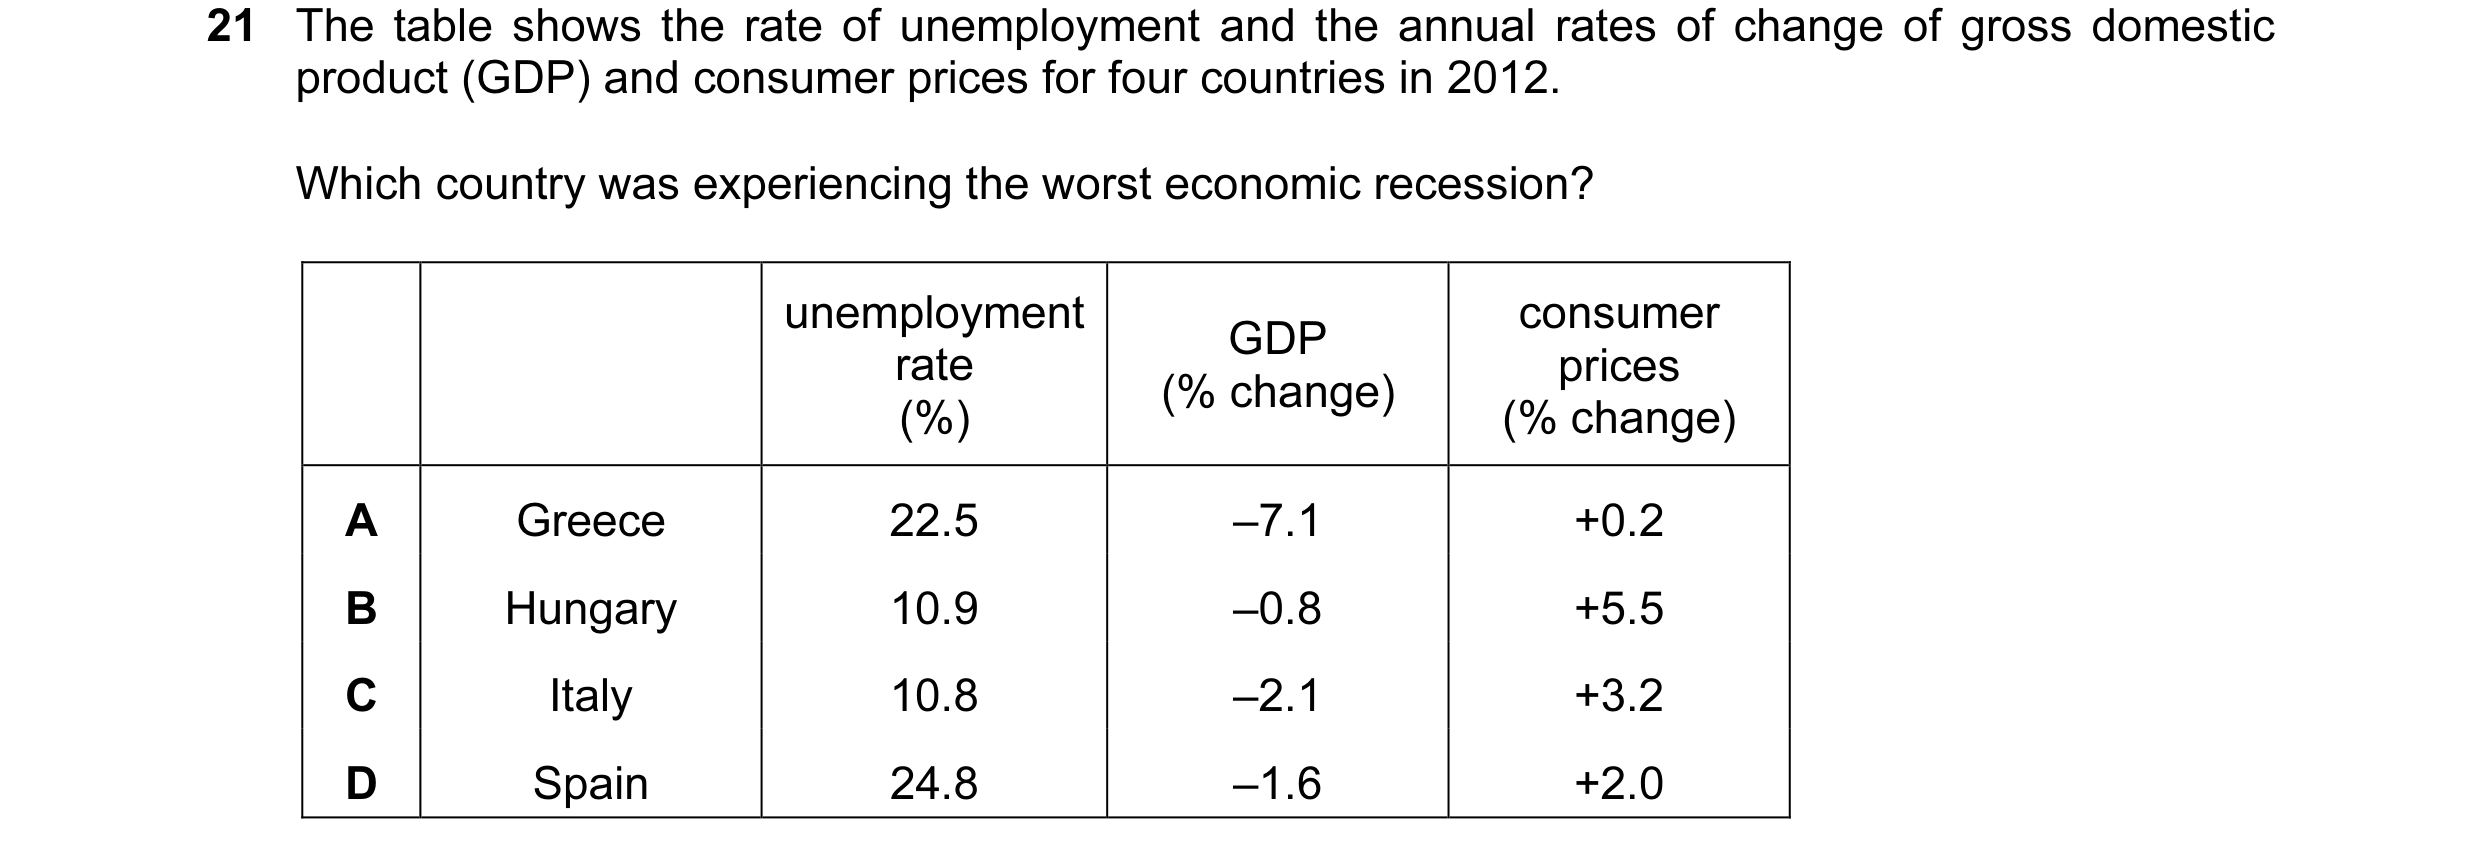
Q54 · The table shows the rate of unemployment and the annual rates of change of gross domestic… 0455/11 Oct/Nov 2014
21 The table shows the rate of unemployment and the annual rates of change of gross domestic product (GDP) and consumer prices for four countries in 2012. Which country was experiencing the worst economic recession? unemployment consumer GDP rate prices (% change) (%) (% change) A Greece 22.5 –7.1 +0.2 B Hungary 10.9 –0.8 +5.5 C Italy 10.8 –2.1 +3.2 D Spain 24.8 –1.6 +2.0
1 marks
Answer: A
This question in 0455/11 Oct/Nov 2014
Q55 · The table shows the rate of unemployment and the annual rates of change of gross domestic… 0455/12 Oct/Nov 2014
22 The table shows the rate of unemployment and the annual rates of change of gross domestic product (GDP) and consumer prices for four countries in 2012. Which country was experiencing the worst economic recession? unemployment consumer GDP rate prices (% change) (%) (% change) A Greece 22.5 –7.1 +0.2 B Hungary 10.9 –0.8 +5.5 C Italy 10.8 –2.1 +3.2 D Spain 24.8 –1.6 +2.0
1 marks
Answer: A
This question in 0455/12 Oct/Nov 2014
Q56 · What is most likely to cause economic growth? 0455/11 May/June 2015
20 What is most likely to cause economic growth? A a better educated workforce B a reduction in the right to own property C decreased wages D higher taxation
1 marks
Answer: A
This question in 0455/11 May/June 2015
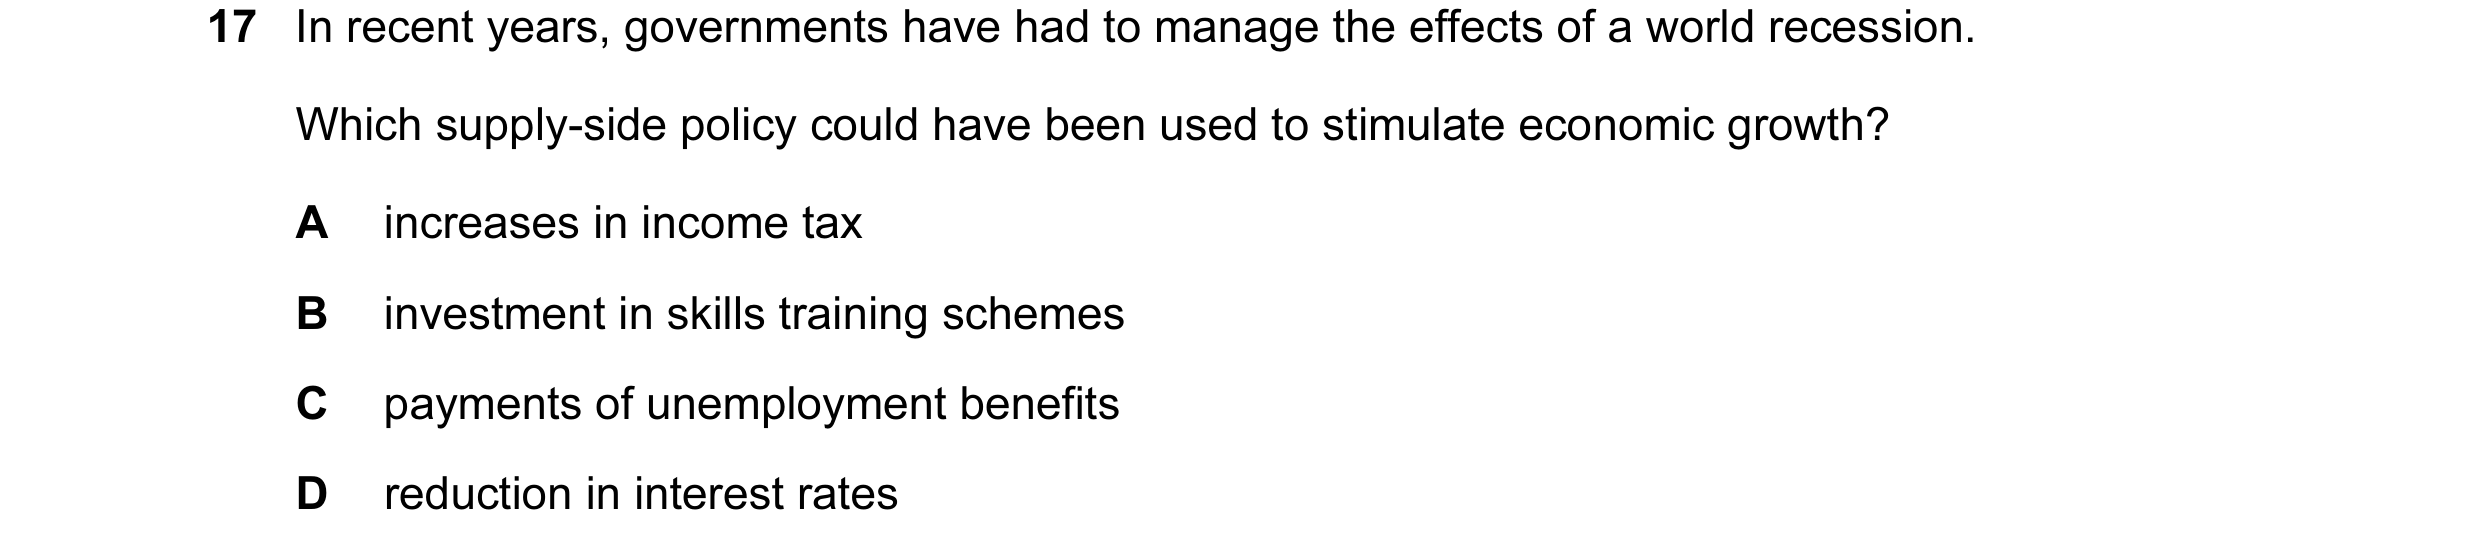
Q57 · In recent years, governments have had to manage the effects of a world recession 0455/12 May/June 2015
17 In recent years, governments have had to manage the effects of a world recession. Which supply-side policy could have been used to stimulate economic growth? A increases in income tax B investment in skills training schemes C payments of unemployment benefits D reduction in interest rates
1 marks
Answer: B
This question in 0455/12 May/June 2015
Q58 · How is economic growth measured? 0455/13 May/June 2015
20 How is economic growth measured? A by an increase in consumer demand B by an increase in literacy C by an increase in output D by an increase in wages
1 marks
Answer: C
This question in 0455/13 May/June 2015
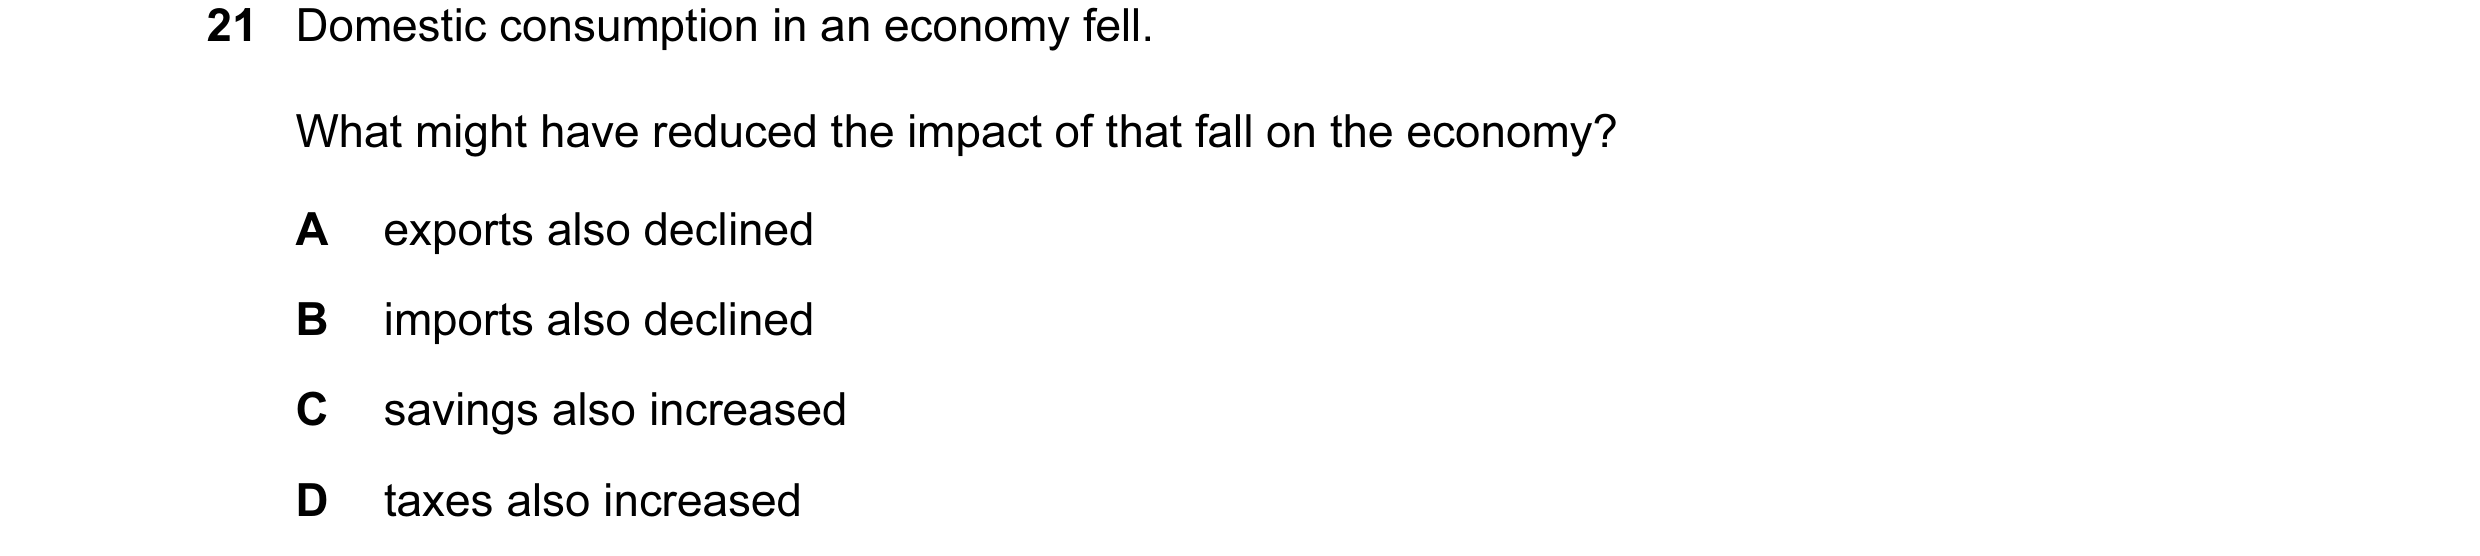
Q59 · Domestic consumption in an economy fell 0455/13 May/June 2015
21 Domestic consumption in an economy fell. What might have reduced the impact of that fall on the economy? A exports also declined B imports also declined C savings also increased D taxes also increased
1 marks
Answer: B
This question in 0455/13 May/June 2015
Q60 · The following information was published by an economy’s central bank 0455/13 May/June 2015
23 The following information was published by an economy’s central bank. In which case was real GDP growth highest? rate of nominal rate of GDP growth (%) inflation (%) A 2.0 1.0 B 7.0 5.0 C 9.0 13.0 D 10.0 11.0
1 marks
Answer: B
This question in 0455/13 May/June 2015
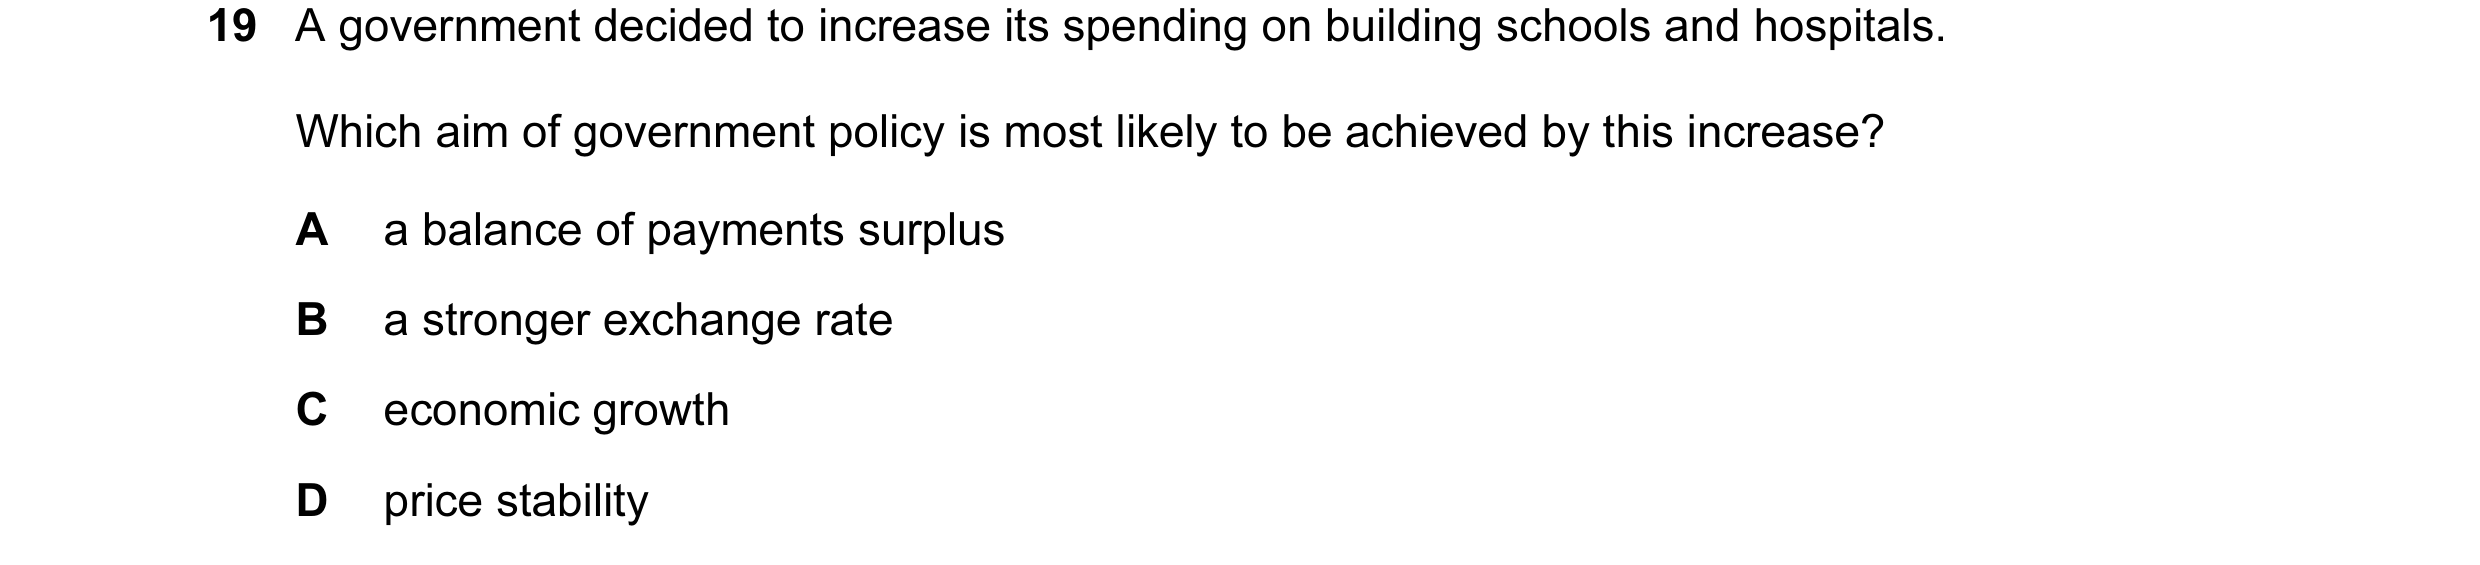
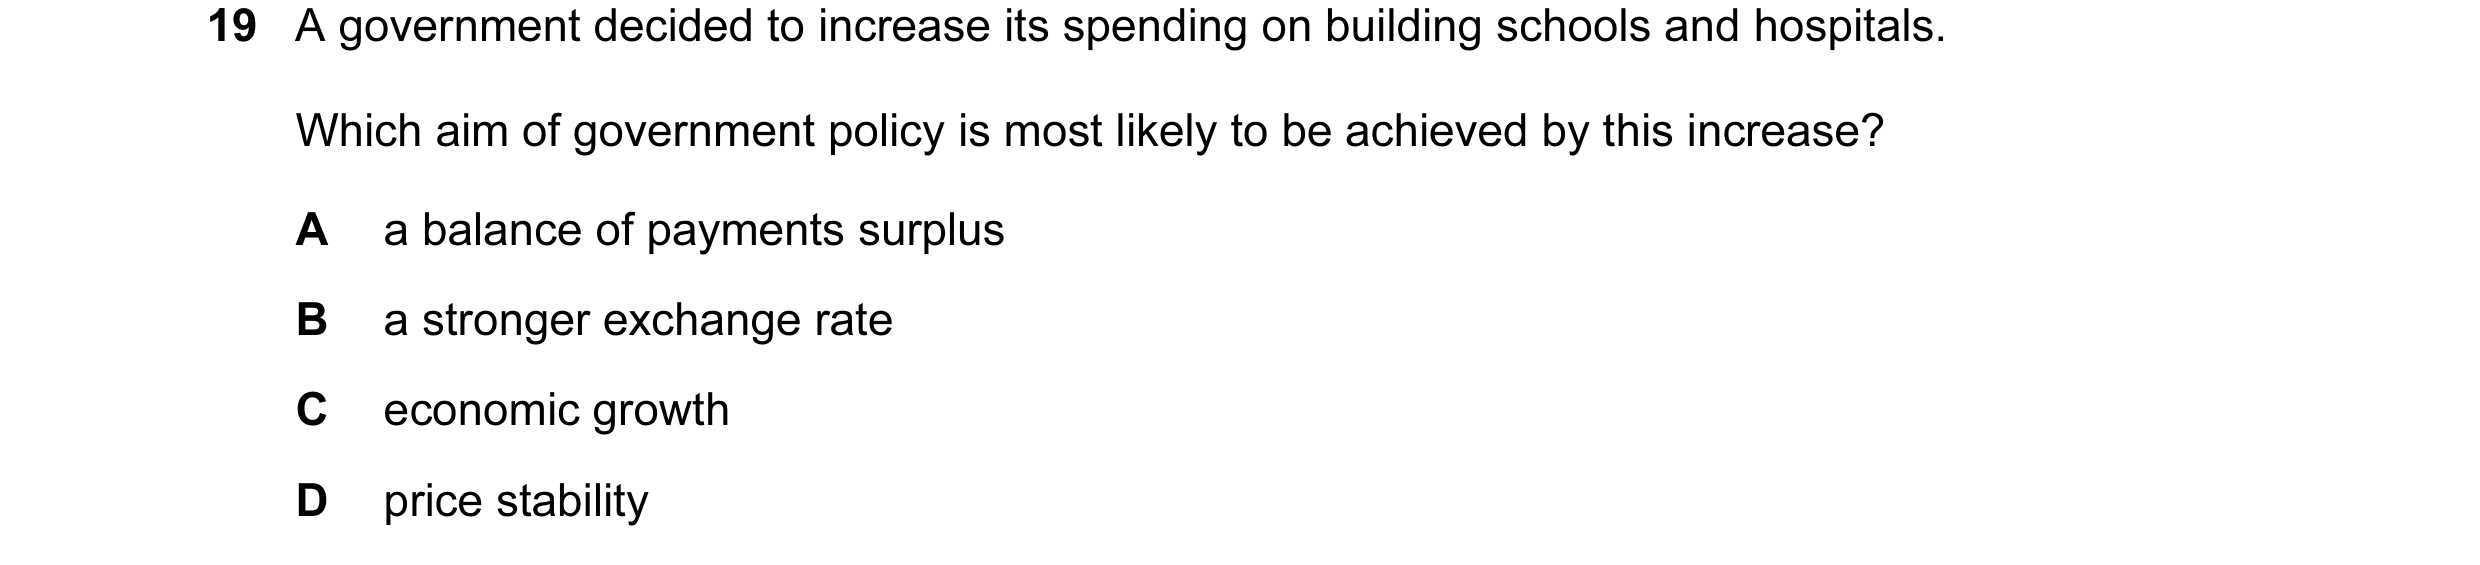
Q61 · A government decided to increase its spending on building schools and hospitals 0455/11 Oct/Nov 2015
19 A government decided to increase its spending on building schools and hospitals. Which aim of government policy is most likely to be achieved by this increase? A a balance of payments surplus B a stronger exchange rate C economic growth D price stability
1 marks
Answer: C
This question in 0455/11 Oct/Nov 2015
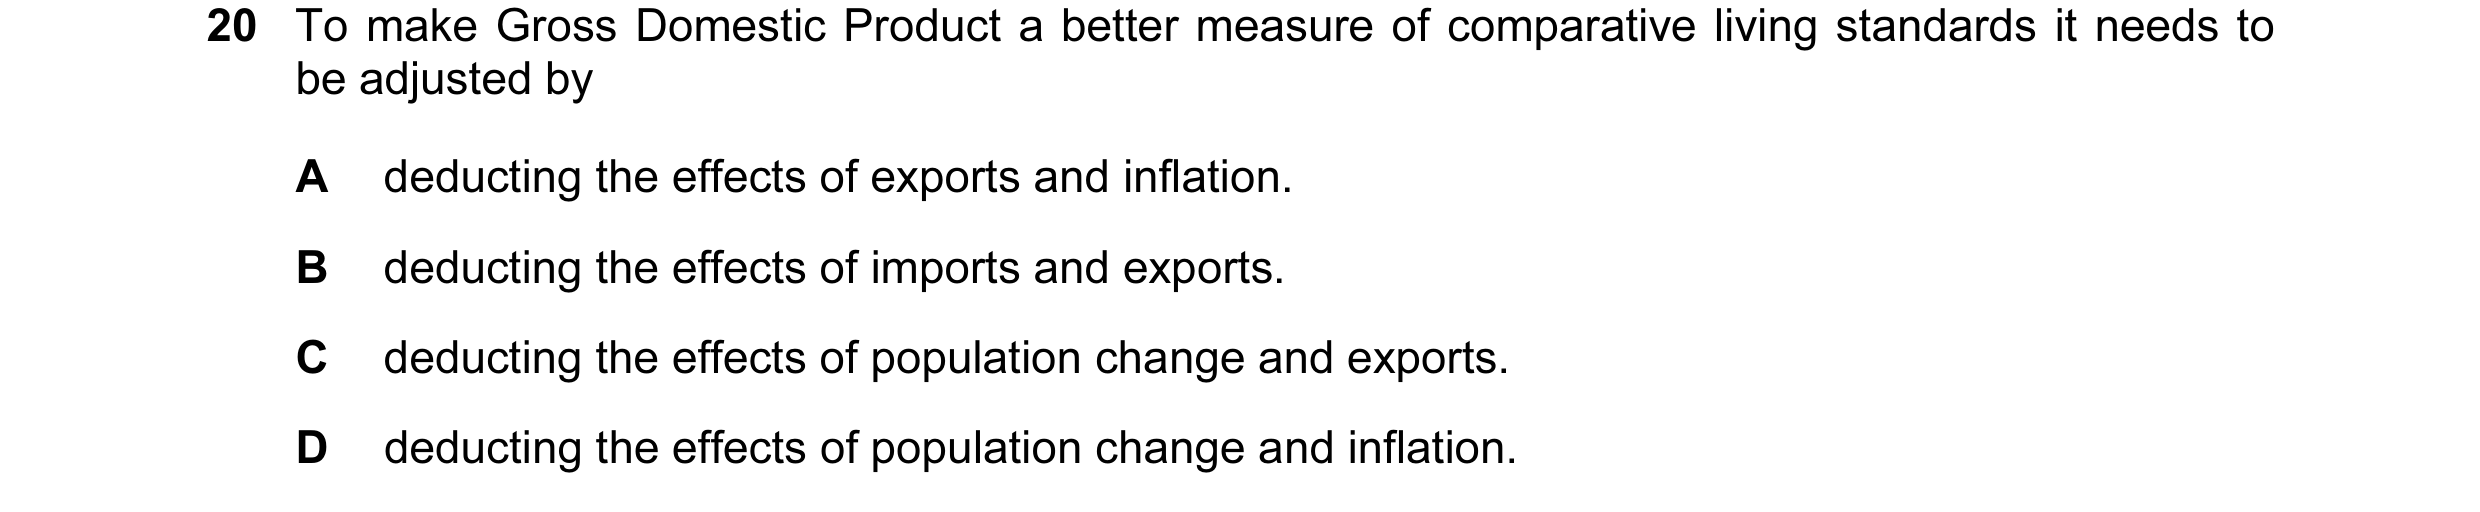
Q62 · To make Gross Domestic Product a better measure of comparative living standards it needs… 0455/11 Oct/Nov 2015
20 To make Gross Domestic Product a better measure of comparative living standards it needs to be adjusted by A deducting the effects of exports and inflation. B deducting the effects of imports and exports. C deducting the effects of population change and exports. D deducting the effects of population change and inflation.
1 marks
Answer: D
This question in 0455/11 Oct/Nov 2015
Q63 · A government decided to increase its spending on building schools and hospitals 0455/12 Oct/Nov 2015
19 A government decided to increase its spending on building schools and hospitals. Which aim of government policy is most likely to be achieved by this increase? A a balance of payments surplus B a stronger exchange rate C economic growth D price stability
1 marks
Answer: C
This question in 0455/12 Oct/Nov 2015
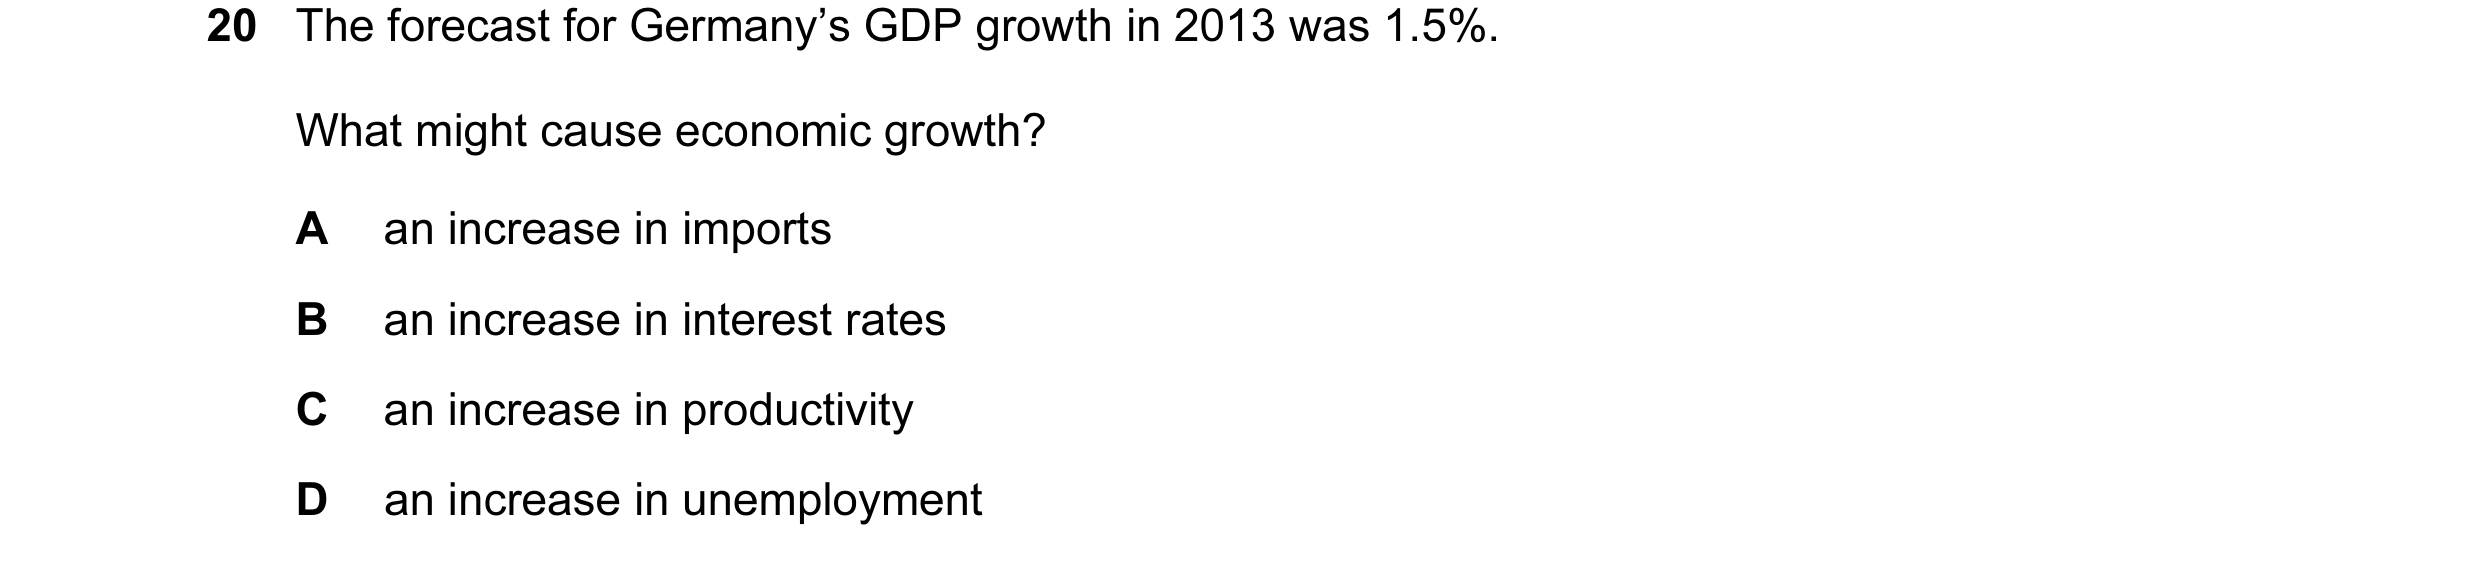
Q64 · The forecast for Germany’s GDP growth in 2013 was 1.5% 0455/12 Oct/Nov 2015
20 The forecast for Germany’s GDP growth in 2013 was 1.5%. What might cause economic growth? A an increase in imports B an increase in interest rates C an increase in productivity D an increase in unemployment
1 marks
Answer: C
This question in 0455/12 Oct/Nov 2015
Q65 · What identifies a recession? 0455/12 Feb/March 2016
21 What identifies a recession? A a fall in the general price level B a fall in the level of national output C a fall in the real value of money D a fall in the stock market index
1 marks
Answer: B
This question in 0455/12 Feb/March 2016
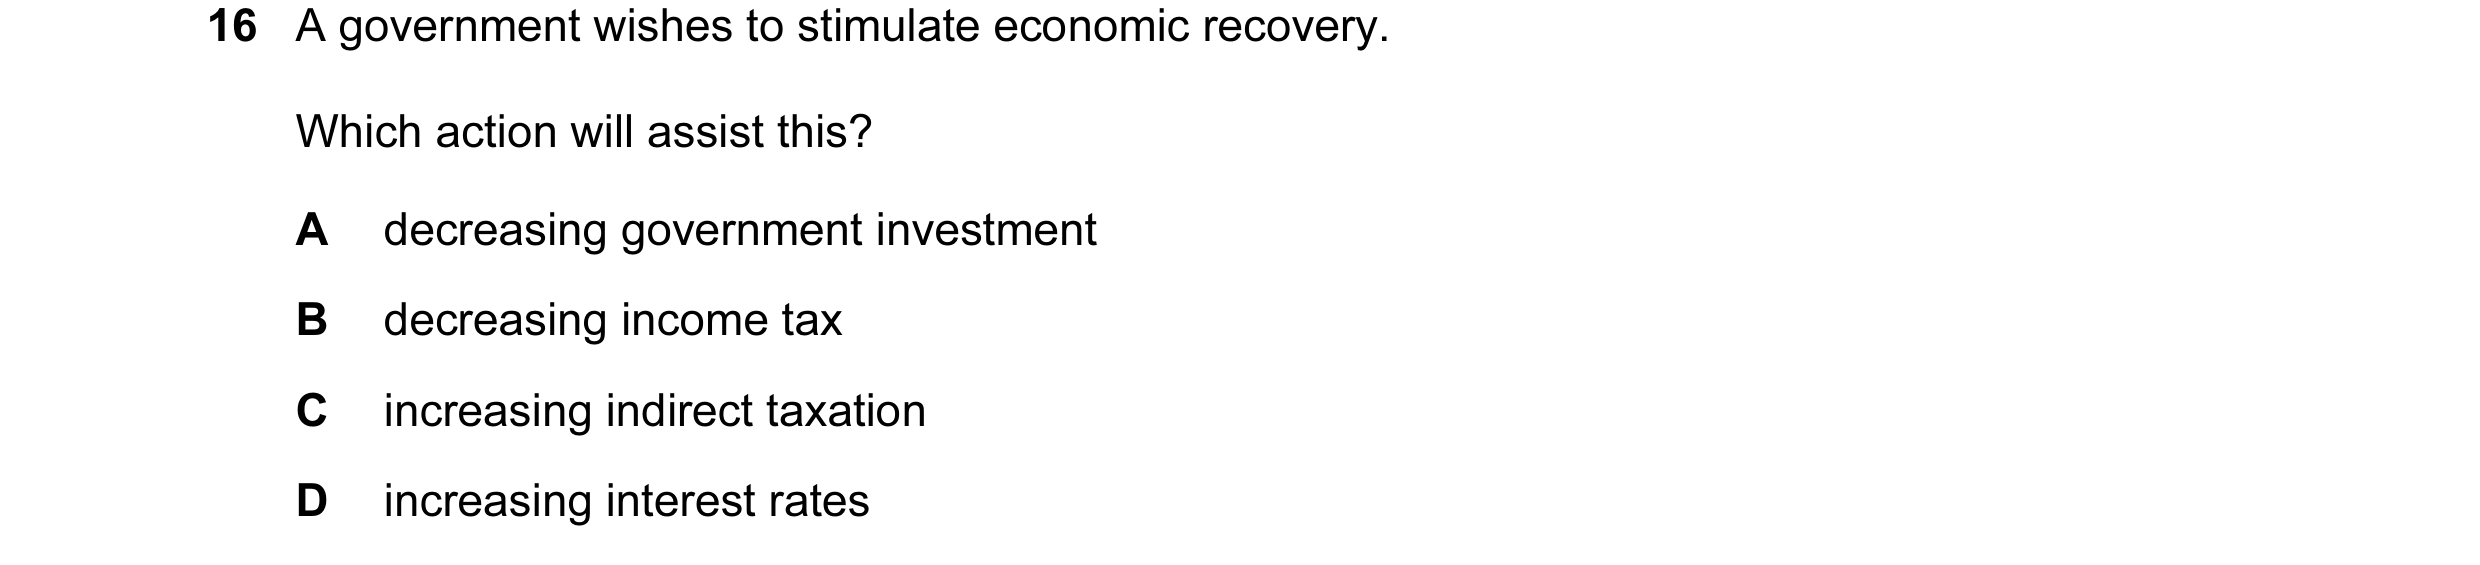
Q66 · A government wishes to stimulate economic recovery 0455/11 May/June 2016
16 A government wishes to stimulate economic recovery. Which action will assist this? A decreasing government investment B decreasing income tax C increasing indirect taxation D increasing interest rates
1 marks
Answer: B
This question in 0455/11 May/June 2016
Q67 · What must result when a country experiences economic growth? 0455/11 May/June 2016
23 What must result when a country experiences economic growth? A a higher Gross Domestic Product B a lower rate of inflation C a surplus on the balance of trade D an improved standard of living for everybody
1 marks
Answer: A
This question in 0455/11 May/June 2016
Q68 · Why may the figure calculated for a developing country’s Gross Domestic Product be… 0455/11 May/June 2016
24 Why may the figure calculated for a developing country’s Gross Domestic Product be inaccurate? A There are unused resources. B There is a high reliance on imports. C There is a large amount of subsistence farming. D There is a small amount of skilled labour.
1 marks
Answer: C
This question in 0455/11 May/June 2016
Q69 · A government wishes to stimulate economic recovery 0455/12 May/June 2016
16 A government wishes to stimulate economic recovery. Which action will assist this? A decreasing government investment B decreasing income tax C increasing indirect taxation D increasing interest rates
1 marks
Answer: B
This question in 0455/12 May/June 2016
Q70 · What would best indicate the start of an economic boom? 0455/12 May/June 2016
20 What would best indicate the start of an economic boom? A negative growth of Gross Domestic Product B rising interest rates C rising levels of employment D steadily falling price levels
1 marks
Answer: C
This question in 0455/12 May/June 2016
Q71 · A government wishes to stimulate economic recovery 0455/13 May/June 2016
16 A government wishes to stimulate economic recovery. Which action will assist this? A decreasing government investment B decreasing income tax C increasing indirect taxation D increasing interest rates
1 marks
Answer: B
This question in 0455/13 May/June 2016
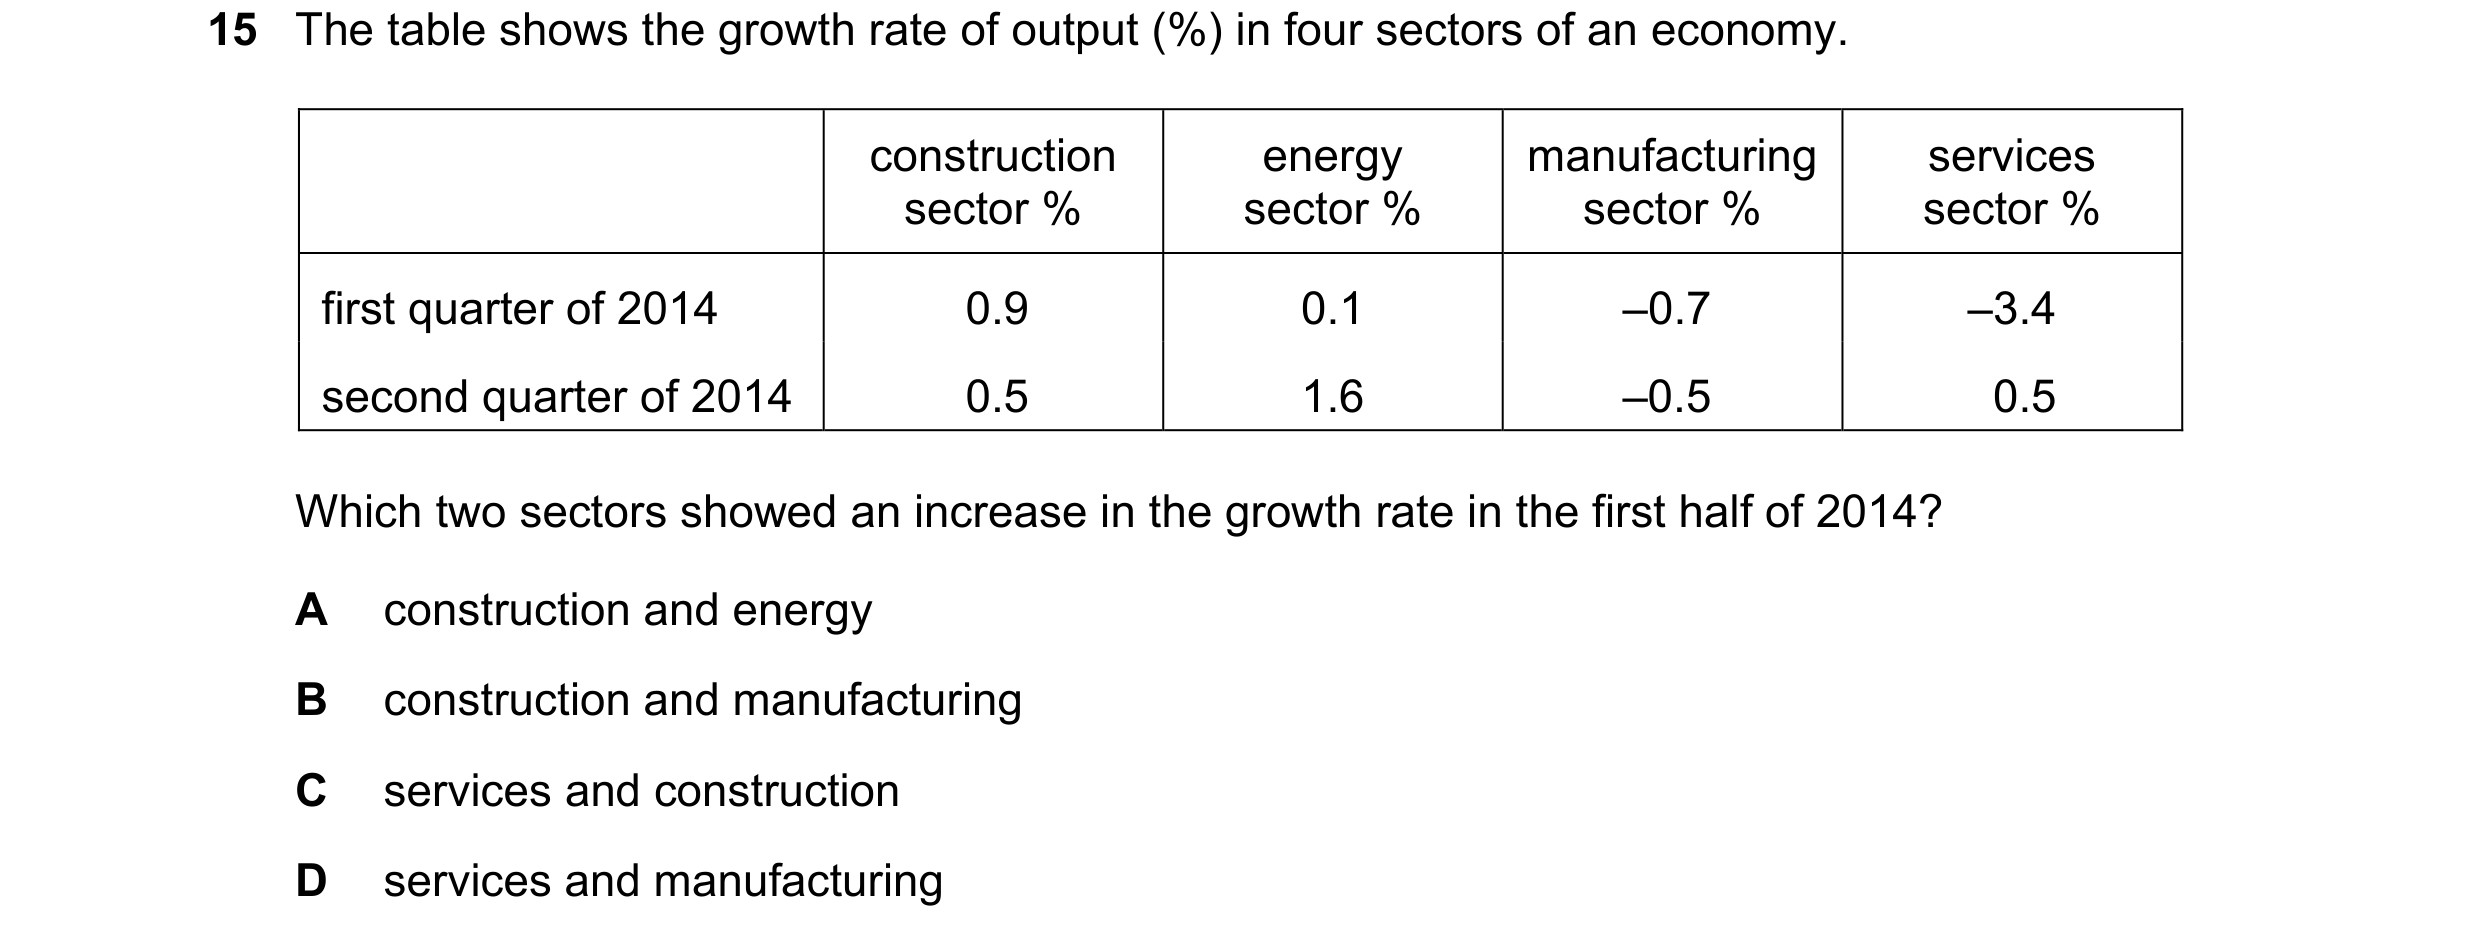
Q72 · The table shows the growth rate of output (%) in four sectors of an economy 0455/12 Oct/Nov 2016
15 The table shows the growth rate of output (%) in four sectors of an economy. construction energy manufacturing services sector % sector % sector % sector % first quarter of 2014 0.9 0.1 –0.7 –3.4 second quarter of 2014 0.5 1.6 –0.5 0.5 Which two sectors showed an increase in the growth rate in the first half of 2014? A construction and energy B construction and manufacturing C services and construction D services and manufacturing
1 marks
This question in 0455/12 Oct/Nov 2016
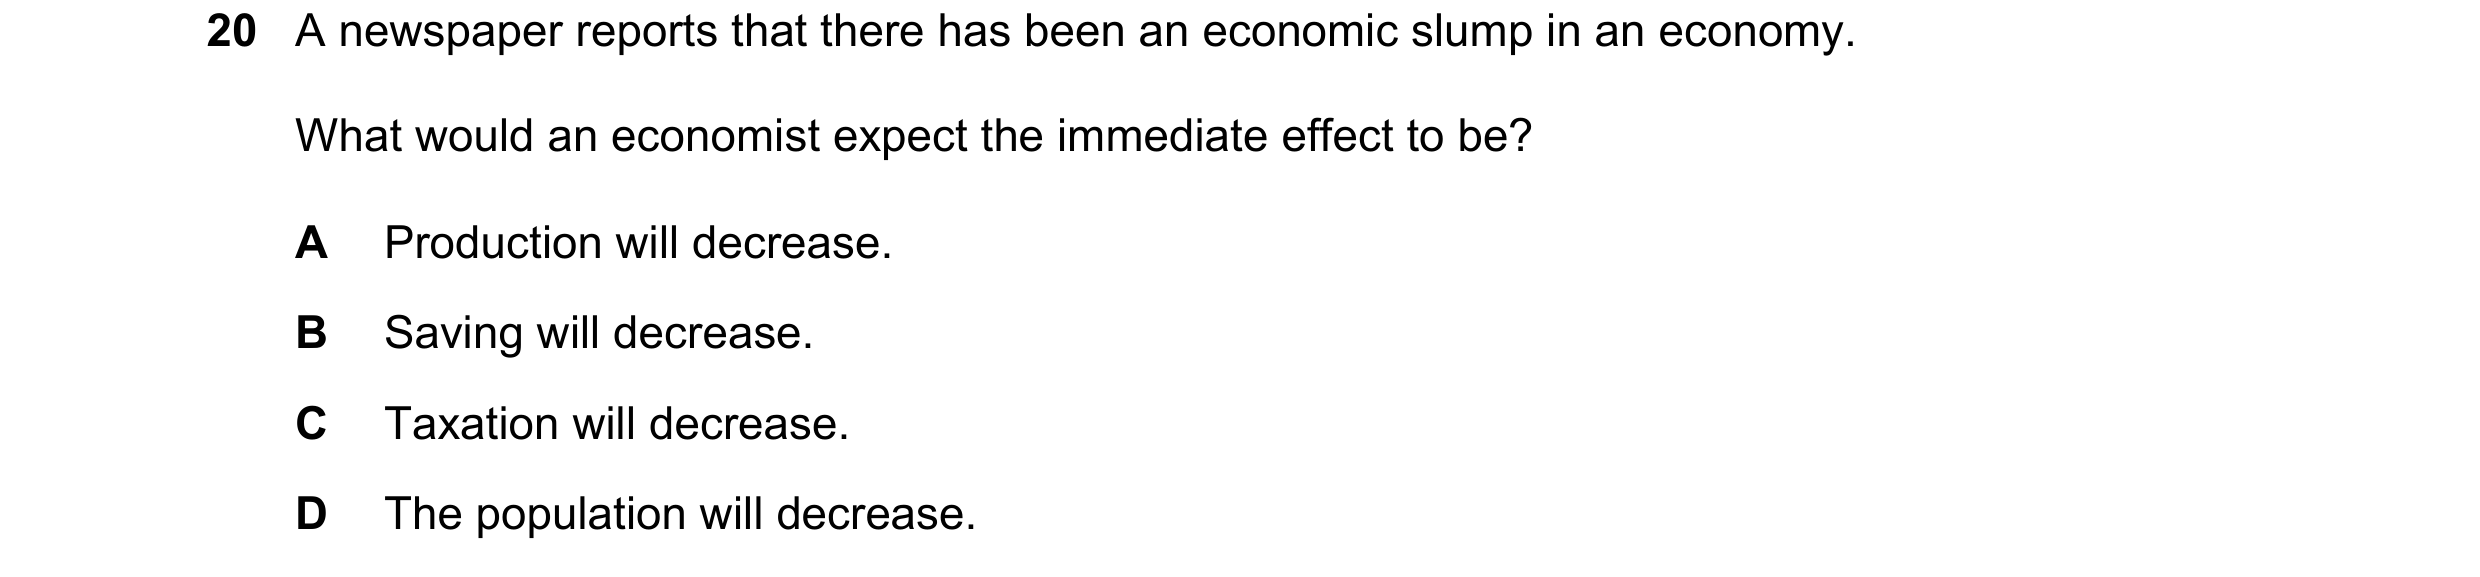
Q73 · A newspaper reports that there has been an economic slump in an economy 0455/13 Oct/Nov 2016
20 A newspaper reports that there has been an economic slump in an economy. What would an economist expect the immediate effect to be? A Production will decrease. B Saving will decrease. C Taxation will decrease. D The population will decrease.
1 marks
Answer: A
This question in 0455/13 Oct/Nov 2016
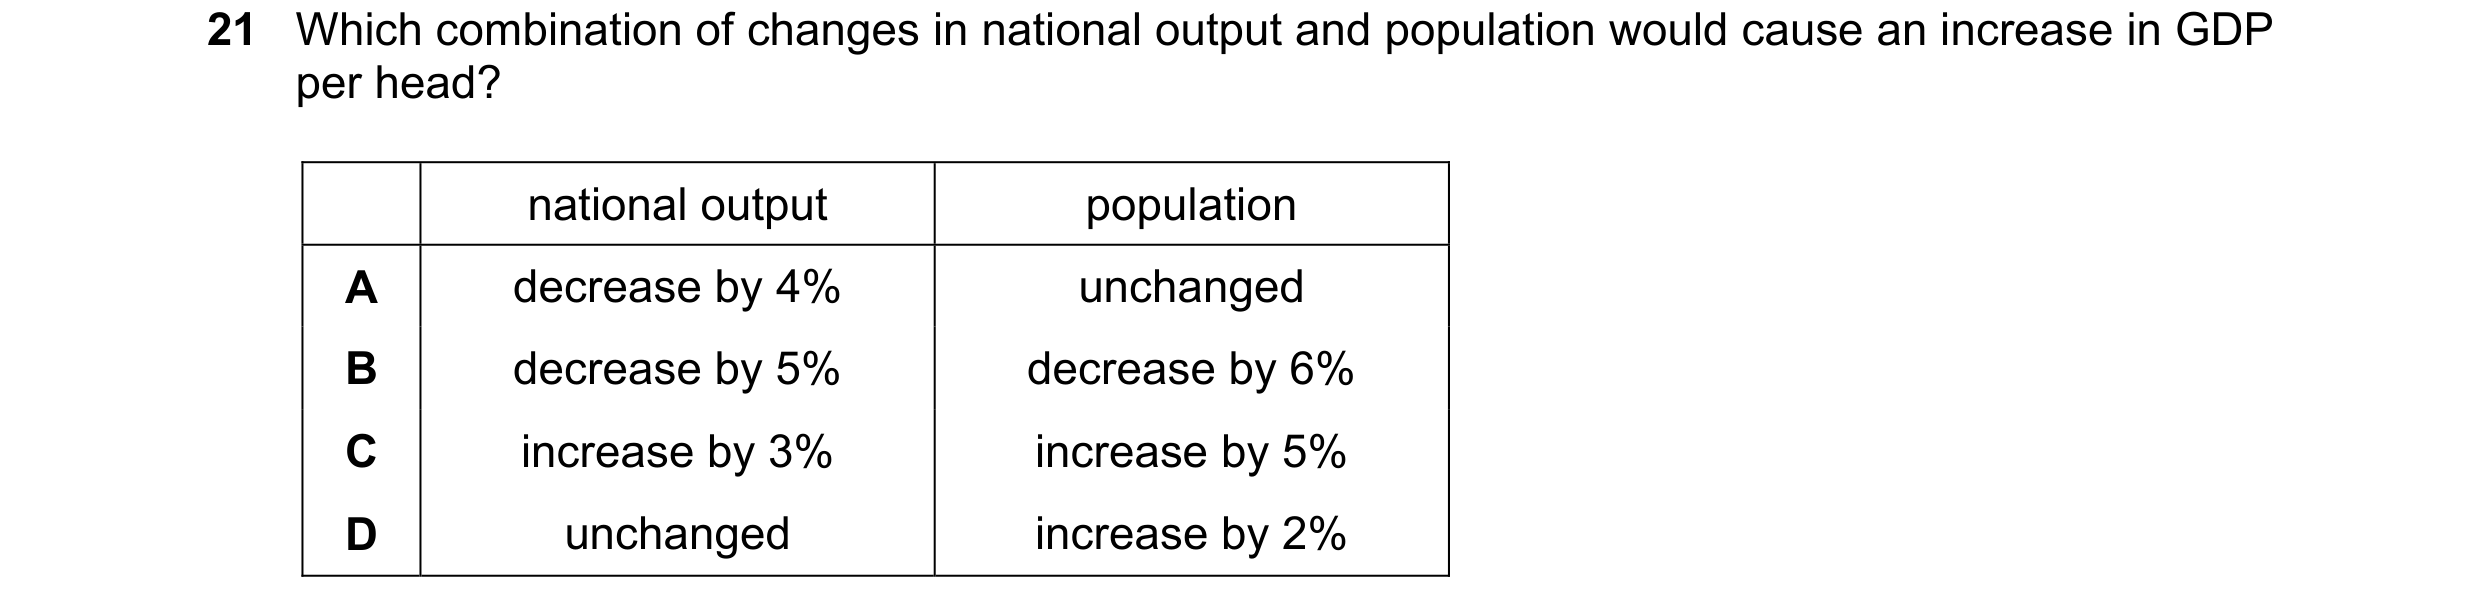
Q74 · Which combination of changes in national output and population would cause an increase in… 0455/12 Feb/March 2017
21 Which combination of changes in national output and population would cause an increase in GDP per head? national output population A decrease by 4% unchanged B decrease by 5% decrease by 6% C increase by 3% increase by 5% D unchanged increase by 2%
1 marks
Answer: B
This question in 0455/12 Feb/March 2017
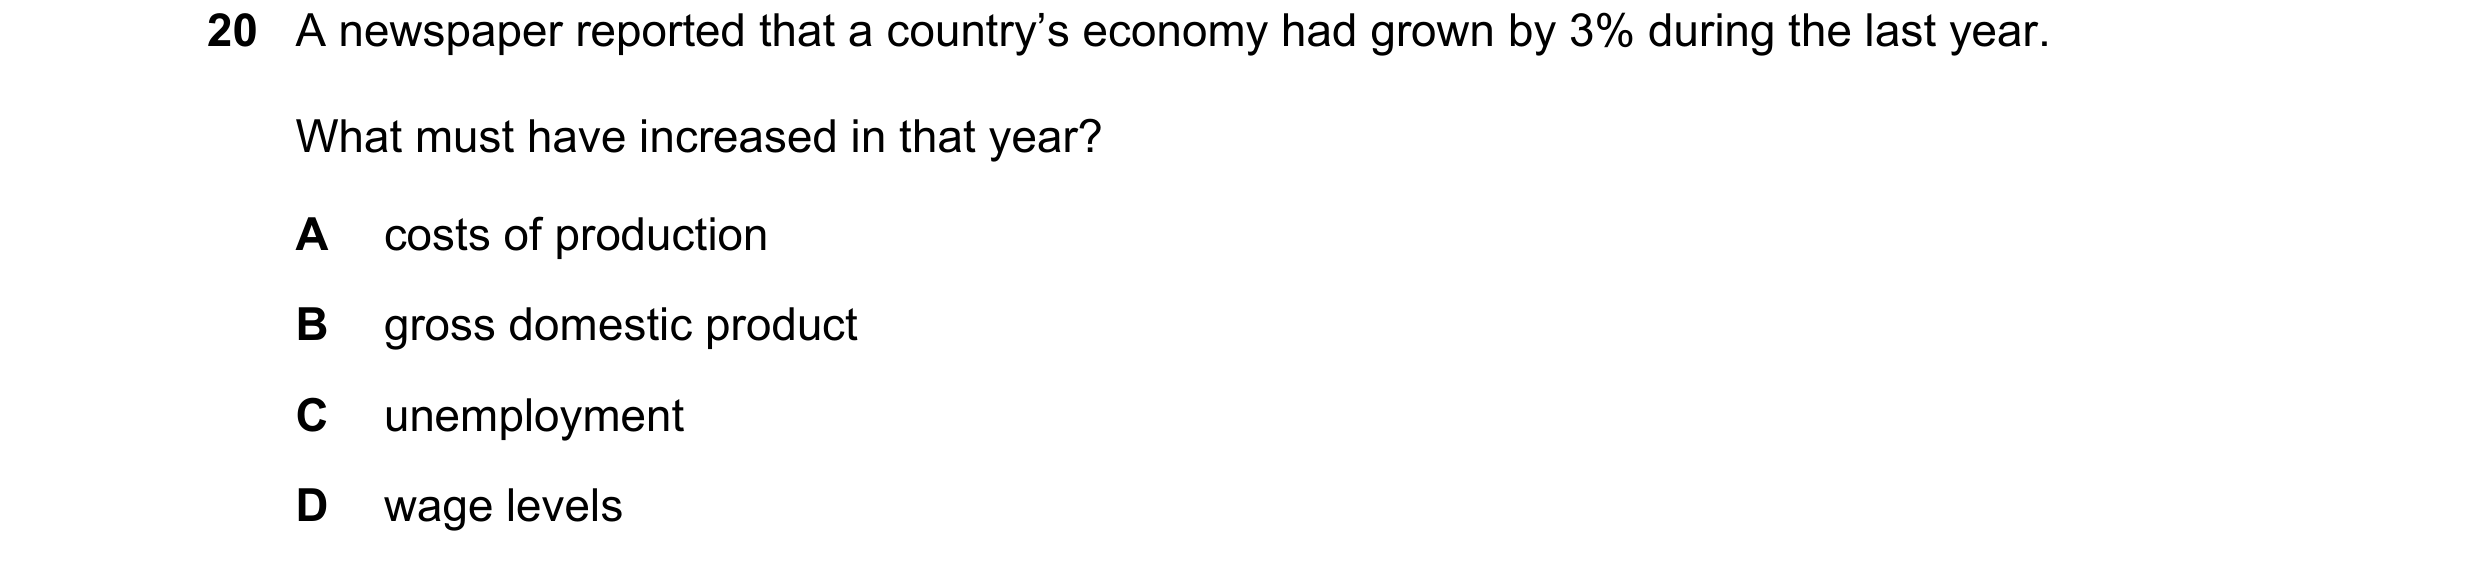
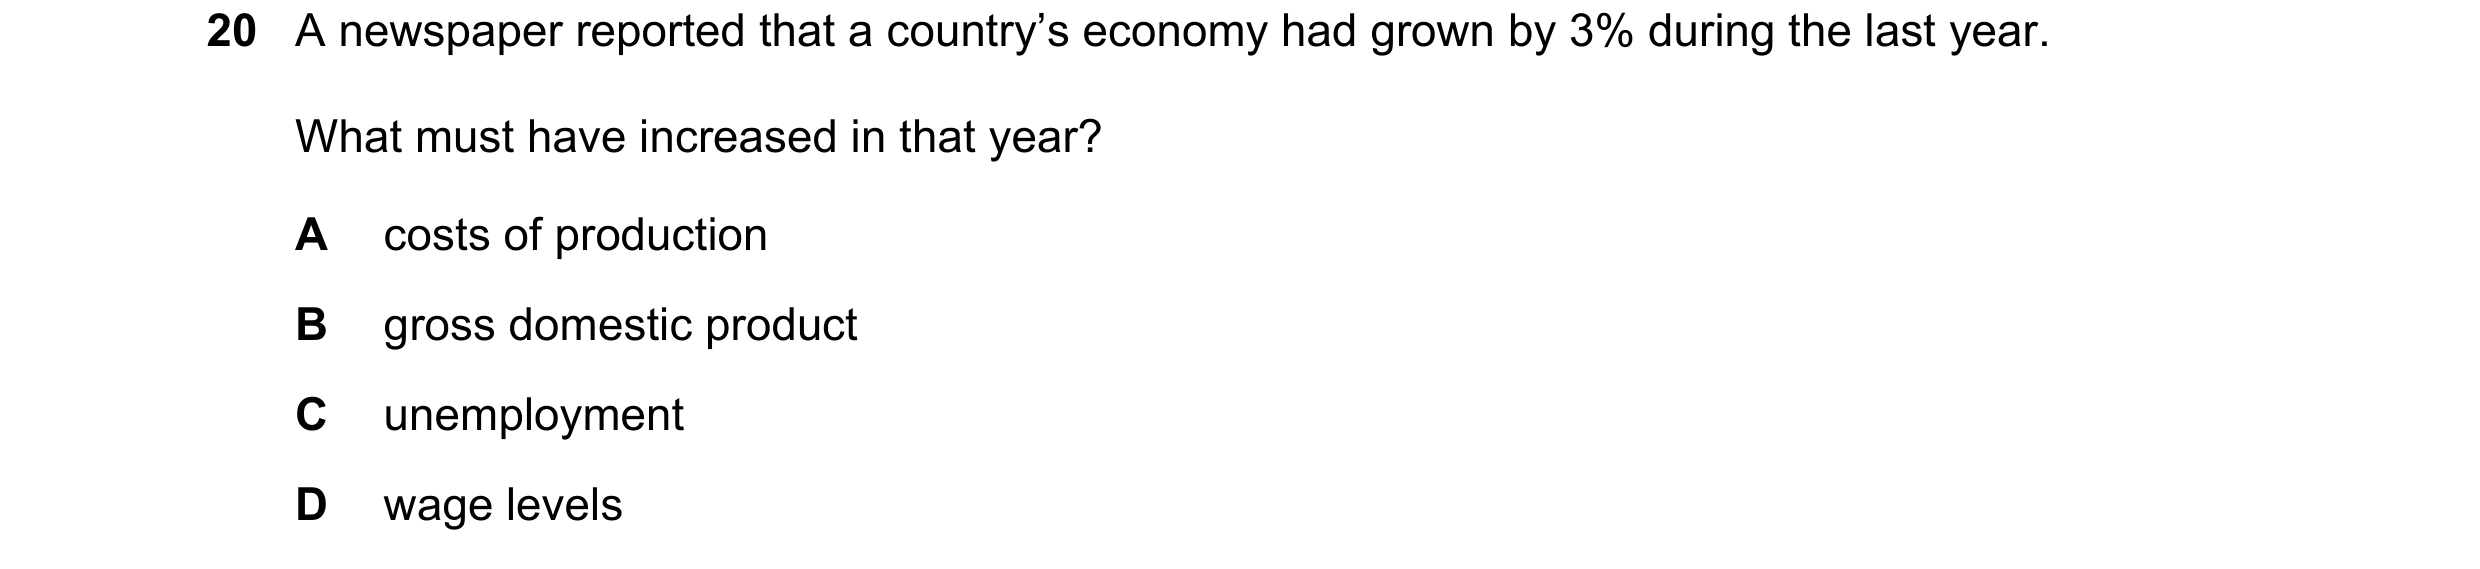
Q75 · A newspaper reported that a country’s economy had grown by 3% during the last year 0455/11 May/June 2017
20 A newspaper reported that a country’s economy had grown by 3% during the last year. What must have increased in that year? A costs of production B gross domestic product C unemployment D wage levels
1 marks
Answer: B
This question in 0455/11 May/June 2017
Q76 · A newspaper reported that a country’s economy had grown by 3% during the last year 0455/12 May/June 2017
20 A newspaper reported that a country’s economy had grown by 3% during the last year. What must have increased in that year? A costs of production B gross domestic product C unemployment D wage levels
1 marks
Answer: B
This question in 0455/12 May/June 2017
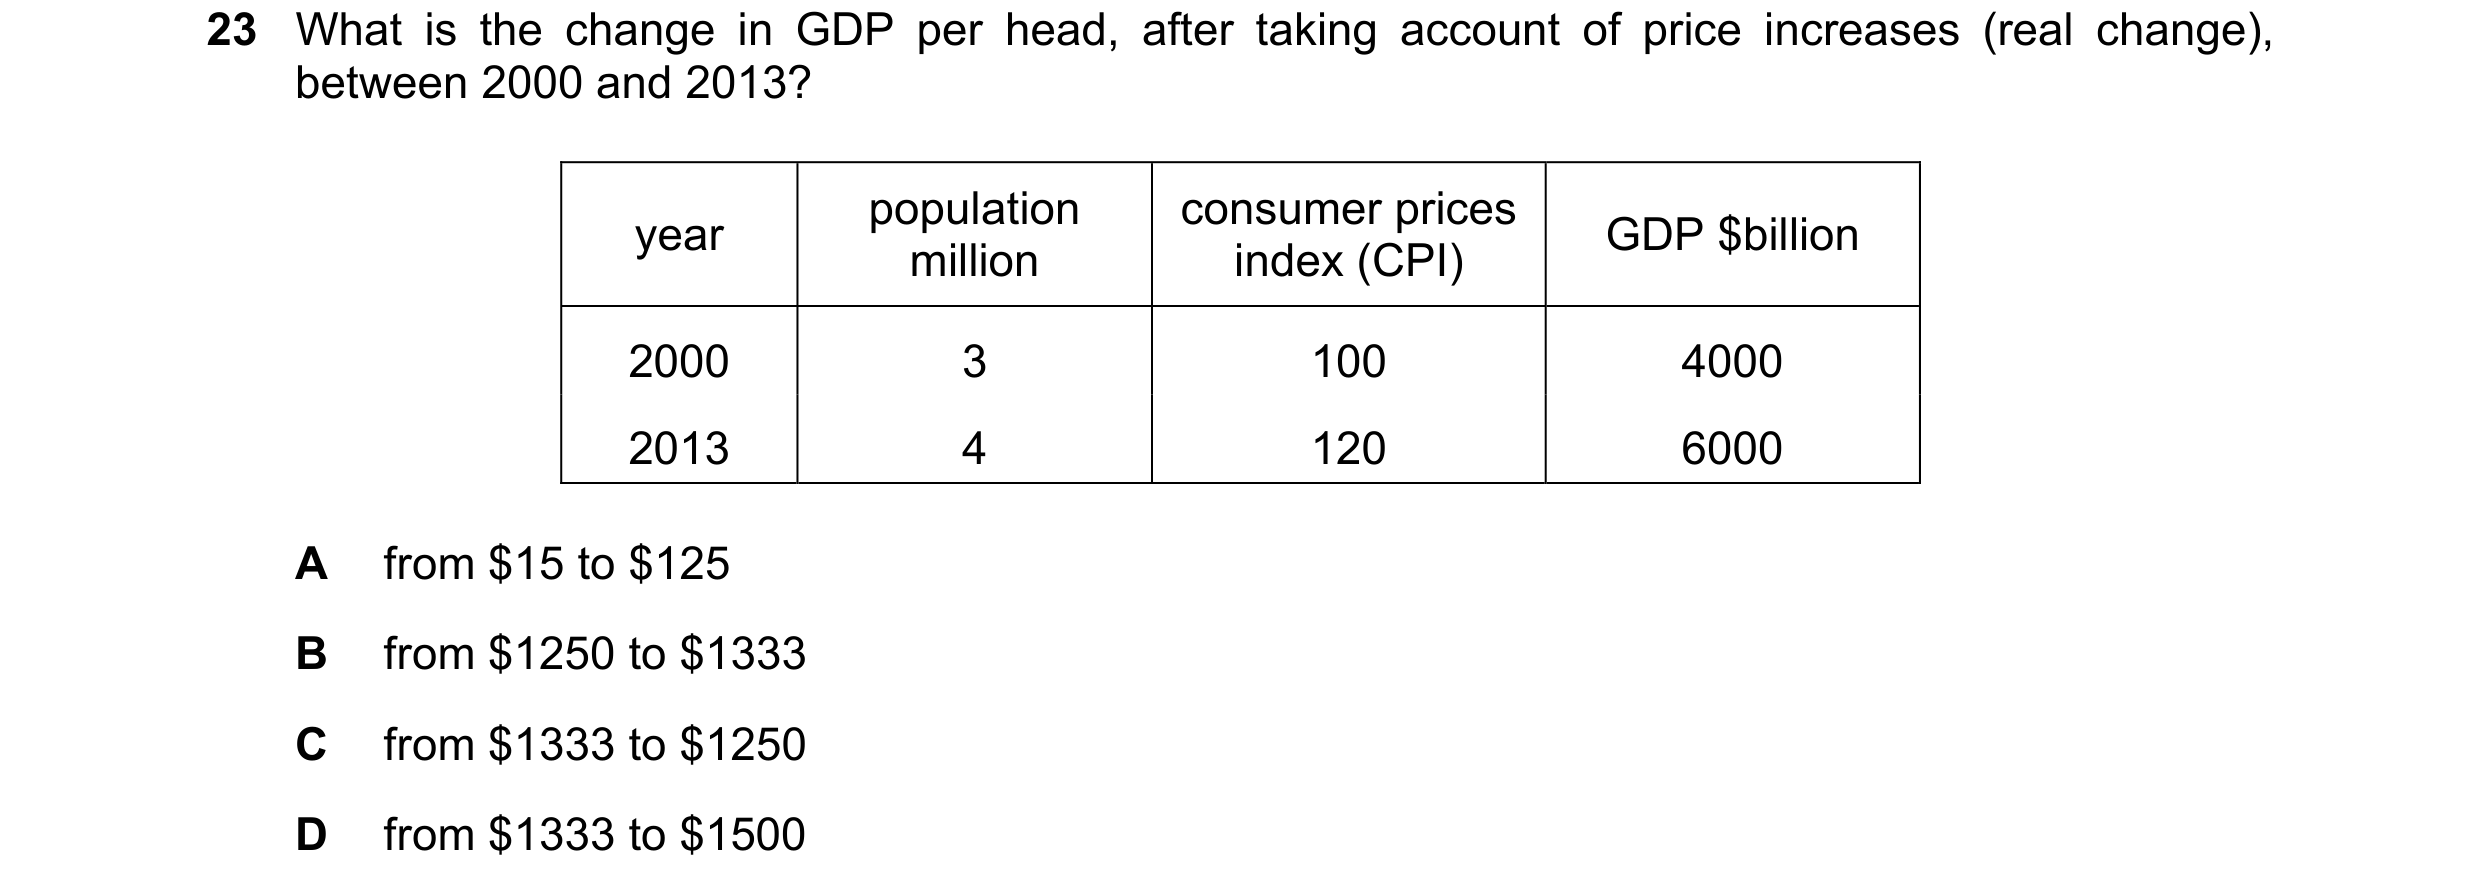
Q77 · What is the change in GDP per head, after taking account of price increases (real… 0455/12 May/June 2017
23 What is the change in GDP per head, after taking account of price increases (real change), between 2000 and 2013? population consumer prices year GDP $billion million index (CPI) 2000 3 100 4000 2013 4 120 6000 A from $15 to $125 B from $1250 to $1333 C from $1333 to $1250 D from $1333 to $1500
1 marks
Answer: C
This question in 0455/12 May/June 2017
Q78 · A newspaper reported that a country’s economy had grown by 3% during the last year 0455/13 May/June 2017
20 A newspaper reported that a country’s economy had grown by 3% during the last year. What must have increased in that year? A costs of production B gross domestic product C unemployment D wage levels
1 marks
Answer: B
This question in 0455/13 May/June 2017
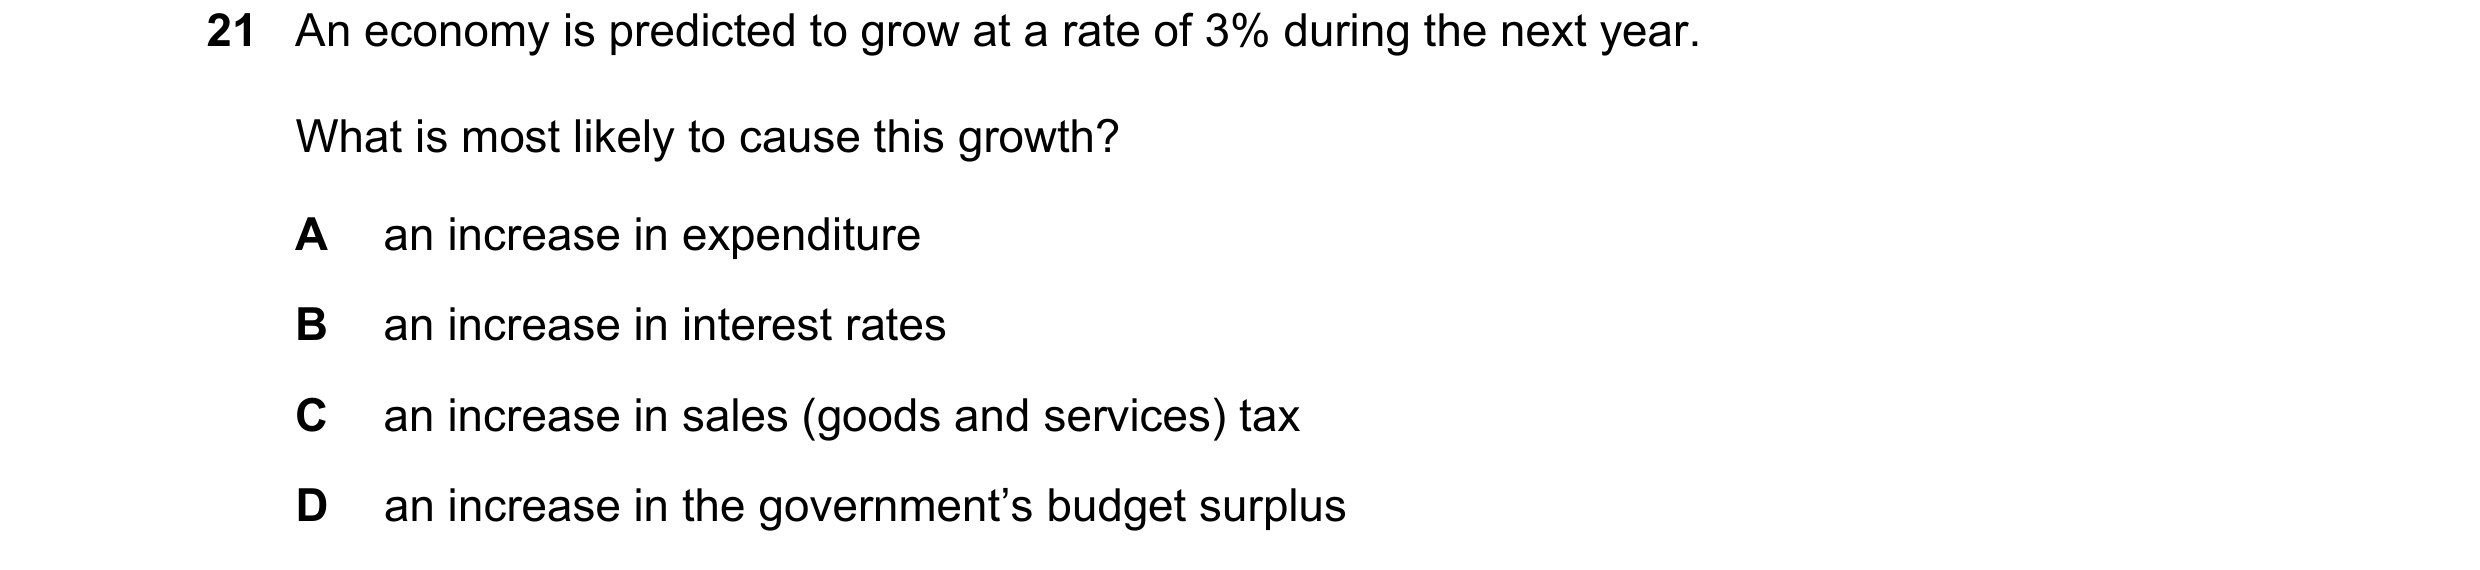
Q79 · An economy is predicted to grow at a rate of 3% during the next year 0455/11 Oct/Nov 2017
21 An economy is predicted to grow at a rate of 3% during the next year. What is most likely to cause this growth? A an increase in expenditure B an increase in interest rates C an increase in sales (goods and services) tax D an increase in the government’s budget surplus
1 marks
Answer: A
This question in 0455/11 Oct/Nov 2017
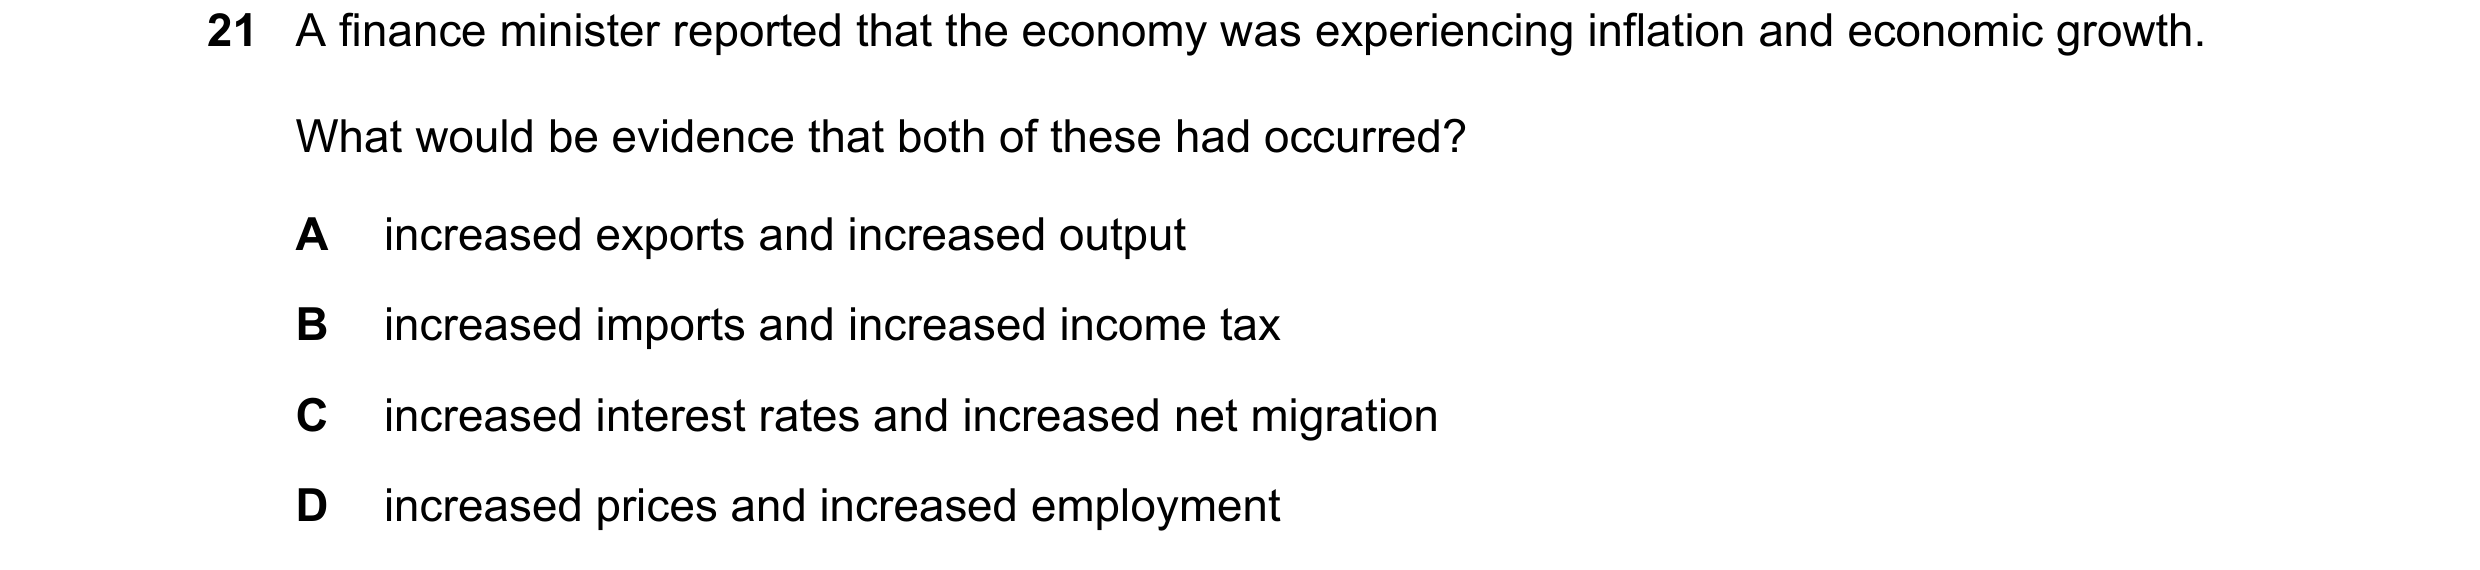
Q80 · A finance minister reported that the economy was experiencing inflation and economic… 0455/12 Oct/Nov 2017
21 A finance minister reported that the economy was experiencing inflation and economic growth. What would be evidence that both of these had occurred? A increased exports and increased output B increased imports and increased income tax C increased interest rates and increased net migration D increased prices and increased employment
1 marks
Answer: D
This question in 0455/12 Oct/Nov 2017
Q81 · An economy is experiencing two consecutive quarters of negative economic growth 0455/11 May/June 2018
20 An economy is experiencing two consecutive quarters of negative economic growth. What is this economy experiencing? A budget deficit B inflation C recession D trade deficit
1 marks
Answer: C
This question in 0455/11 May/June 2018
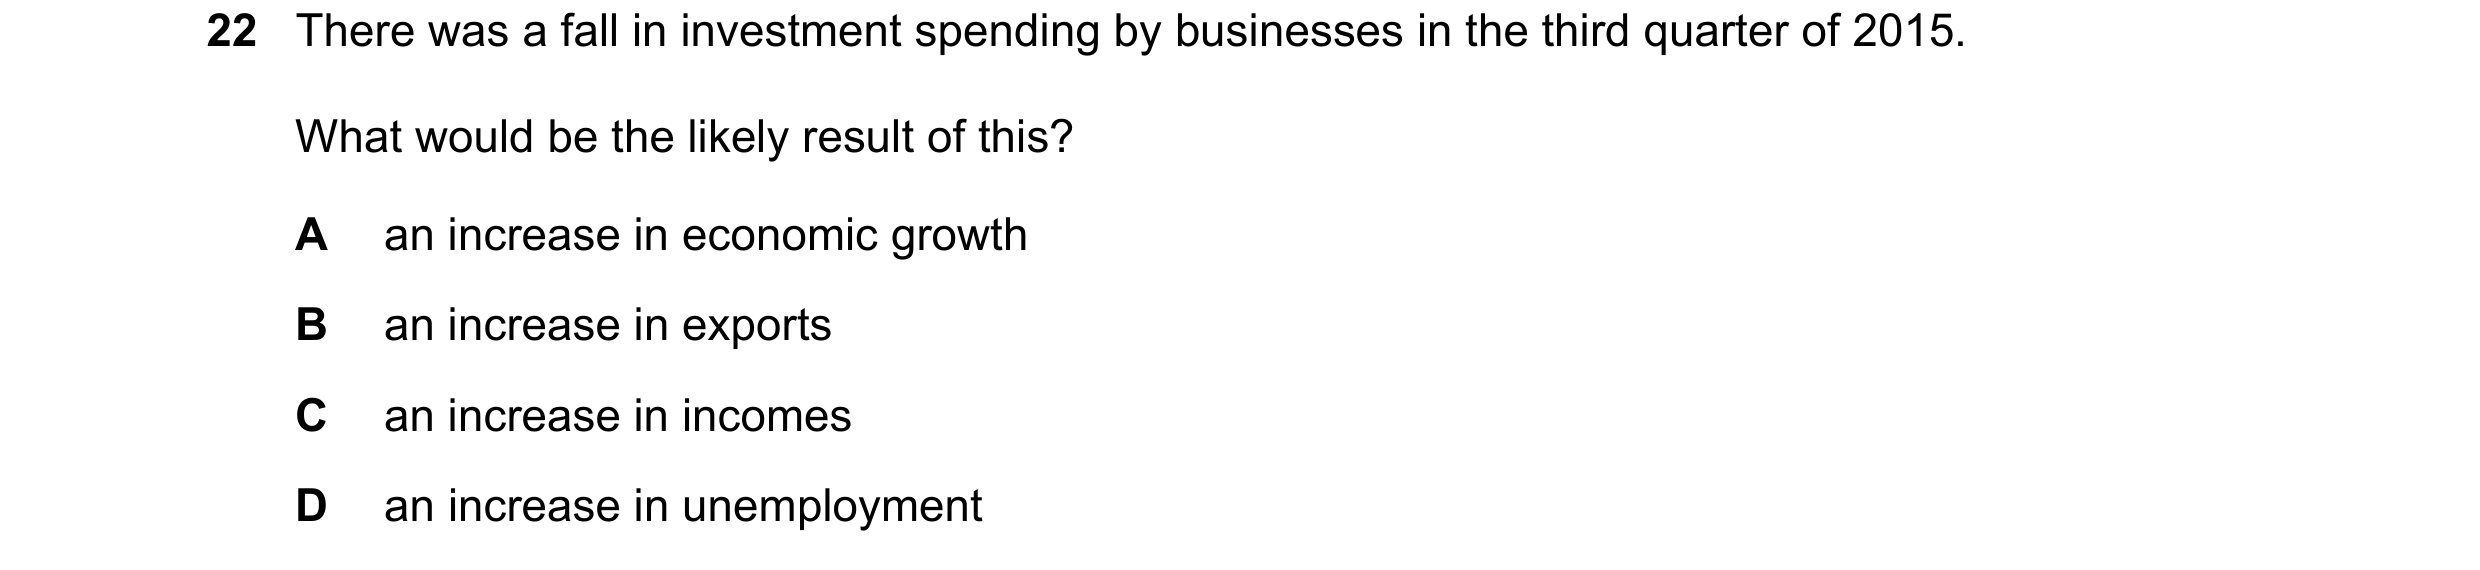
Q82 · There was a fall in investment spending by businesses in the third quarter of 2015 0455/11 May/June 2018
22 There was a fall in investment spending by businesses in the third quarter of 2015. What would be the likely result of this? A an increase in economic growth B an increase in exports C an increase in incomes D an increase in unemployment
1 marks
Answer: D
This question in 0455/11 May/June 2018
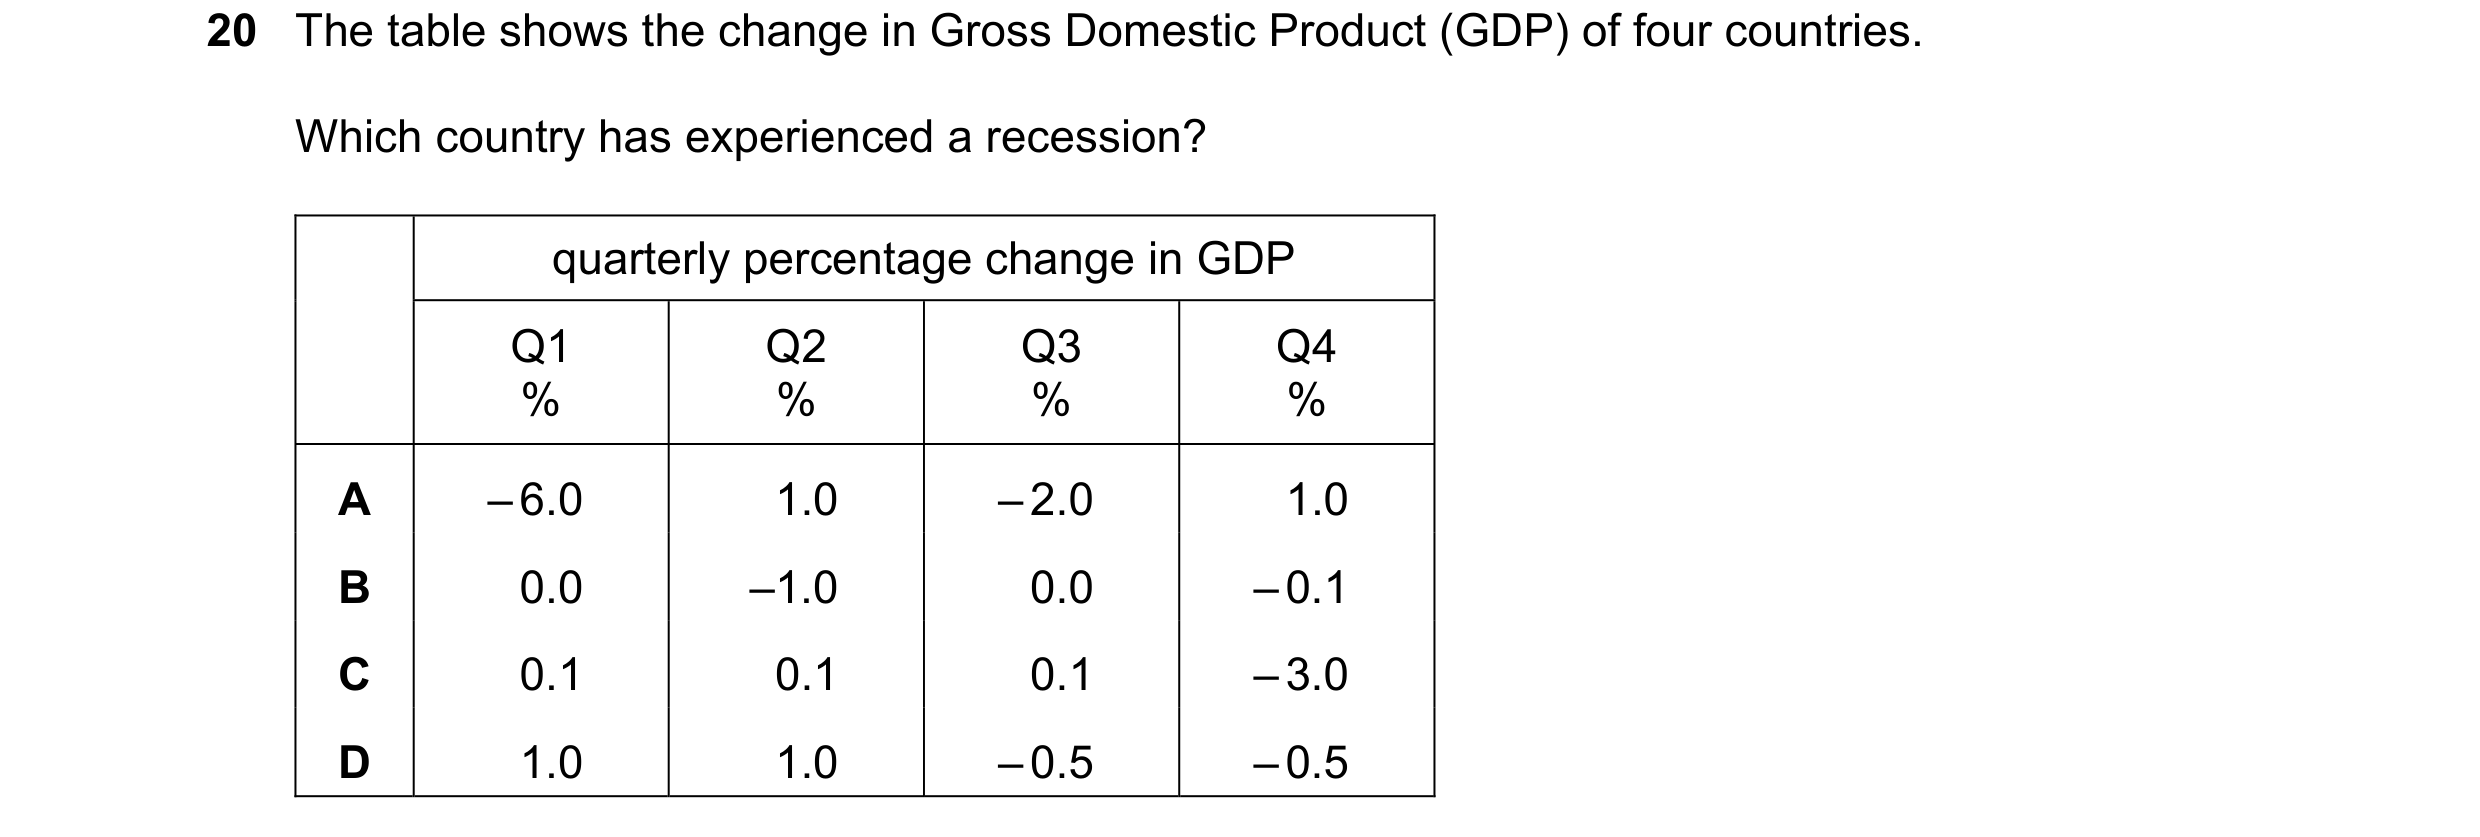
Q83 · The table shows the change in Gross Domestic Product (GDP) of four countries 0455/12 May/June 2018
20 The table shows the change in Gross Domestic Product (GDP) of four countries. Which country has experienced a recession? quarterly percentage change in GDP Q1 Q2 Q3 Q4 % % % % A – 6.0 1.0 – 2.0 1.0 B 0.0 –1.0 0.0 – 0.1 C 0.1 0.1 0.1 – 3.0 D 1.0 1.0 – 0.5 – 0.5
1 marks
Answer: D
This question in 0455/12 May/June 2018
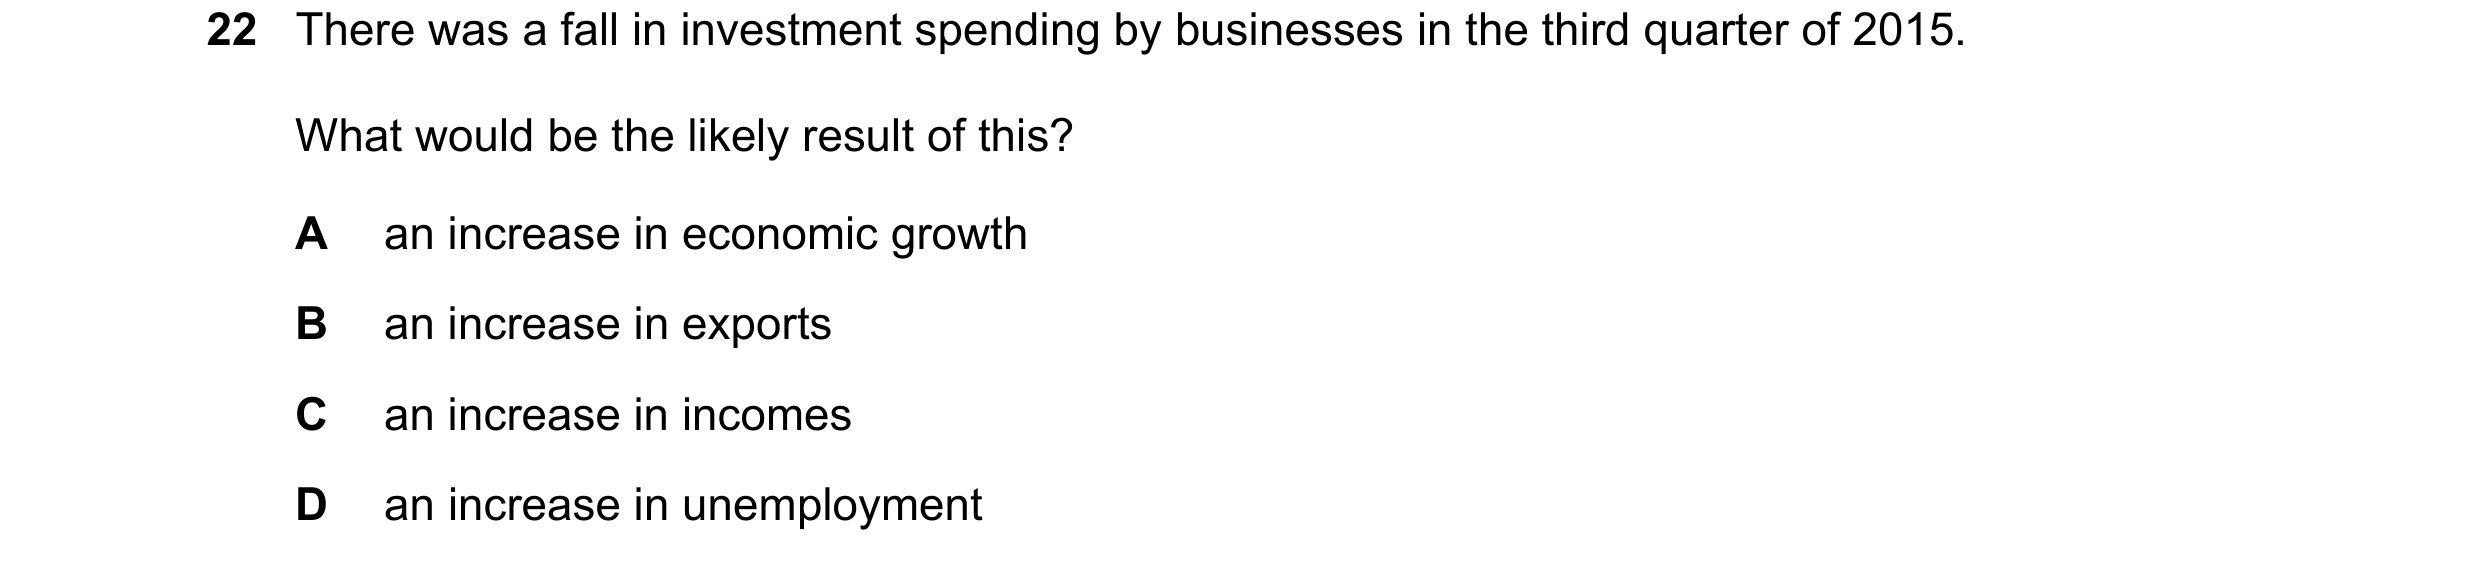
Q84 · There was a fall in investment spending by businesses in the third quarter of 2015 0455/12 May/June 2018
22 There was a fall in investment spending by businesses in the third quarter of 2015. What would be the likely result of this? A an increase in economic growth B an increase in exports C an increase in incomes D an increase in unemployment
1 marks
Answer: D
This question in 0455/12 May/June 2018
Q85 · The diagram shows a country’s original production possibility curve XX 0455/13 May/June 2018
3 The diagram shows a country’s original production possibility curve XX. X manufactured goods O X Y agricultural goods What could cause the country’s production possibility curve to move from XX to XY? A a decrease in the price of manufactured goods B a major war C an improvement in fertilisers D an increase in the employment rate
1 marks
Answer: C
This question in 0455/13 May/June 2018
Q86 · The diagram shows the demand curve D1 and supply curve S1 for healthcare in an economy 0455/13 May/June 2018
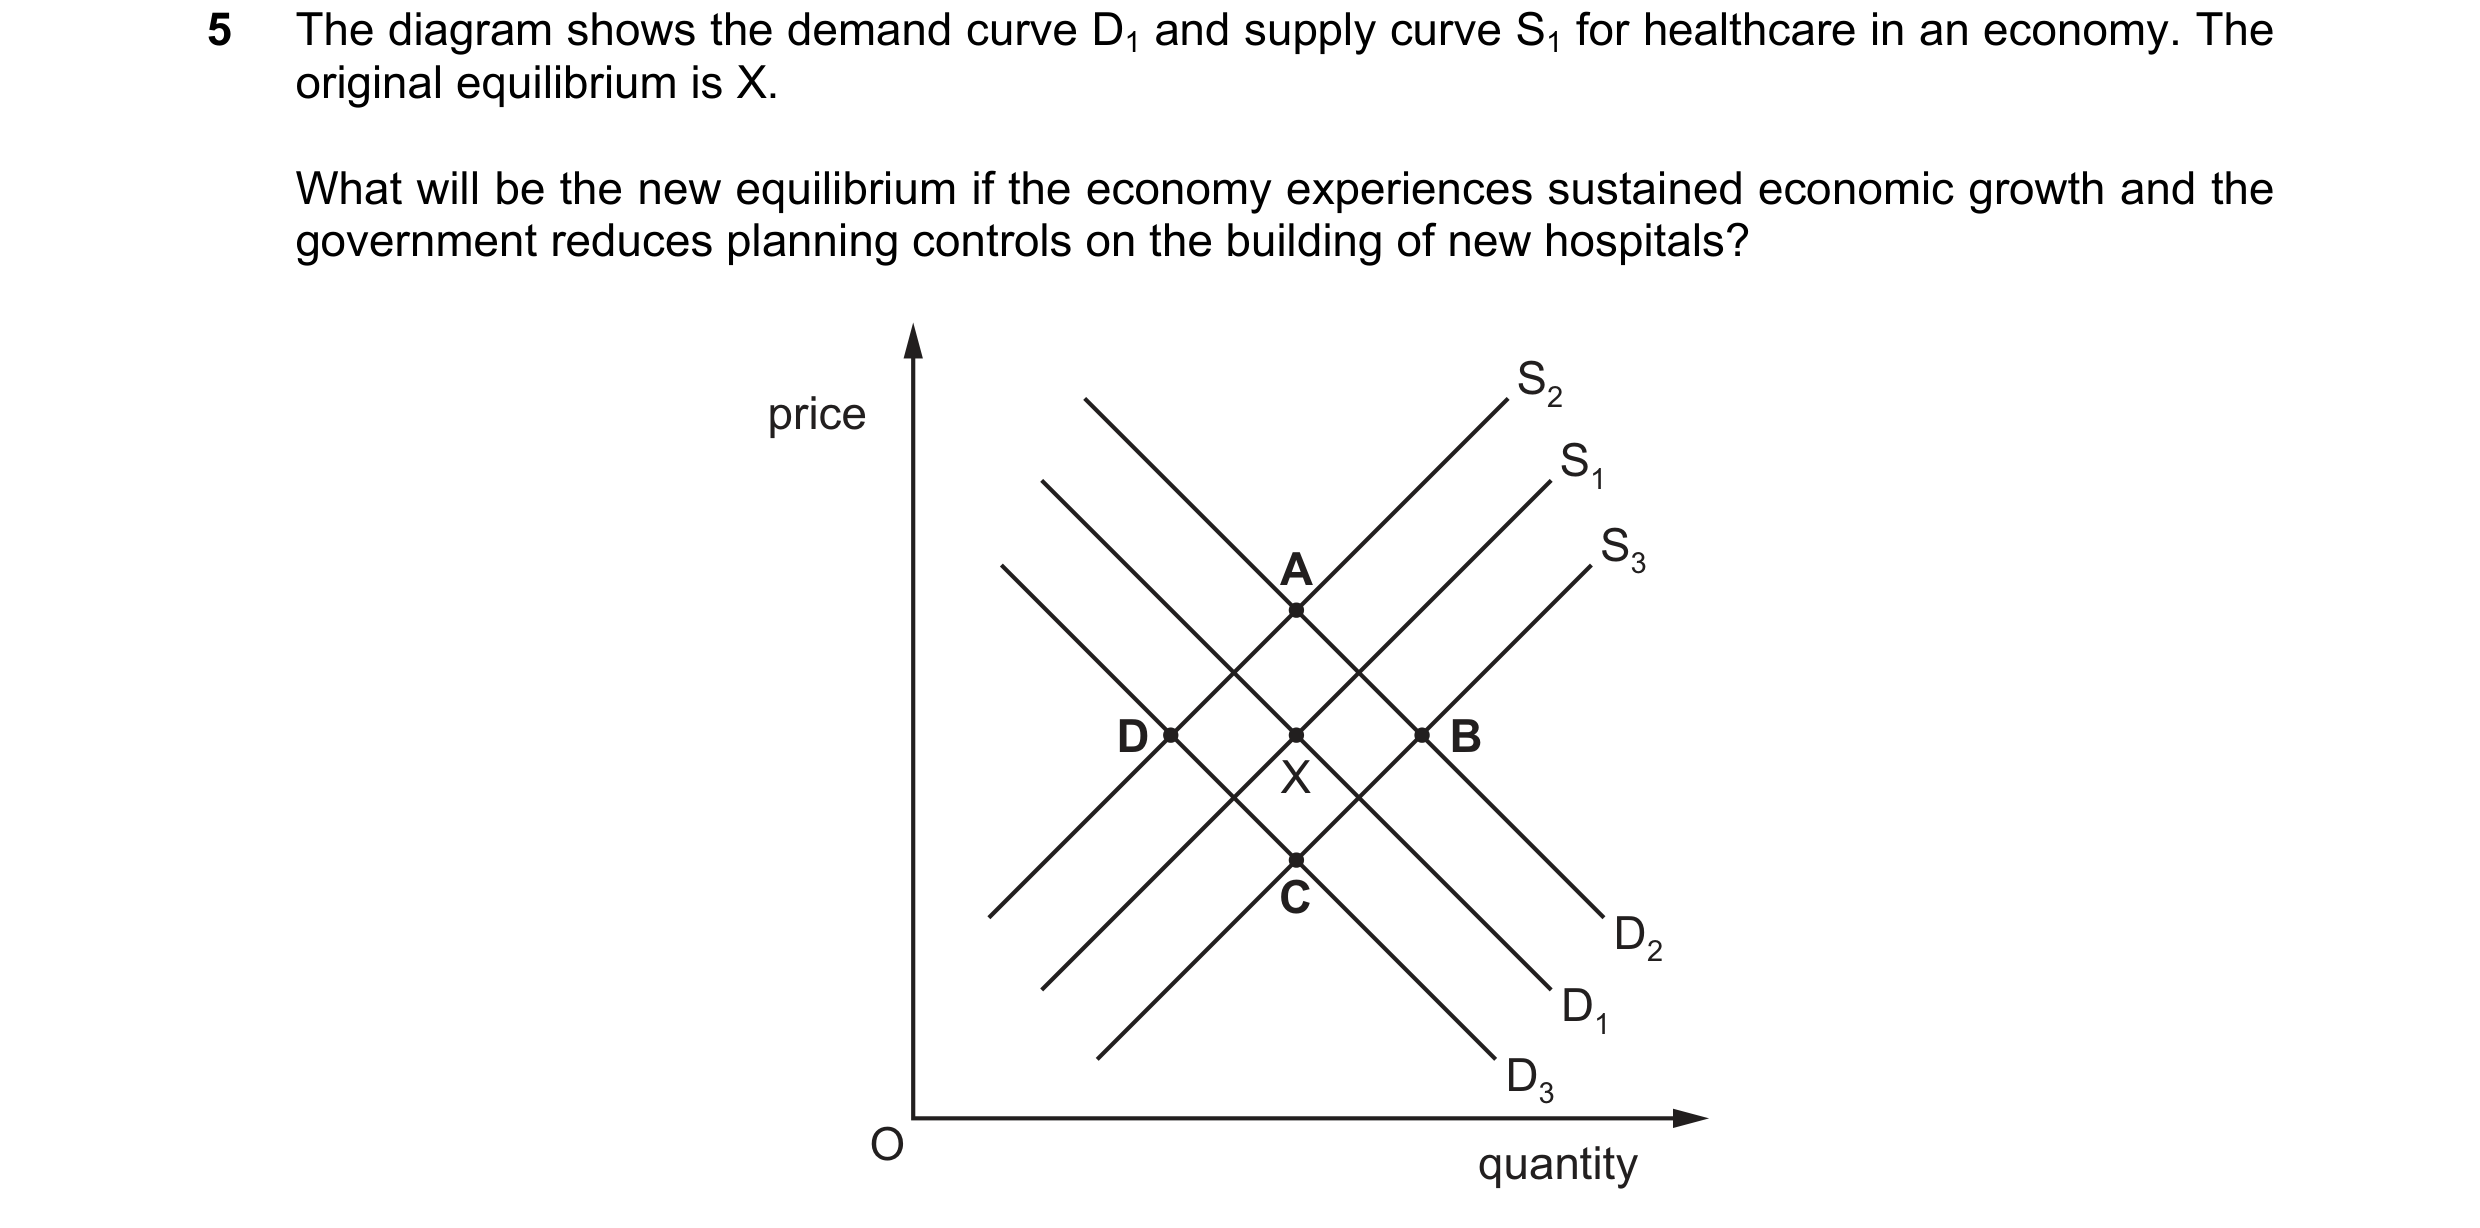
5 The diagram shows the demand curve D1 and supply curve S1 for healthcare in an economy. The original equilibrium is X. What will be the new equilibrium if the economy experiences sustained economic growth and the government reduces planning controls on the building of new hospitals? S2 price S1 S3 A D B X C D2 D1 D3 O quantity
1 marks
Answer: B
This question in 0455/13 May/June 2018
Q87 · What is a likely consequence of economic growth? 0455/13 May/June 2018
20 What is a likely consequence of economic growth? A decreased levels of employment B decreased levels of exports C decreased levels of output D decreased levels of poverty
1 marks
Answer: D
This question in 0455/13 May/June 2018
Q88 · There was a fall in investment spending by businesses in the third quarter of 2015 0455/13 May/June 2018
22 There was a fall in investment spending by businesses in the third quarter of 2015. What would be the likely result of this? A an increase in economic growth B an increase in exports C an increase in incomes D an increase in unemployment
1 marks
Answer: D
This question in 0455/13 May/June 2018
Q89 · An increase in which economic indicator is usually taken as the measure of a country’s… 0455/11 Oct/Nov 2018
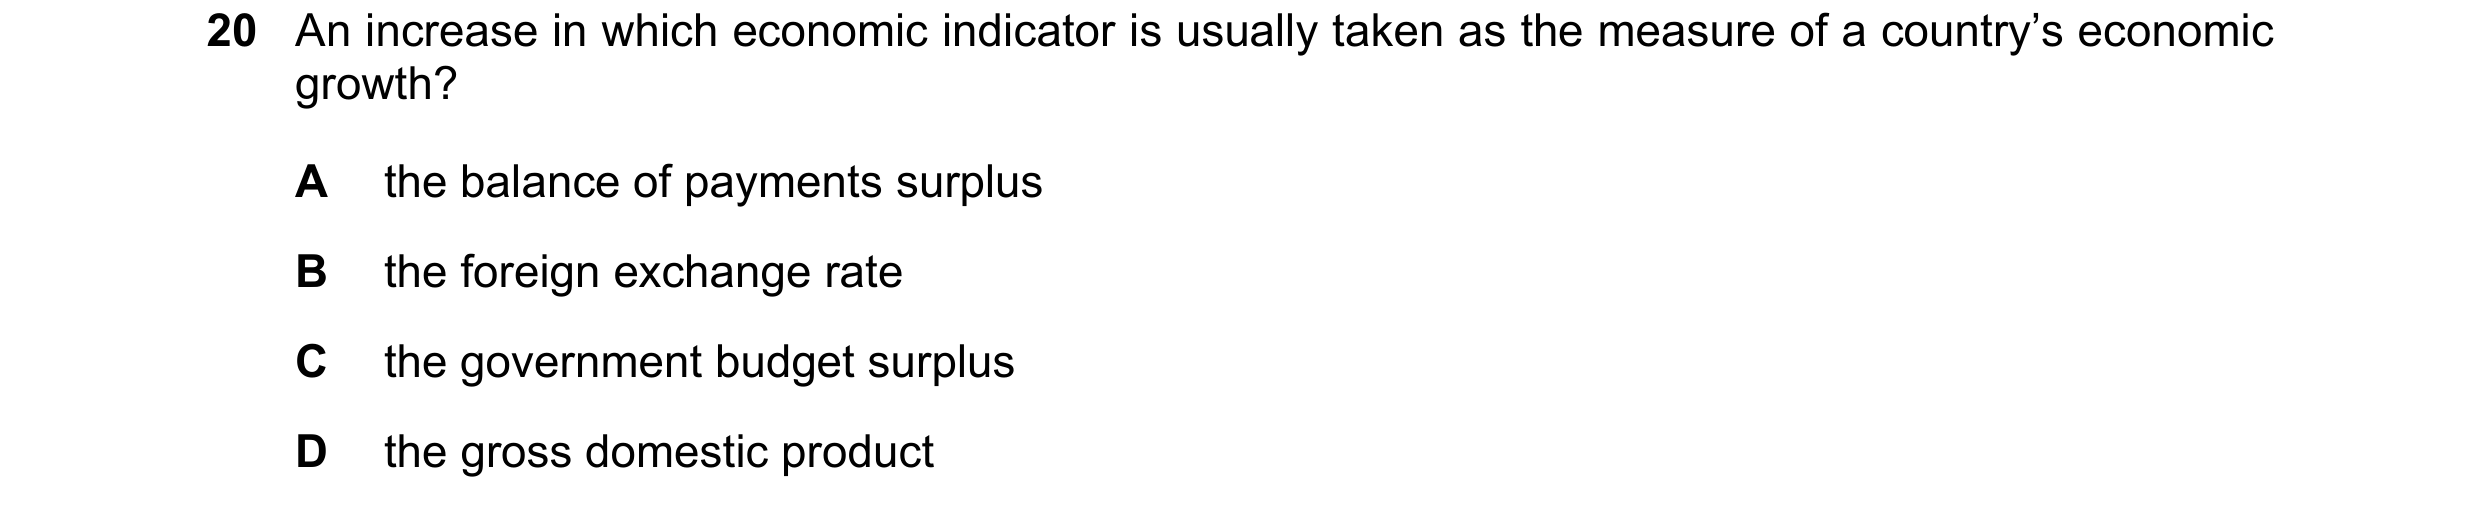
20 An increase in which economic indicator is usually taken as the measure of a country’s economic growth? A the balance of payments surplus B the foreign exchange rate C the government budget surplus D the gross domestic product
1 marks
Answer: D
This question in 0455/11 Oct/Nov 2018
Q90 · Developing countries are sometimes given aid by charities and foreign governments 0455/11 Oct/Nov 2018
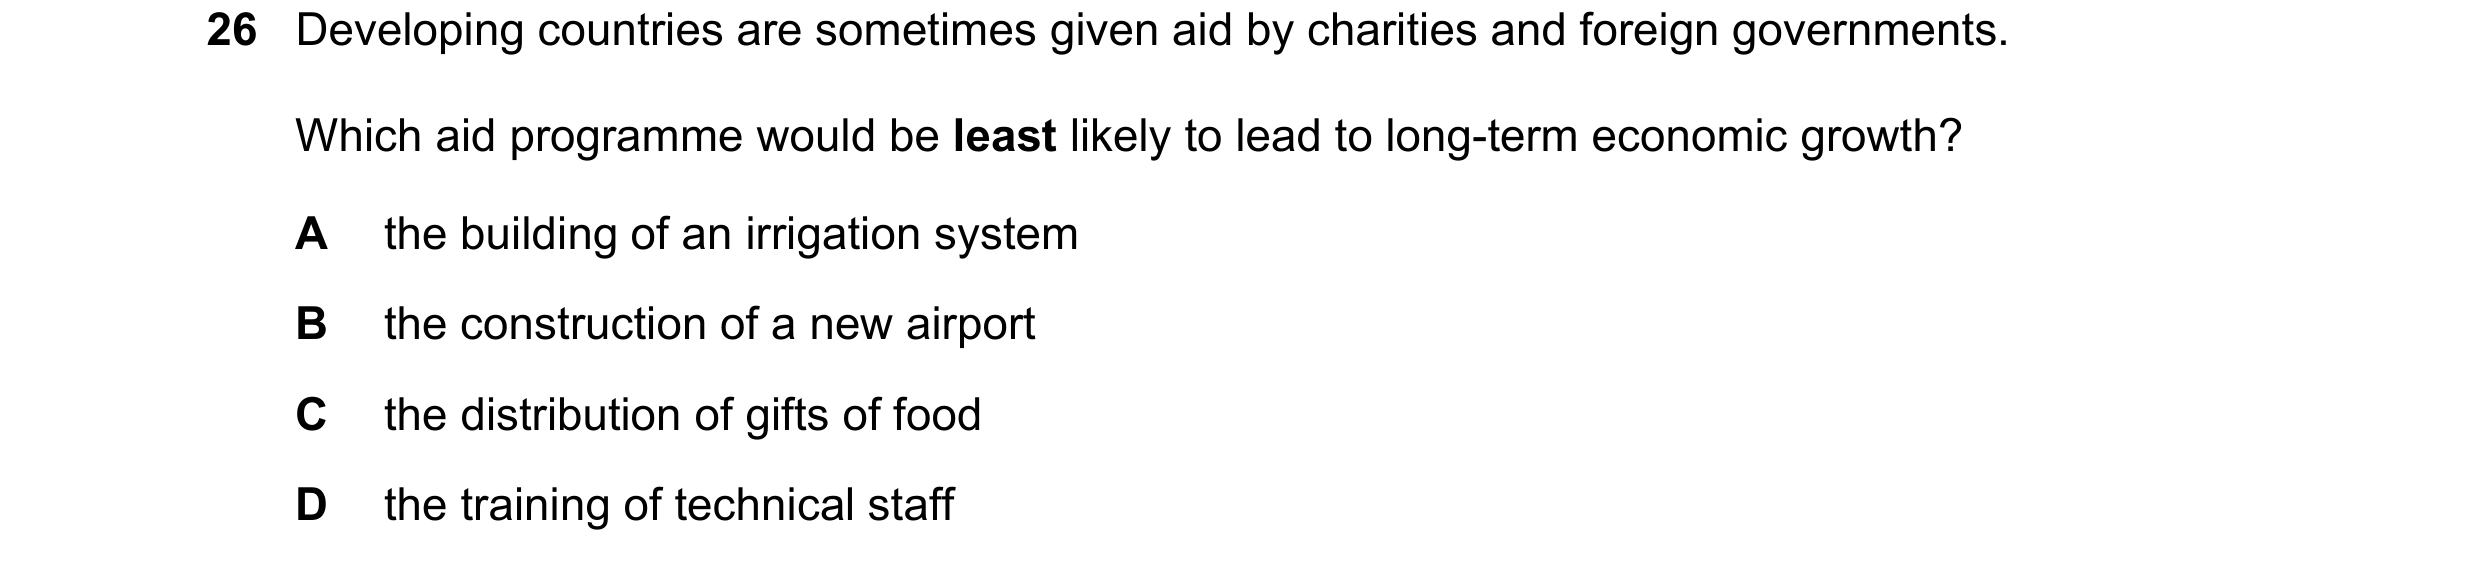
26 Developing countries are sometimes given aid by charities and foreign governments. Which aid programme would be least likely to lead to long-term economic growth? A the building of an irrigation system B the construction of a new airport C the distribution of gifts of food D the training of technical staff
1 marks
Answer: C
This question in 0455/11 Oct/Nov 2018
Q91 · Economic growth is usually measured by the annual change in A consumer spending 0455/12 Oct/Nov 2018
20 Economic growth is usually measured by the annual change in A consumer spending. B gross domestic product. C the output of the manufacturing and construction industries. D the retail price index (RPI).
1 marks
Answer: B
This question in 0455/12 Oct/Nov 2018
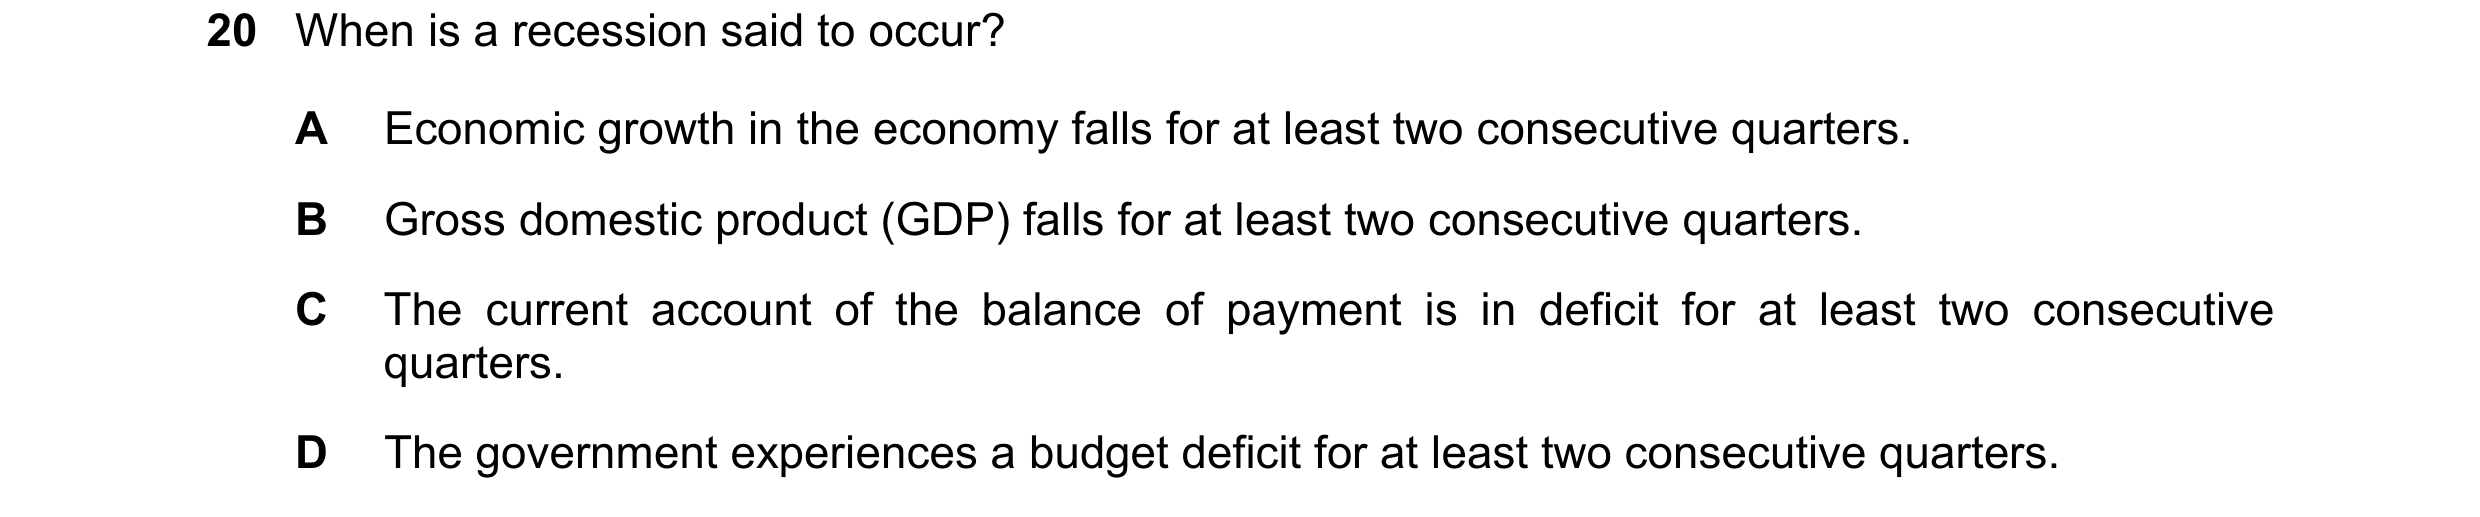
Q92 · When is a recession said to occur? 0455/13 Oct/Nov 2018
20 When is a recession said to occur? A Economic growth in the economy falls for at least two consecutive quarters. B Gross domestic product (GDP) falls for at least two consecutive quarters. C The current account of the balance of payment is in deficit for at least two consecutive quarters. D The government experiences a budget deficit for at least two consecutive quarters.
1 marks
Answer: B
This question in 0455/13 Oct/Nov 2018
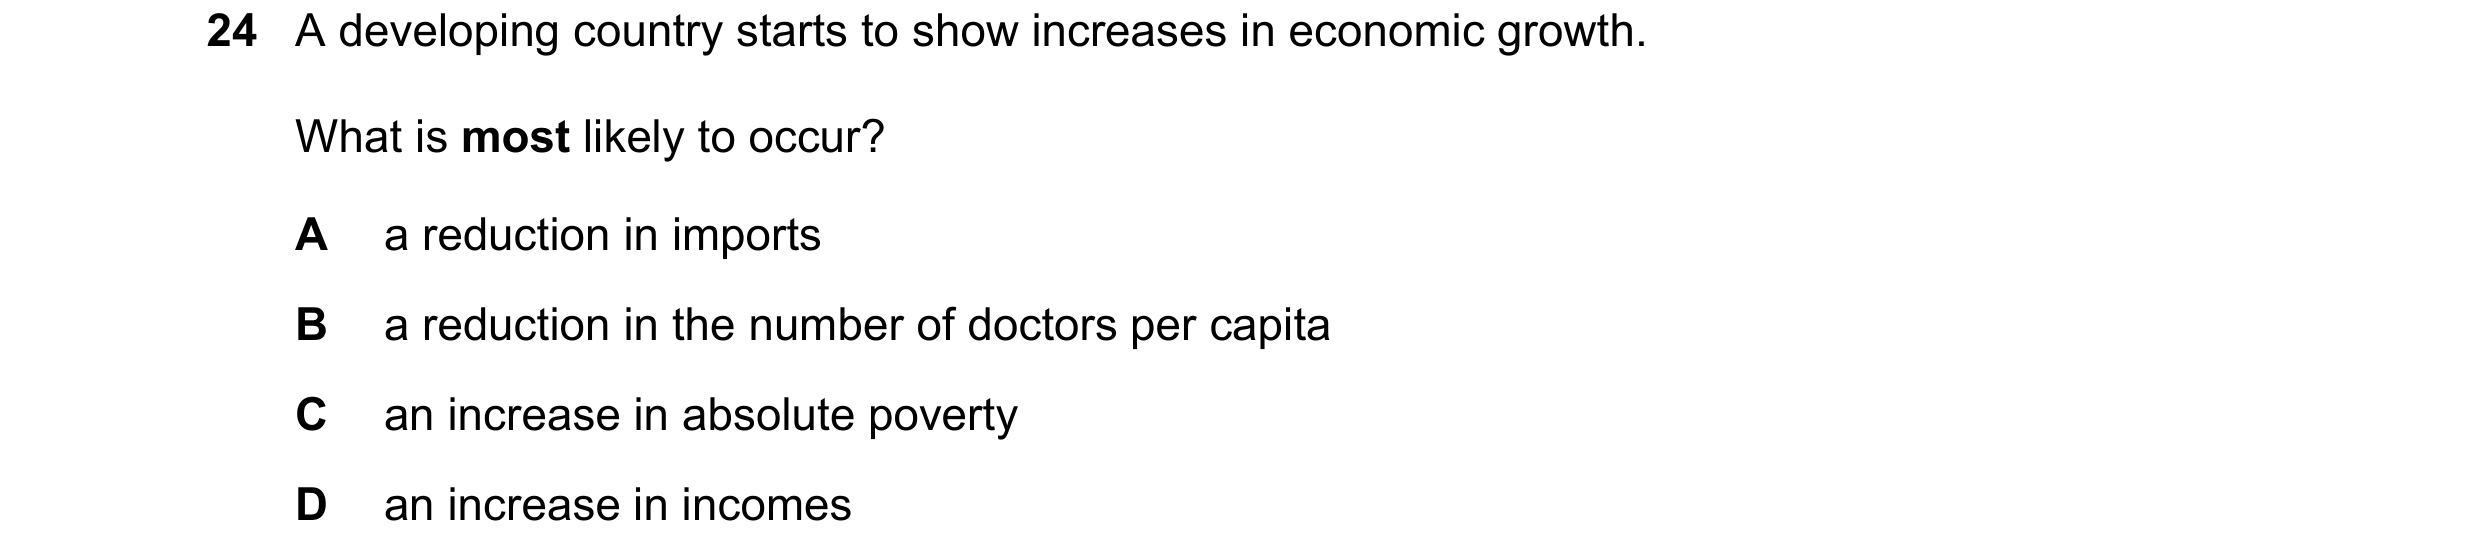
Q93 · A developing country starts to show increases in economic growth 0455/12 Feb/March 2019
24 A developing country starts to show increases in economic growth. What is most likely to occur? A a reduction in imports B a reduction in the number of doctors per capita C an increase in absolute poverty D an increase in incomes
1 marks
Answer: D
This question in 0455/12 Feb/March 2019
Q94 · The table shows the percentage change from 2015–2016 in gross domestic product (GDP) and… 0455/11 May/June 2019
23 The table shows the percentage change from 2015–2016 in gross domestic product (GDP) and consumer prices for selected countries. Which country was suffering from economic recession and inflation? country GDP consumer prices A Australia +1.8 +1.3 B Brazil –2.9 +8.3 C China +6.7 +2.0 D Japan +1.1 –0.2
1 marks
Answer: B
This question in 0455/11 May/June 2019
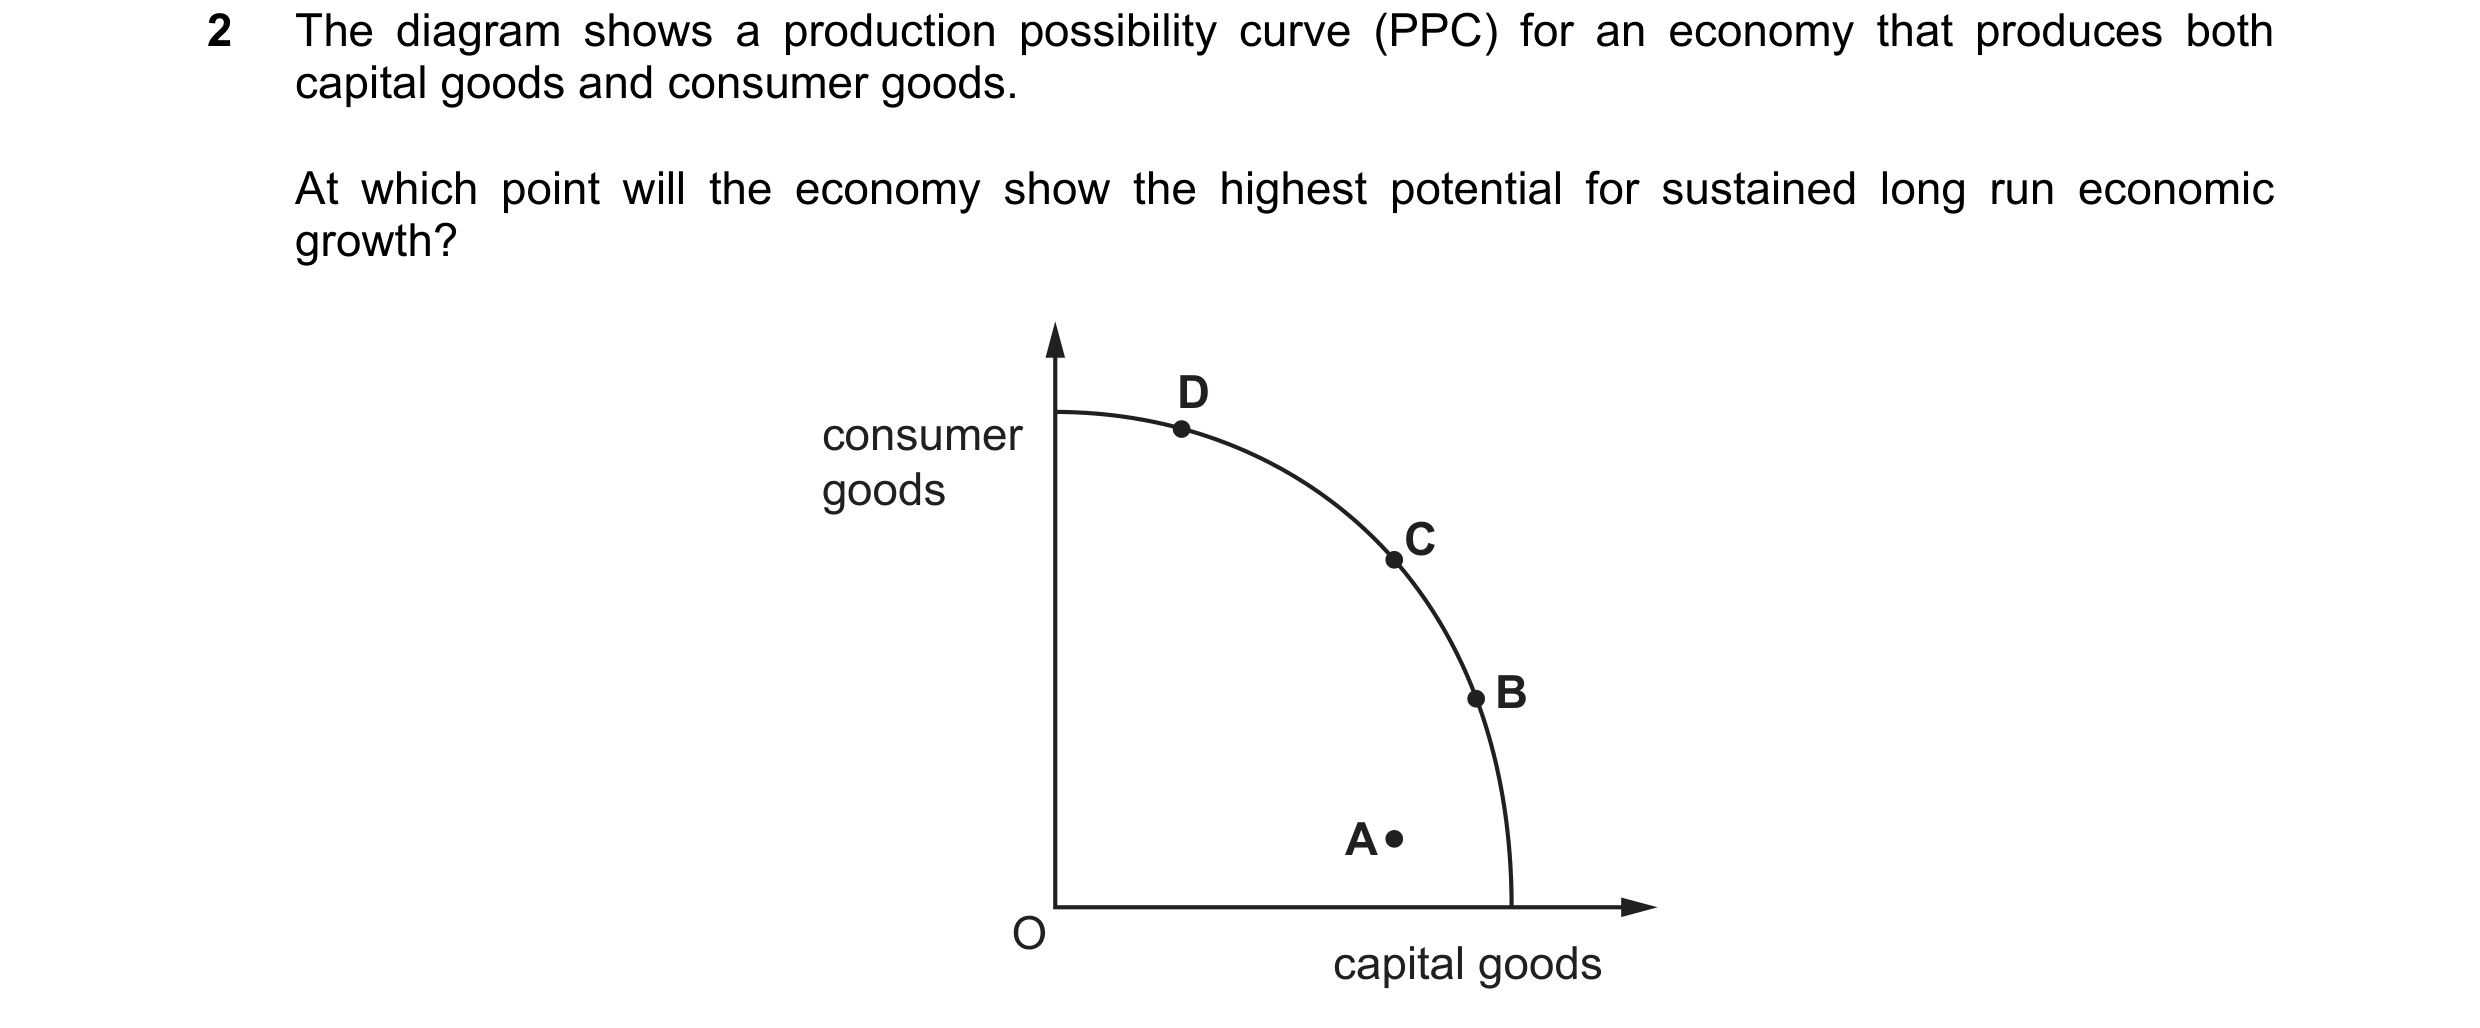
Q95 · The diagram shows a production possibility curve (PPC) for an economy that produces both… 0455/12 May/June 2019
2 The diagram shows a production possibility curve (PPC) for an economy that produces both capital goods and consumer goods. At which point will the economy show the highest potential for sustained long run economic growth? D consumer goods C B A O capital goods
1 marks
Answer: B
This question in 0455/12 May/June 2019
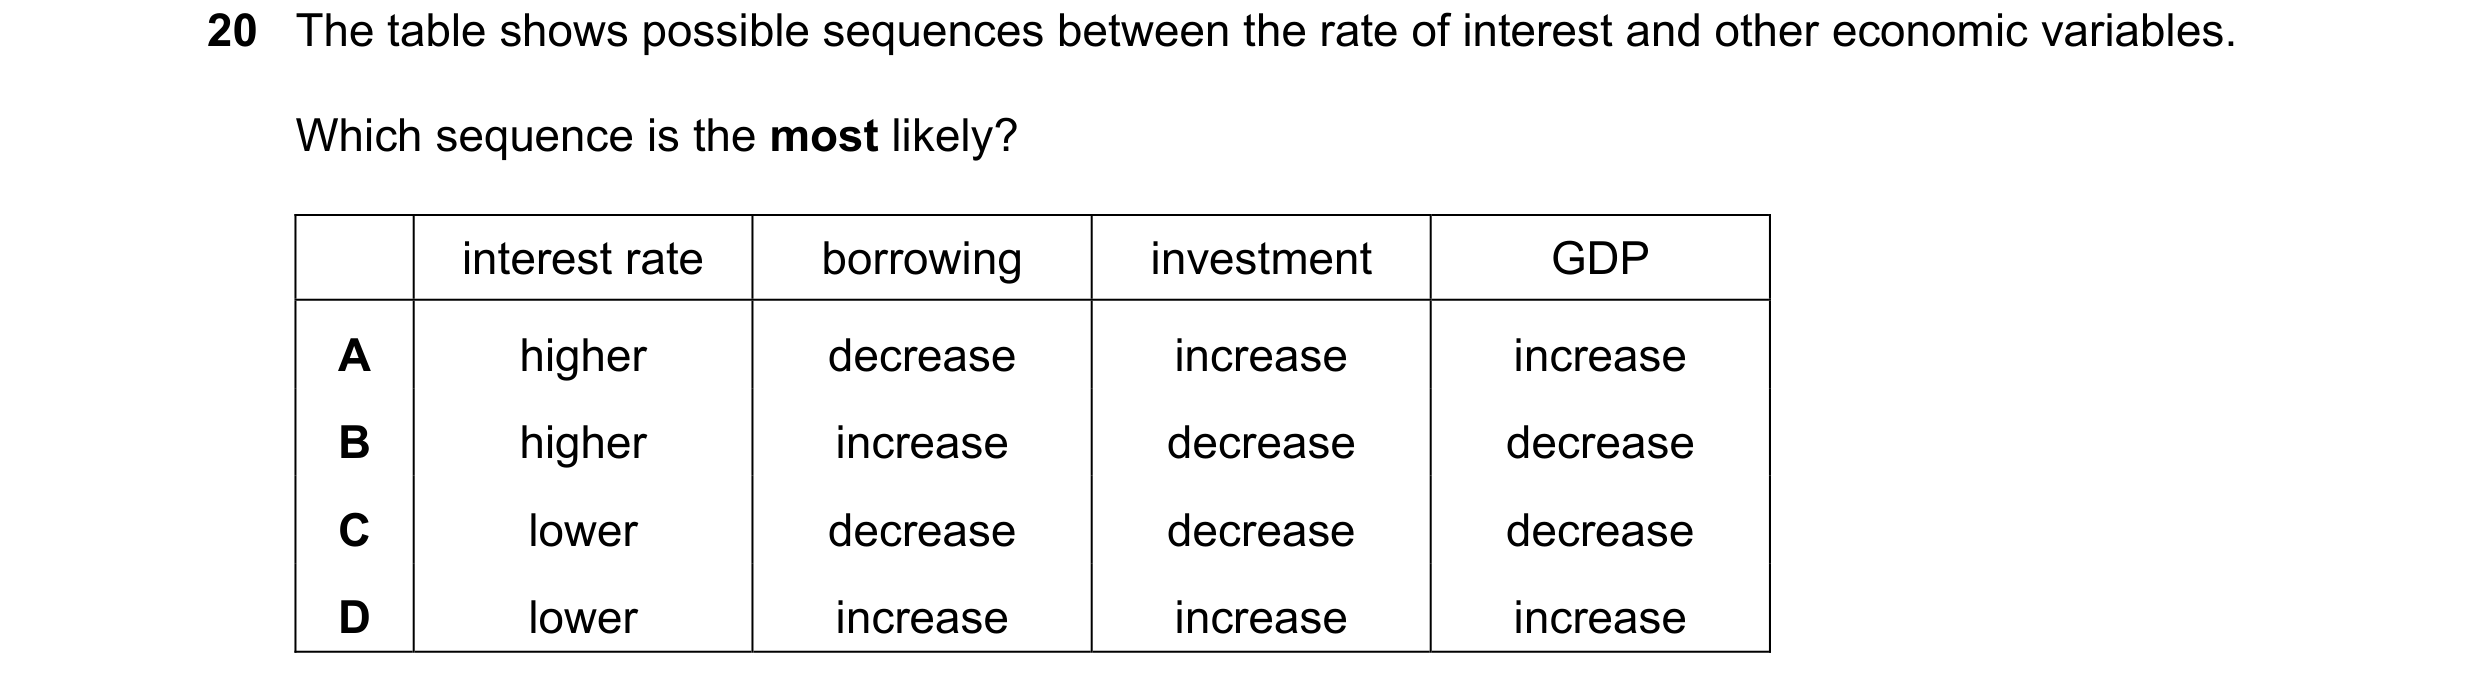
Q96 · The table shows possible sequences between the rate of interest and other economic… 0455/12 May/June 2019
20 The table shows possible sequences between the rate of interest and other economic variables. Which sequence is the most likely? interest rate borrowing investment GDP A higher decrease increase increase B higher increase decrease decrease C lower decrease decrease decrease D lower increase increase increase
1 marks
Answer: D
This question in 0455/12 May/June 2019
Q97 · Which action might be taken by an economy wishing to produce a greater range of products? 0455/13 May/June 2019
24 Which action might be taken by an economy wishing to produce a greater range of products? A concentrate on the production of primary products B encourage imports of manufactured goods C encourage investment by multinational companies D increase interest rates
1 marks
Answer: C
This question in 0455/13 May/June 2019
Q98 · The chart shows the GDP annual growth rate (percentage), 2012–2016, for Greece 0455/11 Oct/Nov 2019
20 The chart shows the GDP annual growth rate (percentage), 2012–2016, for Greece. 2 growth 0 rate % – 2 – 4 – 6 – 8 –10 –12 2012 2013 2014 2015 2016 year In which years did Greece experience the longest period of positive economic growth? A 2012–2013 B 2013–2014 C 2014–2015 D 2015–2016
1 marks
Answer: C
This question in 0455/11 Oct/Nov 2019
Q99 · Which government policy would reduce economic growth? 0455/11 Oct/Nov 2019
22 Which government policy would reduce economic growth? A cutting the rate of corporation tax B increasing expenditure on education C lowering the rate of income tax D raising interest rates
1 marks
Answer: D
This question in 0455/11 Oct/Nov 2019
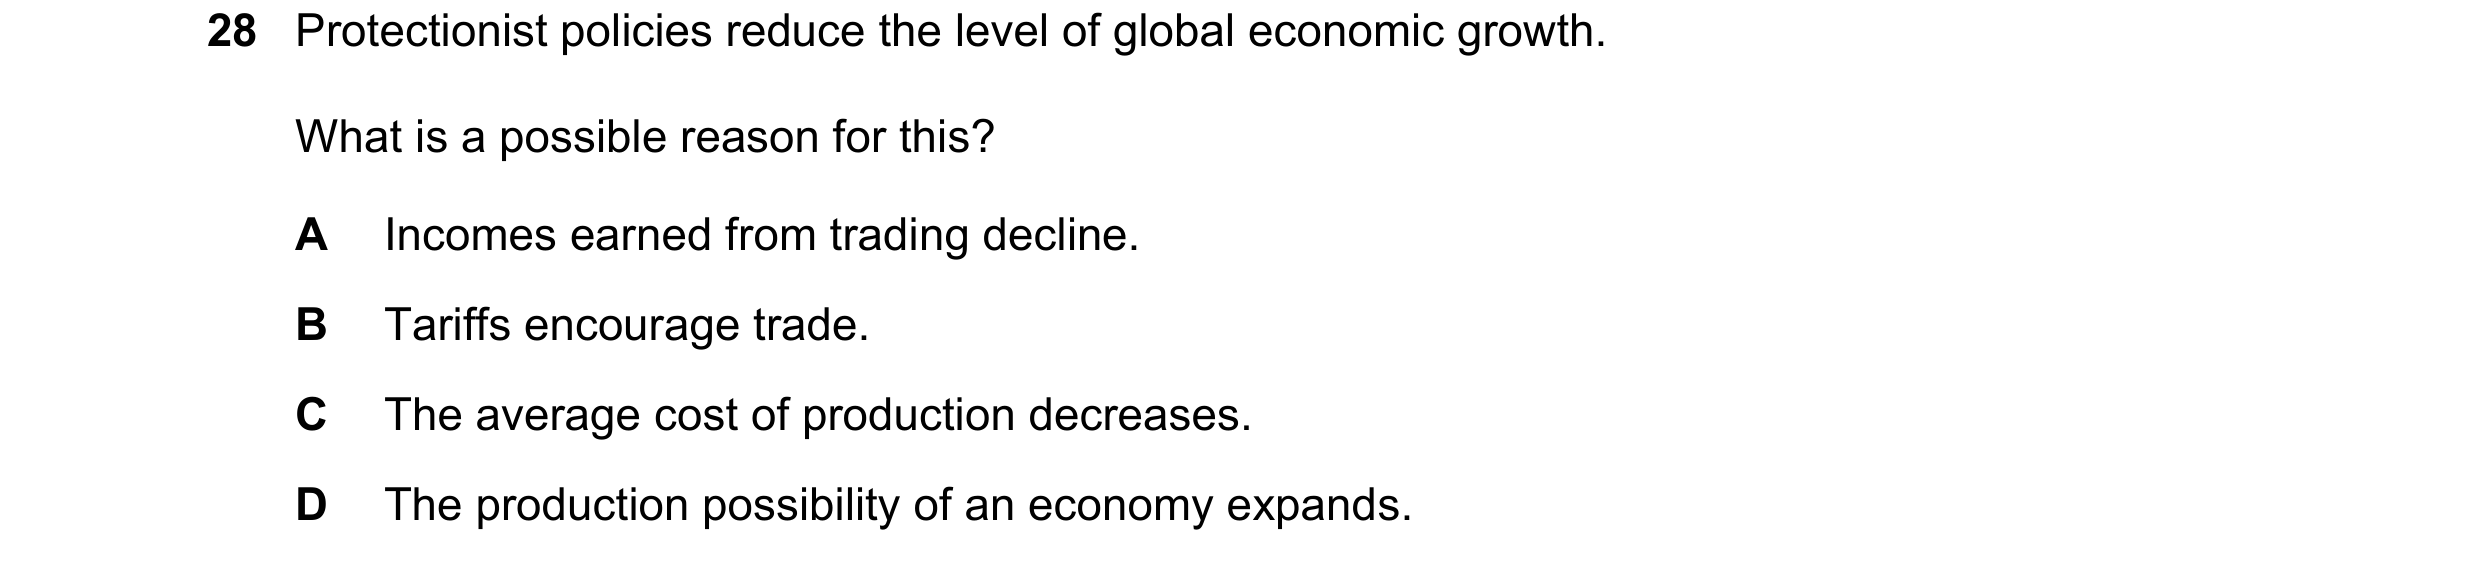
Q100 · Protectionist policies reduce the level of global economic growth 0455/11 Oct/Nov 2019
28 Protectionist policies reduce the level of global economic growth. What is a possible reason for this? A Incomes earned from trading decline. B Tariffs encourage trade. C The average cost of production decreases. D The production possibility of an economy expands.
1 marks
Answer: A
This question in 0455/11 Oct/Nov 2019
Q101 · Which increase is most likely to cause a rise in the output of an economy? 0455/12 Oct/Nov 2019
20 Which increase is most likely to cause a rise in the output of an economy? A hyperinflation B income taxes C interest rates D investment
1 marks
Answer: D
This question in 0455/12 Oct/Nov 2019
Q102 · What is the most likely result of a sustained increase in Gross Domestic Product (GDP)? 0455/13 Oct/Nov 2019
20 What is the most likely result of a sustained increase in Gross Domestic Product (GDP)? A a decrease in living standards B a decrease in the budget surplus C an increase in tax revenues D an increase in unemployment
1 marks
Answer: C
This question in 0455/13 Oct/Nov 2019
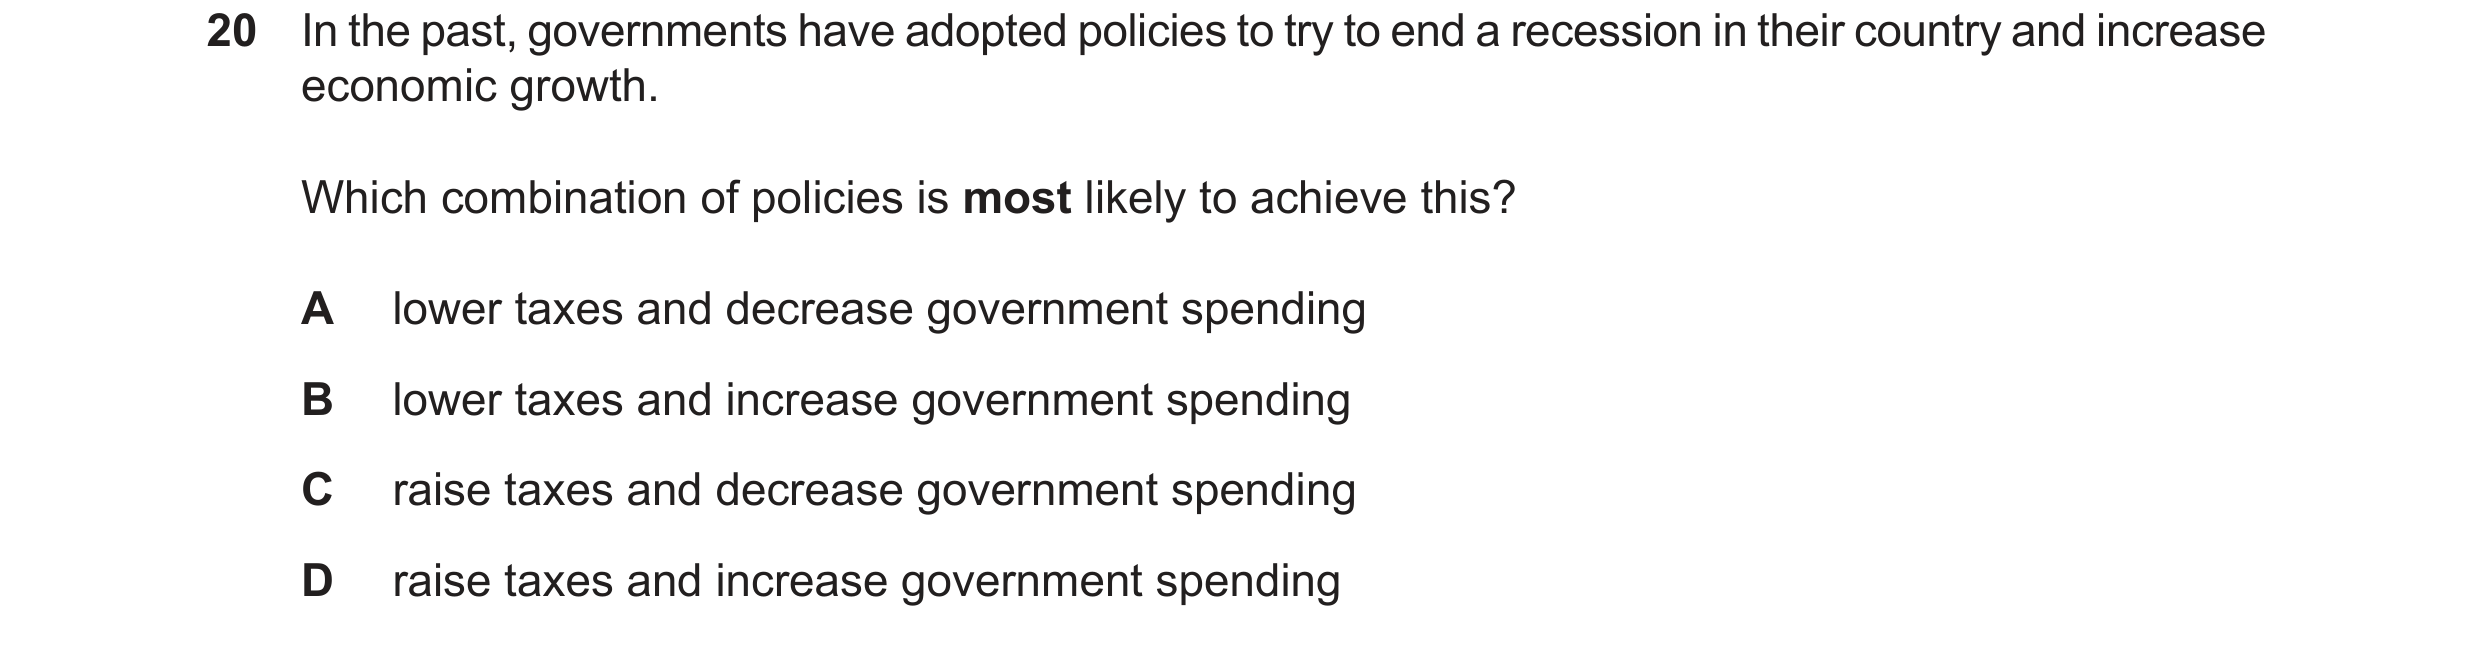
Q103 · In the past, governments have adopted policies to try to end a recession in their country… 0455/12 Feb/March 2020
19 In the past, governments have adopted policies to try to end a recession in their country and increase economic growth. Which combination of policies is most likely to achieve this? A lower taxes and decrease government spending B lower taxes and increase government spending C raise taxes and decrease government spending D raise taxes and increase government spending
1 marks
This question in 0455/12 Feb/March 2020
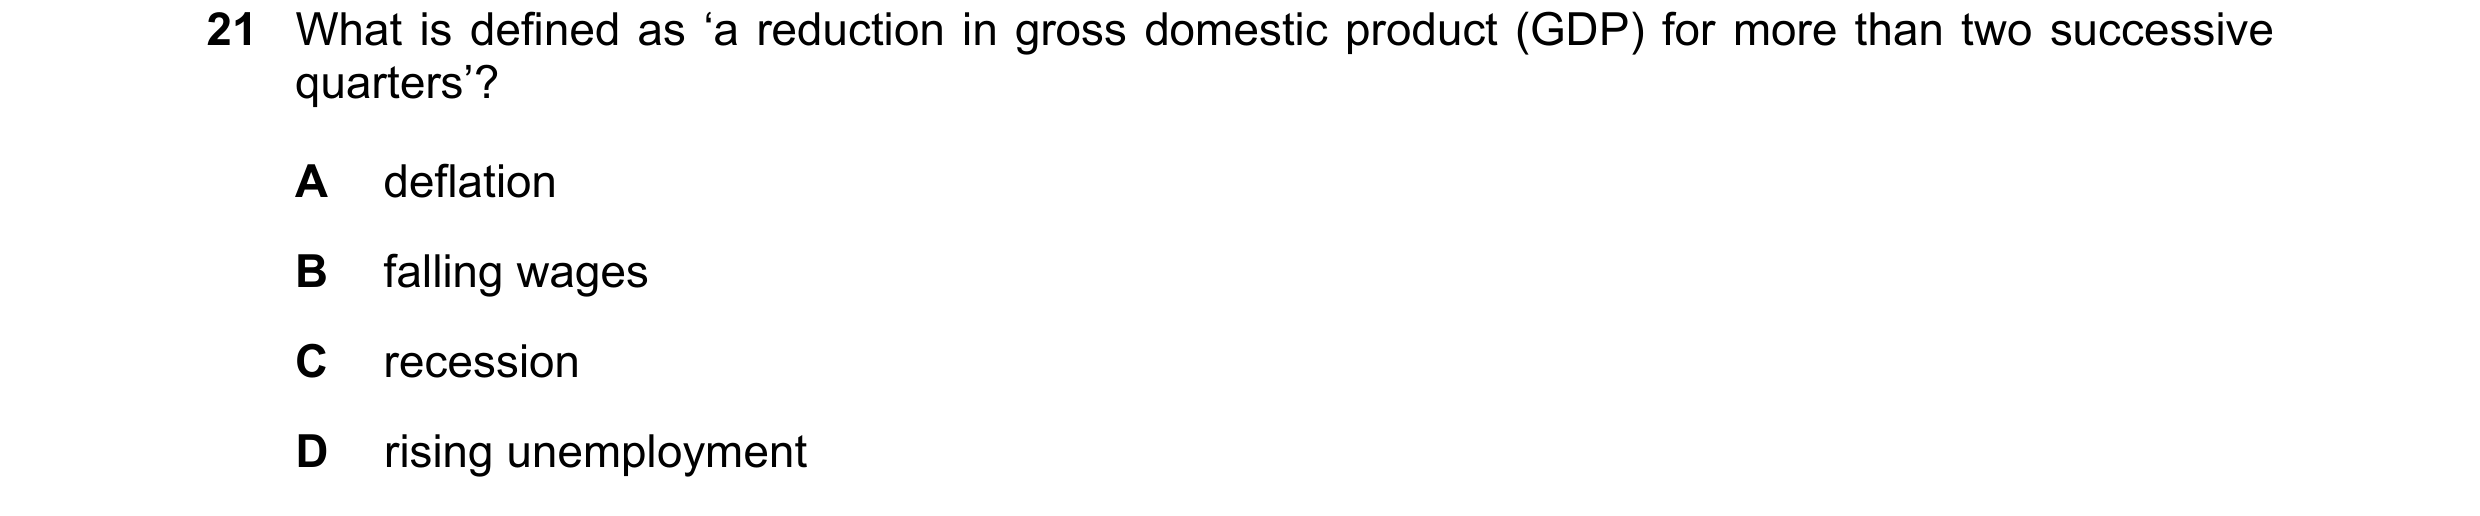
Q104 · What is defined as ‘a reduction in gross domestic product (GDP) for more than two… 0455/12 Feb/March 2020
21 What is defined as ‘a reduction in gross domestic product (GDP) for more than two successive quarters’? A deflation B falling wages C recession D rising unemployment
1 marks
This question in 0455/12 Feb/March 2020
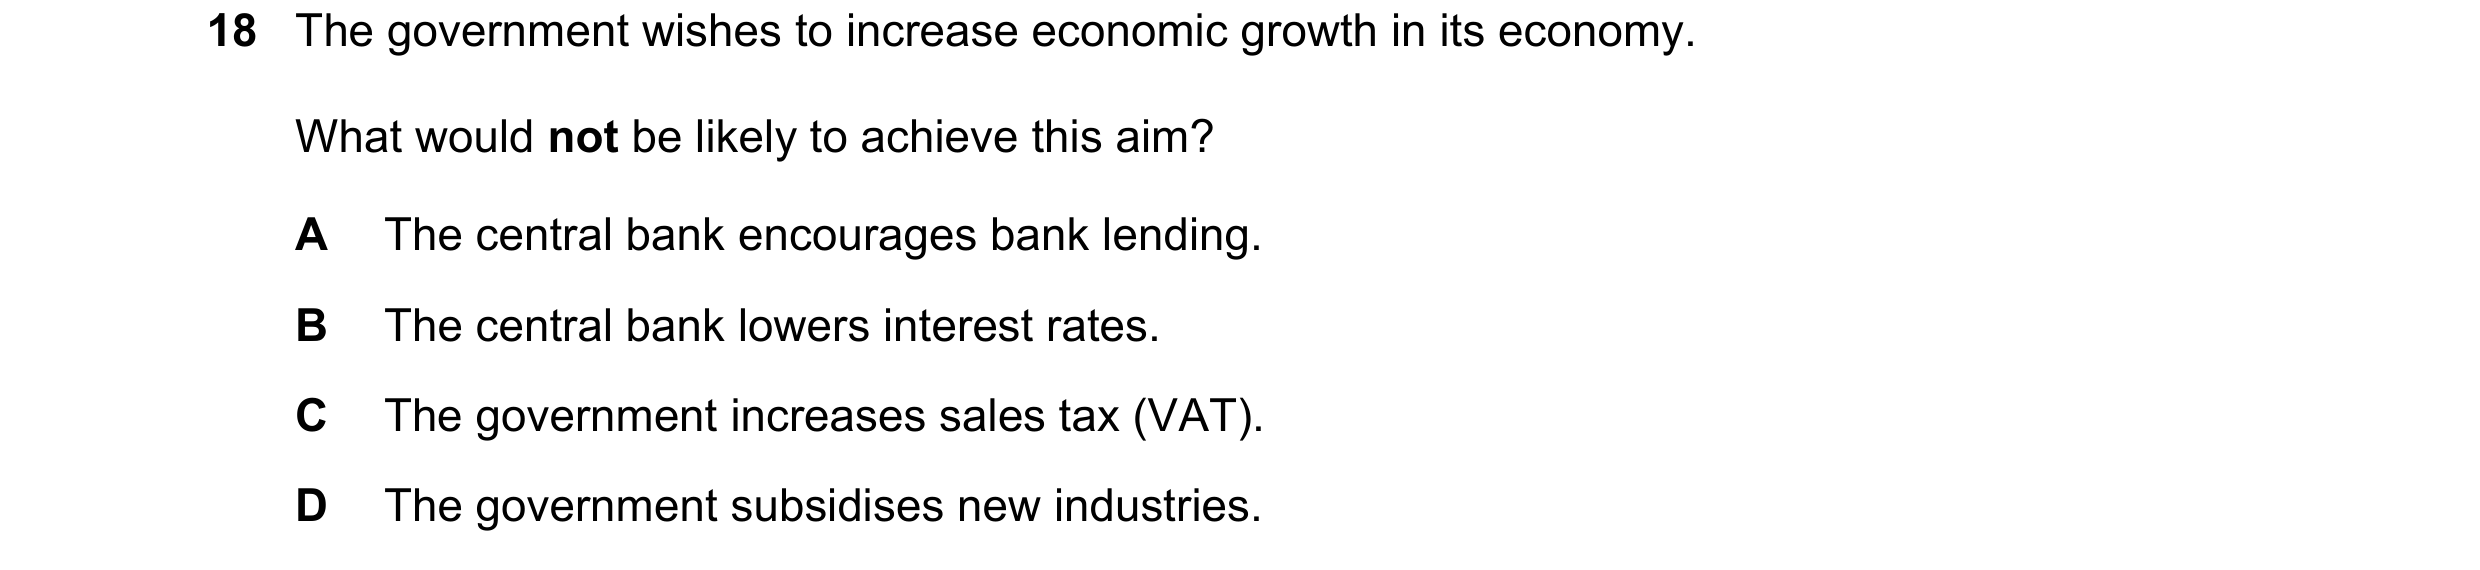
Q105 · The government wishes to increase economic growth in its economy 0455/11 May/June 2020
18 The government wishes to increase economic growth in its economy. What would not be likely to achieve this aim? A The central bank encourages bank lending. B The central bank lowers interest rates. C The government increases sales tax (VAT). D The government subsidises new industries.
1 marks
Answer: C
This question in 0455/11 May/June 2020
Q106 · What may directly cause economic growth? 0455/11 May/June 2020
21 What may directly cause economic growth? A higher imports B higher levels of resources C higher taxation D higher unemployment
1 marks
Answer: B
This question in 0455/11 May/June 2020
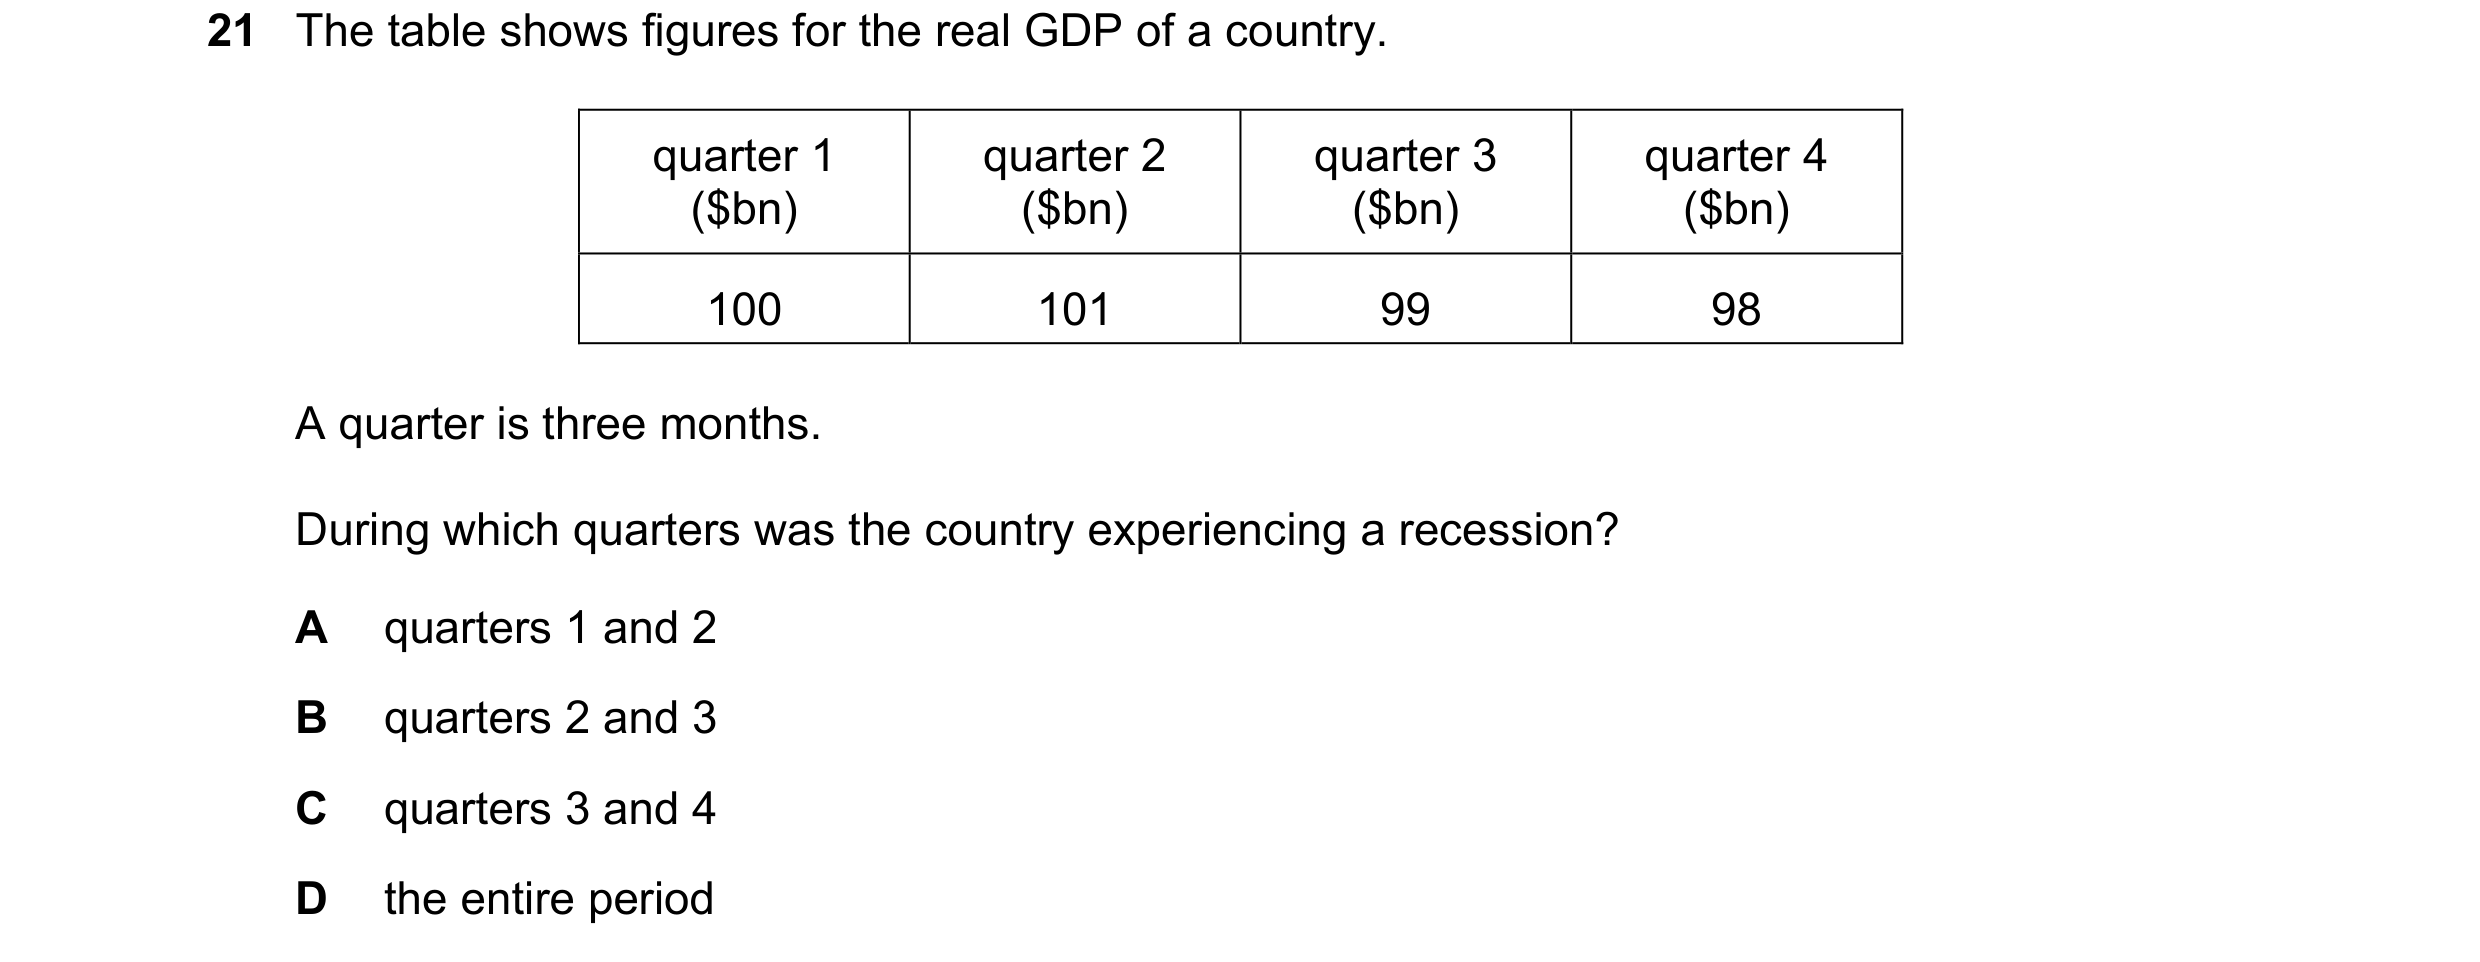
Q107 · The table shows figures for the real GDP of a country 0455/12 May/June 2020
21 The table shows figures for the real GDP of a country. quarter 1 quarter 2 quarter 3 quarter 4 ($bn) ($bn) ($bn) ($bn) 100 101 99 98 A quarter is three months. During which quarters was the country experiencing a recession? A quarters 1 and 2 B quarters 2 and 3 C quarters 3 and 4 D the entire period
1 marks
Answer: C
This question in 0455/12 May/June 2020
Q108 · The diagram shows a shift in a country’s production possibility curve (PPC) 0455/13 May/June 2020
2 The diagram shows a shift in a country’s production possibility curve (PPC). capital goods Y X O consumer goods What would cause the shift from X to Y? A a fall in the unemployment rate B a fall in consumer demand C a rise in the rate of inflation D a rise in the size of the labour force
1 marks
Answer: D
This question in 0455/13 May/June 2020
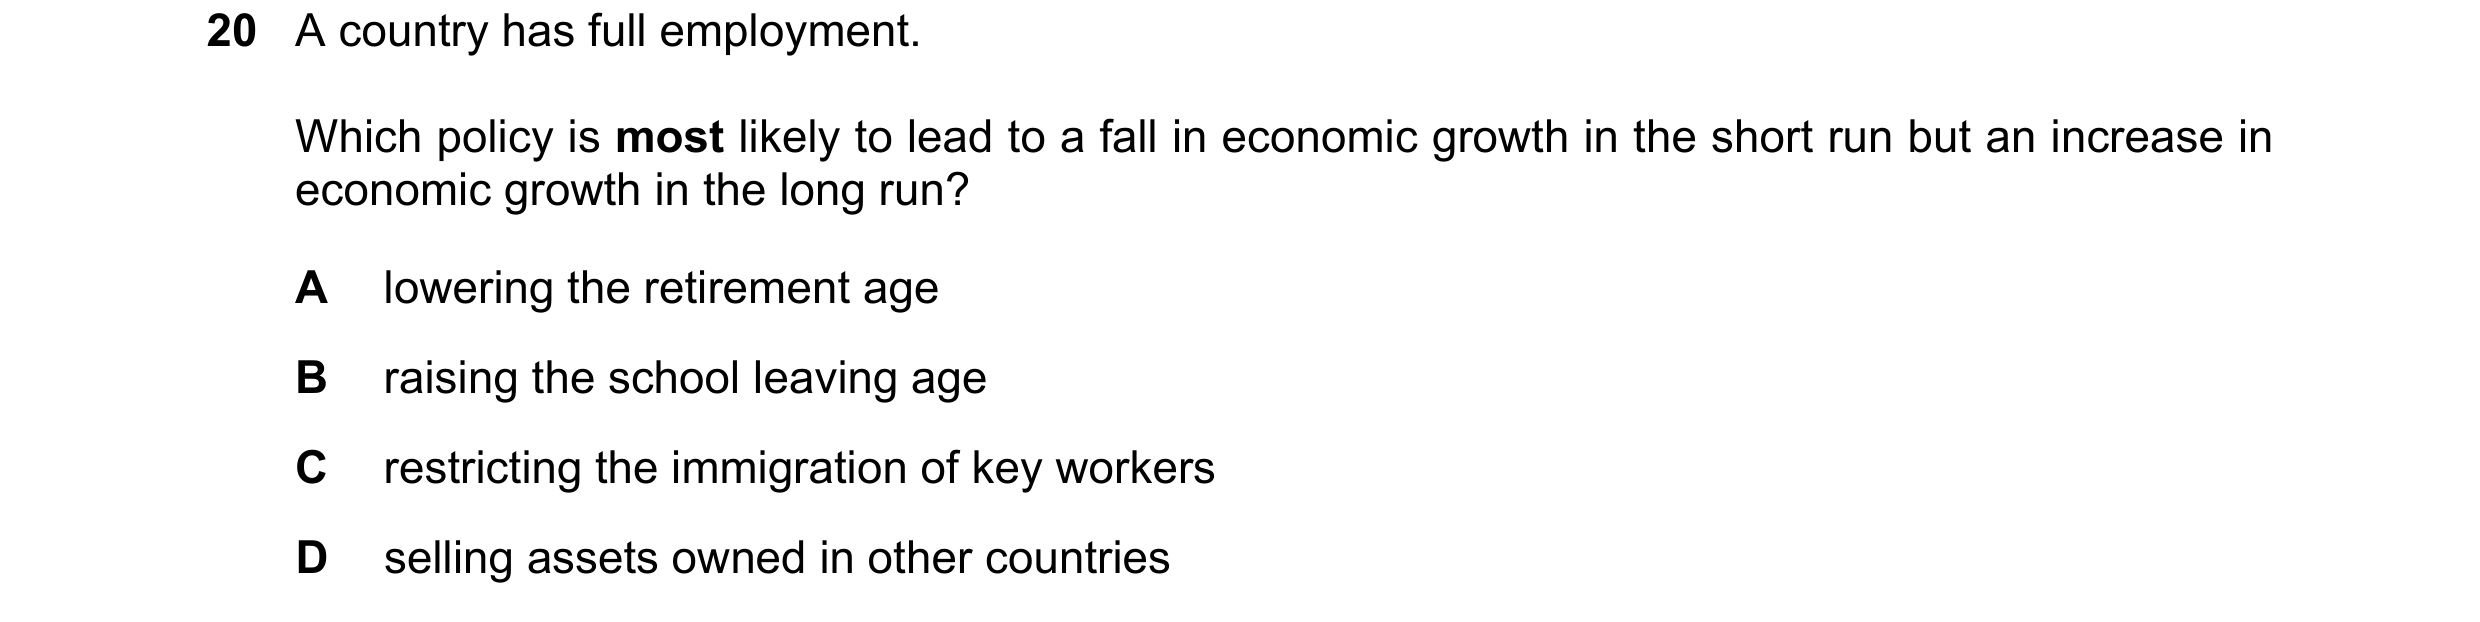
Q109 · A country has full employment 0455/13 May/June 2020
20 A country has full employment. Which policy is most likely to lead to a fall in economic growth in the short run but an increase in economic growth in the long run? A lowering the retirement age B raising the school leaving age C restricting the immigration of key workers D selling assets owned in other countries
1 marks
Answer: B
This question in 0455/13 May/June 2020
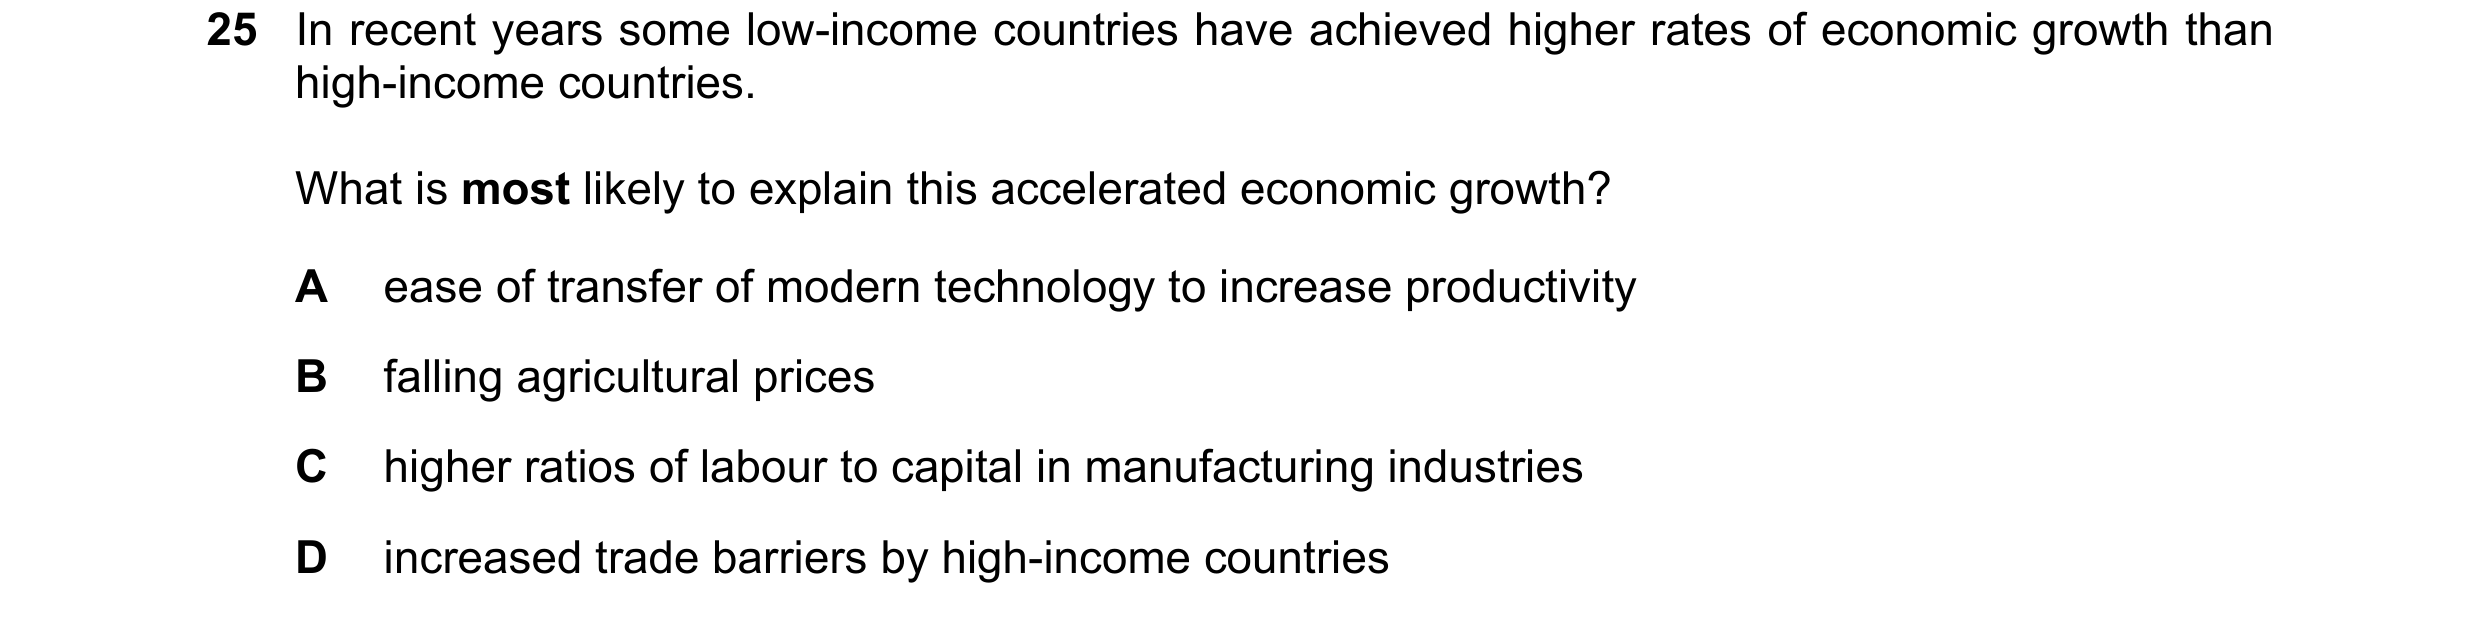
Q110 · In recent years some low-income countries have achieved higher rates of economic growth… 0455/13 May/June 2020
25 In recent years some low-income countries have achieved higher rates of economic growth than high-income countries. What is most likely to explain this accelerated economic growth? A ease of transfer of modern technology to increase productivity B falling agricultural prices C higher ratios of labour to capital in manufacturing industries D increased trade barriers by high-income countries
1 marks
Answer: A
This question in 0455/13 May/June 2020
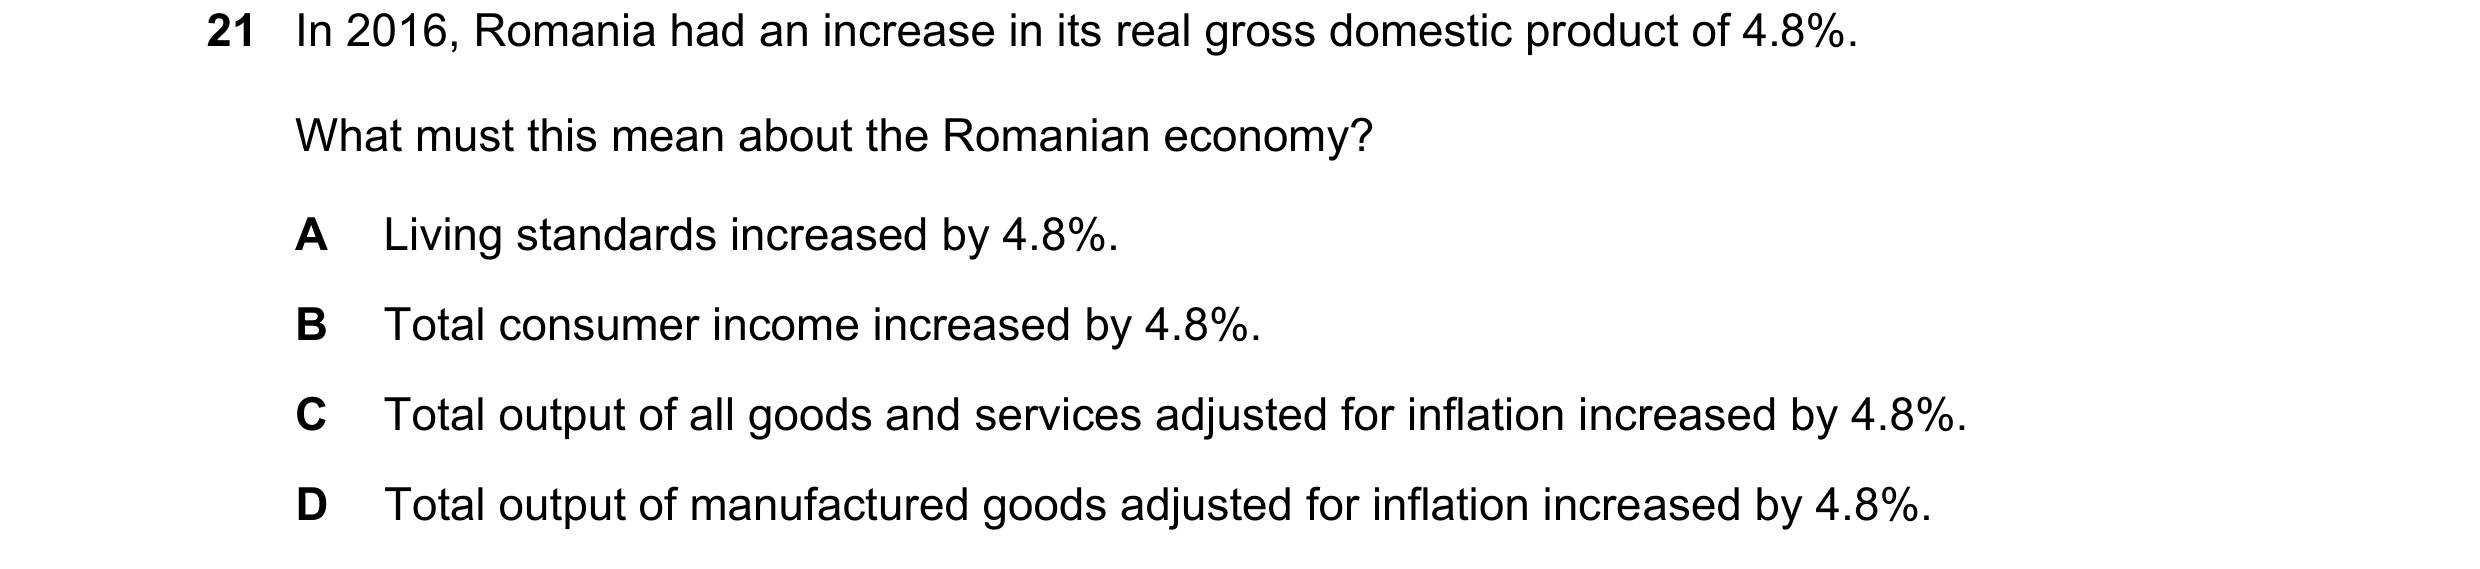
Q111 · In 2016, Romania had an increase in its real gross domestic product of 4.8% 0455/11 Oct/Nov 2020
21 In 2016, Romania had an increase in its real gross domestic product of 4.8%. What must this mean about the Romanian economy? A Living standards increased by 4.8%. B Total consumer income increased by 4.8%. C Total output of all goods and services adjusted for inflation increased by 4.8%. D Total output of manufactured goods adjusted for inflation increased by 4.8%.
1 marks
Answer: C
This question in 0455/11 Oct/Nov 2020
Q112 · A government decreased the tax on all goods produced in its country 0455/13 Oct/Nov 2020
18 A government decreased the tax on all goods produced in its country. What is the most likely consequence of this? A a decrease in exports B an increase in imports C an increase in production D a worsening of the balance of trade in goods
1 marks
Answer: C
This question in 0455/13 Oct/Nov 2020
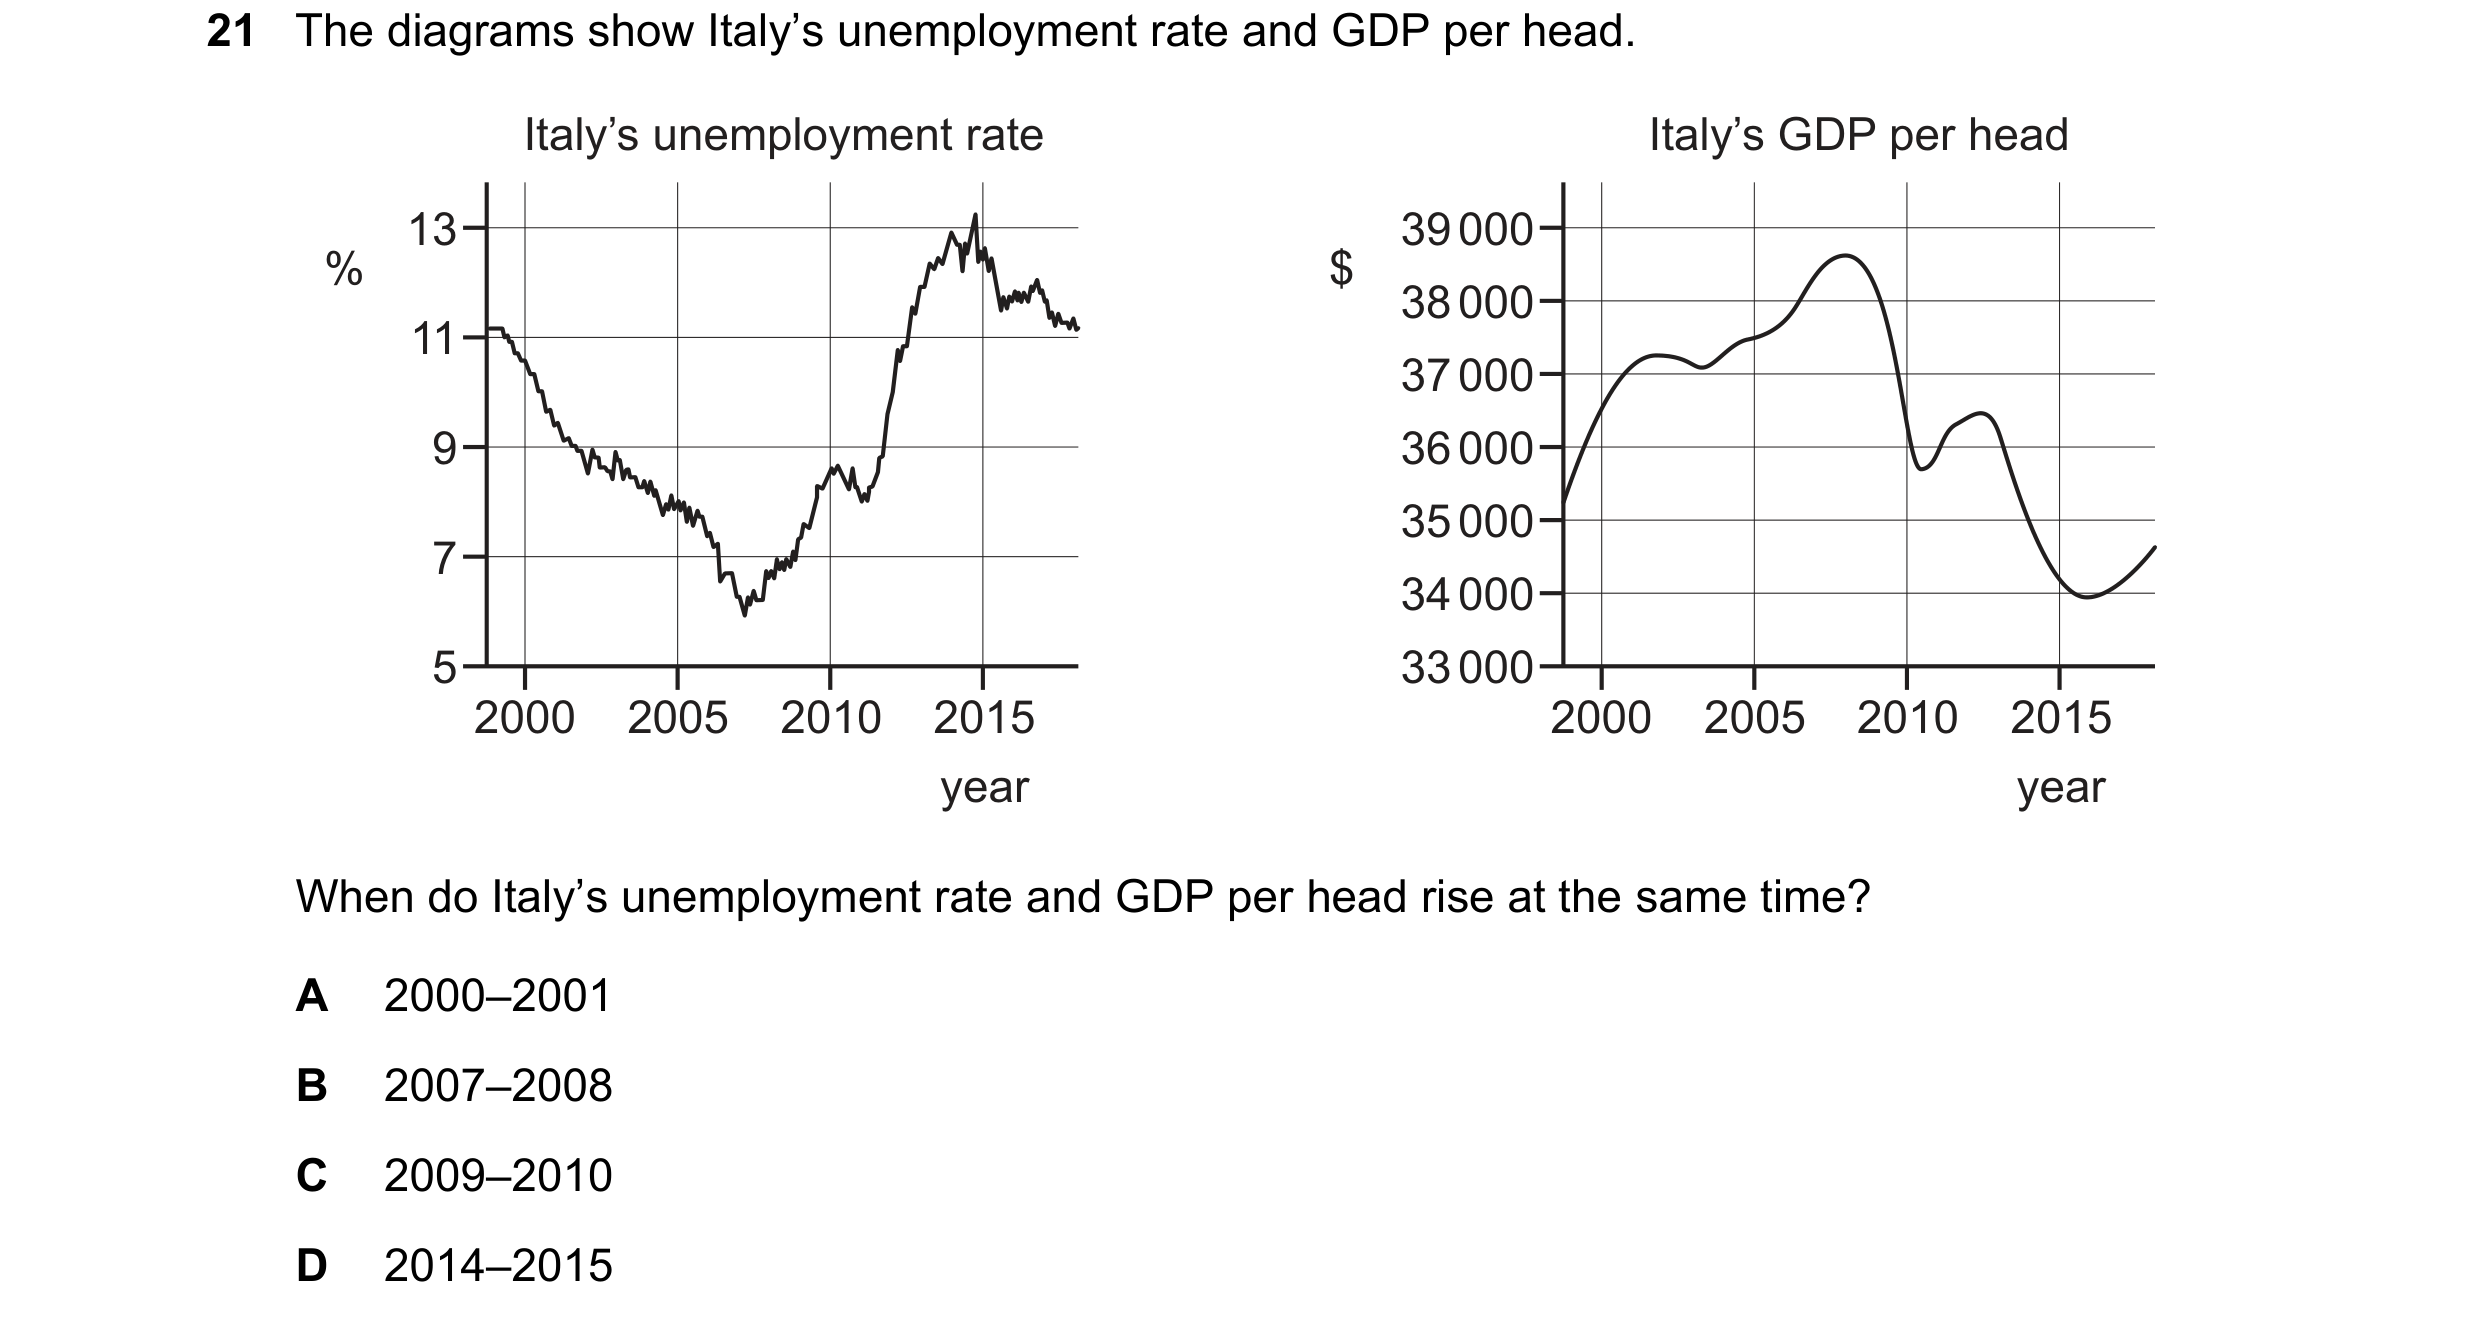
Q113 · The diagrams show Italy’s unemployment rate and GDP per head 0455/13 Oct/Nov 2020
21 The diagrams show Italy’s unemployment rate and GDP per head. Italy’s unemployment rate Italy’s GDP per head 13 39 000 % $ 38 000 11 37 000 9 36 000 35 000 7 34 000 5 33 000 2000 2005 2010 2015 2000 2005 2010 2015 year year When do Italy’s unemployment rate and GDP per head rise at the same time? A 2000–2001 B 2007–2008 C 2009–2010 D 2014–2015
1 marks
Answer: B
This question in 0455/13 Oct/Nov 2020
Q114 · Economic growth can be defined as A a reduction in a country’s rate of inflation 0455/11 May/June 2021
21 Economic growth can be defined as A a reduction in a country’s rate of inflation. B an increase in a country’s exports. C an increase in a country’s population. D an increase in a country’s productive capacity.
1 marks
Answer: D
This question in 0455/11 May/June 2021
Q115 · Economic growth can be defined as A a reduction in a country’s rate of inflation 0455/12 May/June 2021
21 Economic growth can be defined as A a reduction in a country’s rate of inflation. B an increase in a country’s exports. C an increase in a country’s population. D an increase in a country’s productive capacity.
1 marks
Answer: D
This question in 0455/12 May/June 2021
Q116 · Economic growth can be defined as A a reduction in a country’s rate of inflation 0455/13 May/June 2021
21 Economic growth can be defined as A a reduction in a country’s rate of inflation. B an increase in a country’s exports. C an increase in a country’s population. D an increase in a country’s productive capacity.
1 marks
Answer: D
This question in 0455/13 May/June 2021
Q117 · Recession is when there are two consecutive quarters (six months) of A deflation 0455/11 Oct/Nov 2021
16 Recession is when there are two consecutive quarters (six months) of A deflation. B falling GDP. C rising prices. D rising unemployment.
1 marks
Answer: B
This question in 0455/11 Oct/Nov 2021
Q118 · What causes economic growth? 0455/11 Oct/Nov 2021
18 What causes economic growth? A availability of more resources B higher imports of consumer goods C higher unemployment D lower investment
1 marks
Answer: A
This question in 0455/11 Oct/Nov 2021
Q119 · Why can specialisation cause economic growth? 0455/11 Oct/Nov 2021
27 Why can specialisation cause economic growth? A Specialisation can allow a country to produce many different goods and services. B Specialisation can lead to a reduction in average costs of production. C Specialisation can mean that firms in a country will face diseconomies of scale. D Specialisation can reduce a country’s need to depend on other economies.
1 marks
Answer: B
This question in 0455/11 Oct/Nov 2021
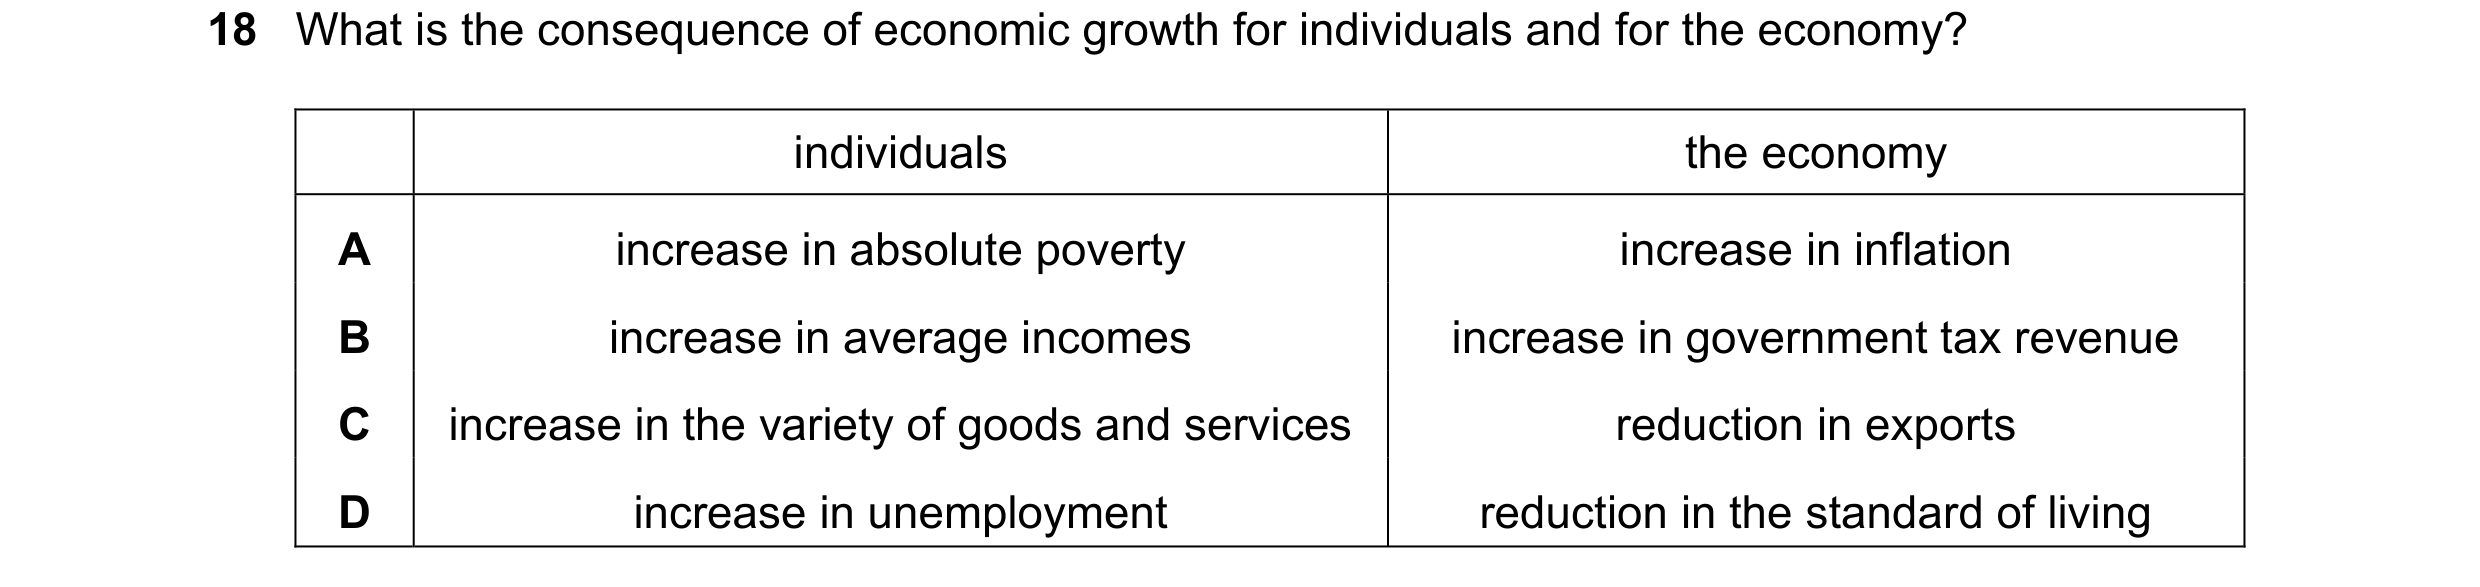
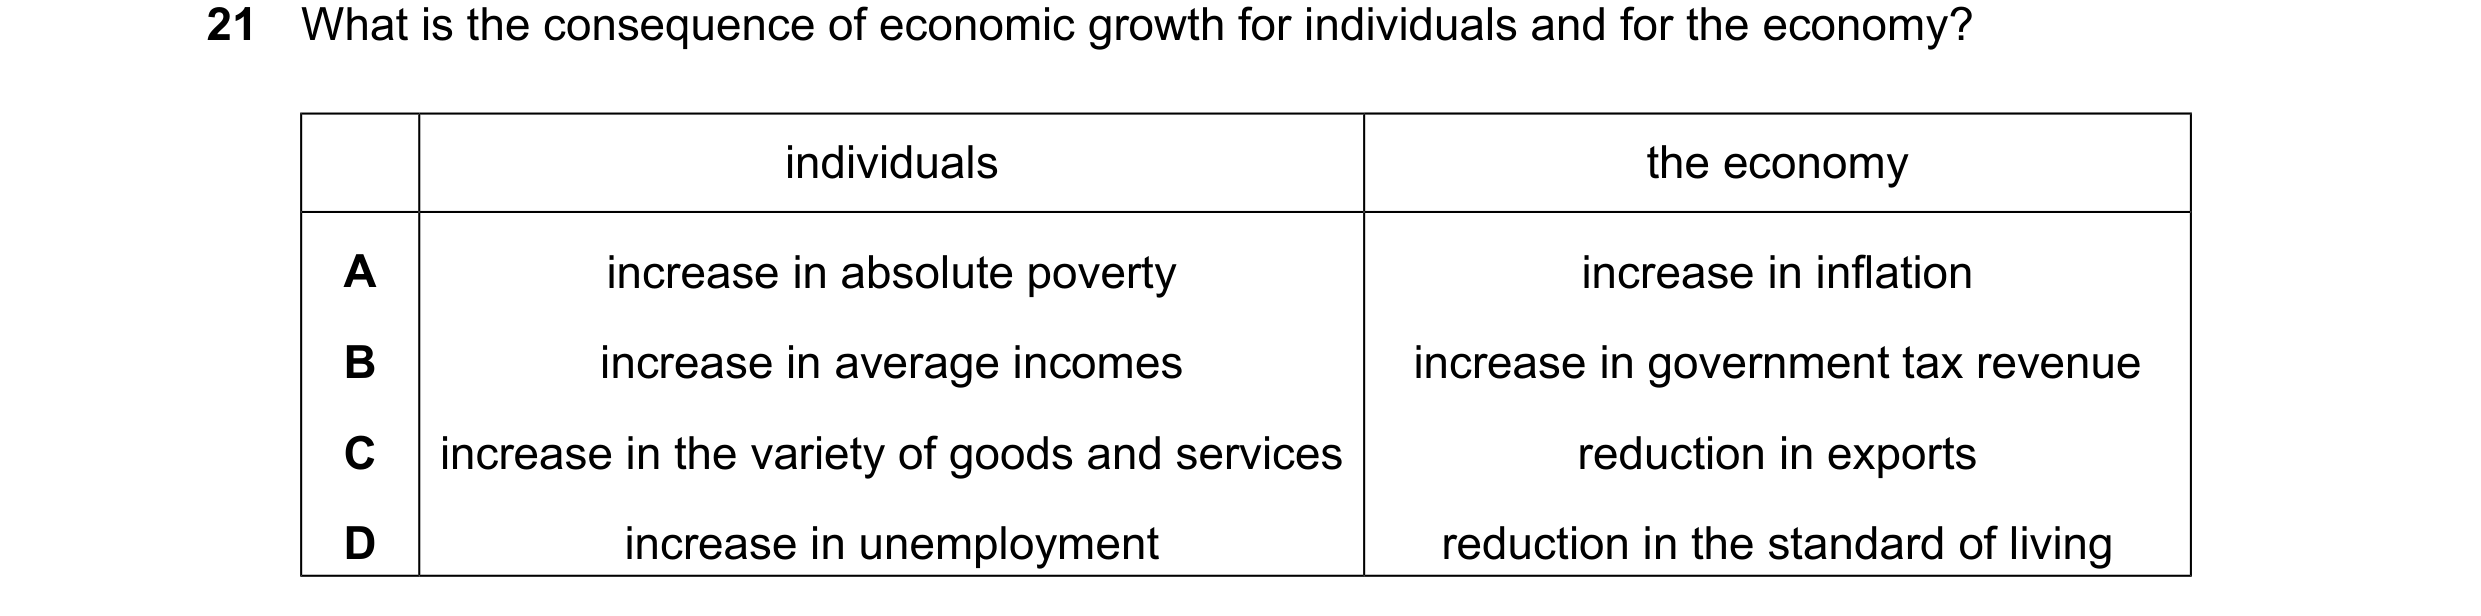
Q120 · What is the consequence of economic growth for individuals and for the economy? 0455/12 Oct/Nov 2021
18 What is the consequence of economic growth for individuals and for the economy? individuals the economy A increase in absolute poverty increase in inflation B increase in average incomes increase in government tax revenue C increase in the variety of goods and services reduction in exports D increase in unemployment reduction in the standard of living
1 marks
Answer: B
This question in 0455/12 Oct/Nov 2021
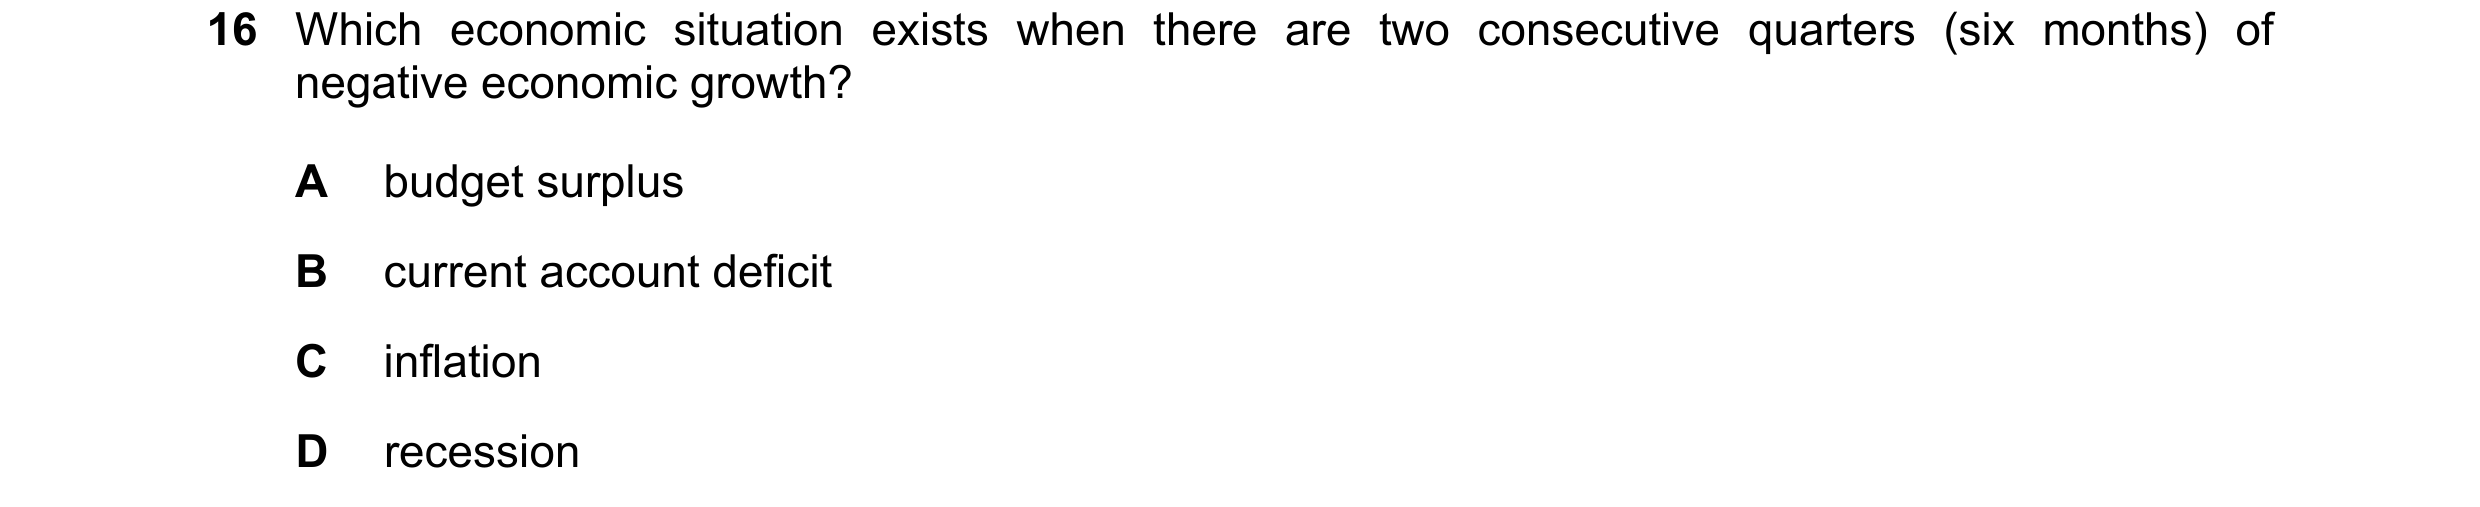
Q121 · Which economic situation exists when there are two consecutive quarters (six months) of… 0455/13 Oct/Nov 2021
16 Which economic situation exists when there are two consecutive quarters (six months) of negative economic growth? A budget surplus B current account deficit C inflation D recession
1 marks
Answer: D
This question in 0455/13 Oct/Nov 2021
Q122 · Which change affecting an economy’s labour market promotes economic growth? 0455/13 Oct/Nov 2021
18 Which change affecting an economy’s labour market promotes economic growth? A increasing trade union strike action B lowering the age of retirement C reducing training of workers D removing immigration controls
1 marks
Answer: D
This question in 0455/13 Oct/Nov 2021
Q123 · What could reduce poverty? 0455/13 Oct/Nov 2021
24 What could reduce poverty? A greater economic growth B less spending on education C more regressive taxation D privatisation of hospitals
1 marks
Answer: A
This question in 0455/13 Oct/Nov 2021
Q124 · What is a likely cause of economic growth? 0455/11 May/June 2022
20 What is a likely cause of economic growth? A decreased employment B decreased investment C decreased productivity D decreased taxation
1 marks
Answer: D
This question in 0455/11 May/June 2022
Q125 · Why would standards of living fall when there is a recession? 0455/11 May/June 2022
23 Why would standards of living fall when there is a recession? A The government would increase taxes to combat the recession. B The purchasing power of households would fall. C The value of the domestic currency would increase. D There would be a rise in the level of immigration.
1 marks
Answer: B
This question in 0455/11 May/June 2022
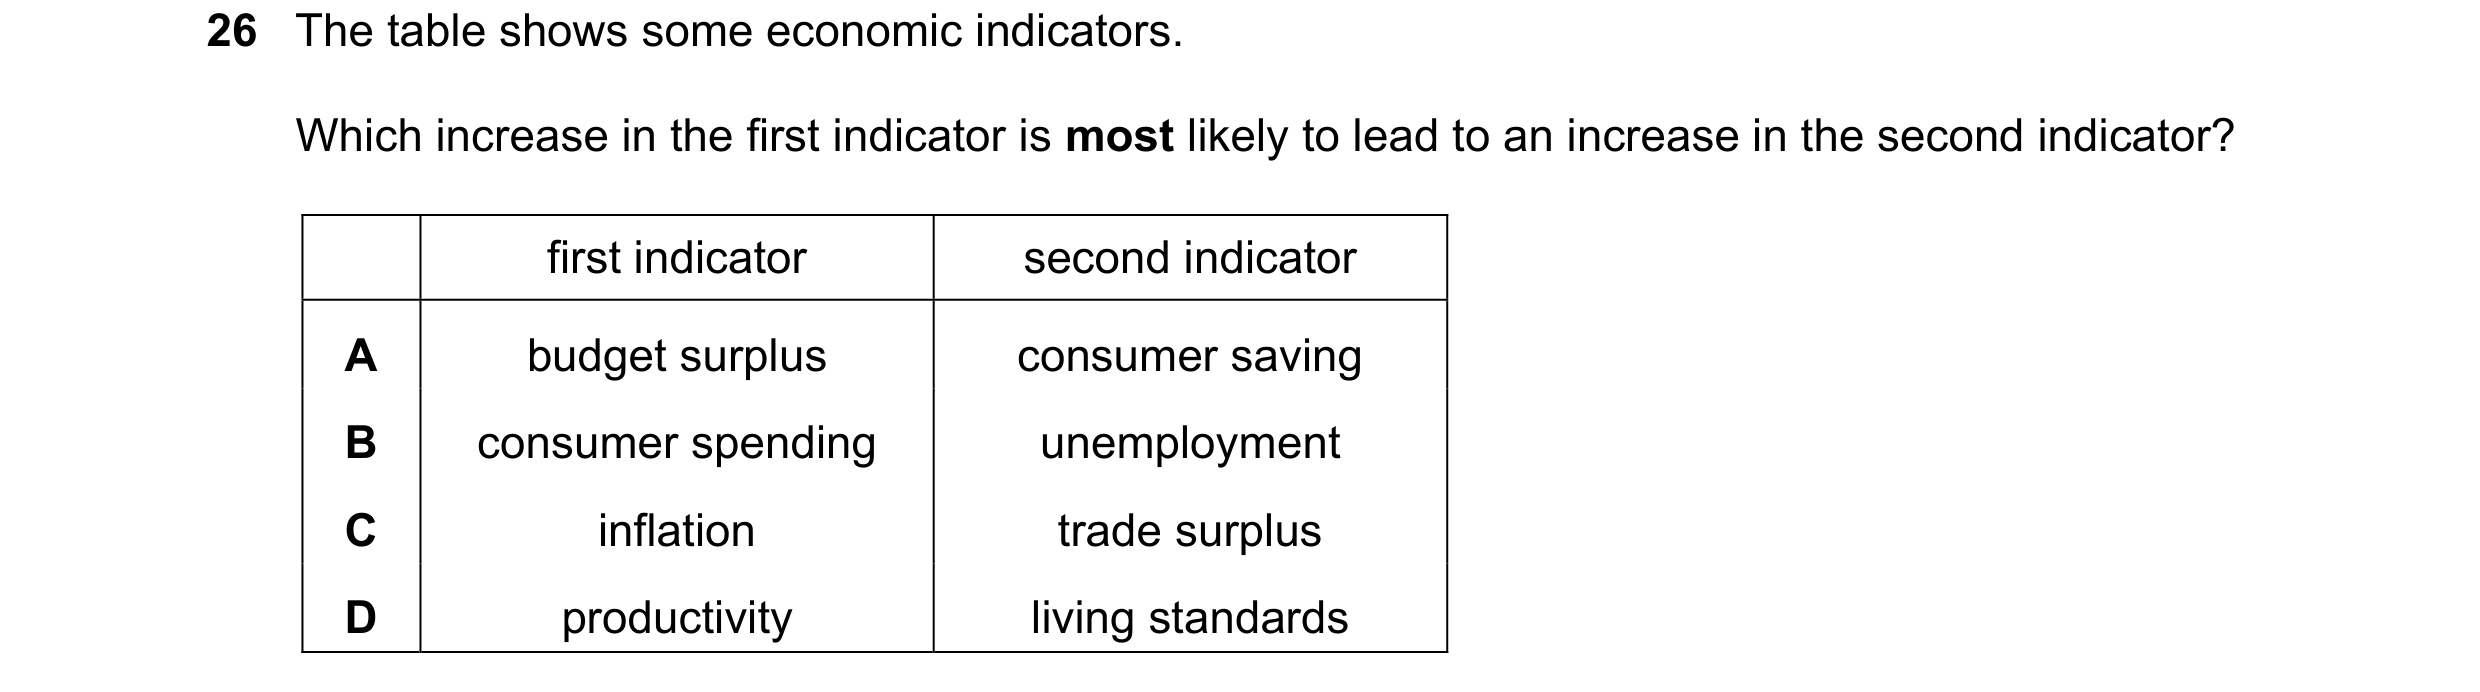
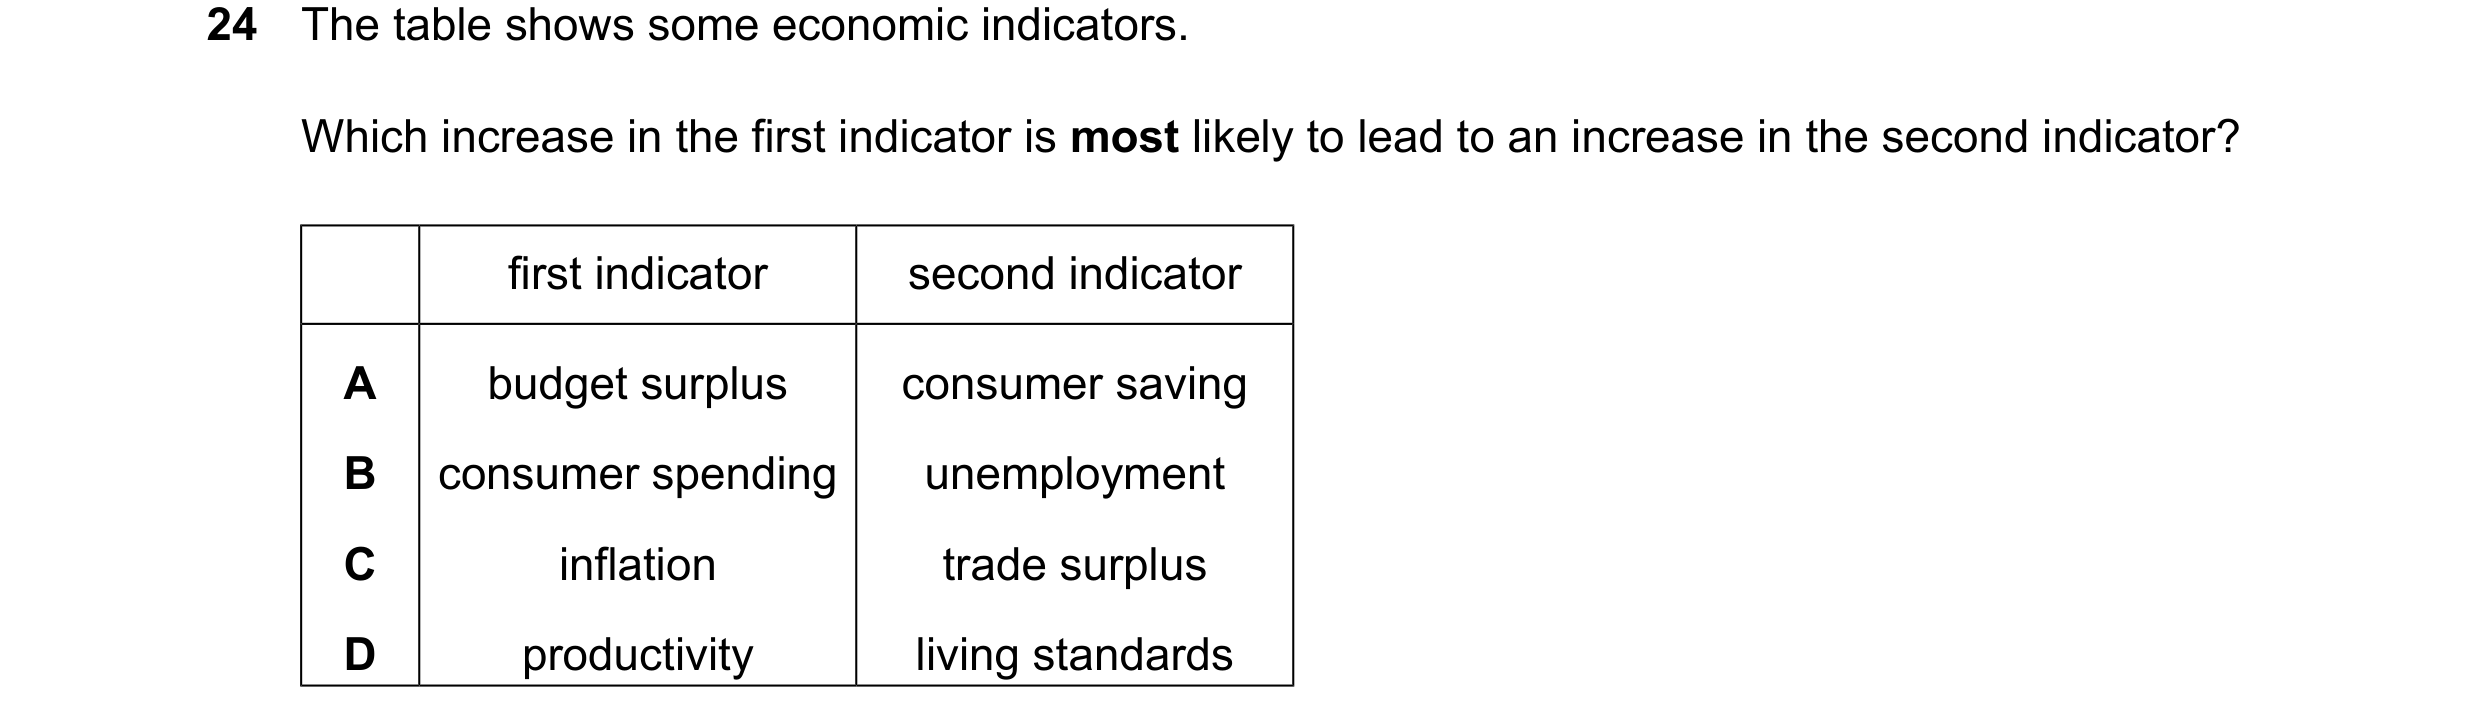
Q126 · The table shows some economic indicators 0455/11 May/June 2022
26 The table shows some economic indicators. Which increase in the first indicator is most likely to lead to an increase in the second indicator? first indicator second indicator A budget surplus consumer saving B consumer spending unemployment C inflation trade surplus D productivity living standards
1 marks
Answer: D
This question in 0455/11 May/June 2022
Q127 · What is identified as economic growth? 0455/12 May/June 2022
20 What is identified as economic growth? A a fall in labour productivity B an increase in the productive capacity of the economy C an increase in the Consumer Prices Index (CPI) D the economy enters a period of recession
1 marks
Answer: B
This question in 0455/12 May/June 2022
Q128 · The table shows some economic indicators 0455/12 May/June 2022
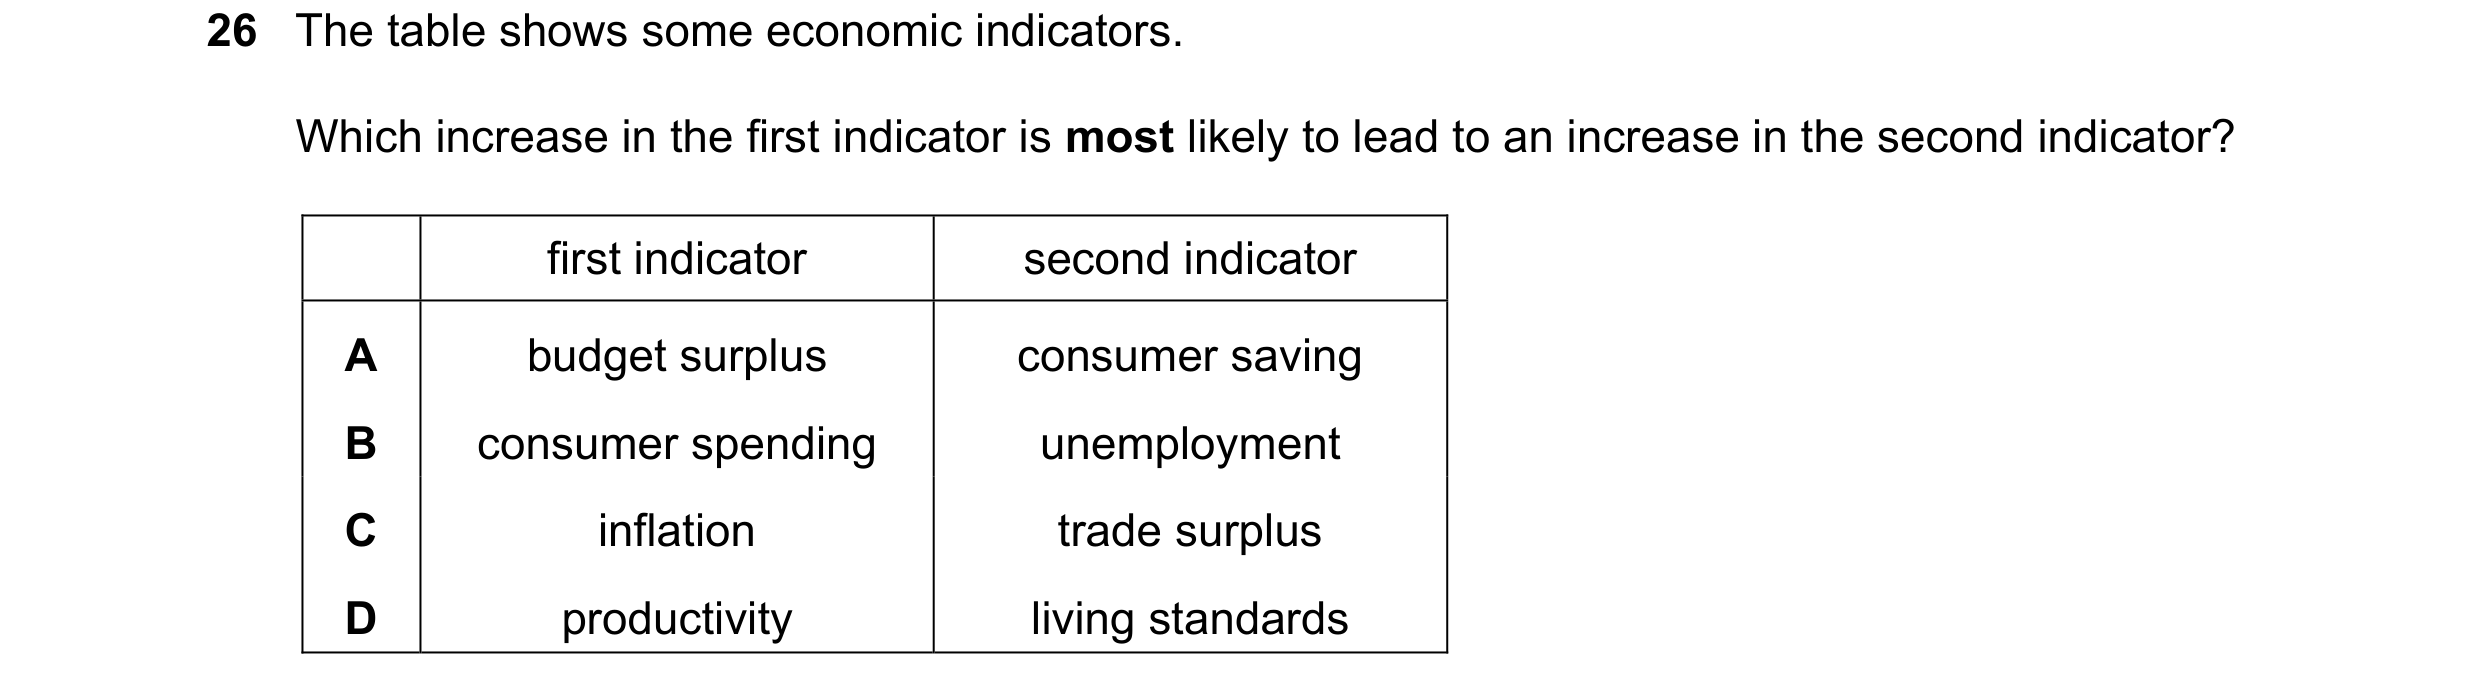
26 The table shows some economic indicators. Which increase in the first indicator is most likely to lead to an increase in the second indicator? first indicator second indicator A budget surplus consumer saving B consumer spending unemployment C inflation trade surplus D productivity living standards
1 marks
Answer: D
This question in 0455/12 May/June 2022
Q129 · What may cause a recession? 0455/13 May/June 2022
20 What may cause a recession? A an increase in consumer spending B an increase in government spending C an increase in imports D an increase in investment
1 marks
Answer: C
This question in 0455/13 May/June 2022
Q130 · The table shows some economic indicators 0455/13 May/June 2022
26 The table shows some economic indicators. Which increase in the first indicator is most likely to lead to an increase in the second indicator? first indicator second indicator A budget surplus consumer saving B consumer spending unemployment C inflation trade surplus D productivity living standards
1 marks
Answer: D
This question in 0455/13 May/June 2022
Q131 · What is the most effective way for a government to raise national output? 0455/11 Oct/Nov 2022
19 What is the most effective way for a government to raise national output? A encourage a period of deflation B improve the productivity of resources C limit the size of its population D restrict its trade with other countries
1 marks
Answer: B
This question in 0455/11 Oct/Nov 2022
Q132 · The diagram shows a country’s economic growth rate over a 5-year period 0455/12 Oct/Nov 2022
19 The diagram shows a country’s economic growth rate over a 5-year period. 6 economic 5 growth rate % 4 3 2 1 0 year 1 year 2 year 3 year 4 year 5 –1 –2 What can be concluded from the diagram? A Output fell throughout the period. B Output was at its highest in year 1. C Output was at its highest in year 5. D Output was at its lowest in year 4.
1 marks
Answer: C
This question in 0455/12 Oct/Nov 2022
Q133 · An individual decides to employ a professional decorator rather than buying the materials… 0455/12 Oct/Nov 2022
20 An individual decides to employ a professional decorator rather than buying the materials and decorating her house herself. Why would this decision cause GDP to rise? A The activity would be recorded as income for the decorator. B The individual would have more leisure time. C The professional decorator can purchase materials at a discount. D The professional decorator would work less efficiently than the individual.
1 marks
Answer: A
This question in 0455/12 Oct/Nov 2022
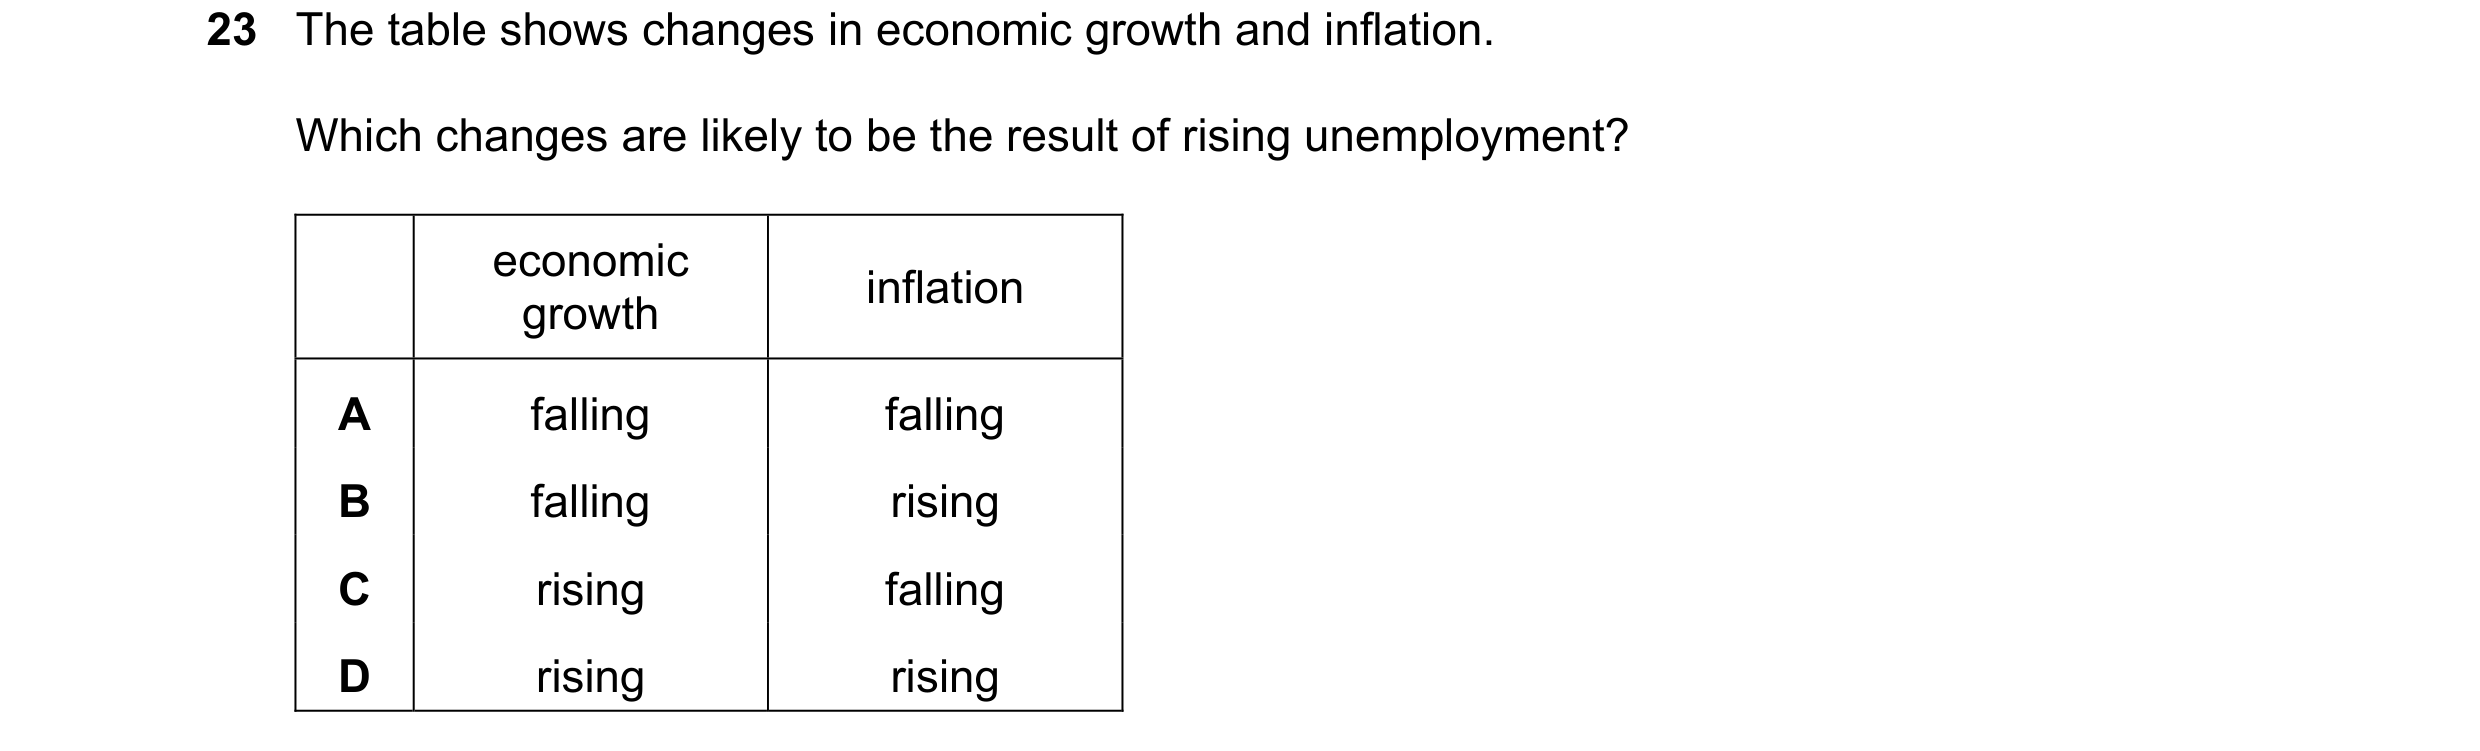
Q134 · The table shows changes in economic growth and inflation 0455/12 Oct/Nov 2022
23 The table shows changes in economic growth and inflation. Which changes are likely to be the result of rising unemployment? economic inflation growth A falling falling B falling rising C rising falling D rising rising
1 marks
Answer: A
This question in 0455/12 Oct/Nov 2022
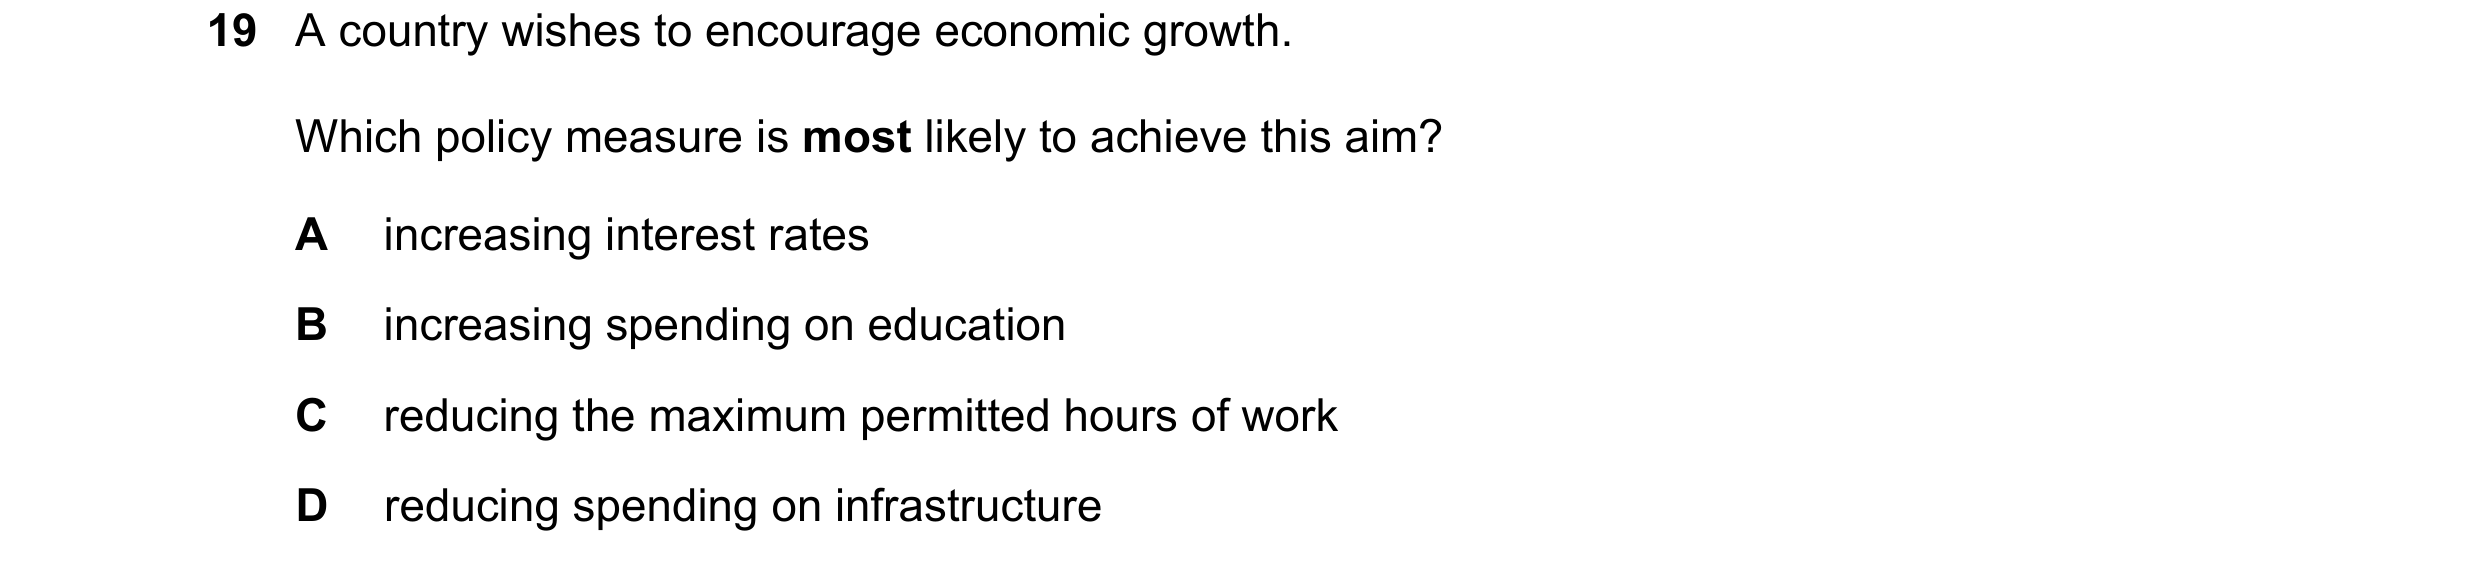
Q135 · A country wishes to encourage economic growth 0455/13 Oct/Nov 2022
19 A country wishes to encourage economic growth. Which policy measure is most likely to achieve this aim? A increasing interest rates B increasing spending on education C reducing the maximum permitted hours of work D reducing spending on infrastructure
1 marks
Answer: B
This question in 0455/13 Oct/Nov 2022
Q136 · How does a country usually measure its Gross Domestic Product? 0455/13 Oct/Nov 2022
20 How does a country usually measure its Gross Domestic Product? A by calculating the total value of all goods and services produced within the economy B by measuring the average prices of a basket of goods and services throughout the country C by subtracting government expenditure from government revenue D by surveying the number of people who are out of work but willing and able to work
1 marks
Answer: A
This question in 0455/13 Oct/Nov 2022
Q137 · In the past, governments have adopted policies to try to end a recession in their country… 0455/12 Feb/March 2023
20 In the past, governments have adopted policies to try to end a recession in their country and increase economic growth. Which combination of policies is most likely to achieve this? A lower taxes and decrease government spending B lower taxes and increase government spending C raise taxes and decrease government spending D raise taxes and increase government spending
1 marks
Answer: B
This question in 0455/12 Feb/March 2023
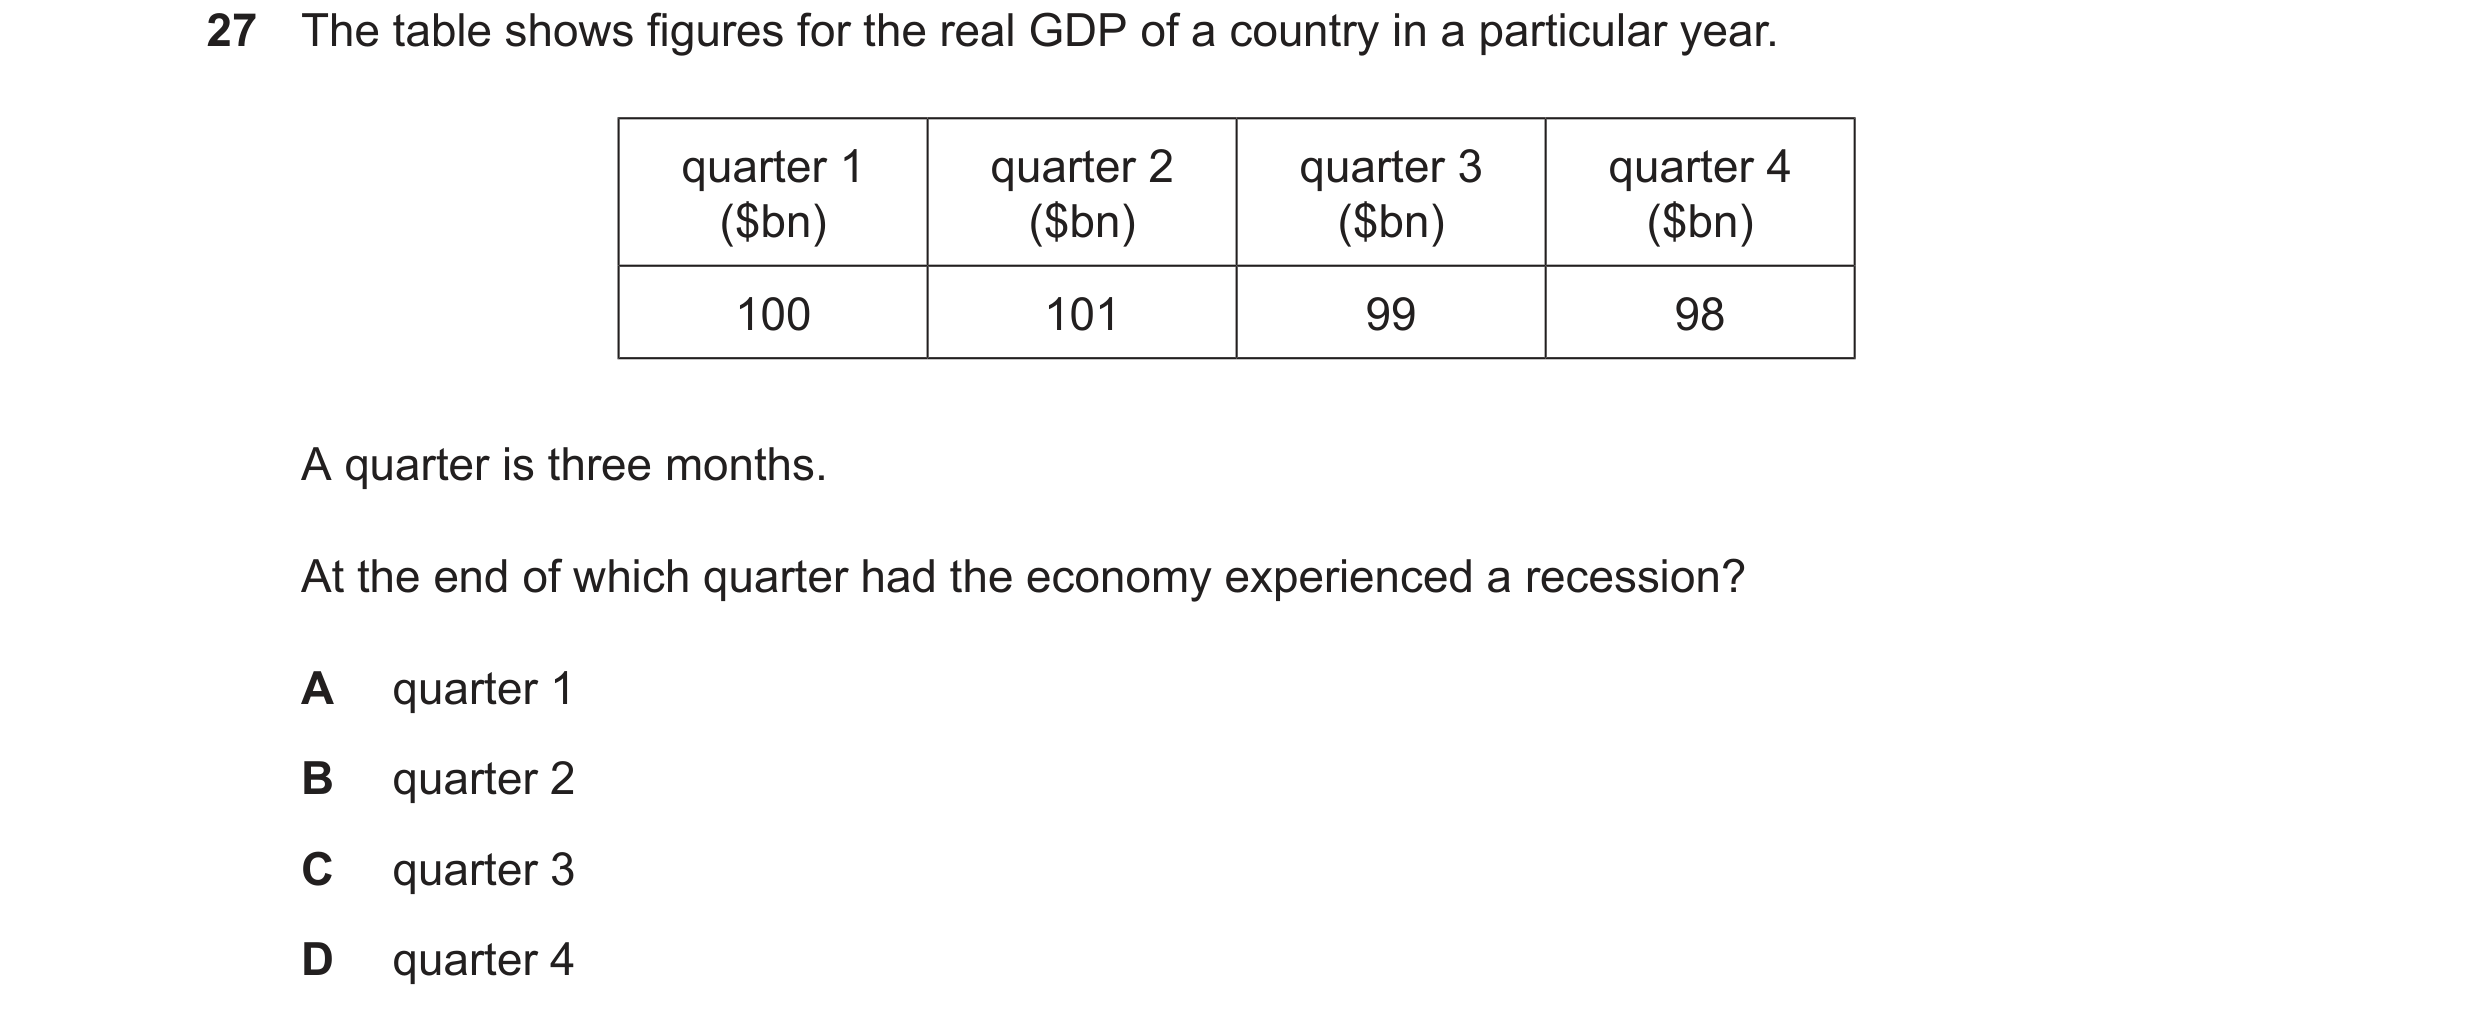
Q138 · The table shows figures for the real GDP of a country in a particular year 0455/12 Feb/March 2023
27 The table shows figures for the real GDP of a country in a particular year. quarter 1 quarter 2 quarter 3 quarter 4 ($bn) ($bn) ($bn) ($bn) 100 101 99 98 A quarter is three months. At the end of which quarter had the economy experienced a recession? A quarter 1 B quarter 2 C quarter 3 D quarter 4
1 marks
Answer: D
This question in 0455/12 Feb/March 2023
Q139 · A country’s production possibility curve (PPC) moves from PPC1 to PPC2 0455/12 May/June 2023
2 A country’s production possibility curve (PPC) moves from PPC1 to PPC2. consumer goods PPC1 PPC2 O capital goods What could cause this movement in the PPC? better higher lower education investment unemployment A false false true B false true false C true false true D true true false
1 marks
Answer: D
This question in 0455/12 May/June 2023
Q140 · The government of country Z announces an increase in spending on work-place training 0455/12 May/June 2023
20 The government of country Z announces an increase in spending on work-place training. What is the effect of this supply-side policy likely to be? A a decrease in country Z’s employment rate B a decrease in country Z’s exchange rate C an increase in country Z’s economic growth rate D an increase in country Z’s interest rate
1 marks
Answer: C
This question in 0455/12 May/June 2023
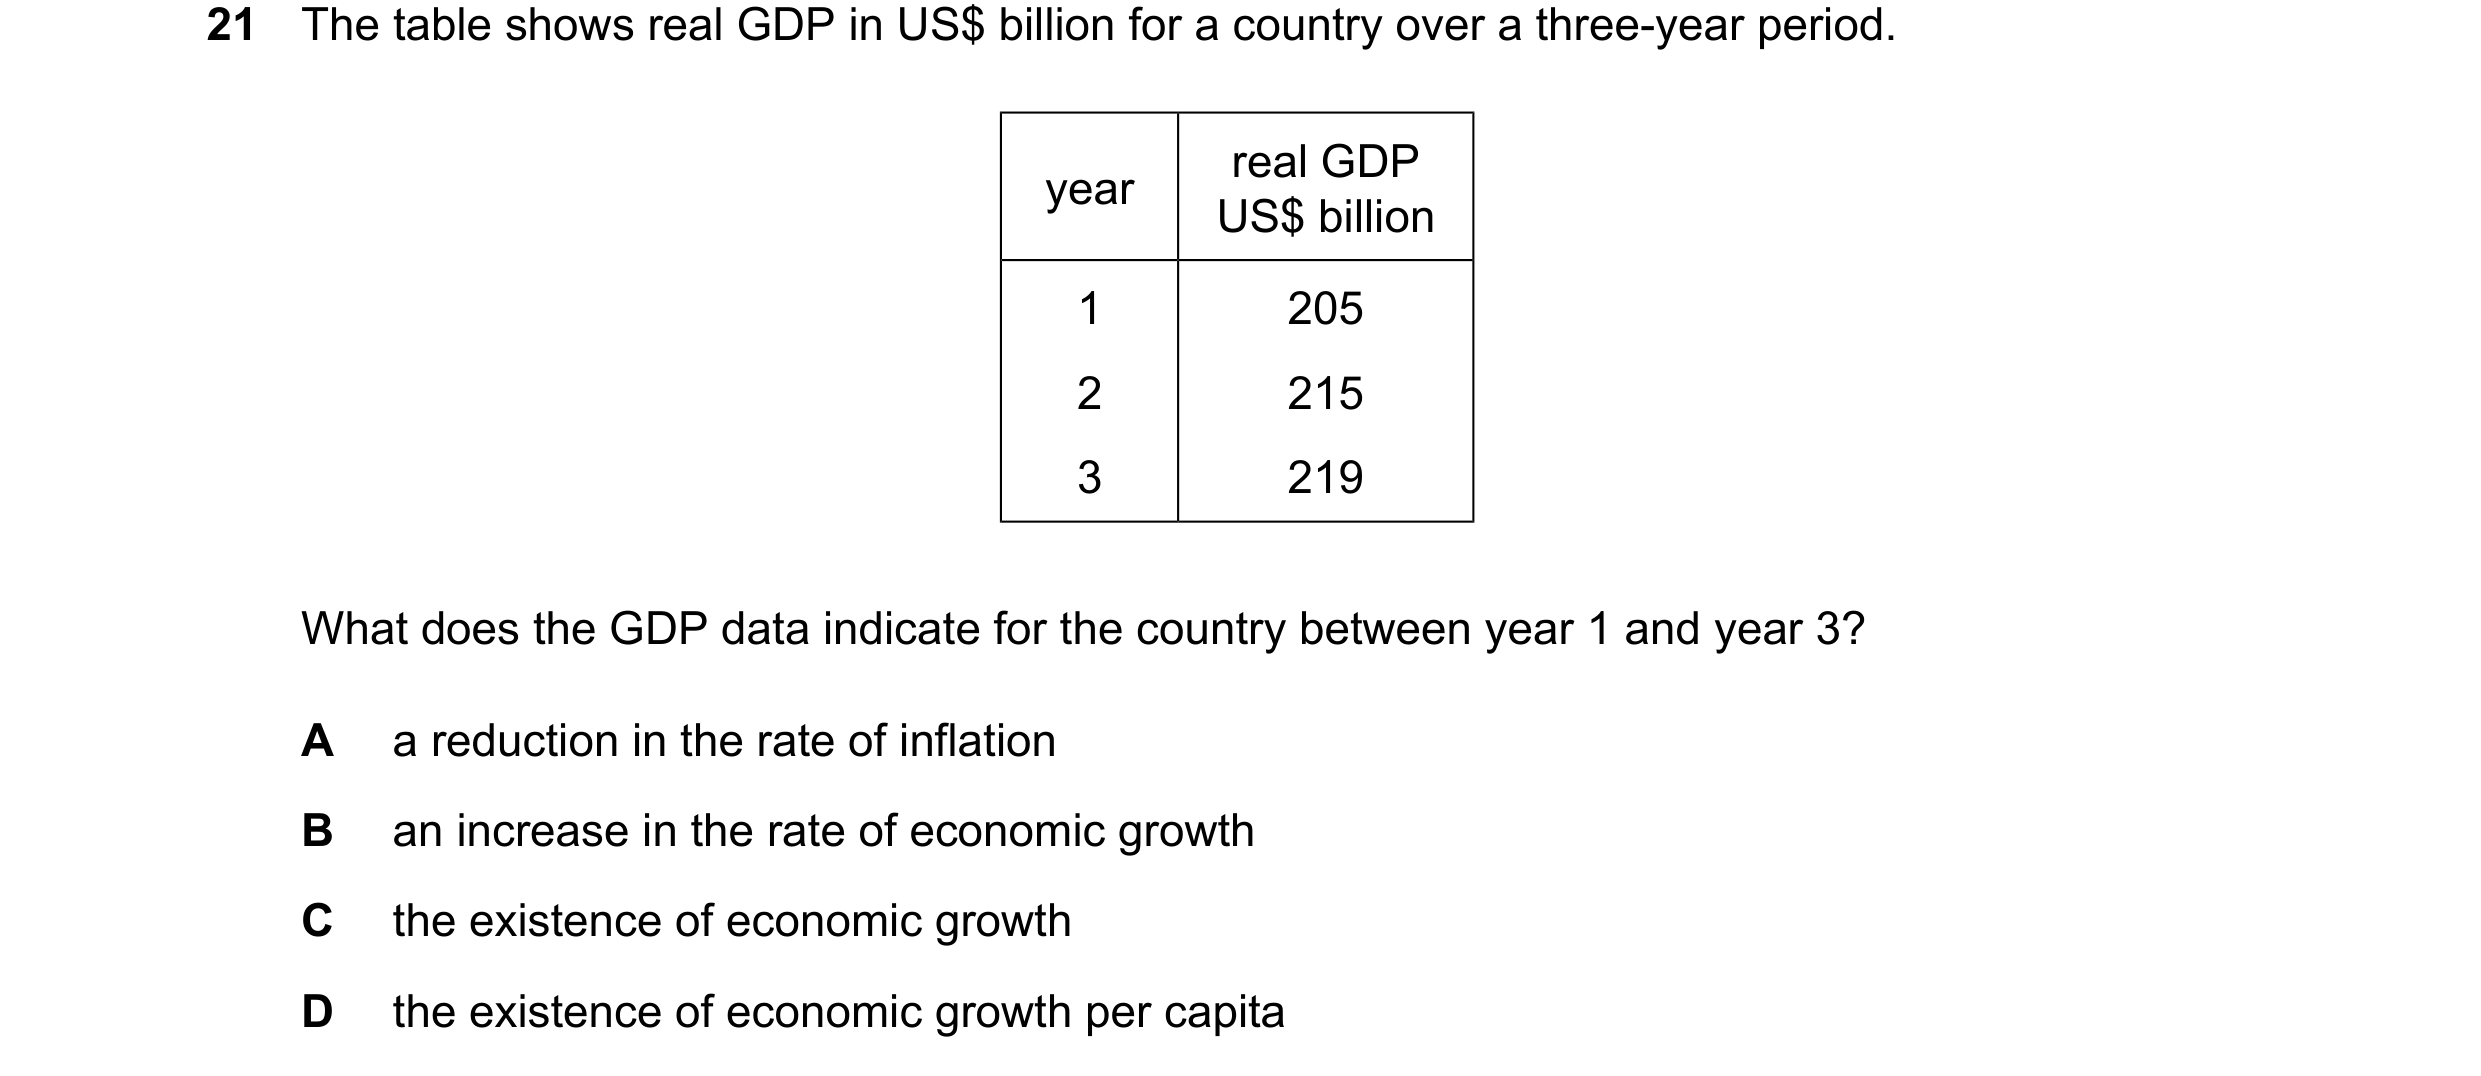
Q141 · The table shows real GDP in US$ billion for a country over a three-year period 0455/12 May/June 2023
21 The table shows real GDP in US$ billion for a country over a three-year period. real GDP year US$ billion 1 205 2 215 3 219 What does the GDP data indicate for the country between year 1 and year 3? A a reduction in the rate of inflation B an increase in the rate of economic growth C the existence of economic growth D the existence of economic growth per capita
1 marks
Answer: C
This question in 0455/12 May/June 2023
Q142 · The diagrams show Italy’s unemployment rate and GDP per head 0455/12 May/June 2023
23 The diagrams show Italy’s unemployment rate and GDP per head. Italy’s unemployment rate Italy’s GDP per head 13 39 000 % $ 38 000 11 37 000 9 36 000 35 000 7 34 000 5 33 000 2000 2005 2010 2015 2000 2005 2010 2015 year year When do Italy’s unemployment rate and GDP per head rise at the same time? A 2000–2001 B 2007–2008 C 2009–2010 D 2014–2015
1 marks
Answer: B
This question in 0455/12 May/June 2023
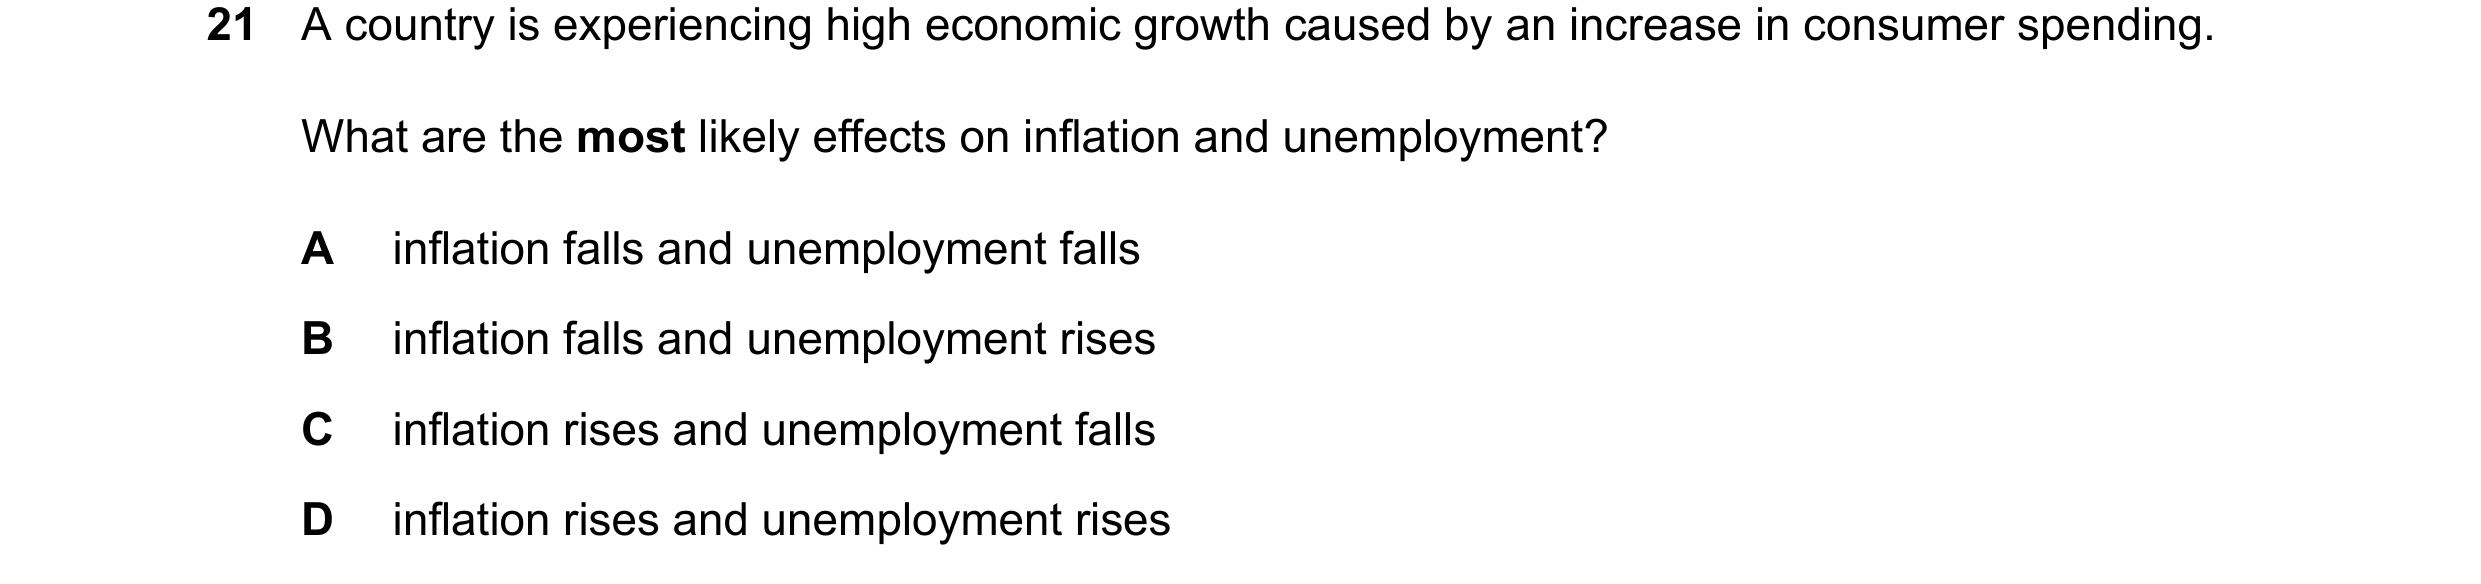
Q143 · A country is experiencing high economic growth caused by an increase in consumer spending 0455/13 May/June 2023
21 A country is experiencing high economic growth caused by an increase in consumer spending. What are the most likely effects on inflation and unemployment? A inflation falls and unemployment falls B inflation falls and unemployment rises C inflation rises and unemployment falls D inflation rises and unemployment rises
1 marks
Answer: C
This question in 0455/13 May/June 2023
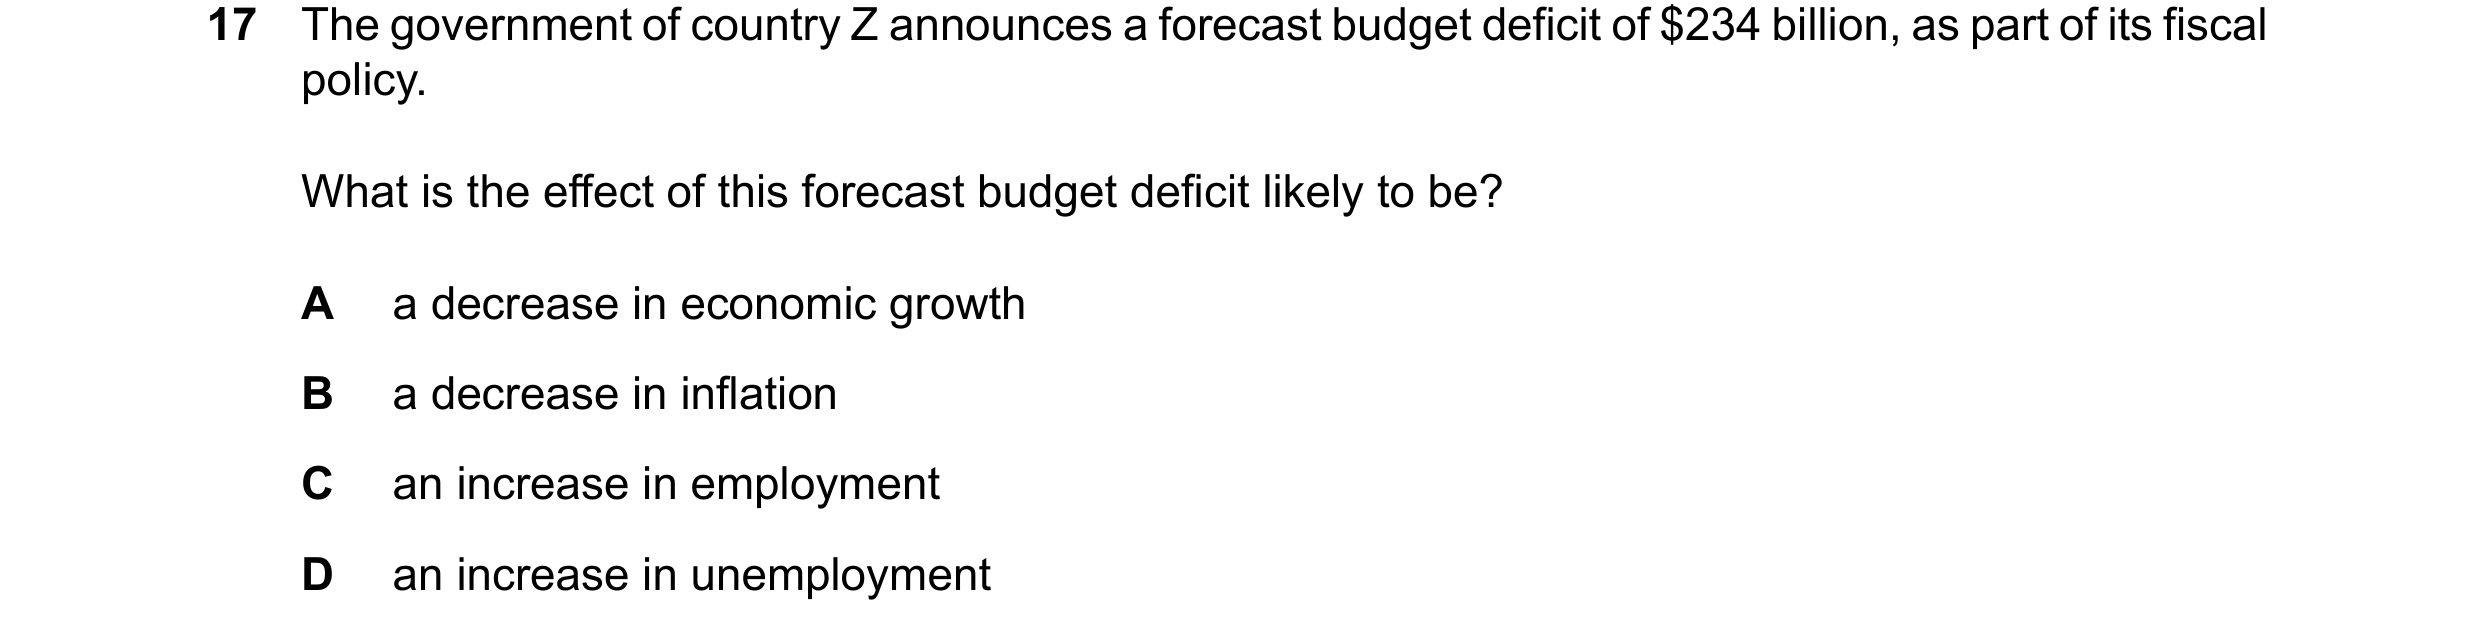
Q144 · The government of country Z announces a forecast budget deficit of $234 billion, as part… 0455/11 Oct/Nov 2023
17 The government of country Z announces a forecast budget deficit of $234 billion, as part of its fiscal policy. What is the effect of this forecast budget deficit likely to be? A a decrease in economic growth B a decrease in inflation C an increase in employment D an increase in unemployment
1 marks
Answer: C
This question in 0455/11 Oct/Nov 2023
Q145 · An increase in which economic indicator best describes economic growth? 0455/11 Oct/Nov 2023
21 An increase in which economic indicator best describes economic growth? A general price level B level of consumption C level of output D living standards
1 marks
Answer: C
This question in 0455/11 Oct/Nov 2023
Q146 · What is the most likely consequence of economic growth? 0455/13 Oct/Nov 2023
21 What is the most likely consequence of economic growth? A more equal income distribution B more use of resources C reduced imports D reduced tax revenue
1 marks
Answer: B
This question in 0455/13 Oct/Nov 2023
Q147 · The table shows some economic indicators 0455/13 Oct/Nov 2023
24 The table shows some economic indicators. Which increase in the first indicator is most likely to lead to an increase in the second indicator? first indicator second indicator A budget surplus consumer saving B consumer spending unemployment C inflation trade surplus D productivity living standards
1 marks
Answer: D
This question in 0455/13 Oct/Nov 2023
Q148 · What is likely to increase with economic growth? 0455/12 Feb/March 2024
18 What is likely to increase with economic growth? A cyclical unemployment B income per head C the budget deficit D the stock of natural resources
1 marks
Answer: B
This question in 0455/12 Feb/March 2024
Q149 · Which change is most likely to cause faster economic growth in the short run? 0455/12 May/June 2024
21 Which change is most likely to cause faster economic growth in the short run? A an increase in net emigration B an increase in the birth rate C an increase in the death rate D an increase in the retirement age
1 marks
Answer: D
This question in 0455/12 May/June 2024
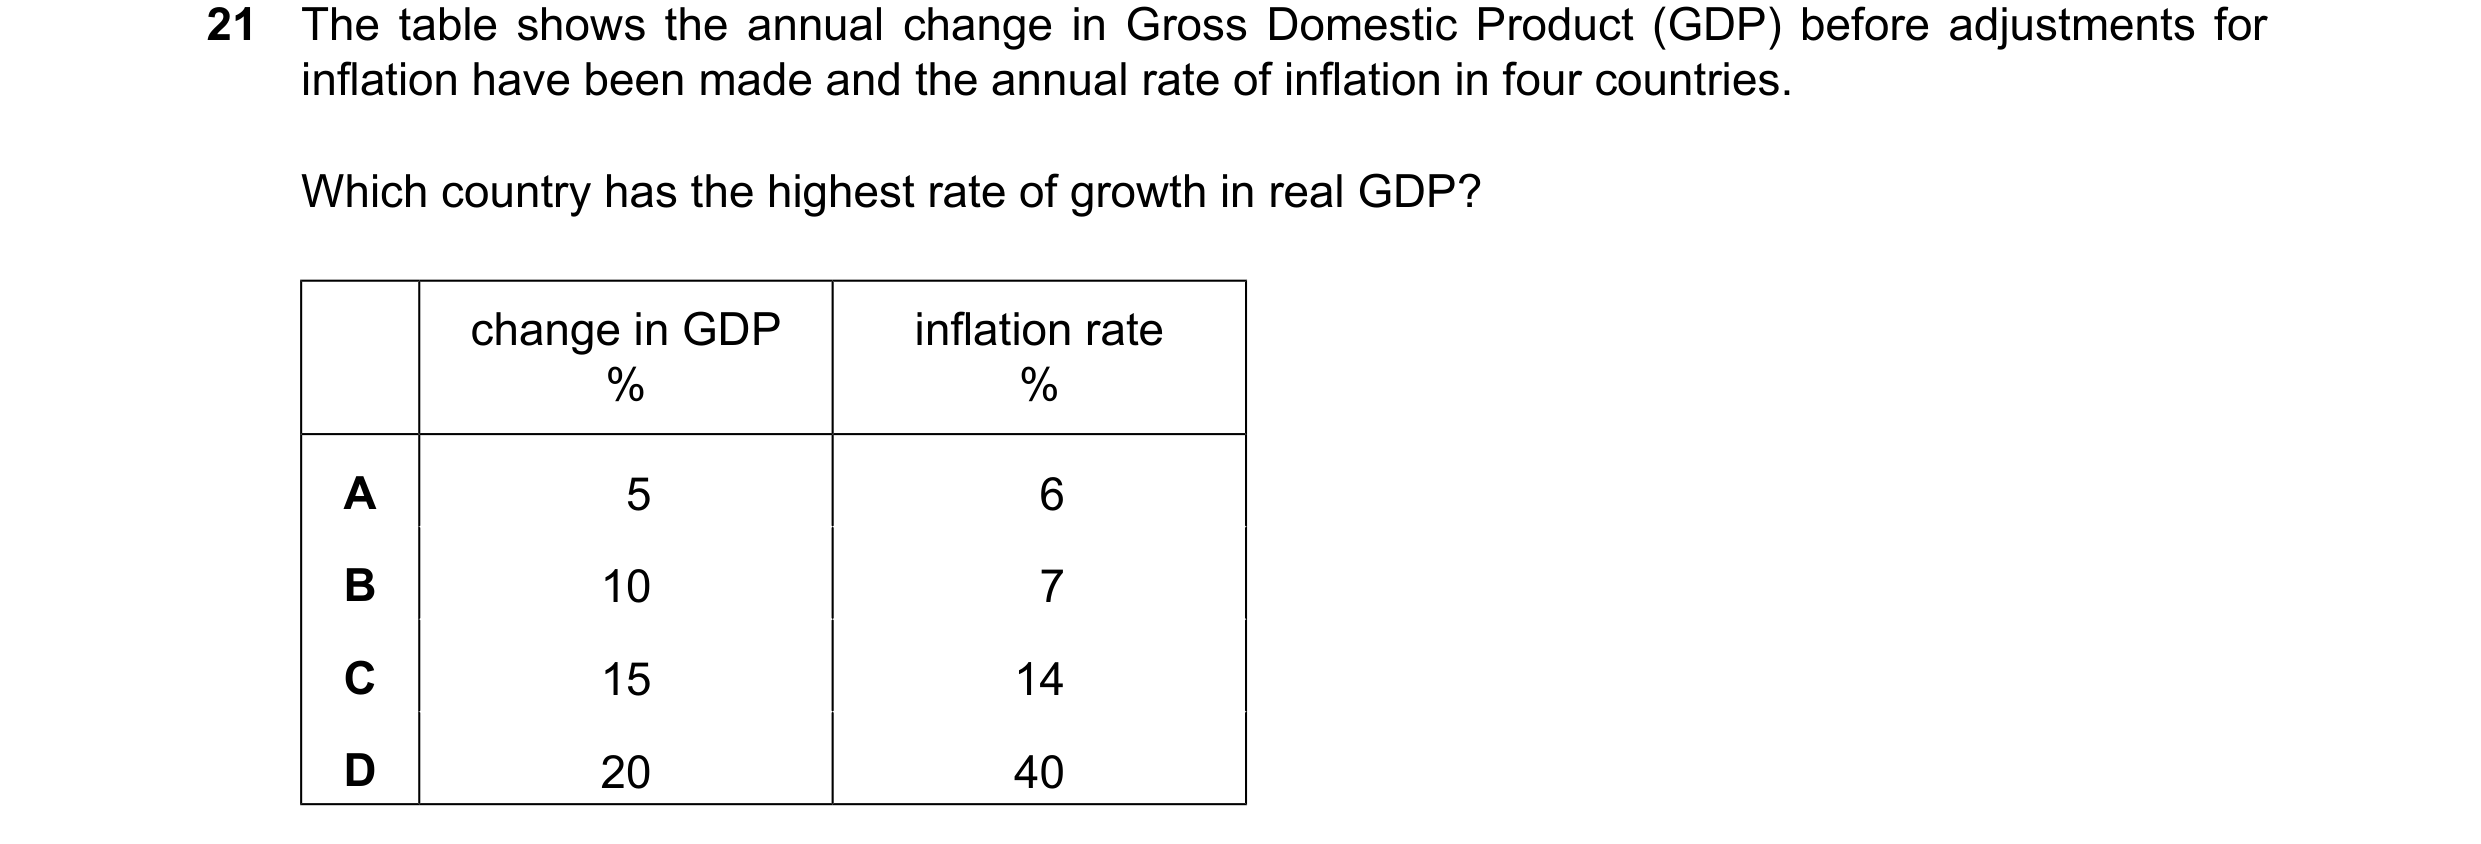
Q150 · The table shows the annual change in Gross Domestic Product (GDP) before adjustments for… 0455/13 May/June 2024
21 The table shows the annual change in Gross Domestic Product (GDP) before adjustments for inflation have been made and the annual rate of inflation in four countries. Which country has the highest rate of growth in real GDP? change in GDP inflation rate % % A 5 6 B 10 7 C 15 14 D 20 40
1 marks
Answer: B
This question in 0455/13 May/June 2024
Q151 · What is most likely to result from a successful supply-side policy? 0455/11 Oct/Nov 2024
20 What is most likely to result from a successful supply-side policy? A a deterioration in the current account of the balance of payments B economic growth C increased inflation D increased structural unemployment
1 marks
Answer: B
This question in 0455/11 Oct/Nov 2024
Q152 · What will cause real GDP to rise in a country? 0455/12 Oct/Nov 2024
17 What will cause real GDP to rise in a country? A nominal GDP rising at a faster rate than employment B nominal GDP rising faster than inflation C nominal GDP rising faster than the population D nominal GDP rising
1 marks
Answer: B
This question in 0455/12 Oct/Nov 2024
Q153 · What is the definition of economic growth? 0455/12 Oct/Nov 2024
20 What is the definition of economic growth? A It is an increase in the general level of prices over time. B It is an increase in the level of a nation's output over time. C It is an increase in the level of total demand over time. D It is an increase in wages, interest, profits and rent over time.
1 marks
Answer: B
This question in 0455/12 Oct/Nov 2024
Q154 · What is the consequence of economic growth for individuals and for the economy? 0455/13 Oct/Nov 2024
21 What is the consequence of economic growth for individuals and for the economy? individuals the economy A increase in absolute poverty increase in inflation B increase in average incomes increase in government tax revenue C increase in the variety of goods and services reduction in exports D increase in unemployment reduction in the standard of living
1 marks
Answer: B
This question in 0455/13 Oct/Nov 2024
Q155 · Which action by employers is most likely to reduce long-term economic growth? 0455/12 Feb/March 2025
22 Which action by employers is most likely to reduce long-term economic growth? A allowing workers time off to attend retraining courses B encouraging workers to work flexibly in different roles C granting workers regular short breaks during the working day D replacing skilled workers with semi-skilled workers
1 marks
Answer: D
This question in 0455/12 Feb/March 2025
Q156 · Which policy decision is most likely to cause economic growth? 0455/11 May/June 2025
21 Which policy decision is most likely to cause economic growth? A an increase in corporation tax rates B an increase in interest rates C an increase in the amount workers can earn before paying income tax D an increase in the government's regulations for starting a new business
1 marks
Answer: C
This question in 0455/11 May/June 2025
Q157 · The diagram shows the production possibility curve (PPC) for an economy that is at point X 0455/12 May/June 2025
3 The diagram shows the production possibility curve (PPC) for an economy that is at point X. output of capital Y goods X O output of consumer goods Which change in the economy’s labour market will allow it to reach point Y? A employed workers become more productive B unemployed workers find new jobs C workers emigrate for higher wages D workers retire at younger ages
1 marks
Answer: A
This question in 0455/12 May/June 2025
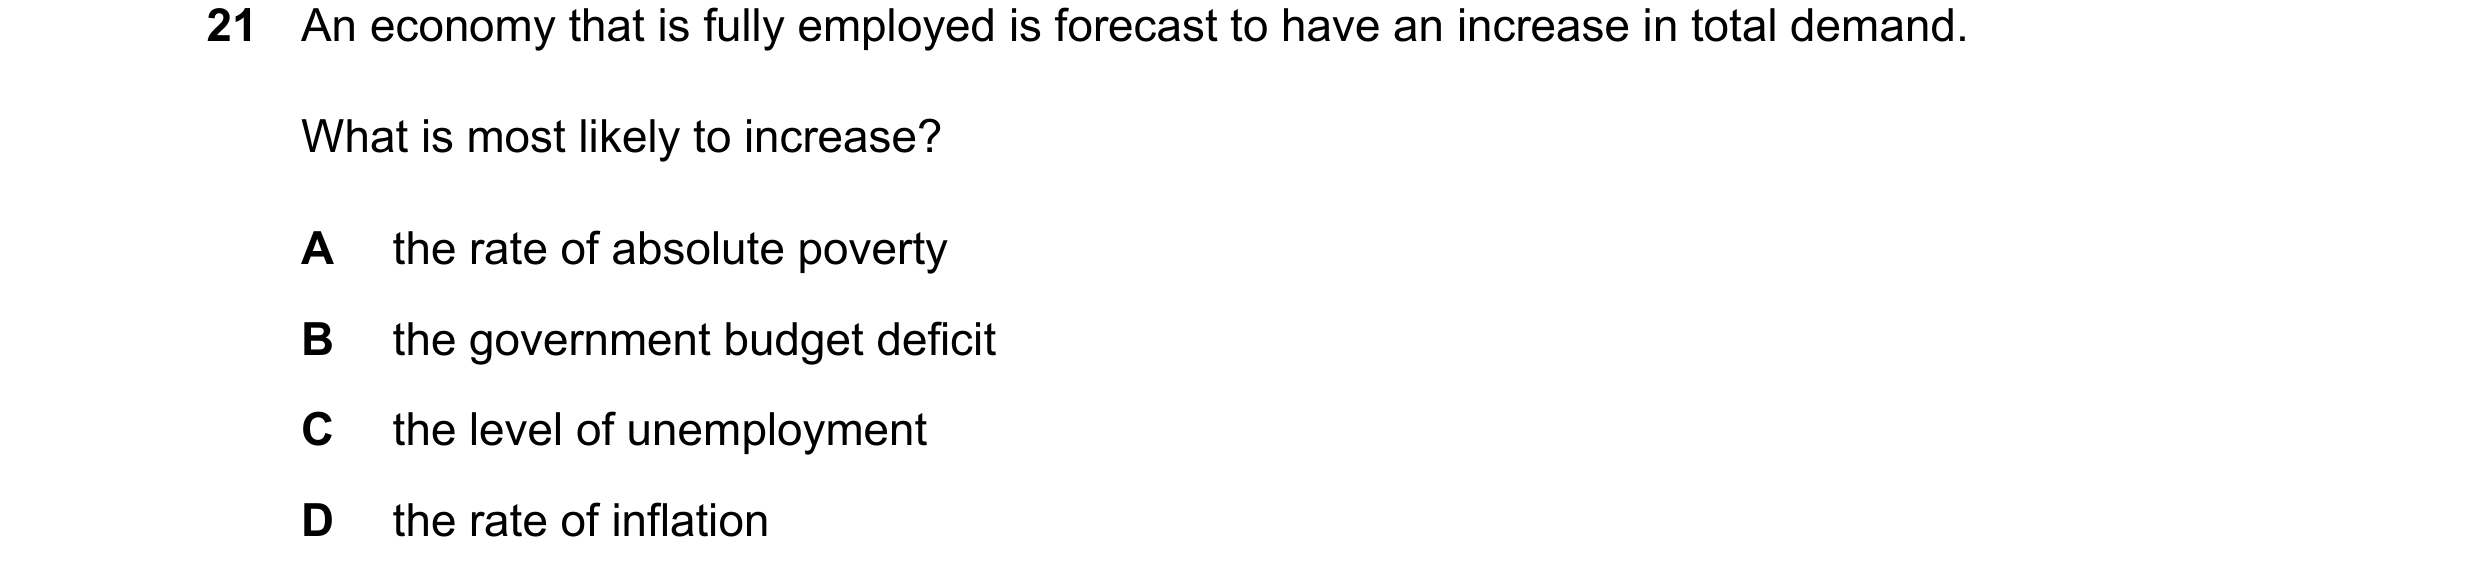
Q158 · An economy that is fully employed is forecast to have an increase in total demand 0455/12 May/June 2025
21 An economy that is fully employed is forecast to have an increase in total demand. What is most likely to increase? A the rate of absolute poverty B the government budget deficit C the level of unemployment D the rate of inflation
1 marks
Answer: D
This question in 0455/12 May/June 2025
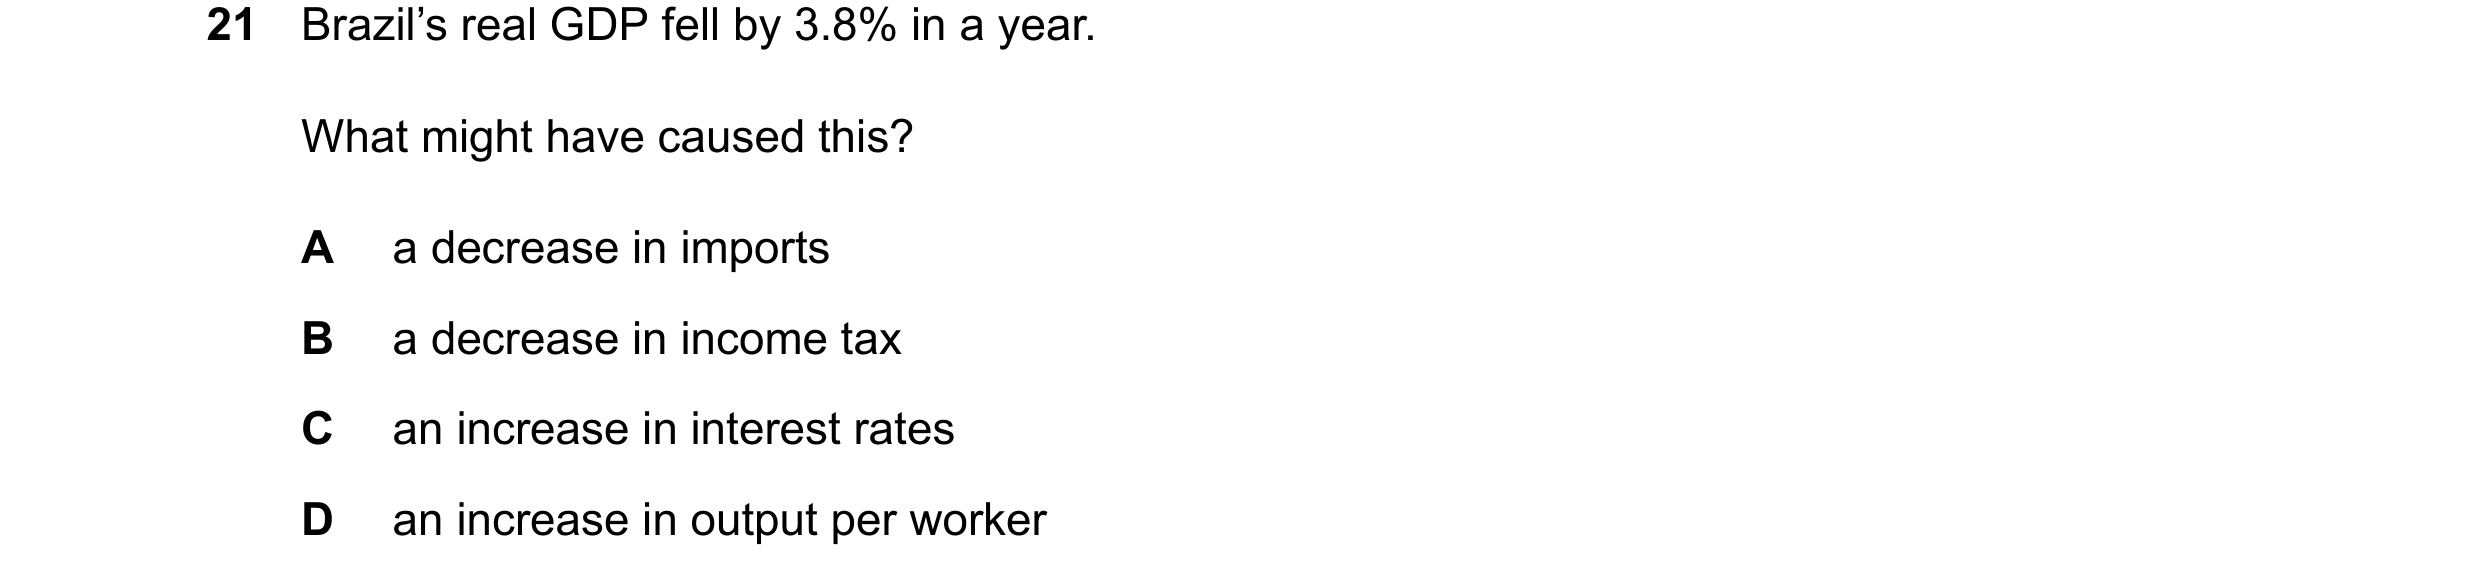
Q159 · Brazil’s real GDP fell by 3.8% in a year 0455/13 May/June 2025
21 Brazil’s real GDP fell by 3.8% in a year. What might have caused this? A a decrease in imports B a decrease in income tax C an increase in interest rates D an increase in output per worker
1 marks
Answer: C
This question in 0455/13 May/June 2025
Q160 · The diagram shows a production possibility curve (PPC) 0455/13 Oct/Nov 2025
3 The diagram shows a production possibility curve (PPC). Which position is most likely to lead to the greatest outward shift of the PPC? consumer goods B A C D O capital goods
1 marks
Answer: D
This question in 0455/13 Oct/Nov 2025
Q161 · How is economic growth of a country measured? 0455/13 Oct/Nov 2025
22 How is economic growth of a country measured? A by an increase in the monetary value of goods produced B by an increase in the number of people in employment C by an increase in the real Gross Domestic Product (GDP) D by an increase in the value of the Human Development Index (HDI)
1 marks
Answer: C
This question in 0455/13 Oct/Nov 2025

 1 / 36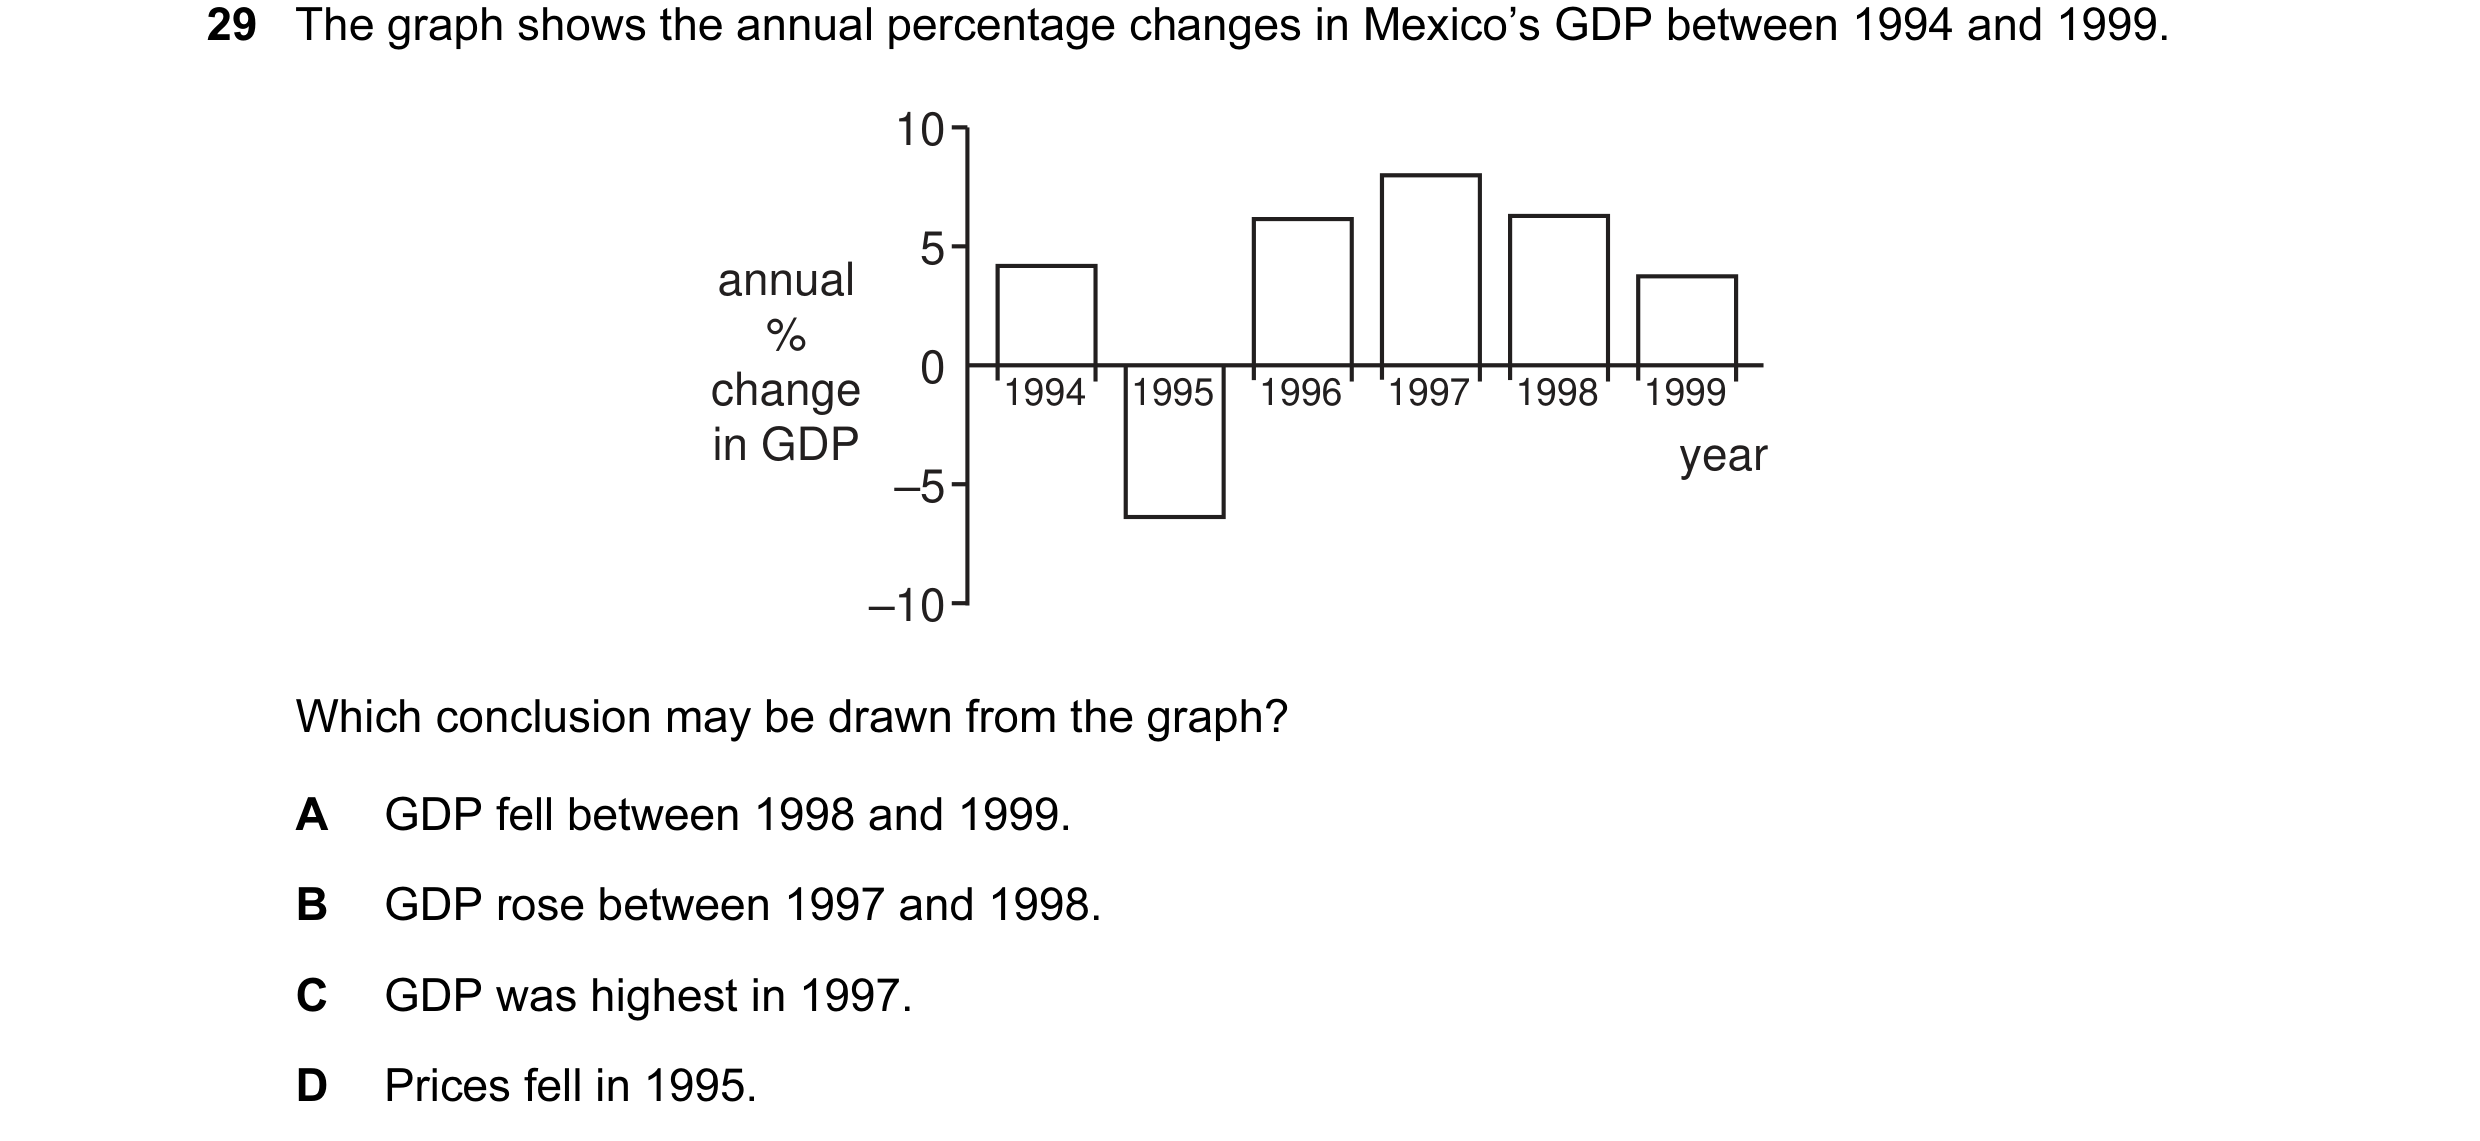


 2 / 36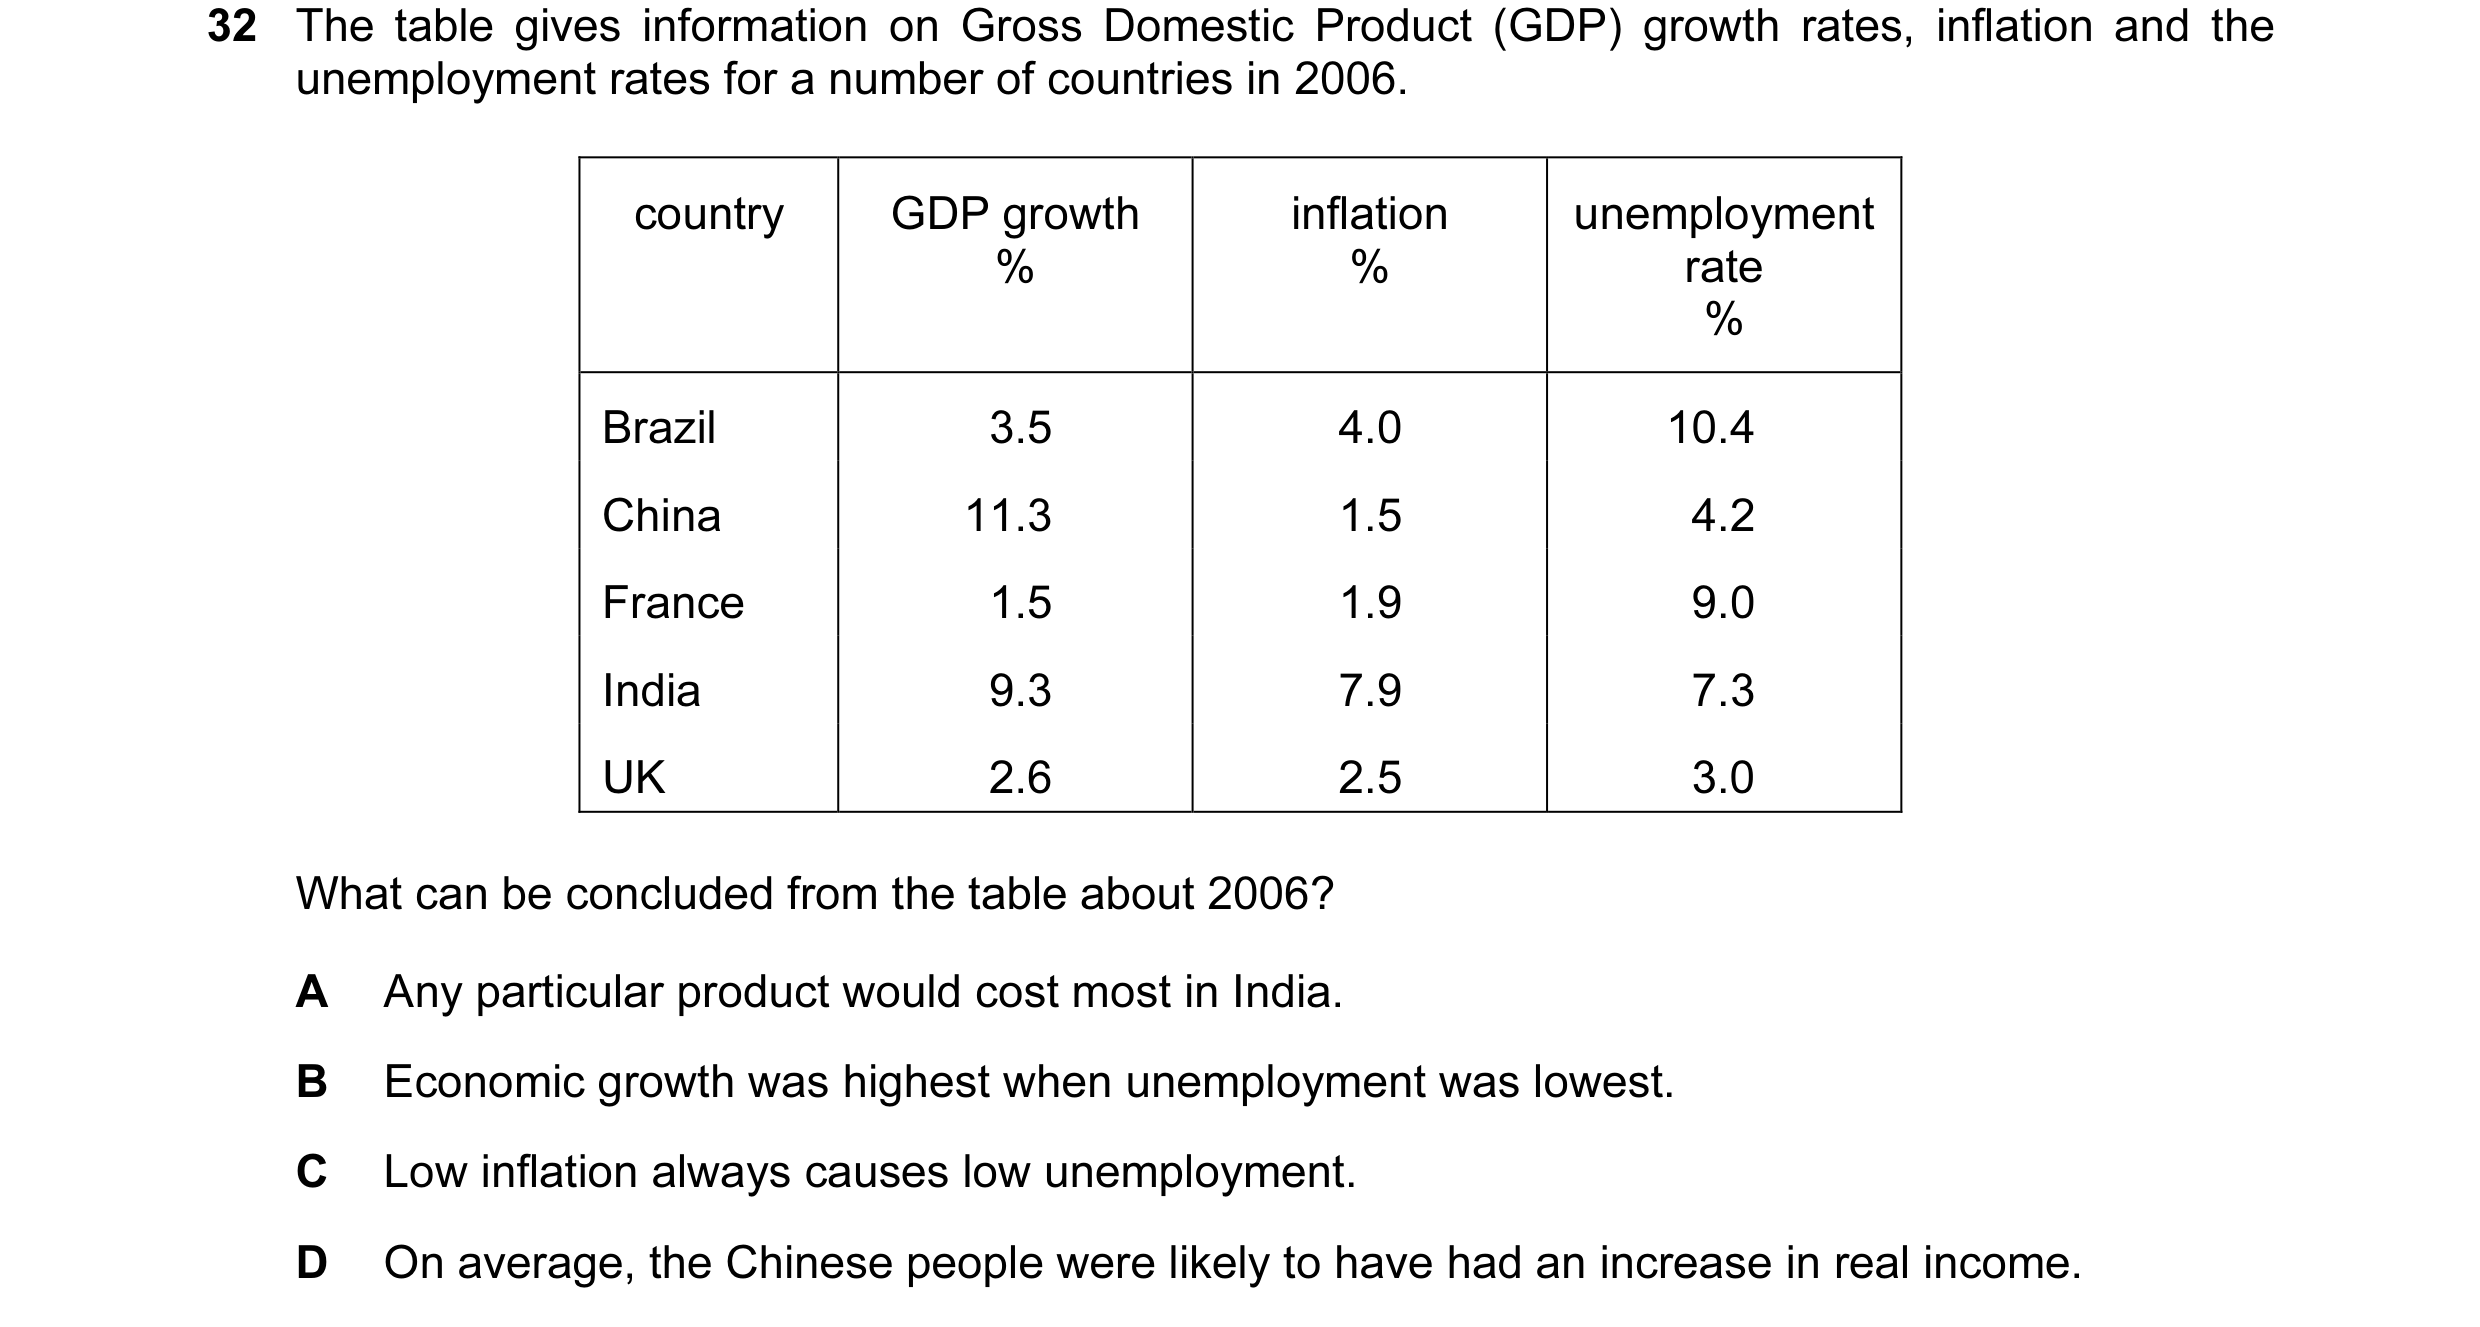

 3 / 36

 4 / 36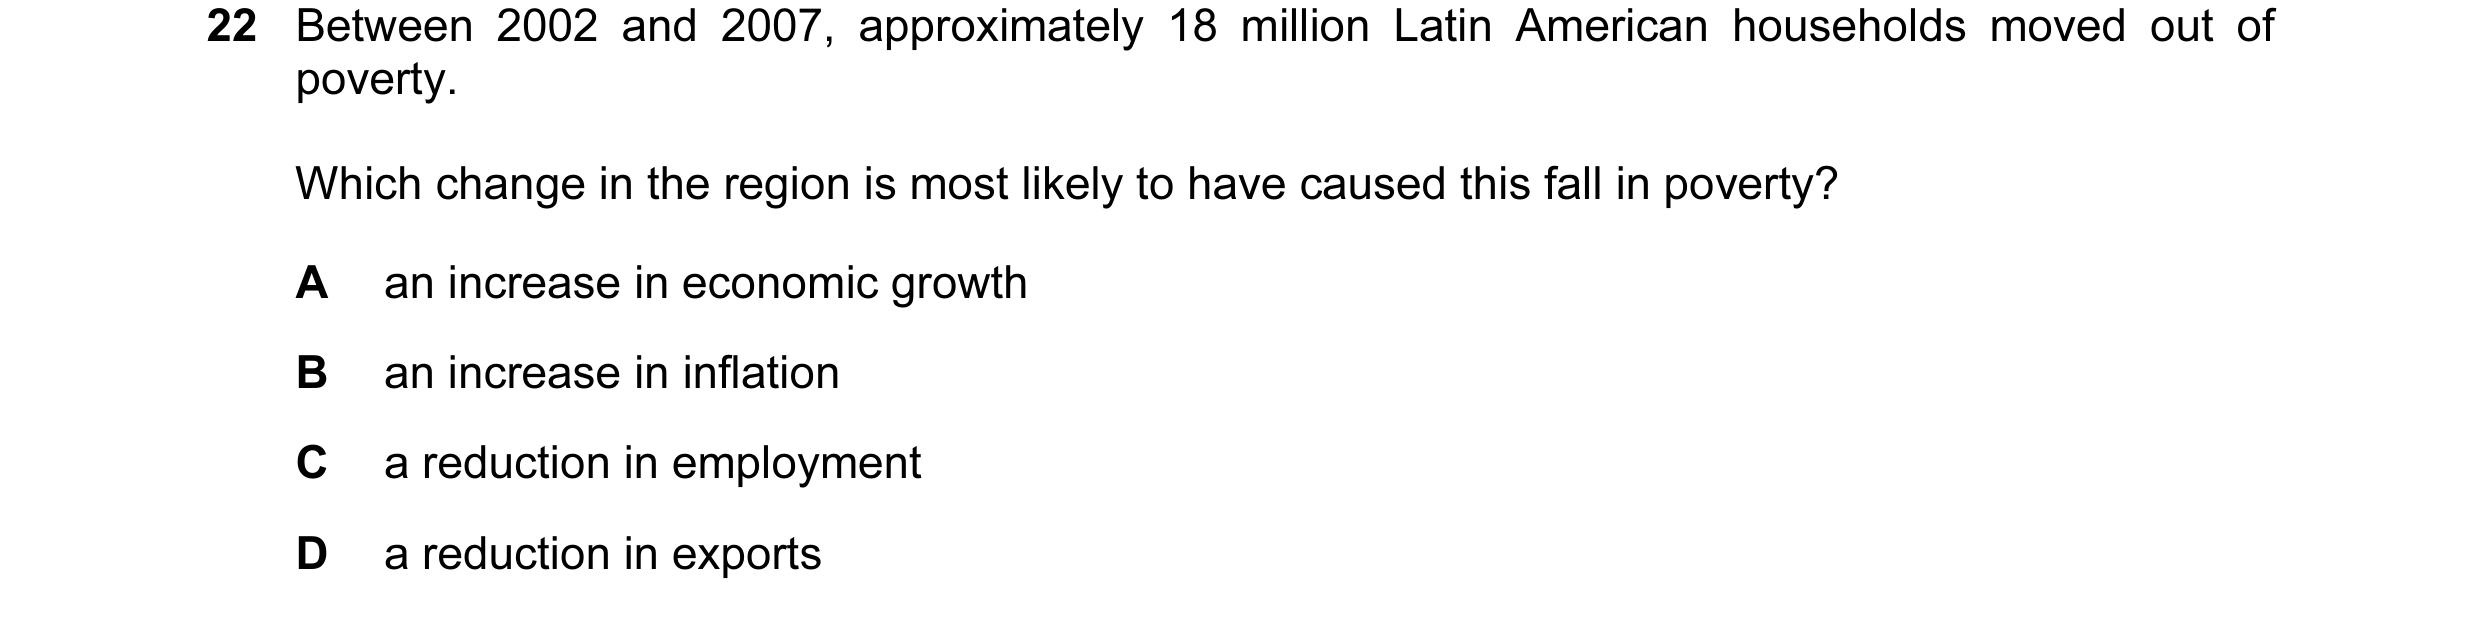
 5 / 36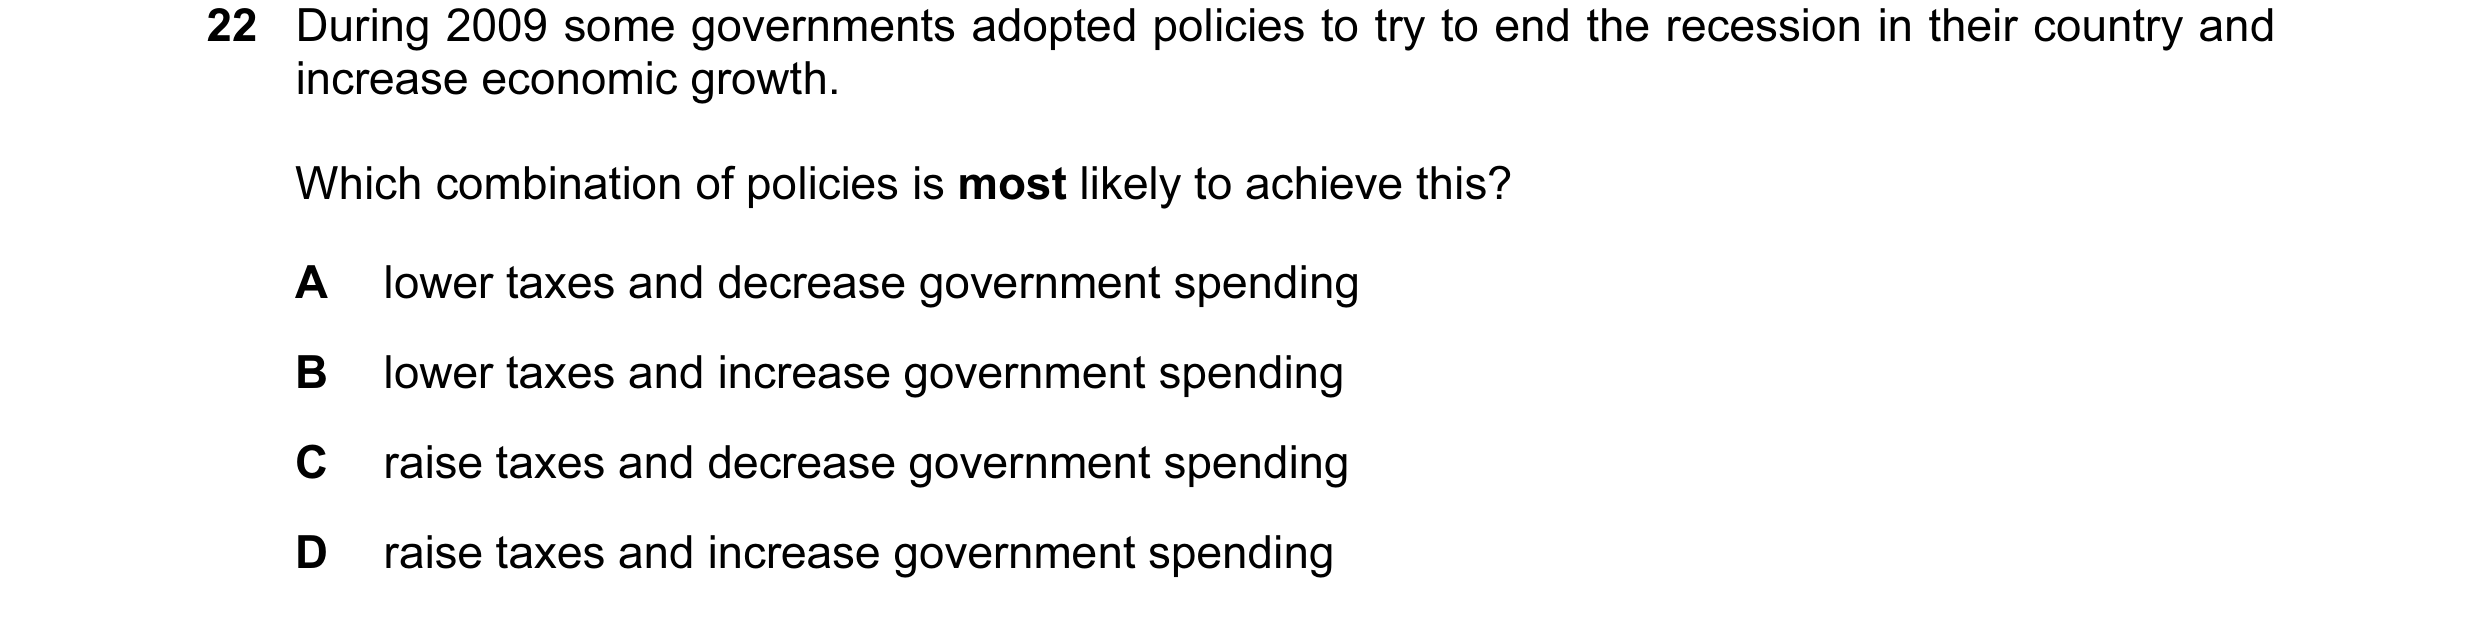

 6 / 36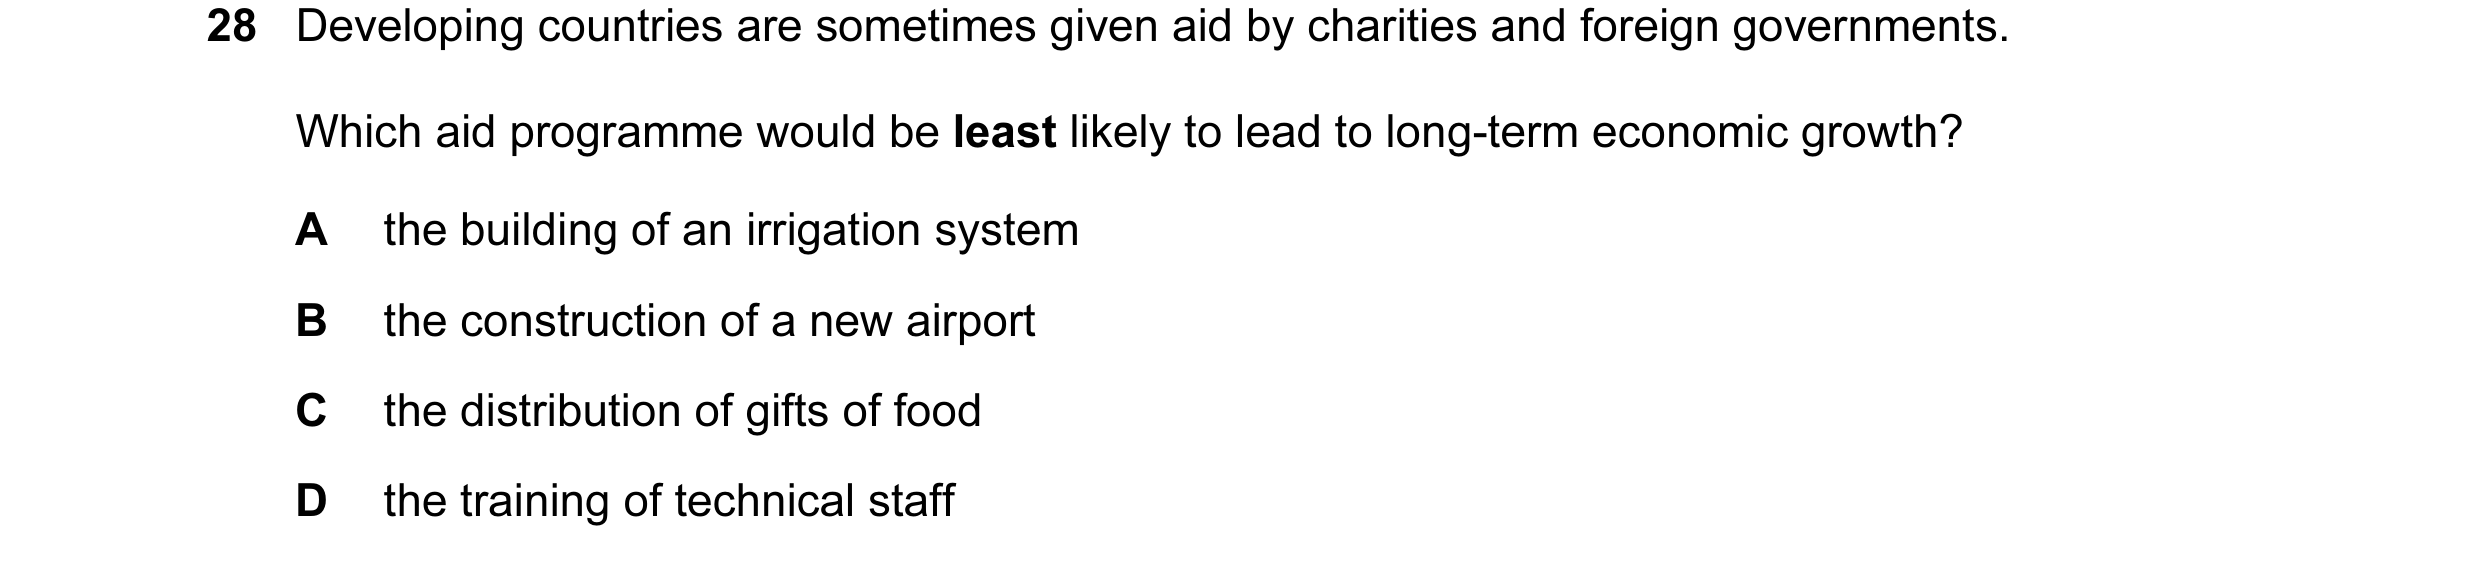


 7 / 36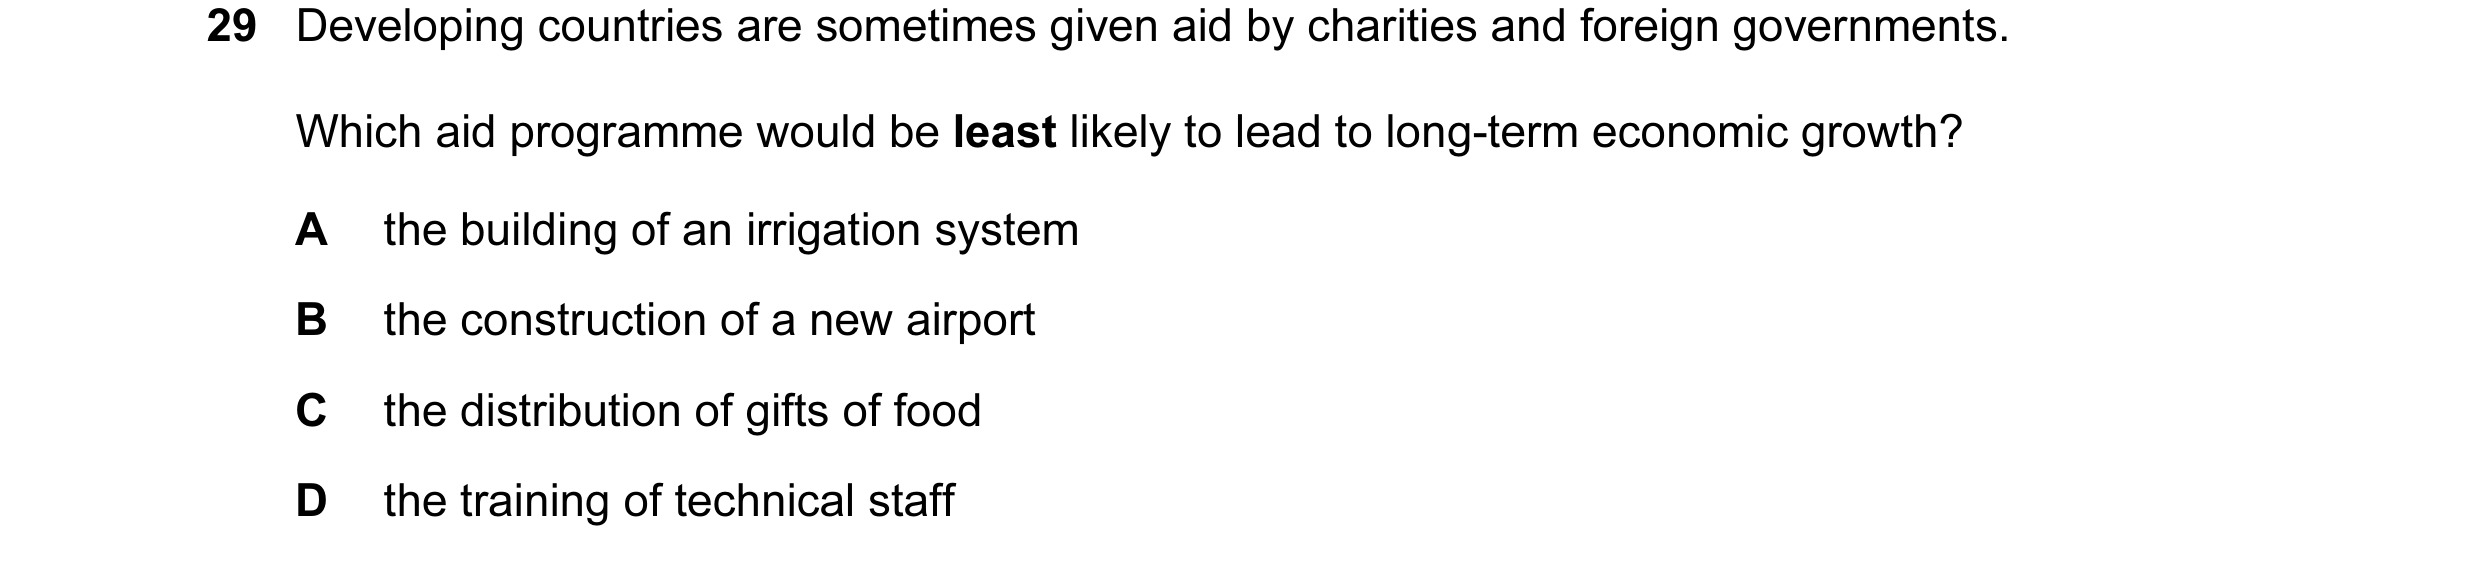

 8 / 36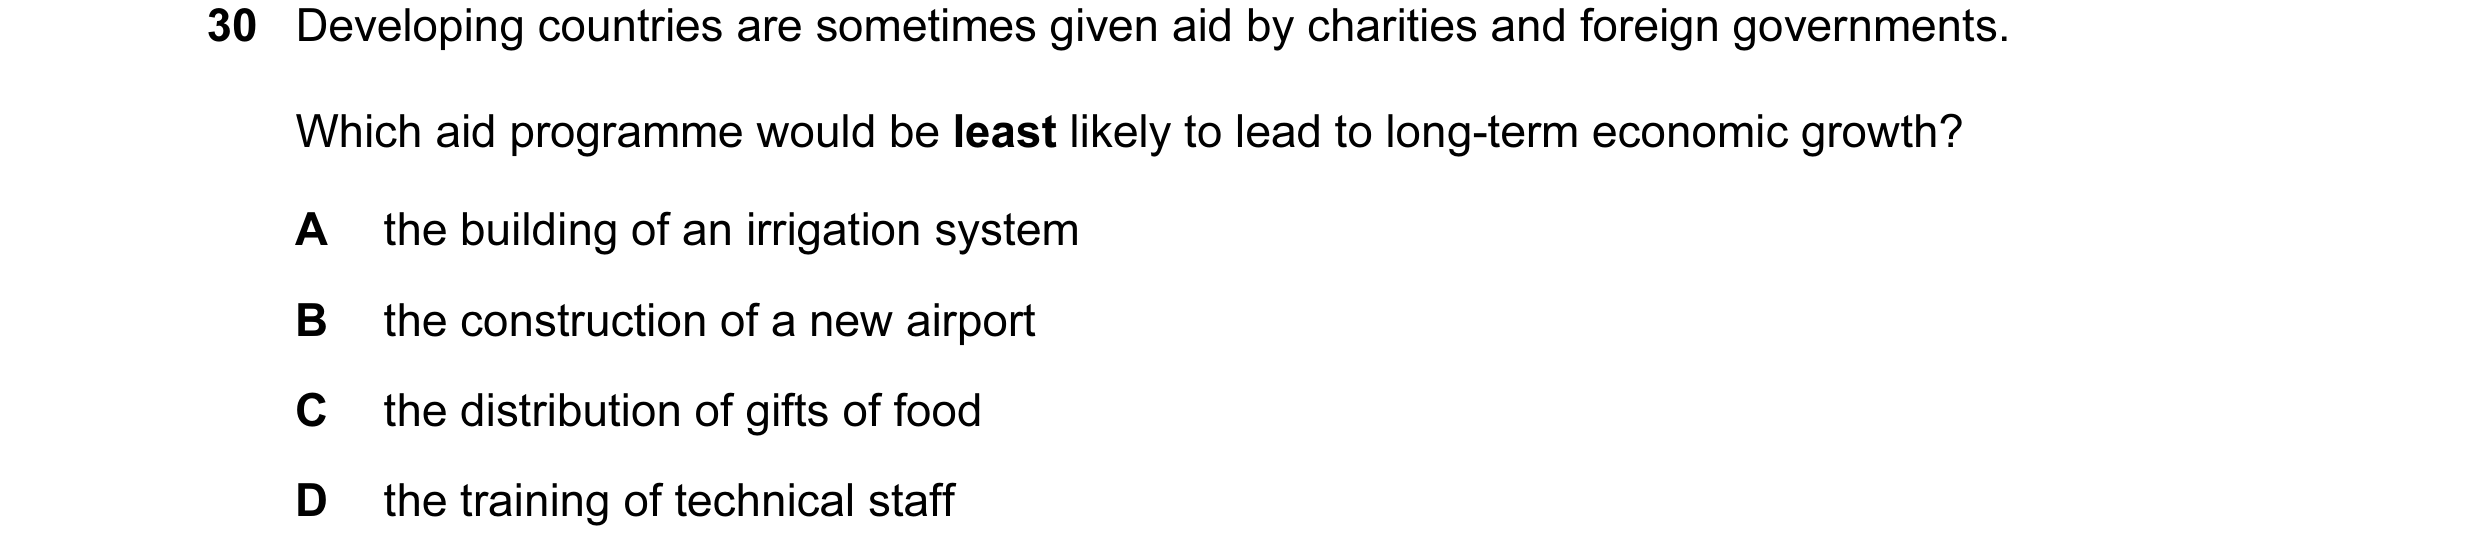
 9 / 36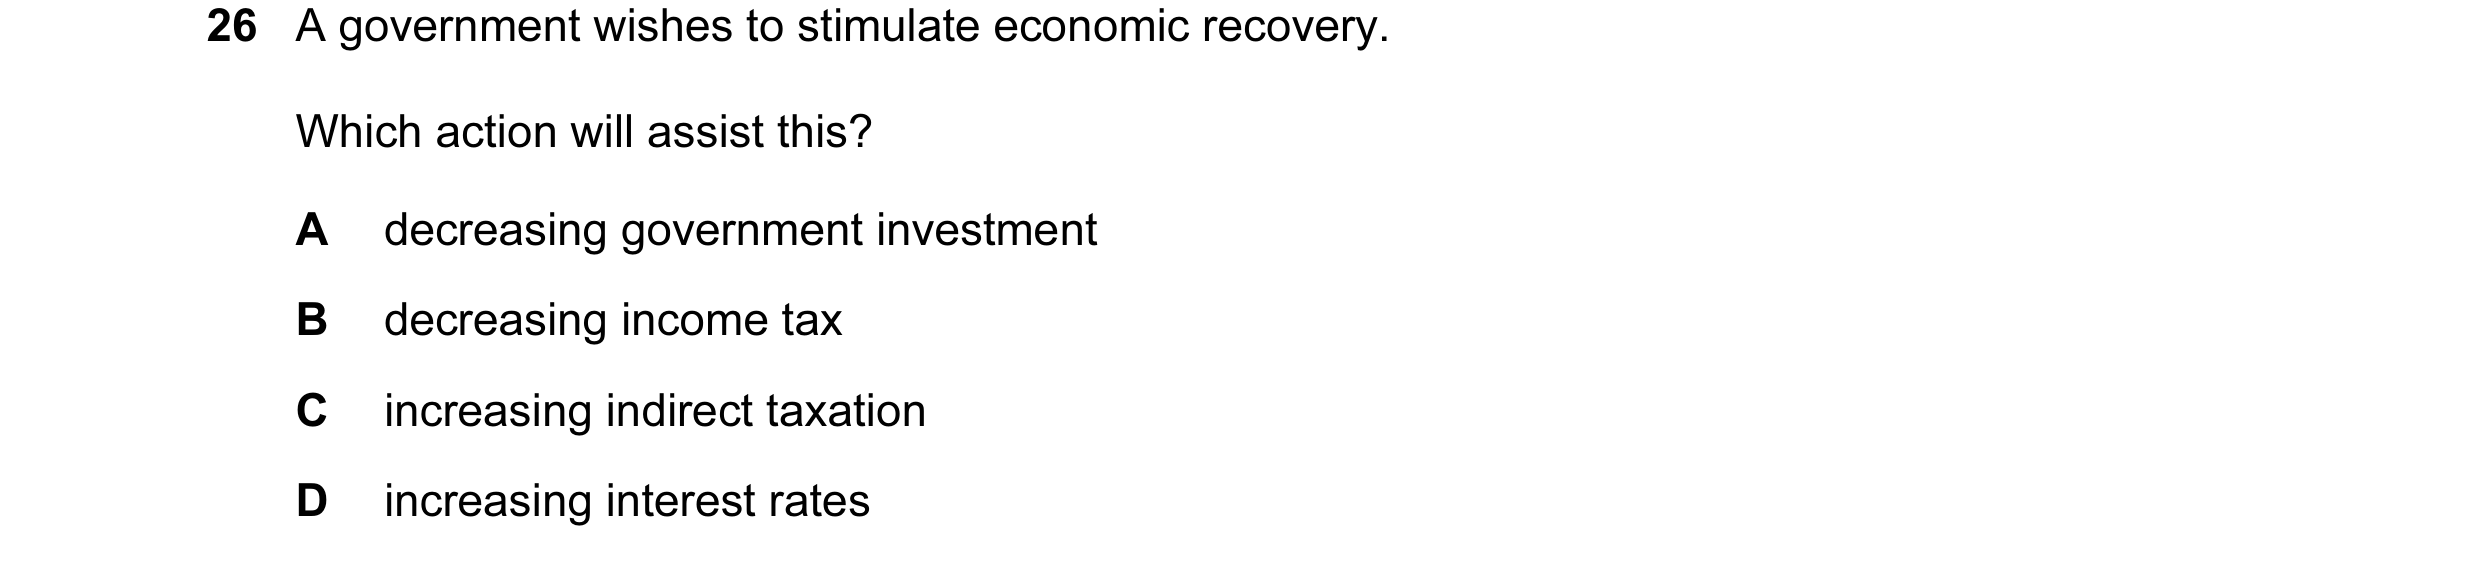

 10 / 36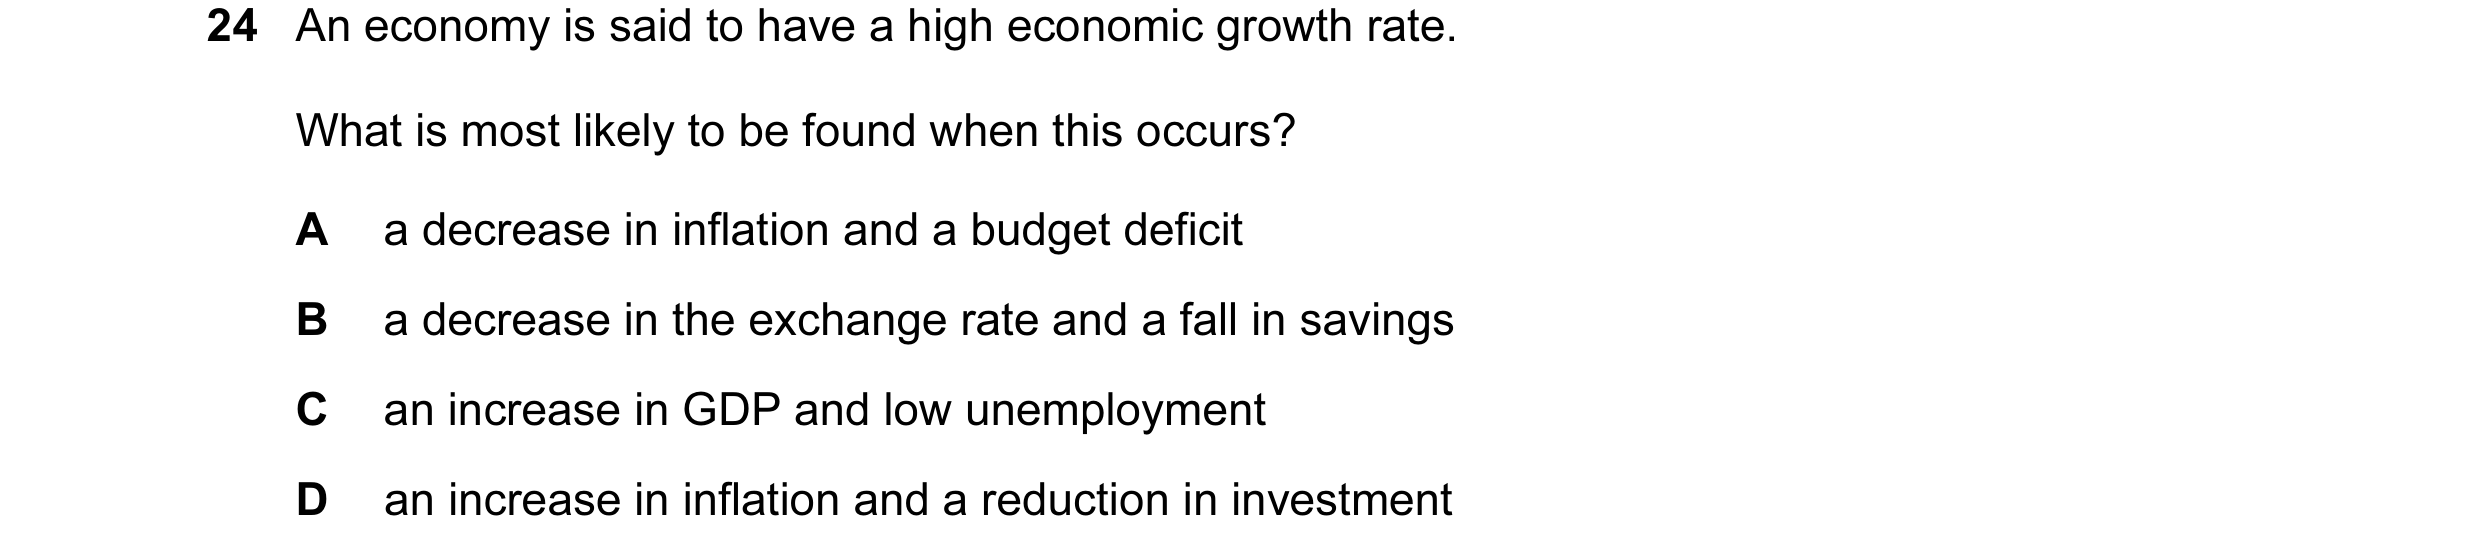
 11 / 36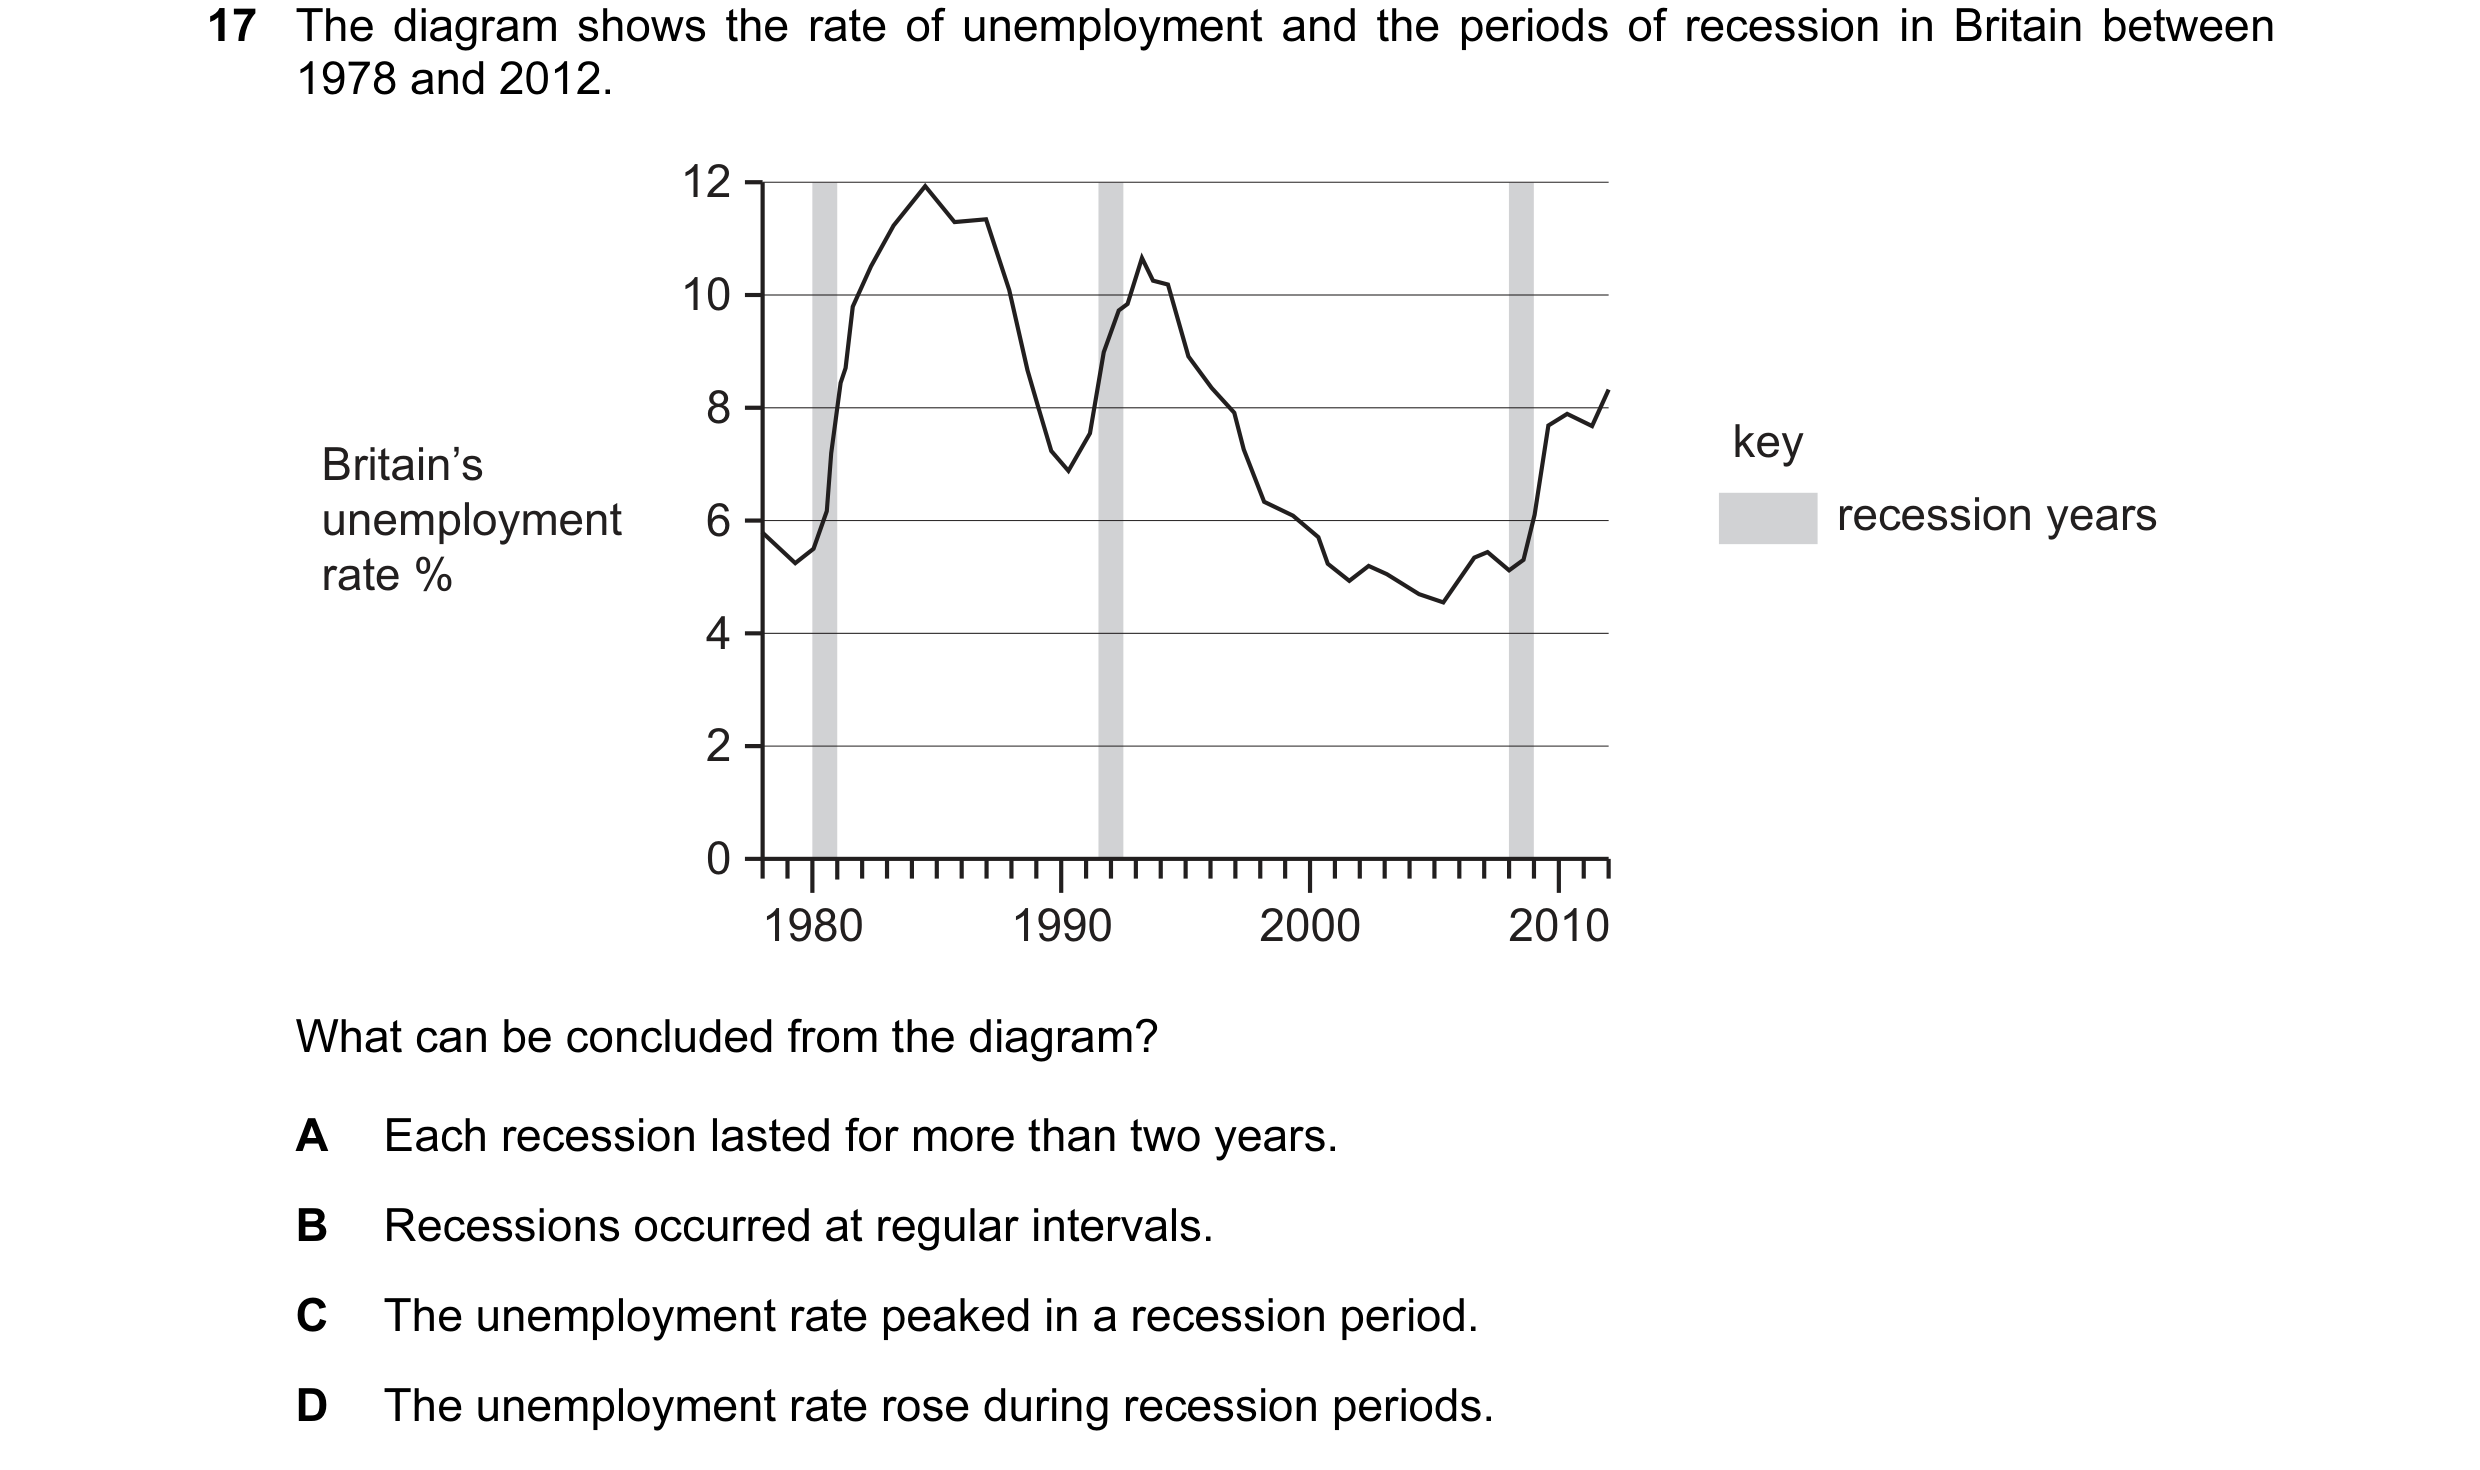
 12 / 36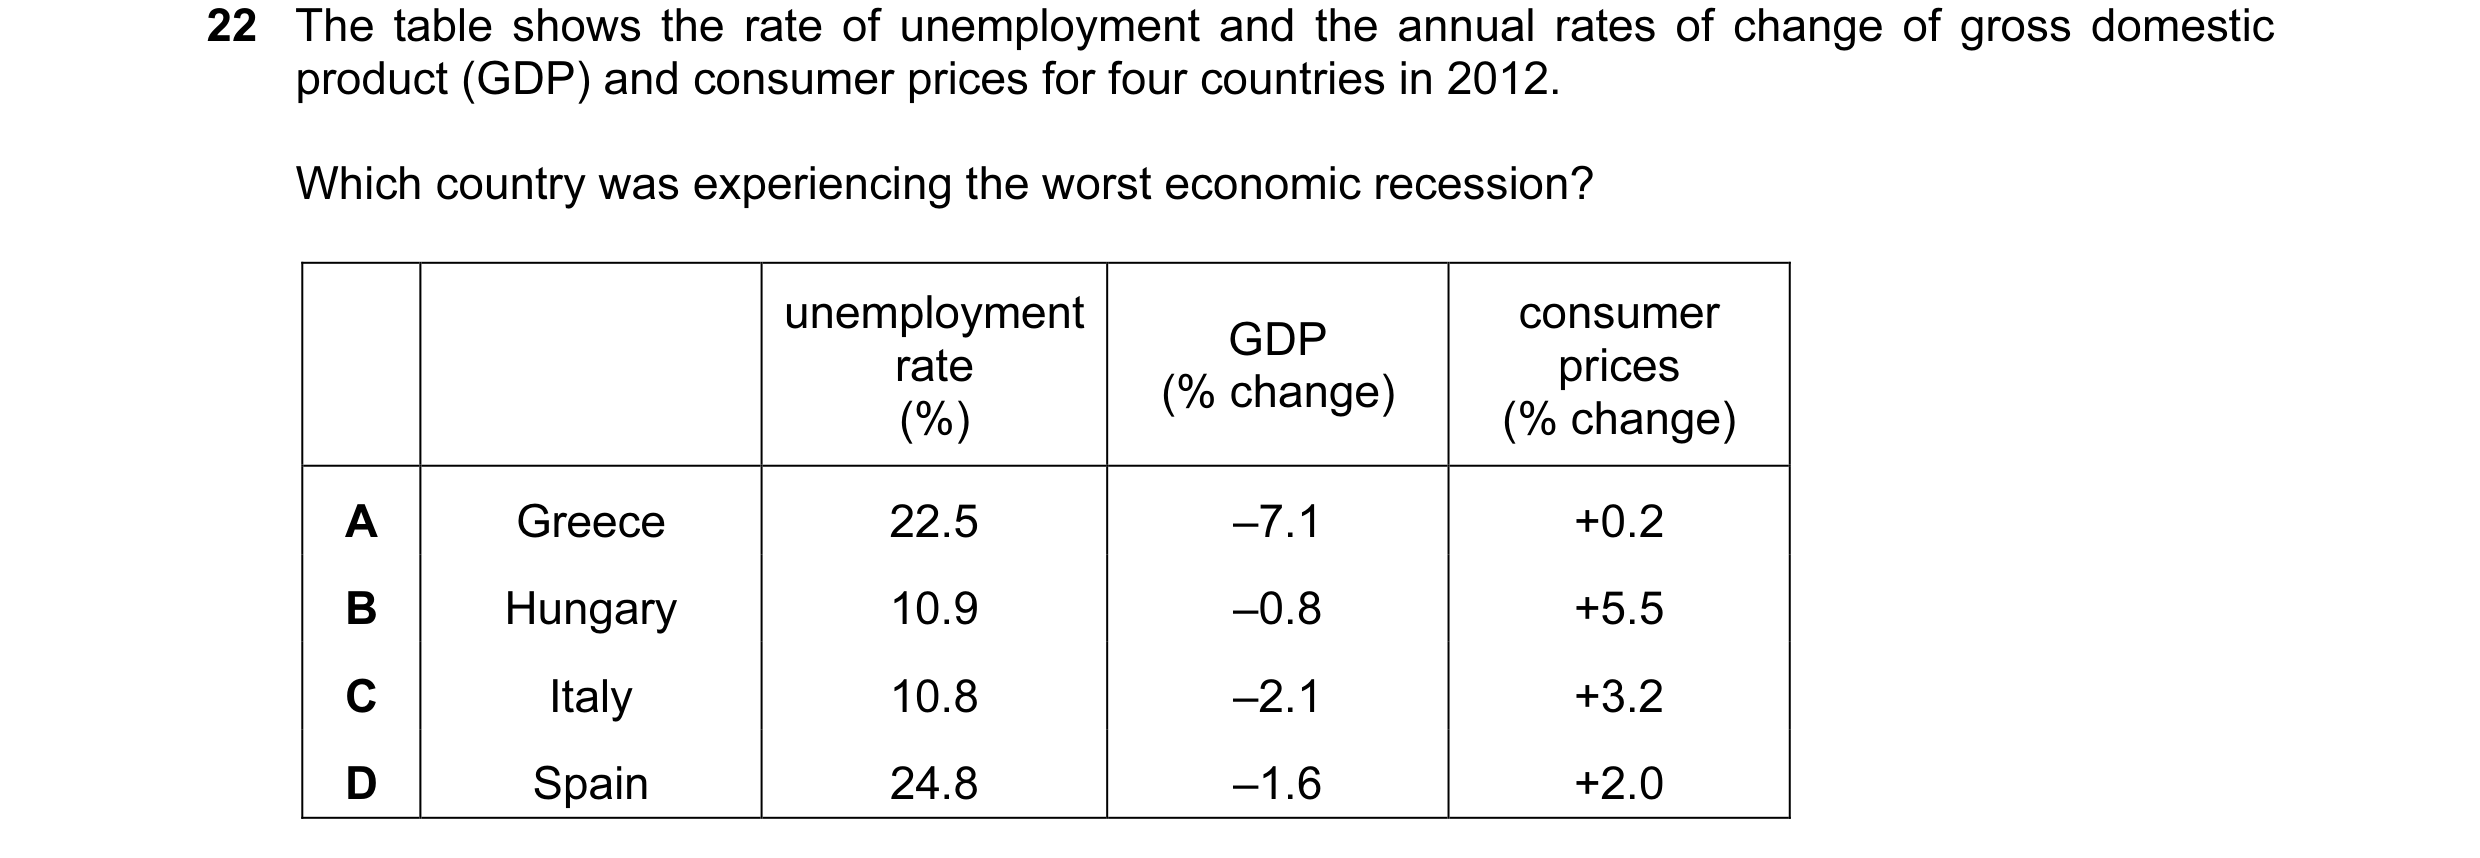


 13 / 36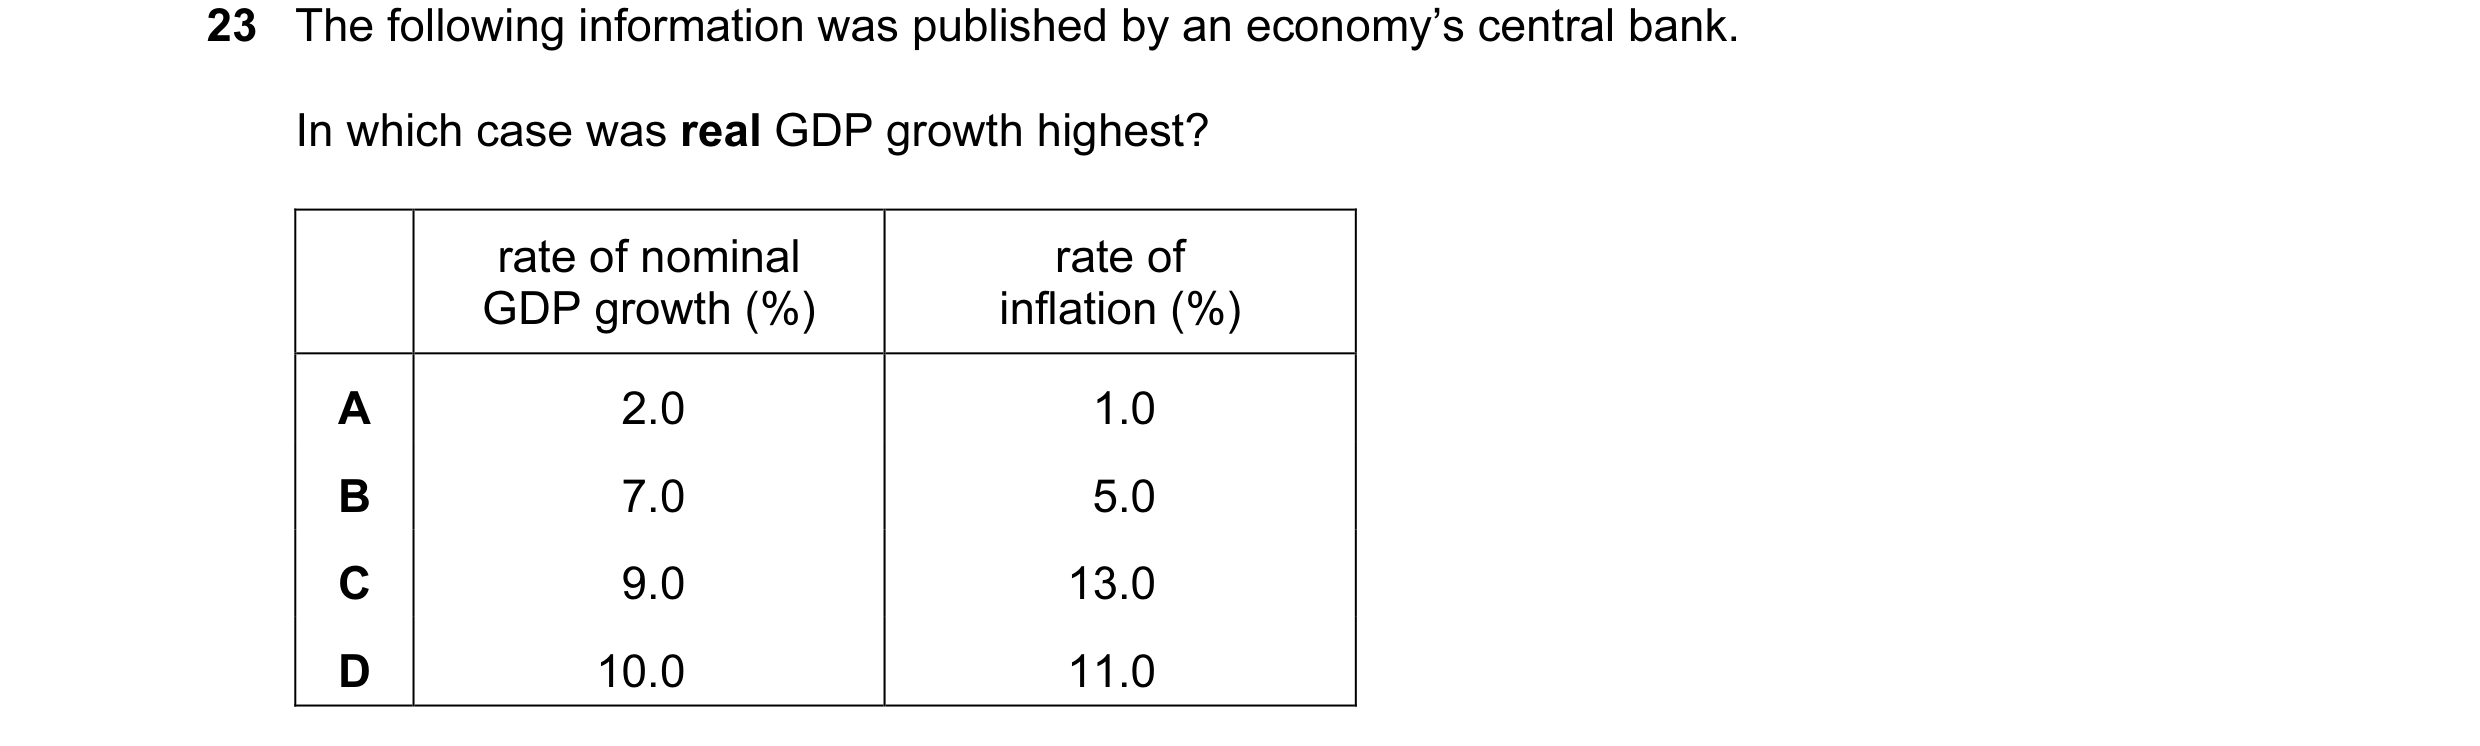
 14 / 36


 15 / 36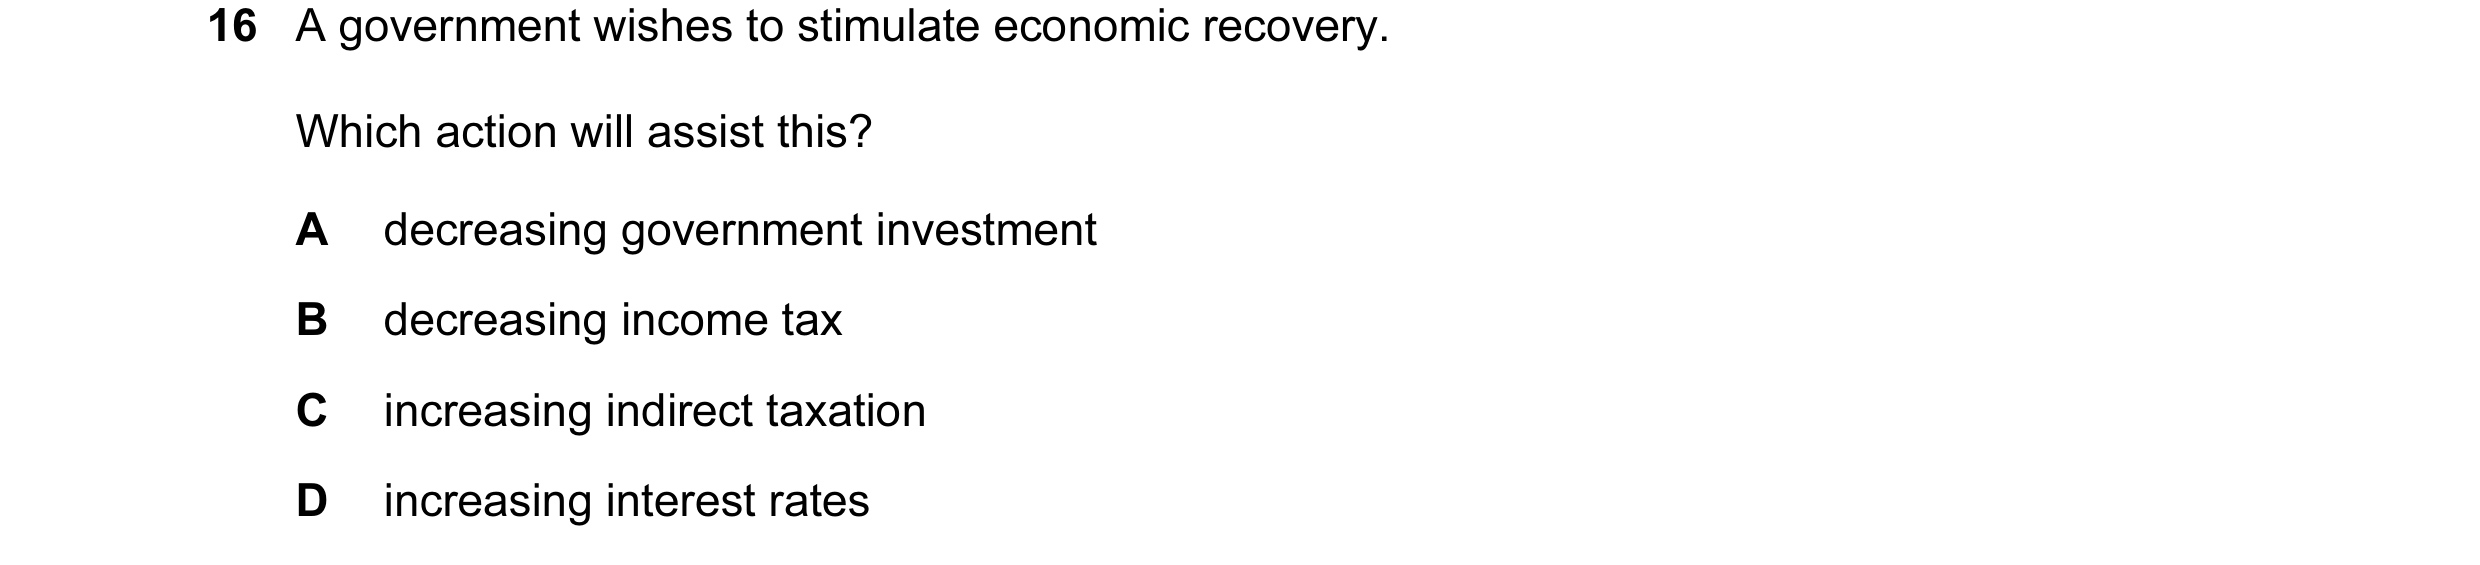
 16 / 36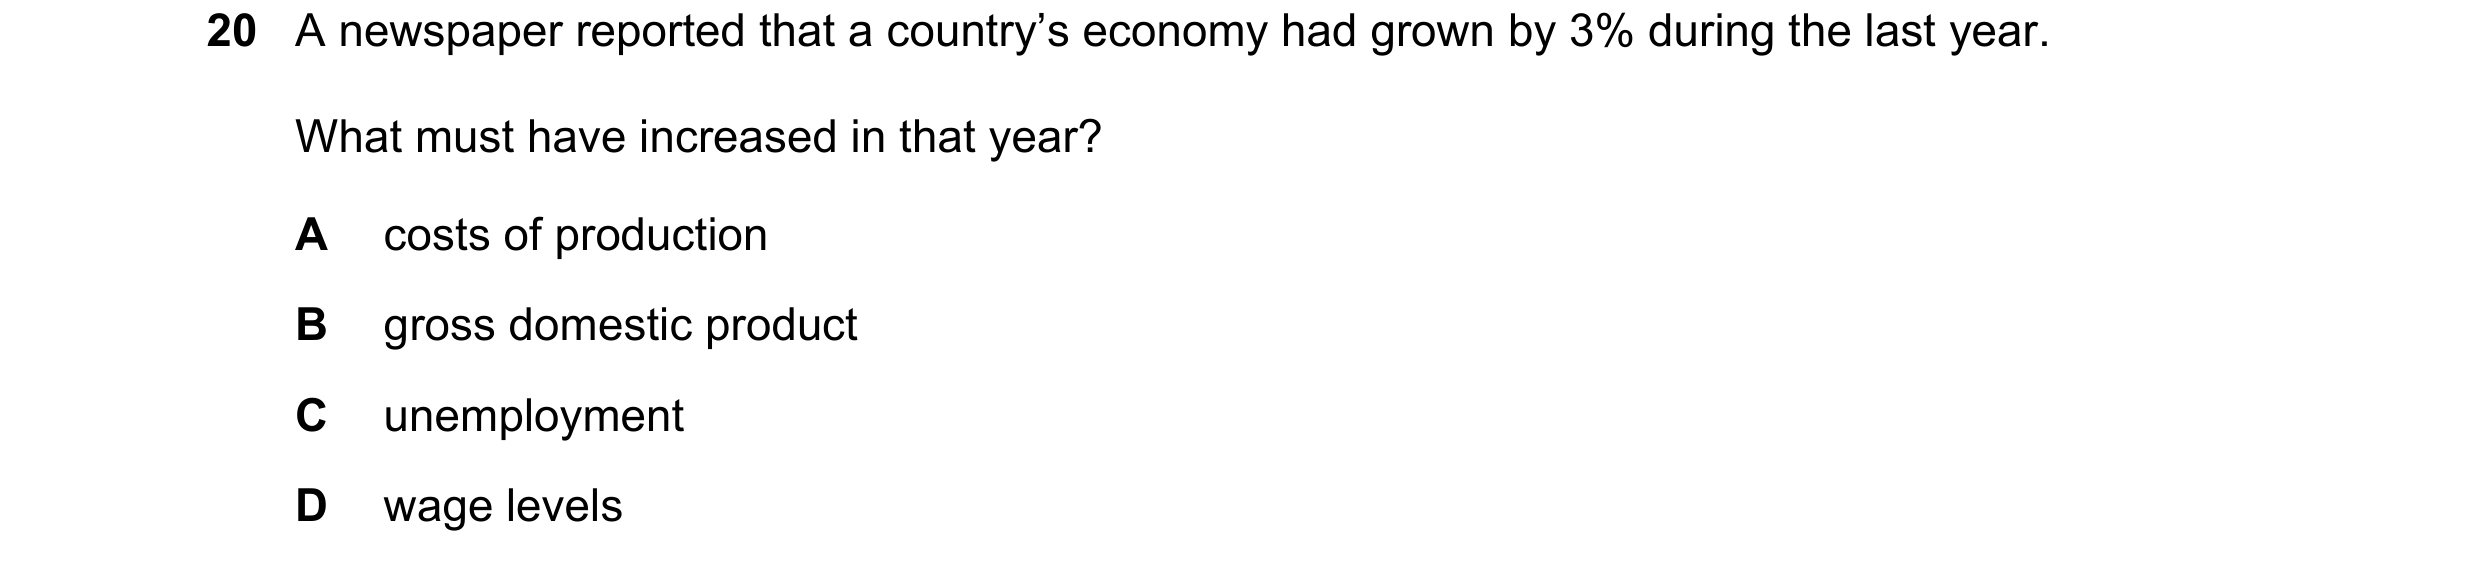
 17 / 36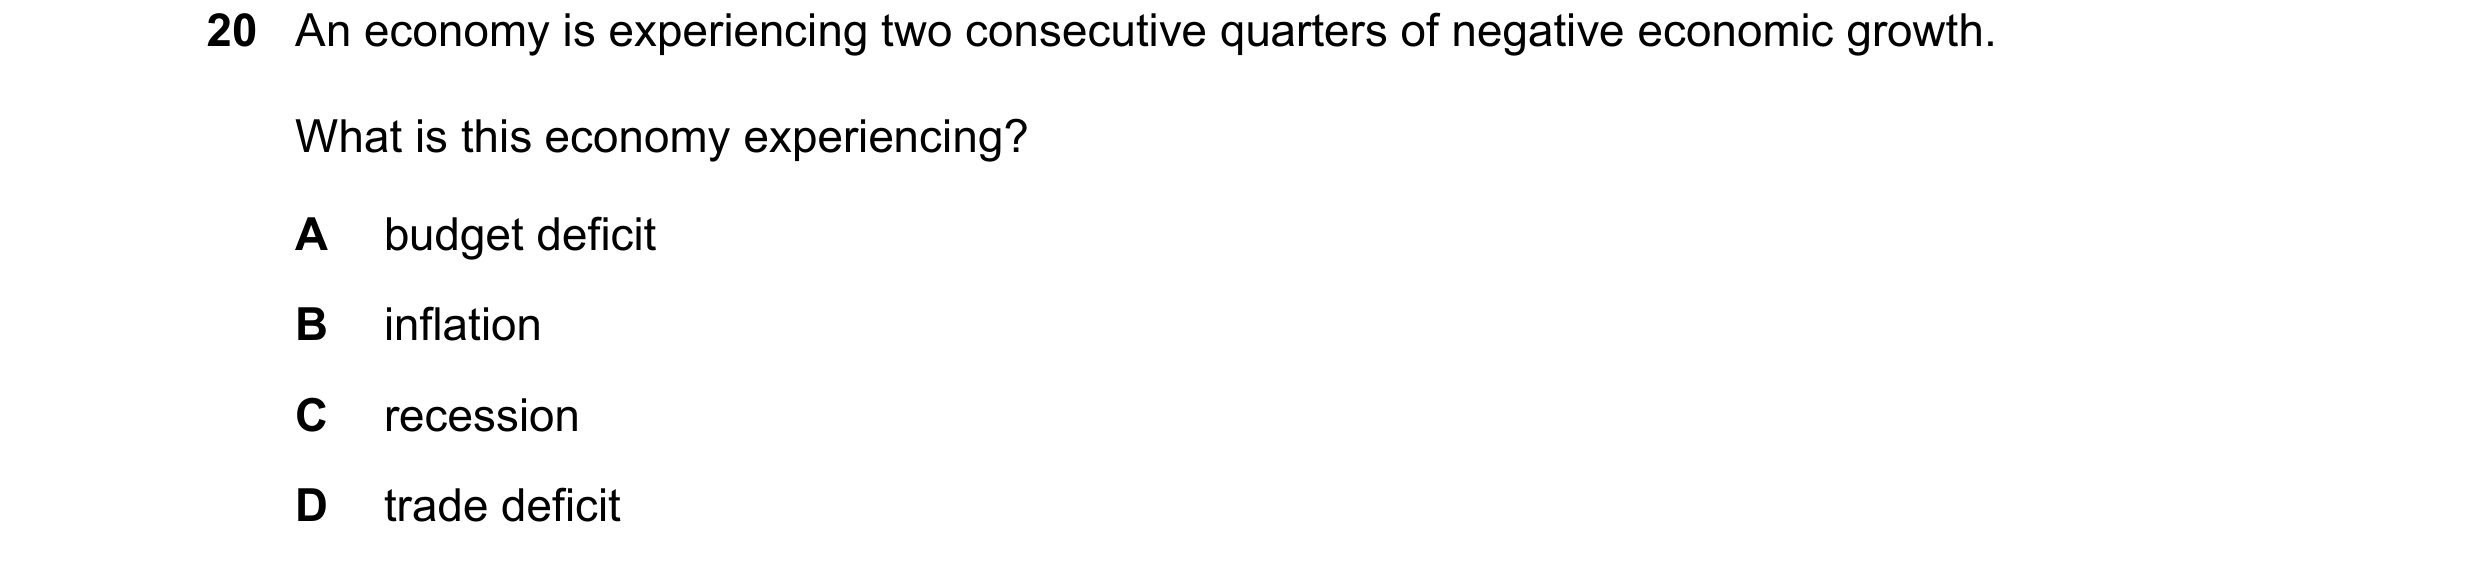
 18 / 36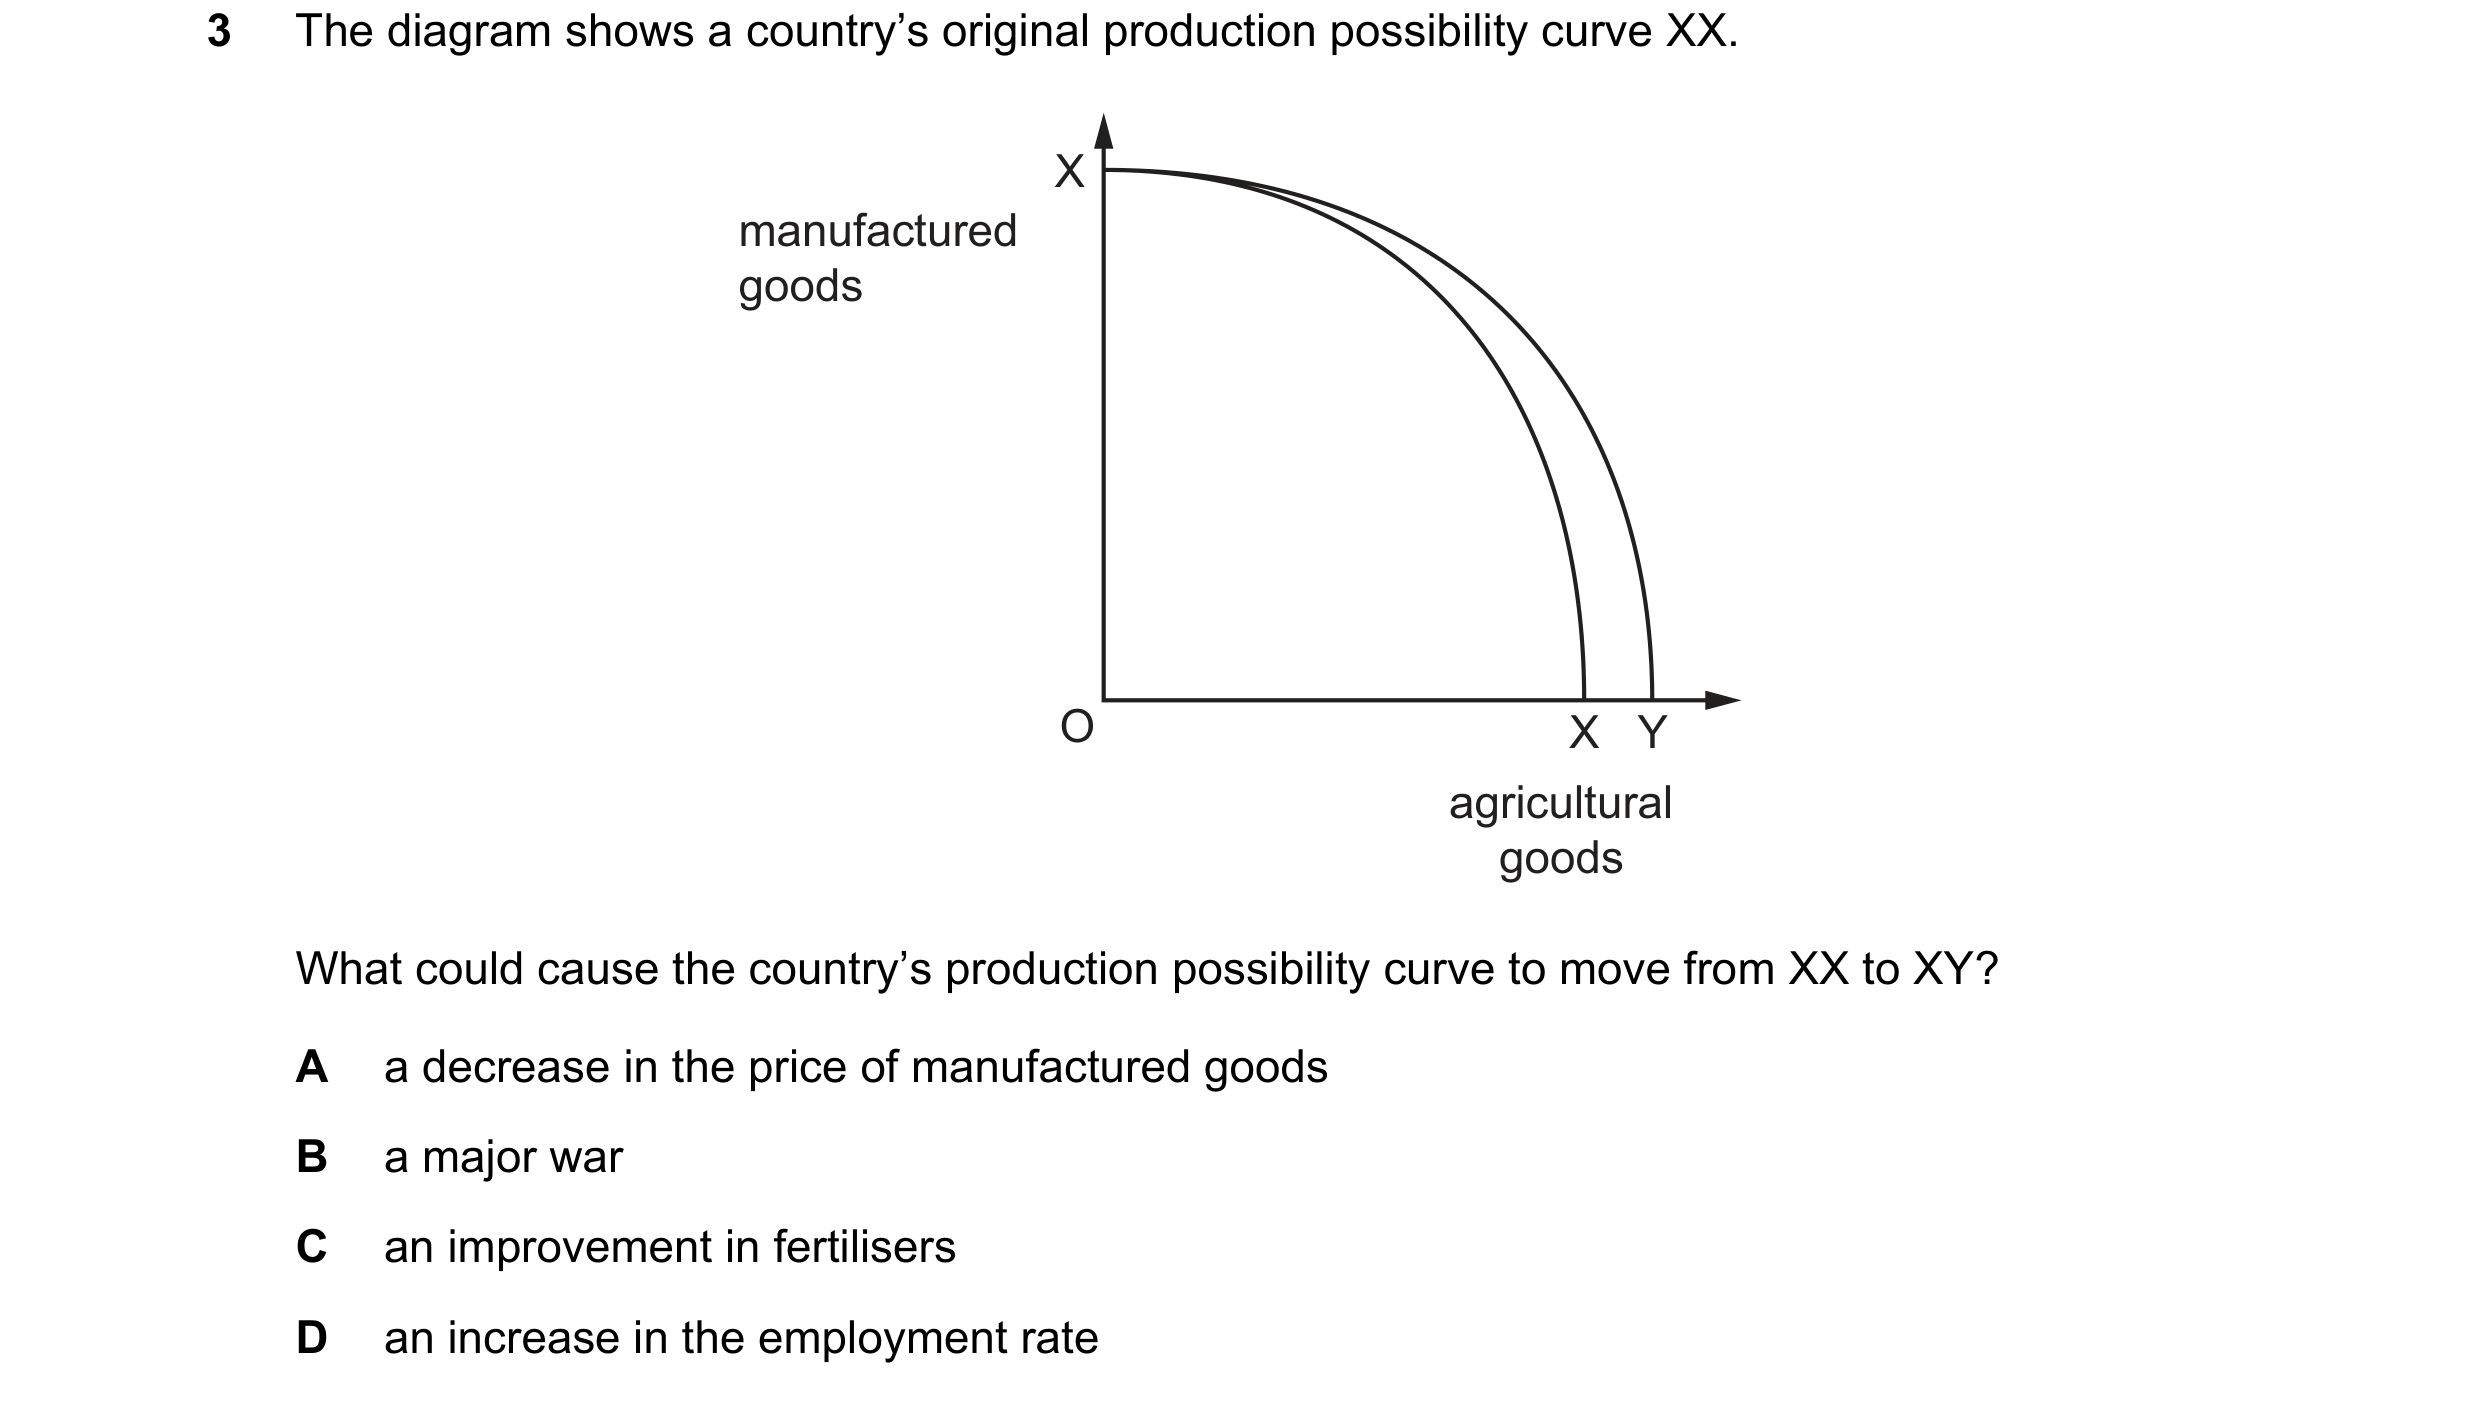
 19 / 36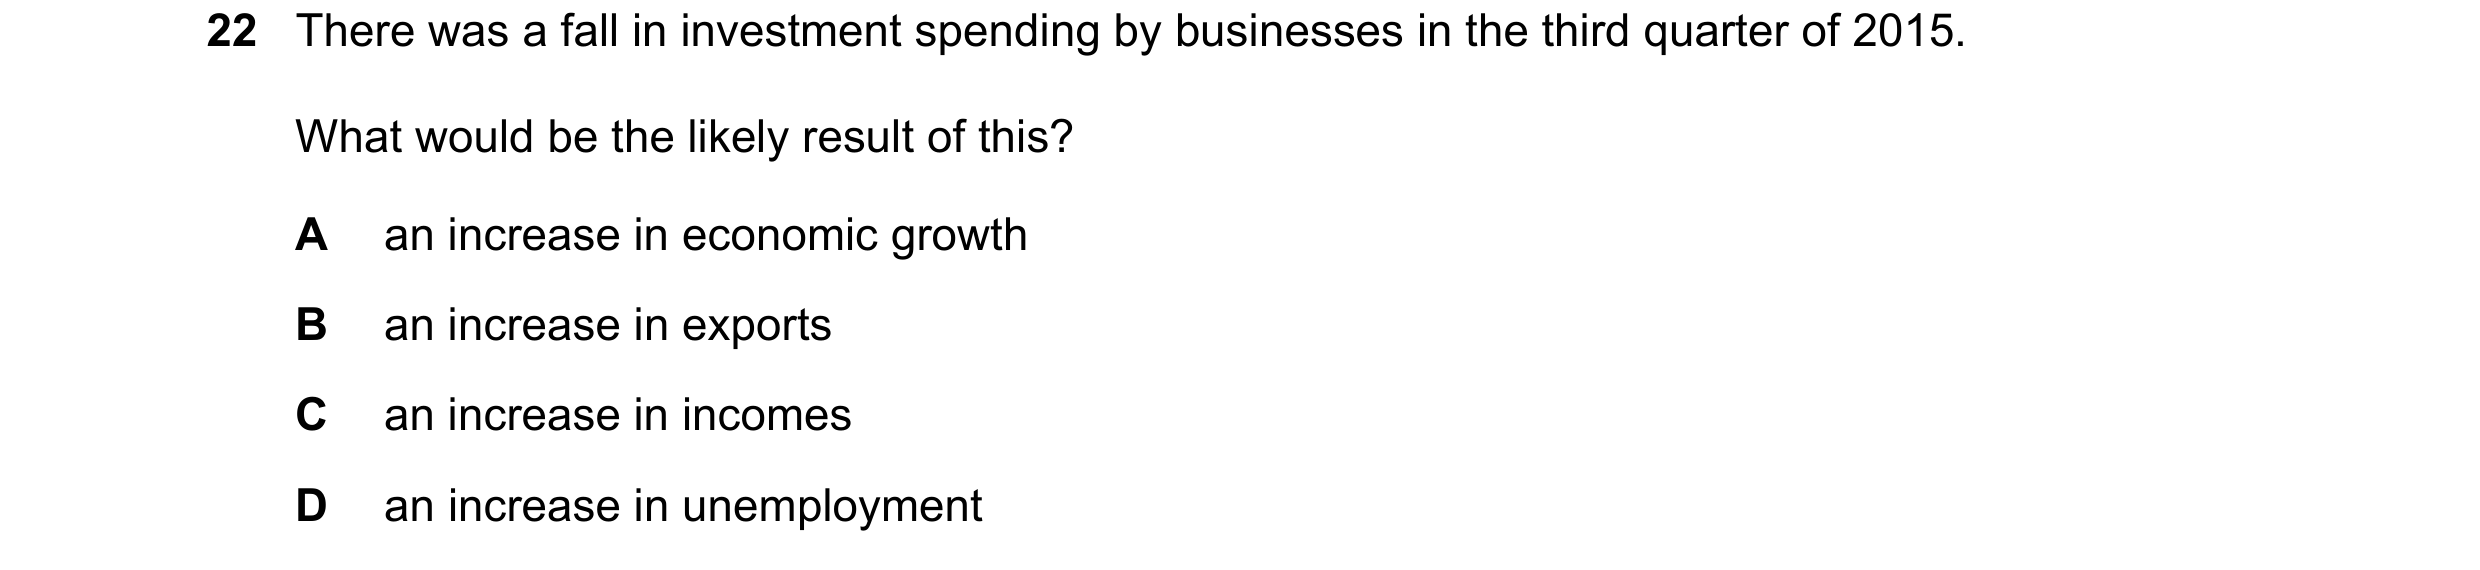

 20 / 36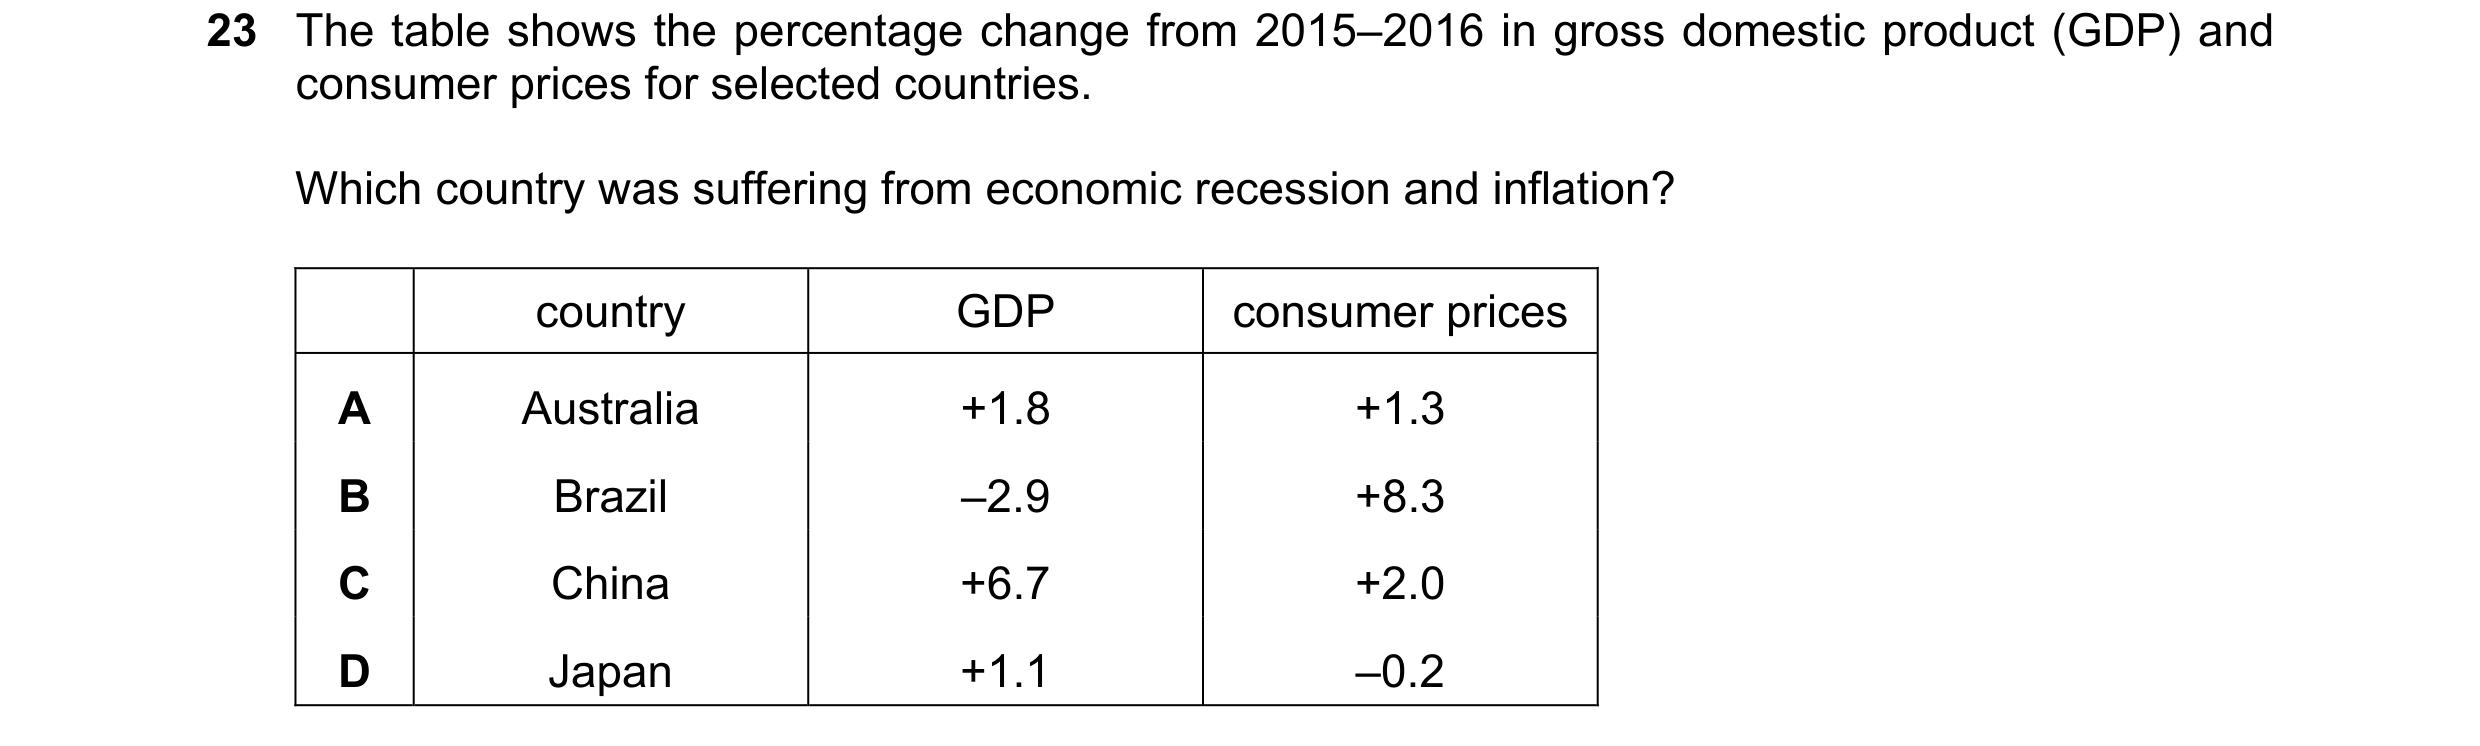
 21 / 36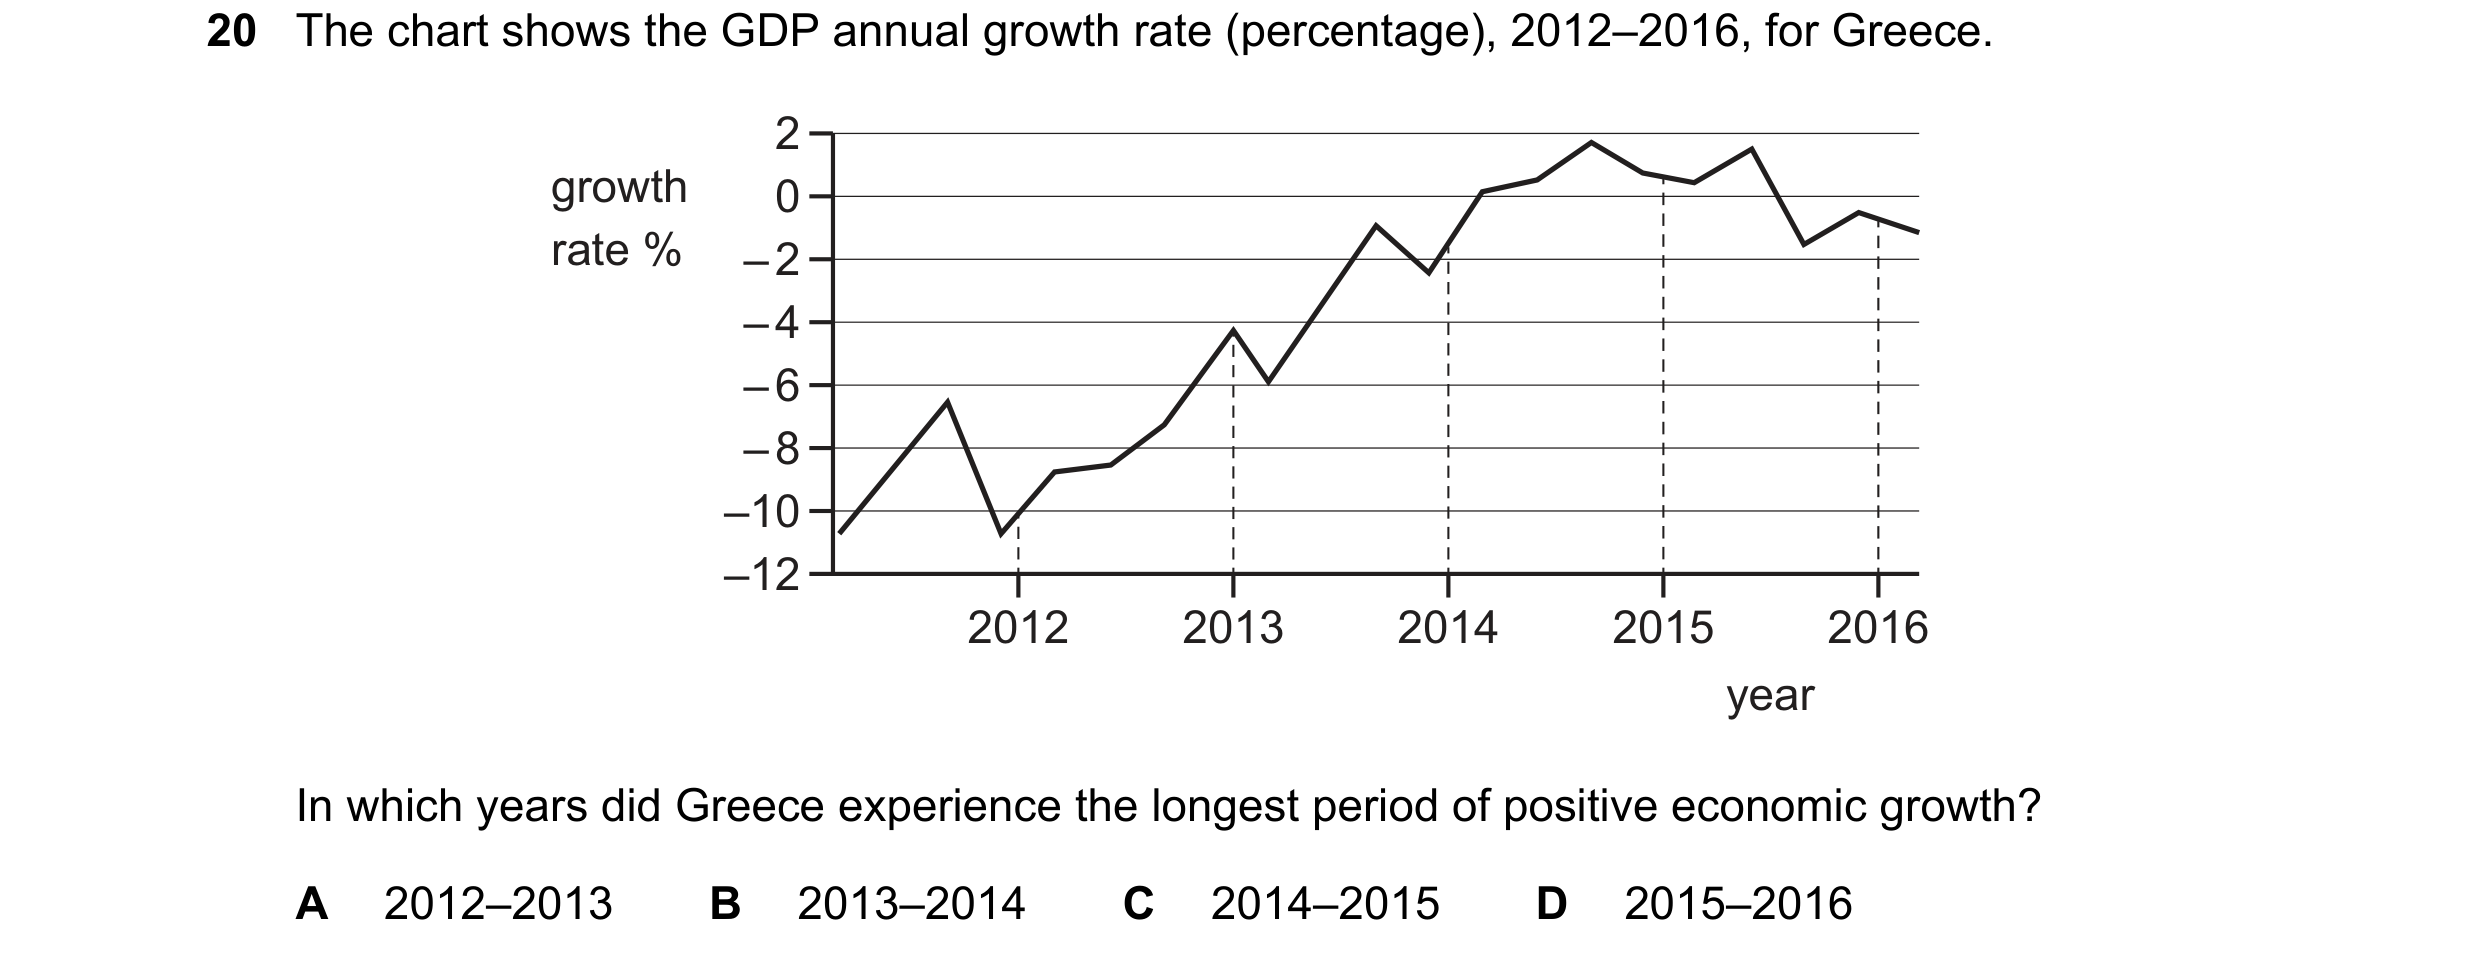


 22 / 36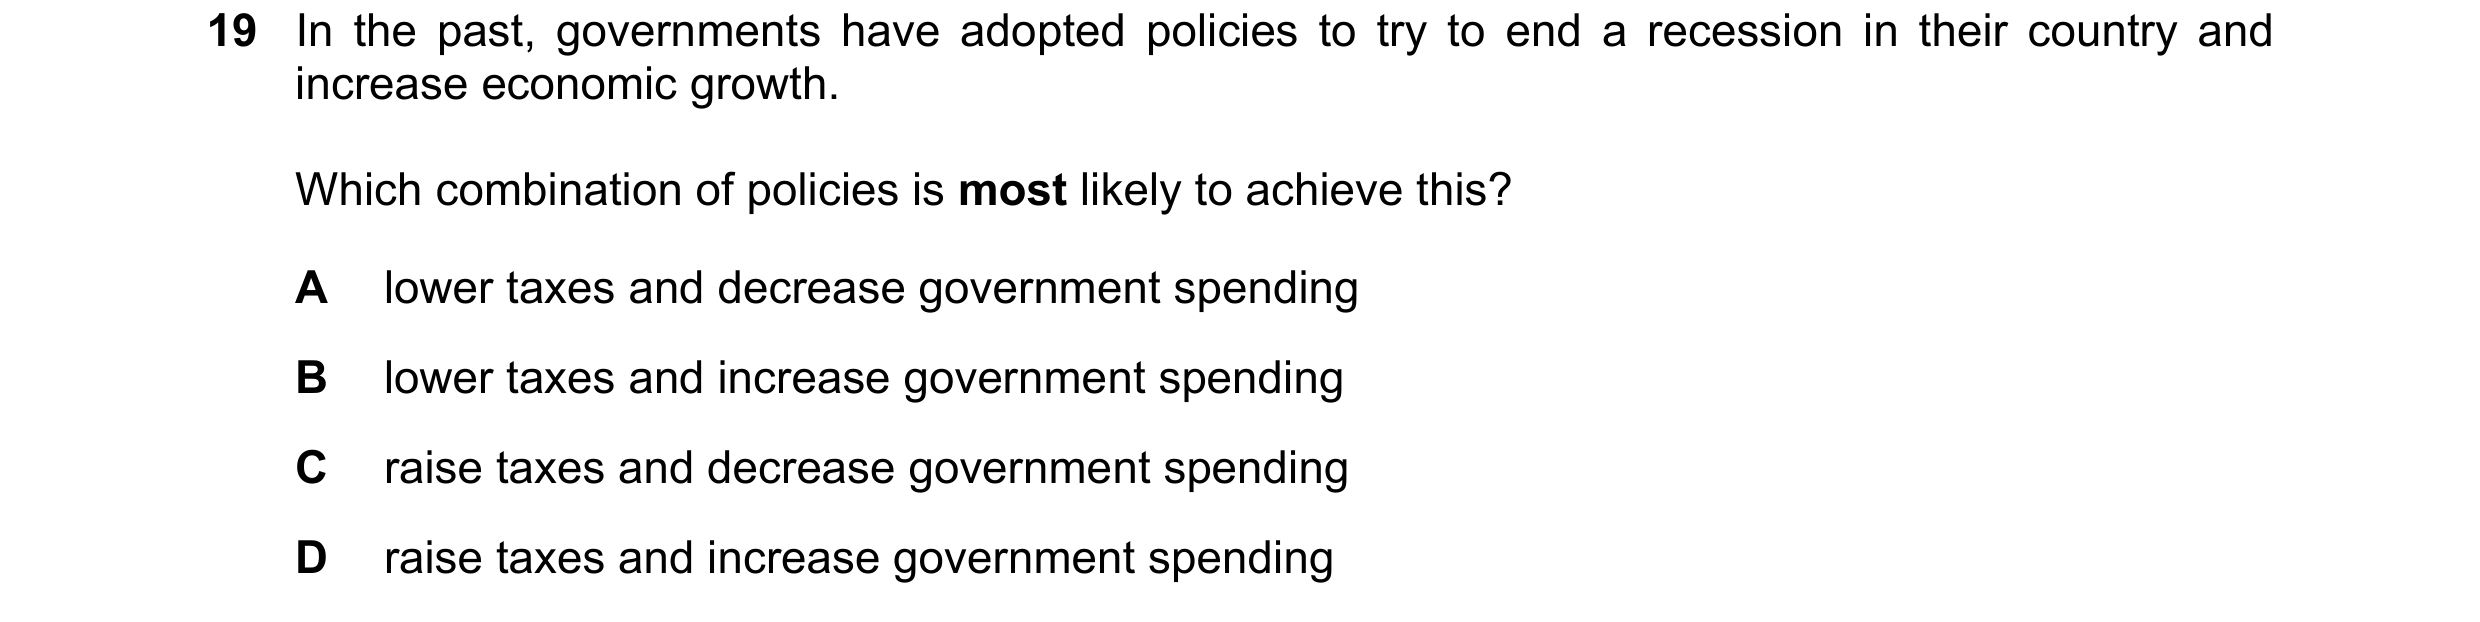

 23 / 36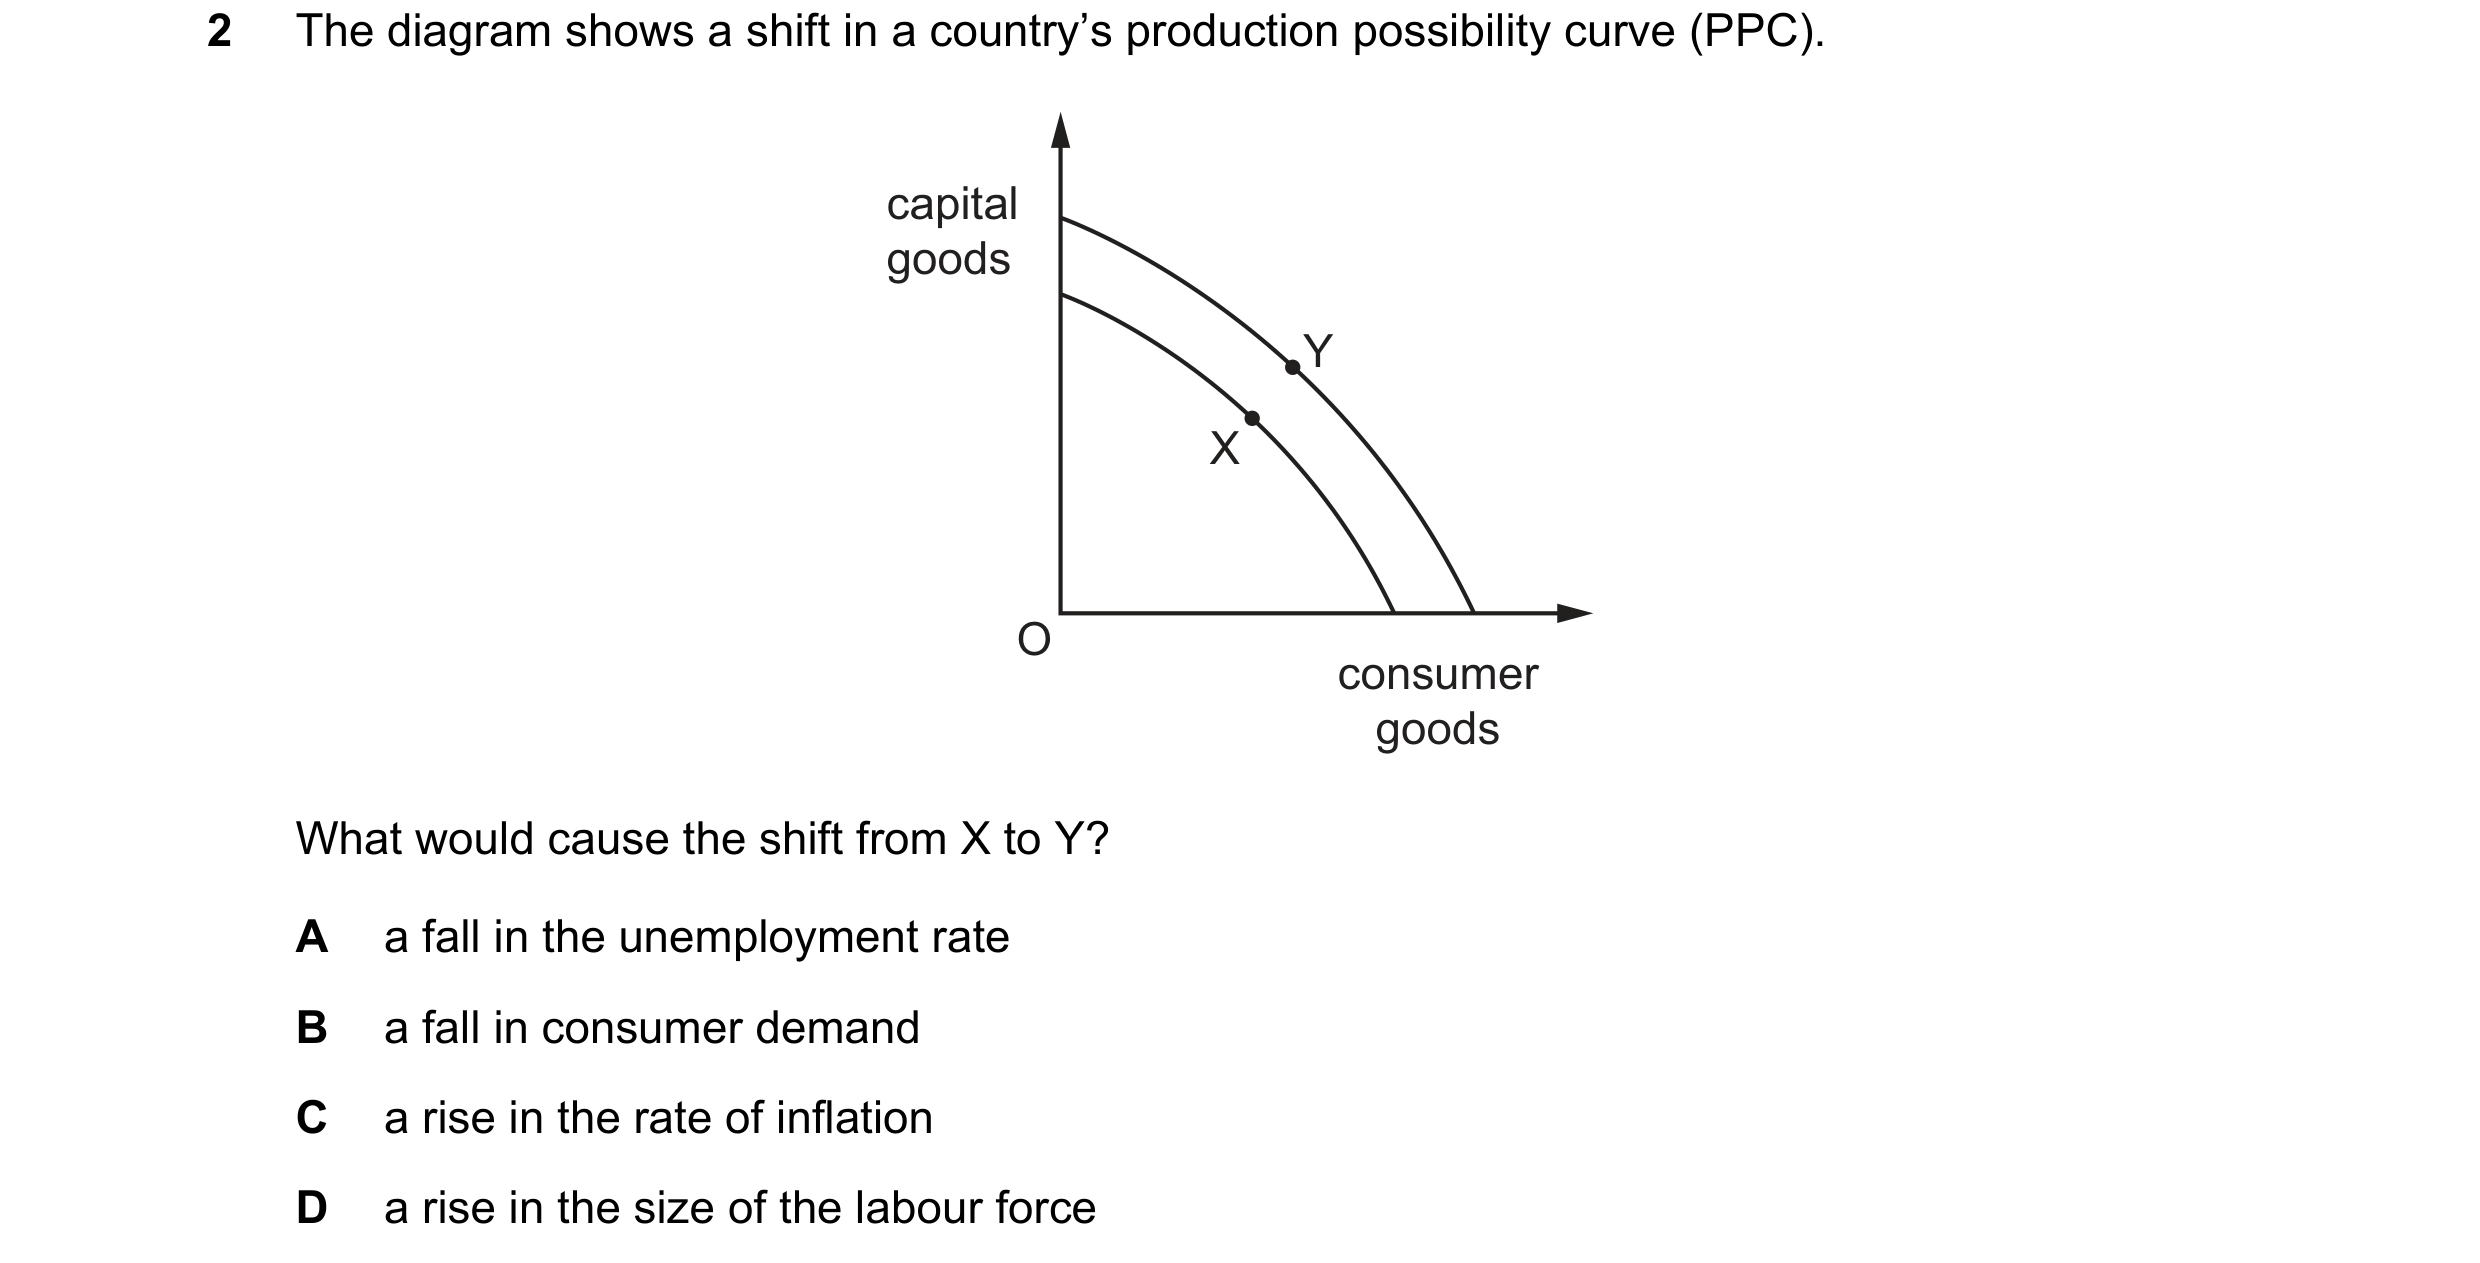
 24 / 36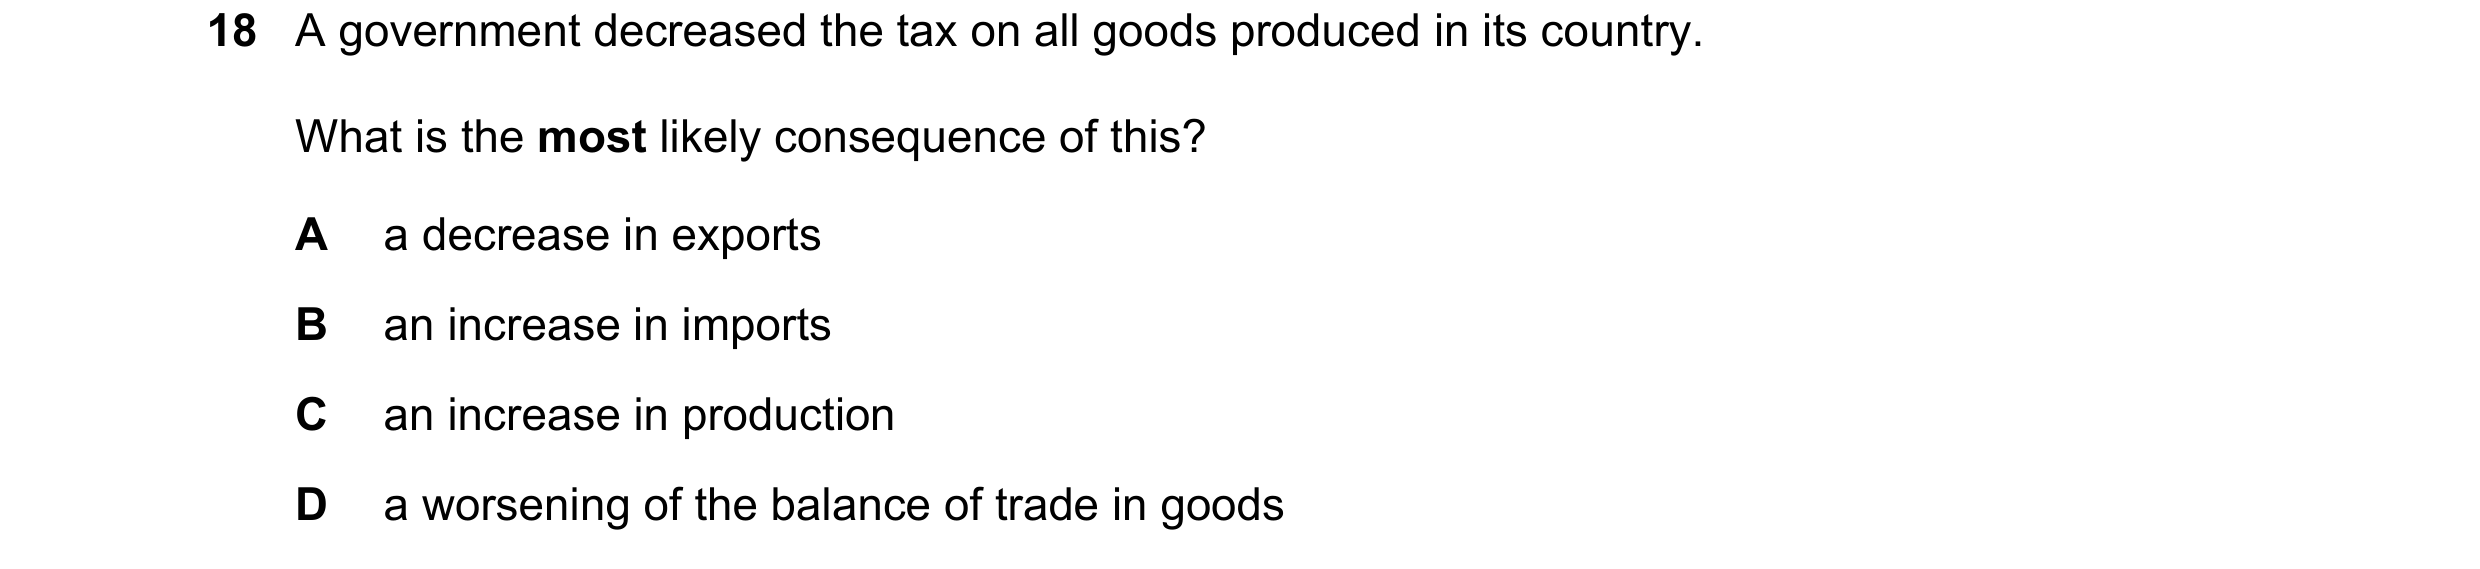


 25 / 36


 26 / 36


 27 / 36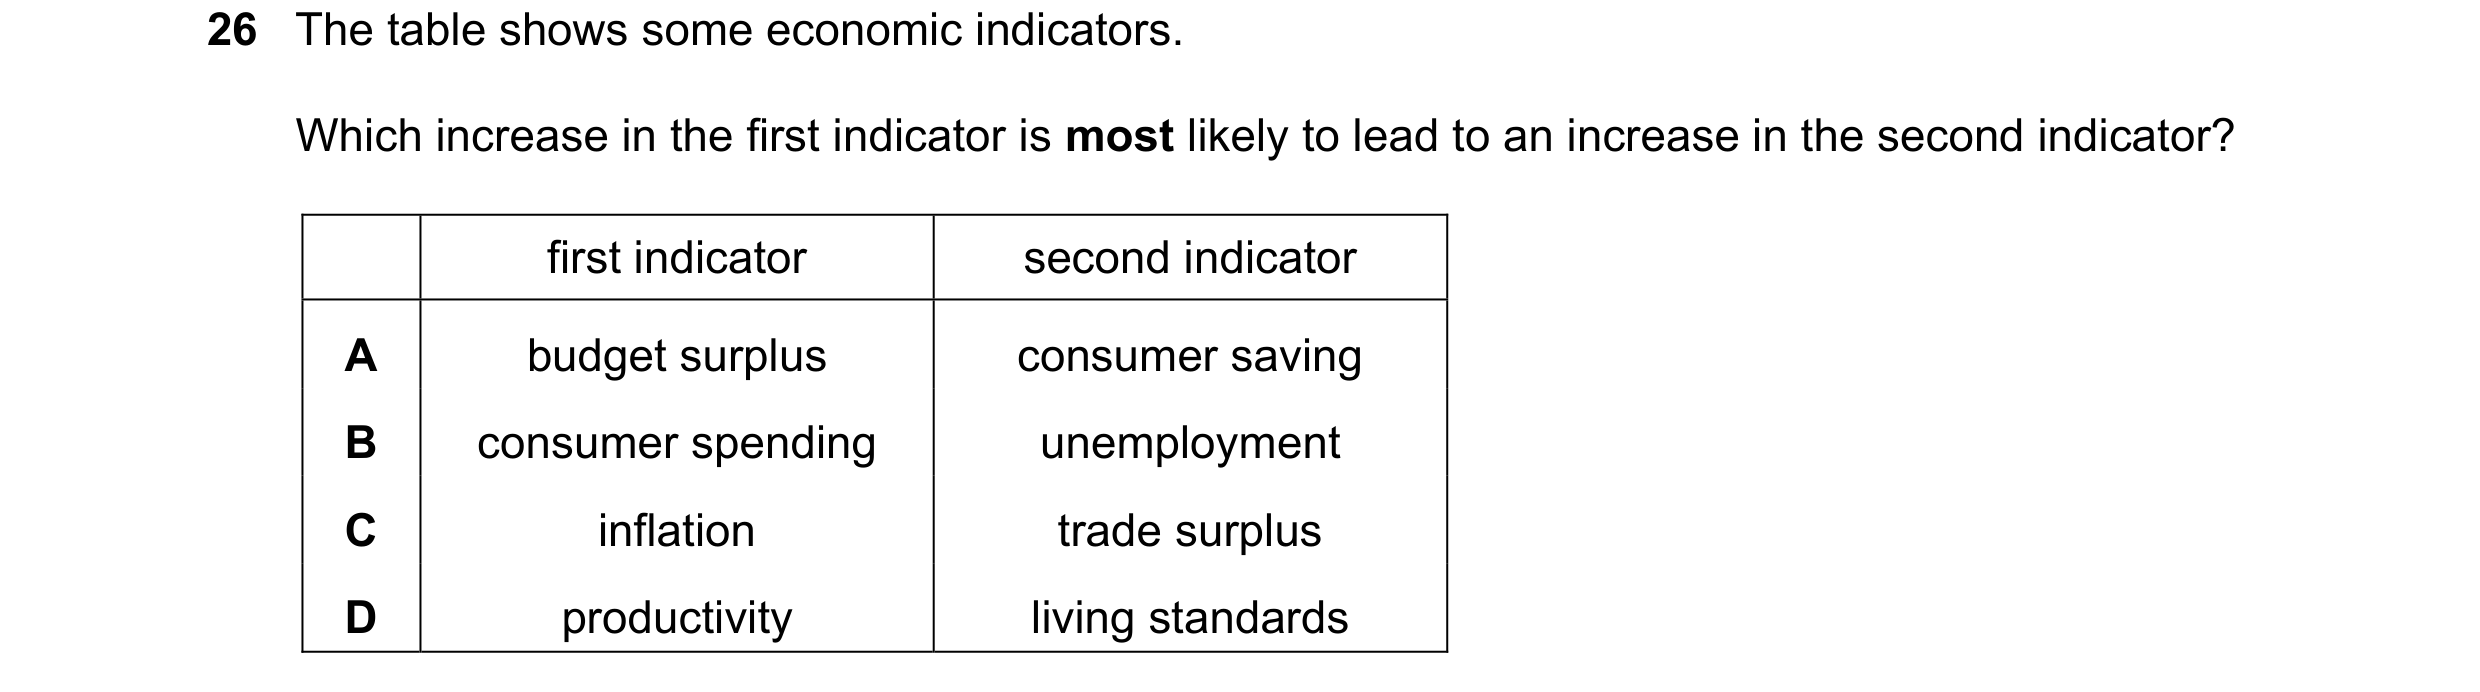

 28 / 36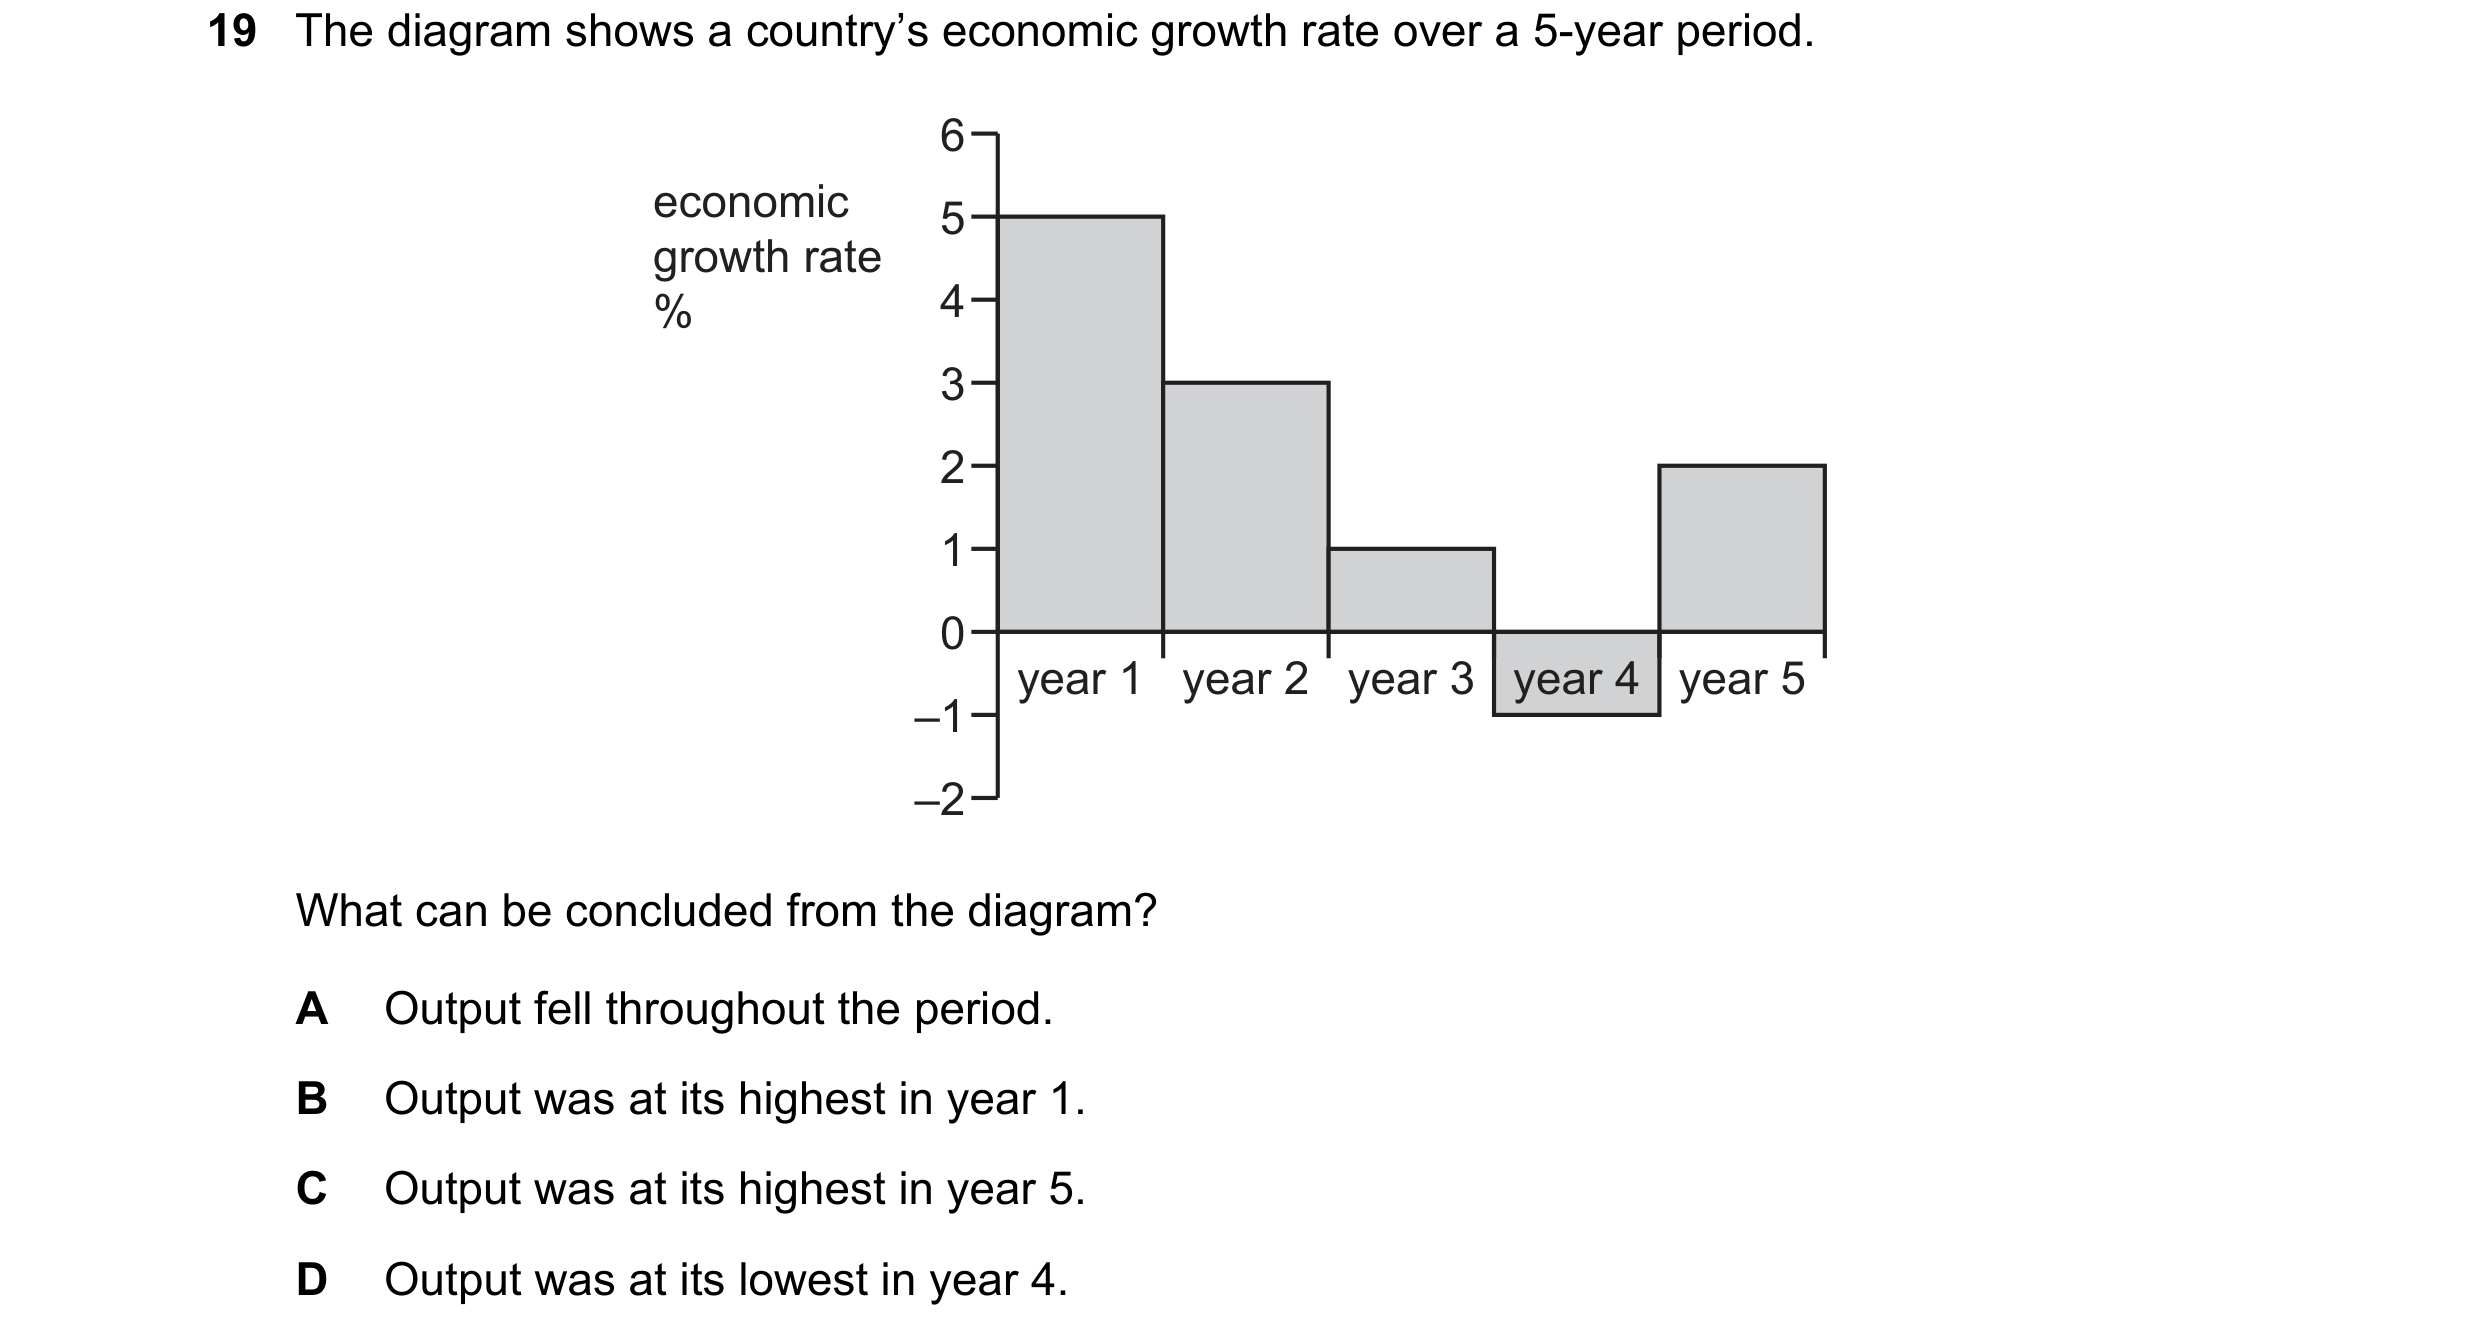
 29 / 36
 30 / 36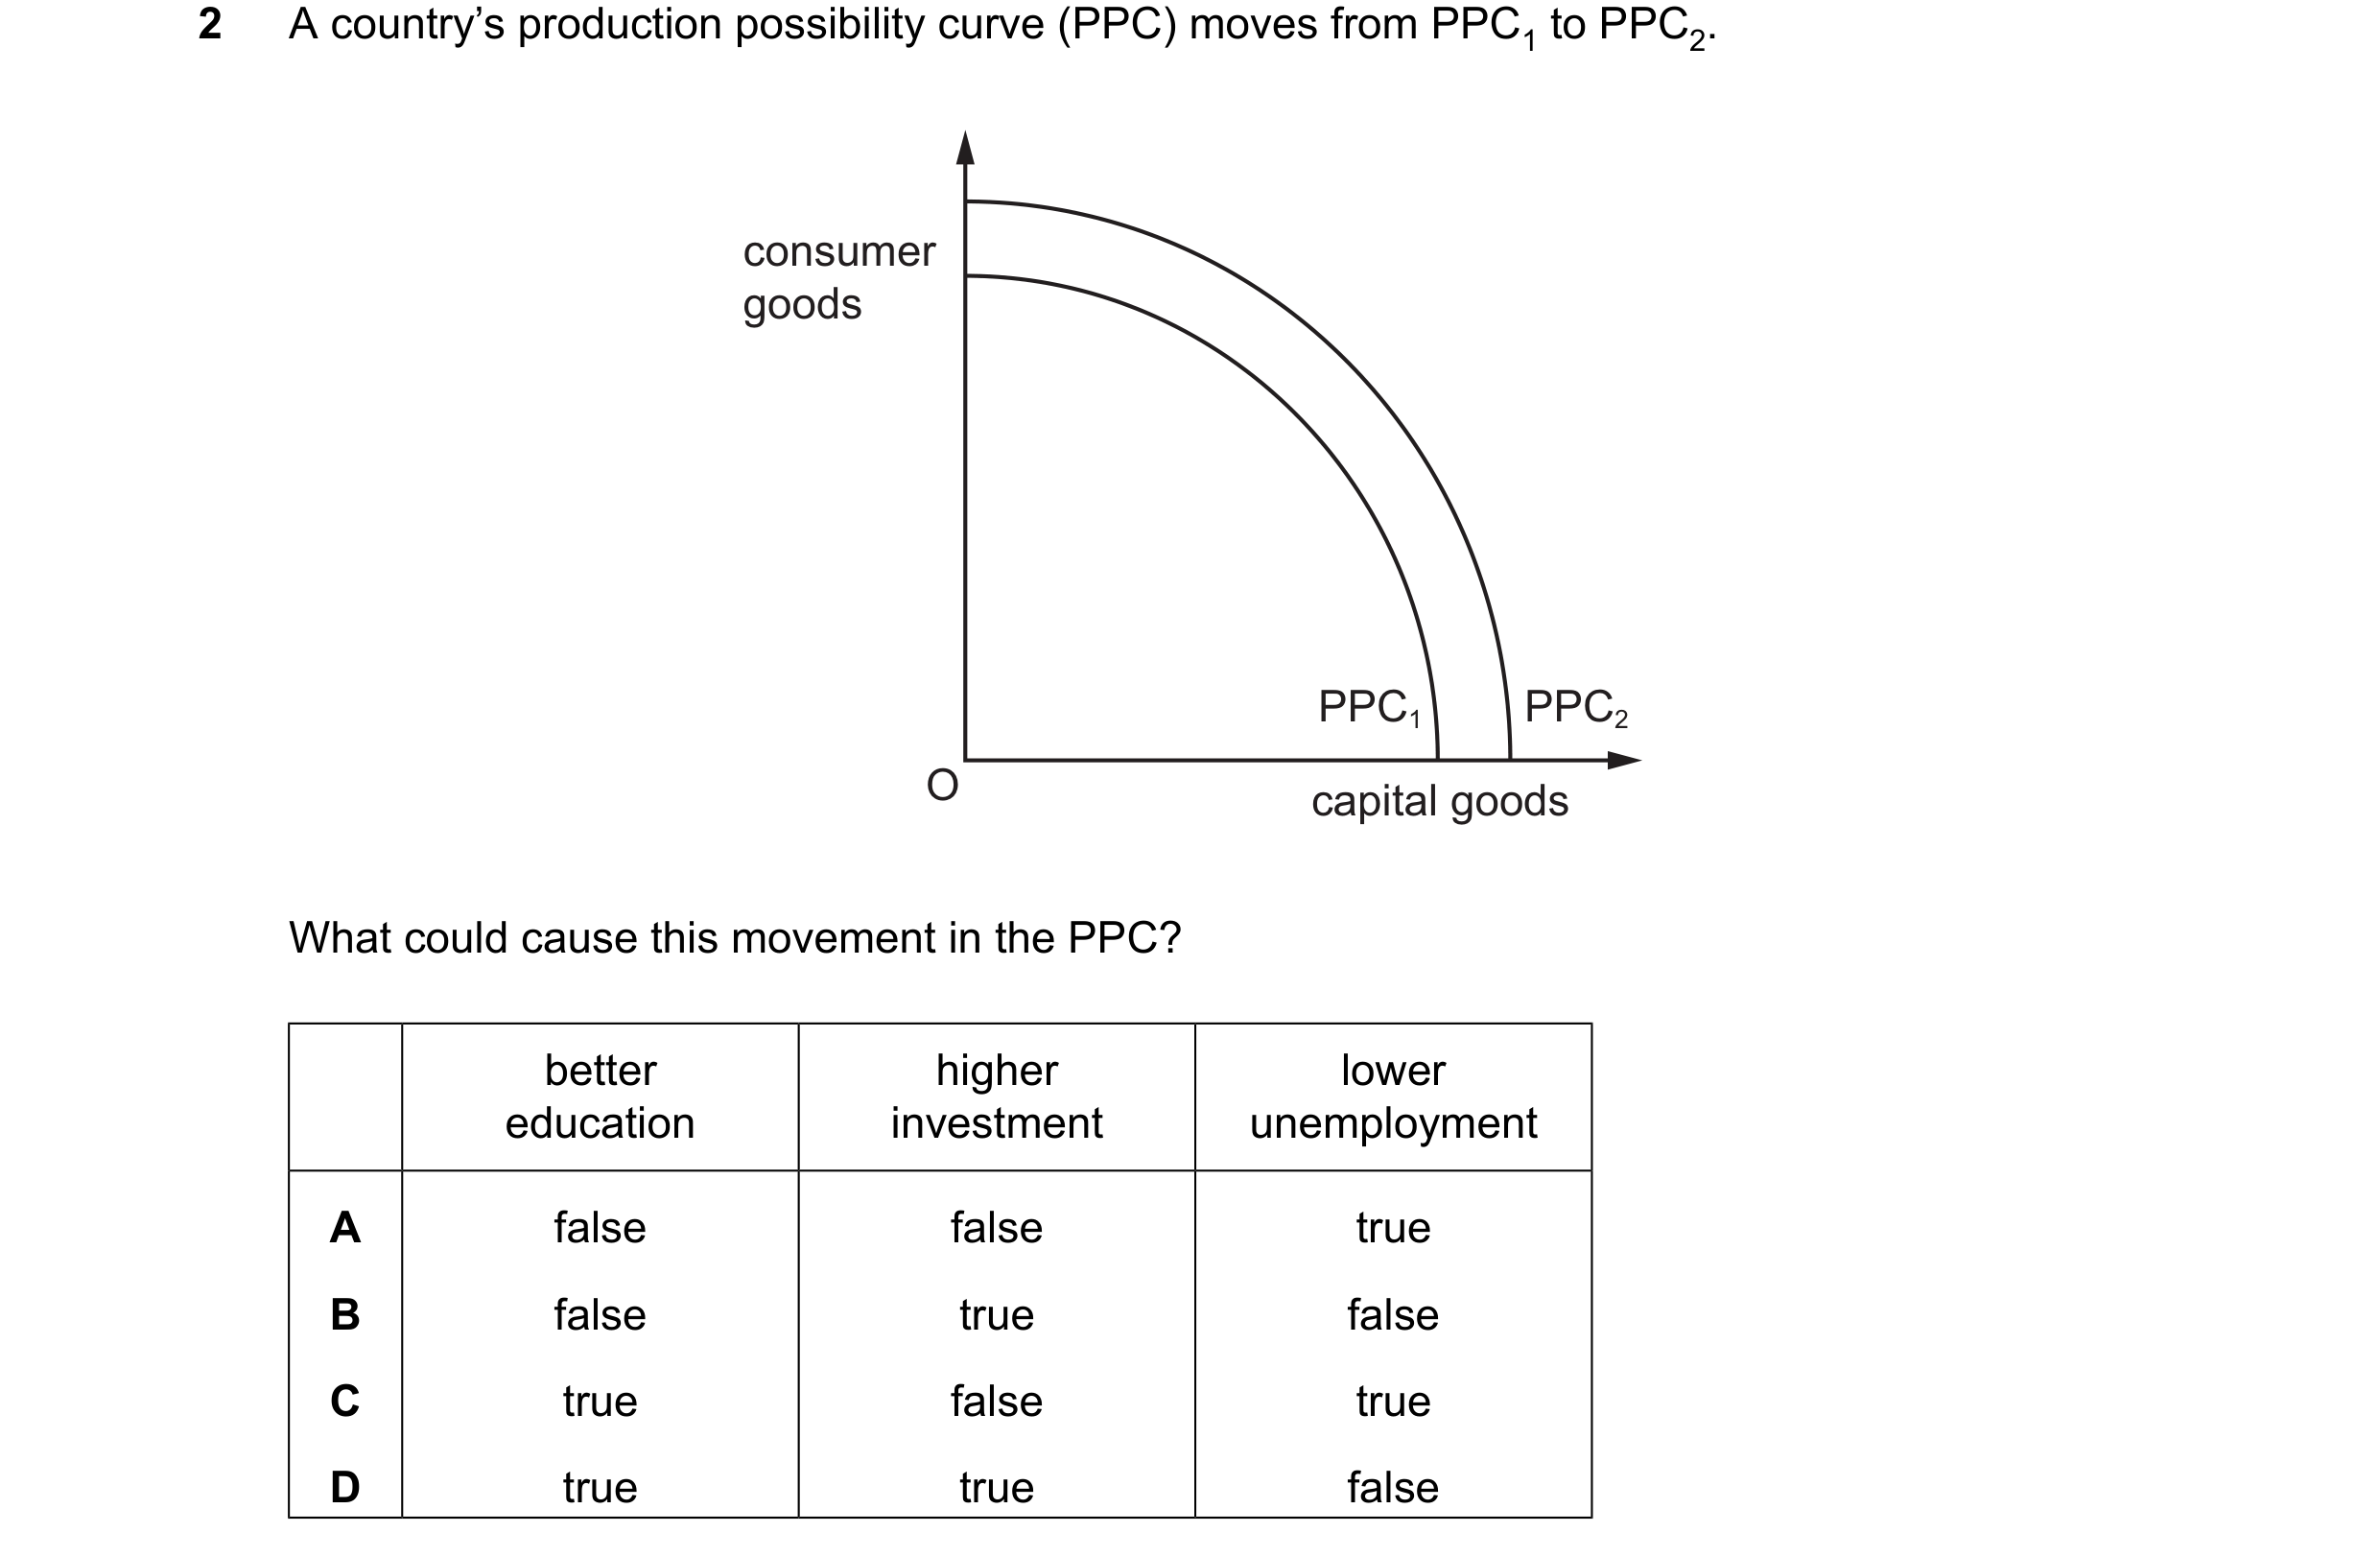
 31 / 36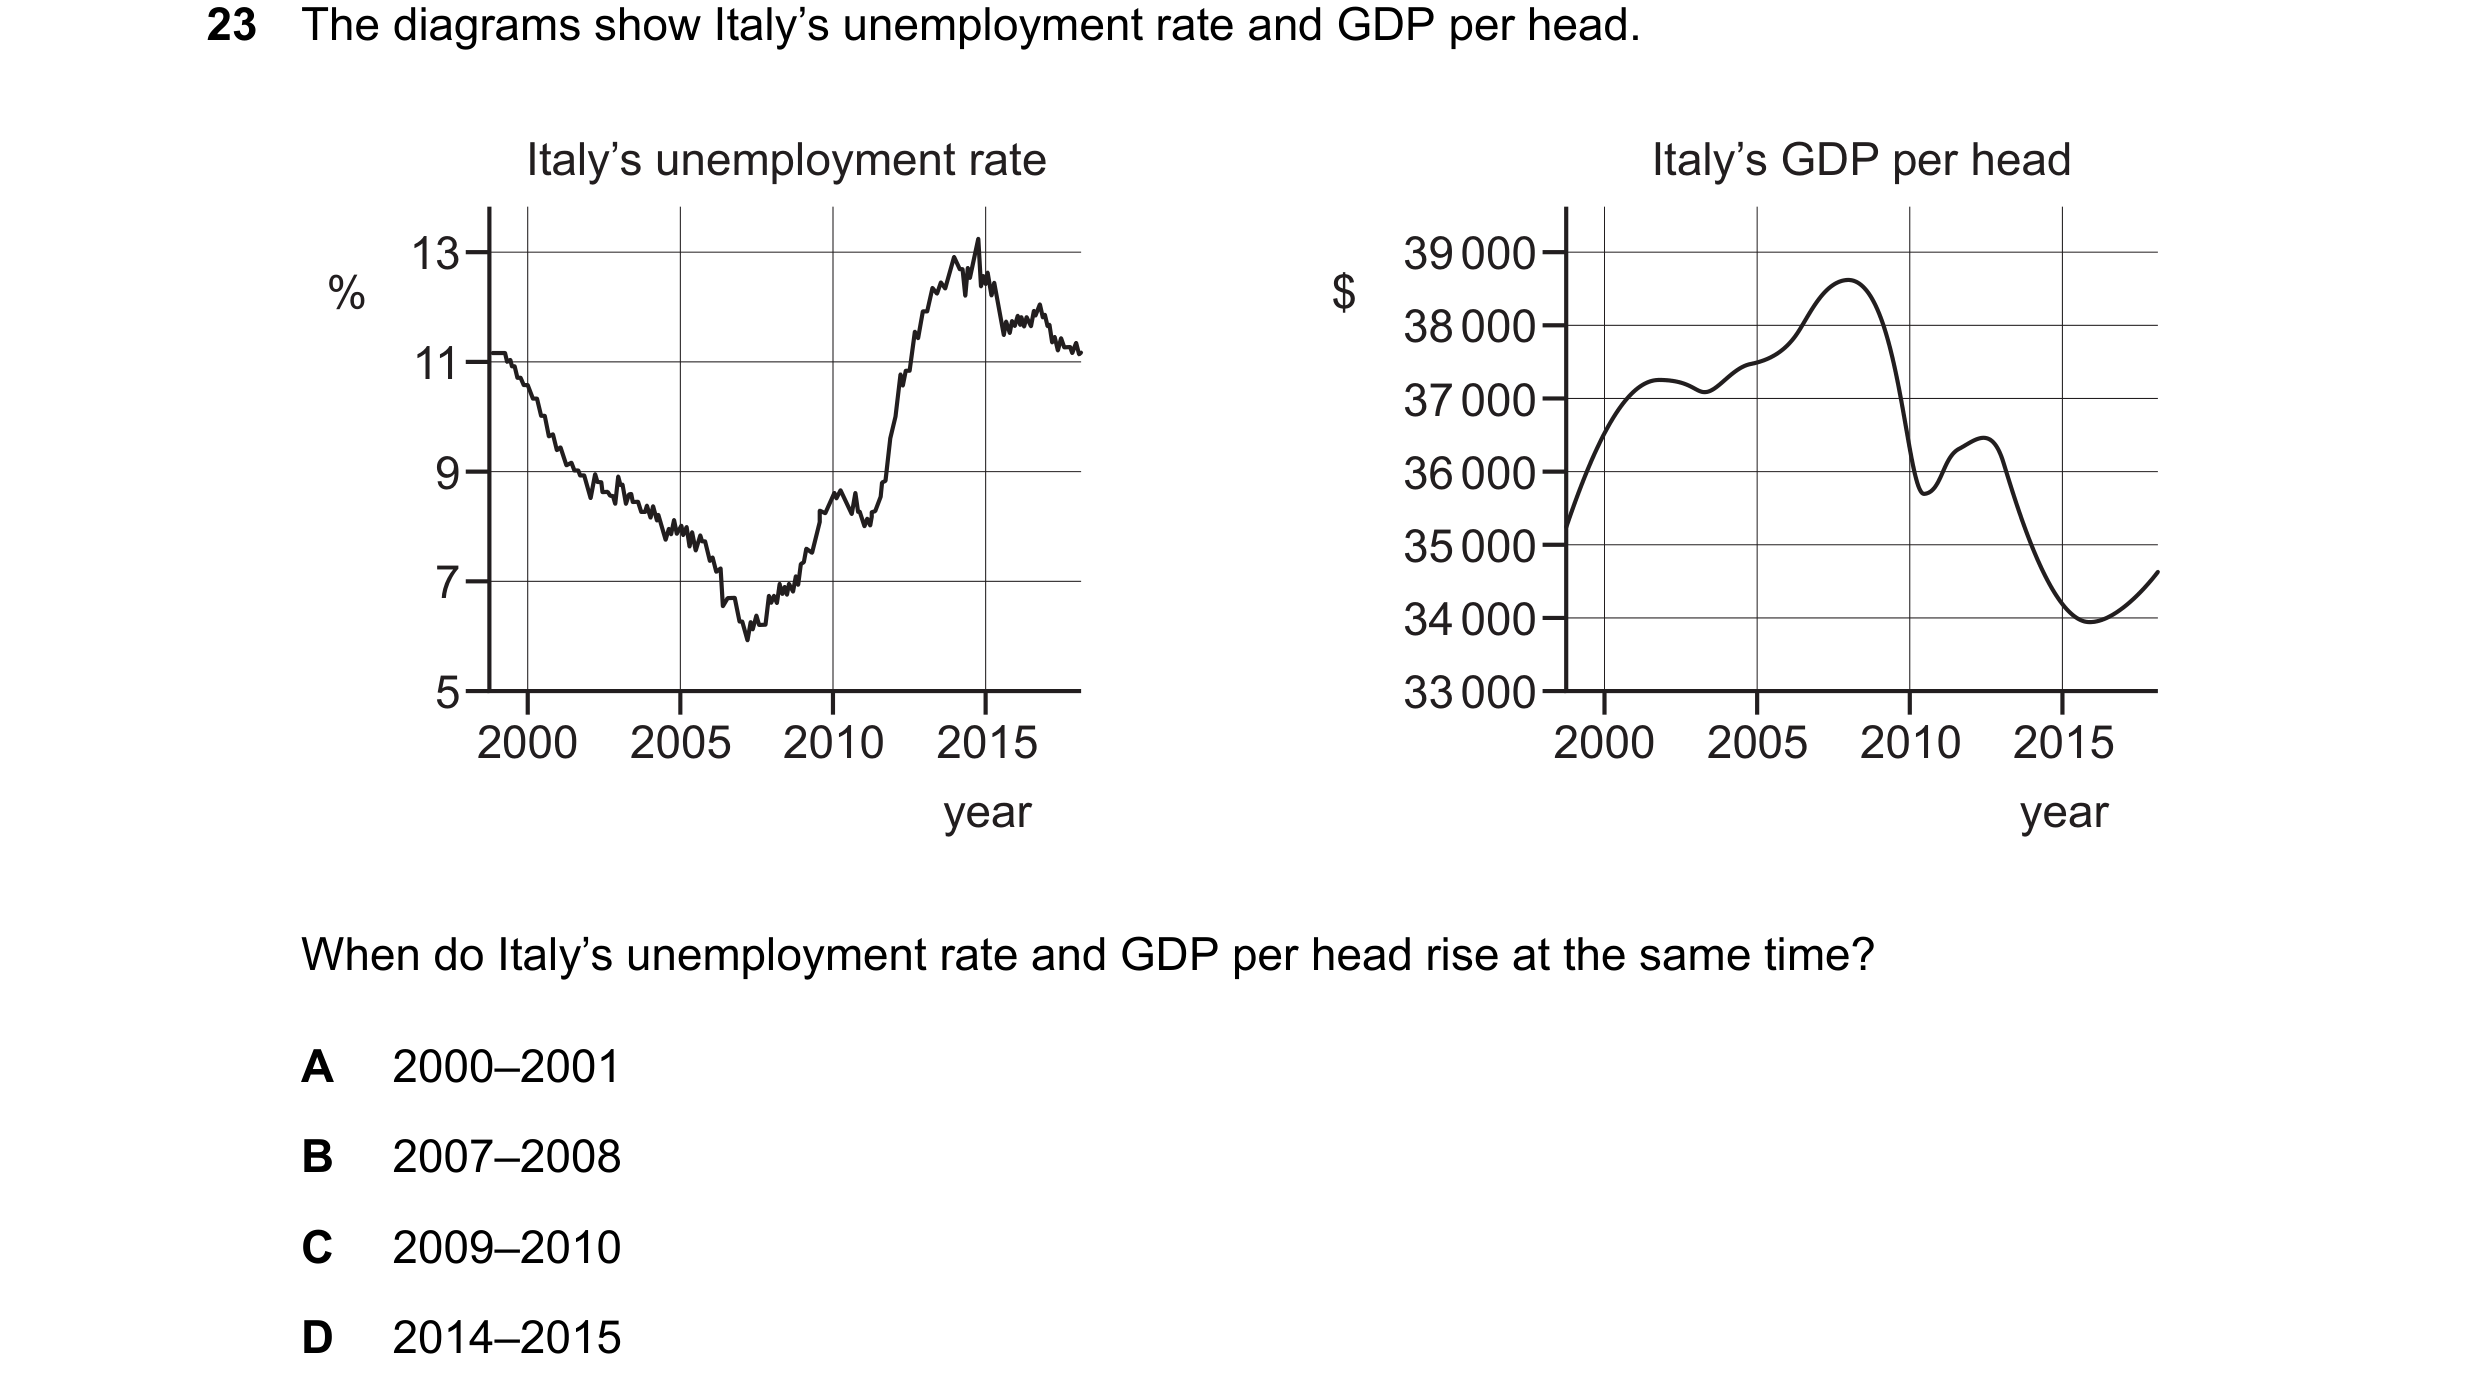
 32 / 36


 33 / 36



 34 / 36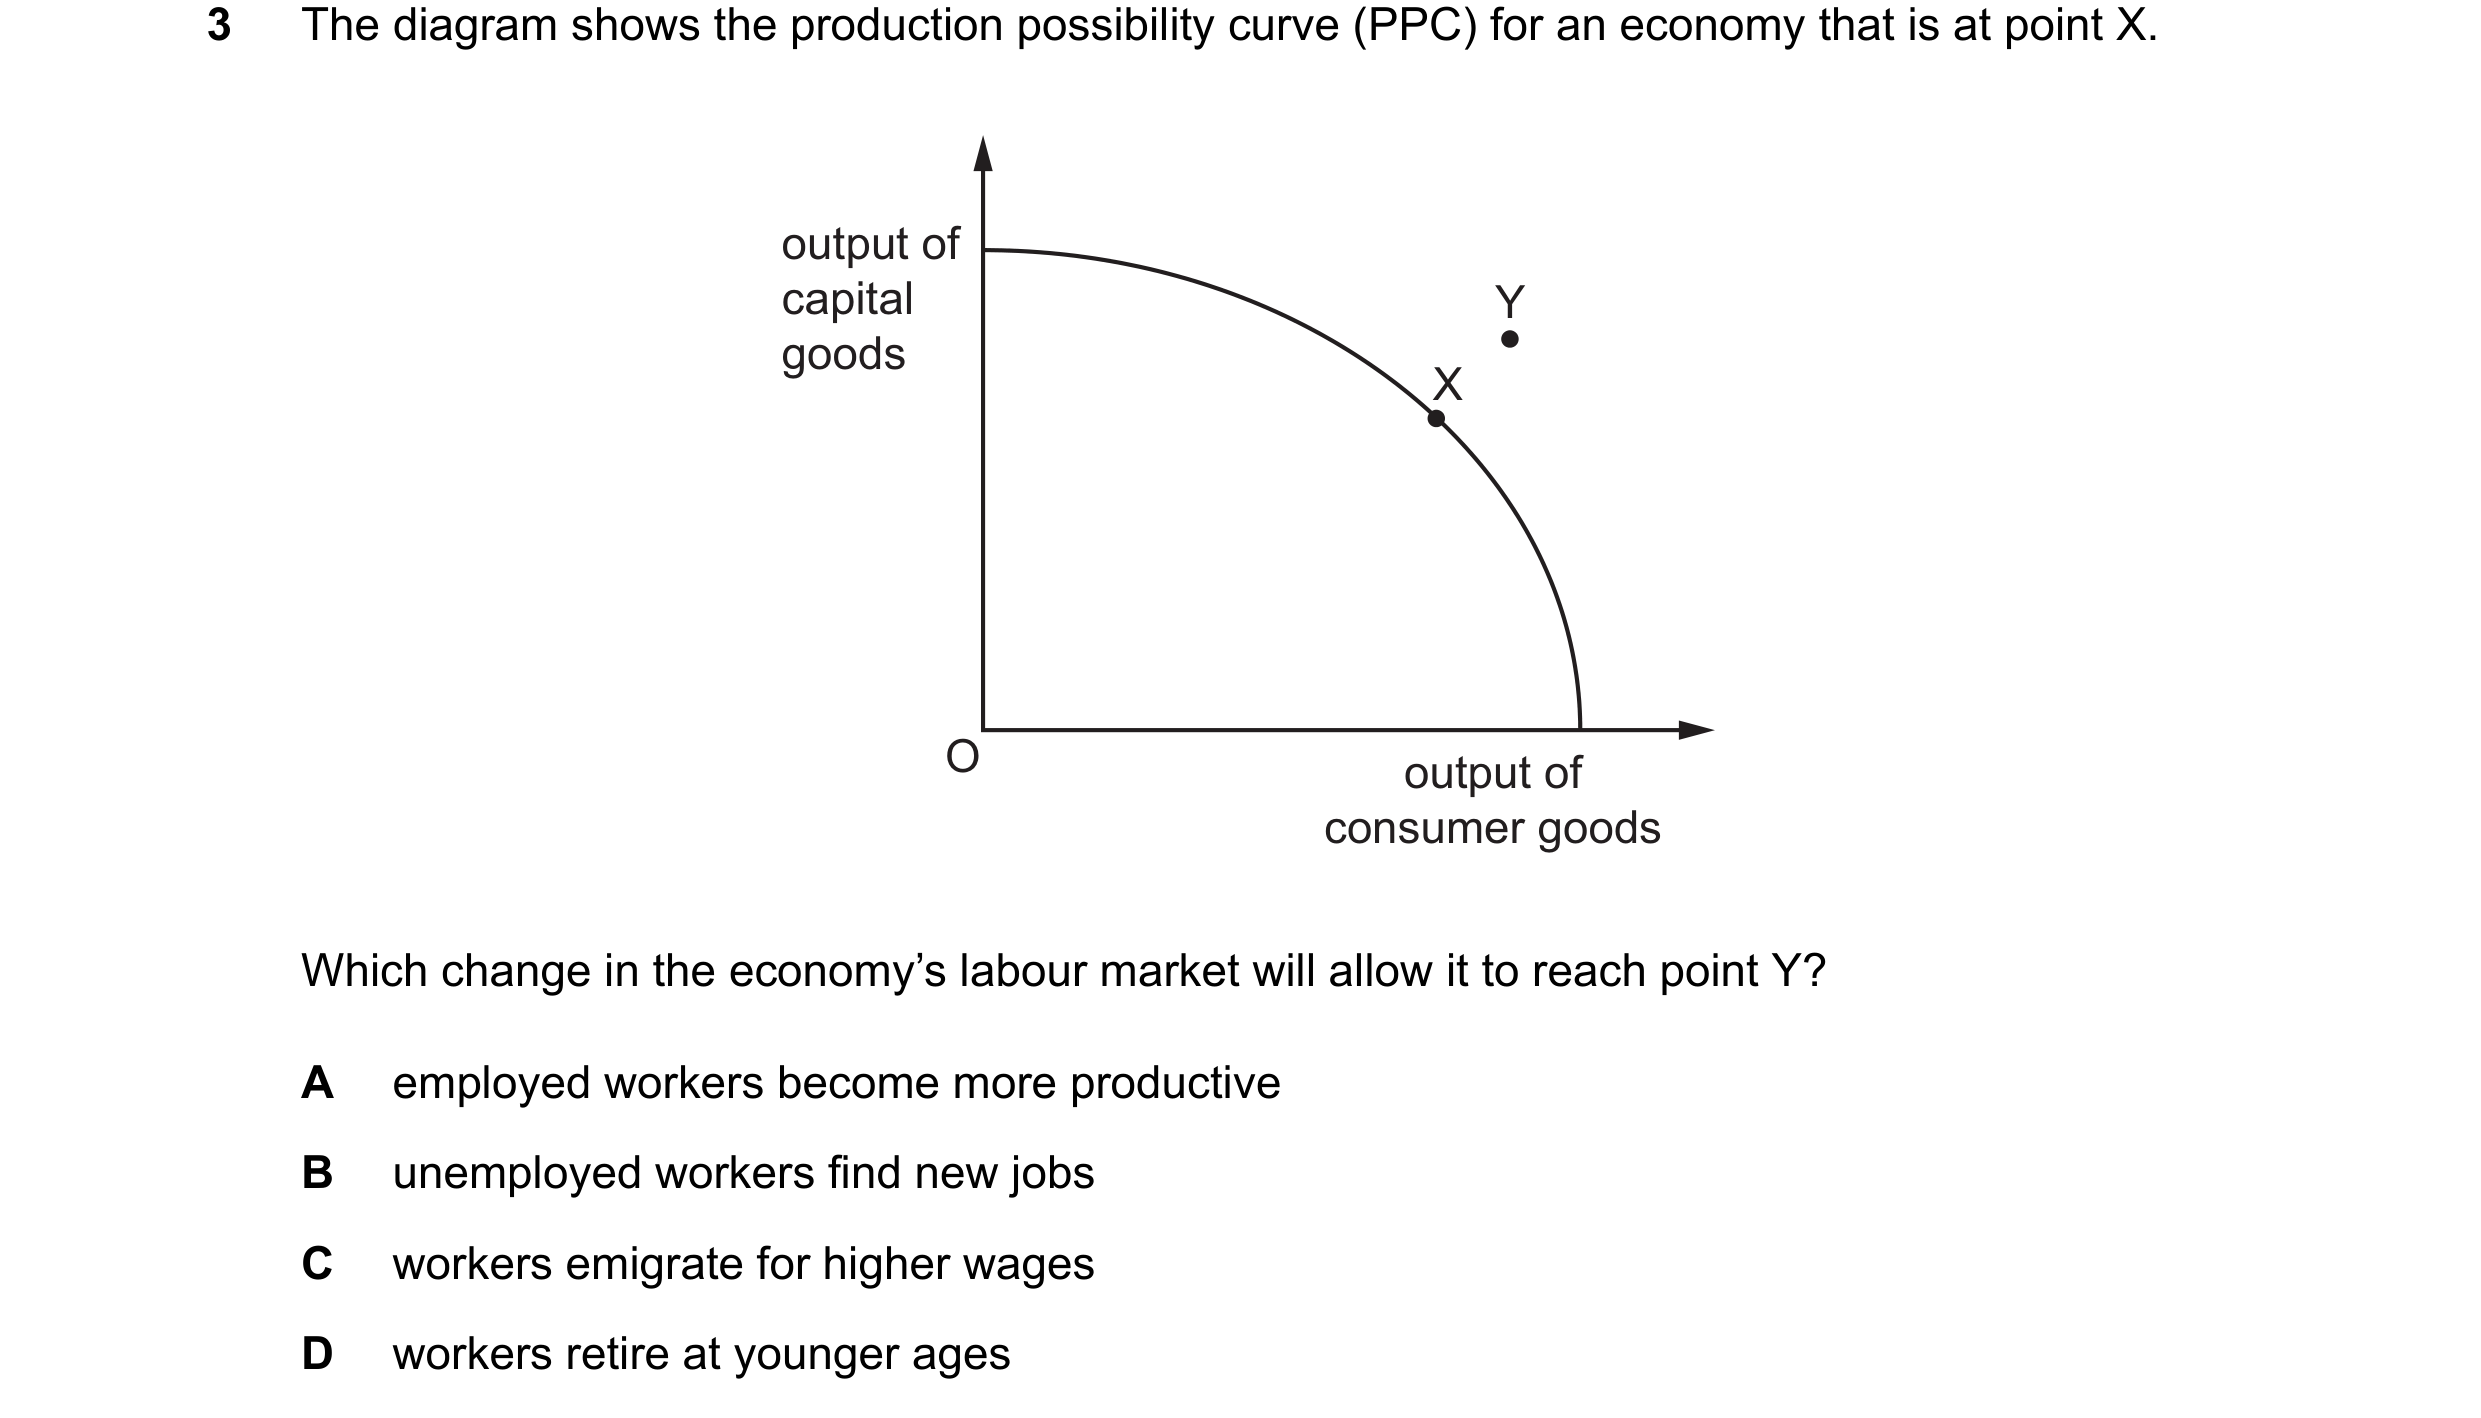
 35 / 36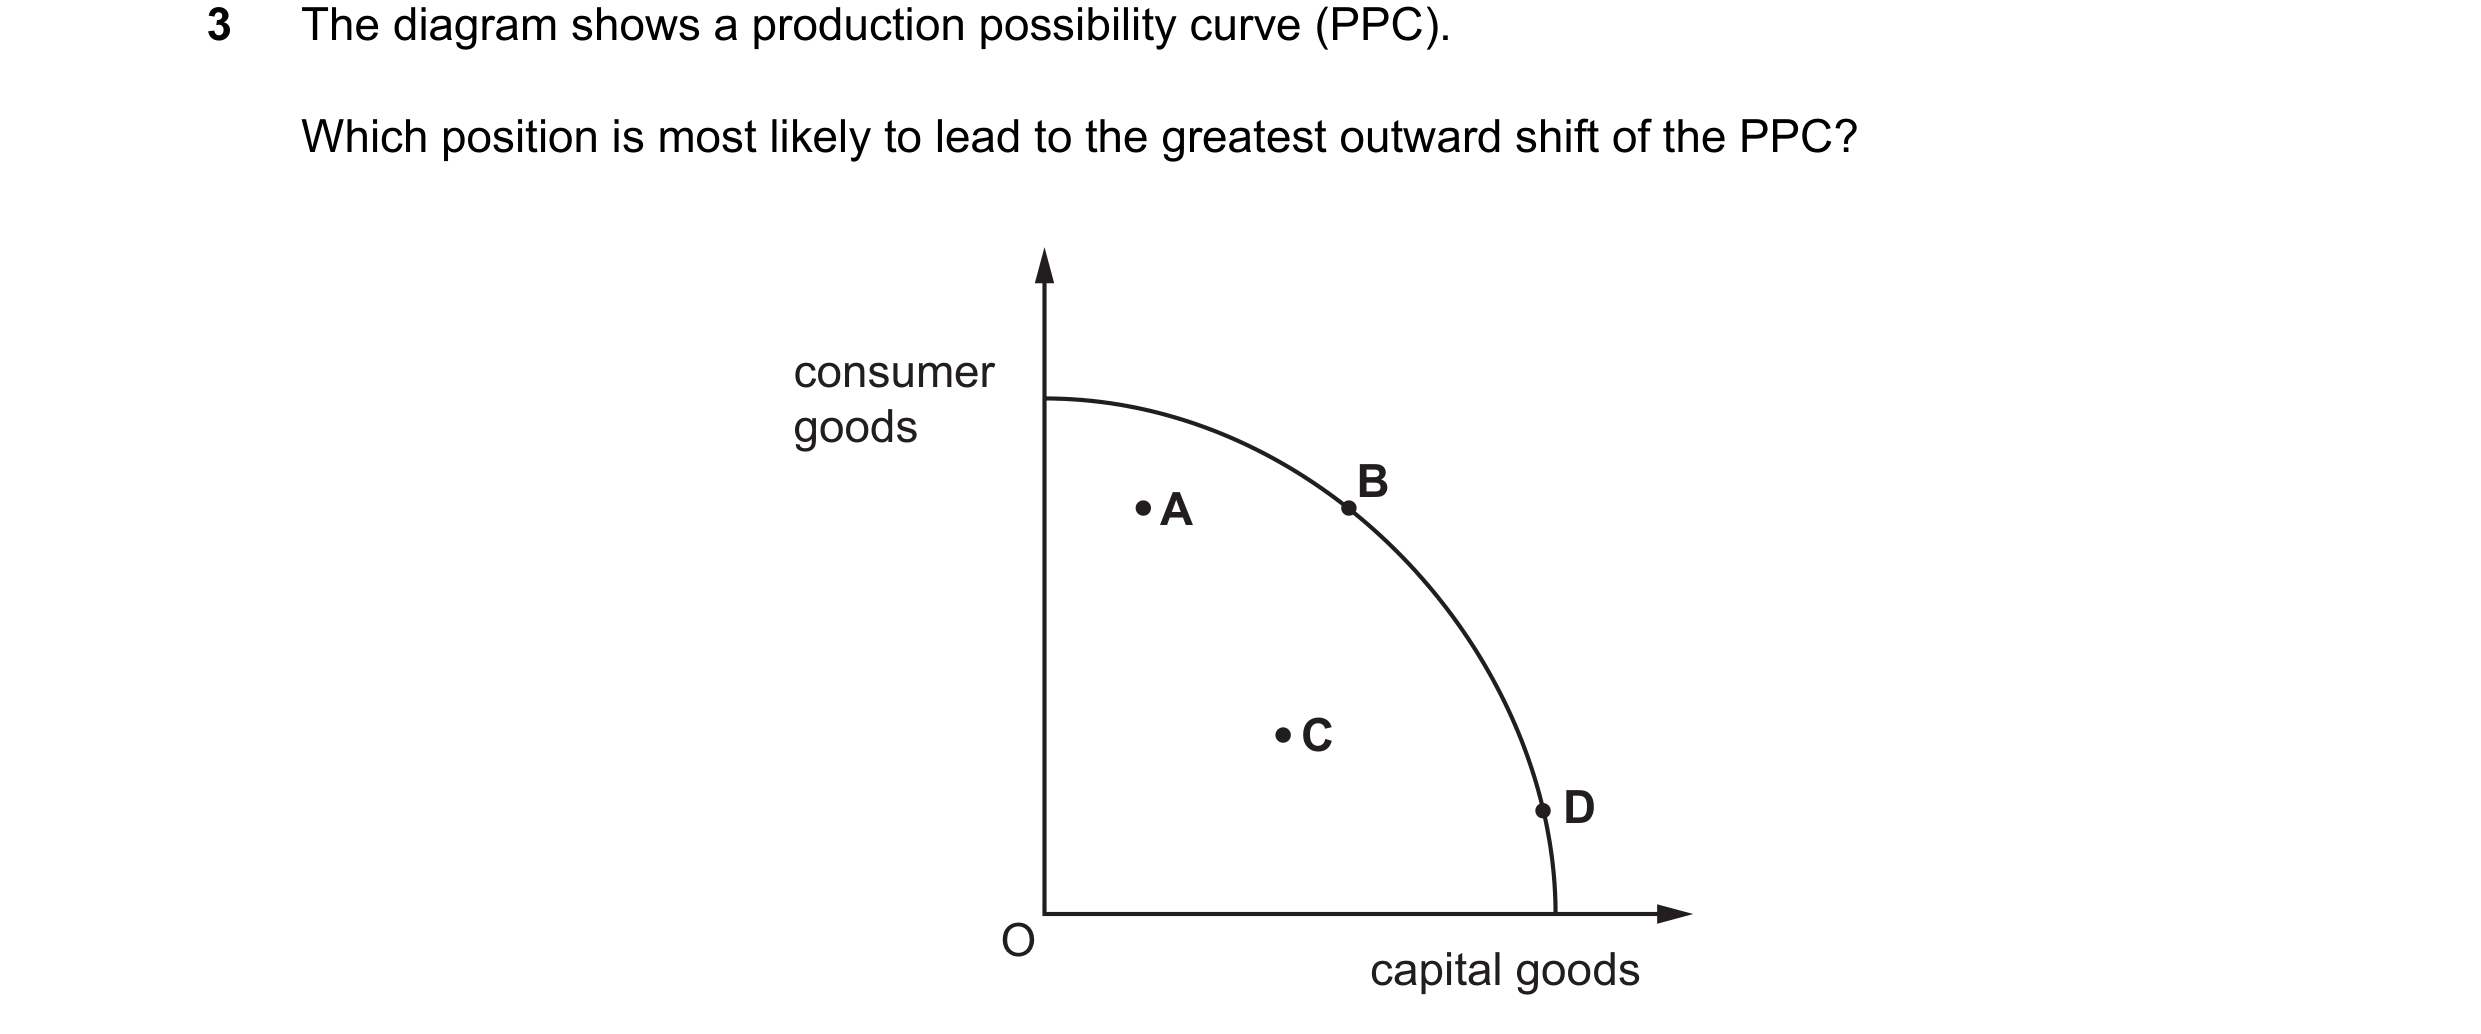
 36 / 36