Cambridge IGCSE Economics 0455 — 2024 Oct/Nov Paper 1 · Variant 1
0455/11/O/N/24 · 30 questions · 30 marks · ≈34 min
The question paper and its mark scheme, free to read here and free to download. This is Cambridge’s own paper, exactly as it was sat.
Question paper12 pages
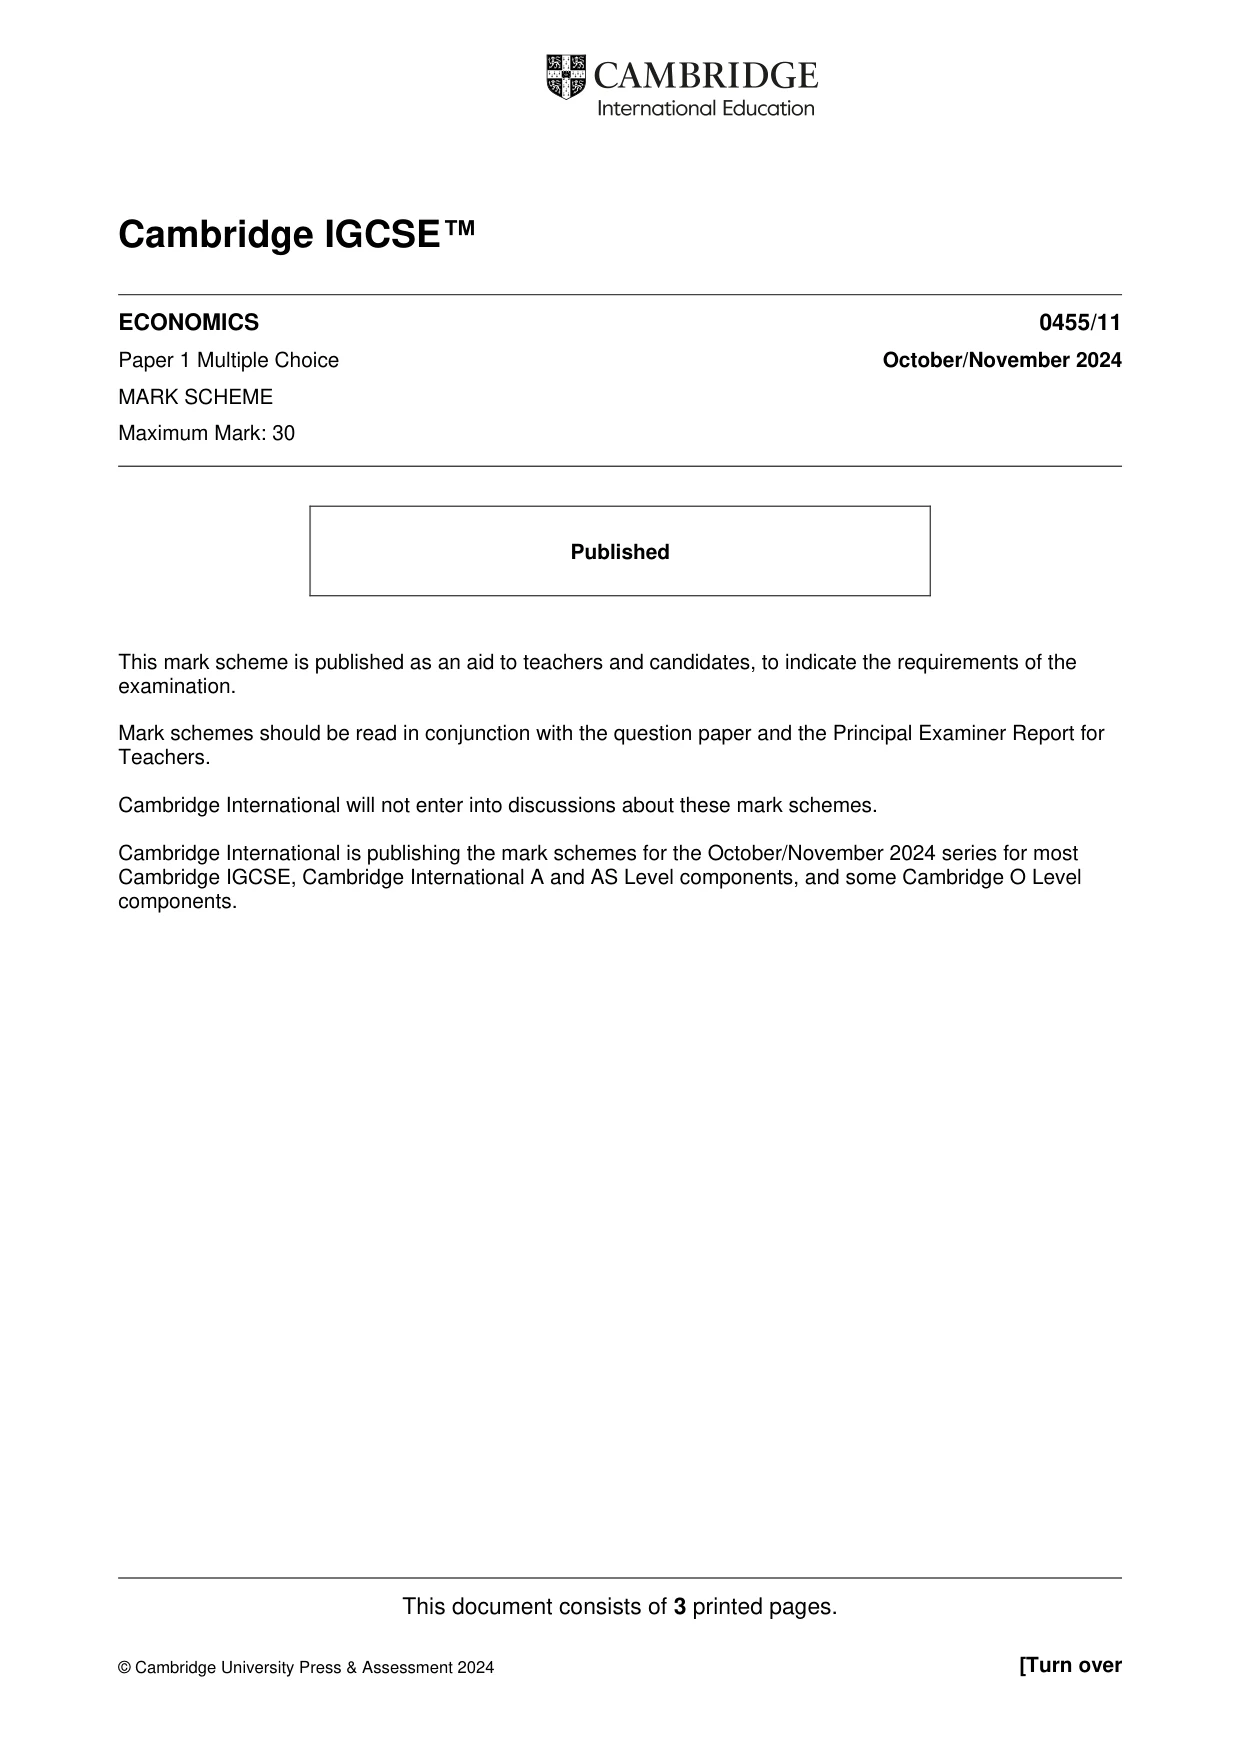
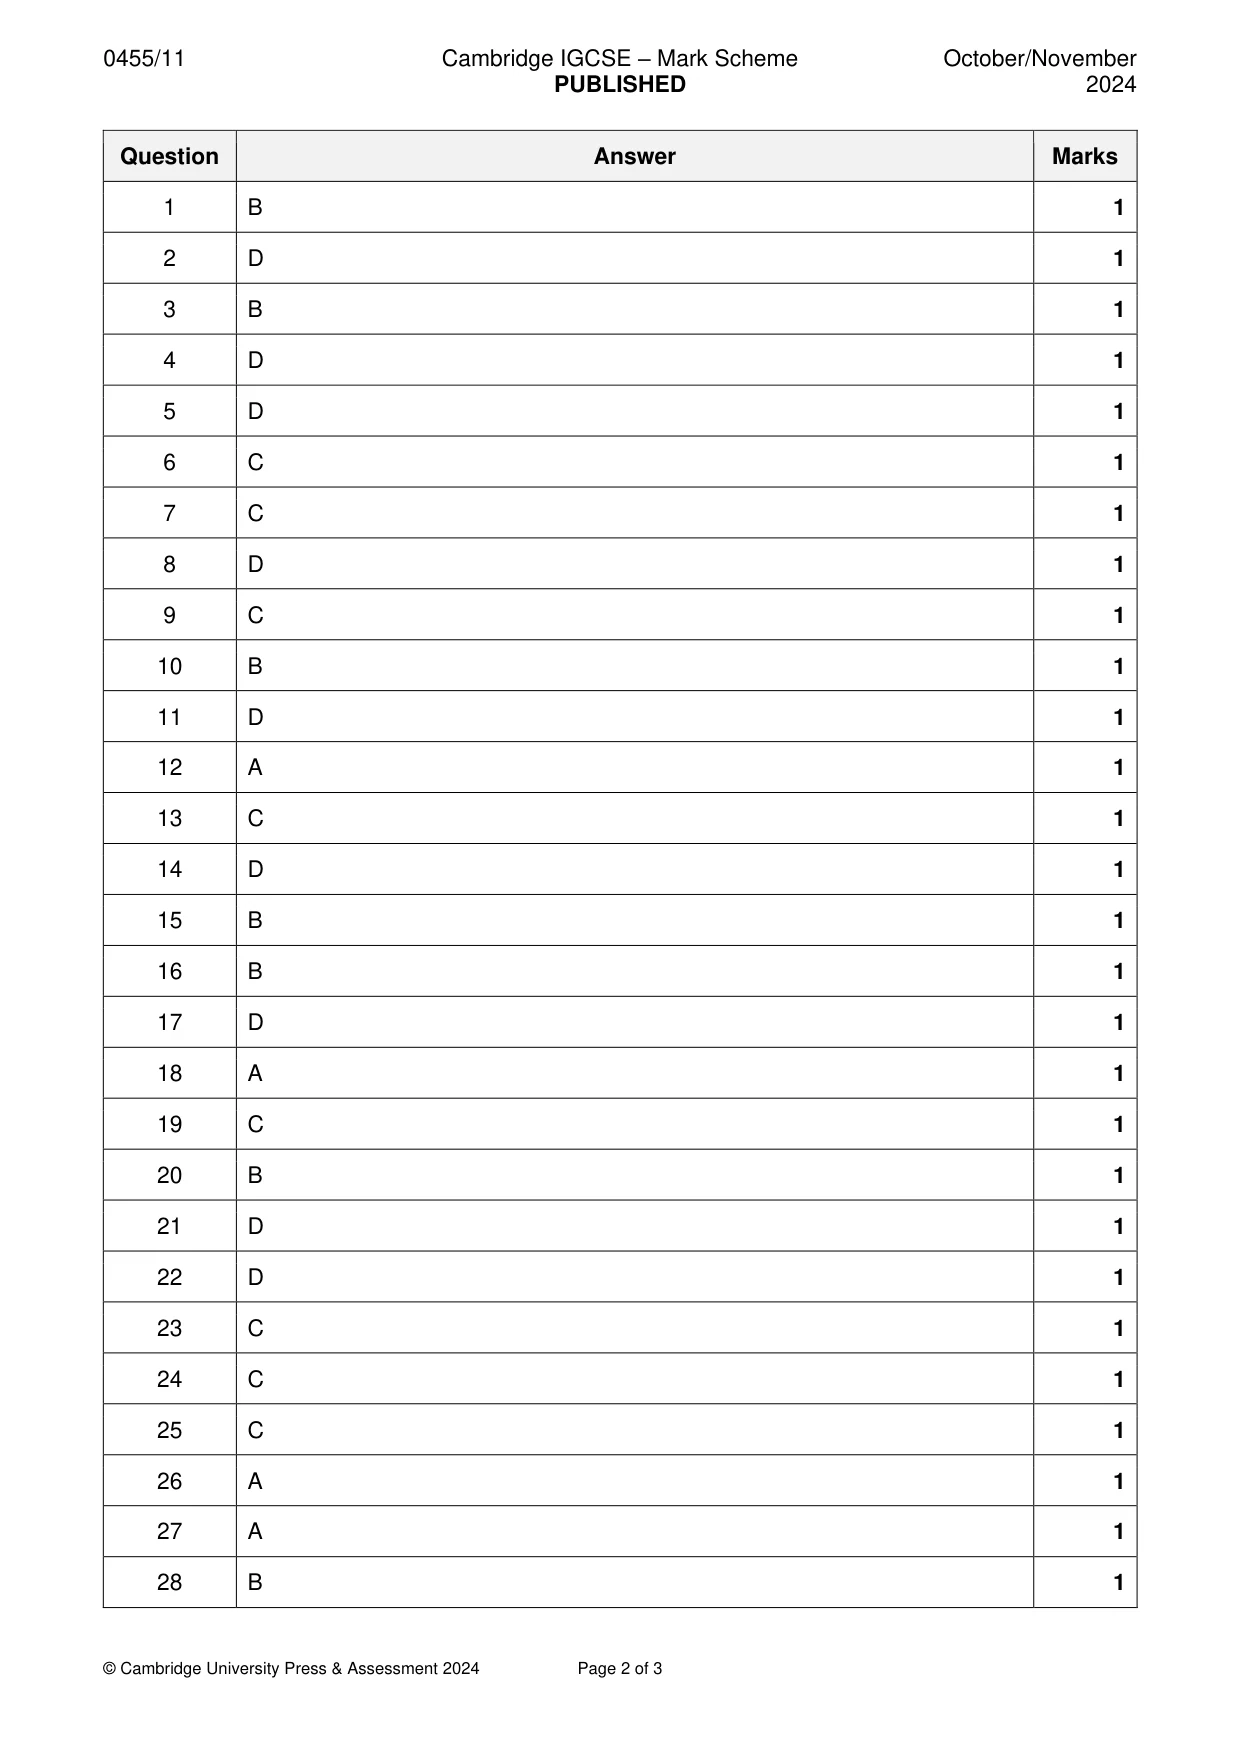
Mark scheme3 pages
Answers below. Sit the paper first if you are practising.

Questions as text
Q1 · What has an opportunity cost in consumption?
1 What has an opportunity cost in consumption? A air B food C sea water D sunlight
Mark scheme: B
Q2 · In which case is it possible to set the level of reward before production takes place for…
2 In which case is it possible to set the level of reward before production takes place for the first factor of production but not for the second factor? first factor second factor A capital land B enterprise labour C labour capital D land enterprise
Mark scheme: D
Q3 · The diagram shows the production possibility curve (PPC) for an economy
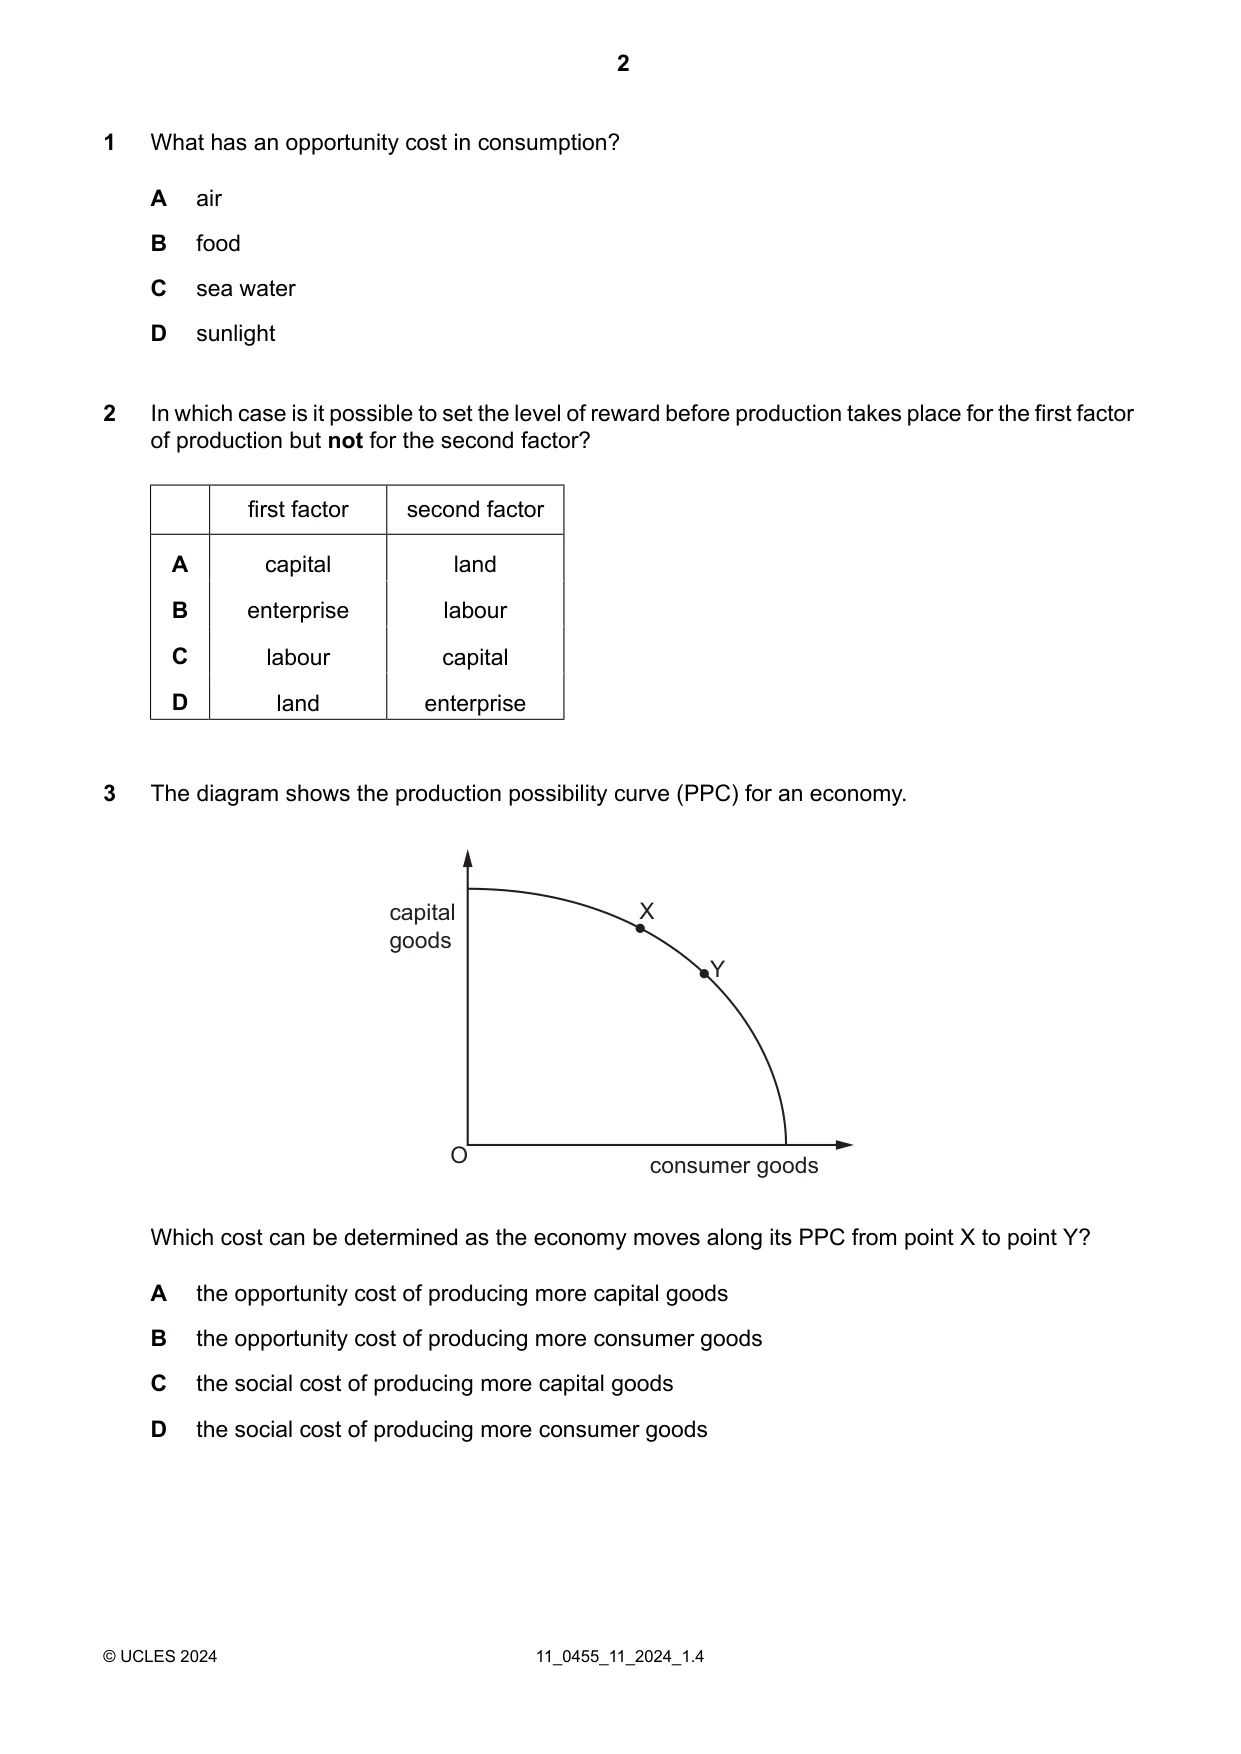
3 The diagram shows the production possibility curve (PPC) for an economy. capital X goods Y O consumer goods Which cost can be determined as the economy moves along its PPC from point X to point Y? A the opportunity cost of producing more capital goods B the opportunity cost of producing more consumer goods C the social cost of producing more capital goods D the social cost of producing more consumer goods
Mark scheme: B
Q4 · Which person is most likely to make a microeconomic decision as part of their job?
4 Which person is most likely to make a microeconomic decision as part of their job? A a government finance minister B the global administrator of the Human Development Index C the governor of the central bank D the manager of a private sector firm
Mark scheme: D
Q5 · What necessarily describes the market system?
5 What necessarily describes the market system? A all resources used to produce consumer goods B an economy with both a private and a public sector C limited resources but unlimited wants D resources allocated through demand and supply
Mark scheme: D
Q6 · The diagram shows the demand for and supply of a product
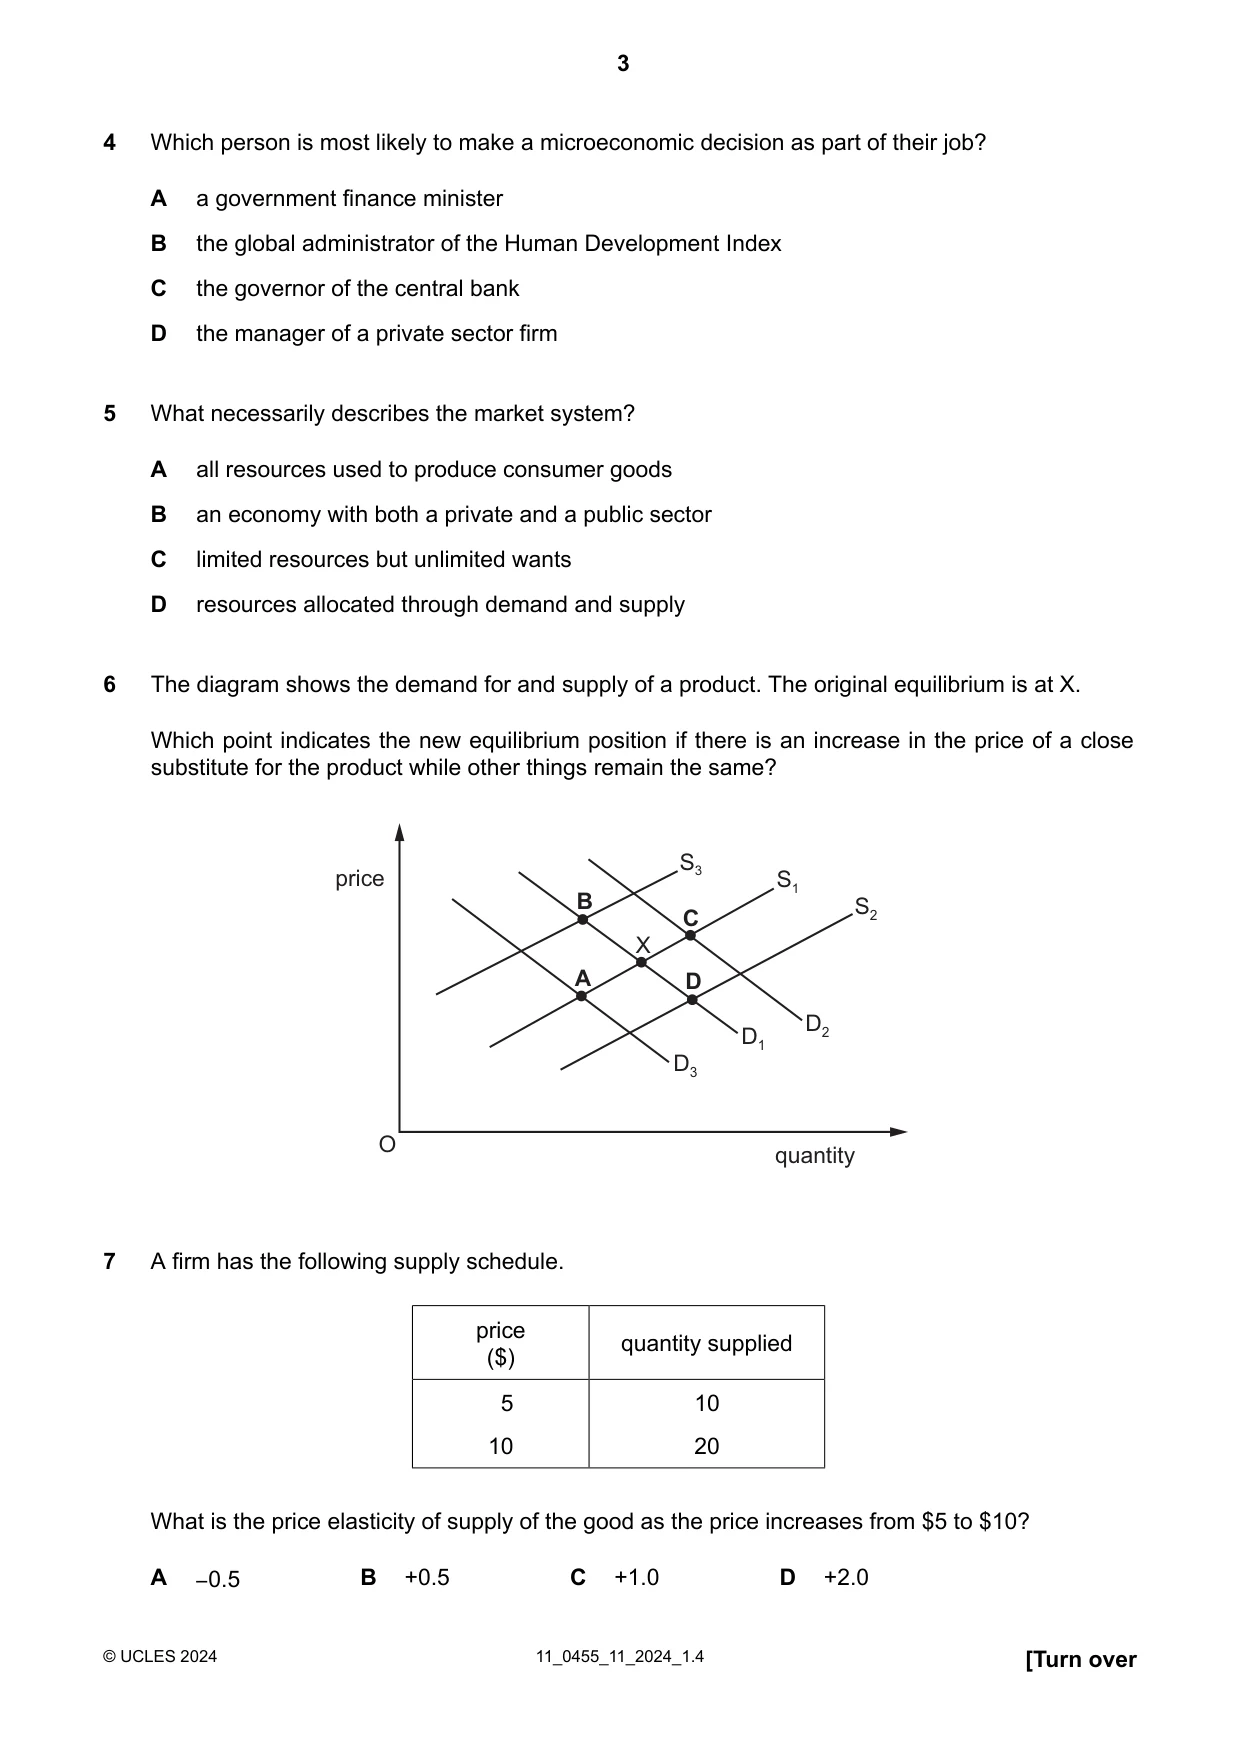
6 The diagram shows the demand for and supply of a product. The original equilibrium is at X. Which point indicates the new equilibrium position if there is an increase in the price of a close substitute for the product while other things remain the same? S3 price S1 B S2 C X A D D2 D1 D3 O quantity
Mark scheme: C
Q7 · A firm has the following supply schedule
7 A firm has the following supply schedule. price quantity supplied ($) 5 10 10 20 What is the price elasticity of supply of the good as the price increases from $5 to $10? A −0.5 B +0.5 C +1.0 D +2.0
Mark scheme: C
Q8 · Why does a government provide certain goods and services in a mixed economic system?
8 Why does a government provide certain goods and services in a mixed economic system? A The government always provides goods more cheaply than private firms. B The government considers only private costs and private benefits. C The government provides goods to prevent the development of monopolies. D The government provides public goods because private firms cannot charge for them.
Mark scheme: D
Q9 · A government intends to subsidise bus fares and increase taxes on private motoring
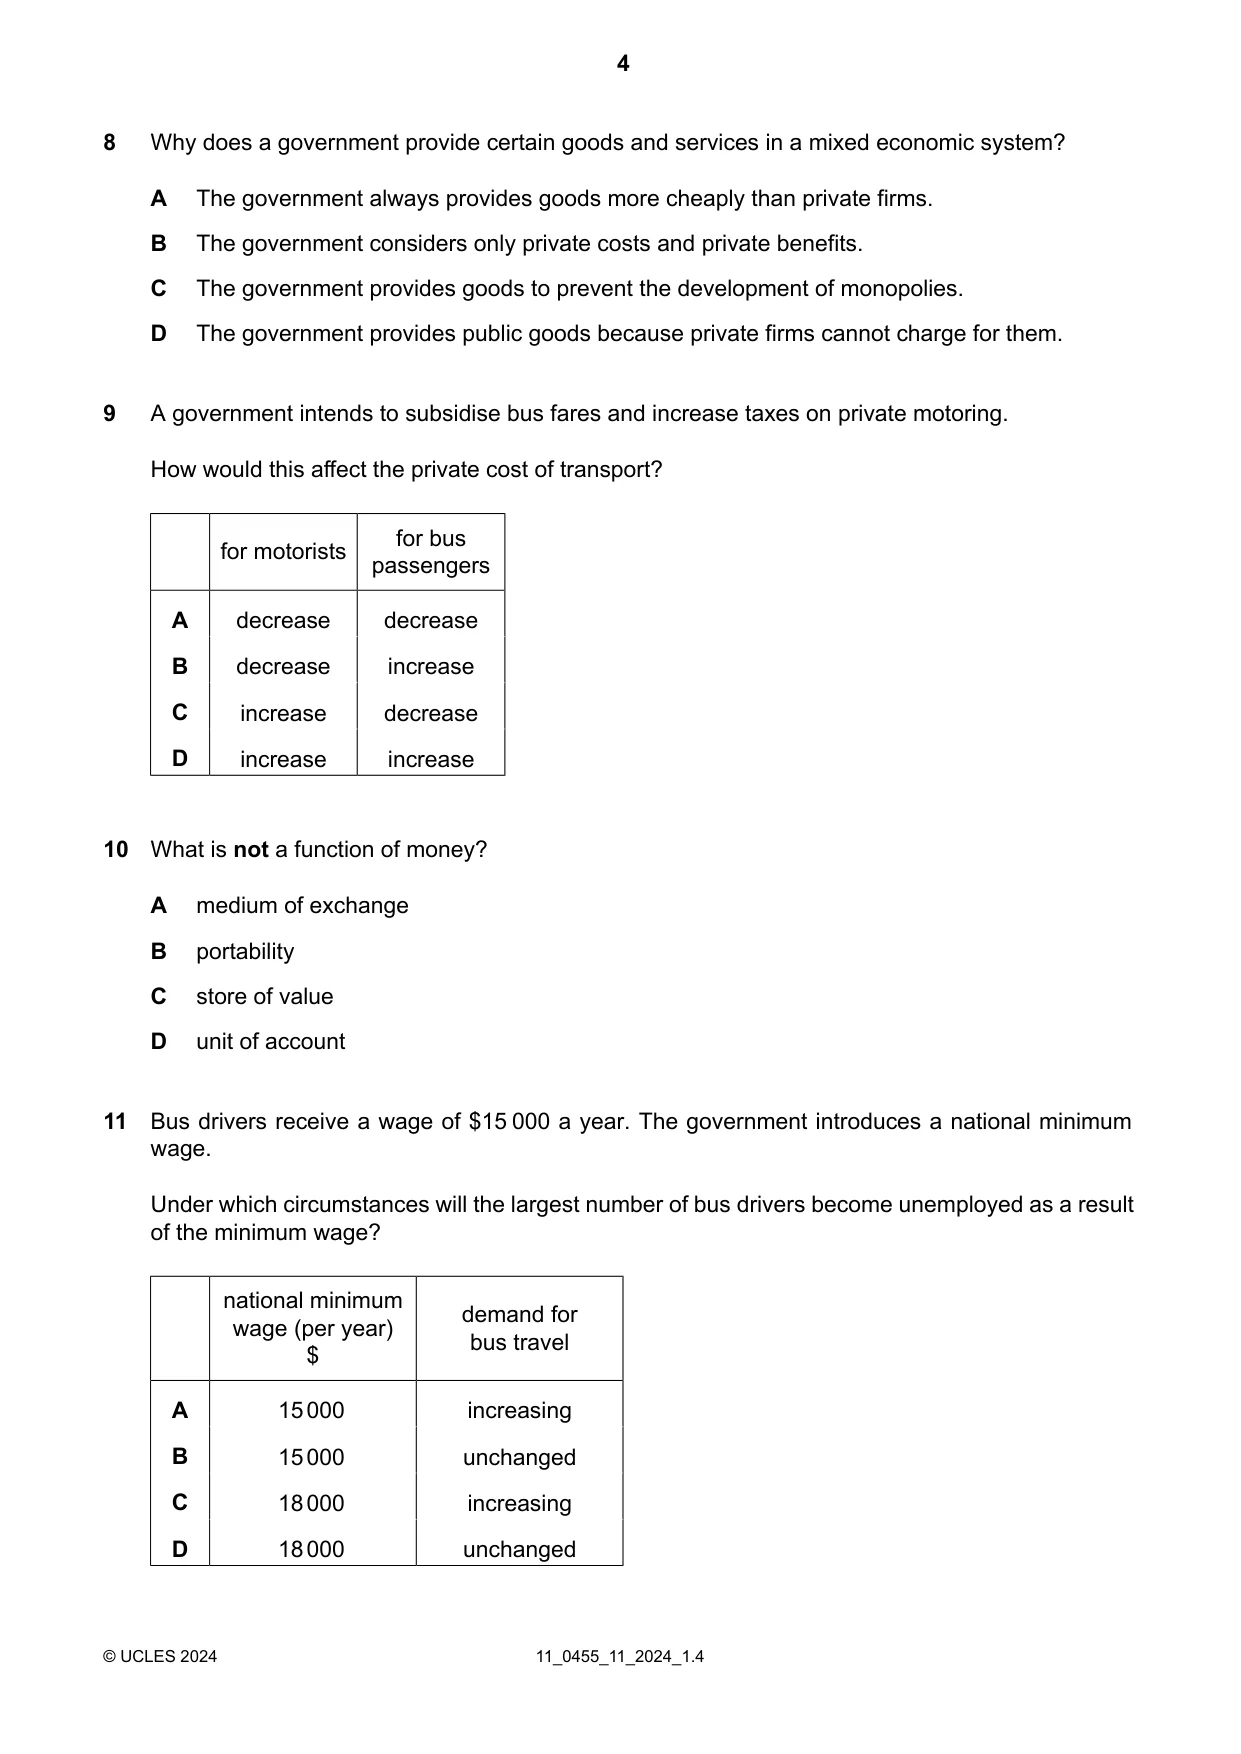
9 A government intends to subsidise bus fares and increase taxes on private motoring. How would this affect the private cost of transport? for bus for motorists passengers A decrease decrease B decrease increase C increase decrease D increase increase
Mark scheme: C
Q10 · What is not a function of money?
10 What is not a function of money? A medium of exchange B portability C store of value D unit of account
Mark scheme: B
Q11 · Bus drivers receive a wage of $15 000 a year
11 Bus drivers receive a wage of $15 000 a year. The government introduces a national minimum wage. Under which circumstances will the largest number of bus drivers become unemployed as a result of the minimum wage? national minimum demand for wage (per year) bus travel $ A 15 000 increasing B 15 000 unchanged C 18 000 increasing D 18 000 unchanged
Mark scheme: D
Q12 · A clothes retailer borrows money to finance the opening of another clothes shop
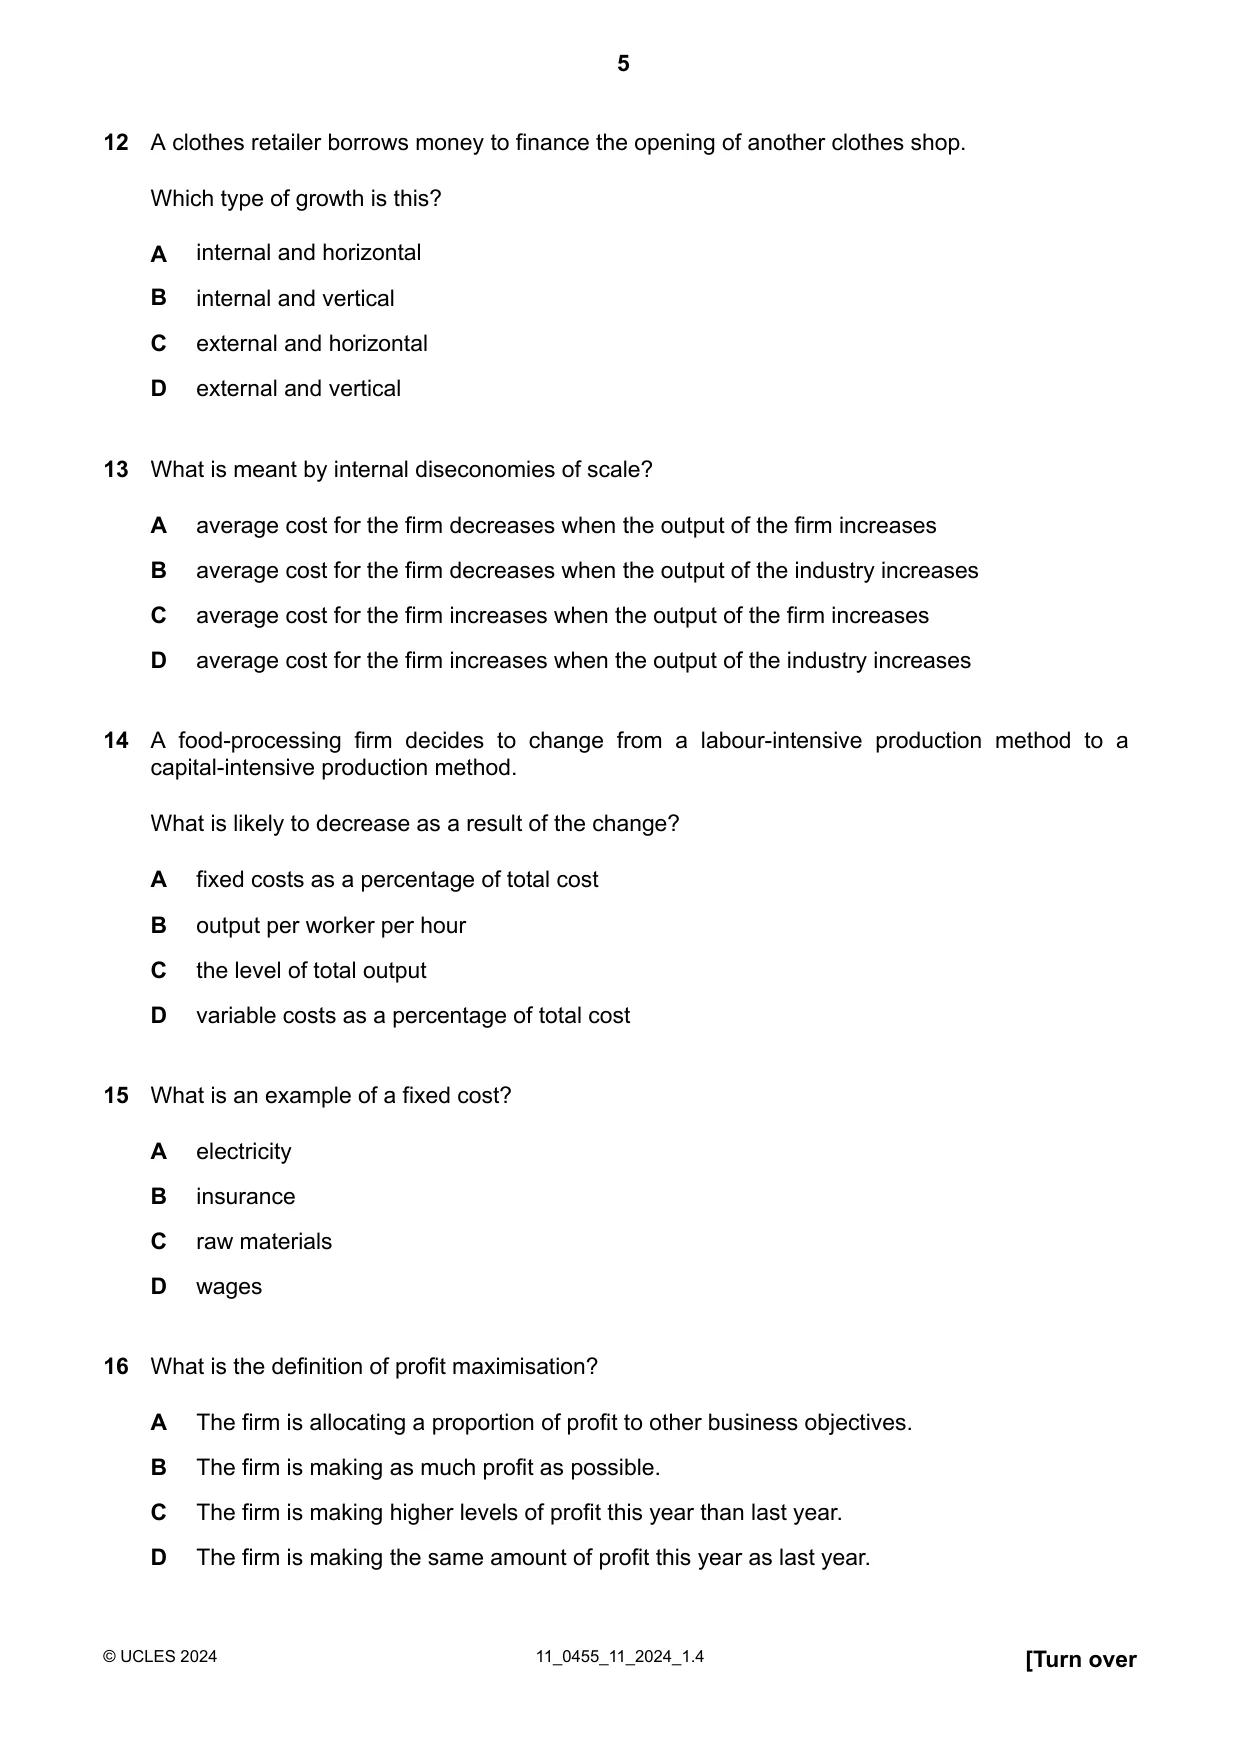
12 A clothes retailer borrows money to finance the opening of another clothes shop. Which type of growth is this? A internal and horizontal B internal and vertical C external and horizontal D external and vertical
Mark scheme: A
Q13 · What is meant by internal diseconomies of scale?
13 What is meant by internal diseconomies of scale? A average cost for the firm decreases when the output of the firm increases B average cost for the firm decreases when the output of the industry increases C average cost for the firm increases when the output of the firm increases D average cost for the firm increases when the output of the industry increases
Mark scheme: C
Q14 · A food-processing firm decides to change from a labour-intensive production method to a…
14 A food-processing firm decides to change from a labour-intensive production method to a capital-intensive production method. What is likely to decrease as a result of the change? A fixed costs as a percentage of total cost B output per worker per hour C the level of total output D variable costs as a percentage of total cost
Mark scheme: D
Q15 · What is an example of a fixed cost?
15 What is an example of a fixed cost? A electricity B insurance C raw materials D wages
Mark scheme: B
Q16 · What is the definition of profit maximisation?
16 What is the definition of profit maximisation? A The firm is allocating a proportion of profit to other business objectives. B The firm is making as much profit as possible. C The firm is making higher levels of profit this year than last year. D The firm is making the same amount of profit this year as last year.
Mark scheme: B
Q17 · The central bank of Mexico set its rate of interest to try to keep the rise in the price…
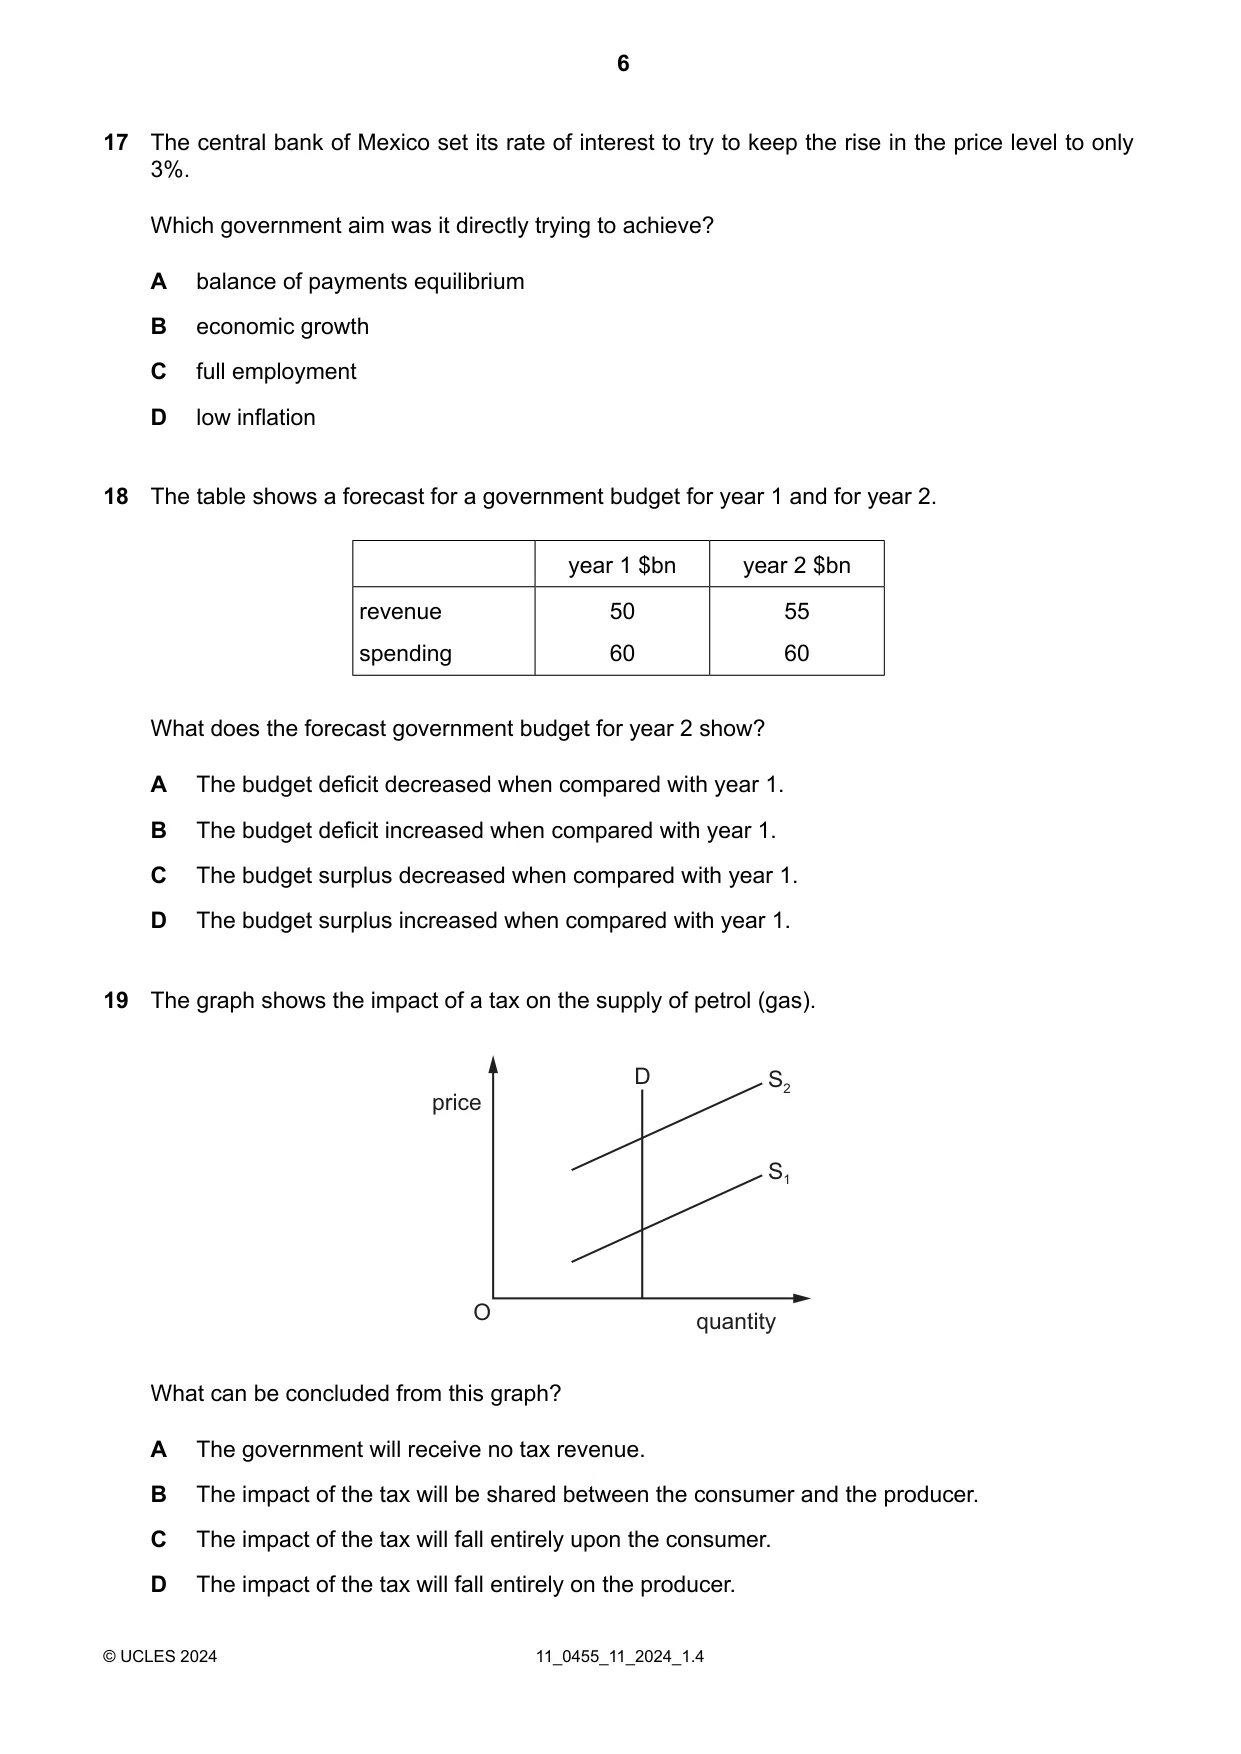
17 The central bank of Mexico set its rate of interest to try to keep the rise in the price level to only 3%. Which government aim was it directly trying to achieve? A balance of payments equilibrium B economic growth C full employment D low inflation
Mark scheme: D
Q18 · The table shows a forecast for a government budget for year 1 and for year 2
18 The table shows a forecast for a government budget for year 1 and for year 2. year 1 $bn year 2 $bn revenue 50 55 spending 60 60 What does the forecast government budget for year 2 show? A The budget deficit decreased when compared with year 1. B The budget deficit increased when compared with year 1. C The budget surplus decreased when compared with year 1. D The budget surplus increased when compared with year 1.
Mark scheme: A
Q19 · The graph shows the impact of a tax on the supply of petrol (gas)
19 The graph shows the impact of a tax on the supply of petrol (gas). D S2 price S1 O quantity What can be concluded from this graph? A The government will receive no tax revenue. B The impact of the tax will be shared between the consumer and the producer. C The impact of the tax will fall entirely upon the consumer. D The impact of the tax will fall entirely on the producer.
Mark scheme: C
Q20 · What is most likely to result from a successful supply-side policy?
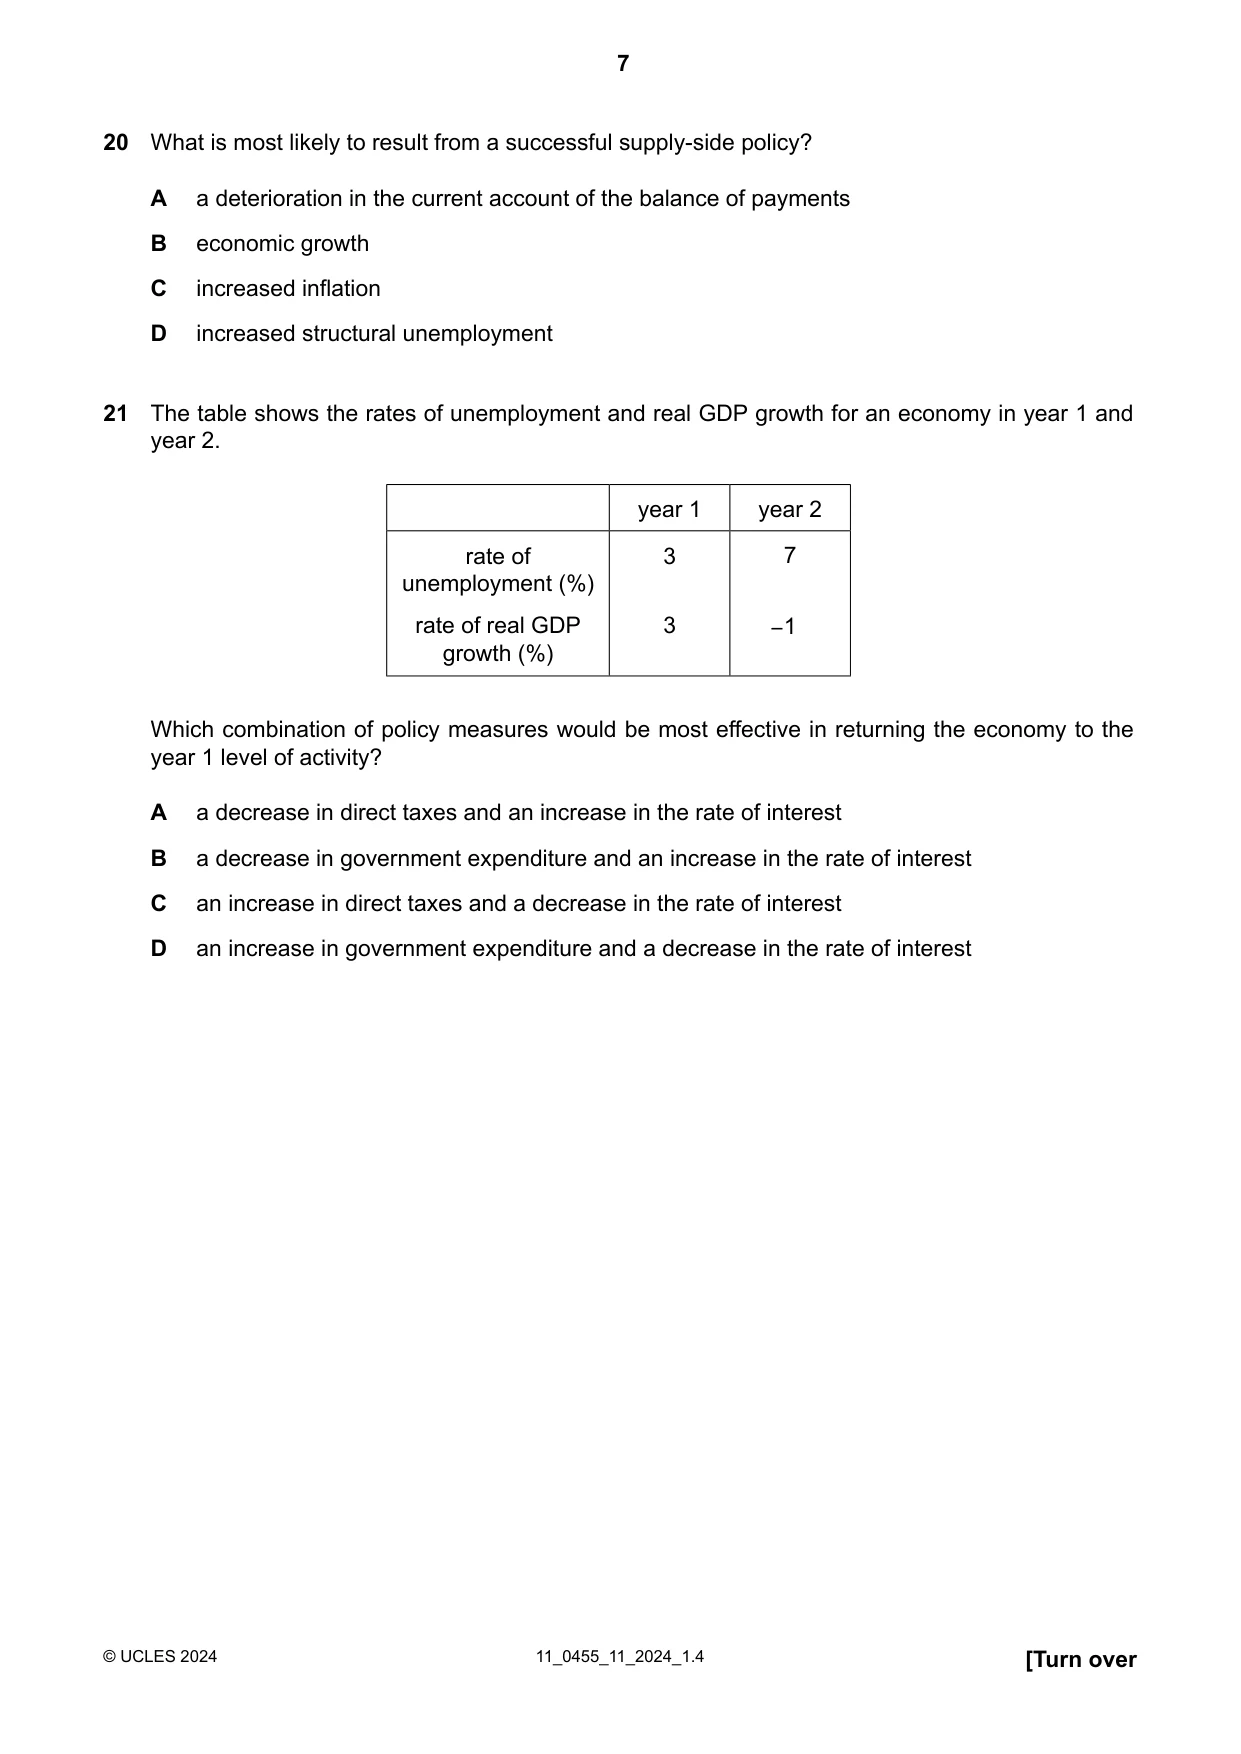
20 What is most likely to result from a successful supply-side policy? A a deterioration in the current account of the balance of payments B economic growth C increased inflation D increased structural unemployment
Mark scheme: B
Q21 · The table shows the rates of unemployment and real GDP growth for an economy in year 1…
21 The table shows the rates of unemployment and real GDP growth for an economy in year 1 and year 2. year 1 year 2 rate of 3 7 unemployment (%) rate of real GDP 3 −1 growth (%) Which combination of policy measures would be most effective in returning the economy to the year 1 level of activity? A a decrease in direct taxes and an increase in the rate of interest B a decrease in government expenditure and an increase in the rate of interest C an increase in direct taxes and a decrease in the rate of interest D an increase in government expenditure and a decrease in the rate of interest
Mark scheme: D
Q22 · The table shows selected indicators for the labour market of an economy in year 1 and…
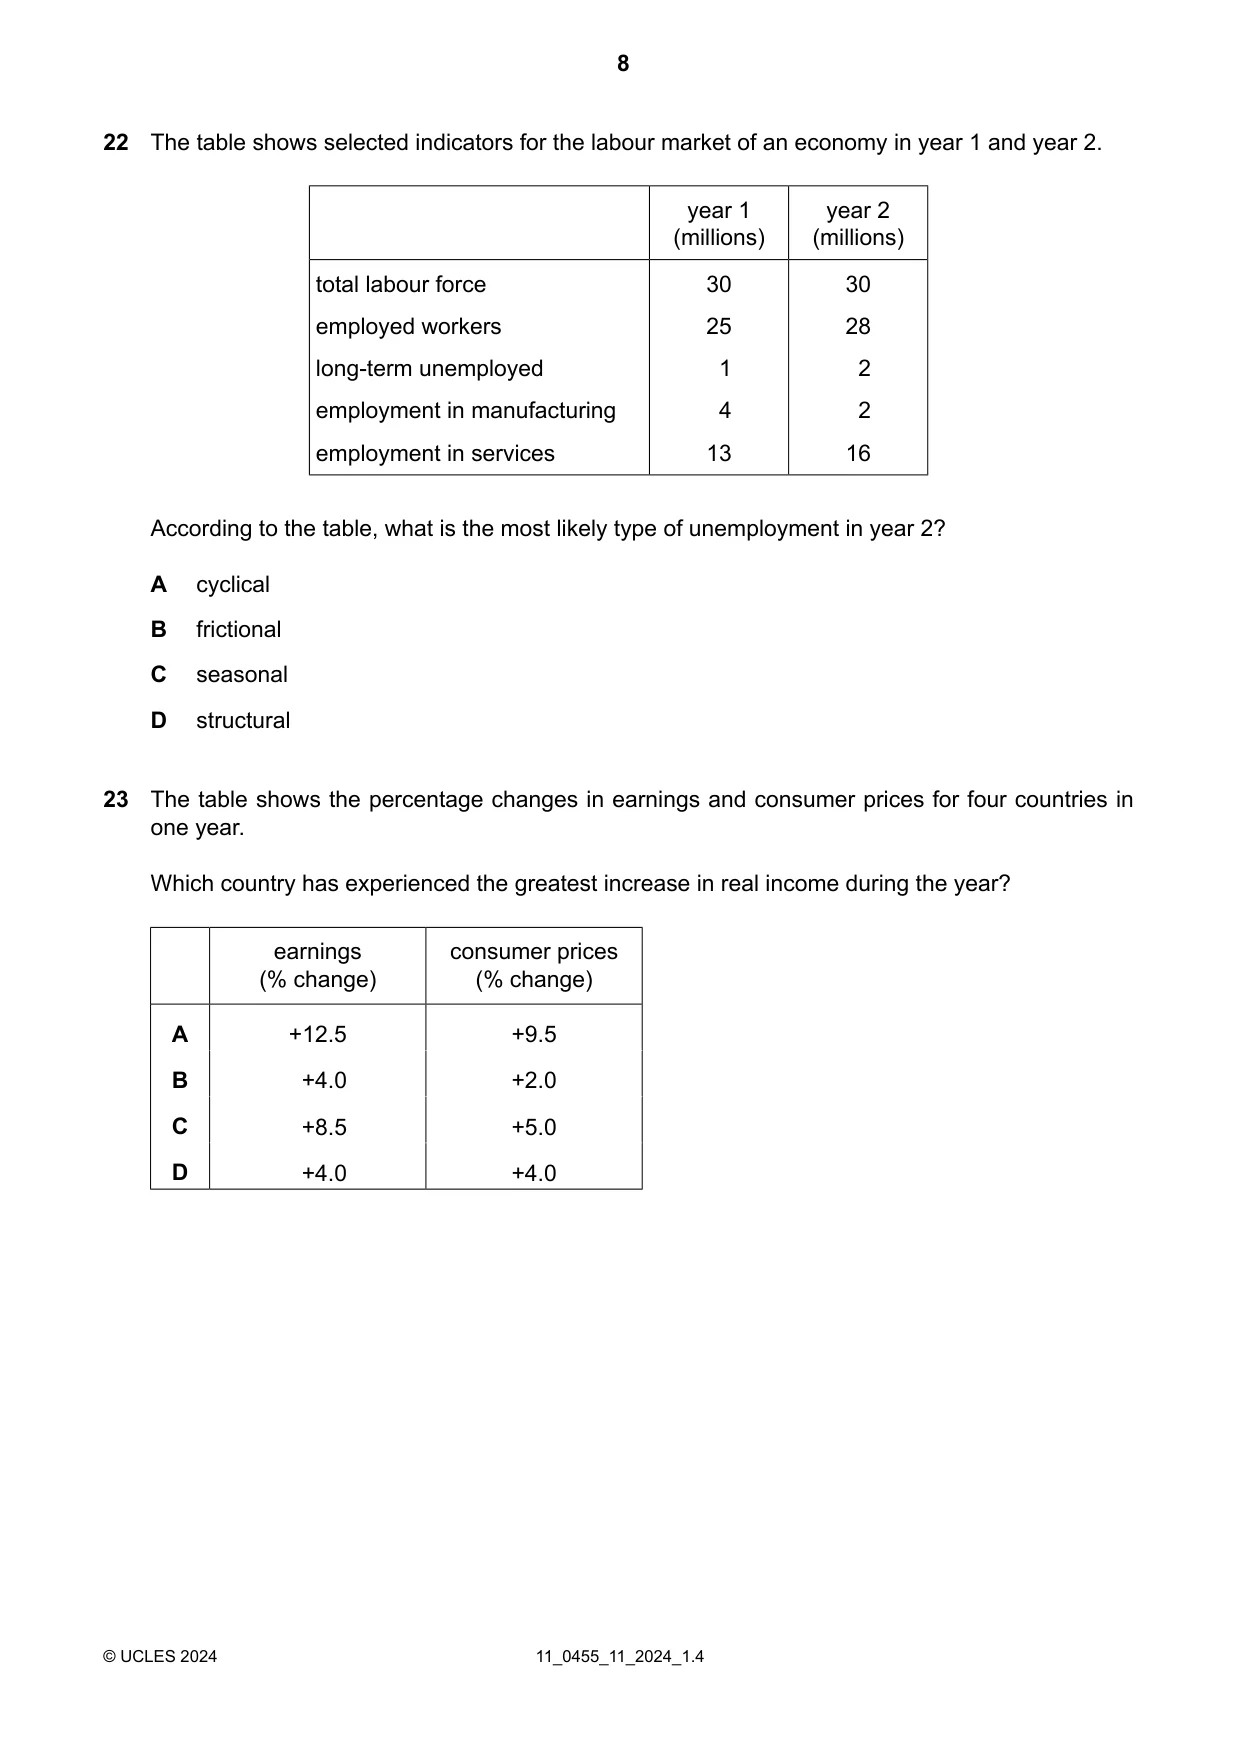
22 The table shows selected indicators for the labour market of an economy in year 1 and year 2. year 1 year 2 (millions) (millions) total labour force 30 30 employed workers 25 28 long-term unemployed 1 2 employment in manufacturing 4 2 employment in services 13 16 According to the table, what is the most likely type of unemployment in year 2? A cyclical B frictional C seasonal D structural
Mark scheme: D
Q23 · The table shows the percentage changes in earnings and consumer prices for four countries…
23 The table shows the percentage changes in earnings and consumer prices for four countries in one year. Which country has experienced the greatest increase in real income during the year? earnings consumer prices (% change) (% change) A +12.5 +9.5 B +4.0 +2.0 C +8.5 +5.0 D +4.0 +4.0
Mark scheme: C
Q24 · The table shows the distribution of income as measured by GDP for three countries in a…
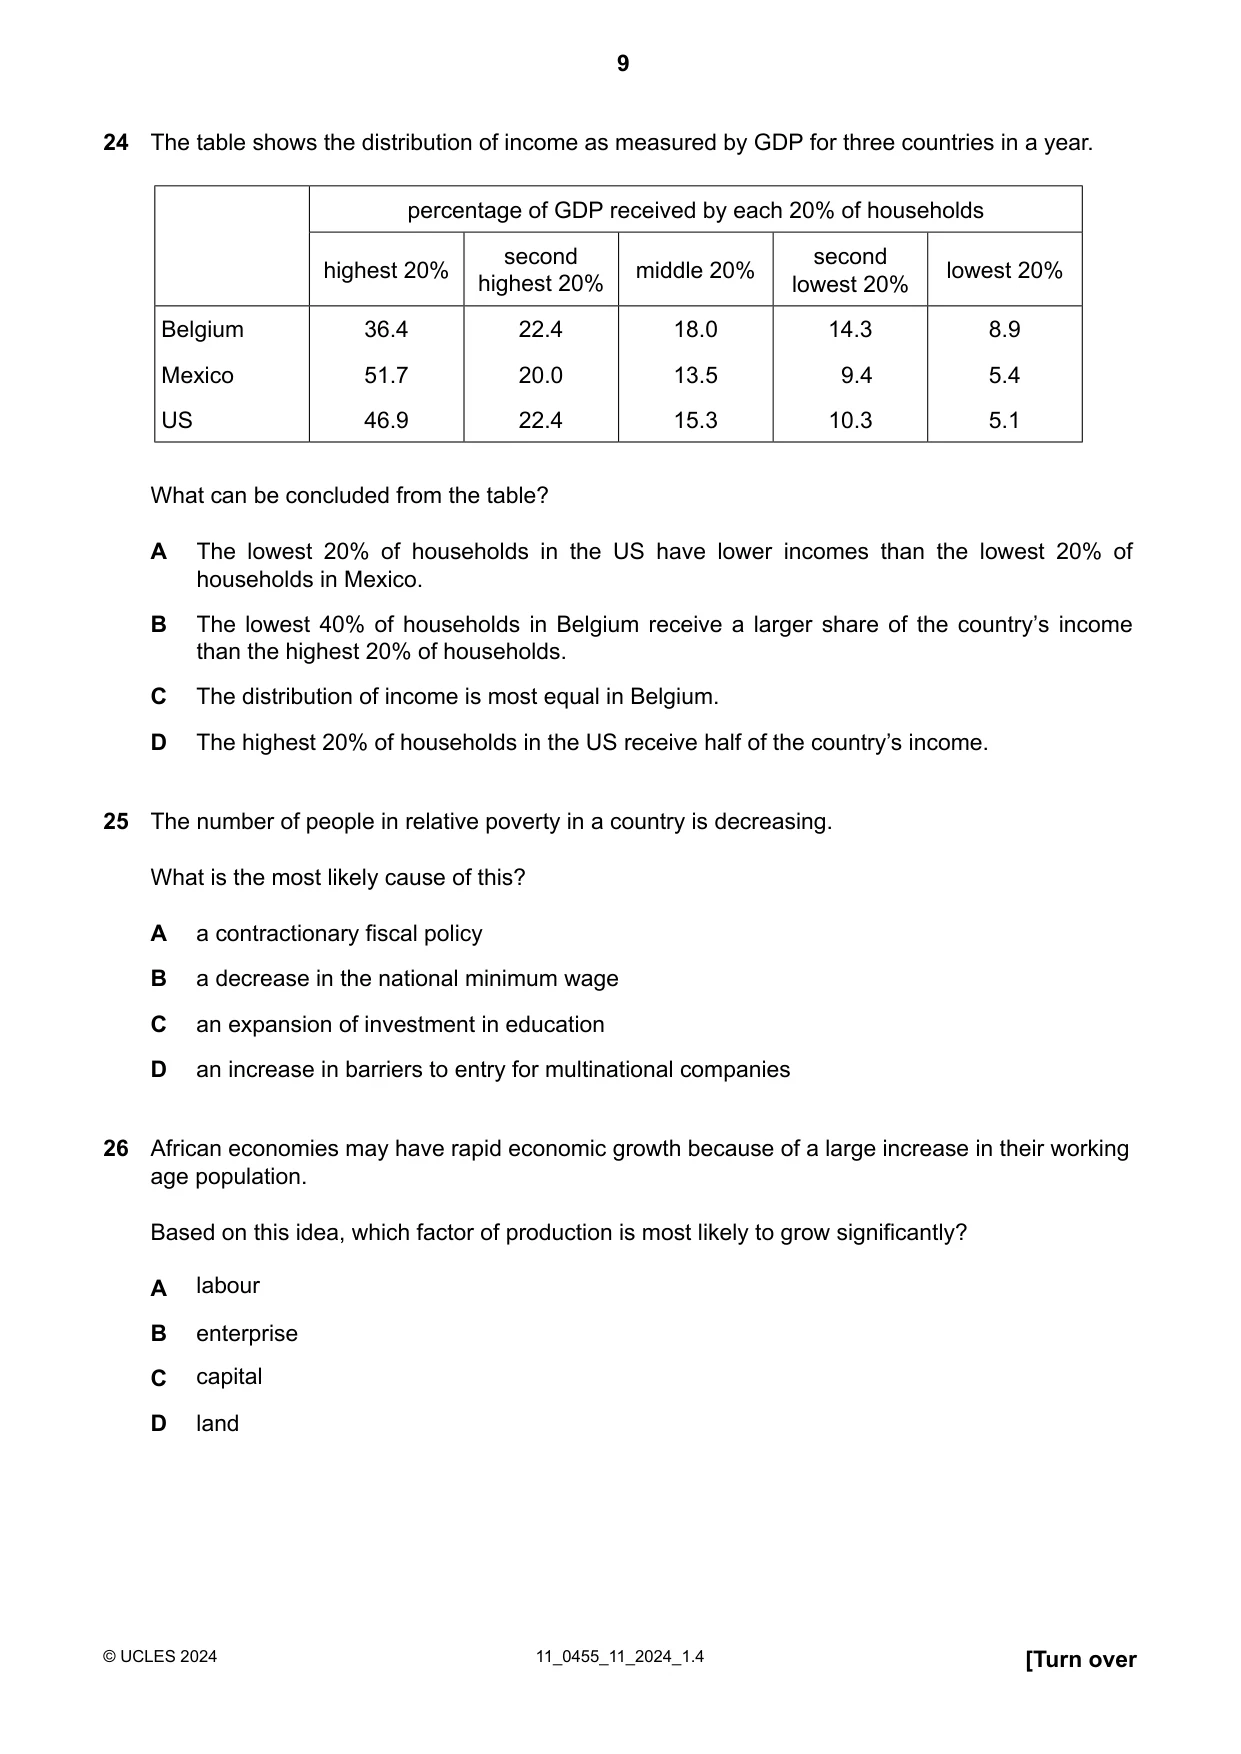
24 The table shows the distribution of income as measured by GDP for three countries in a year. percentage of GDP received by each 20% of households second second highest 20% middle 20% lowest 20% highest 20% lowest 20% Belgium 36.4 22.4 18.0 14.3 8.9 Mexico 51.7 20.0 13.5 9.4 5.4 US 46.9 22.4 15.3 10.3 5.1 What can be concluded from the table? A The lowest 20% of households in the US have lower incomes than the lowest 20% of households in Mexico. B The lowest 40% of households in Belgium receive a larger share of the country’s income than the highest 20% of households. C The distribution of income is most equal in Belgium. D The highest 20% of households in the US receive half of the country’s income.
Mark scheme: C
Q25 · The number of people in relative poverty in a country is decreasing
25 The number of people in relative poverty in a country is decreasing. What is the most likely cause of this? A a contractionary fiscal policy B a decrease in the national minimum wage C an expansion of investment in education D an increase in barriers to entry for multinational companies
Mark scheme: C
Q26 · African economies may have rapid economic growth because of a large increase in their…
26 African economies may have rapid economic growth because of a large increase in their working age population. Based on this idea, which factor of production is most likely to grow significantly? A labour B enterprise C capital D land
Mark scheme: A
Q27 · Which statement shows two benefits for consumers from specialisation at a national level?
27 Which statement shows two benefits for consumers from specialisation at a national level? A decreased prices and better quality B decreased profits and high-quality raw materials C increased choice and high transport costs D increased productivity and increased economies of scale
Mark scheme: A
Q28 · A multinational company (MNC) opens up a new factory in a host country
28 A multinational company (MNC) opens up a new factory in a host country. What is a possible cost of this new factory to the host country? A increased access to modern technology B increased competition for host-country industries C increased employment for workers D increased tax revenue for the government
Mark scheme: B
Q29 · The diagram shows the change in the exchange rate market for country X’s $
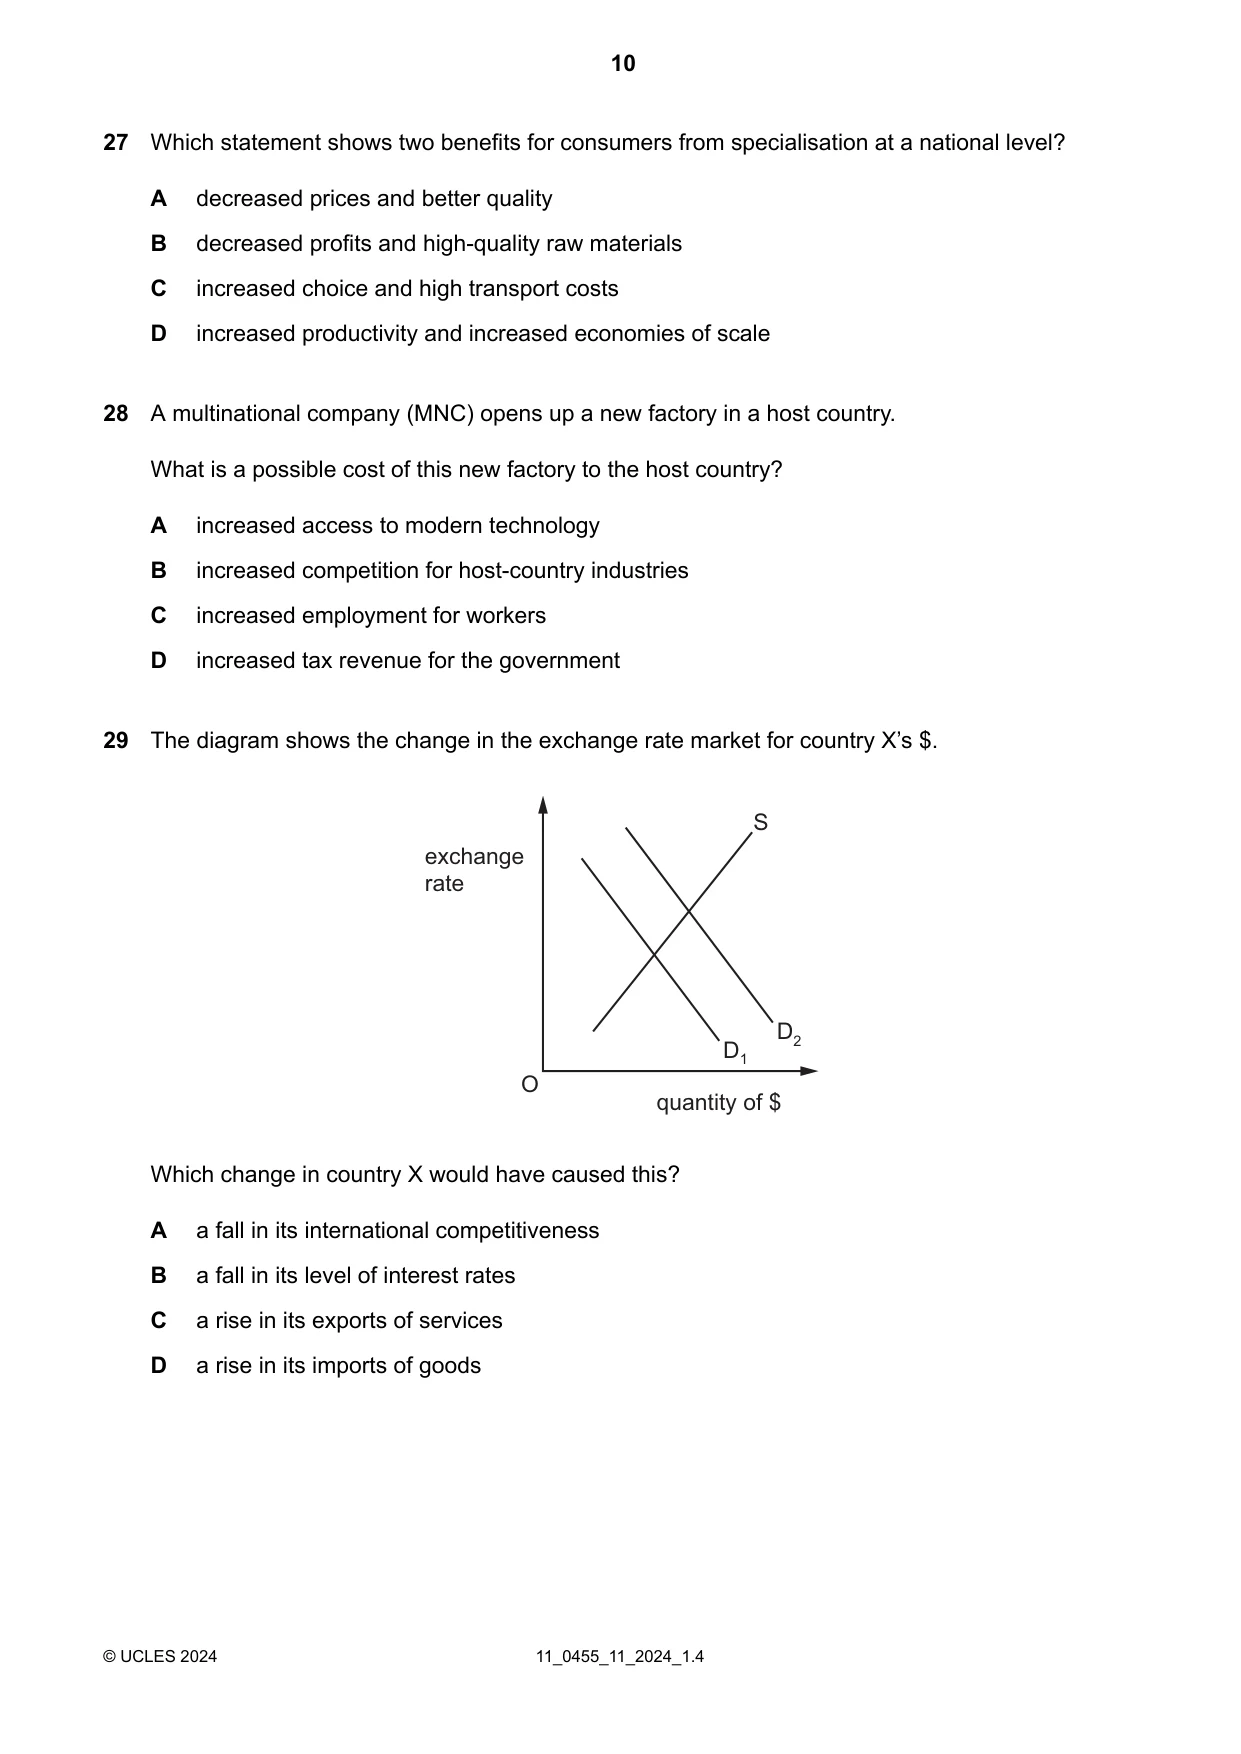
29 The diagram shows the change in the exchange rate market for country X’s $. S exchange rate D2 D1 O quantity of $ Which change in country X would have caused this? A a fall in its international competitiveness B a fall in its level of interest rates C a rise in its exports of services D a rise in its imports of goods
Mark scheme: C
Q30 · What is the most likely cause of an increased current account surplus in a country?
30 What is the most likely cause of an increased current account surplus in a country? A lower prices for the country’s exports B higher exchange rate for the country C economic growth in the country D recession in trade-partner countries
Mark scheme: A
What was in this paper
The subtopics covered by these 30 questions, and how many questions each got. Open one in a new tab to see every Cambridge question on it.
3Fiscal policy2Inflation and deflation2Opportunity cost2The factors of production2Current account of balance of payments1Employment and unemployment1Firms and production1Foreign exchange rates1Globalisation, free trade and protection1International specialisation1Living standards1Market economic system1Market failure1Market structure1Microeconomics and macroeconomics1Mixed economic system1Money and banking1Poverty1Price changes1Price elasticity of supply (PES)1Supply1Supply-side policy1Workers1What you needed in this session
Cambridge’s own grade thresholds for 2024 Oct/Nov, Paper 1 · Variant 1. A higher threshold means an easier paper — the bar moves with how the cohort did.