Questions as text
Q1 · The diagram shows a country’s production possibility curve 9708/11 Oct/Nov 2005
2 The diagram shows a country’s production possibility curve. good Y N M O good X What could allow the economy to move from M to N? A an increase in consumer spending B an increase in demand for exports C an increase in government spending on pensions D an increase in investment
1 marks
Answer: D
This question in 9708/11 Oct/Nov 2005
Q2 · The diagram represents the production possibility curves of two economies X and Y 9708/11 Oct/Nov 2005
19 The diagram represents the production possibility curves of two economies X and Y. 2500 X 2000 X1 agricultural goods (units) 1000 Y 0 500 1000 manufactured goods (units) As a result of soil erosion in economy X, the production possibility curve shifts from X to X1. According to the law of comparative advantage, what should country Y do following this change? A cease to trade with country X B export agricultural goods to country X C export manufactured goods to country X D import both agricultural and manufactured goods from country X
1 marks
Answer: A
This question in 9708/11 Oct/Nov 2005
Q3 · In the diagram the original production possibility curve is LM 9708/11 May/June 2006
2 In the diagram the original production possibility curve is LM. L N good X O good Y P M What might cause the curve to shift to NP? A technological progress B unemployment of resources C the depletion of natural resources D a reallocation of resources
1 marks
Answer: C
This question in 9708/11 May/June 2006
Q4 · The diagram shows a production possibility curve for an economy that produces only two… 9708/11 May/June 2007
1 The diagram shows a production possibility curve for an economy that produces only two goods, X and Y. 1000 good Y 500 0 0 500 1000 1500 2000 good X The economy produces 400 of good Y and produces on its production possibility curve. Which quantity of good X is given up? A 600 B 800 C 1200 D 1600
1 marks
Answer: B
This question in 9708/11 May/June 2007
Q5 · Some people are shipwrecked on a tropical island and allocate their time between… 9708/11 Oct/Nov 2007
1 Some people are shipwrecked on a tropical island and allocate their time between gathering coconuts and fishing. Each individual is equally productive in collecting coconuts or catching fish. Which diagram represents the production possibility curve of this community? A B C D coconuts coconuts coconuts coconuts 0 0 0 0 fish fish fish fish
1 marks
Answer: A
This question in 9708/11 Oct/Nov 2007
Q6 · A country’s production possibility curve moves from XX to YY as shown in the diagram 9708/11 May/June 2008
1 A country’s production possibility curve moves from XX to YY as shown in the diagram. X Y capital goods O Y X consumer goods What could have caused this movement? A a rise in the retirement age B an increase in investment C an increase in net emigration D a rise in technological progress
1 marks
Answer: C
This question in 9708/11 May/June 2008
Q7 · The production possibility curve for an economy producing capital and consumer goods is… 9708/11 Oct/Nov 2008
2 The production possibility curve for an economy producing capital and consumer goods is represented by the line PQ. P capital goods T R O S Q consumer goods What is the opportunity cost of producing OS of consumer goods? A OR of capital goods B PR of capital goods C SQ of consumer goods D SQ of consumer goods + PR of capital goods
1 marks
Answer: B
This question in 9708/11 Oct/Nov 2008
Q8 · The diagram represents the production possibility curves of two economies X and Y 9708/11 Oct/Nov 2008
19 The diagram represents the production possibility curves of two economies X and Y. 2500 X 2000 X1 agricultural goods (units) 1000 Y 0 500 1000 manufactured goods (units) As a result of soil erosion in economy X, the production possibility curve shifts from X to X1. According to the law of comparative advantage, what should country Y do following this change? A cease to trade with country X B export agricultural goods to country X C export manufactured goods to country X D import both agricultural and manufactured goods from country X
1 marks
Answer: A
This question in 9708/11 Oct/Nov 2008
Q9 · The diagram shows two production possibility curves (EF and GH), before and after… 9708/11 May/June 2009
2 The diagram shows two production possibility curves (EF and GH), before and after technological progress has taken place. G E consumer goods X O Y M F H capital goods After technological progress has taken place, what is the opportunity cost in capital goods of producing OX consumer goods? A MH B OH C OM D YF
1 marks
Answer: A
This question in 9708/11 May/June 2009
Q10 · In the diagram, MN is the production possibility curve of a country that has a… 9708/11 May/June 2009
19 In the diagram, MN is the production possibility curve of a country that has a comparative advantage in the production of good Y. M R quantity of good X O N quantity of good Y What might enable the country to consume the quantities of X and Y indicated by point R? A increased specialisation in the production of good X B international trade C a reduction in unemployment D increased specialisation in the production of good Y
1 marks
Answer: B
This question in 9708/11 May/June 2009
Q11 · The diagram illustrates the production possibility curves for an economy in Year 1 (X1… 9708/11 Oct/Nov 2009
2 The diagram illustrates the production possibility curves for an economy in Year 1 (X1 Y1) and Year 2 (X2 Y2). Y1 Y2 good Y O X2 X1 good X What can be concluded from the diagram? A The cost of production was lower in Year 2 than in Year 1. B The full employment level of output was lower in Year 2 than in Year 1. C The opportunity cost of production was lower in Year 2 than in Year 1. D Unemployment rose between Year 1 and Year 2.
1 marks
Answer: B
This question in 9708/11 Oct/Nov 2009
Q12 · The diagram illustrates the production possibility curves for an economy in Year 1 (X1… 9708/12 Oct/Nov 2009
1 The diagram illustrates the production possibility curves for an economy in Year 1 (X1 Y1) and Year 2 (X2 Y2). Y1 Y2 good Y O X2 X1 good X What can be concluded from the diagram? A The cost of production was lower in Year 2 than in Year 1. B The full employment level of output was lower in Year 2 than in Year 1. C The opportunity cost of production was lower in Year 2 than in Year 1. D Unemployment rose between Year 1 and Year 2.
1 marks
Answer: B
This question in 9708/12 Oct/Nov 2009
Q13 · The diagrams show the change in a country’s production possibility curve between Year 1… 9708/11 May/June 2010
2 The diagrams show the change in a country’s production possibility curve between Year 1 and Year 2. Year 1 Year 2 150 consumer consumer goods 100 goods 0 50 0 80 capital goods capital goods What can be deduced from the diagrams? A Future growth prospects have been harmed. B The level of unemployment has fallen. C The opportunity cost of consumer goods has risen. D The proportionate growth in production is greater in consumer goods.
1 marks
Answer: C
This question in 9708/11 May/June 2010
Q14 · The diagram shows production possibility curves for two countries, X and Y 9708/11 May/June 2010
19 The diagram shows production possibility curves for two countries, X and Y. country Y good L country X O good M What can be deduced from the diagram? A Both countries can benefit from specialisation. B Country X has a higher opportunity cost than Y in producing good M. C Country Y has a comparative advantage in both goods. D Trade between X and Y will not take place.
1 marks
Answer: D
This question in 9708/11 May/June 2010
Q15 · The diagrams show the change in a country’s production possibility curve between Year 1… 9708/12 May/June 2010
1 The diagrams show the change in a country’s production possibility curve between Year 1 and Year 2. Year 1 Year 2 150 consumer consumer goods 100 goods 0 50 0 80 capital goods capital goods What can be deduced from the diagrams? A Future growth prospects have been harmed. B The level of unemployment has fallen. C The opportunity cost of consumer goods has risen. D The proportionate growth in production is greater in consumer goods.
1 marks
Answer: C
This question in 9708/12 May/June 2010
Q16 · The diagram shows production possibility curves for two countries, X and Y 9708/12 May/June 2010
18 The diagram shows production possibility curves for two countries, X and Y. country Y good L country X O good M What can be deduced from the diagram? A Both countries can benefit from specialisation. B Country X has a higher opportunity cost than Y in producing good M. C Country Y has a comparative advantage in both goods. D Trade between X and Y will not take place.
1 marks
Answer: D
This question in 9708/12 May/June 2010
Q17 · The diagrams show the change in a country’s production possibility curve between Year 1… 9708/13 May/June 2010
30 The diagrams show the change in a country’s production possibility curve between Year 1 and Year 2. Year 1 Year 2 150 consumer consumer goods 100 goods 0 50 0 80 capital goods capital goods What can be deduced from the diagrams? A Future growth prospects have been harmed. B The level of unemployment has fallen. C The opportunity cost of consumer goods has risen. D The proportionate growth in production is greater in consumer goods.
1 marks
Answer: C
This question in 9708/13 May/June 2010
Q18 · The diagram shows the production possibility curve of an economy 9708/11 Oct/Nov 2010
3 The diagram shows the production possibility curve of an economy. capital goods O consumer goods Which statement explains the shape of this curve? A More efficient workers are drawn away from the production of consumer goods. B Resources cannot be switched between producing capital and consumer goods. C The economy is more efficient at producing capital than consumer goods. D The opportunity cost of producing capital goods increases the more capital goods are made.
1 marks
Answer: D
This question in 9708/11 Oct/Nov 2010
Q19 · The diagram shows the production possibility curve of an economy 9708/12 Oct/Nov 2010
3 The diagram shows the production possibility curve of an economy. capital goods O consumer goods Which statement explains the shape of this curve? A More efficient workers are drawn away from the production of consumer goods. B Resources cannot be switched between producing capital and consumer goods. C The economy is more efficient at producing capital than consumer goods. D The opportunity cost of producing capital goods increases the more capital goods are made.
1 marks
Answer: D
This question in 9708/12 Oct/Nov 2010
Q20 · The diagram shows the production possibility curve of an economy 9708/13 Oct/Nov 2010
2 The diagram shows the production possibility curve of an economy. capital goods O consumer goods Which statement explains the shape of this curve? A More efficient workers are drawn away from the production of consumer goods. B Resources cannot be switched between producing capital and consumer goods. C The economy is more efficient at producing capital than consumer goods. D The opportunity cost of producing capital goods increases the more capital goods are made.
1 marks
Answer: D
This question in 9708/13 Oct/Nov 2010
Q21 · The diagram shows the production possibility curves of two economies, X and Y 9708/11 May/June 2011
1 The diagram shows the production possibility curves of two economies, X and Y. 200 capital X goods 100 Y 0 0 100 200 consumer goods Which statement about the two economies is correct? A Both economies always have the identical opportunity costs. B Both economies have the same future growth prospects. C The opportunity costs are constant in both economies. D The two economies can never produce the same combination of products.
1 marks
Answer: C
This question in 9708/11 May/June 2011
Q22 · Each diagram shows the production possibility curves of two economies, X and Y, which… 9708/11 May/June 2011
19 Each diagram shows the production possibility curves of two economies, X and Y, which produce food and clothes. In which diagram would both economies benefit by specialising in the good in which they have comparative advantage and trading at an exchange rate of 1 unit of clothes to 1.5 units of food? A B C D 5 5 4 4 4 4 3 Y Y food food food food Y Y 2 X X X X 0 0 0 0 0 1 2 0 4 5 0 2 5 0 4 clothes clothes clothes clothes
1 marks
Answer: C
This question in 9708/11 May/June 2011
Q23 · Each diagram shows the production possibility curves of two economies, X and Y, which… 9708/12 May/June 2011
18 Each diagram shows the production possibility curves of two economies, X and Y, which produce food and clothes. In which diagram would both economies benefit by specialising in the good in which they have comparative advantage and trading at an exchange rate of 1 unit of clothes to 1.5 units of food? A B C D 5 5 4 4 4 4 3 Y Y food food food food Y Y 2 X X X X 0 0 0 0 0 1 2 0 4 5 0 2 5 0 4 clothes clothes clothes clothes
1 marks
Answer: C
This question in 9708/12 May/June 2011
Q24 · The diagram shows the production possibility curves of two economies, X and Y 9708/12 May/June 2011
30 The diagram shows the production possibility curves of two economies, X and Y. 200 capital X goods 100 Y 0 0 100 200 consumer goods Which statement about the two economies is correct? A Both economies always have the identical opportunity costs. B Both economies have the same future growth prospects. C The opportunity costs are constant in both economies. D The two economies can never produce the same combination of products.
1 marks
Answer: C
This question in 9708/12 May/June 2011
Q25 · The diagram shows the production possibility curves of two economies, X and Y 9708/13 May/June 2011
29 The diagram shows the production possibility curves of two economies, X and Y. 200 capital X goods 100 Y 0 0 100 200 consumer goods Which statement about the two economies is correct? A Both economies always have the identical opportunity costs. B Both economies have the same future growth prospects. C The opportunity costs are constant in both economies. D The two economies can never produce the same combination of products.
1 marks
Answer: C
This question in 9708/13 May/June 2011
Q26 · The diagram shows a production possibility curve for an economy 9708/11 Oct/Nov 2011
1 The diagram shows a production possibility curve for an economy. X consumer goods Y O capital goods Assuming that the production possibility curve remains unchanged, what is the most likely reason for the movement from point X to point Y? A a civil war causing a widespread loss of resources B a permanent fall in productivity in both capital and consumer goods C a rise in unemployment due to a recession D the exhaustion of a natural resource
1 marks
Answer: C
This question in 9708/11 Oct/Nov 2011
Q27 · The curve PP in the diagram is the production possibility curve for a country producing… 9708/12 Oct/Nov 2011
2 The curve PP in the diagram is the production possibility curve for a country producing goods X and Y. The production of X is more labour intensive than the production of Y. R Q P S good Y T O S T P R Q good X The working hours of the labour force are reduced by law. Which curve could be the country’s new production possibility curve? A TT B SS C QQ D RR
1 marks
Answer: B
This question in 9708/12 Oct/Nov 2011
Q28 · The diagram shows a production possibility curve for an economy 9708/13 Oct/Nov 2011
29 The diagram shows a production possibility curve for an economy. X consumer goods Y O capital goods Assuming that the production possibility curve remains unchanged, what is the most likely reason for the movement from point X to point Y? A a civil war causing a widespread loss of resources B a permanent fall in productivity in both capital and consumer goods C a rise in unemployment due to a recession D the exhaustion of a natural resource
1 marks
Answer: C
This question in 9708/13 Oct/Nov 2011
Q29 · In the diagram, JK is an economy’s production possibility curve 9708/11 May/June 2012
2 In the diagram, JK is an economy’s production possibility curve. J G industrial goods O H K agricultural goods What could cause the curve to shift to GH? A a decrease in innovation B an increase in the retirement age C an increase in the price of energy D an increase in the unemployment rate
1 marks
Answer: C
This question in 9708/11 May/June 2012
Q30 · The diagram shows the production possibility curves for two countries, X and Y 9708/11 May/June 2012
20 The diagram shows the production possibility curves for two countries, X and Y. A decrease in productivity moves country X’s production possibility curve from X1 to X2. 40 30 raw materials X2 Y X1 0 50 90 120 manufactured goods Which statement is correct? A After the change X would export raw materials and import manufactured goods. B After the change there is no economic basis for trade. C Before the change Y had an absolute advantage in the production of raw materials. D Before the change X had a comparative advantage in both products.
1 marks
Answer: A
This question in 9708/11 May/June 2012
Q31 · In the diagram, JK is an economy’s production possibility curve 9708/12 May/June 2012
2 In the diagram, JK is an economy’s production possibility curve. J G industrial goods O H K agricultural goods What could cause the curve to shift to GH? A a decrease in innovation B an increase in the retirement age C an increase in the price of energy D an increase in the unemployment rate
1 marks
Answer: C
This question in 9708/12 May/June 2012
Q32 · The diagram shows the production possibility curves for two countries, X and Y 9708/12 May/June 2012
20 The diagram shows the production possibility curves for two countries, X and Y. A decrease in productivity moves country X’s production possibility curve from X1 to X2. 40 30 raw materials X2 Y X1 0 50 90 120 manufactured goods Which statement is correct? A After the change X would export raw materials and import manufactured goods. B After the change there is no economic basis for trade. C Before the change Y had an absolute advantage in the production of raw materials. D Before the change X had a comparative advantage in both products.
1 marks
Answer: A
This question in 9708/12 May/June 2012
Q33 · In the diagram, the curve JK is a country’s production possibility curve 9708/13 May/June 2012
2 In the diagram, the curve JK is a country’s production possibility curve. L J good X O K M good Y What could cause the curve to shift to LM? A a decrease in the participation rate B a decrease in the unemployment rate C an increase in the dependency ratio D an increase in the population of working age
1 marks
Answer: D
This question in 9708/13 May/June 2012
Q34 · The diagram shows the production possibility frontier of a desert island economy where… 9708/11 Oct/Nov 2012
2 The diagram shows the production possibility frontier of a desert island economy where the inhabitants live off just two commodities, coconuts and fish. coconuts O fish What explains the shape of the production possibility frontier? A Coconuts and fish are perfect complements. B Coconuts and fish are perfect substitutes. C Fishing and coconut growing are equally efficient. D The opportunity cost of fish increases as more time is devoted to fishing.
1 marks
Answer: C
This question in 9708/11 Oct/Nov 2012
Q35 · In the diagram the original production possibility curve is LM 9708/12 Oct/Nov 2012
2 In the diagram the original production possibility curve is LM. L N good X O P M good Y What might cause the curve to shift to NP? A a higher retirement age B a reallocation of resources C the depletion of natural resources D the underemployment of resources
1 marks
Answer: C
This question in 9708/12 Oct/Nov 2012
Q36 · The diagram shows a production possibility curve for an economy that produces only two… 9708/12 Oct/Nov 2012
3 The diagram shows a production possibility curve for an economy that produces only two goods, X and Y. 1000 good Y 500 0 0 500 1000 1500 2000 good X The economy produces 1200 of good X and produces on its production possibility curve. Which quantity of good Y is given up? A 400 B 600 C 800 D 1000
1 marks
Answer: B
This question in 9708/12 Oct/Nov 2012
Q37 · The production possibility curve for an economy producing capital goods and consumer… 9708/13 Oct/Nov 2012
2 The production possibility curve for an economy producing capital goods and consumer goods is represented by the line PQ. P capital goods T R O S Q consumer goods What is the opportunity cost of producing OS of consumer goods? A OR of capital goods B PR of capital goods C SQ of consumer goods D SQ of consumer goods + PR of capital goods
1 marks
Answer: B
This question in 9708/13 Oct/Nov 2012
Q38 · The diagram represents the production possibility curves of two economies X and Y 9708/13 Oct/Nov 2012
19 The diagram represents the production possibility curves of two economies X and Y. 2500 X 2000 X1 agricultural goods (units) 1000 Y 0 500 1000 manufactured goods (units) As a result of soil erosion in economy X, the production possibility curve shifts from X to X1. According to the law of comparative advantage, what should country Y do following this change? A cease to trade with country X B export agricultural goods to country X C export manufactured goods to country X D import both agricultural and manufactured goods from country X
1 marks
Answer: A
This question in 9708/13 Oct/Nov 2012
Q39 · The diagram shows the production possibility curve (PPC) of an economy that produces… 9708/11 May/June 2013
1 The diagram shows the production possibility curve (PPC) of an economy that produces goods and services. X output of goods O Y2 Y1 output of services What might cause the shift of the PPC from XY1 to XY2? A a decrease in the demand for services B a decrease in the efficiency in the production of services C a decrease in the opportunity cost of producing services D a decrease in the resources employed in services
1 marks
Answer: B
This question in 9708/11 May/June 2013
Q40 · The diagram shows two production possibility curves (EF and GH), before and after… 9708/12 May/June 2013
2 The diagram shows two production possibility curves (EF and GH), before and after technological progress has taken place. G E consumer goods X O Y M F H capital goods After technological progress has taken place, what is the opportunity cost in capital goods of producing OX consumer goods? A MH B OH C OM D YF
1 marks
Answer: A
This question in 9708/12 May/June 2013
Q41 · The diagram shows a production possibility curve for an economy that produces only two… 9708/13 May/June 2013
2 The diagram shows a production possibility curve for an economy that produces only two goods, X and Y. 1000 good Y 500 0 0 500 1000 1500 2000 good X The economy produces 400 of good Y and produces on its production possibility curve. Which quantity of good X is given up? A 600 B 800 C 1200 D 1600
1 marks
Answer: B
This question in 9708/13 May/June 2013
Q42 · In the diagram, JK is a country’s production possibility curve 9708/13 May/June 2013
19 In the diagram, JK is a country’s production possibility curve. LK is its trading possibility curve which shows possible combinations of good X and good Y after specialising in the product in which it has comparative advantage, and then trading it. L J good X R S O T K good Y The country consumes OR of good X and OT of good Y. Which quantities of goods X and Y does it produce? good X good Y A JS OT B OS OT C RS TK D zero OK
1 marks
Answer: D
This question in 9708/13 May/June 2013
Q43 · The diagram shows a country’s production possibility curve 9708/11 Oct/Nov 2013
2 The diagram shows a country’s production possibility curve. N good Y M O good X What could allow the economy to move from M to N in the long run? A an increase in consumer spending B an increase in demand for exports C an increase in government spending on pensions D an increase in investment
1 marks
Answer: D
This question in 9708/11 Oct/Nov 2013
Q44 · In the diagram, MN is the production possibility curve of a country that has a… 9708/11 Oct/Nov 2013
19 In the diagram, MN is the production possibility curve of a country that has a comparative advantage in the production of good Y. M R quantity of good X O N quantity of good Y What might enable the country to consume the quantities of X and Y indicated by point R? A increased specialisation in the production of good X B international trade C a reduction in unemployment D increased specialisation in the production of good Y
1 marks
Answer: B
This question in 9708/11 Oct/Nov 2013
Q45 · Two workers, George and Zaheer, can produce the following amounts in one working day if… 9708/13 Oct/Nov 2013
2 Two workers, George and Zaheer, can produce the following amounts in one working day if they concentrate on producing only one of the products. units of food units of clothing pairs of shoes George 9 or 18 or 36 Zaheer 15 or 45 or 30 First they decide to produce for themselves the 6 units of food they need to survive. Then they specialise in the product at which they are relatively efficient. What will be the total output of clothing and shoes, in addition to the 12 units of food, that is produced in one working day? units of clothing pairs of shoes A 6 18 B 21 22 C 27 12 D 36 12
1 marks
Answer: C
This question in 9708/13 Oct/Nov 2013
Q46 · The graphs show the production possibilities for commodities X and Y in two countries M… 9708/13 Oct/Nov 2013
21 The graphs show the production possibilities for commodities X and Y in two countries M and N. country M country N Y Y 50 140 X X 0 100 0 560 What will be the effect of an agreement between M and N to exchange the commodities at a rate of 1Y for 3X? A Both countries will gain, because their consumption possibilities will increase. B Consumers in country M will lose, because a unit of Y will now cost 3X instead of 2X. C Only country N will gain, because N can produce more of both commodities than M. D Neither country will gain, because they both have a comparative advantage in the production of the same commodity, X.
1 marks
Answer: A
This question in 9708/13 Oct/Nov 2013
Q47 · What is likely to occur as a result of a permanent rise in unemployment resulting in loss… 9708/11 May/June 2014
1 What is likely to occur as a result of a permanent rise in unemployment resulting in loss of skills? A a reduction in the economy’s long-run production possibility B a reduction in the scarcity of resources C an increase in the cost of allocating resources D an increase in the number of adults experiencing the economic problem
1 marks
Answer: A
This question in 9708/11 May/June 2014
Q48 · The diagram illustrates the production possibility curve of an economy in Year 1 (X1 Y1)… 9708/11 May/June 2014
3 The diagram illustrates the production possibility curve of an economy in Year 1 (X1 Y1) and in Year 2 (X2 Y2). Y2 Y1 good Y O X1 X2 good X What can be concluded from the diagram? A The cost of production was higher in Year 2 than in Year 1. B The full employment level of output was higher in Year 2 than in Year 1. C The opportunity cost of production was higher in Year 2 than in Year 1. D Unemployment was higher in Year 2 than in Year 1.
1 marks
Answer: B
This question in 9708/11 May/June 2014
Q49 · A country was at point P on its production possibility curve 9708/12 May/June 2014
2 A country was at point P on its production possibility curve. Following the threat of invasion it prepared for war. The war then reduced the country’s infrastructure. P consumer goods S R Q O military goods What are the most likely changes on the production possibility curve diagram that are consistent with these events? A P to Q followed by Q to R B P to Q followed by Q to S C P to R followed by R to Q D P to R followed by R to S
1 marks
Answer: B
This question in 9708/12 May/June 2014
Q50 · A country is producing electrical goods and medicines at full capacity 9708/13 May/June 2014
3 A country is producing electrical goods and medicines at full capacity. An innovation is developed that enables the country to produce a new medicine which becomes in great demand. How would this be represented by its production possibility curves? electrical Z X goods Y W O medicines A as a movement from W to X B as a movement from X to Y C as a movement from X to Z D as a movement from Y to X
1 marks
Answer: C
This question in 9708/13 May/June 2014
Q51 · The curve JK in the diagram is an economy’s production possibility curve 9708/11 Oct/Nov 2014
2 The curve JK in the diagram is an economy’s production possibility curve. J M N good X O K good Y What could cause the economy to move from point M to point N? A a decrease in the dependency ratio B a decrease in the population of working age C an increase in the participation rate D an increase in the unemployment rate
1 marks
This question in 9708/11 Oct/Nov 2014
Q52 · The diagram shows the production possibility curve XX of an economy that produces both… 9708/12 Oct/Nov 2014
3 The diagram shows the production possibility curve XX of an economy that produces both consumer goods and capital goods. X M capital N goods X O consumer goods If the economy moves from point M to point N, which diagram represents the most likely position of the production possibility curve YY in the future? A B X X Y Y capital capital goods goods Y X Y X O consumer goods O consumer goods C D X Y capital Y capital X goods goods X Y X Y O consumer goods O consumer goods
1 marks
Answer: B
This question in 9708/12 Oct/Nov 2014
Q53 · The diagrams show an economy’s production possibility curve before and after a change has… 9708/13 Oct/Nov 2014
2 The diagrams show an economy’s production possibility curve before and after a change has occurred. before after 50 50 capital capital goods goods 0 consumer 100 0 consumer 100 goods goods What would this change indicate about opportunity cost and the production possibility curve? opportunity cost production possibility curve A switched from constant to increasing involved some increase B switched from decreasing to constant involved some decrease C switched from decreasing to increasing involved some increase D switched from increasing to constant involved some decrease
1 marks
Answer: D
This question in 9708/13 Oct/Nov 2014
Q54 · A farmer can produce both wheat and barley at constant costs of production 9708/13 Oct/Nov 2014
4 A farmer can produce both wheat and barley at constant costs of production. The opportunity cost of a kilo of wheat is 1.5 kilos of barley. The price of a kilo of wheat is twice that of barley. What should the farmer do to maximise revenue? A Concentrate on barley production. B Concentrate on wheat production. C Produce wheat and barley in the ratio 2 : 1. D Produce wheat and barley in the ratio 3 : 2.
1 marks
Answer: B
This question in 9708/13 Oct/Nov 2014
Q55 · Some people are shipwrecked on a tropical island and allocate their time between… 9708/11 May/June 2015
2 Some people are shipwrecked on a tropical island and allocate their time between gathering coconuts and fishing. Each individual is equally productive in collecting coconuts or catching fish. Which diagram represents the production possibility curve of this community? A B C D coconuts coconuts coconuts coconuts O fish O fish O fish O fish
1 marks
Answer: A
This question in 9708/11 May/June 2015
Q56 · The diagram shows the production possibility curve of a desert island economy where the… 9708/12 May/June 2015
3 The diagram shows the production possibility curve of a desert island economy where the inhabitants live off just two commodities, coconuts and fish. coconuts O fish What explains the shape of the production possibility curve? A Coconuts and fish are in joint demand. B Coconuts and fish are perfect substitutes when consumed. C Fishing and coconut growing are equally efficient. D The opportunity cost of fish falls as more time is devoted to fishing.
1 marks
Answer: C
This question in 9708/12 May/June 2015
Q57 · The diagram shows the change in a country’s production possibility curve from PQ to PR 9708/13 May/June 2015
3 The diagram shows the change in a country’s production possibility curve from PQ to PR. P public goods O Q R private goods What increases as a result of the change from PQ to PR? A the price of private goods B the price of public goods C the opportunity cost of private goods D the opportunity cost of public goods
1 marks
Answer: D
This question in 9708/13 May/June 2015
Q58 · The diagram shows a production possibility curve for an economy 9708/13 May/June 2015
4 The diagram shows a production possibility curve for an economy. X consumer goods Y O capital goods Assuming that the production possibility curve remains unchanged, what is the most likely reason for the movement from point X to point Y? A a civil war causing a widespread loss of resources B a permanent fall in productivity in both capital and consumer goods C the exhaustion of a natural resource D the rise in unemployment due to a recession
1 marks
Answer: D
This question in 9708/13 May/June 2015
Q59 · The diagram shows a production possibility curve for an economy that produces only two… 9708/11 Oct/Nov 2015
2 The diagram shows a production possibility curve for an economy that produces only two goods, X and Y. 1000 good Y 500 0 0 500 1000 1500 2000 good X The economy produces 800 of good Y and produces on its production possibility curve. Which quantity of good X is given up? A 200 B 400 C 800 D 1600
1 marks
Answer: D
This question in 9708/11 Oct/Nov 2015
Q60 · In the diagram, GH is an economy’s initial production possibility curve 9708/11 Oct/Nov 2015
3 In the diagram, GH is an economy’s initial production possibility curve. G J good Y O K H good X What could cause the curve to shift to JK? A a decrease in net exports B an increase in the average price level C an increase in the unemployment rate D net outward migration
1 marks
Answer: D
This question in 9708/11 Oct/Nov 2015
Q61 · An economy produces two goods, X and Y 9708/11 Oct/Nov 2015
19 An economy produces two goods, X and Y. In the diagram, the line ML is the economy’s production possibility curve and the line MN its trading possibility curve. M good Y O L N good X What does the diagram show? A The economy’s consumers prefer good X to good Y. B The economy’s consumers prefer good Y to good X. C The economy has a comparative advantage in the production of good X. D The economy has a comparative advantage in the production of good Y.
1 marks
Answer: D
This question in 9708/11 Oct/Nov 2015
Q62 · The diagram shows the change in an economy’s production possibility curve as it grows in… 9708/12 Oct/Nov 2015
2 The diagram shows the change in an economy’s production possibility curve as it grows in the long run. Which movement from point X is most likely to show the highest potential for growth? A B consumer C X goods D O capital goods
1 marks
Answer: C
This question in 9708/12 Oct/Nov 2015
Q63 · The diagrams show the change in a country’s production possibility curve between Year 1… 9708/12 Oct/Nov 2015
3 The diagrams show the change in a country’s production possibility curve between Year 1 and Year 2. Year 1 Year 2 150 consumer consumer goods 100 goods 0 50 0 80 services services What can be concluded from the diagrams? A Future growth prospects have been harmed. B The level of unemployment has fallen. C The opportunity cost of consumer goods has risen. D The proportionate growth in production is greater in consumer goods.
1 marks
Answer: C
This question in 9708/12 Oct/Nov 2015
Q64 · A country’s production possibility curve moves from XX to YY as shown in the diagram 9708/13 Oct/Nov 2015
1 A country’s production possibility curve moves from XX to YY as shown in the diagram. X Y capital goods O Y X consumer goods What could have caused this movement? A a rise in technological progress B a rise in the retirement age C an increase in investment D an increase in net emigration
1 marks
Answer: D
This question in 9708/13 Oct/Nov 2015
Q65 · The diagram shows the production possibility frontier of a desert island economy where… 9708/12 Feb/March 2016
3 The diagram shows the production possibility frontier of a desert island economy where the inhabitants live off just two commodities, coconuts and fish. coconuts O fish What explains the shape of the production possibility frontier? A Coconuts and fish are perfect complements. B Coconuts and fish are perfect substitutes. C The inhabitants consume more fish than coconuts. D The opportunity cost of fish is constant as more time is devoted to fishing.
1 marks
Answer: D
This question in 9708/12 Feb/March 2016
Q66 · The diagram shows the production possibility curves of two economies, X and Y 9708/11 May/June 2016
3 The diagram shows the production possibility curves of two economies, X and Y. 200 capital X goods 100 65 Y 0 0 65 100 200 consumer goods Which statement about the two economies is correct? A Both economies always have identical opportunity costs. B Both economies have the same future growth prospects. C The opportunity costs are constant in each economy. D The terms of trade for both countries will be one capital good for one consumer good.
1 marks
Answer: C
This question in 9708/11 May/June 2016
Q67 · A production possibility curve shows labour-intensive farming output and… 9708/11 May/June 2016
4 A production possibility curve shows labour-intensive farming output and capital-intensive manufacturing output. What would not cause a shift in this curve? A a reduction in sales tax on manufactured products B better training of workers in the manufacturing sector of the economy C improvements in the productivity of agricultural machinery D the reclamation of land to be used for both agriculture and manufacturing
1 marks
Answer: A
This question in 9708/11 May/June 2016
Q68 · The diagram shows the production possibility curves for two countries, X and Y 9708/11 May/June 2016
26 The diagram shows the production possibility curves for two countries, X and Y. A decrease in productivity moves country X’s production possibility curve from X1 to X2. 40 30 raw materials X2 Y X1 0 50 90 120 manufactured goods Which statement is correct? A After the change X would export raw materials and import manufactured goods. B After the change there is no economic basis for trade. C Before the change Y had an absolute advantage in the production of raw materials. D Before the change X had a comparative advantage in both products.
1 marks
Answer: A
This question in 9708/11 May/June 2016
Q69 · The change from WX to YZ in a country’s production possibility curve is shown 9708/12 May/June 2016
3 The change from WX to YZ in a country’s production possibility curve is shown. Y W food O X Z clothes What could have caused this shift? A an increase in employment among the existing labour force B an increase in the rate of interest C the closing of an inefficient factory D the discovery of a new resource
1 marks
Answer: D
This question in 9708/12 May/June 2016
Q70 · The diagram shows different production possibilities for a bakery 9708/13 May/June 2016
1 The diagram shows different production possibilities for a bakery. 100 70 bread 50 0 15 25 50 cakes They wish to increase production of cakes from 15 units to 25 units. What is the opportunity cost? A 10 units of cake B 15 units of cake C 20 units of bread D 50 units of bread
1 marks
Answer: C
This question in 9708/13 May/June 2016
Q71 · The curve PP in the diagram is the production possibility curve for a country producing… 9708/13 May/June 2016
3 The curve PP in the diagram is the production possibility curve for a country producing goods X and Y. The production of X is more labour-intensive than the production of Y. R Q P S good Y T O S T P R Q good X The working hours of the labour force are reduced by law. Which curve could be the country’s new production possibility curve? A TT B SS C QQ D RR
1 marks
Answer: B
This question in 9708/13 May/June 2016
Q72 · The production possibility curve for an economy producing capital goods and consumer… 9708/11 Oct/Nov 2016
2 The production possibility curve for an economy producing capital goods and consumer goods is represented by the line PQ. P capital goods T R O S Q consumer goods What is the opportunity cost of producing OS of consumer goods? A OR of capital goods B PR of capital goods C SQ of consumer goods D SQ of consumer goods + PR of capital goods
1 marks
Answer: B
This question in 9708/11 Oct/Nov 2016
Q73 · In the diagram XY is an economy’s production possibility curve 9708/11 Oct/Nov 2016
3 In the diagram XY is an economy’s production possibility curve. X financial services O Y Z manufactured goods What could cause the curve to shift to XZ? A a fall in productivity in manufacturing B a fall in the price of manufactured goods C a higher demand for manufactured goods D an improvement in manufacturing technology
1 marks
Answer: D
This question in 9708/11 Oct/Nov 2016
Q74 · The diagram shows an economy’s production possibility curve, PPC, and trading possibility… 9708/11 Oct/Nov 2016
27 The diagram shows an economy’s production possibility curve, PPC, and trading possibility curve, TPC. food TPC PPC O clothing Why is the diagram not able to demonstrate the benefits of international trade? A It assumes there are no transport costs and no barriers to trade. B It deals with only two products. C The curves are drawn as straight lines. D The position of the curves does not support the existence of benefits.
1 marks
Answer: D
This question in 9708/11 Oct/Nov 2016
Q75 · The diagram shows a production possibility curve for an economy that produces only two… 9708/12 Oct/Nov 2016
1 The diagram shows a production possibility curve for an economy that produces only two goods, X and Y. 1000 good Y 500 0 0 500 1000 1500 2000 good X The economy produces 1200 of good X and operates on its production possibility curve. Which quantity of good Y is given up? A 400 B 600 C 800 D 1000
1 marks
Answer: B
This question in 9708/12 Oct/Nov 2016
Q76 · An economy can produce only two goods at any one time 9708/12 Oct/Nov 2016
4 An economy can produce only two goods at any one time. These are good X and one other good from A, B, C or D. The table shows the outputs of goods A, B, C and D with each output of good X when the economy’s resources are fully employed. Which good must be produced with good X to show a production possibility curve with increasing costs? units X 0 100 200 300 400 A 0 20 40 60 80 B 110 70 40 20 0 C 120 90 60 30 0 D 140 120 90 50 0
1 marks
Answer: D
This question in 9708/12 Oct/Nov 2016
Q77 · The diagram shows a production possibility curve for an economy 9708/13 Oct/Nov 2016
3 The diagram shows a production possibility curve for an economy. goods for export X Y O goods for domestic use What might cause the movement from X to Y? A a more efficient use of resources B an increased emphasis on international trade C growth in the productive capacity of the economy D new innovations and technology
1 marks
Answer: A
This question in 9708/13 Oct/Nov 2016
Q78 · The diagram shows a production possibility curve for an economy that is producing at… 9708/12 Feb/March 2017
3 The diagram shows a production possibility curve for an economy that is producing at point P. 150 good Y P 100 50 0 0 50 100 150 good X Which quantity of X is given up to produce the quantity of Y shown? A 40 B 50 C 100 D 110
1 marks
Answer: B
This question in 9708/12 Feb/March 2017
Q79 · The diagram shows that the production possibility frontier of maize and beans has changed… 9708/11 May/June 2017
3 The diagram shows that the production possibility frontier of maize and beans has changed from PPF1 to PPF2. 100 output of maize (tonnes) PPF2 PPF1 0 0 100 200 output of beans (tonnes) What has happened to the opportunity cost of maize and the returns to factors producing beans? opportunity cost returns to factors of maize producing beans A fallen fallen B fallen risen C risen fallen D risen risen
1 marks
Answer: D
This question in 9708/11 May/June 2017
Q80 · Line XX is the production possibility curve (PPC) of a worker picking peas and beans in a… 9708/12 May/June 2017
3 Line XX is the production possibility curve (PPC) of a worker picking peas and beans in a 10 hour working day. Y quantity of peas picked per day X Y X O quantity of beans picked per day What would cause the worker’s PPC to shift to the line YY? A a machine that increases the worker’s pea picking productivity only B a new work schedule where the worker spends 6 hours per day picking peas and only 4 hours picking beans C a reduction in working hours to 8 per day and a machine that increases the worker’s pea picking productivity D a reduction in working hours to 8 per day only
1 marks
Answer: C
This question in 9708/12 May/June 2017
Q81 · The diagram shows a production possibility curve for an economy that is producing at… 9708/13 May/June 2017
3 The diagram shows a production possibility curve for an economy that is producing at point P. 150 good Y P 100 50 0 0 50 100 150 good X Which quantity of Y is given up to produce the quantity of X shown? A 40 B 50 C 100 D 110
1 marks
Answer: A
This question in 9708/13 May/June 2017
Q82 · Farmers using traditional methods lack access to finance and often employ family members… 9708/11 Oct/Nov 2017
3 Farmers using traditional methods lack access to finance and often employ family members on a part-time basis. If working practices in agriculture could be improved, how would this be likely to be shown on the production possibility curve? R manufactured goods T S O agricultural goods A by a movement from R to T B by a movement from S to R C by a movement from S to T D by a movement from T to R
1 marks
Answer: C
This question in 9708/11 Oct/Nov 2017
Q83 · Economy X uses its resources in the labour-intensive production of wheat and wooden… 9708/12 Oct/Nov 2017
3 Economy X uses its resources in the labour-intensive production of wheat and wooden furniture as shown by the production possibility curve FW. With the help of new strains of wheat seeds, X increased yields and shifted to a new production possibility curve. Which diagram depicts this change? A B furniture furniture F F O W O W wheat wheat C D furniture furniture F F O W O W wheat wheat
1 marks
Answer: C
This question in 9708/12 Oct/Nov 2017
Q84 · R1S1, R2S2, R3S3 and R4S4 are production possibility curves (PPC) for four different… 9708/13 Oct/Nov 2017
3 R1S1, R2S2, R3S3 and R4S4 are production possibility curves (PPC) for four different countries 1, 2, 3 and 4. R4 good R R3 R2 R1 O S1 S2 S3 S4 good S Which statement about the opportunity cost of good R in terms of good S is not correct? A It is greater at all points on R4S4 than on R3S3. B It is greater in country 3 than country 2. C It is lower in country 2 than country 1. D It is the same at each point on R3S3.
1 marks
Answer: A
This question in 9708/13 Oct/Nov 2017
Q85 · A farmer is able to grow three crops, X, Y and Z, on his land 9708/12 Feb/March 2018
2 A farmer is able to grow three crops, X, Y and Z, on his land. The farmer decides to grow at most two crops in any year. The table shows six possible combinations of units of output of the three crops. output X 0 0 80 40 40 0 Y 0 60 0 30 0 30 Z 40 0 0 0 20 20 What is the opportunity cost of 1 unit of X? A 1.33 units of Y B 1.5 units of Y C 0.5 units of Z D 2.0 units of Z
1 marks
Answer: C
This question in 9708/12 Feb/March 2018
Q86 · The diagram shows a production possibility curve for an economy that produces capital… 9708/12 Feb/March 2018
3 The diagram shows a production possibility curve for an economy that produces capital goods and consumer goods. capital goods O consumer goods Why is the production possibility curve drawn concave to the origin? A Capital goods are a more labour intensive output than consumer goods. B Consumers always seek to maximise their satisfaction from consumption. C Profit maximisation for firms always ensures efficiency in production. D Some resources are more efficient in production of some goods than others.
1 marks
Answer: D
This question in 9708/12 Feb/March 2018
Q87 · What would be an opportunity cost of growth in an economy? 9708/11 May/June 2018
1 What would be an opportunity cost of growth in an economy? A the faster growth of services than of manufacturing B the need for an increased level of imported raw materials C the need for greater government intervention D the reduction of consumption if growth requires investment
1 marks
Answer: D
This question in 9708/11 May/June 2018
Q88 · A country can produce manufactured goods and agricultural products as shown in the diagram 9708/11 May/June 2018
4 A country can produce manufactured goods and agricultural products as shown in the diagram. agricultural V products T Q S R O manufactured goods Given this information, which statement is definitely correct? A If the country produces at Q it has unused or inefficiently used resources. B The country should produce at T instead of at Q. C The country would be better off producing at R than S. D The monetary costs are the same to produce at V as they are to produce at R.
1 marks
Answer: A
This question in 9708/11 May/June 2018
Q89 · The graphs show the production possibilities for commodities X and Y in two countries M… 9708/11 May/June 2018
25 The graphs show the production possibilities for commodities X and Y in two countries M and N. country M country N Y Y 50 140 X X 0 100 0 560 What will be the effect of an agreement between M and N to exchange the commodities at a rate of 1Y for 3X? A Both countries will gain, because their consumption possibilities will increase. B Consumers in country M will lose, because a unit of Y will now cost 3X instead of 2X. C Neither country will gain, because they both have a comparative advantage in the production of the same commodity, X. D Only country N will gain, because N can produce more of both commodities than M.
1 marks
Answer: A
This question in 9708/11 May/June 2018
Q90 · YX is an economy’s production possibility curve (PPC) 9708/12 May/June 2018
2 YX is an economy’s production possibility curve (PPC). The equation of the curve is qY = 1000 – 2qX. 1000 Y output of good Y (qY) X O 500 output of good X (qX) What is the opportunity cost of producing one extra unit of good X? A 1 unit of good Y 2 B 2 units of good Y C 500 units of good Y D 1000 units of good Y
1 marks
Answer: B
This question in 9708/12 May/June 2018
Q91 · A farmer picks 10 kg of strawberries in each hour 9708/12 May/June 2018
3 A farmer picks 10 kg of strawberries in each hour. The farmer is twice as productive at picking raspberries. Which diagram shows the farmer’s daily production possibility curve when working 8 hours a day? A B 20 160 raspberries raspberries picked (kg) picked (kg) O 10 O 80 strawberries strawberries picked (kg) picked (kg) C D raspberry raspberry picking (hours) picking (hours) 4 8 O 8 O 16 strawberry strawberry picking (hours) picking (hours)
1 marks
Answer: B
This question in 9708/12 May/June 2018
Q92 · In the diagram, MN is the production possibility curve of a country that has a… 9708/12 May/June 2018
25 In the diagram, MN is the production possibility curve of a country that has a comparative advantage in the production of good Y. M quantity of good X R O N quantity of good Y What might enable the country to consume the quantities of X and Y indicated by point R? A a reduction in unemployment B increased specialisation in the production of good X C increased specialisation in the production of good Y D more participation in international trade
1 marks
Answer: D
This question in 9708/12 May/June 2018
Q93 · XY is the production possibility curve (PPC) of a firm that produces desks and chairs 9708/13 May/June 2018
1 XY is the production possibility curve (PPC) of a firm that produces desks and chairs. X 5 output of chairs per day 4 3 2 1 Y 0 0 1 2 3 4 5 output of desks per day What are the opportunity costs of the 4th and 5th desks produced by the firm? opportunity cost opportunity cost of 4th desk of 5th desk A 1 chair 3 chairs B 2 chairs 5 chairs C 3 chairs 0 chairs D 4 chairs 5 chairs
1 marks
Answer: A
This question in 9708/13 May/June 2018
Q94 · The production possibility curves show the abilities of four economies to produce trucks… 9708/11 Oct/Nov 2018
3 The production possibility curves show the abilities of four economies to produce trucks and cars. In which economy is the opportunity cost of producing cars lowest? 6 trucks 5 (thousands) 4 3 D C 2 B 1 A 0 0 1 2 3 4 5 6 cars (thousands)
1 marks
Answer: A
This question in 9708/11 Oct/Nov 2018
Q95 · The diagram shows an economy's production possibility curve for goods X and Y 9708/12 Oct/Nov 2018
2 The diagram shows an economy's production possibility curve for goods X and Y. Y R Y1 Y2 S O X1 X2 X What is the opportunity cost of moving from point R to point S on the production possibility curve? A OX1 B OY2 C X1X2 D Y1Y2
1 marks
Answer: D
This question in 9708/12 Oct/Nov 2018
Q96 · The combinations of output of goods X and Y shown in the table could all be produced… 9708/13 Oct/Nov 2018
2 The combinations of output of goods X and Y shown in the table could all be produced using the existing resources in a country to their maximum capacity. 1 2 3 4 5 X 220 200 180 140 90 Y 10 25 40 70 100 Which statement about the opportunity cost of good Y in terms of good X is correct? A It decreases as the output of Y increases. B It is always below 1Y = 1X. C It is constant throughout the range of output shown. D It is never above 1Y = 2X.
1 marks
Answer: D
This question in 9708/13 Oct/Nov 2018
Q97 · The diagram shows two production possibility curves for goods and services in an economy 9708/13 Oct/Nov 2018
3 The diagram shows two production possibility curves for goods and services in an economy. goods PPC2 PPC1 O services What would not cause the economy’s production possibility curve to shift from PPC1 to PPC2? A an increase in the level of employment B an increase in the retirement age C an increase in the skills level of employees D an increase in the use of capital by firms
1 marks
Answer: A
This question in 9708/13 Oct/Nov 2018
Q98 · The diagram shows a production possibility curve for a farmer 9708/12 Feb/March 2019
3 The diagram shows a production possibility curve for a farmer. The original position is X. If the farmer switches some of his land from producing pears to producing apples, which point represents his new position? pears A D X B C O apples
1 marks
Answer: B
This question in 9708/12 Feb/March 2019
Q99 · The diagram shows a production possibility curve (PPC) 9708/11 May/June 2019
4 The diagram shows a production possibility curve (PPC). It indicates the combinations of consumer goods and capital goods produced by an economy using all its available resources. 50 units of consumer 40 X goods 30 20 PPC 10 0 1 2 3 4 5 units of capital goods What does position X indicate? A a lower ratio of capital to consumer goods is necessary to achieve economic growth B increasing levels of unemployment C insufficient factors of production are available D too many consumer goods are causing a fall in economic growth
1 marks
Answer: C
This question in 9708/11 May/June 2019
Q100 · A production possibility curve for a country is shown 9708/12 May/June 2019
1 A production possibility curve for a country is shown. consumer P goods and services P1 O P1 P capital goods What would cause the shift from PP to P1P1? A application of more machinery used in manufacturing B productivity decreases C scientific methods applied to farming D switch from production of consumer goods to capital goods
1 marks
Answer: B
This question in 9708/12 May/June 2019
Q101 · What would be a determinant of a country’s production possibility curve boundary? 9708/12 May/June 2019
3 What would be a determinant of a country’s production possibility curve boundary? A the capital invested in infrastructure B the level of price and wage inflation C the level of unemployed labour D the volume of imports and exports
1 marks
Answer: A
This question in 9708/12 May/June 2019
Q102 · What is correct at any point along an economy’s production possibility curve? 9708/13 May/June 2019
3 What is correct at any point along an economy’s production possibility curve? existing resources existing technology are fully employed is fully used A correct correct B correct false C false correct D false false
1 marks
Answer: A
This question in 9708/13 May/June 2019
Q103 · What does a production possibility curve show? 9708/11 Oct/Nov 2019
2 What does a production possibility curve show? A the maximum output that can be produced by a firm in a year B the maximum output that can be produced per worker per year in the economy C the maximum output that could be exported from a country D the maximum output of two or more goods in an economy from a given amount of inputs
1 marks
Answer: D
This question in 9708/11 Oct/Nov 2019
Q104 · The diagram shows two production possibility curves, XX and YY 9708/11 Oct/Nov 2019
4 The diagram shows two production possibility curves, XX and YY. Y manufacturing output X O X Y agriculture output What would cause a movement from XX to YY? A a decrease in scarce resources B a decrease in the cost of resources C an increase in the cost of labour D an increase in the labour force
1 marks
Answer: D
This question in 9708/11 Oct/Nov 2019
Q105 · Which labels might be used on a production possibility curve diagram? 9708/12 Oct/Nov 2019
2 Which labels might be used on a production possibility curve diagram? Y (vertical) axis X (horizontal) axis A capital input labour input B cost of production quantity produced C output of rice labour input D output of rice output of sugar
1 marks
Answer: D
This question in 9708/12 Oct/Nov 2019
Q106 · In the diagram the original production possibility curve is LM 9708/13 Oct/Nov 2019
4 In the diagram the original production possibility curve is LM. L consumer N goods O P M capital goods What could cause the curve to shift to NP? A a fall in the working population B a reallocation of resources from consumer goods to capital goods C an increase in output per worker D an increase in unemployment
1 marks
Answer: A
This question in 9708/13 Oct/Nov 2019
Q107 · The diagram shows the production possibility curve of a desert island economy where the… 9708/12 Feb/March 2020
1 The diagram shows the production possibility curve of a desert island economy where the inhabitants produce just two commodities, coconuts and fish. coconuts O fish What explains the shape of the production possibility curve? A Coconuts and fish are perfect complements. B Coconuts and fish are perfect substitutes. C The inhabitants consume more fish than coconuts. D The opportunity cost of increasing fish production is constant.
1 marks
Answer: D
This question in 9708/12 Feb/March 2020
Q108 · An economist knows the current point at which an economy is operating within its… 9708/13 May/June 2020
1 An economist knows the current point at which an economy is operating within its production possibility curve. What can the economist judge from this knowledge about the economy? A its degree of self-sufficiency B its international competitiveness C its level of output of two goods D its rate of economic growth
1 marks
Answer: C
This question in 9708/13 May/June 2020
Q109 · The diagram shows an economy’s production possibility curve 9708/11 Oct/Nov 2020
1 The diagram shows an economy’s production possibility curve. 1000 consumer goods 0 50 capital goods It has been employing its resources in the ratio of 80% consumer goods production and 20% capital goods production. What will be the result if it decides to double its output of capital goods? A a gain of 20 capital goods B a gain of 40 capital goods C a loss of 200 consumer goods D a loss of 600 consumer goods
1 marks
Answer: C
This question in 9708/11 Oct/Nov 2020
Q110 · The diagram shows a production possibility curve 9708/12 Oct/Nov 2020
1 The diagram shows a production possibility curve. good X O good Y What can be deduced from the shape of this curve? A decreasing marginal returns to consumption B decreasing opportunity costs of consumption C increasing opportunity costs of production D increasing returns to scale
1 marks
Answer: C
This question in 9708/12 Oct/Nov 2020
Q111 · An economy is operating at a point inside its production possibility curve 9708/13 Oct/Nov 2020
1 An economy is operating at a point inside its production possibility curve. Why is this described as inefficient? A Individuals are enjoying too much leisure. B More of one good can be produced without decreasing production of another. C The combination of labour and capital is wrong. D There are shortages of some goods and an excess supply of others.
1 marks
Answer: B
This question in 9708/13 Oct/Nov 2020
Q112 · The diagram shows two production possibility curves for an economy 9708/12 Feb/March 2021
2 The diagram shows two production possibility curves for an economy. services N L M K O goods Which combination of movements correctly illustrates these changes in production? short-run long-run no economic growth economic growth economic growth A K to L L to M M to N B K to L M to N L to M C M to N K to L L to M D M to N L to M K to L
1 marks
Answer: B
This question in 9708/12 Feb/March 2021
Q113 · The diagram shows the production possibility curves of two economies, Northland (Y1–X1)… 9708/11 Oct/Nov 2021
4 The diagram shows the production possibility curves of two economies, Northland (Y1–X1) and Southland (Y2–X2). Y1 R food Y2 P O X1 X2 drink Both economies specialise based on the theory of comparative advantage and trade with one another. What can be concluded from the diagram? A Both economies face increasing opportunity costs. B Point P represents the final equilibrium outcome. C Point R shows the total possible combined production of food and drink. D All points on Y1–X2 are only attainable through trade.
1 marks
Answer: C
This question in 9708/11 Oct/Nov 2021
Q114 · Line XX is the production possibility curve (PPC) of a worker picking peas and beans in a… 9708/12 Oct/Nov 2021
1 Line XX is the production possibility curve (PPC) of a worker picking peas and beans in a 10 hour working day. Y quantity of peas picked per day X Y X O quantity of beans picked per day What could cause the worker’s PPC to shift to the line YY? A a decrease in working hours to 8 per day and a machine that increases the worker’s pea picking productivity B a machine that increases the worker’s pea picking productivity only C a new work schedule where the worker spends 6 hours per day picking peas and only 4 hours picking beans D a reduction in working hours to 8 per day only
1 marks
Answer: A
This question in 9708/12 Oct/Nov 2021
Q115 · In the diagram JK is the initial production possibility curve for an economy producing… 9708/13 Oct/Nov 2021
1 In the diagram JK is the initial production possibility curve for an economy producing computers and cars. J computers O L K cars What could cause the curve to shift to JL? A a fall in output per worker in the car industry B a fall in the level of competition in the car industry C a rise in the potential workforce of the economy D a rise in the price of cars
1 marks
Answer: A
This question in 9708/13 Oct/Nov 2021
Q116 · A production possibility curve shows the combinations of outputs an economy can produce… 9708/12 Feb/March 2022
1 A production possibility curve shows the combinations of outputs an economy can produce using all available resources. At which points on the diagram are all available resources used? food (units) 20 W Z Y X 0 25 manufactures (units) A W and X only B W, X and Z only C W, X, Y and Z D Z and Y only
1 marks
Answer: A
This question in 9708/12 Feb/March 2022
Q117 · The production possibility curves (PPCs) show the abilities of four economies to produce… 9708/12 Feb/March 2022
4 The production possibility curves (PPCs) show the abilities of four economies to produce wheat and rice. Which PPC has the lowest opportunity cost for producing wheat? 6 wheat (tonnes) 4 1 A B C D 0 40 80 120 rice (tonnes)
1 marks
Answer: B
This question in 9708/12 Feb/March 2022
Q118 · The diagram shows a production possibility curve for an economy that is producing at… 9708/11 May/June 2022
1 The diagram shows a production possibility curve for an economy that is producing at point P. 150 good Y P 100 50 0 0 50 100 150 good X Which quantity of X is given up to produce the quantity of Y shown? A 40 B 50 C 100 D 110
1 marks
Answer: B
This question in 9708/11 May/June 2022
Q119 · An economy produces combinations of computers and food as shown on the diagram of a… 9708/12 May/June 2022
3 An economy produces combinations of computers and food as shown on the diagram of a production possibility curve (PPC). computers W Y Z X O food If all available resources were used, which two points on the PPC diagram show the maximum combinations of computers and food that the economy can produce? A W and X B X and Y C Y and Z D Z and W
1 marks
Answer: A
This question in 9708/12 May/June 2022
Q120 · A farmer with a fixed area of land grows two crops, wheat and barley 9708/14 May/June 2022
2 A farmer with a fixed area of land grows two crops, wheat and barley. Some land used for barley is flooded and cannot be used. The farmer then starts to plant genetically modified (GM) wheat that produces wheat more efficiently on the land that is not flooded. Which diagram shows the most likely effect of these changes on the farmer’s production possibility curve (PPC) as it moves from XX to YY? A B wheat wheat output X output X Y Y Y X X Y O barley output O barley output C D Y Y wheat wheat output X output X Y X X Y O barley output O barley output
1 marks
Answer: C
This question in 9708/14 May/June 2022
Q121 · The diagram shows an economy’s production possibility curve (PPC) 9708/12 Oct/Nov 2022
5 The diagram shows an economy’s production possibility curve (PPC). The economy has moved from X to Y. capital Y P goods X Q O R S consumer goods What can be deduced from the diagram? A Current living standards have fallen. B The economy has become more efficient. C There has been a rise in unemployment. D There has been an opportunity cost of OR consumer goods.
1 marks
Answer: B
This question in 9708/12 Oct/Nov 2022
Q122 · The diagram shows a production possibility curve 9708/13 Oct/Nov 2022
4 The diagram shows a production possibility curve. good Y O good X Which combination is correct? opportunity cost of opportunity cost of producing more of producing more of good Y good X A decreases decreases B decreases increases C increases decreases D increases increases
1 marks
Answer: D
This question in 9708/13 Oct/Nov 2022
Q123 · The diagram shows the production possibility curve for wheat and corn 9708/12 Feb/March 2023
4 The diagram shows the production possibility curve for wheat and corn. M output of wheat N O output of corn What can be deduced from the diagram? A As the price of corn falls, more of it is demanded. B Resources used in producing corn are more efficient than in producing wheat. C The opportunity cost of producing corn falls when moving from M to N. D The opportunity cost of producing corn is constant when moving from M to N.
1 marks
Answer: D
This question in 9708/12 Feb/March 2023
Q124 · The diagram shows the change in a country’s production possibility curve from XX to YY 9708/11 May/June 2023
3 The diagram shows the change in a country’s production possibility curve from XX to YY. Y food X O Y X drink What would explain this change? A Consumers chose to consume more food and less drink. B Government taxed food production and subsidised drink production. C Productivity rose in food production and fell in drink production. D There were more imports of food and more exports of drink.
1 marks
Answer: C
This question in 9708/11 May/June 2023
Q125 · Assuming nothing else changes, which change in an economy’s labour market will cause the… 9708/12 May/June 2023
2 Assuming nothing else changes, which change in an economy’s labour market will cause the production possibility curve to shift to the left? A an increase in worker immigration B an increase in the retirement age C an increase in labour productivity D an increase in the school leaving age
1 marks
Answer: D
This question in 9708/12 May/June 2023
Q126 · The world consists of two countries, M and N 9708/12 May/June 2023
26 The world consists of two countries, M and N. The graphs show their production possibilities for wheat and rice. country M country N 100 rice rice 75 0 0 0 100 0 50 wheat wheat Countries M and N operate on their production possibility curves and, before specialisation, country M produces 60 units of wheat and country N produces 30 units of wheat. What will be the change in the world output of rice if both countries decide to specialise according to comparative advantage? A It will fall by 5 units. B It will fall by 30 units. C It will rise by 5 units. D It will rise by 30 units.
1 marks
Answer: C
This question in 9708/12 May/June 2023
Q127 · The diagram shows an economy’s production possibility curve 9708/13 May/June 2023
3 The diagram shows an economy’s production possibility curve. The economy produces combinations of goods and services using all available resources. services O goods What does the production possibility curve indicate for goods and services? A constant returns to scale in the production of both goods and services B diminishing returns to scale in the production of both goods and services C increasing returns to scale in the production of both goods and services D infinite returns to scale in the production of both goods and services
1 marks
Answer: A
This question in 9708/13 May/June 2023
Q128 · Country Z operates with a production possibility curve (PPC) 9708/11 Oct/Nov 2023
2 Country Z operates with a production possibility curve (PPC). Currently, output is at combination 1. PPC good Y 2 3 1 4 O good X Which movement has zero opportunity cost in terms of the goods produced? A 1 to 2 B 1 to 3 C 2 to 3 D 3 to 4
1 marks
Answer: B
This question in 9708/11 Oct/Nov 2023
Q129 · PPC is the production possibility curve in country T 9708/12 Oct/Nov 2023
1 PPC is the production possibility curve in country T. PPC 1 good Y 2 3 4 O good X Which changes take place in country T’s opportunity costs of producing X as it increases production of X? A Opportunity costs are constant between points 1 and 2, and between points 3 and 4. B Opportunity costs decrease between points 1 and 2, and increase between points 3 and 4. C Opportunity costs decrease between points 1 and 2, and between points 3 and 4. D Opportunity costs increase between points 1 and 2, and between points 3 and 4.
1 marks
Answer: D
This question in 9708/12 Oct/Nov 2023
Q130 · The diagram shows three production possibility curves (PPC) for a country, labelled 3, 2… 9708/12 Oct/Nov 2023
23 The diagram shows three production possibility curves (PPC) for a country, labelled 3, 2 and 1. The original PPC for the country is 2. This country experiences a fall in its working population and then this is followed by a long period of recession. consumer goods s t u r 3 2 1 O capital goods If an increase in GDP then takes place, what is the increase in production? A r to s B r to u C s to t D t to u
1 marks
Answer: A
This question in 9708/12 Oct/Nov 2023
Q131 · The table shows different combinations of rings and bracelets that can be produced by… 9708/13 Oct/Nov 2023
3 The table shows different combinations of rings and bracelets that can be produced by Luke and Zoe in the same time period. Luke Zoe rings bracelets rings bracelets 18 0 20 0 12 6 16 8 6 12 12 16 0 18 8 24 Which statement is not correct? A Luke has a larger opportunity cost than Zoe for making bracelets. B The opportunity cost of producing rings is constant for both Luke and Zoe. C Zoe should specialise in making rings. D Zoe’s opportunity cost for each bracelet is 2 rings.
1 marks
Answer: D
This question in 9708/13 Oct/Nov 2023
Q132 · Why does a production possibility curve exist for every economy? 9708/12 Feb/March 2024
1 Why does a production possibility curve exist for every economy? A Resources are unlimited. B Resources have alternative uses. C Some resources can be imported. D Some resources may be unemployed.
1 marks
Answer: B
This question in 9708/12 Feb/March 2024
Q133 · An economist knows the current point at which an economy operates within its production… 9708/11 May/June 2024
5 An economist knows the current point at which an economy operates within its production possibility curve. What can the economist conclude about this economy? A its degree of self-sufficiency B its international competitiveness C its level of output of two goods D its rate of economic growth
1 marks
Answer: C
This question in 9708/11 May/June 2024
Q134 · The diagram shows a production possibility curve (PPC) 9708/12 May/June 2024
1 The diagram shows a production possibility curve (PPC). It indicates the combinations of consumer goods and capital goods produced by an economy using all its available resources. 50 units of consumer 40 X goods 30 20 PPC 10 0 0 1 2 3 4 5 units of capital goods What does position X indicate? A a lower ratio of capital to consumer goods is necessary to achieve economic growth B increasing levels of unemployment C insufficient factors of production are available D too many consumer goods are causing a fall in economic growth
1 marks
Answer: C
This question in 9708/12 May/June 2024
Q135 · The diagram shows a production possibility curve for an economy that produces two goods… 9708/13 May/June 2024
2 The diagram shows a production possibility curve for an economy that produces two goods, X and Y. good Y G F E H O good X When will the opportunity cost of producing more of good X be the largest? A moving from point E to point F B moving from point E to point G C moving from point E to point H D moving from point G to point H
1 marks
Answer: D
This question in 9708/13 May/June 2024
Q136 · The diagrams show production possibility curves 9708/11 Oct/Nov 2024
4 The diagrams show production possibility curves. Which diagram shows constant opportunity costs? A B consumer consumer goods goods O capital goods O capital goods C D consumer consumer goods goods O capital goods O capital goods
1 marks
Answer: A
This question in 9708/11 Oct/Nov 2024
Q137 · Farmers using traditional methods lack access to finance and often employ family members… 9708/11 Oct/Nov 2024
5 Farmers using traditional methods lack access to finance and often employ family members on a part-time basis. If working practices in agriculture could be improved, how would this be likely to be shown on the production possibility curve? R manufactured goods T S O agricultural goods A by a movement from R to T B by a movement from S to R C by a movement from S to T D by a movement from T to R
1 marks
Answer: C
This question in 9708/11 Oct/Nov 2024
Q138 · The production possibility curve for a country is shown 9708/12 Oct/Nov 2024
1 The production possibility curve for a country is shown. manufactured goods O agricultural goods What can be determined from the diagram? A the consumers’ preferred combination of output B the level of economic growth C the opportunity cost of manufactured goods in terms of agricultural products D the preference for present consumption rather than future consumption
1 marks
Answer: C
This question in 9708/12 Oct/Nov 2024
Q139 · The diagram shows the change in a country’s production possibility curve from PQ to PR 9708/12 Oct/Nov 2024
5 The diagram shows the change in a country’s production possibility curve from PQ to PR. P public goods O Q R private goods What increases as a result of the change from PQ to PR? A the price of private goods B the price of public goods C the opportunity cost of private goods D the opportunity cost of public goods
1 marks
Answer: D
This question in 9708/12 Oct/Nov 2024
Q140 · The diagram shows a country’s production possibility curve 9708/13 Oct/Nov 2024
1 The diagram shows a country’s production possibility curve. 100 food (units) 0 0 50 drink (units) What can be concluded from the diagram? A Food and drink are normal goods. B The country is self-sufficient in the production of food and drink. C The opportunity cost of food falls as more drink is produced. D There is a constant opportunity cost between food and drink.
1 marks
Answer: D
This question in 9708/13 Oct/Nov 2024
Q141 · A country currently producing at point X on its production possibility curve decides to… 9708/13 Oct/Nov 2024
26 A country currently producing at point X on its production possibility curve decides to specialise in the manufacture of cars and import trucks. It finds it can import one truck in exchange for four cars. 2000 trucks X 1000 0 0 5000 10 000 cars What is the result in the domestic market if it exports all the extra cars? A 250 extra trucks B 1000 extra trucks C 1250 extra trucks D 2000 extra trucks
1 marks
Answer: A
This question in 9708/13 Oct/Nov 2024
Q142 · The production possibility curve shows the maximum potential output of apples and pears… 9708/12 Feb/March 2025
3 The production possibility curve shows the maximum potential output of apples and pears for an economy using current resources. Y X apples W Z O pears Which pair of positions identifies an efficient and an inefficient outcome? A W and Y B W and X C X and Z D Y and Z
1 marks
Answer: B
This question in 9708/12 Feb/March 2025
Q143 · The diagram shows the production possibility curves of two countries, X and Y 9708/11 May/June 2025
2 The diagram shows the production possibility curves of two countries, X and Y. country X 60 capital 50 goods 40 country Y 0 0 20 60 100 consumer goods What can be concluded from the diagram? A Both countries have decreasing opportunity cost in the production of consumer goods. B Both countries should produce 40 units of capital goods and 20 units of consumer goods. C Country Y has constant opportunity cost in the production of consumer goods. D Country Y is producing more consumer goods than country X.
1 marks
Answer: C
This question in 9708/11 May/June 2025
Q144 · The diagram shows an outward shift of the production possibility curve from PPC1 to PPC2 9708/12 May/June 2025
5 The diagram shows an outward shift of the production possibility curve from PPC1 to PPC2. consumer goods PPC1 PPC2 O capital goods What could have caused this shift? A a decrease in mineral resources B a decrease in prices of consumer goods C an increase in employment D an increase in technology
1 marks
Answer: D
This question in 9708/12 May/June 2025
Q145 · The diagram shows a country’s production possibilities 9708/13 May/June 2025
2 The diagram shows a country’s production possibilities. Points K, L, M, N, R and S represent different combinations of capital goods and consumer goods. Point K cannot be achieved unless there is economic growth. Point M lies on the country’s production possibility curve. K consumer L M N goods S R O capital goods Which two points must be on opposite sides of the country’s production possibility curve? A K and N B L and R C N and R D R and S
1 marks
Answer: C
This question in 9708/13 May/June 2025
Q146 · The diagram shows a production possibility curve for an economy that produces capital… 9708/11 Oct/Nov 2025
3 The diagram shows a production possibility curve for an economy that produces capital goods and consumer goods. capital goods O consumer goods Why is the production possibility curve drawn concave to the origin? A Capital goods are a more labour-intensive output than consumer goods. B Consumers always seek to maximise their satisfaction from consumption. C Profit maximisation for firms always ensures efficiency in production. D Some resources are more efficient in production of some goods than others.
1 marks
Answer: D
This question in 9708/11 Oct/Nov 2025
Q147 · The diagram shows a production possibility curve (PPC) for a country that produces two… 9708/12 Oct/Nov 2025
5 The diagram shows a production possibility curve (PPC) for a country that produces two goods, X and Y. The initial PPC is given by ST. good Y U S O V T W good X What is the effect on the PPC when the productivity of workers producing good X increases? A The PPC shifts from ST to SV. B The PPC shifts from ST to SW. C The PPC shifts from ST to UT. D The PPC shifts from ST to UW.
1 marks
Answer: B
This question in 9708/12 Oct/Nov 2025
Q148 · What would be an opportunity cost of growth in an economy? 9708/13 Oct/Nov 2025
3 What would be an opportunity cost of growth in an economy? A the faster growth of services than of manufacturing B the need for an increased level of imported raw materials C the need for greater government intervention D the reduction of consumption if growth requires investment
1 marks
Answer: D
This question in 9708/13 Oct/Nov 2025
Q149 · The diagram shows a production possibility curve (PPC) for an economy that produces two… 9708/13 Oct/Nov 2025
5 The diagram shows a production possibility curve (PPC) for an economy that produces two goods, X and Y. Both goods require labour to produce. The initial position of the PPC is at PPC0. good Y PPC2 PPC0 PPC1 PPC3 O good X What is the effect on the PPC following the emigration of a large number of workers? A the PPC remains at PPC0 B the PPC shifts from PPC0 to PPC1 C the PPC shifts from PPC0 to PPC2 D the PPC shifts from PPC0 to PPC3
1 marks
Answer: B
This question in 9708/13 Oct/Nov 2025
Q150 · An economy specialises in the production of one product 9708/13 Oct/Nov 2025
29 An economy specialises in the production of one product. It exports this product to obtain another product. Which type of diagram can show the combinations of these products? A the production possibility curve B the aggregate demand curve C the principle of absolute advantage D the trading possibility curve
1 marks
Answer: D
This question in 9708/13 Oct/Nov 2025
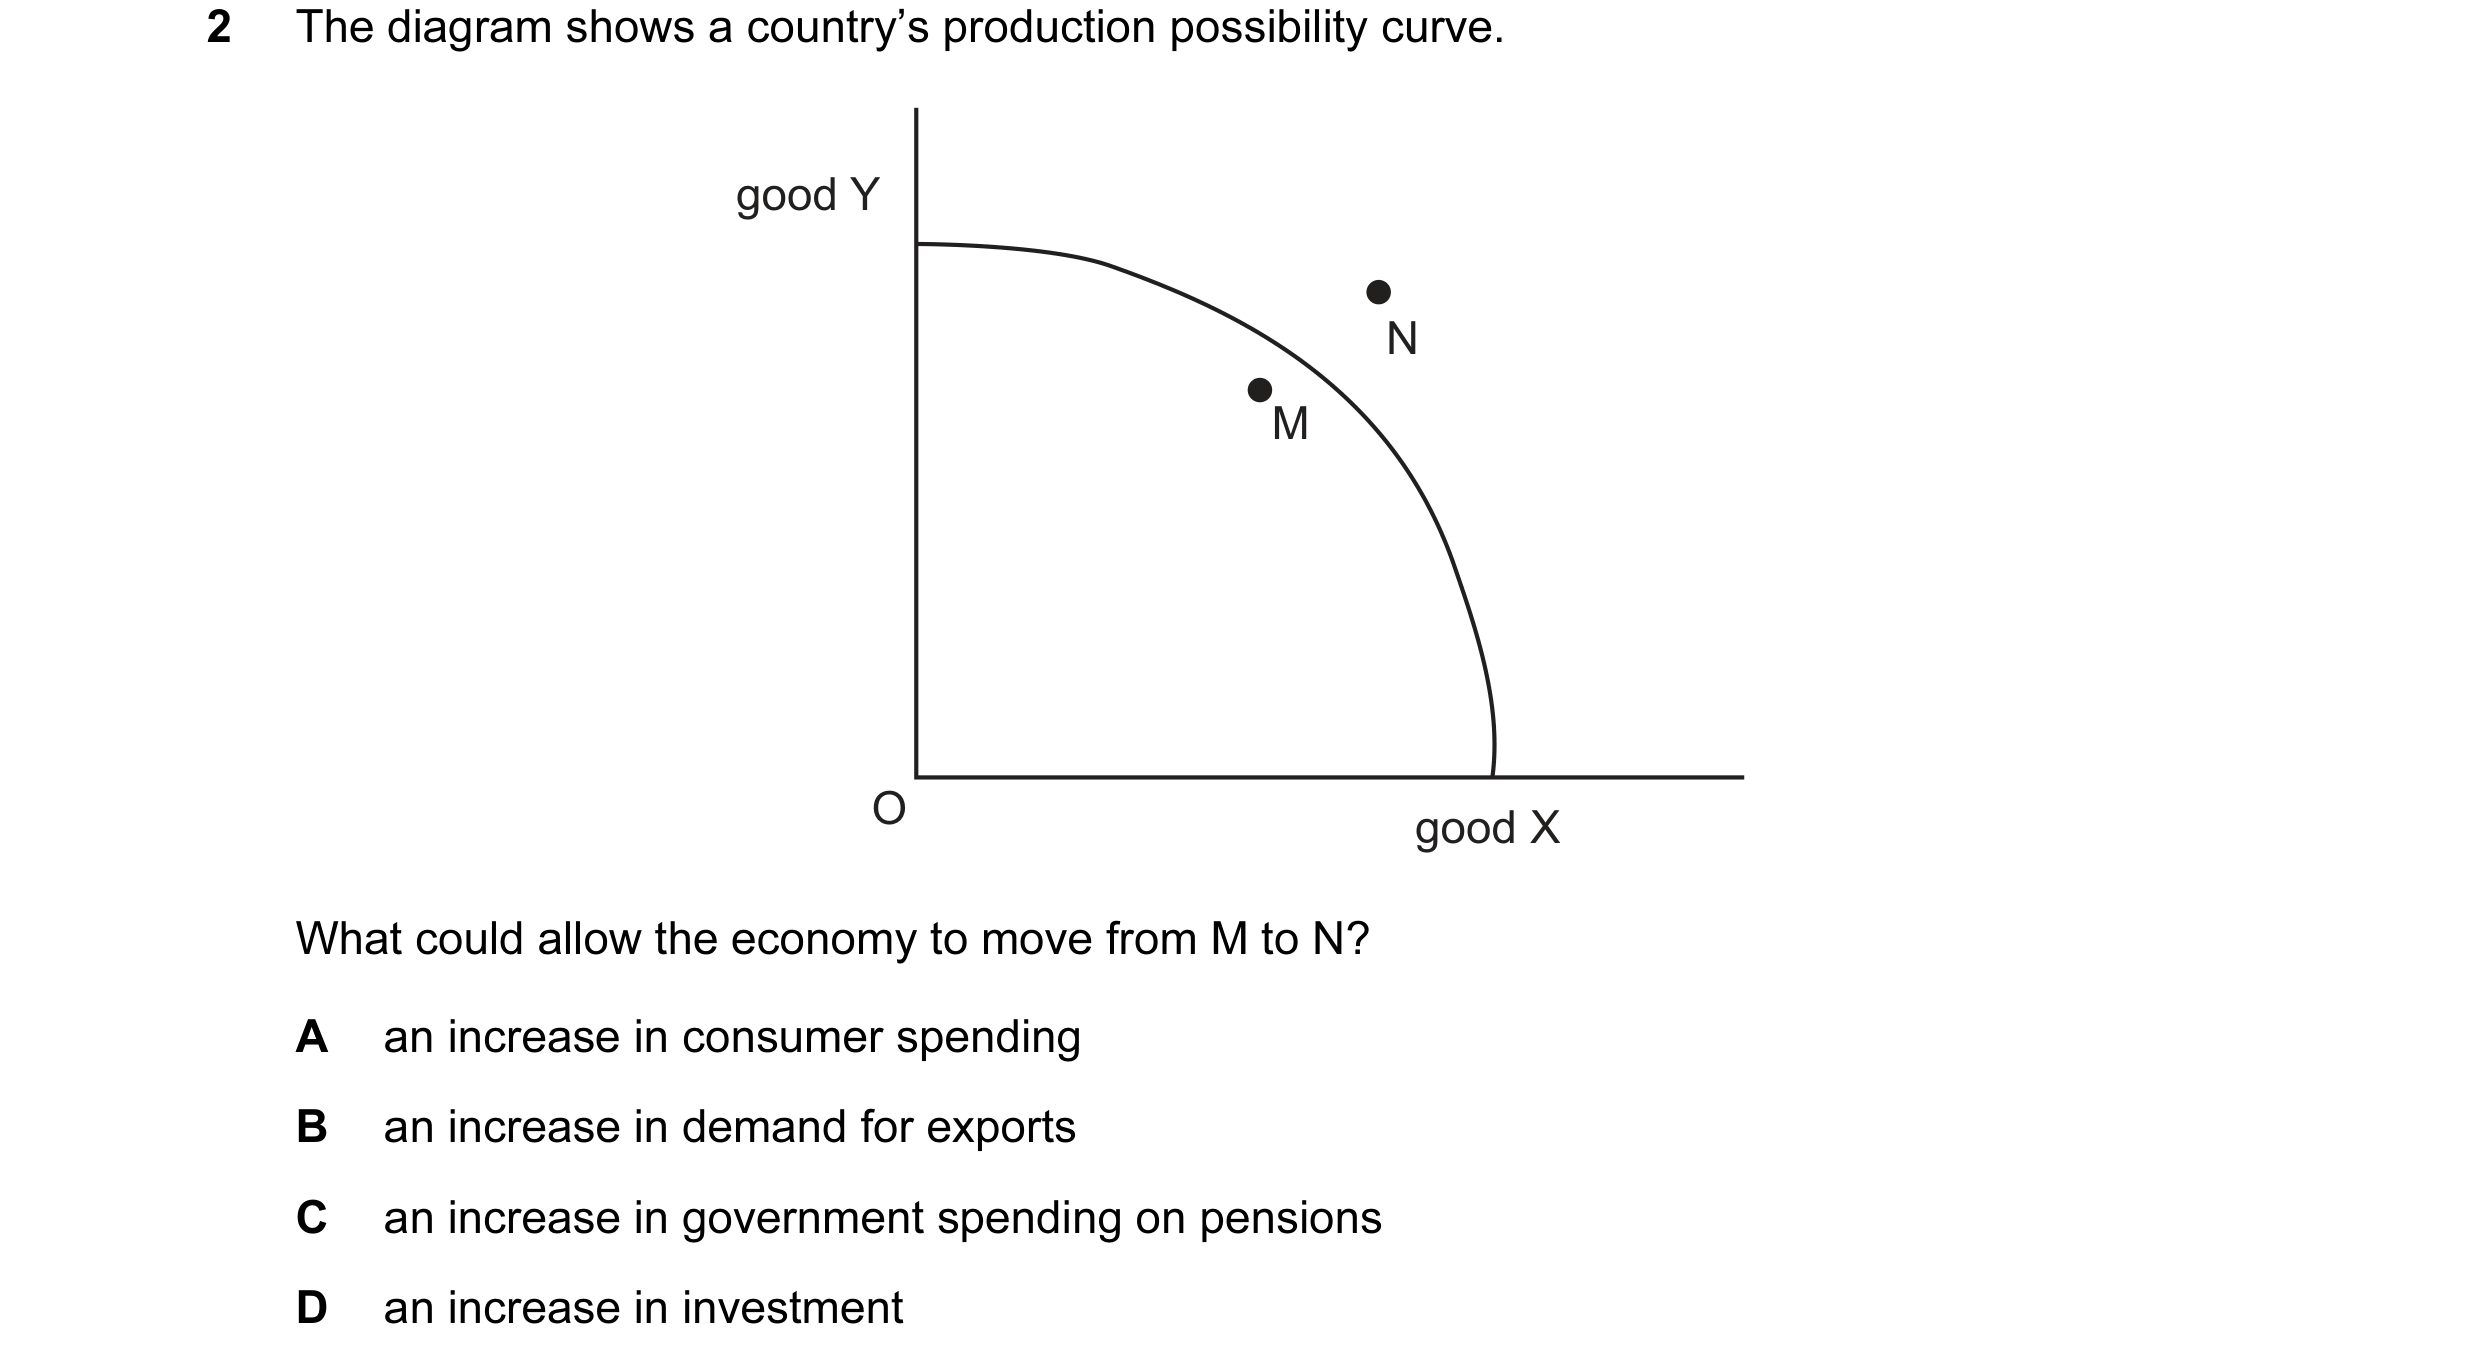
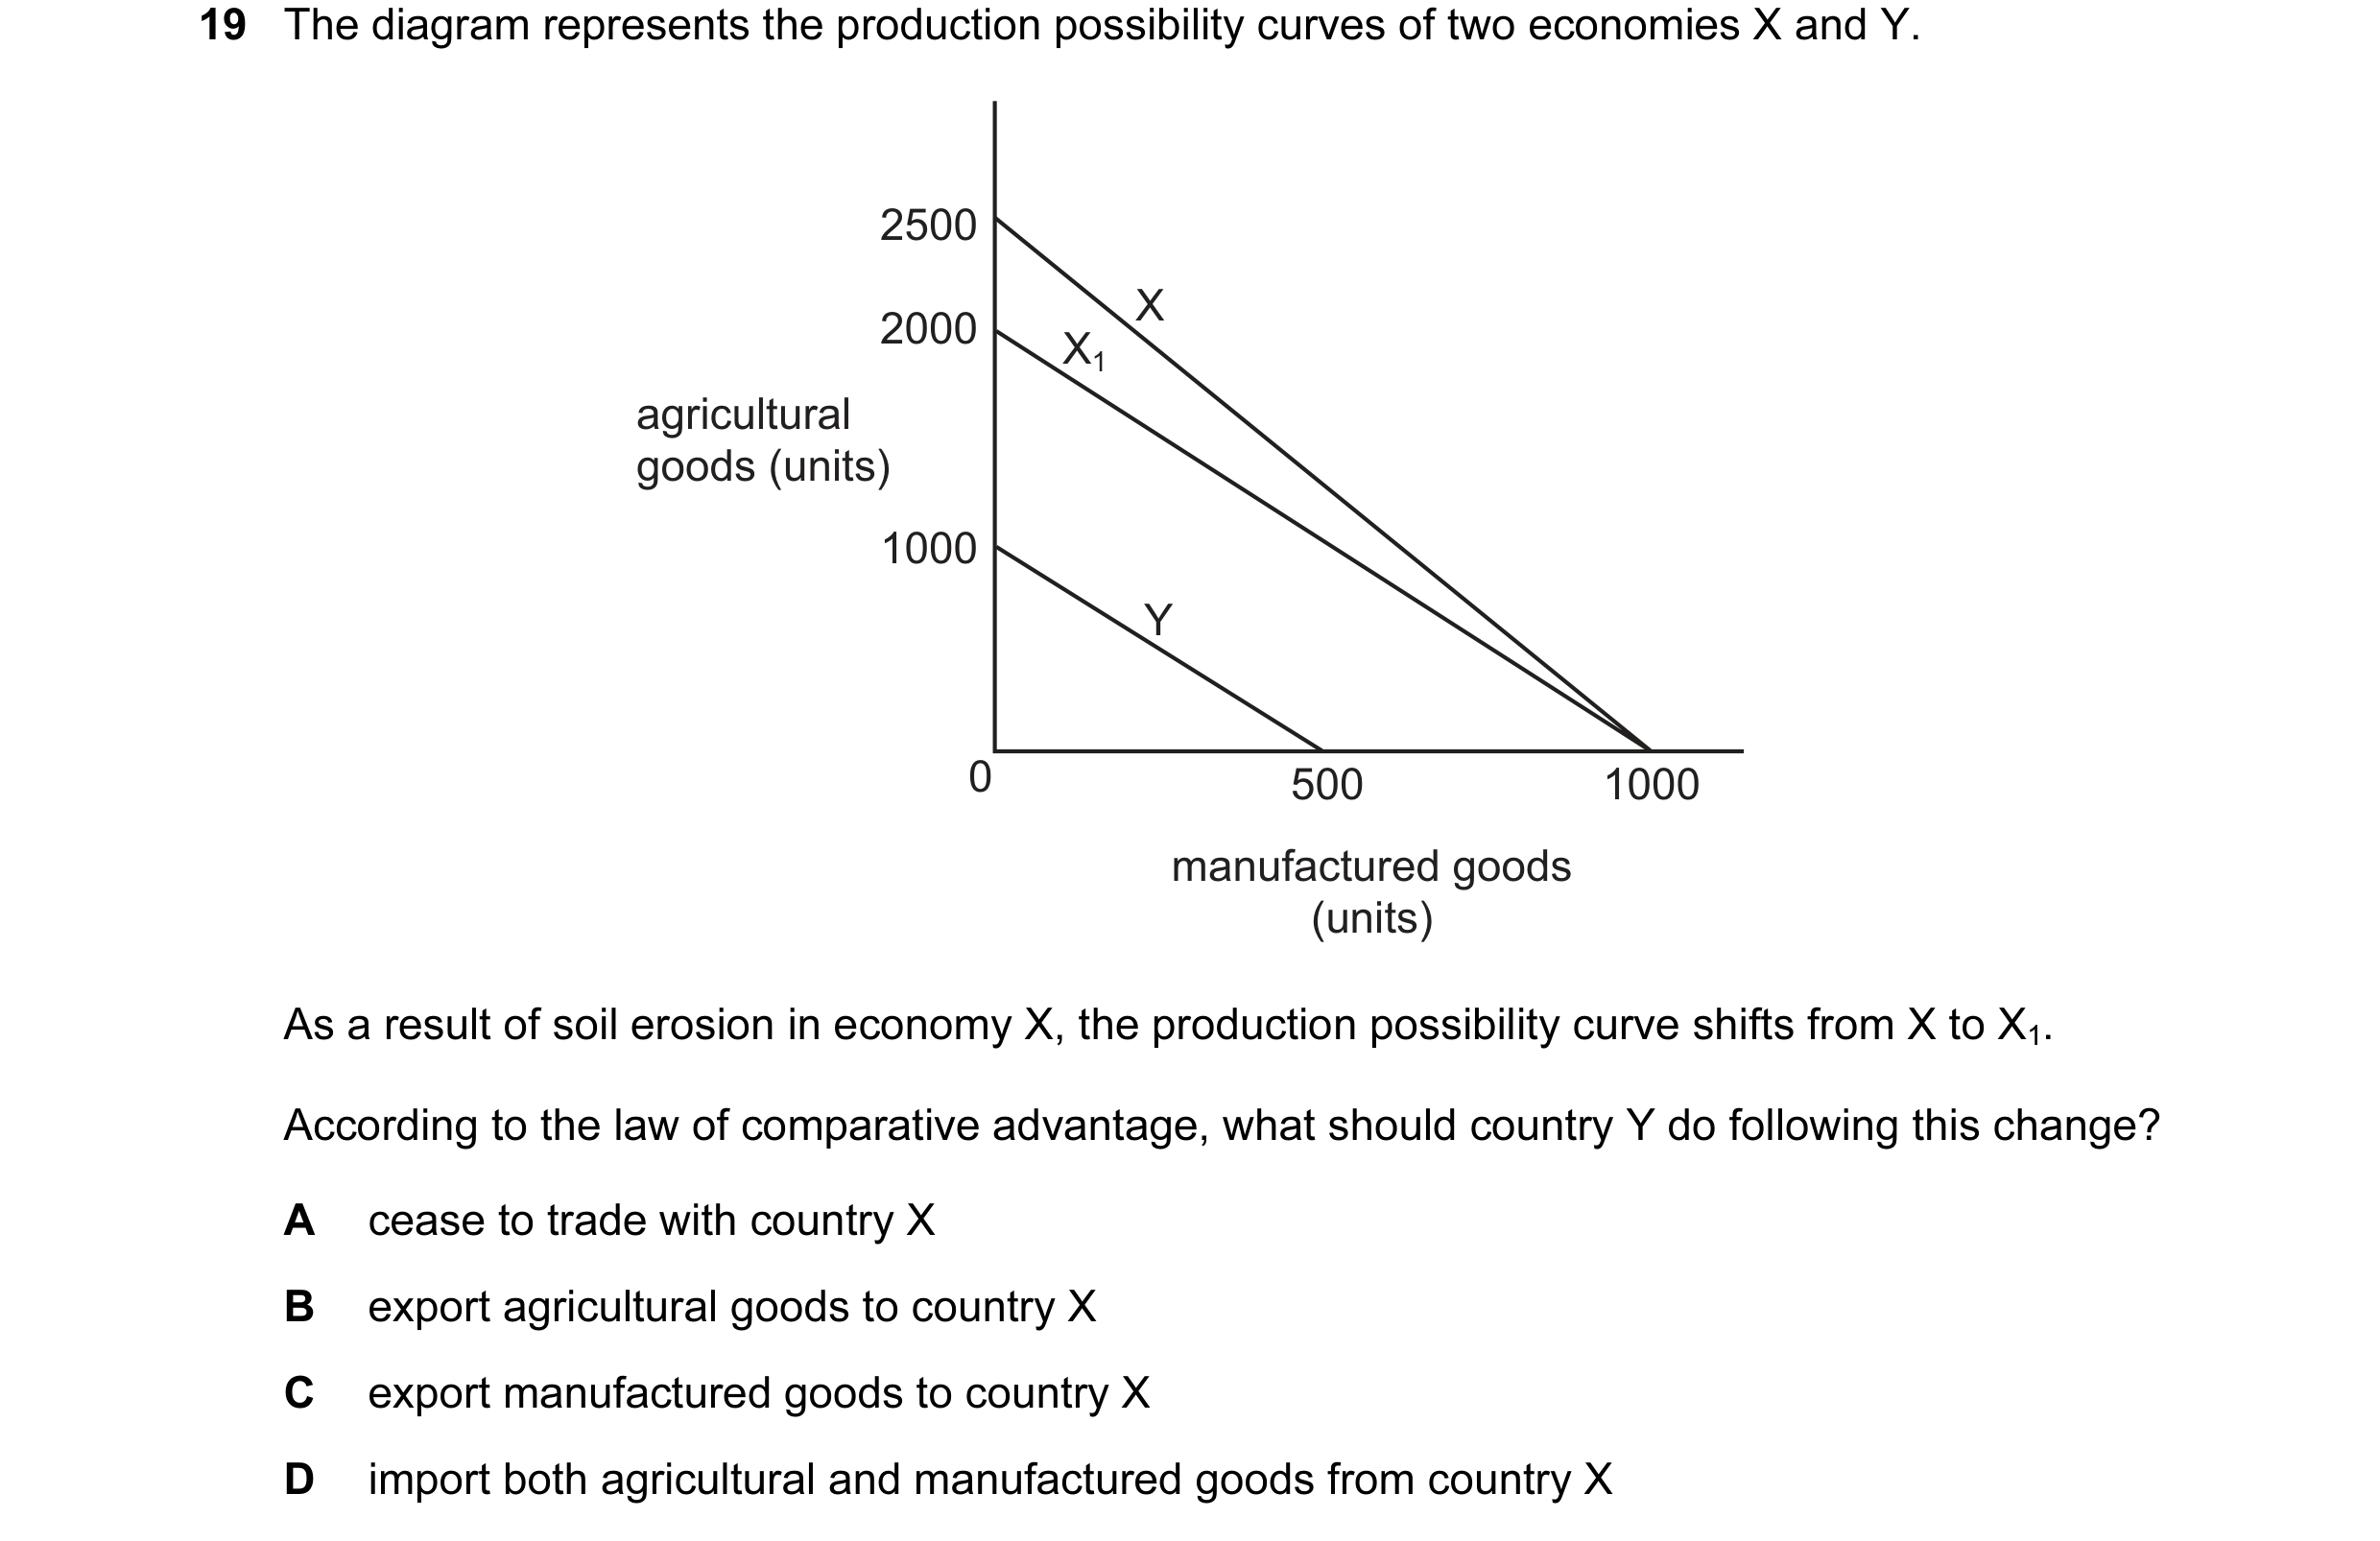 1 / 68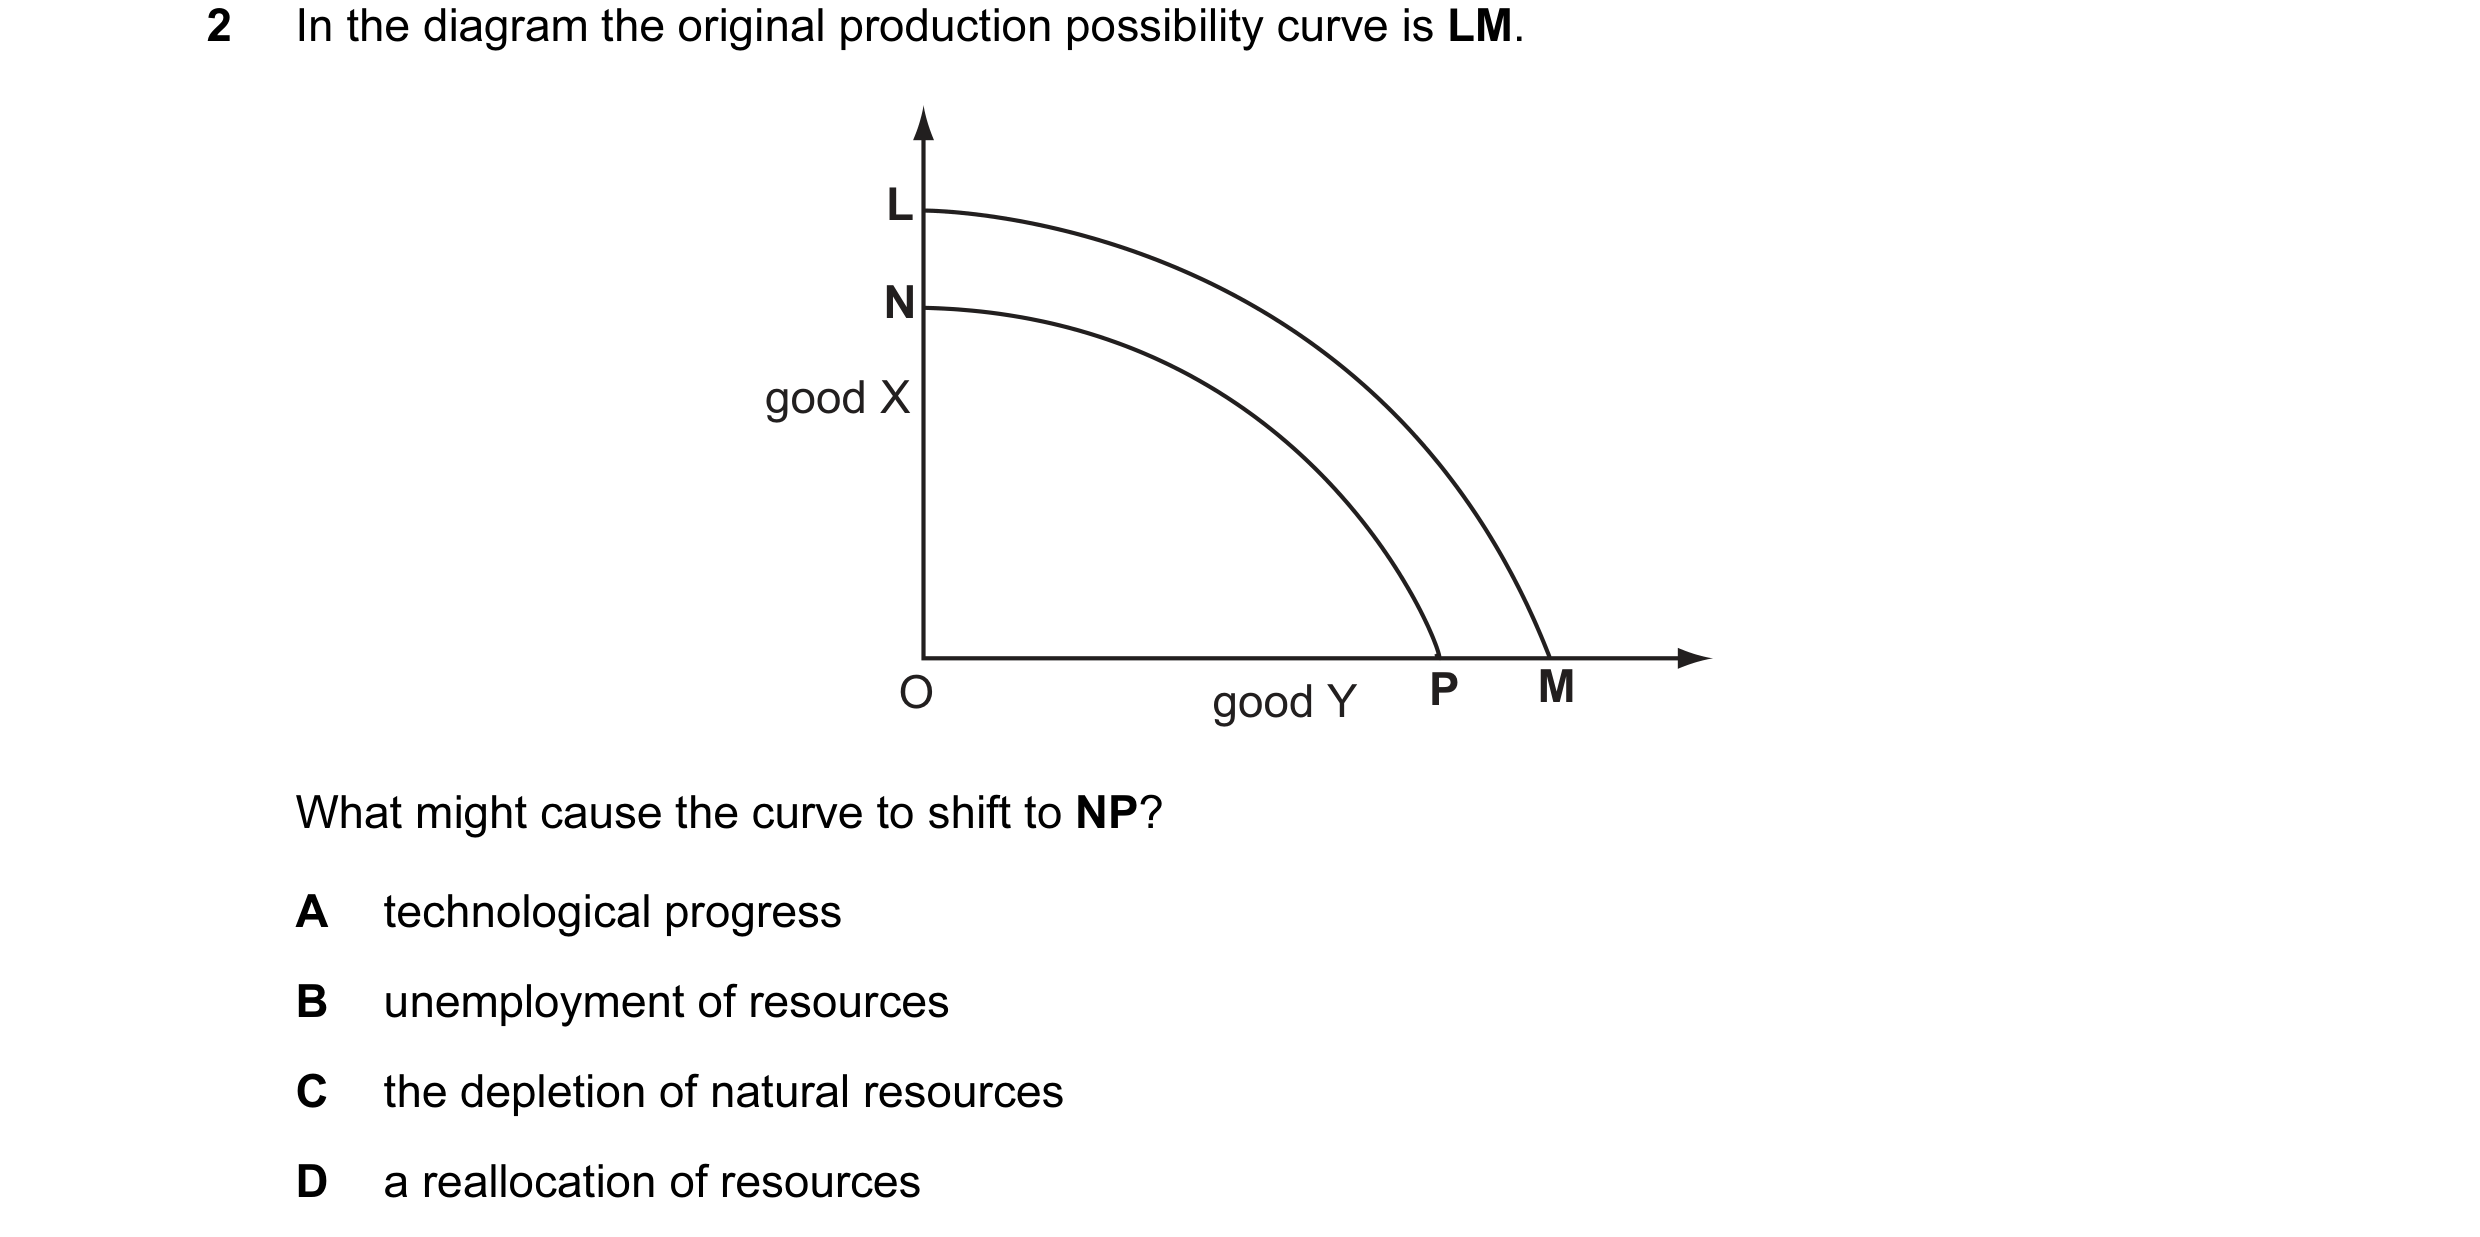
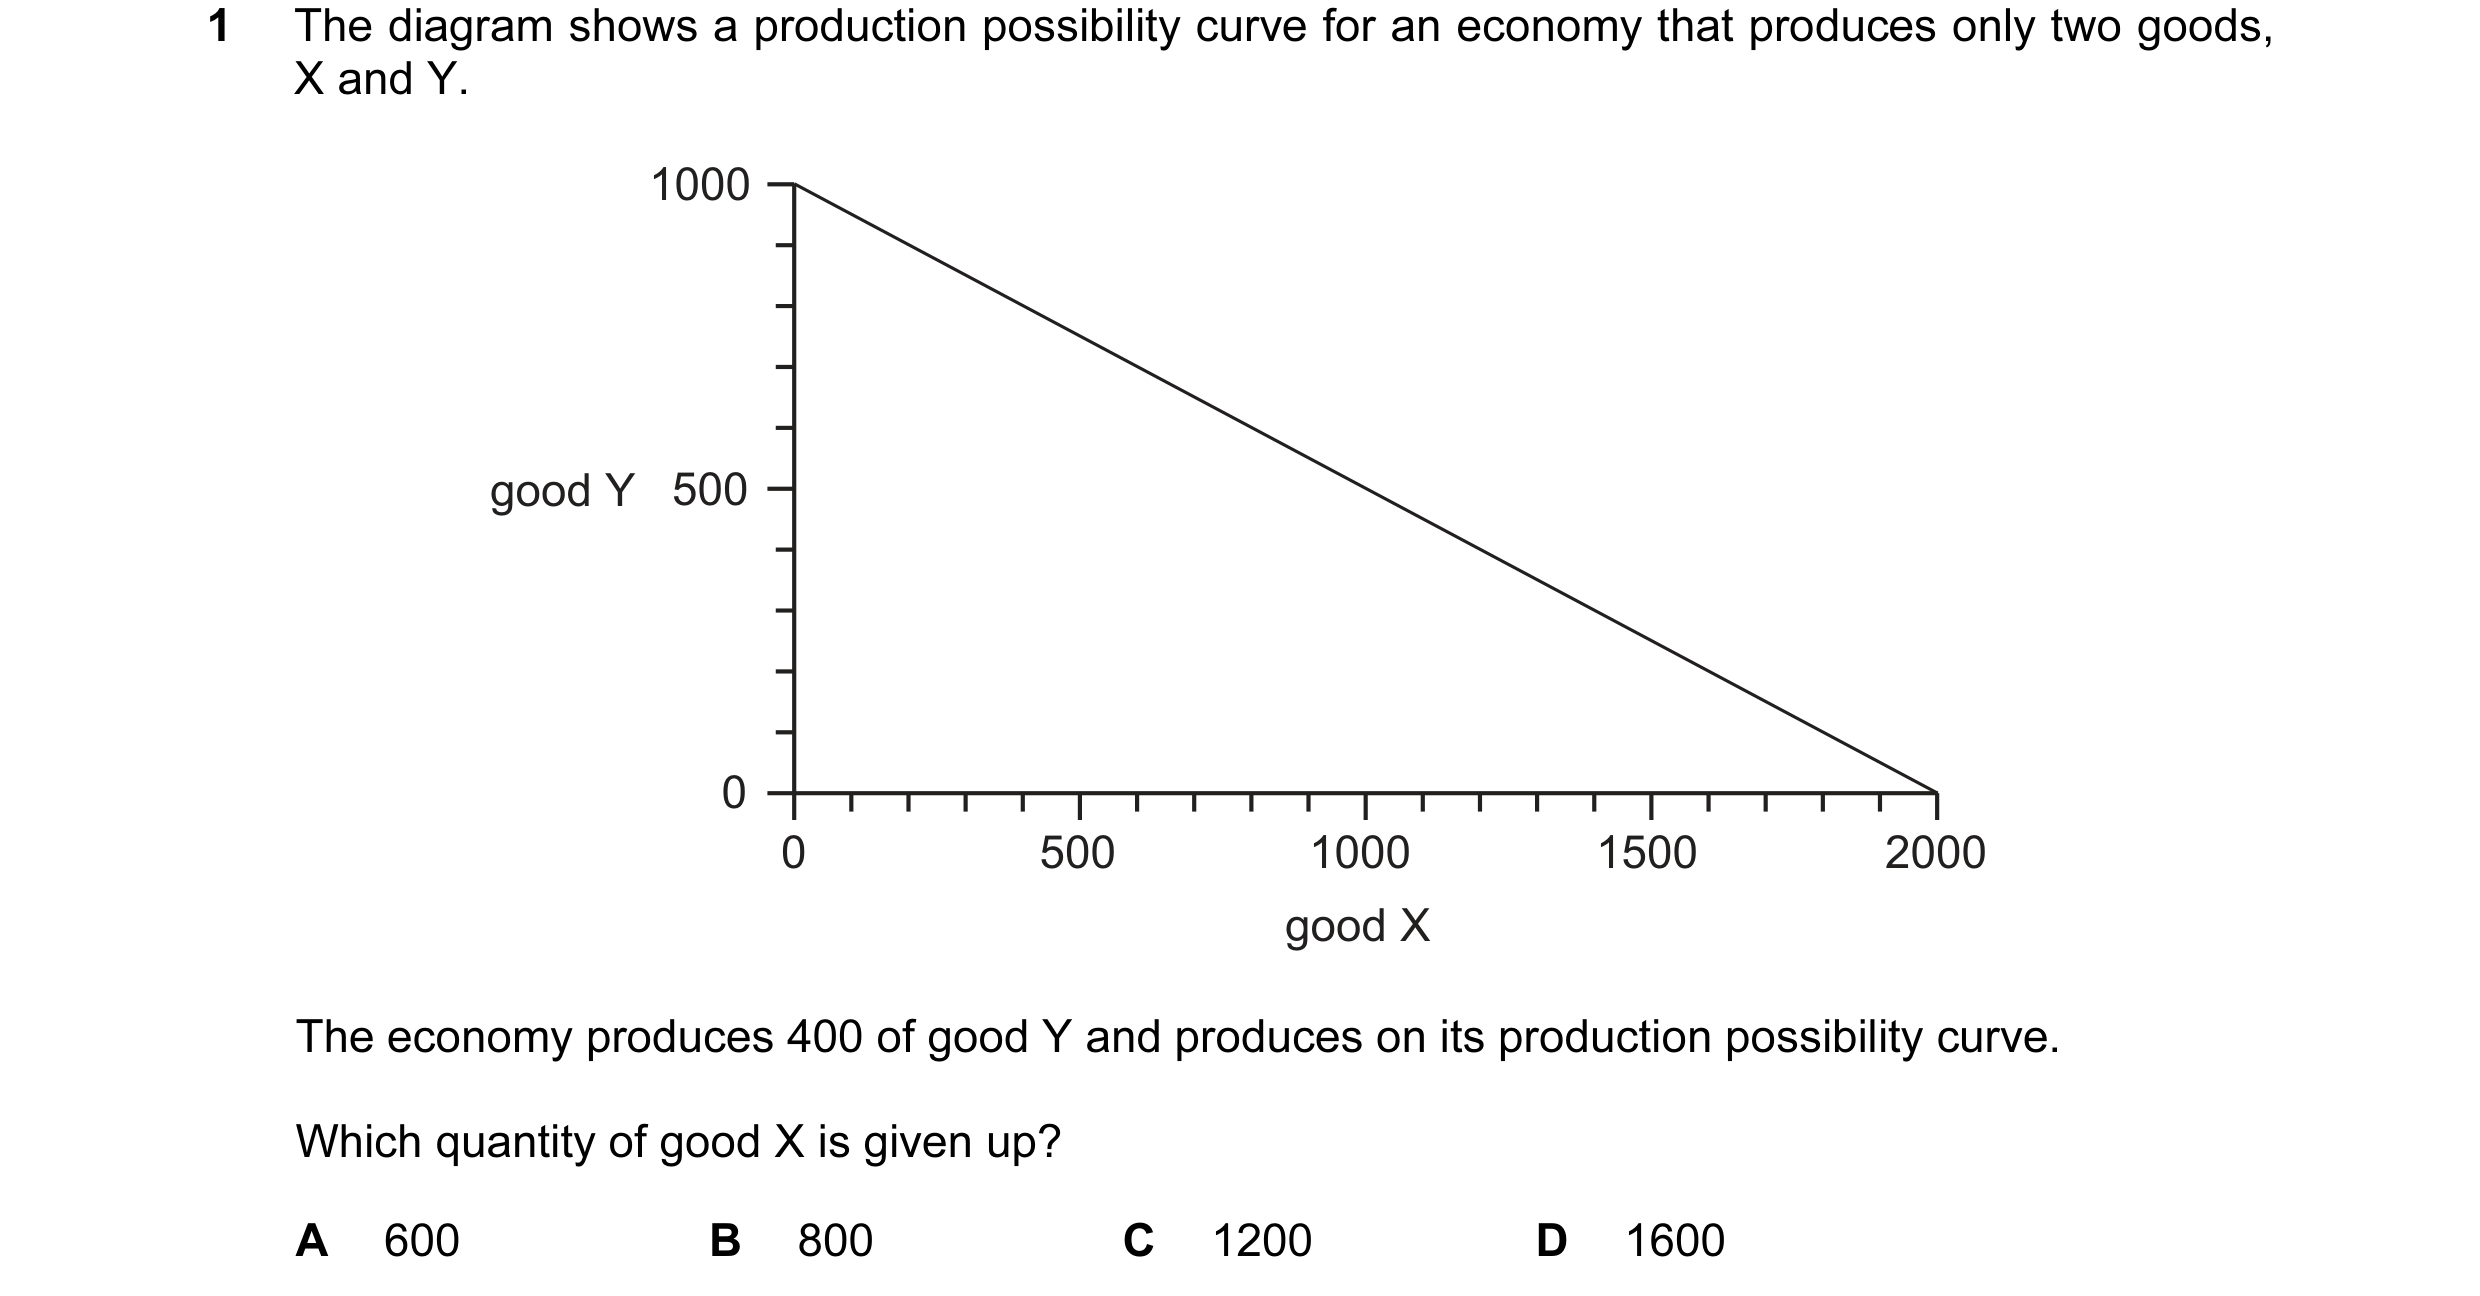
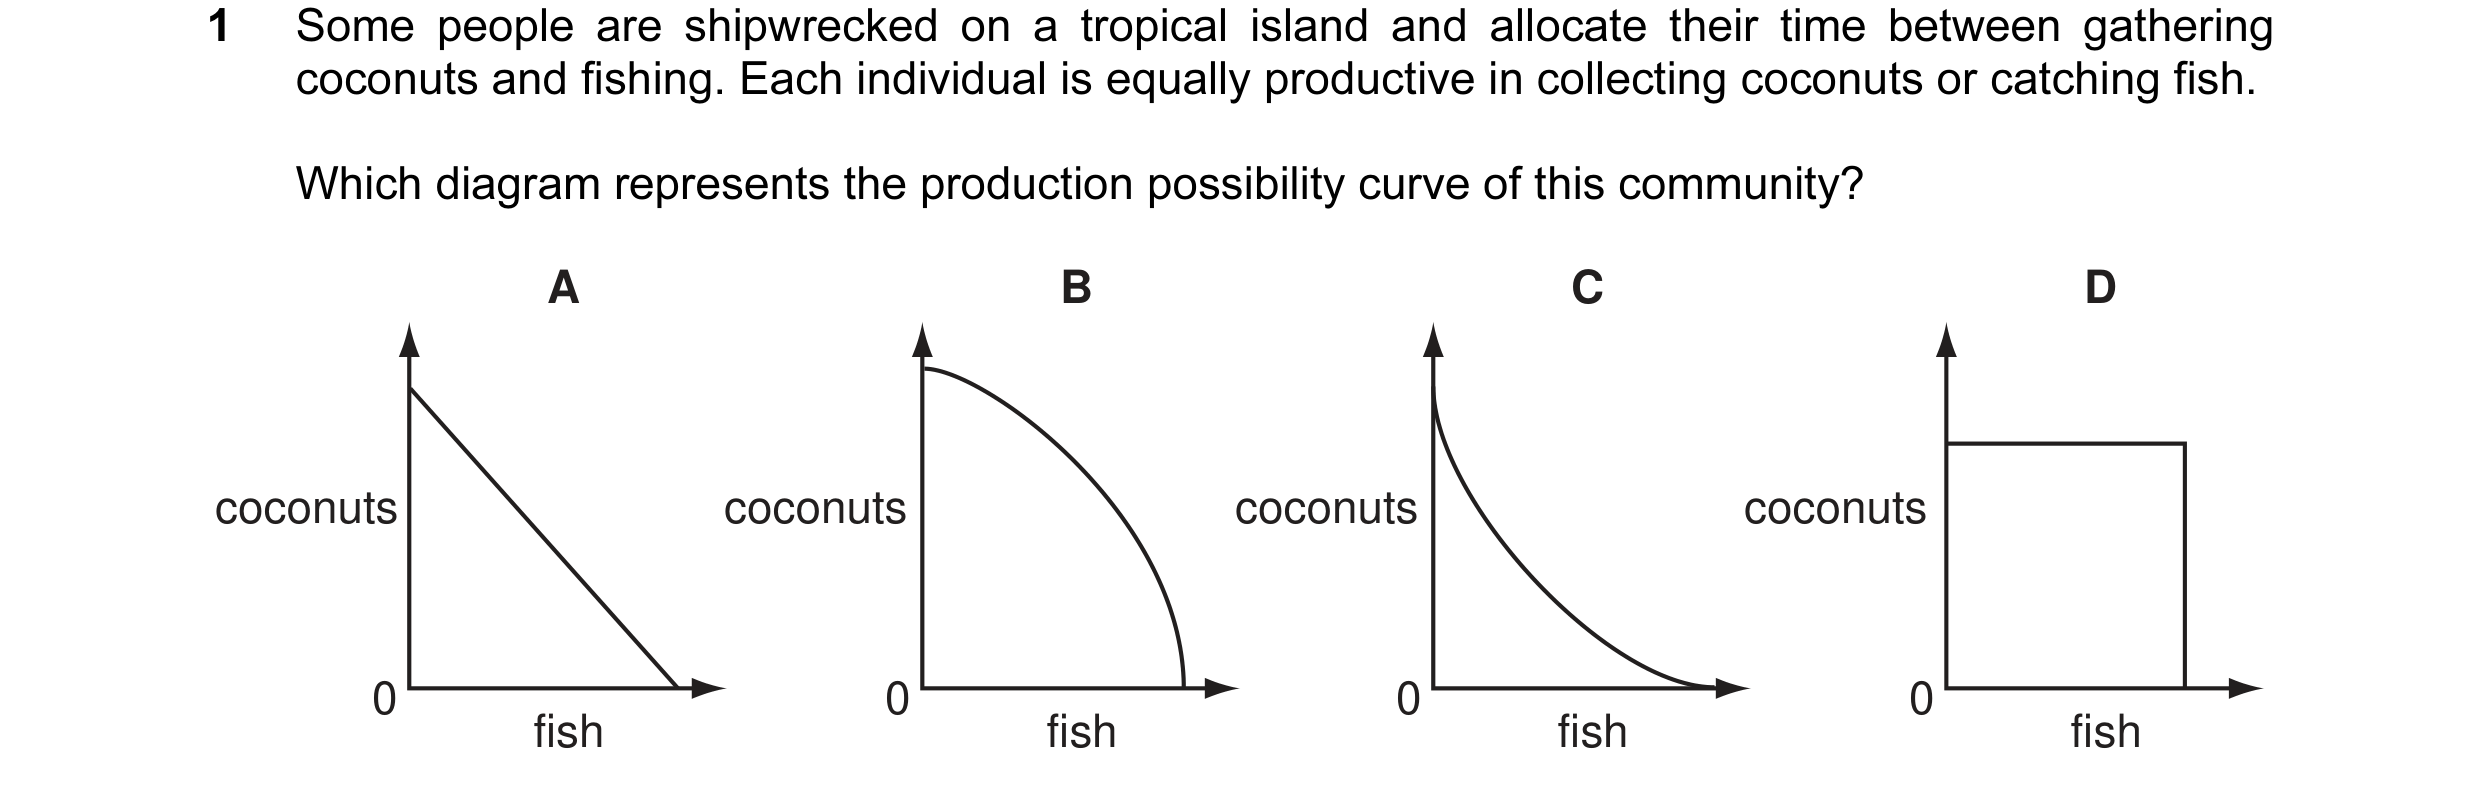 2 / 68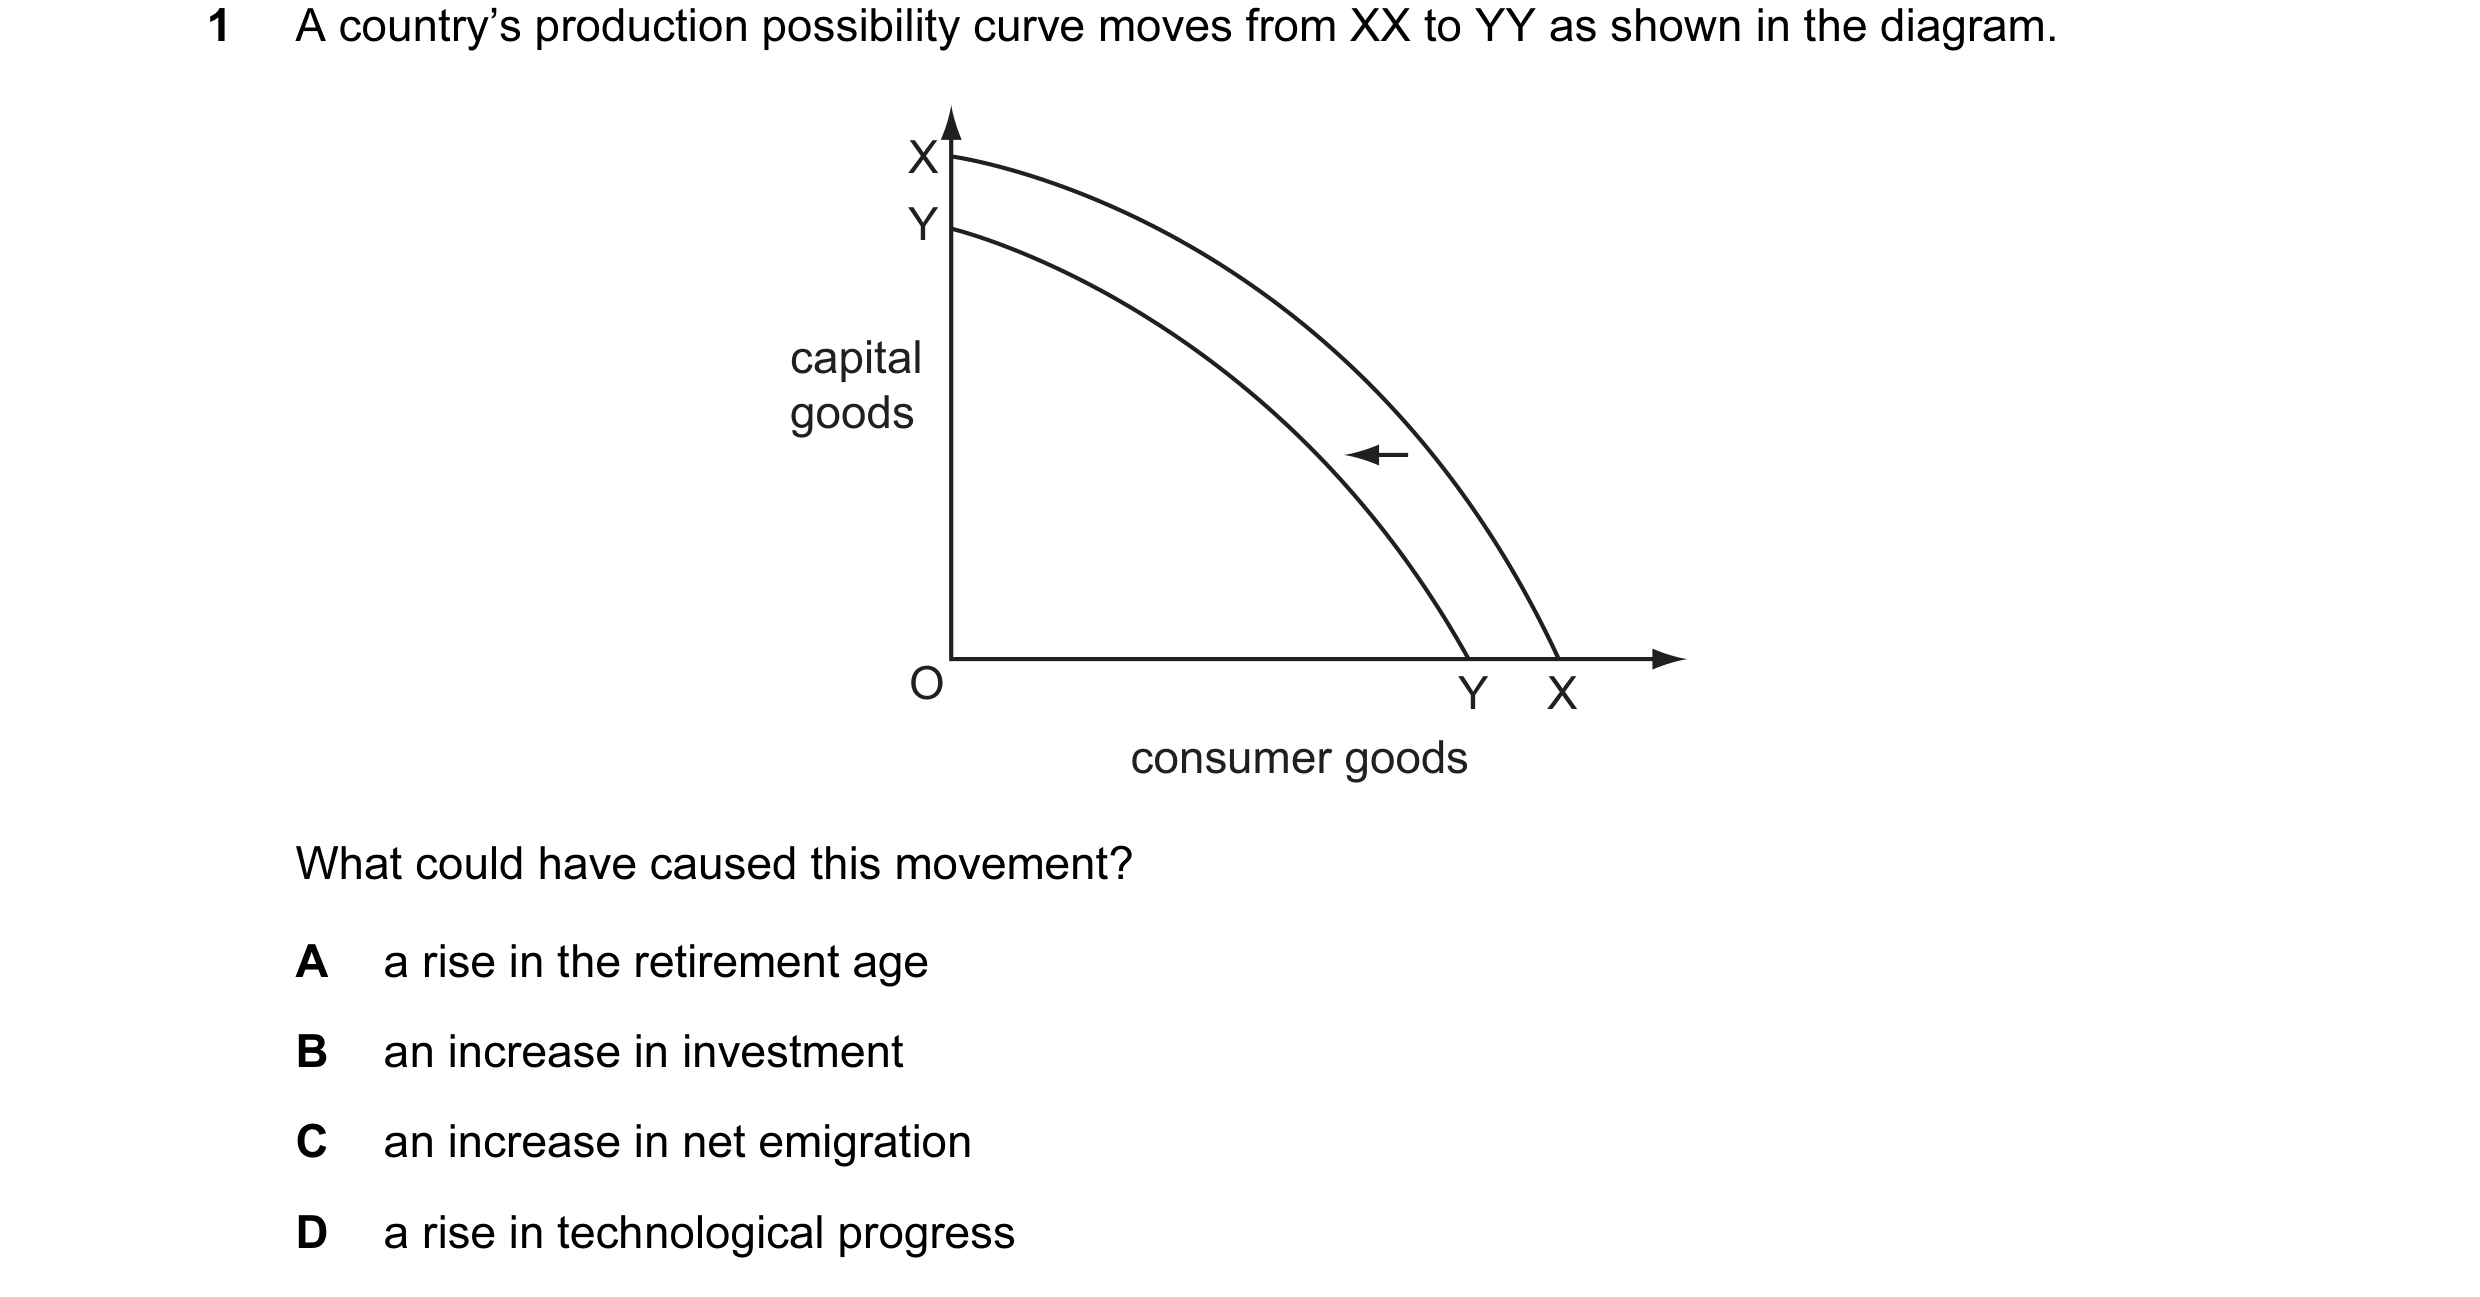
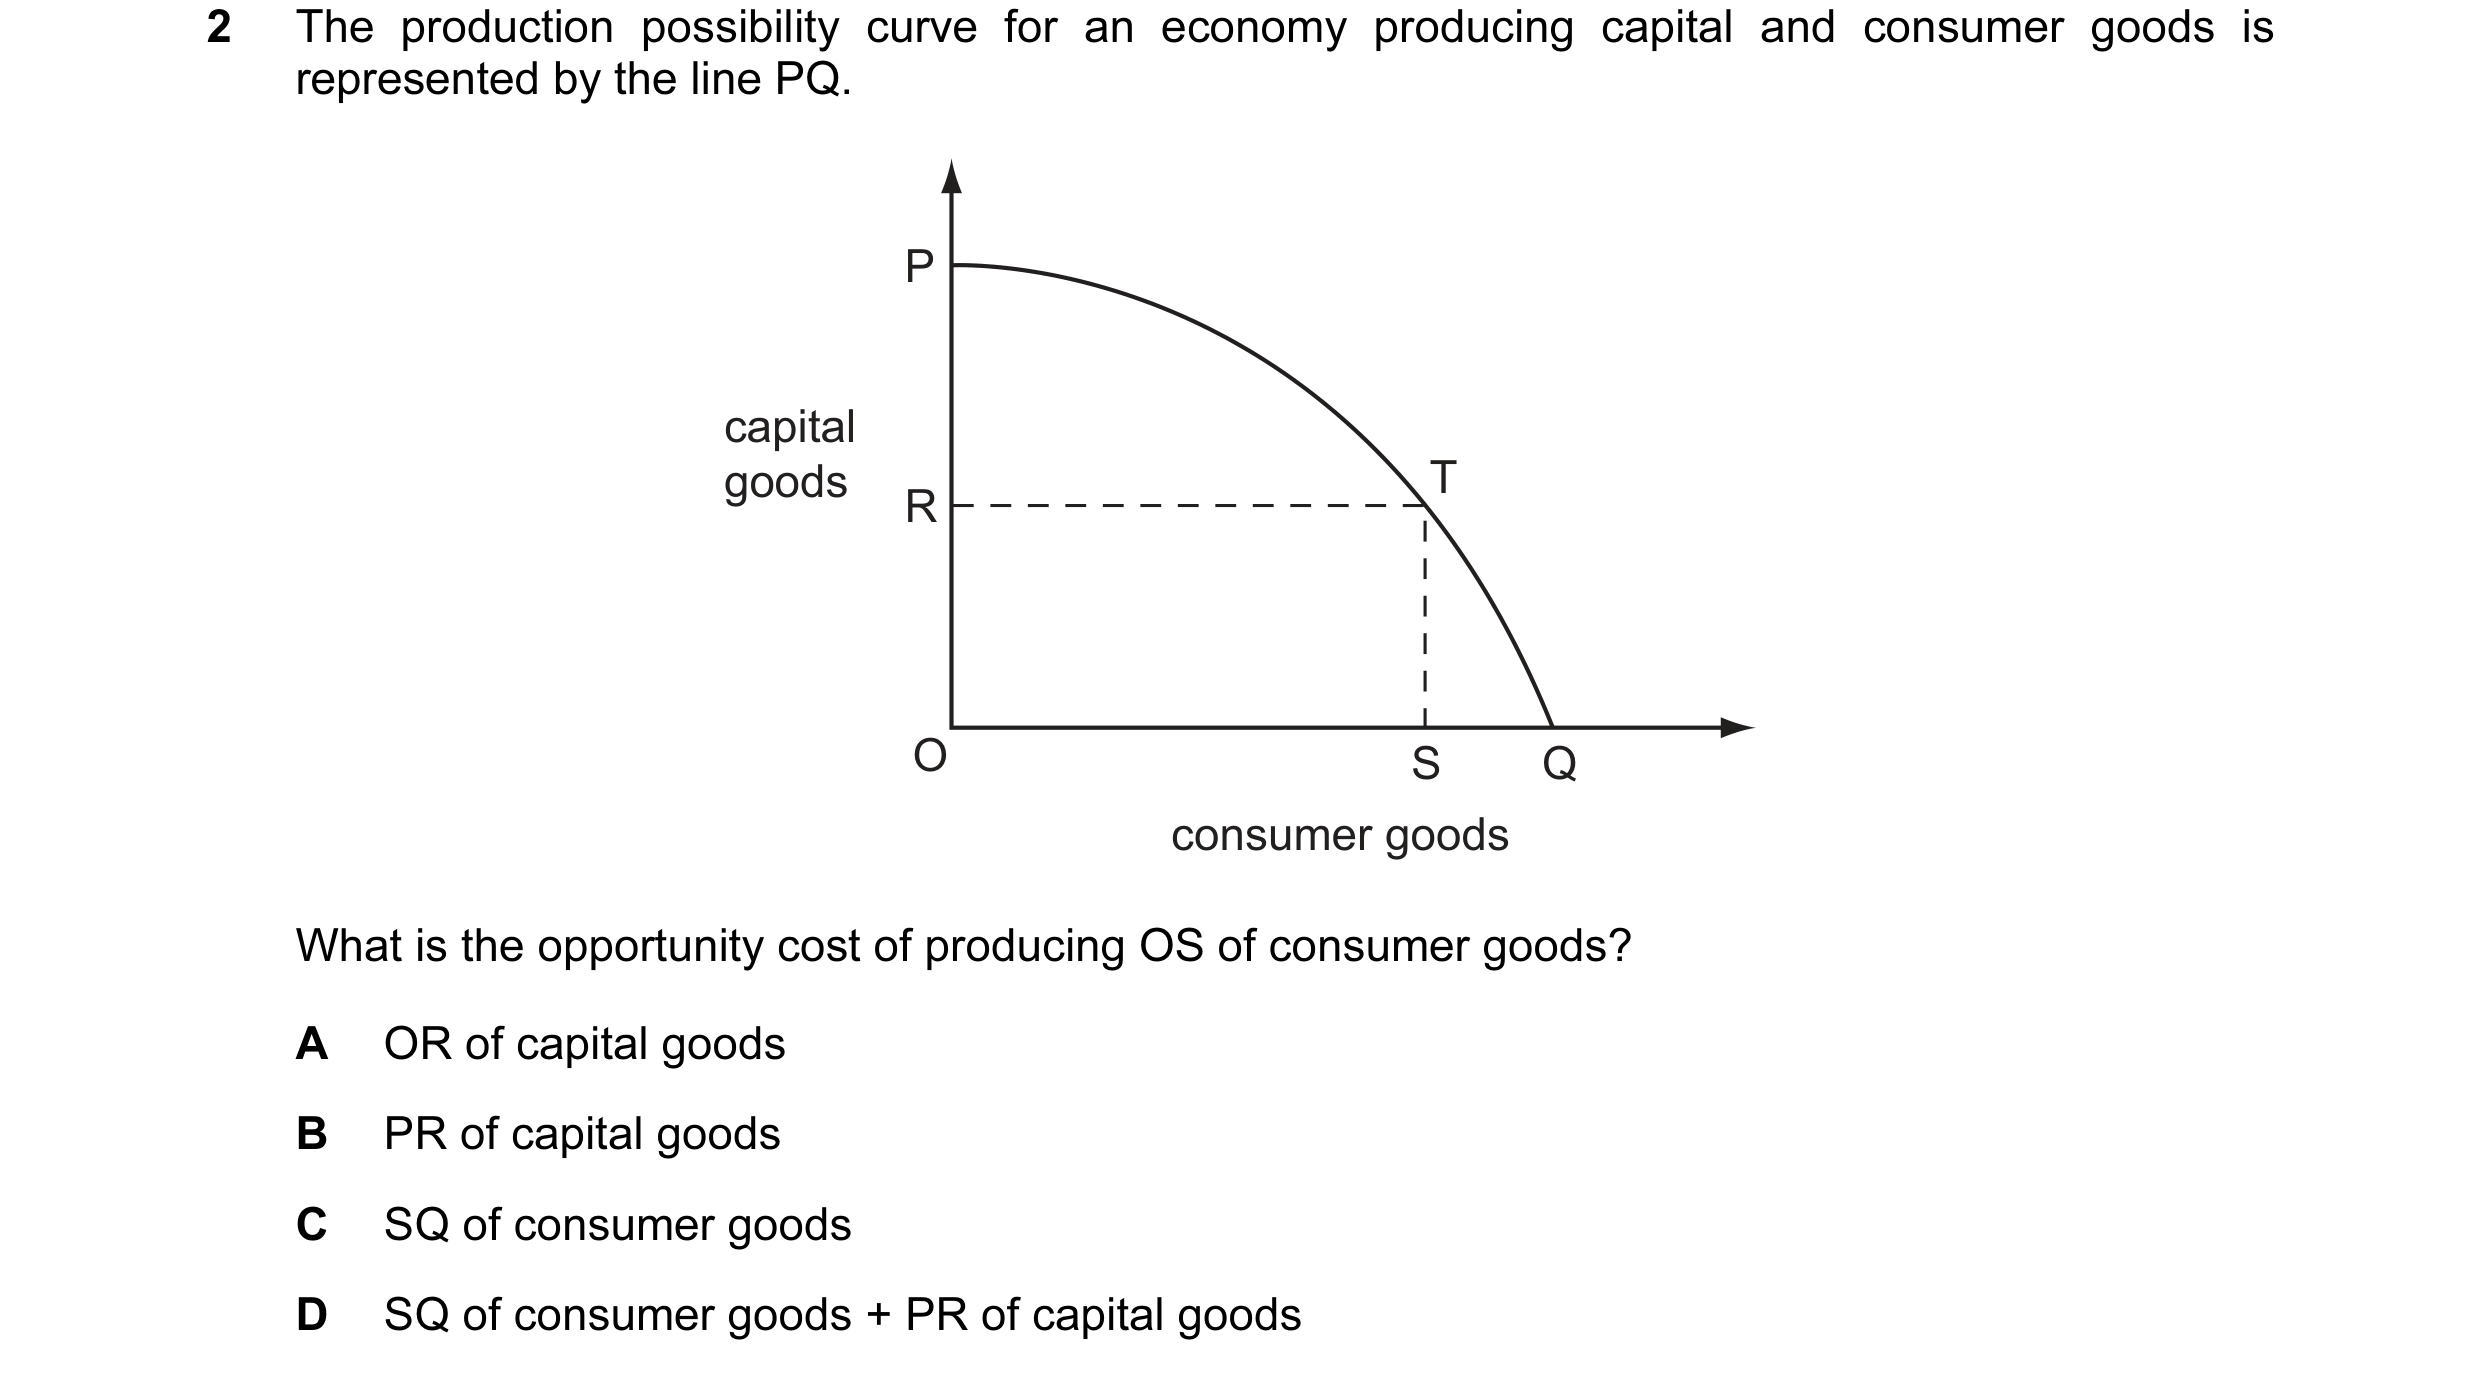 3 / 68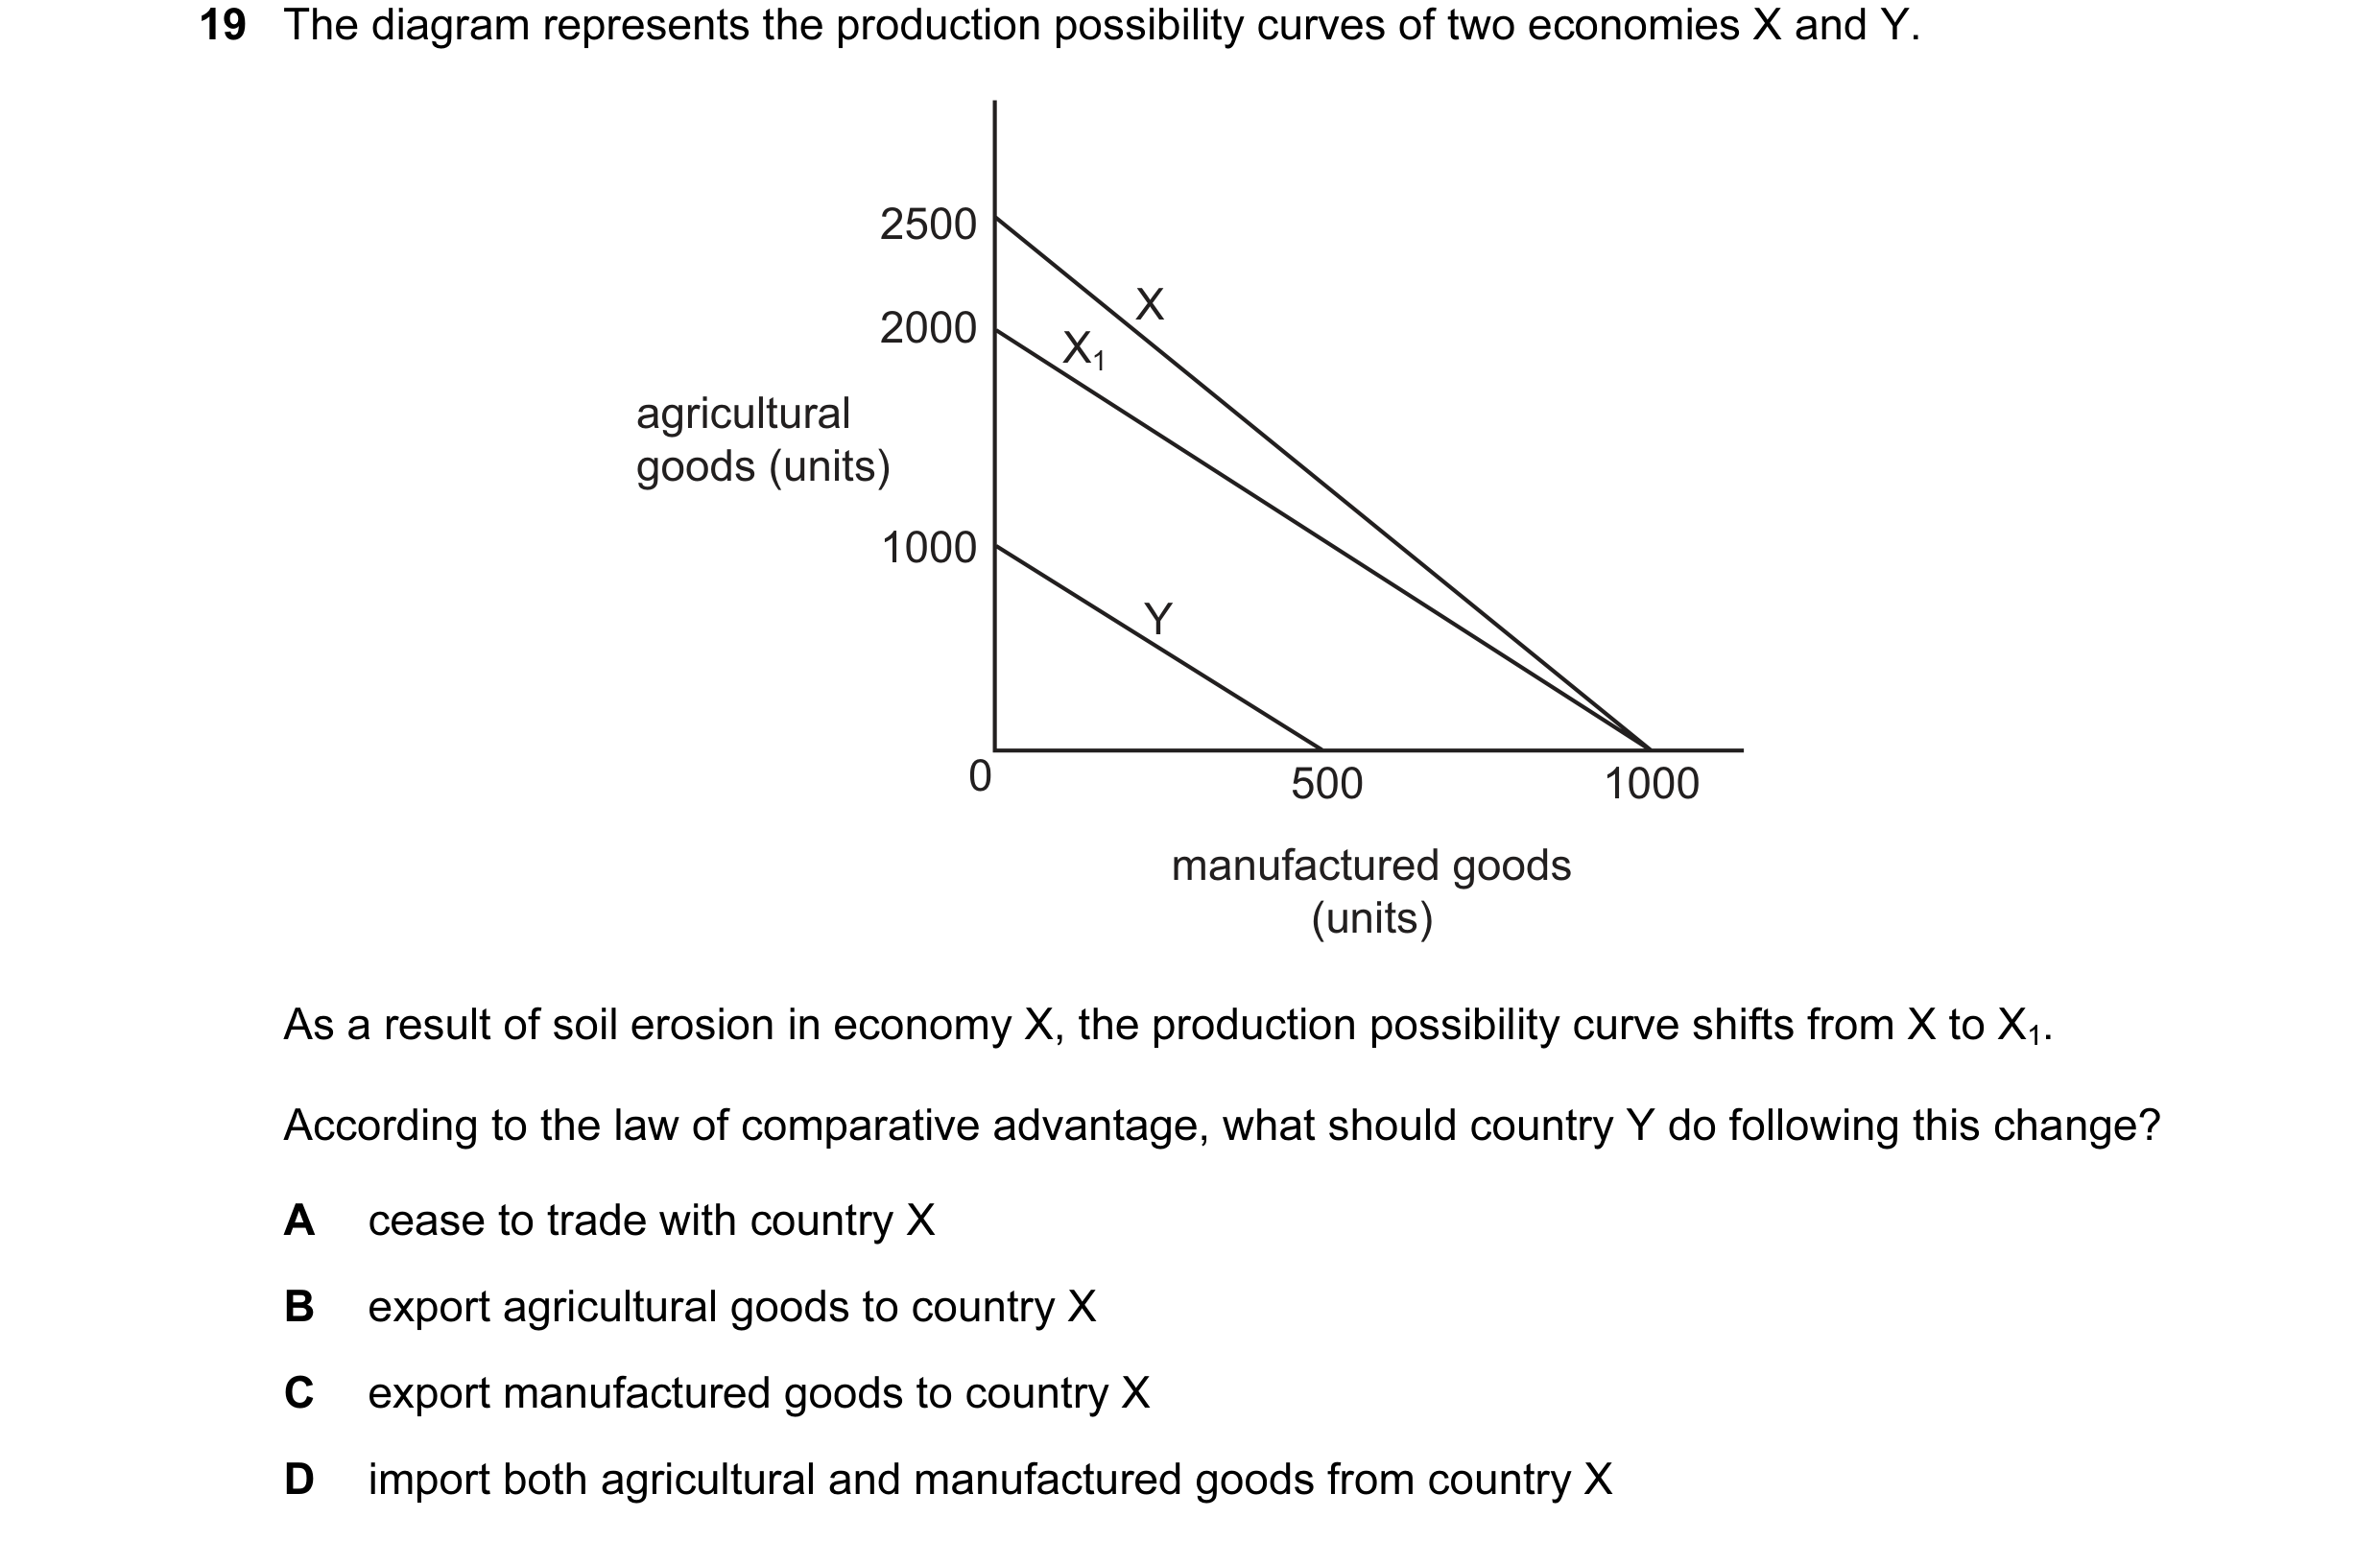
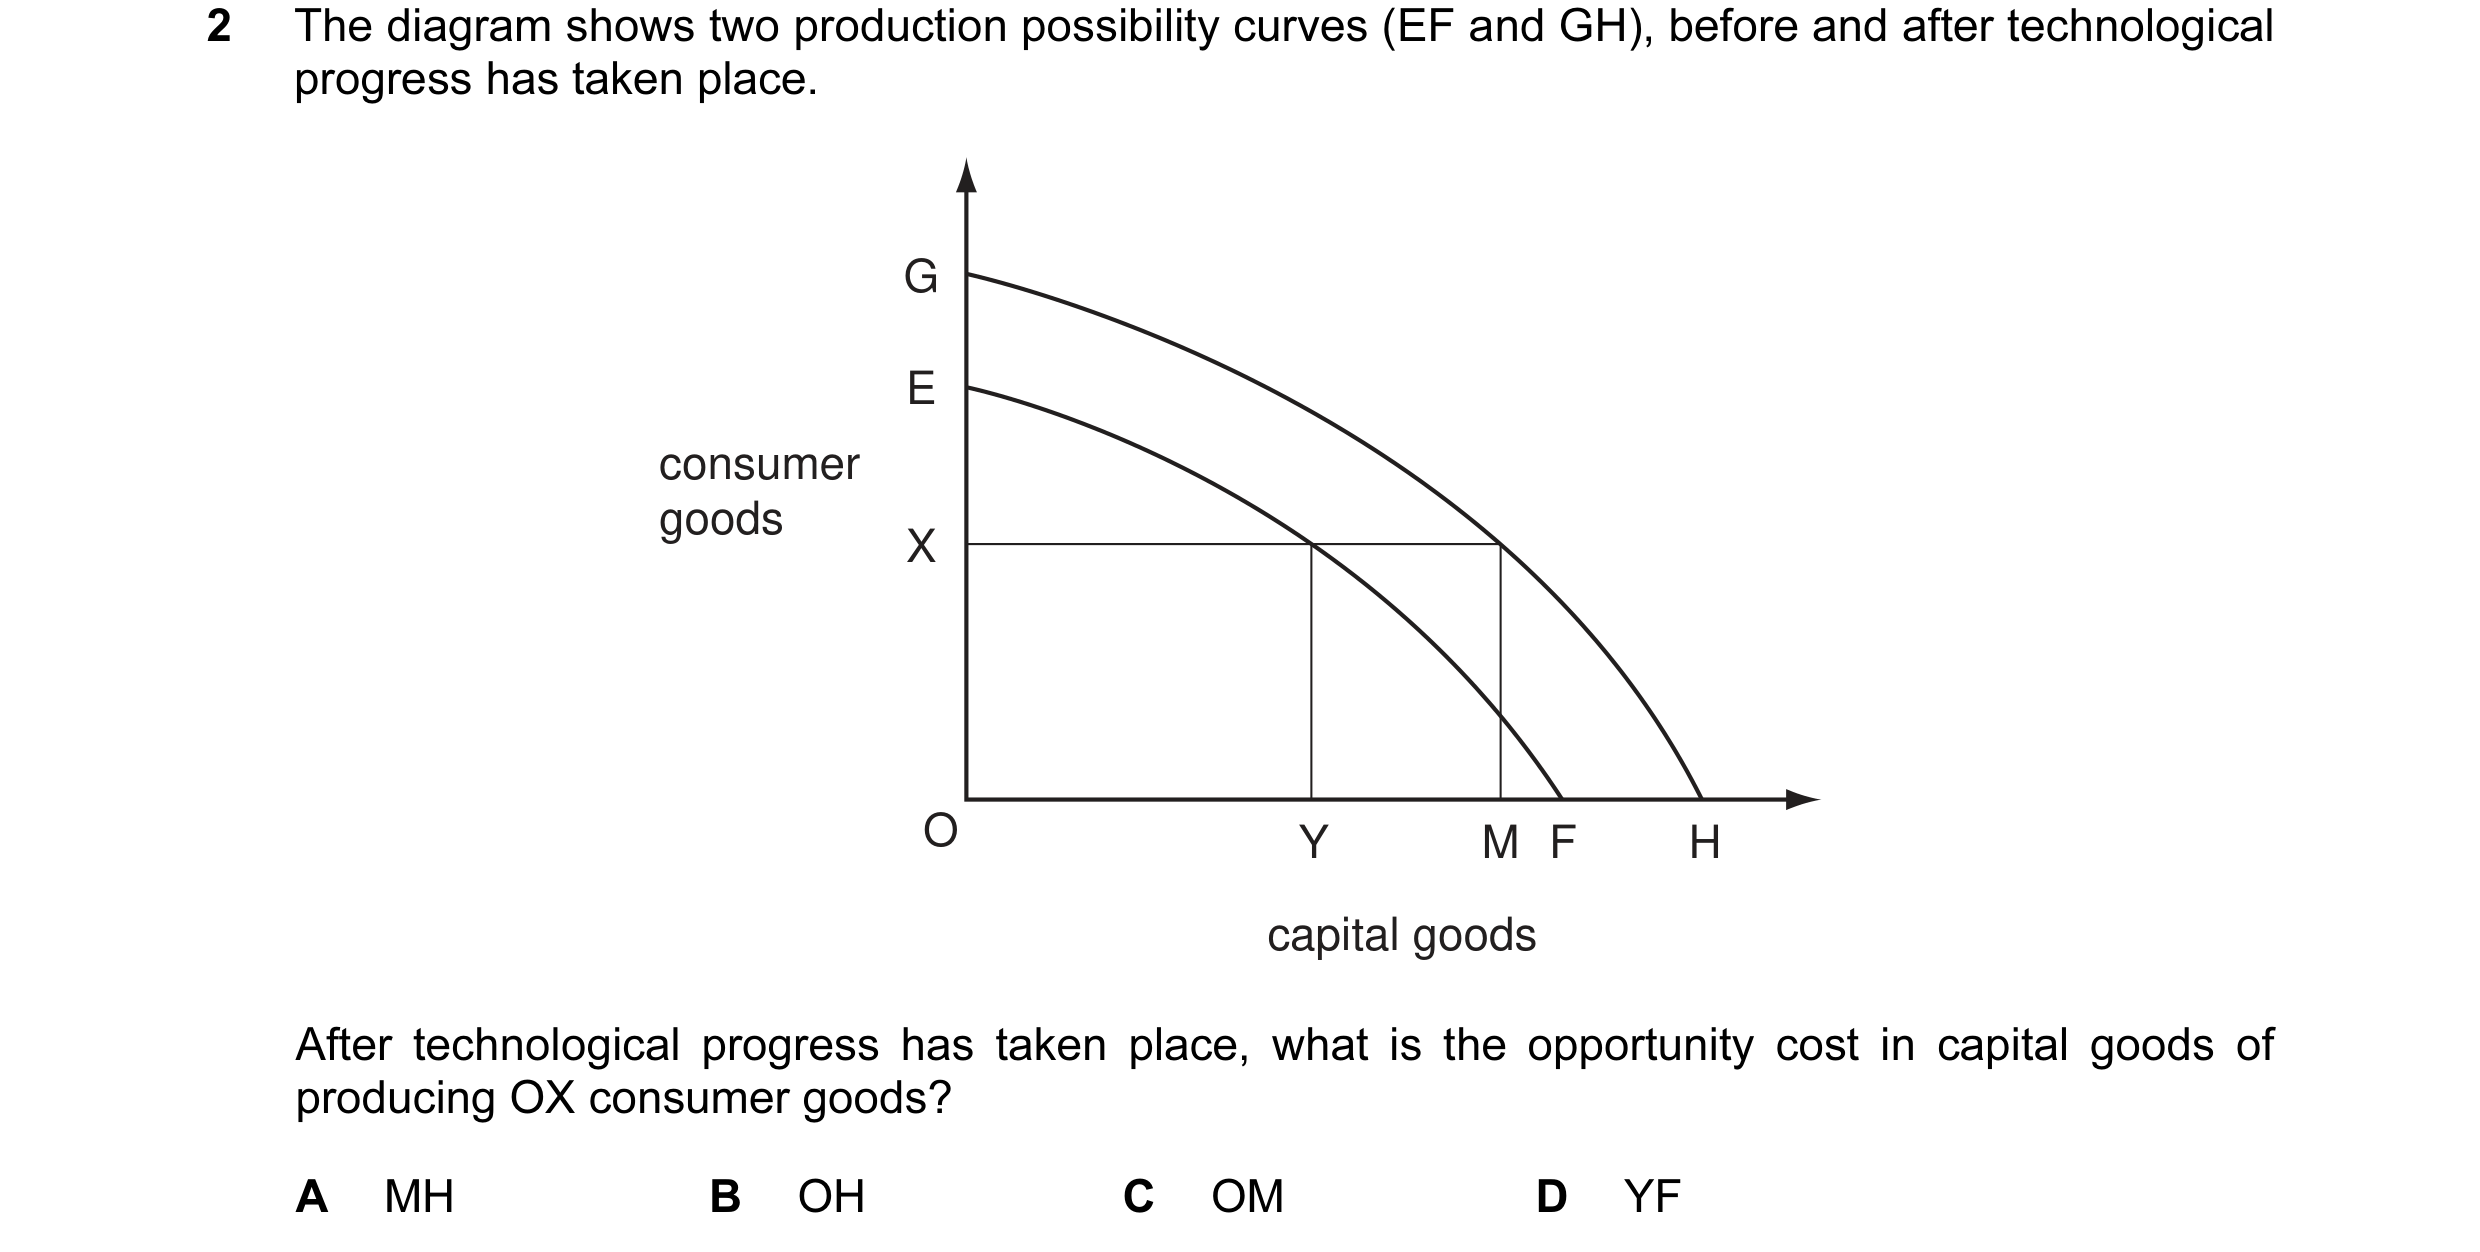 4 / 68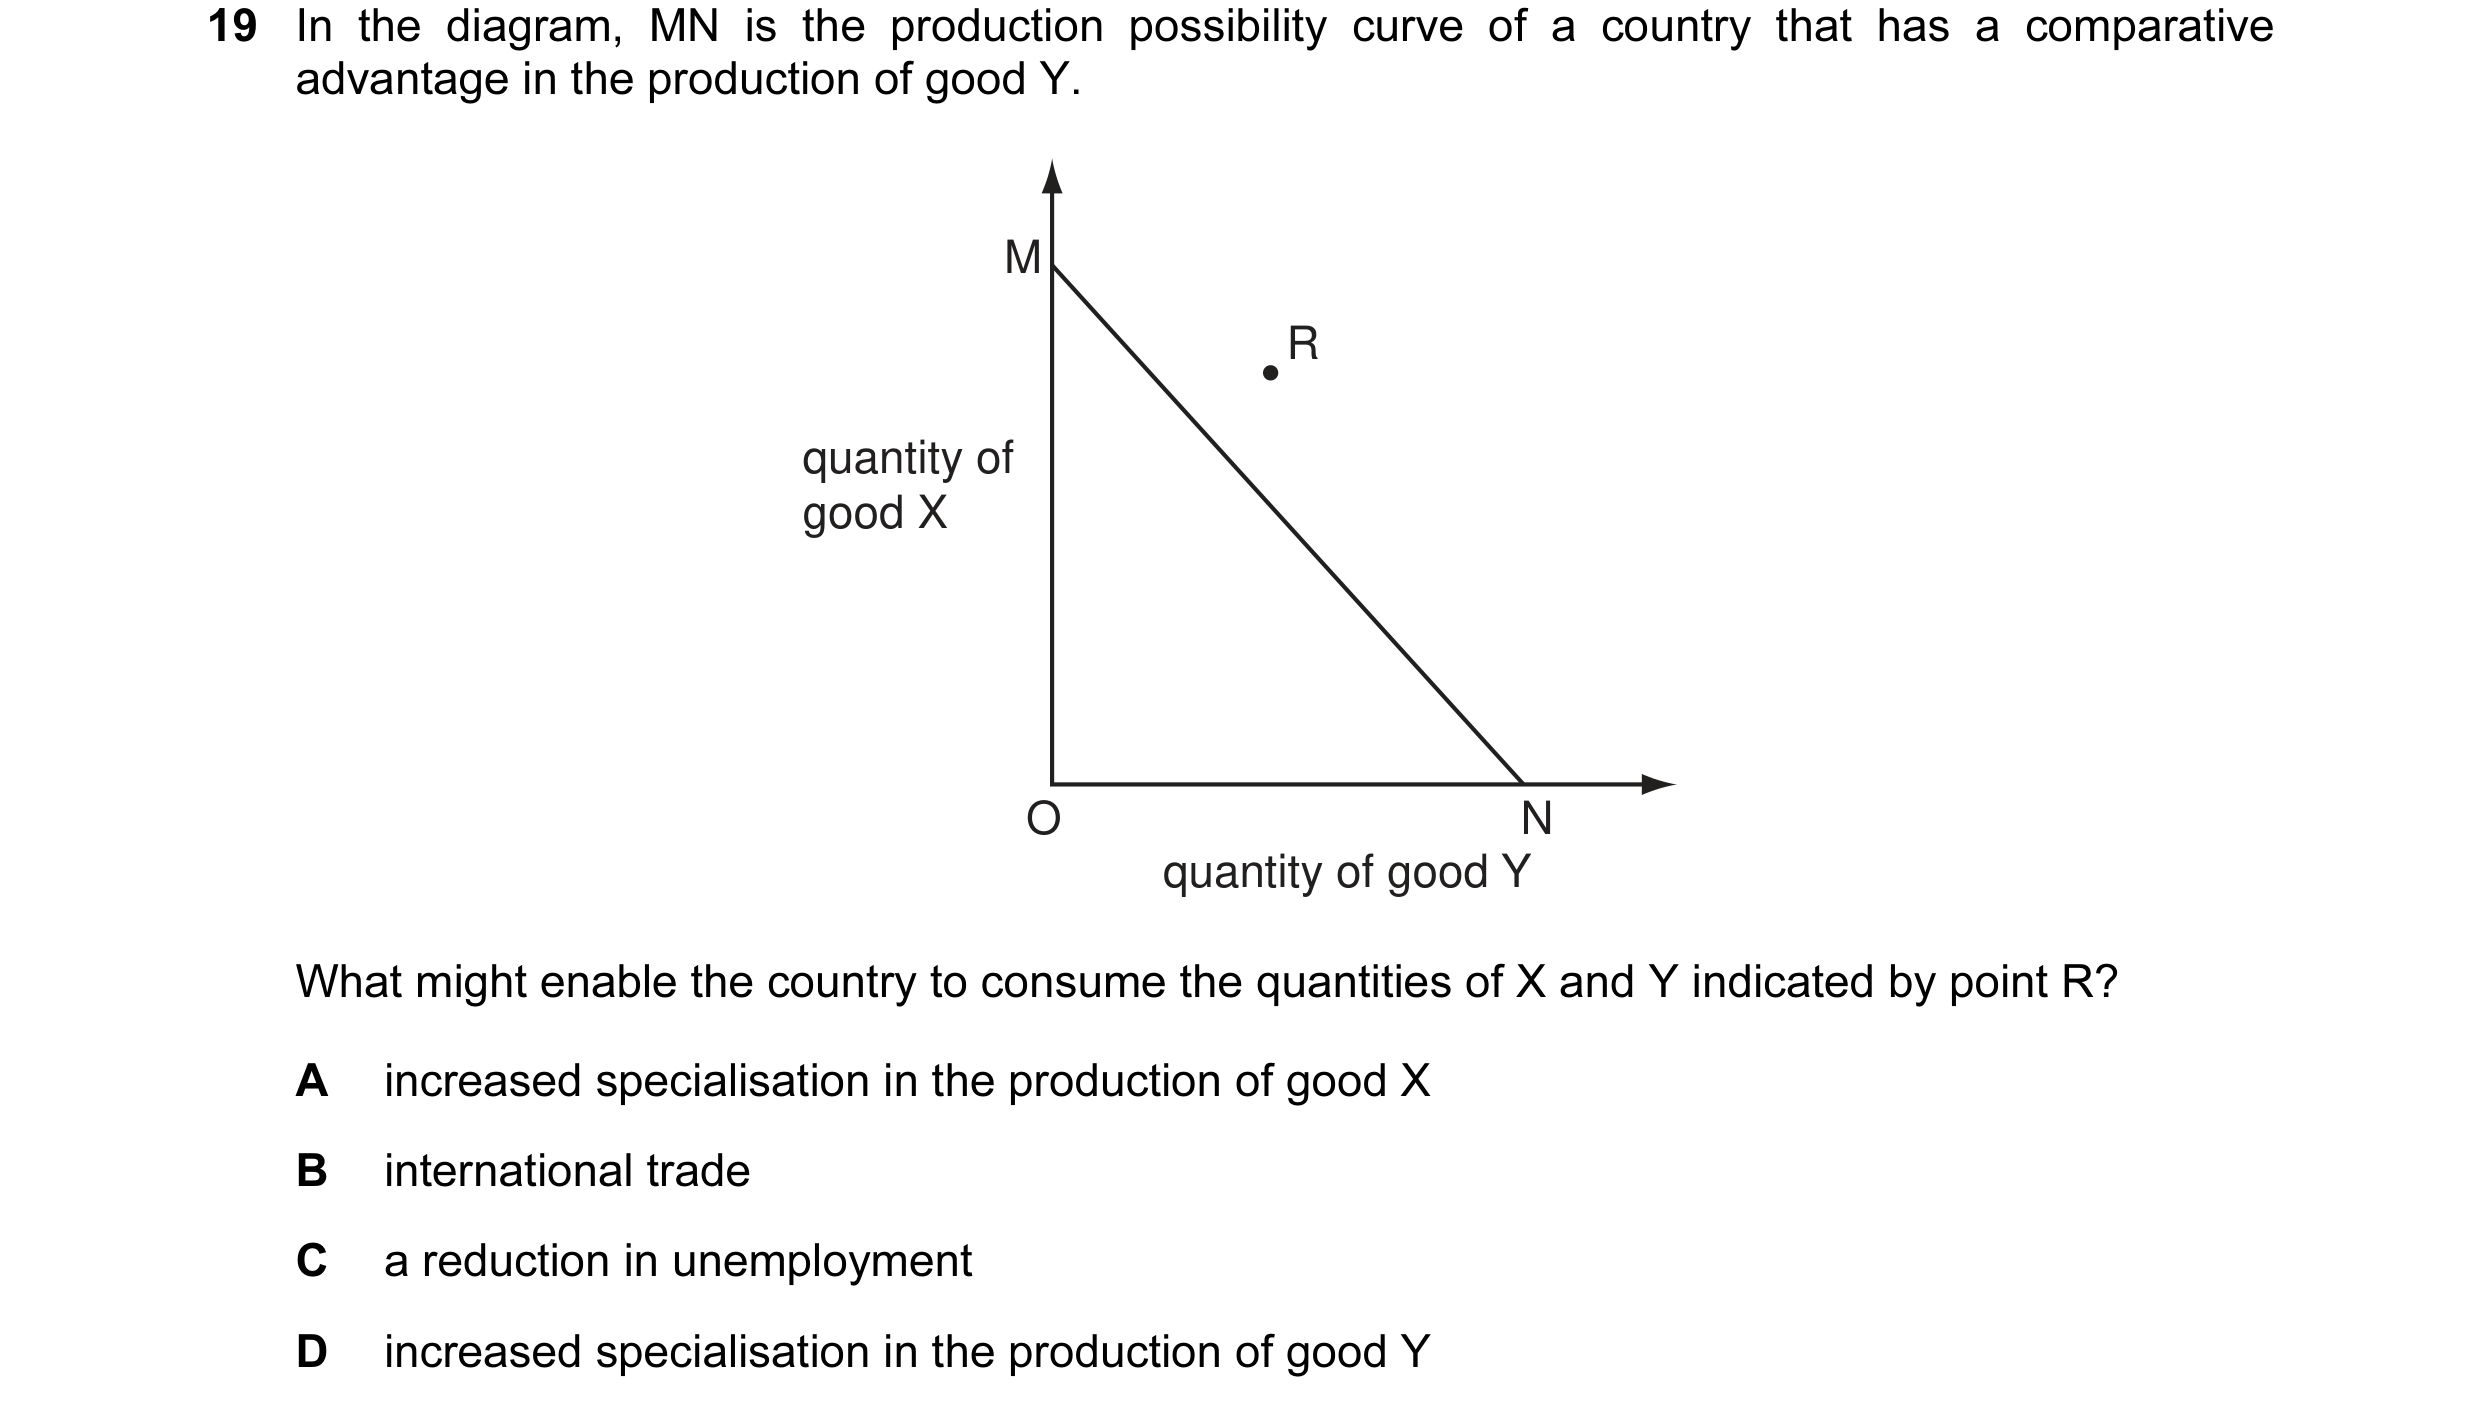
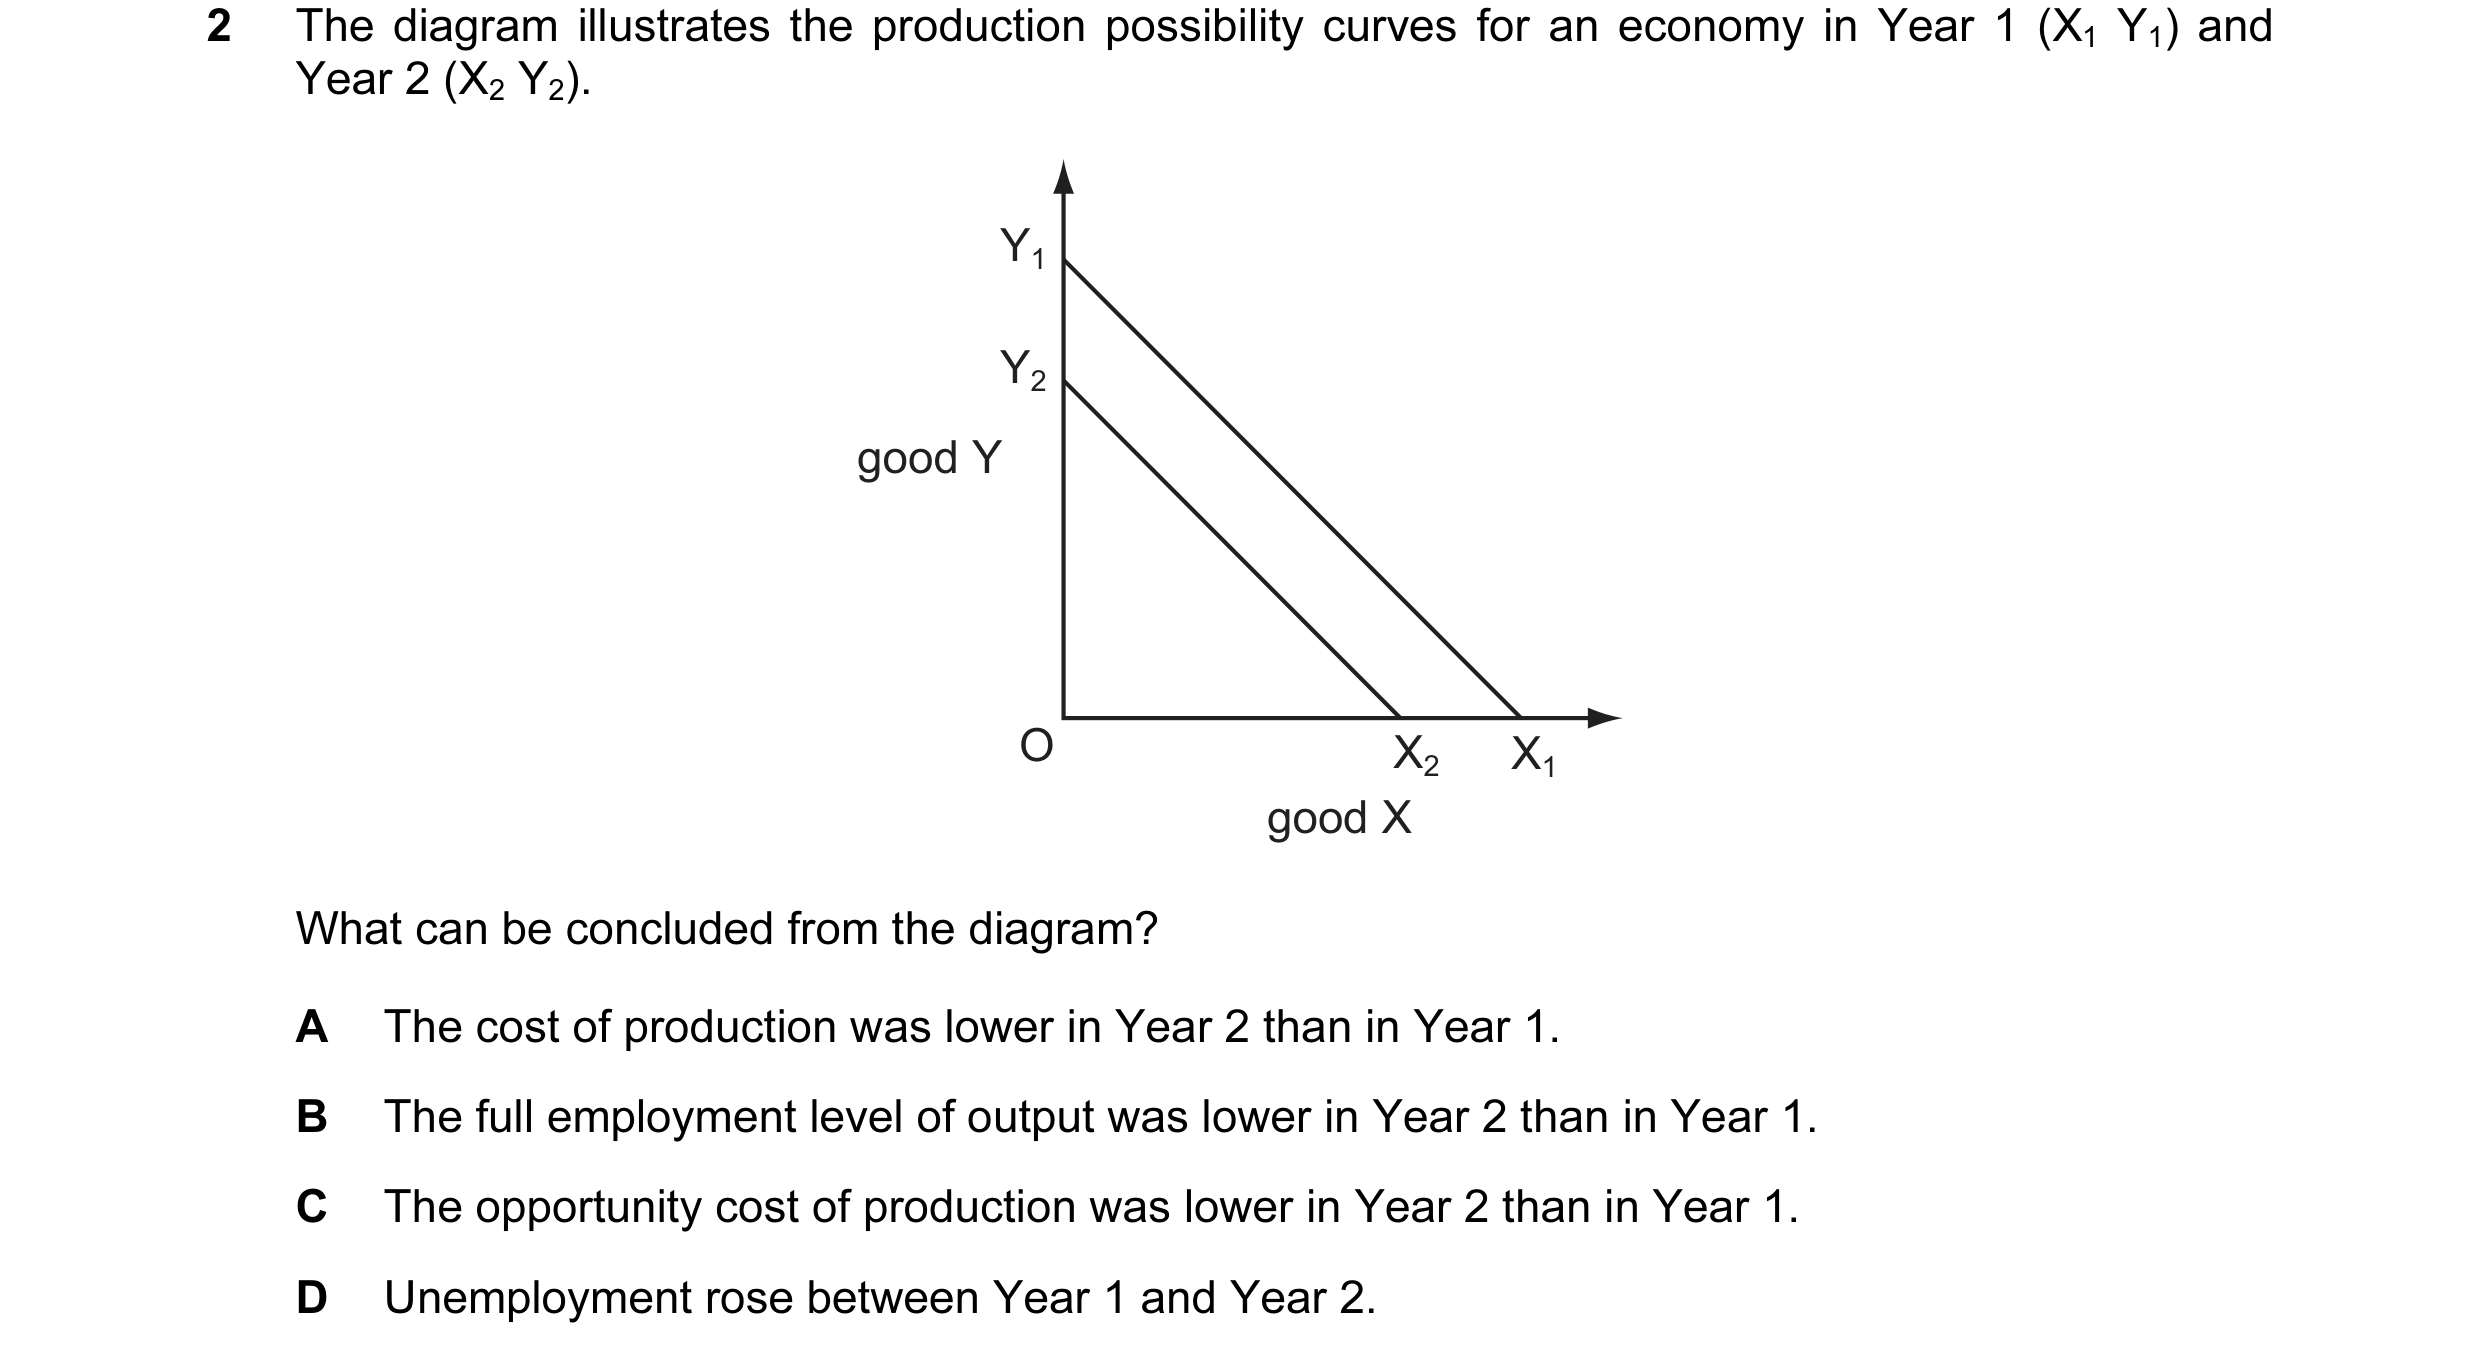 5 / 68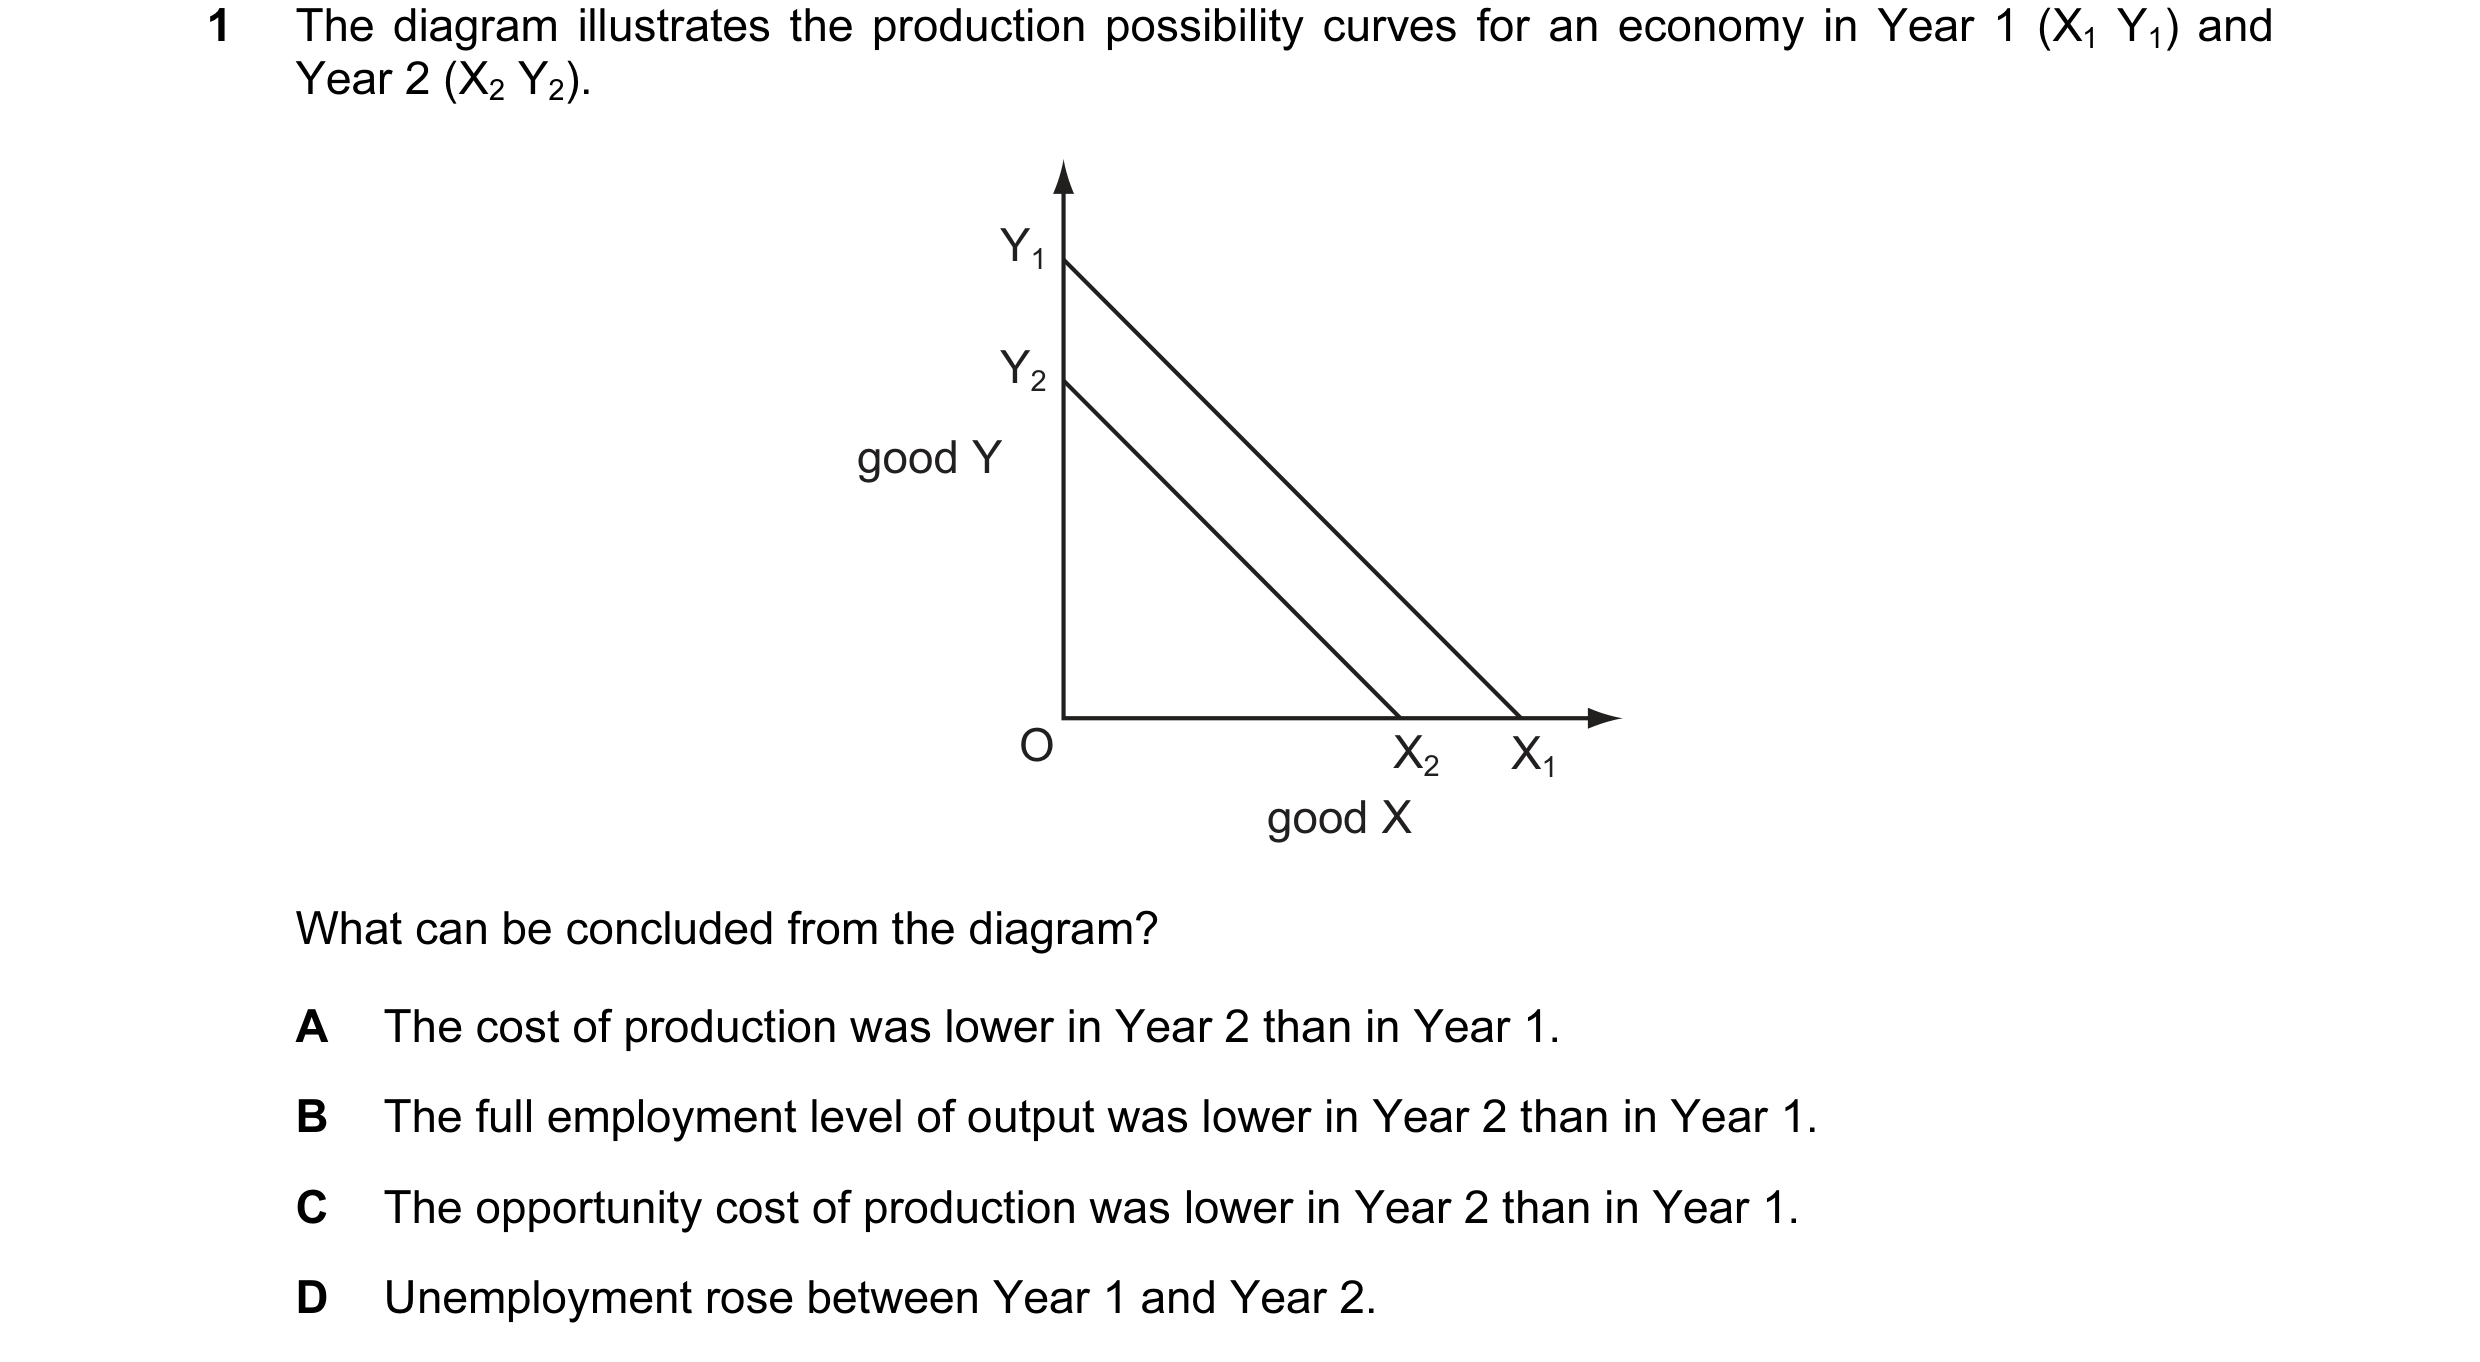
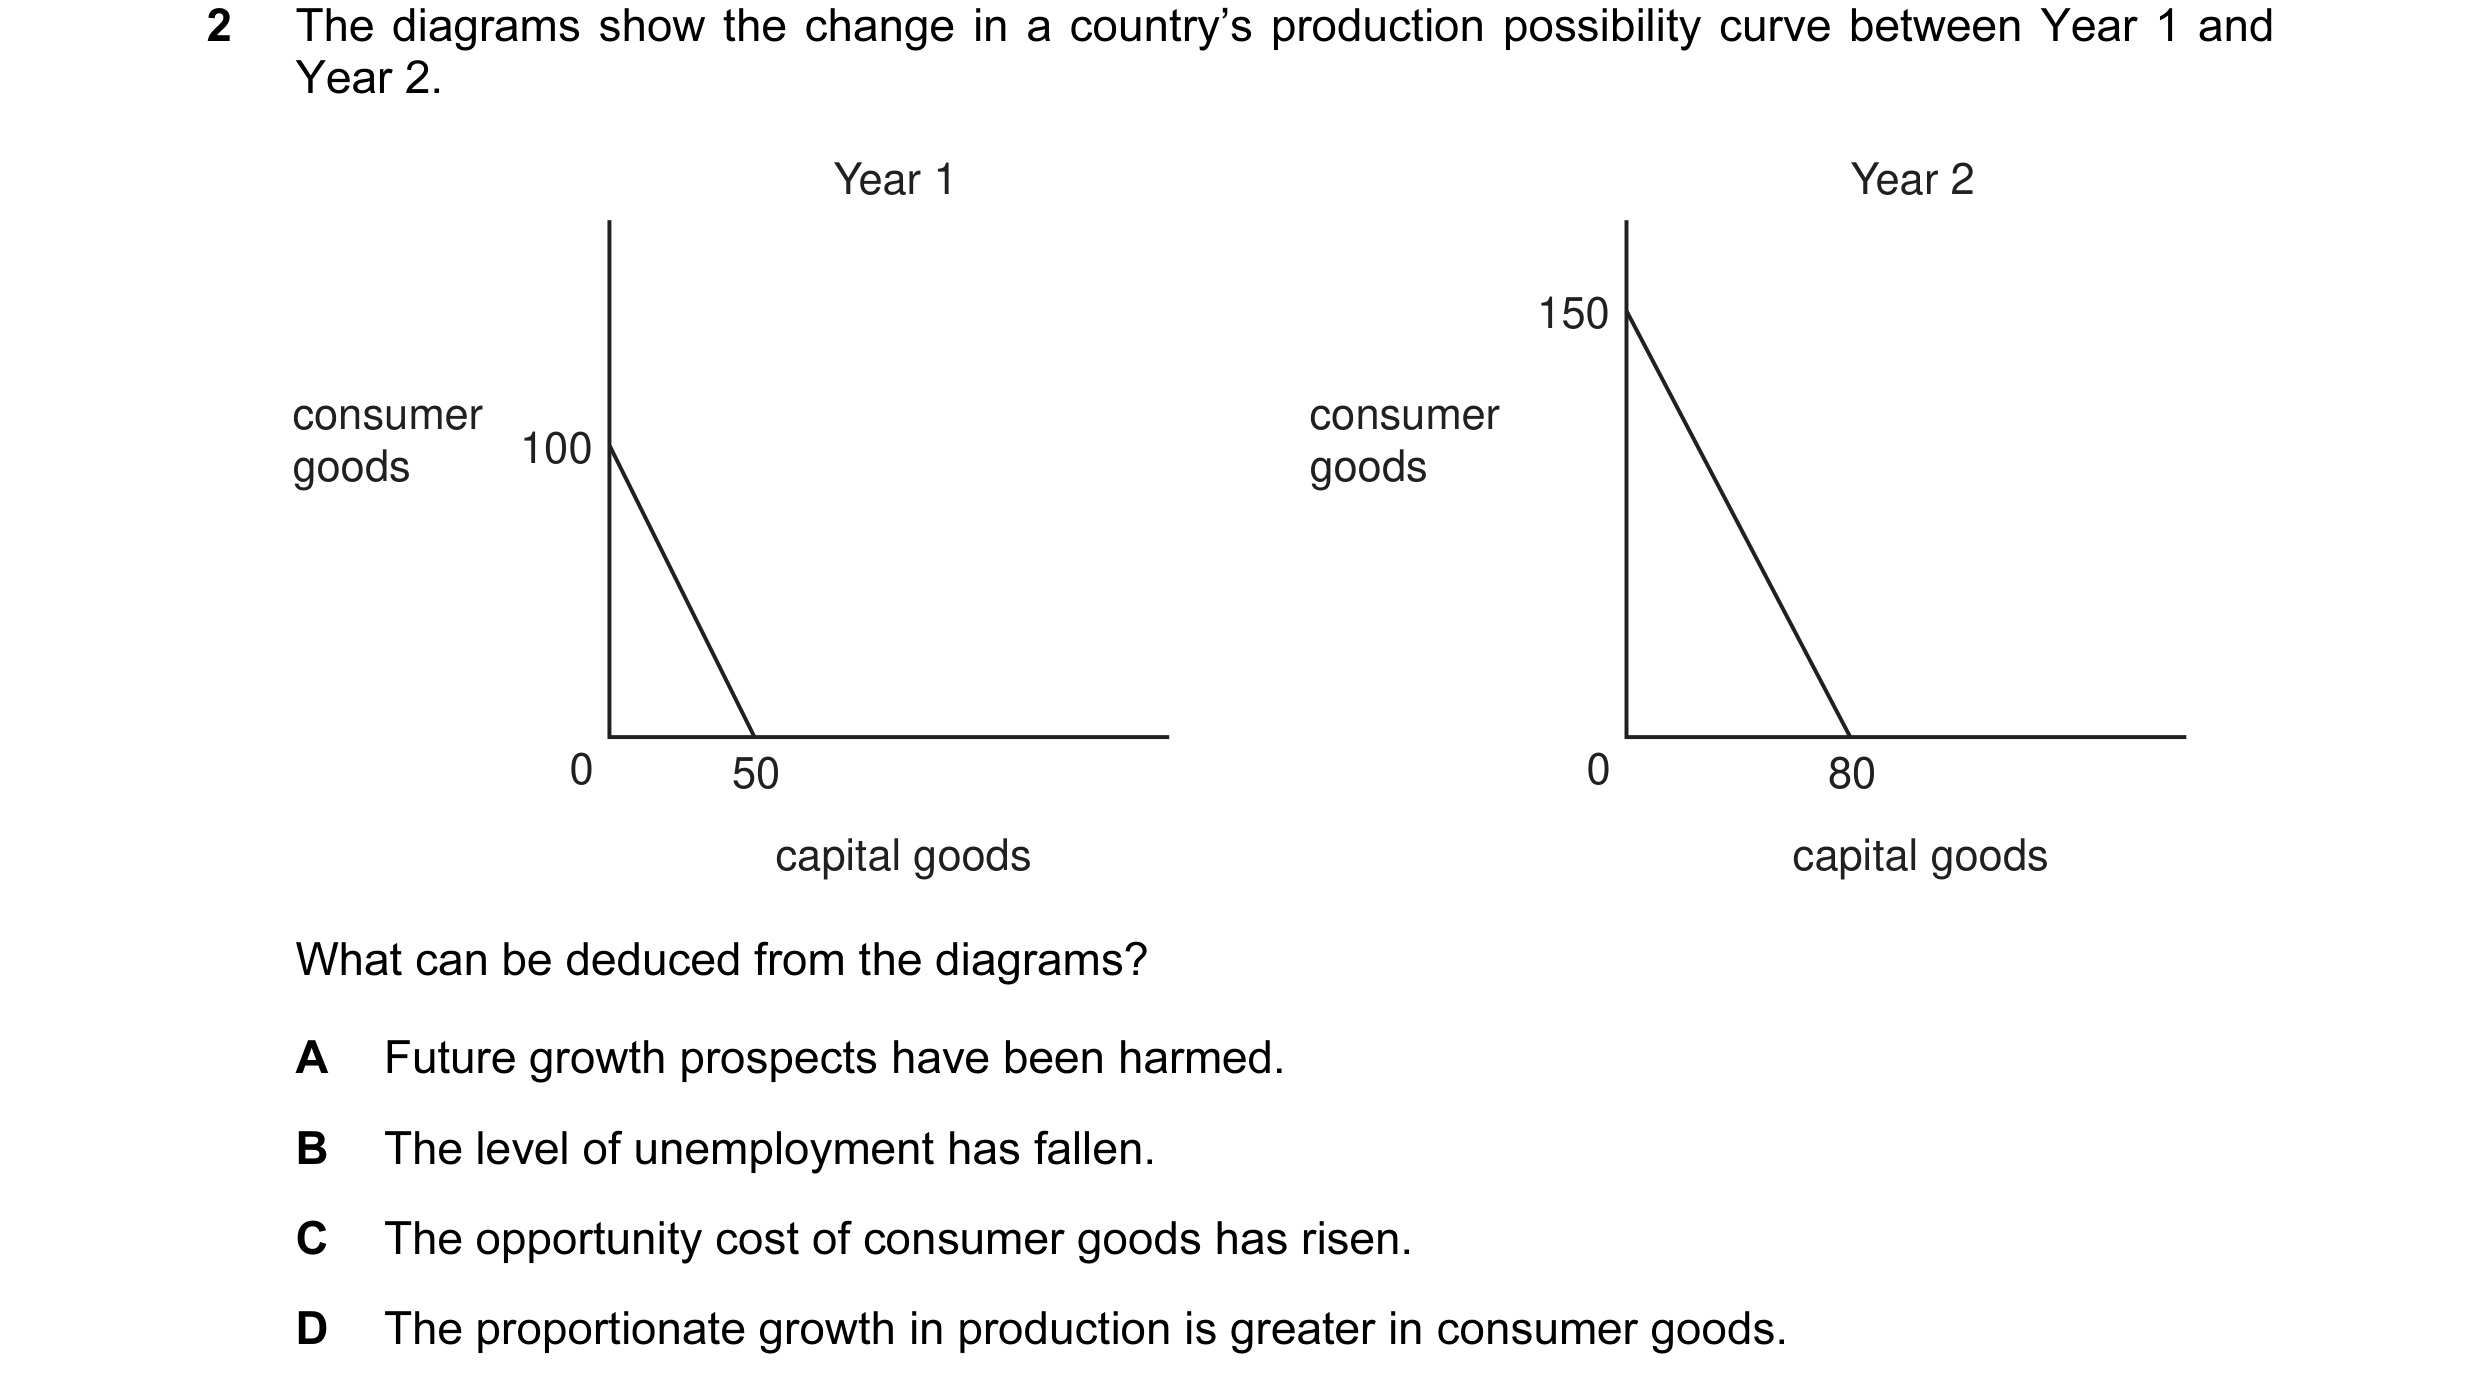 6 / 68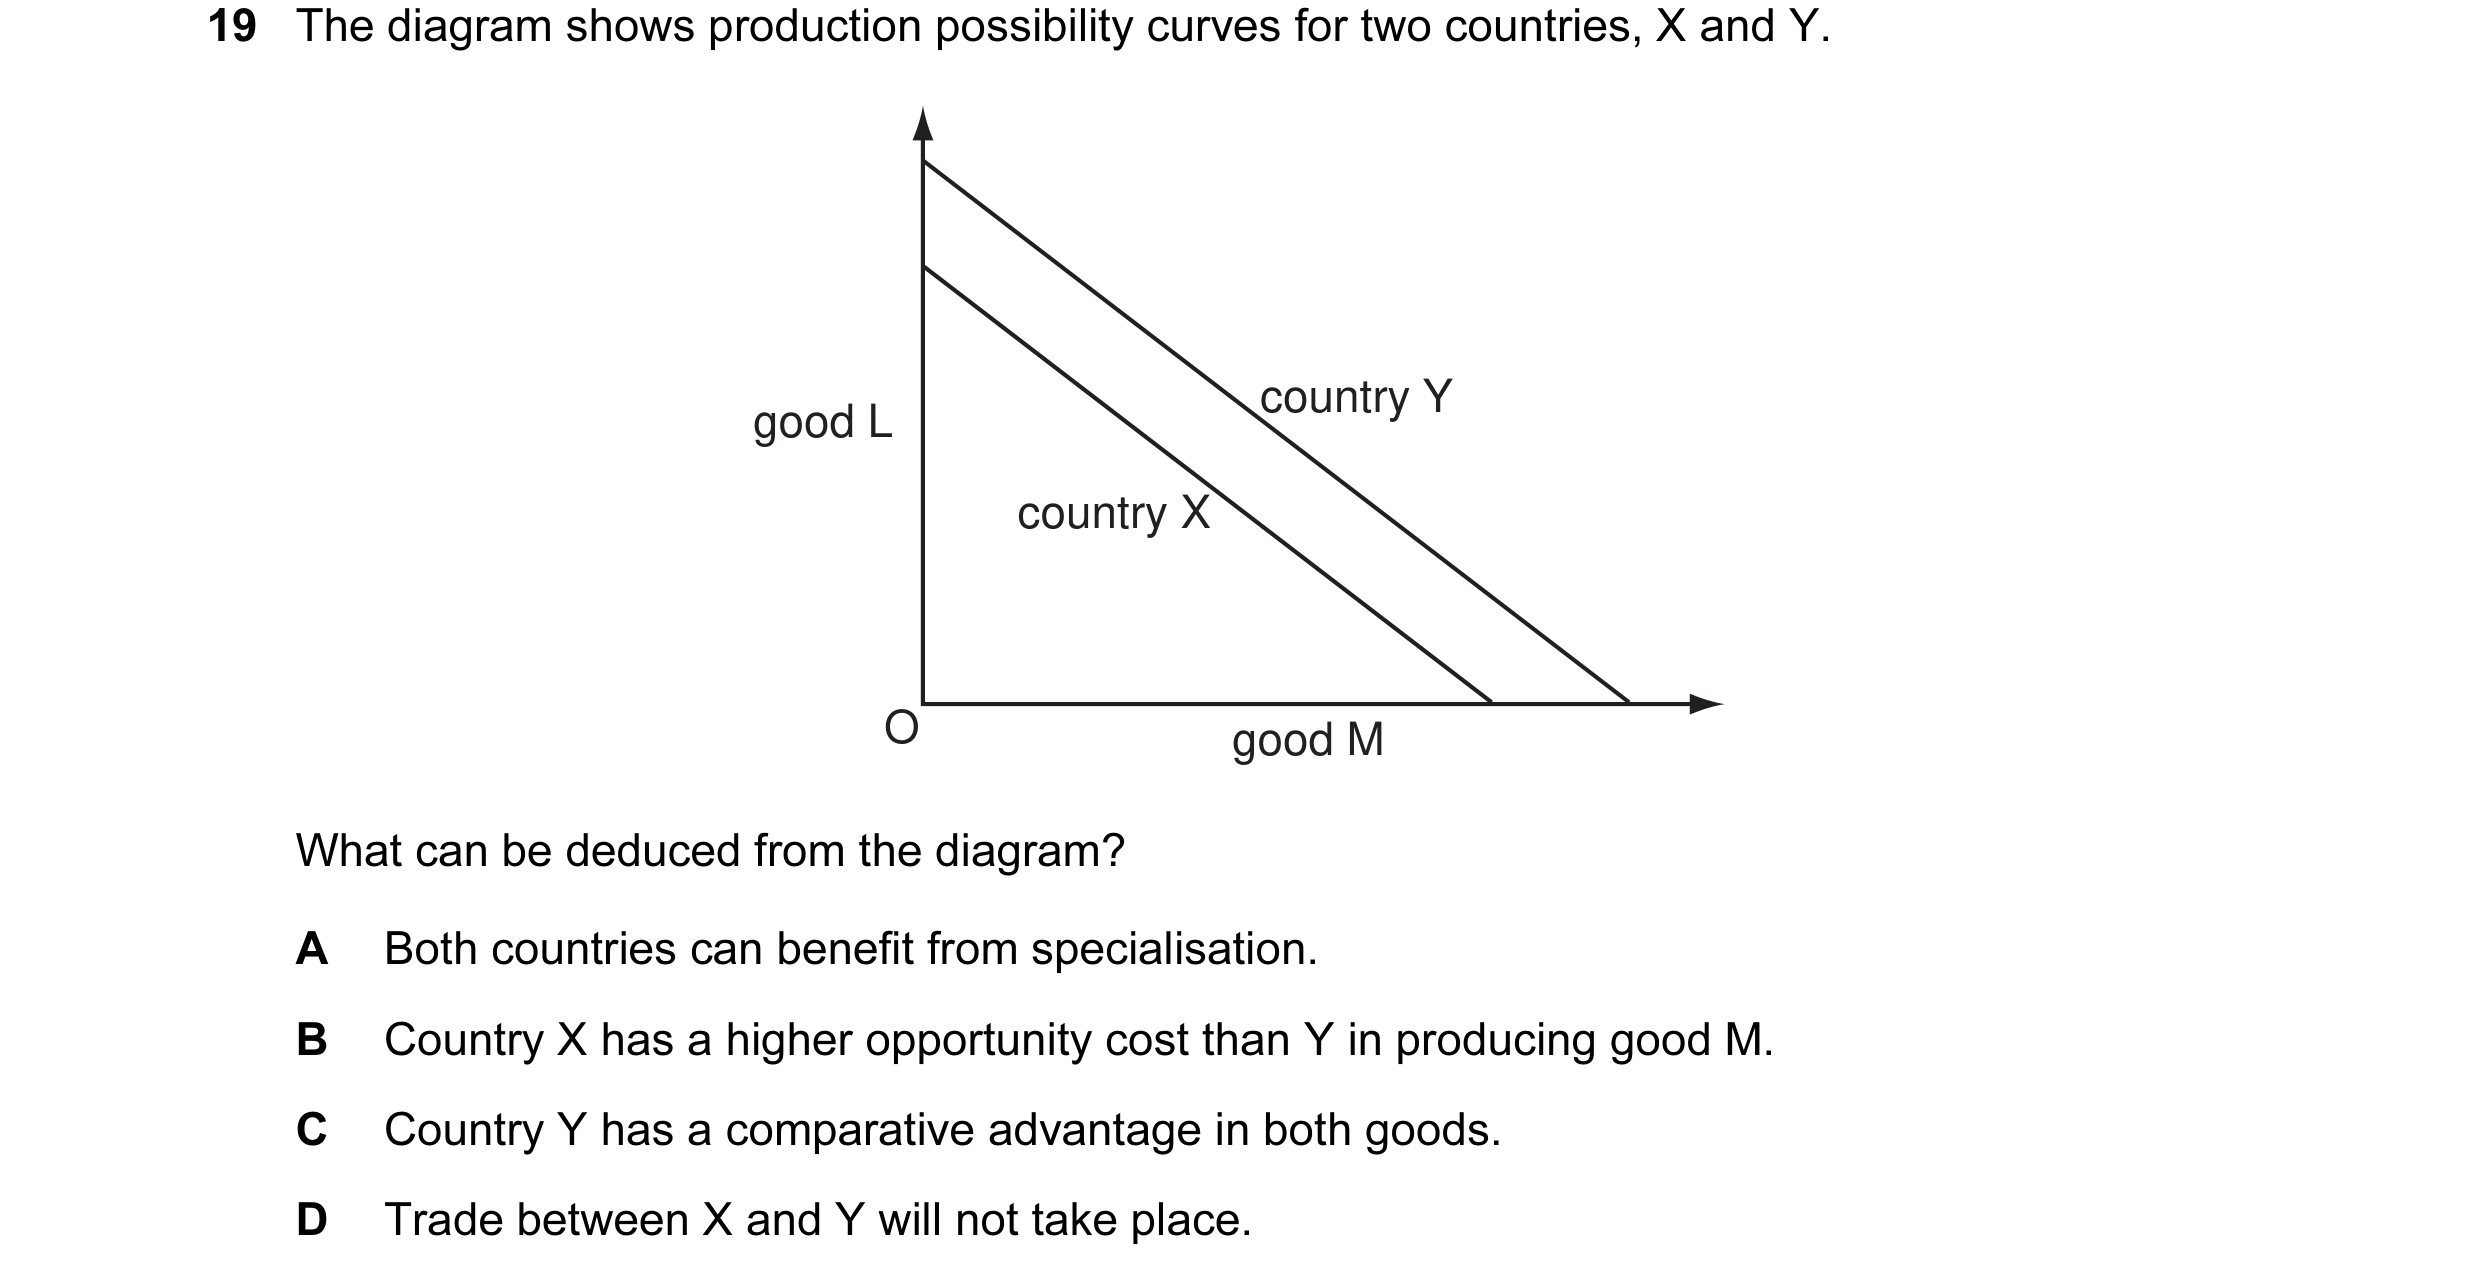
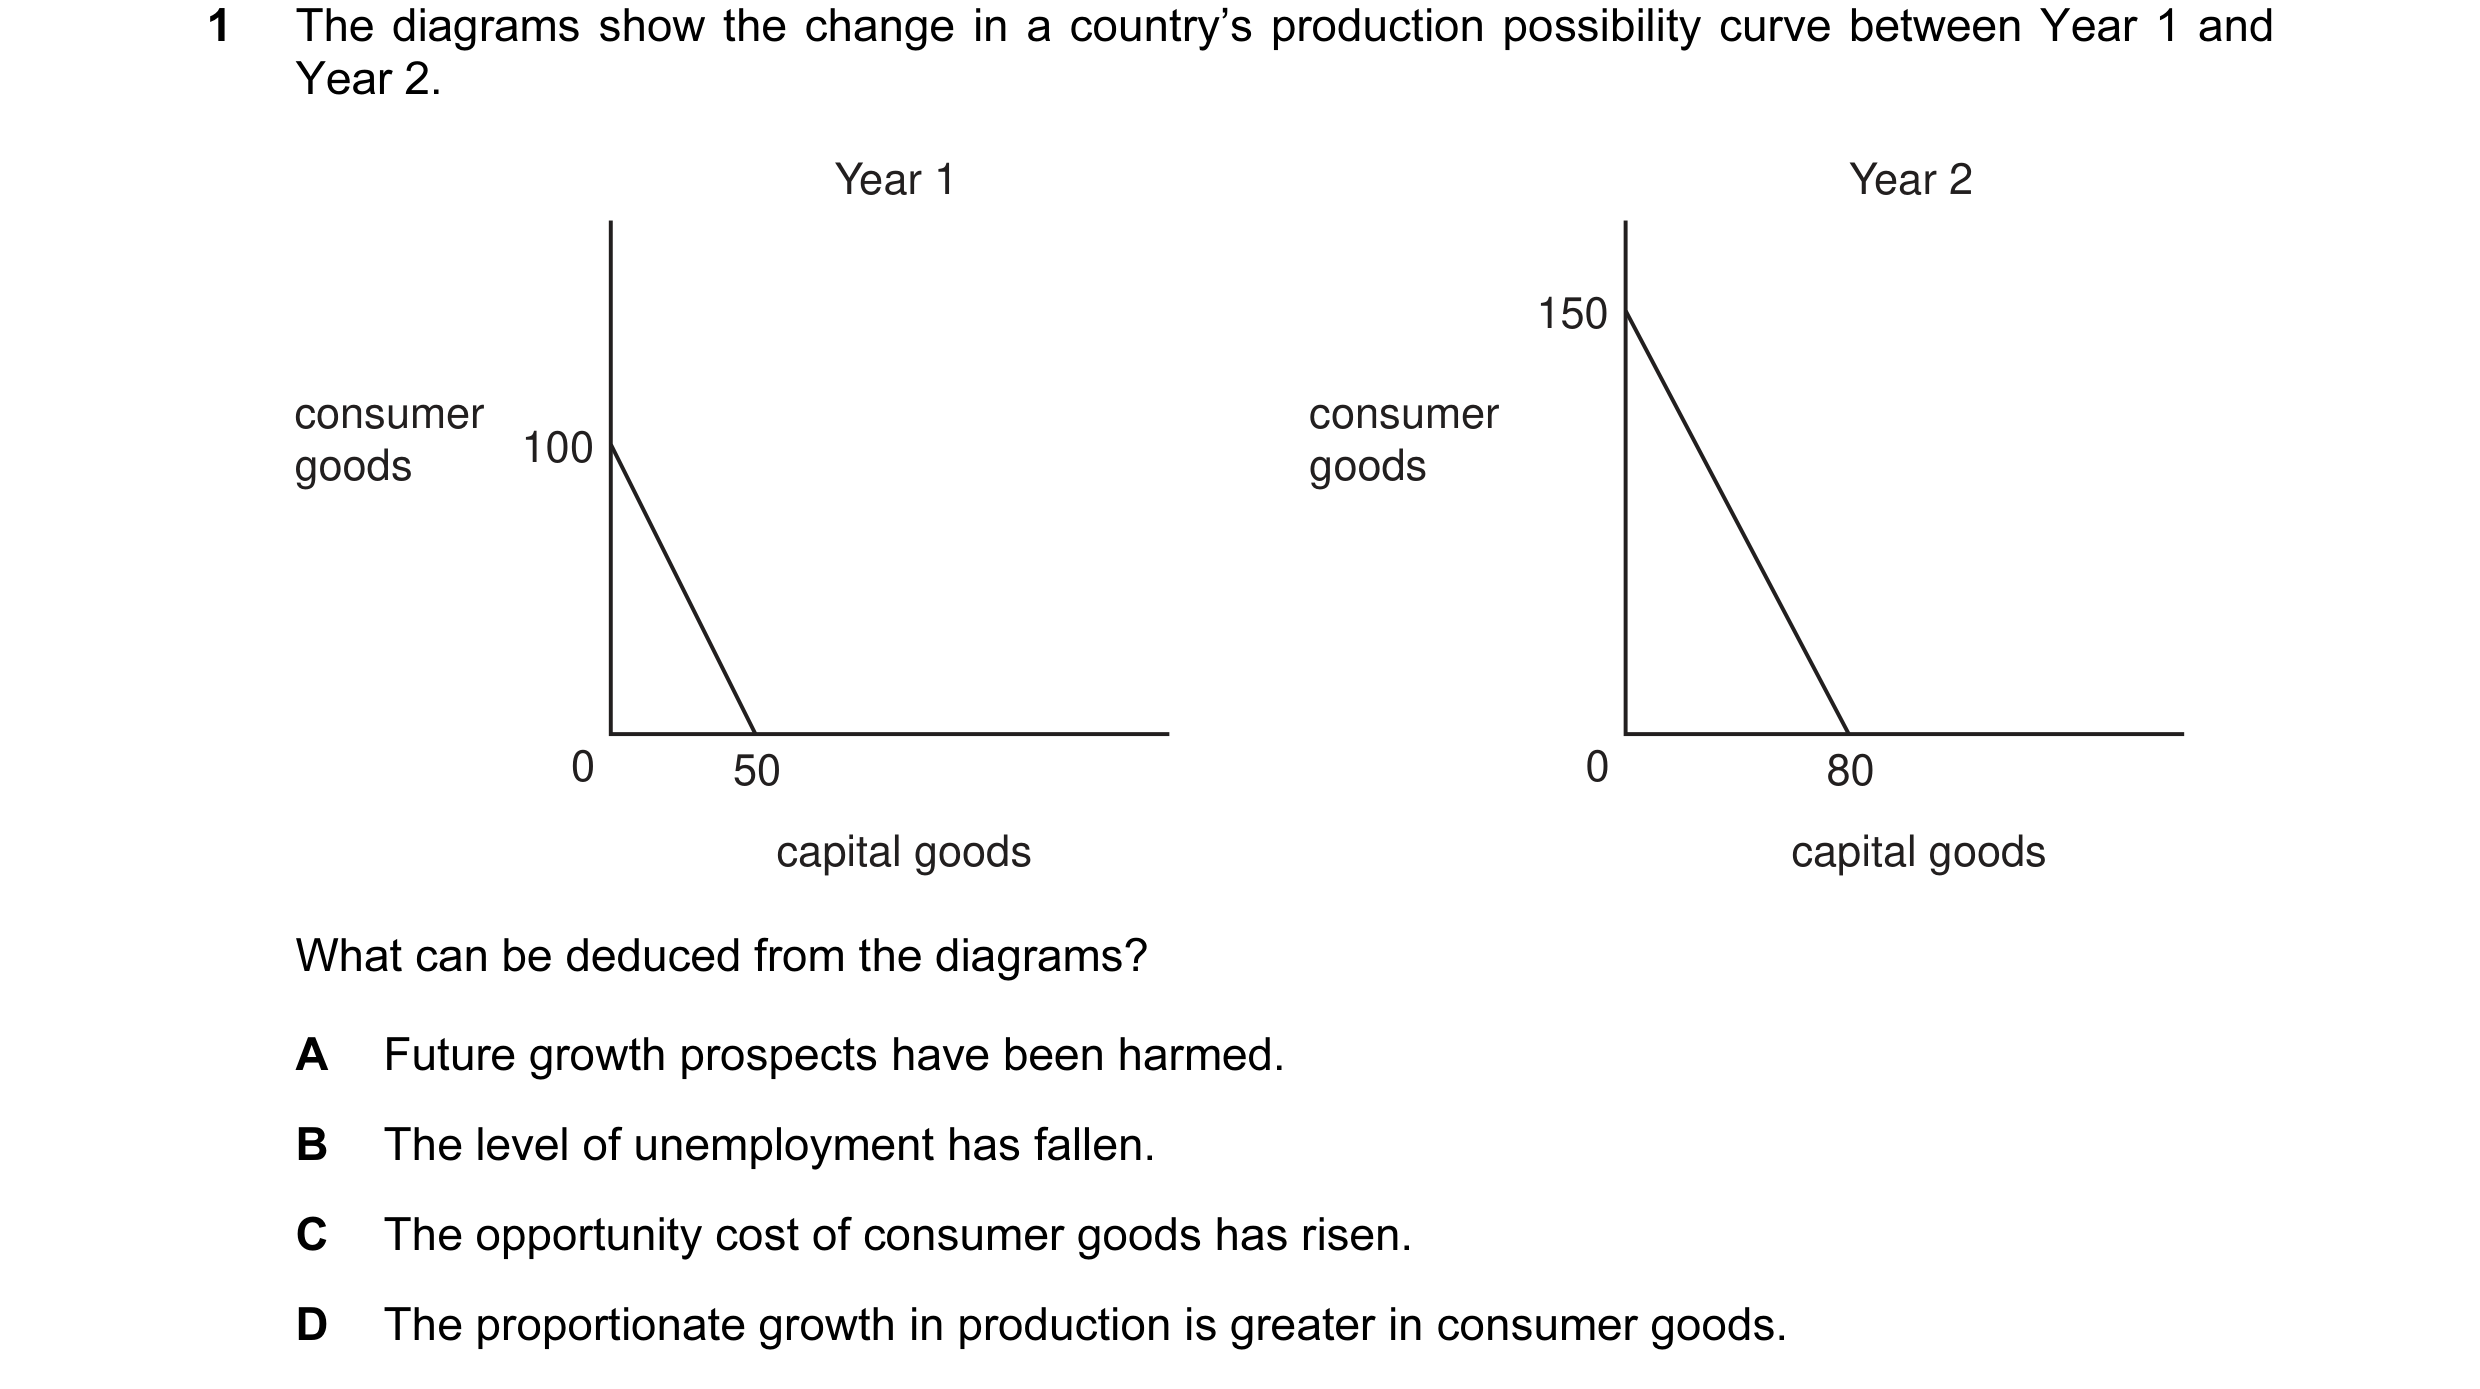 7 / 68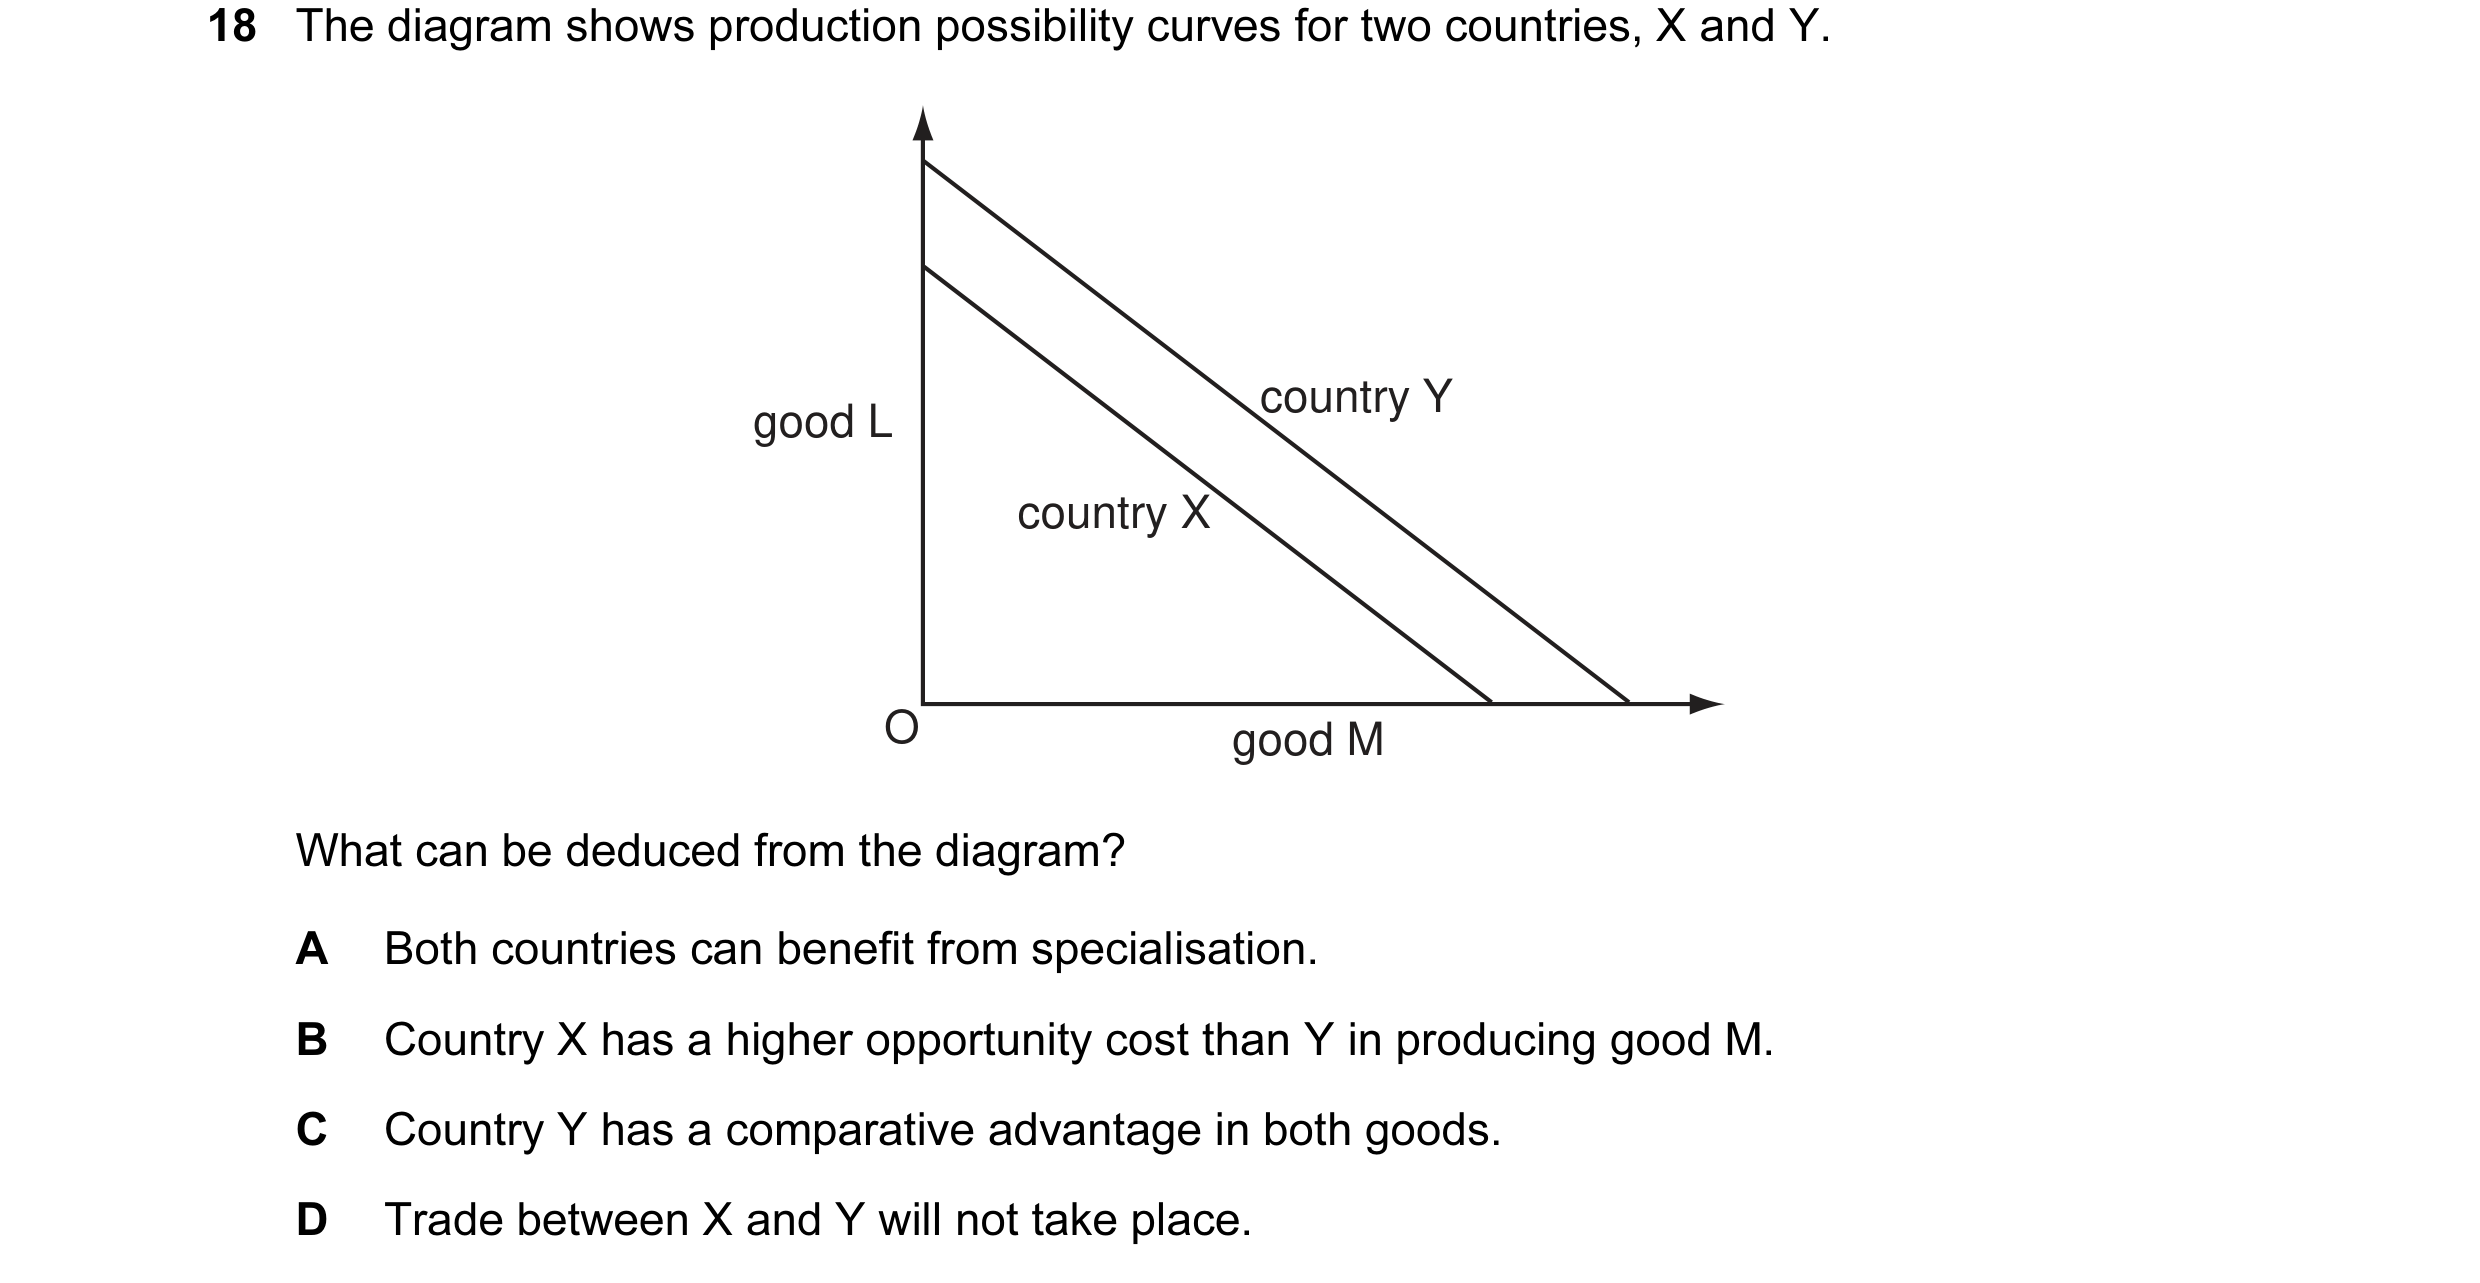
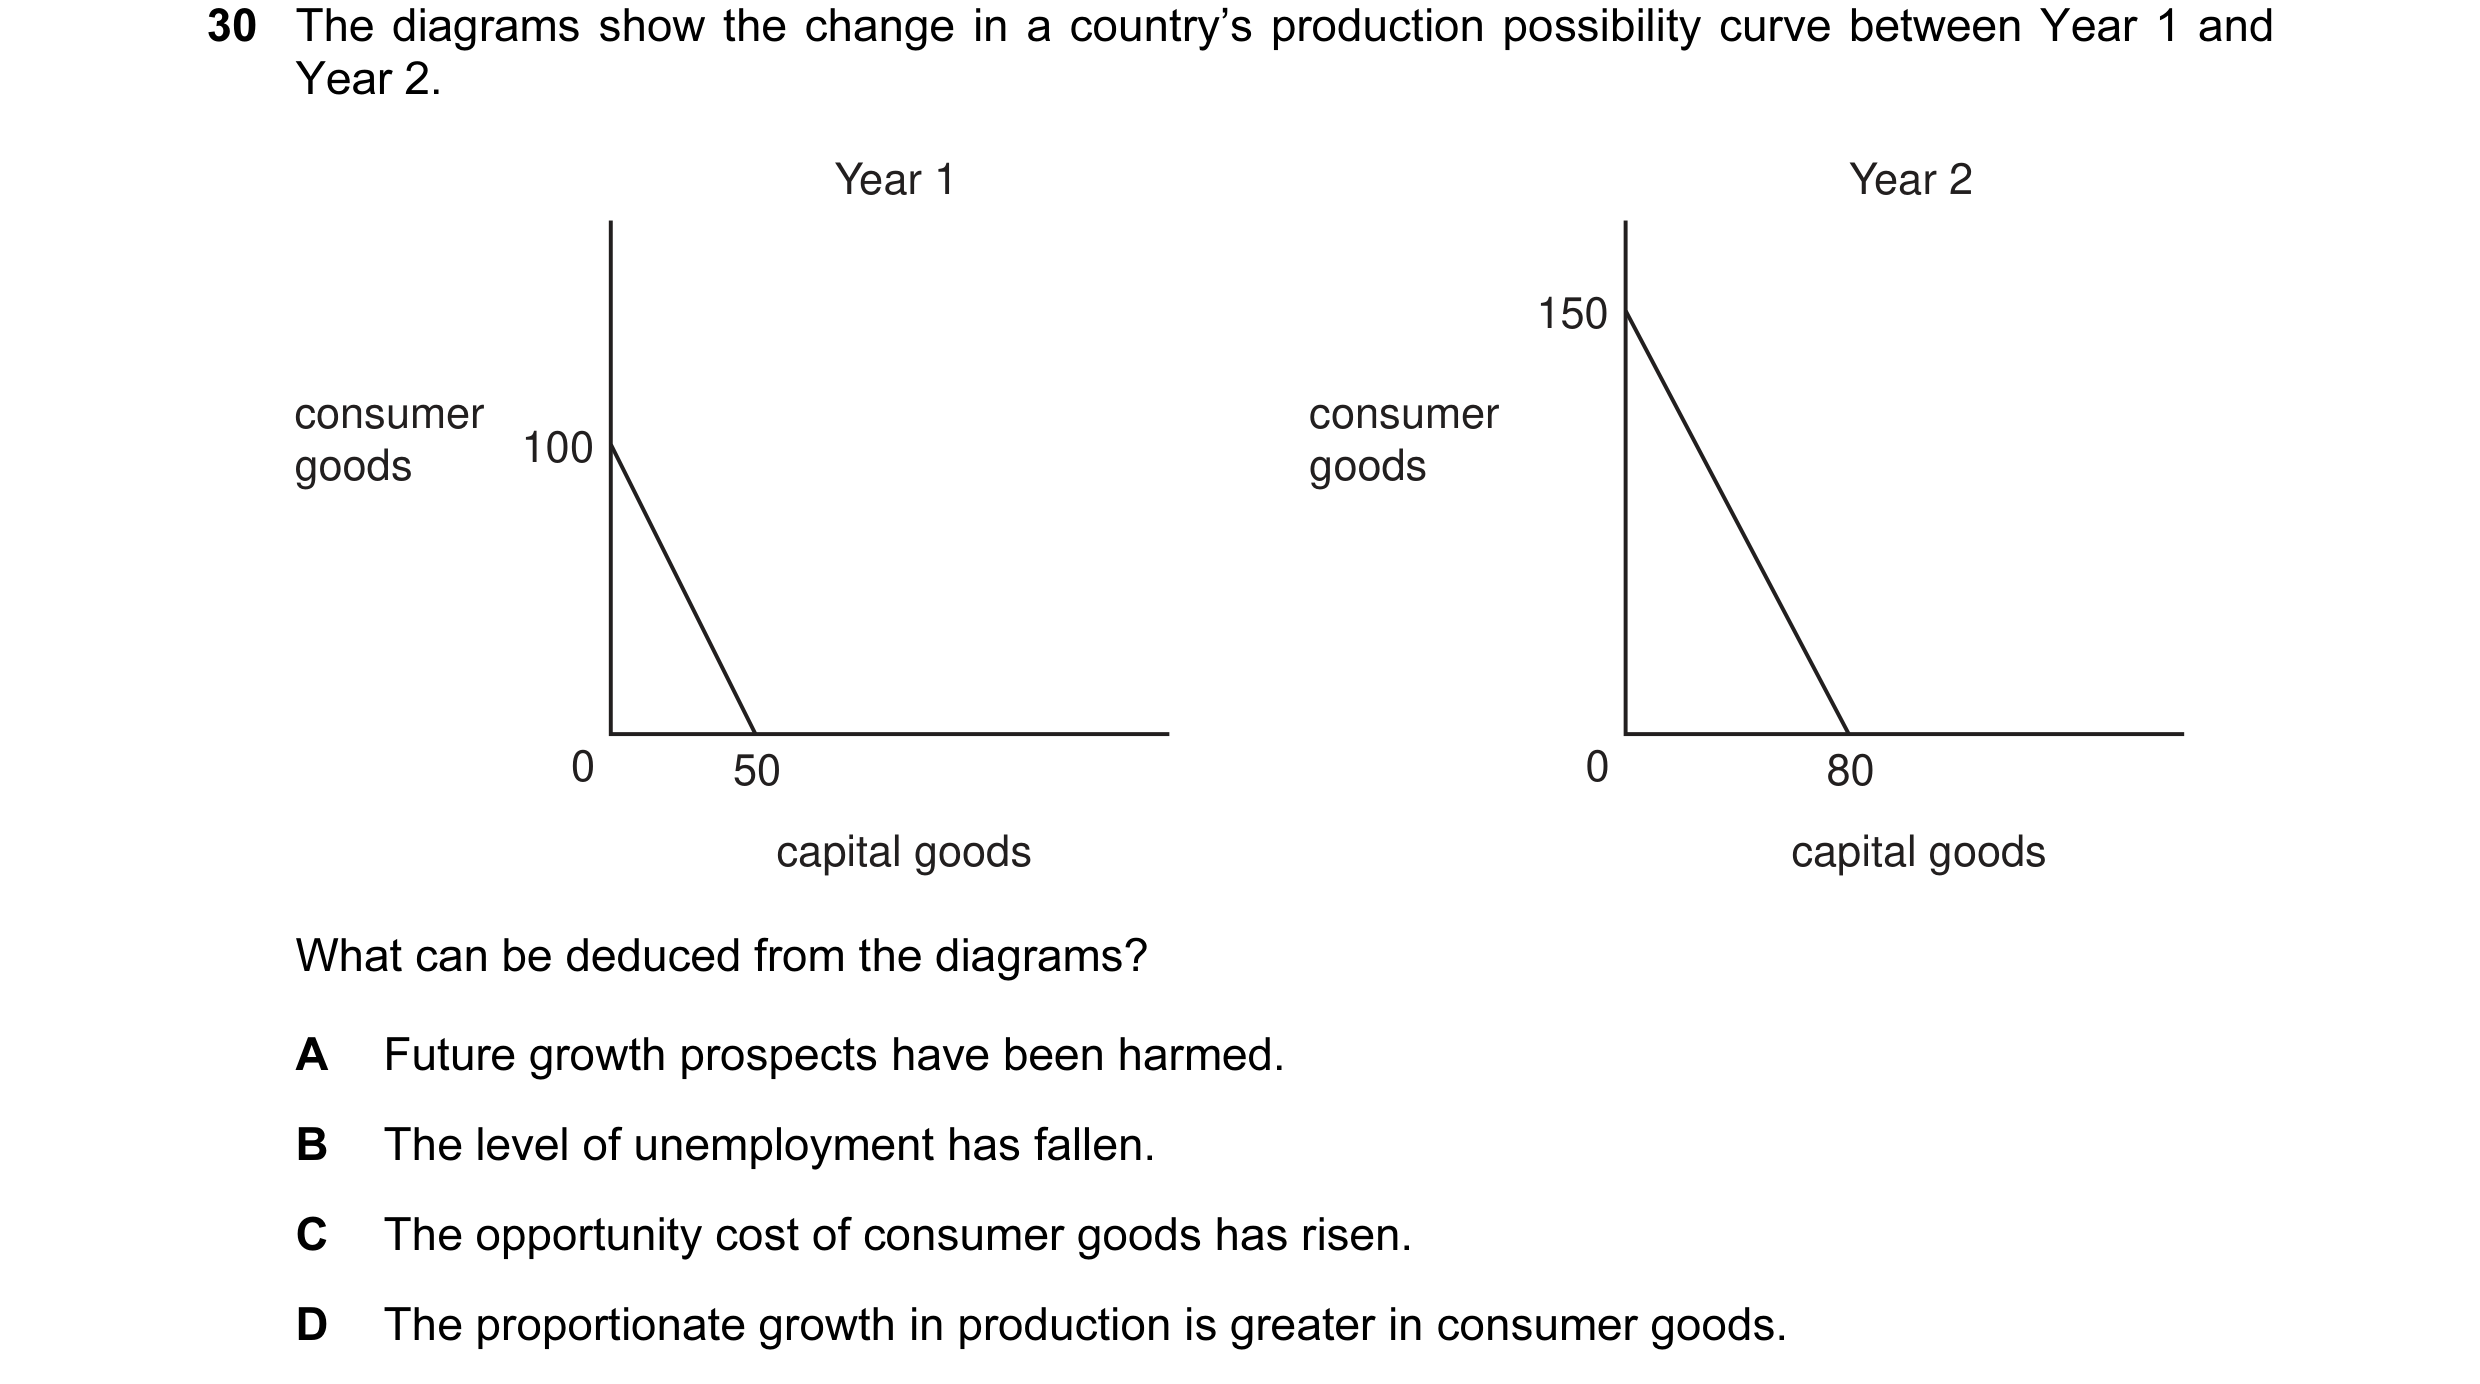 8 / 68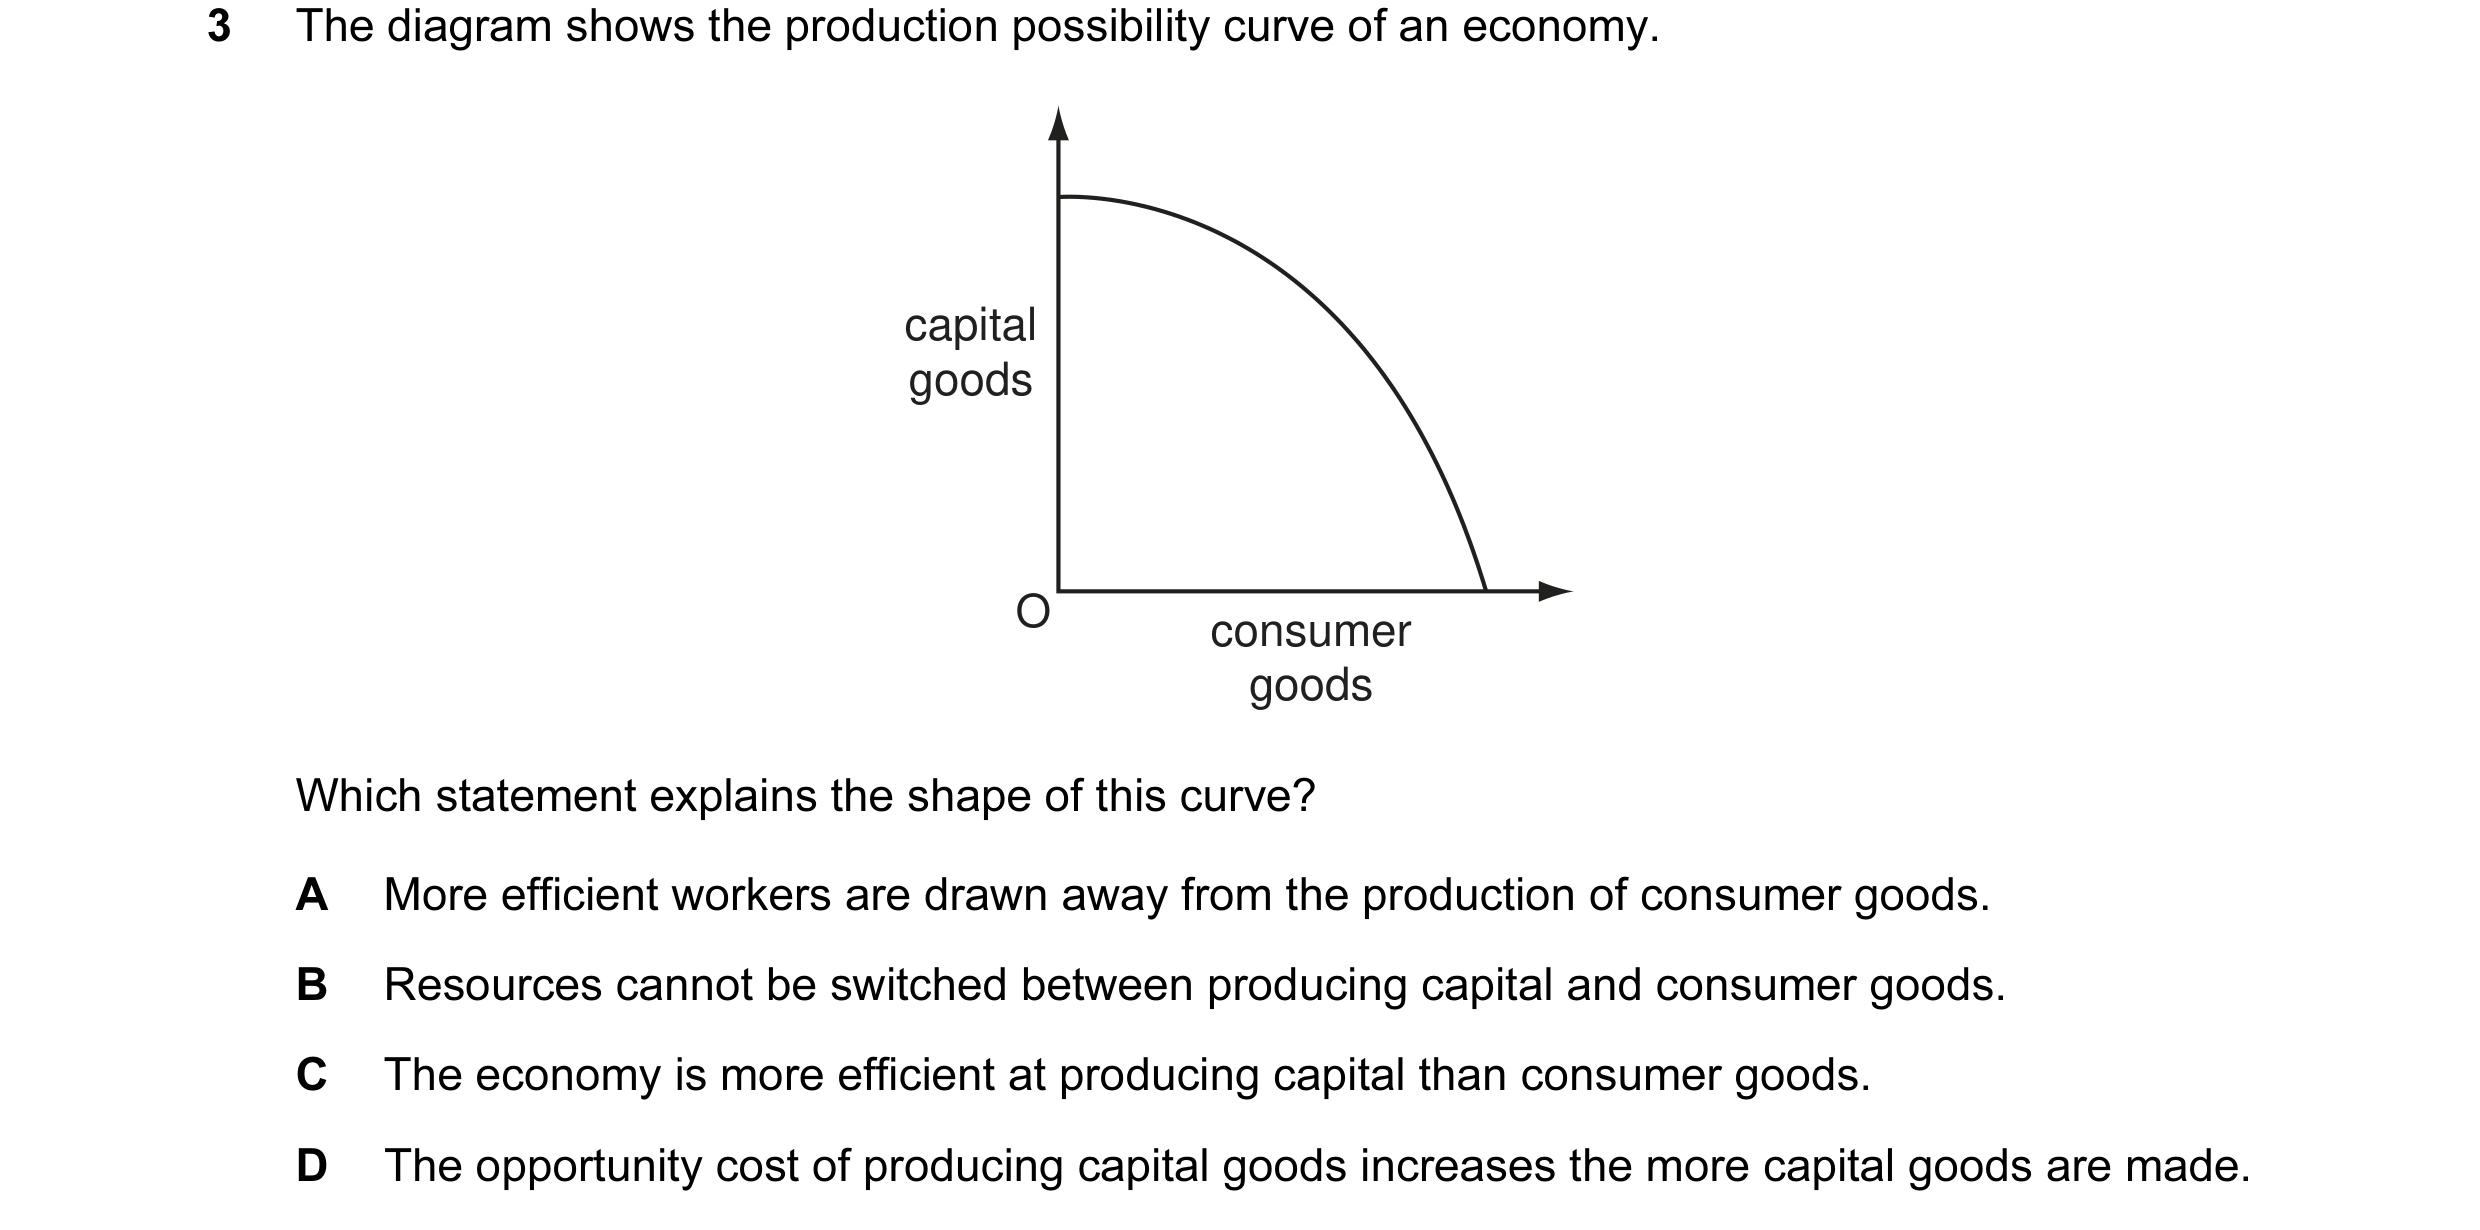
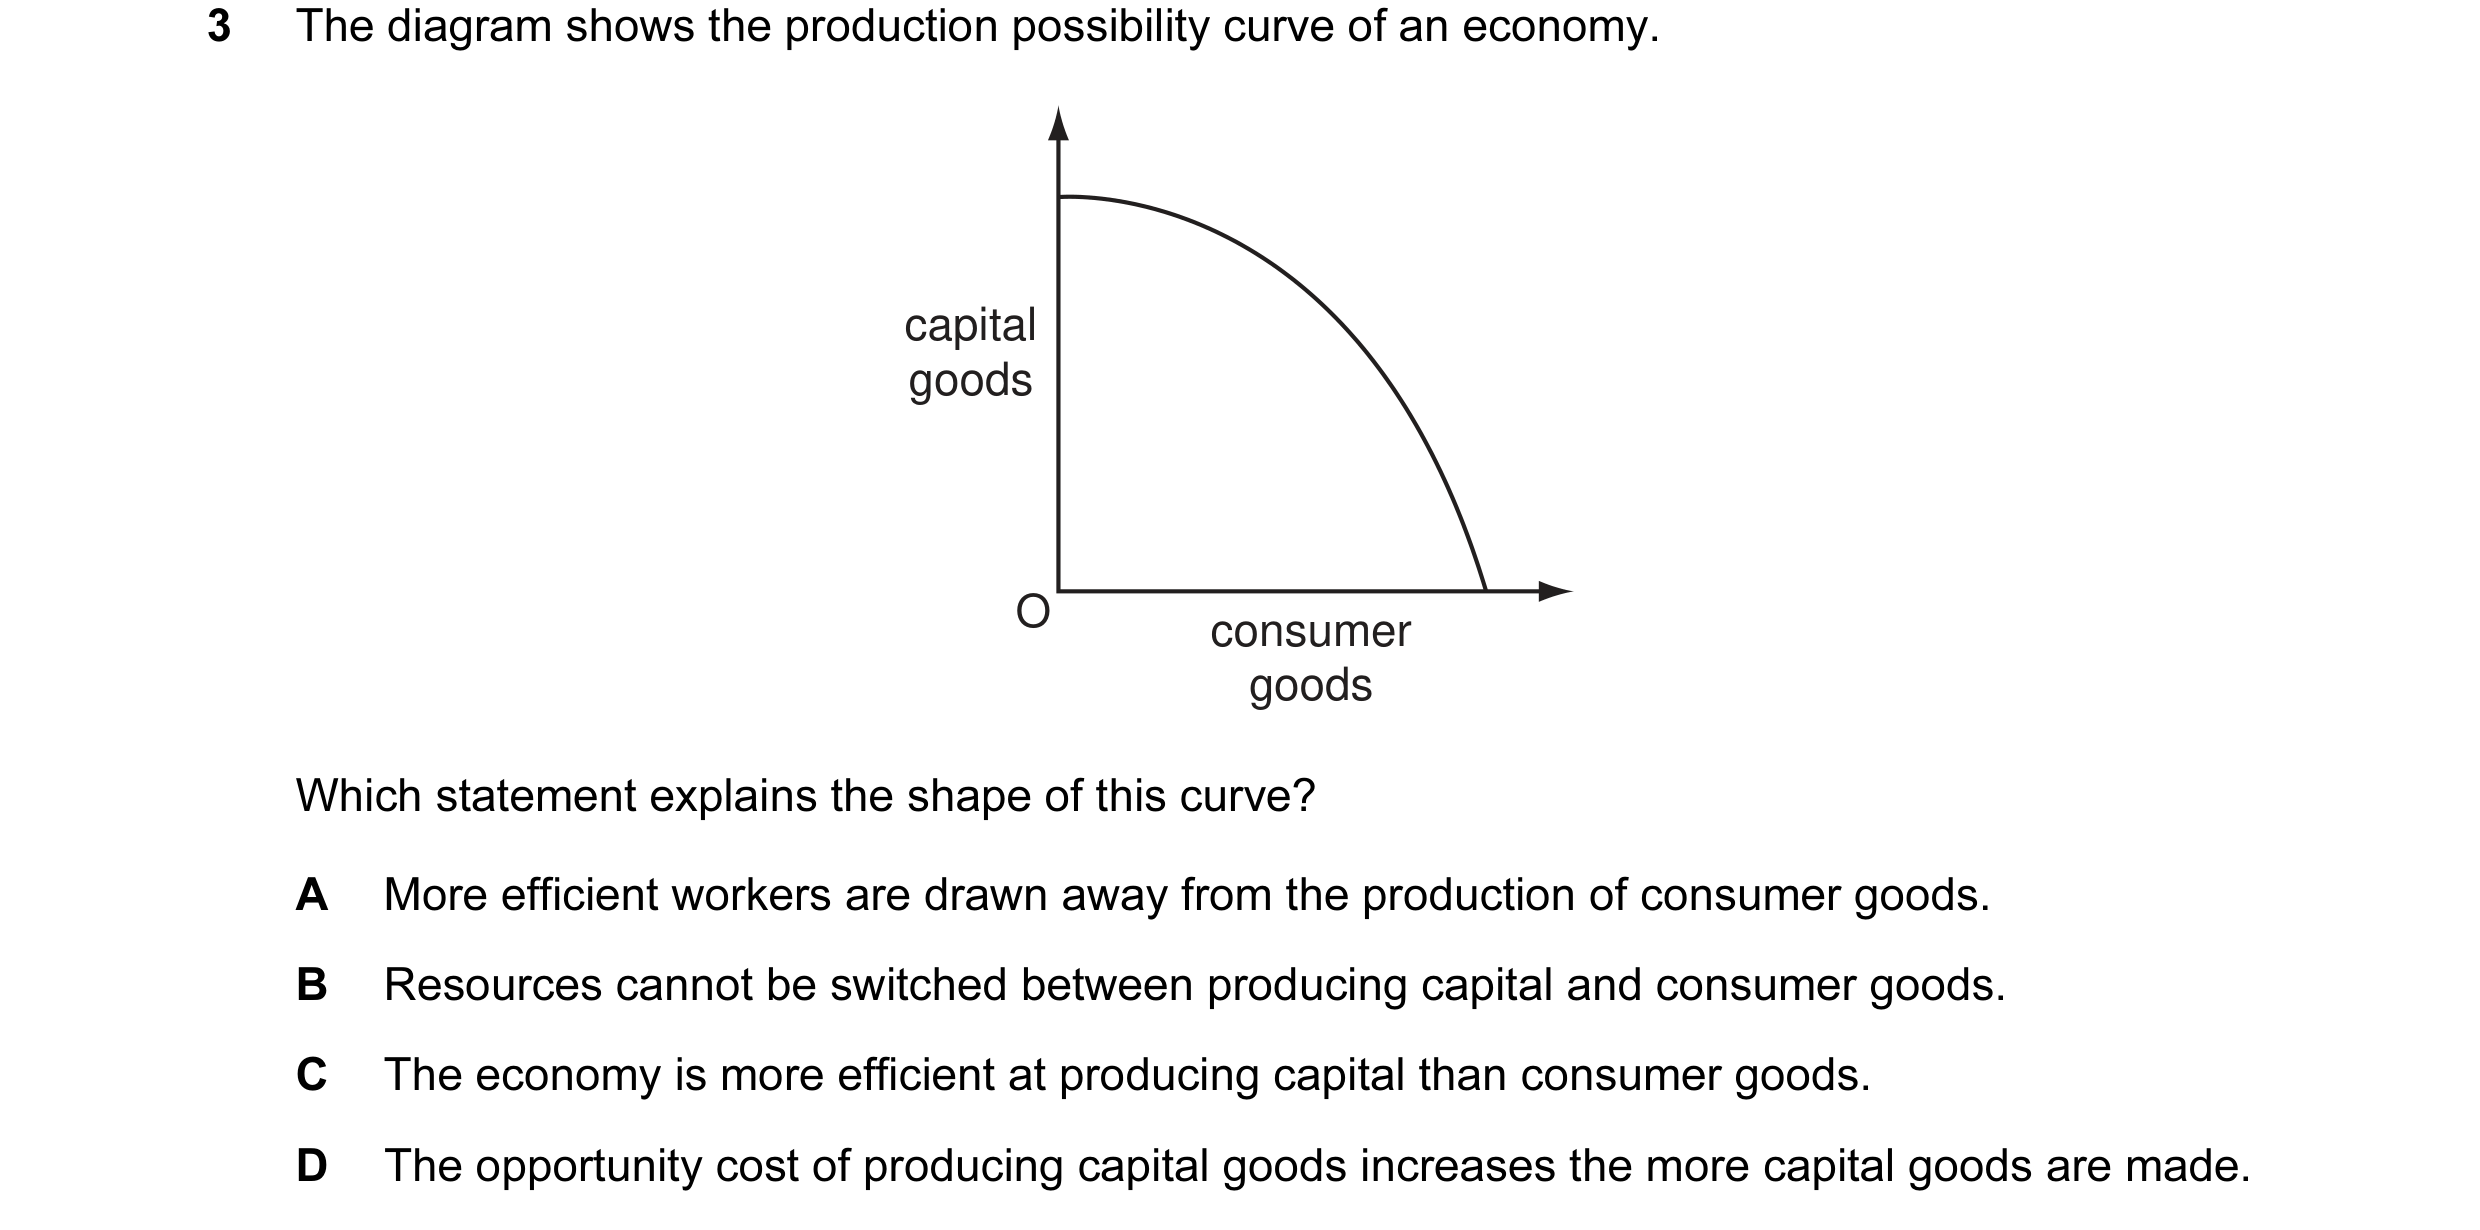 9 / 68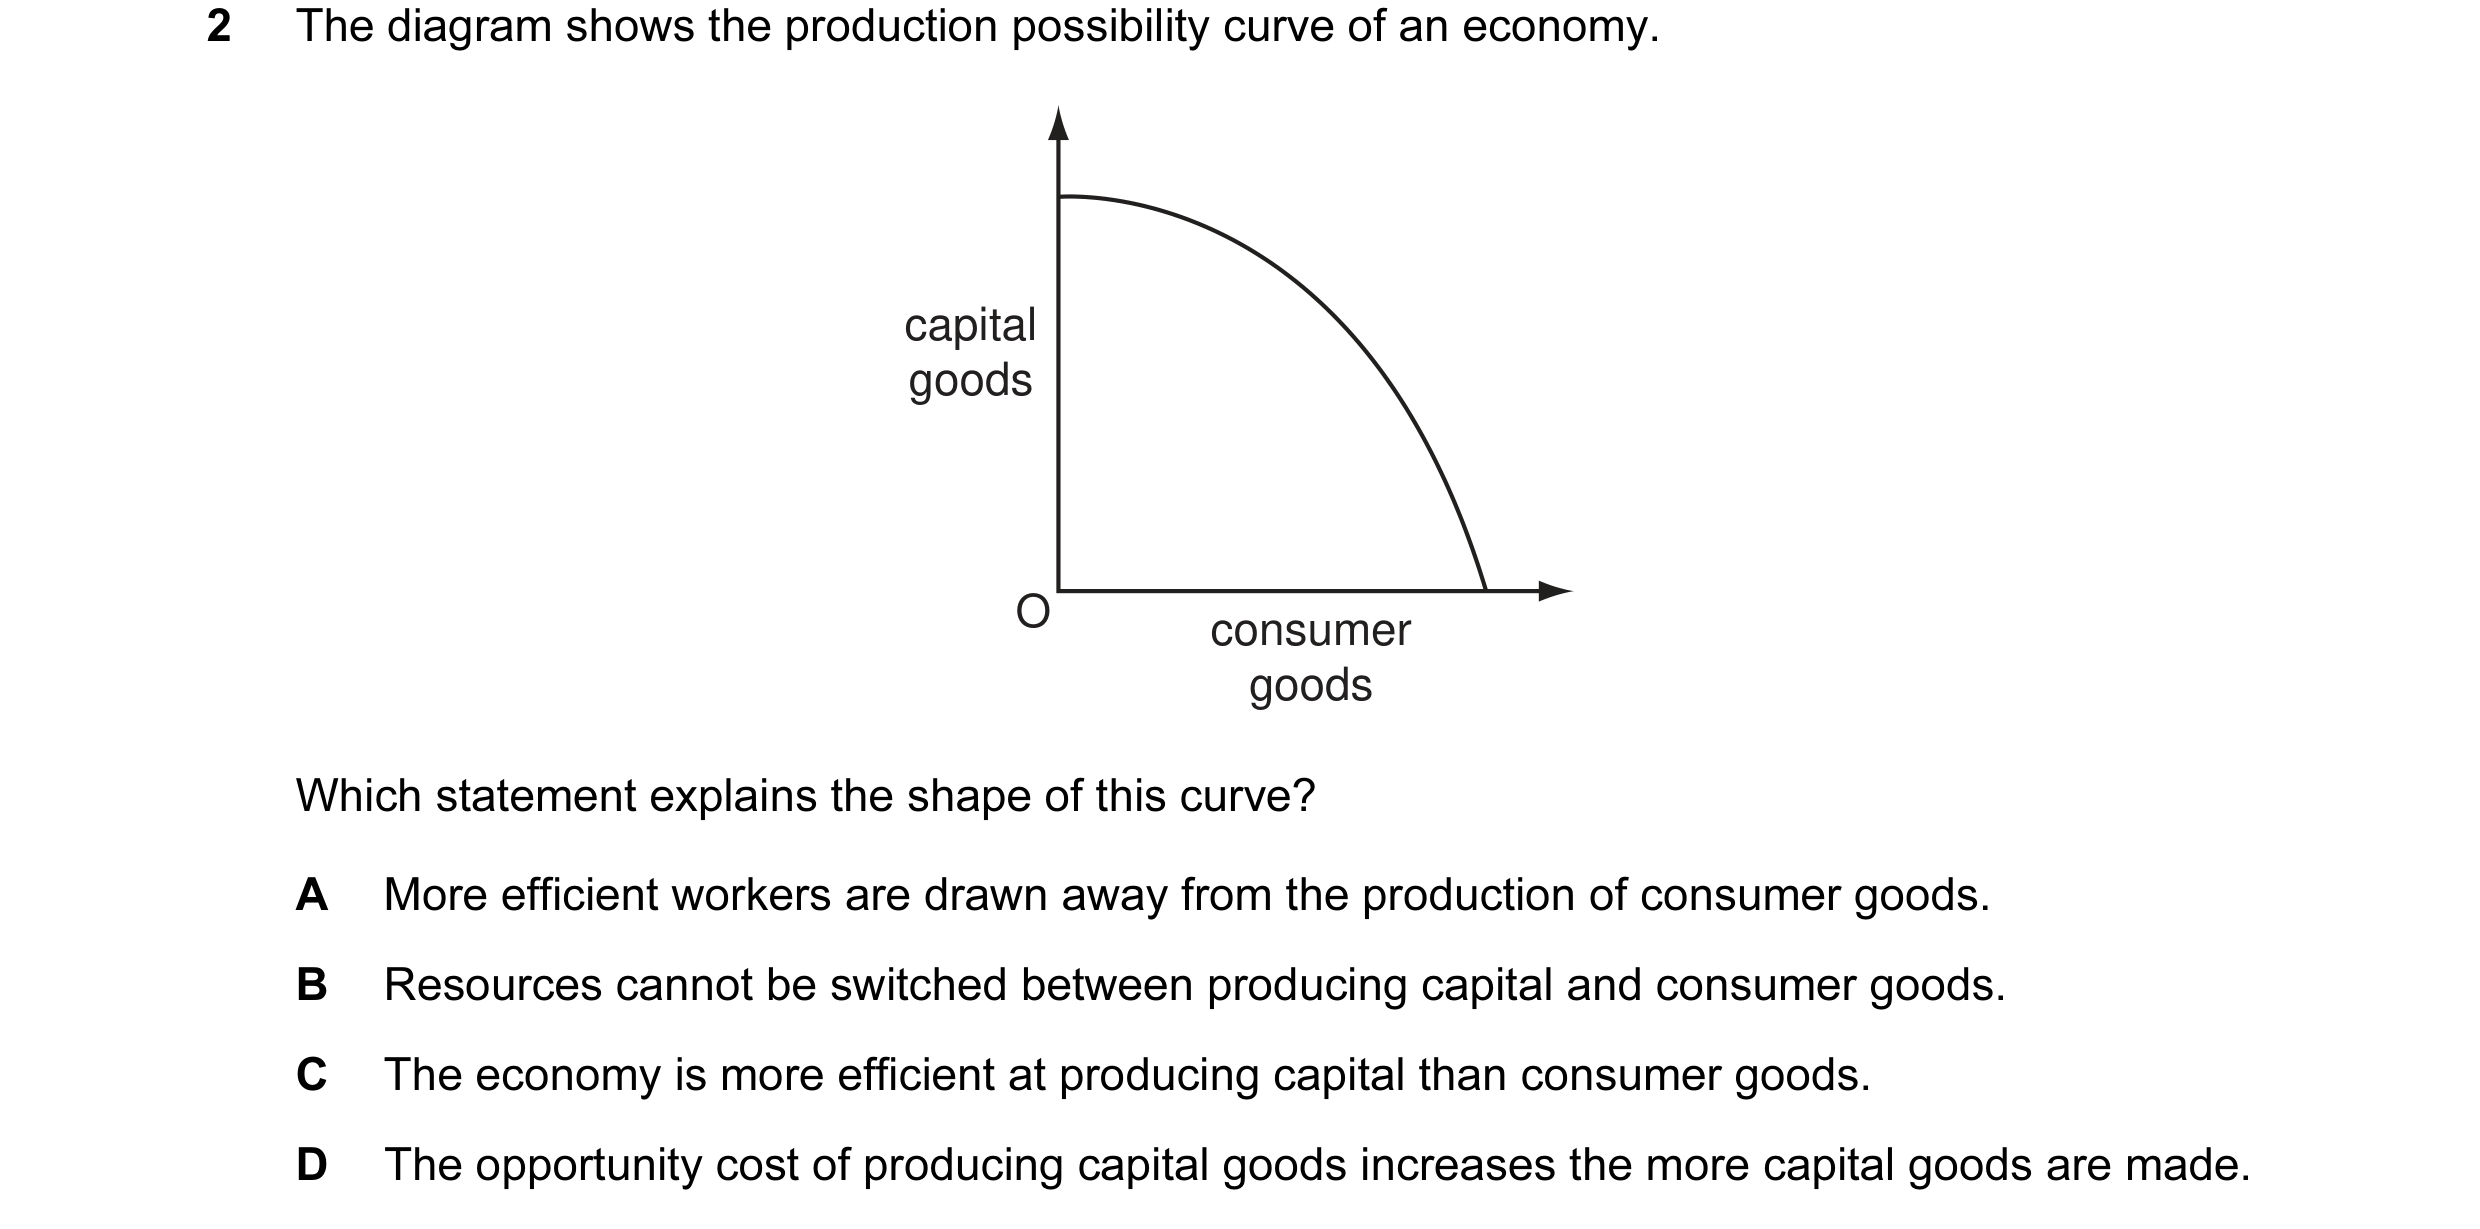
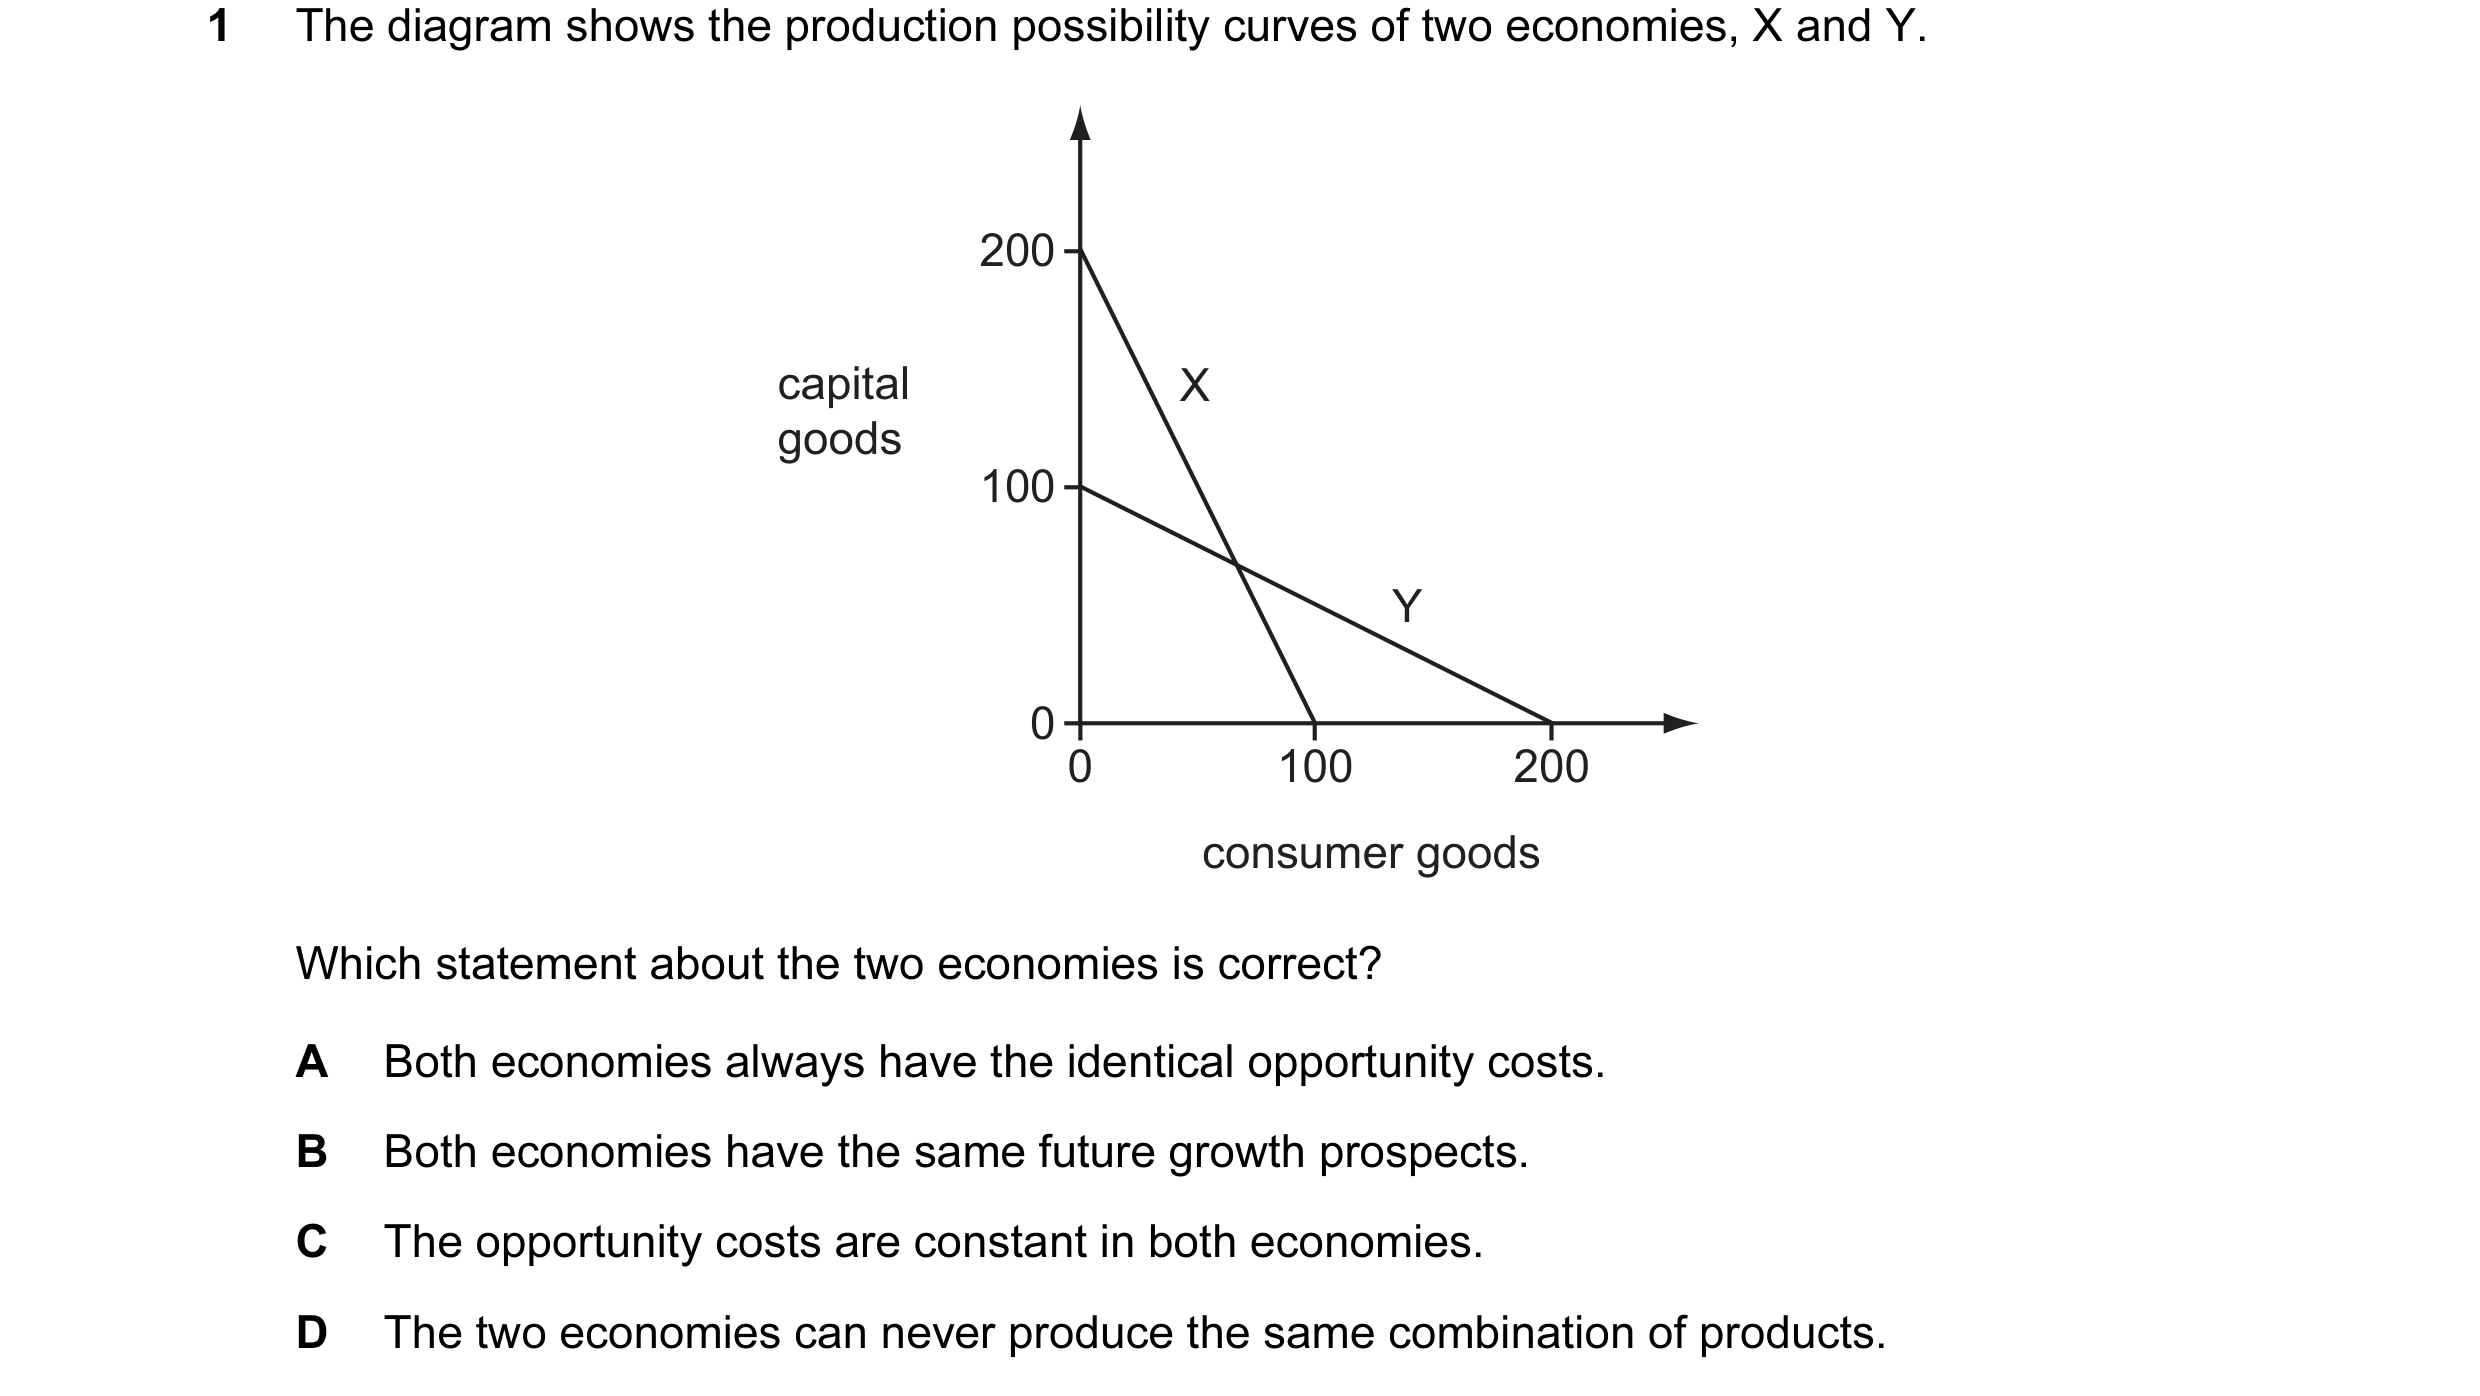 10 / 68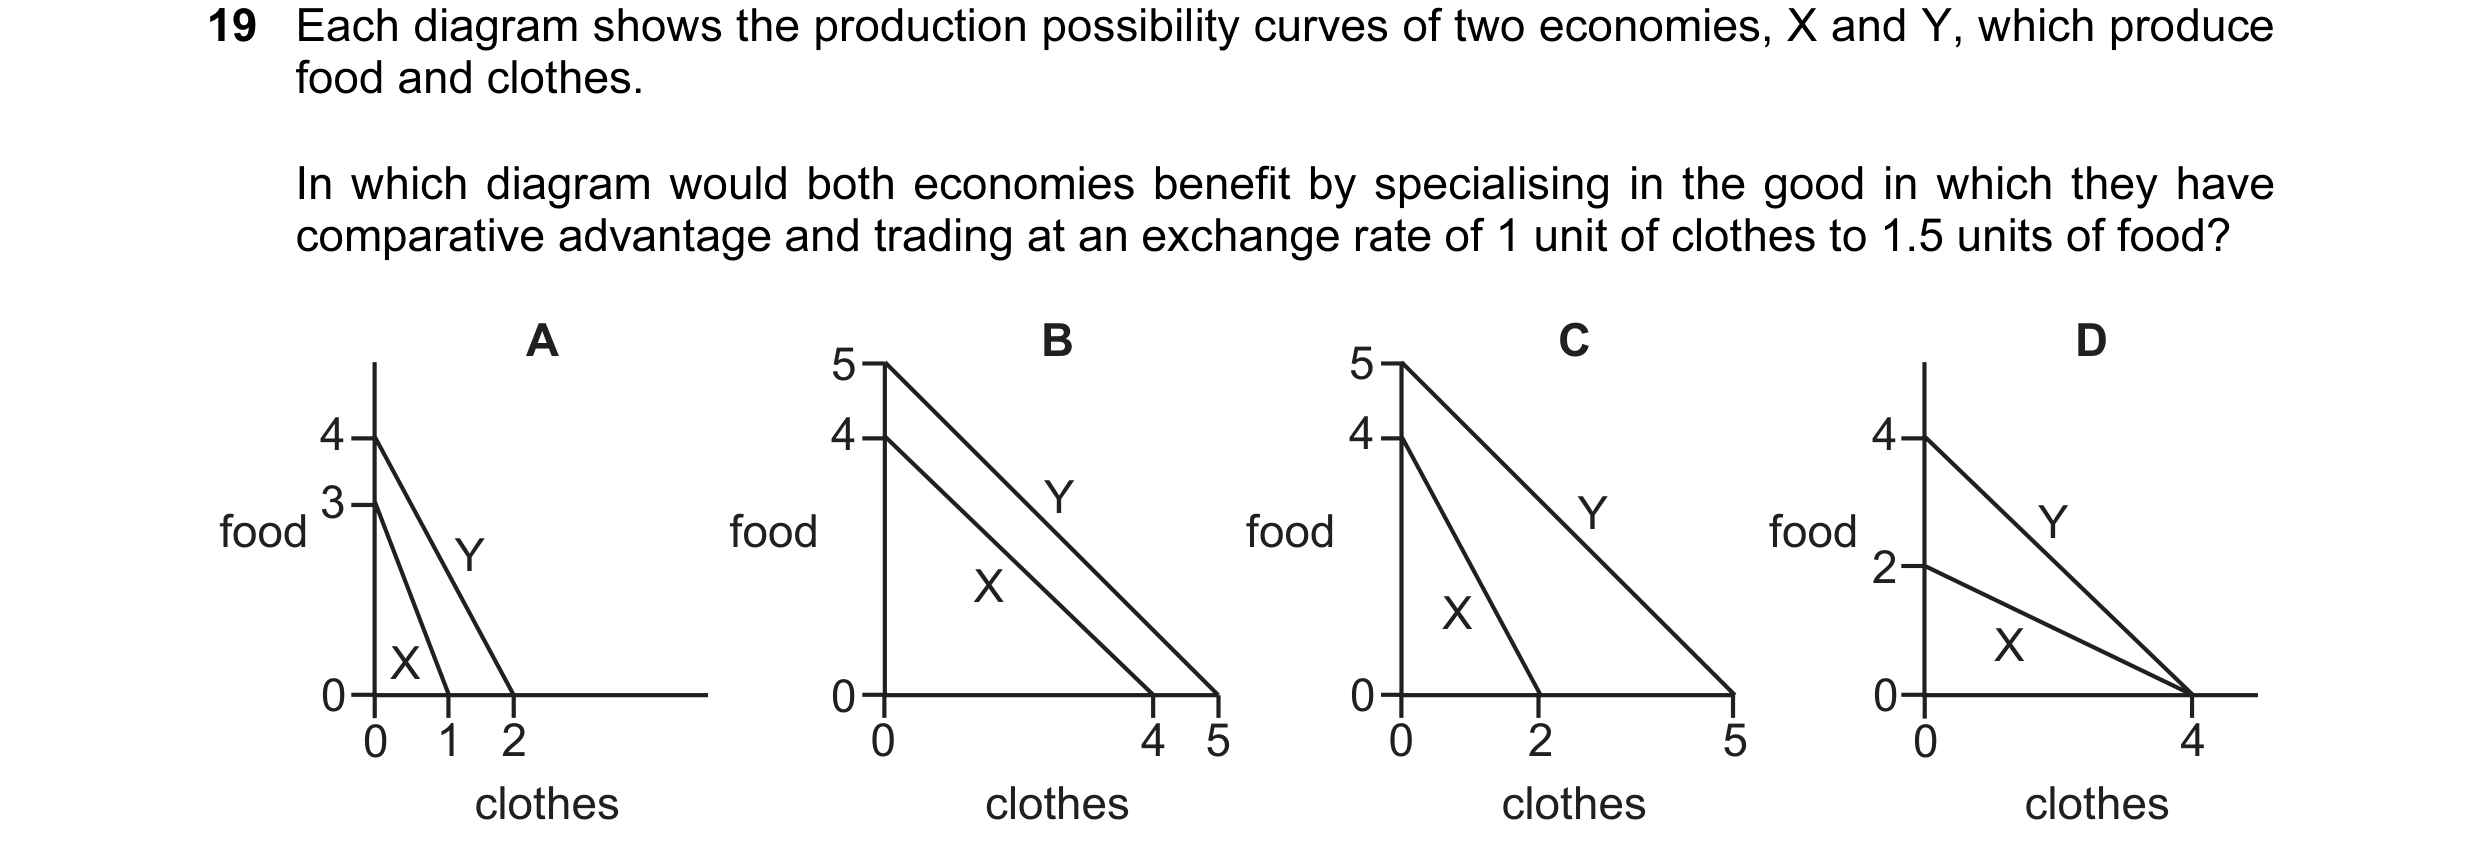
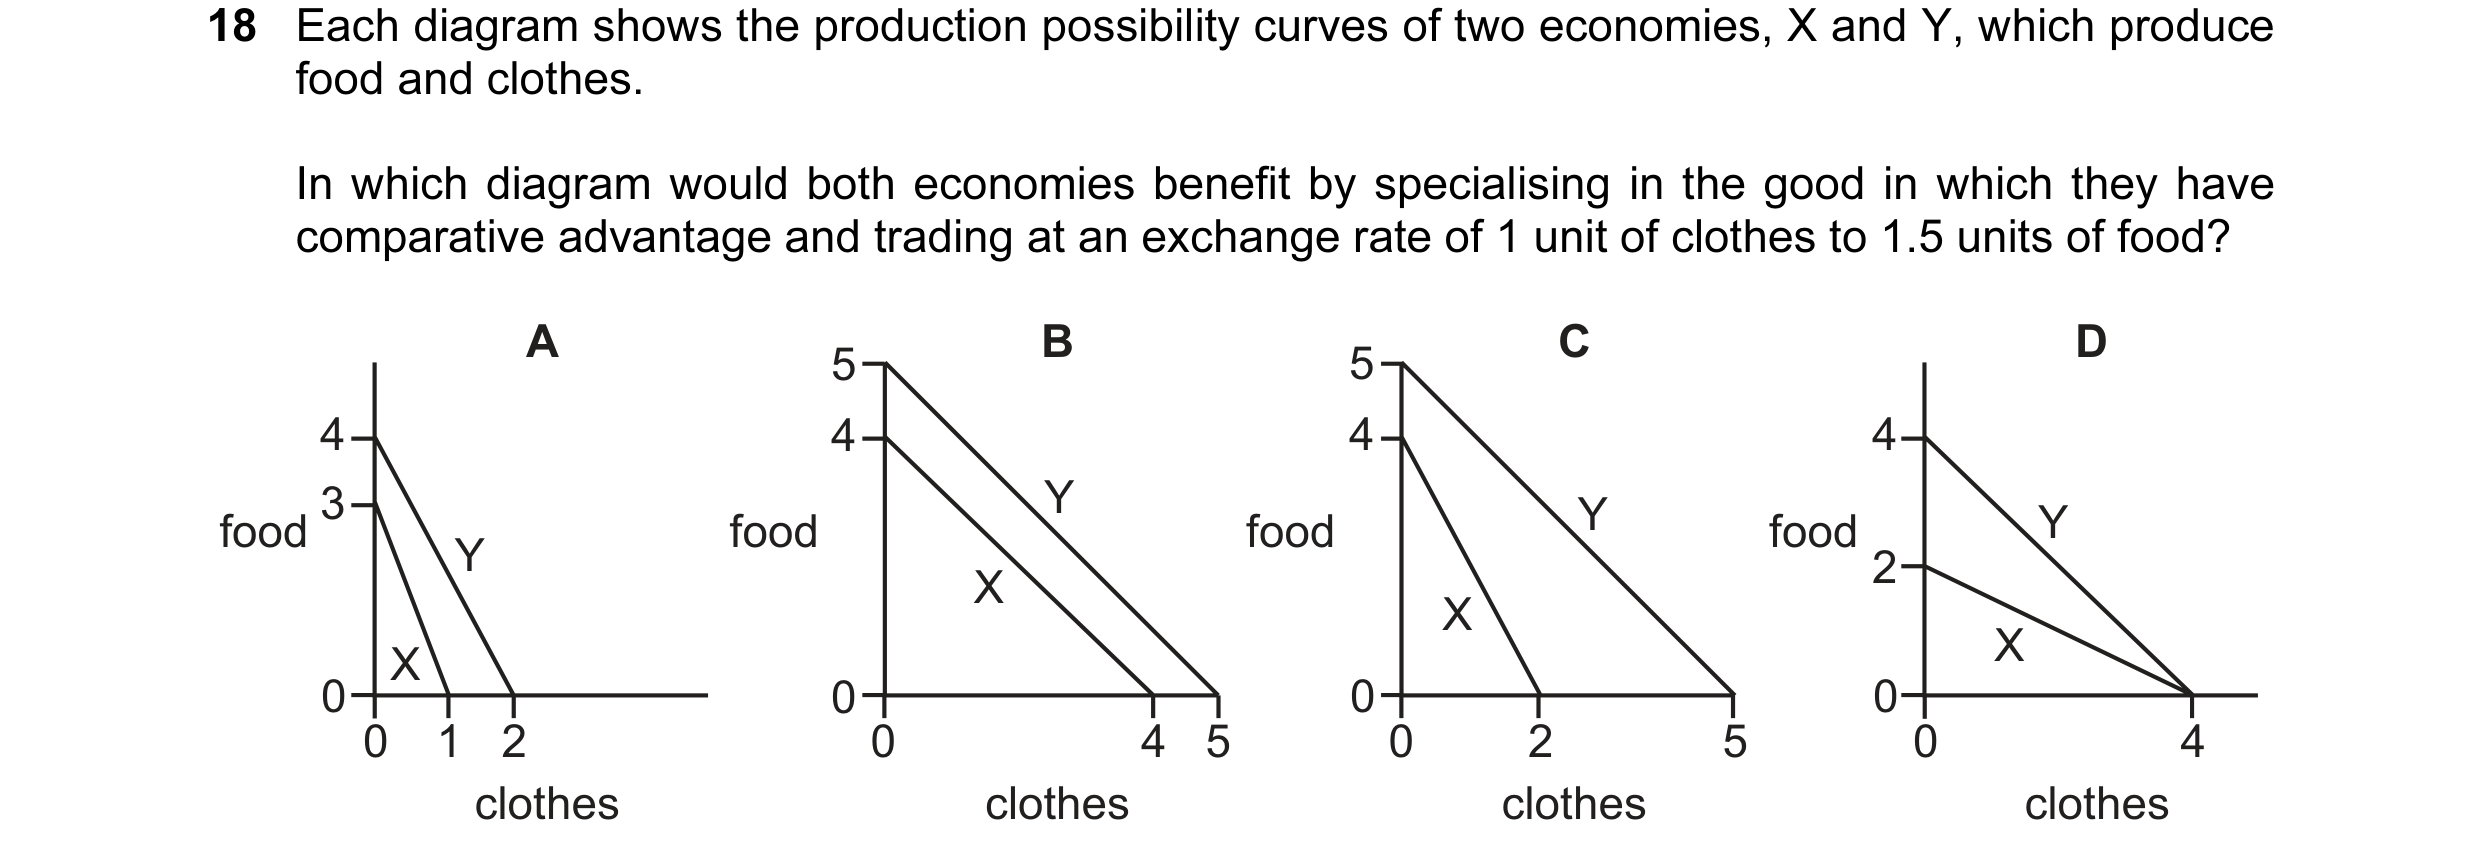
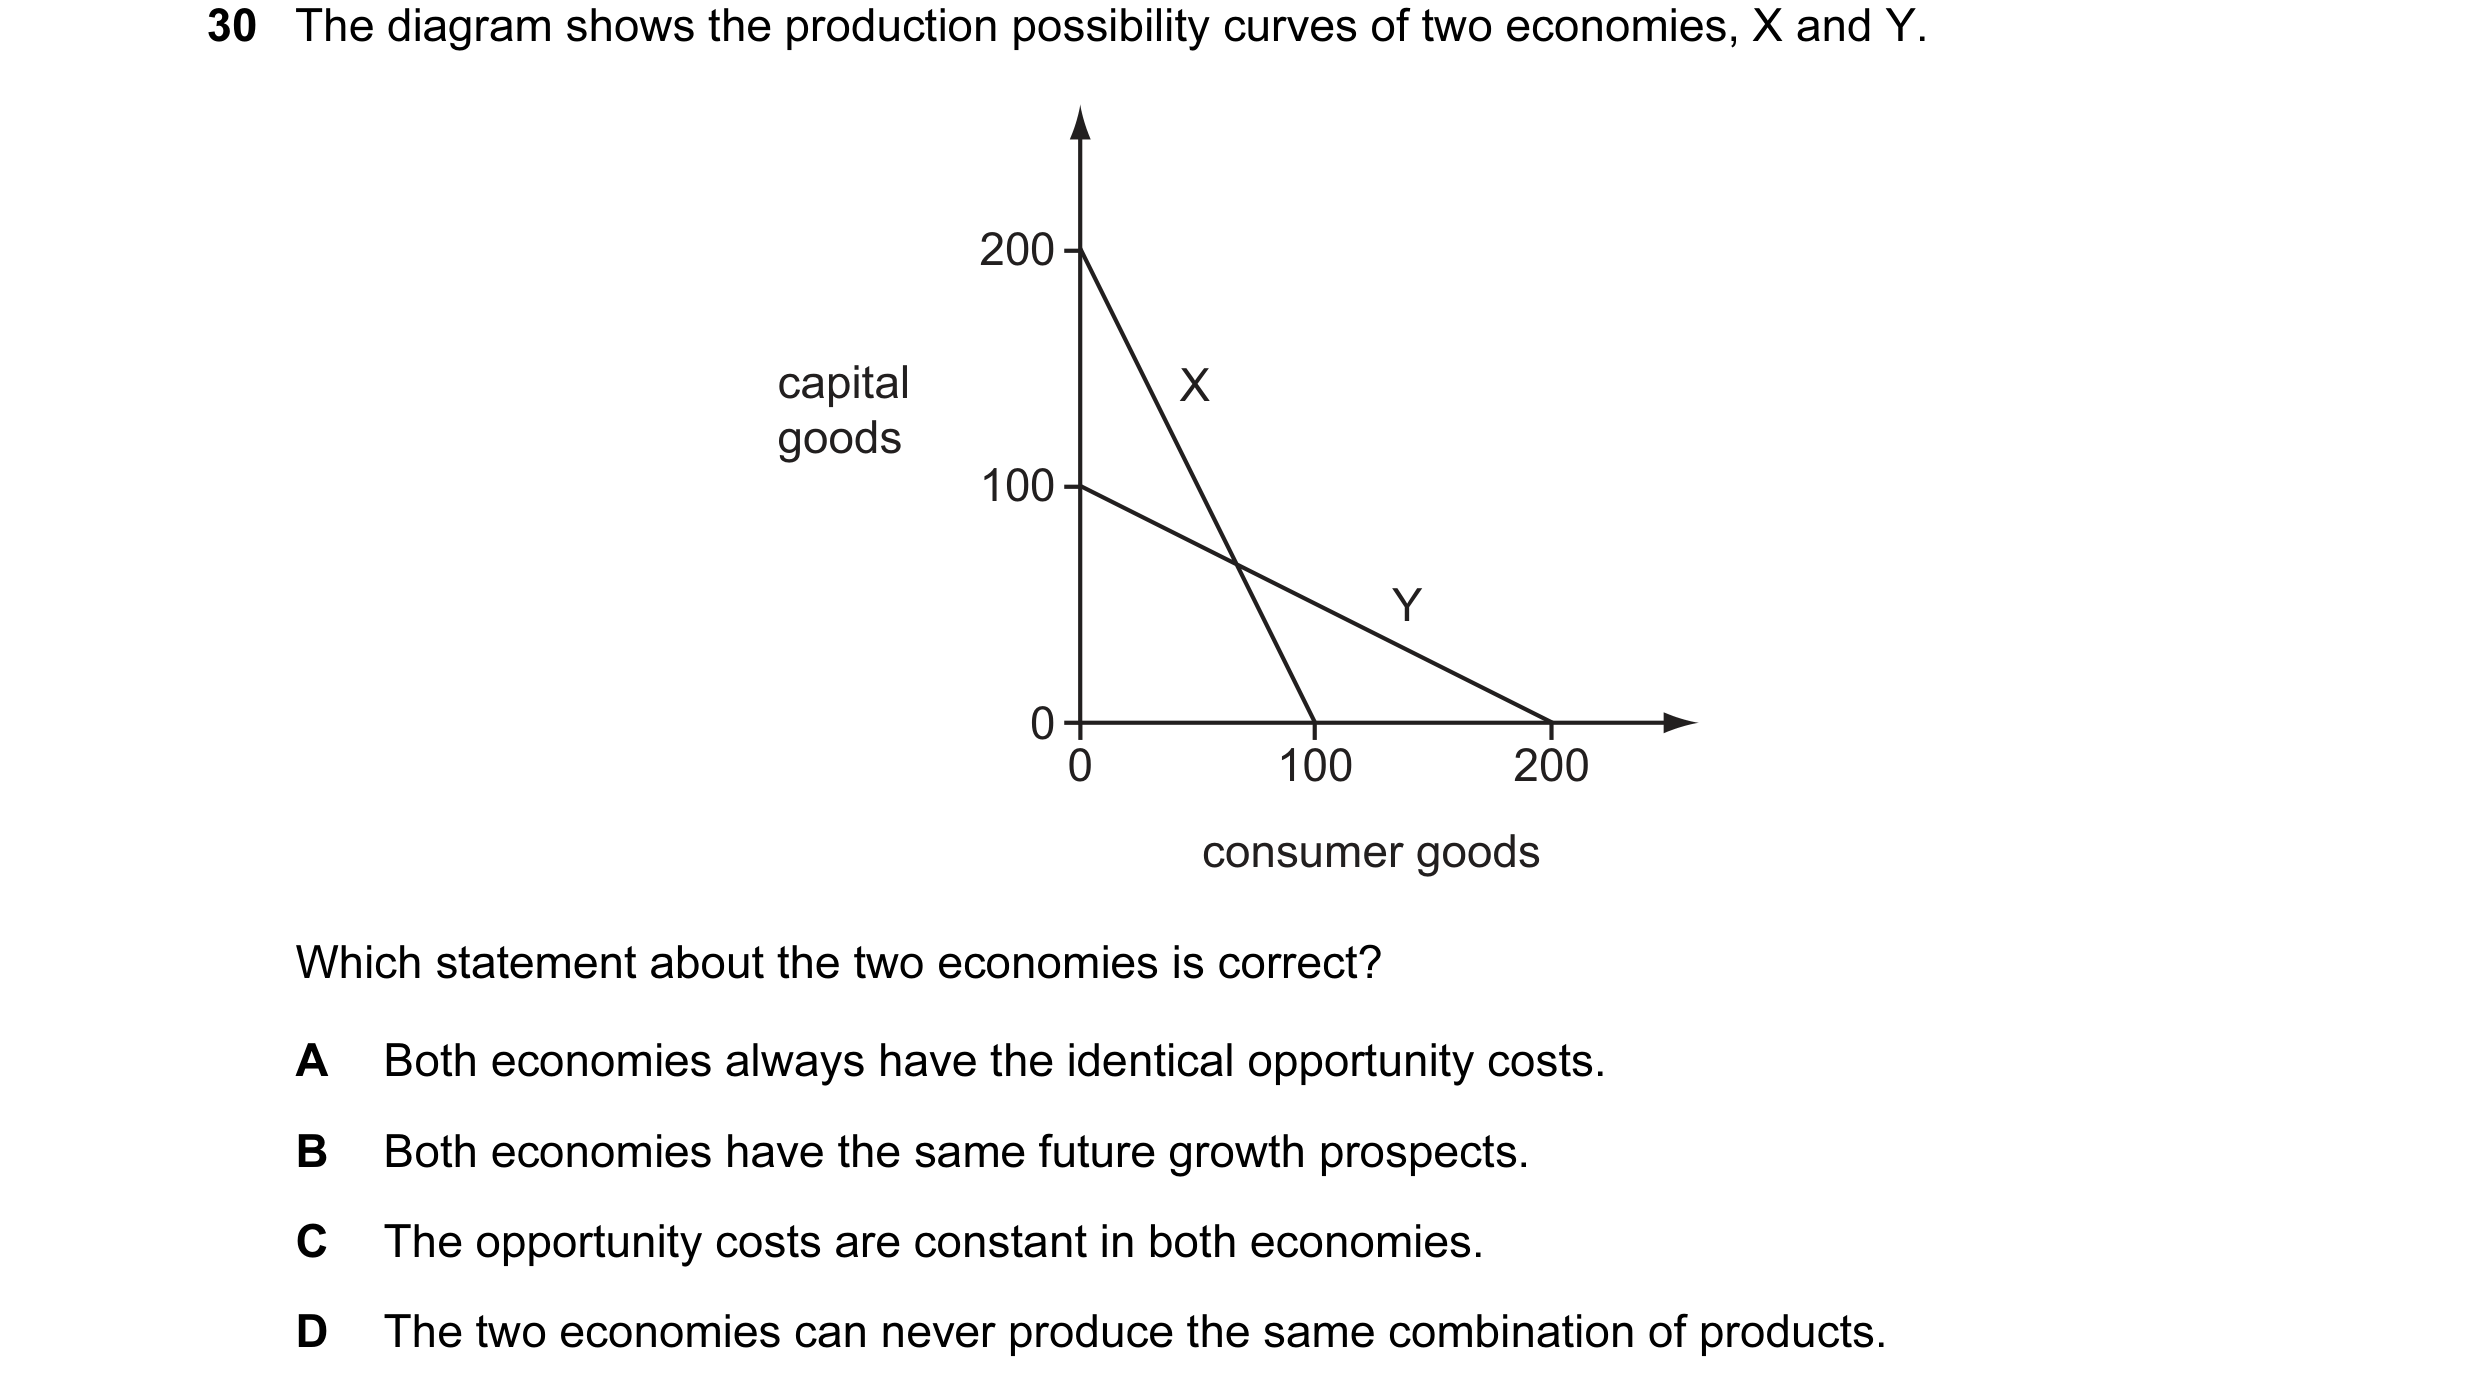 11 / 68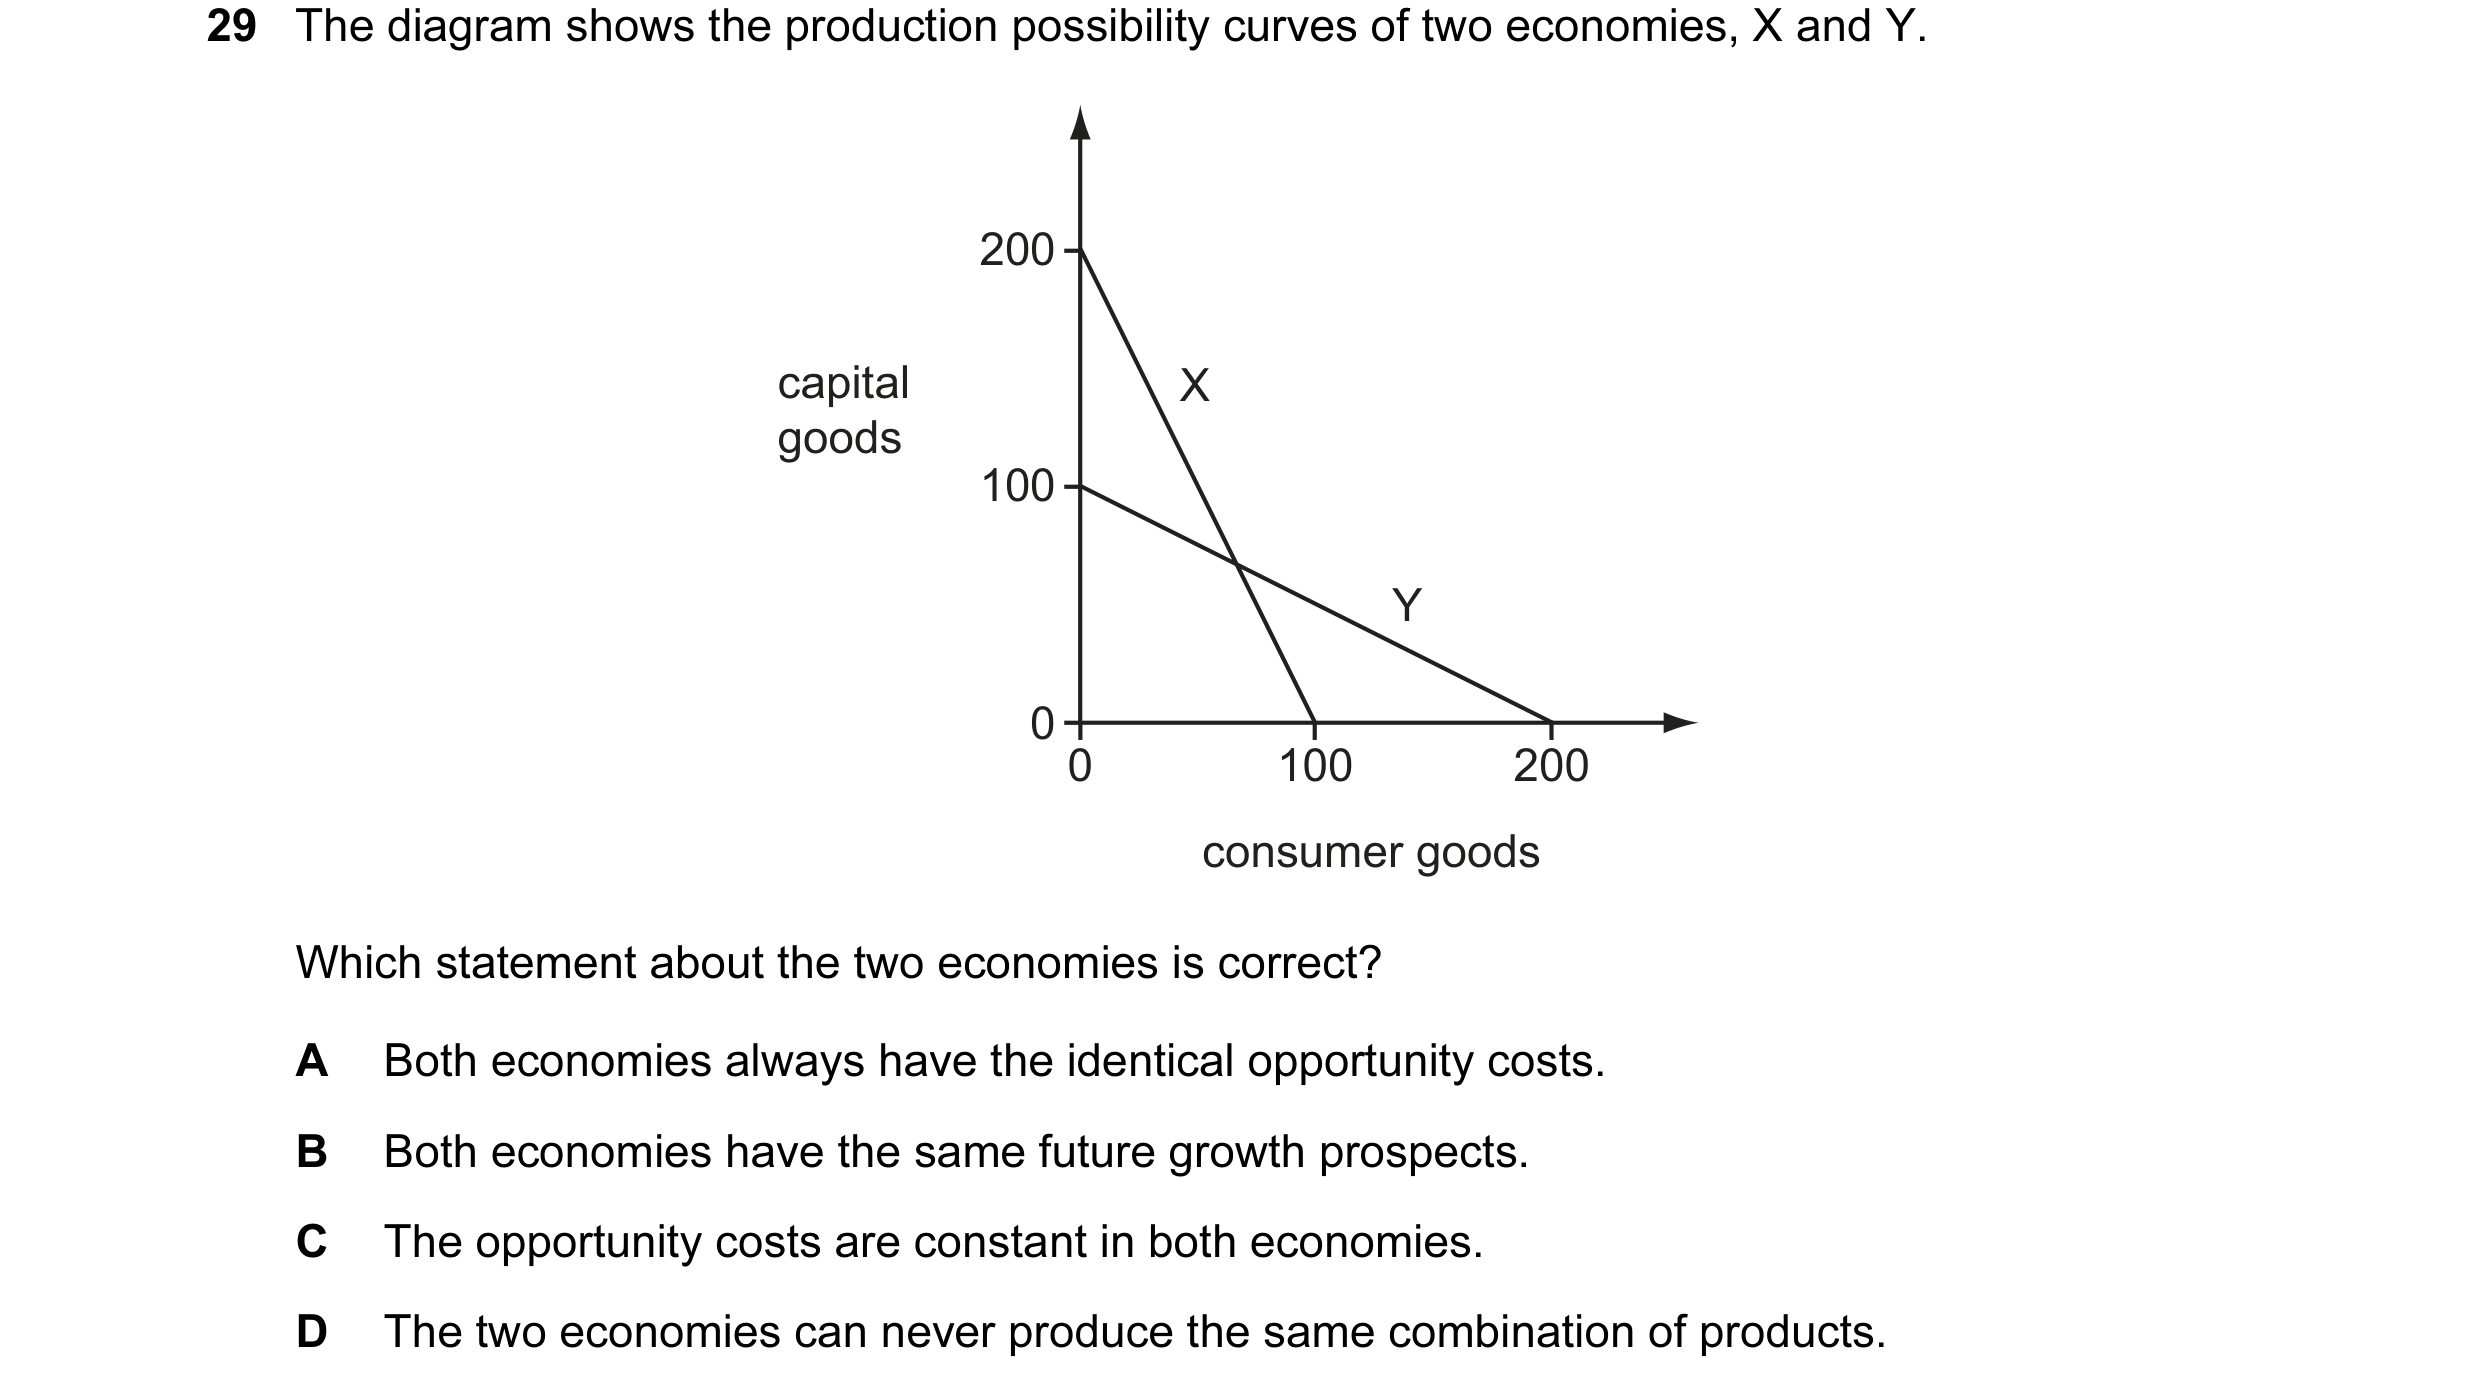
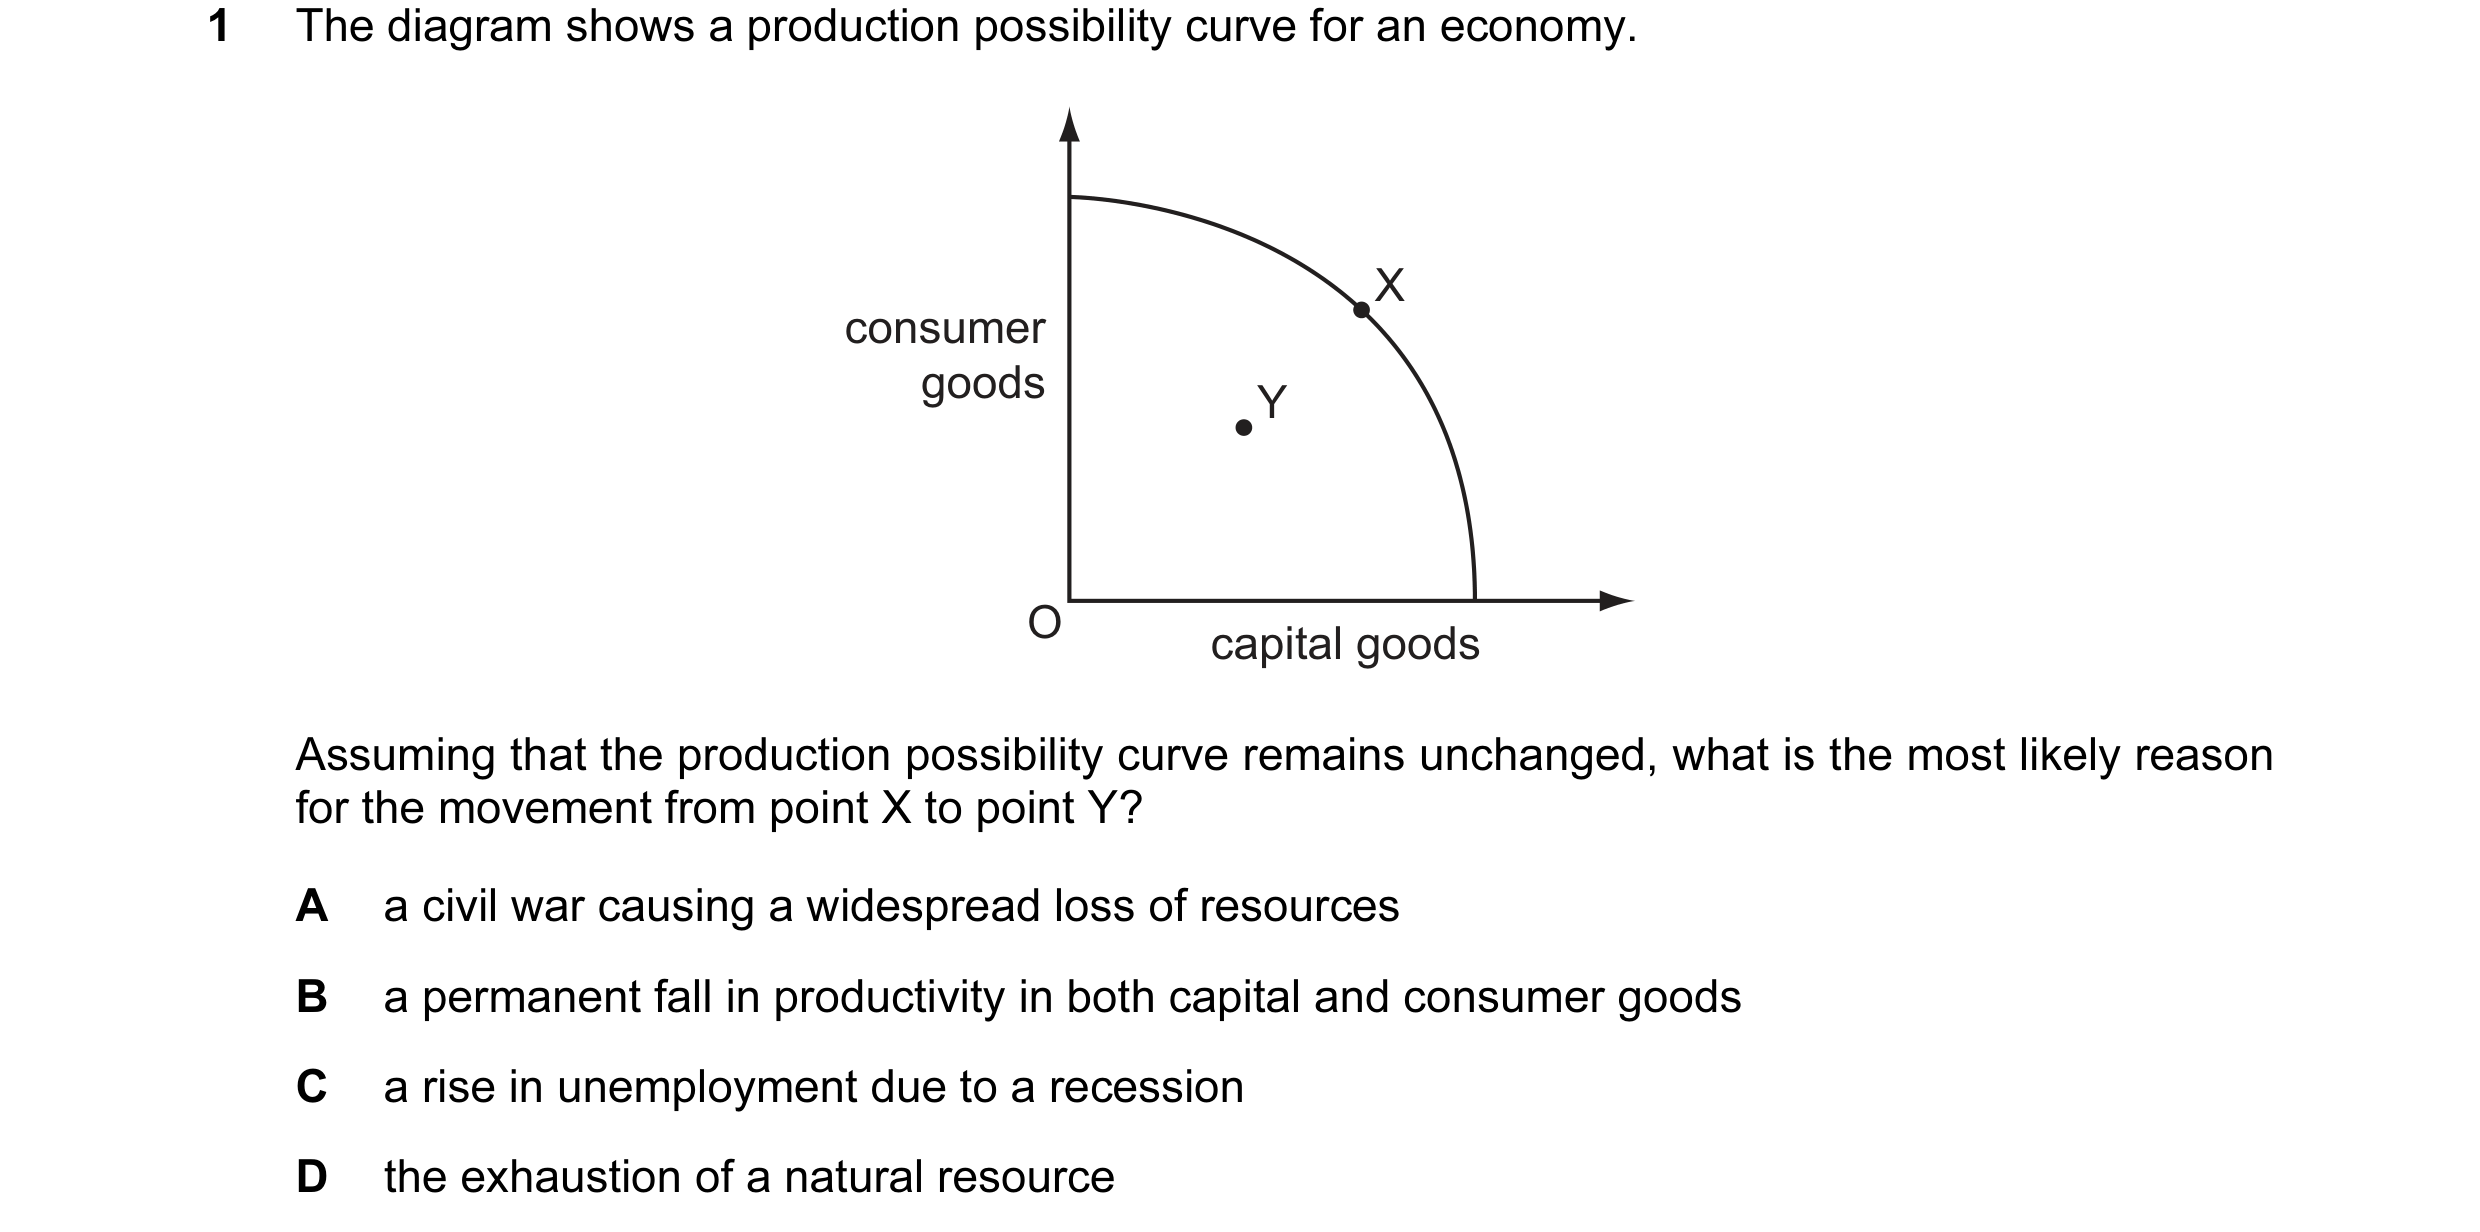 12 / 68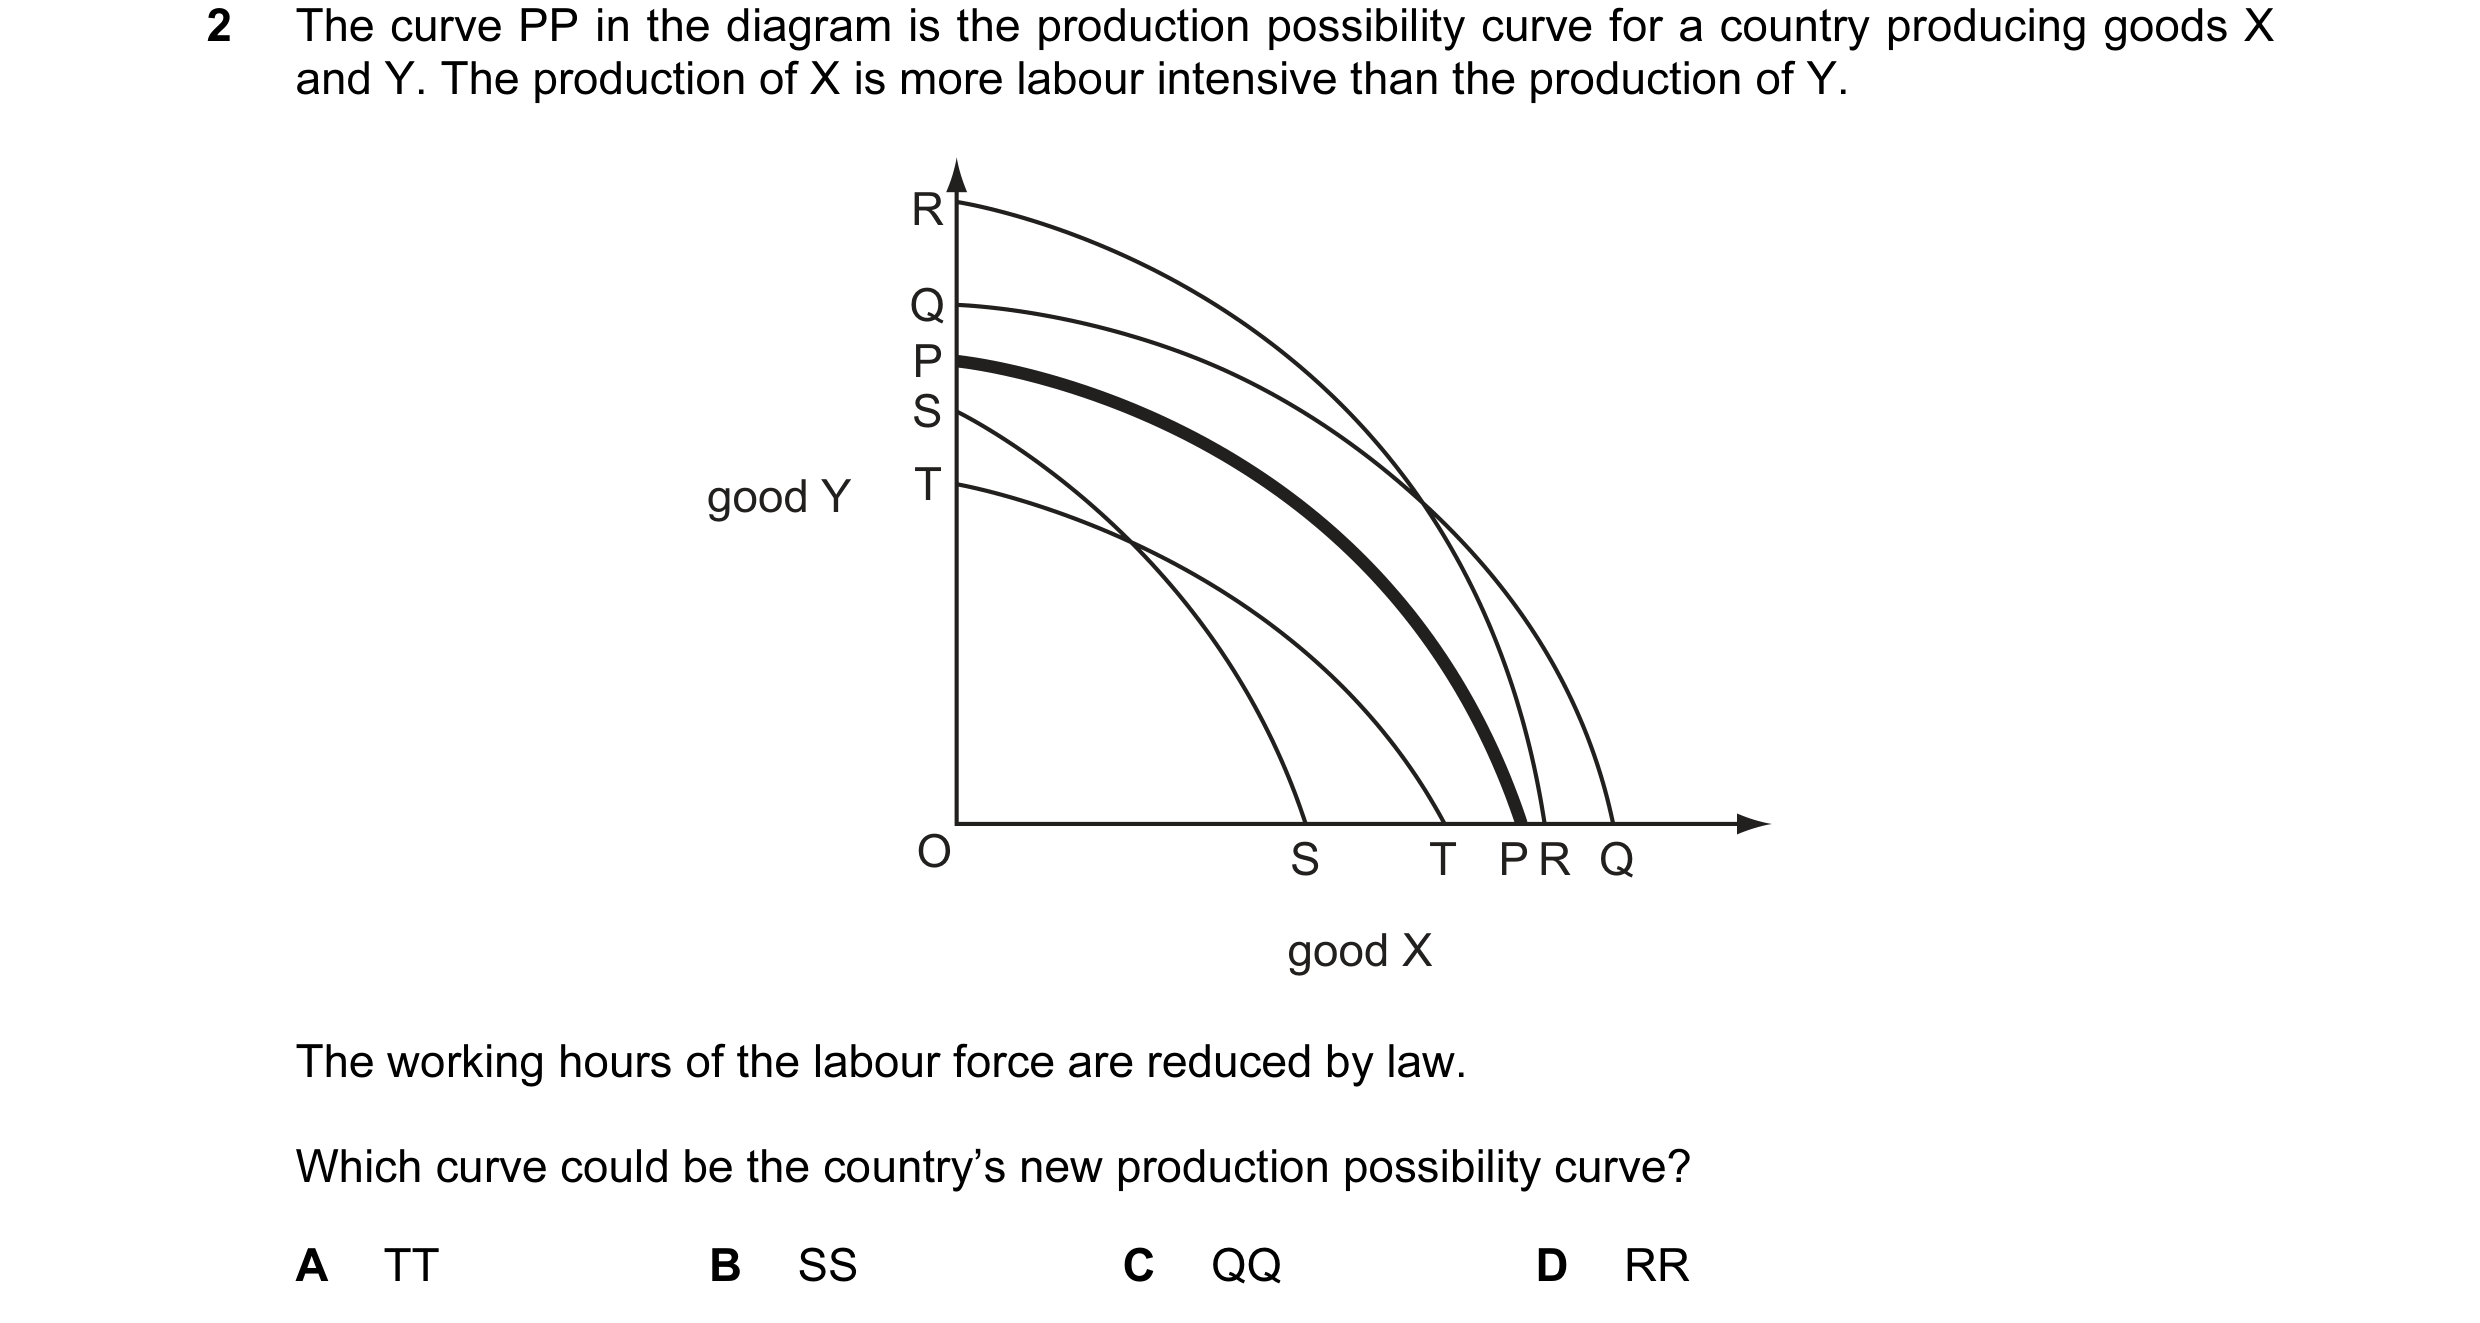
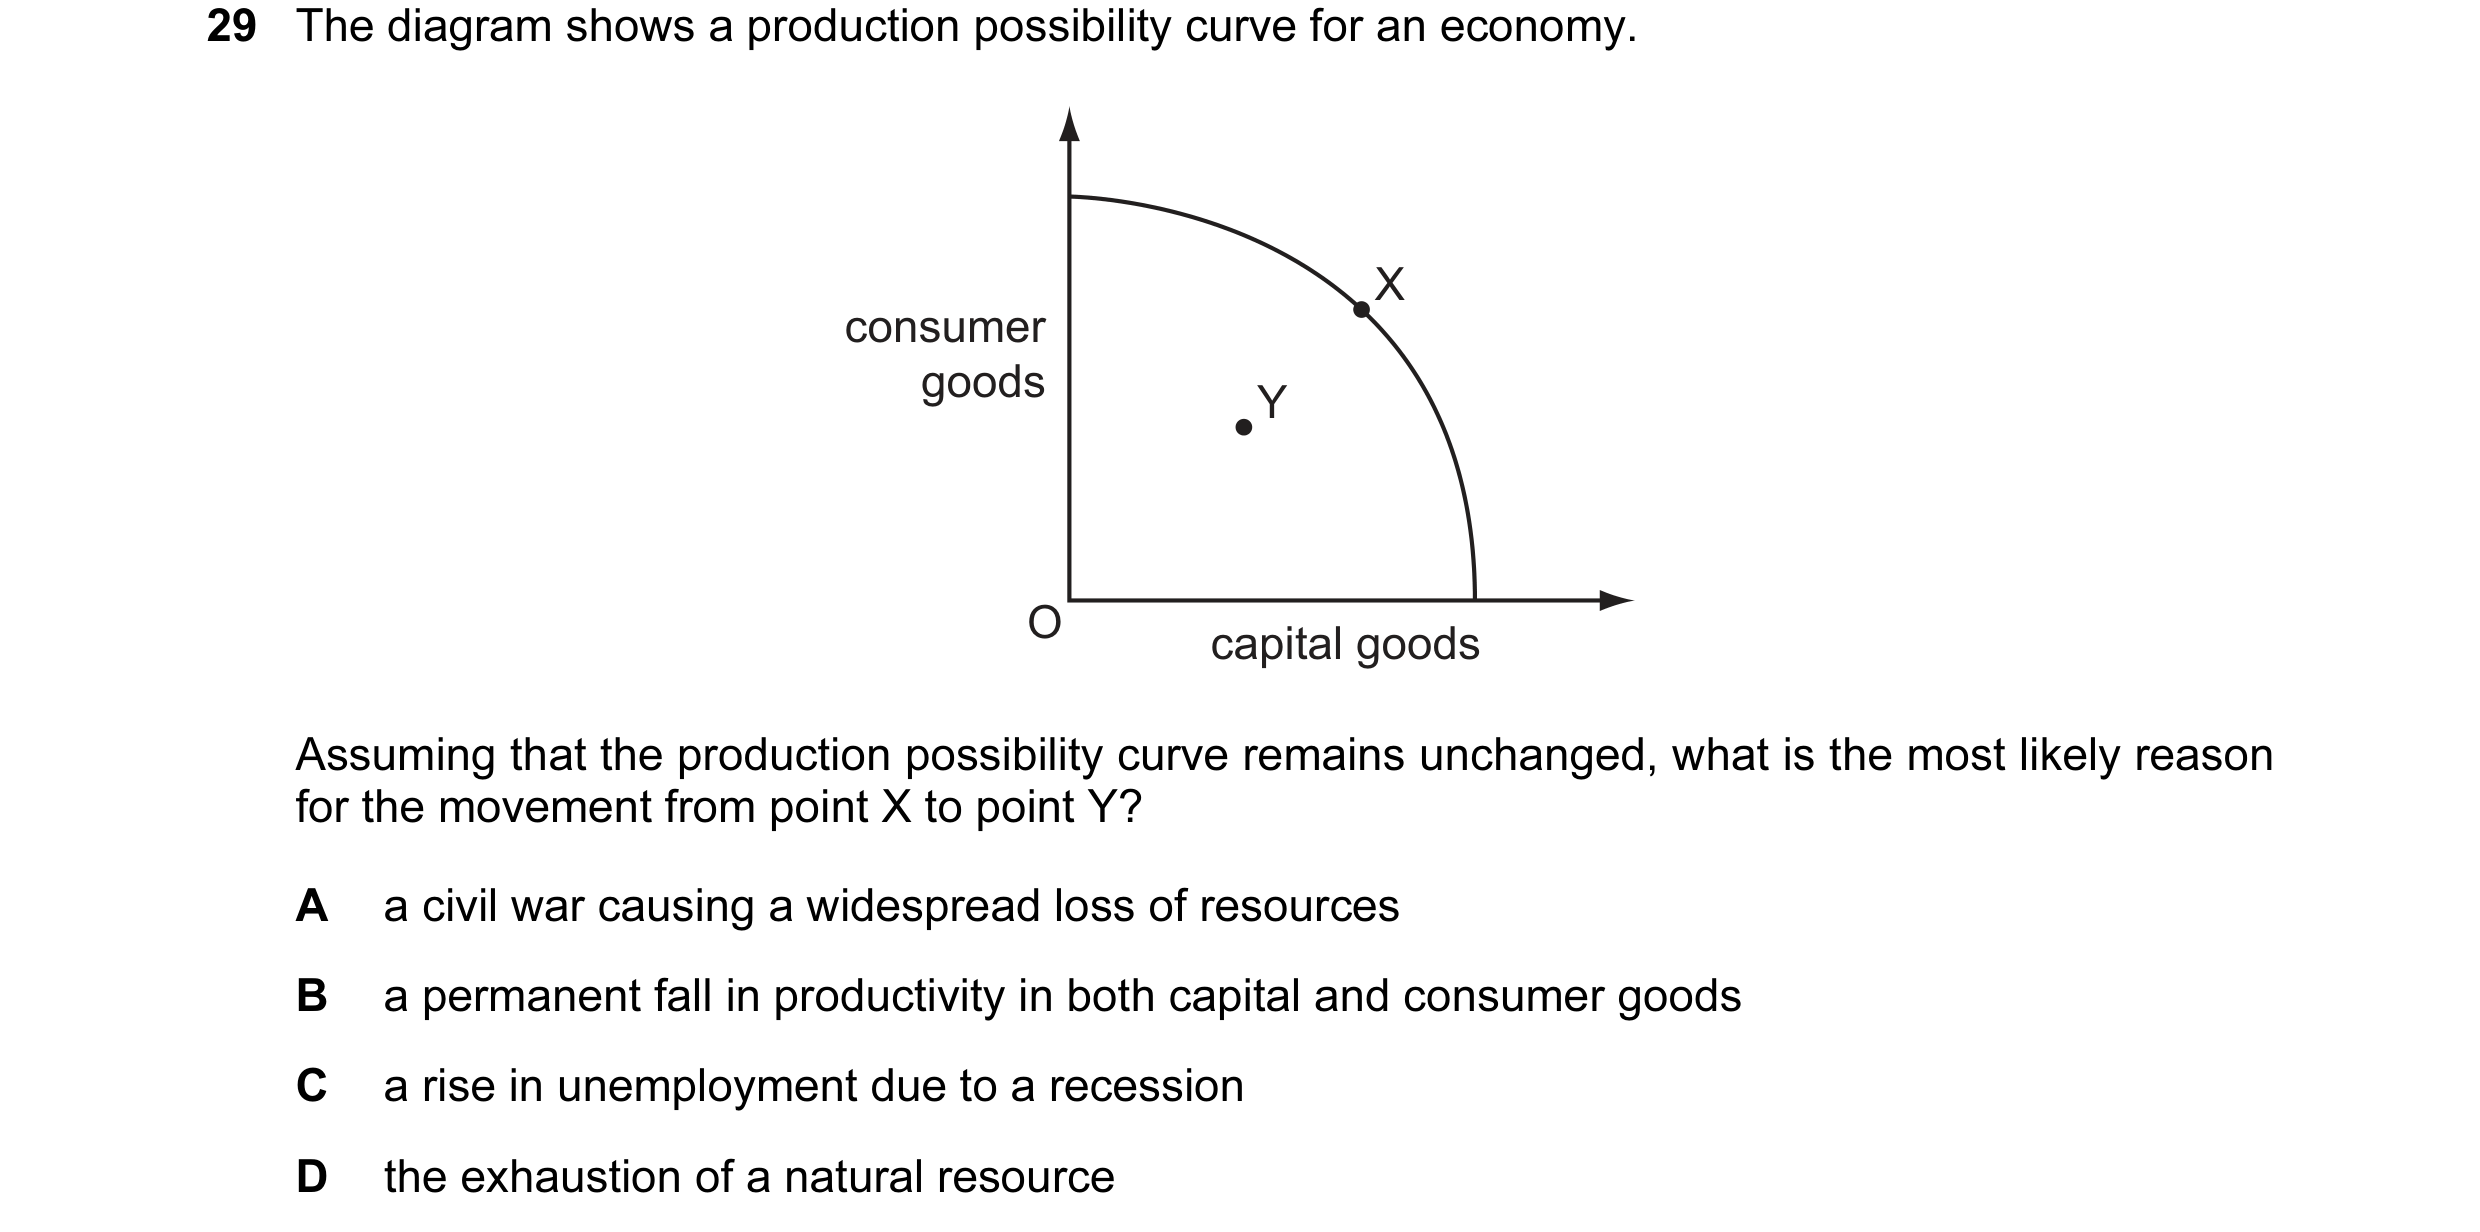 13 / 68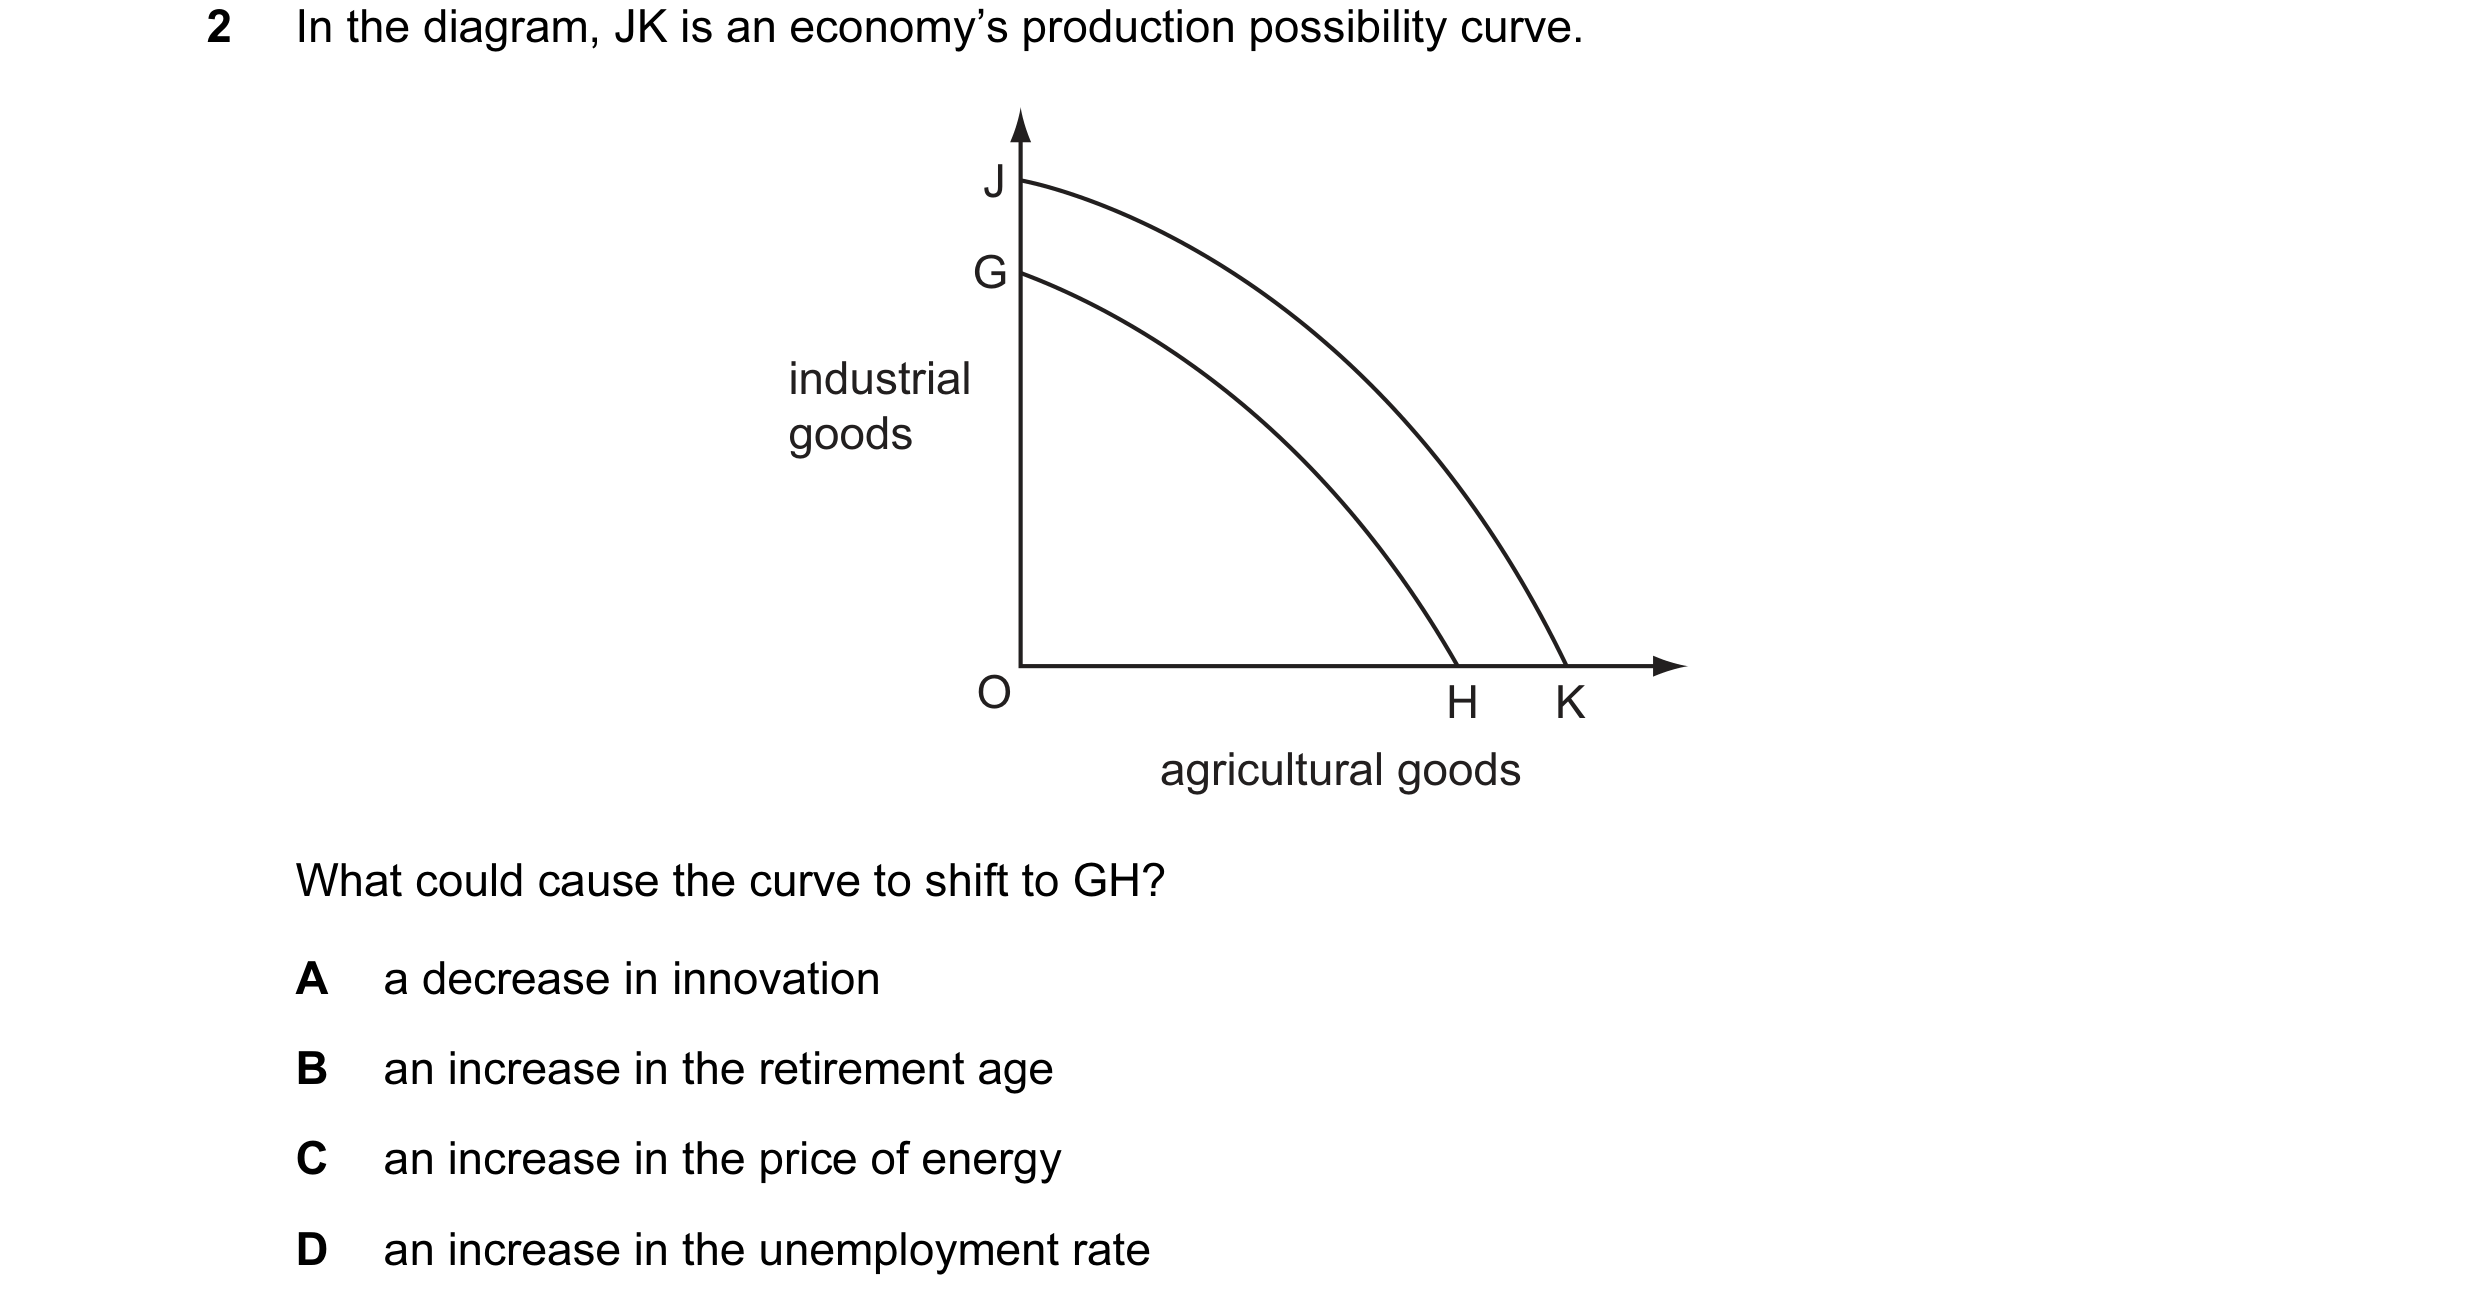
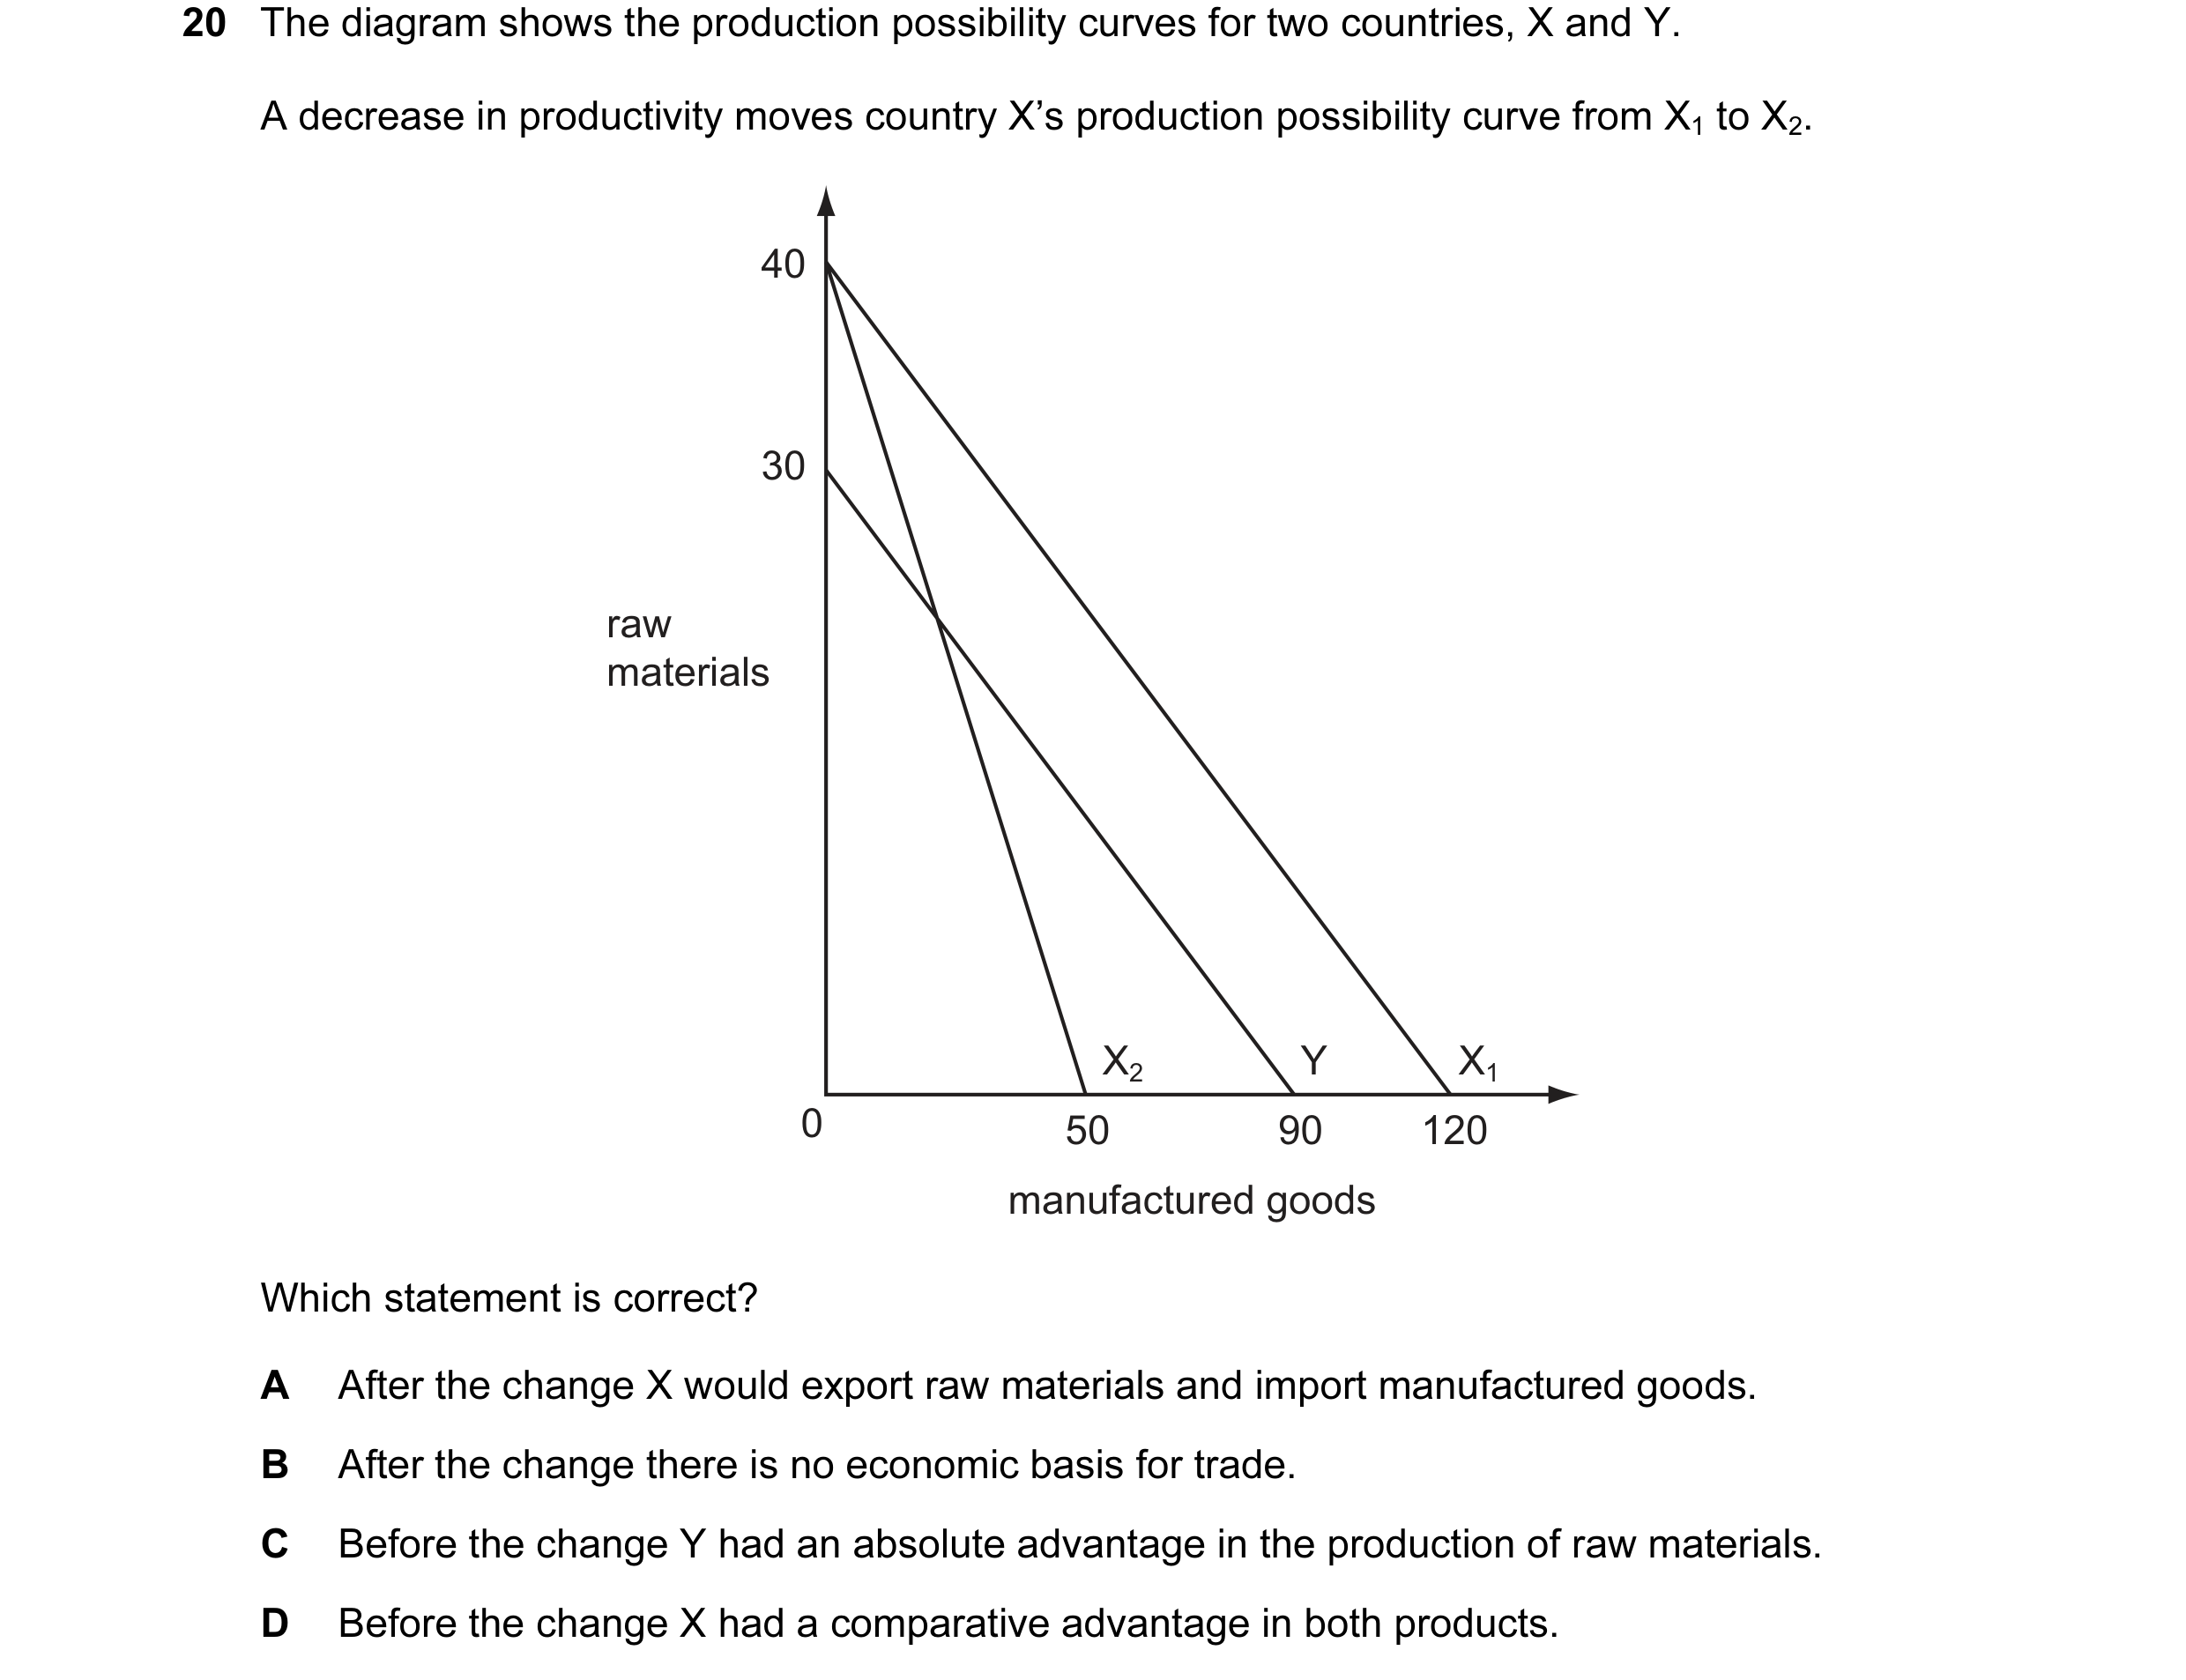 14 / 68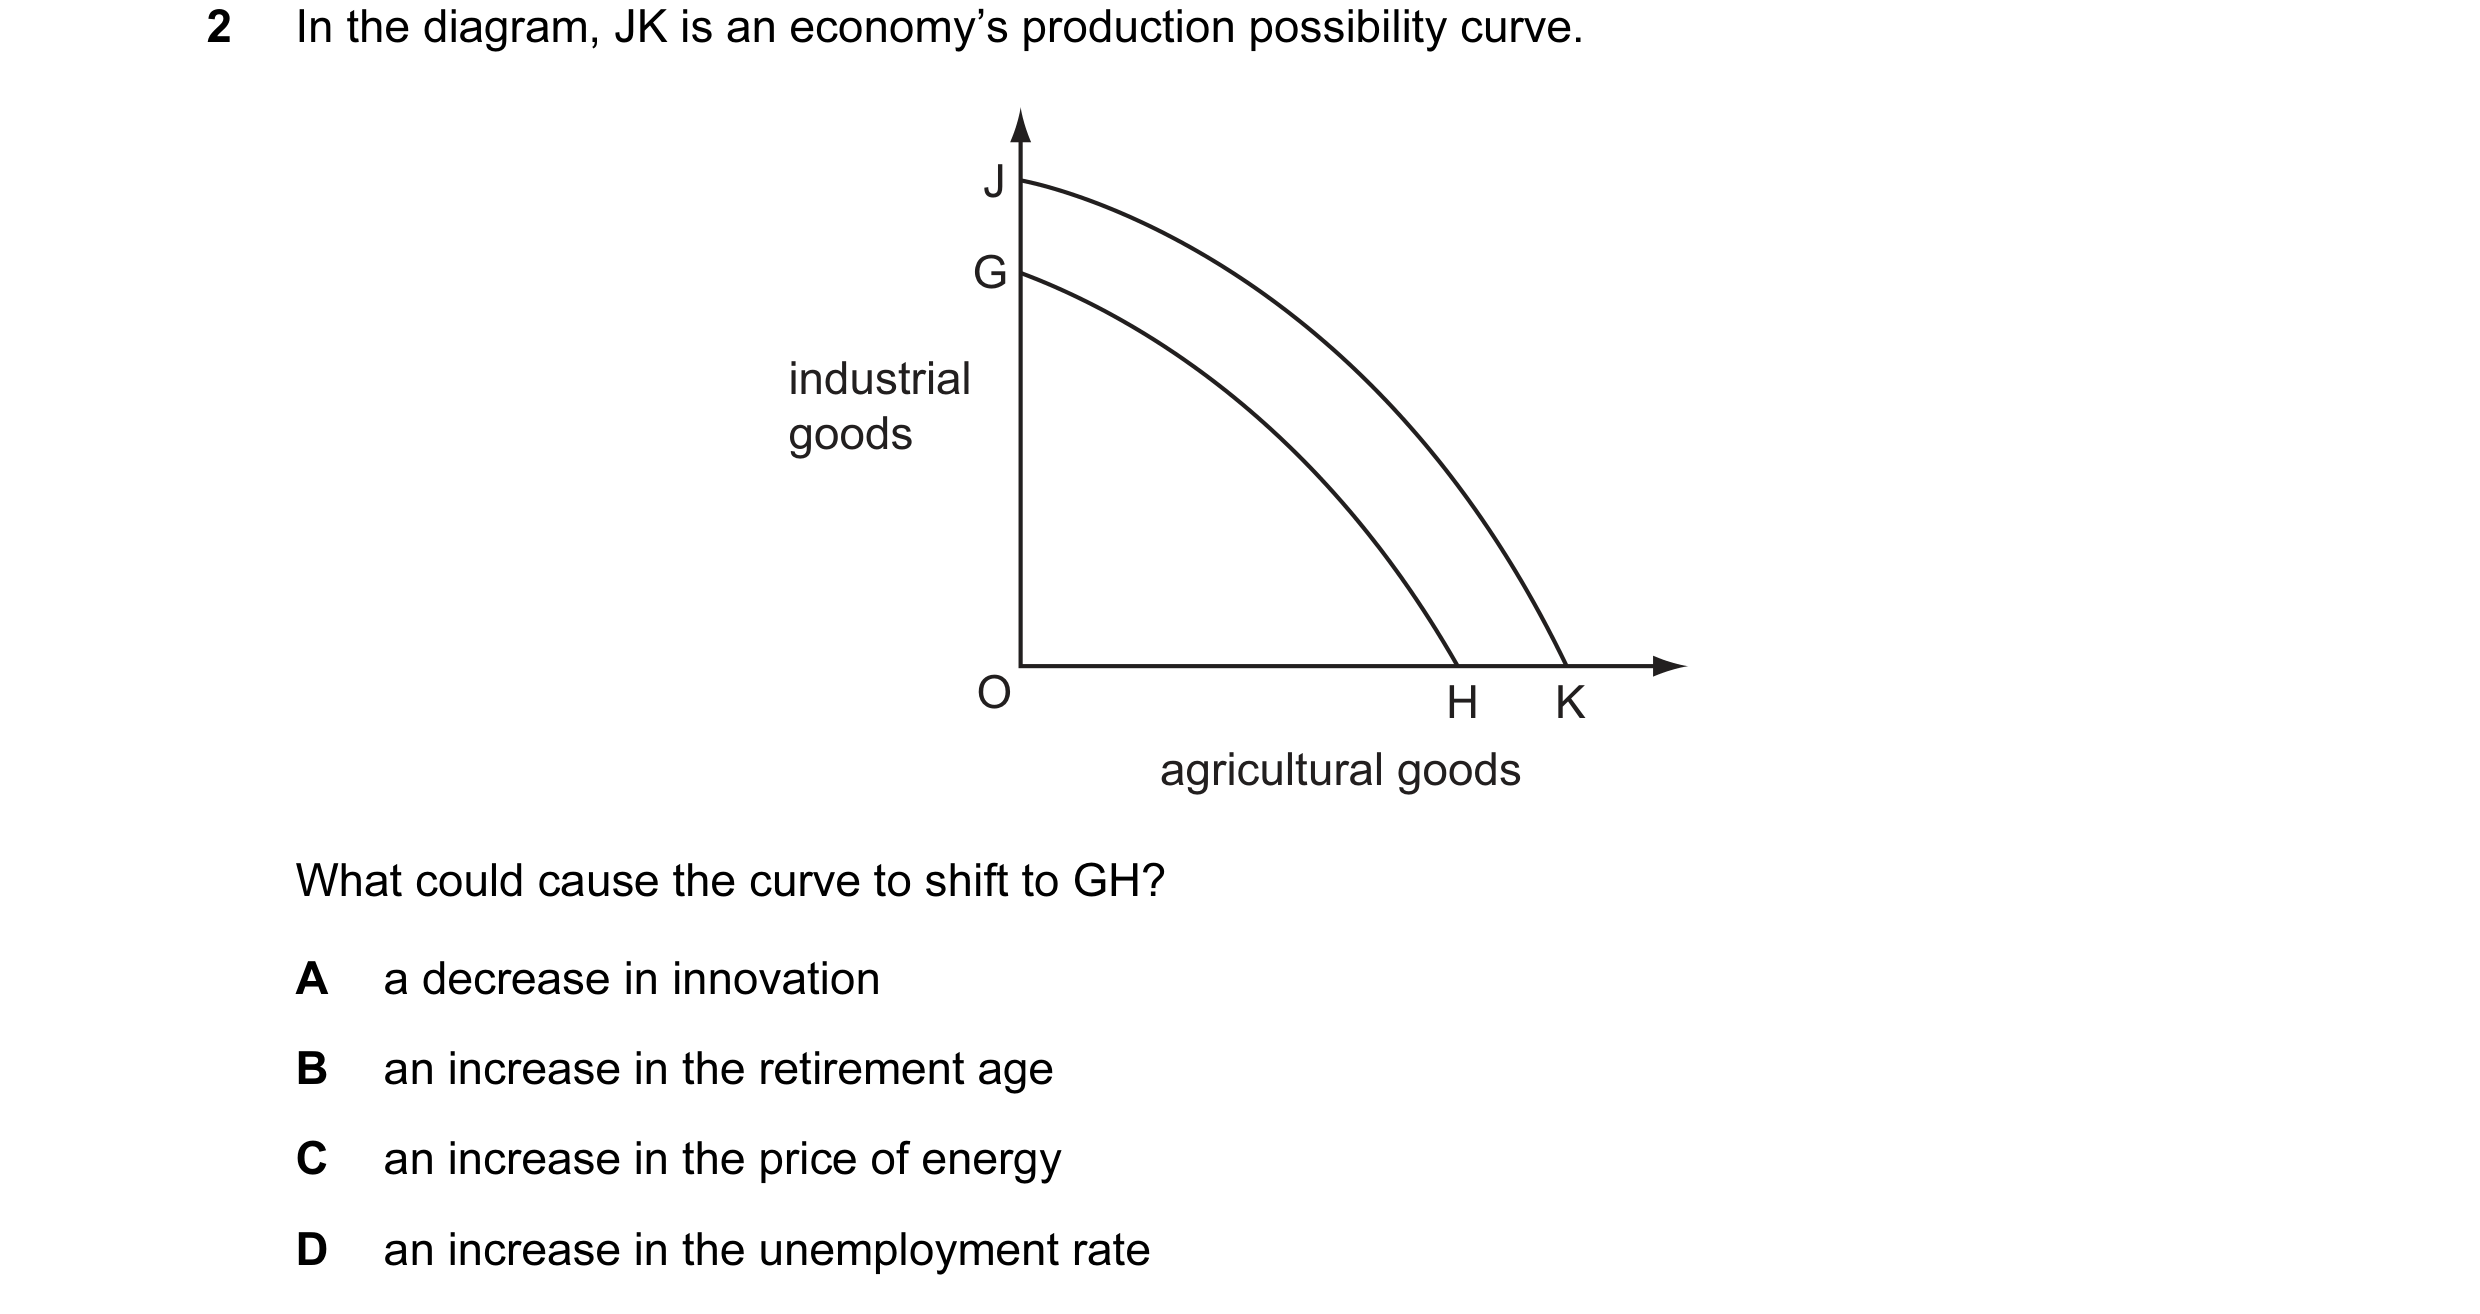
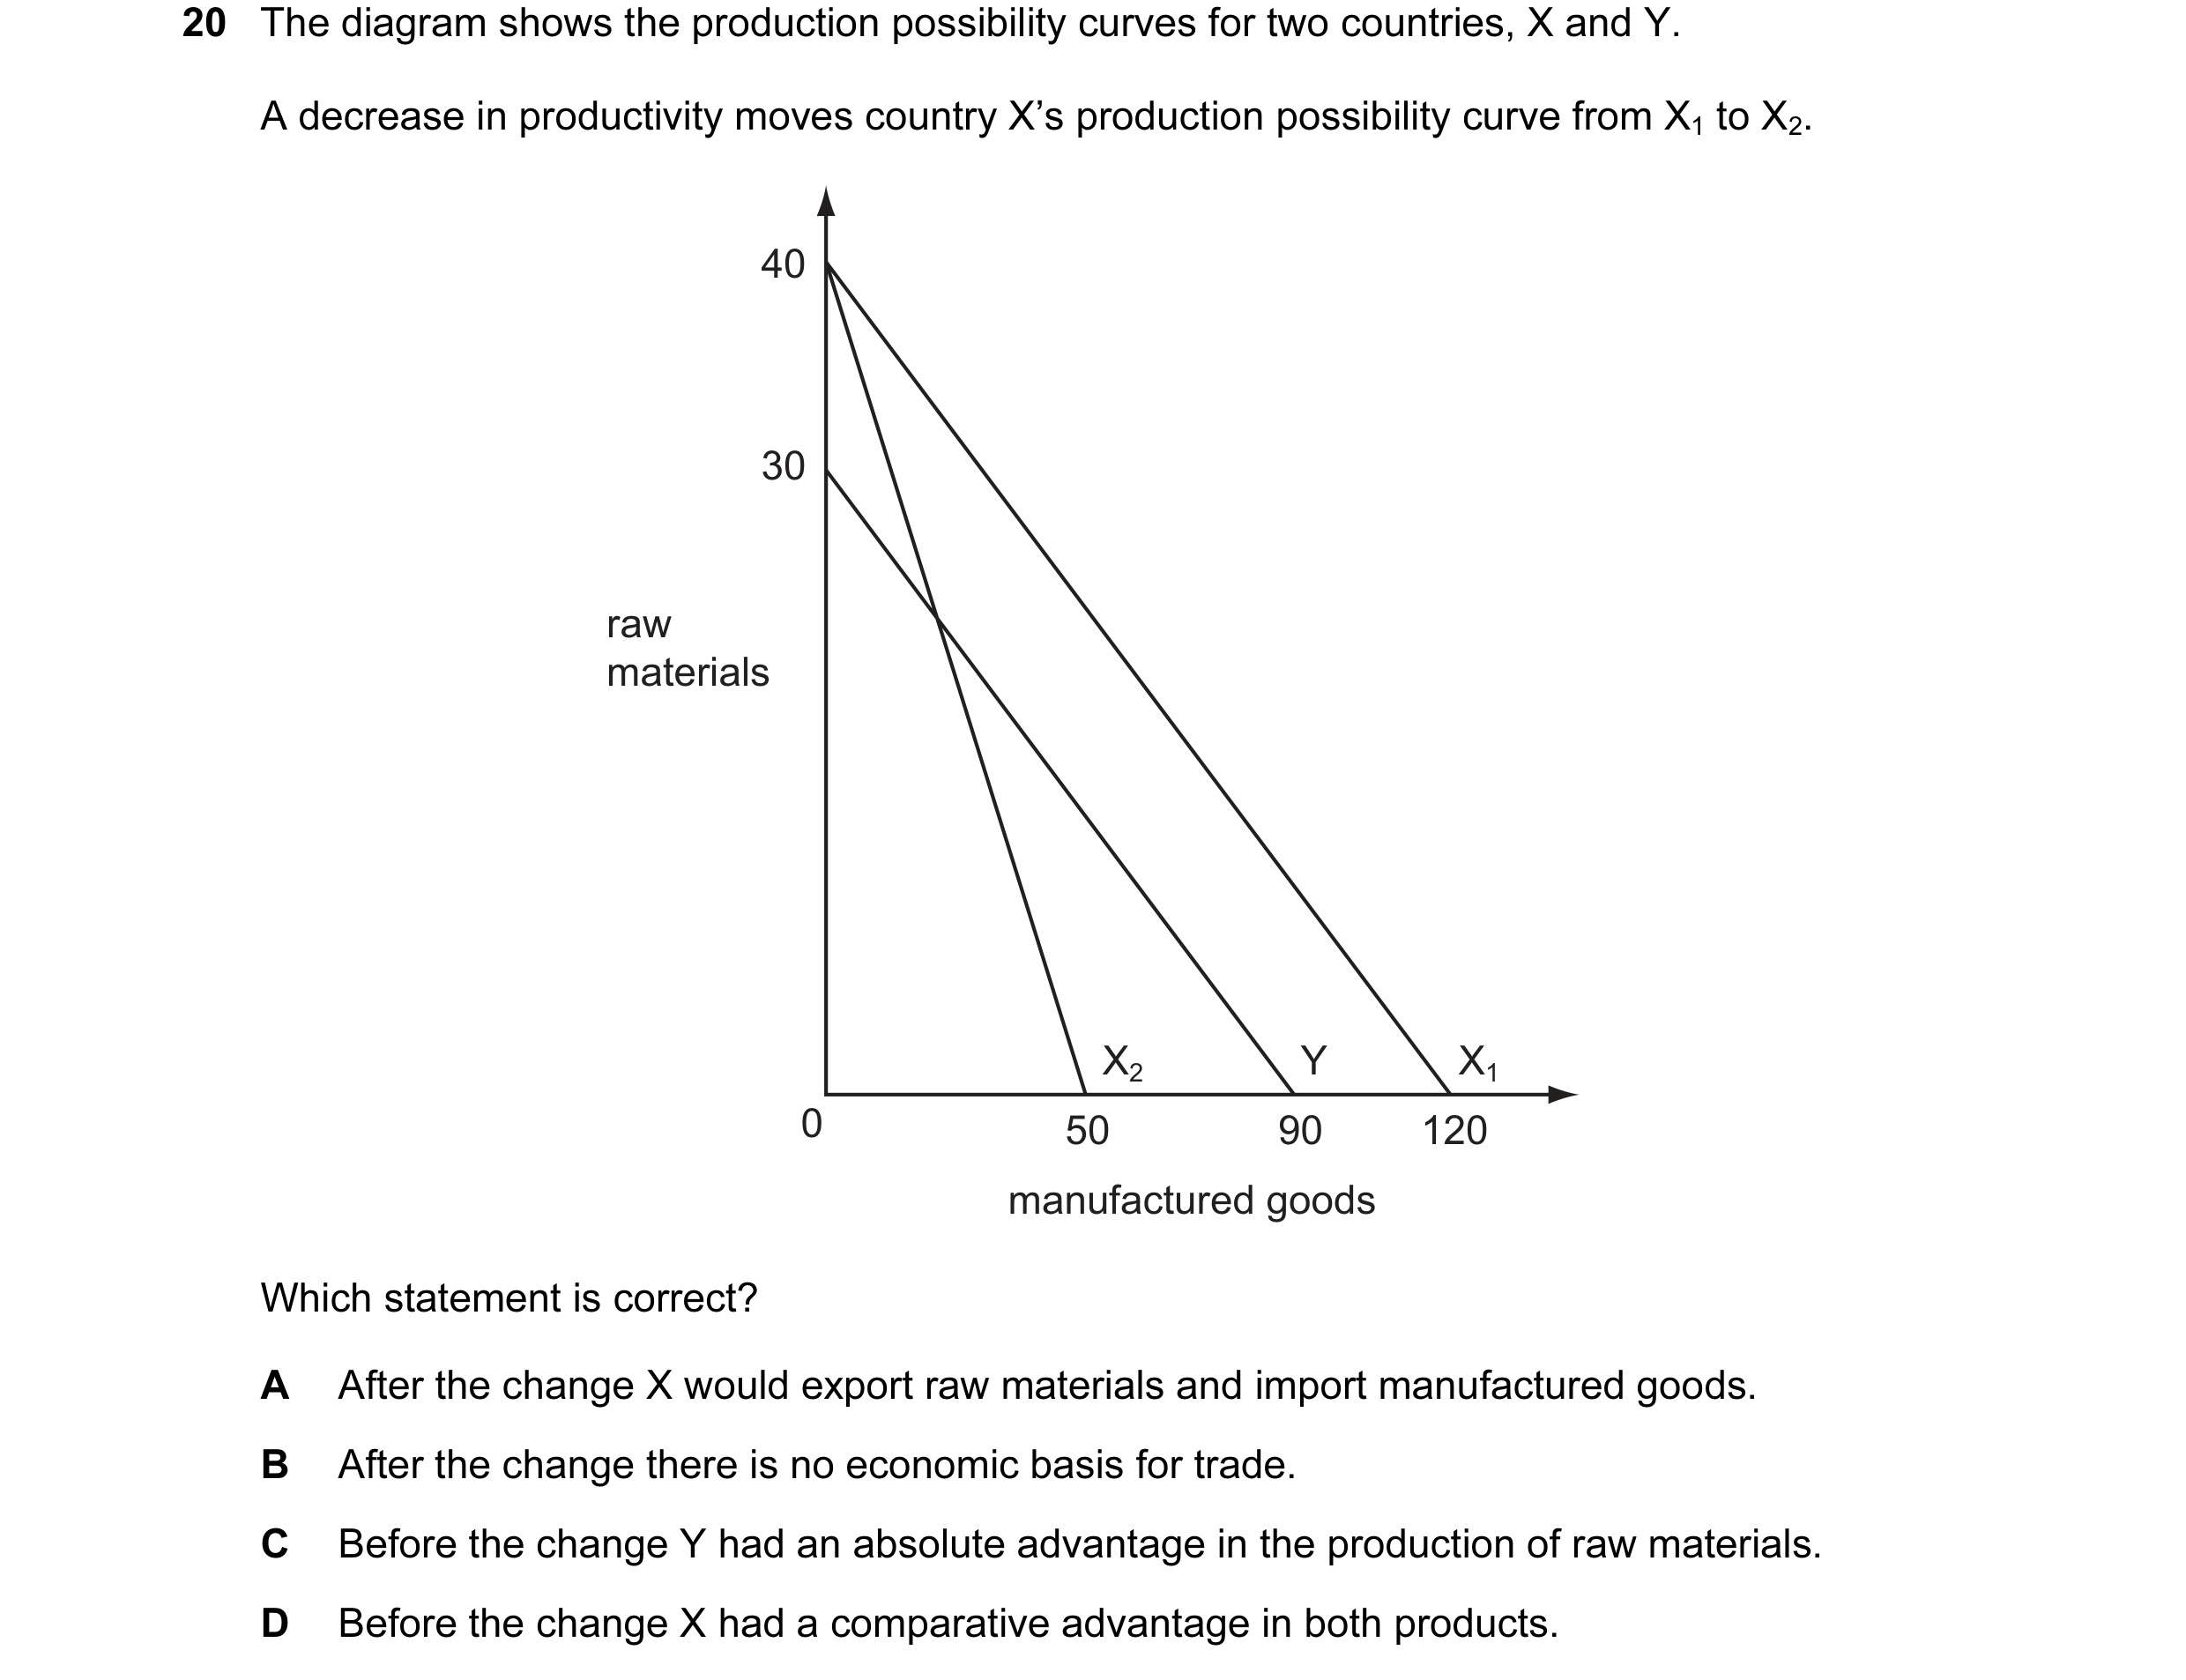 15 / 68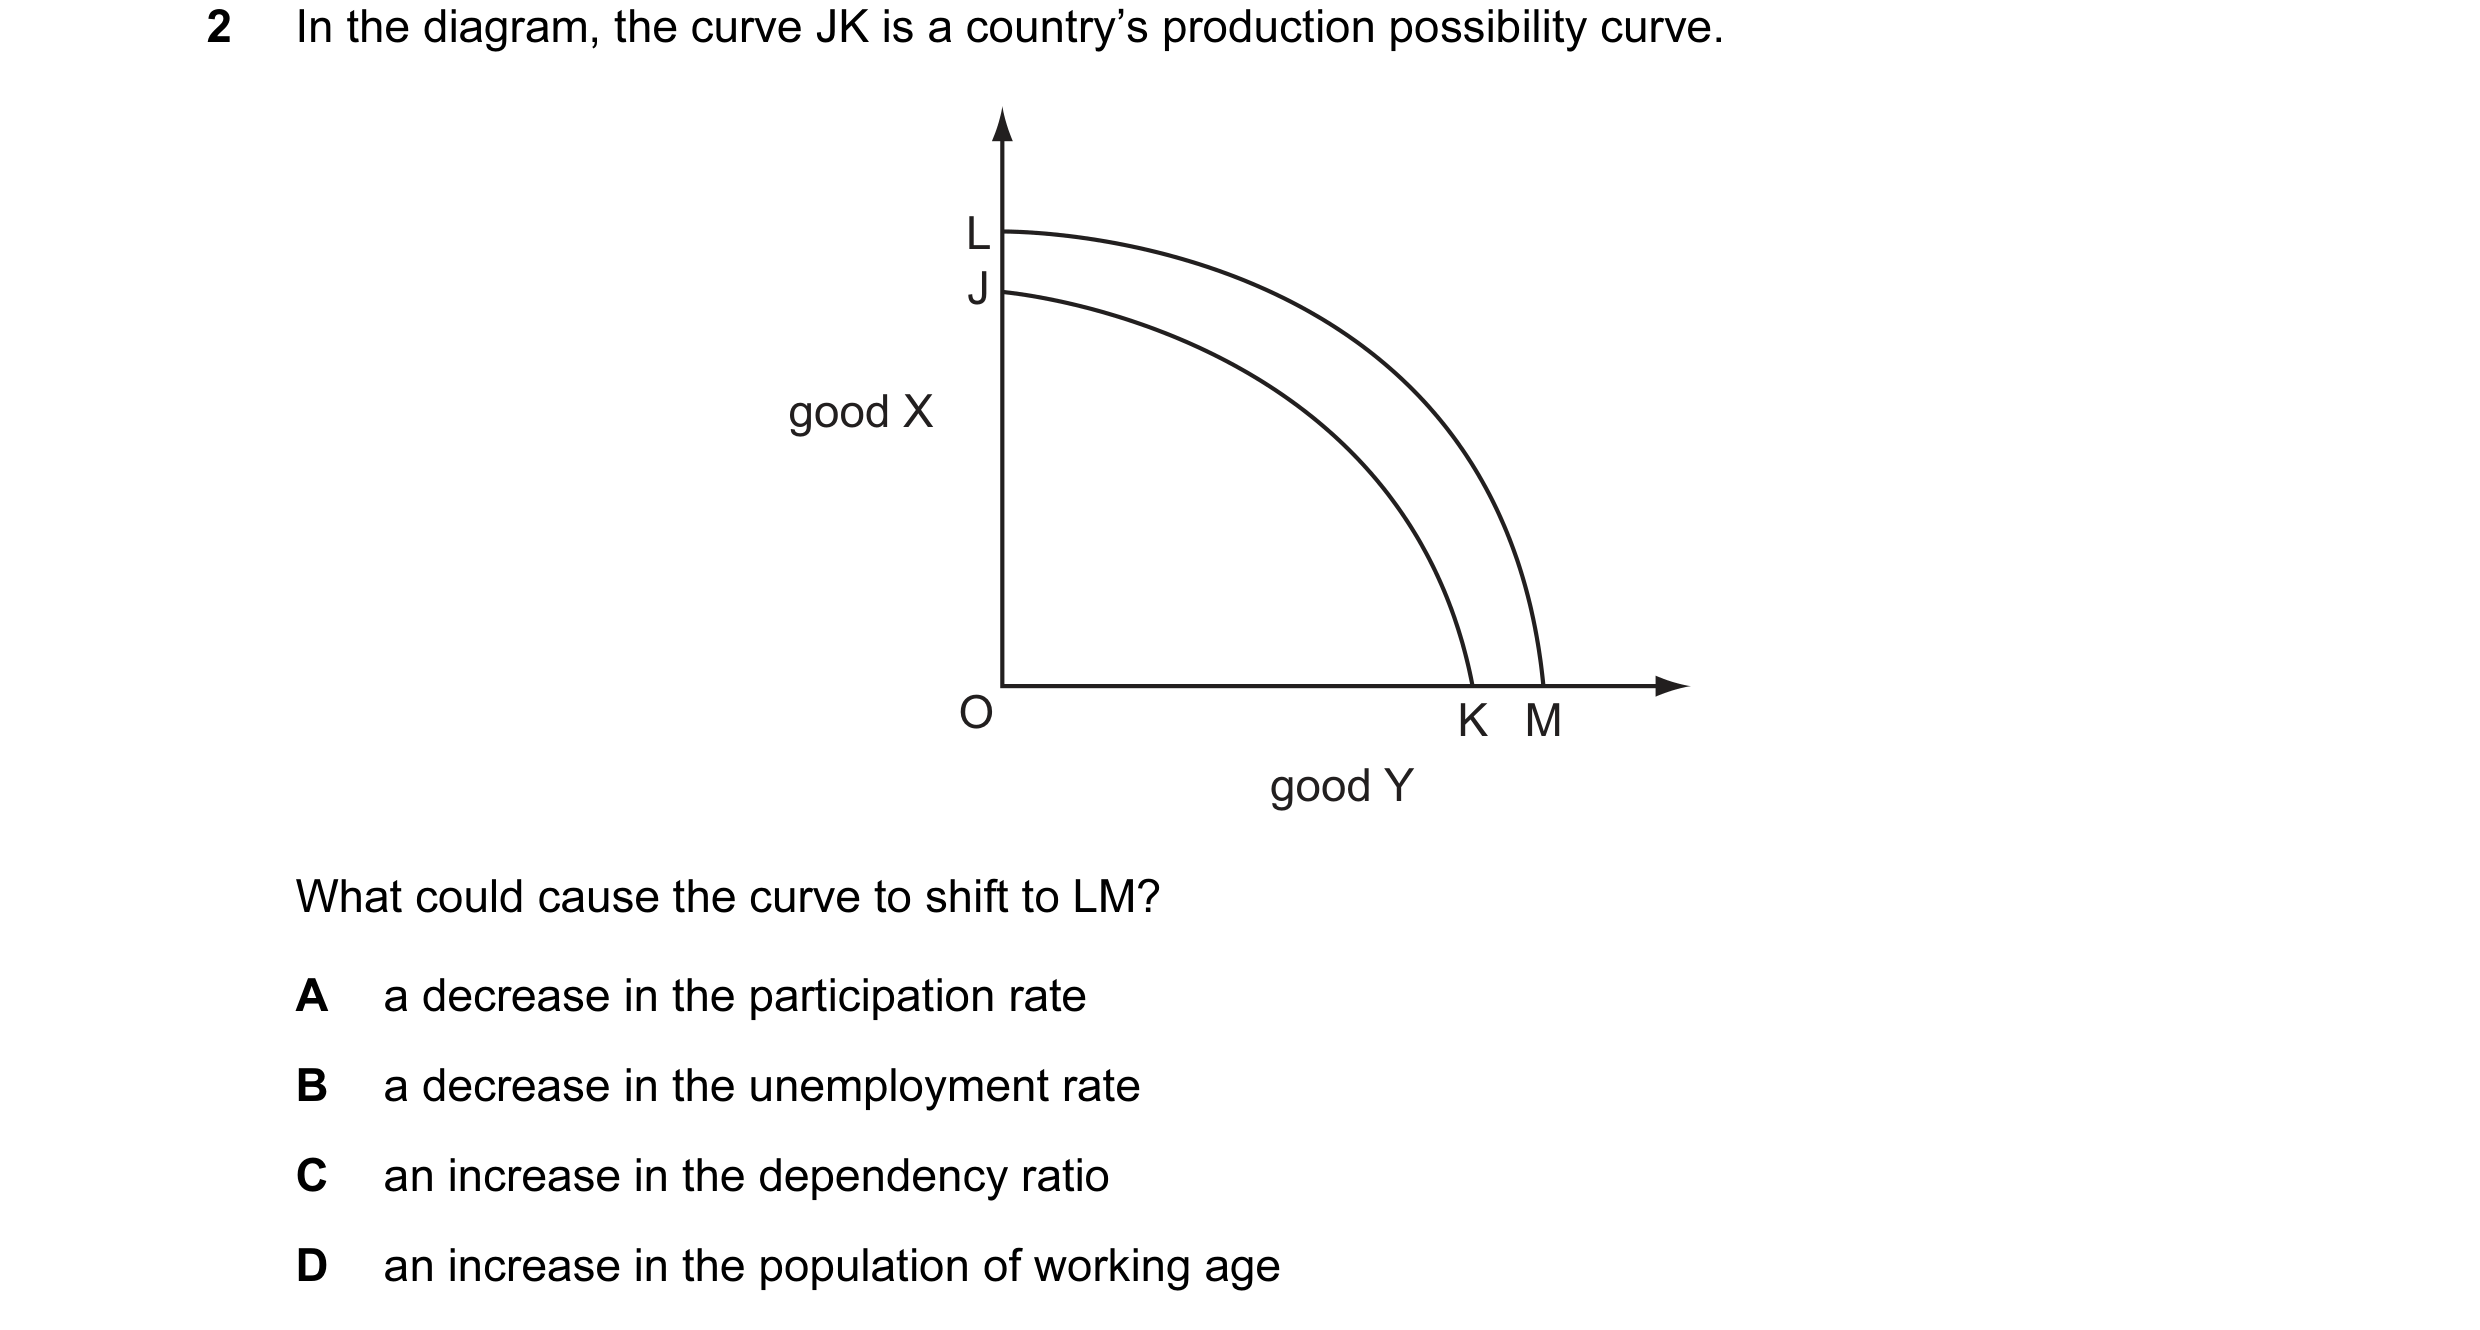
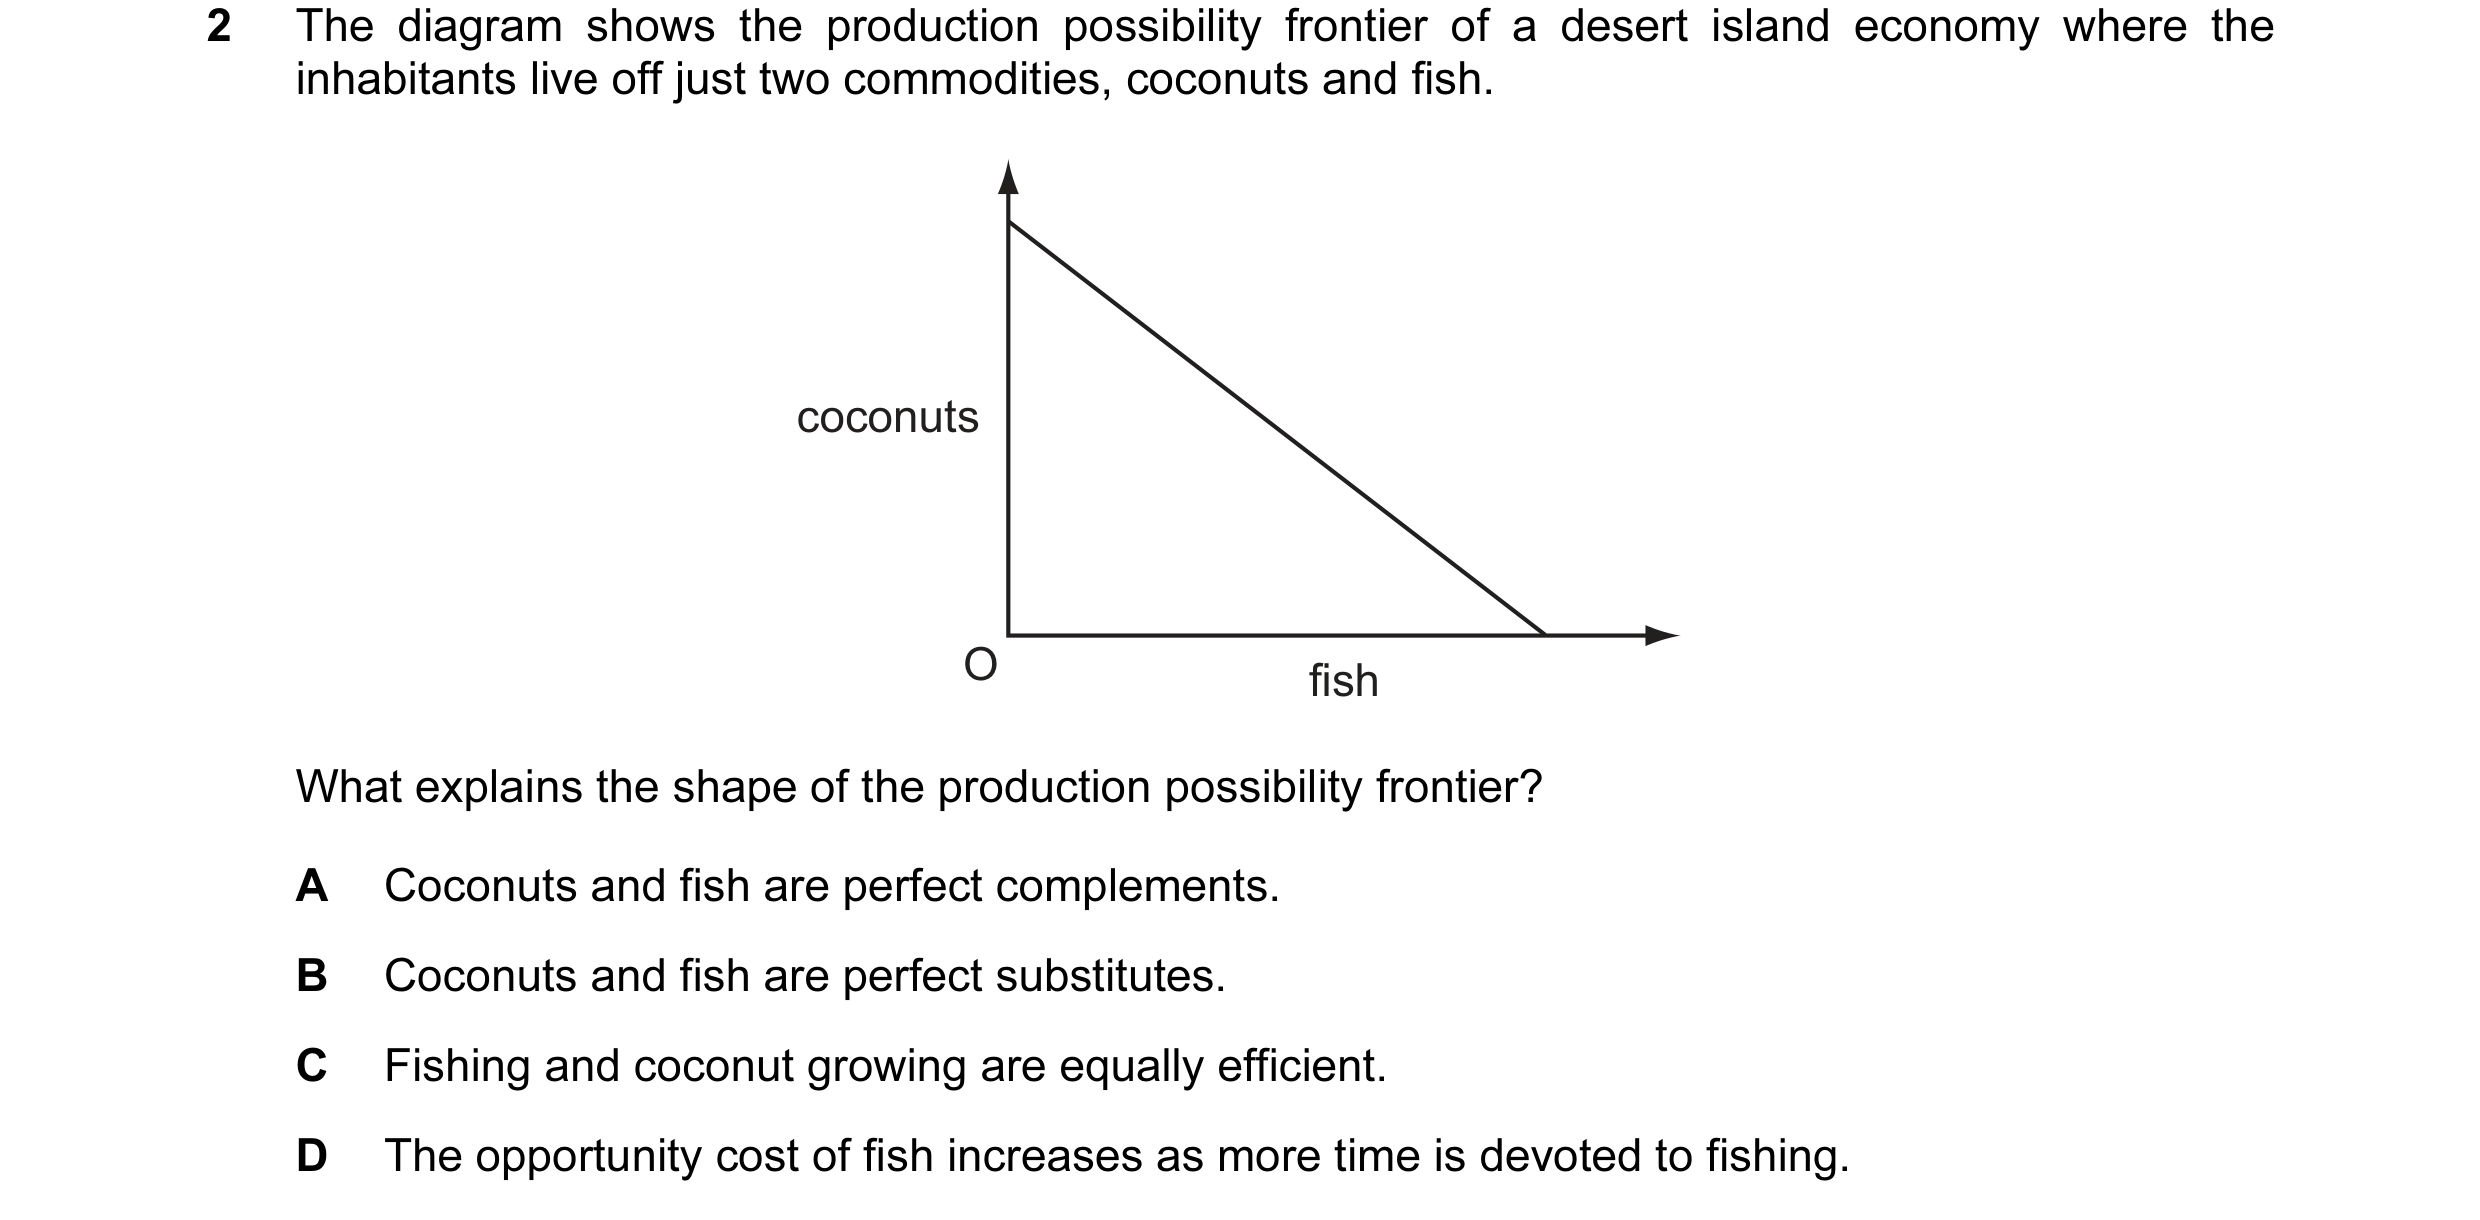 16 / 68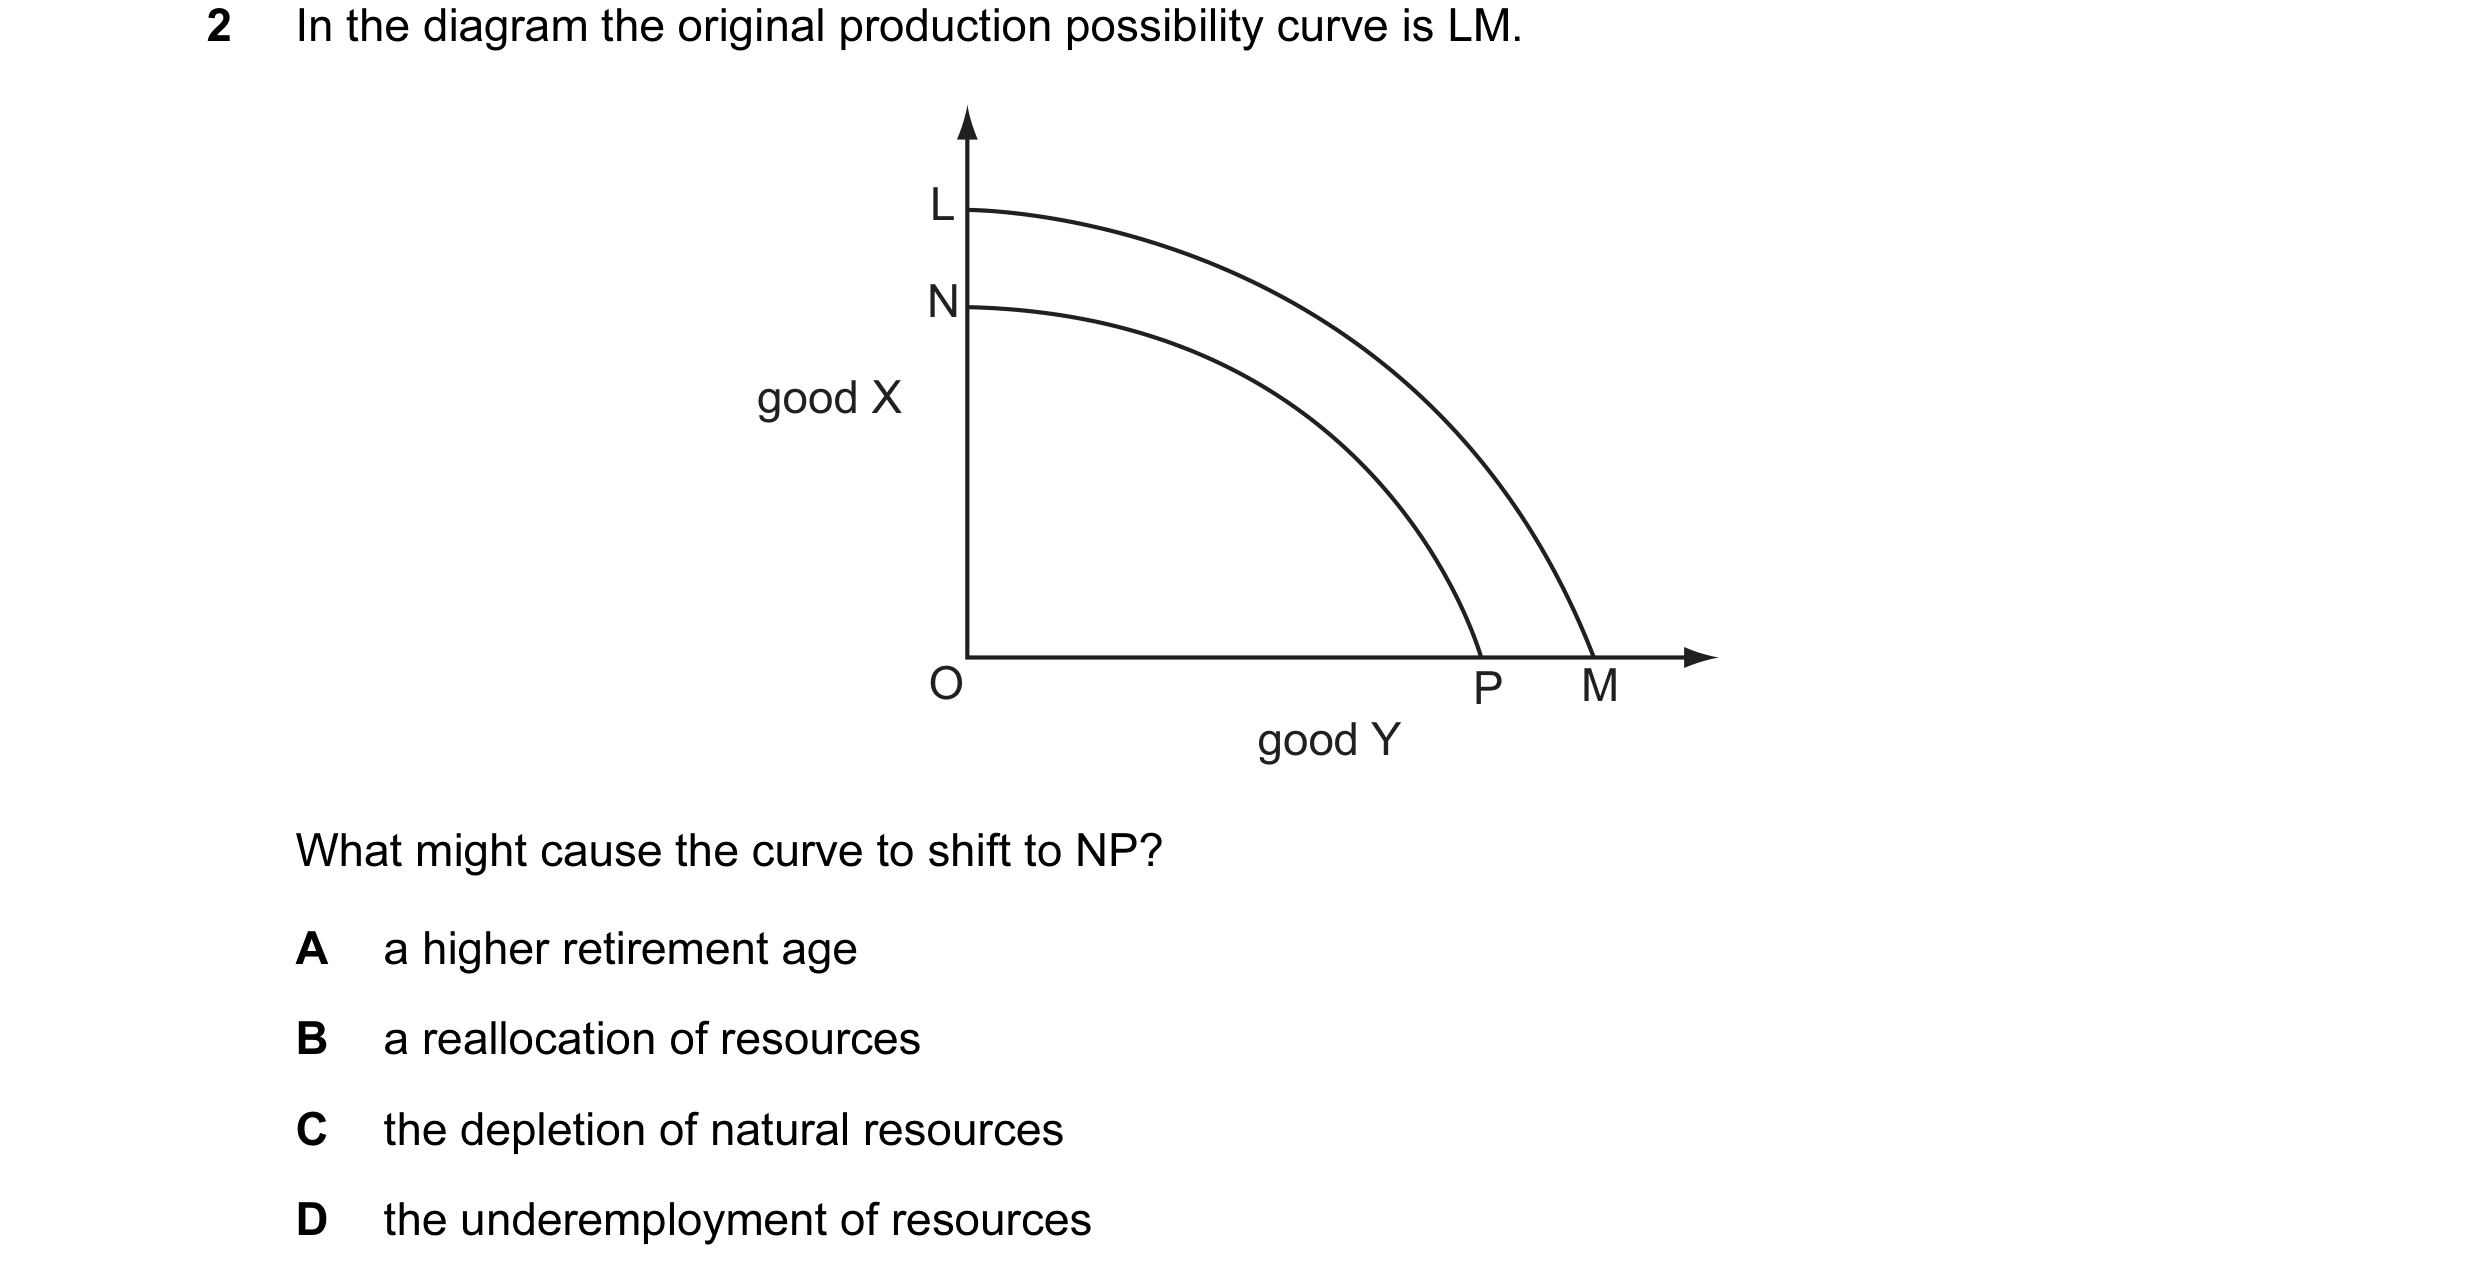
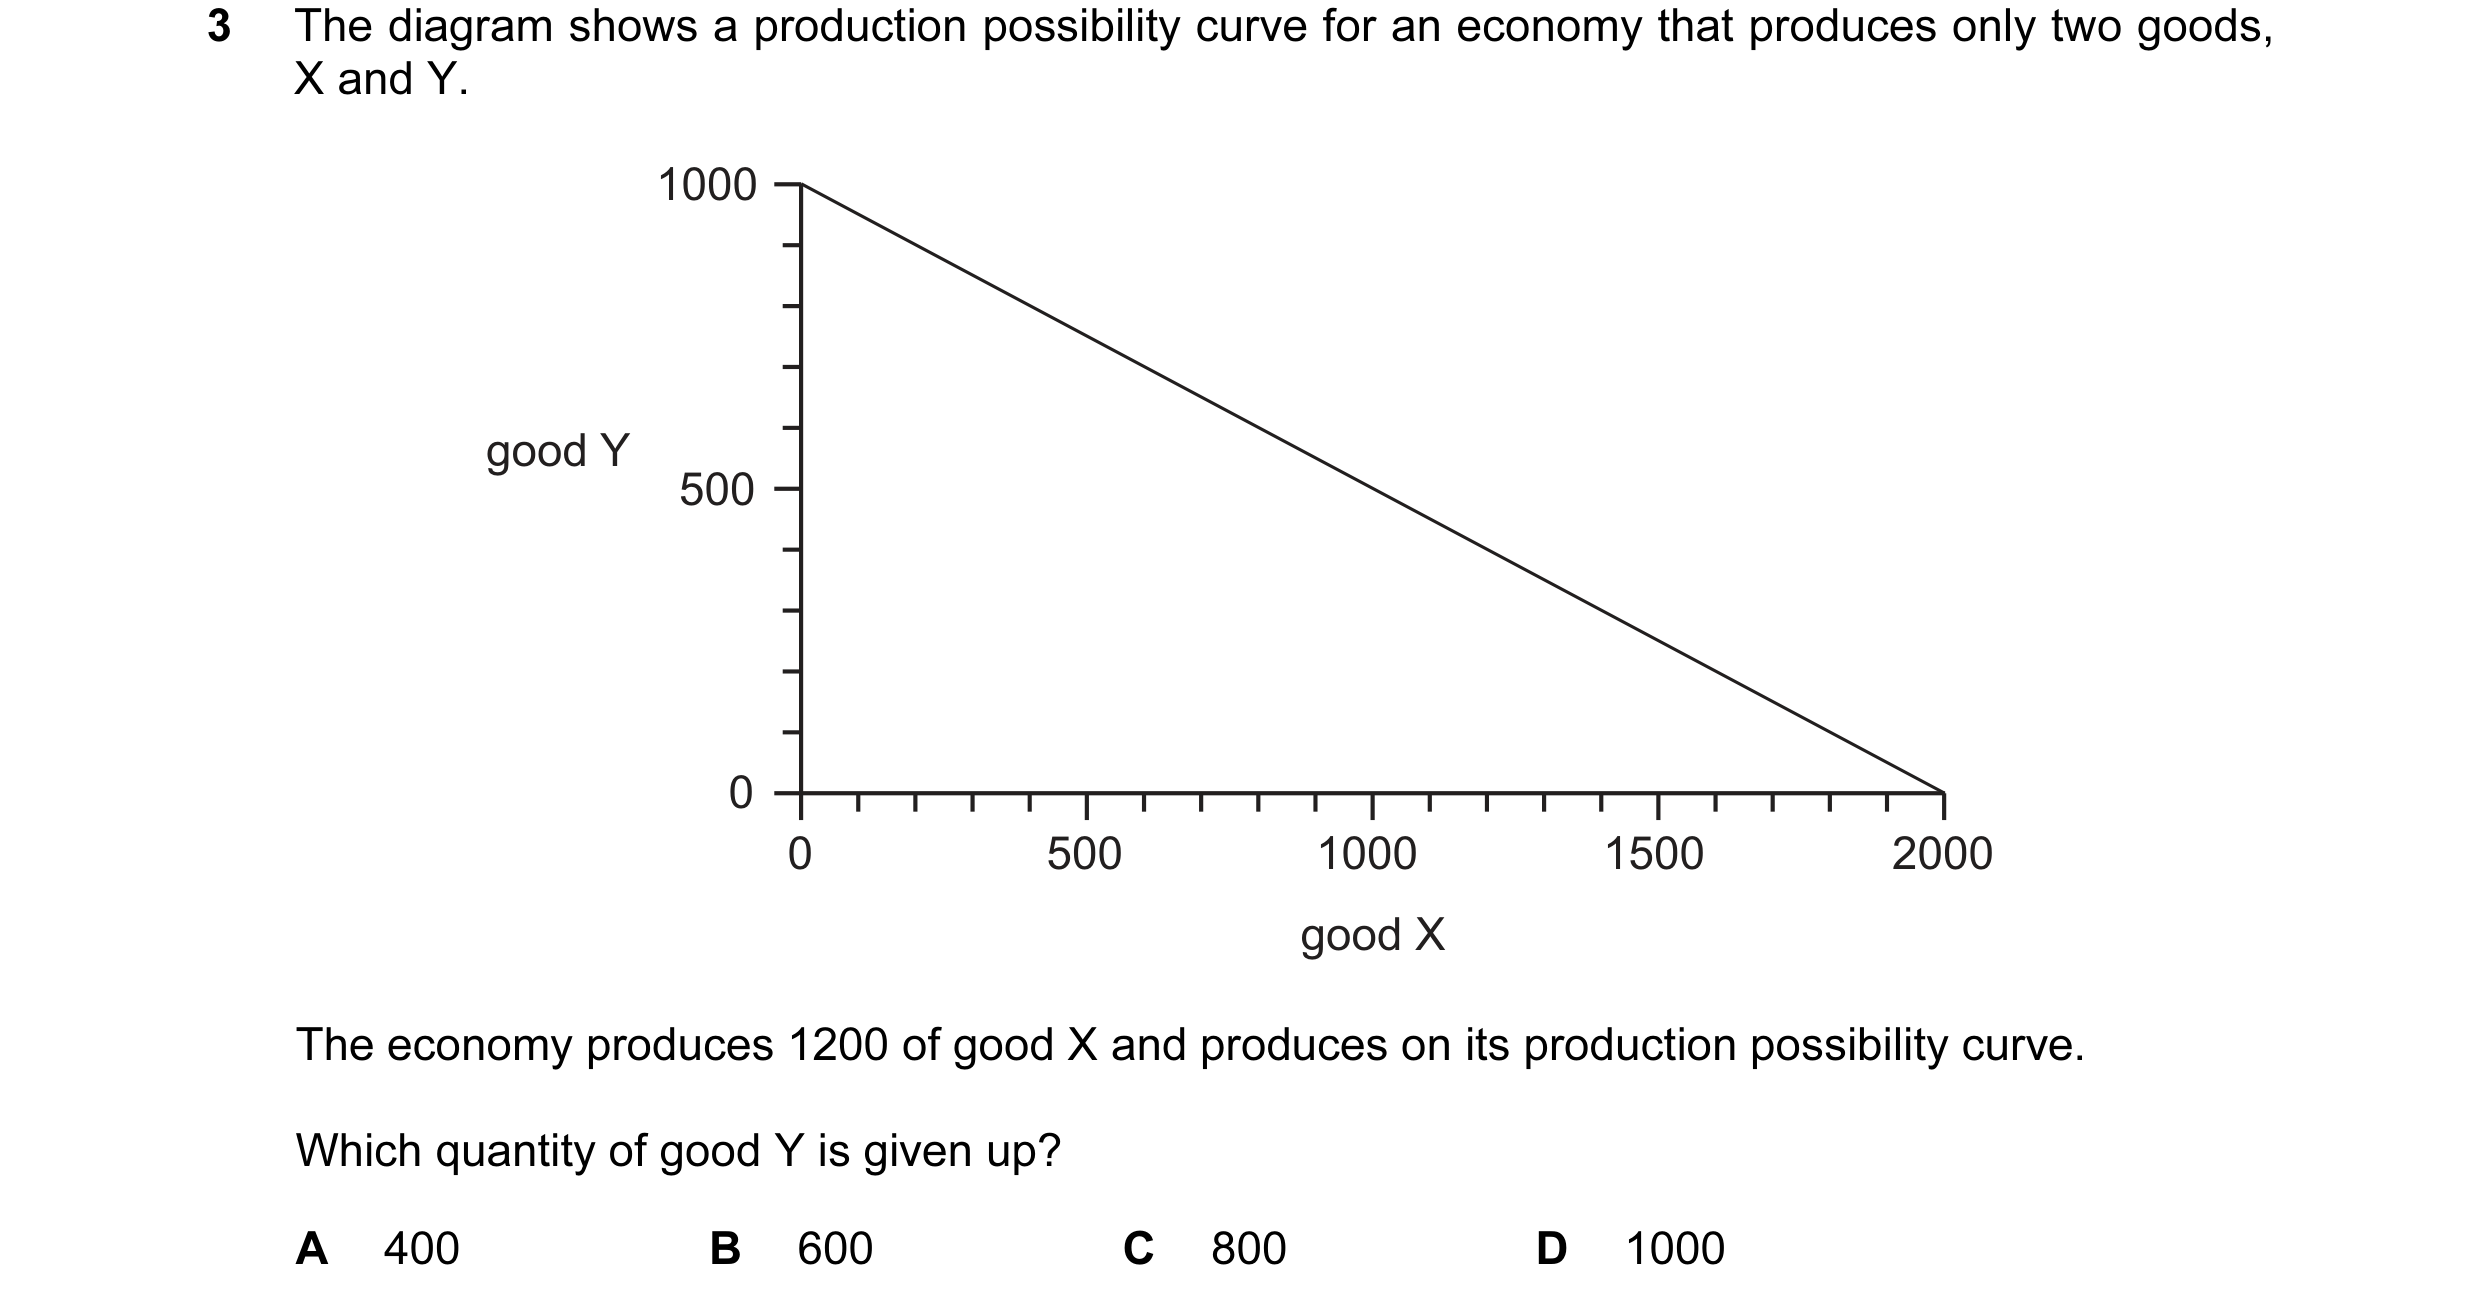 17 / 68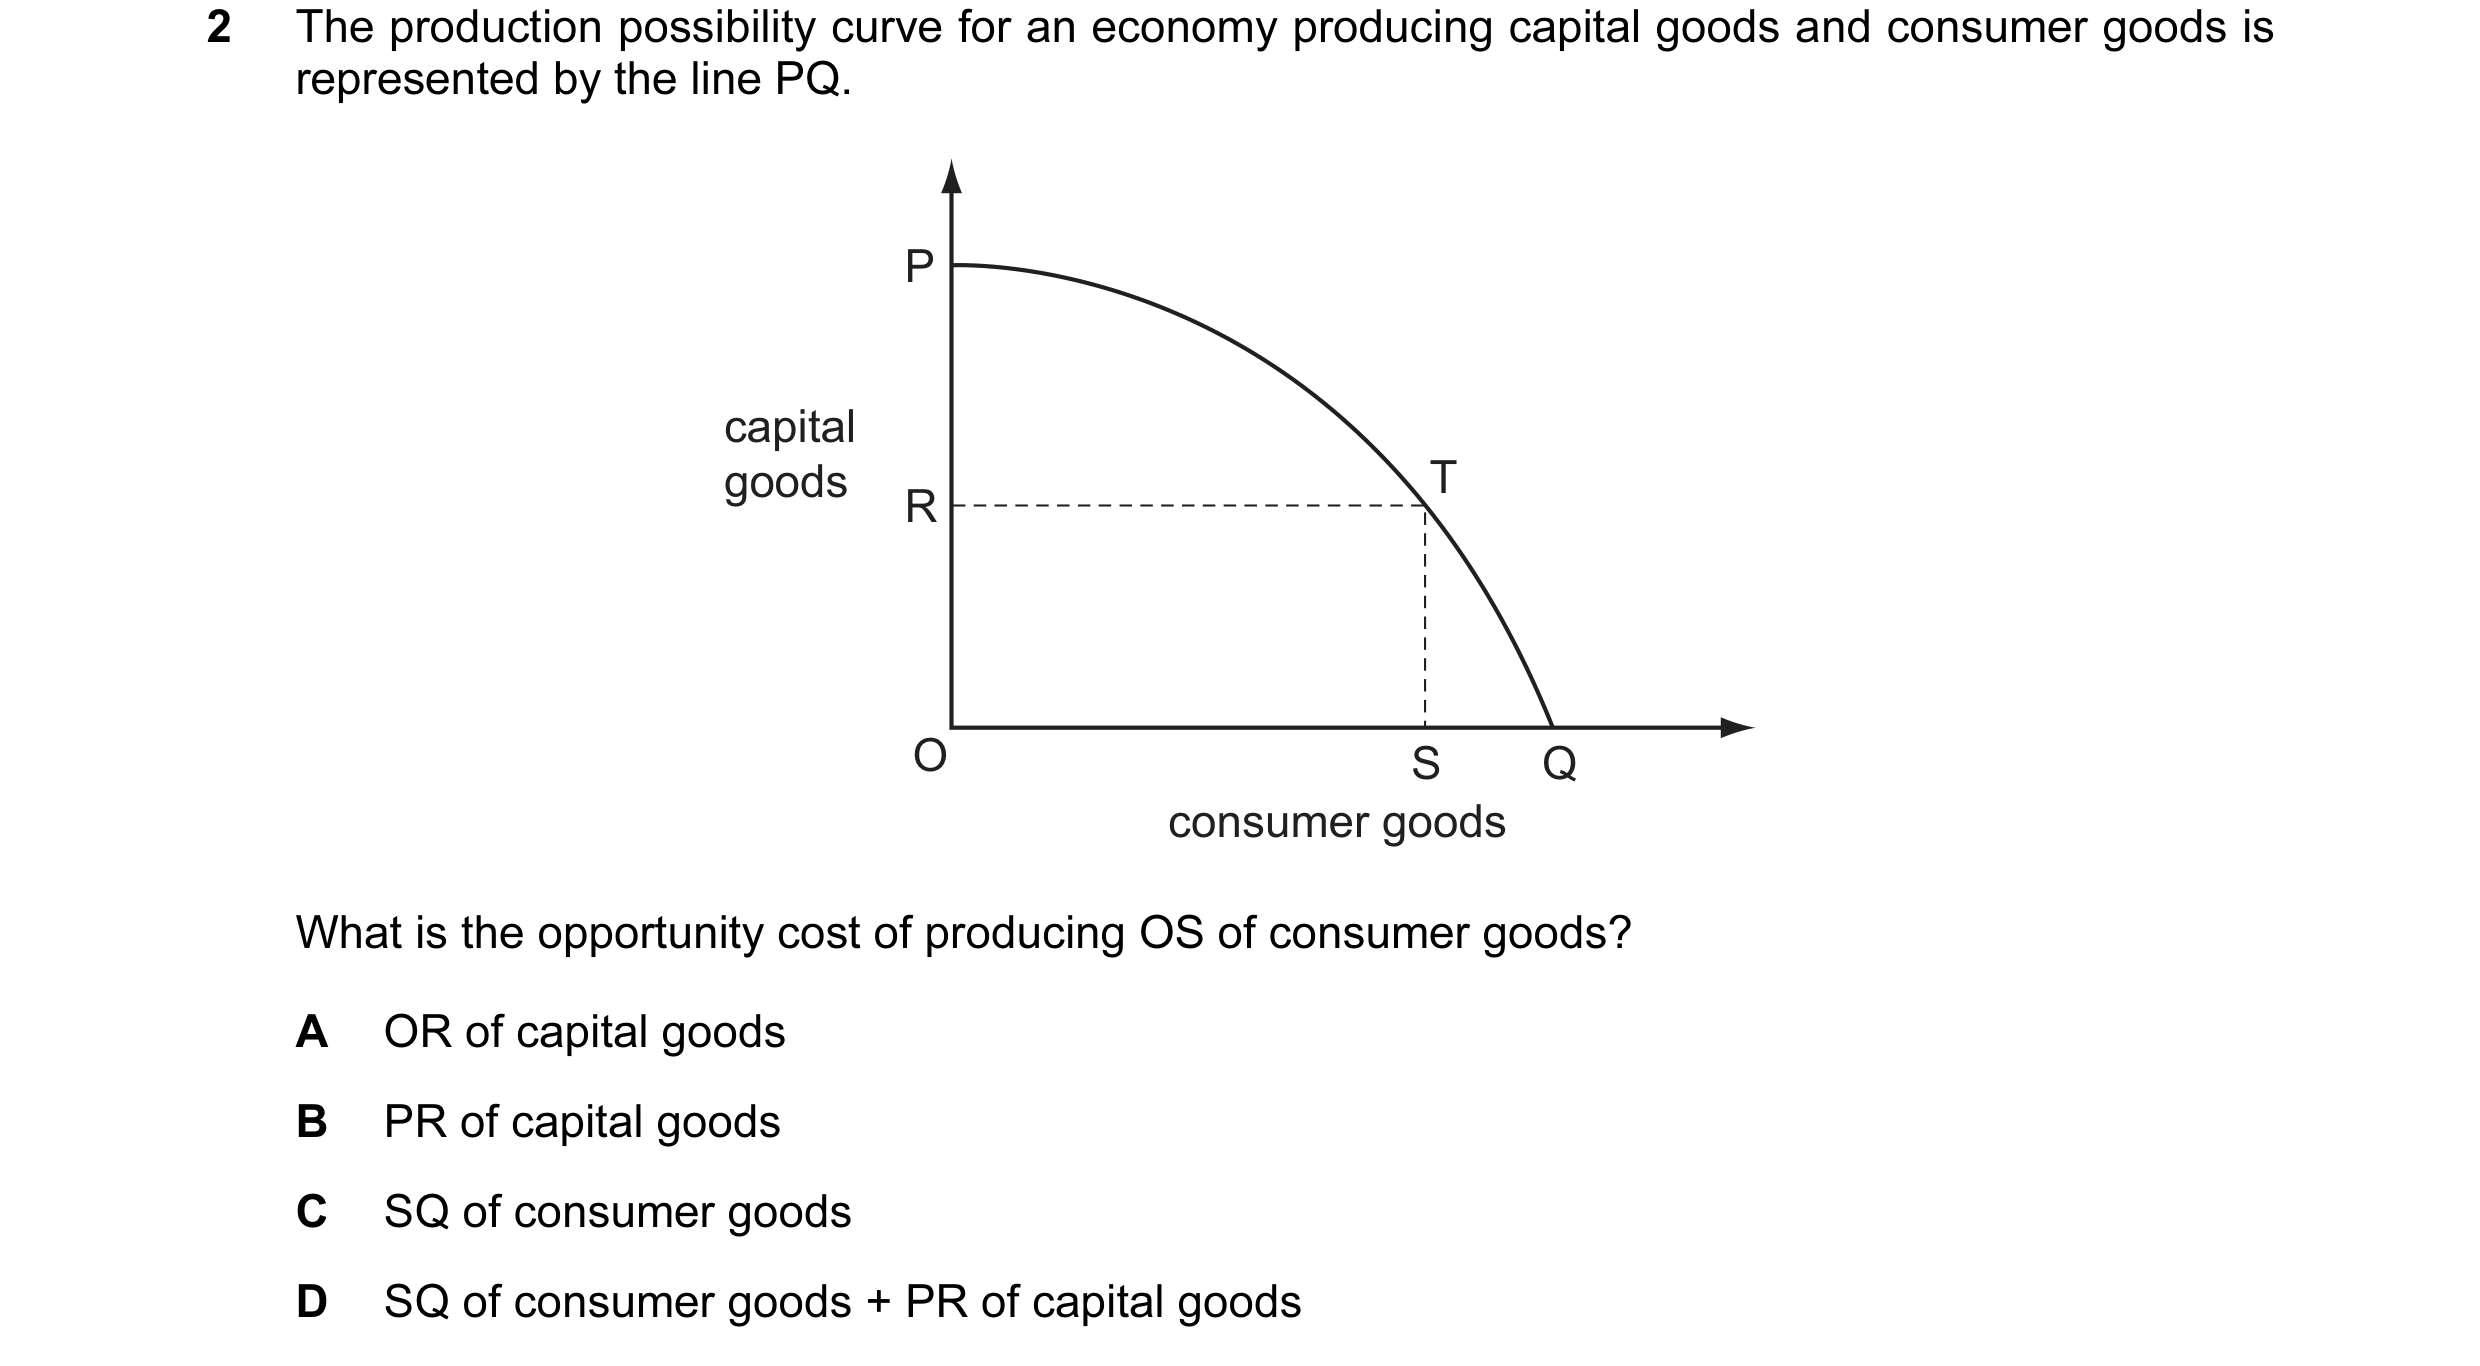
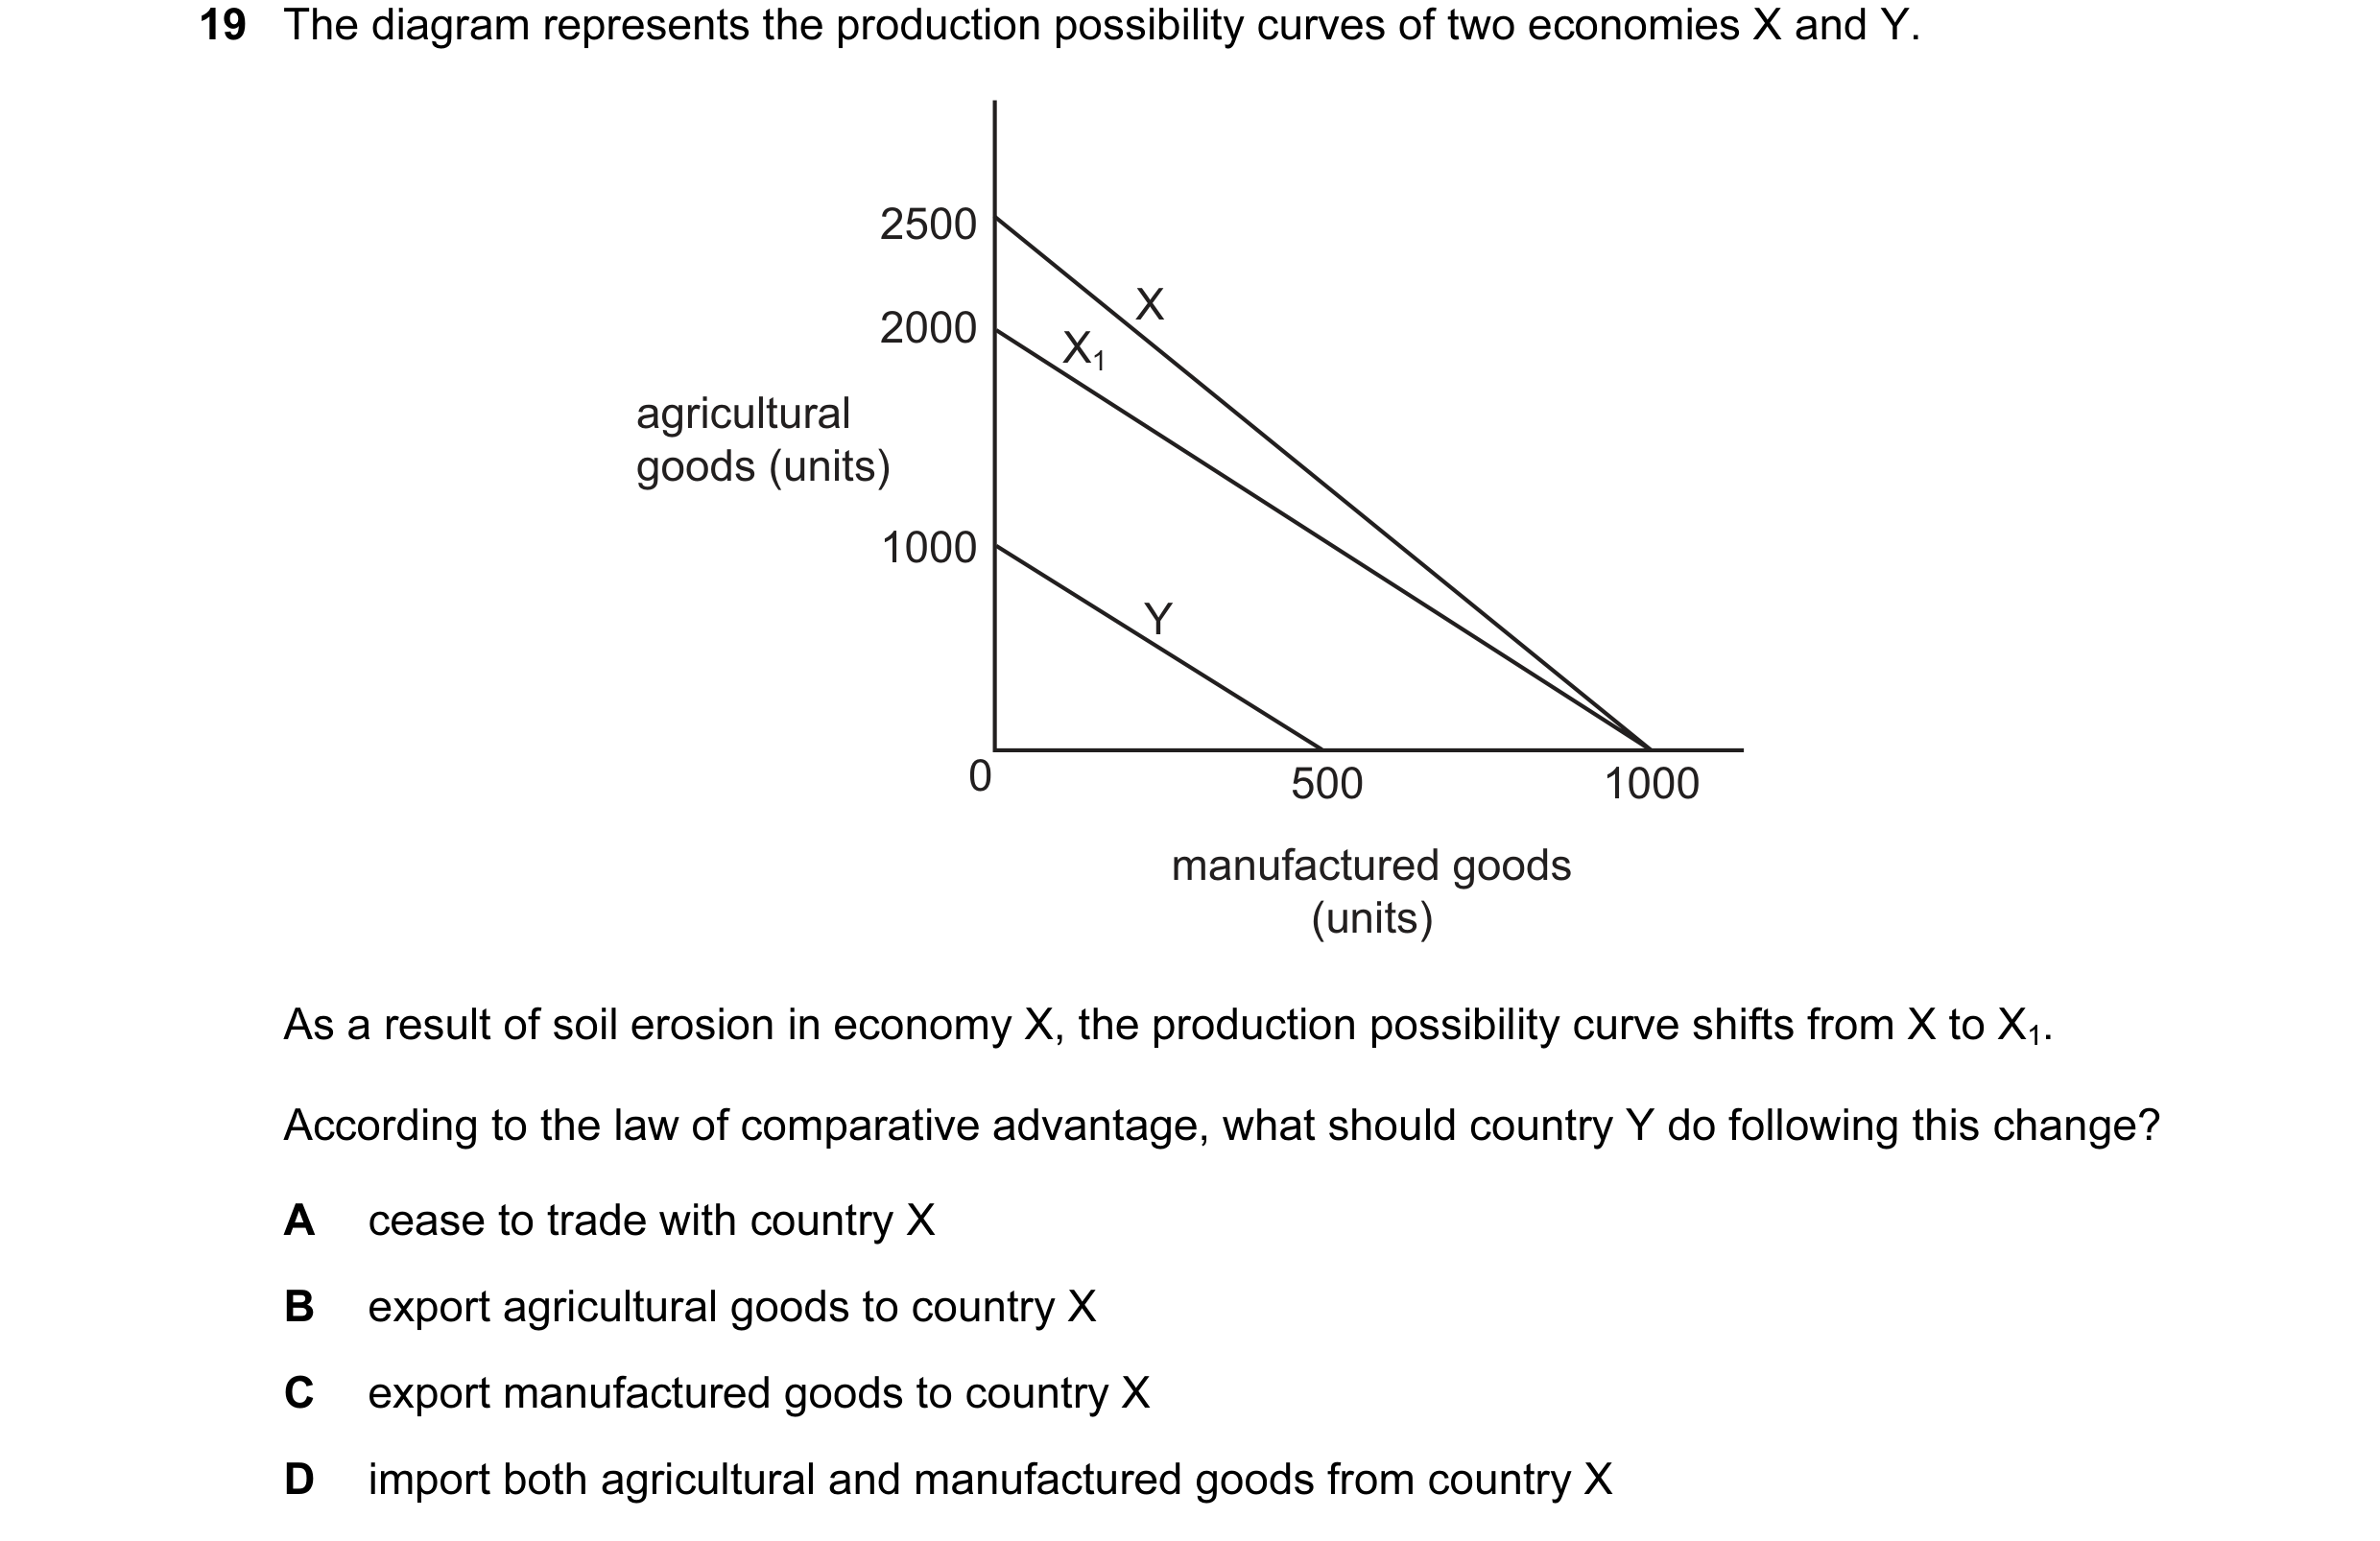 18 / 68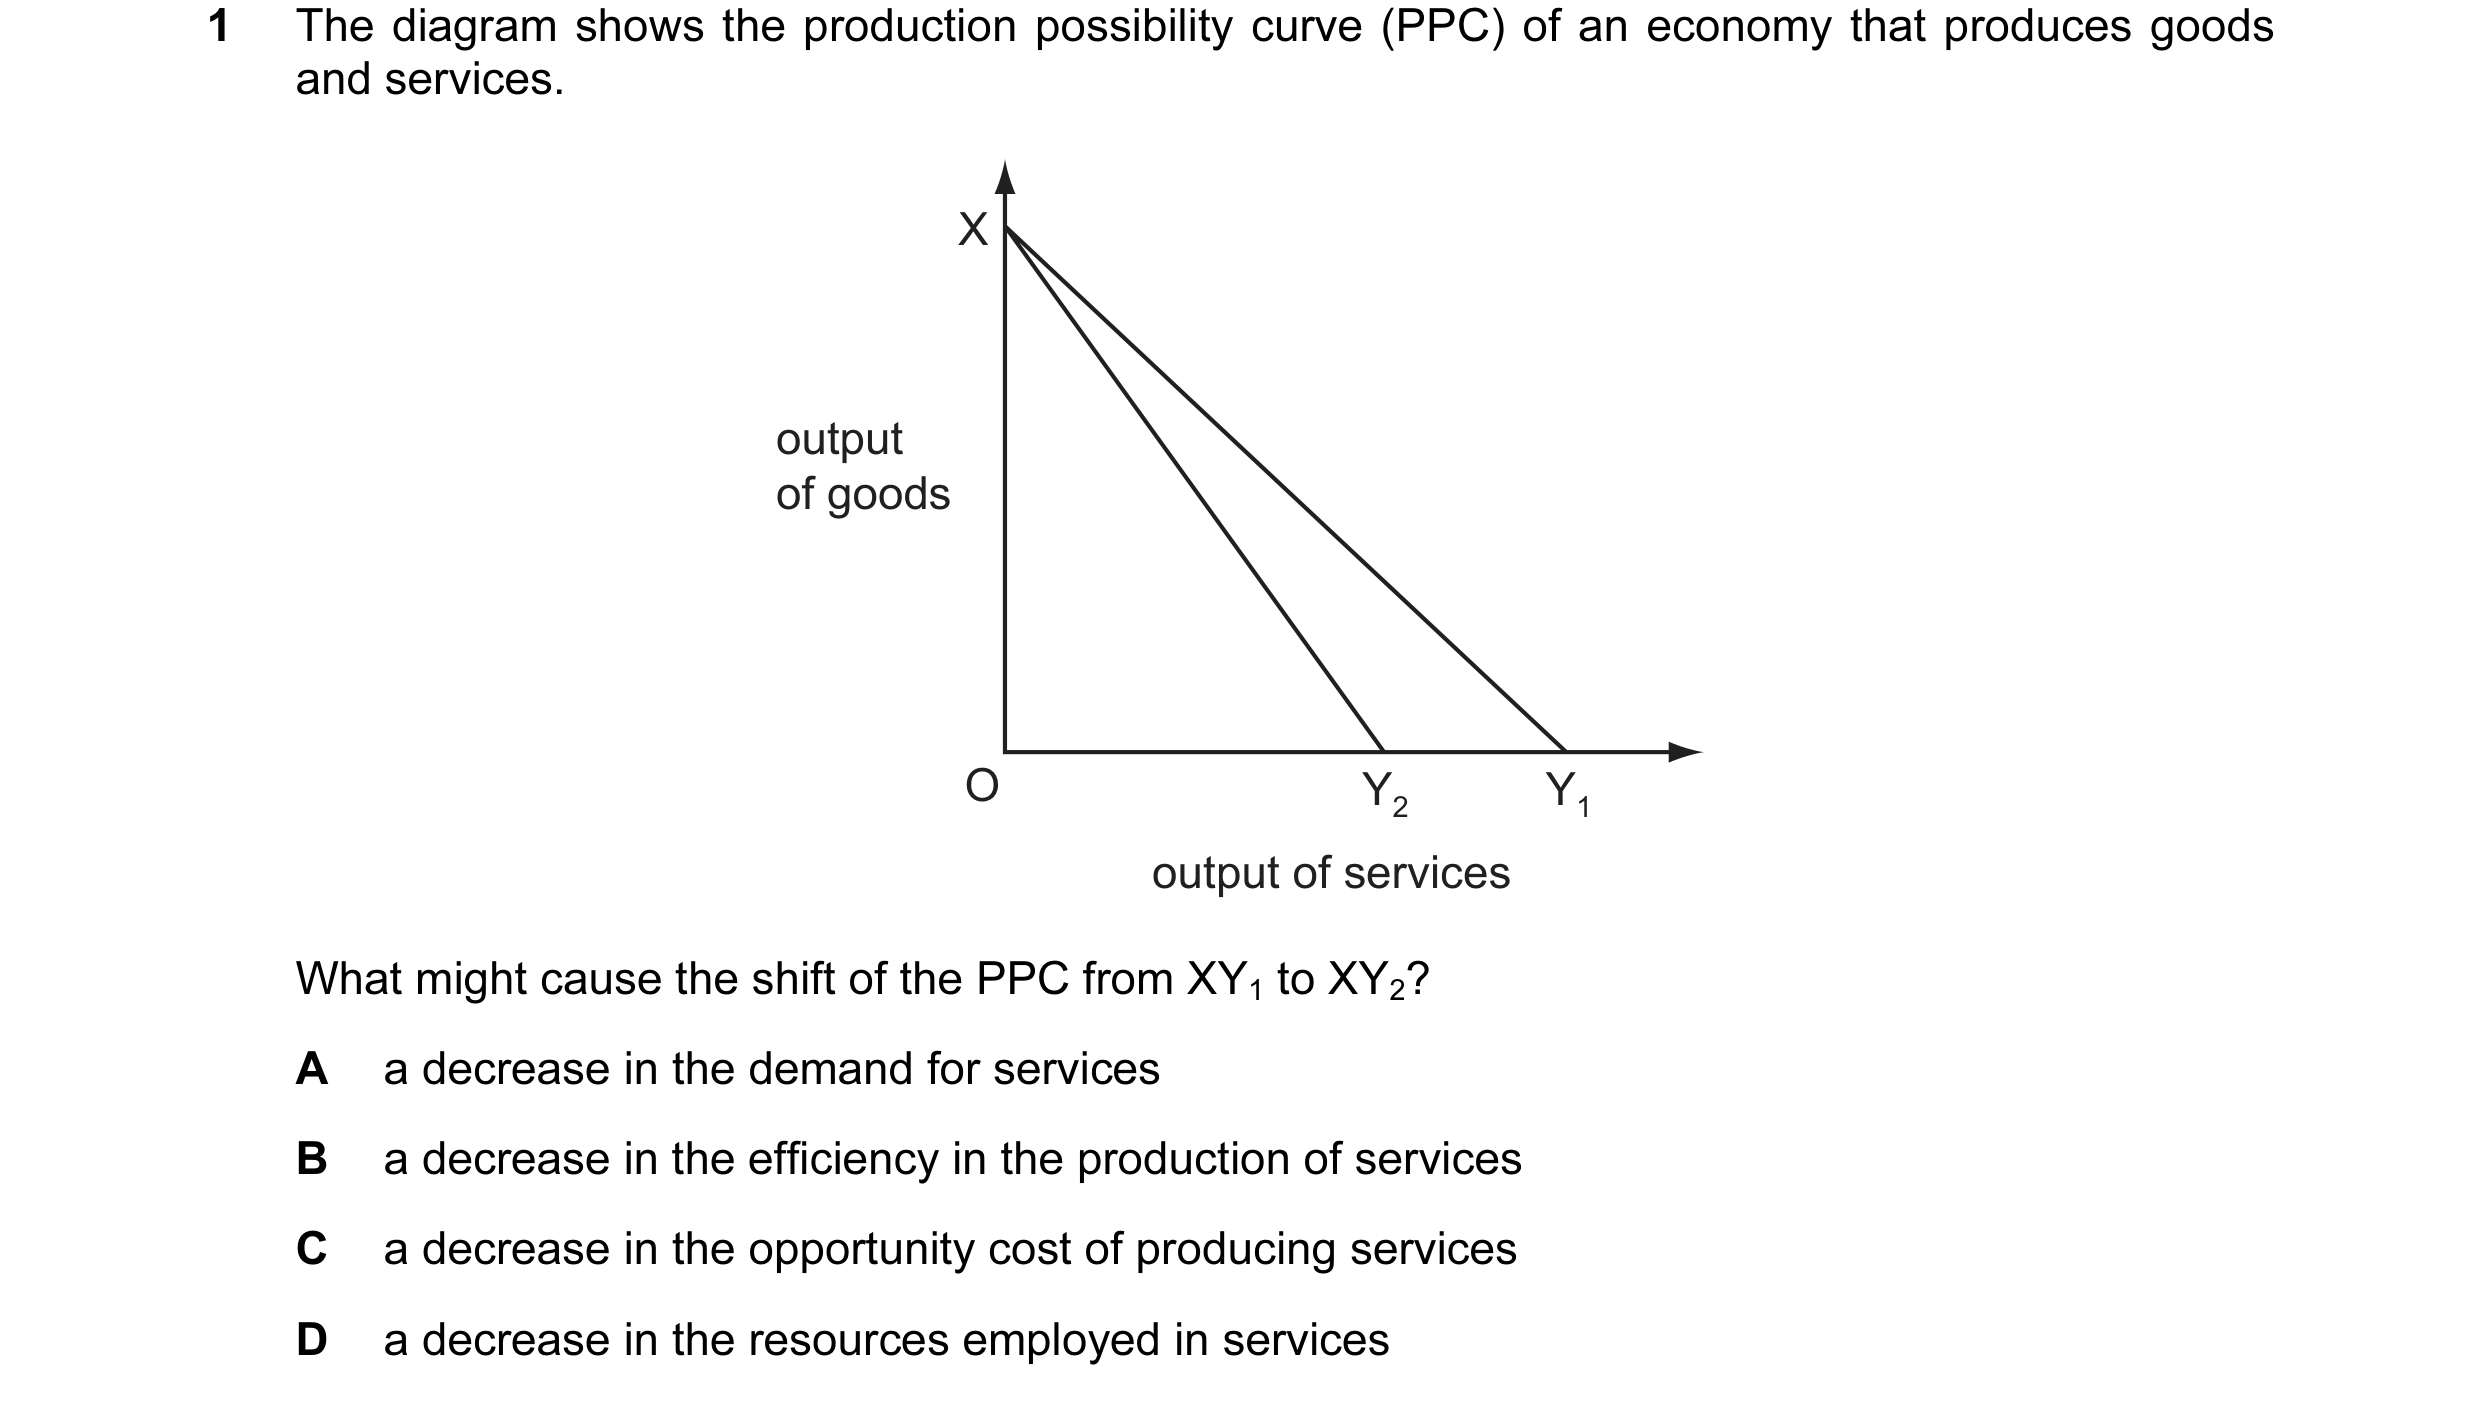
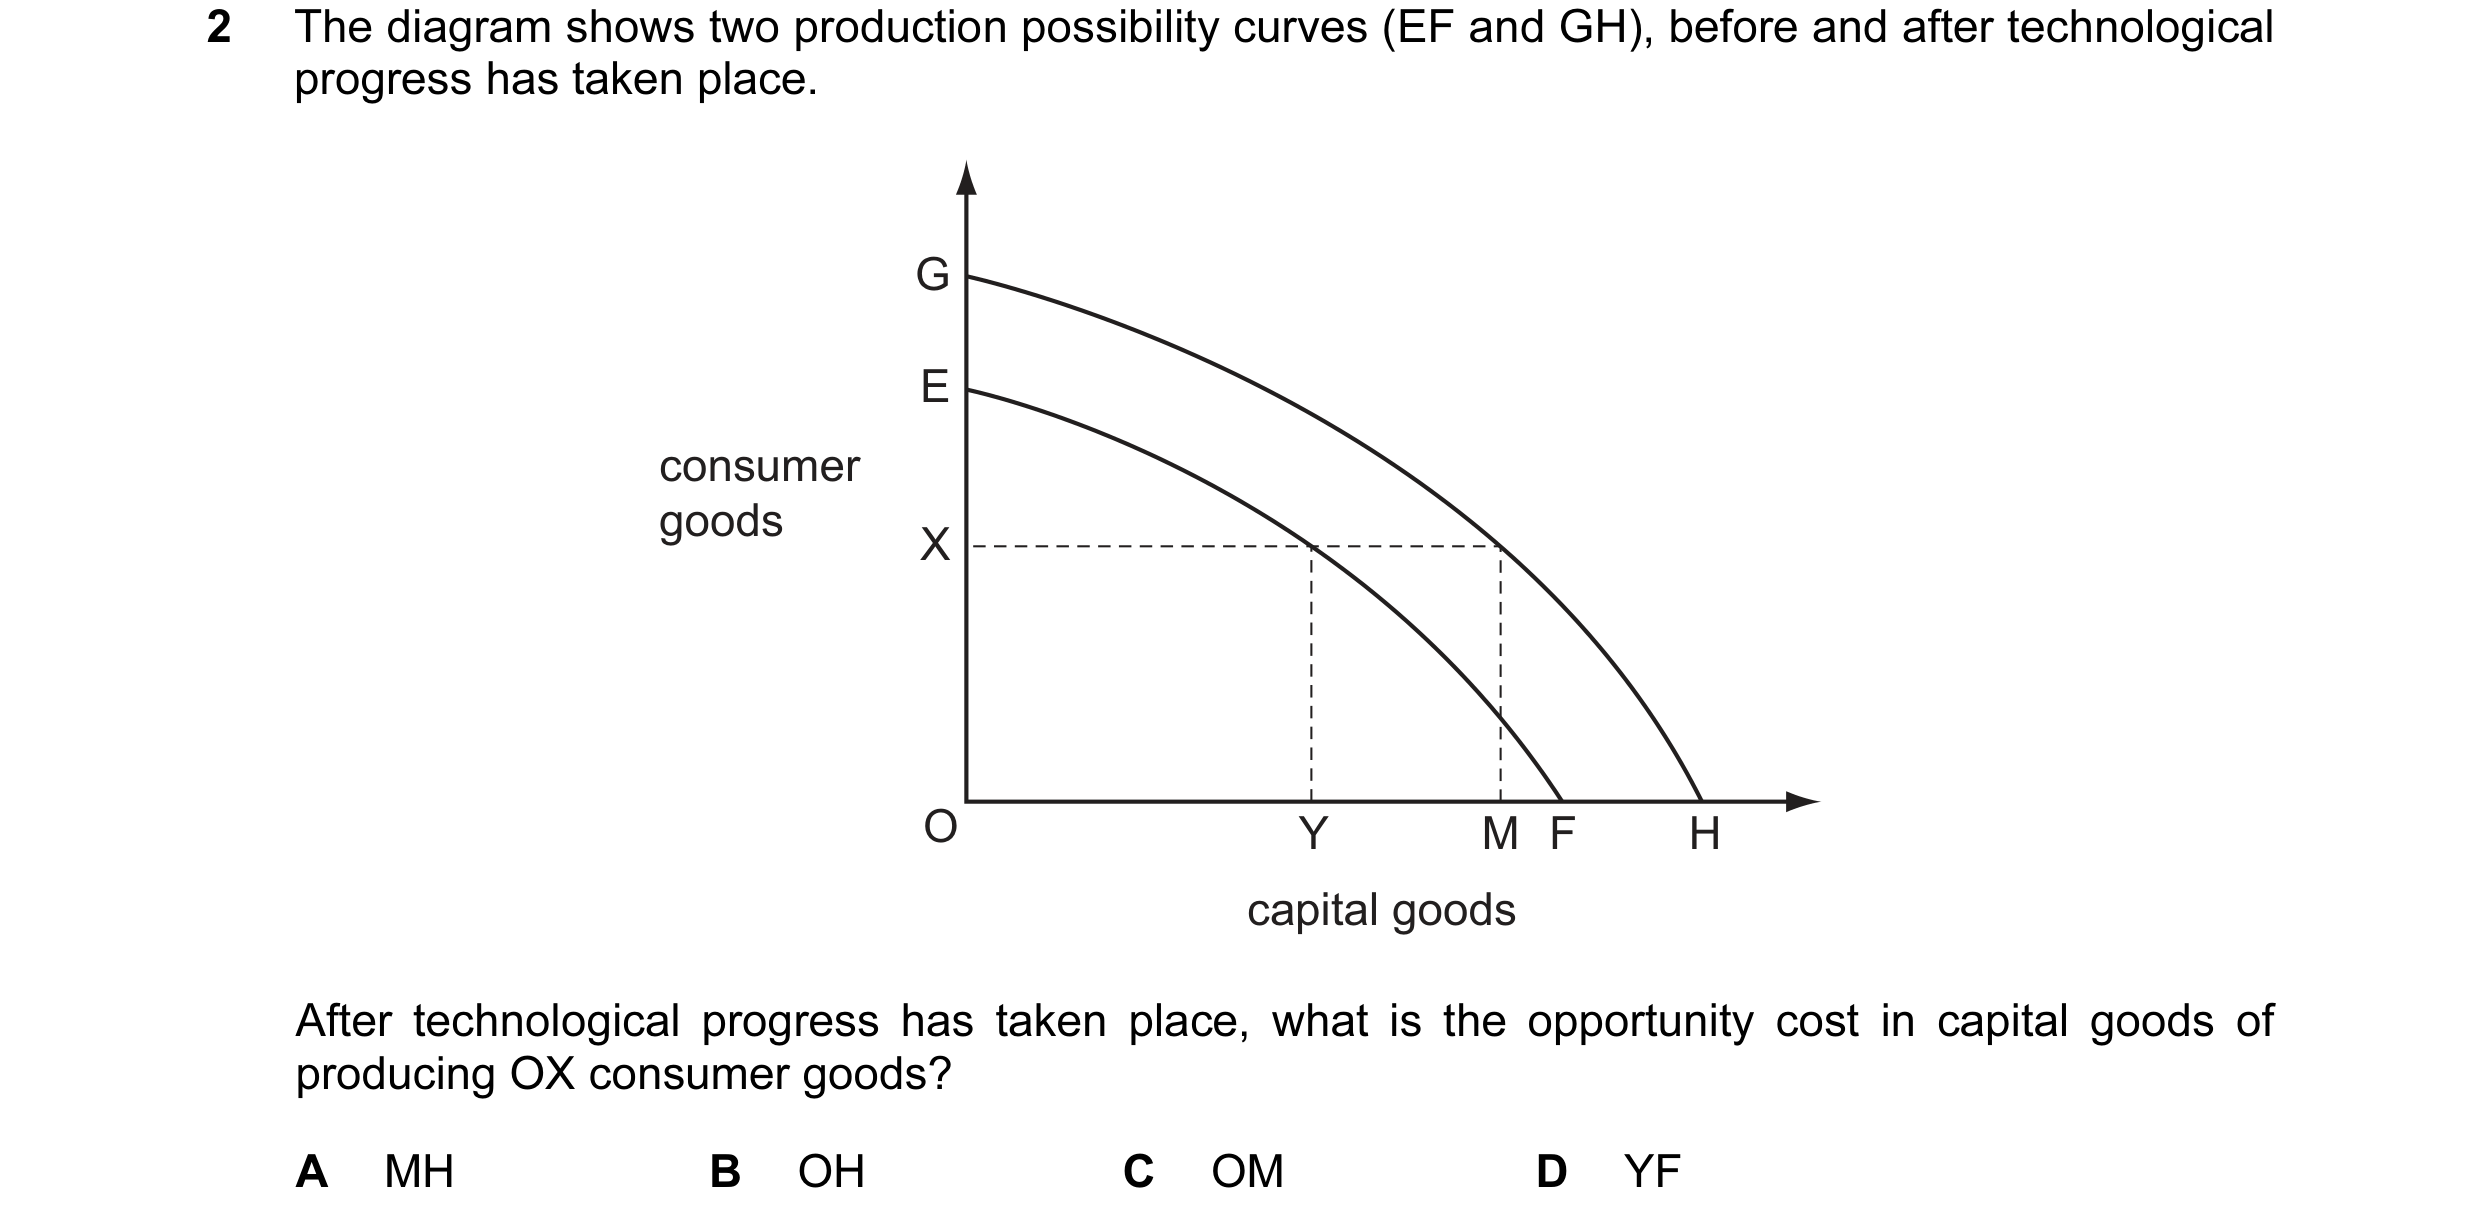 19 / 68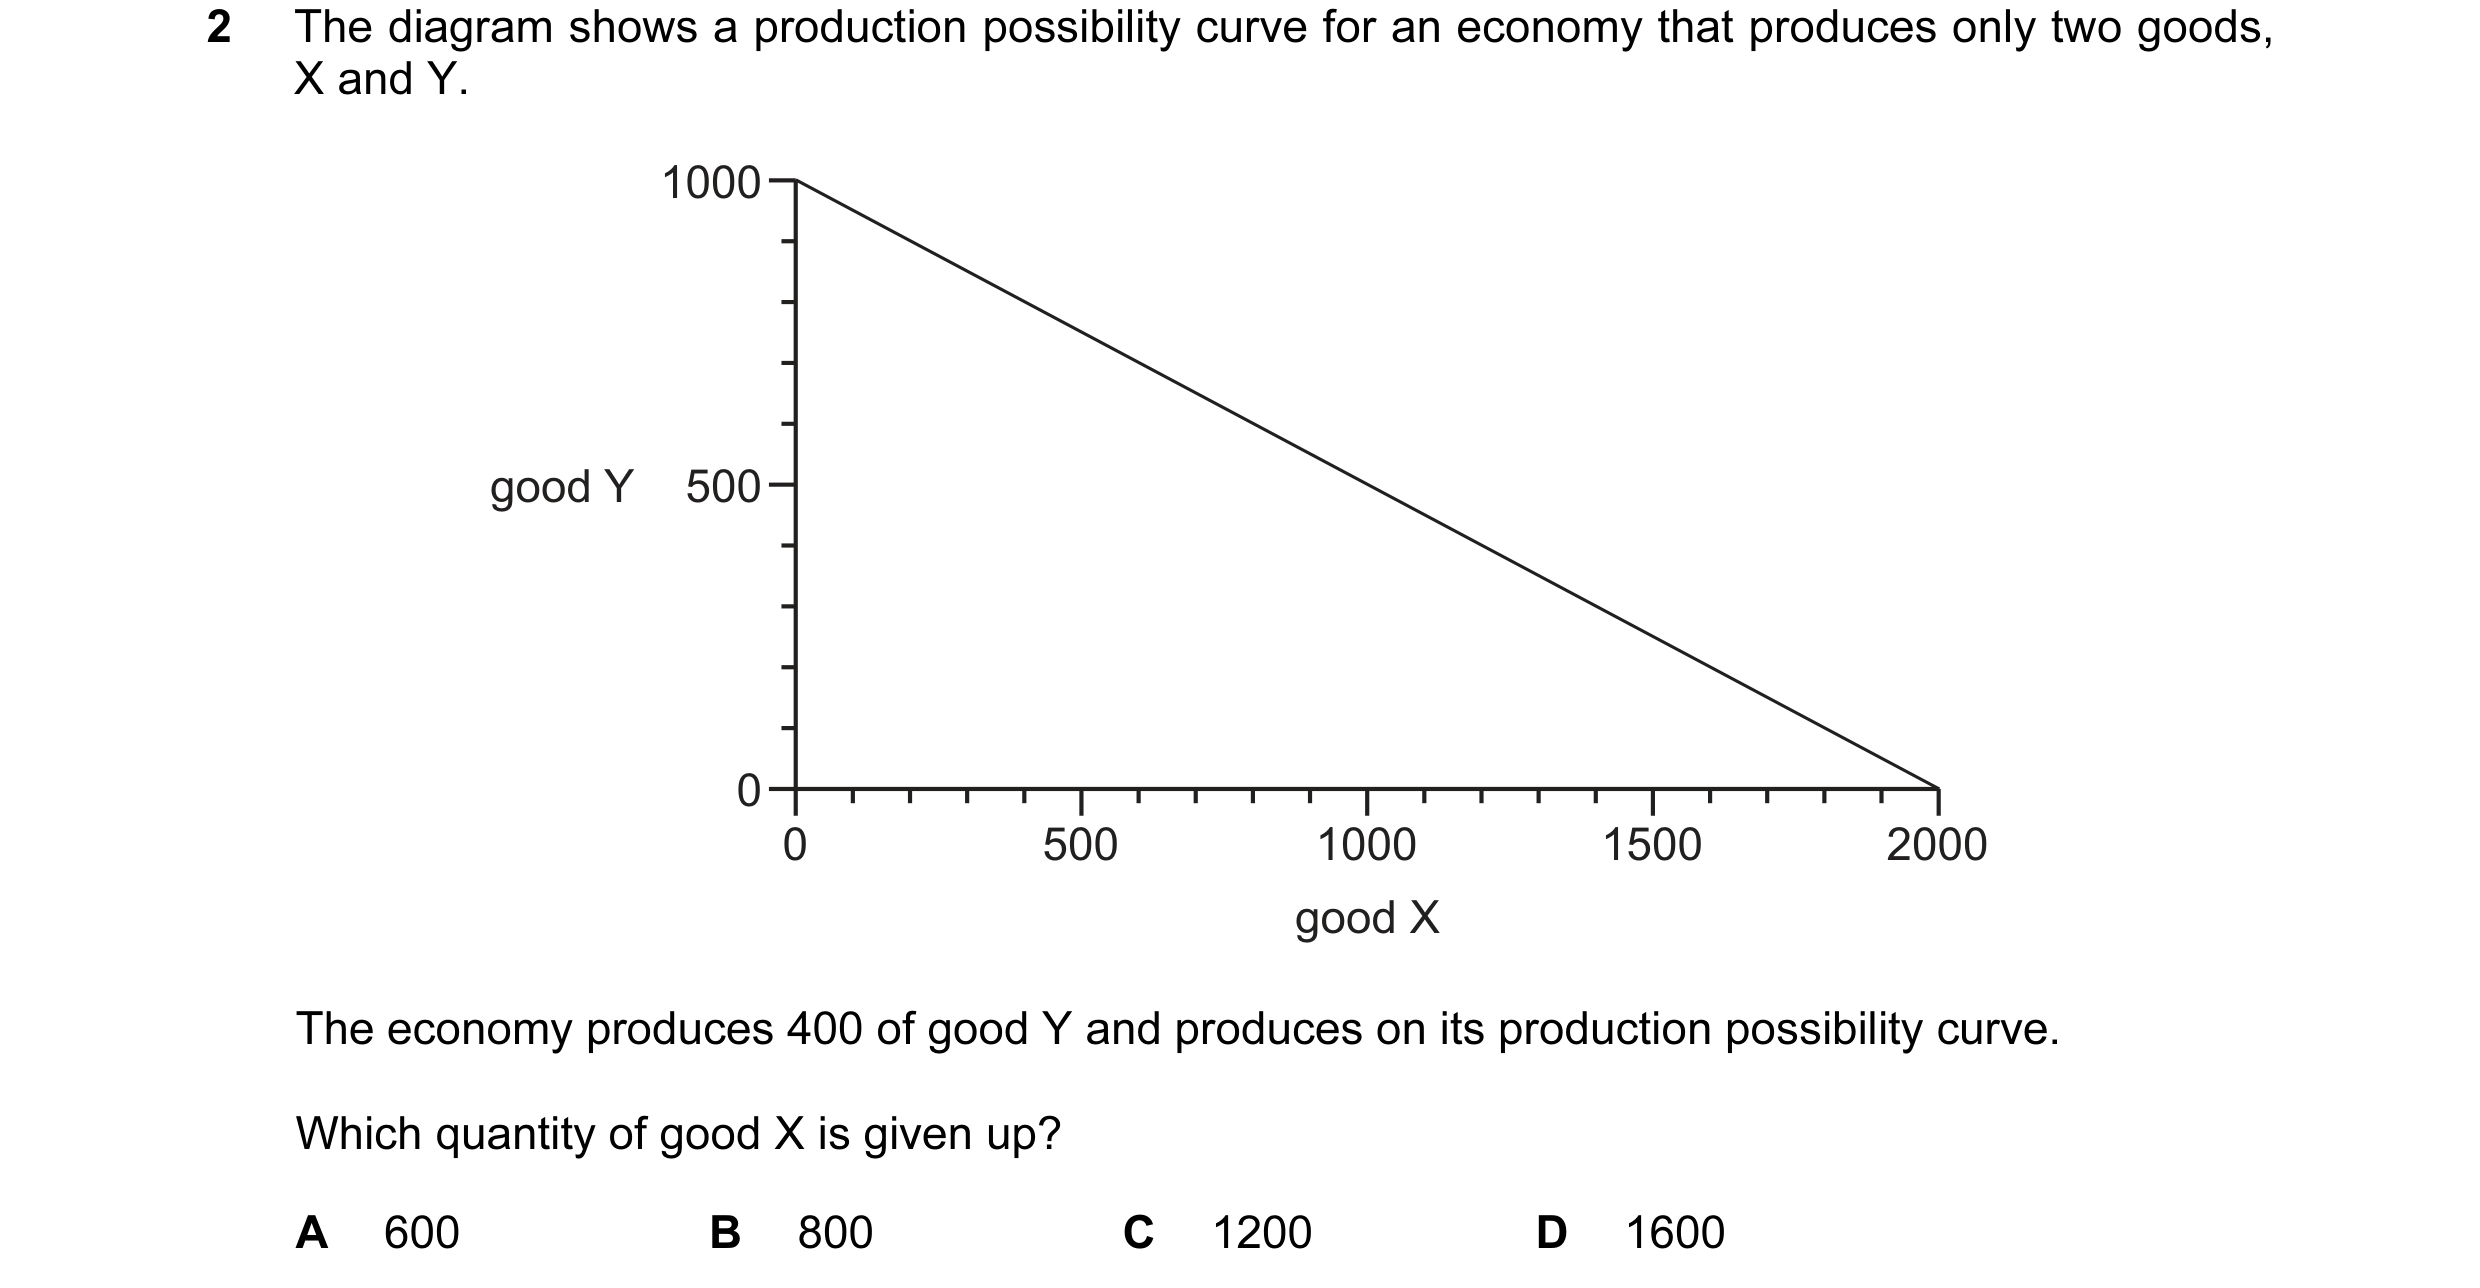
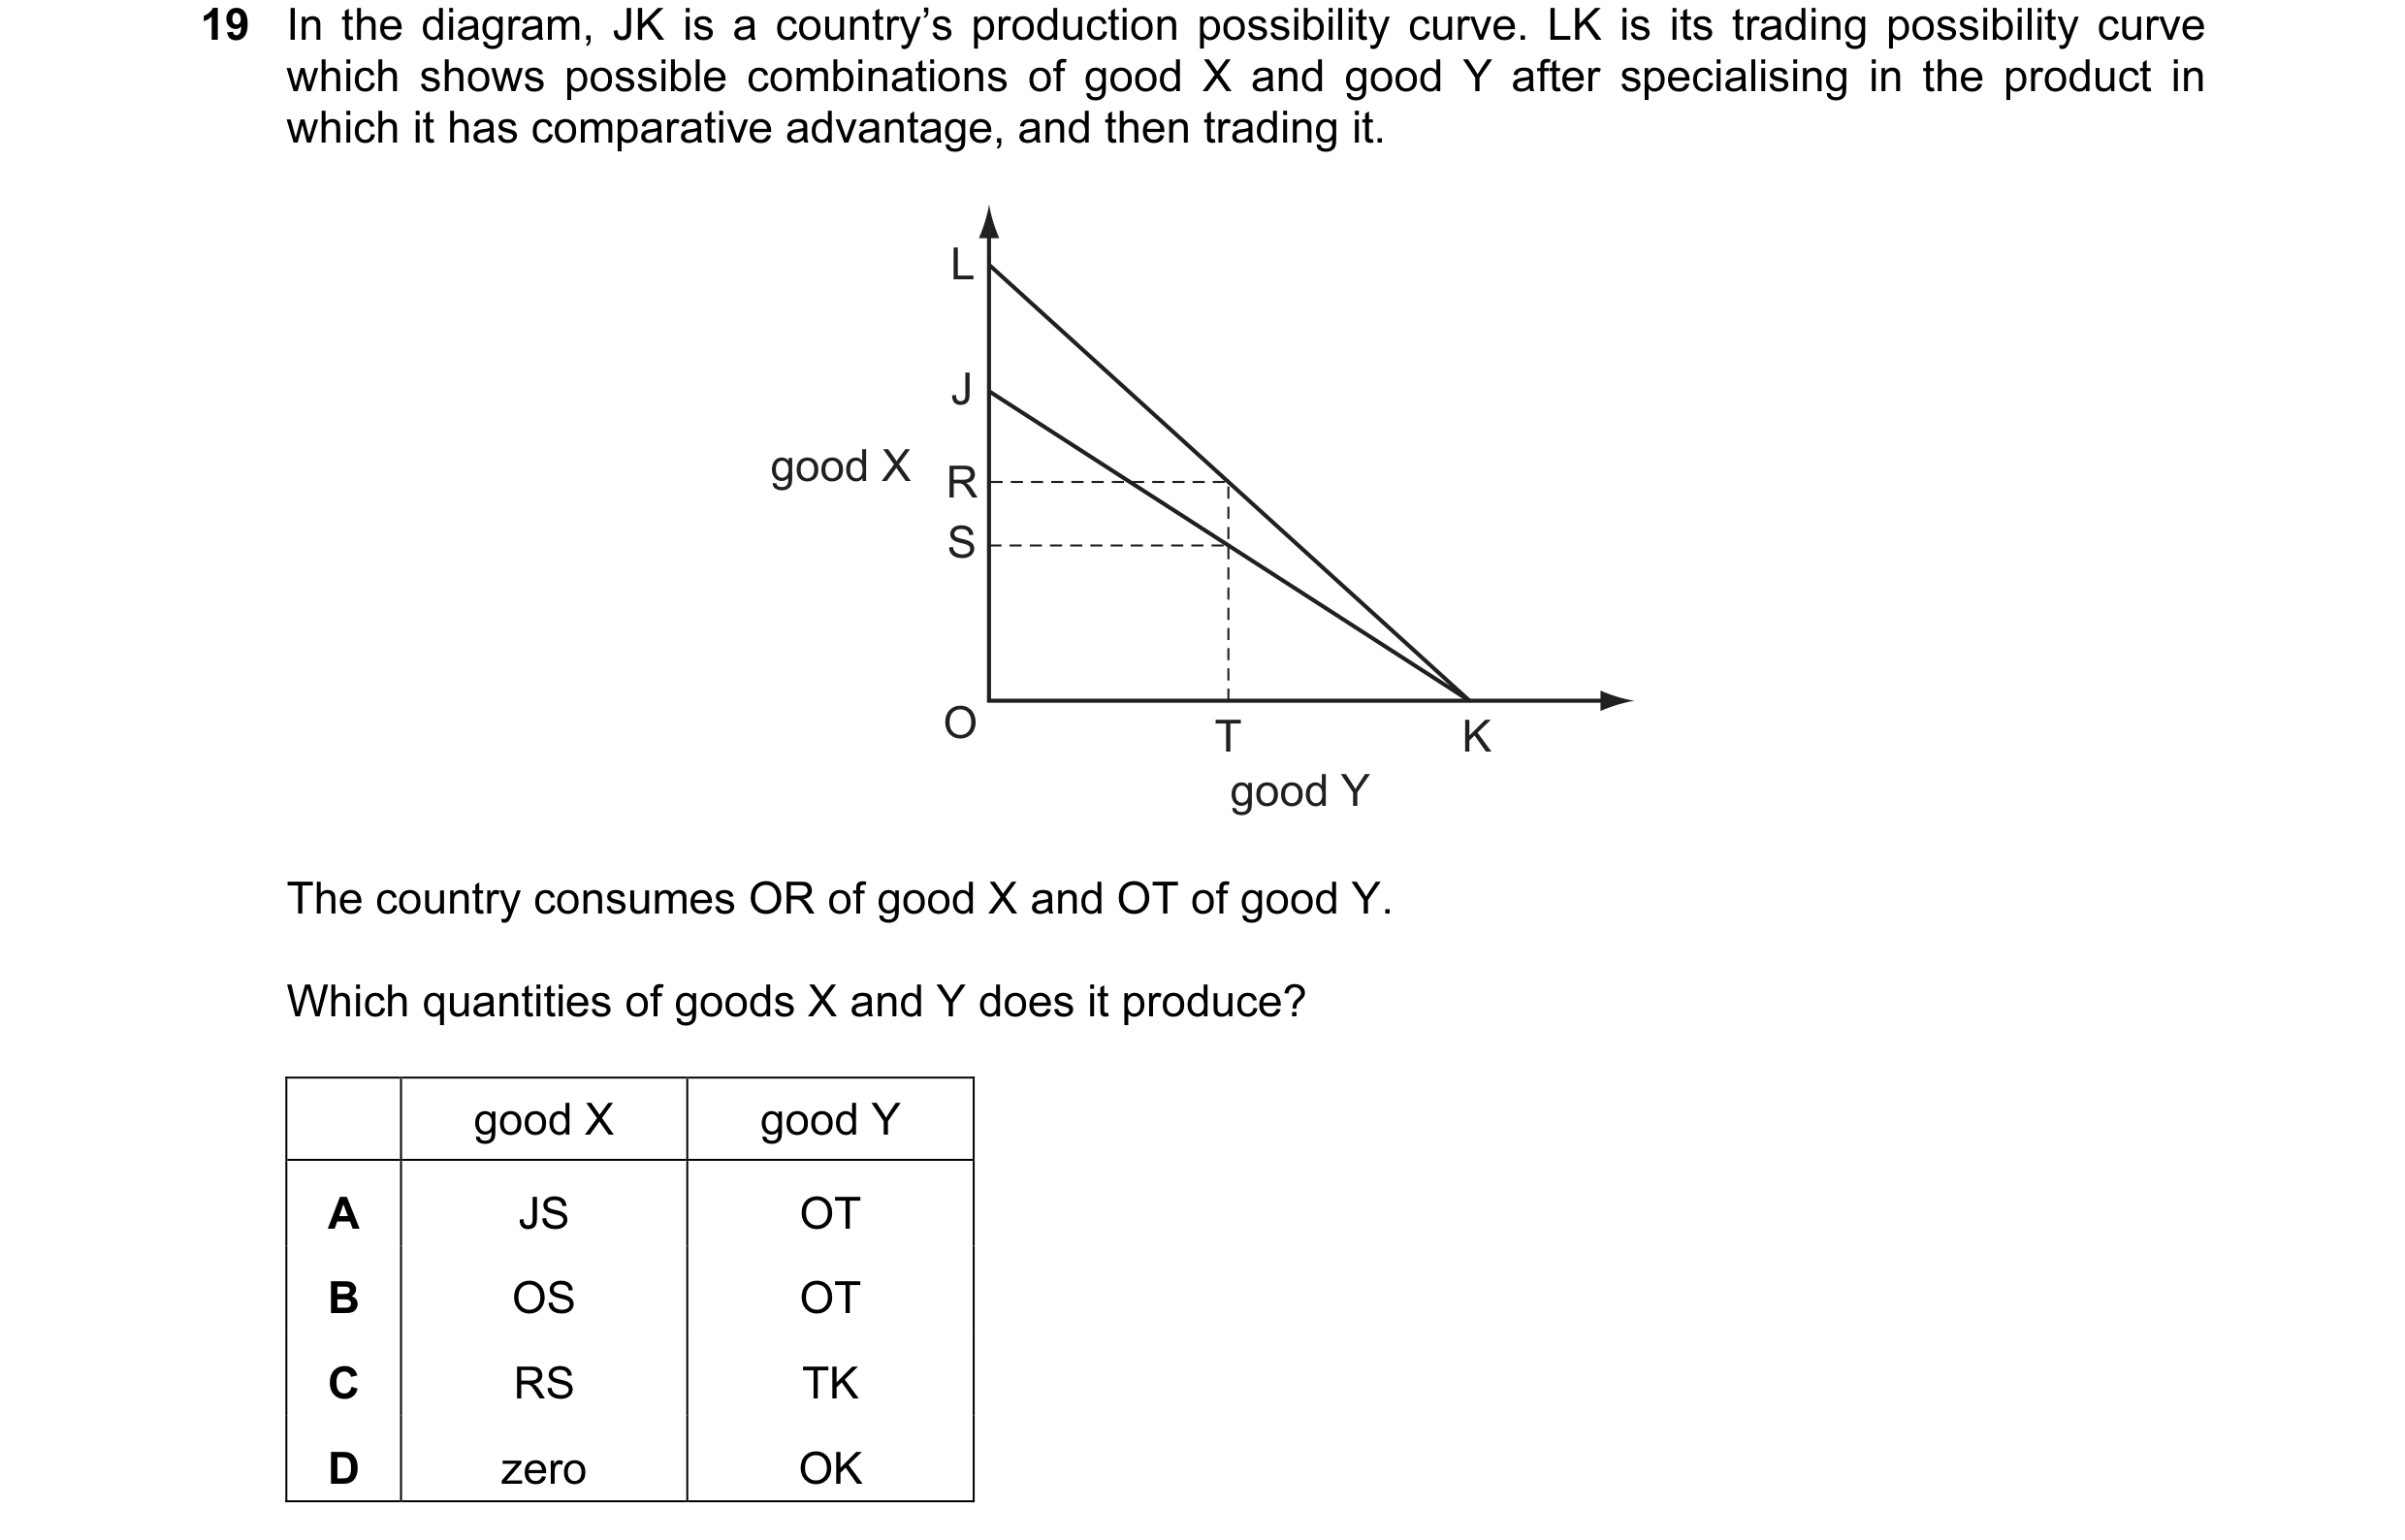 20 / 68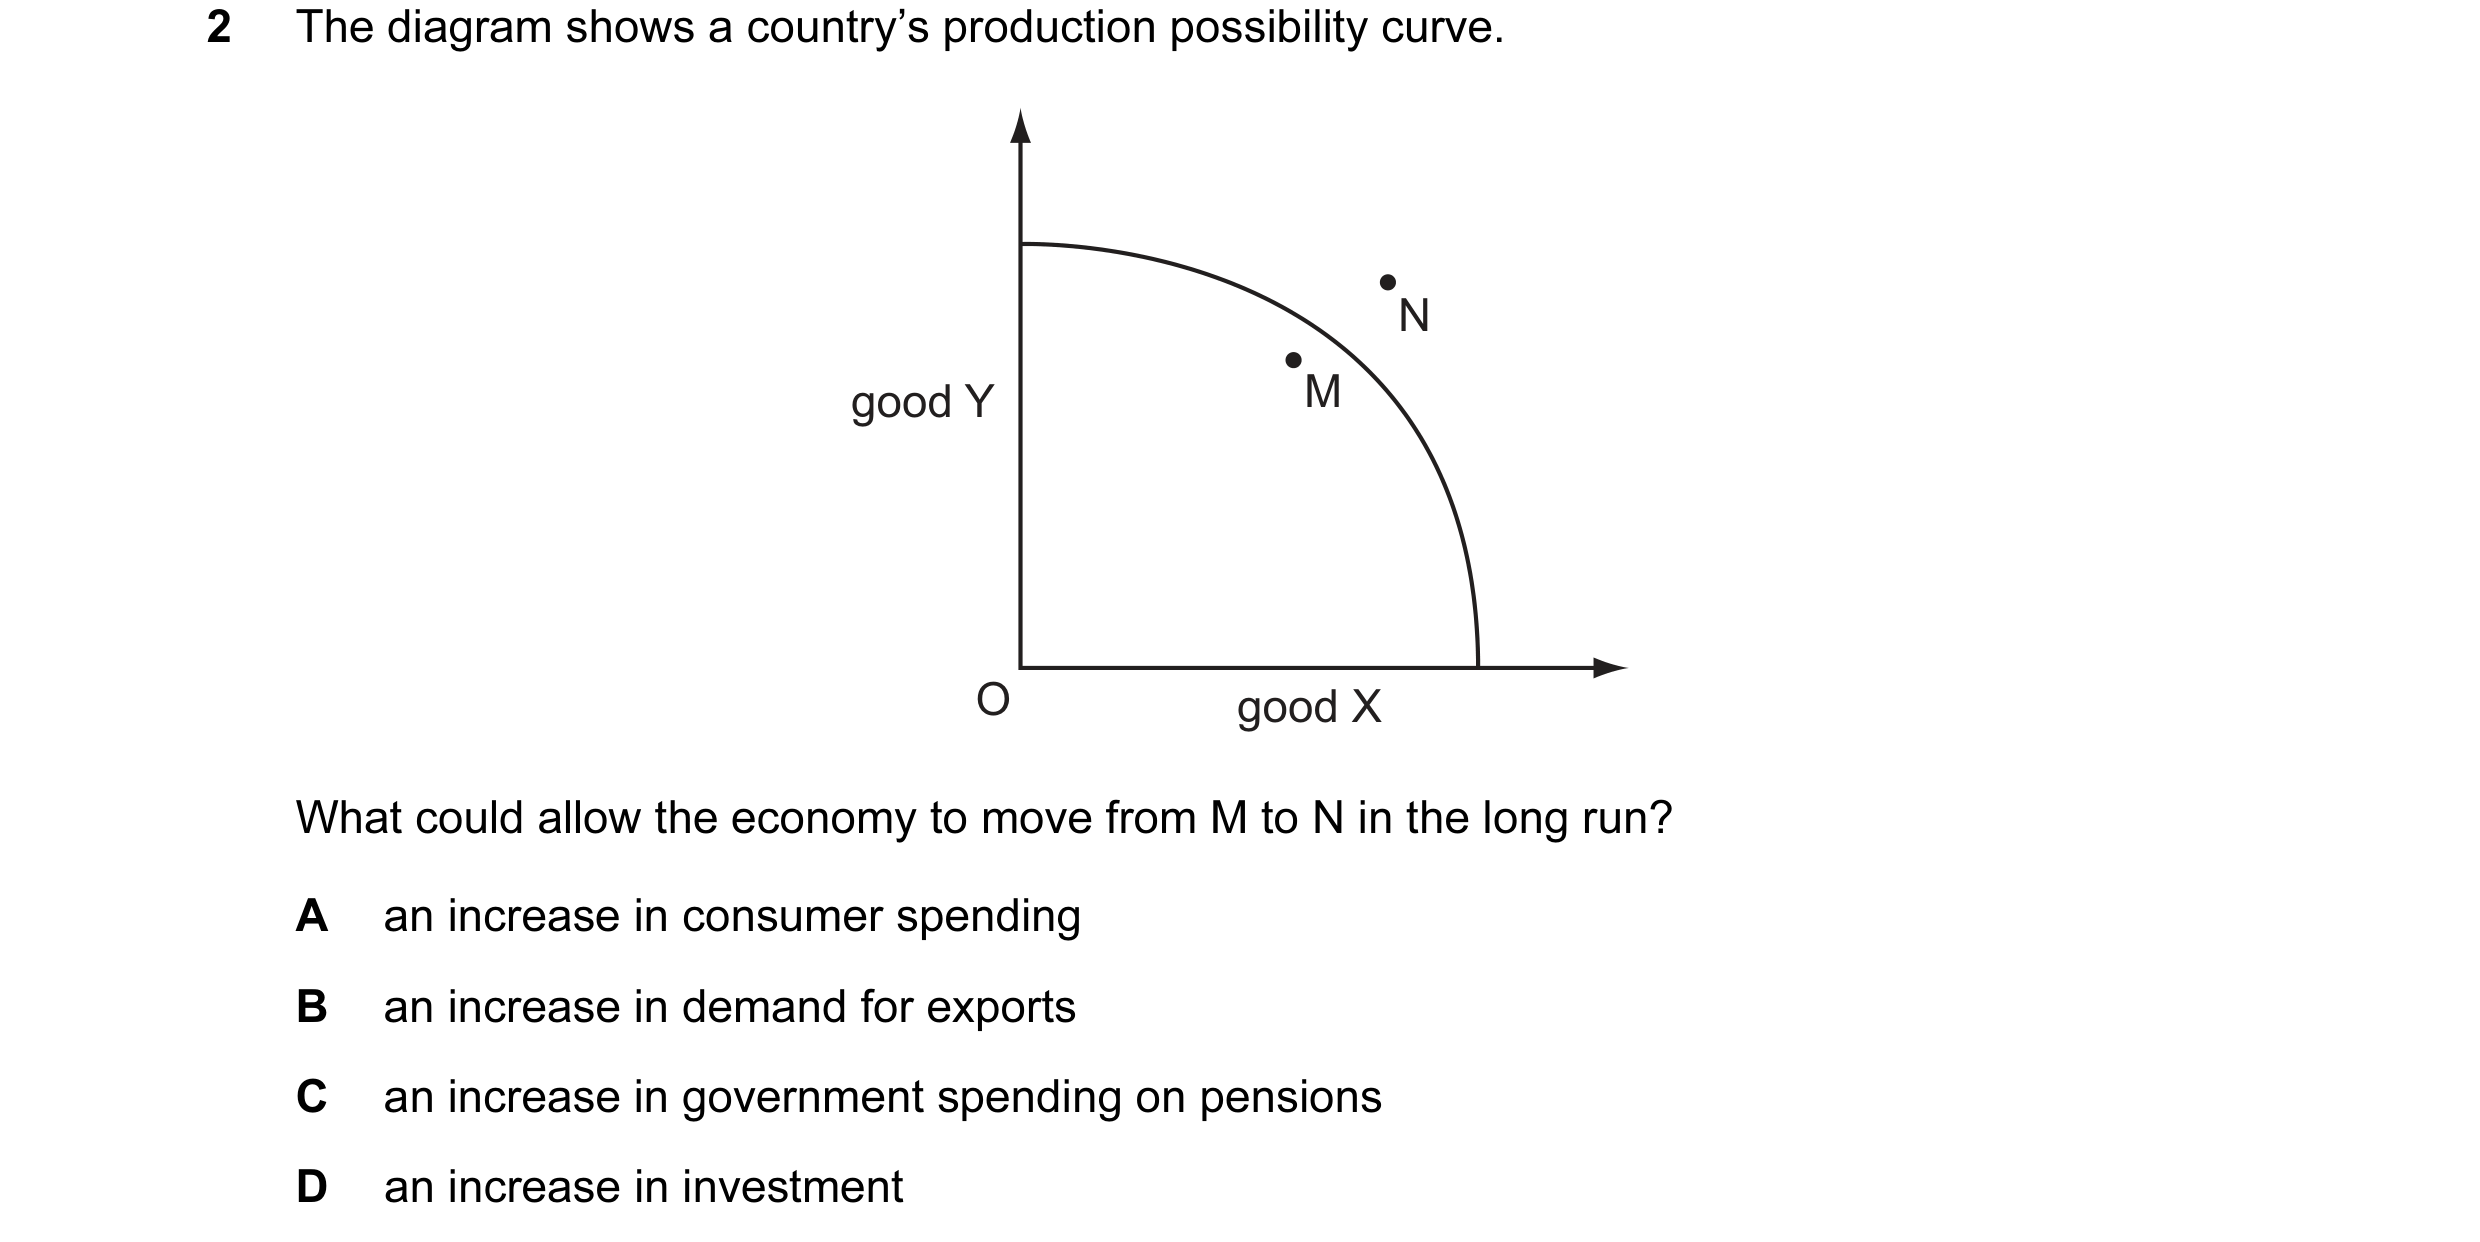
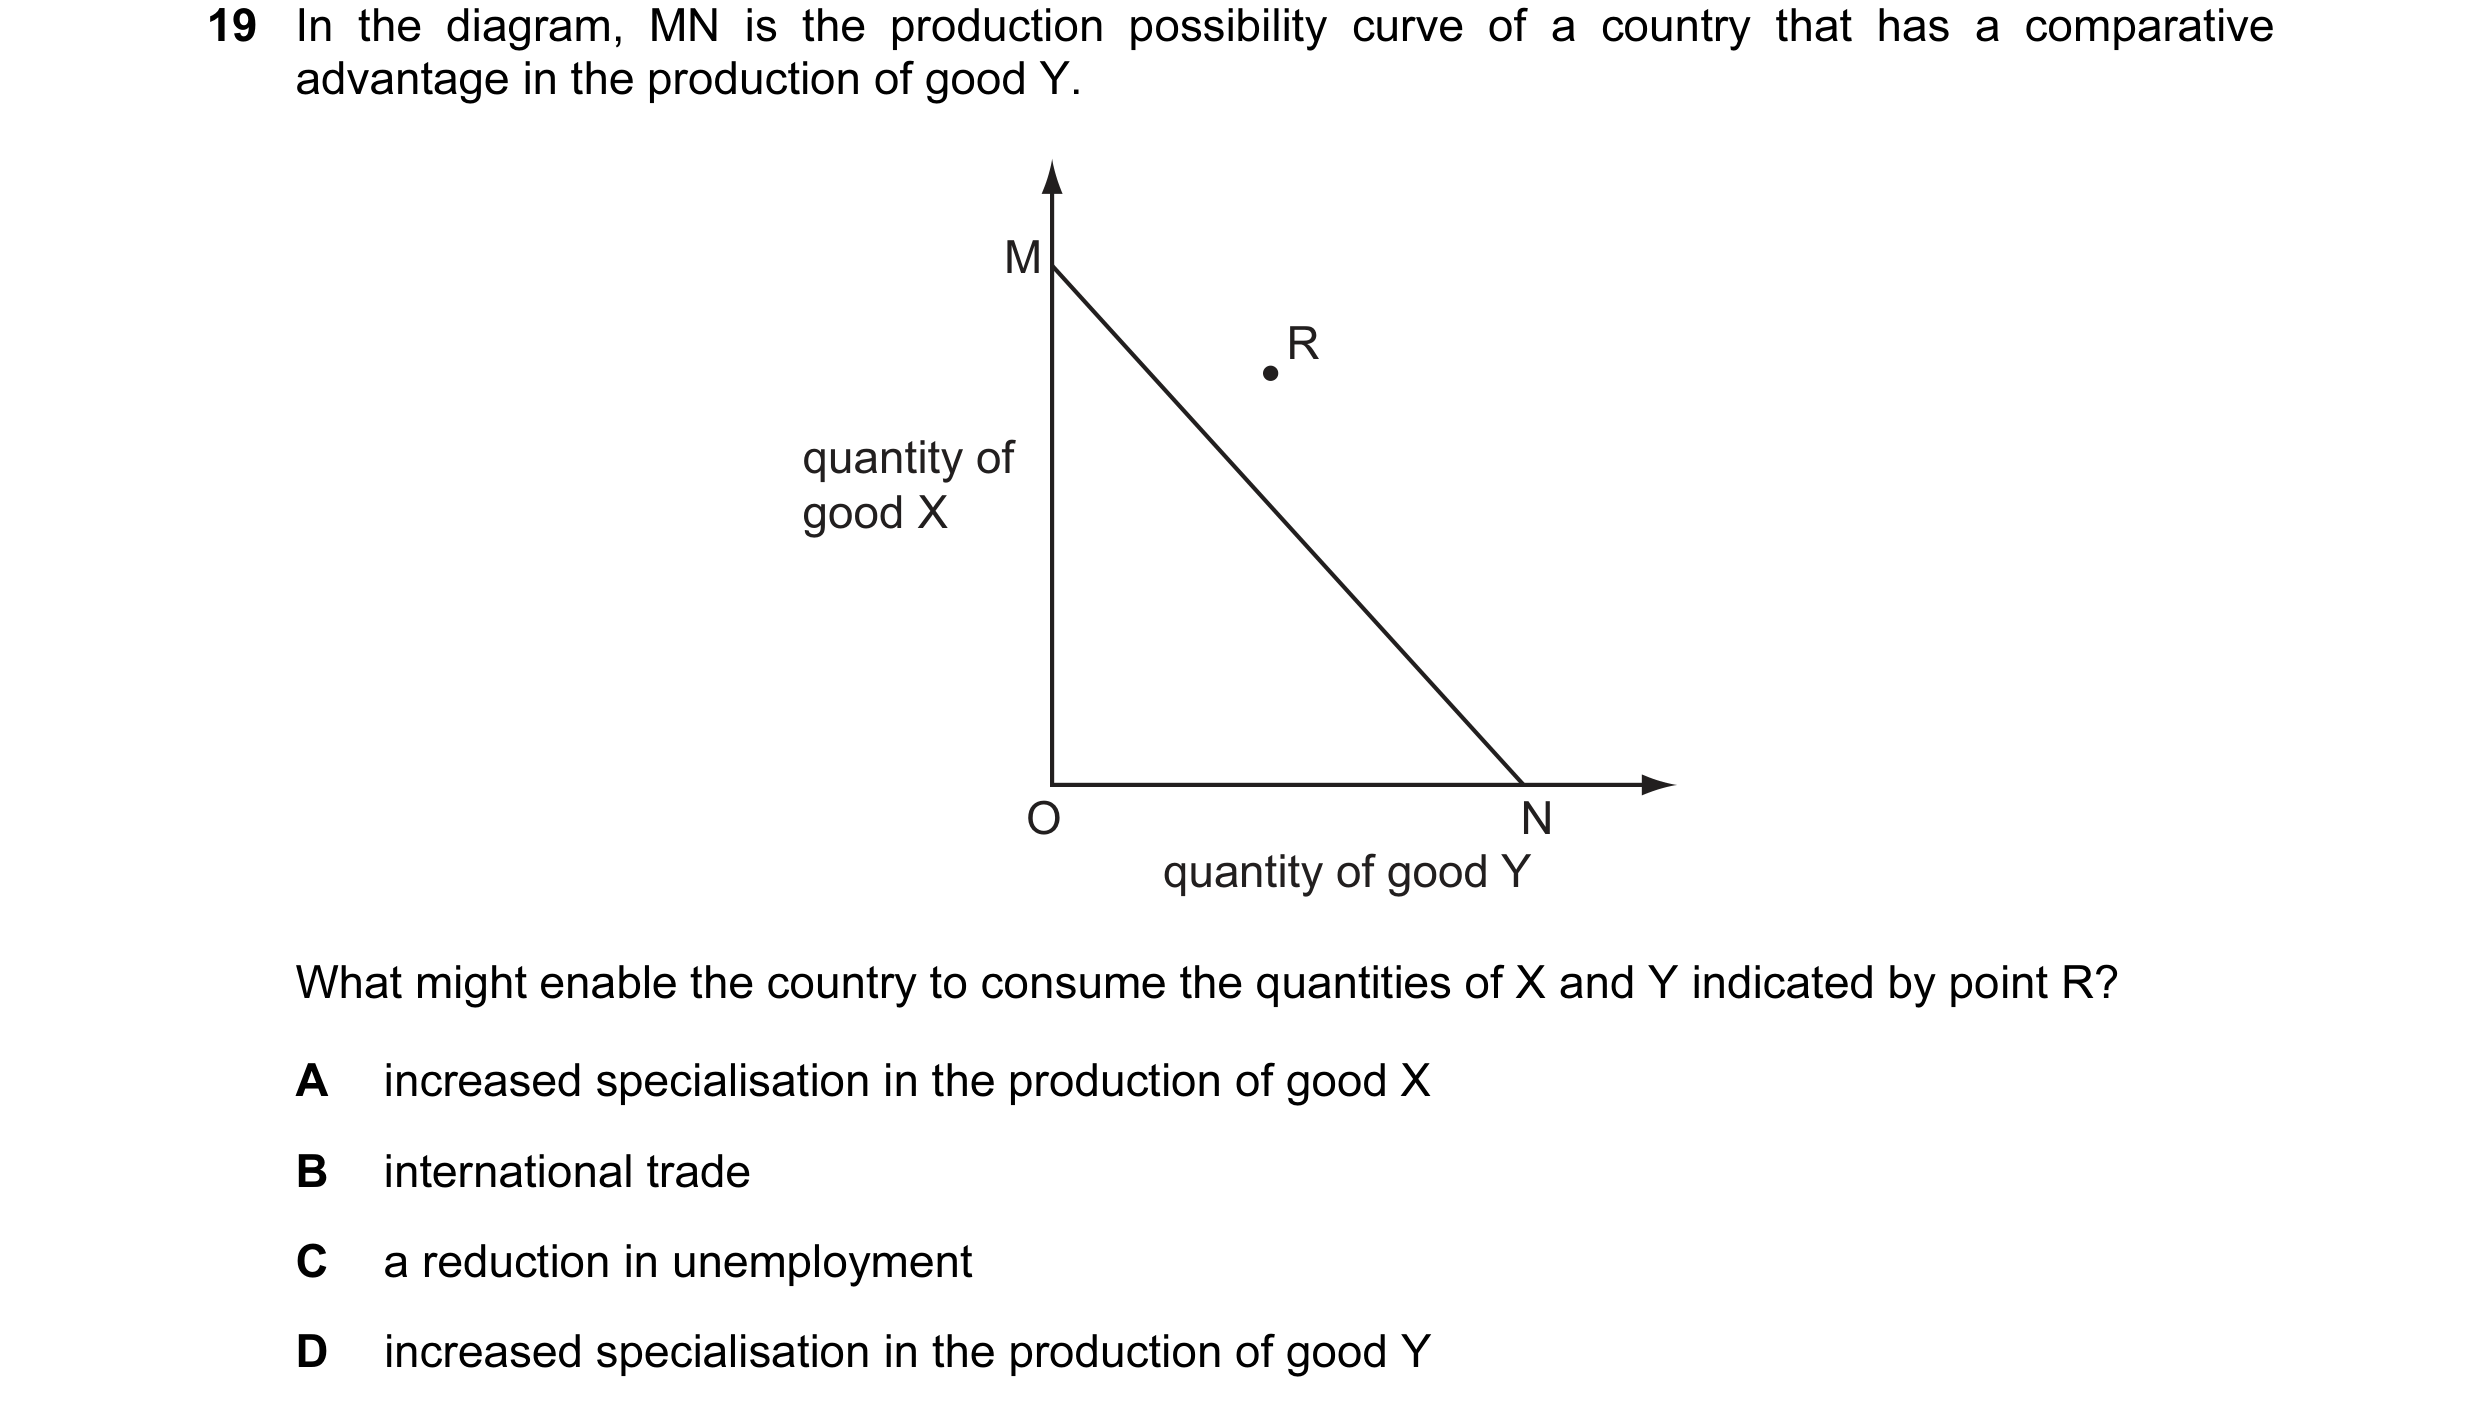 21 / 68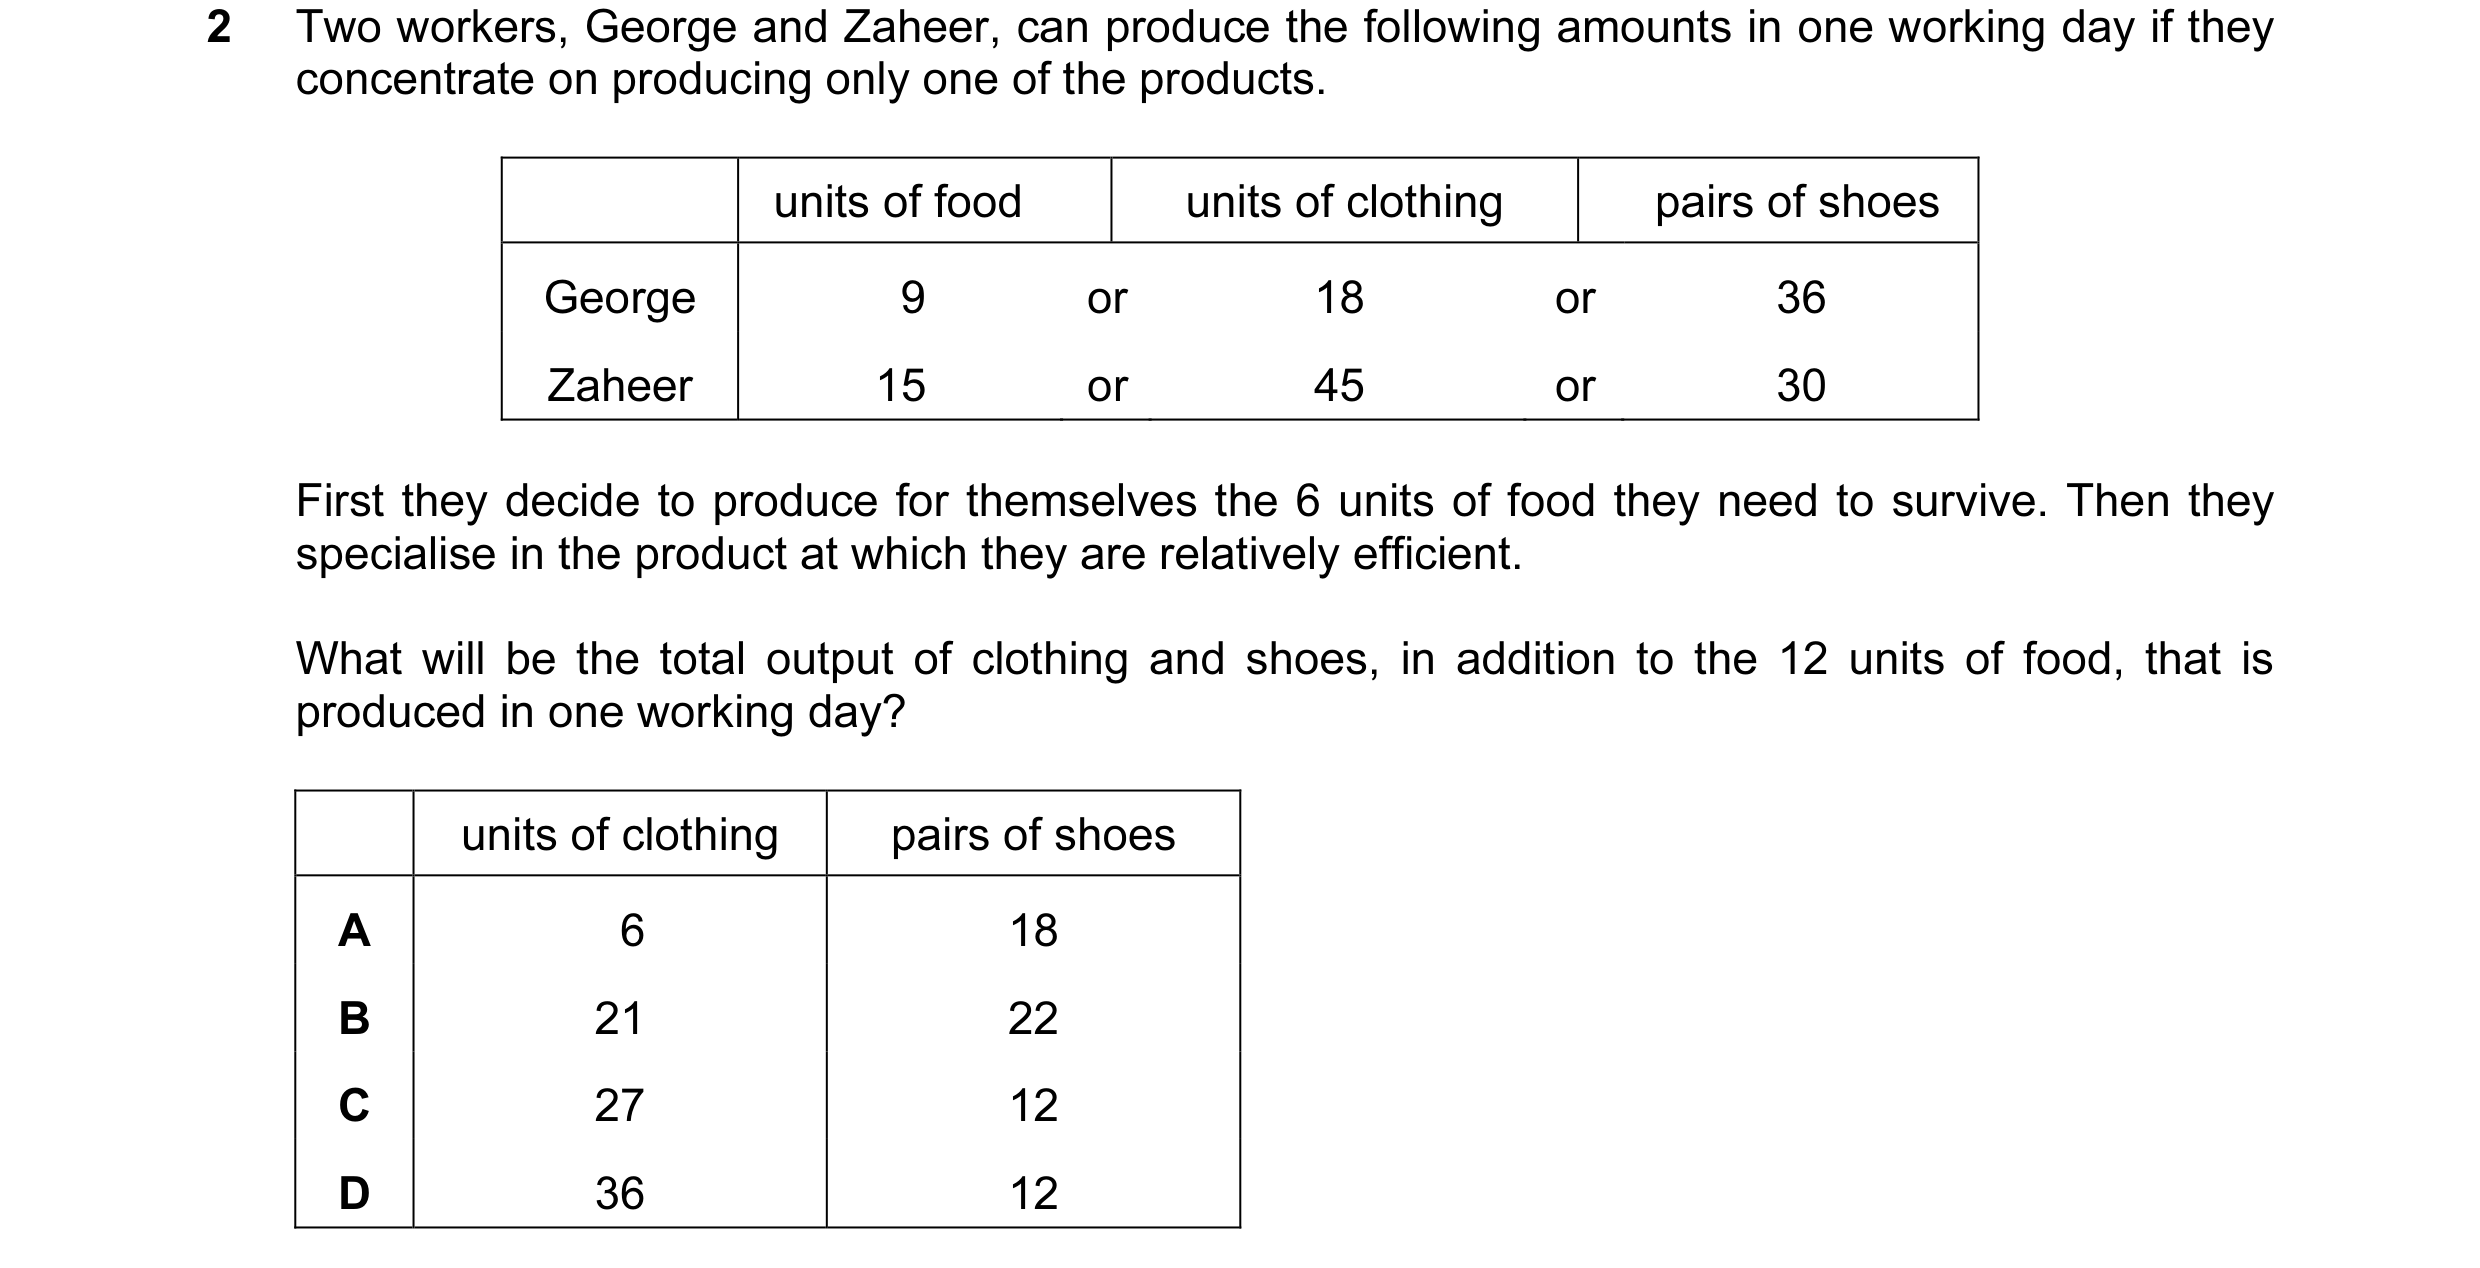
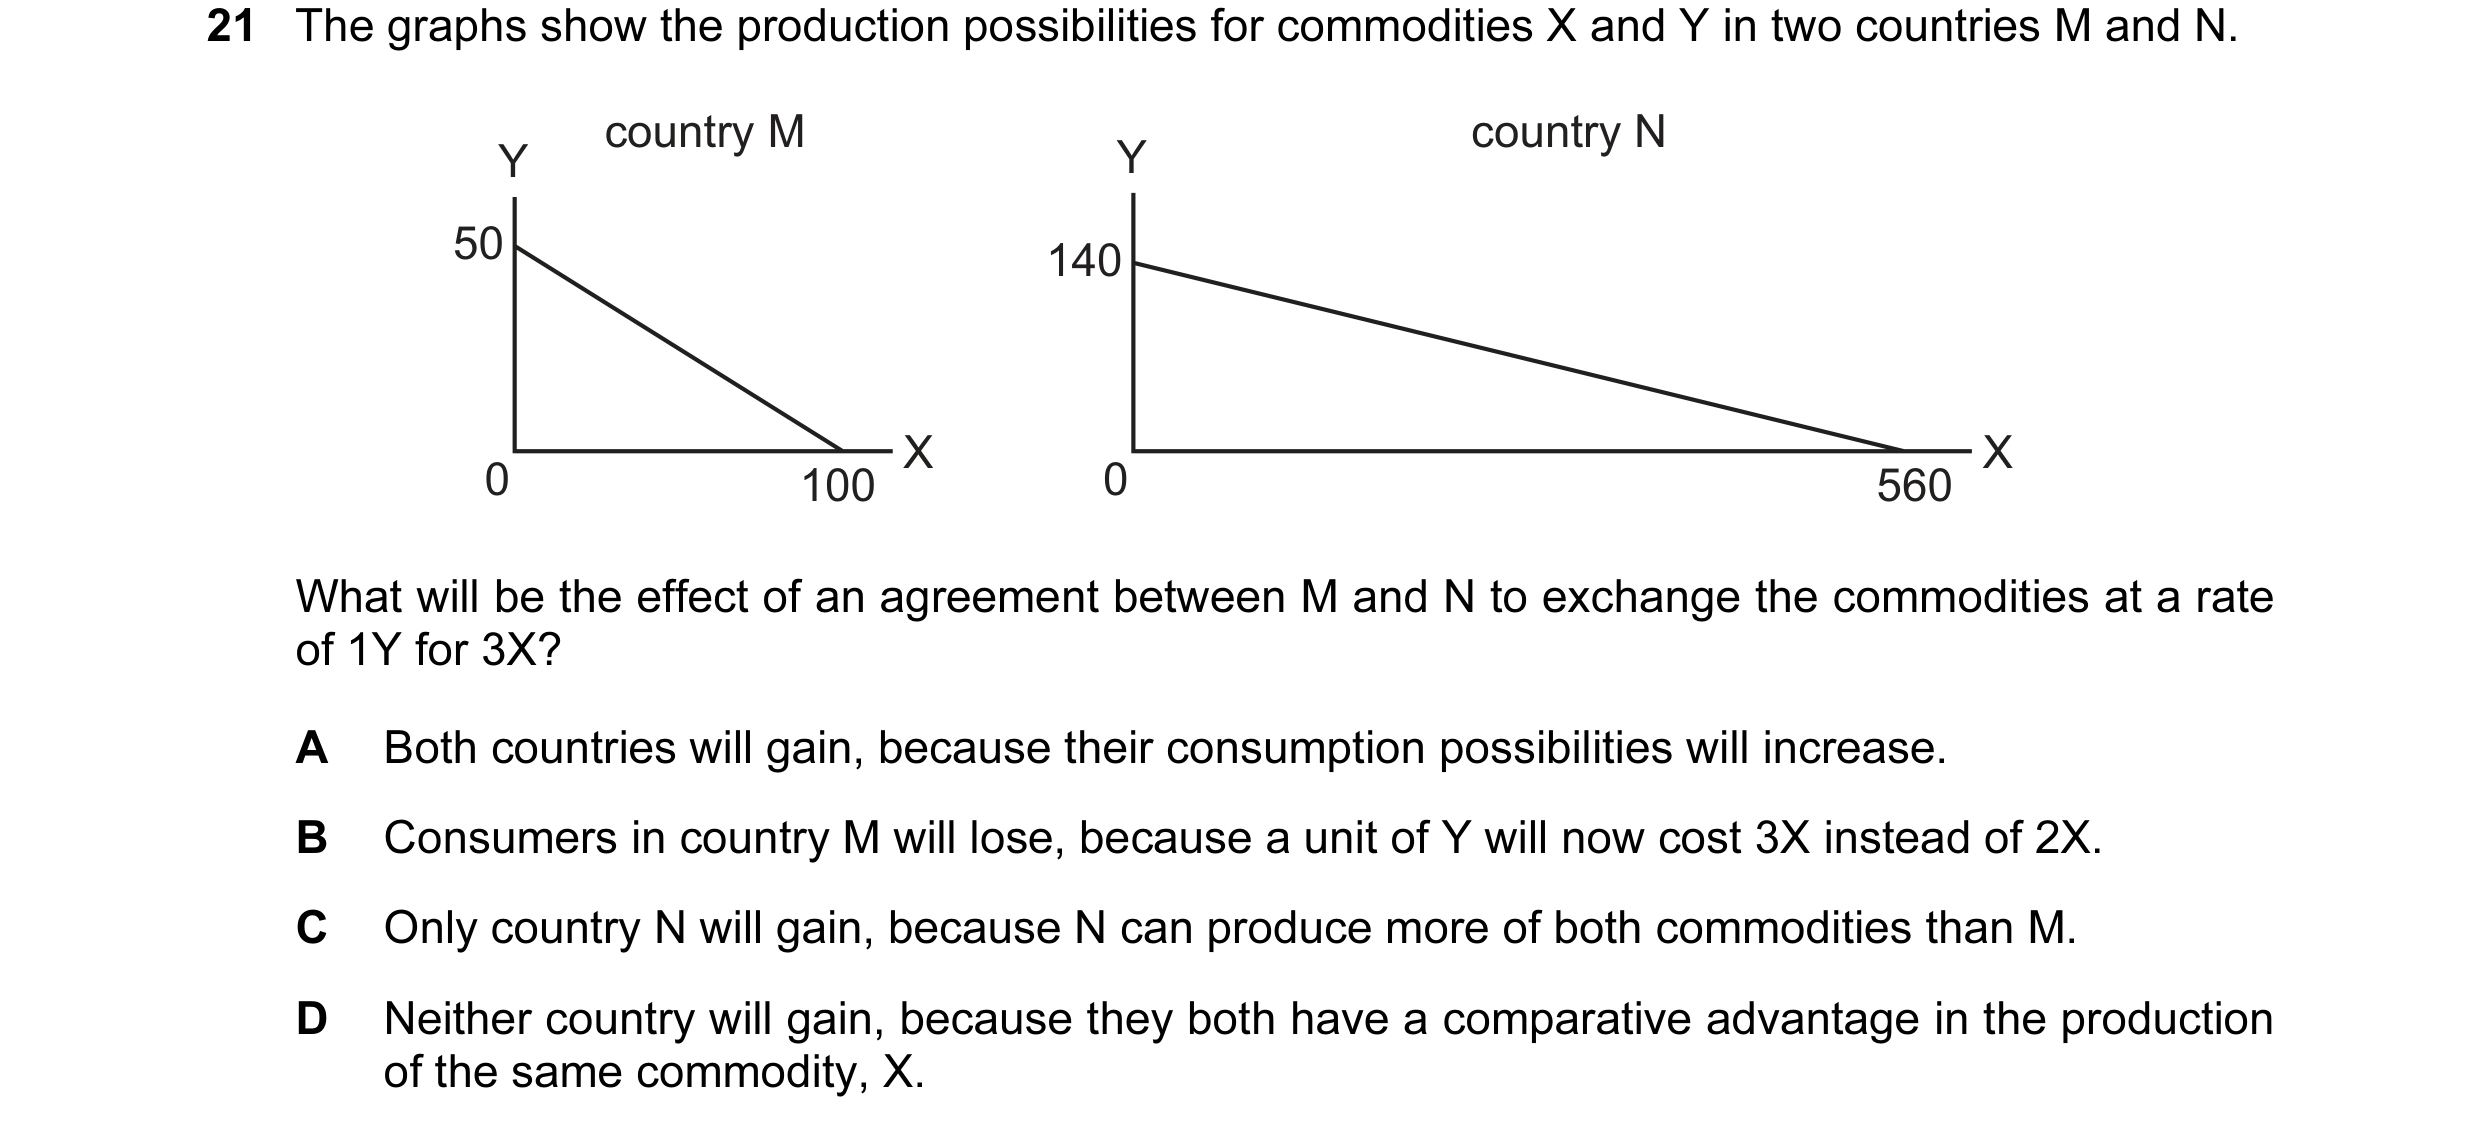
 22 / 68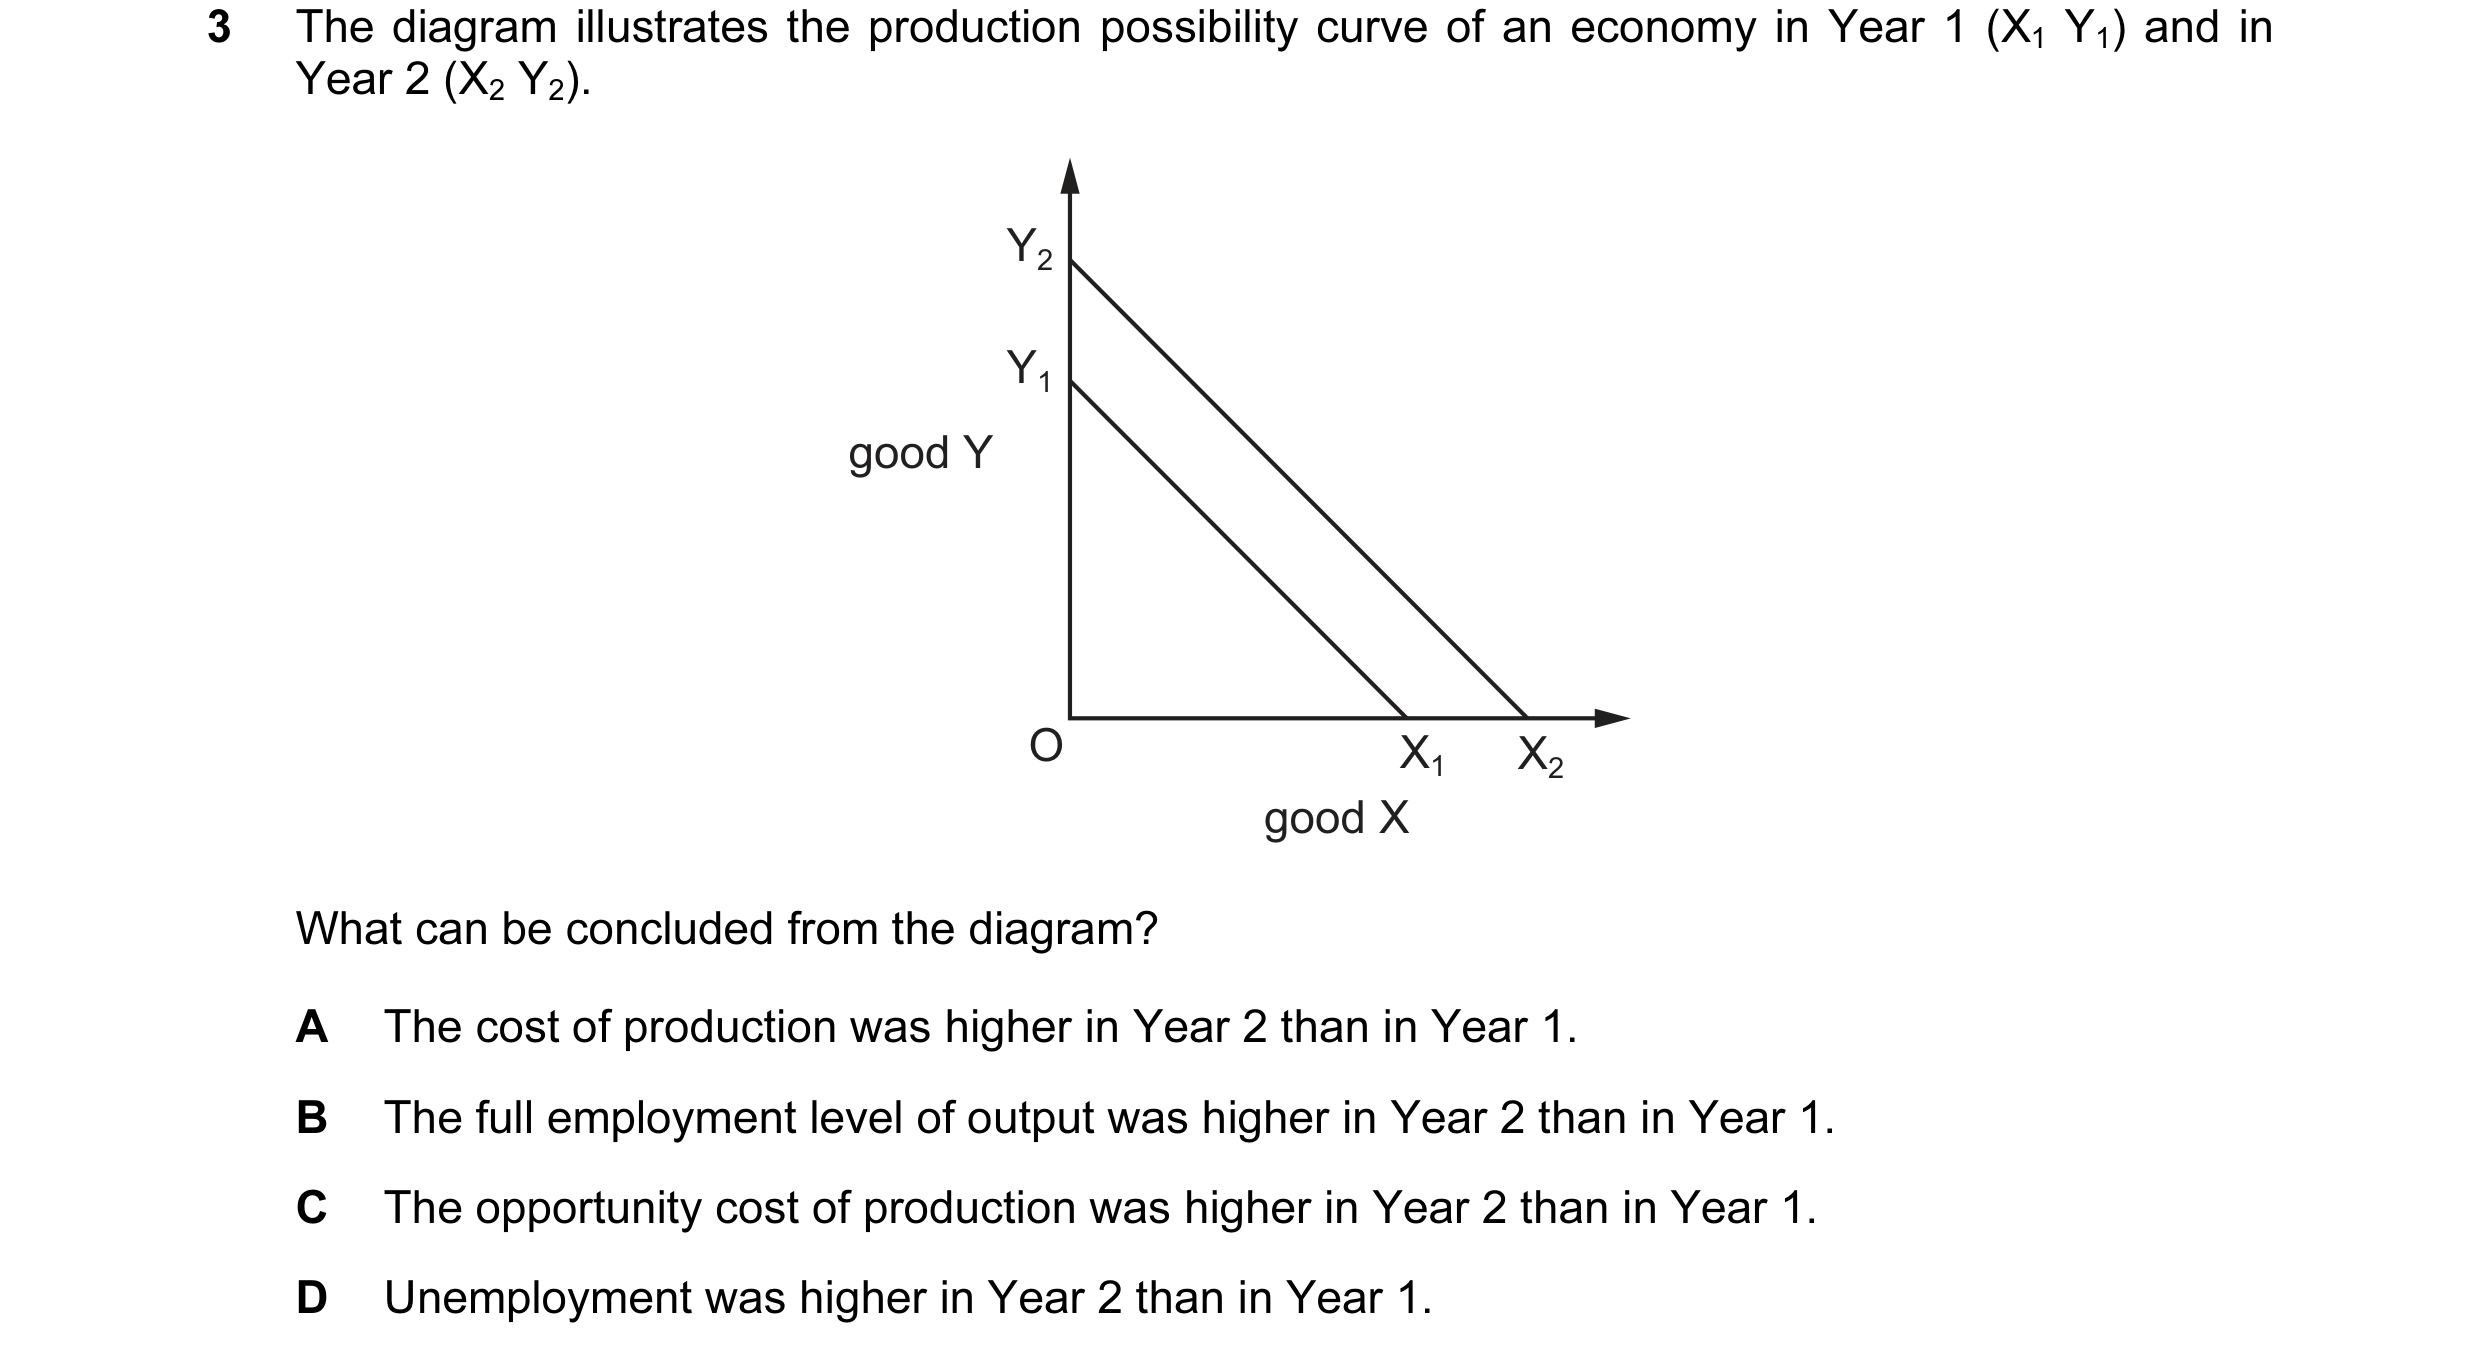
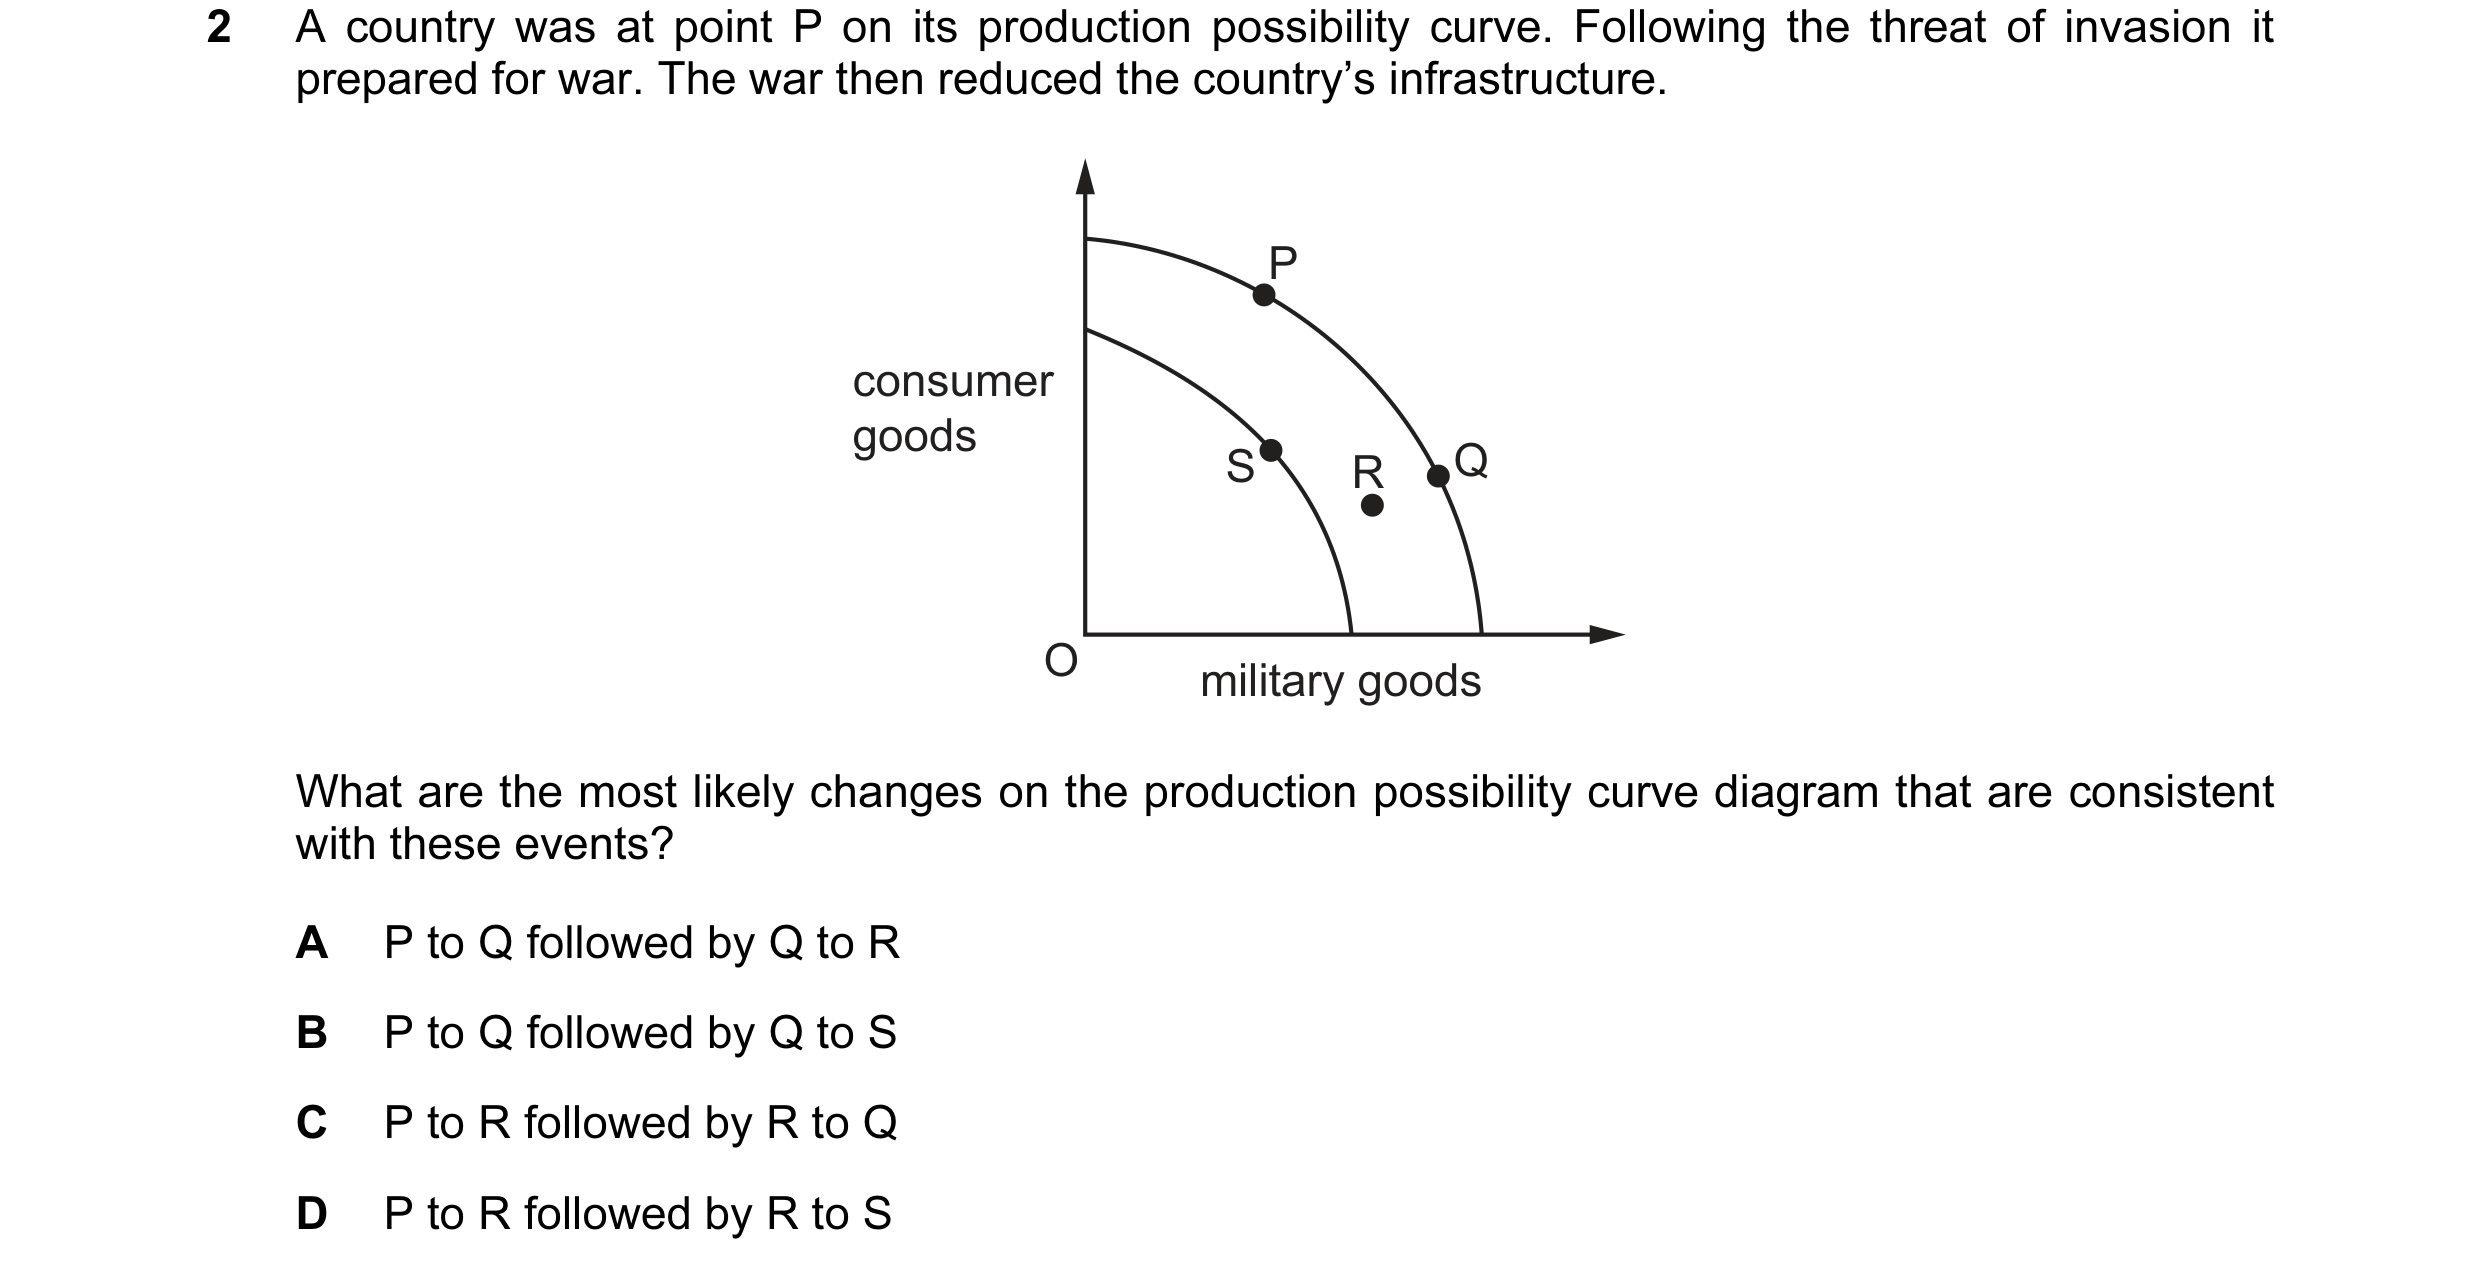 23 / 68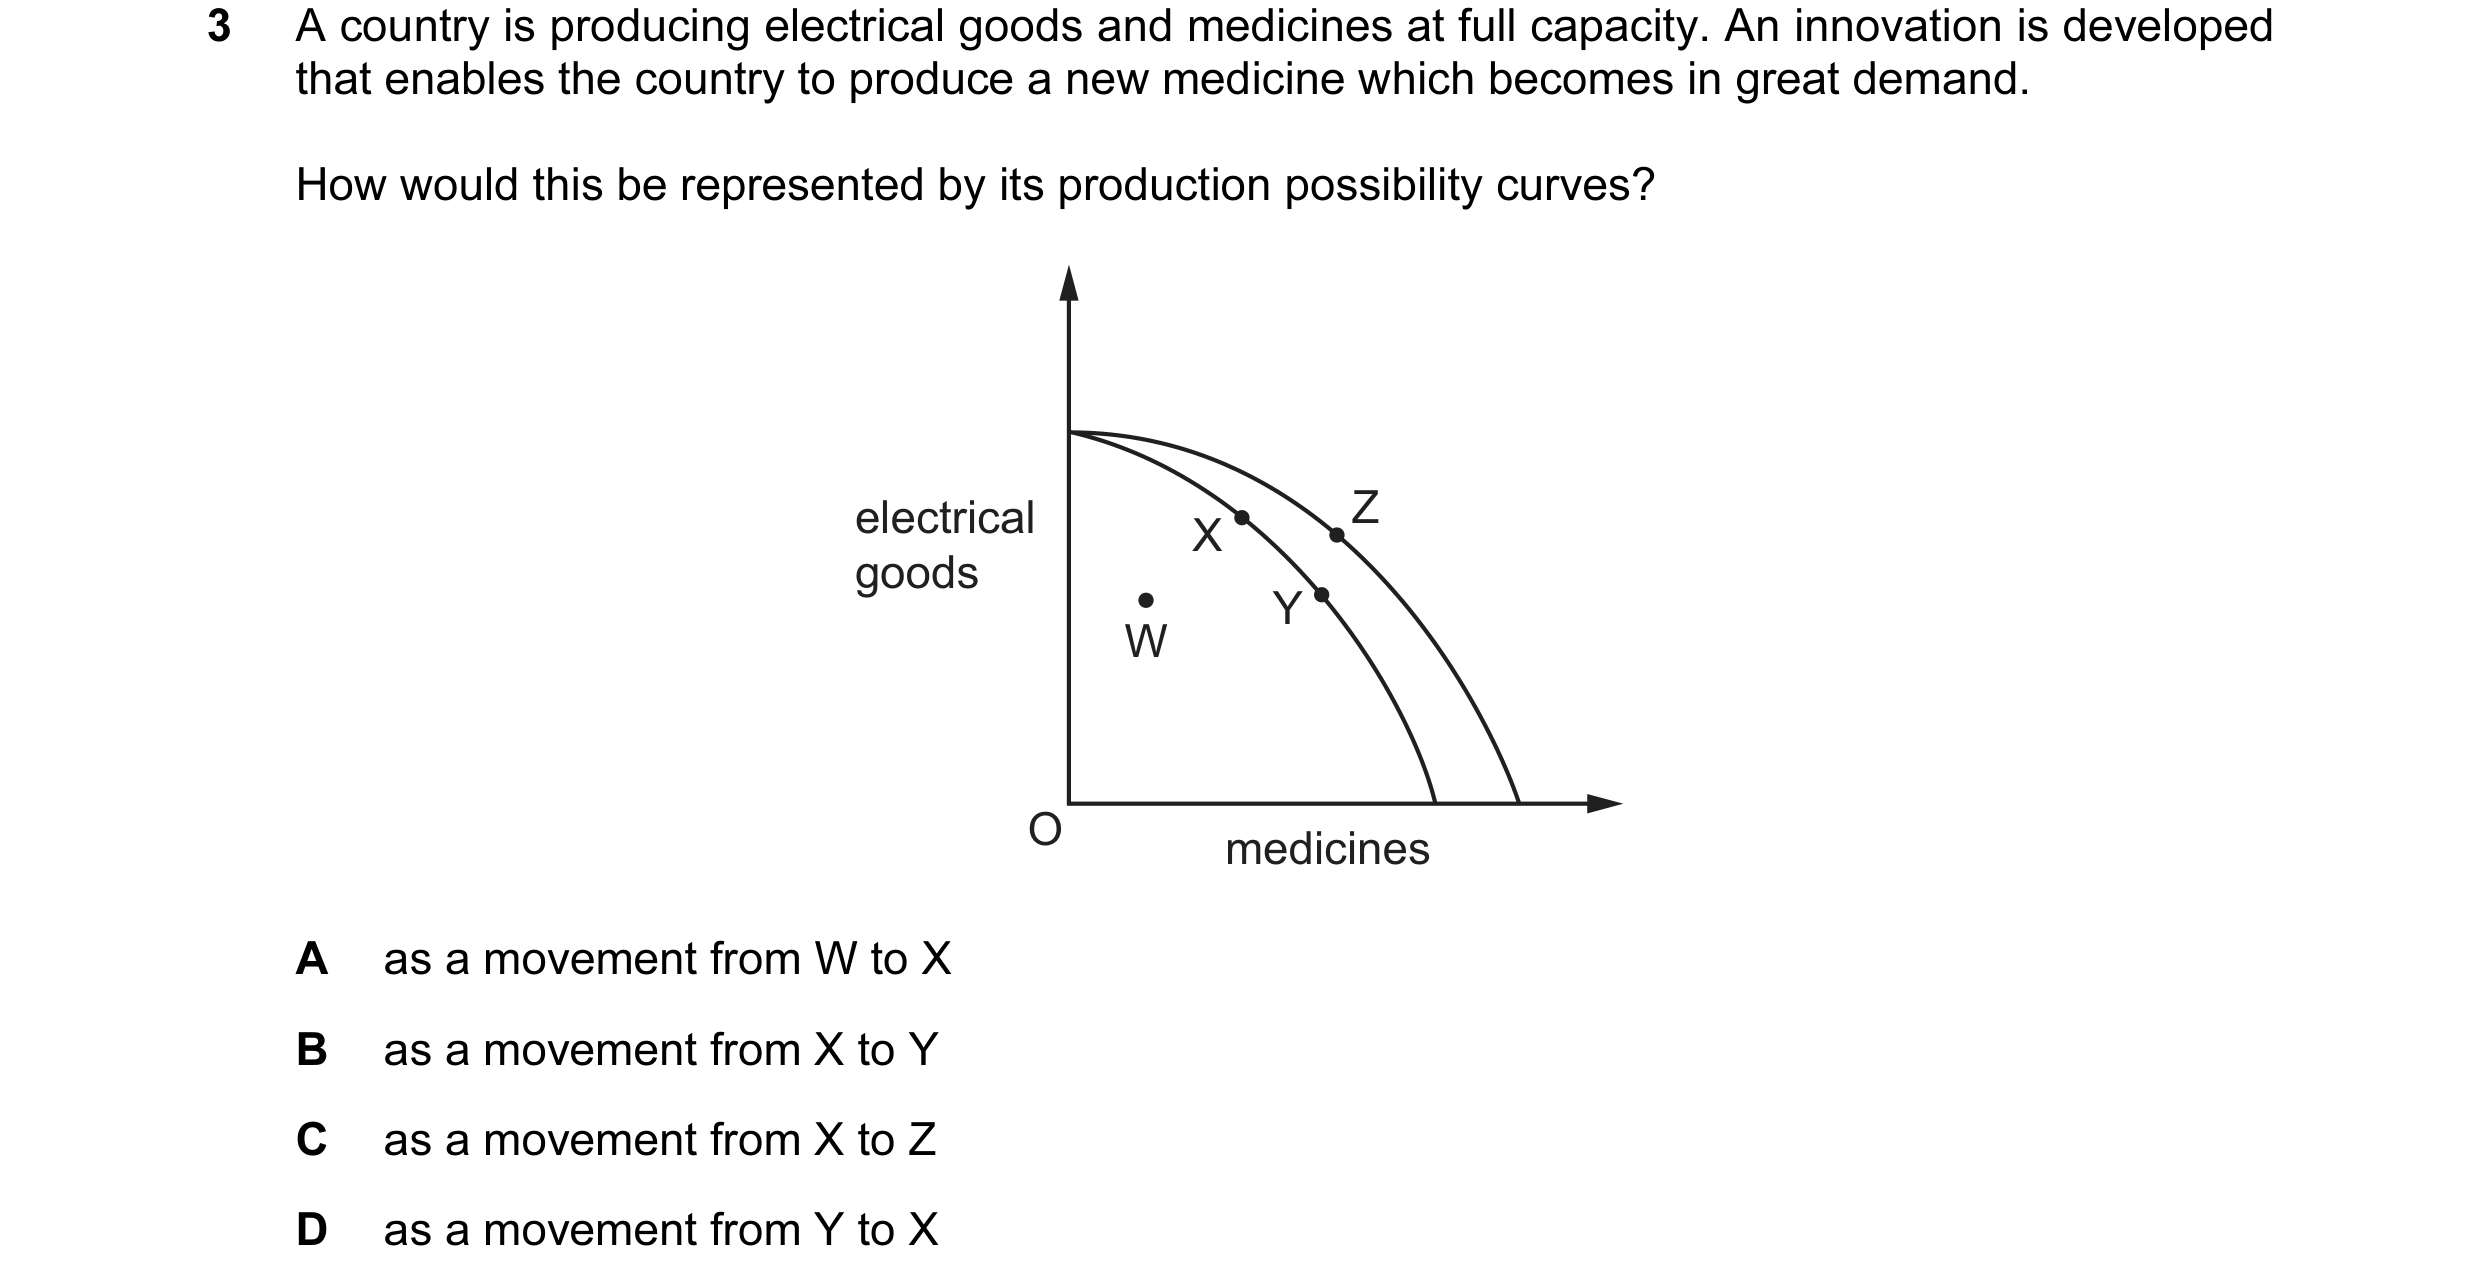
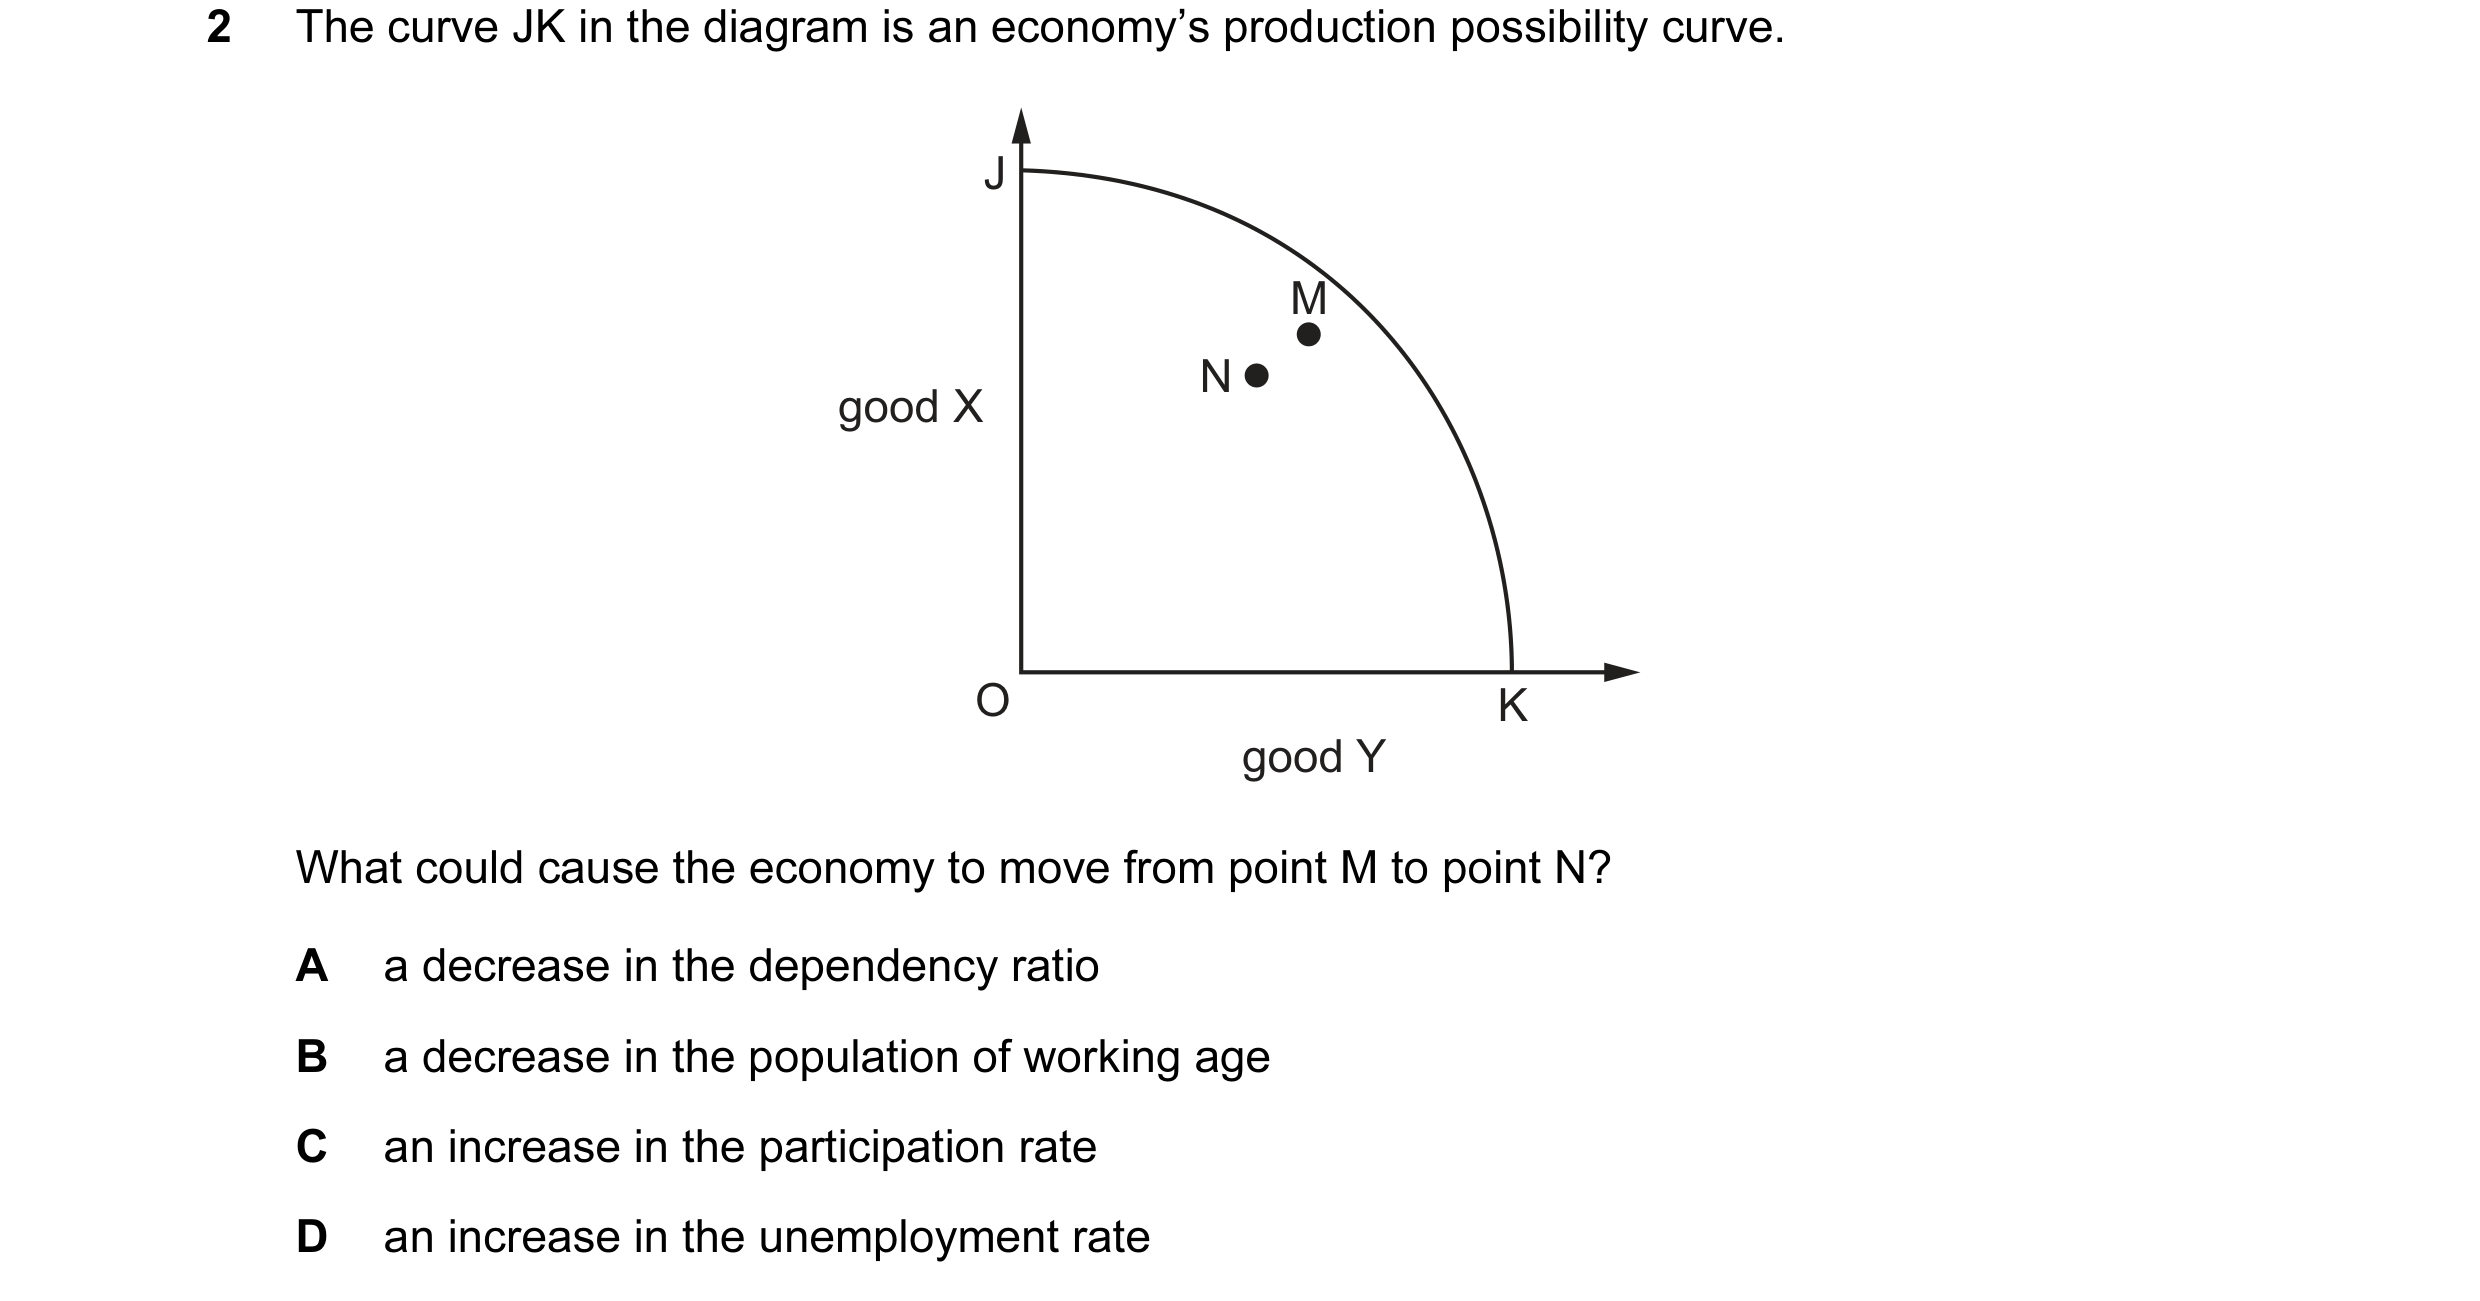 24 / 68
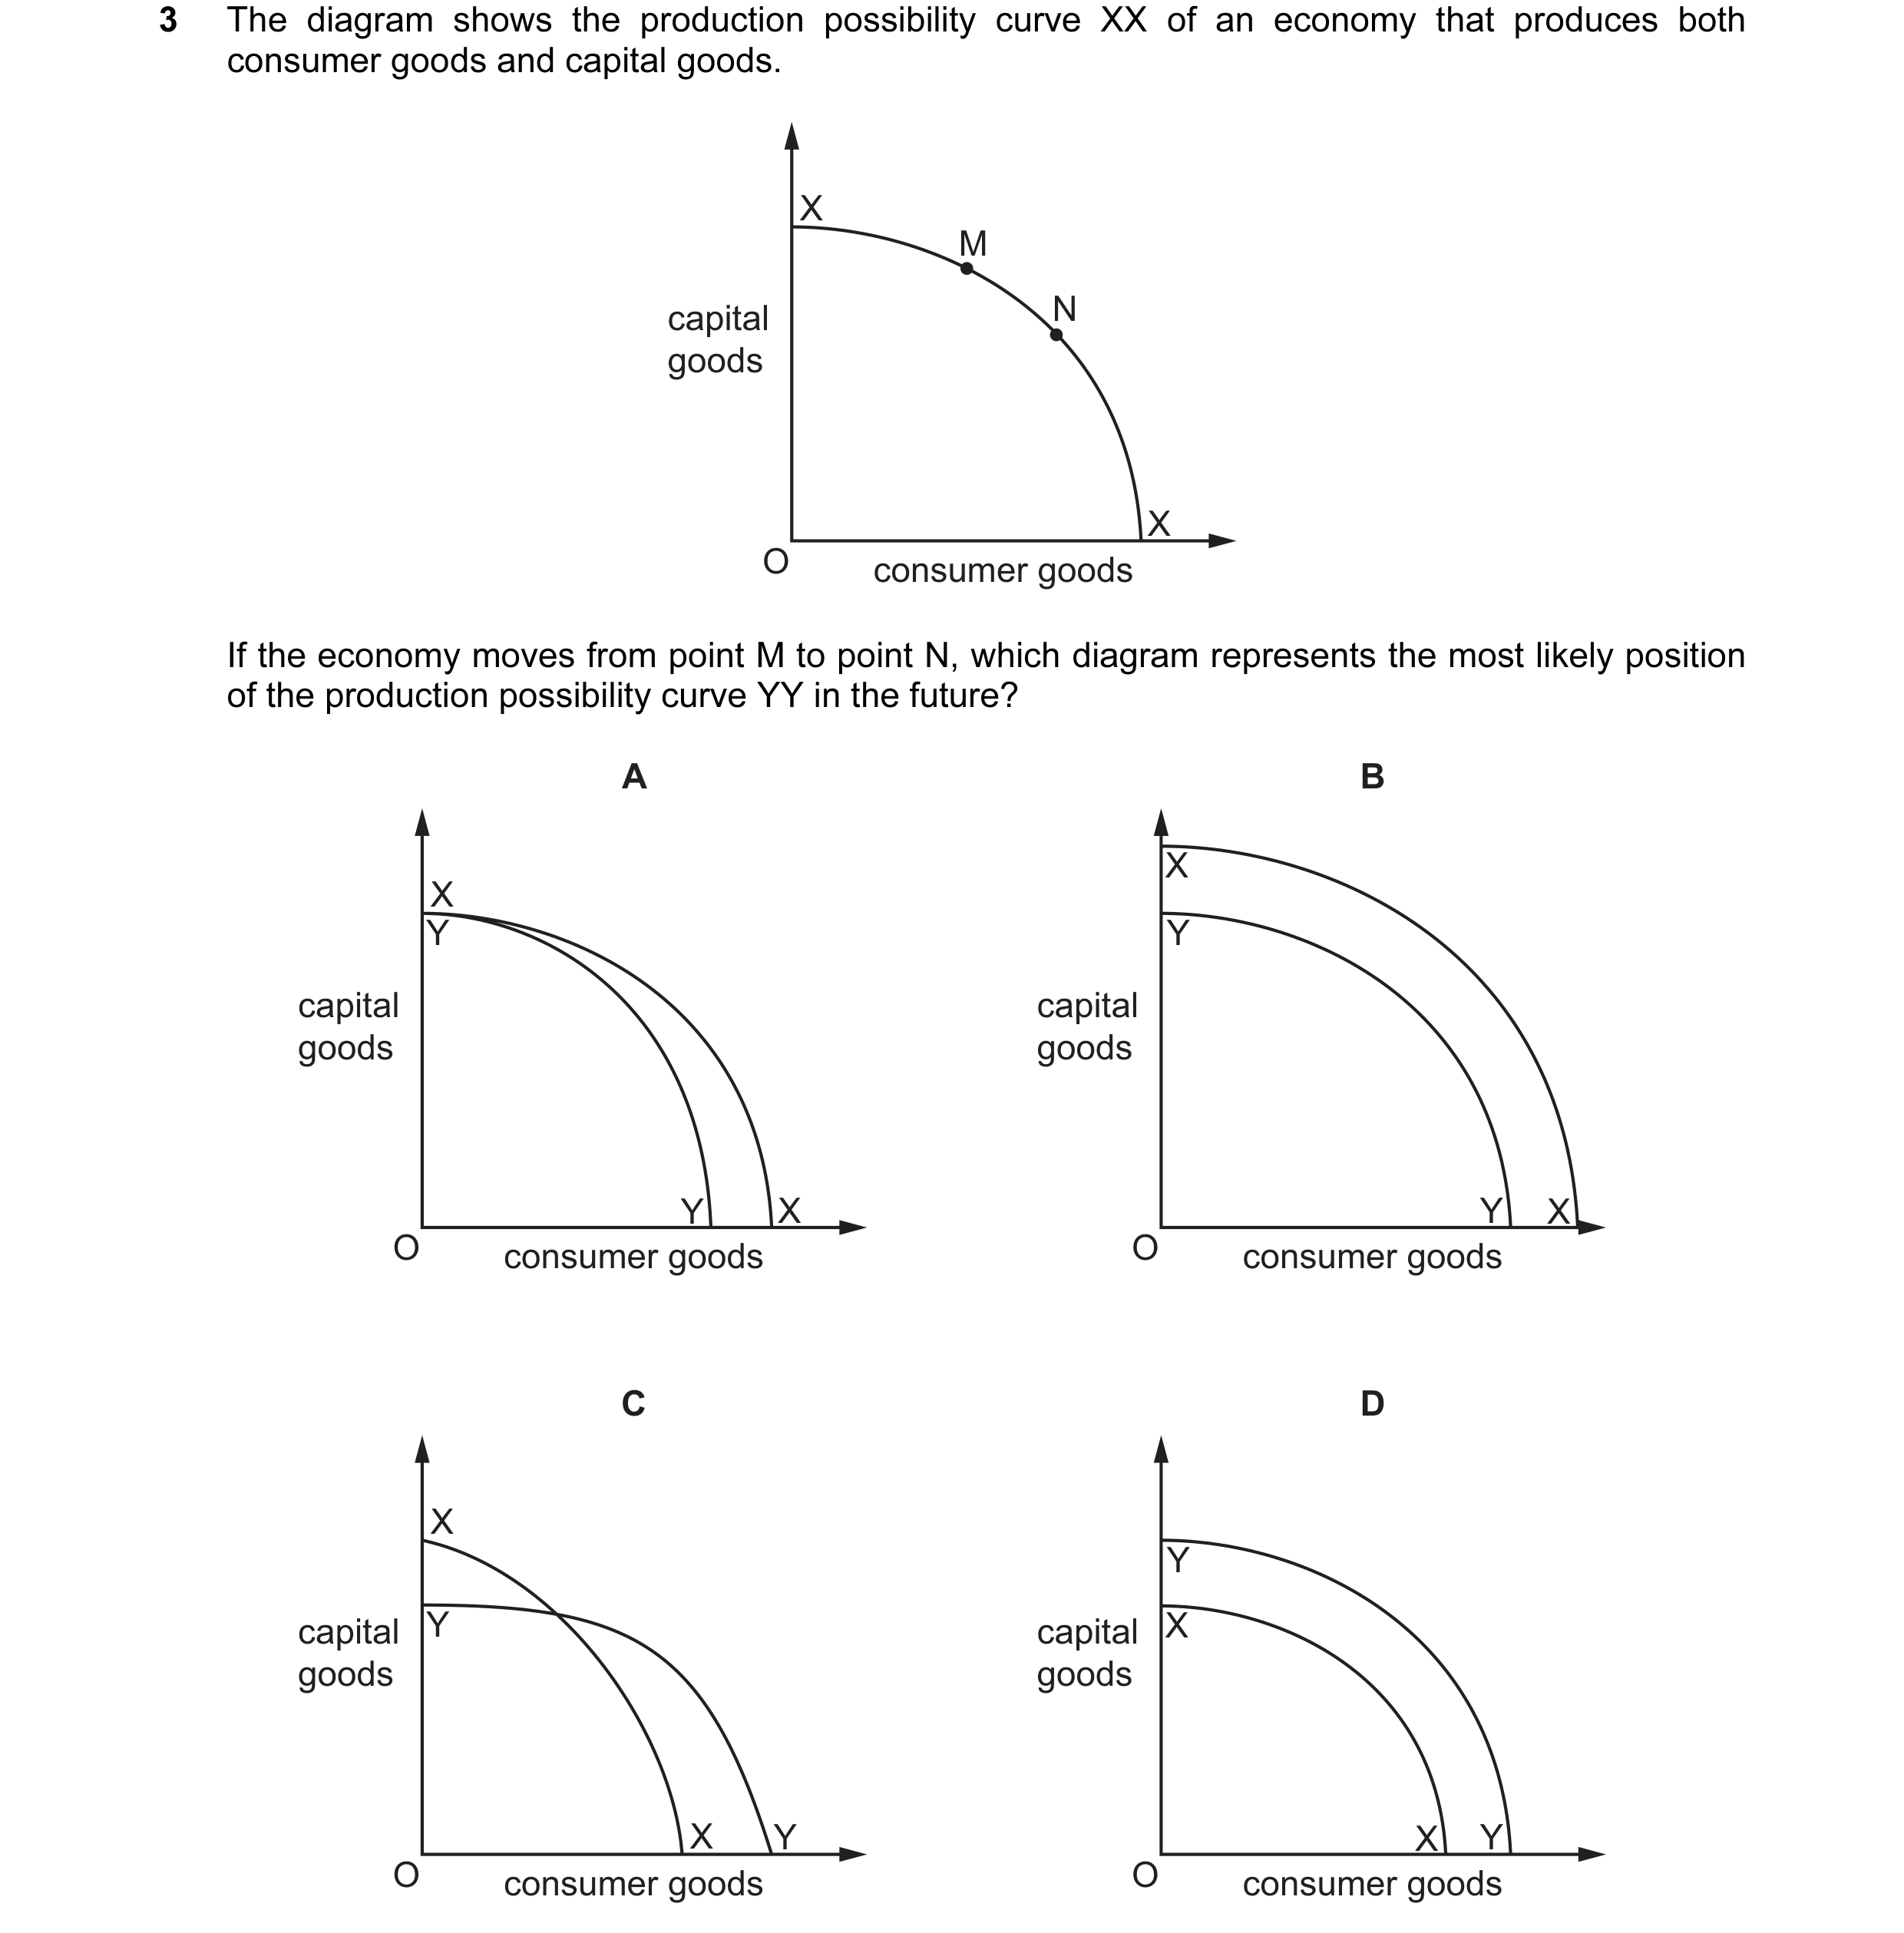 25 / 68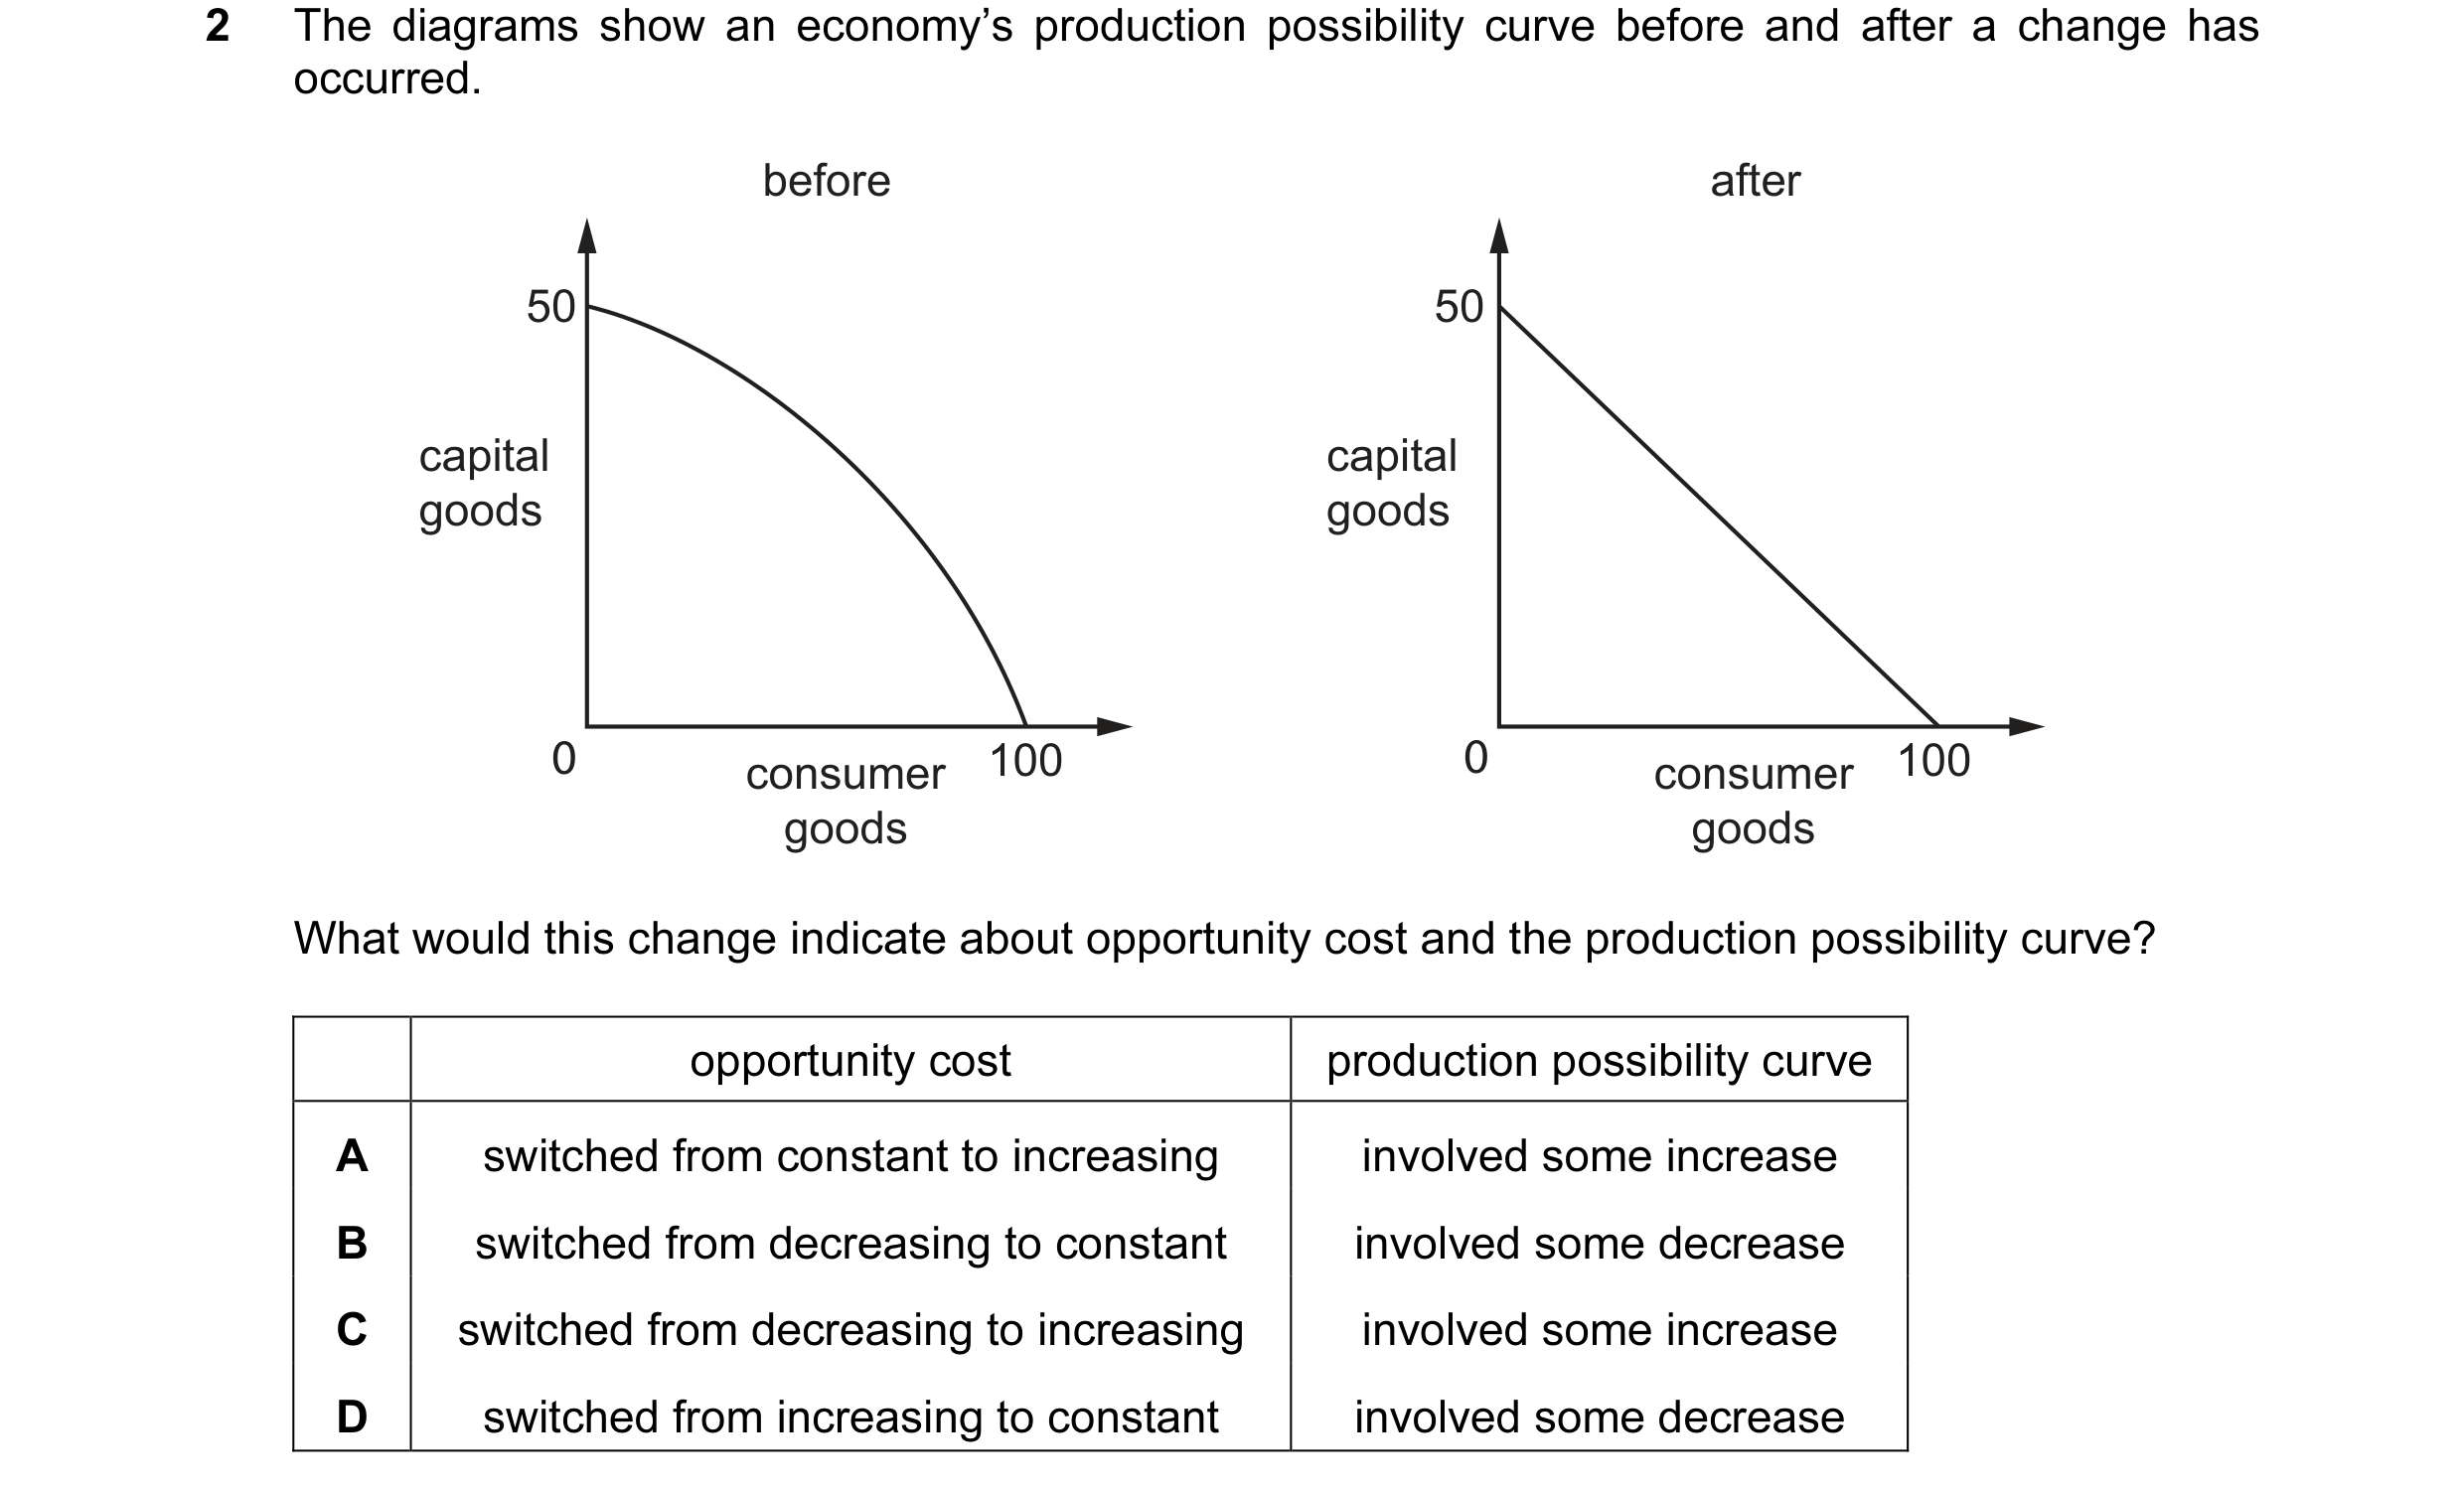
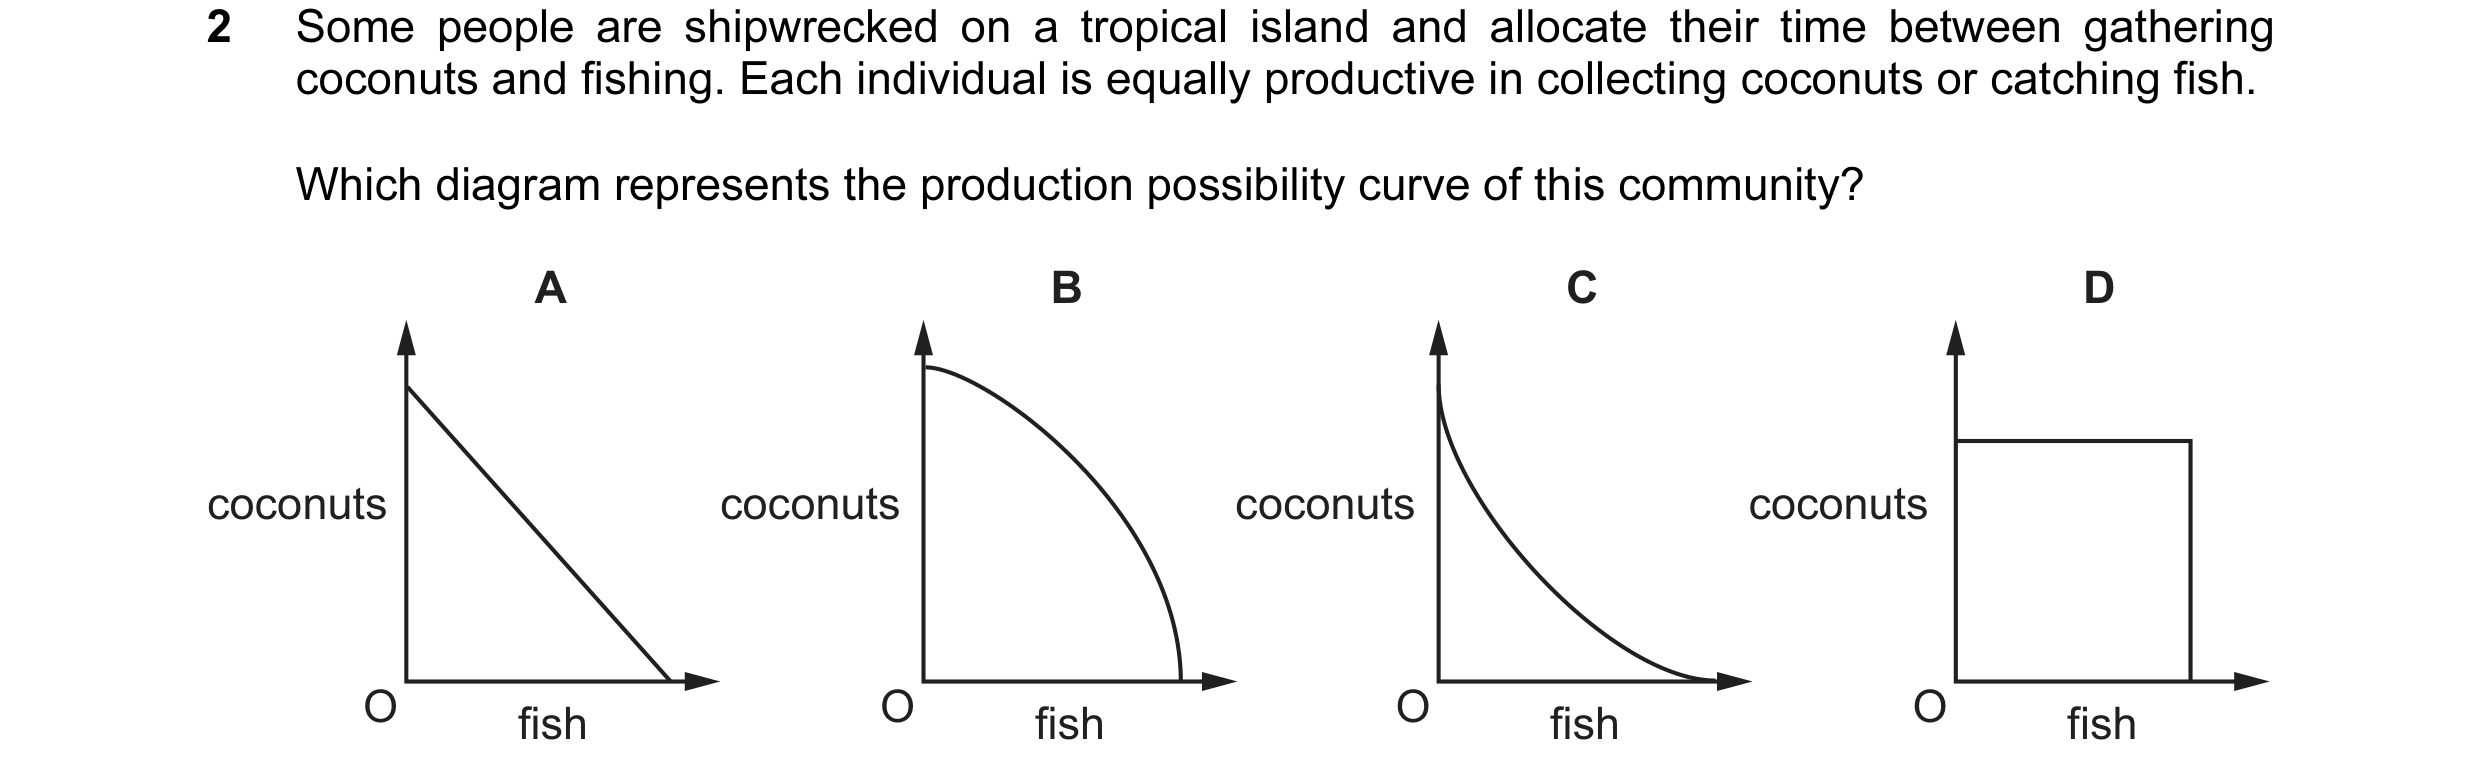 26 / 68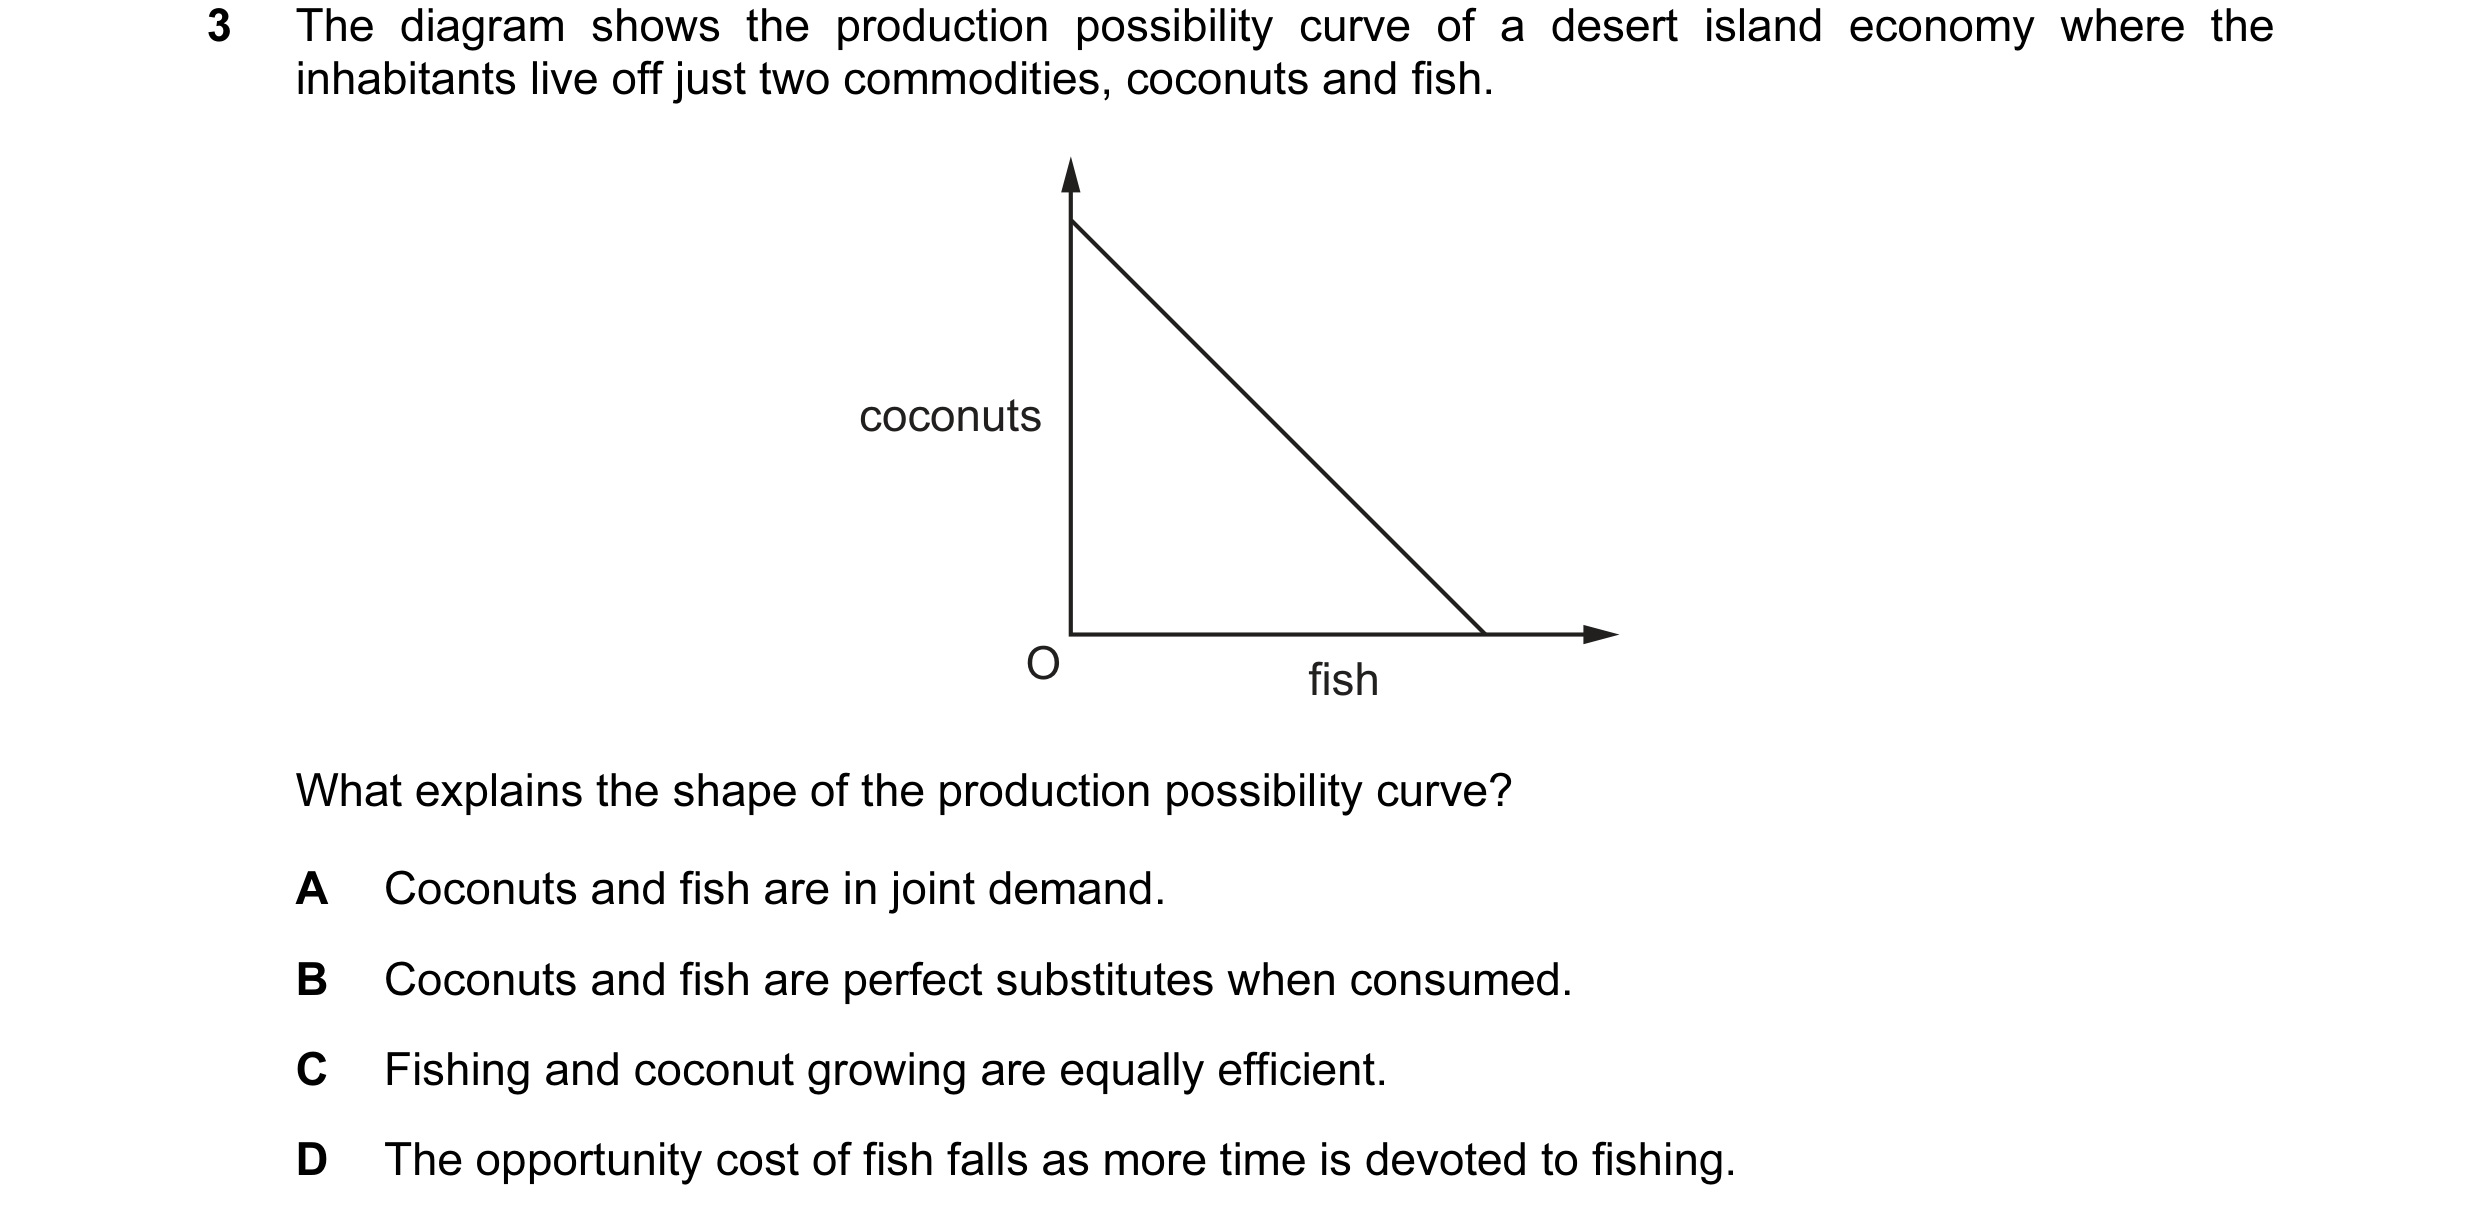
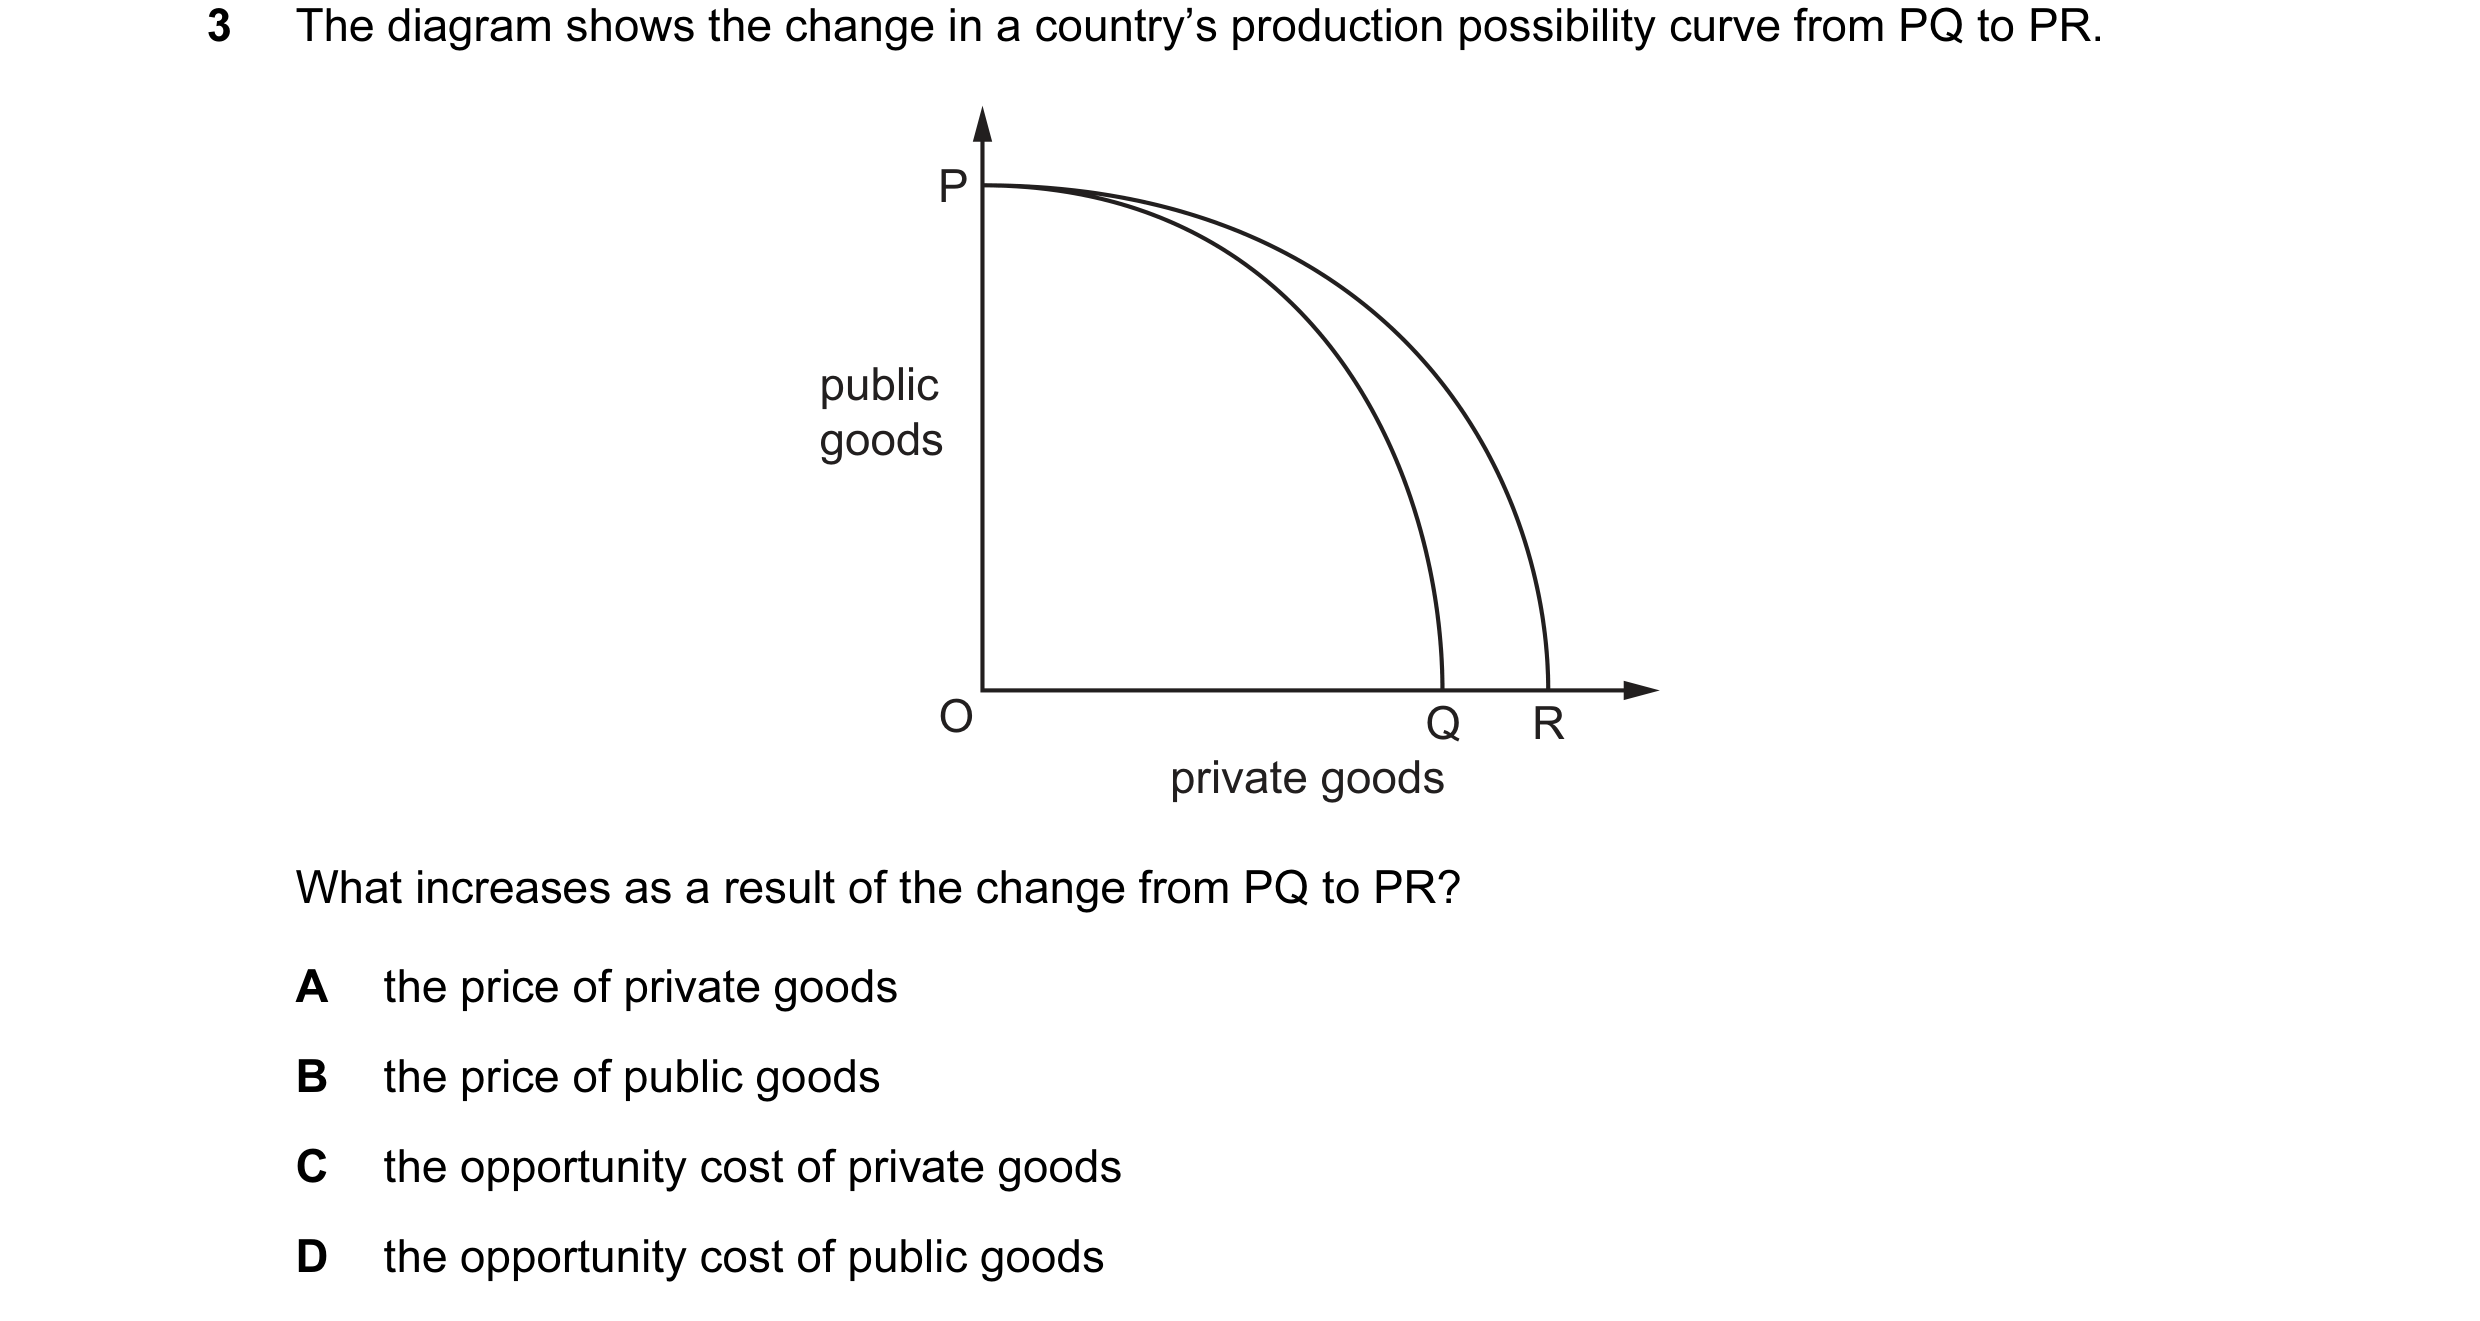 27 / 68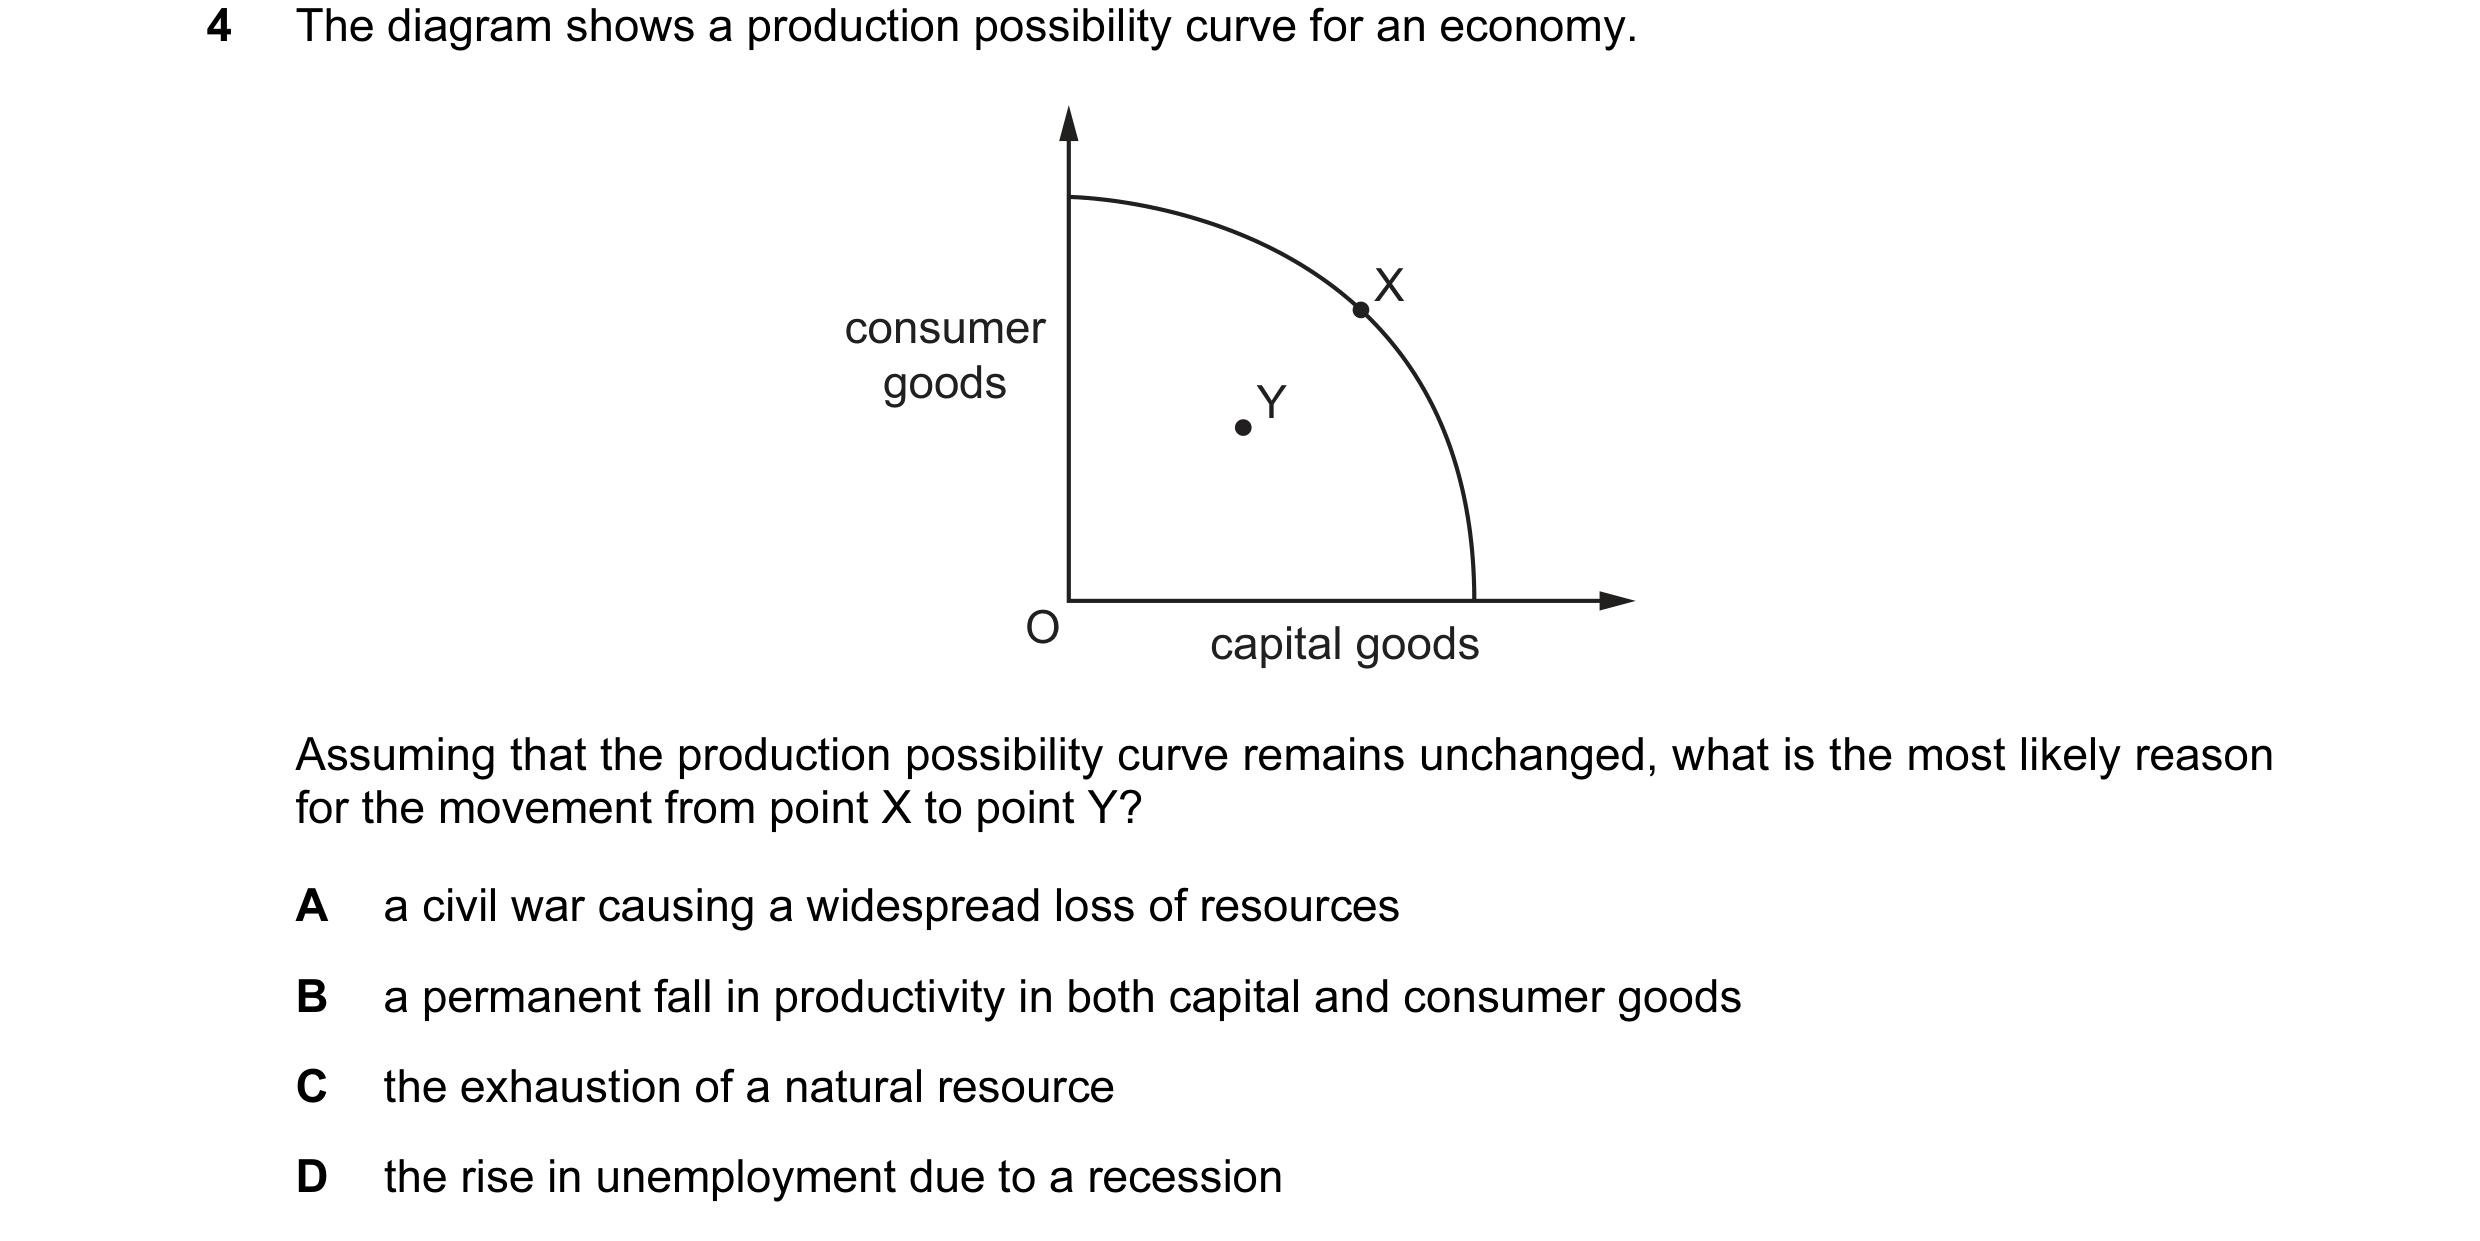
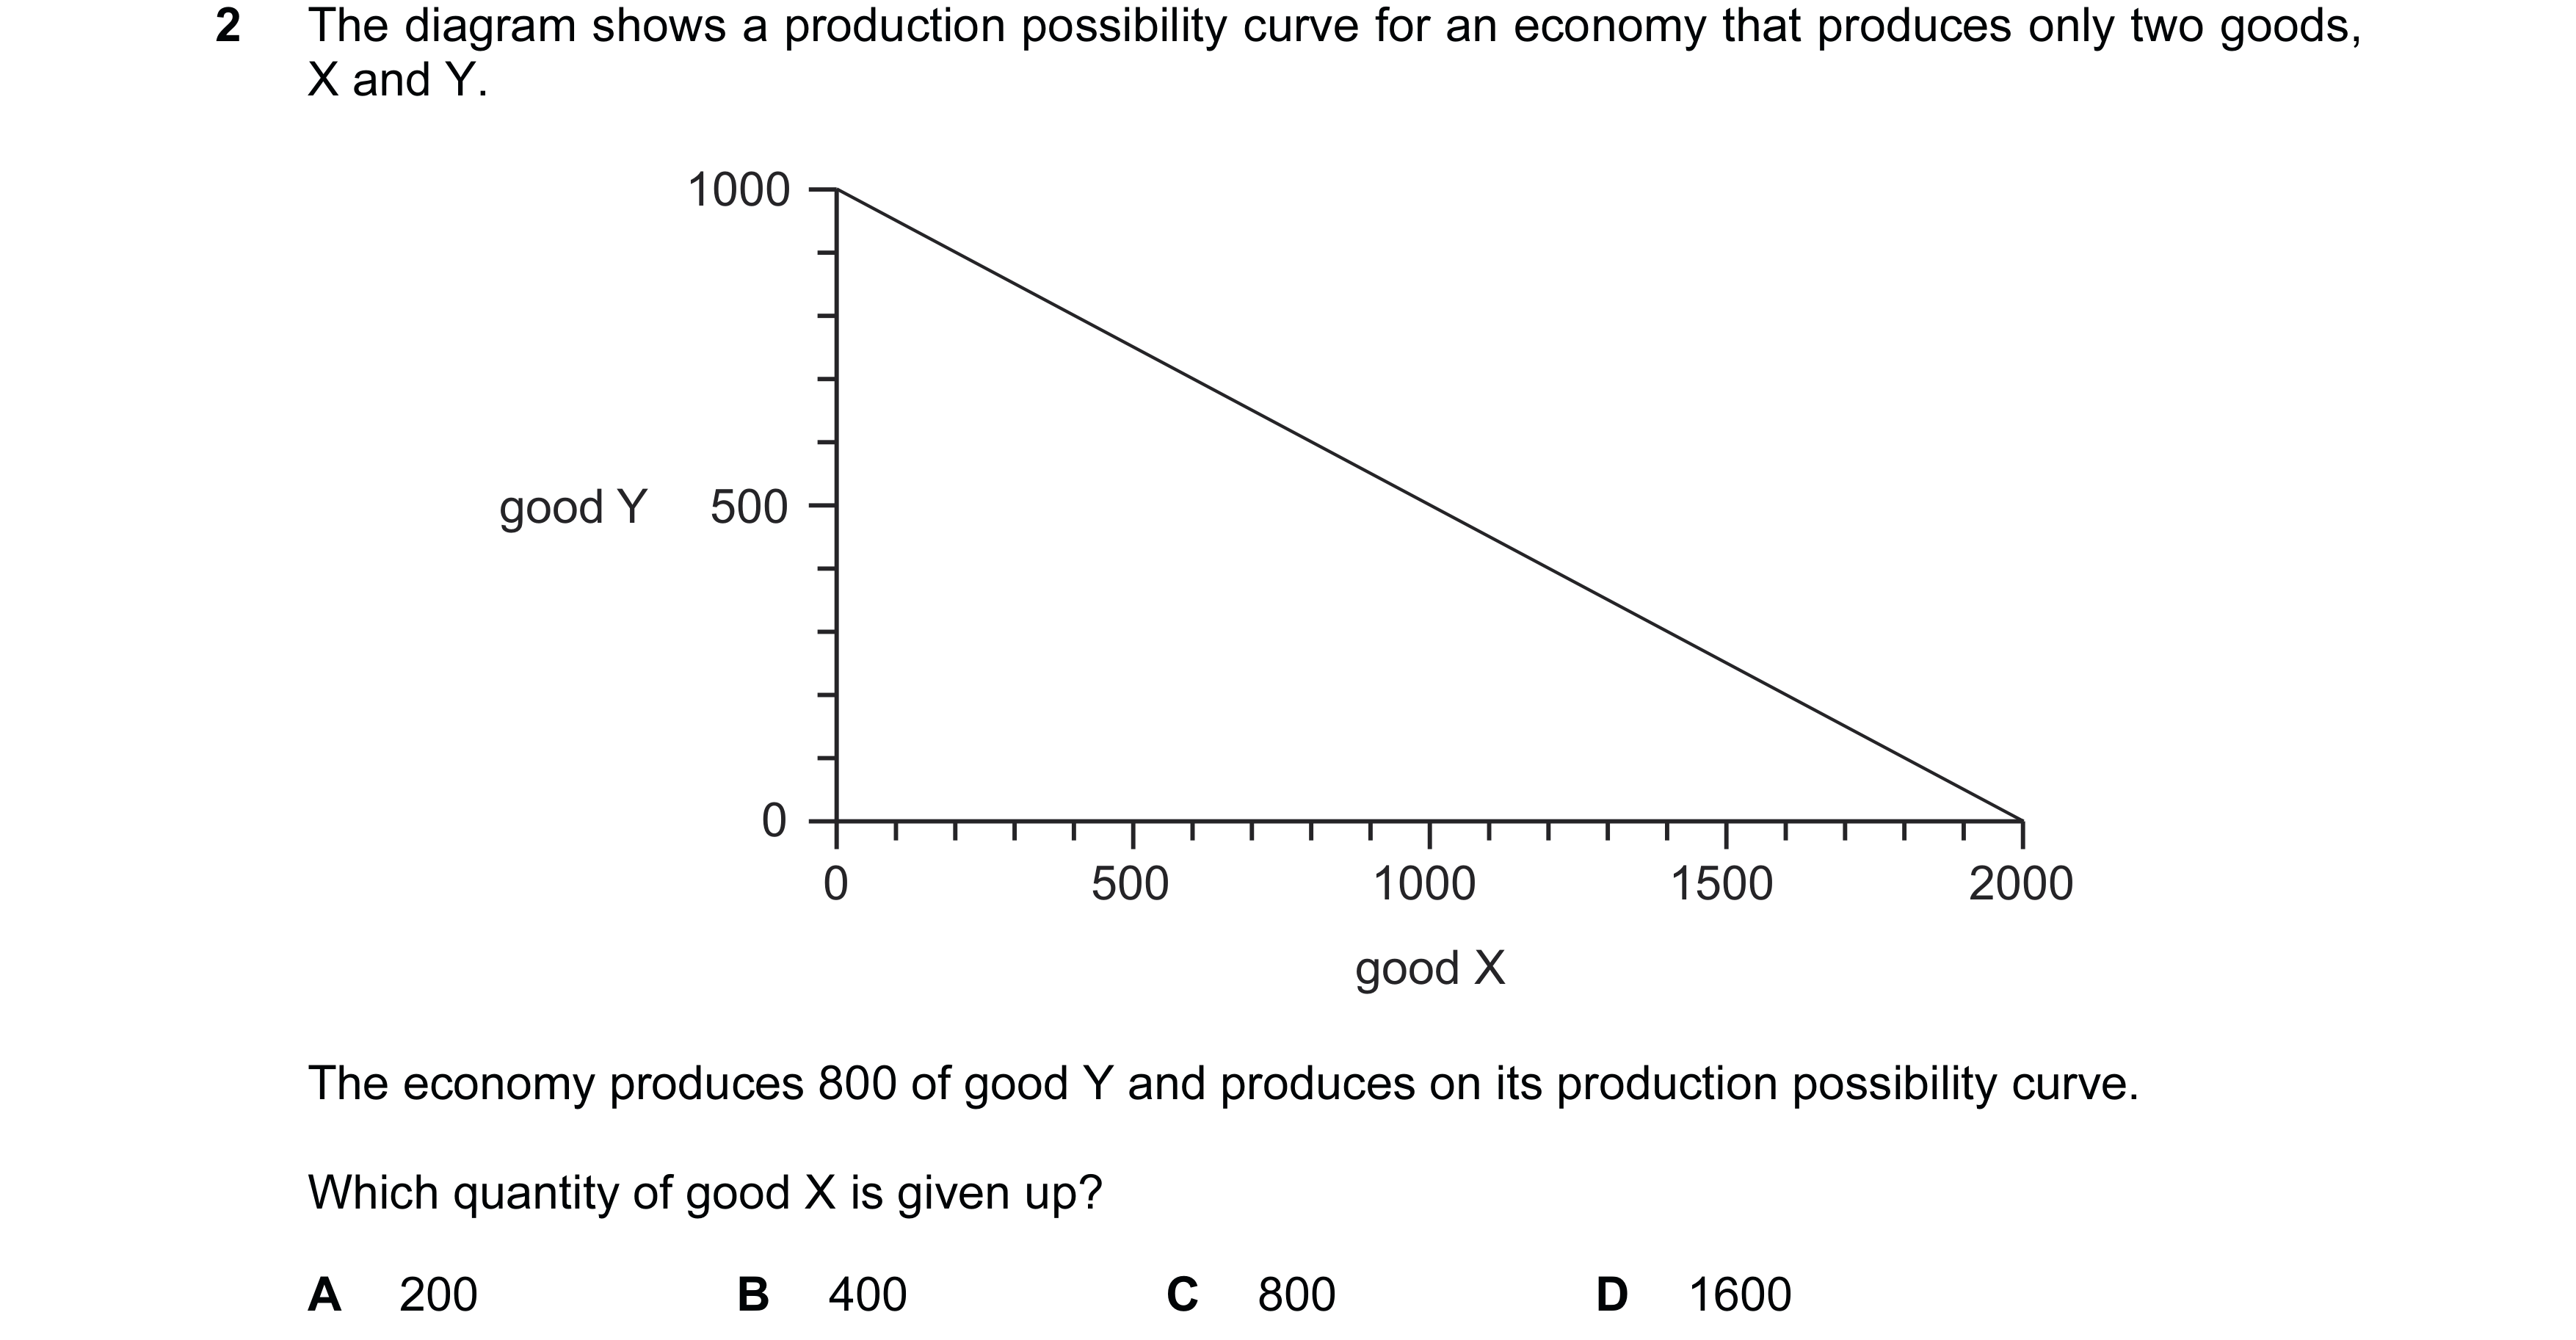 28 / 68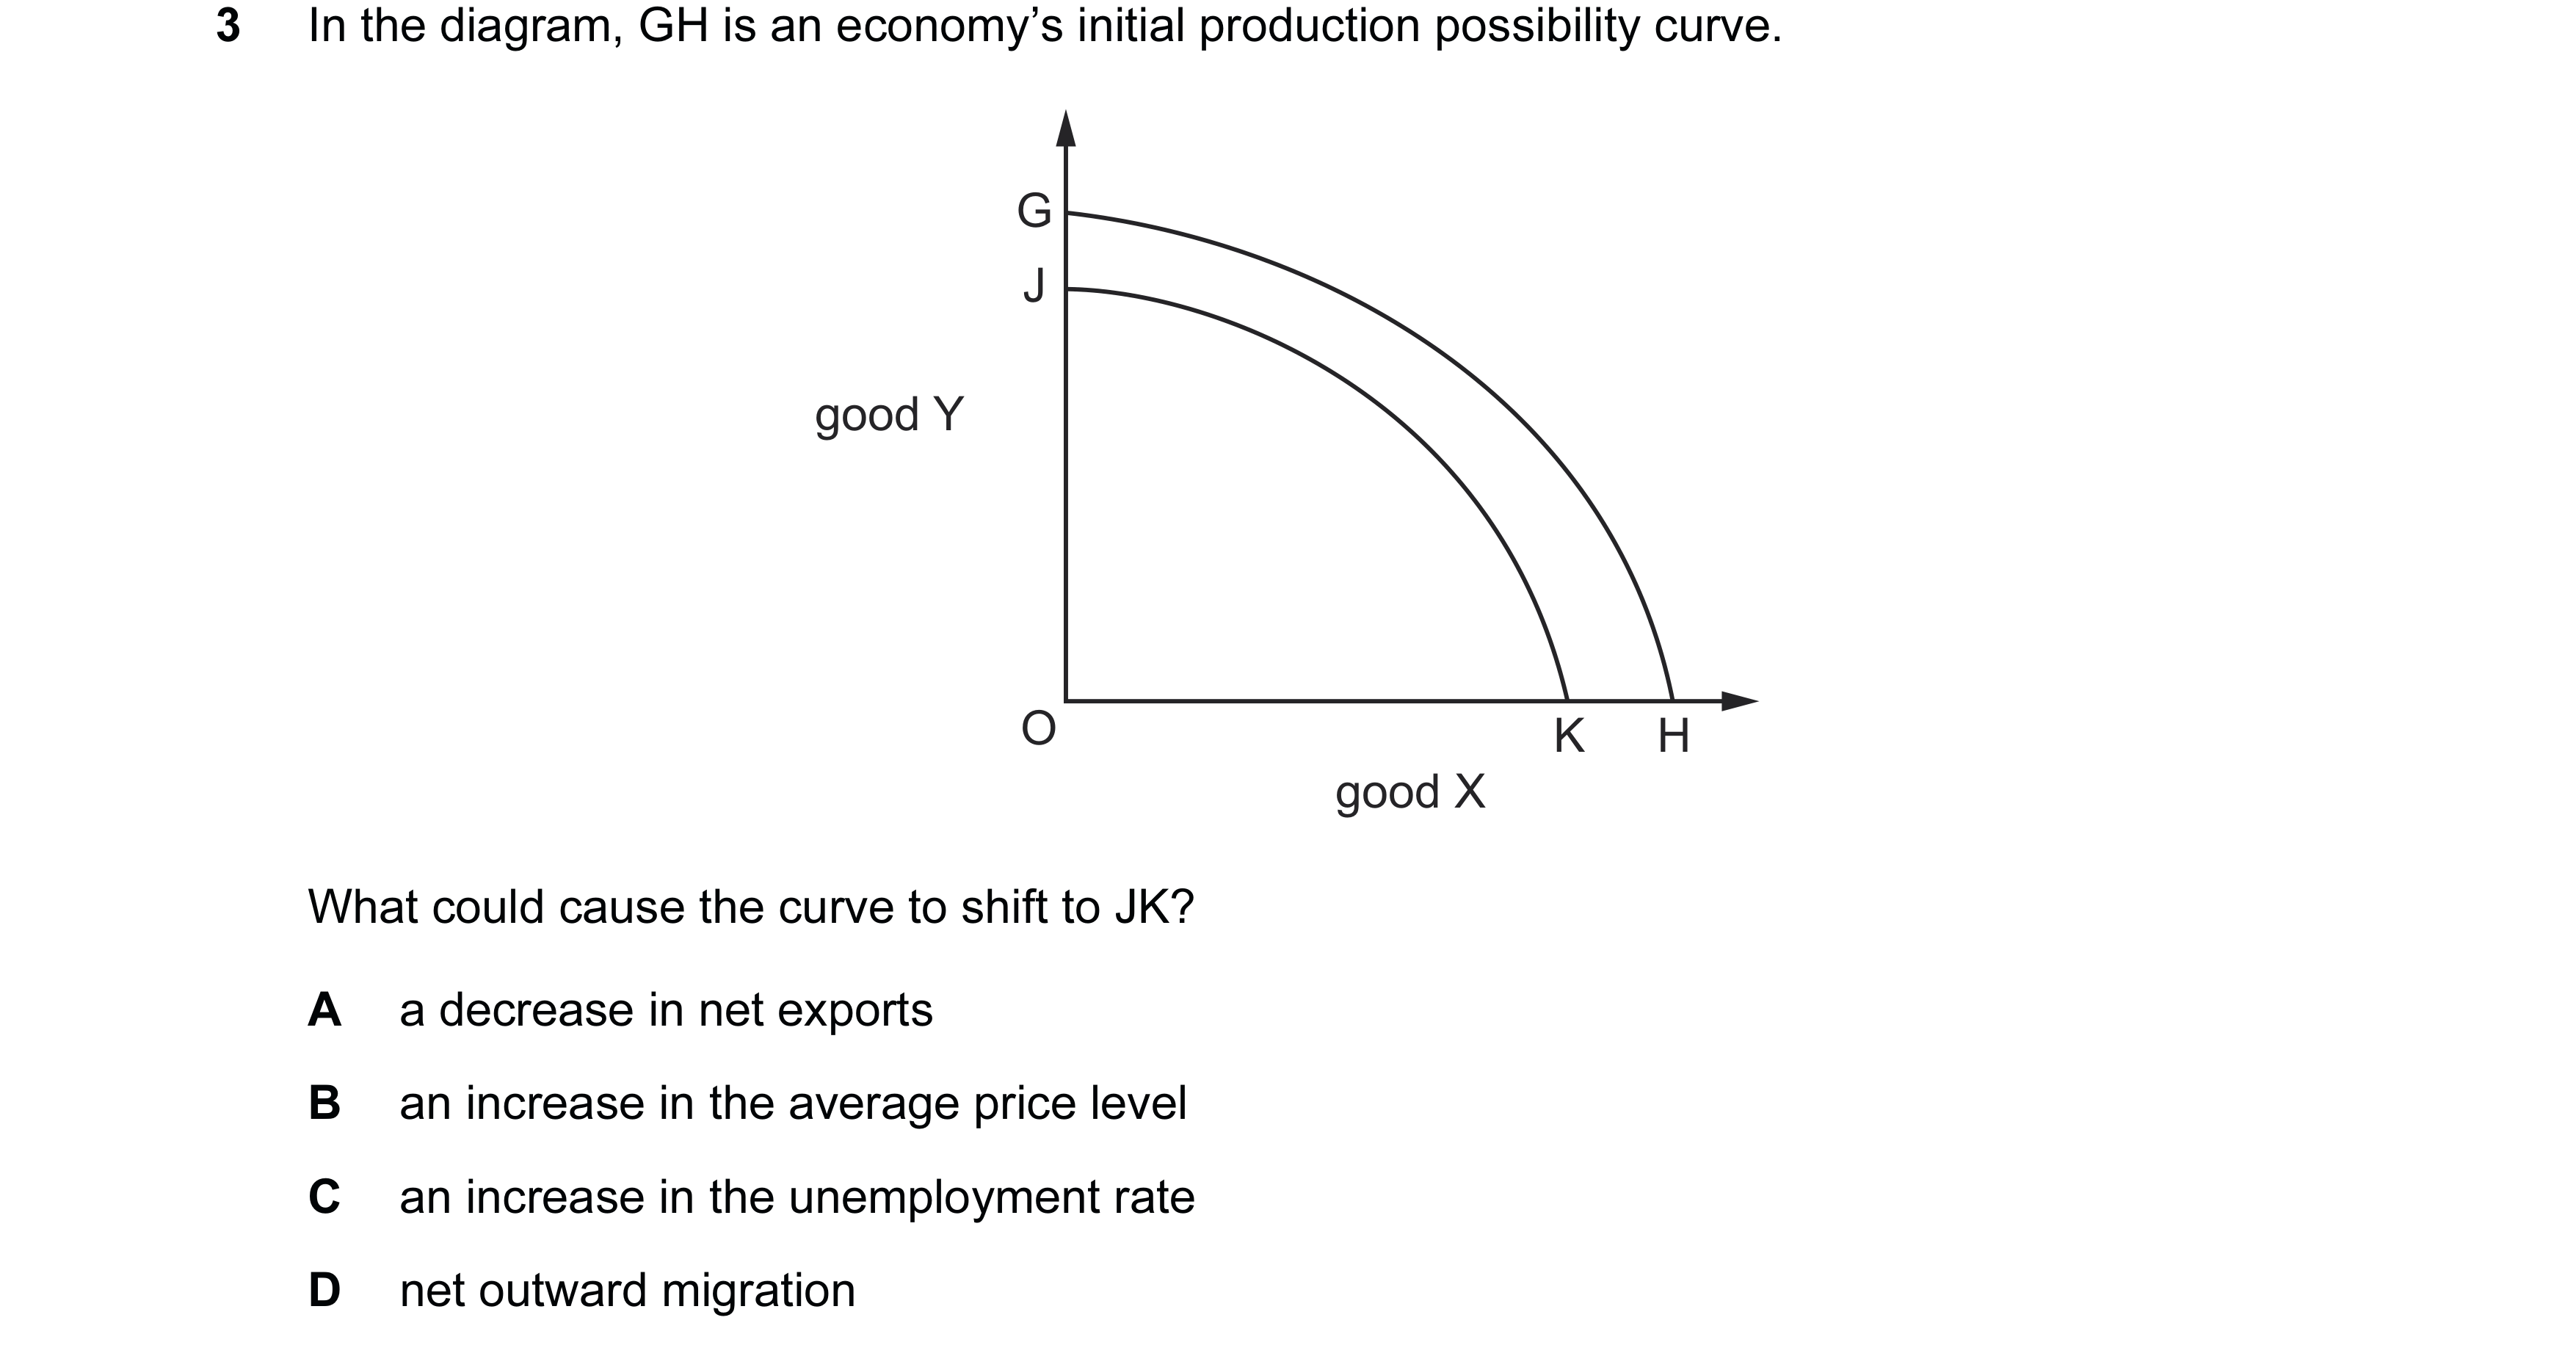
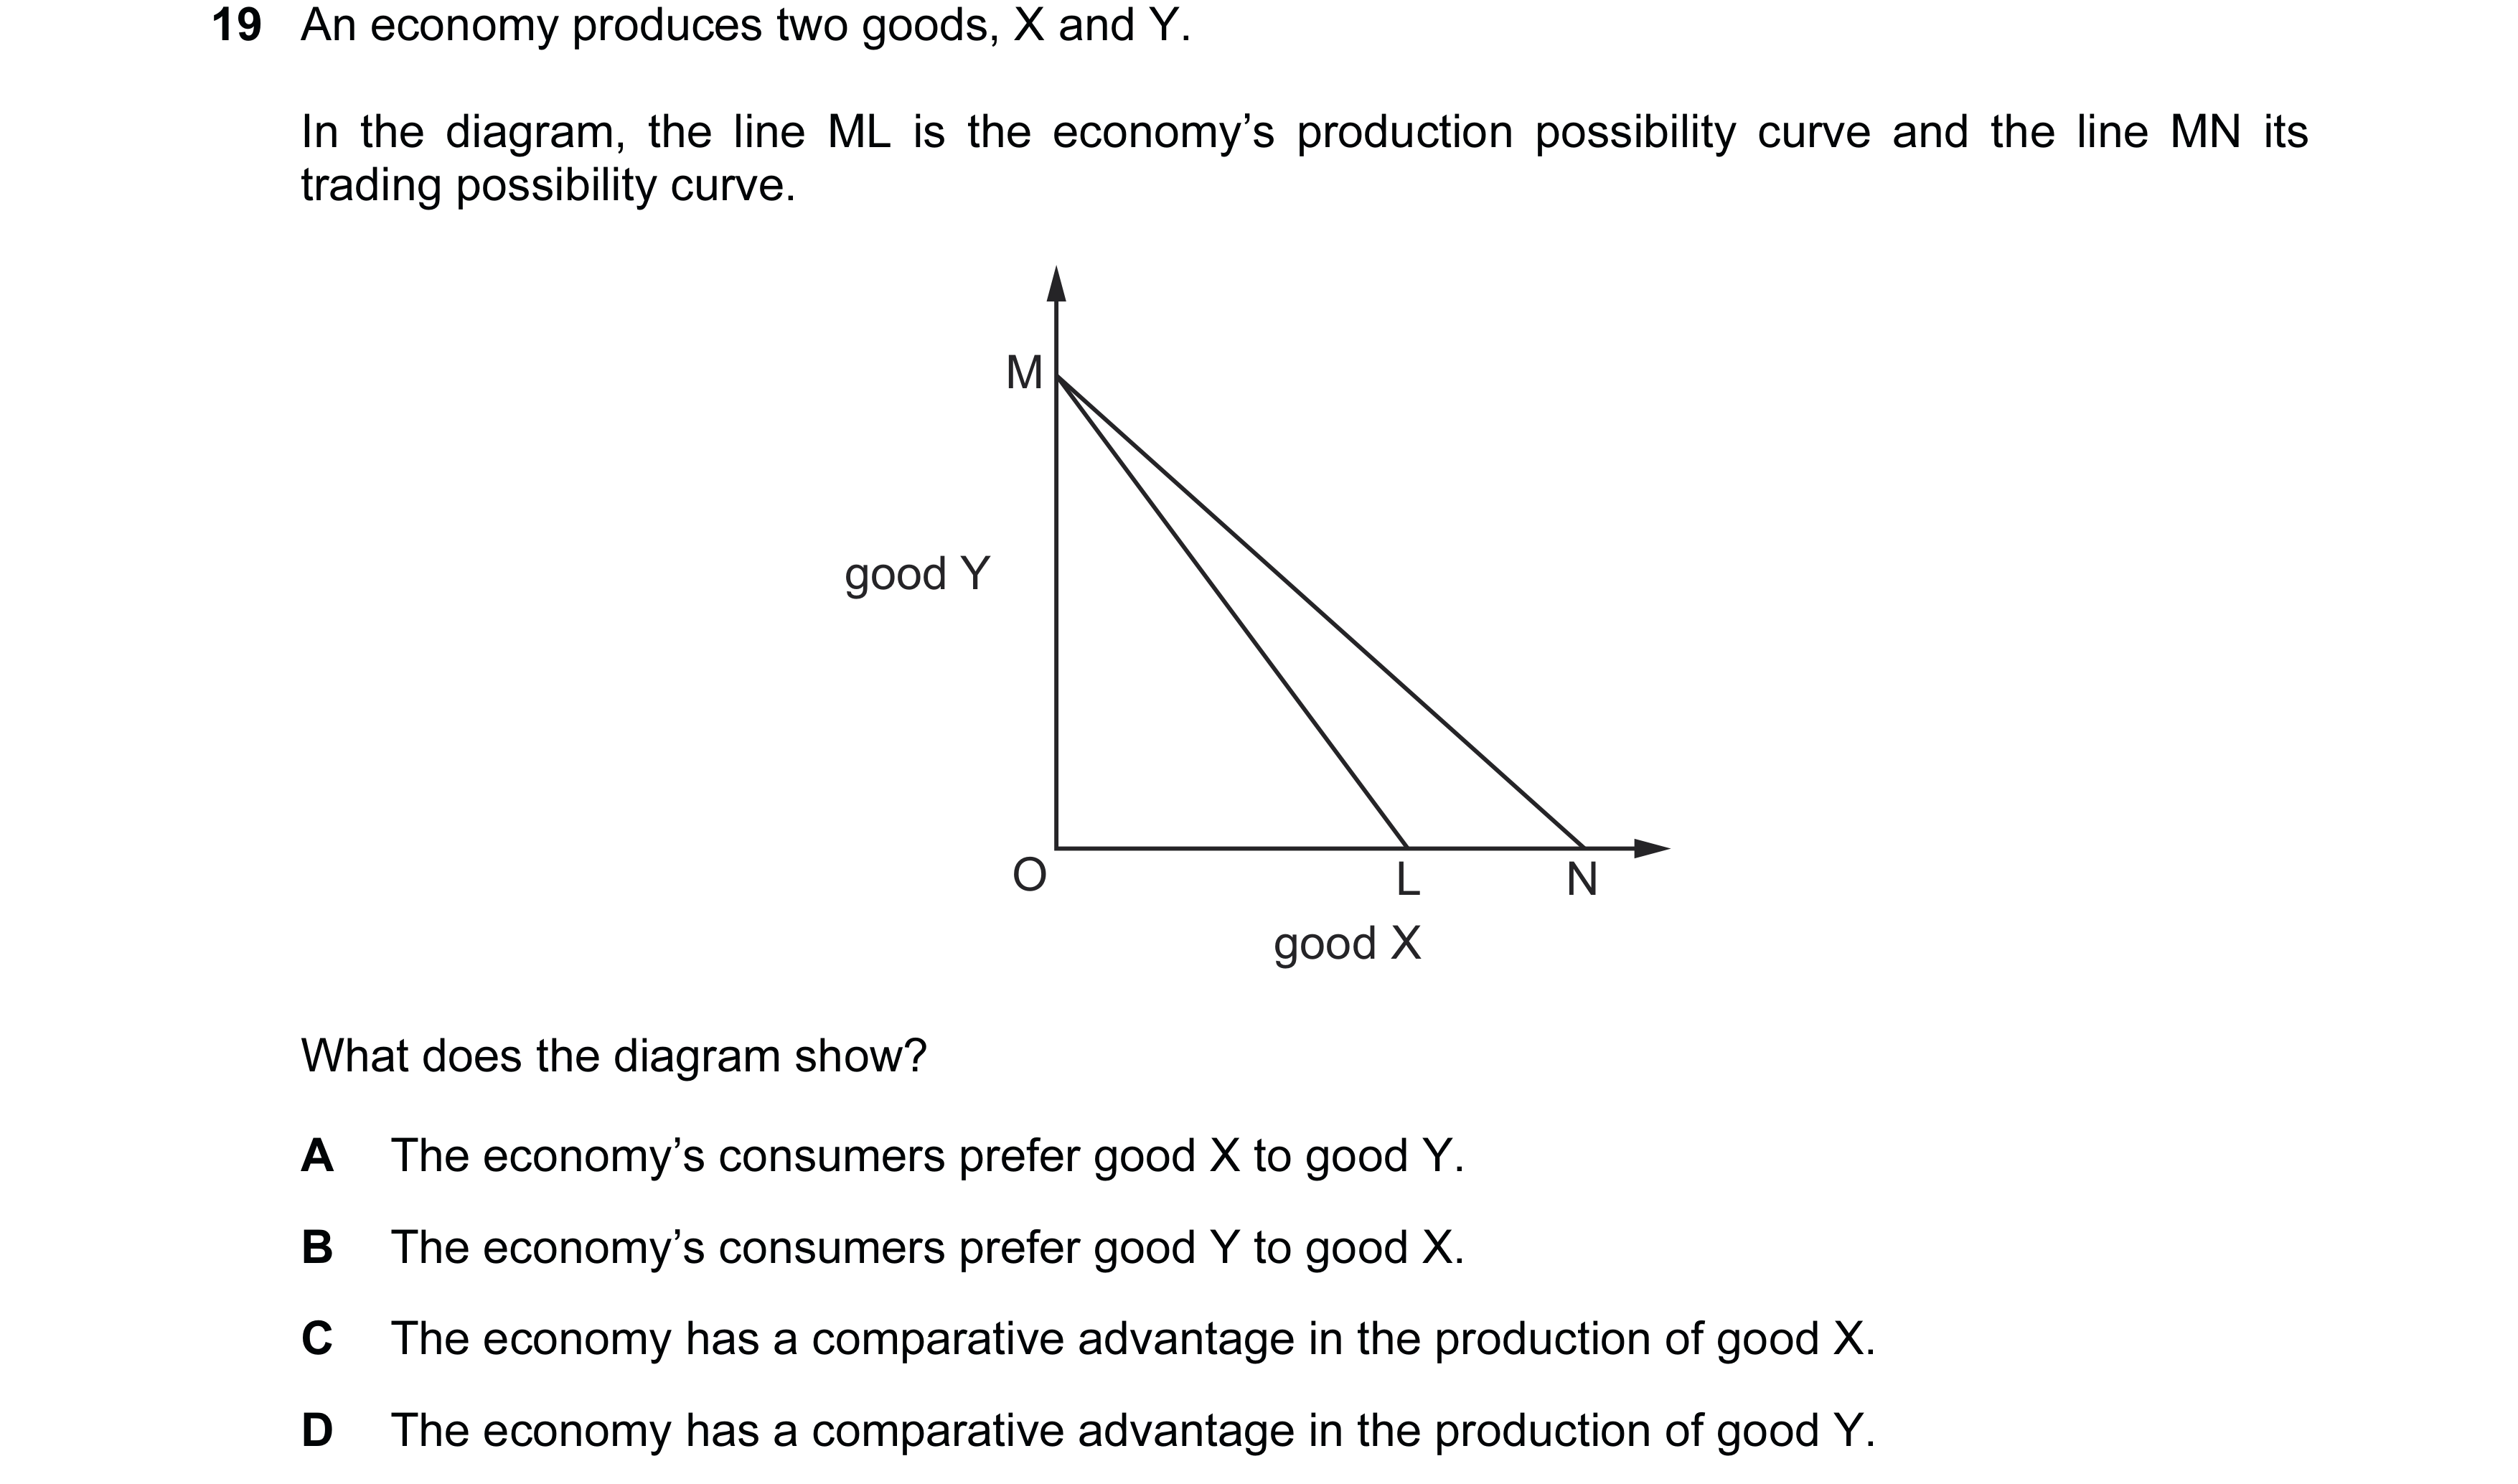 29 / 68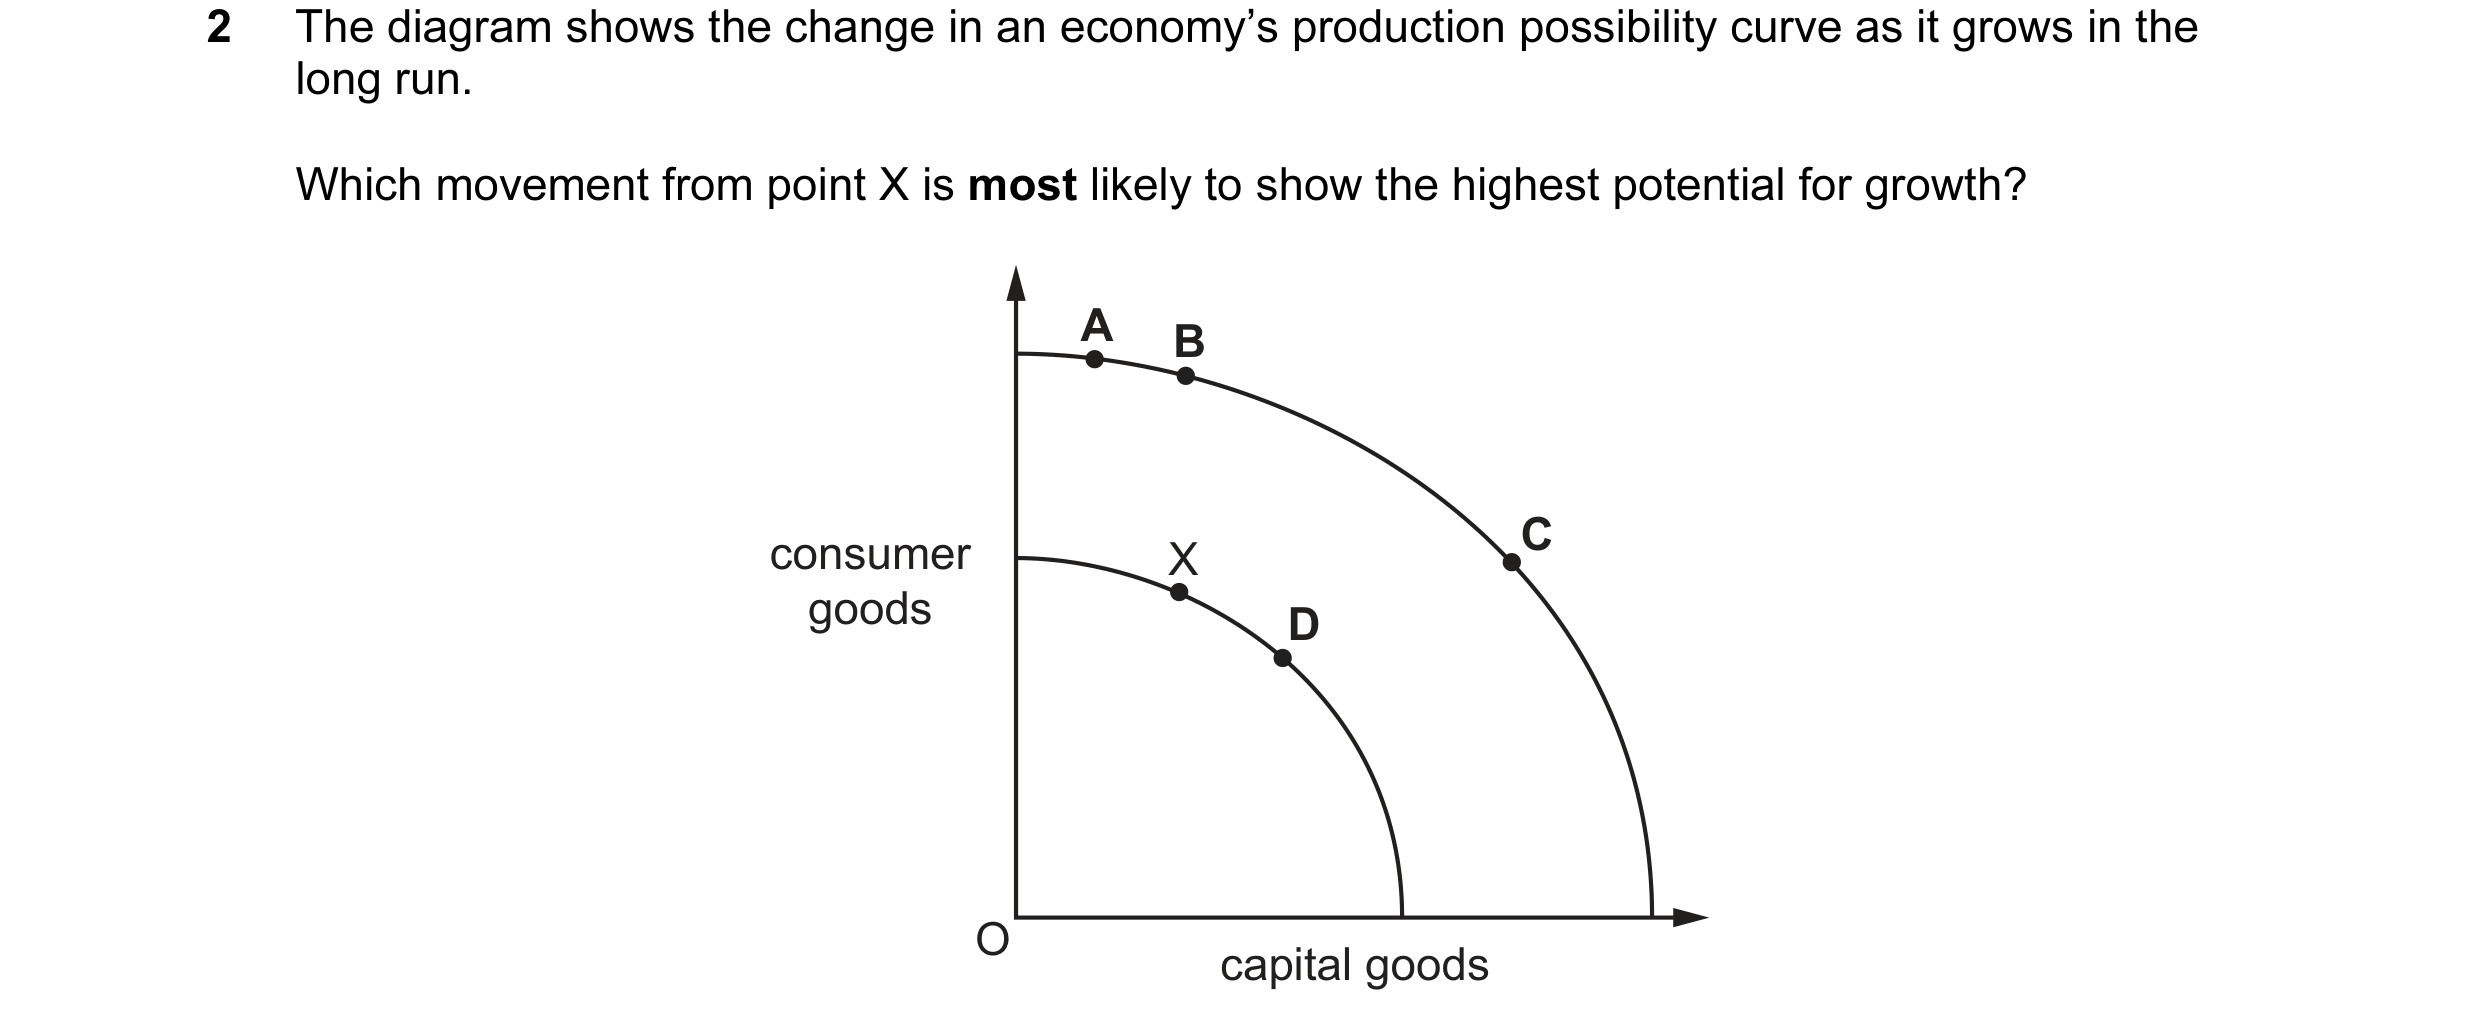
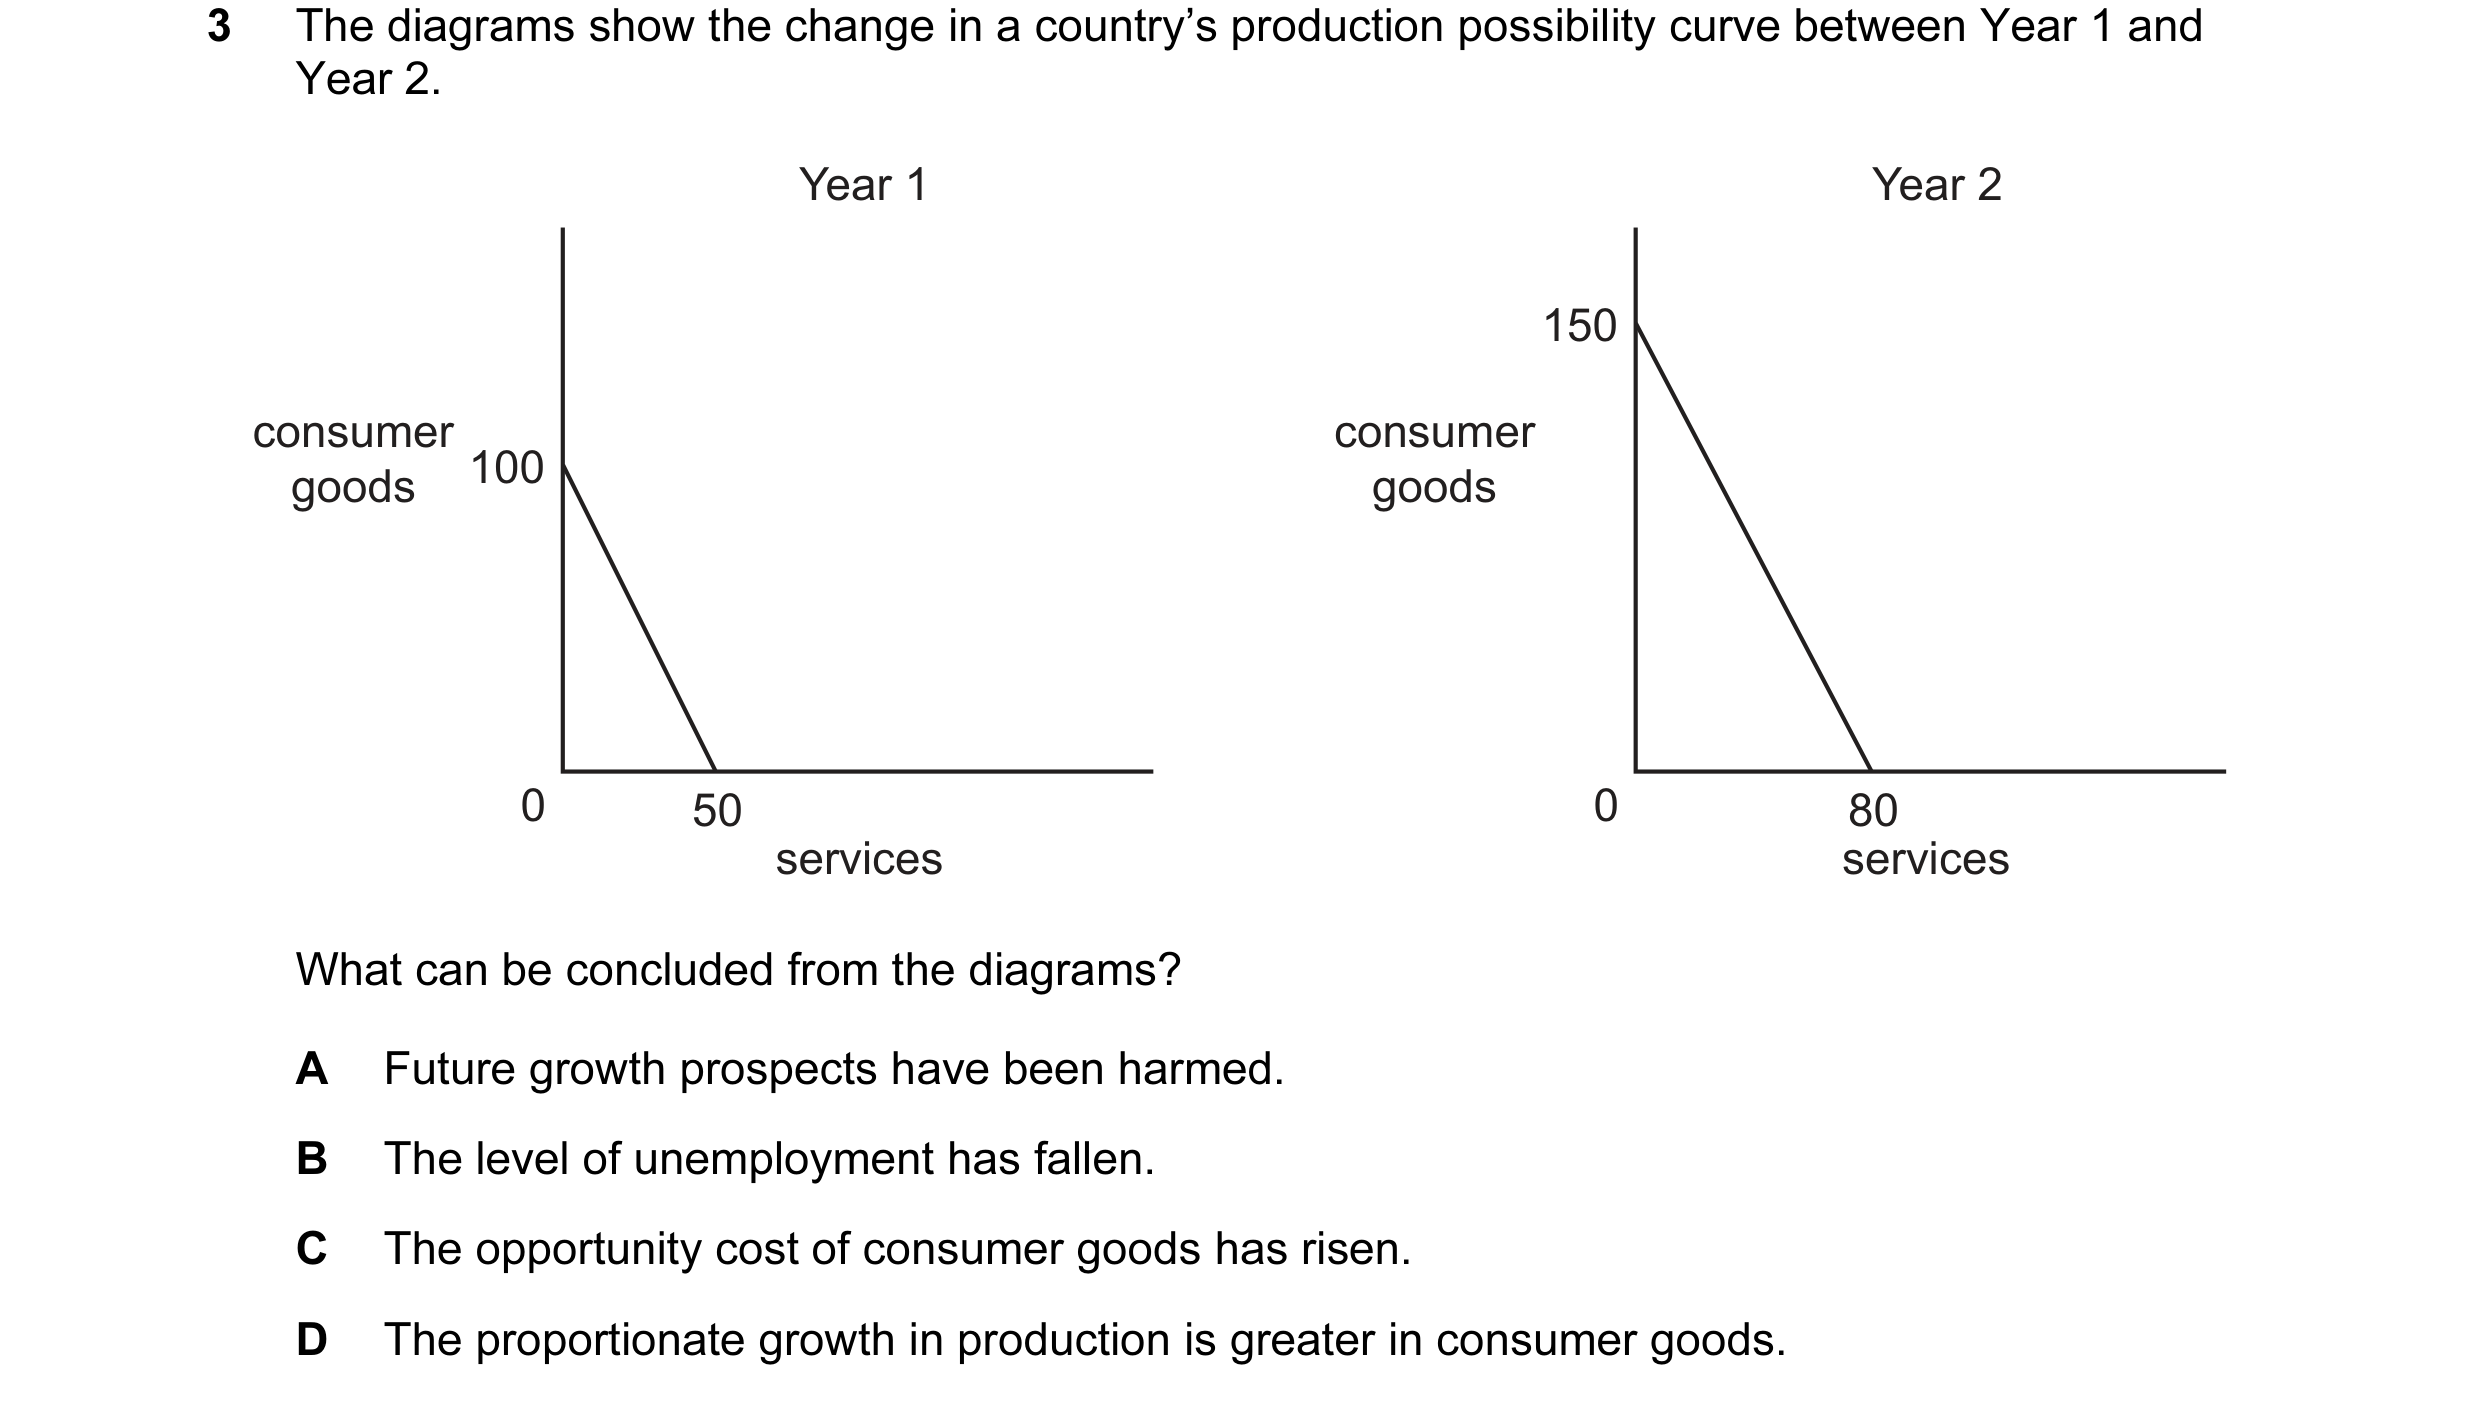 30 / 68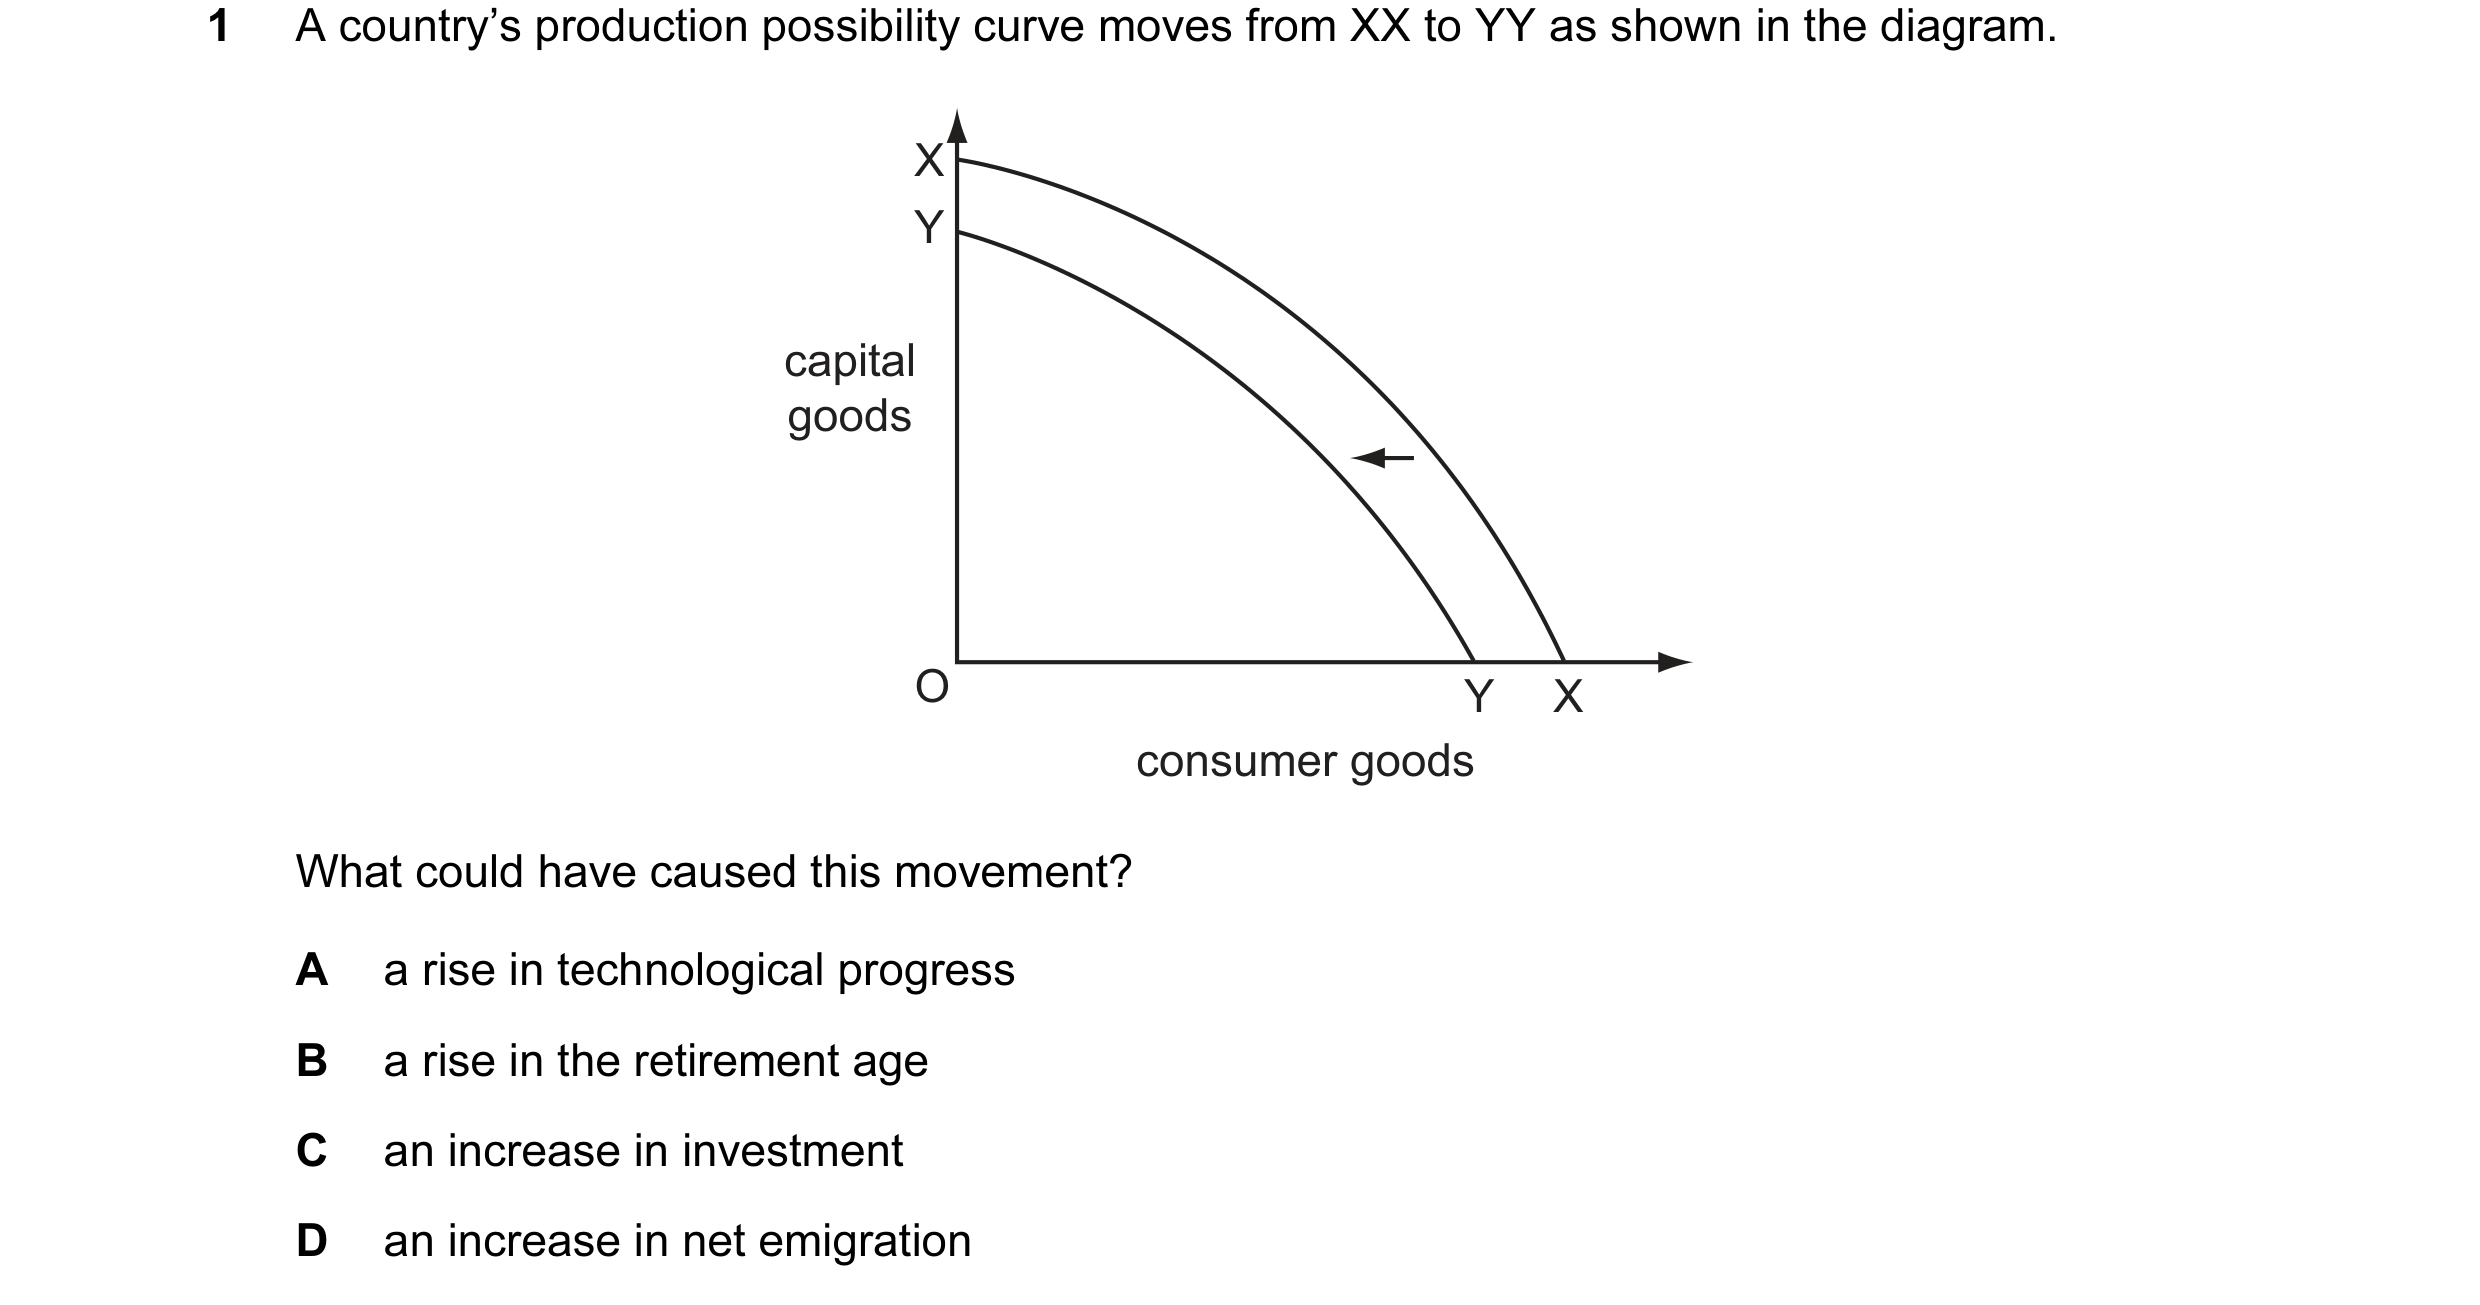
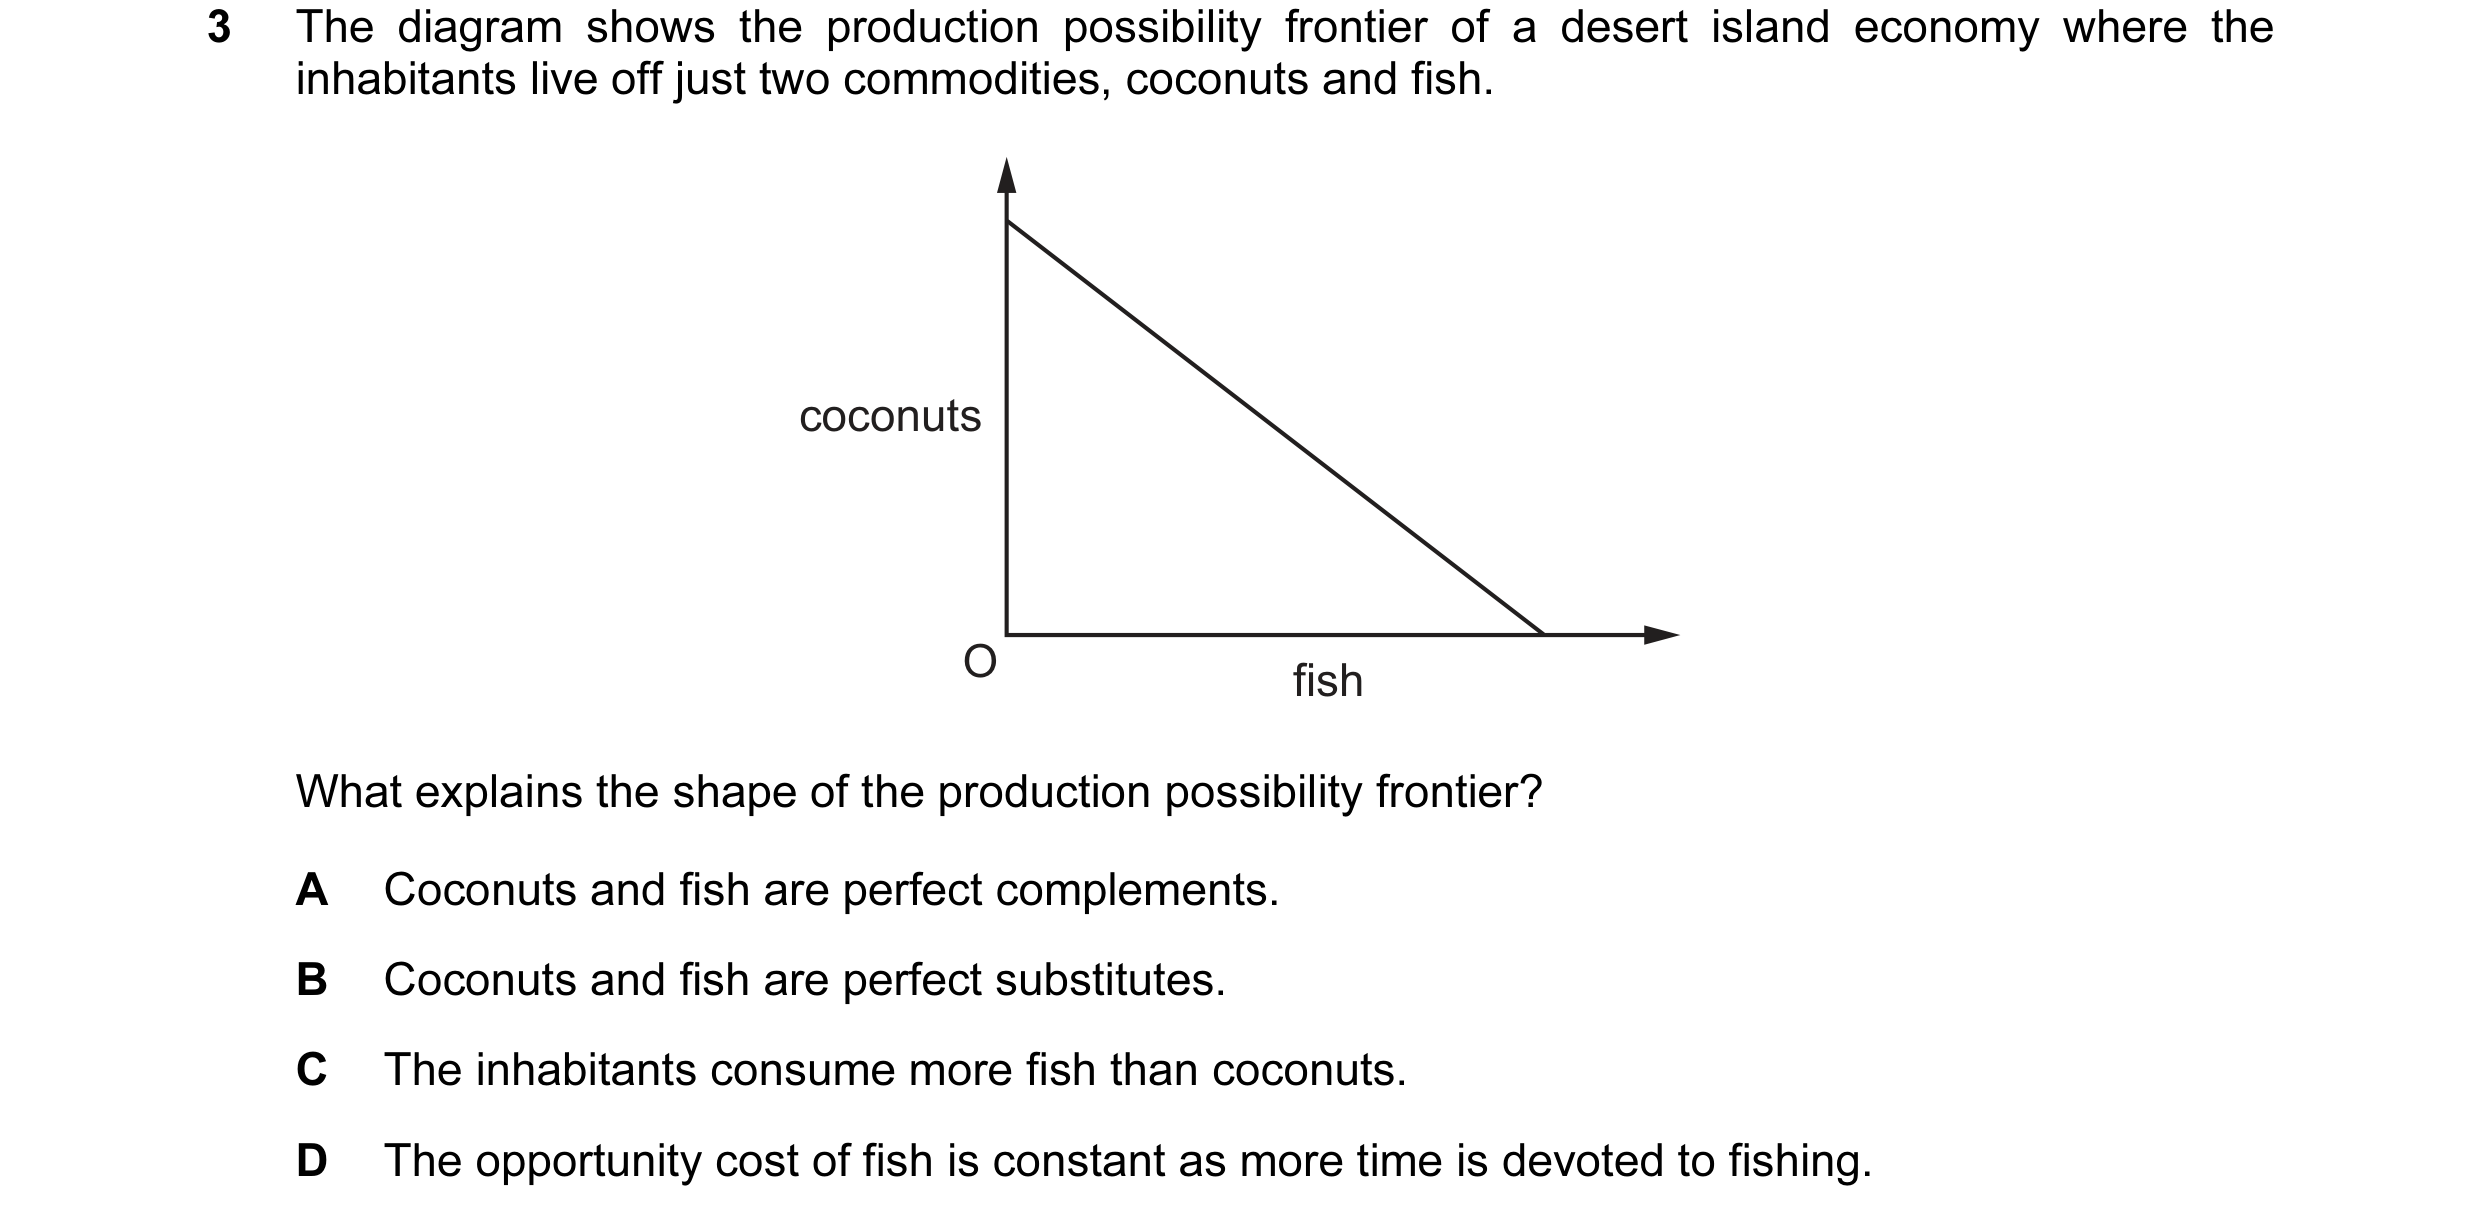 31 / 68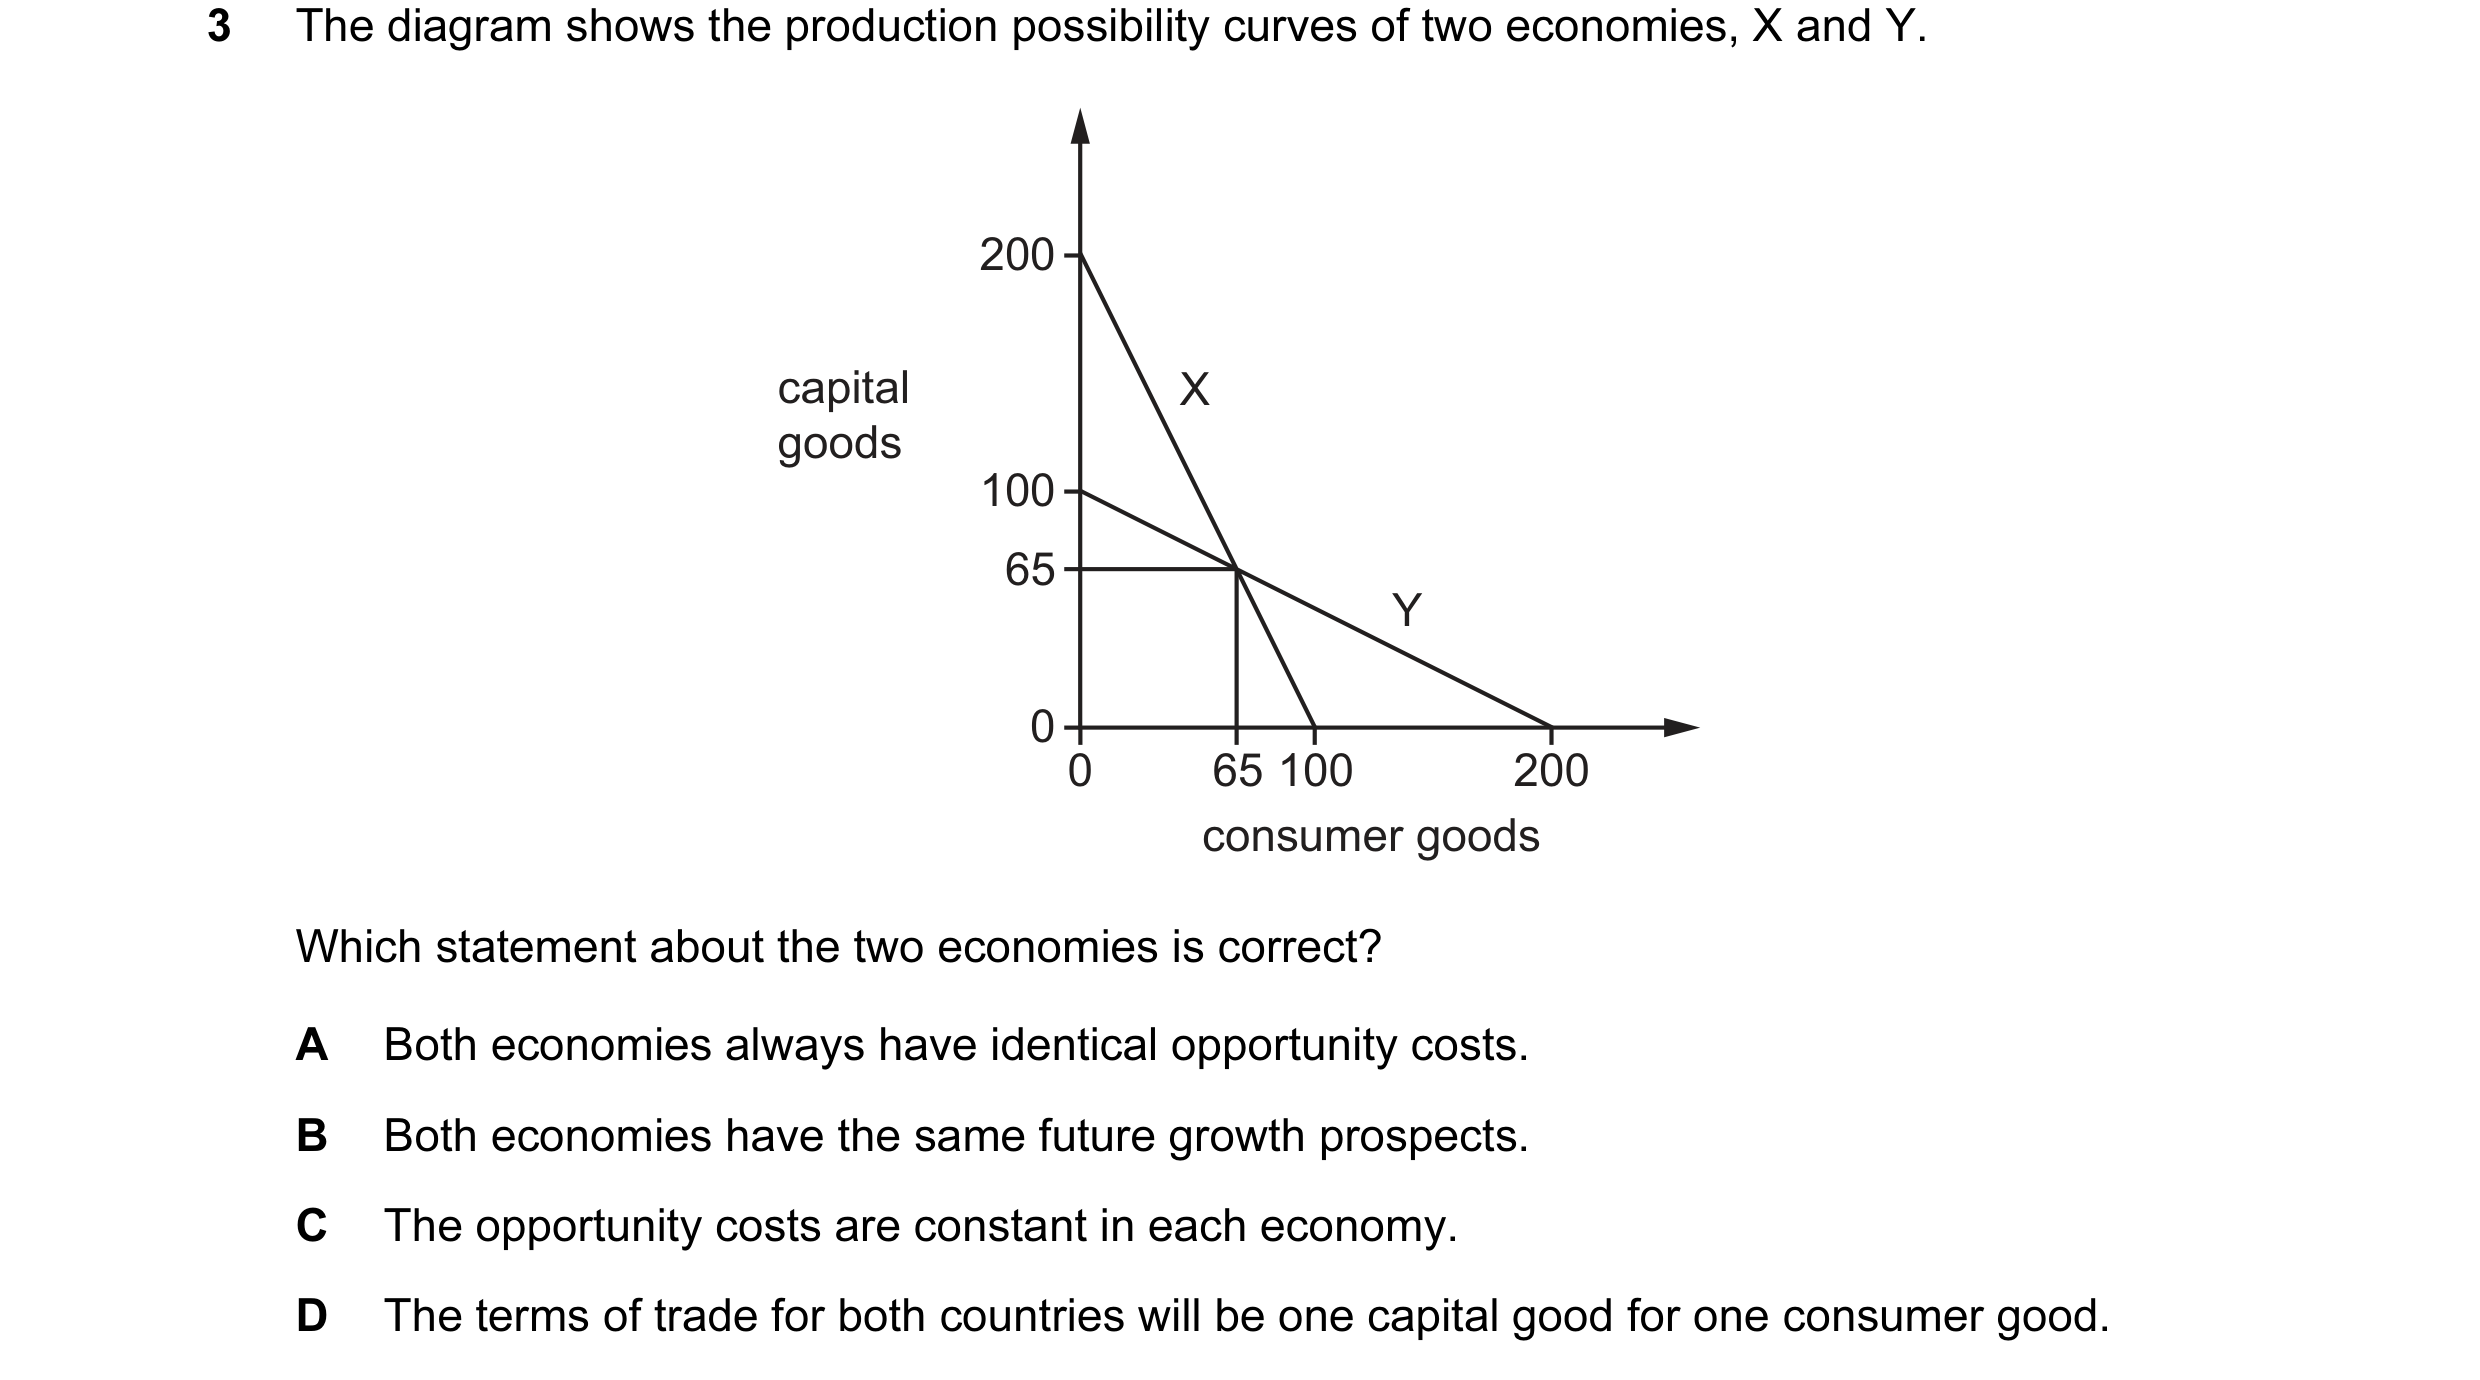
 32 / 68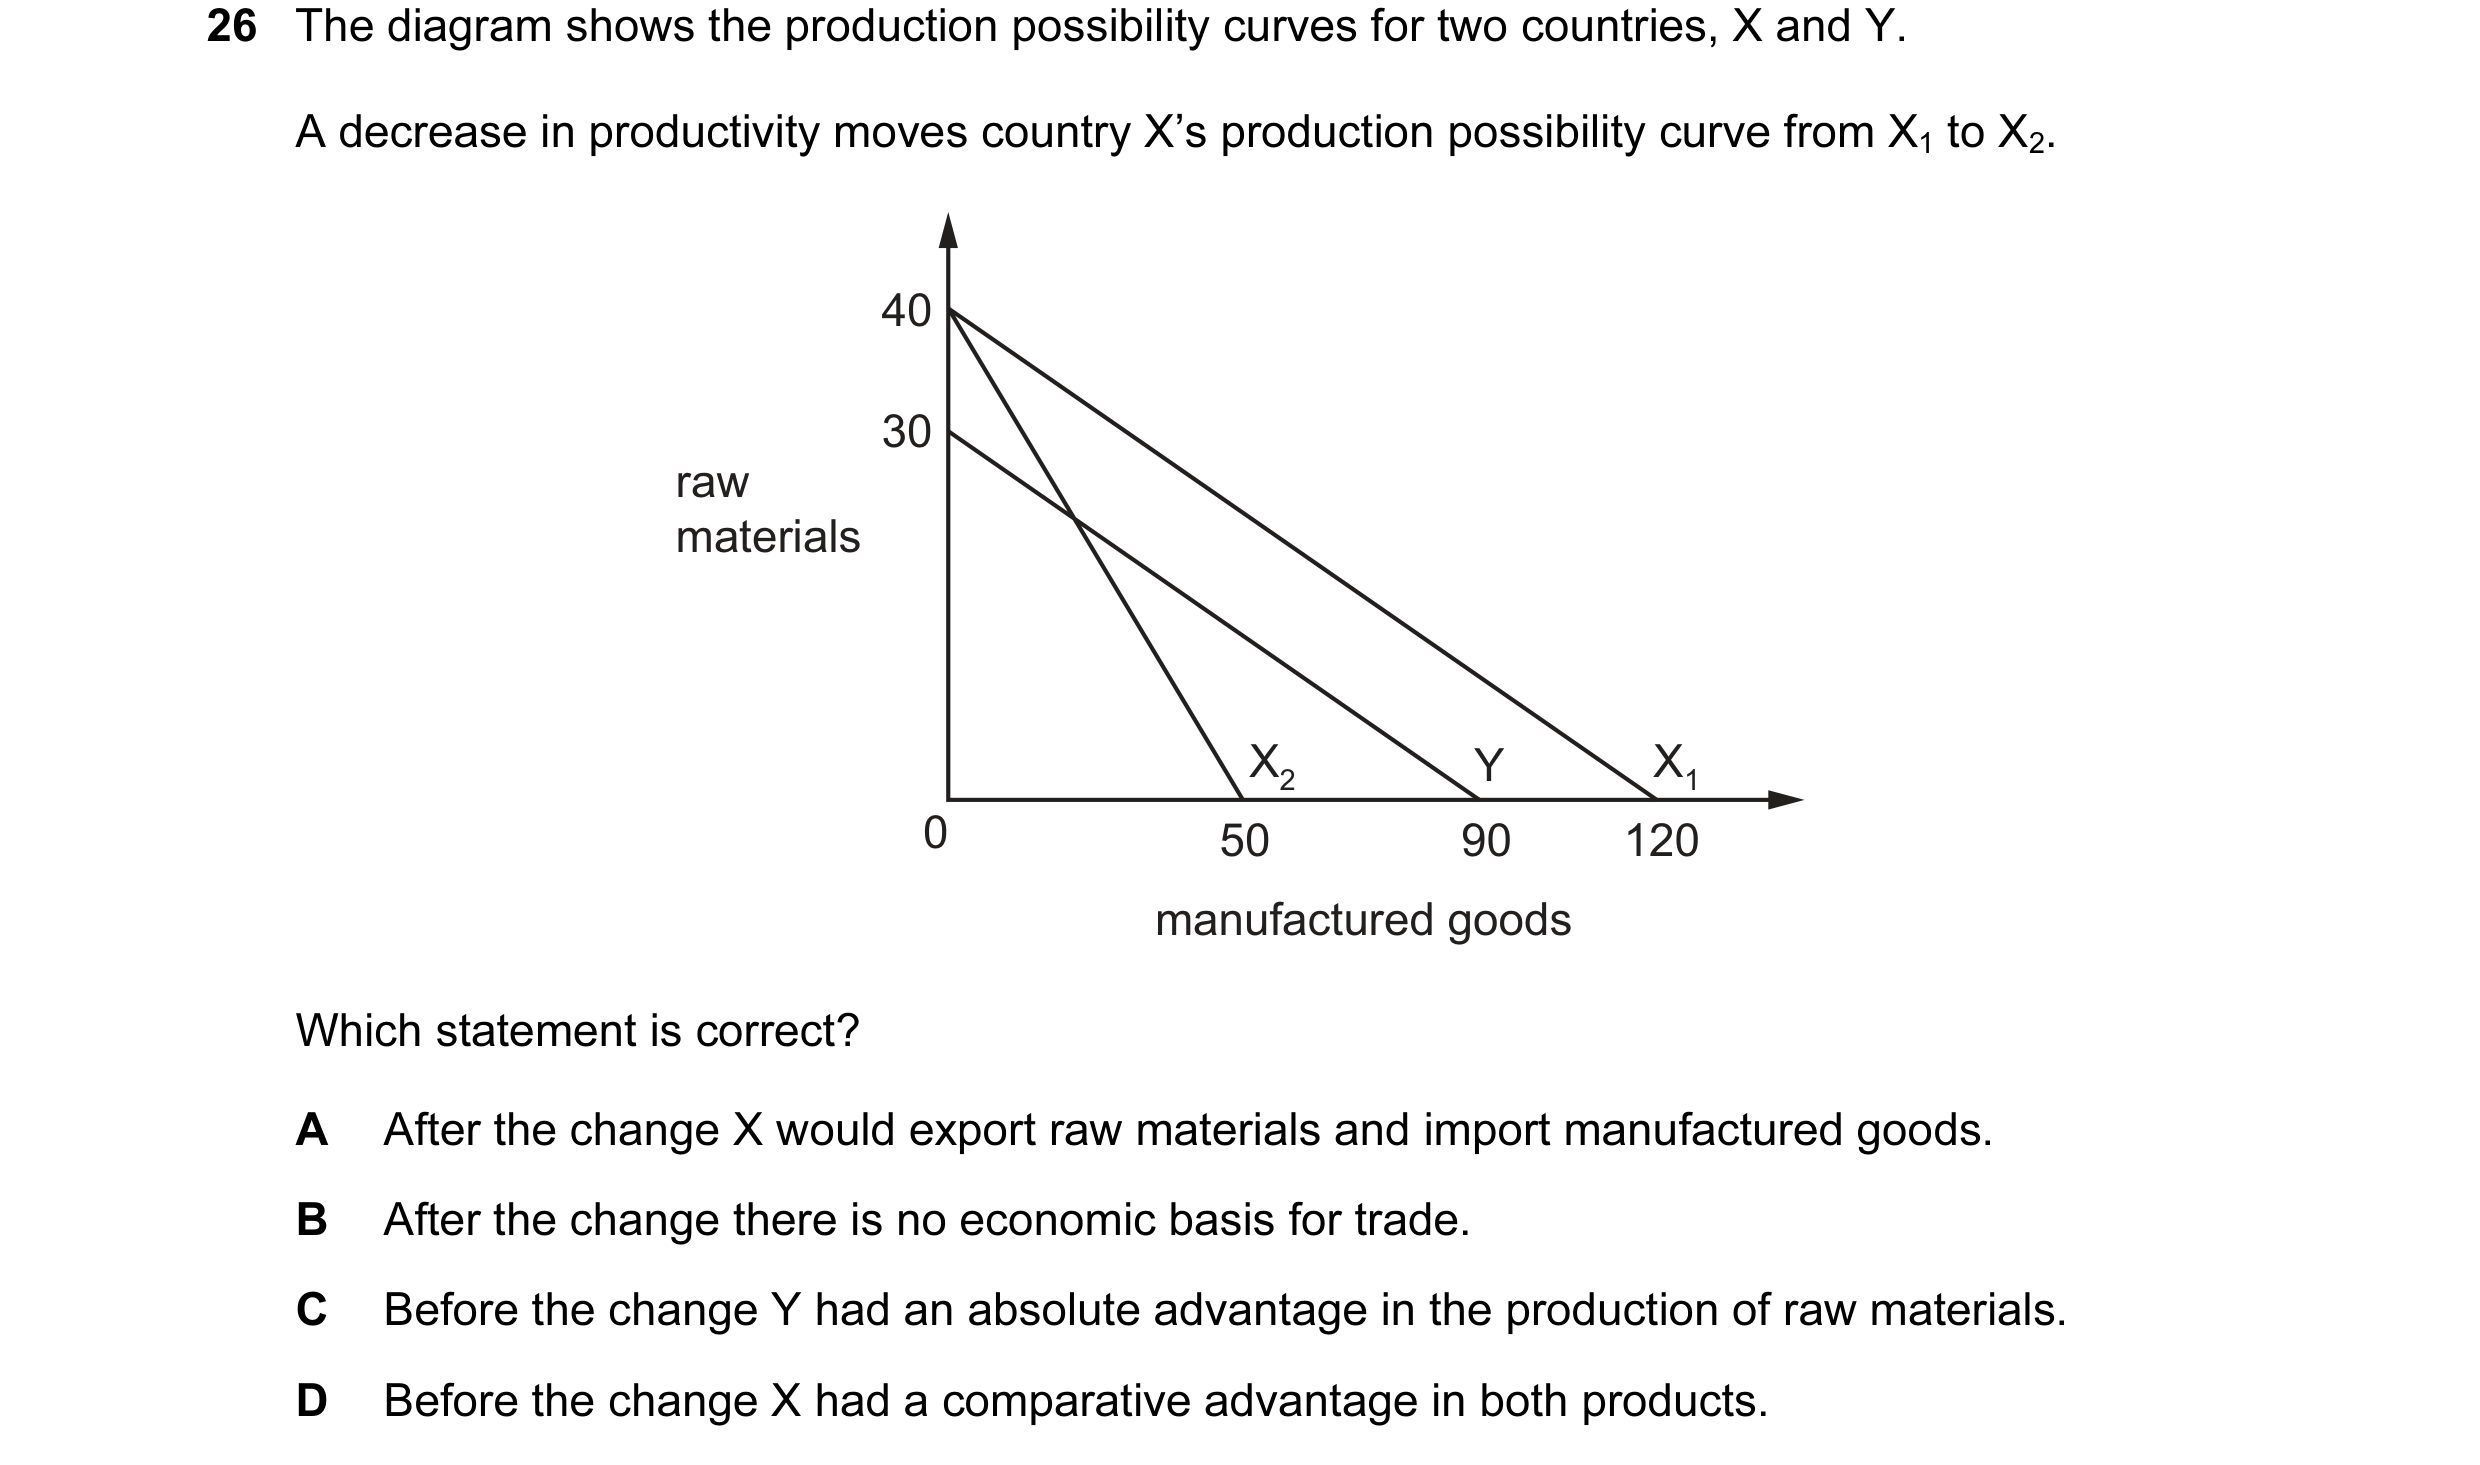
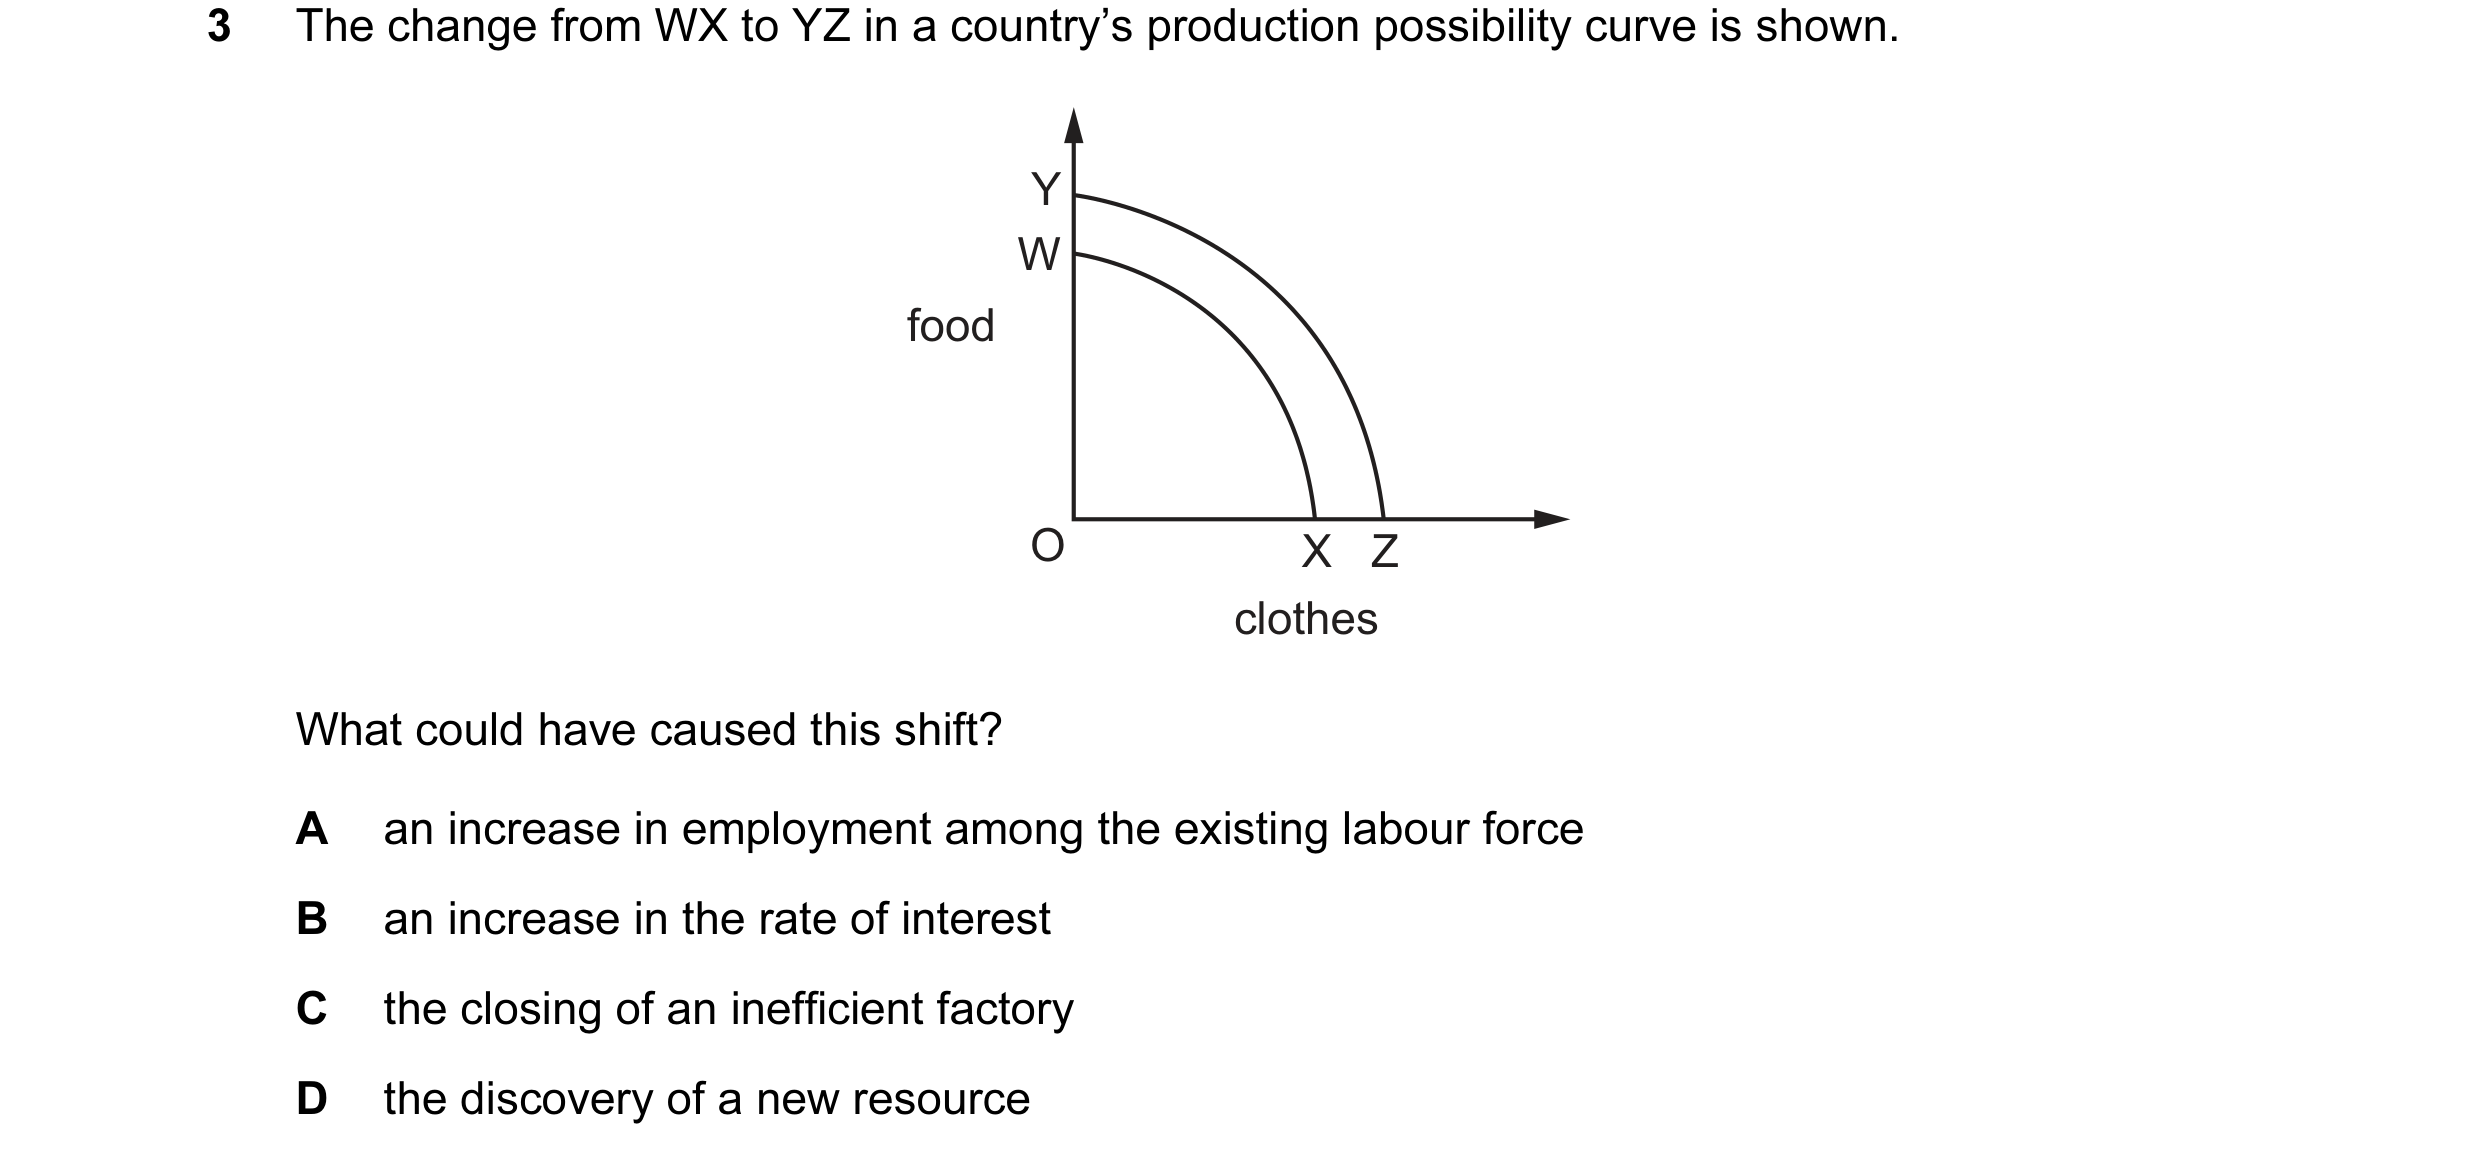 33 / 68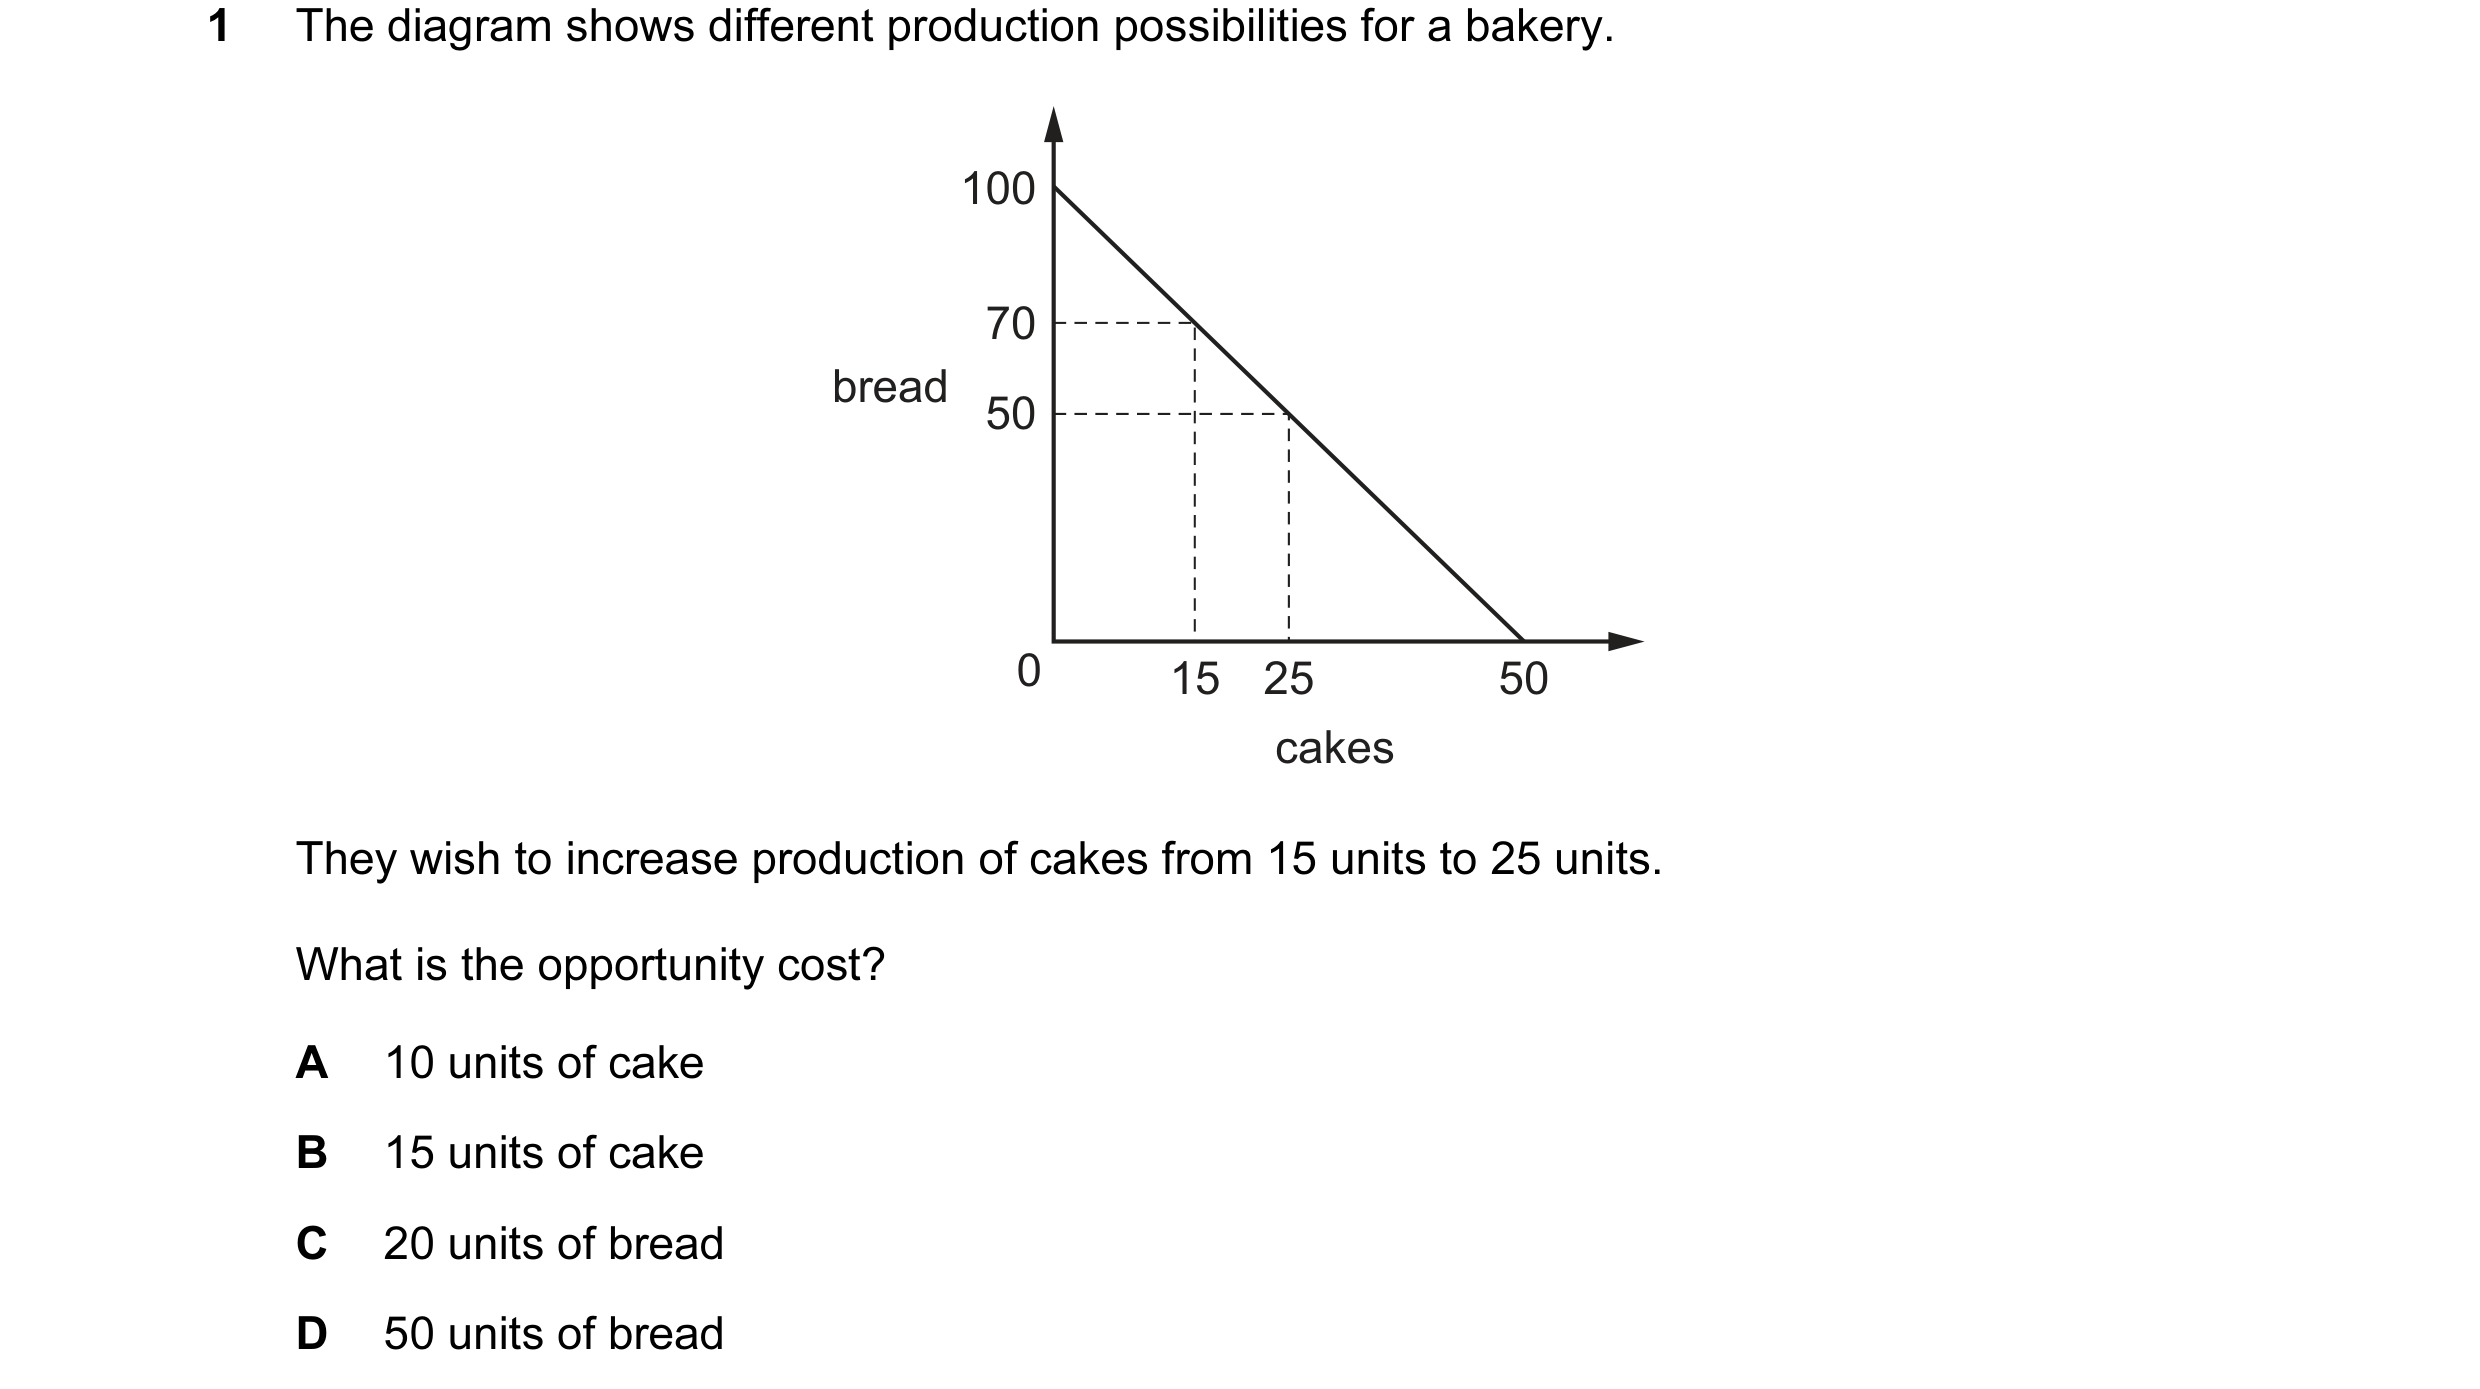
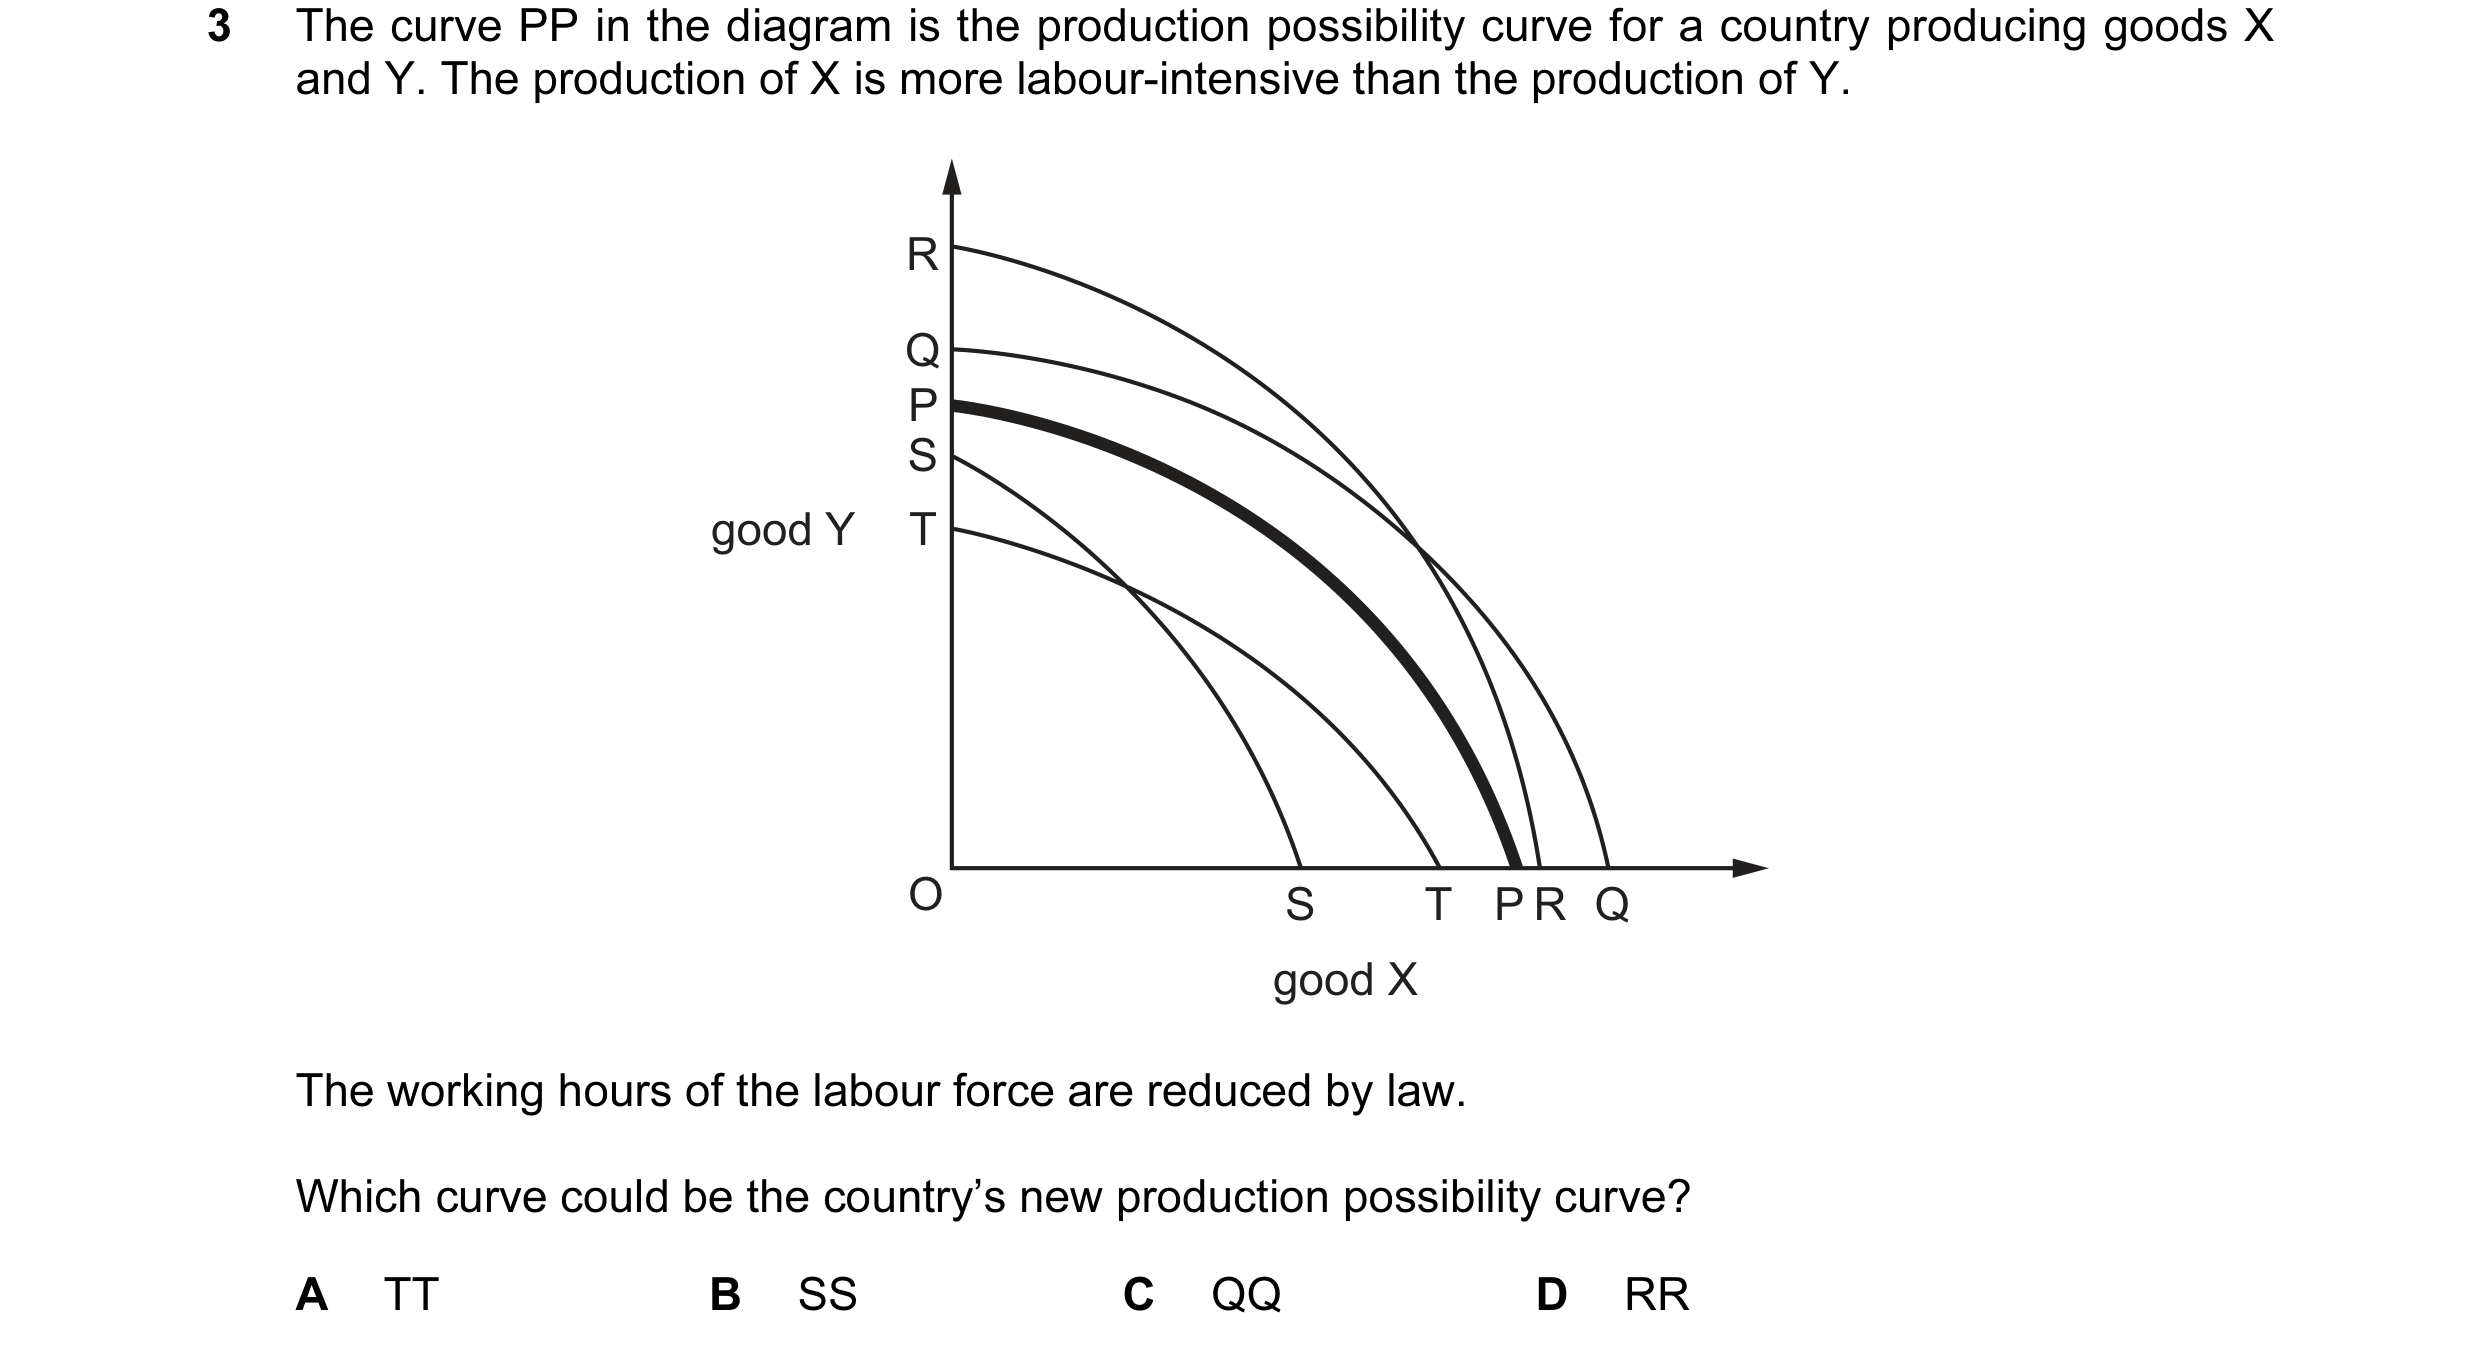 34 / 68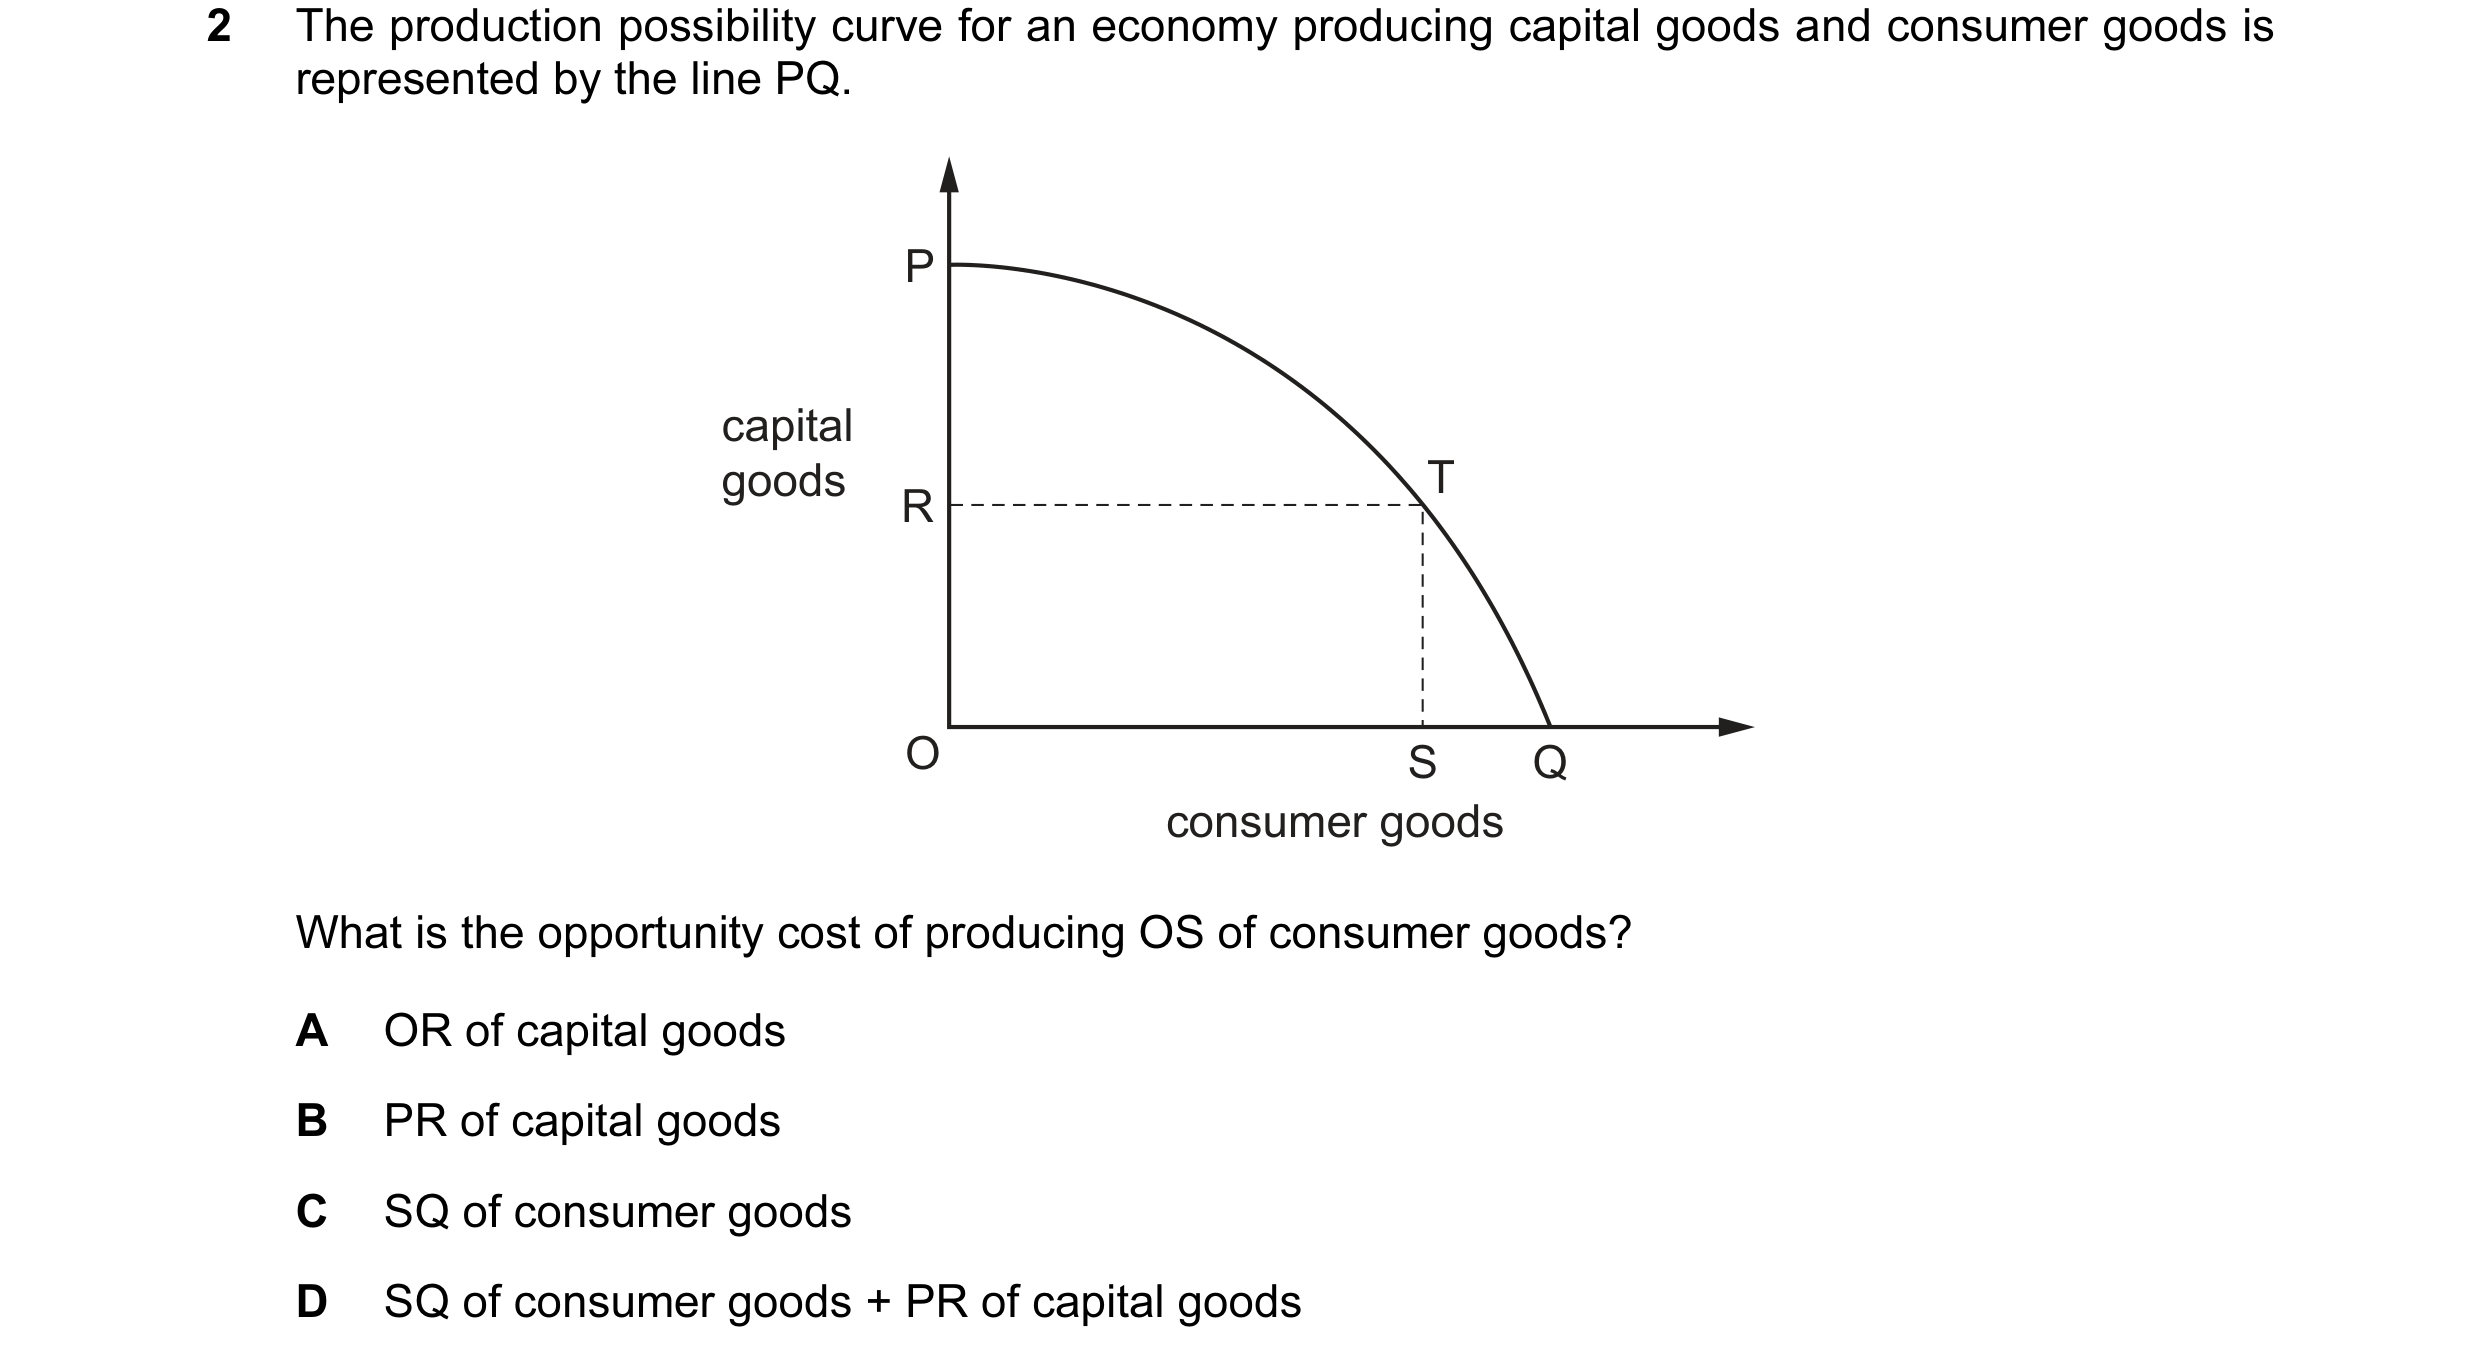
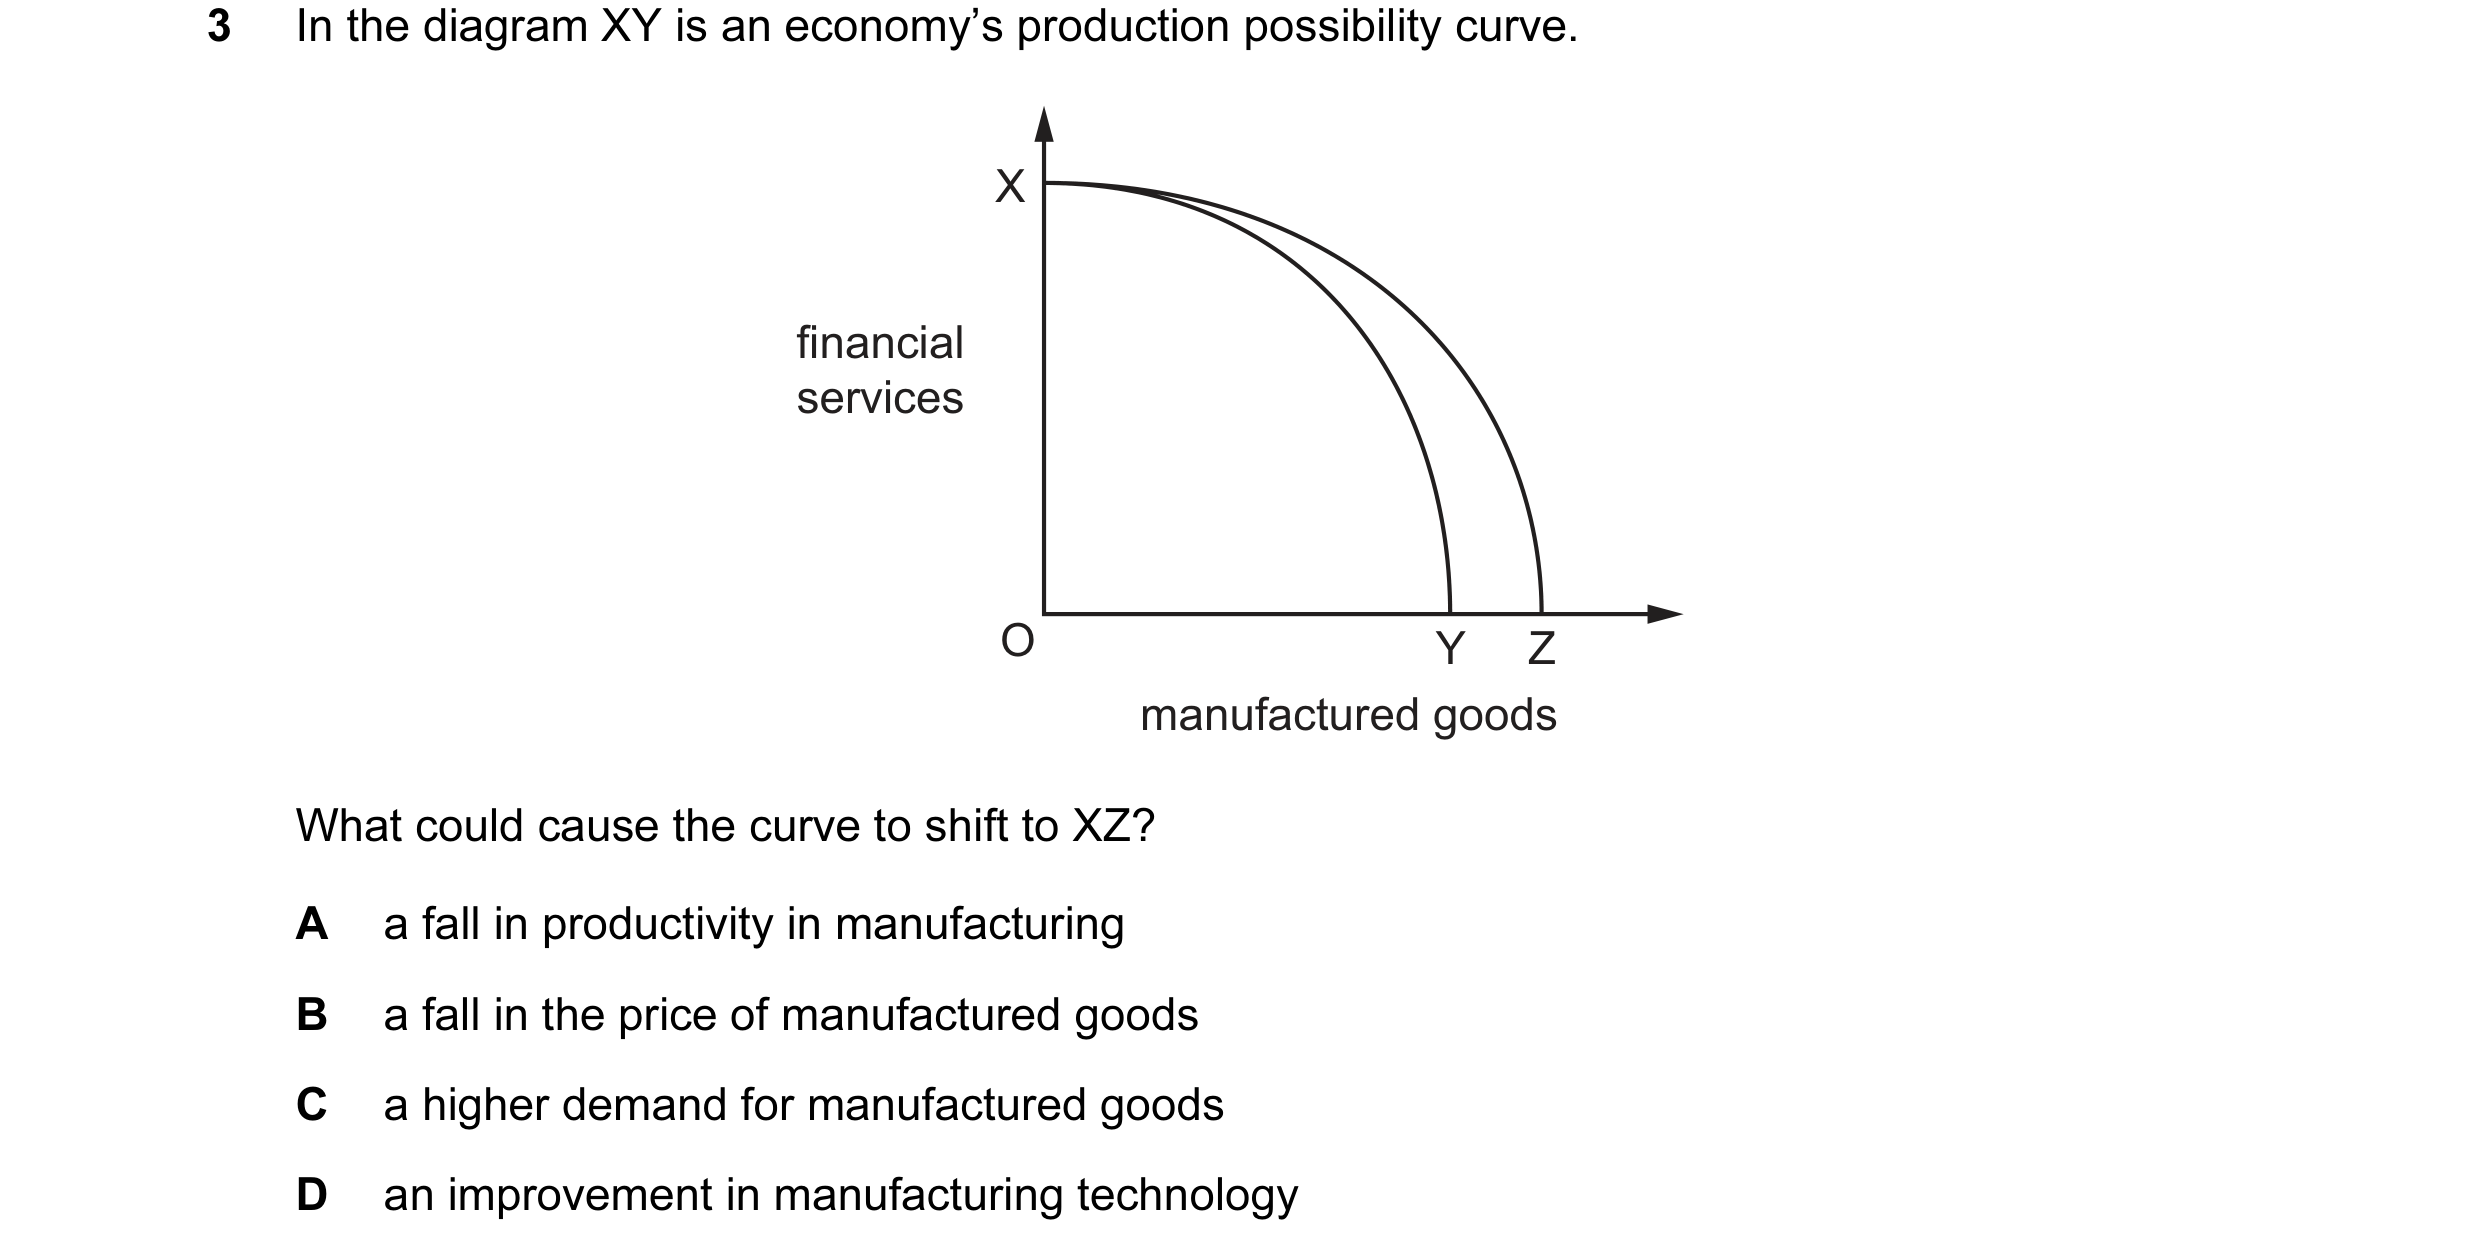 35 / 68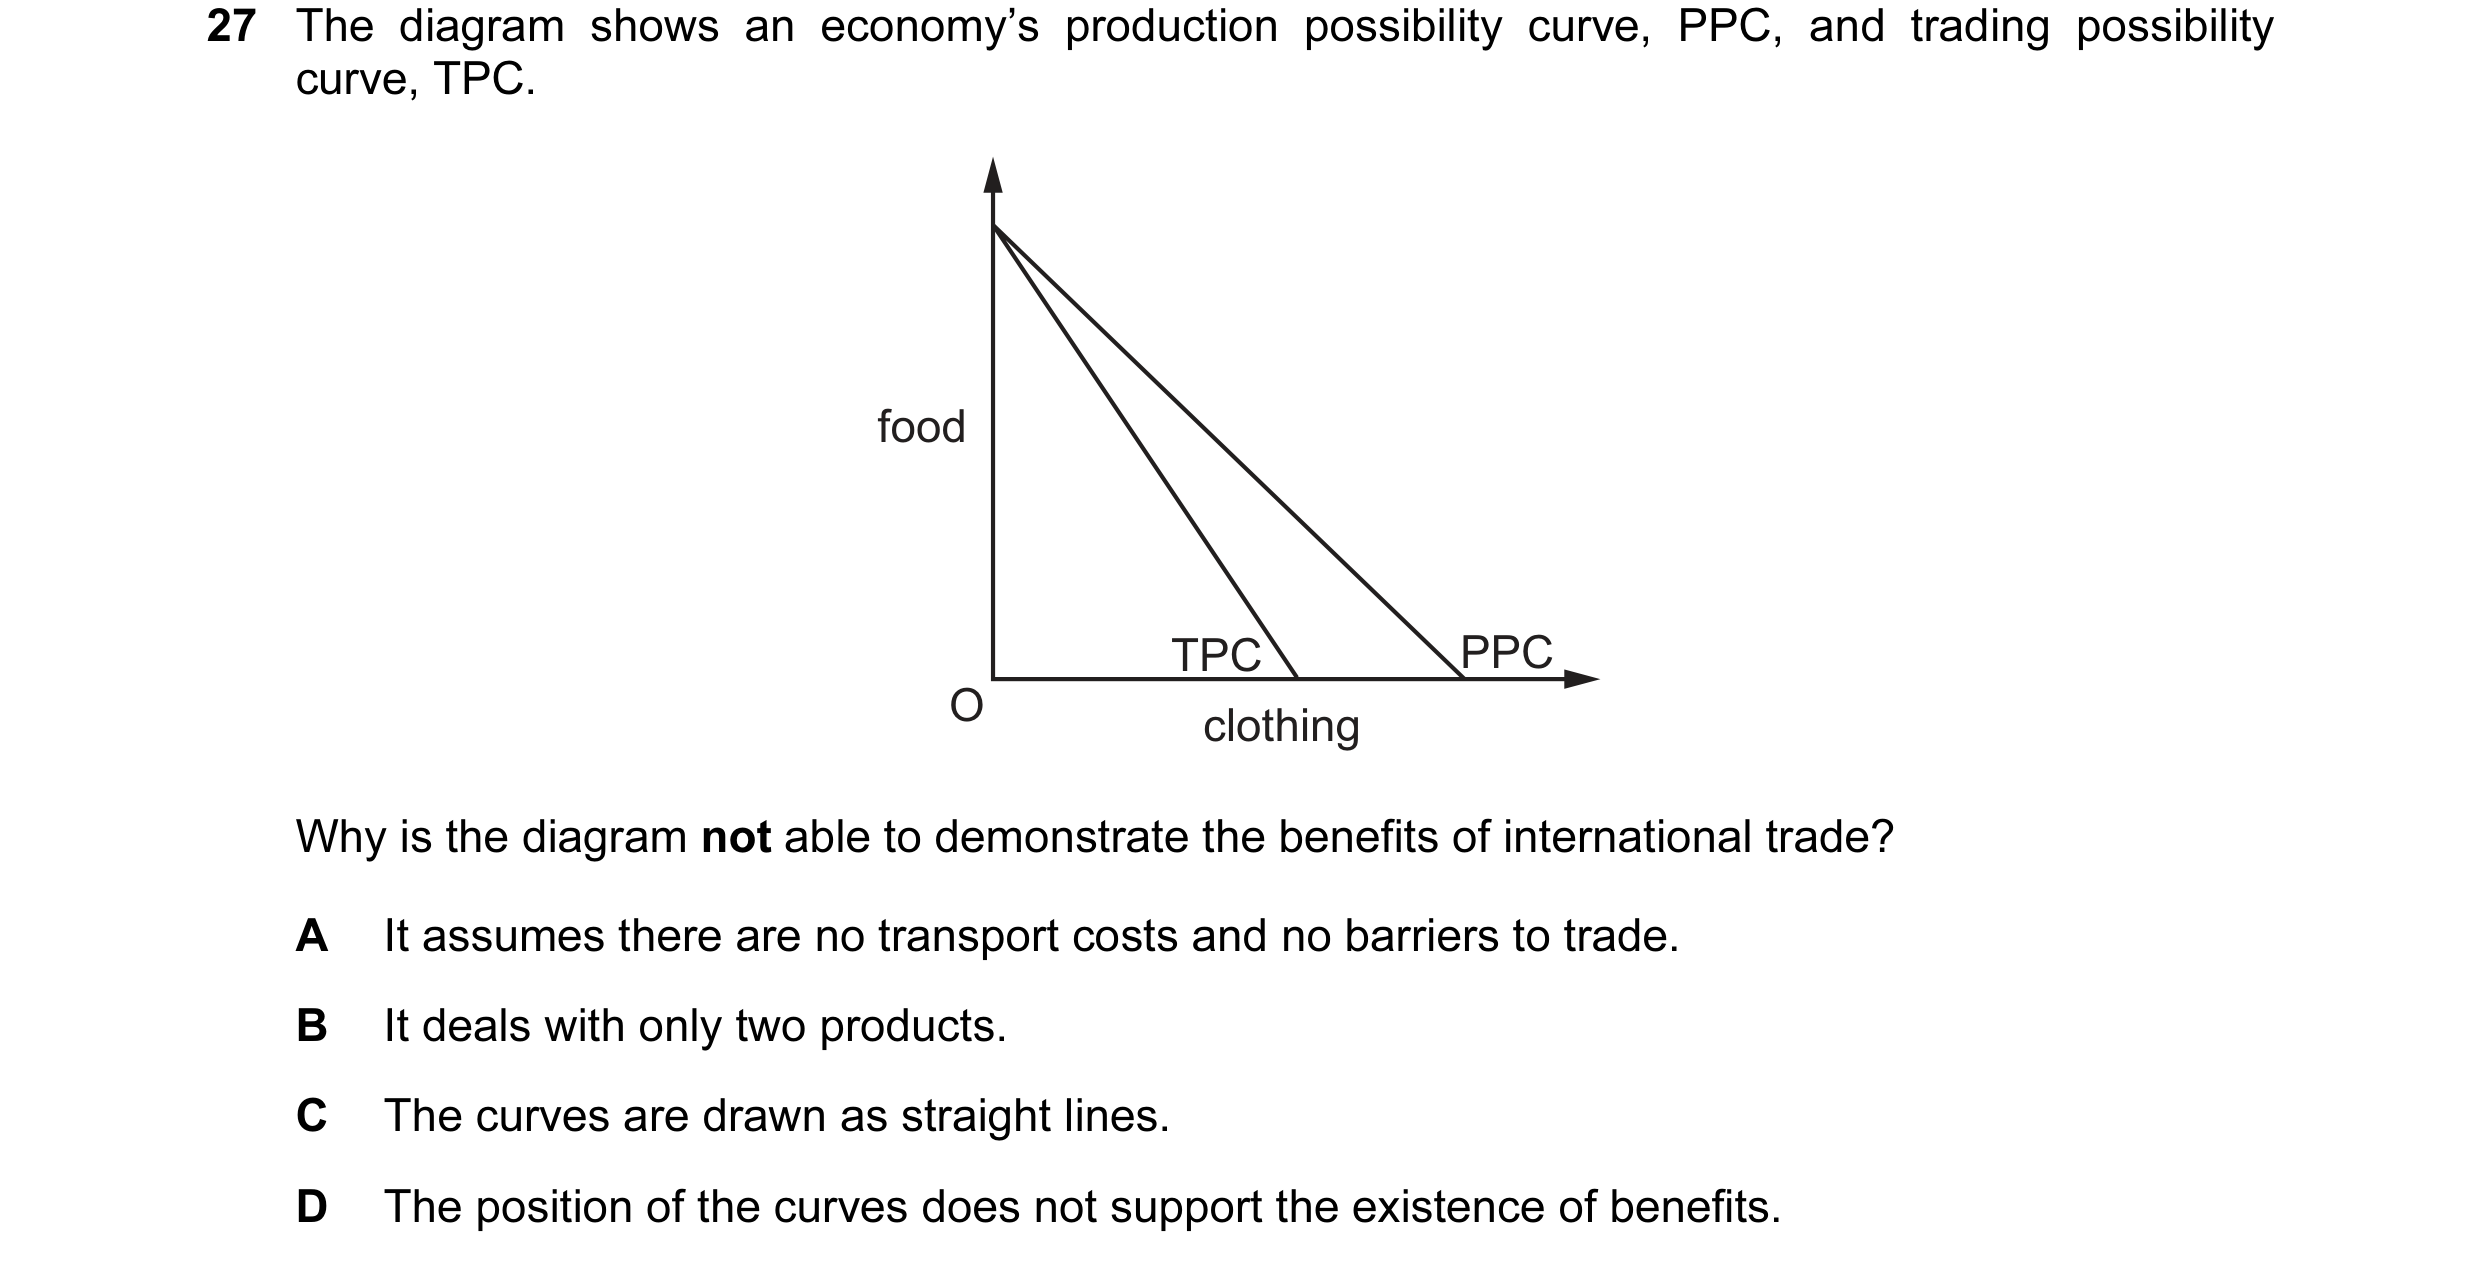
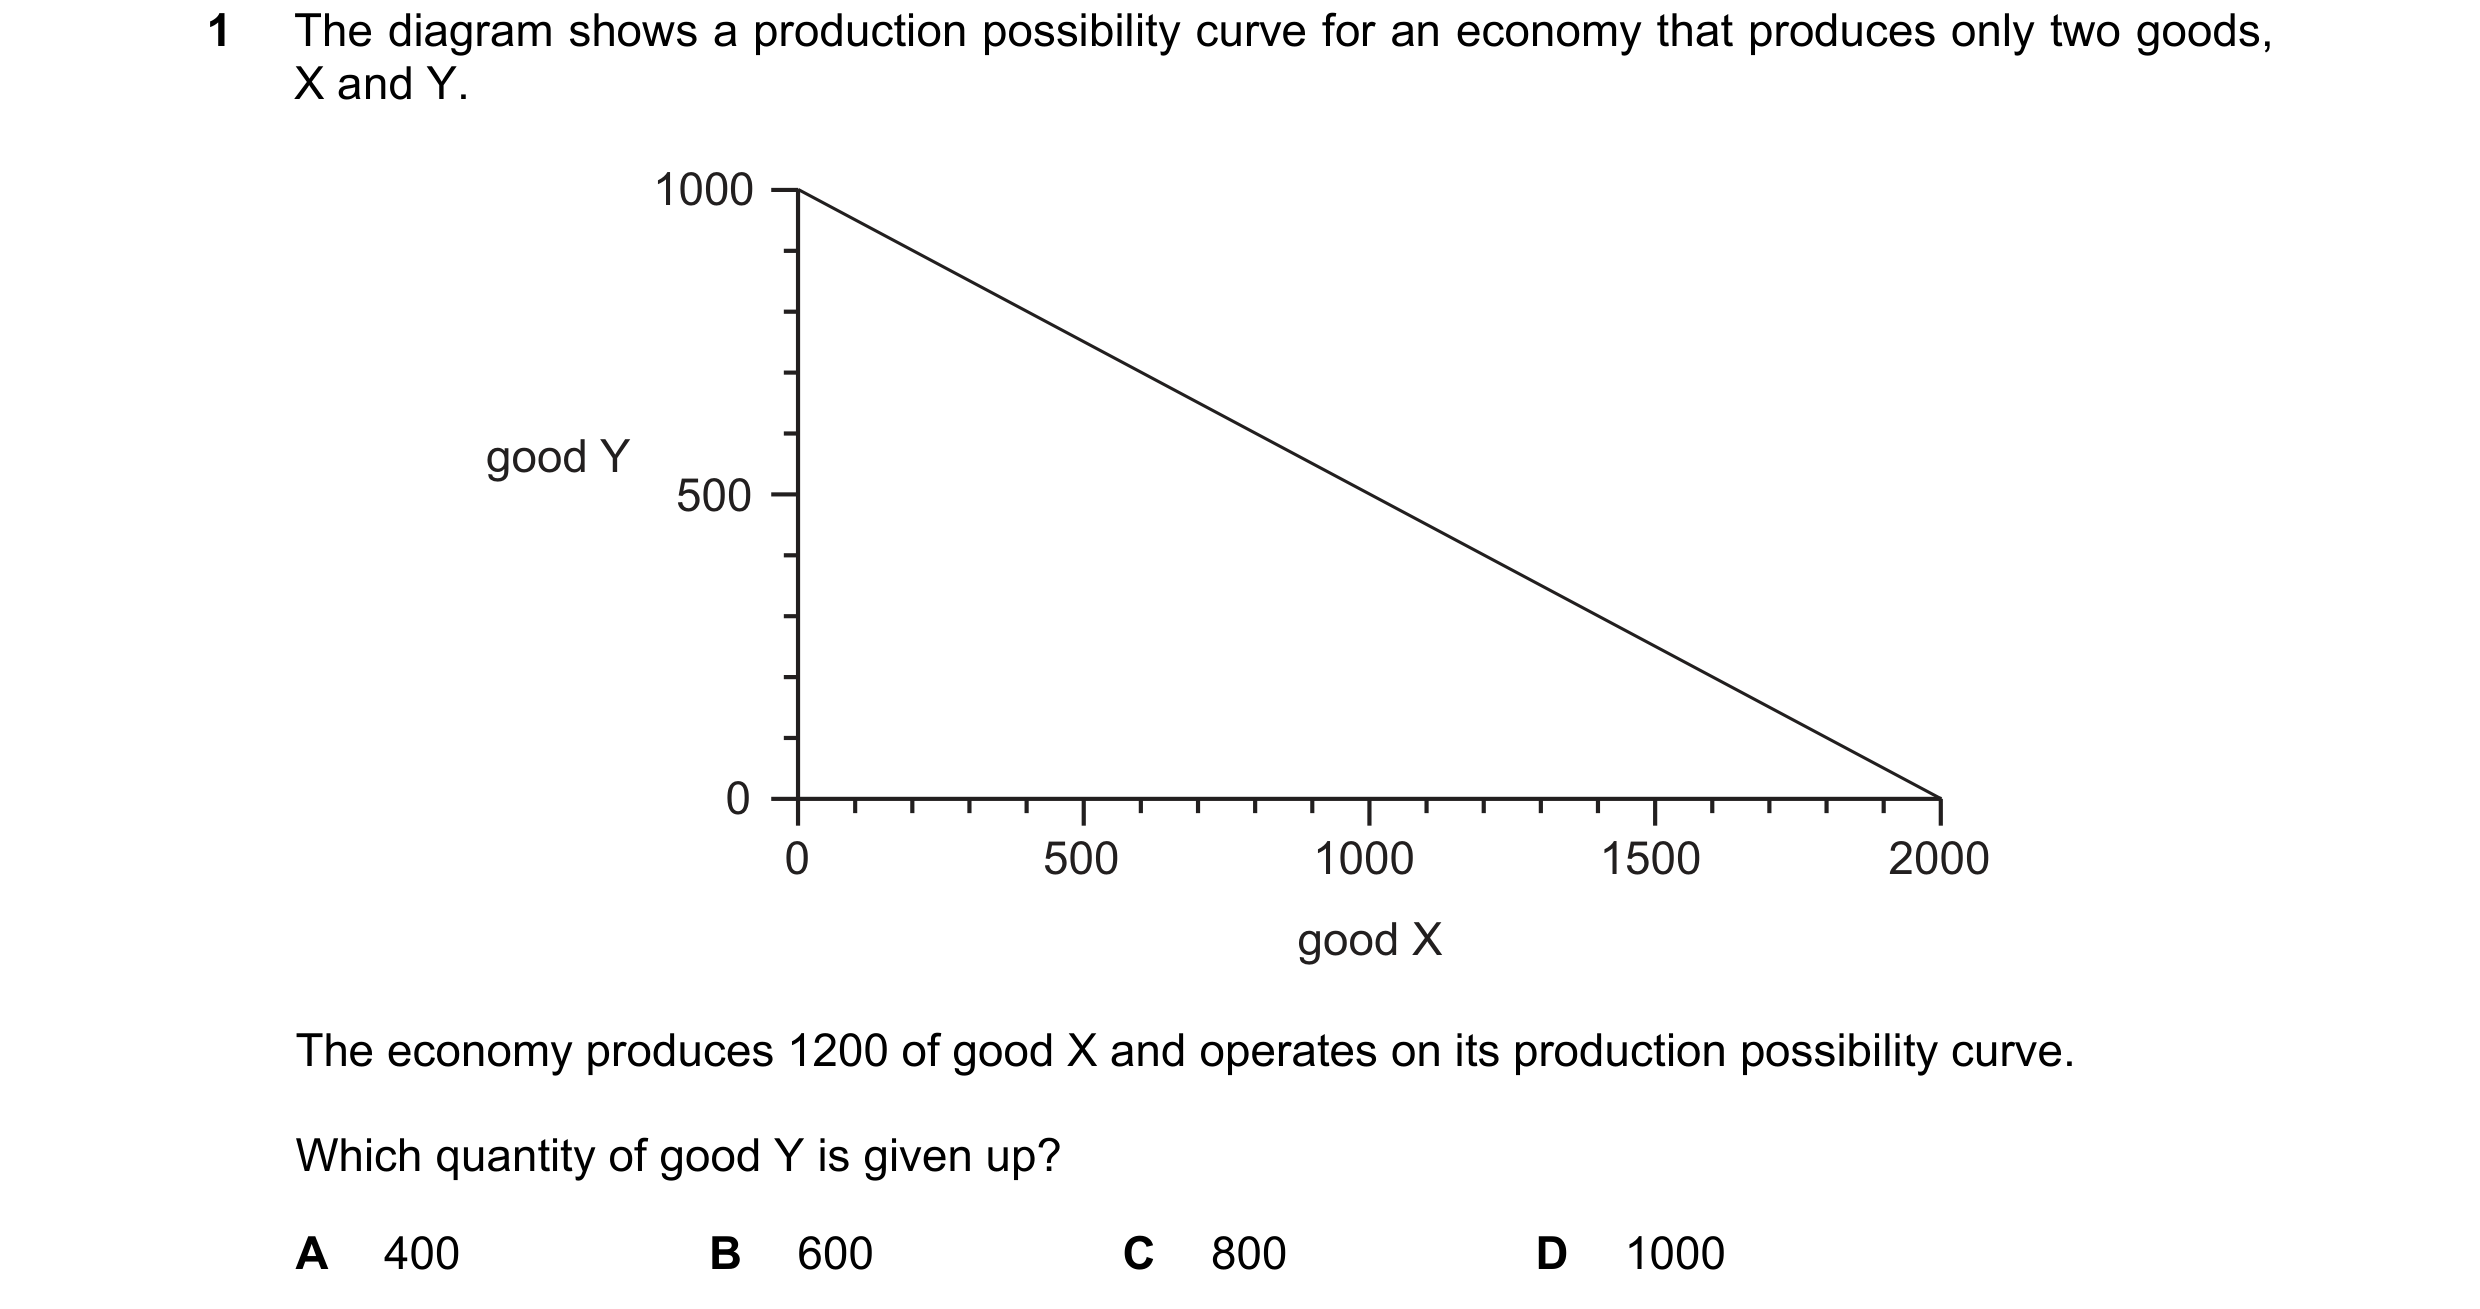 36 / 68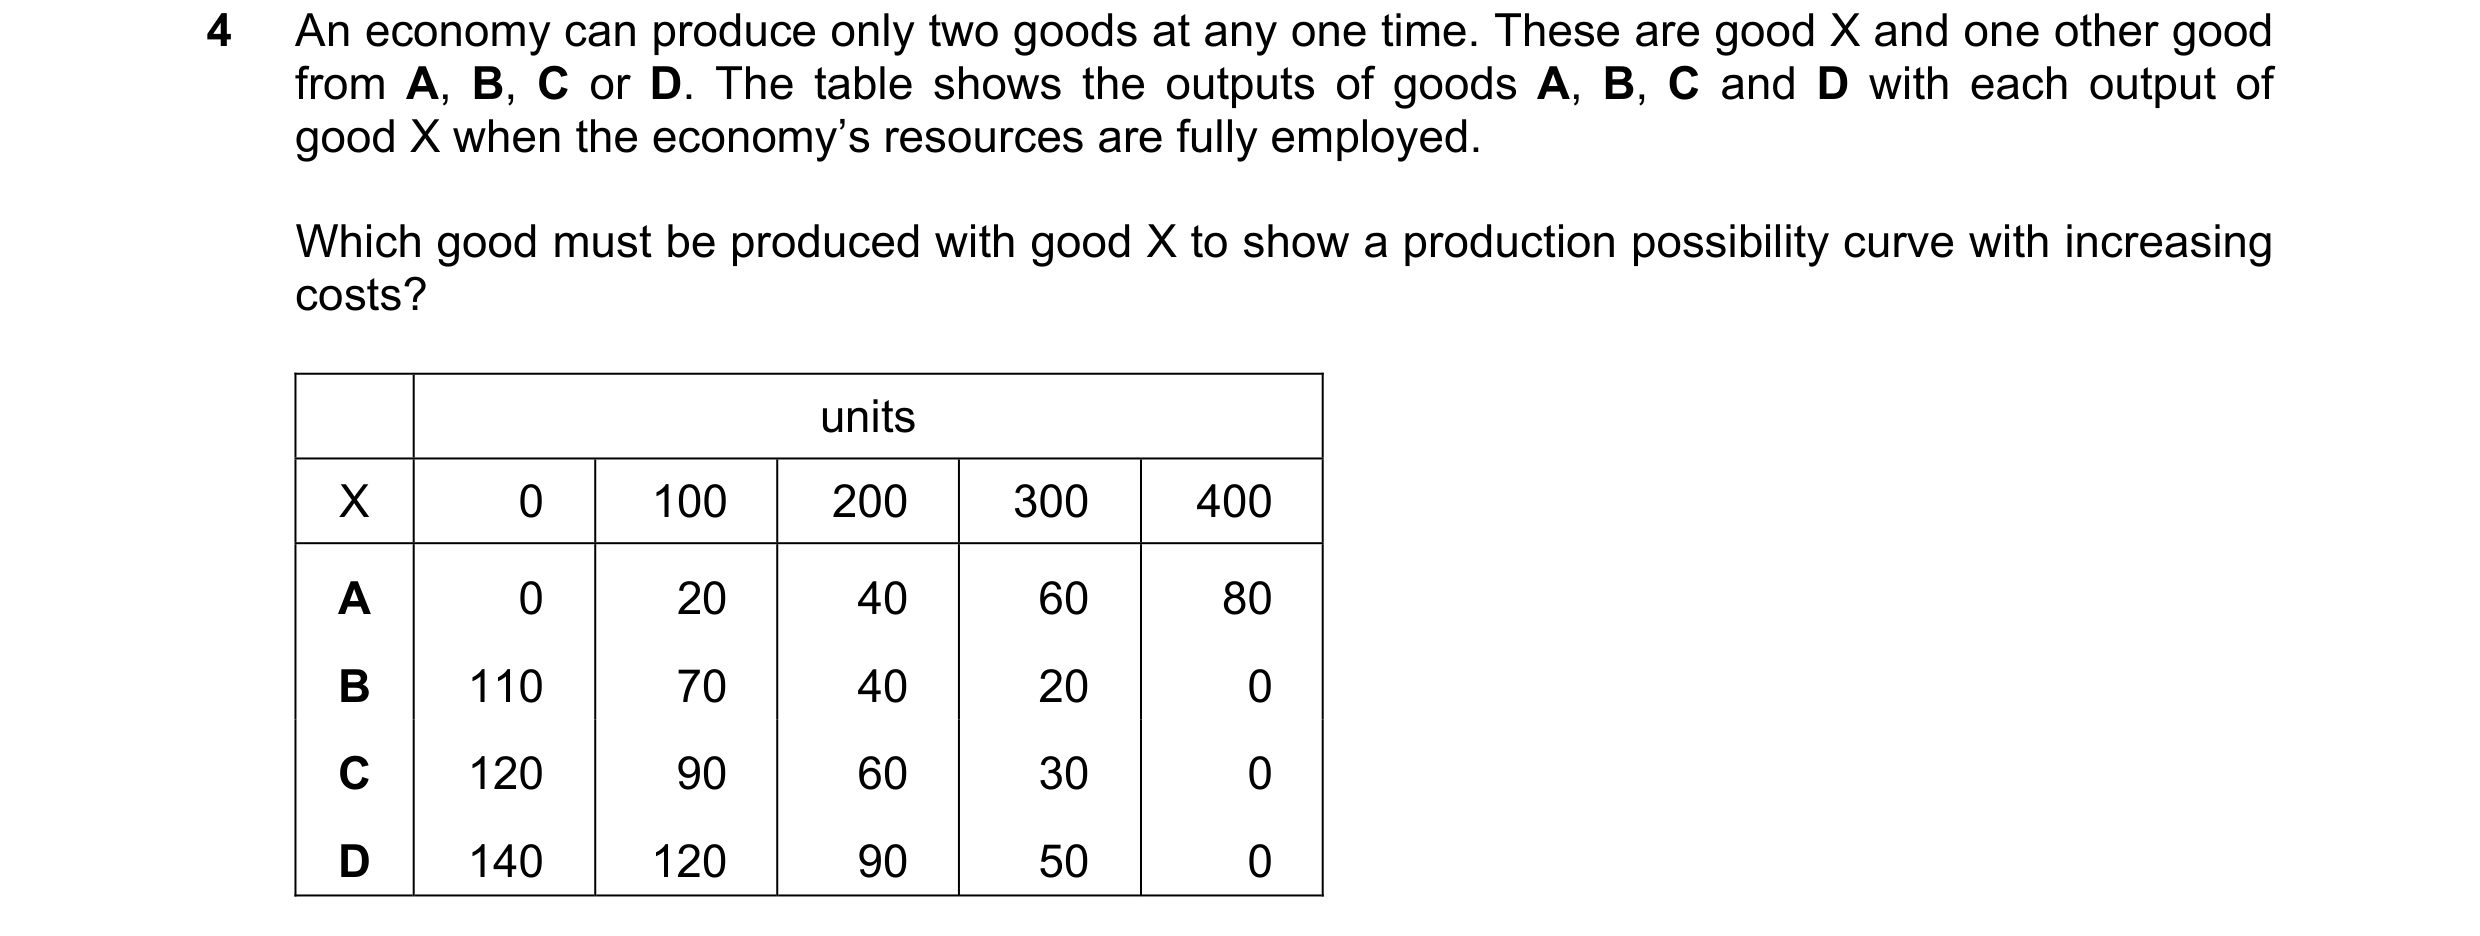
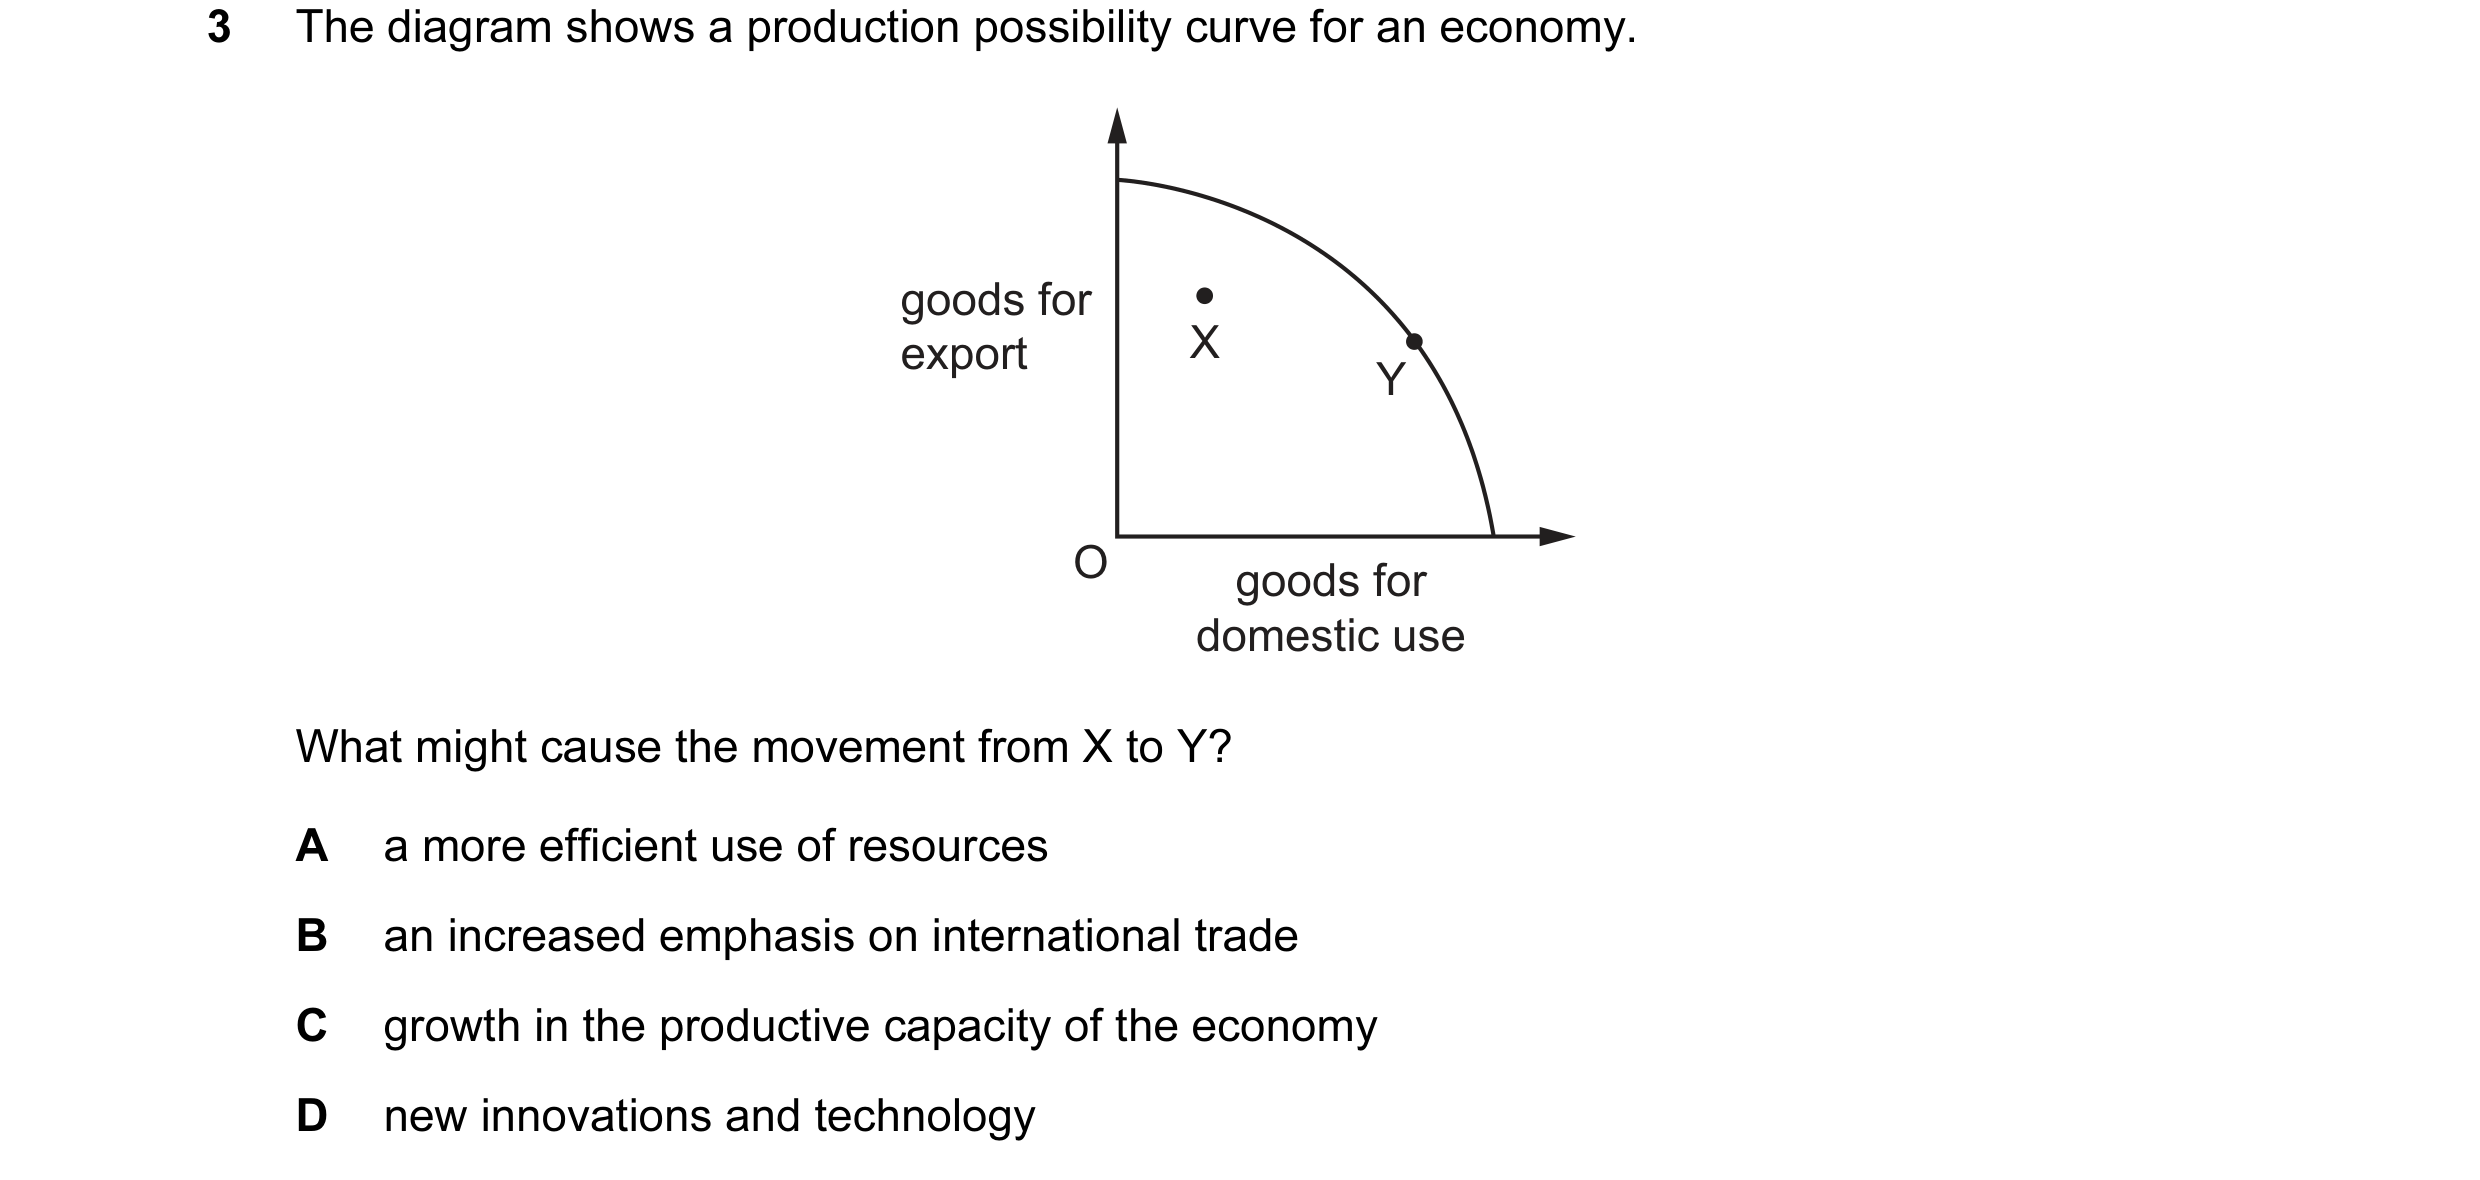
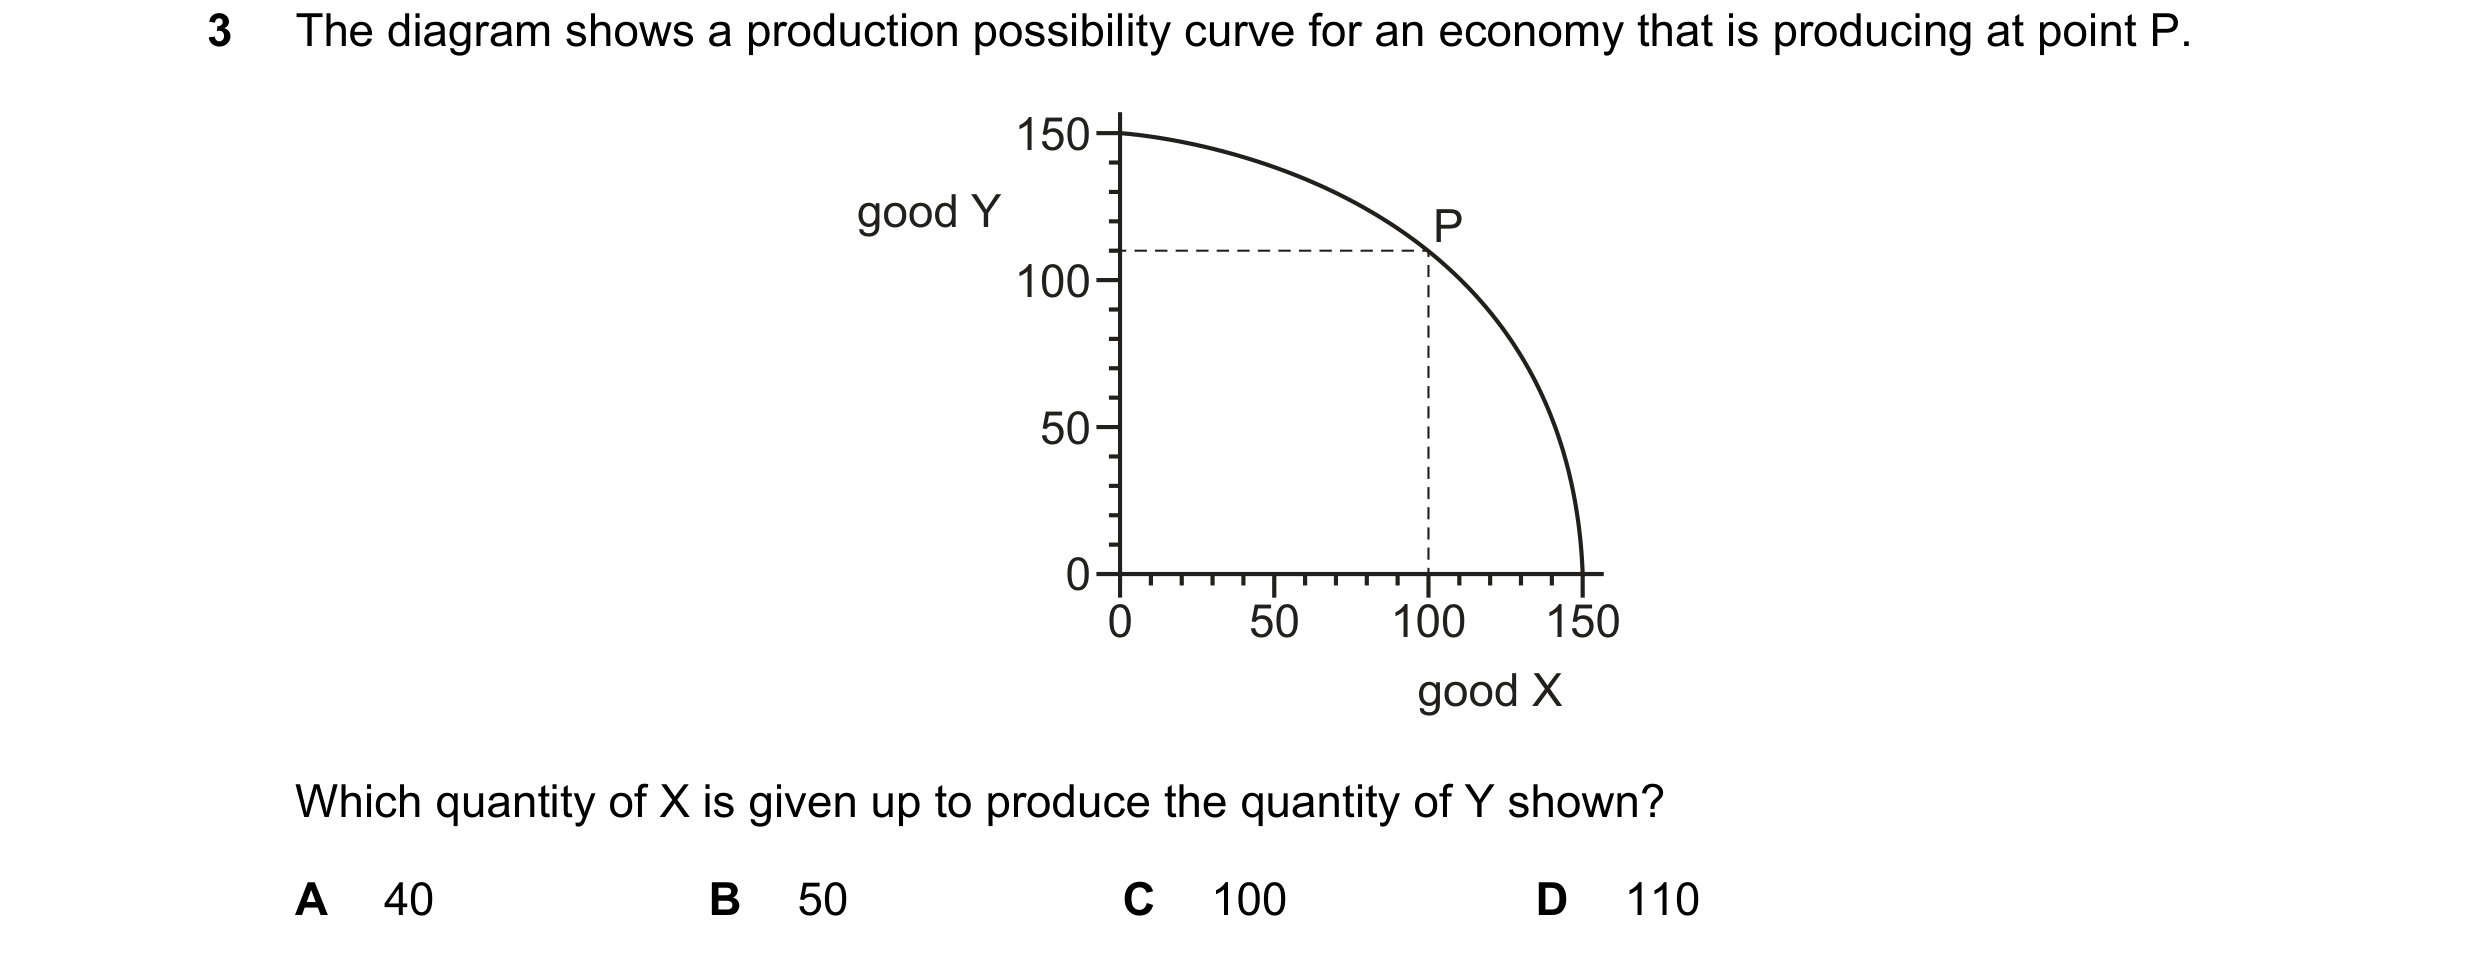 37 / 68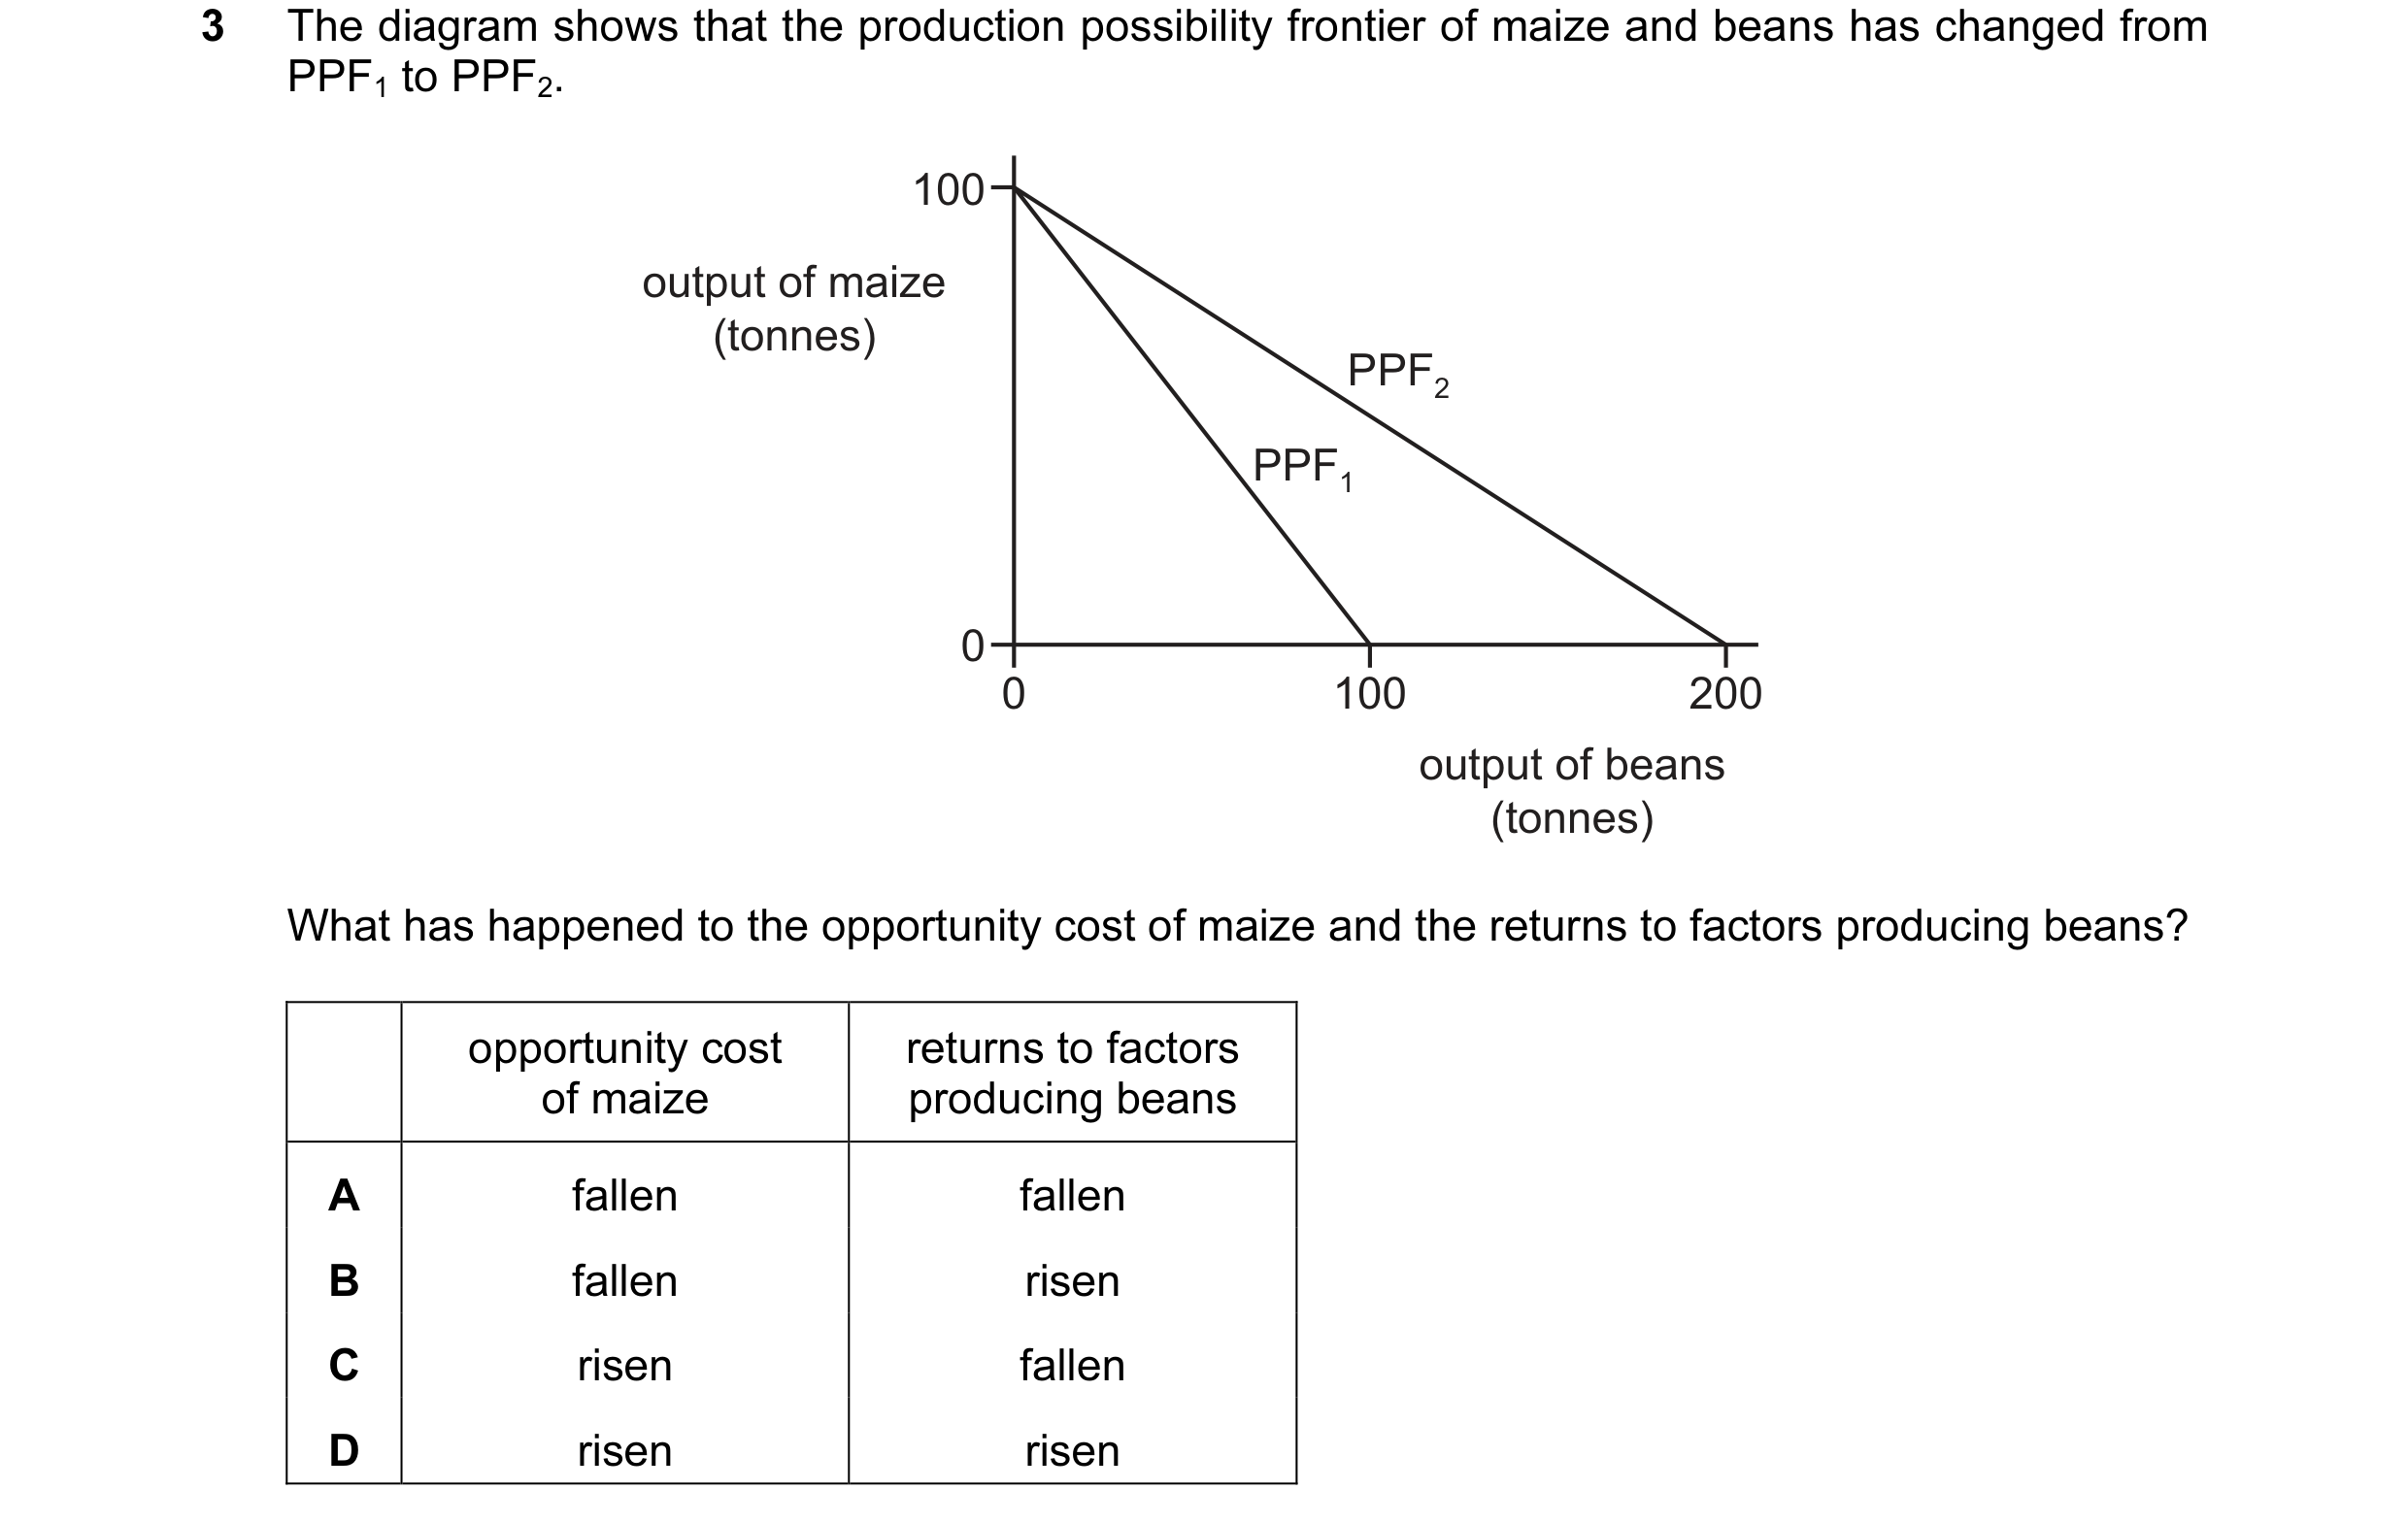
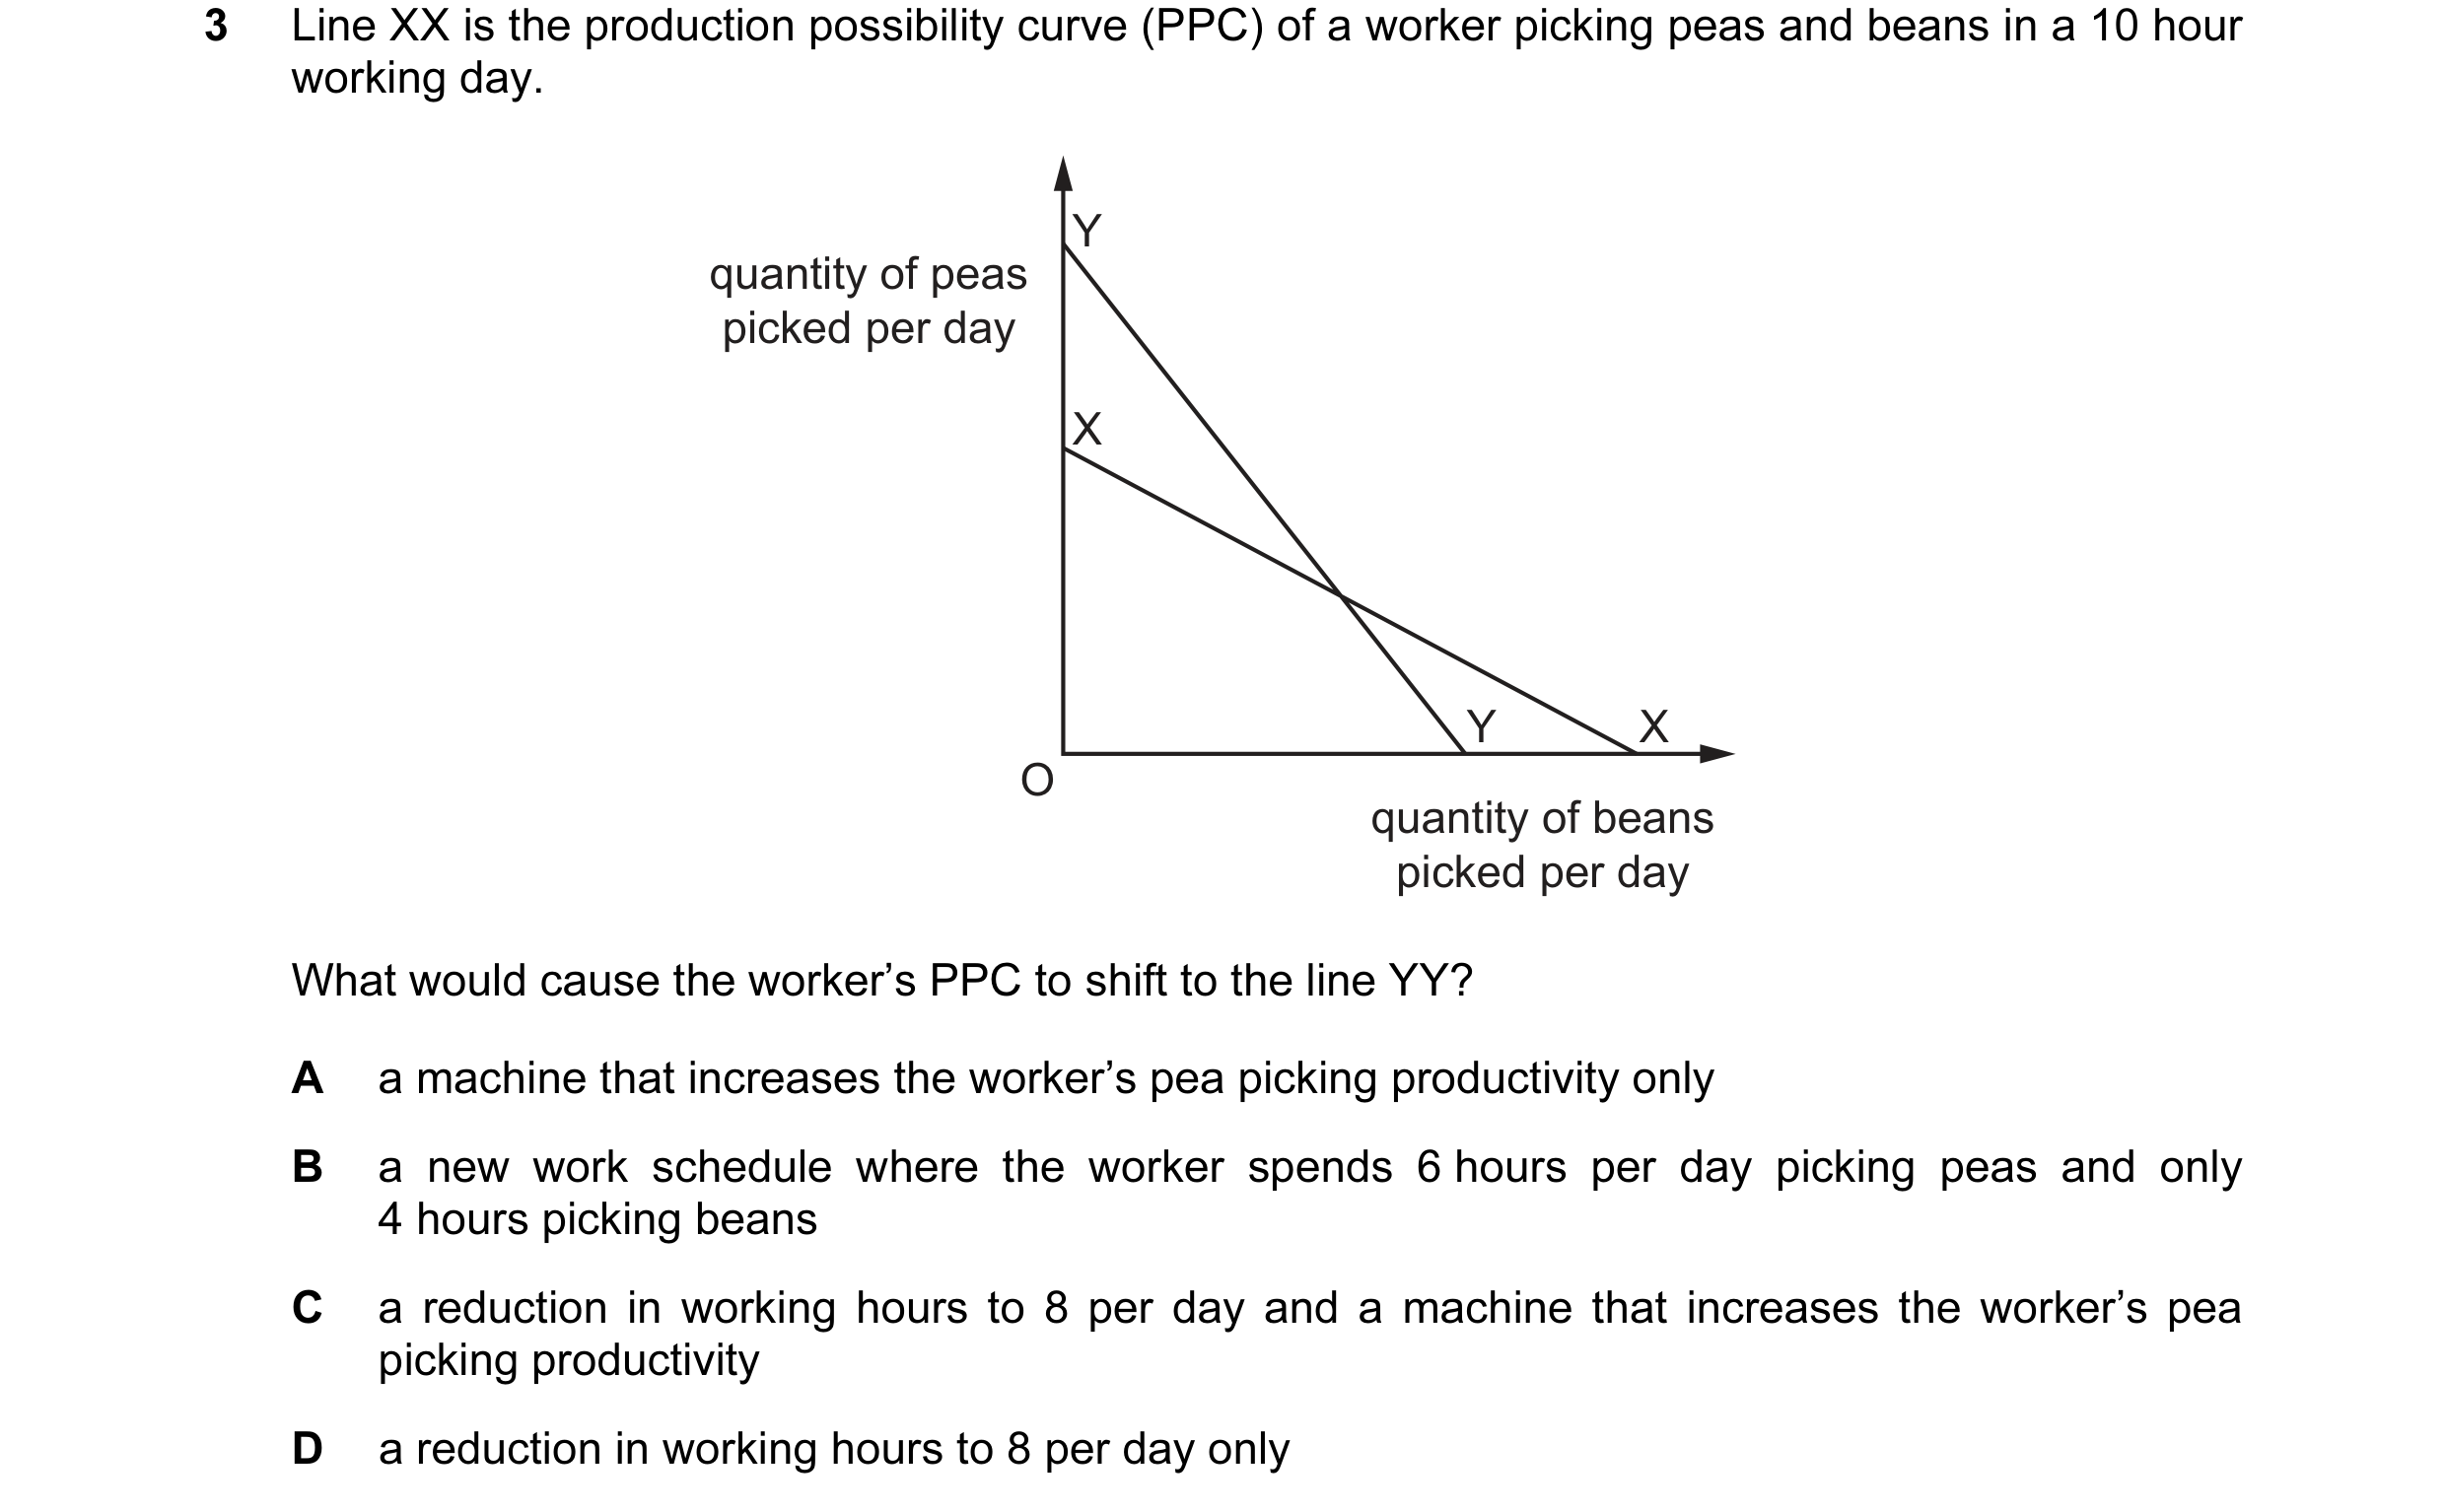 38 / 68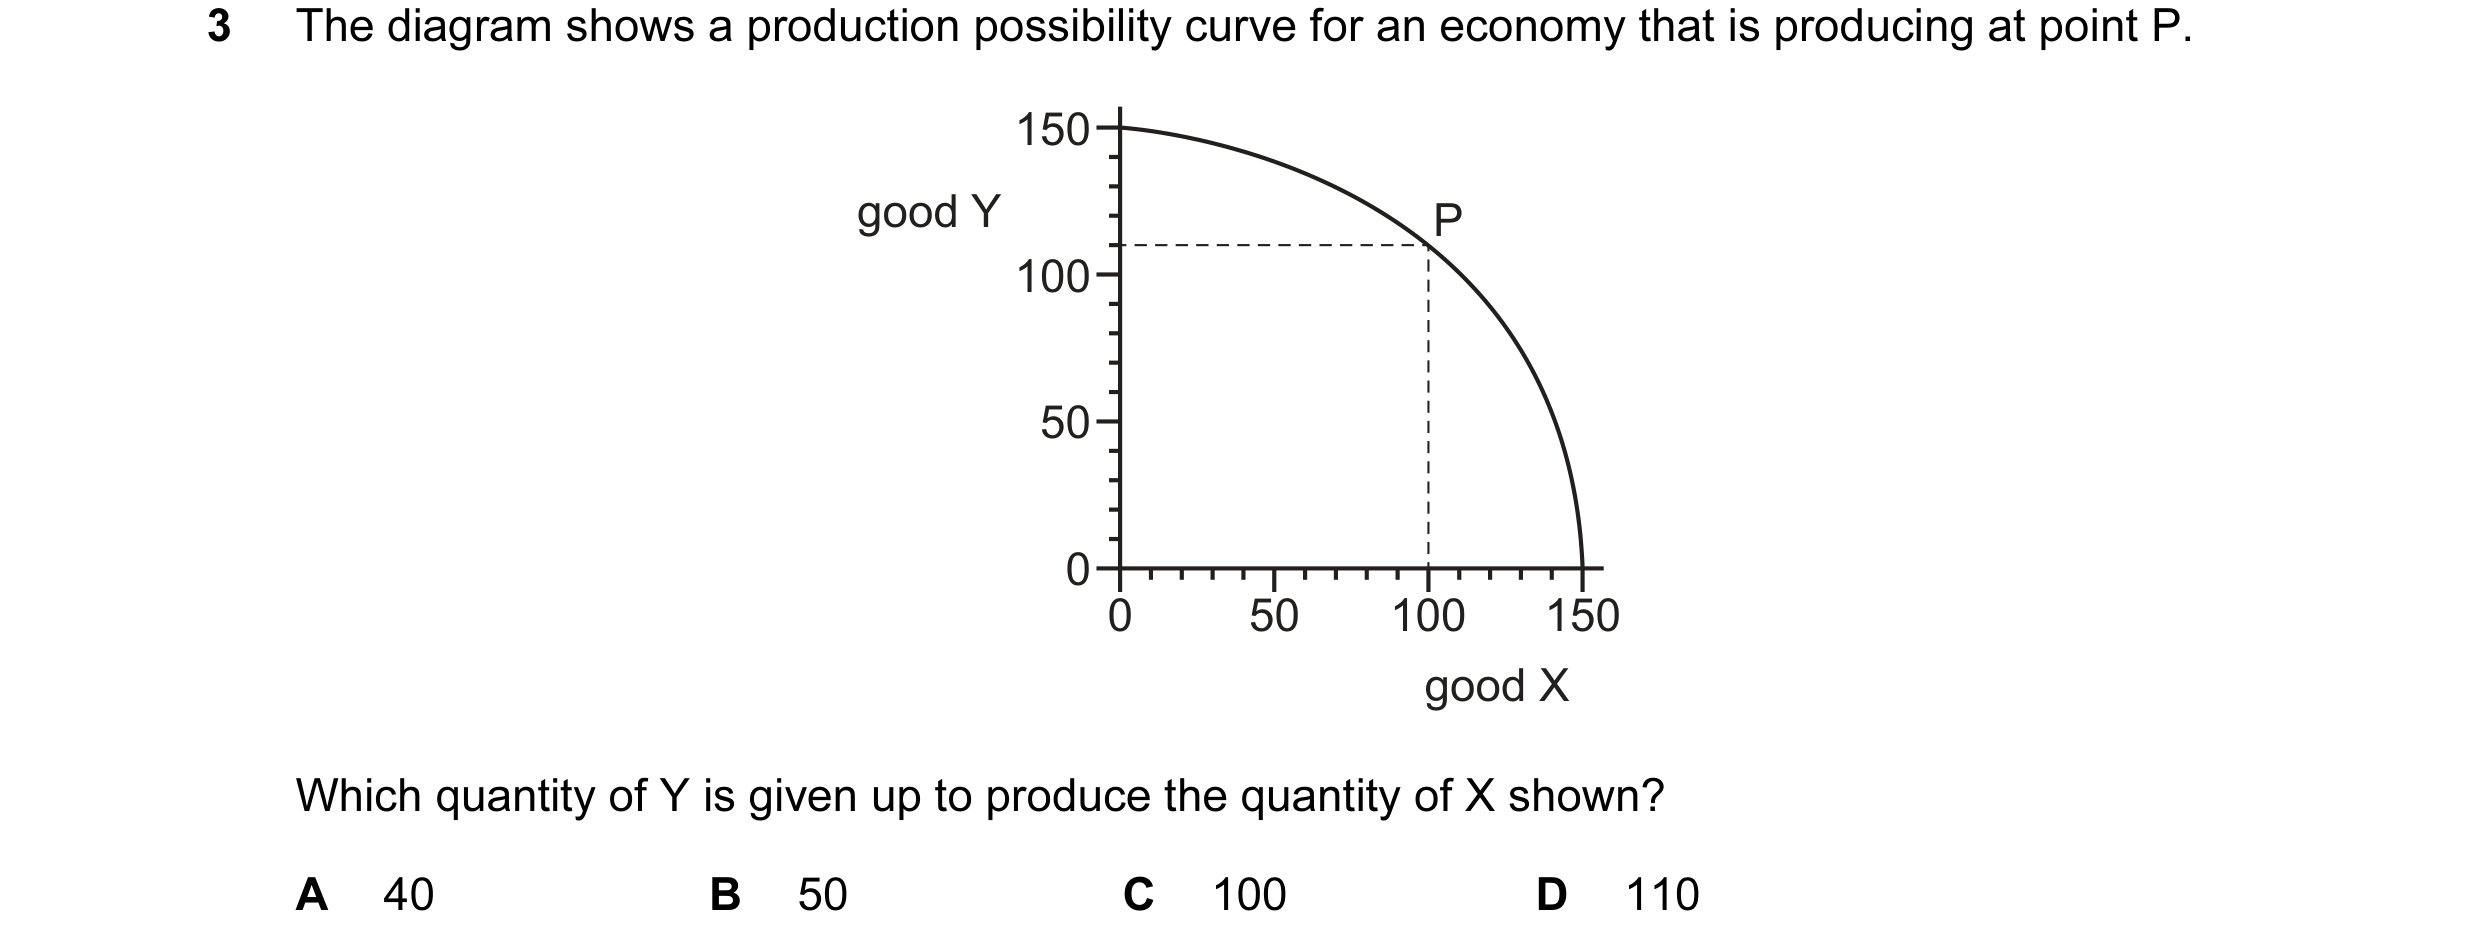
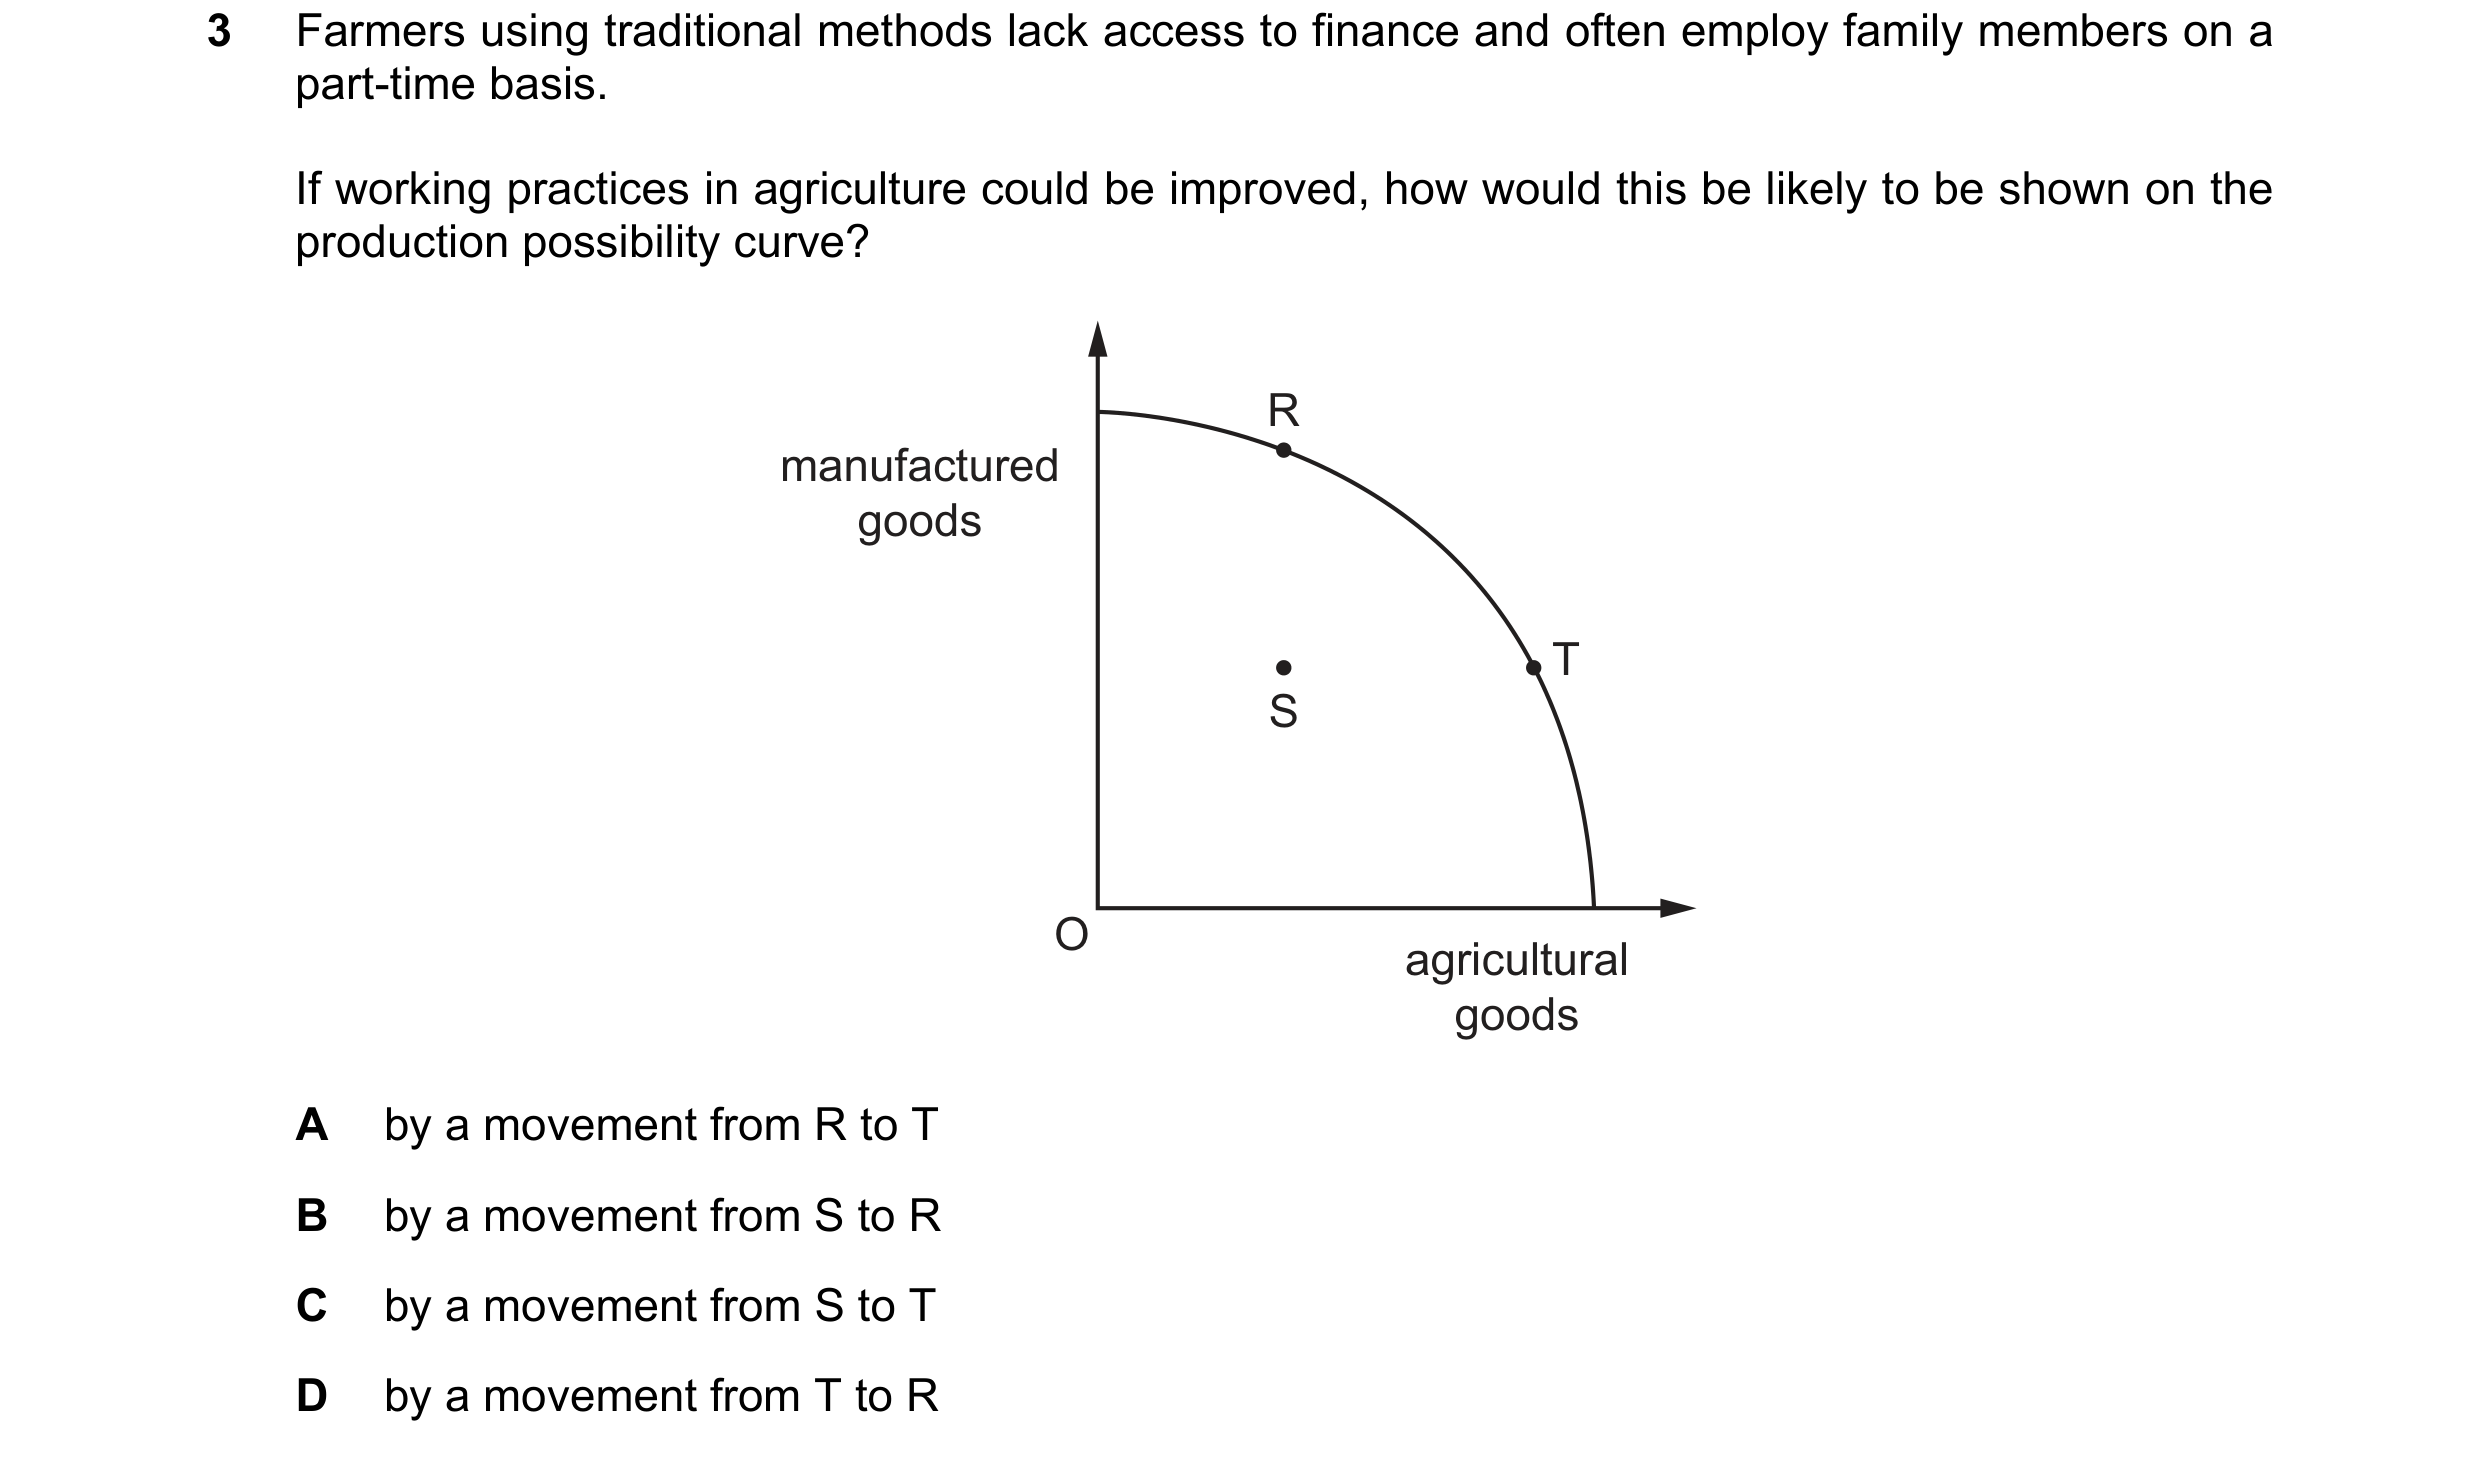 39 / 68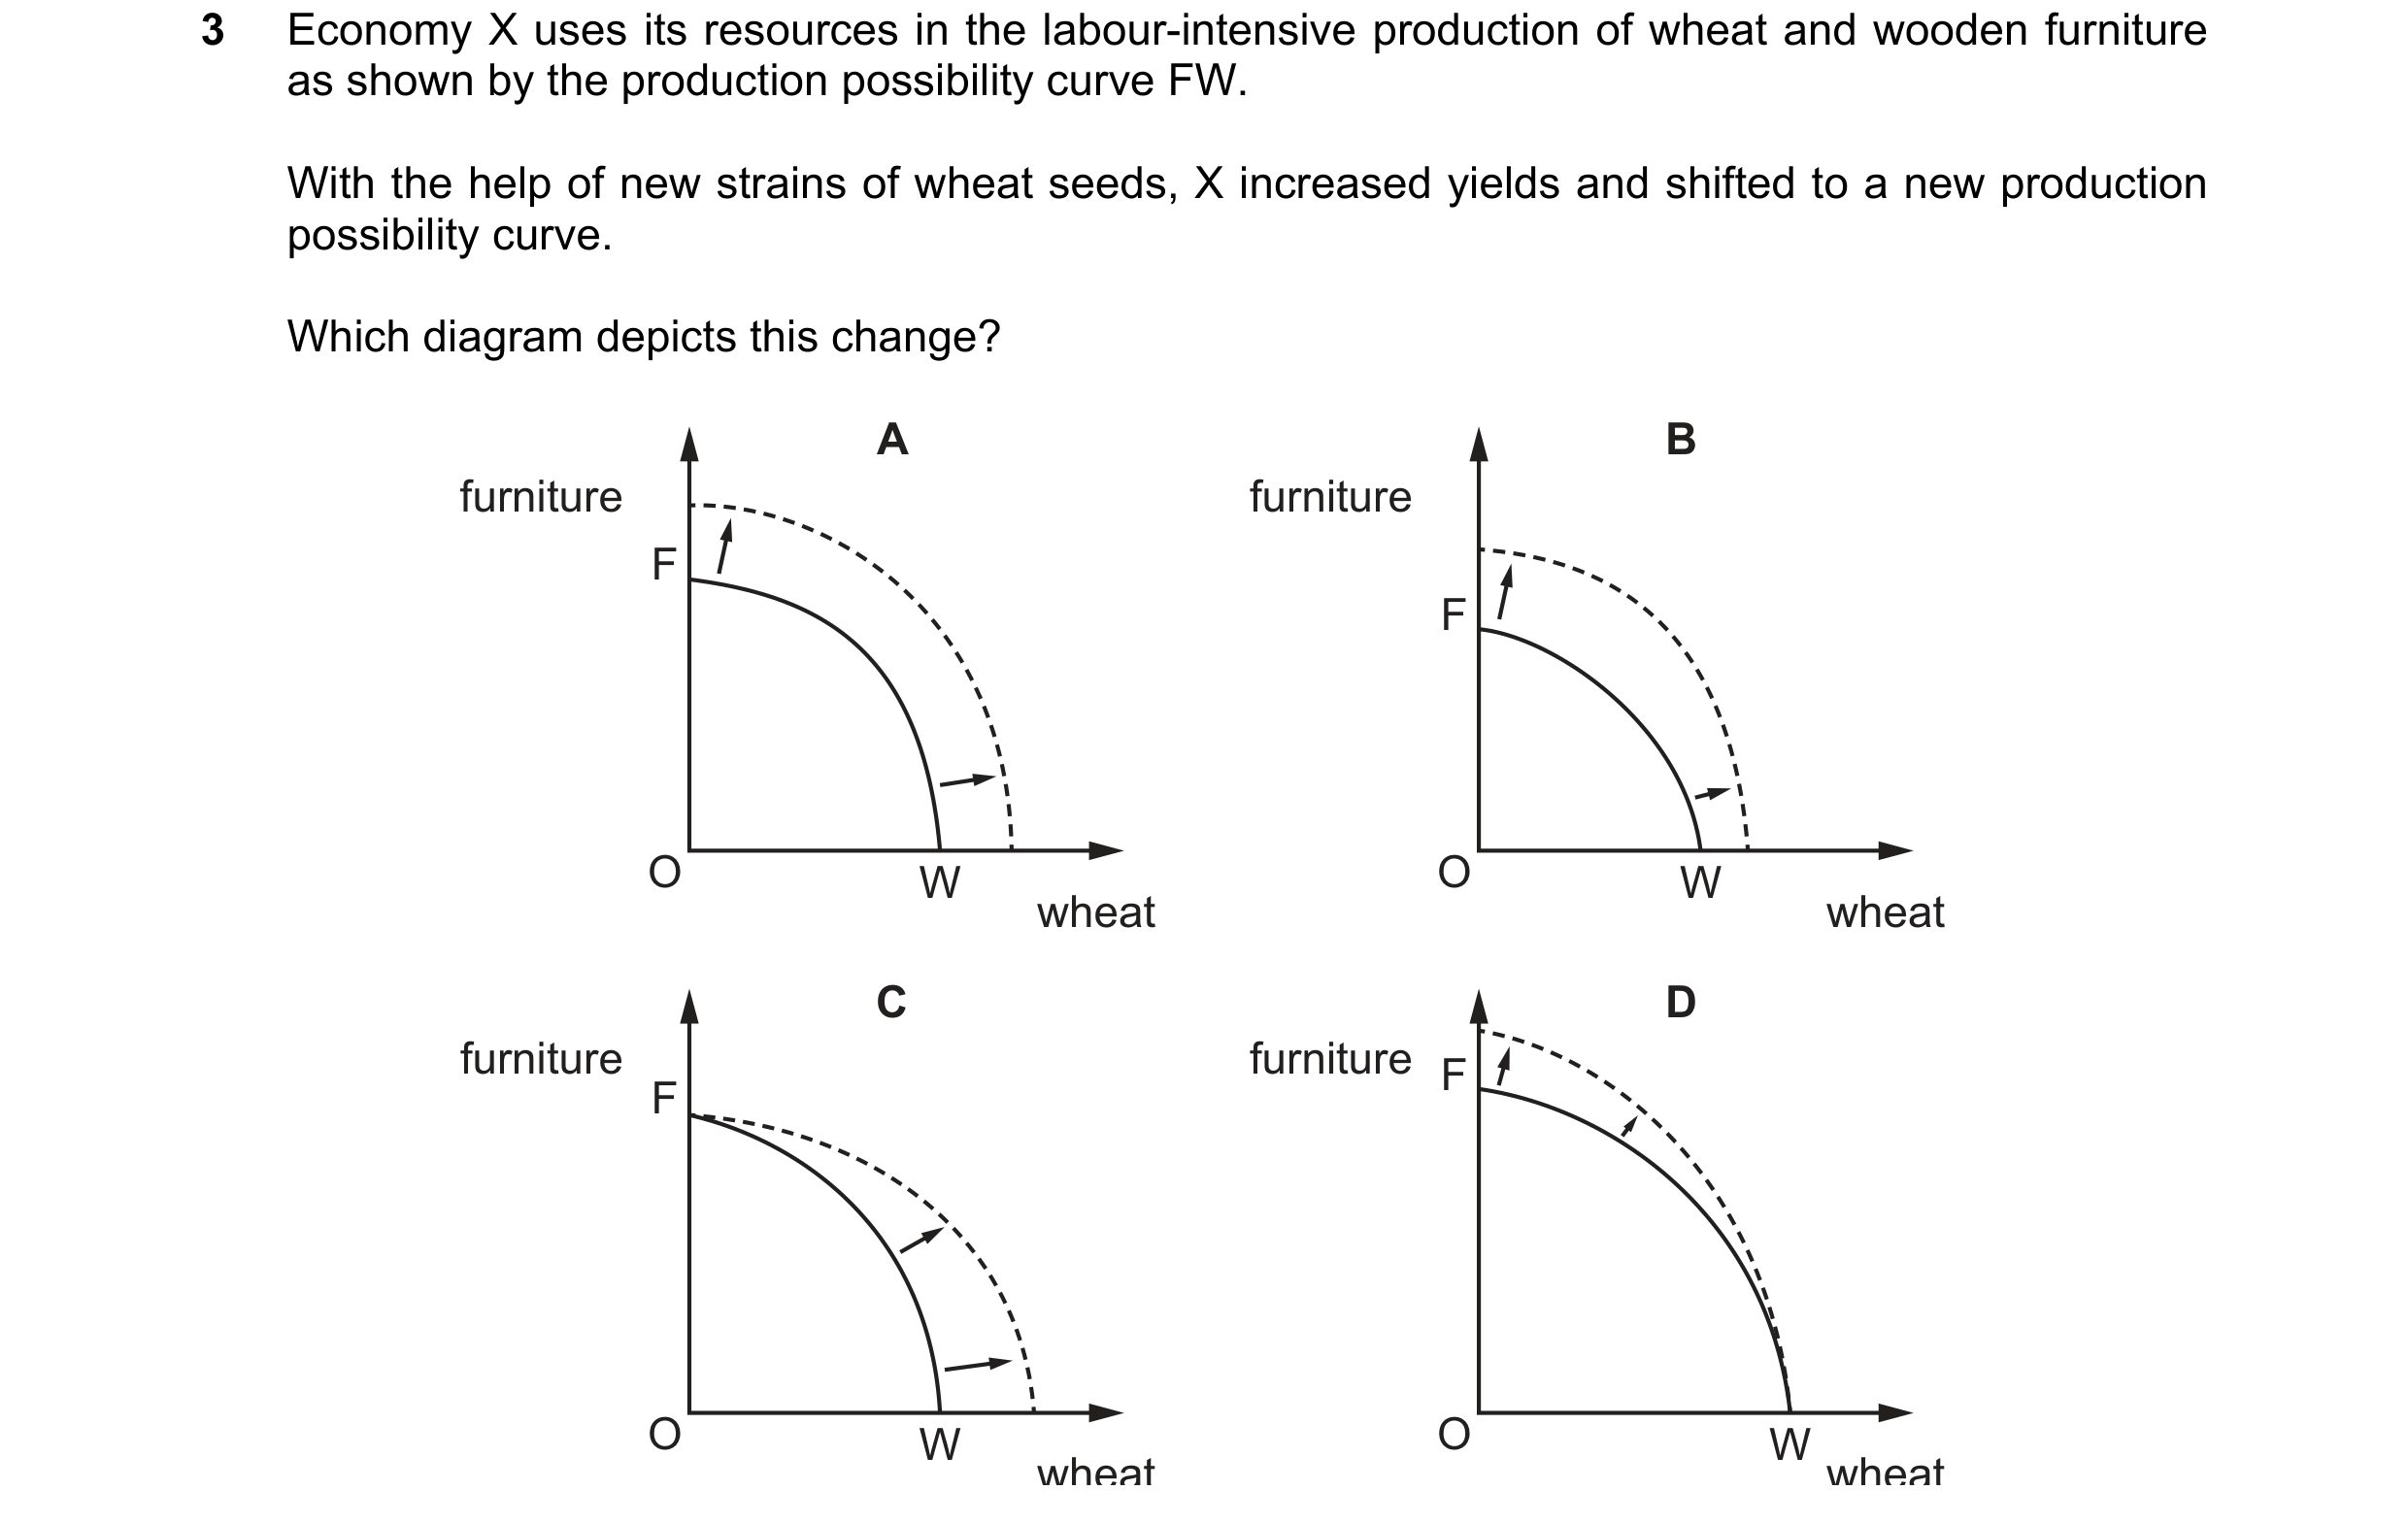
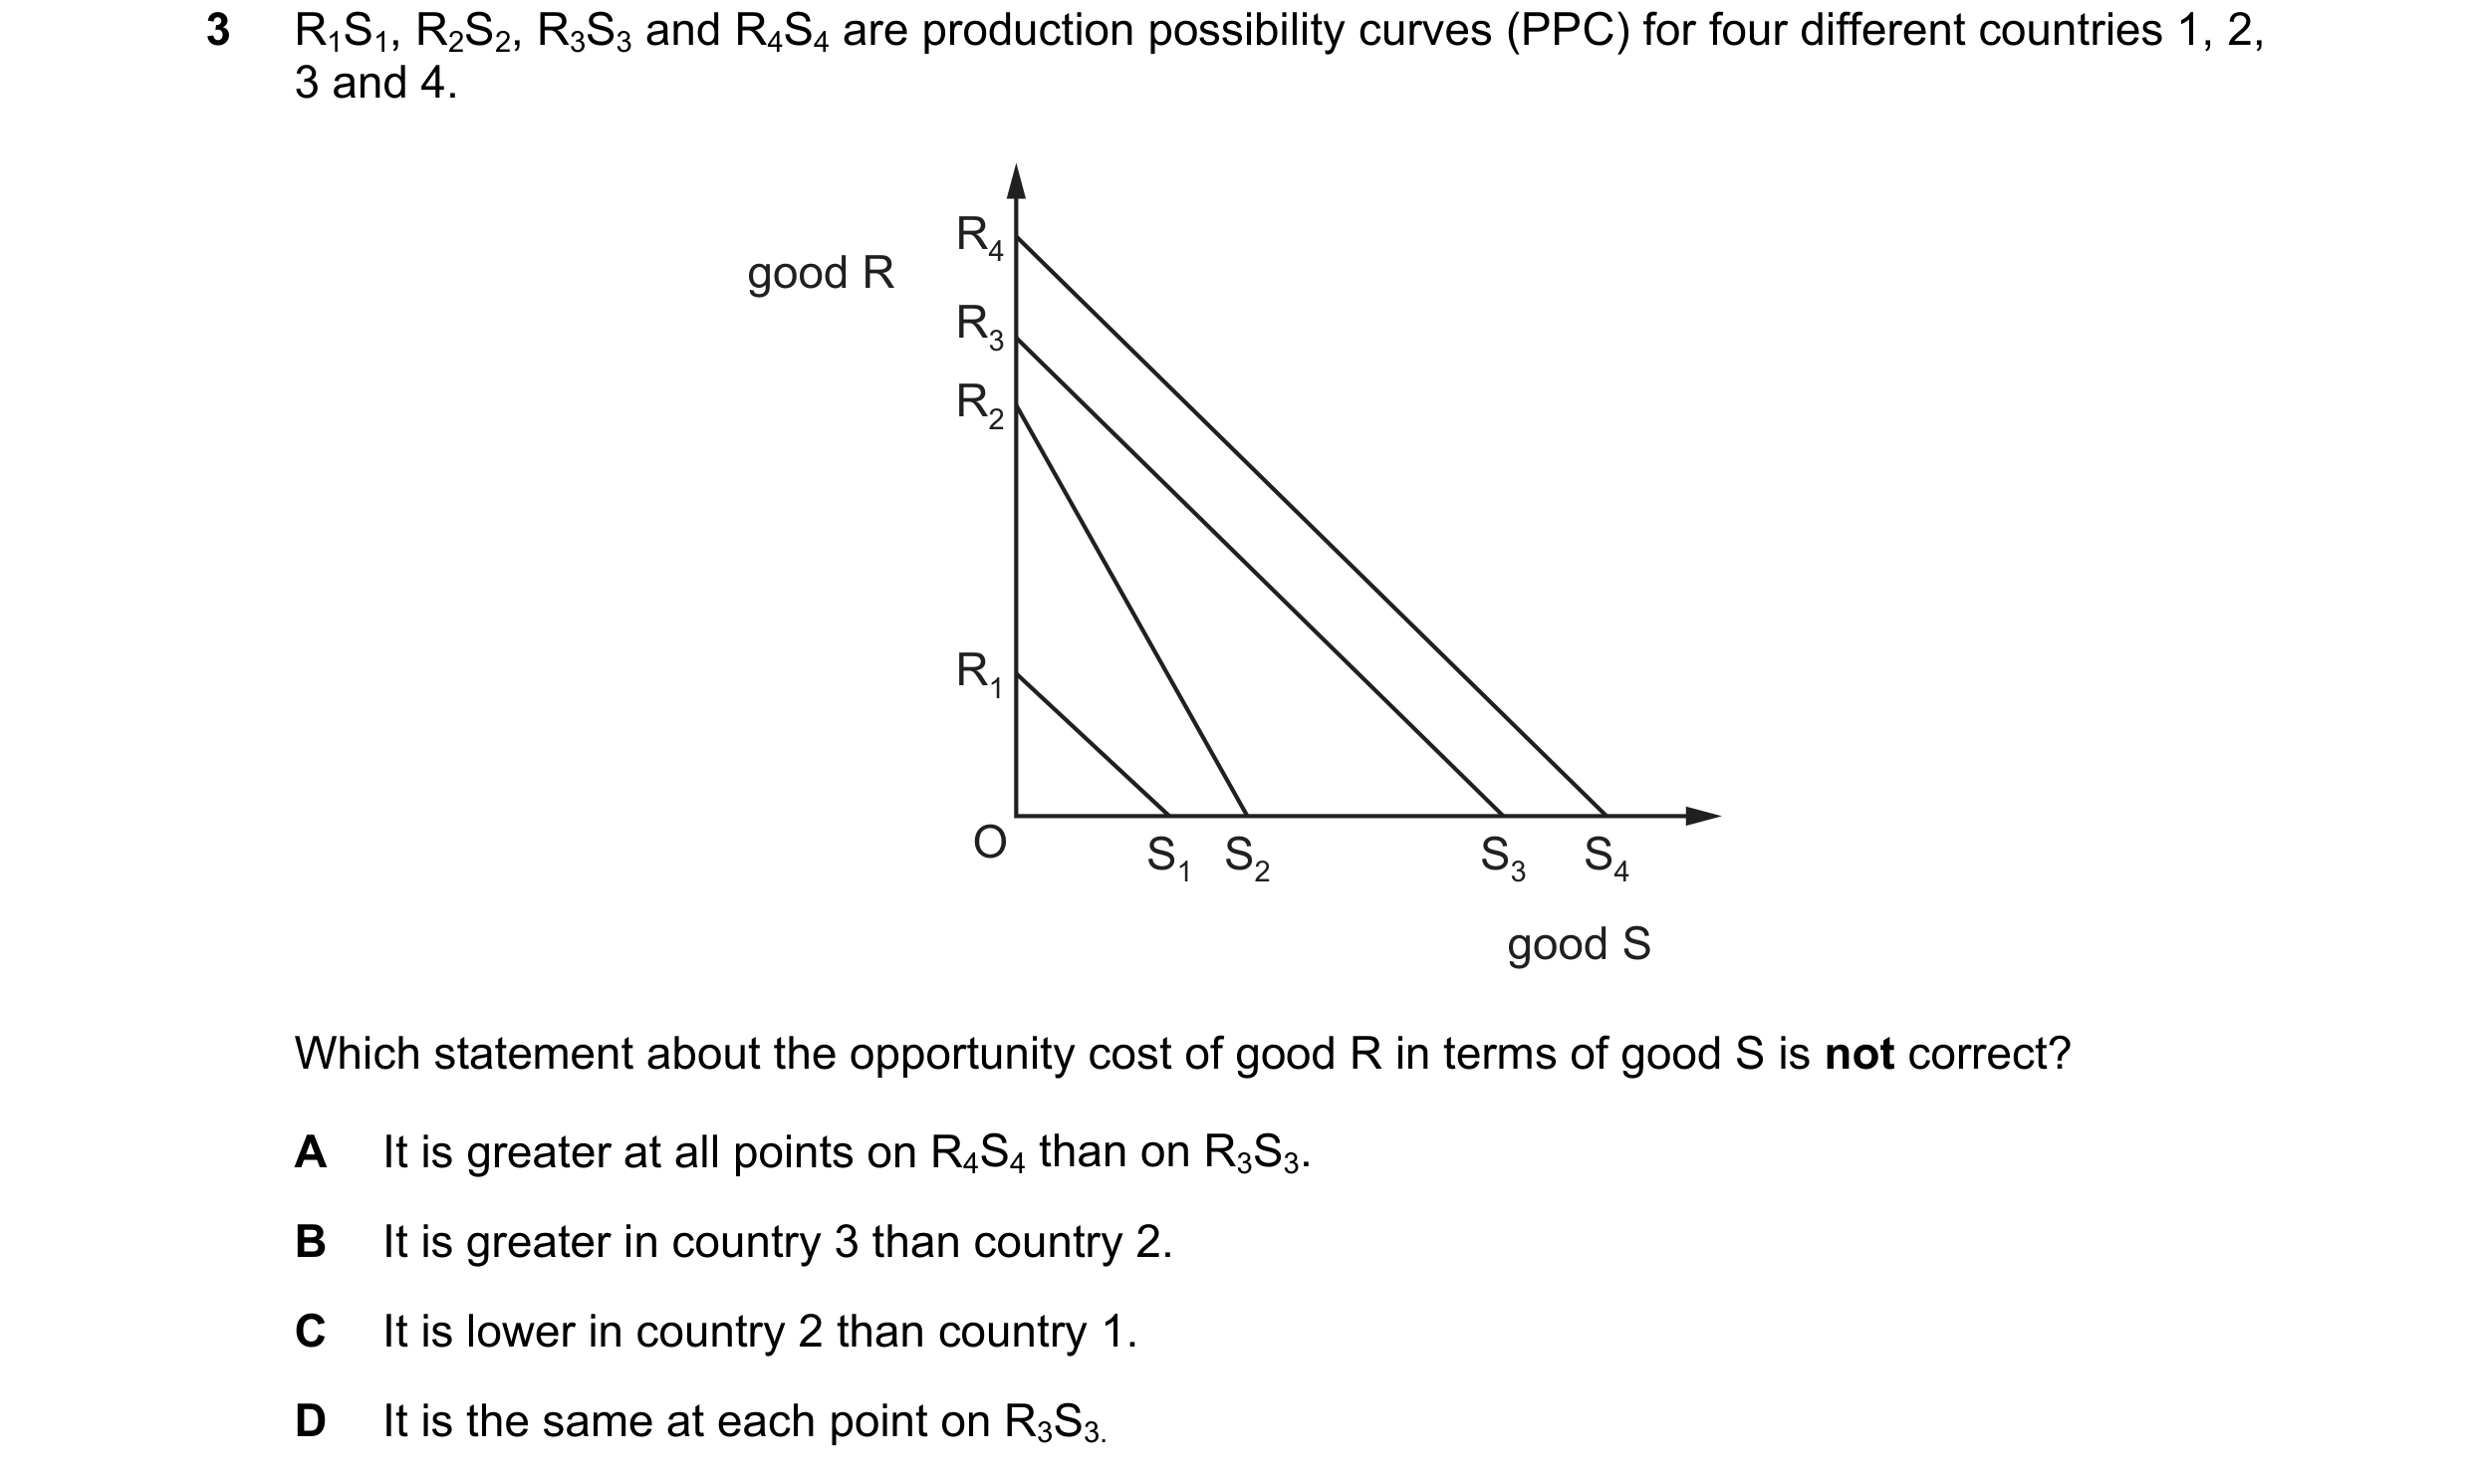 40 / 68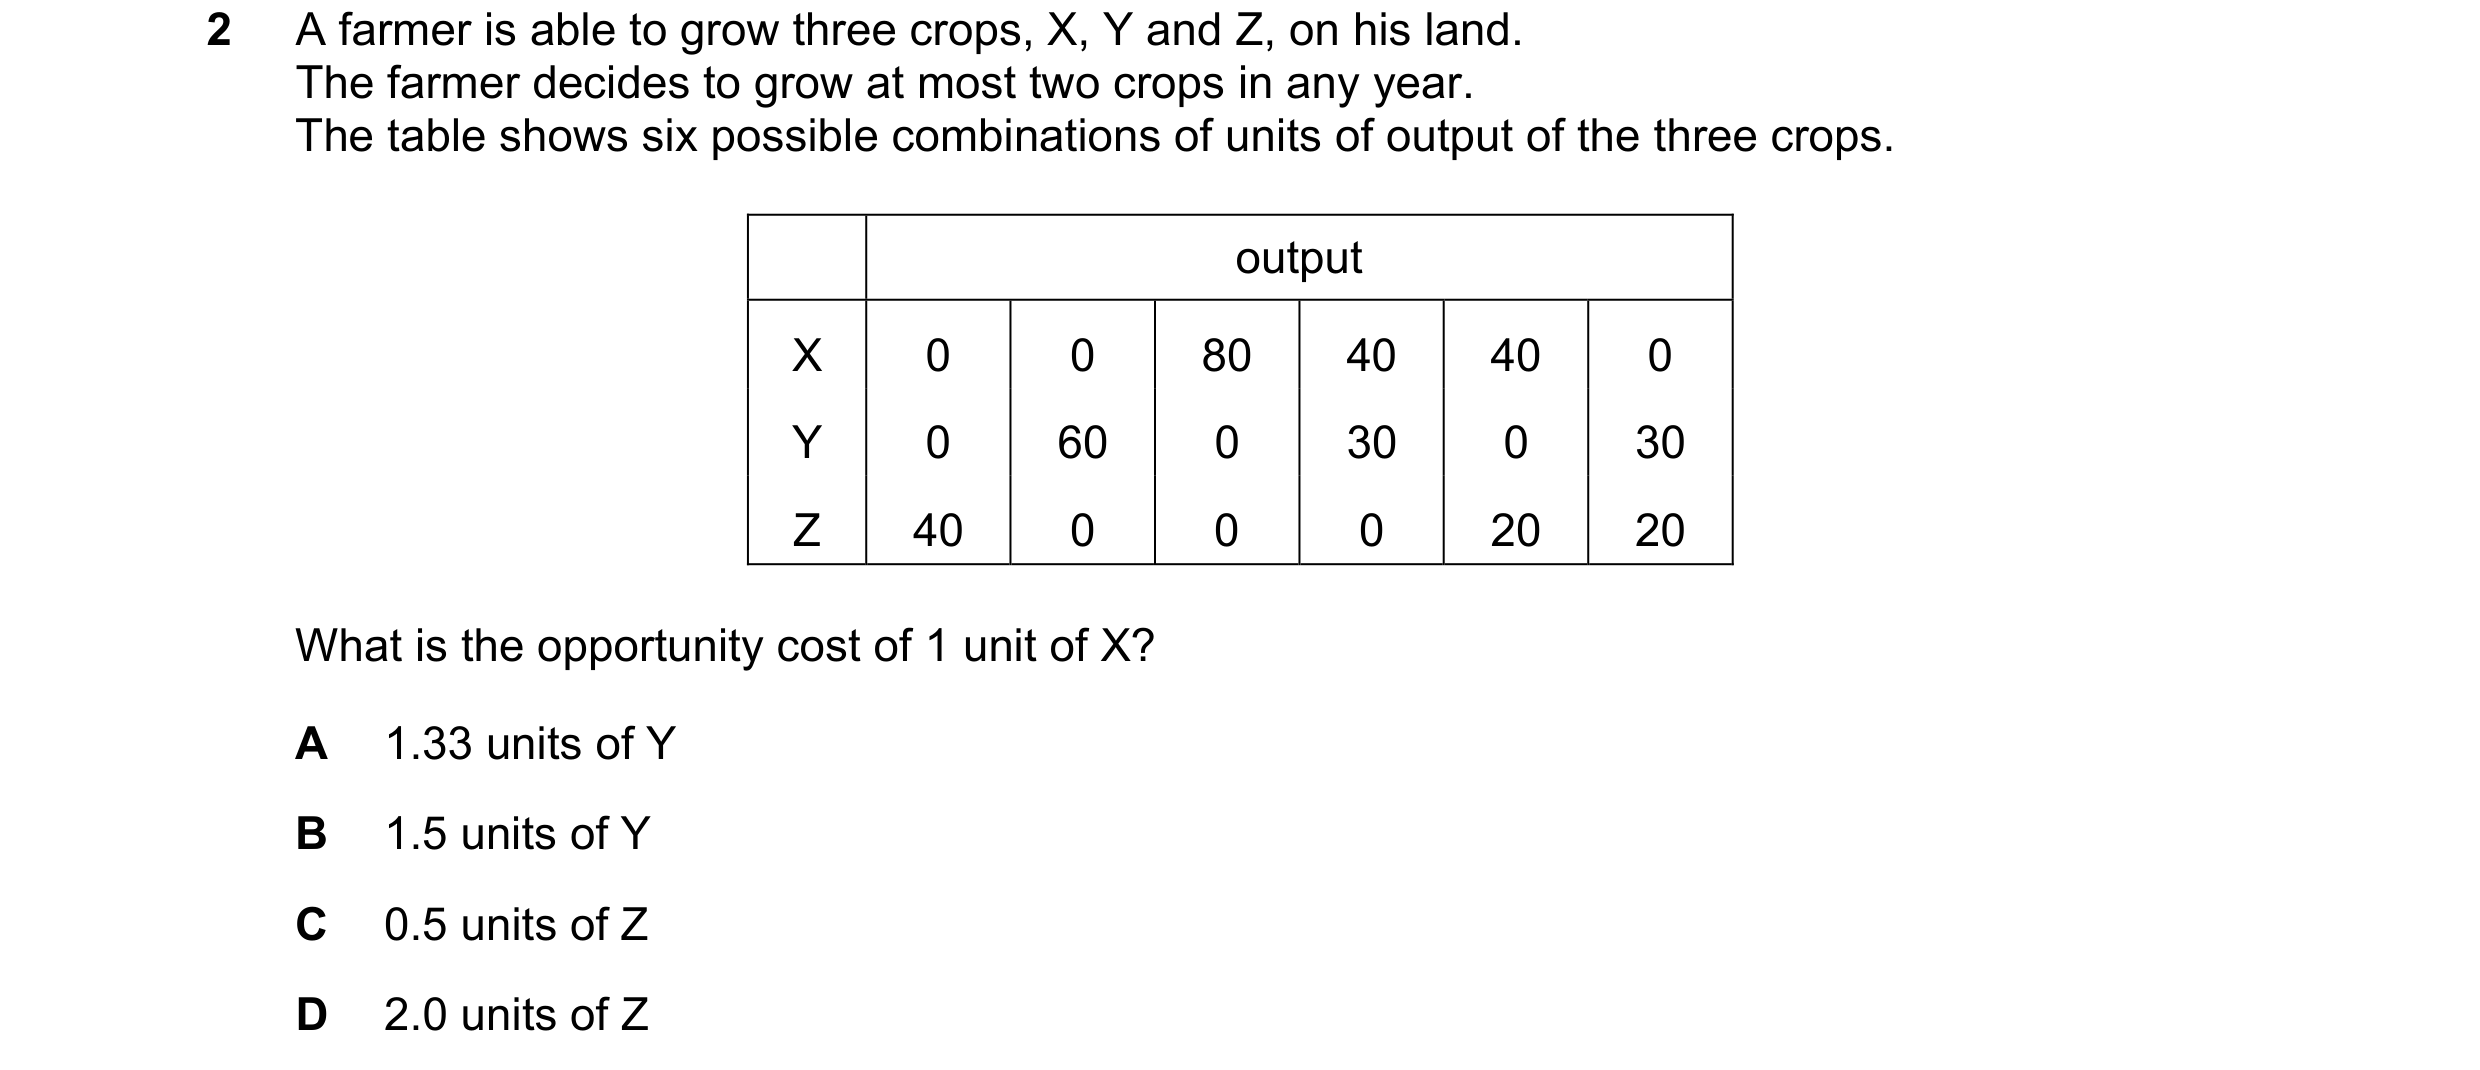
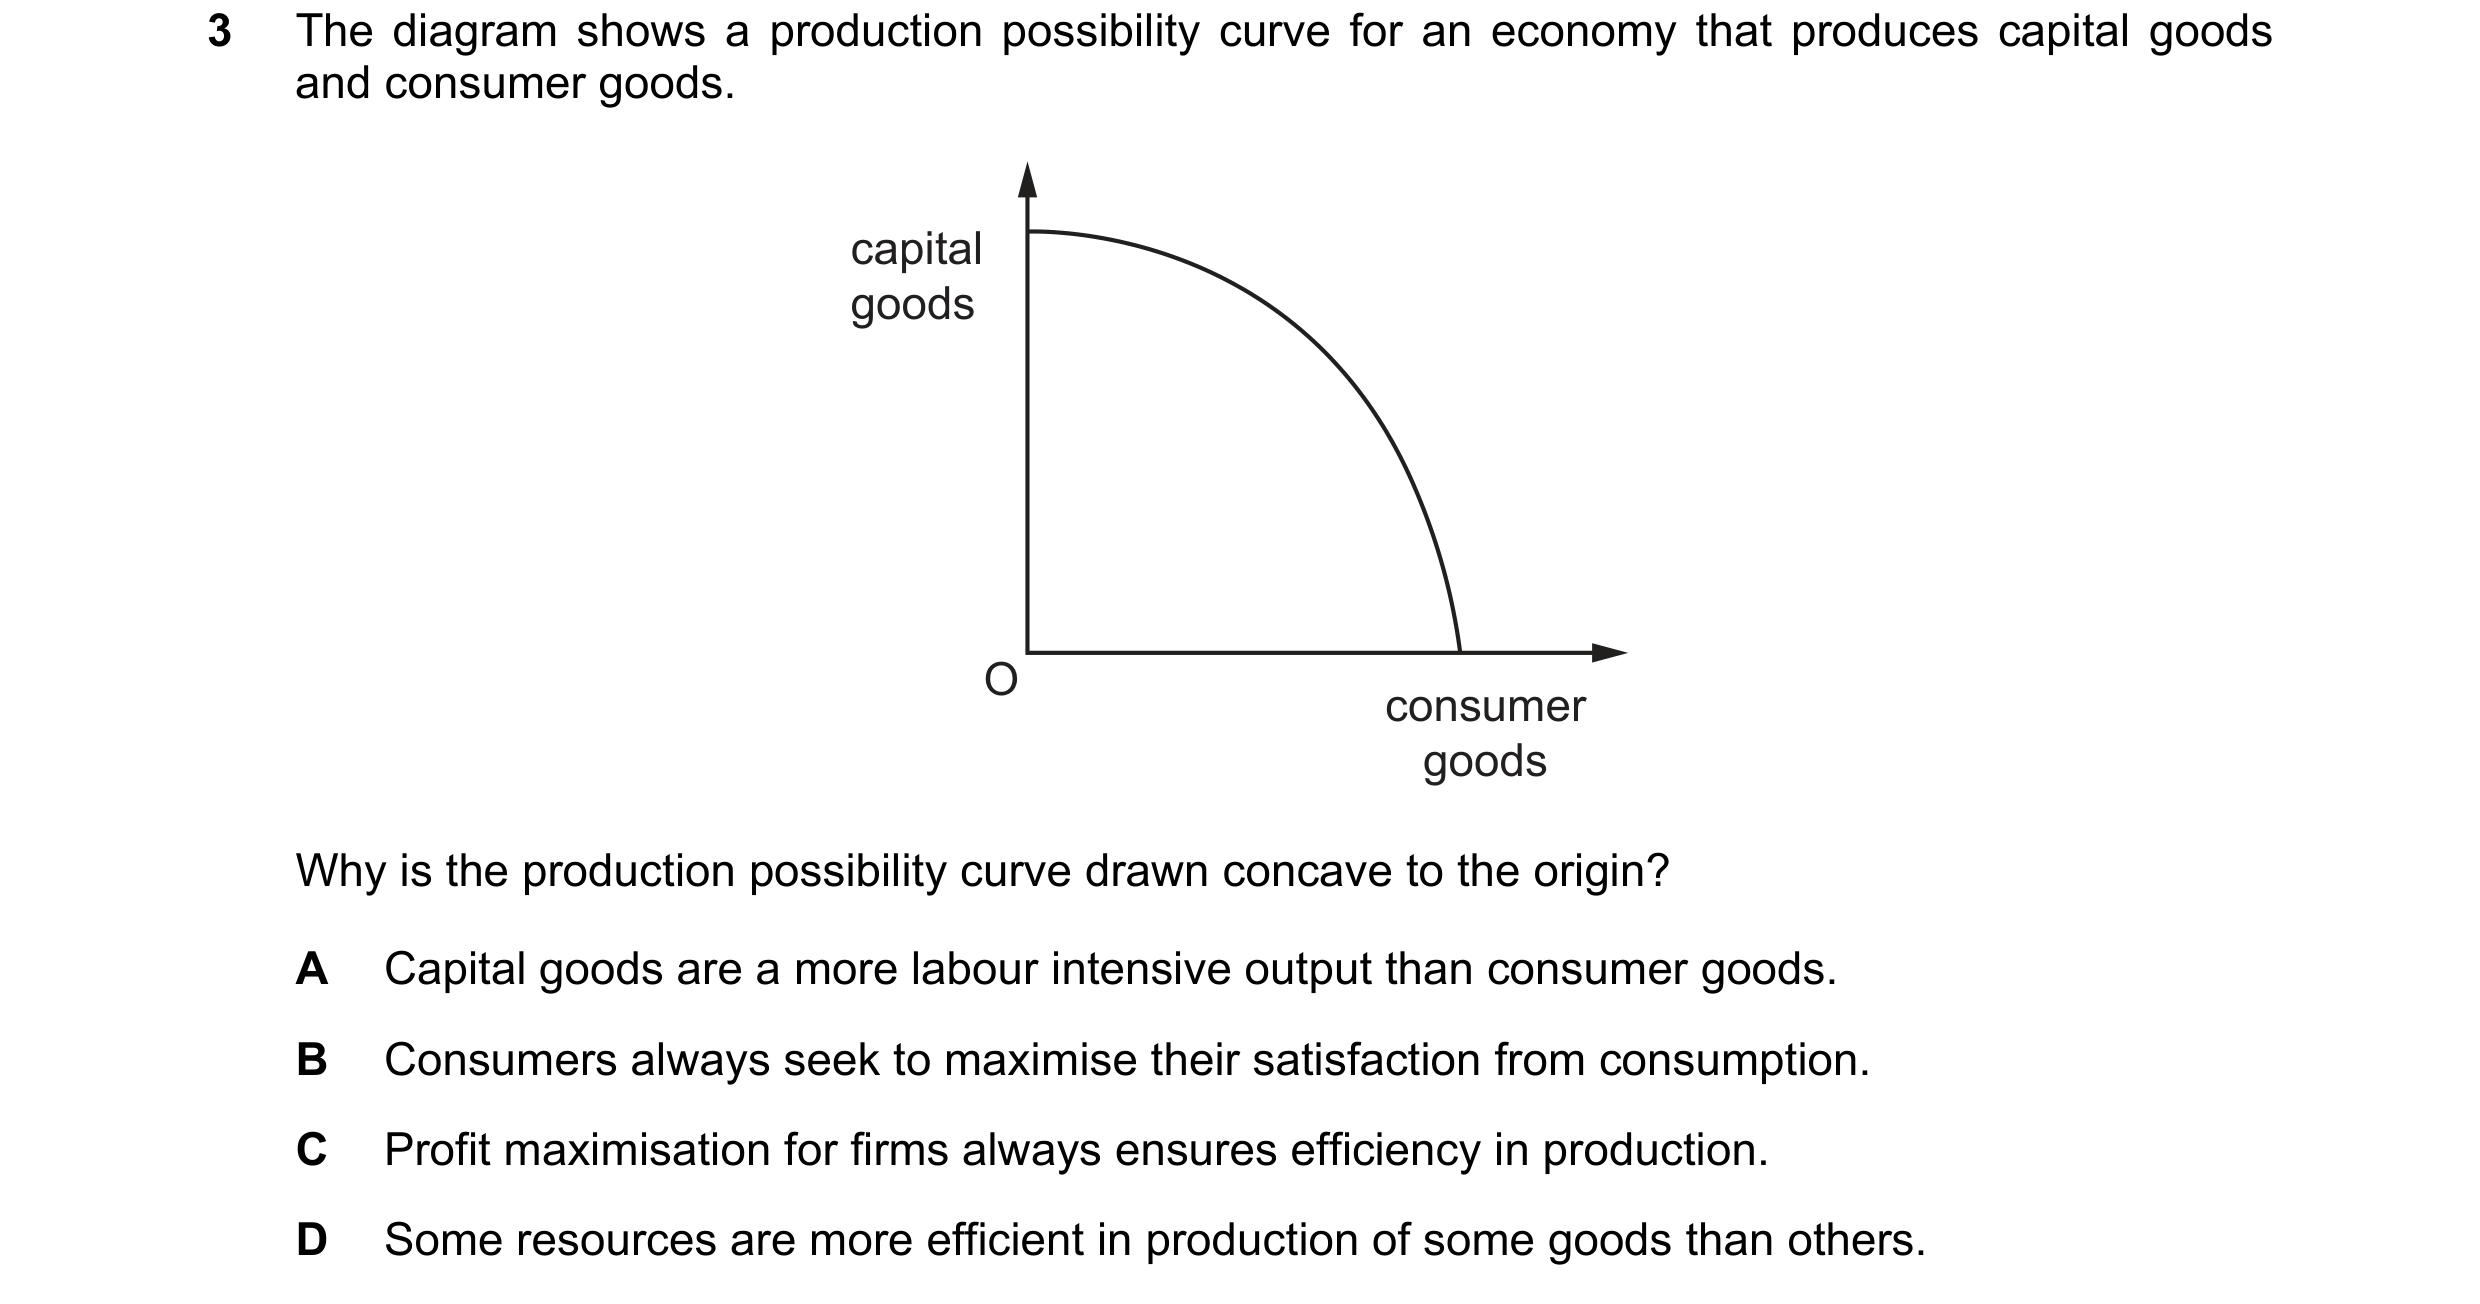
 41 / 68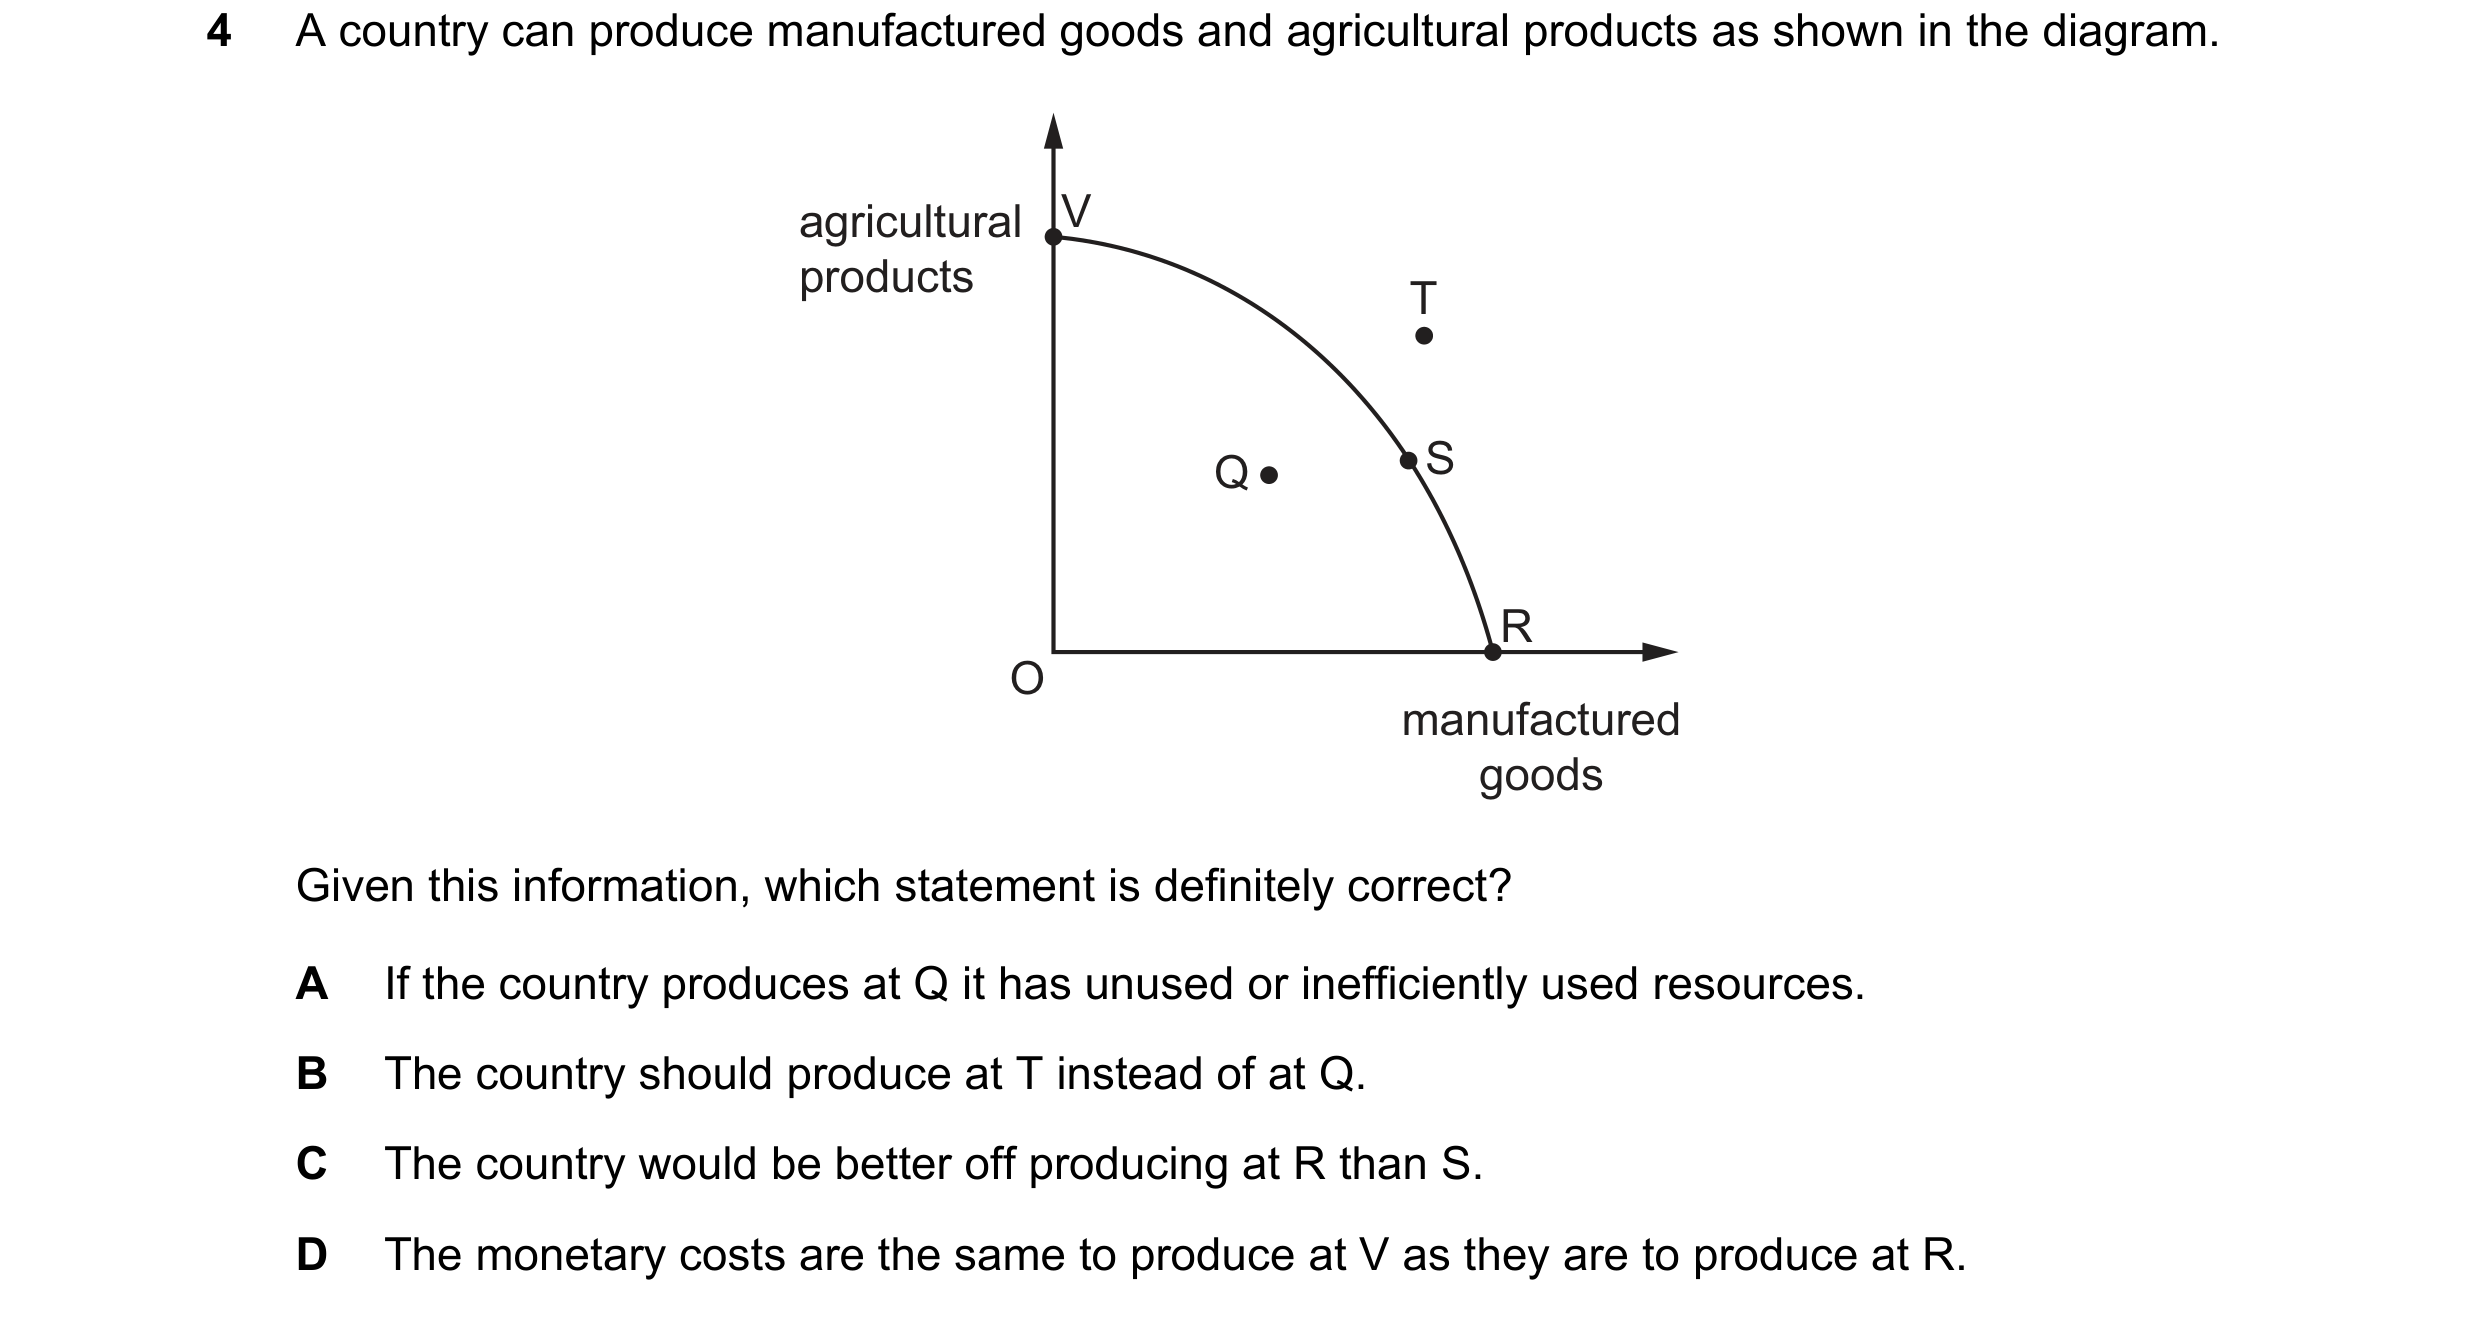
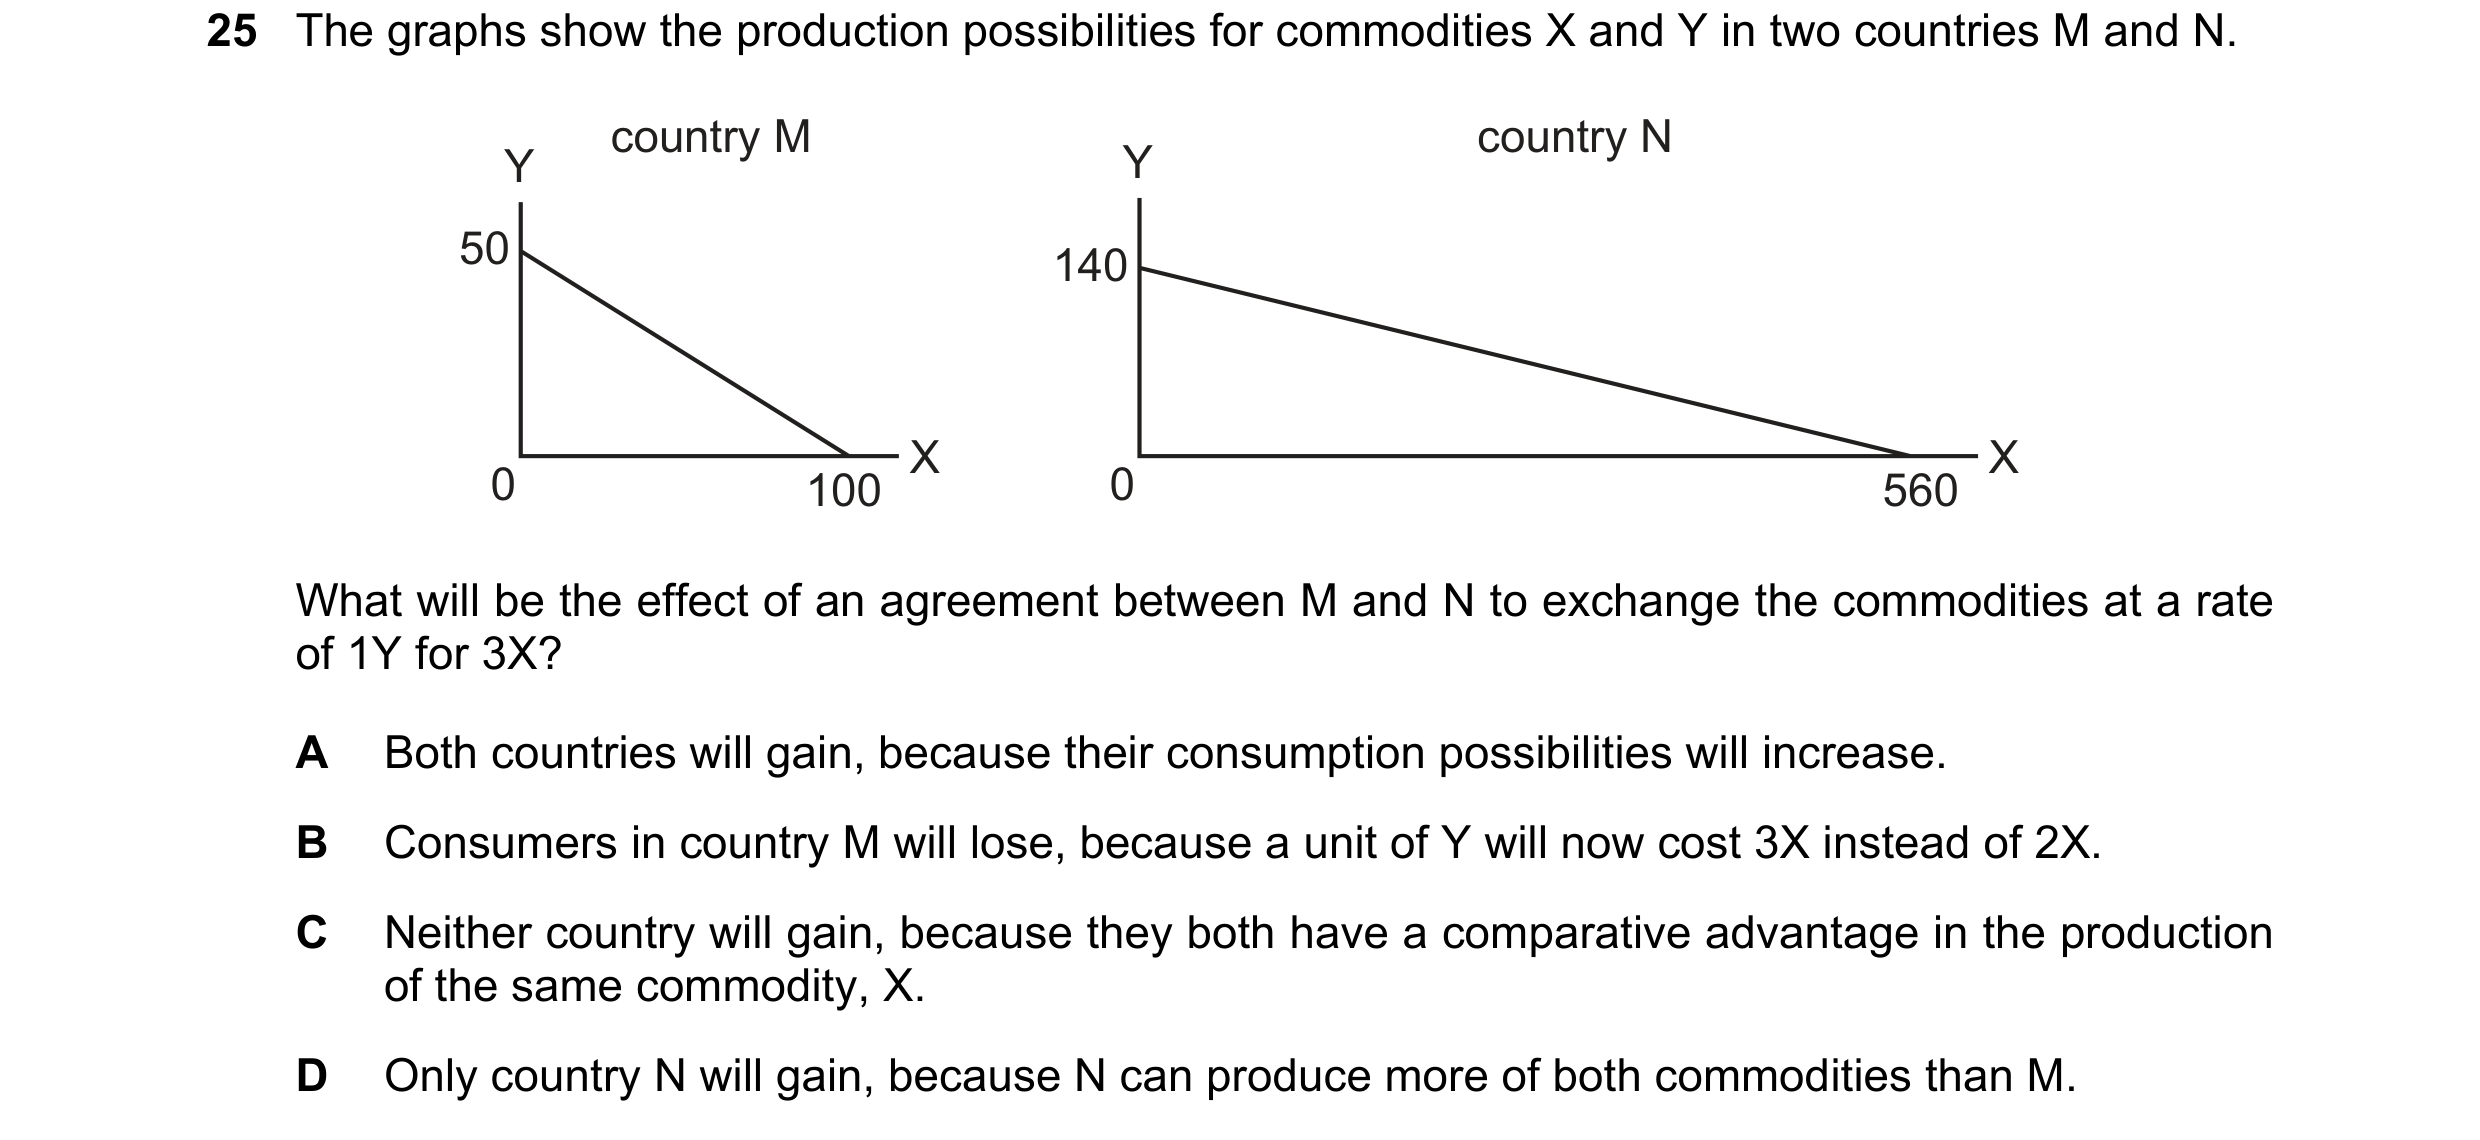 42 / 68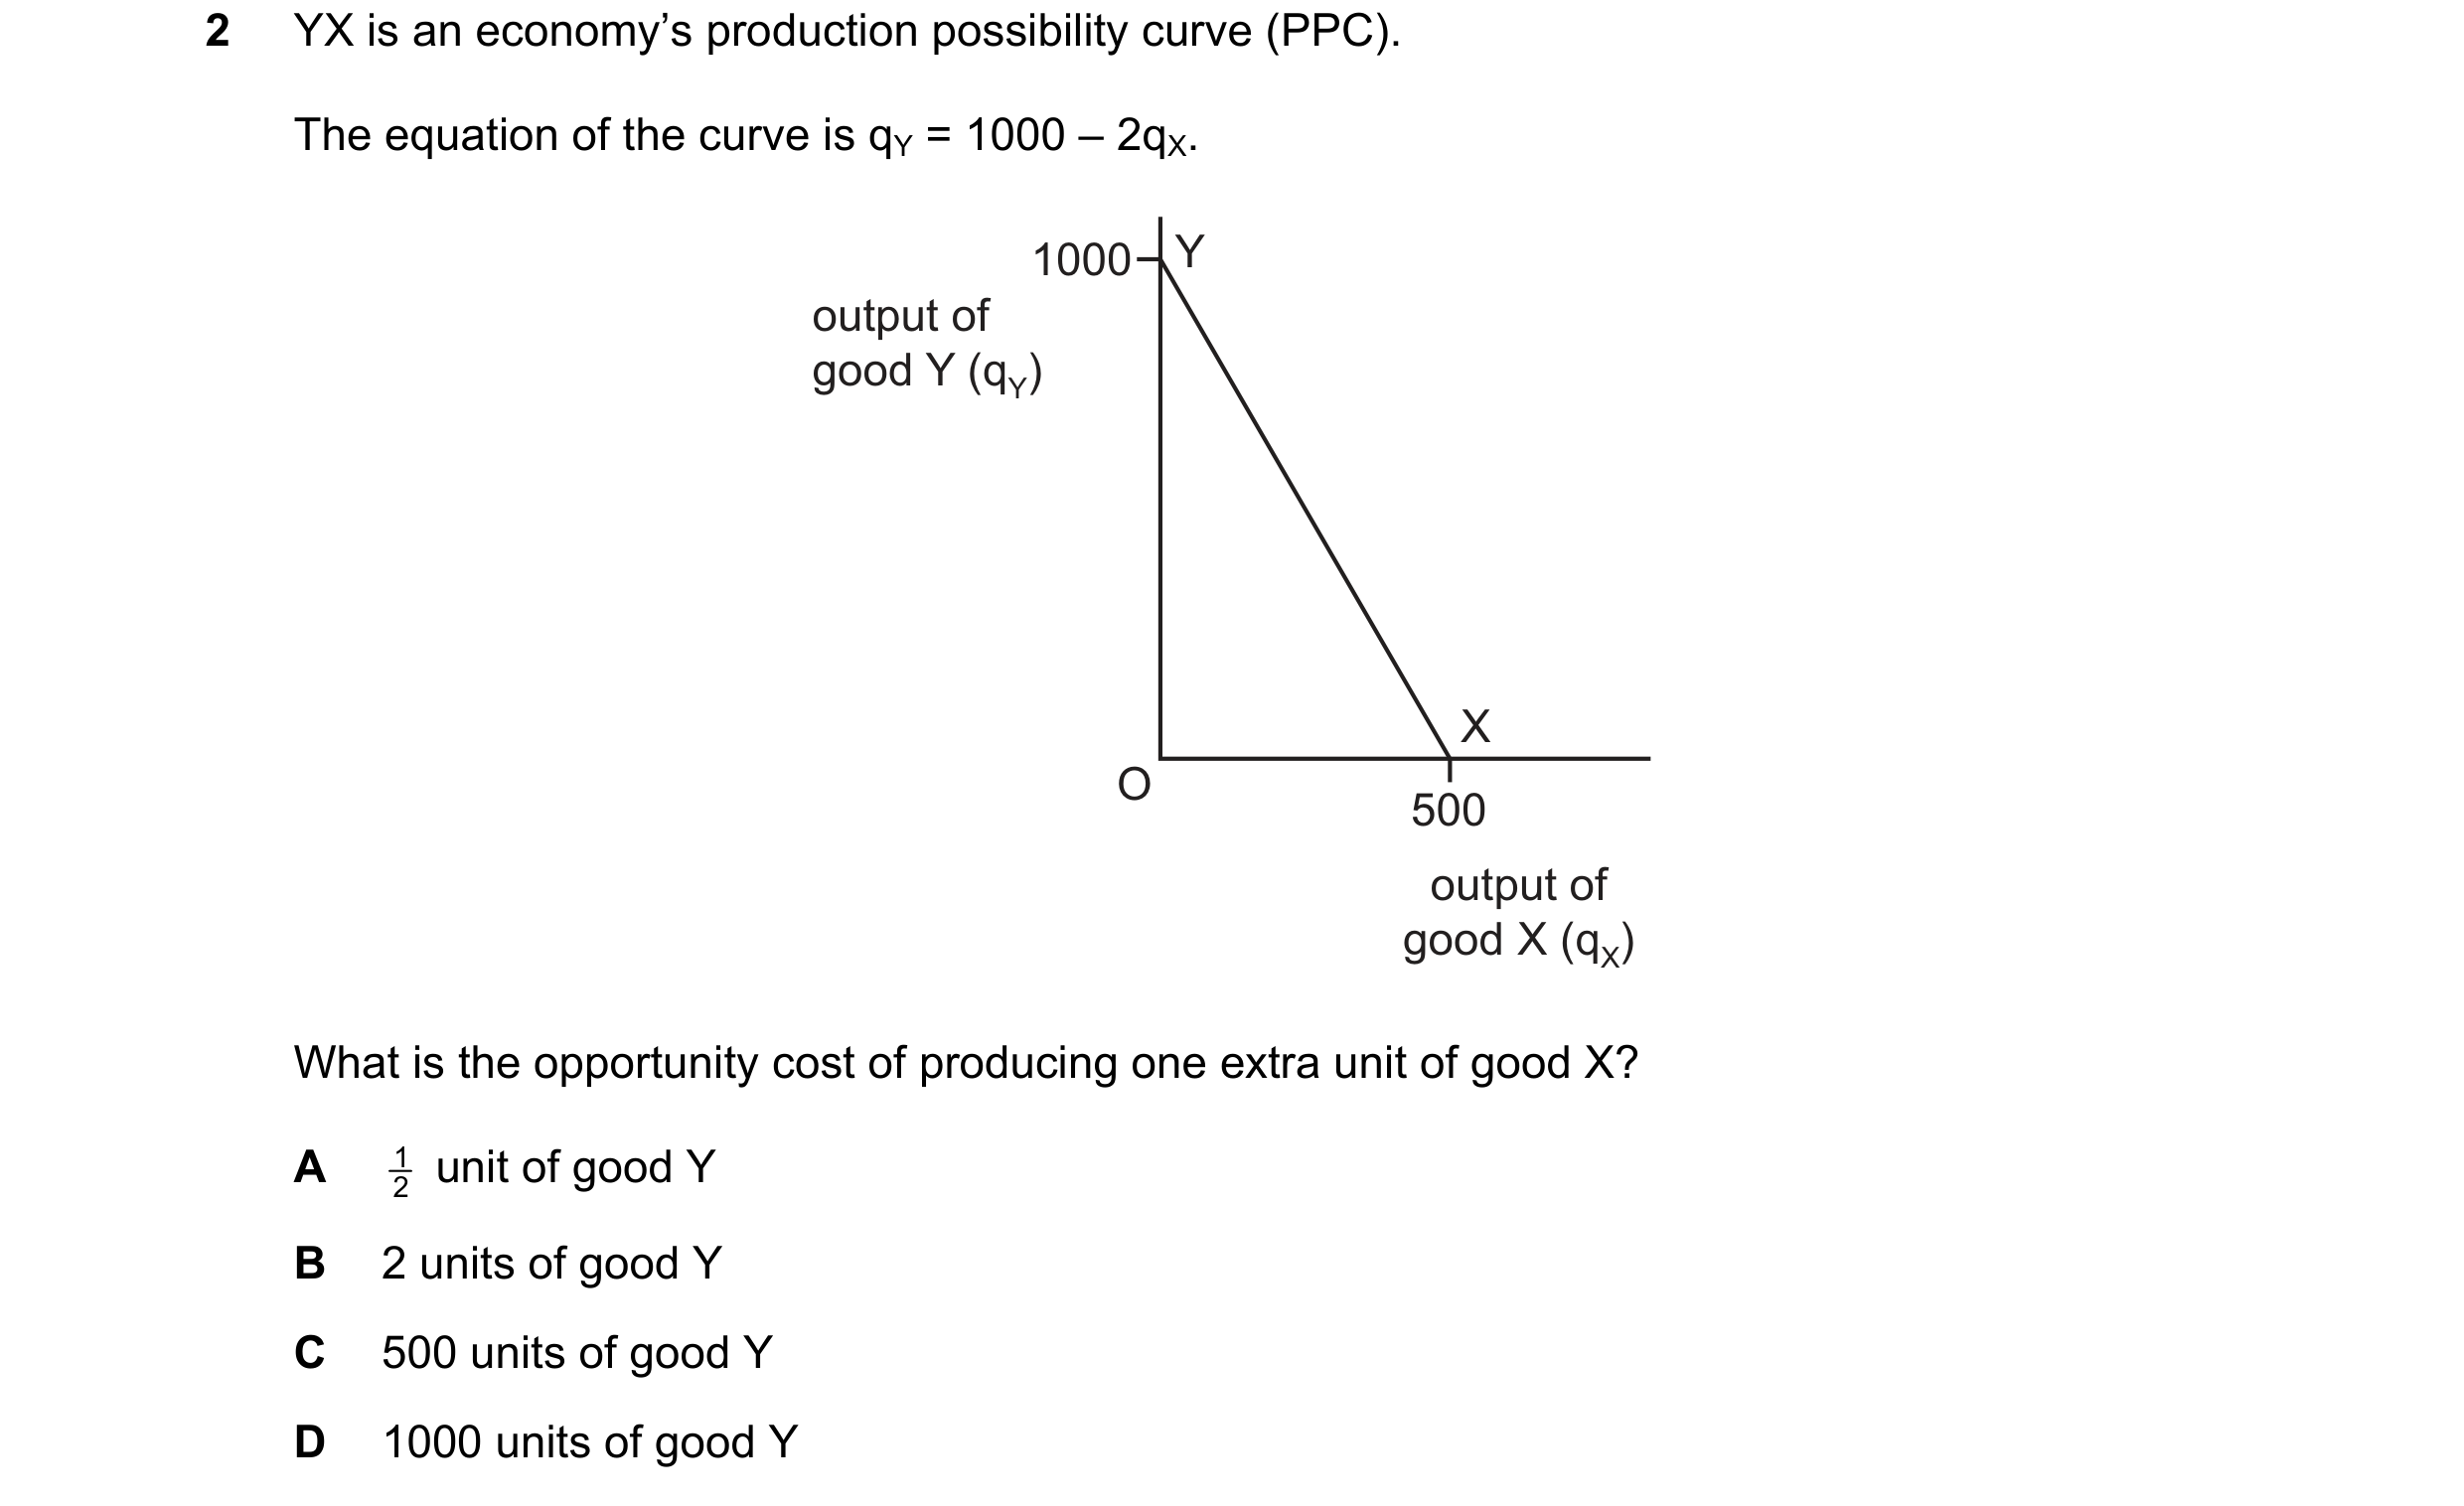
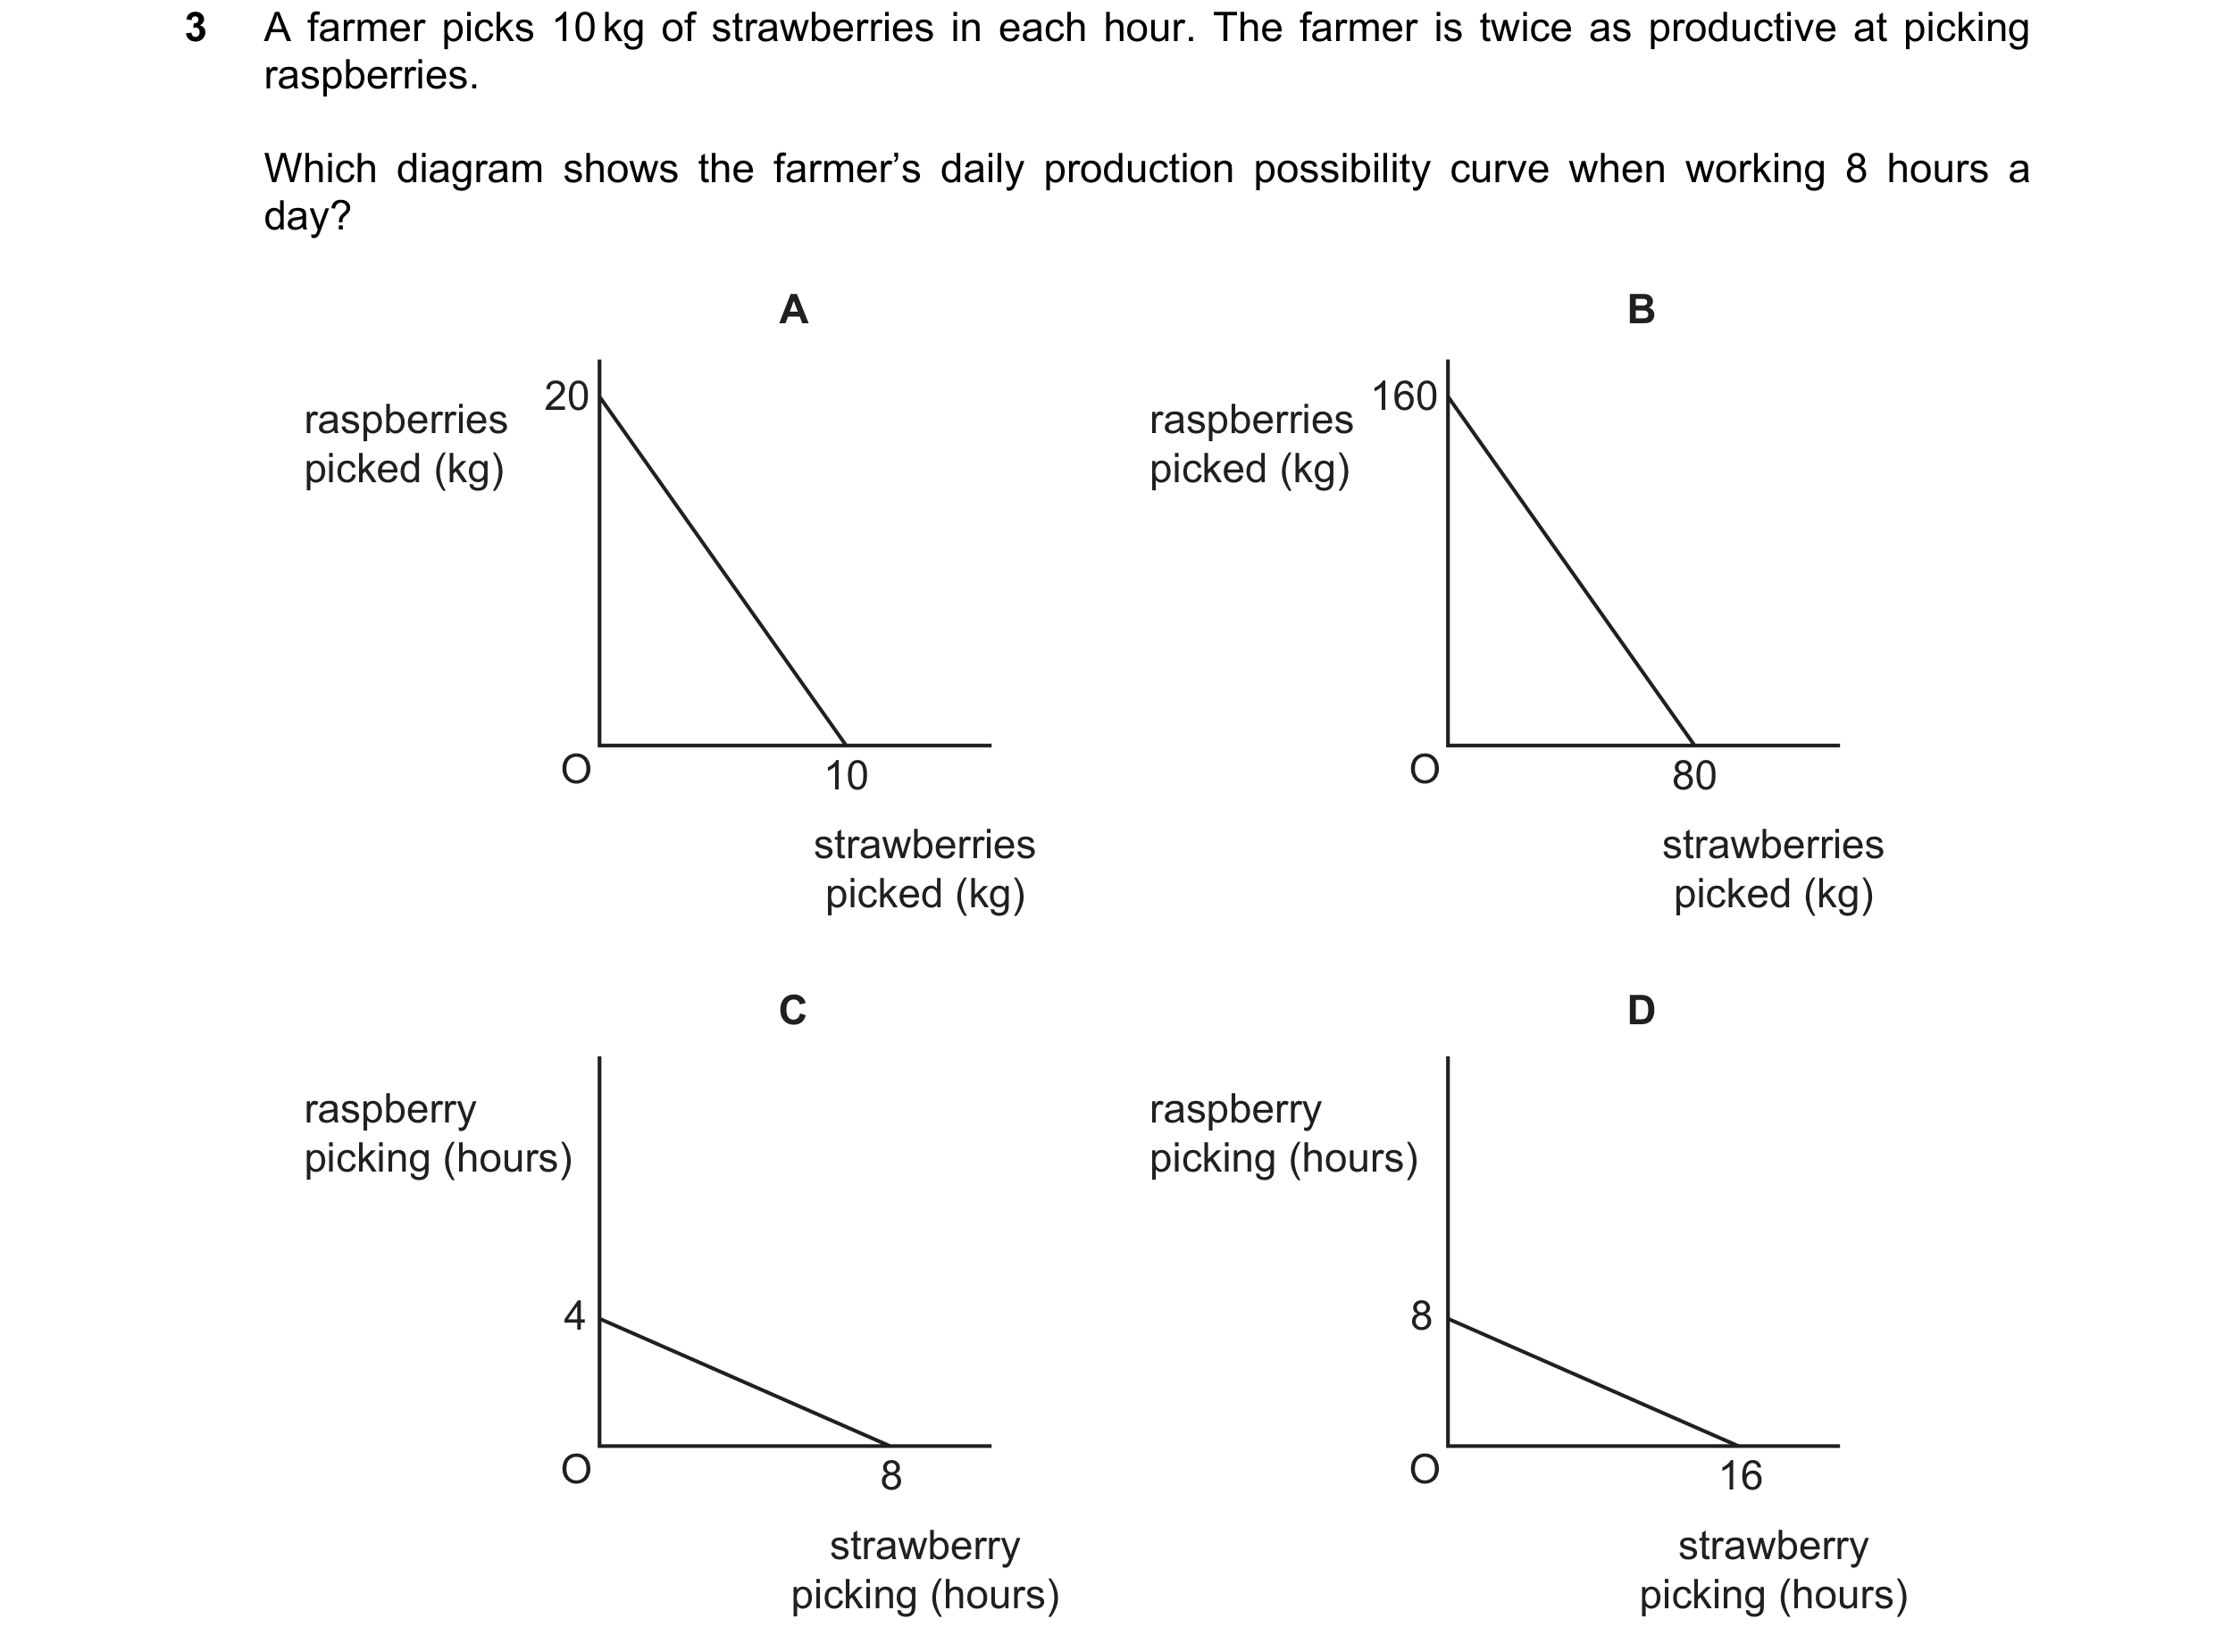 43 / 68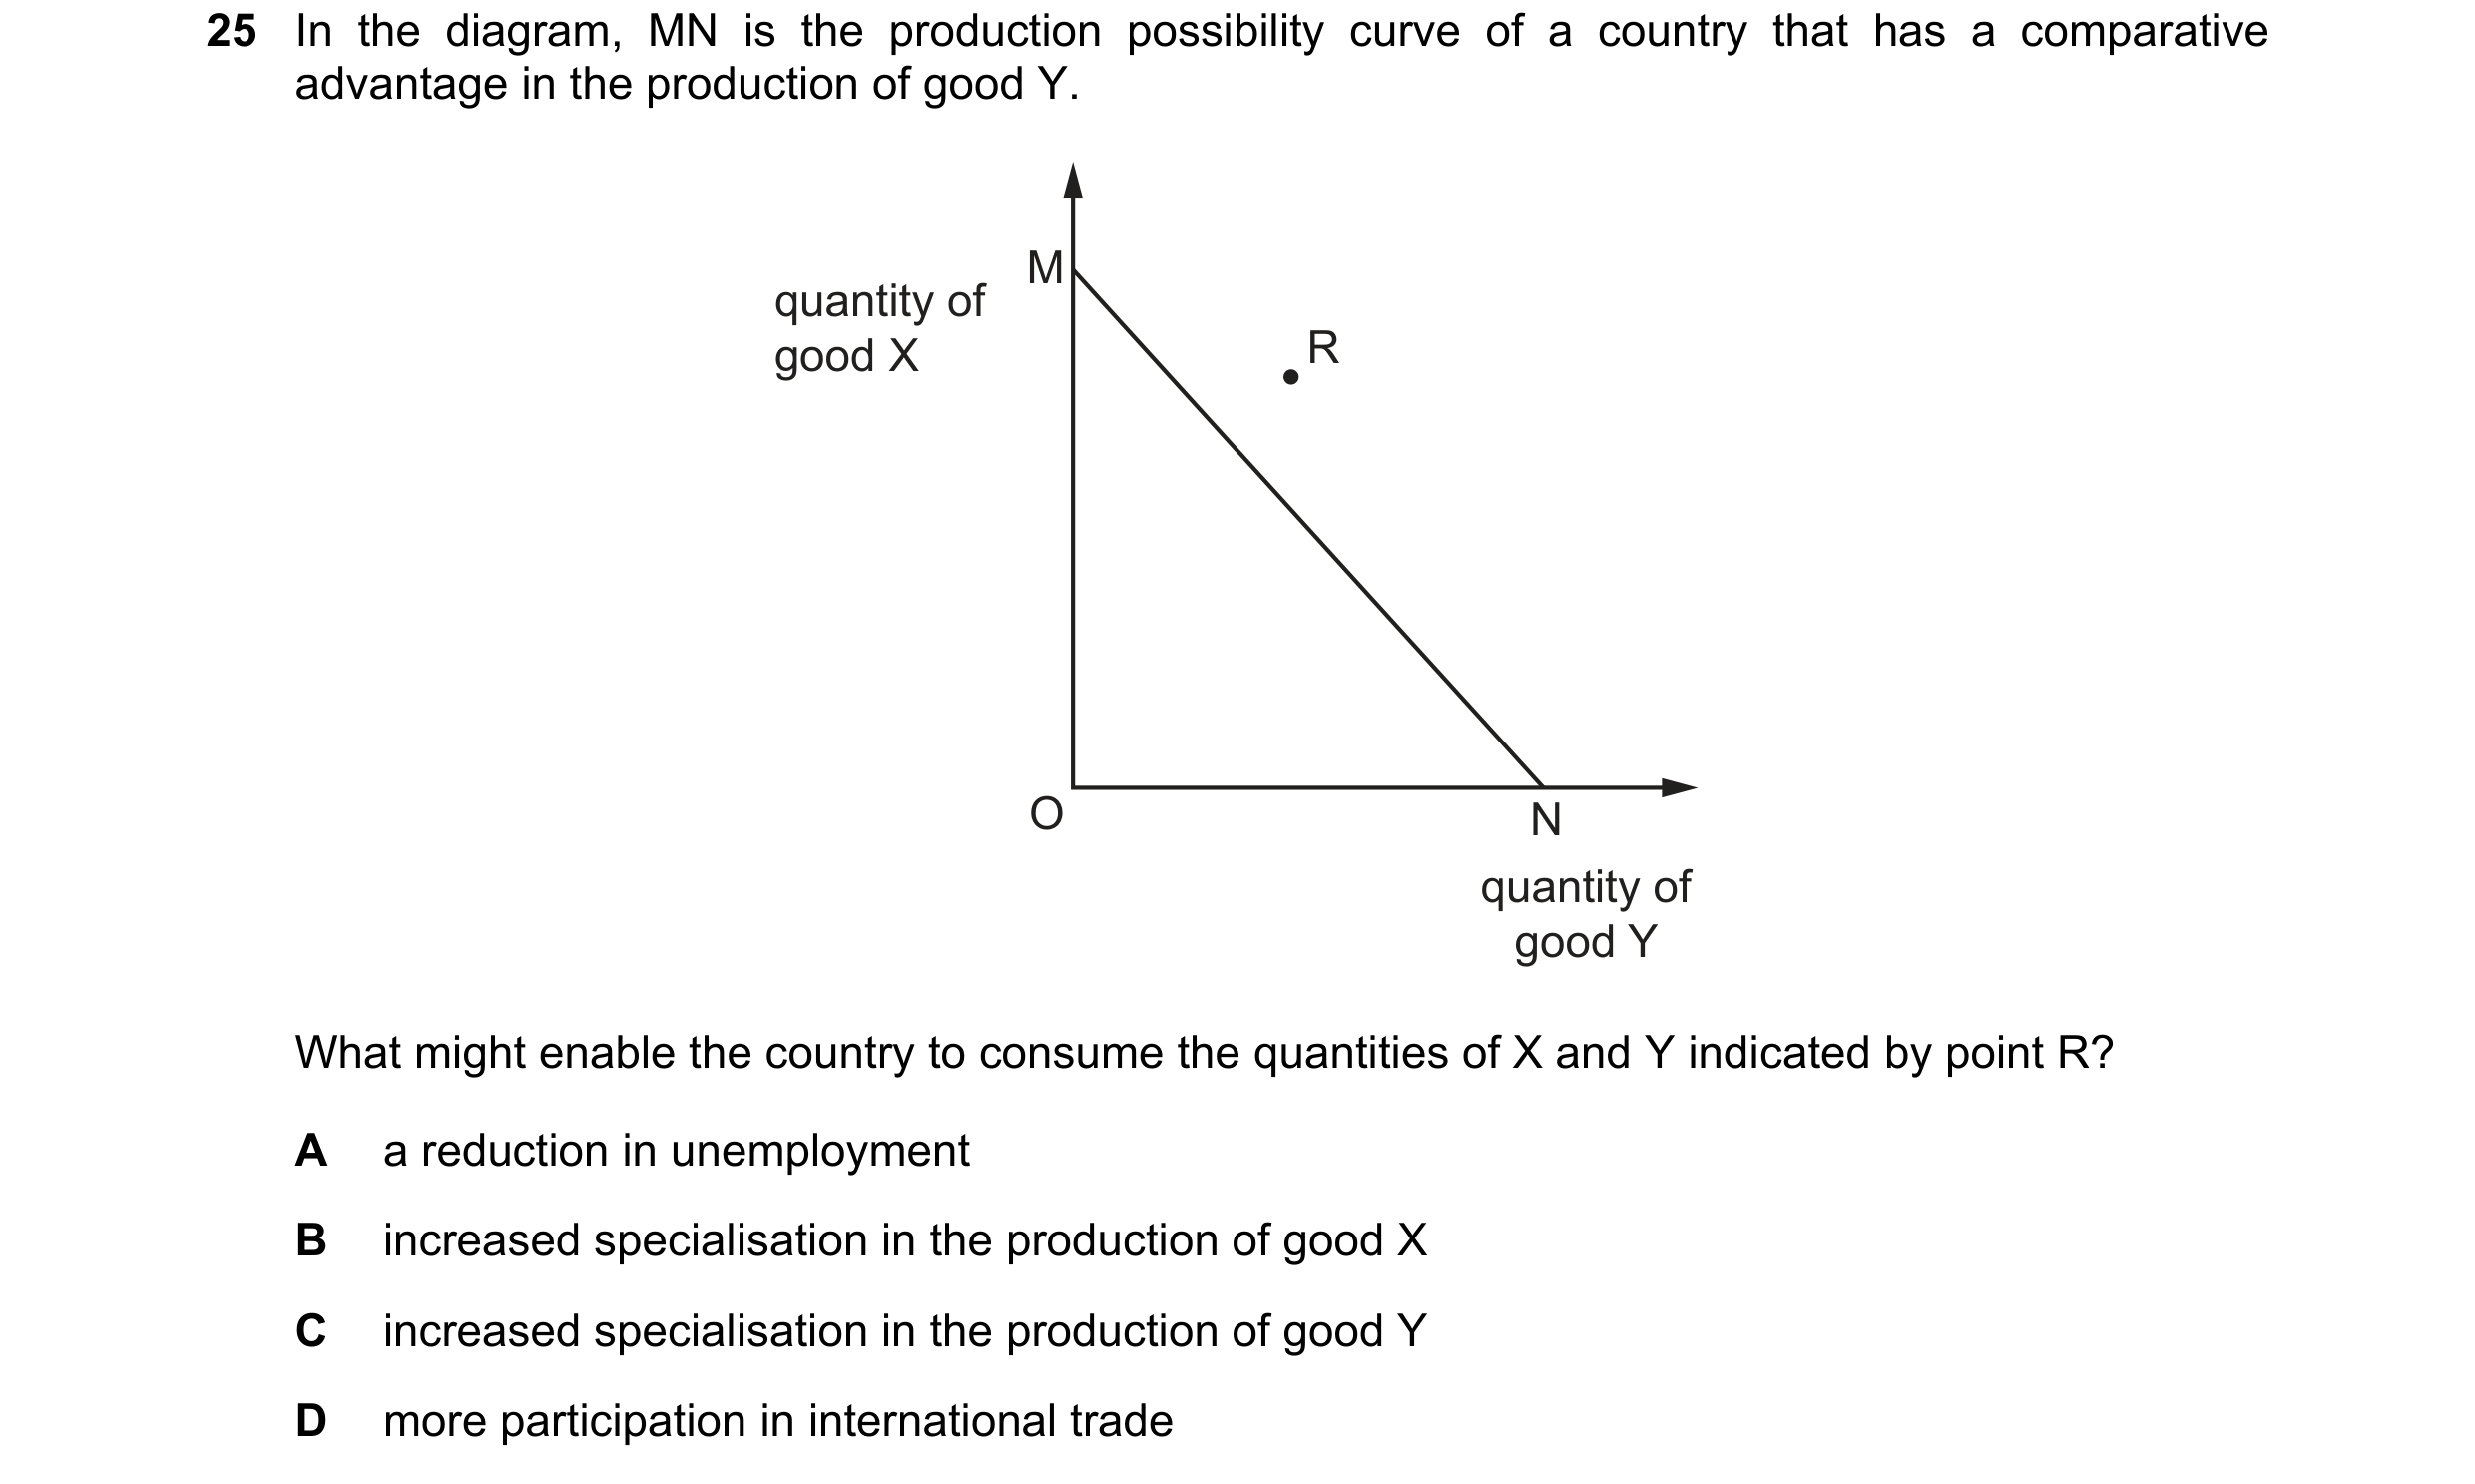
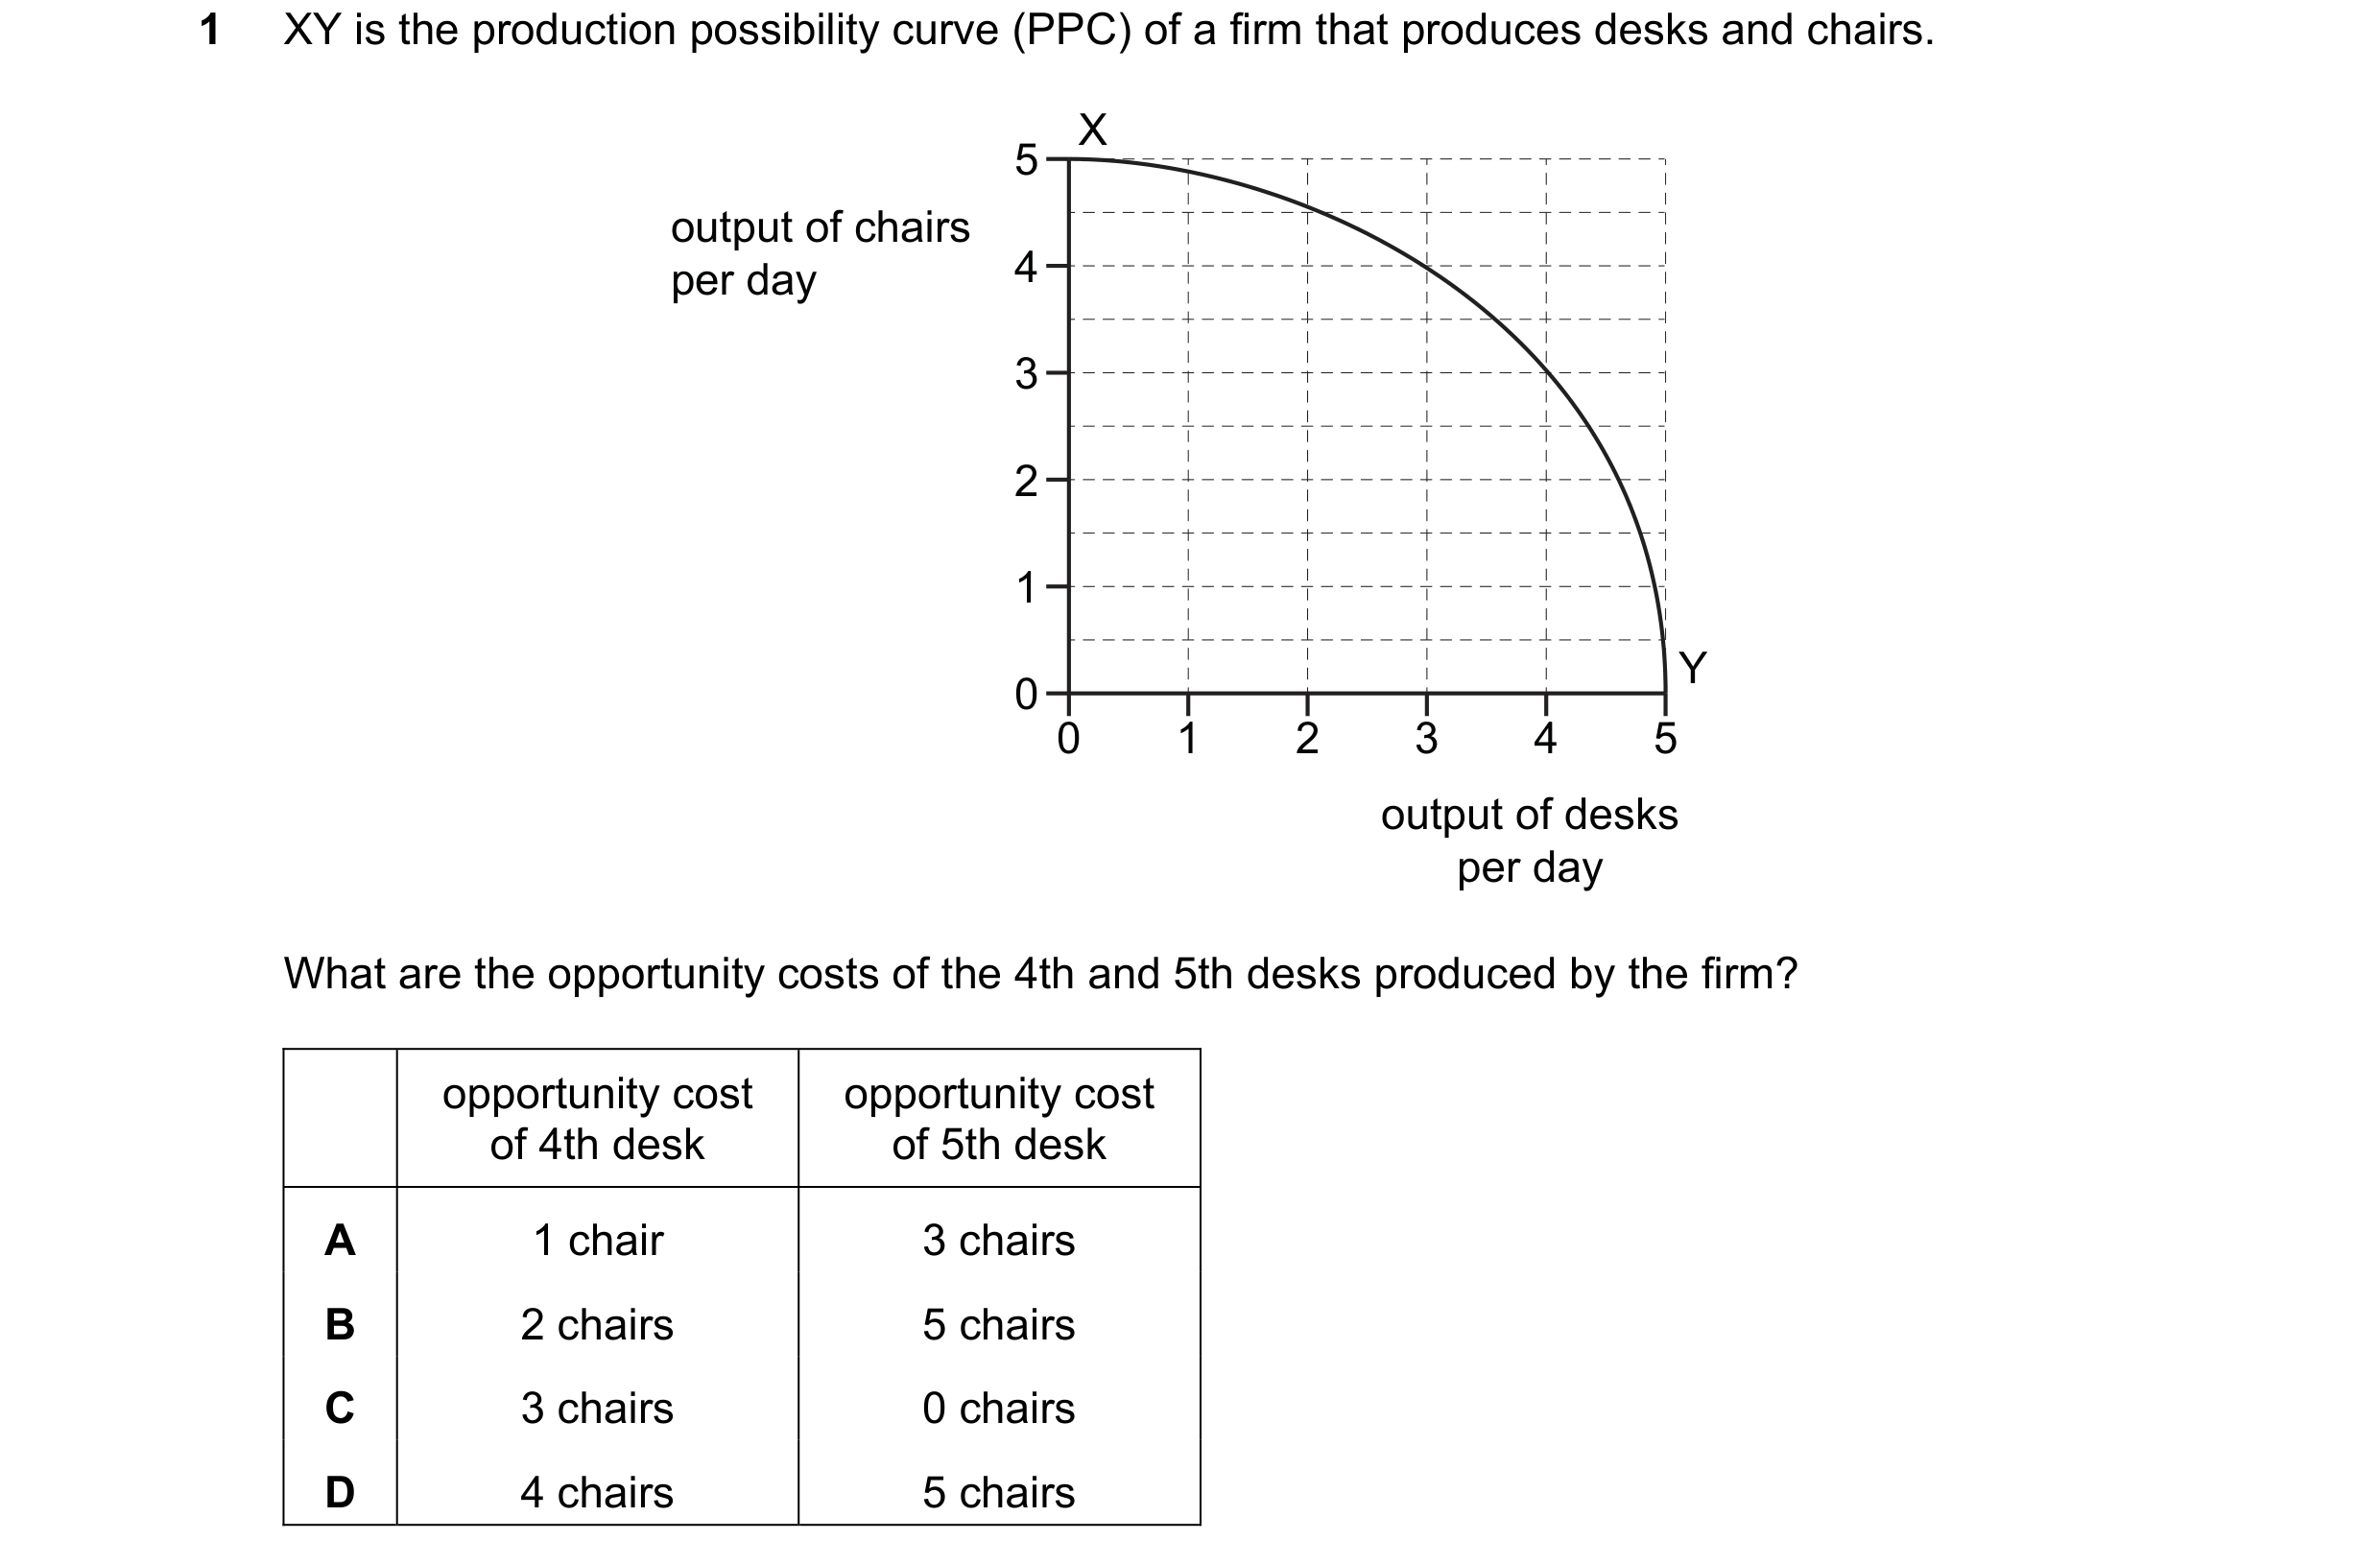 44 / 68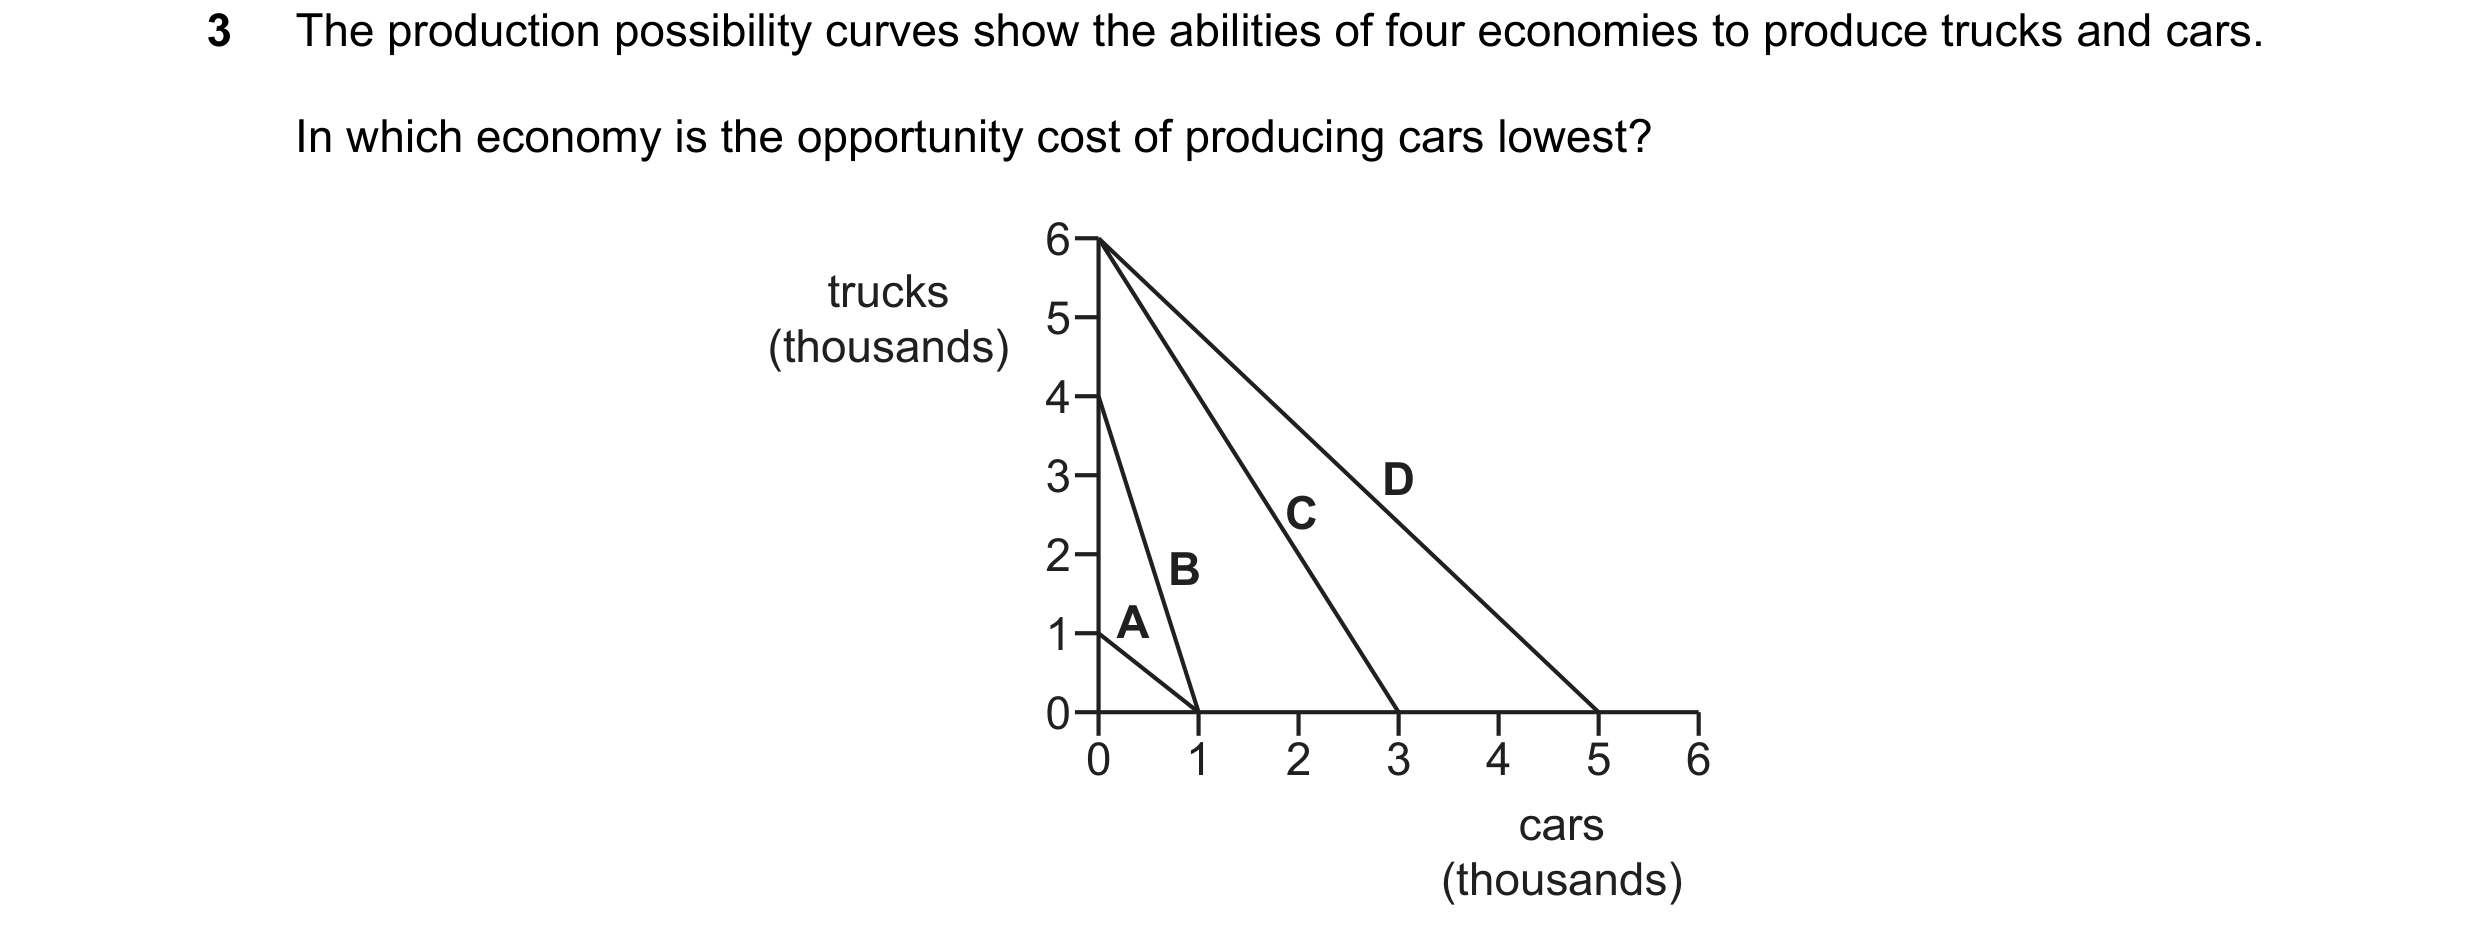
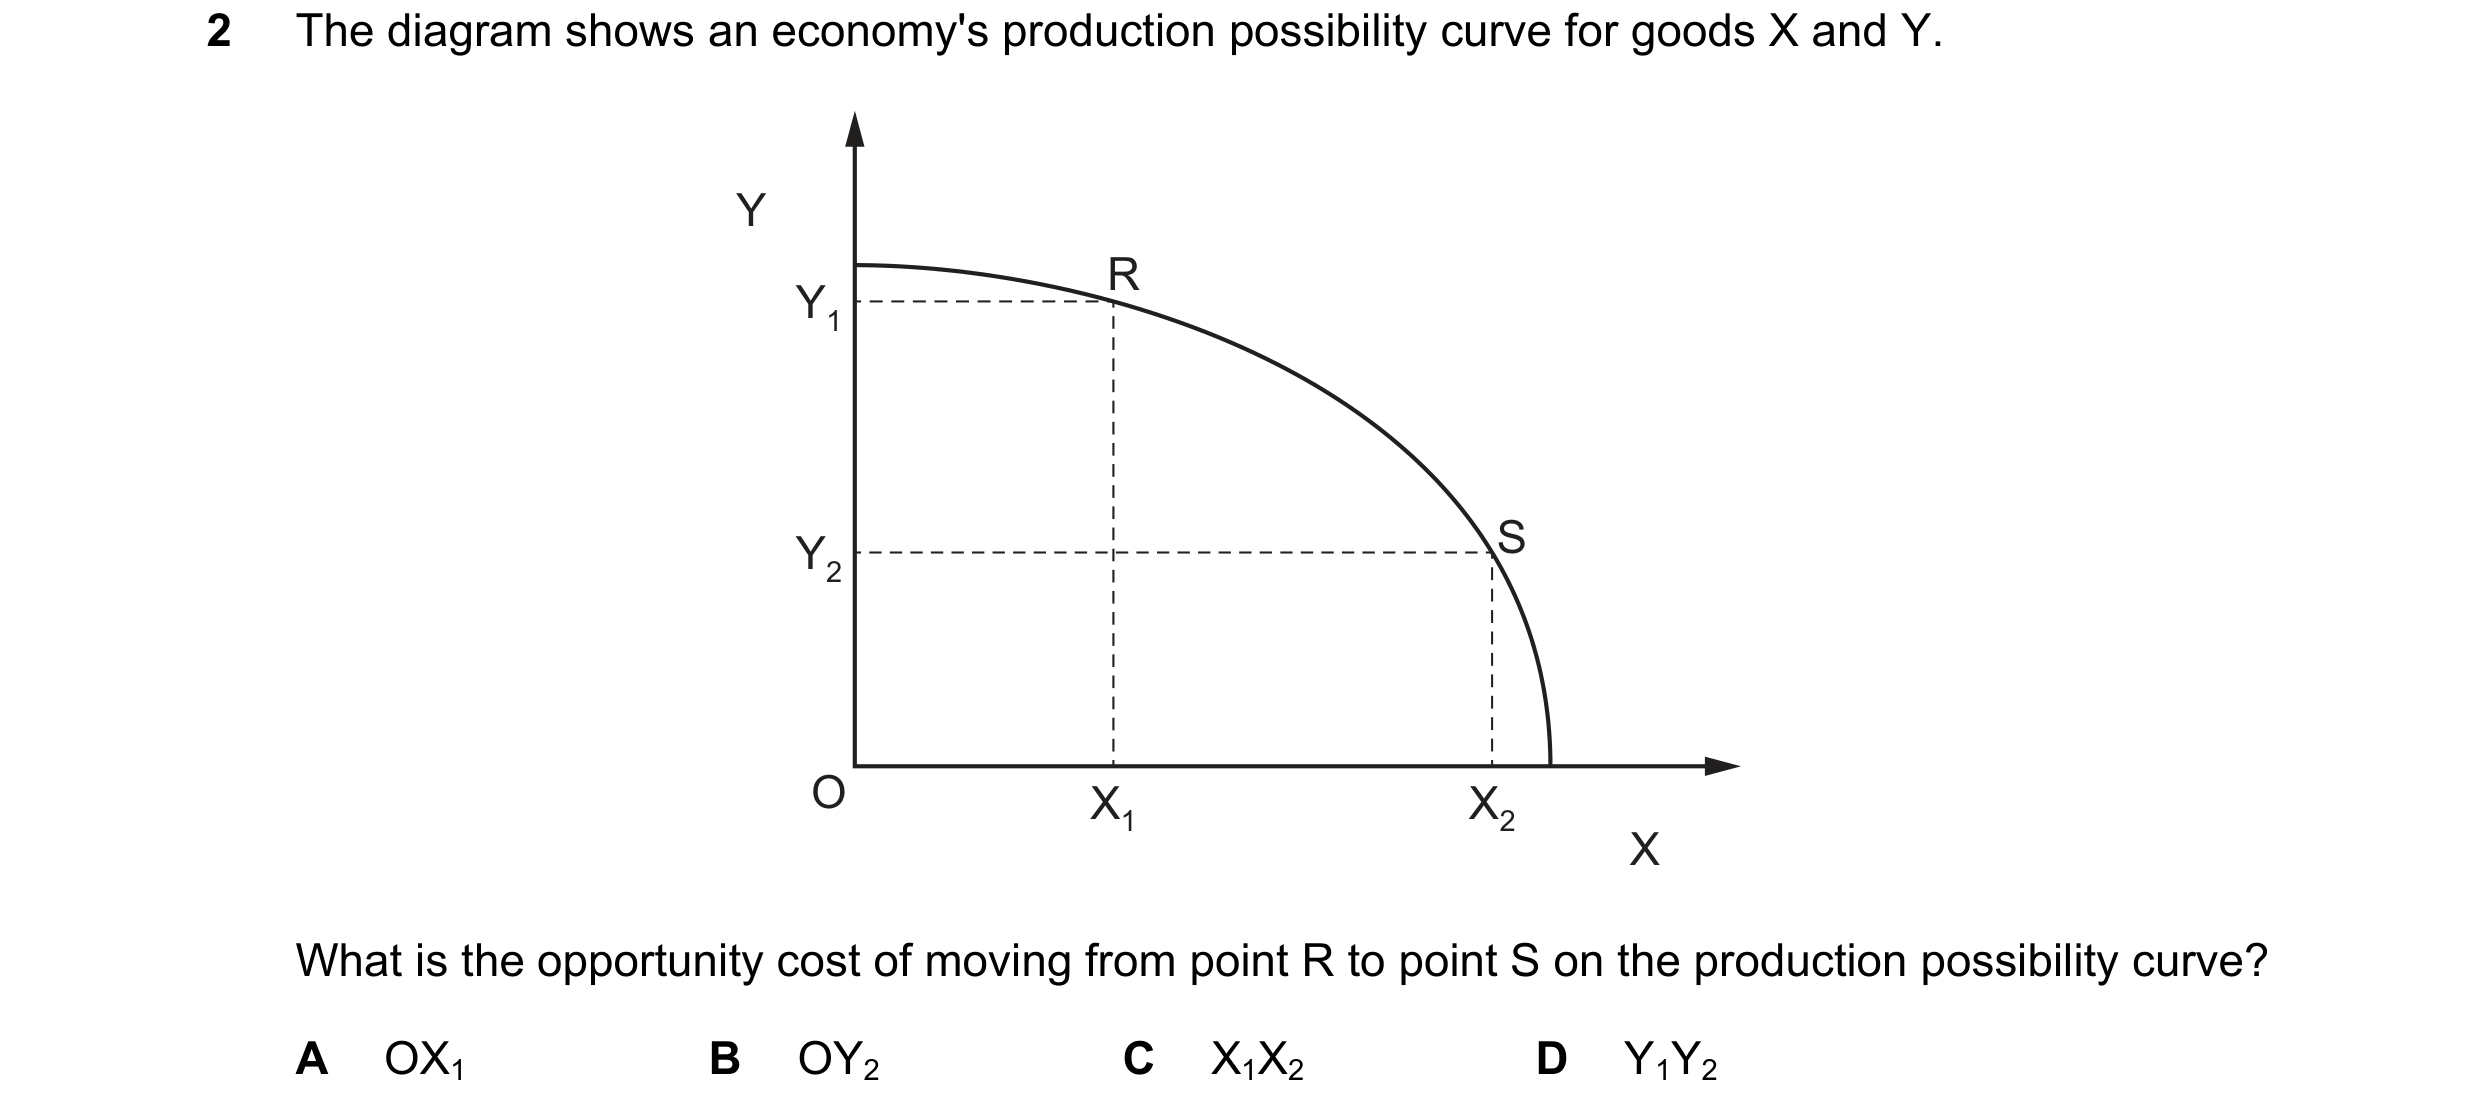
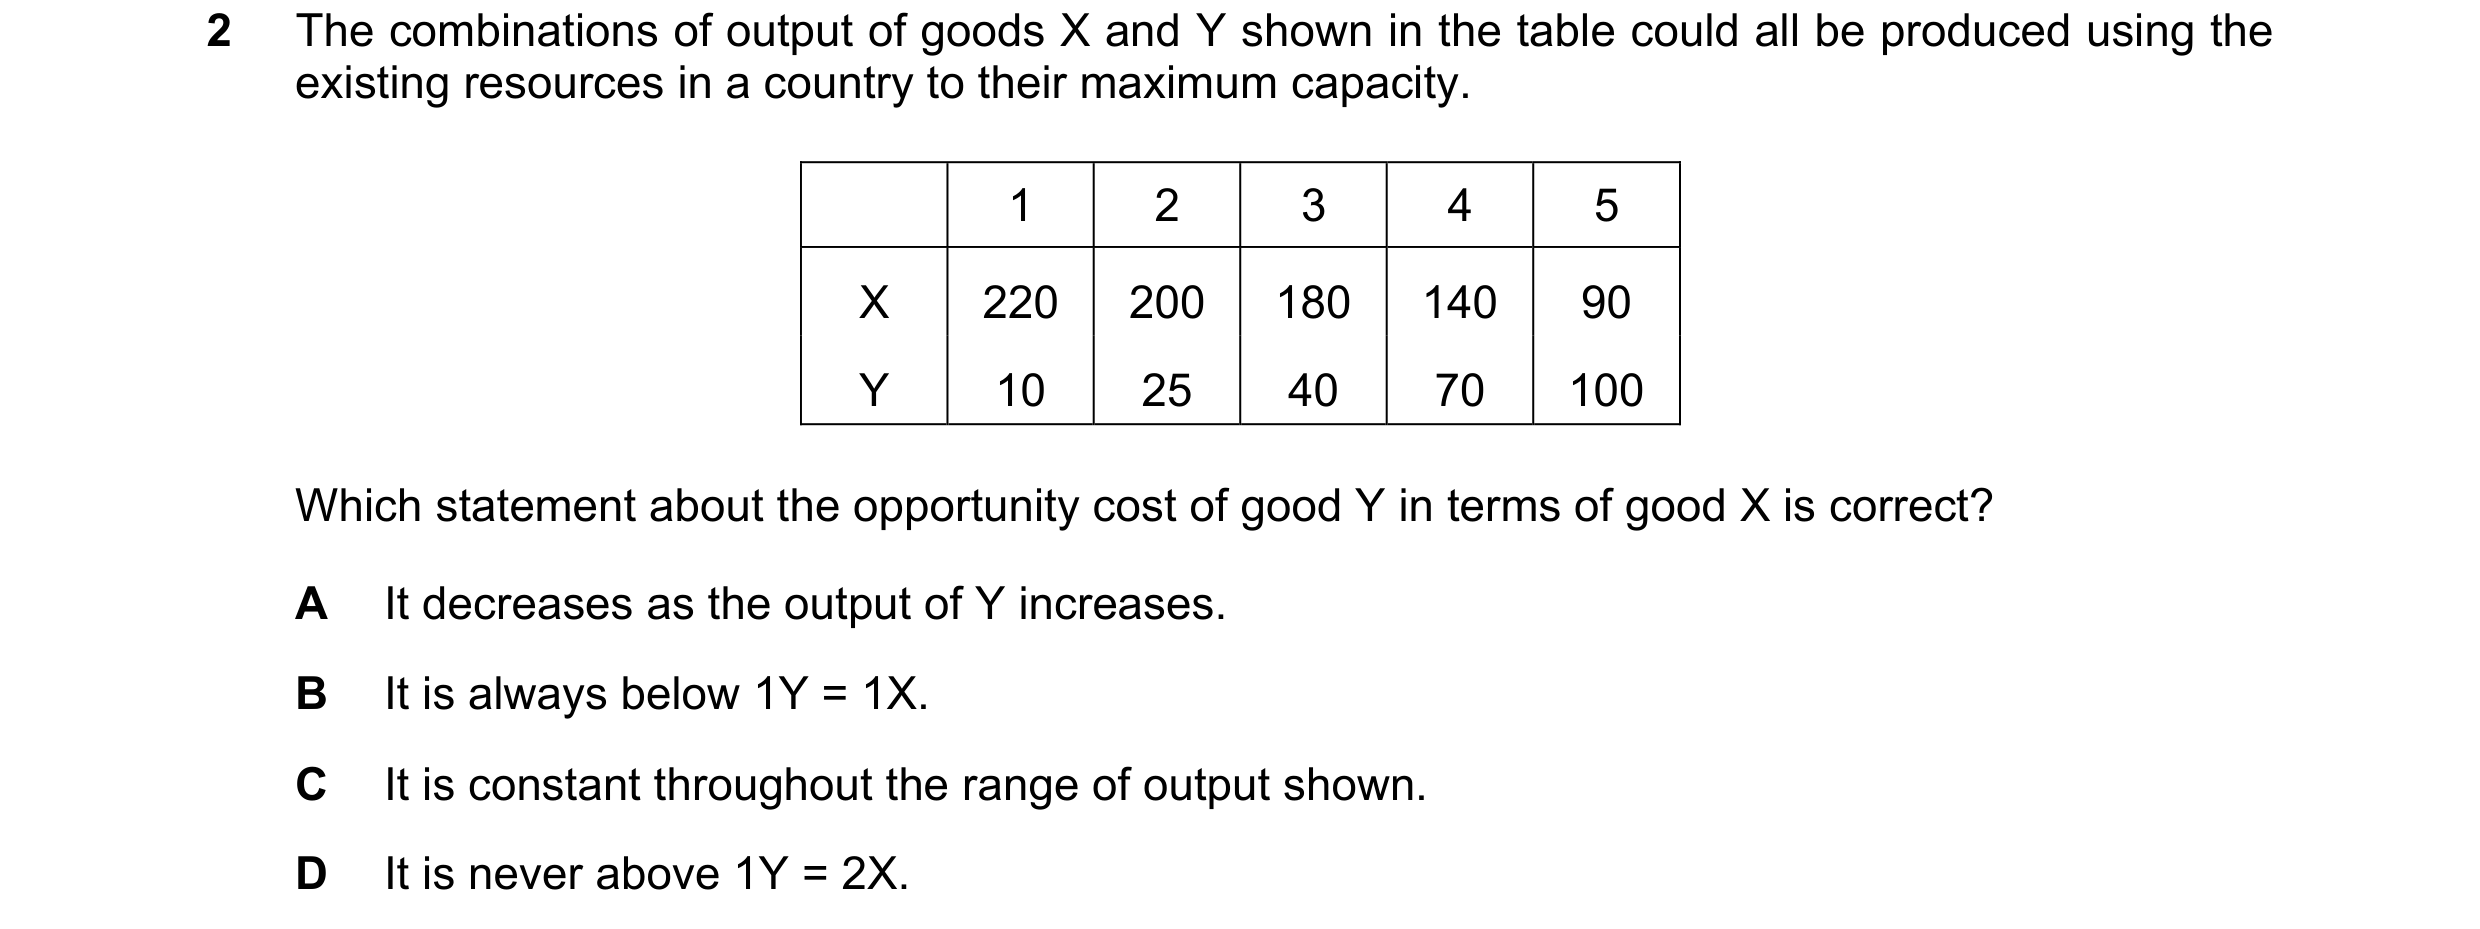 45 / 68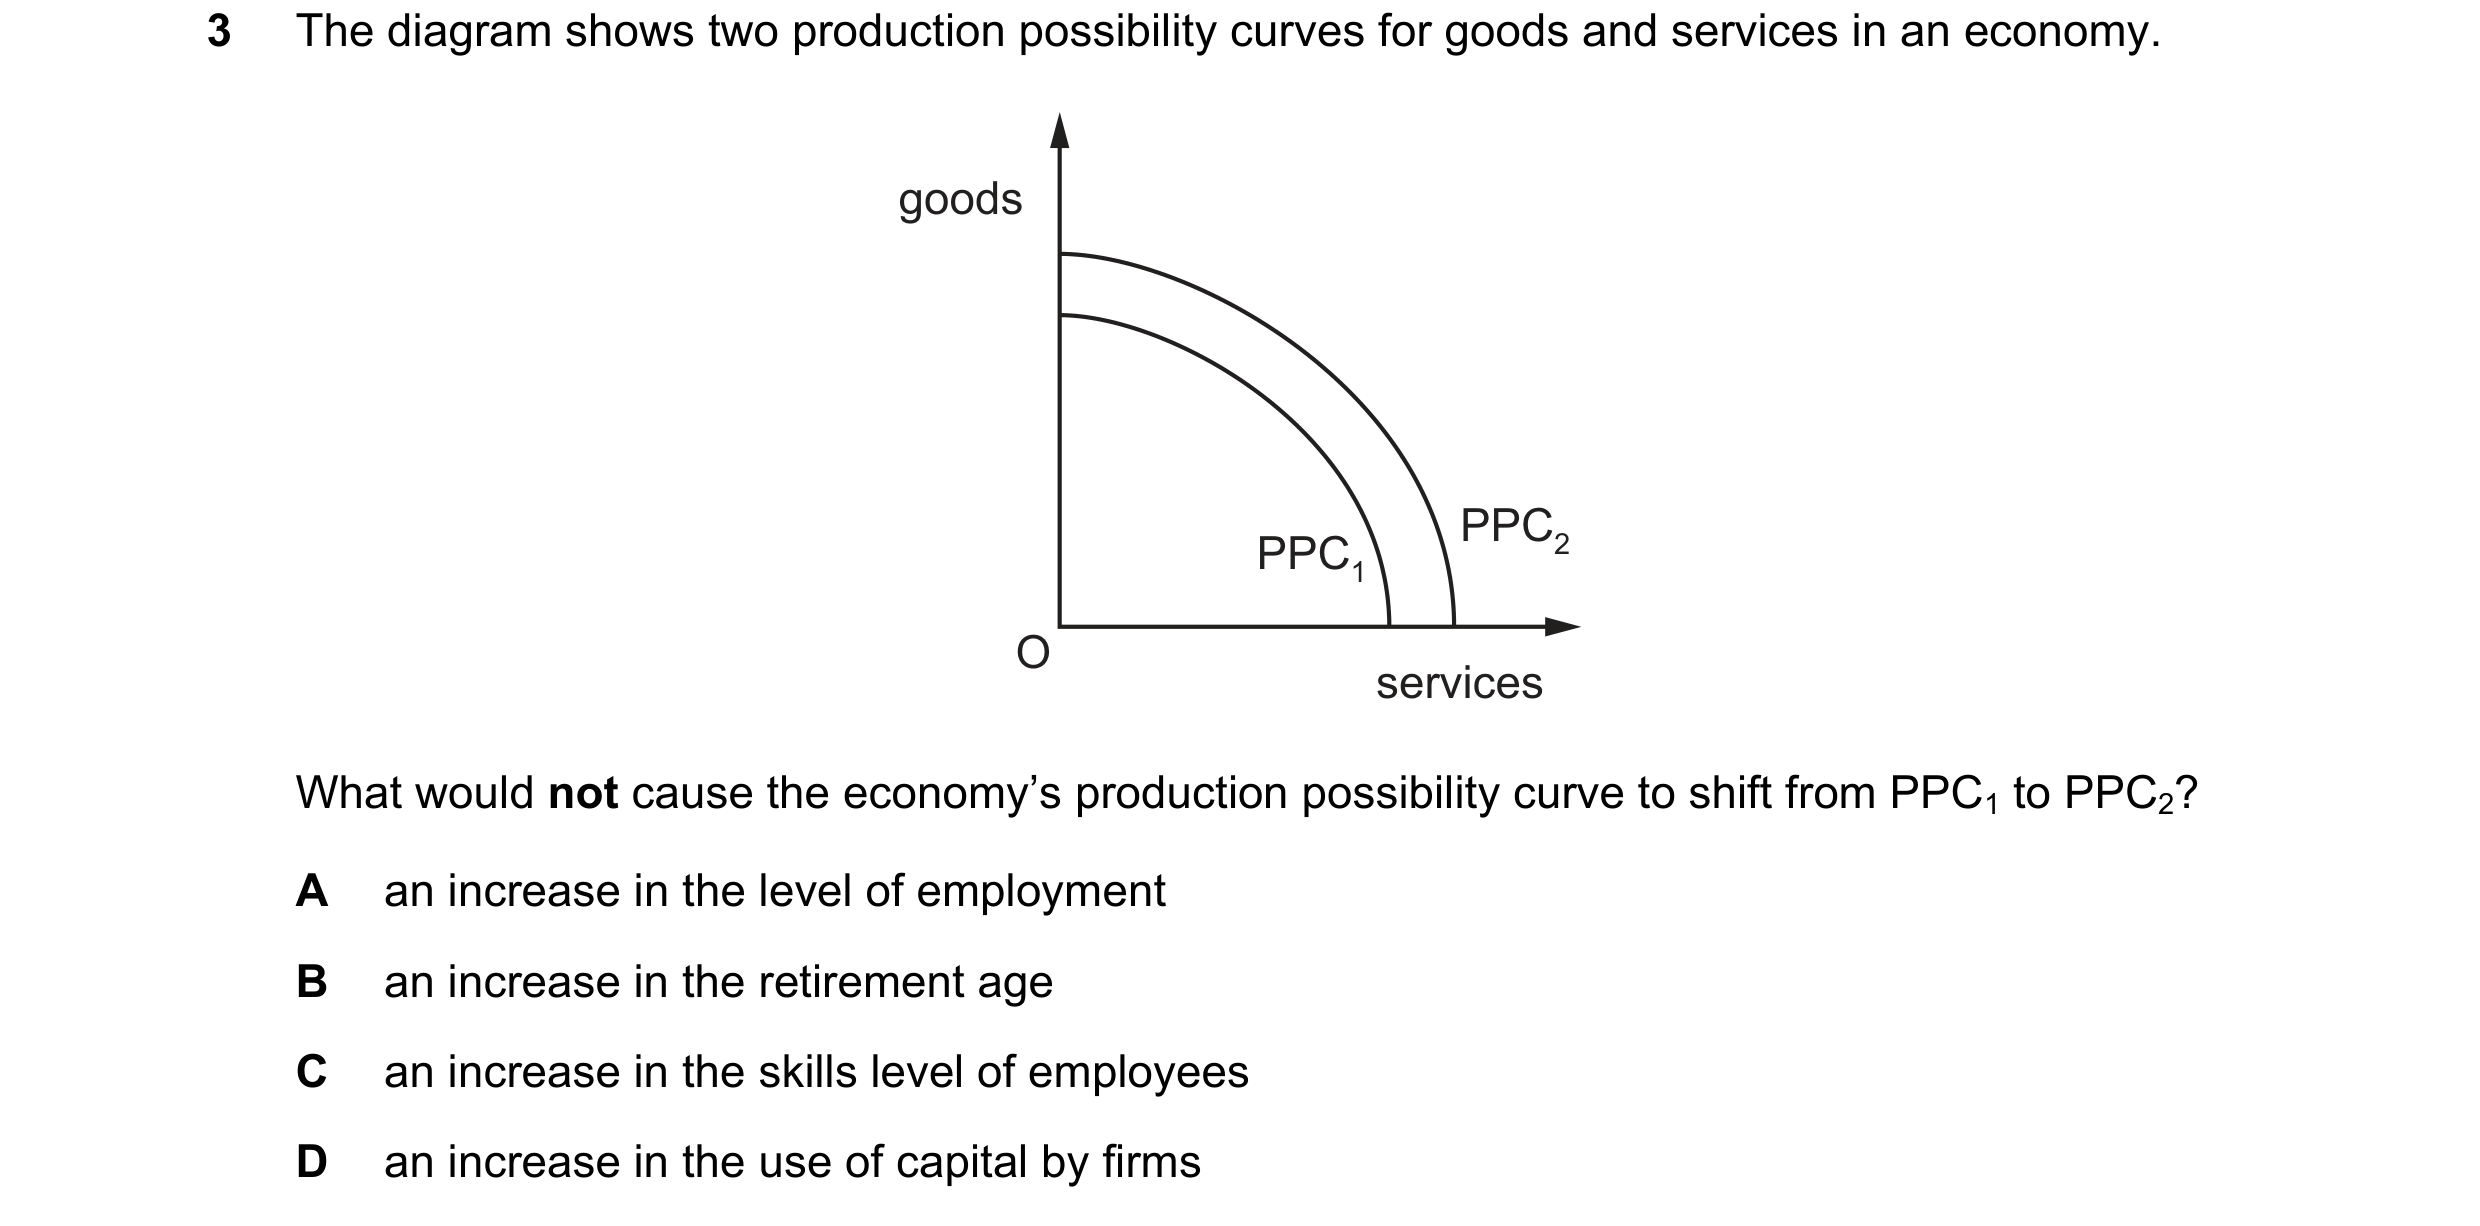
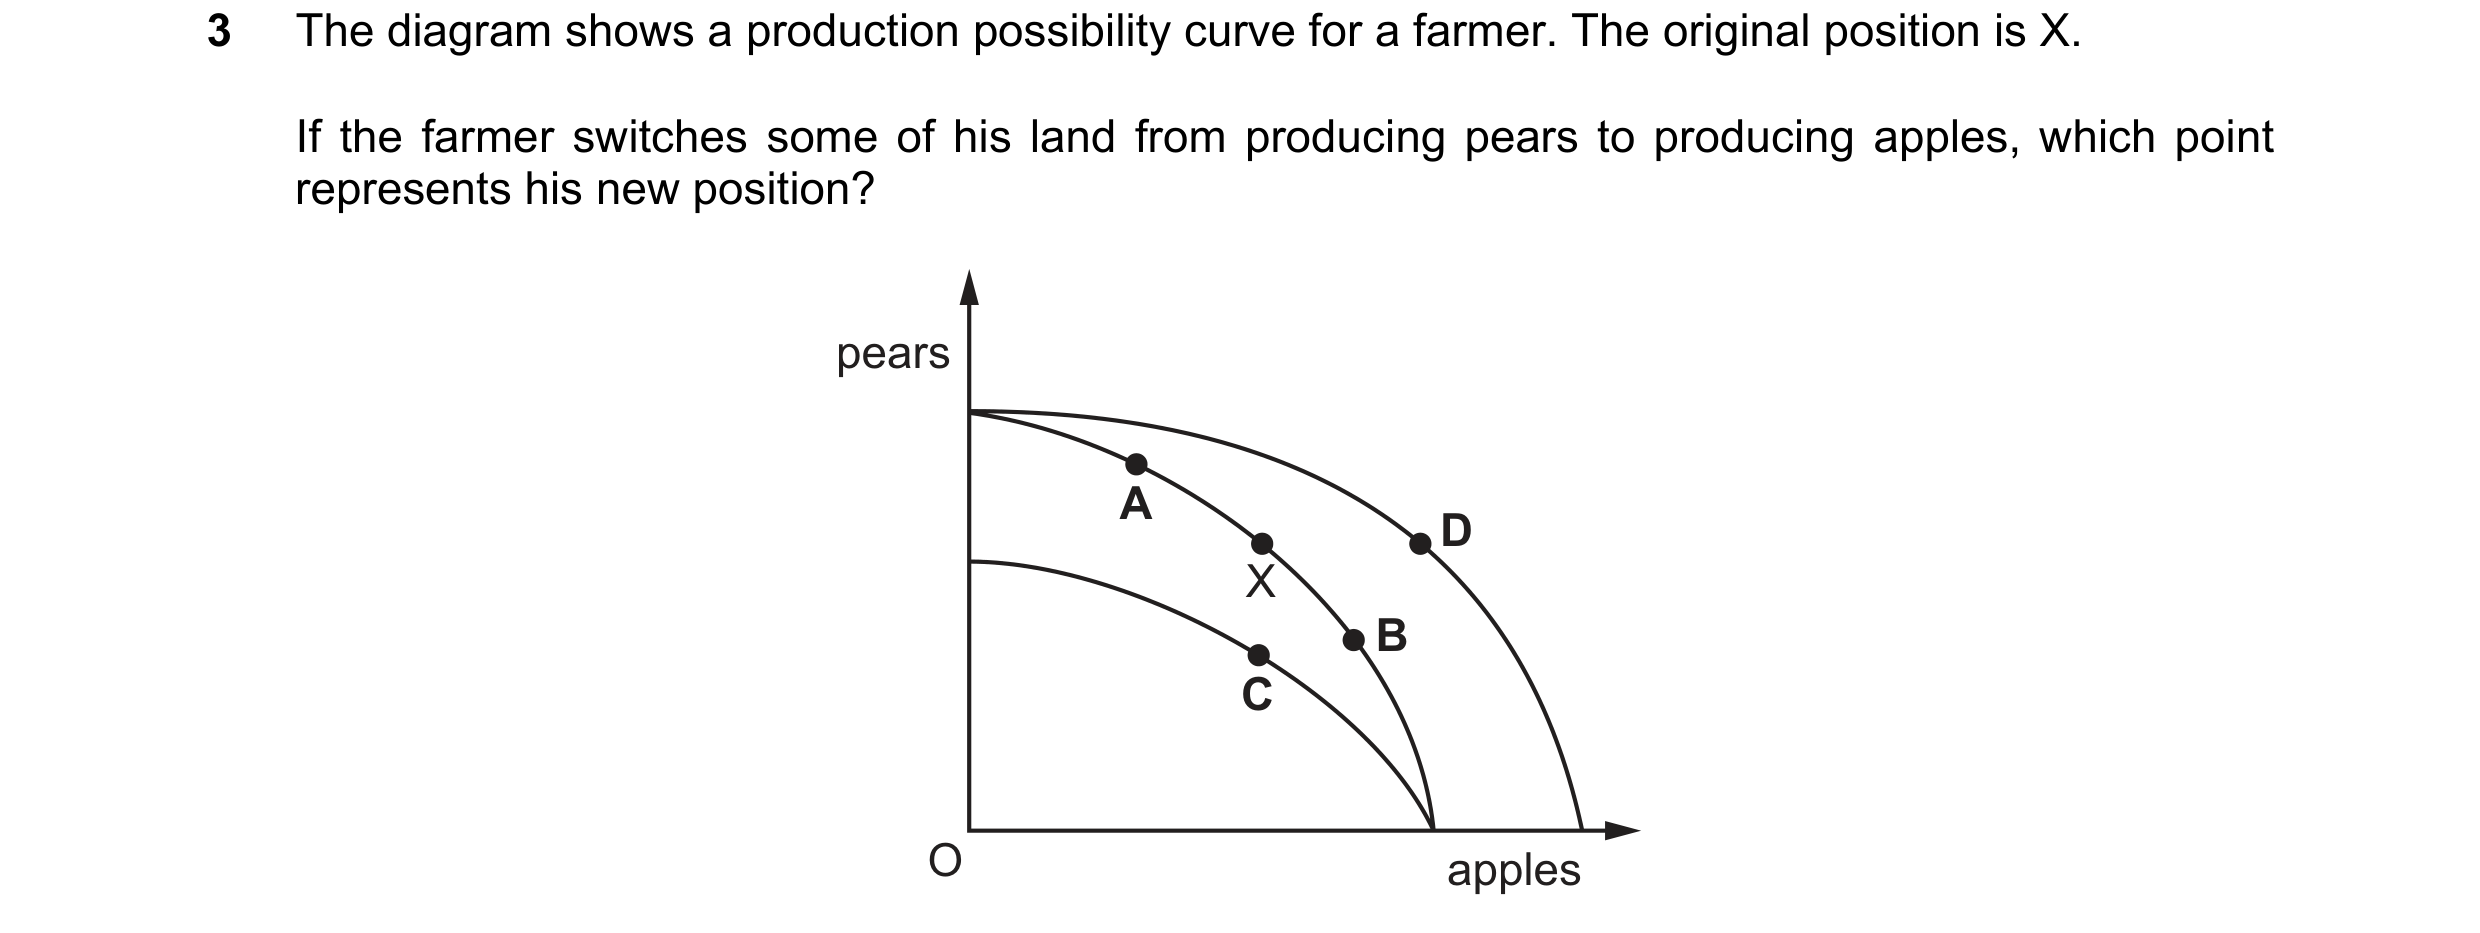 46 / 68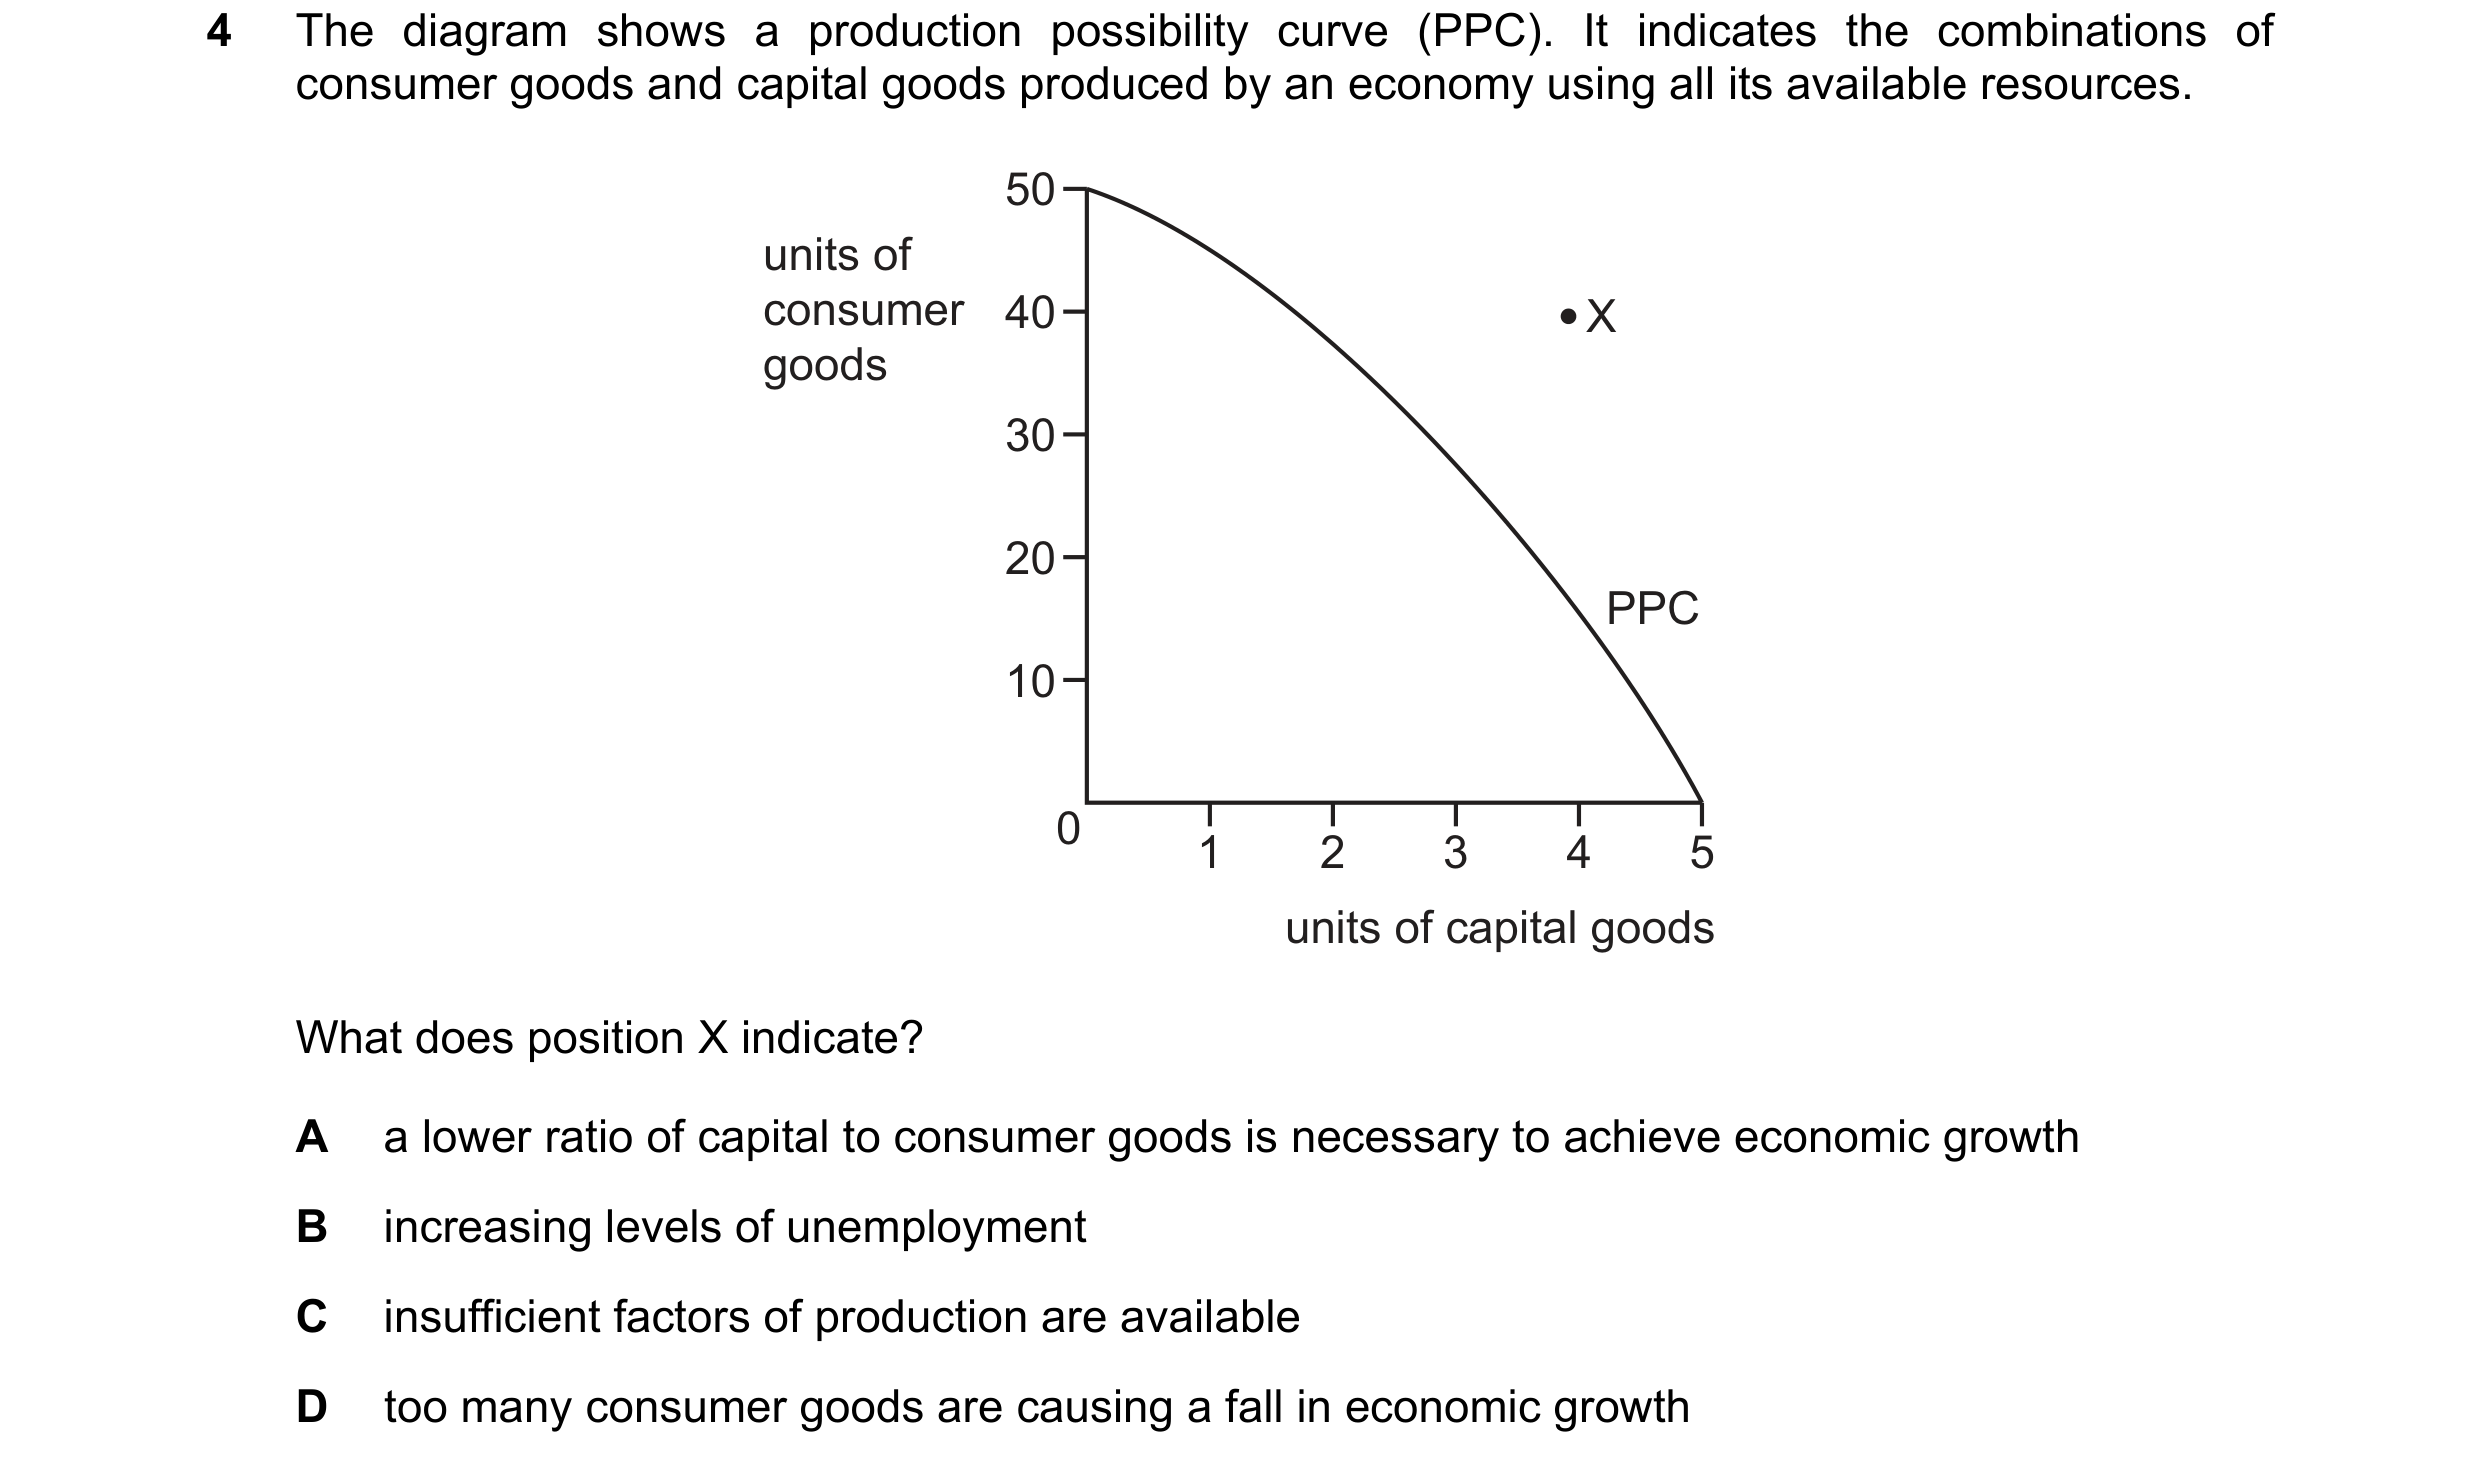
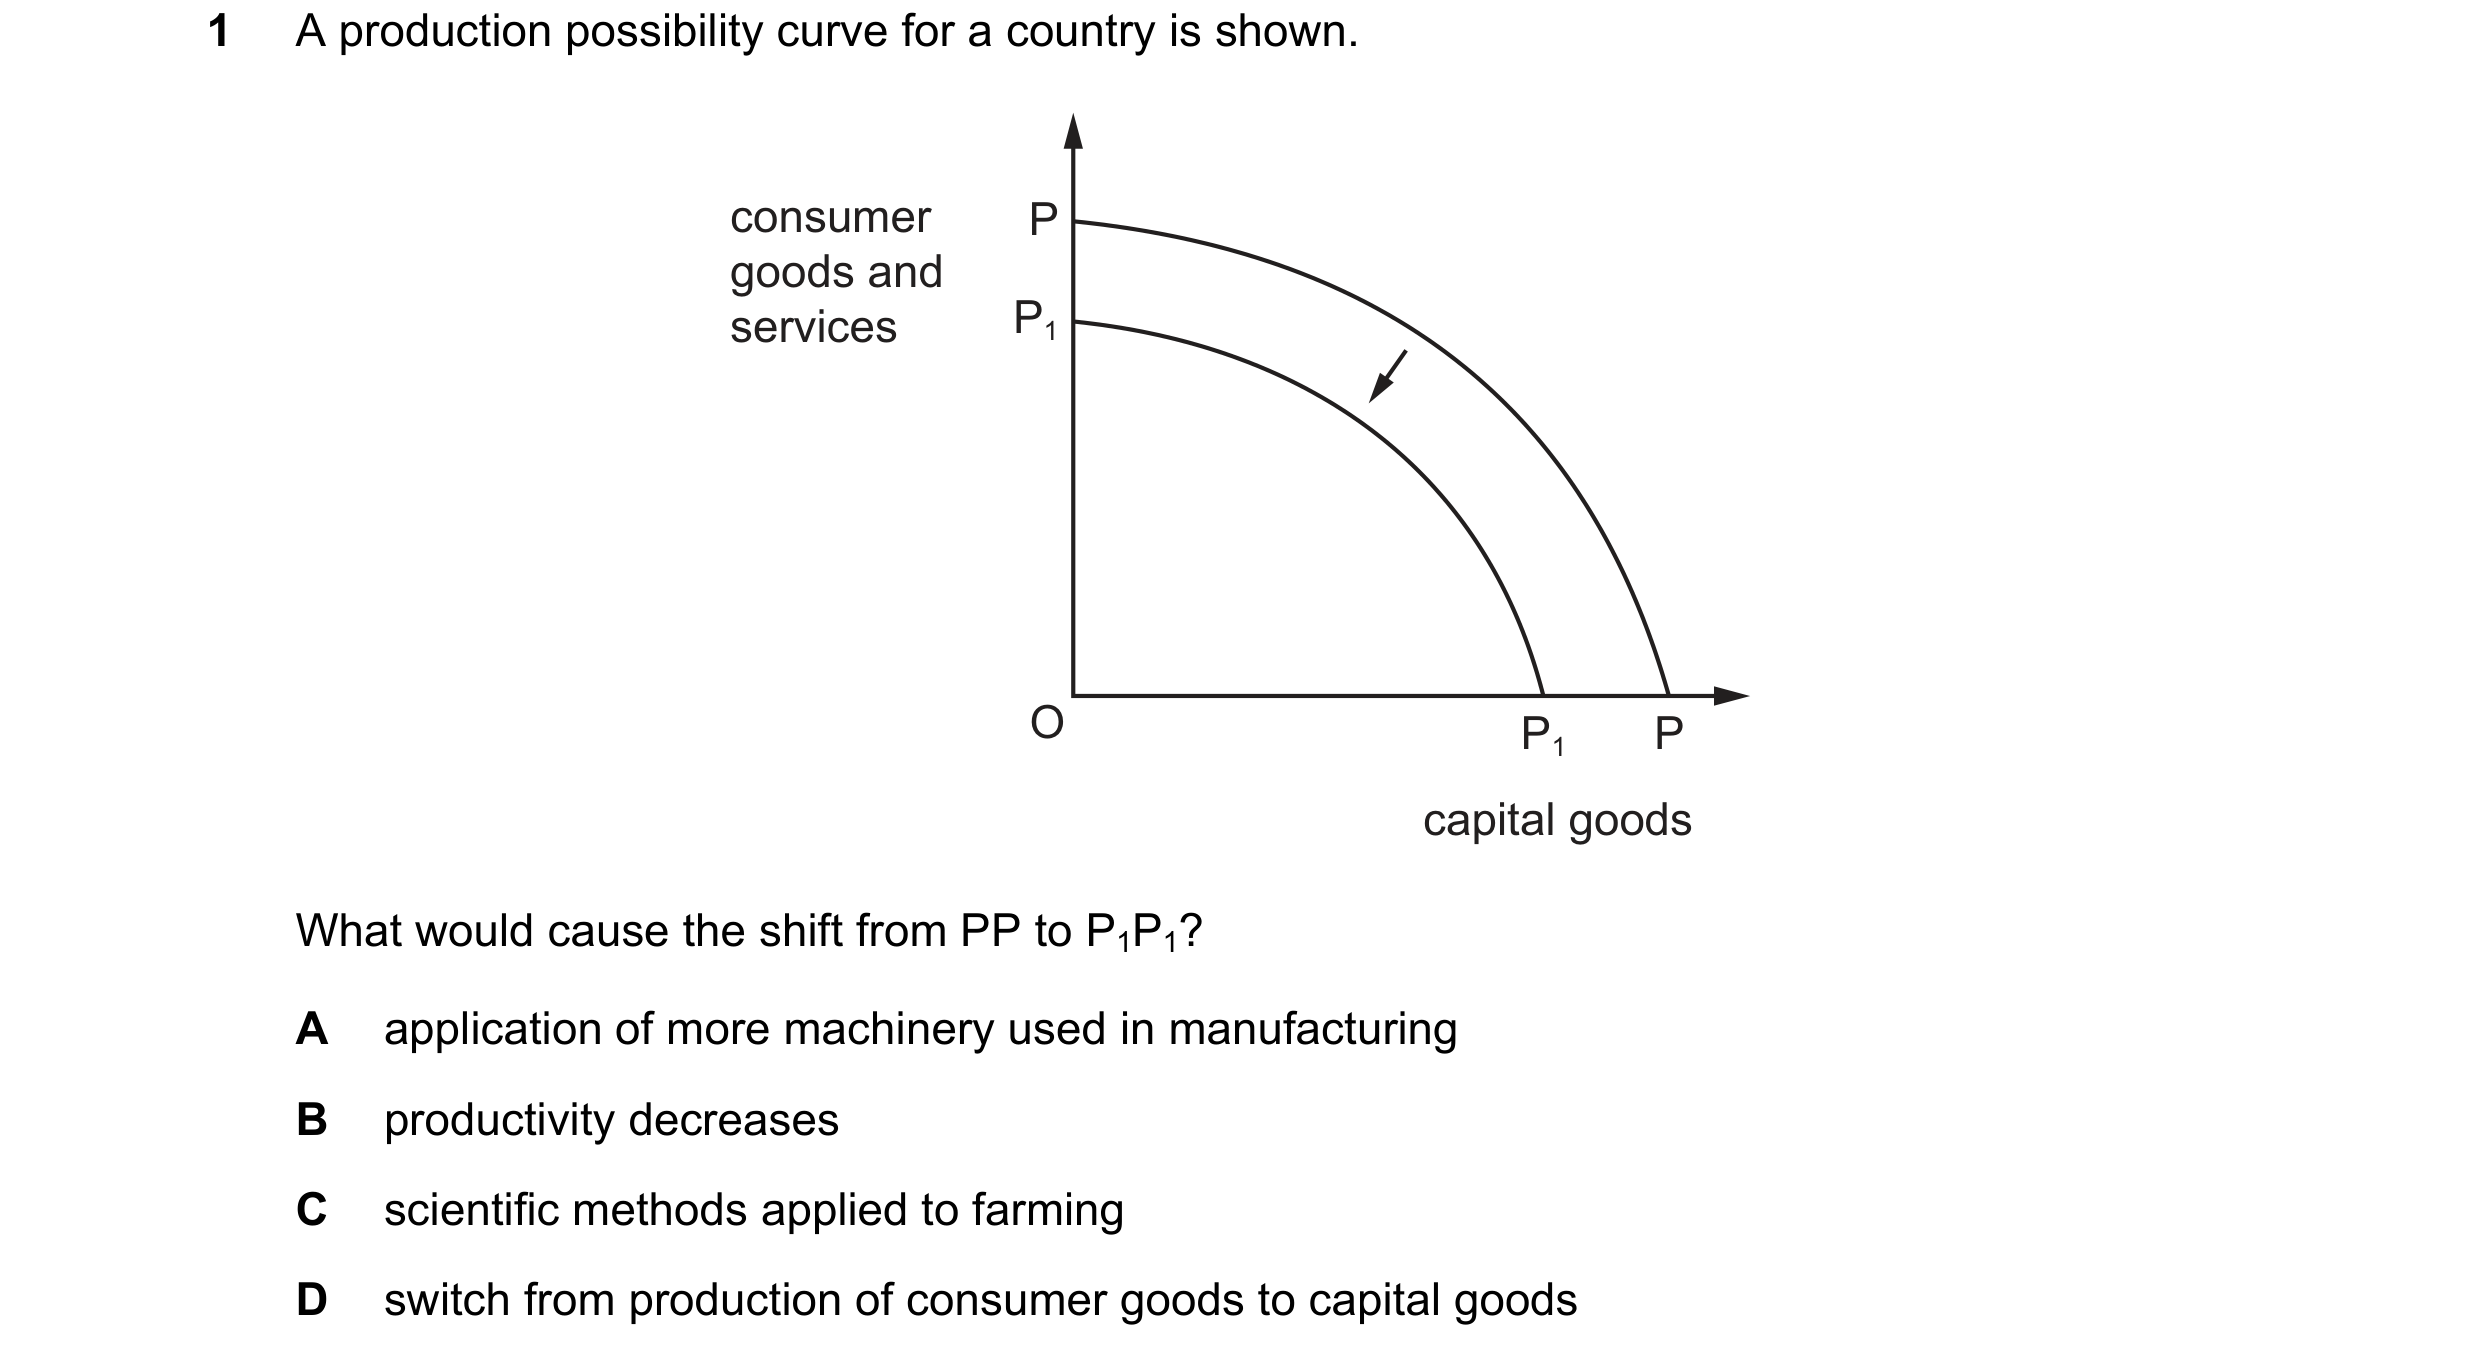
 47 / 68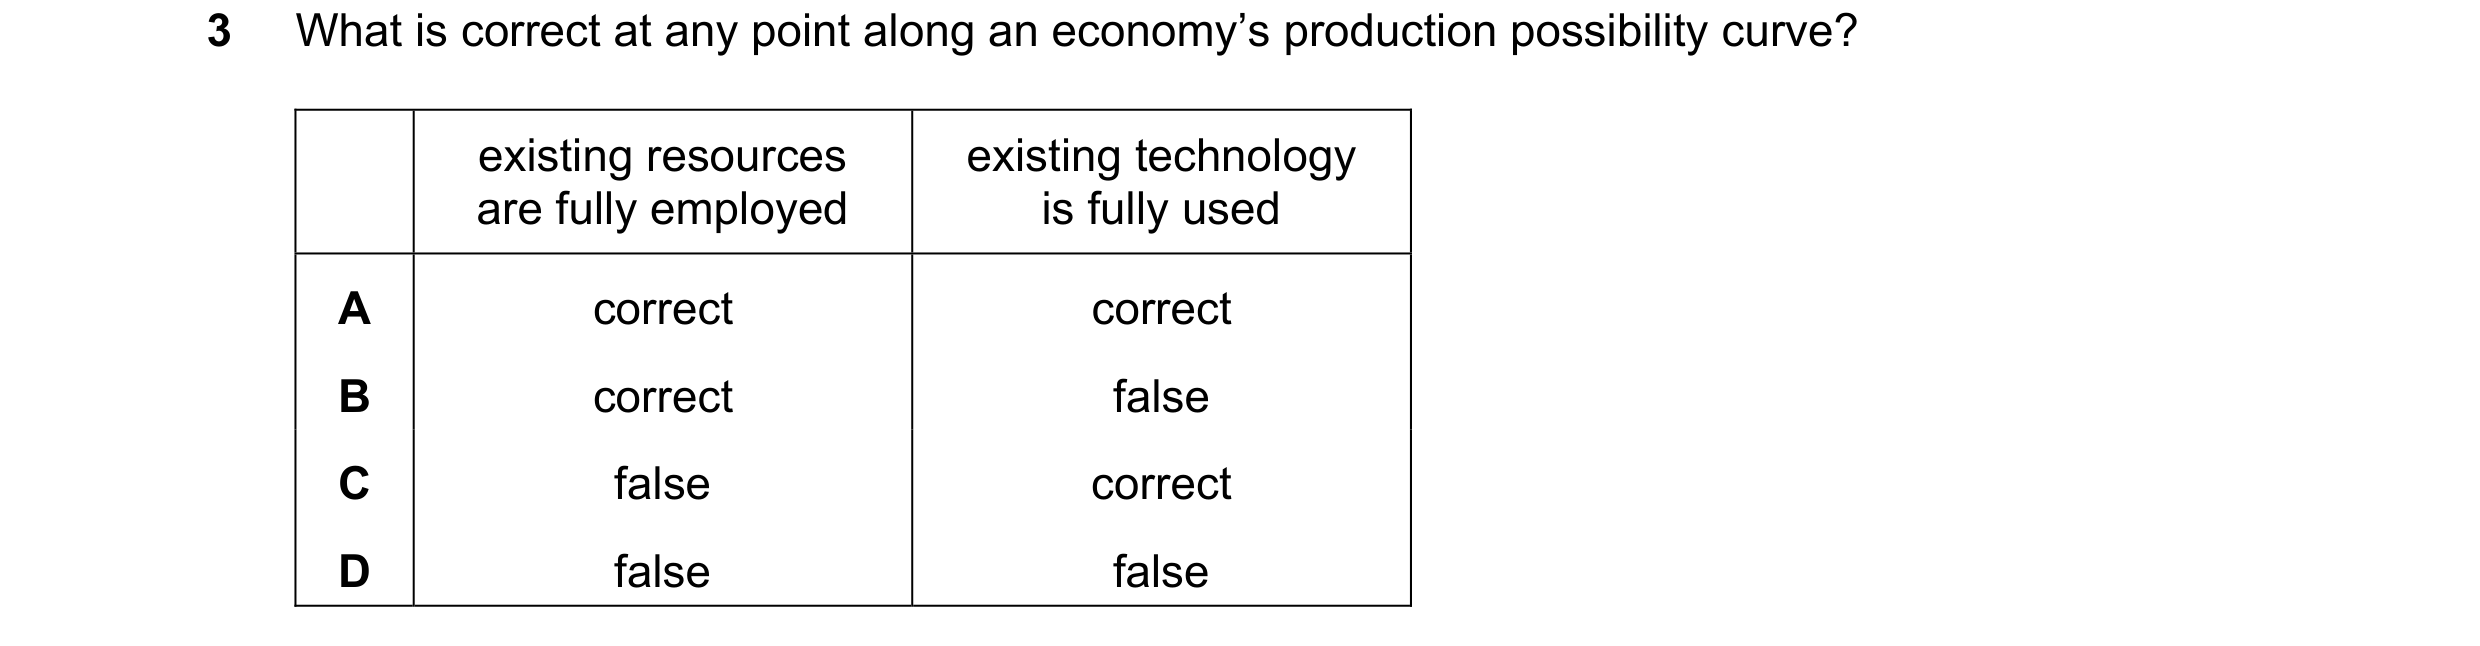

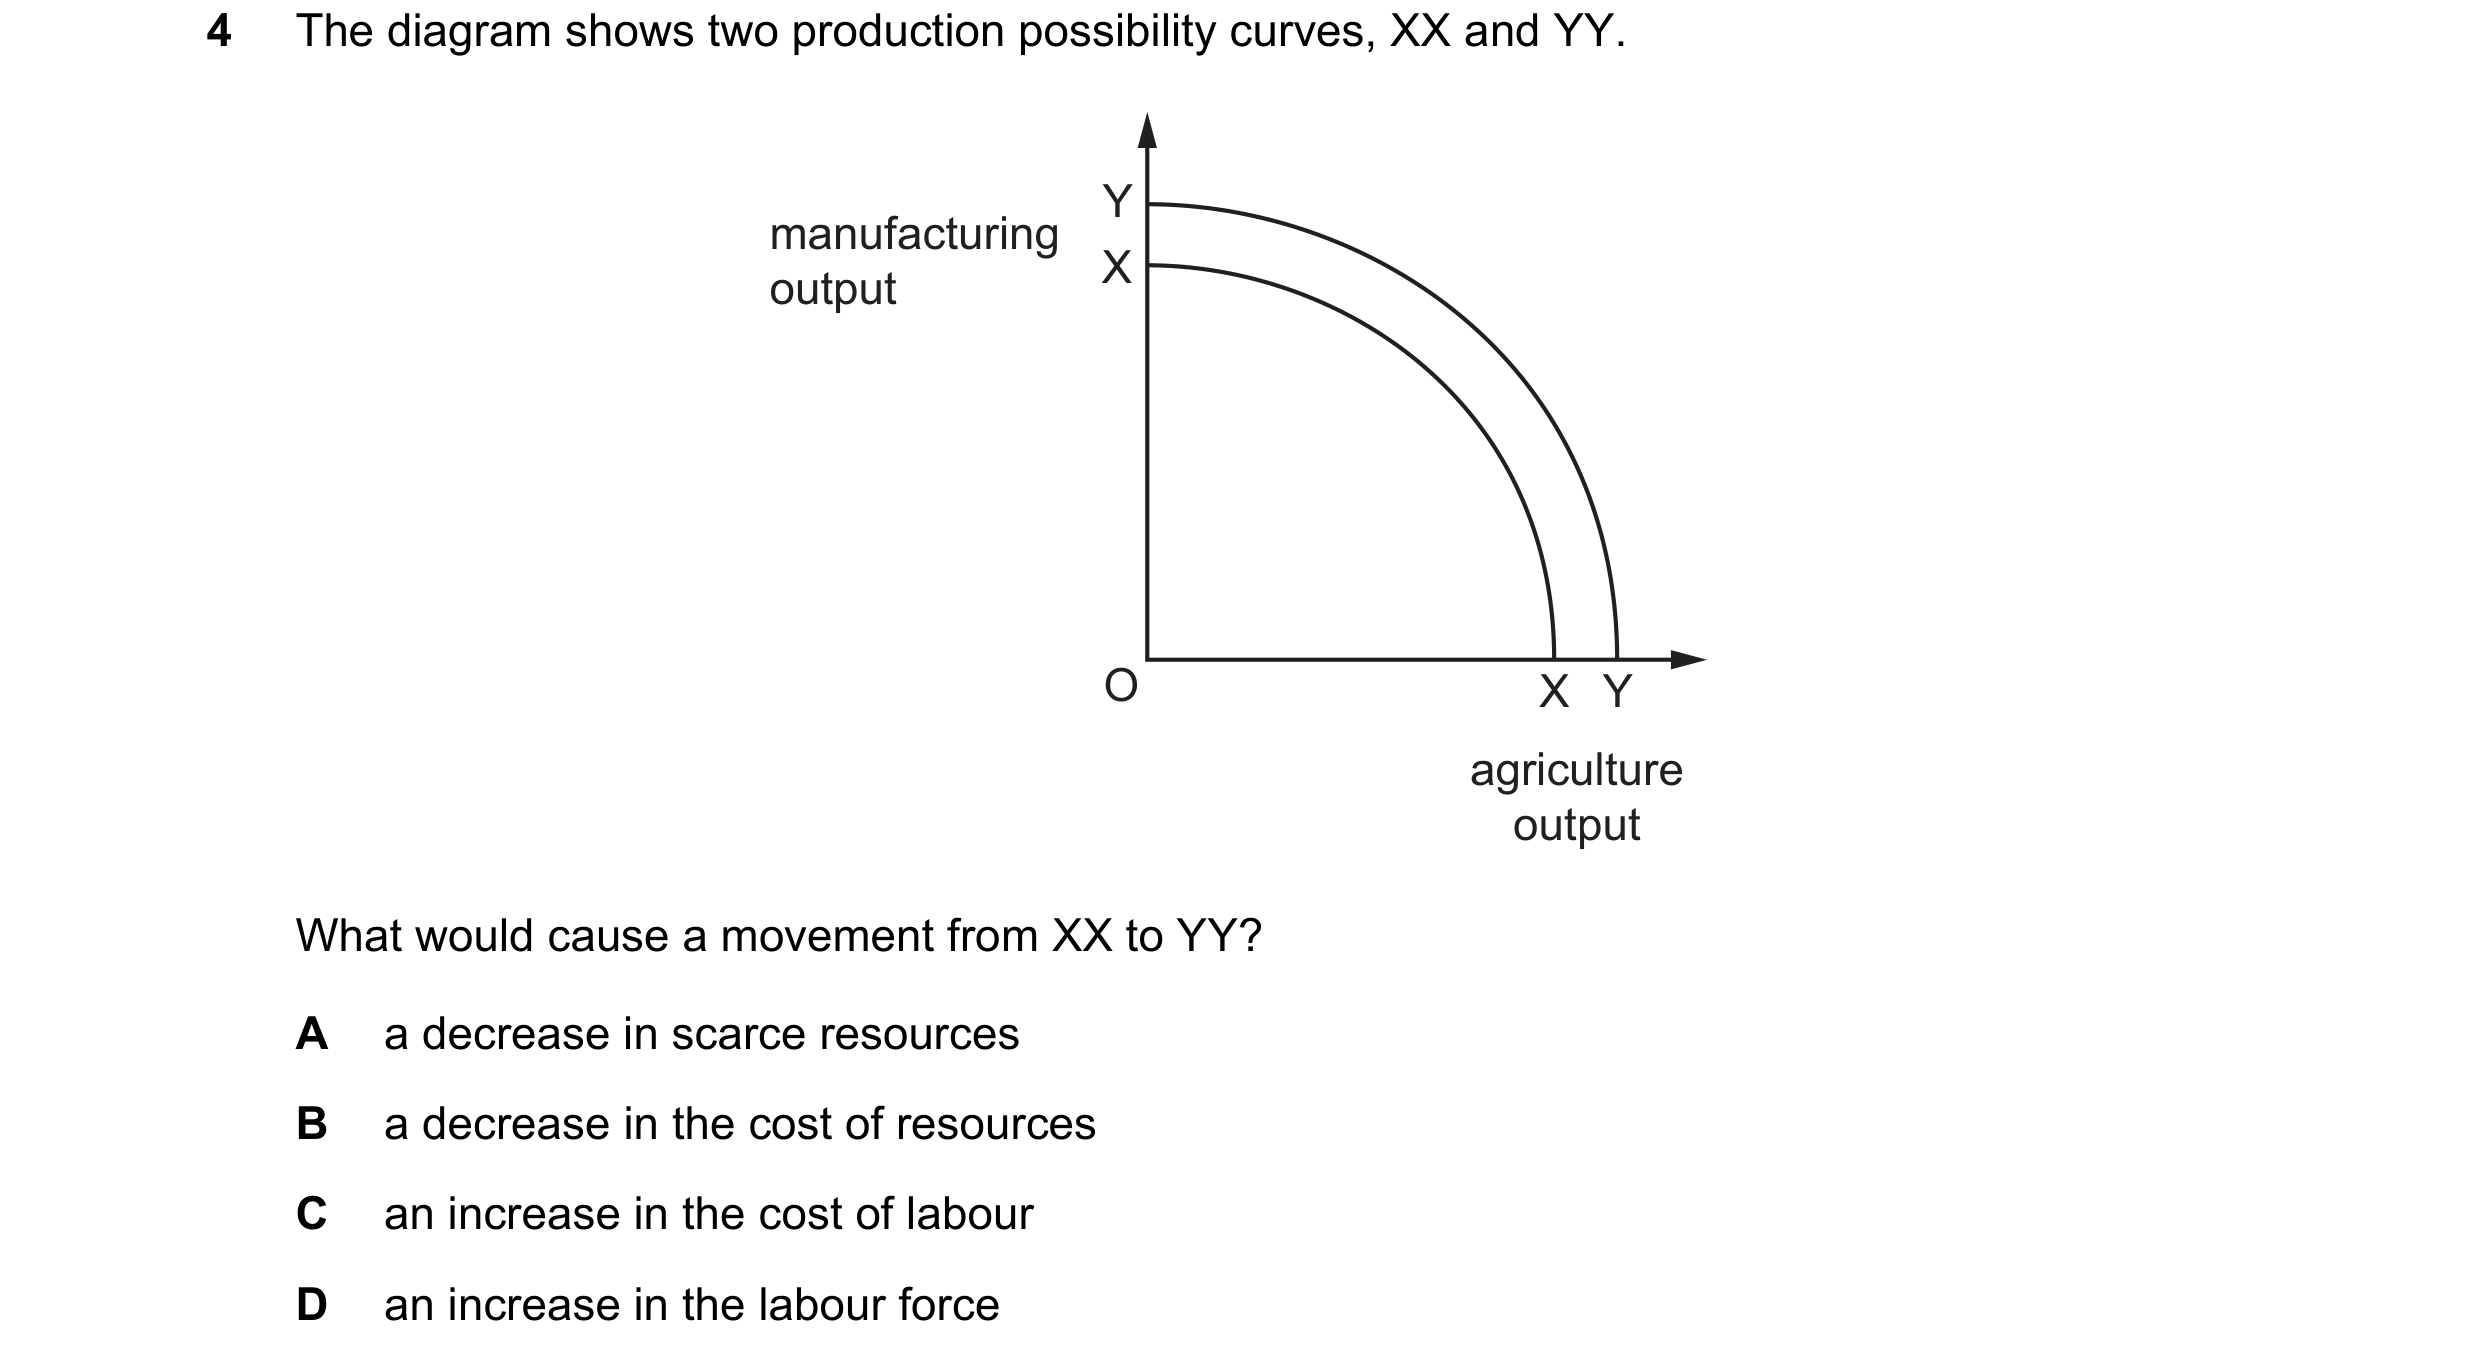
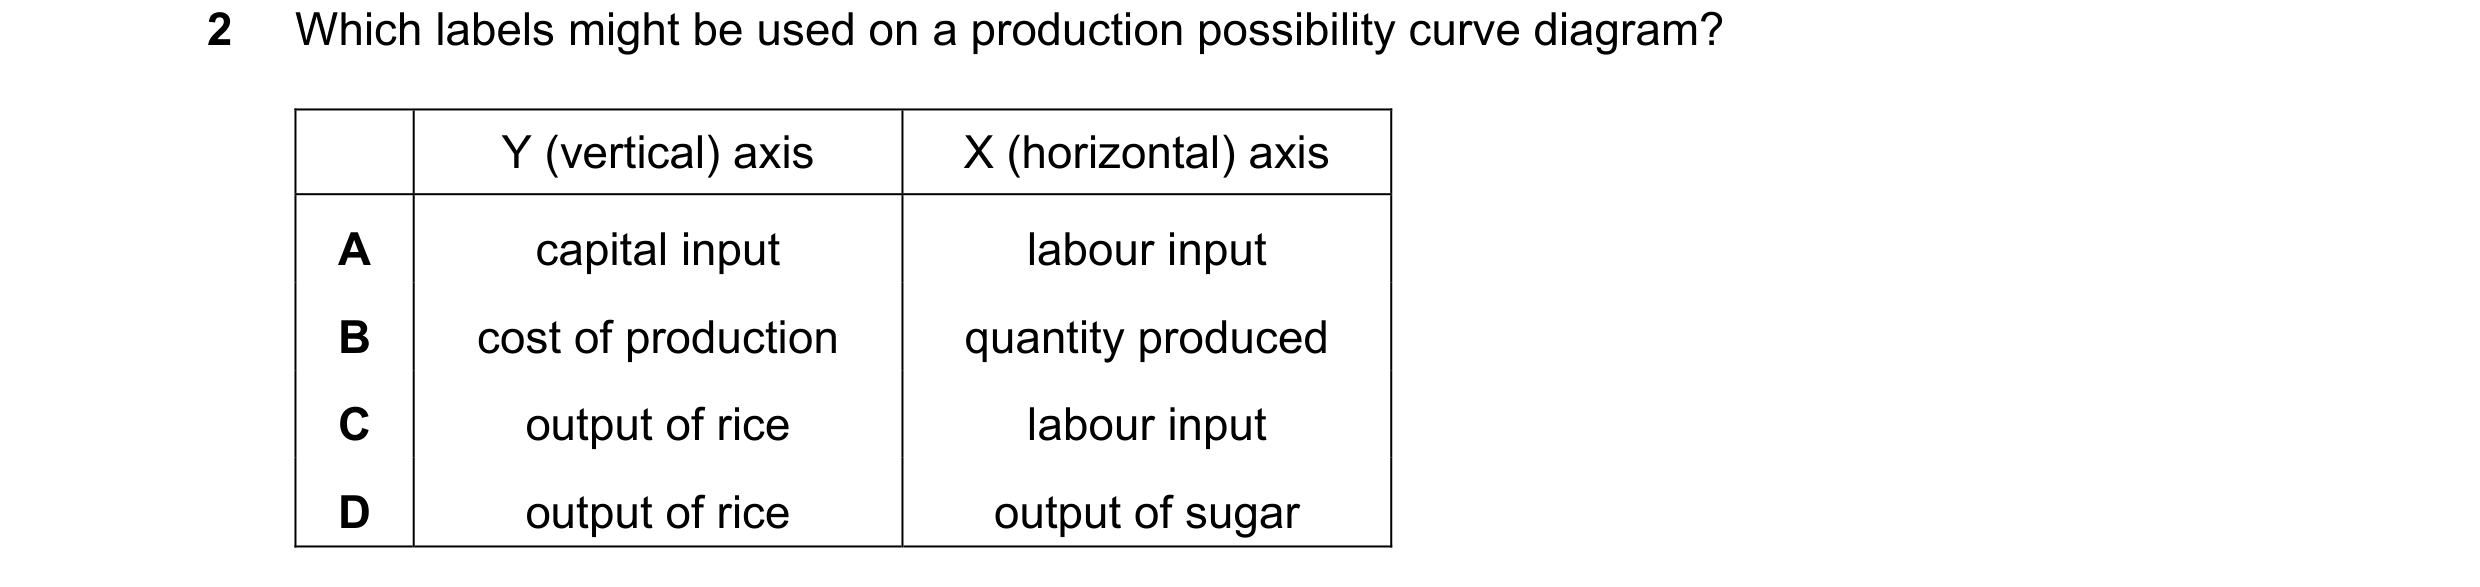 48 / 68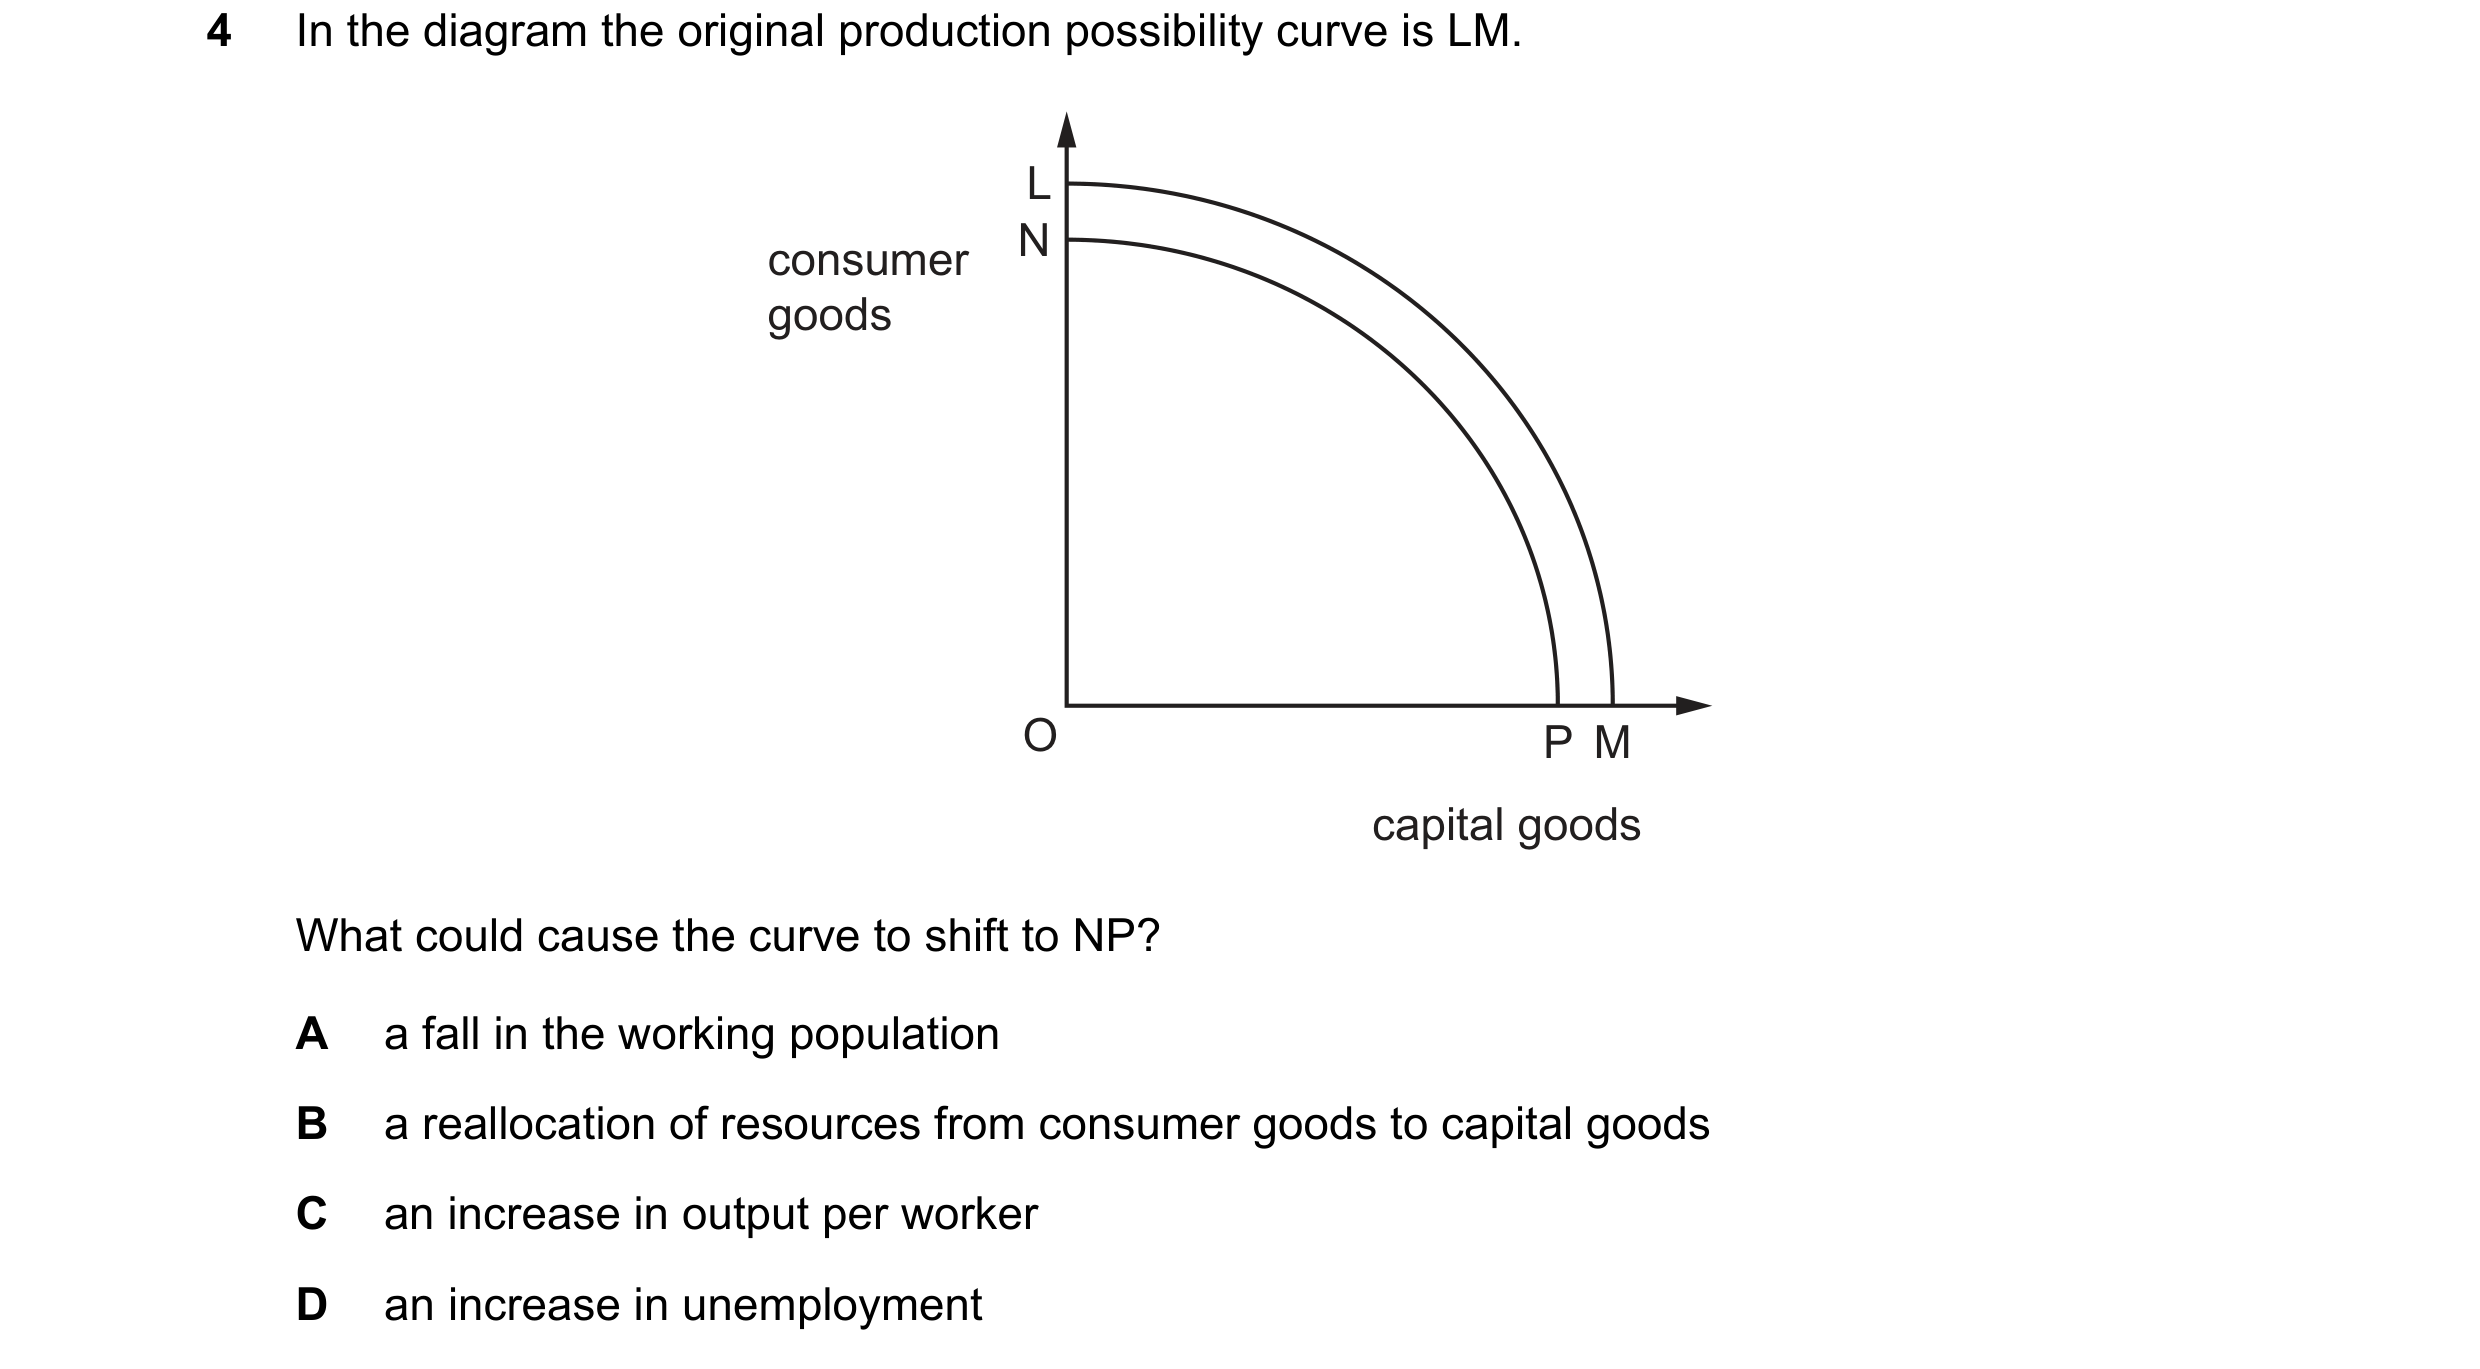
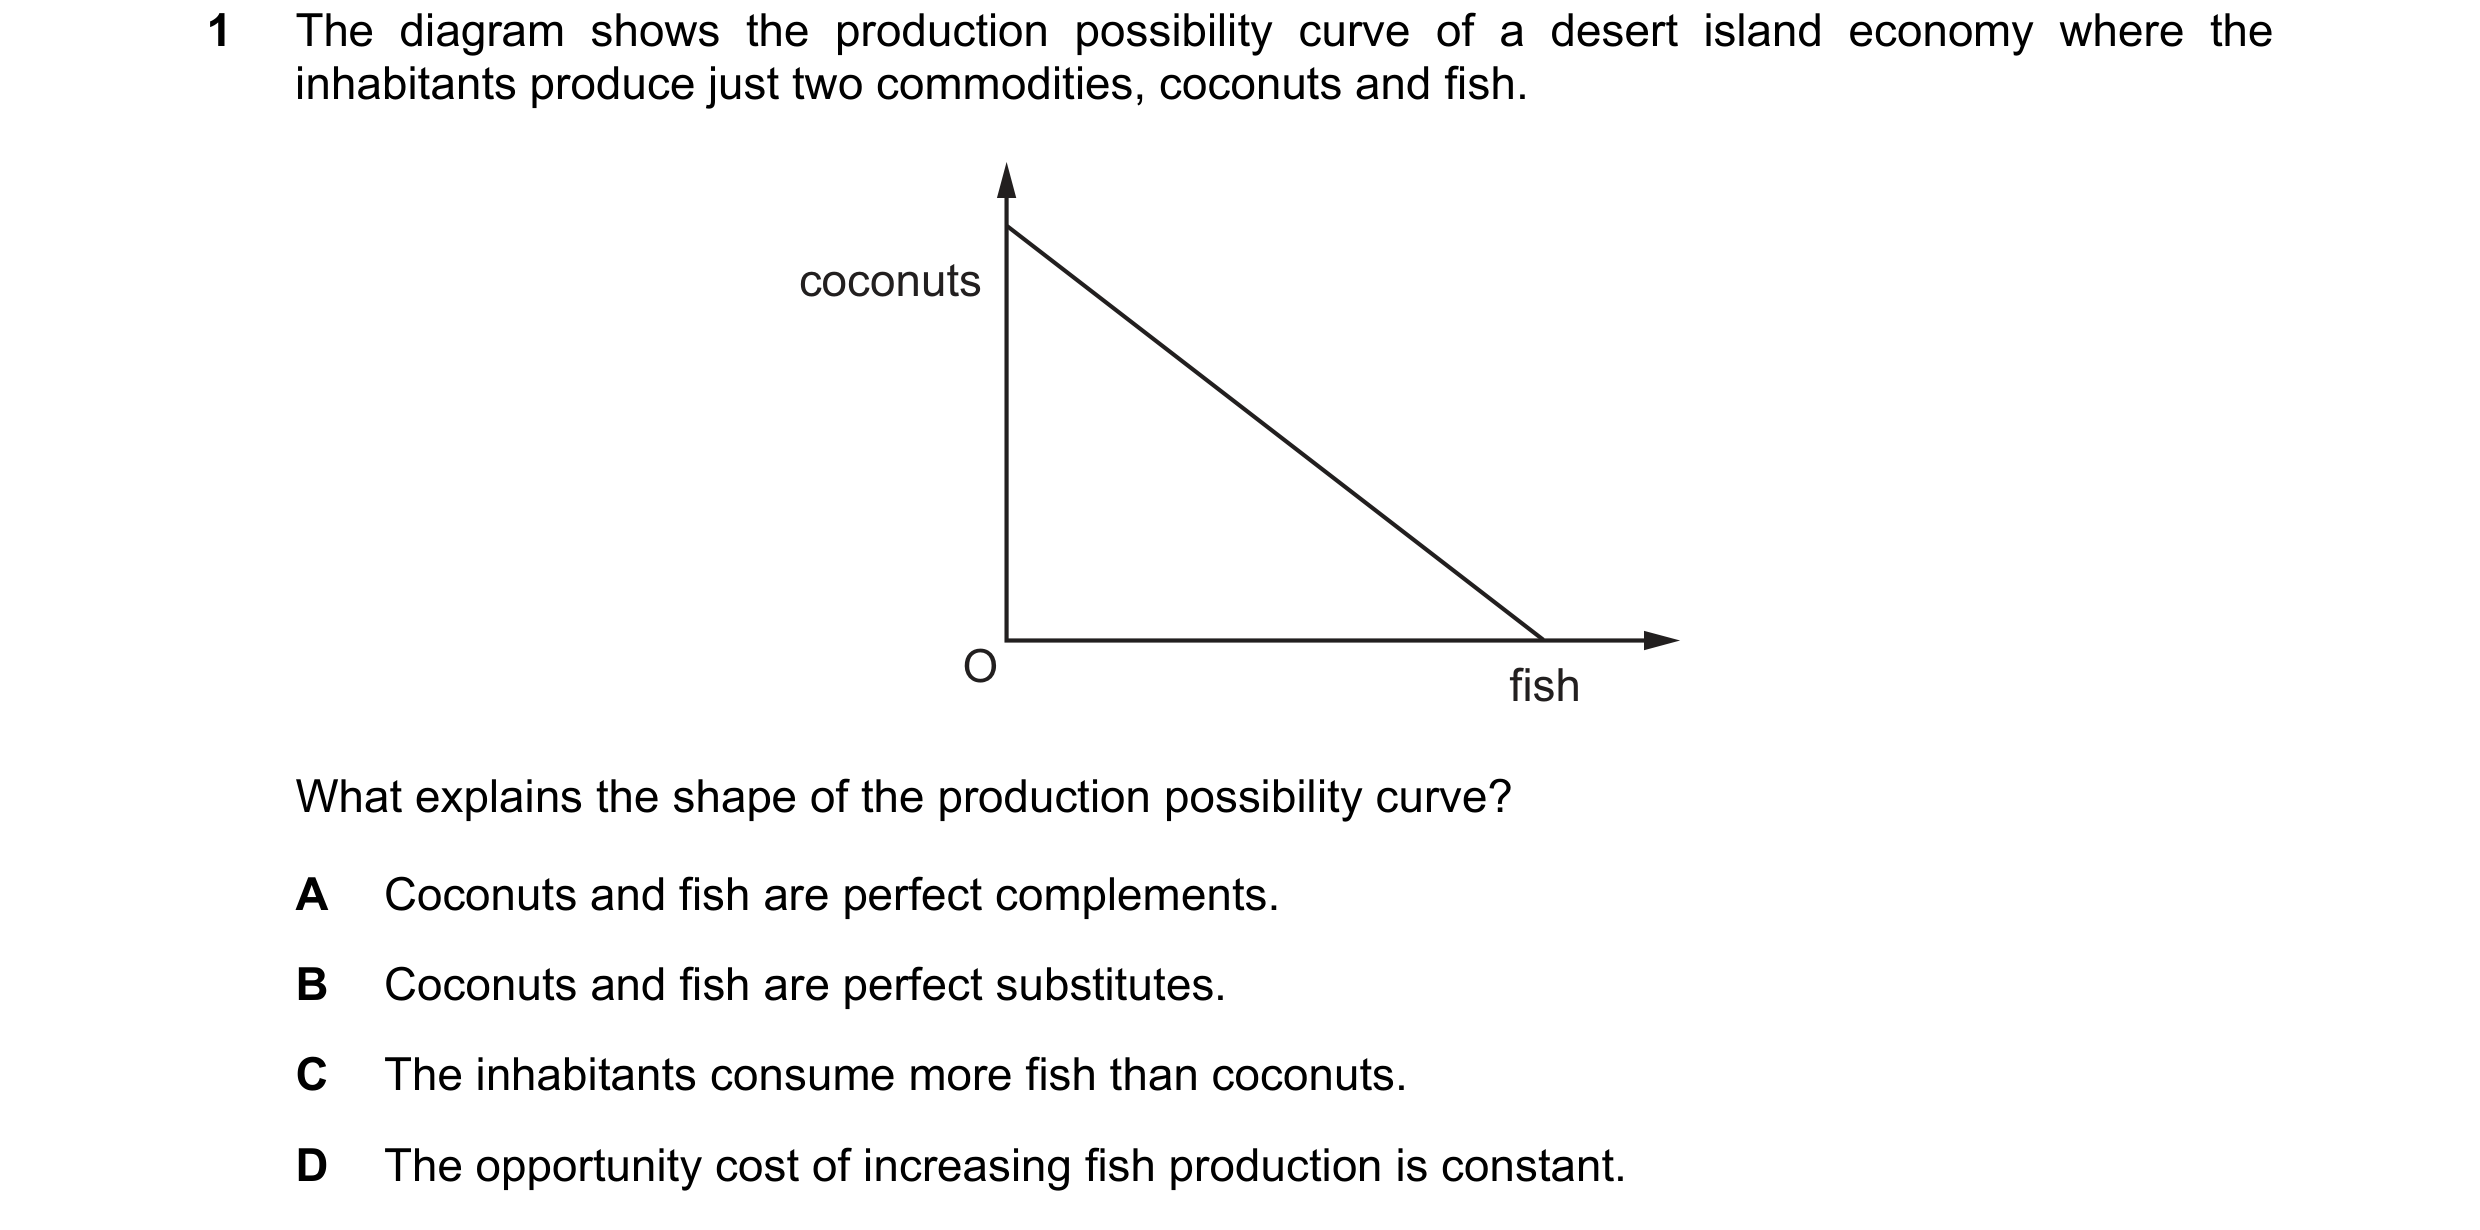
 49 / 68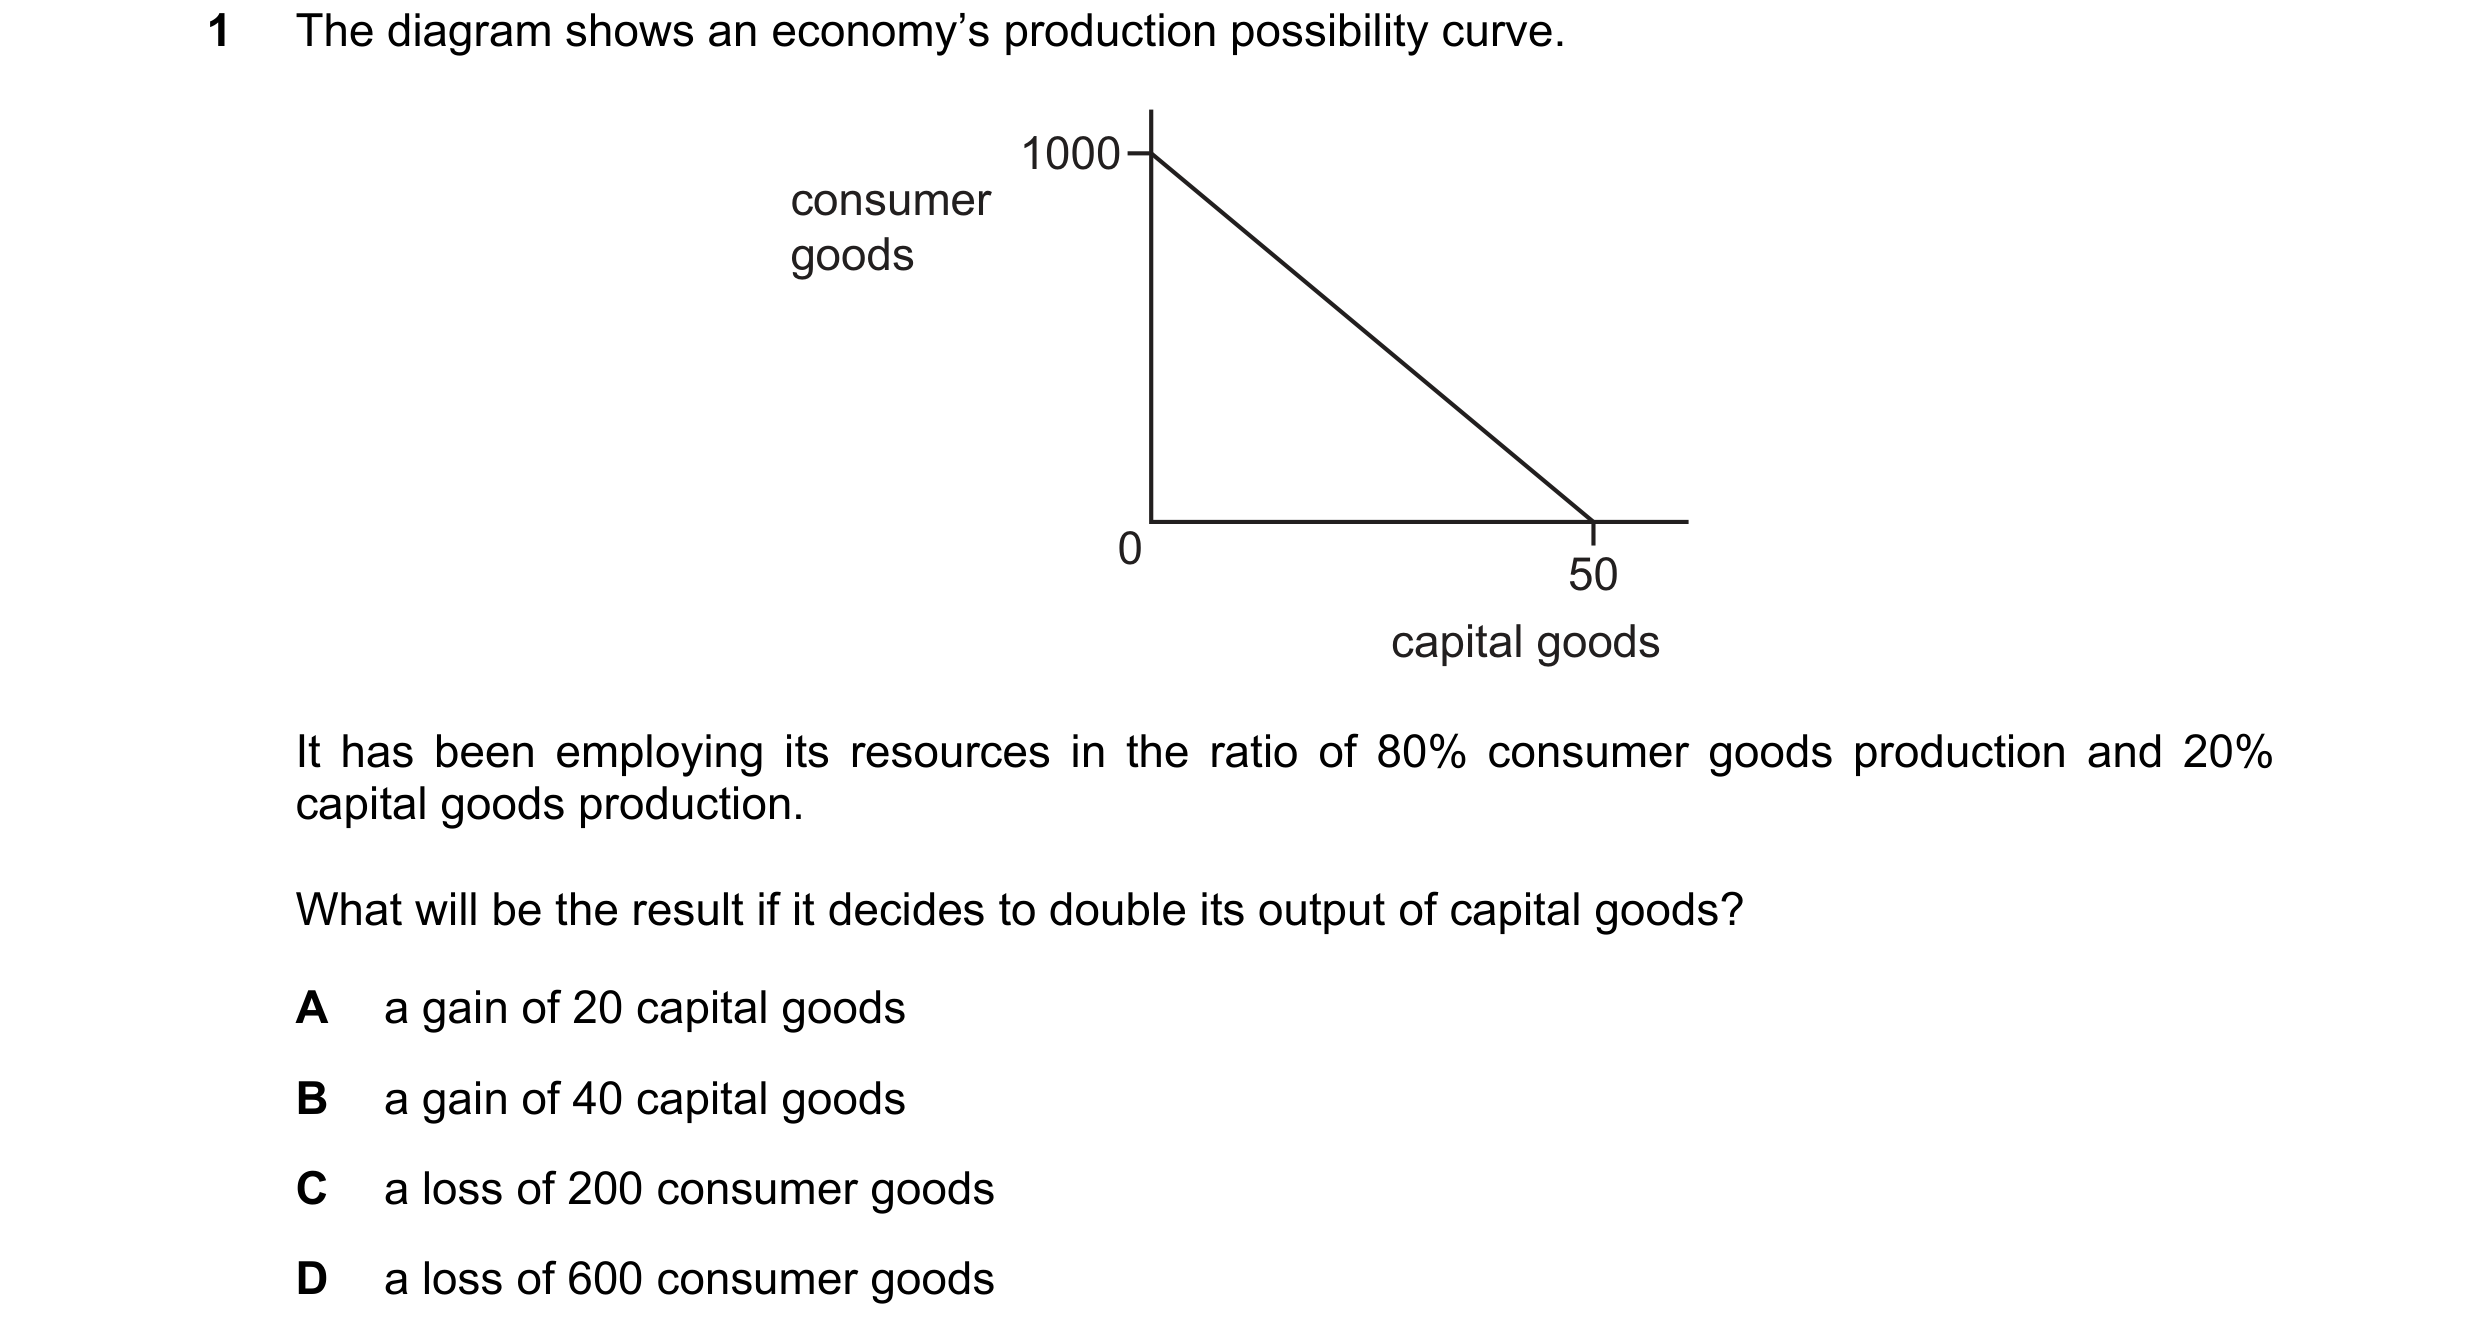
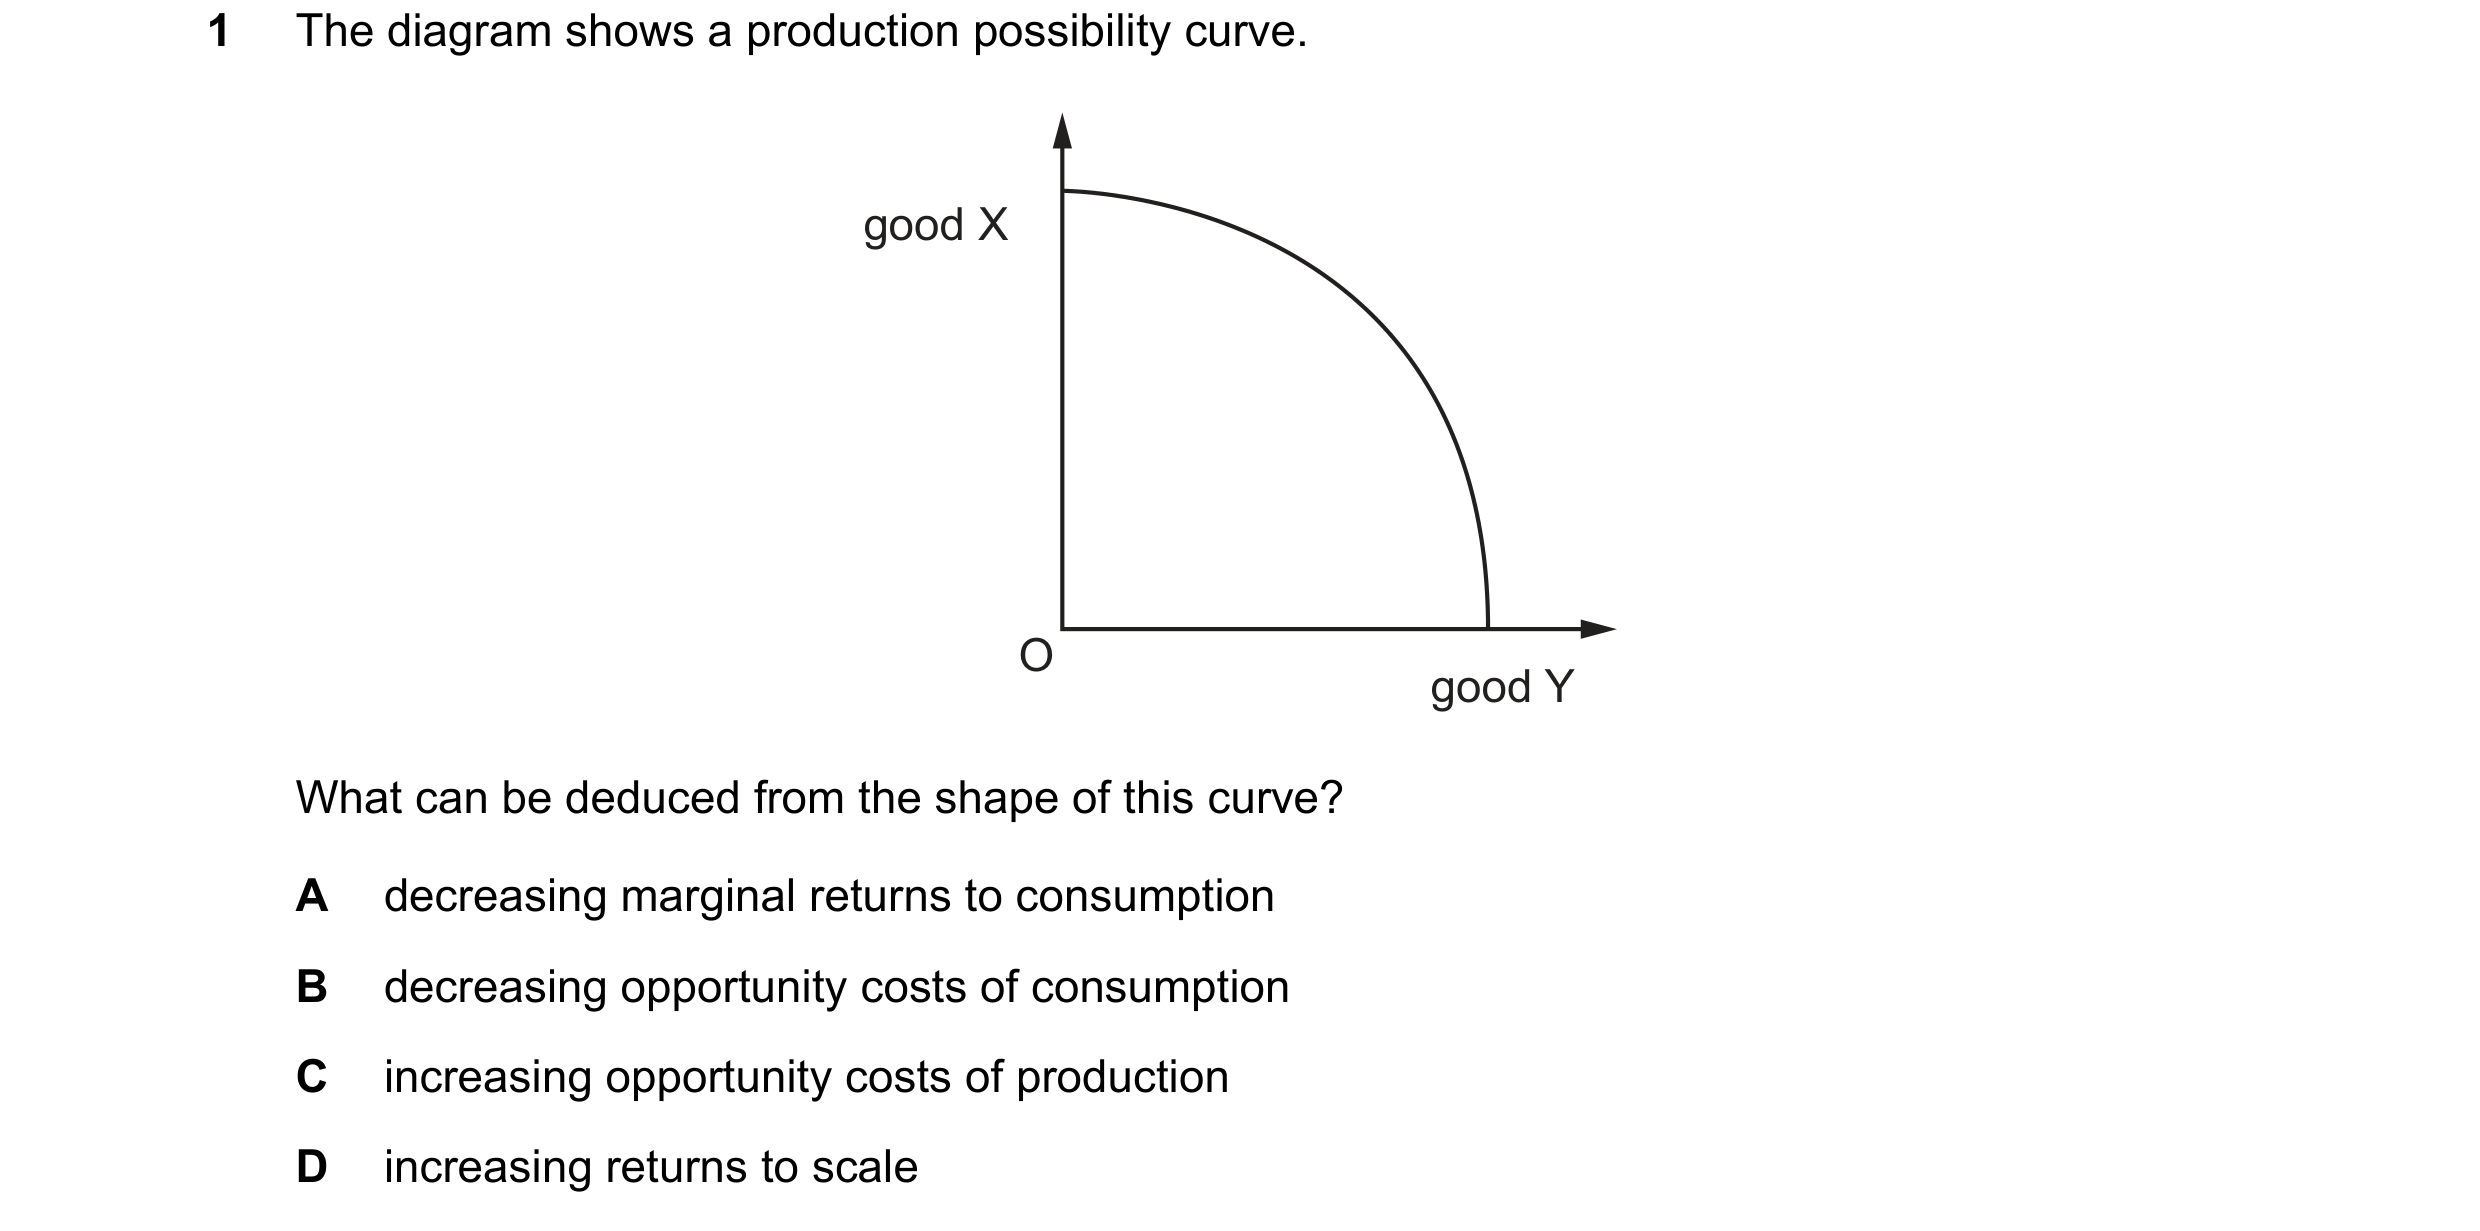
 50 / 68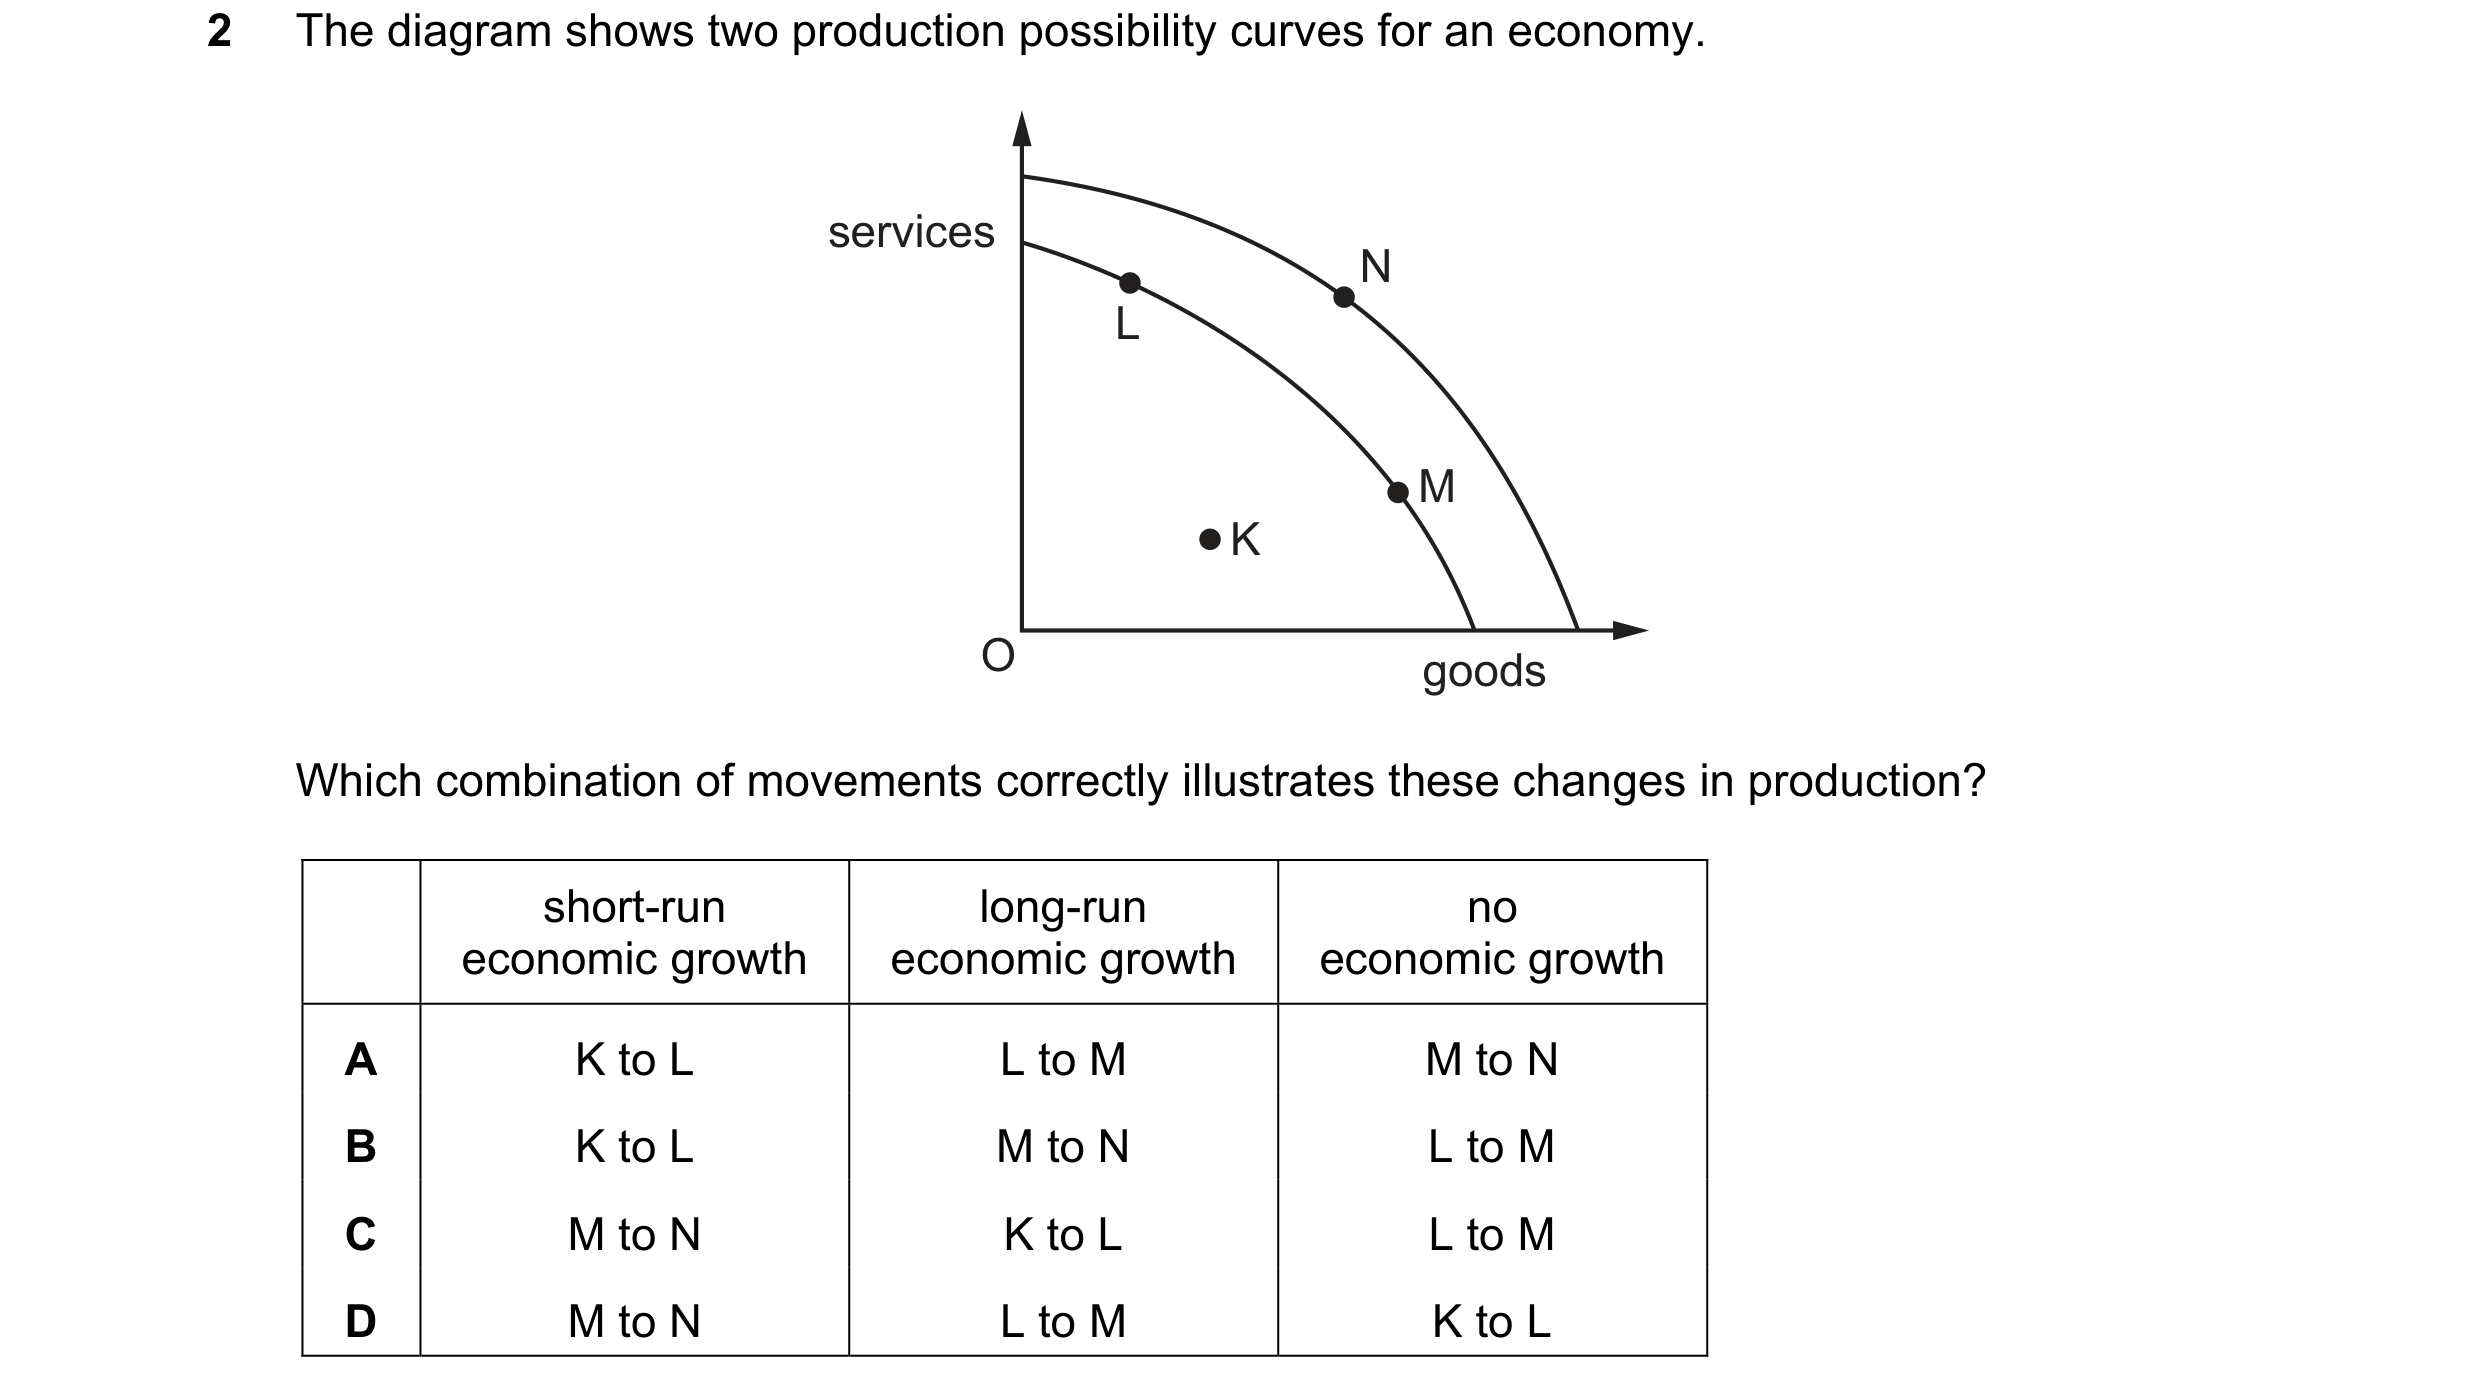
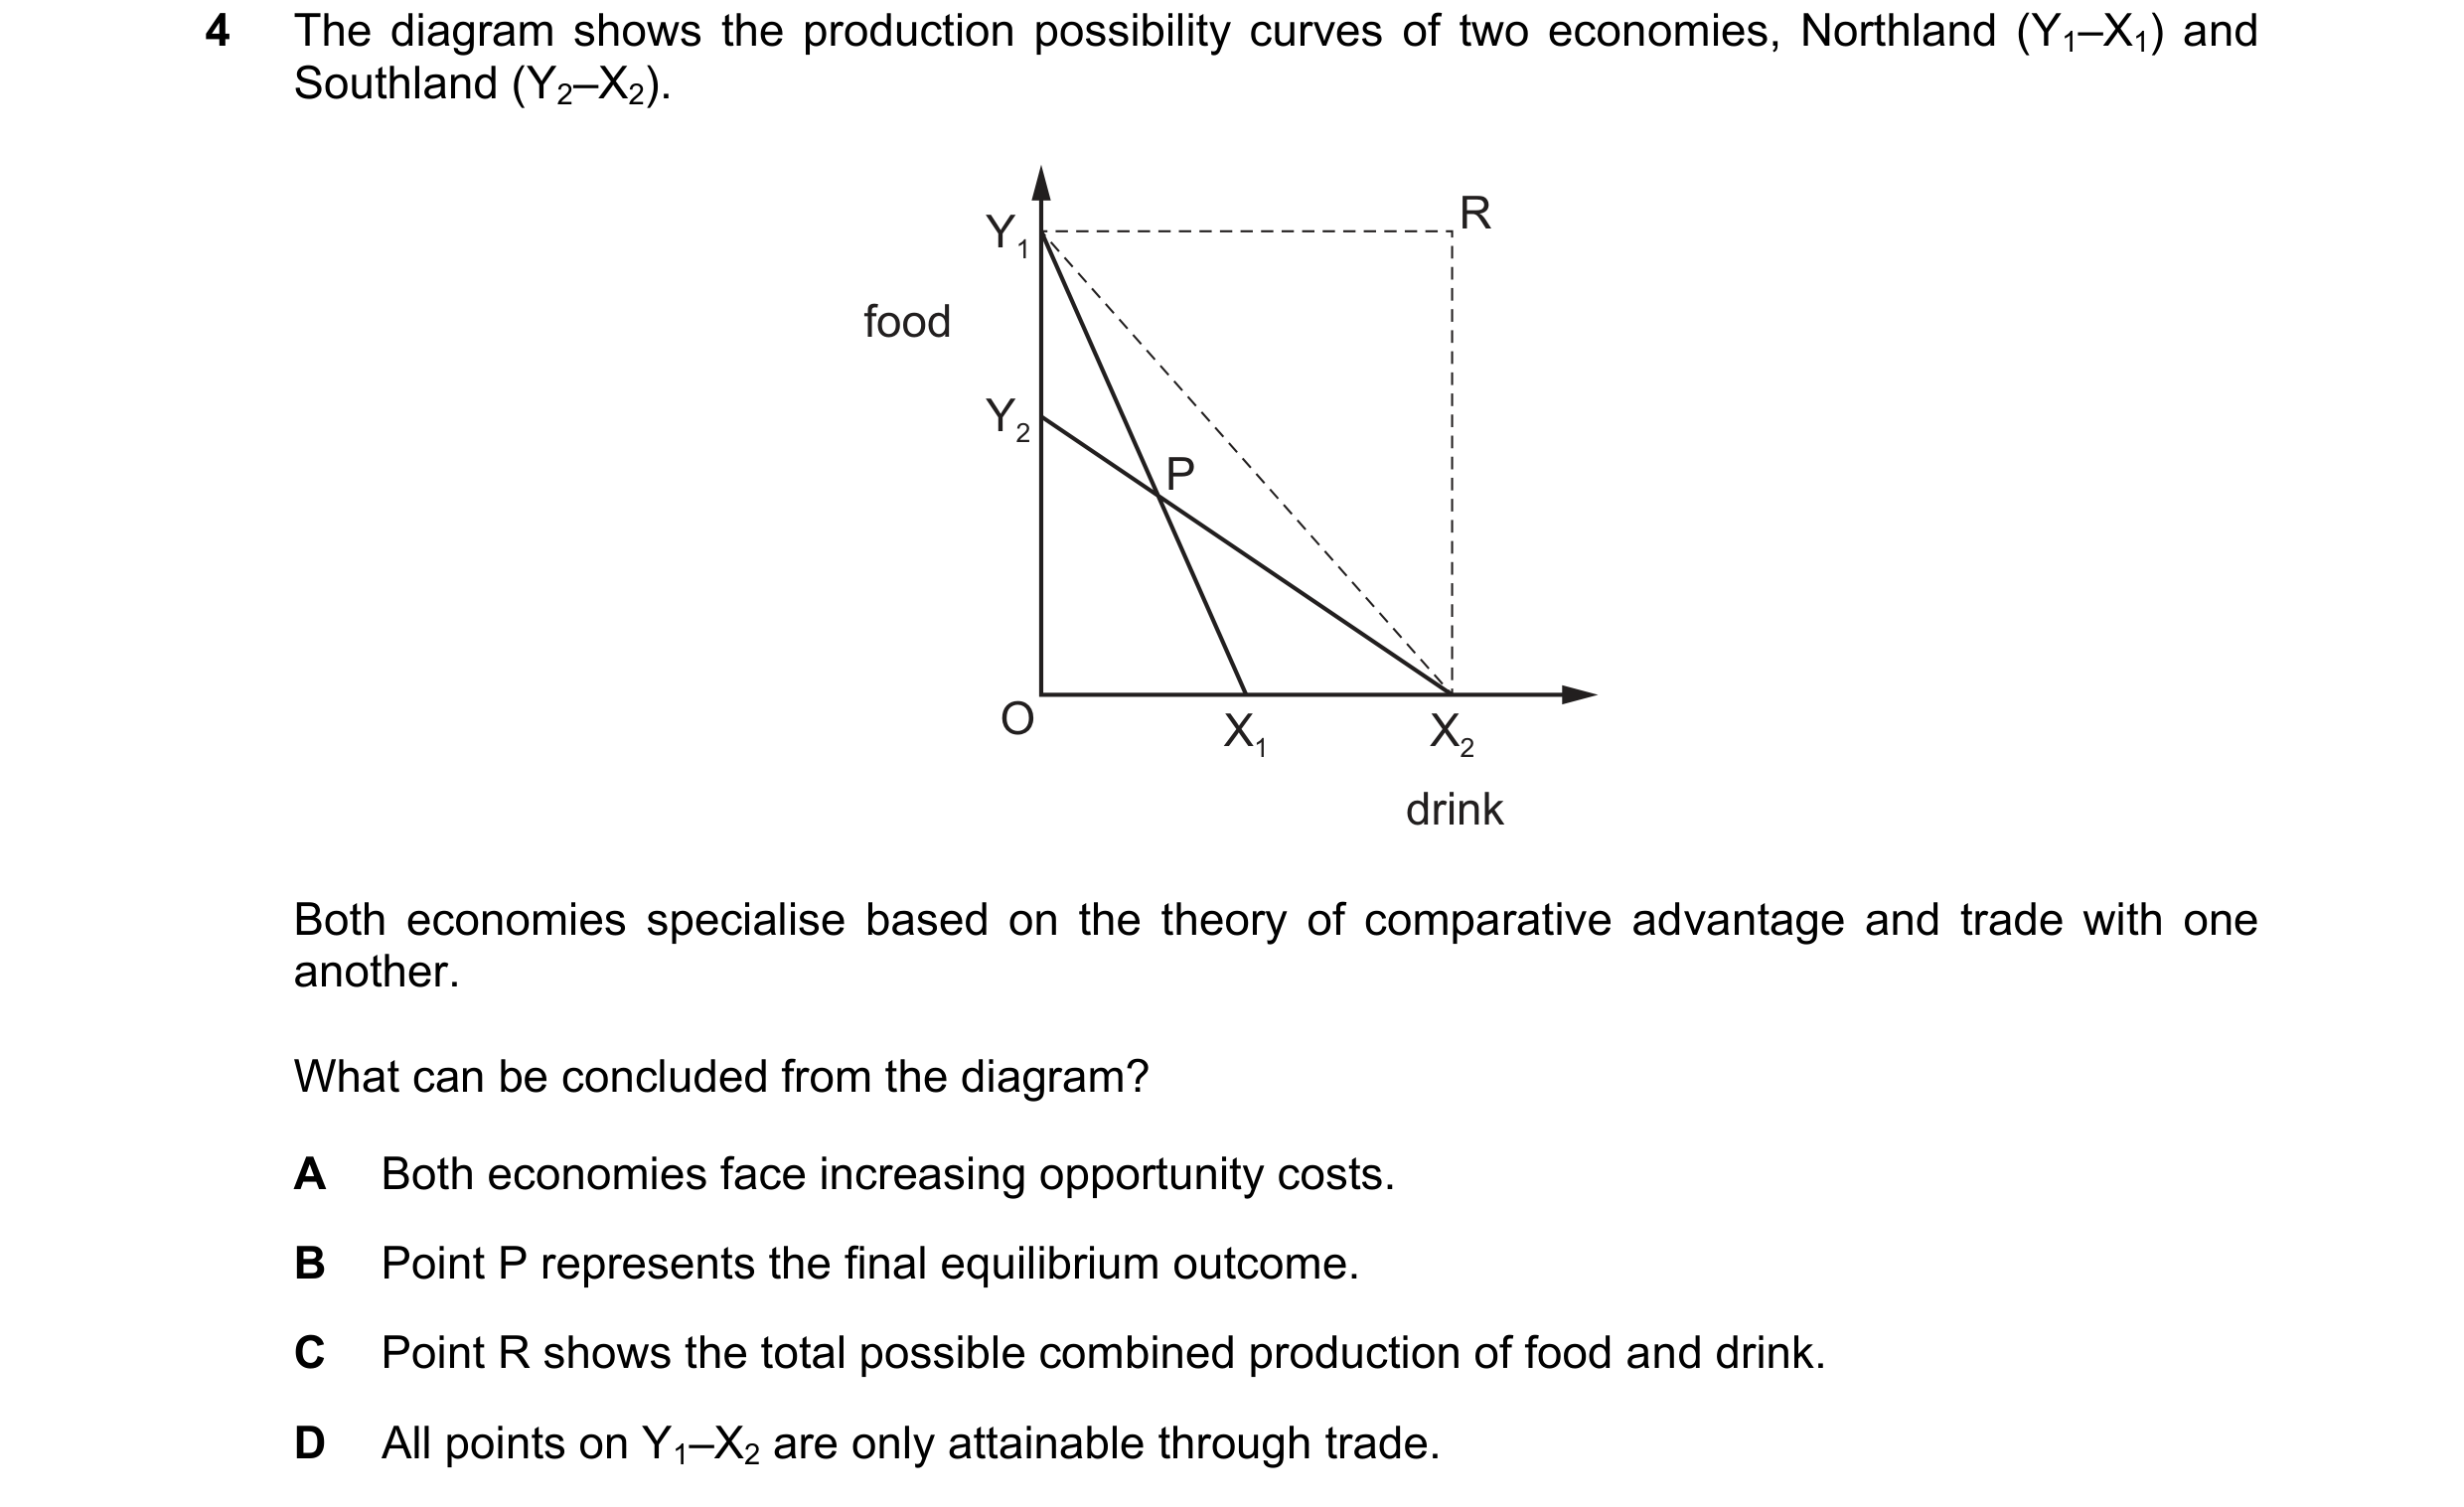 51 / 68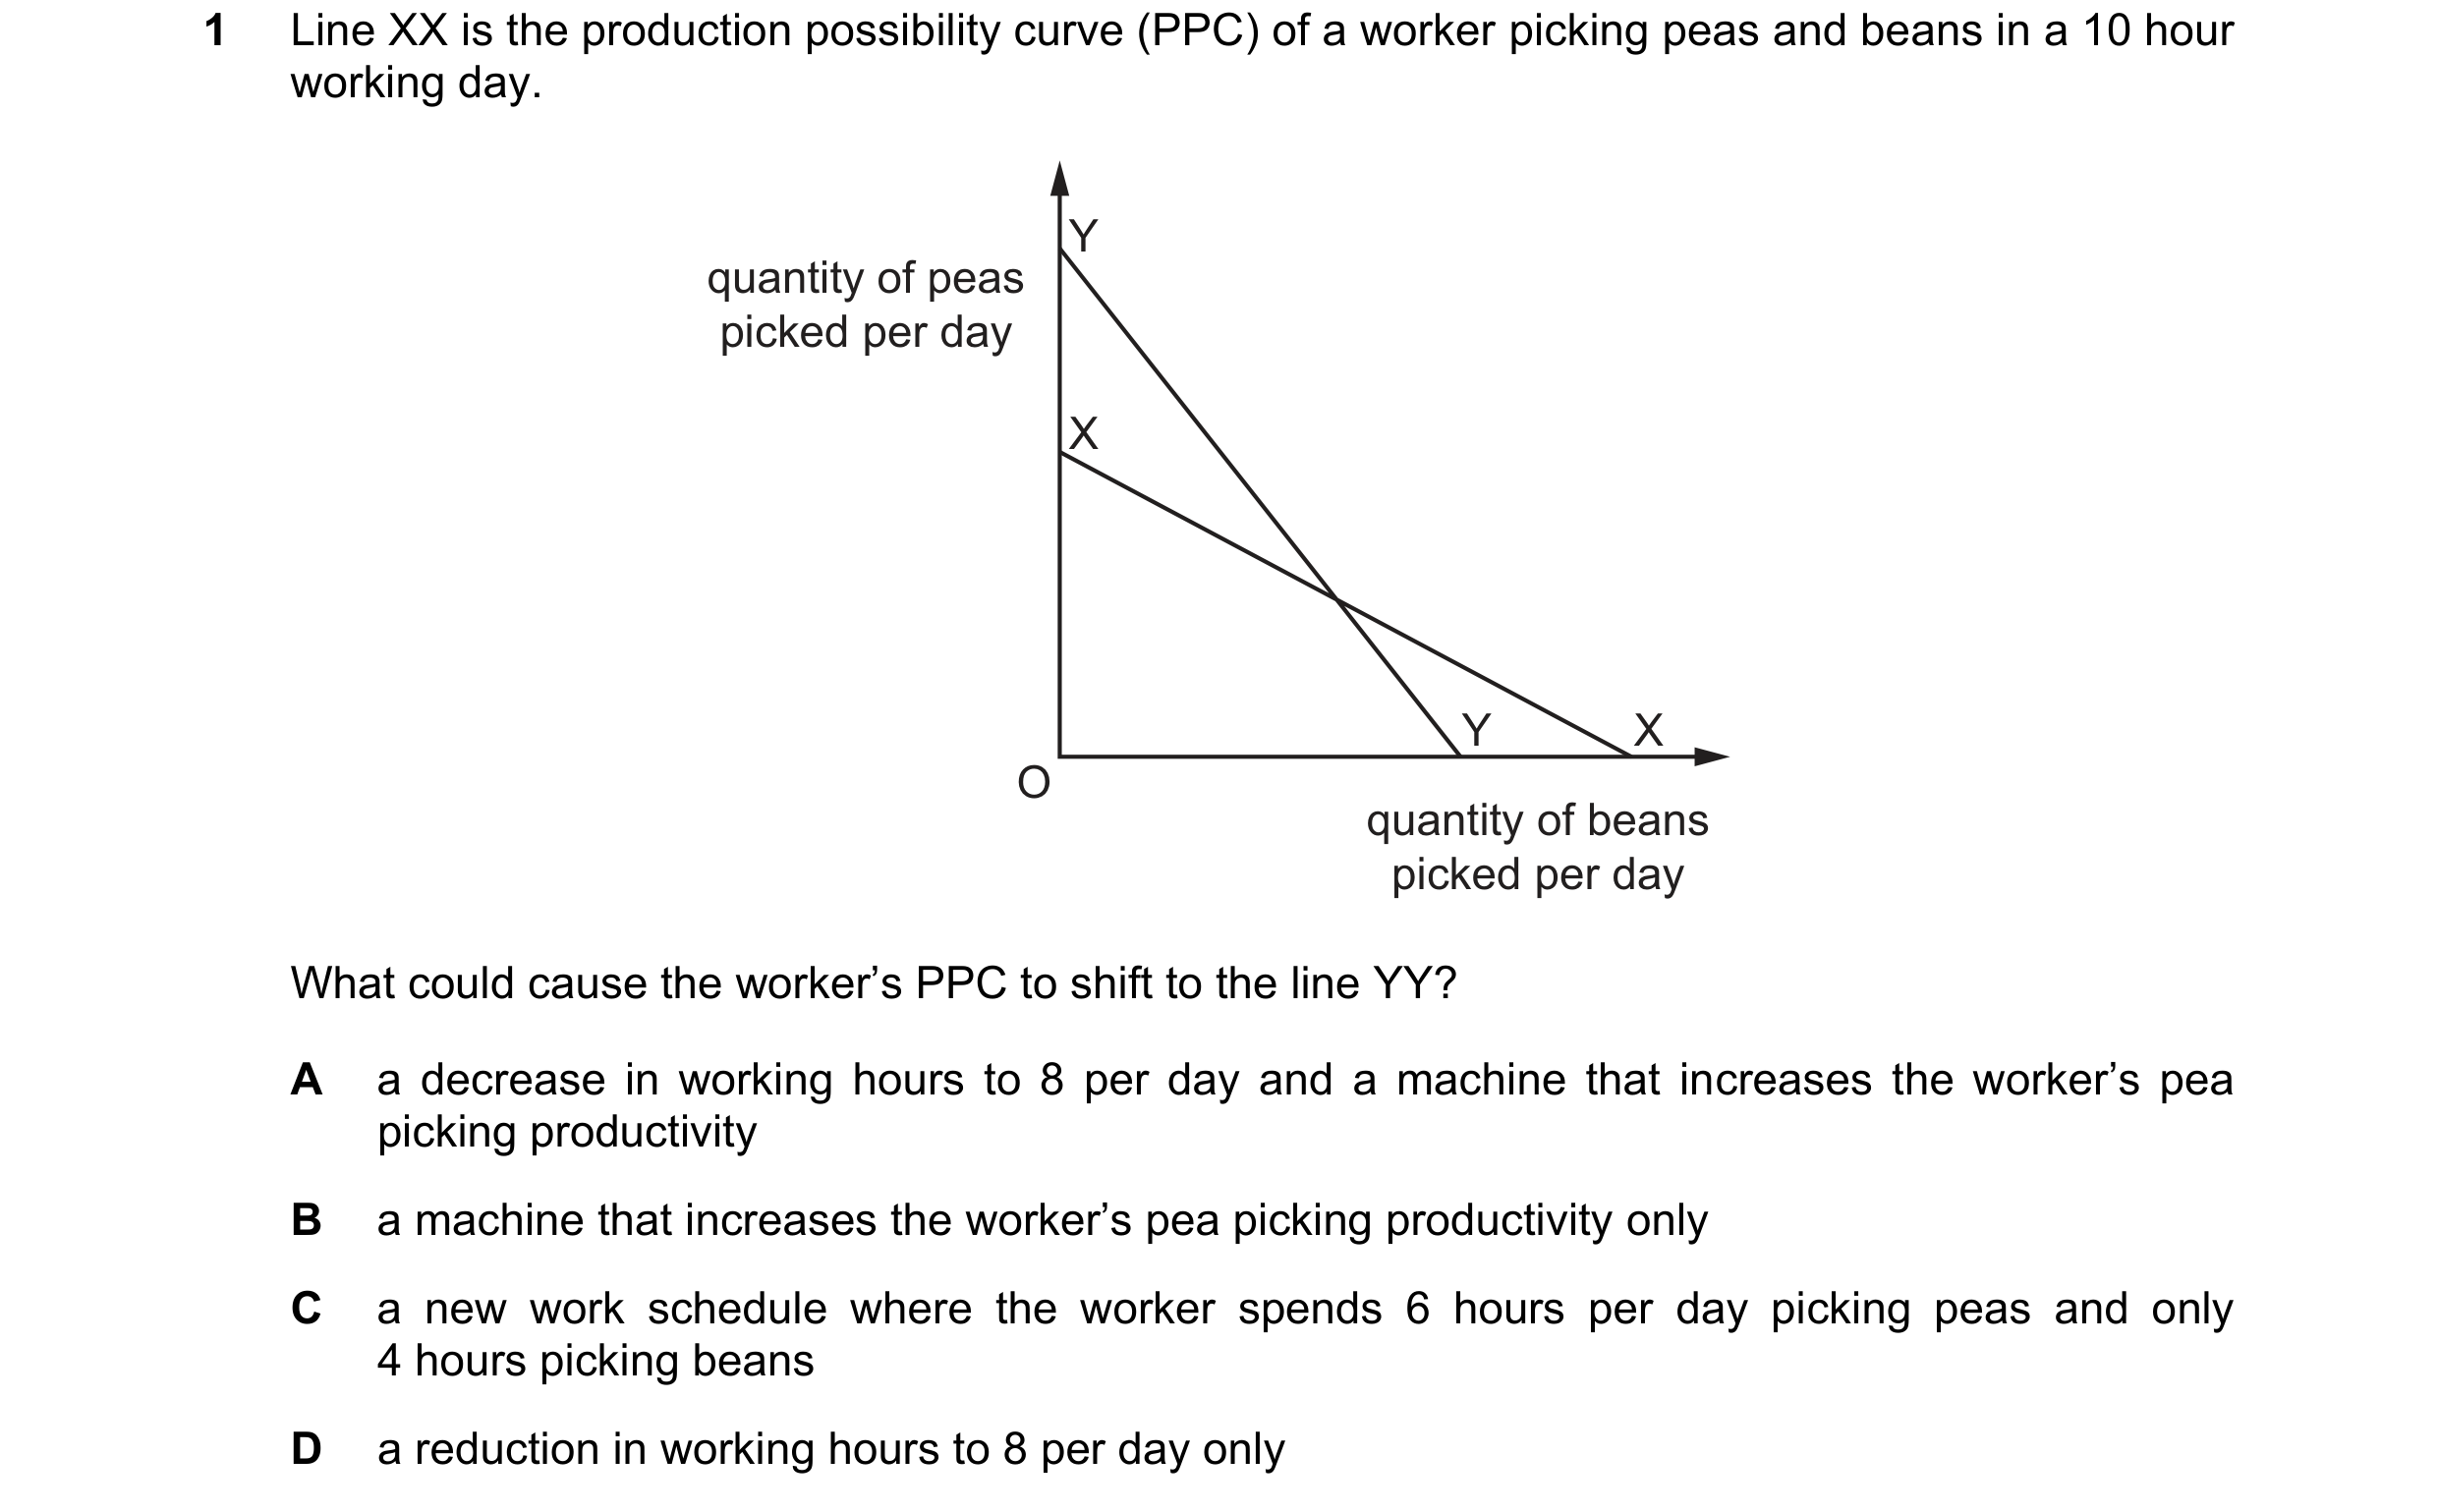
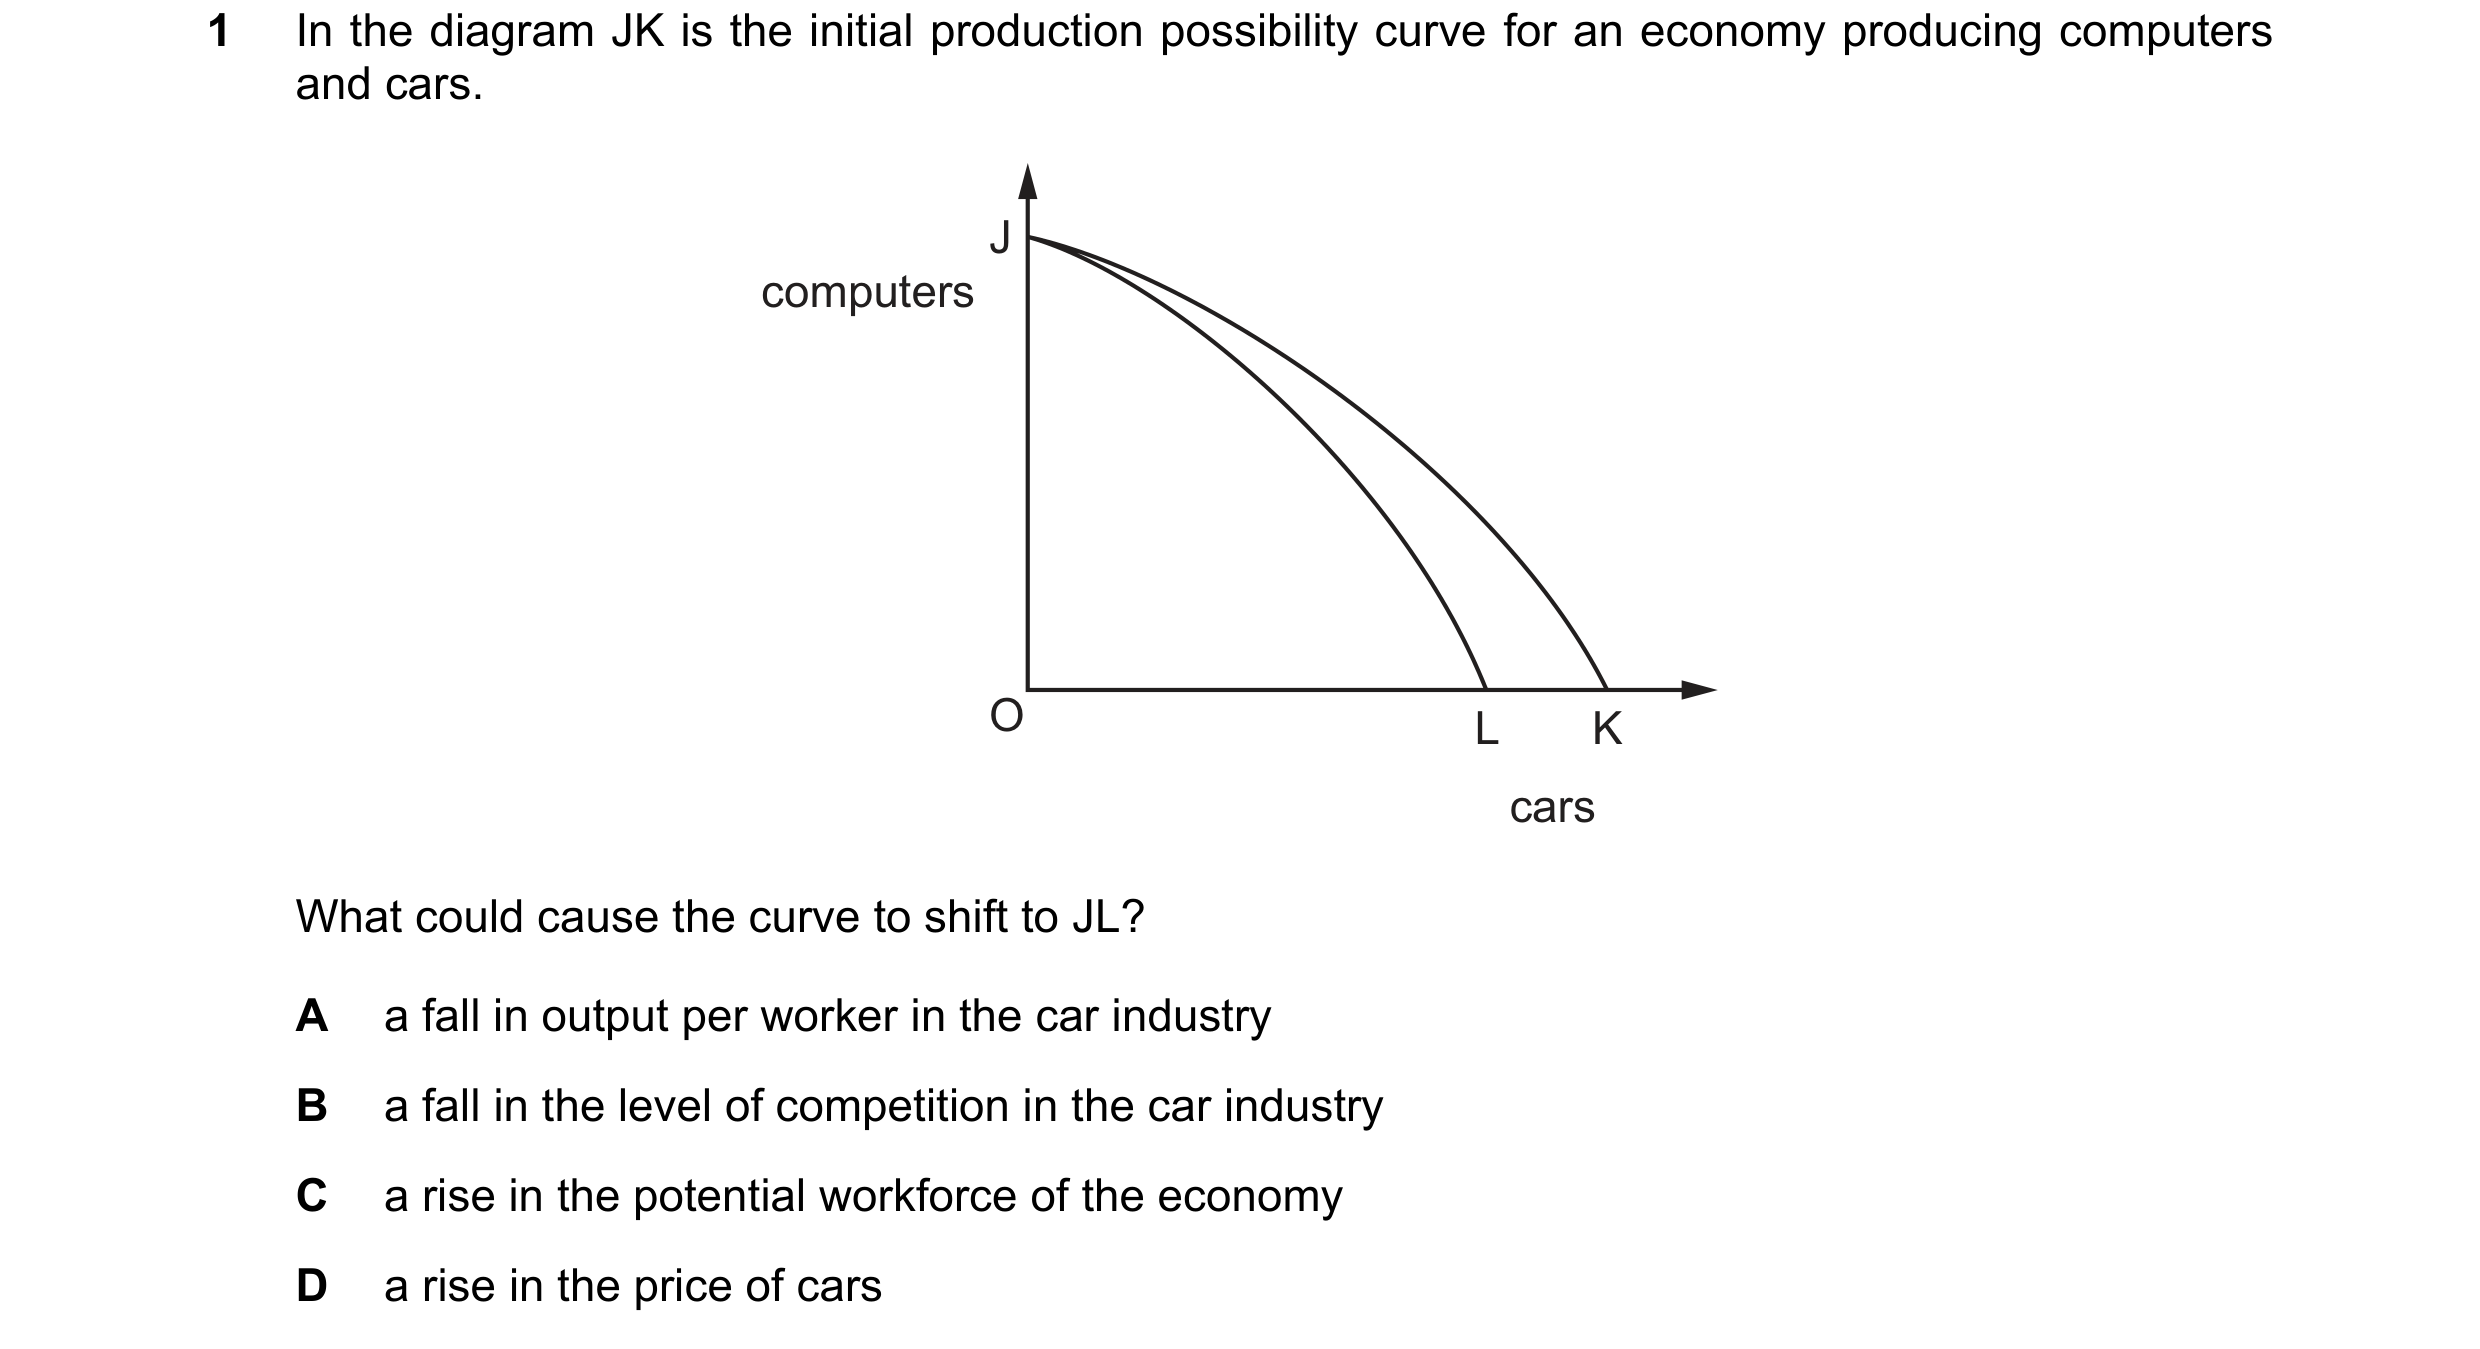 52 / 68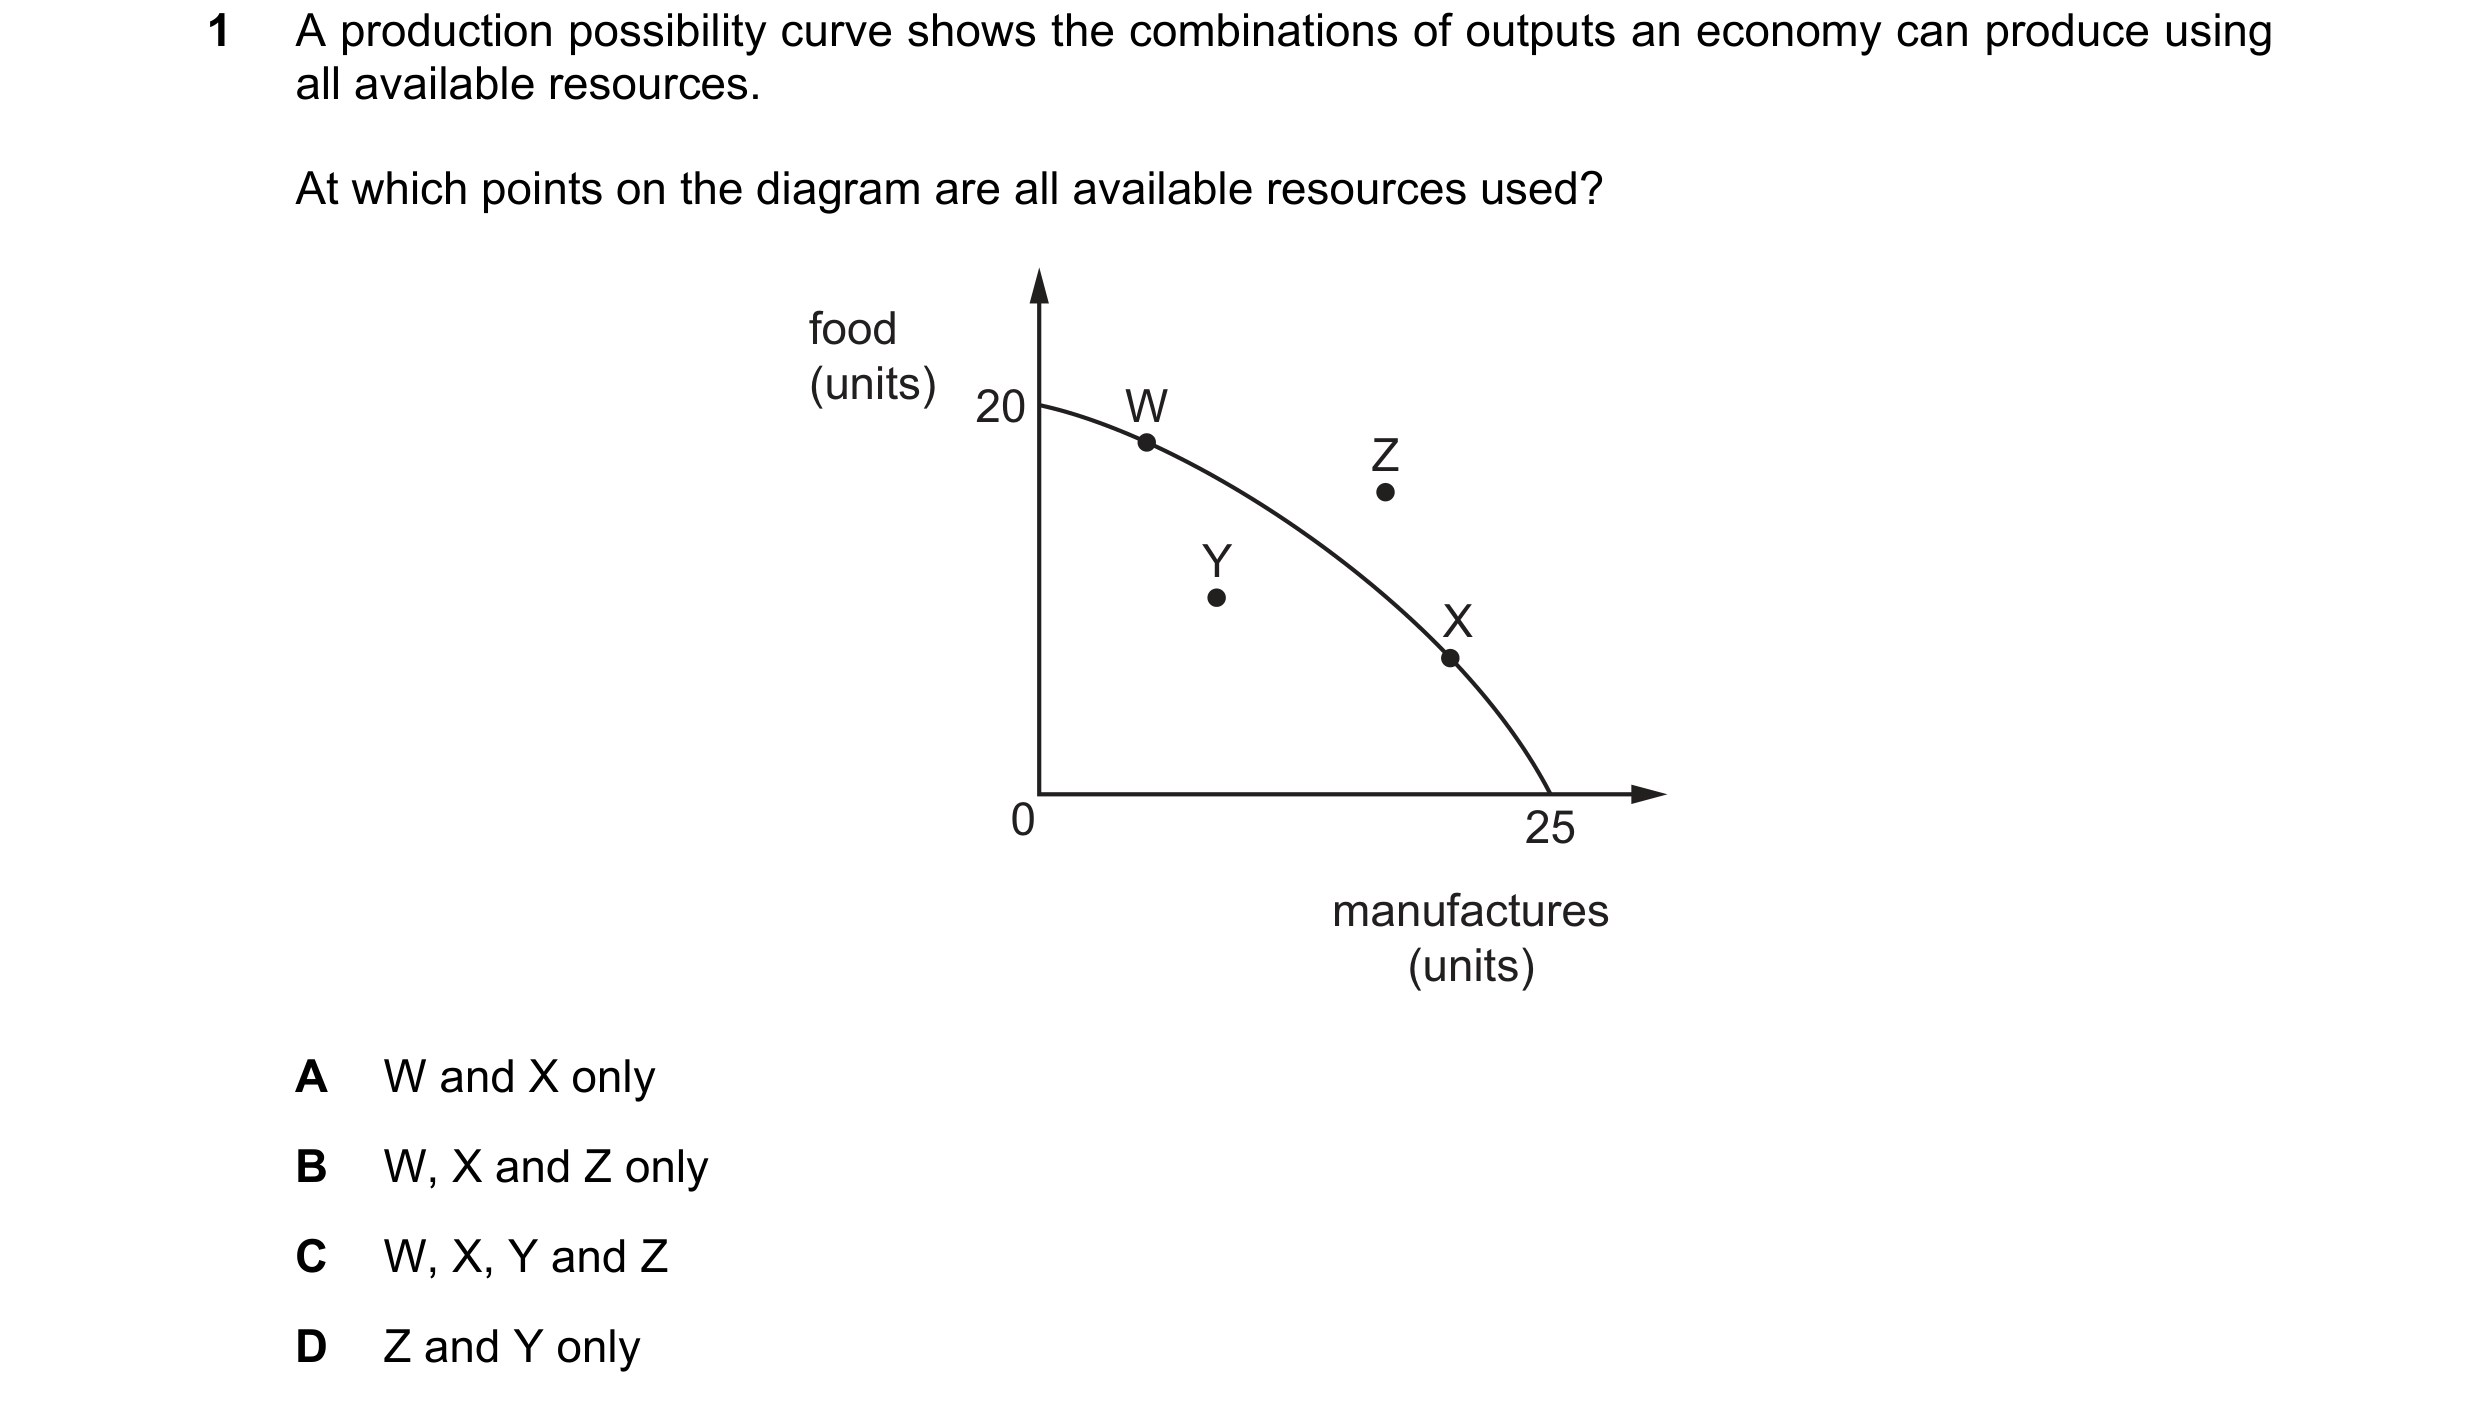
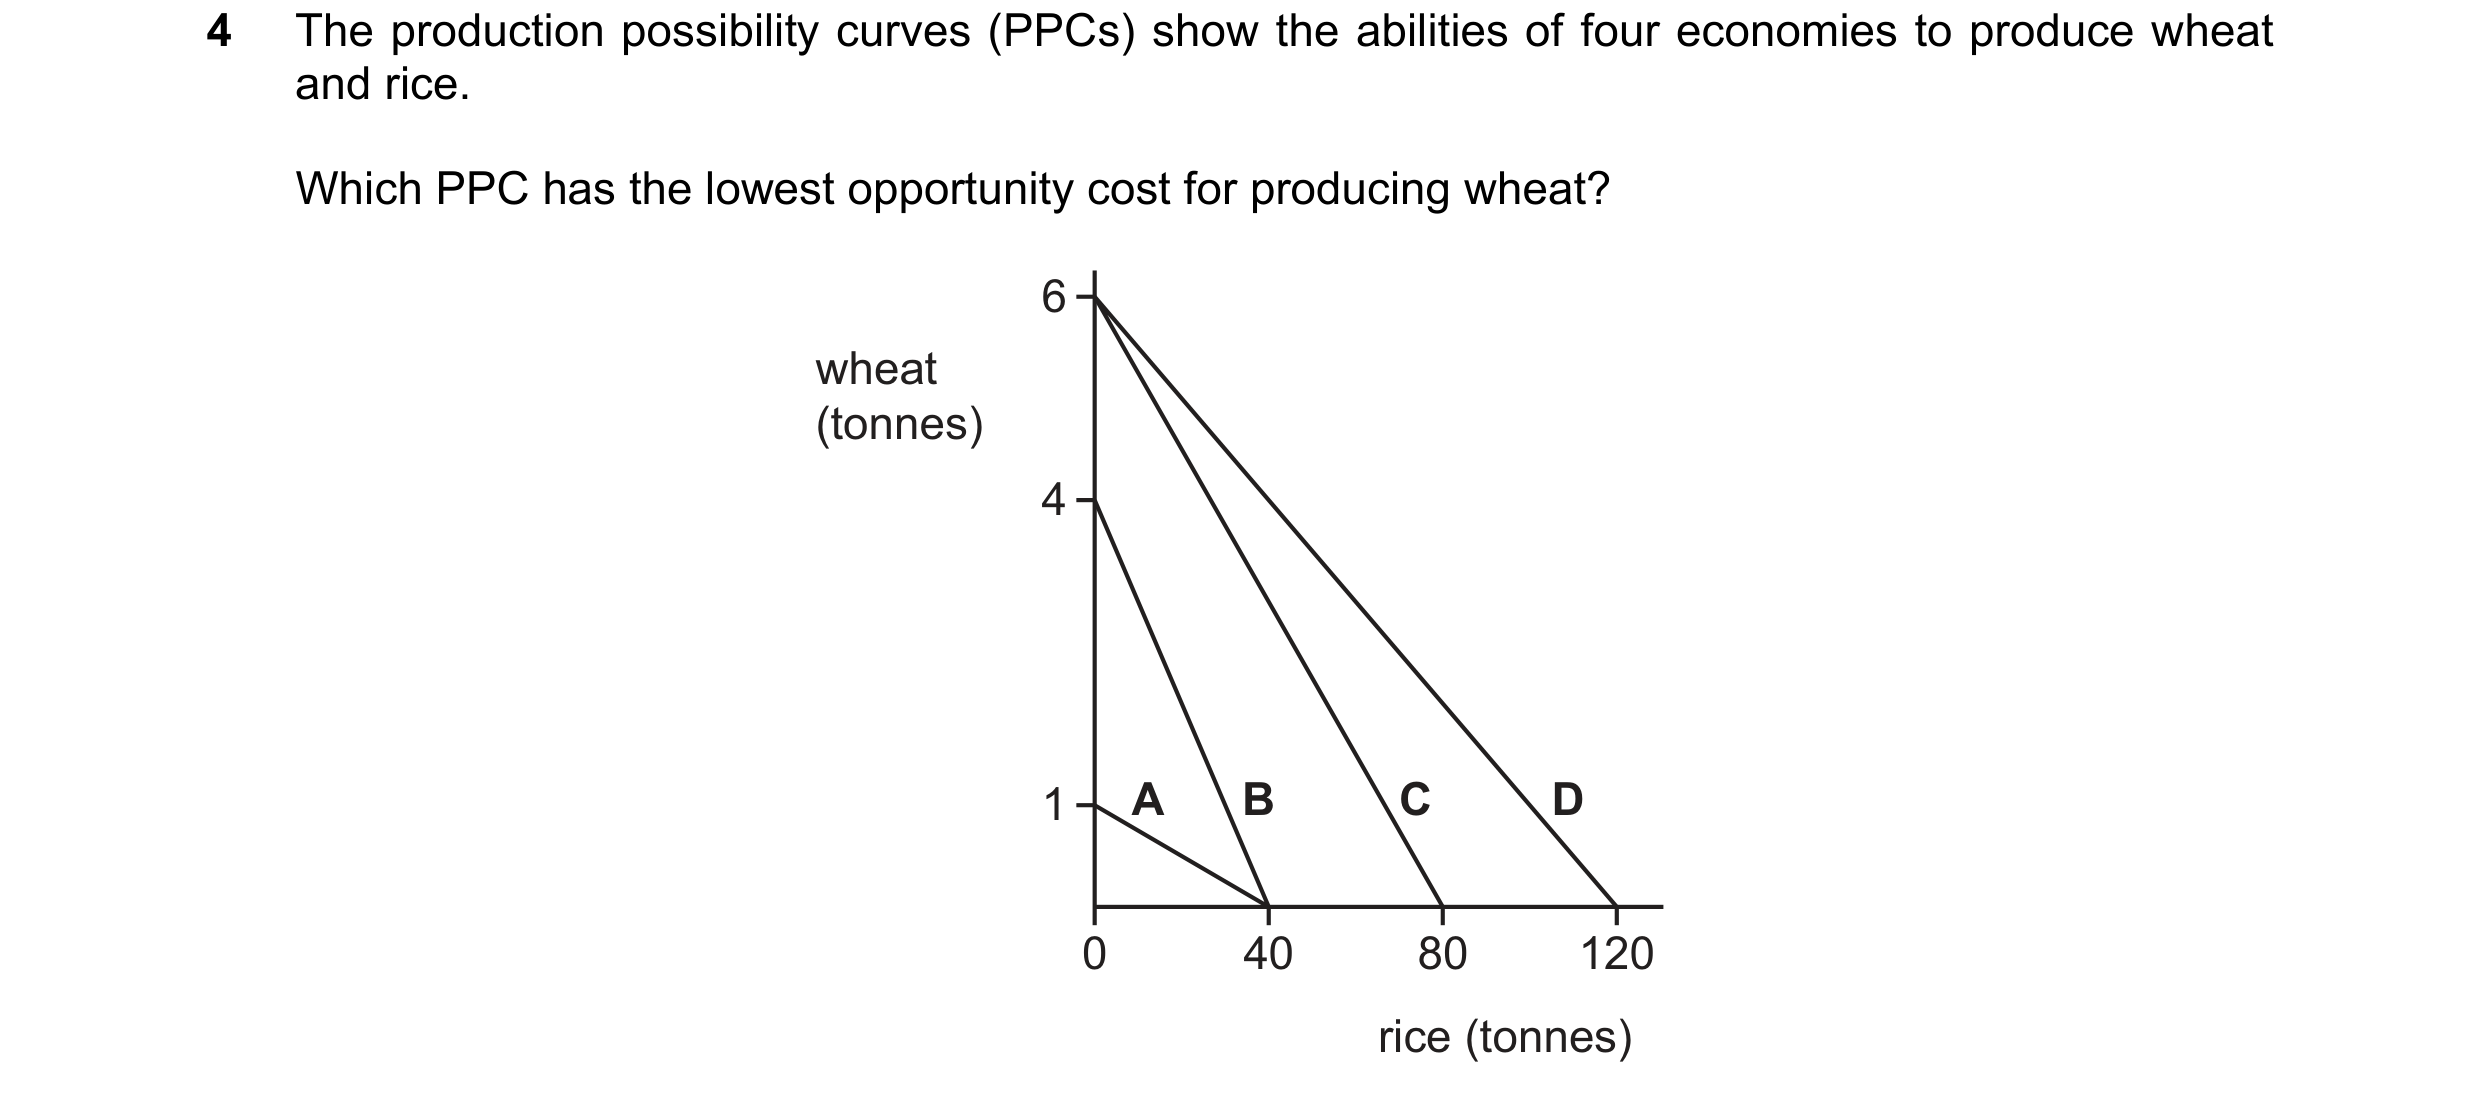 53 / 68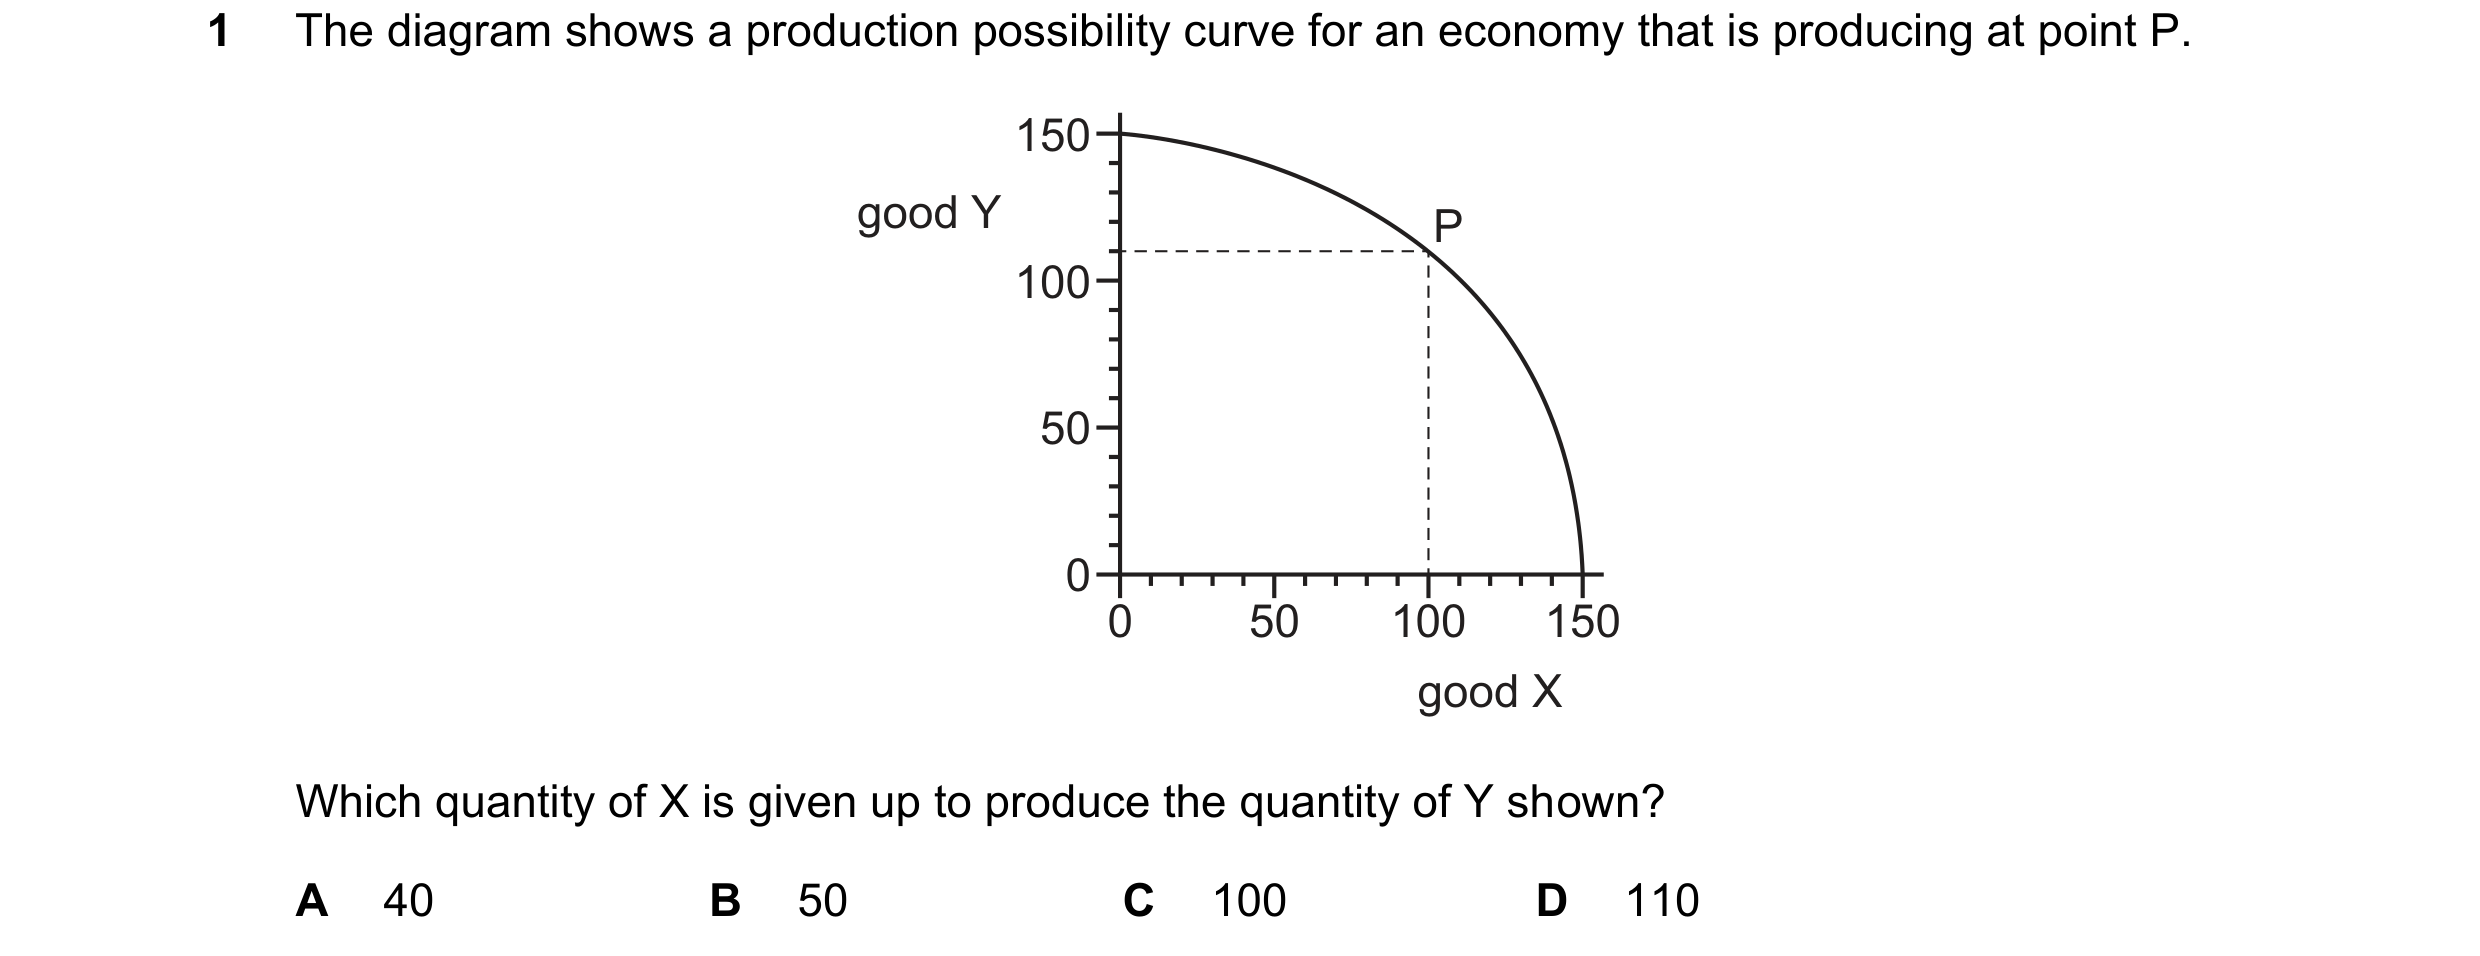
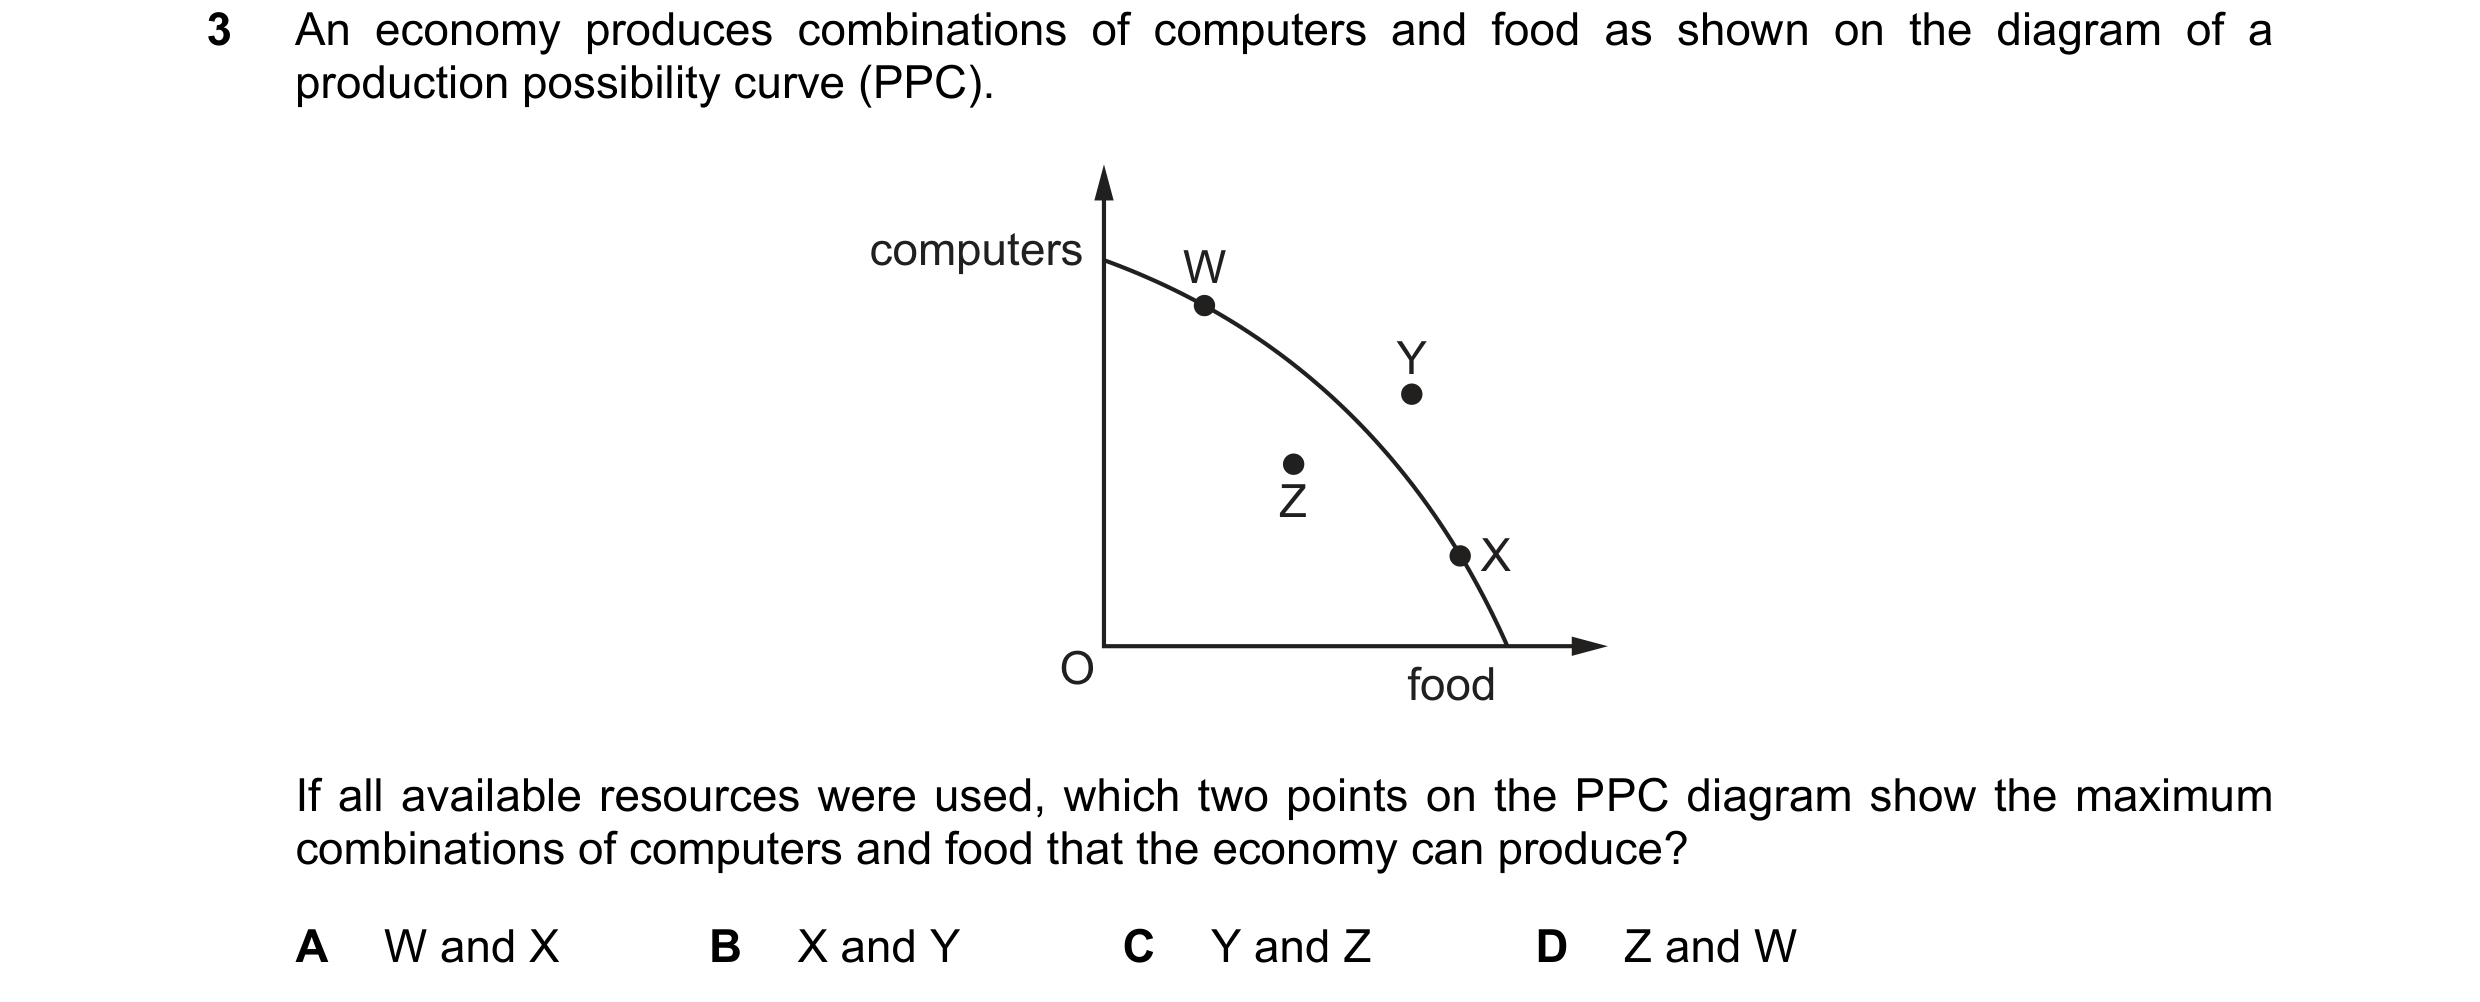 54 / 68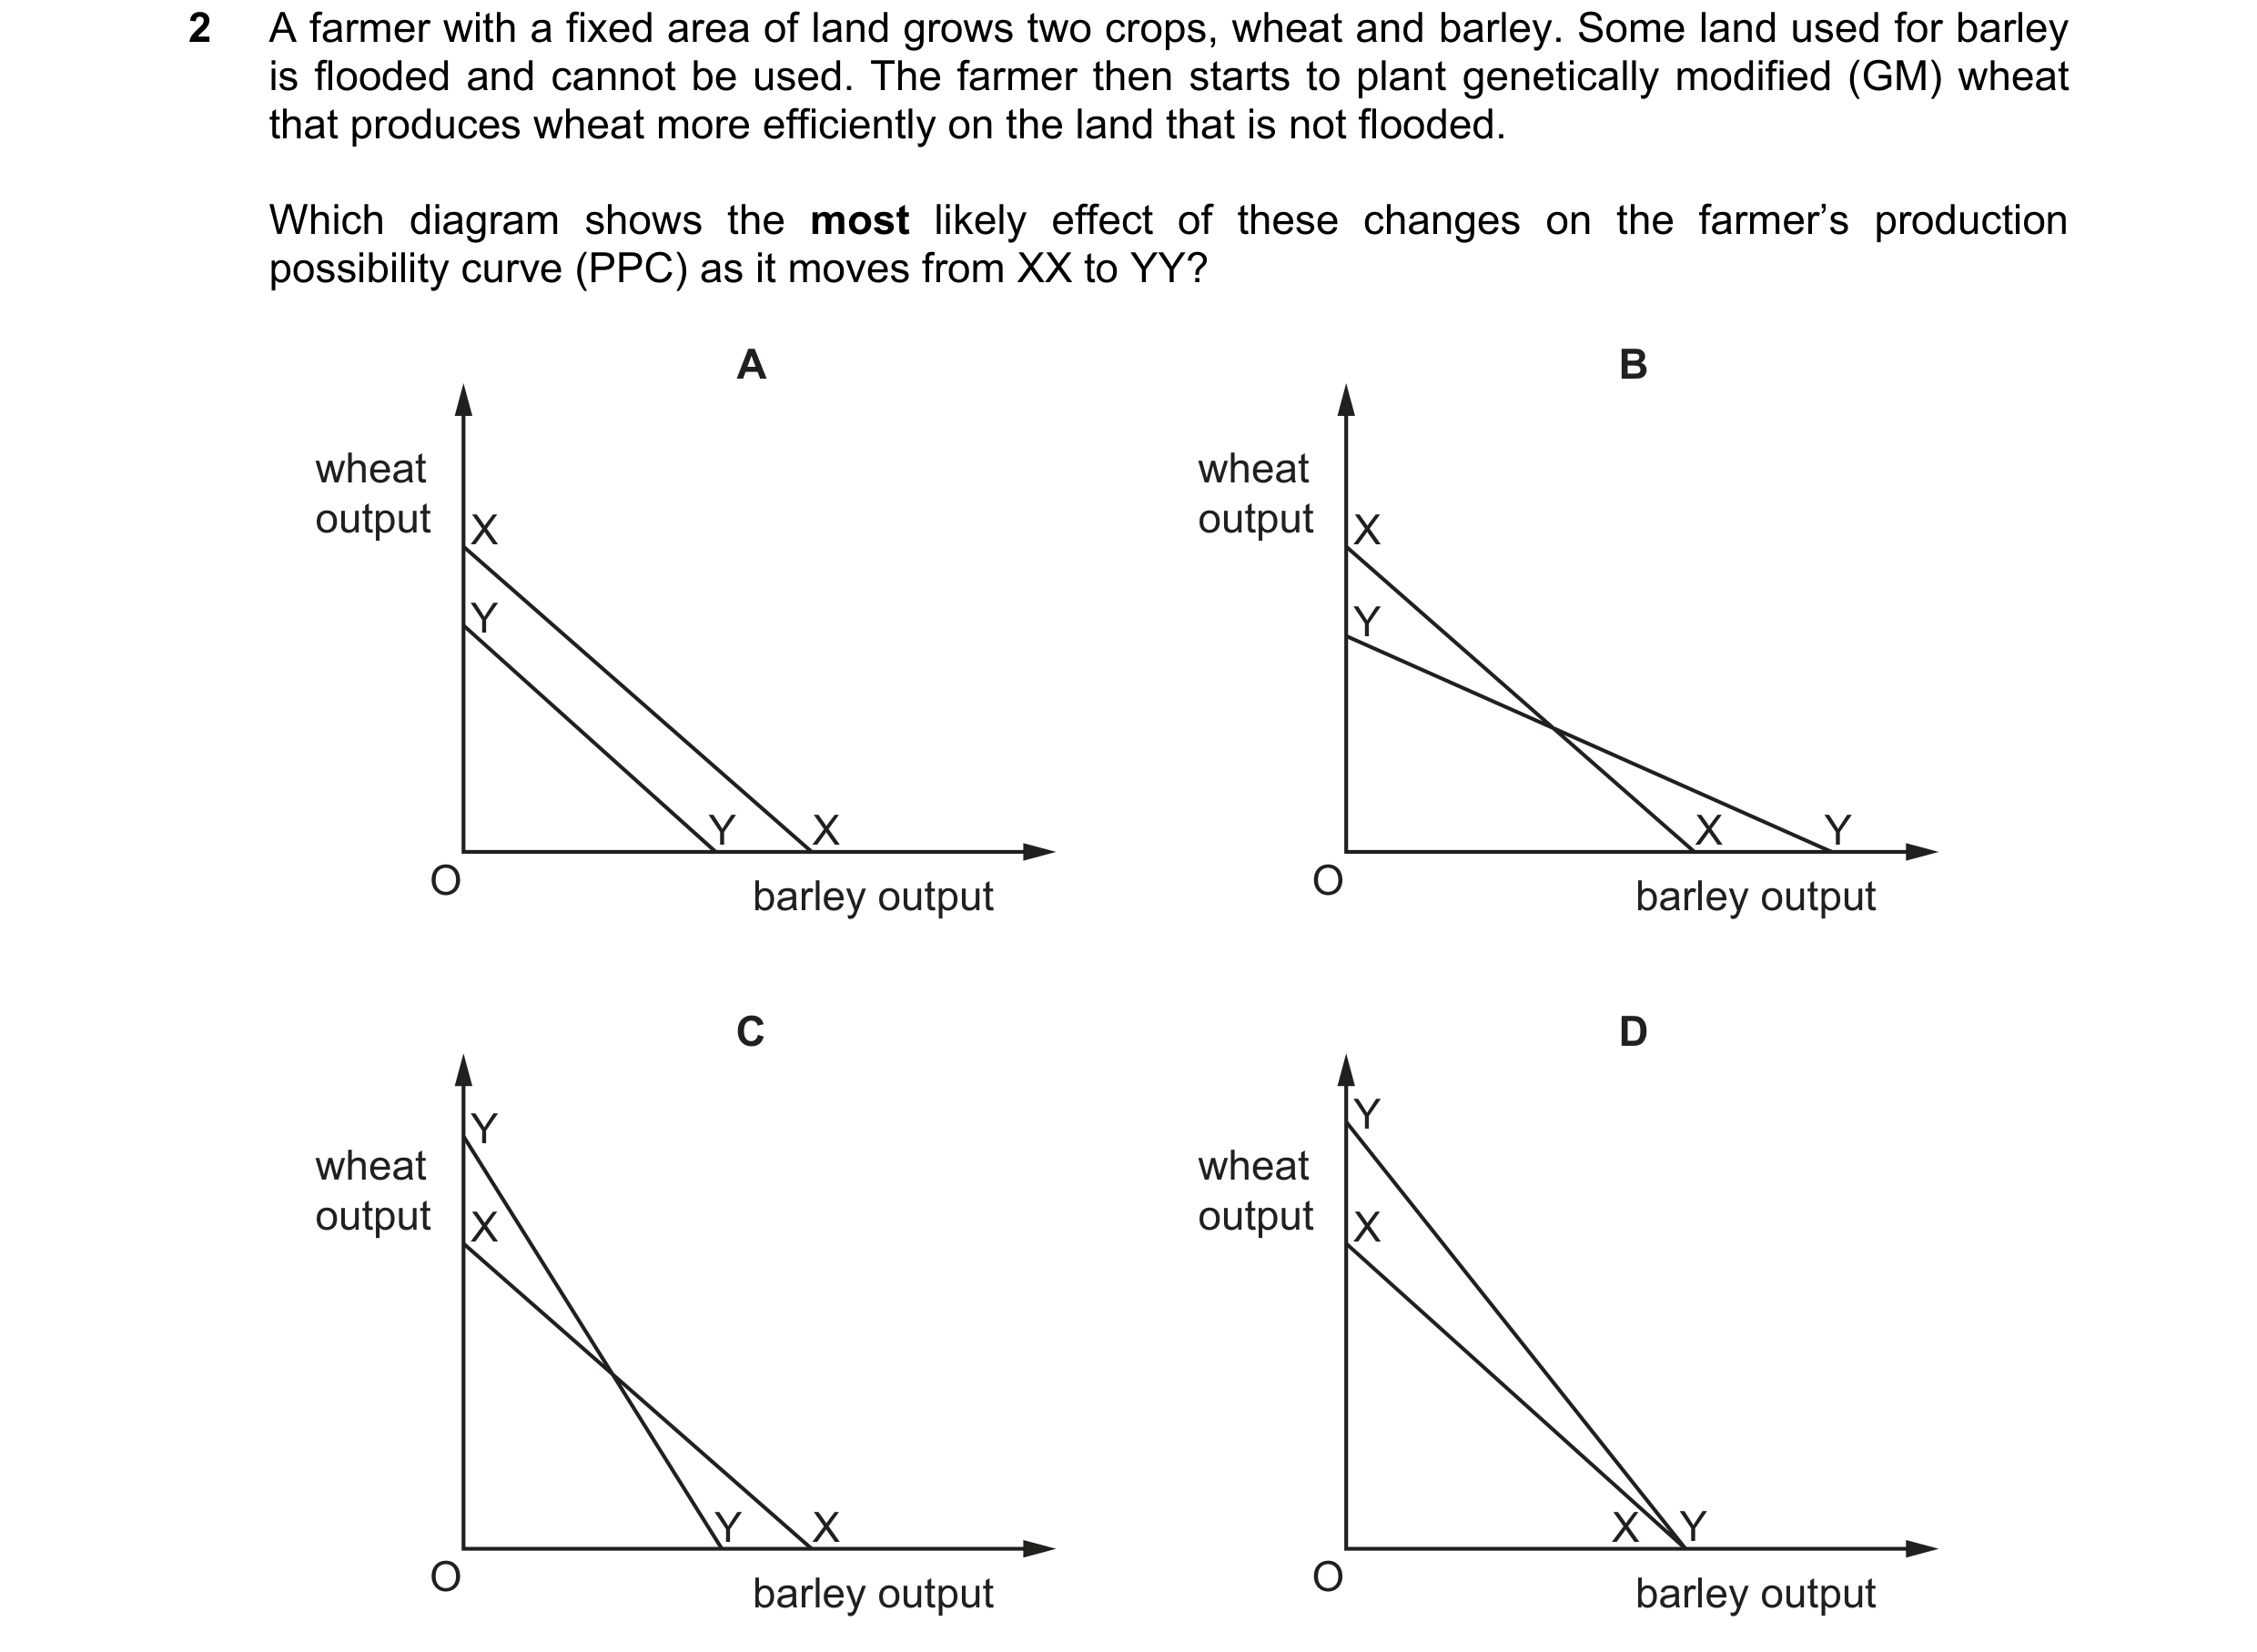
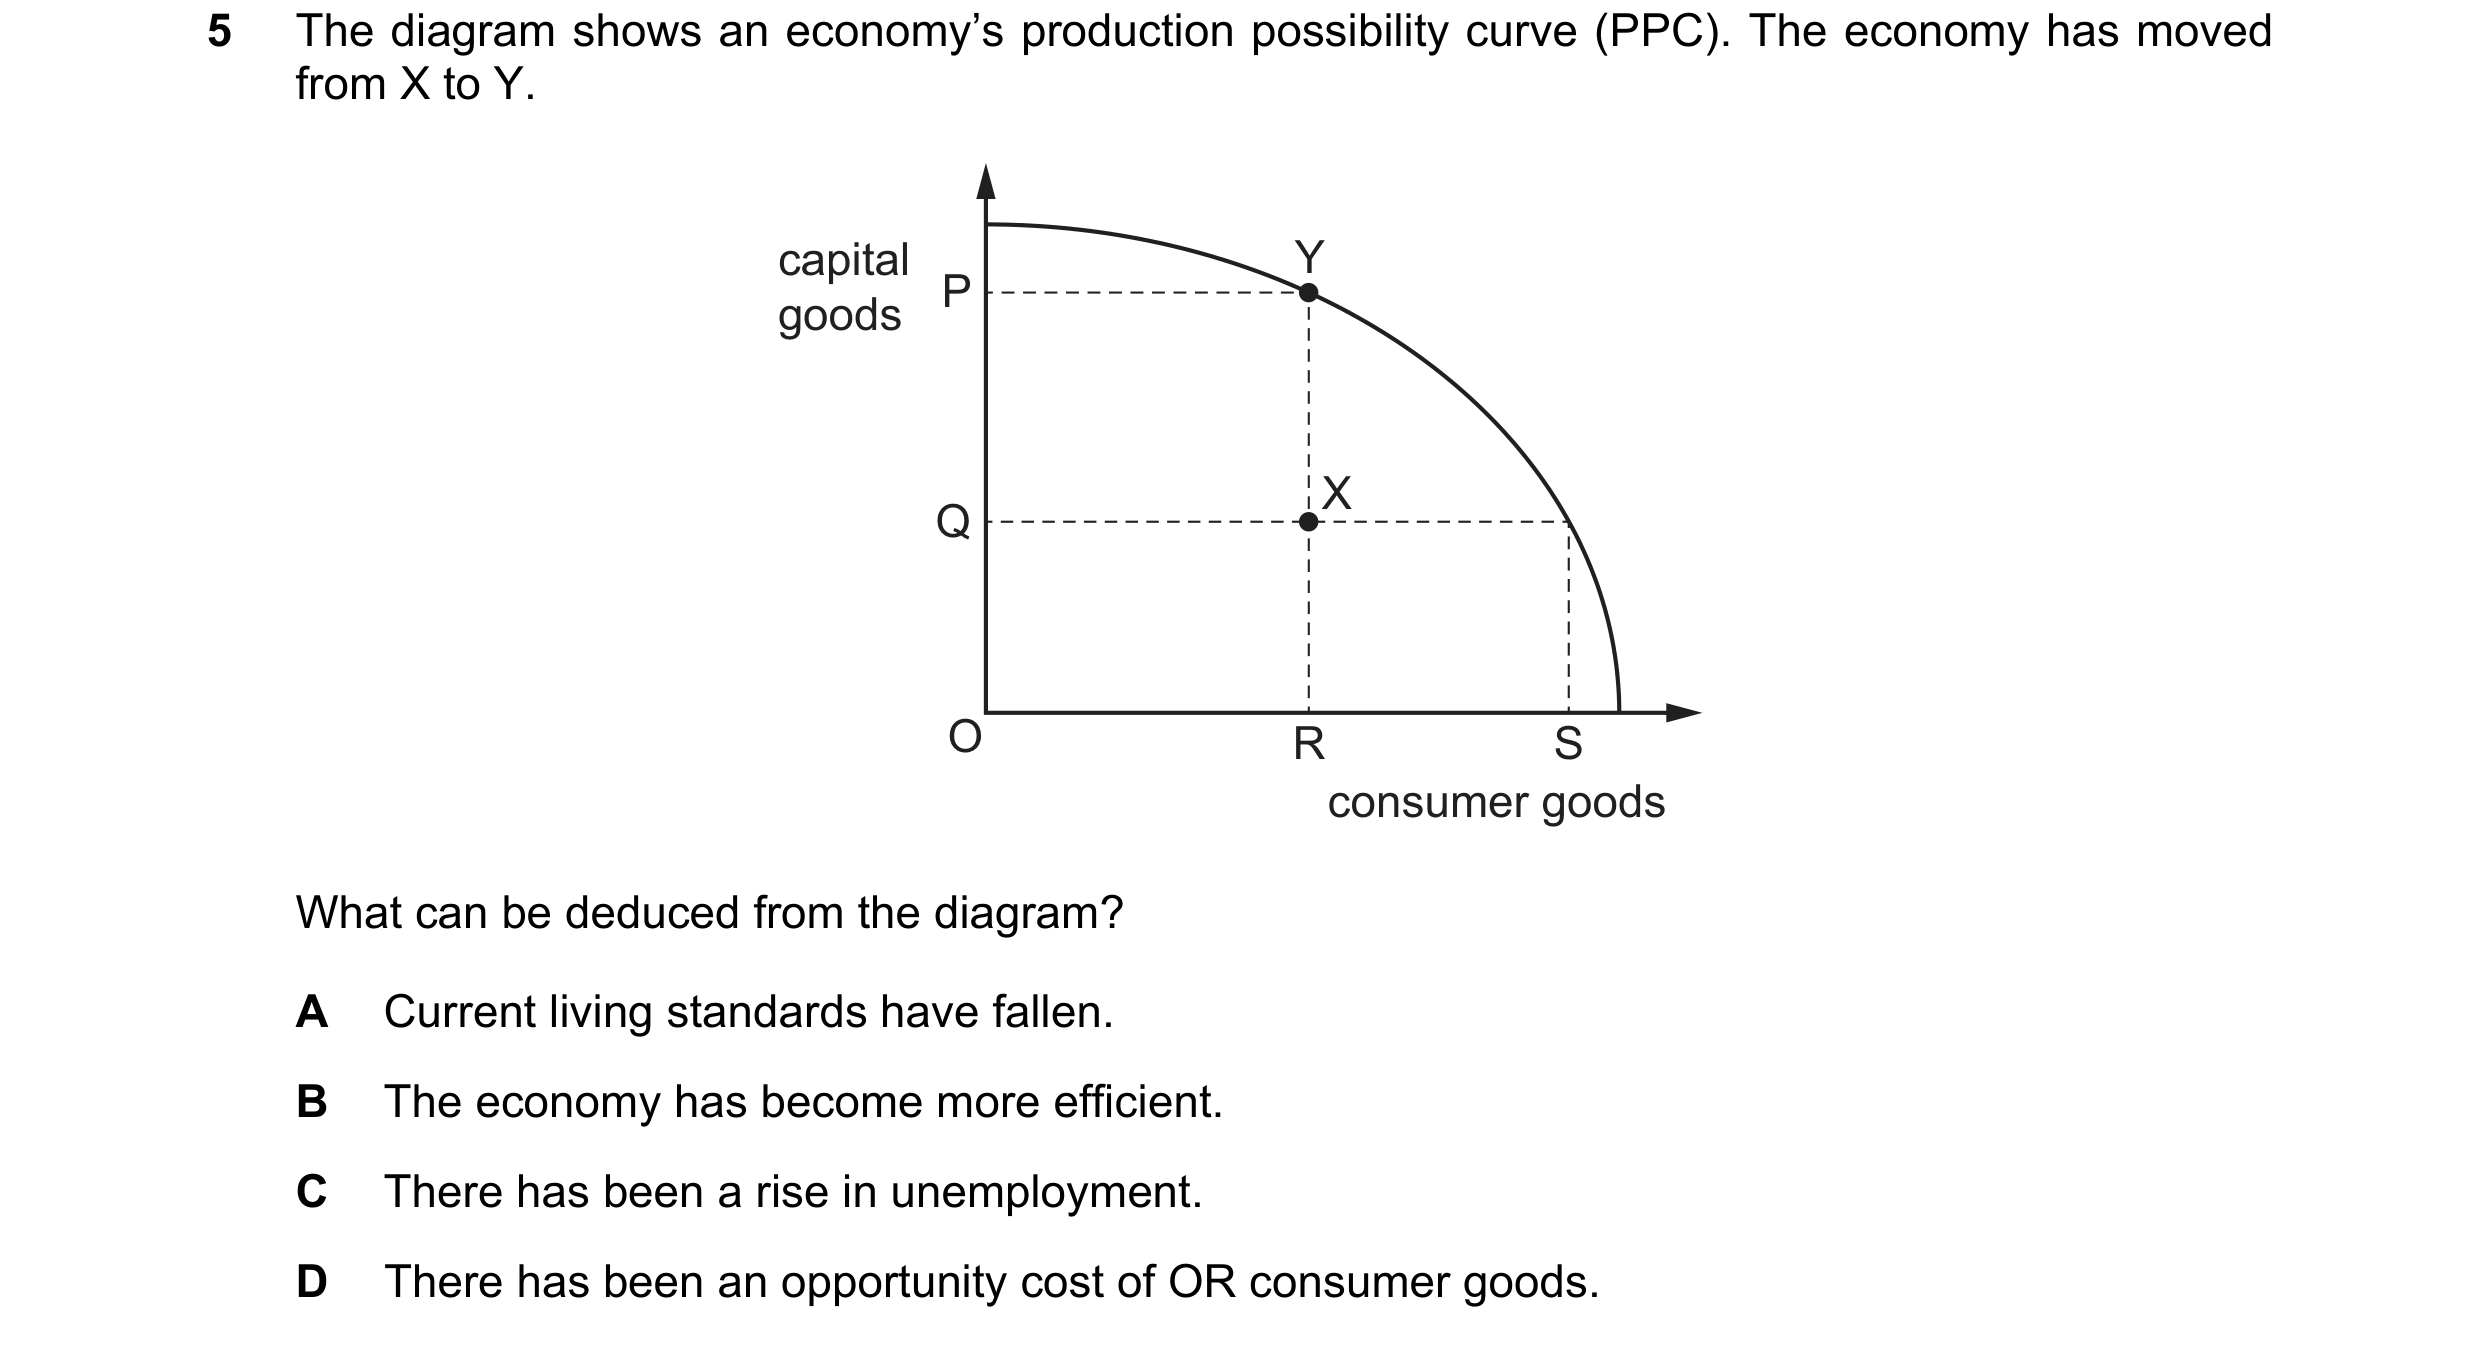 55 / 68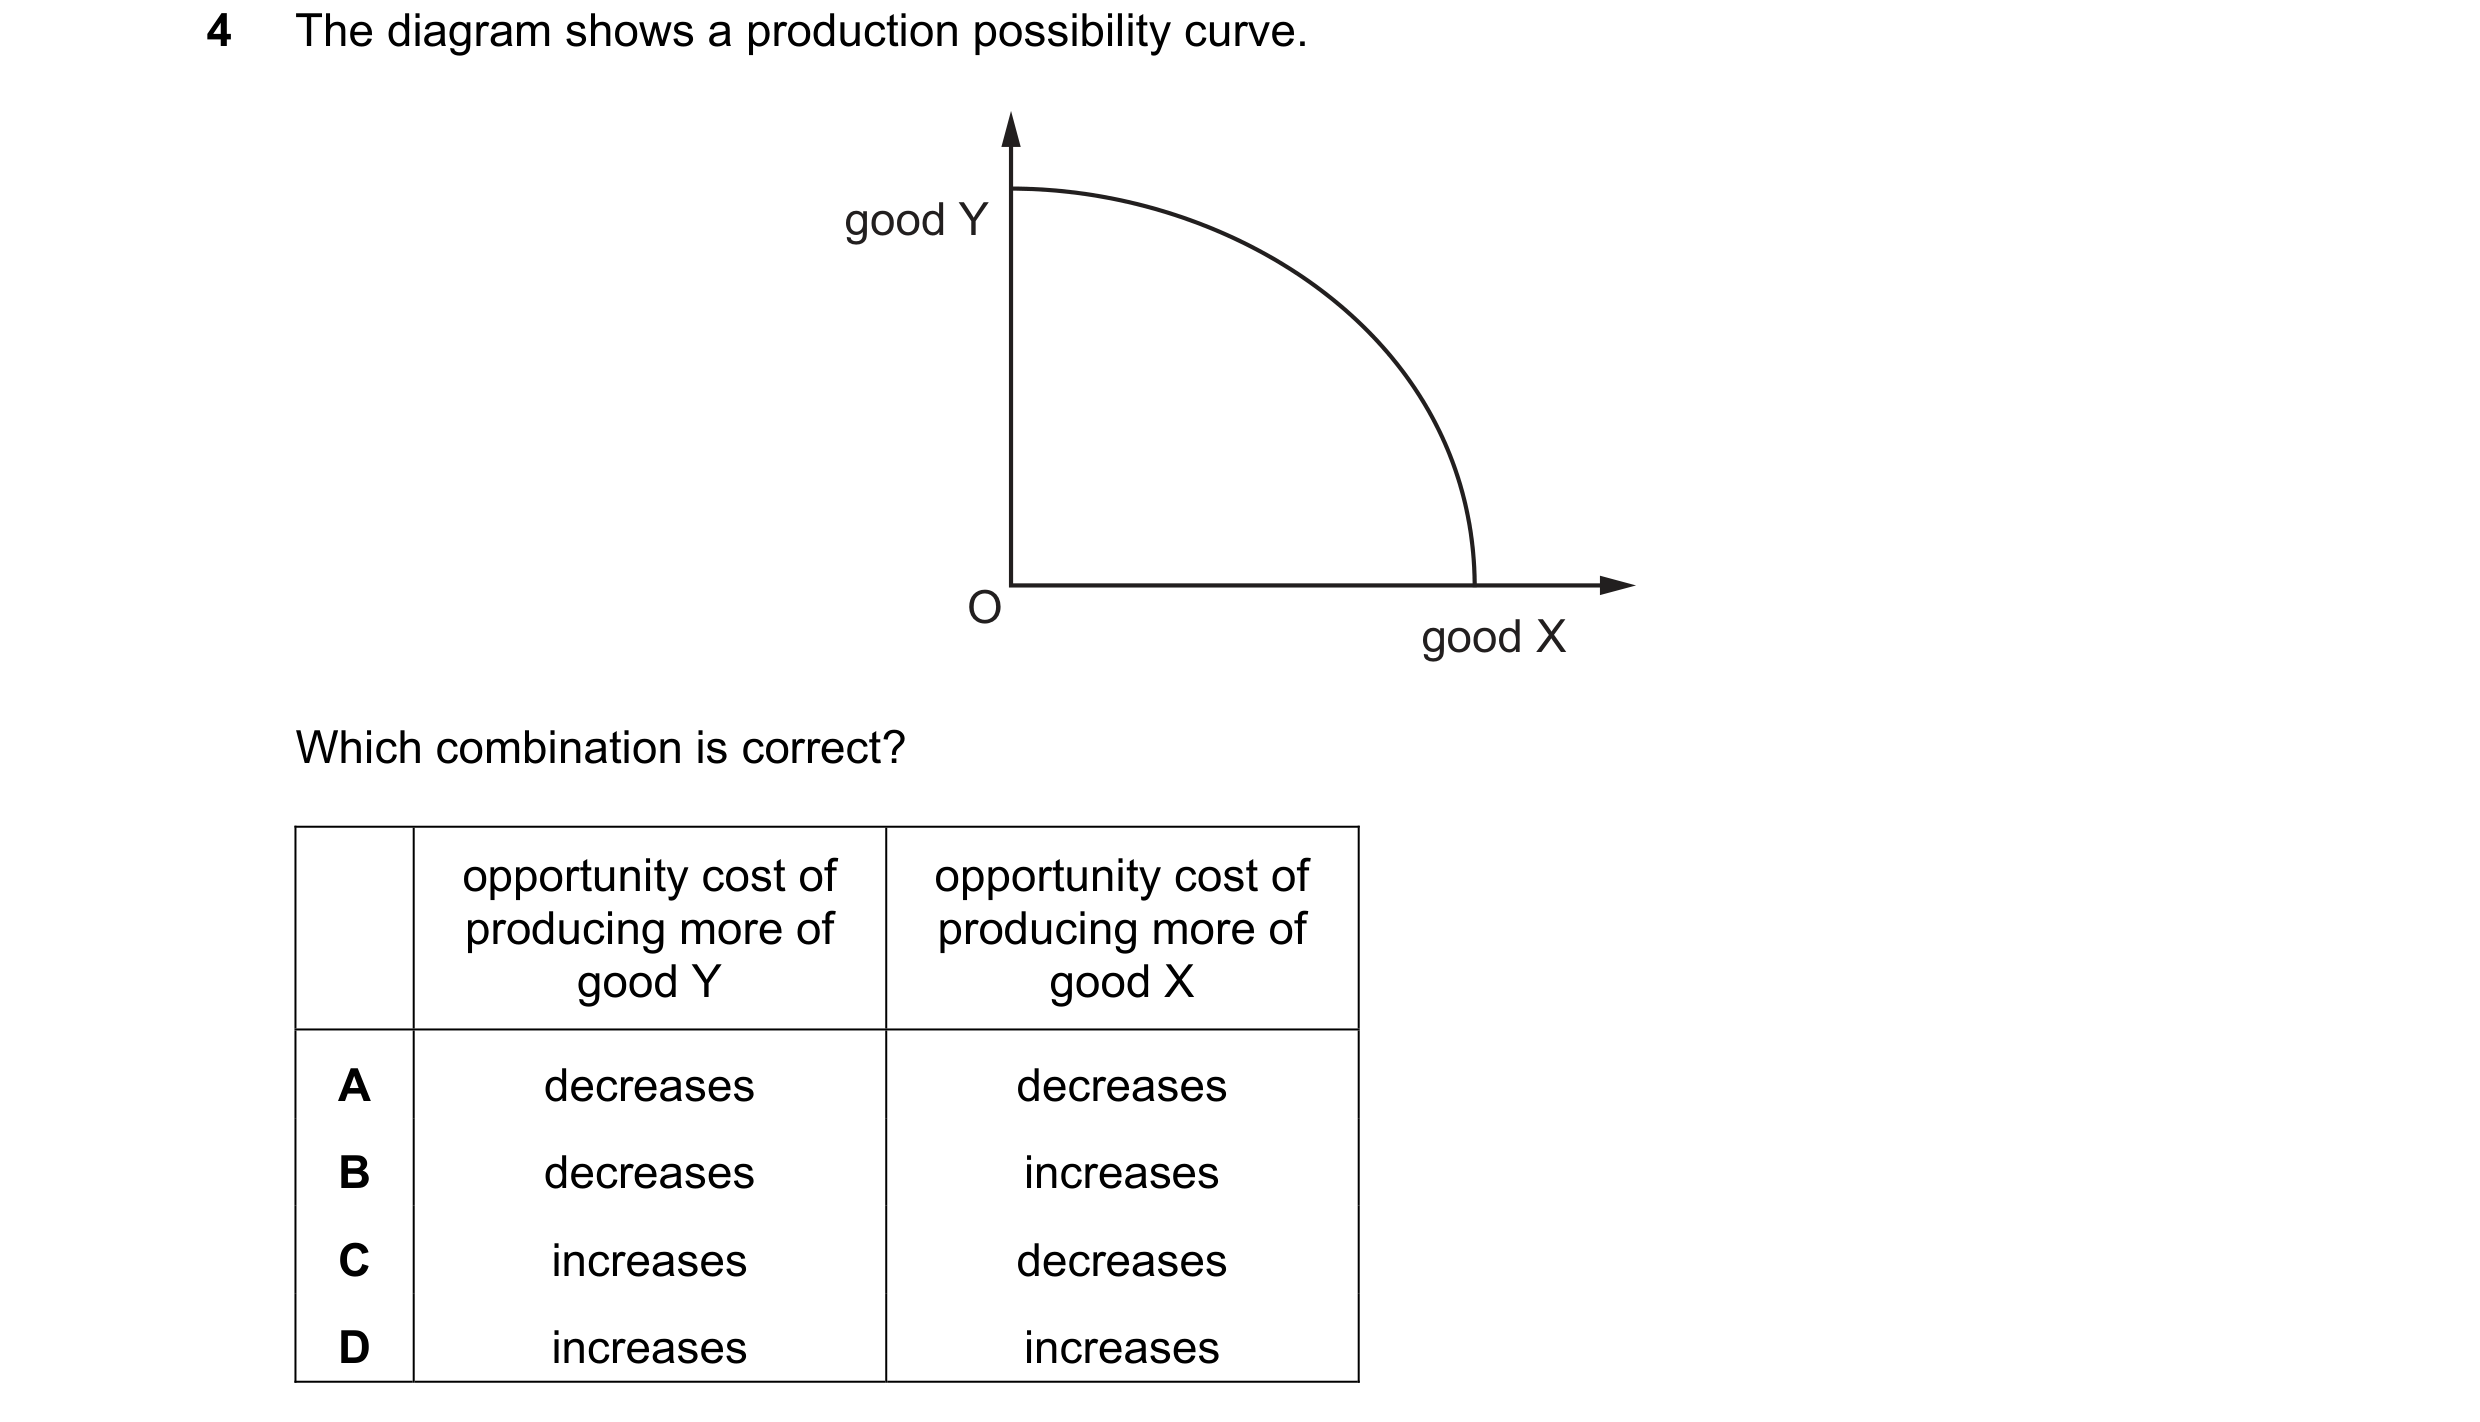
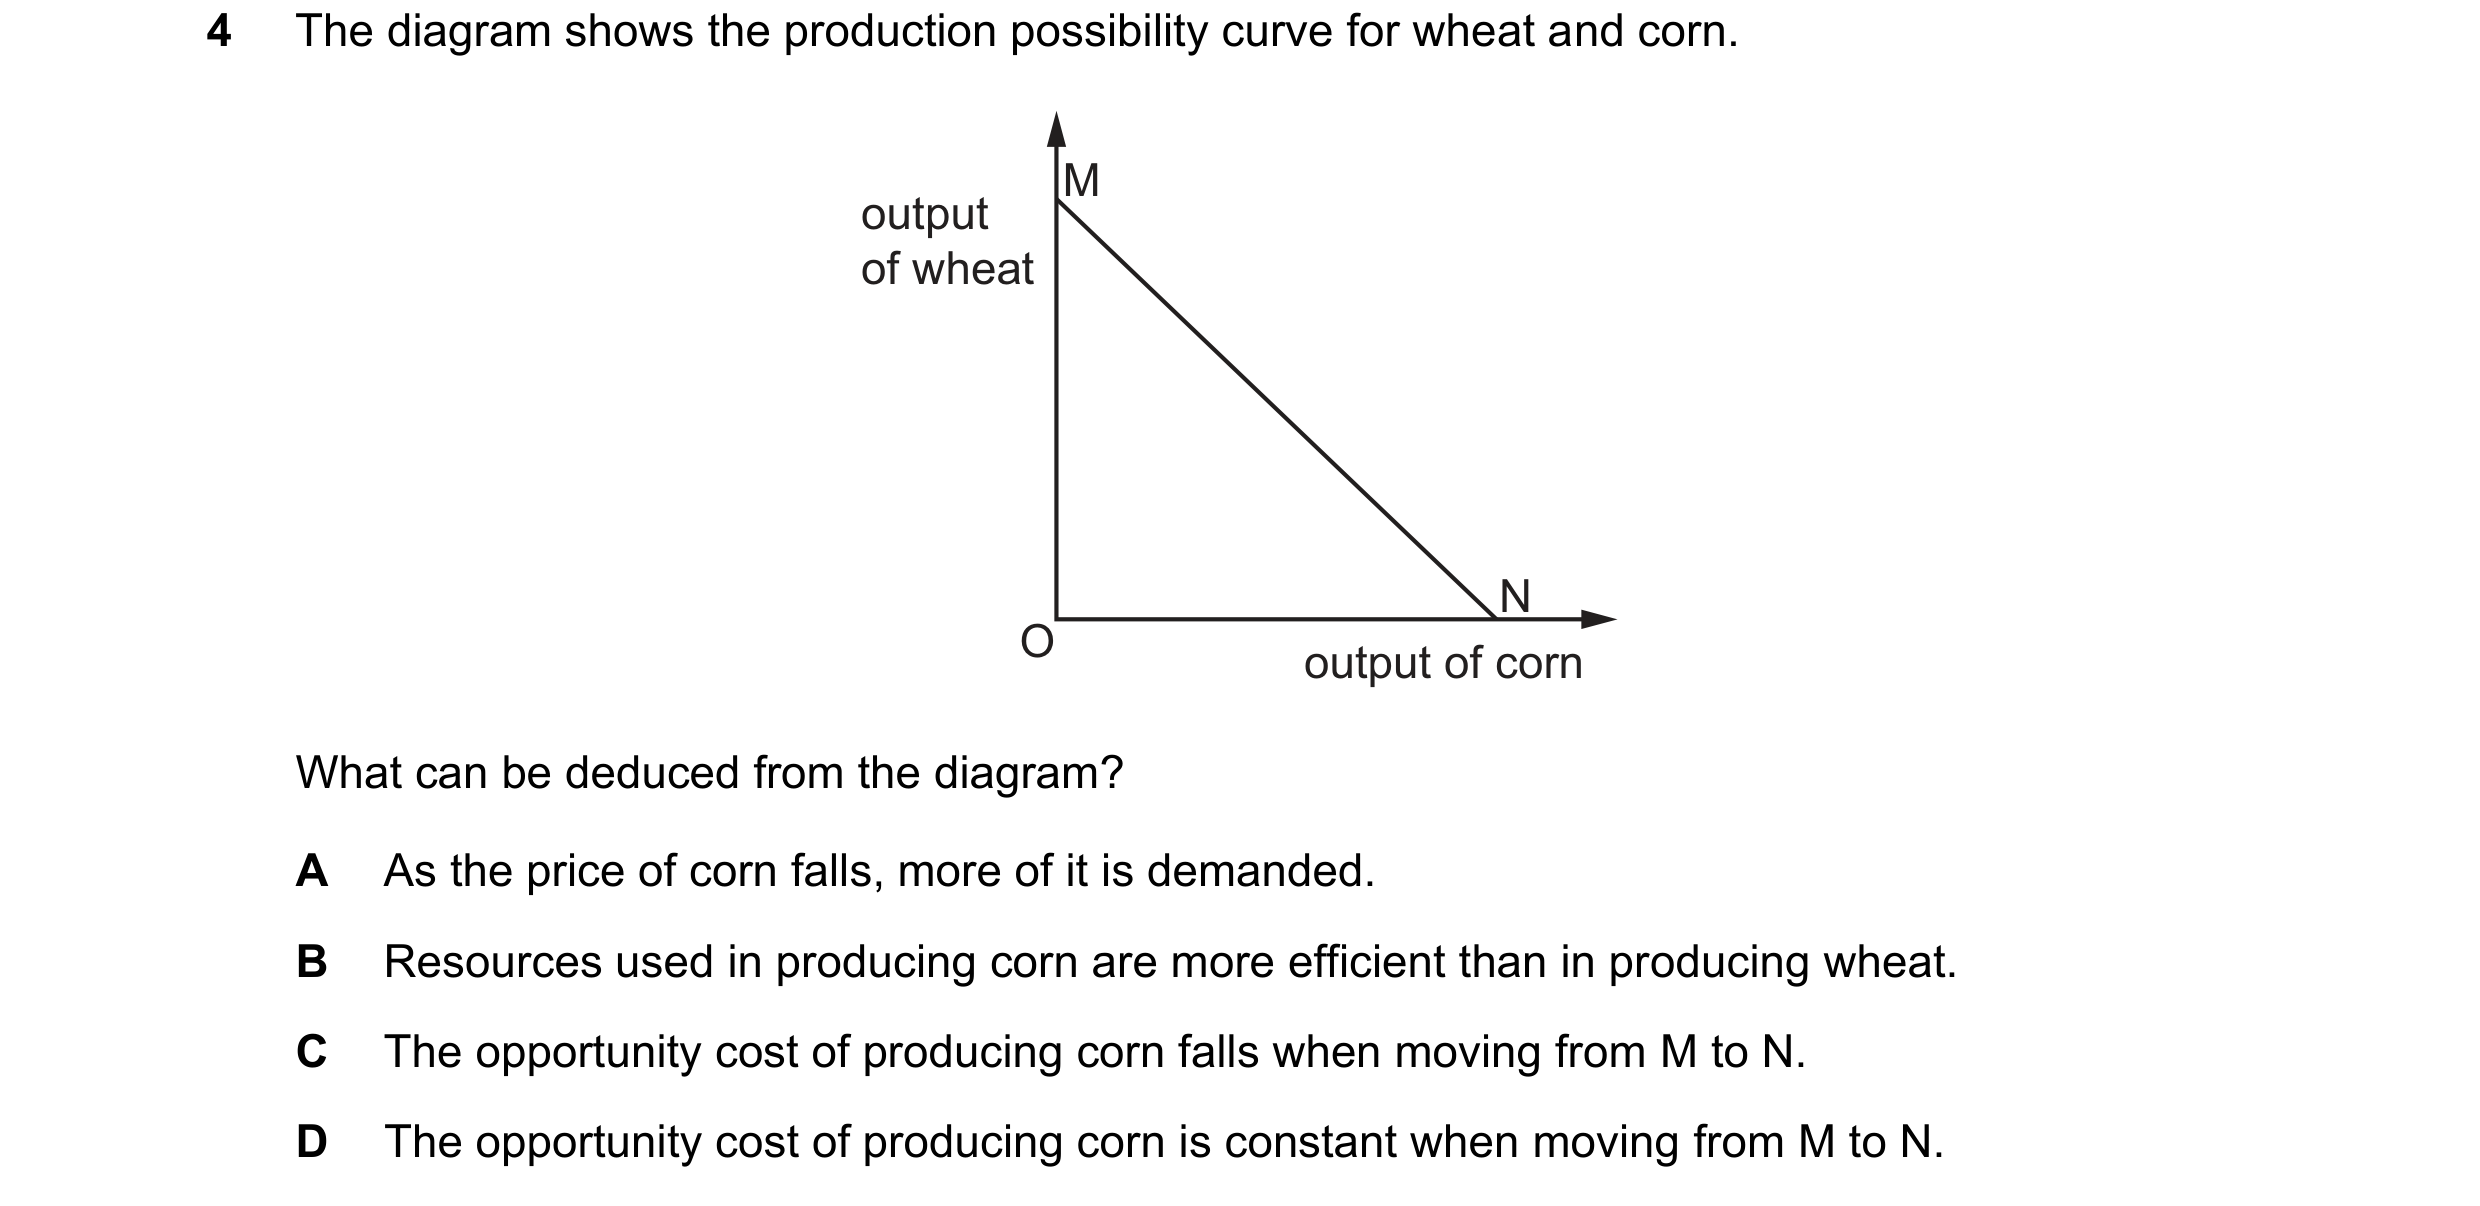 56 / 68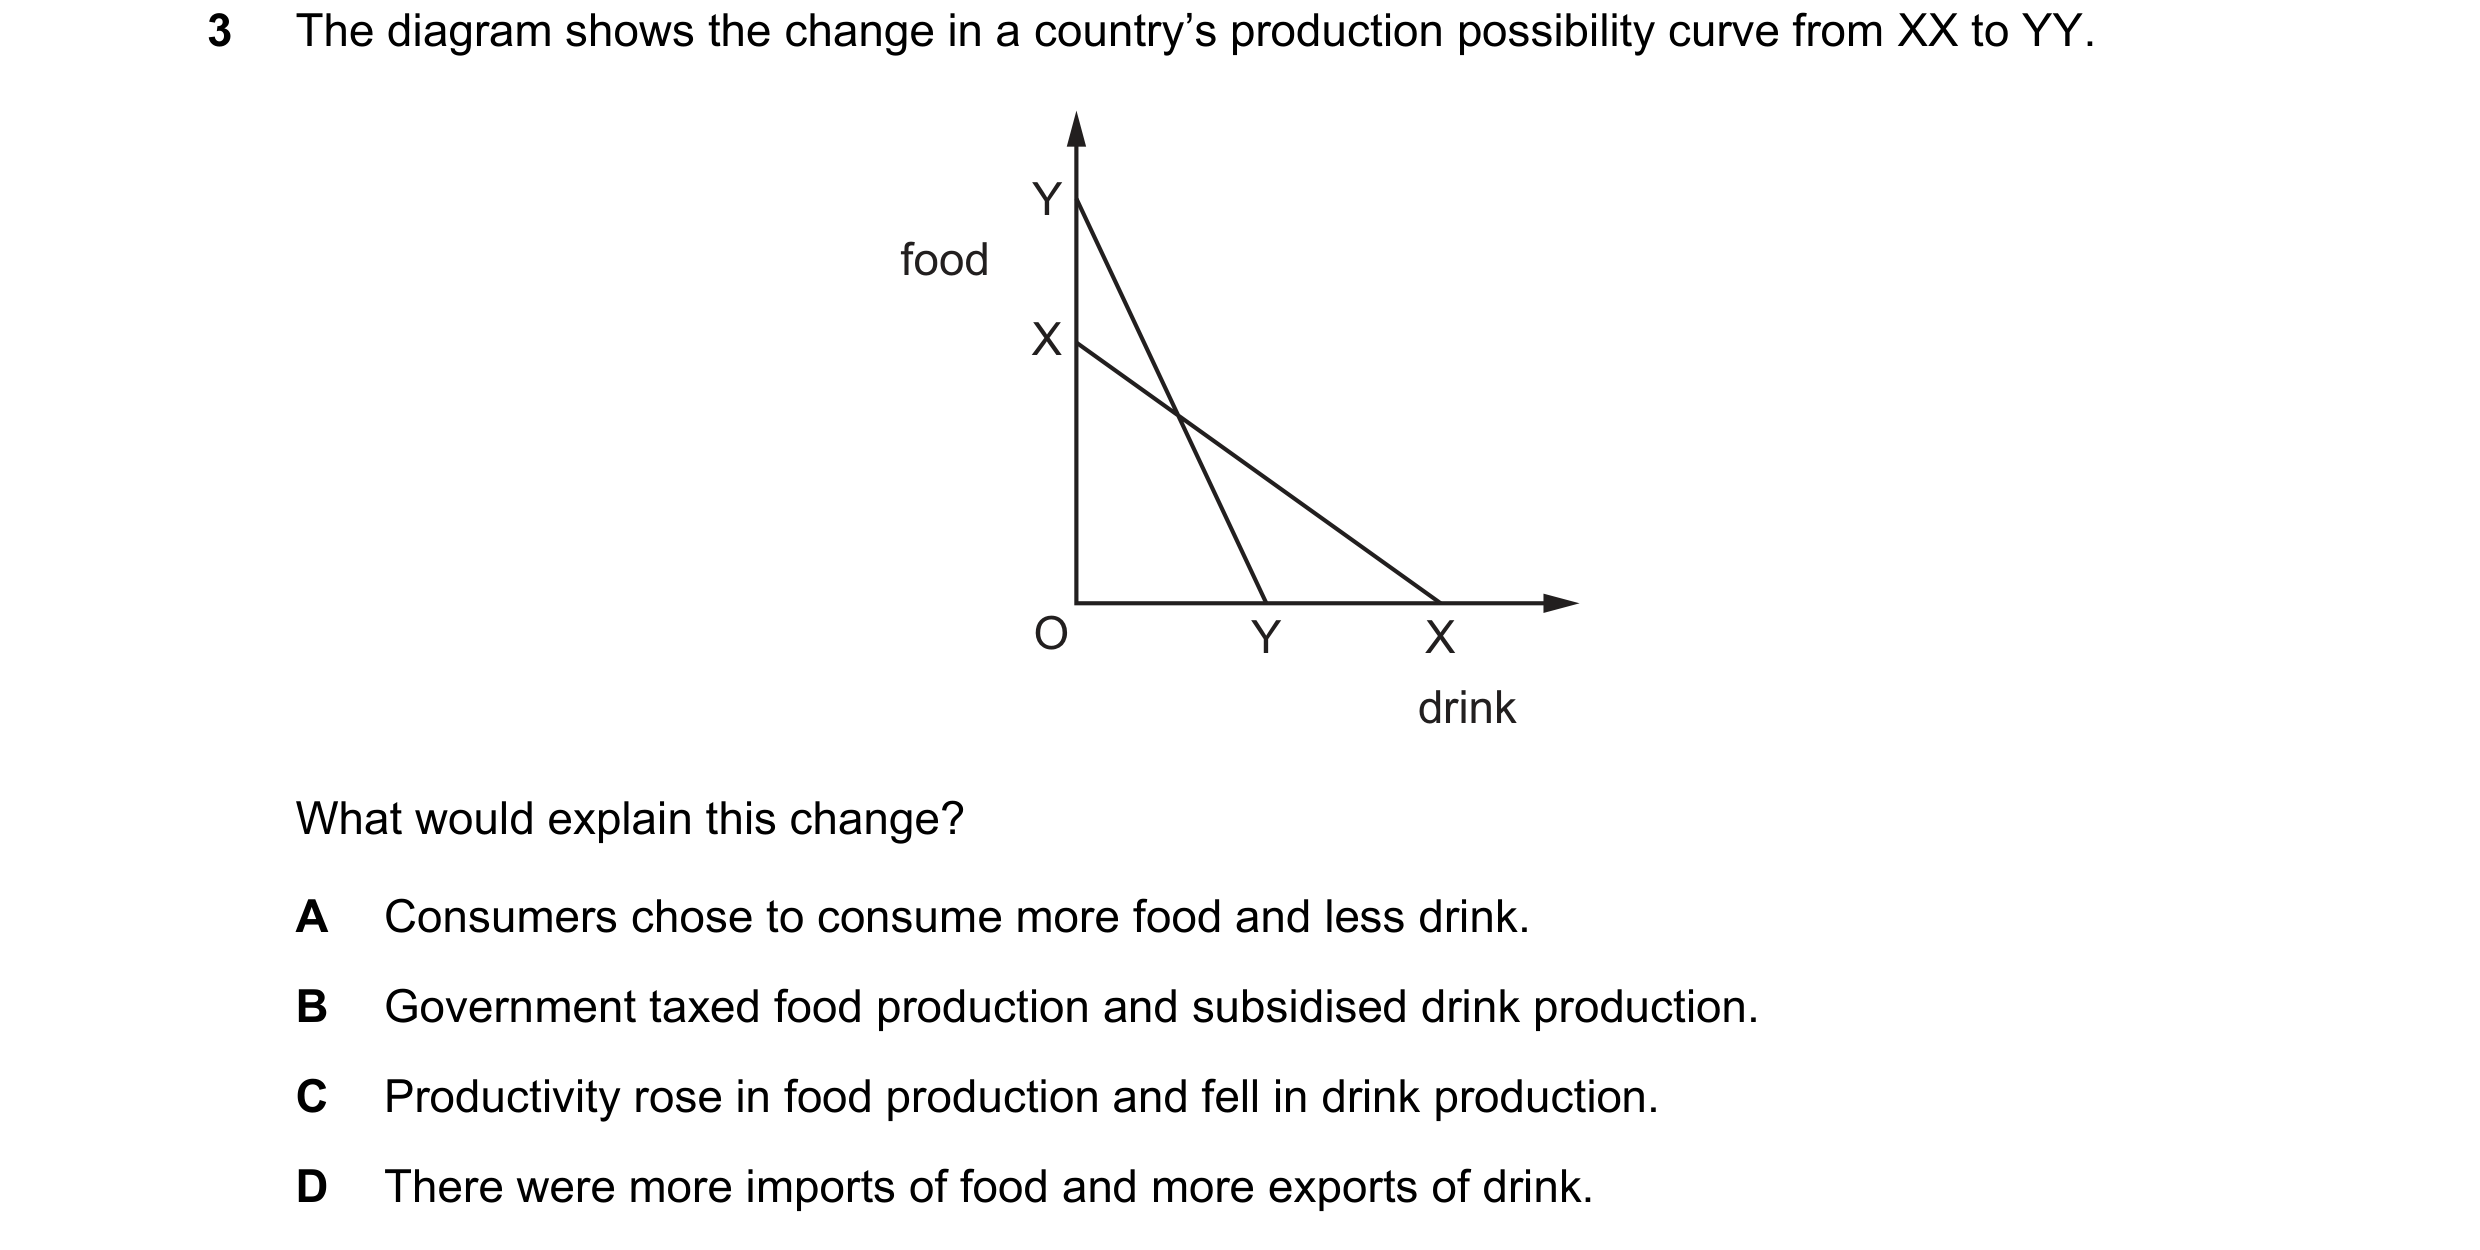
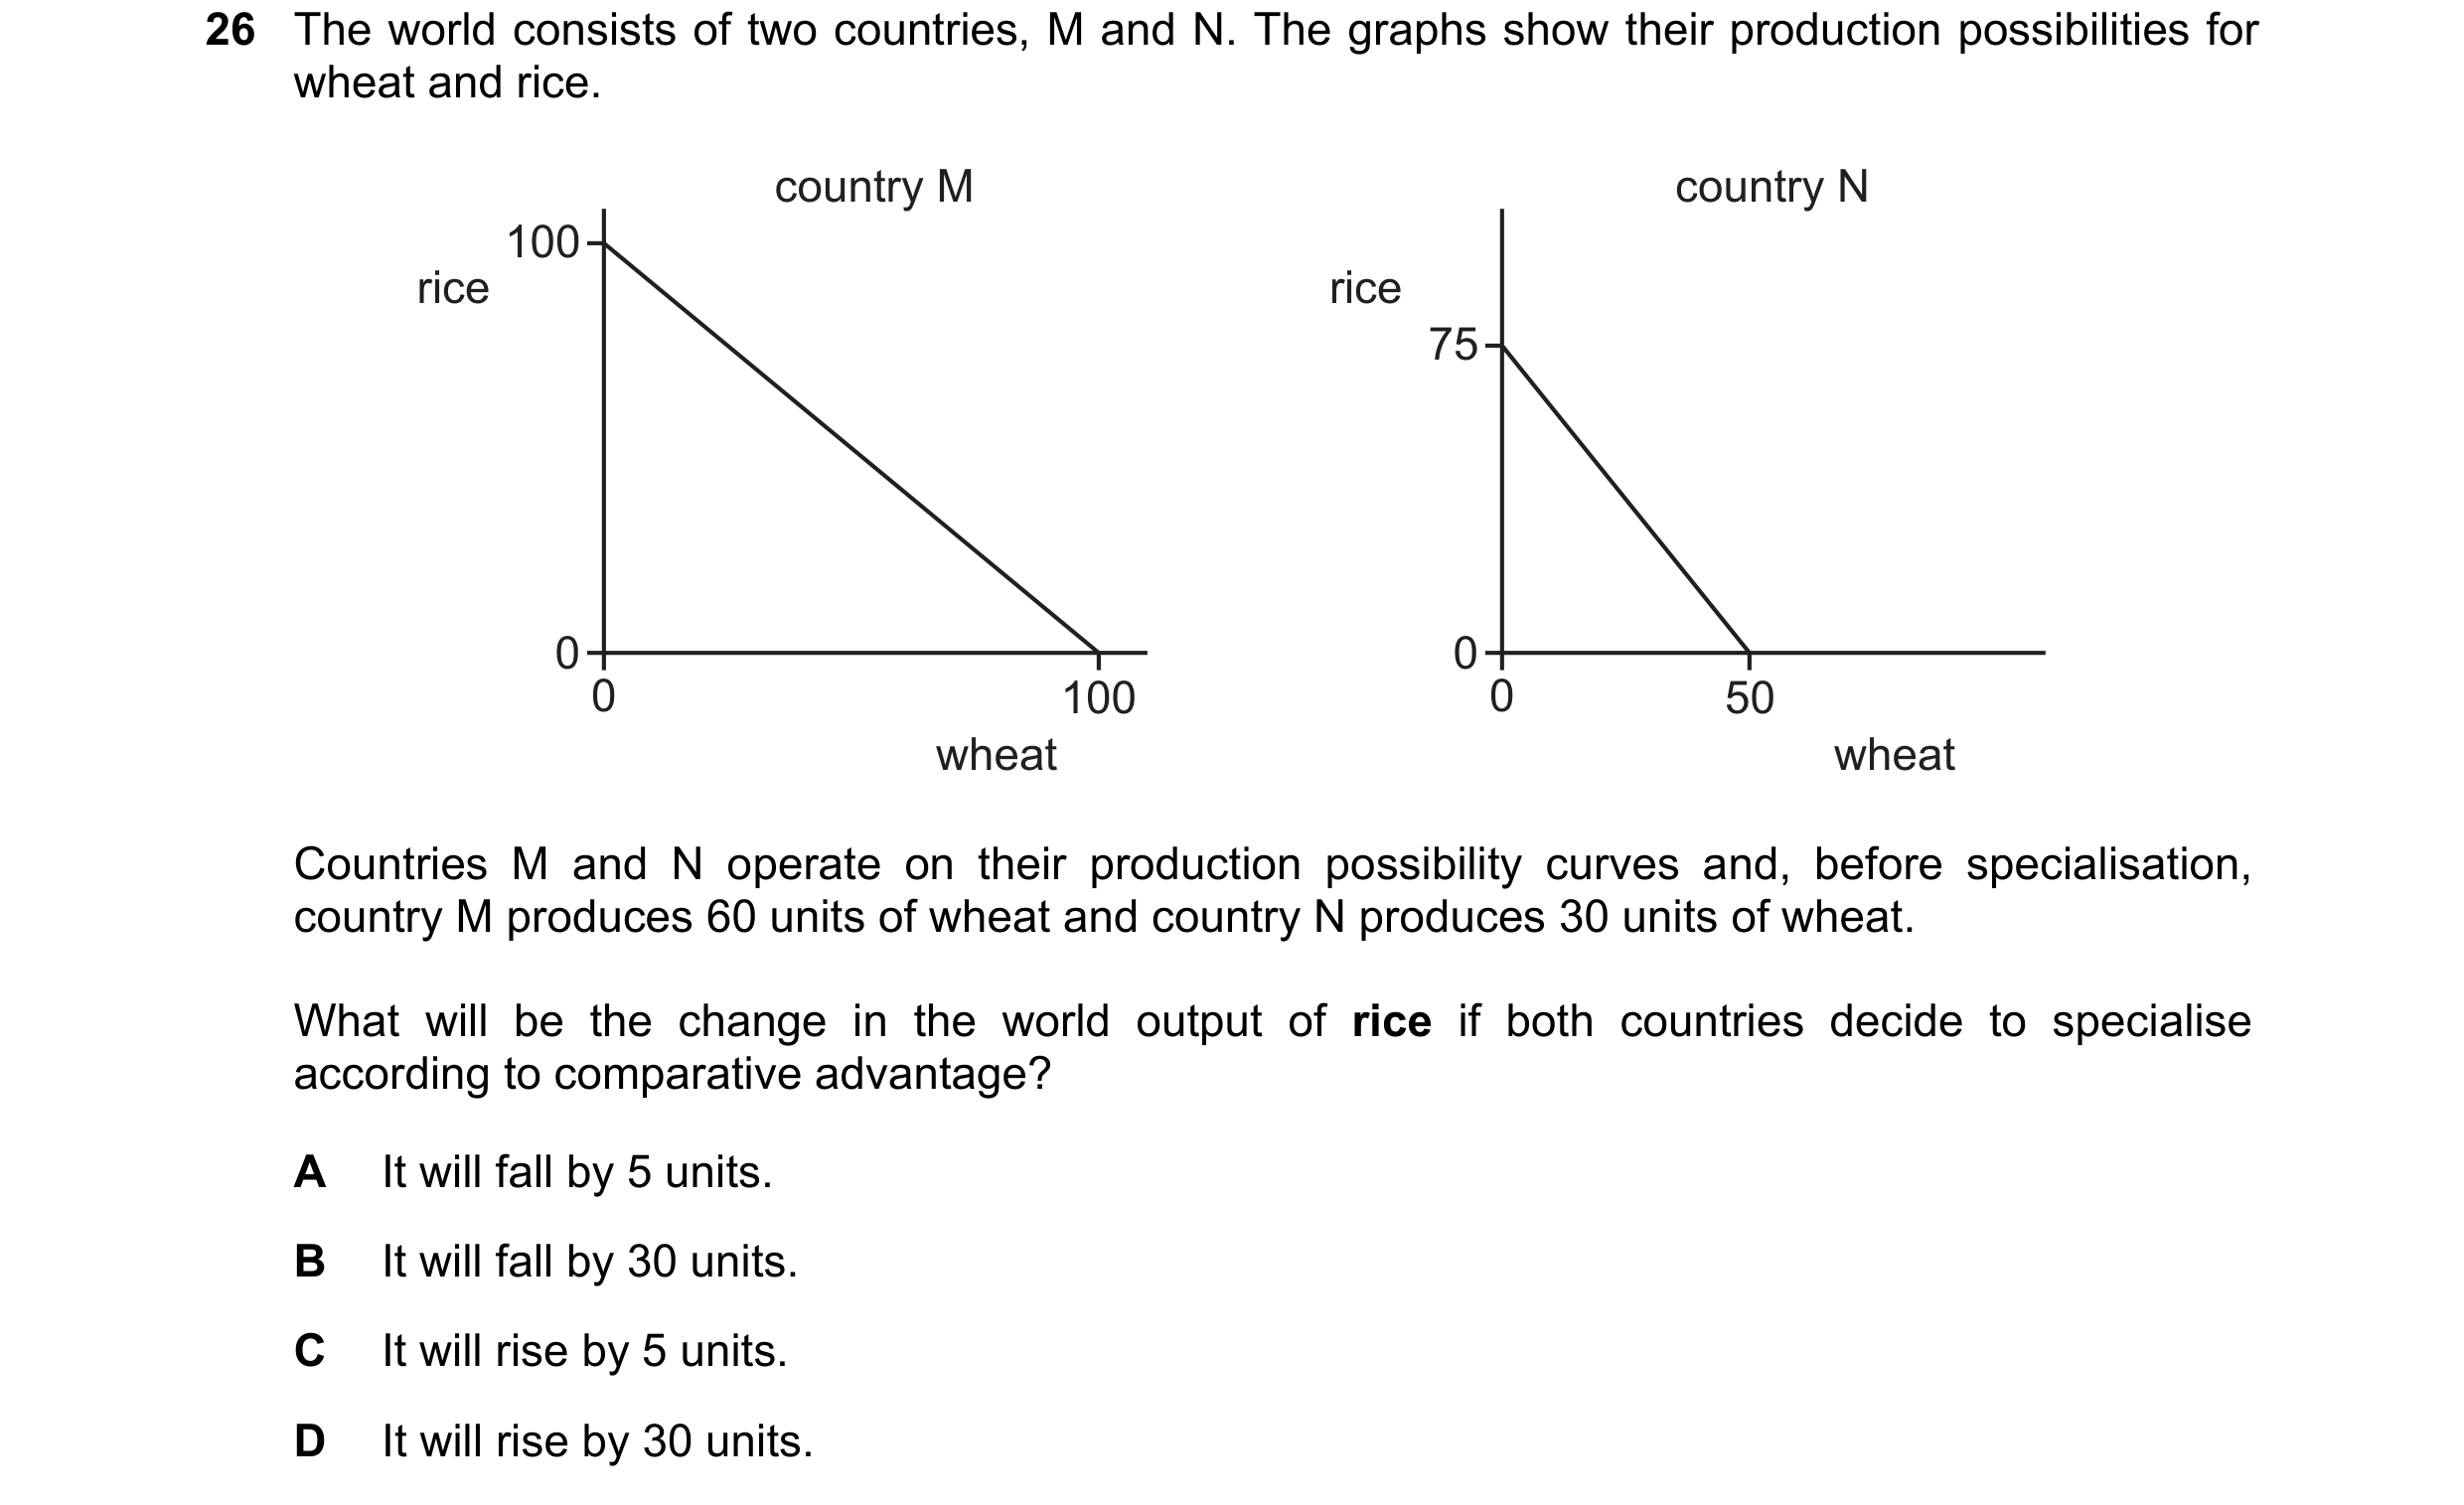 57 / 68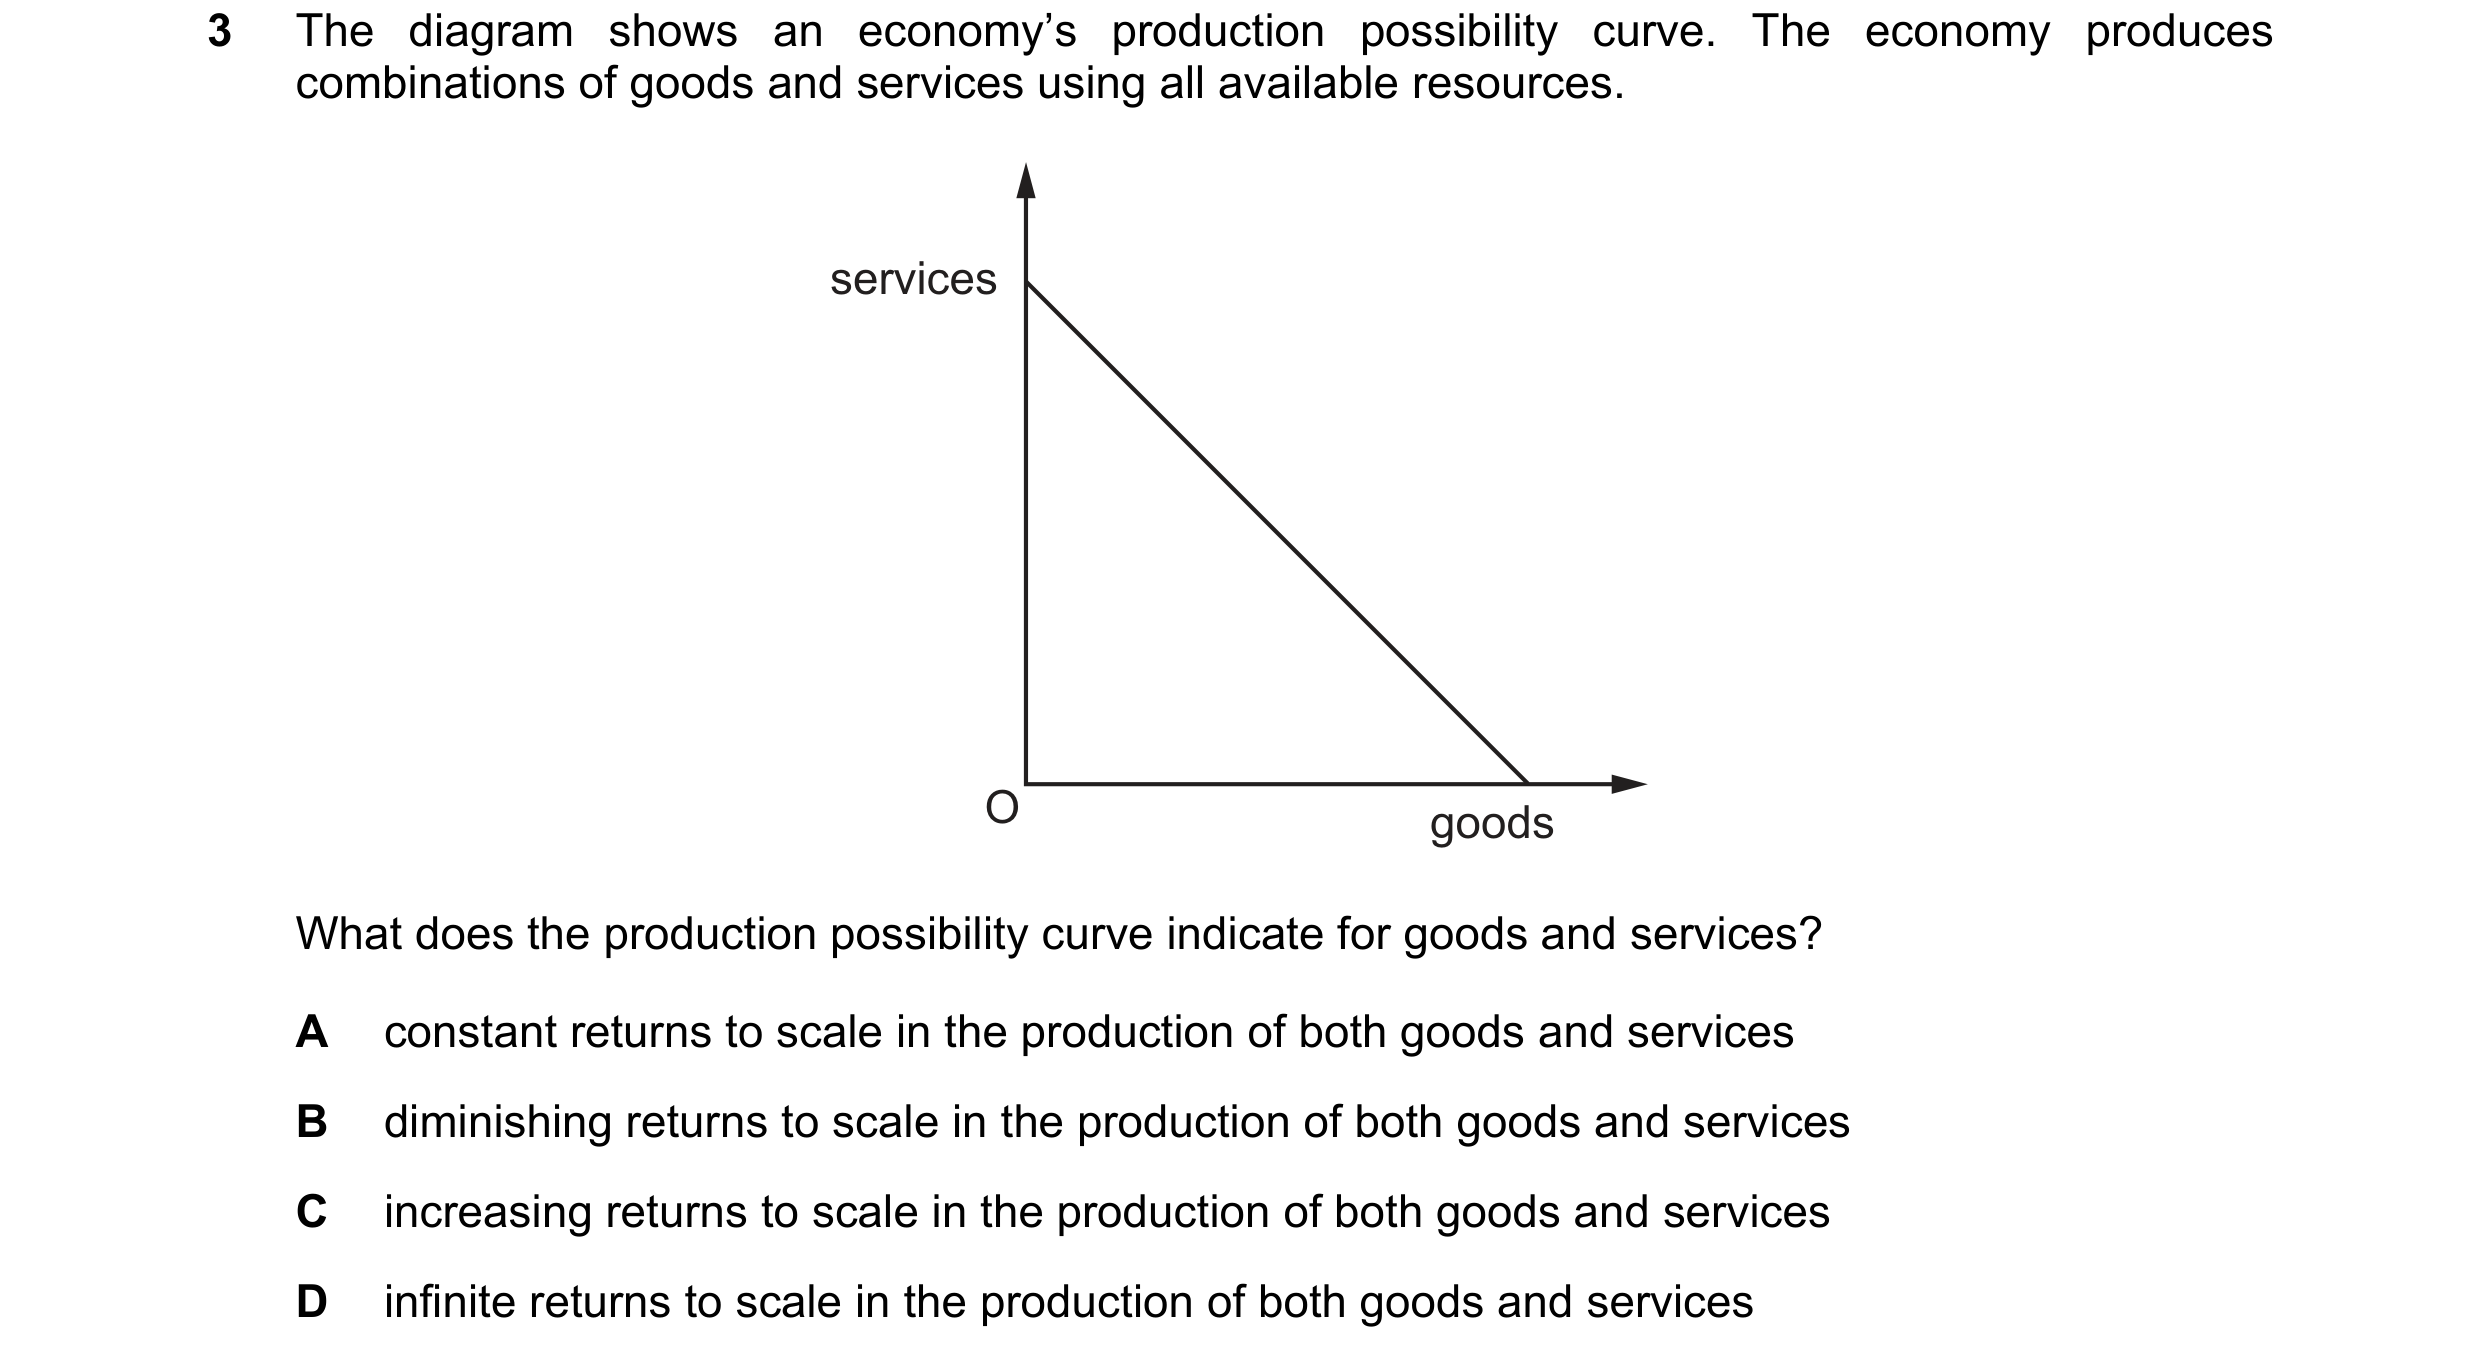
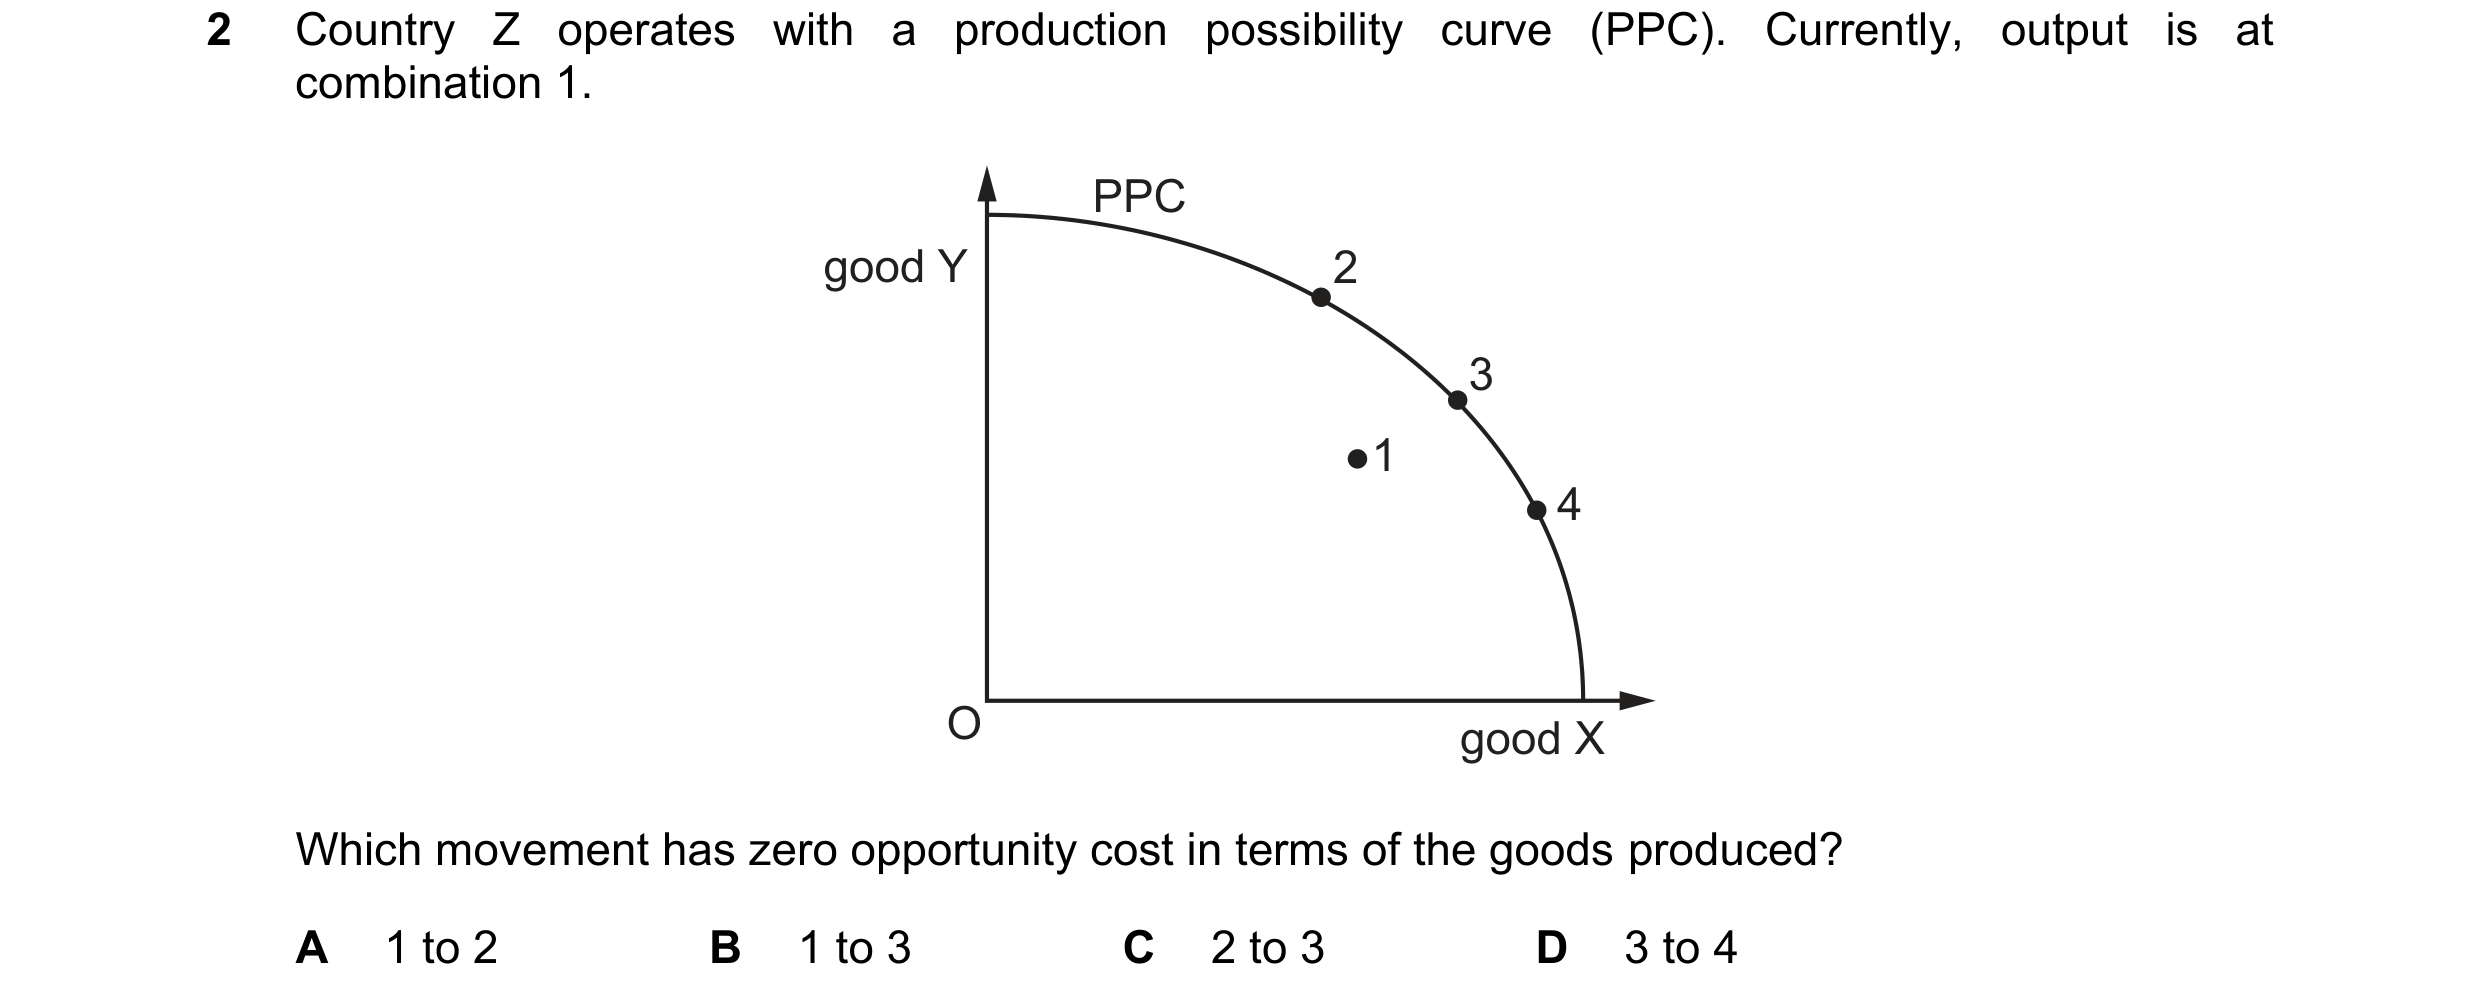 58 / 68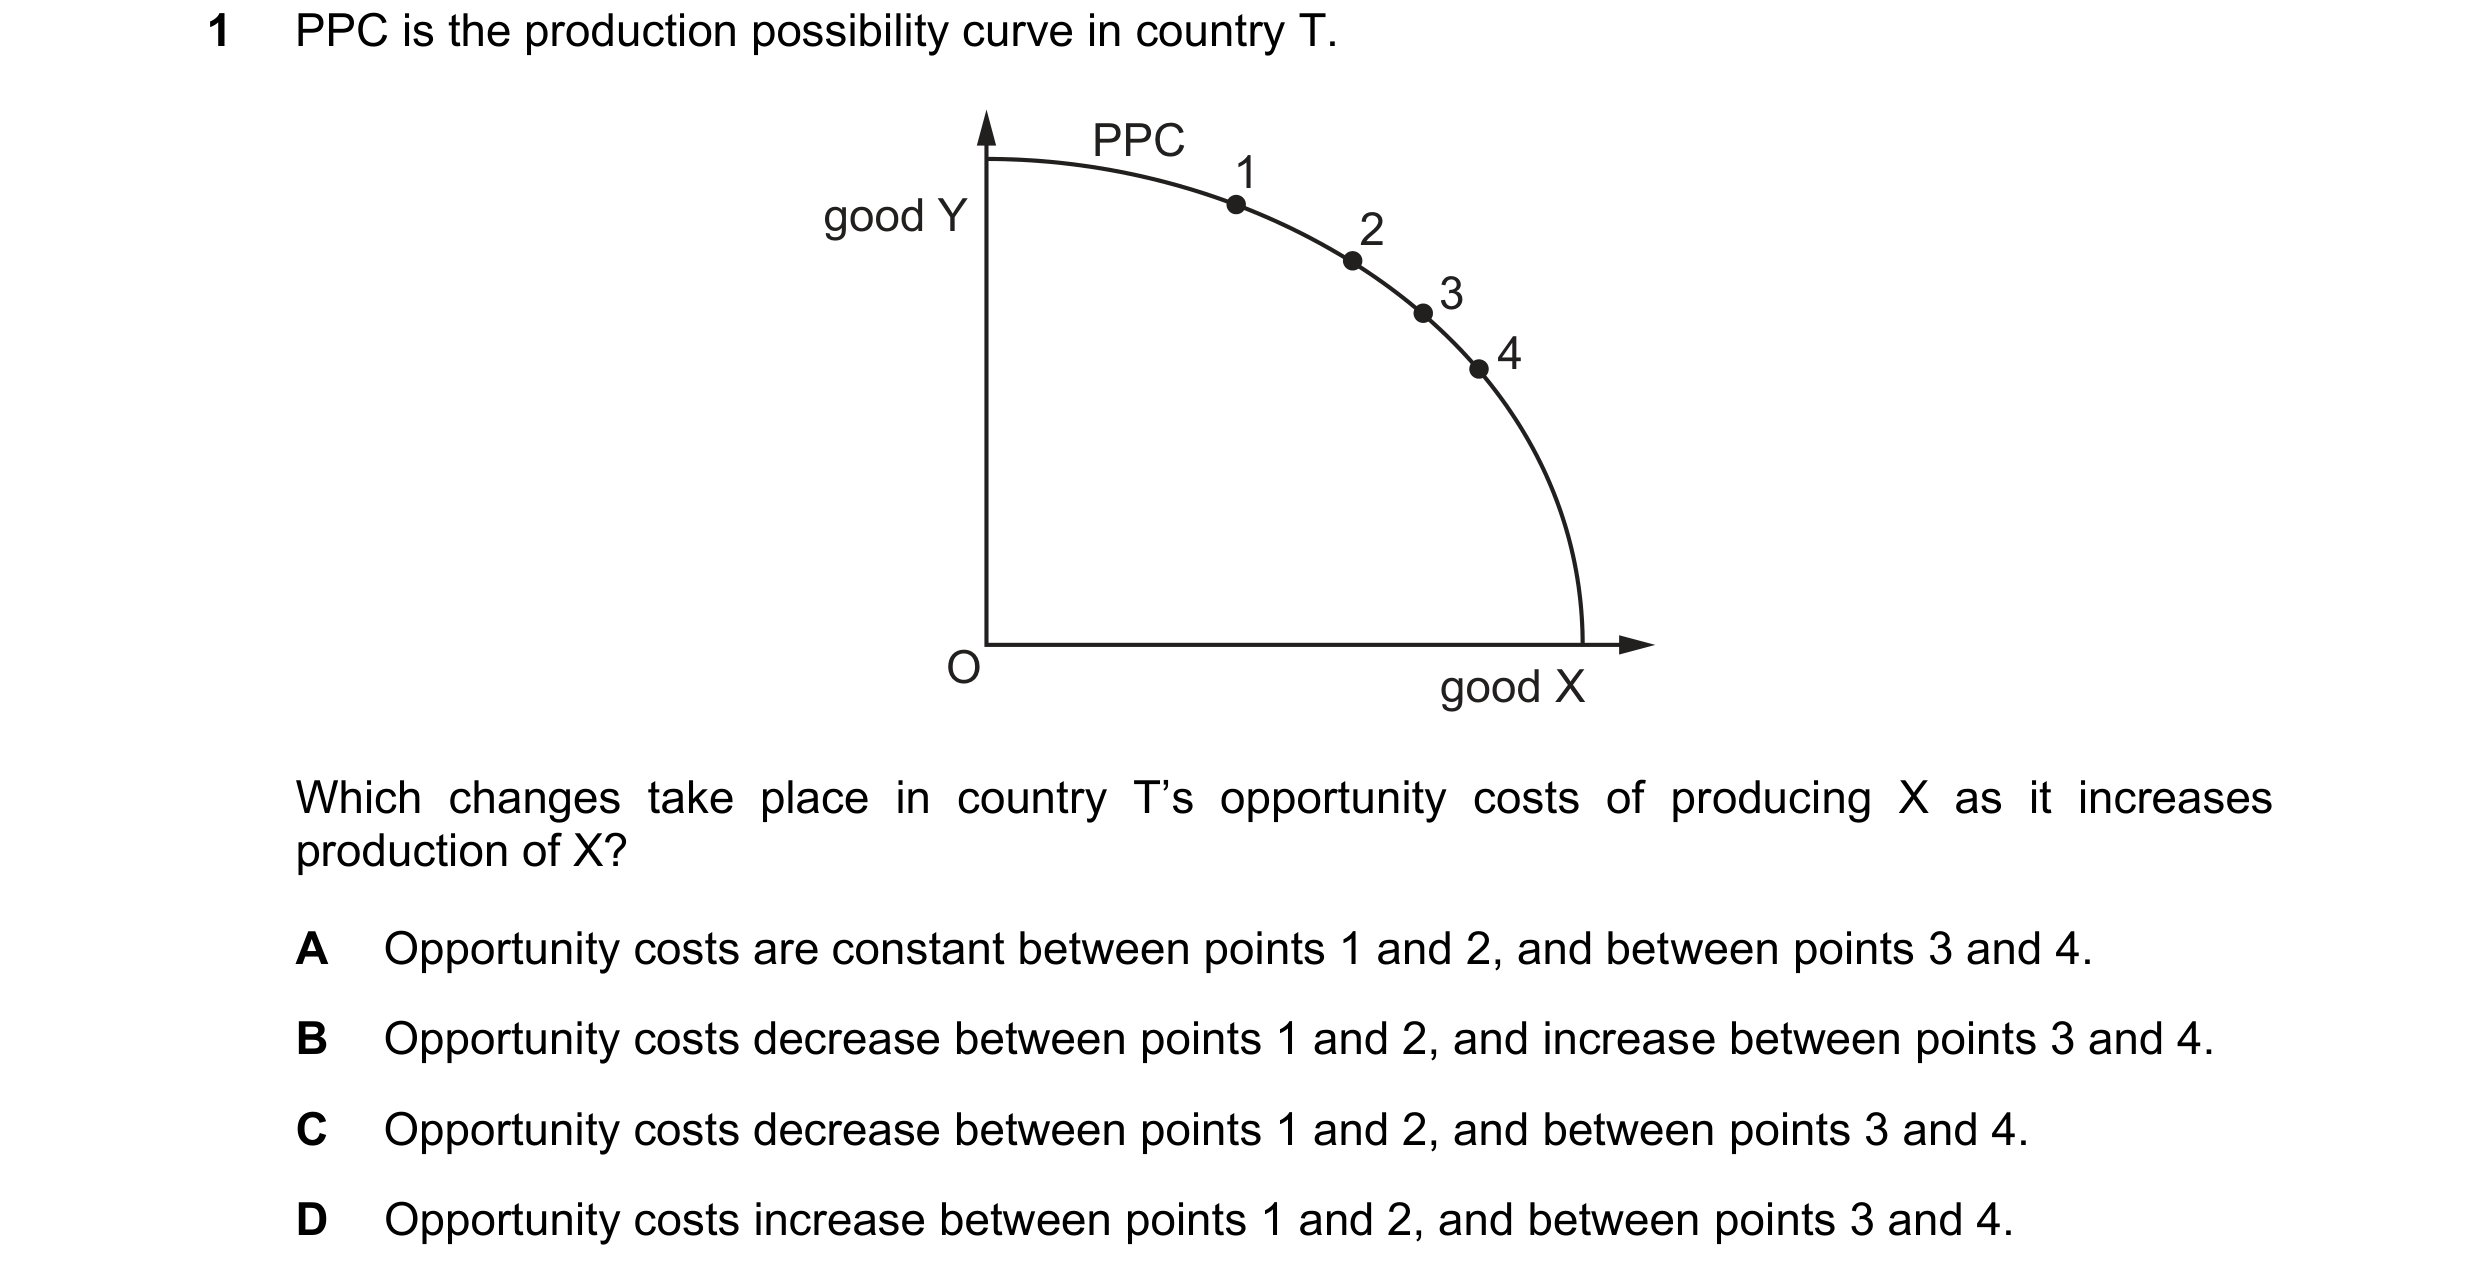
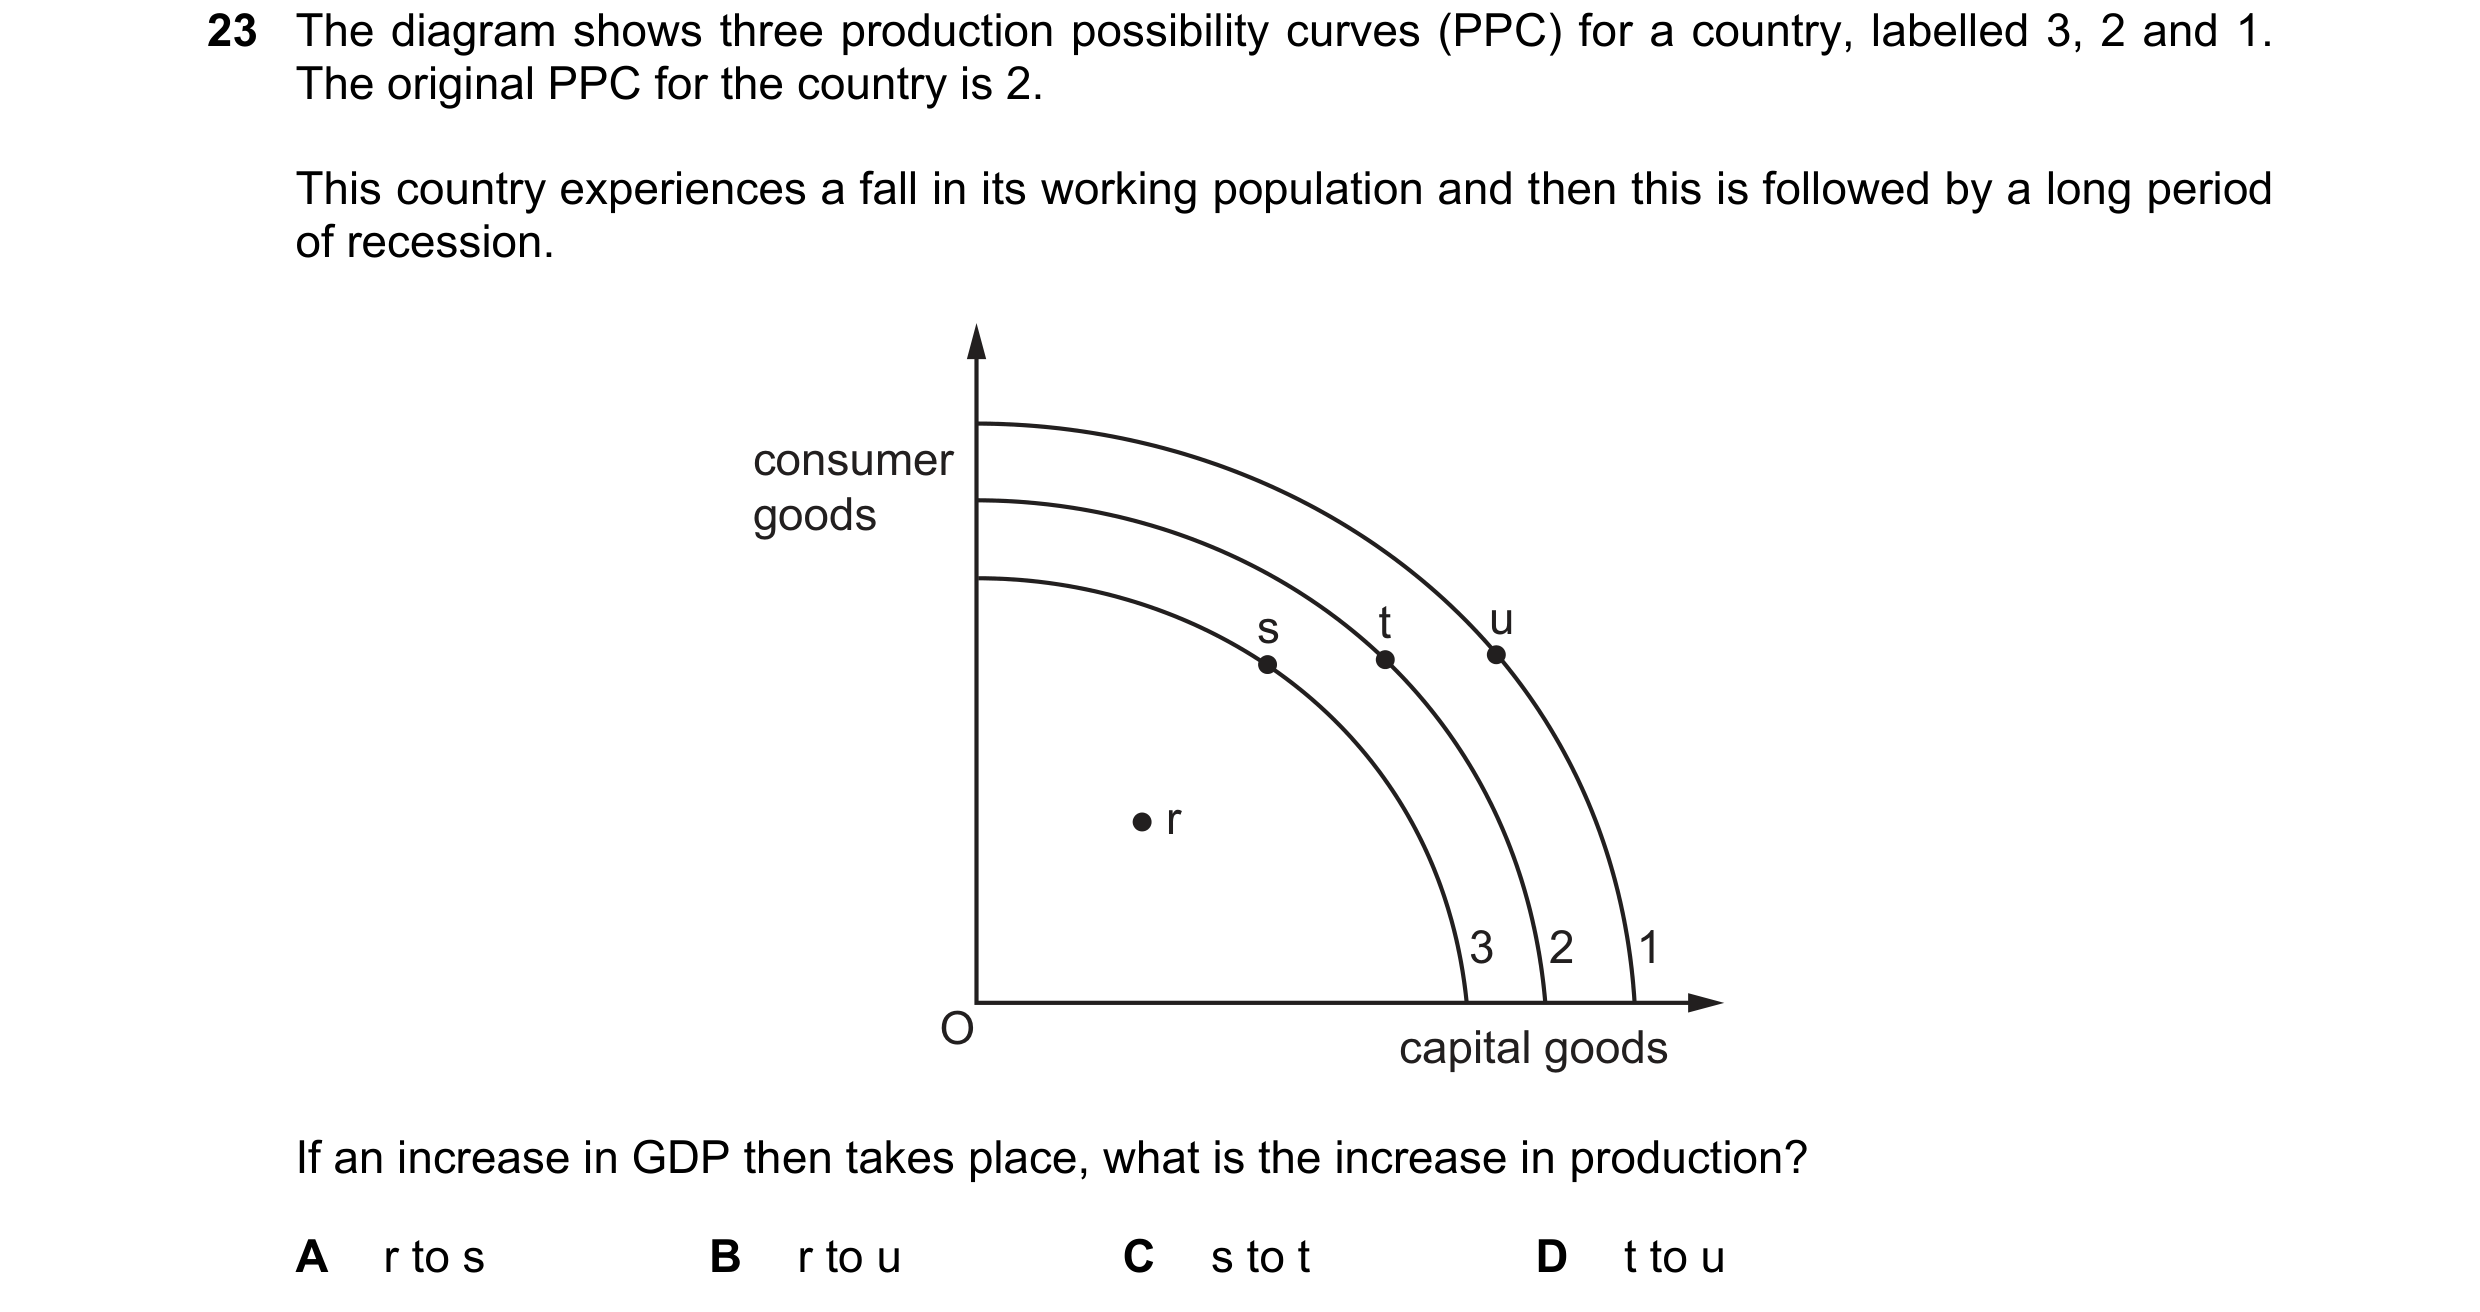 59 / 68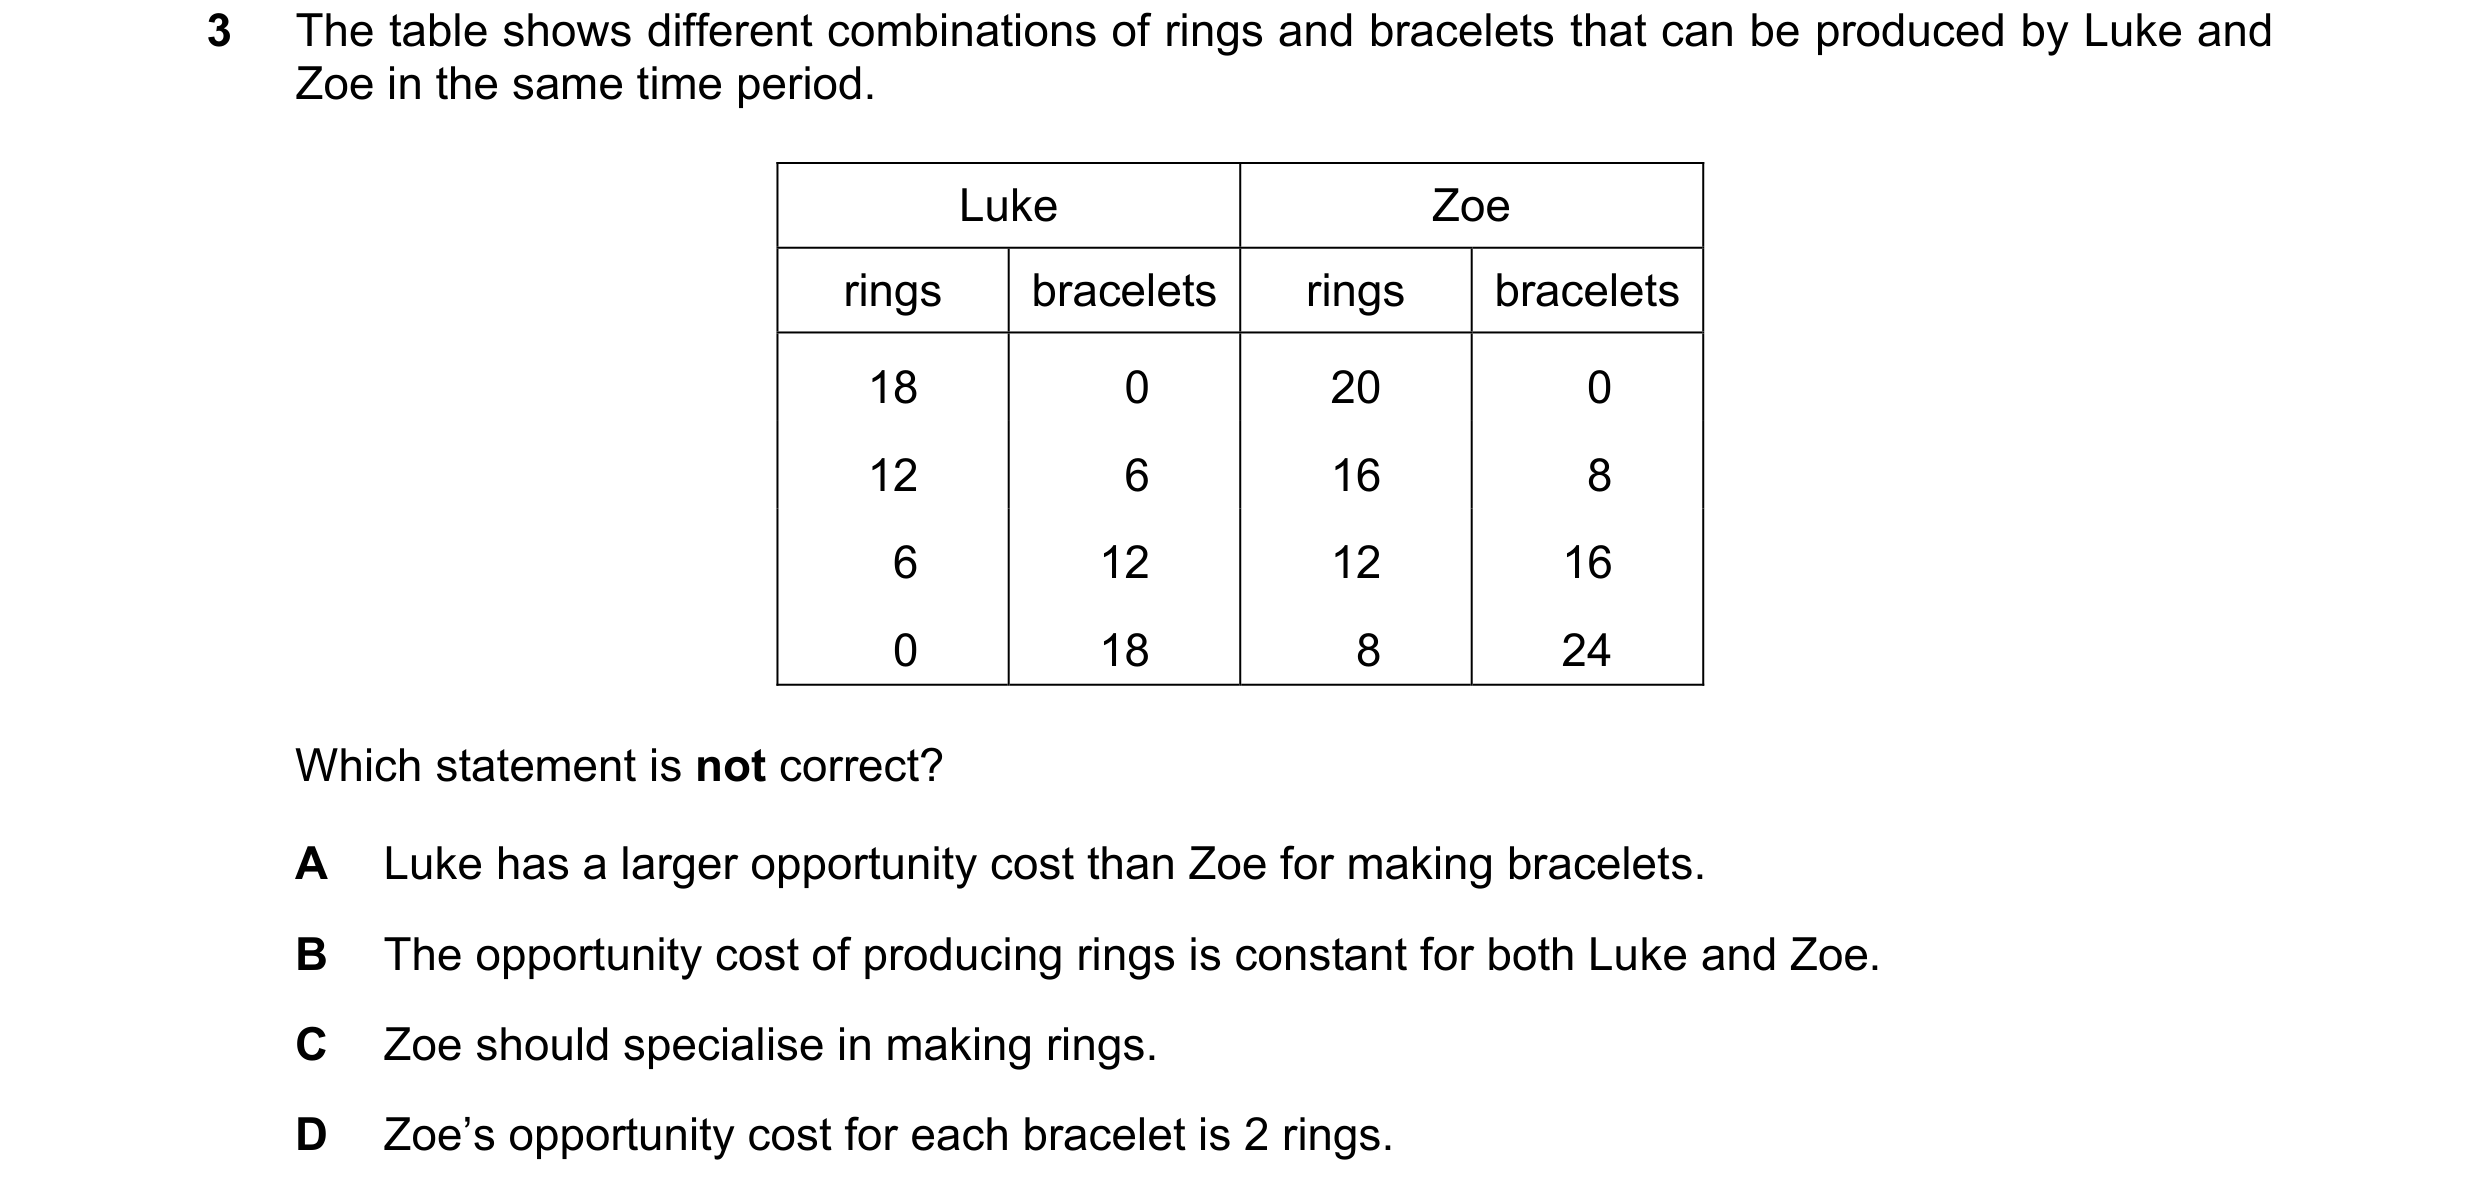

 60 / 68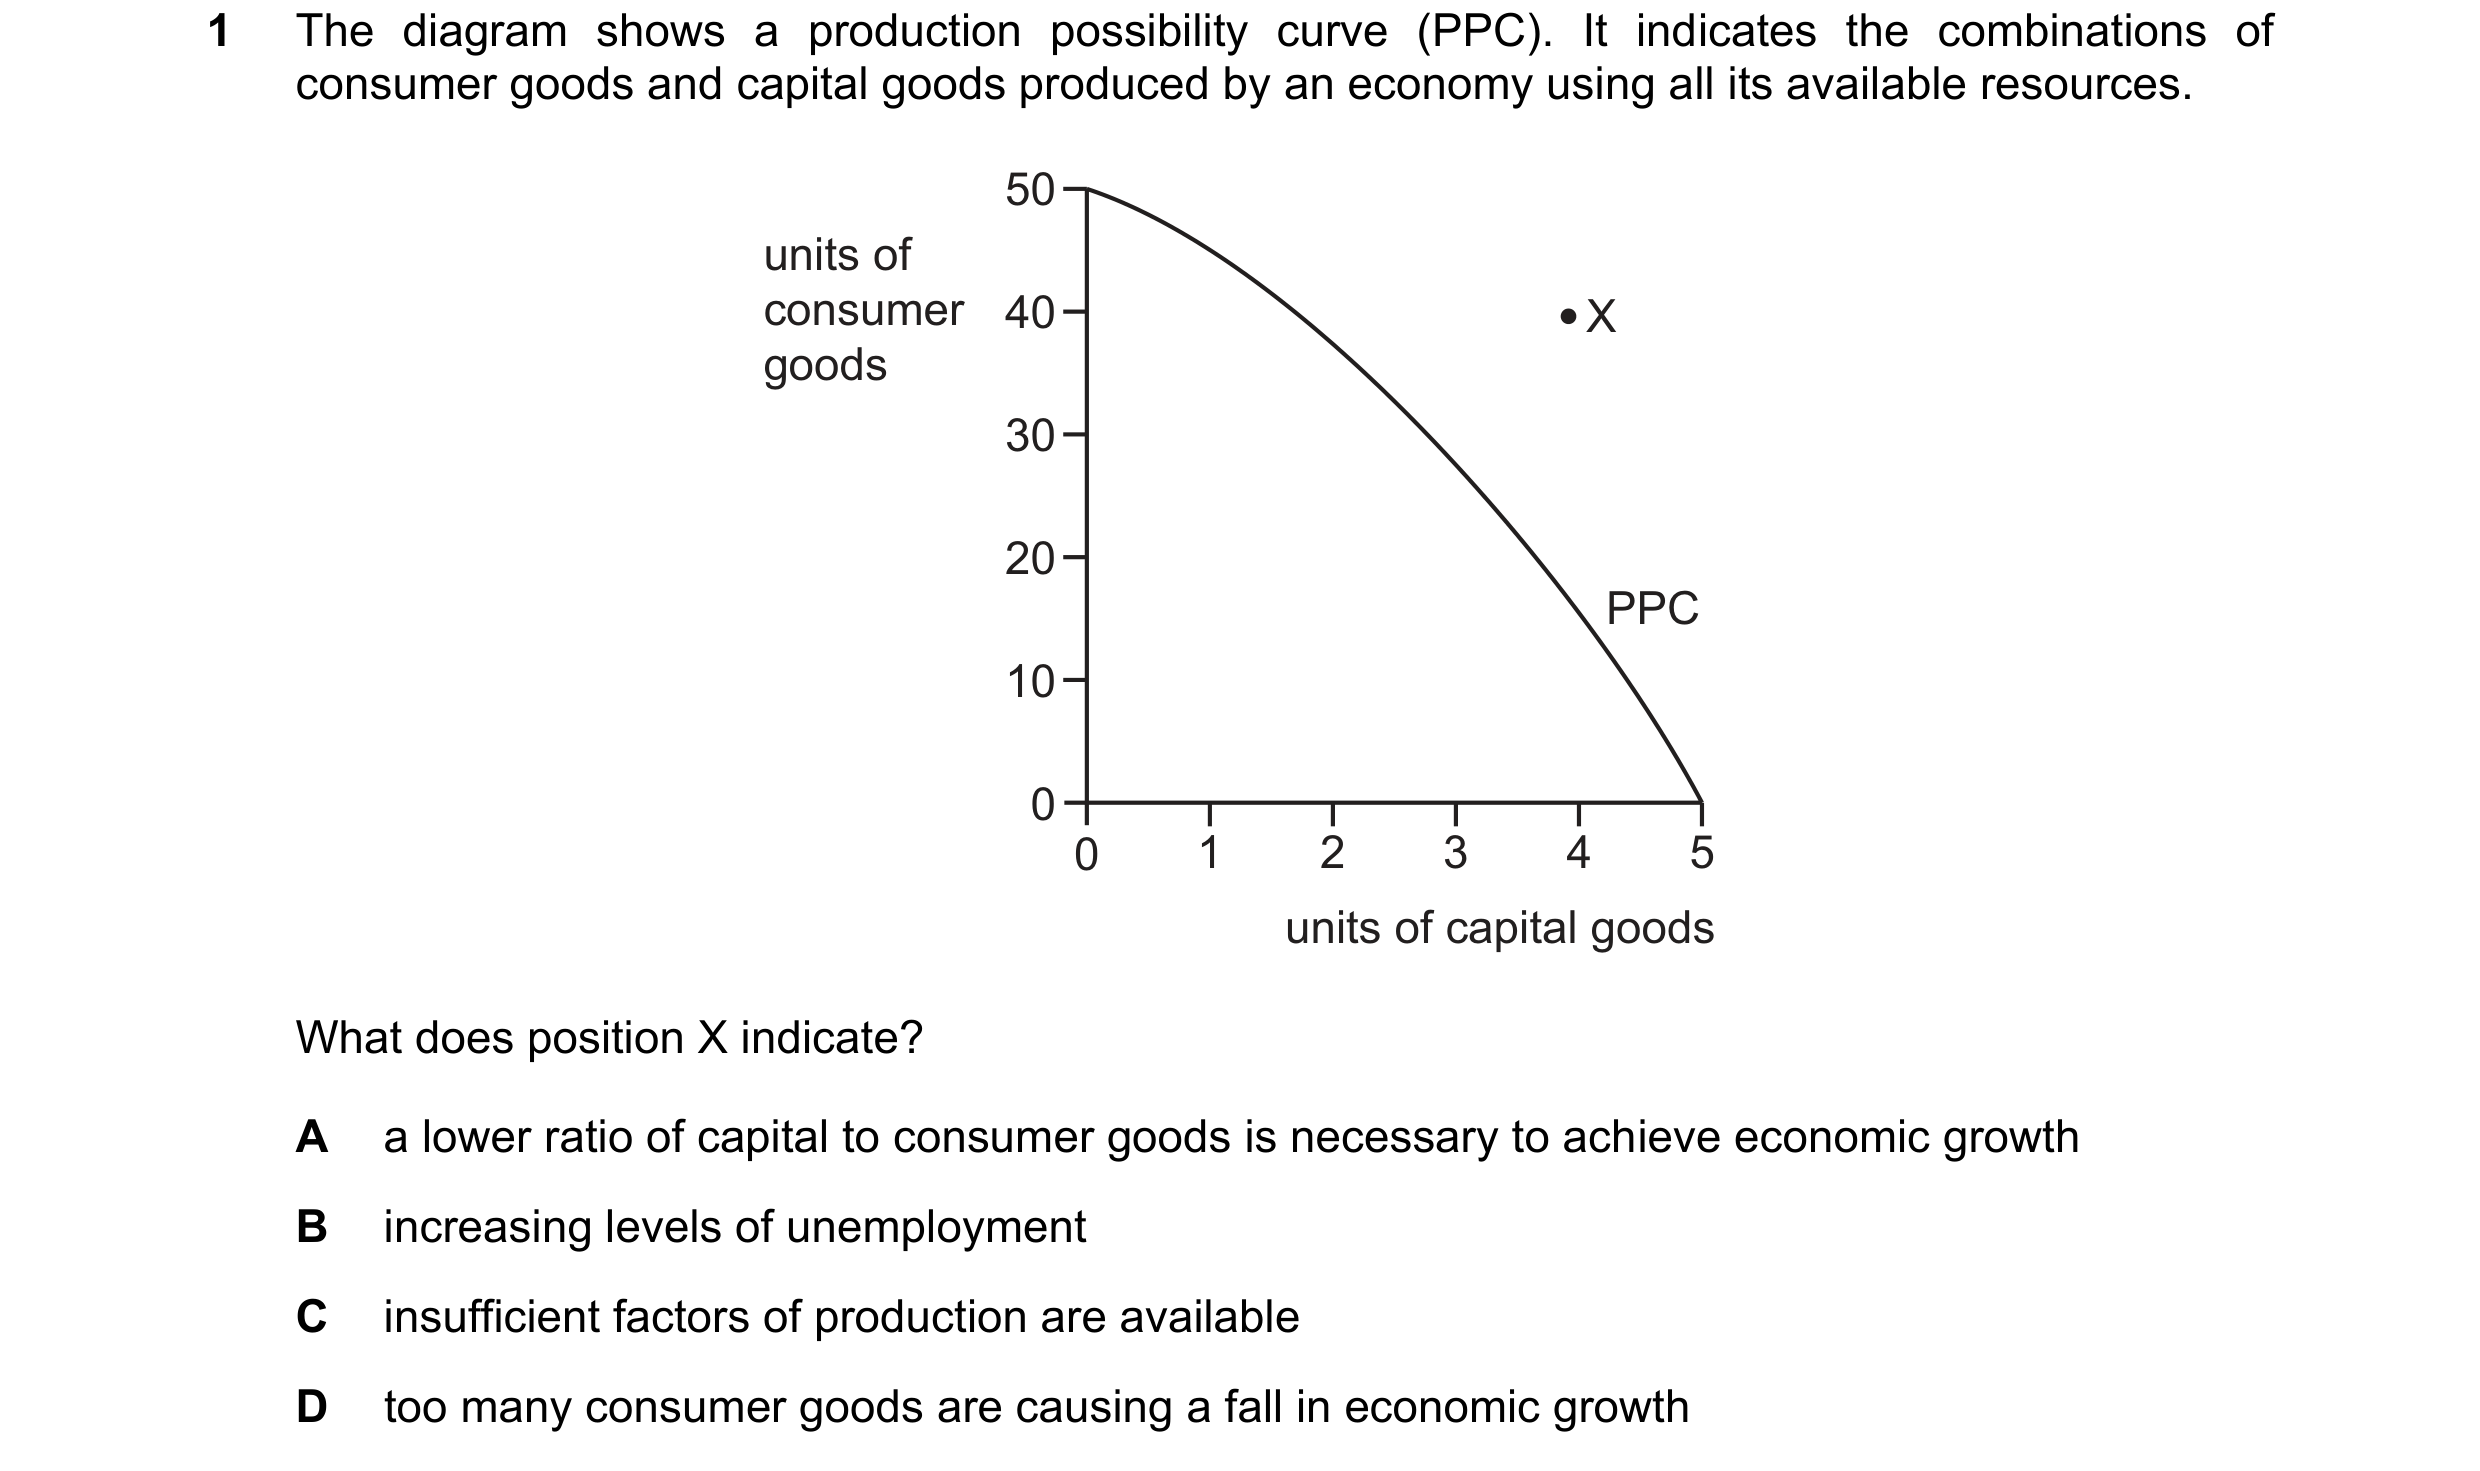
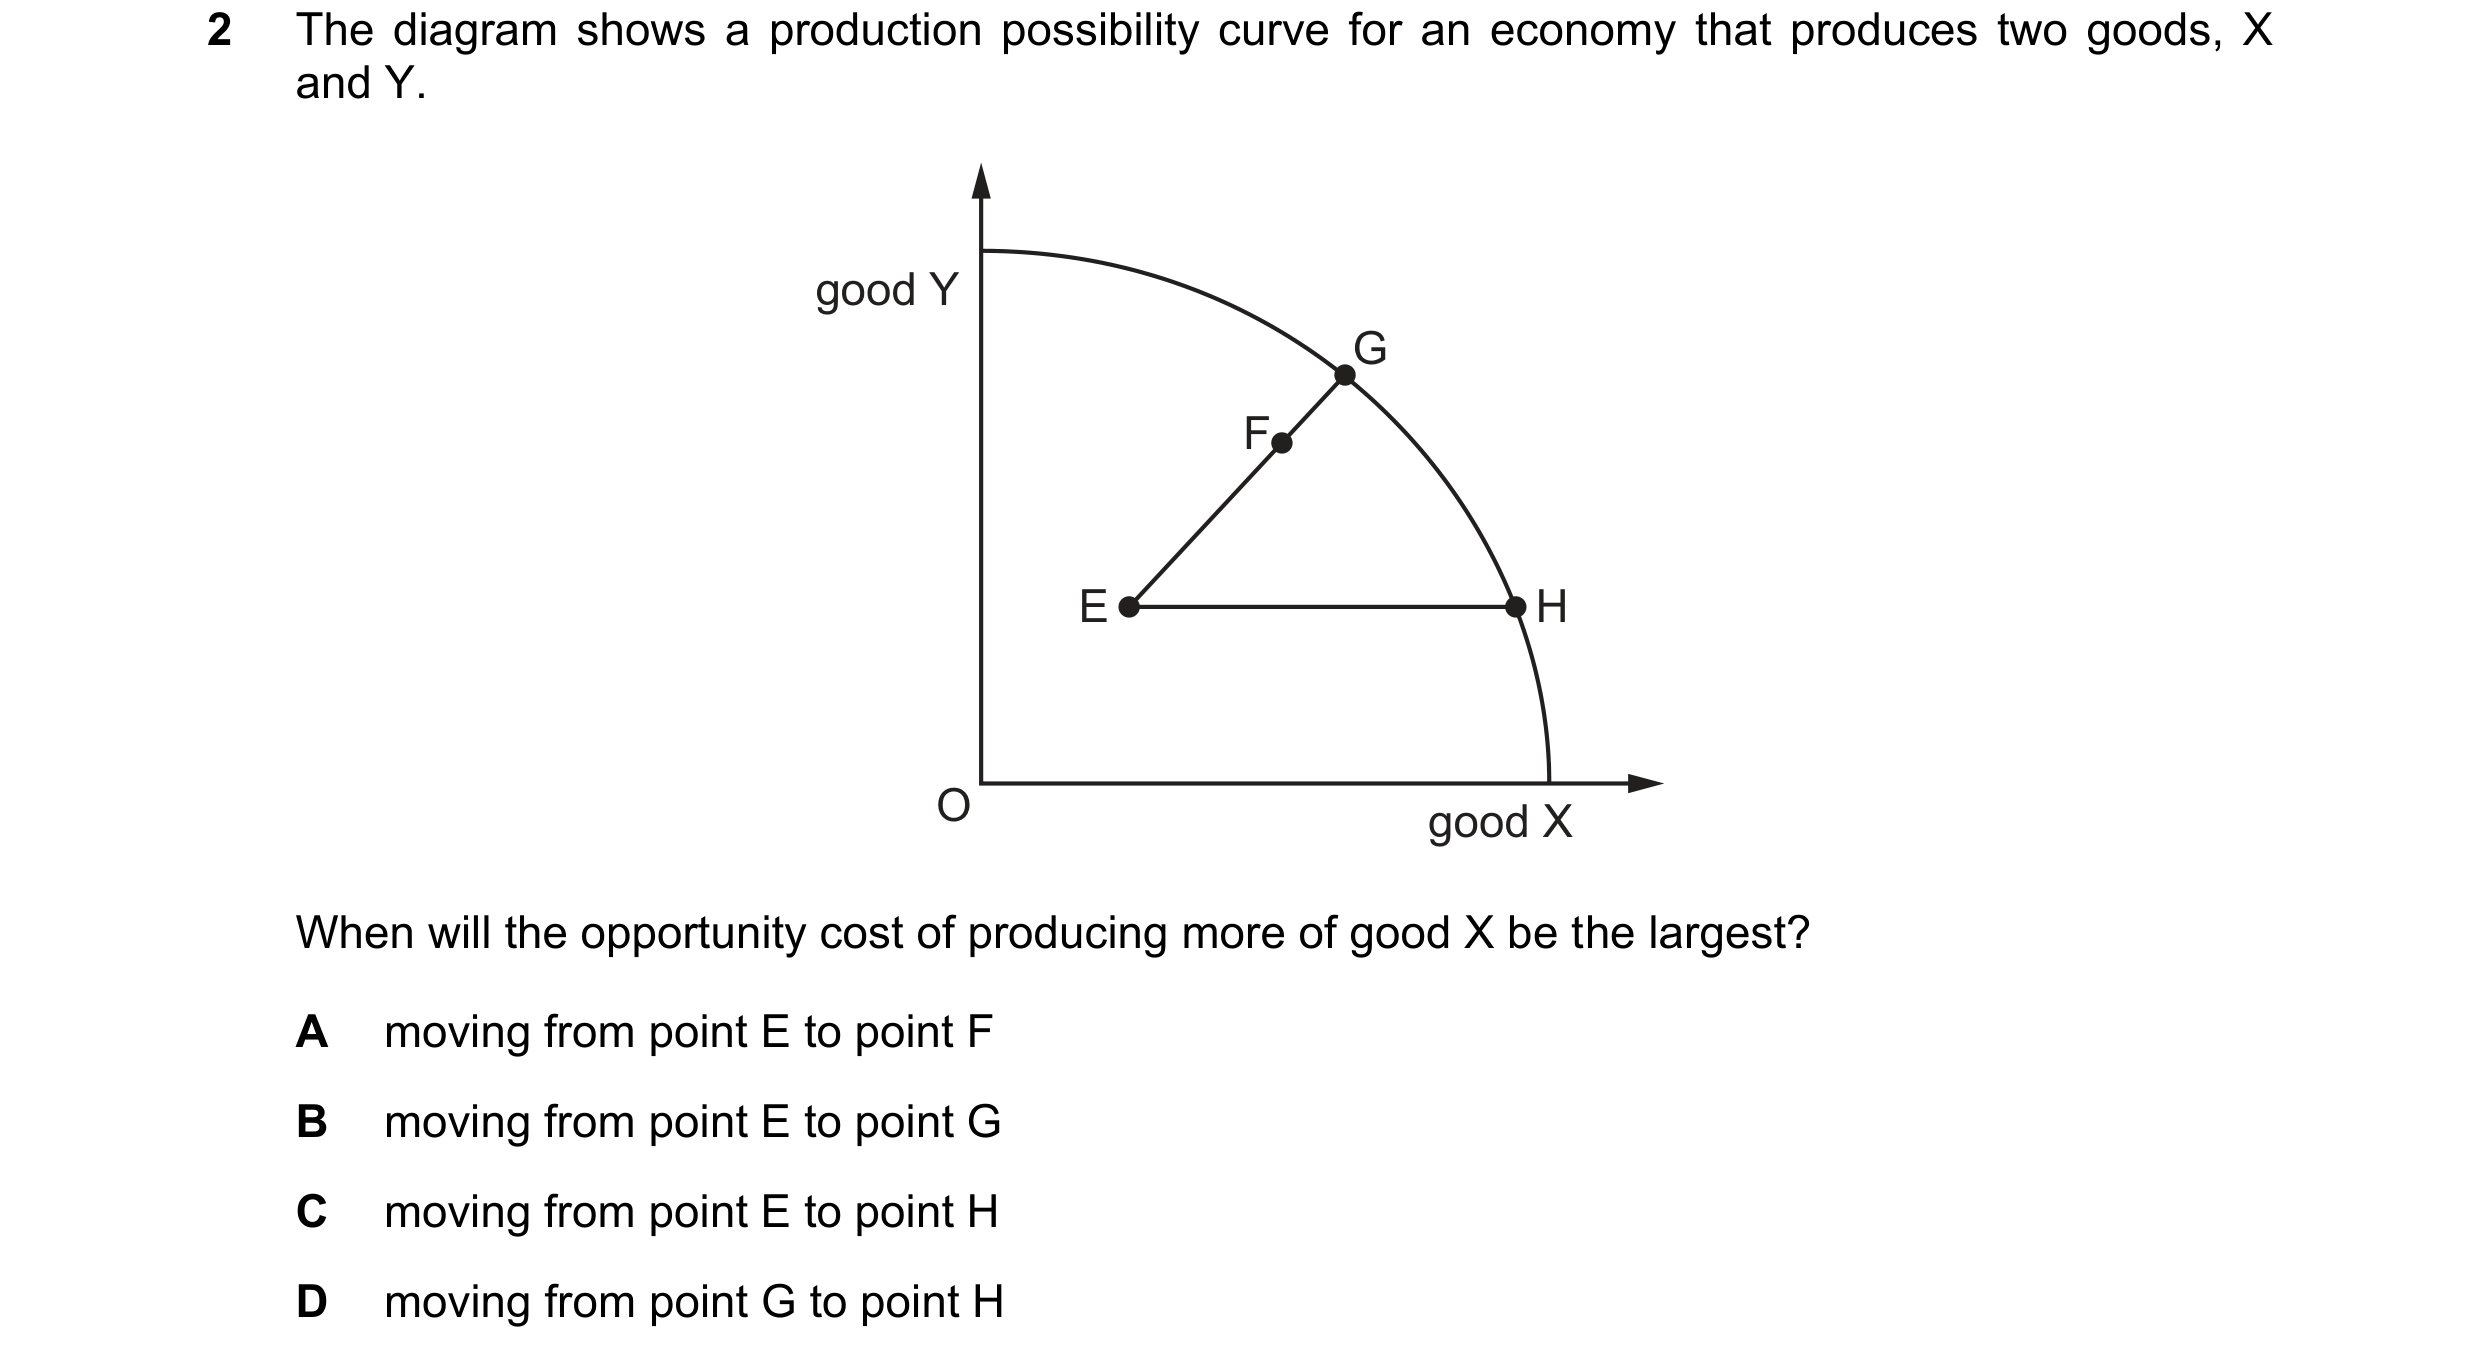 61 / 68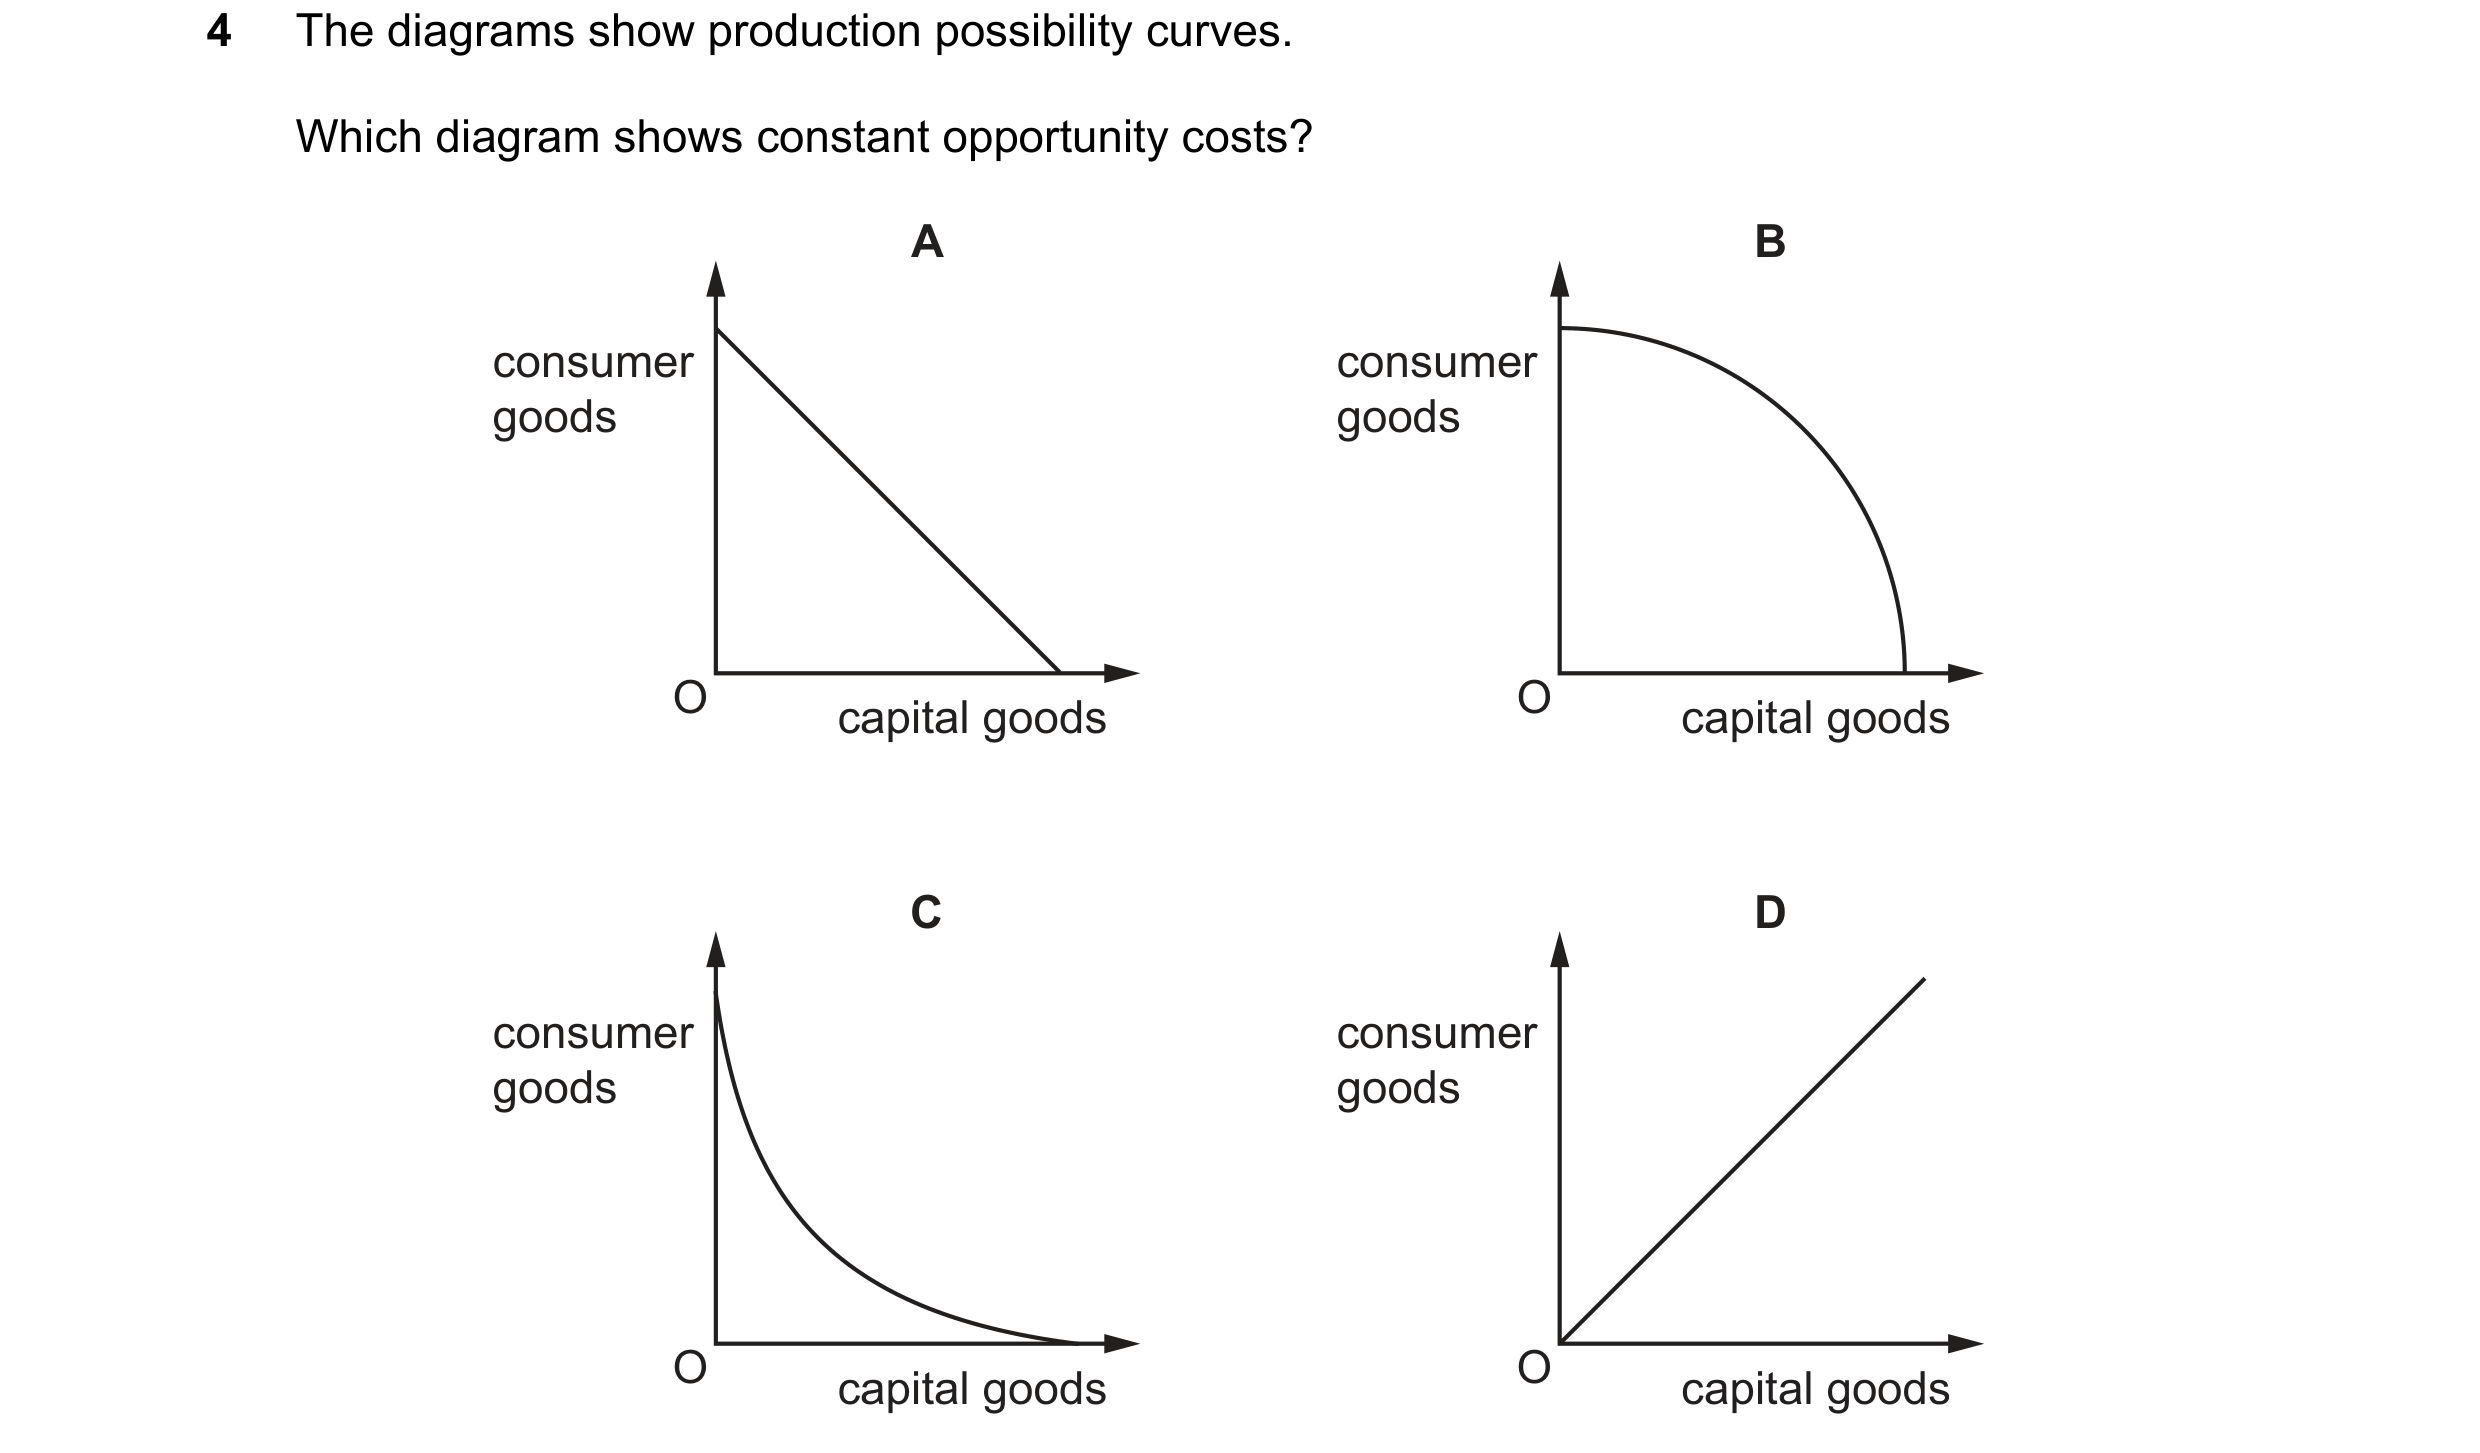
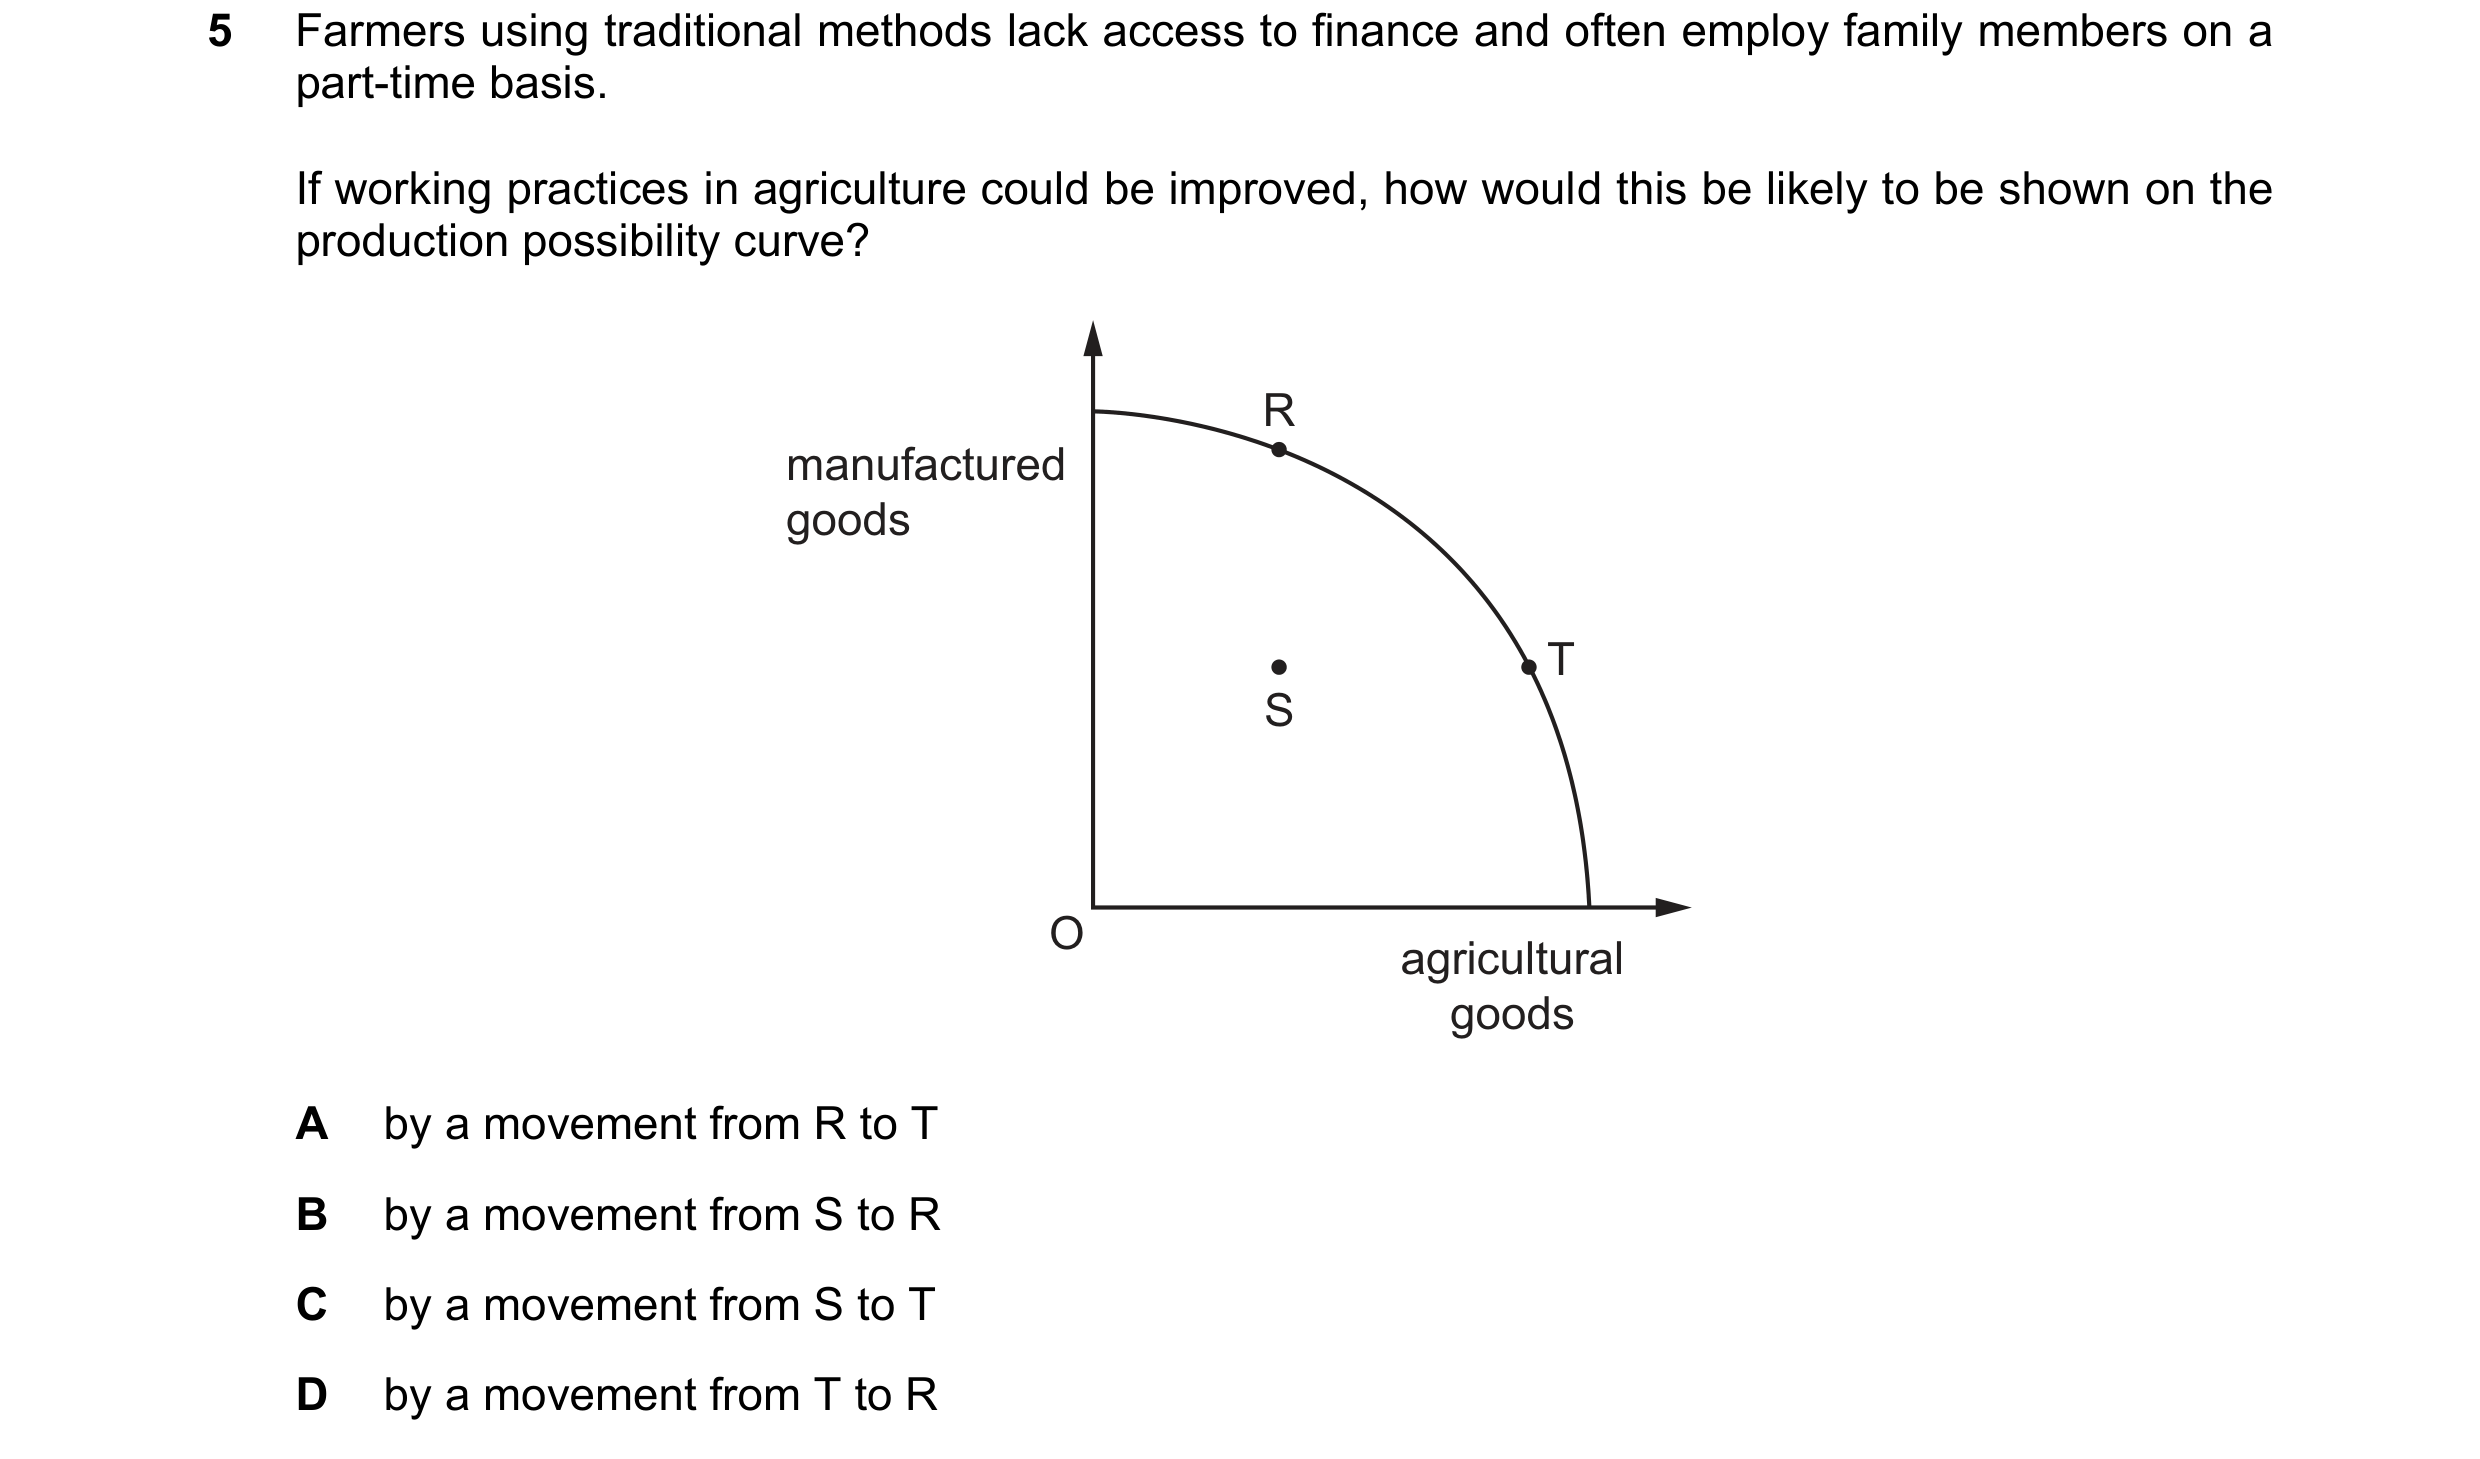 62 / 68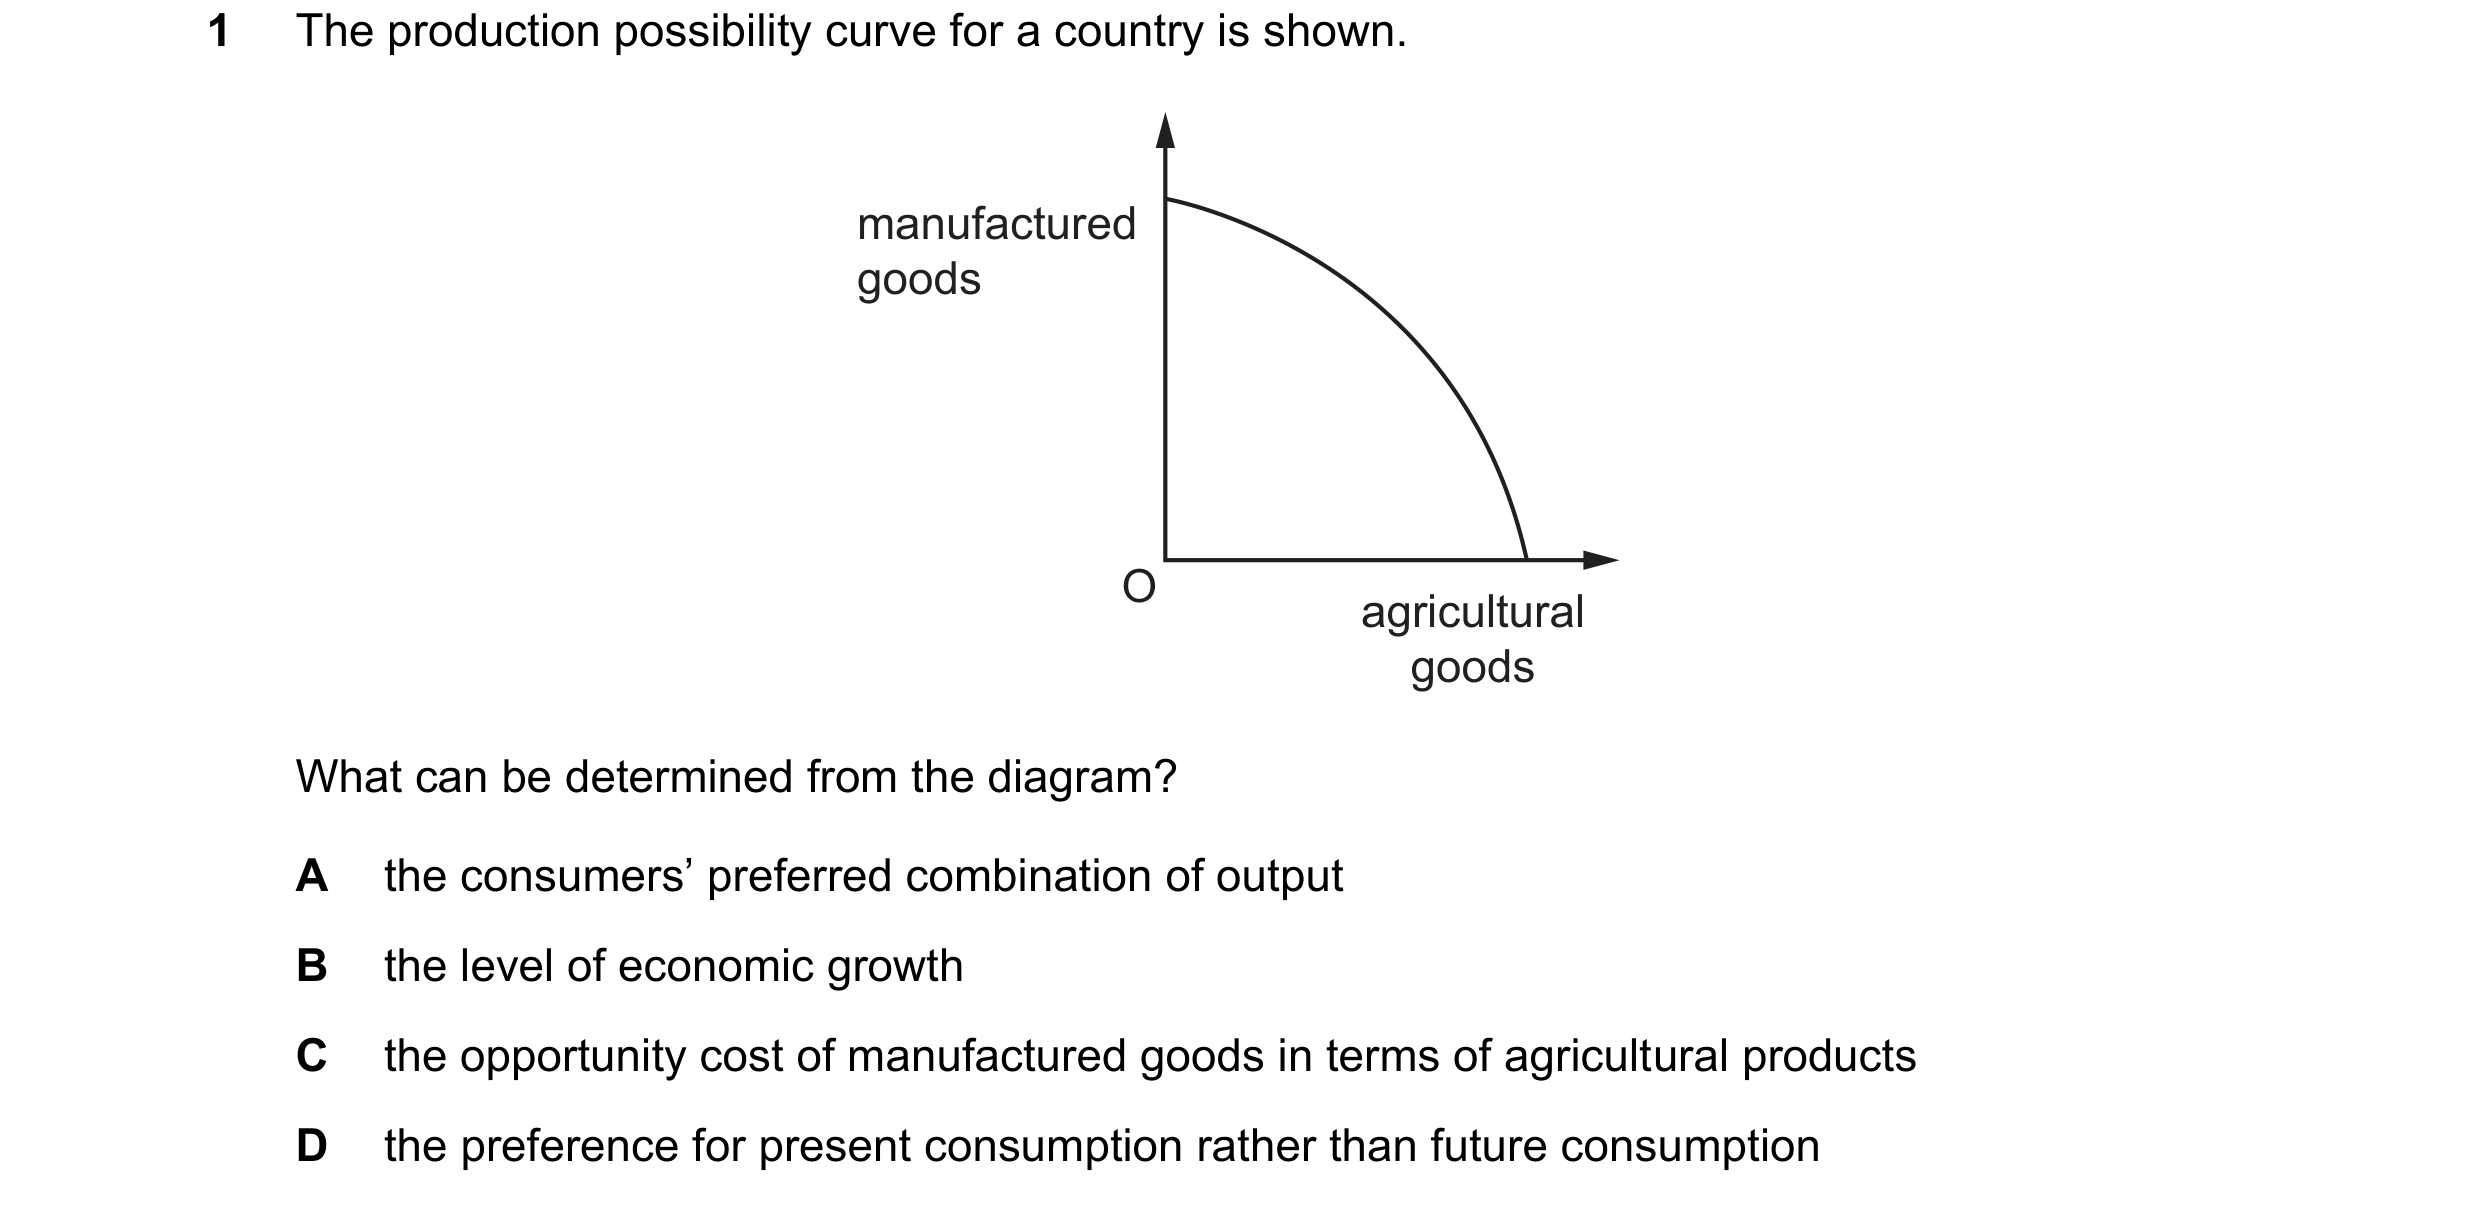
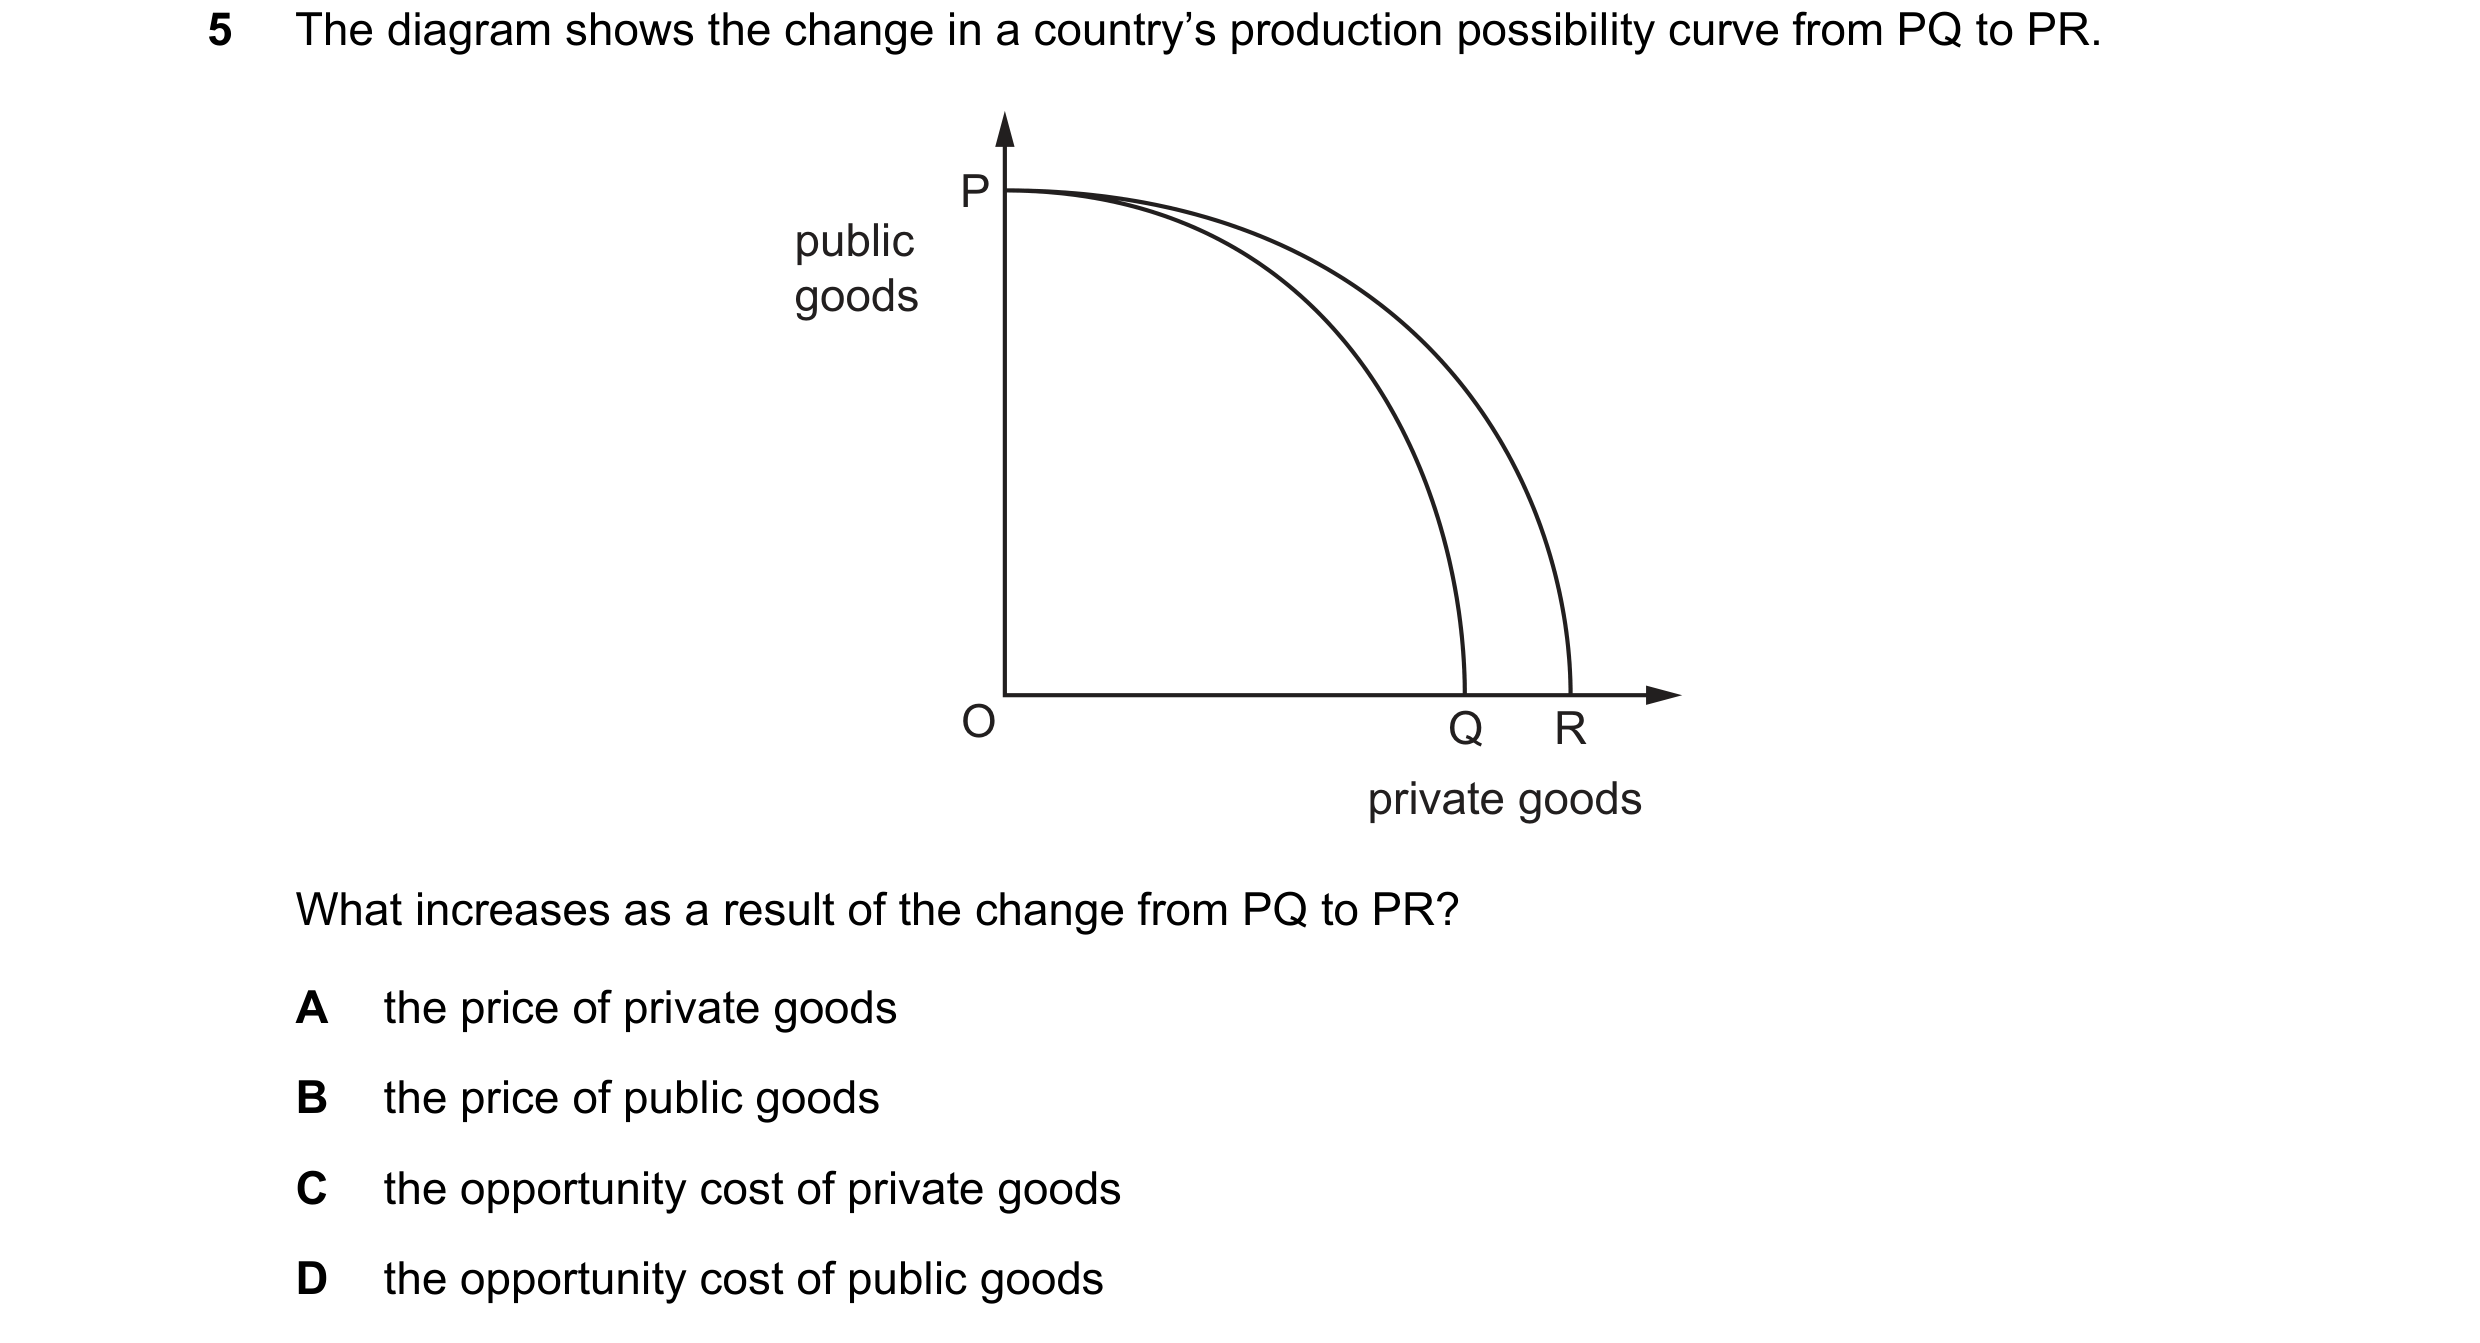 63 / 68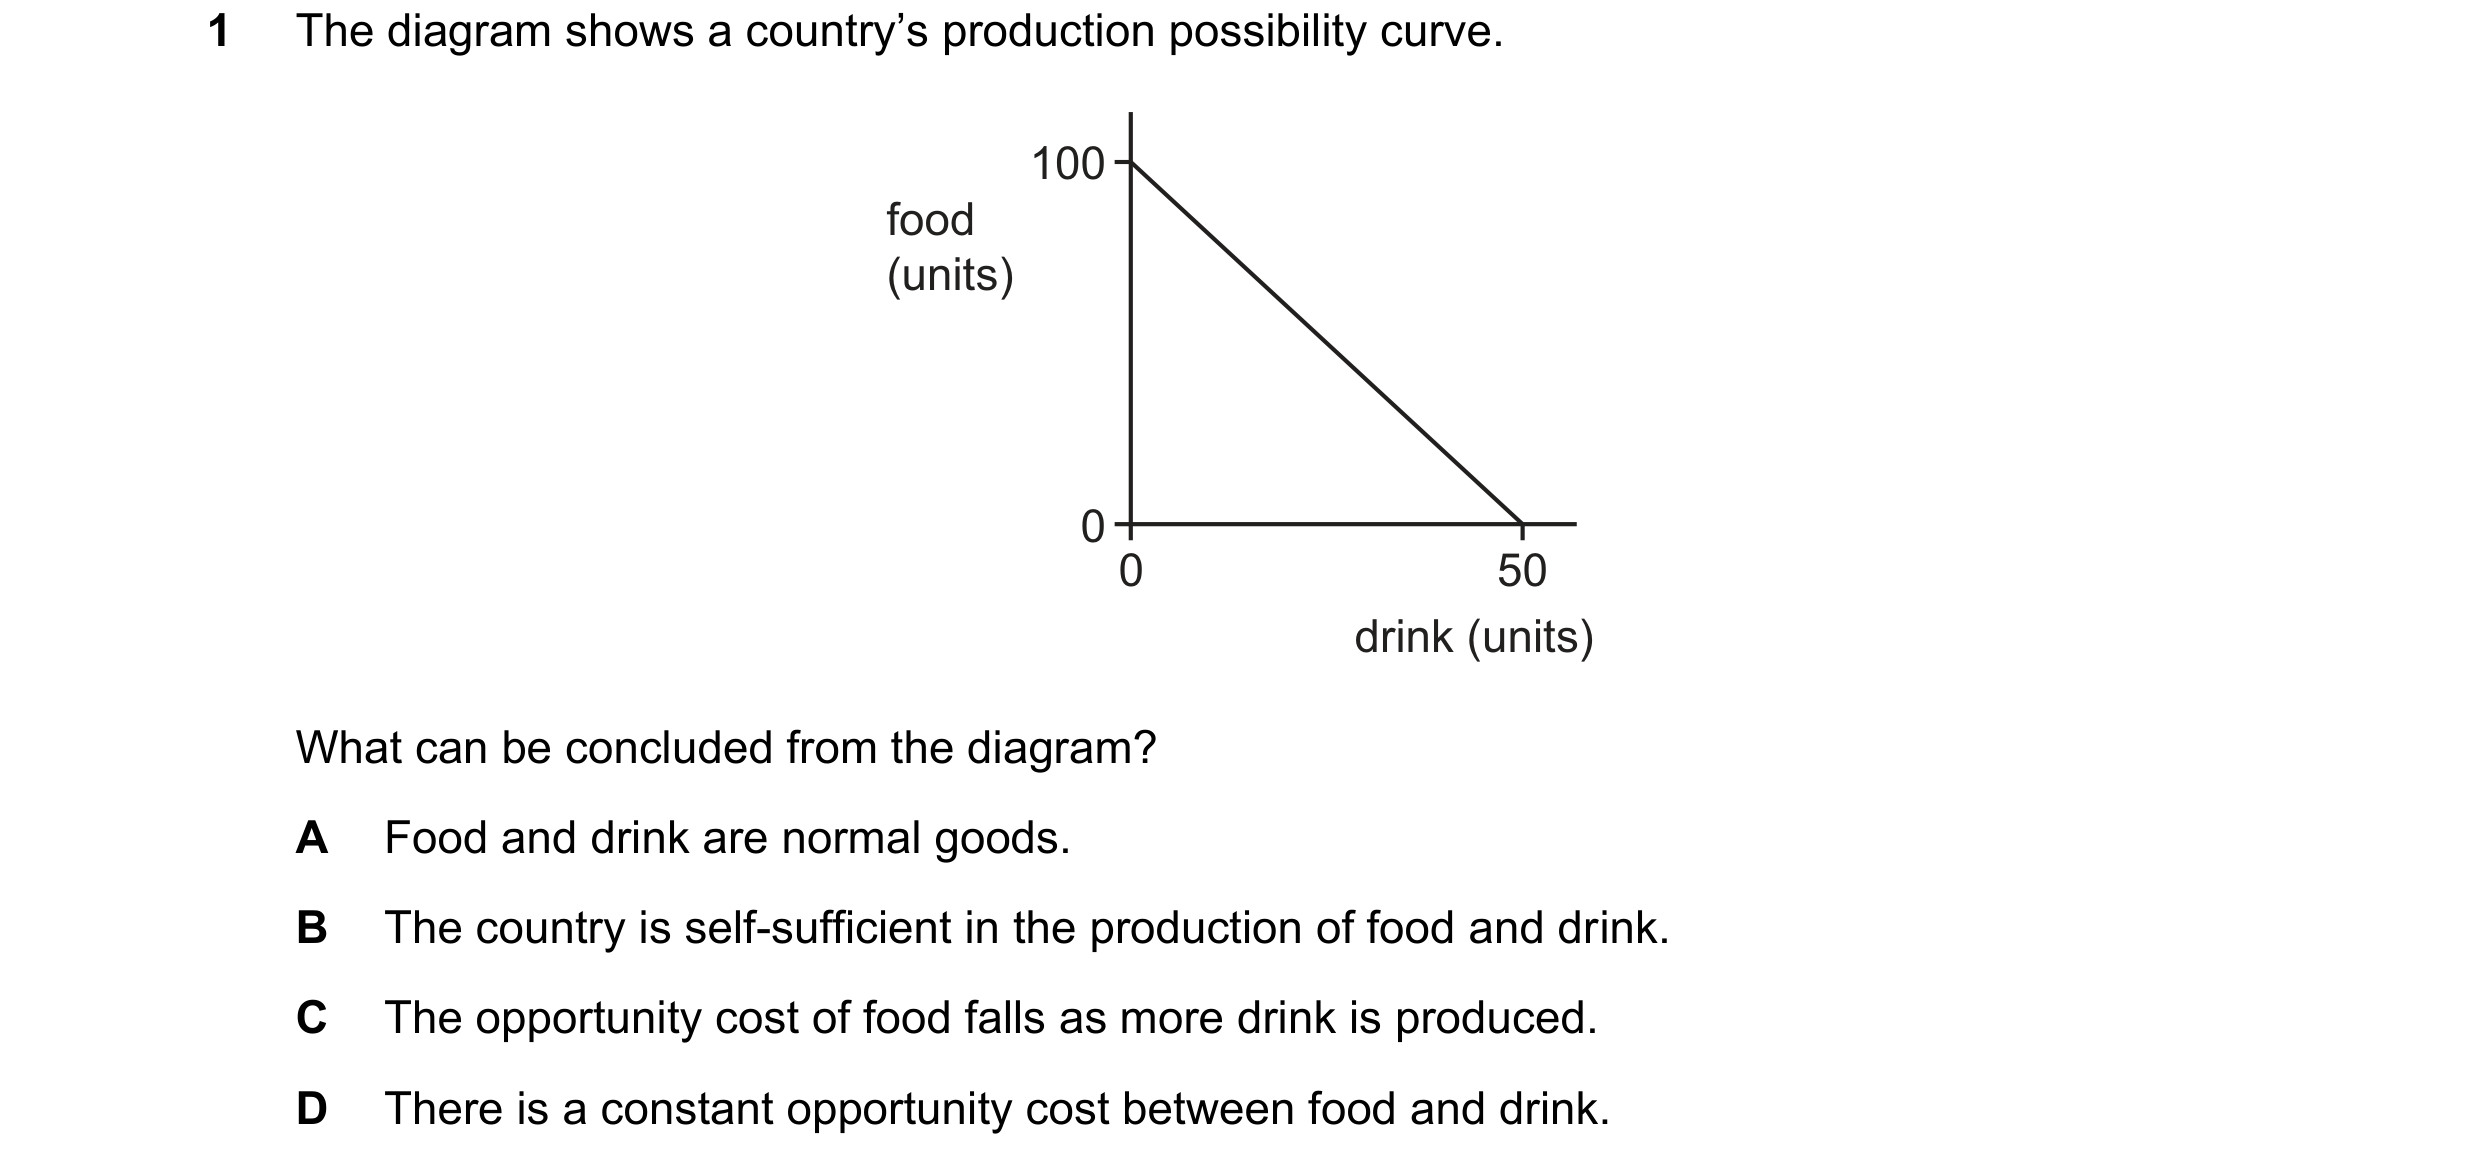
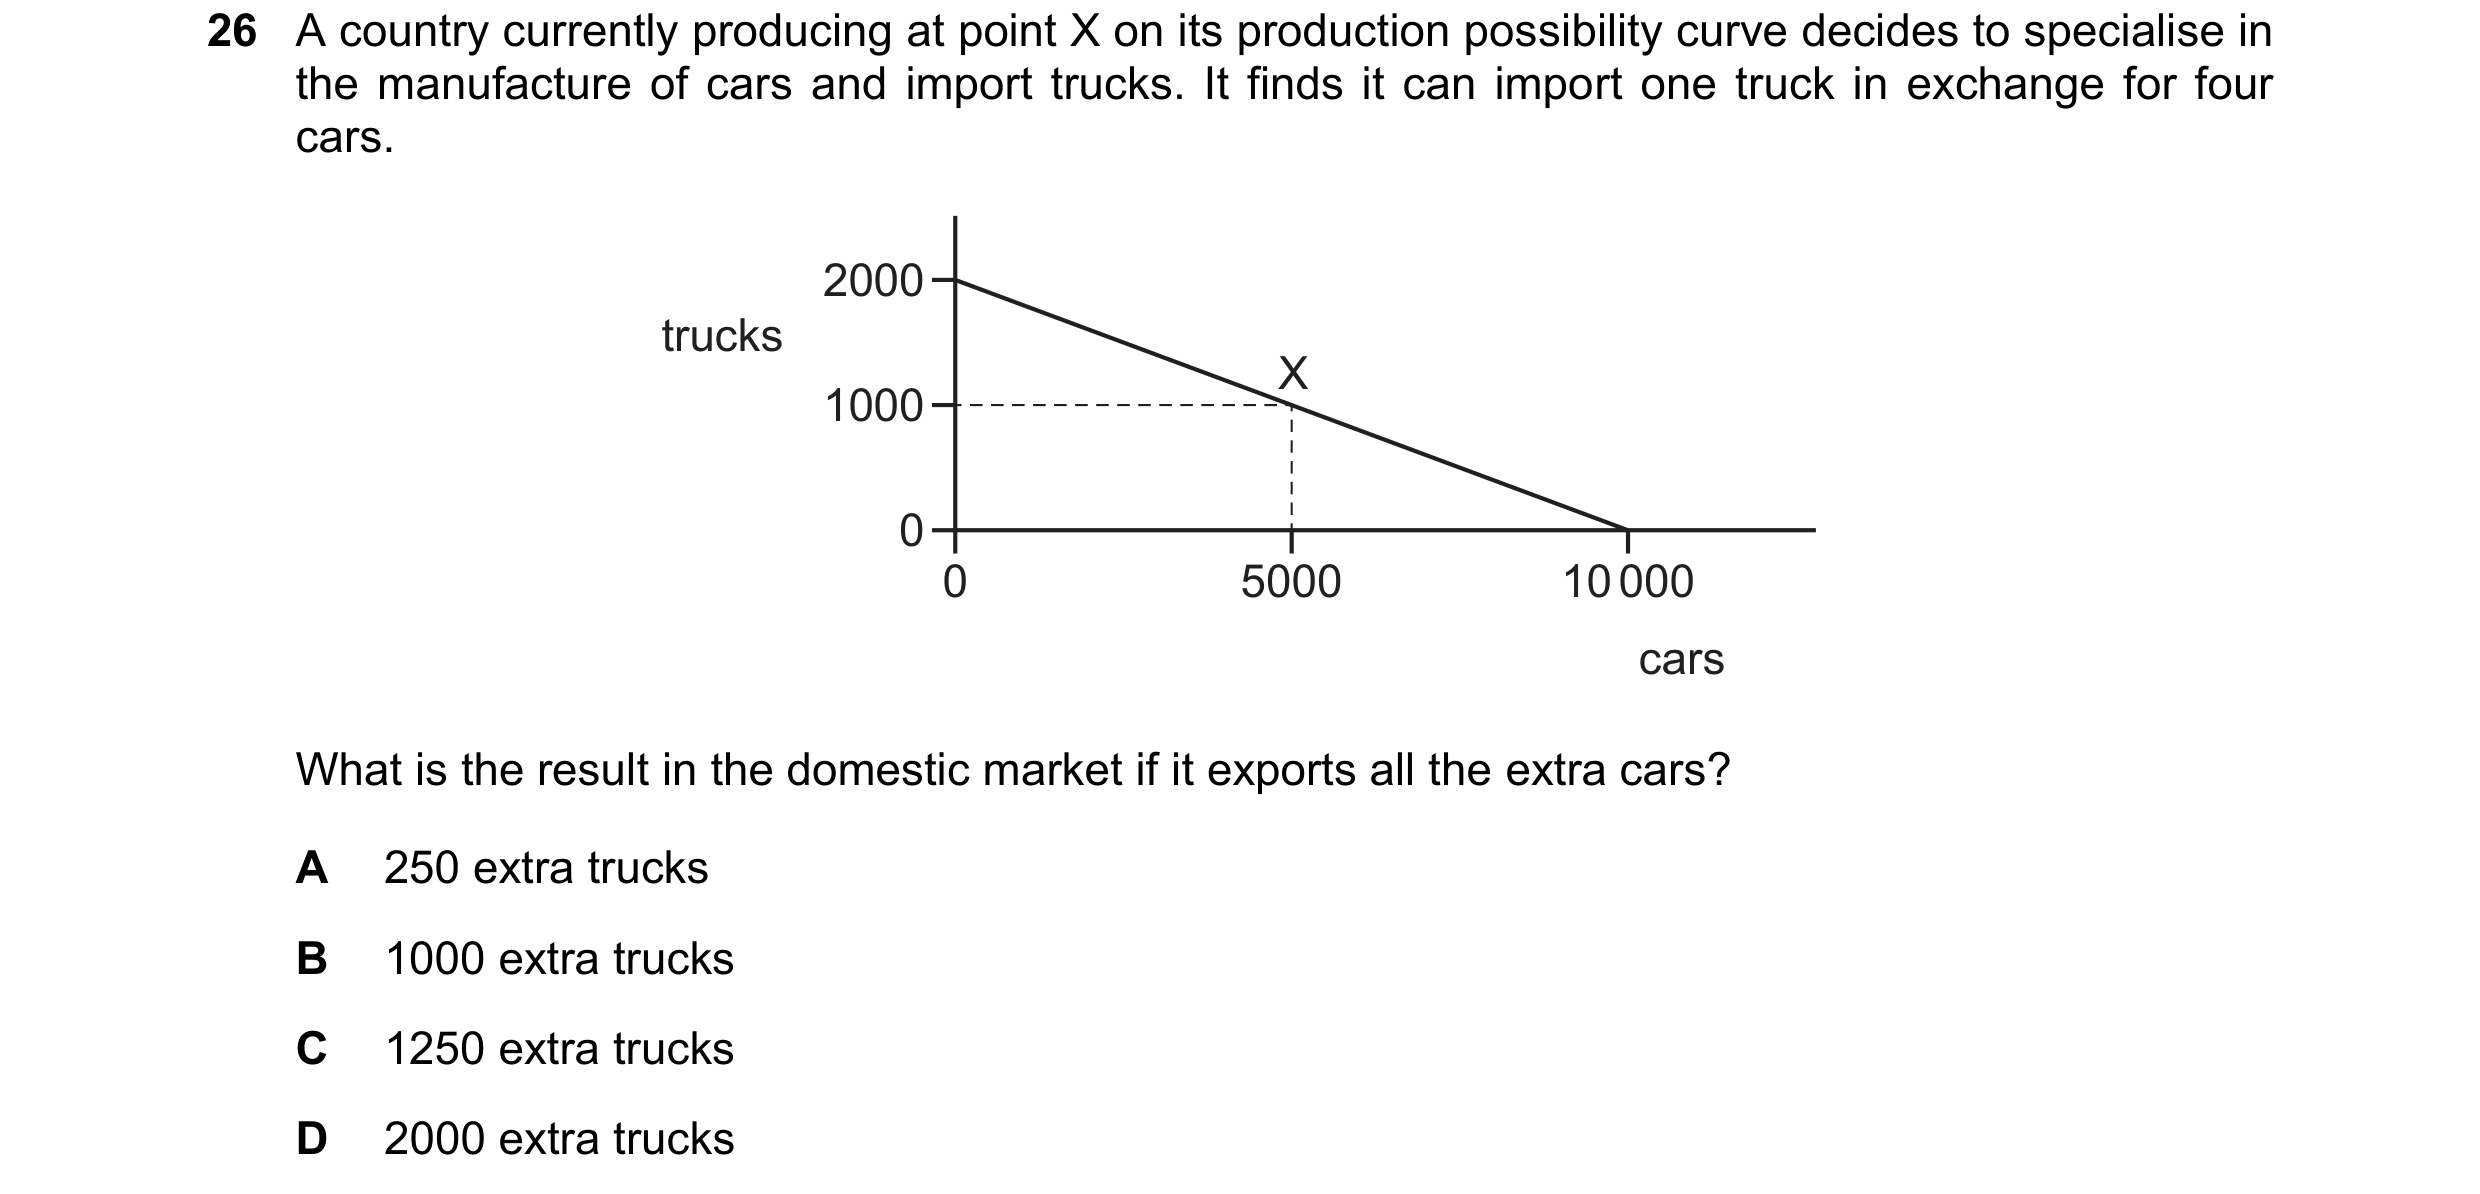 64 / 68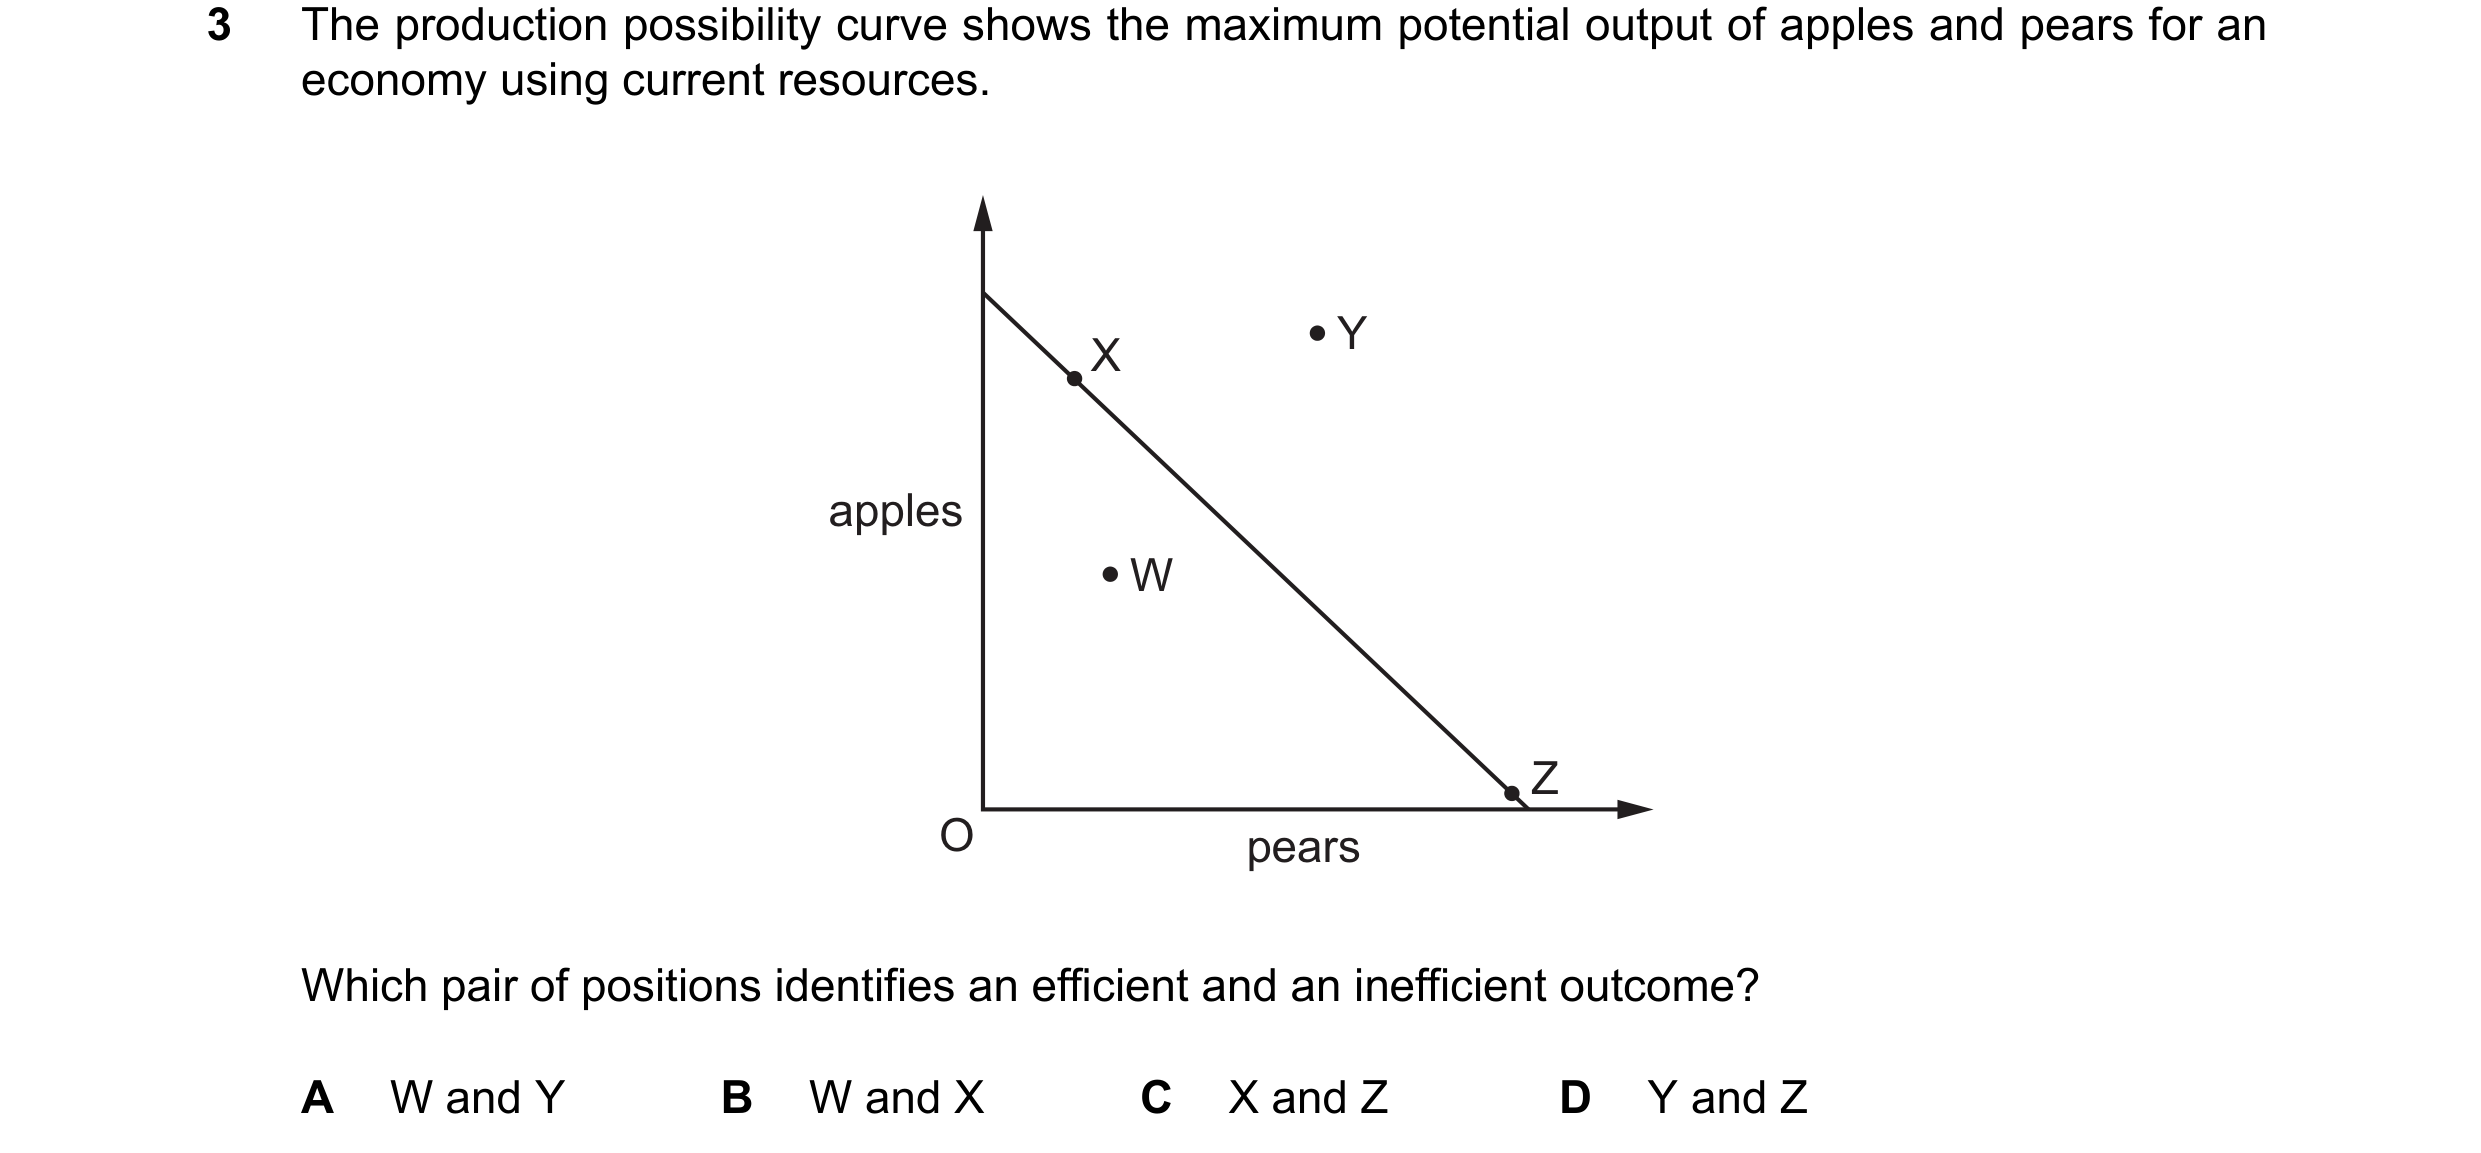
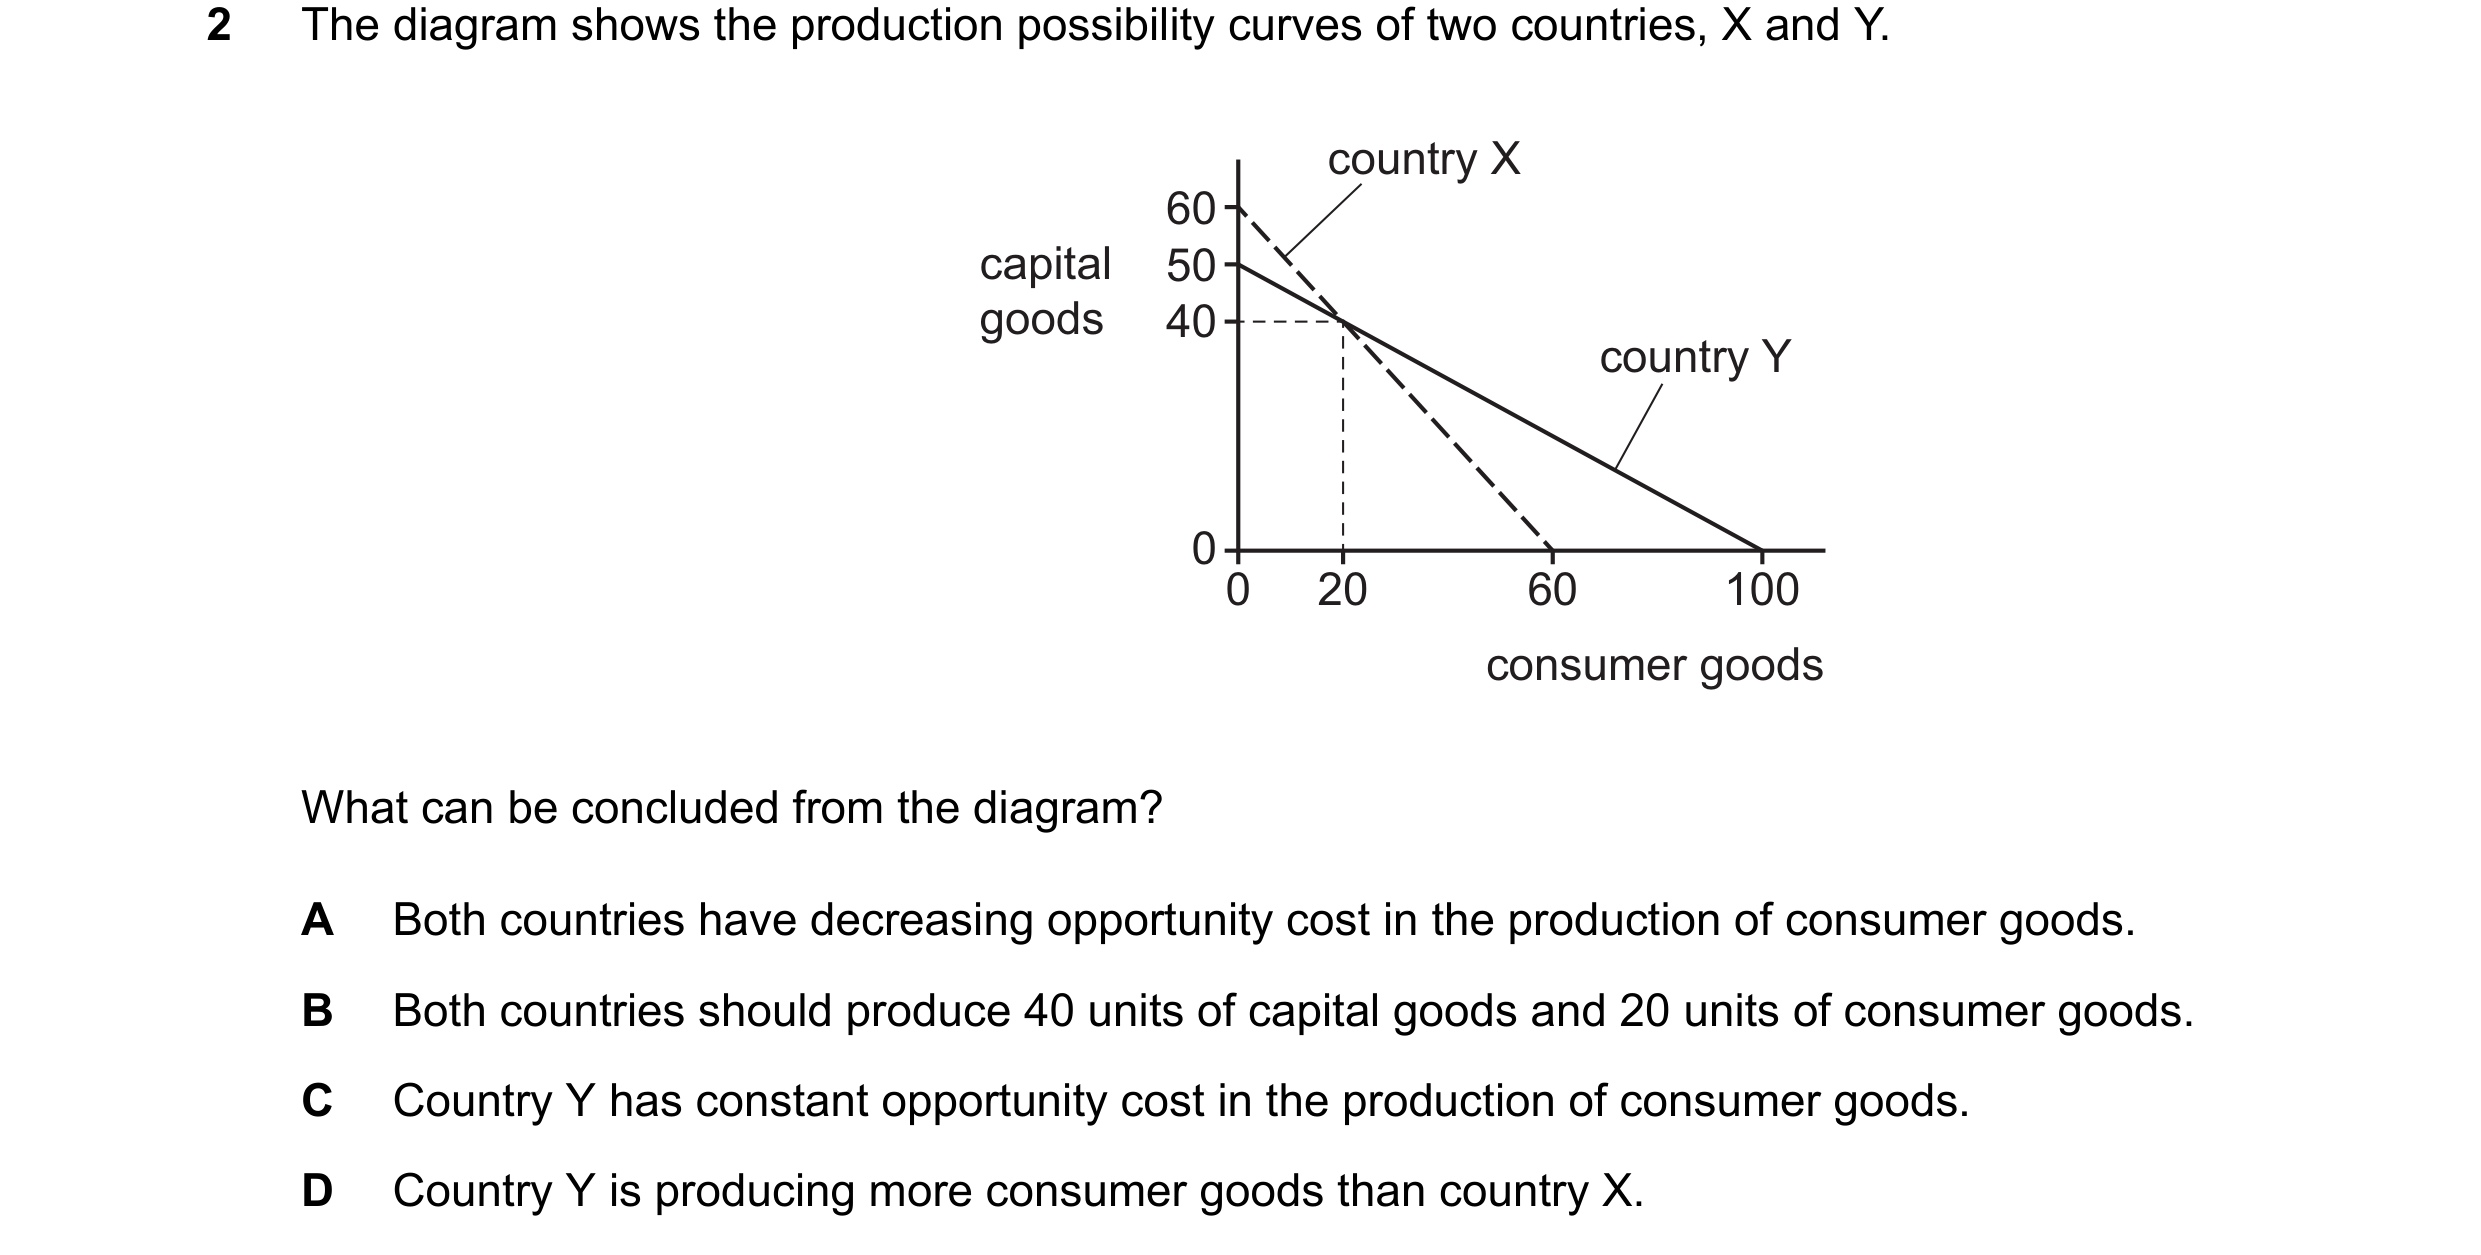 65 / 68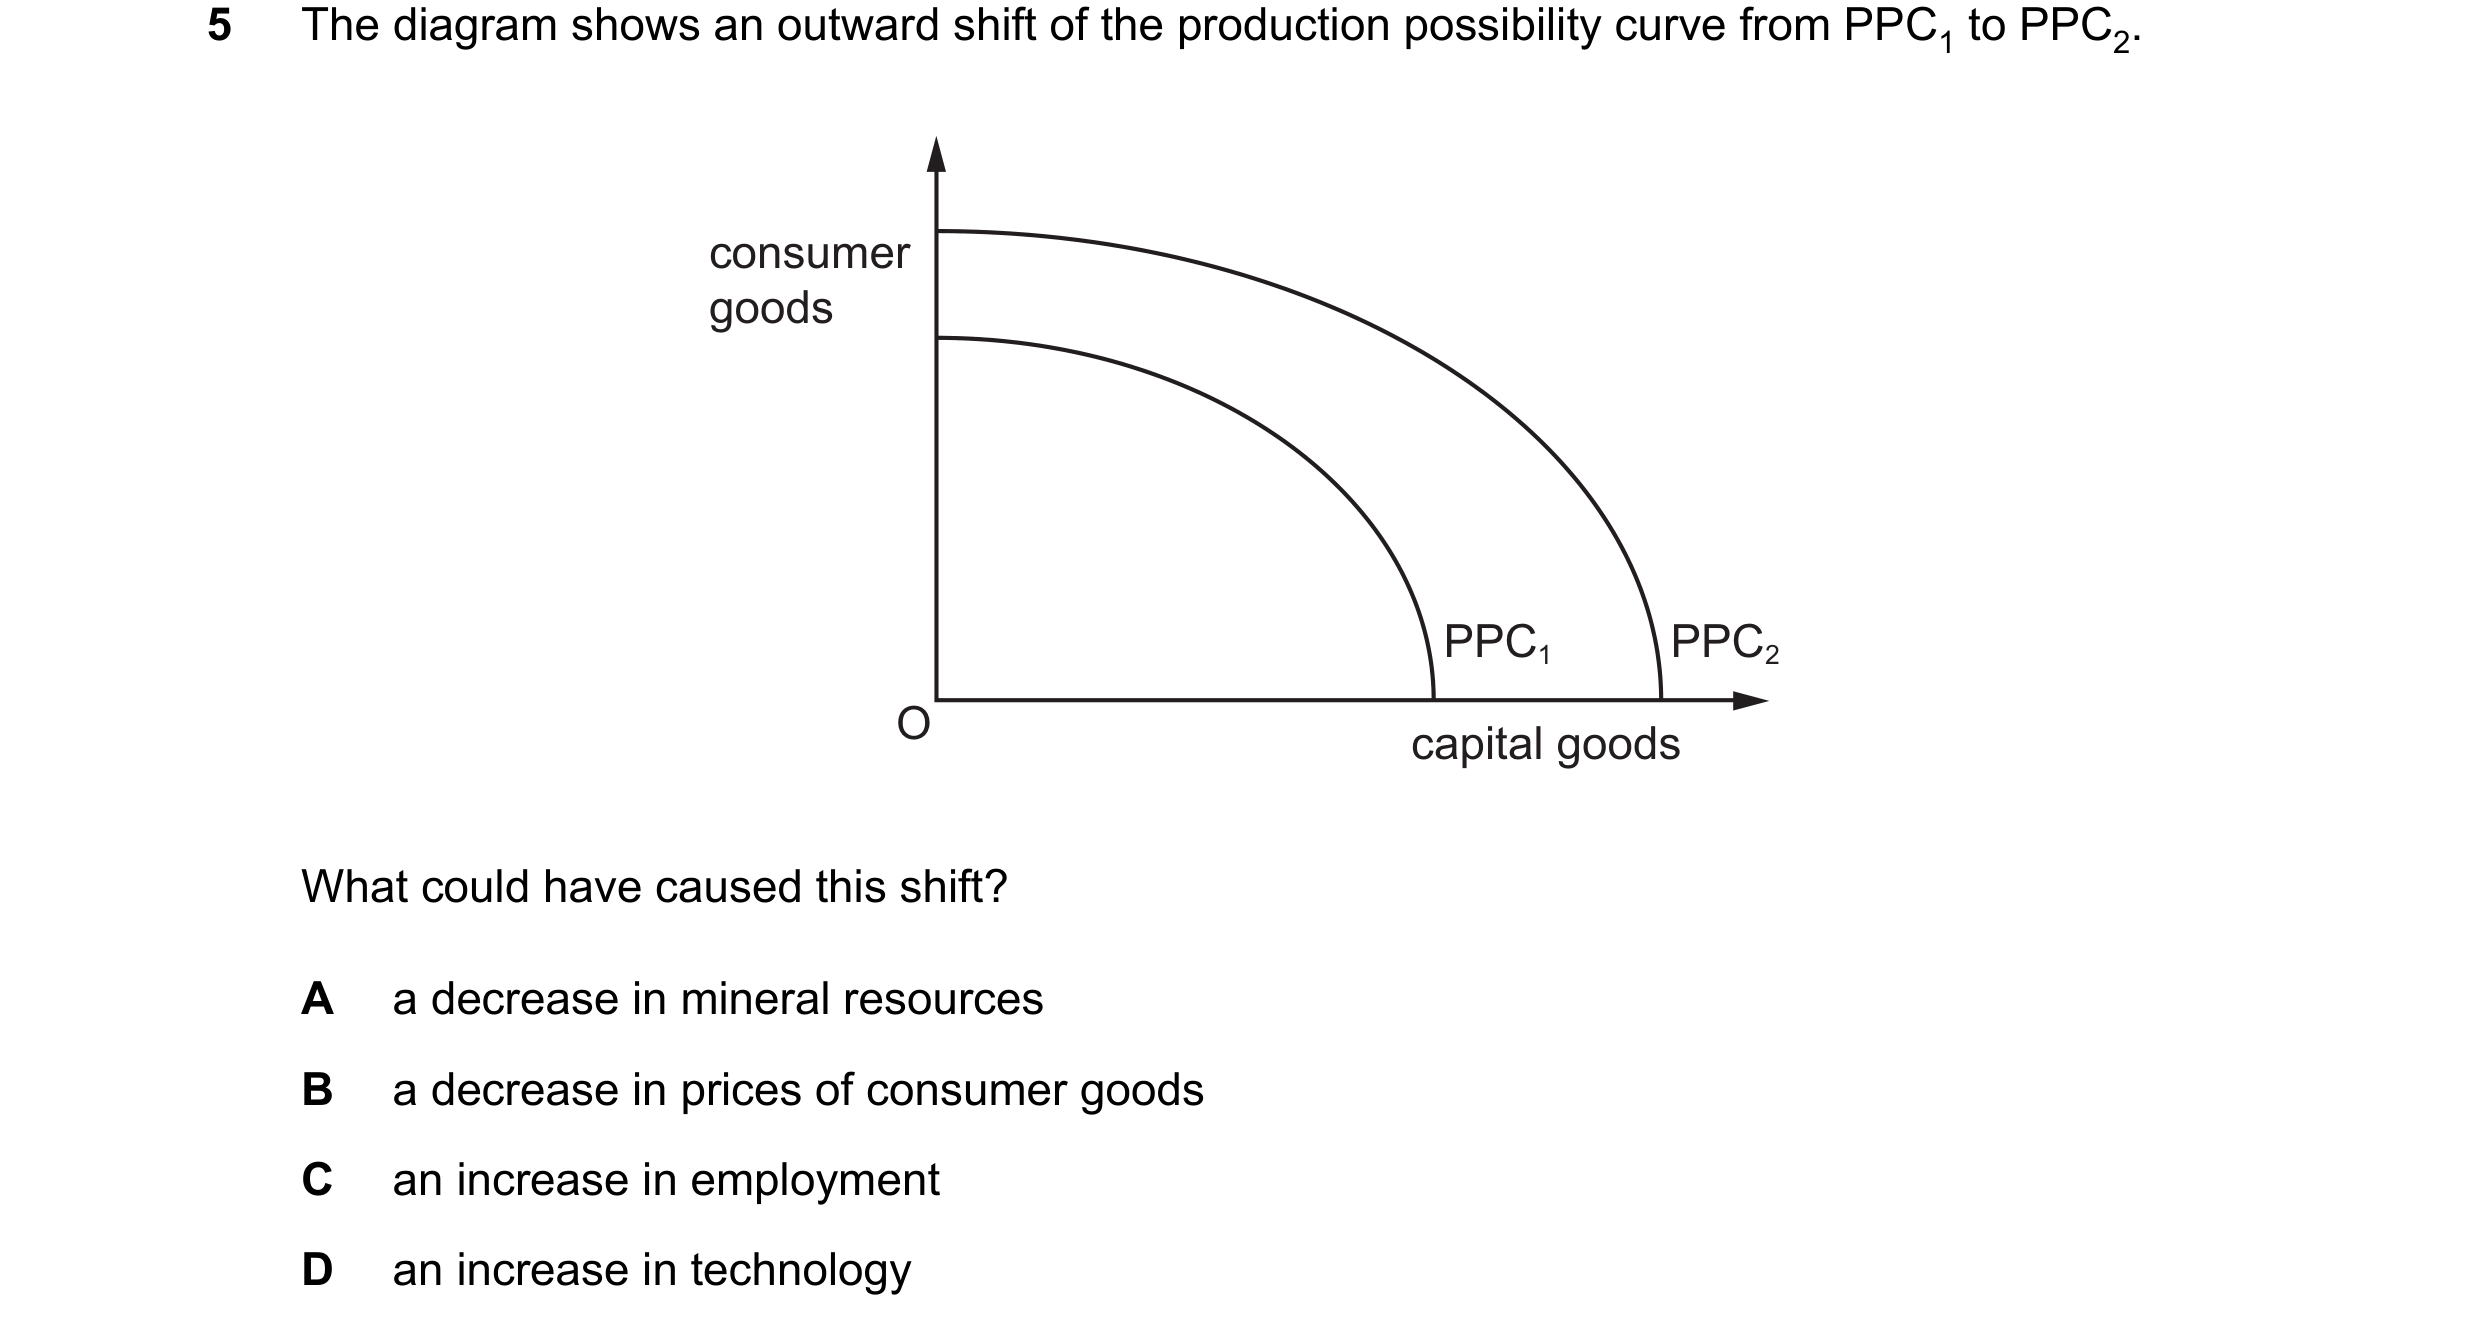
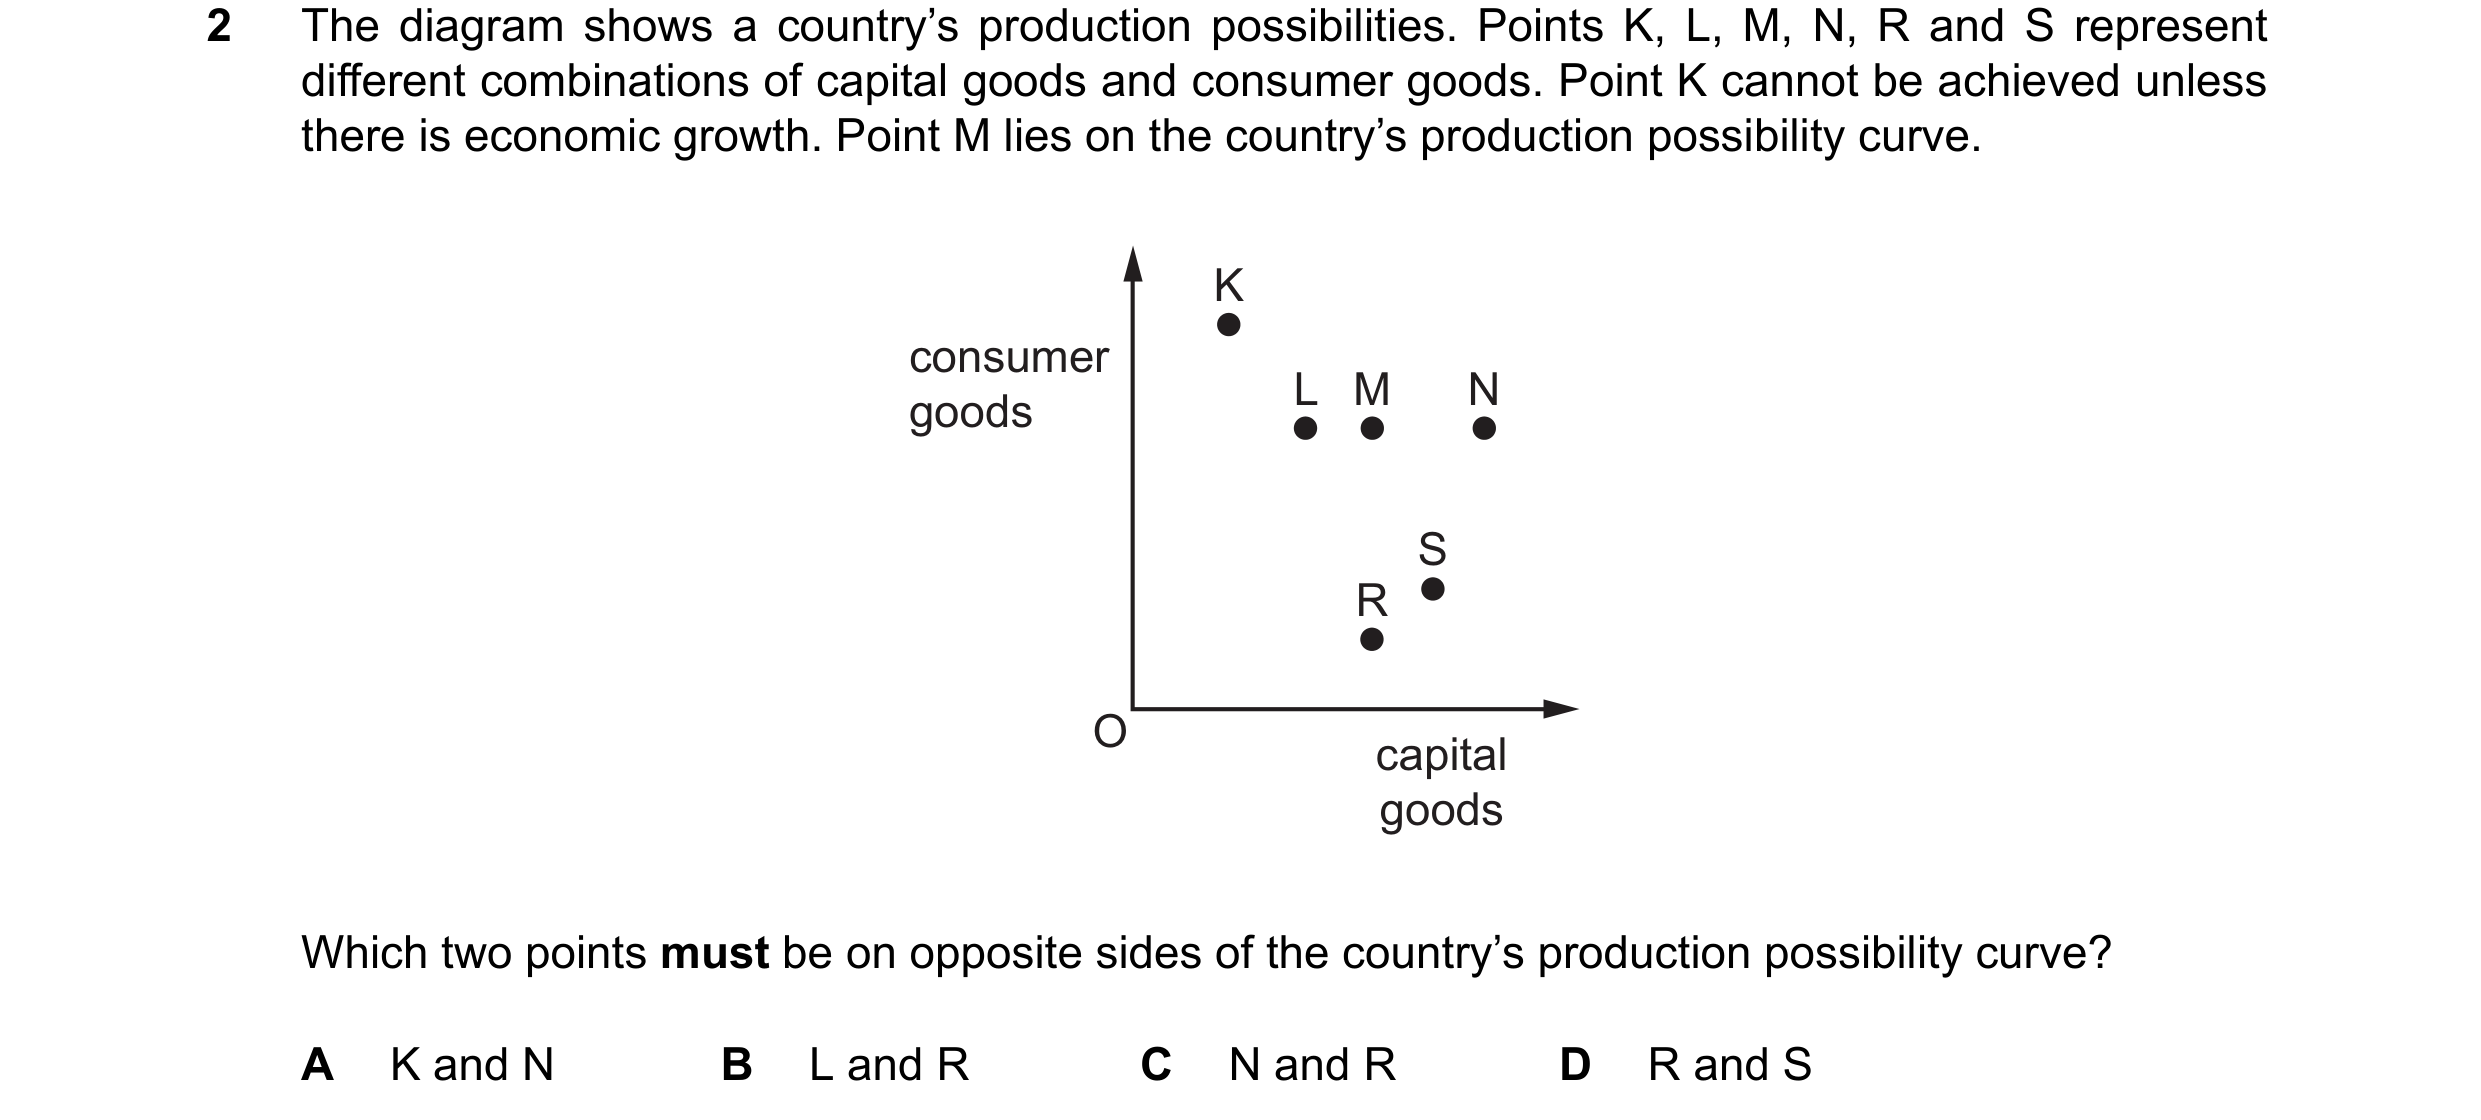 66 / 68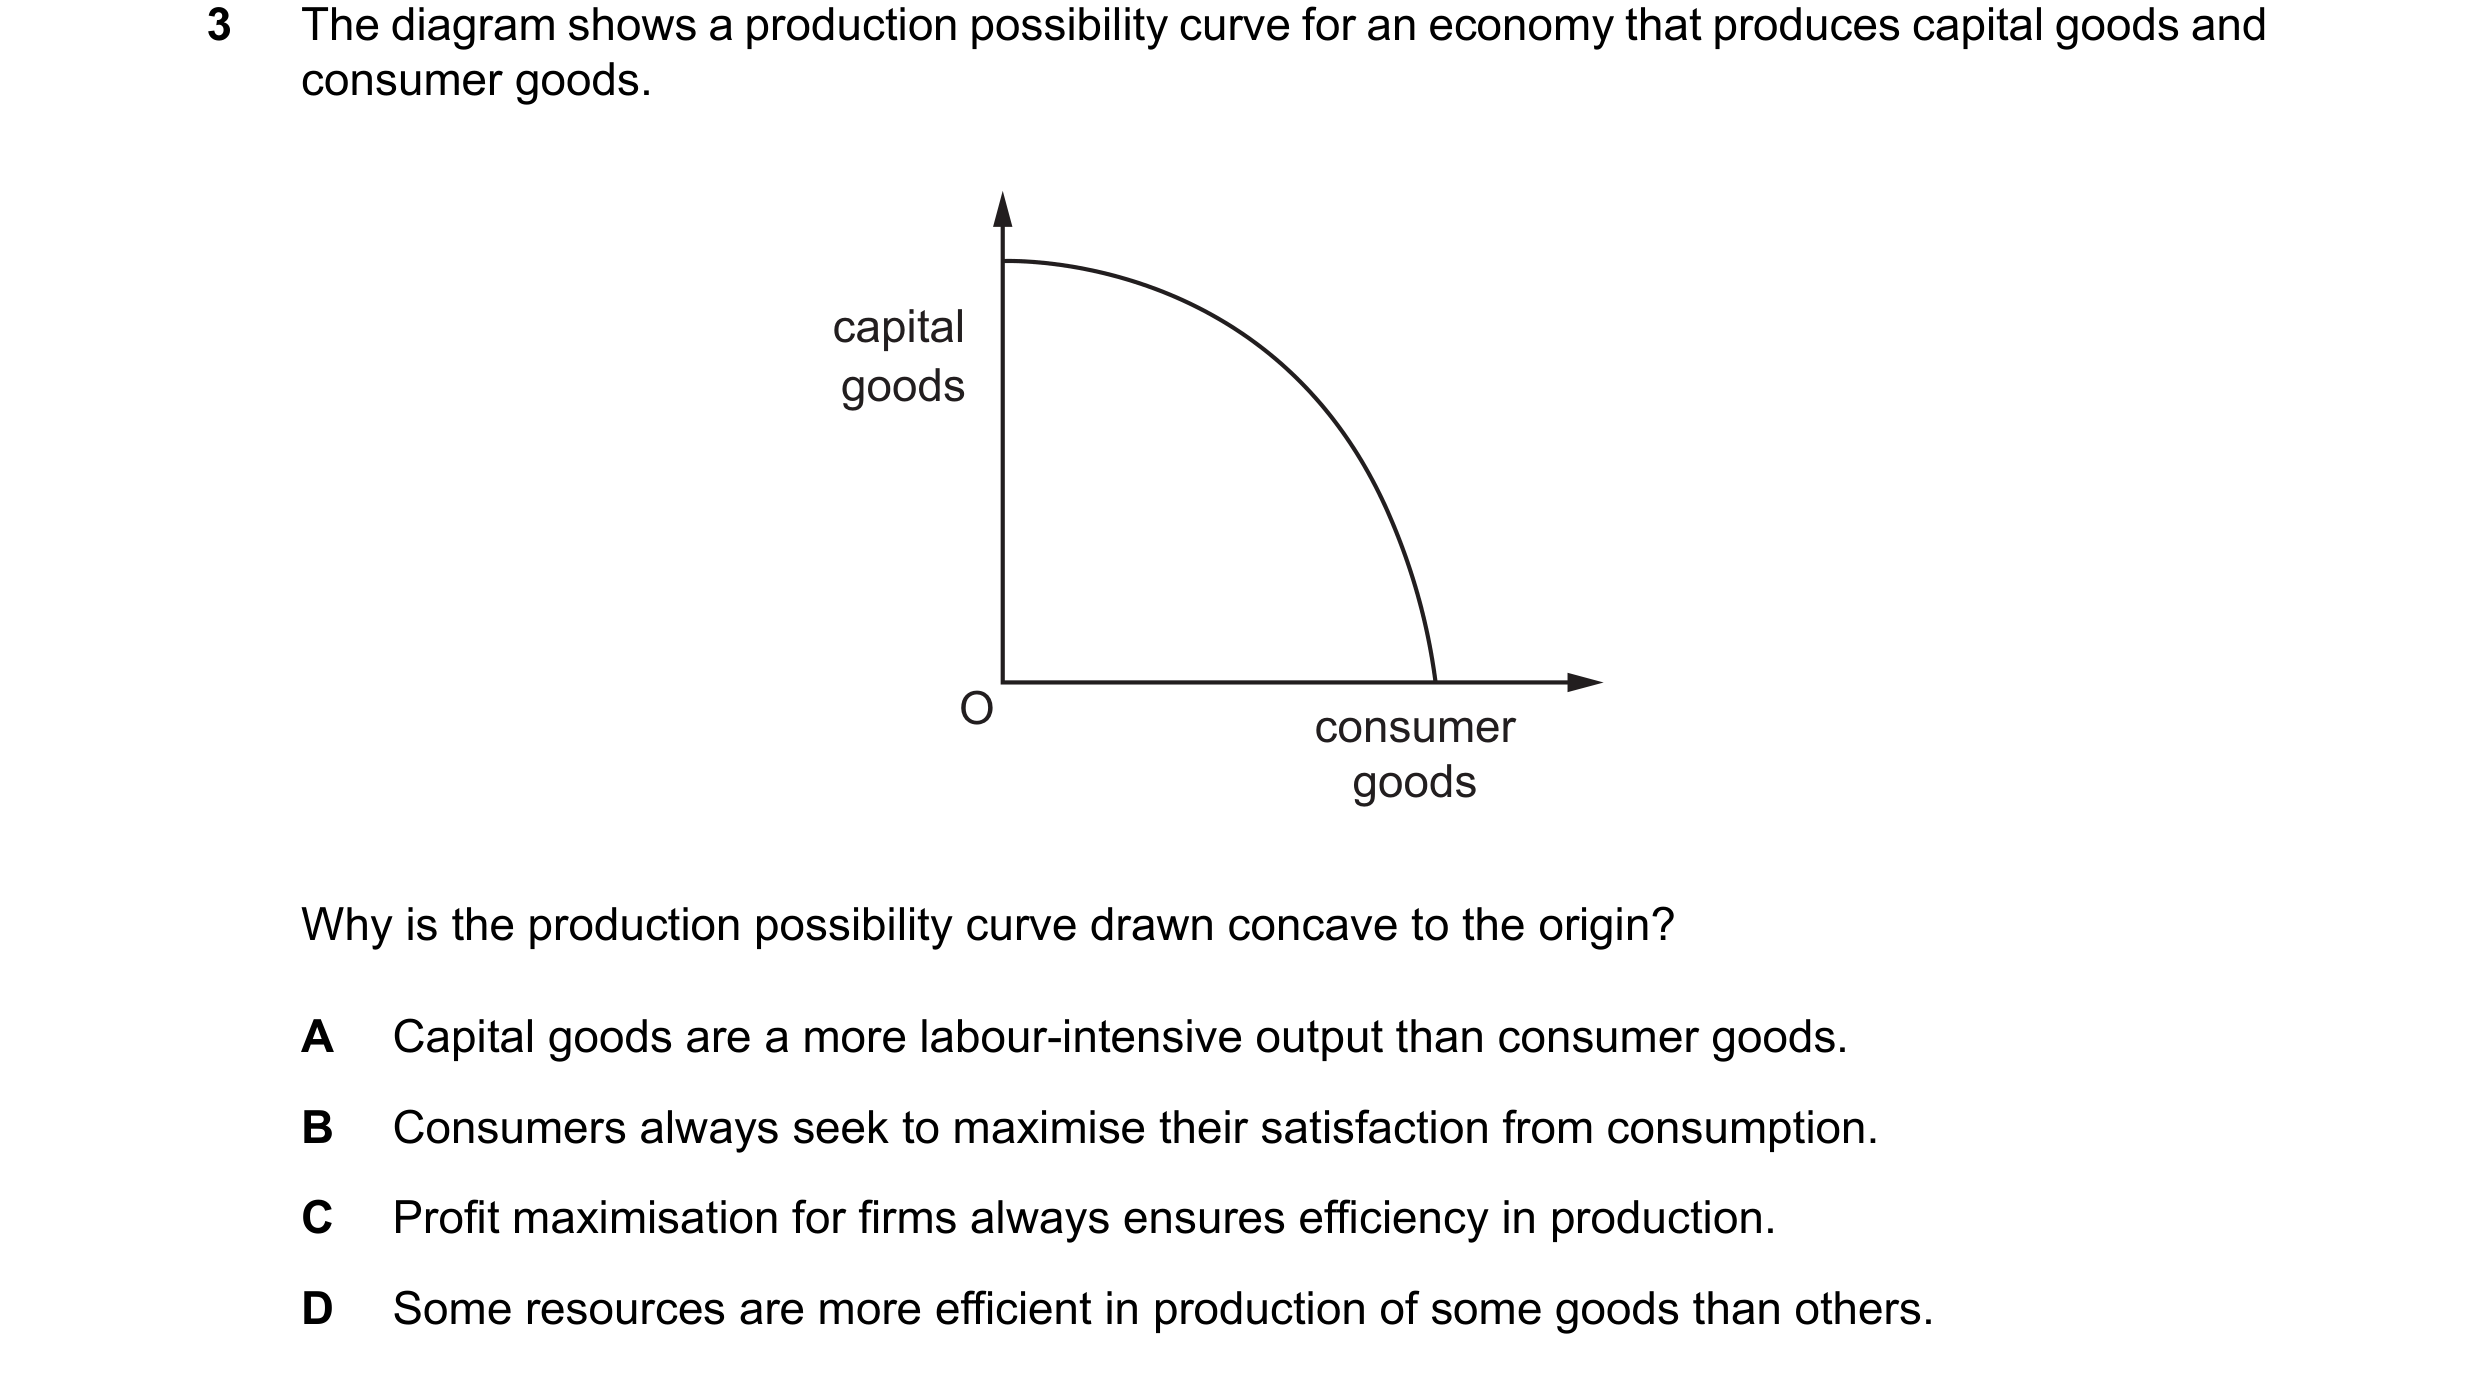
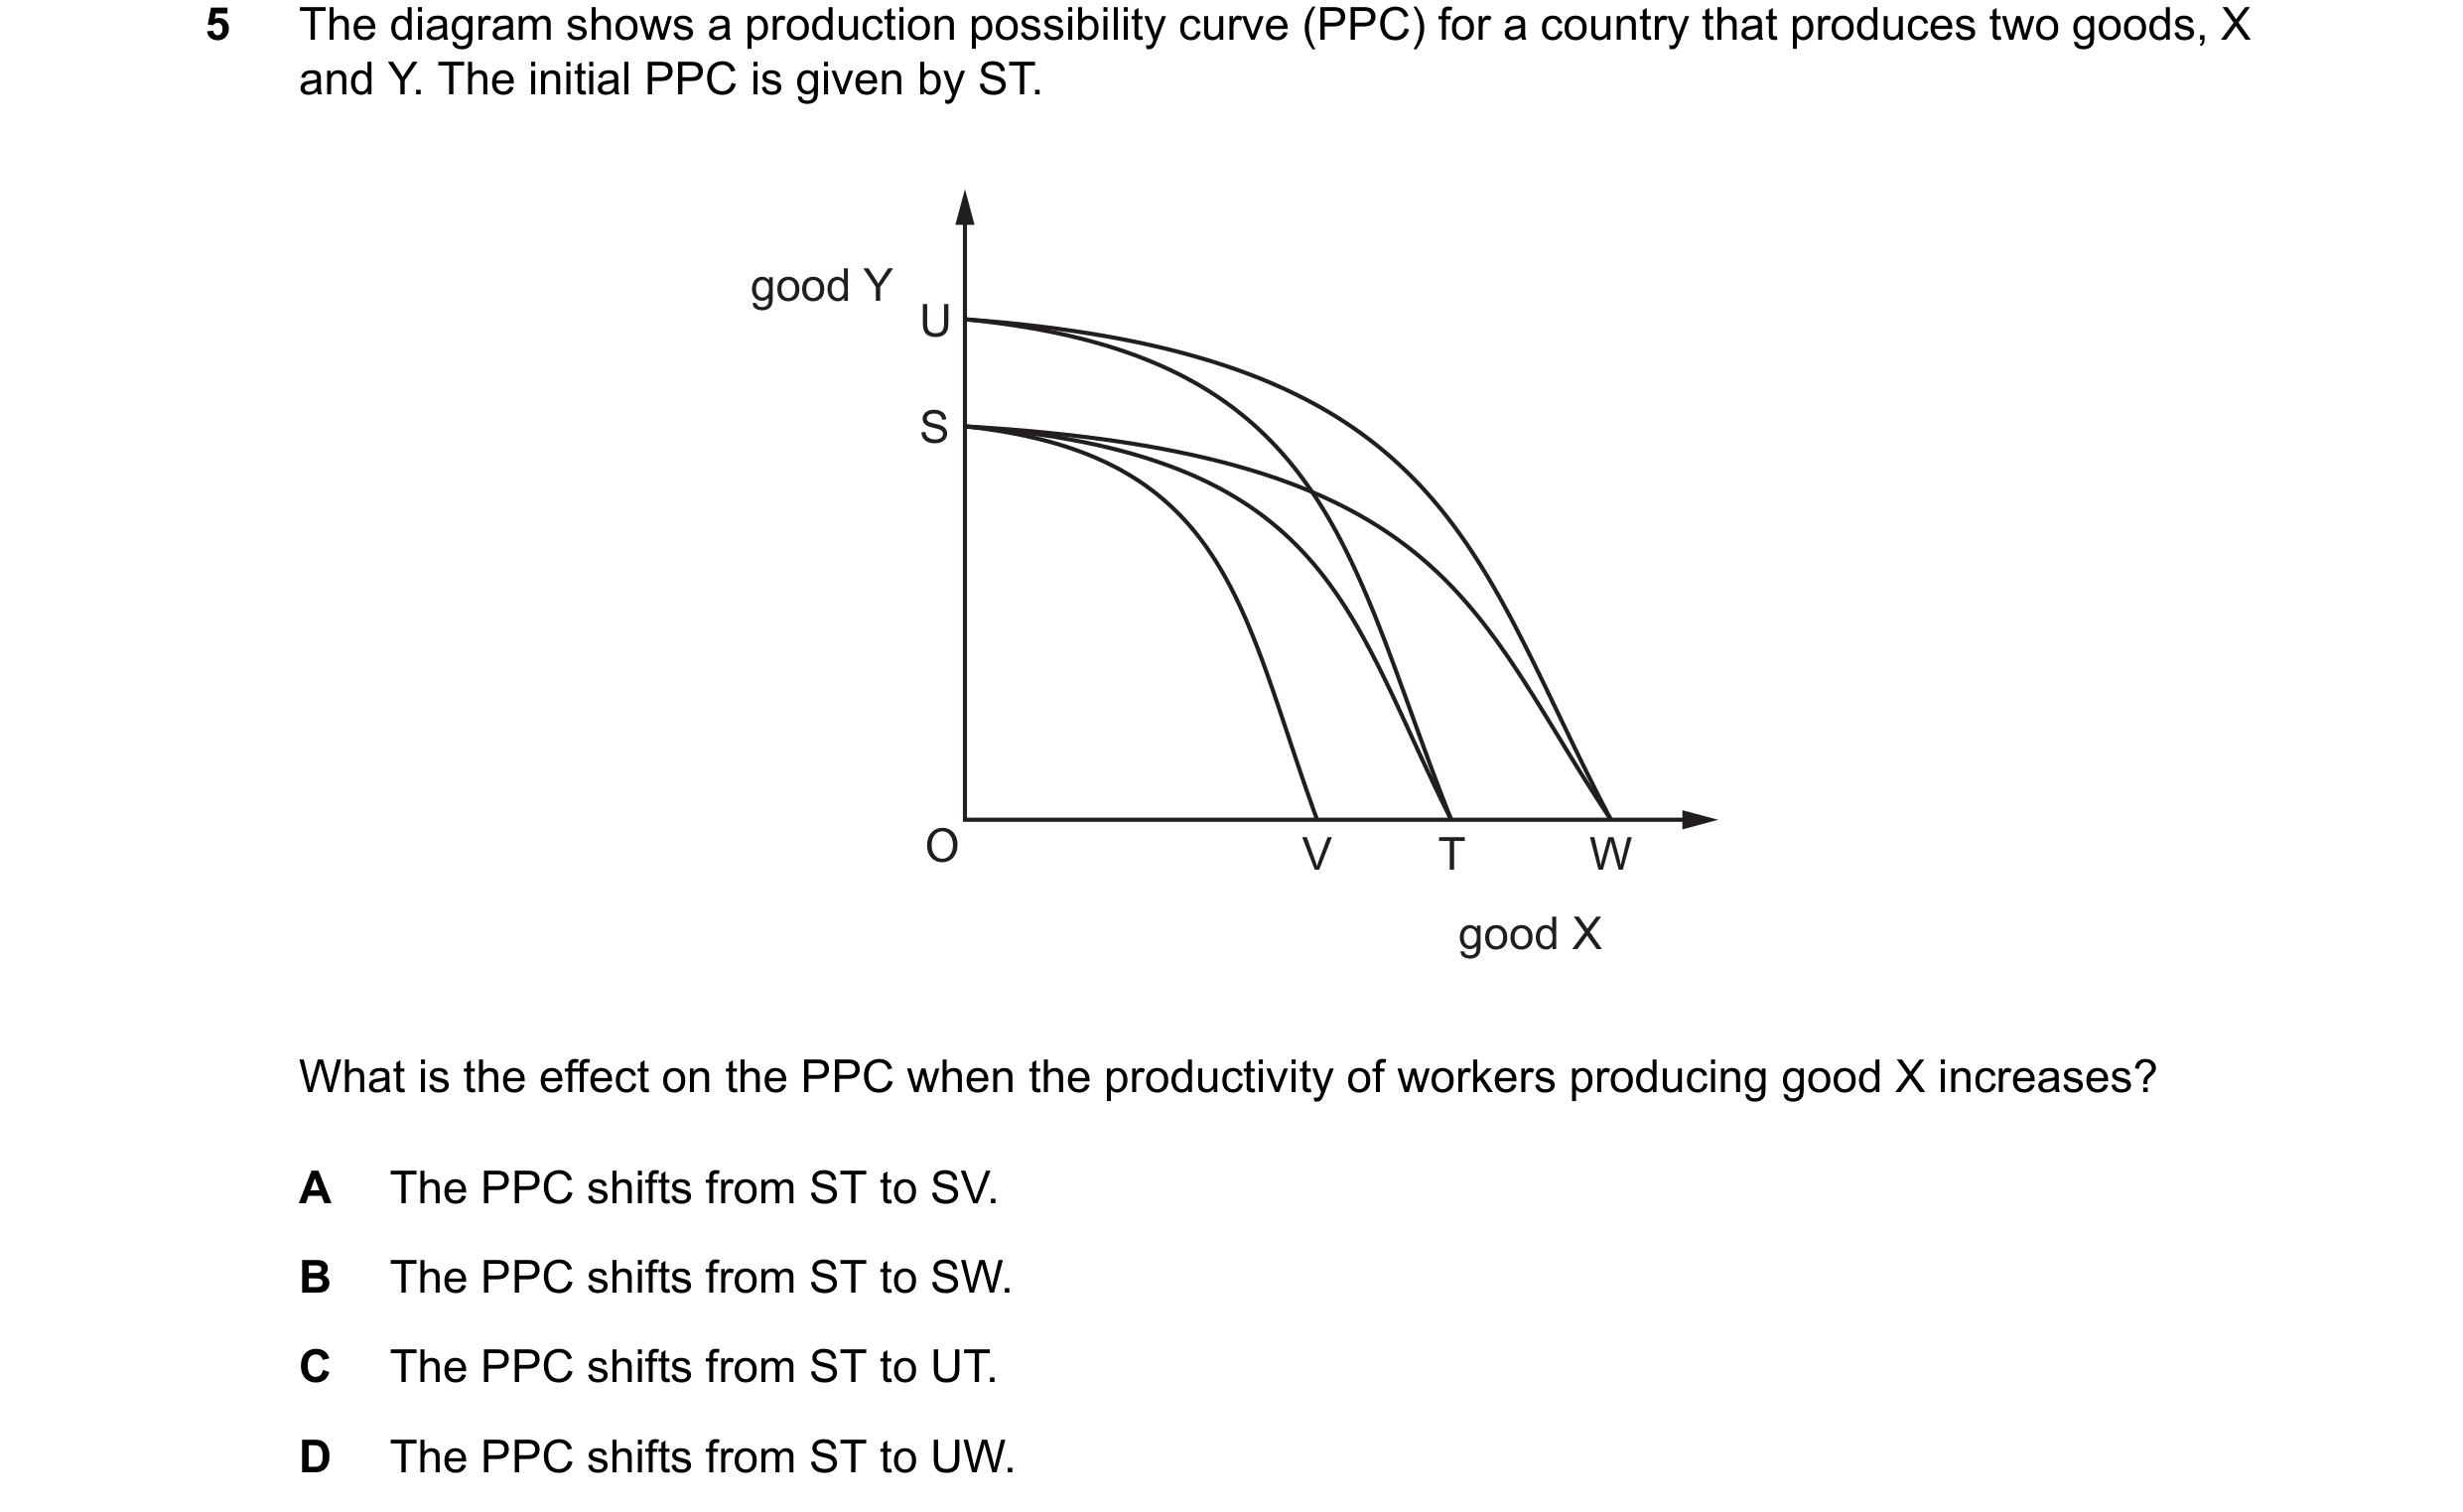
 67 / 68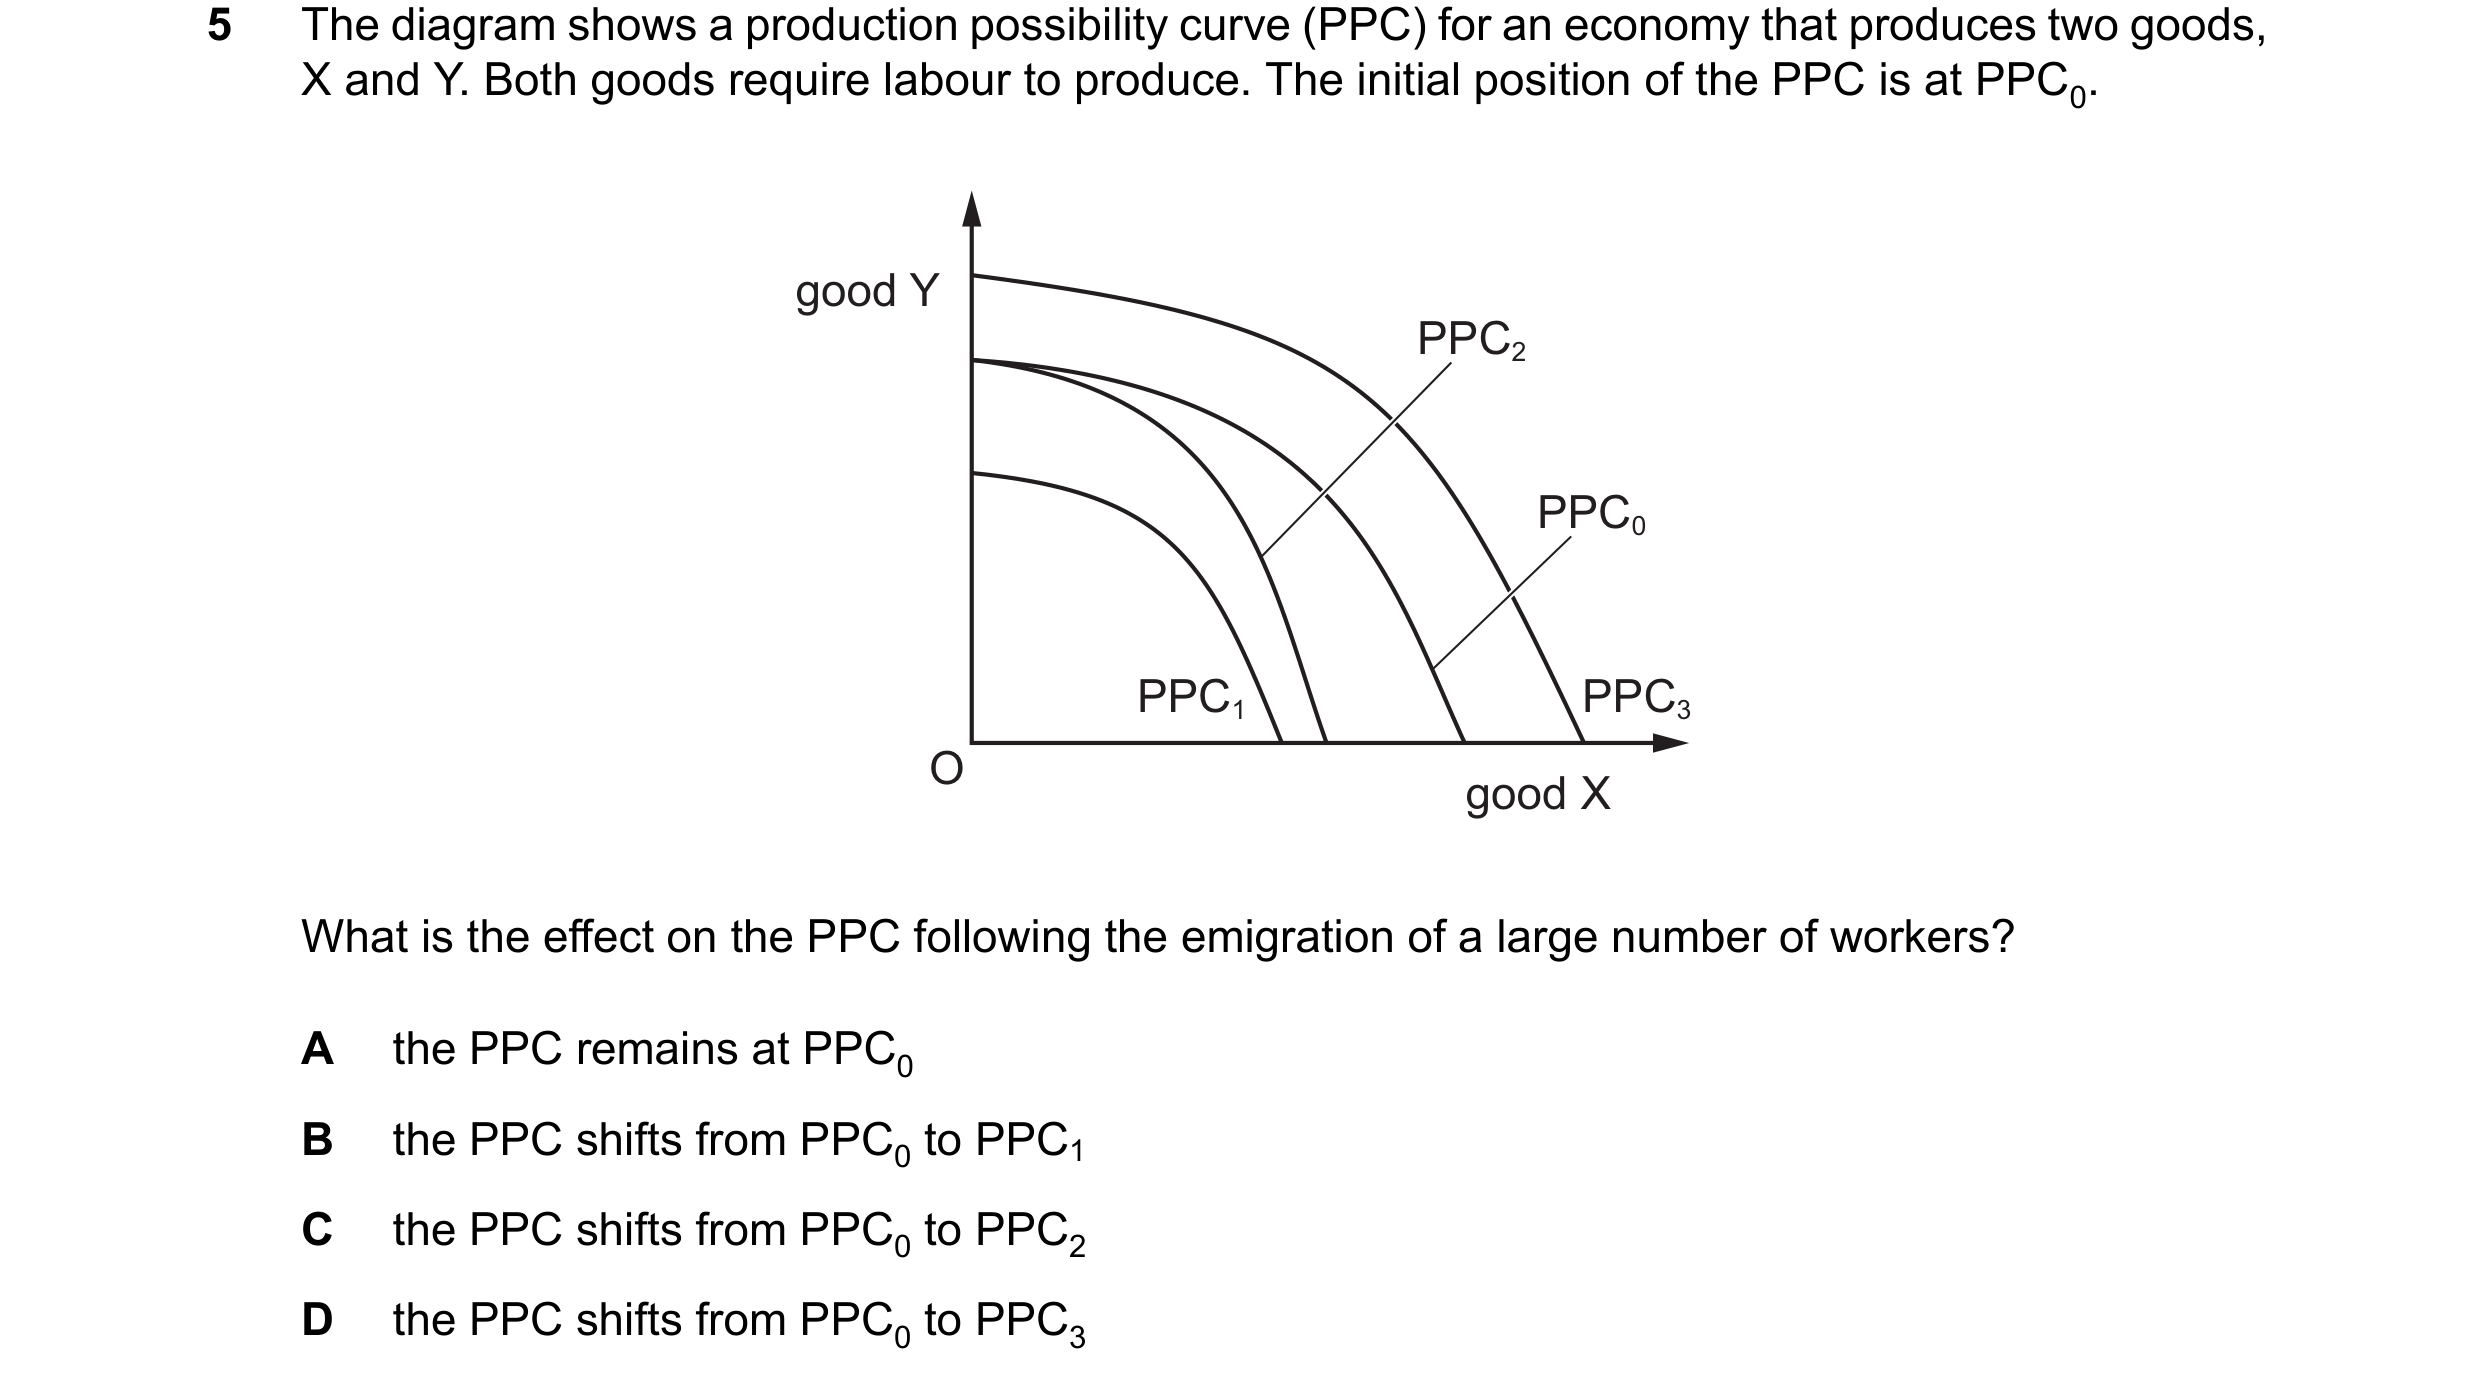
 68 / 68