Questions as text
Q1 · An economy is operating at a point on its production possibility curve 9708/31 Oct/Nov 2009
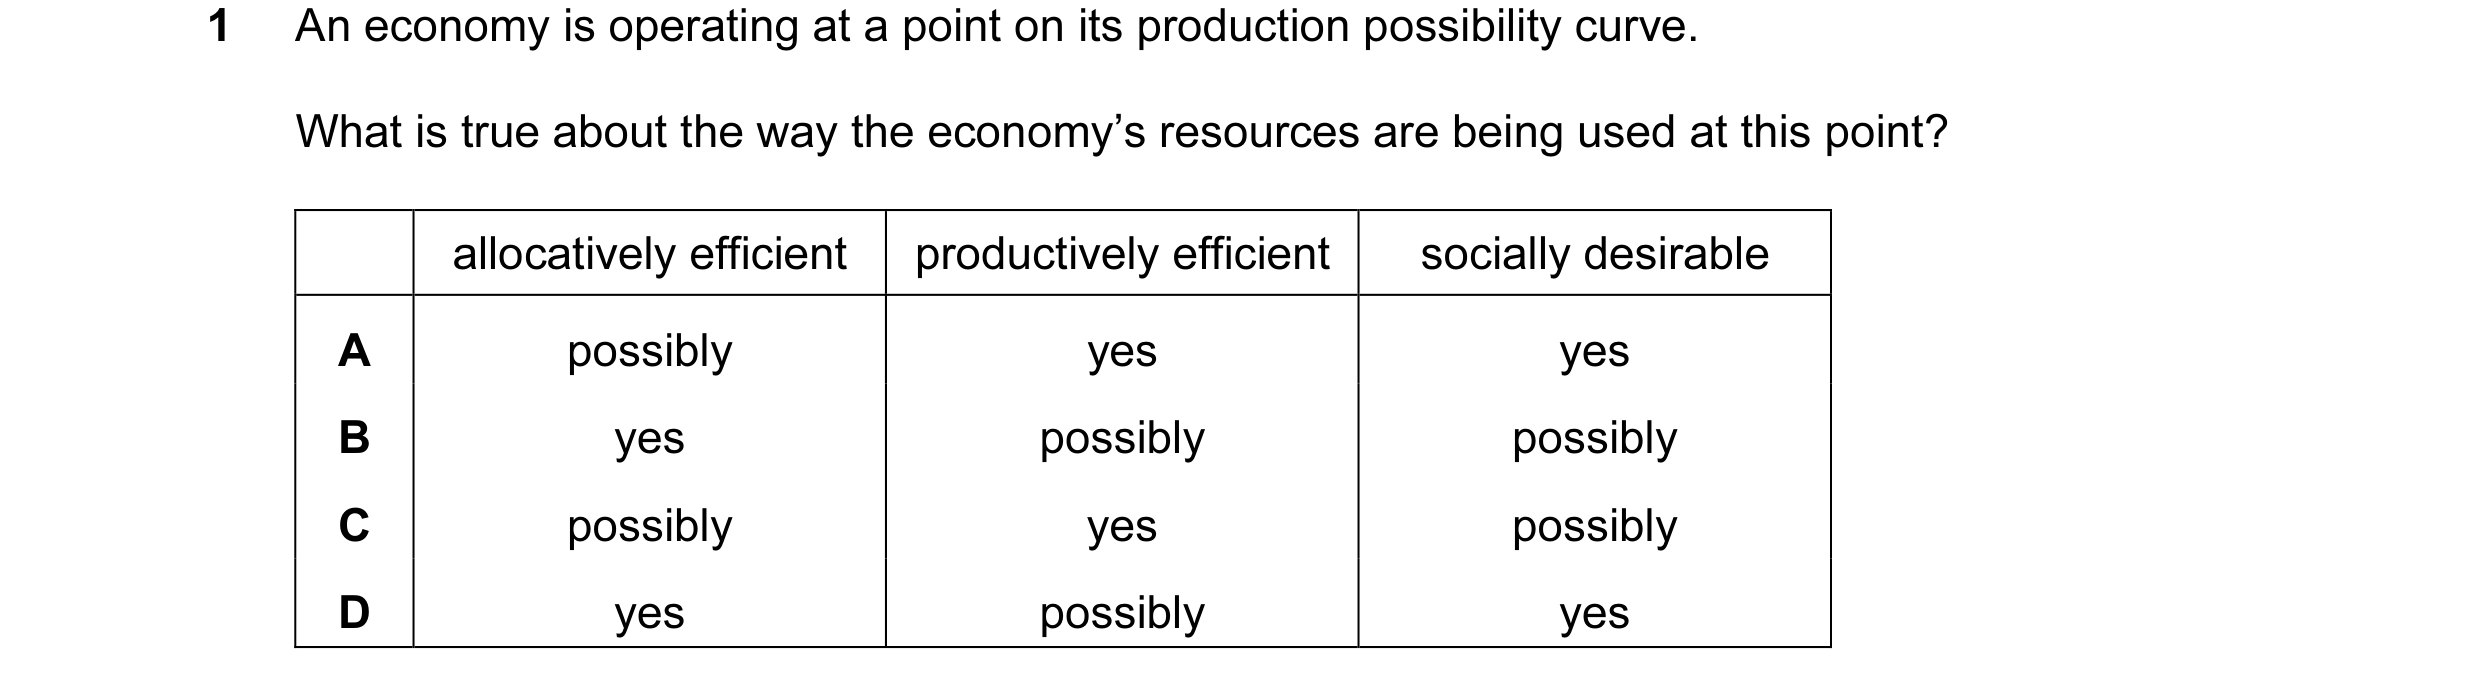
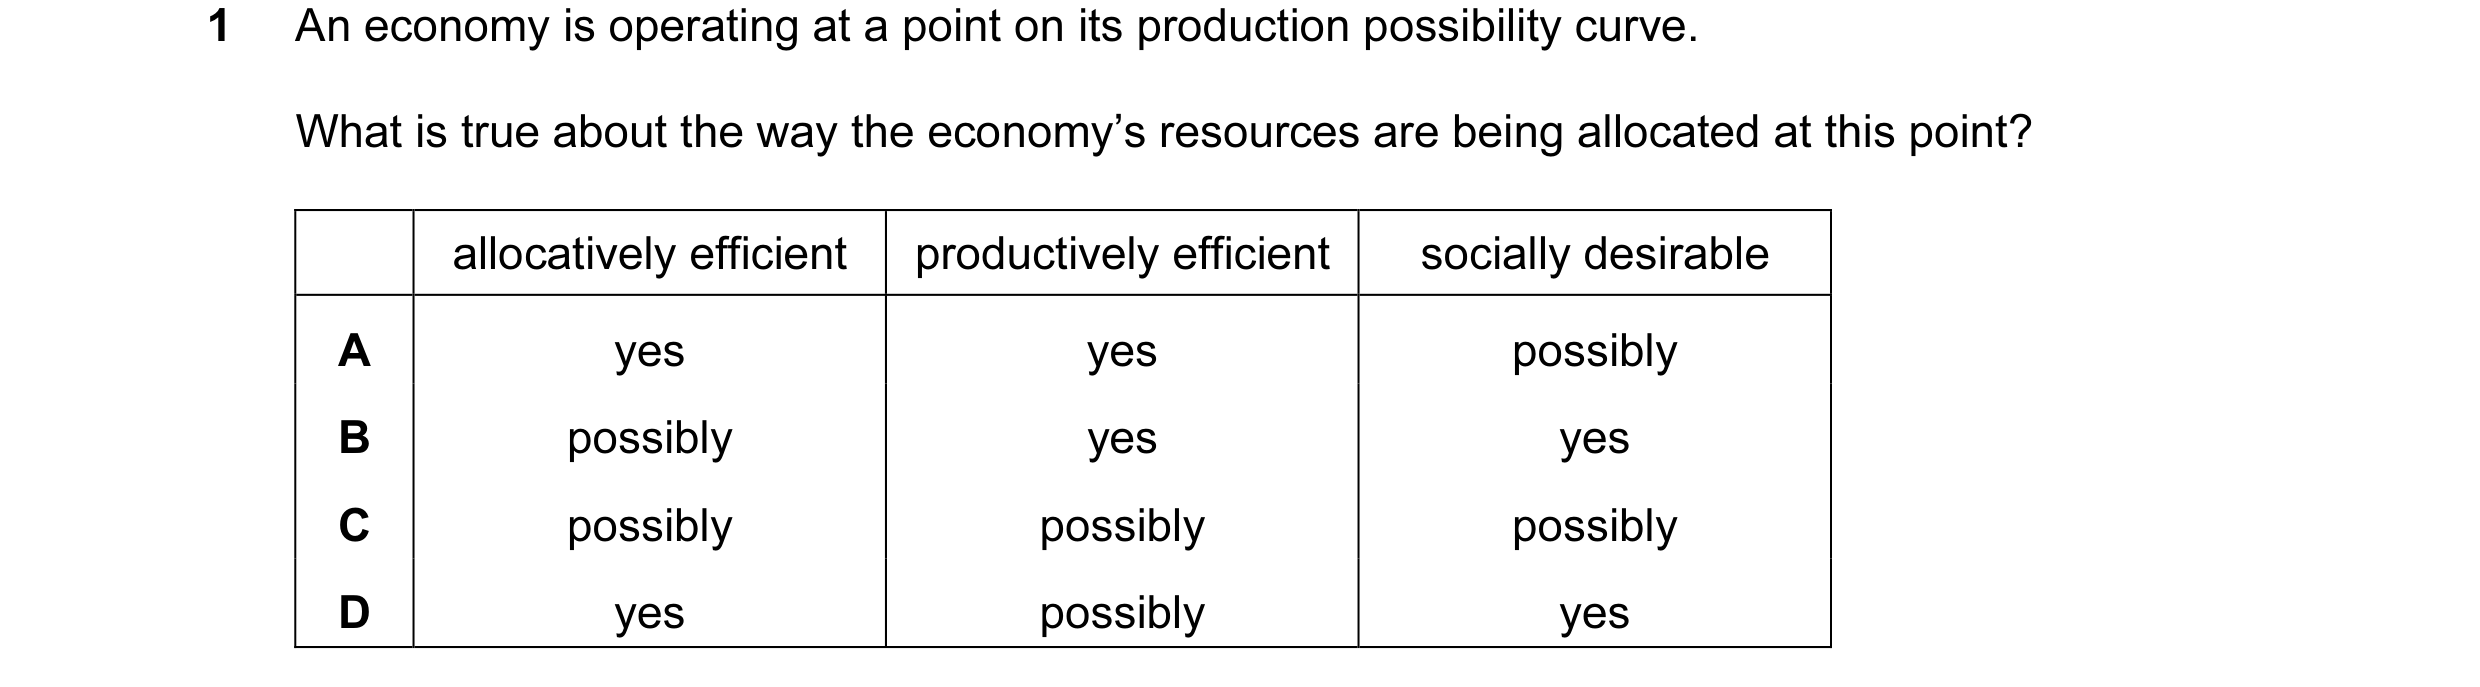
1 An economy is operating at a point on its production possibility curve. What is true about the way the economy’s resources are being used at this point? allocatively efficient productively efficient socially desirable A possibly yes yes B yes possibly possibly C possibly yes possibly D yes possibly yes
1 marks
Answer: C
This question in 9708/31 Oct/Nov 2009
Q2 · An economy is operating at a point on its production possibility curve 9708/32 Oct/Nov 2009
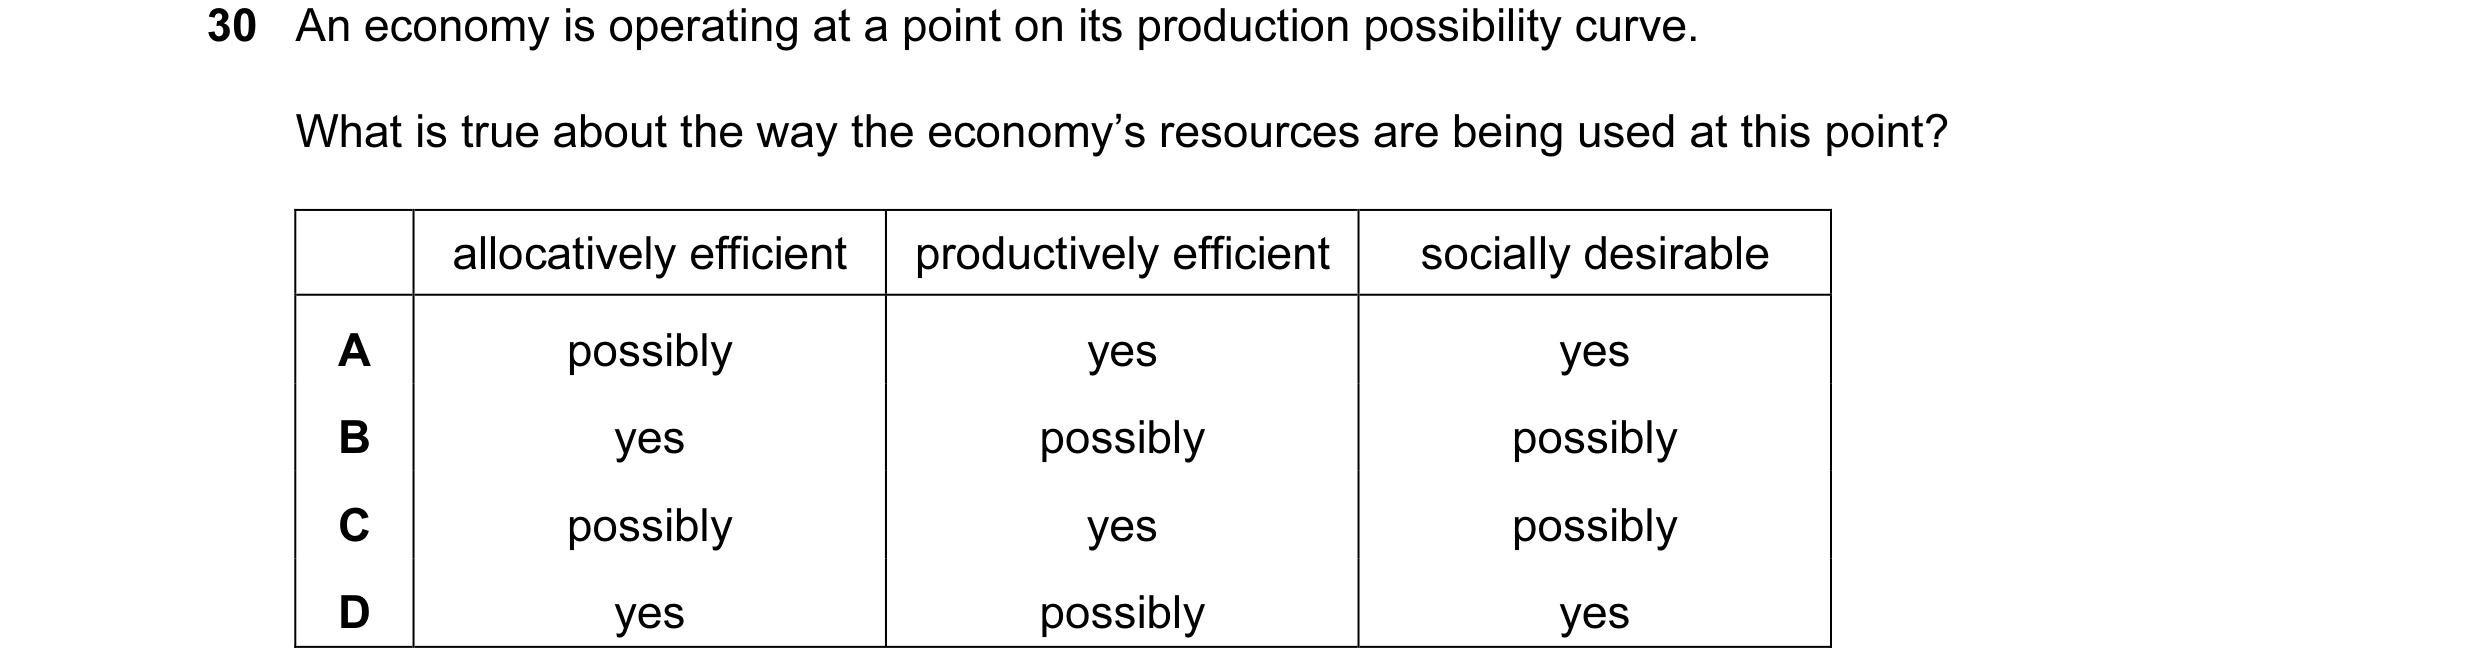
30 An economy is operating at a point on its production possibility curve. What is true about the way the economy’s resources are being used at this point? allocatively efficient productively efficient socially desirable A possibly yes yes B yes possibly possibly C possibly yes possibly D yes possibly yes
1 marks
Answer: C
This question in 9708/32 Oct/Nov 2009
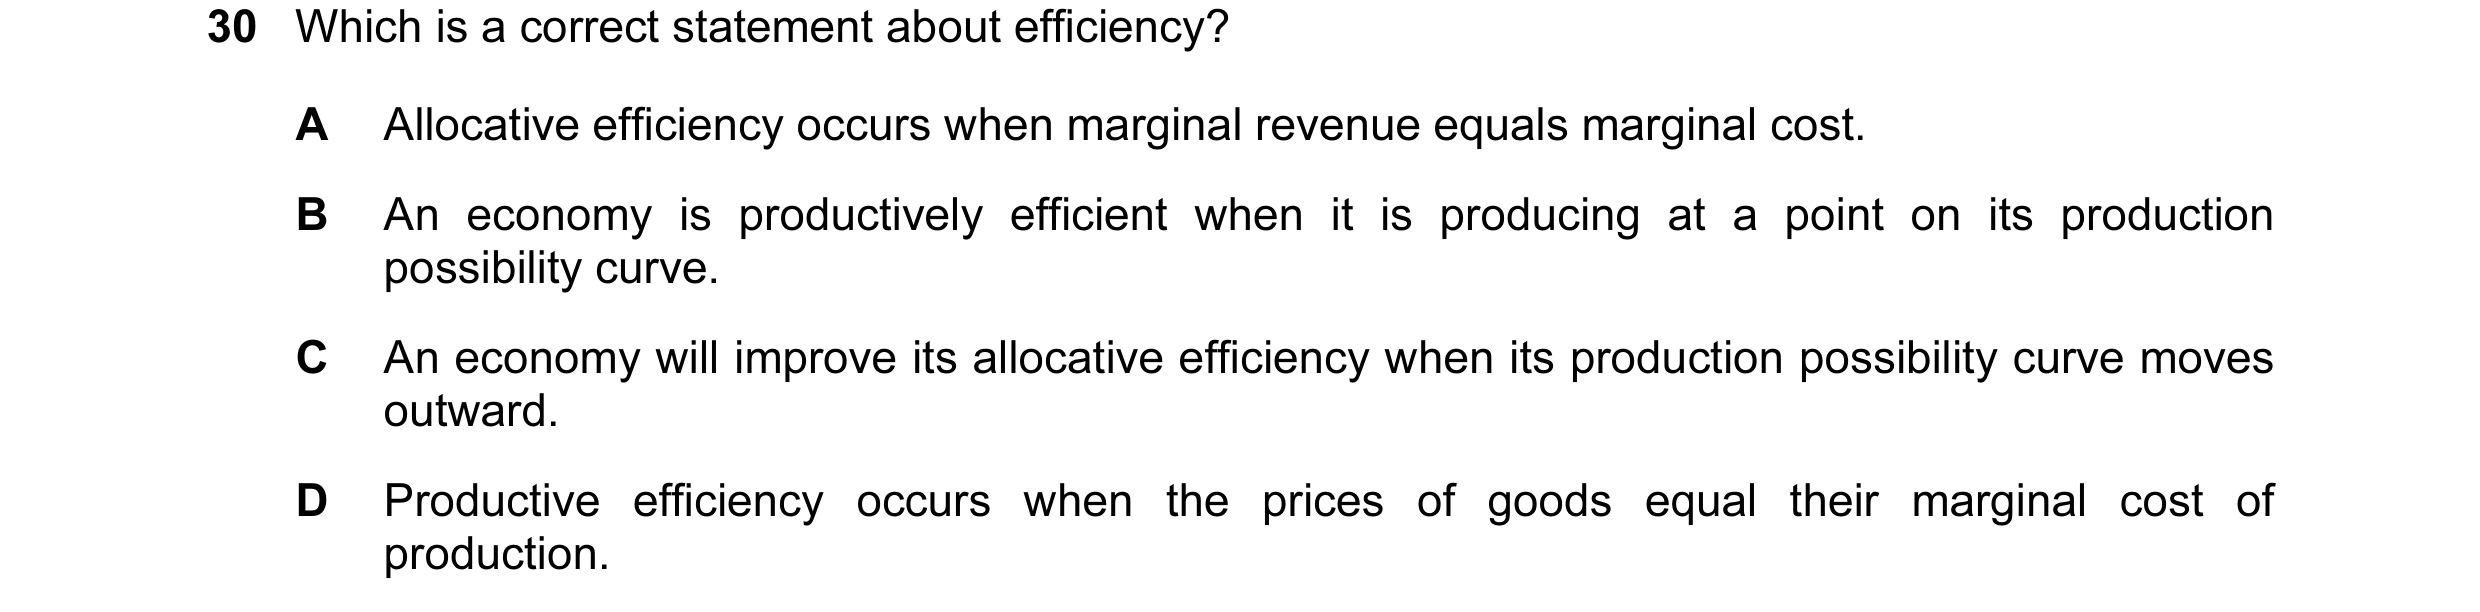
Q3 · Which is a correct statement about efficiency? 9708/31 May/June 2010
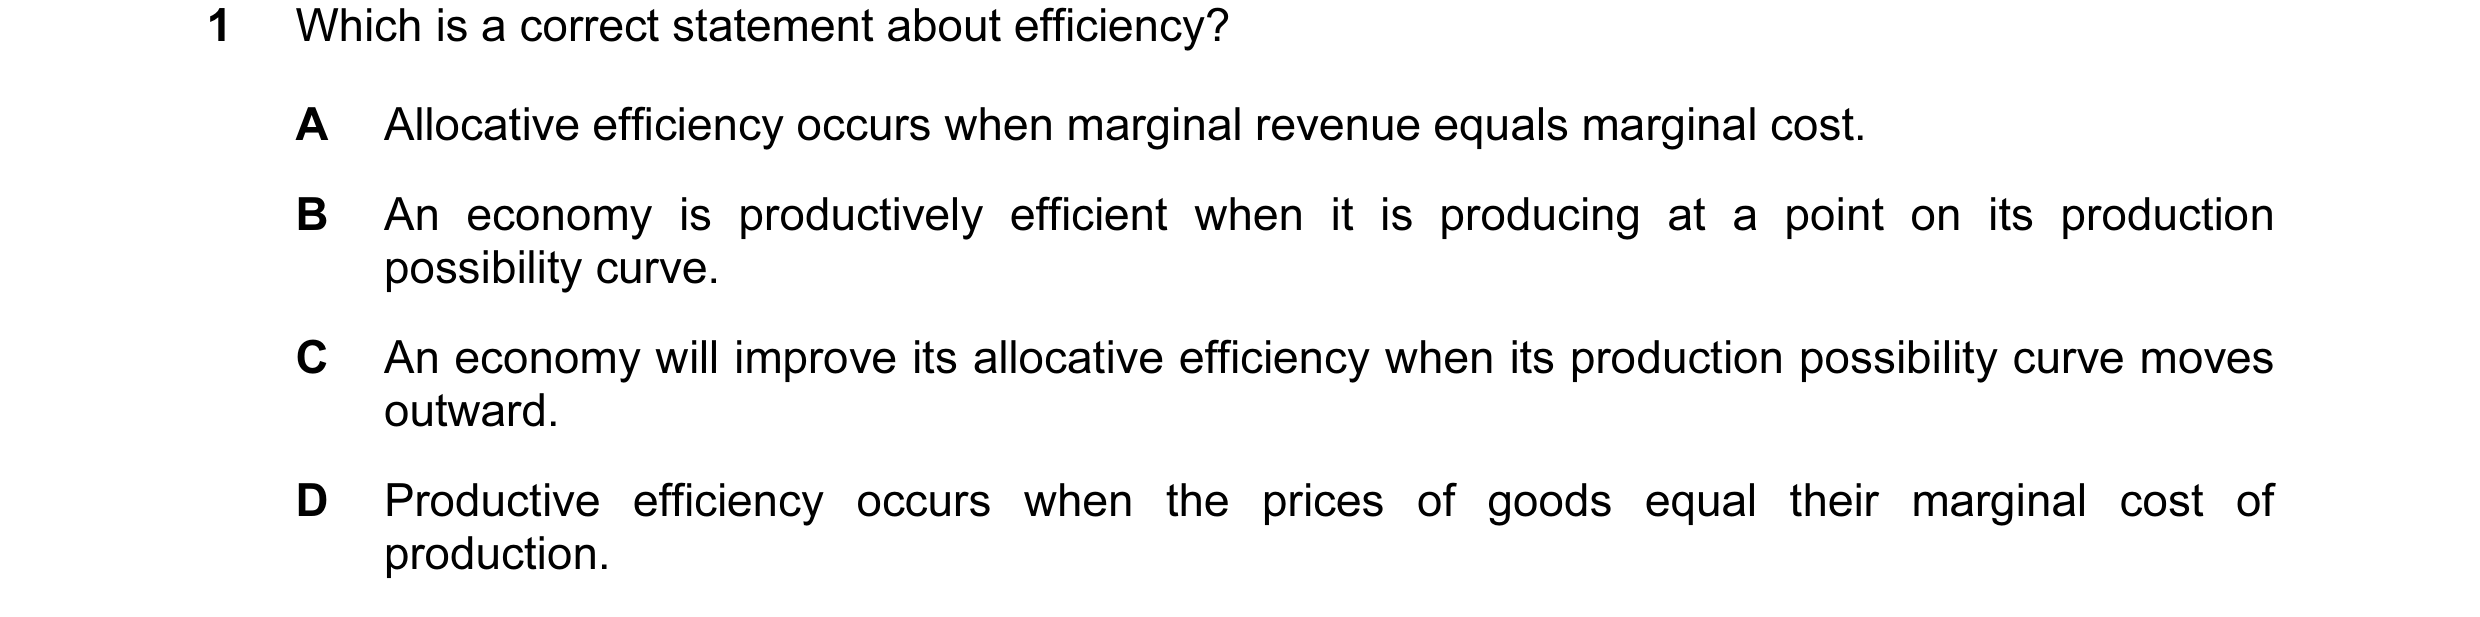
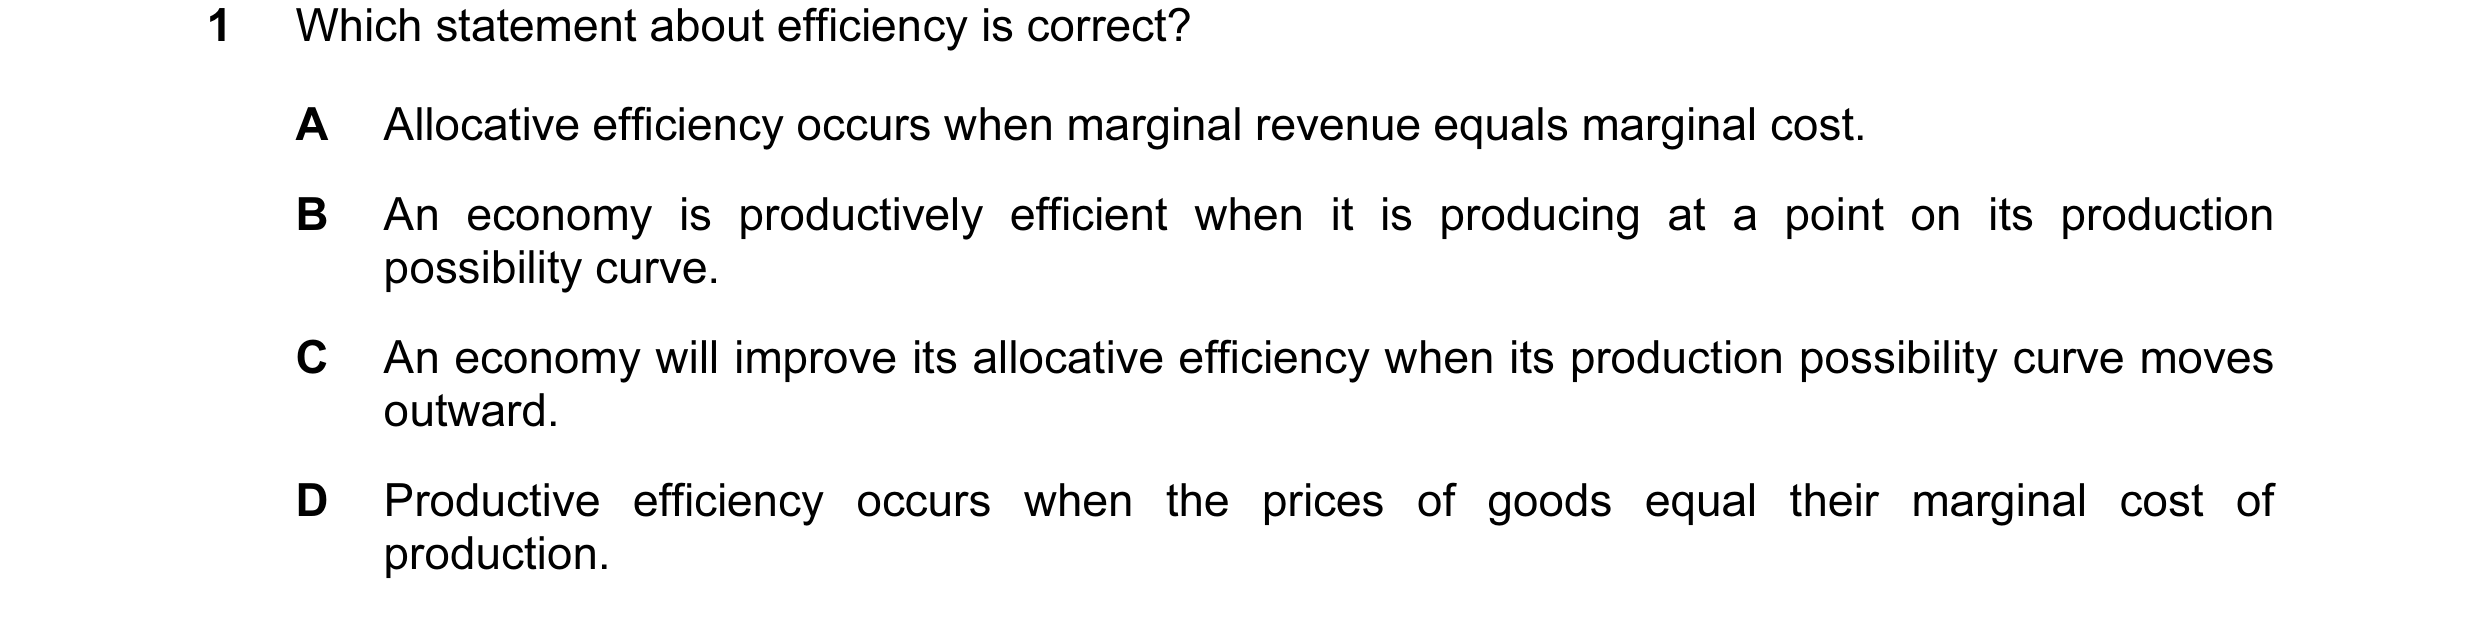
1 Which is a correct statement about efficiency? A Allocative efficiency occurs when marginal revenue equals marginal cost. B An economy is productively efficient when it is producing at a point on its production possibility curve. C An economy will improve its allocative efficiency when its production possibility curve moves outward. D Productive efficiency occurs when the prices of goods equal their marginal cost of production.
1 marks
Answer: B
This question in 9708/31 May/June 2010
Q4 · Which is a correct statement about efficiency? 9708/32 May/June 2010
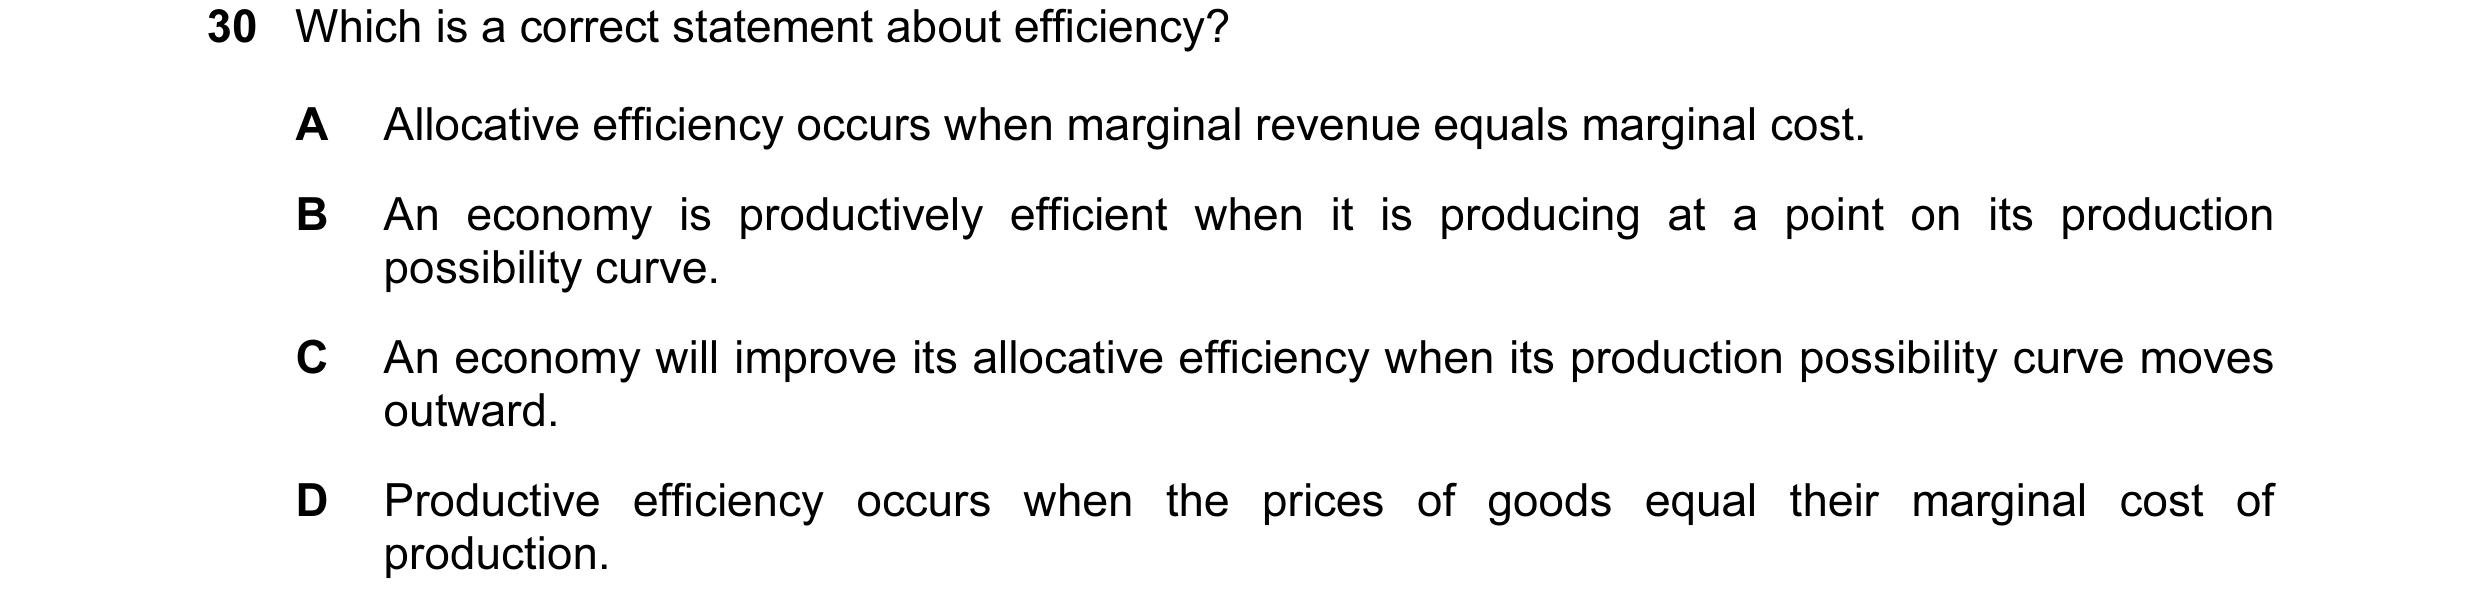
30 Which is a correct statement about efficiency? A Allocative efficiency occurs when marginal revenue equals marginal cost. B An economy is productively efficient when it is producing at a point on its production possibility curve. C An economy will improve its allocative efficiency when its production possibility curve moves outward. D Productive efficiency occurs when the prices of goods equal their marginal cost of production.
1 marks
Answer: B
This question in 9708/32 May/June 2010
Q5 · Which is a correct statement about efficiency? 9708/33 May/June 2010
30 Which is a correct statement about efficiency? A Allocative efficiency occurs when marginal revenue equals marginal cost. B An economy is productively efficient when it is producing at a point on its production possibility curve. C An economy will improve its allocative efficiency when its production possibility curve moves outward. D Productive efficiency occurs when the prices of goods equal their marginal cost of production.
1 marks
Answer: B
This question in 9708/33 May/June 2010
Q6 · In an economy no one can be made better off without making others worse off 9708/31 Oct/Nov 2010
1 In an economy no one can be made better off without making others worse off. What can be concluded from this? A All markets are perfectly competitive. B There are no externalities. C The economy is operating on its production possibility curve. D The distribution of income reflects what each individual deserves.
1 marks
Answer: C
This question in 9708/31 Oct/Nov 2010
Q7 · In an economy no one can be made better off without making others worse off 9708/32 Oct/Nov 2010
1 In an economy no one can be made better off without making others worse off. What can be concluded from this? A All markets are perfectly competitive. B There are no externalities. C The economy is operating on its production possibility curve. D The distribution of income reflects what each individual deserves.
1 marks
Answer: C
This question in 9708/32 Oct/Nov 2010
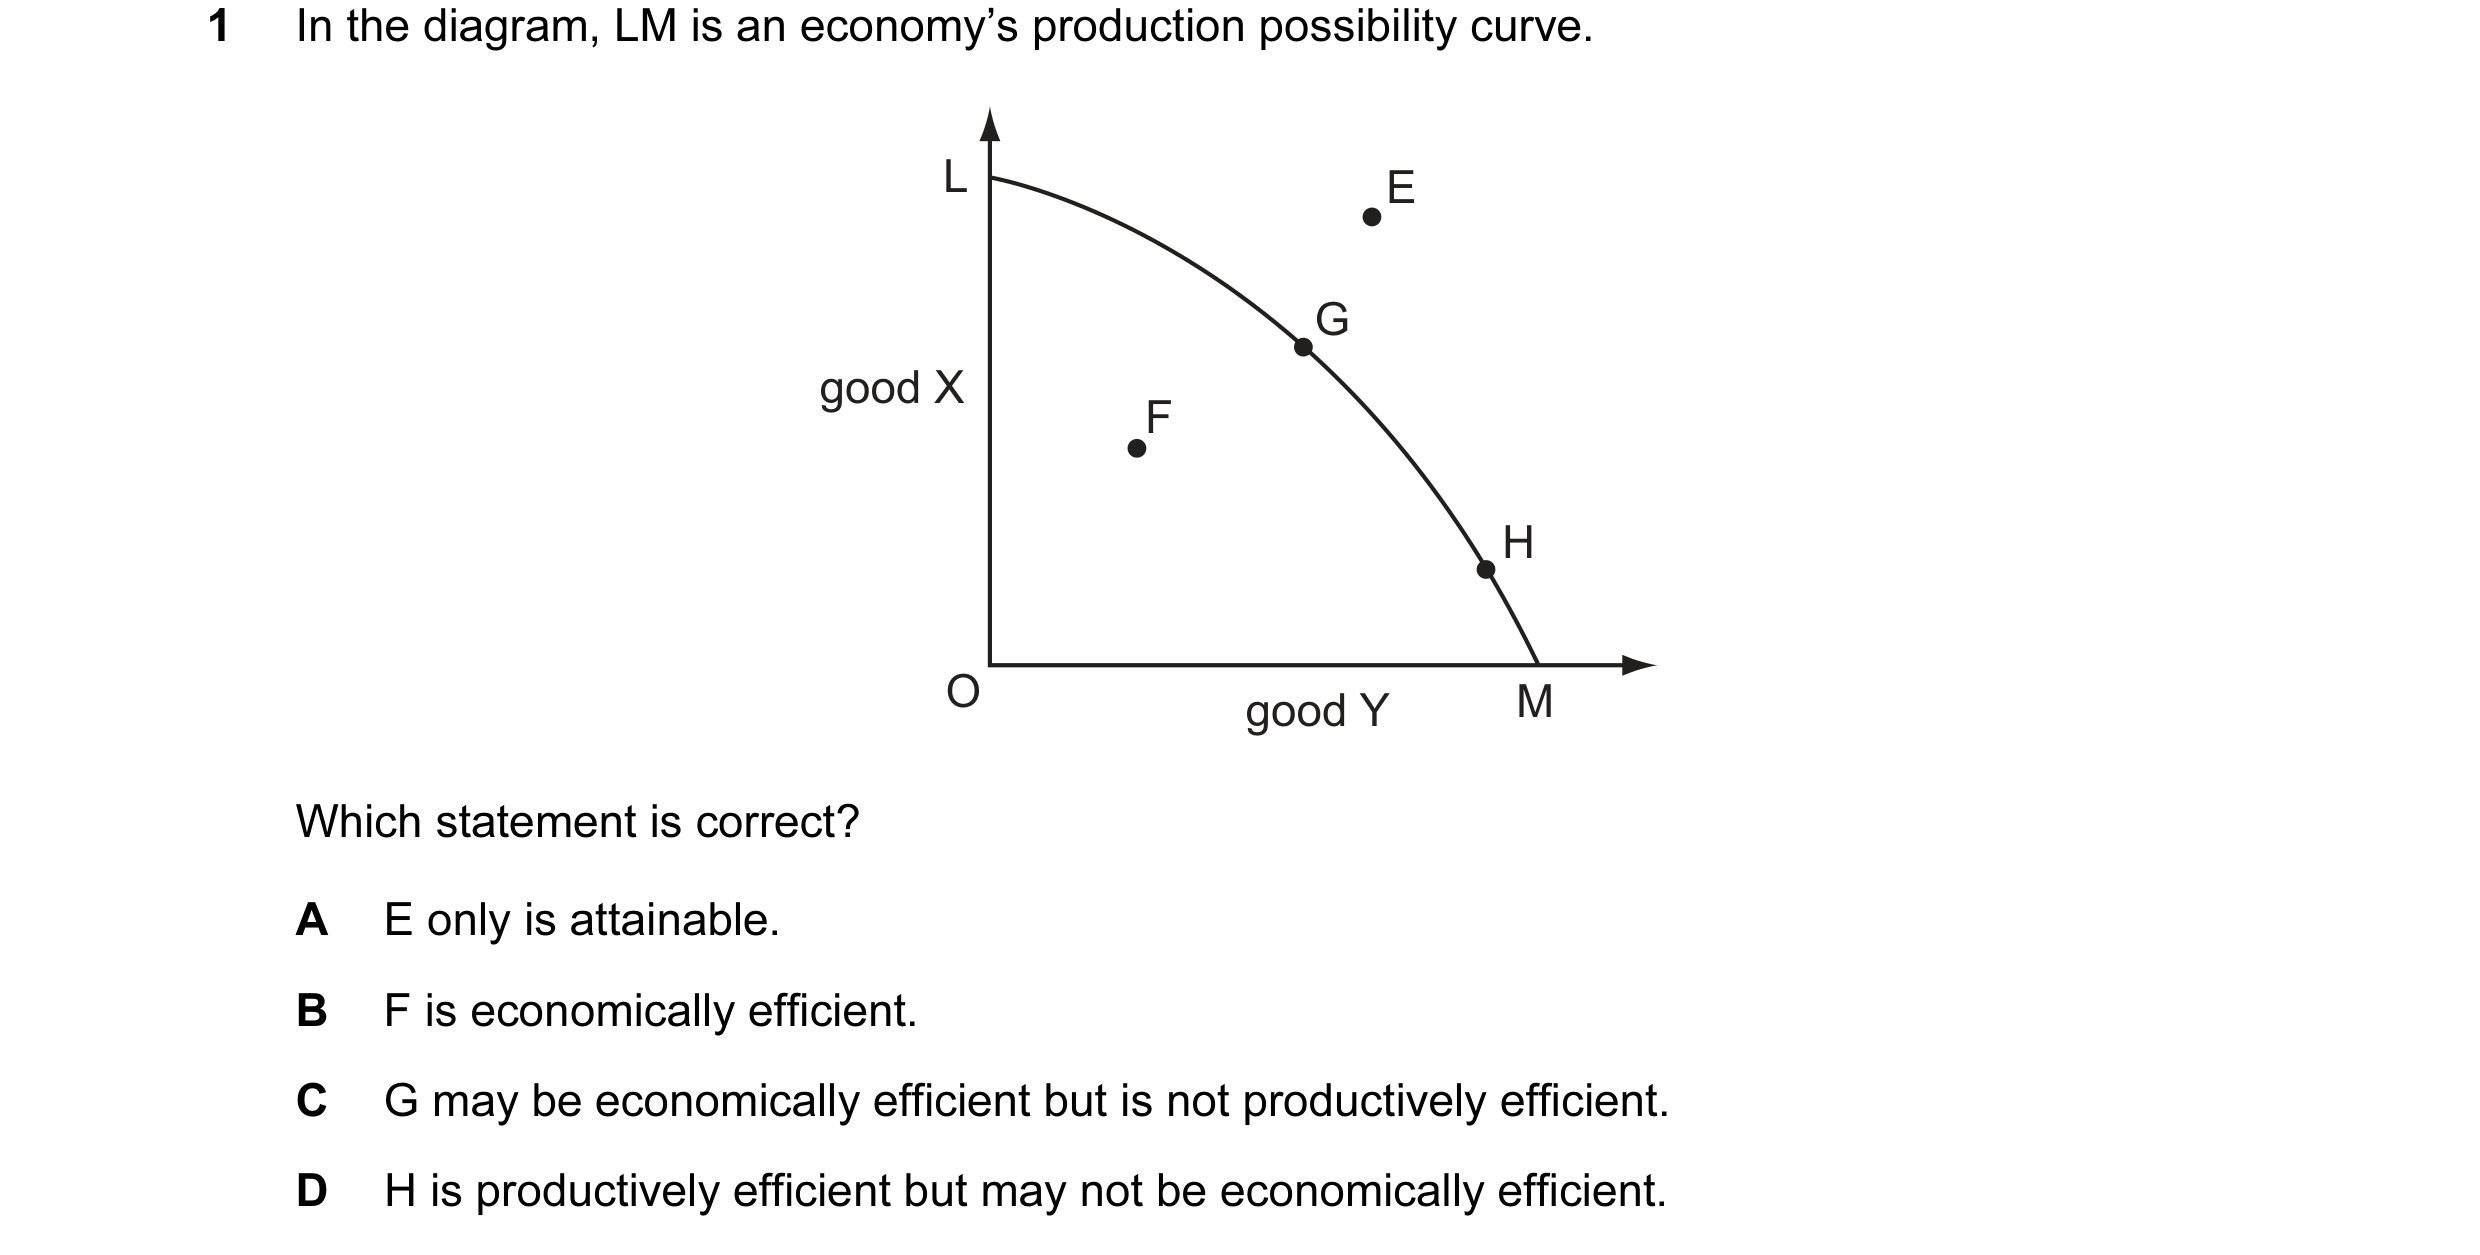
Q8 · In the diagram, LM is an economy’s production possibility curve 9708/31 May/June 2011
1 In the diagram, LM is an economy’s production possibility curve. L E G good X F H O good Y M Which statement is correct? A E only is attainable. B F is economically efficient. C G may be economically efficient but is not productively efficient. D H is productively efficient but may not be economically efficient.
1 marks
Answer: D
This question in 9708/31 May/June 2011
Q9 · In the diagram, LM is an economy’s production possibility curve 9708/32 May/June 2011
30 In the diagram, LM is an economy’s production possibility curve. L E G good X F H O good Y M Which statement is correct? A E only is attainable. B F is economically efficient. C G may be economically efficient but is not productively efficient. D H is productively efficient but may not be economically efficient.
1 marks
Answer: D
This question in 9708/32 May/June 2011
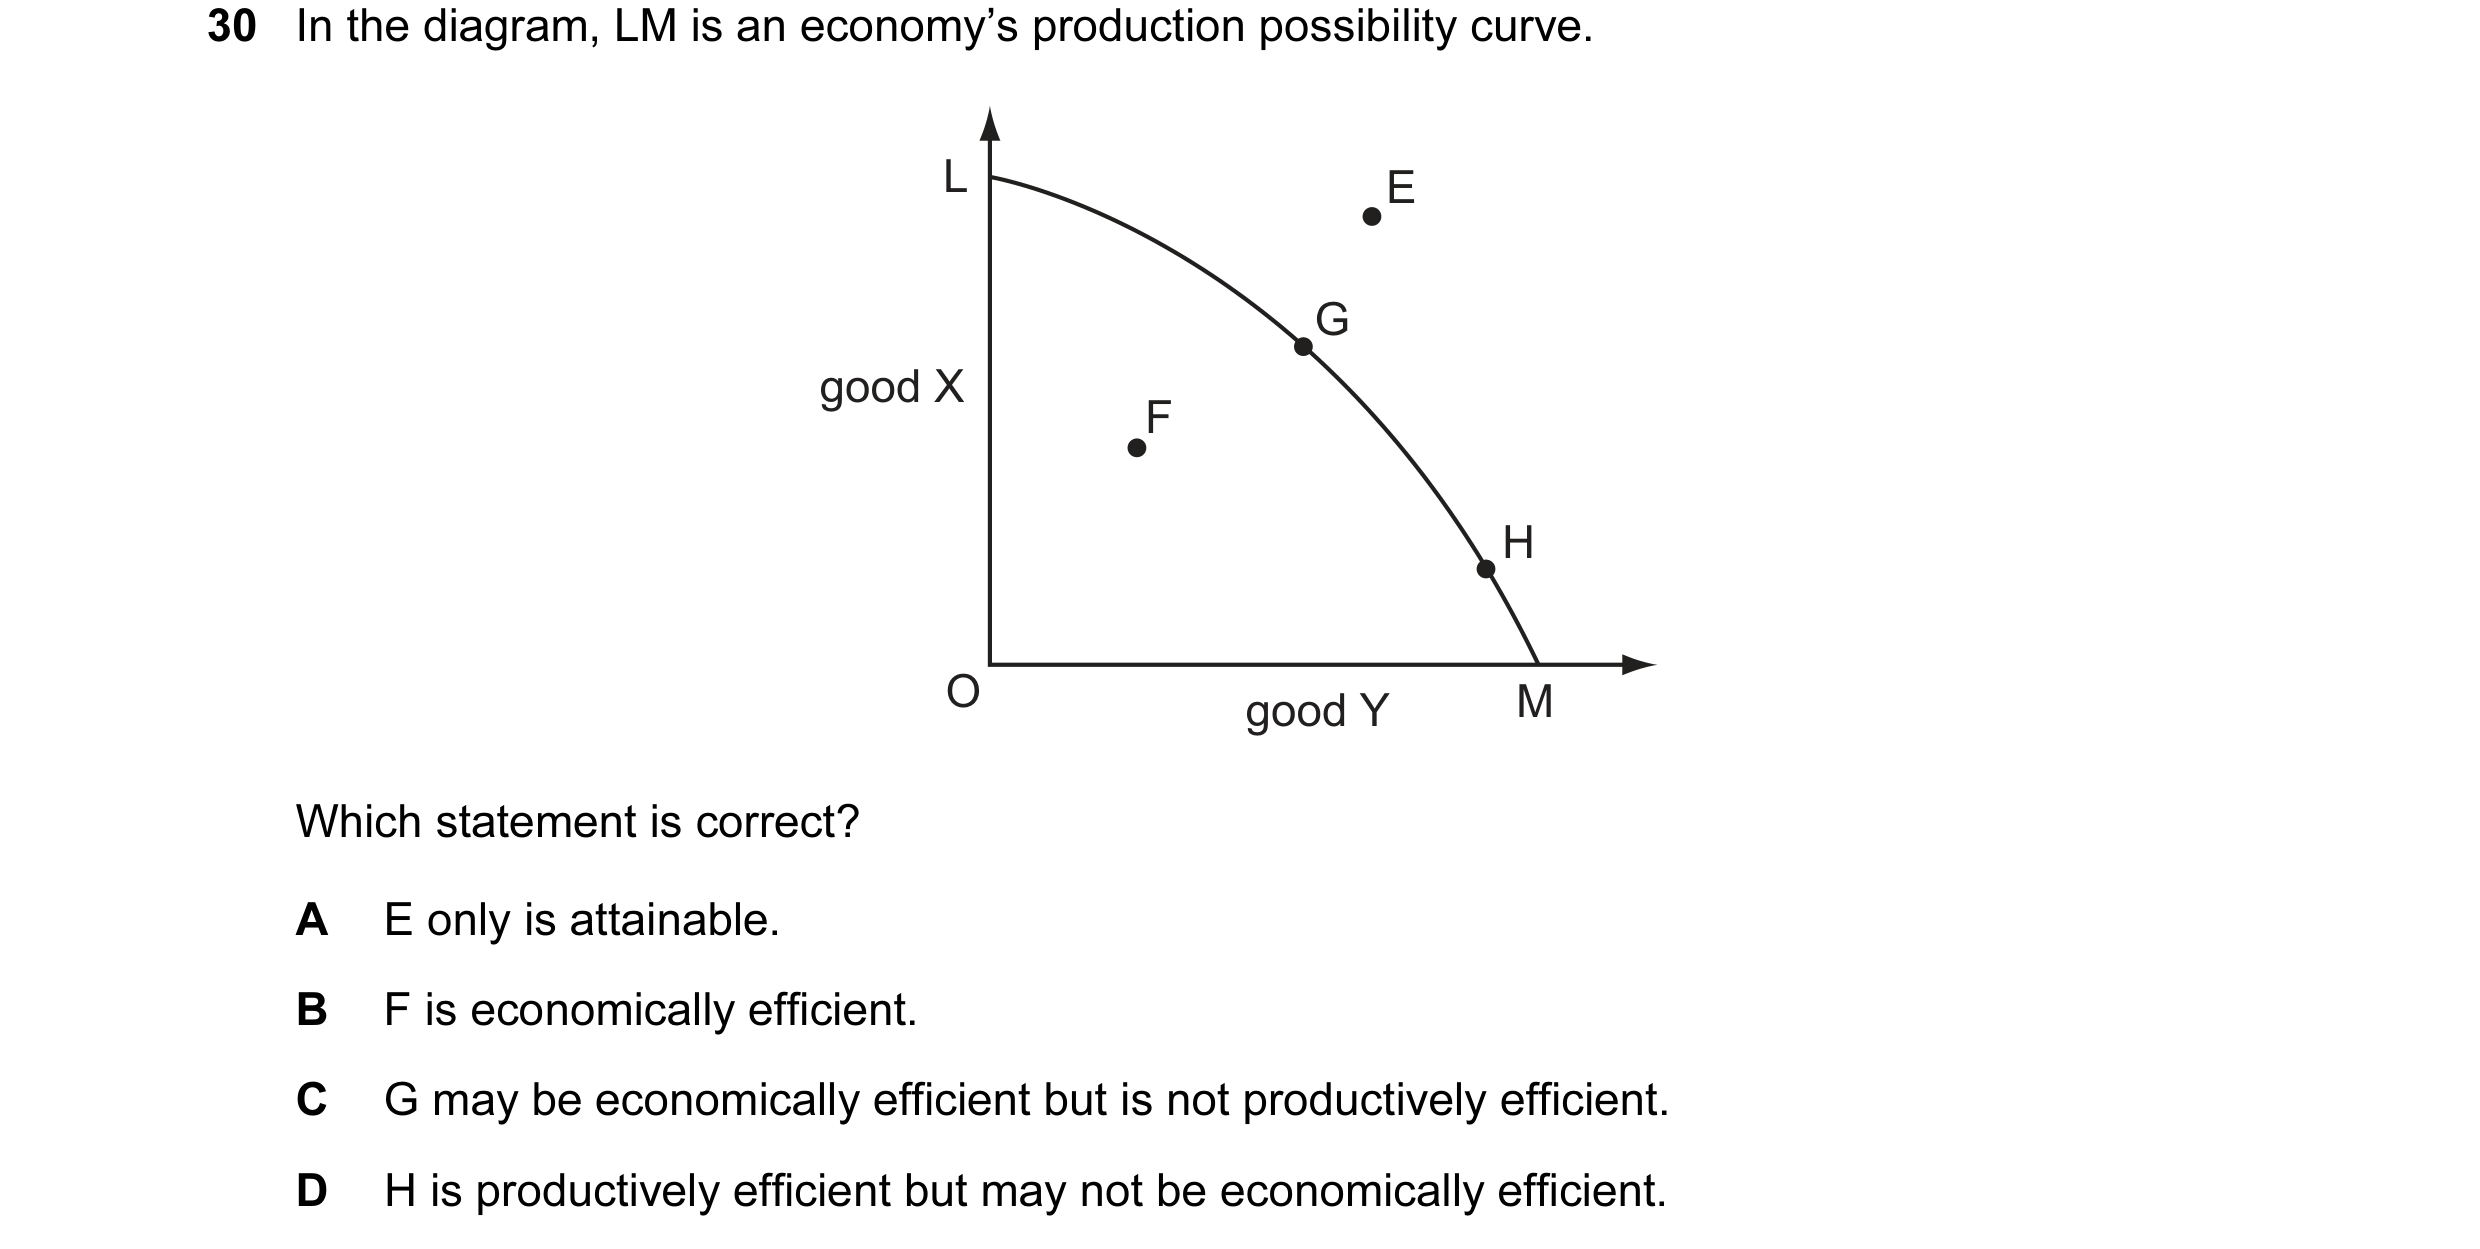
Q10 · In the diagram, LM is an economy’s production possibility curve 9708/33 May/June 2011
30 In the diagram, LM is an economy’s production possibility curve. L E G good X F H O good Y M Which statement is correct? A E only is attainable. B F is economically efficient. C G may be economically efficient but is not productively efficient. D H is productively efficient but may not be economically efficient.
1 marks
Answer: D
This question in 9708/33 May/June 2011
Q11 · The diagram shows a country’s production possibility curve and a number of alternative… 9708/32 Oct/Nov 2012
23 The diagram shows a country’s production possibility curve and a number of alternative production points. X U V capital goods Y Z O consumer goods Which change in the country’s output would be most likely to lead to a fall in potential growth? A U to V B U to X C Y to X D Y to Z
1 marks
Answer: D
This question in 9708/32 Oct/Nov 2012
Q12 · An economy is operating at a point on its production possibility curve 9708/33 Oct/Nov 2012
1 An economy is operating at a point on its production possibility curve. What is true about the way the economy’s resources are being allocated at this point? allocatively efficient productively efficient socially desirable A yes yes possibly B possibly yes yes C possibly possibly possibly D yes possibly yes
1 marks
This question in 9708/33 Oct/Nov 2012
Q13 · How can cyclical growth, as opposed to long-run economic growth, be shown on a diagram? 9708/33 Oct/Nov 2012
24 How can cyclical growth, as opposed to long-run economic growth, be shown on a diagram? A an inward shift in a production possibility curve B an outward shift in a production possibility curve C a movement from a point inside a production possibility curve to a point on the curve D a movement from a point outside a production possibility curve to a point on the curve
1 marks
This question in 9708/33 Oct/Nov 2012
Q14 · The diagram shows the production possibility curve for an economy 9708/31 Oct/Nov 2013
1 The diagram shows the production possibility curve for an economy. L good Y O good X What might make it possible for consumers in this economy to consume the combination of goods X and Y indicated by the point L? A a reduction in unemployment B the achievement of productive efficiency C the elimination of a monopoly in the production of good X D trade with other economies
1 marks
Answer: D
This question in 9708/31 Oct/Nov 2013
Q15 · Which statement about efficiency is correct? 9708/31 Oct/Nov 2014
1 Which statement about efficiency is correct? A Allocative efficiency occurs when marginal revenue equals marginal cost. B An economy is productively efficient when it is producing at a point on its production possibility curve. C An economy will improve its allocative efficiency when its production possibility curve moves outward. D Productive efficiency occurs when the prices of goods equal their marginal cost of production.
1 marks
Answer: B
This question in 9708/31 Oct/Nov 2014
Q16 · In an economy no one can be made better off without making others worse off 9708/33 Oct/Nov 2014
1 In an economy no one can be made better off without making others worse off. What can be concluded from this? A All markets are perfectly competitive. B There are no externalities. C The economy is operating on its production possibility curve. D The distribution of income reflects what each individual deserves.
1 marks
Answer: C
This question in 9708/33 Oct/Nov 2014
Q17 · The diagram shows the production possibility curve for a successful transition economy… 9708/32 Oct/Nov 2015
1 The diagram shows the production possibility curve for a successful transition economy that moves from point X to point Y over time. X public sector output Y O private sector output During the transition process the population of the country expressed a strong preference for increased privatisation. What happens to economic efficiency as a result of the transition from point X to point Y? productive allocative efficiency efficiency A increases decreases B increases increases C unchanged decreases D unchanged unchanged
1 marks
Answer: B
This question in 9708/32 Oct/Nov 2015
Q18 · In an economy, no one can be made better off without making someone else worse off 9708/33 Oct/Nov 2015
1 In an economy, no one can be made better off without making someone else worse off. What does not necessarily follow from this? A The conditions for allocative efficiency have been met. B The conditions for productive efficiency have been met. C The distribution of income is socially acceptable. D The economy is operating at a point on its production possibility frontier.
1 marks
Answer: C
This question in 9708/33 Oct/Nov 2015
Q19 · The diagram shows the production possibility curve for an economy 9708/32 May/June 2017
3 The diagram shows the production possibility curve for an economy. good Y L O good X What might make it possible for consumers in this economy to consume the combination of goods X and Y indicated by the point L? A a reduction in unemployment B the achievement of productive efficiency C the elimination of a monopoly in the production of good X D trade with other economies
1 marks
Answer: D
This question in 9708/32 May/June 2017
Q20 · On a diagram showing a production possibility curve, what definitely represents long-run… 9708/32 Oct/Nov 2018
19 On a diagram showing a production possibility curve, what definitely represents long-run economic growth? A a change in the slope of the curve B a movement from a point below the frontier to a point on the curve C a movement from one point to another along a given curve D an outward shift of the curve
1 marks
Answer: D
This question in 9708/32 Oct/Nov 2018
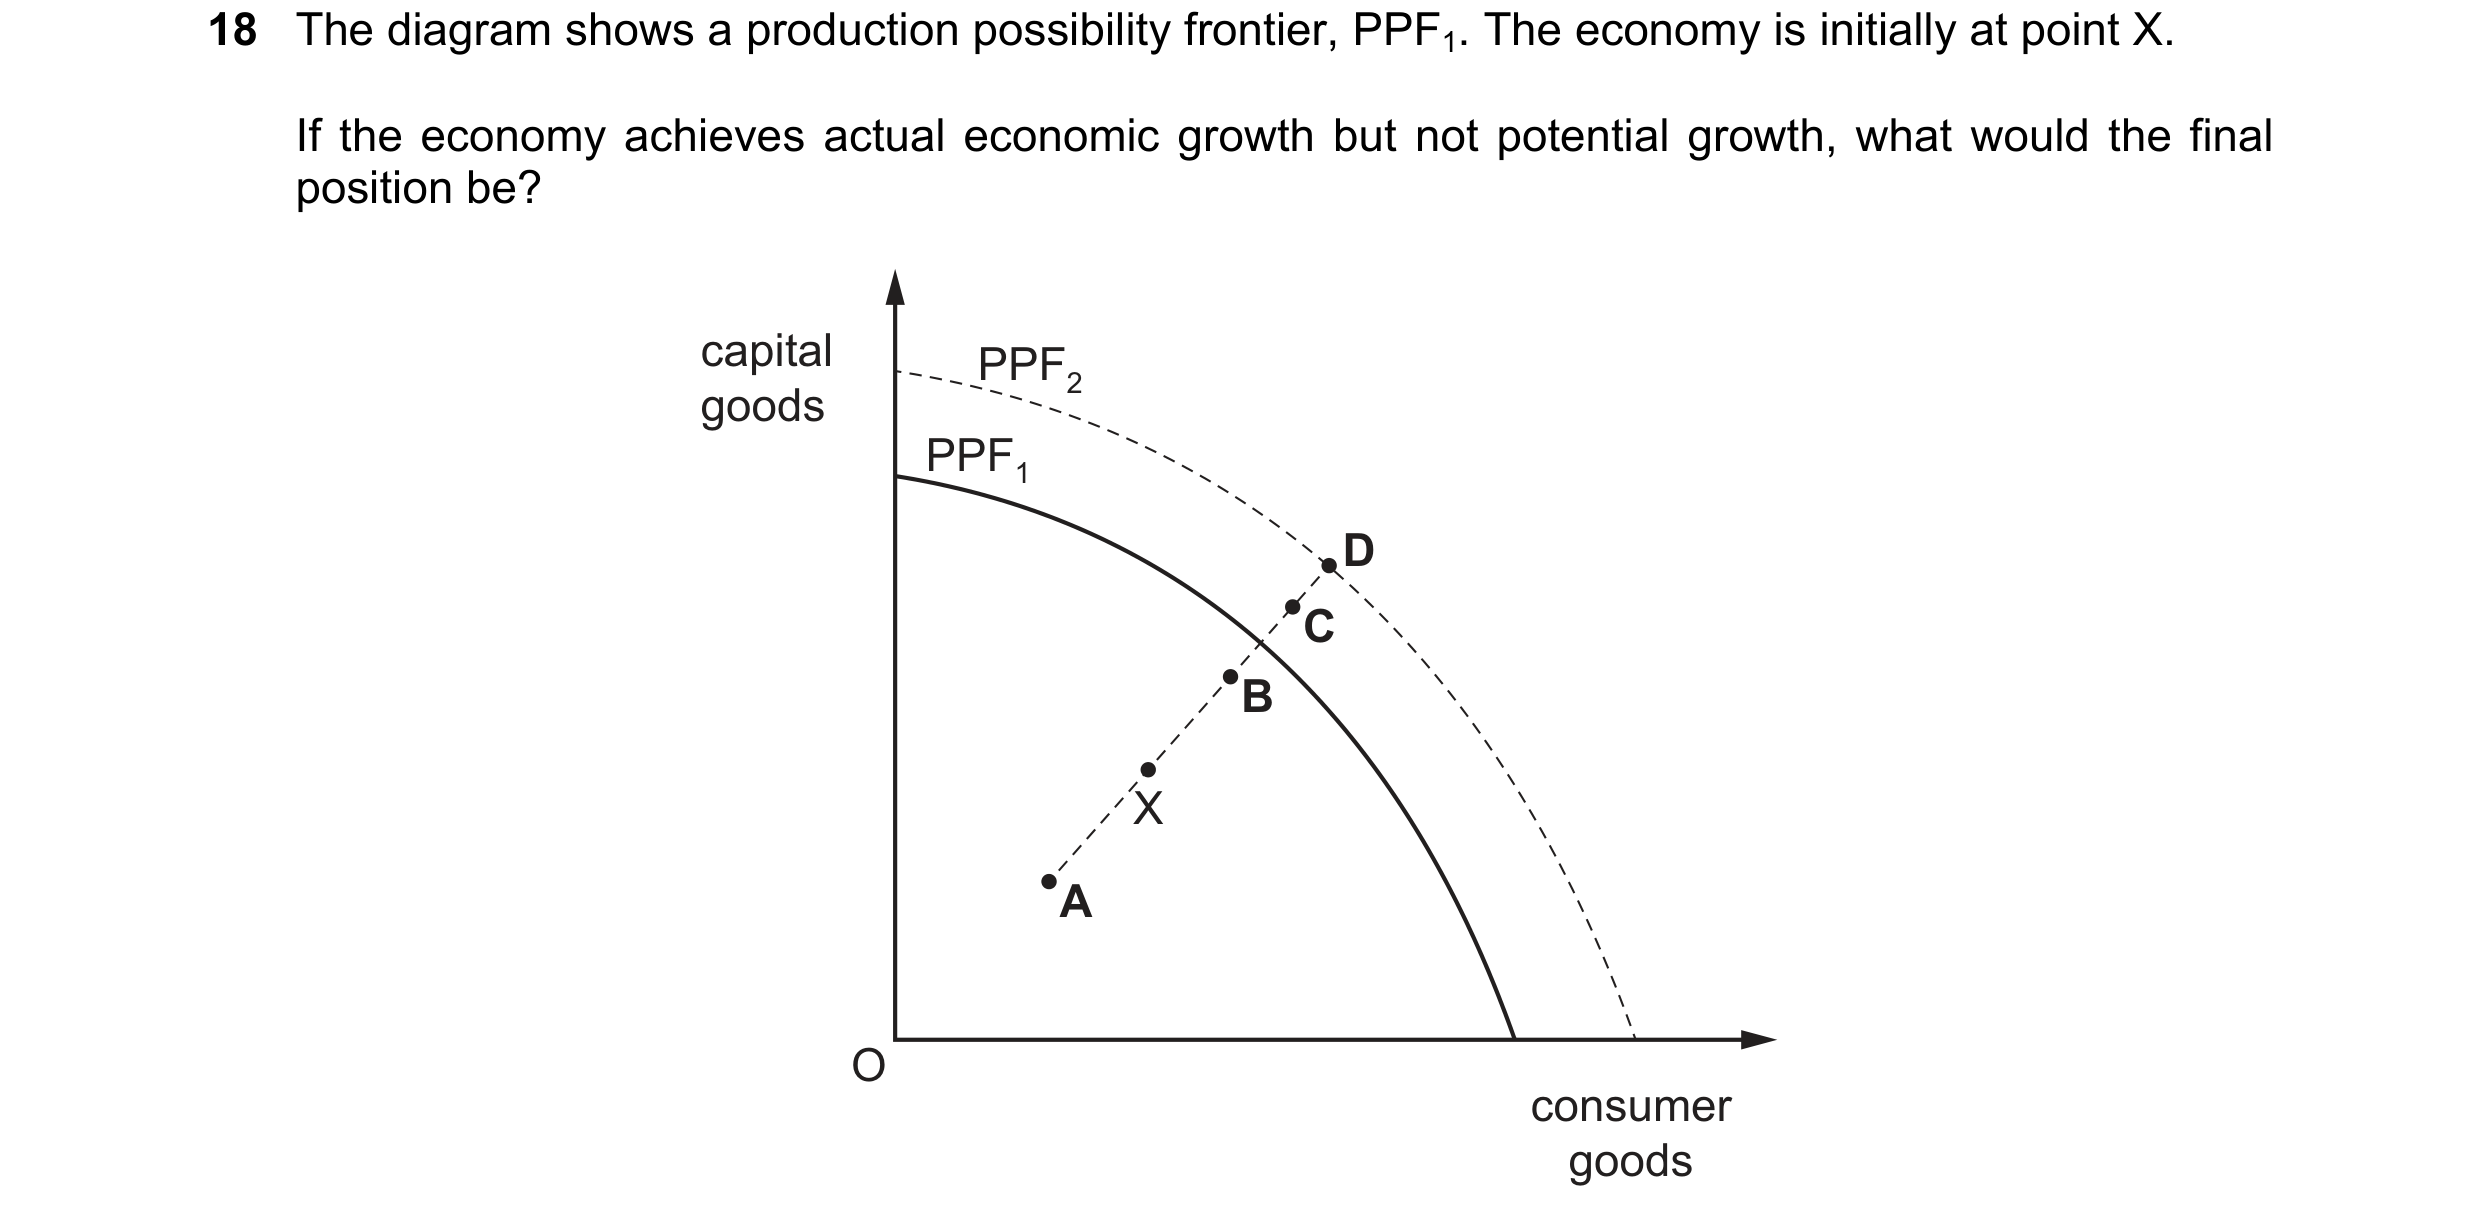
Q21 · The diagram shows a production possibility frontier, PPF1 9708/32 Feb/March 2019
18 The diagram shows a production possibility frontier, PPF1. The economy is initially at point X. If the economy achieves actual economic growth but not potential growth, what would the final position be? capital PPF2 goods PPF1 D C B X A O consumer goods
1 marks
Answer: B
This question in 9708/32 Feb/March 2019
Q22 · In an economy, no one can be made better off without making someone else worse off 9708/32 Oct/Nov 2019
2 In an economy, no one can be made better off without making someone else worse off. What does not necessarily follow from this? A The conditions for allocative efficiency have been met. B The conditions for productive efficiency have been met. C The distribution of income is socially acceptable. D The economy is operating at a point on its production possibility curve.
1 marks
Answer: C
This question in 9708/32 Oct/Nov 2019
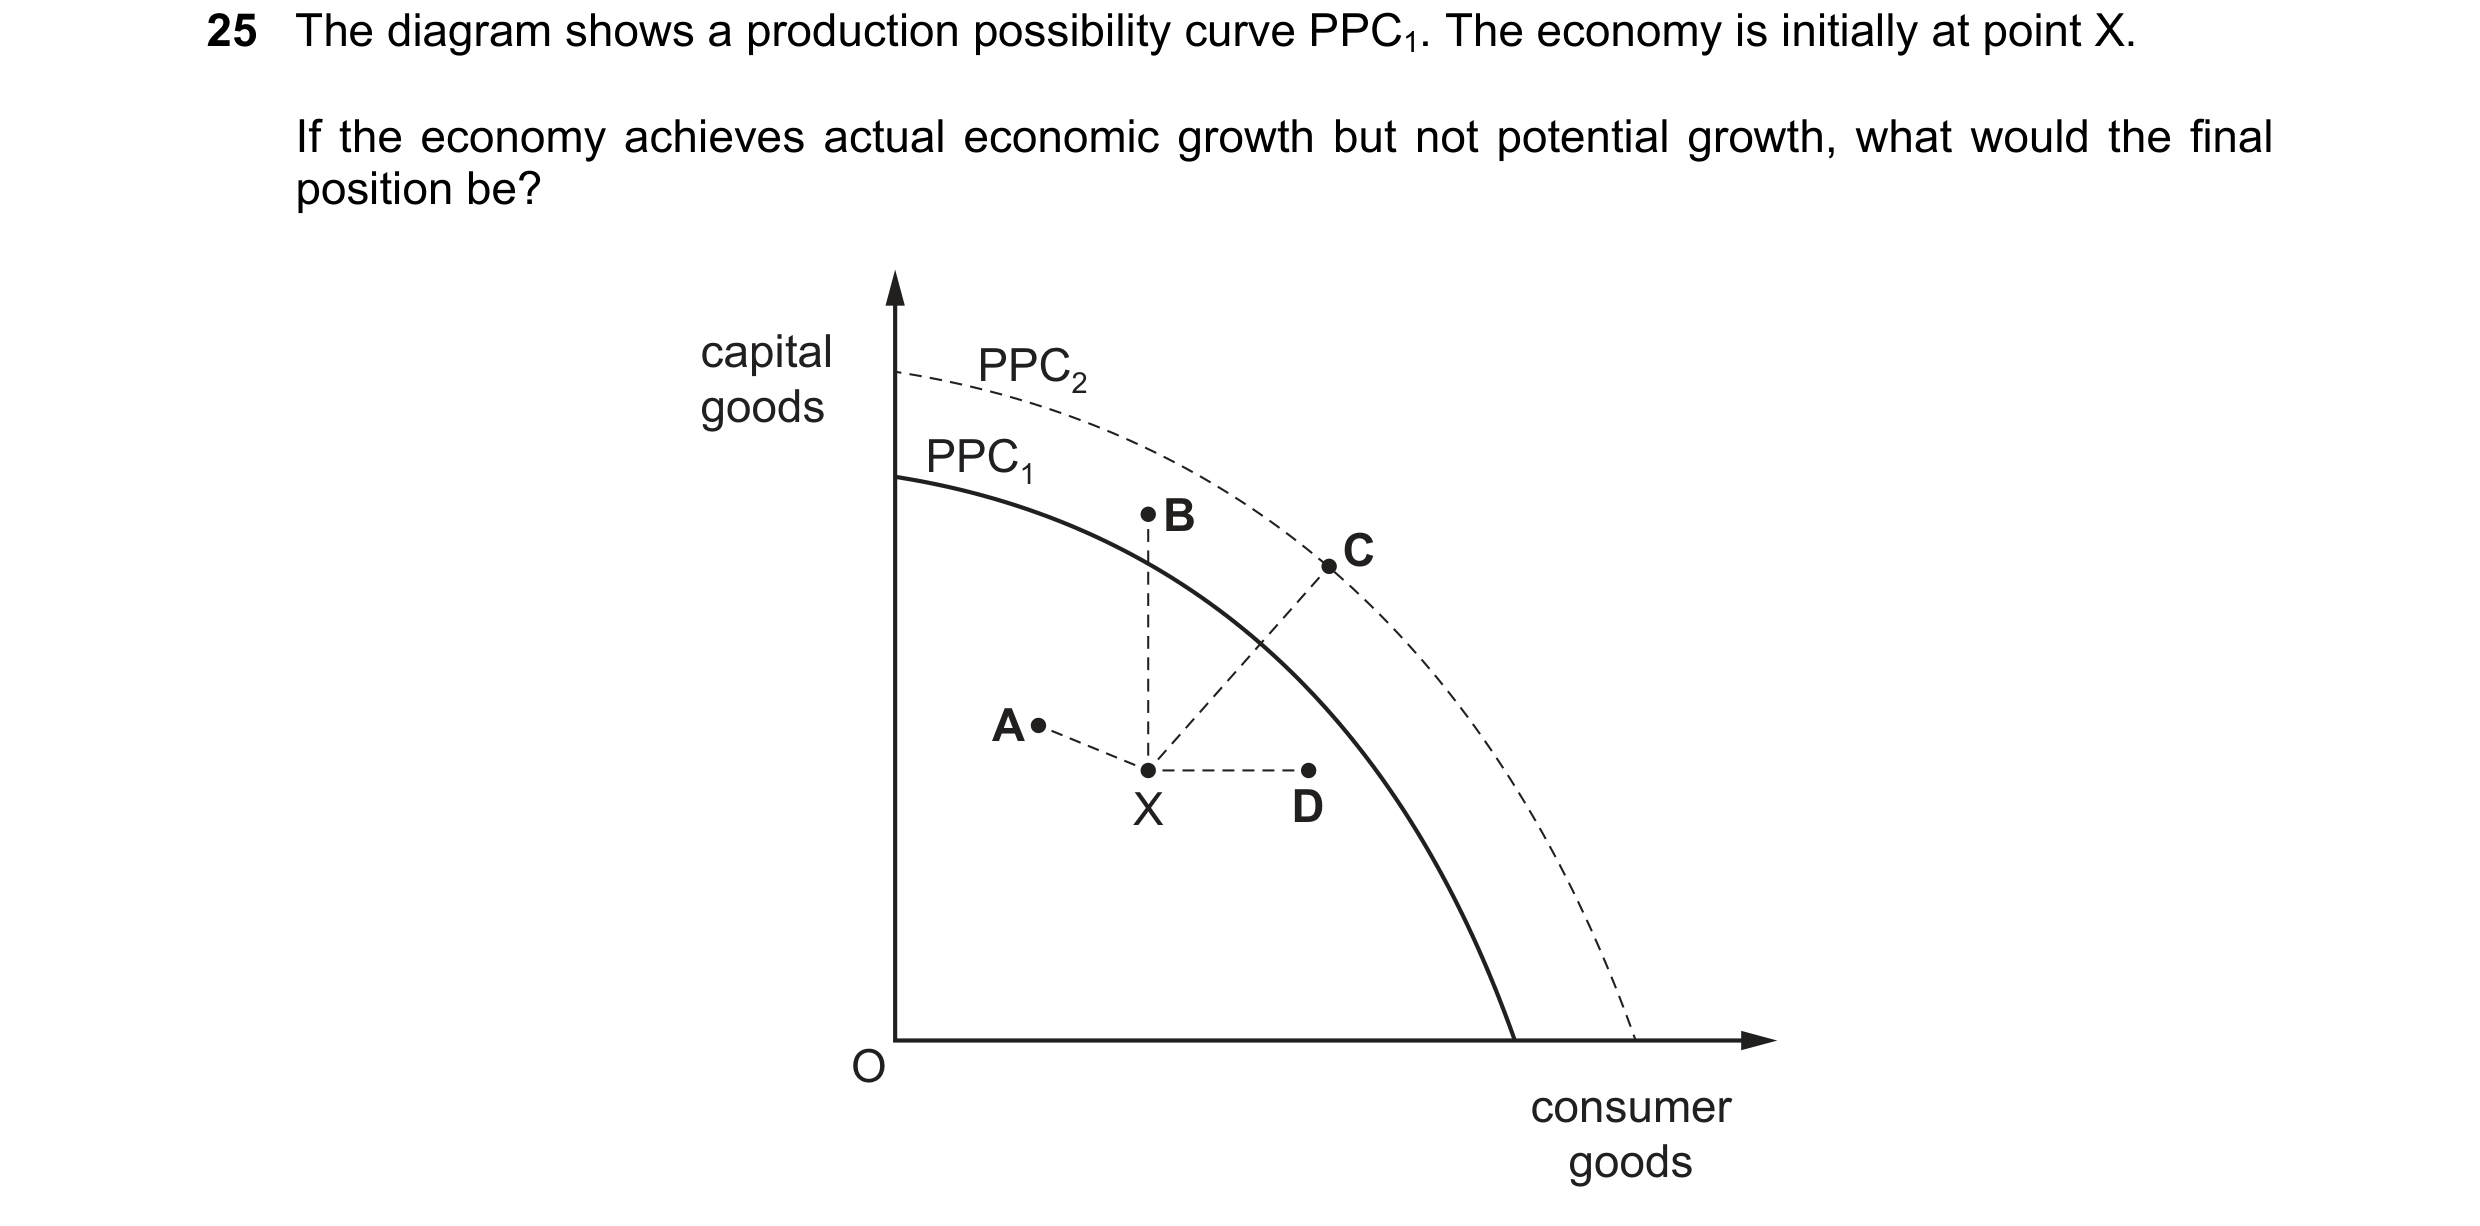
Q23 · The diagram shows a production possibility curve PPC1 9708/32 Oct/Nov 2019
25 The diagram shows a production possibility curve PPC1. The economy is initially at point X. If the economy achieves actual economic growth but not potential growth, what would the final position be? capital PPC2 goods PPC1 B C A X D O consumer goods
1 marks
Answer: D
This question in 9708/32 Oct/Nov 2019
Q24 · At the start of the year, the production possibility frontier for an economy is at PPF1… 9708/32 May/June 2021
23 At the start of the year, the production possibility frontier for an economy is at PPF1 and the economy is at point S. At the end of the year the production possibility frontier is at PPF2 and the economy is at point T. Which diagram shows that the economy has experienced actual growth but not potential growth? A B output Y output Y S T T S PPF1 = PPF2 PPF2 PPF1 O output X O output X C D output Y output Y T S S T PPF1 PPF2 PPF1 = PPF2 O output X O output X
1 marks
Answer: A
This question in 9708/32 May/June 2021
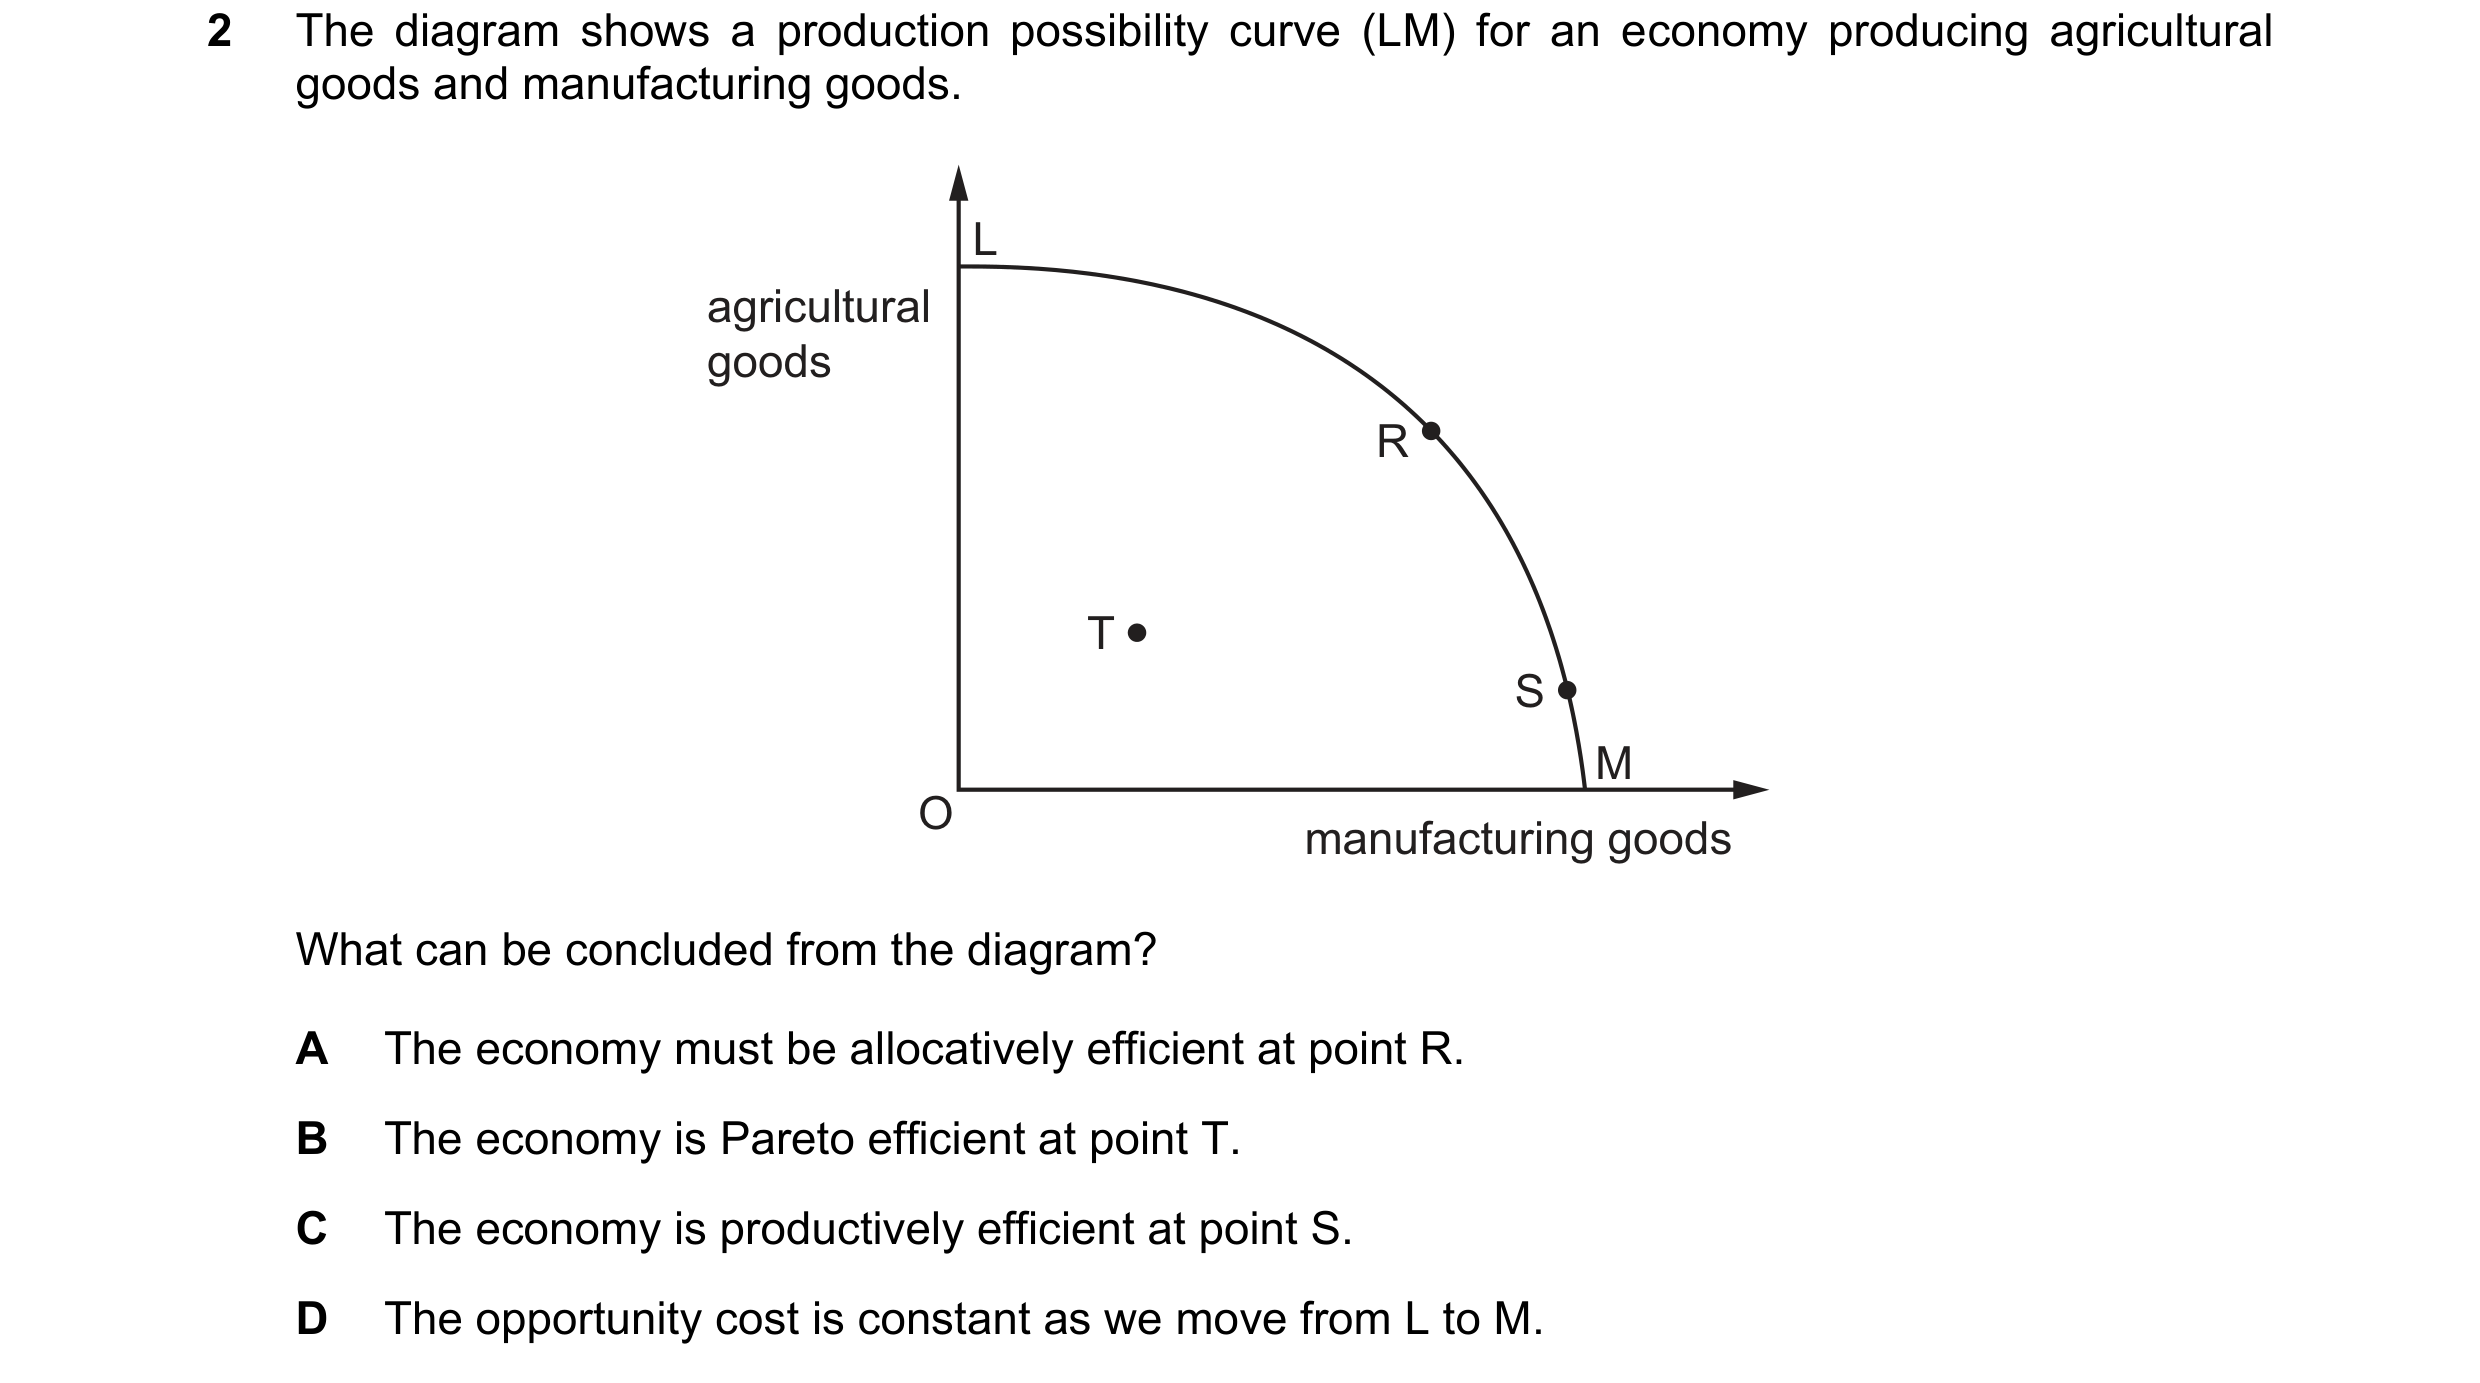
Q25 · The diagram shows a production possibility curve (LM) for an economy producing… 9708/31 May/June 2022
2 The diagram shows a production possibility curve (LM) for an economy producing agricultural goods and manufacturing goods. L agricultural goods R T S M O manufacturing goods What can be concluded from the diagram? A The economy must be allocatively efficient at point R. B The economy is Pareto efficient at point T. C The economy is productively efficient at point S. D The opportunity cost is constant as we move from L to M.
1 marks
Answer: C
This question in 9708/31 May/June 2022
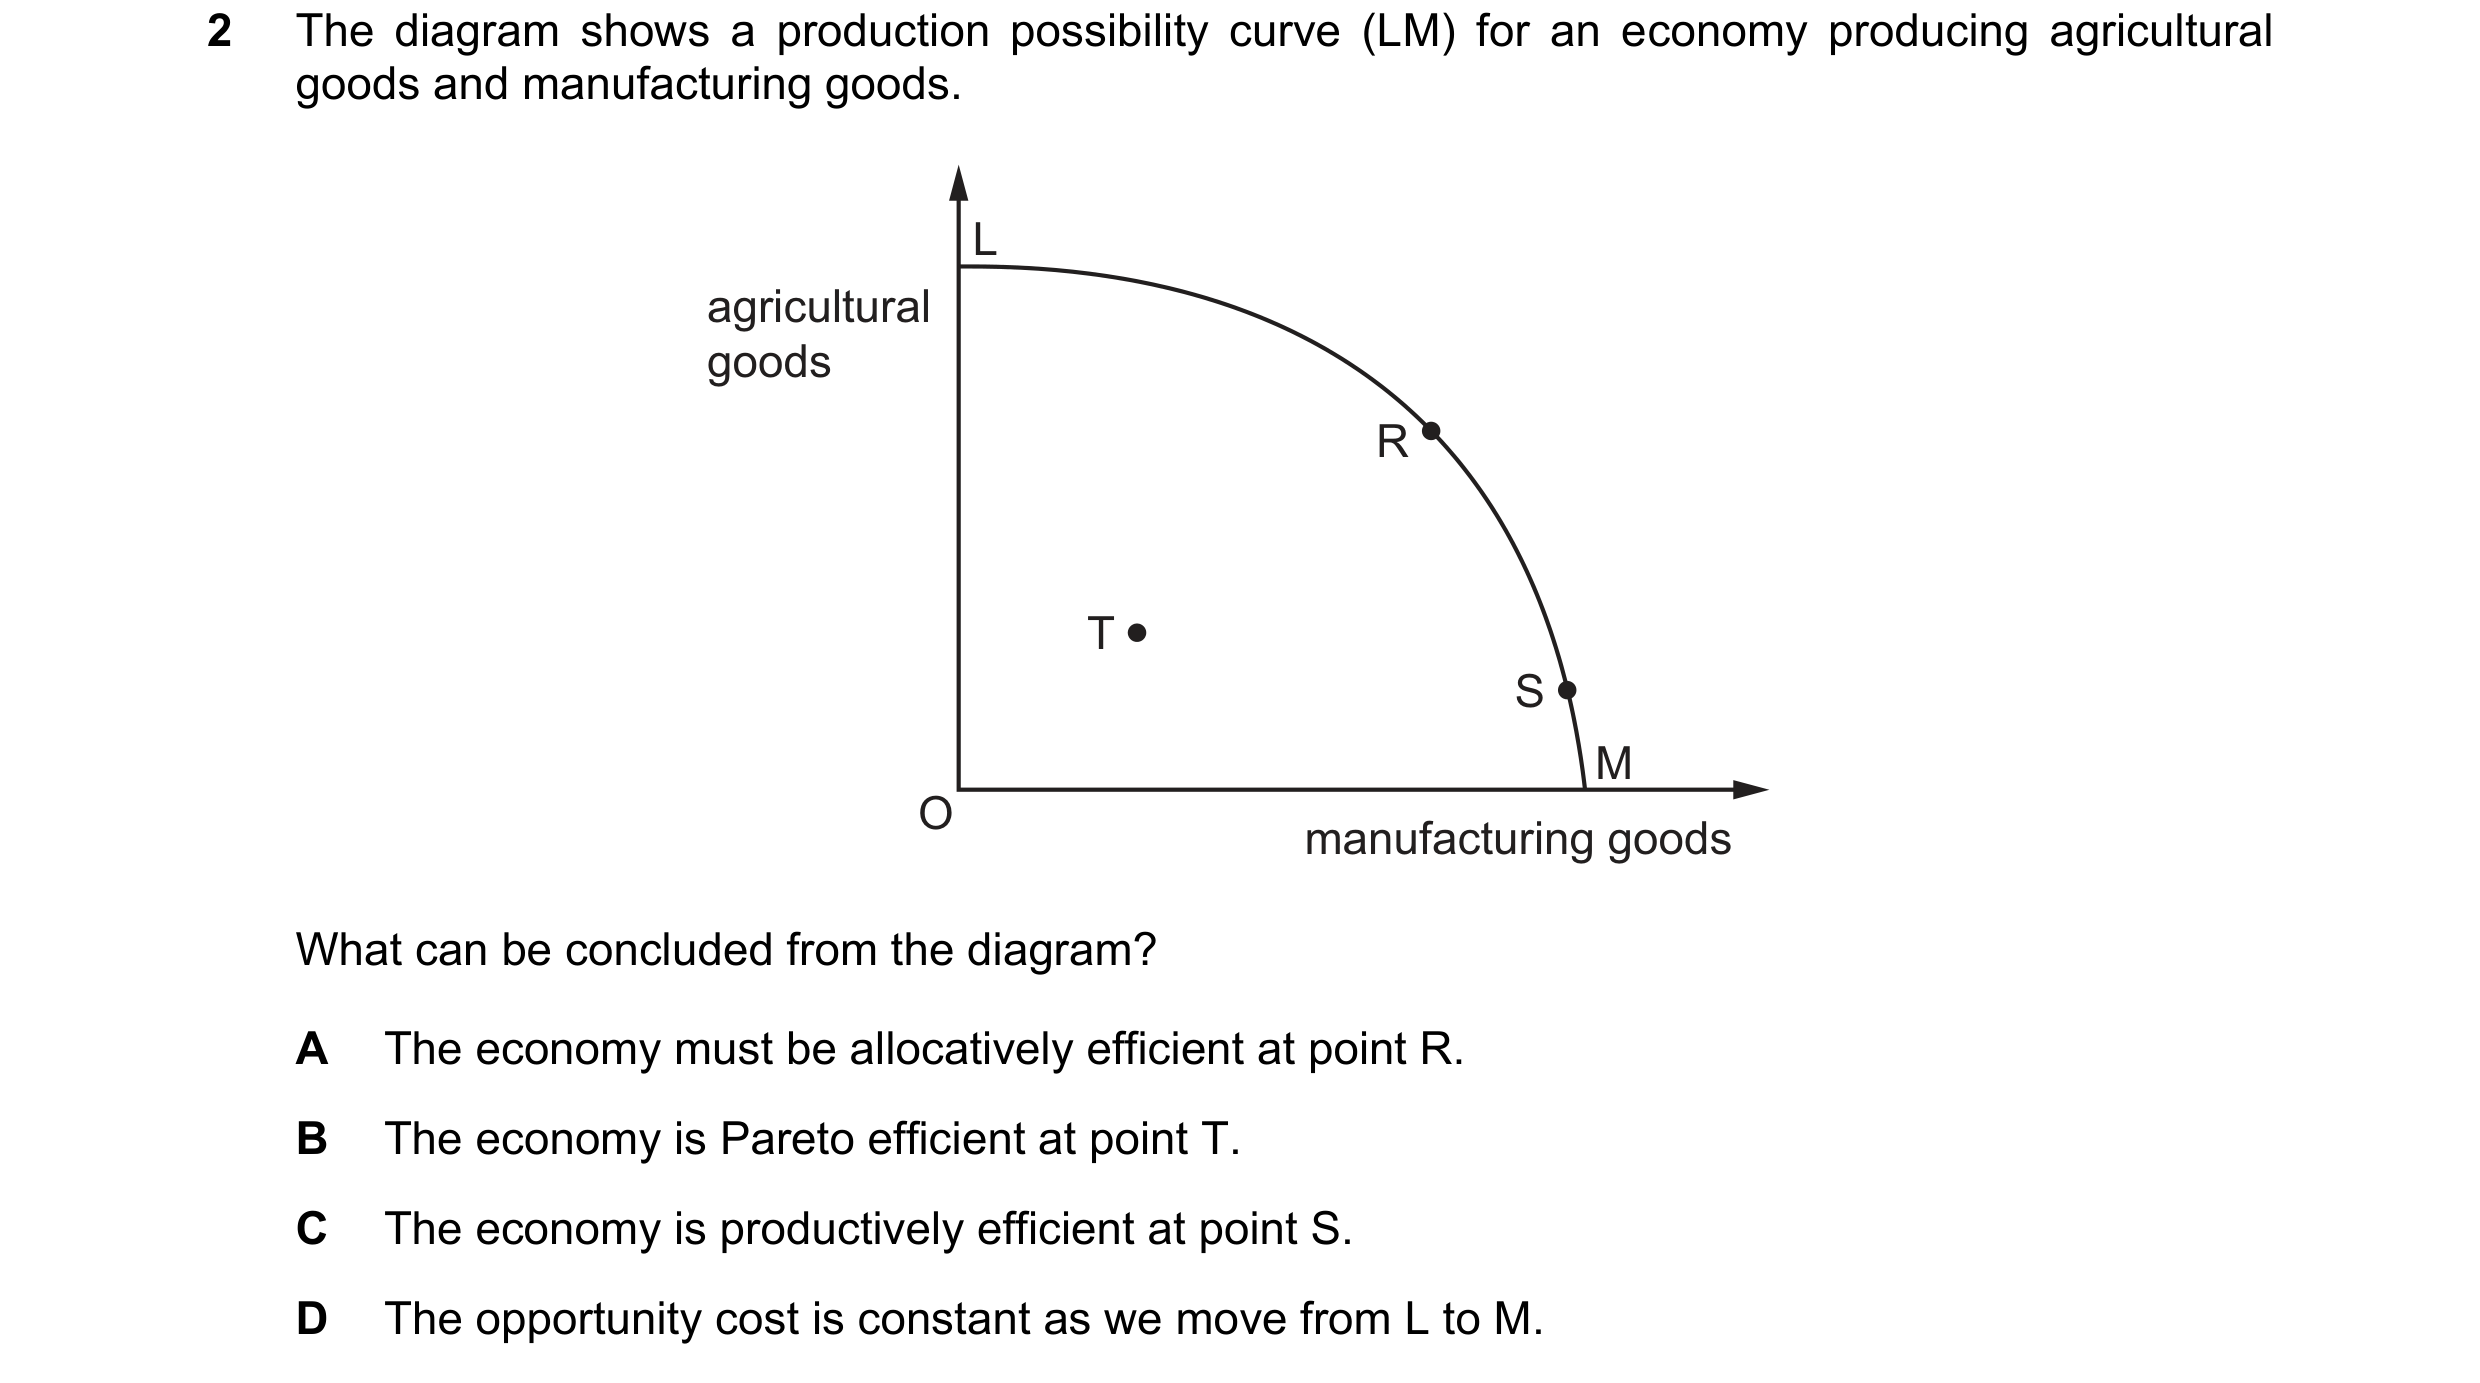
Q26 · The diagram shows a production possibility curve (LM) for an economy producing… 9708/33 May/June 2022
2 The diagram shows a production possibility curve (LM) for an economy producing agricultural goods and manufacturing goods. L agricultural goods R T S M O manufacturing goods What can be concluded from the diagram? A The economy must be allocatively efficient at point R. B The economy is Pareto efficient at point T. C The economy is productively efficient at point S. D The opportunity cost is constant as we move from L to M.
1 marks
Answer: C
This question in 9708/33 May/June 2022
 1 / 10

 2 / 10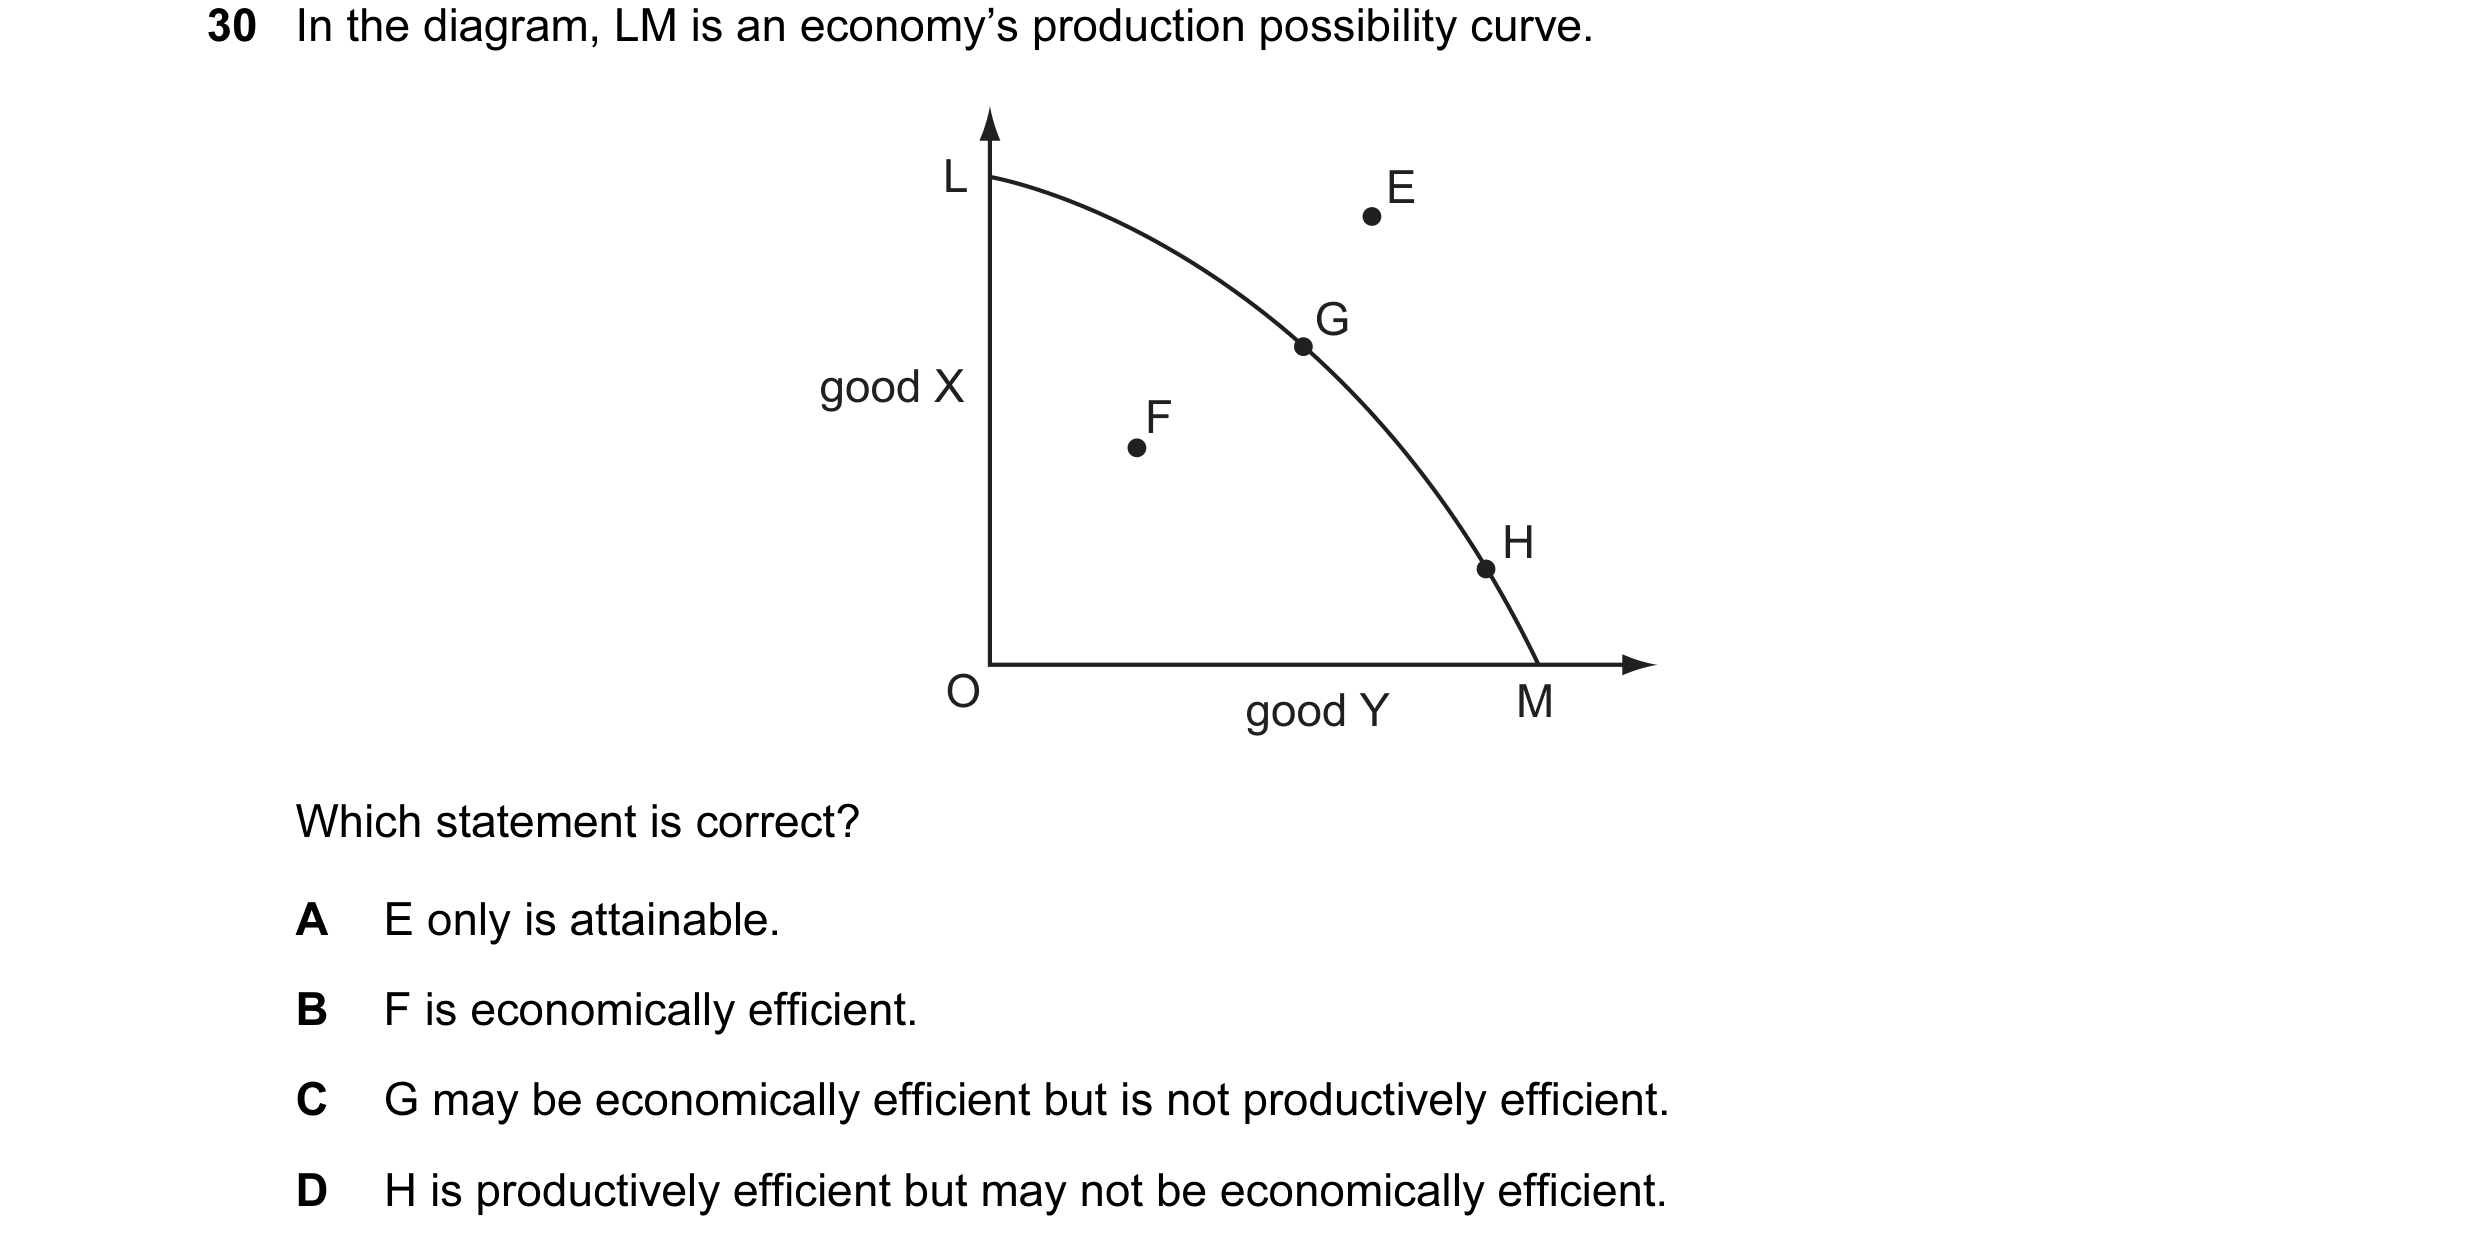
 3 / 10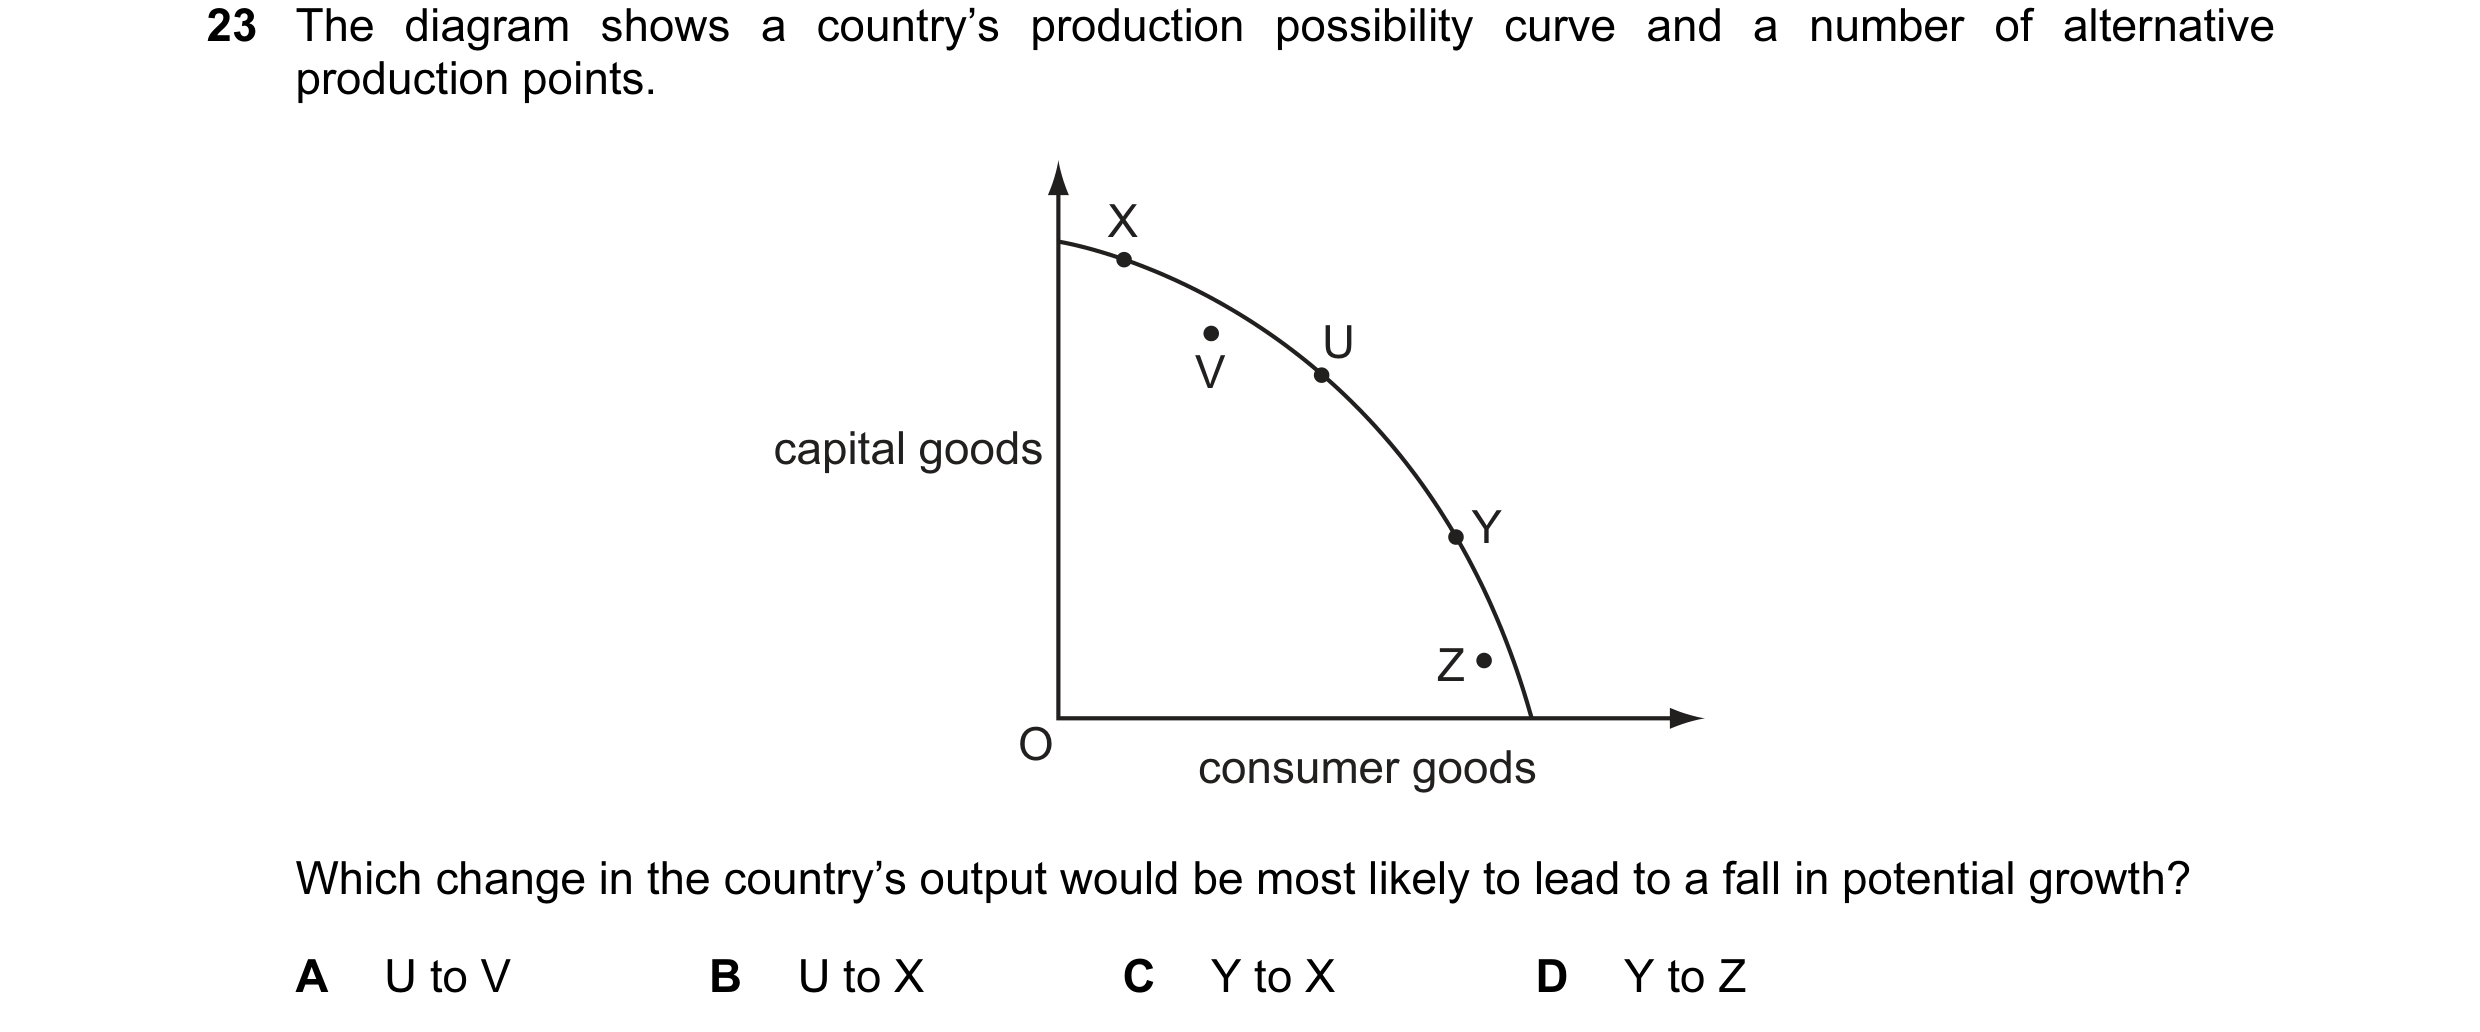
 4 / 10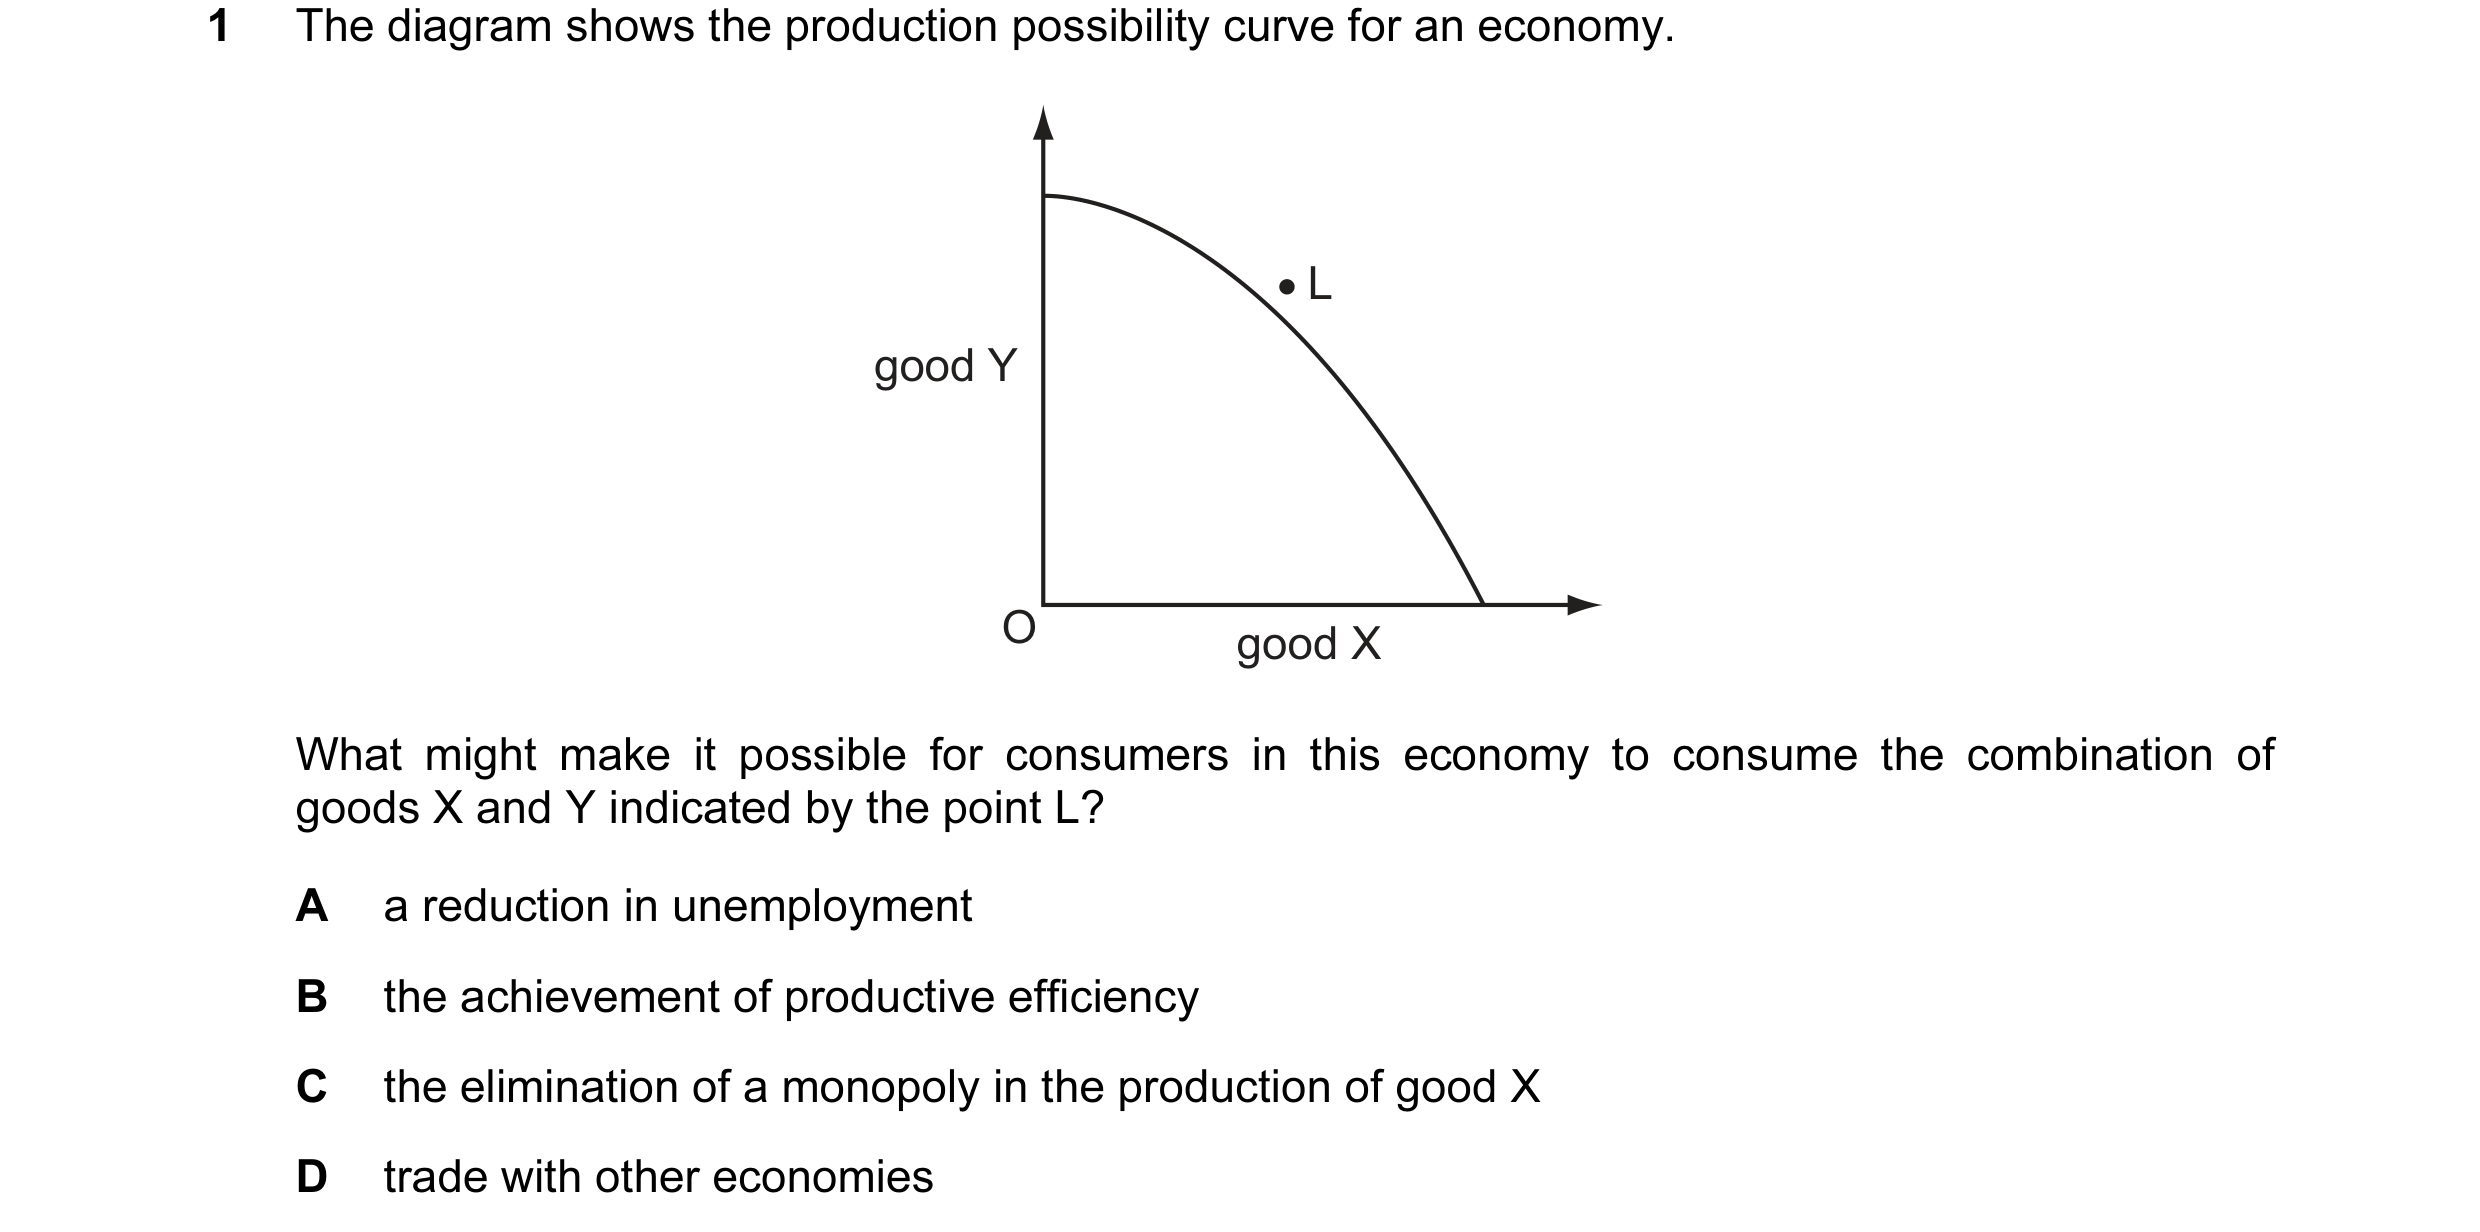
 5 / 10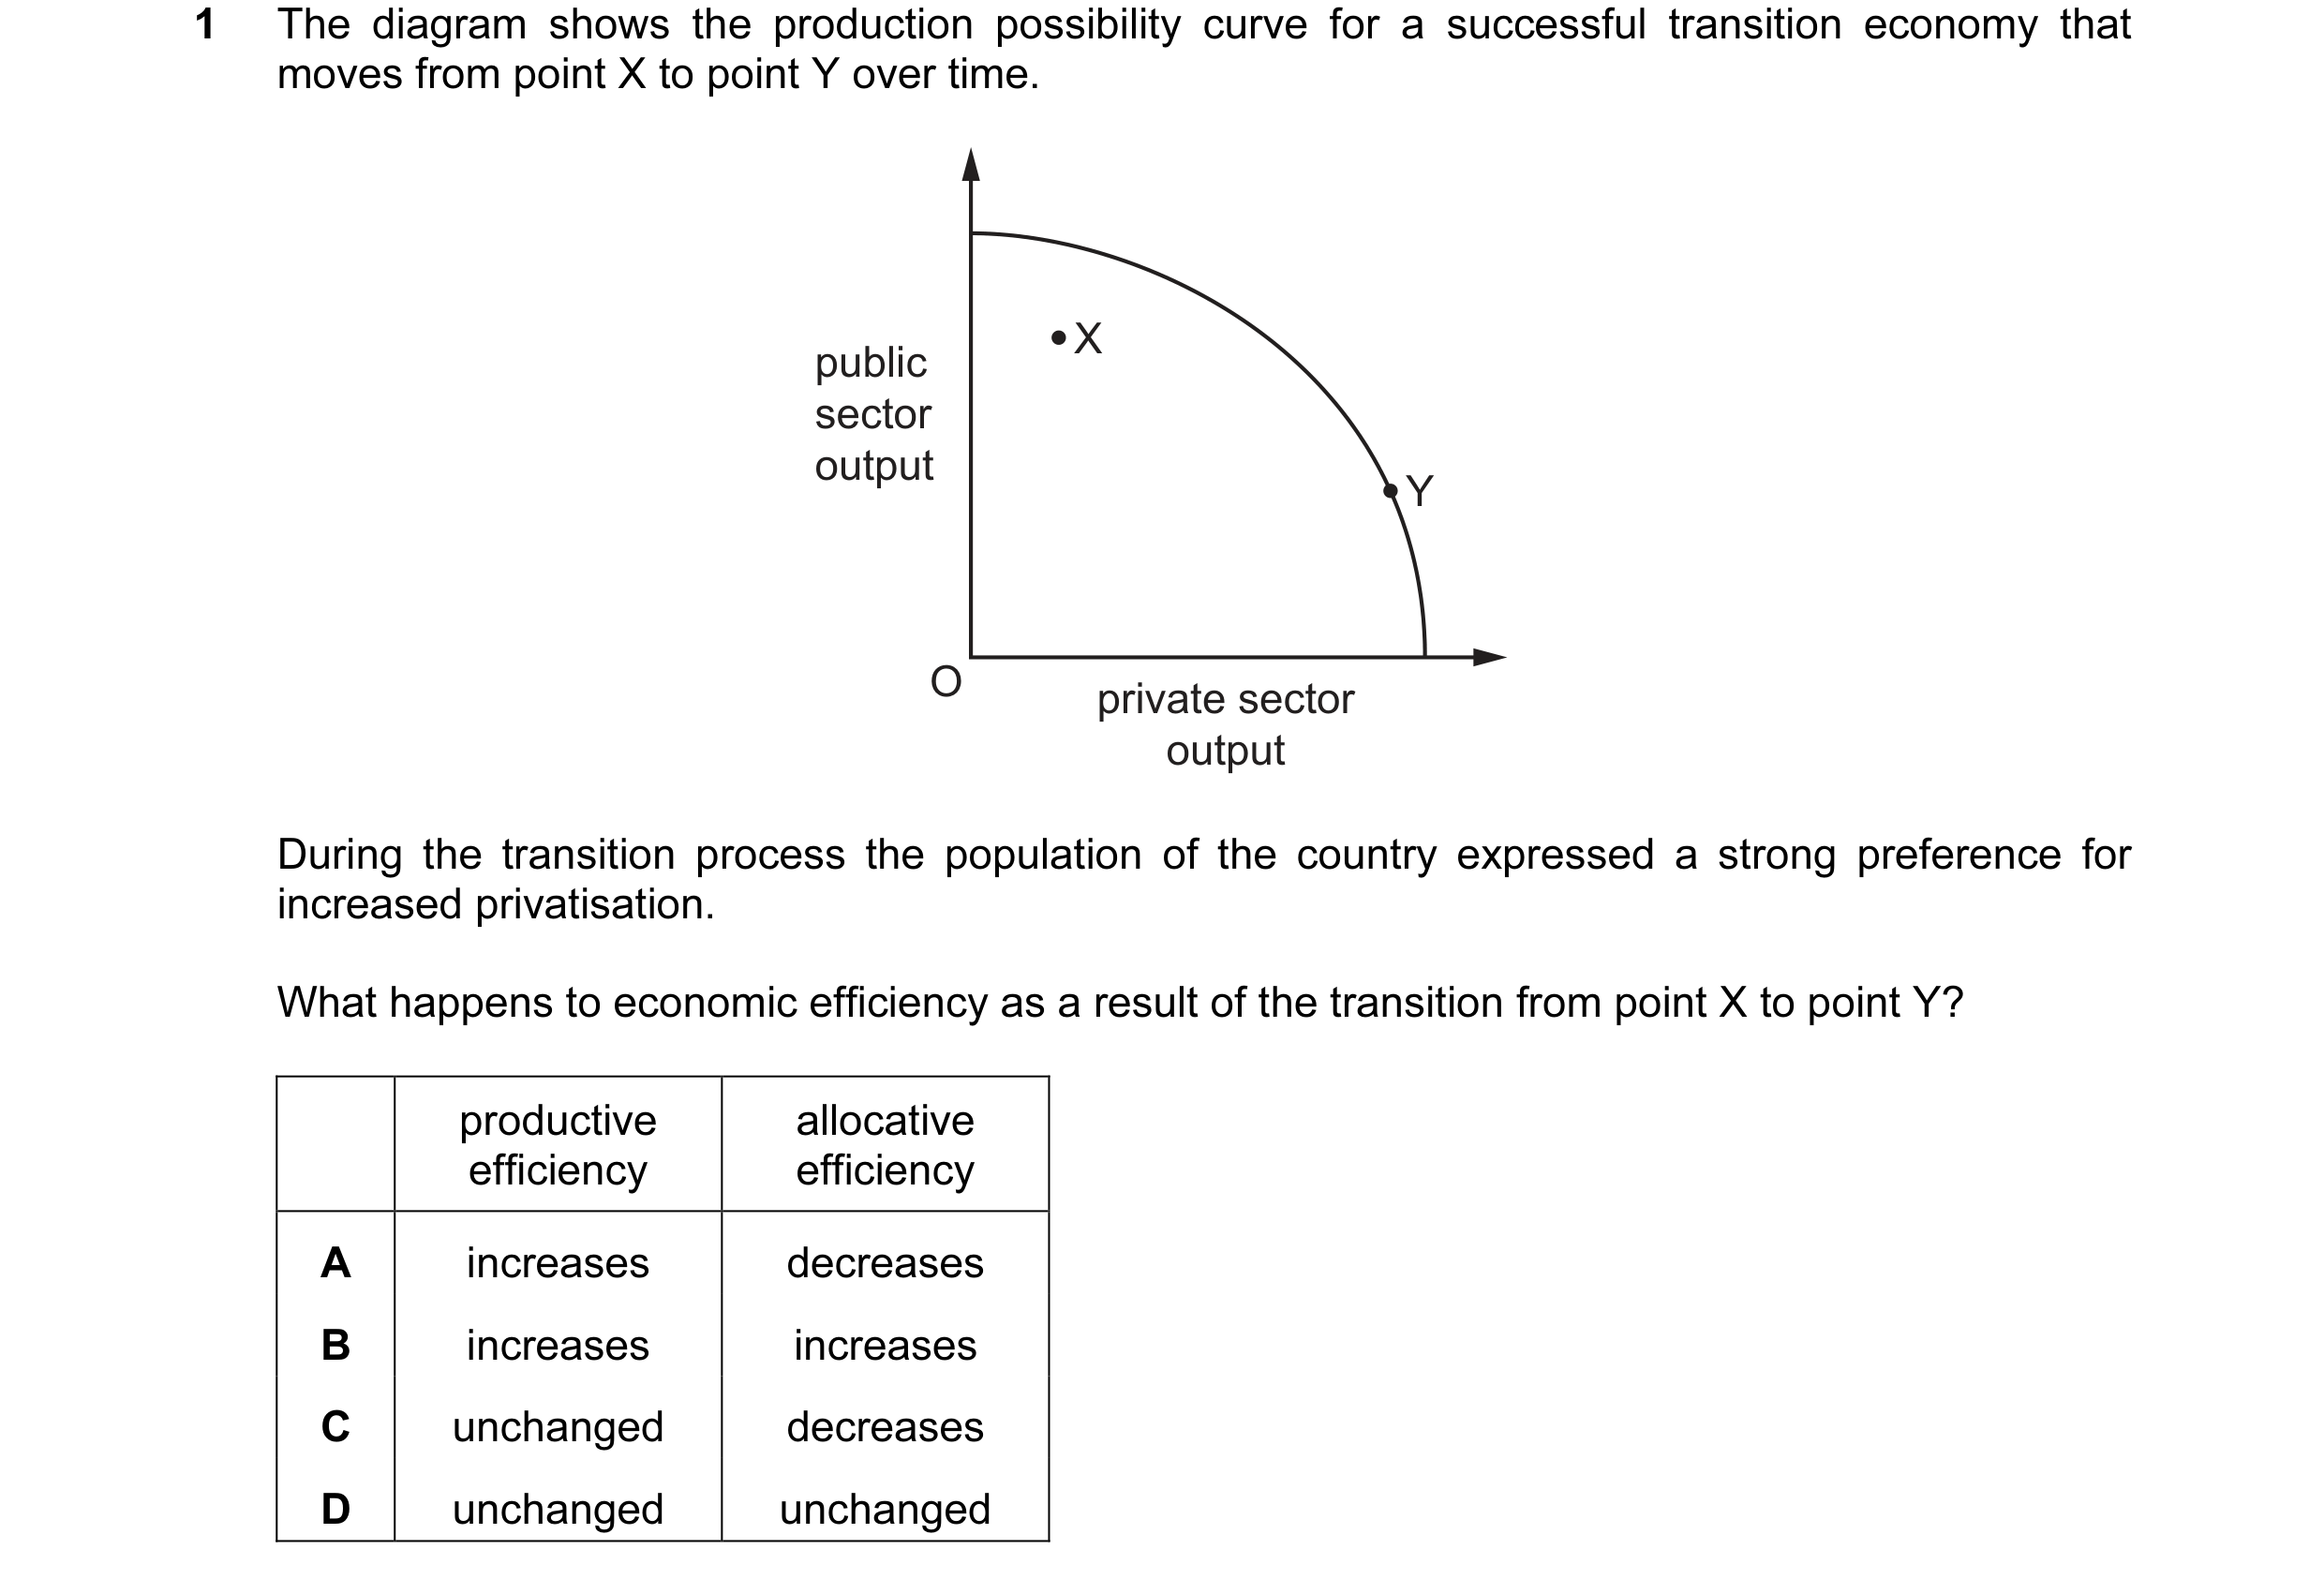
 6 / 10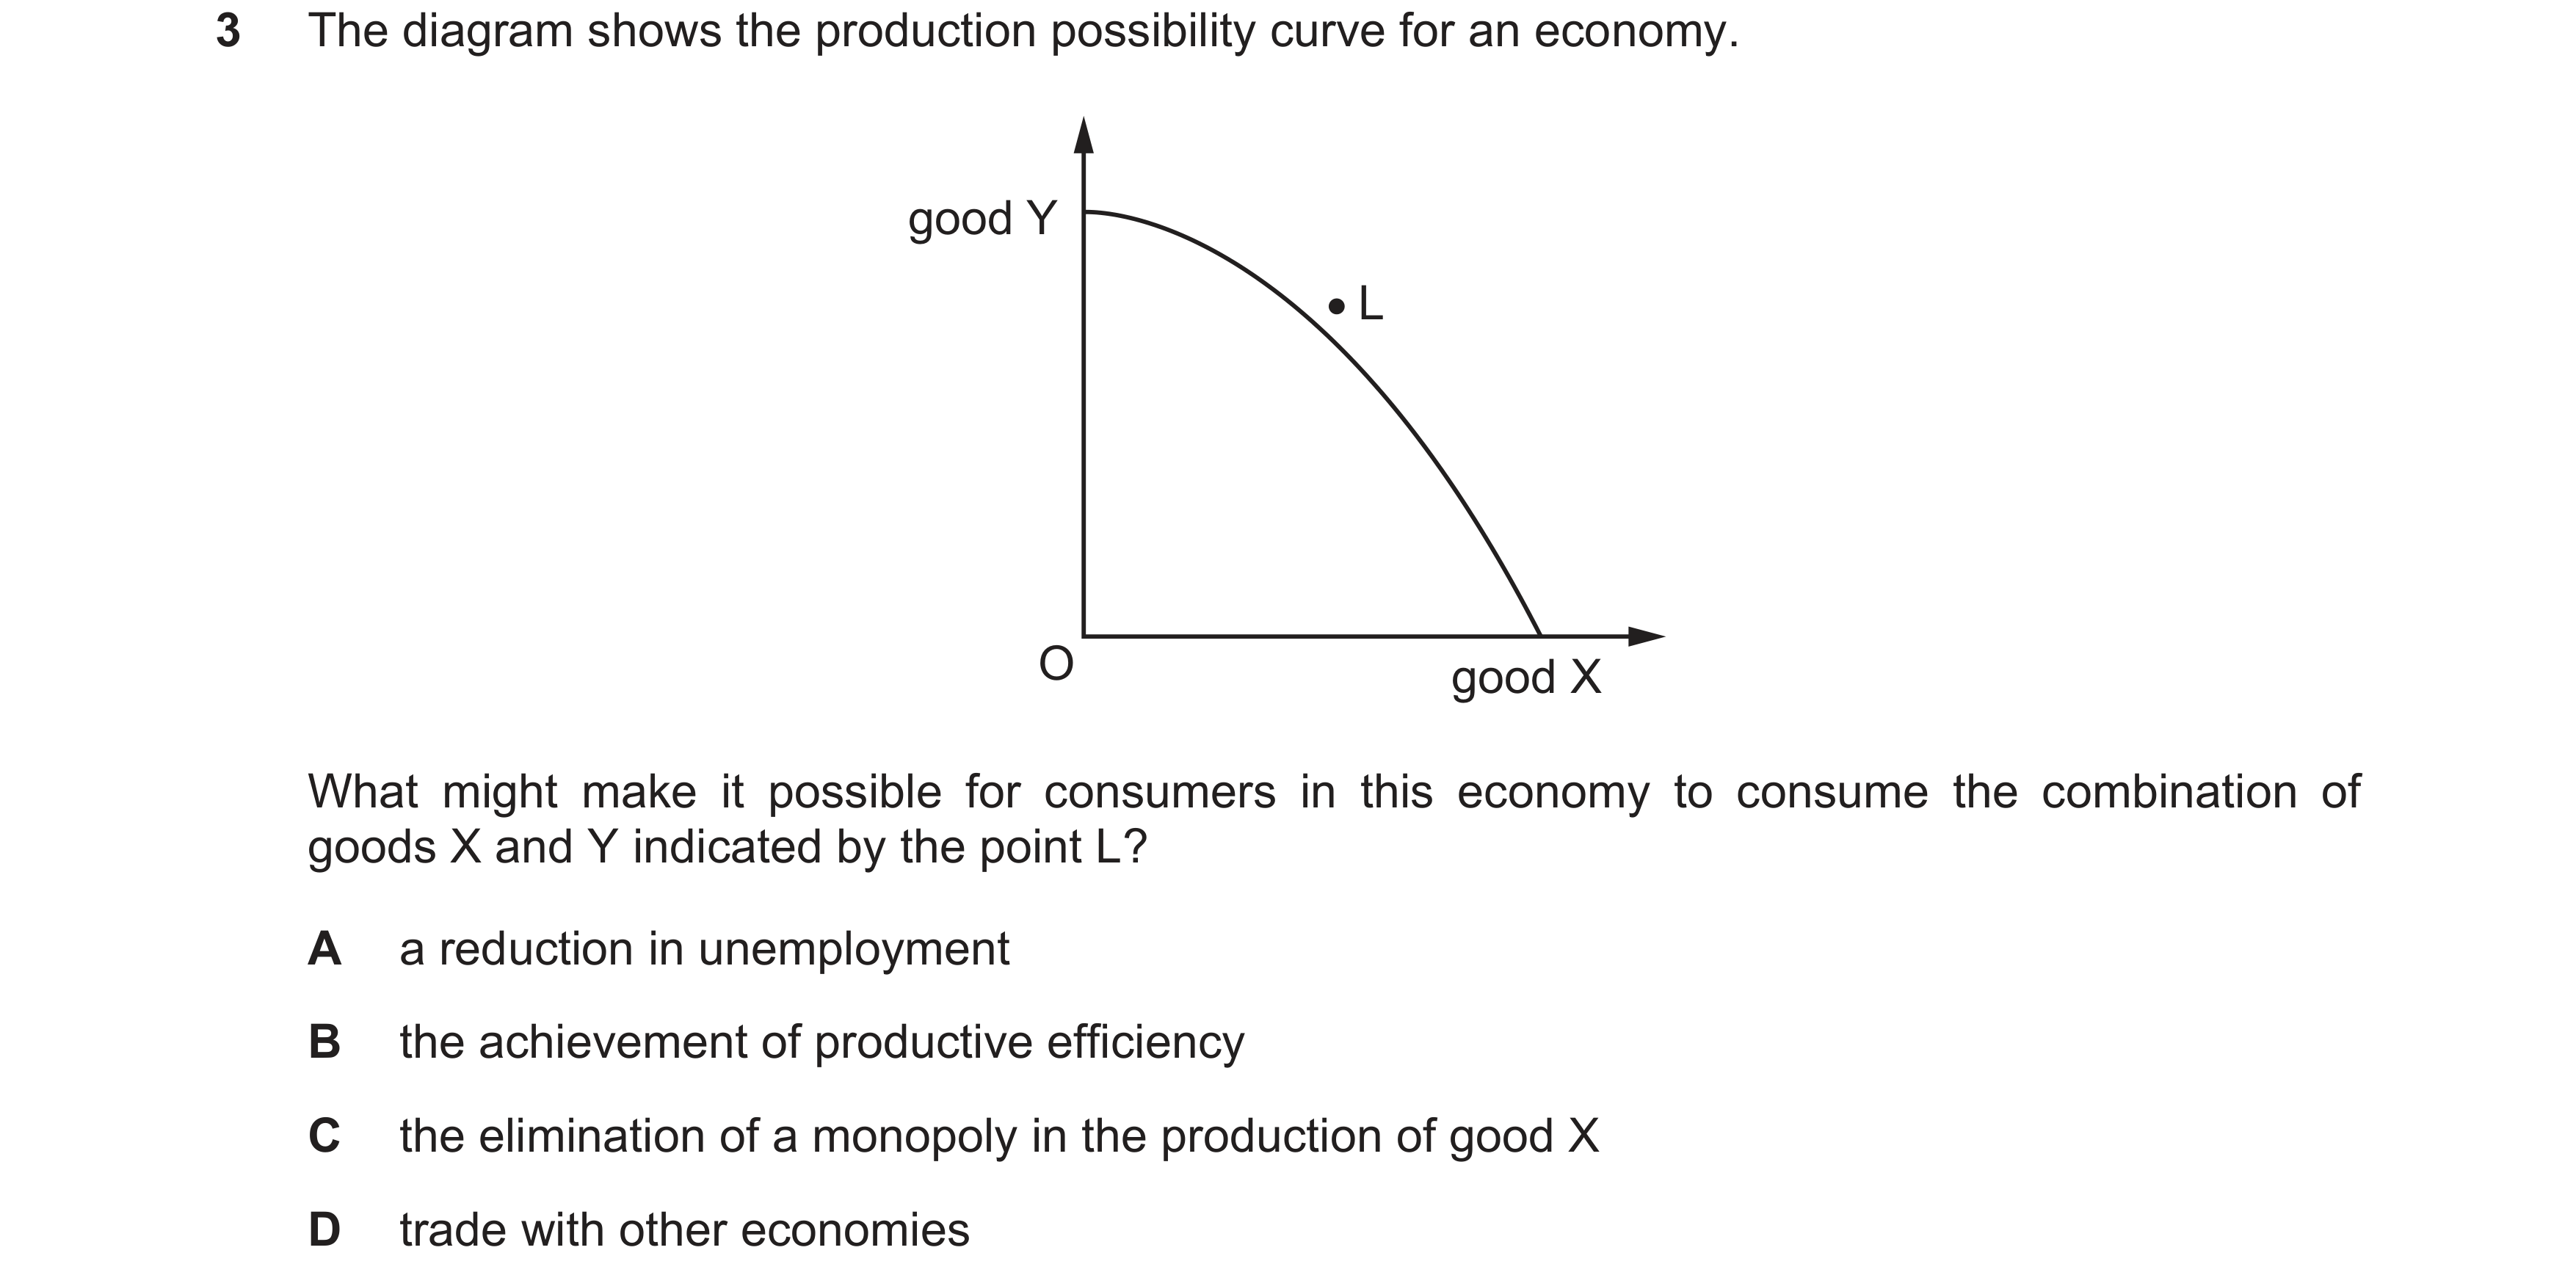
 7 / 10
 8 / 10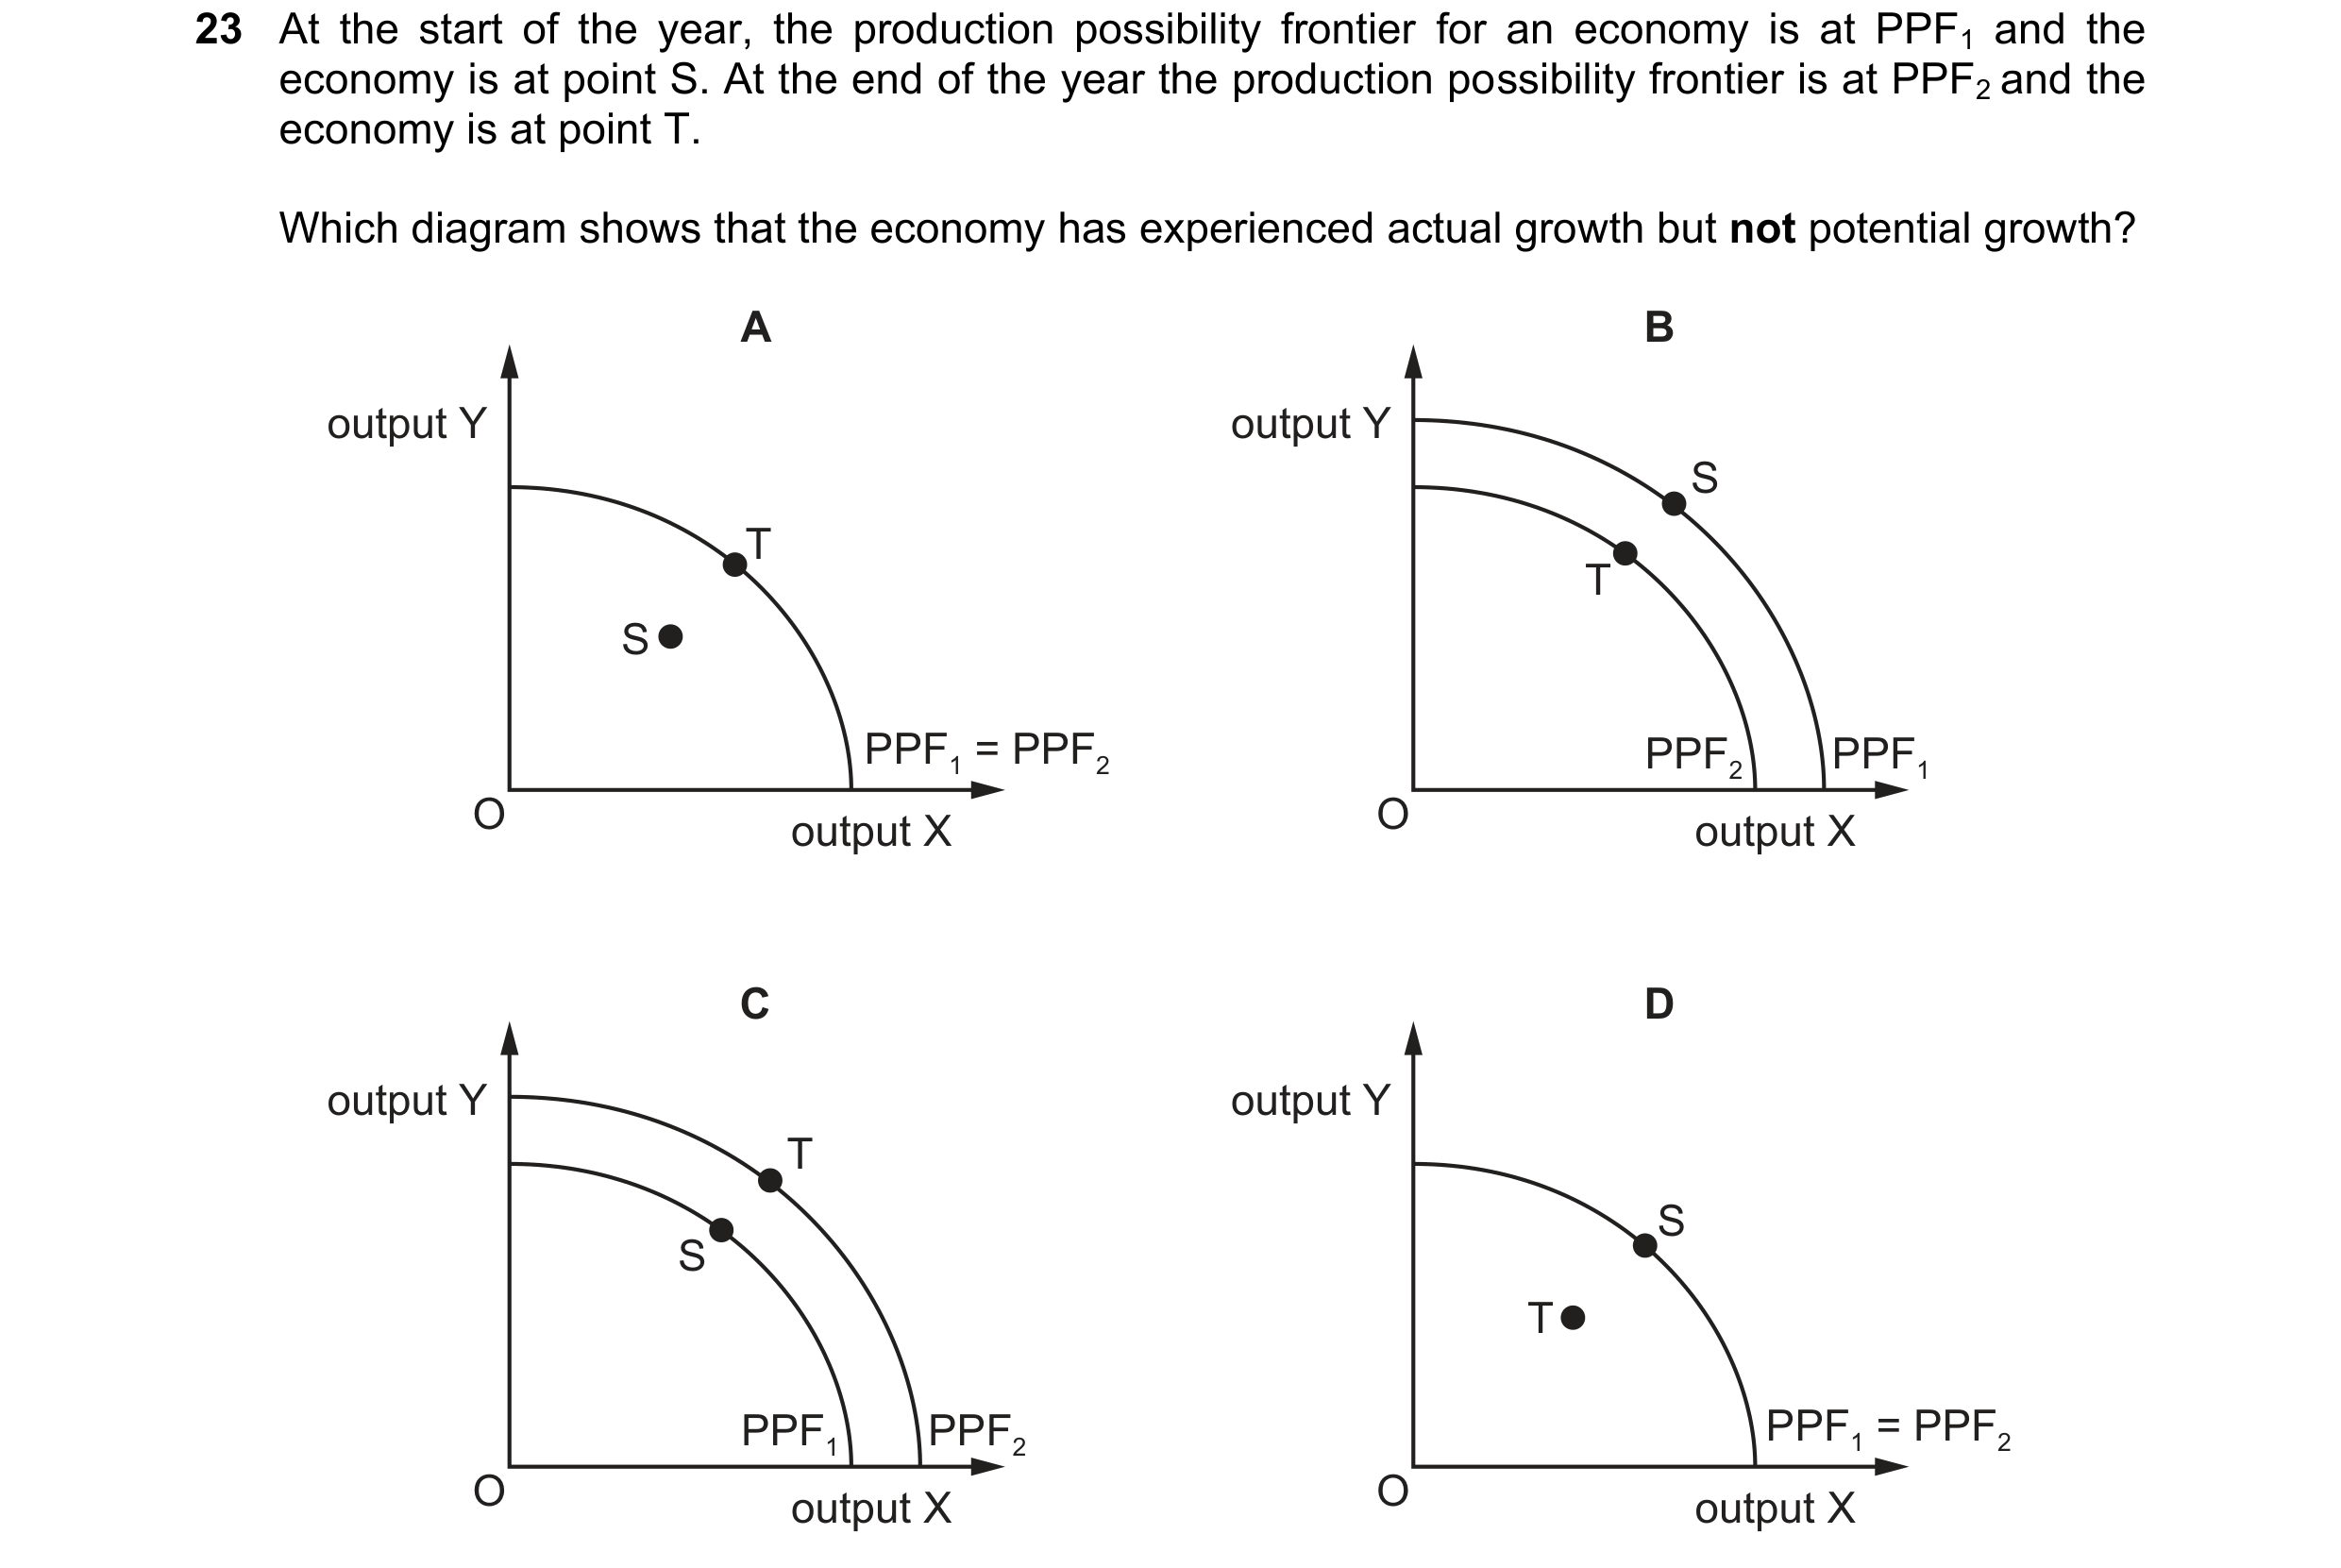
 9 / 10
 10 / 10