Questions as text
Q1 · What is not a possible cause of cost-push inflation? 9708/11 Oct/Nov 2006
26 What is not a possible cause of cost-push inflation? A an increase in firms’ profit margins B an increase in the supply of money C an increase in trade union power D an increase in world oil prices
1 marks
Answer: B
This question in 9708/11 Oct/Nov 2006
Q2 · What would be likely to increase inflation in an economy? 9708/11 May/June 2007
26 What would be likely to increase inflation in an economy? A an increase in consumer saving B an increase in interest rates C an increase in labour productivity D an increase in taxes on imports
1 marks
Answer: D
This question in 9708/11 May/June 2007
Q3 · Which combination is likely to result from demand-pull inflation? 9708/13 Oct/Nov 2011
23 Which combination is likely to result from demand-pull inflation? balance of trade profits A improving falling B improving rising C worsening falling D worsening rising
1 marks
Answer: D
This question in 9708/13 Oct/Nov 2011
Q4 · In 2008-9 American households reduced their consumption of domestic and imported goods… 9708/13 Oct/Nov 2011
24 In 2008-9 American households reduced their consumption of domestic and imported goods and used part of the money to pay back some of their debts. Which outcome could be consistent with this change? A a decline in the US trade deficit B a decrease in savings C a decrease in the US terms of trade D a decrease in unemployment
1 marks
Answer: A
This question in 9708/13 Oct/Nov 2011
Q5 · A country experienced a significant fall in unemployment but its inflation rate remained… 9708/11 May/June 2012
25 A country experienced a significant fall in unemployment but its inflation rate remained low. What could explain this? A Global competition prevented firms passing on higher costs. B Increased spending on imports had lowered the exchange rate. C There was a low level of spare capacity in the economy. D Wage rates had increased by more than labour productivity.
1 marks
Answer: A
This question in 9708/11 May/June 2012
Q6 · A country experienced a significant fall in unemployment but its inflation rate remained… 9708/12 May/June 2012
25 A country experienced a significant fall in unemployment but its inflation rate remained low. What could explain this? A Global competition prevented firms passing on higher costs. B Increased spending on imports had lowered the exchange rate. C There was a low level of spare capacity in the economy. D Wage rates had increased by more than labour productivity.
1 marks
Answer: A
This question in 9708/12 May/June 2012
Q7 · The table shows the number of workers and the annual output of an industry 9708/11 Oct/Nov 2012
23 The table shows the number of workers and the annual output of an industry. year 1 year 2 year 3 workers in 000s 120 130 100 output in $m 12.00 14.30 13.00 Which statement is correct? A Labour productivity increases in year 2 and in year 3. B Labour productivity increases in year 2 and then declines in year 3. C Labour productivity is at its highest in year 1. D Labour productivity is at its lowest in year 3.
1 marks
Answer: A
This question in 9708/11 Oct/Nov 2012
Q8 · The diagram shows the output of an economy 9708/13 May/June 2013
24 The diagram shows the output of an economy. AD AS price level P AD O Y real GDP What would be the effect of a decrease in net exports? aggregate price level real GDP supply A shift decrease unchanged B shift unchanged decrease C unchanged increase unchanged D unchanged unchanged decrease
1 marks
Answer: D
This question in 9708/13 May/June 2013
Q9 · The diagram shows the aggregate demand (AD) and short-run aggregate supply (SRAS) for an… 9708/11 Oct/Nov 2013
24 The diagram shows the aggregate demand (AD) and short-run aggregate supply (SRAS) for an economy with a price level OP. SRAS price P level AD O real output Which combination of events would definitely cause a rise in the general price level? world commodity domestic prices unemployment A decrease decrease B decrease increase C increase decrease D increase increase
1 marks
Answer: C
This question in 9708/11 Oct/Nov 2013
Q10 · The diagram illustrates what happens to aggregate demand (AD) and aggregate supply (AS)… 9708/12 Oct/Nov 2013
24 The diagram illustrates what happens to aggregate demand (AD) and aggregate supply (AS) in an economy during a year. AS general P1 price level P AD1 AD O Q Q1 real output What explains the rise in the general price level? A boom in consumer spending B higher taxes on company profits C reduction in government-financed projects D rising costs of raw materials
1 marks
Answer: A
This question in 9708/12 Oct/Nov 2013
Q11 · What would increase both demand-pull and cost-push inflation? 9708/12 Oct/Nov 2013
25 What would increase both demand-pull and cost-push inflation? A an appreciation of a country’s currency B an increase in the cost of borrowing C an increase in the level of its import tariffs D an increase in the price of oil
1 marks
Answer: C
This question in 9708/12 Oct/Nov 2013
Q12 · In the diagram, AD1 is an economy’s initial aggregate demand curve 9708/13 Oct/Nov 2013
23 In the diagram, AD1 is an economy’s initial aggregate demand curve. general price level AD2 AD1 O real output What could cause the curve to shift to AD2? A Businessmen have come to expect a lower rate of return on capital investment. B Domestic consumers have become more thrifty. C Exports have become more competitive in overseas markets. D The economy’s propensity to import has increased.
1 marks
Answer: C
This question in 9708/13 Oct/Nov 2013
Q13 · The diagram shows the macroeconomic equilibrium output and price level changing from Y… 9708/11 May/June 2014
24 The diagram shows the macroeconomic equilibrium output and price level changing from Y and P to Y1 and P1. AD LRAS AD1 price P level P1 AD AD1 O Y1 Y real output What could have caused this change? A a decrease in exports B a decrease in labour productivity C an increase in the government’s spending D an increase in the money supply
1 marks
Answer: A
This question in 9708/11 May/June 2014
Q14 · The diagram shows an economy’s aggregate demand curve and two short-run aggregate supply… 9708/12 May/June 2014
24 The diagram shows an economy’s aggregate demand curve and two short-run aggregate supply curves. SRAS1 SRAS2 price level AD O Y1 Y2 real output What could cause the change in real output from Y1 to Y2? A a decrease in bank lending B a decrease in world oil prices C an increase in indirect taxation D an increase in wage rates
1 marks
Answer: B
This question in 9708/12 May/June 2014
Q15 · A country experiences a significant appreciation in its foreign exchange rate 9708/13 May/June 2014
30 A country experiences a significant appreciation in its foreign exchange rate. Which statement correctly describes the most likely combination of effects? A Aggregate demand rises and international competitiveness falls. B Exporters’ profits rise and the terms of trade worsen. C Inflation falls and unemployment rises. D The current account deficit falls and production costs rise.
1 marks
Answer: C
This question in 9708/13 May/June 2014
Q16 · In the diagram AS1 is an economy’s long-run aggregate supply curve 9708/11 Oct/Nov 2014
24 In the diagram AS1 is an economy’s long-run aggregate supply curve. AS1 AS2 general price level O real GDP What will cause the aggregate supply curve to shift from AS1 to AS2? A an increase in consumer spending B an increase in inflation C an increase in net exports D an increase in productivity
1 marks
This question in 9708/11 Oct/Nov 2014
Q17 · The diagram, which shows part of the process that causes the aggregate demand curve to… 9708/12 Oct/Nov 2014
24 The diagram, which shows part of the process that causes the aggregate demand curve to slope downwards to the right, is incomplete. rate of interest … 1 … level of aggregate price consumption level rises … 3 … real value of savings … 2 … Which words correctly complete gaps 1, 2 and 3? 1 2 3 A falls falls falls B falls rises rises C rises falls falls D rises rises falls
1 marks
Answer: C
This question in 9708/12 Oct/Nov 2014
Q18 · Which economic change might contribute to both cost-push and demand-pull inflation? 9708/12 Oct/Nov 2014
28 Which economic change might contribute to both cost-push and demand-pull inflation? A a fall in the exchange rate B a fall in the interest rate C a rise in the productivity of industrial workers D an improvement in the terms of trade
1 marks
Answer: A
This question in 9708/12 Oct/Nov 2014
Q19 · People in an economy become more optimistic about the future 9708/13 Oct/Nov 2014
24 People in an economy become more optimistic about the future. This results in an increase in consumer expenditure which shifts the aggregate demand curve to the right, as shown. LRAS SRAS general price P1 level P AD1 AD O Y Y1 real GDP What could cause the economy’s output to return to Y? A a decrease in indirect taxes B a decrease in tariffs on imports C an increase in investment D an increase in wage rates
1 marks
Answer: D
This question in 9708/13 Oct/Nov 2014
Q20 · Why might an increase in a current account surplus cause inflation? 9708/13 Oct/Nov 2014
27 Why might an increase in a current account surplus cause inflation? A It will decrease aggregate supply. B It will decrease the money supply. C It will increase aggregate demand. D It will increase the exchange rate.
1 marks
Answer: C
This question in 9708/13 Oct/Nov 2014
Q21 · Aggregate demand in an economy may decrease as a result of an increase in A consumption… 9708/11 May/June 2015
24 Aggregate demand in an economy may decrease as a result of an increase in A consumption expenditure. B government expenditure. C import expenditure. D investment expenditure.
1 marks
Answer: C
This question in 9708/11 May/June 2015
Q22 · The diagram shows a shift in an economy’s aggregate demand curve from AD1 to AD2 9708/13 May/June 2015
24 The diagram shows a shift in an economy’s aggregate demand curve from AD1 to AD2. general price level AD2 AD1 O real output What could not be a cause of the shift? A a decrease in income tax B a decrease in the price of goods C an increase in money wage rates D an increase in the money supply
1 marks
Answer: B
This question in 9708/13 May/June 2015
Q23 · The diagram shows an economy’s aggregate demand and aggregate supply curves 9708/11 Oct/Nov 2015
24 The diagram shows an economy’s aggregate demand and aggregate supply curves. AS price level AD O output How are the curves likely to be affected by a natural disaster that destroys a large proportion of an economy’s resources? AD curve AS curve A shift to left shift to left B shift to left shift to right C shift to right shift to left D shift to right shift to right
1 marks
Answer: A
This question in 9708/11 Oct/Nov 2015
Q24 · The diagram shows the original aggregate demand curve, AD1, and the original aggregate… 9708/13 Oct/Nov 2015
24 The diagram shows the original aggregate demand curve, AD1, and the original aggregate supply curve, AS1. What will be the new equilibrium if there is a fall in the country’s exports and an increase in government subsidies to firms? AS3 AS1 A AS2 D X B price level C AD2 AD1 AD3 O real output
1 marks
Answer: C
This question in 9708/13 Oct/Nov 2015
Q25 · A government decided to reduce income tax and increase sales tax 9708/12 Feb/March 2016
19 A government decided to reduce income tax and increase sales tax. The initial equilibrium point is shown by X on the aggregate demand (AD) and aggregate supply (AS) diagram. What would be the equilibrium point after these tax changes? AS1 AS C AS2 price X B level D A AD2 AD AD1 O real output
1 marks
Answer: C
This question in 9708/12 Feb/March 2016
Q26 · An economy faces rising raw material costs and a fall in business confidence 9708/11 May/June 2016
19 An economy faces rising raw material costs and a fall in business confidence. How will the economy’s real GDP and the price level be affected? real GDP price level A it may rise or fall it will rise B it will fall it may rise or fall C it will fall it will fall D it will rise it may rise or fall
1 marks
Answer: B
This question in 9708/11 May/June 2016
Q27 · The diagram shows an aggregate demand curve (AD) 9708/11 May/June 2016
20 The diagram shows an aggregate demand curve (AD). Y AD O X What is measured on the horizontal (X) axis and the vertical (Y) axis? horizontal axis X vertical axis Y A money national output real disposable income B price level real GDP C real GDP price level D real disposable income money national output
1 marks
Answer: C
This question in 9708/11 May/June 2016
Q28 · In 2012, high street shops reported a fall in sales as domestic demand in an economy fell 9708/12 May/June 2016
19 In 2012, high street shops reported a fall in sales as domestic demand in an economy fell. However, the impact on the overall economy was not as unfavourable as was first feared. What might have lessened the impact on the economy? A Exports increased. B Imports increased. C Savings increased. D Taxes increased.
1 marks
Answer: A
This question in 9708/12 May/June 2016
Q29 · In the diagram AD1 and AD2 are aggregate demand curves for an economy 9708/13 May/June 2016
19 In the diagram AD1 and AD2 are aggregate demand curves for an economy. price level AD1 AD2 O output What could cause an economy’s aggregate demand to shift from AD1 to AD2? A Consumers spend more. B Interest rates rise. C More output is sent abroad as exports. D The government switches expenditure from roads to hospitals.
1 marks
Answer: B
This question in 9708/13 May/June 2016
Q30 · The diagram shows aggregate supply curves and aggregate demand curves for an economy 9708/11 Oct/Nov 2016
19 The diagram shows aggregate supply curves and aggregate demand curves for an economy. SRAS1 SRAS2 price X level Y AD2 AD1 O real output What is most likely to cause the equilibrium position to move from X to Y? A a decrease in corporation tax and a decrease in labour productivity B a decrease in interest rates and a decrease in electricity prices C an increase in interest rates and an increase in raw material costs D an increase in marginal tax rates and a decrease in labour productivity
1 marks
Answer: B
This question in 9708/11 Oct/Nov 2016
Q31 · Which government policy will increase aggregate demand? 9708/11 Oct/Nov 2016
28 Which government policy will increase aggregate demand? A raising indirect taxation B reducing the budget surplus C removing domestic subsidies D removing import quotas
1 marks
Answer: B
This question in 9708/11 Oct/Nov 2016
Q32 · A government plans to increase spending on education and training every year 9708/12 Oct/Nov 2016
19 A government plans to increase spending on education and training every year. Which diagram shows the likely effect of this increase on the economy’s long-run output and price level? A B LRAS1 LRAS1 LRAS2 price price level P2 level P1 P1 P2 AD1 AD2 AD1 O Y1 O Y1 Y2 real output real output C D LRAS1 LRAS2 LRAS2 LRAS1 price price level level P2 P1 P1 P2 AD1 AD2 AD2 AD1 O Y1 Y2 O Y2 Y1 real output real output
1 marks
Answer: C
This question in 9708/12 Oct/Nov 2016
Q33 · The diagram shows the original aggregate demand AD1 and aggregate supply LRAS1 for an… 9708/13 Oct/Nov 2016
19 The diagram shows the original aggregate demand AD1 and aggregate supply LRAS1 for an economy. LRAS1 LRAS2 price level AD2 AD1 O real GDP What could explain the shifts in aggregate demand to AD2 and aggregate supply to LRAS2? A an increase in government expenditure on health and education B an increase in government expenditure on pensions C an increase in income tax D an increase in interest rates
1 marks
Answer: A
This question in 9708/13 Oct/Nov 2016
Q34 · How does a rise in the price of factors of production affect the aggregate supply (AS)… 9708/12 Feb/March 2017
19 How does a rise in the price of factors of production affect the aggregate supply (AS) curve? A a move left along the AS curve B a move right along the AS curve C a shift to the left of the AS curve D a shift to the right of the AS curve
1 marks
Answer: C
This question in 9708/12 Feb/March 2017
Q35 · In the diagram, AD1 is an economy’s initial aggregate demand curve 9708/12 Feb/March 2017
20 In the diagram, AD1 is an economy’s initial aggregate demand curve. price level AD2 AD1 O output What could cause the curve to shift to AD2? A a decrease in real wages B an appreciation of the currency C an increase in the money supply D an increase in the price level
1 marks
Answer: C
This question in 9708/12 Feb/March 2017
Q36 · The diagram shows four possible aggregate supply curves and an equilibrium point X 9708/12 Feb/March 2017
30 The diagram shows four possible aggregate supply curves and an equilibrium point X. A government employs deflationary fiscal policy in order to reduce the rate of inflation in its economy. This shifts aggregate demand to AD2. With which AS curve would this policy be least effective? A B C price D level X AD1 AD2 O national income
1 marks
Answer: D
This question in 9708/12 Feb/March 2017
Q37 · In a closed economy a rise in aggregate demand is needed to increase output in the country 9708/11 May/June 2017
19 In a closed economy a rise in aggregate demand is needed to increase output in the country. What is necessary to achieve this increase in output in the economy? A enough capacity to produce the extra goods and services demanded B free trade to allow imports to make up any shortages in supply C government spending to be less than tax revenue D reduced credit to lower inflation
1 marks
Answer: A
This question in 9708/11 May/June 2017
Q38 · The diagram shows the long-run aggregate supply (LRAS) curve of an economy 9708/11 May/June 2017
20 The diagram shows the long-run aggregate supply (LRAS) curve of an economy. At which equilibrium level of national income is a balance of trade surplus likely to cause the greatest inflationary increase for the economy? price LRAS level O A B C D real national income
1 marks
Answer: D
This question in 9708/11 May/June 2017
Q39 · The diagram shows a shift in the aggregate demand curve of an economy from AD1 to AD2 9708/12 May/June 2017
19 The diagram shows a shift in the aggregate demand curve of an economy from AD1 to AD2. price level AD2 AD1 O real national income What could have caused this shift? A an increase in expenditure on imports B an increase in government tax rates C an increase in the international trade deficit D an increase in the money supply
1 marks
Answer: D
This question in 9708/12 May/June 2017
Q40 · The government of a country plans to raise income tax rates 9708/12 May/June 2017
28 The government of a country plans to raise income tax rates. The initial equilibrium for the country is represented by point X on the diagram. Which new equilibrium point would an economist predict as the result? price AS1 level A AS2 X B D AD3 C AD1 AD2 O real national income
1 marks
Answer: D
This question in 9708/12 May/June 2017
Q41 · From the initial position of equilibrium shown, there is an increase in government… 9708/13 May/June 2017
19 From the initial position of equilibrium shown, there is an increase in government expenditure on goods and services and simultaneously a reduction in the overall efficiency in the production of goods and services. full employment price AS level AD O real output What best describes the likely impact on the economy? equilibrium level equilibrium level of national income of prices A falls uncertain B no change no change C rises rises D uncertain rises
1 marks
Answer: D
This question in 9708/13 May/June 2017
Q42 · What does an aggregate demand curve show? 9708/13 May/June 2017
20 What does an aggregate demand curve show? A the level of aggregate demand corresponding to different levels of aggregate supply B the aggregate output demanded corresponding to different average price levels C the equilibrium price level corresponding to different levels of aggregate expenditure D the equilibrium level of income corresponding to different levels of aggregate expenditure
1 marks
Answer: B
This question in 9708/13 May/June 2017
Q43 · In its recent budget a government increased defence expenditure and the amount spent on… 9708/11 Oct/Nov 2017
19 In its recent budget a government increased defence expenditure and the amount spent on training to increase the productivity of the workforce. The initial equilibrium point is shown by X on the aggregate demand, AD, and aggregate supply, AS, diagram. What would be the equilibrium point after these changes? AS3 AS1 B price level AS2 X A C D AD3 AD1 AD2 O real output
1 marks
Answer: C
This question in 9708/11 Oct/Nov 2017
Q44 · The government of a country plans to cut income tax rates 9708/11 Oct/Nov 2017
28 The government of a country plans to cut income tax rates. The initial equilibrium for the country is represented by point X on the diagram. Which new equilibrium point would an economist predict as the result? AS2 price A AS1 level B D X C AD3 AD1 AD2 O real national income
1 marks
Answer: B
This question in 9708/11 Oct/Nov 2017
Q45 · In its recent budget a government reduced total expenditure while increasing the amount… 9708/12 Oct/Nov 2017
19 In its recent budget a government reduced total expenditure while increasing the amount spent on training to increase the productivity of the workforce. The initial equilibrium point is shown by X on the aggregate demand (AD) and aggregate supply (AS) diagram. What would be the equilibrium point after these changes? AS3 AS1 price level C AS2 X B D A AD3 AD1 AD2 O real output
1 marks
Answer: A
This question in 9708/12 Oct/Nov 2017
Q46 · The diagram shows four possible aggregate supply curves and an equilibrium point X 9708/12 Oct/Nov 2017
30 The diagram shows four possible aggregate supply curves and an equilibrium point X. A government employs deflationary fiscal policy in order to reduce the rate of inflation in its economy. This shifts aggregate demand to AD2. With which AS curve would this policy be most effective? A B C price D level X AD1 AD2 O national income
1 marks
Answer: A
This question in 9708/12 Oct/Nov 2017
Q47 · The diagram shows changes in aggregate demand and aggregate supply that have resulted in… 9708/13 Oct/Nov 2017
19 The diagram shows changes in aggregate demand and aggregate supply that have resulted in a move from equilibrium point X to equilibrium point Y. SRAS2 SRAS1 price level Y X AD1 AD2 O real output Which combination of events could have caused this change? A higher interest rates and the discovery of new natural resources B increased consumer confidence and reduced raw material prices C less business confidence and higher indirect taxes D lower exchange rate and net outward migration
1 marks
Answer: D
This question in 9708/13 Oct/Nov 2017
Q48 · An aggregate demand curve slopes downwards from left to right 9708/12 Feb/March 2018
19 An aggregate demand curve slopes downwards from left to right. One reason for this is that a reduction in the average price level will lead to A a decline in the country’s international competitiveness. B an increase in interest rates. C an increase in the real value of money balances. D the expectation of further price falls.
1 marks
Answer: C
This question in 9708/12 Feb/March 2018
Q49 · In the diagram an economy is initially in equilibrium at point X 9708/12 Feb/March 2018
20 In the diagram an economy is initially in equilibrium at point X. The government increases spending on education. This coincides with an increase in wage rate inflation. Which point shows the most likely short-run equilibrium of the economy? SRAS2 C SRAS price level D B SRAS1 A X AD1 AD AD2 O real output
1 marks
Answer: C
This question in 9708/12 Feb/March 2018
Q50 · In its 2016 budget statement, the South African government proposed stimulating business… 9708/11 May/June 2018
19 In its 2016 budget statement, the South African government proposed stimulating business activity by the removal of regulations. It also announced that government expenditure was expected to grow by 7.1%. The diagram shows aggregate demand (AD) and aggregate supply (AS) for the South African economy. X is the original equilibrium point. Which new equilibrium would result from the changes? price AS level B A X C D AD O real GDP
1 marks
Answer: C
This question in 9708/11 May/June 2018
Q51 · The diagram shows short-run aggregate supply and demand in an economy, where the initial… 9708/12 May/June 2018
19 The diagram shows short-run aggregate supply and demand in an economy, where the initial equilibrium is at S. SRAS3 price level SRAS1 SRAS2 T S AD2 AD1 AD3 O real output What is most likely to cause a movement from S to T? A an increase in consumer expenditure and an increase in productivity B an increase in consumer expenditure and a reduction in imports C an increase in education and training and an increase in income tax D an increase in the exchange rate and a reduction in corporation tax
1 marks
Answer: B
This question in 9708/12 May/June 2018
Q52 · What is both a valid statement and consistent with the features of the diagram? 9708/13 May/June 2018
19 What is both a valid statement and consistent with the features of the diagram? AS price level AD O real output A AS cannot be increased beyond some level of real output. B Consumption is a component of AD and is lower when the general level of prices is lower. C Investment is a component of AS and is independent of the general level of prices. D The greater the demand for a country’s exports, the lower will be AD.
1 marks
Answer: A
This question in 9708/13 May/June 2018
Q53 · The diagram shows an economy’s aggregate supply curve 9708/11 Oct/Nov 2018
20 The diagram shows an economy’s aggregate supply curve. price AS level O output What is likely to cause the curve to shift to the left? A an increase in investment due to a reduction in interest rates B an increase in the marginal rate of income tax C improvements in technology D schemes to increase the geographical mobility of labour
1 marks
Answer: B
This question in 9708/11 Oct/Nov 2018
Q54 · The diagram shows a shift in the aggregate demand curve, from AD1 to AD2 9708/12 Oct/Nov 2018
19 The diagram shows a shift in the aggregate demand curve, from AD1 to AD2. price level AD2 AD1 O real output What might have caused this shift? A a fall in the budget surplus B a fall in the trade surplus C a rise in imports D a rise in the interest rate
1 marks
Answer: A
This question in 9708/12 Oct/Nov 2018
Q55 · Between June and the end of July 2016 the UK pound sterling depreciated by 11% against a… 9708/12 Oct/Nov 2018
21 Between June and the end of July 2016 the UK pound sterling depreciated by 11% against a basket of currencies of the UK’s major trading partners. The diagram shows the original aggregate demand curve AD1 and the original aggregate supply curve AS1 for the UK economy before June 2016. The equilibrium is at X. What will be the new equilibrium for the UK economy as a result of the depreciation of the pound sterling? price level AS1 A B X D C AD1 O real output
1 marks
Answer: A
This question in 9708/12 Oct/Nov 2018
Q56 · An economy has an equilibrium level of real output Y, but wishes to move towards its full… 9708/13 Oct/Nov 2018
19 An economy has an equilibrium level of real output Y, but wishes to move towards its full employment level of real output YFE. price AS level AD O Y YFE real output Which combination of policy measures is most likely to achieve this wish without high inflation? A decreasing interest rates and raising investment in new technology B decreasing the money supply and raising corporation tax rates C increasing interest rates and raising income tax thresholds D increasing the money supply and raising welfare benefit payments
1 marks
Answer: A
This question in 9708/13 Oct/Nov 2018
Q57 · In the diagram, AD1 and AS are an economy’s original aggregate demand and aggregate… 9708/13 Oct/Nov 2018
20 In the diagram, AD1 and AS are an economy’s original aggregate demand and aggregate supply curves. price AS level AD2 AD1 O real output What will cause the aggregate demand curve to shift to AD2? A an appreciation of the currency B an increase in the money supply C an increase in the price level D an increase in the real wage
1 marks
Answer: A
This question in 9708/13 Oct/Nov 2018
Q58 · The diagram shows an aggregate supply curve, and aggregate demand curves 9708/12 Feb/March 2019
23 The diagram shows an aggregate supply curve, and aggregate demand curves. AS price level AD1 AD2 O national income What would cause a decrease in aggregate demand from AD1 to AD2? A an increase in income tax B an increase in the price of electricity C an increase in the tax on goods D an increase in wage rates
1 marks
Answer: A
This question in 9708/12 Feb/March 2019
Q59 · The diagram shows aggregate demand (AD) and aggregate supply (AS) in an economy 9708/12 Feb/March 2019
27 The diagram shows aggregate demand (AD) and aggregate supply (AS) in an economy. The initial equilibrium is at point E. AS1 AS W AS2 price P1 level E P X P2 AD O national output What causes shifts in the aggregate supply curve from AS to AS1 and from AS to AS2? shift from AS to AS1 shift from AS to AS2 A change in AD from E to W change in AD from E to X B increase in price level from P to P1 decrease in price level from P to P2 C increase in productivity of capital fall in the returns to capital D shortages of skilled labour improvements in training of workforce
1 marks
Answer: D
This question in 9708/12 Feb/March 2019
Q60 · The diagram shows aggregate demand and aggregate supply curves for an economy 9708/11 May/June 2019
19 The diagram shows aggregate demand and aggregate supply curves for an economy. general AS price level AD AD1 O national output What would cause a change in the aggregate demand from AD to AD1? A a decrease in the budget surplus B consumption of domestic instead of foreign goods C government campaigns to encourage household savings D investment in knowledge-based enterprises
1 marks
Answer: C
This question in 9708/11 May/June 2019
Q61 · What would cause a shift in the short-run aggregate supply curve but not the long-run… 9708/11 May/June 2019
20 What would cause a shift in the short-run aggregate supply curve but not the long-run aggregate supply curve? A advances in technology B a change in the money wage rate C emigration of people of working age D gross investment exceeding depreciation
1 marks
Answer: B
This question in 9708/11 May/June 2019
Q62 · The diagram shows aggregate supply and aggregate demand curves for an economy 9708/11 May/June 2019
24 The diagram shows aggregate supply and aggregate demand curves for an economy. general SRAS1 price level SRAS2 X Y AD2 AD1 O real output What would cause a movement from X to Y? A a decrease in income tax and in the cost of production B a decrease in interest rates and increase in the cost of production C an increase in income tax and in the cost of production D an increase in interest rates and decrease in the cost of production
1 marks
Answer: A
This question in 9708/11 May/June 2019
Q63 · How can a change in consumption that increases unemployment be illustrated on an… 9708/12 May/June 2019
20 How can a change in consumption that increases unemployment be illustrated on an aggregate demand and aggregate supply diagram? effect on the aggregate demand curve effect on the aggregate supply curve A movement down the demand curve shift outwards B movement up the demand curve shift inwards C shift inwards movement down the supply curve D shift inwards movement up the supply curve
1 marks
Answer: C
This question in 9708/12 May/June 2019
Q64 · What is assumed to be constant when drawing an aggregate demand curve? 9708/12 May/June 2019
23 What is assumed to be constant when drawing an aggregate demand curve? A government tax revenue B interest rates C the level of unemployment D the money supply
1 marks
Answer: D
This question in 9708/12 May/June 2019
Q65 · An economy is currently in the position PY shown on the diagram 9708/12 May/June 2019
29 An economy is currently in the position PY shown on the diagram. SRAS price level P AD O Y real GDP Which short-run effects is government spending on education likely to have on unemployment and inflation? unemployment inflation A fall fall B fall rise C rise fall D rise rise
1 marks
Answer: B
This question in 9708/12 May/June 2019
Q66 · The diagram illustrates what happens to aggregate demand (AD) and aggregate supply (AS)… 9708/13 May/June 2019
18 The diagram illustrates what happens to aggregate demand (AD) and aggregate supply (AS) in an economy during a year. AS general price level P1 P AD1 AD O Q Q1 real output What explains the rise in the general price level? A boom in consumer spending B higher taxes on company profits C reduction in government-financed projects D rising costs of raw materials
1 marks
Answer: A
This question in 9708/13 May/June 2019
Q67 · Australia’s aggregate demand decreased over the last year 9708/13 May/June 2019
22 Australia’s aggregate demand decreased over the last year. What might have been the cause of this? A a reduction in consumer saving B a reduction in direct taxes C a reduction in imports D a reduction in investment
1 marks
Answer: D
This question in 9708/13 May/June 2019
Q68 · An increase in what will shift the aggregate demand curve in an economy to the right? 9708/13 May/June 2019
27 An increase in what will shift the aggregate demand curve in an economy to the right? A budget deficit B consumer savings C general price level D interest rate
1 marks
Answer: A
This question in 9708/13 May/June 2019
Q69 · How will an increase in government spending on infrastructure affect aggregate demand and… 9708/11 Oct/Nov 2019
20 How will an increase in government spending on infrastructure affect aggregate demand and aggregate supply? aggregate demand aggregate supply A decreases increases B increases decreases C increases increases D stays the same increases
1 marks
Answer: C
This question in 9708/11 Oct/Nov 2019
Q70 · The diagrams show a country’s aggregate demand (AD1) and aggregate supply (AS1) curves 9708/11 Oct/Nov 2019
24 The diagrams show a country’s aggregate demand (AD1) and aggregate supply (AS1) curves. Since the world economic downturn (2007–2008) some governments have reduced labour costs and ensured interest rates remained unchanged. How would this most likely be shown on a diagram? A B AS1 AS1 price price AS2 level level P1 P1 P2 P2 AD1 AD1 AD2 O real GDP O real GDP C D AS2 AS1 price price AS1 level level P2 P2 P1 P1 AD1 AD2 AD1 O real GDP O real GDP
1 marks
Answer: A
This question in 9708/11 Oct/Nov 2019
Q71 · Which change in economic circumstances is most likely to lead to a reduction in the rate… 9708/11 Oct/Nov 2019
30 Which change in economic circumstances is most likely to lead to a reduction in the rate of domestic inflation in an economy? A a depreciation in the currency B a reduction in the productivity of labour C a world-wide recession D an increase in direct taxes to finance increased welfare payments
1 marks
Answer: C
This question in 9708/11 Oct/Nov 2019
Q72 · The diagram shows the original aggregate demand curve, AD1, and original aggregate supply… 9708/12 Oct/Nov 2019
20 The diagram shows the original aggregate demand curve, AD1, and original aggregate supply curve, AS1. The original equilibrium is at X. AS2 price AS1 level Y P2 P1 X AD1 O Y2 Y1 real GDP What would cause the new equilibrium to be at Y? A an increase in export prices B an increase in government spending on education C an increase in import prices D an increase in the money supply
1 marks
Answer: C
This question in 9708/12 Oct/Nov 2019
Q73 · In February 2016 the Organisation for Economic Cooperation and Development (OECD) urged… 9708/12 Oct/Nov 2019
24 In February 2016 the Organisation for Economic Cooperation and Development (OECD) urged major economies such as the US and Japan to increase government spending. How would this affect the aggregate demand (AD) curve in these countries? A a move left along the AD curve B a move right along the AD curve C a move to the left of the AD curve D a move to the right of the AD curve
1 marks
Answer: D
This question in 9708/12 Oct/Nov 2019
Q74 · The diagram shows the original aggregate demand curve, AD1, and the original aggregate… 9708/13 Oct/Nov 2019
20 The diagram shows the original aggregate demand curve, AD1, and the original aggregate supply curve, AS1. The original equilibrium is at X. What would be the new equilibrium if there is an increase in private sector investment and an increase in government spending on training courses? price AS2 level AS1 A AS3 D X B C AD1 AD2 AD3 O real GDP
1 marks
Answer: B
This question in 9708/13 Oct/Nov 2019
Q75 · A government reduces the rate of tax firms are charged on their land and buildings 9708/13 Oct/Nov 2019
29 A government reduces the rate of tax firms are charged on their land and buildings. How is this likely to affect the economy’s price level and real output? price level real output A fall fall B fall rise C rise fall D rise rise
1 marks
Answer: B
This question in 9708/13 Oct/Nov 2019
Q76 · A central bank forecasts a rise in raw material costs 9708/12 Feb/March 2020
23 A central bank forecasts a rise in raw material costs. The government plans to increase spending on health and education. The initial equilibrium point is shown by X on the aggregate demand, AD, and aggregate supply, AS, diagram. What would be the new equilibrium point in the short run if the forecasts prove to be accurate and the government plans are implemented? AS1 general AS2 AS price C level D X B A AD AD2 AD1 O real output
1 marks
Answer: C
This question in 9708/12 Feb/March 2020
Q77 · In a closed economy a rise in aggregate demand is needed to increase output in the country 9708/12 Feb/March 2020
27 In a closed economy a rise in aggregate demand is needed to increase output in the country. What is necessary to achieve this increase in output in the economy? A enough capacity to produce the extra goods and services demanded B free trade to allow imports to make up any shortages in supply C government spending to be less than tax revenue D reduced credit to lower inflation
1 marks
Answer: A
This question in 9708/12 Feb/March 2020
Q78 · The diagram shows the aggregate demand (AD) and aggregate supply (AS) curves for an… 9708/11 May/June 2020
20 The diagram shows the aggregate demand (AD) and aggregate supply (AS) curves for an economy. general AS price level AD2 AD1 O real output Which situation would not cause a shift from AD1 to AD2? A a fall in the general price level as government spending is reduced B an easing of credit by commercial banks for household purchases of consumer goods C an increase in earnings from exports of high-tech products D an increase in investment by firms in computer systems
1 marks
Answer: A
This question in 9708/11 May/June 2020
Q79 · Which combination of changes is most likely to lead to an increase in the aggregate price… 9708/11 May/June 2020
21 Which combination of changes is most likely to lead to an increase in the aggregate price level and the level of real output? income tax rate net exports A fall decrease B fall increase C rise decrease D rise increase
1 marks
Answer: B
This question in 9708/11 May/June 2020
Q80 · The diagram shows the aggregate demand (AD) and aggregate supply (AS) for an economy 9708/11 May/June 2020
26 The diagram shows the aggregate demand (AD) and aggregate supply (AS) for an economy. AS2 general price AS1 level AD O real output Which changes in subsidies and indirect taxes would have caused the change in AS shown? A higher subsidies and higher indirect taxes B higher subsidies and lower indirect taxes C lower subsidies and higher indirect taxes D lower subsidies and lower indirect taxes
1 marks
Answer: C
This question in 9708/11 May/June 2020
Q81 · In its recent budget a government increased defence expenditure and also the amount spent… 9708/11 May/June 2020
27 In its recent budget a government increased defence expenditure and also the amount spent on training that increased the productivity of the workforce. The initial equilibrium point is shown by X on the aggregate demand (AD) and aggregate supply (AS) diagram. What would be the equilibrium point after these changes? AS3 AS1 general B price level AS2 X A C D AD3 AD1 AD2 O real output
1 marks
Answer: C
This question in 9708/11 May/June 2020
Q82 · In 2018 the United States (US) government reduced direct taxes on consumers and businesses 9708/11 May/June 2020
29 In 2018 the United States (US) government reduced direct taxes on consumers and businesses. What are likely to be the effects of these changes on consumption, investment and national output? consumption investment national output A decrease decrease decrease B decrease increase increase C increase decrease decrease D increase increase increase
1 marks
Answer: D
This question in 9708/11 May/June 2020
Q83 · What is likely to cause a decrease in aggregate demand? 9708/12 May/June 2020
19 What is likely to cause a decrease in aggregate demand? A an appreciation in the exchange rate B an improvement in consumer confidence C an increase in government expenditure D an increase in the money supply
1 marks
Answer: A
This question in 9708/12 May/June 2020
Q84 · During the Great Depression the US government believed that deflation was caused by a… 9708/12 May/June 2020
30 During the Great Depression the US government believed that deflation was caused by a collapse in the prices of stock and other assets, reducing the levels of wealth and confidence. The diagrams show two approaches to counter deflation. diagram Y diagram Z price price level AS1 level AS2 P2 AS1 P1 P2 P1 AD2 AD1 AD1 O Y1 Y2 O Y2 Y1 real GDP real GDP Given this belief, which policy should the US government have used, in an attempt to remove the deflation and which diagram represents the intended outcome of the policy? policy intended outcome A decrease interest rates diagram Y B reduce corporation tax diagram Z C increase interest rates diagram Z D reduce corporation tax diagram Y
1 marks
Answer: A
This question in 9708/12 May/June 2020
Q85 · What will increase if aggregate demand rises when aggregate supply is perfectly elastic? 9708/13 May/June 2020
21 What will increase if aggregate demand rises when aggregate supply is perfectly elastic? A labour shortages B real output C the price level D wage rates
1 marks
Answer: B
This question in 9708/13 May/June 2020
Q86 · What would be a positive effect on the growth of an economy in the short run, if the… 9708/13 May/June 2020
28 What would be a positive effect on the growth of an economy in the short run, if the government reduced a direct tax on individual earnings? A food prices would increase due to shortages B imports of luxury cars would increase to satisfy a change in demand C savings would increase due to additional disposable income D the consumption of domestically produced goods would increase
1 marks
Answer: D
This question in 9708/13 May/June 2020
Q87 · An economy is represented by the AD / AS diagram, which is initially in macroeconomic… 9708/11 Oct/Nov 2020
21 An economy is represented by the AD / AS diagram, which is initially in macroeconomic equilibrium. AS price level AD O real output Which change will definitely result in a rise in real output? A a fall in personal taxation and a fall in government expenditure B a rise in consumption and a rise in the cost of raw materials C a rise in export revenues and a fall in import expenditure D a rise in government expenditure and a fall in investment
1 marks
Answer: C
This question in 9708/11 Oct/Nov 2020
Q88 · The diagram shows aggregate demand curves AD1 and AD2 and an aggregate supply curve AS1 9708/12 Oct/Nov 2020
25 The diagram shows aggregate demand curves AD1 and AD2 and an aggregate supply curve AS1. AS1 price level AD2 AD1 O real output What could cause the shift in the aggregate demand curve from AD1 to AD2? A a rise in the interest rates B a rise in output per worker C a rise in the budget deficit D a rise in the value of the exchange rate
1 marks
Answer: B
This question in 9708/12 Oct/Nov 2020
Q89 · What represents the total of aggregate demand in a closed economy? 9708/12 Oct/Nov 2020
30 What represents the total of aggregate demand in a closed economy? A C + I + G B C + I + G + X C C + I + G + (X – M) D C – (S + T)
1 marks
Answer: A
This question in 9708/12 Oct/Nov 2020
Q90 · Under which circumstance would the rate of inflation be most likely to fall? 9708/13 Oct/Nov 2020
19 Under which circumstance would the rate of inflation be most likely to fall? A Government spending increases and society’s marginal propensity to save falls. B Reduced interest rates result in consumers increasing their spending. C The government increases direct taxes and the level of investment falls. D The prices of imported raw materials rise, whilst demand for exports falls.
1 marks
Answer: C
This question in 9708/13 Oct/Nov 2020
Q91 · The diagram shows an economy with an initial equilibrium real output of Y1 at a price… 9708/13 Oct/Nov 2020
21 The diagram shows an economy with an initial equilibrium real output of Y1 at a price level of P1. price AS1 AS2 level P1 AD1 AD2 O Y1 Y2 real output Which combination of events is likely to cause the equilibrium real output to rise to Y2? A an increased budget deficit and a fall in energy costs B an increased budget surplus and a rise in energy costs C an increased trade deficit and a fall in indirect tax D an increased trade surplus and a rise in indirect tax
1 marks
Answer: A
This question in 9708/13 Oct/Nov 2020
Q92 · What will cause a movement along an aggregate supply curve? 9708/12 May/June 2021
19 What will cause a movement along an aggregate supply curve? A a rise in the demand for exports B a rise in the price of raw materials C a rise in the productivity of labour D a rise in the rate of sales tax
1 marks
Answer: A
This question in 9708/12 May/June 2021
Q93 · A government plans to increase spending on education and training every year 9708/11 Oct/Nov 2021
19 A government plans to increase spending on education and training every year. Which diagram shows the likely effect of this increase on the economy’s long-run output and price level? A B LRAS1 LRAS1 LRAS2 price price level level P2 P1 P1 P2 AD1 AD2 AD1 O Y1 O Y1 Y2 real output real output C D LRAS1 LRAS2 LRAS2 LRAS1 price price level level P2 P1 P1 P2 AD1 AD2 AD2 AD1 O Y1 Y2 O Y2 Y1 real output real output
1 marks
Answer: C
This question in 9708/11 Oct/Nov 2021
Q94 · The diagram shows aggregate demand (AD) and aggregate supply (AS) for an economy 9708/13 Oct/Nov 2021
23 The diagram shows aggregate demand (AD) and aggregate supply (AS) for an economy. AS1 AS2 price level P1 P2 AD O Y1 Y2 real output What is most likely to cause the shift from AS1 to AS2? A a decrease in the exchange rate B a decrease in the price level C a fall in immigration D a fall in the average level of wages
1 marks
Answer: D
This question in 9708/13 Oct/Nov 2021
Q95 · What are the components of aggregate demand? 9708/13 Oct/Nov 2021
30 What are the components of aggregate demand? A consumption + investment + government spending + (exports – imports) B consumption + investment + taxation – (exports – imports) C consumption + saving + taxation – (exports – imports) D consumption + saving + taxation + (exports – imports)
1 marks
Answer: A
This question in 9708/13 Oct/Nov 2021
Q96 · From the initial position of equilibrium shown, there is an increase in government… 9708/12 Feb/March 2022
22 From the initial position of equilibrium shown, there is an increase in government expenditure on goods and services and simultaneously an increase in the costs of production of goods and services. full employment price AS level AD O real output What best describes the likely impact on the economy? equilibrium level equilibrium level of national income of prices A falls uncertain B no change no change C rises rises D uncertain rises
1 marks
Answer: D
This question in 9708/12 Feb/March 2022
Q97 · The diagram shows a shift in an economy’s aggregate demand curve from AD1 to AD2 9708/12 Feb/March 2022
23 The diagram shows a shift in an economy’s aggregate demand curve from AD1 to AD2. general price level AD2 AD1 O real output What could not be a cause of the shift? A a decrease in income tax B a decrease in the price of goods C an increase in money wage rates D an increase in the money supply
1 marks
Answer: B
This question in 9708/12 Feb/March 2022
Q98 · The aggregate demand (AD) and aggregate supply (AS) diagram shows an economy in… 9708/11 May/June 2022
22 The aggregate demand (AD) and aggregate supply (AS) diagram shows an economy in equilibrium at X. In this economy, a severe shortage of raw materials causes a large rise in their price. The effect of this change is shown by a move to which point? AD3 AS2 AD1 general AD2 AS1 price level C B D A X O real national income
1 marks
Answer: B
This question in 9708/11 May/June 2022
Q99 · In 2020, shops reported a fall in sales as domestic demand in an economy fell 9708/12 May/June 2022
19 In 2020, shops reported a fall in sales as domestic demand in an economy fell. However, the impact on the overall economy was not as unfavourable as was first feared. What might have lessened the impact on the economy? A Exports increased. B Imports increased. C Savings increased. D Taxes increased.
1 marks
Answer: A
This question in 9708/12 May/June 2022
Q100 · The diagram shows a shift in a country’s short-run aggregate supply curve from SRAS1 to… 9708/12 May/June 2022
27 The diagram shows a shift in a country’s short-run aggregate supply curve from SRAS1 to SRAS2. The country imports oil. price SRAS2 level SRAS1 O real output Why might an increase in the world price of oil have caused this shift? A A rise in inflation is expected. B Consumers face a fall in their disposable income. C Domestic firms’ costs have increased. D The government reduces tax on oil and petroleum products.
1 marks
Answer: C
This question in 9708/12 May/June 2022
Q101 · The diagram shows an aggregate demand (AD) curve 9708/13 May/June 2022
19 The diagram shows an aggregate demand (AD) curve. Y AD O X What is measured on the horizontal (X) axis and the vertical (Y) axis? horizontal axis X vertical axis Y A money national output real disposable income B price level real GDP C real GDP price level D real disposable income money national output
1 marks
Answer: C
This question in 9708/13 May/June 2022
Q102 · What is a correct description of an aggregate demand (AD) curve? 9708/13 May/June 2022
21 What is a correct description of an aggregate demand (AD) curve? A It is a curve obtained by adding the market demand curves of all consumer goods traded in an economy. B It is a curve determined by the horizontal summation of all individual consumer demand curves for a product. C It is a curve that shows the total amount of goods and services firms are willing to buy at a given price in an economy. D It is a curve that shows the total demand of all goods and services produced at all price levels in an economy.
1 marks
Answer: D
This question in 9708/13 May/June 2022
Q103 · The diagram shows the aggregate demand (AD) and aggregate supply (AS) for a country 9708/13 May/June 2022
26 The diagram shows the aggregate demand (AD) and aggregate supply (AS) for a country. The initial equilibrium is at point E. The sum of the price elasticities of demand for imports and exports for this country exceeds one. A devaluation of the country’s exchange rate will cause aggregate demand to change. What will be the new equilibrium? AS price level A B E D C AD O real output
1 marks
Answer: B
This question in 9708/13 May/June 2022
Q104 · The diagram shows the AD / AS curves for an economy 9708/13 May/June 2022
29 The diagram shows the AD / AS curves for an economy. AS1 price level AS2 X Y AD2 AD1 O real GDP Which government action is most likely to cause the equilibrium position to move from X to Y? A an increase in the exchange rate that makes locally produced goods less price-competitive, both at home and abroad B an increase in government spending on infrastructure that increases the production potential of the economy C an increase in interest rates that increases the cost of borrowing D an increase in real wages of labour
1 marks
Answer: B
This question in 9708/13 May/June 2022
Q105 · The diagram shows an aggregate demand (AD) and an aggregate supply (AS) curve 9708/14 May/June 2022
24 The diagram shows an aggregate demand (AD) and an aggregate supply (AS) curve. AS price level AD O national output There is a sustained rise in the prices of imported raw materials on which the economy depends. Assuming AD remains independent of AS, what are the most likely effects on the economy? AS price level A decreases falls B increases falls C decreases rises D increases rises
1 marks
Answer: C
This question in 9708/14 May/June 2022
Q106 · Assuming the demand for oil is price-inelastic, what will be the effect on demand-pull… 9708/11 Oct/Nov 2022
19 Assuming the demand for oil is price-inelastic, what will be the effect on demand-pull inflation and on cost-push inflation in an oil-importing country of an increase in the world price of oil? effect on demand-pull effect on cost-push inflation inflation A increase increase B increase reduce C reduce increase D reduce reduce
1 marks
Answer: C
This question in 9708/11 Oct/Nov 2022
Q107 · The diagrams show initial equilibrium positions at Y1P1 9708/11 Oct/Nov 2022
22 The diagrams show initial equilibrium positions at Y1P1. Which diagram reflects the impact on an economy of higher unit wage costs and an improvement in the balance of trade? A B SRAS2 SRAS2 price price level level SRAS1 P2 SRAS1 P2 P1 AD1 AD2 P1 AD AD2 AD2 AD AD2 AD1 O Y2 Y1 O Y2 Y1 real real GDP GDP C D SRAS1 SRAS1 price price SRAS2 level level P1 SRAS2 P1 P2 AD2 AD1 P2 AD1 AD AD2 AD AD2 AD2 O Y1 Y2 O Y1 Y2 real real GDP GDP
1 marks
Answer: B
This question in 9708/11 Oct/Nov 2022
Q108 · An increase in what will shift the aggregate demand curve in an economy to the right? 9708/12 Oct/Nov 2022
20 An increase in what will shift the aggregate demand curve in an economy to the right? A budget deficit B consumer savings C general price level D interest rate
1 marks
Answer: A
This question in 9708/12 Oct/Nov 2022
Q109 · The diagram shows four possible aggregate supply curves and an equilibrium point X 9708/12 Oct/Nov 2022
30 The diagram shows four possible aggregate supply curves and an equilibrium point X. A government employs deflationary fiscal policy in order to reduce the rate of inflation in its economy. This shifts aggregate demand to AD2. With which AS curve would this policy be most effective? A B C price D level X AD1 AD2 O national income
1 marks
Answer: A
This question in 9708/12 Oct/Nov 2022
Q110 · An economy is initially in equilibrium 9708/13 Oct/Nov 2022
21 An economy is initially in equilibrium. Which combination of events will definitely cause an increase in the general price level of the economy and a decrease in its real output? aggregate short-run demand aggregate supply A decreases decreases B decreases unchanged C increases decreases D unchanged decreases
1 marks
Answer: D
This question in 9708/13 Oct/Nov 2022
Q111 · The government of a country changes from a balanced budget to a budget deficit 9708/13 Oct/Nov 2022
22 The government of a country changes from a balanced budget to a budget deficit. From which point along the country’s long-run aggregate supply curve (LRAS) will this change cause the largest increase in employment without creating inflationary pressure? LRAS price level D C A B O real output
1 marks
Answer: A
This question in 9708/13 Oct/Nov 2022
Q112 · What is a certain outcome on an aggregate demand and aggregate supply diagram of an… 9708/13 Oct/Nov 2022
24 What is a certain outcome on an aggregate demand and aggregate supply diagram of an increase in factor productivity? A downward shift of the aggregate demand curve B downward shift of the aggregate supply curve C an upward shift of the aggregate demand curve D an upward shift of the aggregate supply curve
1 marks
Answer: B
This question in 9708/13 Oct/Nov 2022
Q113 · The diagram shows the aggregate demand (AD) and long-run aggregate supply (LRAS) curves… 9708/12 Feb/March 2023
21 The diagram shows the aggregate demand (AD) and long-run aggregate supply (LRAS) curves for a country. X is the original equilibrium position. In one year, over one million foreign workers left the country and at the same time the country’s currency appreciated against the currencies of its major trading partners. What will be the most likely new equilibrium position for this country? LRAS3 LRAS1 LRAS2 general D price level A X AD2 C AD1 B AD3 O real ouput
1 marks
Answer: C
This question in 9708/12 Feb/March 2023
Q114 · Which statement explains why the aggregate demand curve is downward sloping? 9708/11 May/June 2023
18 Which statement explains why the aggregate demand curve is downward sloping? A As prices fall, the demand for exports becomes more elastic. B As prices fall, fewer goods are imported. C As prices fall, the rate of interest will rise. D As prices fall, real wealth rises and so spending increases.
1 marks
Answer: D
This question in 9708/11 May/June 2023
Q115 · The diagram shows the aggregate demand (AD) and aggregate supply (AS) for an economy 9708/11 May/June 2023
19 The diagram shows the aggregate demand (AD) and aggregate supply (AS) for an economy. AS2 general price AS1 level AD O real output Which changes in subsidies and indirect taxes would have caused the change from AS1 to AS2? A higher subsidies and higher indirect taxes B higher subsidies and lower indirect taxes C lower subsidies and higher indirect taxes D lower subsidies and lower indirect taxes
1 marks
Answer: C
This question in 9708/11 May/June 2023
Q116 · In the diagram, the intersection of AD and LRAS at point X represents the current… 9708/11 May/June 2023
21 In the diagram, the intersection of AD and LRAS at point X represents the current macroeconomic equilibrium. Which point could represent the new equilibrium after the introduction of an increase in the retirement age? LRAS2 LRAS LRAS1 general price level B C D X AD1 A AD AD2 O real GDP
1 marks
Answer: C
This question in 9708/11 May/June 2023
Q117 · A country experiences a fall in the value of exports and an increase in the value of… 9708/11 May/June 2023
29 A country experiences a fall in the value of exports and an increase in the value of imports of goods and services. What are the effects of these changes? balance of aggregate payments on demand goods and services A fall improve B fall worsen C rise improve D rise worsen
1 marks
Answer: B
This question in 9708/11 May/June 2023
Q118 · Which change is shown directly by the use of aggregate demand and aggregate supply… 9708/12 May/June 2023
18 Which change is shown directly by the use of aggregate demand and aggregate supply analysis? A the nominal income level B the price level C the unemployment level D the wage level
1 marks
Answer: B
This question in 9708/12 May/June 2023
Q119 · Why might aggregate demand increase when a country’s price level falls? 9708/12 May/June 2023
19 Why might aggregate demand increase when a country’s price level falls? A Domestic interest rates will tend to fall. B Imports become more price competitive. C Real incomes fall. D The purchasing power of savings falls.
1 marks
Answer: A
This question in 9708/12 May/June 2023
Q120 · The diagram shows the current equilibrium of an economy 9708/12 May/June 2023
27 The diagram shows the current equilibrium of an economy. The government introduces a contractionary monetary policy. AS price level AD O output What is the most likely outcome? A a fall in investment and a fall in inflation B a fall in investment and a rise in inflation C a rise in investment and a fall in inflation D a rise in investment and a rise in inflation
1 marks
Answer: A
This question in 9708/12 May/June 2023
Q121 · What is the most likely cause of an outward shift of a country’s aggregate demand curve? 9708/13 May/June 2023
25 What is the most likely cause of an outward shift of a country’s aggregate demand curve? A a decrease in the competitiveness of domestically produced products B a decrease in the general price level C a decrease in the money supply D a depreciation of the country’s exchange rate
1 marks
Answer: D
This question in 9708/13 May/June 2023
Q122 · The diagram shows the macroeconomic equilibrium output and price level changing from Y… 9708/13 May/June 2023
26 The diagram shows the macroeconomic equilibrium output and price level changing from Y and P to Y1 and P1. LRAS price level P P1 AD AD1 O Y1 Y real output What could have caused this change? A a decrease in exports B a decrease in labour productivity C an increase in the government’s spending D an increase in the money supply
1 marks
Answer: A
This question in 9708/13 May/June 2023
Q123 · The diagram shows aggregate demand (AD) and aggregate supply in the short run (SRAS) and… 9708/13 May/June 2023
28 The diagram shows aggregate demand (AD) and aggregate supply in the short run (SRAS) and the long run (LRAS). LRAS LRAS1 price level W SRAS SRAS1 Y AD O real GDP Which row is correct in causing a shift in the short run aggregate supply from SRAS to SRAS1 and the long run aggregate supply from LRAS to LRAS1? shift from SRAS to SRAS1 shift from LRAS to LRAS1 A change in AD from W to Y increase in population B decrease in raw material costs improvements in the education of workers C decrease in wage rates decrease in immigration D increase in availability of labour increase in labour productivity
1 marks
Answer: B
This question in 9708/13 May/June 2023
Q124 · A government has increased output with no effect on the price level 9708/11 Oct/Nov 2023
16 A government has increased output with no effect on the price level. AS price level AD1 AD2 AD3 AD4 O output What must have been the initial level of aggregate demand (AD)? A AD1 B AD2 C AD3 D AD4
1 marks
Answer: A
This question in 9708/11 Oct/Nov 2023
Q125 · Why is increased government provision of education most likely to shift the aggregate… 9708/11 Oct/Nov 2023
21 Why is increased government provision of education most likely to shift the aggregate demand curve to the right? A It will increase aggregate supply. B More schools will be built. C The government will have to raise taxes. D Workers will be more highly skilled.
1 marks
Answer: B
This question in 9708/11 Oct/Nov 2023
Q126 · The government of a country plans to raise income tax rates 9708/11 Oct/Nov 2023
28 The government of a country plans to raise income tax rates. The initial equilibrium for the country is represented by point X on the diagram. Which new equilibrium point would an economist predict as the result? price AS1 level A AS2 X B D AD3 C AD1 AD2 O real national income
1 marks
Answer: D
This question in 9708/11 Oct/Nov 2023
Q127 · A government increases the rate of income tax 9708/12 Oct/Nov 2023
24 A government increases the rate of income tax. What is the effect, in the short run, on the aggregate demand curve or the aggregate supply curve? A The aggregate demand curve shifts left. B The aggregate demand curve shifts right. C The aggregate supply curve shifts left. D The aggregate supply curve shifts right.
1 marks
Answer: A
This question in 9708/12 Oct/Nov 2023
Q128 · A government wants to reduce inflation 9708/12 Oct/Nov 2023
29 A government wants to reduce inflation. It has decided to cut government spending by $1bn. The diagram shows different starting positions for the country’s aggregate demand (AD) curve. AS price level AD4 AD3 AD2 AD1 O real GDP Which starting position for the aggregate demand curve would make this policy least effective? A AD1 B AD2 C AD3 D AD4
1 marks
Answer: A
This question in 9708/12 Oct/Nov 2023
Q129 · A government reduces the rate of tax firms are charged on their land and buildings 9708/12 Oct/Nov 2023
30 A government reduces the rate of tax firms are charged on their land and buildings. How is this likely to affect the economy’s price level and real output? price level real output A fall fall B fall rise C rise fall D rise rise
1 marks
Answer: B
This question in 9708/12 Oct/Nov 2023
Q130 · An aggregate demand curve slopes downwards from left to right 9708/13 Oct/Nov 2023
20 An aggregate demand curve slopes downwards from left to right. One reason for this is that a reduction in the average price level will lead to A a decline in the country’s international competitiveness. B an increase in interest rates. C an increase in the real value of money balances. D the expectation of further price falls.
1 marks
Answer: C
This question in 9708/13 Oct/Nov 2023
Q131 · The diagram shows the long-run aggregate supply (LRAS) and aggregate demand (AD) curves… 9708/13 Oct/Nov 2023
26 The diagram shows the long-run aggregate supply (LRAS) and aggregate demand (AD) curves for an economy. LRAS price level Y X AD O real output The initial equilibrium is at point X. Which combination of monetary policies will shift the equilibrium position to point Y? money rate of supply interest A increase increase B decrease increase C increase decrease D decrease decrease
1 marks
Answer: C
This question in 9708/13 Oct/Nov 2023
Q132 · Which combination of initial equilibrium and supply-side policy is likely to be least… 9708/13 Oct/Nov 2023
28 Which combination of initial equilibrium and supply-side policy is likely to be least effective when attempting to increase the real output of an economy? initial equilibrium real output supply-side policy measure A below full employment abolition of national minimum wage B below full employment extra spending on training C full employment extra investment in infrastructure D full employment reduction in the rate of income tax
1 marks
Answer: A
This question in 9708/13 Oct/Nov 2023
Q133 · What is least likely to cause a simultaneous increase in demand-pull and cost-push… 9708/12 Feb/March 2024
16 What is least likely to cause a simultaneous increase in demand-pull and cost-push inflation? A depreciation of currency B increased import tariffs C decreased spending on infrastructure D increased wages
1 marks
Answer: C
This question in 9708/12 Feb/March 2024
Q134 · Aggregate demand in an economy may decrease as a result of an increase in A consumption… 9708/12 Feb/March 2024
19 Aggregate demand in an economy may decrease as a result of an increase in A consumption expenditure. B government expenditure. C import expenditure. D investment expenditure.
1 marks
Answer: C
This question in 9708/12 Feb/March 2024
Q135 · The diagram shows aggregate demand (AD) curves for an economy 9708/12 Feb/March 2024
22 The diagram shows aggregate demand (AD) curves for an economy. price level AD1 AD2 O real output Which combination is most likely to have caused the shift from AD1 to AD2? income tax sales tax A decrease decrease B decrease increase C increase decrease D increase increase
1 marks
Answer: D
This question in 9708/12 Feb/March 2024
Q136 · The table illustrates macroeconomic data for an economy 9708/11 May/June 2024
15 The table illustrates macroeconomic data for an economy. All figures are in $ billions. What is the equilibrium real output? consumption government investment exports imports real output expenditure expenditure A 110 100 50 10 20 100 B 120 100 60 20 30 200 C 140 100 70 30 40 300 D 160 100 80 40 50 430
1 marks
Answer: C
This question in 9708/11 May/June 2024
Q137 · A major trading nation, country X, is in equilibrium at the full employment level of real… 9708/11 May/June 2024
18 A major trading nation, country X, is in equilibrium at the full employment level of real output. There is then a recession in its main international markets. What are the most likely consequences of this change for country X? rate of inflation unemployment A decrease decrease B decrease increase C unchanged decrease D unchanged increase
1 marks
Answer: B
This question in 9708/11 May/June 2024
Q138 · Why would a fall in a country's average price level cause its aggregate demand curve to… 9708/11 May/June 2024
19 Why would a fall in a country's average price level cause its aggregate demand curve to slope downwards? A It leads to an increase in interest rates. B It reduces the real value of money balances. C It makes the country’s goods cheaper relative to foreign goods. D It leads to the expectation of further price falls.
1 marks
Answer: C
This question in 9708/11 May/June 2024
Q139 · Which government policy will increase aggregate demand? 9708/12 May/June 2024
15 Which government policy will increase aggregate demand? A raising indirect taxation B reducing the budget surplus C removing domestic subsidies D removing import quotas
1 marks
Answer: B
This question in 9708/12 May/June 2024
Q140 · What causes a rise in cost-push inflation? 9708/12 May/June 2024
17 What causes a rise in cost-push inflation? A a fall in the rate of income tax B a rise in the rate of income tax C a depreciation of the exchange rate D an appreciation of the exchange rate
1 marks
Answer: C
This question in 9708/12 May/June 2024
Q141 · Which change affecting an economy’s labour force will cause an increase in economic… 9708/12 May/June 2024
18 Which change affecting an economy’s labour force will cause an increase in economic growth in the short run? A an increase in students entering university B an increase in the birth rate C an increase in the immigration of skilled labour D an increase in the school leaving age
1 marks
Answer: C
This question in 9708/12 May/June 2024
Q142 · The original equilibrium in the economy is represented by point X, the intersection of… 9708/12 May/June 2024
21 The original equilibrium in the economy is represented by point X, the intersection of AD1 and AS1, on the AD / AS diagram shown. The government decreases the money supply. What is the new equilibrium point? price level AS2 AS1 AS3 A B X Pe D C AD2 AD1 AD3 O Ye national income
1 marks
Answer: D
This question in 9708/12 May/June 2024
Q143 · A company uses large amounts of gas to produce steel 9708/13 May/June 2024
7 A company uses large amounts of gas to produce steel. Supplies of gas are reduced at the same time as the market for steel is hit by a recession. What can be said about the likely changes in the market for steel? equilibrium equilibrium price quantity A falls uncertain B rises uncertain C uncertain falls D uncertain rises
1 marks
Answer: C
This question in 9708/13 May/June 2024
Q144 · The diagrams show a country’s aggregate demand (AD1) and aggregate supply (AS1) curves 9708/13 May/June 2024
15 The diagrams show a country’s aggregate demand (AD1) and aggregate supply (AS1) curves. Since the world economic downturn (2007–2008), some governments have reduced labour costs and ensured interest rates remained unchanged. How would this most likely be shown on a diagram? A B AS1 AS1 price price AS2 level level P1 P1 P2 P2 AD1 AD1 AD2 O real GDP O real GDP C D AS2 AS1 price price AS1 level level P2 P2 P1 P1 AD1 AD2 AD1 O real GDP O real GDP
1 marks
Answer: A
This question in 9708/13 May/June 2024
Q145 · The diagram shows the effect on the average price level when aggregate demand (AD)… 9708/13 May/June 2024
16 The diagram shows the effect on the average price level when aggregate demand (AD) increases from AD1 to AD2. average LRAS price level P2 P1 AD2 AD1 O real GDP Which statement relating to this change in aggregate demand is correct? A Nominal GDP has increased. B Nominal GDP is unchanged. C Real GDP has increased. D Real GDP has fallen.
1 marks
Answer: A
This question in 9708/13 May/June 2024
Q146 · What is most likely to cause the price level to rise? 9708/11 Oct/Nov 2024
16 What is most likely to cause the price level to rise? An increase in A productivity of labour. B raw material prices. C income taxes. D subsidies paid to producers.
1 marks
Answer: B
This question in 9708/11 Oct/Nov 2024
Q147 · Which combination correctly identifies the necessary information to construct an… 9708/11 Oct/Nov 2024
19 Which combination correctly identifies the necessary information to construct an accurately labelled graph of a normal short-run aggregate supply curve (SRAS)? gradient of the horizontal x-axis vertical y-axis SRAS curve A negative quantity price level B positive real output price level C positive real output price D positive price level real output
1 marks
Answer: B
This question in 9708/11 Oct/Nov 2024
Q148 · A government makes two changes to income tax 9708/11 Oct/Nov 2024
20 A government makes two changes to income tax. 1 The individual tax-free income allowance is increased. 2 The marginal rate of income tax is decreased. How will these changes affect aggregate demand and aggregate supply in the economy? aggregate aggregate demand supply A decrease increase B decrease unchanged C increase increase D increase unchanged
1 marks
Answer: C
This question in 9708/11 Oct/Nov 2024
Q149 · The central bank of a country raises interest rates to reduce the general price level 9708/11 Oct/Nov 2024
23 The central bank of a country raises interest rates to reduce the general price level. When is this policy likely to have the biggest impact? position of the economy responsiveness of on its production possibility aggregate demand to curve (PPC) diagram interest rate changes A below the PPC high B below the PPC low C on the PPC high D on the PPC low
1 marks
Answer: C
This question in 9708/11 Oct/Nov 2024
Q150 · What is likely to move an economy’s aggregate demand curve to the right? 9708/12 Oct/Nov 2024
17 What is likely to move an economy’s aggregate demand curve to the right? A a fall in income equality B a fall in incomes abroad C a fall in the exchange rate D a fall in the government budget deficit
1 marks
Answer: C
This question in 9708/12 Oct/Nov 2024
Q151 · An economy is in equilibrium at point E on the diagram 9708/12 Oct/Nov 2024
22 An economy is in equilibrium at point E on the diagram. The government reduces its expenditure on defence. Which point on the diagram shows the new equilibrium? AS1 AS2 price level P1 E A B P2 C P3 D AD1 P4 AD2 AD3 O Y1 Y2 Y3 national income
1 marks
Answer: A
This question in 9708/12 Oct/Nov 2024
Q152 · A government is considering building a large hospital 9708/13 Oct/Nov 2024
19 A government is considering building a large hospital. The impact on the country’s price level will depend partly on the amount of expensive raw materials the country imports for the hospital and the level of unemployment in the country. Which combination of imports of materials for the hospital and the level of unemployment is most likely to lead to the largest rise in the price level? imports of unemployment materials A high high B high low C low high D low low
1 marks
Answer: B
This question in 9708/13 Oct/Nov 2024
Q153 · The diagram shows aggregate demand (AD) and long-run aggregate supply (LRAS) with X as… 9708/12 Feb/March 2025
18 The diagram shows aggregate demand (AD) and long-run aggregate supply (LRAS) with X as the initial equilibrium. LRAS LRAS1 price level F G X H AD1 J AD AD2 O real GDP Which combination of policy and new final equilibrium point is correct? new final policy equilibrium point A increased direct taxation F B increased government G spending on infrastructure C appreciation of the H exchange rates D decreased interest rates J
1 marks
Answer: B
This question in 9708/12 Feb/March 2025
Q154 · A government decides to use supply-side policy to increase long-run aggregate supply… 9708/12 Feb/March 2025
24 A government decides to use supply-side policy to increase long-run aggregate supply (LRAS). What is the most likely reason why this policy tool will not lead to a fall in the price level? A Aggregate demand will also increase. B Labour productivity levels will increase. C Workers will save any extra wages they earn. D Workers will spend any extra wages on imports.
1 marks
Answer: A
This question in 9708/12 Feb/March 2025
Q155 · Which statement is not correct? 9708/11 May/June 2025
19 Which statement is not correct? A The long-run aggregate supply curve can be downward sloping. B The long-run aggregate supply curve can be horizontal. C The long-run aggregate supply curve can be upward sloping. D The long-run aggregate supply curve can be vertical.
1 marks
Answer: A
This question in 9708/11 May/June 2025
Q156 · A government uses expansionary monetary policy over a three-year period 9708/11 May/June 2025
23 A government uses expansionary monetary policy over a three-year period. Which combination identifies the likely impact of such a policy? real GDP price level unemployment A falling rising falling B rising rising rising C rising rising falling D rising falling rising
1 marks
Answer: C
This question in 9708/11 May/June 2025
Q157 · The aggregate demand curve is typically downward sloping 9708/12 May/June 2025
18 The aggregate demand curve is typically downward sloping. What is one possible explanation for this? A A fall in the price level will lead to a rise in demand for imports. B As the price level falls, improved productivity will reduce unit costs. C If the price level is high, any interest rate changes will encourage consumption. D The real value of assets increases as the price level falls.
1 marks
Answer: D
This question in 9708/12 May/June 2025
Q158 · The diagram shows aggregate demand (AD) and aggregate supply (AS) curves 9708/12 May/June 2025
25 The diagram shows aggregate demand (AD) and aggregate supply (AS) curves. The initial equilibrium is at X. A government decides to invest in an increase in infrastructure. What will be the short-term effect of this policy on the equilibrium? AD AD1 price level A AS1 B AS X C AS2 D O real GDP
1 marks
Answer: B
This question in 9708/12 May/June 2025
Q159 · The diagram shows aggregate demand (AD) and aggregate supply (AS) where the initial… 9708/13 May/June 2025
18 The diagram shows aggregate demand (AD) and aggregate supply (AS) where the initial equilibrium is at point X. The central bank forecasts a rise in raw material costs. The government plans to increase spending on health. What would be the new equilibrium in the short run if the forecasts prove to be accurate and the government plans are implemented? AS1 general AS2 C AS price level D X B A AD AD2 AD1 O real output
1 marks
Answer: C
This question in 9708/13 May/June 2025
Q160 · What is an example of fiscal policy aimed at increasing aggregate demand in an economy? 9708/11 Oct/Nov 2025
19 What is an example of fiscal policy aimed at increasing aggregate demand in an economy? A increasing expenditure by firms on skills training programmes for unskilled workers B increasing the commercial banks’ lending ability C reducing the rate of income tax for all income earners D reducing the rate of interest on loans to manufacturing companies
1 marks
Answer: C
This question in 9708/11 Oct/Nov 2025
Q161 · The aggregate demand (AD) curve in an economy shifts to the left 9708/11 Oct/Nov 2025
20 The aggregate demand (AD) curve in an economy shifts to the left. What is most likely to cause this shift? A a decrease in the exchange rate B a decrease in the interest rate C an increase in the budget deficit D an increase in the current account deficit
1 marks
Answer: D
This question in 9708/11 Oct/Nov 2025
Q162 · The diagram shows the AD and AS curves for a low income country 9708/11 Oct/Nov 2025
21 The diagram shows the AD and AS curves for a low income country. Oil and gas make up 90% of its exports. The initial equilibrium level of national income is Y1. What is the most likely new equilibrium point if the worldwide prices of oil and gas rise dramatically? AS general price level A B D C AD O Y1 national income
1 marks
Answer: B
This question in 9708/11 Oct/Nov 2025
Q163 · The diagram shows the AD and AS curves for a country 9708/12 Oct/Nov 2025
16 The diagram shows the AD and AS curves for a country. The equilibrium level of national income is Y1 and the general price level is P1. AS general price level P1 AD O Y1 national income What is the most likely effect on employment and the general price level of a small decrease in government expenditure? employment general price level A falls falls B falls unchanged C unchanged falls D unchanged unchanged
1 marks
Answer: C
This question in 9708/12 Oct/Nov 2025
Q164 · The diagram shows aggregate demand and aggregate supply curves for an economy 9708/12 Oct/Nov 2025
17 The diagram shows aggregate demand and aggregate supply curves for an economy. general AS price level AD AD1 O national output What would cause a change in the aggregate demand from AD to AD1? A government campaigns to encourage household savings B consumption of domestic instead of foreign goods C a decrease in the budget surplus D investment in knowledge-based enterprises
1 marks
Answer: A
This question in 9708/12 Oct/Nov 2025
Q165 · What is the effect of an increase in the money supply on the interest rate and the… 9708/12 Oct/Nov 2025
22 What is the effect of an increase in the money supply on the interest rate and the aggregate demand (AD) curve? interest rate AD curve A falls shifts left B rises shifts left C falls shifts right D rises shifts right
1 marks
Answer: C
This question in 9708/12 Oct/Nov 2025
Q166 · Between June and the end of July 2016, the UK pound sterling depreciated by 11% against a… 9708/12 Oct/Nov 2025
28 Between June and the end of July 2016, the UK pound sterling depreciated by 11% against a basket of currencies of the UK’s major trading partners. The diagram shows the original aggregate demand curve AD1 and the original aggregate supply curve AS1 for the UK economy before June 2016. The equilibrium is at X. What would have been the new equilibrium for the UK economy as a result of the depreciation of the pound sterling? price level AS1 A B X D C AD1 O real output
1 marks
Answer: A
This question in 9708/12 Oct/Nov 2025
Q167 · What might be a consequence of a fall in the domestic price level? 9708/13 Oct/Nov 2025
20 What might be a consequence of a fall in the domestic price level? A imports become more competitive B interest rates increase C the purchasing power of savings falls D the real value of incomes increases
1 marks
Answer: D
This question in 9708/13 Oct/Nov 2025


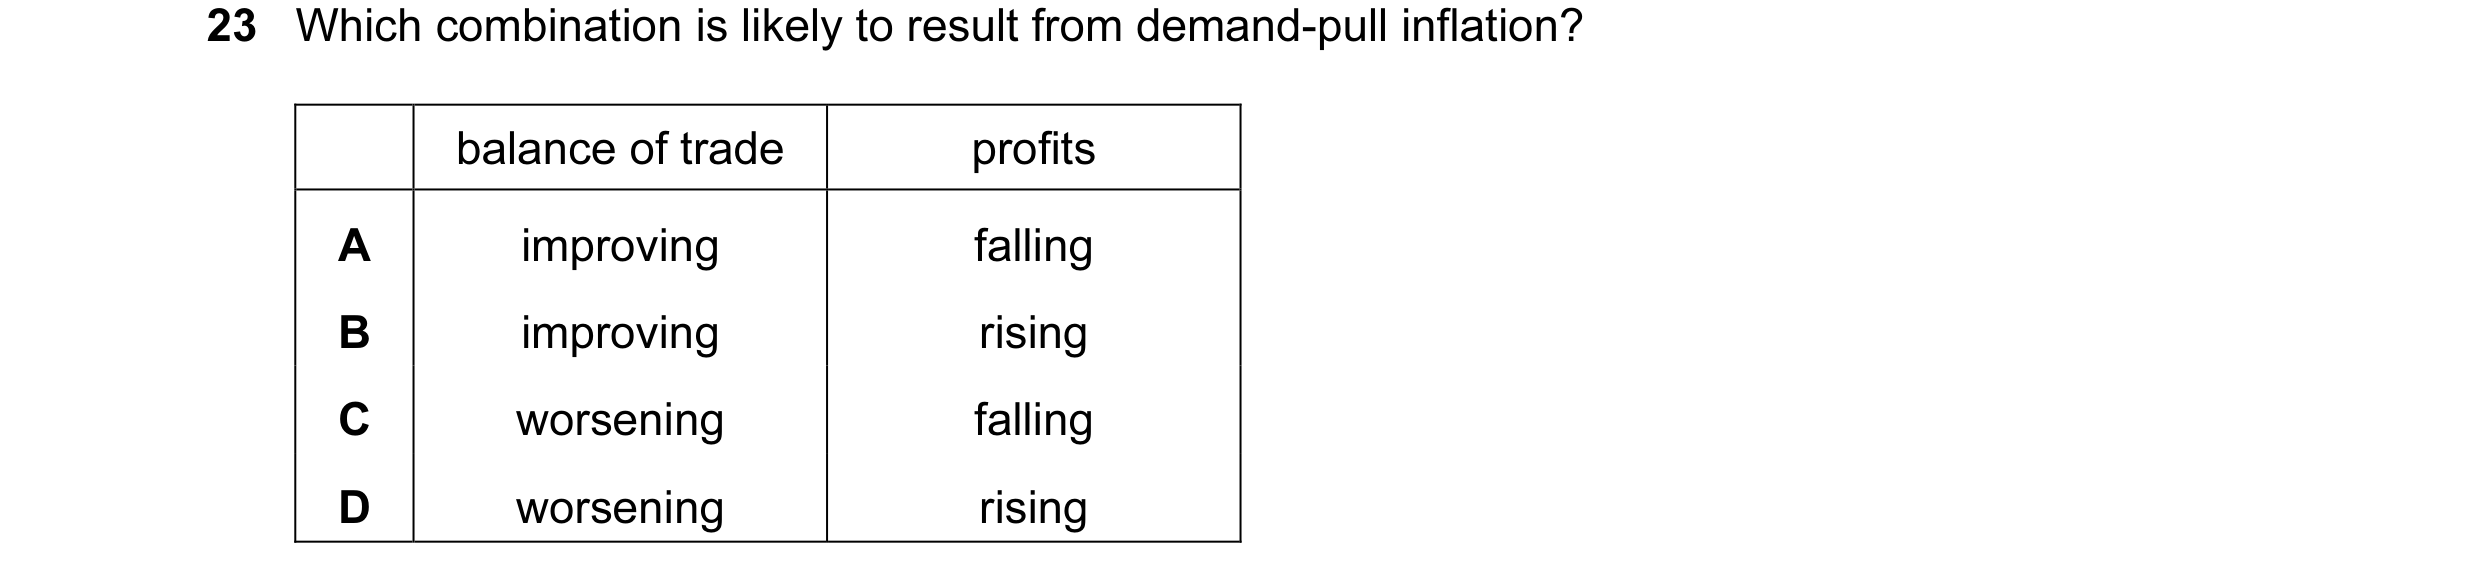
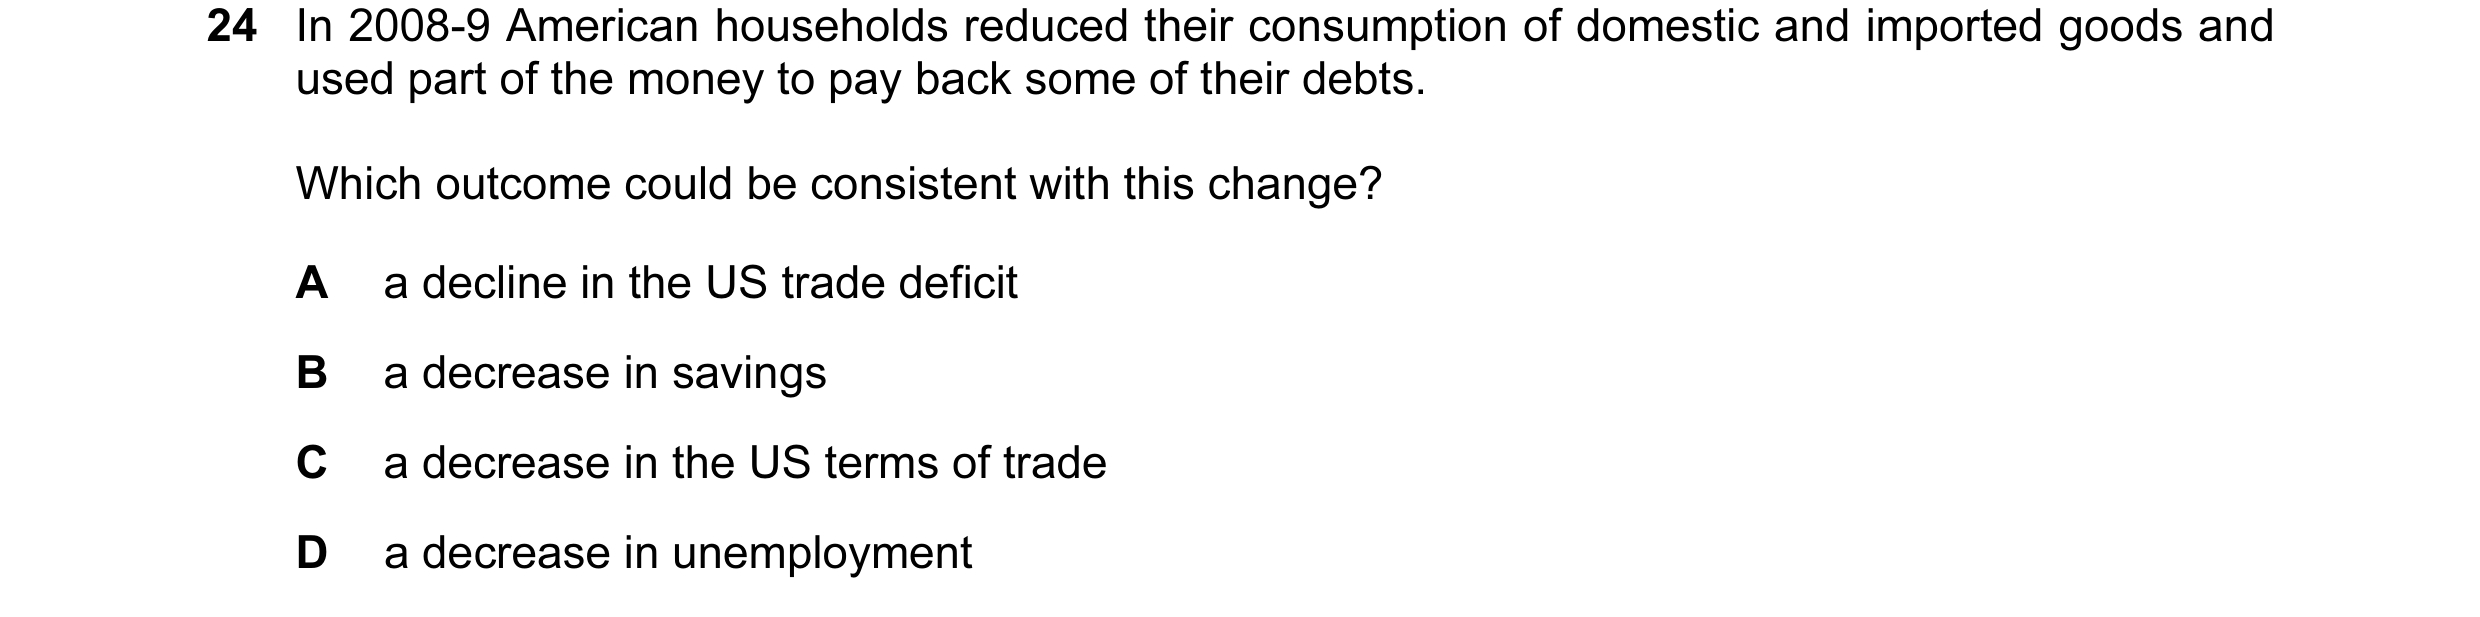
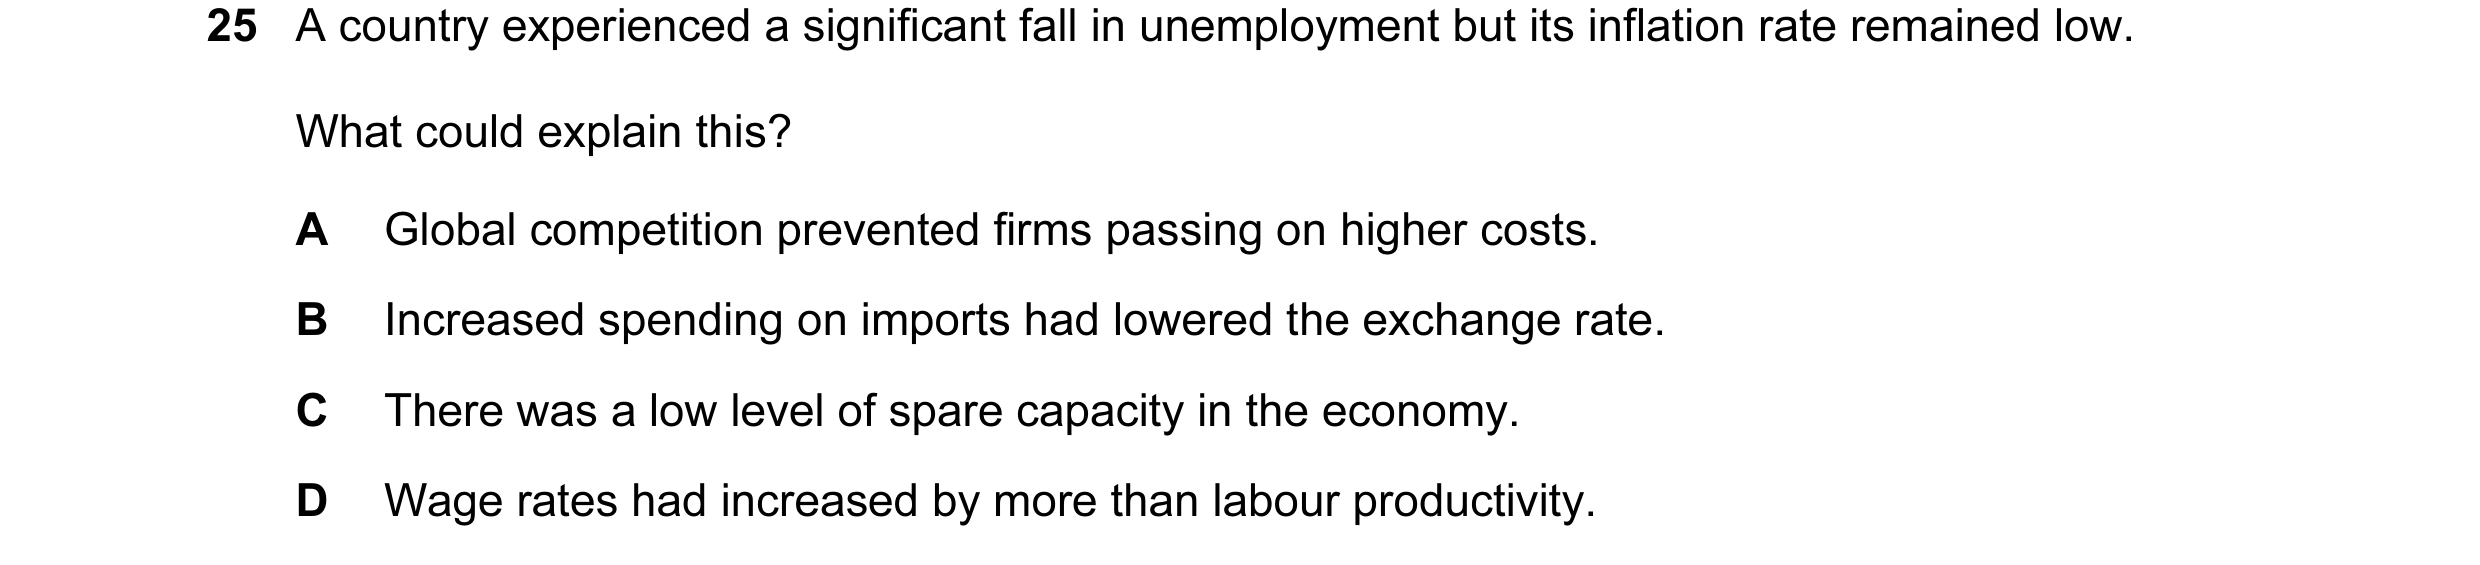 1 / 57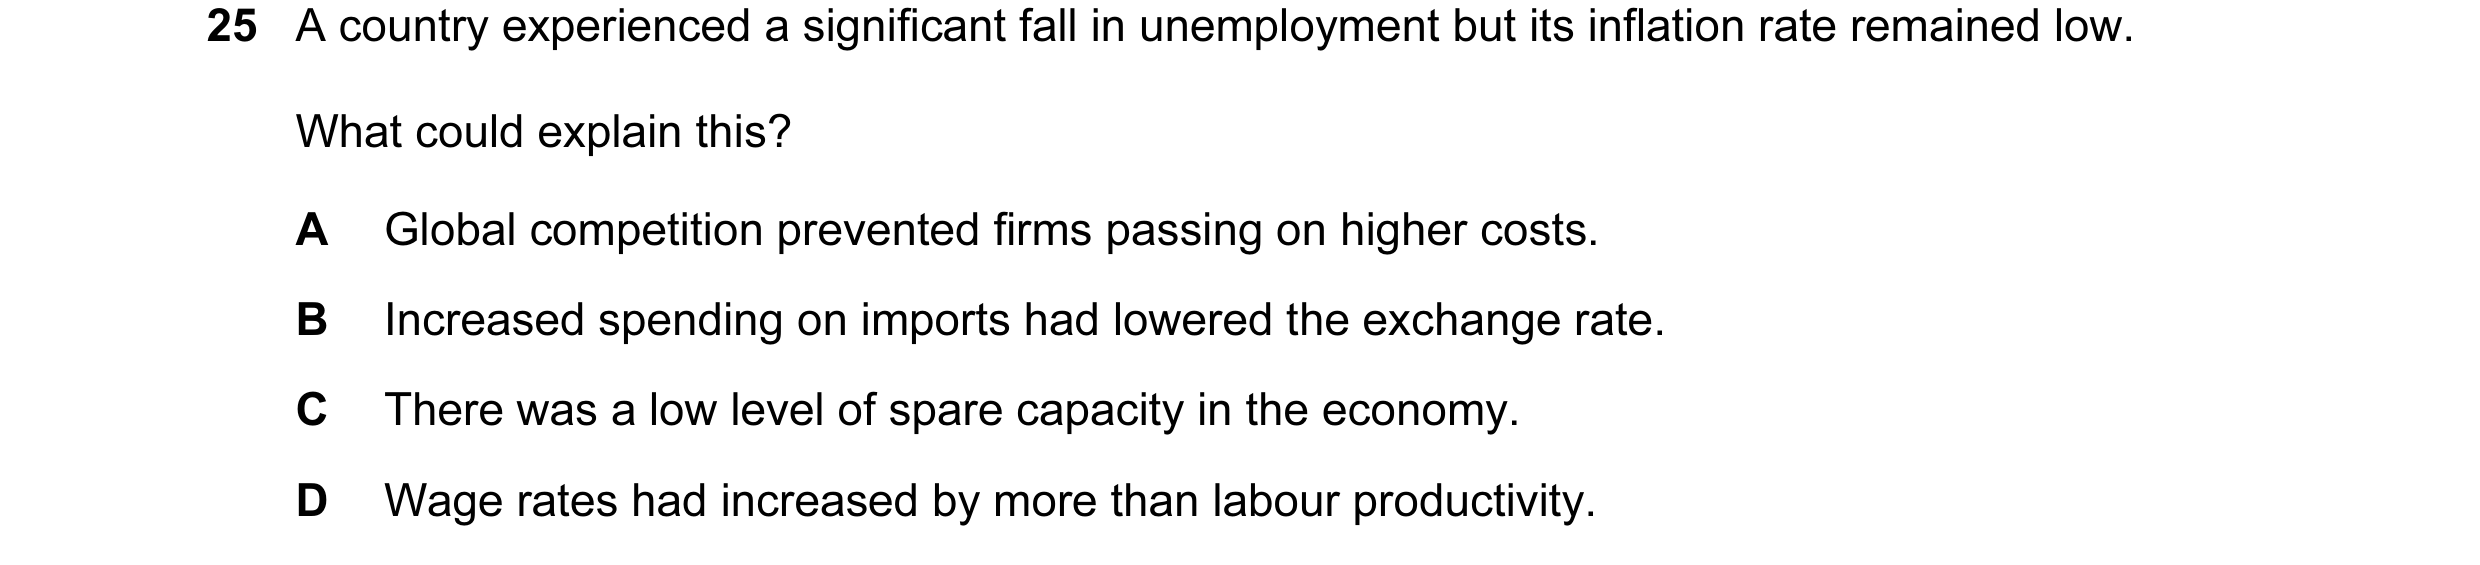
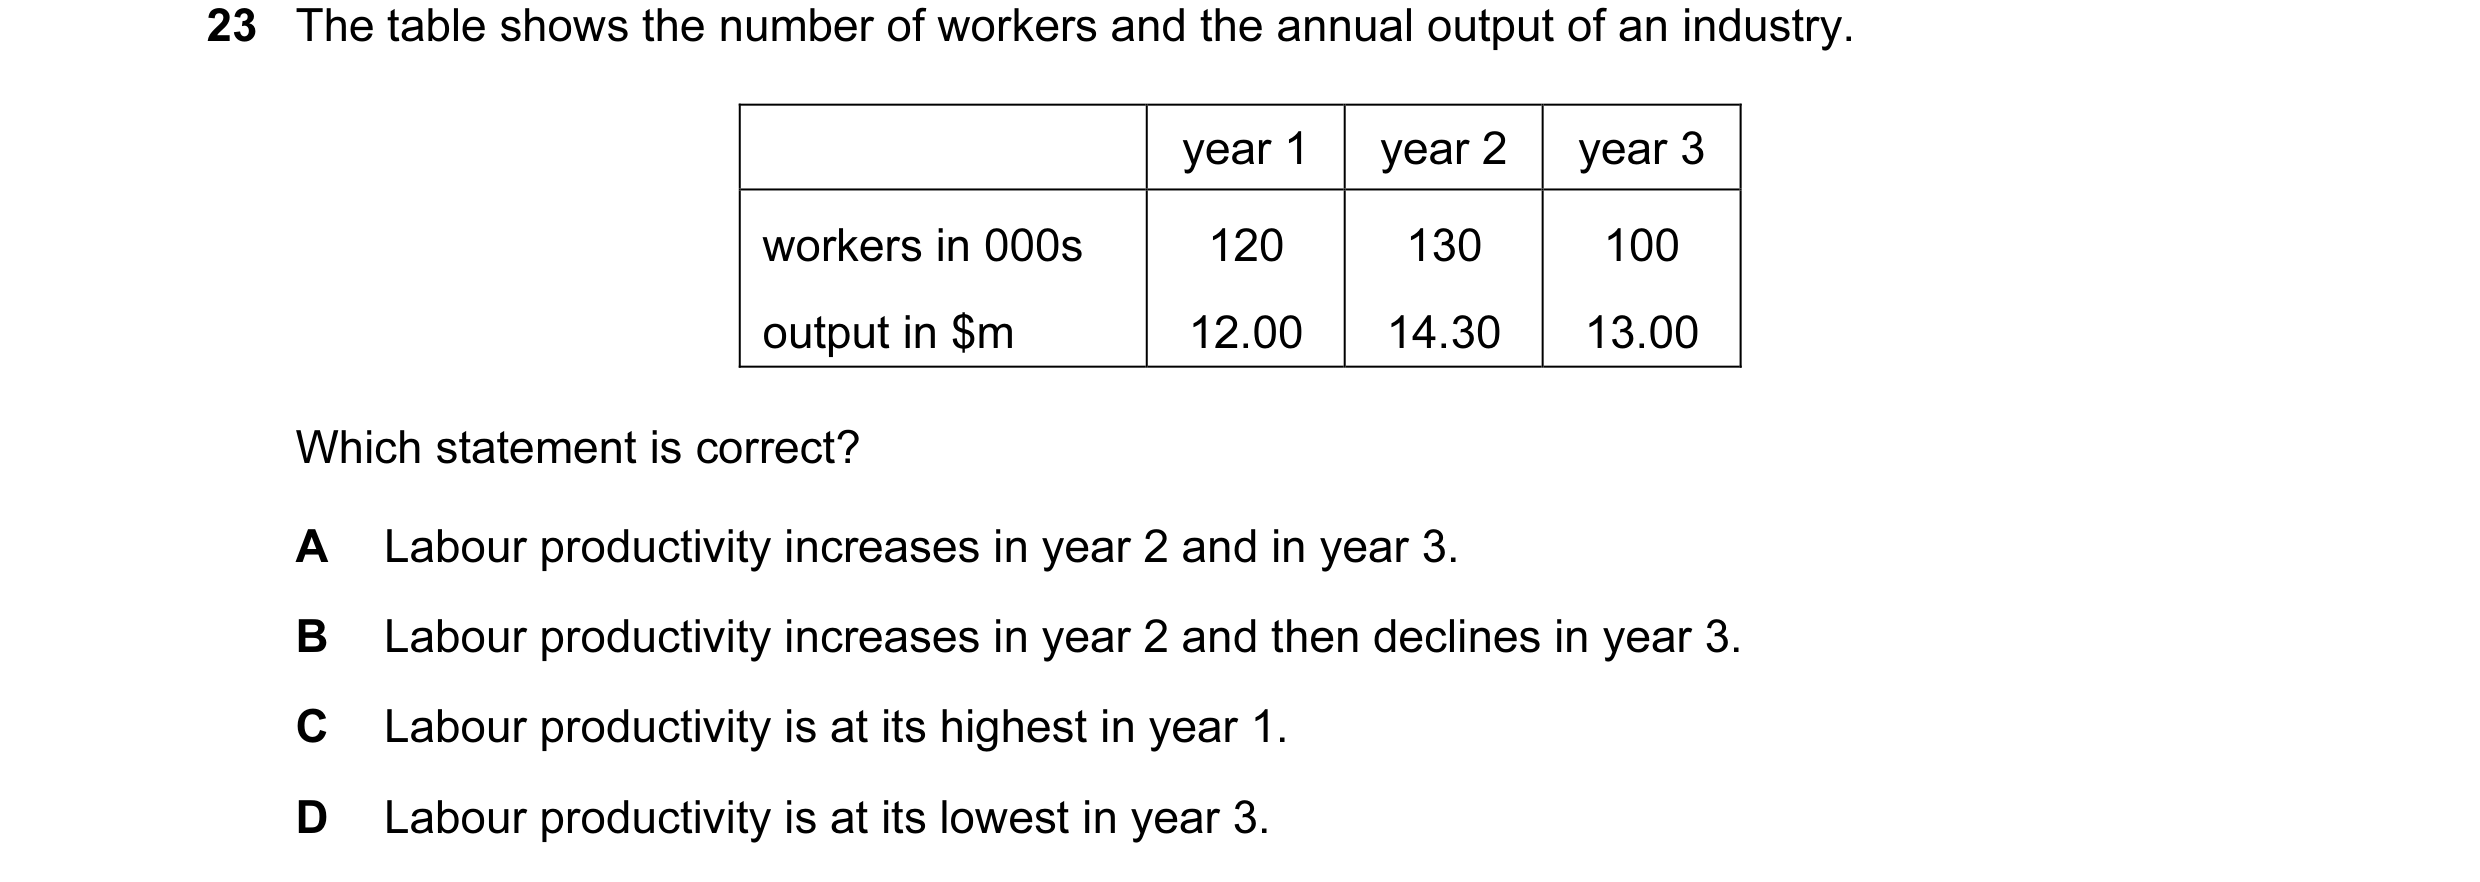
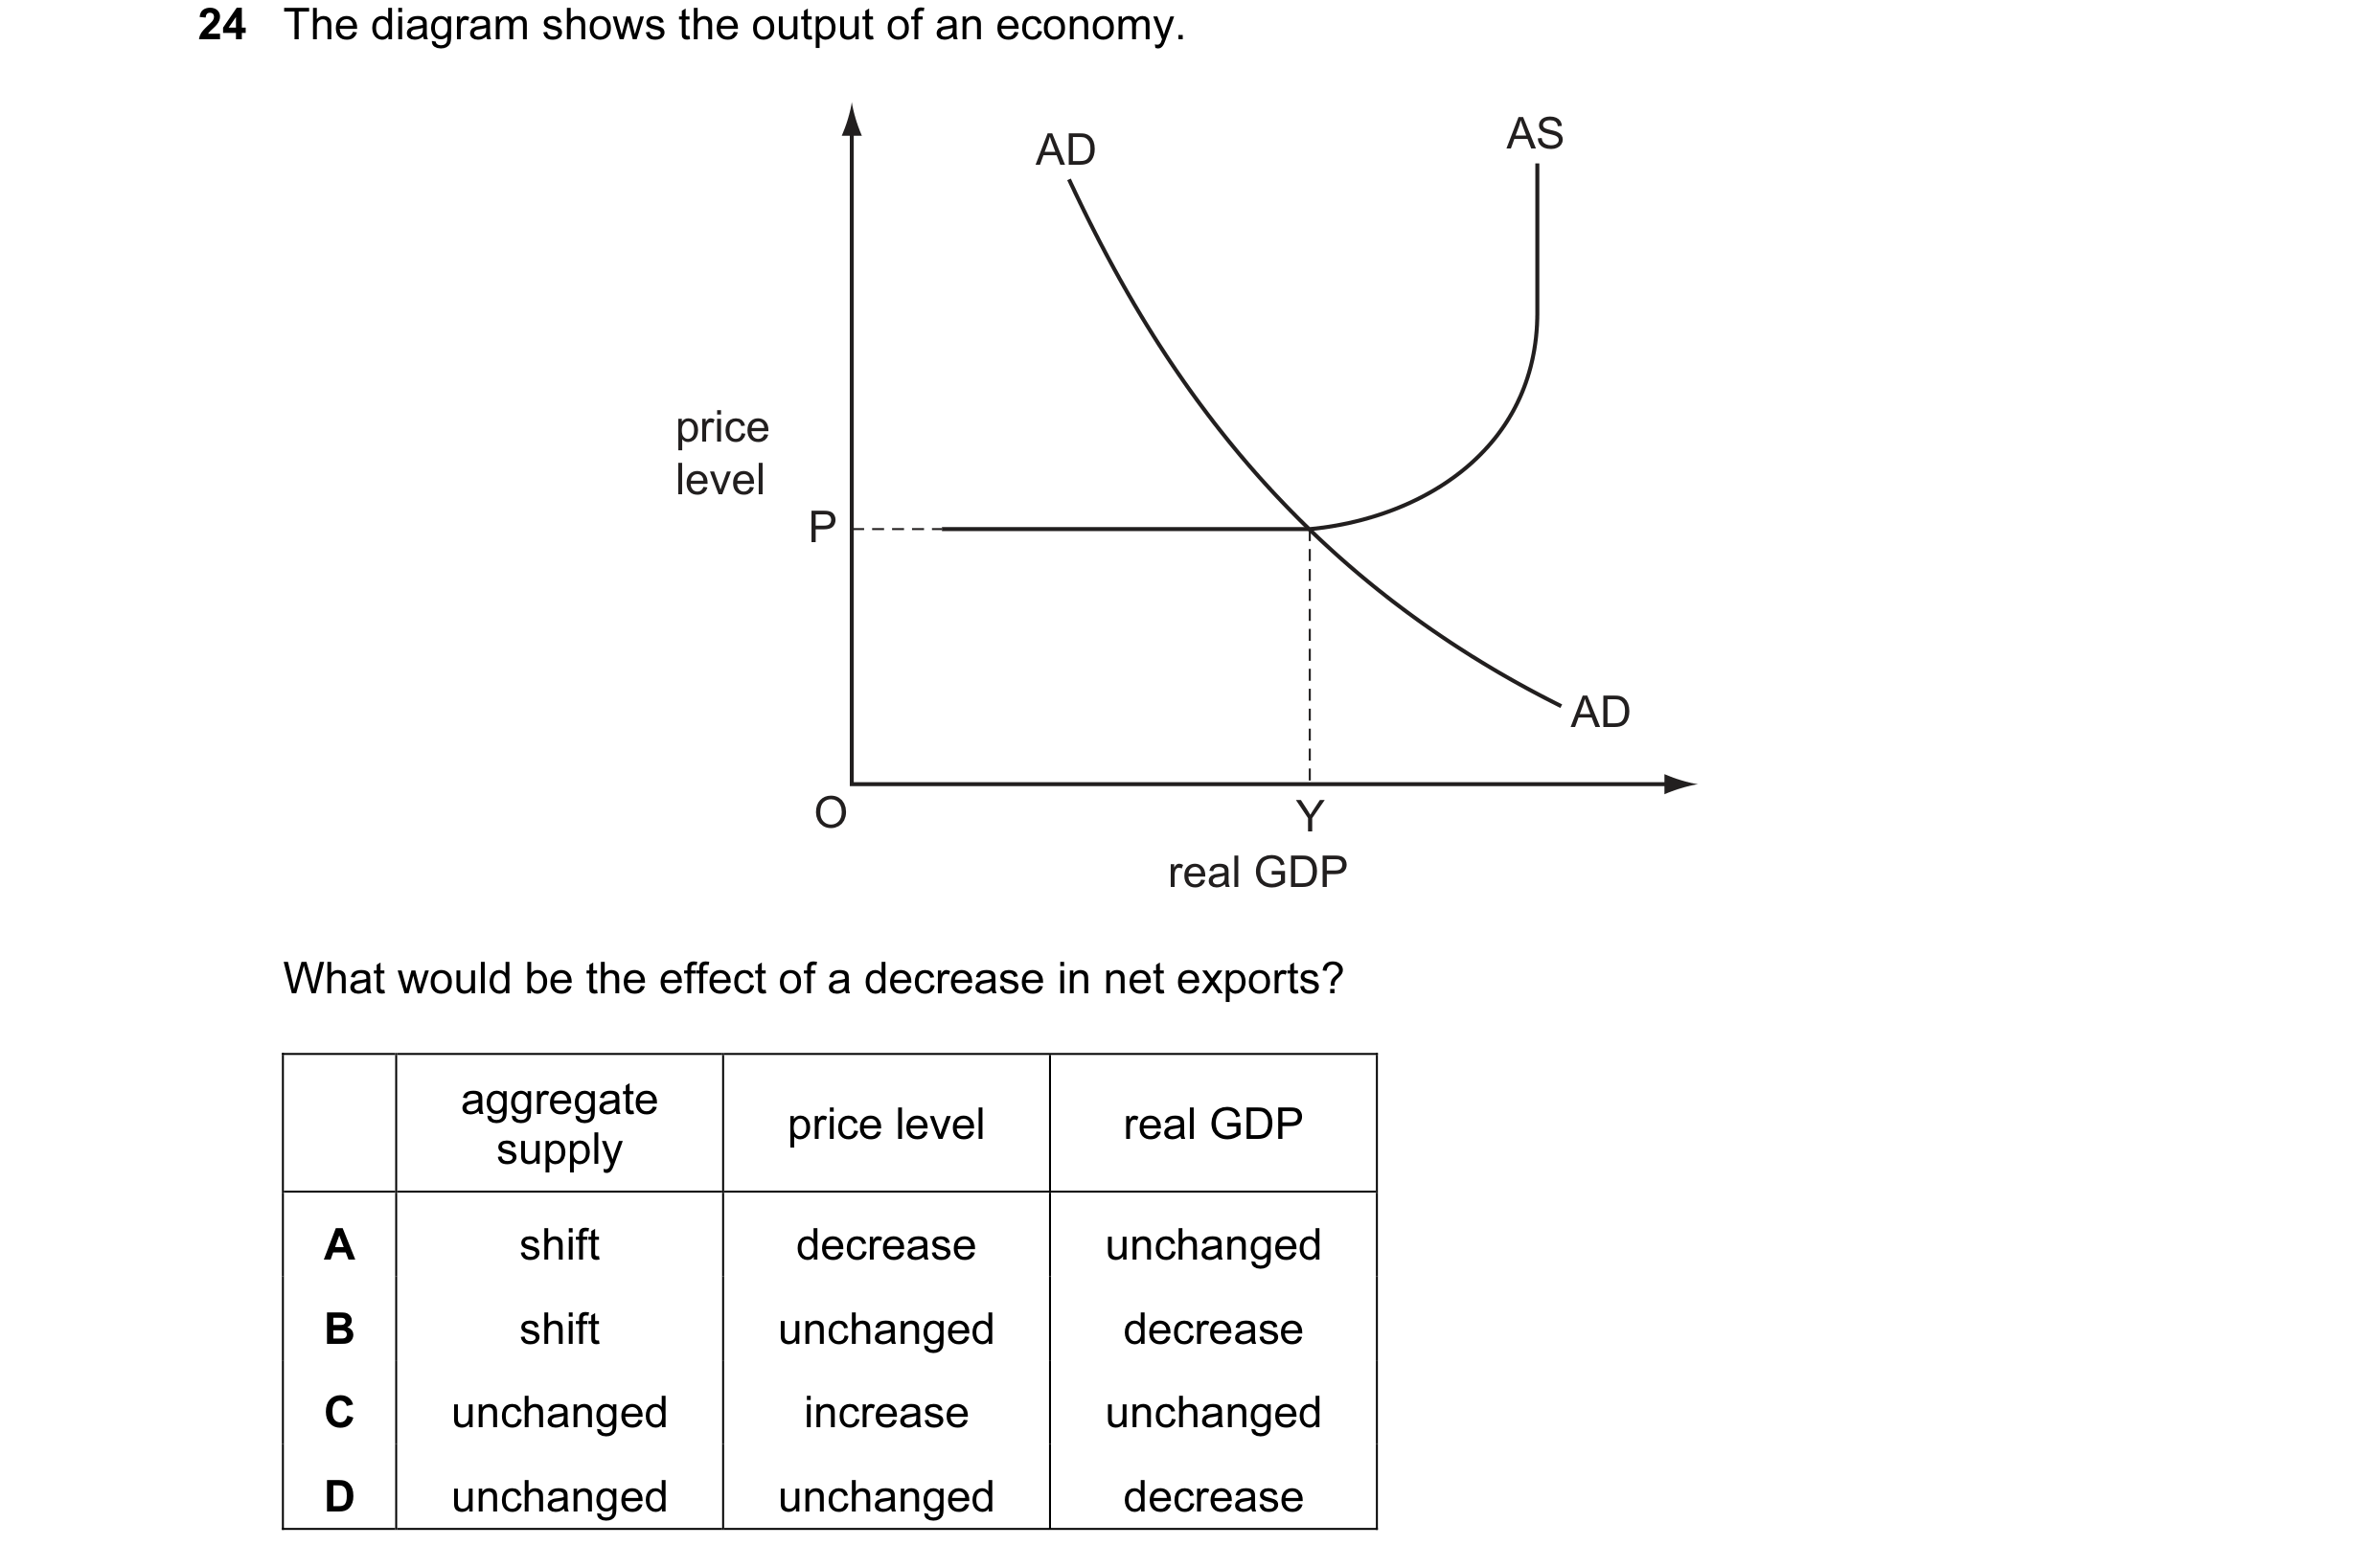 2 / 57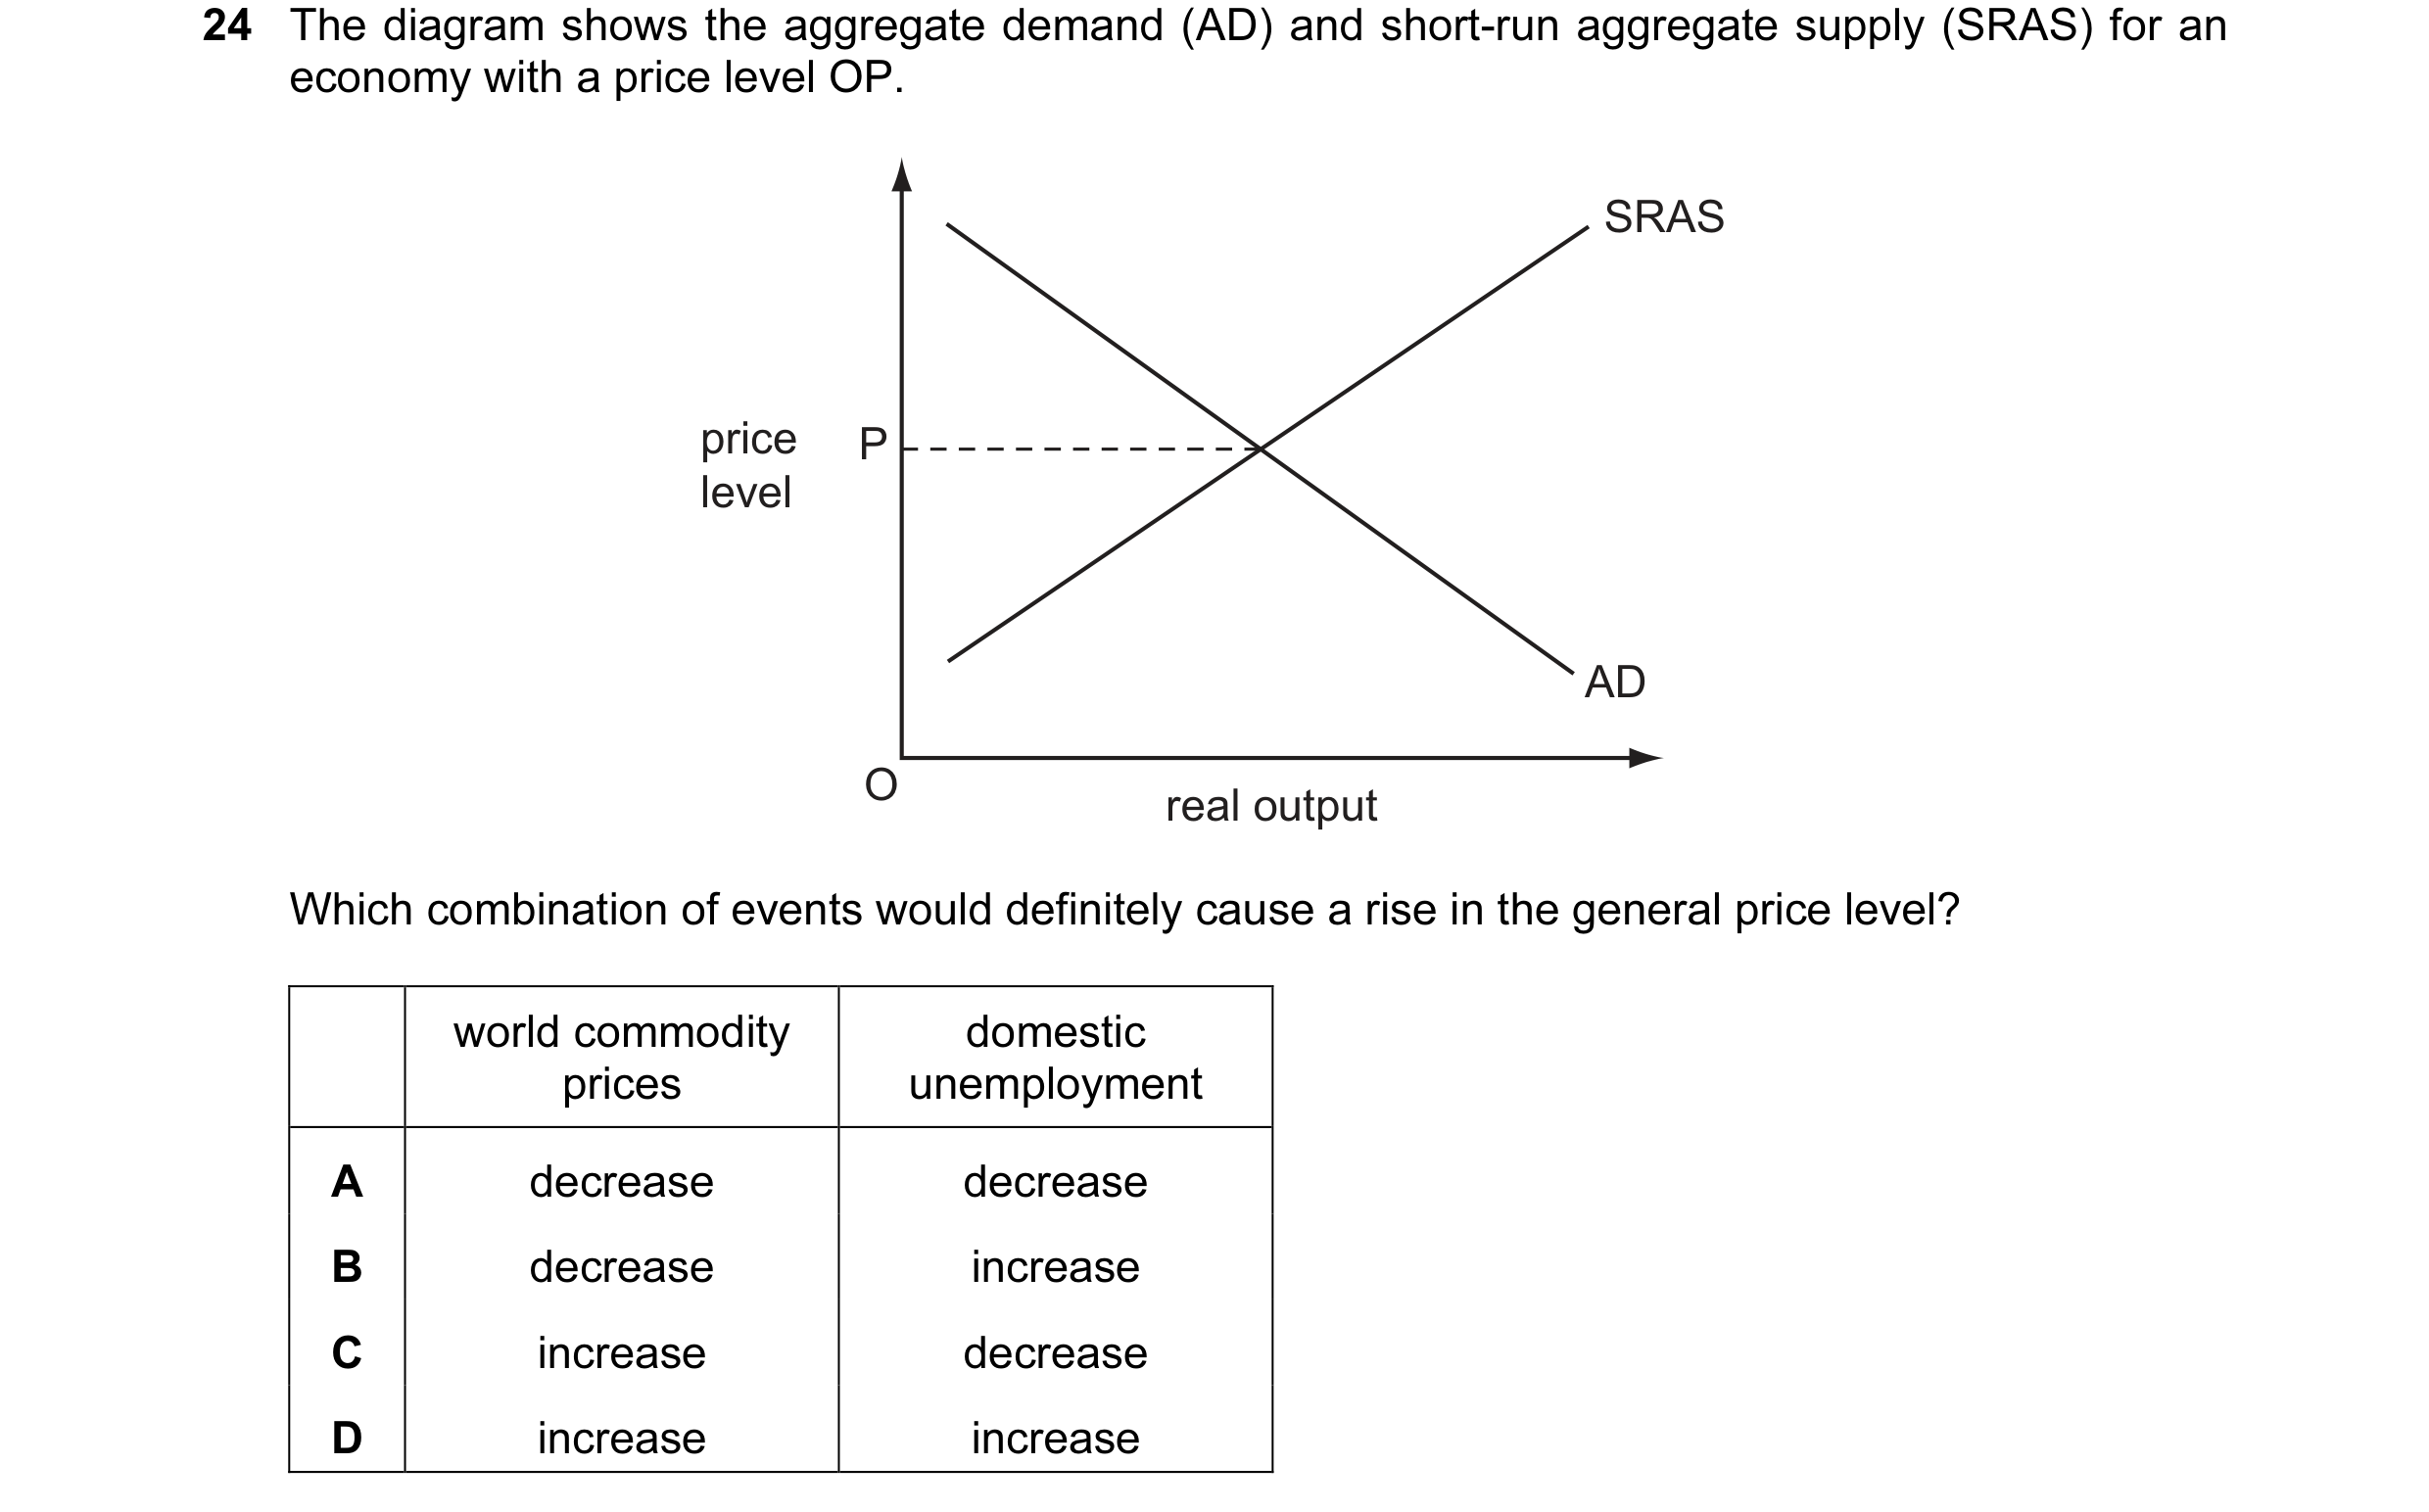
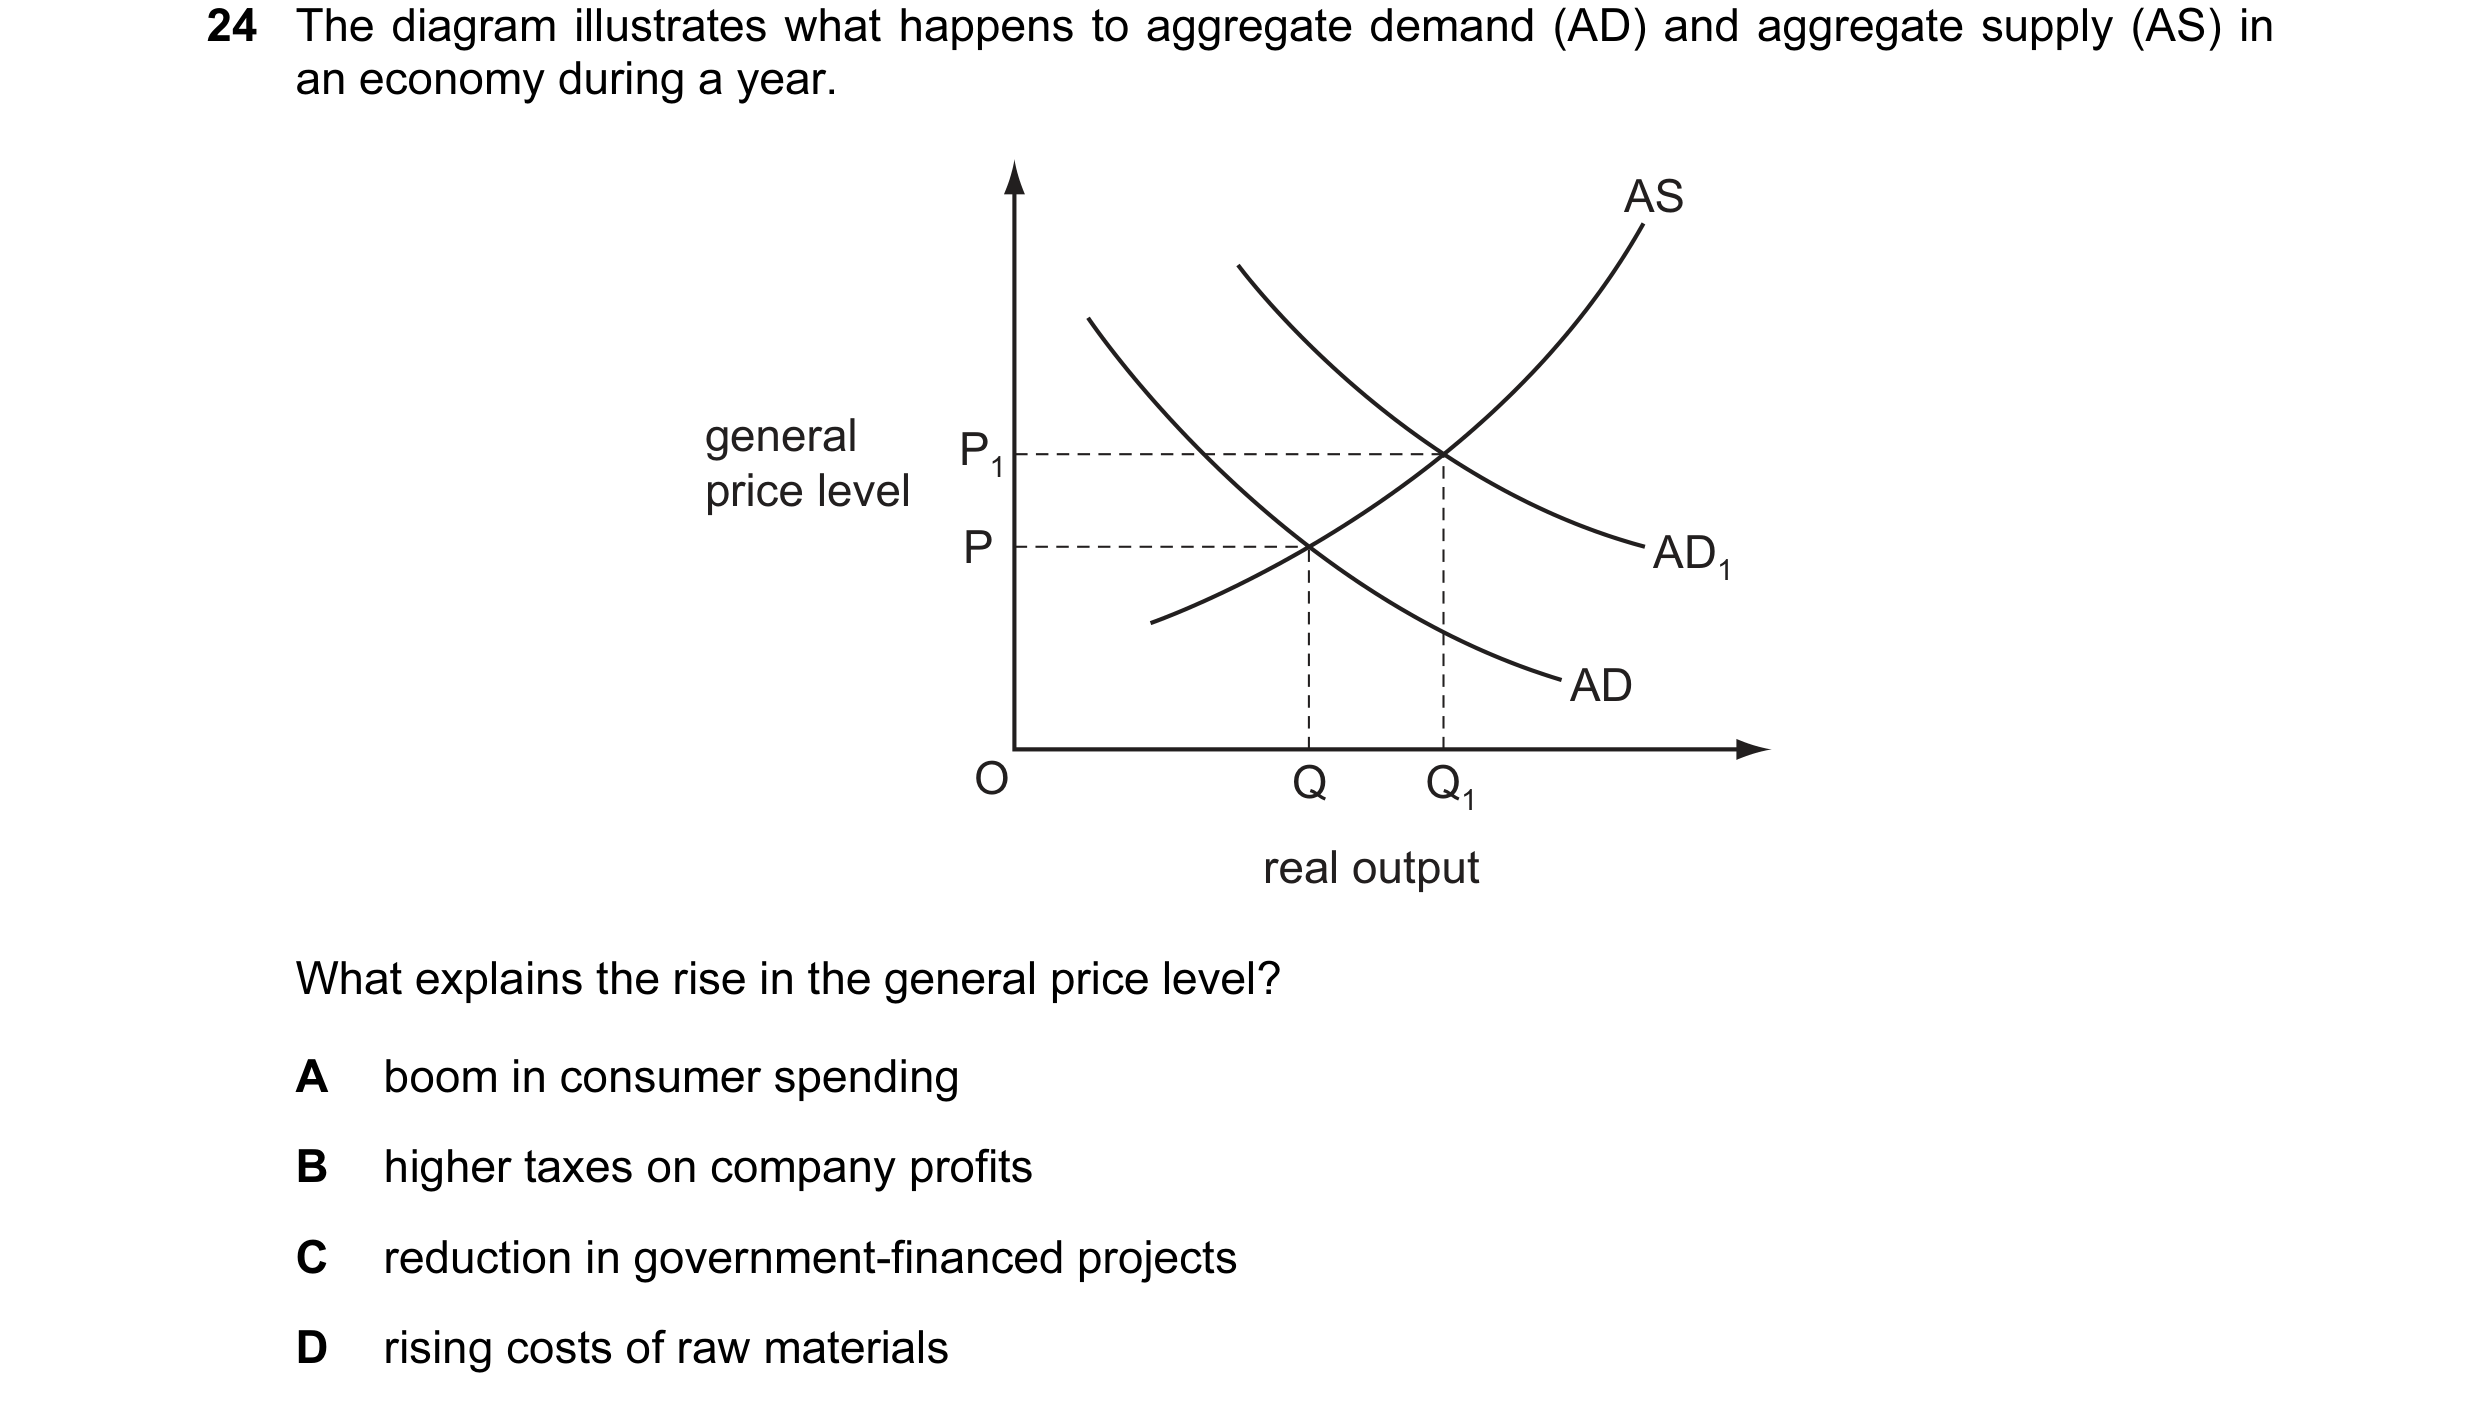
 3 / 57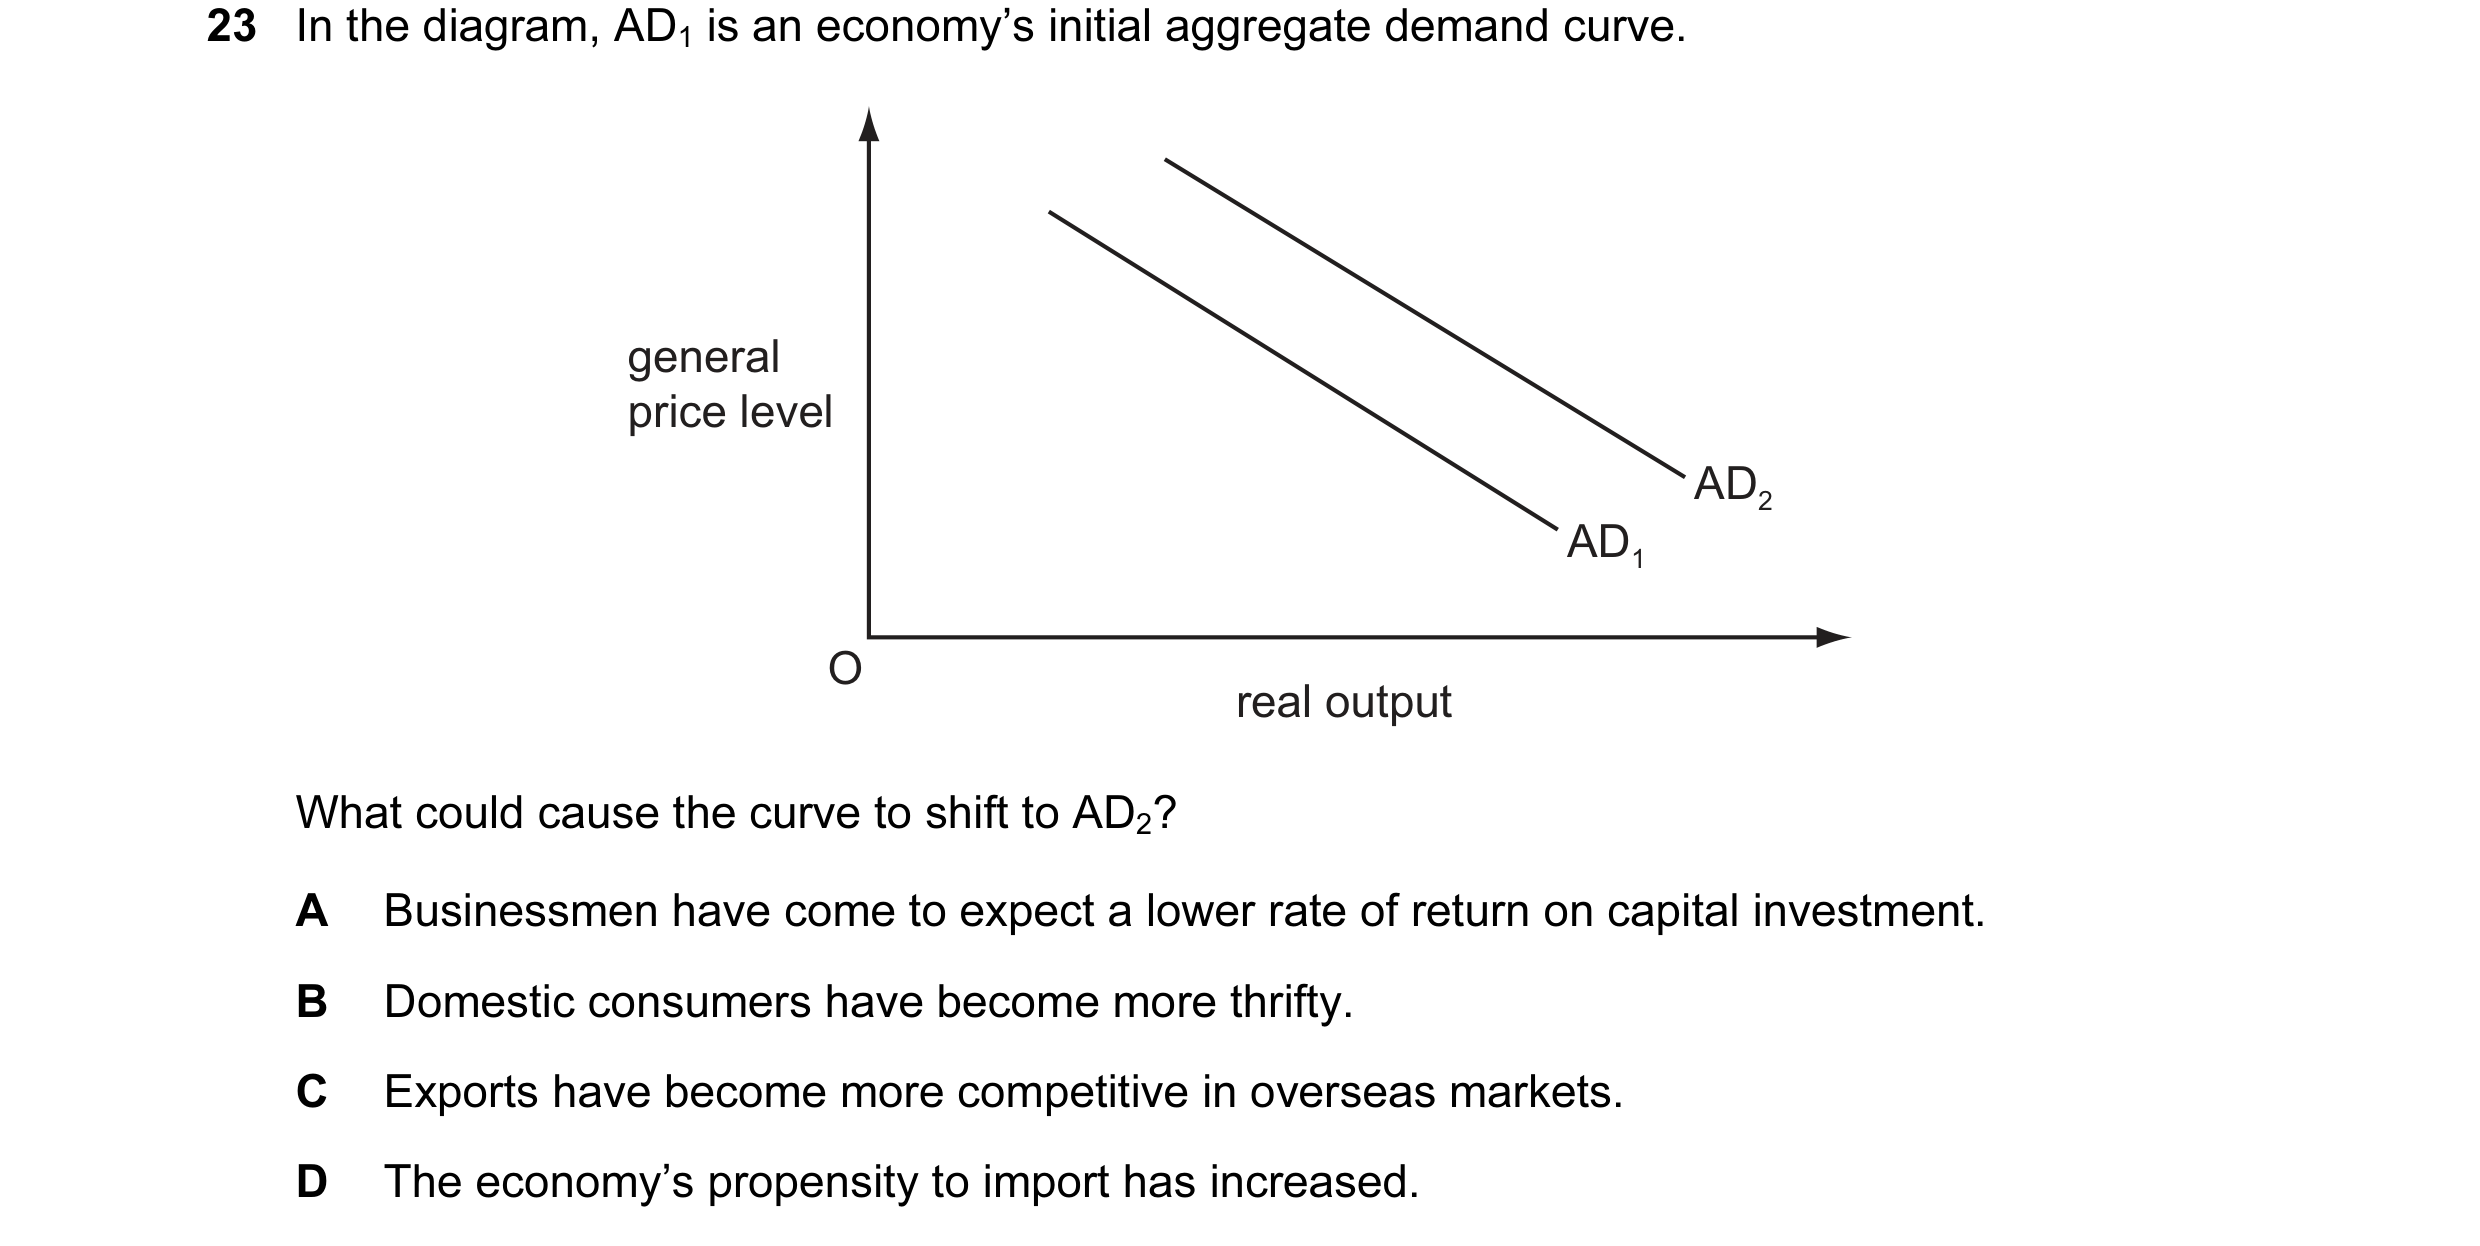
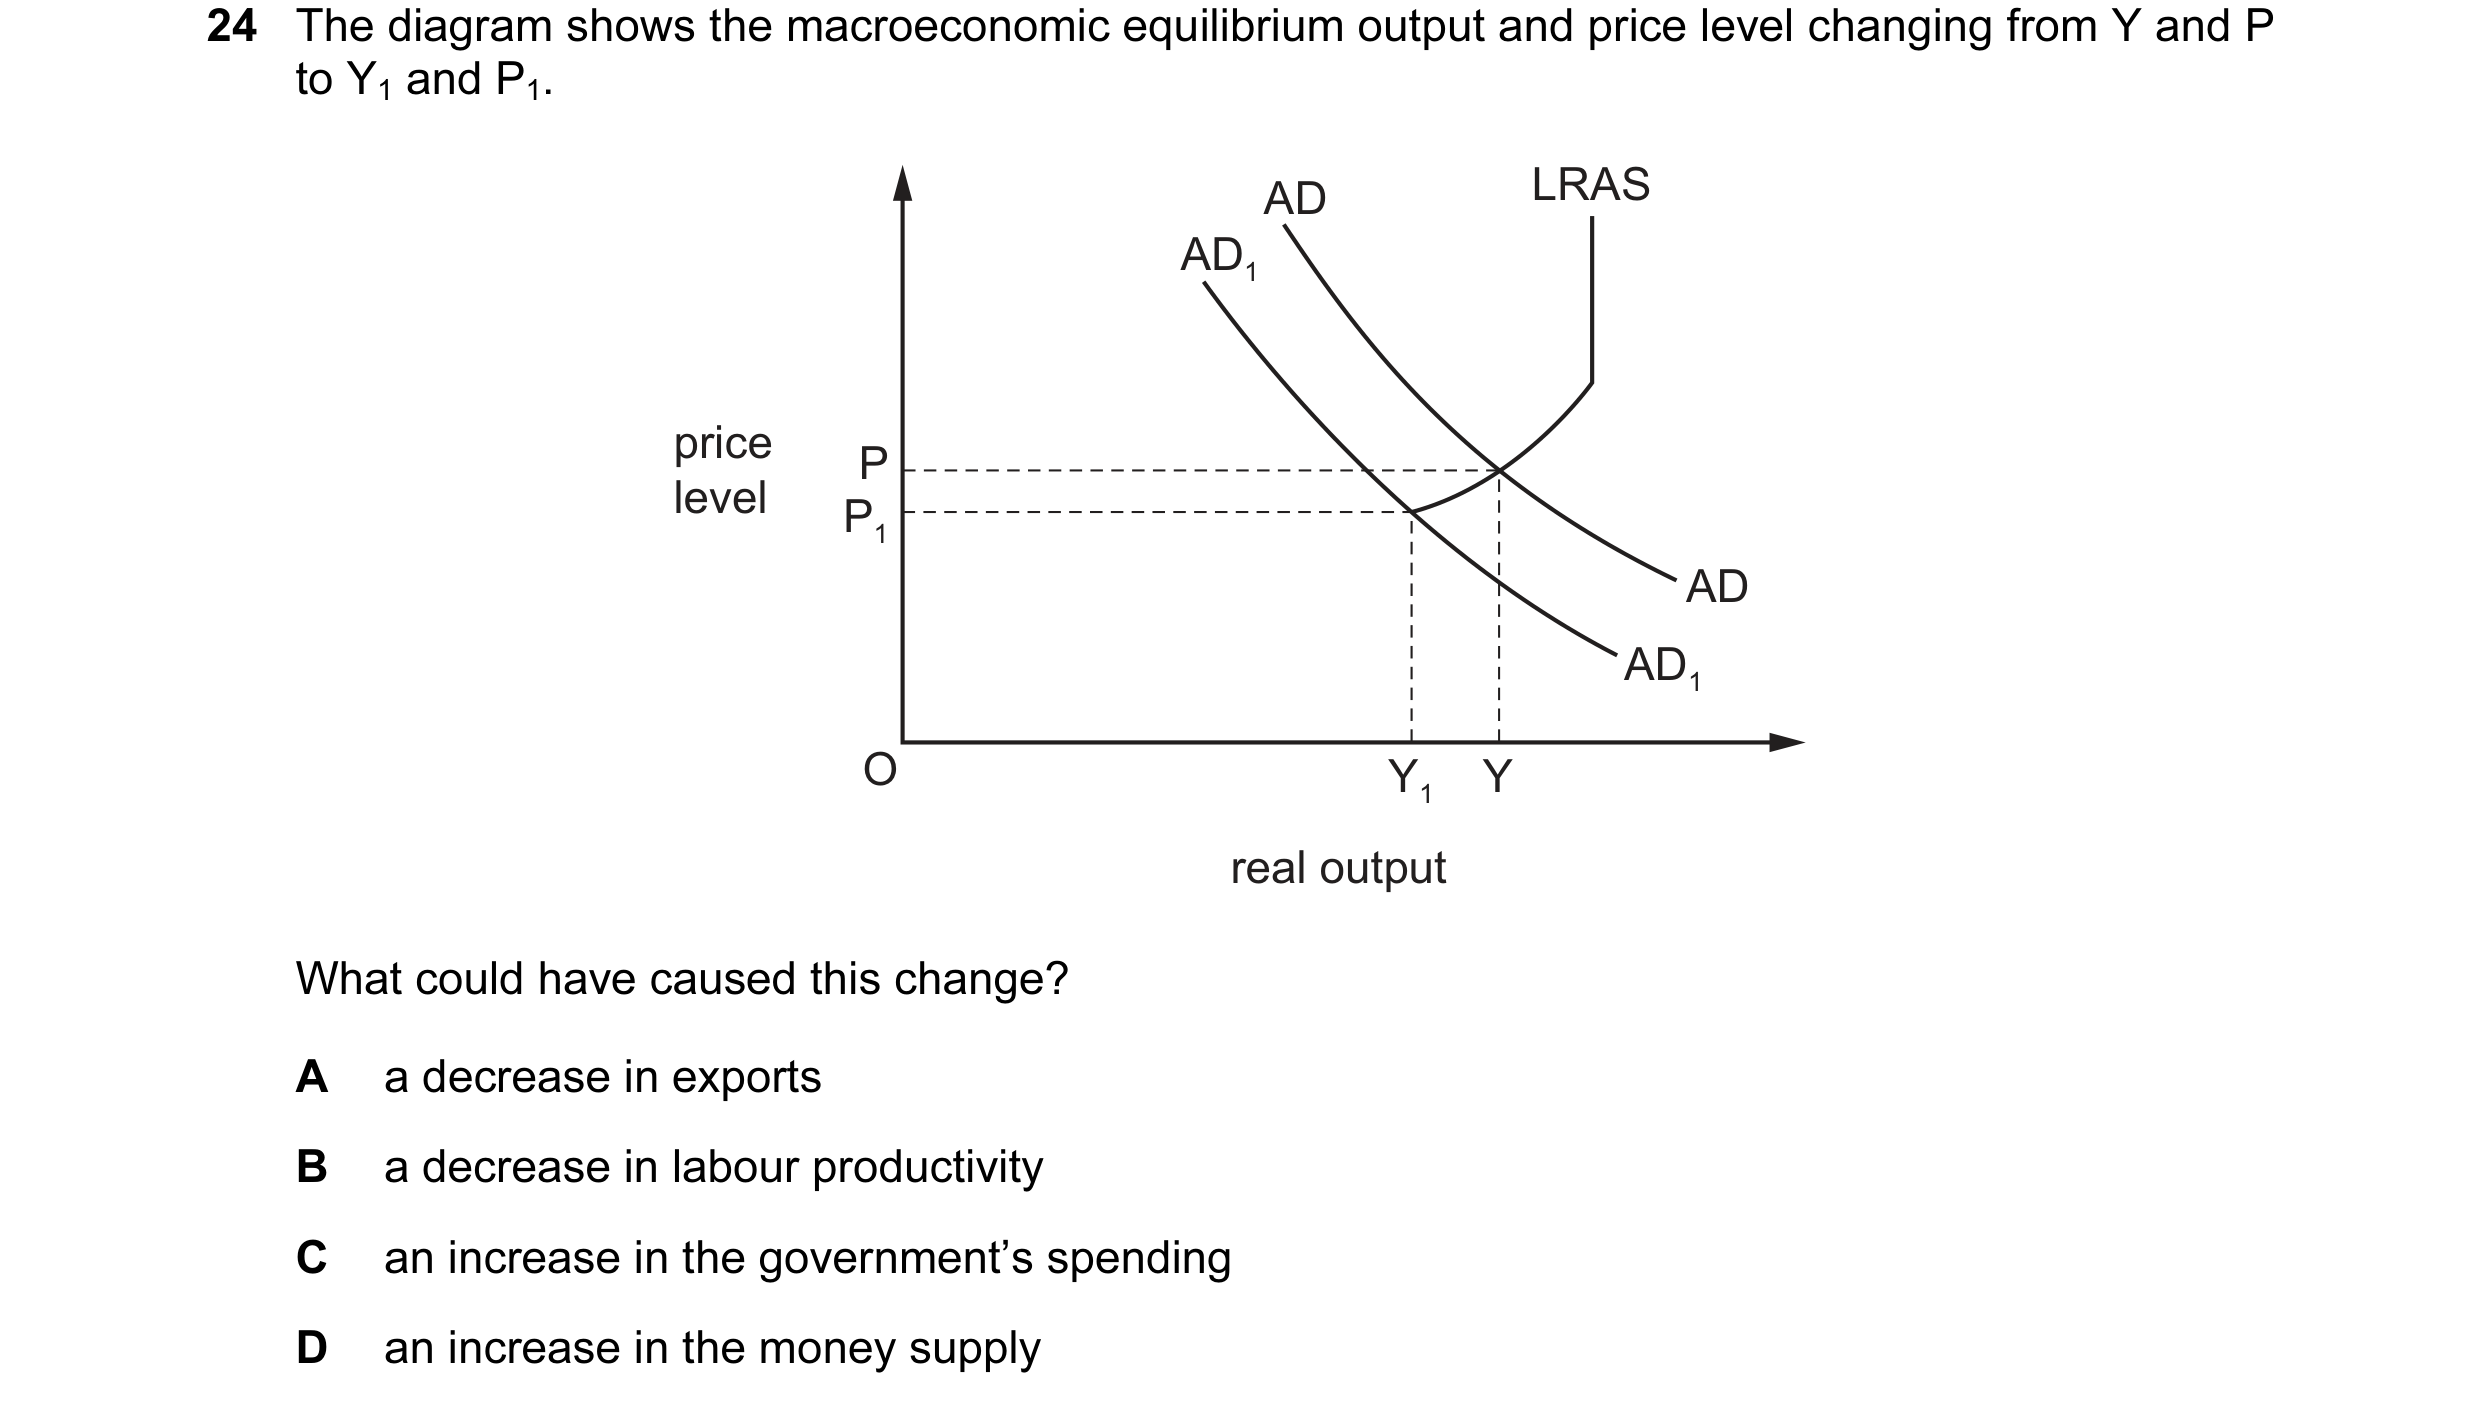 4 / 57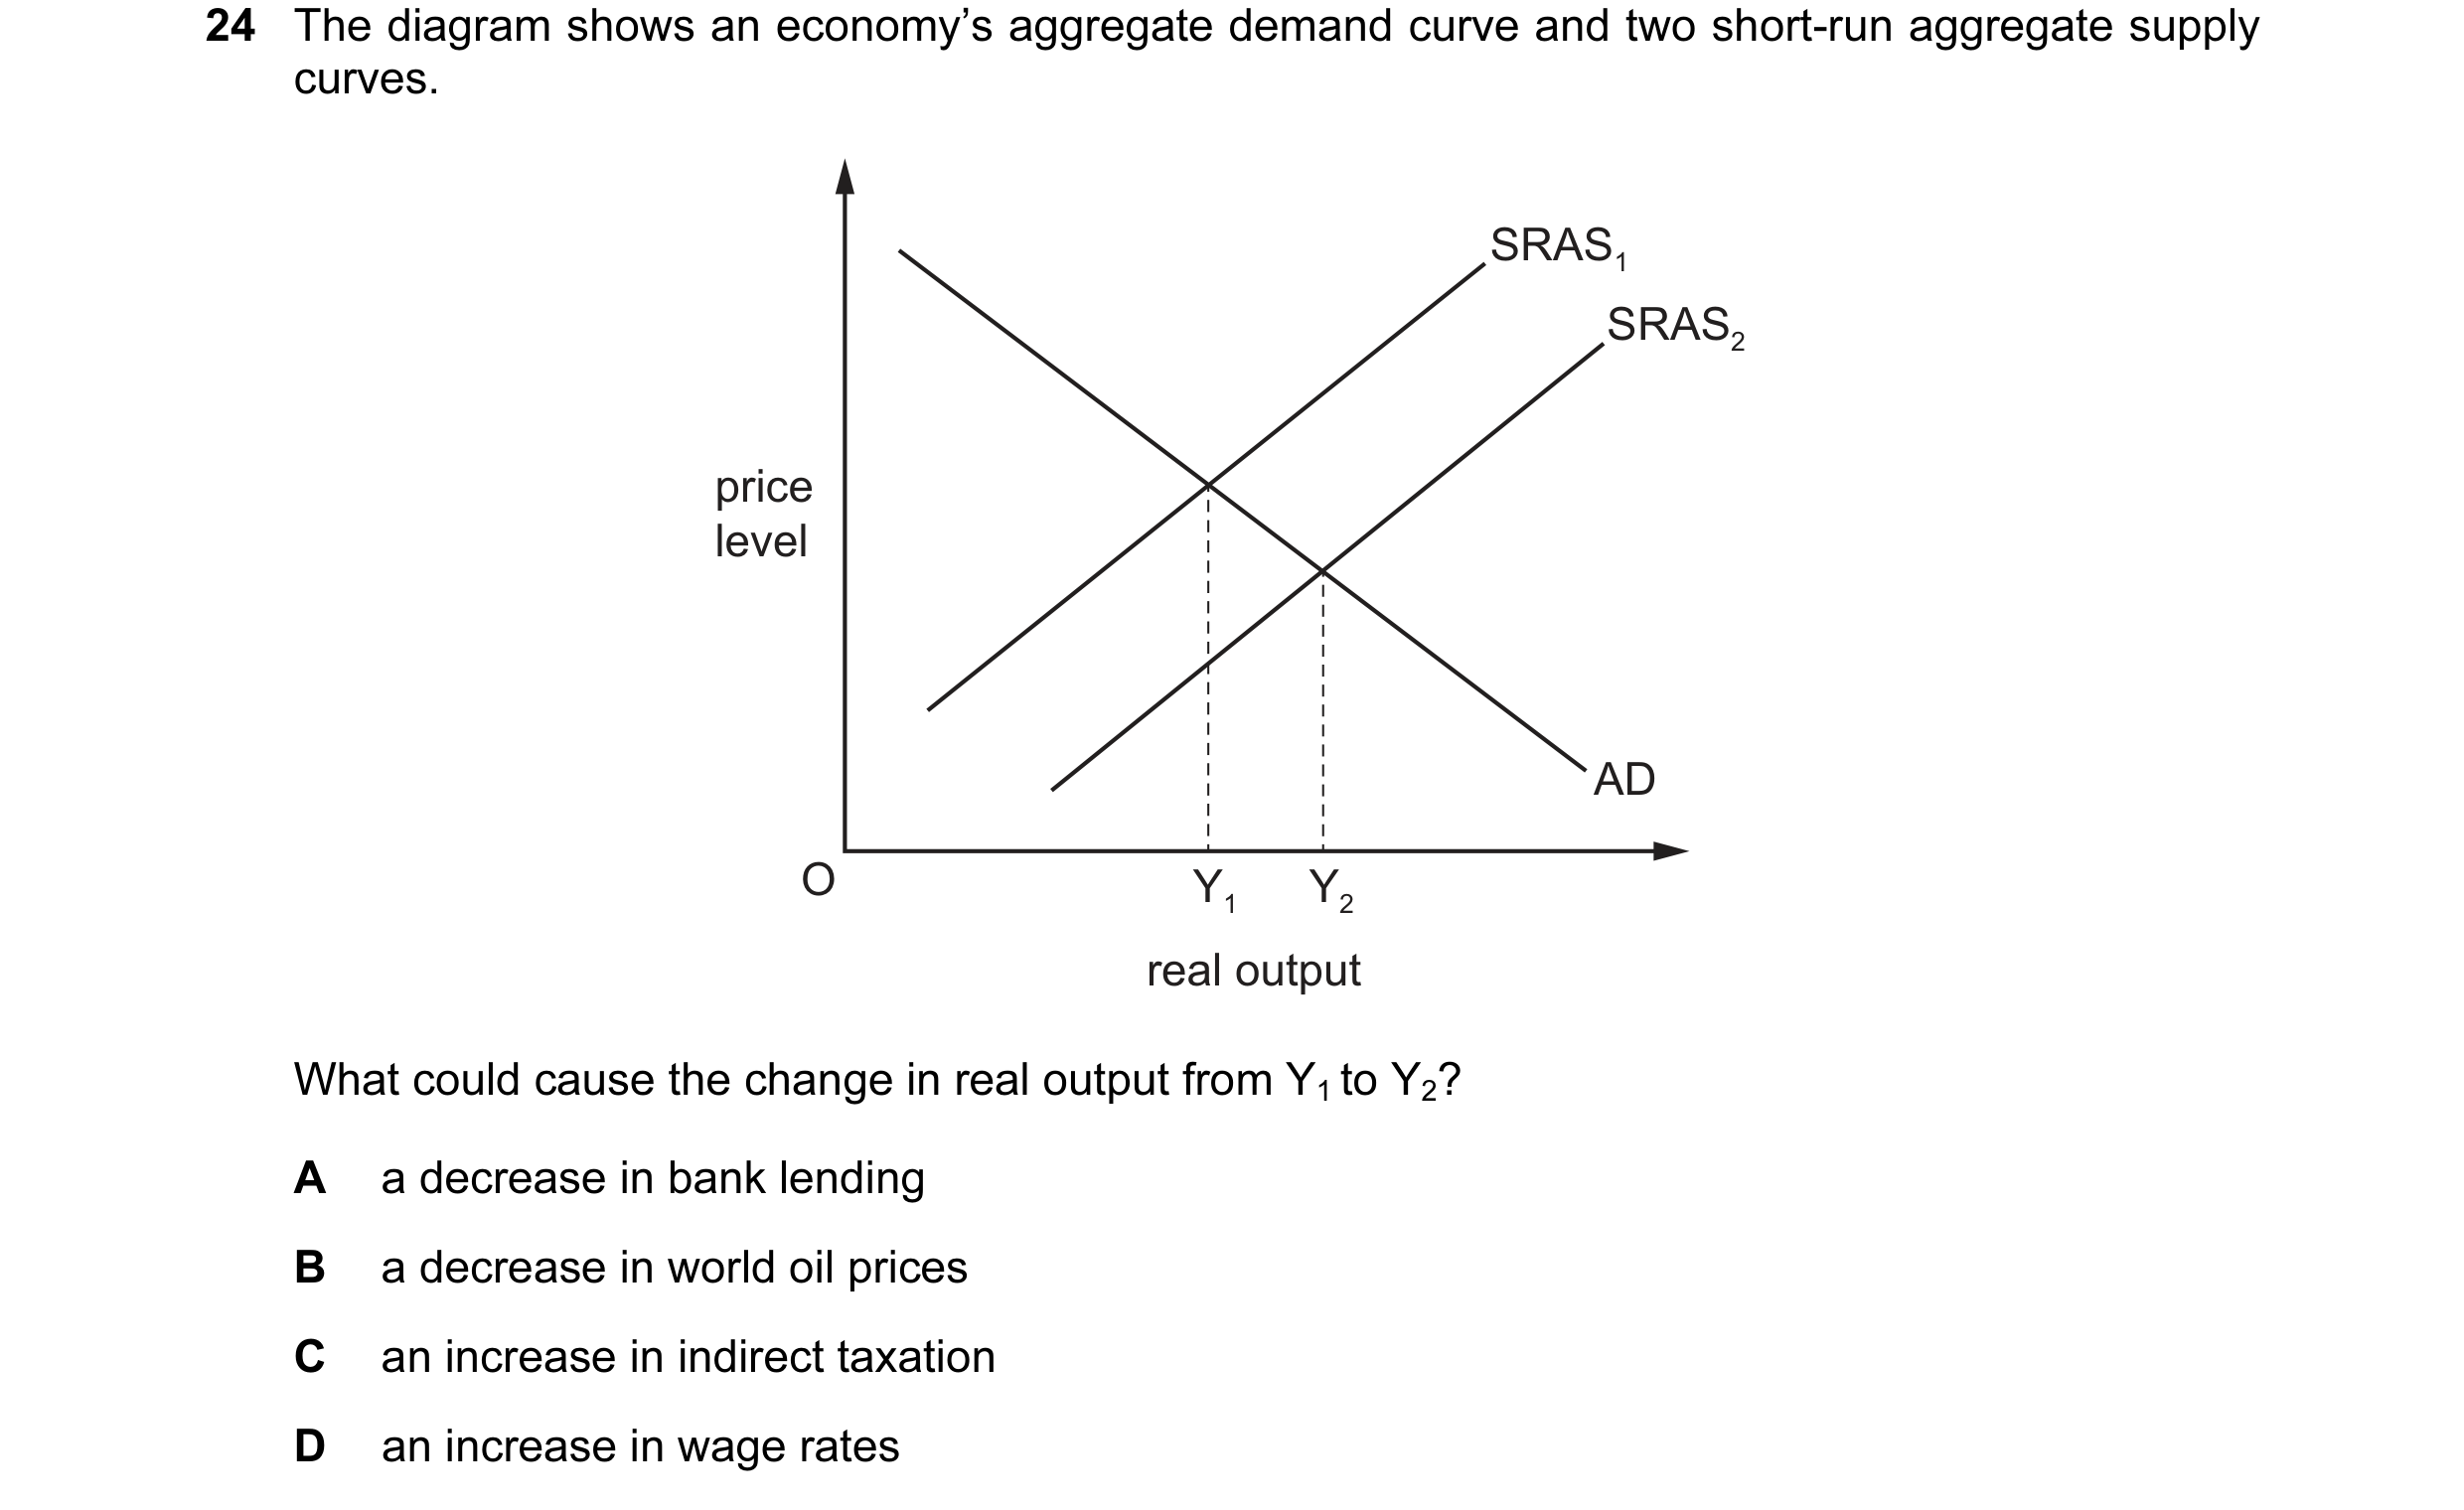
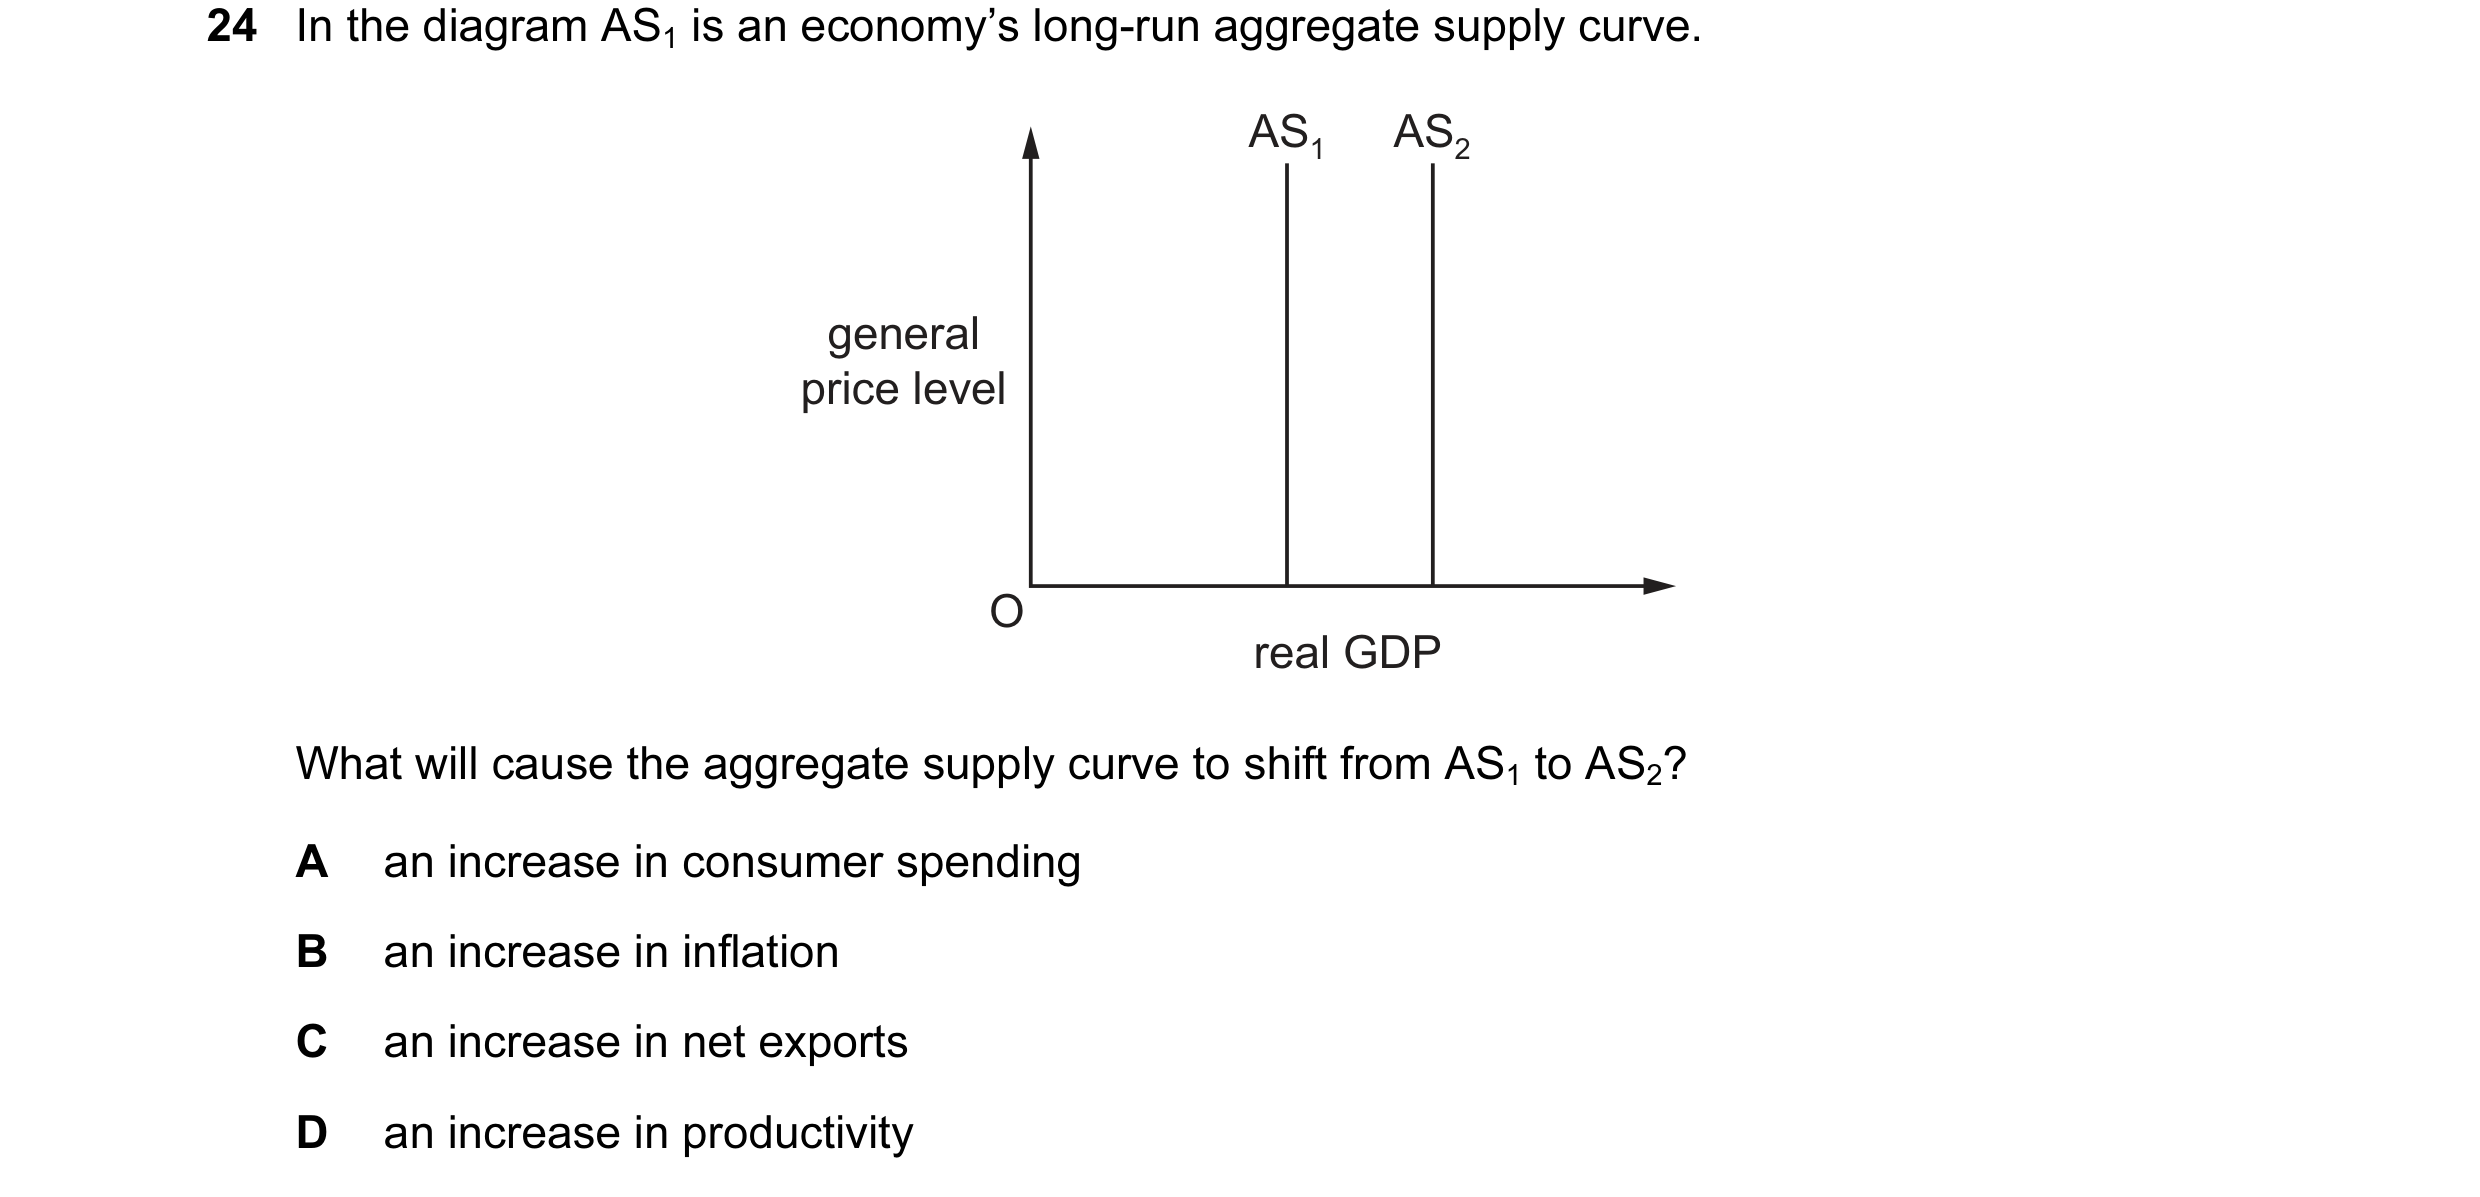 5 / 57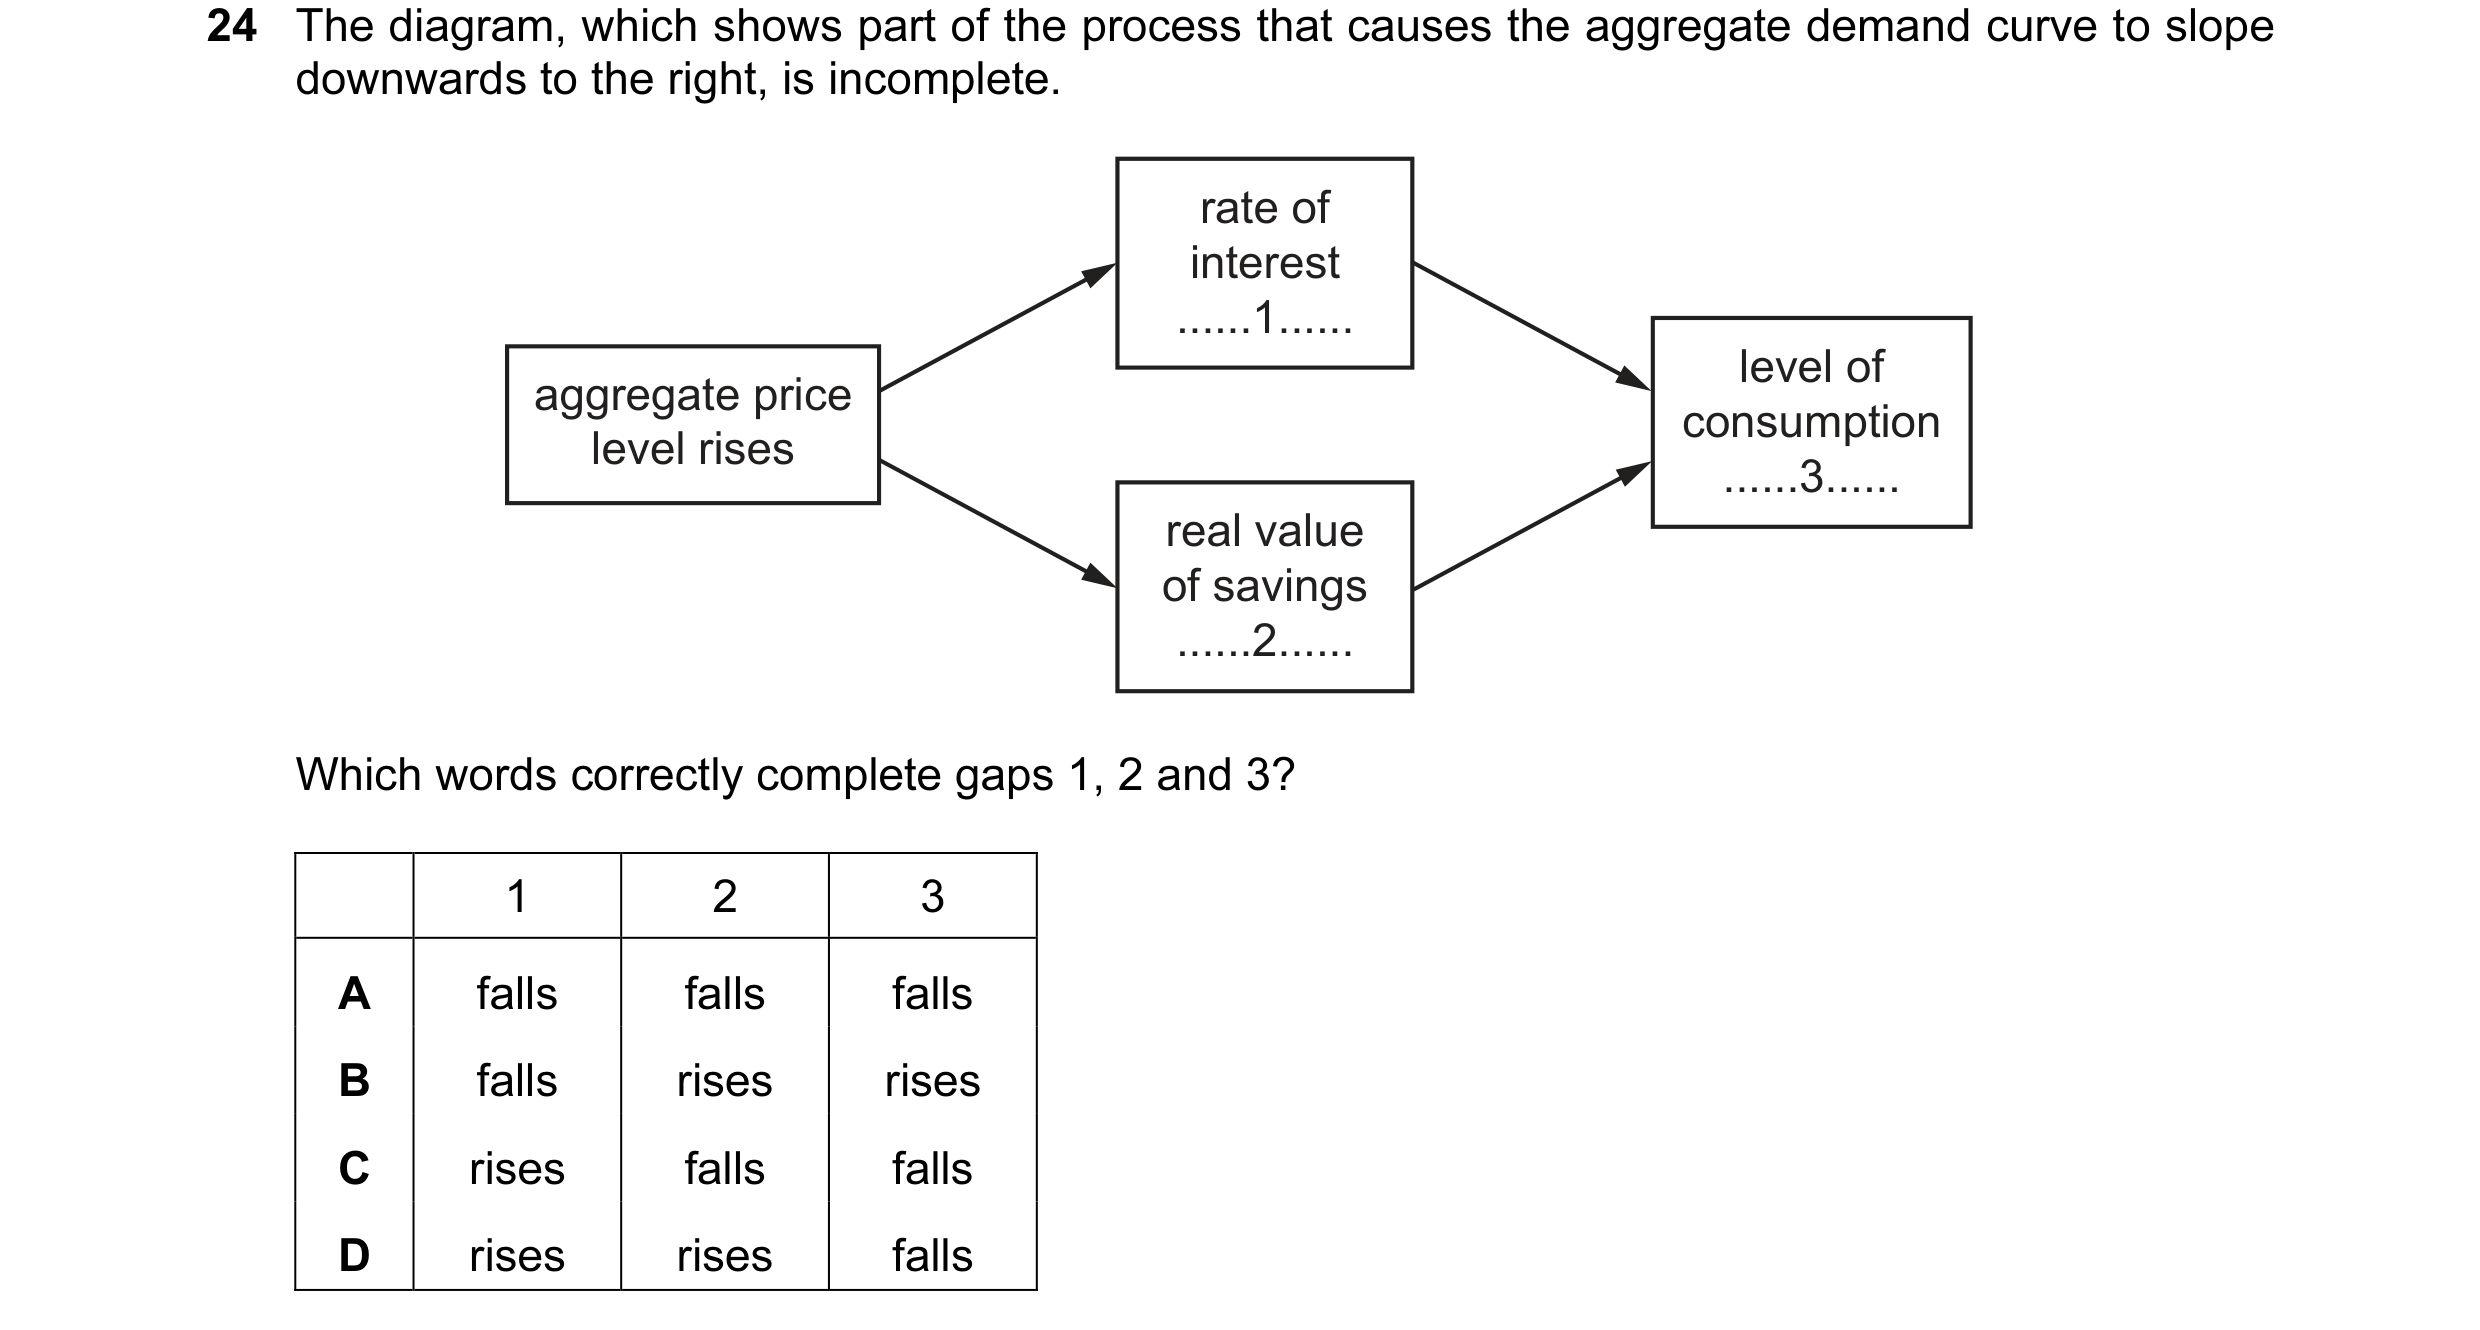

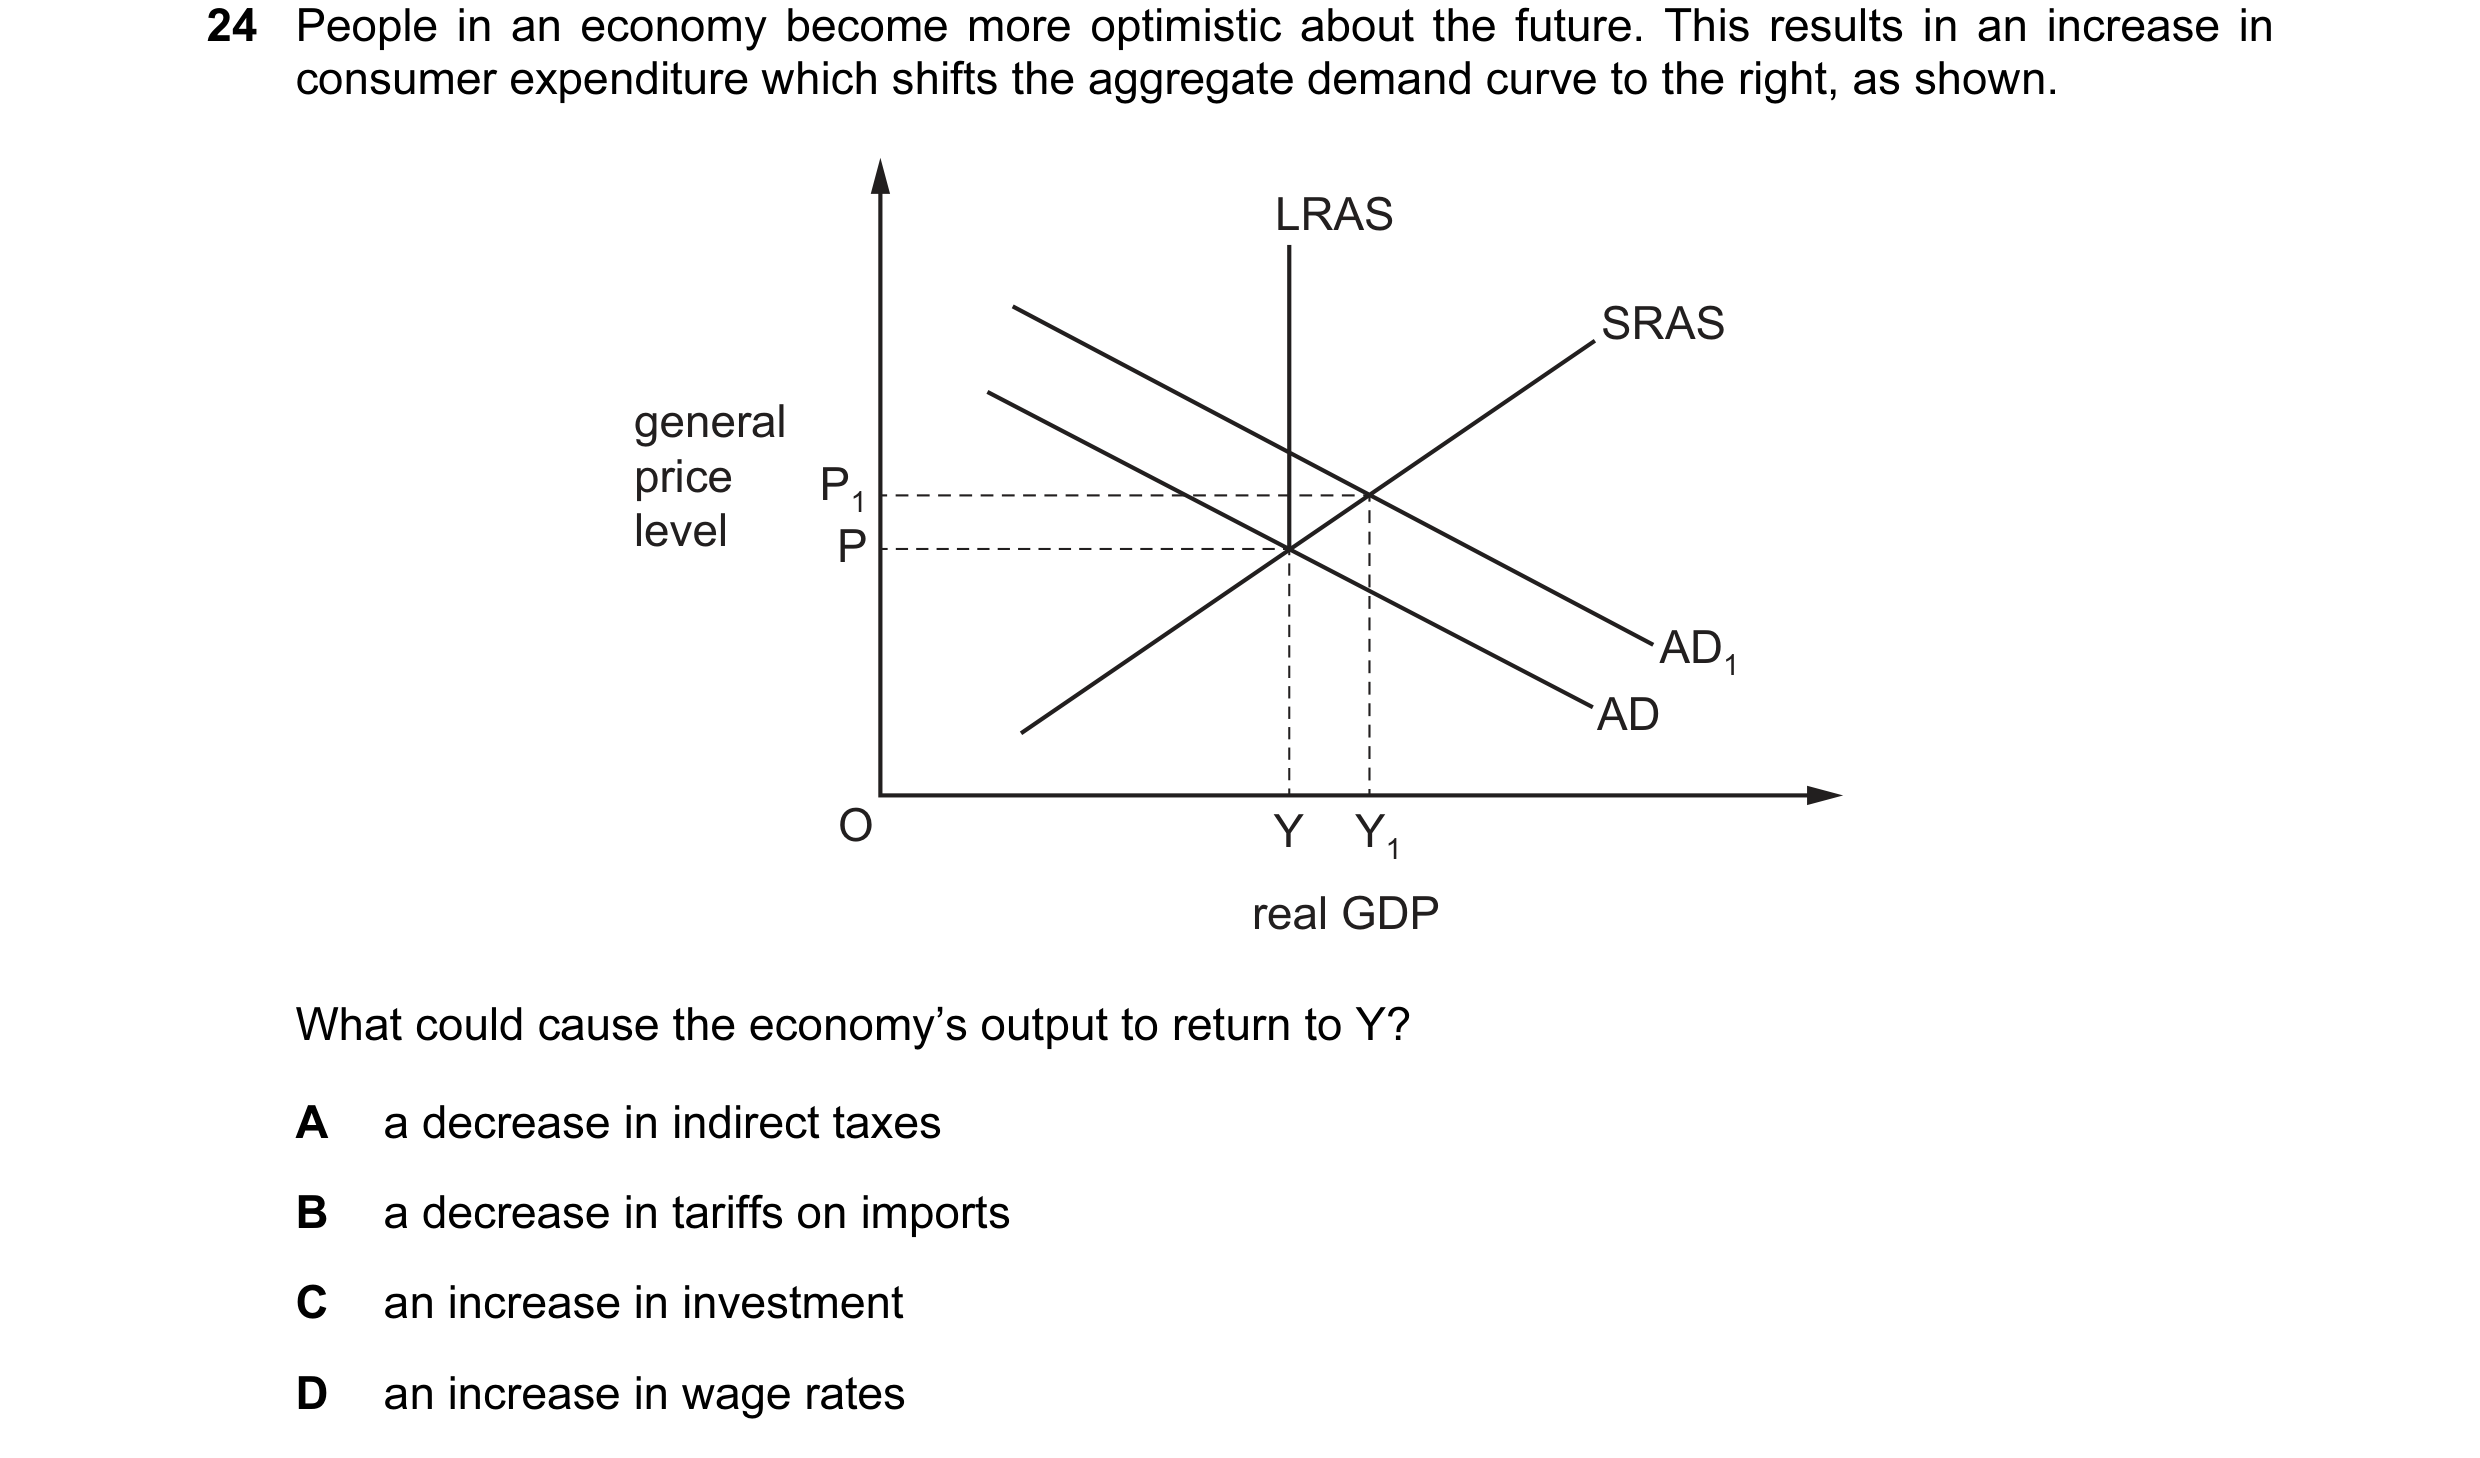 6 / 57

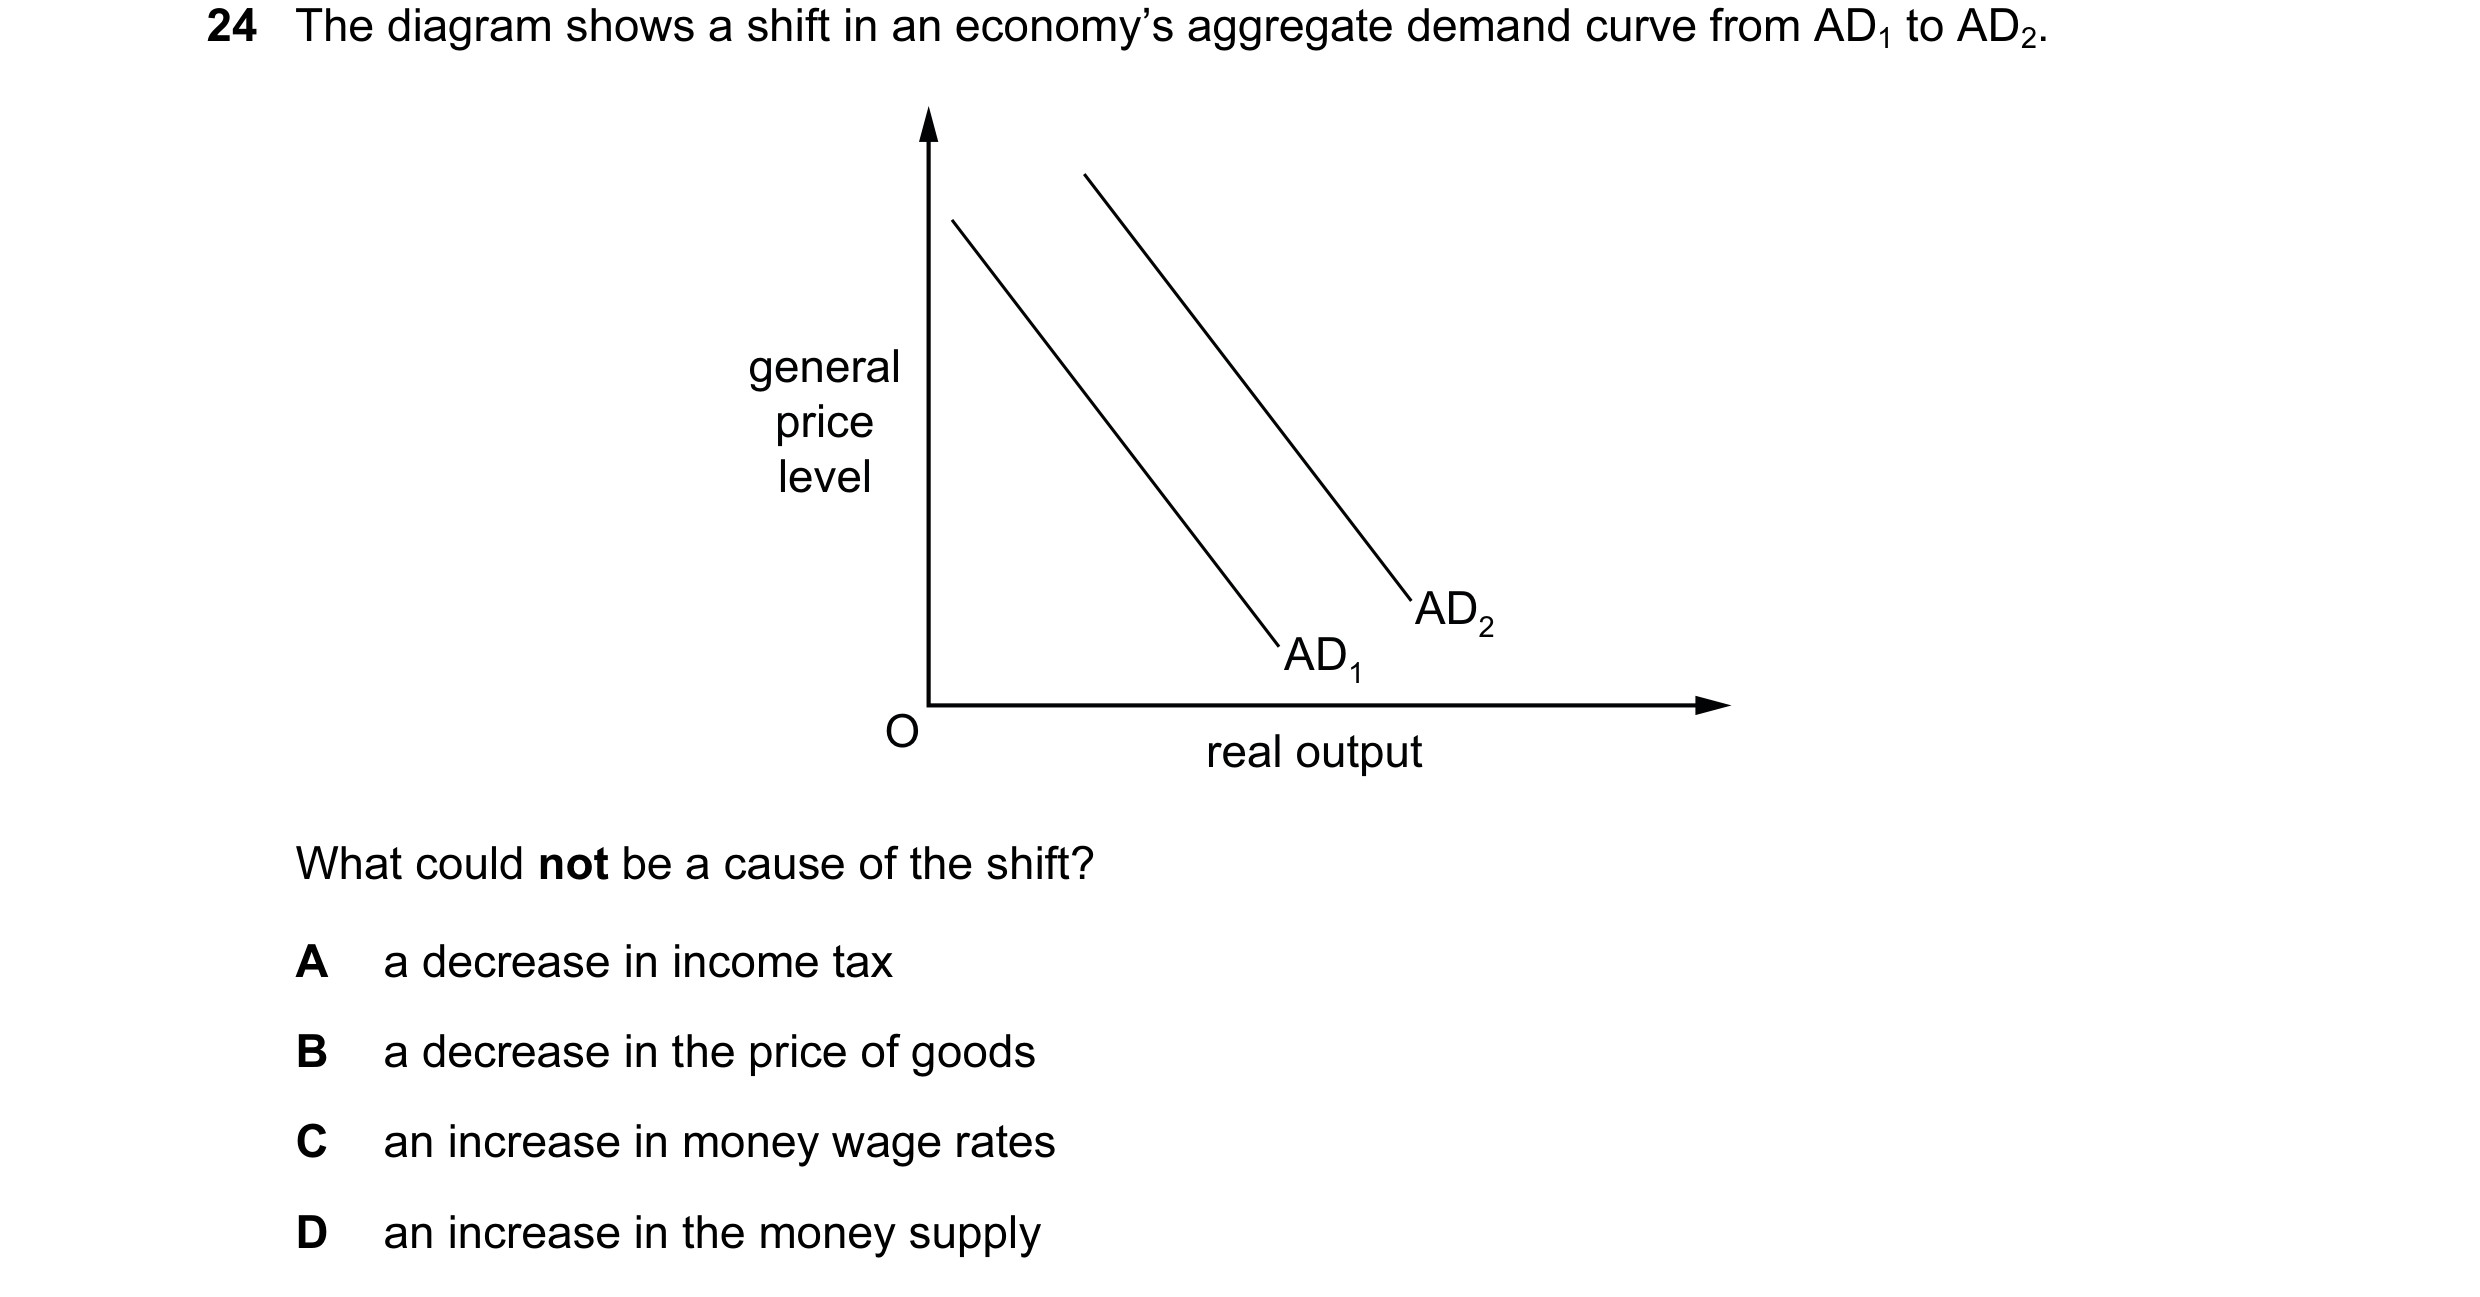 7 / 57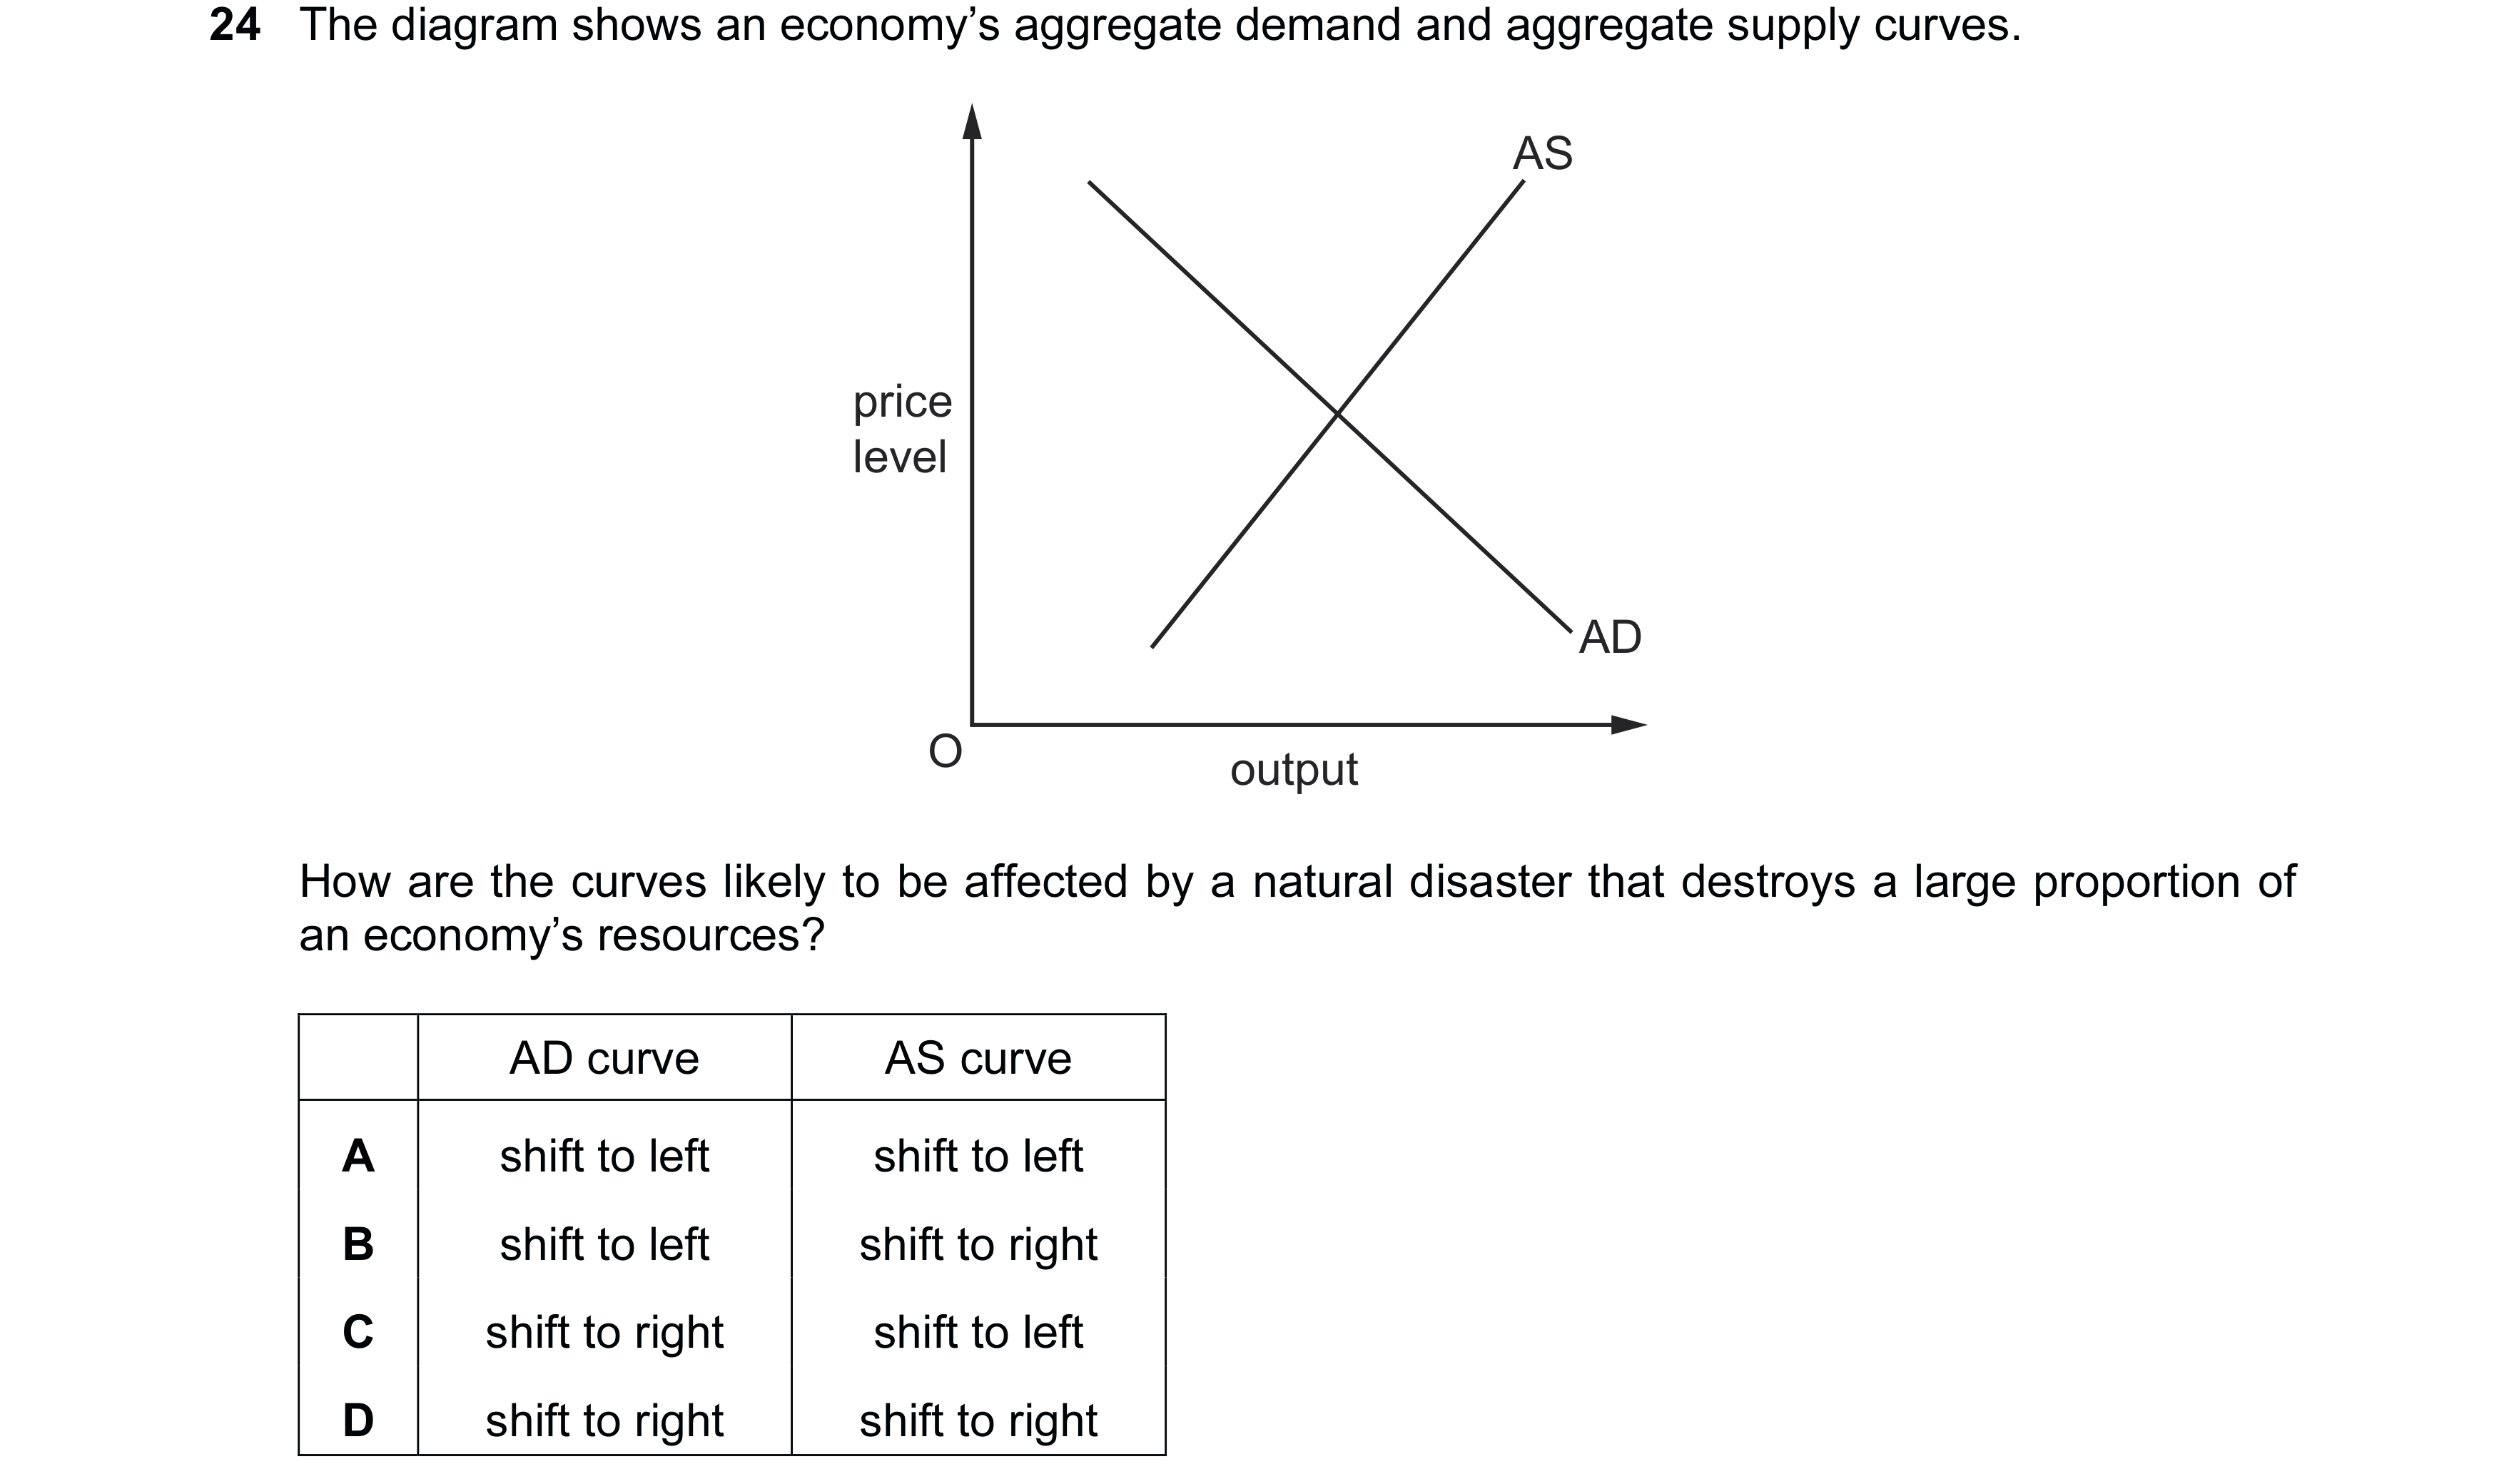
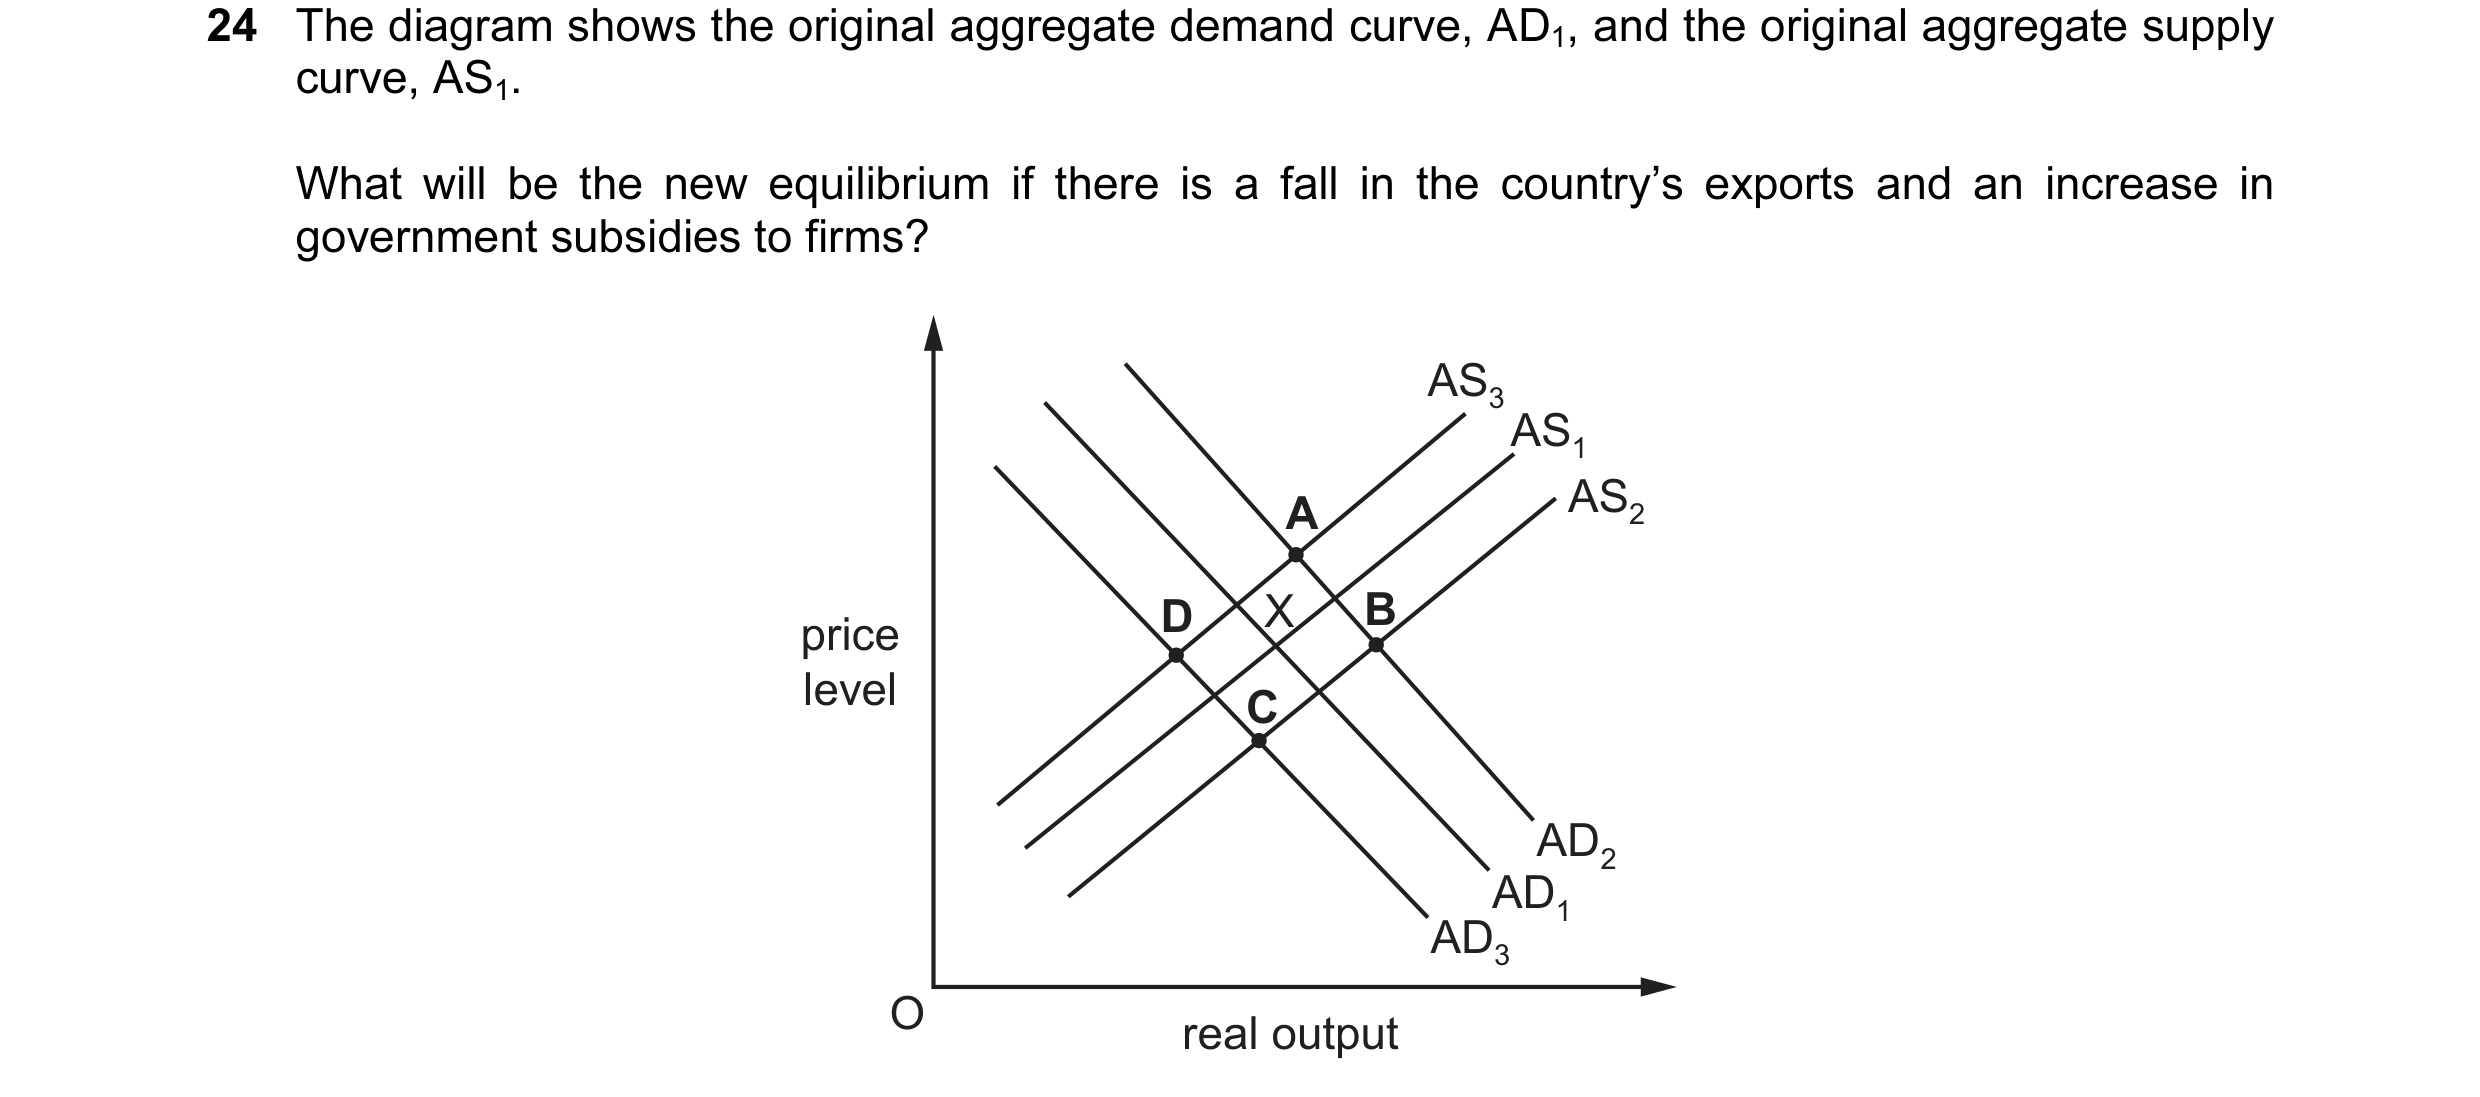 8 / 57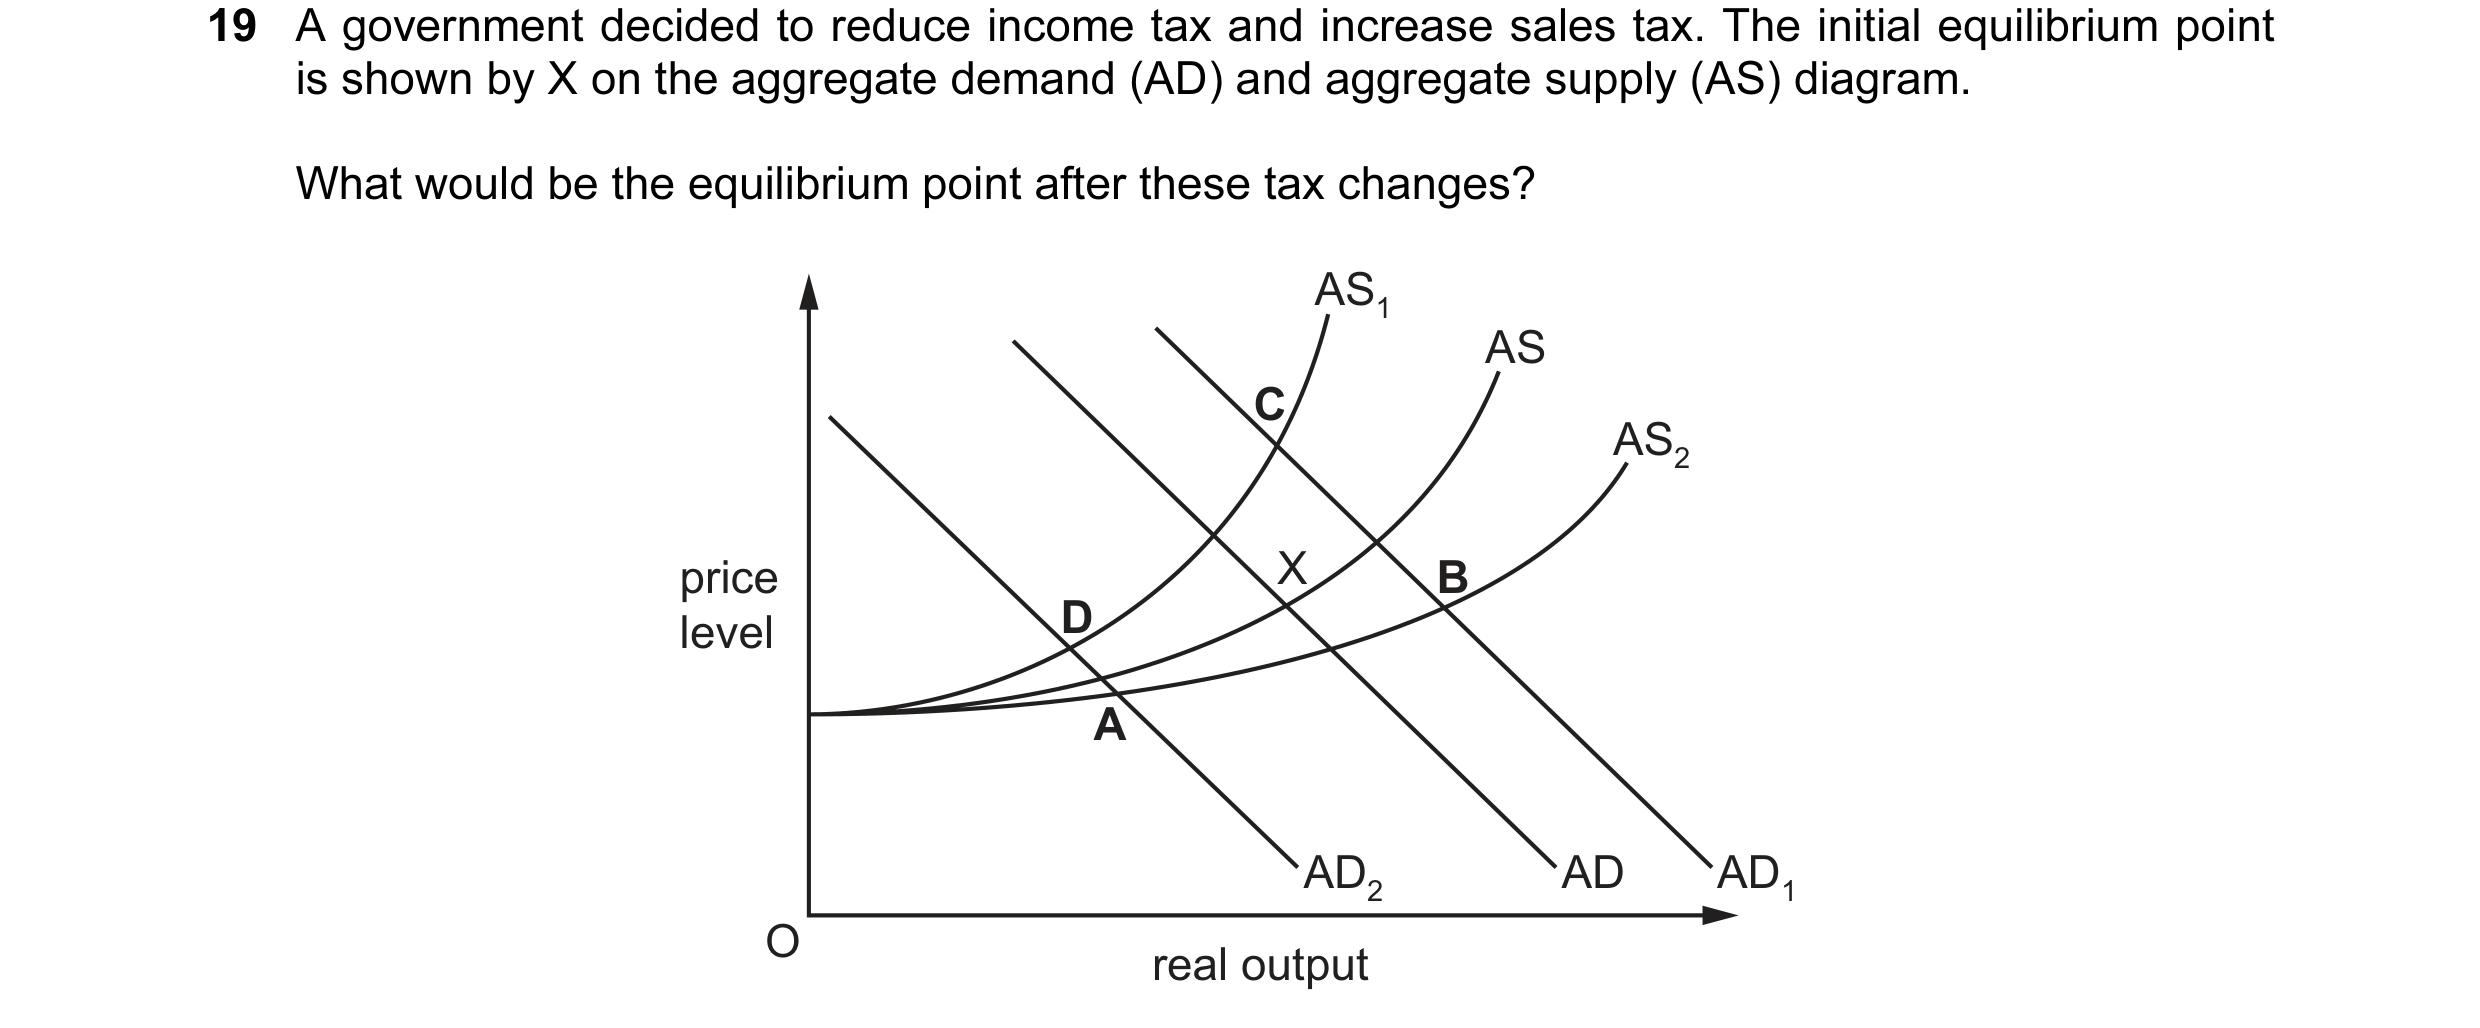
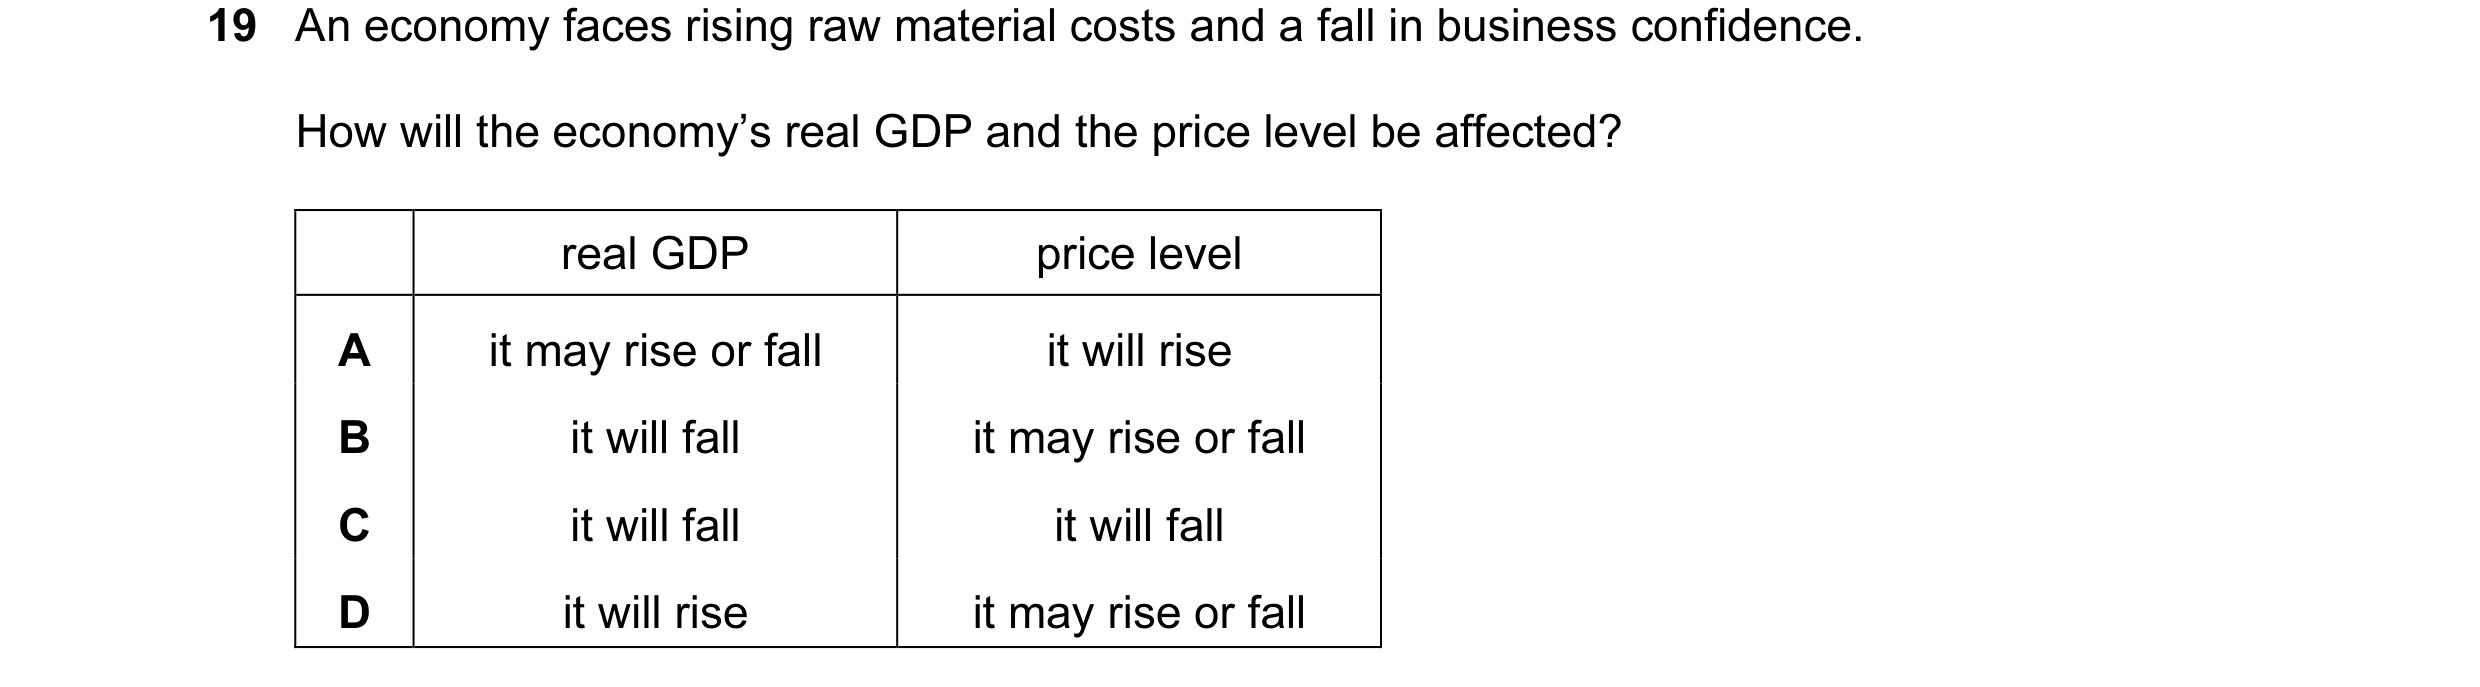
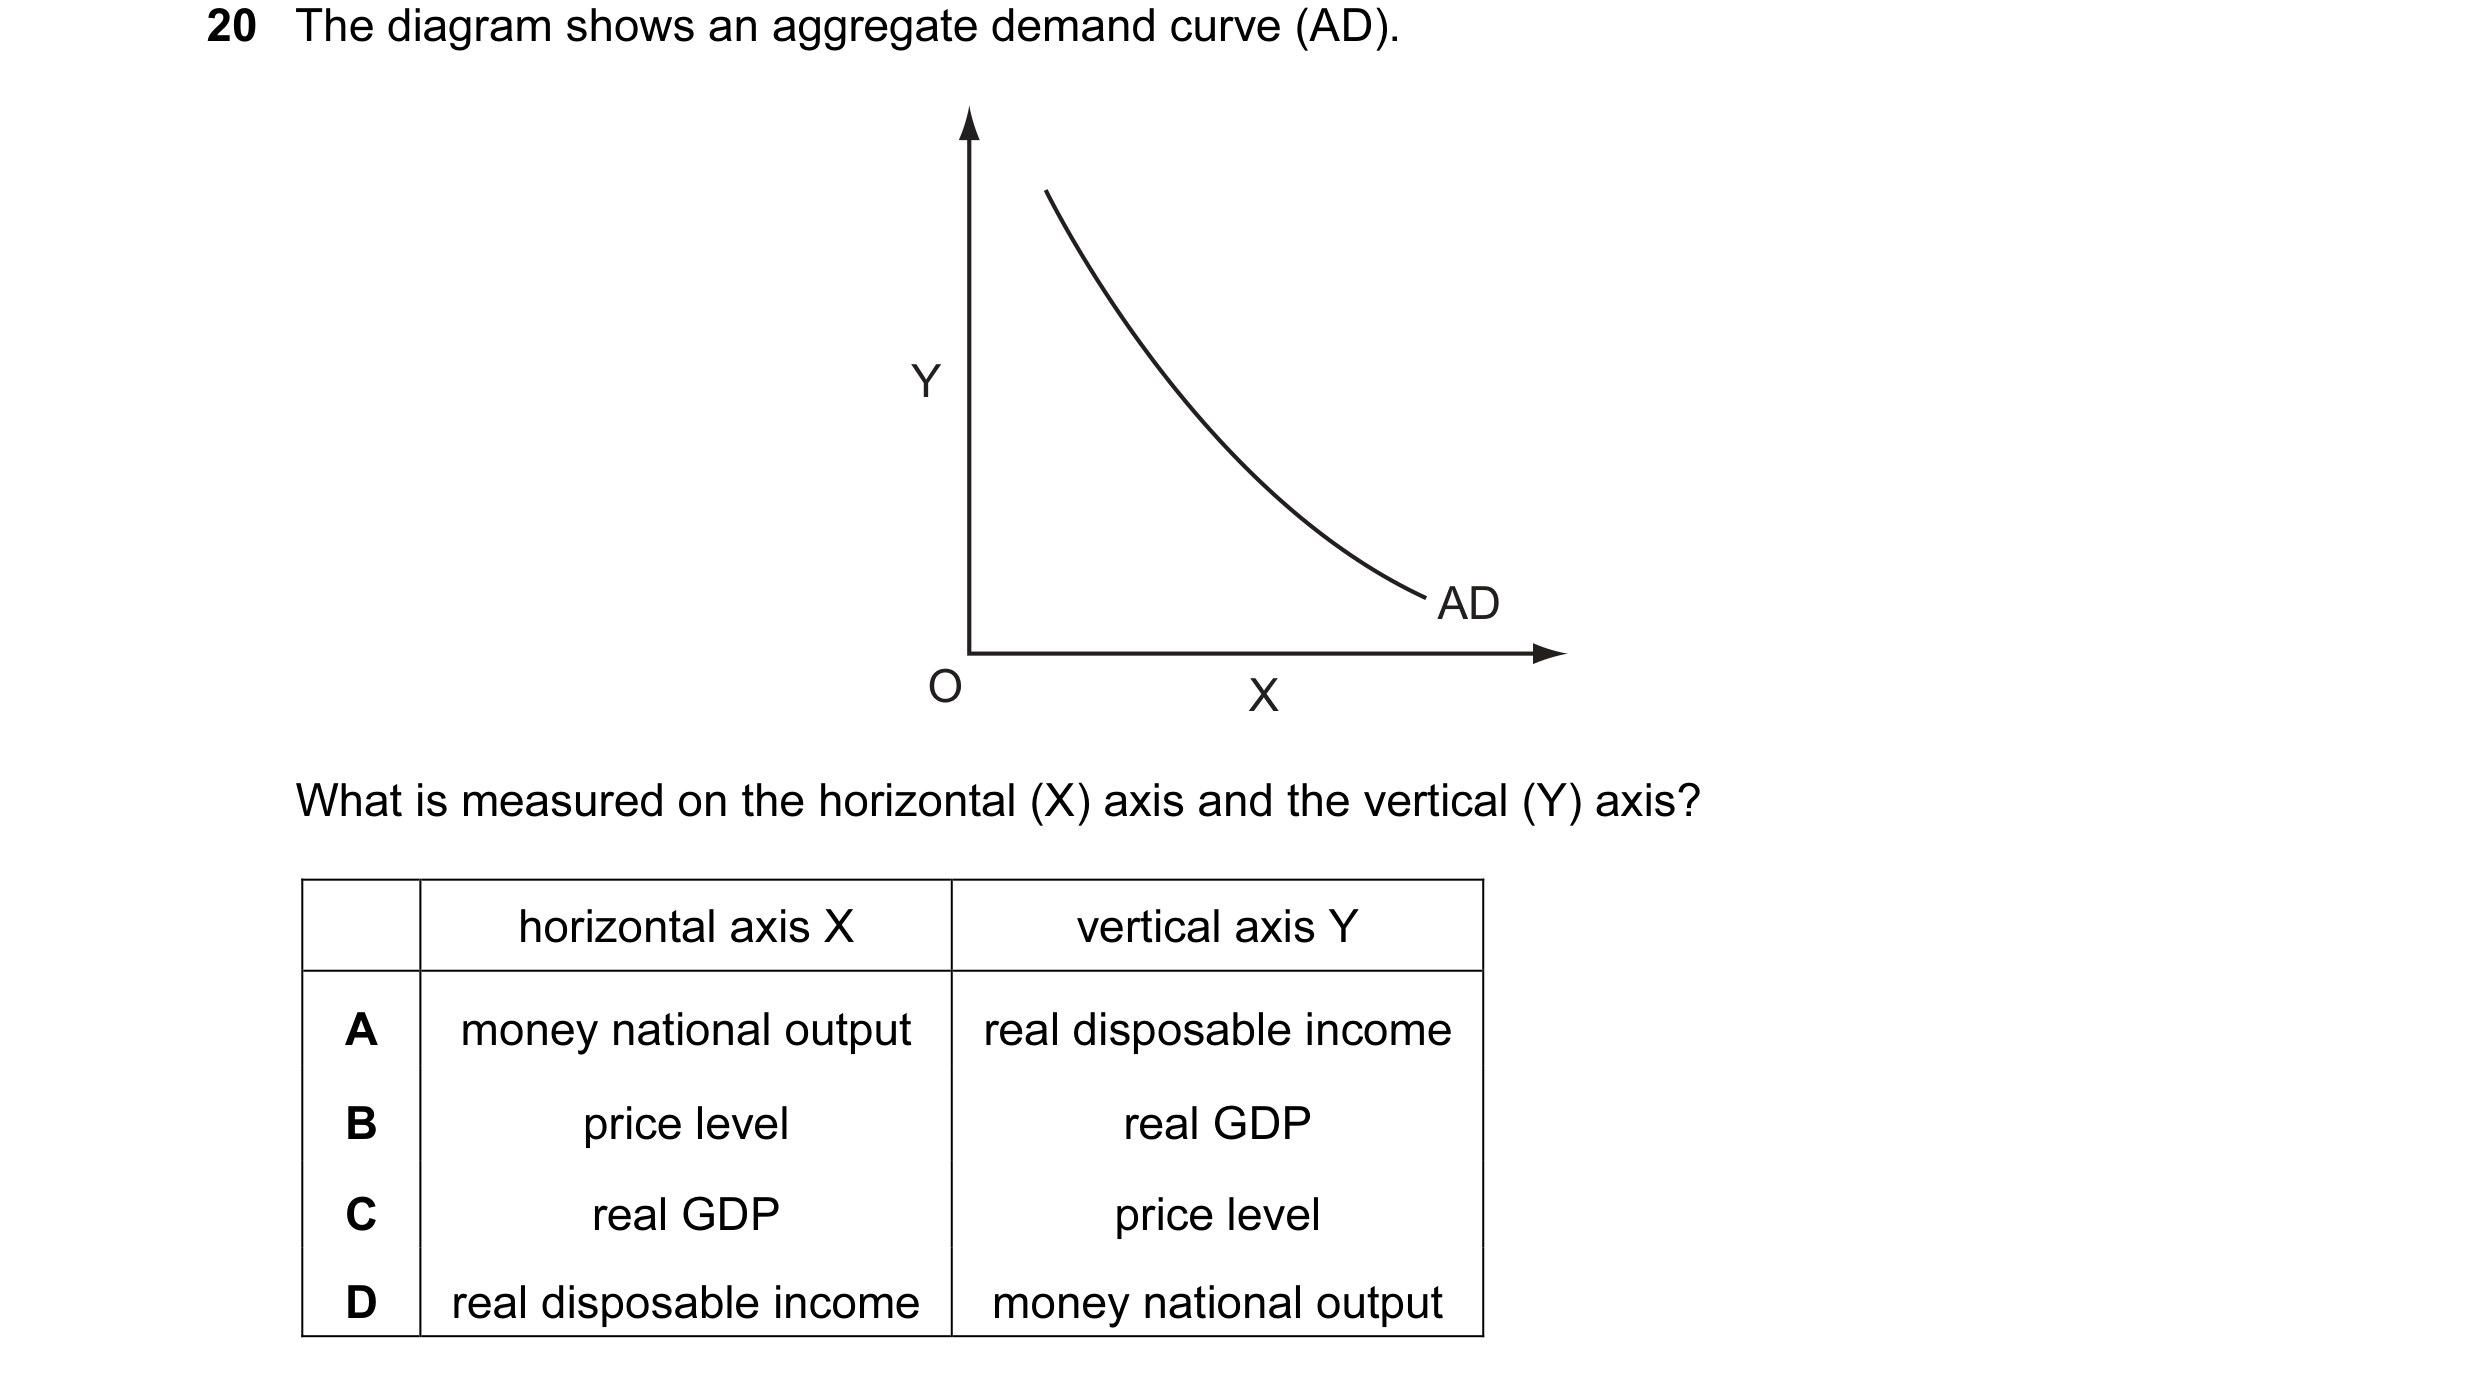 9 / 57
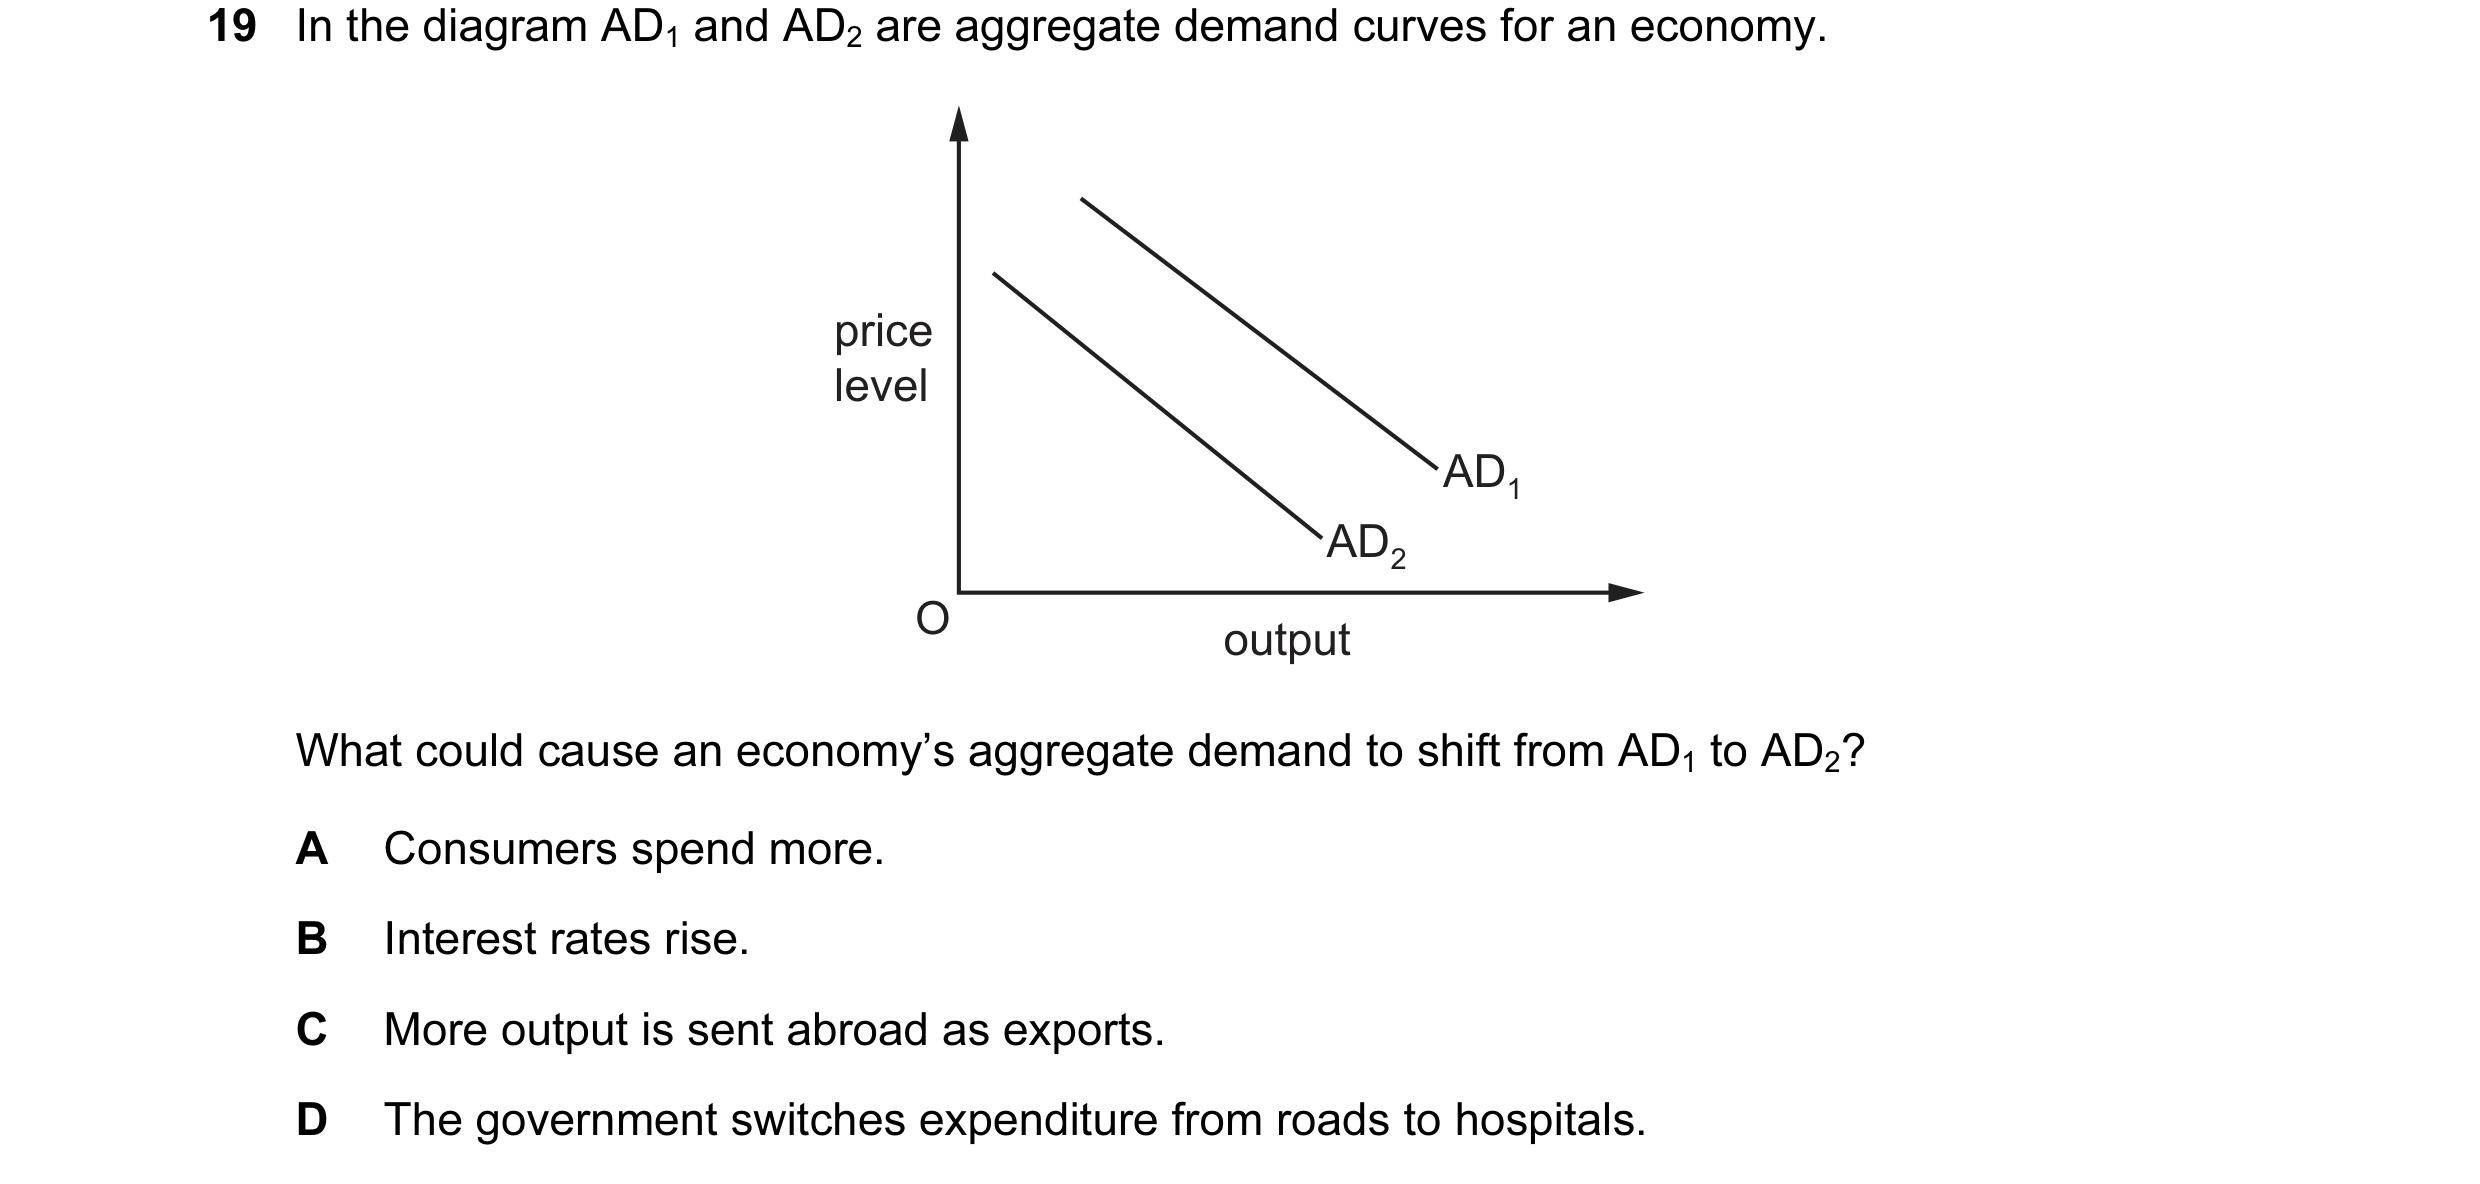
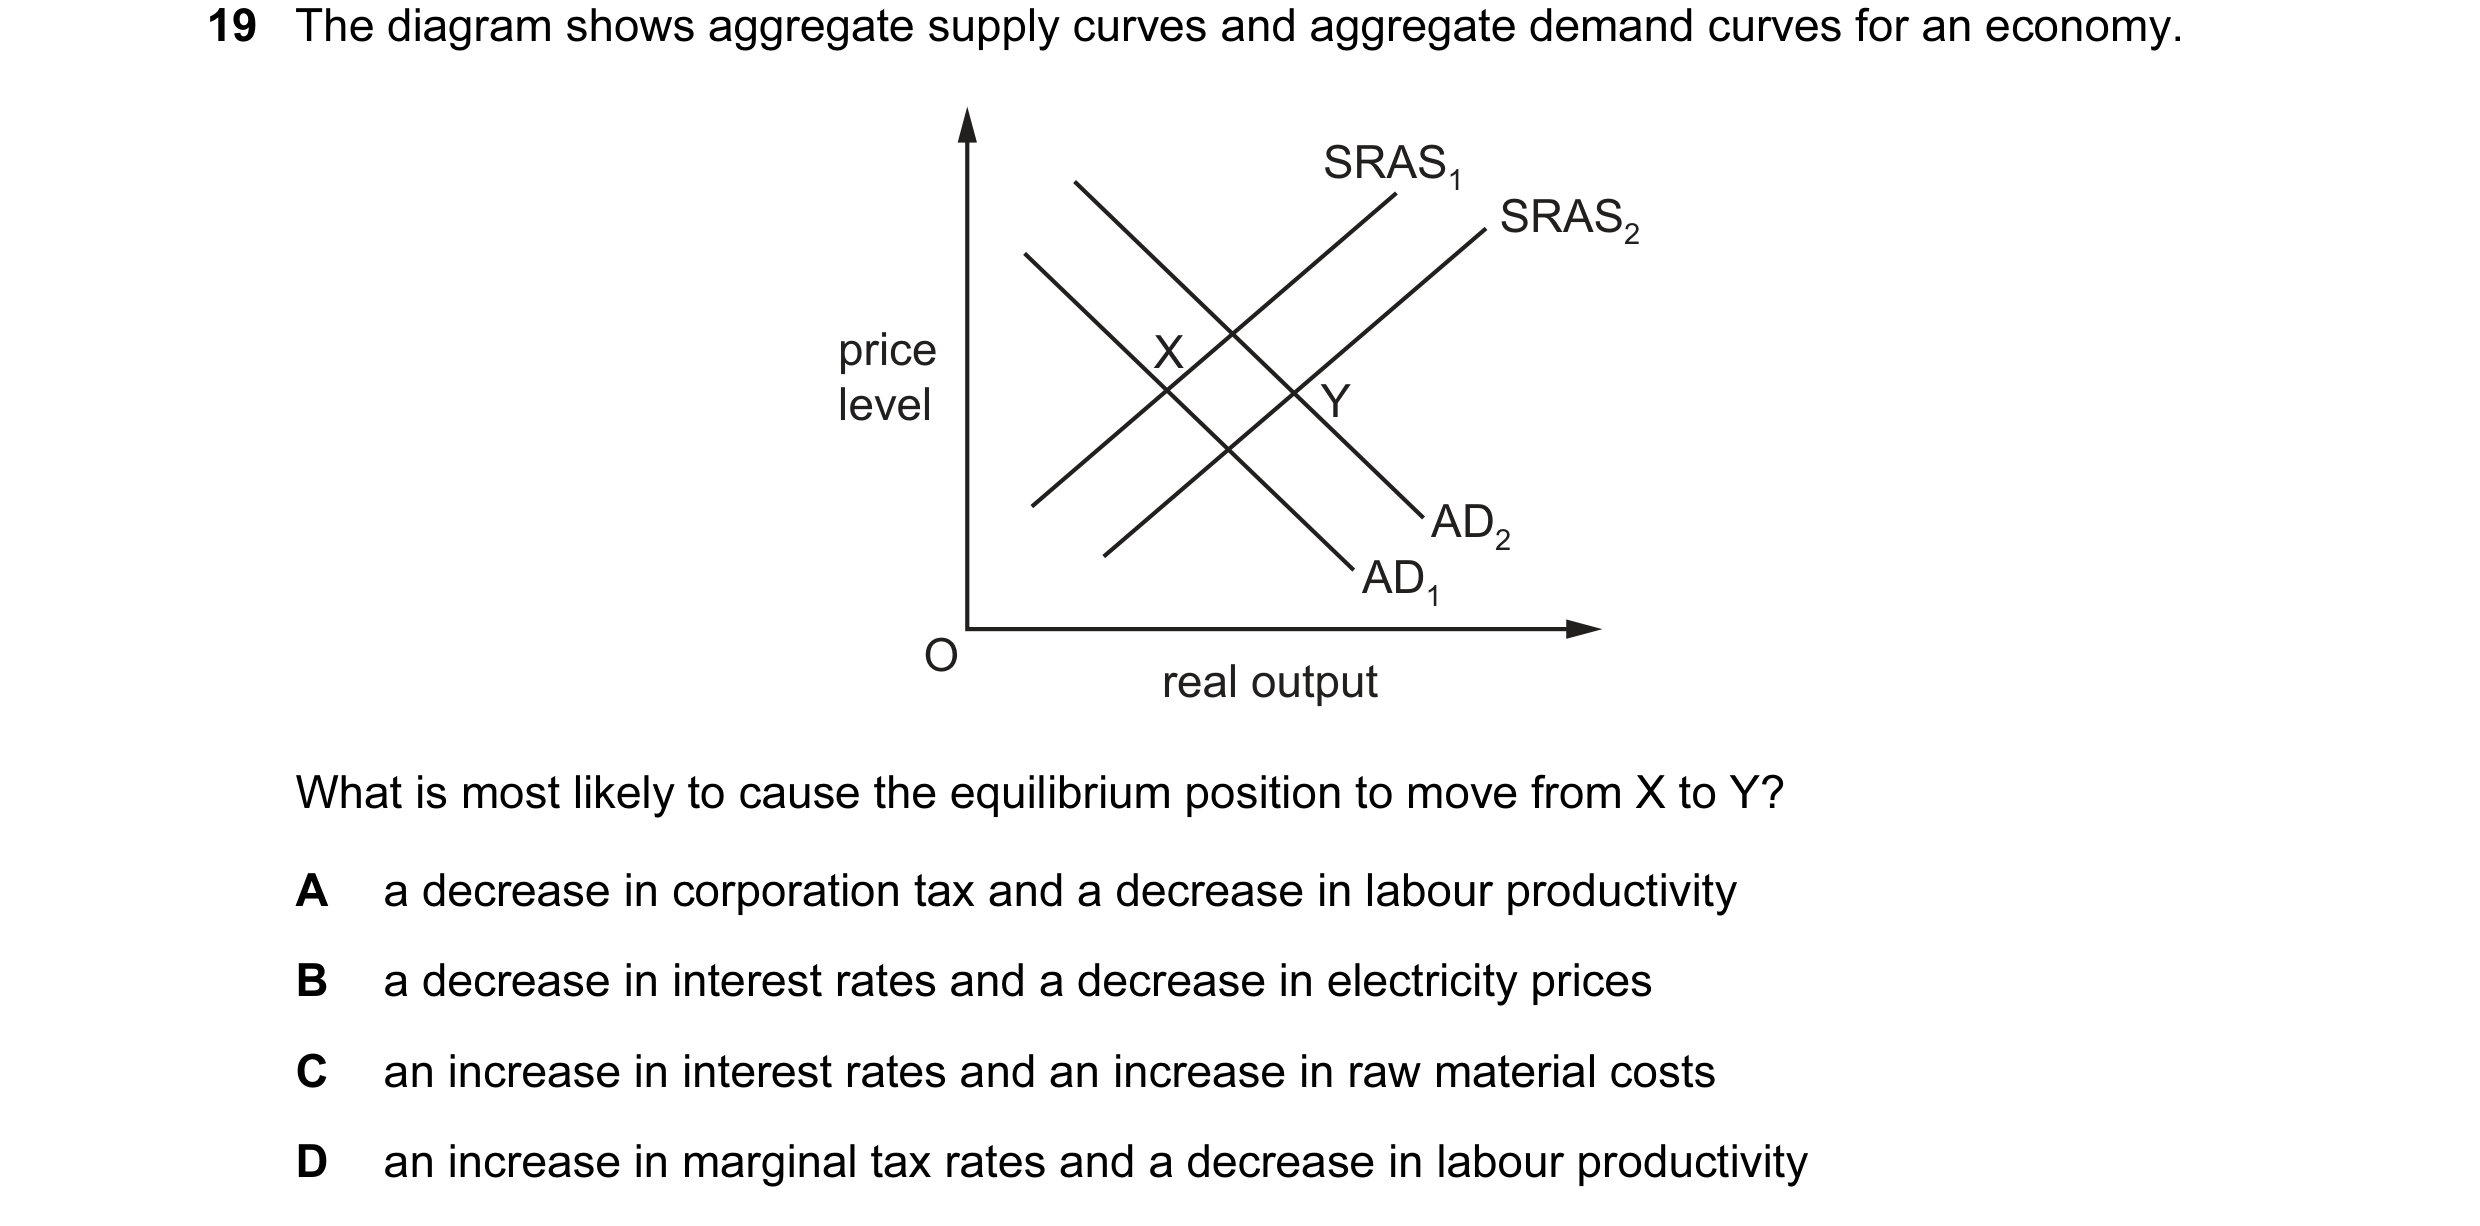 10 / 57
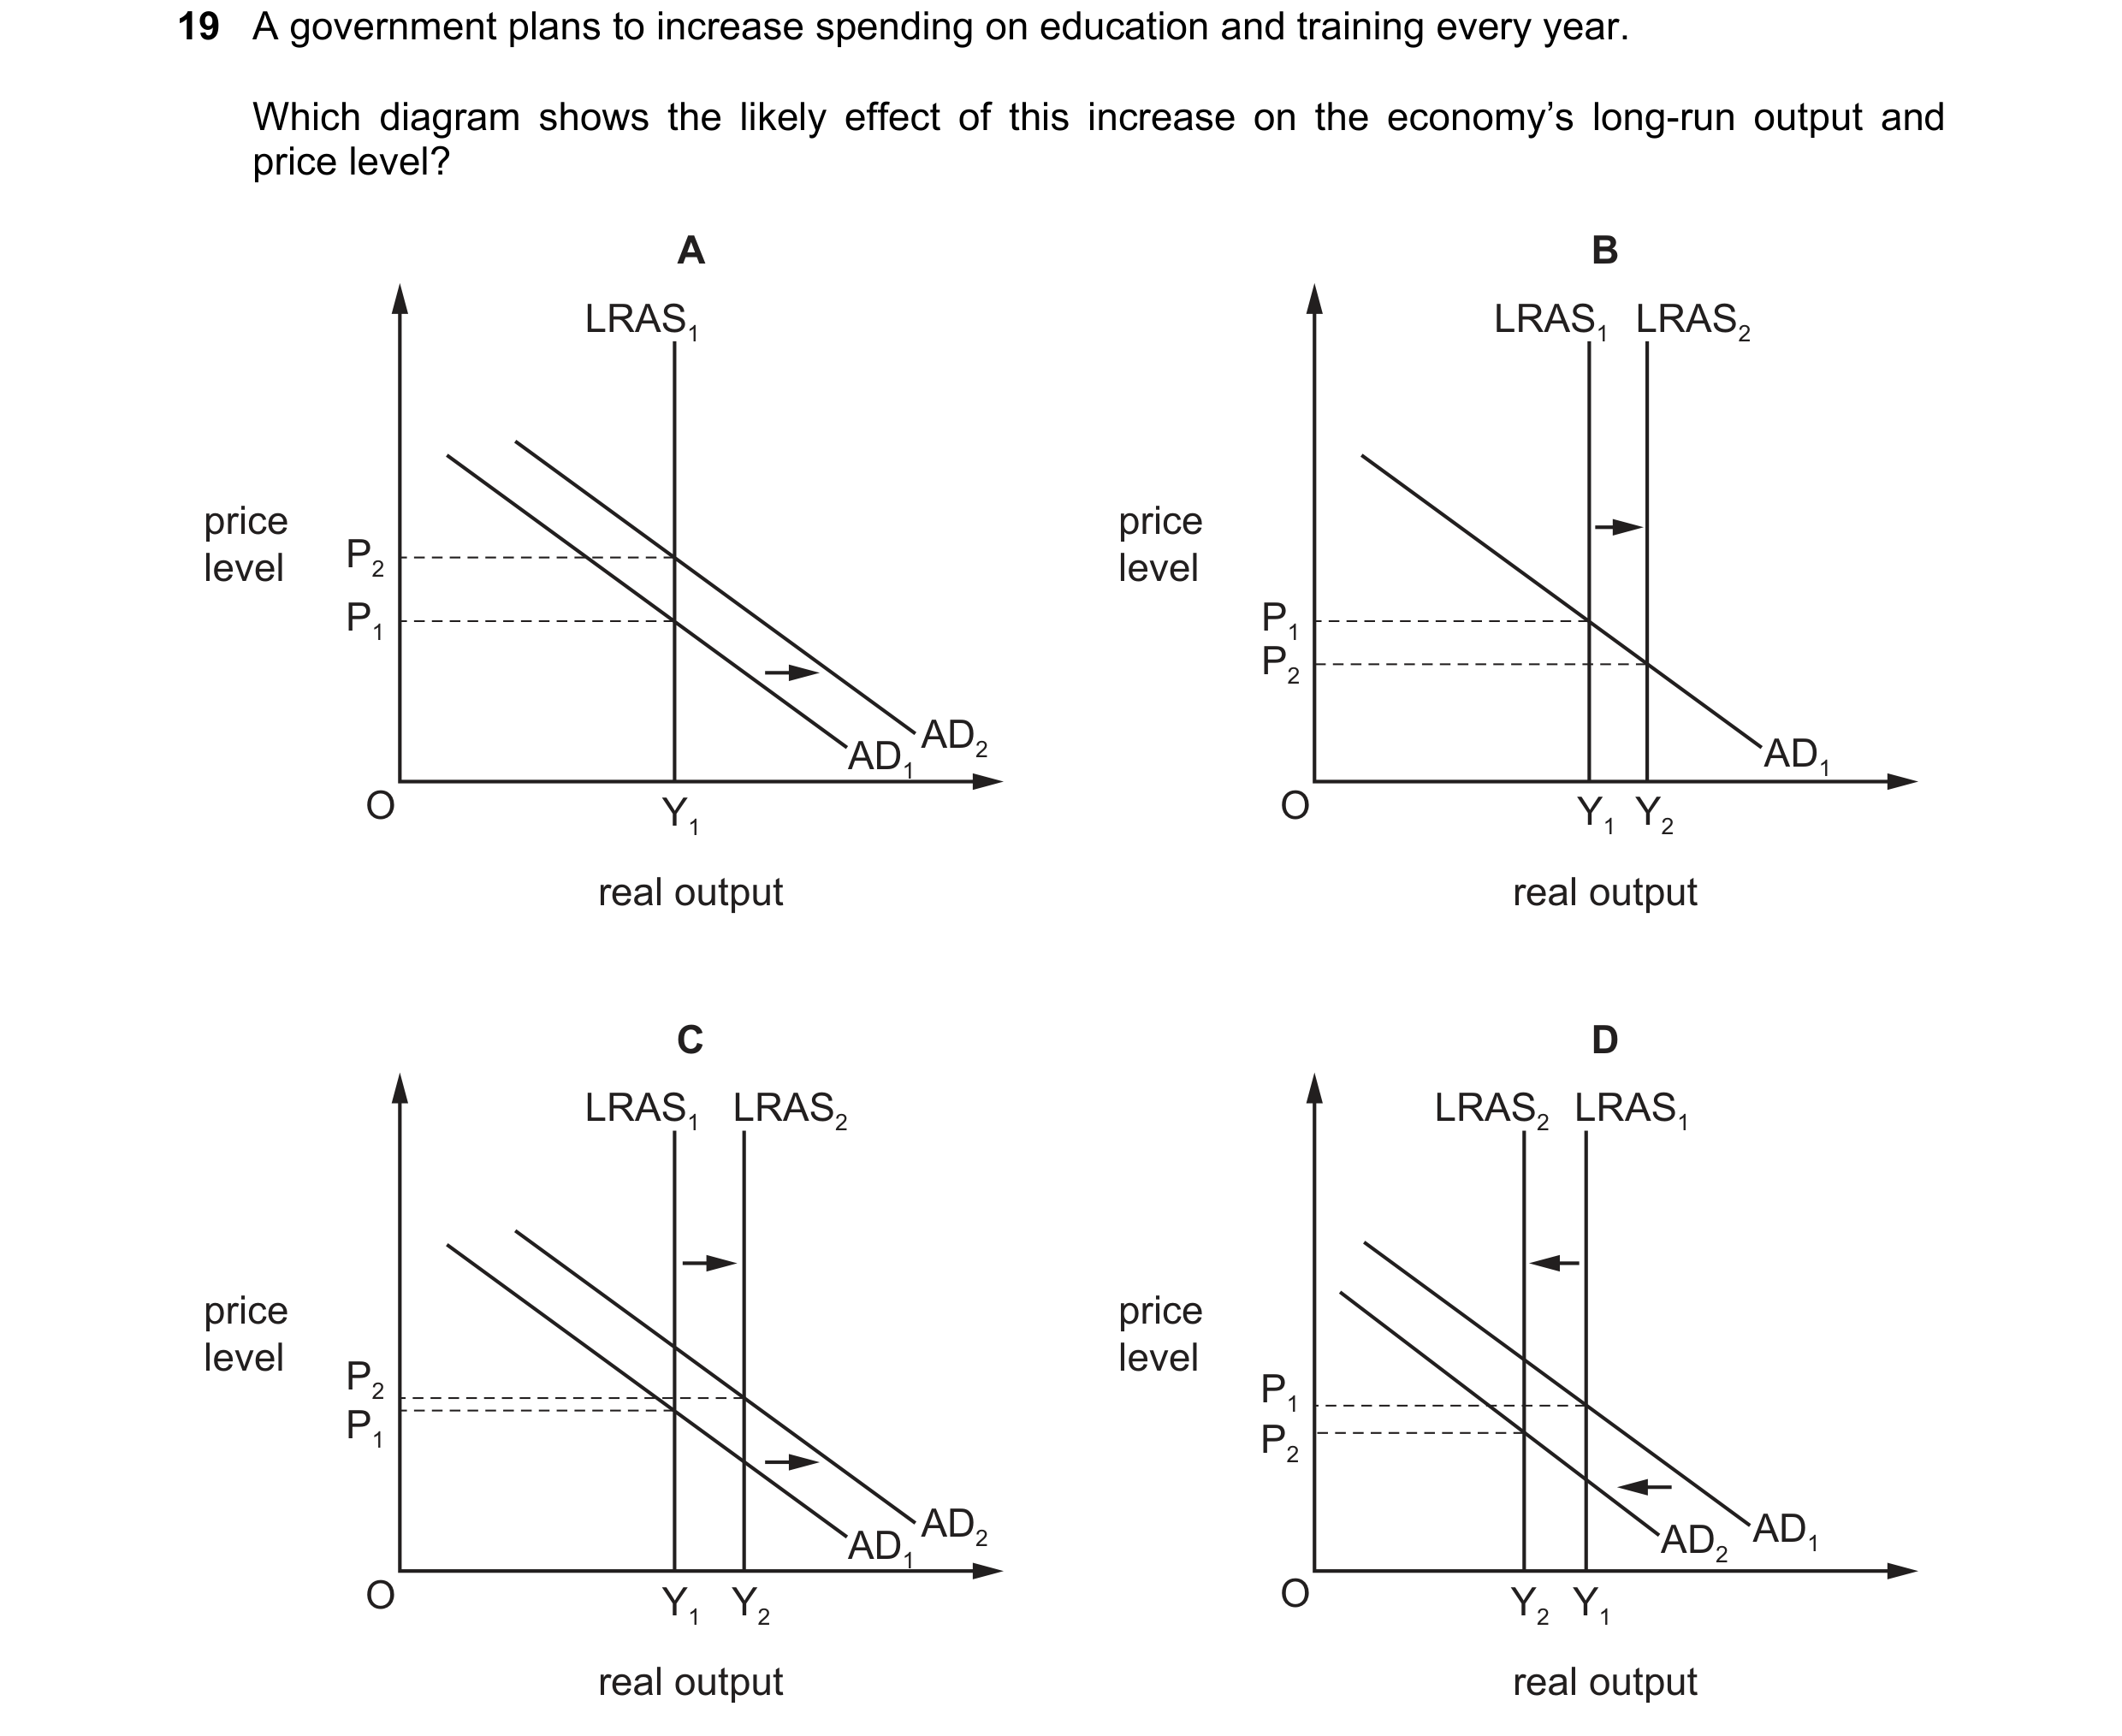 11 / 57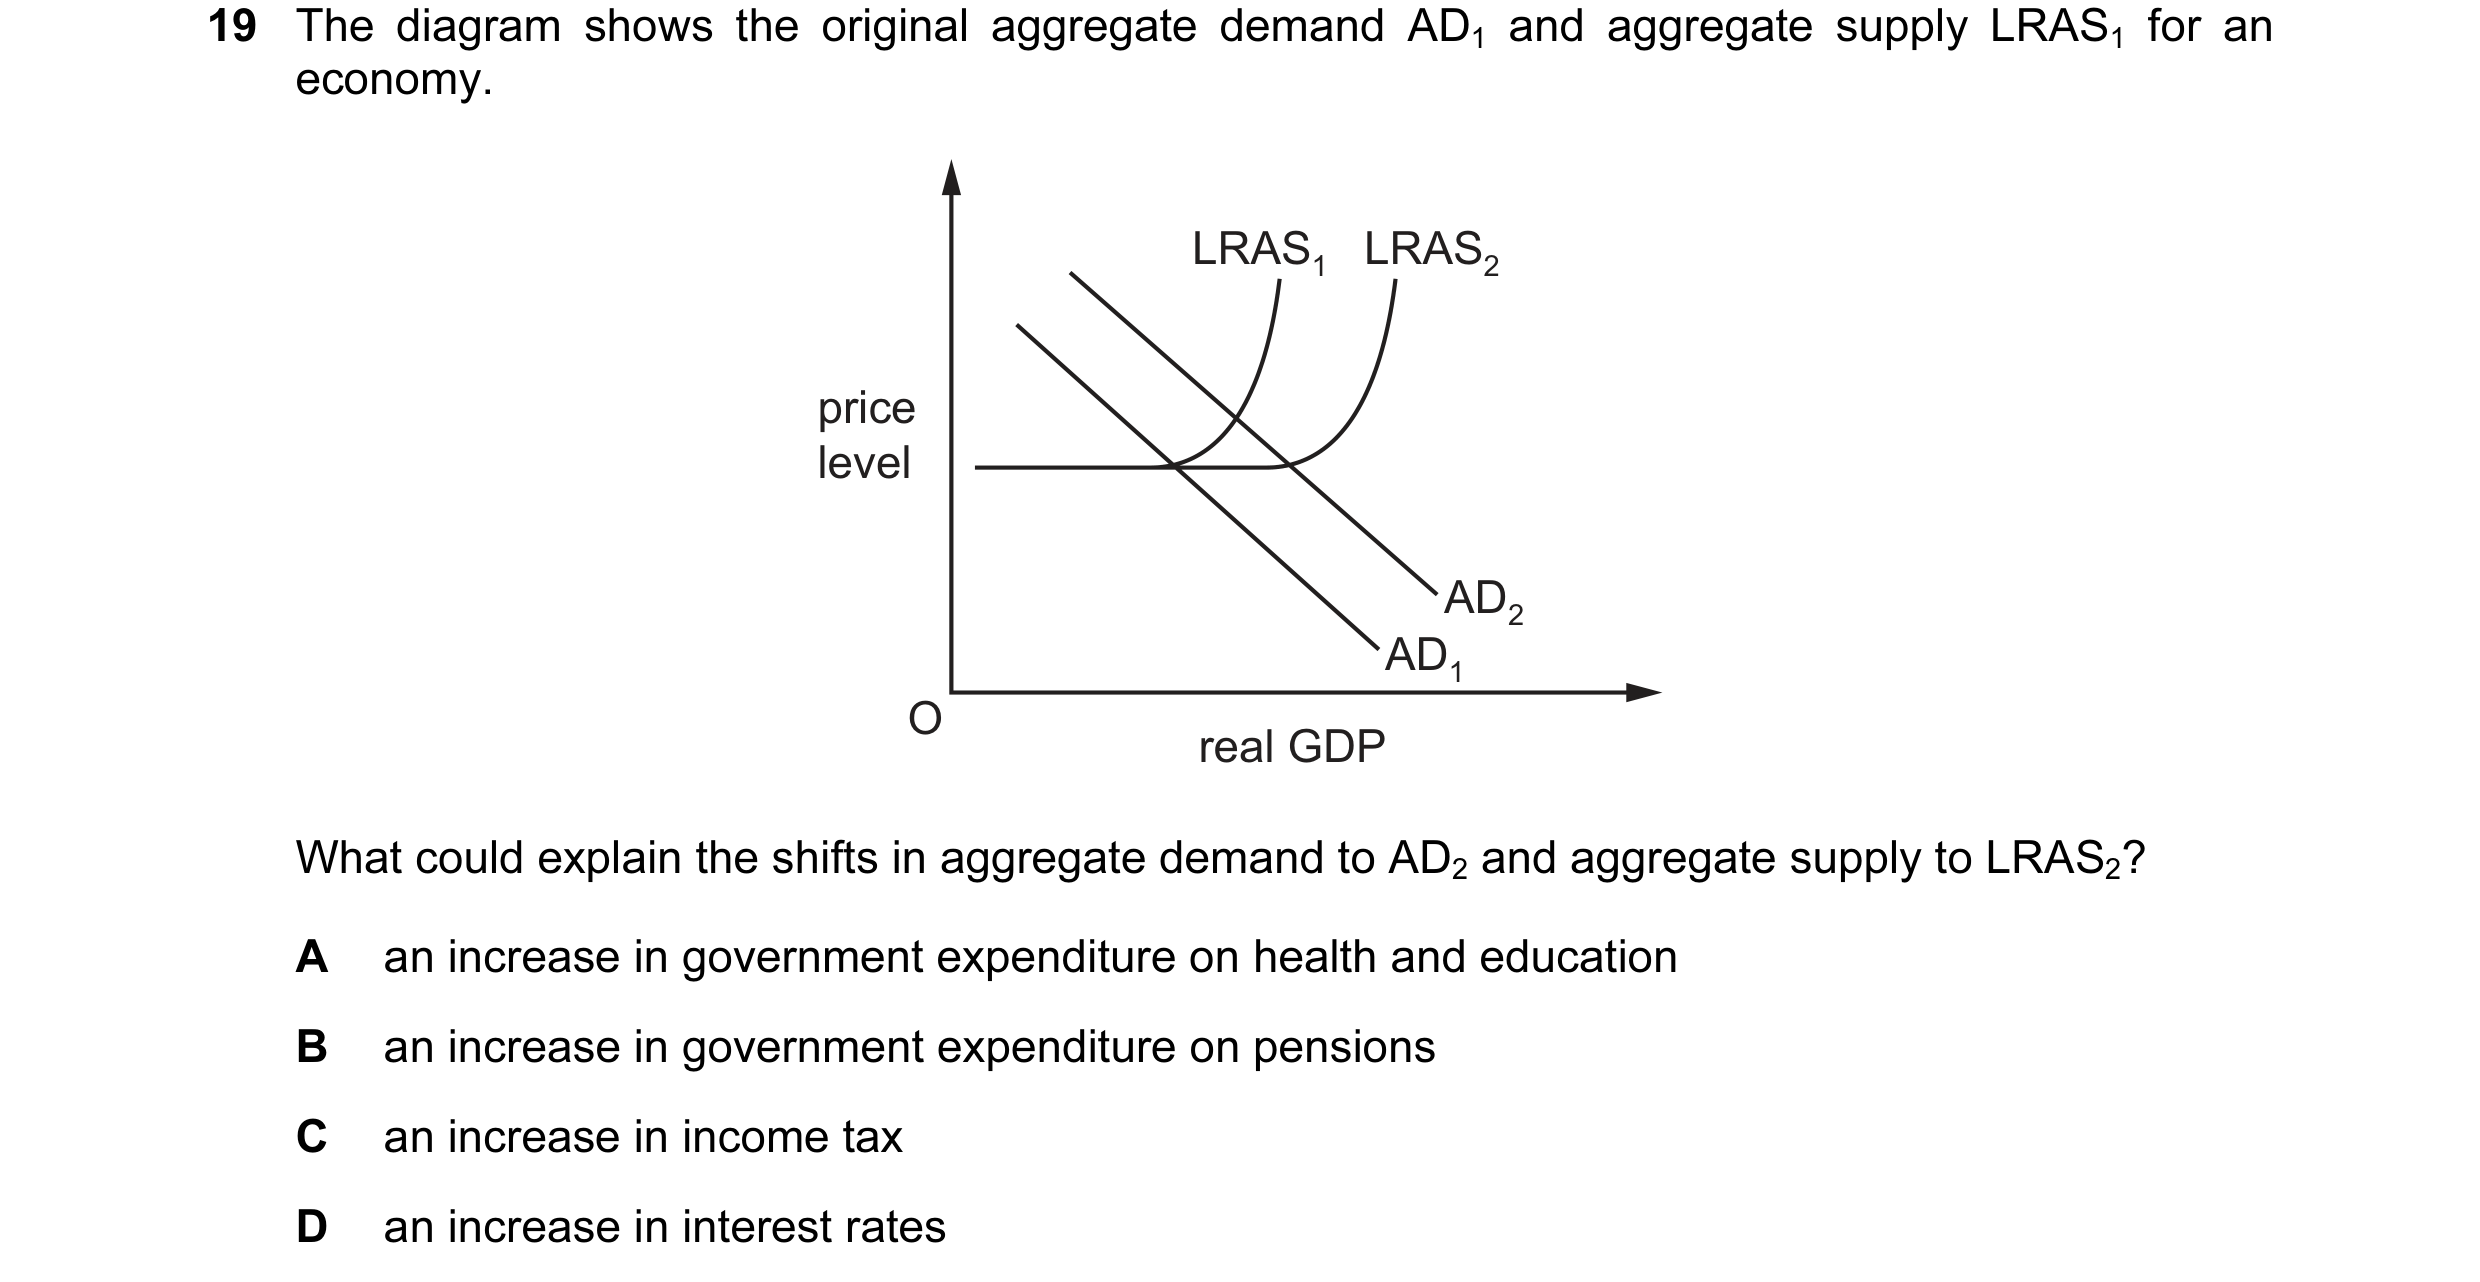

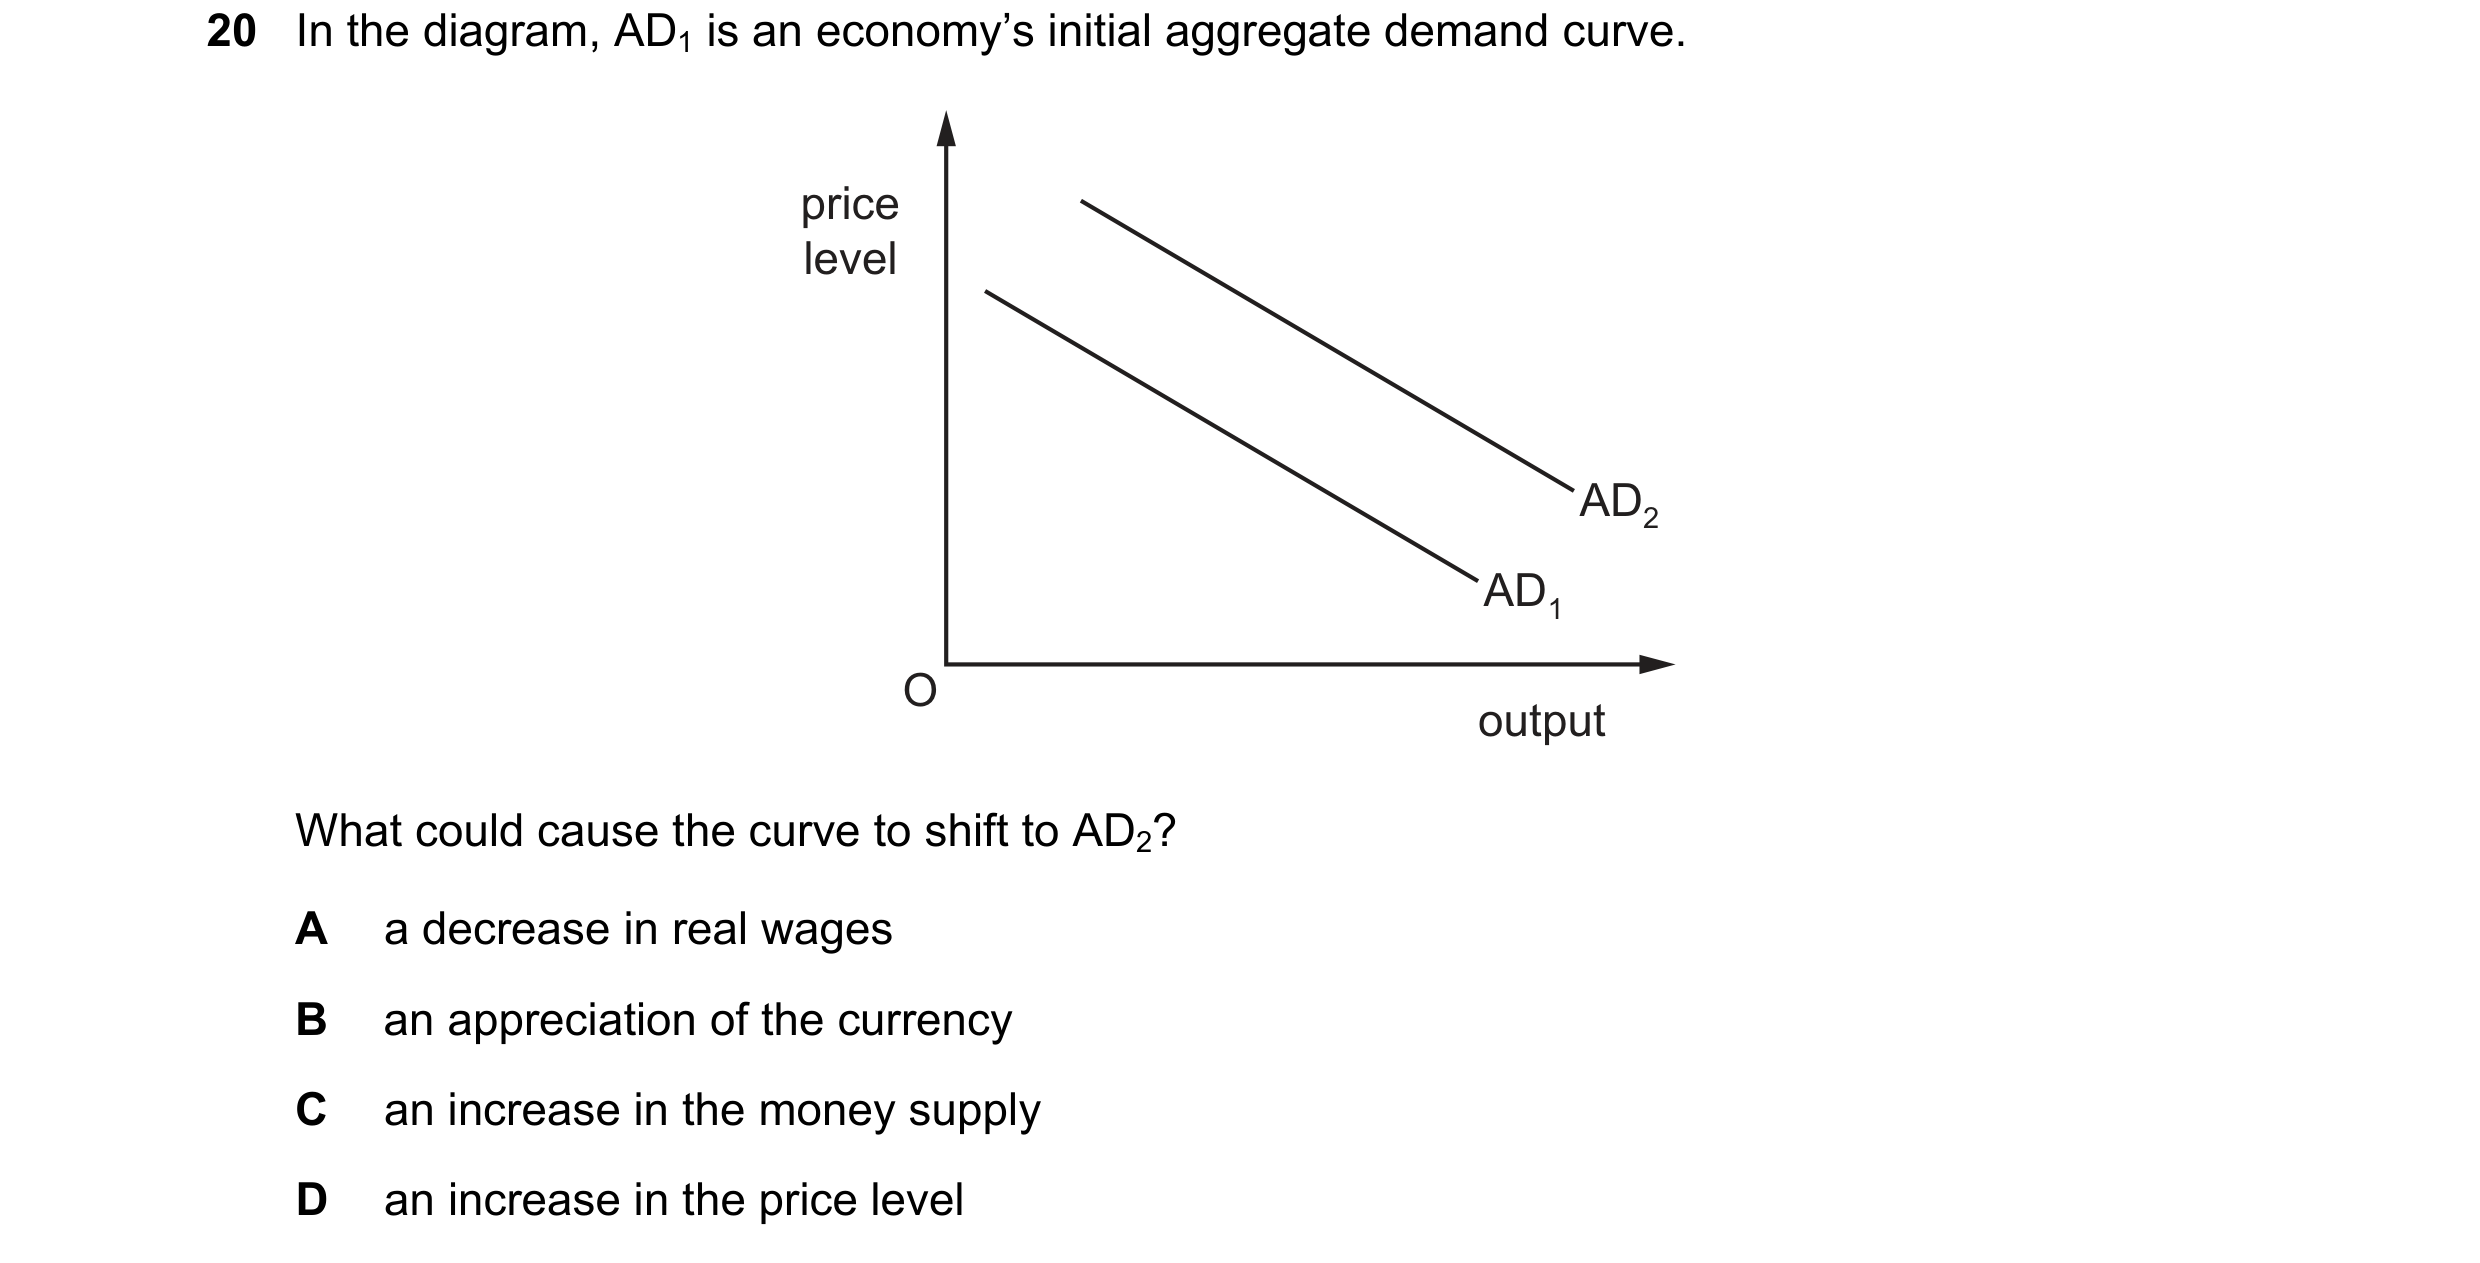 12 / 57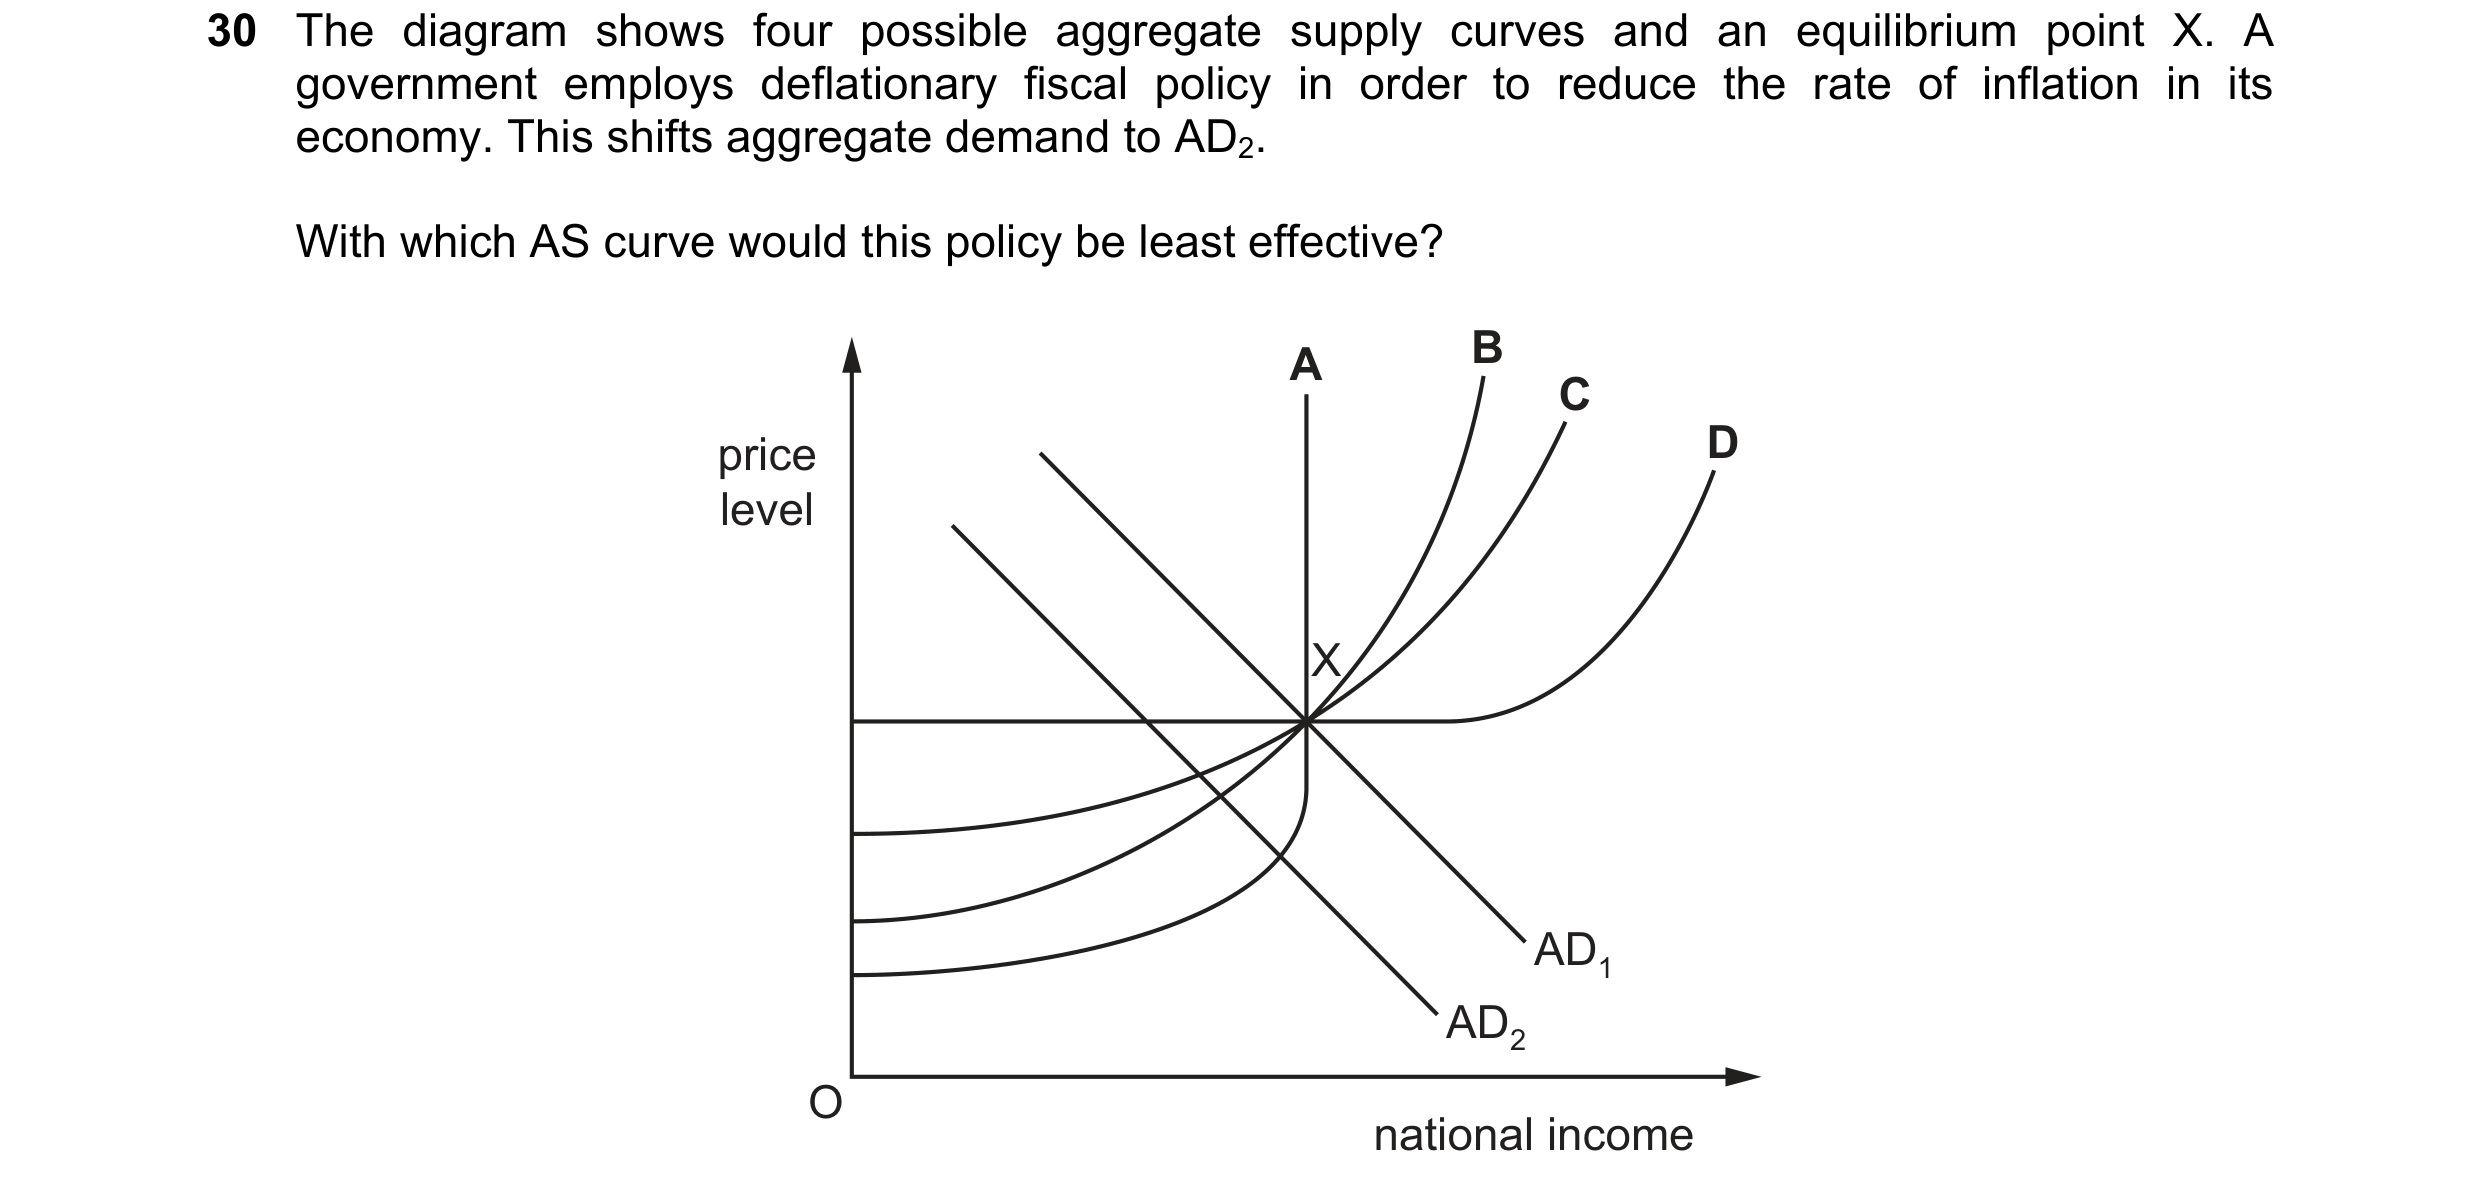
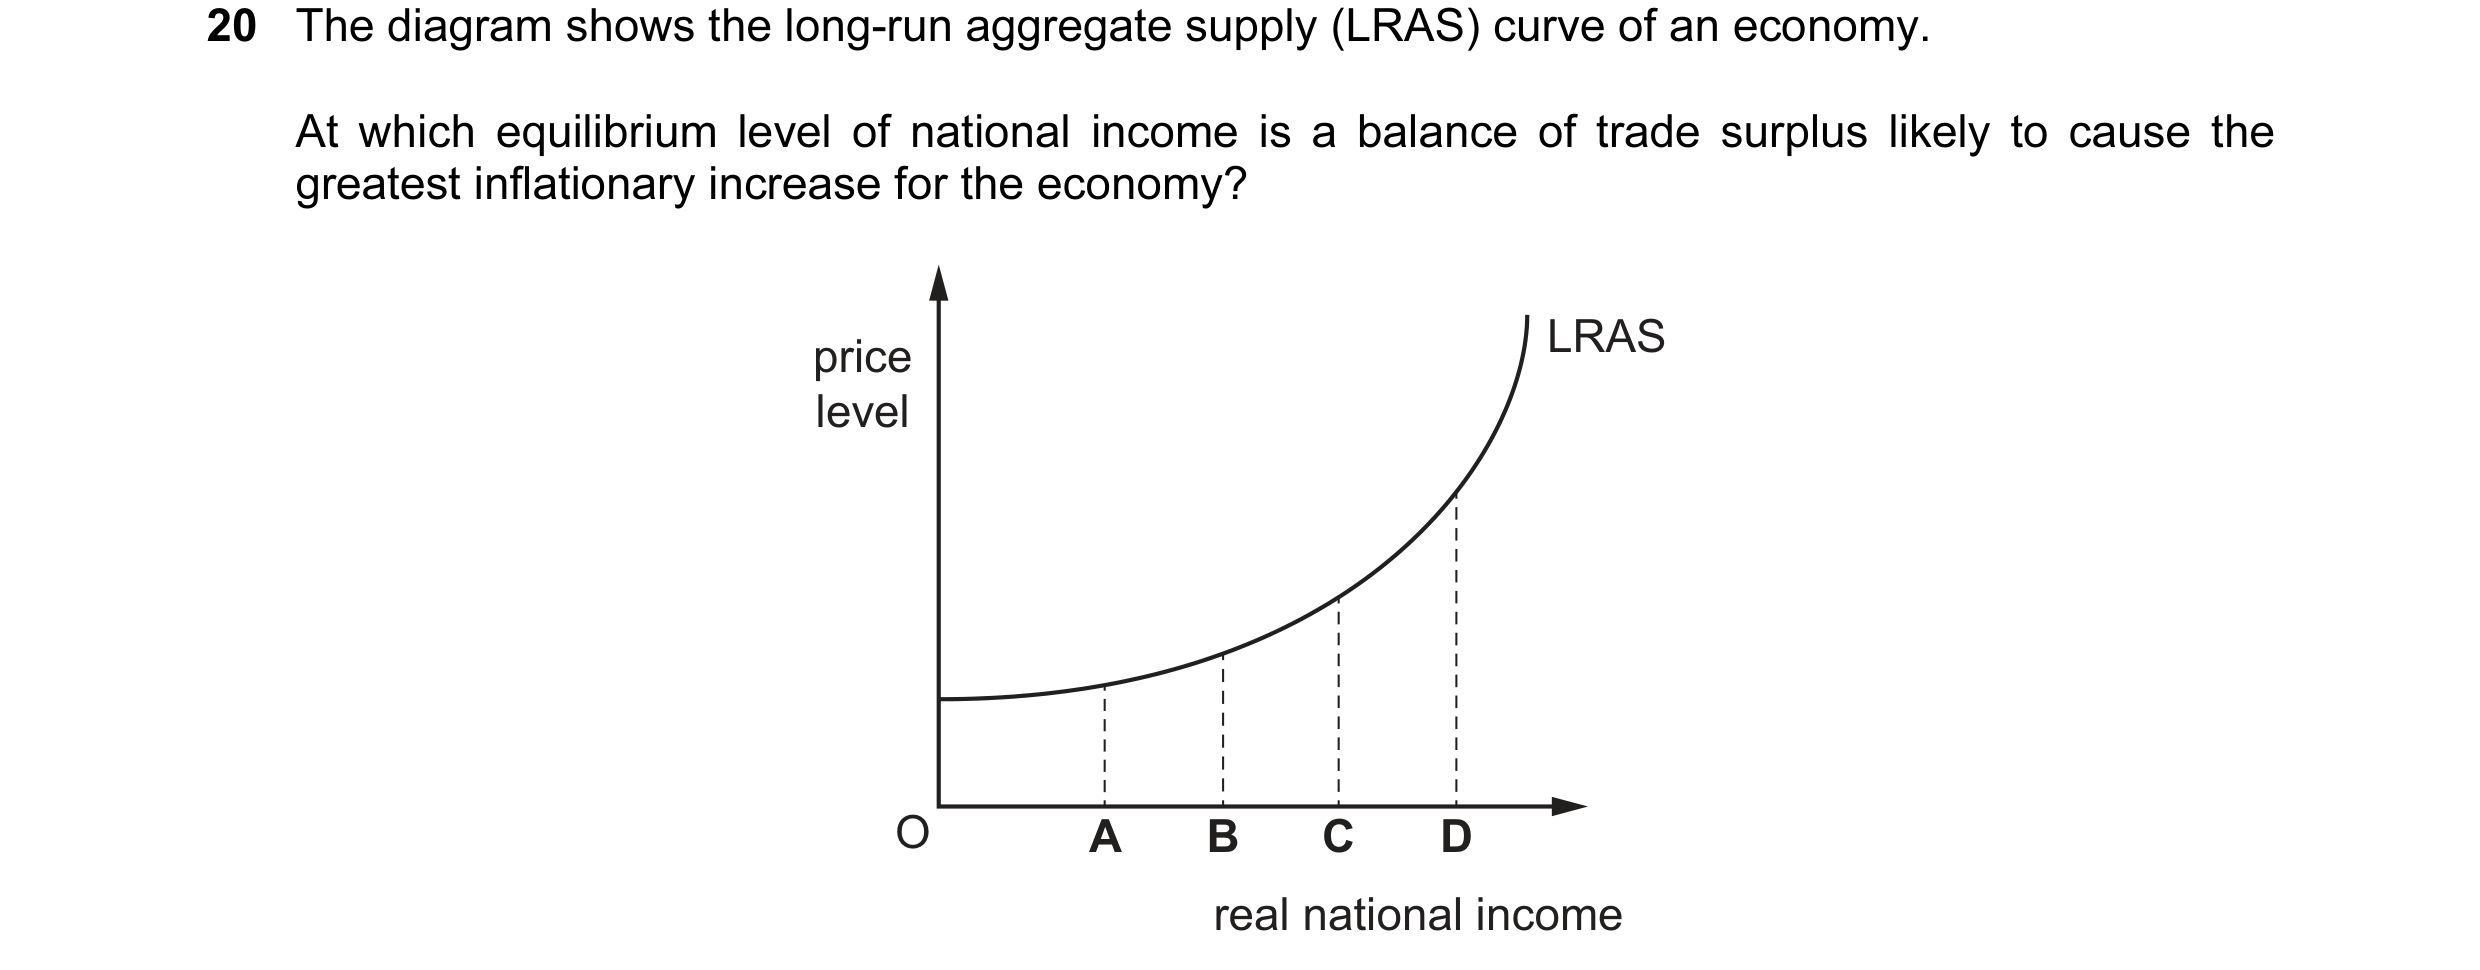 13 / 57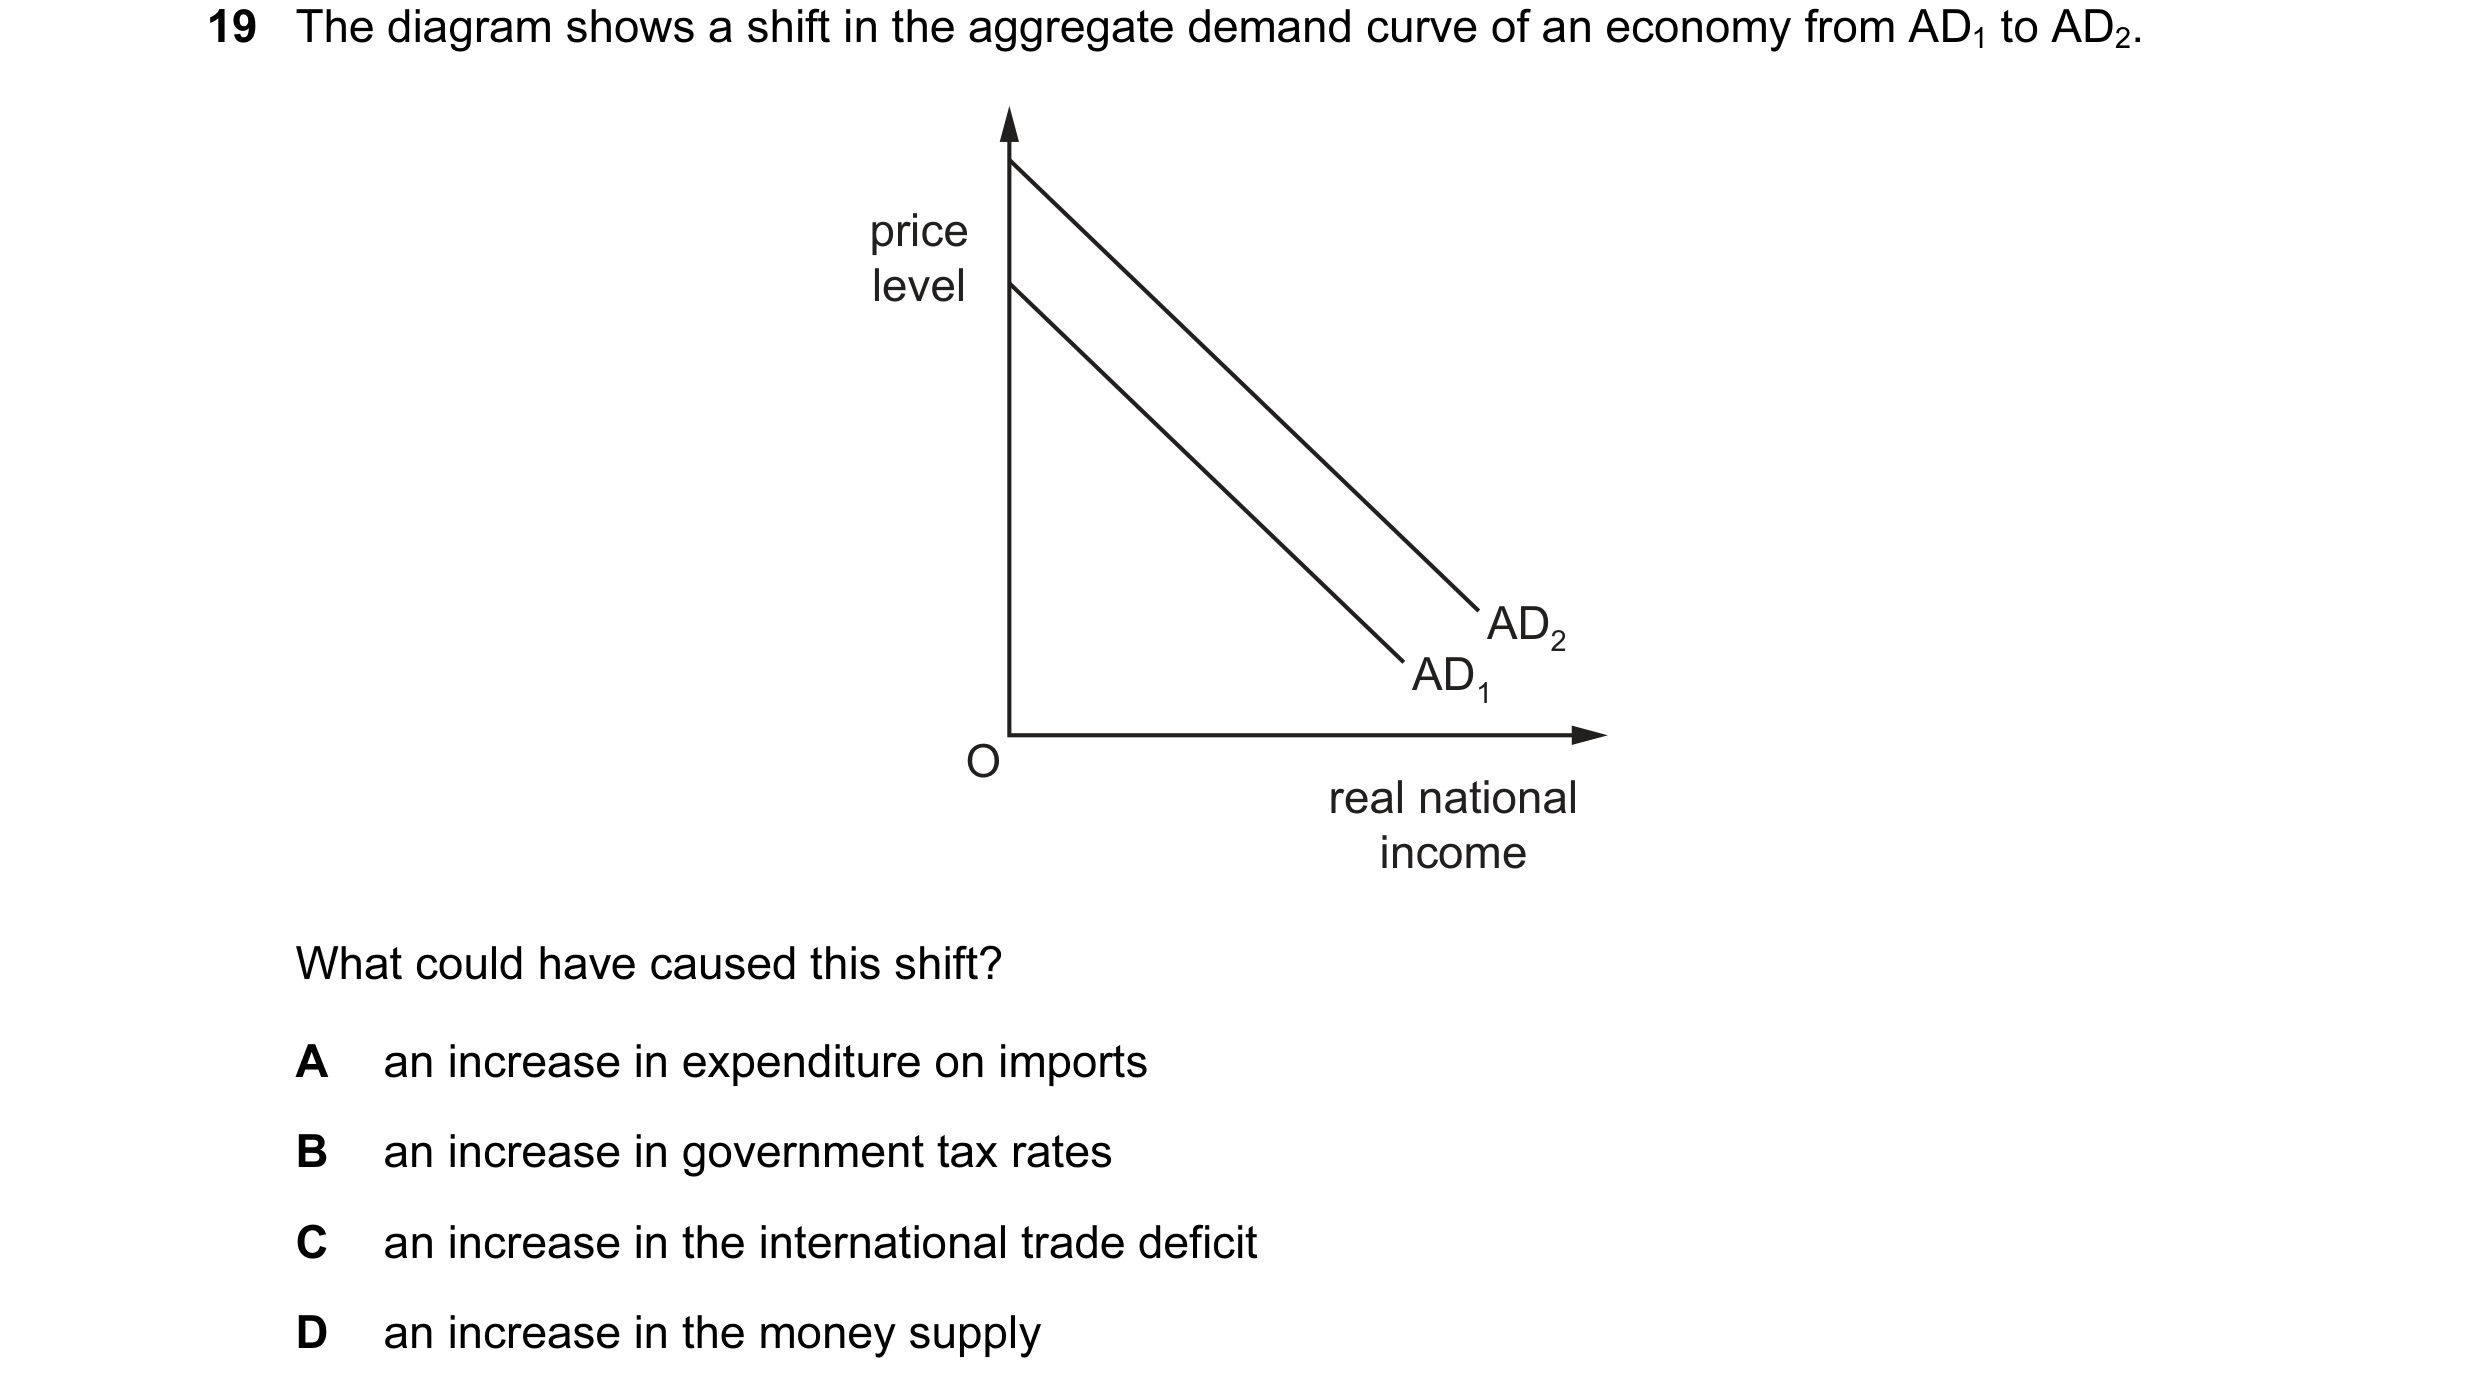
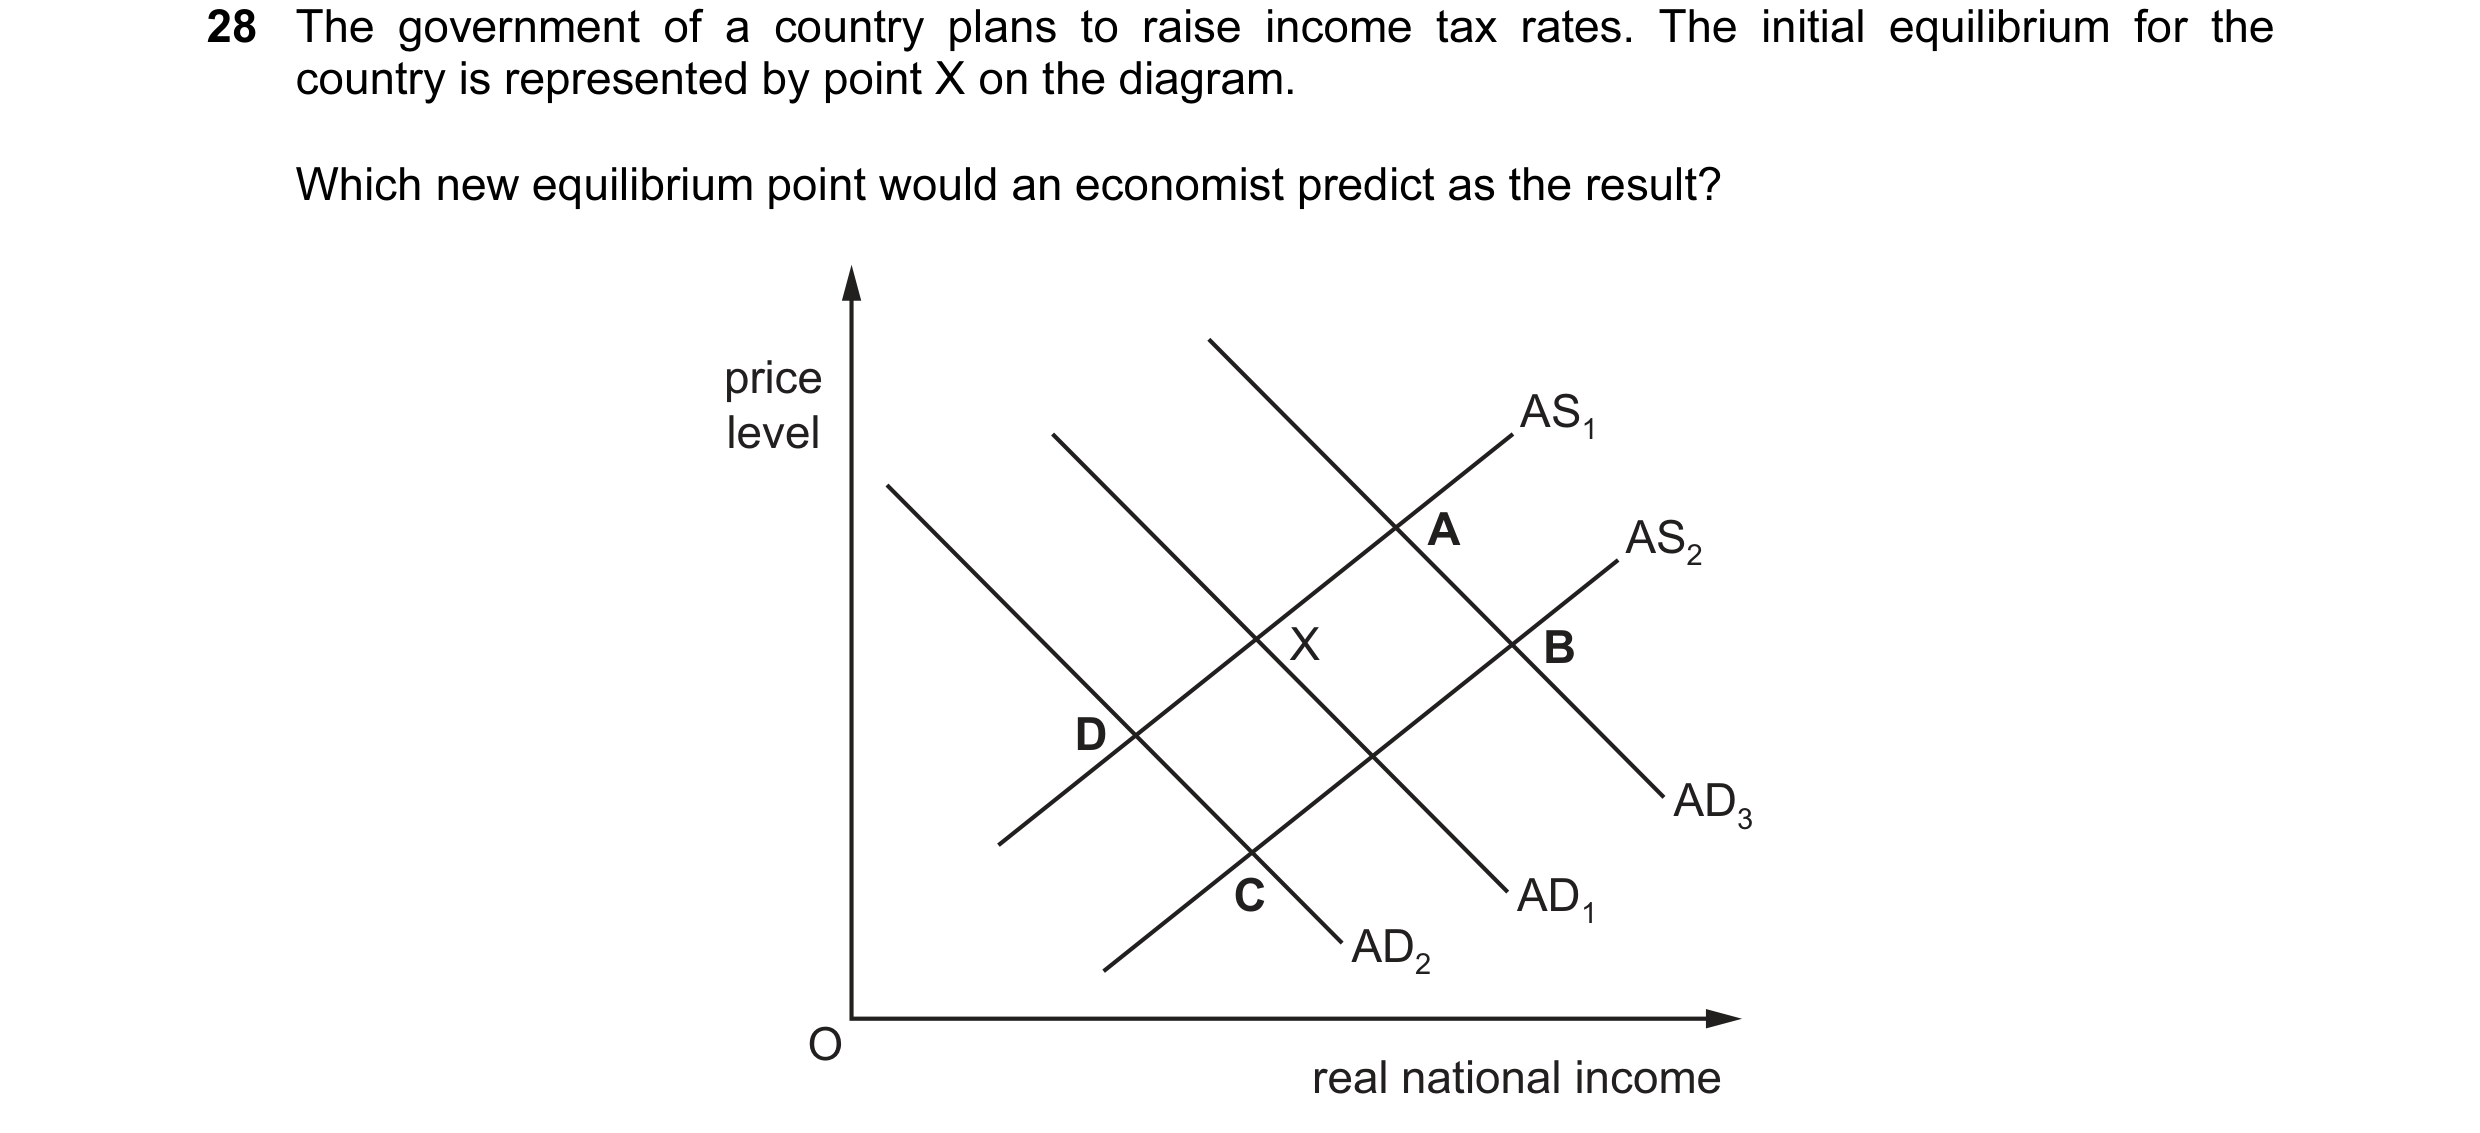 14 / 57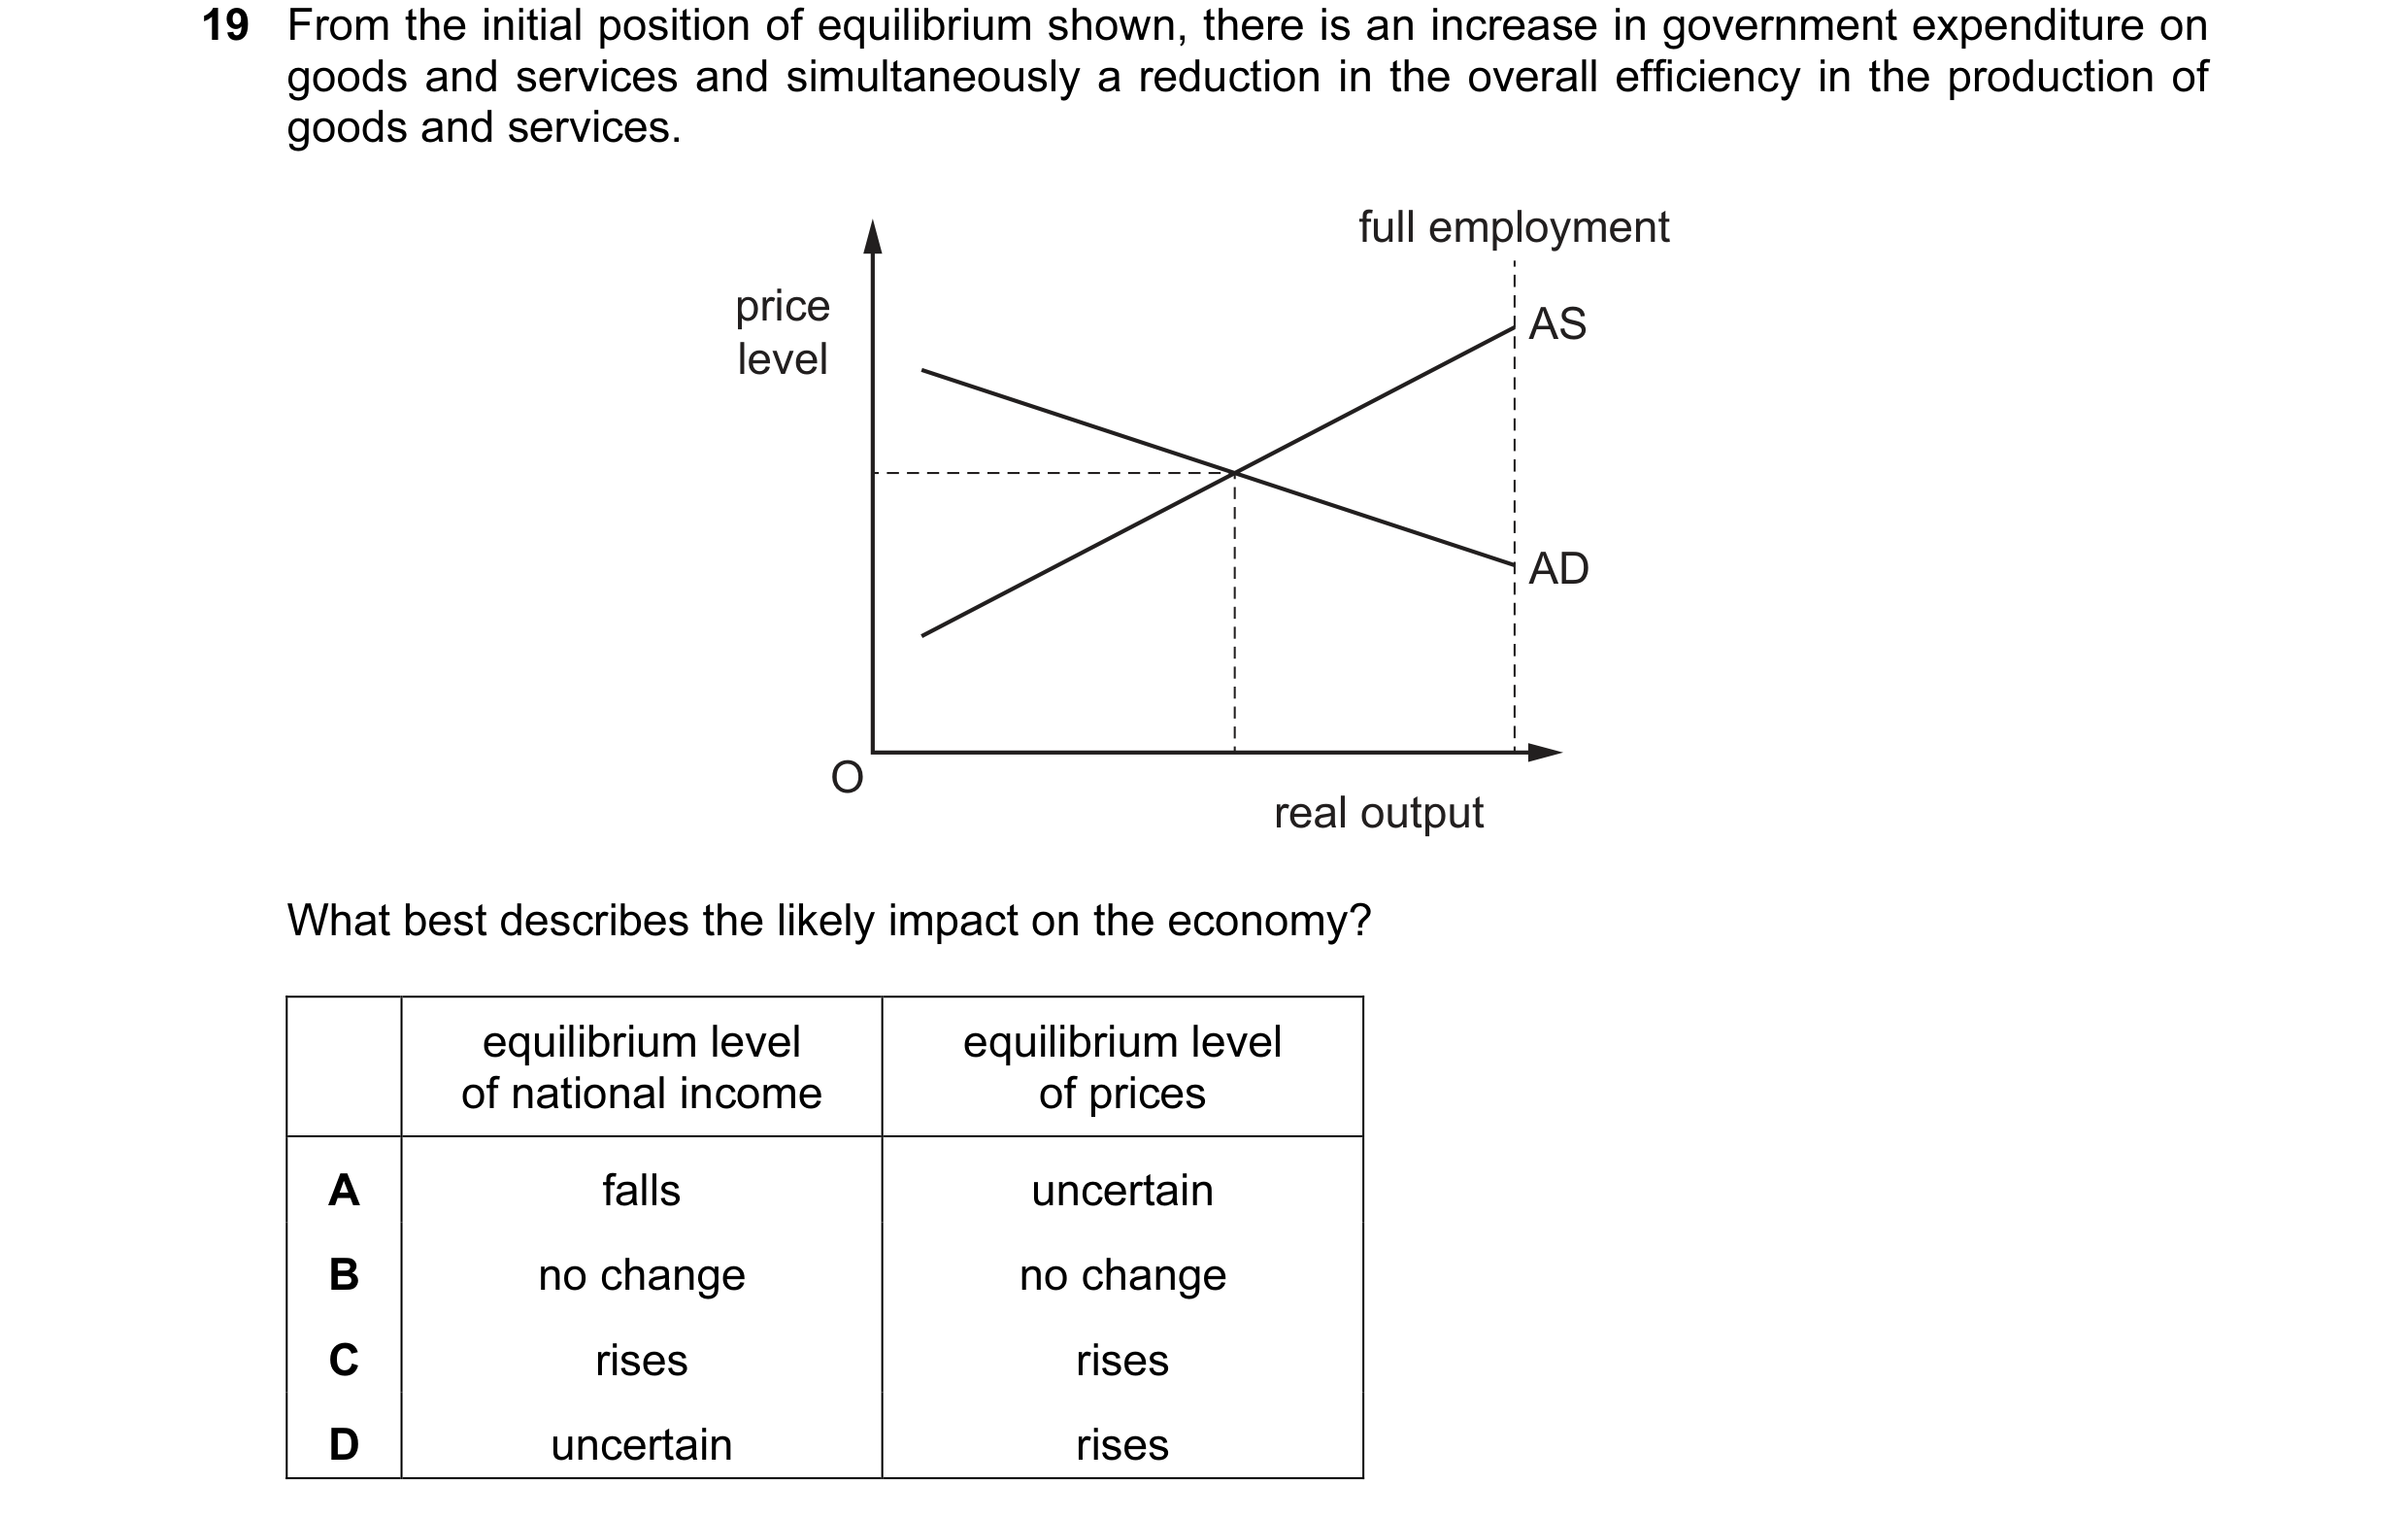

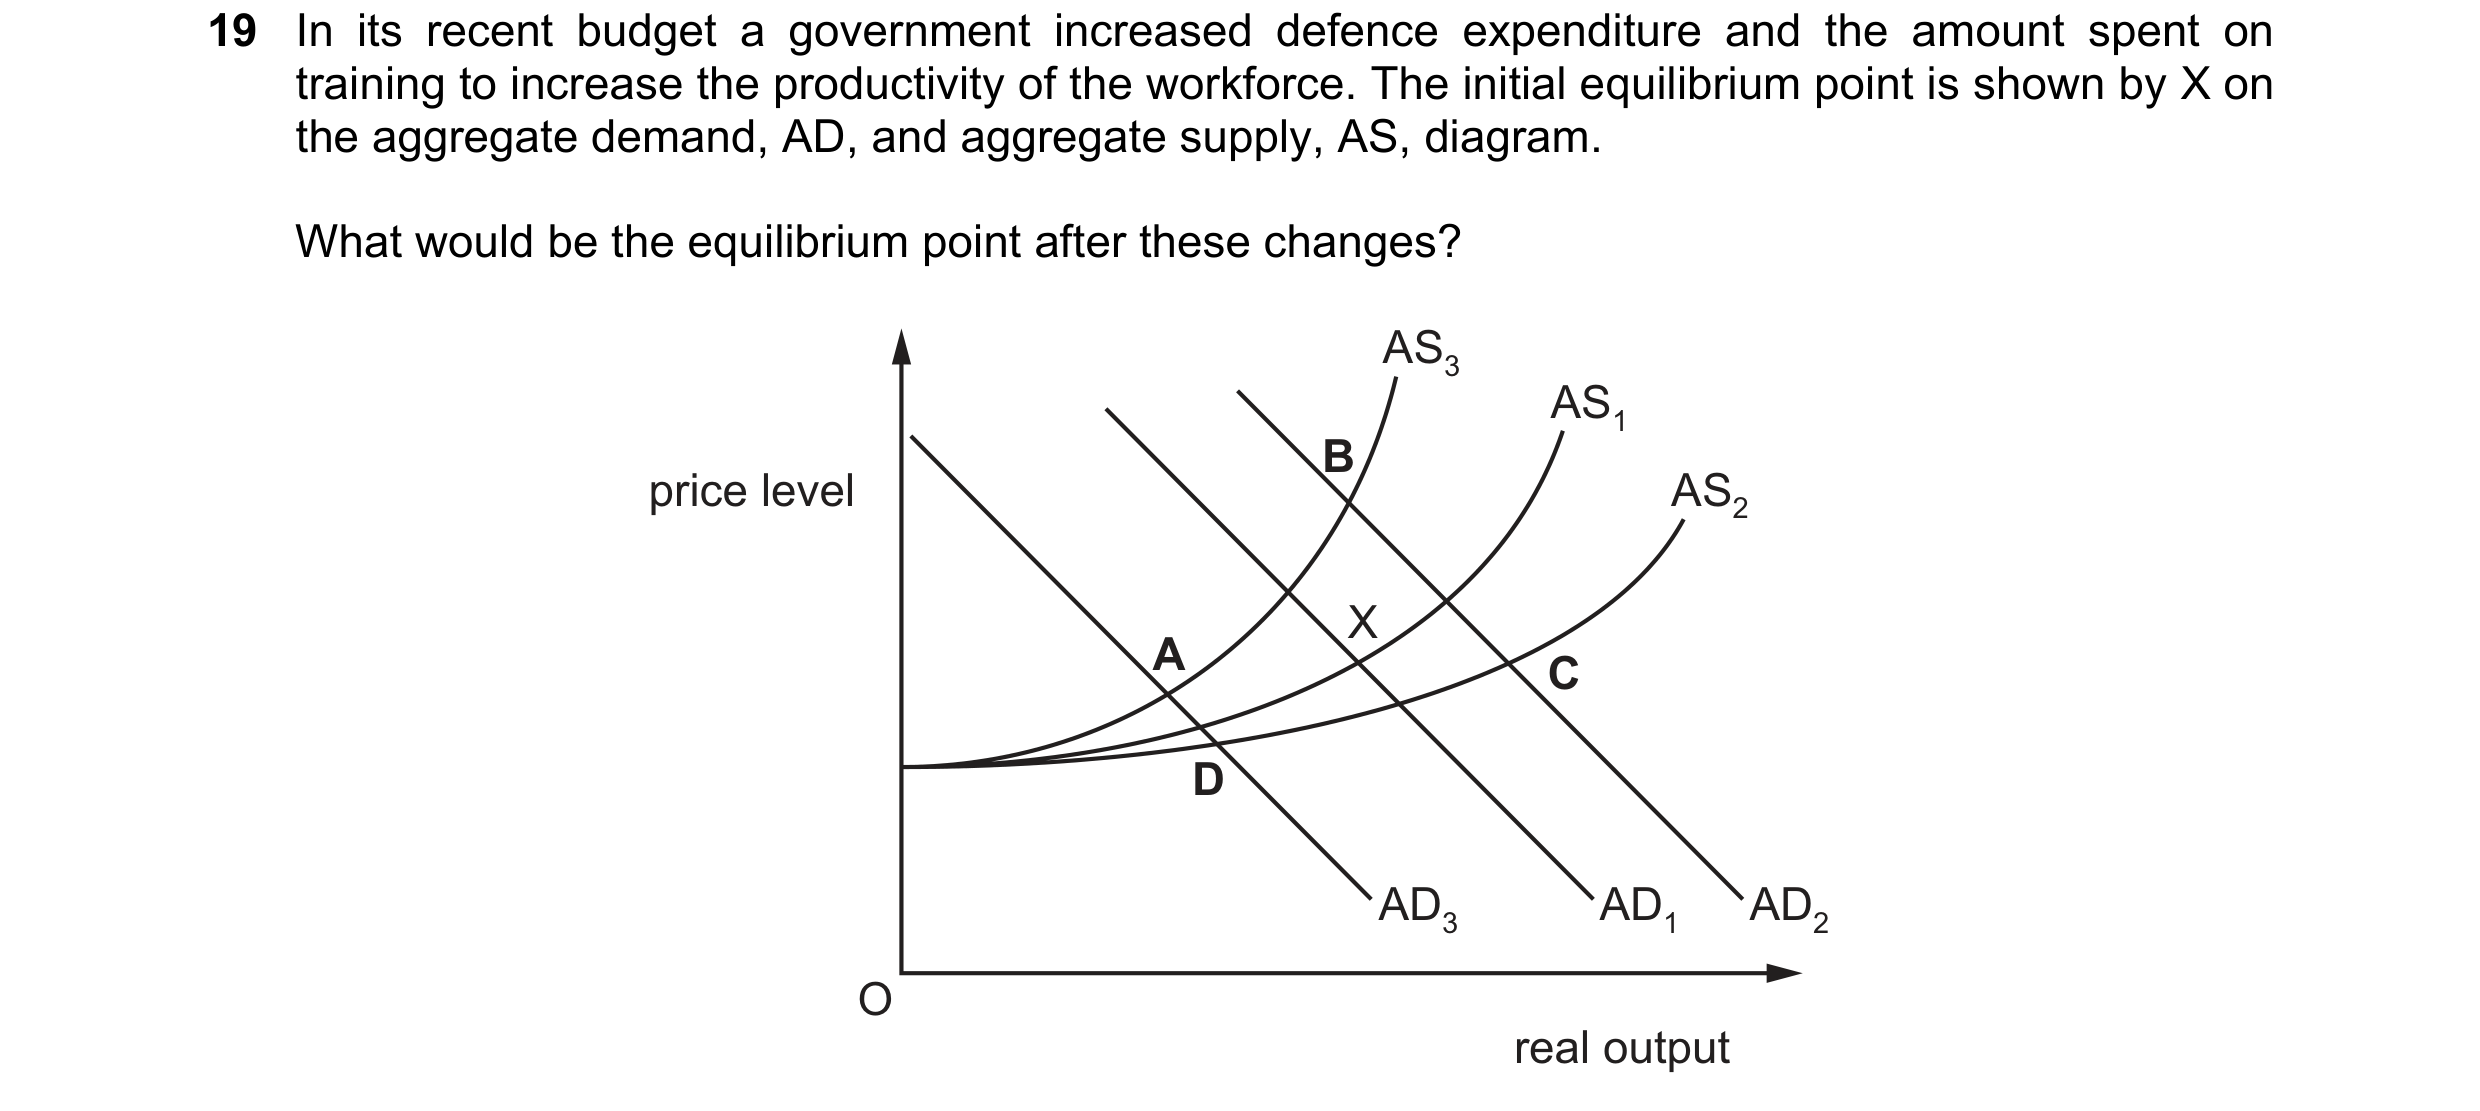 15 / 57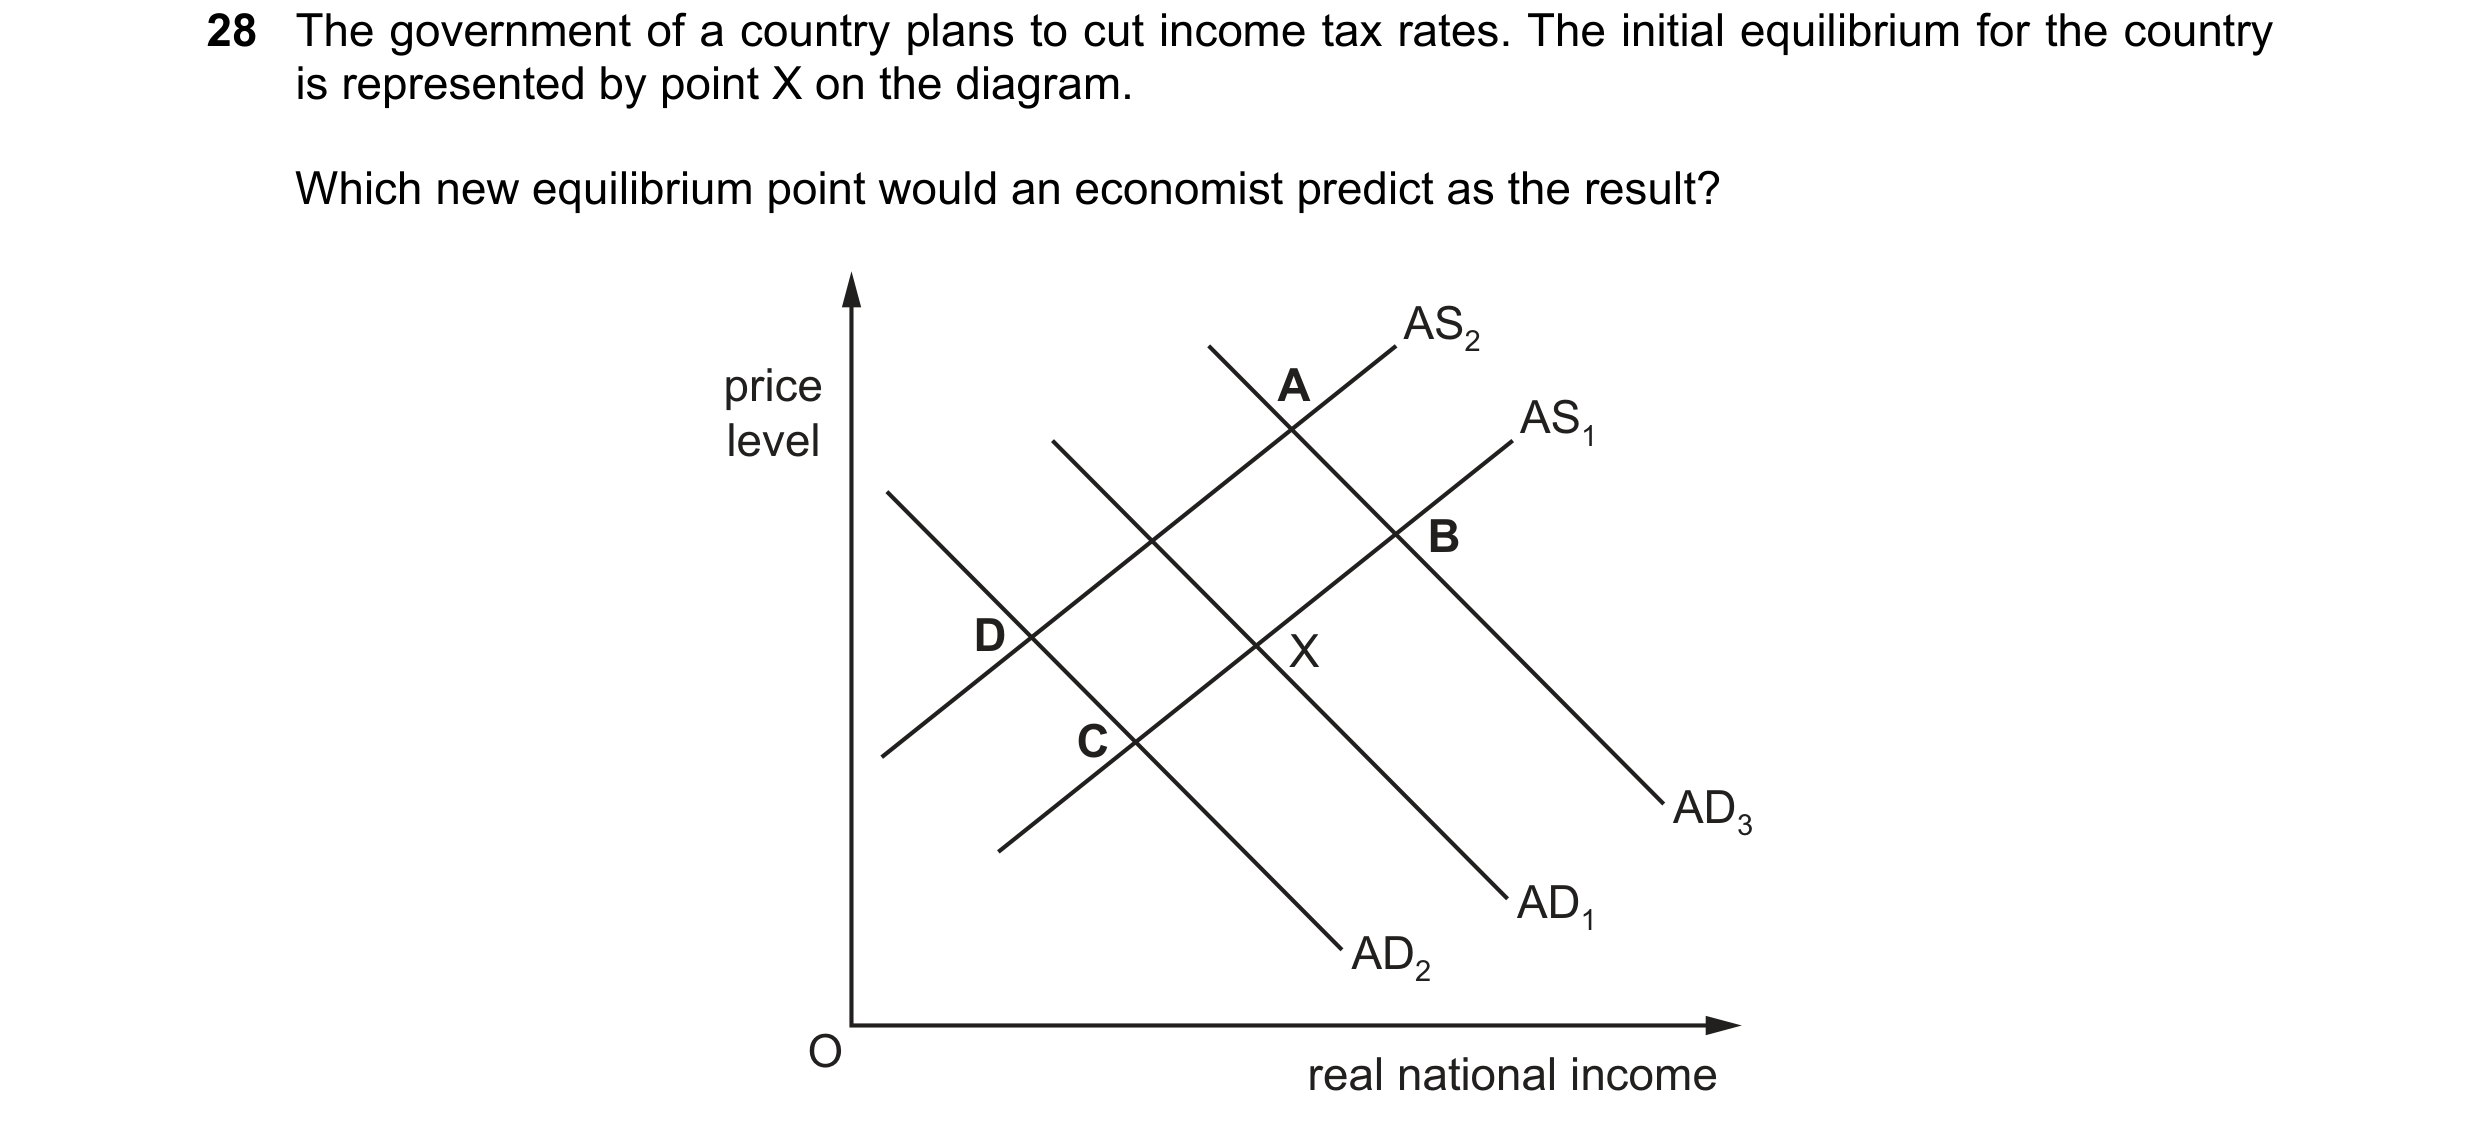
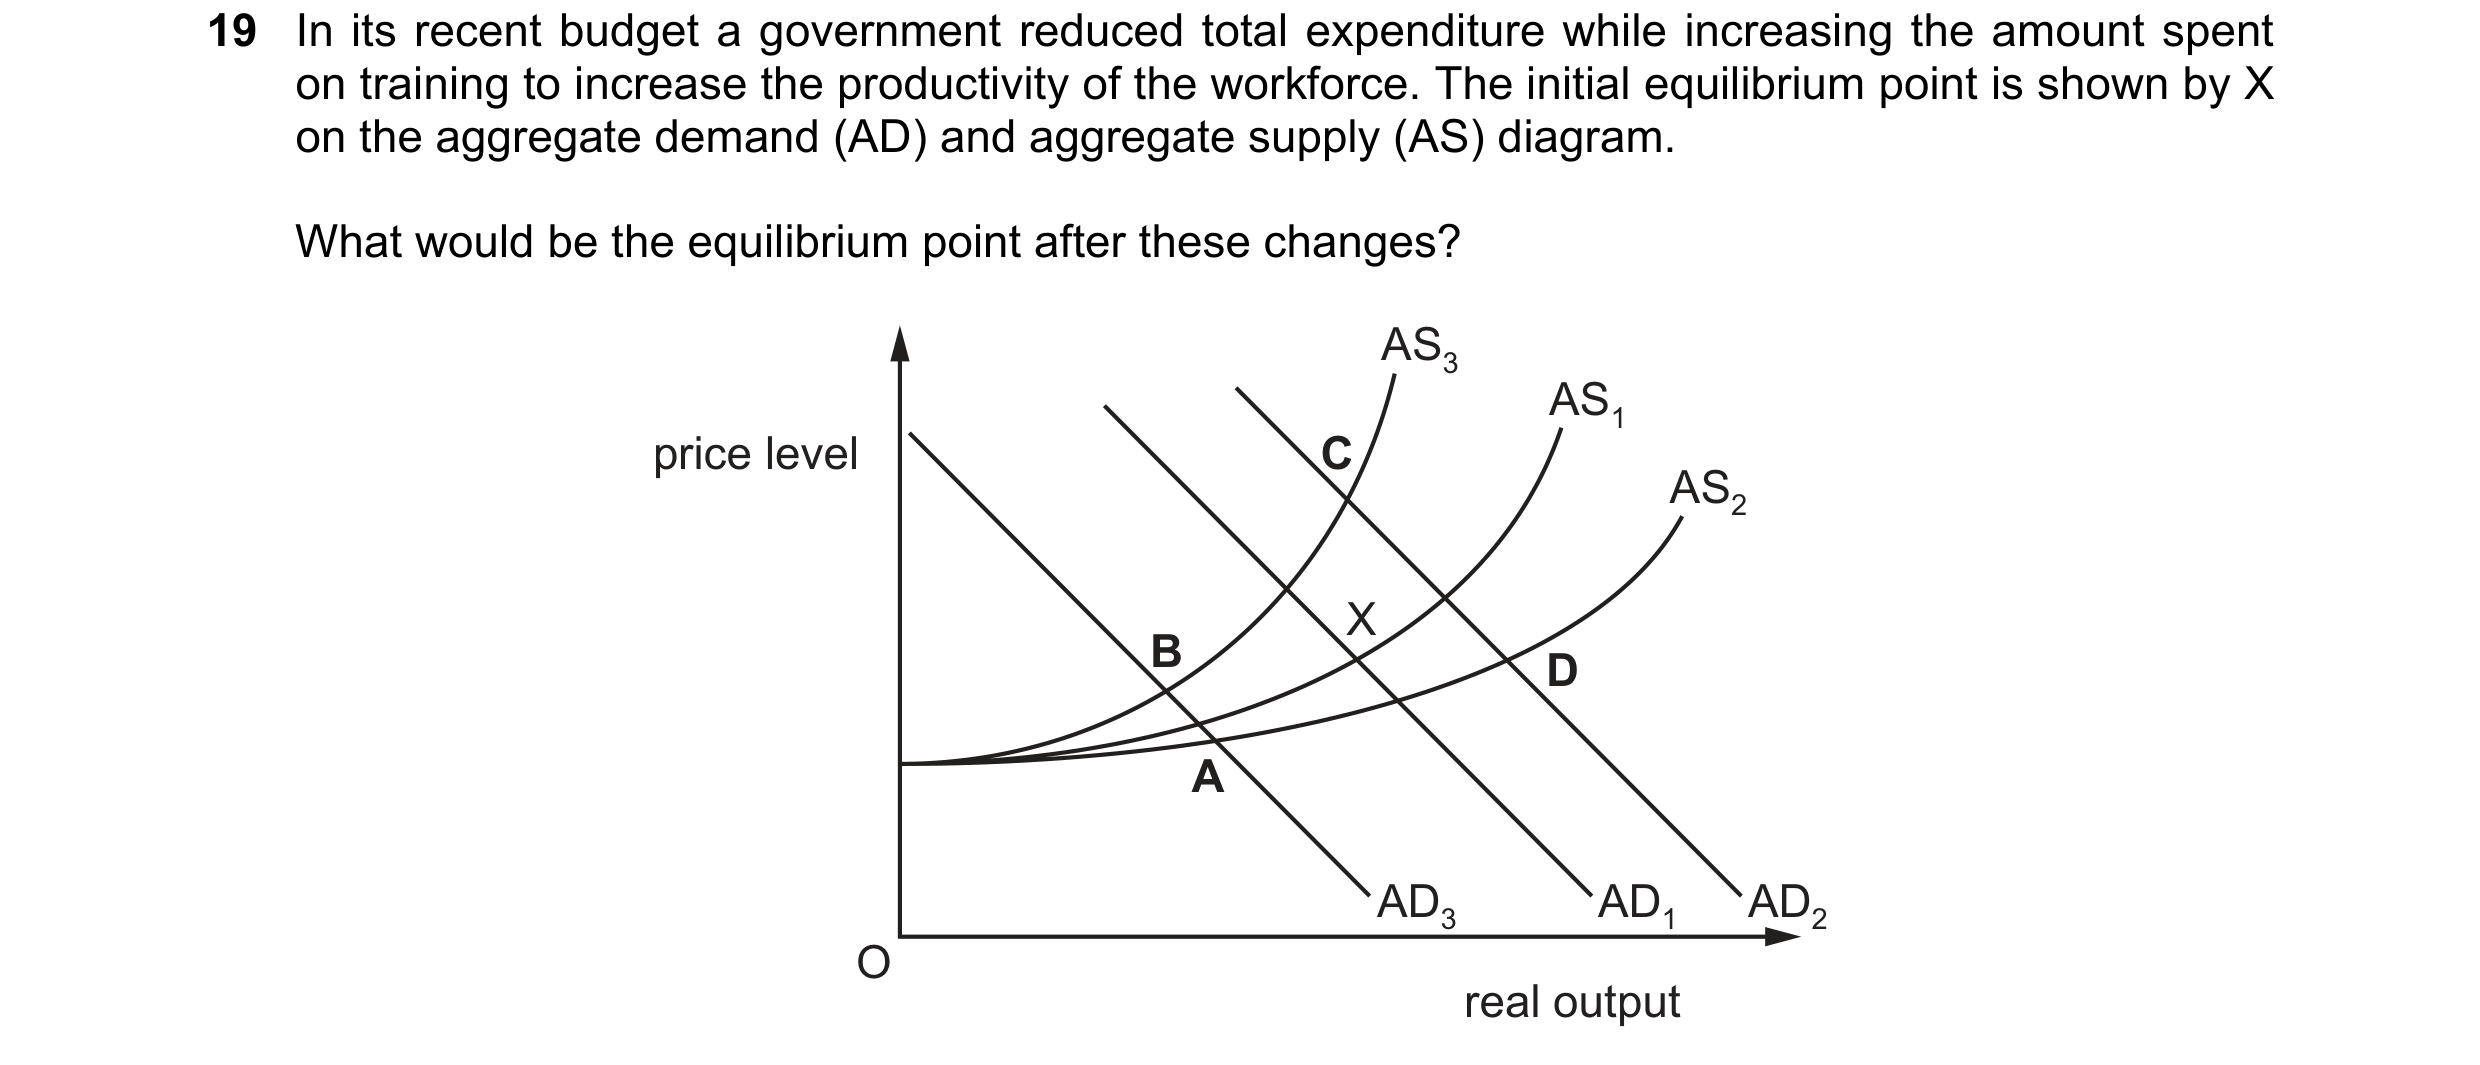
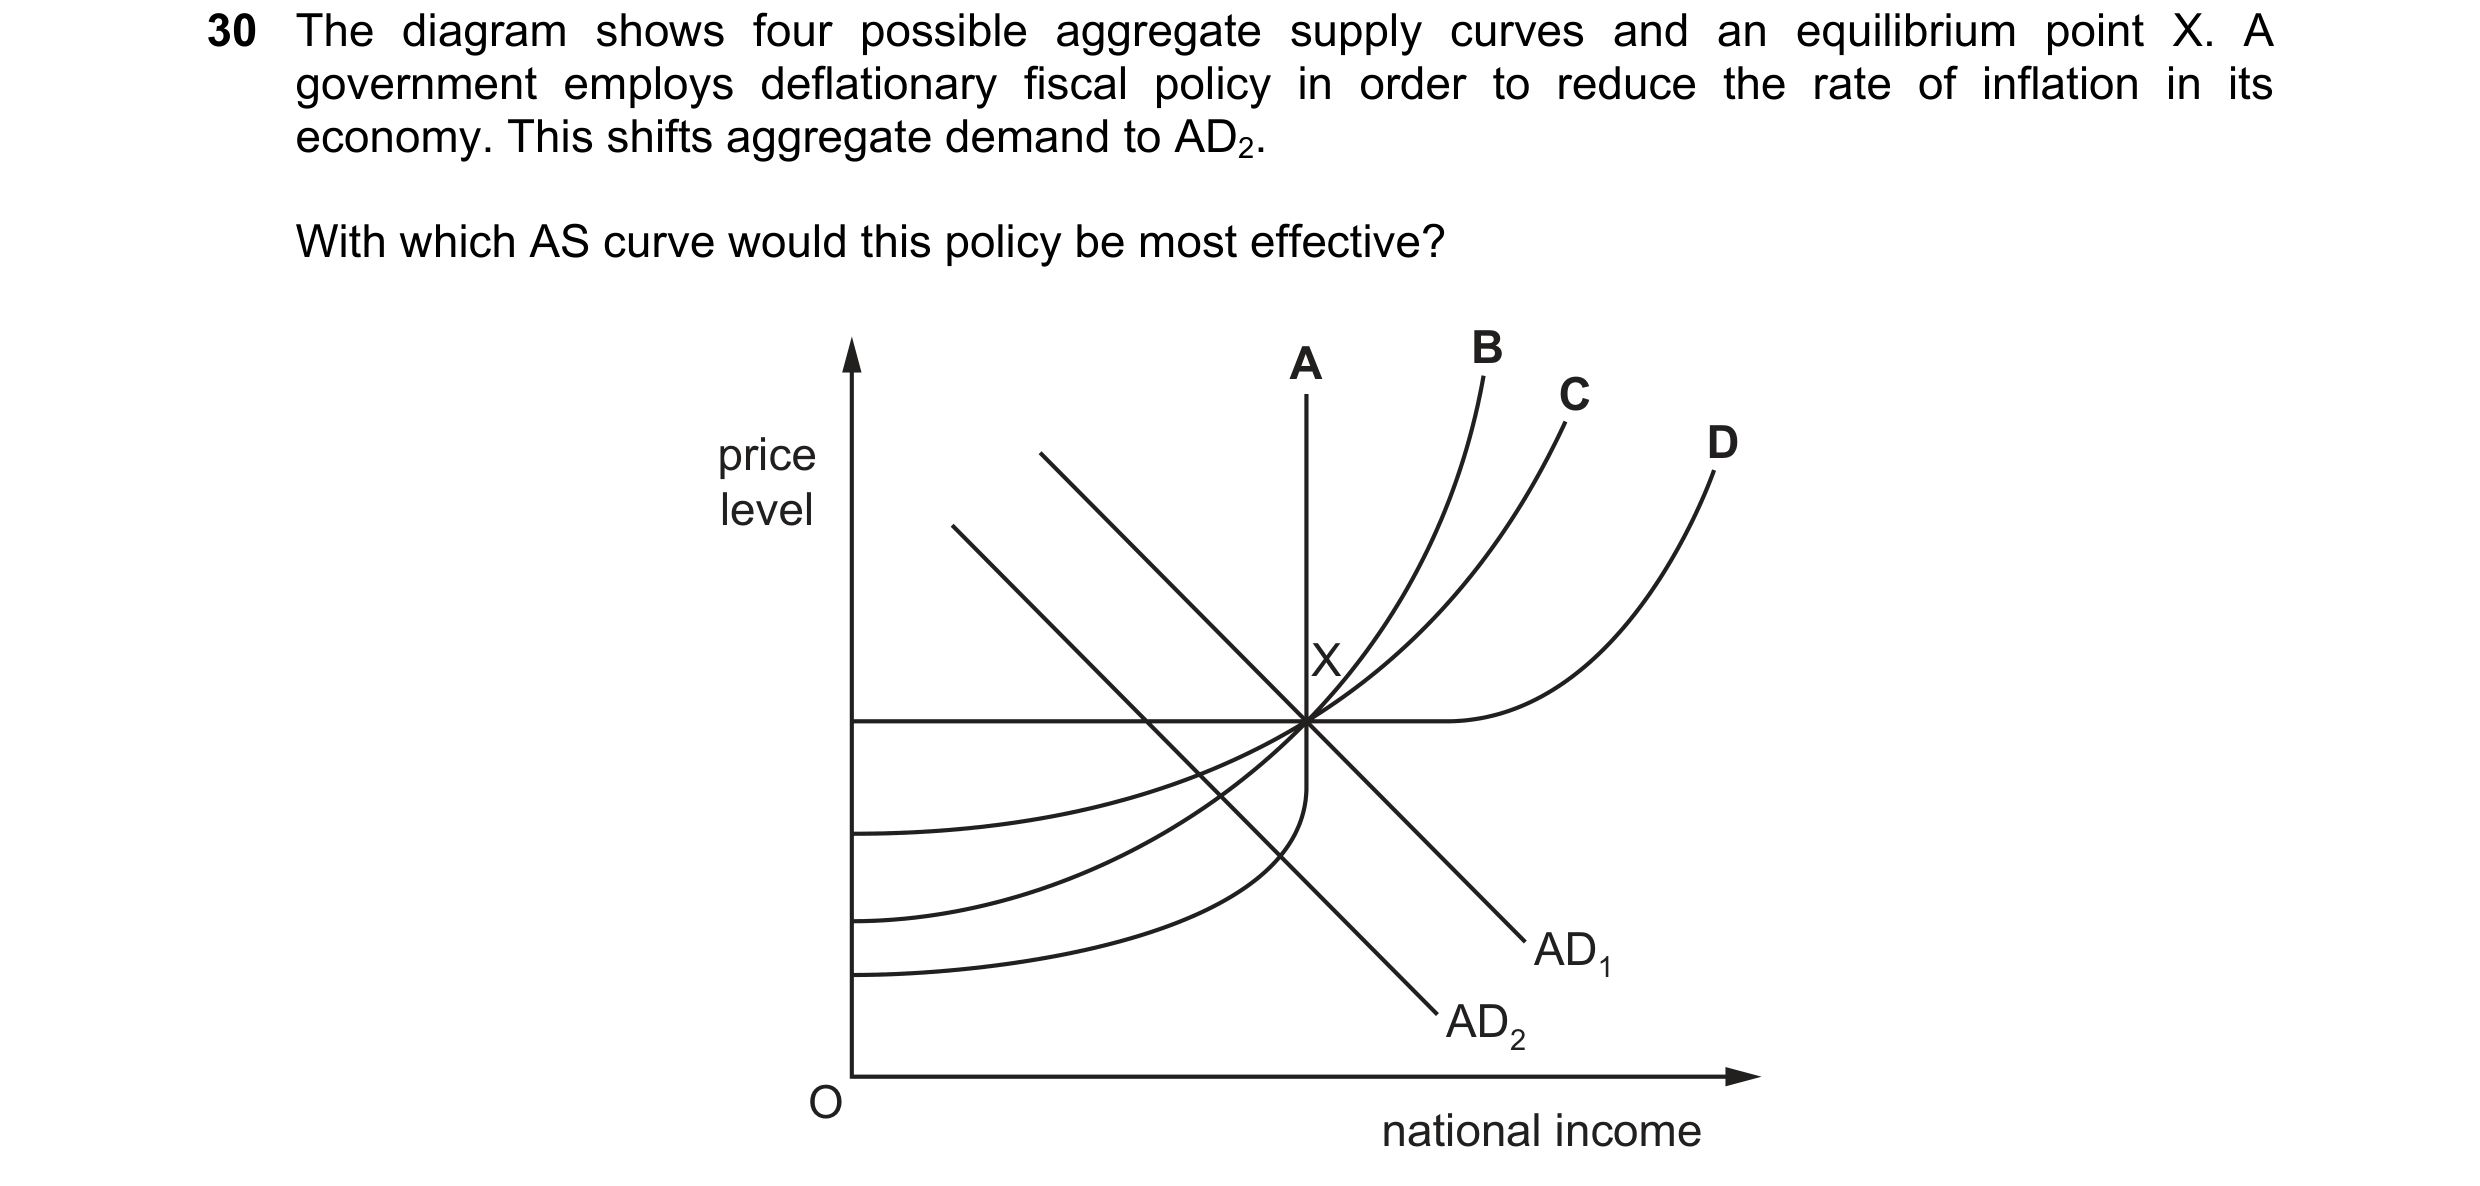 16 / 57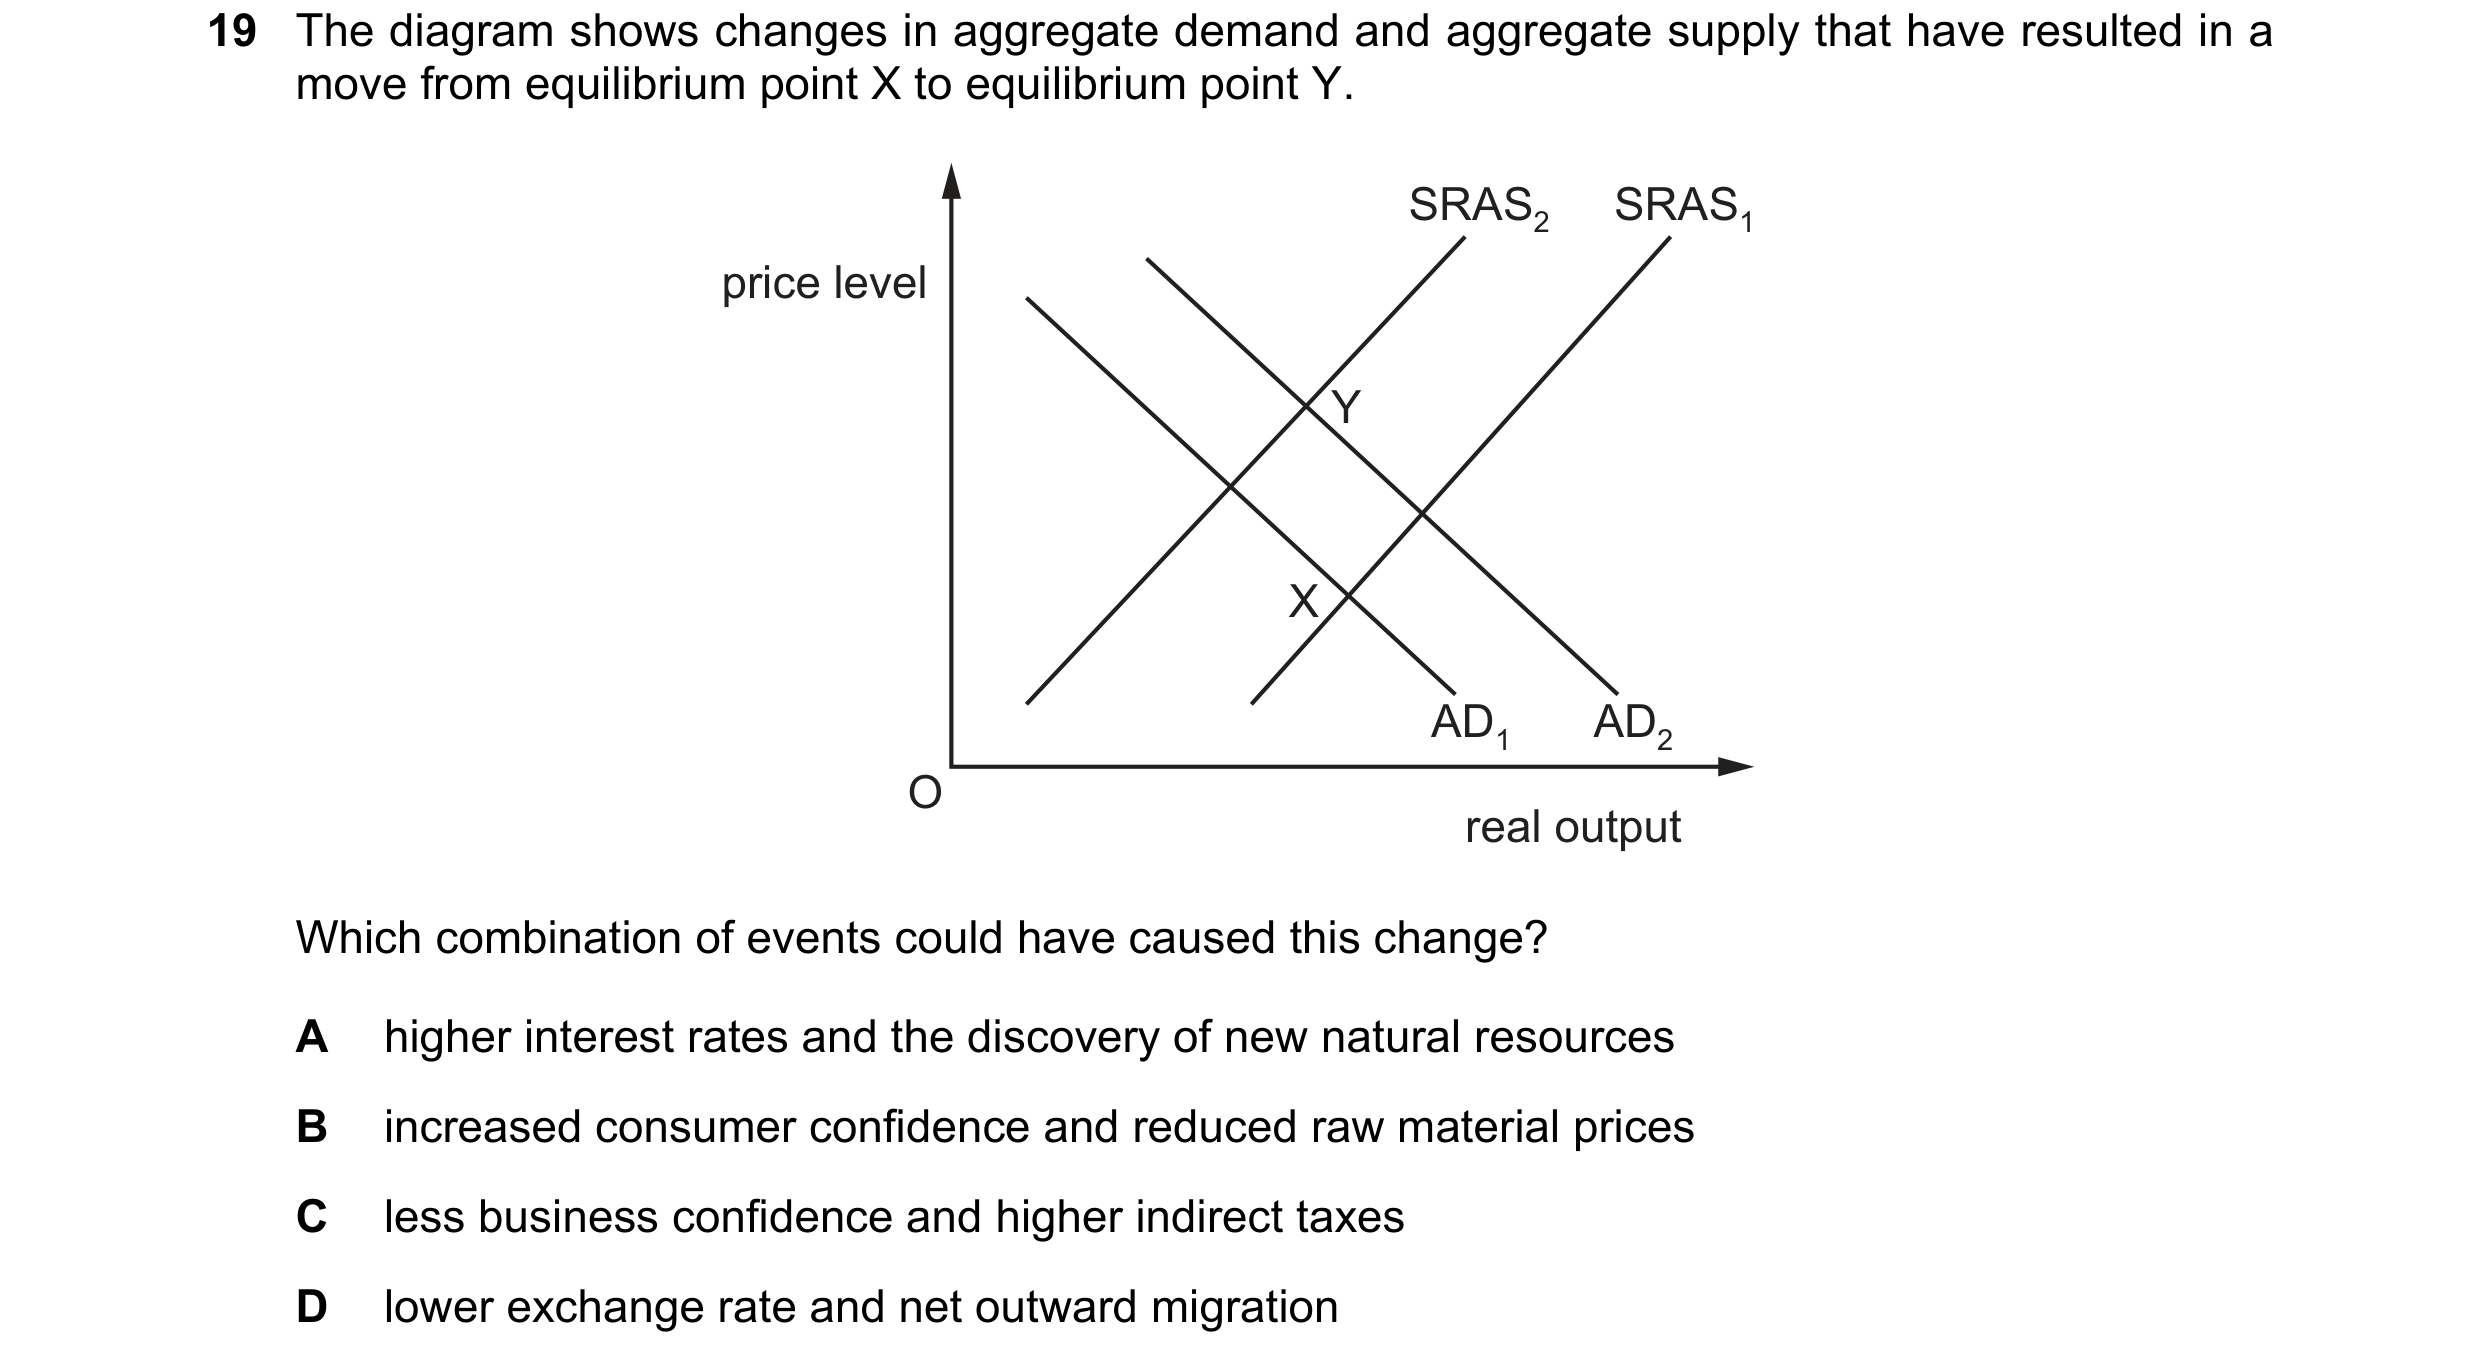
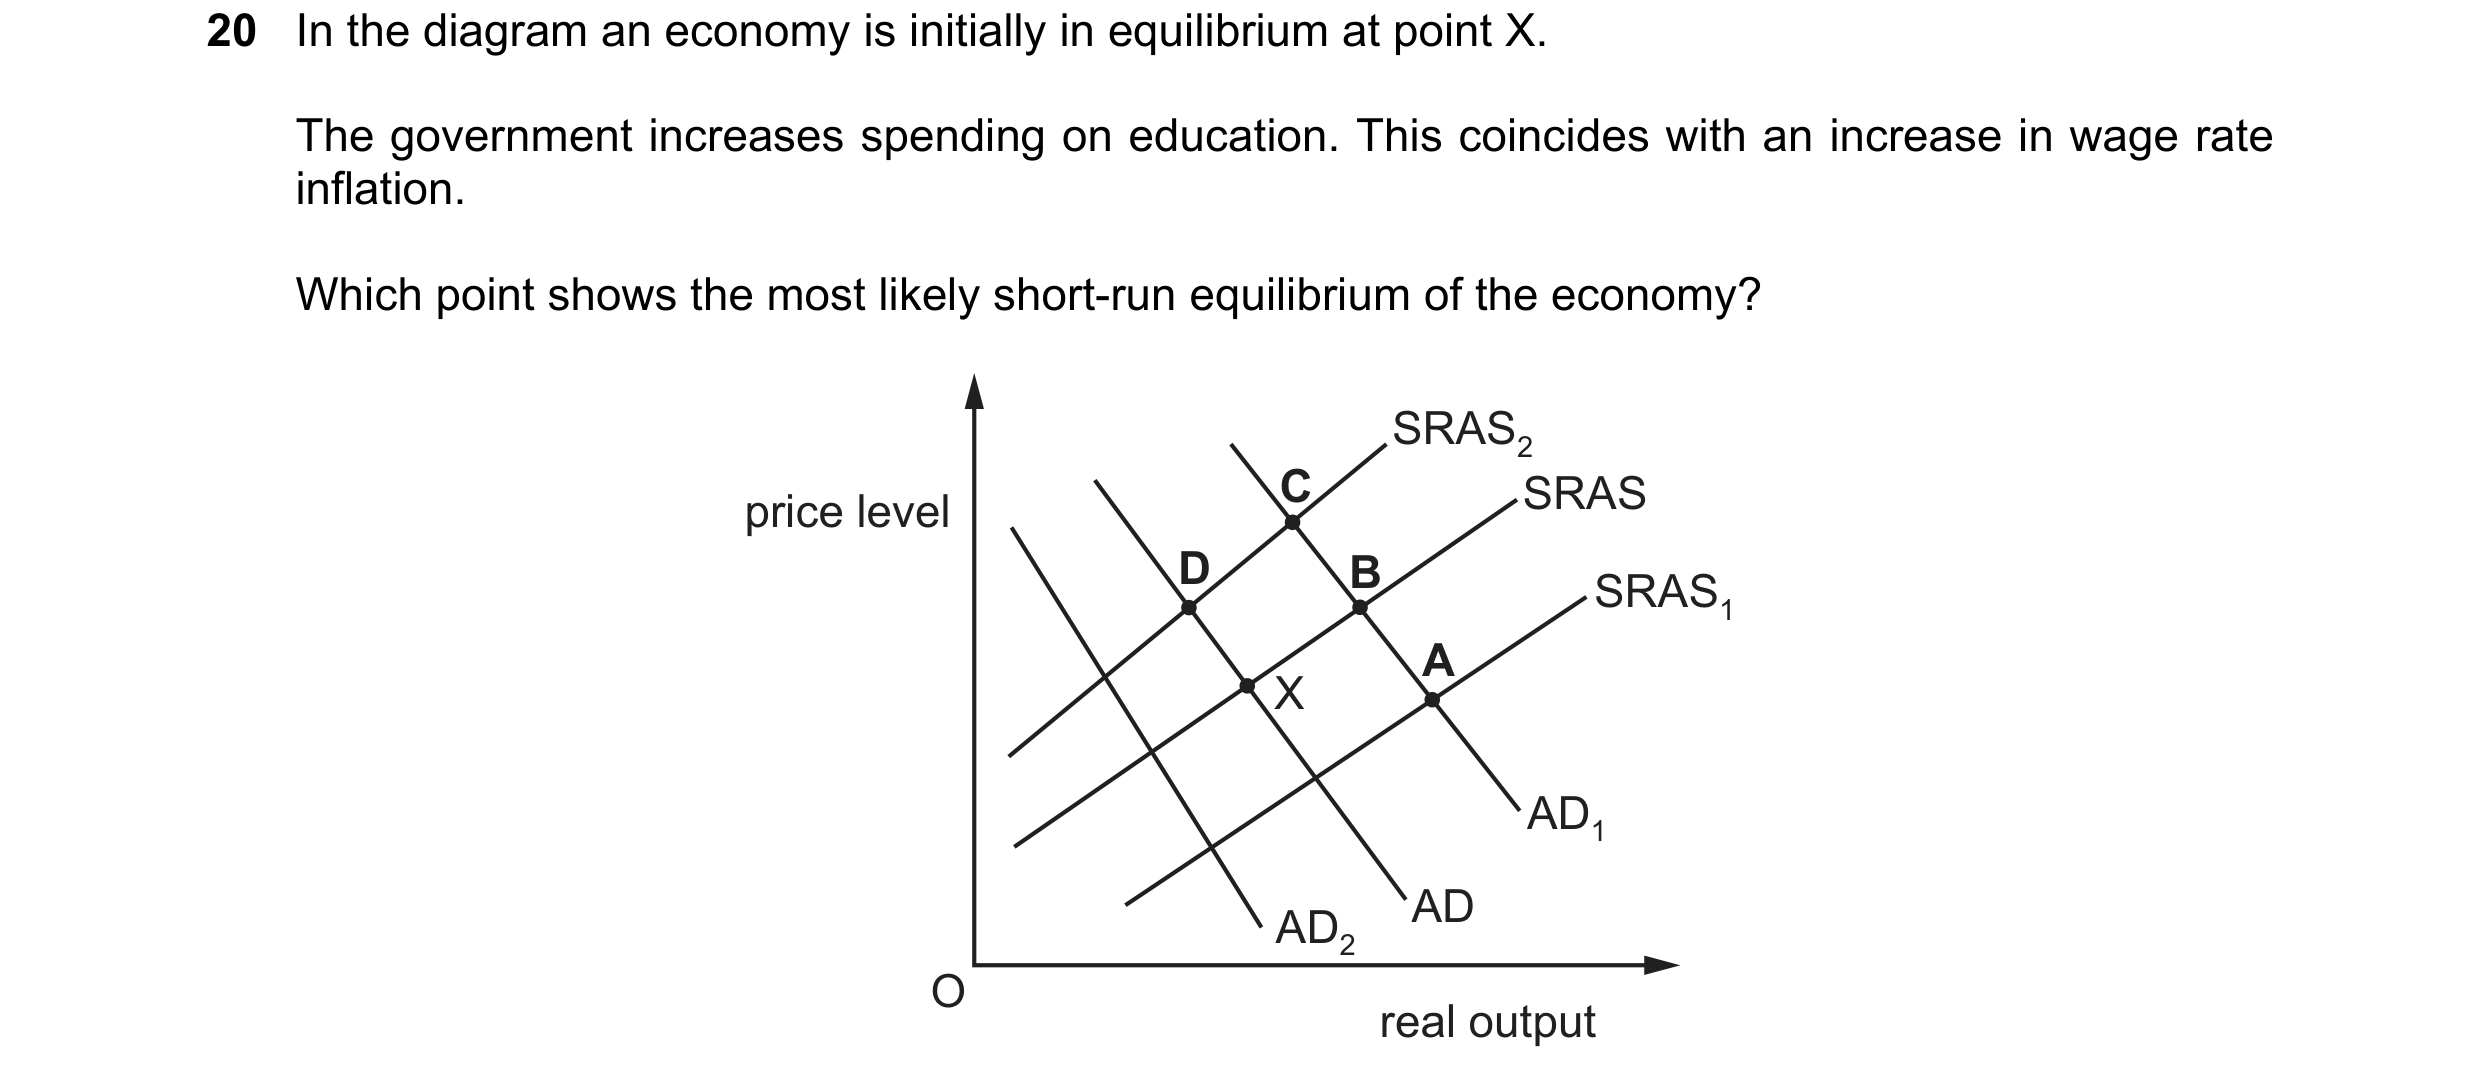 17 / 57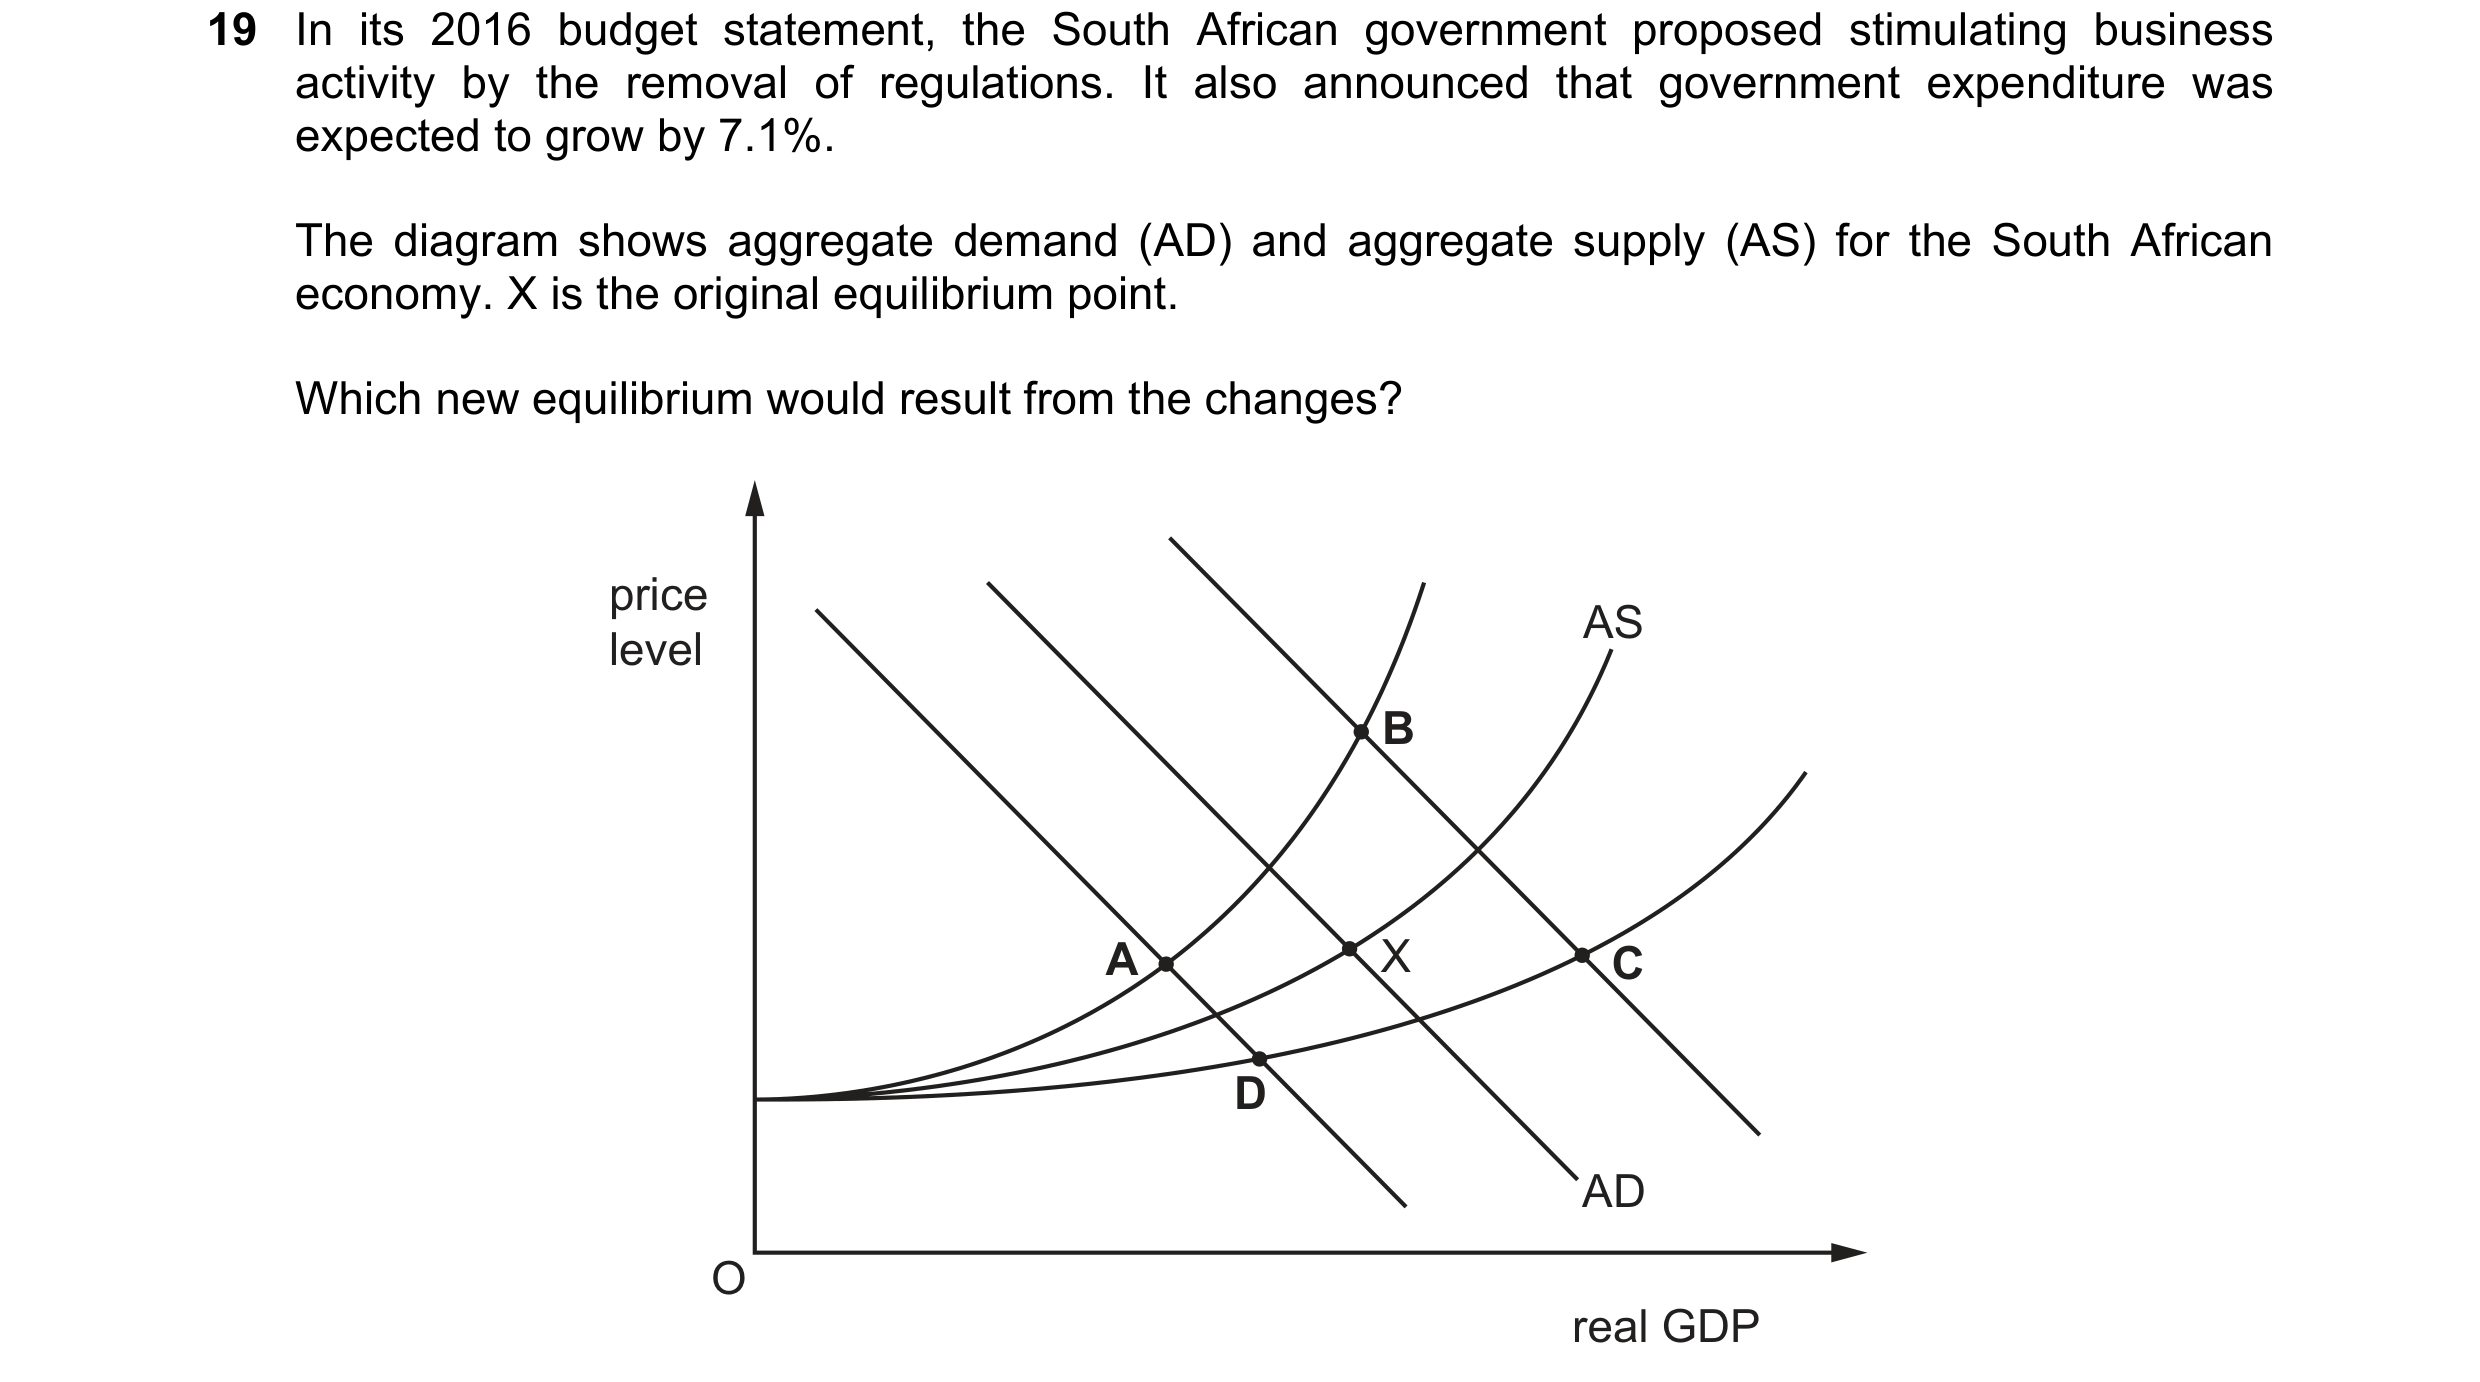
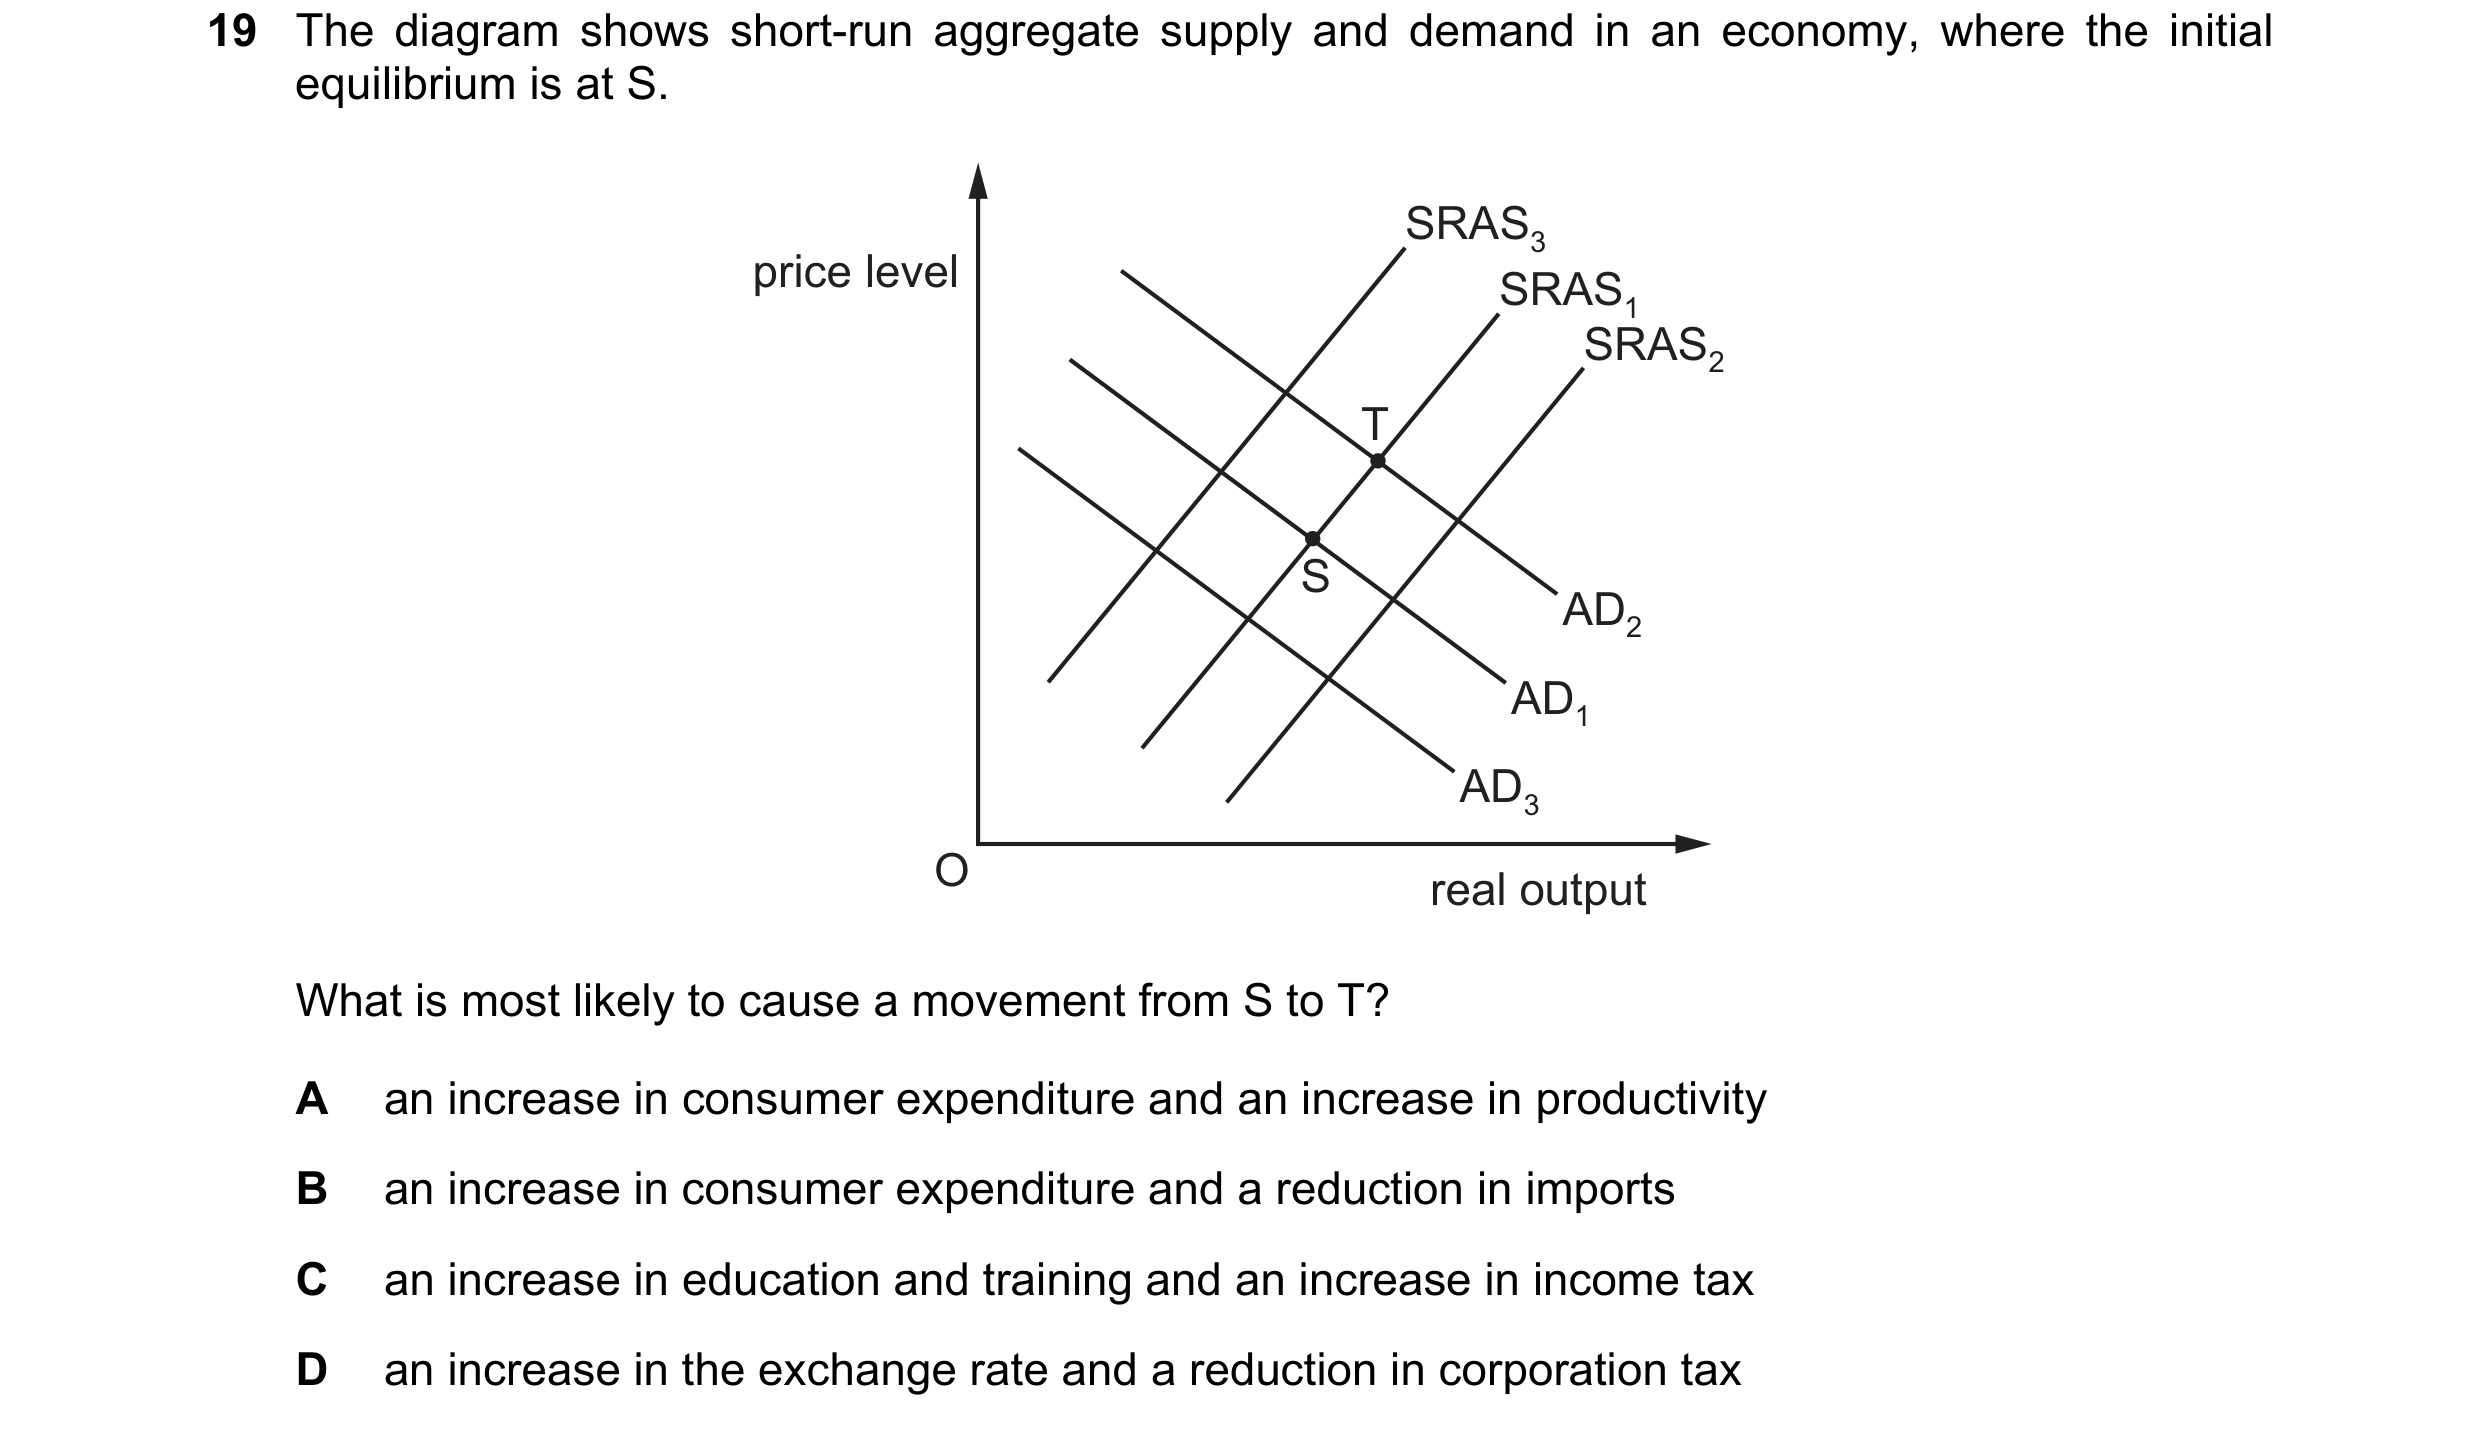 18 / 57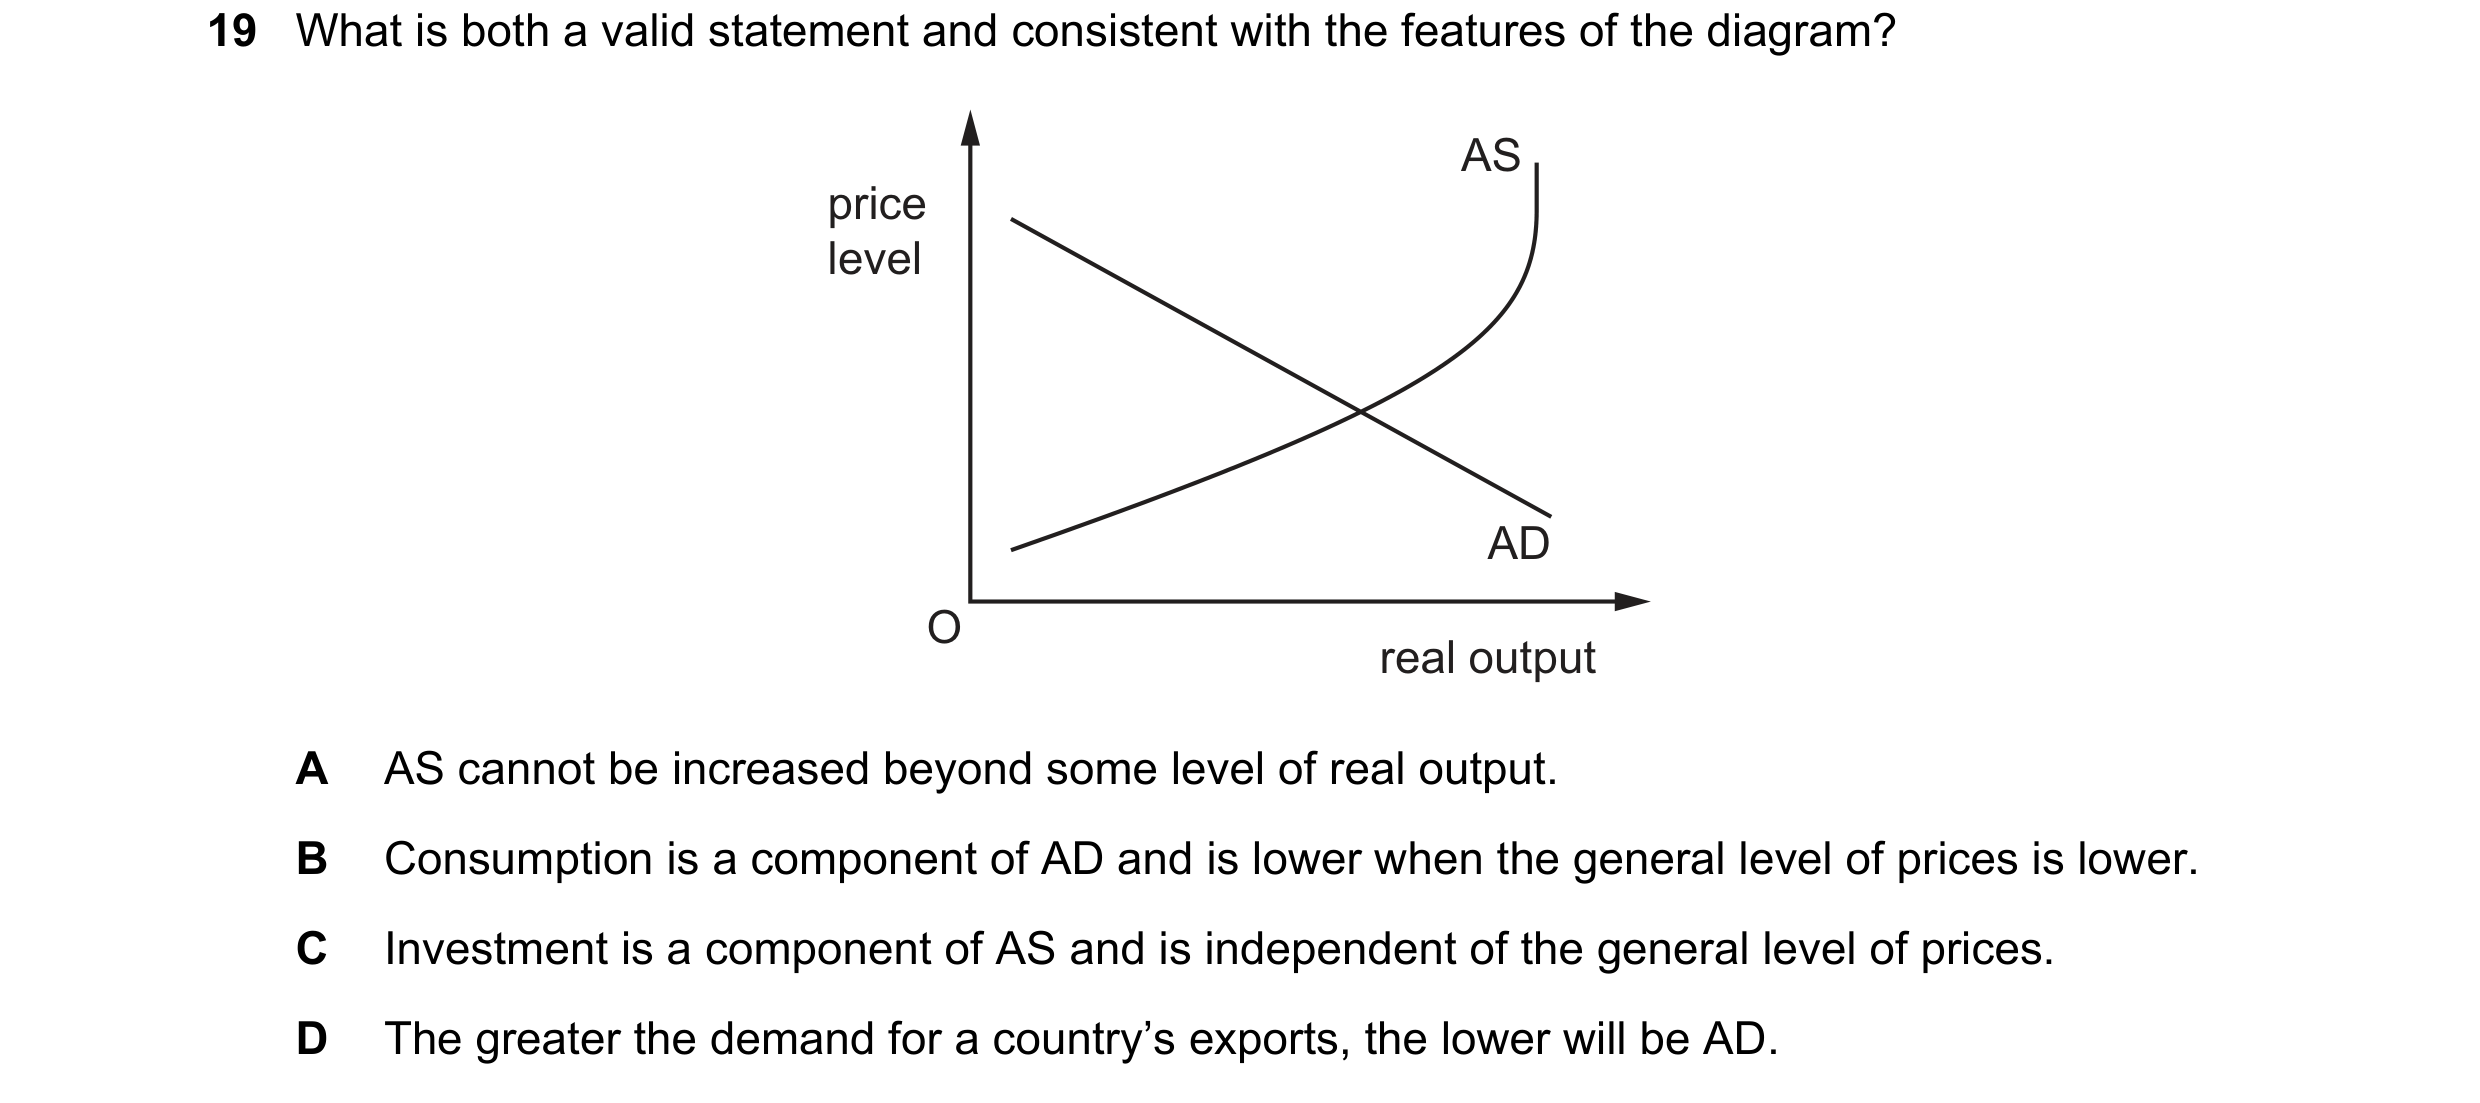
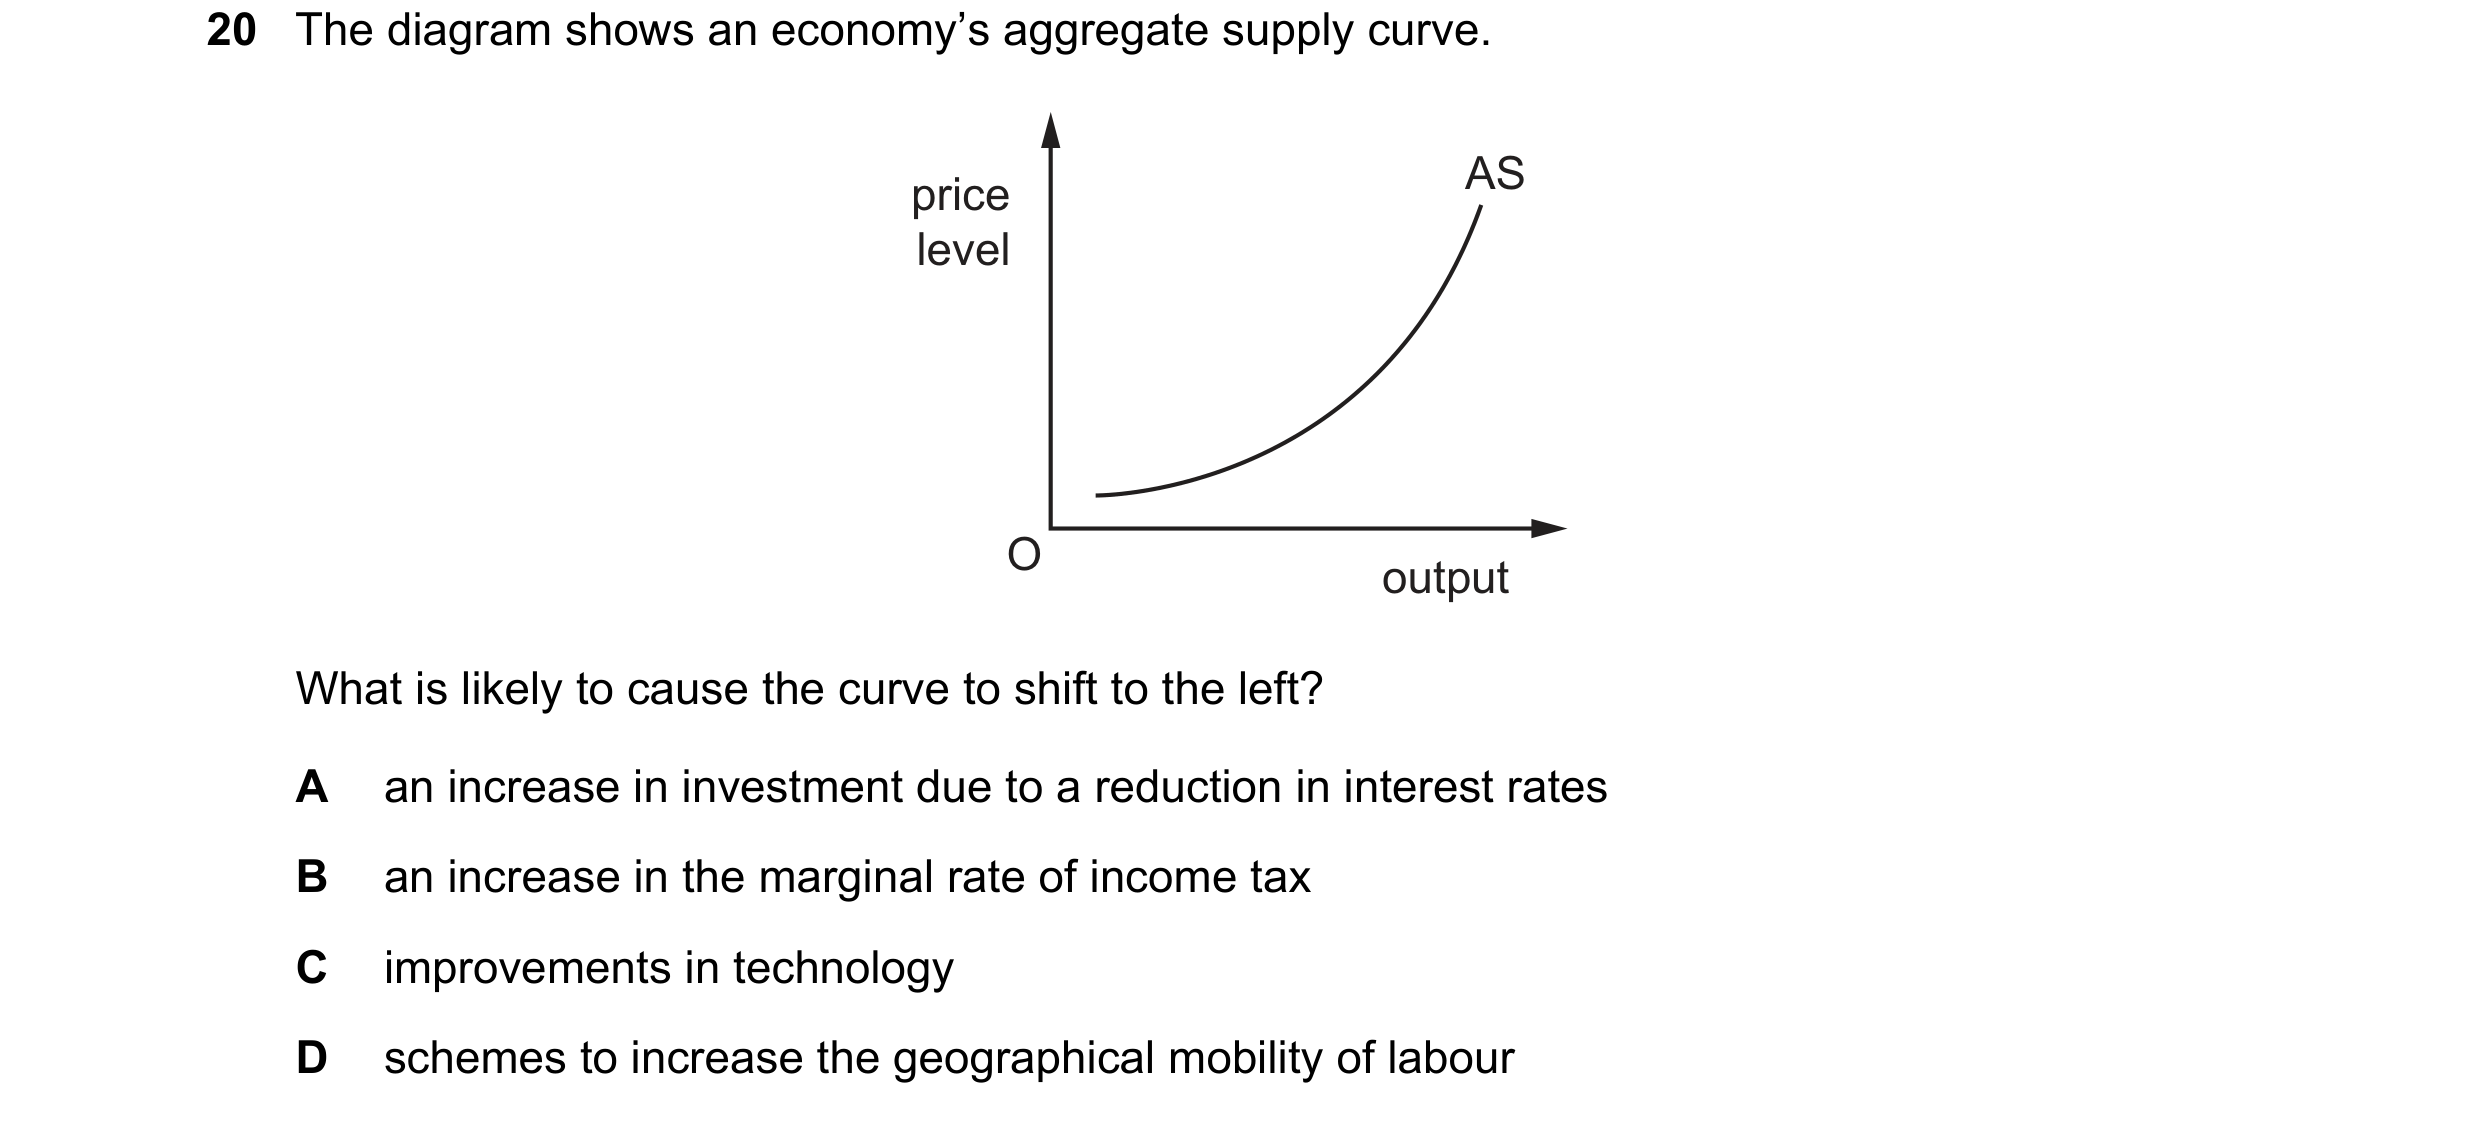 19 / 57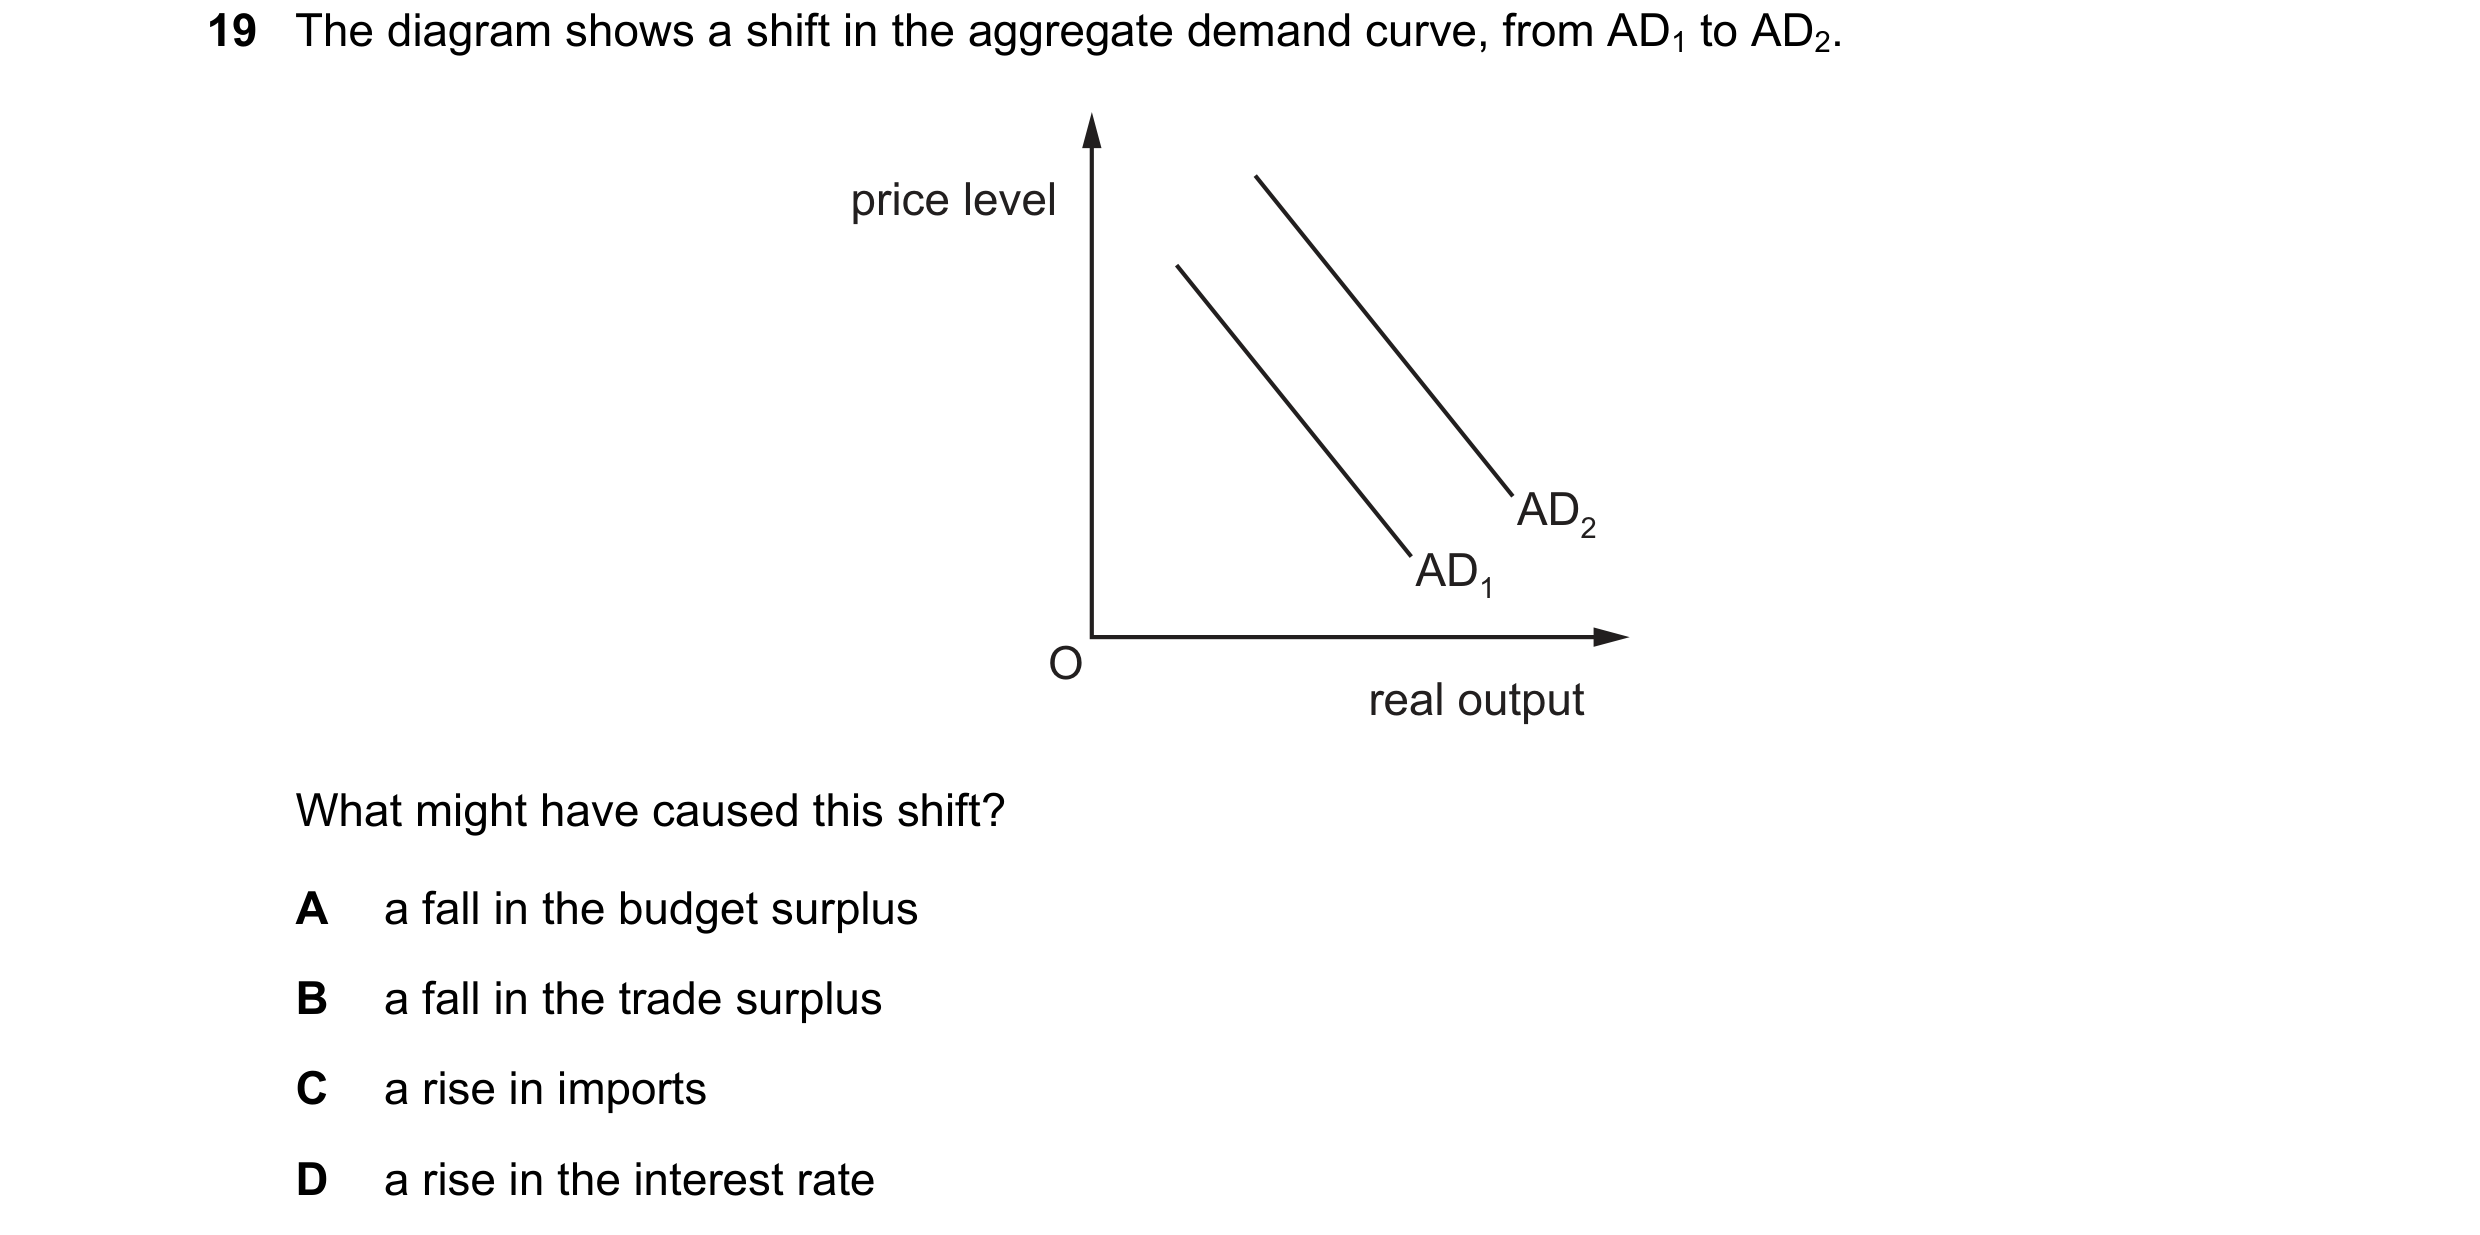
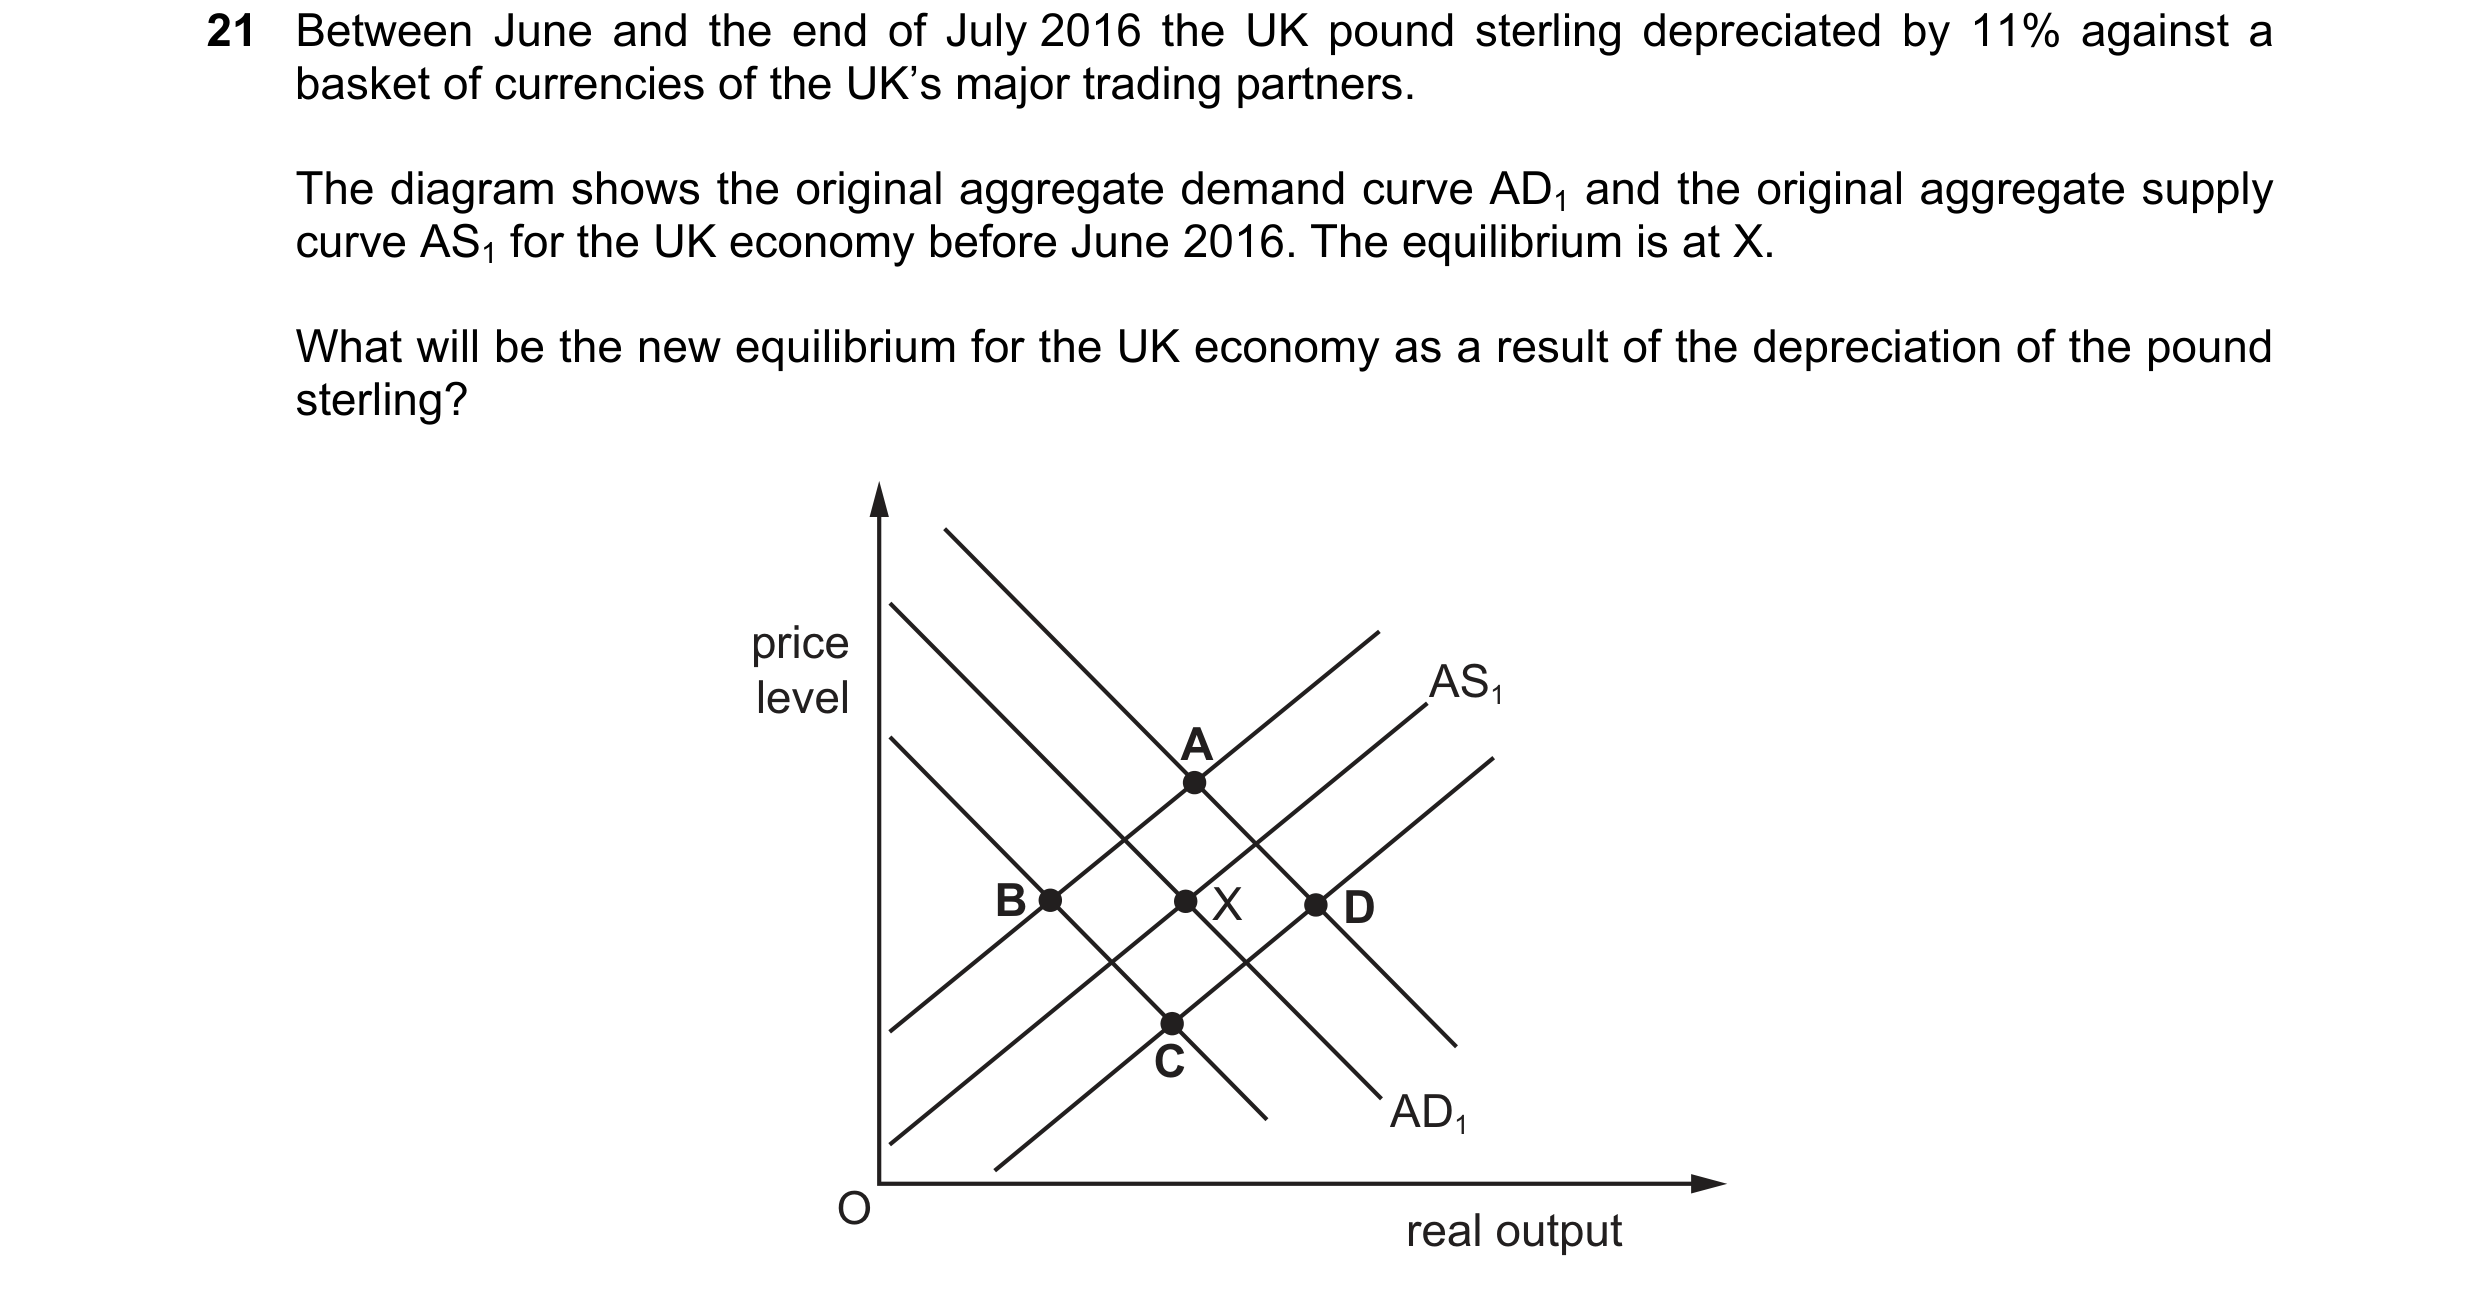 20 / 57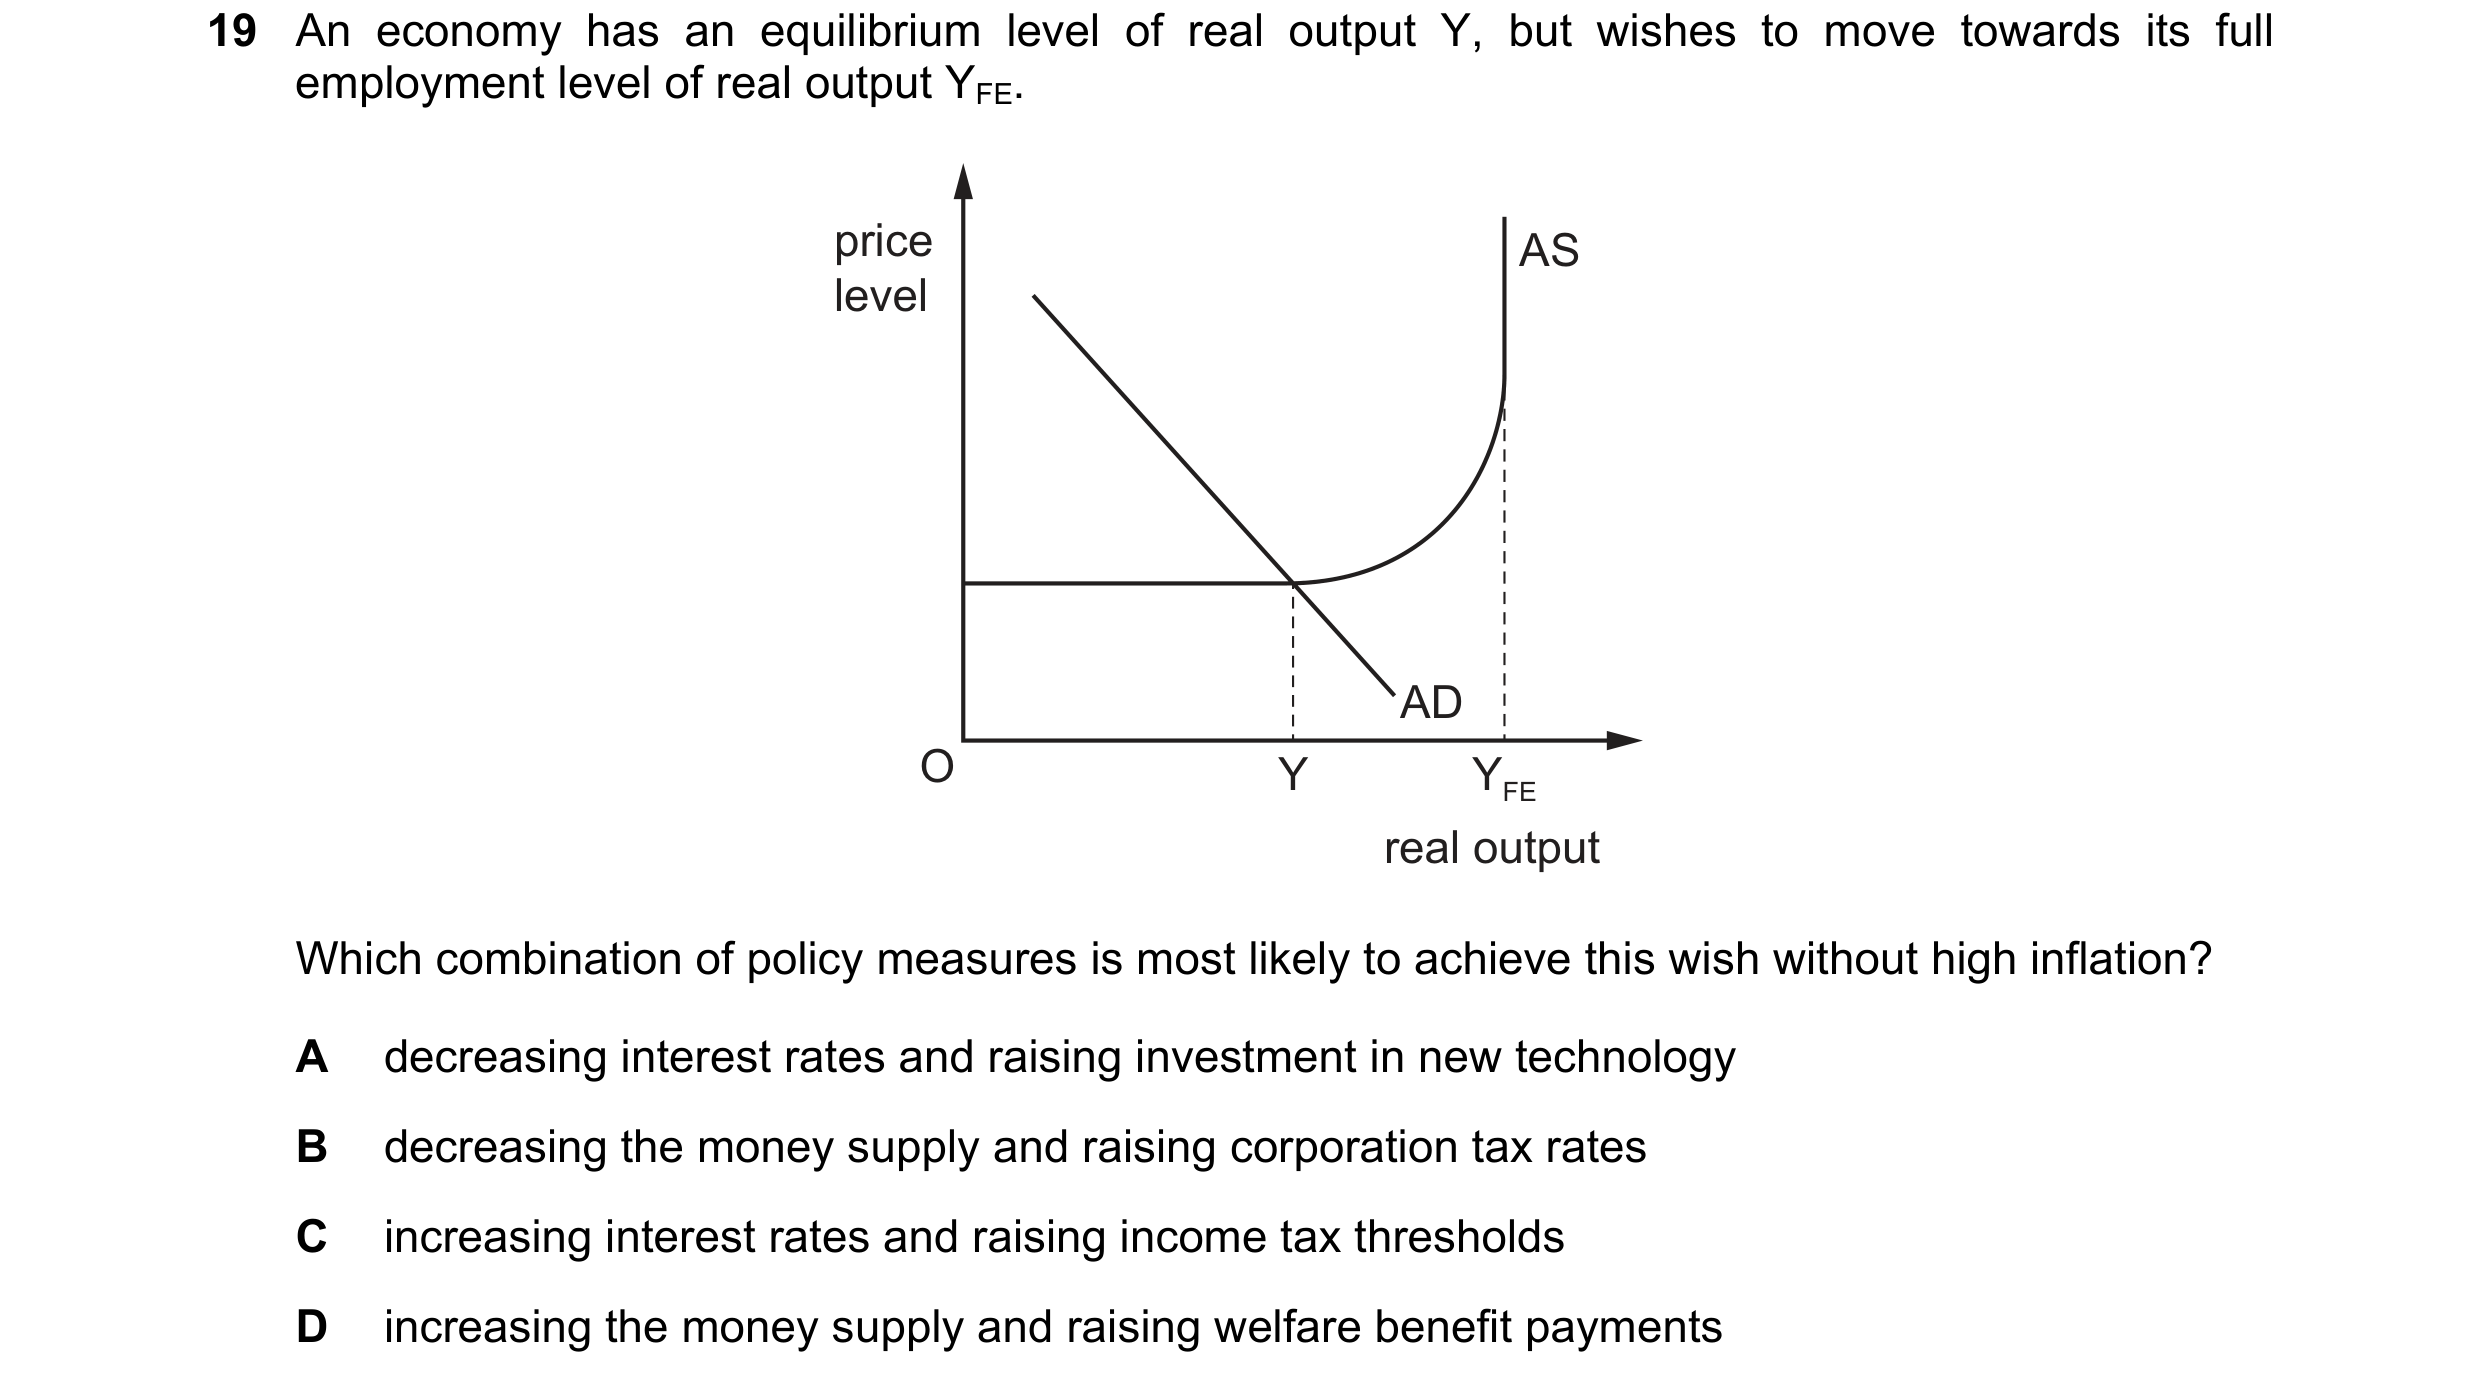
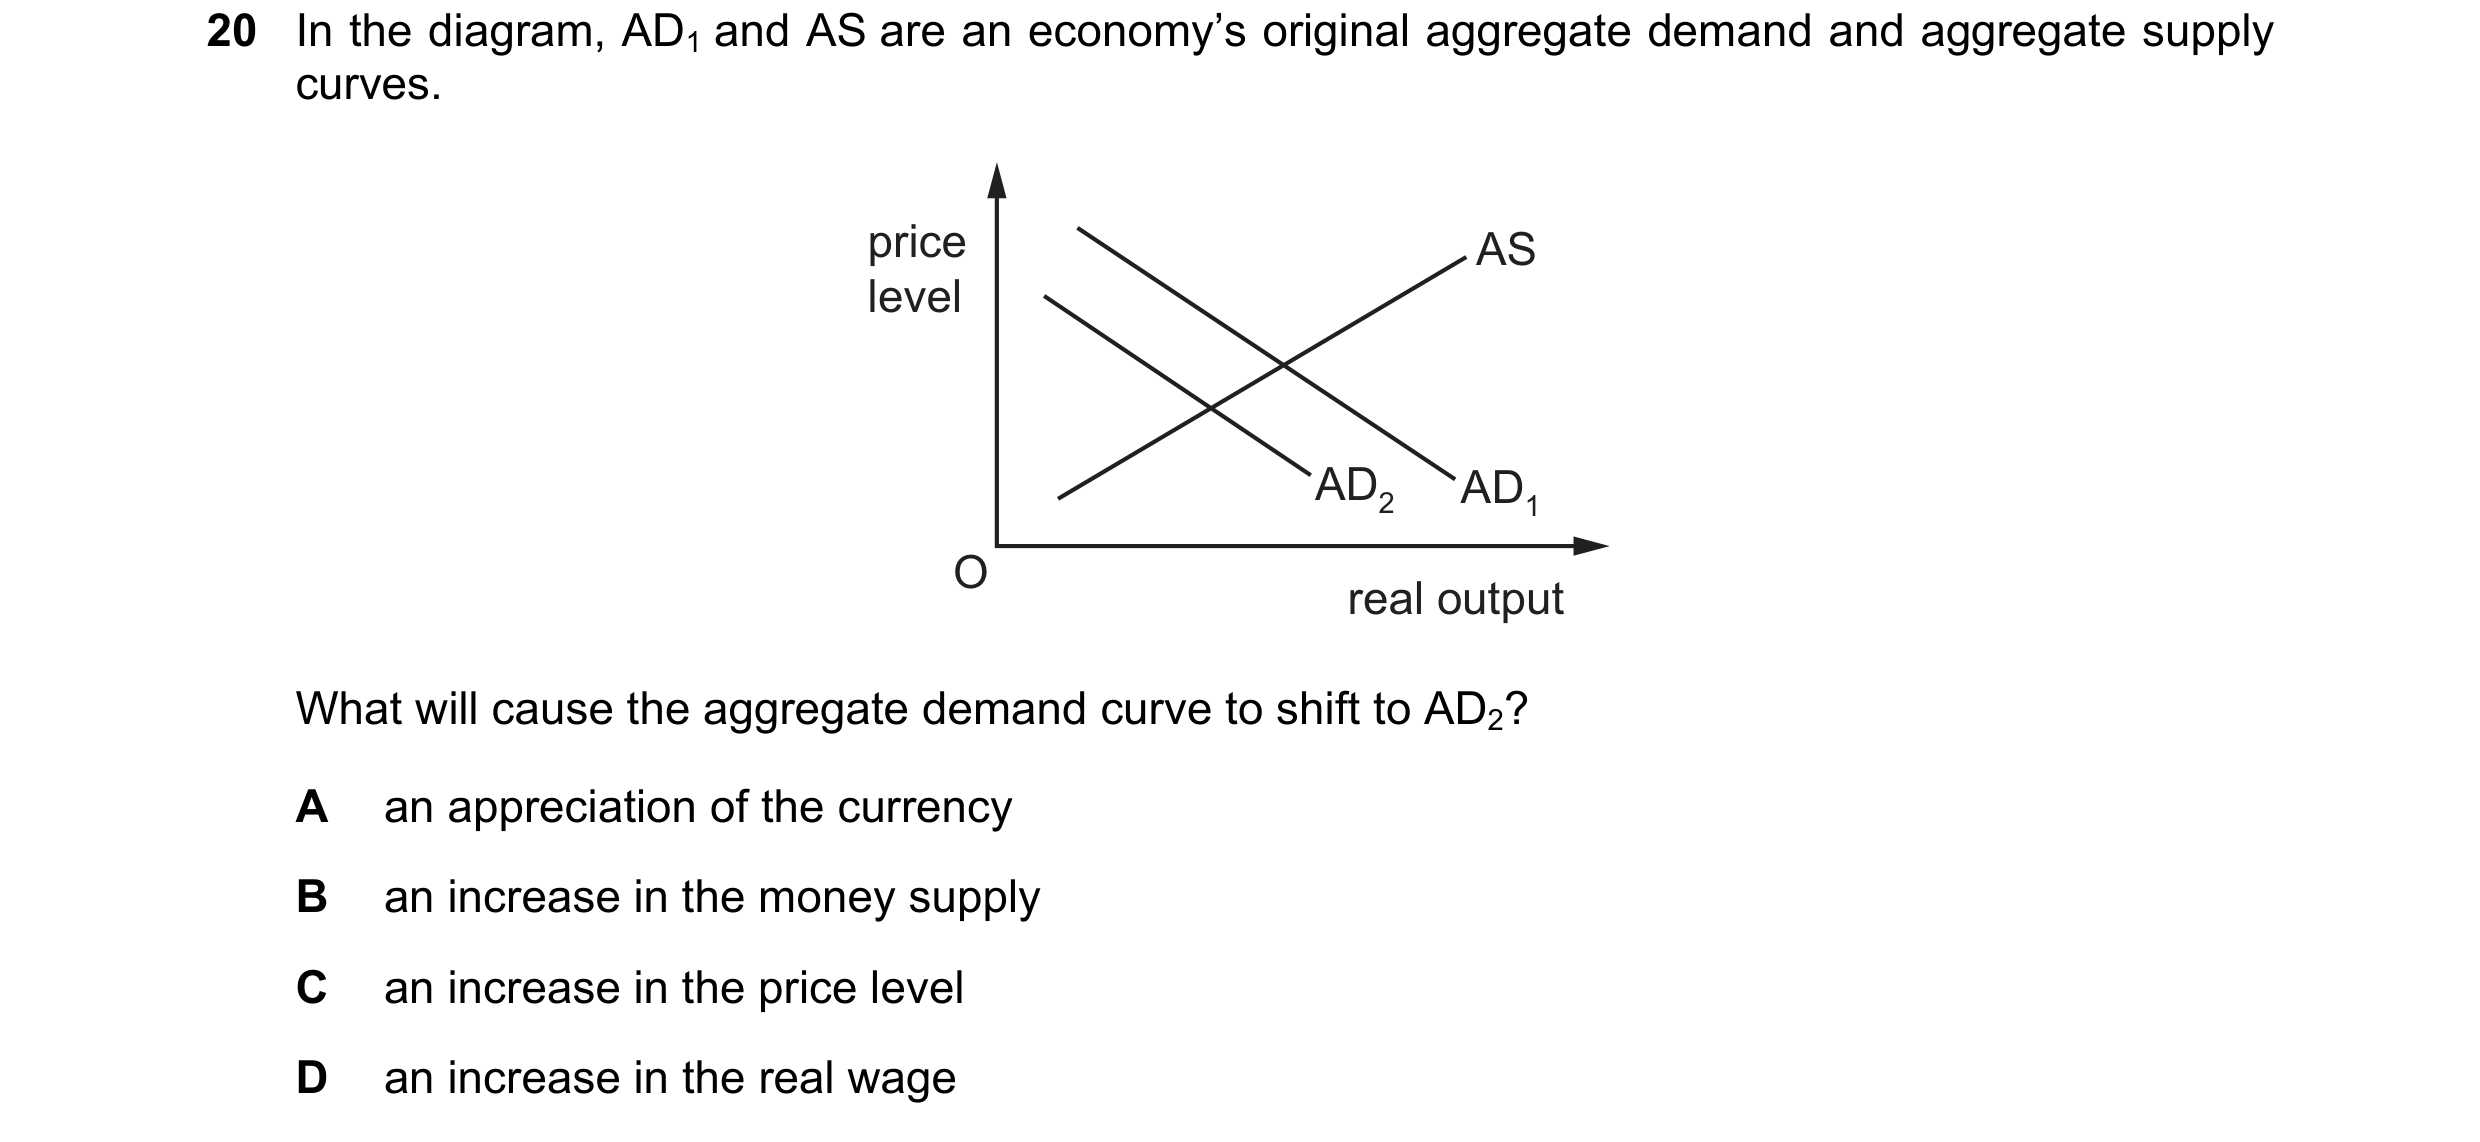 21 / 57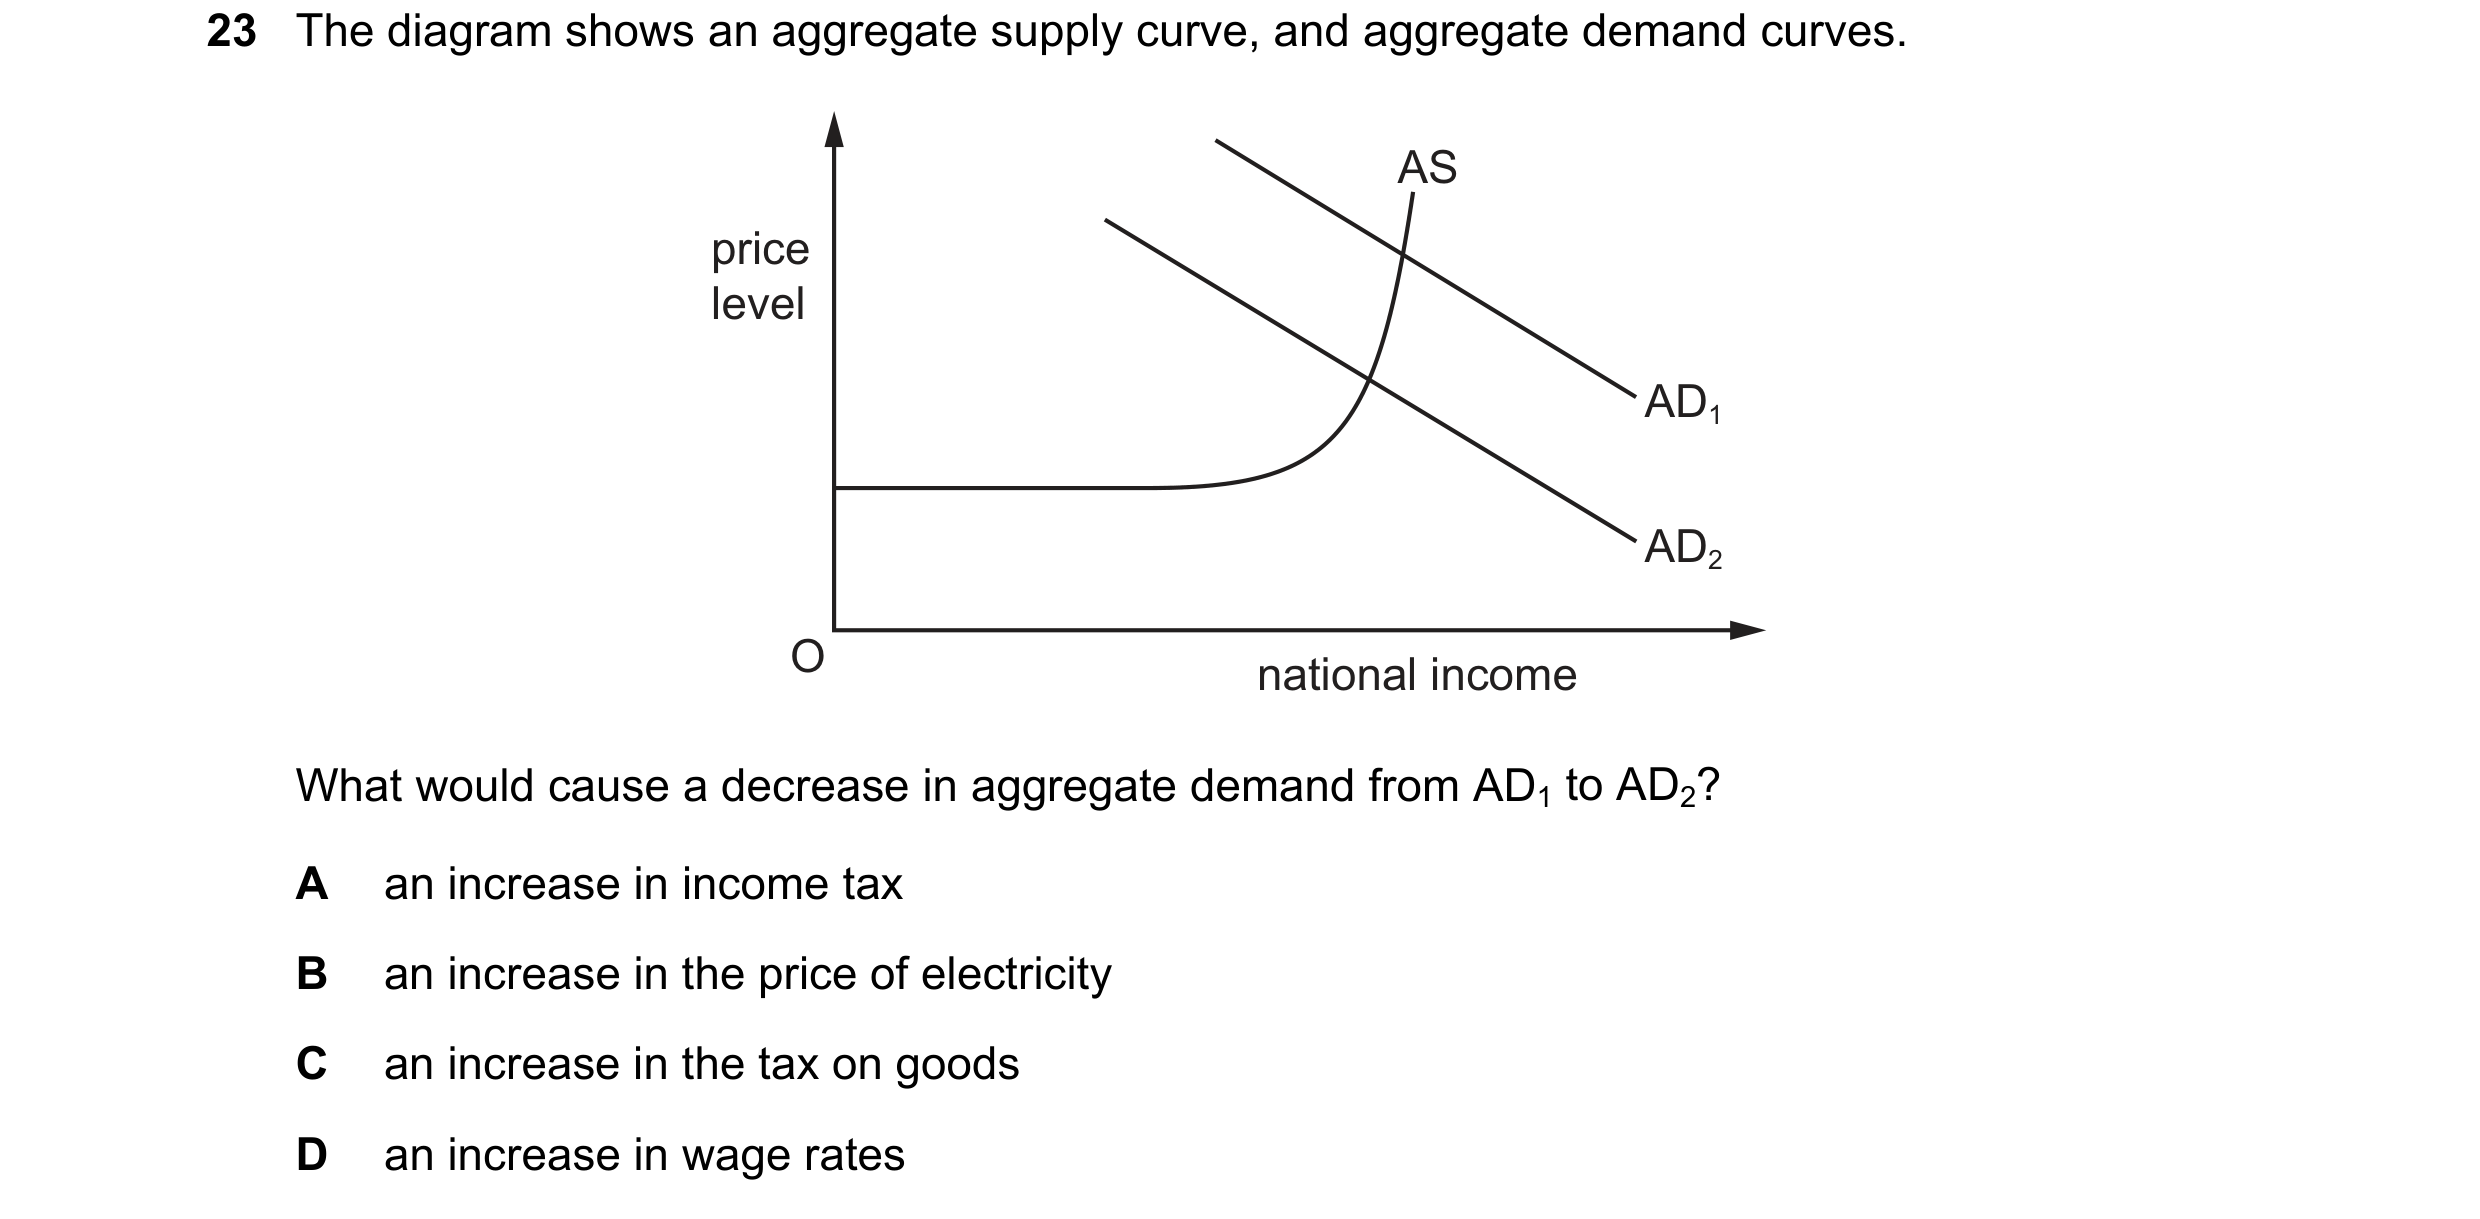
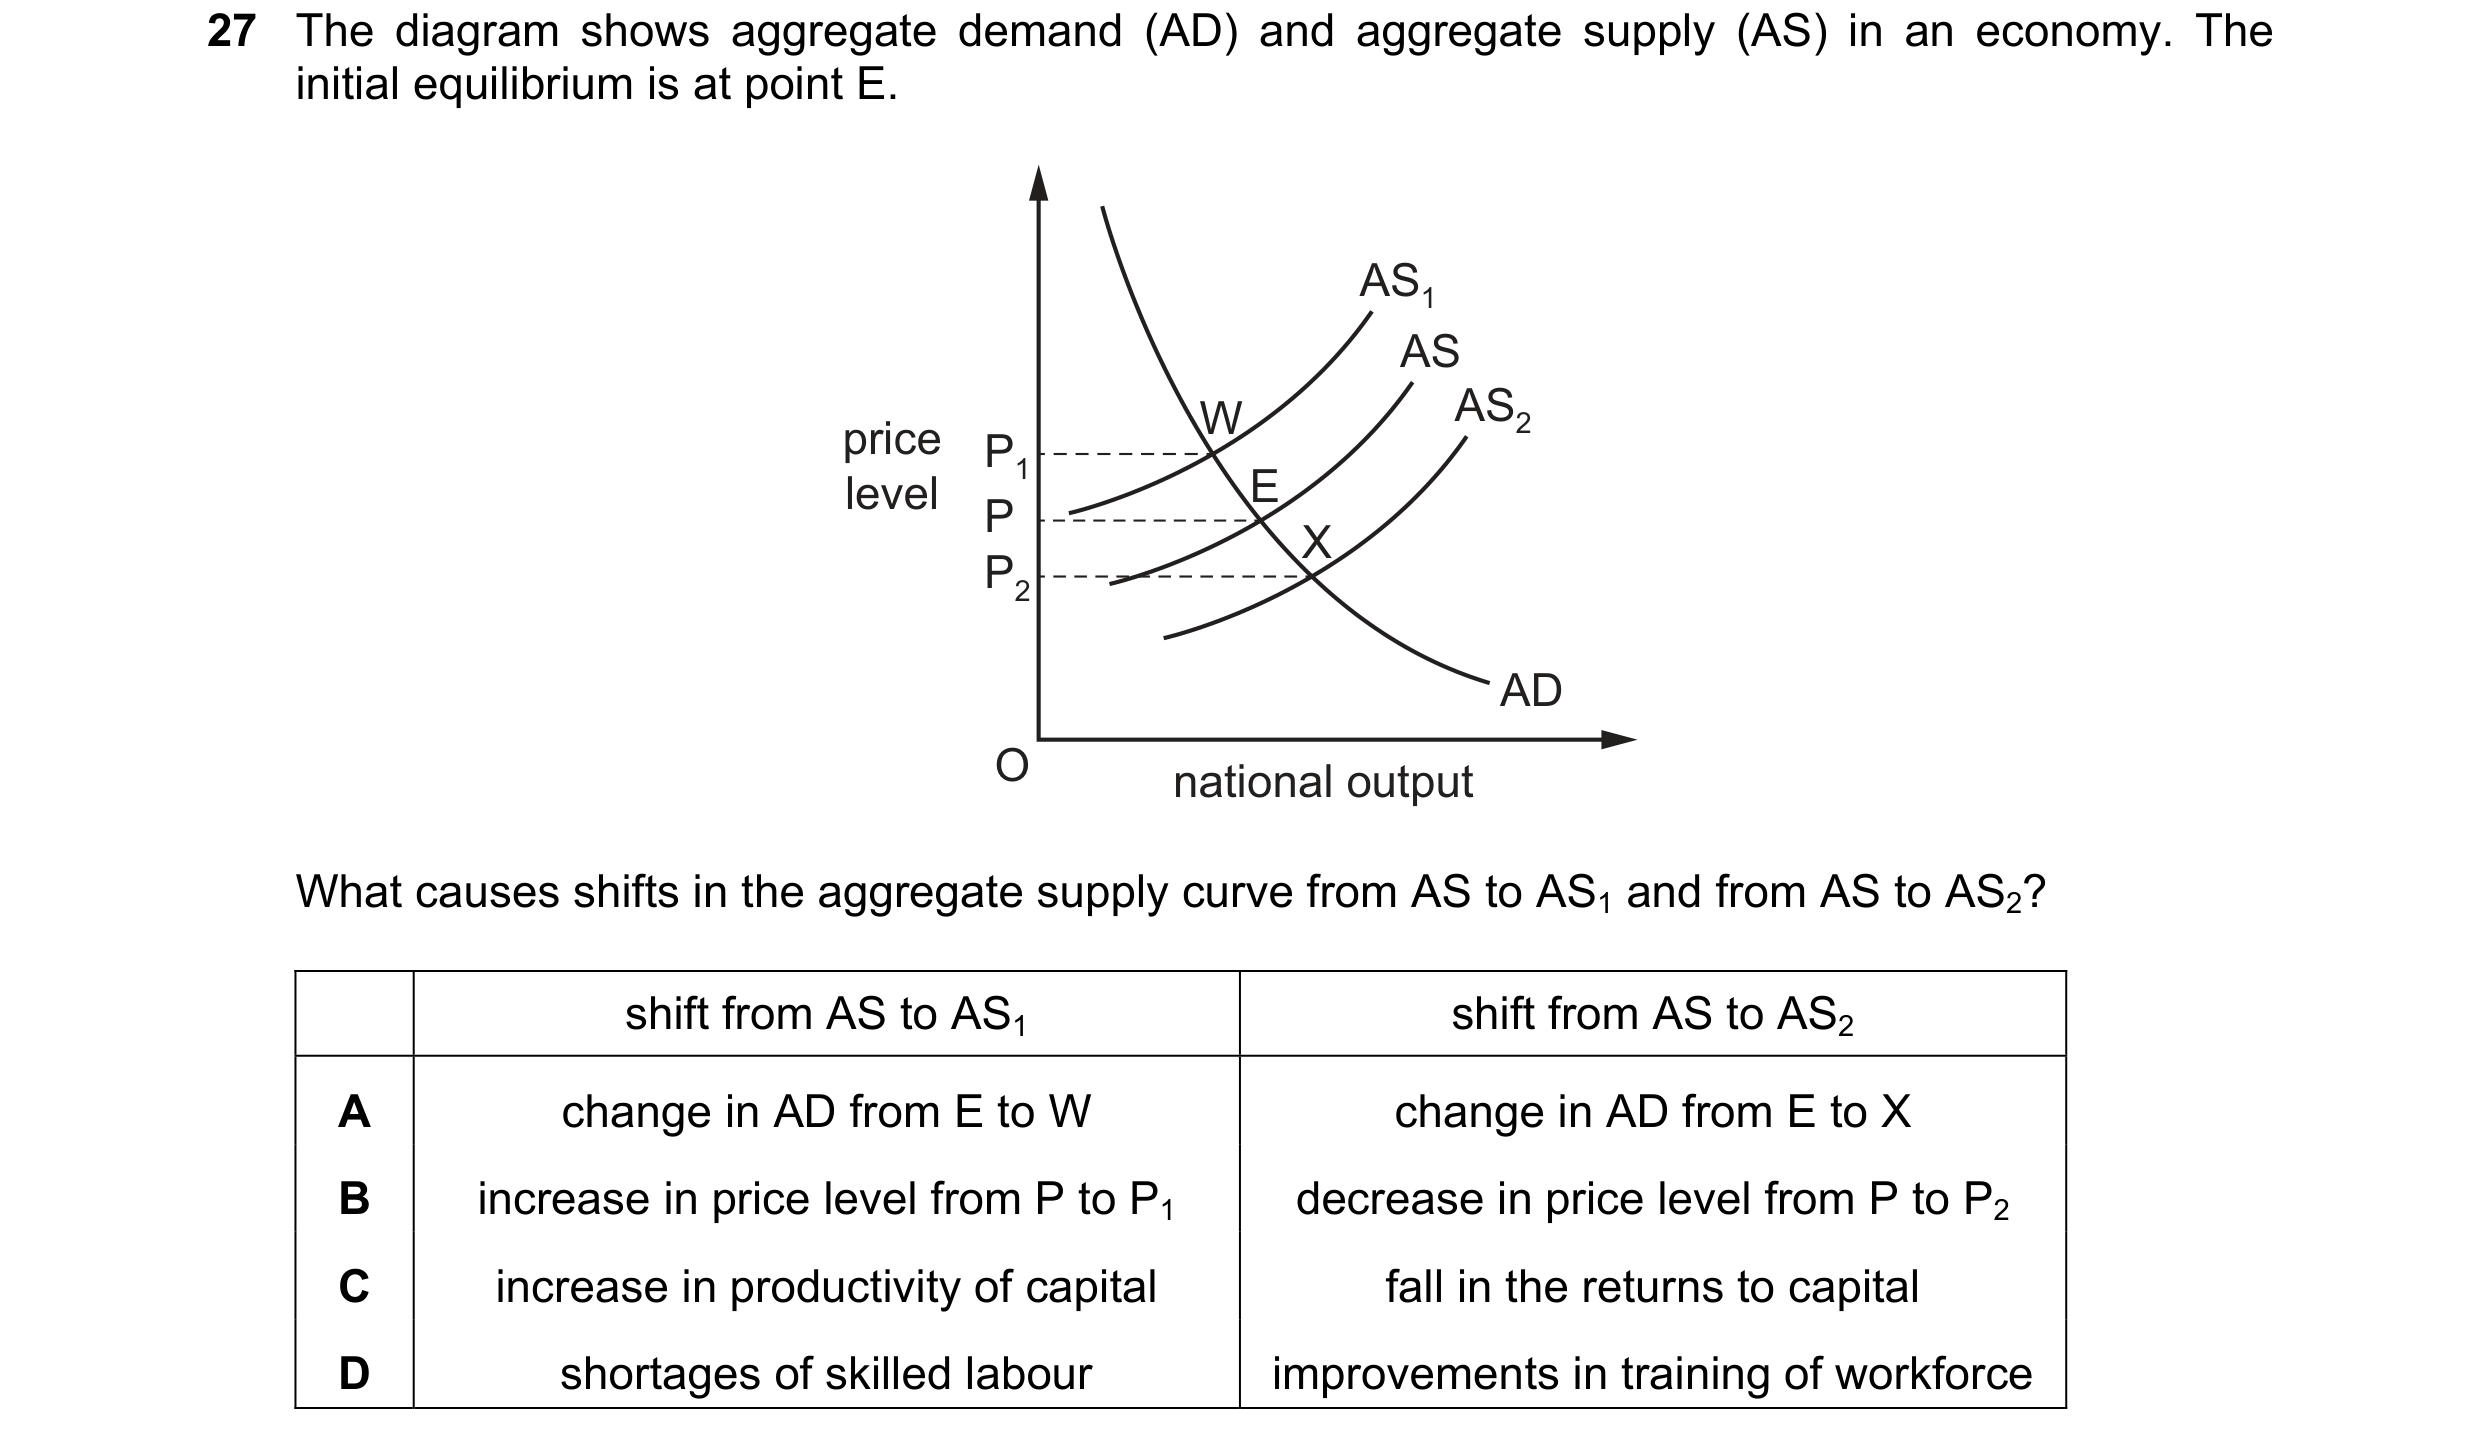 22 / 57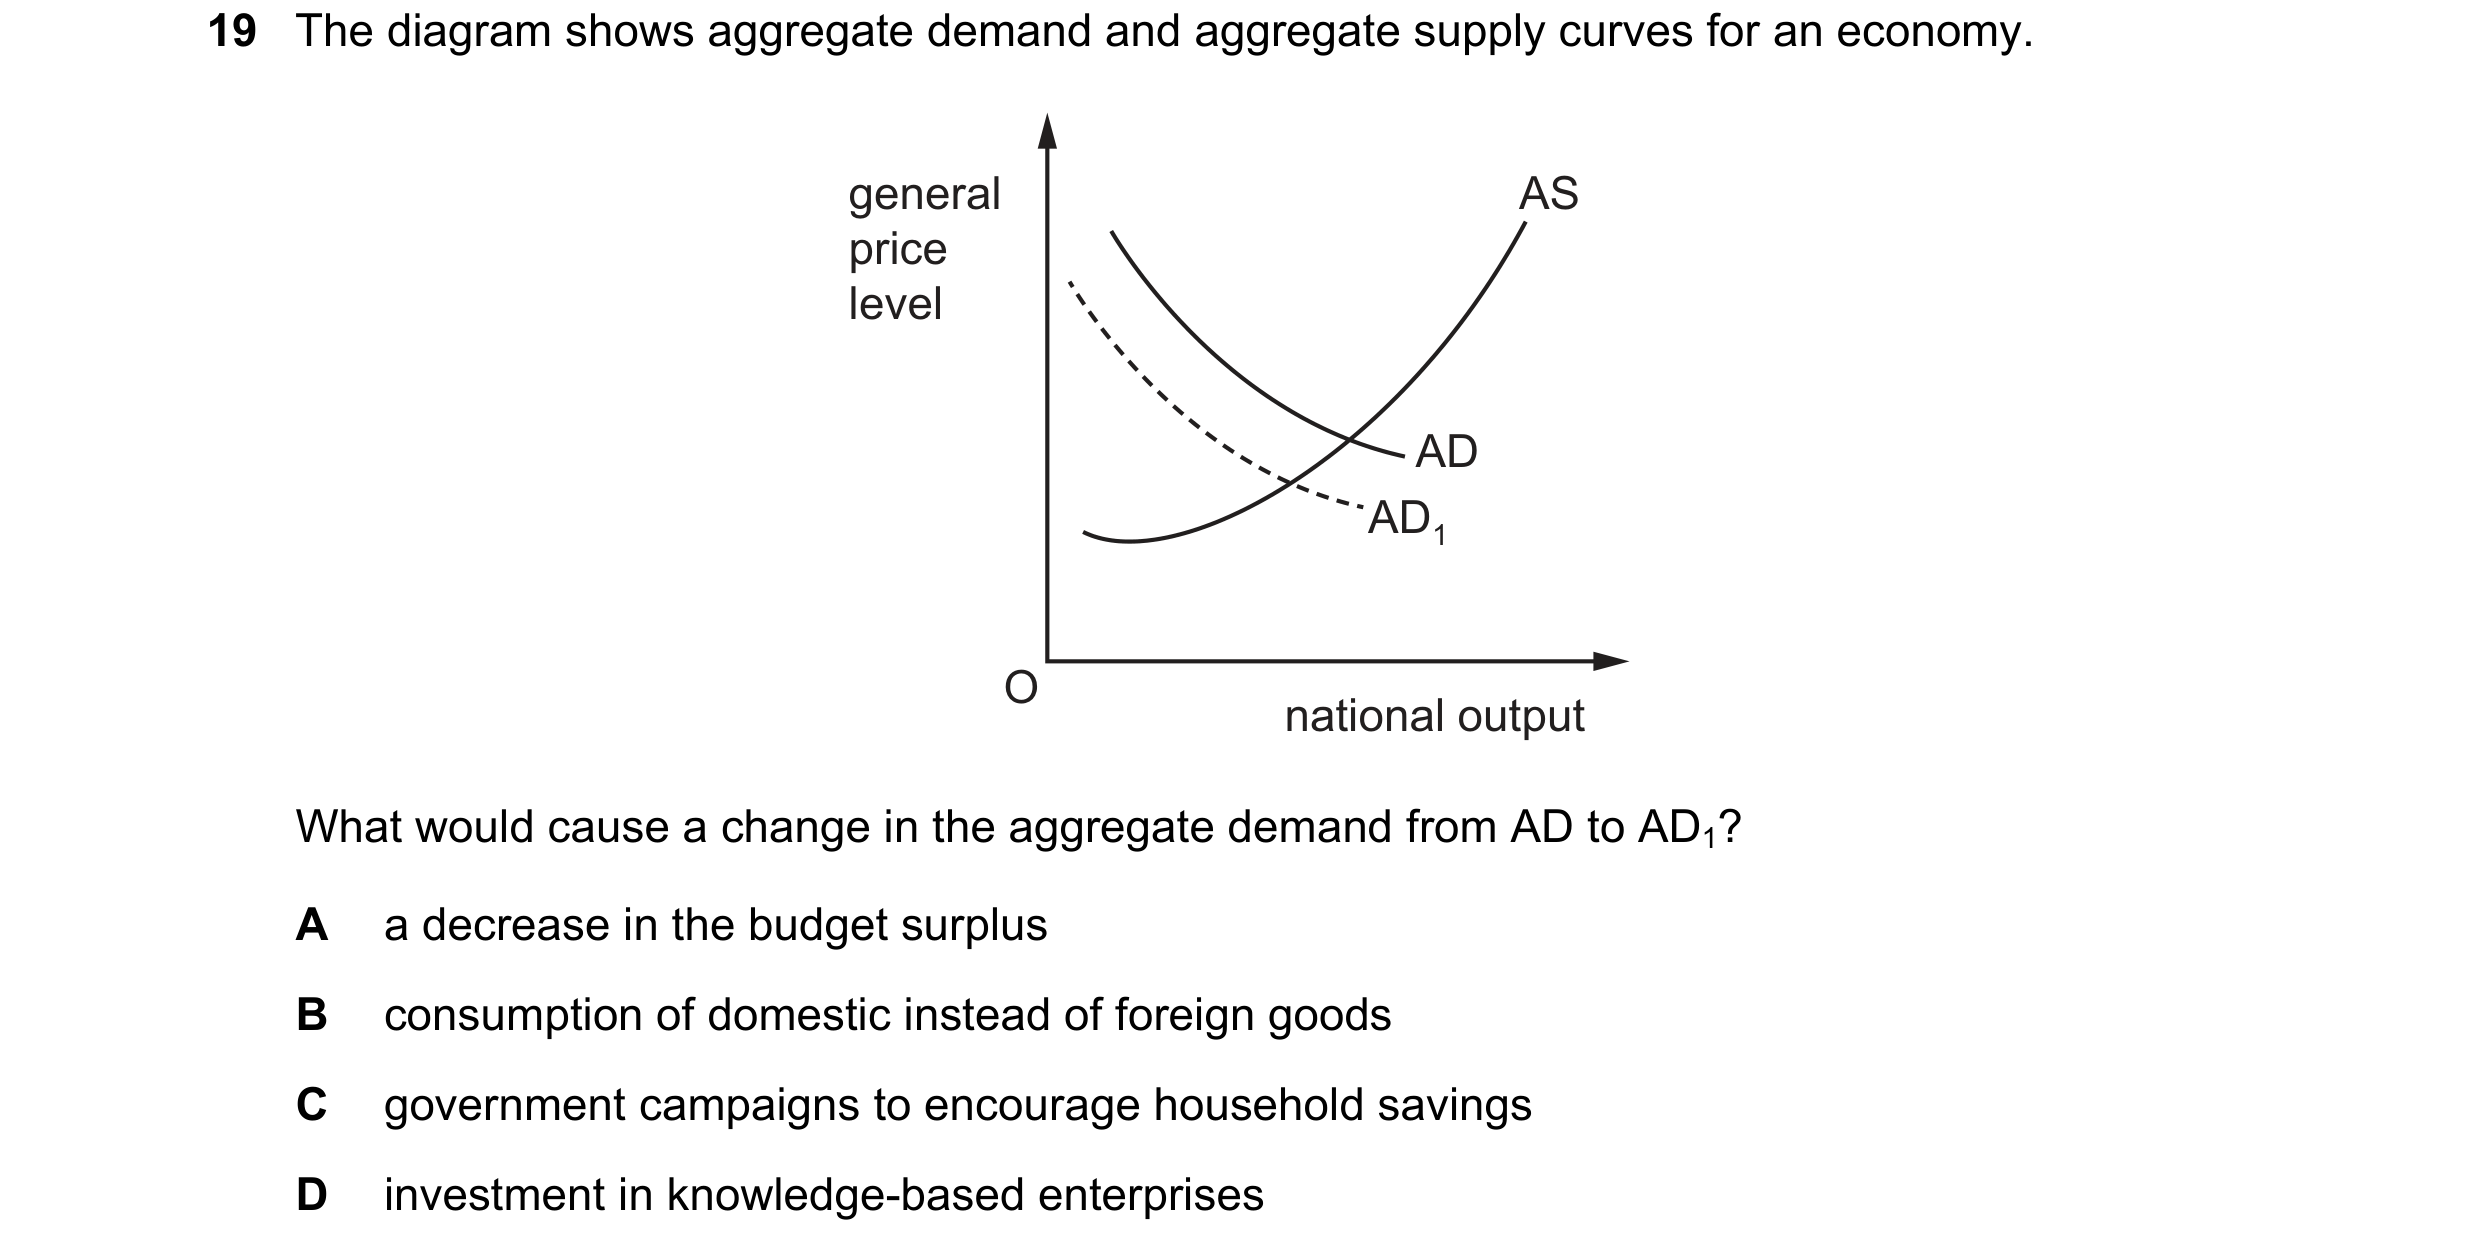
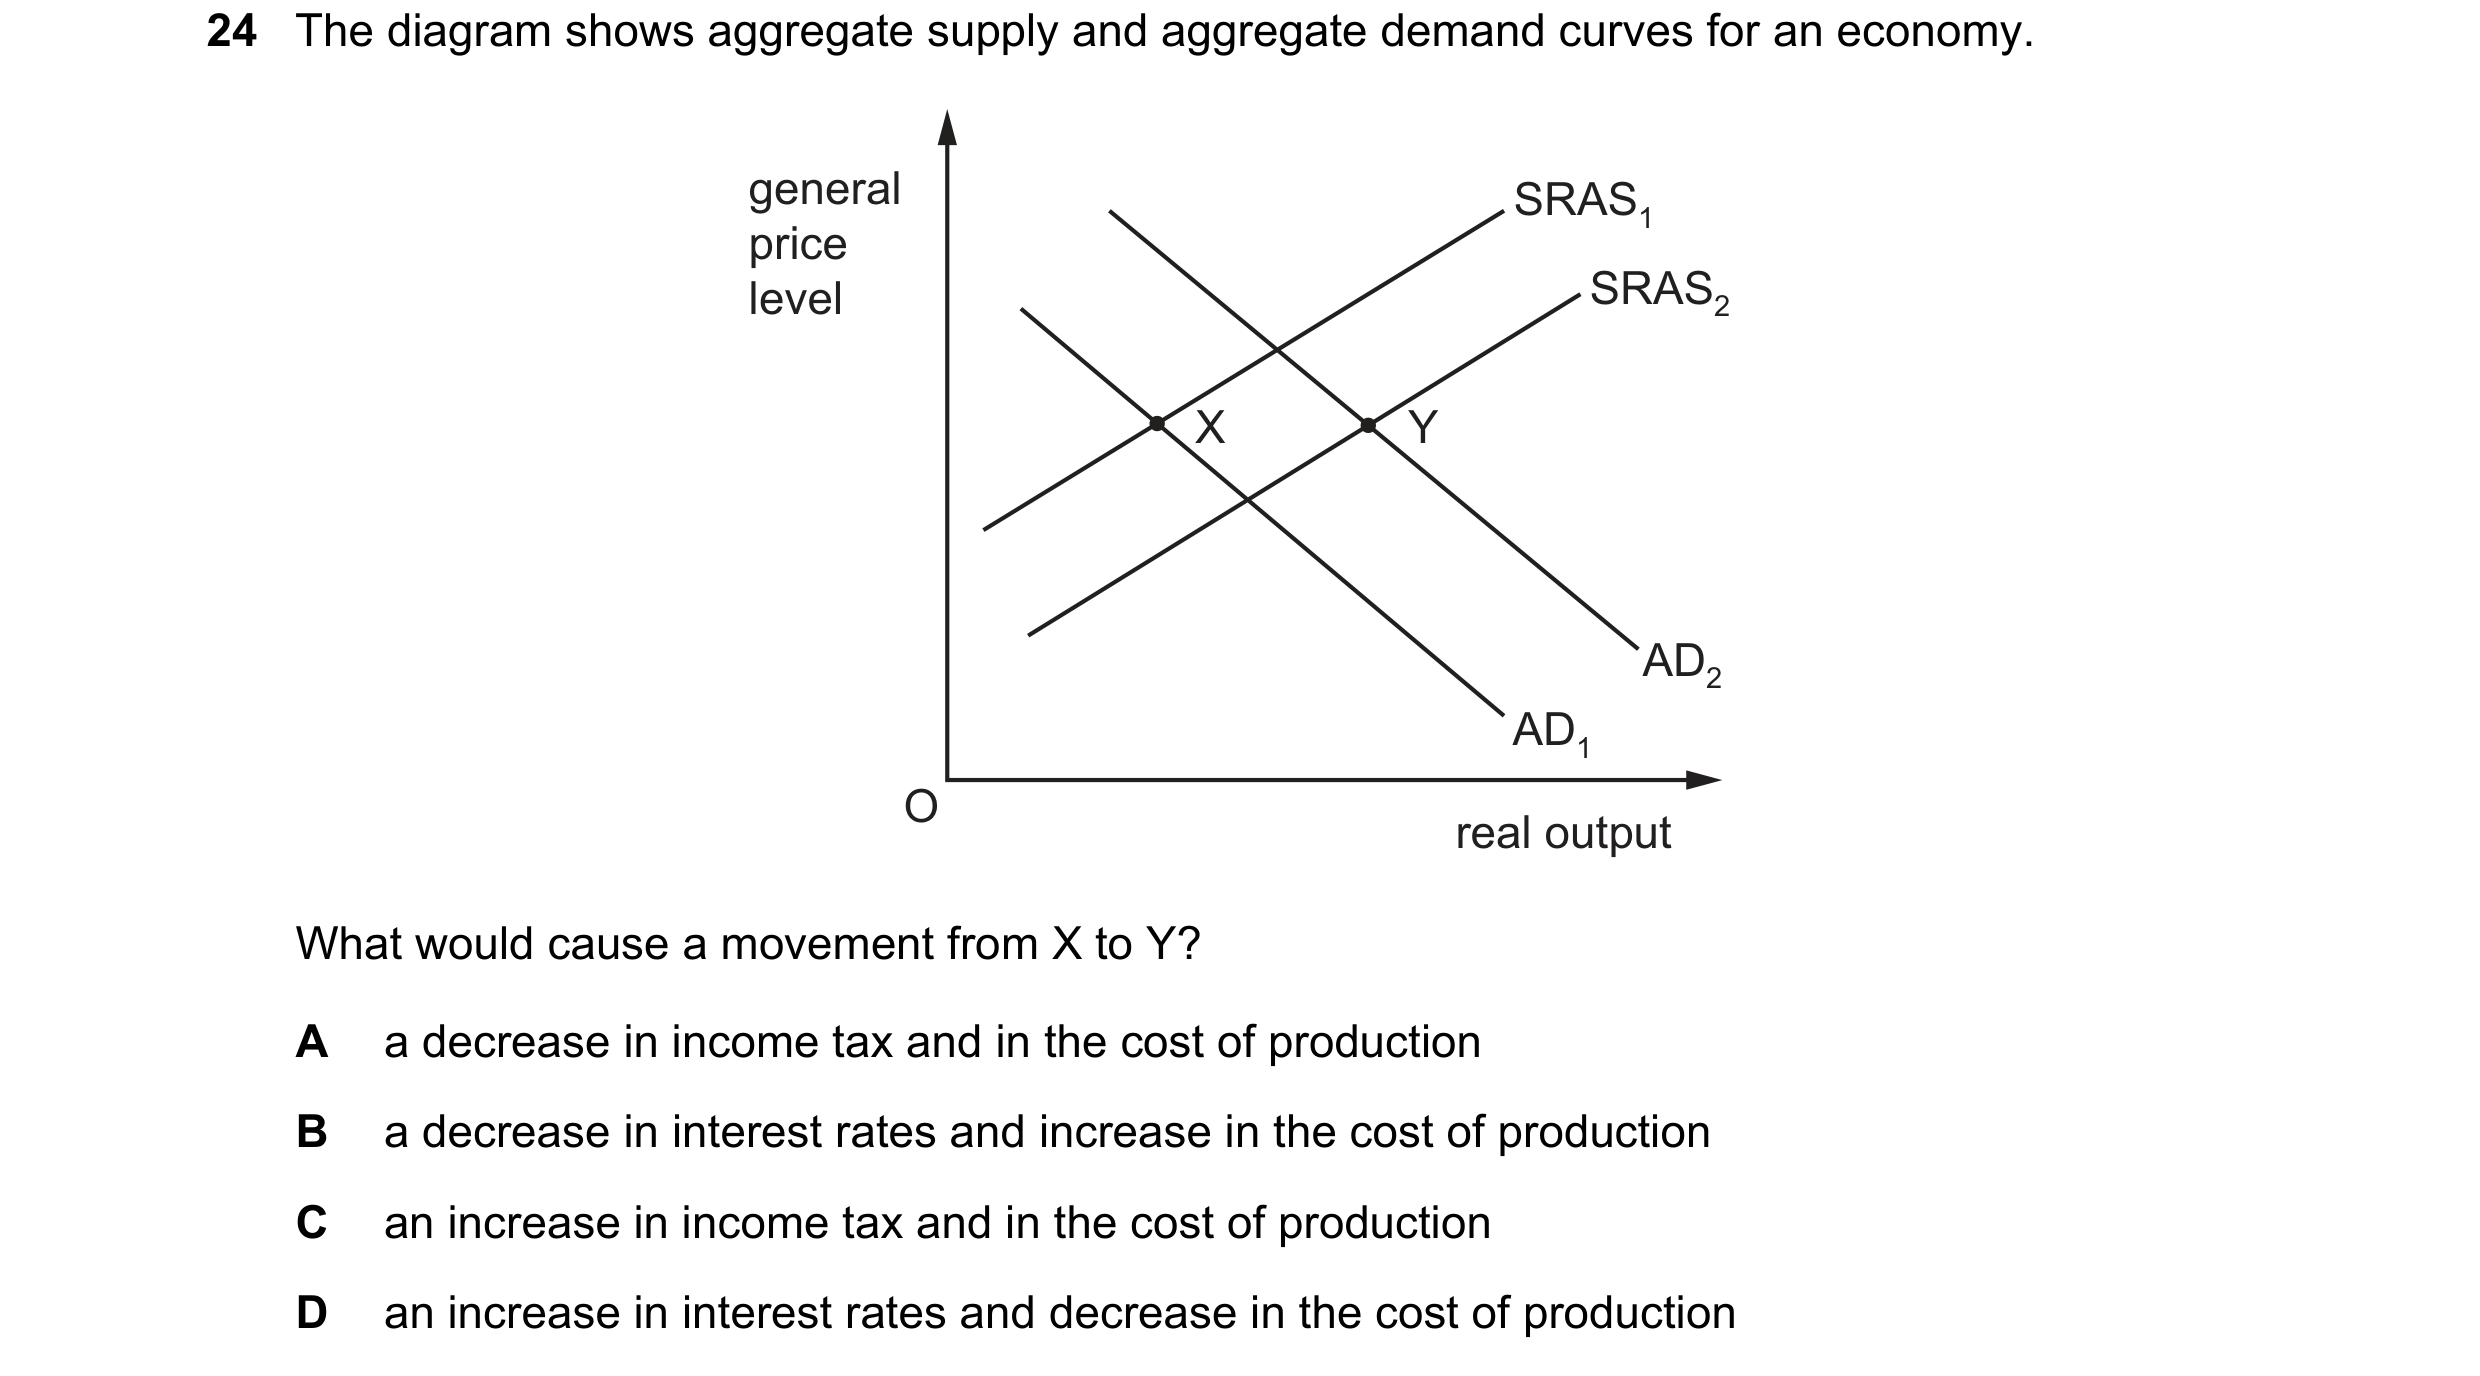 23 / 57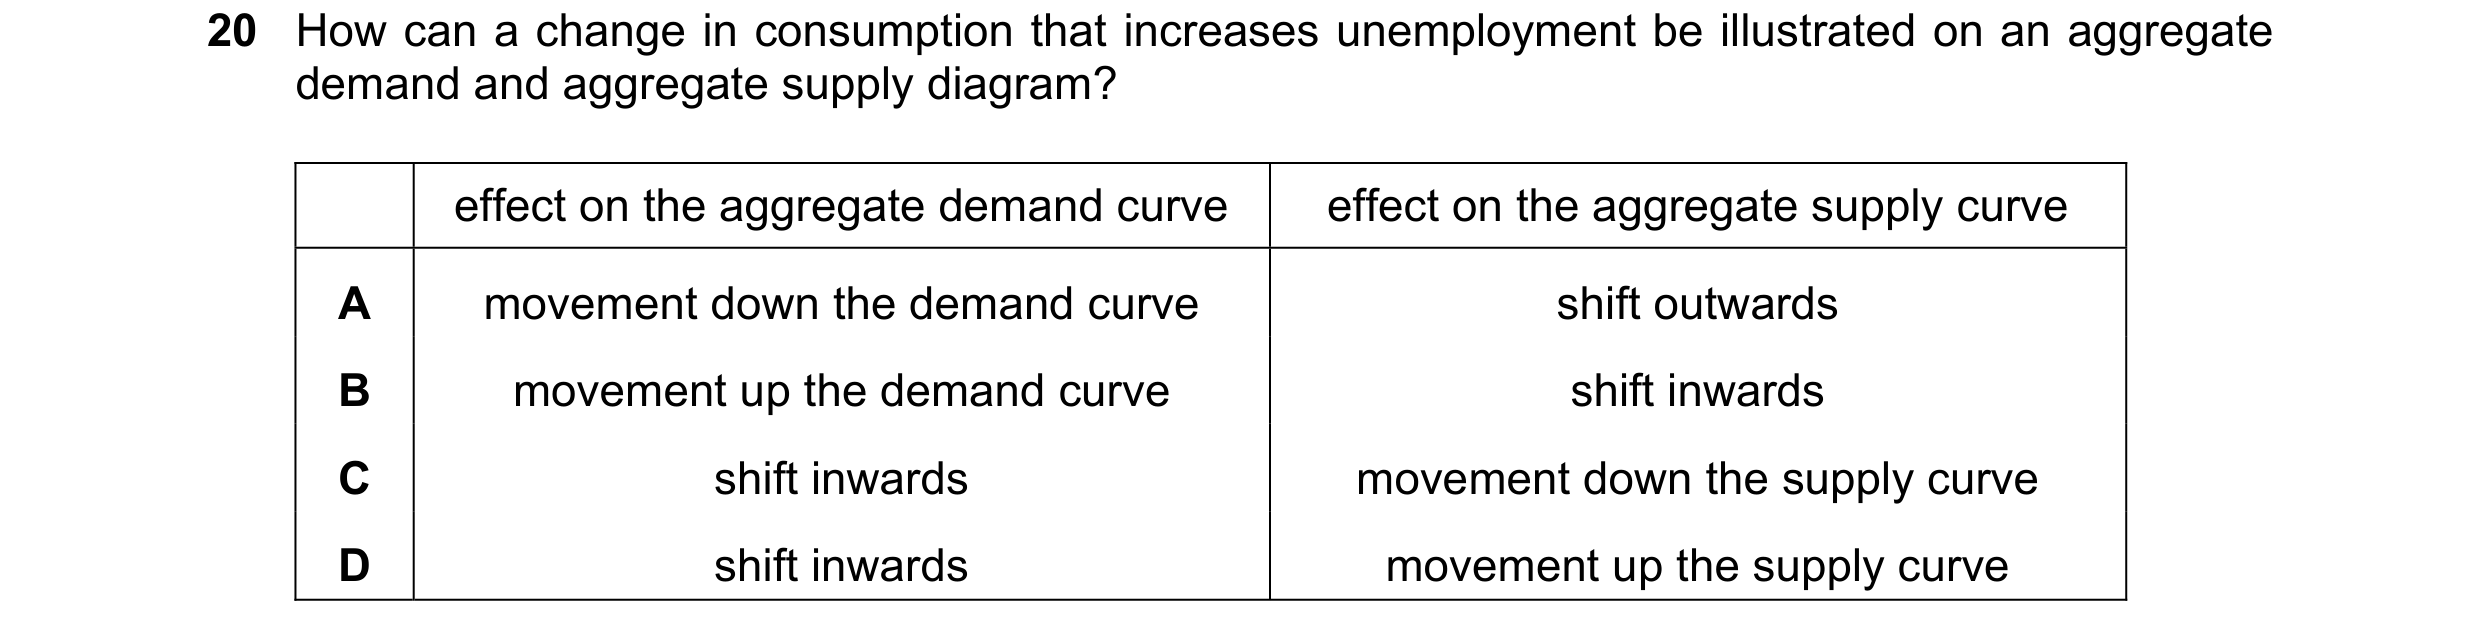

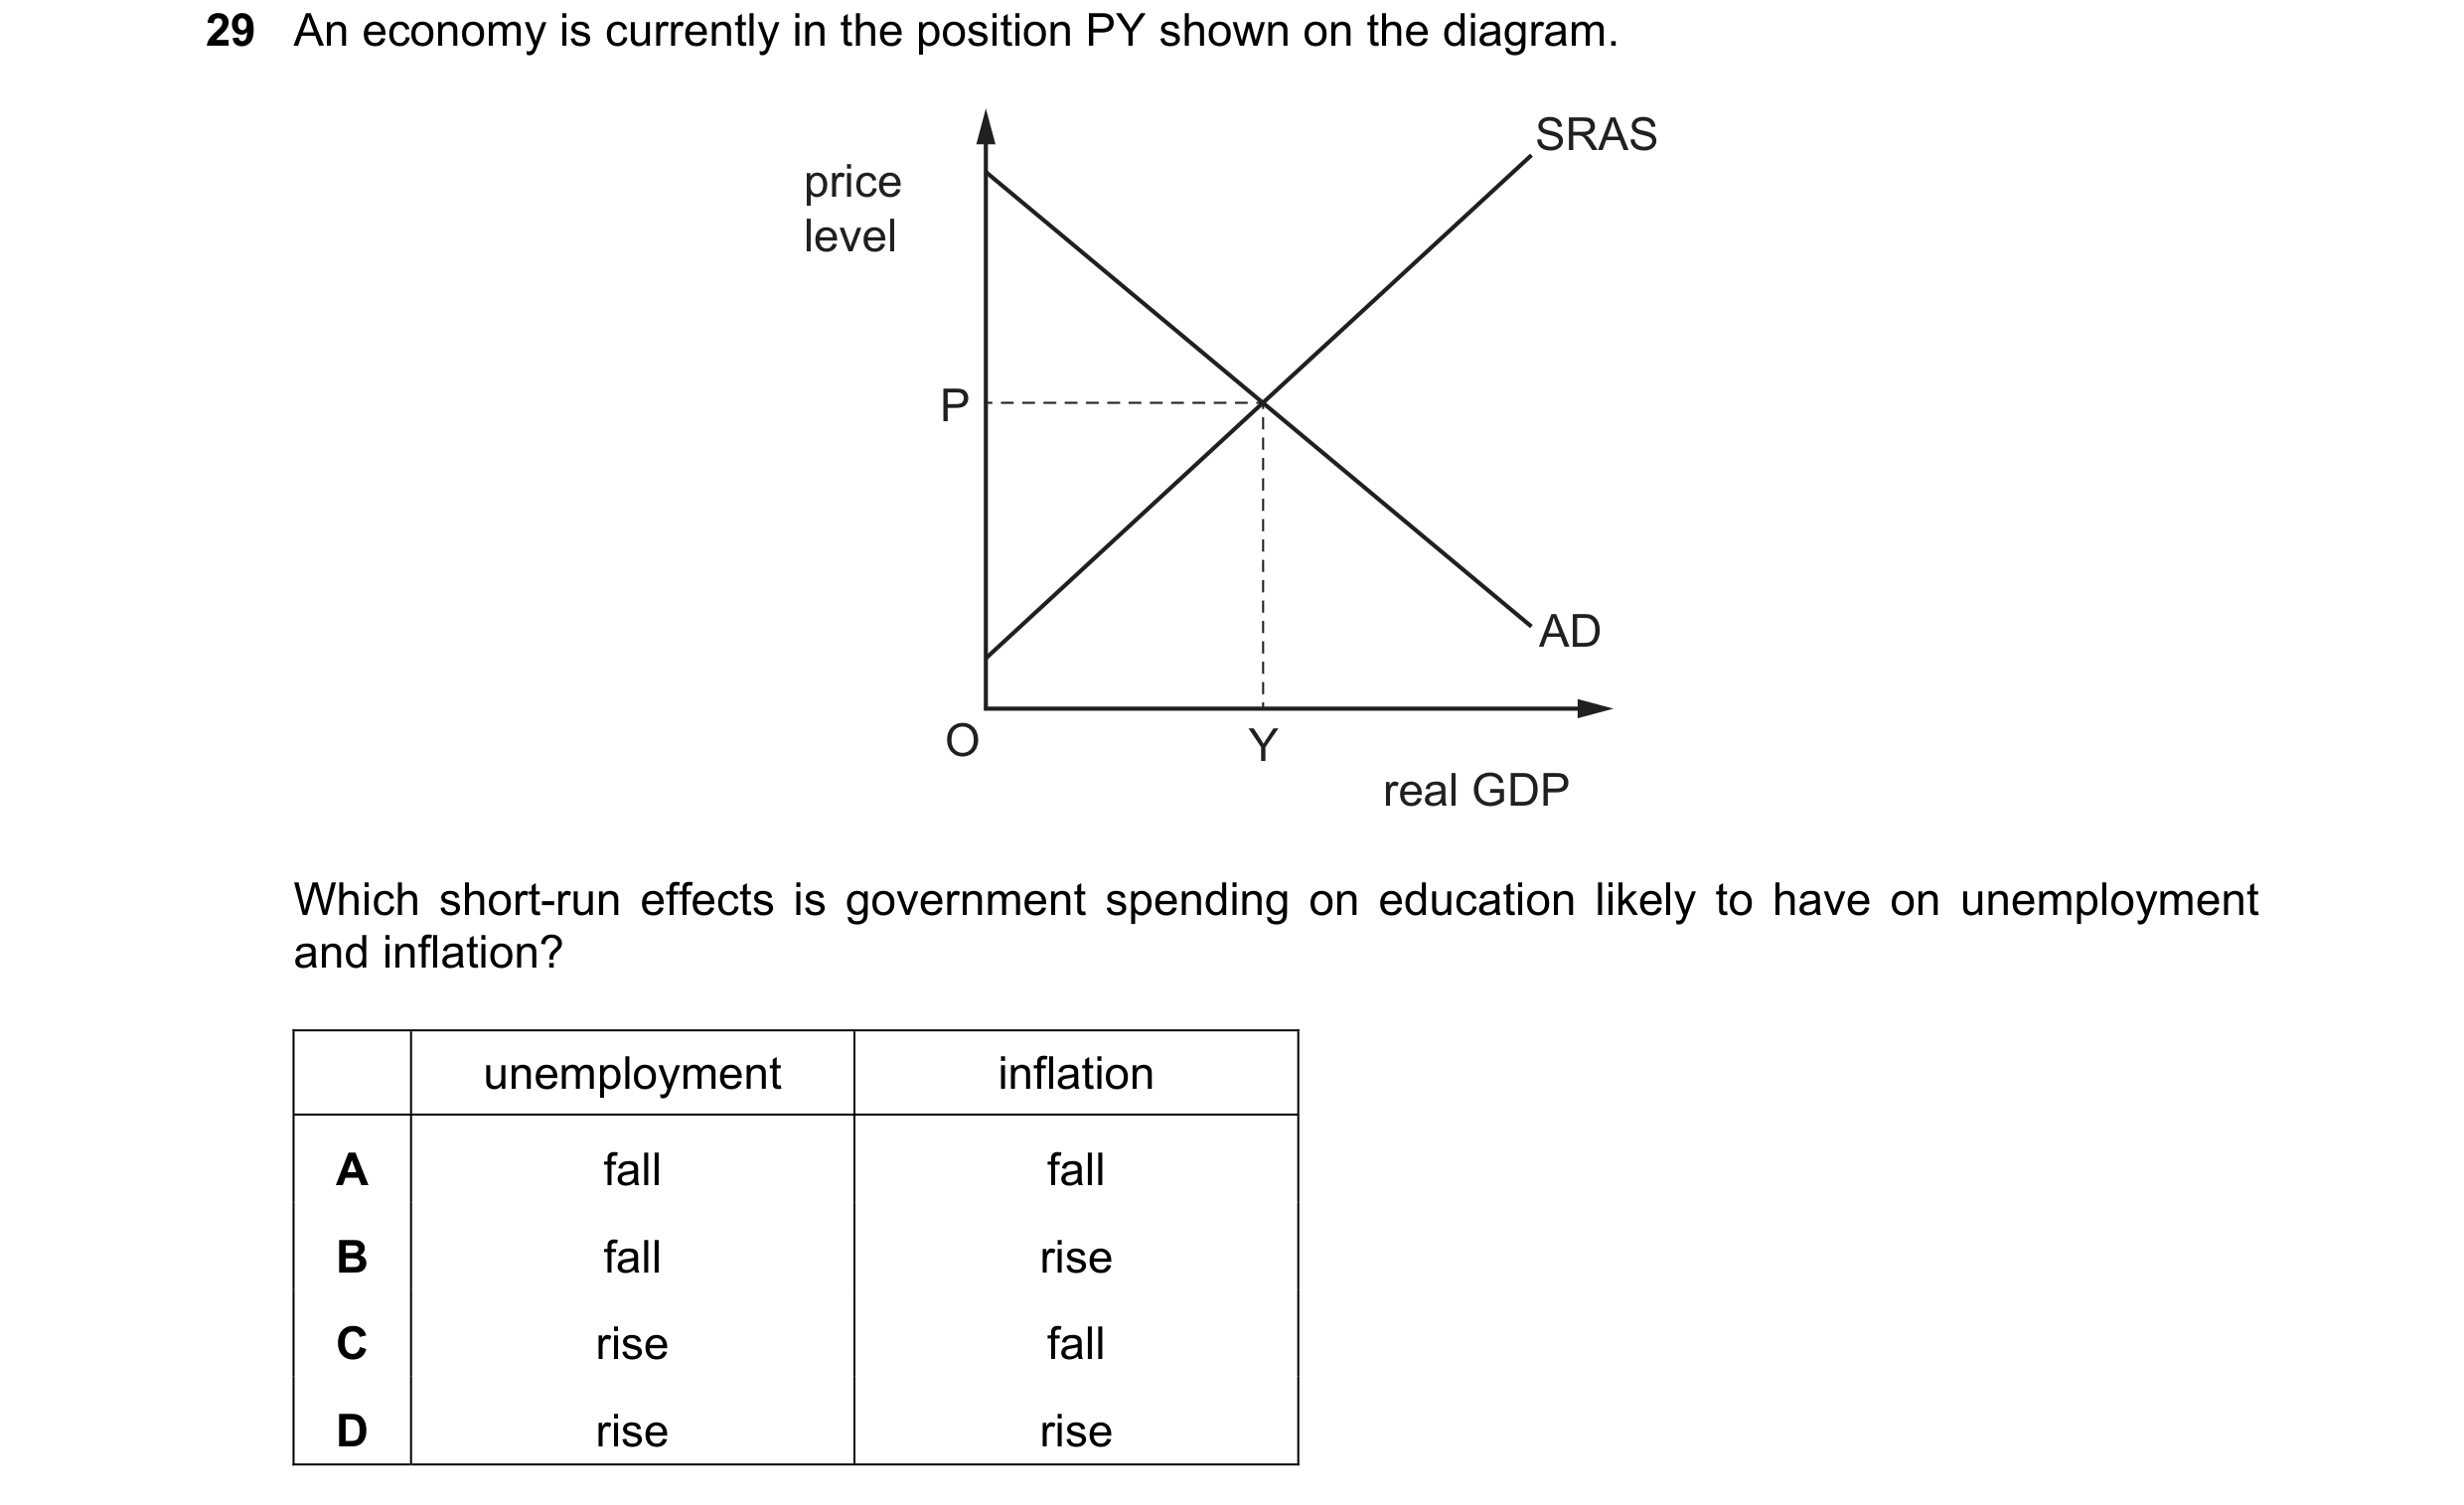 24 / 57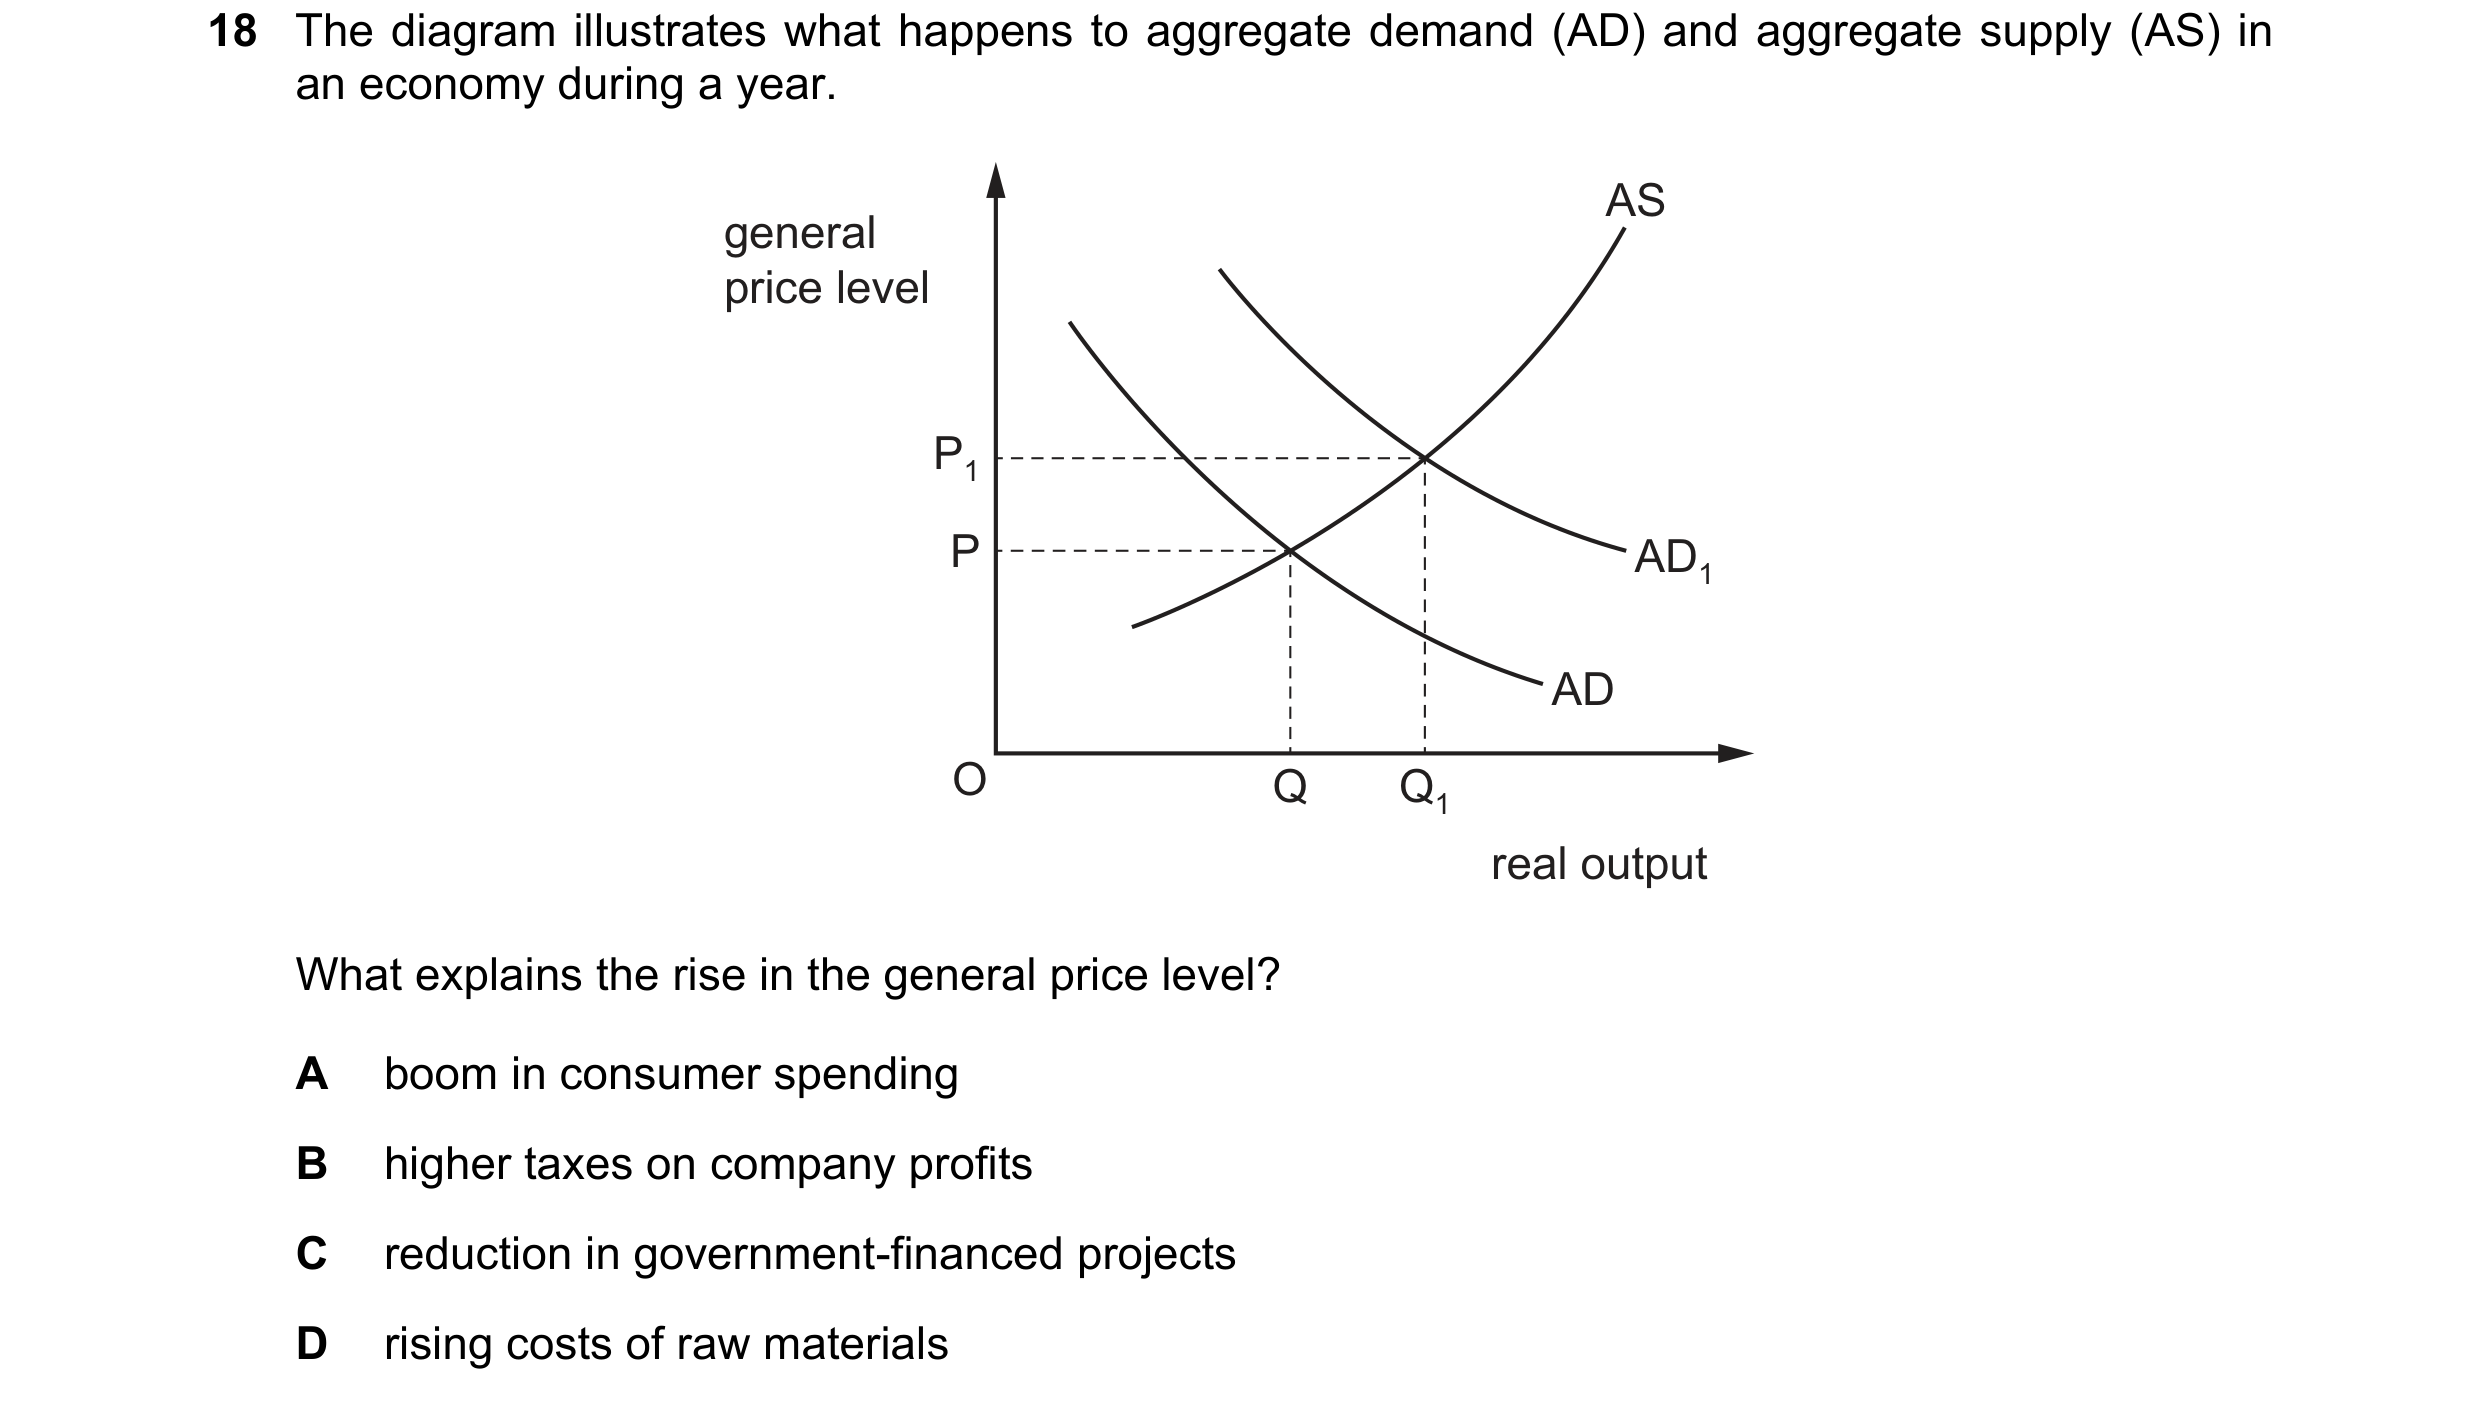
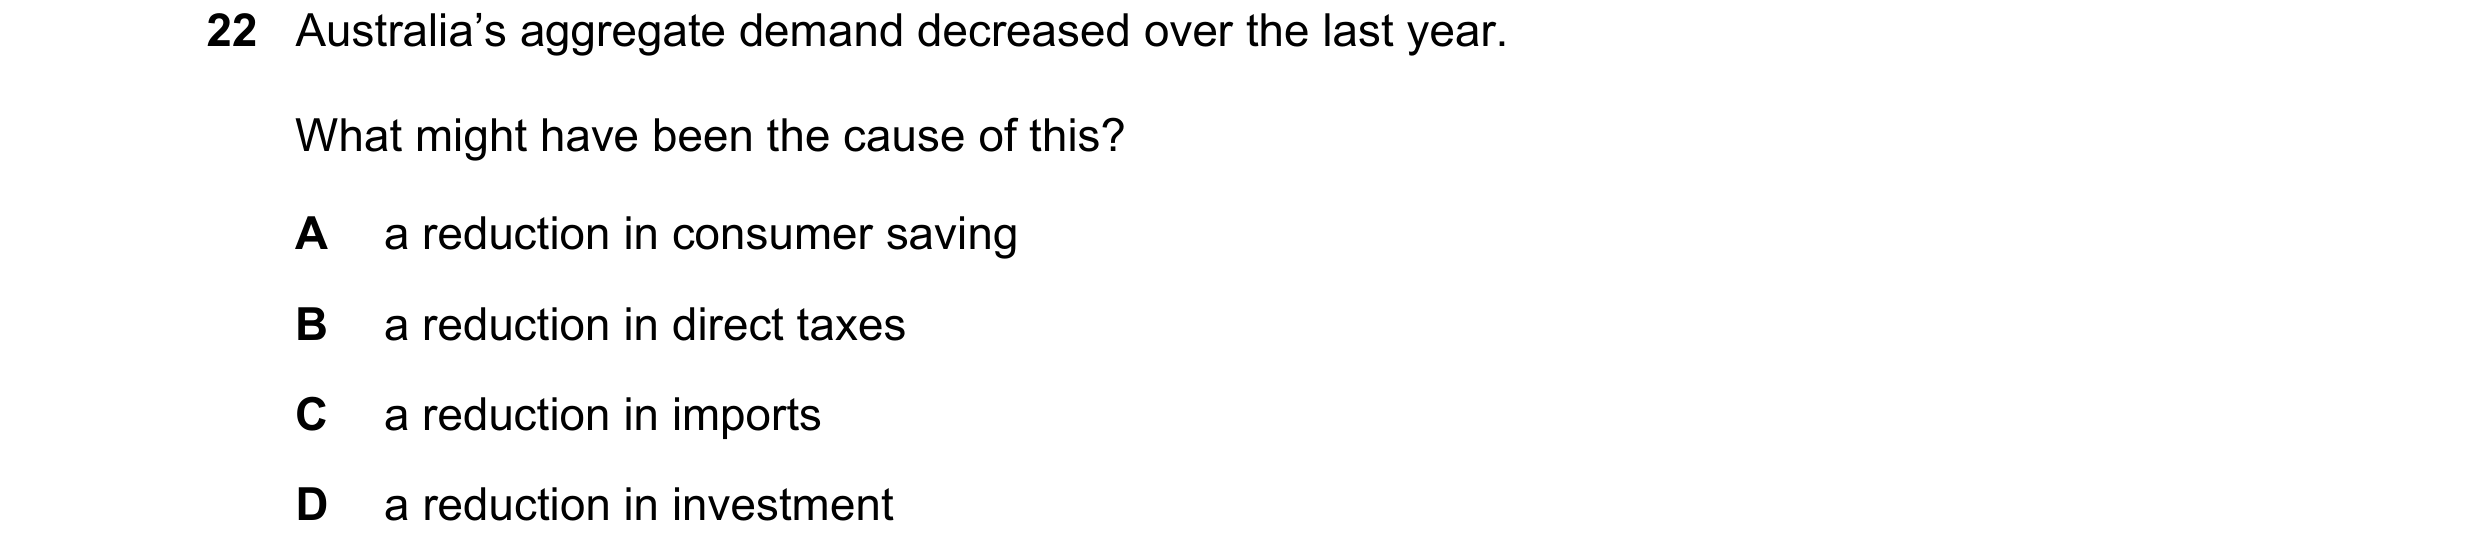

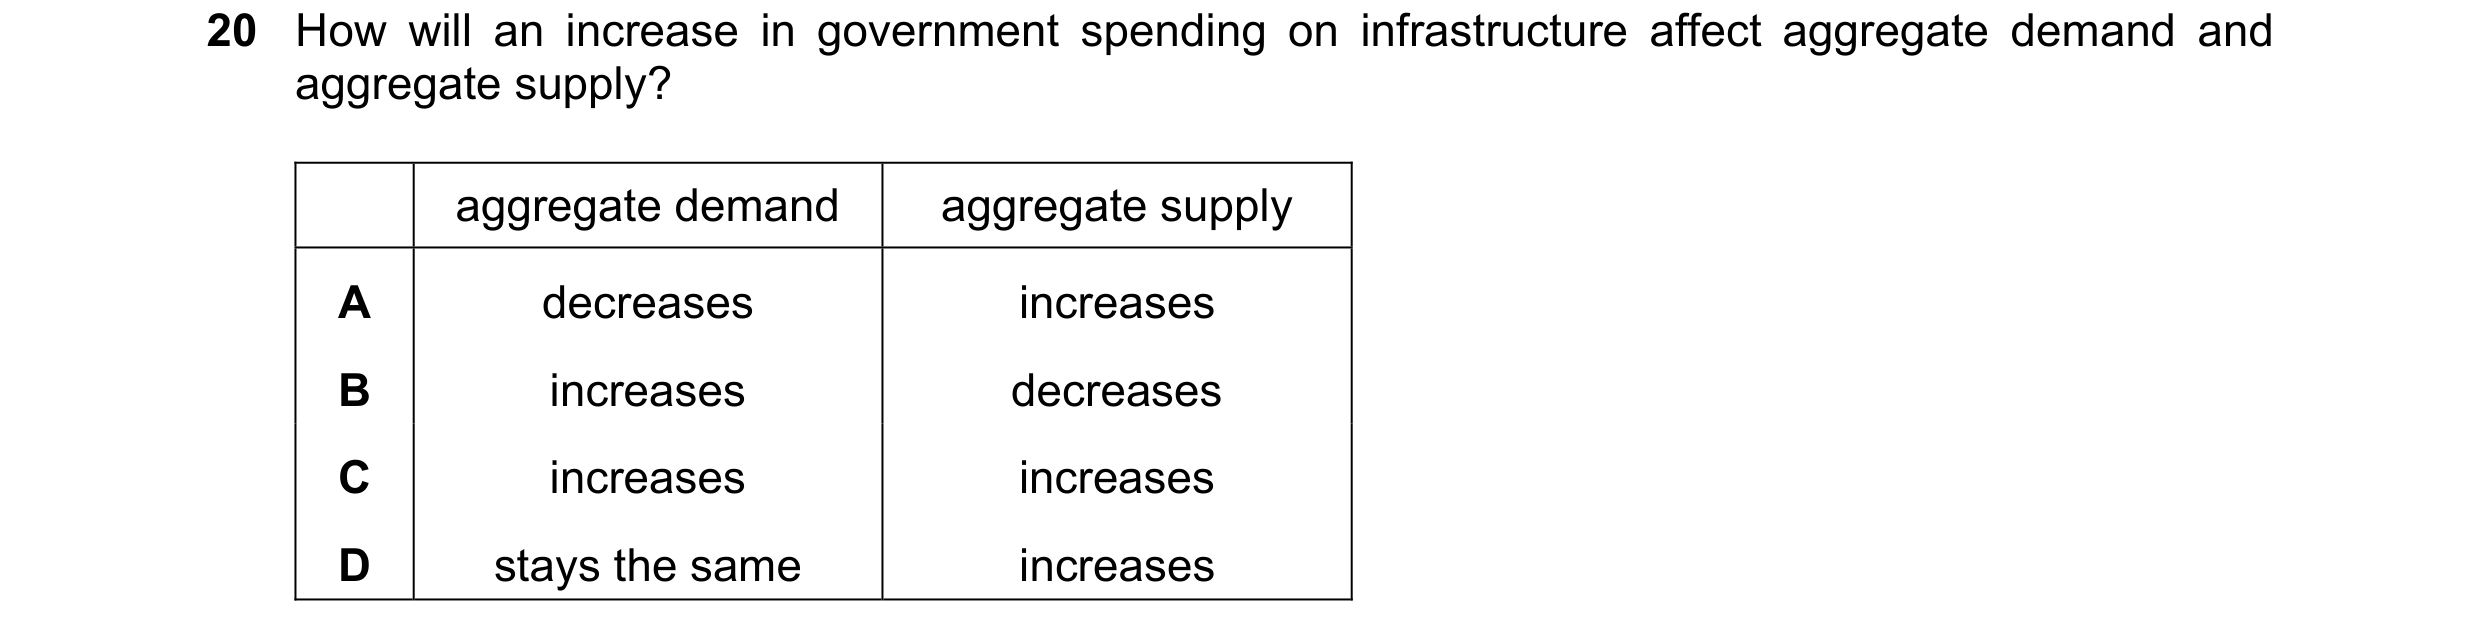 25 / 57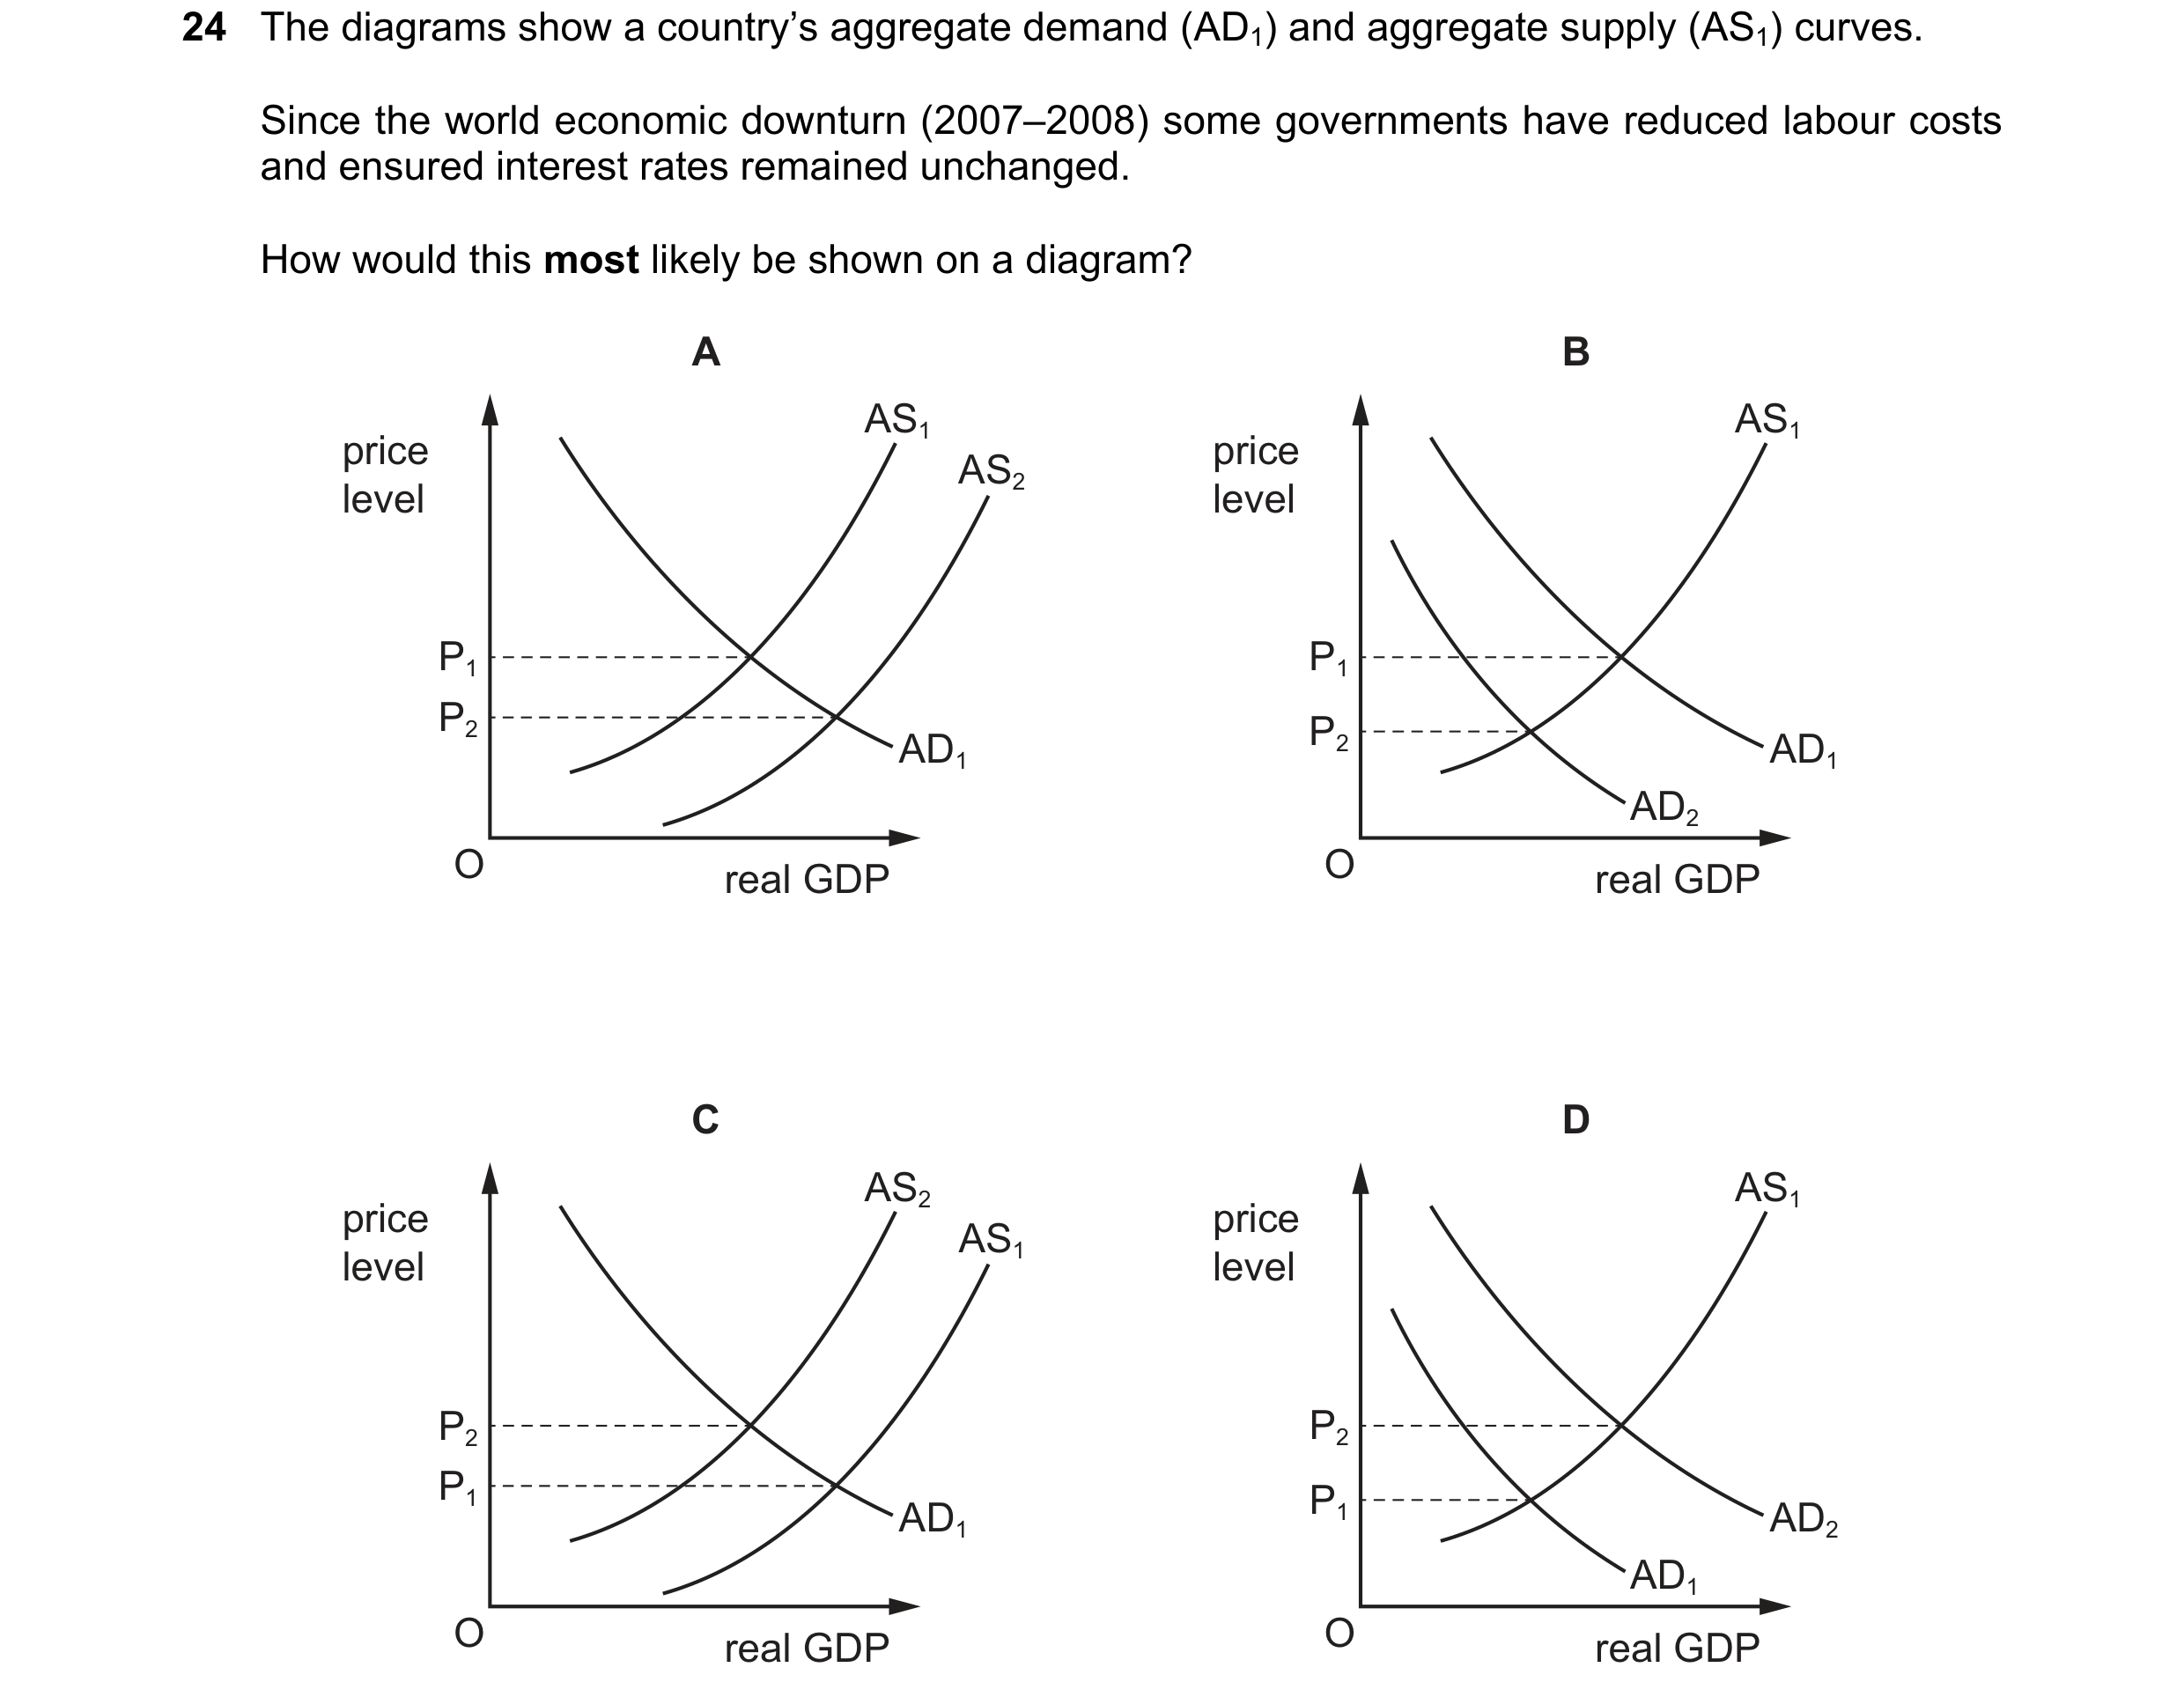
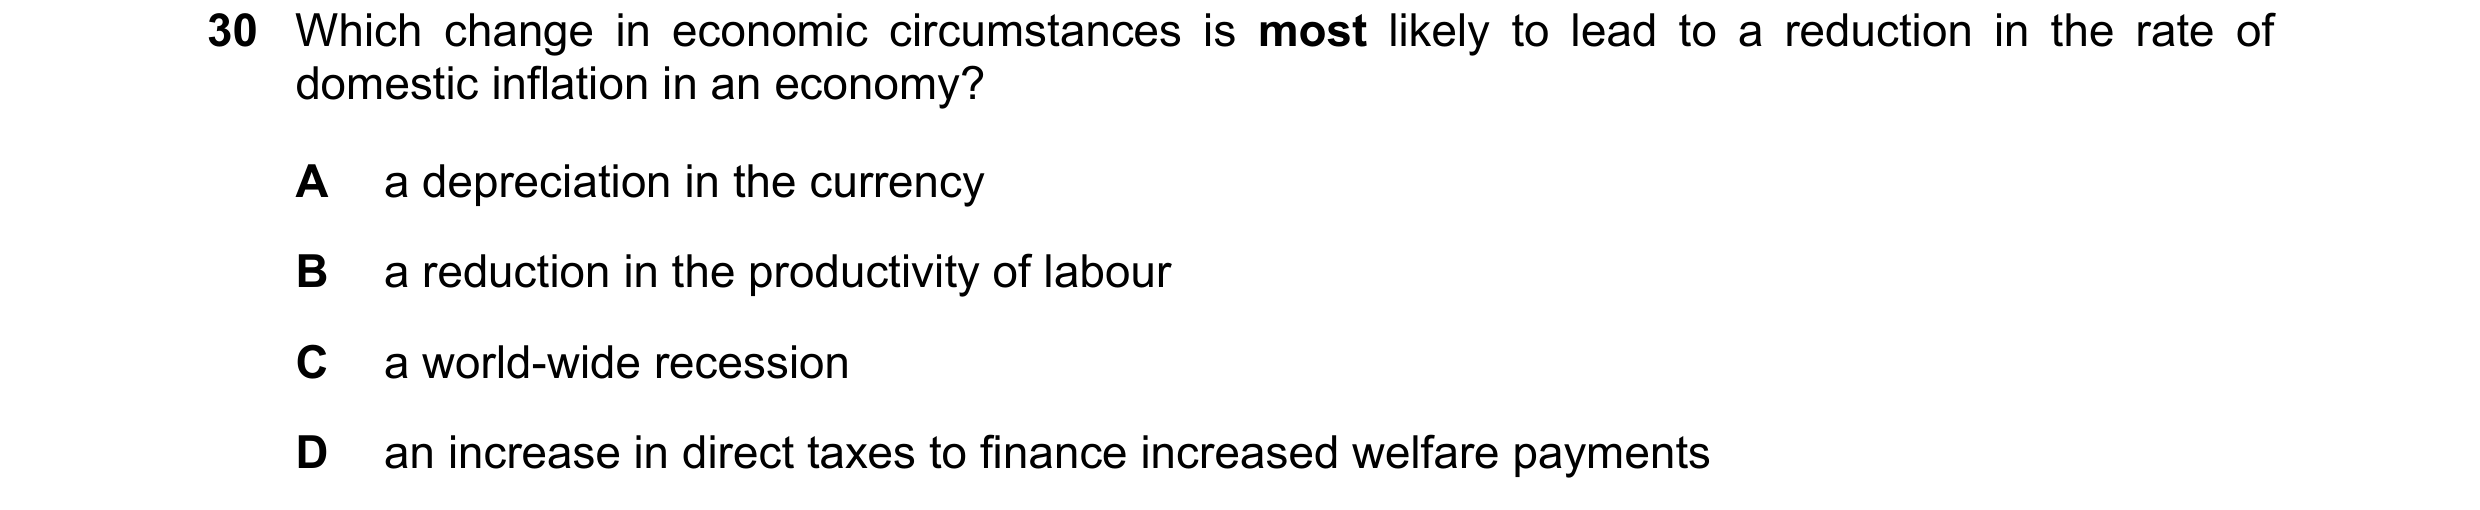 26 / 57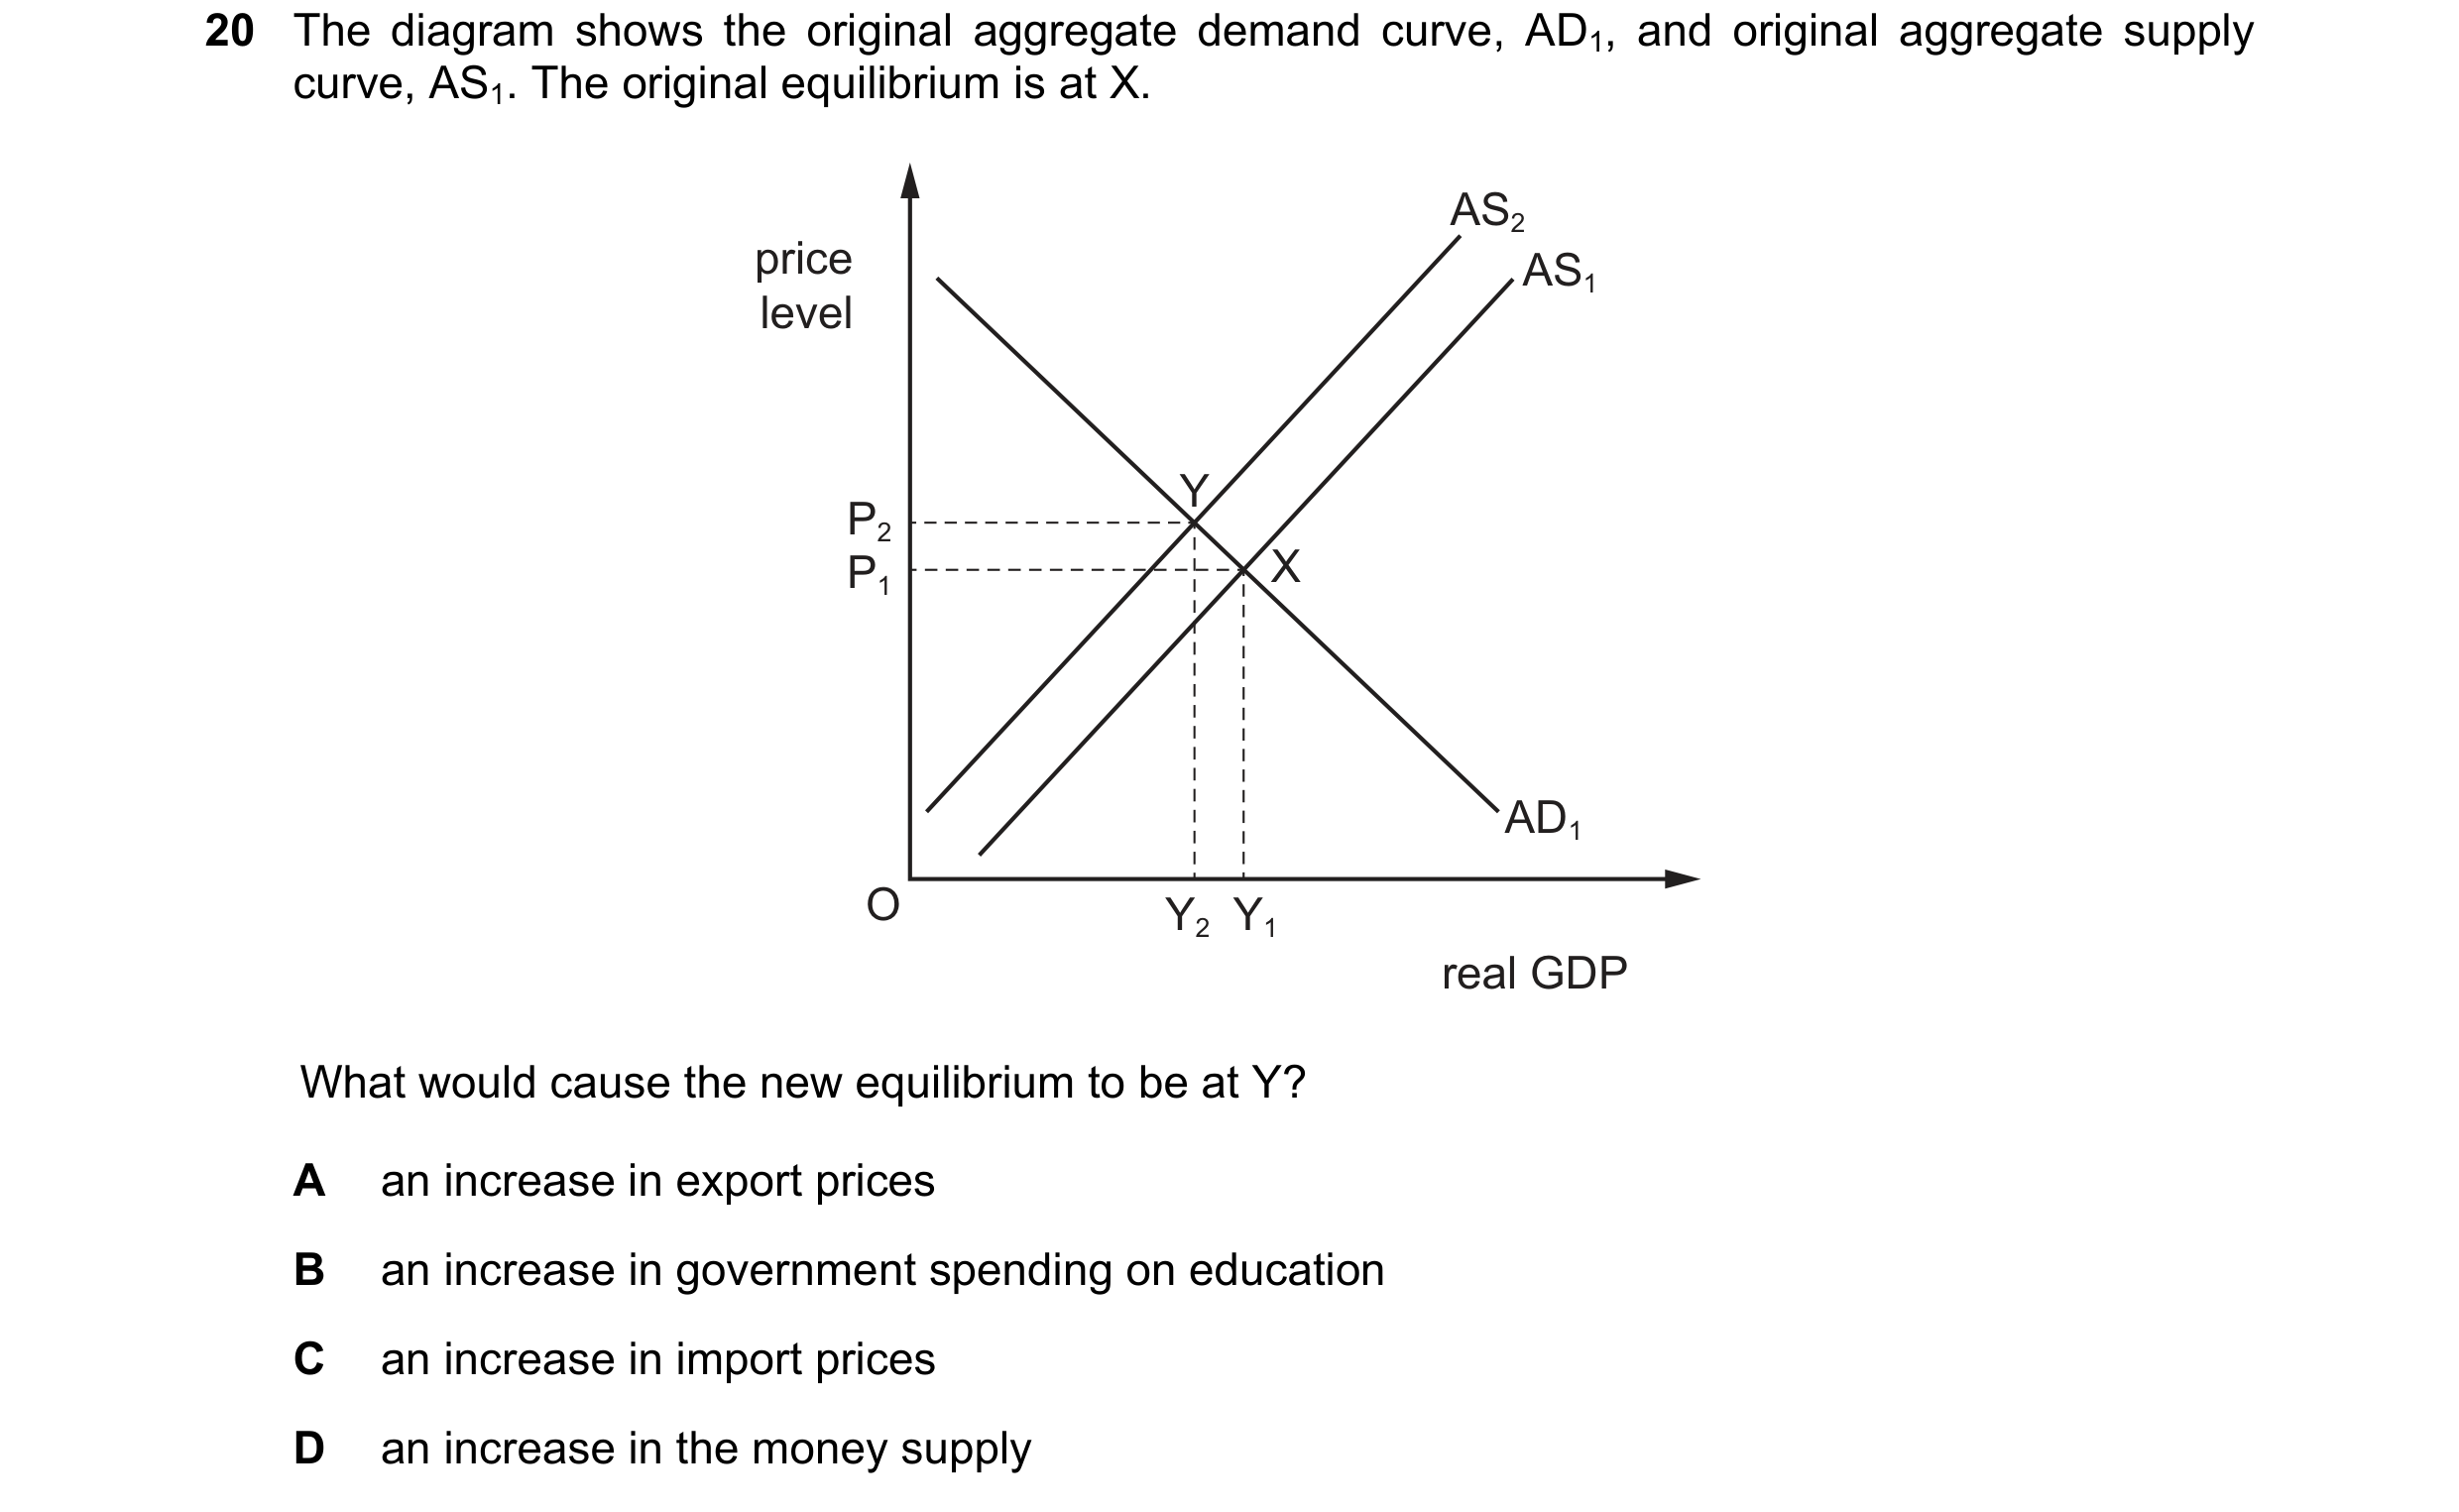
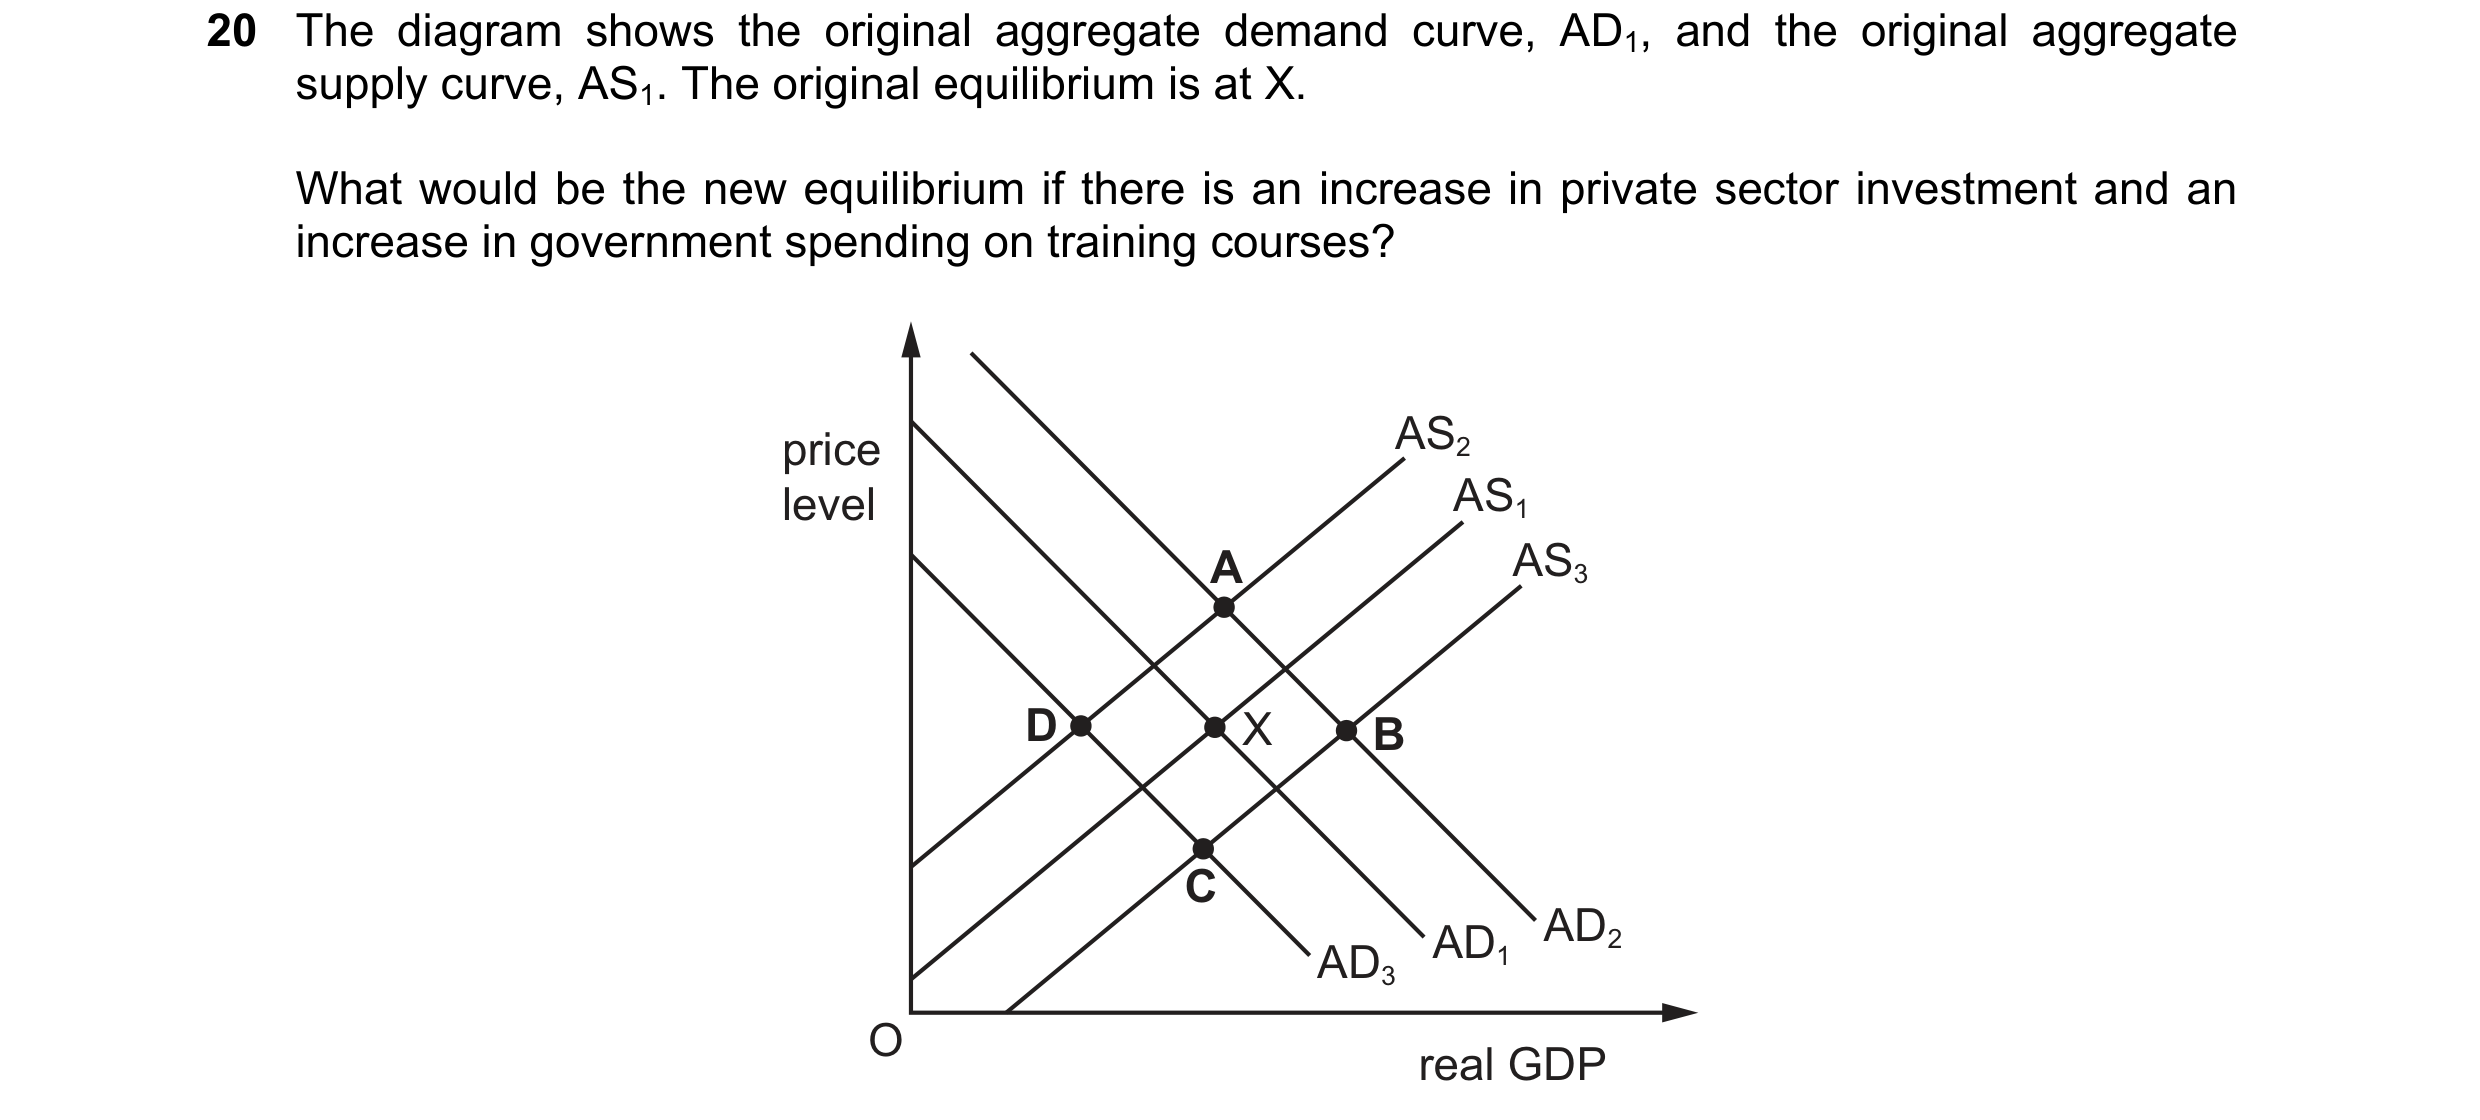 27 / 57
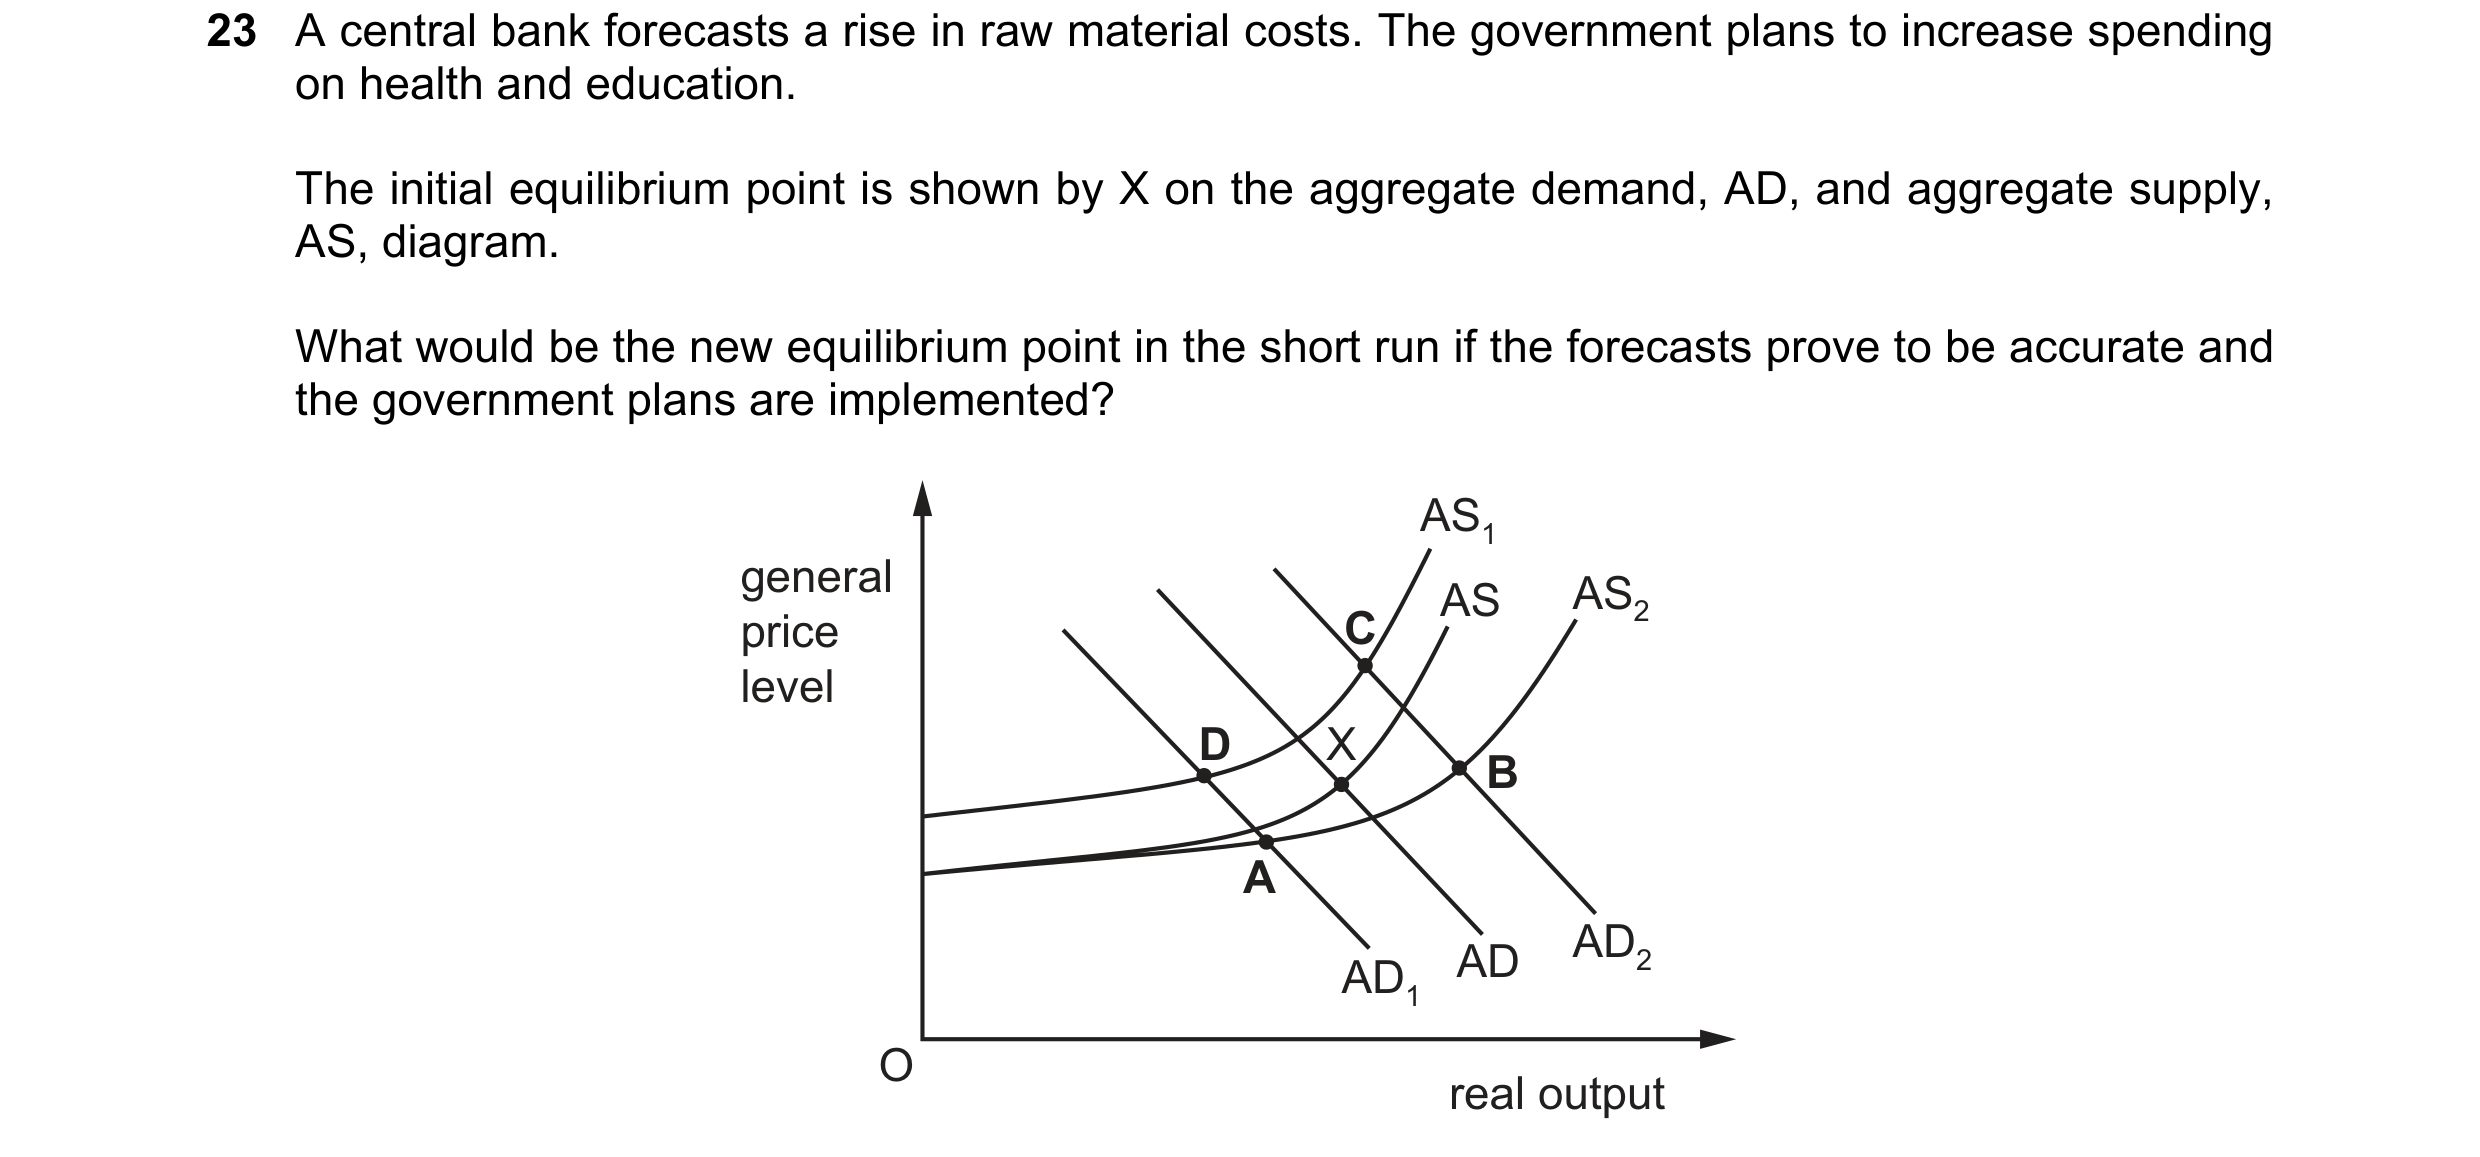
 28 / 57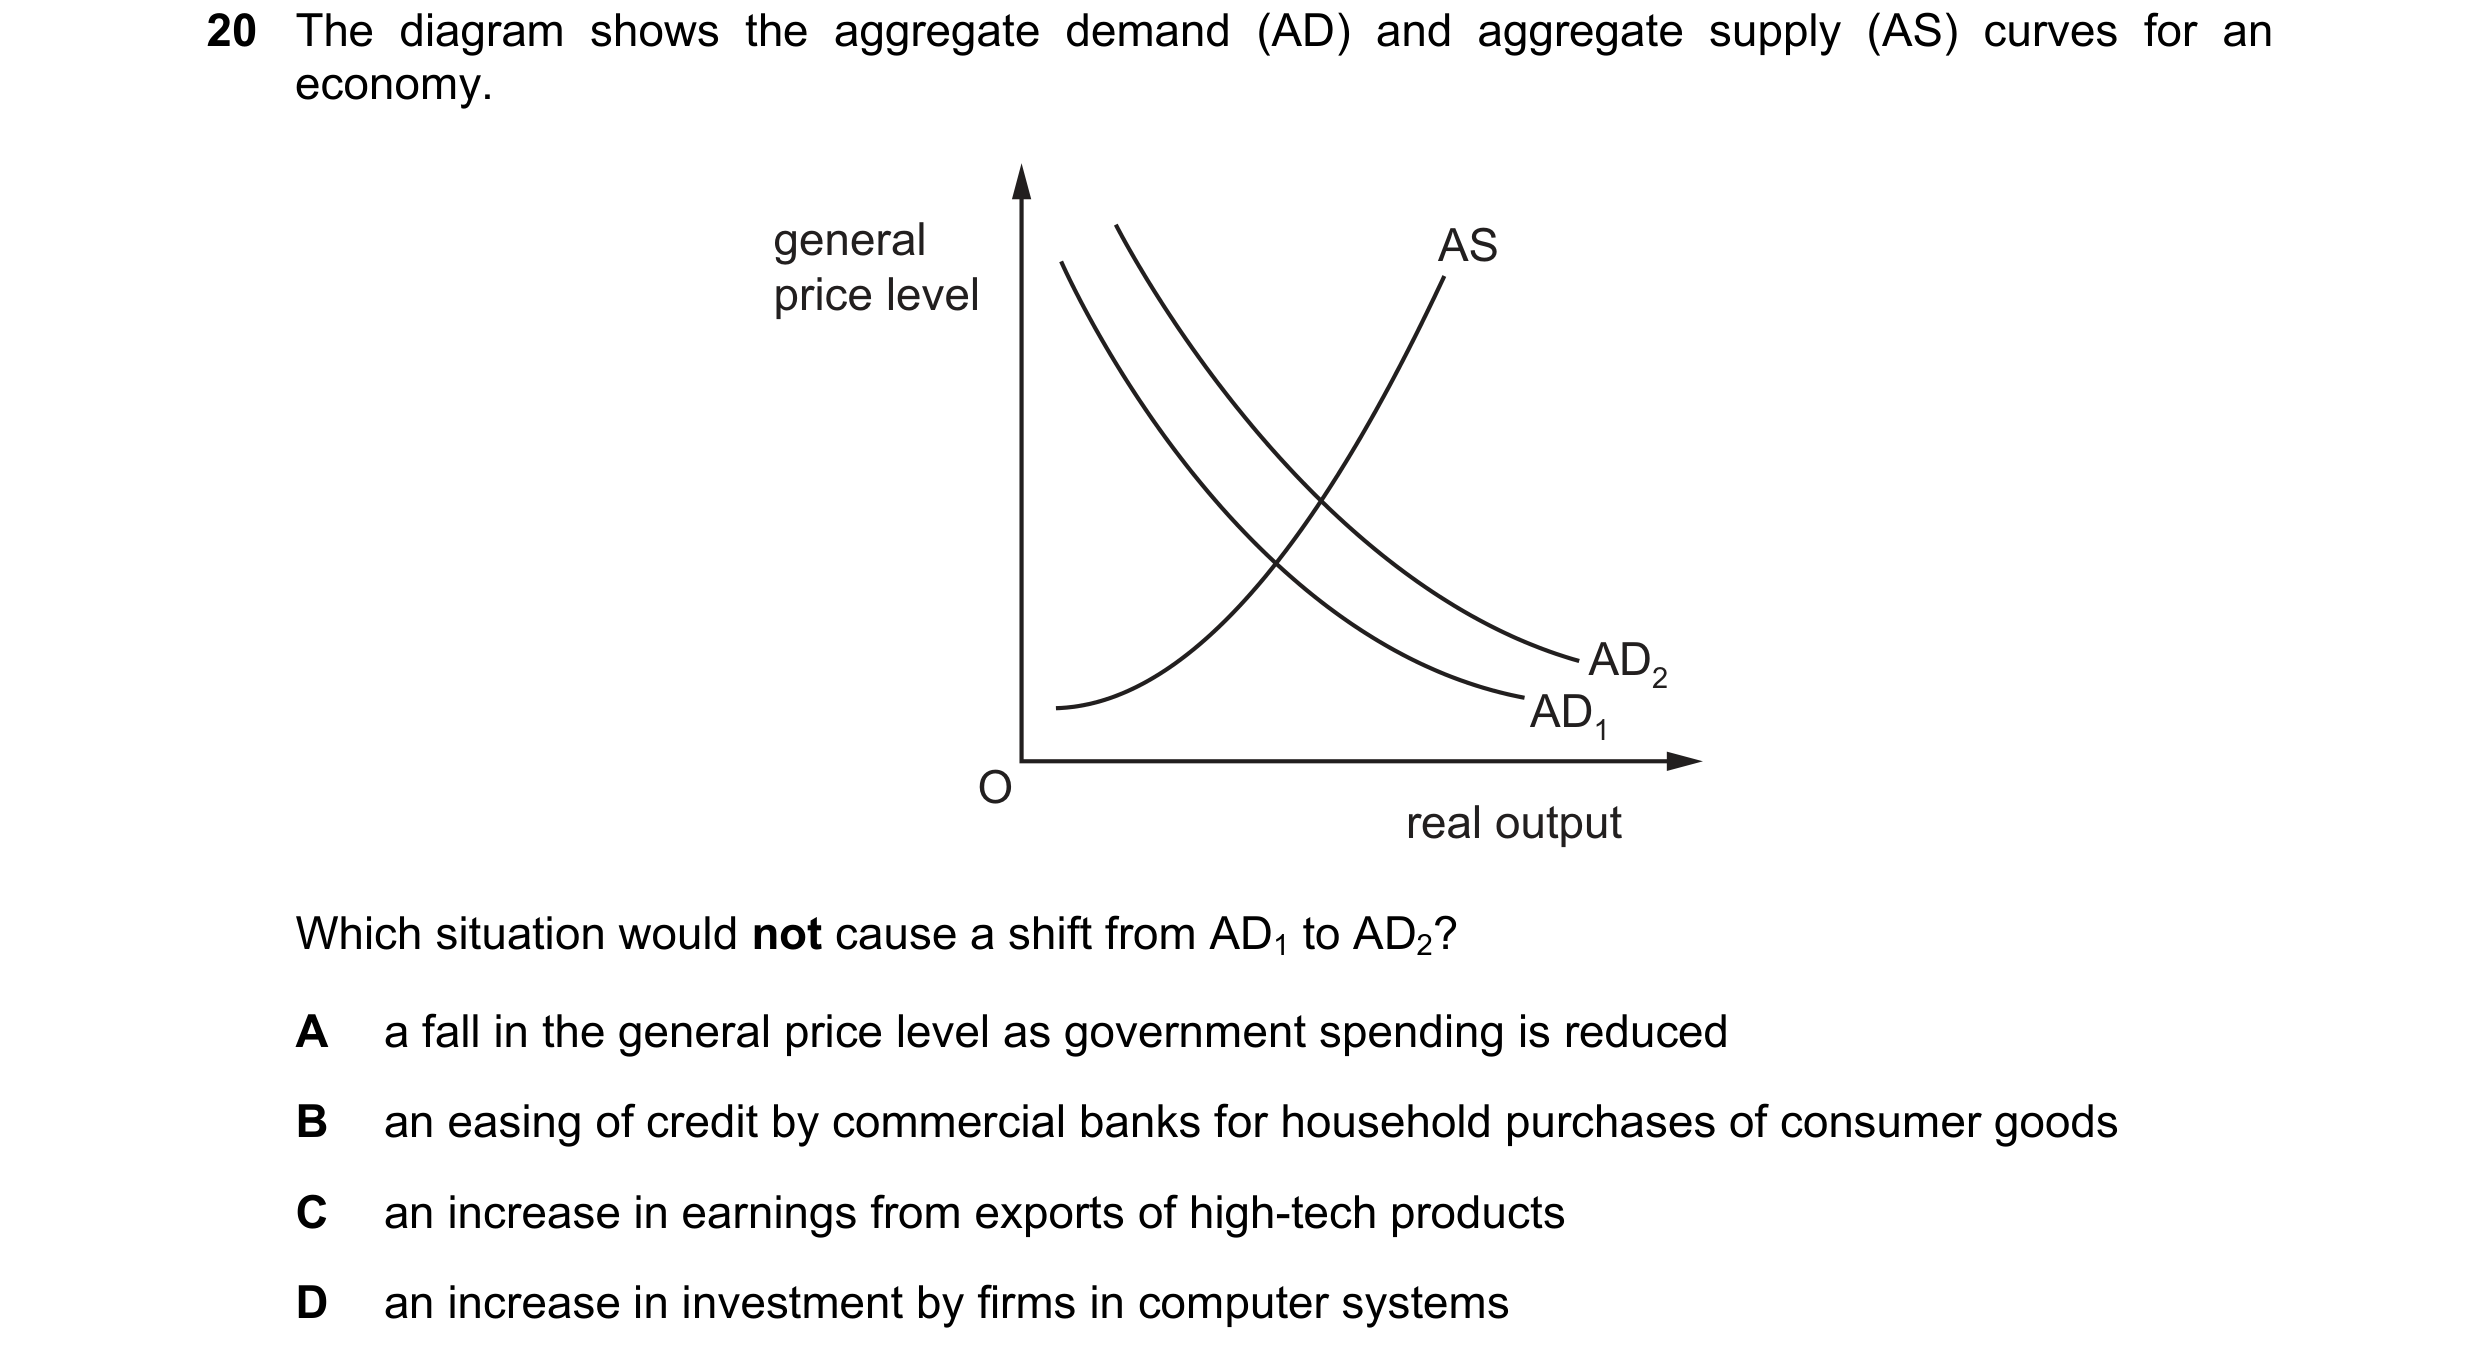
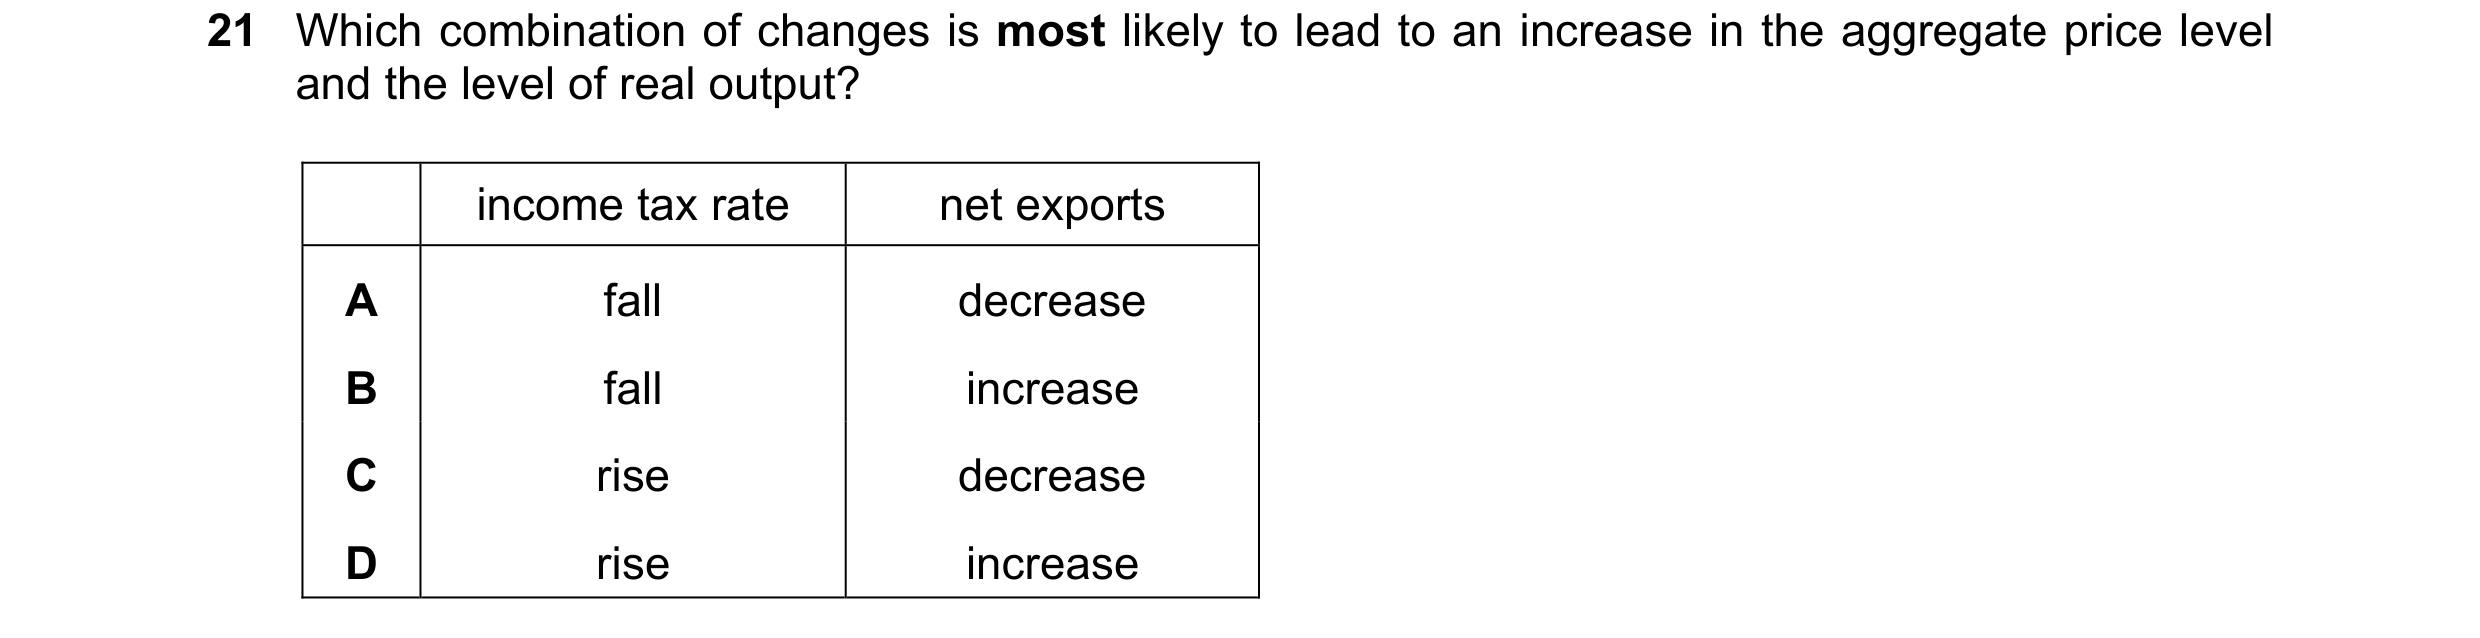
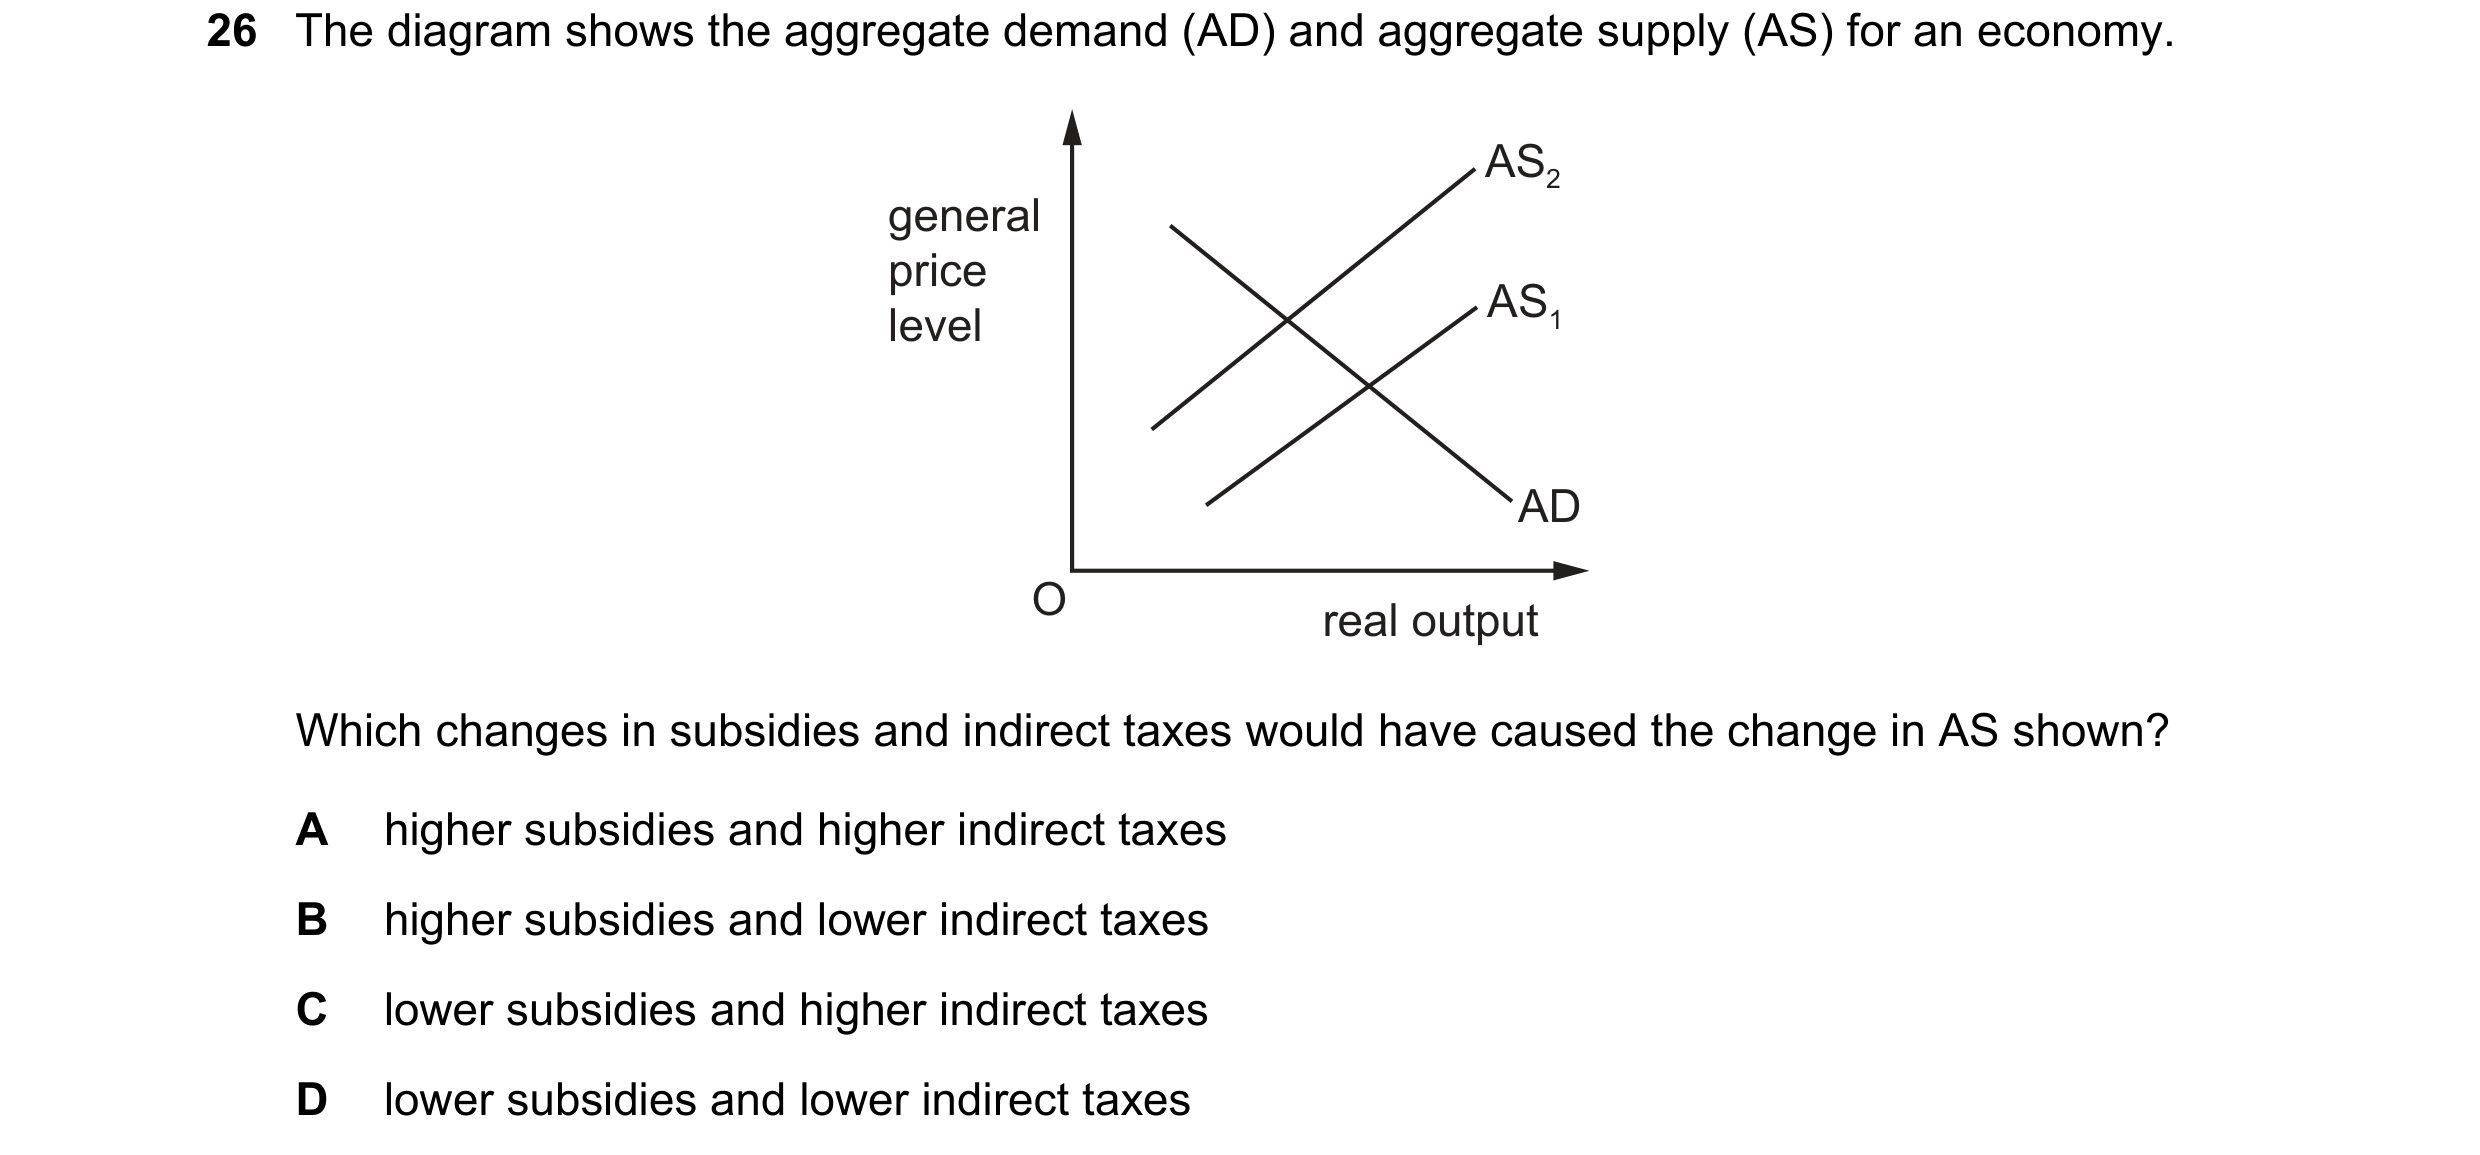 29 / 57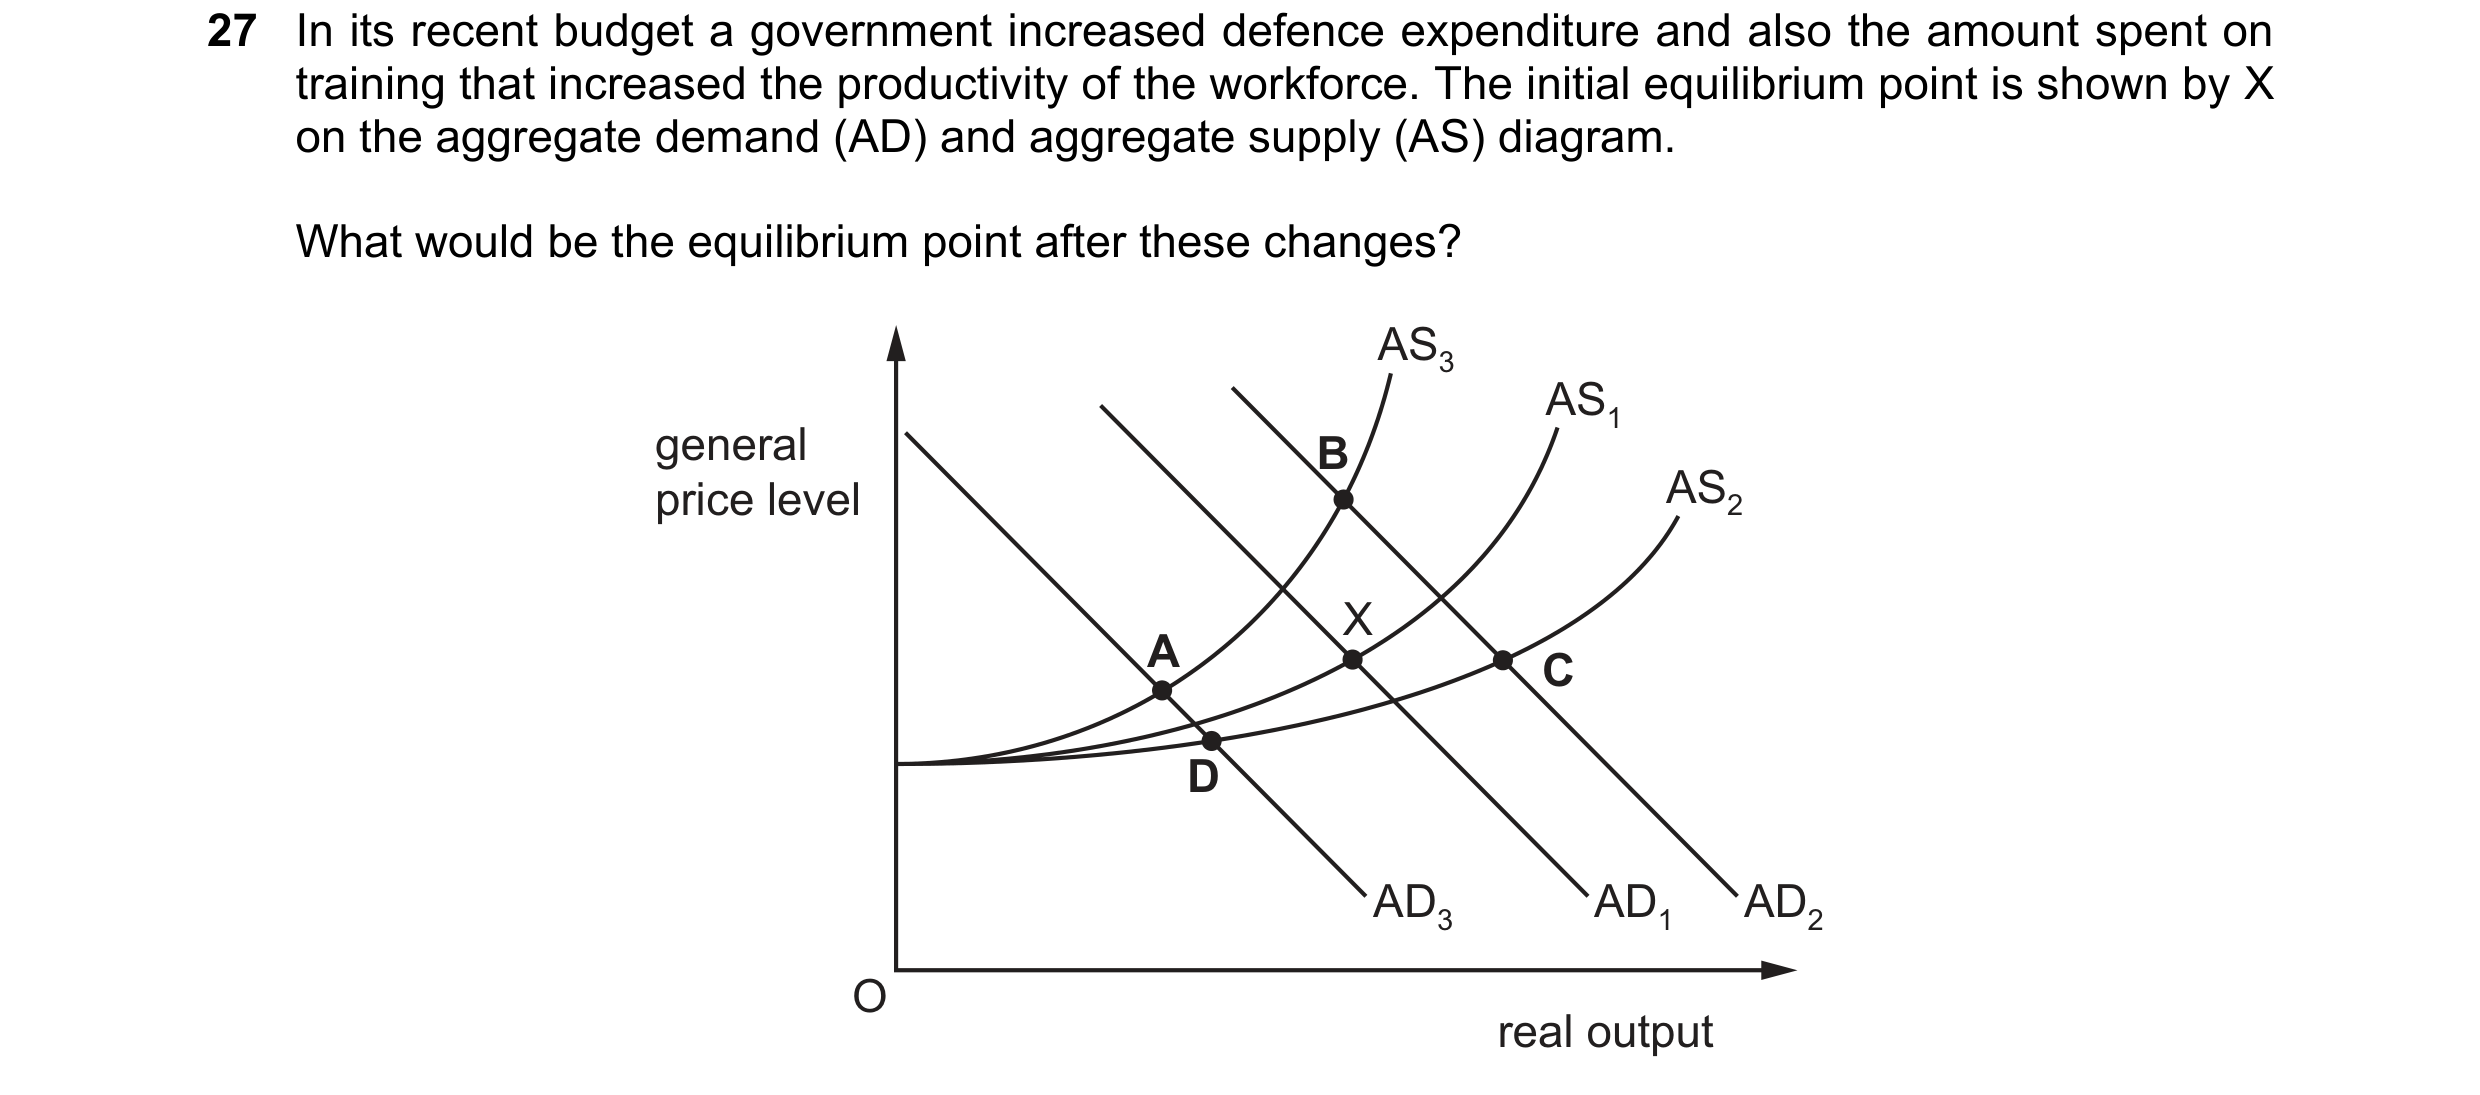
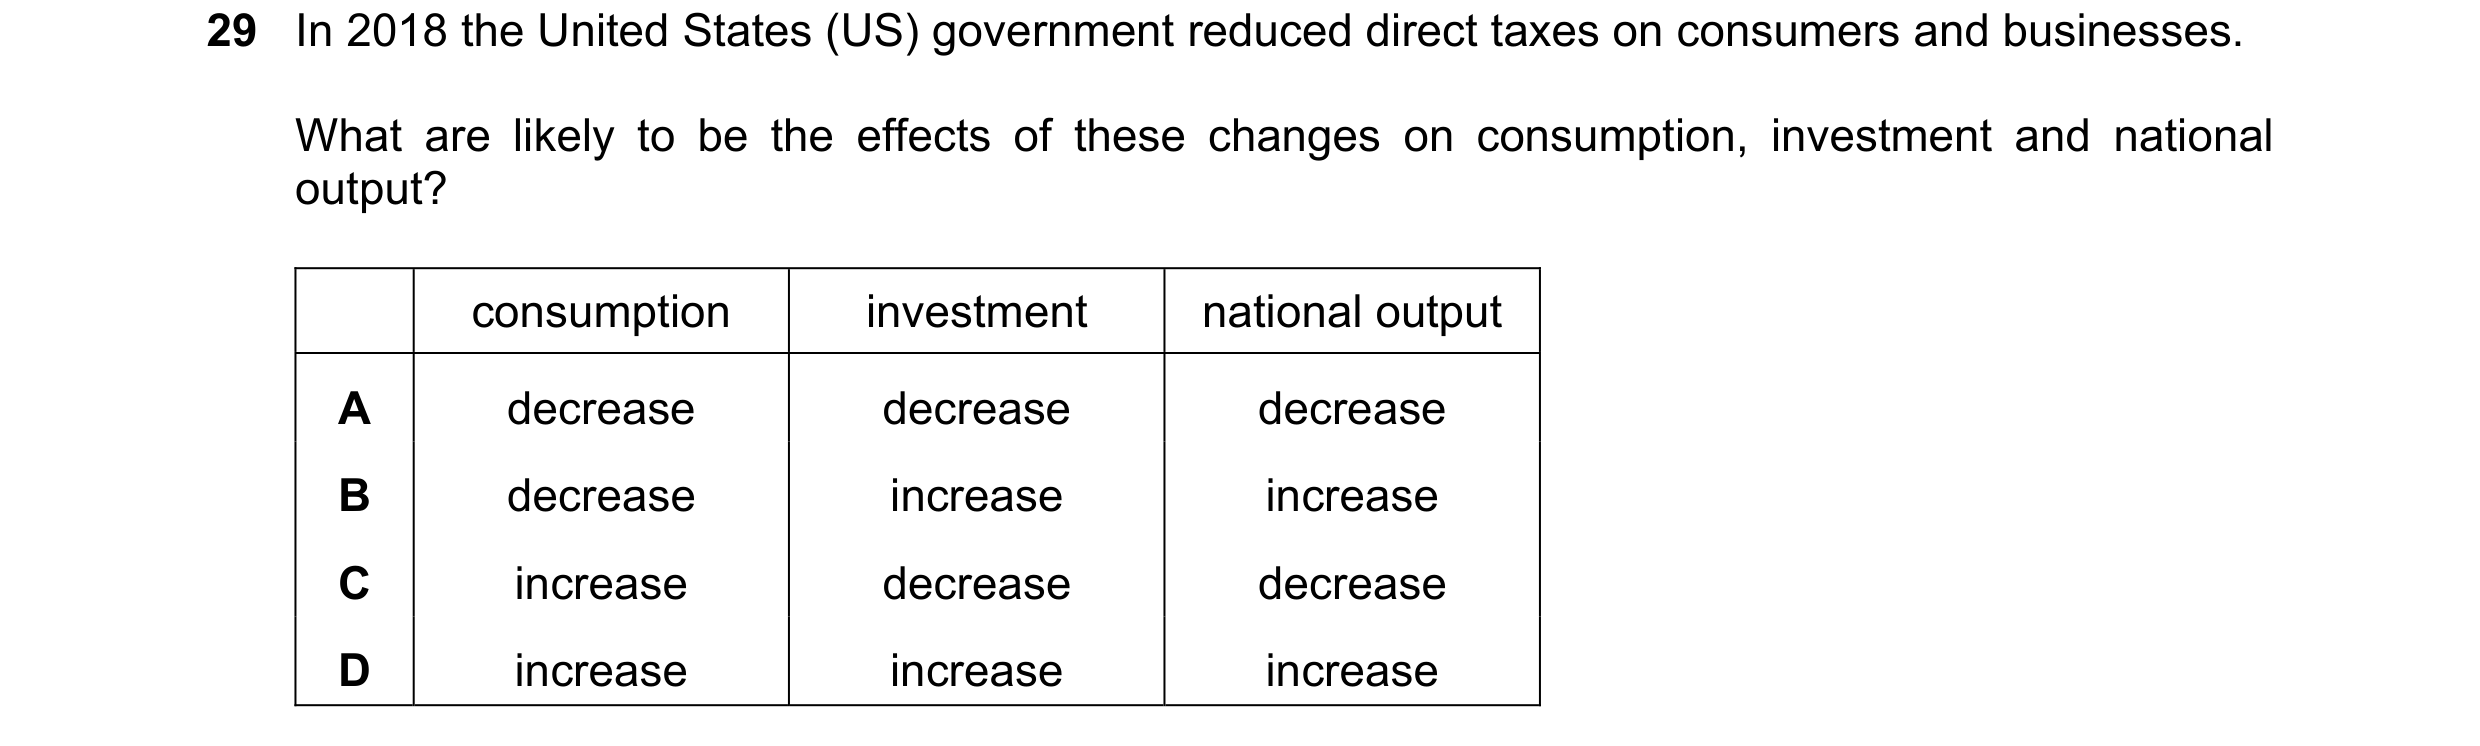
 30 / 57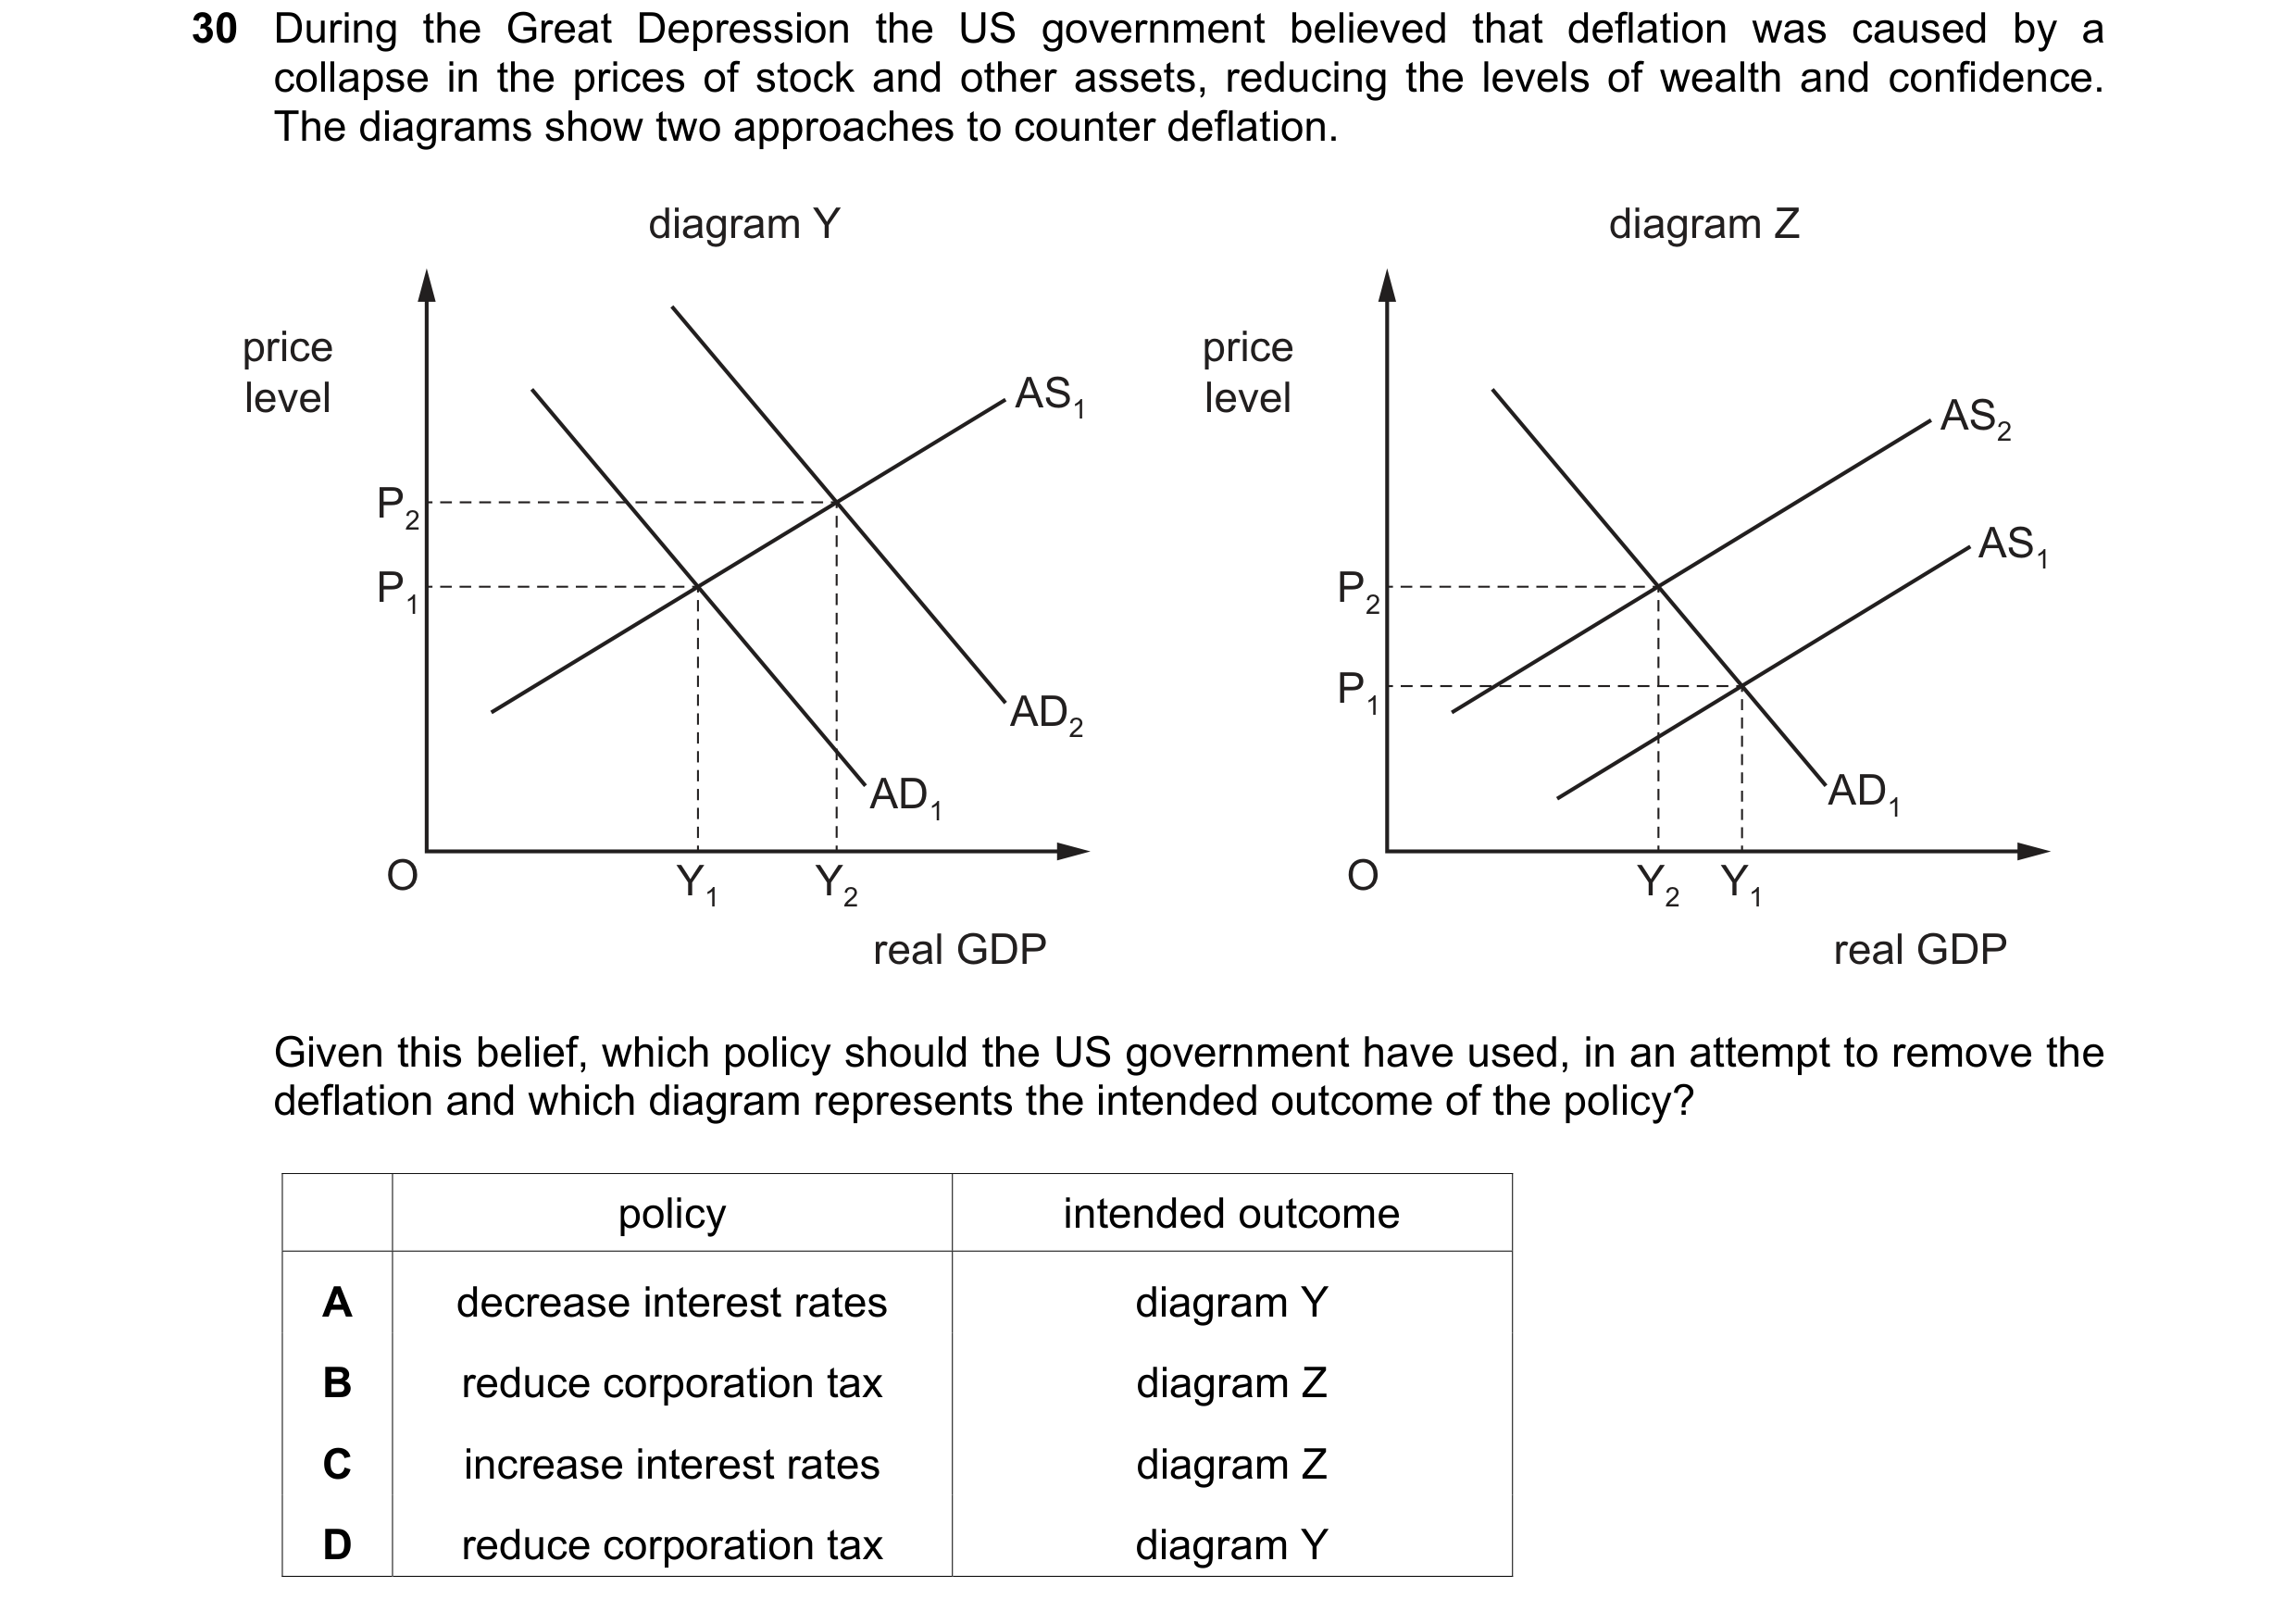

 31 / 57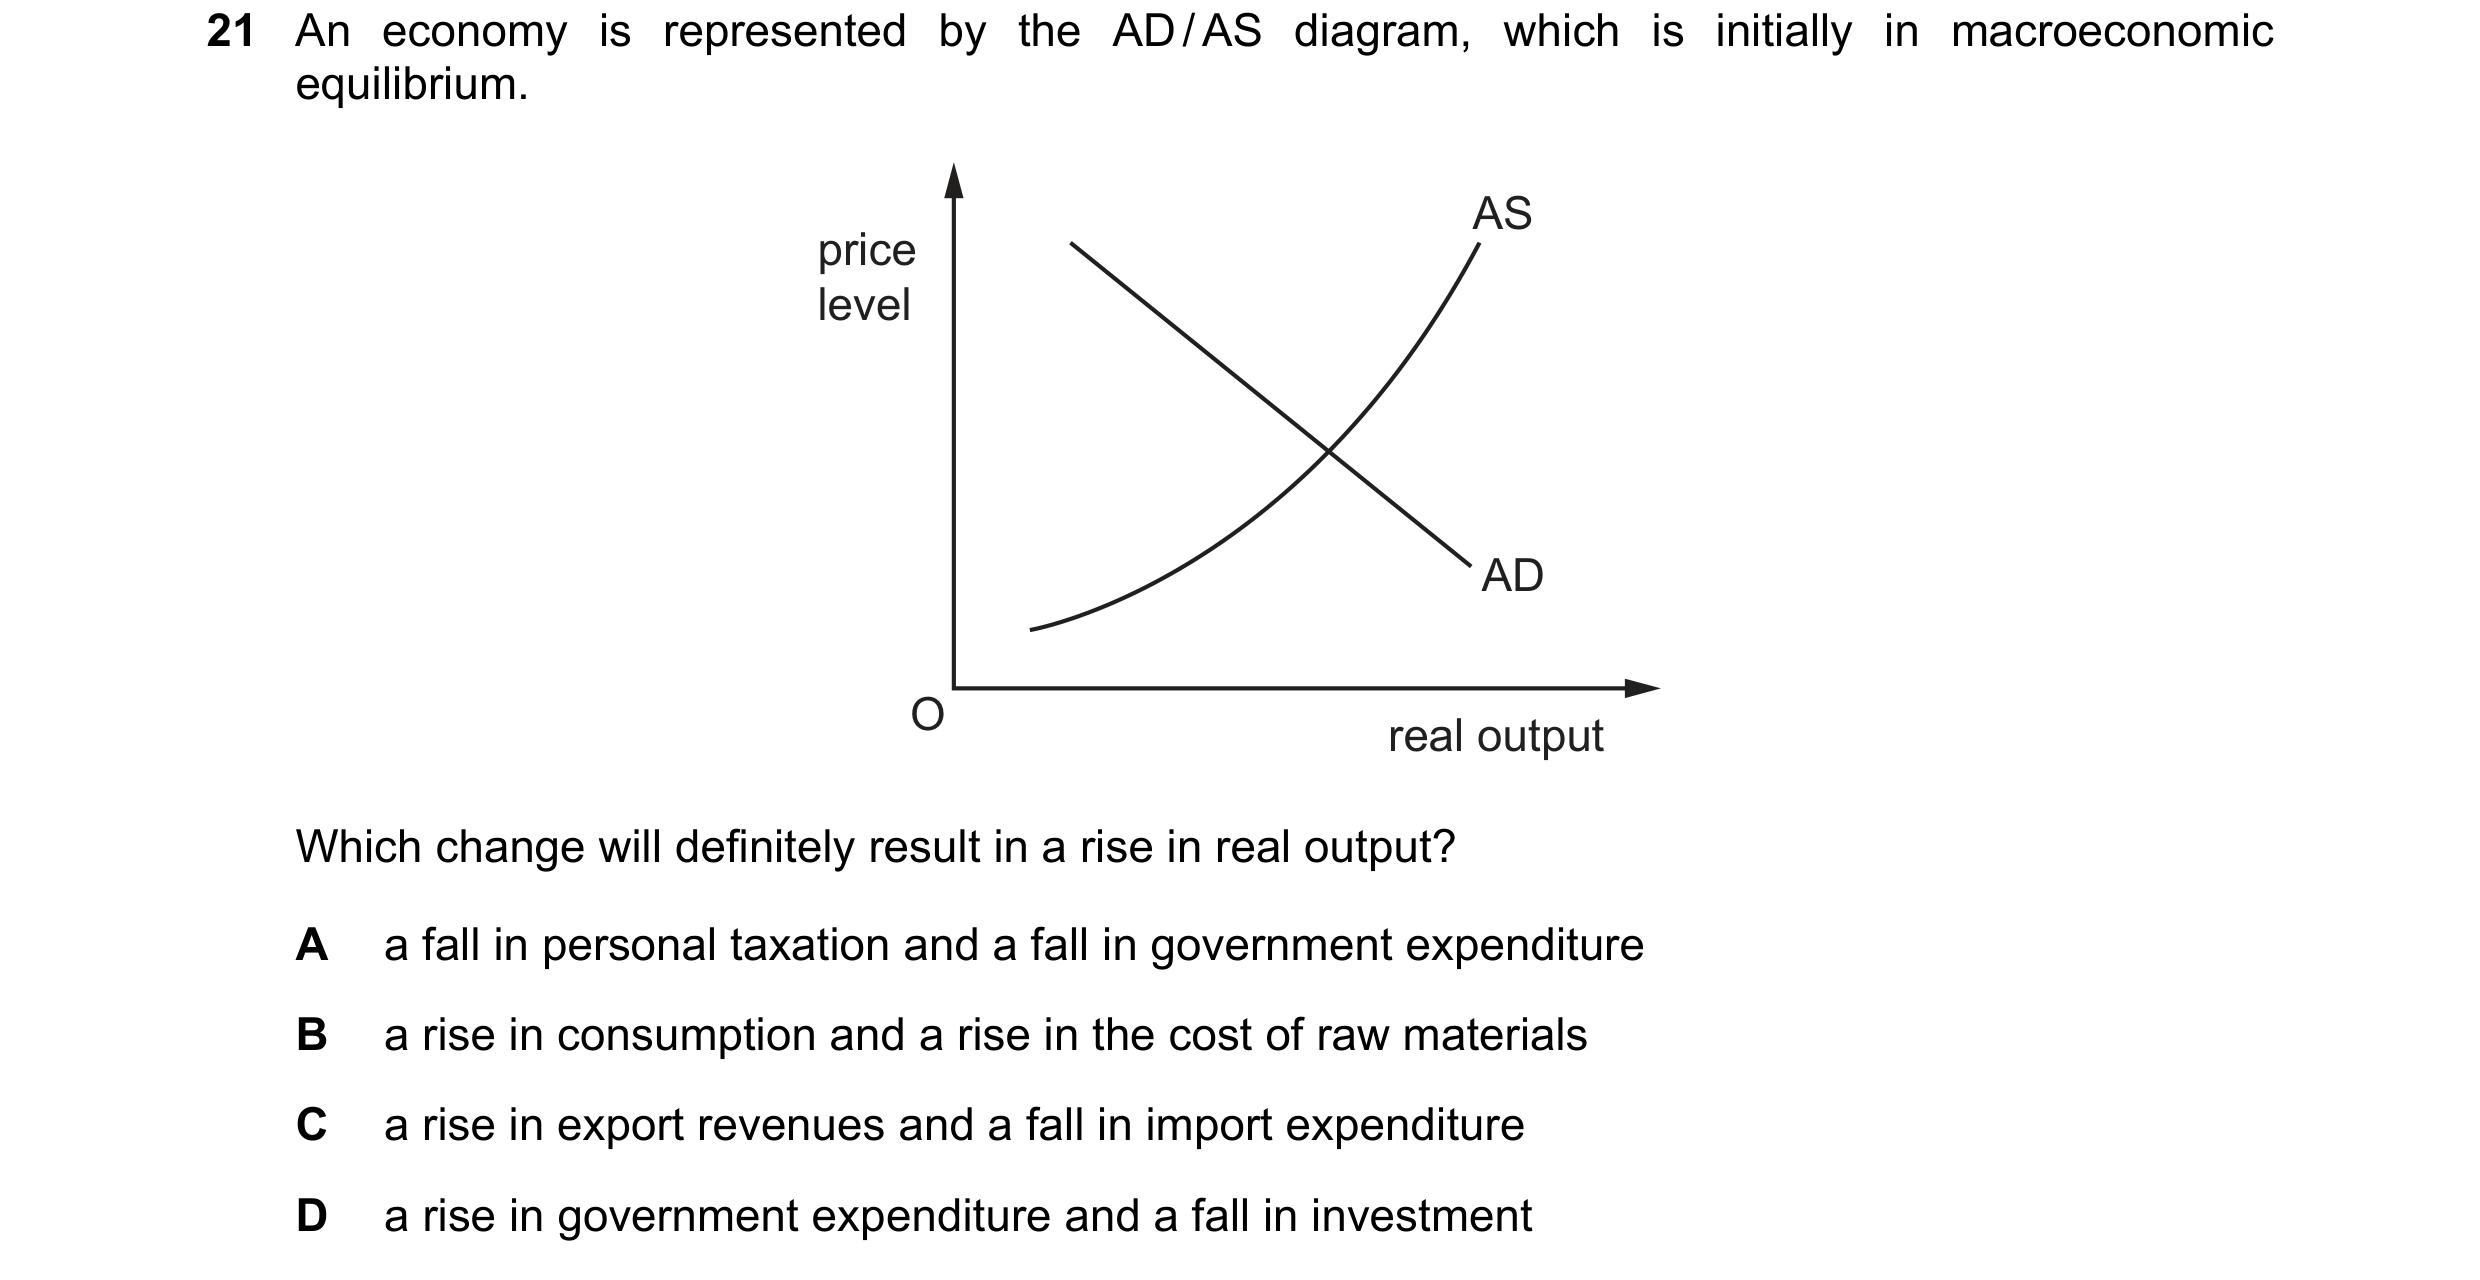
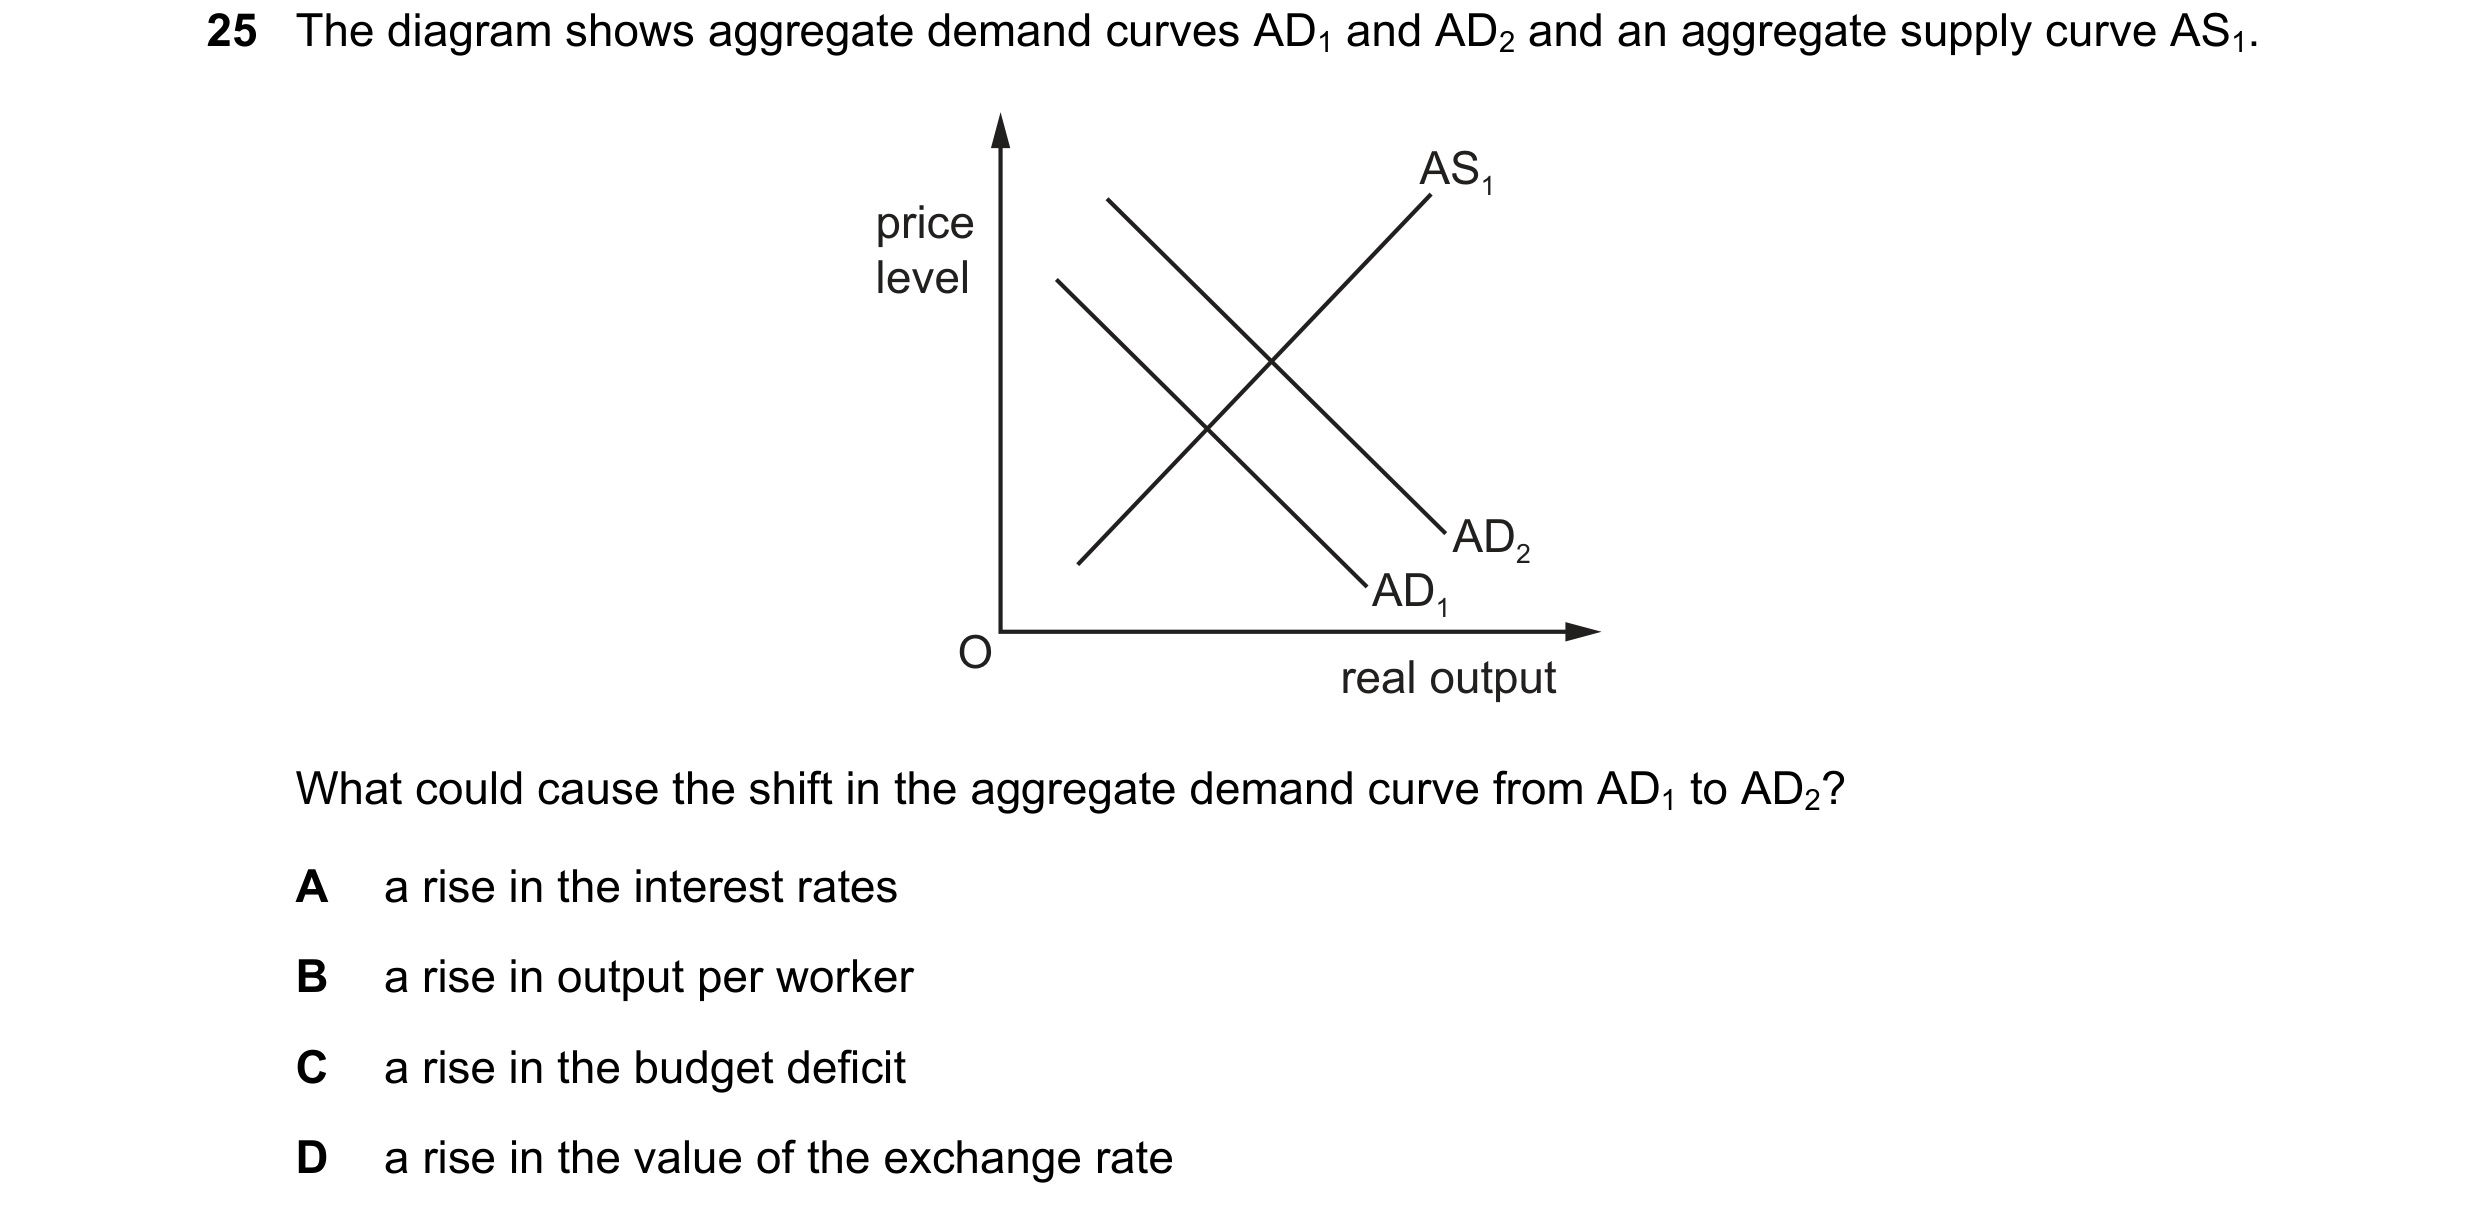
 32 / 57
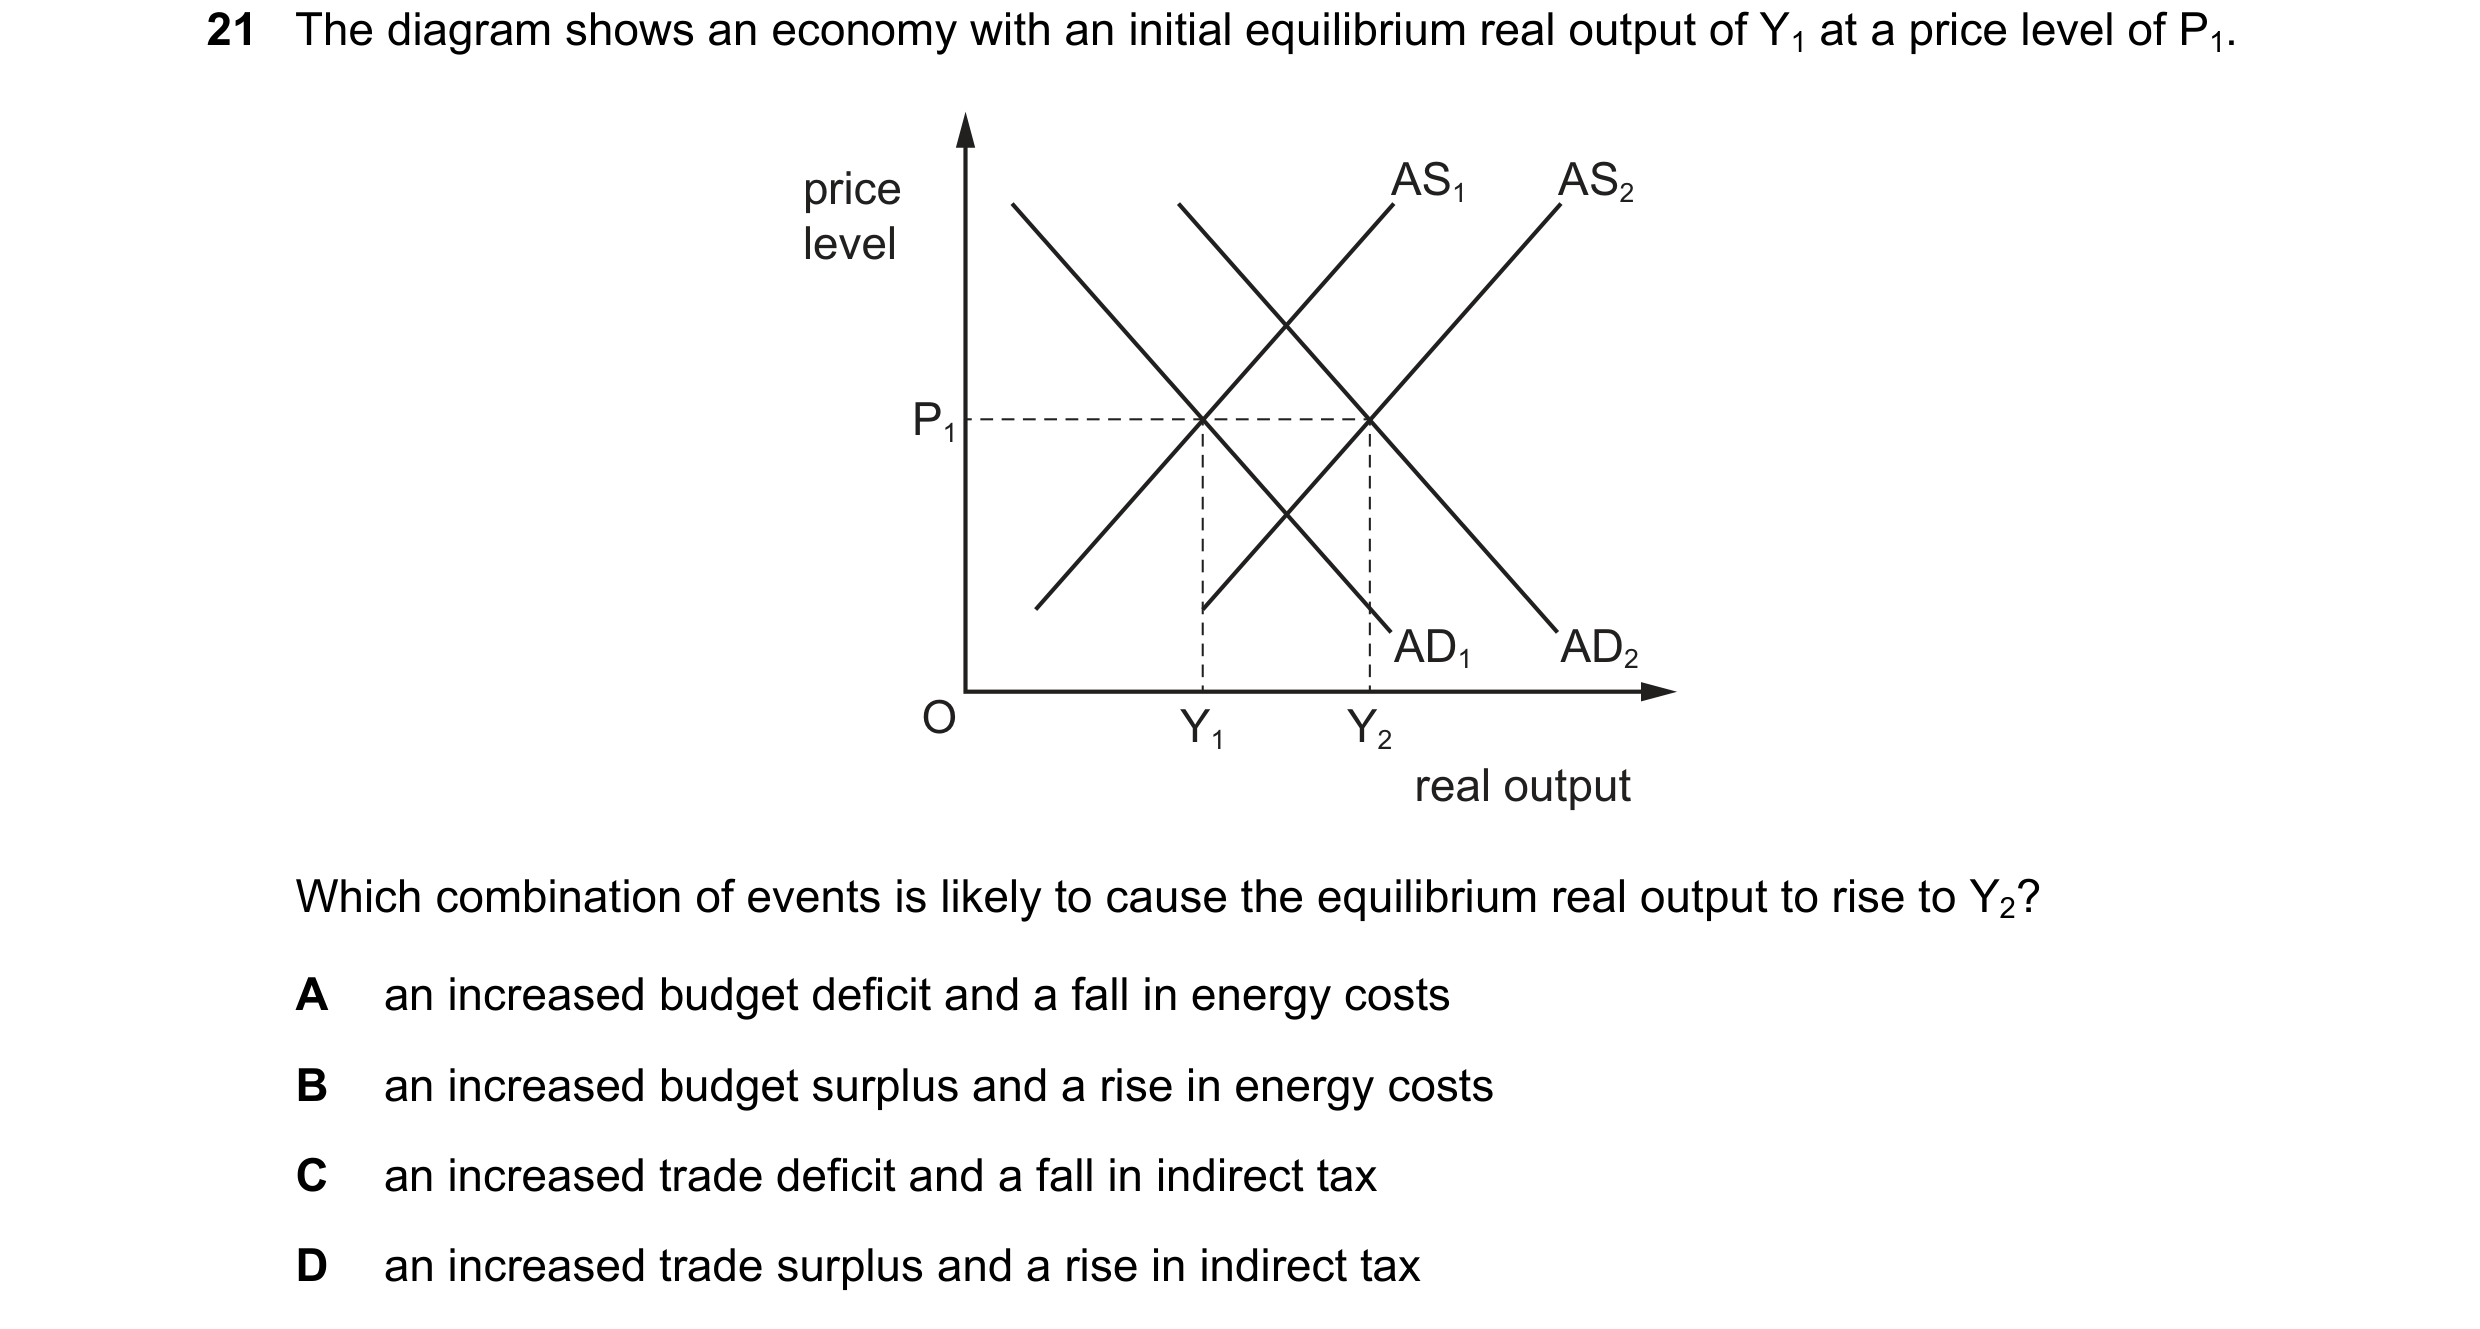
 33 / 57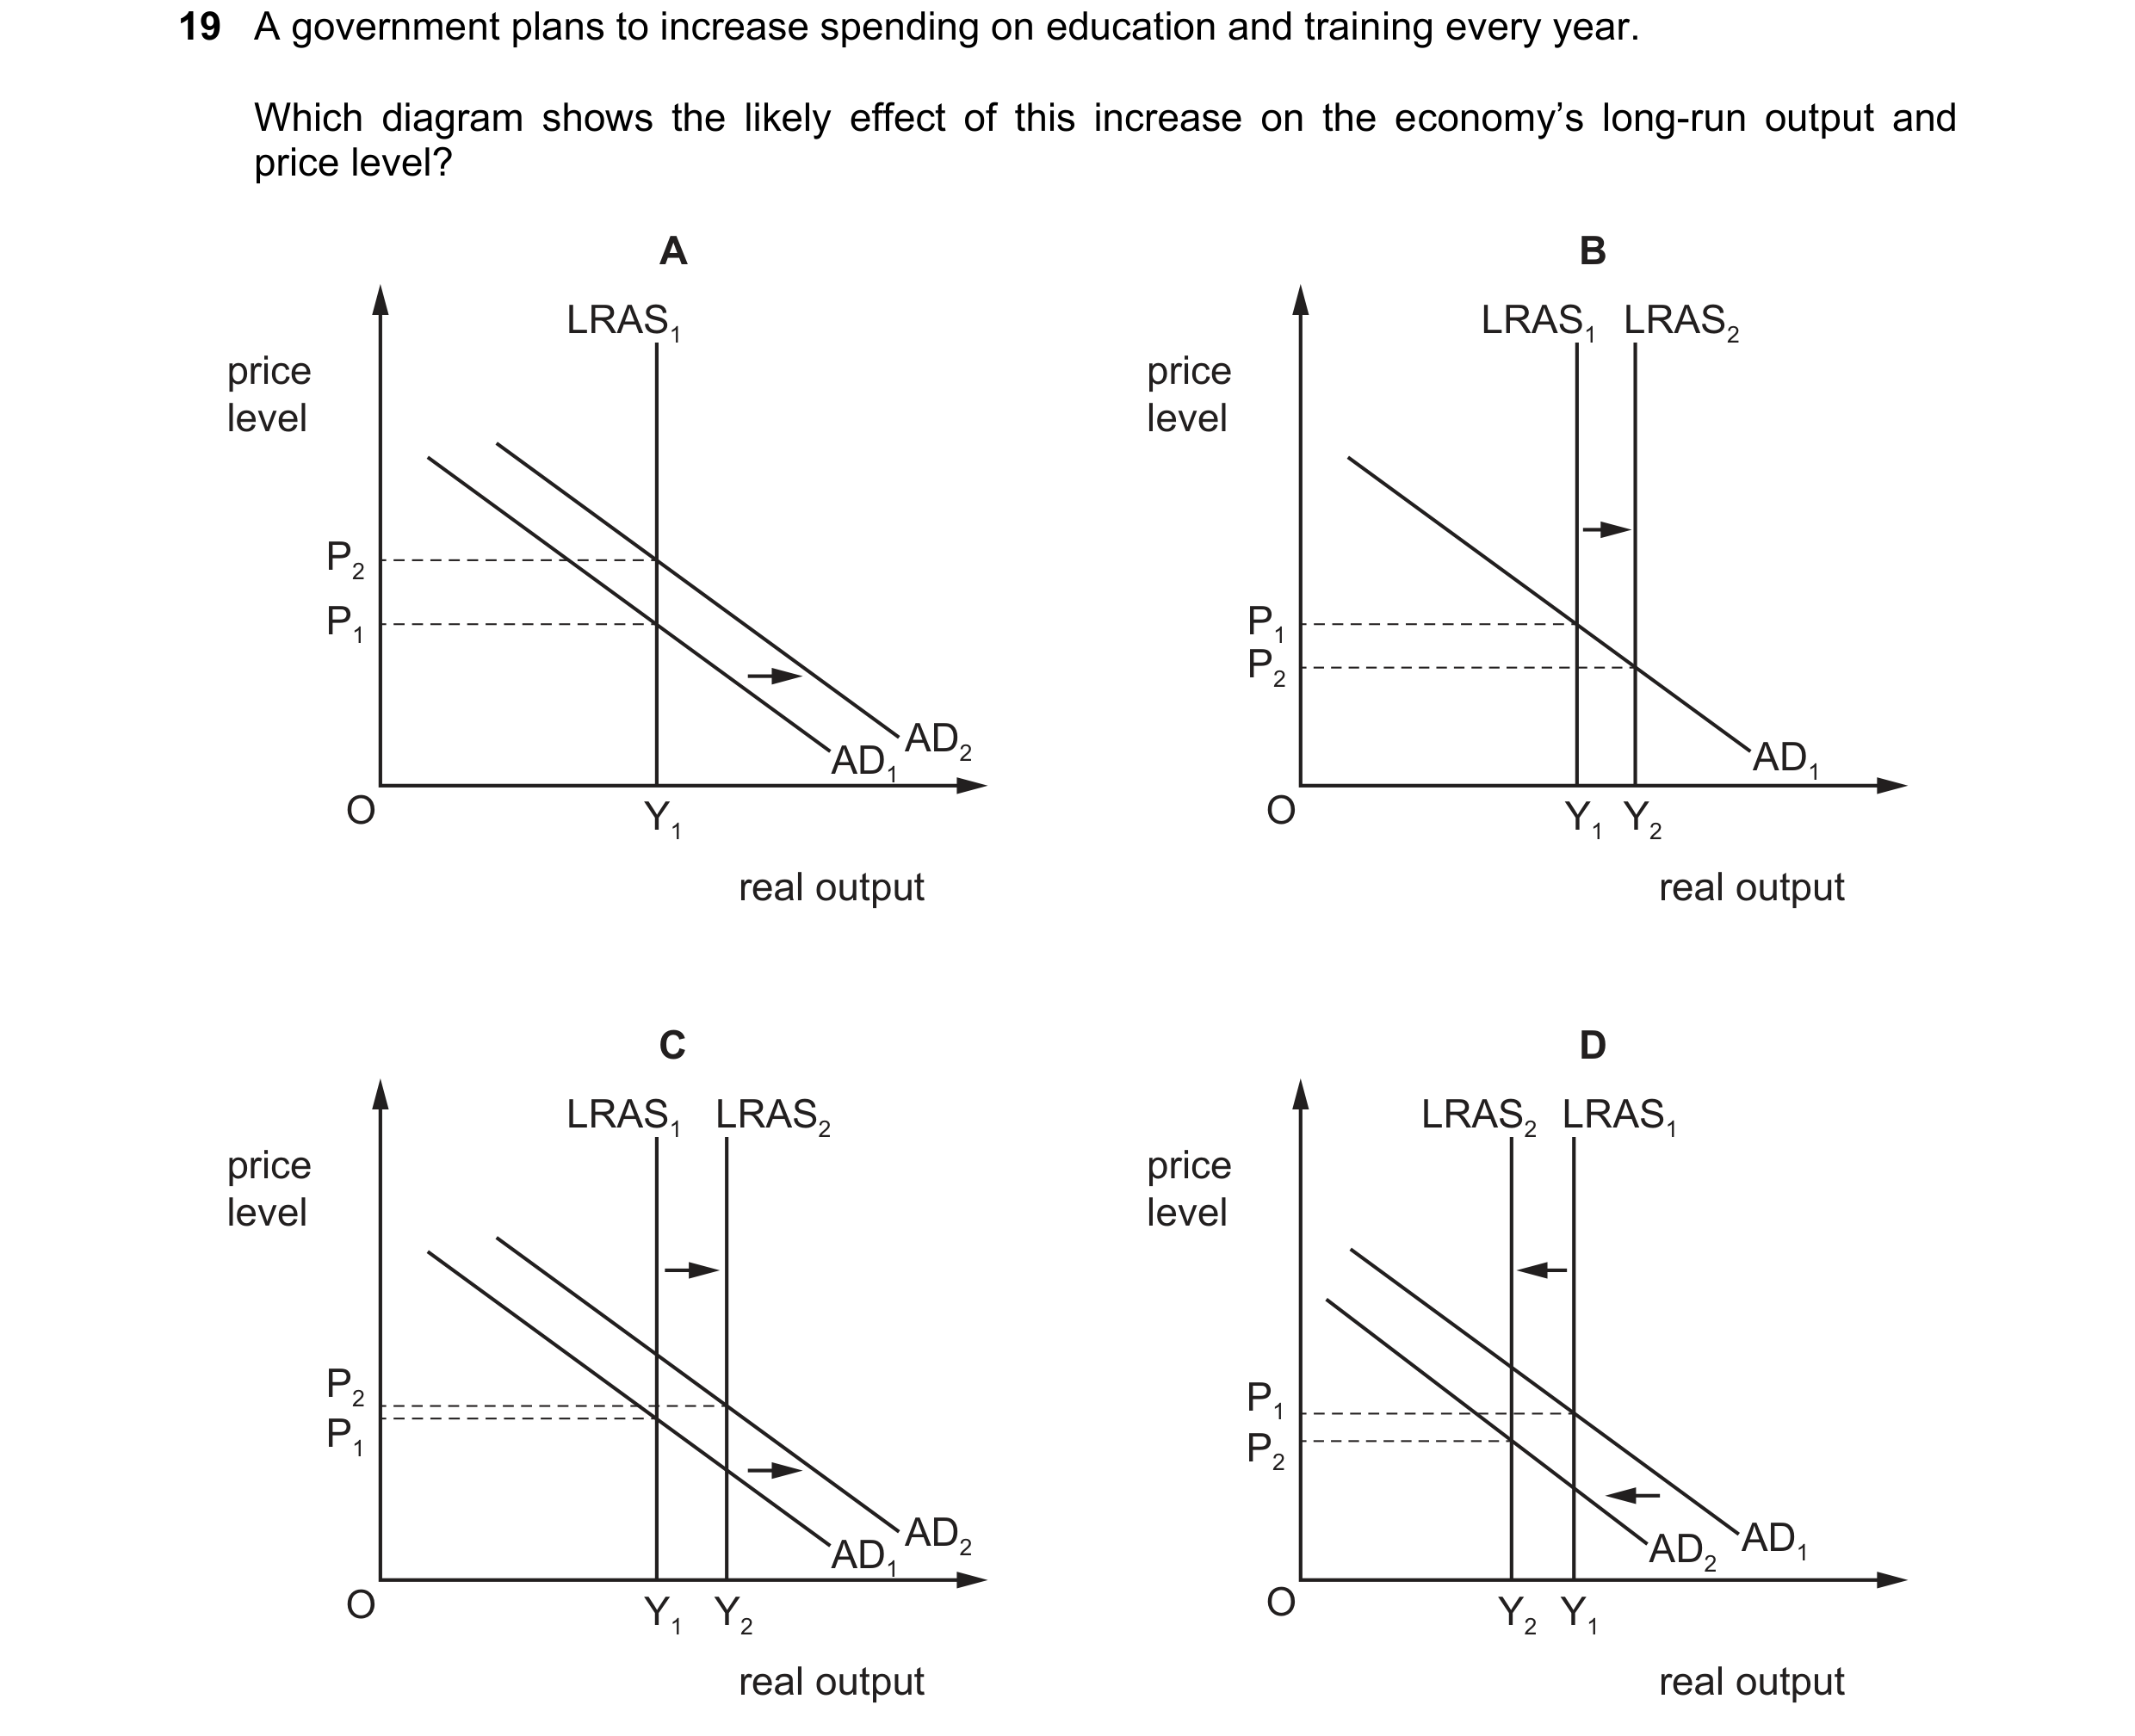
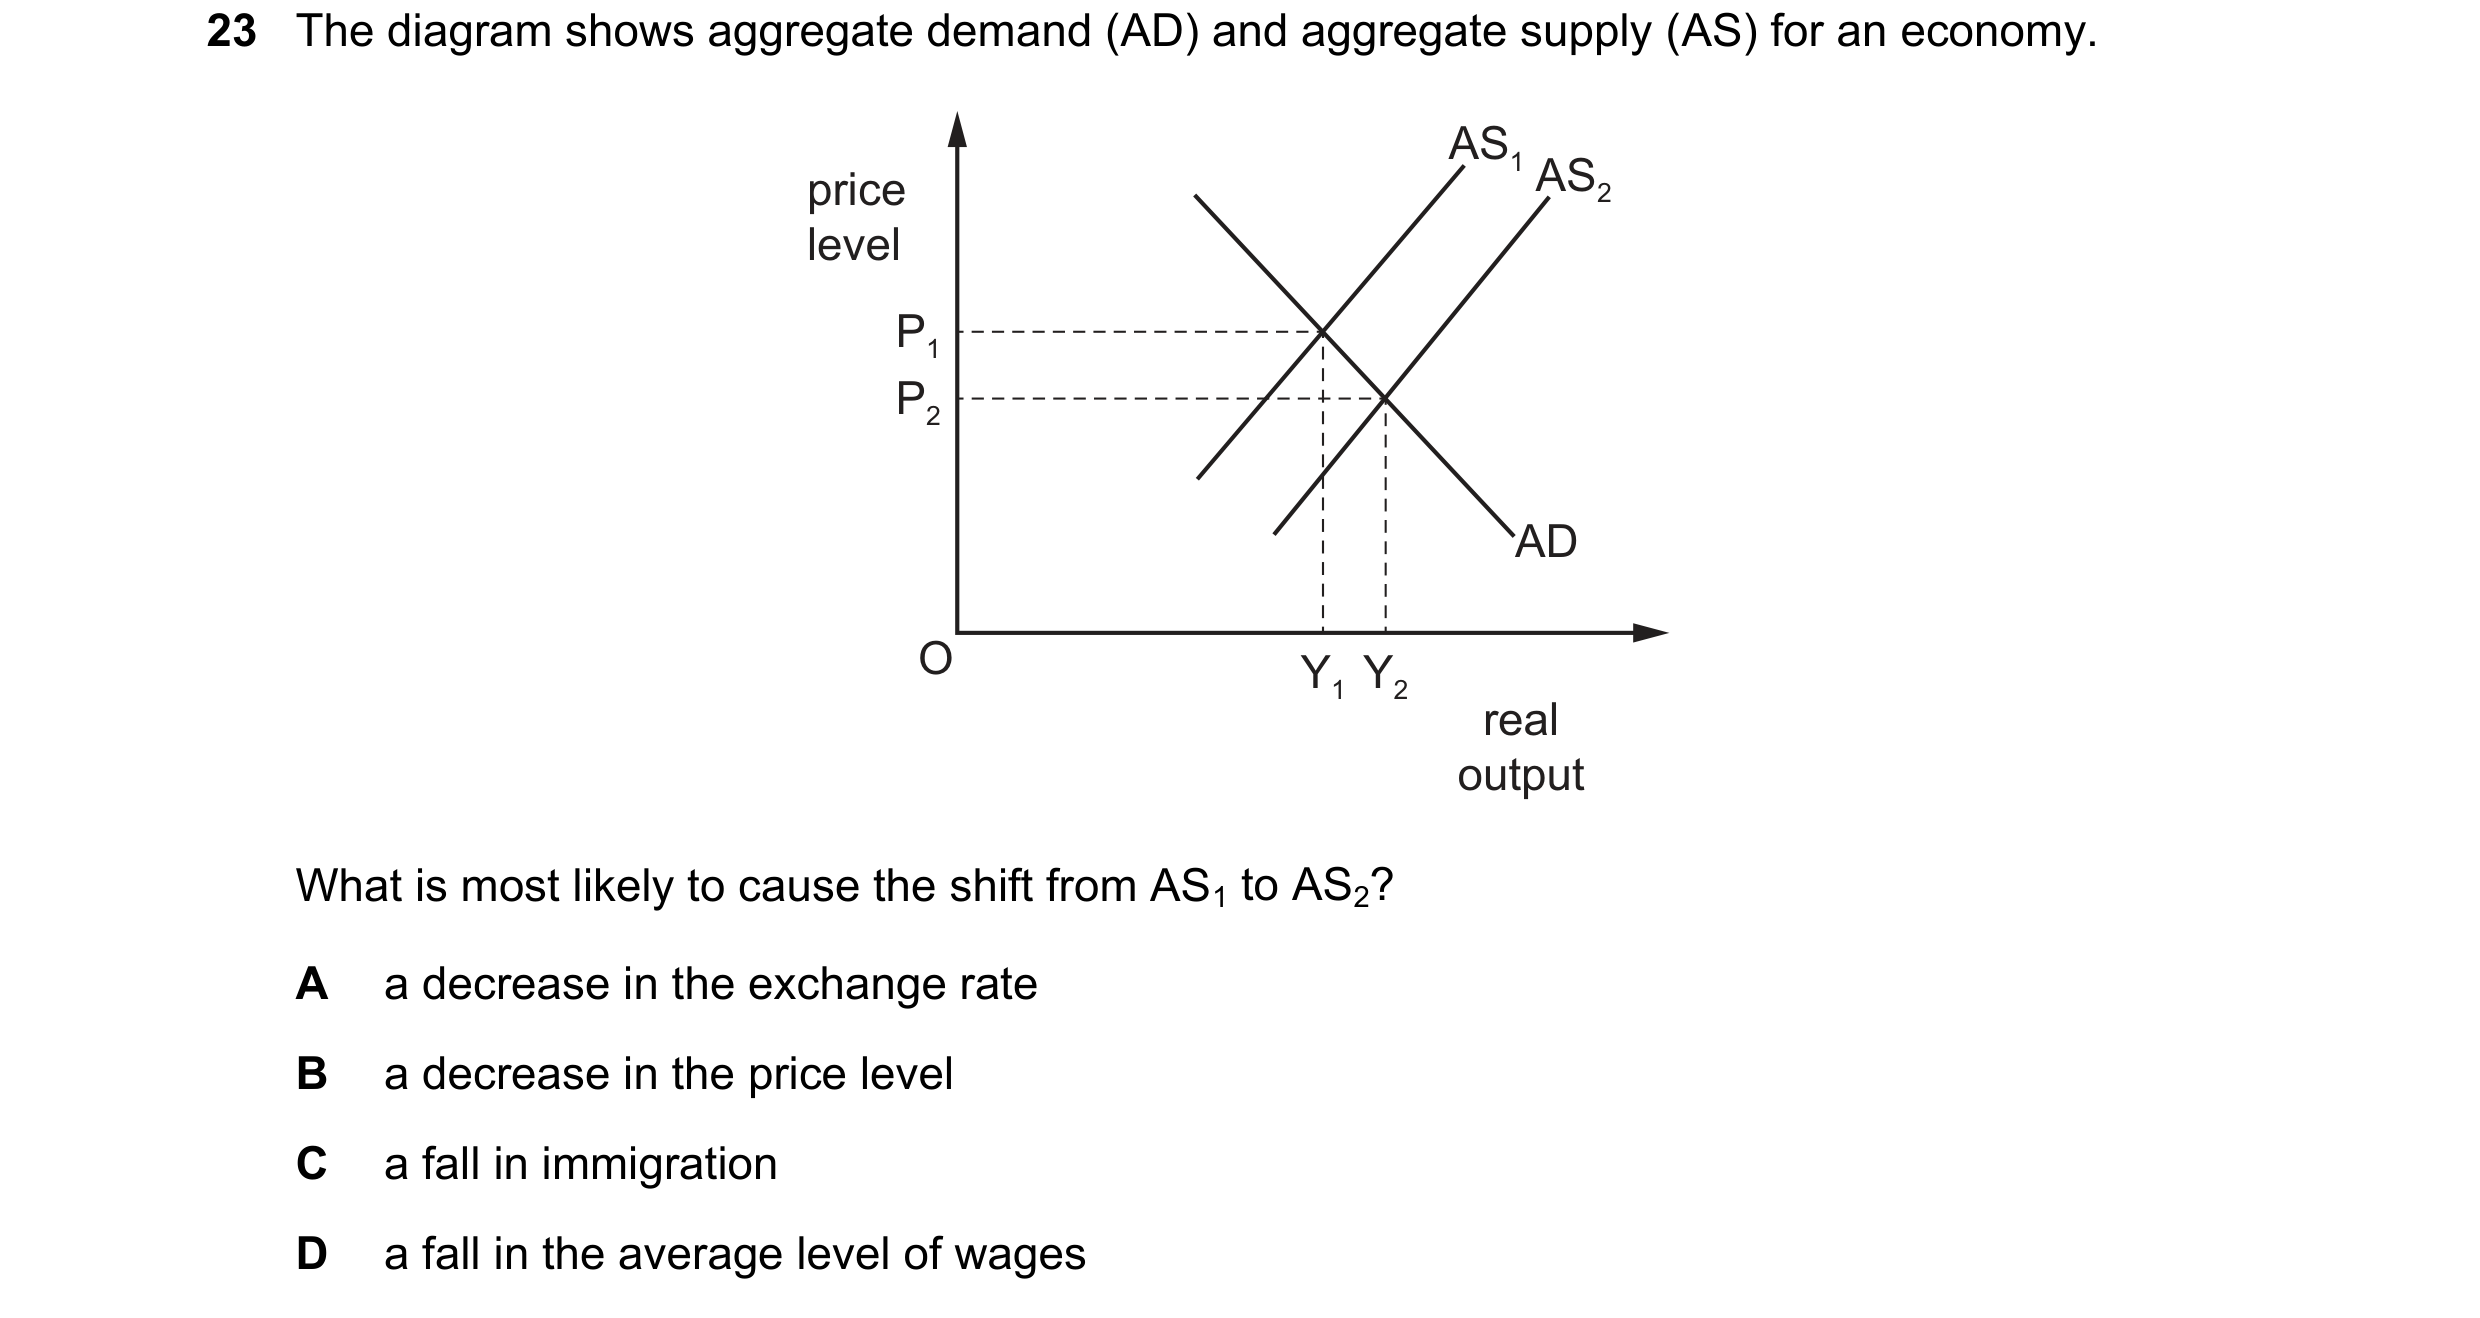 34 / 57
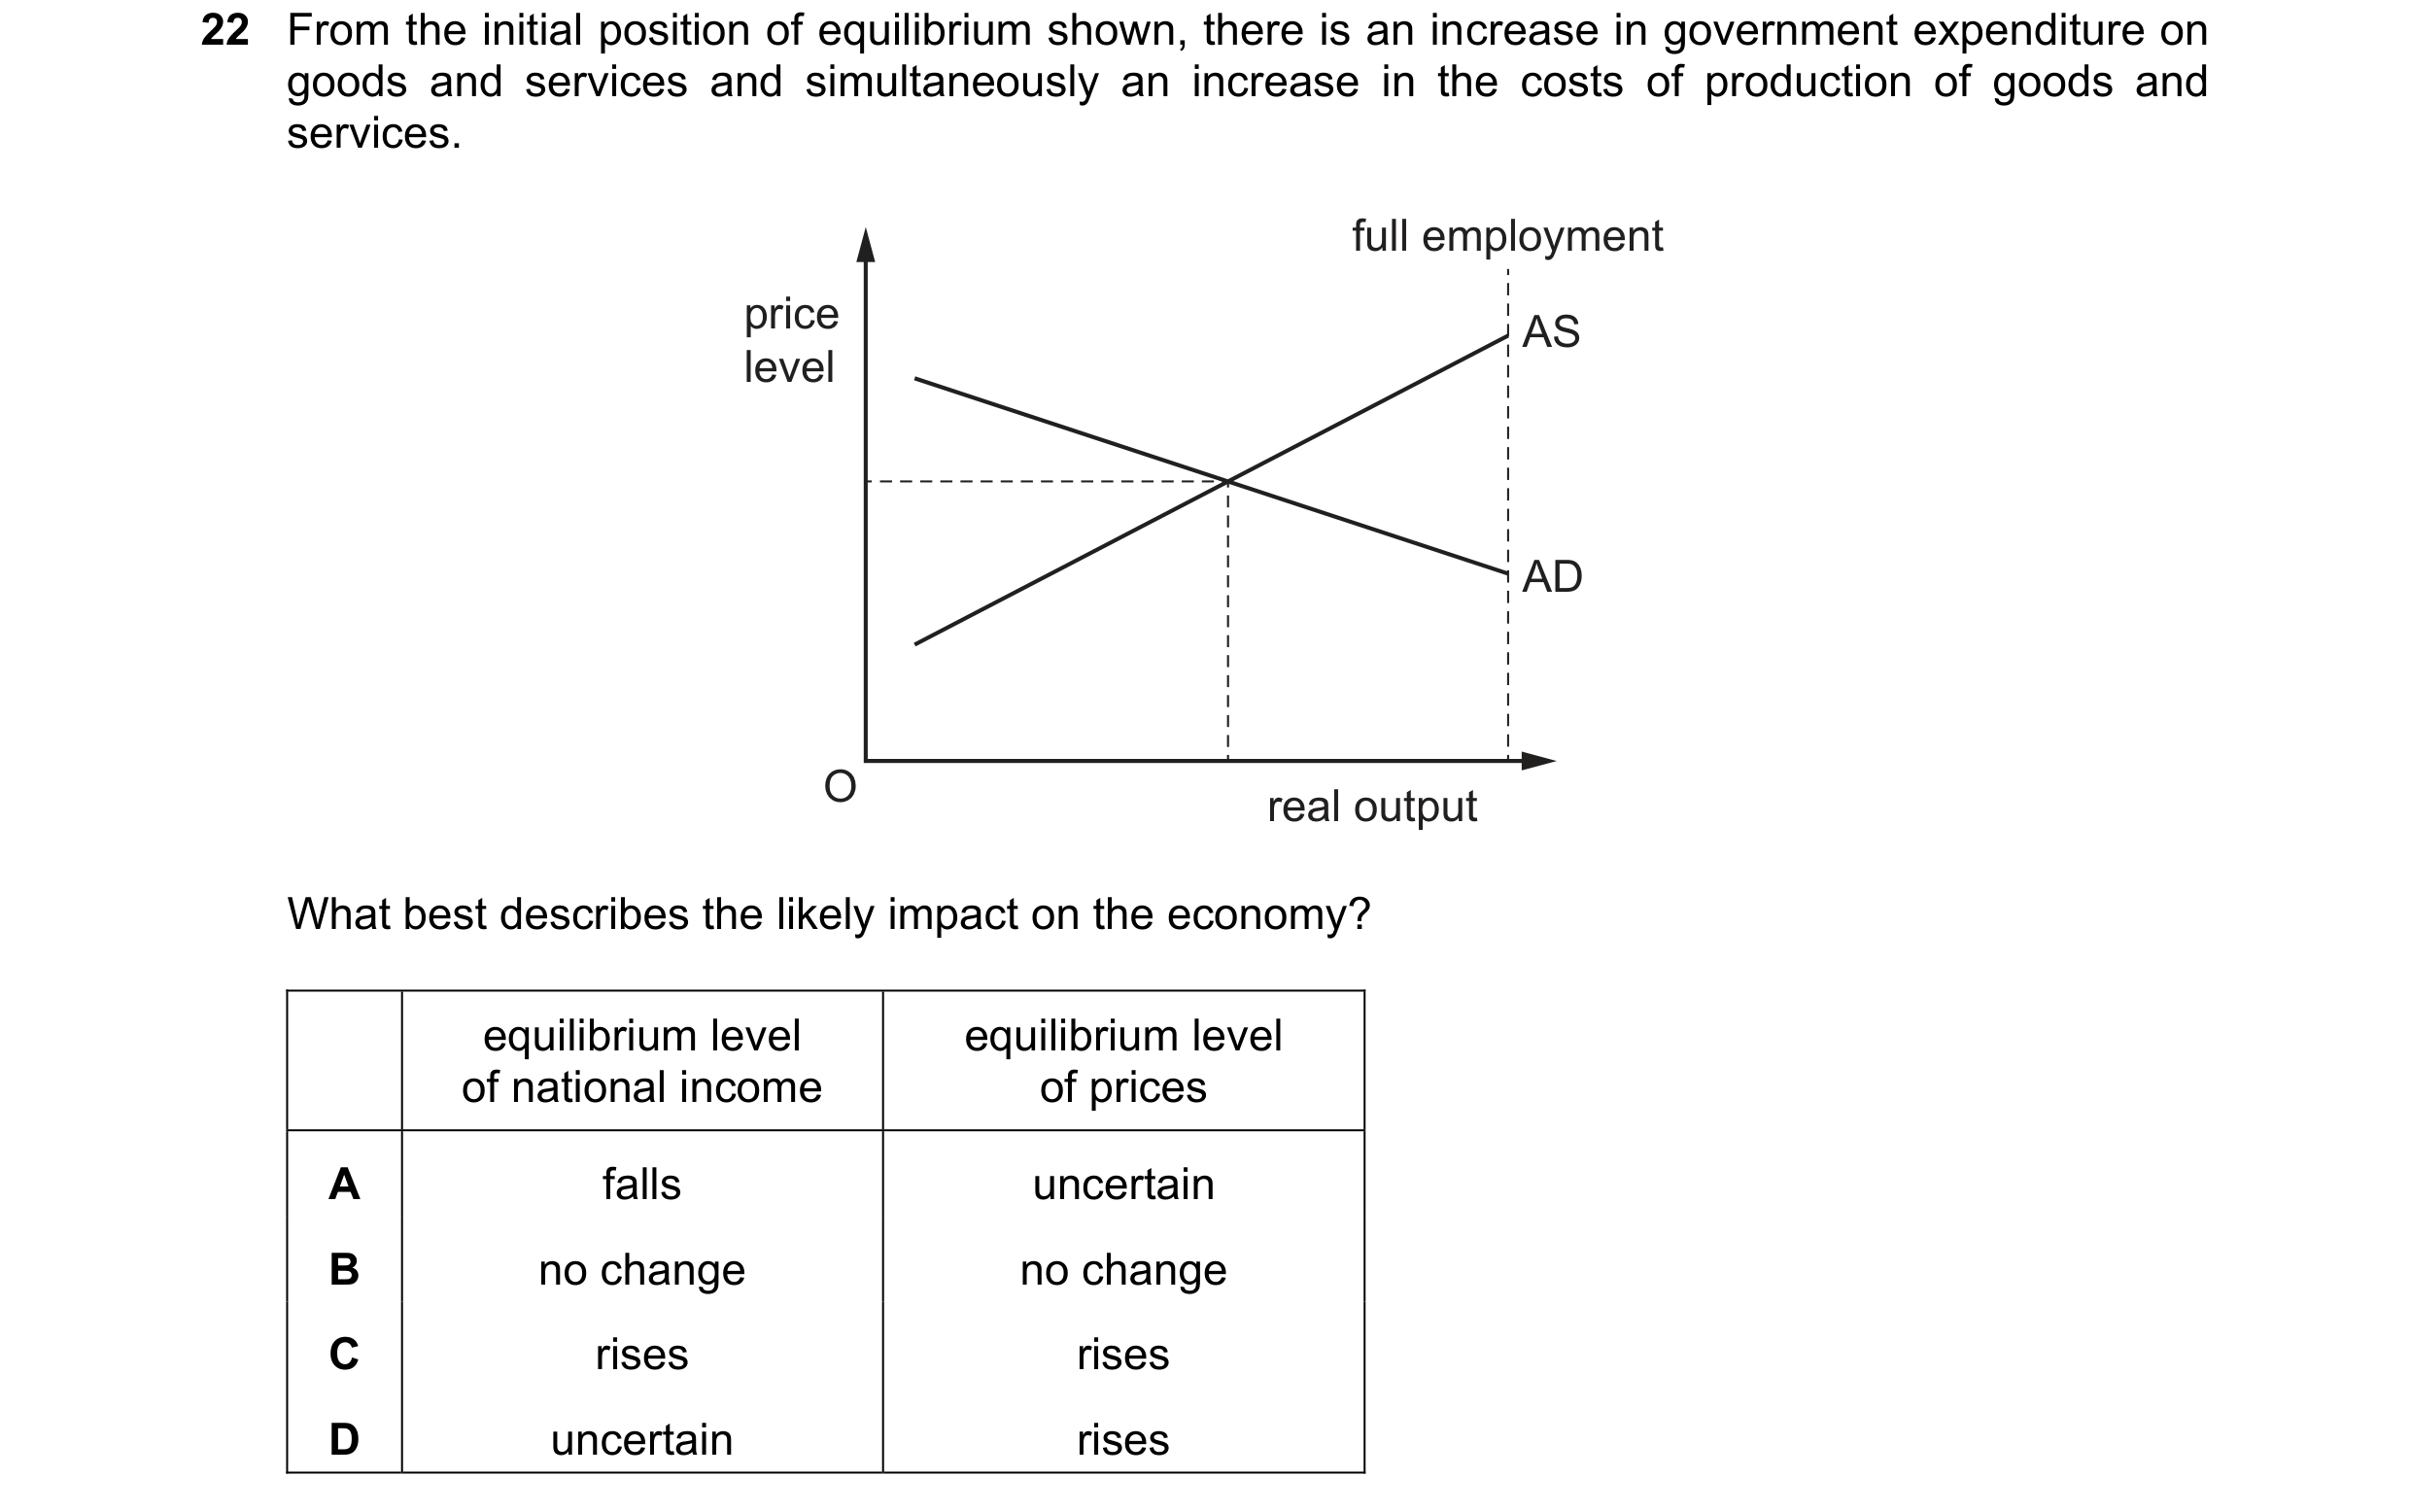
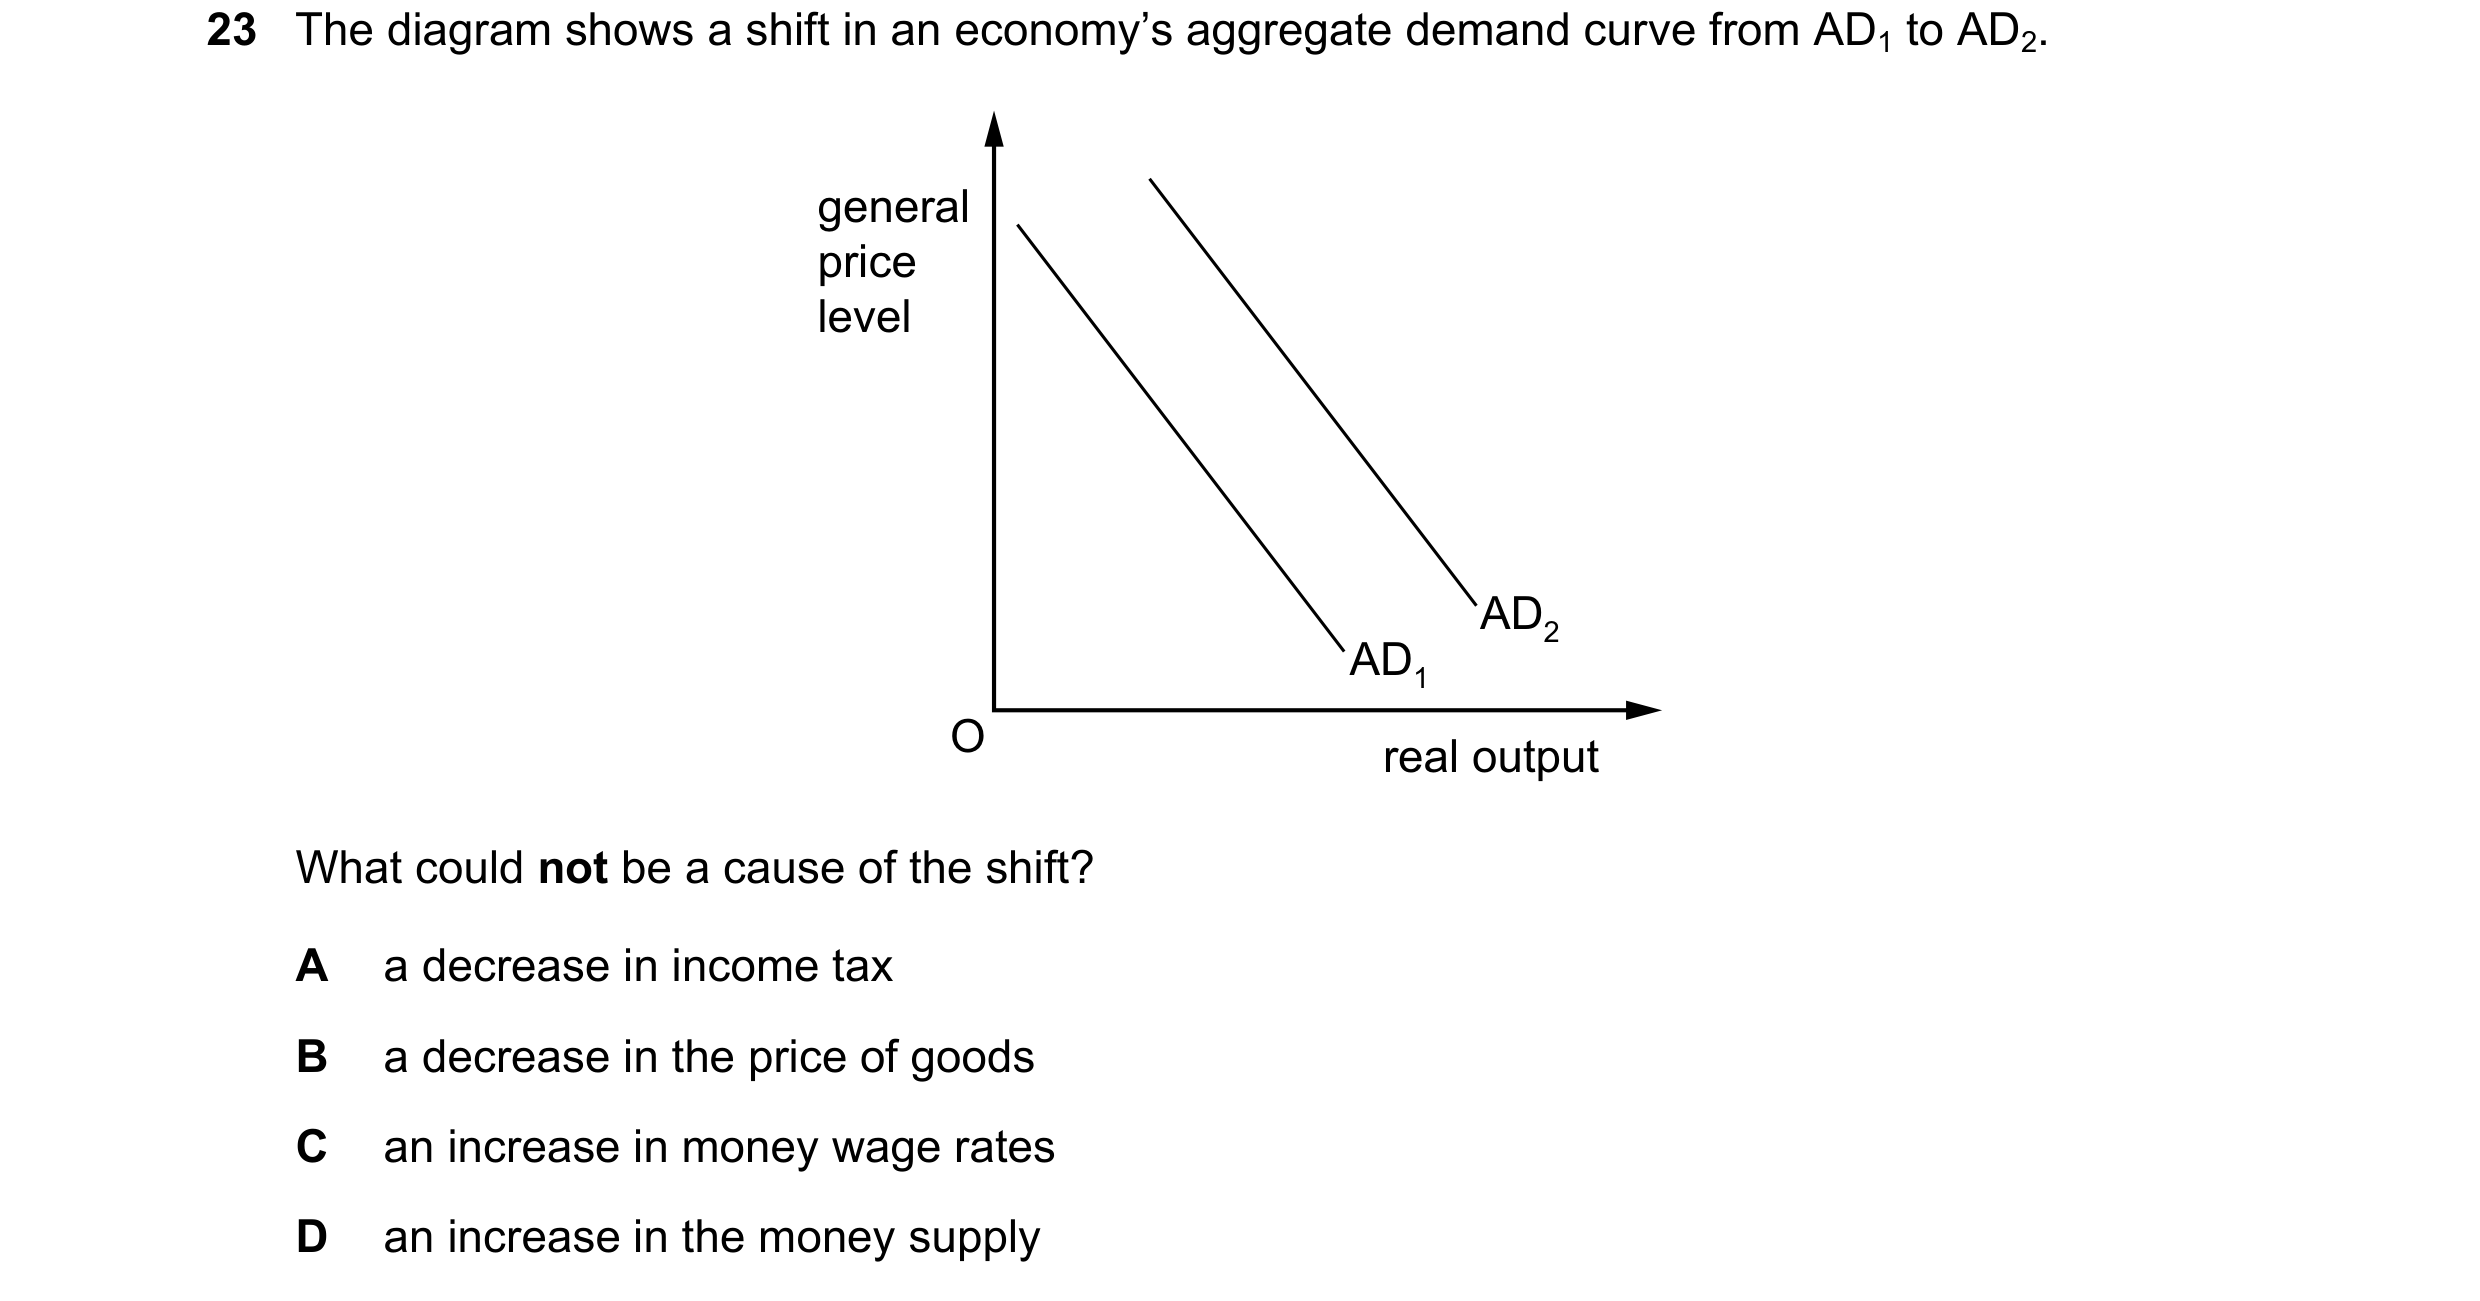 35 / 57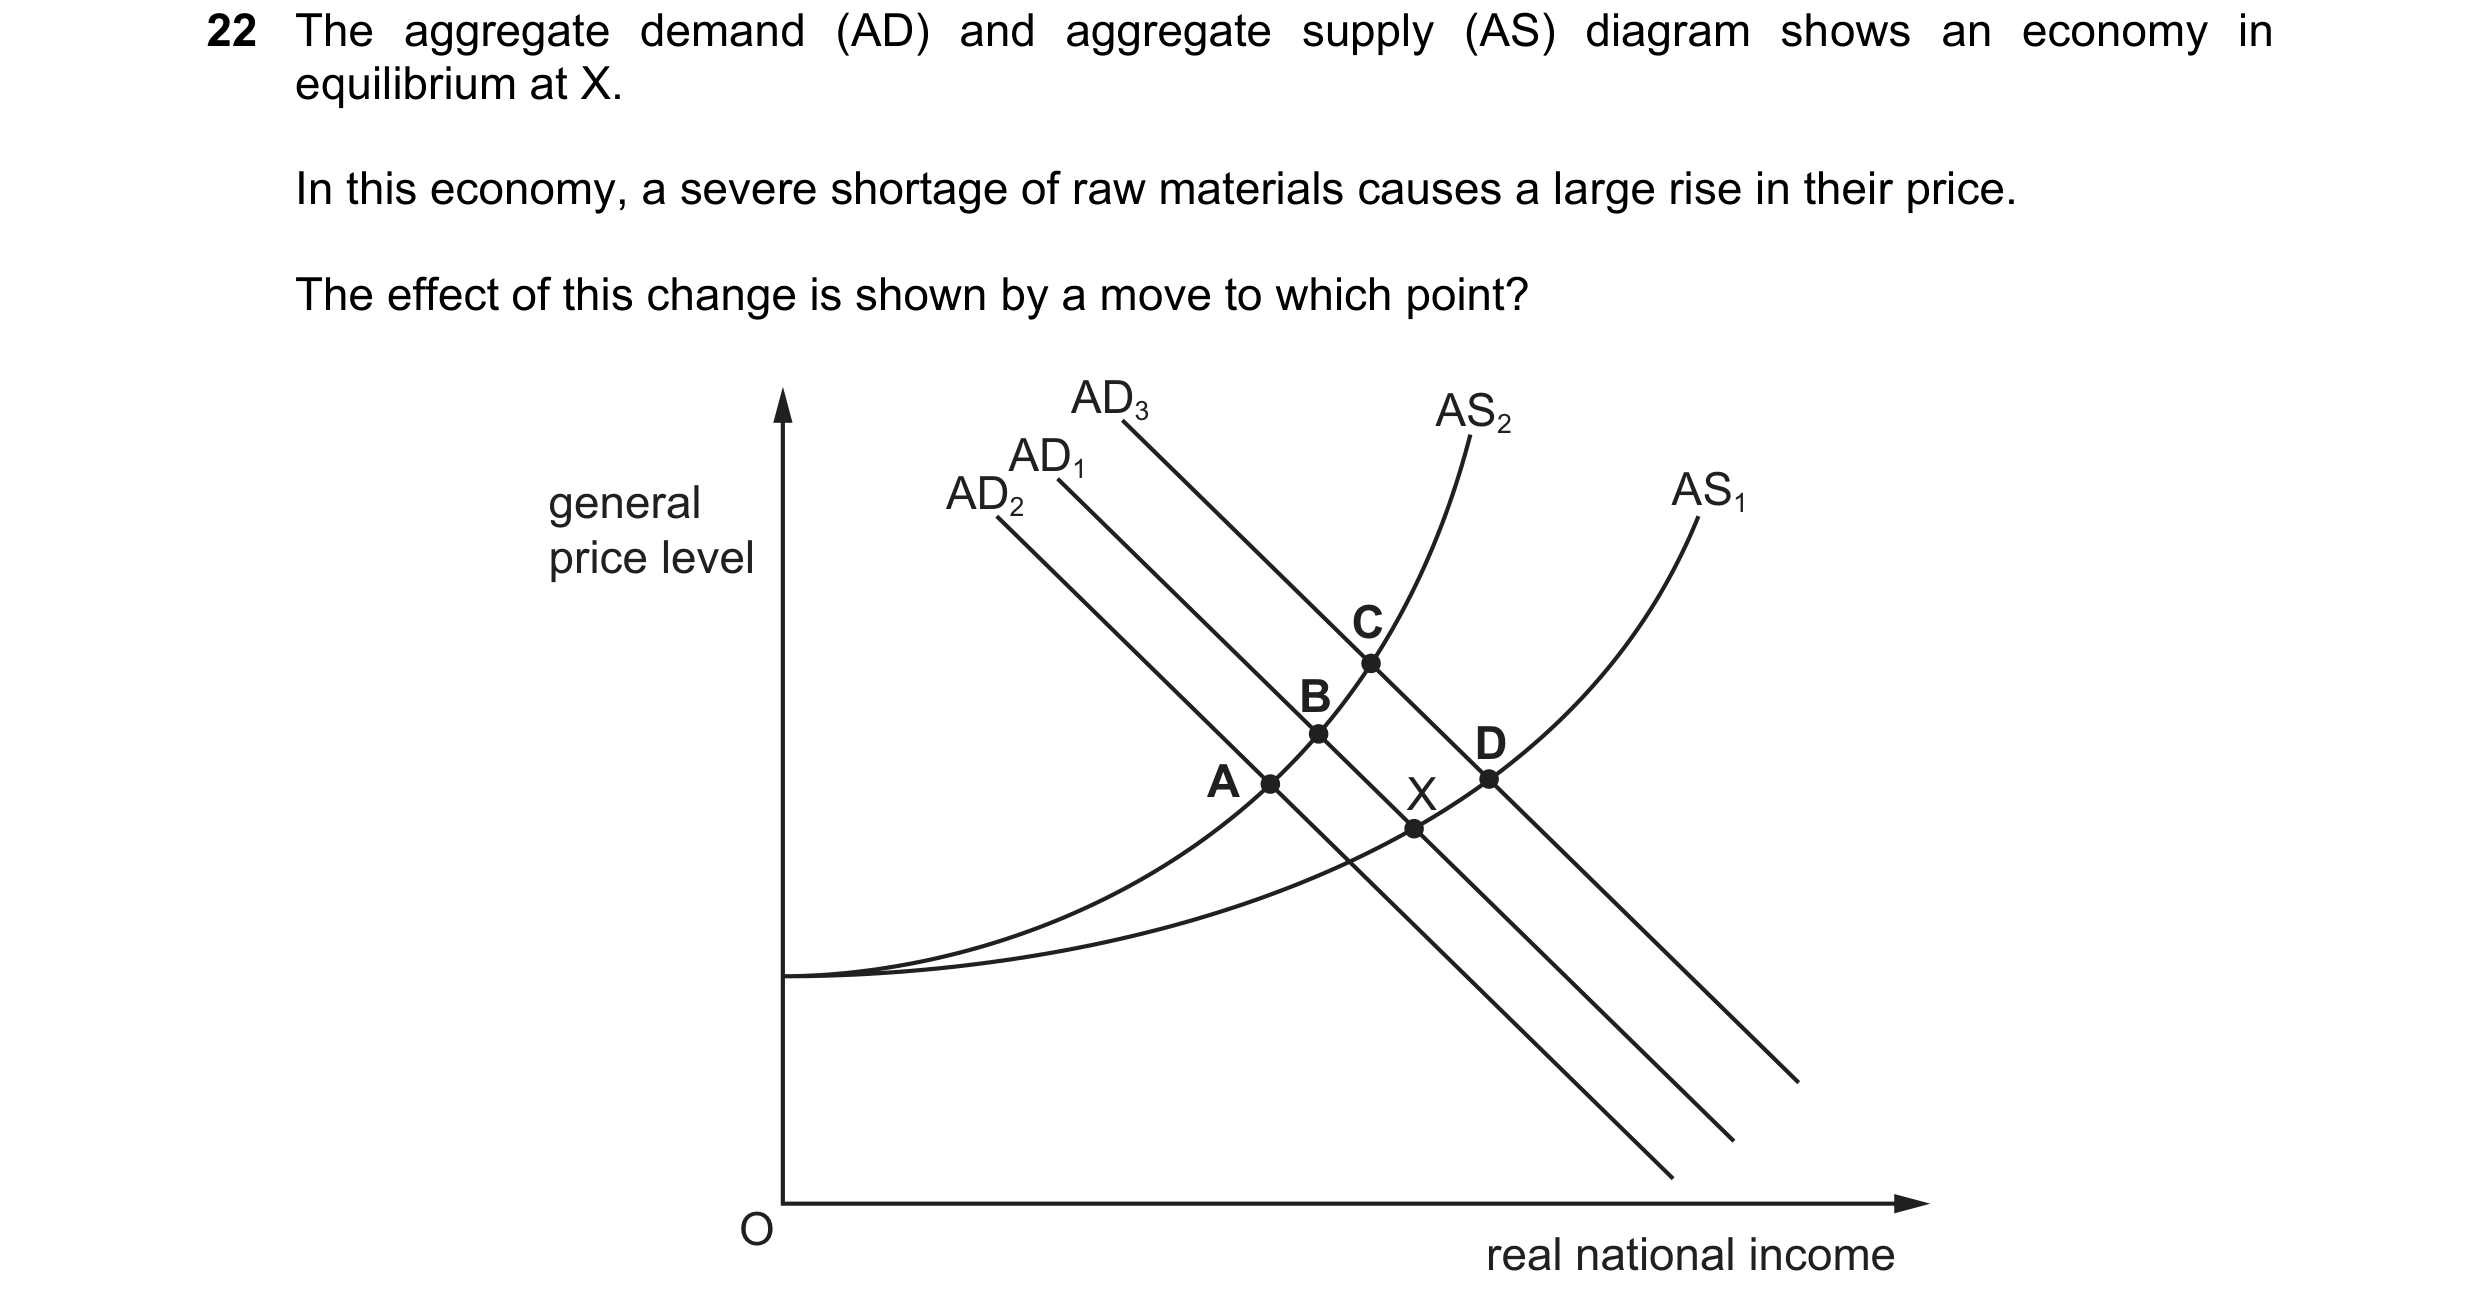
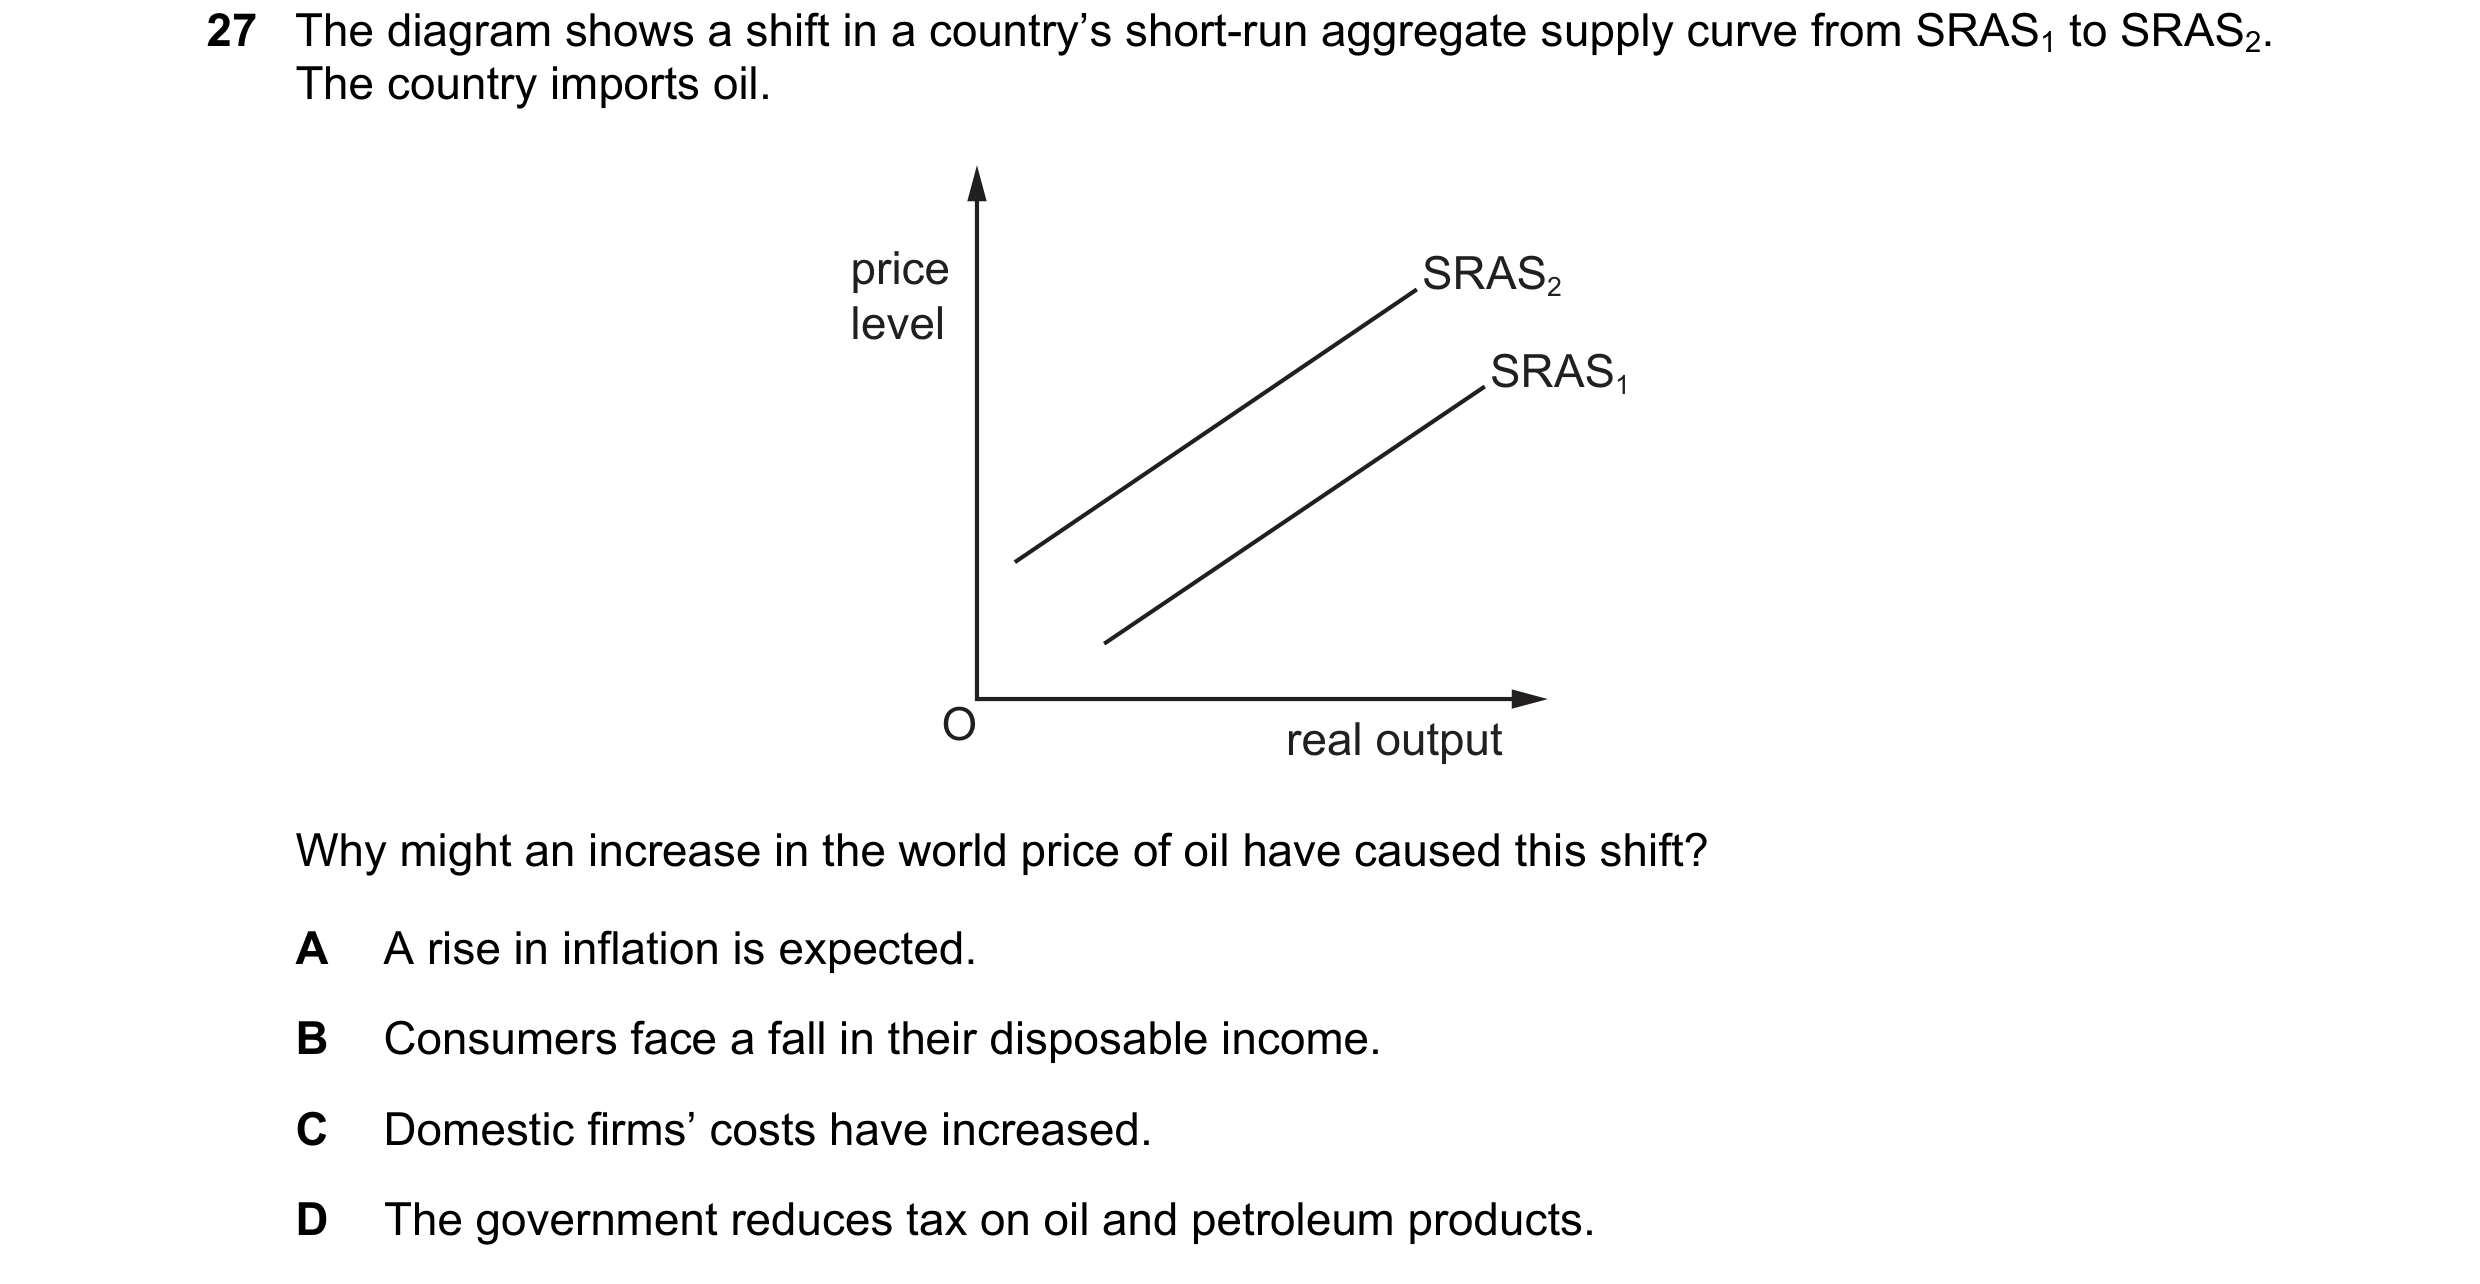 36 / 57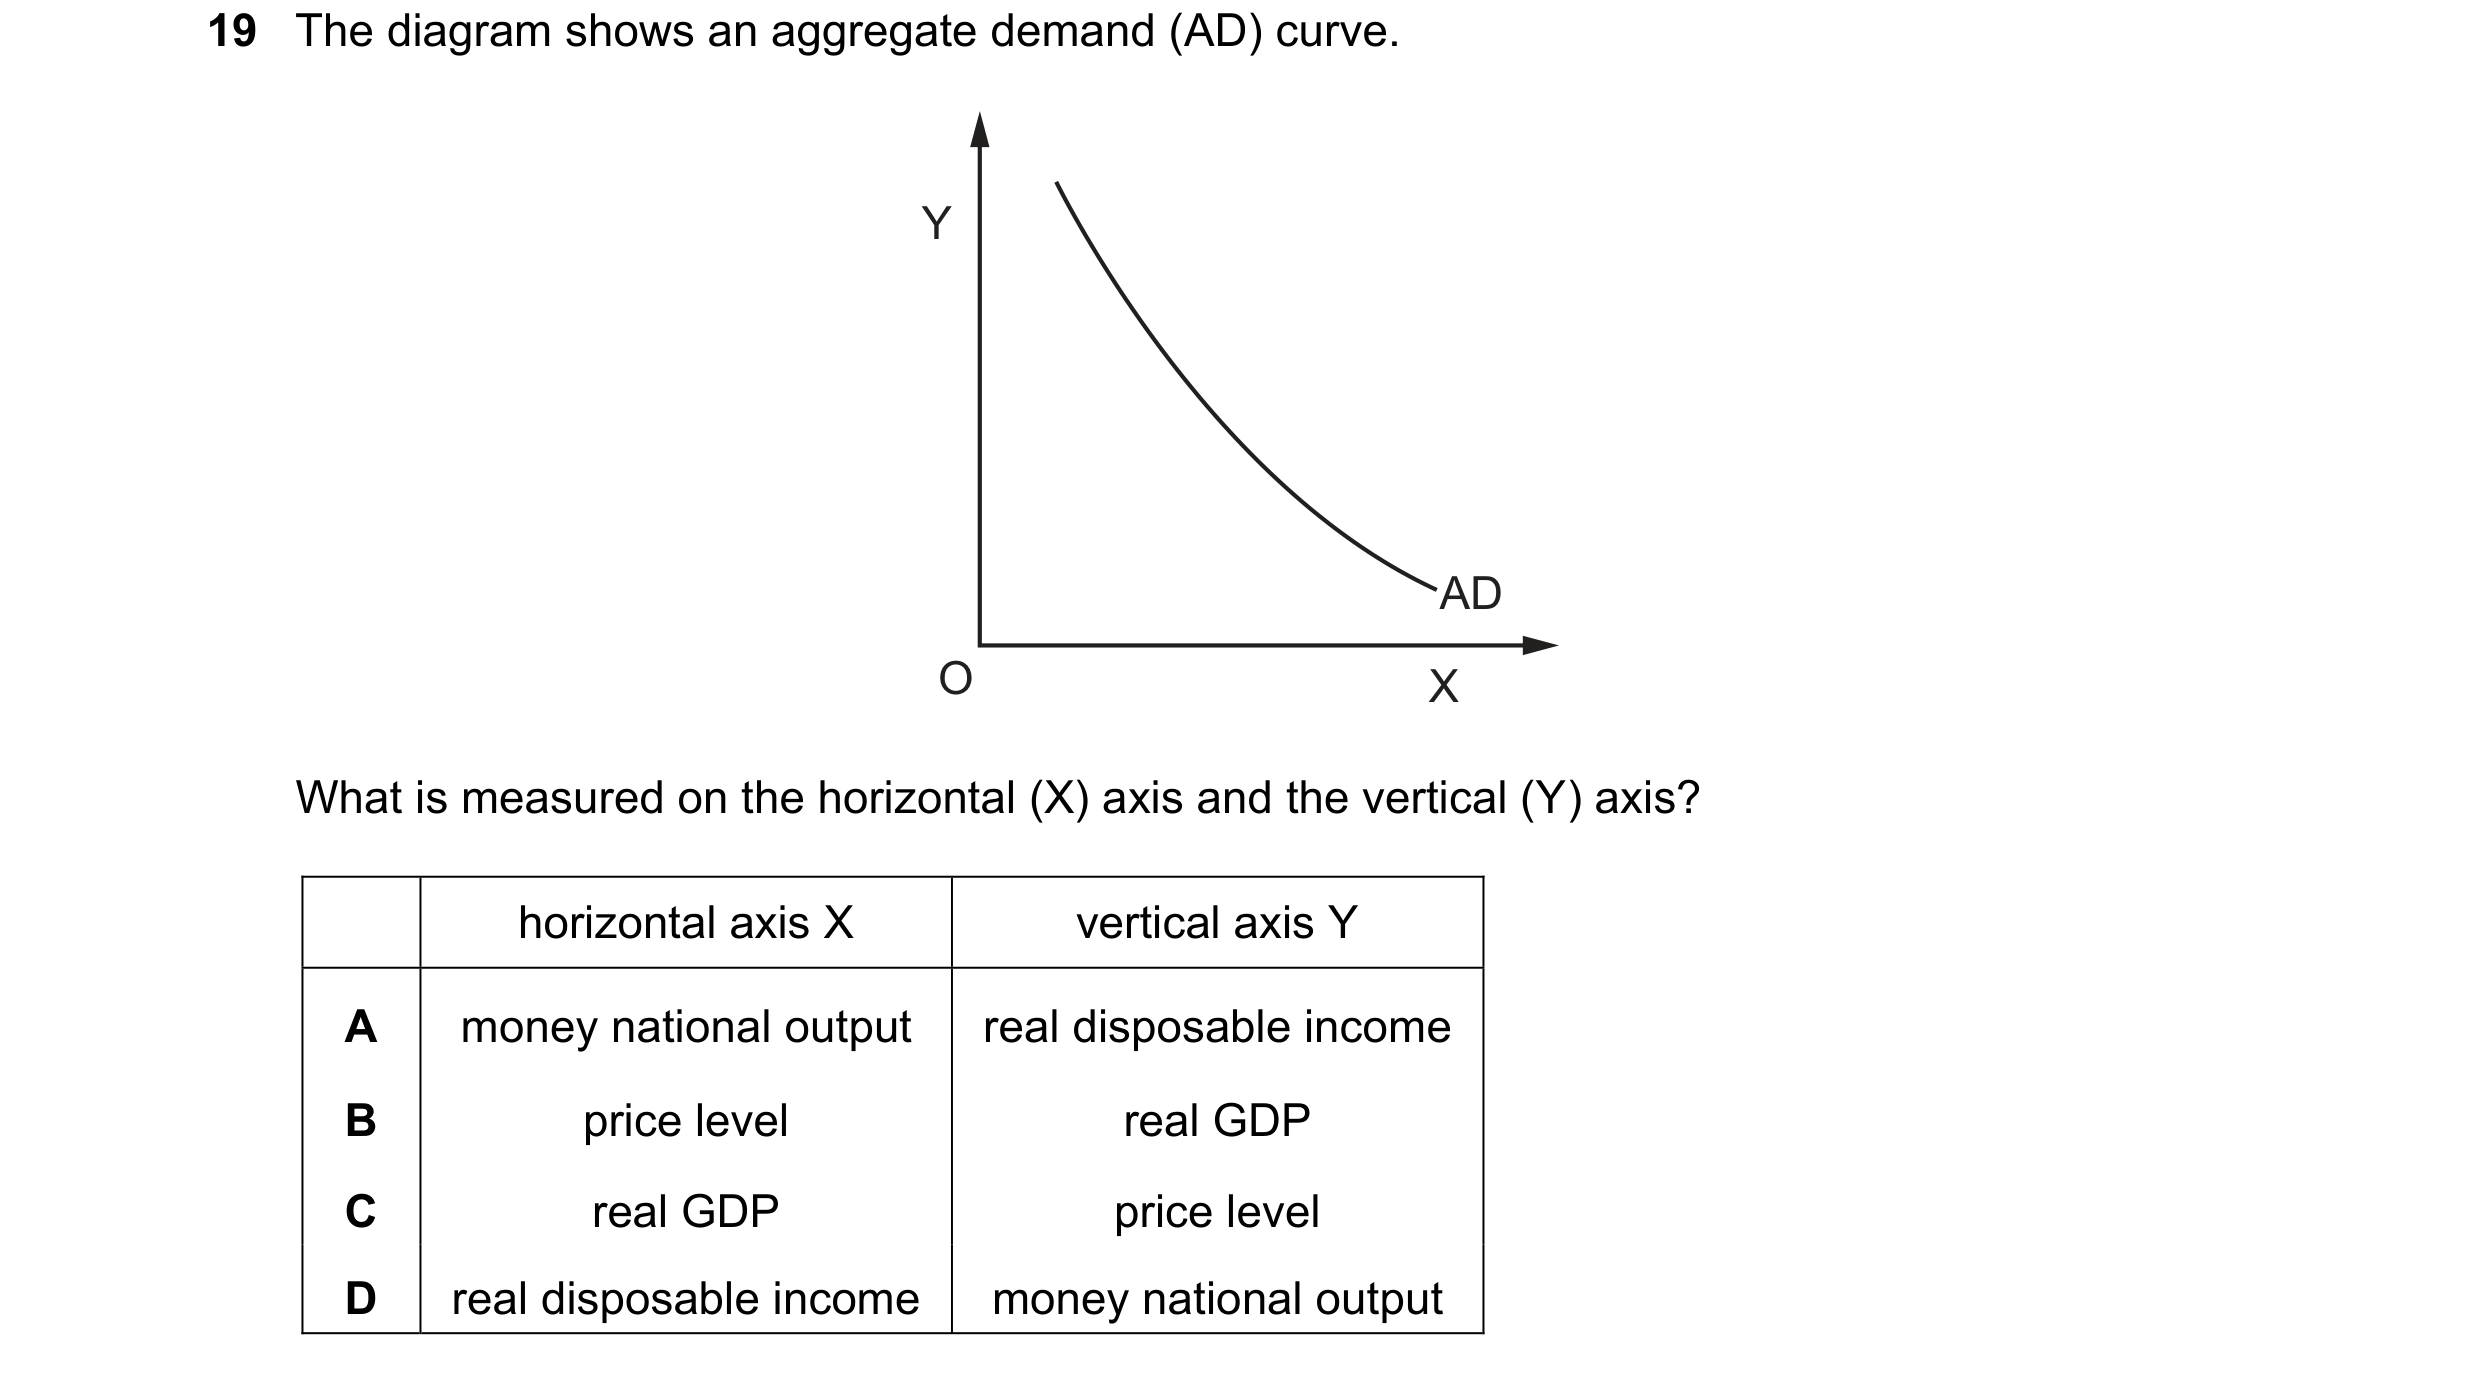
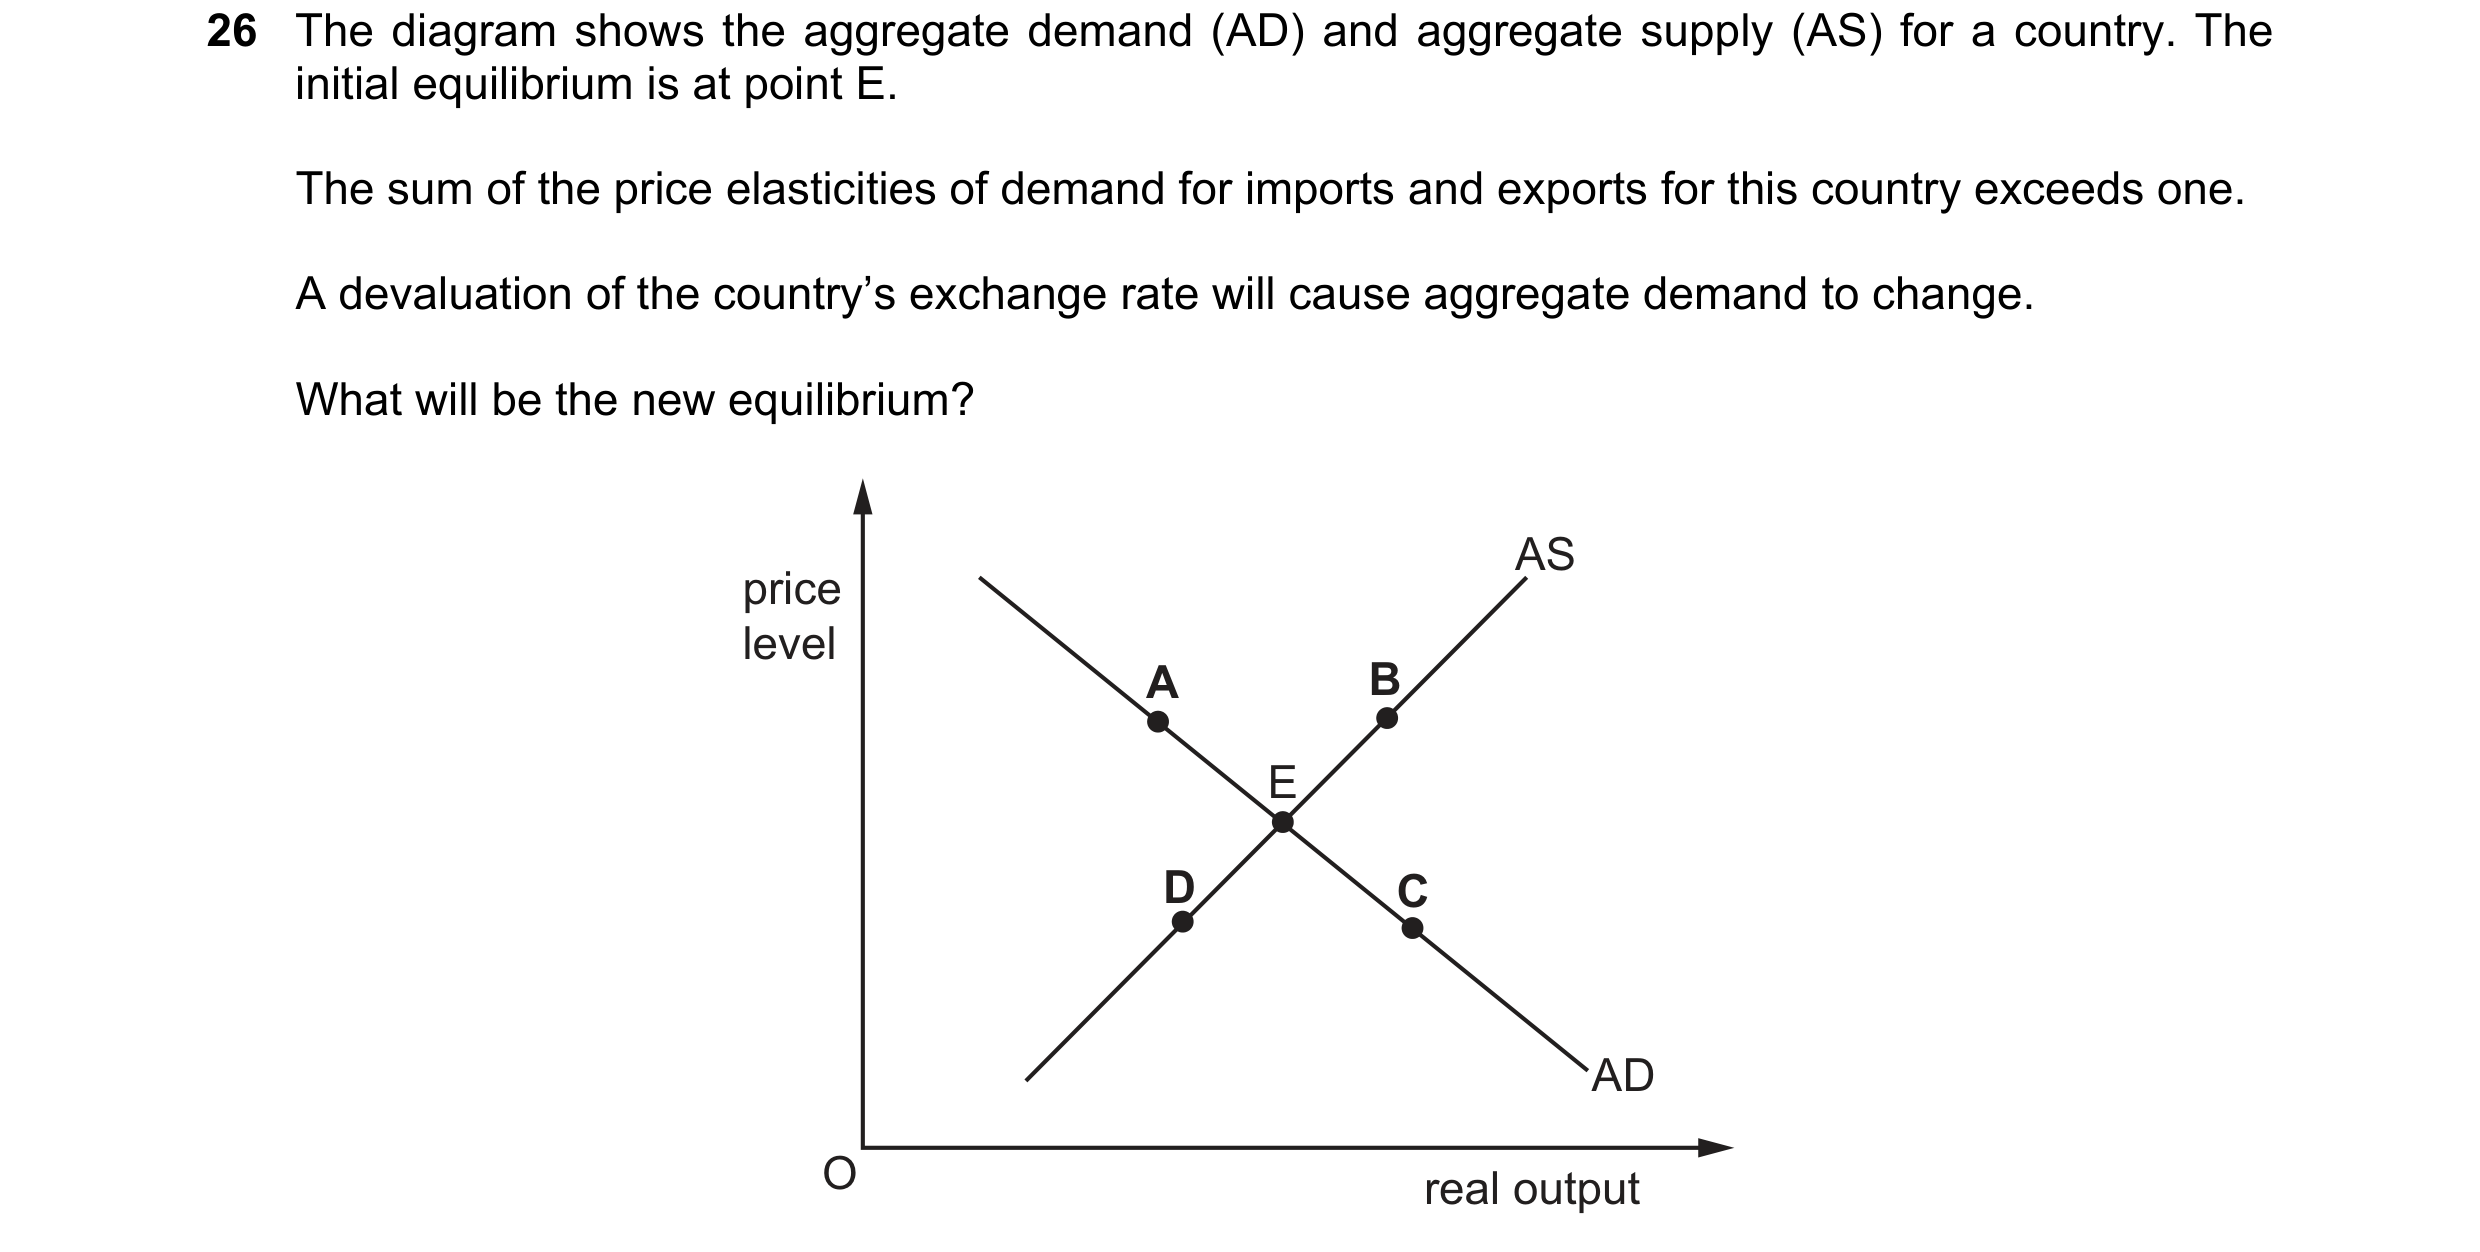 37 / 57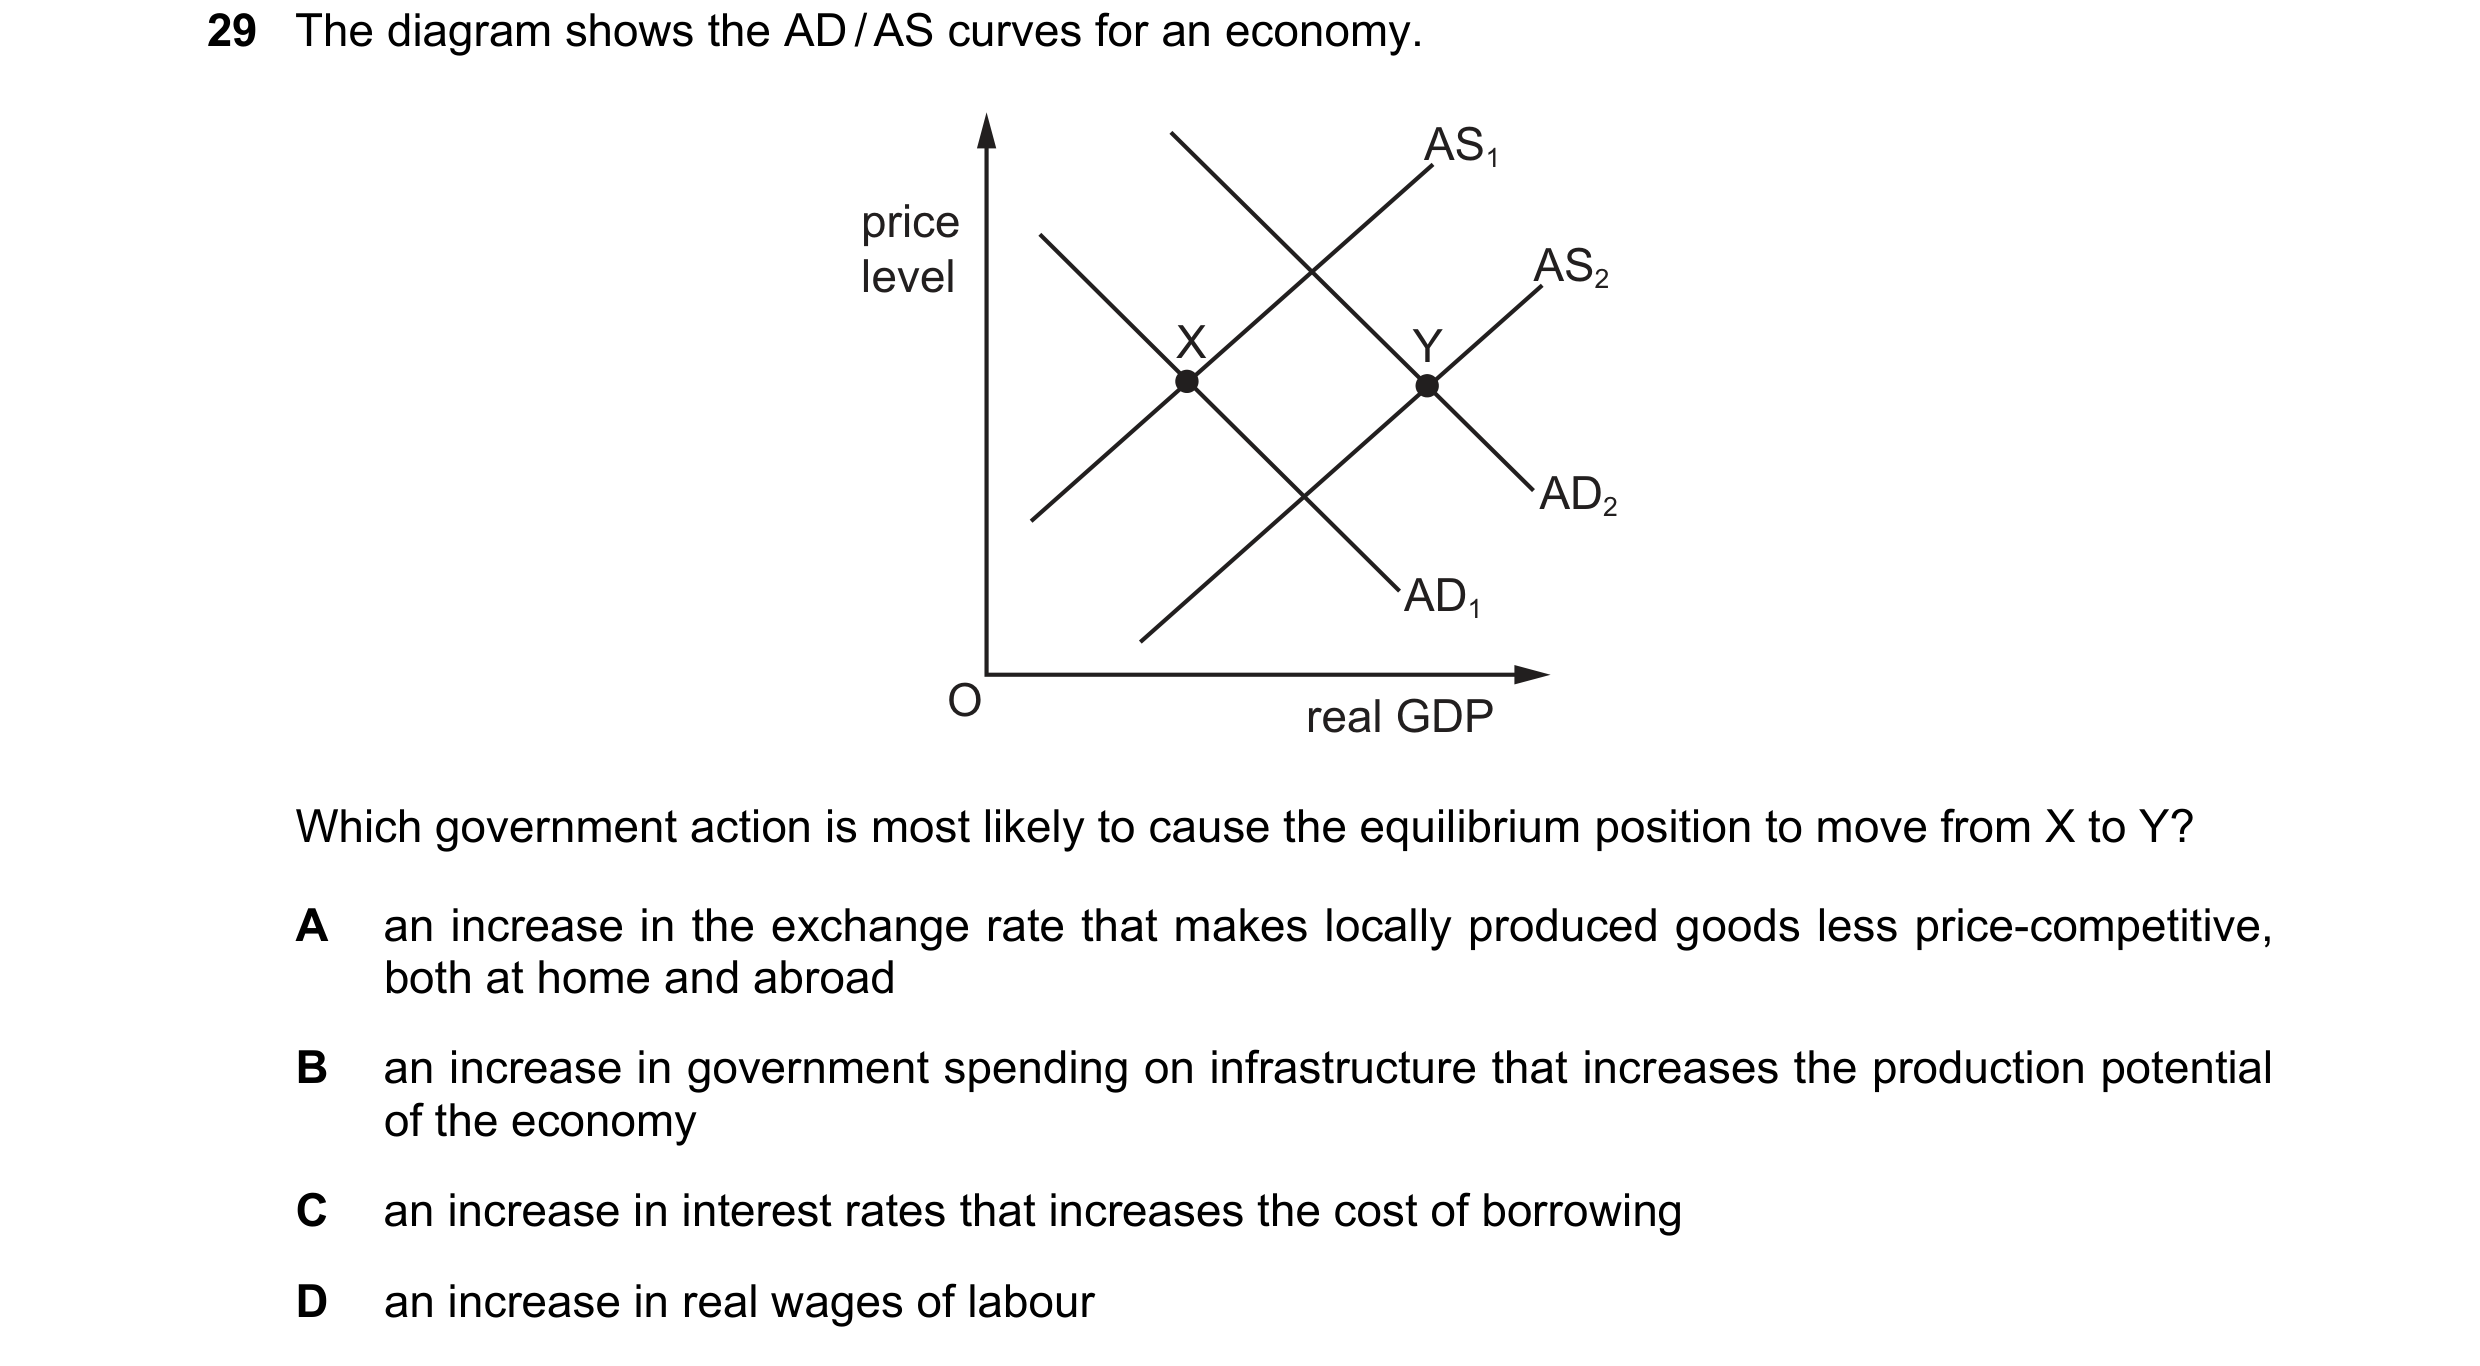
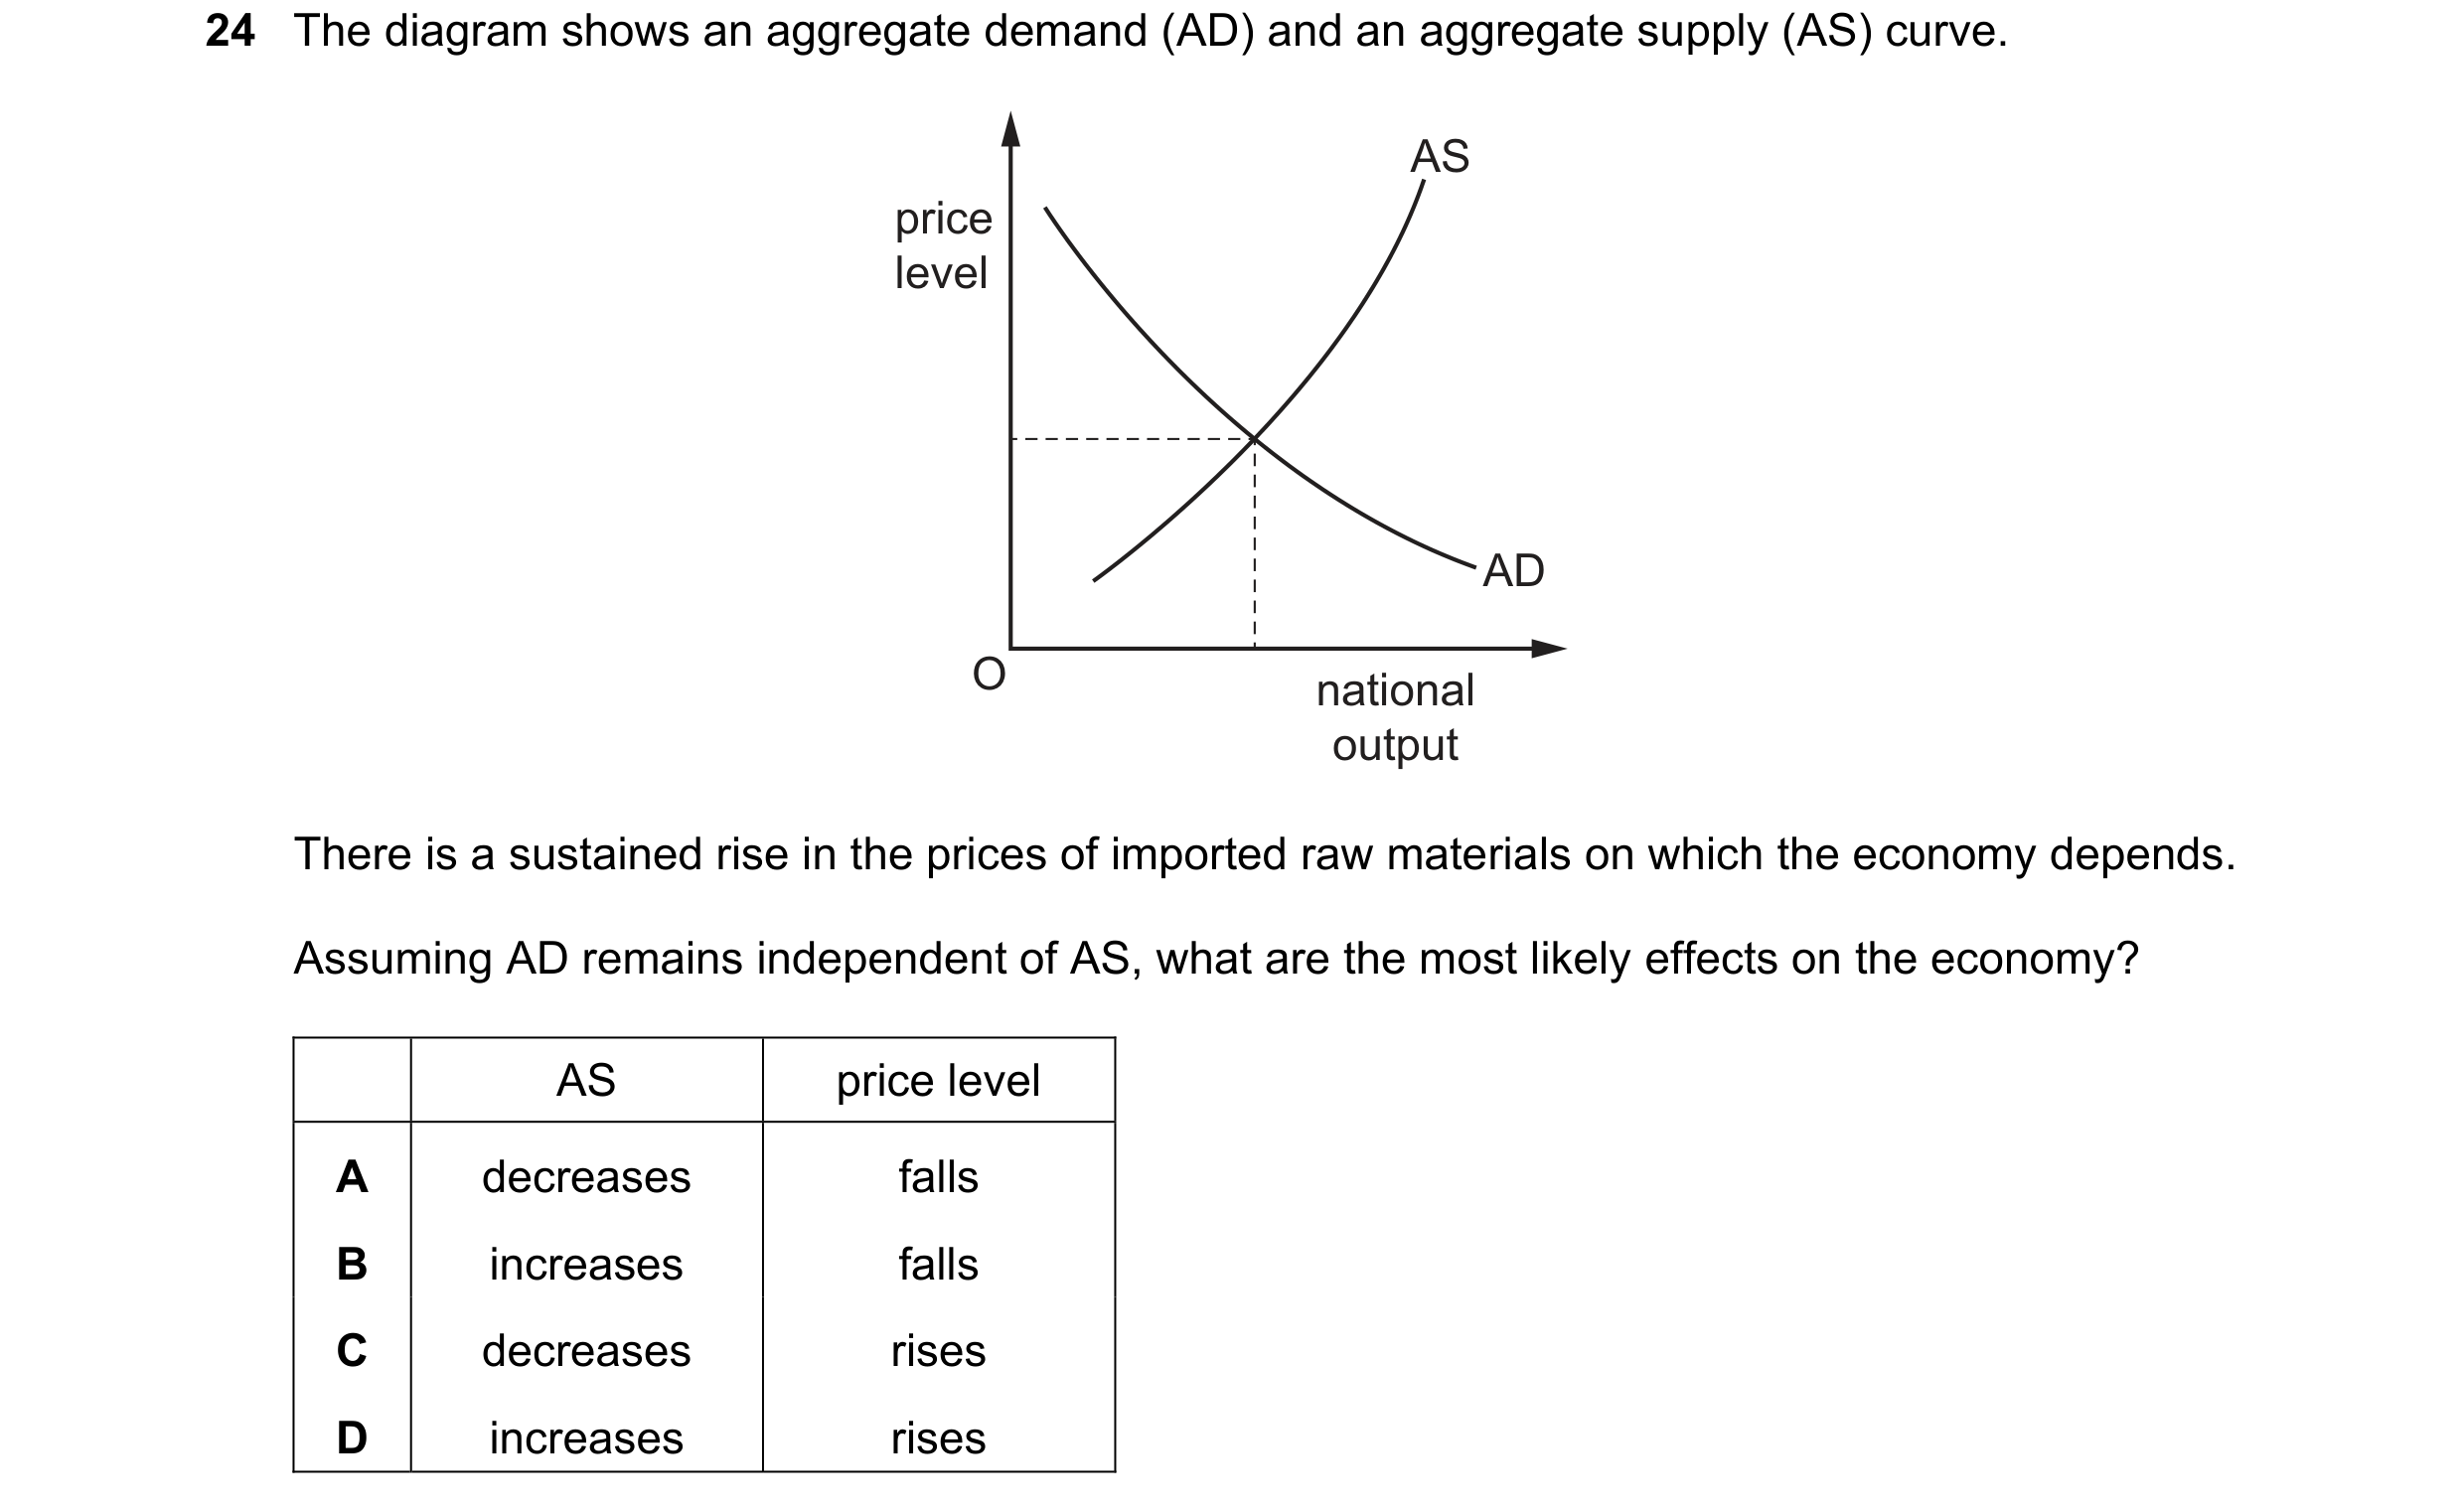 38 / 57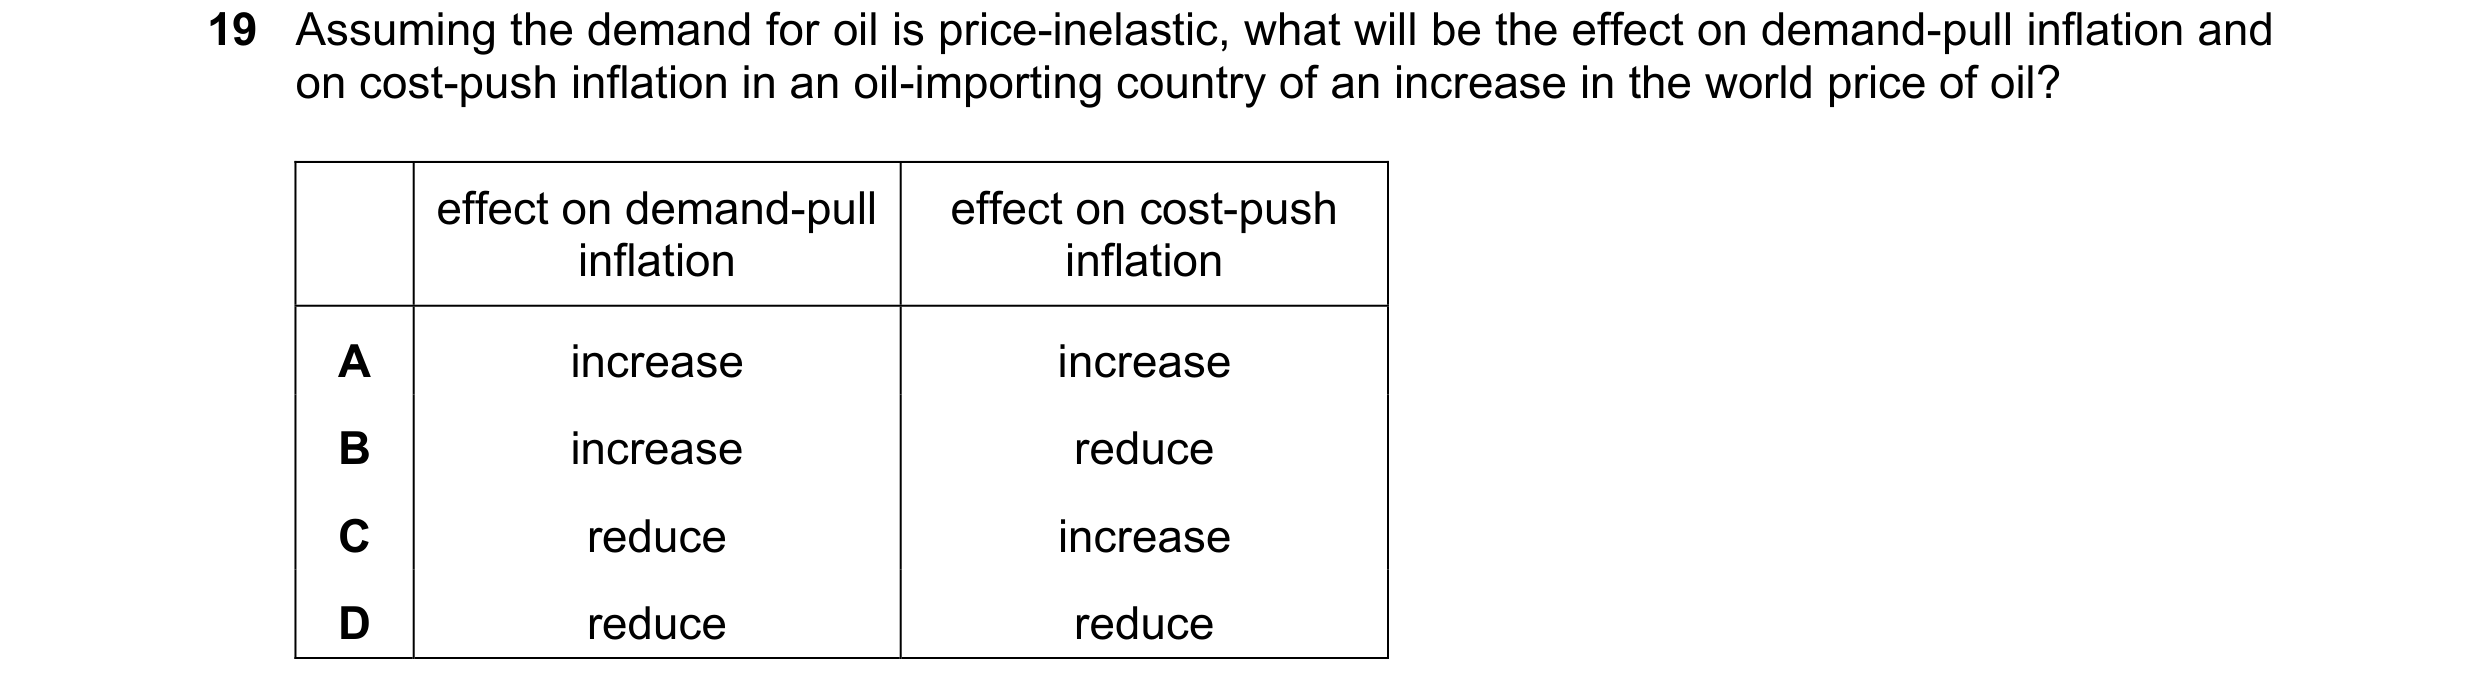
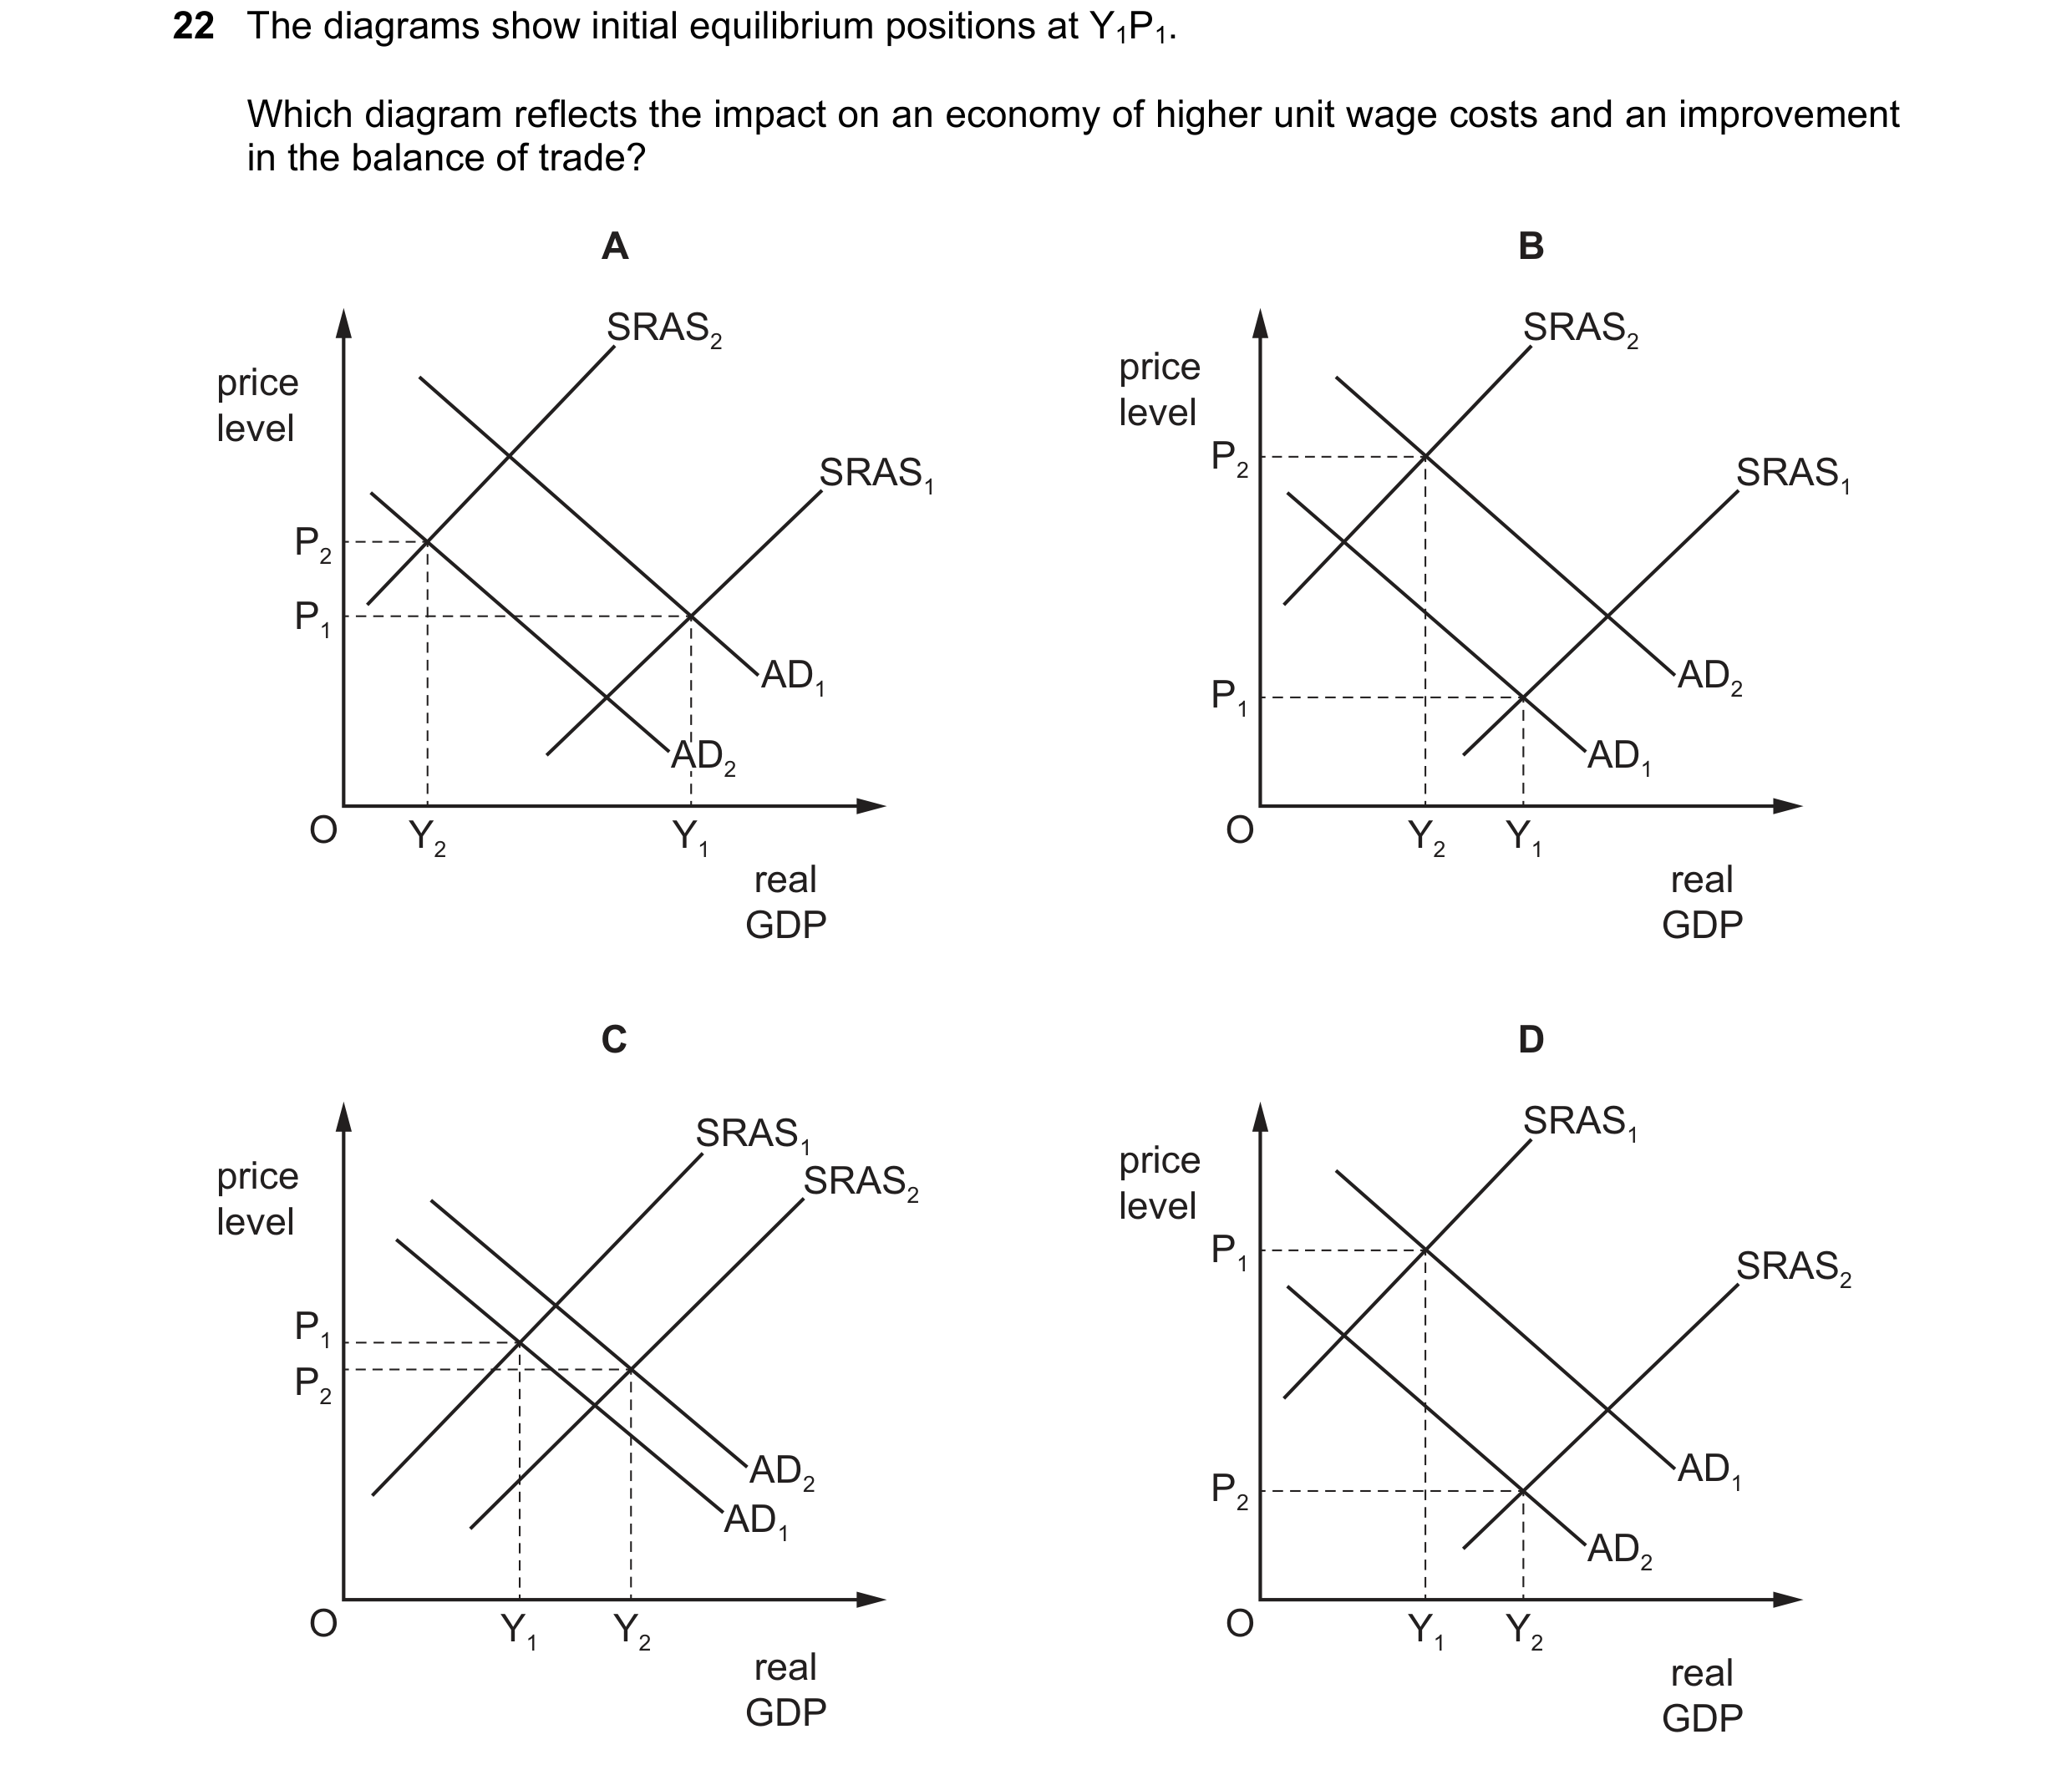
 39 / 57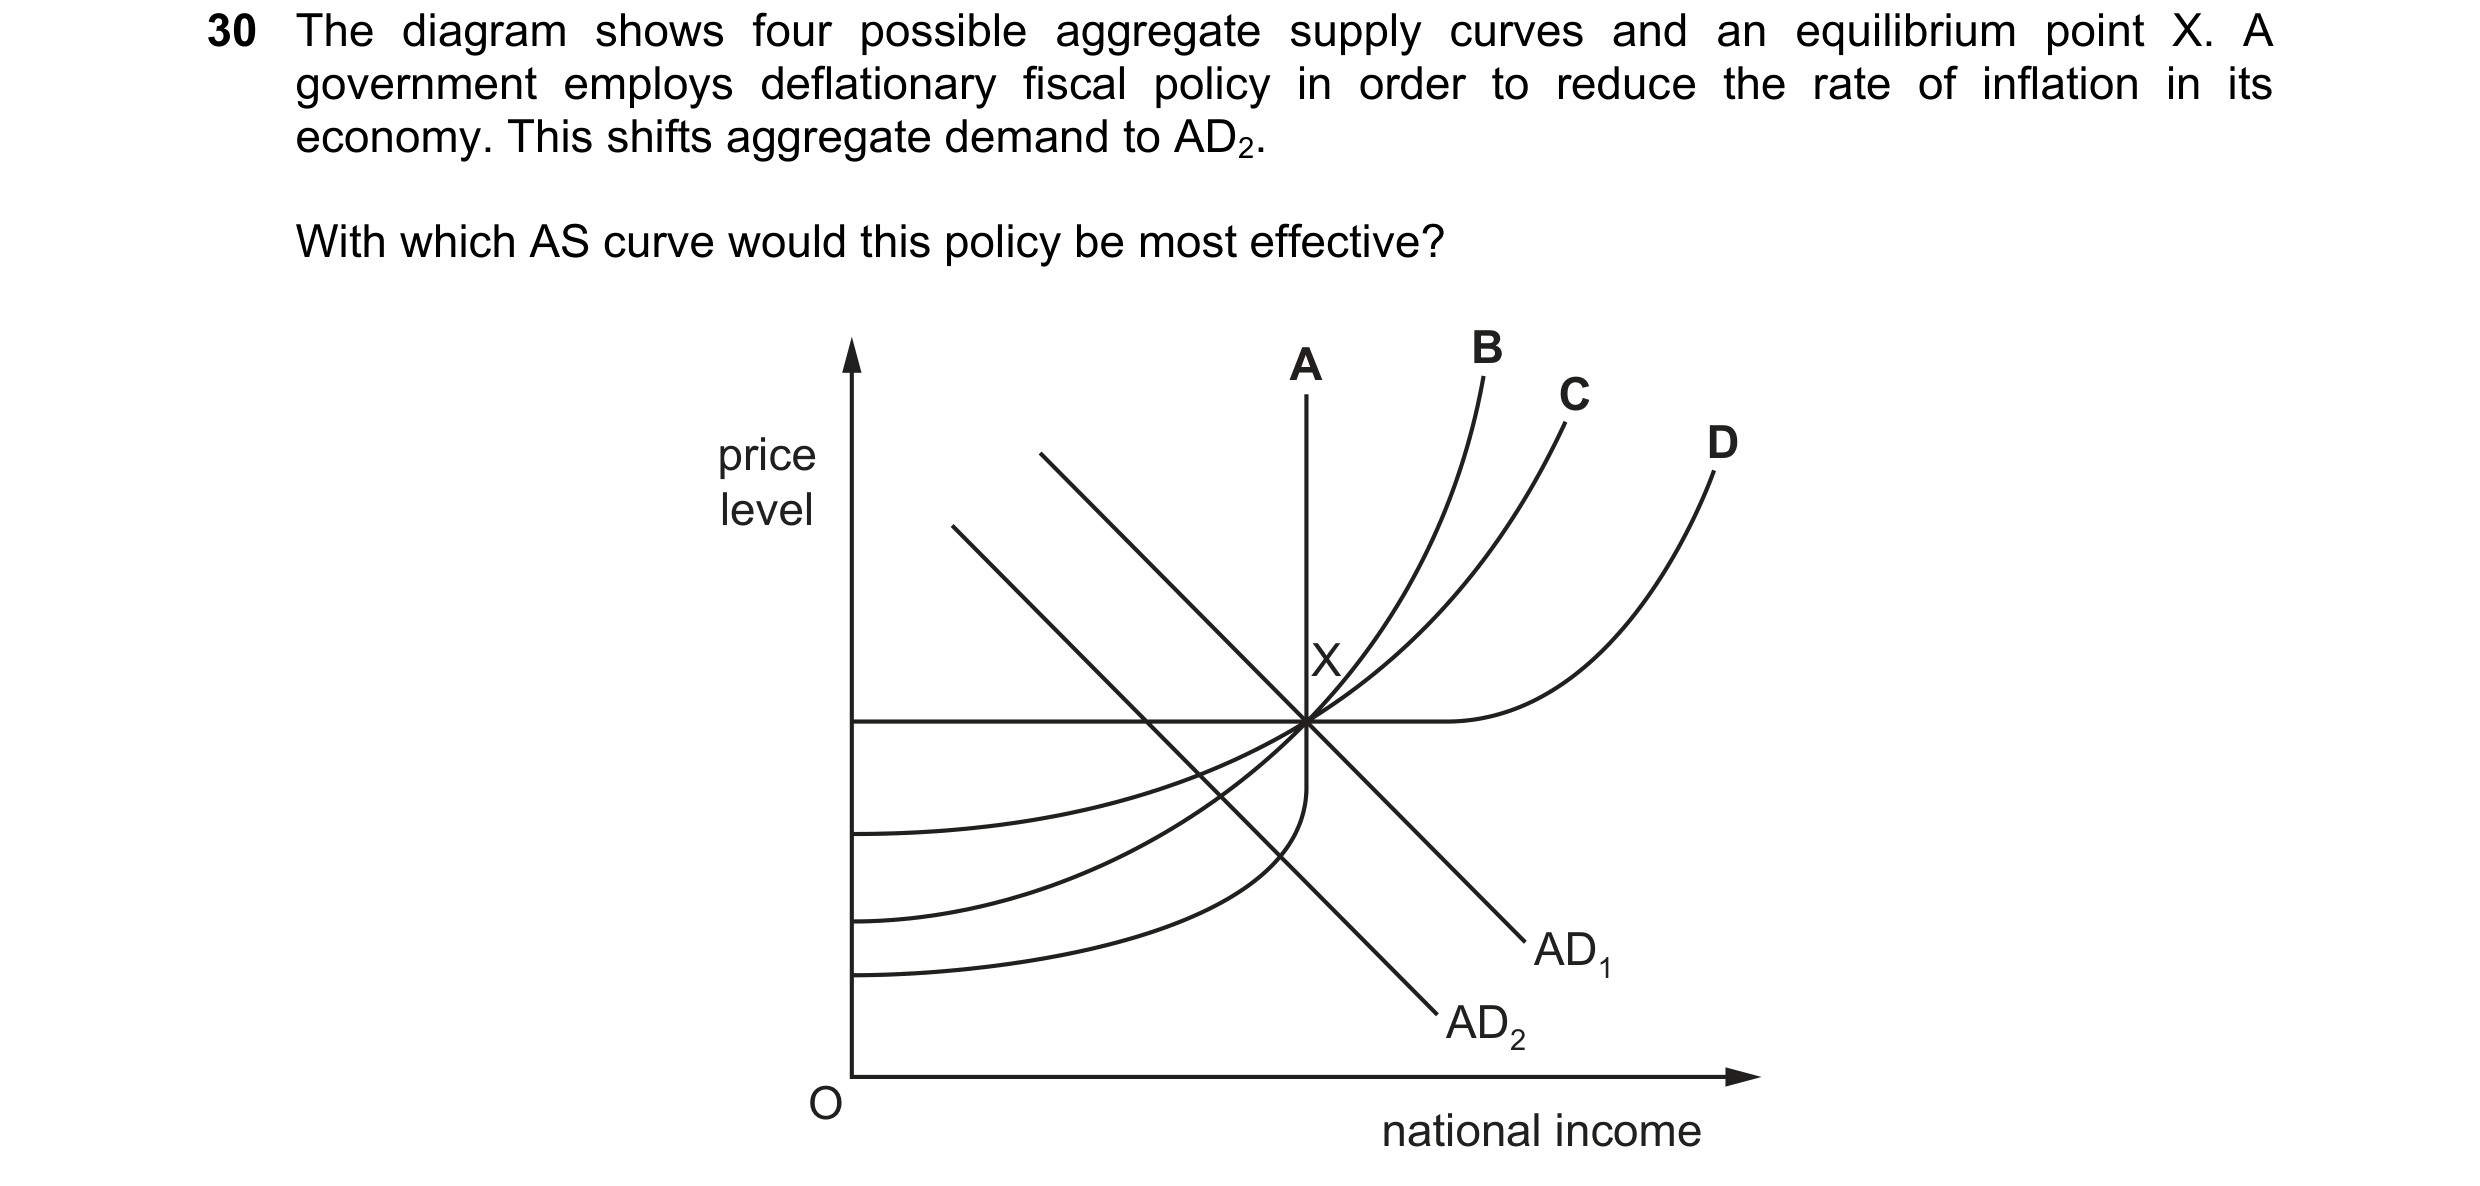
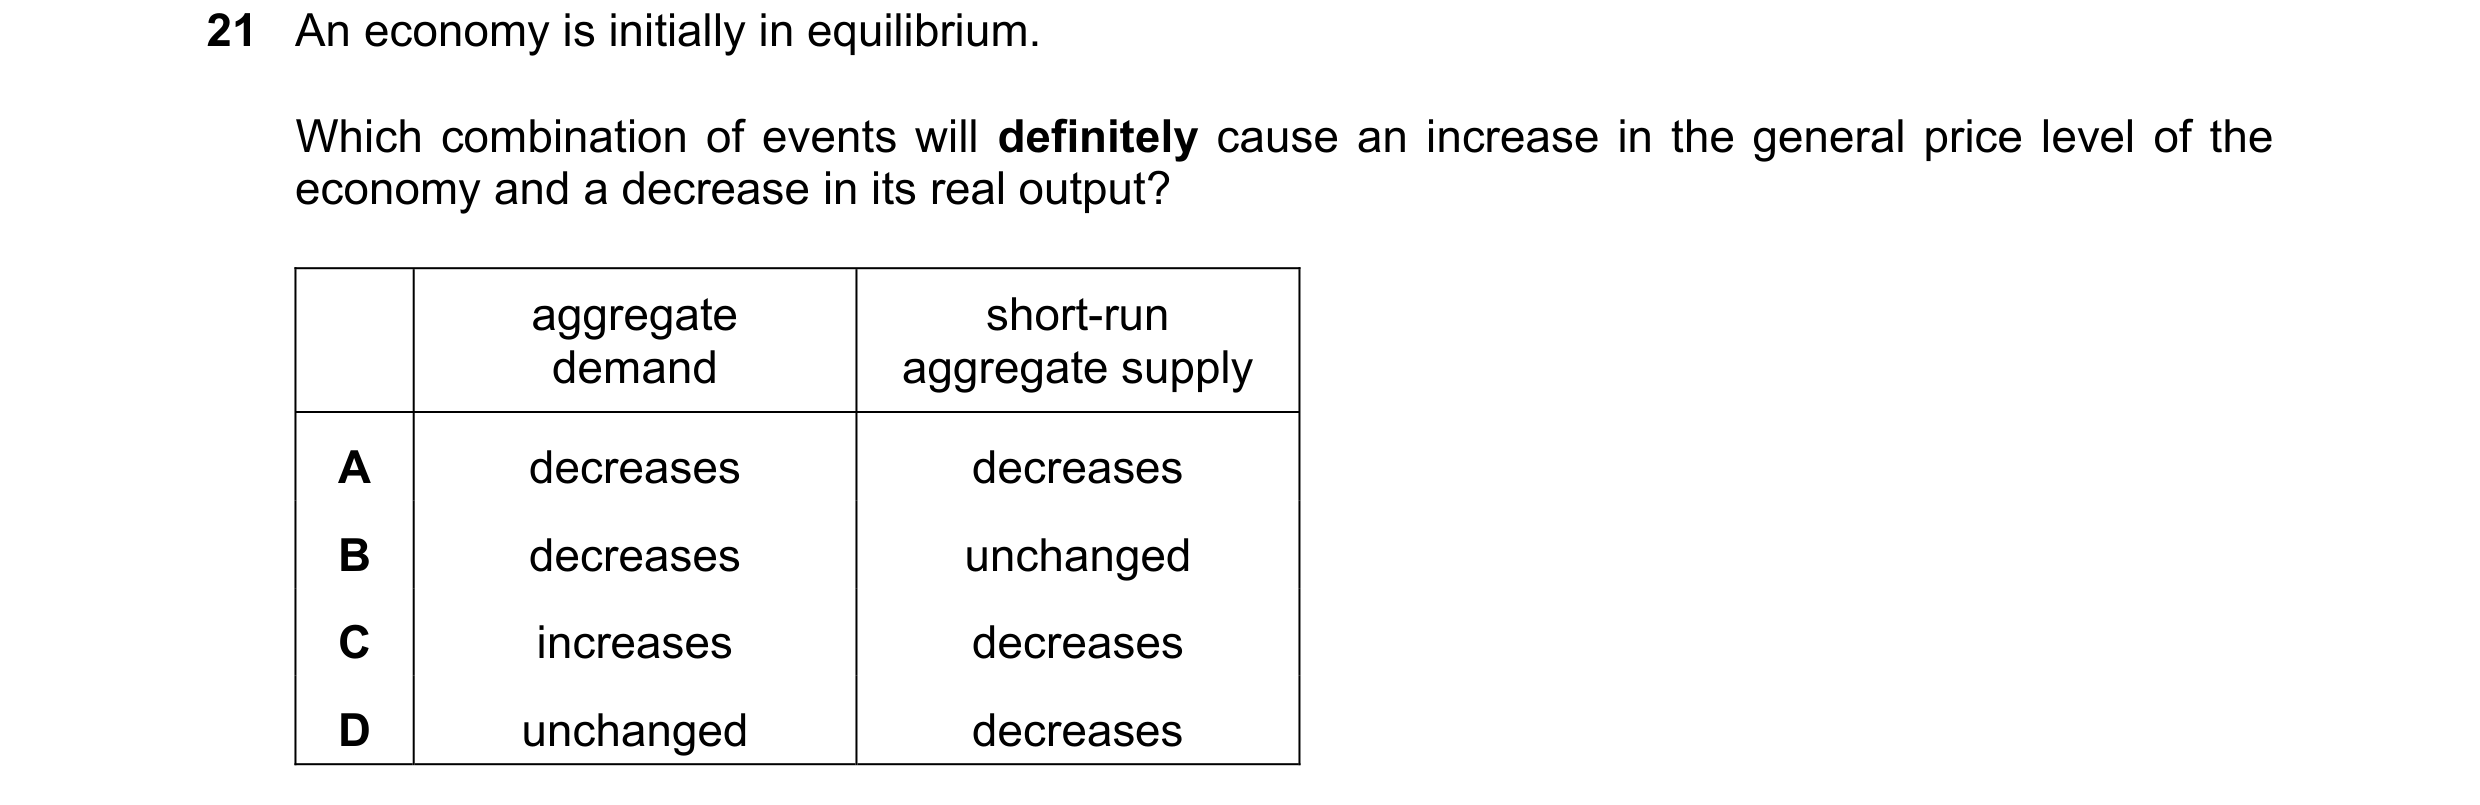
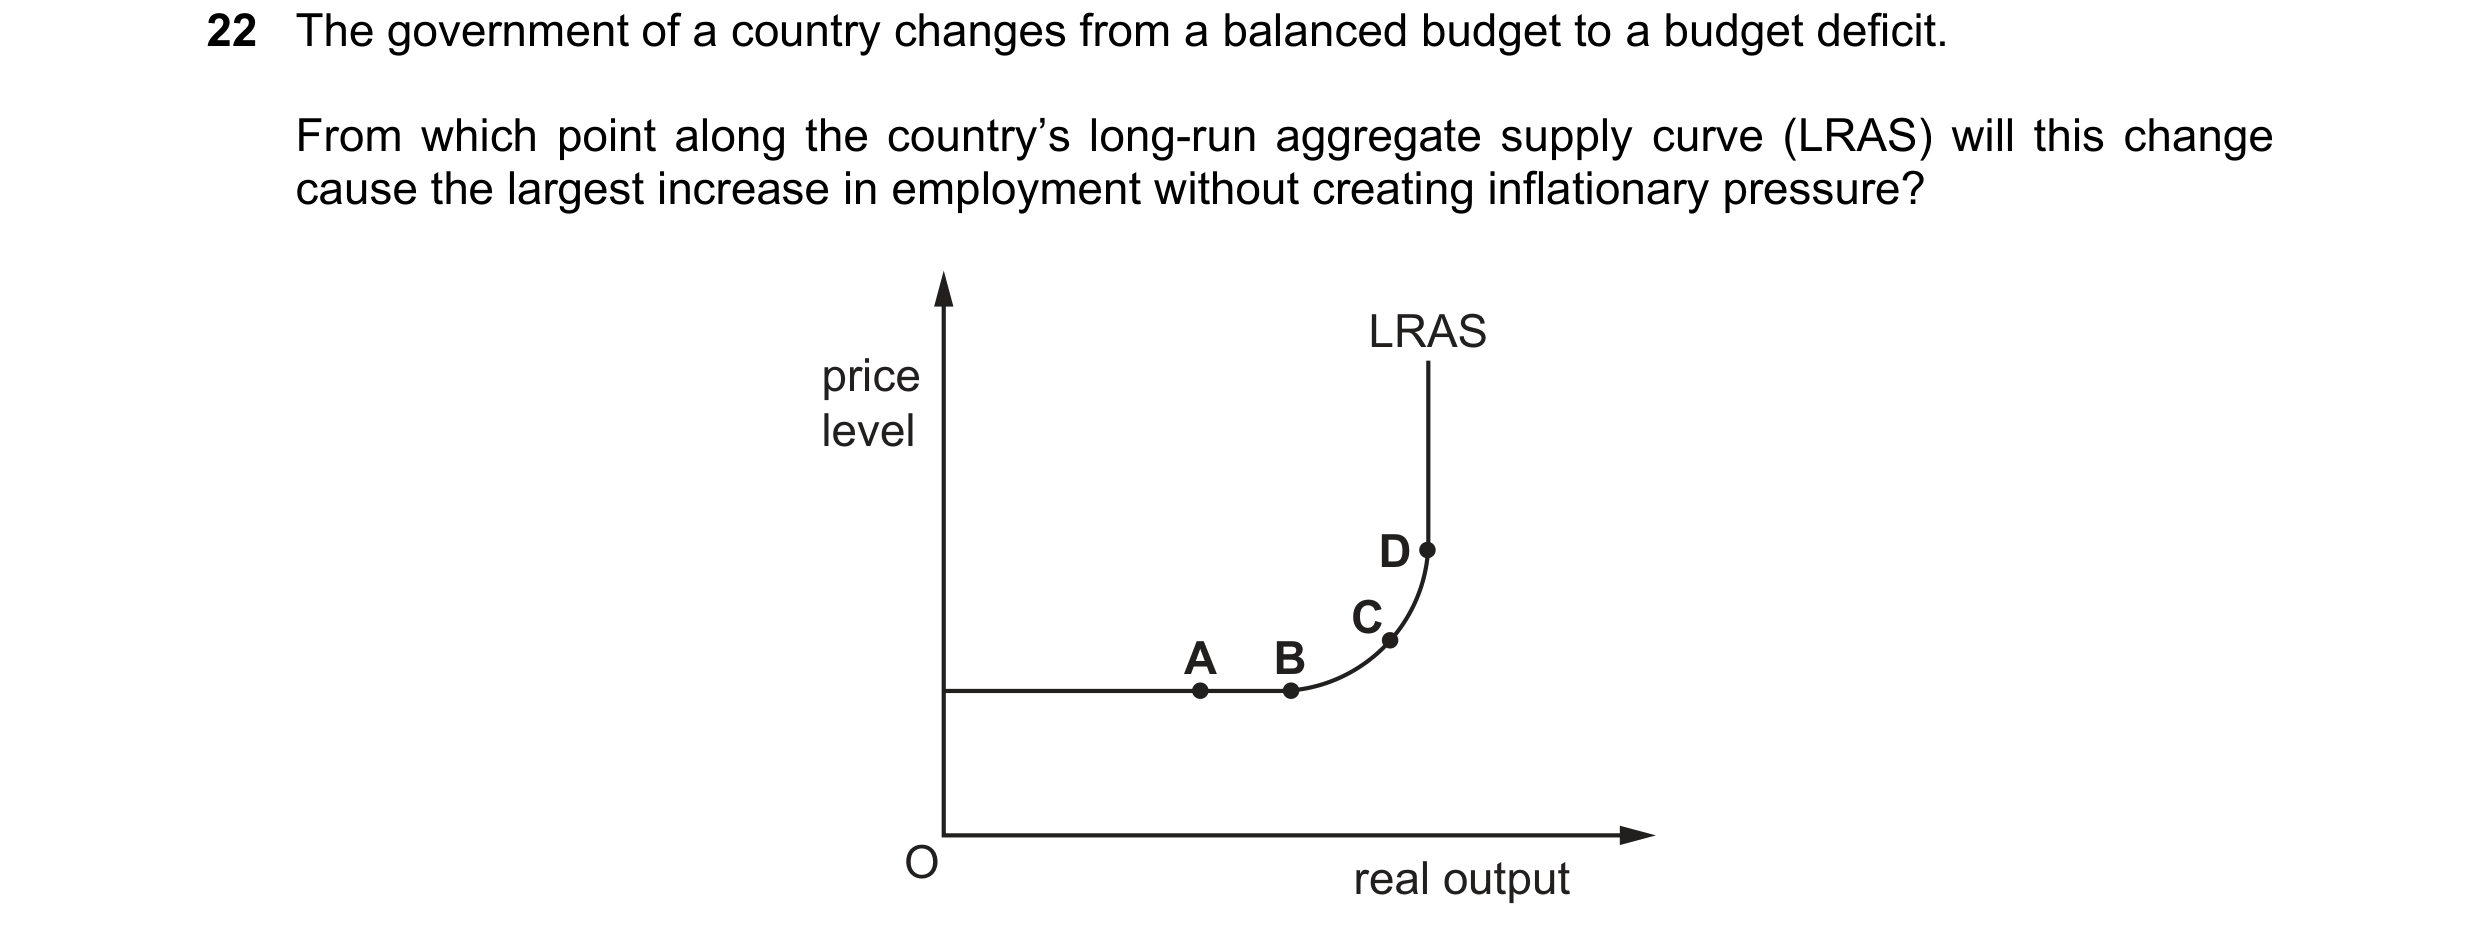 40 / 57
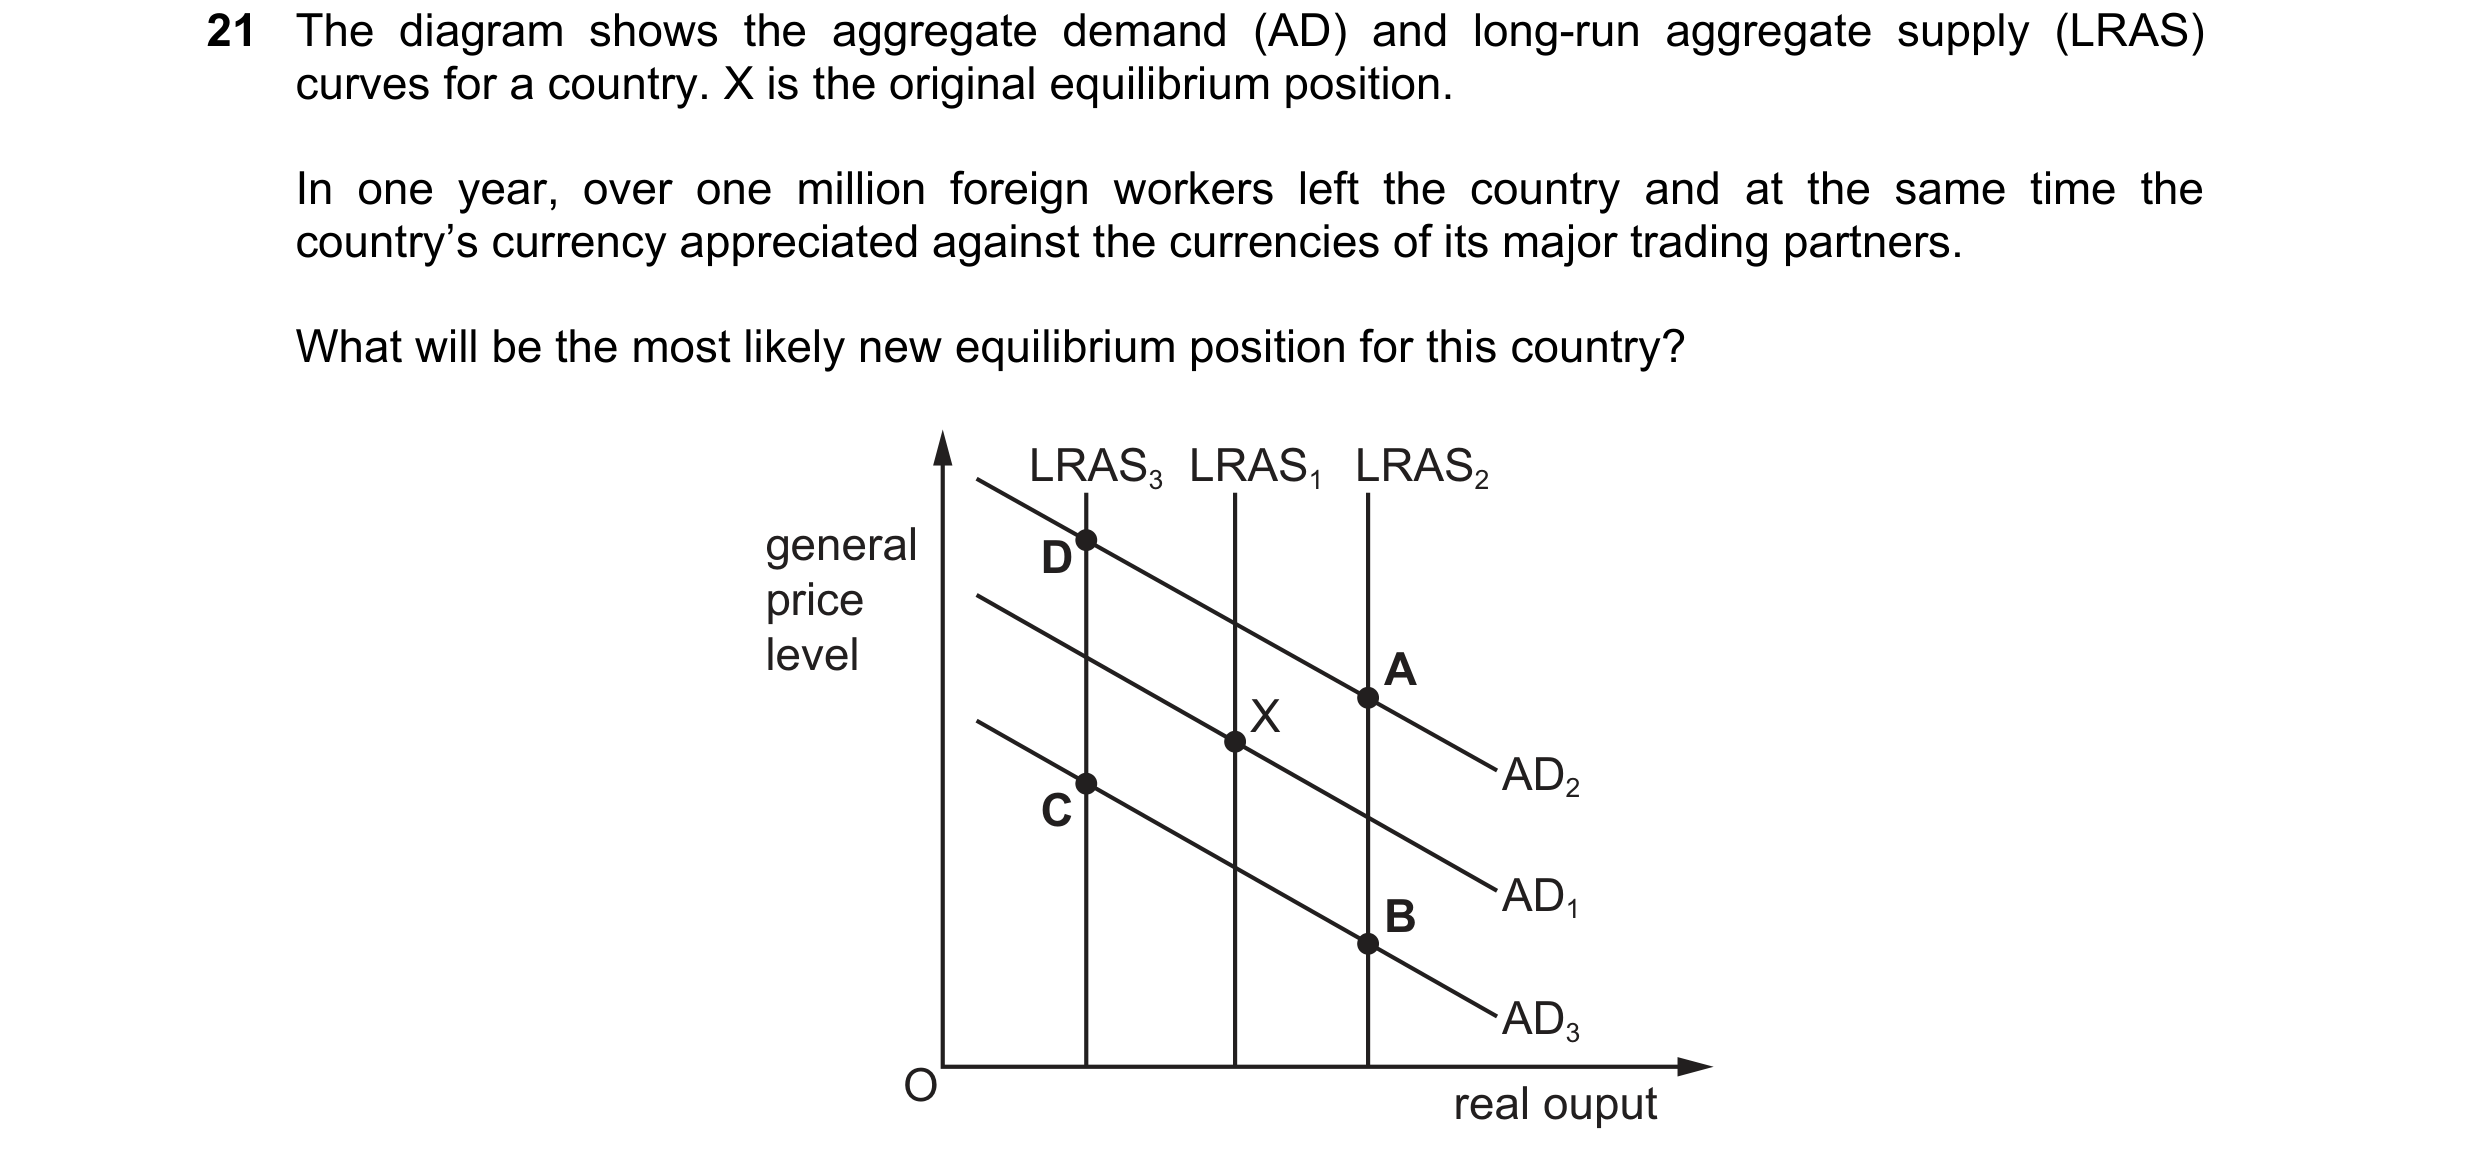

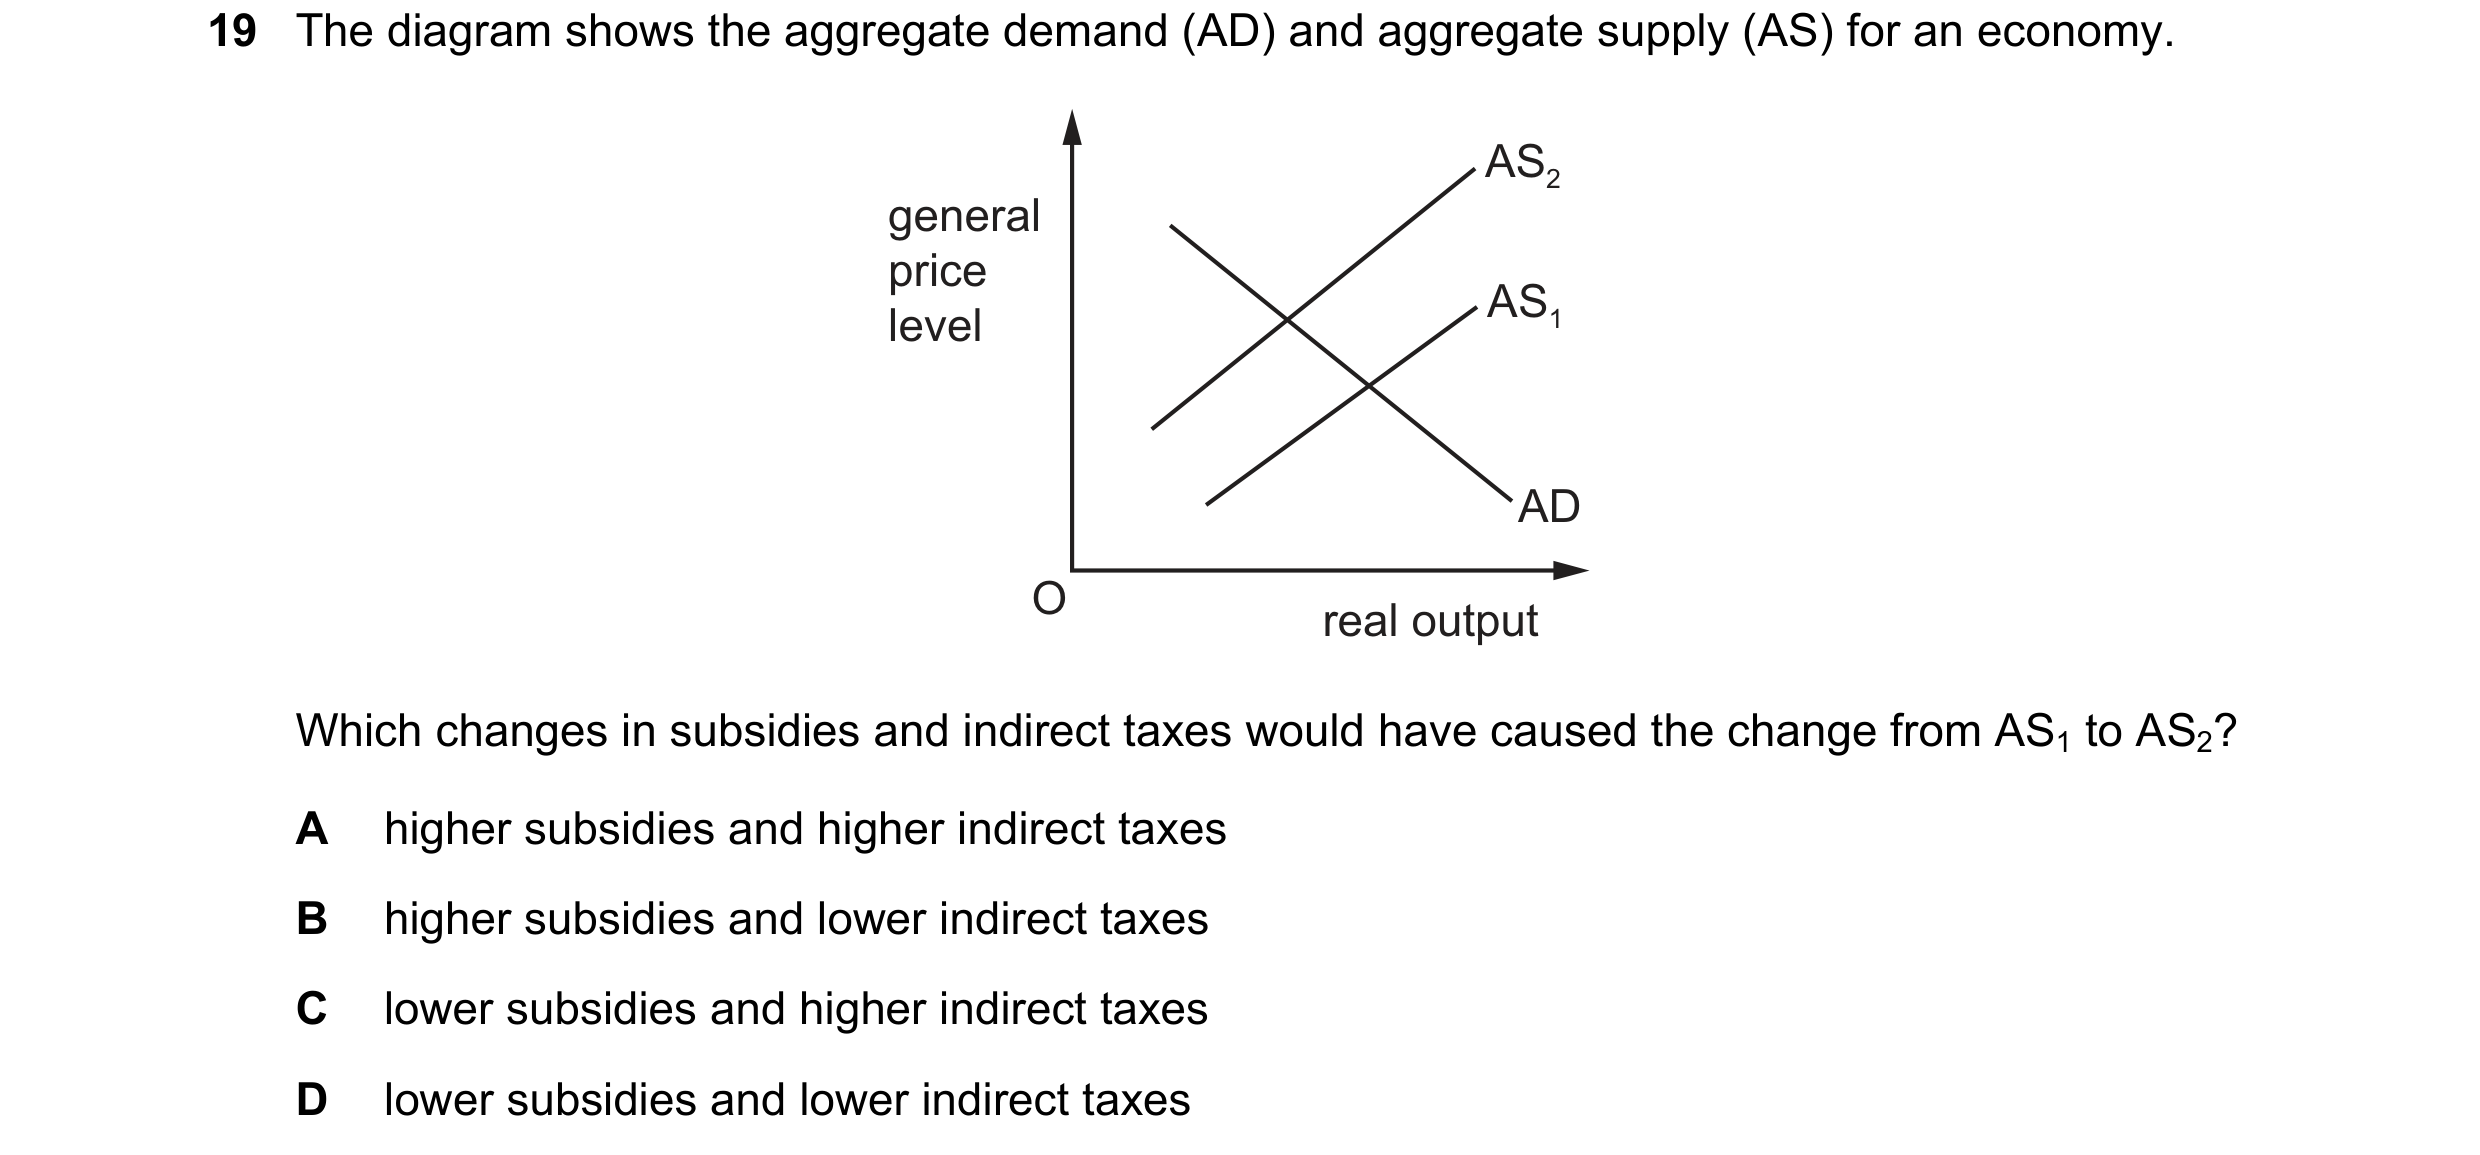 41 / 57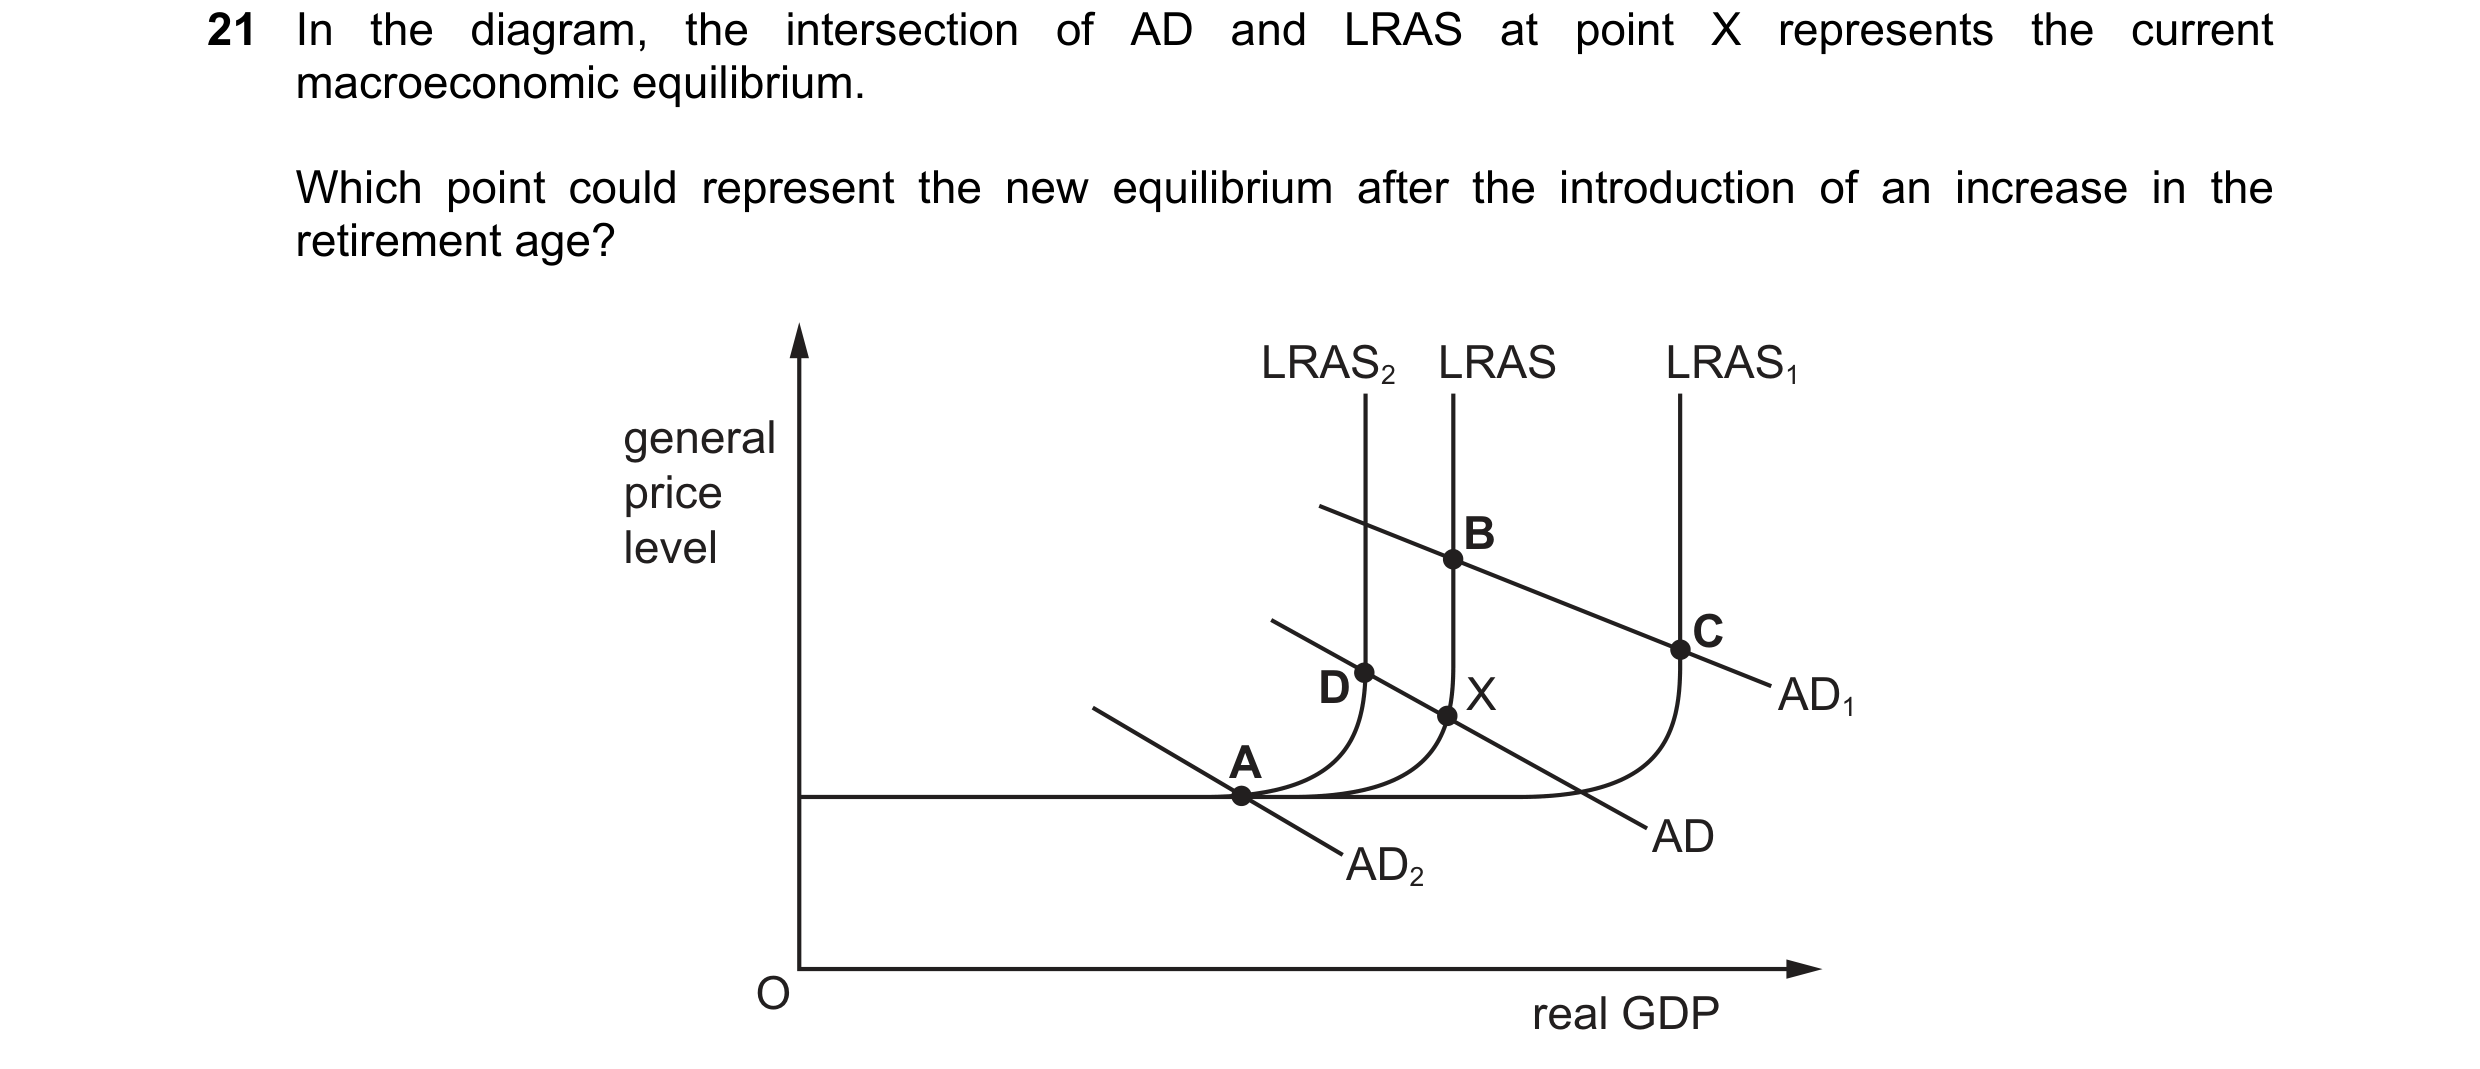
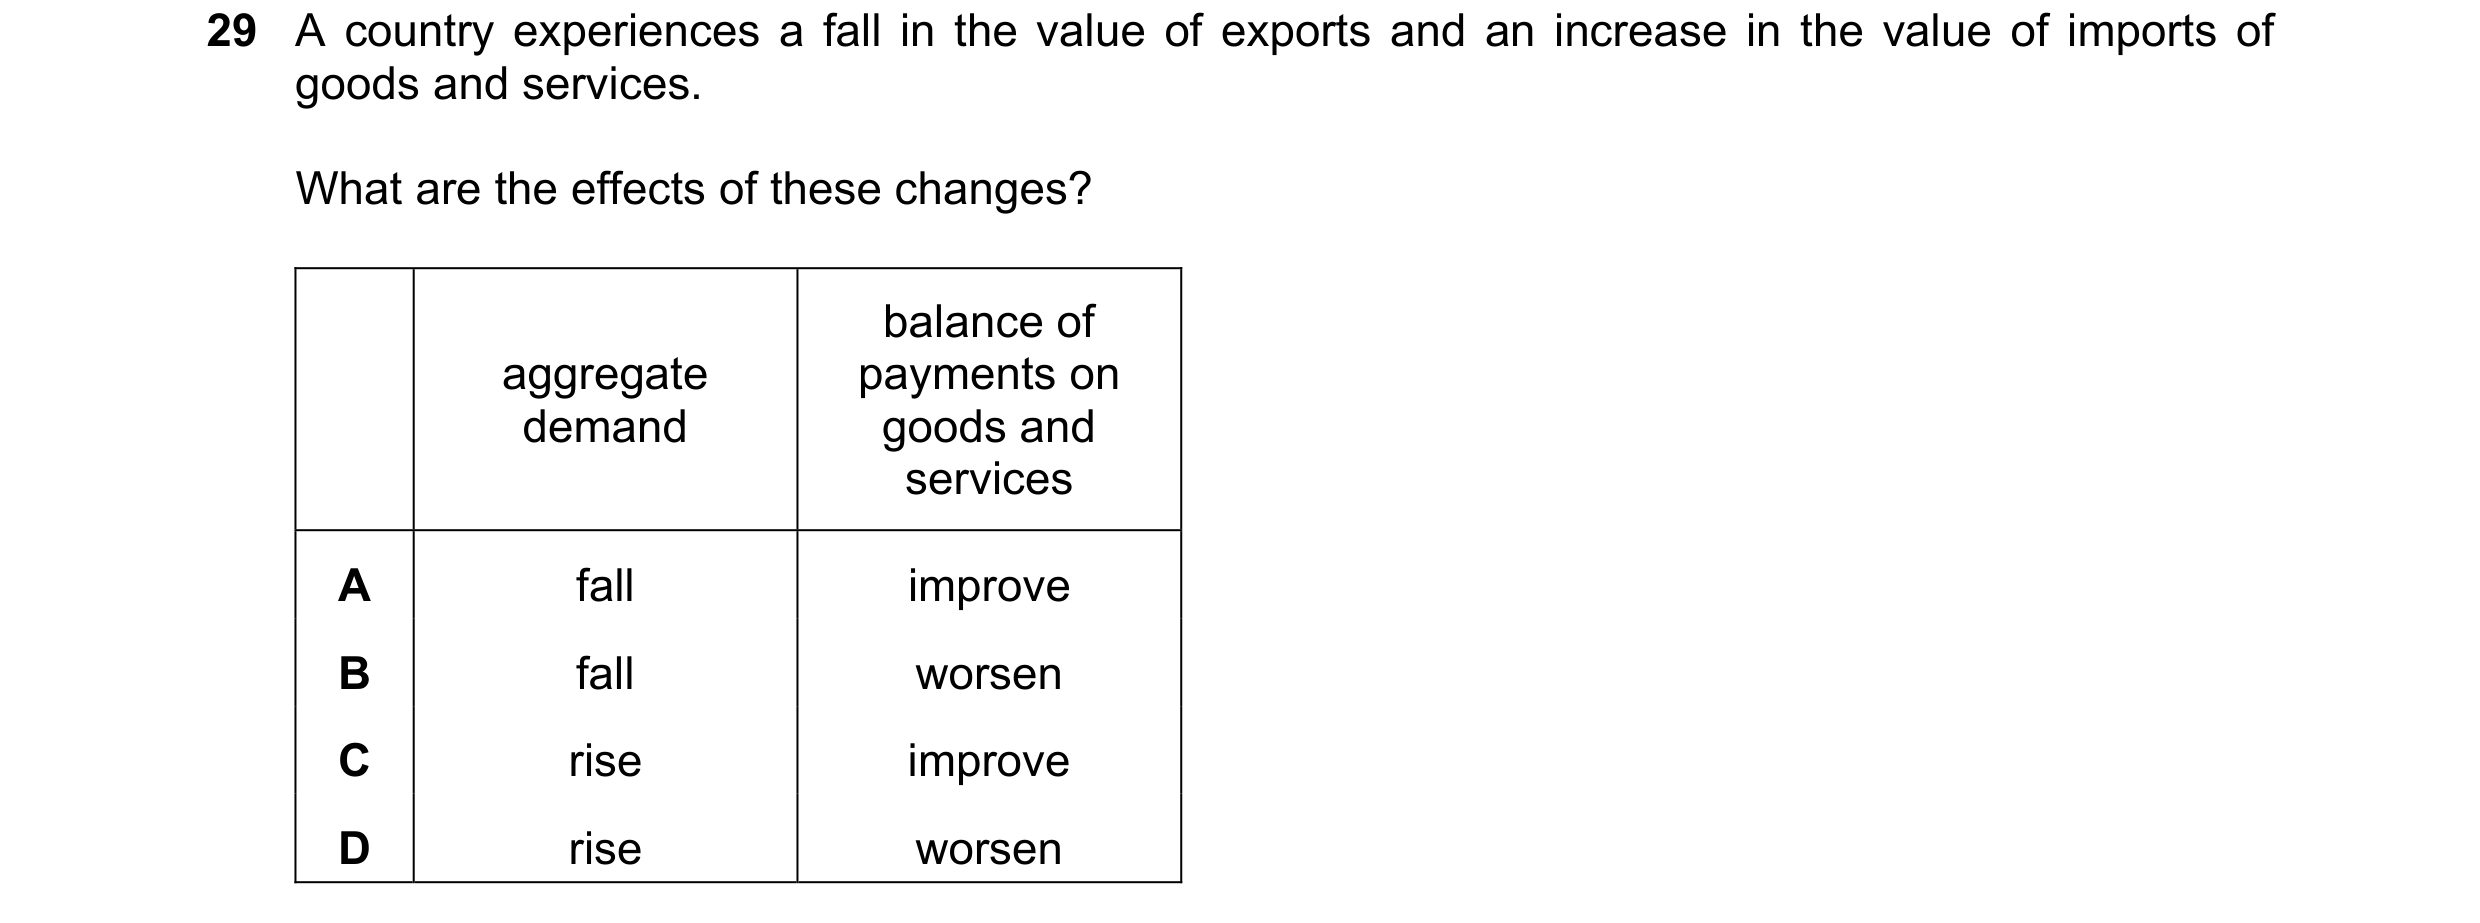

 42 / 57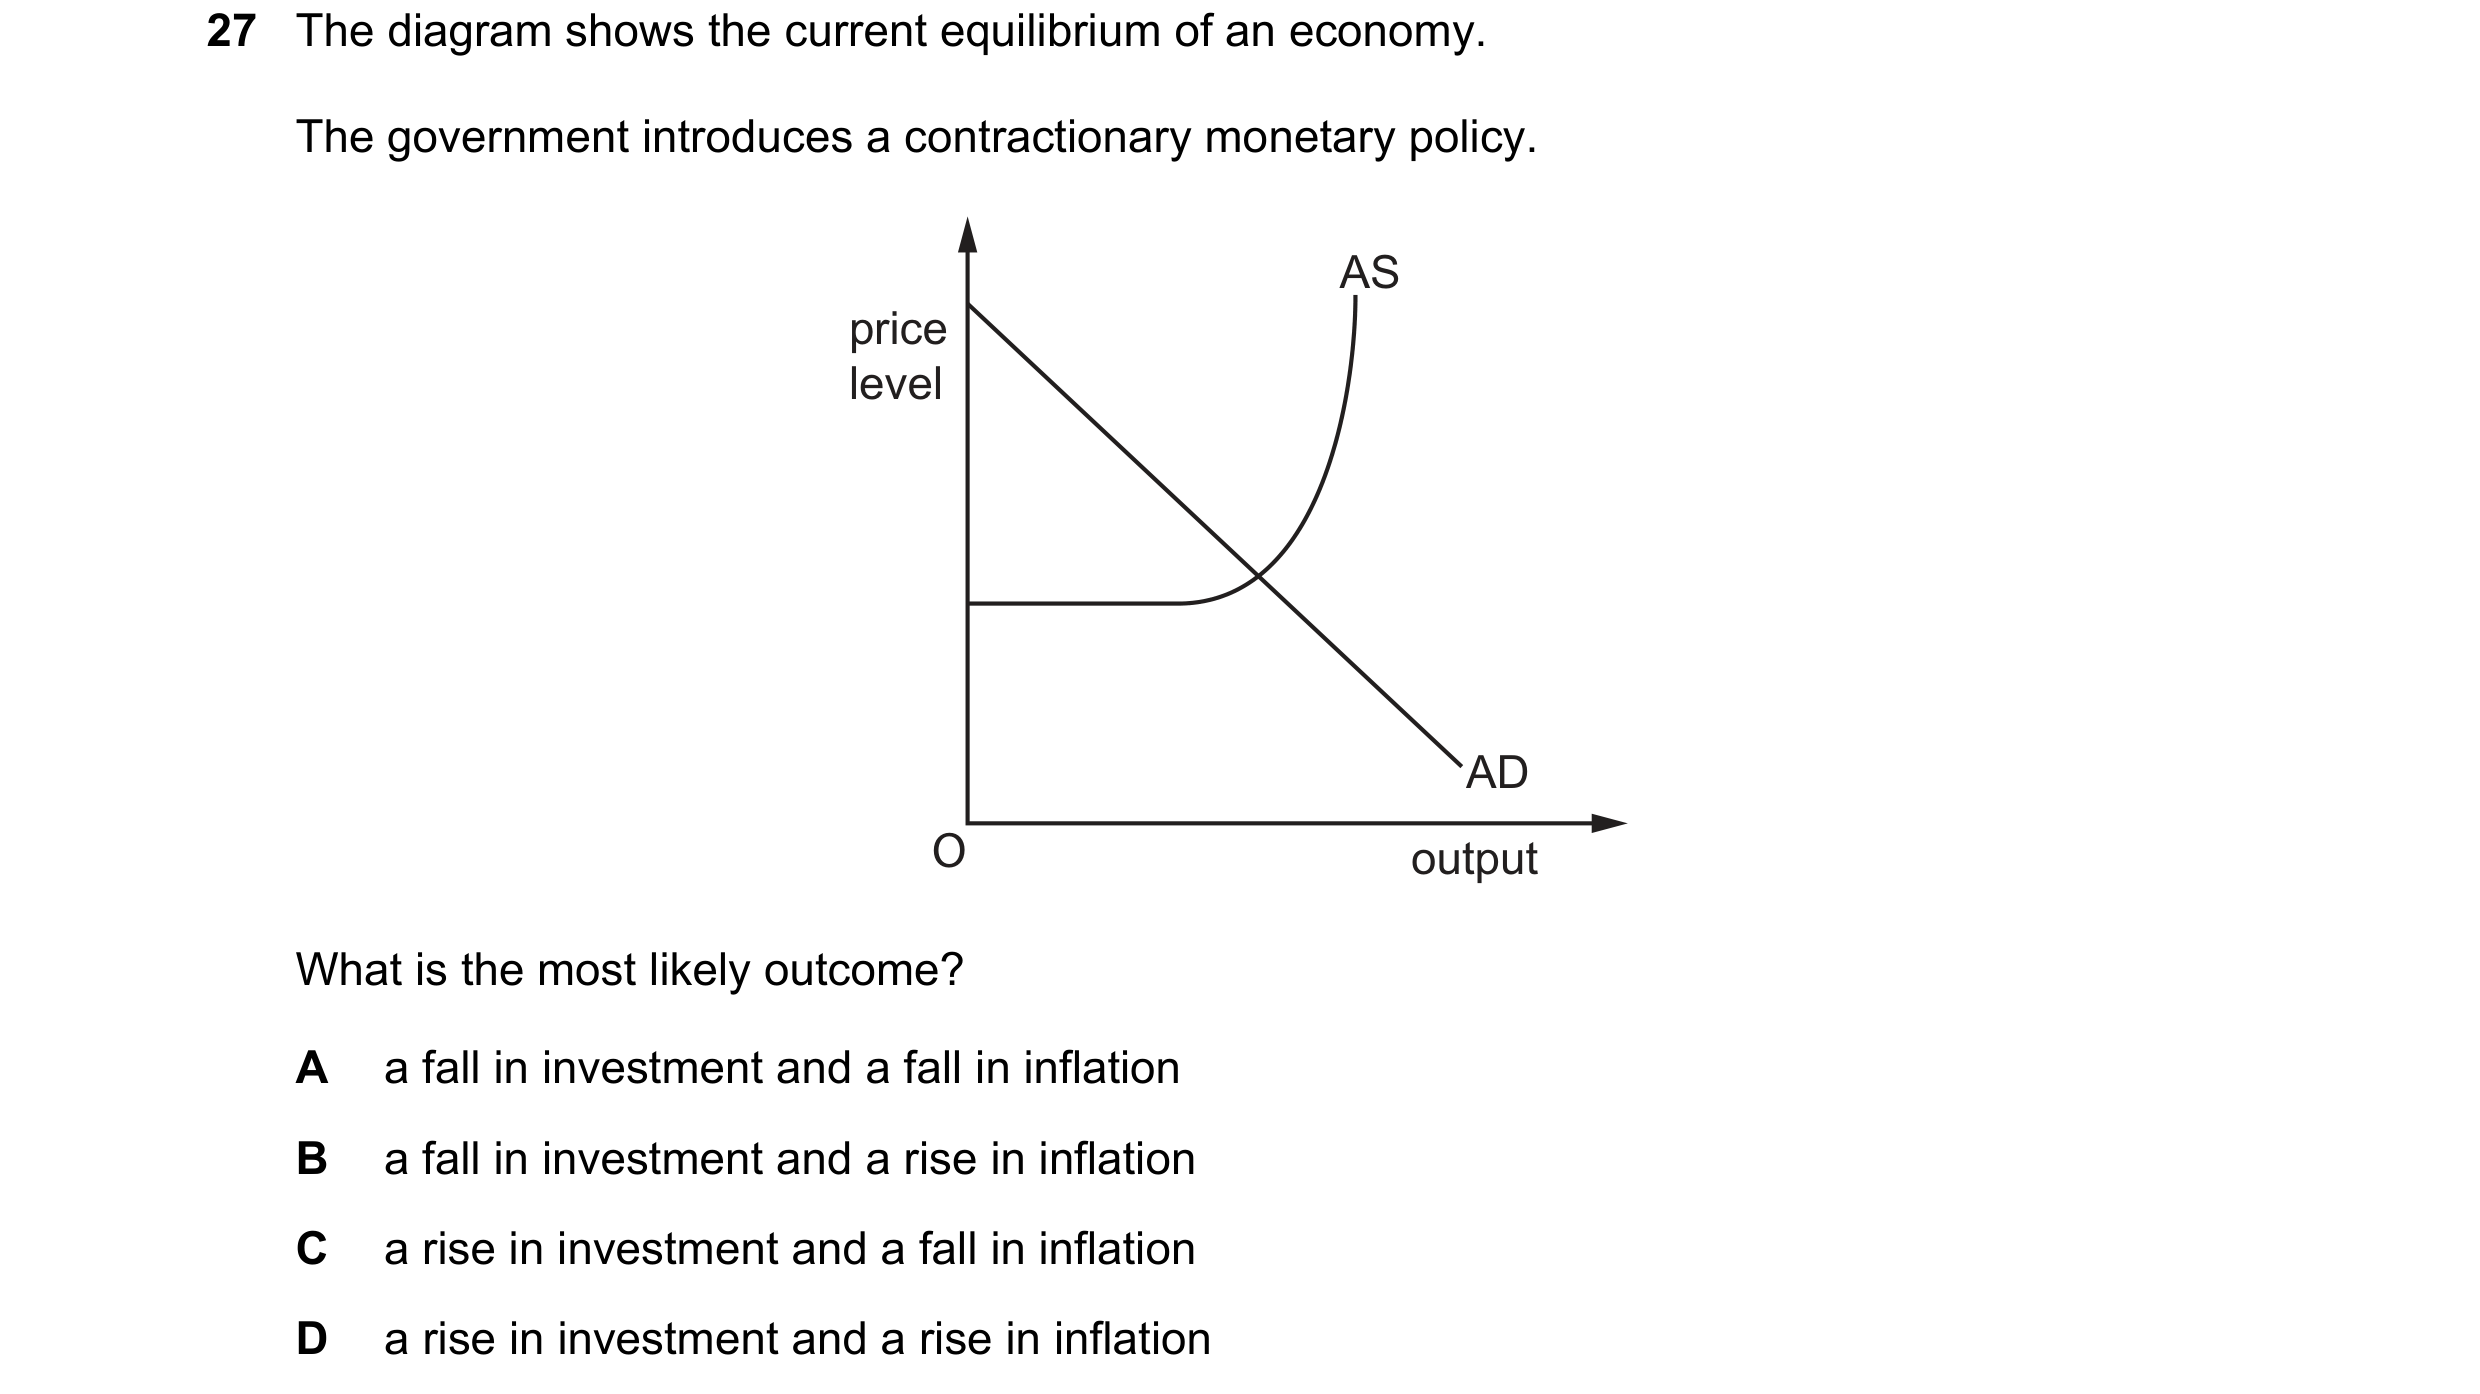

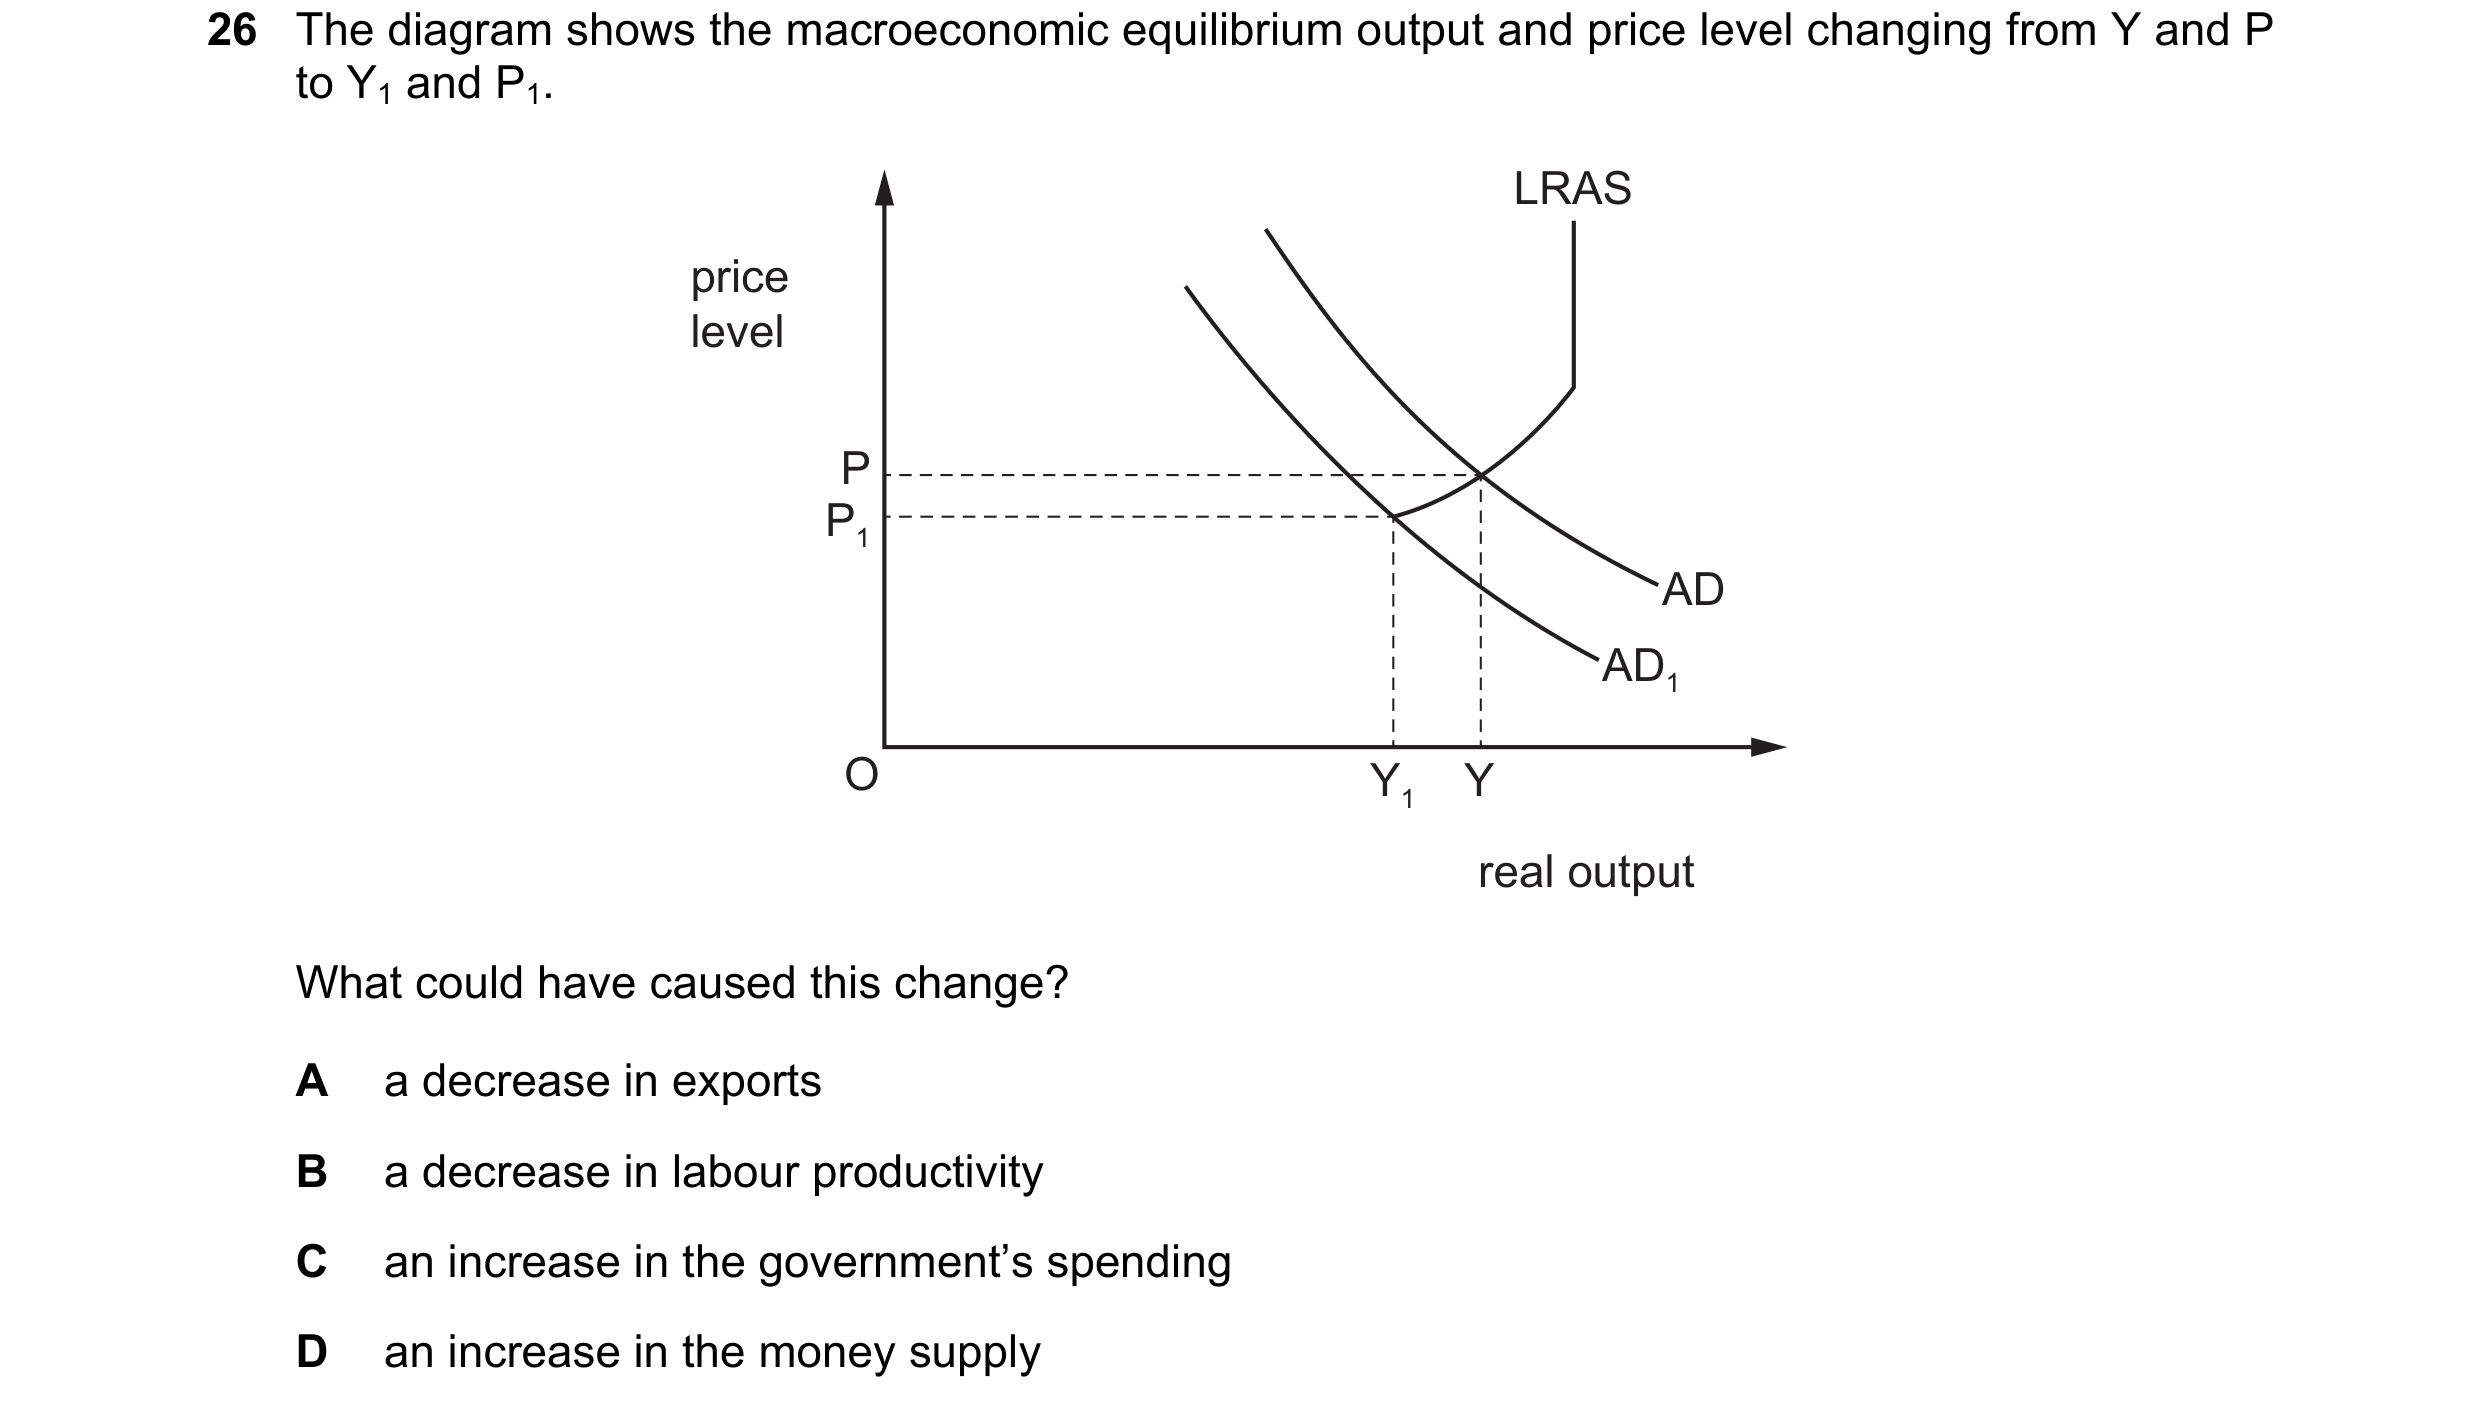 43 / 57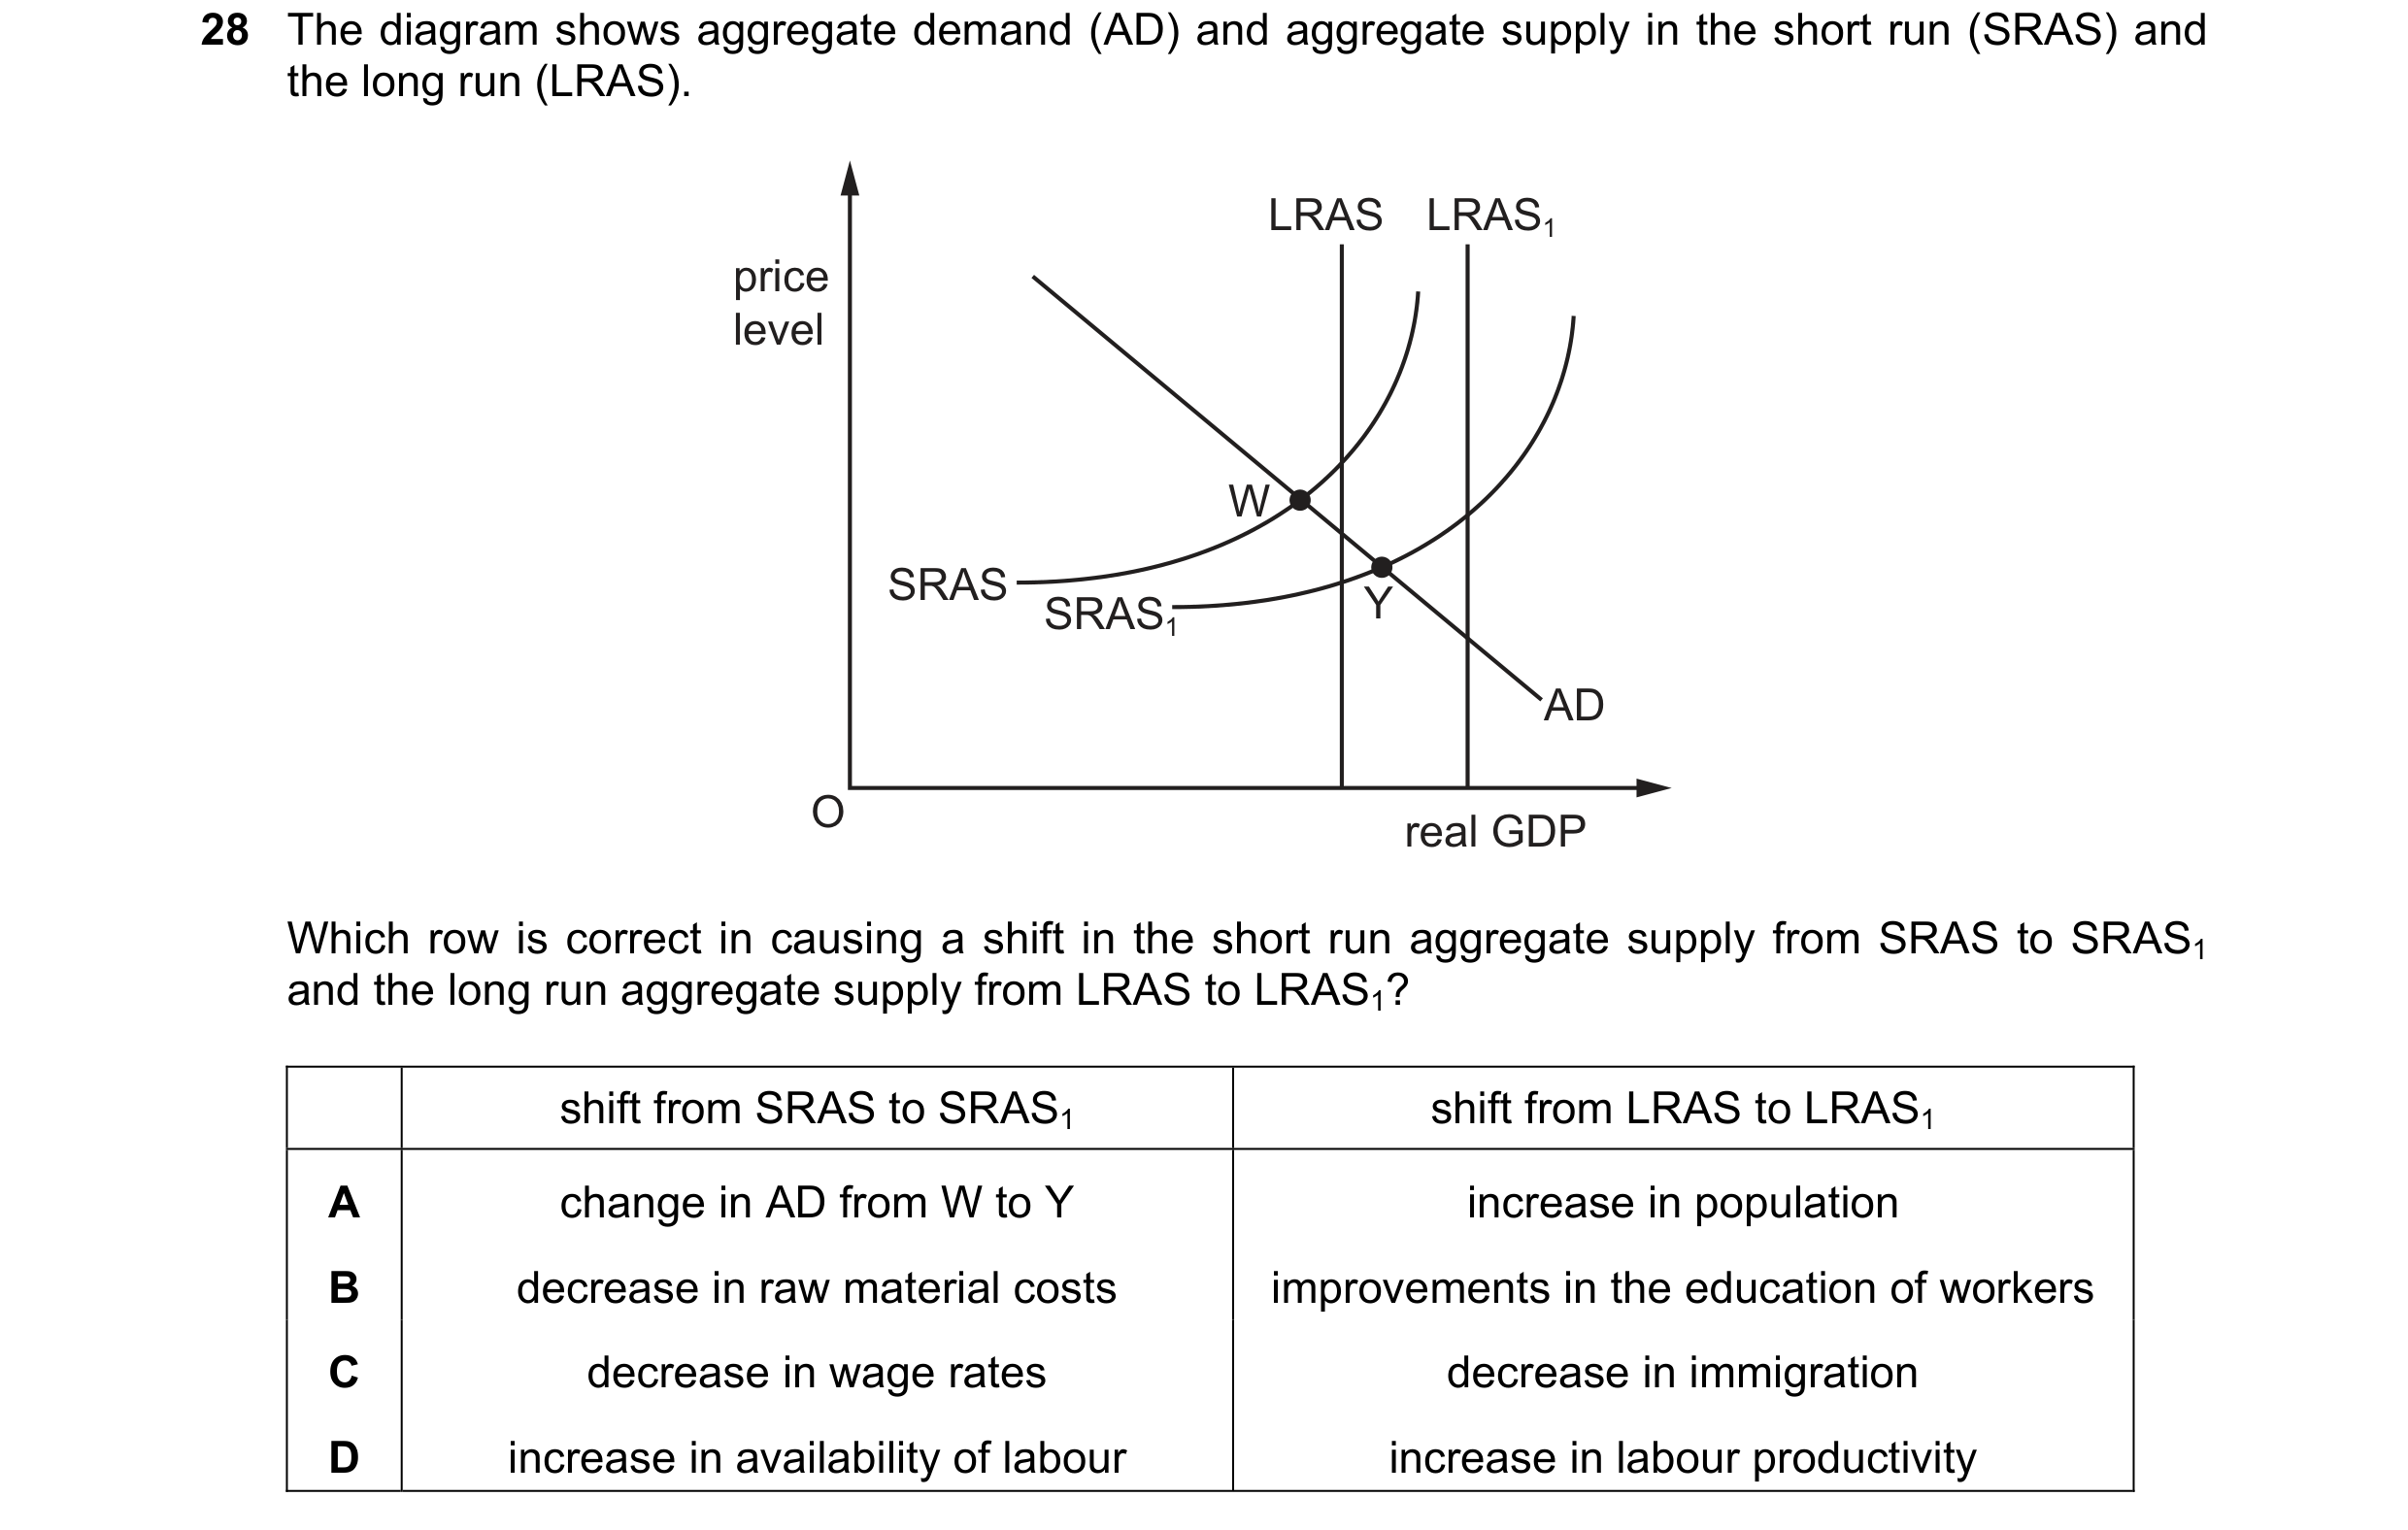
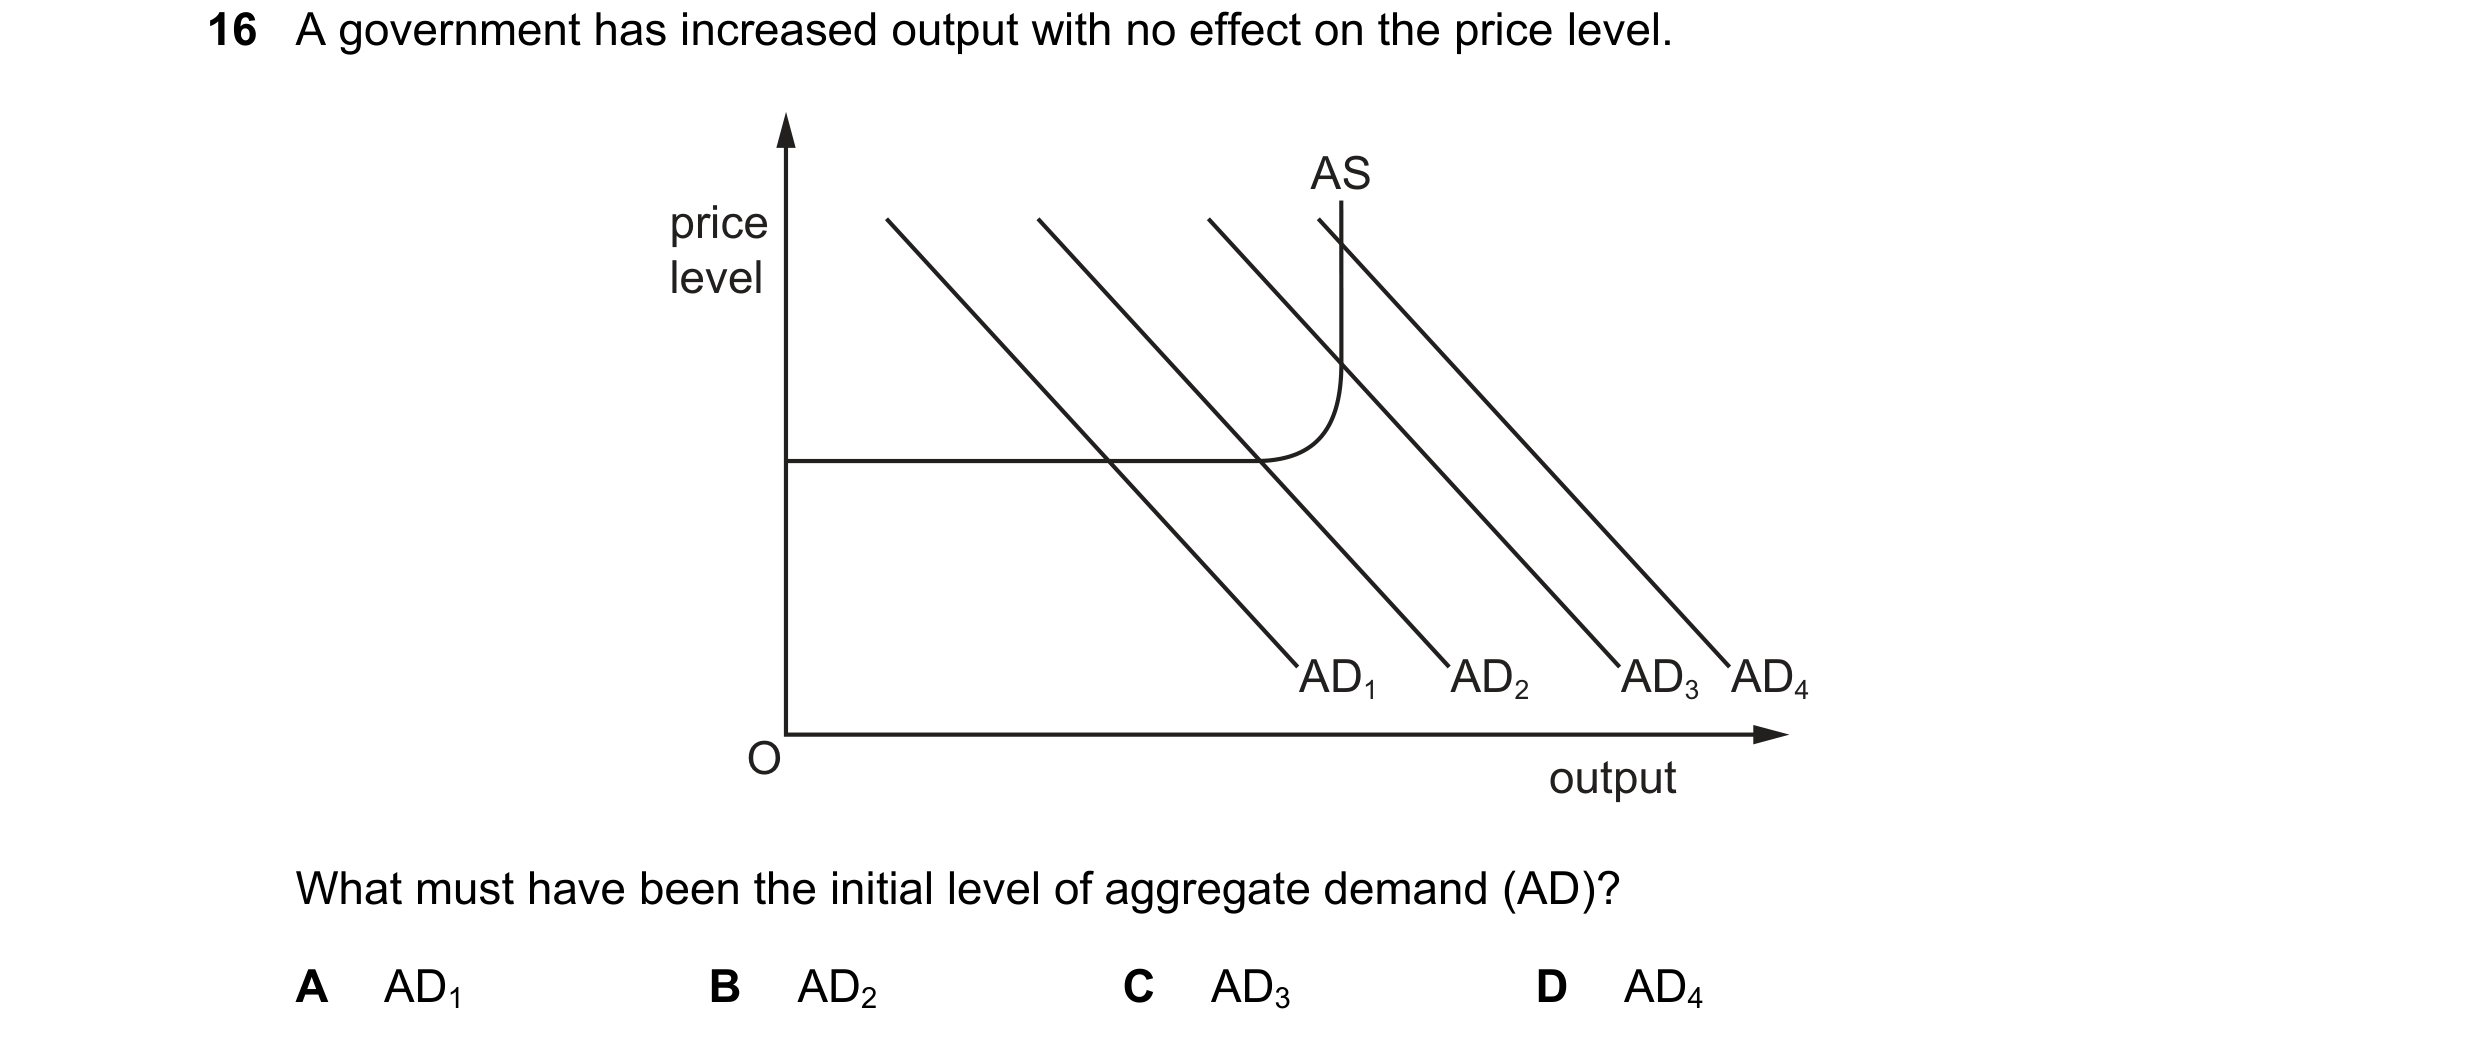
 44 / 57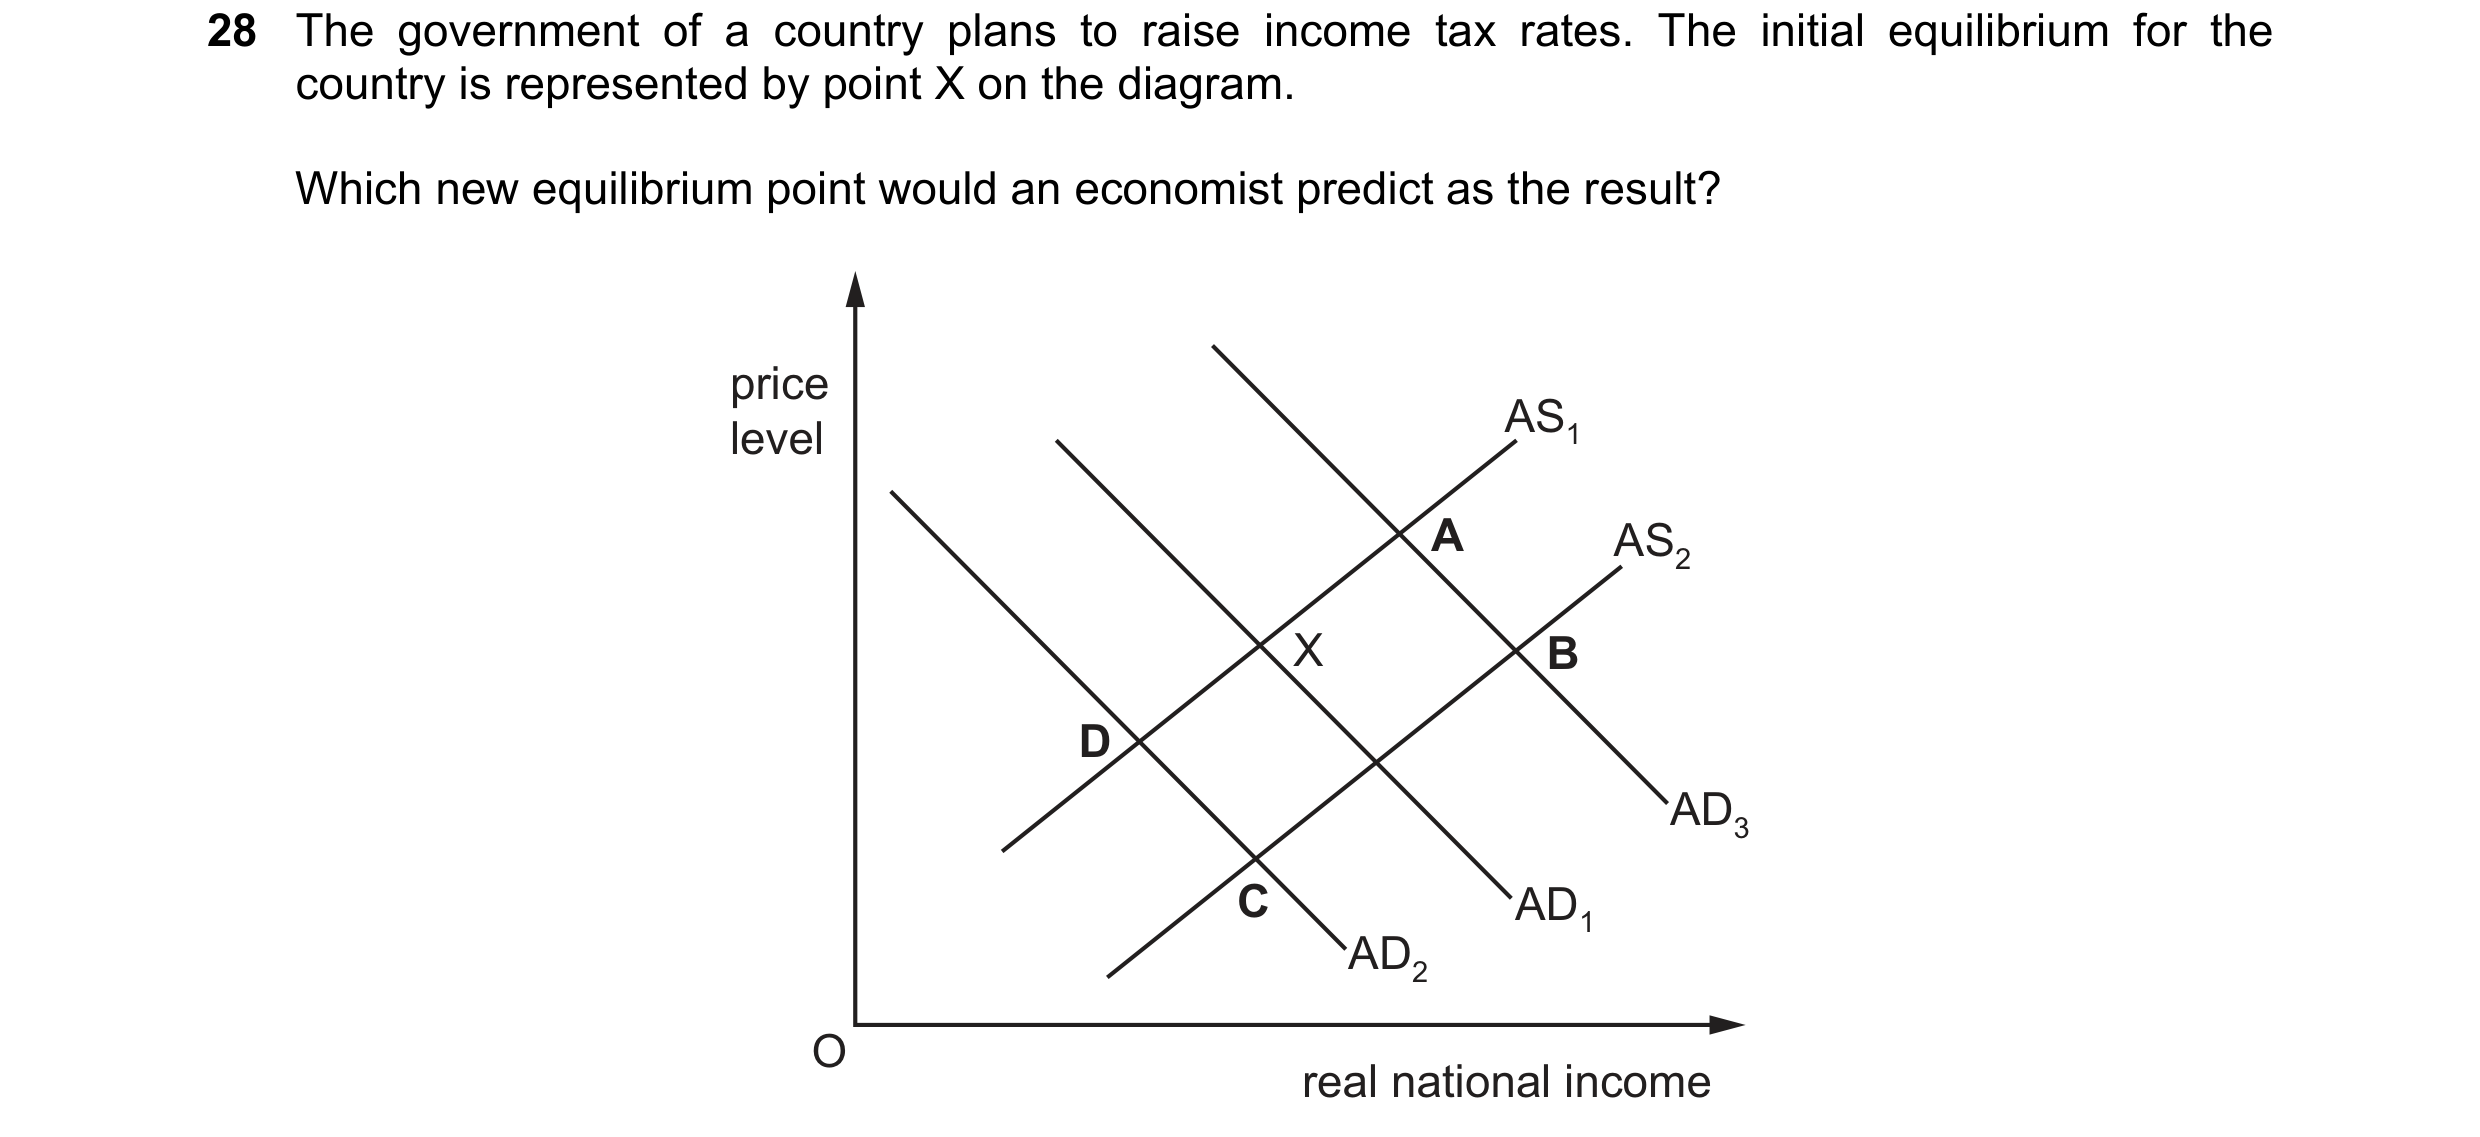
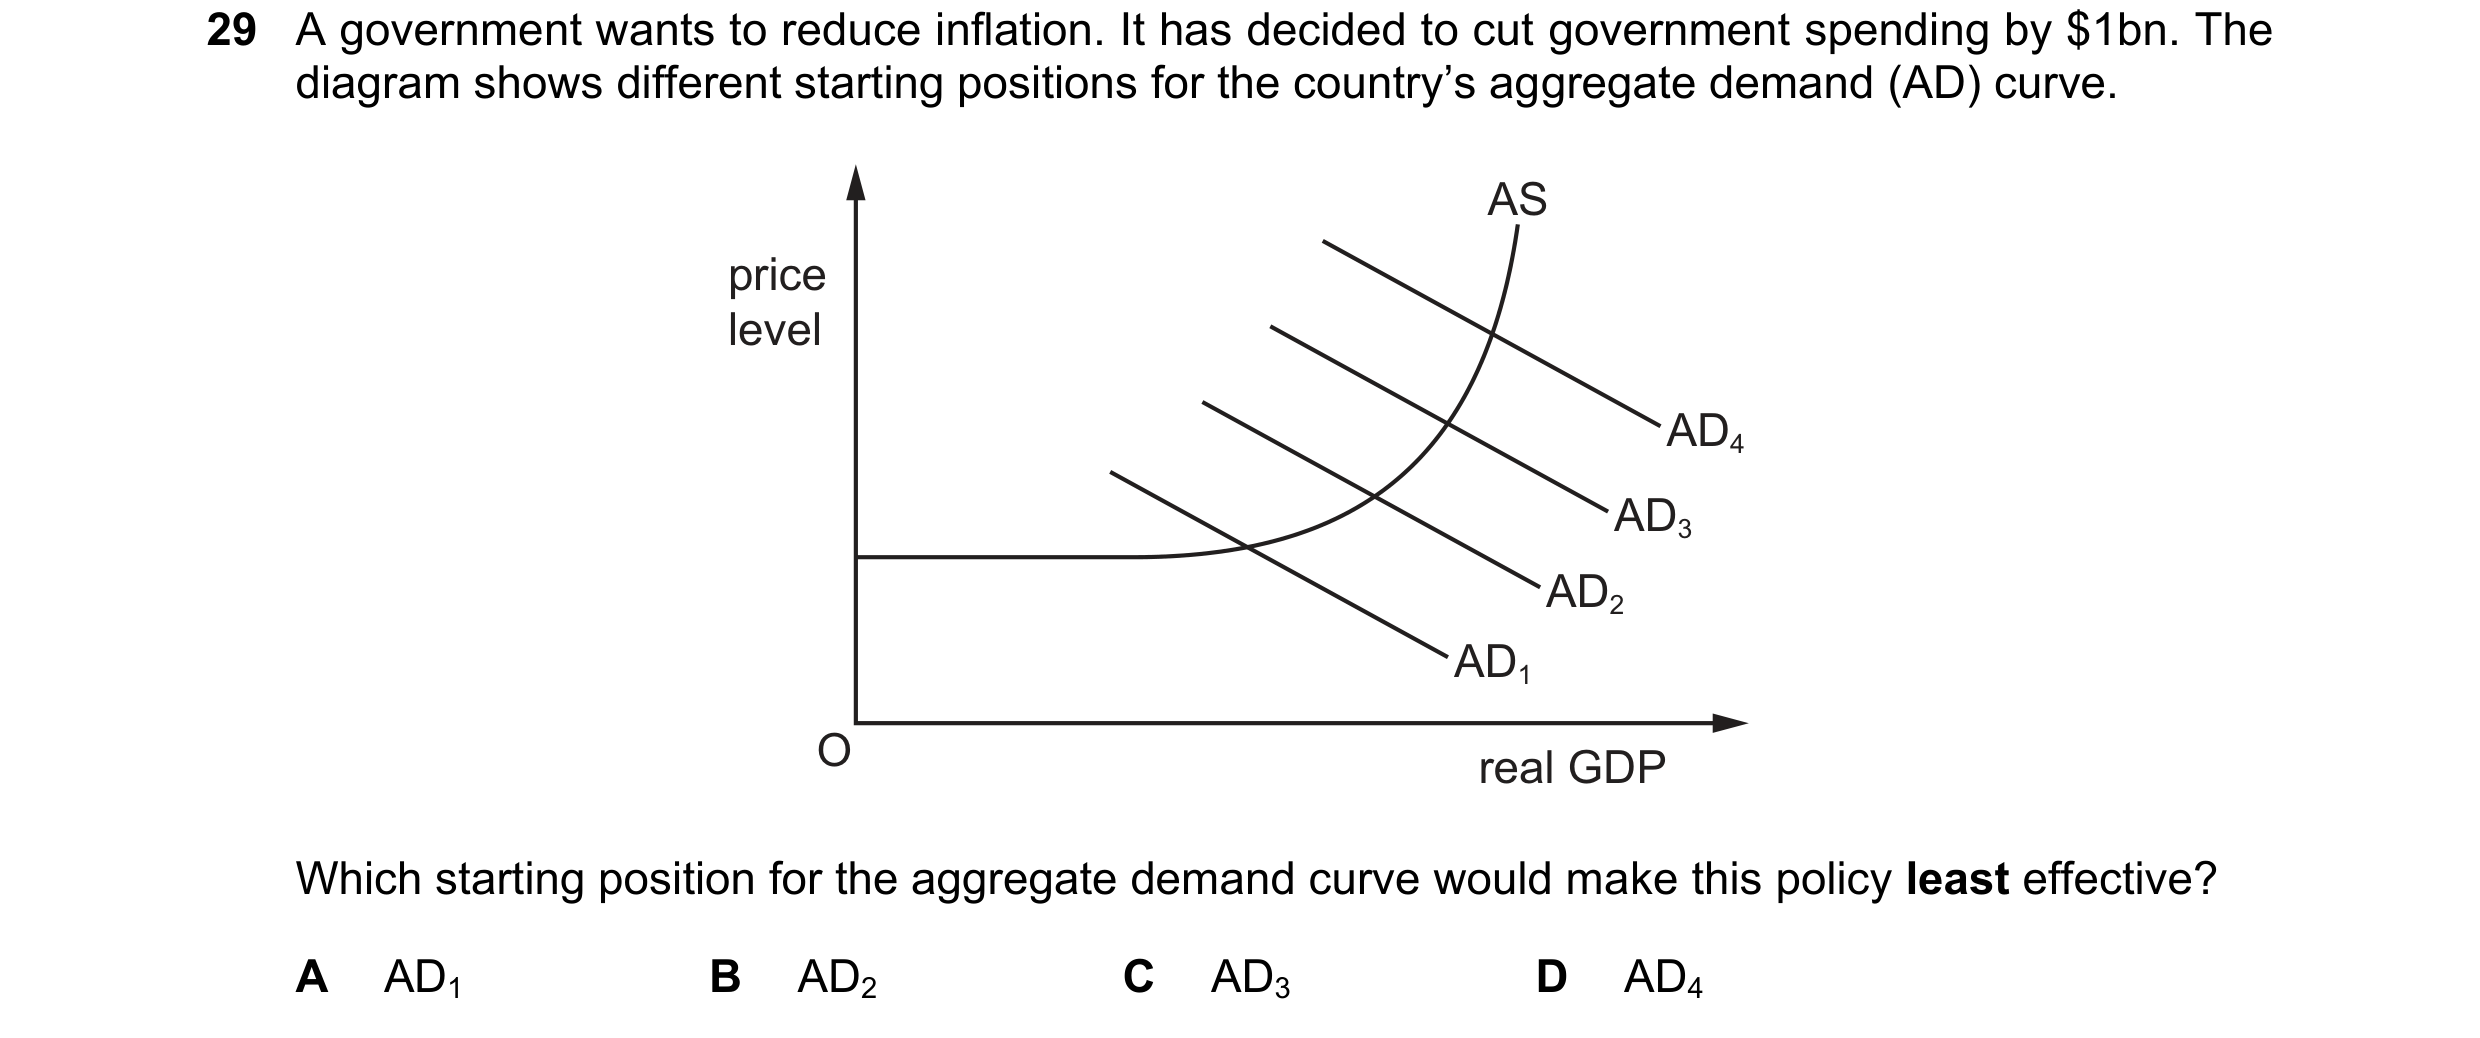 45 / 57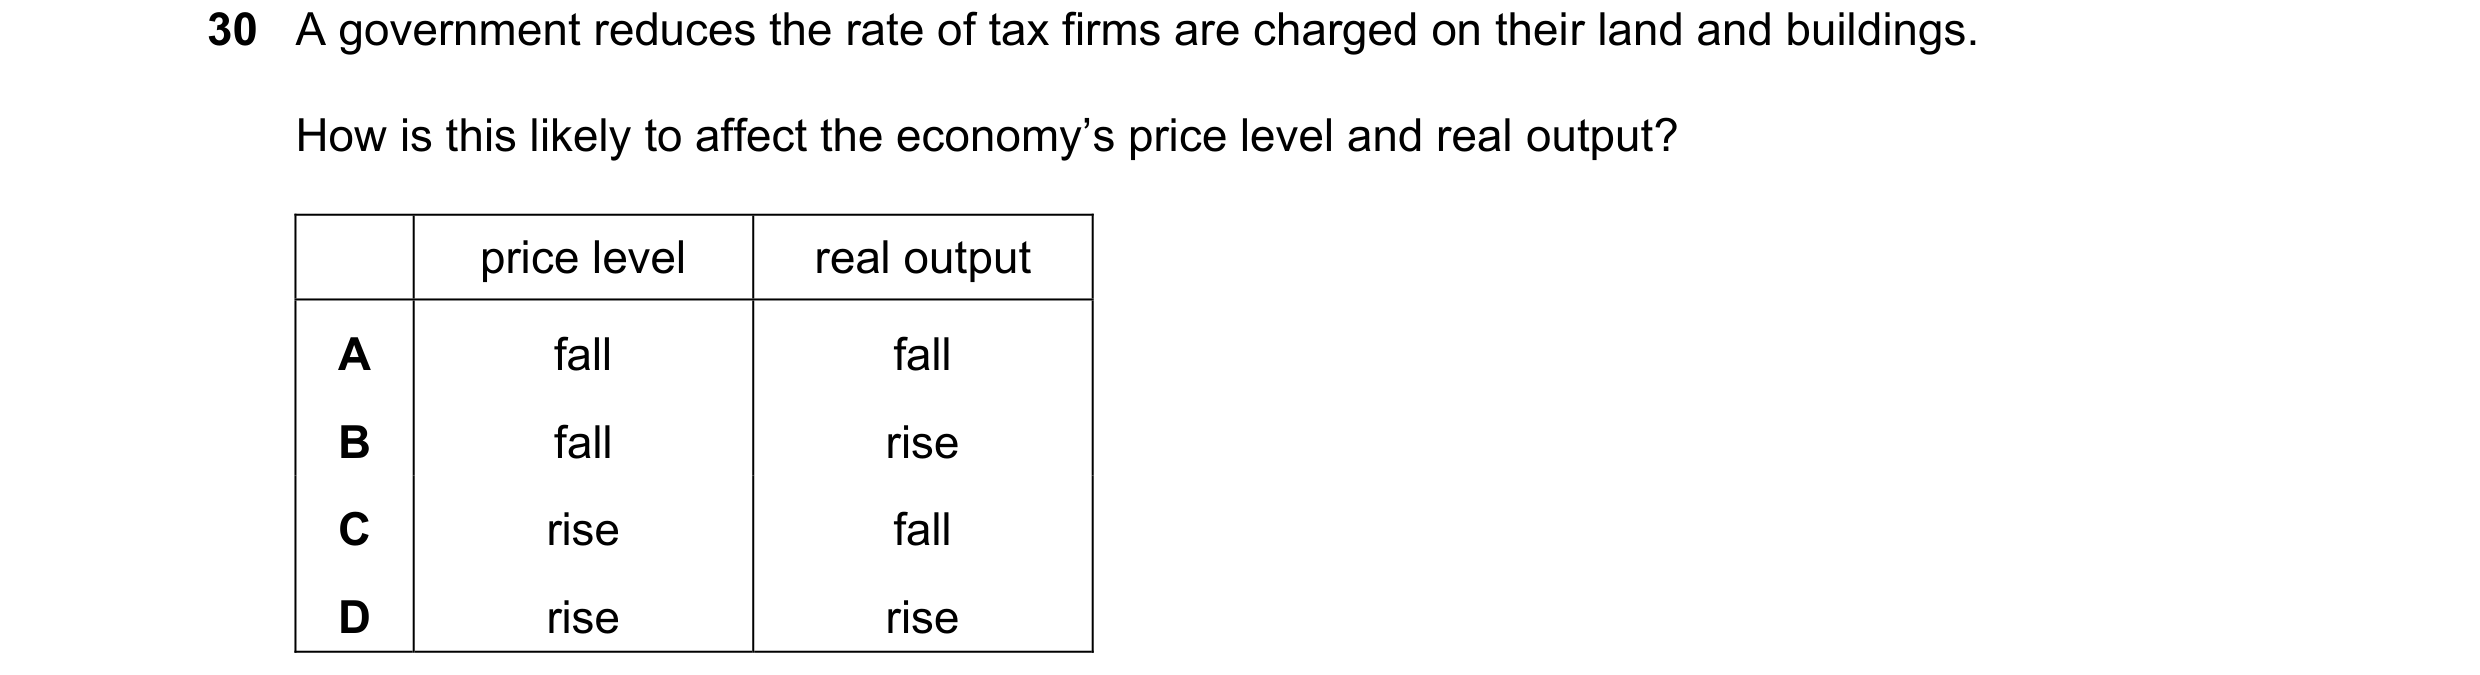
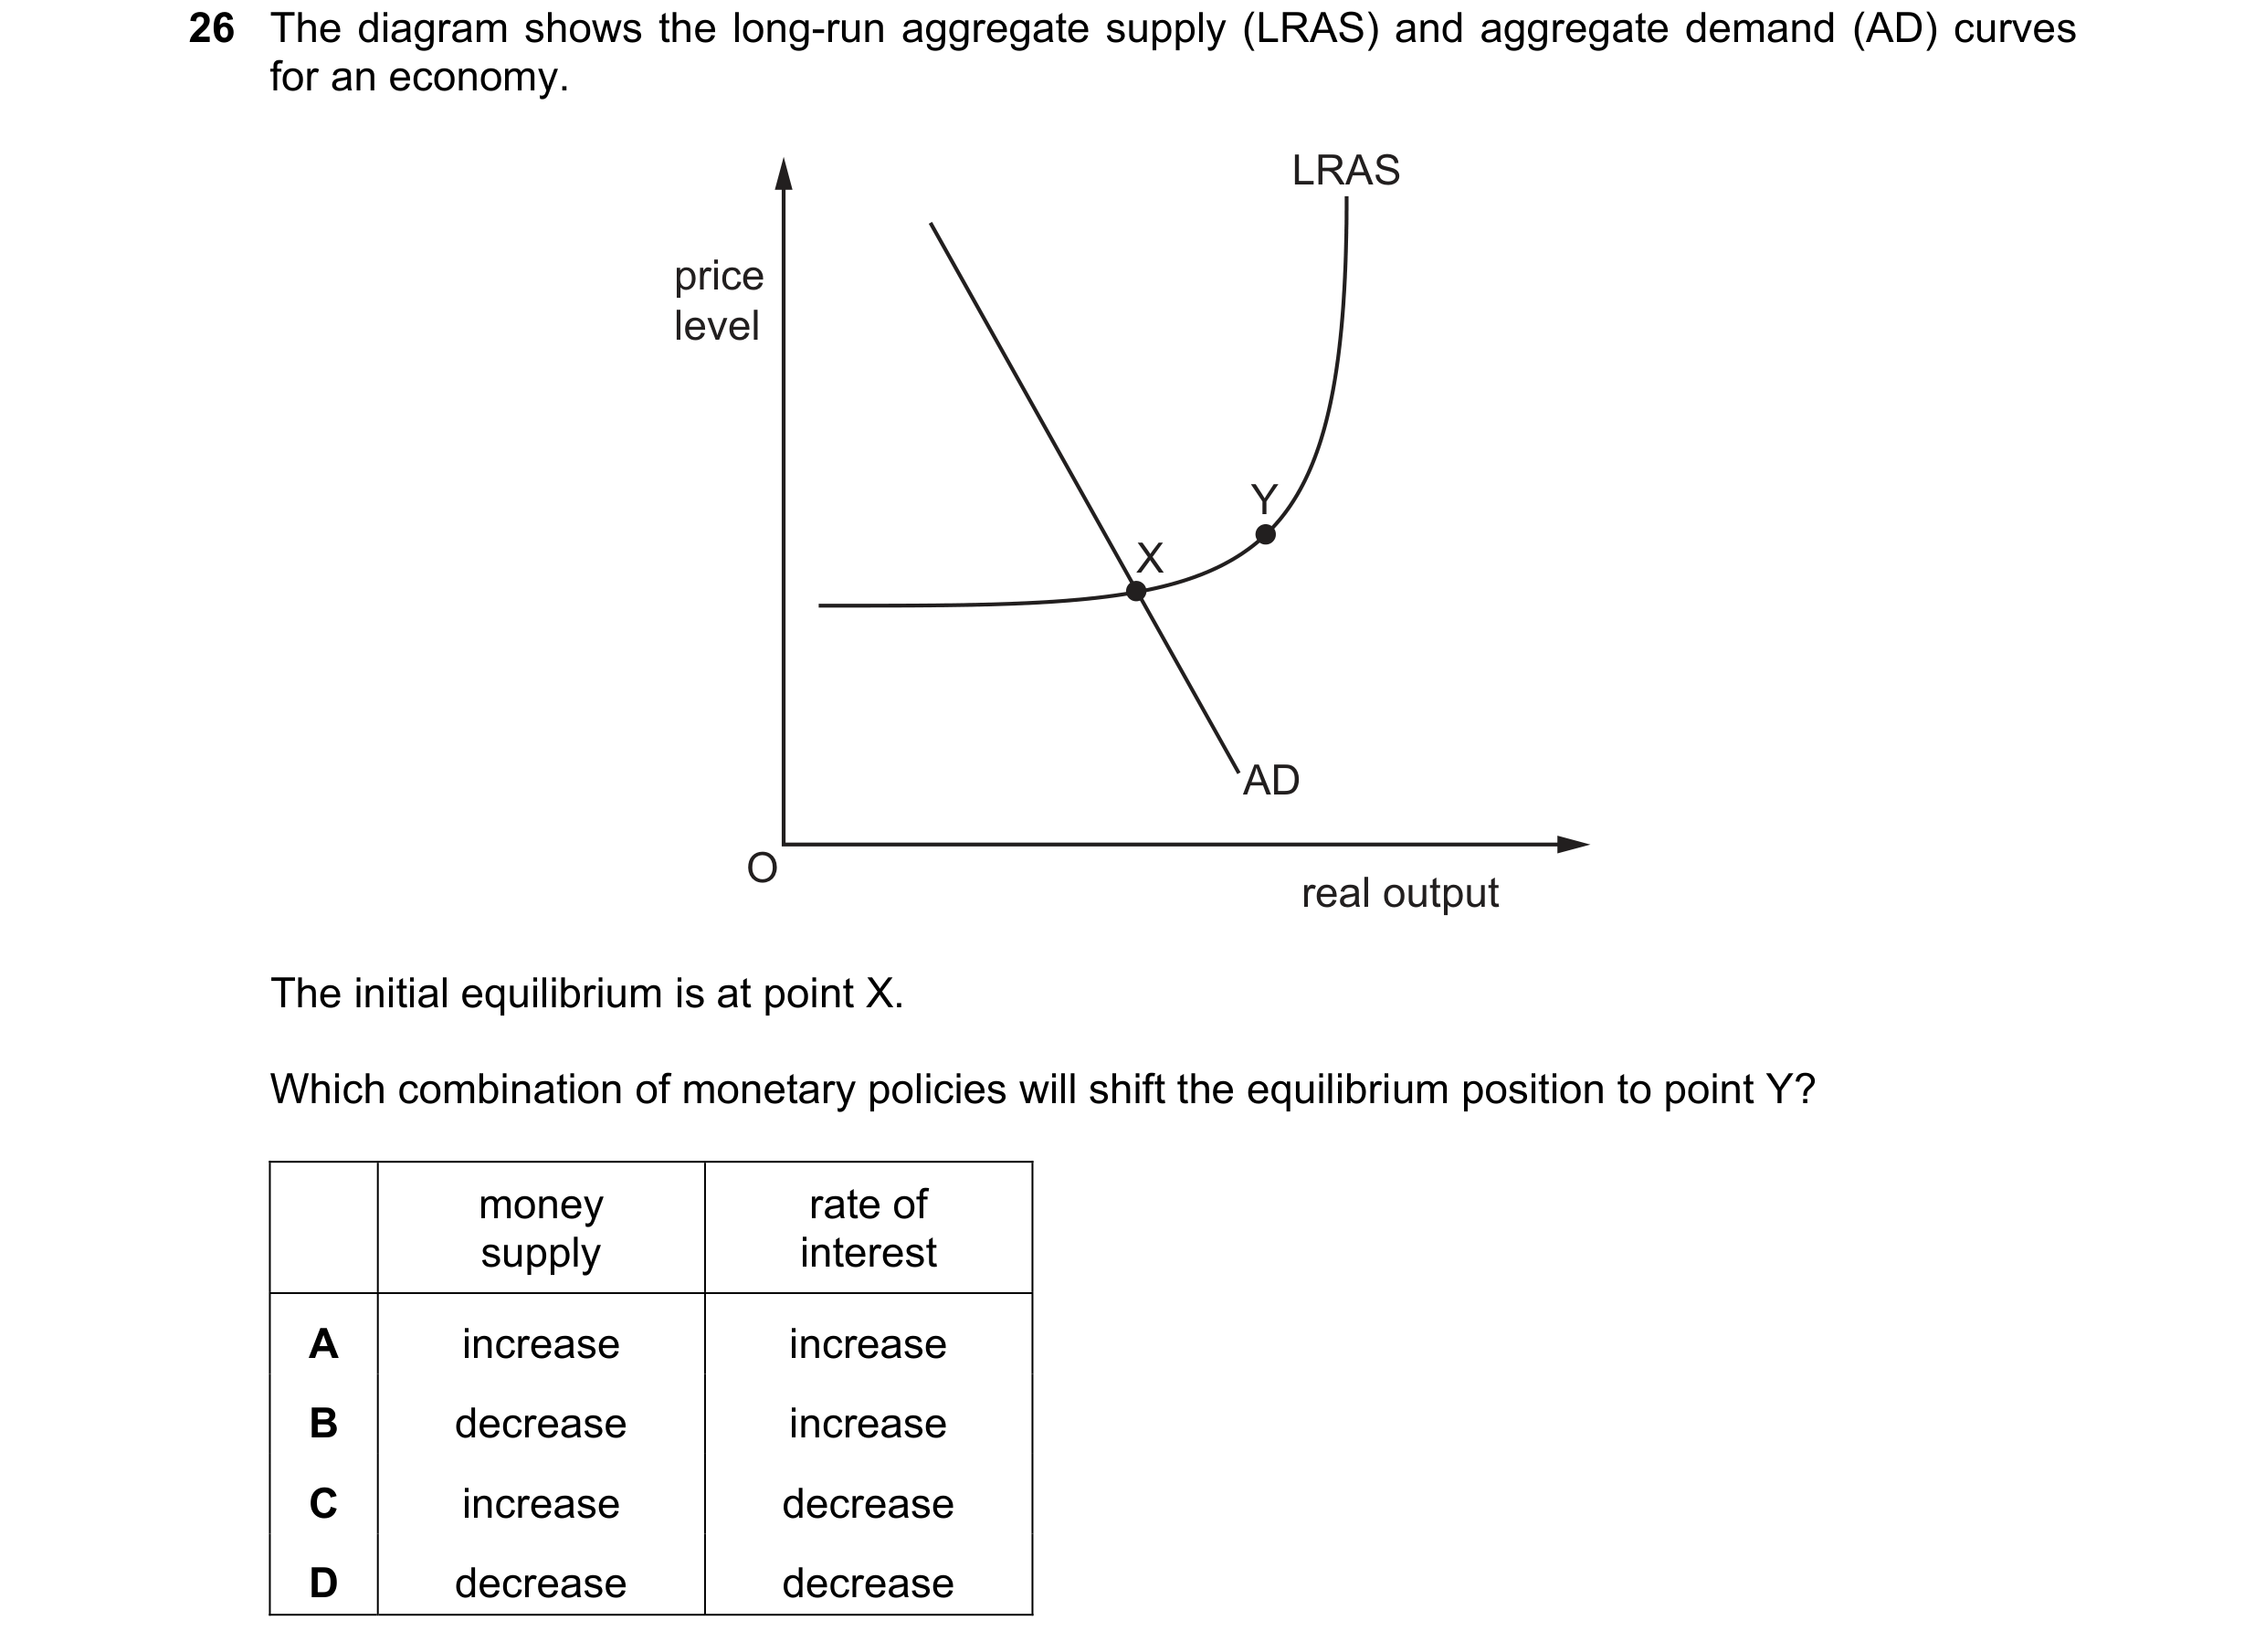 46 / 57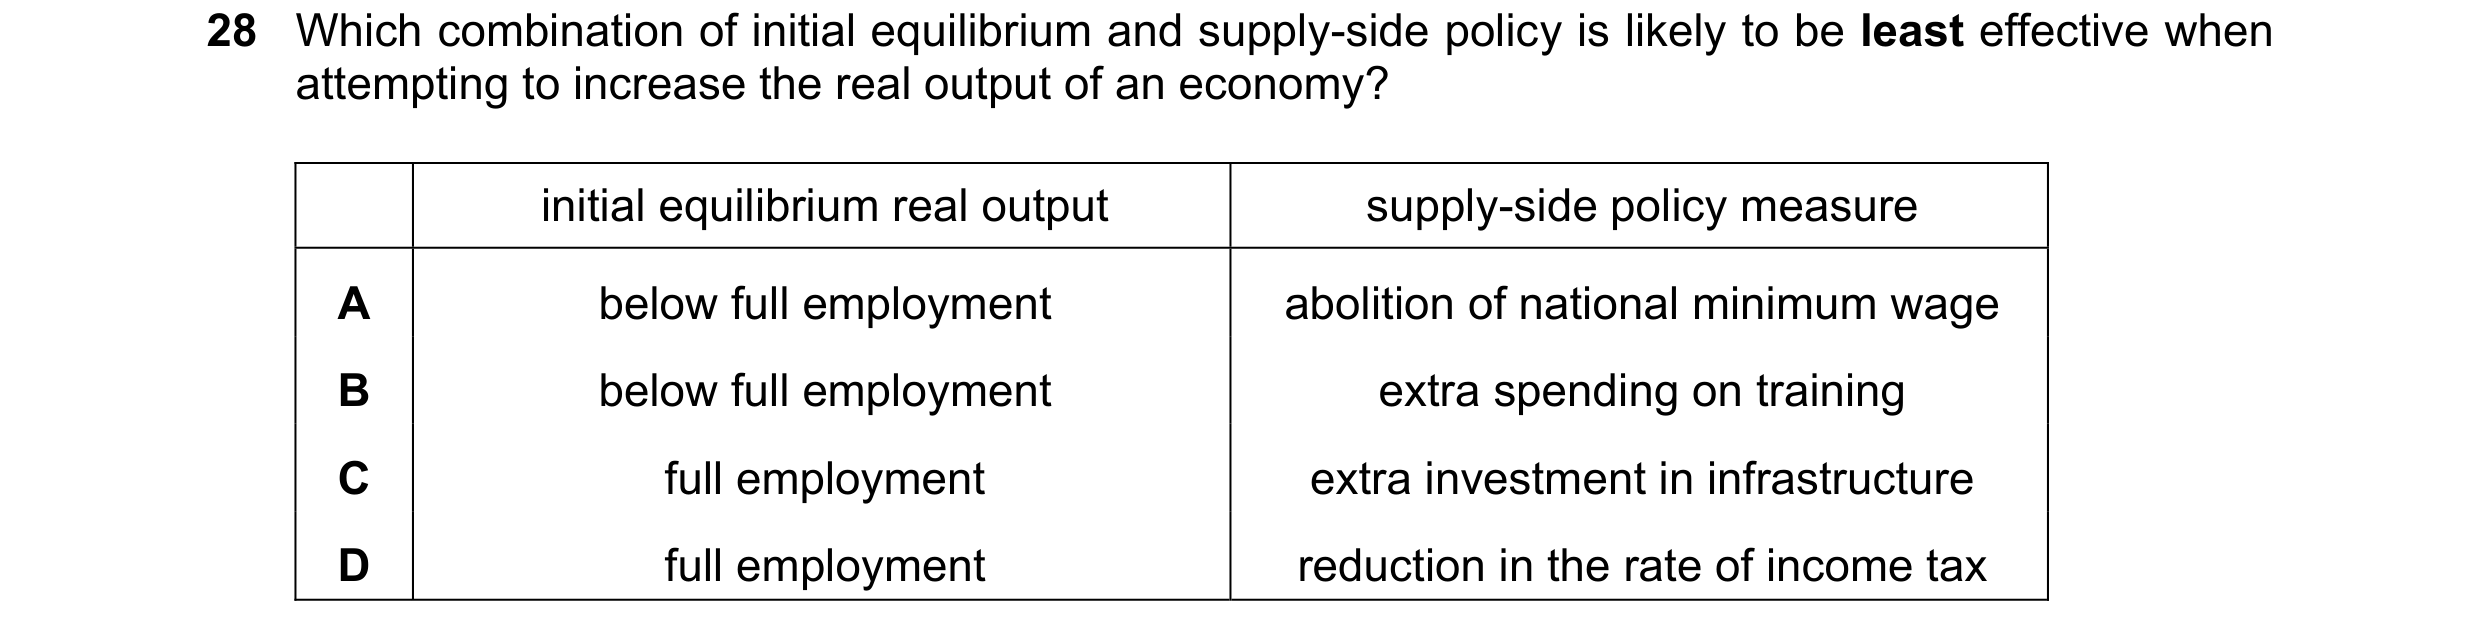


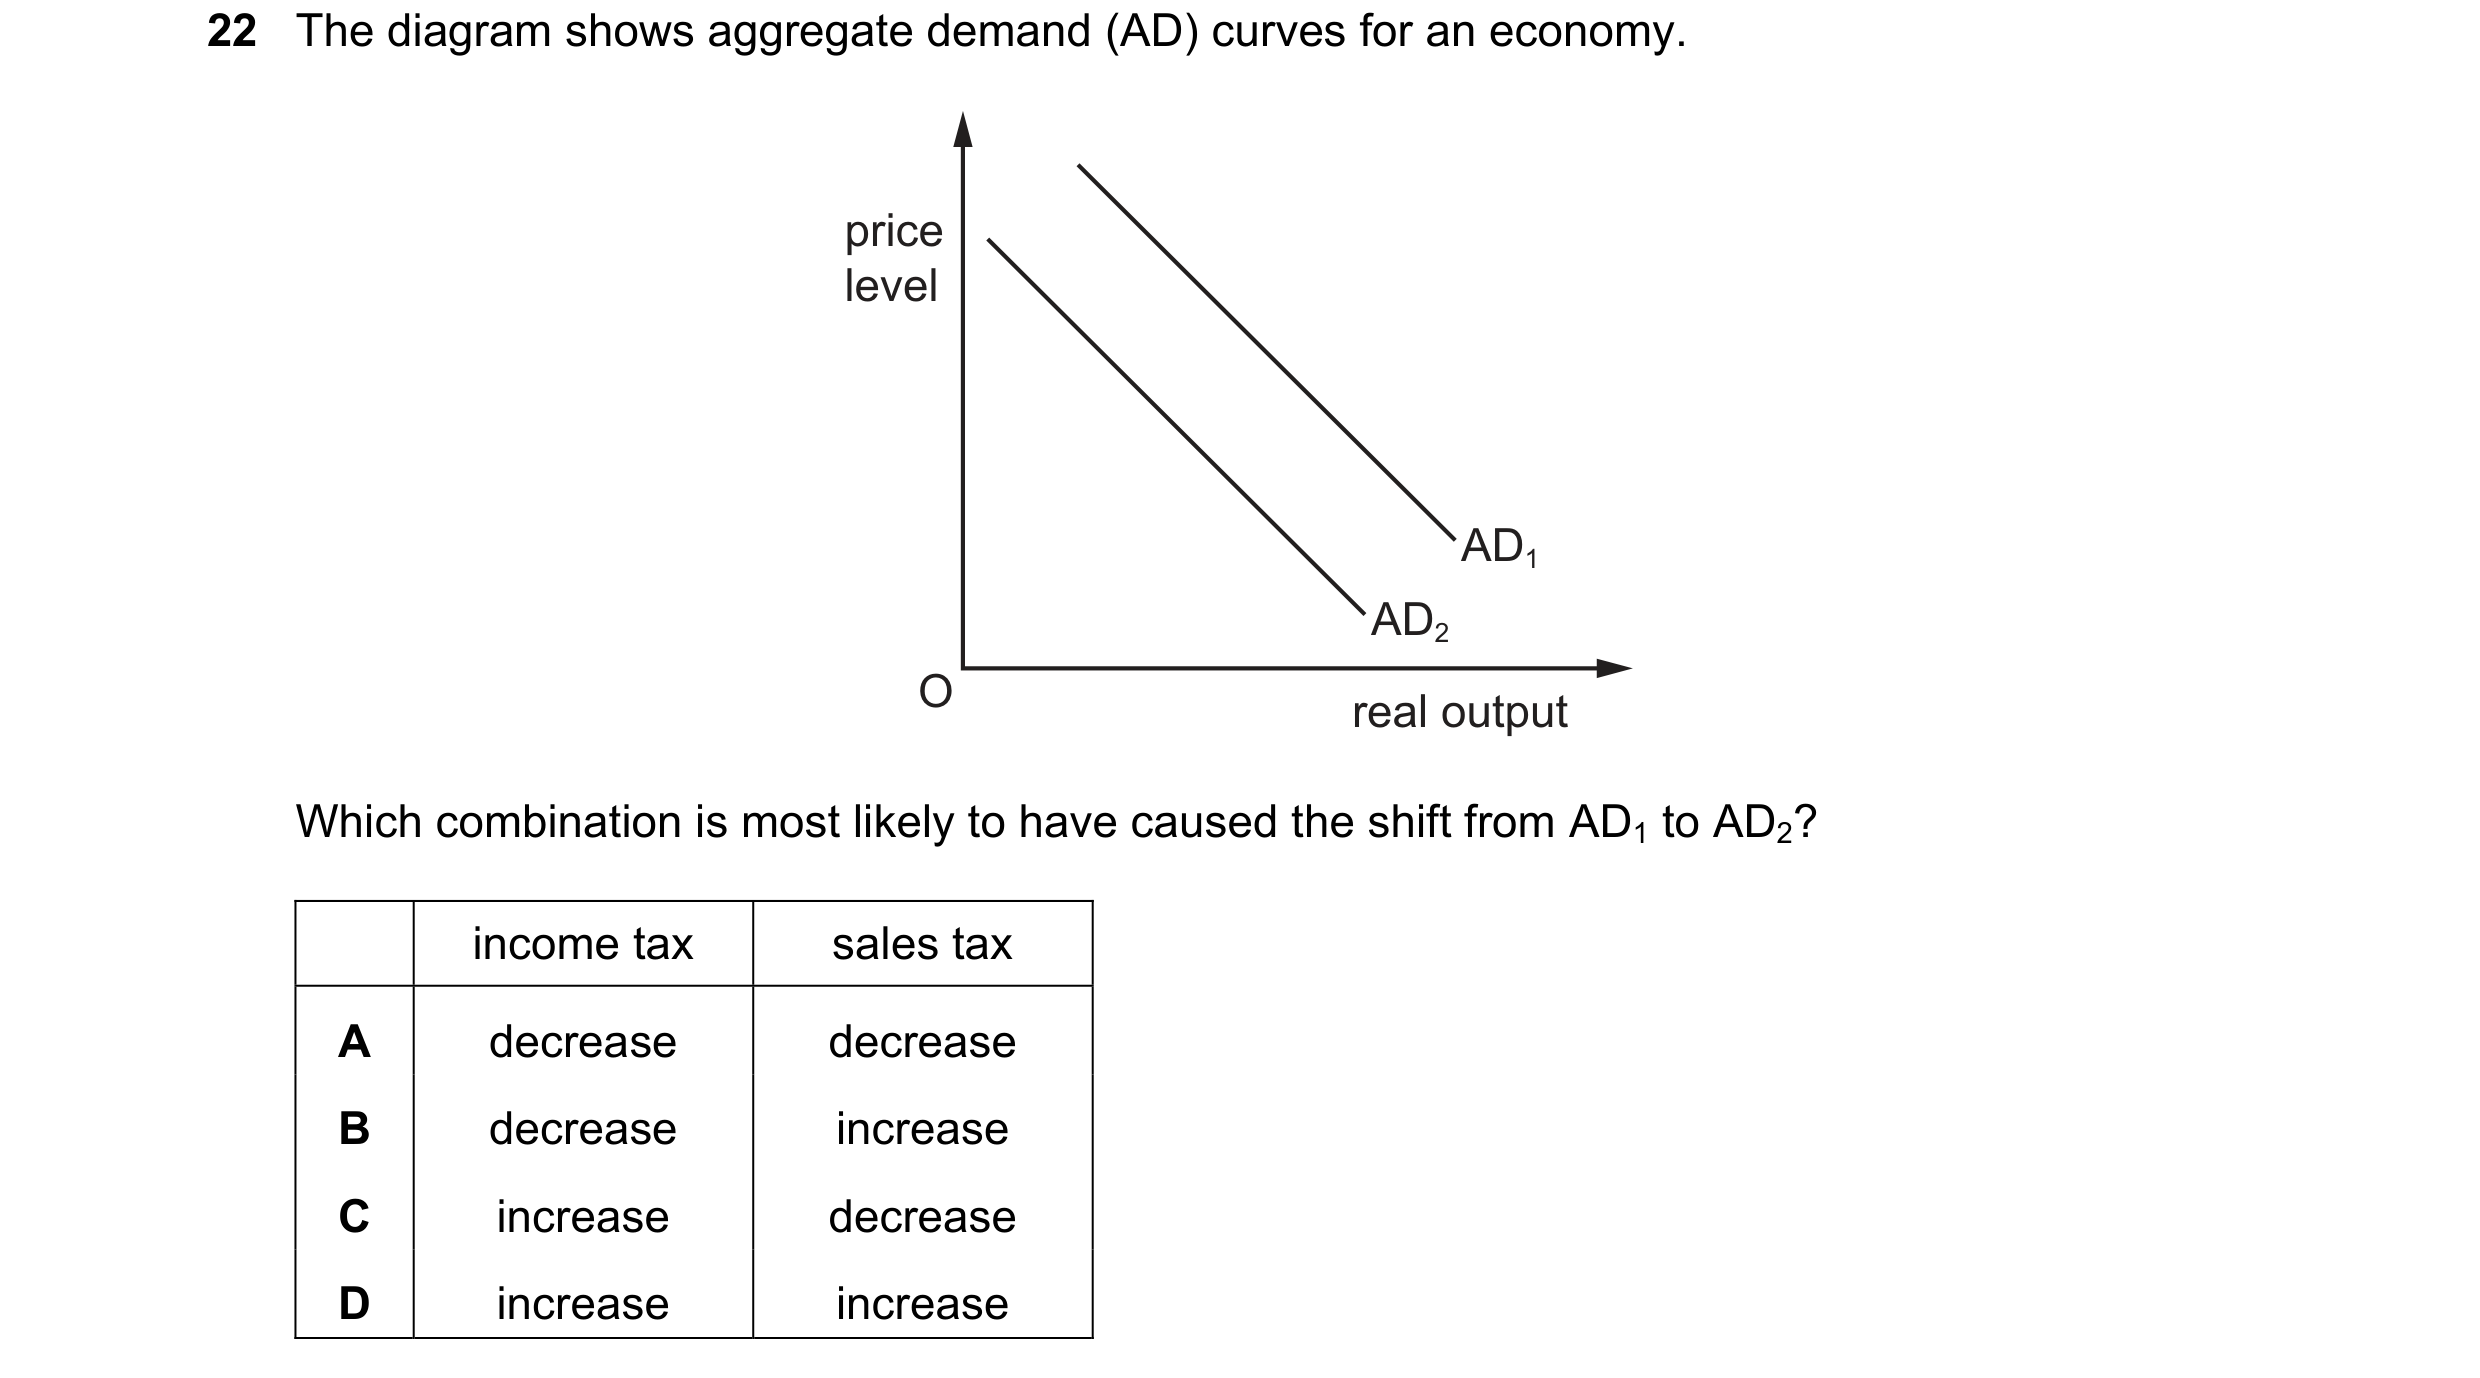 47 / 57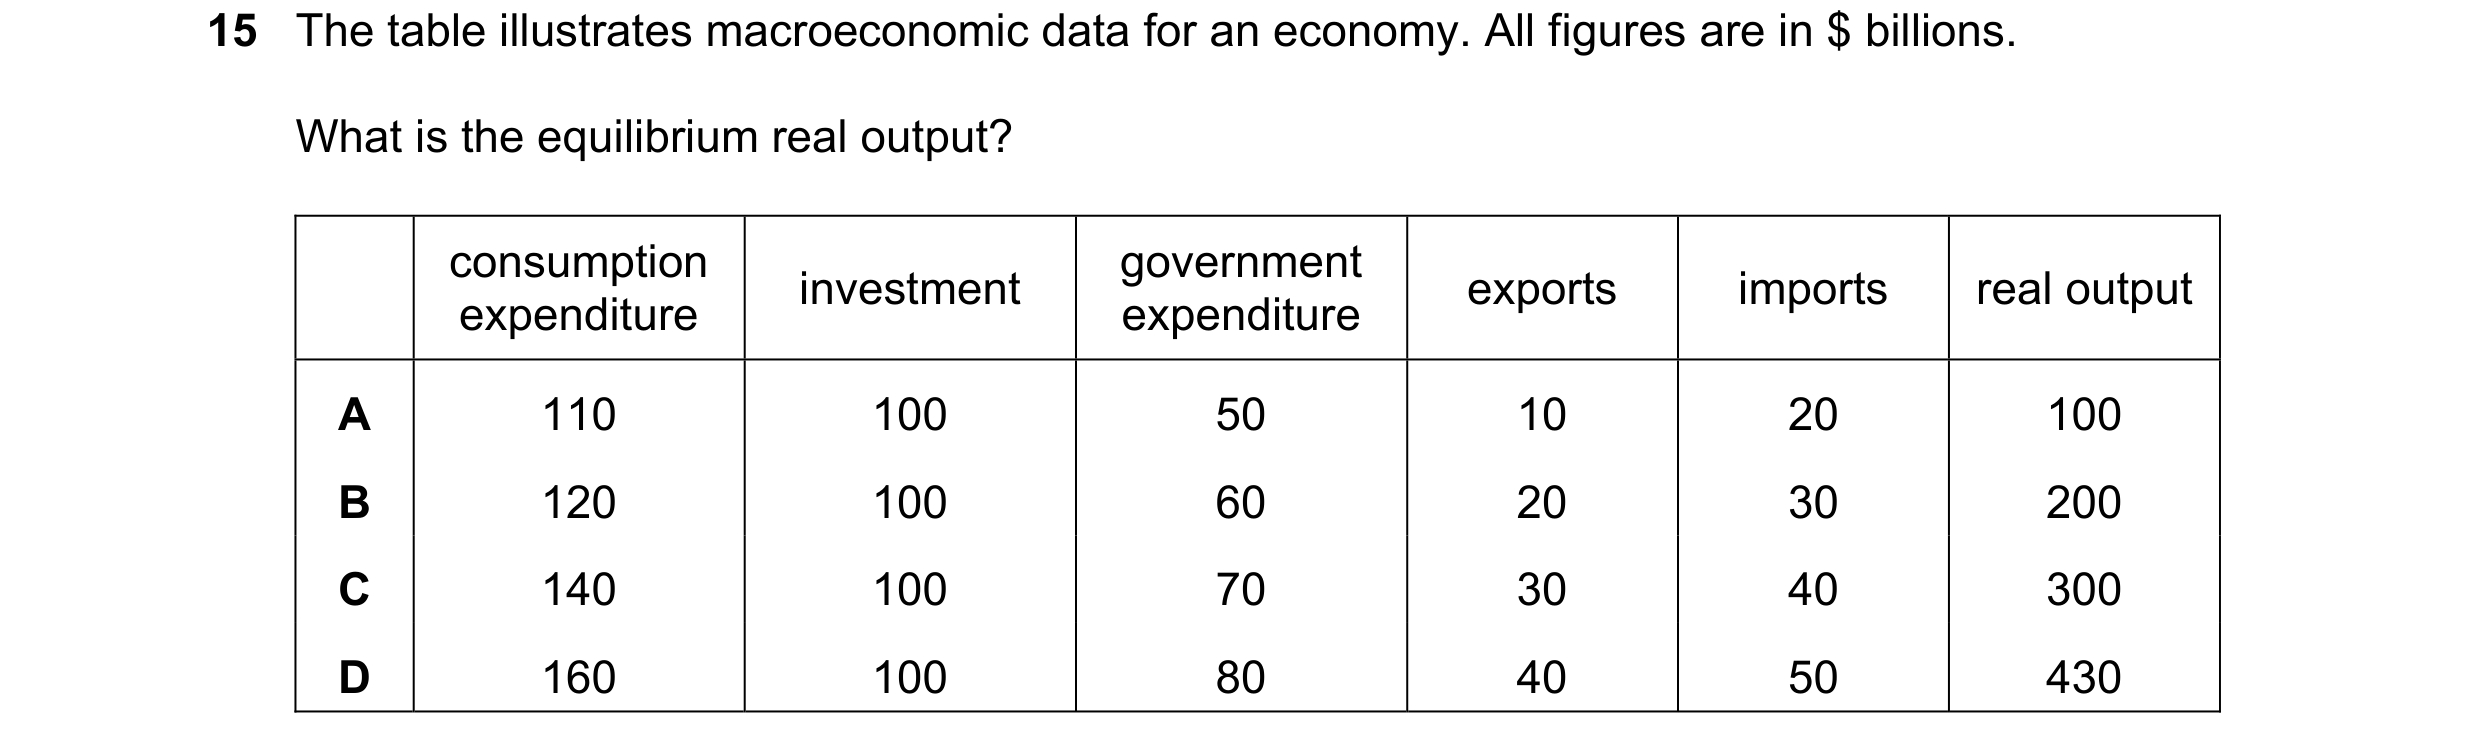
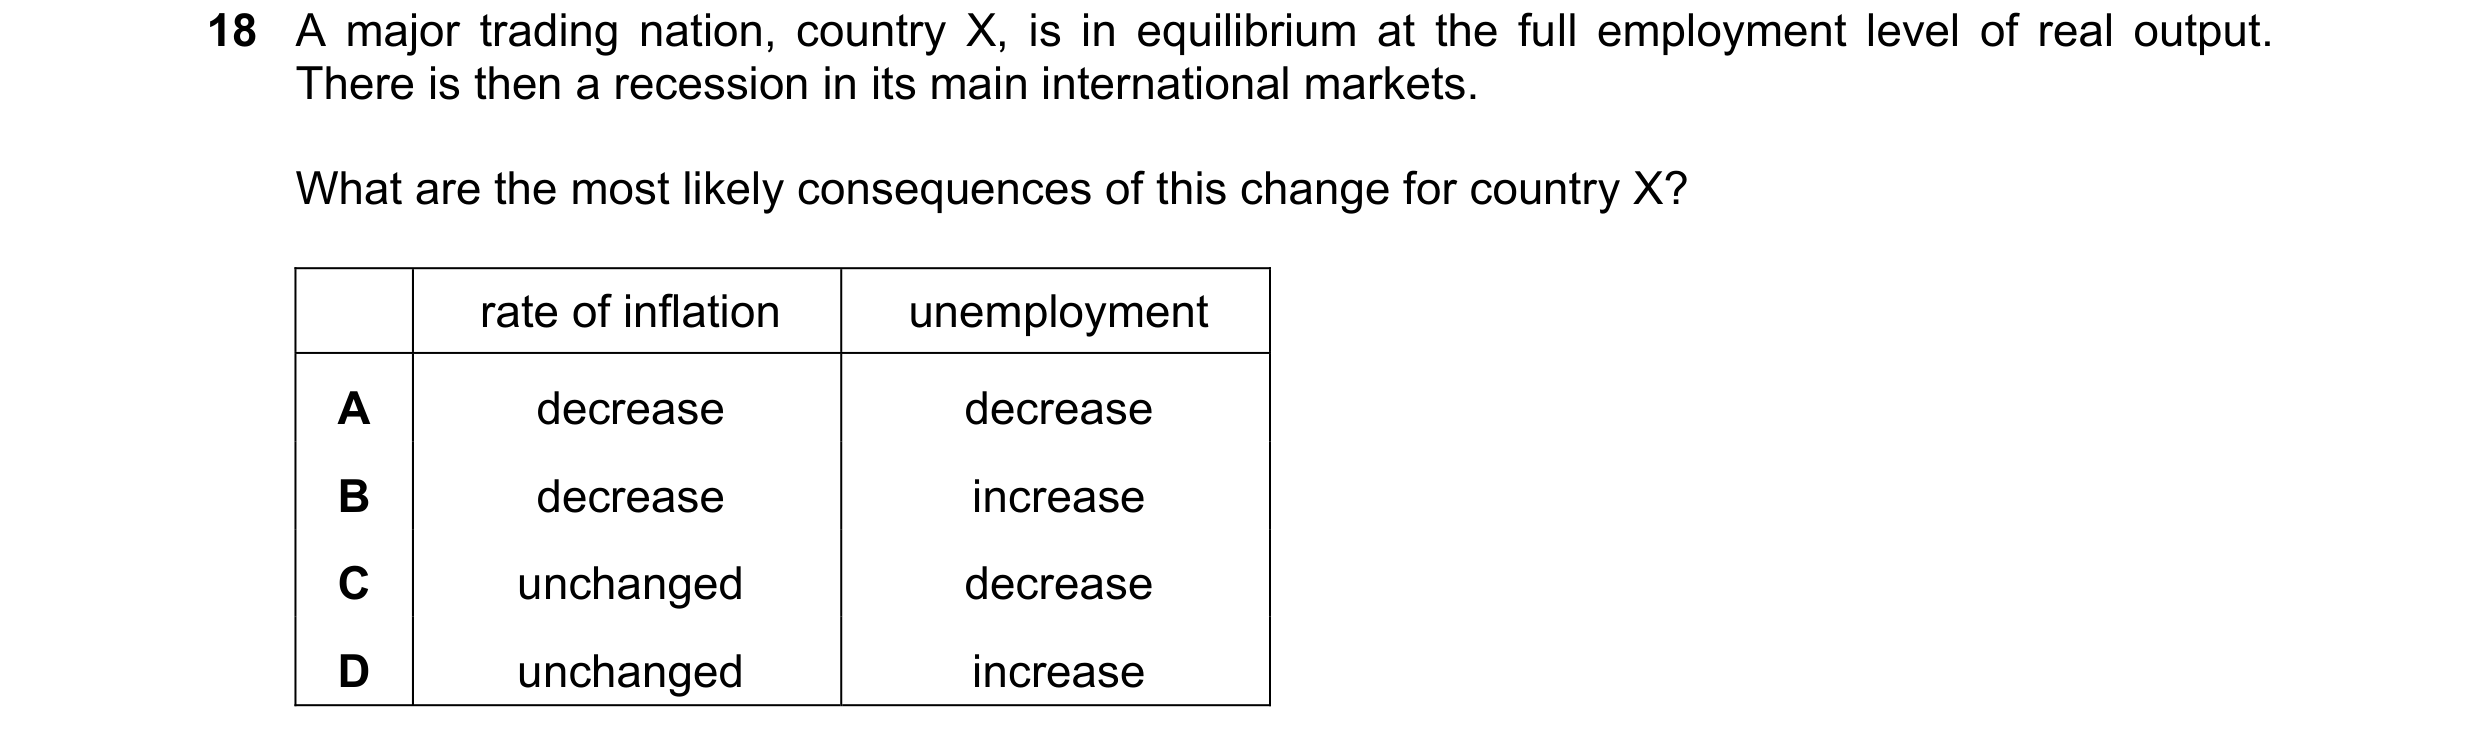
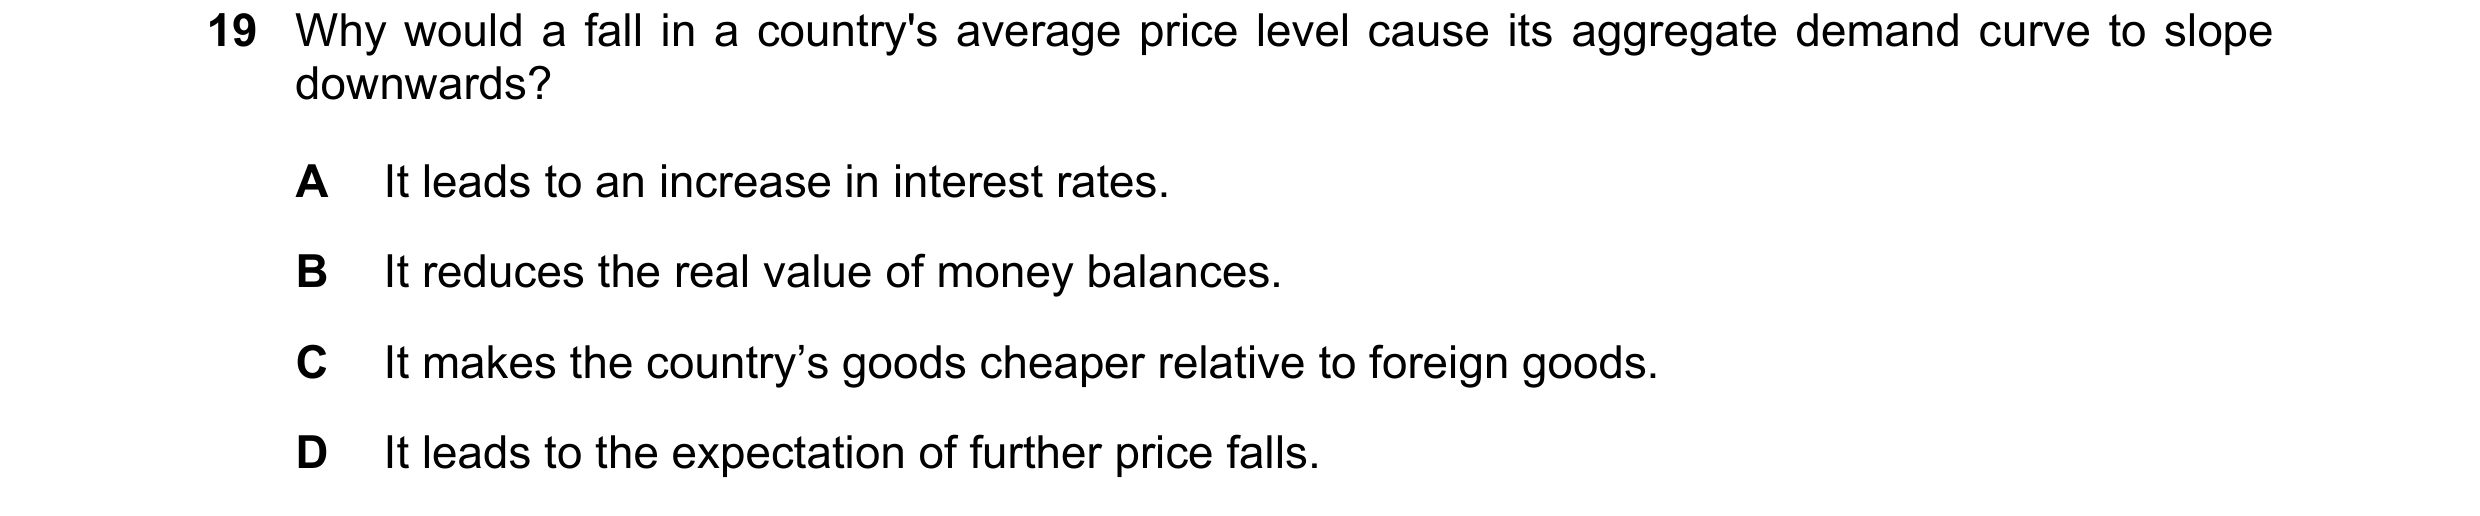

 48 / 57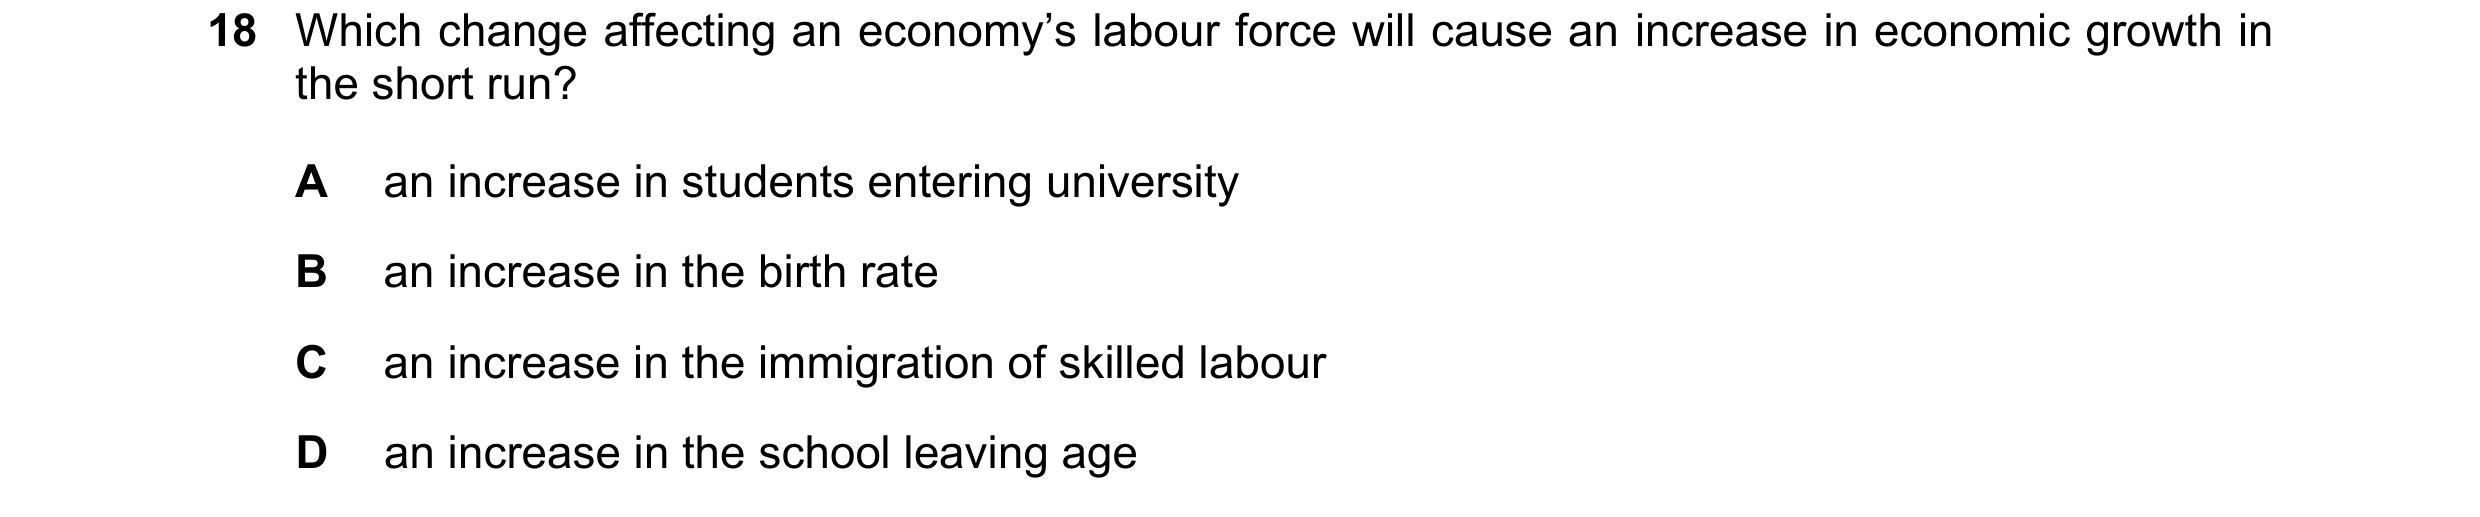
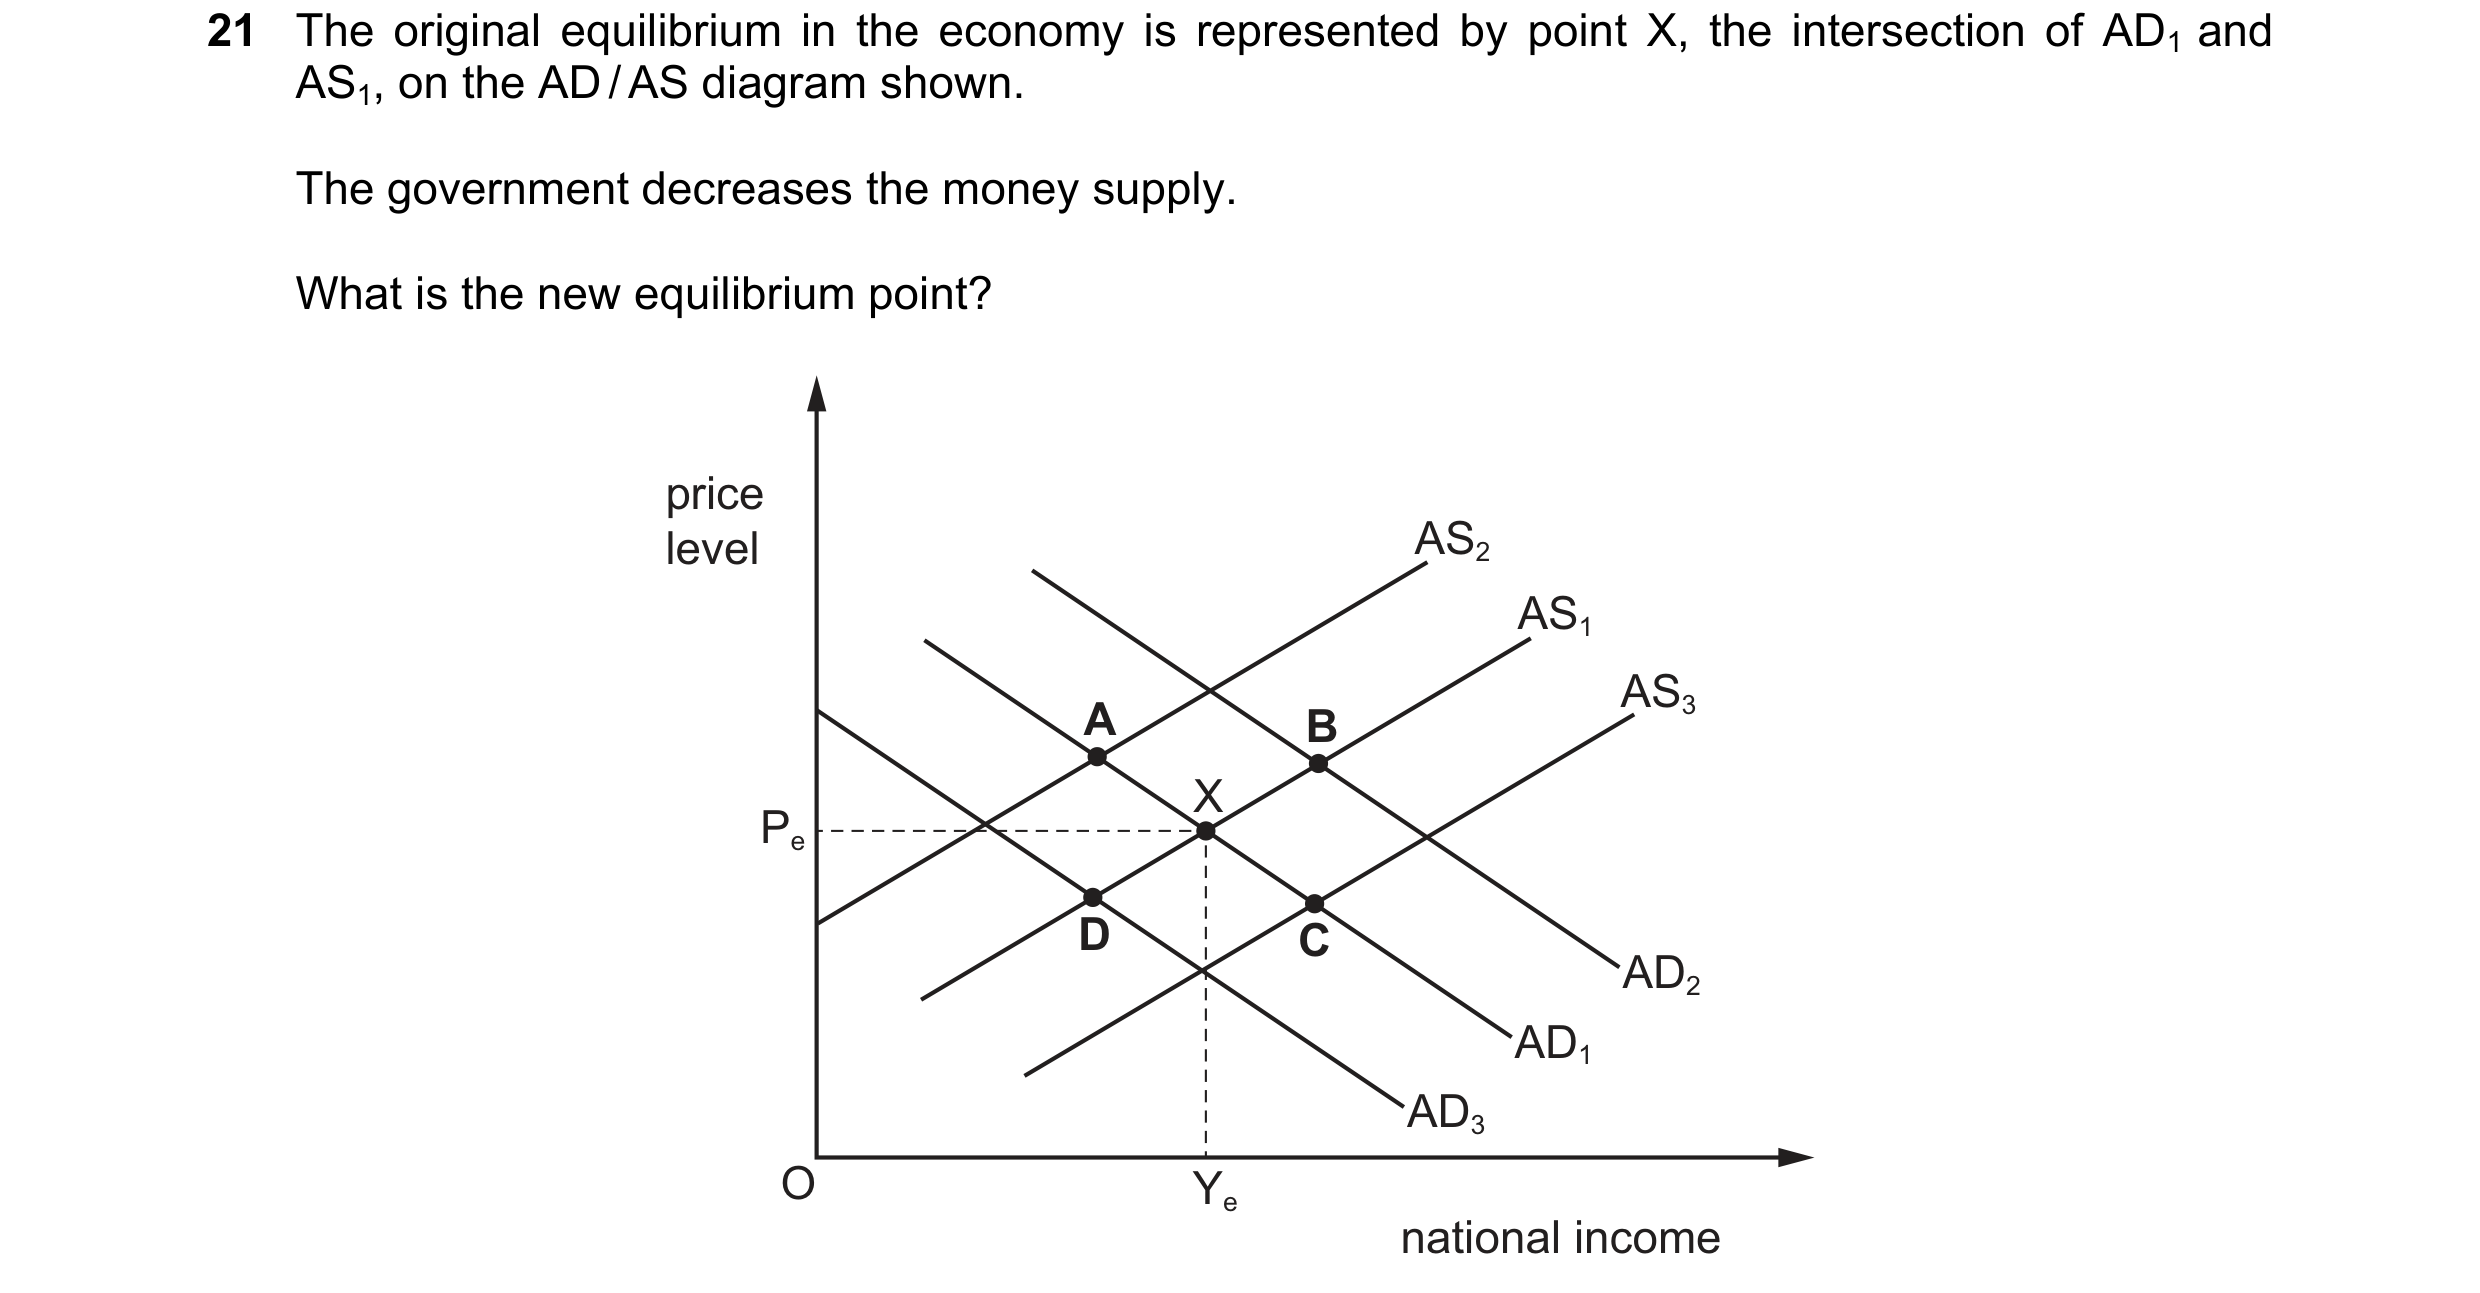
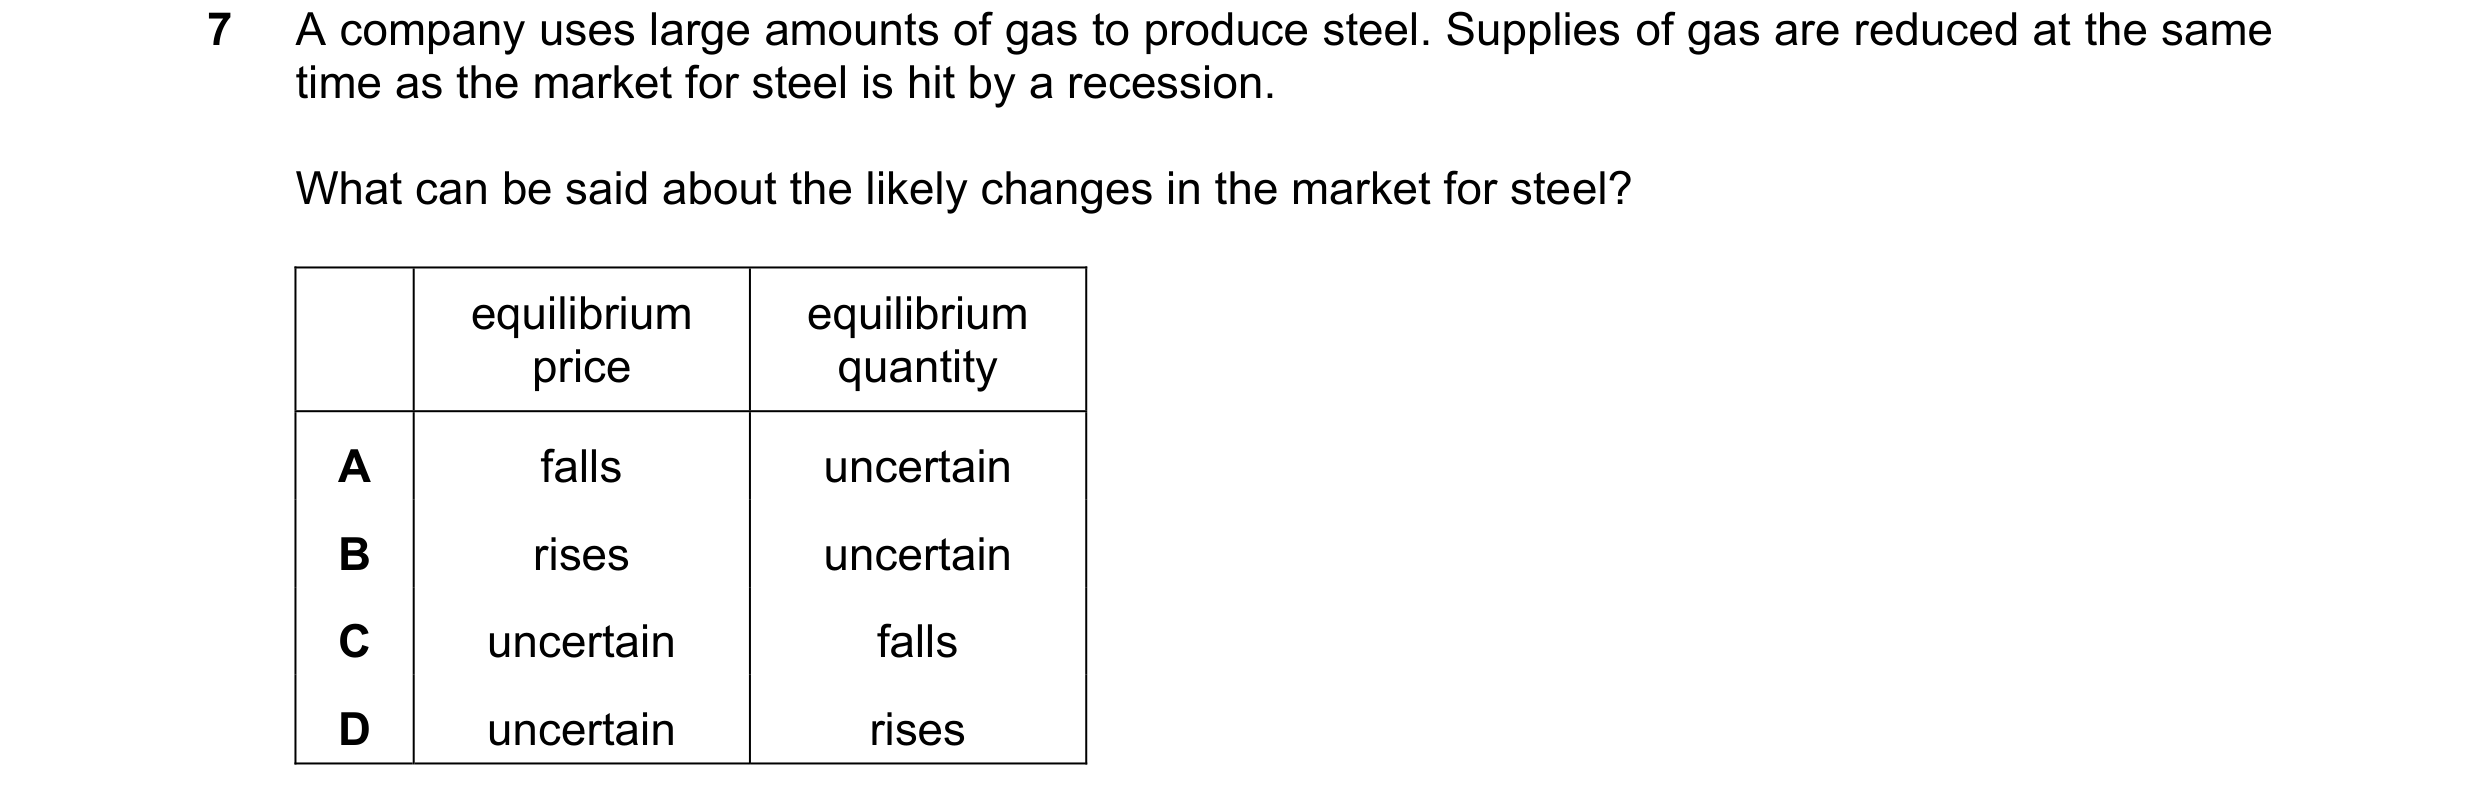 49 / 57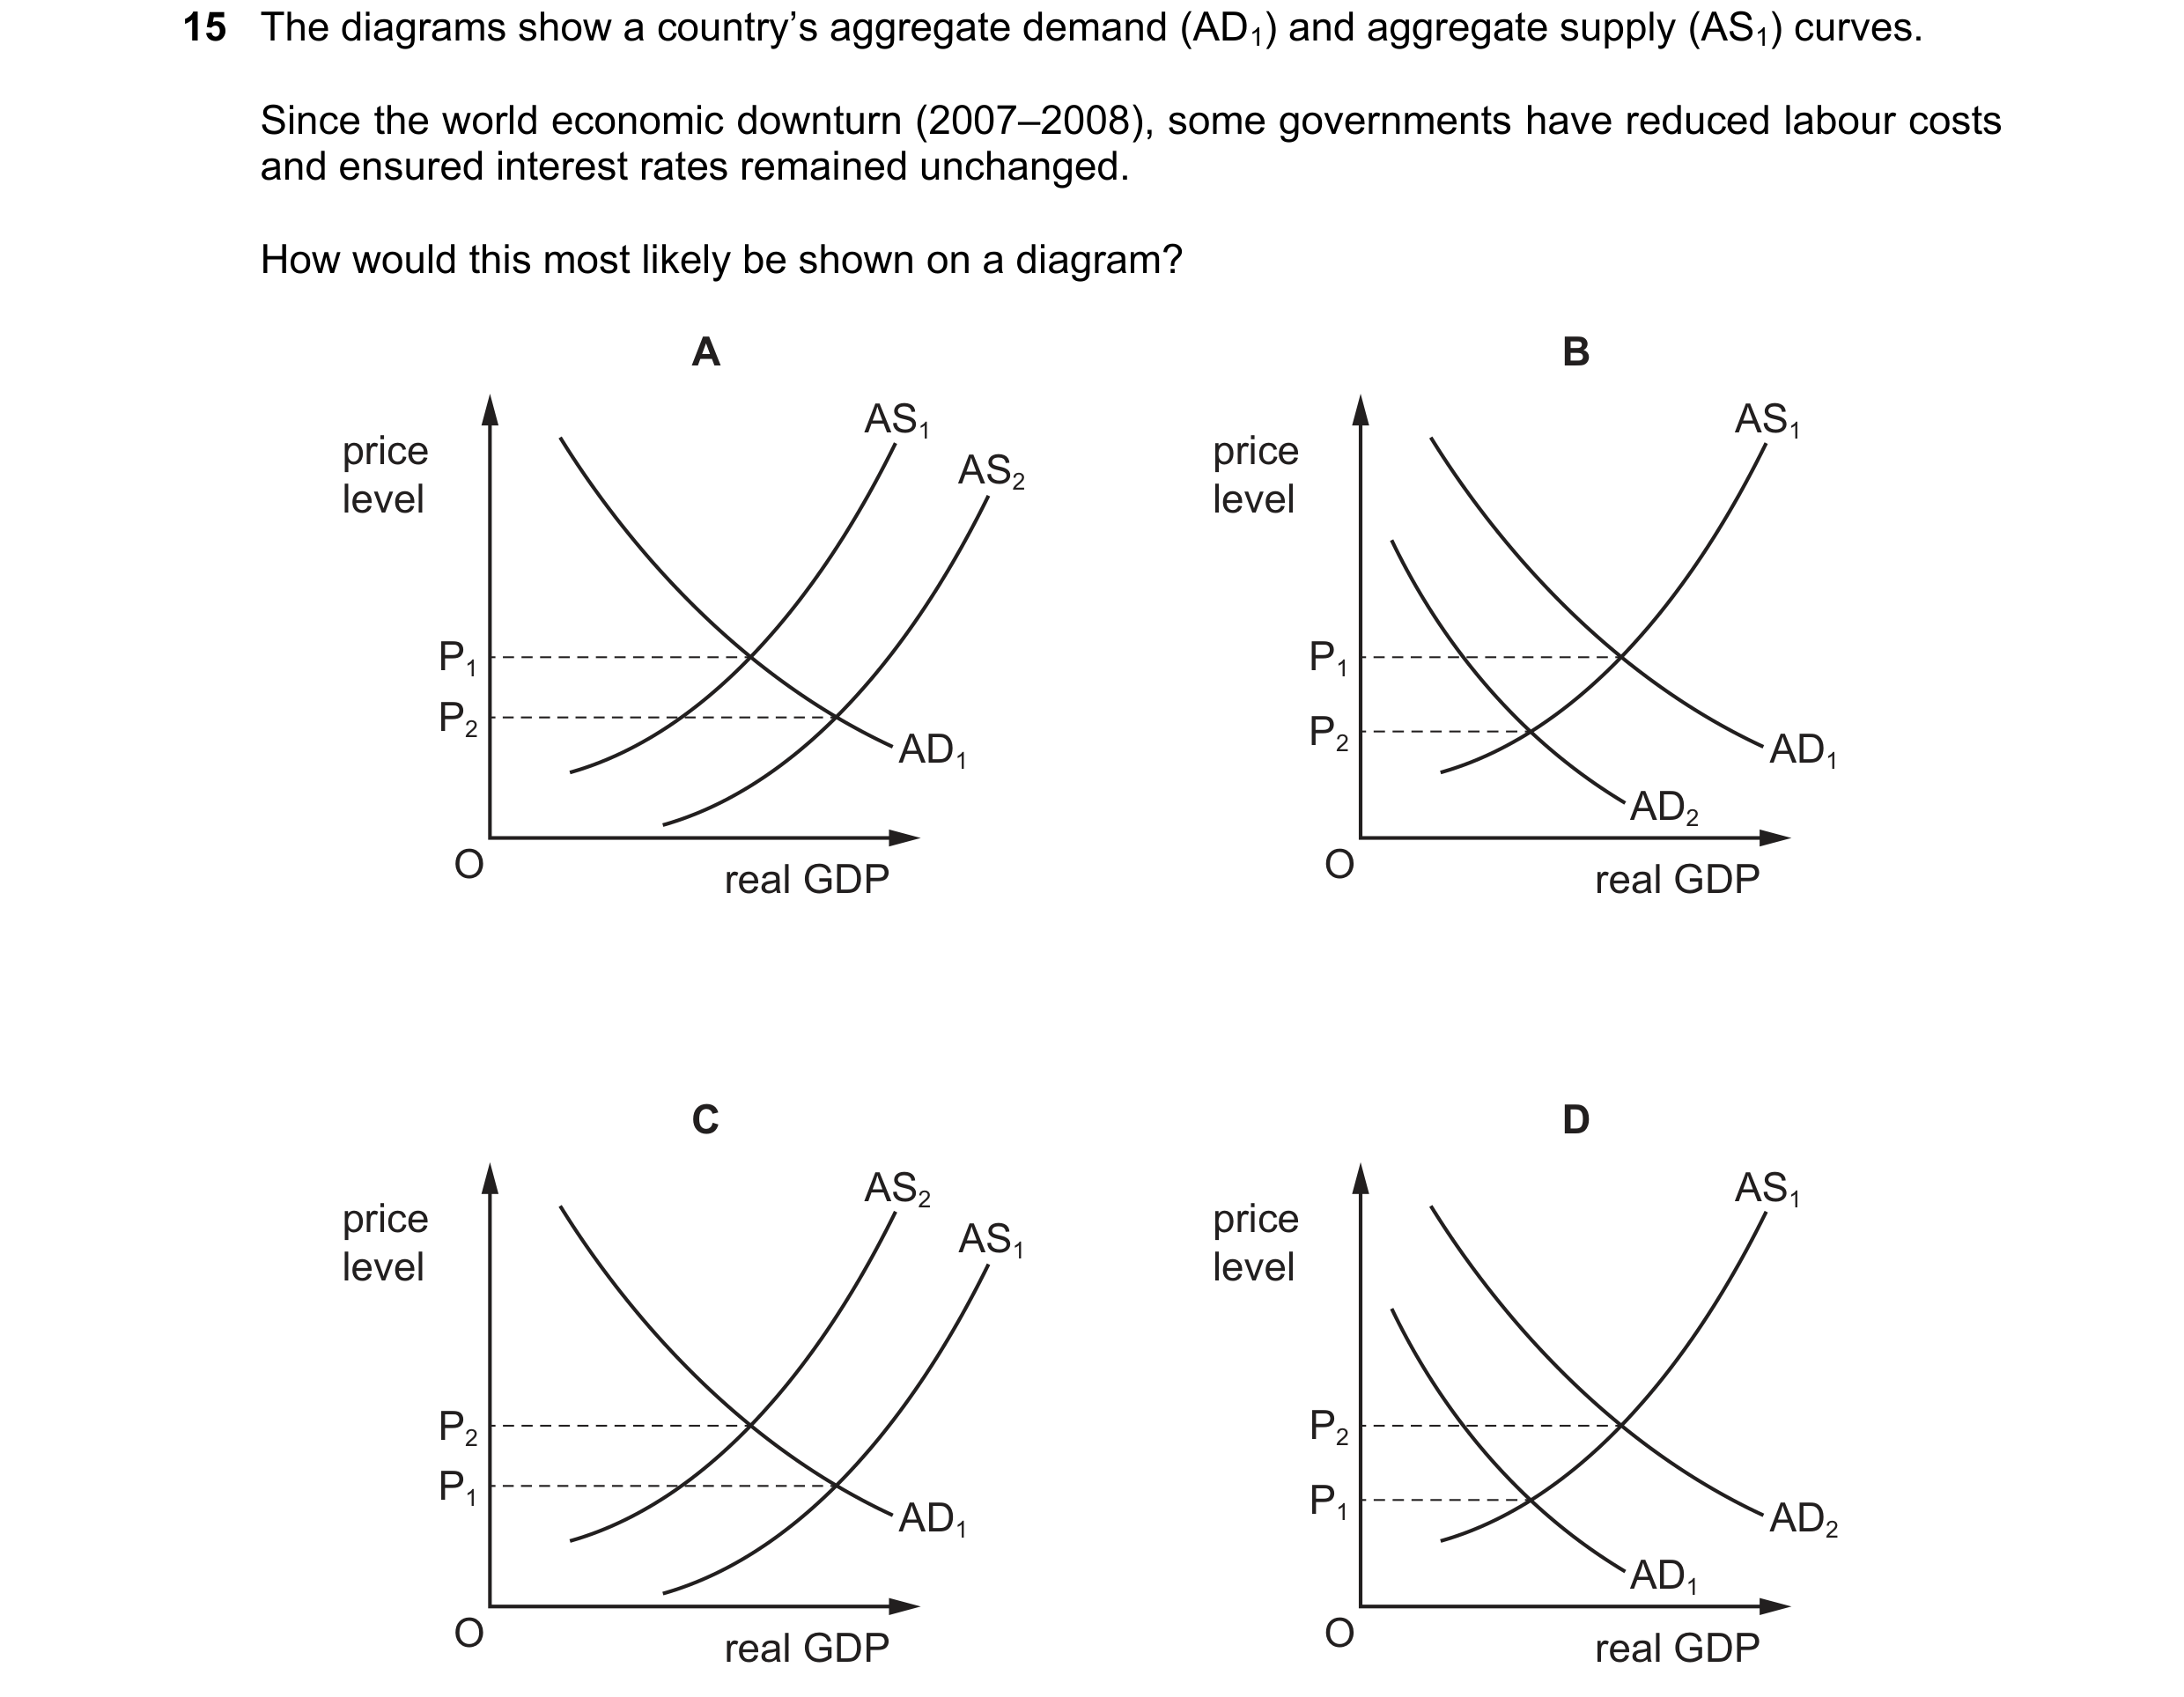
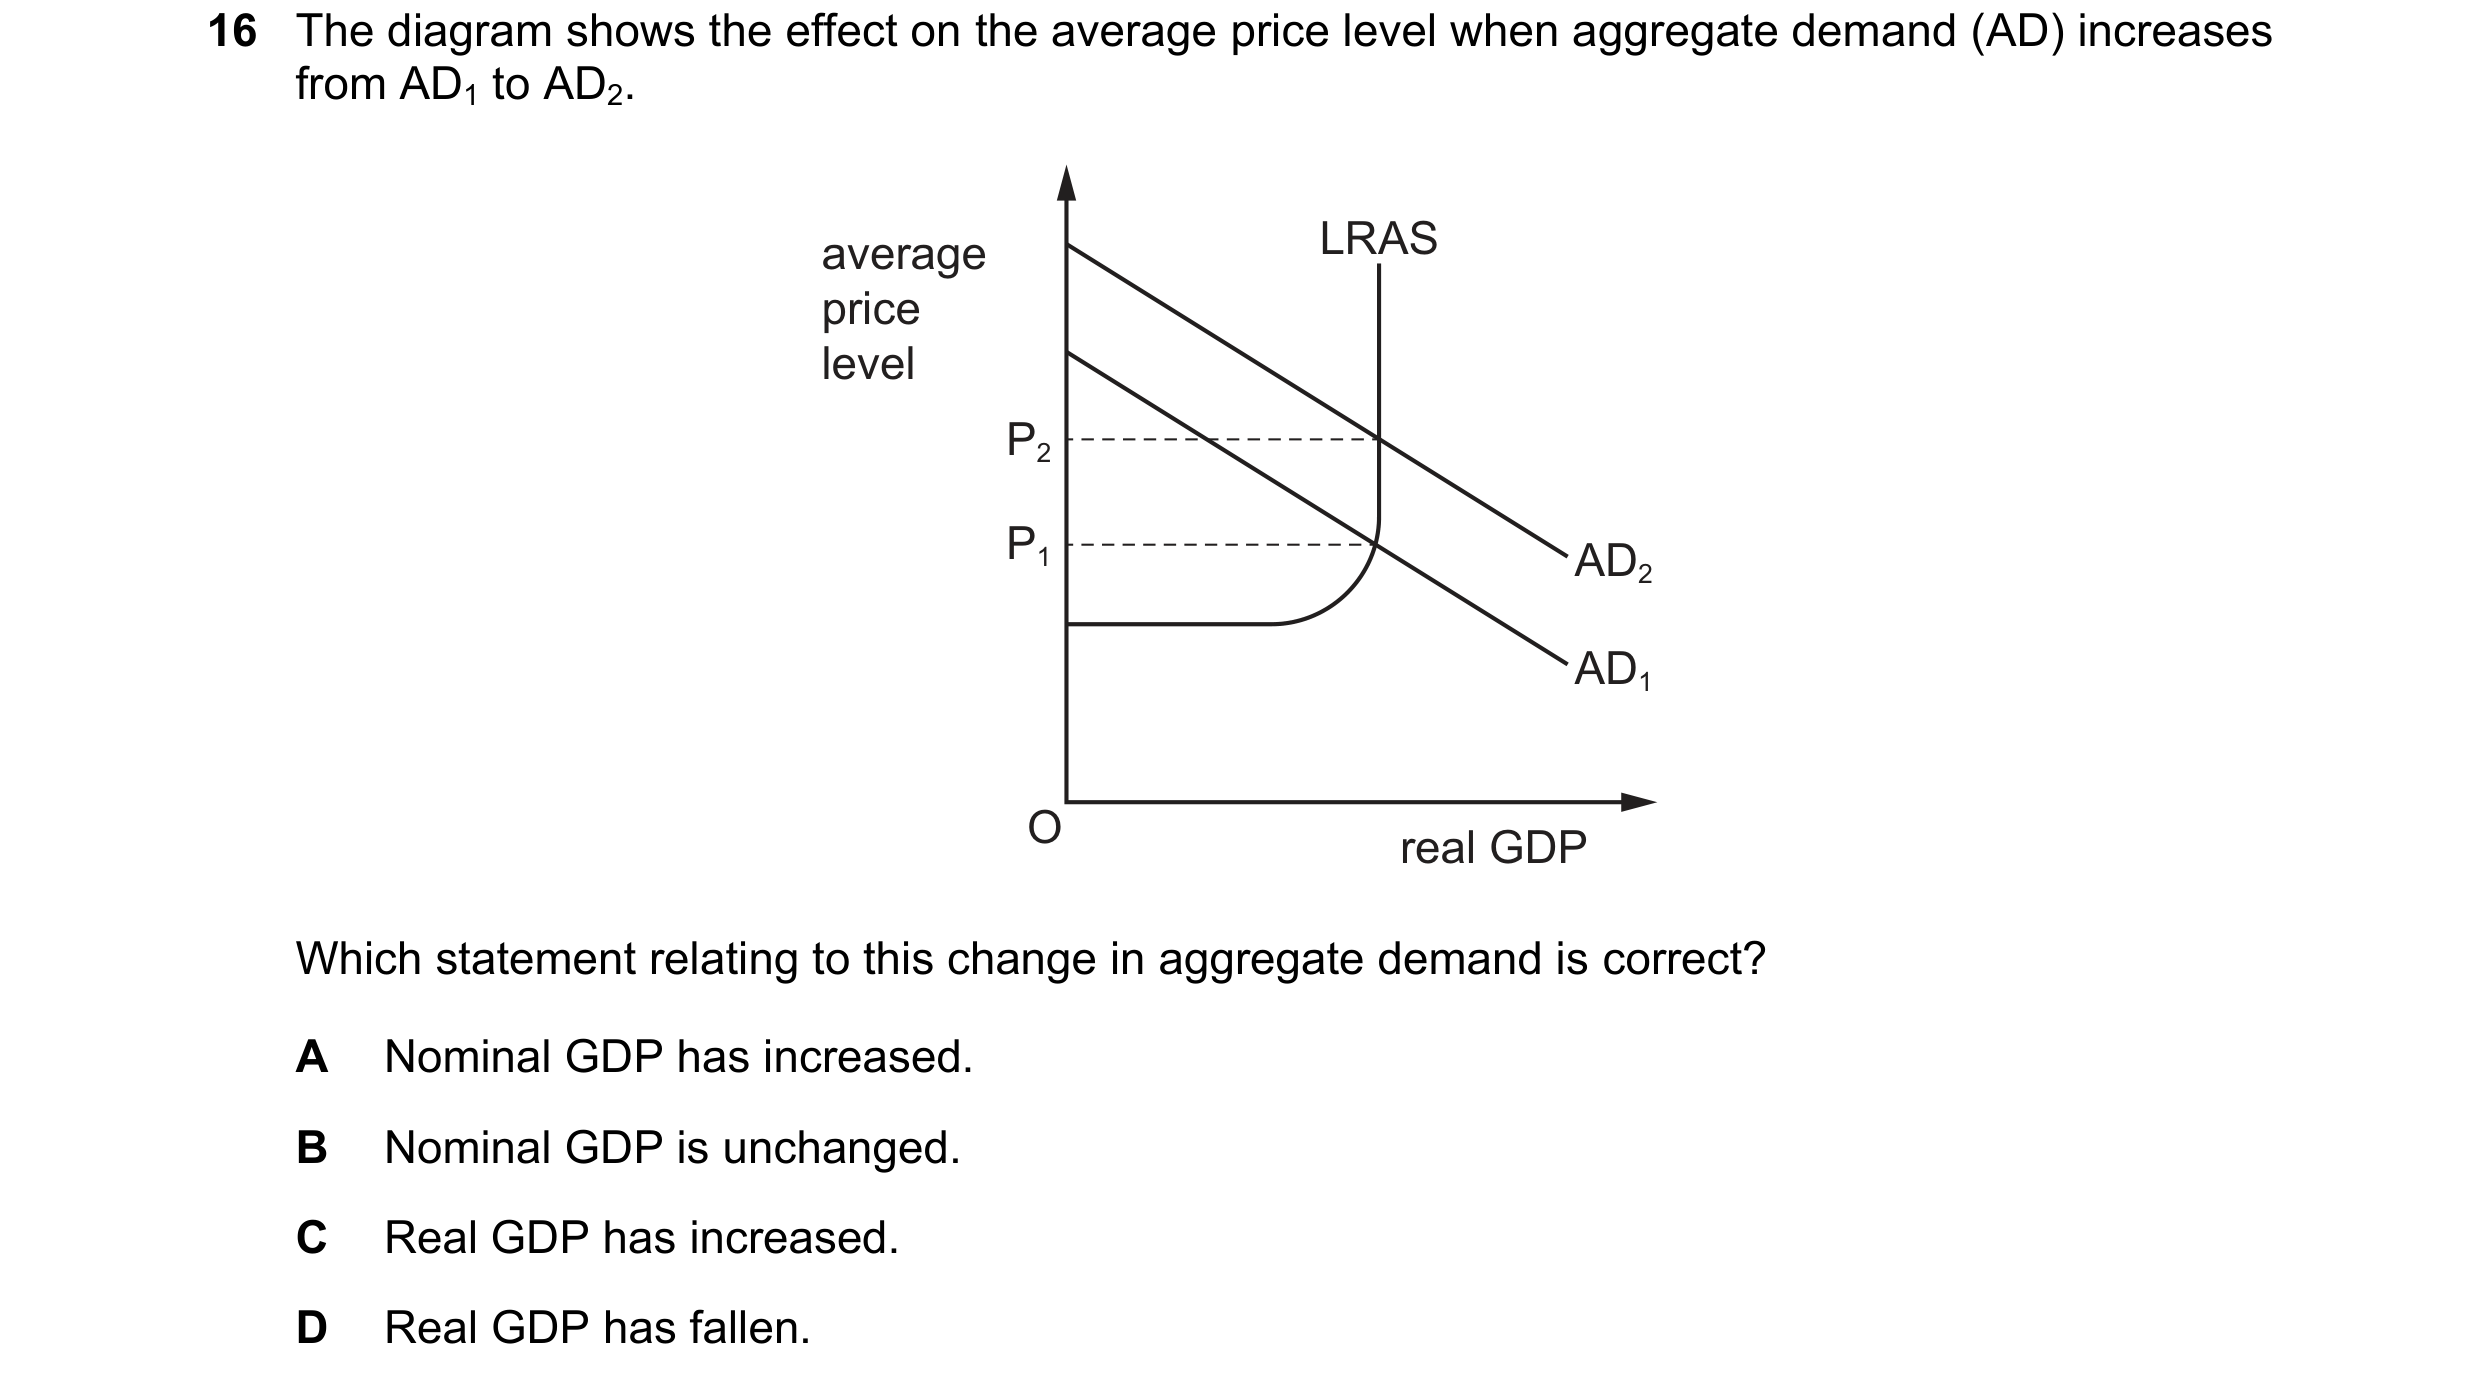 50 / 57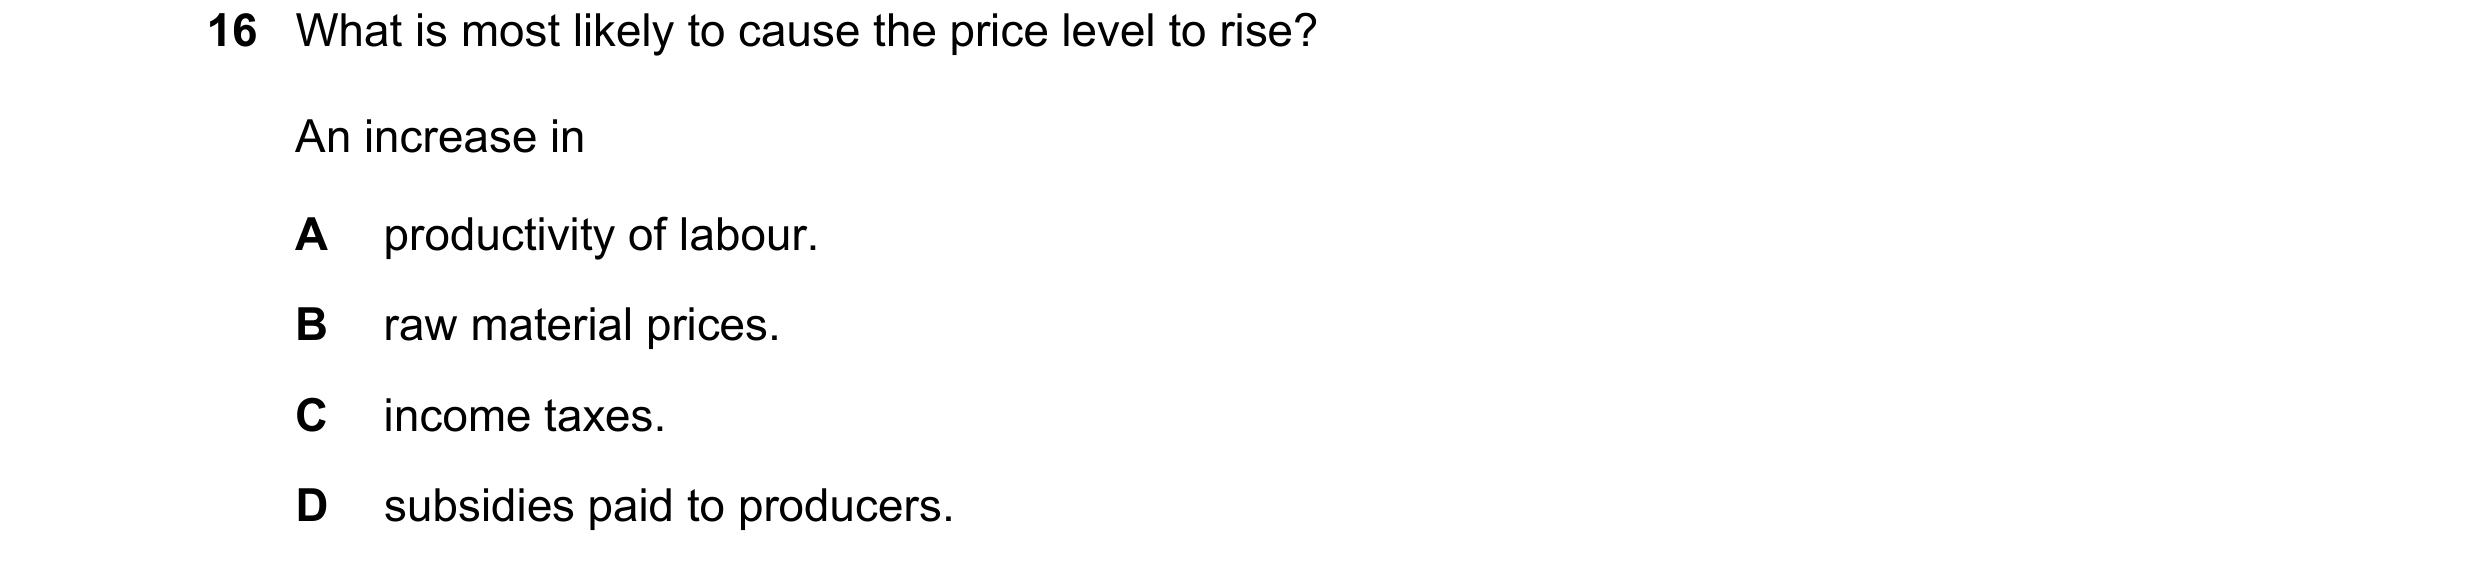
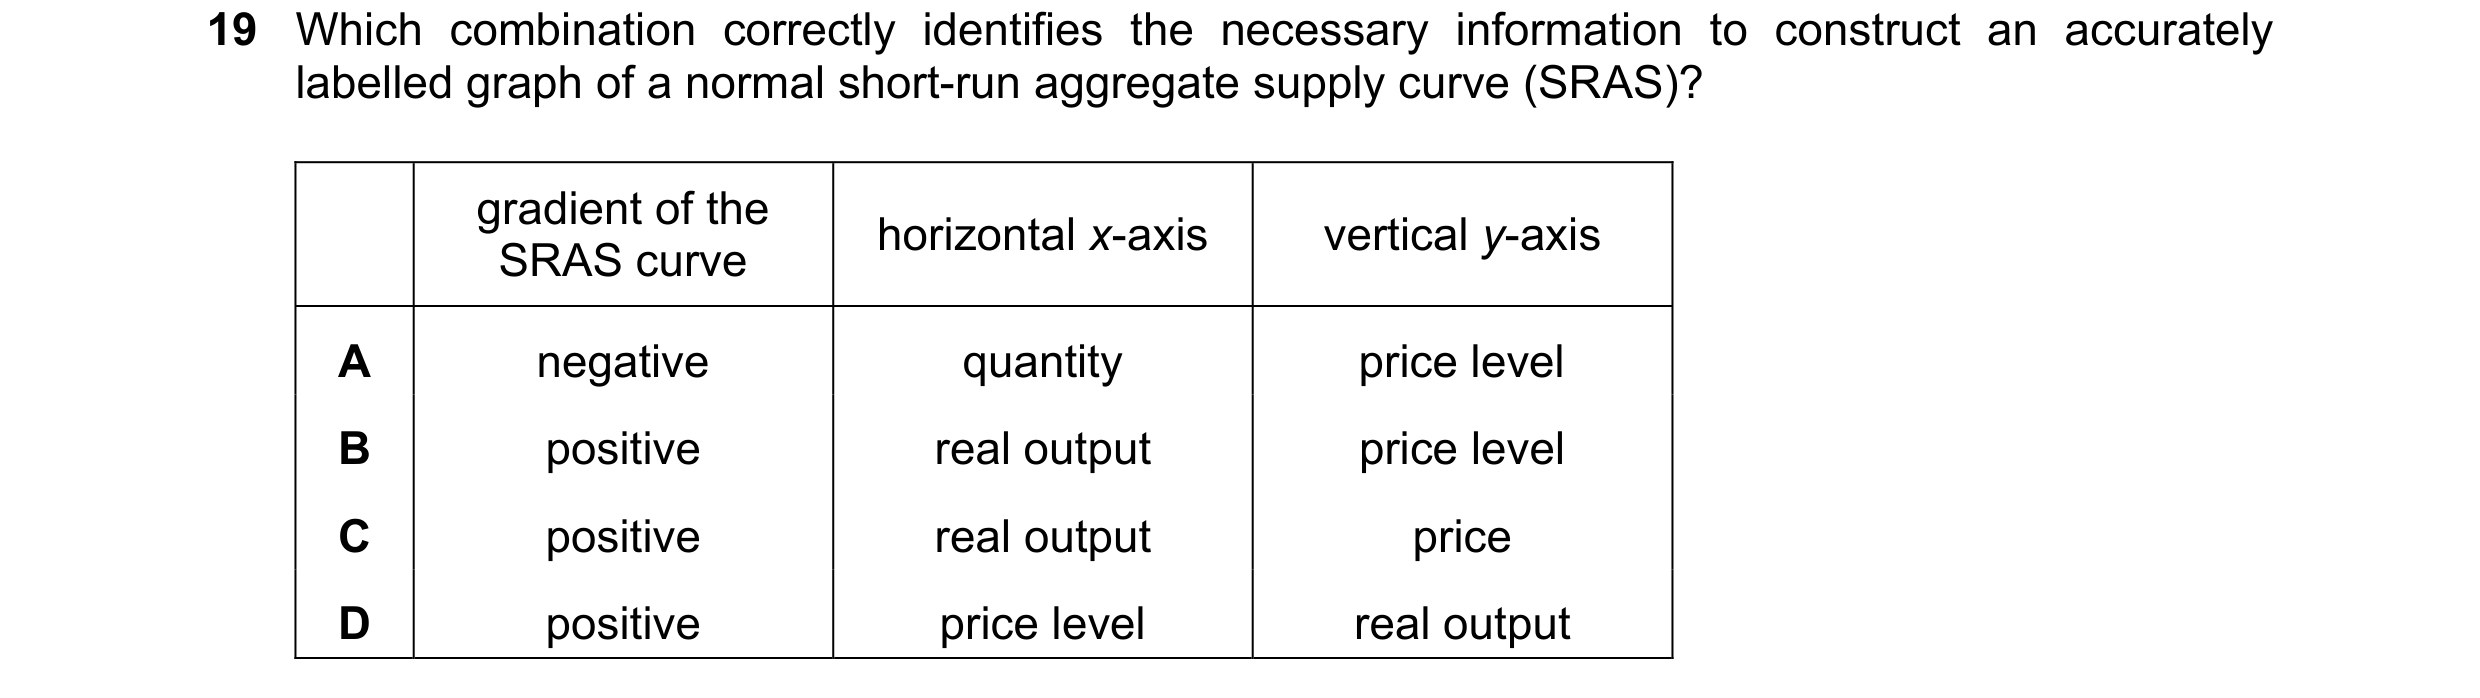
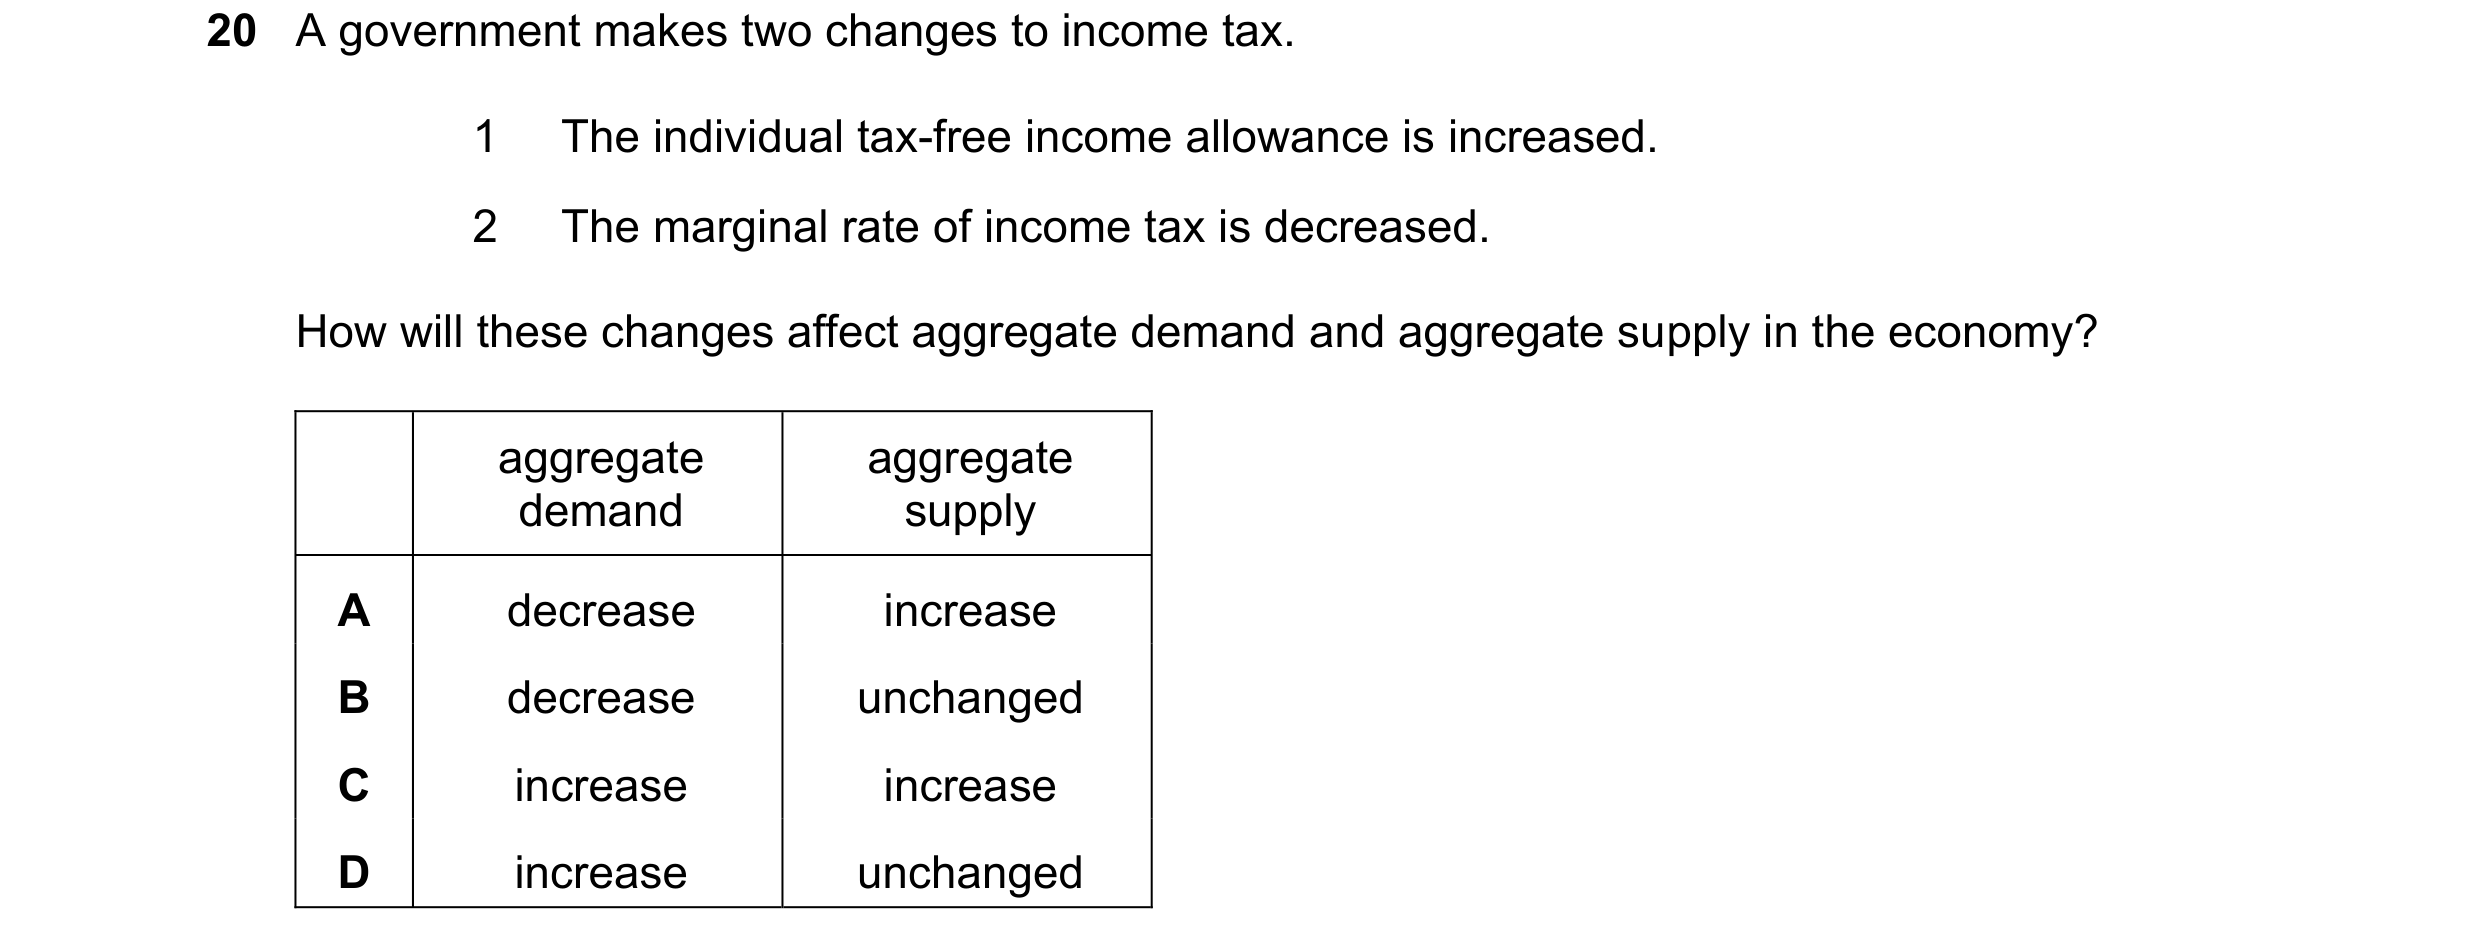
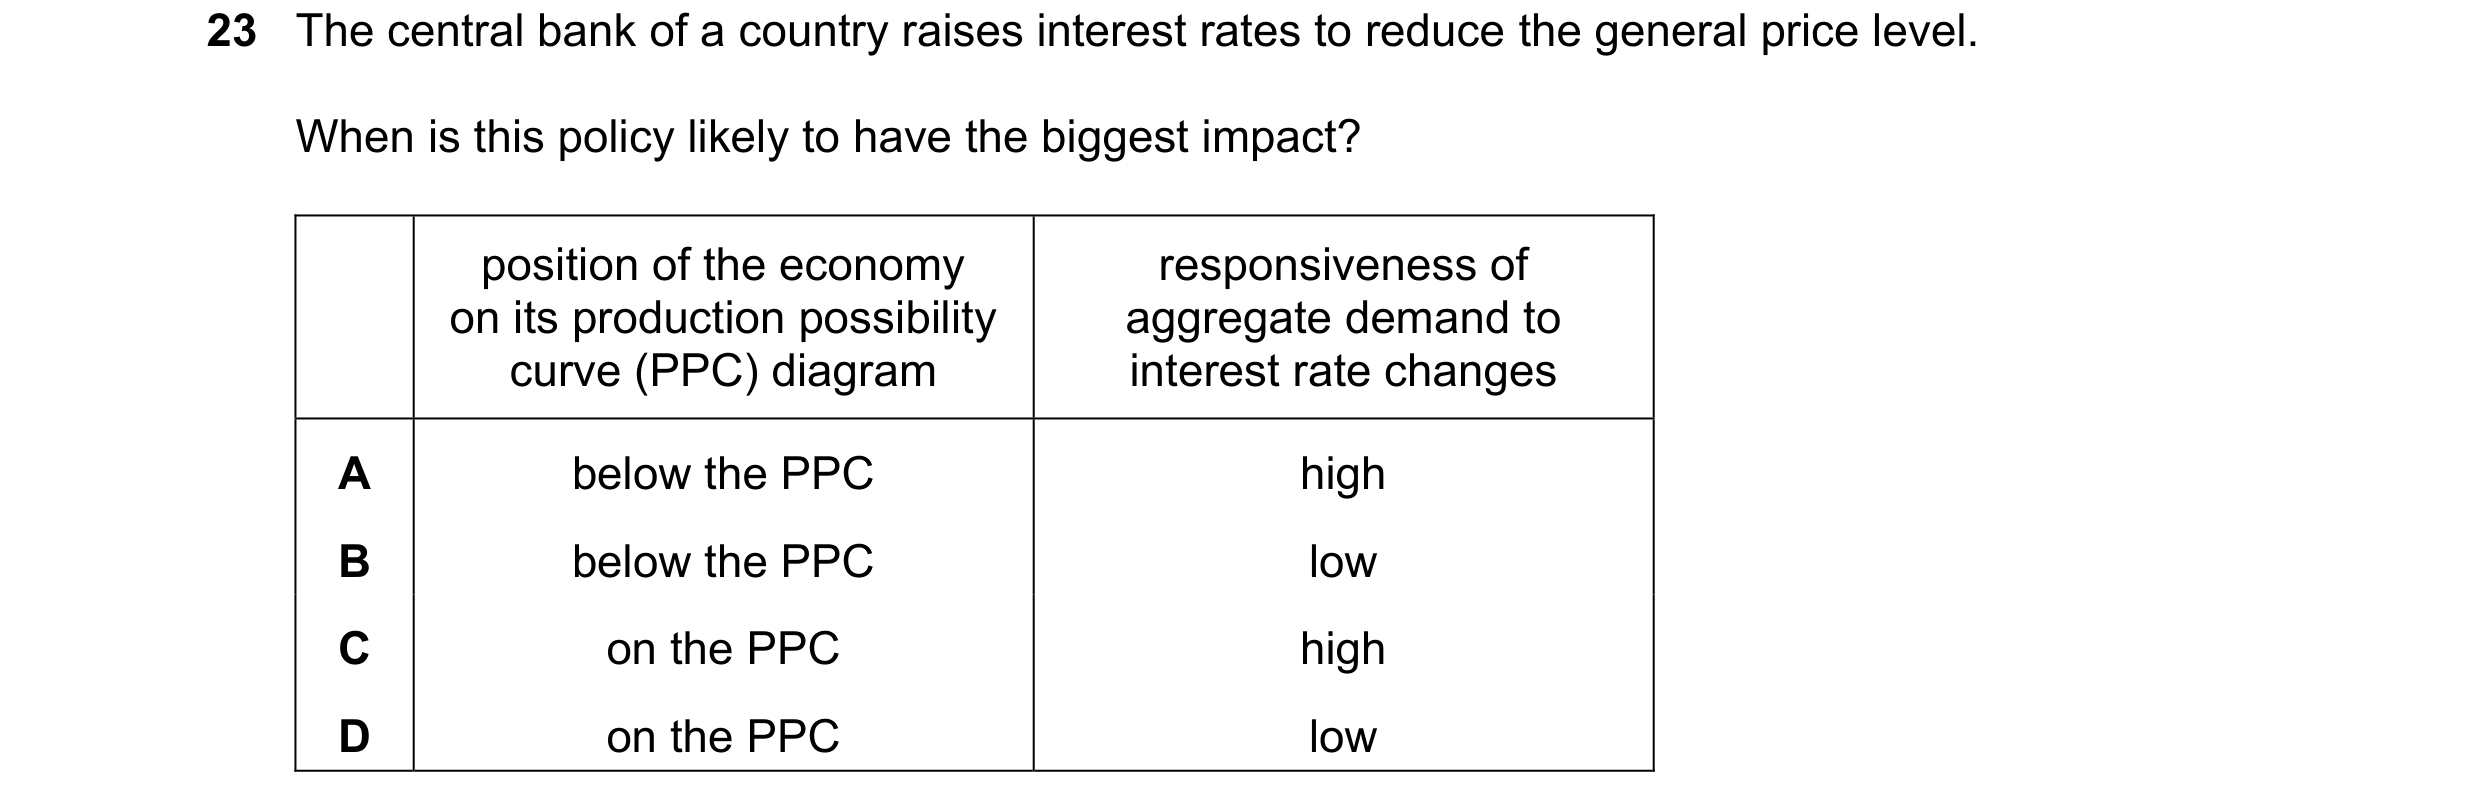 51 / 57
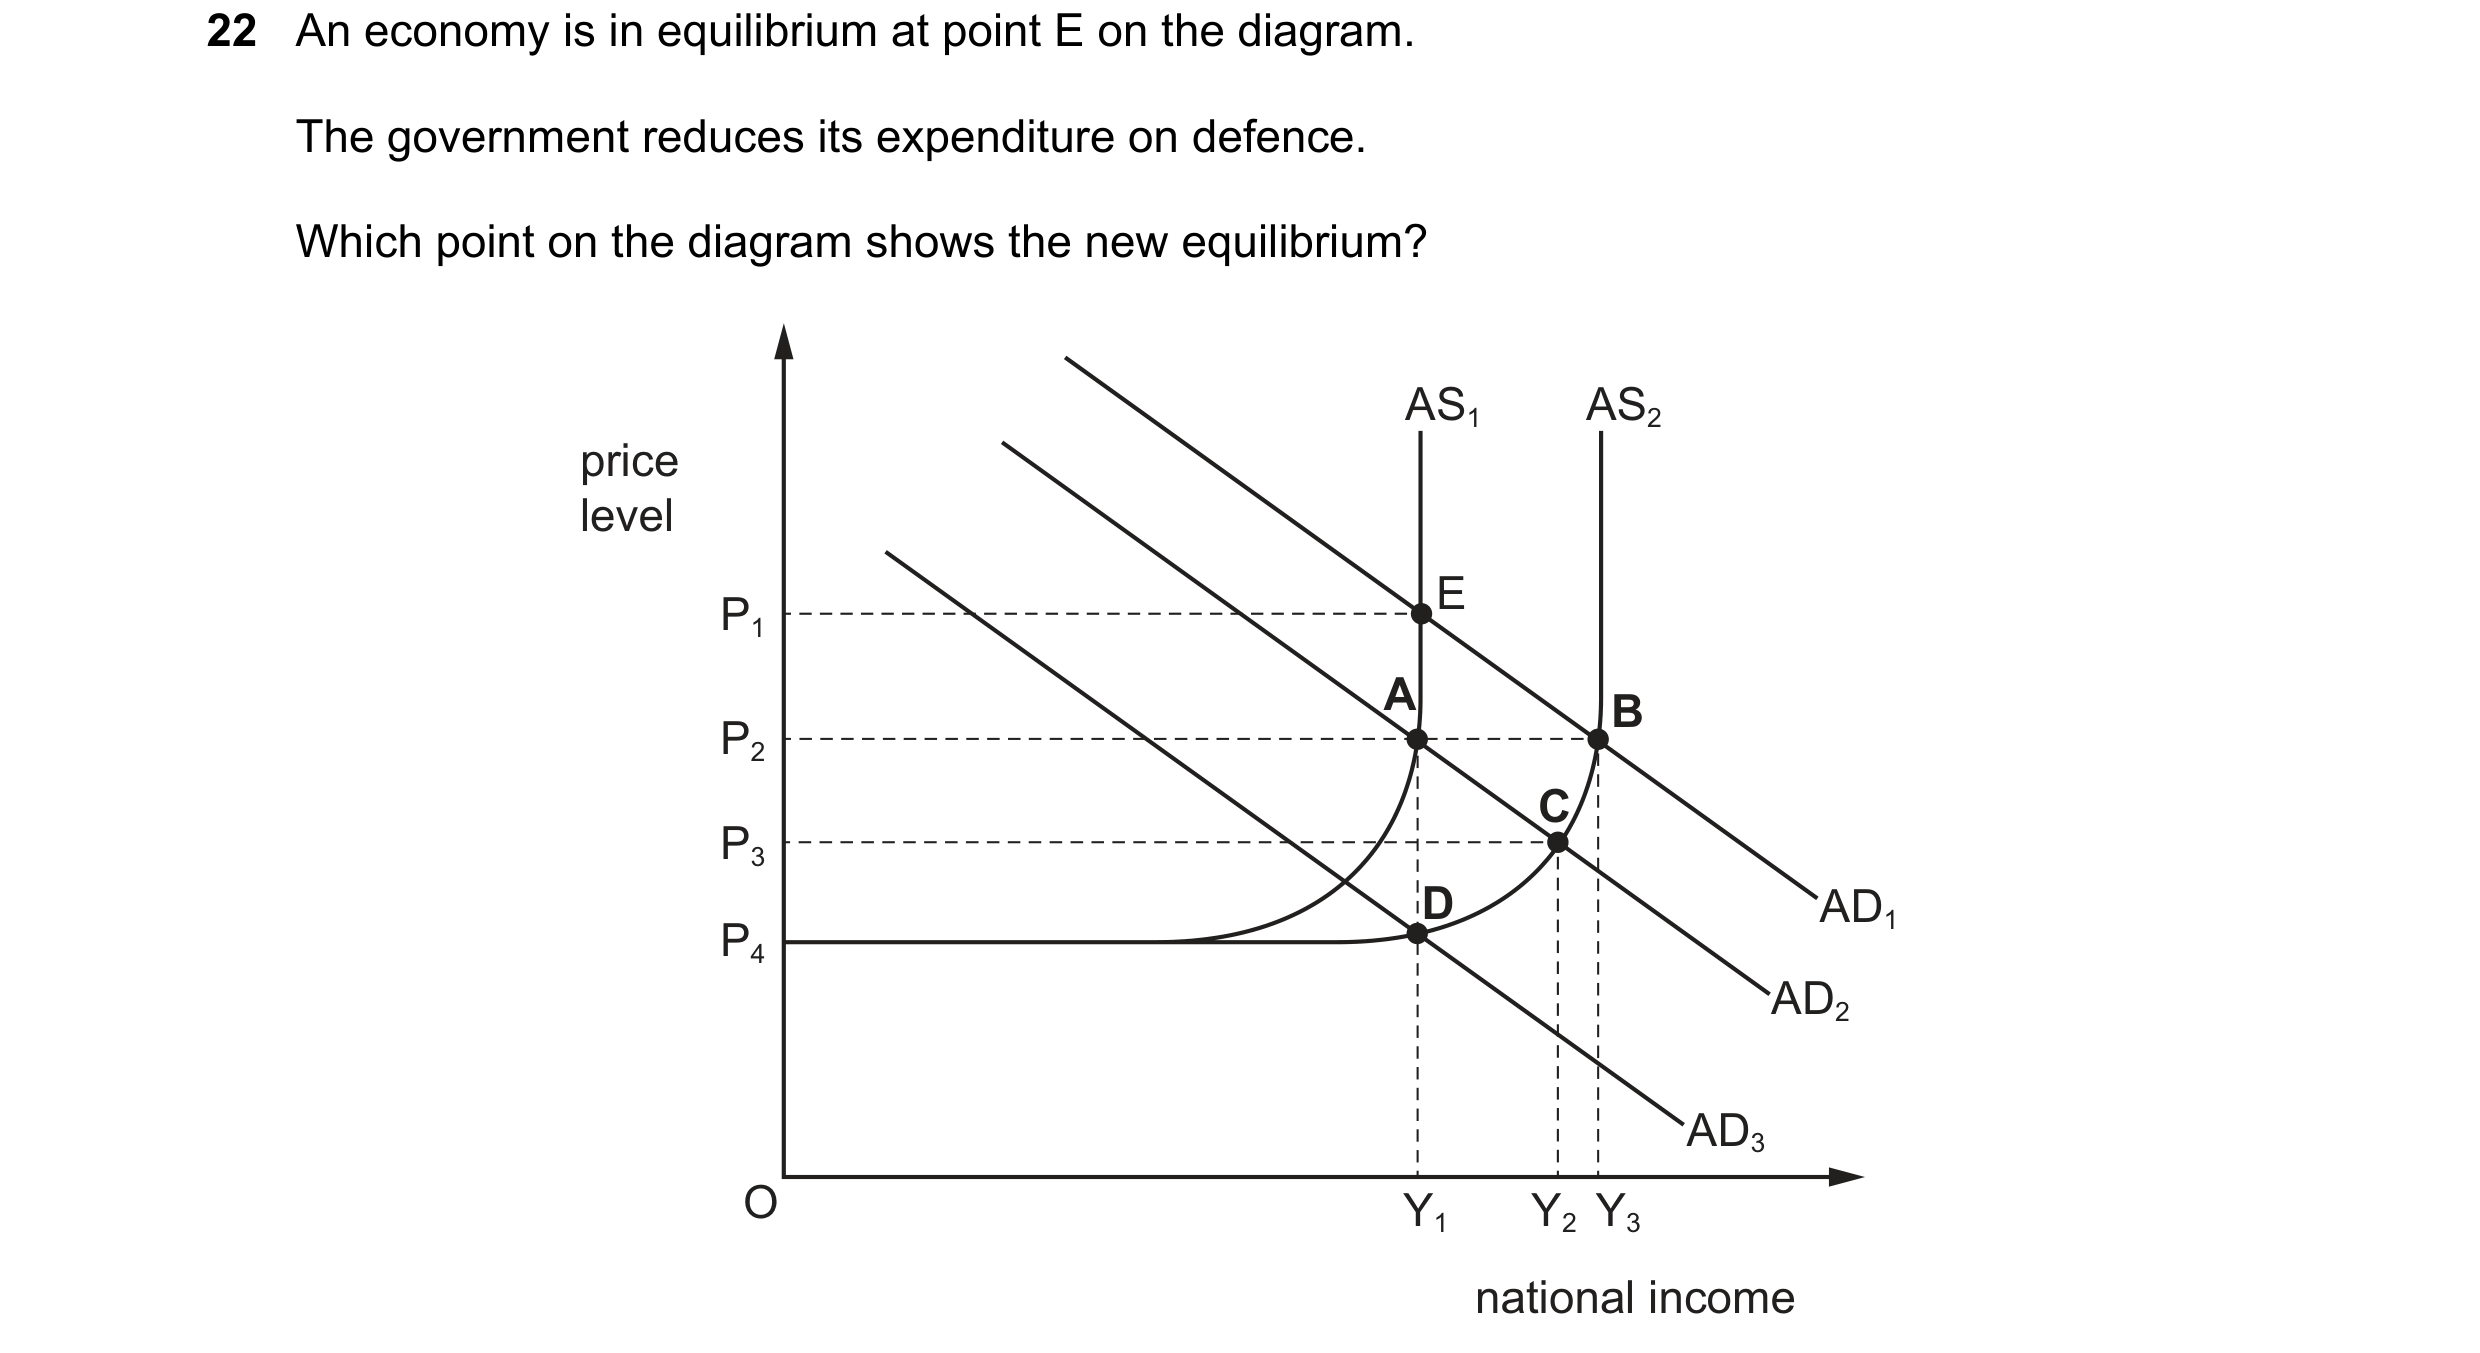
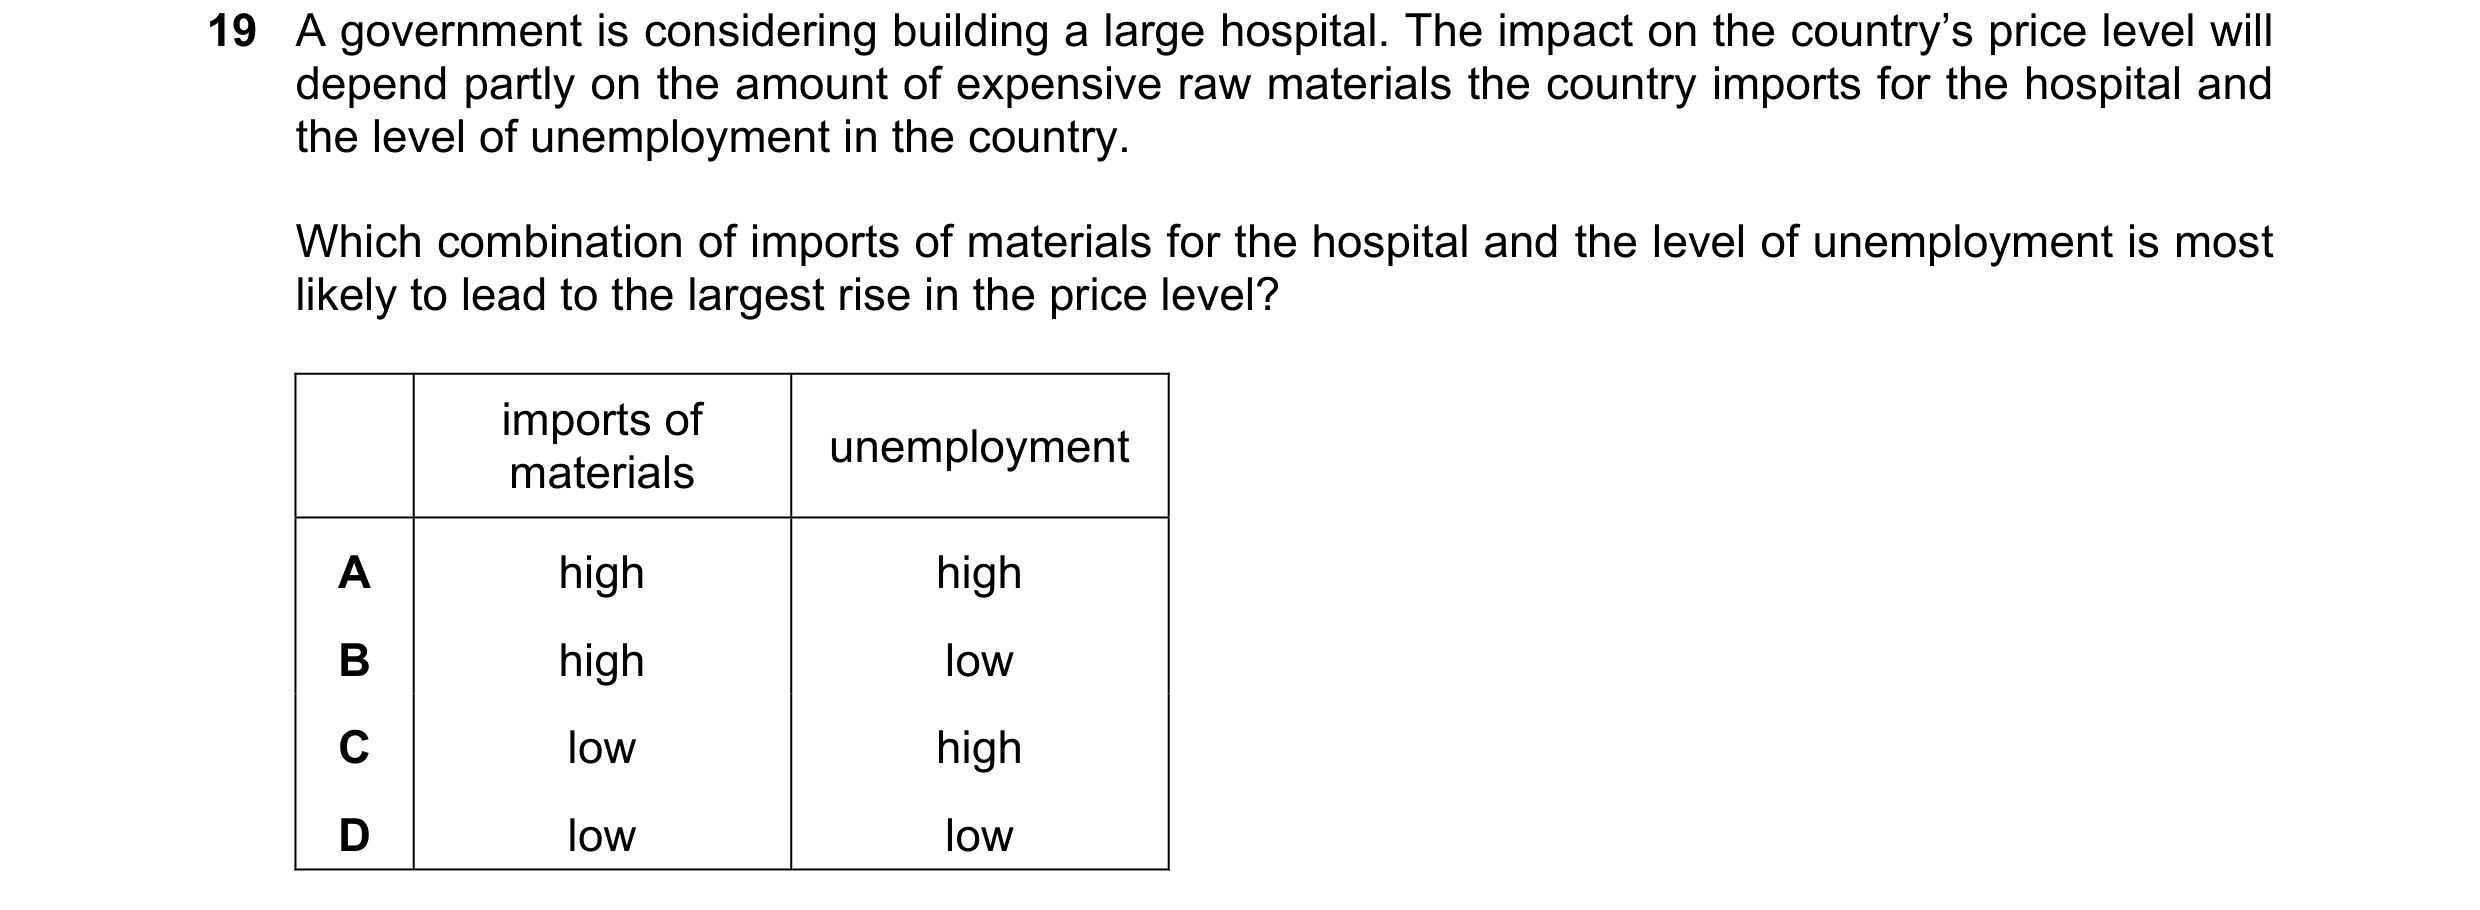 52 / 57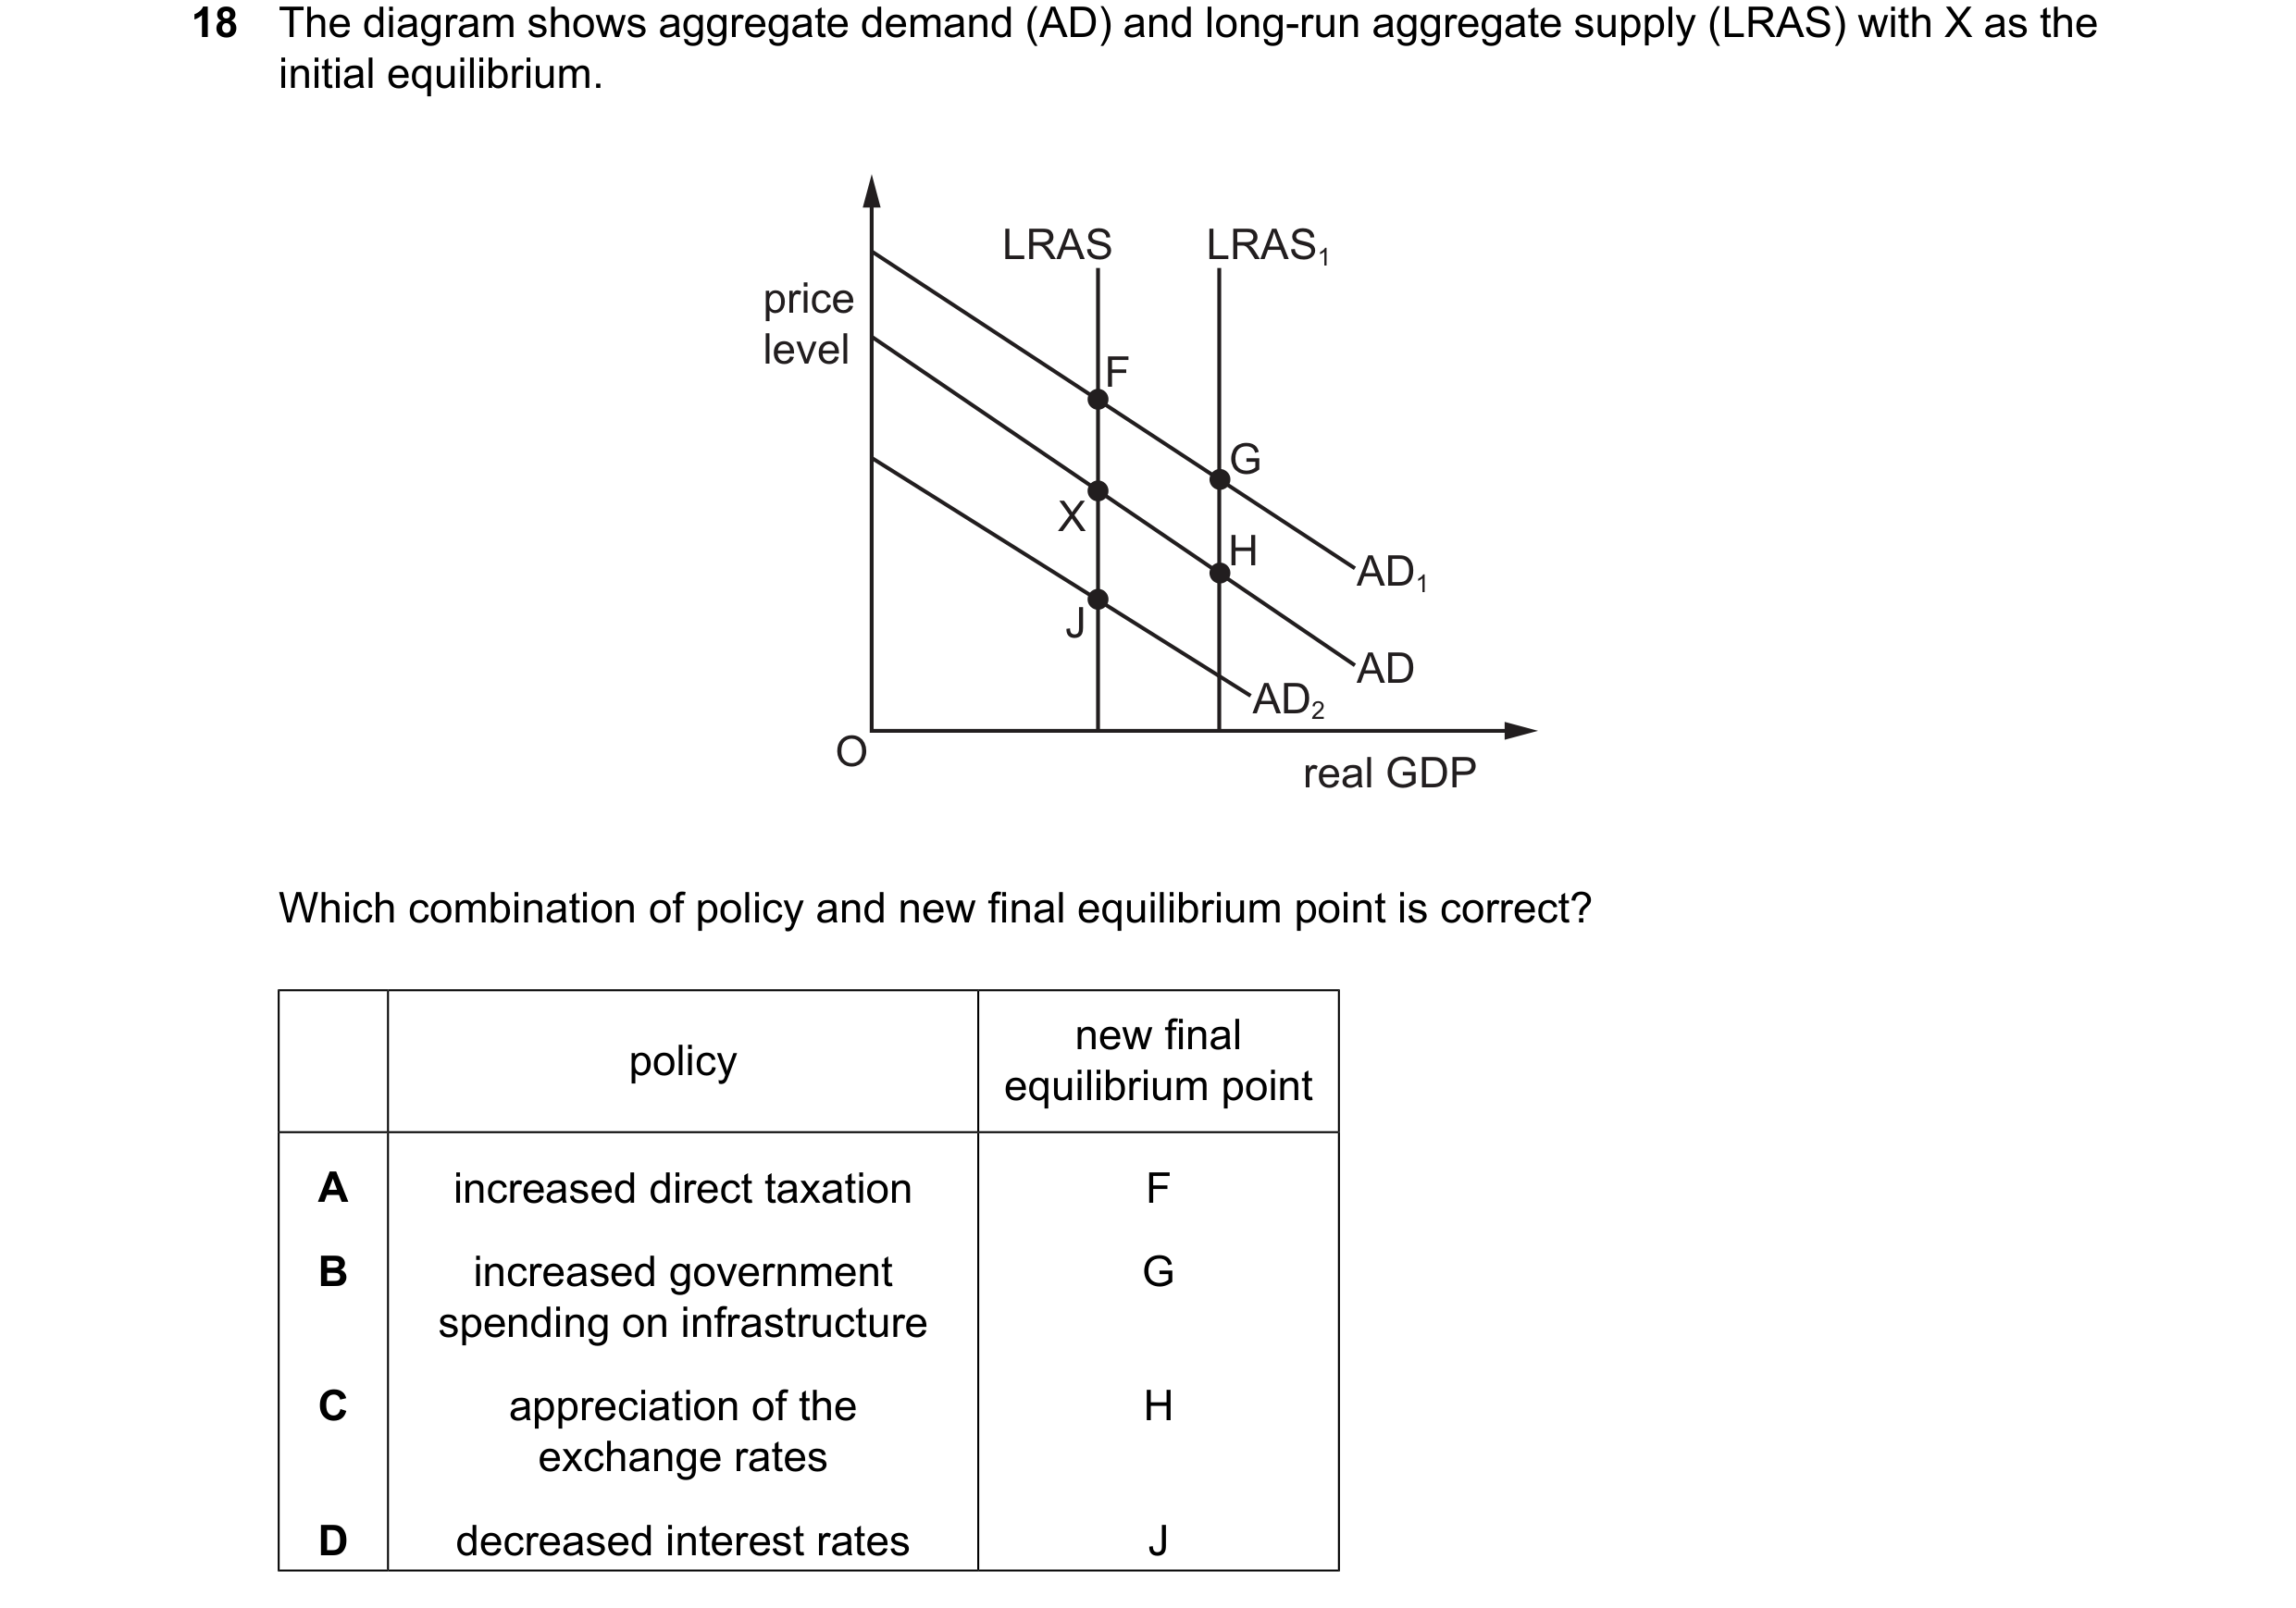
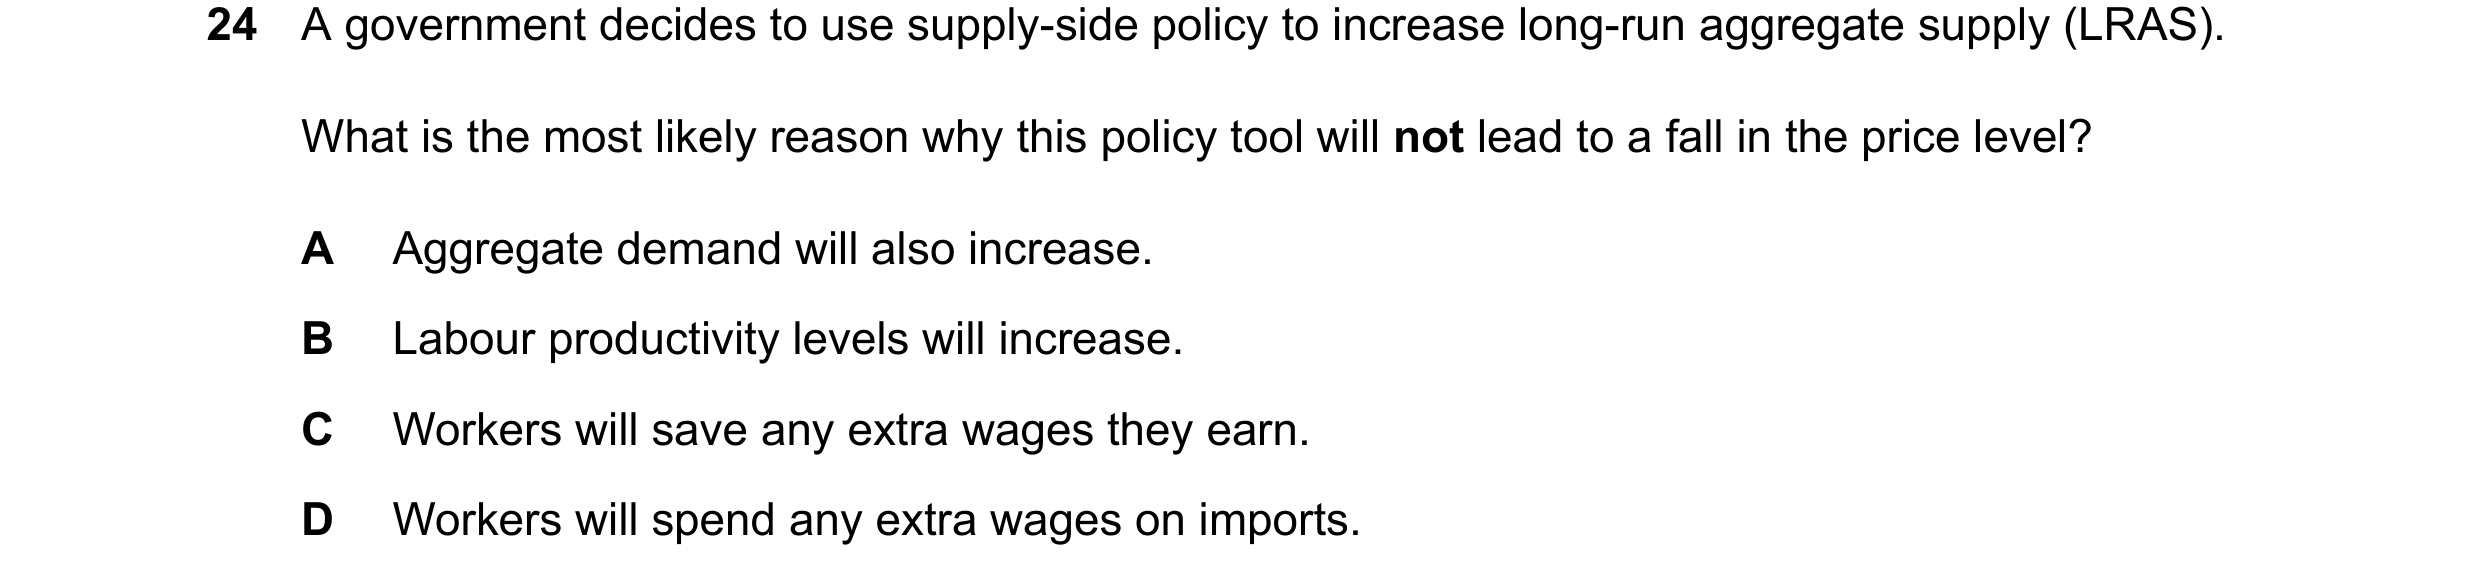
 53 / 57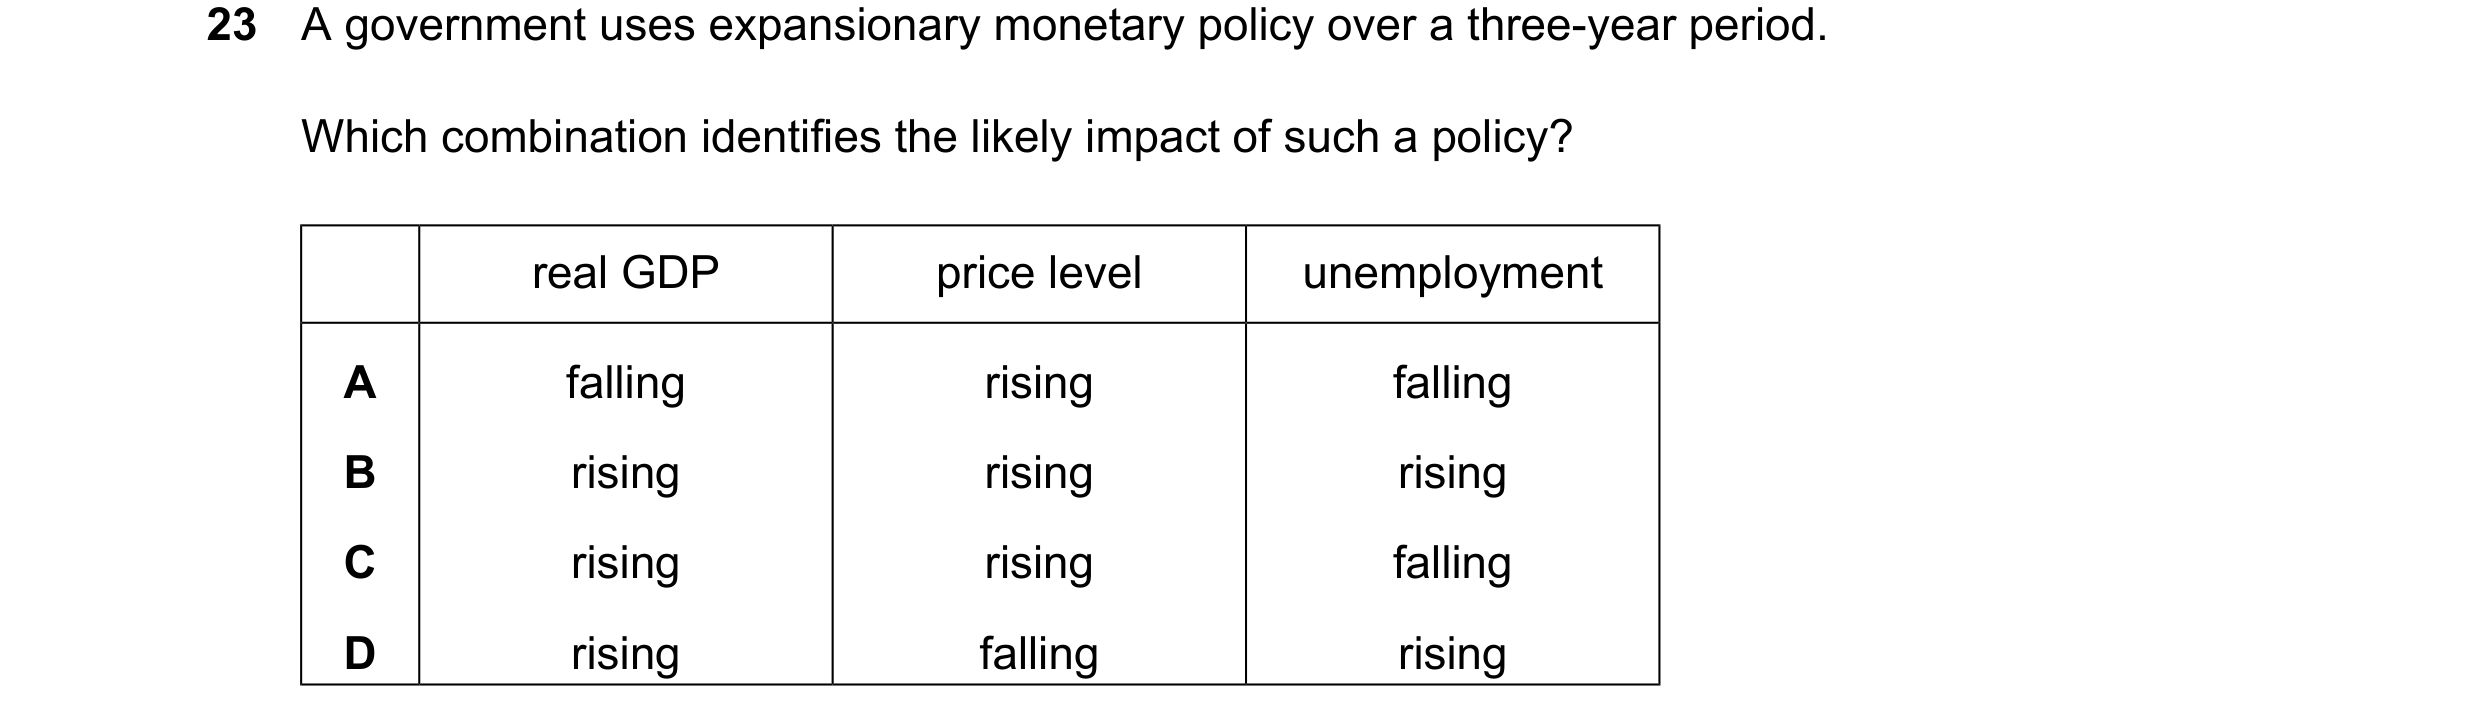
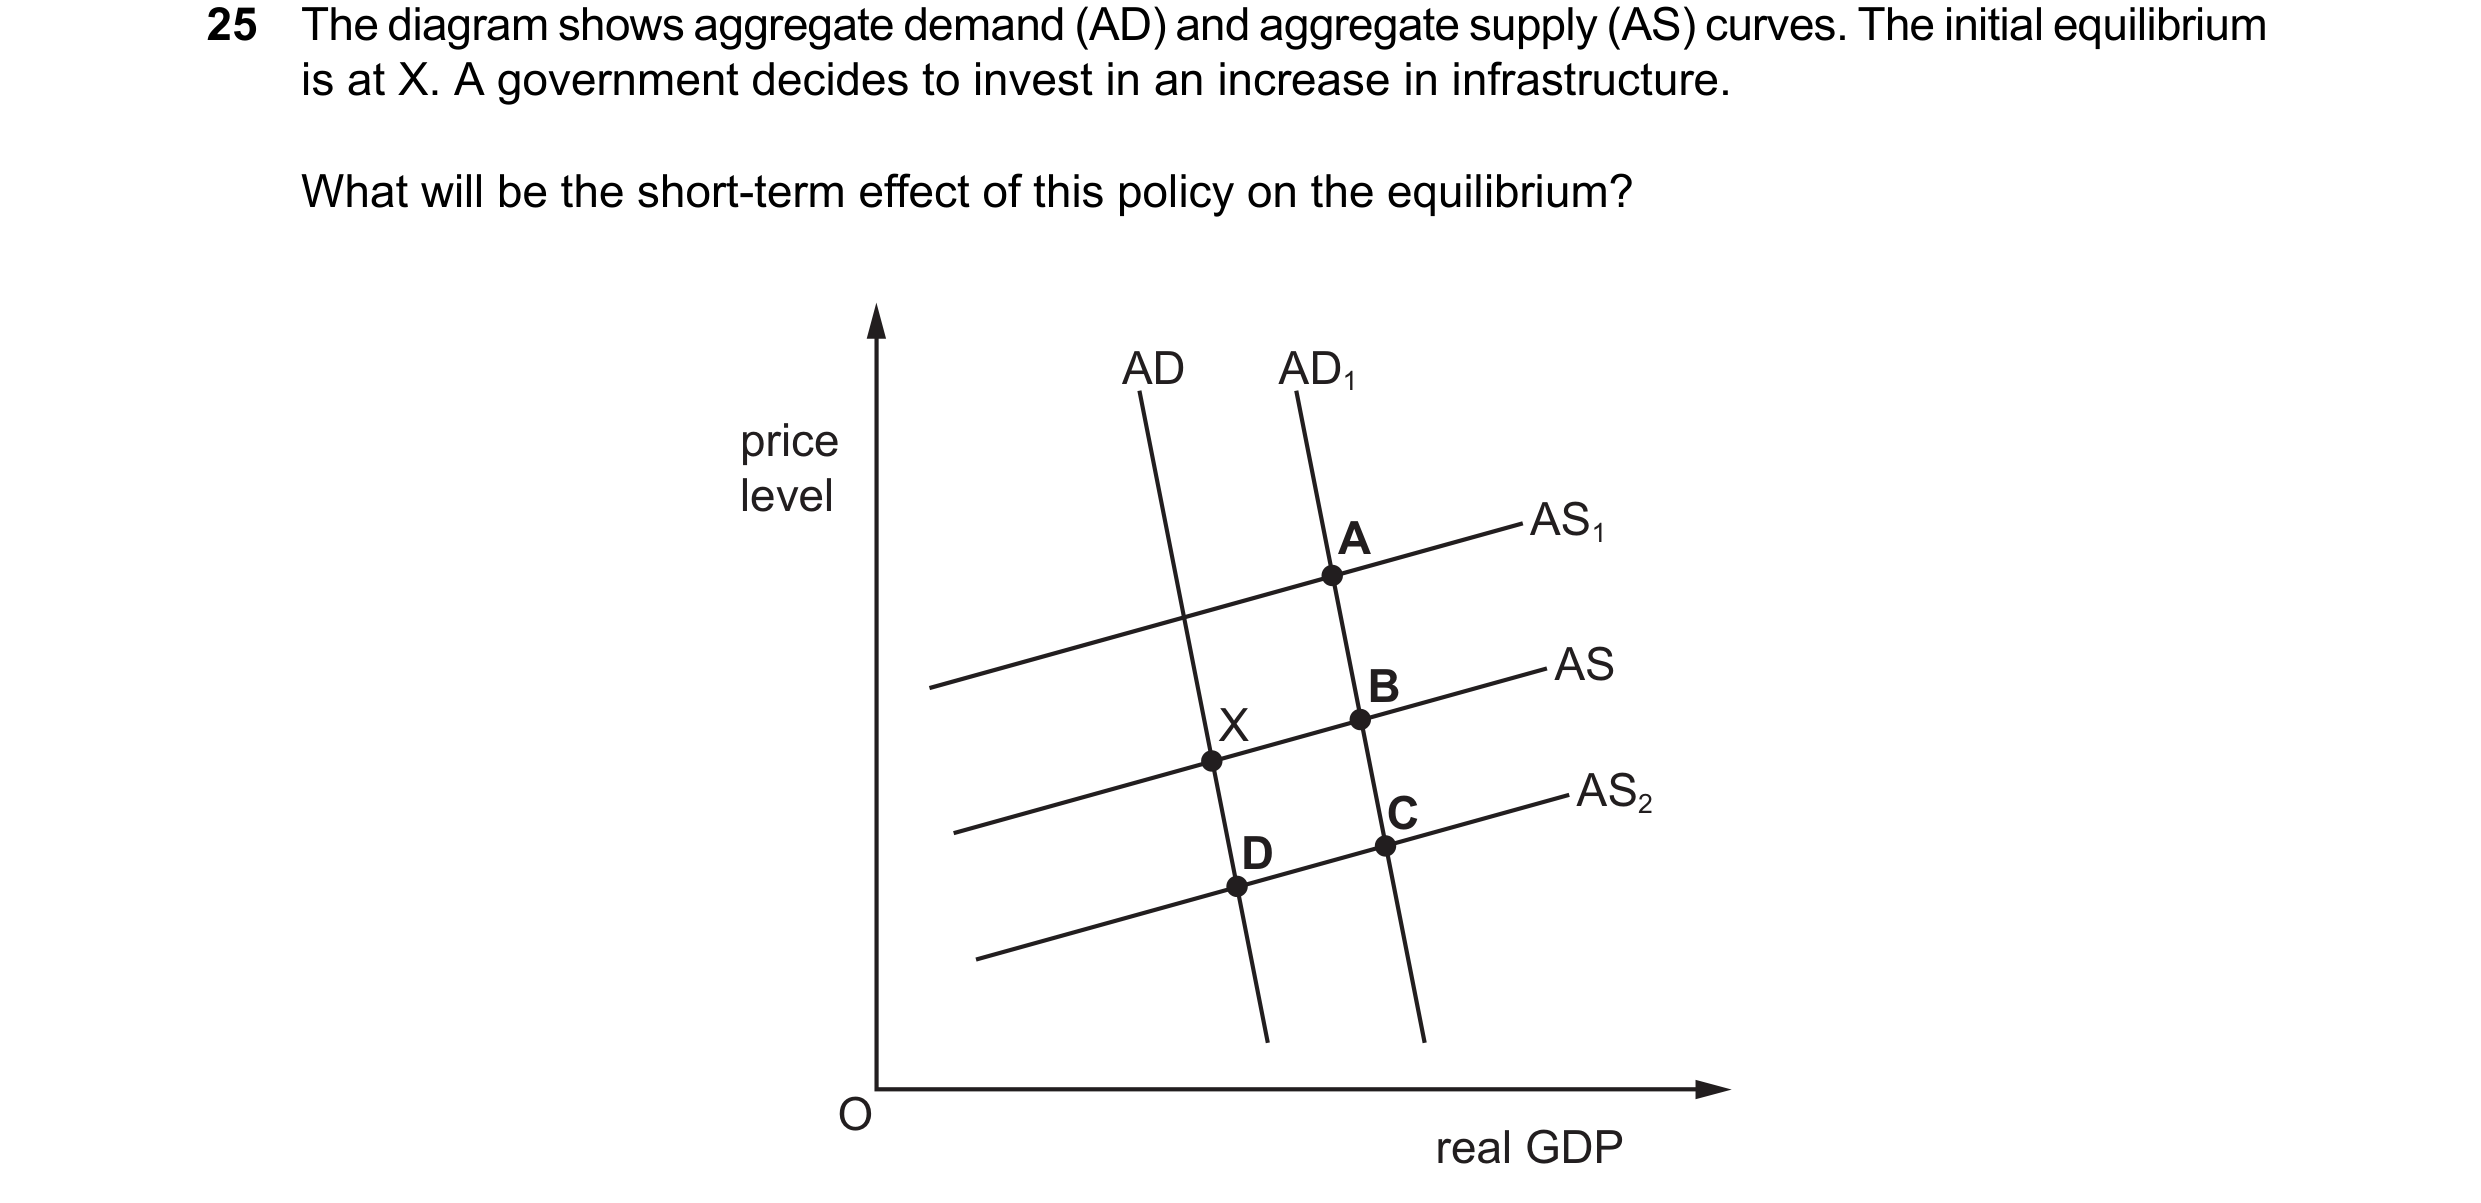 54 / 57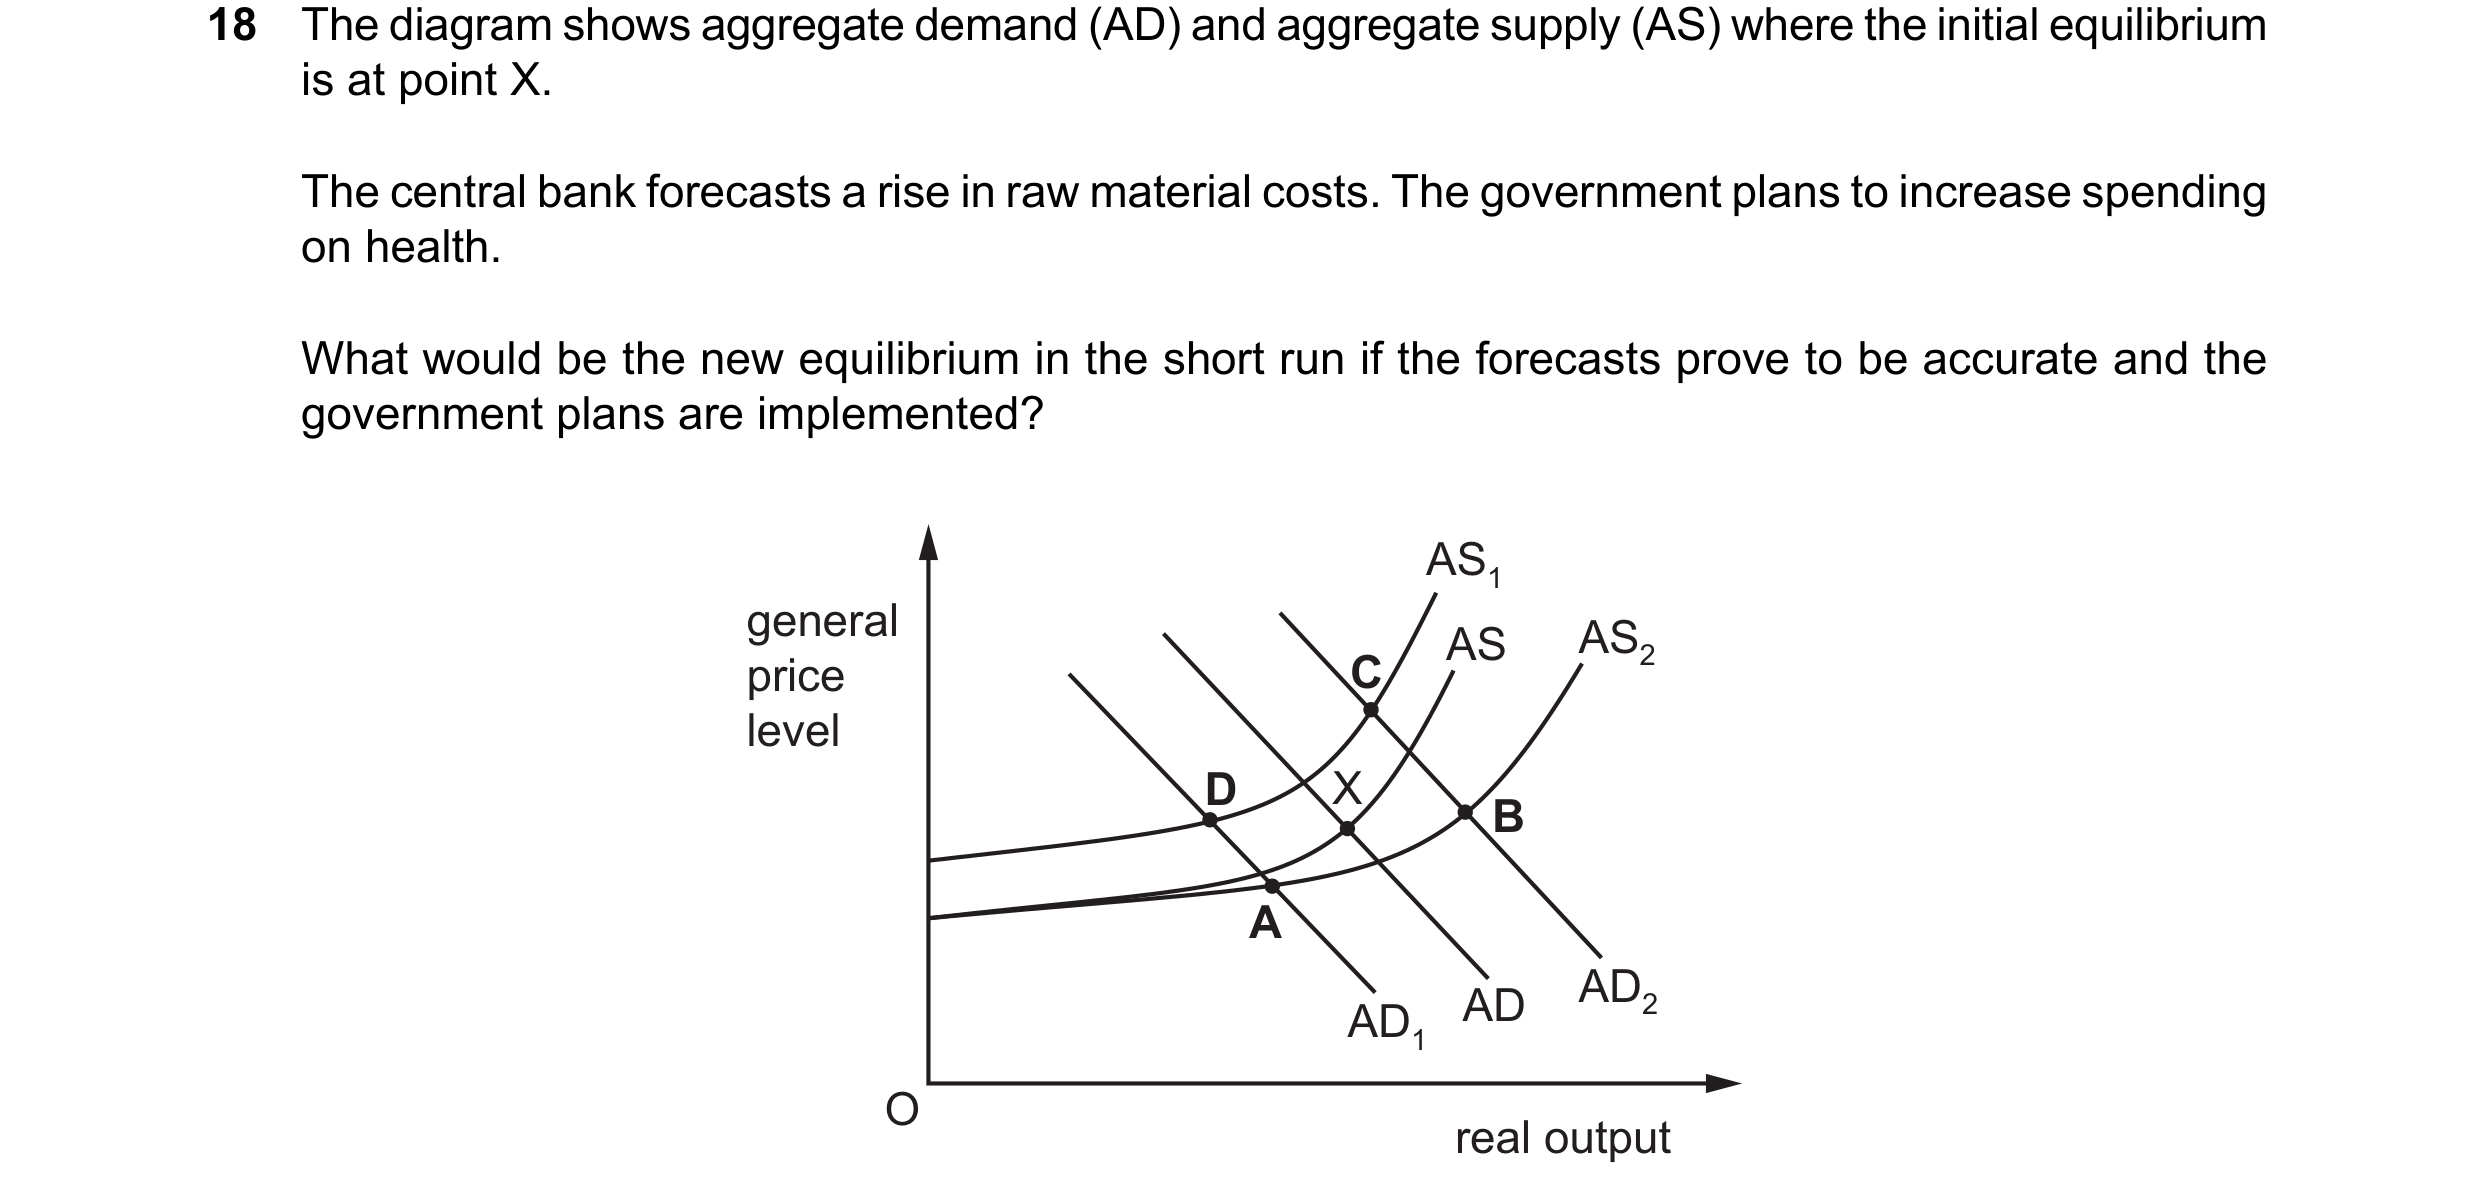

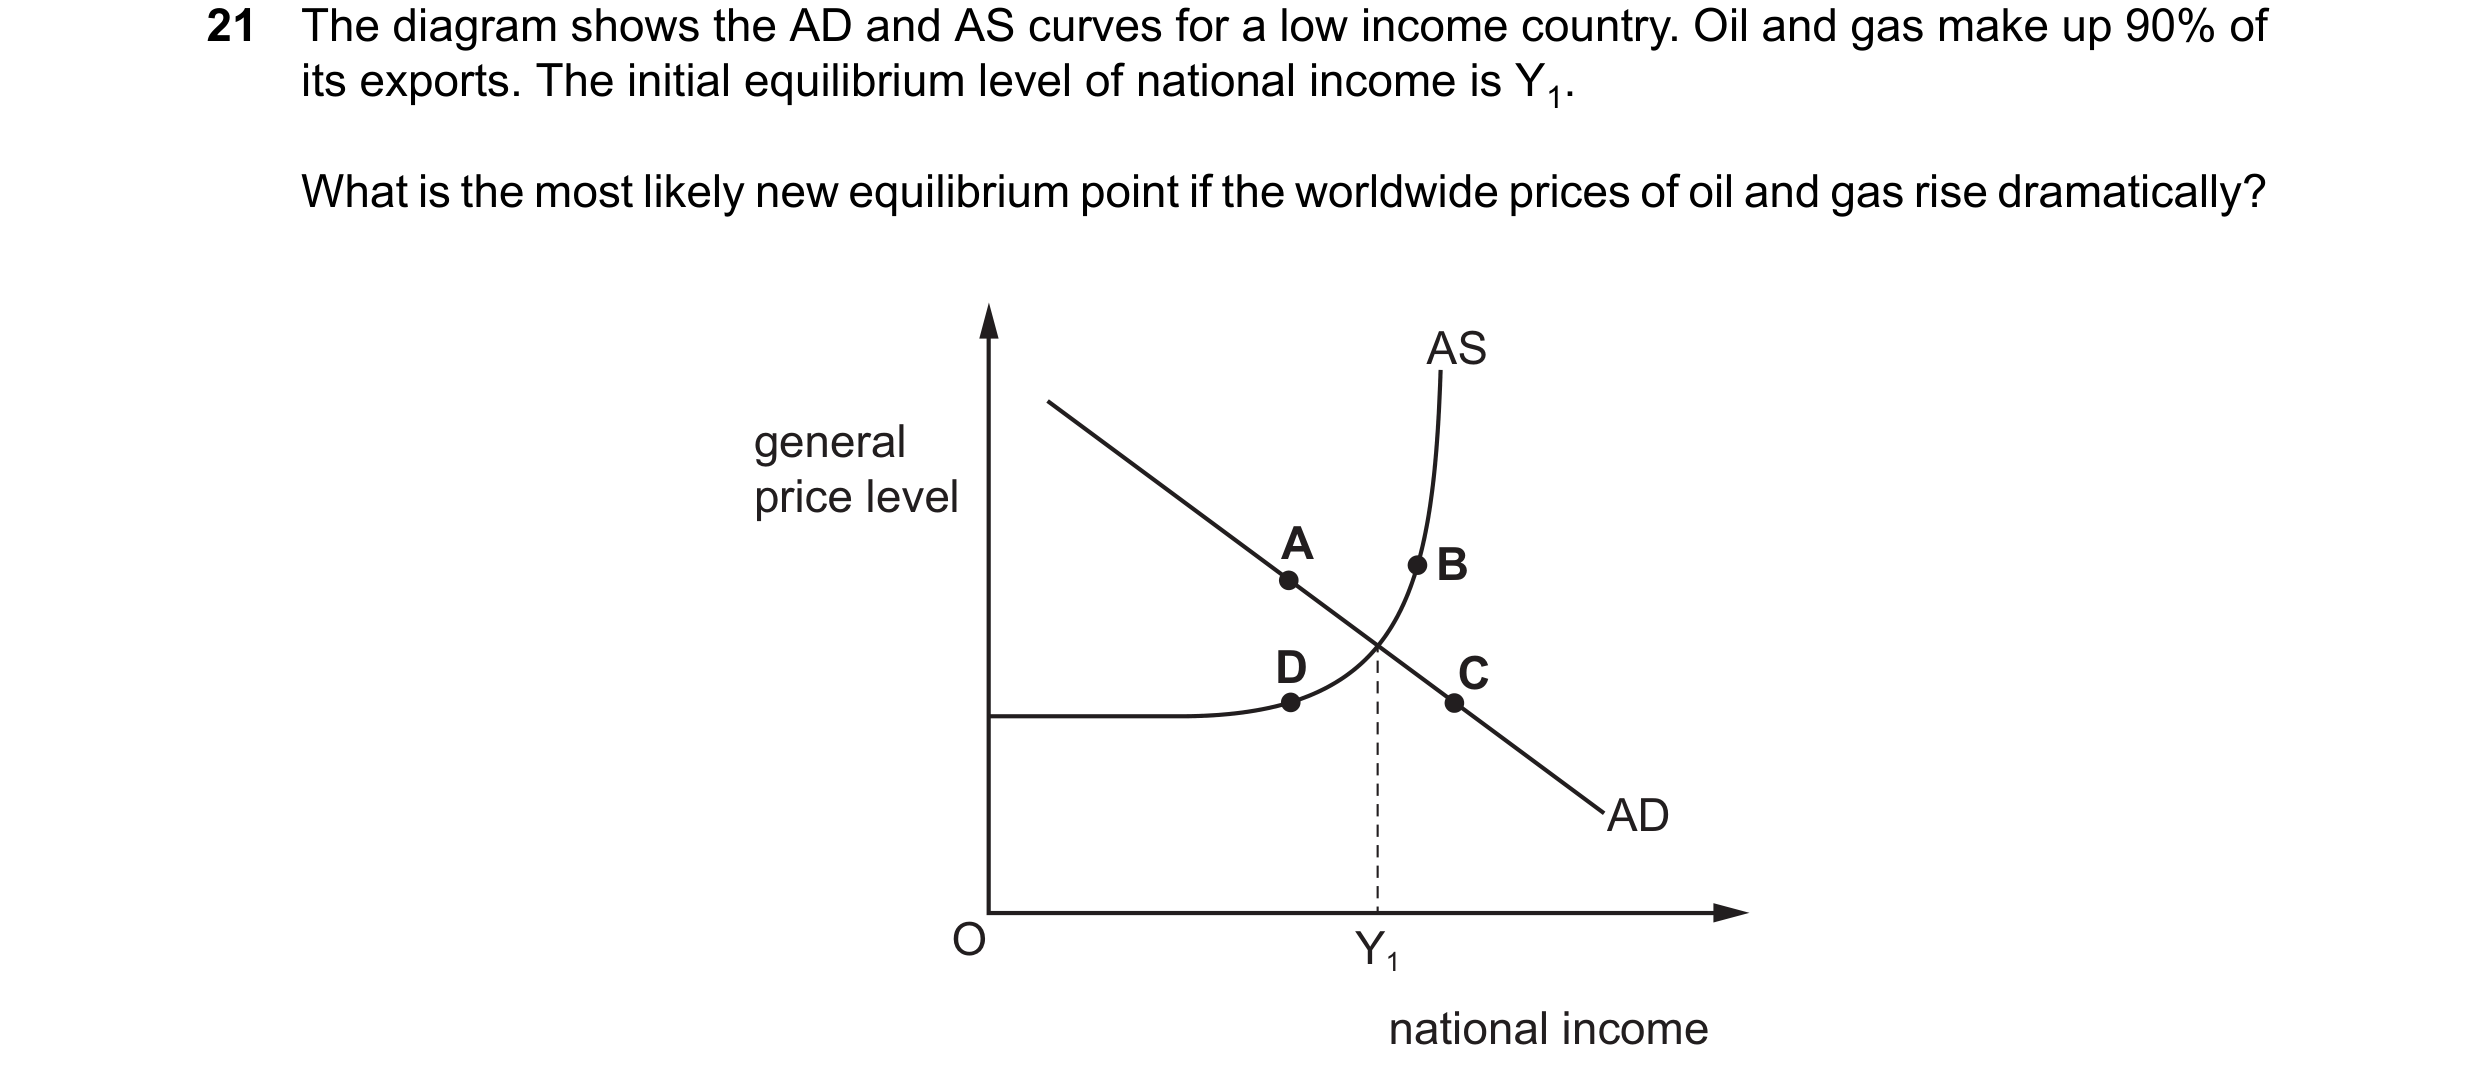 55 / 57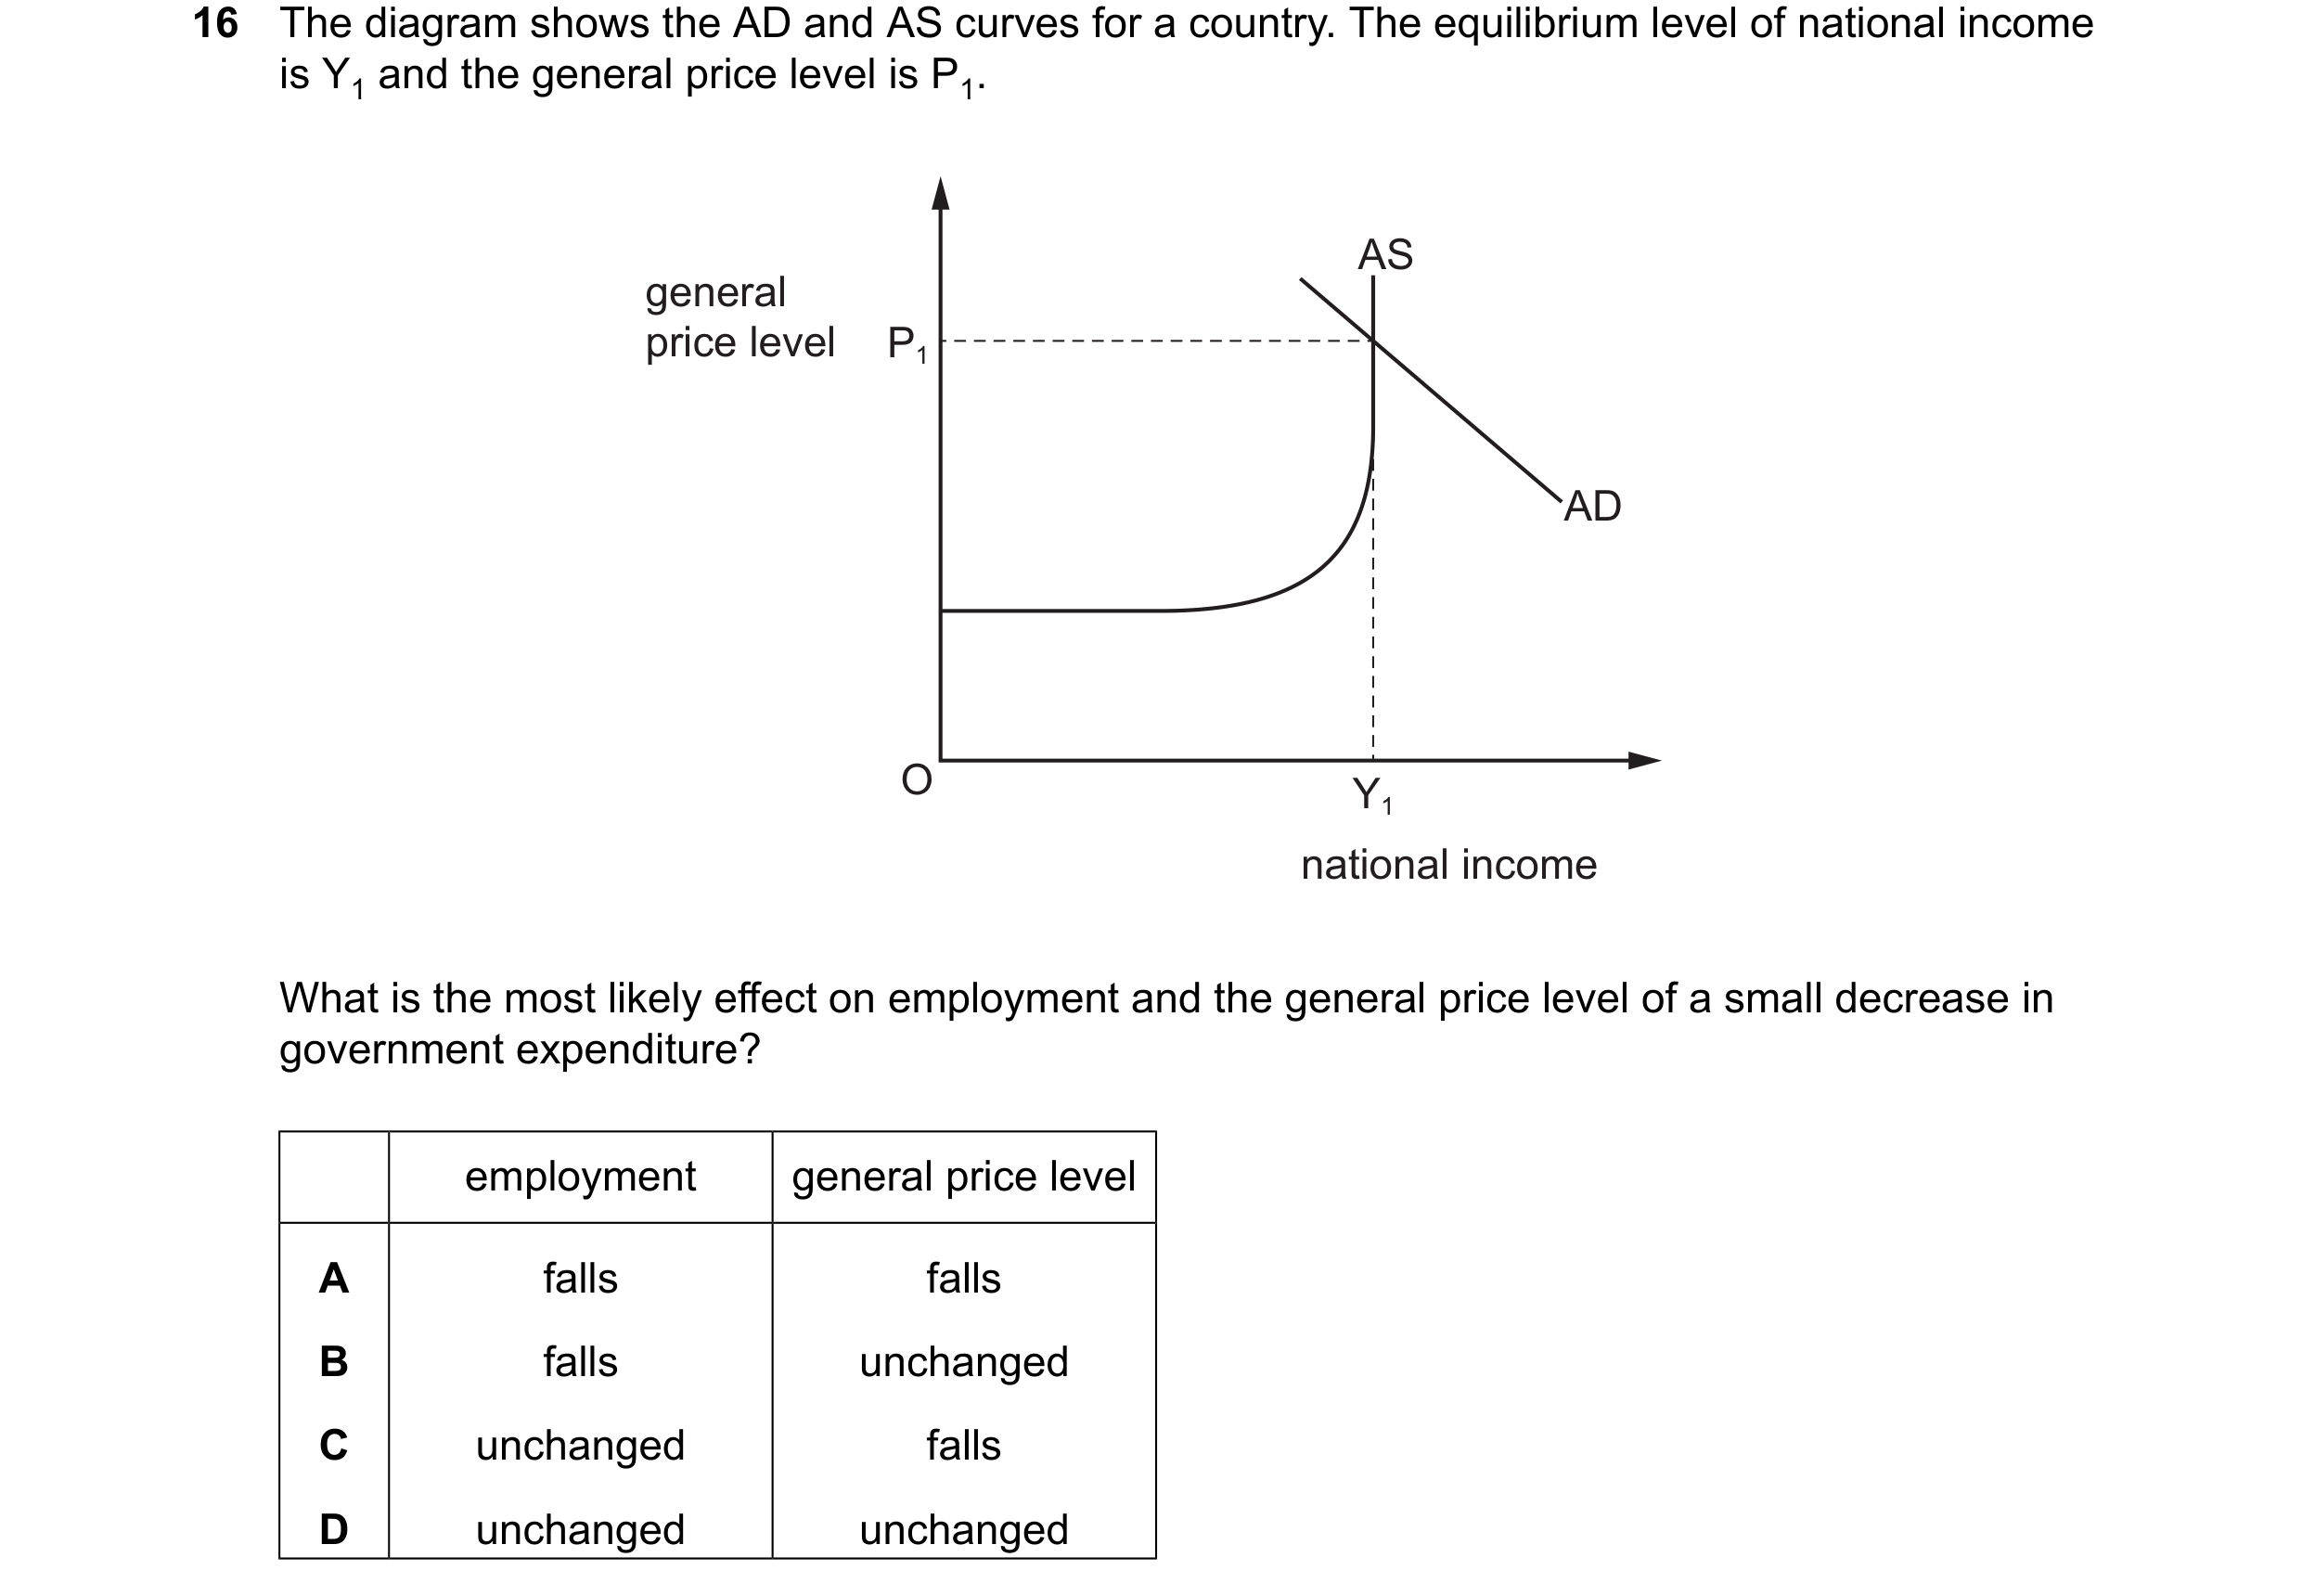
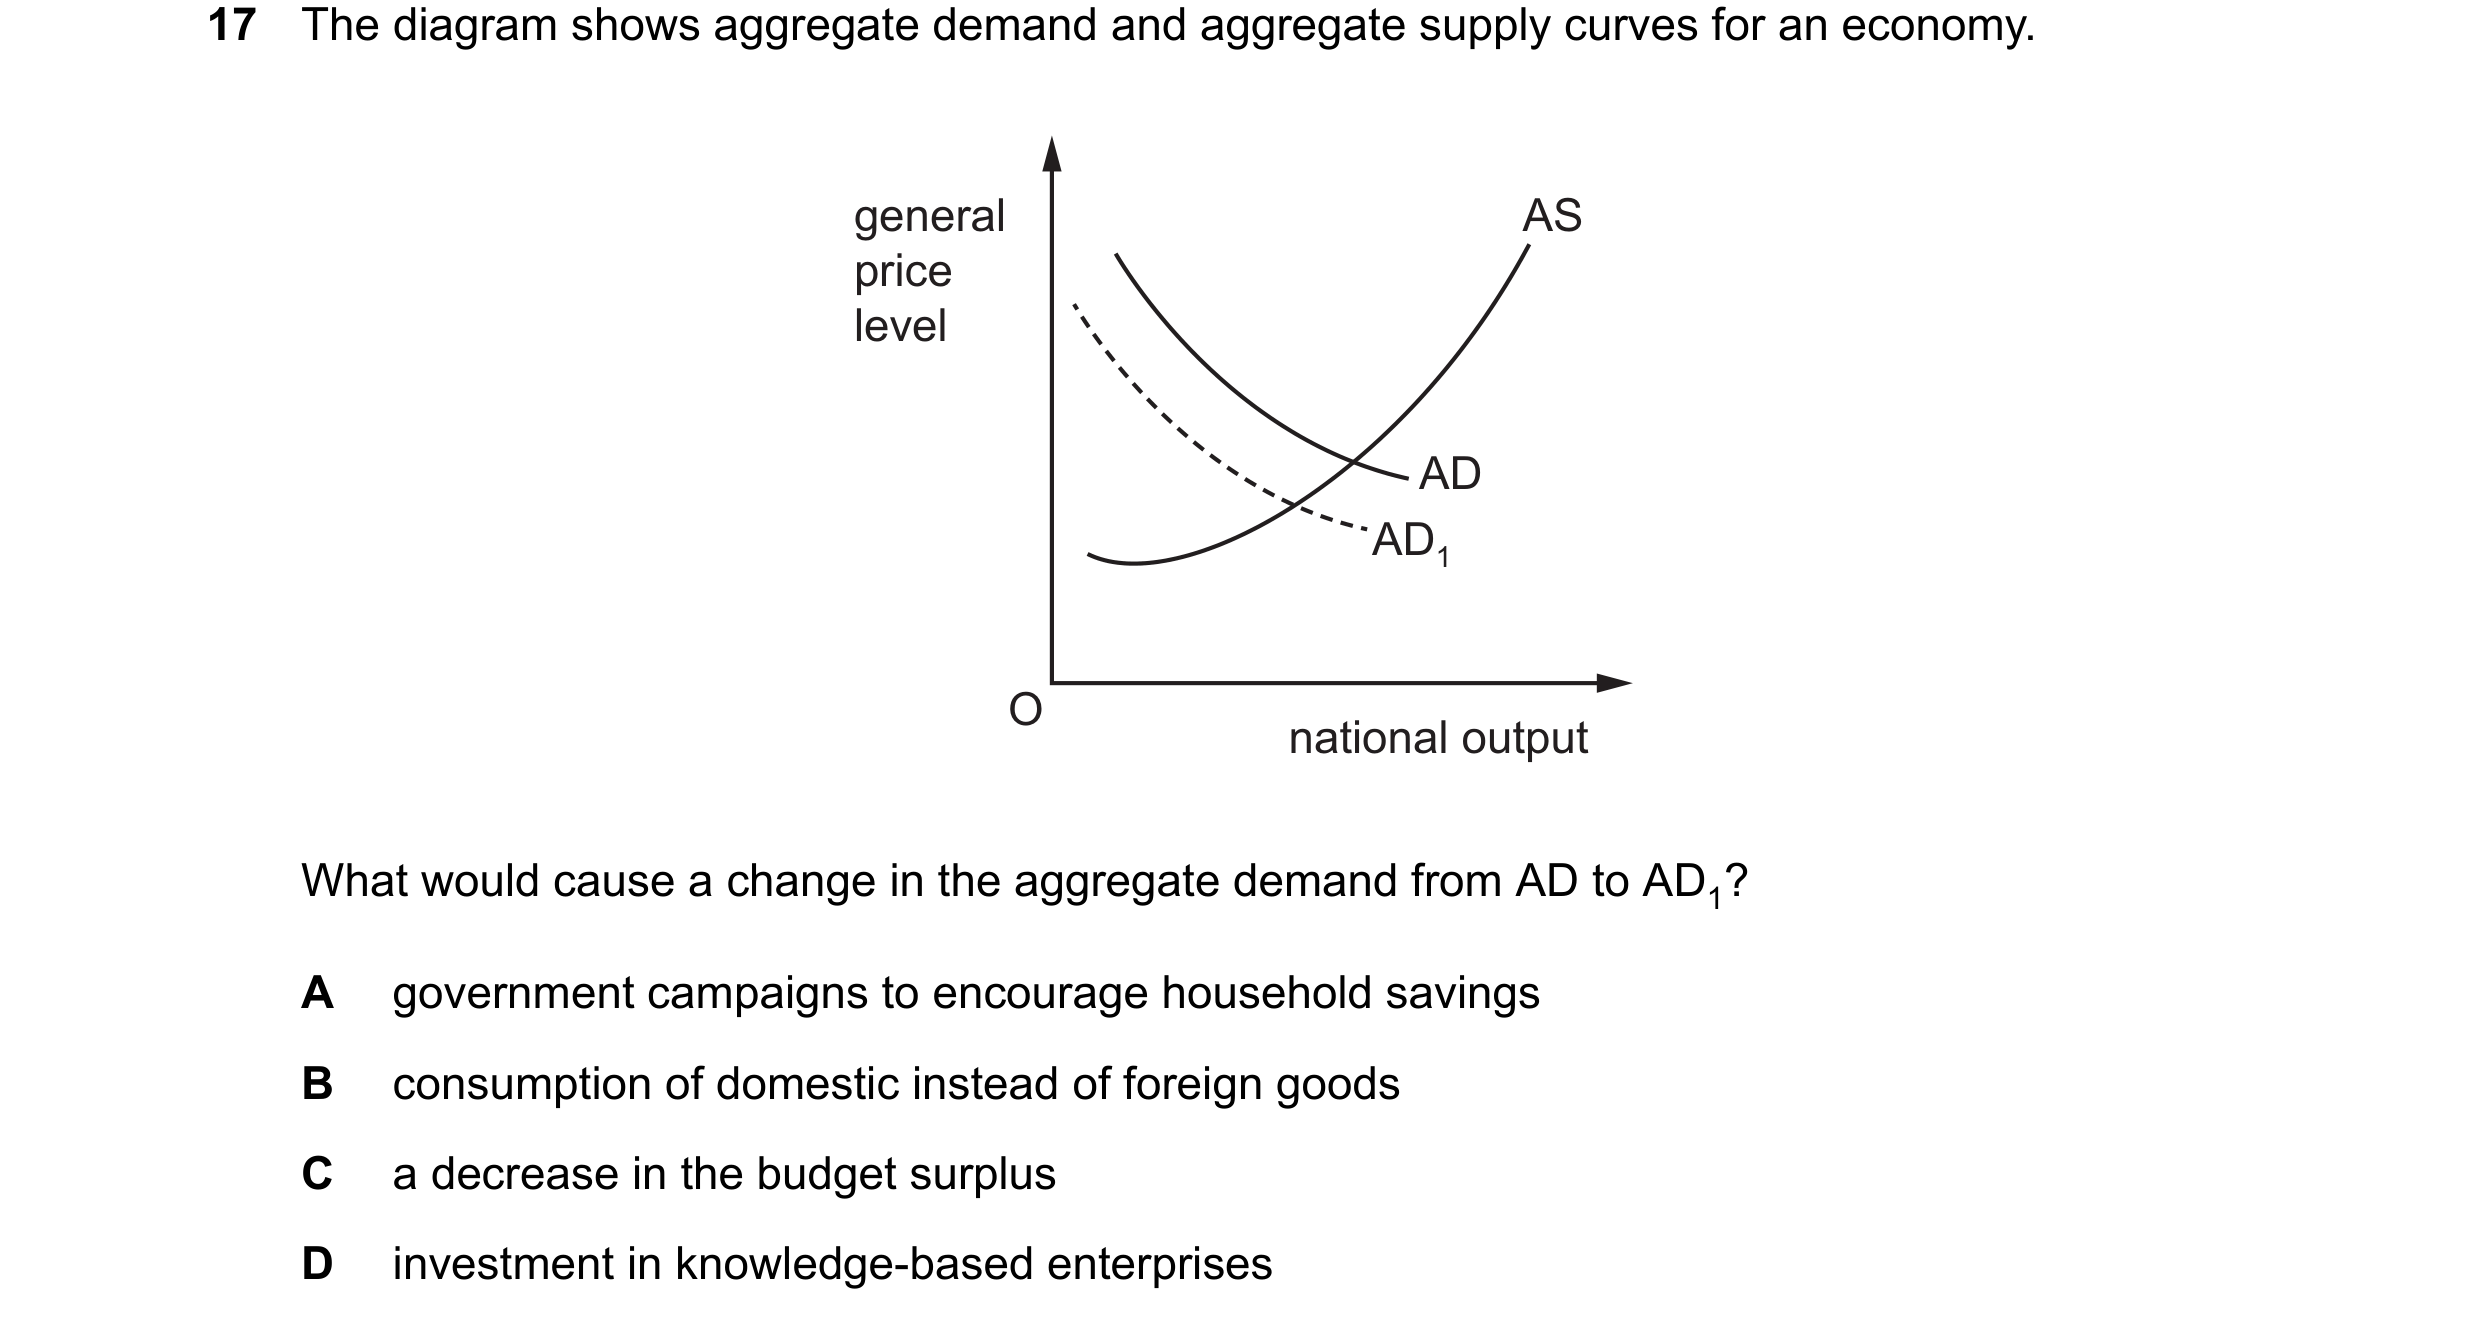 56 / 57
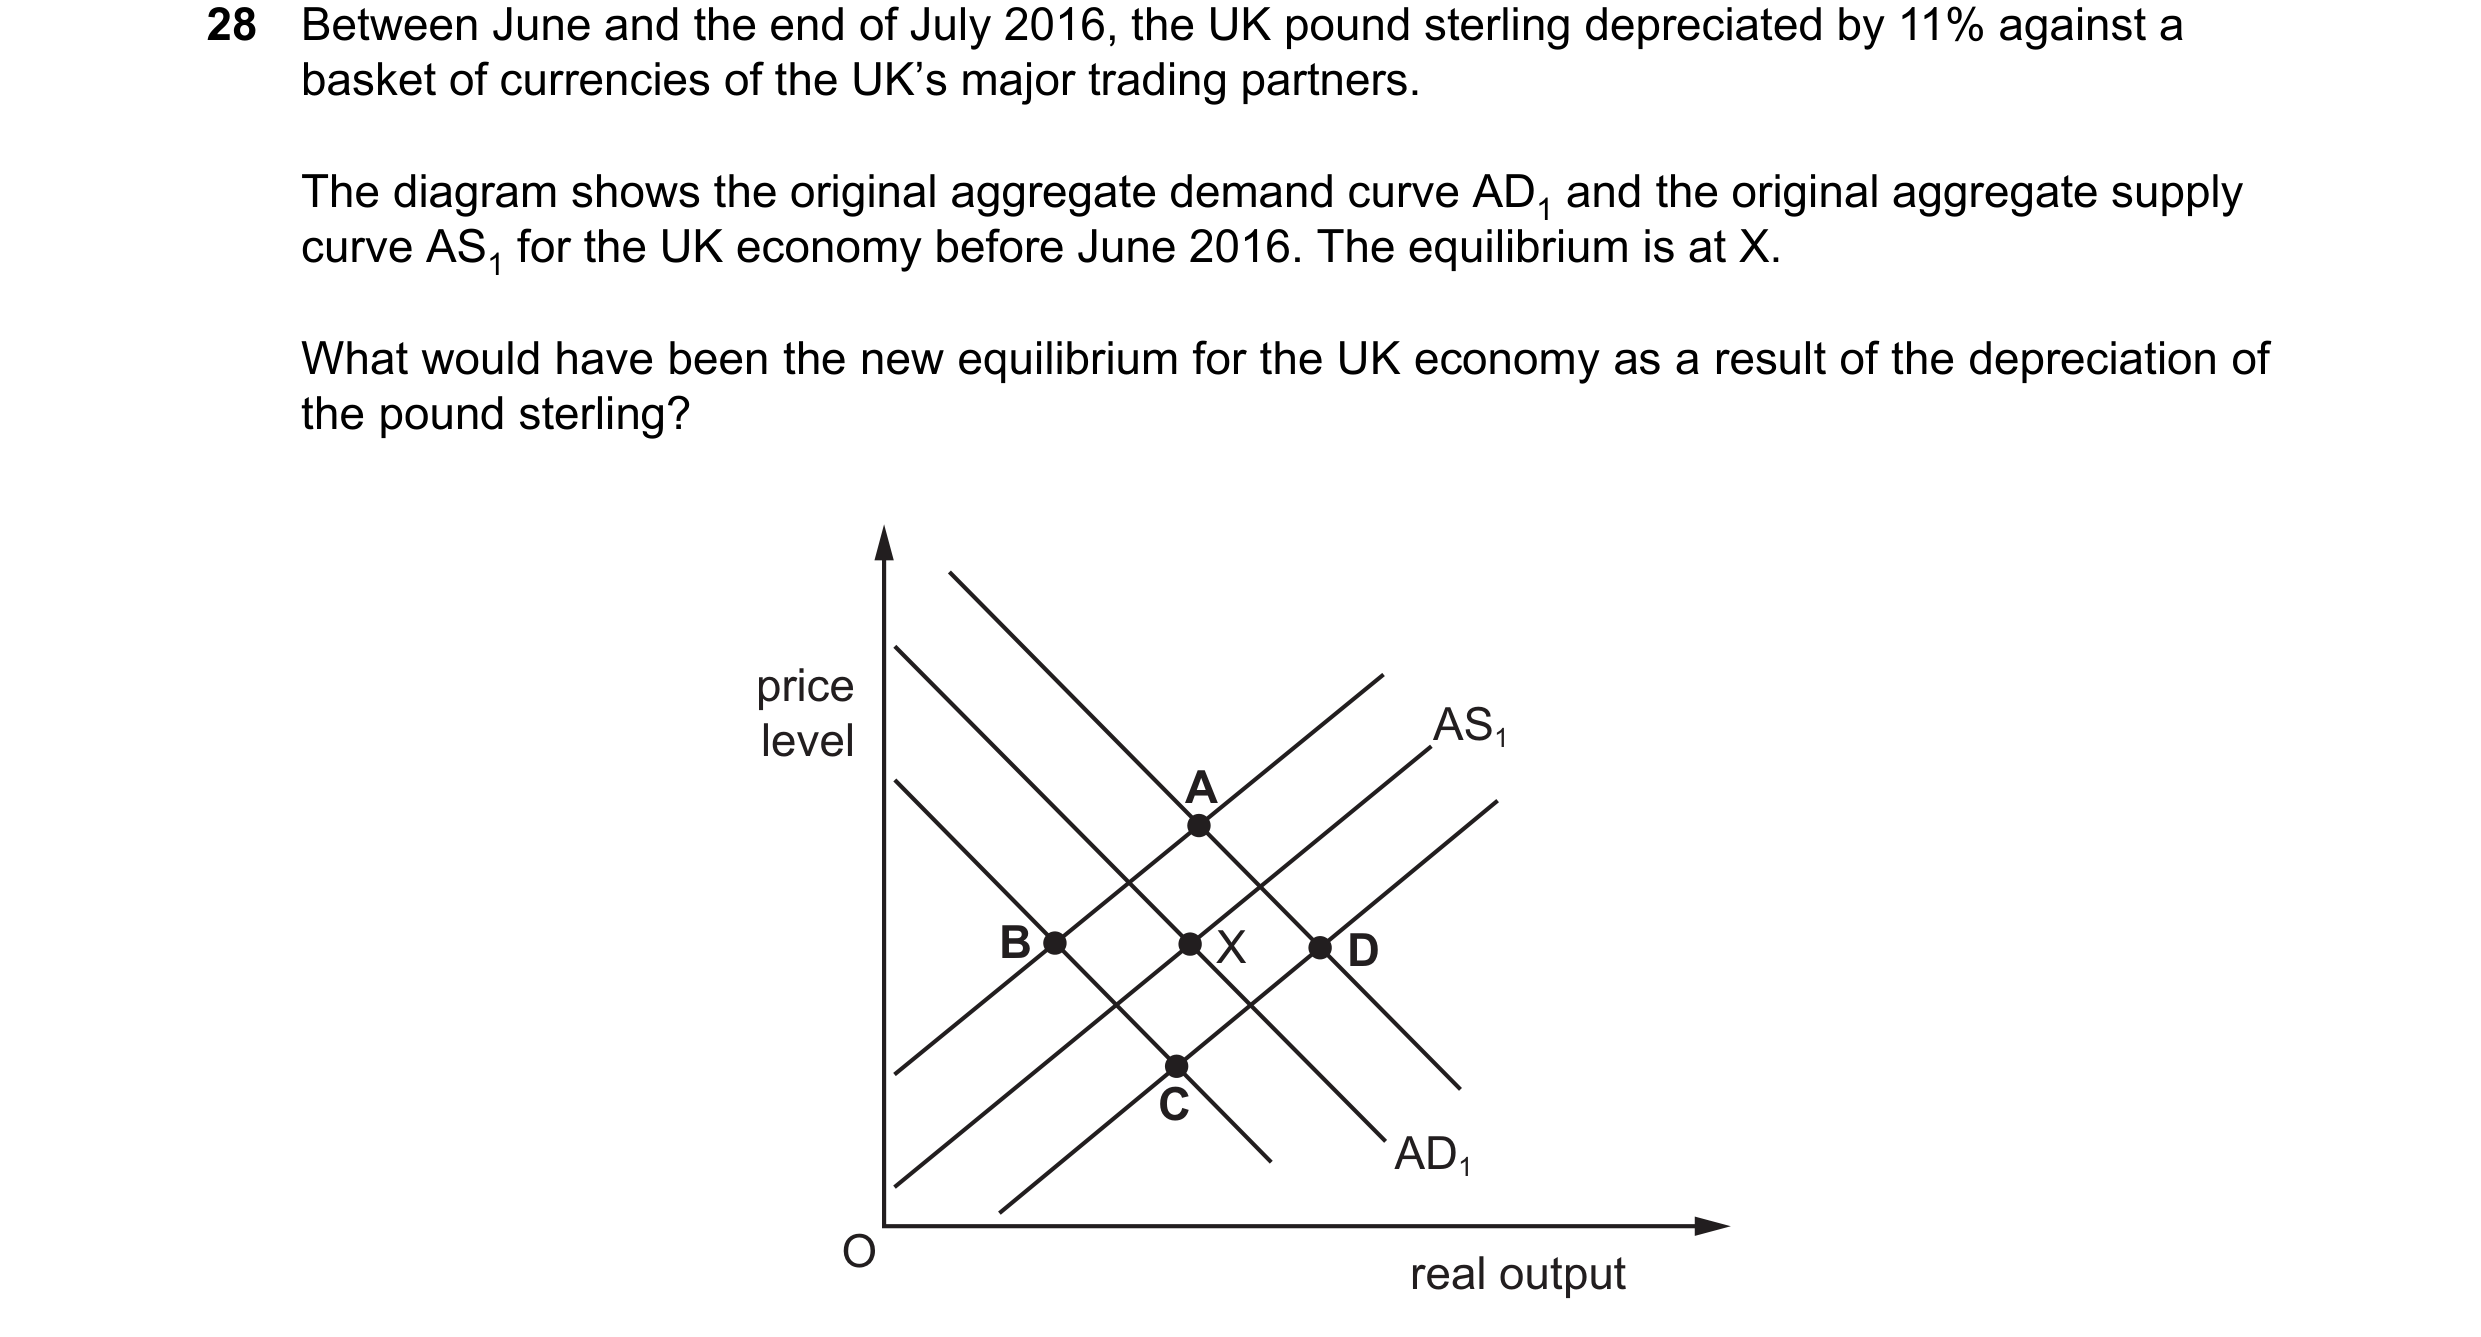
 57 / 57