Questions as text
Q1 · The diagram shows a number of expenditure functions 9708/31 Oct/Nov 2009
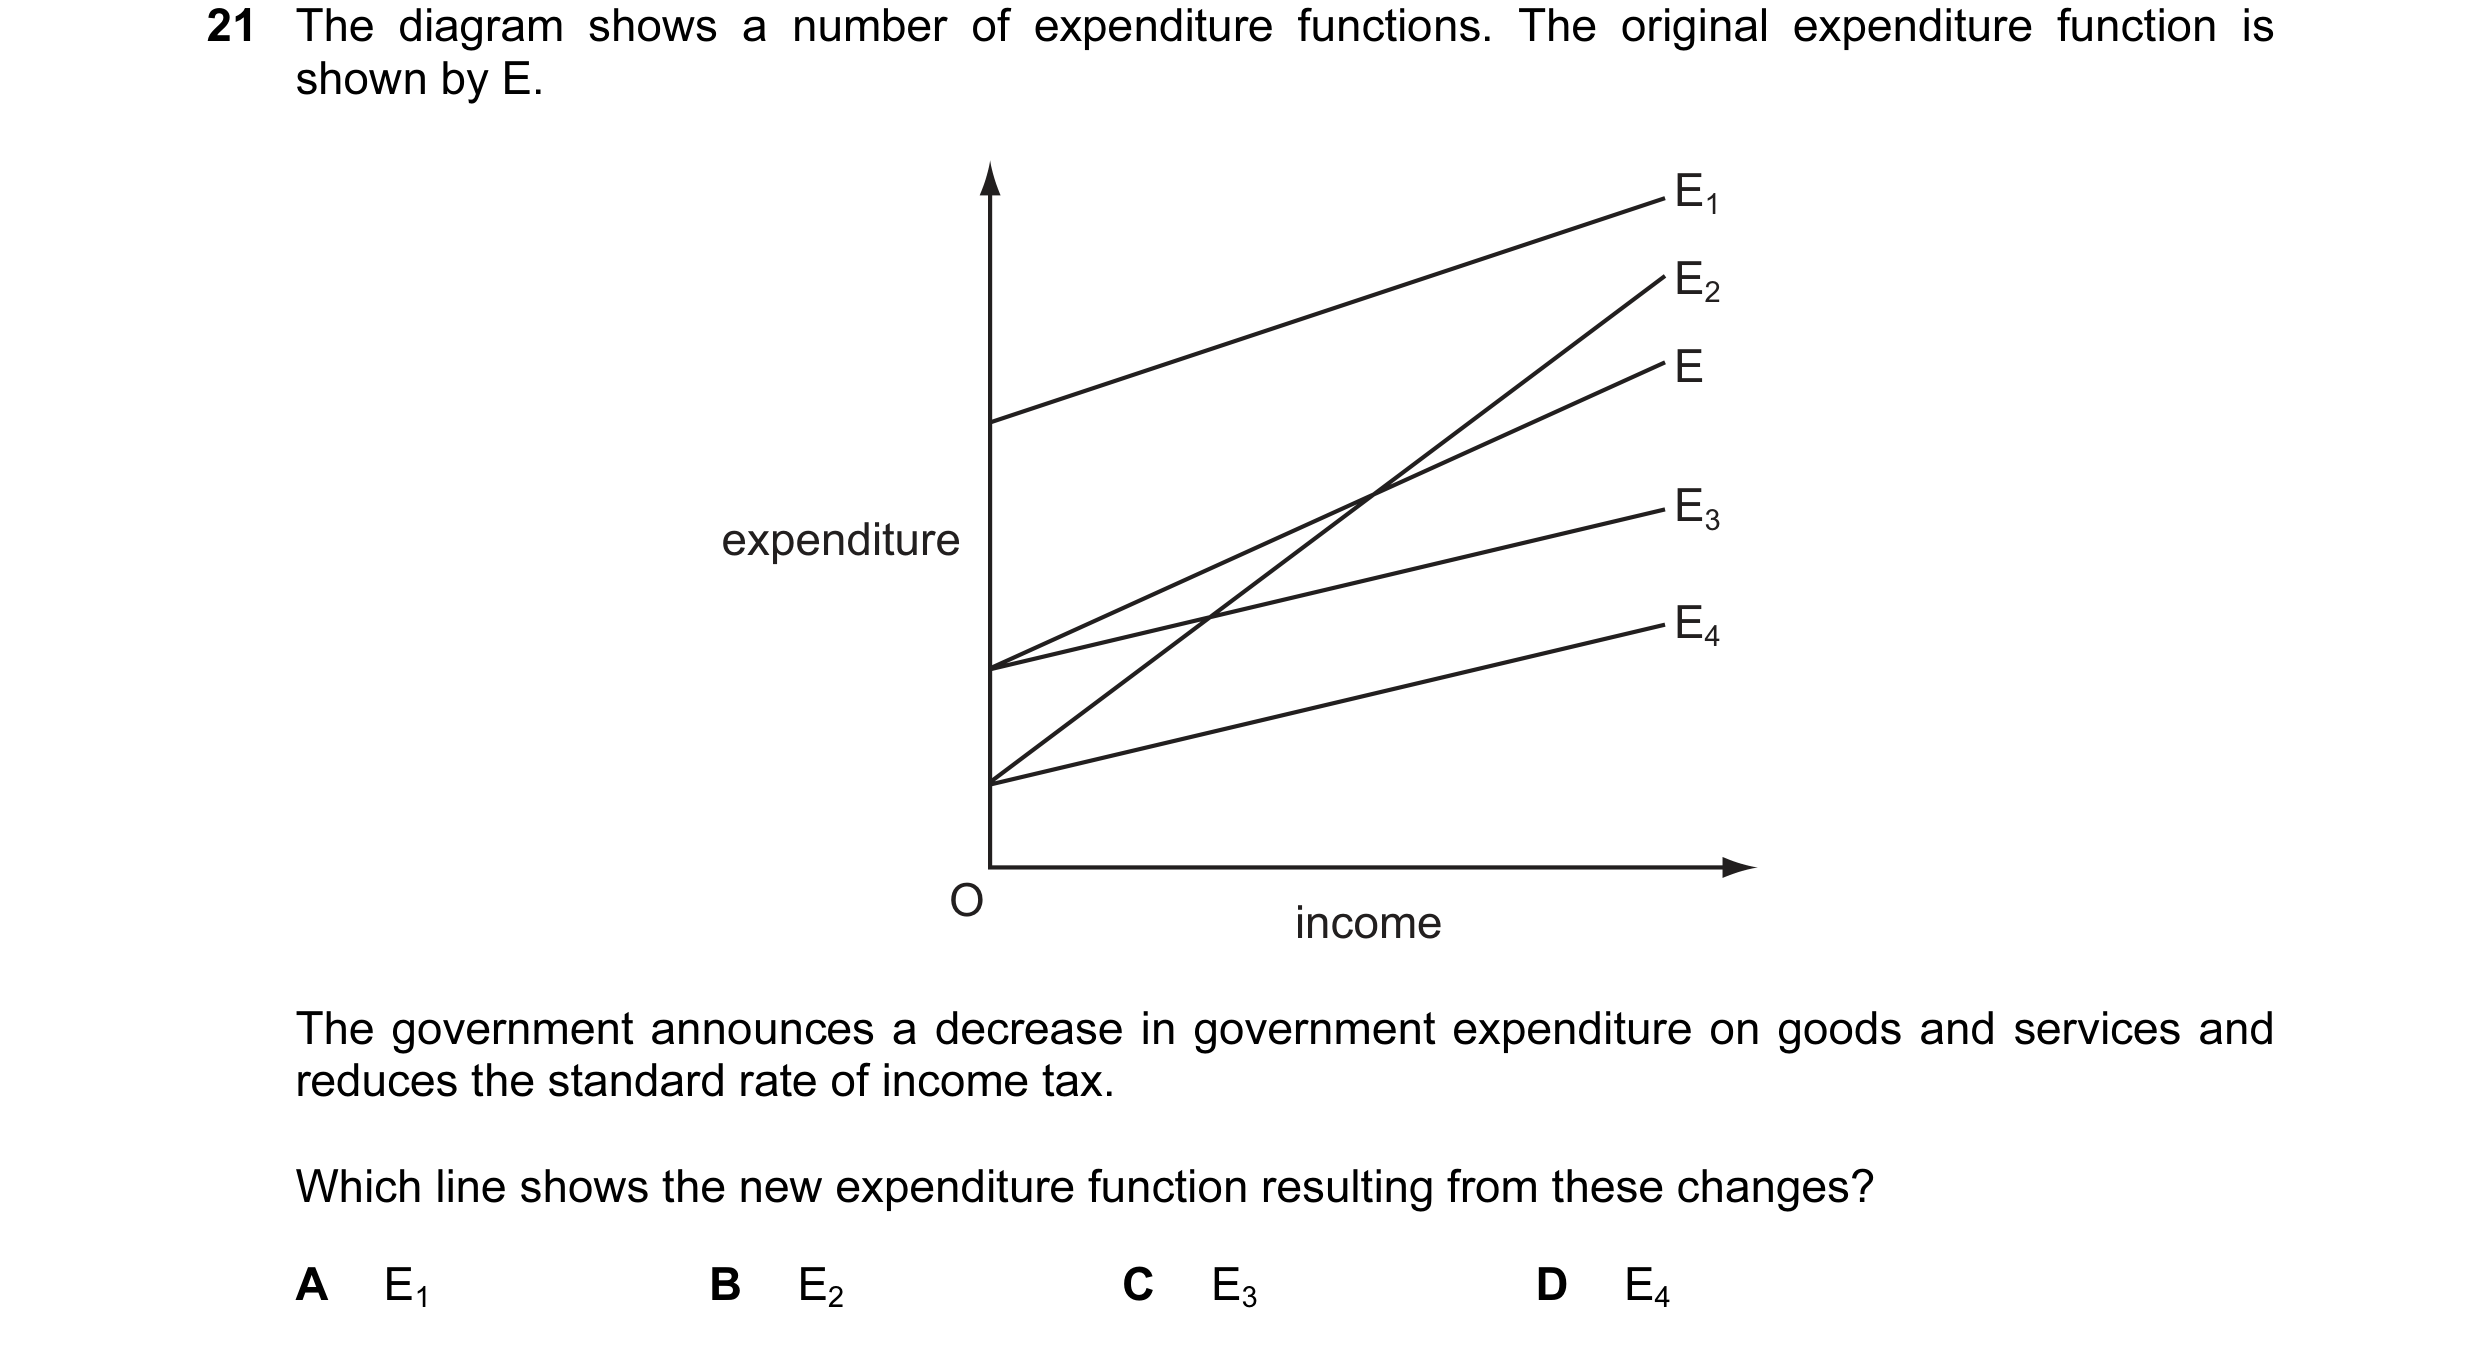
21 The diagram shows a number of expenditure functions. The original expenditure function is shown by E. E1 E2 E E3 expenditure E4 O income The government announces a decrease in government expenditure on goods and services and reduces the standard rate of income tax. Which line shows the new expenditure function resulting from these changes? A E1 B E2 C E3 D E4
1 marks
Answer: B
This question in 9708/31 Oct/Nov 2009
Q2 · The diagram shows an economy’s aggregate supply curve 9708/31 Oct/Nov 2009
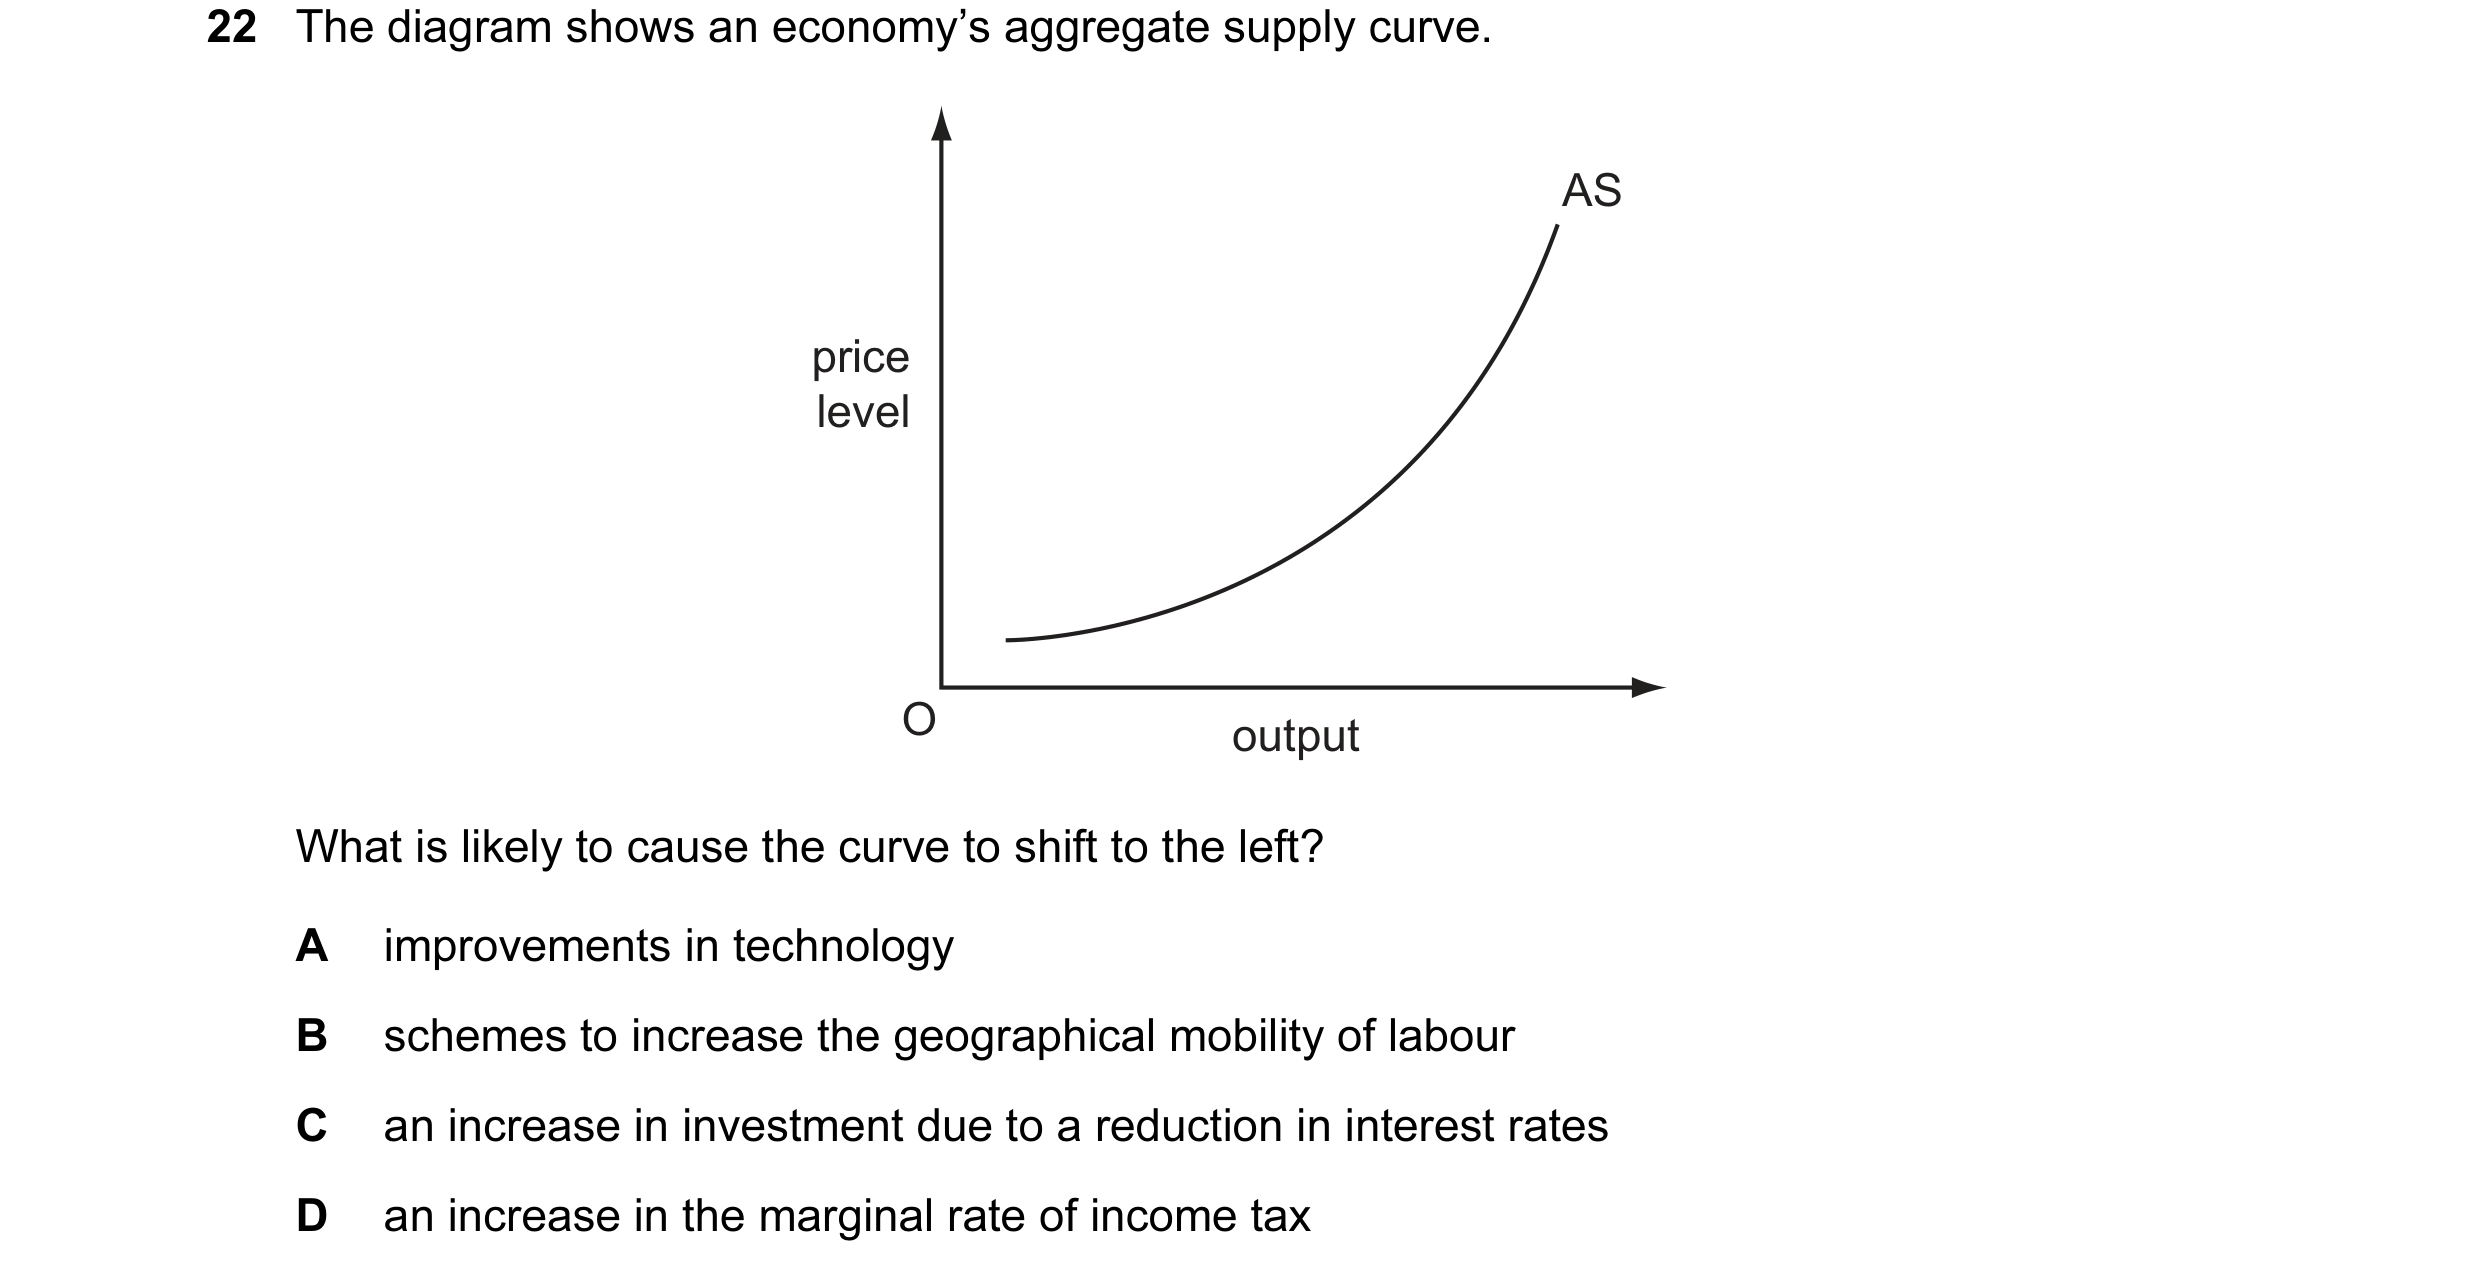
22 The diagram shows an economy’s aggregate supply curve. AS price level O output What is likely to cause the curve to shift to the left? A improvements in technology B schemes to increase the geographical mobility of labour C an increase in investment due to a reduction in interest rates D an increase in the marginal rate of income tax
1 marks
Answer: D
This question in 9708/31 Oct/Nov 2009
Q3 · The diagram shows an economy’s aggregate supply curve 9708/32 Oct/Nov 2009
21 The diagram shows an economy’s aggregate supply curve. AS price level O output What is likely to cause the curve to shift to the left? A improvements in technology B schemes to increase the geographical mobility of labour C an increase in investment due to a reduction in interest rates D an increase in the marginal rate of income tax
1 marks
Answer: D
This question in 9708/32 Oct/Nov 2009
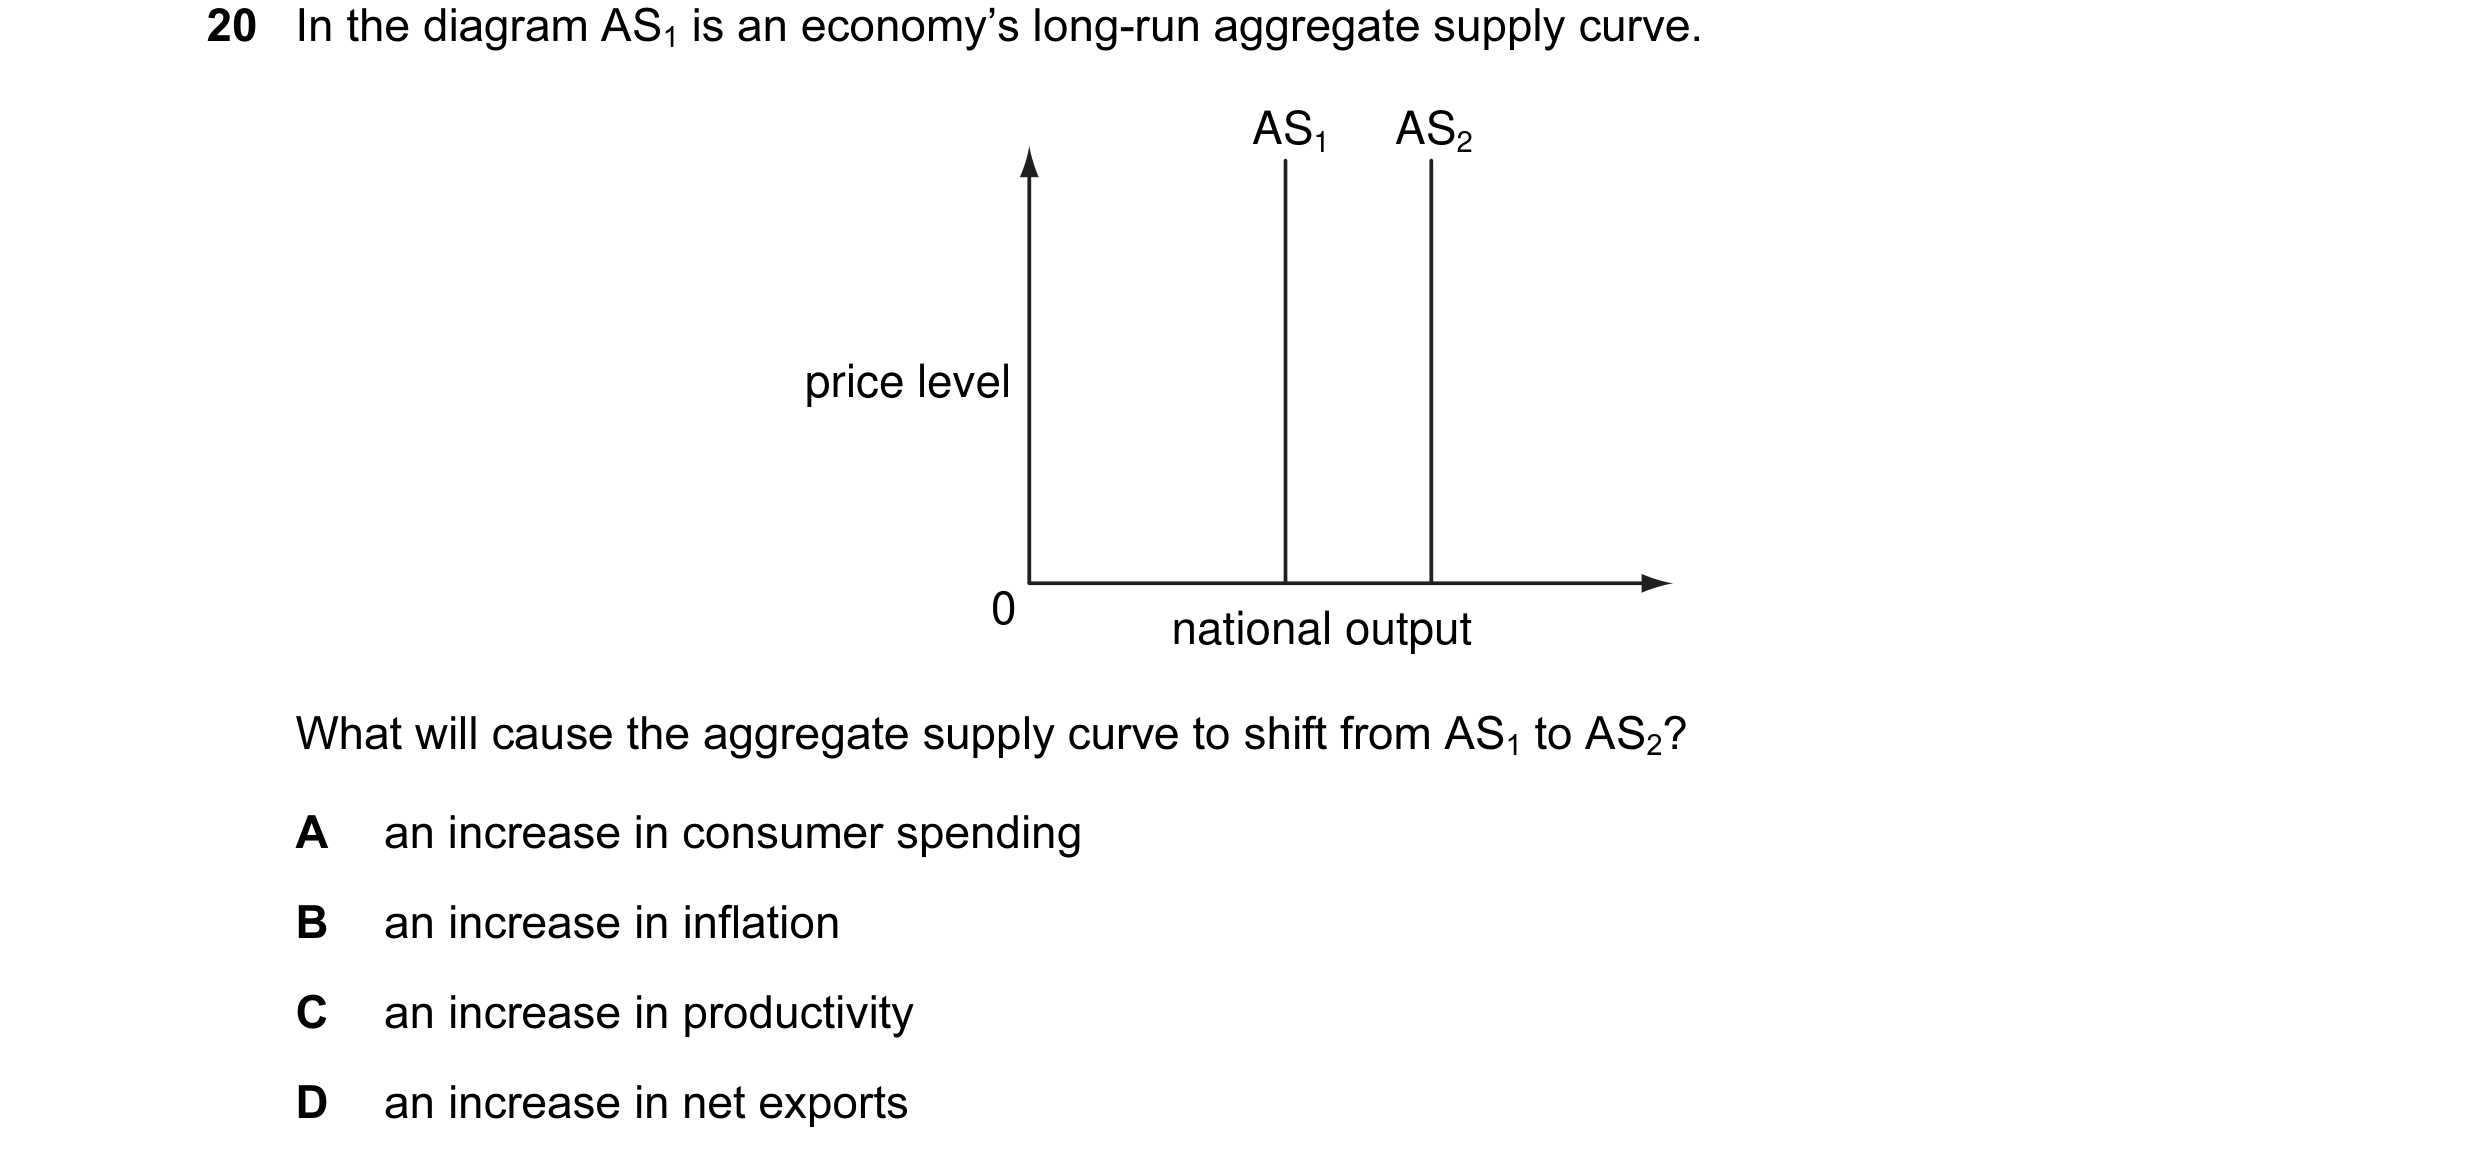
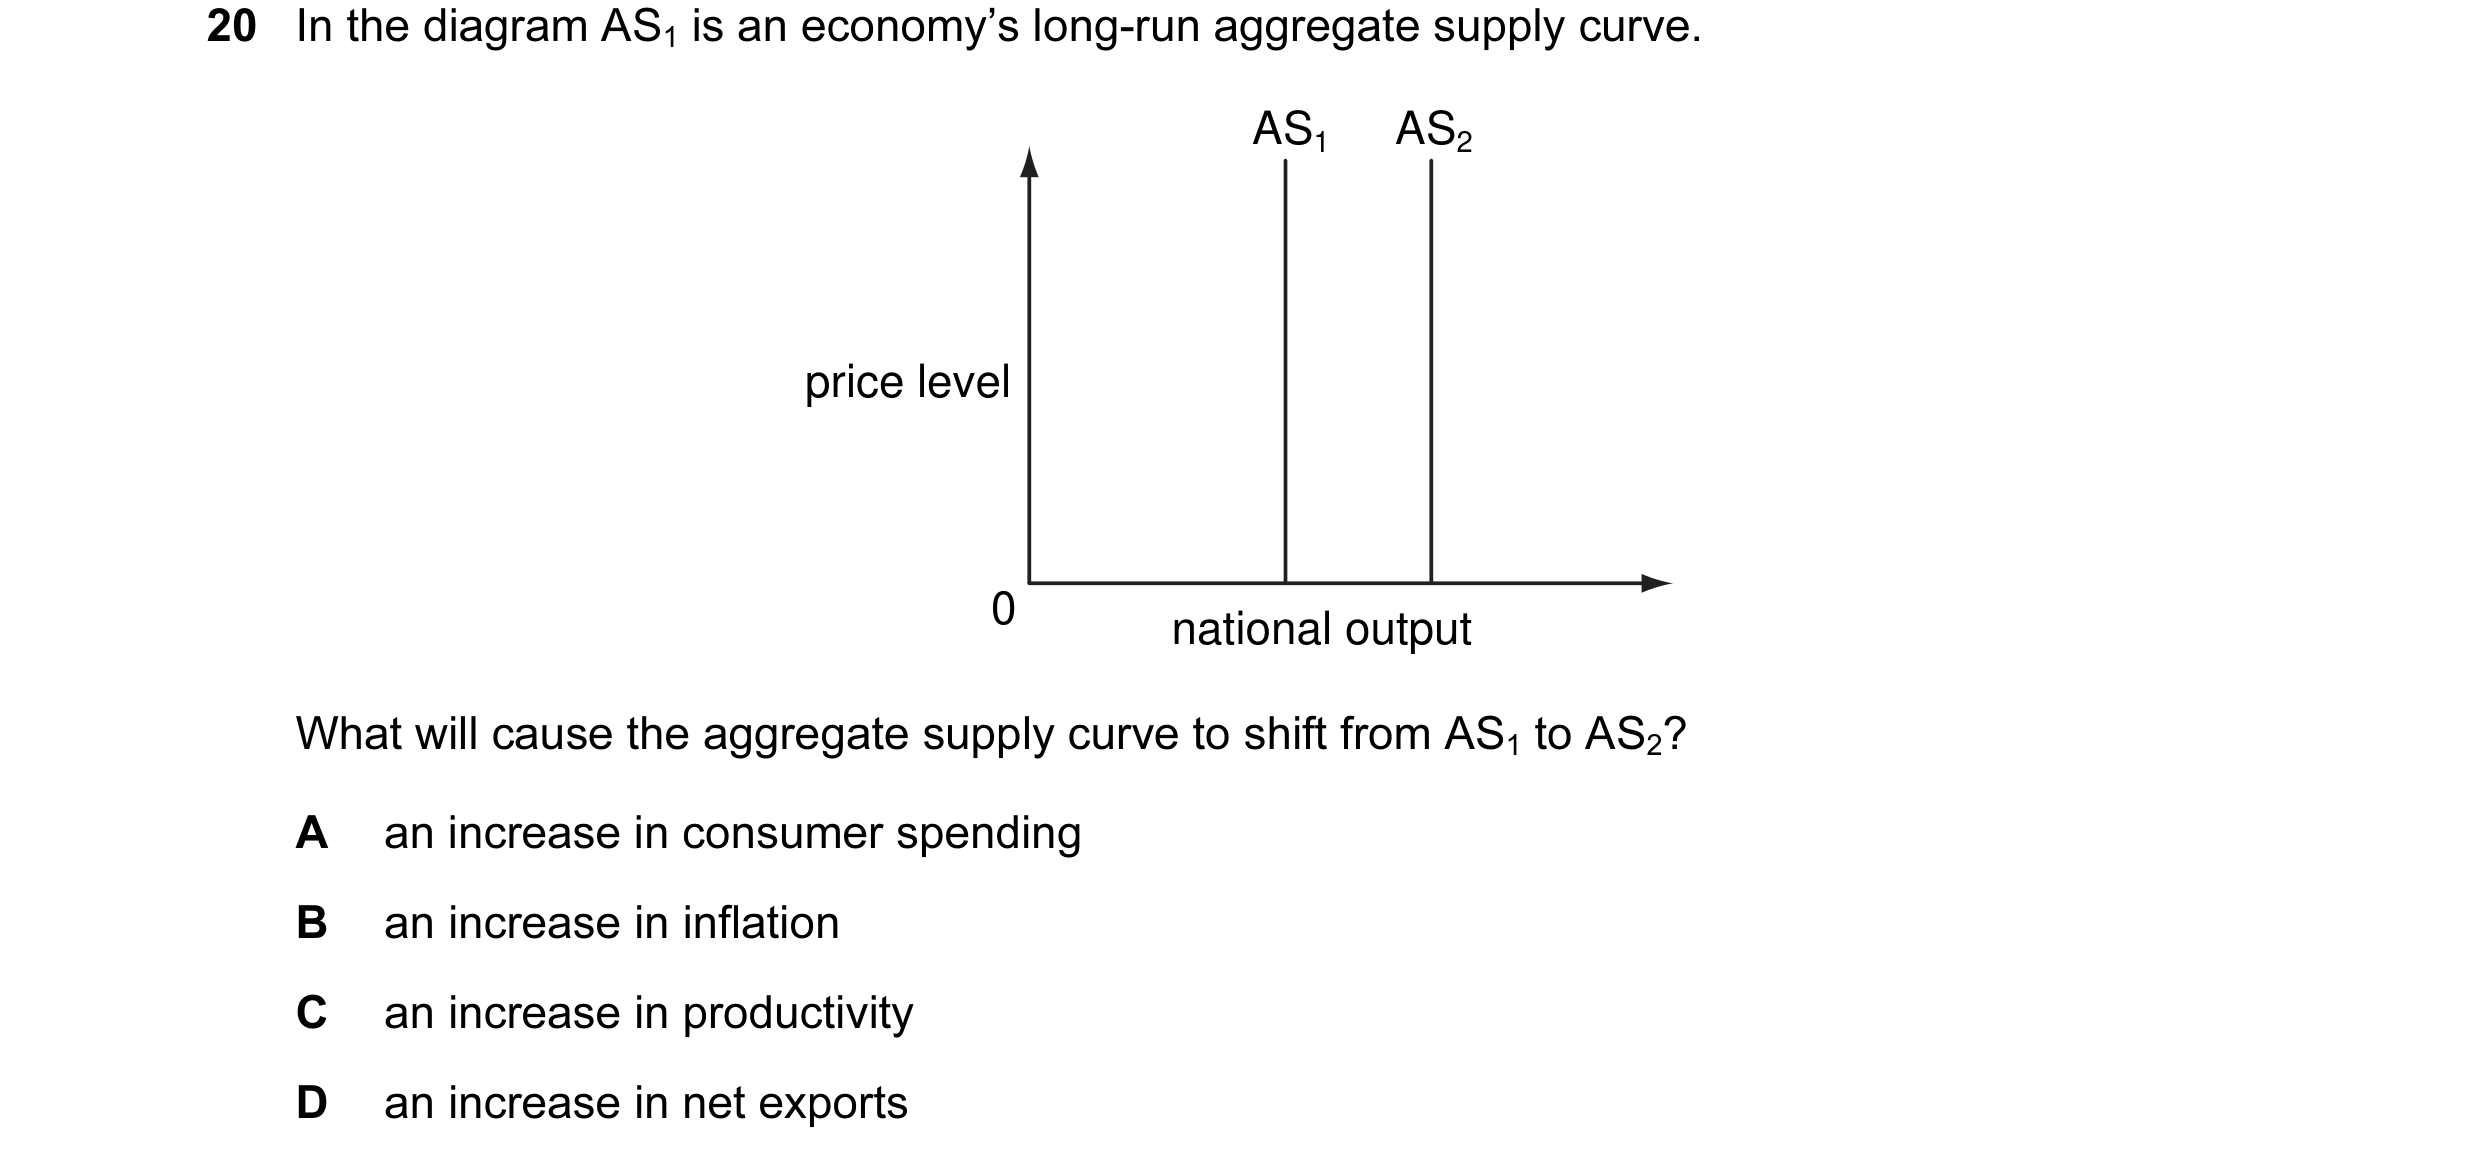
Q4 · In the diagram AS1 is an economy’s long-run aggregate supply curve 9708/31 May/June 2010
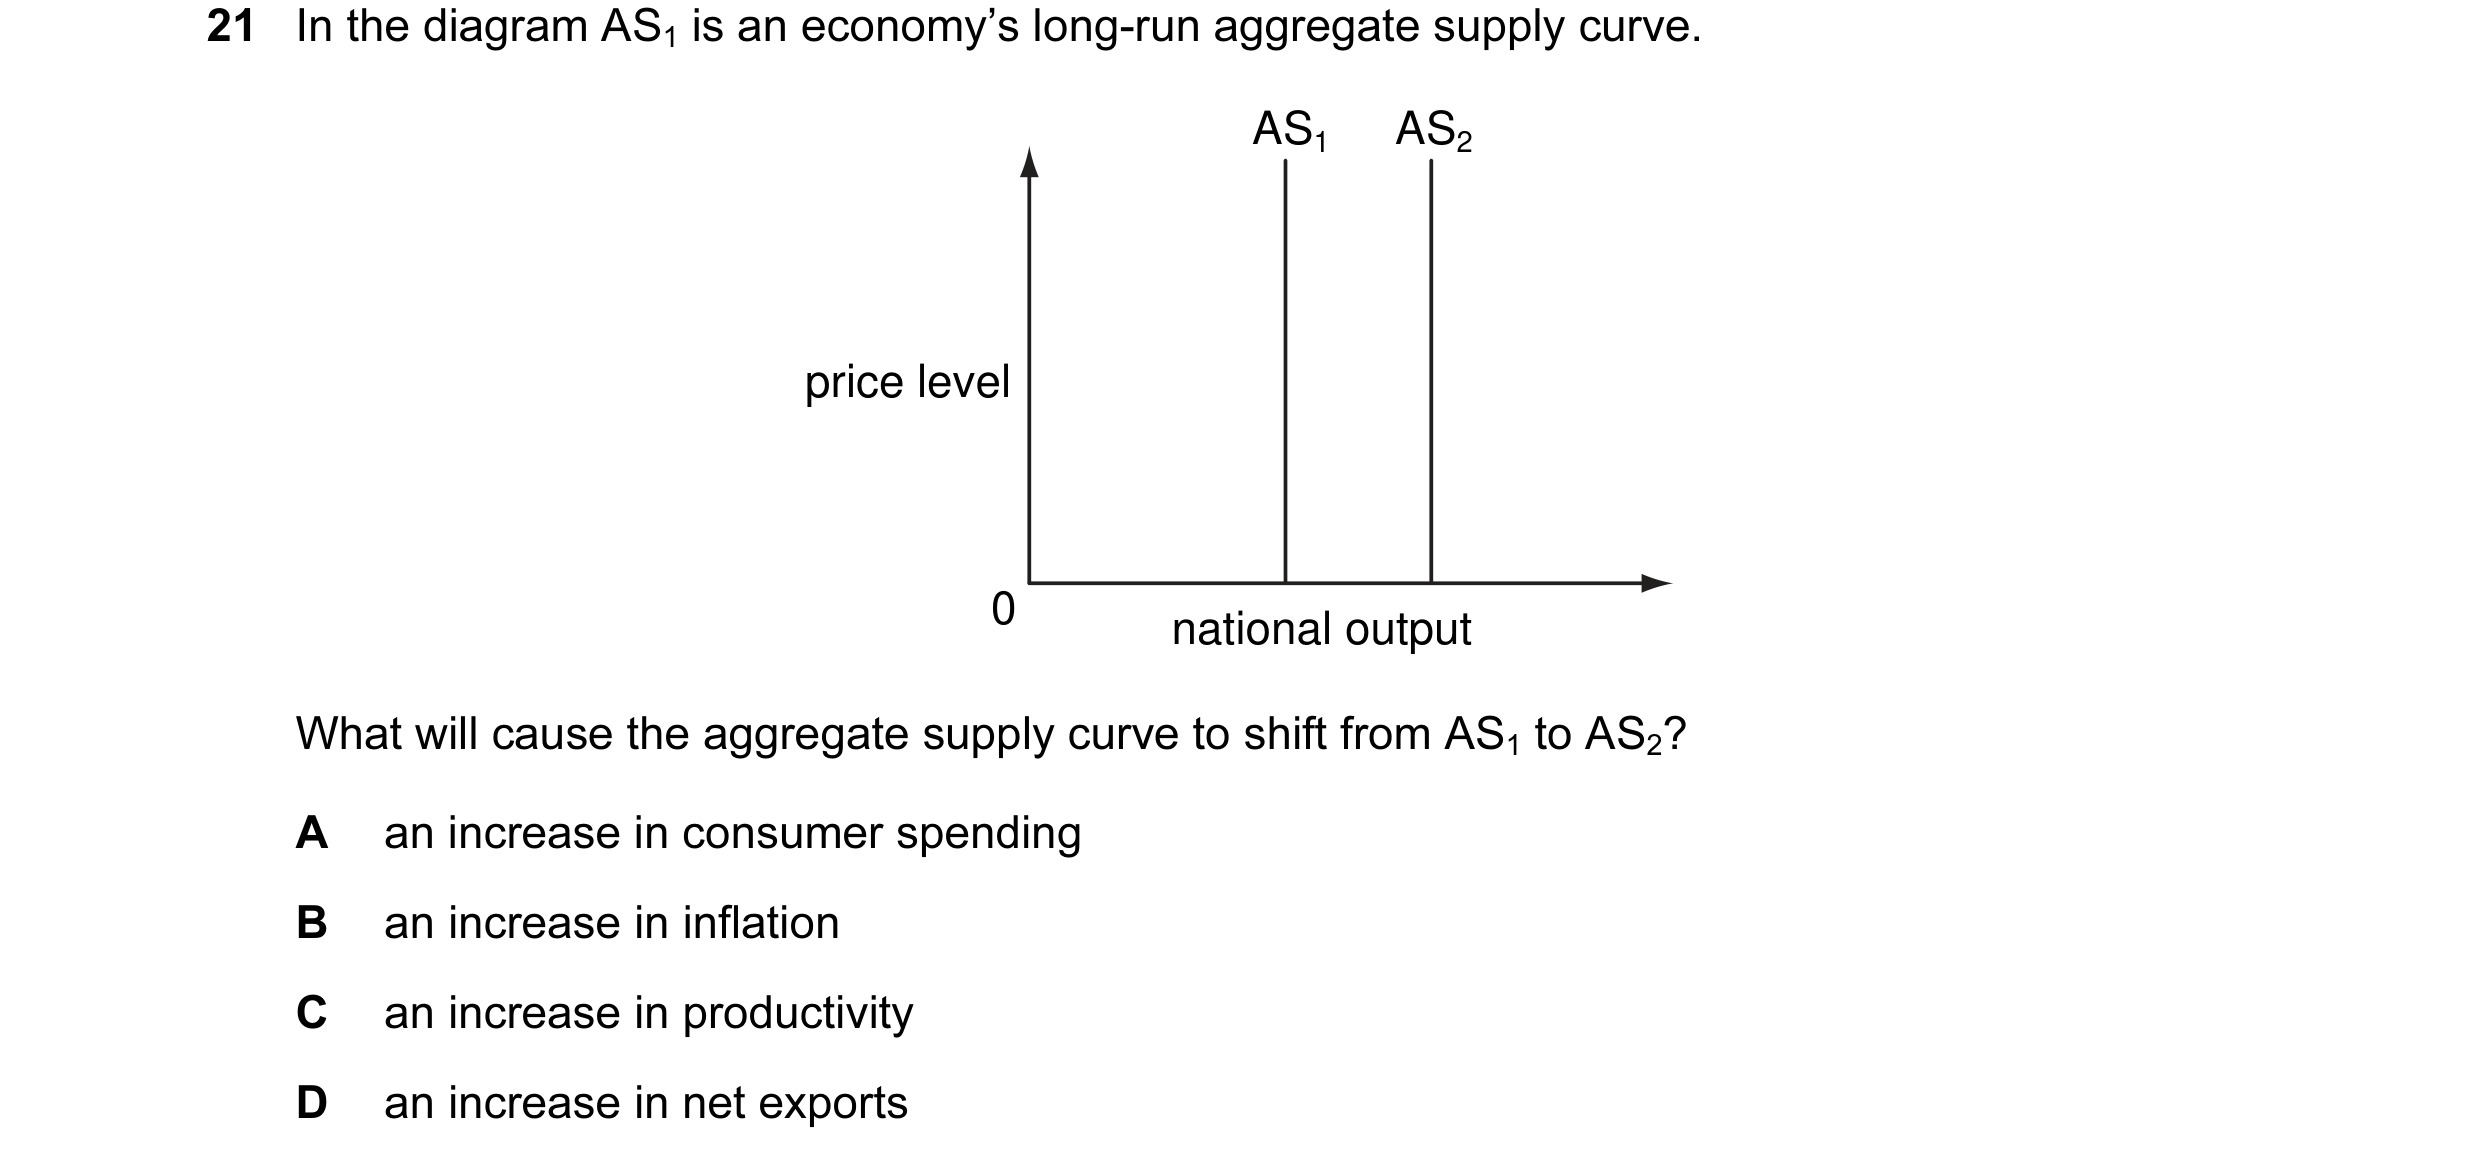
21 In the diagram AS1 is an economy’s long-run aggregate supply curve. AS1 AS2 price level 0 national output What will cause the aggregate supply curve to shift from AS1 to AS2? A an increase in consumer spending B an increase in inflation C an increase in productivity D an increase in net exports
1 marks
Answer: C
This question in 9708/31 May/June 2010
Q5 · The diagram shows the relationship between household income and household consumption 9708/32 May/June 2010
17 The diagram shows the relationship between household income and household consumption. C2 C1 household consumption O household income What would be likely to cause the household consumption curve to shift from C1 to C2? A a decrease in household income B a decrease in the value of household assets C an increase in interest rates D an increase in the expected future level of household income
1 marks
Answer: D
This question in 9708/32 May/June 2010
Q6 · In the diagram AS1 is an economy’s long-run aggregate supply curve 9708/32 May/June 2010
20 In the diagram AS1 is an economy’s long-run aggregate supply curve. AS1 AS2 price level 0 national output What will cause the aggregate supply curve to shift from AS1 to AS2? A an increase in consumer spending B an increase in inflation C an increase in productivity D an increase in net exports
1 marks
Answer: C
This question in 9708/32 May/June 2010
Q7 · The diagram shows the relationship between household income and household consumption 9708/33 May/June 2010
17 The diagram shows the relationship between household income and household consumption. C2 C1 household consumption O household income What would be likely to cause the household consumption curve to shift from C1 to C2? A a decrease in household income B a decrease in the value of household assets C an increase in interest rates D an increase in the expected future level of household income
1 marks
Answer: D
This question in 9708/33 May/June 2010
Q8 · In the diagram AS1 is an economy’s long-run aggregate supply curve 9708/33 May/June 2010
20 In the diagram AS1 is an economy’s long-run aggregate supply curve. AS1 AS2 price level 0 national output What will cause the aggregate supply curve to shift from AS1 to AS2? A an increase in consumer spending B an increase in inflation C an increase in productivity D an increase in net exports
1 marks
Answer: C
This question in 9708/33 May/June 2010
Q9 · The diagram shows an aggregate demand curve 9708/31 Oct/Nov 2010
21 The diagram shows an aggregate demand curve. price level AD O national output What helps to explain why the curve is downward sloping? A When exports increase there will be an increase in national income. B When government expenditure increases there will be an increase in national output. C When investment increases there will be an increase in consumption. D When the price level increases there will be an increase in interest rates.
1 marks
Answer: D
This question in 9708/31 Oct/Nov 2010
Q10 · What is likely to be the effect of a fall in oil prices on the global economy? 9708/31 Oct/Nov 2010
25 What is likely to be the effect of a fall in oil prices on the global economy? A a decrease in the rate of economic growth B a decrease in unemployment C a strengthening of cost-push inflation D a weakening of demand-pull inflation
1 marks
Answer: B
This question in 9708/31 Oct/Nov 2010
Q11 · What could be expected to increase the pressure of demand-pull inflation in an open… 9708/31 Oct/Nov 2010
27 What could be expected to increase the pressure of demand-pull inflation in an open economy? A an appreciation of the foreign exchange rate B an increase in indirect taxes C an increase in interest rates D the imposition of import controls
1 marks
Answer: D
This question in 9708/31 Oct/Nov 2010
Q12 · The diagram shows an aggregate demand curve 9708/32 Oct/Nov 2010
21 The diagram shows an aggregate demand curve. price level AD O national output What helps to explain why the curve is downward sloping? A When exports increase there will be an increase in national income. B When government expenditure increases there will be an increase in national output. C When investment increases there will be an increase in consumption. D When the price level increases there will be an increase in interest rates.
1 marks
Answer: D
This question in 9708/32 Oct/Nov 2010
Q13 · What is likely to be the effect of a fall in oil prices on the global economy? 9708/32 Oct/Nov 2010
25 What is likely to be the effect of a fall in oil prices on the global economy? A a decrease in the rate of economic growth B a decrease in unemployment C a strengthening of cost-push inflation D a weakening of demand-pull inflation
1 marks
Answer: B
This question in 9708/32 Oct/Nov 2010
Q14 · What could be expected to increase the pressure of demand-pull inflation in an open… 9708/32 Oct/Nov 2010
27 What could be expected to increase the pressure of demand-pull inflation in an open economy? A an appreciation of the foreign exchange rate B an increase in indirect taxes C an increase in interest rates D the imposition of import controls
1 marks
Answer: D
This question in 9708/32 Oct/Nov 2010
Q15 · The diagram shows an aggregate demand curve 9708/33 Oct/Nov 2010
20 The diagram shows an aggregate demand curve. price level AD O national output What helps to explain why the curve is downward sloping? A When exports increase there will be an increase in national income. B When government expenditure increases there will be an increase in national output. C When investment increases there will be an increase in consumption. D When the price level increases there will be an increase in interest rates.
1 marks
Answer: D
This question in 9708/33 Oct/Nov 2010
Q16 · Other things being equal, what will result in a decrease in aggregate demand? 9708/31 May/June 2011
18 Other things being equal, what will result in a decrease in aggregate demand? A a decrease in interest rates B a decrease in the balance of trade deficit C a decrease in the government’s budget deficit D a decrease in the household saving ratio
1 marks
Answer: C
This question in 9708/31 May/June 2011
Q17 · Other things being equal, what will result in a decrease in aggregate demand? 9708/32 May/June 2011
17 Other things being equal, what will result in a decrease in aggregate demand? A a decrease in interest rates B a decrease in the balance of trade deficit C a decrease in the government’s budget deficit D a decrease in the household saving ratio
1 marks
Answer: C
This question in 9708/32 May/June 2011
Q18 · Other things being equal, what will result in a decrease in aggregate demand? 9708/33 May/June 2011
17 Other things being equal, what will result in a decrease in aggregate demand? A a decrease in interest rates B a decrease in the balance of trade deficit C a decrease in the government’s budget deficit D a decrease in the household saving ratio
1 marks
Answer: C
This question in 9708/33 May/June 2011
Q19 · In the diagram, AD1 and AS are an economy’s original aggregate demand and aggregate… 9708/31 Oct/Nov 2011
17 In the diagram, AD1 and AS are an economy’s original aggregate demand and aggregate supply curves. AS price level AD2 AD1 O output What will cause the aggregate demand curve to shift to AD2? A an appreciation of the currency B an increase in the money supply C an increase in the price level D an increase in the real wage
1 marks
Answer: A
This question in 9708/31 Oct/Nov 2011
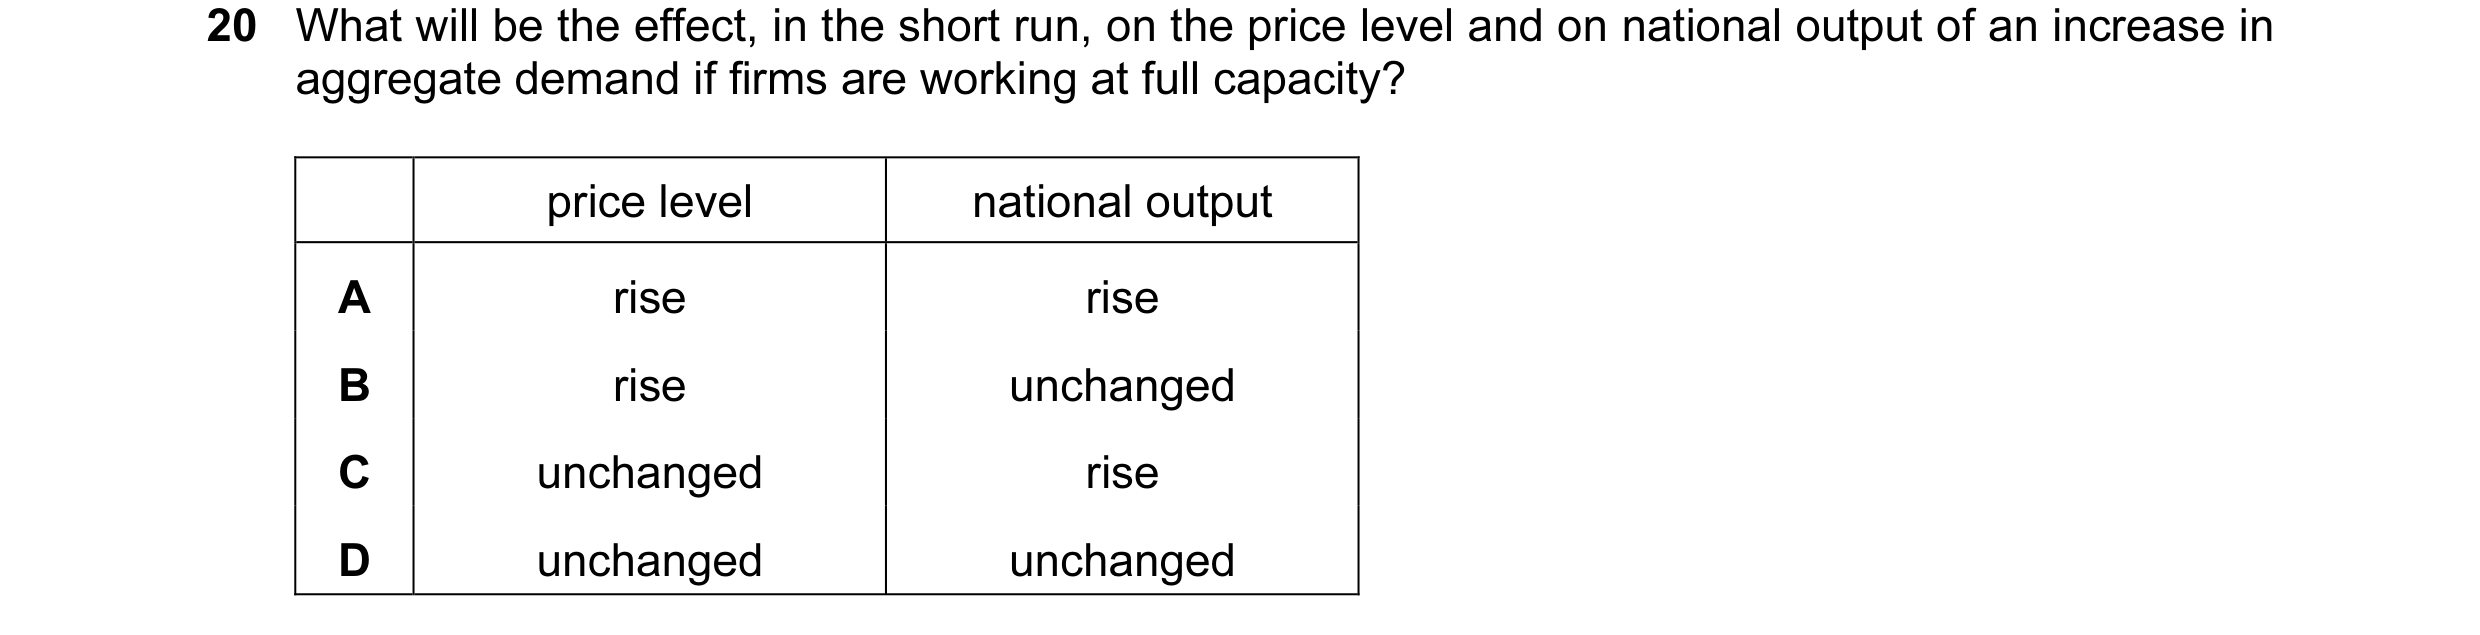
Q20 · What will be the effect, in the short run, on the price level and on national output of… 9708/32 Oct/Nov 2011
20 What will be the effect, in the short run, on the price level and on national output of an increase in aggregate demand if firms are working at full capacity? price level national output A rise rise B rise unchanged C unchanged rise D unchanged unchanged
1 marks
Answer: B
This question in 9708/32 Oct/Nov 2011
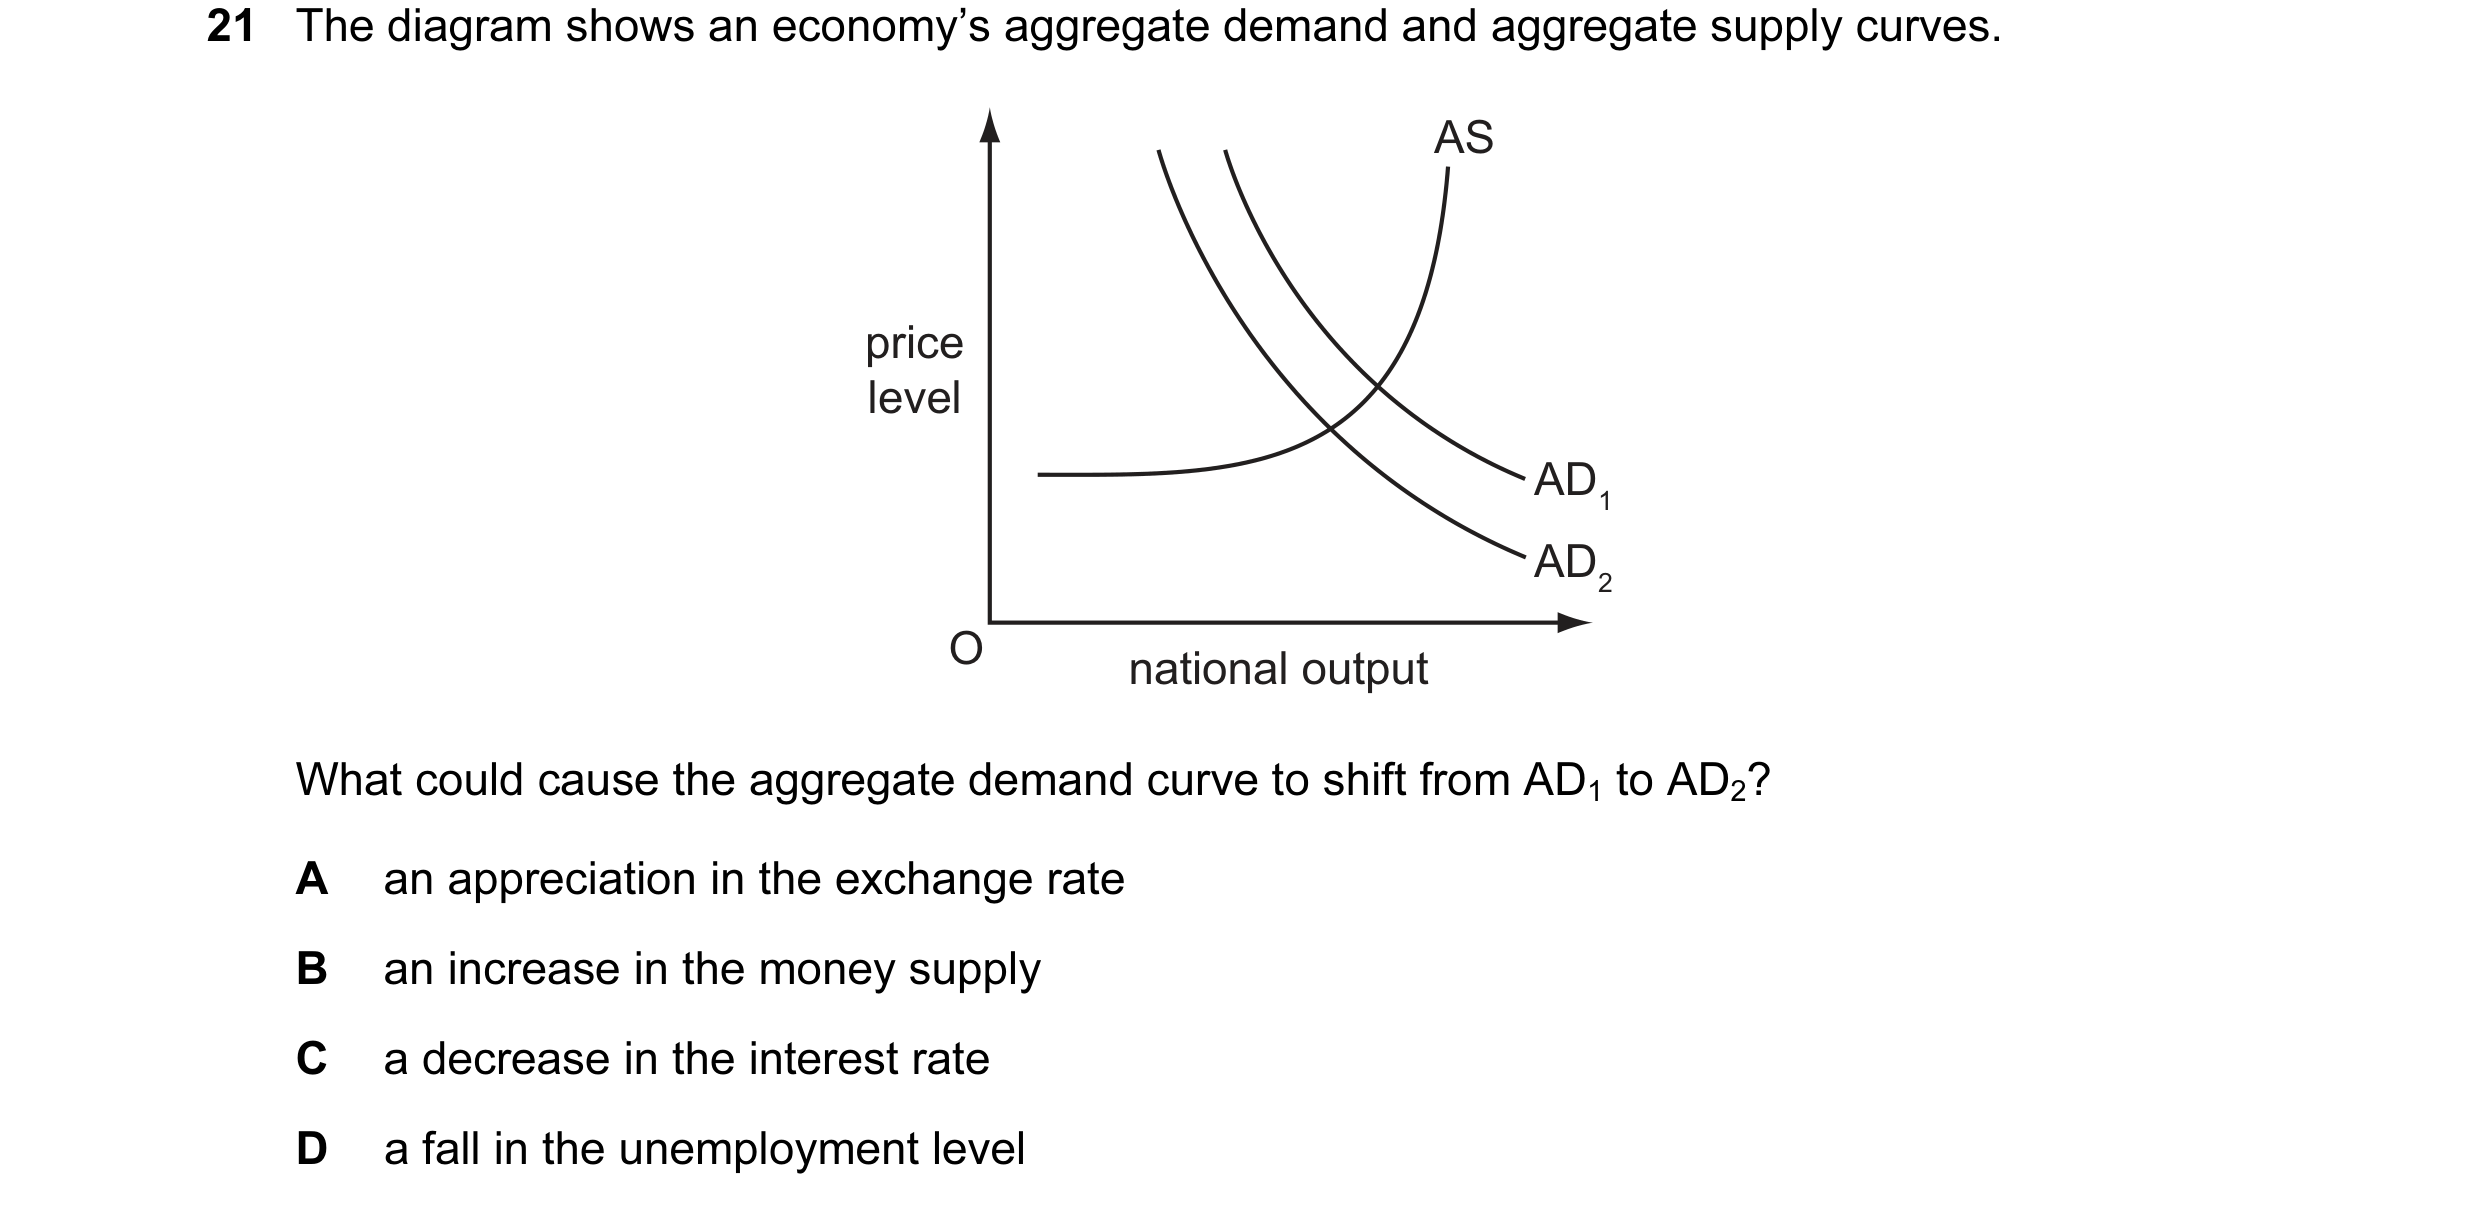
Q21 · The diagram shows an economy’s aggregate demand and aggregate supply curves 9708/32 Oct/Nov 2011
21 The diagram shows an economy’s aggregate demand and aggregate supply curves. AS price level AD1 AD2 O national output What could cause the aggregate demand curve to shift from AD1 to AD2? A an appreciation in the exchange rate B an increase in the money supply C a decrease in the interest rate D a fall in the unemployment level
1 marks
Answer: A
This question in 9708/32 Oct/Nov 2011
Q22 · According to Keynesian analysis, what will be the result of a decrease in the money… 9708/32 Oct/Nov 2011
22 According to Keynesian analysis, what will be the result of a decrease in the money supply? A The rate of interest will be reduced, thereby reducing the levels of investment and income. B The rate of interest will be increased, thereby reducing the levels of investment and income. C The level of income will be increased as a result of a lower rate of interest and a higher level of investment. D The price level will fall by the same percentage change as the decrease in the money supply.
1 marks
Answer: B
This question in 9708/32 Oct/Nov 2011
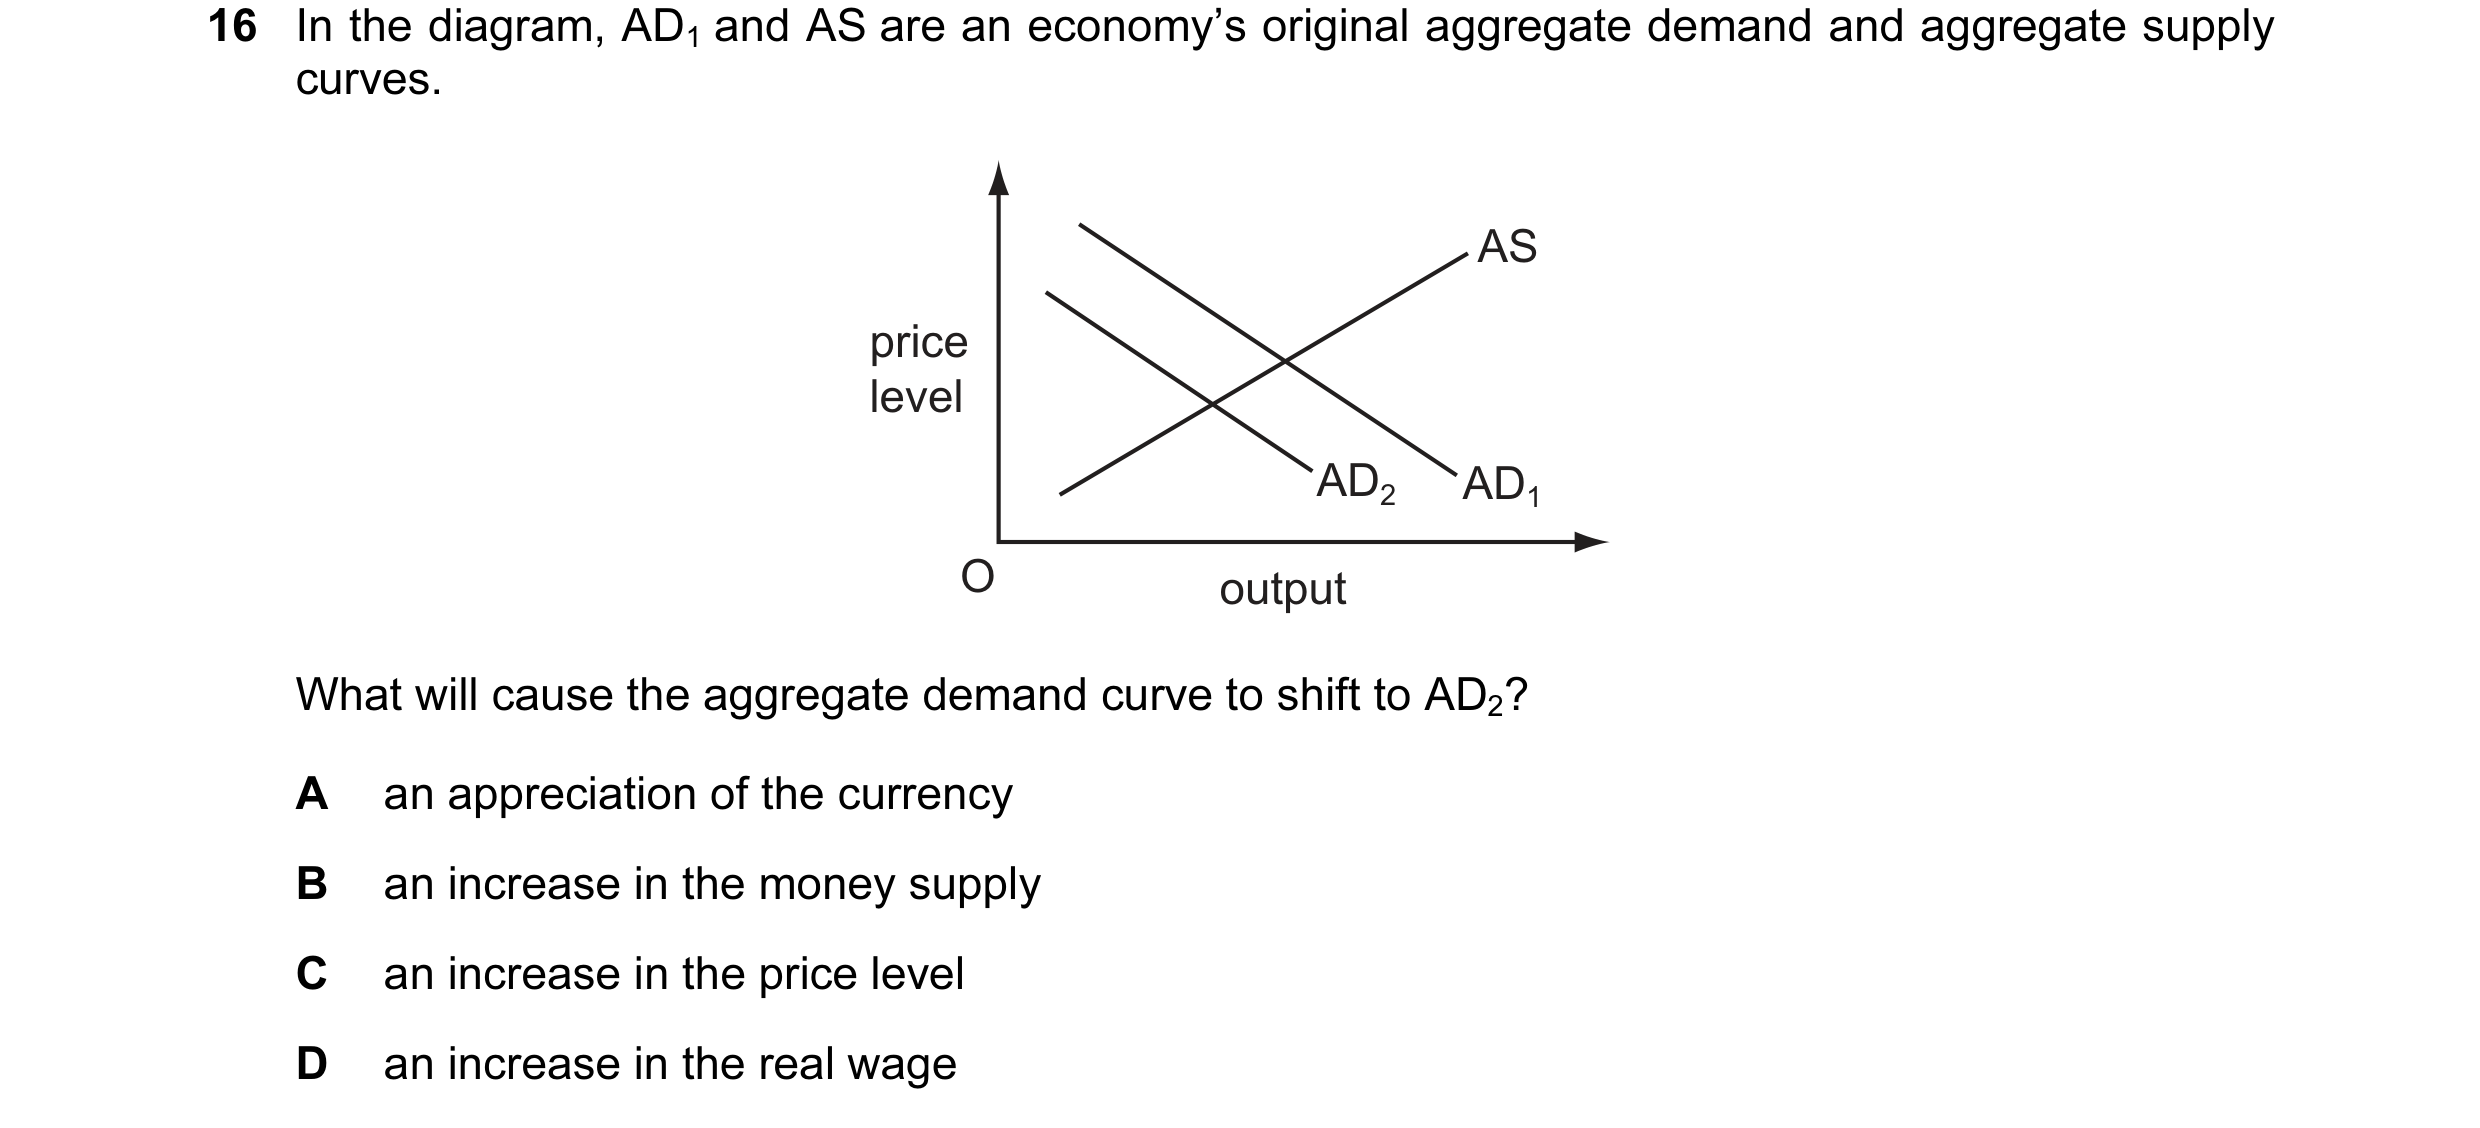
Q23 · In the diagram, AD1 and AS are an economy’s original aggregate demand and aggregate… 9708/33 Oct/Nov 2011
16 In the diagram, AD1 and AS are an economy’s original aggregate demand and aggregate supply curves. AS price level AD2 AD1 O output What will cause the aggregate demand curve to shift to AD2? A an appreciation of the currency B an increase in the money supply C an increase in the price level D an increase in the real wage
1 marks
Answer: A
This question in 9708/33 Oct/Nov 2011
Q24 · According to monetarist theory, what will be the short-run effect of an unexpected… 9708/31 May/June 2012
20 According to monetarist theory, what will be the short-run effect of an unexpected increase in the money supply? A an appreciation of the foreign exchange rate B an increase in output C an increase in real wages D an increase in the rate of interest
1 marks
Answer: B
This question in 9708/31 May/June 2012
Q25 · According to monetarist theory, what will be the short-run effect of an unexpected… 9708/32 May/June 2012
20 According to monetarist theory, what will be the short-run effect of an unexpected increase in the money supply? A an appreciation of the foreign exchange rate B an increase in output C an increase in real wages D an increase in the rate of interest
1 marks
Answer: B
This question in 9708/32 May/June 2012
Q26 · In a closed economy with no government, the level of investment is $5 million, the… 9708/32 Oct/Nov 2012
18 In a closed economy with no government, the level of investment is $5 million, the equilibrium level of income is $22 million, the full employment level of income is $25 million and there is a deflationary gap of $1 million. What can be deduced from this information? A The marginal propensity to consume is 3 2 . B The marginal propensity to consume is 3 1 . C The value of the investment multiplier is 5. D The value of the investment multiplier is 1.5.
1 marks
Answer: A
This question in 9708/32 Oct/Nov 2012
Q27 · Let C = consumption, I = investment, X = exports, M = imports, Y = national income in an… 9708/33 Oct/Nov 2012
20 Let C = consumption, I = investment, X = exports, M = imports, Y = national income in an economy with no government sector. If C = 20 + 0.9Y, I = 60, X = 120 and M = 100, what will be the equilibrium level of Y? A 100 B 180 C 1000 D 2000
1 marks
This question in 9708/33 Oct/Nov 2012
Q28 · According to monetarist theory, what will be the short-run effect on the level of output… 9708/32 May/June 2013
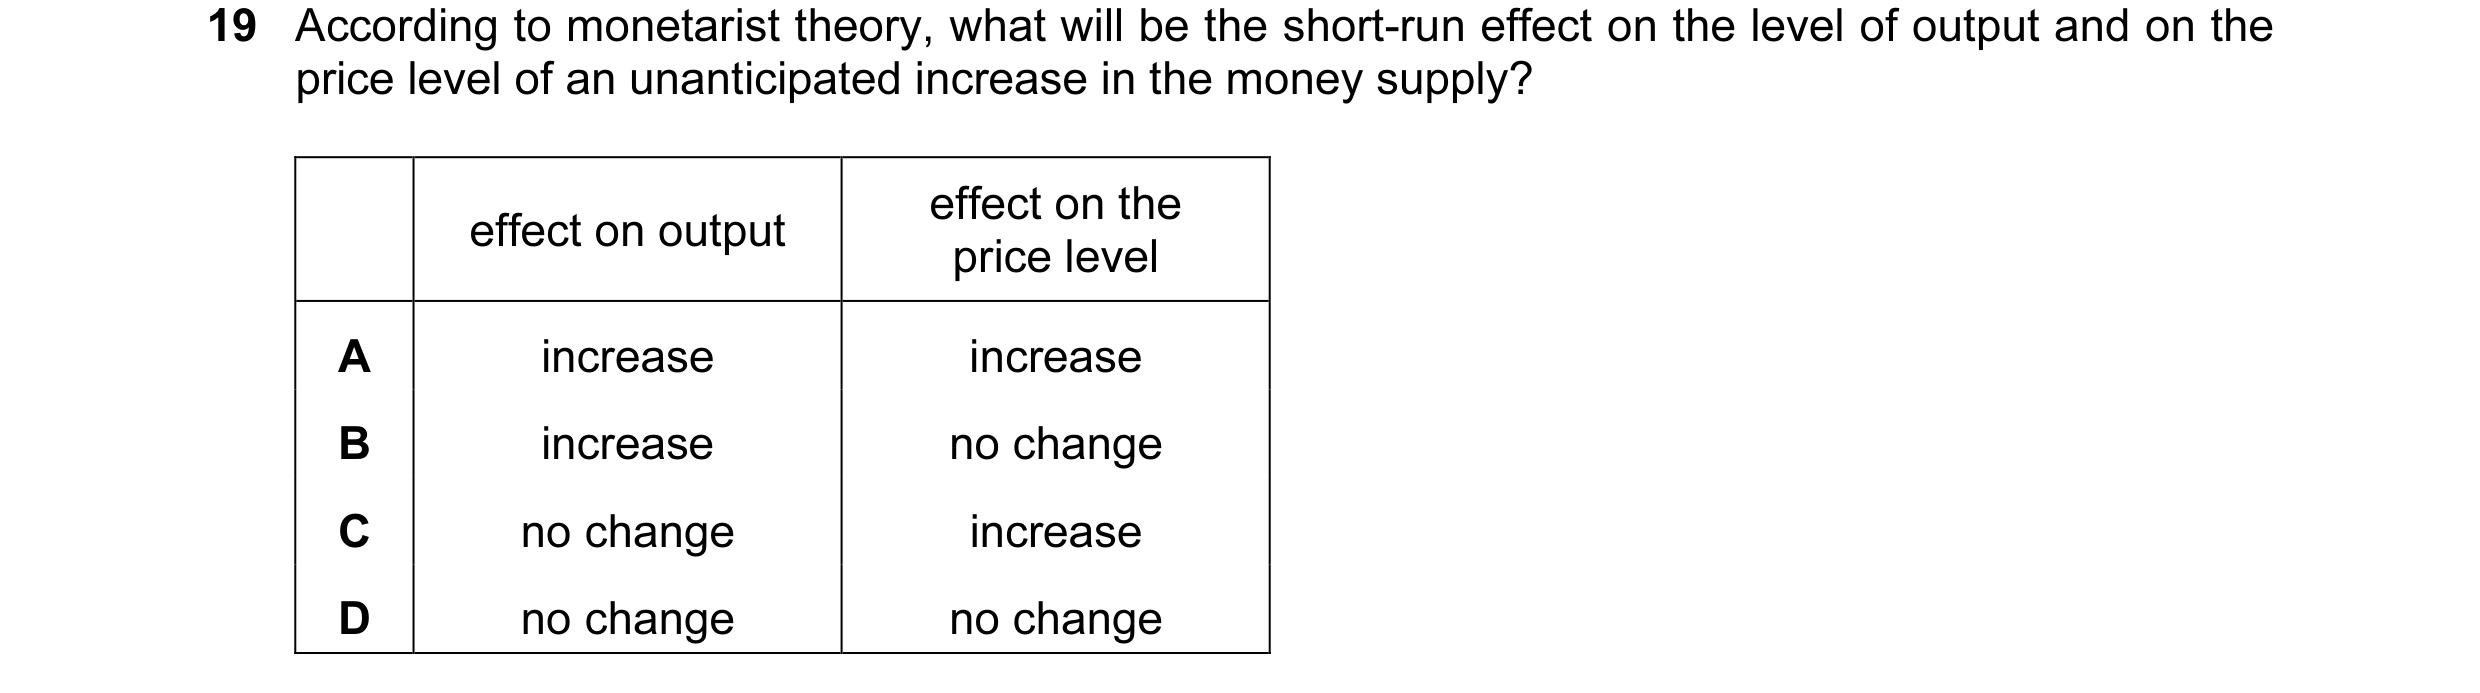
19 According to monetarist theory, what will be the short-run effect on the level of output and on the price level of an unanticipated increase in the money supply? effect on the effect on output price level A increase increase B increase no change C no change increase D no change no change
1 marks
Answer: A
This question in 9708/32 May/June 2013
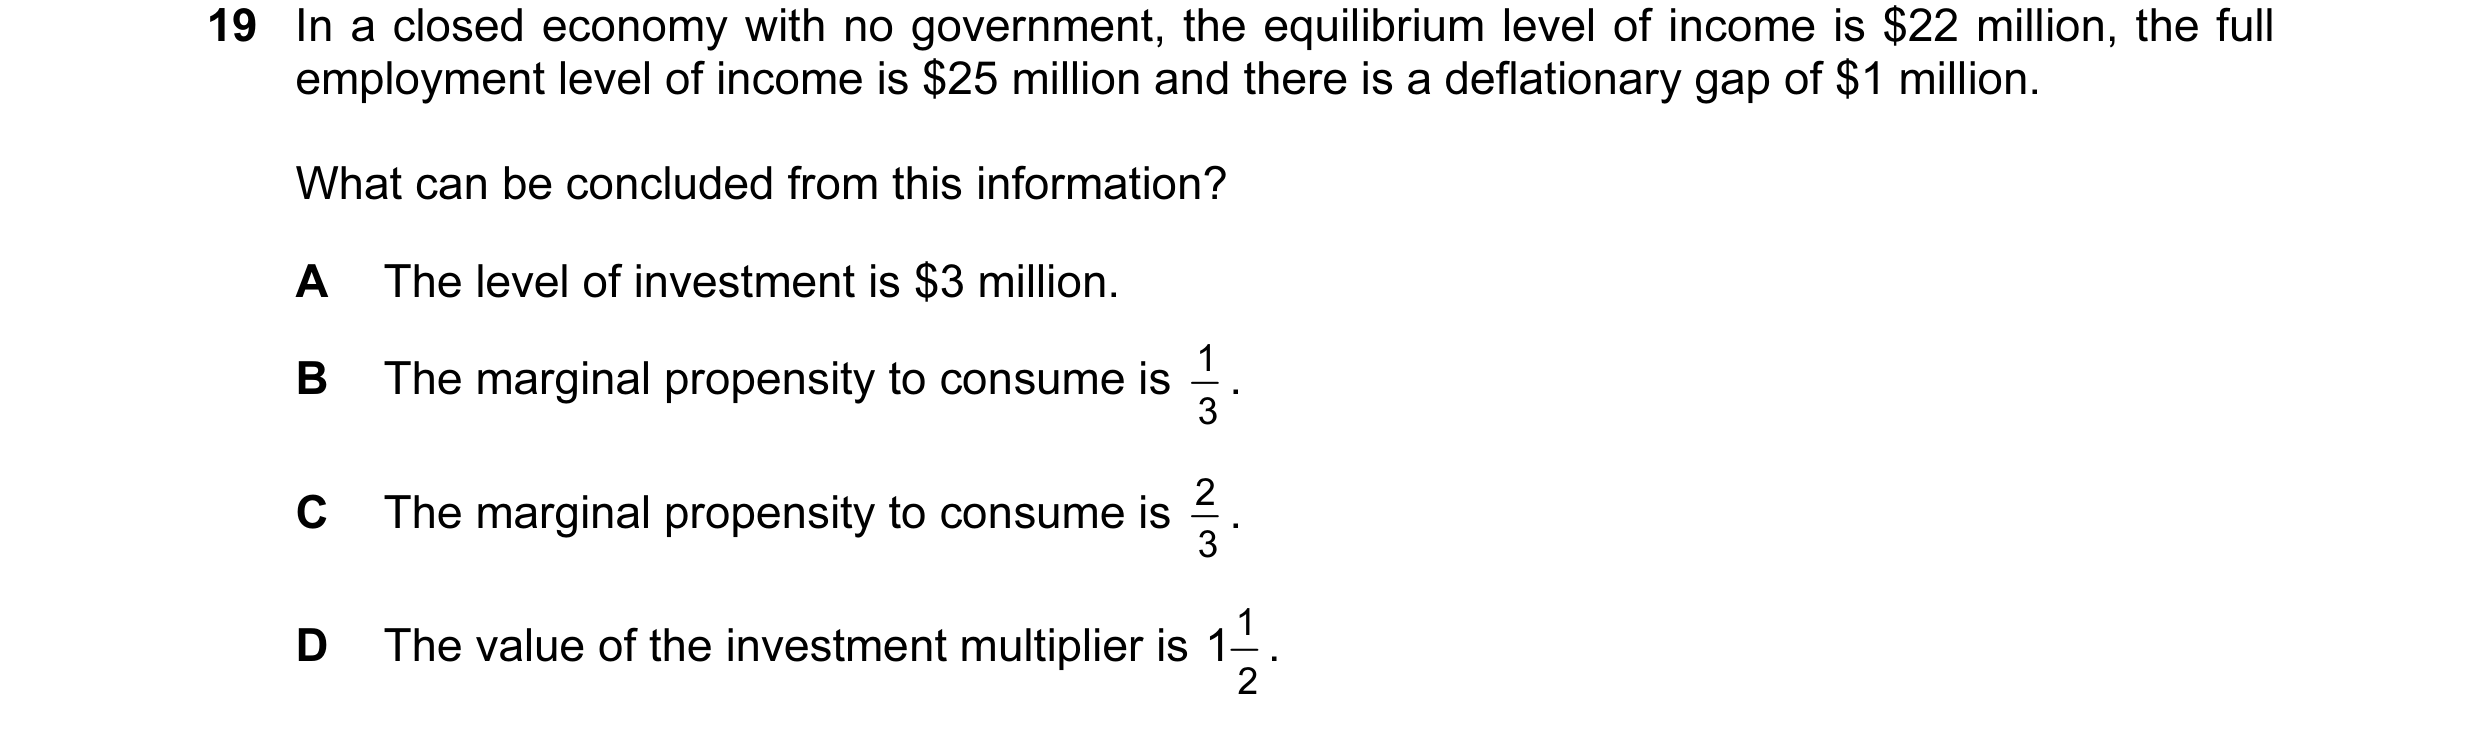
Q29 · In a closed economy with no government, the equilibrium level of income is $22 million… 9708/33 Oct/Nov 2015
19 In a closed economy with no government, the equilibrium level of income is $22 million, the full employment level of income is $25 million and there is a deflationary gap of $1 million. What can be concluded from this information? A The level of investment is $3 million. 1 . B The marginal propensity to consume is 3 2 . C The marginal propensity to consume is 3 D The value of the investment multiplier is 1 1 . 2
1 marks
Answer: C
This question in 9708/33 Oct/Nov 2015
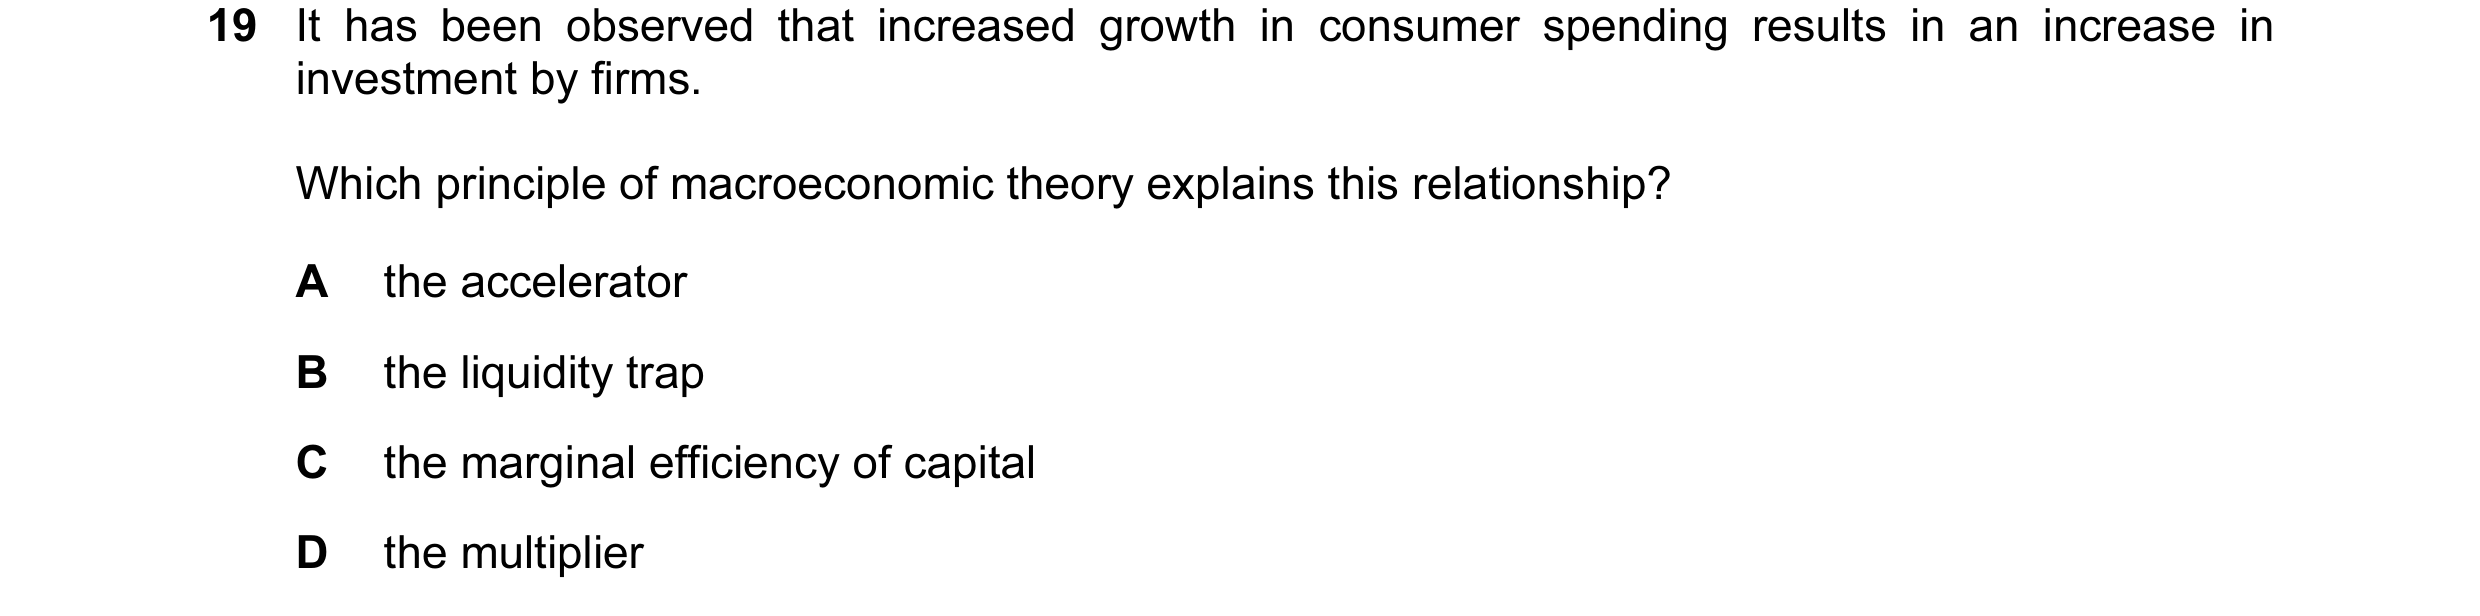
Q30 · It has been observed that increased growth in consumer spending results in an increase in… 9708/33 May/June 2017
19 It has been observed that increased growth in consumer spending results in an increase in investment by firms. Which principle of macroeconomic theory explains this relationship? A the accelerator B the liquidity trap C the marginal efficiency of capital D the multiplier
1 marks
Answer: A
This question in 9708/33 May/June 2017
Q31 · The diagram shows an economy in equilibrium at point X 9708/32 Oct/Nov 2018
28 The diagram shows an economy in equilibrium at point X. SRAS price level X Y AD O real GDP What would be most likely to cause the economy to move from point X to point Y? A an increase in government spending on transfer payments B an increase in income tax C an increase in the average wage rate D an increase in the productivity of labour
1 marks
Answer: D
This question in 9708/32 Oct/Nov 2018
Q32 · An increase in which of the following will cause a decrease in investment spending? 9708/32 May/June 2019
27 An increase in which of the following will cause a decrease in investment spending? A business confidence B company profits C interest rates D national income
1 marks
Answer: C
This question in 9708/32 May/June 2019
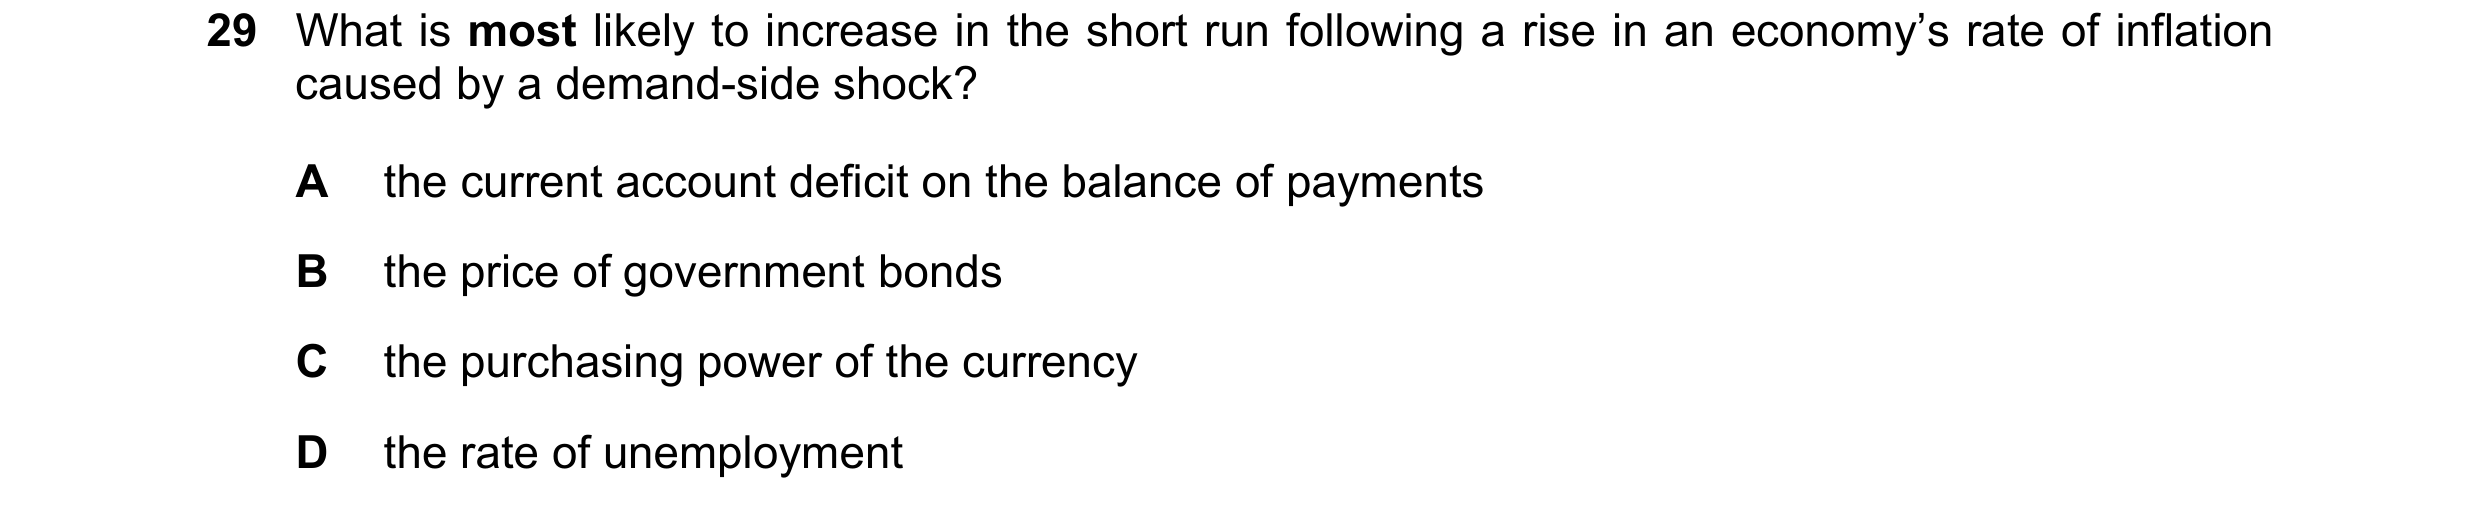
Q33 · What is most likely to increase in the short run following a rise in an economy’s rate of… 9708/32 May/June 2019
29 What is most likely to increase in the short run following a rise in an economy’s rate of inflation caused by a demand-side shock? A the current account deficit on the balance of payments B the price of government bonds C the purchasing power of the currency D the rate of unemployment
1 marks
Answer: A
This question in 9708/32 May/June 2019
Q34 · In the diagram, OP is the equilibrium level of income and OQ the full employment level of… 9708/32 Oct/Nov 2019
21 In the diagram, OP is the equilibrium level of income and OQ the full employment level of income in a closed economy. expenditure V U C + I + G T C + I R C 45° O P Q income What is the deflationary gap? A PQ B RV C TV D UV
1 marks
Answer: D
This question in 9708/32 Oct/Nov 2019
Q35 · What may prevent a government achieving a faster rate of growth of real GDP? 9708/32 Feb/March 2020
30 What may prevent a government achieving a faster rate of growth of real GDP? A Consumption and investment expenditure are interest rate elastic. B The consumer price index is below its target set by the central bank. C The economy is operating on the long-run aggregate supply curve. D There is a large negative output gap in the economy.
1 marks
Answer: C
This question in 9708/32 Feb/March 2020
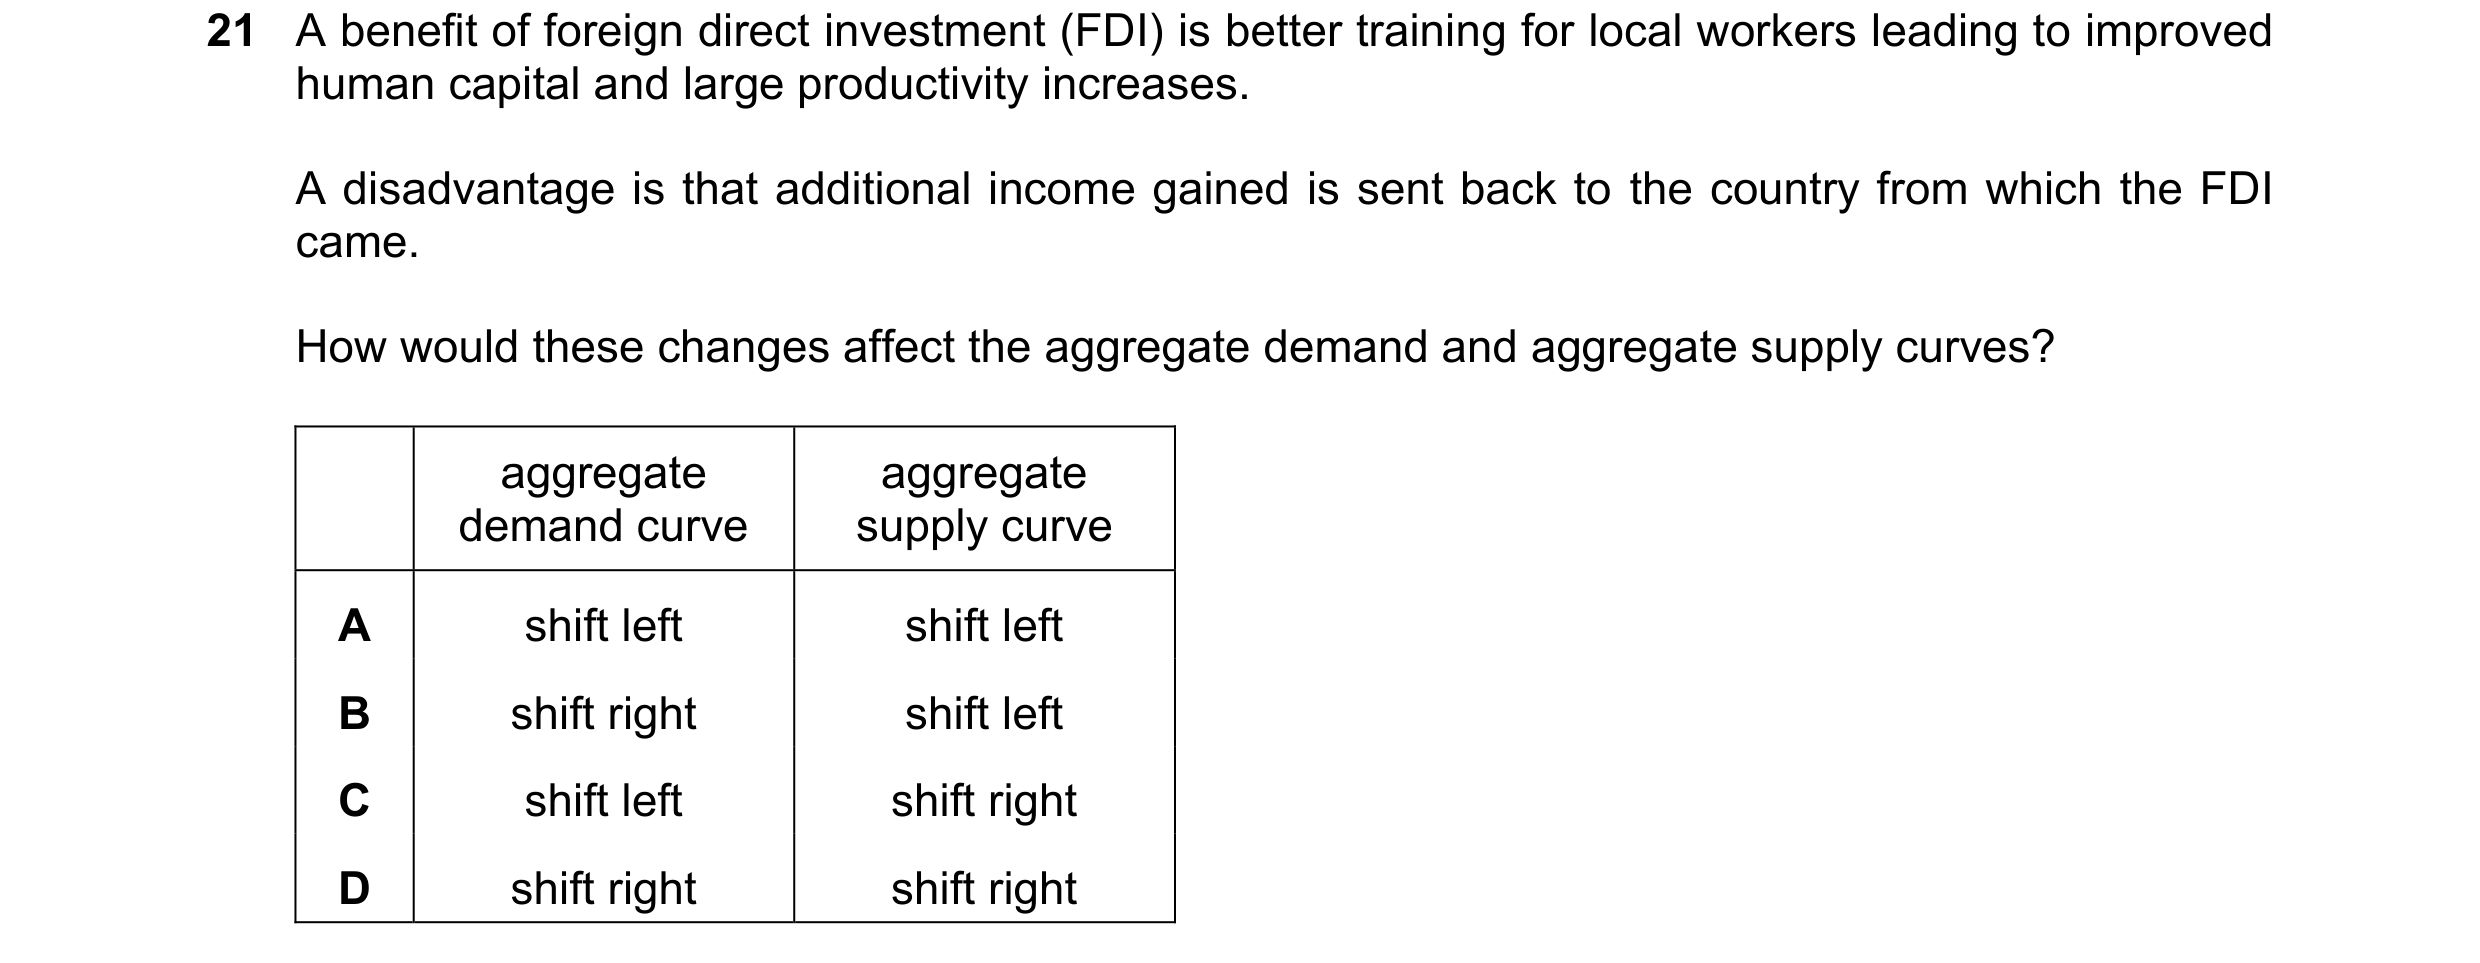
Q36 · A benefit of foreign direct investment (FDI) is better training for local workers leading… 9708/33 Oct/Nov 2020
21 A benefit of foreign direct investment (FDI) is better training for local workers leading to improved human capital and large productivity increases. A disadvantage is that additional income gained is sent back to the country from which the FDI came. How would these changes affect the aggregate demand and aggregate supply curves? aggregate aggregate demand curve supply curve A shift left shift left B shift right shift left C shift left shift right D shift right shift right
1 marks
Answer: C
This question in 9708/33 Oct/Nov 2020
Q37 · The table shows national income statistics for an economy 9708/33 Oct/Nov 2020
25 The table shows national income statistics for an economy. US dollars item ($) billion income from wages 300 consumption expenditure 400 investment expenditure 200 government expenditure 400 value of exports 300 value of imports 400 What is the value of aggregate demand, in billions of dollars? A 900 B 1200 C 1300 D 2000
1 marks
Answer: A
This question in 9708/33 Oct/Nov 2020
Q38 · What is assumed by Keynesians? 9708/32 Feb/March 2021
26 What is assumed by Keynesians? A An increase in supply always creates an equal increase in demand. B Government intervention is required to manage the economy. C Prices always adjust so that markets clear. D The economy always has full employment.
1 marks
Answer: B
This question in 9708/32 Feb/March 2021
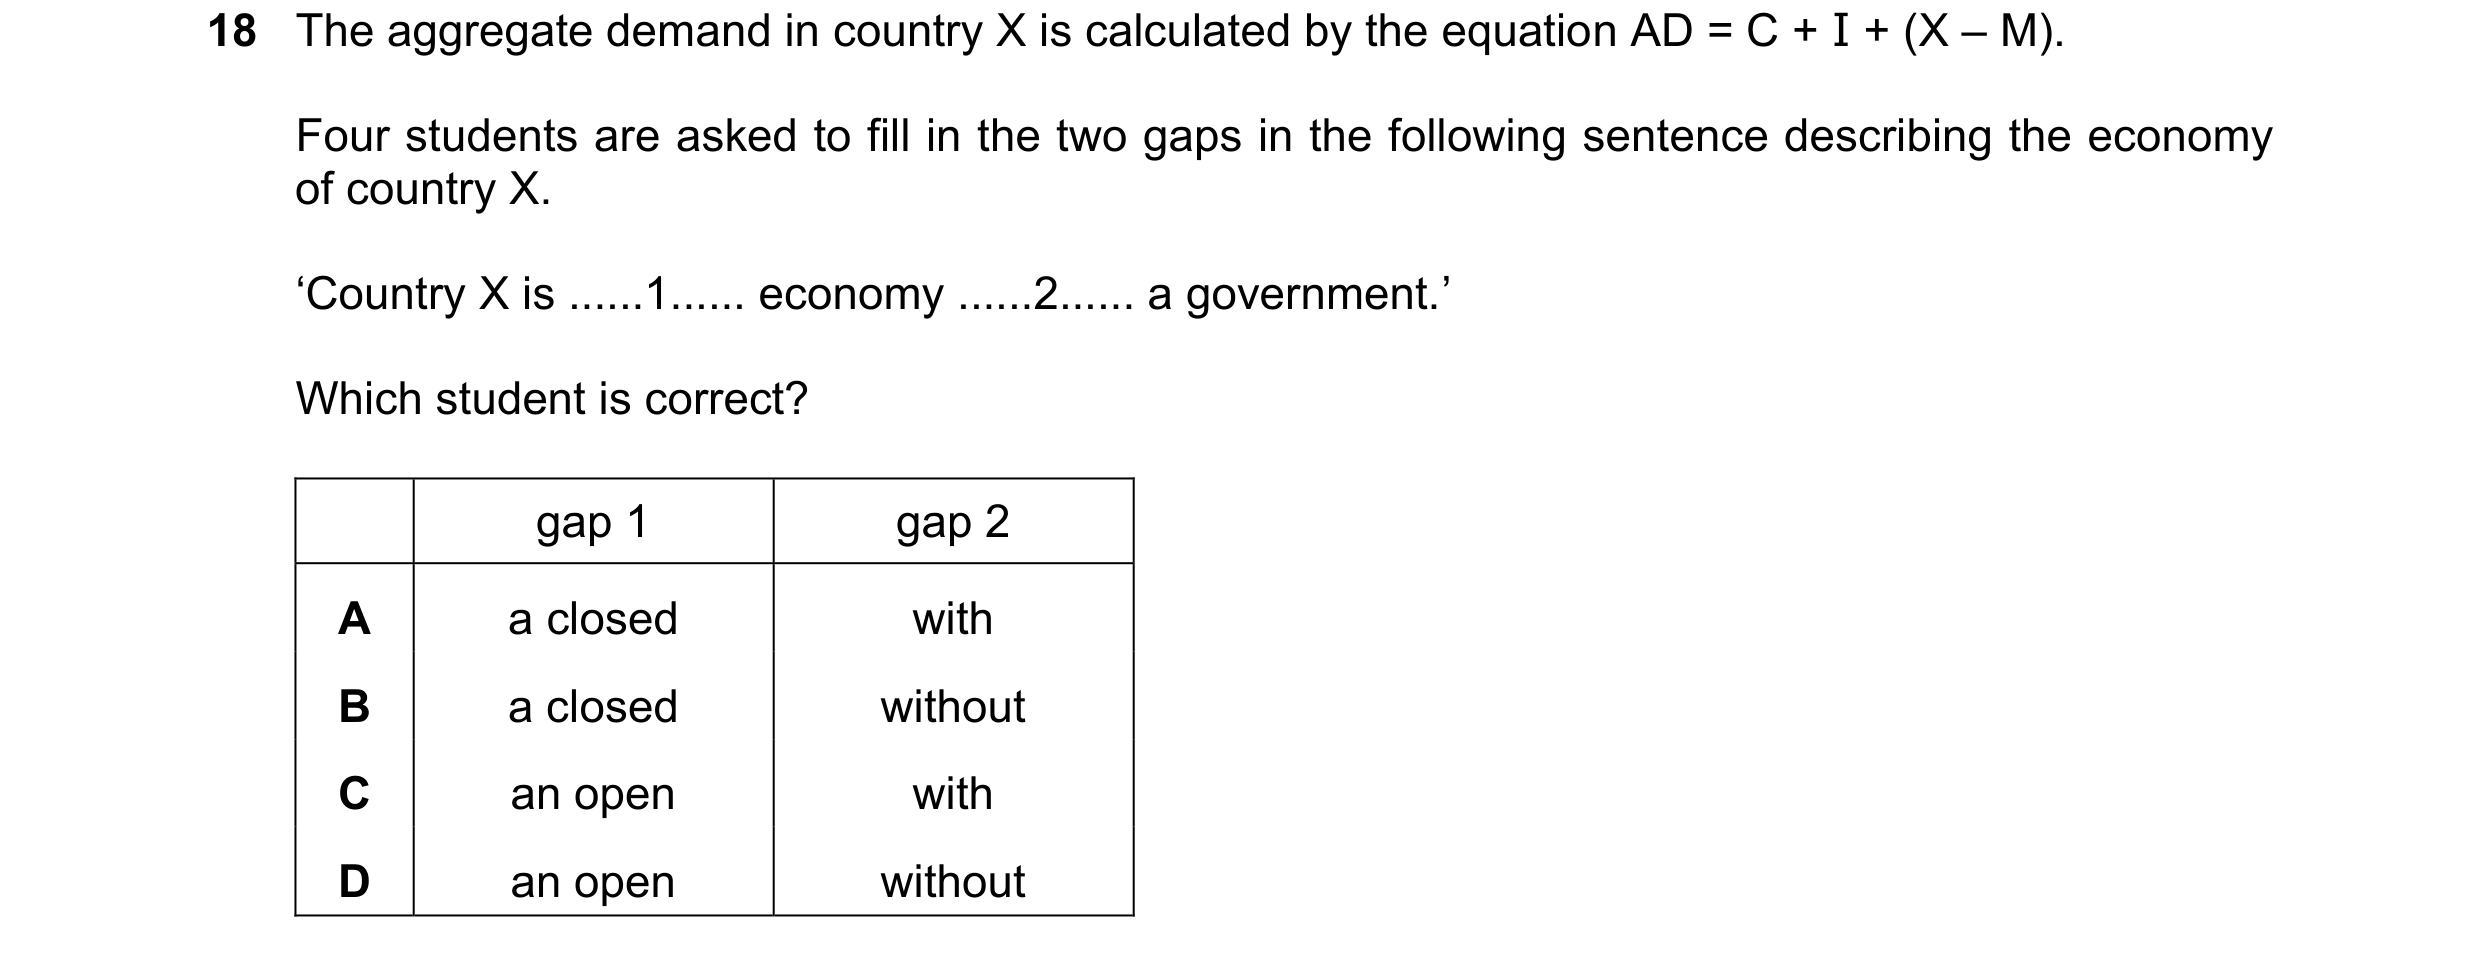
Q39 · The aggregate demand in country X is calculated by the equation AD = C + I + (X – M) 9708/31 Oct/Nov 2021
18 The aggregate demand in country X is calculated by the equation AD = C + I + (X – M). Four students are asked to fill in the two gaps in the following sentence describing the economy of country X. ‘Country X is … 1 … economy … 2 … a government.’ Which student is correct? gap 1 gap 2 A a closed with B a closed without C an open with D an open without
1 marks
Answer: D
This question in 9708/31 Oct/Nov 2021
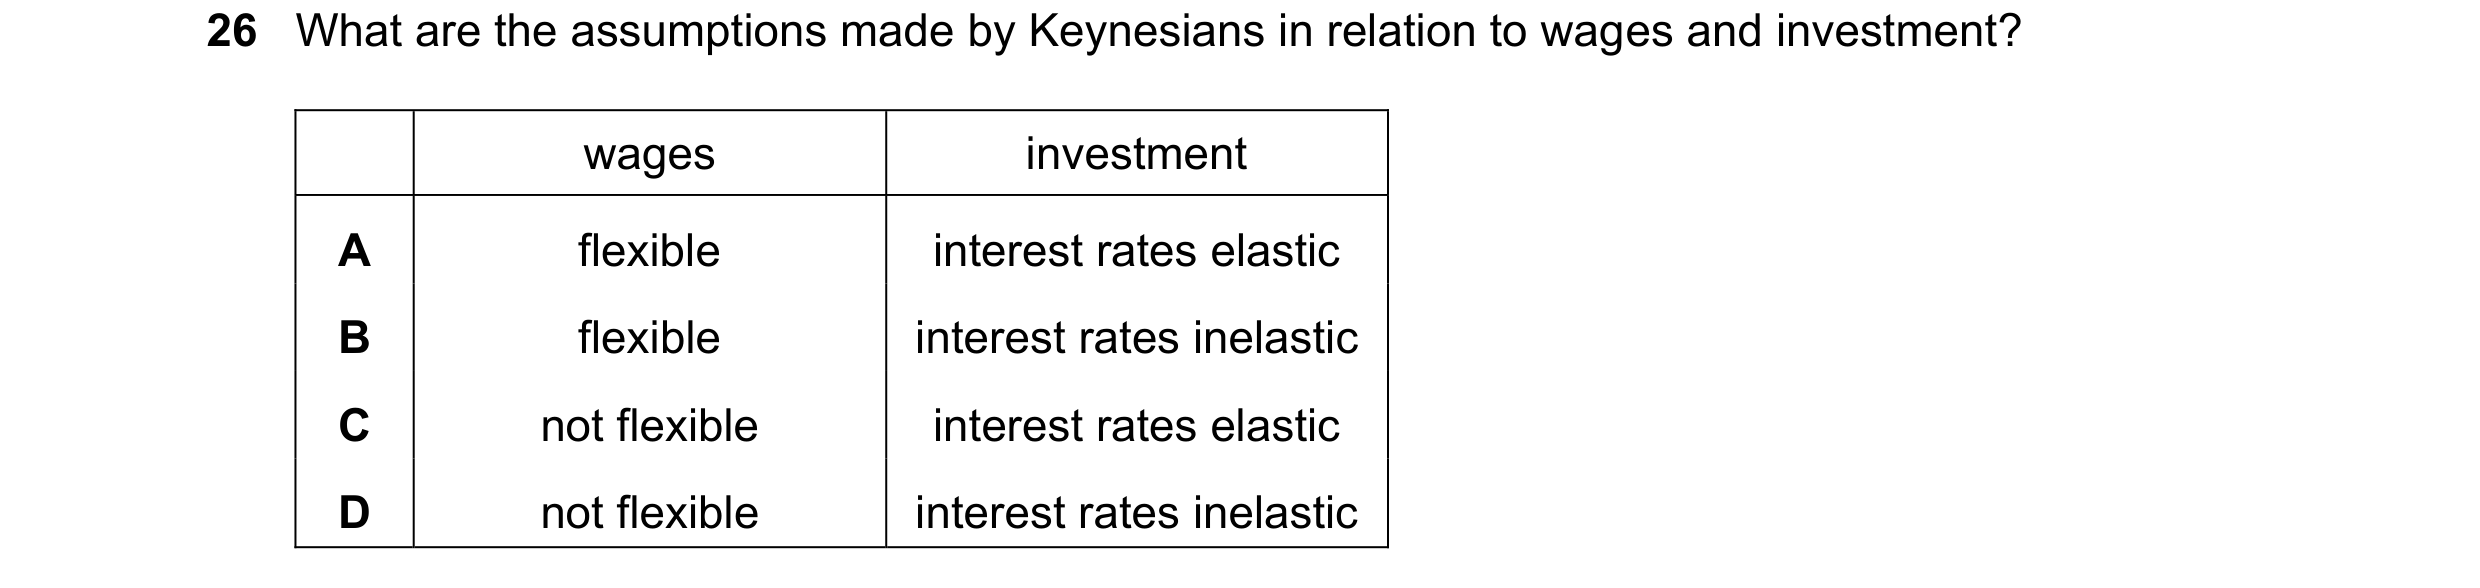
Q40 · What are the assumptions made by Keynesians in relation to wages and investment? 9708/31 Oct/Nov 2021
26 What are the assumptions made by Keynesians in relation to wages and investment? wages investment A flexible interest rates elastic B flexible interest rates inelastic C not flexible interest rates elastic D not flexible interest rates inelastic
1 marks
Answer: D
This question in 9708/31 Oct/Nov 2021
Q41 · In an economy operating below full employment, which combination of changes will… 9708/31 Oct/Nov 2021
30 In an economy operating below full employment, which combination of changes will definitely result in an increase in national income? A a fall in the rate of taxation together with a rise in the saving rate B a rise in government expenditure together with a fall in the propensity to import C a rise in investment expenditure together with a rise in the rate of taxation D a rise in the propensity to save together with a rise in exports
1 marks
Answer: B
This question in 9708/31 Oct/Nov 2021
Q42 · What is most likely to be found in an economy with a positive output gap? 9708/31 May/June 2022
24 What is most likely to be found in an economy with a positive output gap? A a higher potential than actual GDP B high unemployment C inflation D low labour costs
1 marks
Answer: C
This question in 9708/31 May/June 2022
Q43 · Which type of unemployment is associated with a deficiency in aggregate demand? 9708/33 May/June 2022
21 Which type of unemployment is associated with a deficiency in aggregate demand? A cyclical B frictional C structural D voluntary
1 marks
Answer: A
This question in 9708/33 May/June 2022
Q44 · What is most likely to be found in an economy with a positive output gap? 9708/33 May/June 2022
24 What is most likely to be found in an economy with a positive output gap? A a higher potential than actual GDP B high unemployment C inflation D low labour costs
1 marks
Answer: C
This question in 9708/33 May/June 2022
Q45 · What will decrease if an open economy experiences a positive output gap? 9708/31 Oct/Nov 2022
24 What will decrease if an open economy experiences a positive output gap? A general price level B import spending C spare capacity D wage rates
1 marks
Answer: C
This question in 9708/31 Oct/Nov 2022
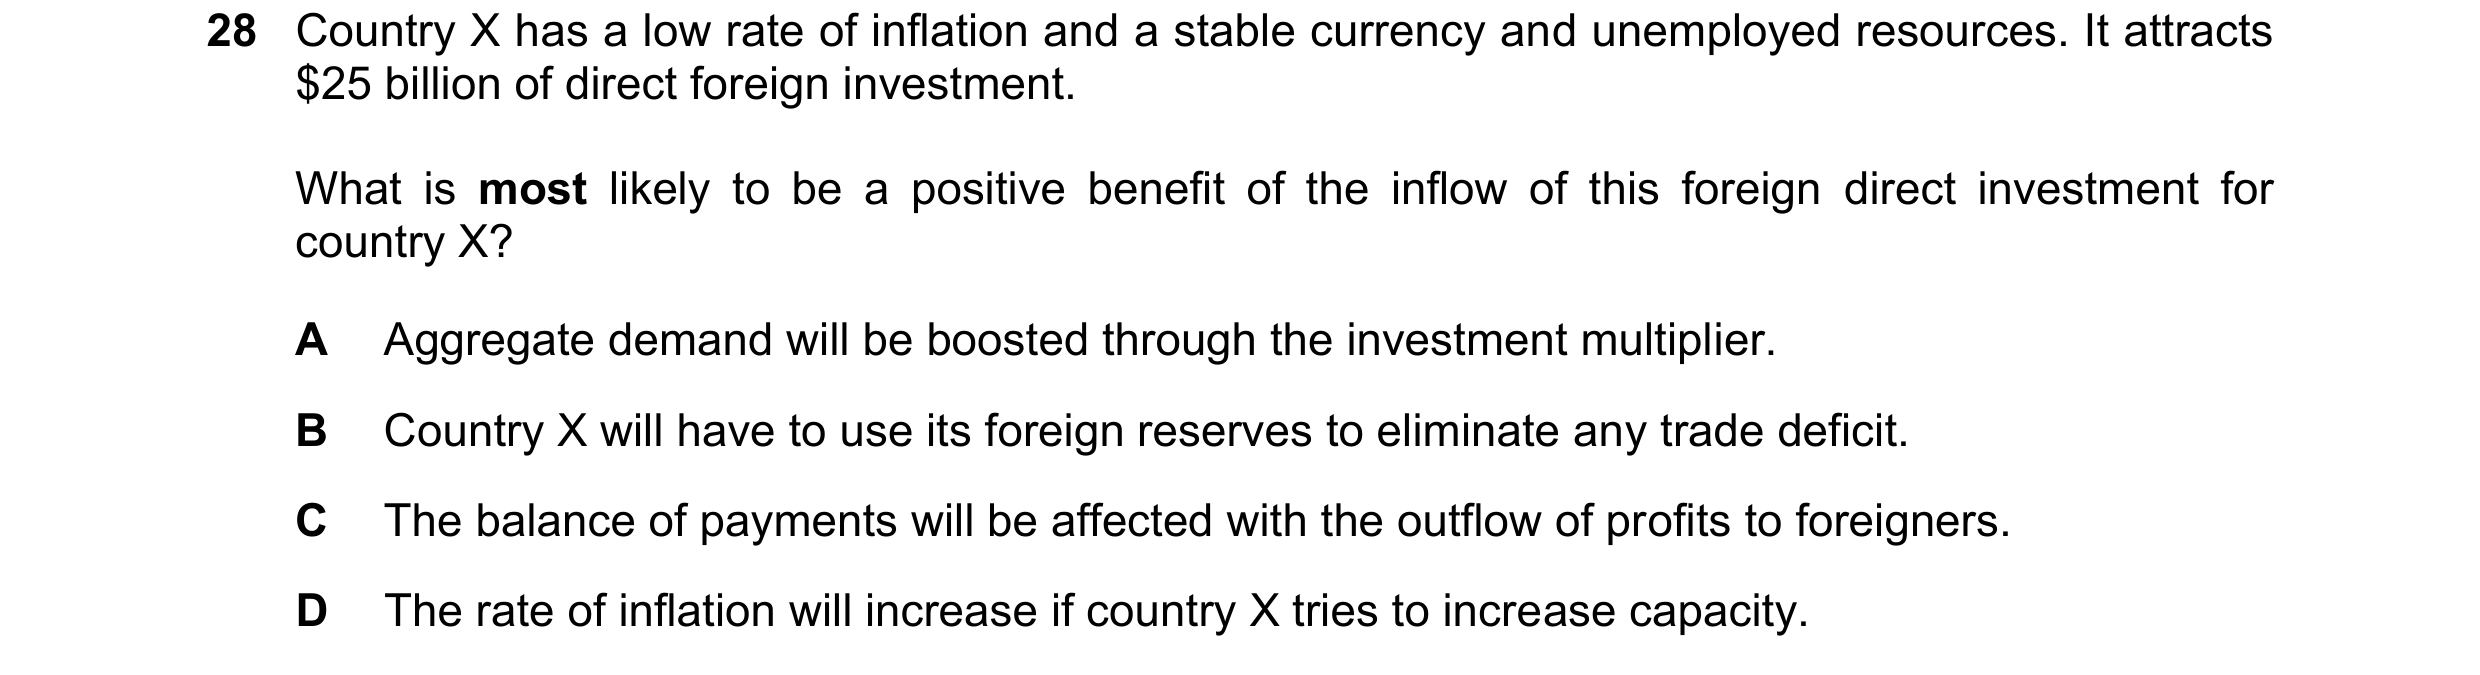
Q46 · Country X has a low rate of inflation and a stable currency and unemployed resources 9708/32 Oct/Nov 2022
28 Country X has a low rate of inflation and a stable currency and unemployed resources. It attracts $25 billion of direct foreign investment. What is most likely to be a positive benefit of the inflow of this foreign direct investment for country X? A Aggregate demand will be boosted through the investment multiplier. B Country X will have to use its foreign reserves to eliminate any trade deficit. C The balance of payments will be affected with the outflow of profits to foreigners. D The rate of inflation will increase if country X tries to increase capacity.
1 marks
Answer: A
This question in 9708/32 Oct/Nov 2022
Q47 · Four students are asked to complete a table showing the aggregate demand equation and the… 9708/33 Oct/Nov 2022
24 Four students are asked to complete a table showing the aggregate demand equation and the multiplier formula for a closed economy without a government. Which student is correct? aggregate demand multiplier 1 A C + I marginal propensity to consume 1 B C + I marginal propensity to save 1 C C + I – S marginal propensity to consume 1 D C + I – S marginal propensity to save
1 marks
Answer: B
This question in 9708/33 Oct/Nov 2022
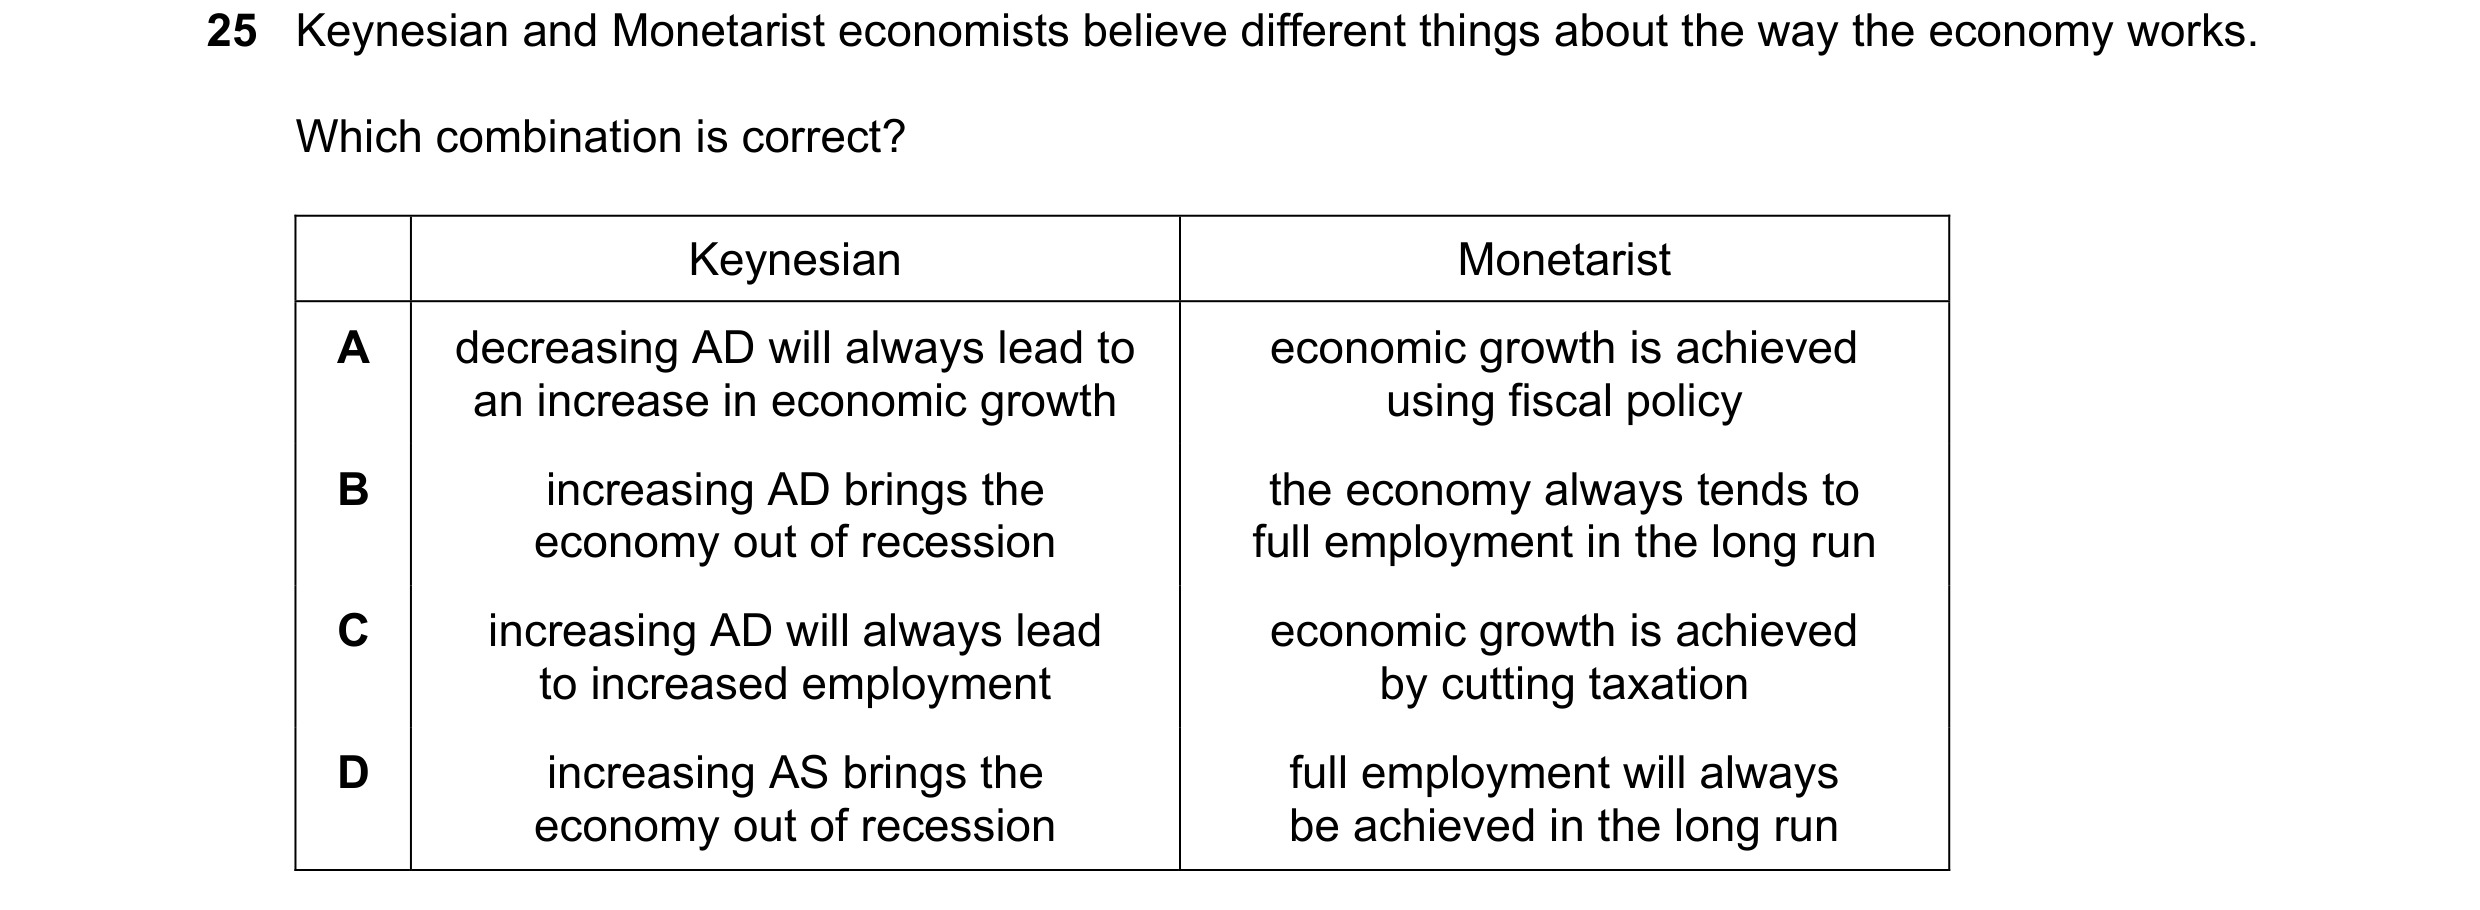
Q48 · Keynesian and Monetarist economists believe different things about the way the economy… 9708/33 Oct/Nov 2022
25 Keynesian and Monetarist economists believe different things about the way the economy works. Which combination is correct? Keynesian Monetarist A decreasing AD will always lead to economic growth is achieved an increase in economic growth using fiscal policy B increasing AD brings the the economy always tends to economy out of recession full employment in the long run C increasing AD will always lead economic growth is achieved to increased employment by cutting taxation D increasing AS brings the full employment will always economy out of recession be achieved in the long run
1 marks
Answer: B
This question in 9708/33 Oct/Nov 2022
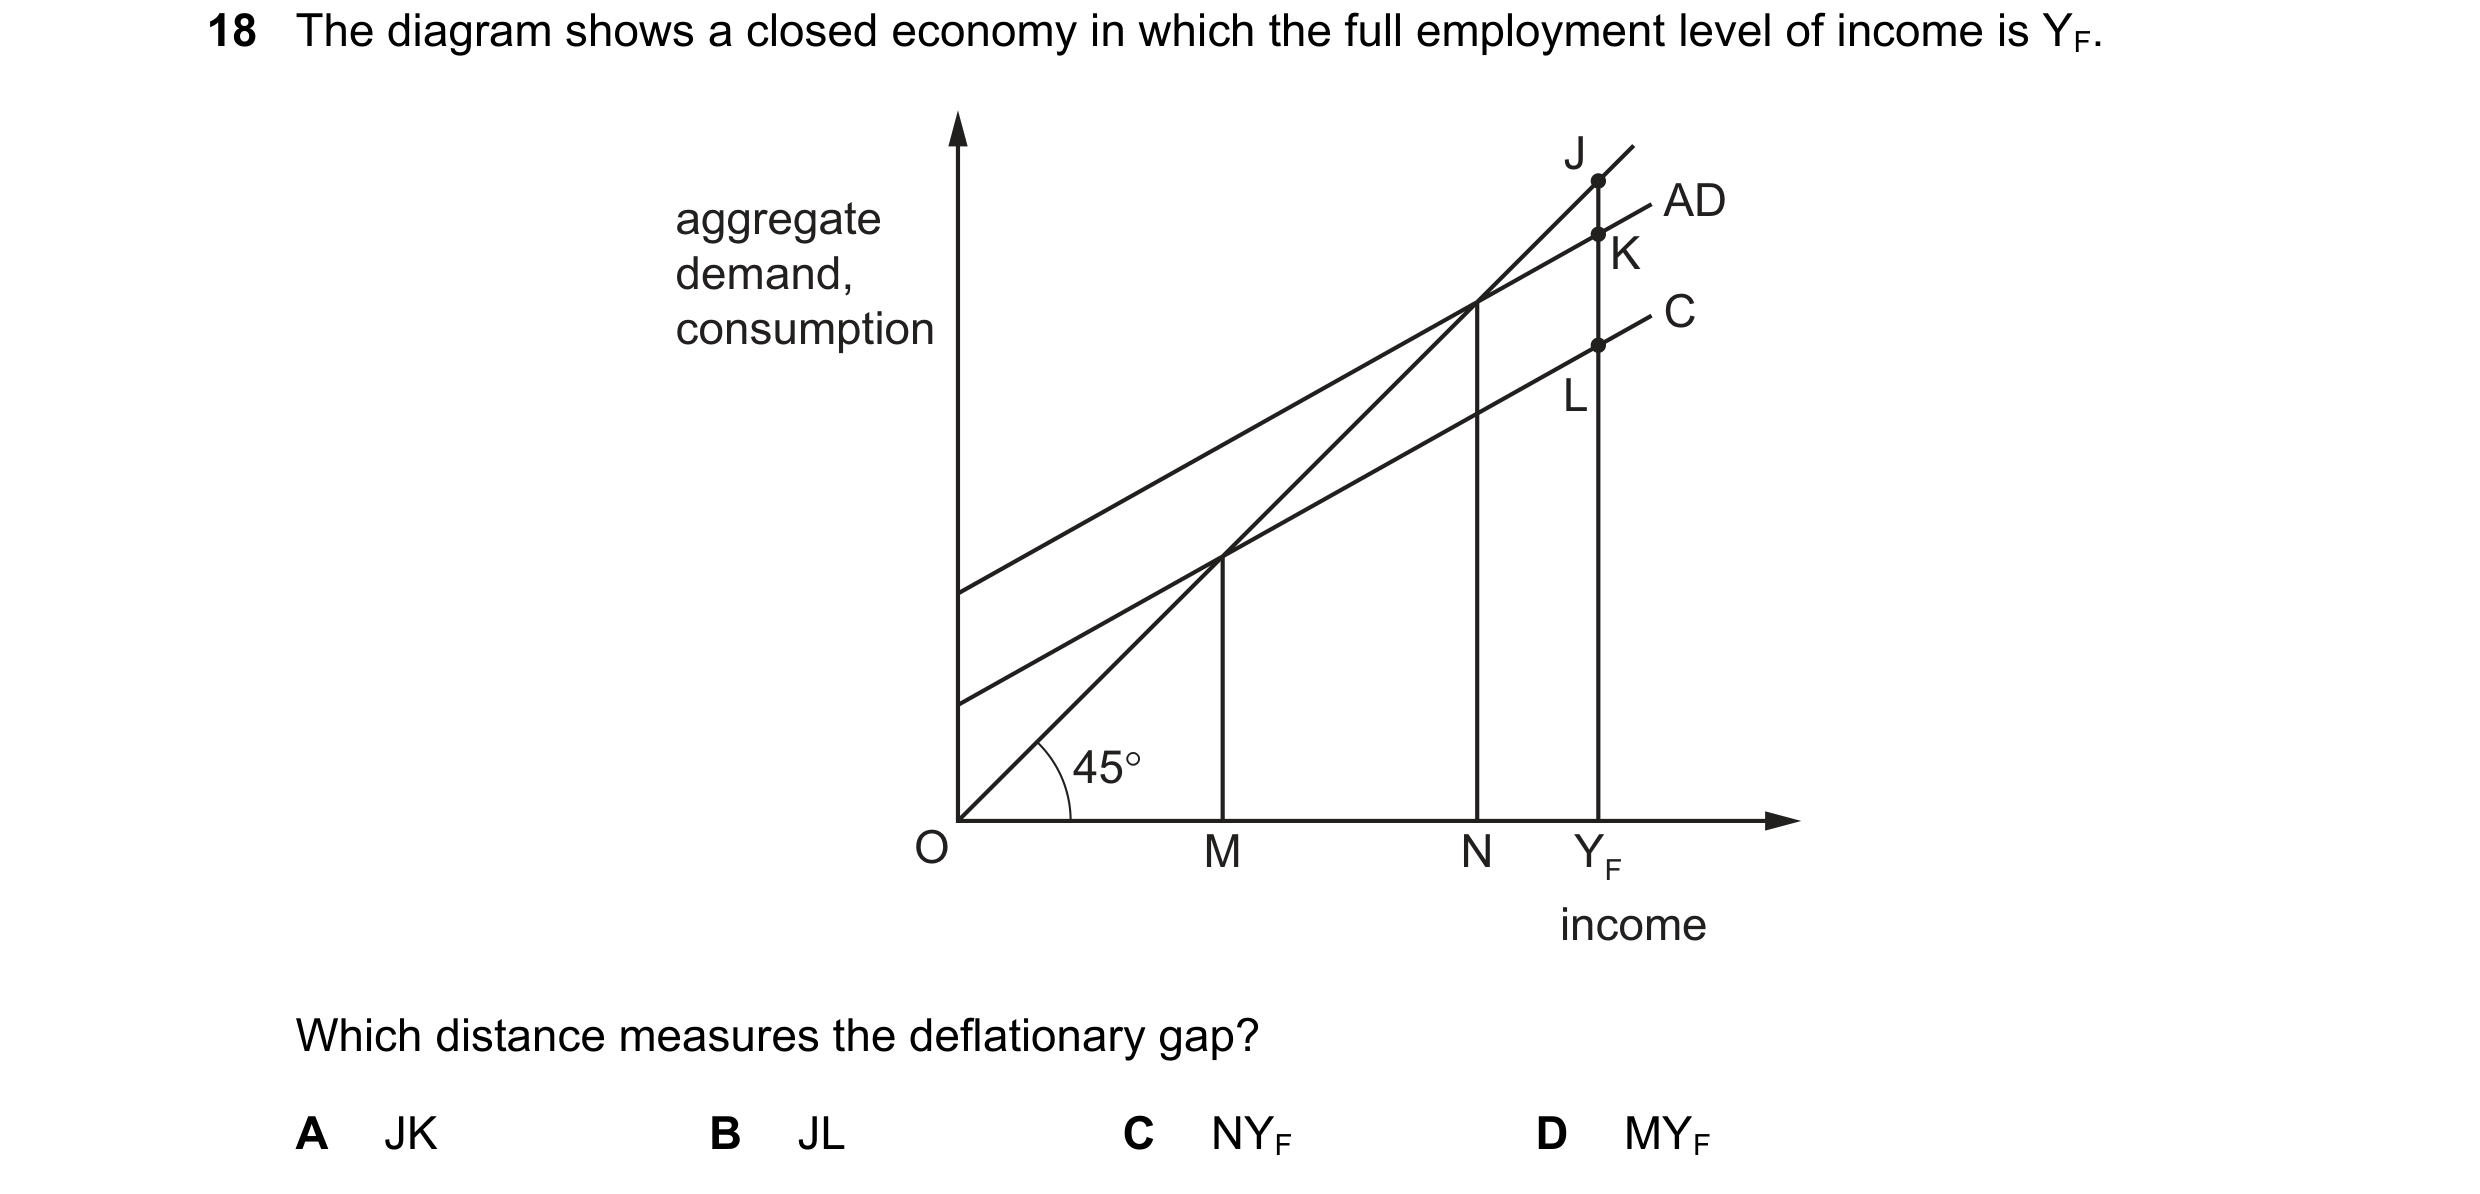
Q49 · The diagram shows a closed economy in which the full employment level of income is YF 9708/31 Oct/Nov 2023
18 The diagram shows a closed economy in which the full employment level of income is YF. J aggregate AD demand, K consumption C L 45° O M N YF income Which distance measures the deflationary gap? A JK B JL C NYF D MYF
1 marks
Answer: A
This question in 9708/31 Oct/Nov 2023
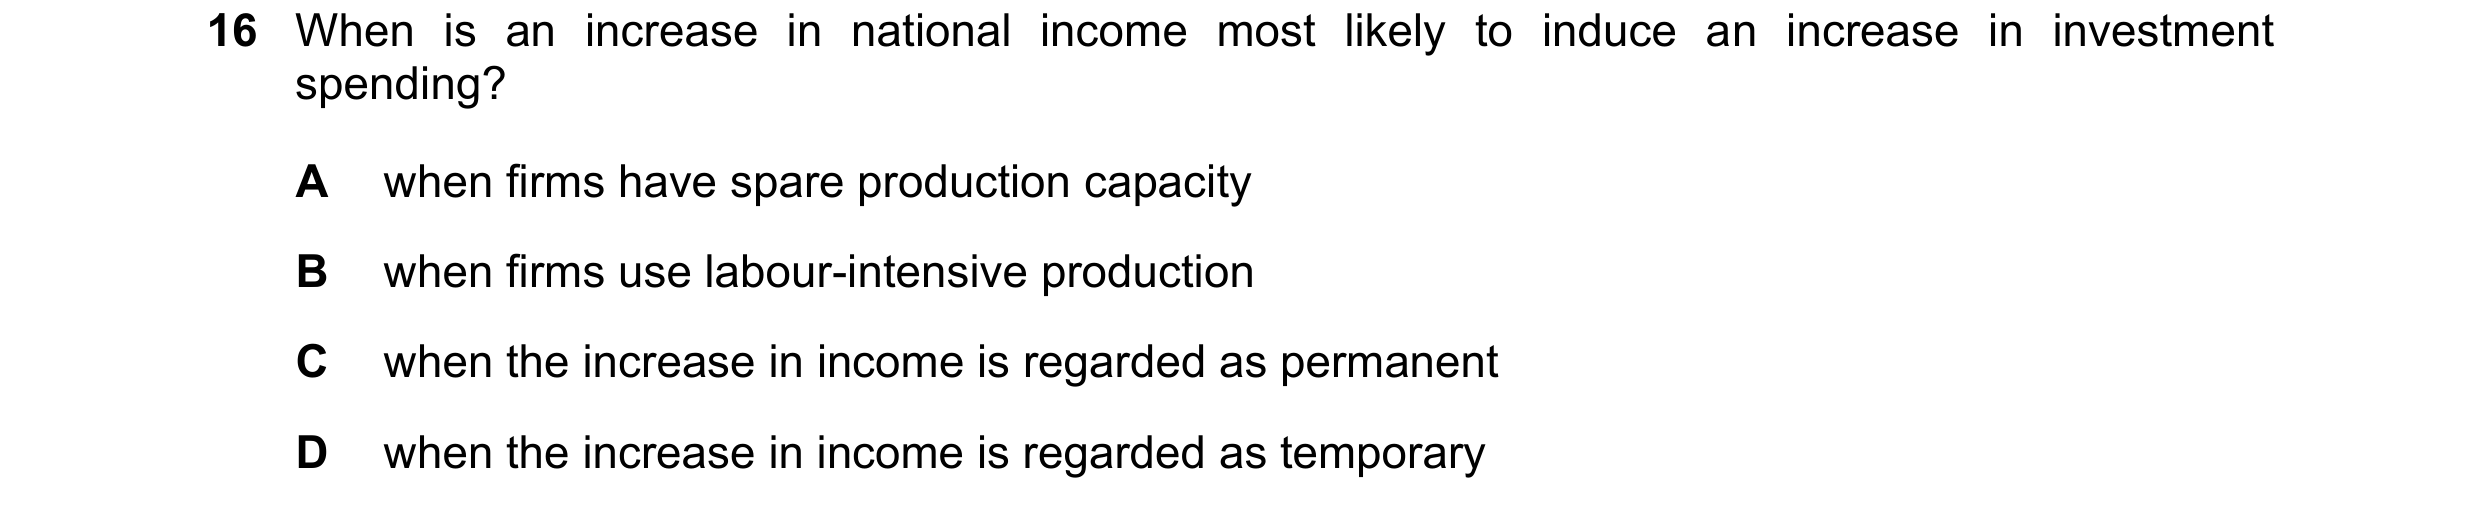
Q50 · When is an increase in national income most likely to induce an increase in investment… 9708/33 Oct/Nov 2023
16 When is an increase in national income most likely to induce an increase in investment spending? A when firms have spare production capacity B when firms use labour-intensive production C when the increase in income is regarded as permanent D when the increase in income is regarded as temporary
1 marks
Answer: C
This question in 9708/33 Oct/Nov 2023
 1 / 16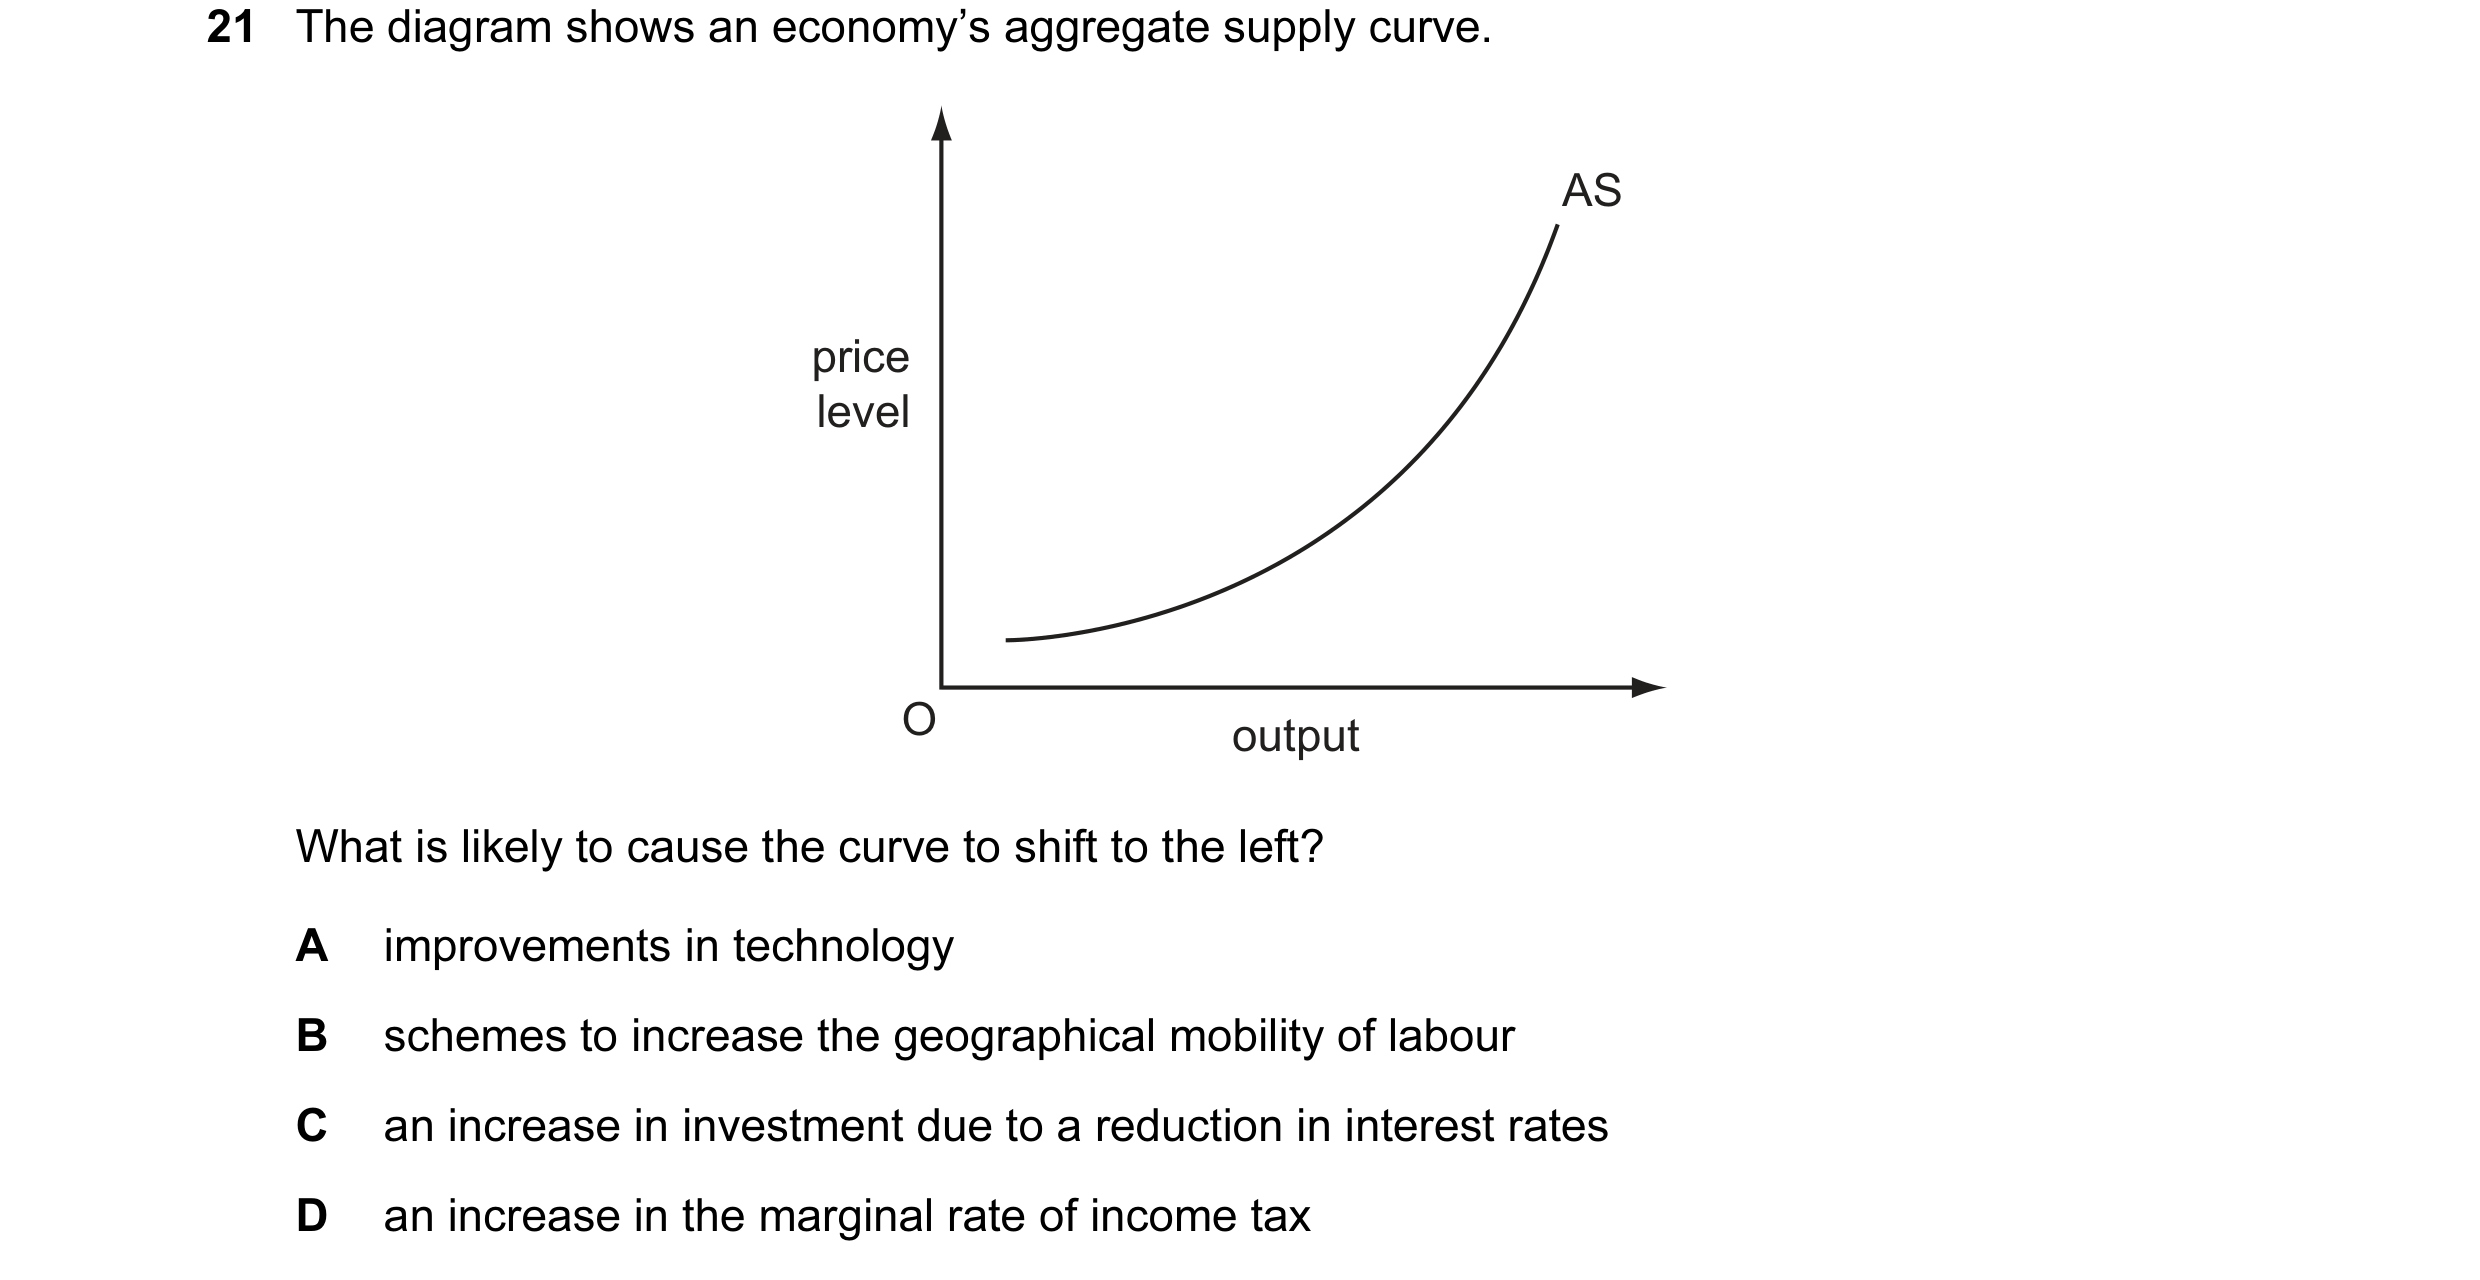
 2 / 16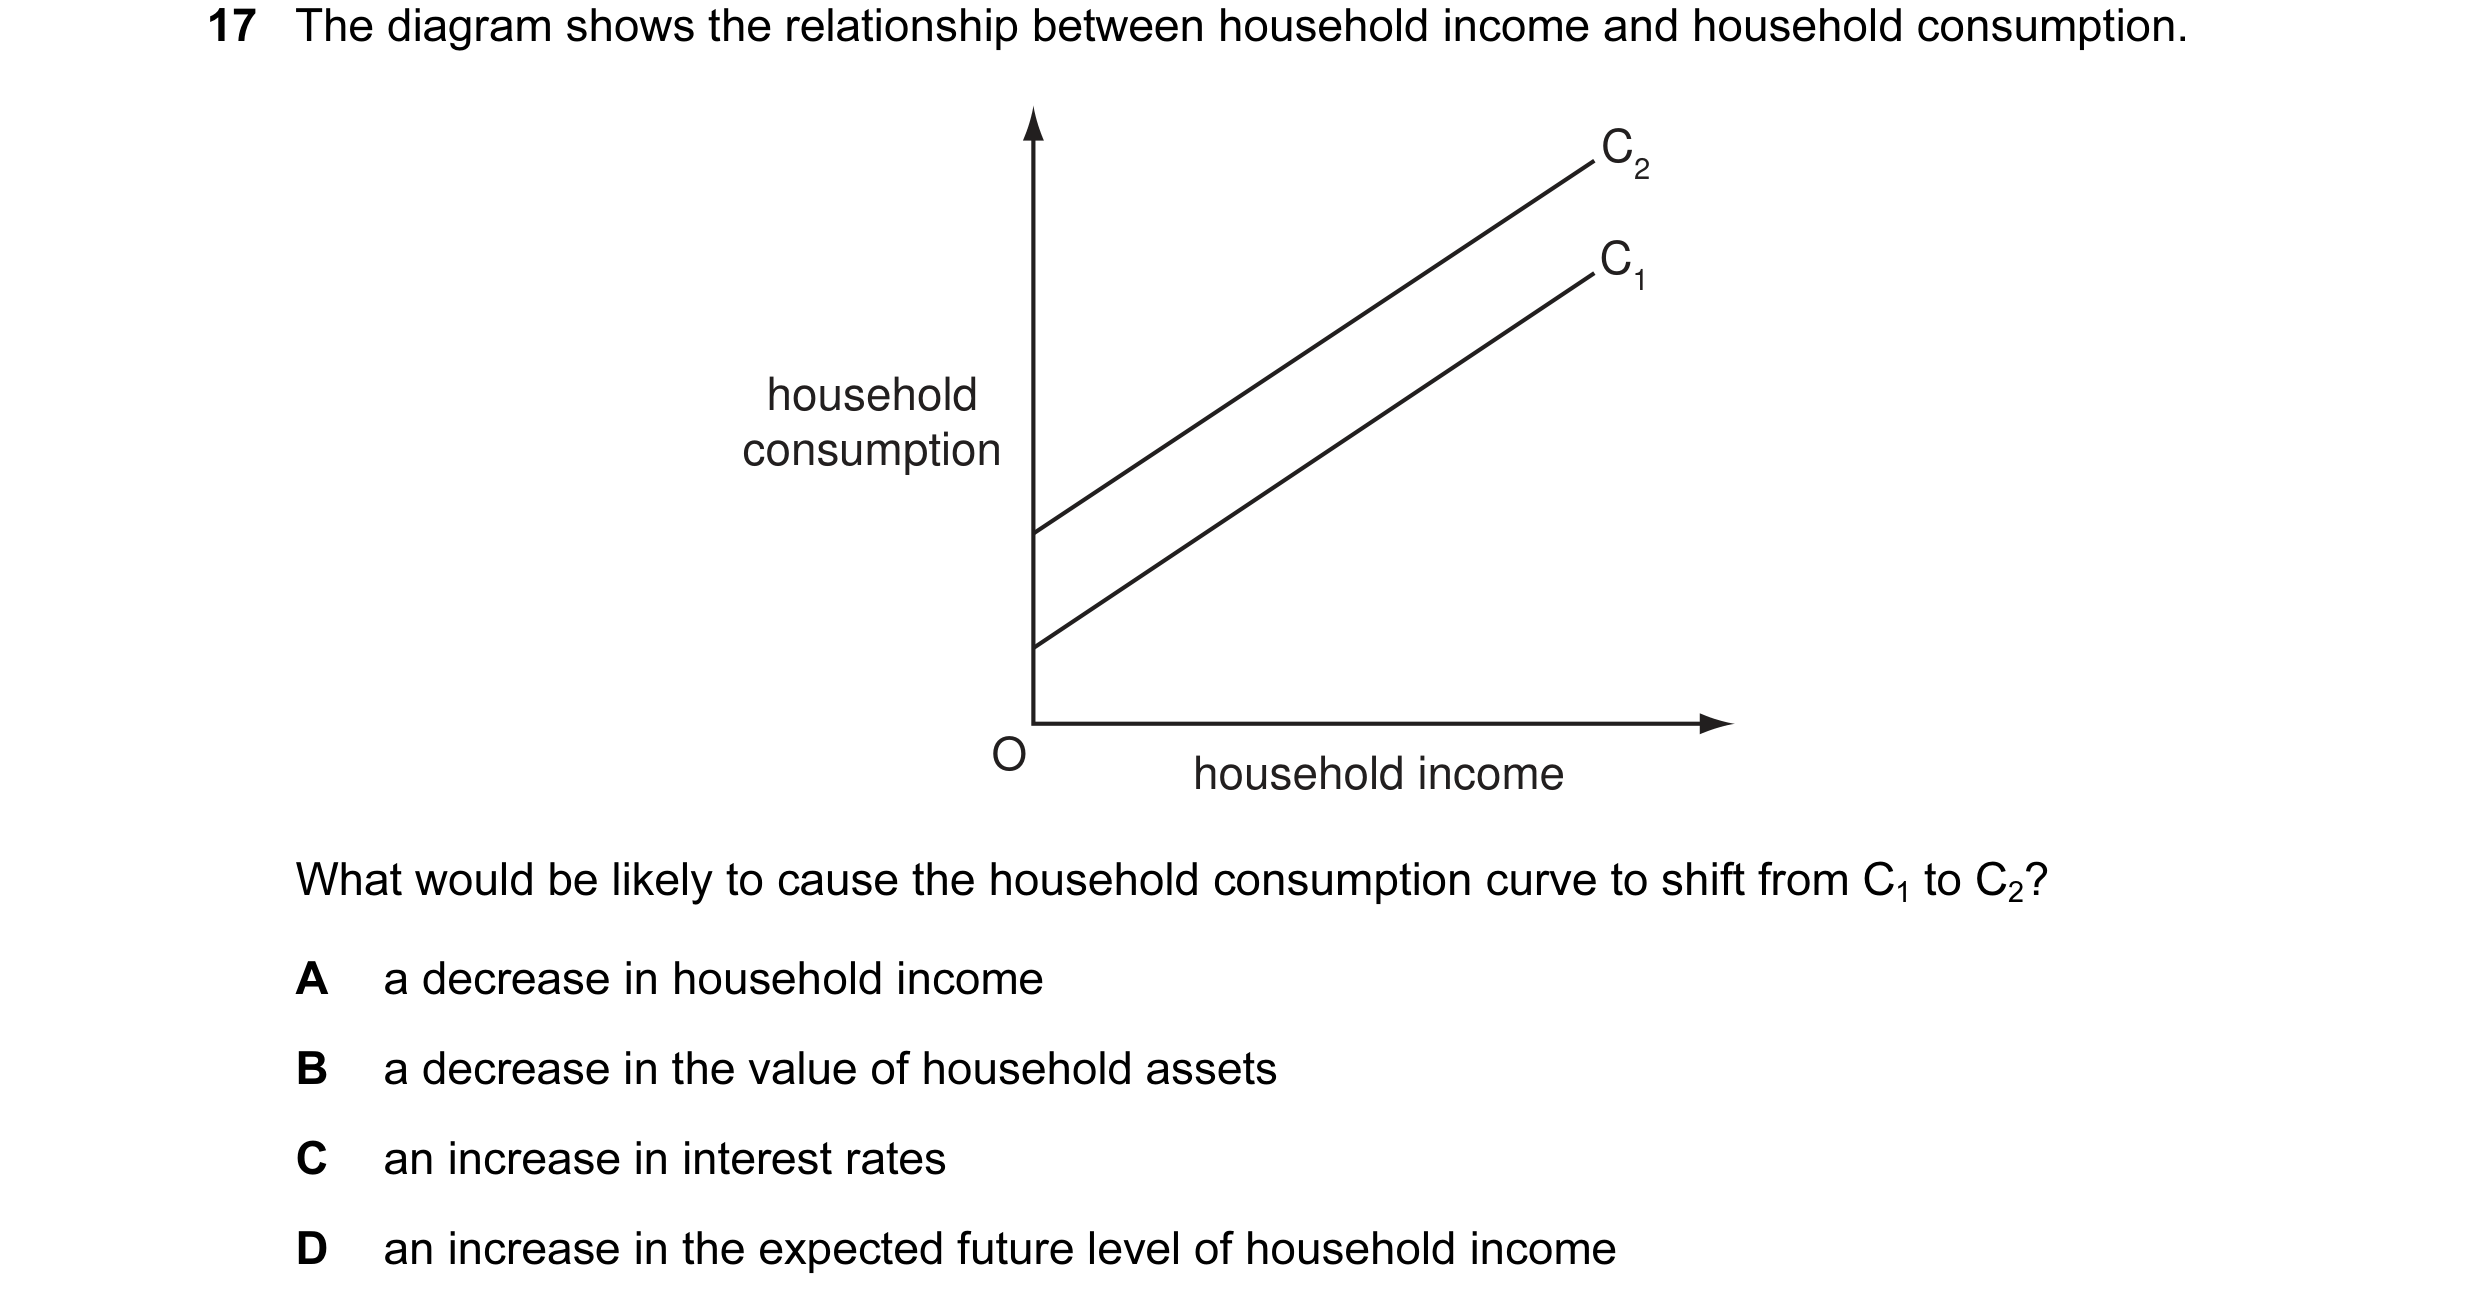
 3 / 16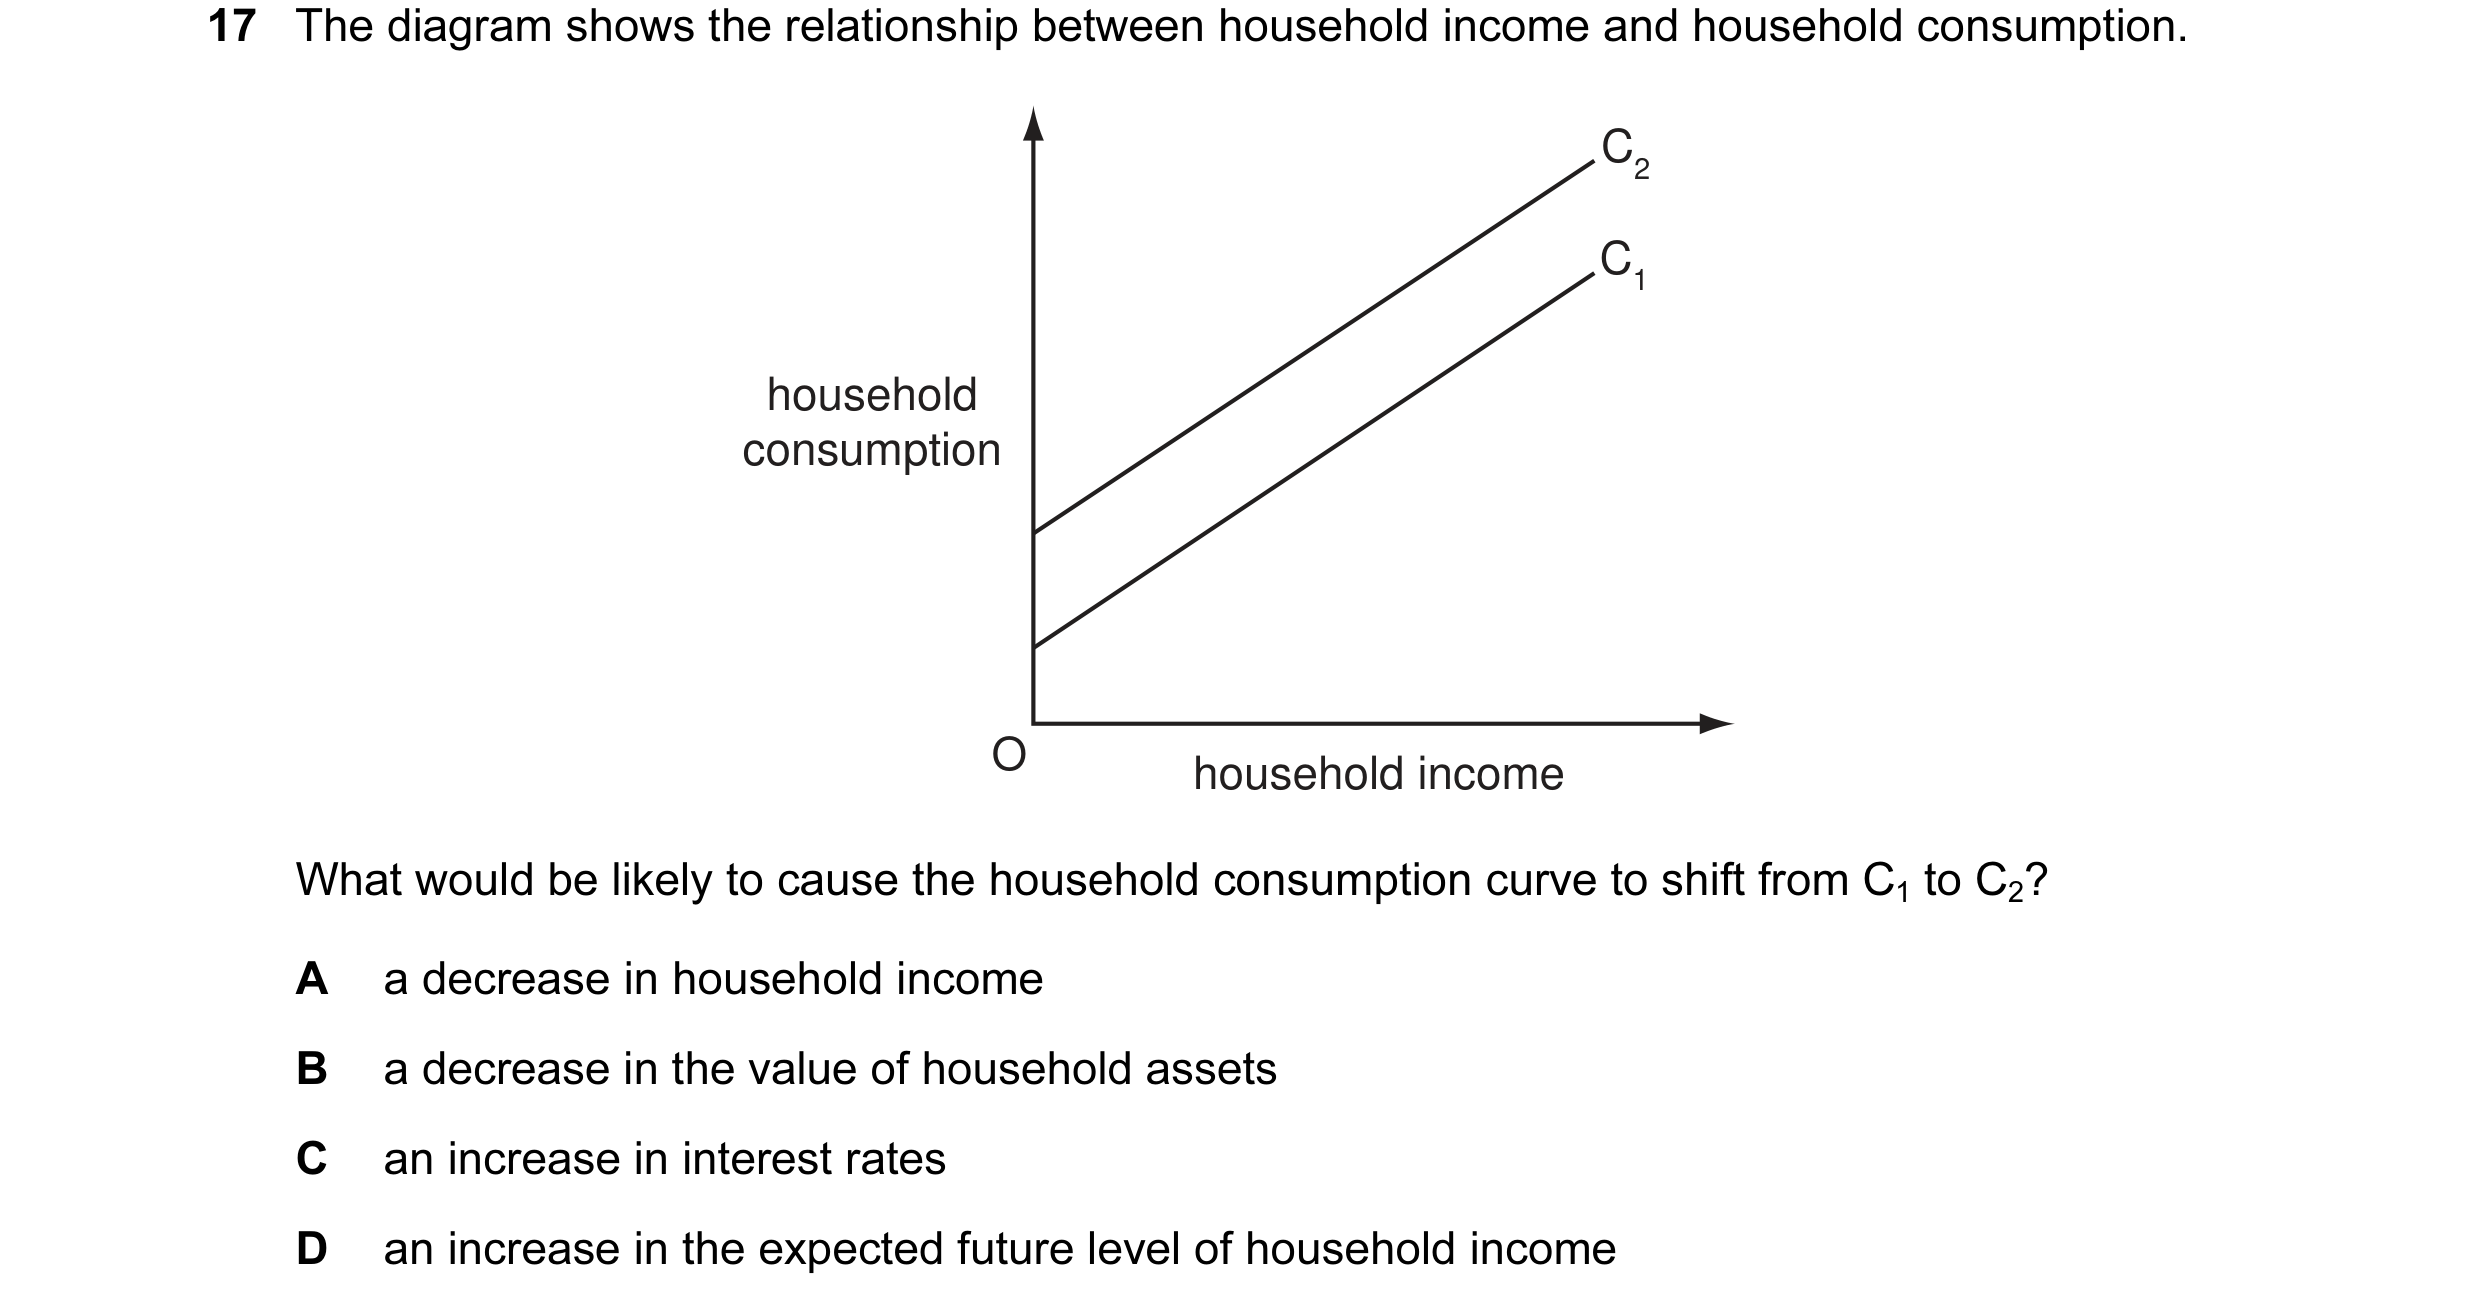
 4 / 16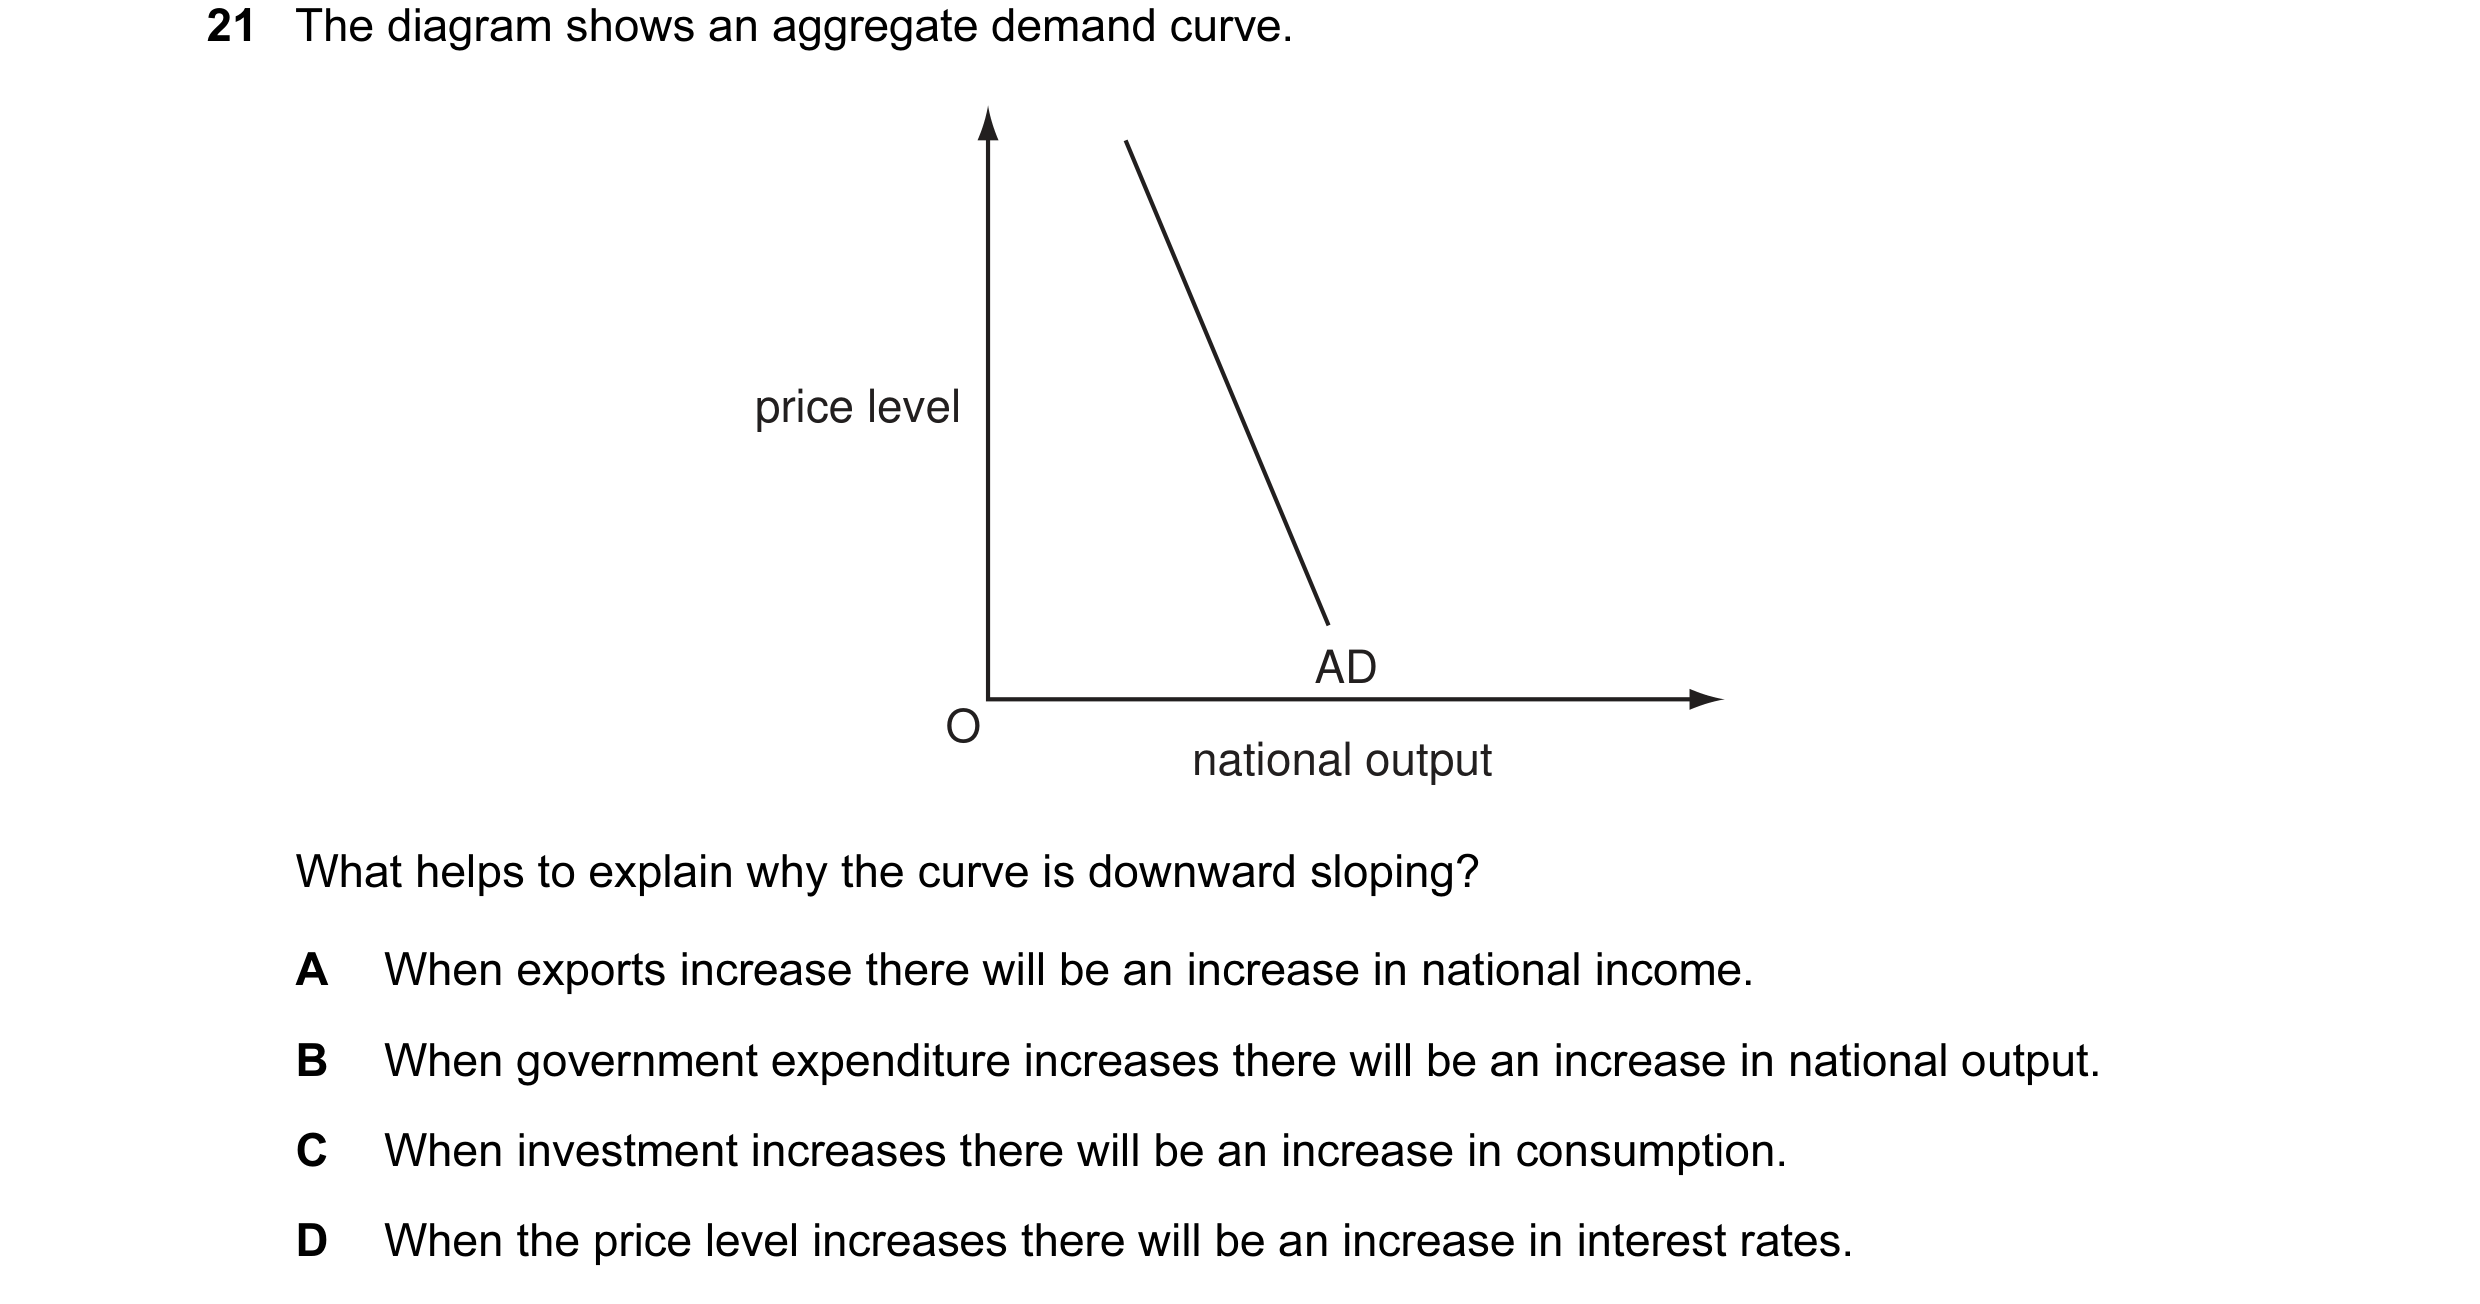

 5 / 16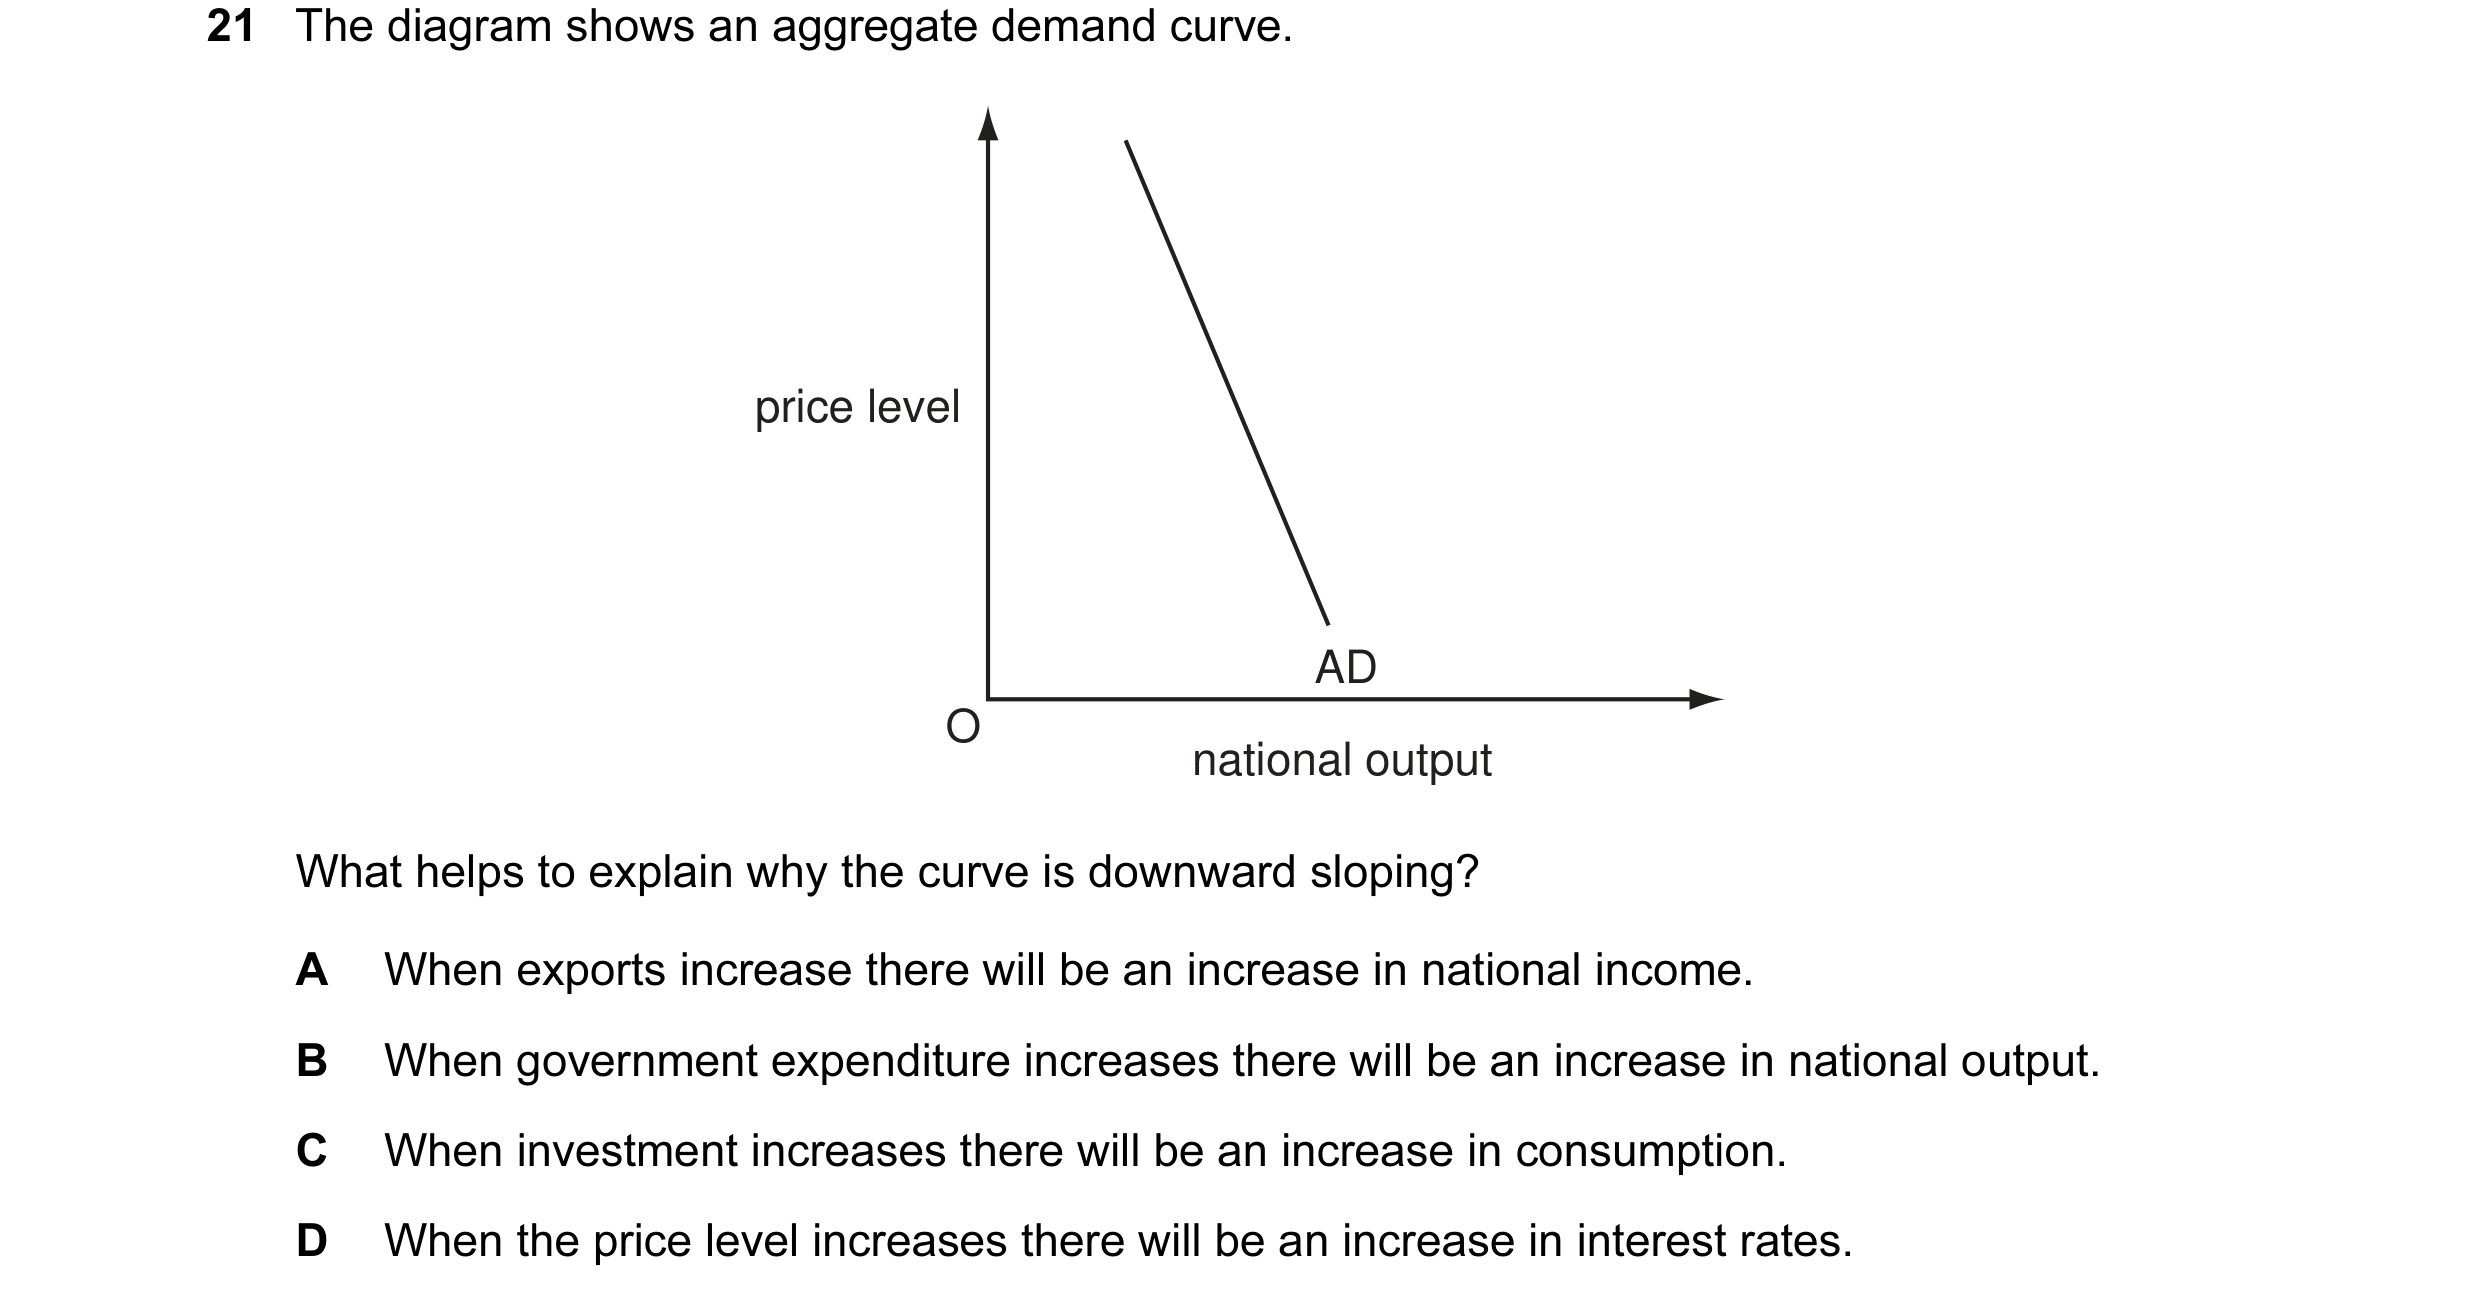

 6 / 16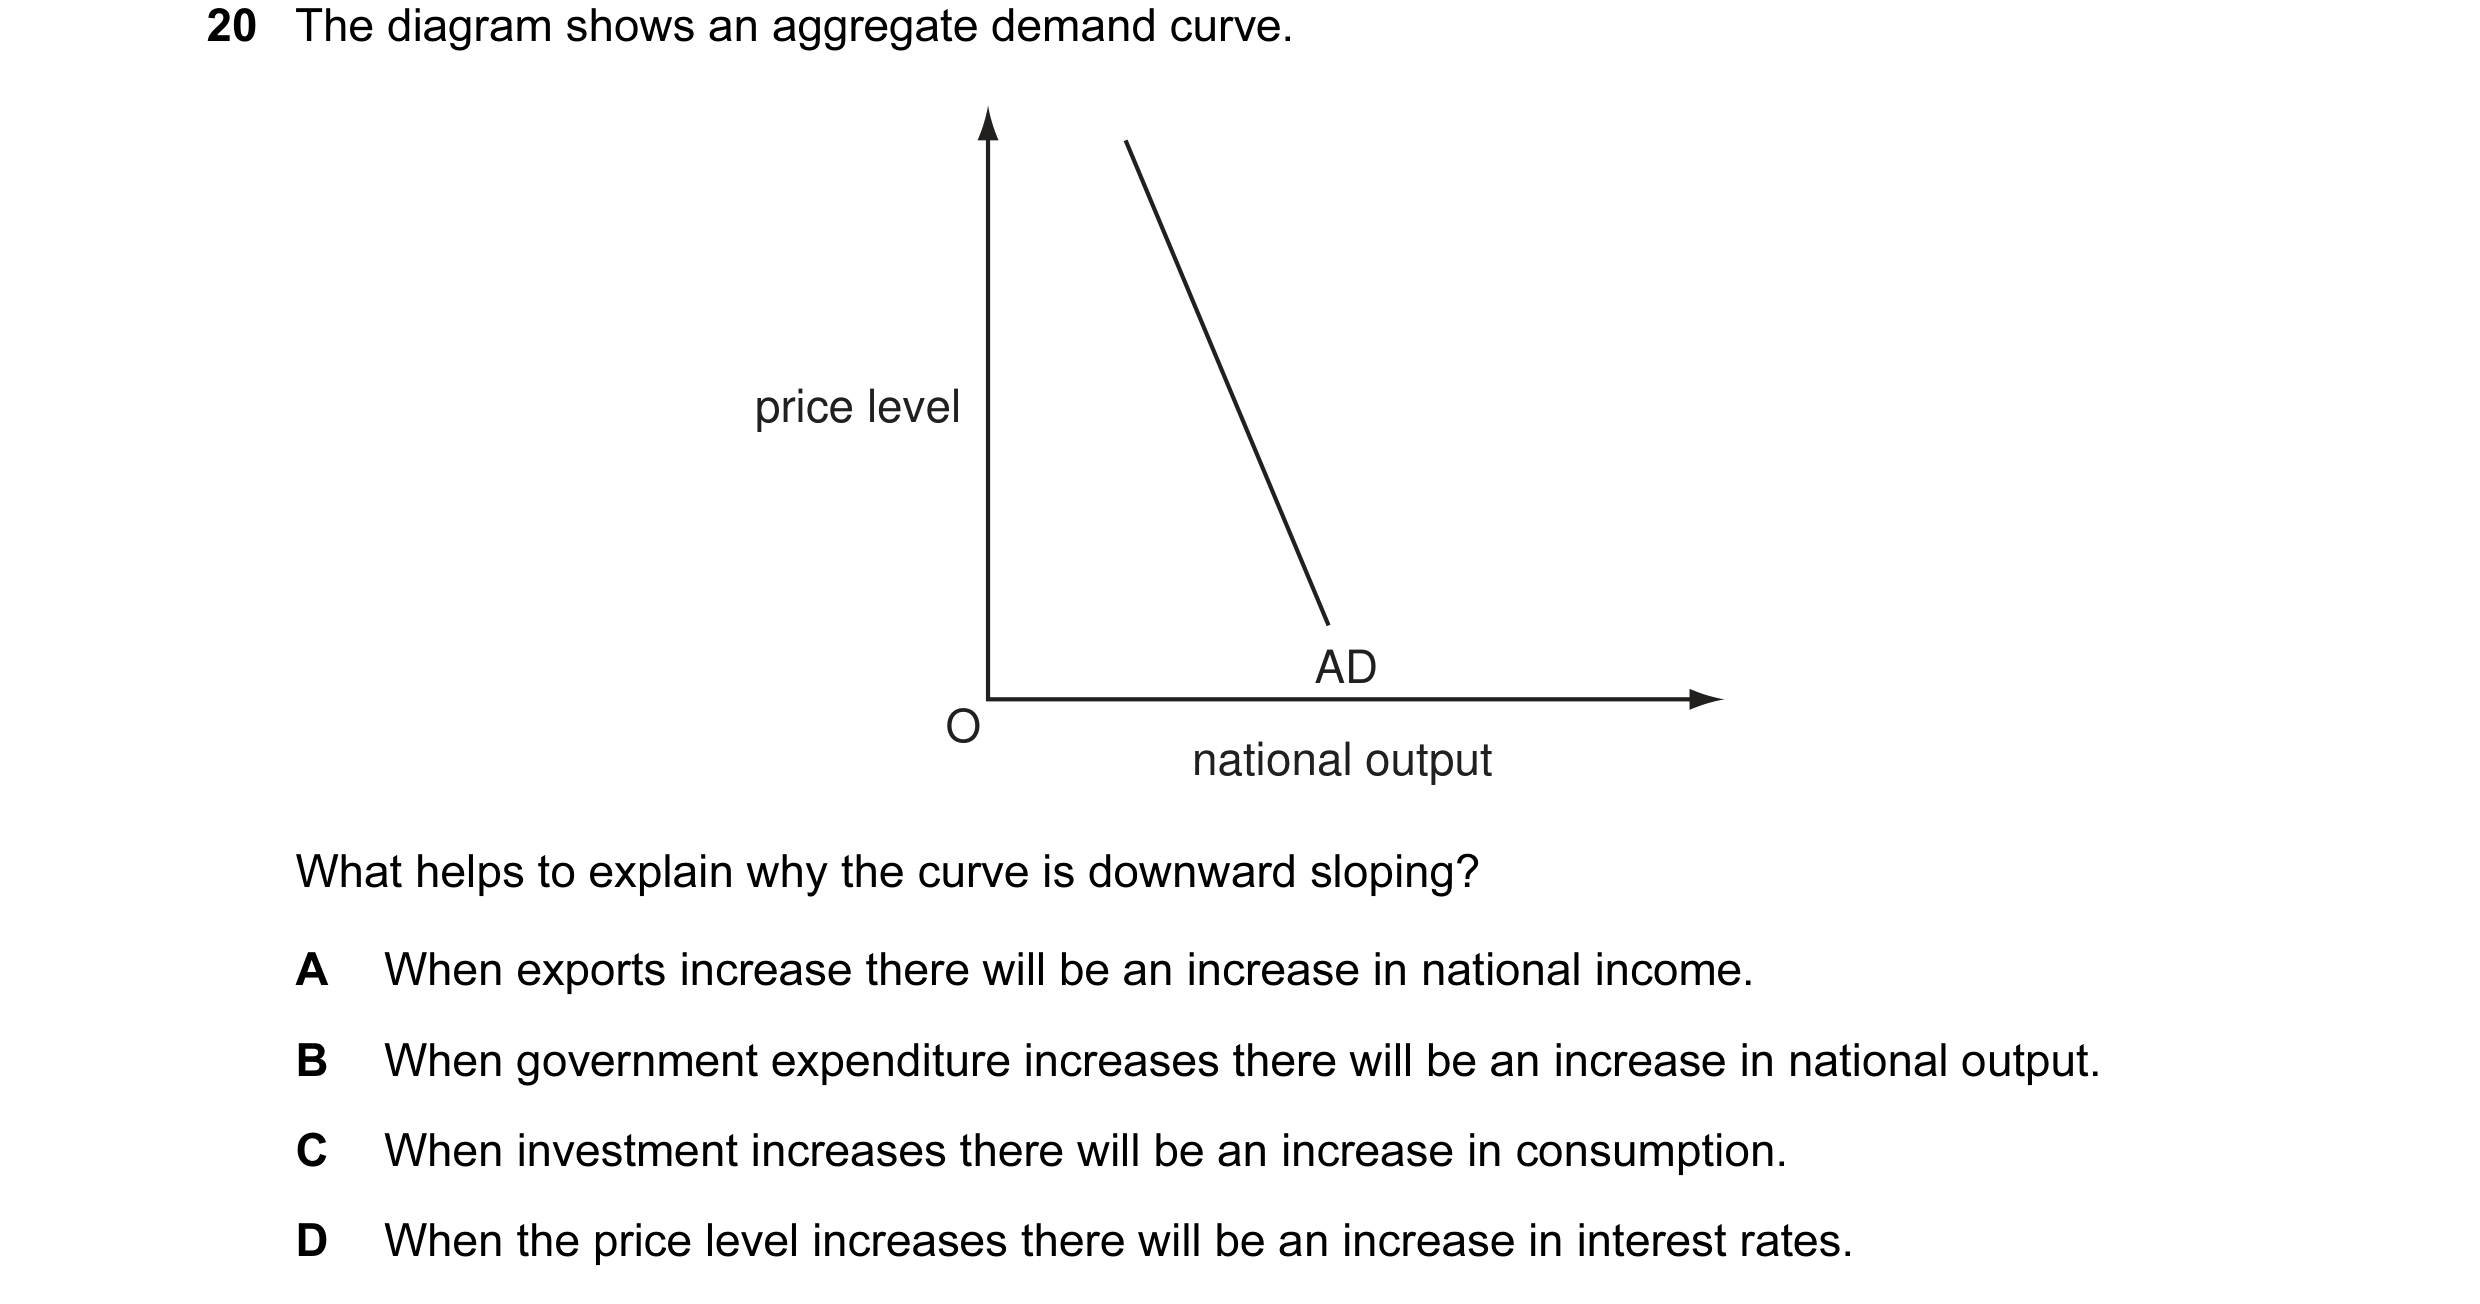


 7 / 16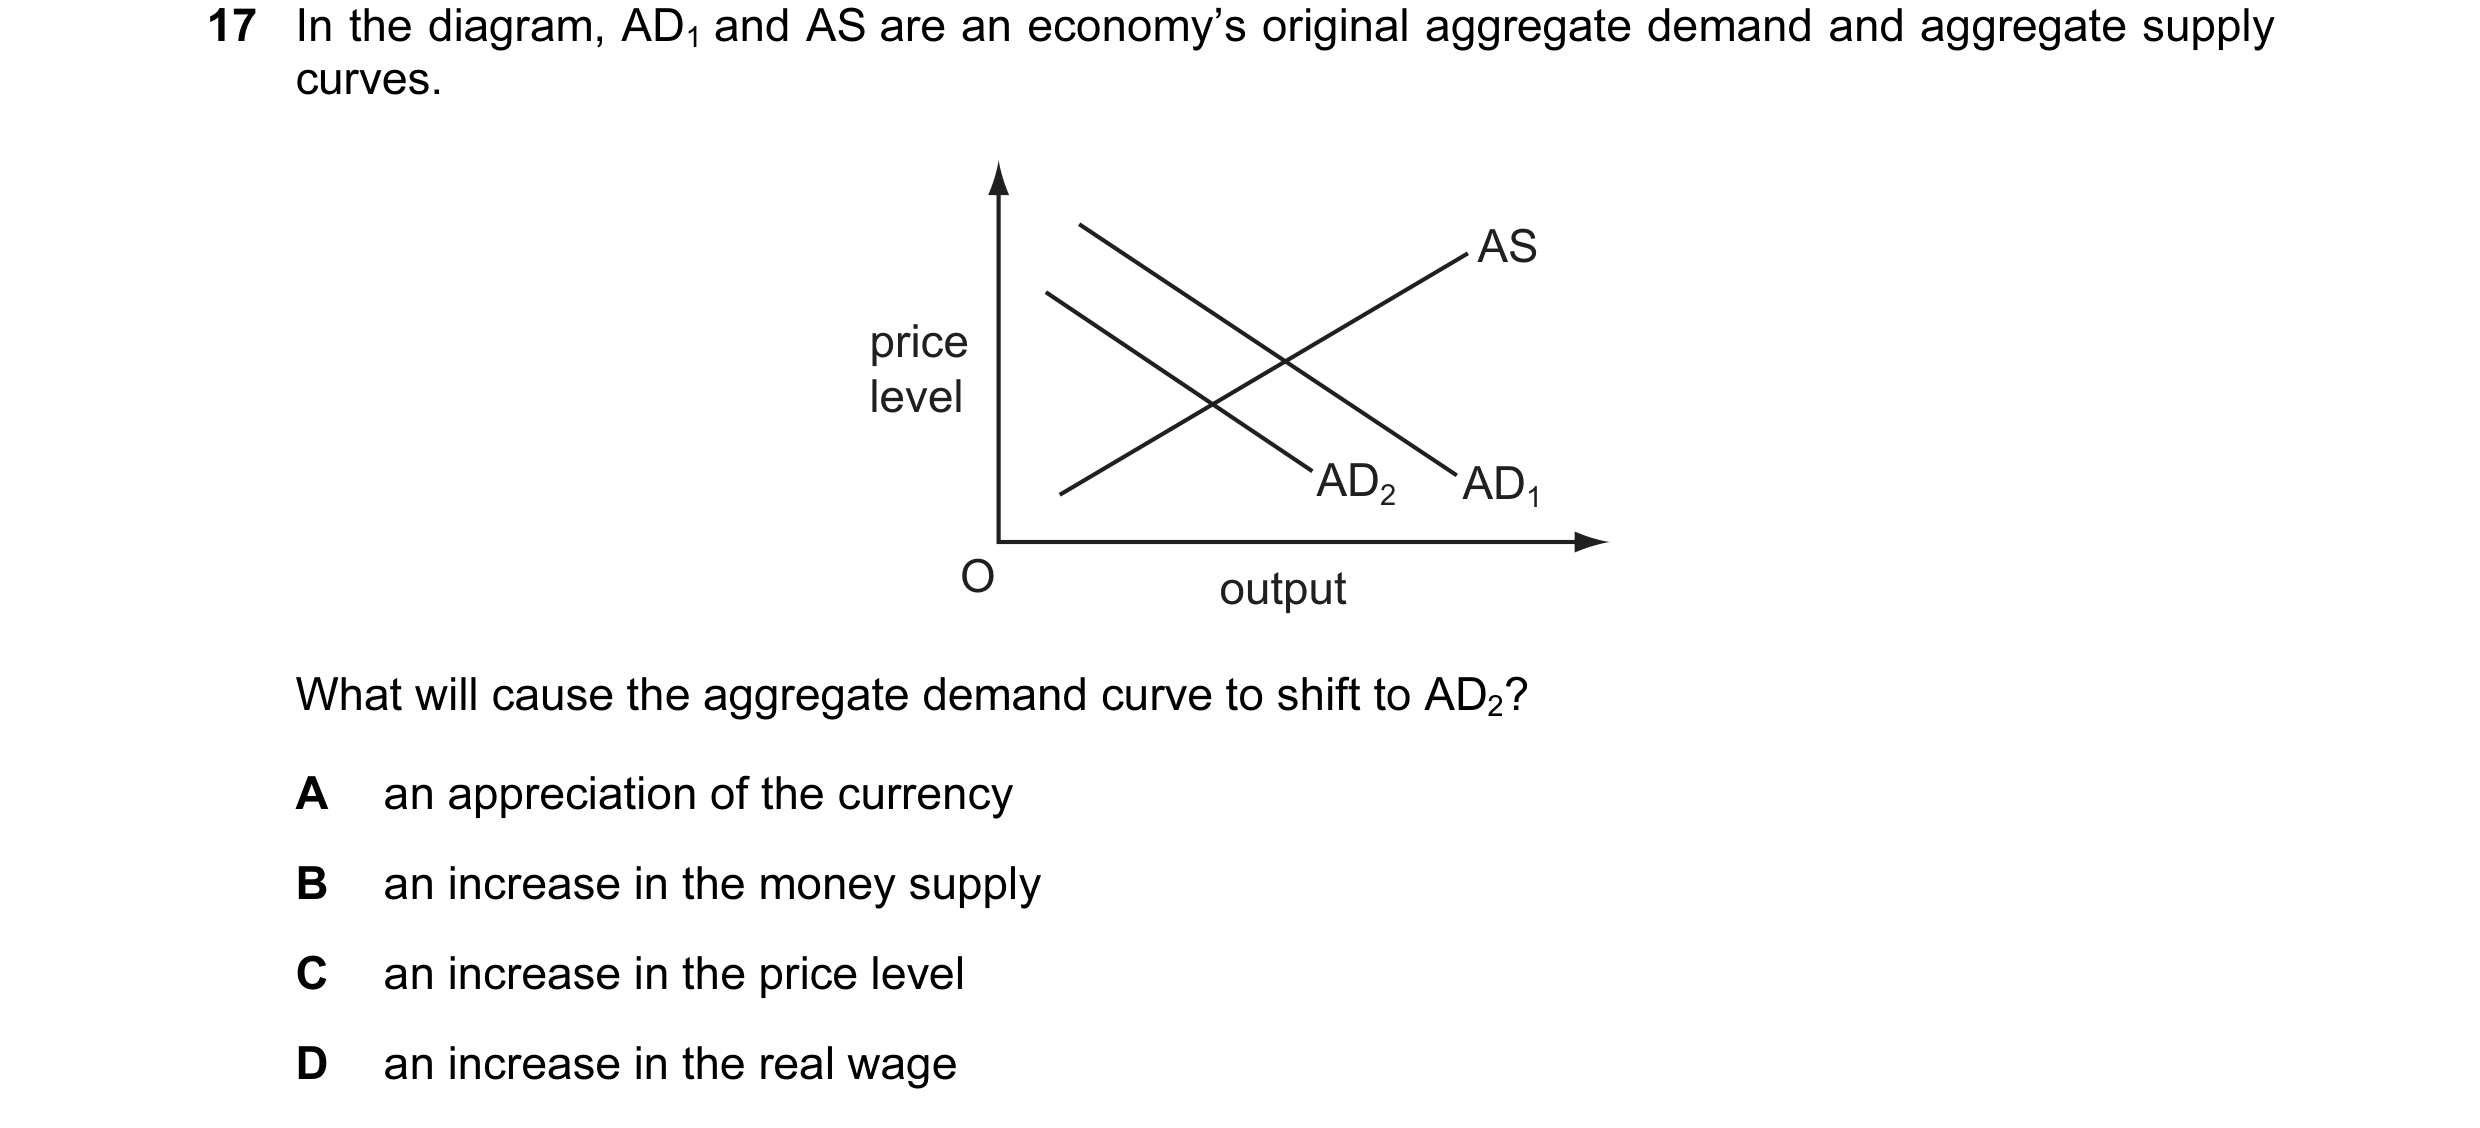
 8 / 16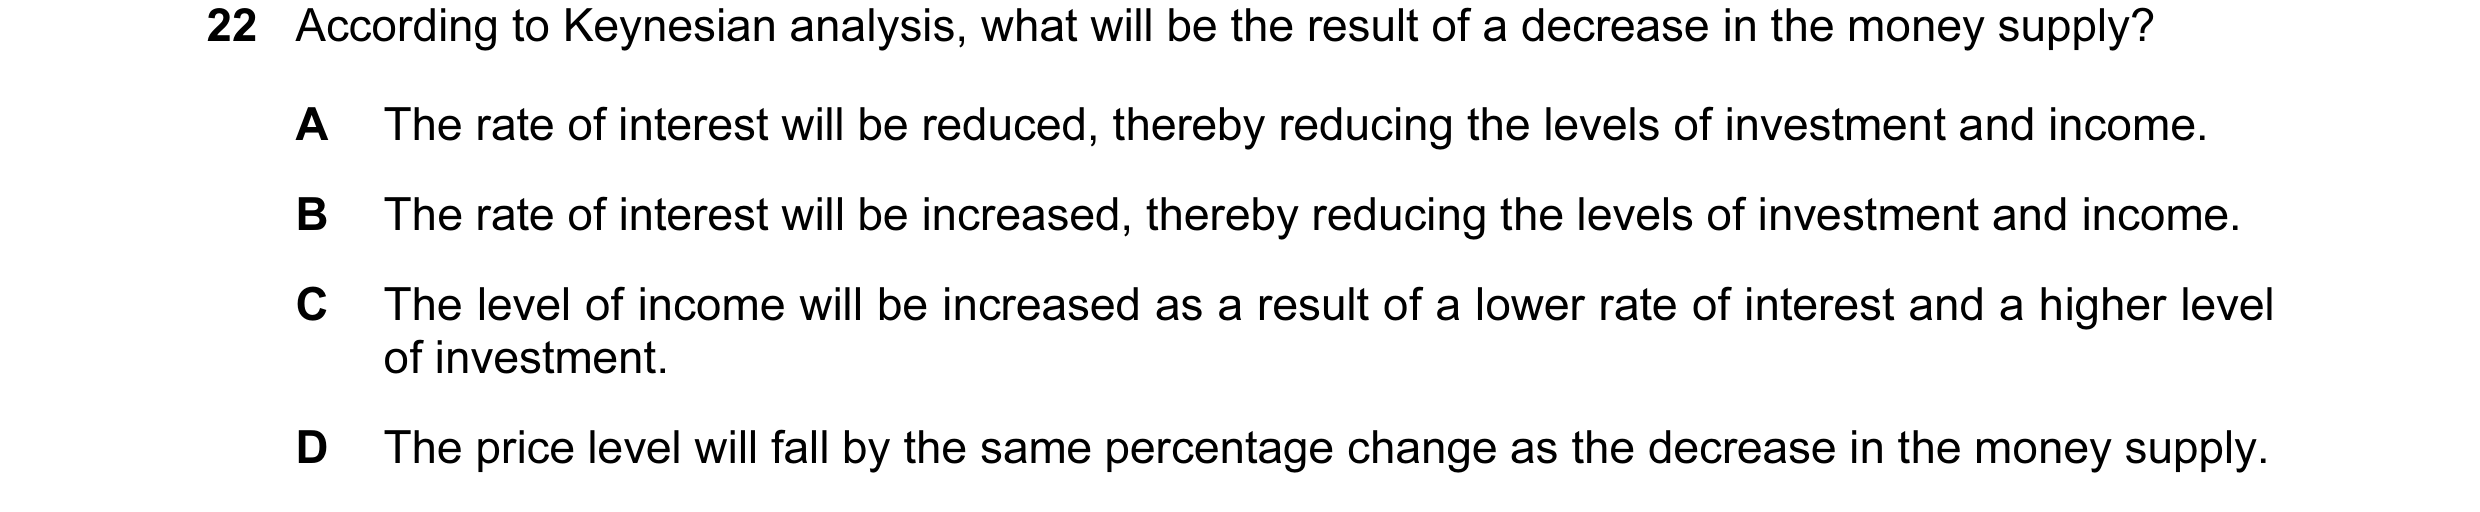
 9 / 16

 10 / 16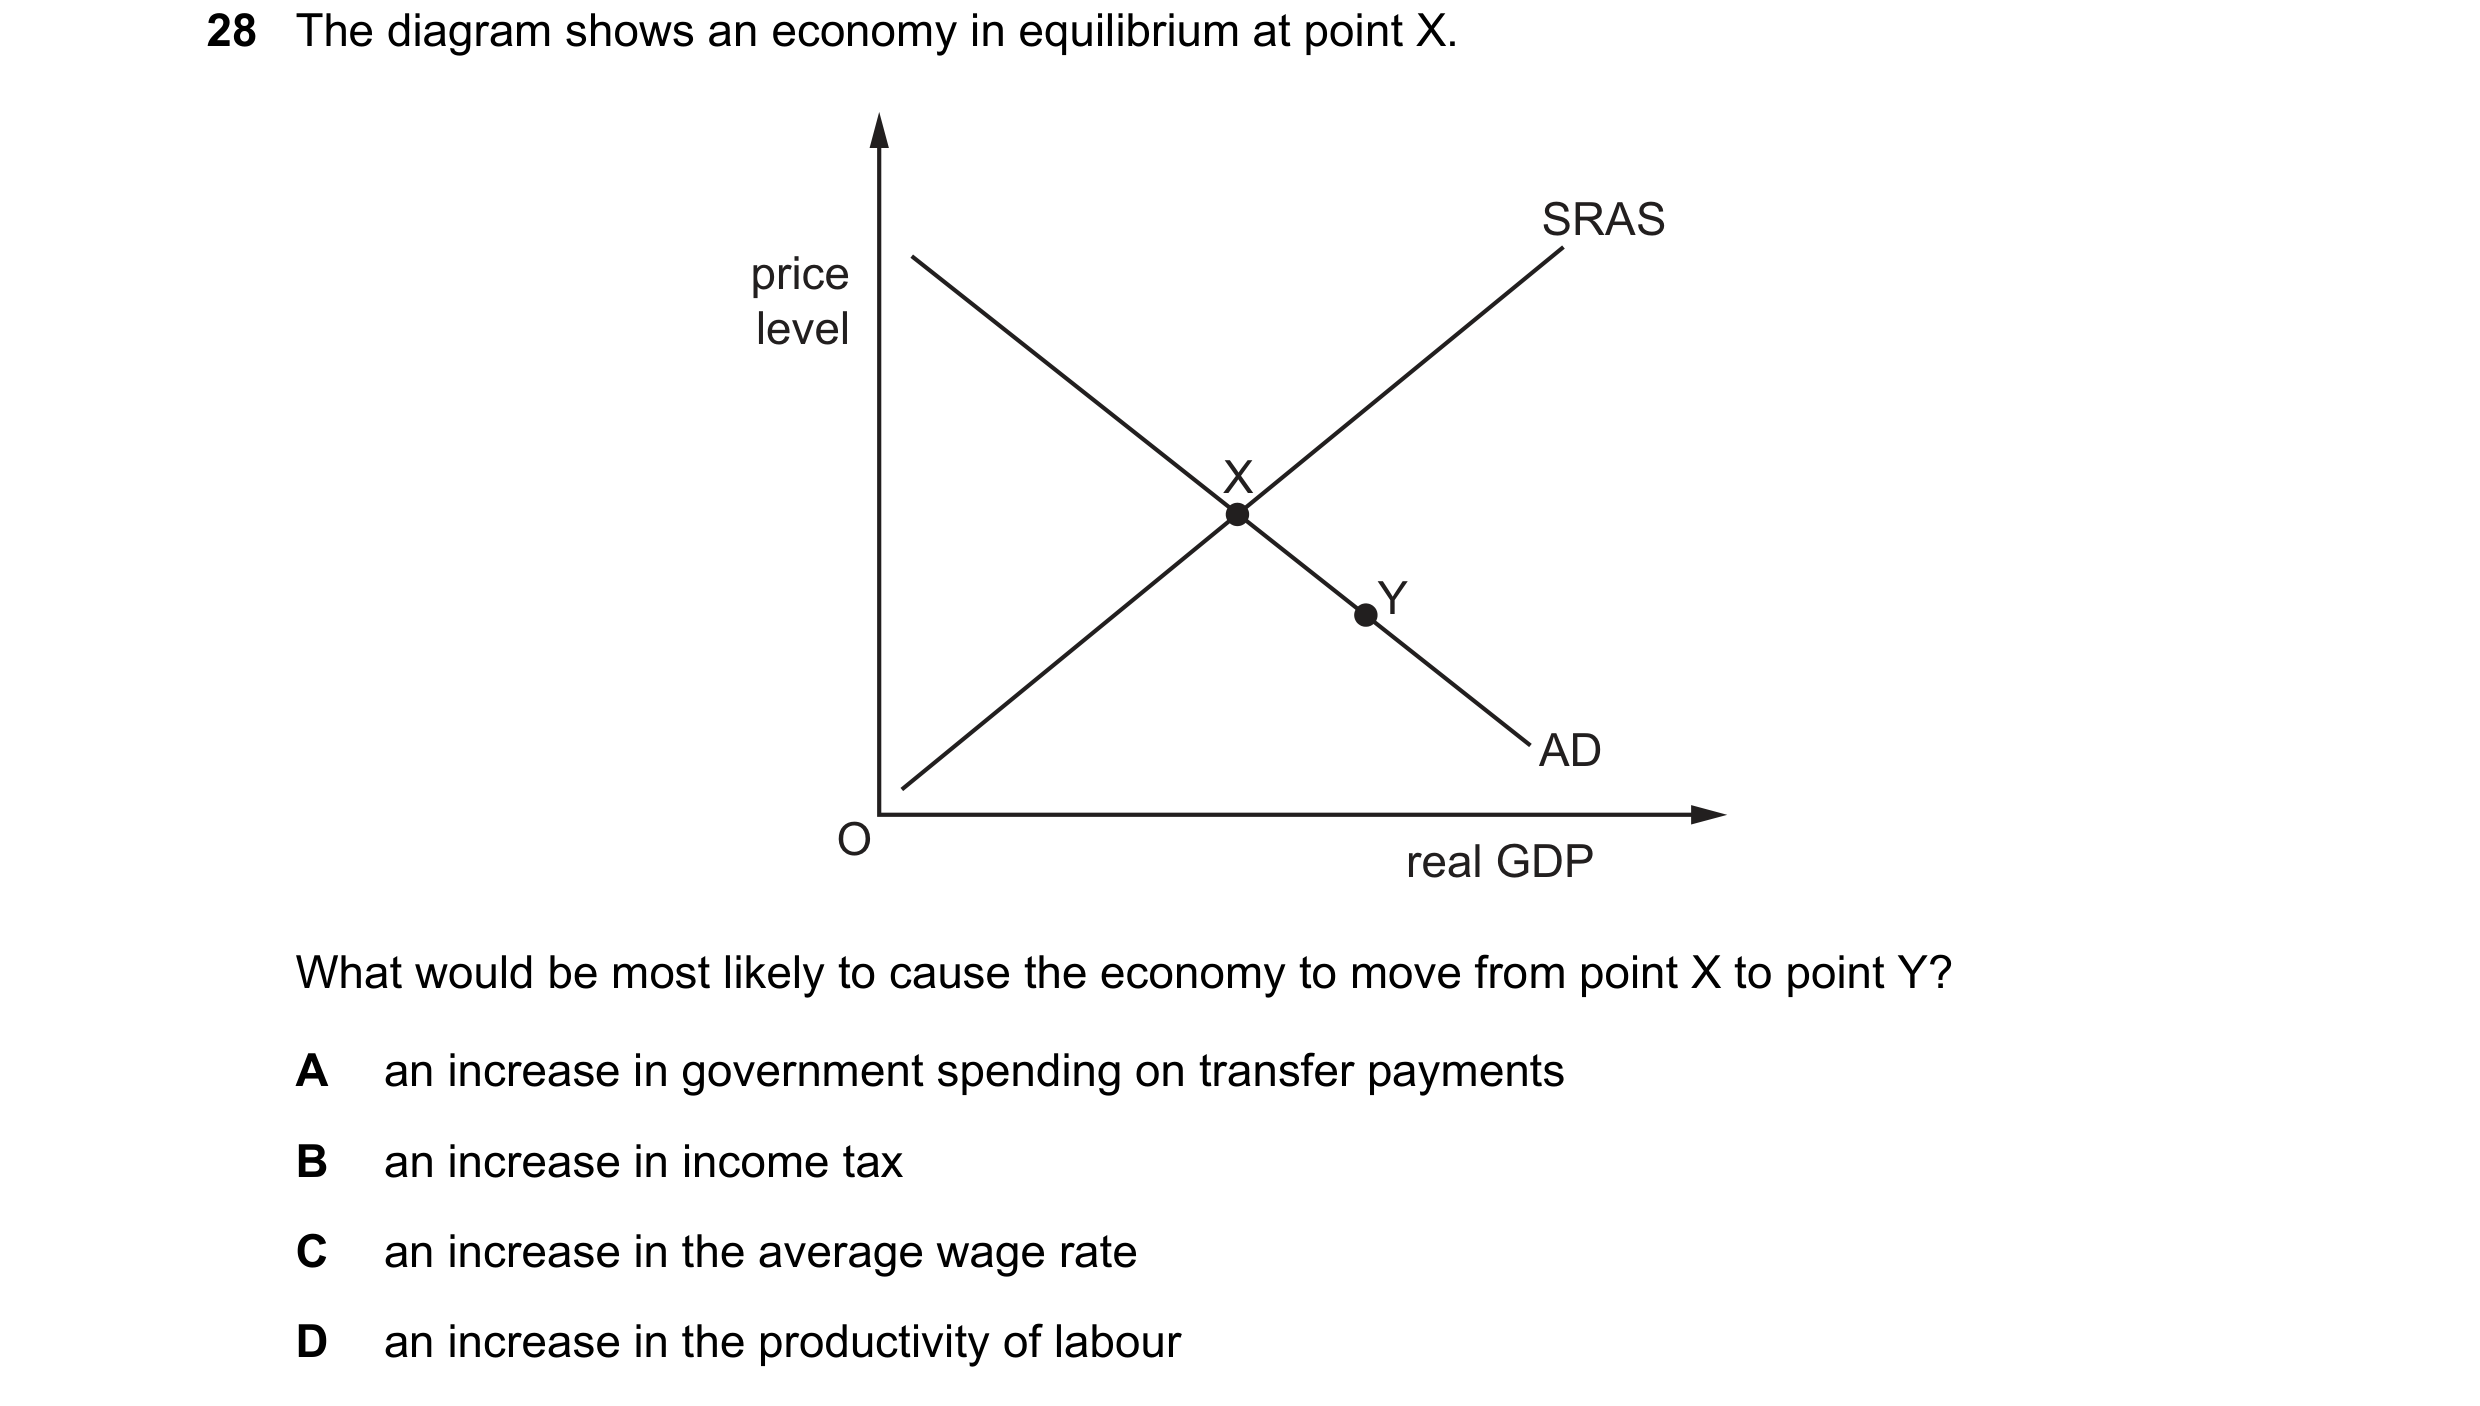

 11 / 16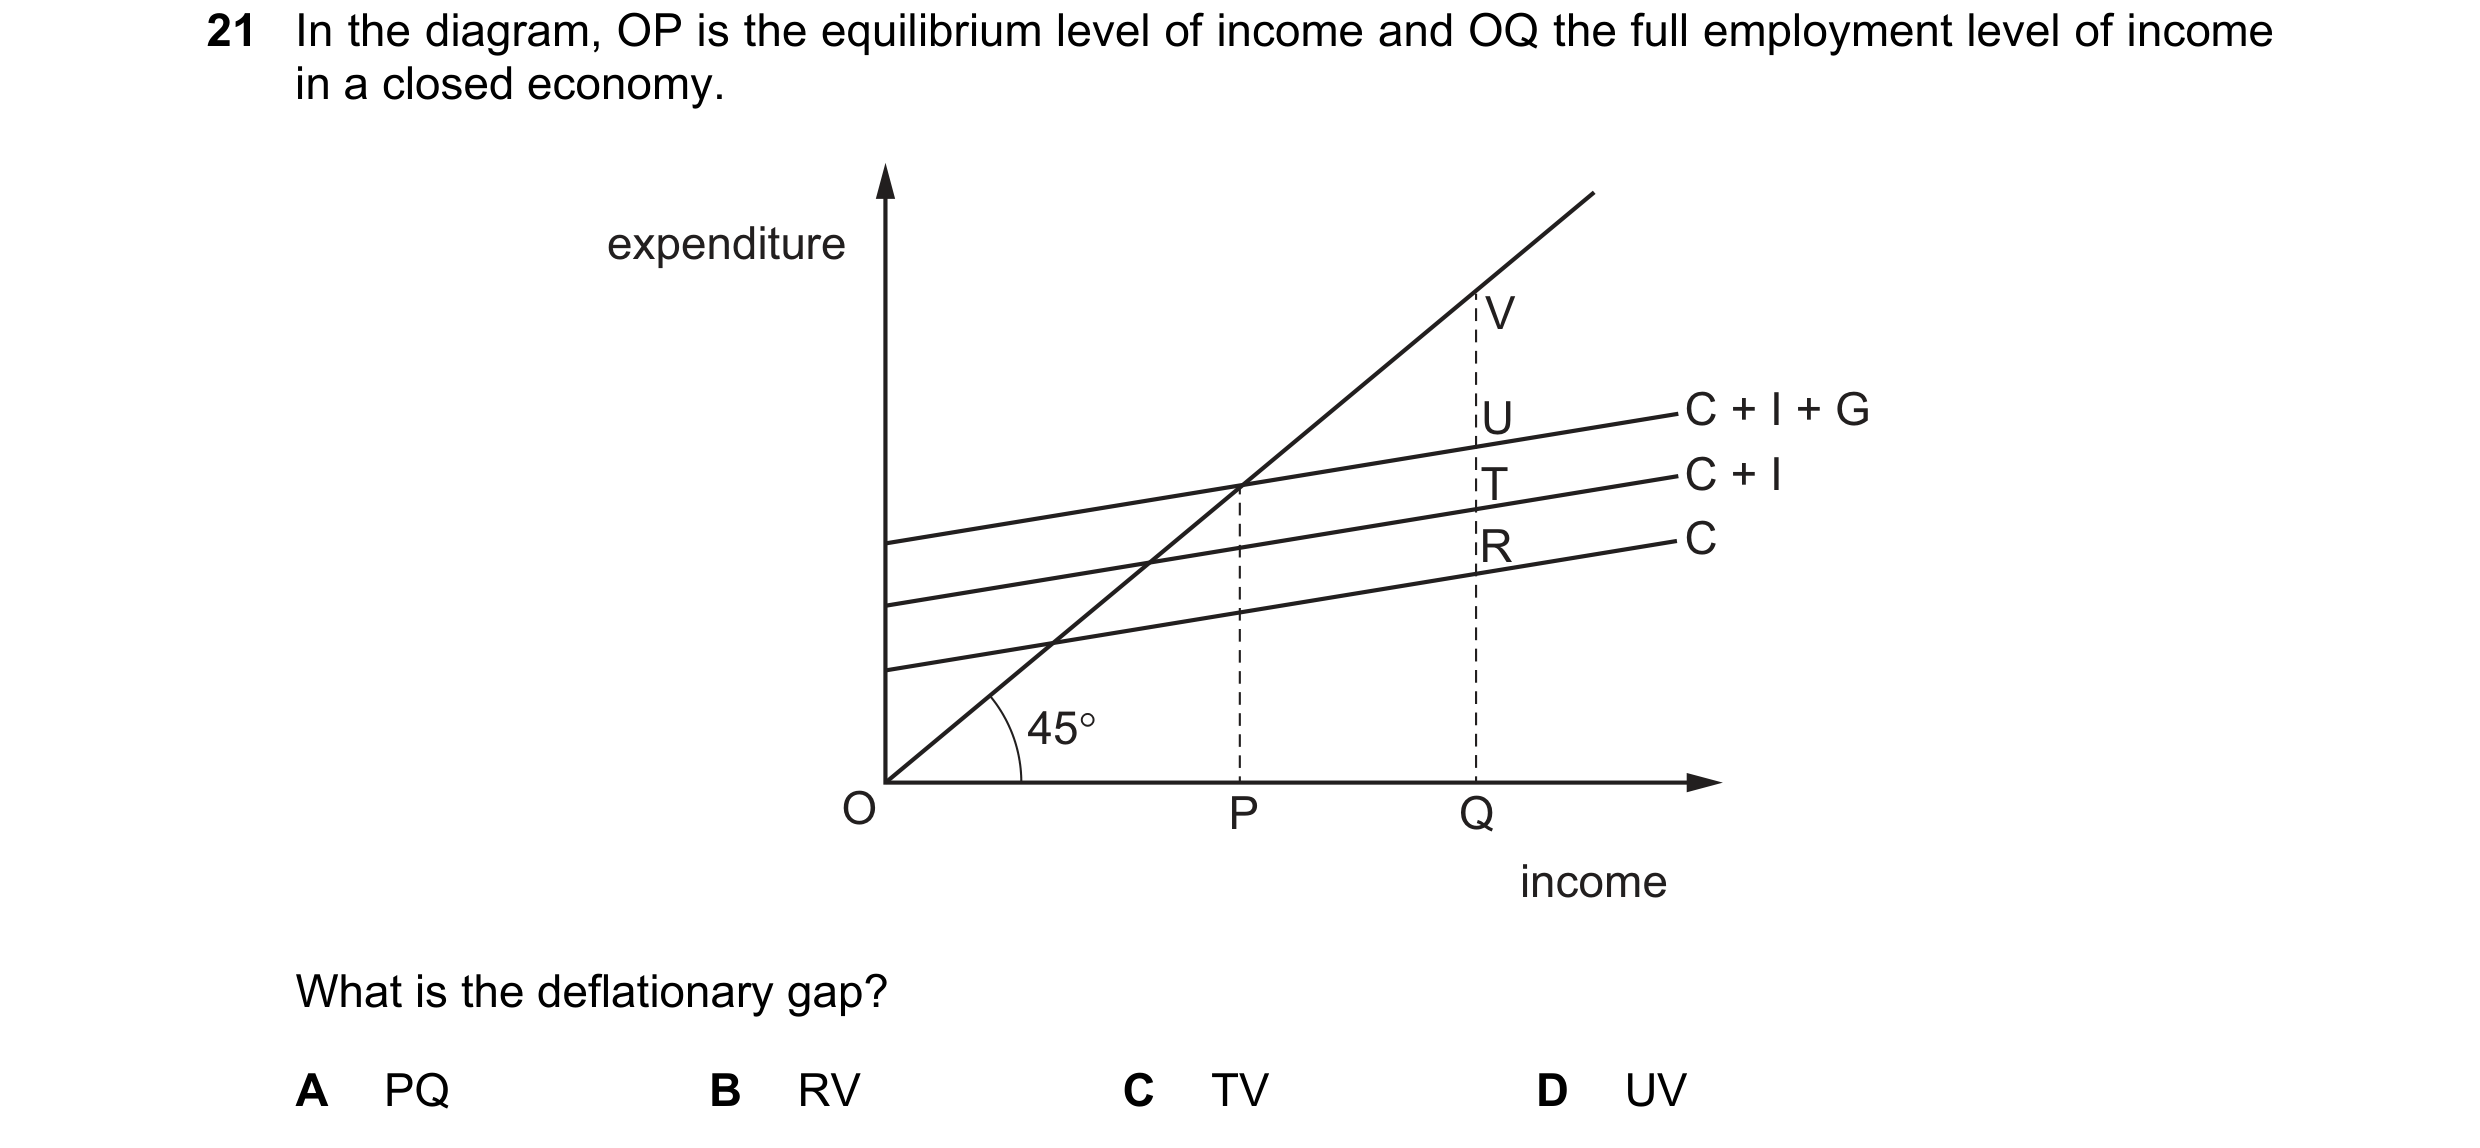

 12 / 16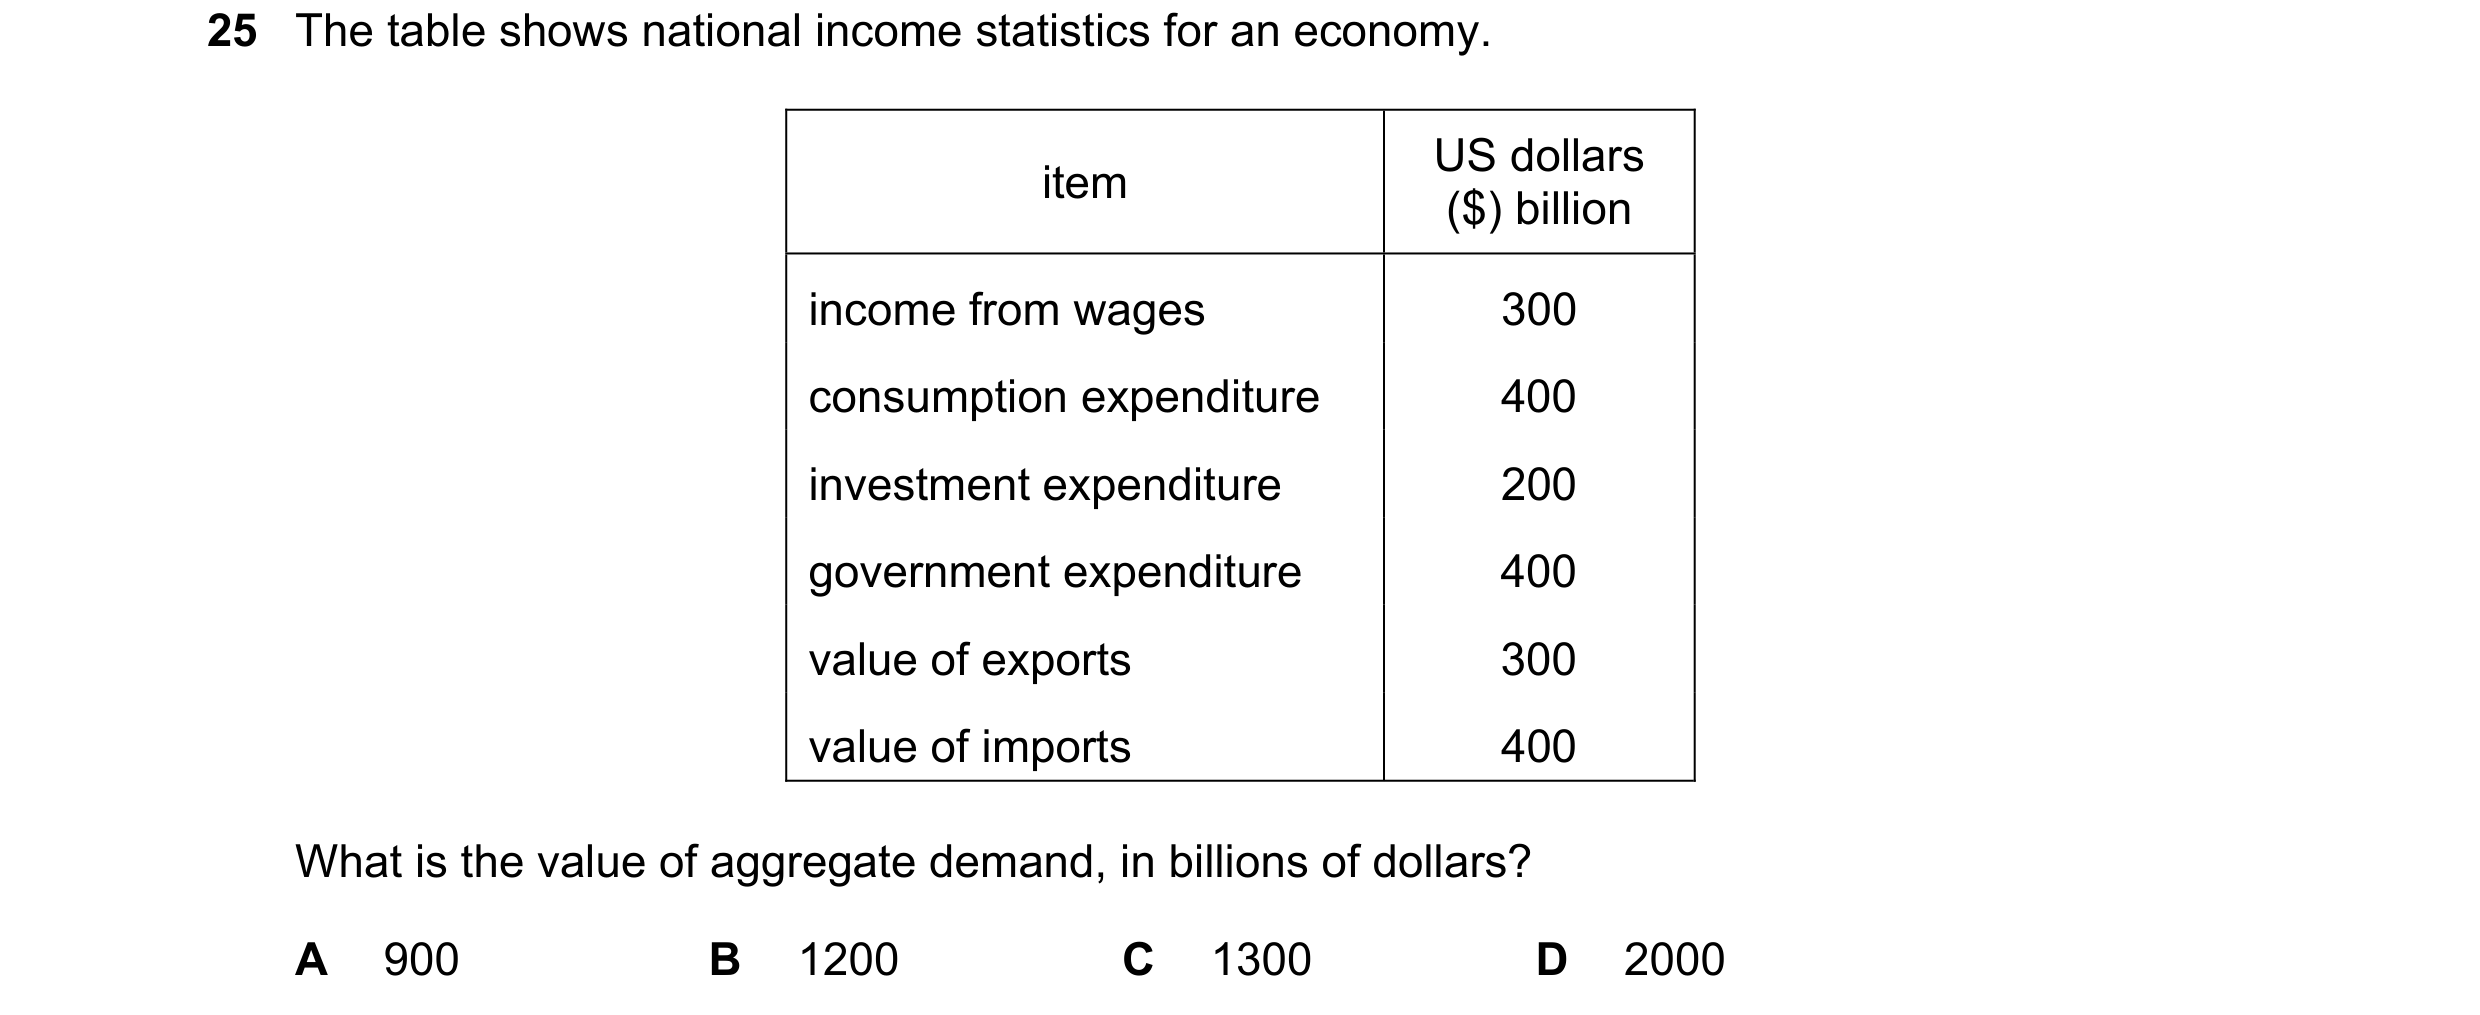

 13 / 16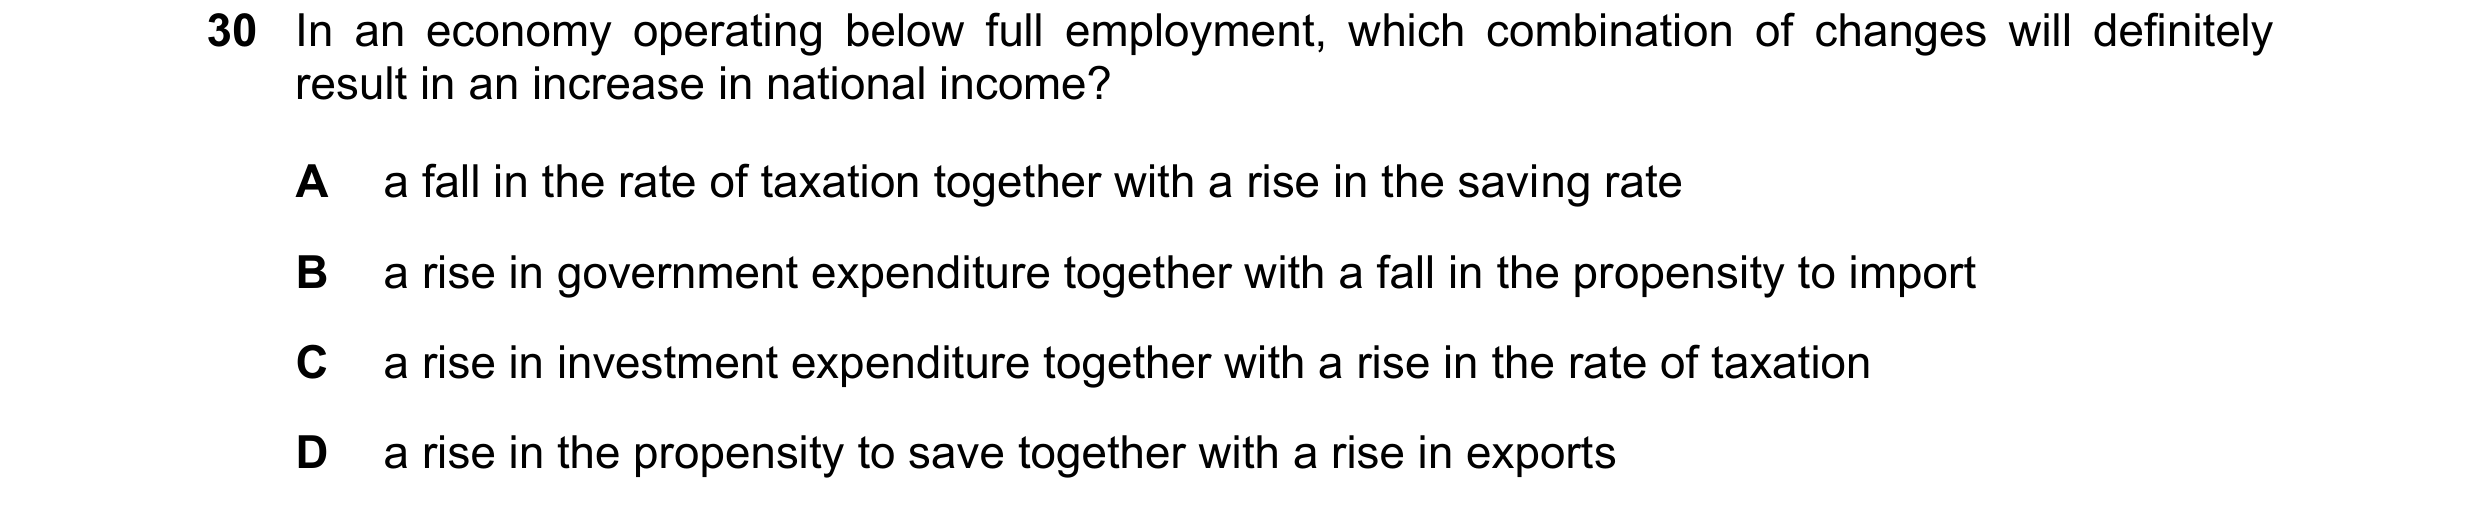




 14 / 16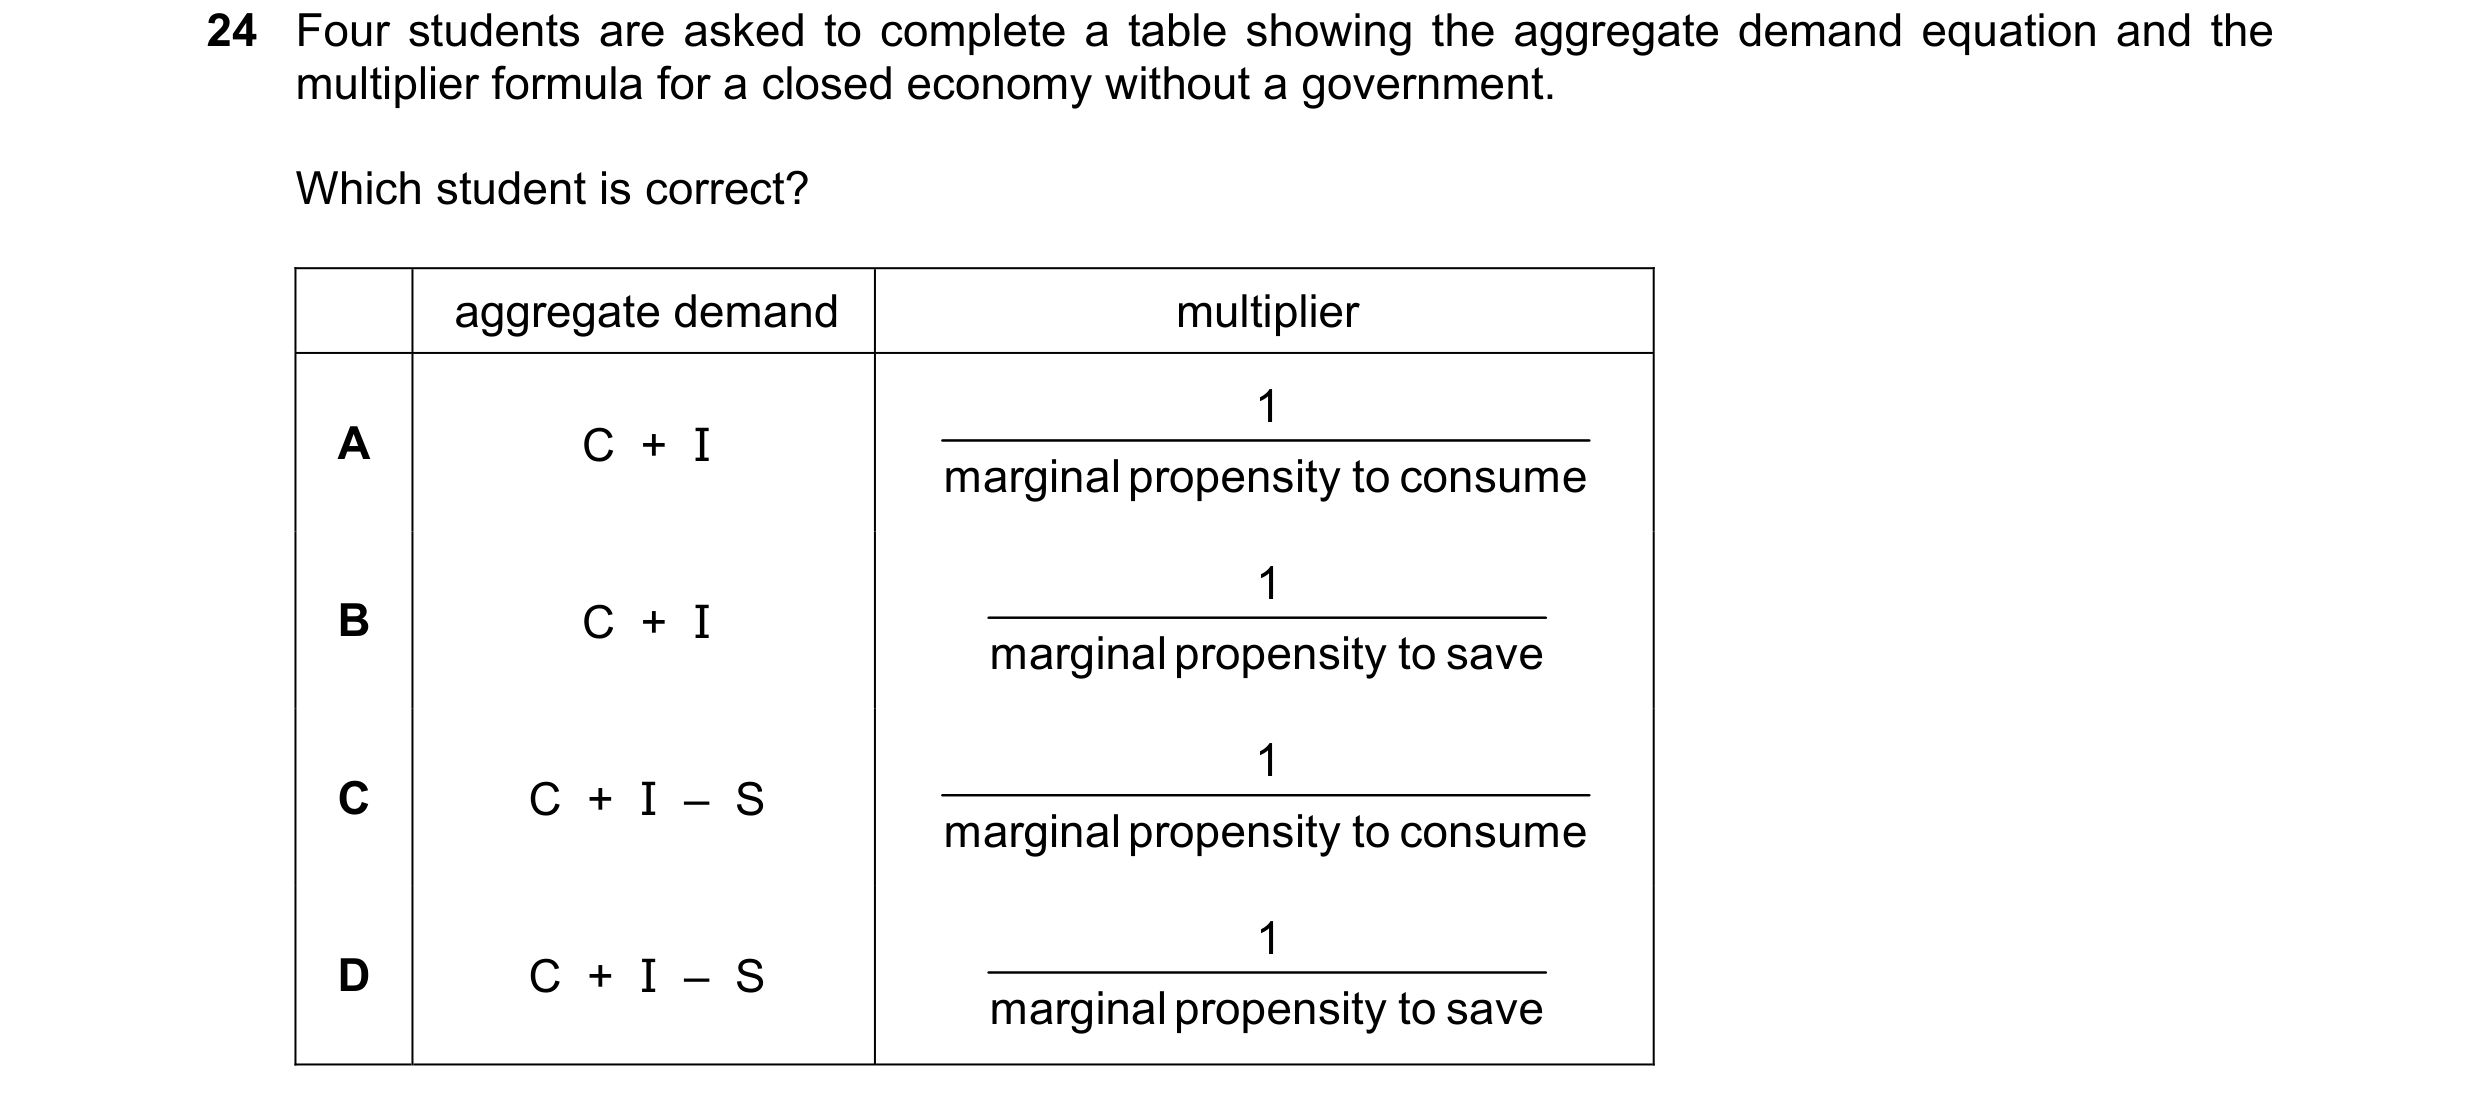
 15 / 16
 16 / 16