Questions as text
Q1 · The table shows the levels of demand for silver in millions of ounces for different uses… 9708/11 Oct/Nov 2005
5 The table shows the levels of demand for silver in millions of ounces for different uses between 1999 and 2001. 1999 2000 2001 Industrial use 340.6 377.1 338.5 Photography 225.9 219.5 210.2 Jewellery and silverware 273.3 281.4 287.6 Coins and medals 27.6 29.8 27.2 What can be concluded about the different demands for silver between 1999 and 2001? A All types of demand followed the same trend. B Industrial use had the greatest fall in demand. C Jewellery and silverware had a continuous increase in demand. D Total demand increased.
1 marks
Answer: C
This question in 9708/11 Oct/Nov 2005
Q2 · Which of the following will not cause a shift in the market supply curve of a commodity? 9708/11 Oct/Nov 2005
9 Which of the following will not cause a shift in the market supply curve of a commodity? A a rise in the price of the commodity B a rise in the price of a factor input C a change in technology D the introduction of a specific tax on the commodity
1 marks
Answer: A
This question in 9708/11 Oct/Nov 2005
Q3 · Which piece of information would enable you to construct the market demand curve for a… 9708/11 May/June 2006
5 Which piece of information would enable you to construct the market demand curve for a product? A the equilibrium price of the product B the number of consumers who would purchase the product at each price C the number of firms in the industry D the quantity that each consumer would be willing and able to buy at each price
1 marks
Answer: D
This question in 9708/11 May/June 2006
Q4 · What is most likely to increase the demand for compact disc players? 9708/11 May/June 2006
6 What is most likely to increase the demand for compact disc players? A a fall in disposable incomes B a fall in the price of cinema tickets C a fall in the price of compact discs D a fall in the price of video recorders
1 marks
Answer: C
This question in 9708/11 May/June 2006
Q5 · The diagram shows the demand curve for good X 9708/11 Oct/Nov 2006
6 The diagram shows the demand curve for good X. M N price D O quantity What could cause a movement along the curve from M to N? A a change in consumer tastes in favour of X B a decrease in labour costs of producing X C a decrease in the demand for X D an increase in the price of a substitute good
1 marks
Answer: B
This question in 9708/11 Oct/Nov 2006
Q6 · A firm publishes and sells books 9708/11 Oct/Nov 2006
9 A firm publishes and sells books. The diagram shows a shift in the firm’s supply curve from S1 to S2. S1 S2 price of books O quantity of books What would have caused this shift in the firm’s supply curve? A a fall in the subsidies paid to book publishers B a fall in the price of paper C a rise in the real income of customers D a rise in the wages of the firm’s workers
1 marks
Answer: B
This question in 9708/11 Oct/Nov 2006
Q7 · What ensures that demand for a product is effective? 9708/11 May/June 2007
5 What ensures that demand for a product is effective? A The consumer must be in the private sector of the economy. B The consumer must have sufficient income to buy the product. C The consumer must receive consumer surplus. D The consumer must want to buy the product.
1 marks
Answer: B
This question in 9708/11 May/June 2007
Q8 · The diagram shows the supply curve of coffee in an economy 9708/11 May/June 2007
6 The diagram shows the supply curve of coffee in an economy. supply Y price X O quantity The market equilibrium is initially at point X, but a change moves it to point Y. What might explain this? A an increase in wages paid by producers of coffee B a switch in consumer tastes from coffee to tea C an increase in the price of tea D a tax imposed on coffee producers
1 marks
Answer: C
This question in 9708/11 May/June 2007
Q9 · The following might influence the demand for a good 9708/11 Oct/Nov 2007
5 The following might influence the demand for a good. Which would not cause a shift in the demand curve for the good? A a change in the price of a complement B a change in the price of a substitute C a change in the price of the good itself D a change in consumers’ incomes
1 marks
Answer: C
This question in 9708/11 Oct/Nov 2007
Q10 · What is correct about market supply? 9708/11 Oct/Nov 2007
7 What is correct about market supply? A Market supply can increase only when all individual firms increase their output. B Market supply is effective when consumers have sufficient income to buy the good. C Market supply is the result of aggregating the supply of all individual firms. D Market supply of an inferior good falls as price increases.
1 marks
Answer: C
This question in 9708/11 Oct/Nov 2007
Q11 · Jam and honey are substitutes and honey and beeswax are in joint supply 9708/11 Oct/Nov 2007
10 Jam and honey are substitutes and honey and beeswax are in joint supply. Other things being equal, what will be the result of an increase in the price of jam? price of honey price of beeswax A fall fall B fall rise C rise fall D rise rise
1 marks
Answer: C
This question in 9708/11 Oct/Nov 2007
Q12 · The number of passenger journeys per week by train on a certain route is shown by the… 9708/11 Oct/Nov 2007
11 The number of passenger journeys per week by train on a certain route is shown by the demand curve in the diagram. V P fare T W U demand O R S number of journeys / week Initially the fare is OP, but it is then reduced by PW. Which area measures the amount spent on the extra journeys resulting from the lower fare? A VUT B PWTV C VRST D URST
1 marks
Answer: D
This question in 9708/11 Oct/Nov 2007
Q13 · Brazil and Colombia attempt to control the supply of coffee in the world market to help… 9708/11 Oct/Nov 2007
18 Brazil and Colombia attempt to control the supply of coffee in the world market to help stabilise their incomes. What condition is essential for this to stabilise their incomes effectively? A There must be large firms in the industry. B It must be possible to store the coffee and release stocks when necessary. C Other countries must supply a significant percentage of the total market. D The demand for the product must be elastic.
1 marks
Answer: B
This question in 9708/11 Oct/Nov 2007
Q14 · The demand for a product is affected by a number of influences 9708/11 May/June 2008
5 The demand for a product is affected by a number of influences. What will cause a movement along its demand curve? A a rise in consumers’ income B a rise in the popularity of the product C a rise in the population D a rise in the price of the product
1 marks
Answer: D
This question in 9708/11 May/June 2008
Q15 · Good X is a substitute for good Y and a complement to good Z 9708/11 May/June 2008
6 Good X is a substitute for good Y and a complement to good Z. What would happen after a fall in the price of good X? A Only the demand for X will rise. B Demand for X, Y and Z will rise. C Demand for Y will fall and for Z will rise. D Demand for Y will rise and for Z will fall.
1 marks
Answer: C
This question in 9708/11 May/June 2008
Q16 · A change in the price of a good causes an increase in the quantity of the good demanded 9708/11 Oct/Nov 2008
5 A change in the price of a good causes an increase in the quantity of the good demanded. What would be the nature of the good and the direction of price change for this to be certain to happen? nature of good price change A inferior fall B inferior rise C normal fall D normal rise
1 marks
Answer: C
This question in 9708/11 Oct/Nov 2008
Q17 · There are three firms (X, Y and Z) supplying a market 9708/11 Oct/Nov 2008
9 There are three firms (X, Y and Z) supplying a market. The table shows their supply at four different prices. price ($) firm X’s supply firm Y’s supply firm Z’s supply 10 50 40 10 20 60 60 20 30 85 80 35 40 120 100 55 Which price change is required for market supply to double? A $10 to $20 B $10 to $30 C $20 to $30 D $20 to $40
1 marks
Answer: B
This question in 9708/11 Oct/Nov 2008
Q18 · The diagram shows demand and supply curves for petrol 9708/11 Oct/Nov 2008
11 The diagram shows demand and supply curves for petrol. The present equilibrium is at X. What could be the new equilibrium if there were a large fall in the price of cars? D1 S2 D A S D2 S1 B price X S2 D C D1 S D S1 D2 O quantity
1 marks
Answer: B
This question in 9708/11 Oct/Nov 2008
Q19 · The diagram shows the demand and supply curves for a product 9708/11 Oct/Nov 2008
12 The diagram shows the demand and supply curves for a product. X S price Y W V D O Z quantity Which area measures the total amount consumers would be willing to pay for the equilibrium level of output? A OWYZ B OXYZ C OVYZ D XYV
1 marks
Answer: B
This question in 9708/11 Oct/Nov 2008
Q20 · The diagram shows the average world price of coffee in US cents per pound weight (lb)… 9708/11 Oct/Nov 2008
13 The diagram shows the average world price of coffee in US cents per pound weight (lb) between 1997 and 2005. The price of coffee, 1997 to 2005 150 125 100 US cents / lb 75 50 25 0 1997 2001 2005 year Which event is consistent with the price behaviour shown in the specified time period? A a continuous rise in the price of tea between 1997 and 2001 B the entry to the market of new producers of coffee between 1997 and 2001 C a series of good coffee harvests between 2001 and 2005 D increasing health worries about drinking coffee between 2001 and 2005
1 marks
Answer: B
This question in 9708/11 Oct/Nov 2008
Q21 · What is not held constant when aggregating individual firms’ supply curves to give the… 9708/11 May/June 2009
5 What is not held constant when aggregating individual firms’ supply curves to give the market supply curve? A the number of firms in the industry B the price of the product C the prices of factors of production D the state of technology
1 marks
Answer: B
This question in 9708/11 May/June 2009
Q22 · A change in market conditions causes a reduction in supply 9708/11 Oct/Nov 2009
5 A change in market conditions causes a reduction in supply. This results in a higher price for the product, which has a downward-sloping demand curve. What must be the outcome of this higher price? A an increase in the factors employed in the industry B an increase in producer’s revenue C a reduction in the quantity demanded D a reduction in the demand for substitutes
1 marks
Answer: C
This question in 9708/11 Oct/Nov 2009
Q23 · The demand curve in the diagram shows the relationship between the number of car journeys… 9708/11 Oct/Nov 2009
12 The demand curve in the diagram shows the relationship between the number of car journeys and the cost of a car journey. cost of a car journey D O number of car journeys What would cause the demand curve to shift to the left? A a reduction in car tax B a reduction in petrol prices C a reduction in public transport prices D the introduction of tolls on motorways
1 marks
Answer: C
This question in 9708/11 Oct/Nov 2009
Q24 · A change in market conditions causes a reduction in supply 9708/12 Oct/Nov 2009
4 A change in market conditions causes a reduction in supply. This results in a higher price for the product, which has a downward-sloping demand curve. What must be the outcome of this higher price? A an increase in the factors employed in the industry B an increase in producer’s revenue C a reduction in the quantity demanded D a reduction in the demand for substitutes
1 marks
Answer: C
This question in 9708/12 Oct/Nov 2009
Q25 · The demand curve in the diagram shows the relationship between the number of car journeys… 9708/12 Oct/Nov 2009
11 The demand curve in the diagram shows the relationship between the number of car journeys and the cost of a car journey. cost of a car journey D O number of car journeys What would cause the demand curve to shift to the left? A a reduction in car tax B a reduction in petrol prices C a reduction in public transport prices D the introduction of tolls on motorways
1 marks
Answer: C
This question in 9708/12 Oct/Nov 2009
Q26 · In 2008 the demand curve for new cars in the European Union shifted to the left 9708/11 May/June 2010
6 In 2008 the demand curve for new cars in the European Union shifted to the left. Which change could have caused such a shift? A an increase in real disposable income B an increase in the cost of borrowing C an increase in the price of new cars D an increase in the price of train travel
1 marks
Answer: B
This question in 9708/11 May/June 2010
Q27 · Worldwide, the film industry has increased its expenditure to over $1 billion each year… 9708/11 May/June 2010
7 Worldwide, the film industry has increased its expenditure to over $1 billion each year on successful anti-piracy measures which it finances by charges on DVD products. How would this be shown in a demand and supply diagram of the market for legally produced DVDs? demand curve supply curve A shifts left shifts left B shifts left shifts right C shifts right shifts left D shifts right shifts right
1 marks
Answer: C
This question in 9708/11 May/June 2010
Q28 · In 2008 a disease killed a significant number of sheep used to produce wool 9708/11 May/June 2010
10 In 2008 a disease killed a significant number of sheep used to produce wool. How would the short-run effect be shown on a demand and supply diagram for wool? A a movement down the existing supply curve B a movement up the existing supply curve C a shift to the left of the supply curve D a shift to the right of the supply curve
1 marks
Answer: C
This question in 9708/11 May/June 2010
Q29 · In 2008 the demand curve for new cars in the European Union shifted to the left 9708/12 May/June 2010
5 In 2008 the demand curve for new cars in the European Union shifted to the left. Which change could have caused such a shift? A an increase in real disposable income B an increase in the cost of borrowing C an increase in the price of new cars D an increase in the price of train travel
1 marks
Answer: B
This question in 9708/12 May/June 2010
Q30 · In 2008 the demand curve for new cars in the European Union shifted to the left 9708/13 May/June 2010
4 In 2008 the demand curve for new cars in the European Union shifted to the left. Which change could have caused such a shift? A an increase in real disposable income B an increase in the cost of borrowing C an increase in the price of new cars D an increase in the price of train travel
1 marks
Answer: B
This question in 9708/13 May/June 2010
Q31 · What might shift an individual’s demand curve for petrol to the left? 9708/11 Oct/Nov 2010
5 What might shift an individual’s demand curve for petrol to the left? A a fall in the price of parking B a fall in the price of petrol C a rise in the price of cars D a rise in the price of public transport
1 marks
Answer: C
This question in 9708/11 Oct/Nov 2010
Q32 · What might shift an individual’s demand curve for petrol to the left? 9708/12 Oct/Nov 2010
5 What might shift an individual’s demand curve for petrol to the left? A a fall in the price of parking B a fall in the price of petrol C a rise in the price of cars D a rise in the price of public transport
1 marks
Answer: C
This question in 9708/12 Oct/Nov 2010
Q33 · What might shift an individual’s demand curve for petrol to the left? 9708/13 Oct/Nov 2010
4 What might shift an individual’s demand curve for petrol to the left? A a fall in the price of parking B a fall in the price of petrol C a rise in the price of cars D a rise in the price of public transport
1 marks
Answer: C
This question in 9708/13 Oct/Nov 2010
Q34 · What is consistent with an individual demand curve that slopes down from left to right? 9708/11 May/June 2011
5 What is consistent with an individual demand curve that slopes down from left to right? A As price falls, a person switches away from rival products towards the product. B As price falls, a person’s willingness and ability to buy the product will decline. C As price rises, a person becomes less sensitive to price changes. D As price rises, a person’s opportunity cost of purchasing the product falls.
1 marks
Answer: A
This question in 9708/11 May/June 2011
Q35 · What will cause the demand curve for domestically produced cars to shift to the left? 9708/11 May/June 2011
6 What will cause the demand curve for domestically produced cars to shift to the left? A an increase in the costs of production of domestically produced cars B a reduction in taxes on the purchase of cars C a reduction in the tariff on imported cars D a reduction in the tax on petrol
1 marks
Answer: C
This question in 9708/11 May/June 2011
Q36 · The diagrams show changes in the market for a good 9708/11 May/June 2011
7 The diagrams show changes in the market for a good. 1 2 3 S S S S1 price price price D1 D1 D D D O quantity O quantity O quantity Which diagrams represent ‘a change in the quantity demanded’? A 1 and 2 B 1 and 3 C 1 only D 3 only
1 marks
Answer: D
This question in 9708/11 May/June 2011
Q37 · In the diagram D and S are the demand and supply curves of a good 9708/11 May/June 2011
9 In the diagram D and S are the demand and supply curves of a good. S S1 price D O quantity What could cause the supply curve to shift in the short run to S1? A a change in consumer preferences B a decrease in the price of a complementary good C a fall in the cost of raw materials D a government warning that consumption of the good can damage health
1 marks
Answer: C
This question in 9708/11 May/June 2011
Q38 · What is consistent with an individual demand curve that slopes down from left to right? 9708/12 May/June 2011
4 What is consistent with an individual demand curve that slopes down from left to right? A As price falls, a person switches away from rival products towards the product. B As price falls, a person’s willingness and ability to buy the product will decline. C As price rises, a person becomes less sensitive to price changes. D As price rises, a person’s opportunity cost of purchasing the product falls.
1 marks
Answer: A
This question in 9708/12 May/June 2011
Q39 · What will cause the demand curve for domestically produced cars to shift to the left? 9708/12 May/June 2011
5 What will cause the demand curve for domestically produced cars to shift to the left? A an increase in the costs of production of domestically produced cars B a reduction in taxes on the purchase of cars C a reduction in the tariff on imported cars D a reduction in the tax on petrol
1 marks
Answer: C
This question in 9708/12 May/June 2011
Q40 · In the diagram D and S are the demand and supply curves of a good 9708/12 May/June 2011
8 In the diagram D and S are the demand and supply curves of a good. S S1 price D O quantity What could cause the supply curve to shift in the short run to S1? A a change in consumer preferences B a decrease in the price of a complementary good C a fall in the cost of raw materials D a government warning that consumption of the good can damage health
1 marks
Answer: C
This question in 9708/12 May/June 2011
Q41 · What is consistent with an individual demand curve that slopes down from left to right? 9708/13 May/June 2011
3 What is consistent with an individual demand curve that slopes down from left to right? A As price falls, a person switches away from rival products towards the product. B As price falls, a person’s willingness and ability to buy the product will decline. C As price rises, a person becomes less sensitive to price changes. D As price rises, a person’s opportunity cost of purchasing the product falls.
1 marks
Answer: A
This question in 9708/13 May/June 2011
Q42 · What will cause the demand curve for domestically produced cars to shift to the left? 9708/13 May/June 2011
4 What will cause the demand curve for domestically produced cars to shift to the left? A an increase in the costs of production of domestically produced cars B a reduction in taxes on the purchase of cars C a reduction in the tariff on imported cars D a reduction in the tax on petrol
1 marks
Answer: C
This question in 9708/13 May/June 2011
Q43 · The diagrams show changes in the market for a good 9708/13 May/June 2011
5 The diagrams show changes in the market for a good. 1 2 3 S S S S1 price price price D1 D1 D D D O quantity O quantity O quantity Which diagrams represent ‘a change in the quantity demanded’? A 1 and 2 B 1 and 3 C 1 only D 3 only
1 marks
Answer: D
This question in 9708/13 May/June 2011
Q44 · In the diagram D and S are the demand and supply curves of a good 9708/13 May/June 2011
7 In the diagram D and S are the demand and supply curves of a good. S S1 price D O quantity What could cause the supply curve to shift in the short run to S1? A a change in consumer preferences B a decrease in the price of a complementary good C a fall in the cost of raw materials D a government warning that consumption of the good can damage health
1 marks
Answer: C
This question in 9708/13 May/June 2011
Q45 · The diagram shows a demand curve for a good 9708/11 Oct/Nov 2011
5 The diagram shows a demand curve for a good. price D O quantity Which statement describes the nature of this demand curve? A A fall in price is the result of a fall in demand. B A greater or smaller quantity is demanded as price changes. C As demand increases so does price. D Quantity changes in proportion to the change in price.
1 marks
Answer: B
This question in 9708/11 Oct/Nov 2011
Q46 · How would an economist establish the market demand curve for a private good? 9708/11 Oct/Nov 2011
6 How would an economist establish the market demand curve for a private good? A by adding consumer surplus to total expenditure B by combining individual demand curves horizontally C by combining the price elasticity of individual demands D by multiplying price by quantity demanded
1 marks
Answer: B
This question in 9708/11 Oct/Nov 2011
Q47 · What could cause a shift in the supply curve of good X and a movement along its supply… 9708/11 Oct/Nov 2011
7 What could cause a shift in the supply curve of good X and a movement along its supply curve? shift in the curve movement along the curve A a change in consumer preferences an increase in the price of a substitute good B a decrease in factor productivity the imposition of a tax on good X C an increase in the price of a an increase in factor productivity complementary good D an increase in the wage rates a change in consumer preferences in the industry
1 marks
Answer: D
This question in 9708/11 Oct/Nov 2011
Q48 · During a period of falling incomes in Germany in 2009, demand for jewellery declined 9708/12 Oct/Nov 2011
5 During a period of falling incomes in Germany in 2009, demand for jewellery declined. There was, however, a rise in demand for frozen foods. How would the effect on the demand for the two products be illustrated? jewellery frozen food A a movement downwards a movement upwards along the demand curve along the demand curve B a movement upwards a shift to the right of along the demand curve the demand curve C a shift to the left of a shift to the right of the demand curve the demand curve D a shift to the right of a movement upwards the demand curve along the demand curve
1 marks
Answer: C
This question in 9708/12 Oct/Nov 2011
Q49 · When demand for a good falls, its price falls 9708/12 Oct/Nov 2011
12 When demand for a good falls, its price falls. What is the function of the price fall? A to eliminate shortages B to reduce consumer surplus C to send a signal to producers D to stimulate a further fall in demand
1 marks
Answer: C
This question in 9708/12 Oct/Nov 2011
Q50 · The diagram shows a demand curve for a good 9708/13 Oct/Nov 2011
3 The diagram shows a demand curve for a good. price D O quantity Which statement describes the nature of this demand curve? A A fall in price is the result of a fall in demand. B A greater or smaller quantity is demanded as price changes. C As demand increases so does price. D Quantity changes in proportion to the change in price.
1 marks
Answer: B
This question in 9708/13 Oct/Nov 2011
Q51 · How would an economist establish the market demand curve for a private good? 9708/13 Oct/Nov 2011
4 How would an economist establish the market demand curve for a private good? A by adding consumer surplus to total expenditure B by combining individual demand curves horizontally C by combining the price elasticity of individual demands D by multiplying price by quantity demanded
1 marks
Answer: B
This question in 9708/13 Oct/Nov 2011
Q52 · What is necessary for consumer surplus to be zero? 9708/13 Oct/Nov 2011
11 What is necessary for consumer surplus to be zero? A Demand is perfectly elastic. B Demand is perfectly inelastic. C Supply is perfectly elastic. D Supply is perfectly inelastic.
1 marks
Answer: A
This question in 9708/13 Oct/Nov 2011
Q53 · What is a market demand curve? 9708/11 May/June 2012
5 What is a market demand curve? A the demand for all of a country’s products B the total sum of individual demand curves for a product C the output of all the firms in an industry D the stocks of a particular good available for sale
1 marks
Answer: B
This question in 9708/11 May/June 2012
Q54 · The table gives the short-run supply schedules of three firms X, Y and Z, which comprise… 9708/11 May/June 2012
8 The table gives the short-run supply schedules of three firms X, Y and Z, which comprise an industry. price quantity supplied (units) ($) firm X firm Y firm Z 1 200 – – 2 300 100 – 3 400 160 140 4 500 300 200 Which is a point on the short-run supply schedule of the industry? price ($) quantity supplied (units) A 1 600 B 3 650 C 3 700 D 4 900
1 marks
Answer: C
This question in 9708/11 May/June 2012
Q55 · The diagram shows the demand and supply curves of a commodity before and after a specific… 9708/11 May/June 2012
9 The diagram shows the demand and supply curves of a commodity before and after a specific tax is removed. S S 12 10 8 price 6 4 2 D 0 quantity What is the tax per unit of output and what is the price after the removal of the tax? price after the tax per unit removal of the tax A 6 6 B 6 8 C 4 6 D 4 8
1 marks
Answer: A
This question in 9708/11 May/June 2012
Q56 · What is a market demand curve? 9708/12 May/June 2012
5 What is a market demand curve? A the demand for all of a country’s products B the total sum of individual demand curves for a product C the output of all the firms in an industry D the stocks of a particular good available for sale
1 marks
Answer: B
This question in 9708/12 May/June 2012
Q57 · The table gives the short-run supply schedules of three firms X, Y and Z, which comprise… 9708/12 May/June 2012
6 The table gives the short-run supply schedules of three firms X, Y and Z, which comprise an industry. price quantity supplied (units) ($) firm X firm Y firm Z 1 100 – – 2 150 50 – 3 200 80 70 4 250 150 100 Which is a point on the short-run supply schedule of the industry? quantity price supplied ($) (units) A 2 300 B 3 350 C 3 450 D 4 1150
1 marks
Answer: B
This question in 9708/12 May/June 2012
Q58 · The table gives the short-run supply schedules of three firms X, Y and Z, which comprise… 9708/13 May/June 2012
8 The table gives the short-run supply schedules of three firms X, Y and Z, which comprise an industry. price quantity supplied (units) ($) firm X firm Y firm Z 1 200 – – 2 300 100 – 3 400 160 140 4 500 300 200 Which is a point on the short-run supply schedule of the industry? price ($) quantity supplied (units) A 1 600 B 3 650 C 3 700 D 4 900
1 marks
Answer: C
This question in 9708/13 May/June 2012
Q59 · What will happen to an industry’s supply curve if new firms enter the industry? 9708/11 Oct/Nov 2012
5 What will happen to an industry’s supply curve if new firms enter the industry? A It will shift to the left at any given price. B It will shift to the right at any given price. C There will be a downward movement along the supply curve. D There will be an upward movement along the supply curve.
1 marks
Answer: B
This question in 9708/11 Oct/Nov 2012
Q60 · The number of passenger journeys per week by train on a certain route is shown by the… 9708/11 Oct/Nov 2012
6 The number of passenger journeys per week by train on a certain route is shown by the demand curve in the diagram. V P T fare W U demand O R S number of journeys / week Initially the fare is OP, but it is then reduced by PW. Which area measures the amount spent on the extra journeys resulting from the lower fare? A VUT B PWTV C VRST D URST
1 marks
Answer: D
This question in 9708/11 Oct/Nov 2012
Q61 · What must be the effect on consumer surplus if the supply of a product, that has a normal… 9708/11 Oct/Nov 2012
12 What must be the effect on consumer surplus if the supply of a product, that has a normal demand curve, halves? A Consumer surplus will fall. B Consumer surplus will fall by 50 %. C Consumer surplus will rise. D Consumer surplus will rise by 100 %.
1 marks
Answer: A
This question in 9708/11 Oct/Nov 2012
Q62 · What does not cause the demand curve for a good to shift its position? 9708/12 Oct/Nov 2012
5 What does not cause the demand curve for a good to shift its position? A advertising expenditure B consumer tastes C the price of substitute goods D the price of the good
1 marks
Answer: D
This question in 9708/12 Oct/Nov 2012
Q63 · The diagram shows the market for computer games 9708/12 Oct/Nov 2012
10 The diagram shows the market for computer games. The market starts in equilibrium at X. What will be the new equilibrium if the tax on computer games is increased and incomes fall? S2 S1 S3 A B price of X computer games C D D2 D1 O quantity of computer games
1 marks
Answer: B
This question in 9708/12 Oct/Nov 2012
Q64 · When will the demand curve for motorcycles shift to the left? 9708/13 Oct/Nov 2012
5 When will the demand curve for motorcycles shift to the left? A when the price of cars falls B when the price of motorcycles falls C when the tax on motorcycles rises D when the price of public transport rises
1 marks
Answer: A
This question in 9708/13 Oct/Nov 2012
Q65 · There are three firms, X, Y and Z, supplying a market 9708/13 Oct/Nov 2012
6 There are three firms, X, Y and Z, supplying a market. The table shows their supply at four different prices. firm X’s firm Y’s firm Z’s price ($) supply supply supply 70 60 60 30 80 65 70 65 90 75 80 95 100 80 90 130 Which price change is required for market supply to halve? A $90 to $70 B $90 to $80 C $100 to $70 D $100 to $90
1 marks
Answer: C
This question in 9708/13 Oct/Nov 2012
Q66 · The diagram shows the market for coffee 9708/13 Oct/Nov 2012
10 The diagram shows the market for coffee. The initial equilibrium position is X. The price of tea, a substitute, falls and an indirect tax is imposed on coffee. What will be the new equilibrium position? S1 B price of X C coffee A D D1 O quantity of coffee
1 marks
Answer: A
This question in 9708/13 Oct/Nov 2012
Q67 · In 2009, demand for second-hand used cars in Venezuela increased 9708/11 May/June 2013
5 In 2009, demand for second-hand used cars in Venezuela increased. What could have explained this? A a decrease in the number of Venezuelans passing their driving test B a decrease in the price of public transport C an increase in restrictions on new cars imported into Venezuela D an increase in the domestic production of cars
1 marks
Answer: C
This question in 9708/11 May/June 2013
Q68 · In 2008, Ansell, makers of surgical products and rubber gloves, increased profits by 2.6… 9708/11 May/June 2013
8 In 2008, Ansell, makers of surgical products and rubber gloves, increased profits by 2.6 %, partly because of increased safety and health concerns in Brazil, Mexico, China and Russia. What would happen to the demand and supply curves on a diagram for Ansell’s products? demand curve supply curve A a shift to the left a shift to the left B a shift to the left a shift to the right C a shift to the right no change D no change a shift to the left
1 marks
Answer: C
This question in 9708/11 May/June 2013
Q69 · What will cause a shift in the demand curve for a computer? 9708/12 May/June 2013
5 What will cause a shift in the demand curve for a computer? A a change in the cost of production of the computer B a change in the price of the computer C a change in the performance of the computer D the imposition of a specific tax on the computer
1 marks
Answer: C
This question in 9708/12 May/June 2013
Q70 · If the price of maize rises, the quantity of maize demanded should fall 9708/12 May/June 2013
6 If the price of maize rises, the quantity of maize demanded should fall. If the demand for maize decreases, the price of maize should rise. What can be said about these two statements? first statement second statement A correct correct B correct incorrect C incorrect correct D incorrect incorrect
1 marks
Answer: B
This question in 9708/12 May/June 2013
Q71 · A supply curve is represented by the equation, quantity supplied = 10 + 5P, where P = the… 9708/12 May/June 2013
9 A supply curve is represented by the equation, quantity supplied = 10 + 5P, where P = the price of the product. Which price rise would cause the quantity supplied to double? A $1 to $2 B $1 to $3 C $1 to $4 D $1 to $5
1 marks
Answer: C
This question in 9708/12 May/June 2013
Q72 · Firm Z is one of a number of firms producing televisions 9708/12 May/June 2013
10 Firm Z is one of a number of firms producing televisions. What would cause firm Z’s supply curve to shift to the left whilst the market supply curve for televisions shifts to the right? A Firm Z benefits more from advances in technology than the other firms in the industry. B Firm Z experiences a strike whilst more firms enter the industry. C Firm Z passes on more of a tax to its customers than the other firms in the industry. D Firm Z reduces its costs of raw materials whilst other firms in the industry lower their wage costs.
1 marks
Answer: B
This question in 9708/12 May/June 2013
Q73 · Which change does not have an immediate effect on the position of the demand curve for a… 9708/13 May/June 2013
5 Which change does not have an immediate effect on the position of the demand curve for a product? A a fall in the price of a complementary product B an increase in the labour costs of its production C a range of new products entering the market D a rise in the price of a substitute product
1 marks
Answer: B
This question in 9708/13 May/June 2013
Q74 · Palm oil and sunflower oil are substitutes 9708/13 May/June 2013
10 Palm oil and sunflower oil are substitutes. Palm oil and palm kernel cake for animal feed are in joint supply. Other things being equal, what will be the effects of a fall in the price of sunflower oil? price of price of palm palm oil kernel cake A fall fall B fall rise C rise fall D rise rise
1 marks
Answer: B
This question in 9708/13 May/June 2013
Q75 · A rise in the price of a good is accompanied by an increase in the quantity demanded 9708/13 May/June 2013
11 A rise in the price of a good is accompanied by an increase in the quantity demanded. What could explain this? A Consumers spend a high proportion of disposable income on the good. B The price of a complementary good has also increased. C The substitute goods are all very much more expensive. D The price of the good is taken to be an indication of the level of quality.
1 marks
Answer: D
This question in 9708/13 May/June 2013
Q76 · It is expected that the price of gold rings will increase in the future 9708/11 Oct/Nov 2013
5 It is expected that the price of gold rings will increase in the future. Which diagram shows the impact this expectation is likely to have on demand for gold rings in the present? A B D D start point price of start point price of gold rings gold rings D D O quantity of gold rings O quantity of gold rings C D D1 D D D1 price of price of gold rings gold rings D1 D D D1 O quantity of gold rings O quantity of gold rings
1 marks
Answer: C
This question in 9708/11 Oct/Nov 2013
Q77 · Which combination of changes could leave the position of the demand curve for a normal… 9708/11 Oct/Nov 2013
6 Which combination of changes could leave the position of the demand curve for a normal good X unchanged? A a decrease in taste for product X and a decrease in the quality of product Y for which product X is a complement B a decrease in the quality of a substitute and an increase in incomes C an increase in the price of a substitute and an increase in population size D an increase in the price of product Y for which product X is a complement and a successful advertising campaign for product X
1 marks
Answer: D
This question in 9708/11 Oct/Nov 2013
Q78 · The diagram represents the market for diamonds 9708/12 Oct/Nov 2013
6 The diagram represents the market for diamonds. S2 D P2 S1 price S2 P1 D S1 O Q2 Q1 quantity What could have caused price to change from P1 to P2? A a fall in the price of substitute gems B a fall in the tax on diamonds C a rise in the productivity of diamond miners D a rise in the wages of diamond miners
1 marks
Answer: D
This question in 9708/12 Oct/Nov 2013
Q79 · How is the market supply of a product in a competitive market obtained? 9708/12 Oct/Nov 2013
7 How is the market supply of a product in a competitive market obtained? A by aggregating the supply of all firms producing the product B by averaging the supply of all firms producing the product C by calculating the supply of the typical firm producing the product D by estimating the supply of the largest firm producing the product
1 marks
Answer: A
This question in 9708/12 Oct/Nov 2013
Q80 · The diagram shows the demand for a product for which there are only three buyers… 9708/12 Oct/Nov 2013
8 The diagram shows the demand for a product for which there are only three buyers, Freeman, Hardy and Willis. D 25 20 price 15 ($) 10 5 D 0 0 10 20 30 40 50 quantity The table shows the demand from two of the three buyers. price ($) Freeman’s demand Hardy’s demand 10 24 6 15 15 5 20 6 4 Which statement about the demand for the product from Willis is correct? A It has unitary price elasticity of demand. B It is a downward sloping straight line demand curve. C It is a perfectly elastic demand curve. D It is a perfectly inelastic demand curve.
1 marks
Answer: D
This question in 9708/12 Oct/Nov 2013
Q81 · The diagram shows the demand for telephone calls in four countries in 2004 and 2009 9708/13 Oct/Nov 2013
5 The diagram shows the demand for telephone calls in four countries in 2004 and 2009. telephone calls France minutes per month fixed mobile Germany line 2004 2009 Spain Japan 0 200 400 600 Which statement about the demand for telephone calls is correct? A Between 2004 and 2009 the demand for fixed line calls decreased in each of the four countries. B Between 2004 and 2009 the total demand for telephone calls increased in each of the four countries. C In 2004 demand for fixed line calls was greater than demand for mobile calls in each of the four countries. D In 2009 demand for mobile calls was greater than demand for fixed line calls in each of the four countries.
1 marks
Answer: C
This question in 9708/13 Oct/Nov 2013
Q82 · There are three firms (X, Y and Z) supplying a market 9708/13 Oct/Nov 2013
6 There are three firms (X, Y and Z) supplying a market. The table shows their supply at four different prices. price ($) firm X’s supply firm Y’s supply firm Z’s supply 10 50 40 10 20 60 60 20 30 85 80 35 40 120 100 55 Which price change is required for market supply to double? A $10 to $20 B $10 to $30 C $20 to $30 D $20 to $40
1 marks
Answer: B
This question in 9708/13 Oct/Nov 2013
Q83 · In the diagram, D1 is the initial demand curve for student places at universities 9708/11 May/June 2014
6 In the diagram, D1 is the initial demand curve for student places at universities. D1 D2 fees D2 D1 O student places What could cause the demand curve to shift to D2? A a decrease in student fees for universities B a decrease in the level of youth unemployment C an increase in graduate earnings compared with non-graduate earnings D higher A Level grades demanded for university entrance
1 marks
Answer: C
This question in 9708/11 May/June 2014
Q84 · The diagram shows the demand for and supply of a product 9708/11 May/June 2014
9 The diagram shows the demand for and supply of a product. D price S O quantity What can be deduced about the product? A It has infinite price elasticity of demand. B It has no substitutes. C It is an inferior good. D It takes a large proportion of consumer income.
1 marks
Answer: B
This question in 9708/11 May/June 2014
Q85 · The demand curve in the diagram shows the relationship between the number of car journeys… 9708/12 May/June 2014
5 The demand curve in the diagram shows the relationship between the number of car journeys and the cost of a car journey. cost of a car journey D O number of car journeys What would cause the demand curve to shift to the left? A a reduction in car tax B a reduction in petrol prices C a reduction in public transport prices D the introduction of tolls on motorways
1 marks
Answer: C
This question in 9708/12 May/June 2014
Q86 · What might cause a market supply curve to shift to the right? 9708/12 May/June 2014
9 What might cause a market supply curve to shift to the right? A increased government subsidies B increased labour costs C increased product advertising D lower income tax rates
1 marks
Answer: A
This question in 9708/12 May/June 2014
Q87 · What would not cause the demand curve for foreign holidays to shift to the left? 9708/13 May/June 2014
5 What would not cause the demand curve for foreign holidays to shift to the left? A a fall in consumers’ disposable income B a fall in the price of domestic holidays C a rise in advertising of domestic holidays D a rise in the price of foreign holidays
1 marks
Answer: D
This question in 9708/13 May/June 2014
Q88 · A movement along a supply curve for a product is likely to occur if there is a rise in A… 9708/13 May/June 2014
9 A movement along a supply curve for a product is likely to occur if there is a rise in A the demand for a complementary product. B the distribution costs of the product. C the subsidy a producer receives for producing the product. D the wages of the employees who produce the product.
1 marks
Answer: A
This question in 9708/13 May/June 2014
Q89 · What might shift an individual’s demand curve for petrol to the right? 9708/11 Oct/Nov 2014
5 What might shift an individual’s demand curve for petrol to the right? A a fall in the price of cars B a fall in the price of public transport C a rise in the price of parking D a rise in the price of petrol
1 marks
This question in 9708/11 Oct/Nov 2014
Q90 · A country imports components which it uses in the production of electrical goods for the… 9708/11 Oct/Nov 2014
22 A country imports components which it uses in the production of electrical goods for the domestic market. The country is experiencing a rise in incomes. What is likely to happen to the price of electrical goods and the country’s balance of trade? price of balance electrical goods of trade A fall improve B fall worsen C rise improve D rise worsen
1 marks
This question in 9708/11 Oct/Nov 2014
Q91 · The market price of a product rose from $8 to $10 and as a result the market demand fell… 9708/12 Oct/Nov 2014
5 The market price of a product rose from $8 to $10 and as a result the market demand fell from 20 000 to 8000 a week. Consumer X’s demand declined from 30 to 24 and consumer Y’s demand fell from 100 to 60 a week. What can be concluded from this information? A Consumer X’s demand for the product was more elastic than the market demand. B Consumer X’s percentage share of the market increased. C Producer’s total profit fell. D Producer’s total revenue rose.
1 marks
Answer: B
This question in 9708/12 Oct/Nov 2014
Q92 · The diagram shows the supply curve of coffee in an economy 9708/12 Oct/Nov 2014
9 The diagram shows the supply curve of coffee in an economy. supply Y price X O quantity The market equilibrium is initially at point X, but a change moves it to point Y. What might explain this? A an increase in wages paid by producers of coffee B a switch in consumer tastes from coffee to tea C an increase in the price of tea D a tax imposed on coffee producers
1 marks
Answer: C
This question in 9708/12 Oct/Nov 2014
Q93 · A firm publishes and sells magazines 9708/13 Oct/Nov 2014
9 A firm publishes and sells magazines. The diagram shows a shift in the firm’s supply curve from S1 to S2. S1 S2 price of magazines O quantity of magazines What would have caused this shift in the firm’s supply curve? A a fall in the subsidies paid to magazine publishers B a fall in the price of paper C a rise in the real income of customers D a rise in the wages of the firm’s workers
1 marks
Answer: B
This question in 9708/13 Oct/Nov 2014
Q94 · In the diagram, D1D1 shows an individual’s initial demand curve for public transport 9708/11 May/June 2015
5 In the diagram, D1D1 shows an individual’s initial demand curve for public transport. D2 price of public D1 transport D1 O quantity of public transport What could cause the demand curve to shift to D2D1? A The costs of running the individual’s car fall. B The individual is no longer able to drive. C The price of public transport falls. D The public transport services are reduced.
1 marks
Answer: B
This question in 9708/11 May/June 2015
Q95 · The diagram shows a demand curve for a good 9708/12 May/June 2015
5 The diagram shows a demand curve for a good. price D O quantity Which statement describes the nature of this demand curve? A A greater or smaller quantity is demanded as price changes. B A lower price is the result of a fall in demand. C As demand increases so does price. D Quantity changes in proportion to the change in price.
1 marks
Answer: A
This question in 9708/12 May/June 2015
Q96 · Assume that Tiger Woods, a famous golfer, announces that his final golf appearance will… 9708/12 May/June 2015
6 Assume that Tiger Woods, a famous golfer, announces that his final golf appearance will be at the next US Open Tournament. How might this affect the demand for tickets for the tournament? A It will cause a movement downward along the demand curve. B It will cause a movement upward along the demand curve. C It will cause a shift to the left in the position of the demand curve. D It will cause a shift to the right in the position of the demand curve.
1 marks
Answer: D
This question in 9708/12 May/June 2015
Q97 · Buses currently run every two hours between X and Y 9708/13 May/June 2015
5 Buses currently run every two hours between X and Y. The bus company which operates the service decides to introduce an hourly service. How will this most likely affect the number of passengers carried per day and the number of passengers carried per journey? number of number of passengers per day passengers per journey A increase decrease B increase uncertain C unchanged decrease D unchanged uncertain
1 marks
Answer: B
This question in 9708/13 May/June 2015
Q98 · The Toyota Motor Corporation makes cars in response to customer orders rather than… 9708/13 May/June 2015
8 The Toyota Motor Corporation makes cars in response to customer orders rather than attempting to sell cars it has already built. If the company received a large increase in orders for its Prius model, what will be expected of its current supply curve on a demand and supply diagram? A It will be unchanged. B It will become flatter. C It will shift to the left. D It will shift to the right.
1 marks
Answer: A
This question in 9708/13 May/June 2015
Q99 · During a certain period, 10 000 units of a normal good are sold at a price of US$20 9708/13 May/June 2015
11 During a certain period, 10 000 units of a normal good are sold at a price of US$20. During a later period, 12 000 units are sold at a price of US$22. What could explain this change? A an increase in indirect taxation B an increase in the cost of raw materials C an increase in the price of a substitute commodity D an increase in the productivity of factors of production
1 marks
Answer: C
This question in 9708/13 May/June 2015
Q100 · The final of a major sports event is held in a stadium which has a fixed capacity of 40… 9708/13 May/June 2015
12 The final of a major sports event is held in a stadium which has a fixed capacity of 40 000 people. The price for a seat is set at PF but when the tickets go on sale all tickets are sold very quickly with many disappointed people unable to buy a ticket. Which diagram best represents this? A B S S PF price price PF D D O O 40 000 40 000 quantity quantity C D S S PF price price PF D D O O 40 000 40 000 quantity quantity
1 marks
Answer: D
This question in 9708/13 May/June 2015
Q101 · In recent years, downloading music to computers and other electronic devices has become… 9708/13 May/June 2015
13 In recent years, downloading music to computers and other electronic devices has become more popular replacing other ways of buying music, e.g. compact discs (CDs). What is likely to happen to the price and the amount of resources allocated to each of these markets? downloaded music market CD market resources resources price price allocated allocated A decrease decrease increase decrease B decrease increase increase increase C increase decrease decrease increase D increase increase decrease decrease
1 marks
Answer: D
This question in 9708/13 May/June 2015
Q102 · A government tried to increase the sales of cars by offering consumers $3000 if they… 9708/11 Oct/Nov 2015
5 A government tried to increase the sales of cars by offering consumers $3000 if they scrapped any car over 10 years old and bought a new one. How would this be shown on a demand and supply diagram for new cars? A The demand curve would move to the left. B The demand curve would move to the right. C There would be a shift along the demand curve to the left. D There would be a shift along the demand curve to the right.
1 marks
Answer: B
This question in 9708/11 Oct/Nov 2015
Q103 · Good X and good Y are in joint supply 9708/11 Oct/Nov 2015
6 Good X and good Y are in joint supply. When would an increase in the supply of good X not lead to a change in the price of good X? A Good X has a perfect price elasticity of demand. B Good X has a perfect price inelasticity of demand. C Good Y has a perfect price elasticity of demand. D Good Y has a perfect price inelasticity of demand.
1 marks
Answer: A
This question in 9708/11 Oct/Nov 2015
Q104 · What is not held constant when aggregating individual firms’ supply curves to give the… 9708/11 Oct/Nov 2015
8 What is not held constant when aggregating individual firms’ supply curves to give the short-run market supply curve? A the number of firms in the industry B the price of the product C the prices of factors of production D the state of technology
1 marks
Answer: B
This question in 9708/11 Oct/Nov 2015
Q105 · In the diagram, S1 is the initial market supply curve of good X 9708/11 Oct/Nov 2015
9 In the diagram, S1 is the initial market supply curve of good X. S1 S2 price O quantity What could cause the curve to shift to S2? A an increase in the price of a substitute good B an increase in the profitability of supplying good X C an increase in the wage rates paid by good X suppliers D the introduction of a specific tax on good X
1 marks
Answer: B
This question in 9708/11 Oct/Nov 2015
Q106 · The diagram shows the demand curve for housing 9708/12 Oct/Nov 2015
5 The diagram shows the demand curve for housing. price D O quantity What is not assumed to remain constant when drawing this curve? A consumer incomes B expectations about future house prices C the price of houses D the rate of interest charged on loans for house purchase
1 marks
Answer: C
This question in 9708/12 Oct/Nov 2015
Q107 · What does not cause the demand curve for cars to shift to the right? 9708/12 Oct/Nov 2015
6 What does not cause the demand curve for cars to shift to the right? A a fall in the price of petrol (gas) B a fall in the price of public transport C an advertising campaign by car manufacturers D an economy-wide increase in incomes
1 marks
Answer: B
This question in 9708/12 Oct/Nov 2015
Q108 · The diagram shows a supply curve for beef 9708/12 Oct/Nov 2015
9 The diagram shows a supply curve for beef. S price O quantity What explains why the supply curve for beef slopes upwards? A An increase in the demand for beef will bring about an increase in supply. B Farmers’ productivity rises as the price rises. C Increased production leads to a reduction in costs. D The cost of additional beef production rises as output increases.
1 marks
Answer: D
This question in 9708/12 Oct/Nov 2015
Q109 · What is correct about market demand? 9708/13 Oct/Nov 2015
5 What is correct about market demand? A Market demand can increase only when all individuals increase their consumption. B Market demand for an inferior good falls as price falls. C Market demand is effective when consumers desire to buy the good. D Market demand is the result of aggregating the demand of all individuals.
1 marks
Answer: D
This question in 9708/13 Oct/Nov 2015
Q110 · D1D1 shows an individual’s initial demand curve for public transport 9708/13 Oct/Nov 2015
6 D1D1 shows an individual’s initial demand curve for public transport. D1 price of public D2 transport D1 O quantity of public transport What would cause the demand curve to shift to D2D1? A The cost of running the individual’s car rises. B The individual is banned from driving. C The price of public transport rises. D The quality of public transport declines.
1 marks
Answer: D
This question in 9708/13 Oct/Nov 2015
Q111 · The diagrams show changes in the market for a good 9708/13 Oct/Nov 2015
9 The diagrams show changes in the market for a good. 1 2 3 S S S S1 price price price D1 D1 D D D O quantity O quantity O quantity Which show(s) an increase in the quantity supplied? A 1 and 2 B 2 and 3 C 1 only D 3 only
1 marks
Answer: C
This question in 9708/13 Oct/Nov 2015
Q112 · A rise in the price of a good is accompanied by an increase in the quantity demanded 9708/12 Feb/March 2016
5 A rise in the price of a good is accompanied by an increase in the quantity demanded. What could explain this? A Consumers spend a high proportion of disposable income on the good. B The price of a complementary good has also increased. C The price of the good is taken to be an indication of the level of quality. D The substitute goods are all very much more expensive.
1 marks
Answer: C
This question in 9708/12 Feb/March 2016
Q113 · What causes the demand curve for an inferior good to shift to the right? 9708/12 Feb/March 2016
6 What causes the demand curve for an inferior good to shift to the right? A a decrease in consumer incomes B a decrease in income tax C a decrease in the price of a substitute good D a decrease in the price of the good
1 marks
Answer: A
This question in 9708/12 Feb/March 2016
Q114 · The demand for tablets increases, while the cost of producing them decreases 9708/12 Feb/March 2016
10 The demand for tablets increases, while the cost of producing them decreases. What will be the effect on the price of tablets and on the quantity supplied? price quantity A fall uncertain B rise increase C uncertain increase D uncertain uncertain
1 marks
Answer: C
This question in 9708/12 Feb/March 2016
Q115 · What describes a market supply curve? 9708/12 May/June 2016
5 What describes a market supply curve? A It is downward sloping. B It is the same as the aggregate supply curve. C It is the sum of all firms’ supply curves for a product. D It is the supply of all products within an economy.
1 marks
Answer: C
This question in 9708/12 May/June 2016
Q116 · The demand curve for new cars in a country shifted to the left 9708/12 May/June 2016
6 The demand curve for new cars in a country shifted to the left. Which change could have caused such a shift? A an increase in real disposable income B an increase in the cost of borrowing C an increase in the price of new cars D an increase in the price of train travel
1 marks
Answer: B
This question in 9708/12 May/June 2016
Q117 · Which change does not have an immediate effect on the position of the demand curve for a… 9708/13 May/June 2016
5 Which change does not have an immediate effect on the position of the demand curve for a product? A a fall in the price of a complementary product B a range of new products entering the market C a rise in the labour costs of its production D an increase in the price of a substitute product
1 marks
Answer: C
This question in 9708/13 May/June 2016
Q118 · What is correct about market supply? 9708/13 May/June 2016
6 What is correct about market supply? A Market supply can increase only when all individual firms increase their output. B Market supply is effective when consumers have sufficient income to buy the good. C Market supply is the result of aggregating the supply of all individual firms. D Market supply of an inferior good falls as price increases.
1 marks
Answer: C
This question in 9708/13 May/June 2016
Q119 · The diagram shows the demand for air travel in Asia 9708/11 Oct/Nov 2016
5 The diagram shows the demand for air travel in Asia. price D1 D2 O quantity If air travel is a normal good, what could have caused the shift in the demand curve from D1 to D2? A a fall in employment in Asia B a fall in the price of aviation fuel C an increase in road congestion D an increase in the price of train travel
1 marks
Answer: A
This question in 9708/11 Oct/Nov 2016
Q120 · What will not cause a shift in the market supply curve of a commodity? 9708/11 Oct/Nov 2016
6 What will not cause a shift in the market supply curve of a commodity? A a change in technology B a rise in the price of a factor input C a rise in the price of the commodity D the introduction of a specific tax on the commodity
1 marks
Answer: C
This question in 9708/11 Oct/Nov 2016
Q121 · What could not cause a shift in an individual’s demand curve for good Z? 9708/12 Oct/Nov 2016
5 What could not cause a shift in an individual’s demand curve for good Z? A a change in advertising expenditure on Z B a change in the individual’s income C a change in the individual’s tastes D a change in the price of Z
1 marks
Answer: D
This question in 9708/12 Oct/Nov 2016
Q122 · What is most likely to increase the quantity of houses supplied? 9708/12 Oct/Nov 2016
6 What is most likely to increase the quantity of houses supplied? A a policy to help house buyers on modest incomes B a restriction on the level of rent that can be charged C a rise in the tax on materials used for building houses D the removal of a subsidy to house builders
1 marks
Answer: A
This question in 9708/12 Oct/Nov 2016
Q123 · The diagram shows the market for a luxury brand of smartphones 9708/12 Oct/Nov 2016
11 The diagram shows the market for a luxury brand of smartphones. The initial equilibrium is at point X. What will be the new equilibrium following a rise in the price of batteries used by the manufacturer of smartphones and a rise in consumer incomes? supply A D X price B C demand O quantity
1 marks
Answer: A
This question in 9708/12 Oct/Nov 2016
Q124 · What ensures that demand for a product is effective? 9708/13 Oct/Nov 2016
5 What ensures that demand for a product is effective? A The consumer must have the ability to buy the product. B The consumer must purchase in the private sector of the economy. C The consumer must receive consumer surplus. D The consumer must want to buy the product.
1 marks
Answer: A
This question in 9708/13 Oct/Nov 2016
Q125 · What will happen to an industry’s supply curve if firms leave the industry? 9708/13 Oct/Nov 2016
6 What will happen to an industry’s supply curve if firms leave the industry? A It will shift to the left at any given price. B It will shift to the right at any given price. C There will be a downward movement along the supply curve. D There will be an upward movement along the supply curve.
1 marks
Answer: A
This question in 9708/13 Oct/Nov 2016
Q126 · On a demand and supply diagram, other things remaining the same, a fall in the price of a… 9708/12 Feb/March 2017
5 On a demand and supply diagram, other things remaining the same, a fall in the price of a commodity will normally shift A the demand curve for a substitute to the right. B the demand curve for the commodity to the right. C the supply curve for a jointly produced commodity to the left. D the supply curve for the commodity to the left.
1 marks
Answer: C
This question in 9708/12 Feb/March 2017
Q127 · The diagram shows the market for coffee 9708/12 Feb/March 2017
9 The diagram shows the market for coffee. The initial equilibrium position is X. The price of tea, a substitute, falls and an indirect tax is imposed on coffee. What will be the new equilibrium position? S1 price of coffee B X C A D D1 O quantity of coffee
1 marks
Answer: A
This question in 9708/12 Feb/March 2017
Q128 · The diagram shows the market for new houses 9708/12 Feb/March 2017
10 The diagram shows the market for new houses. S2 S1 price Y X D2 D1 O quantity What would cause the change in the market equilibrium position from X to Y? A a fall in income tax and a rise in building costs B a fall in interest rates and increased efficiency in house-building C a fall in population and a rise in the price of building land D a rise in building subsidies and a fall in incomes
1 marks
Answer: A
This question in 9708/12 Feb/March 2017
Q129 · Jam and honey are substitutes 9708/12 Feb/March 2017
11 Jam and honey are substitutes. Honey and beeswax are in joint supply. Other things being equal, what will be the result of an increase in the price of jam? price of honey price of beeswax A fall fall B fall rise C rise fall D rise rise
1 marks
Answer: C
This question in 9708/12 Feb/March 2017
Q130 · The diagram shows a shift in a firm’s supply curve from S1 to S2 9708/11 May/June 2017
5 The diagram shows a shift in a firm’s supply curve from S1 to S2. price S2 S1 O quantity What may have caused the shift from S1 to S2? A a decrease in the costs of production of the firm B a decrease in the popularity of the firm’s product C a decrease in the subsidy on the good D a decrease in the tax on the good
1 marks
Answer: C
This question in 9708/11 May/June 2017
Q131 · A change in the price of a good causes an increase in the quantity of the good demanded 9708/11 May/June 2017
6 A change in the price of a good causes an increase in the quantity of the good demanded. What would be the nature of the good and the direction of price change for this to be certain to happen? nature of good price change A inferior fall B inferior rise C normal fall D normal rise
1 marks
Answer: C
This question in 9708/11 May/June 2017
Q132 · Good X is a substitute for good Y and a complement to good Z 9708/11 May/June 2017
11 Good X is a substitute for good Y and a complement to good Z. What would happen after a fall in the price of good X? A Only the demand for X will rise. B Demand for X, Y and Z will rise. C Demand for Y will fall and for Z will rise. D Demand for Y will rise and for Z will fall.
1 marks
Answer: C
This question in 9708/11 May/June 2017
Q133 · How would an economist establish the market demand curve for a private good? 9708/12 May/June 2017
5 How would an economist establish the market demand curve for a private good? A by adding consumer surplus to total expenditure B by combining individual demand curves horizontally C by combining the price elasticity of individual demands D by multiplying price by quantity demanded
1 marks
Answer: B
This question in 9708/12 May/June 2017
Q134 · A local government is deciding whether to increase parking charges and provide more lanes… 9708/12 May/June 2017
11 A local government is deciding whether to increase parking charges and provide more lanes for bus use only. One official said that the increase in parking charges should cause more bus travel. A second official said that an increase in the frequency of bus services will not cause demand for bus travel to rise. Are these official statements correct or incorrect? first statement second statement A correct correct B correct incorrect C incorrect correct D incorrect incorrect
1 marks
Answer: B
This question in 9708/12 May/June 2017
Q135 · Why does an individual’s demand curve generally slope downwards to the right? 9708/13 May/June 2017
5 Why does an individual’s demand curve generally slope downwards to the right? A The additional satisfaction an individual gets from consuming most goods decreases as consumption increases. B The additional satisfaction an individual gets from consumption decreases as income rises. C The individual has finite income which is used to attempt to satisfy many wants. D For most goods the price charged by producers falls as the quantity purchased increases.
1 marks
Answer: A
This question in 9708/13 May/June 2017
Q136 · The soap industry consists of several firms 9708/13 May/June 2017
12 The soap industry consists of several firms. Firm X produces a small percentage of total output. What is likely to cause the supply curve for firm X to shift to the right while the market supply curve shifts to the left? A Firm X has improved technology while other firms have higher input costs. B Firm X has to pay a large fine for polluting a river while other firms have a tax reduction. C Firm X is involved in a strike while other firms enter the industry. D Firm X’s rent and interest charges increase while other firms receive a government subsidy.
1 marks
Answer: A
This question in 9708/13 May/June 2017
Q137 · What could cause a shift in the supply curve of good X and a movement along its supply… 9708/11 Oct/Nov 2017
5 What could cause a shift in the supply curve of good X and a movement along its supply curve? shift in the supply curve movement along the supply curve A a change in consumer preferences an increase in the price of a substitute good B a decrease in factor productivity the imposition of a tax on good X C an increase in the price of a an increase in factor productivity complementary good D an increase in the wage rates a change in consumer preferences in the industry
1 marks
Answer: D
This question in 9708/11 Oct/Nov 2017
Q138 · Along which axis can the market demand curve be aggregated from individual demand curves? 9708/11 Oct/Nov 2017
7 Along which axis can the market demand curve be aggregated from individual demand curves? A both the horizontal and vertical axis B the horizontal axis only C the horizontal or the vertical axis but not both D the vertical axis only
1 marks
Answer: B
This question in 9708/11 Oct/Nov 2017
Q139 · What would not affect the position of the demand curve for wigs? 9708/12 Oct/Nov 2017
5 What would not affect the position of the demand curve for wigs? A an increase in incomes B a reduction in the price of hairdressing C an increase in wigs worn by television celebrities D a reduction in the price of wigs
1 marks
Answer: D
This question in 9708/12 Oct/Nov 2017
Q140 · What is treated as a variable in constructing a market demand curve? 9708/12 Feb/March 2018
5 What is treated as a variable in constructing a market demand curve? A consumers’ tastes B the distribution of income C the price of related goods D the price of the good
1 marks
Answer: D
This question in 9708/12 Feb/March 2018
Q141 · The diagram represents the market for diamonds 9708/12 Feb/March 2018
10 The diagram represents the market for diamonds. S2 price P2 S1 P1 D O Q2 Q1 quantity What could have caused price to change from P1 to P2? A a fall in the price of substitute gems B a fall in the tax on diamonds C a rise in the productivity of diamond miners D a rise in the wages of diamond miners
1 marks
Answer: D
This question in 9708/12 Feb/March 2018
Q142 · Good X has a substitute, good Y, and a complement, good Z 9708/12 Feb/March 2018
11 Good X has a substitute, good Y, and a complement, good Z. The price of good Y decreases and the price of good Z increases. Why might the equilibrium price of good X remain unchanged? A Producers of good X adopt new technology. B Producers of good X receive a subsidy. C Some firms stop production of good X. D The tax on the production of good X is cut.
1 marks
Answer: C
This question in 9708/12 Feb/March 2018
Q143 · The diagram shows a demand curve for a good 9708/11 May/June 2018
5 The diagram shows a demand curve for a good. price D O quantity Which statement describes the nature of this demand curve? A A greater or smaller quantity is demanded as price changes. B A lower price is the result of a fall in demand. C As demand increases so does price. D Quantity changes in proportion to the change in price.
1 marks
Answer: A
This question in 9708/11 May/June 2018
Q144 · The diagram shows the demand curve, DD1, and the supply curve, SS1, for eye operations 9708/11 May/June 2018
10 The diagram shows the demand curve, DD1, and the supply curve, SS1, for eye operations. S D price P O S1 D1 number of operations The operations are provided free to the consumer. Which statement is correct? A Consumer surplus from the operations is ODD1. B The equilibrium price is indeterminate, because the supply curve is vertical. C The equilibrium price is P. D The equilibrium price is zero.
1 marks
Answer: C
This question in 9708/11 May/June 2018
Q145 · The demand for houses in London has caused house prices to rise considerably in the last… 9708/11 May/June 2018
11 The demand for houses in London has caused house prices to rise considerably in the last five years. Many people cannot now afford to buy a house. What can be concluded from this? A On a demand and supply diagram for houses there has been a movement up the demand curve. B On a demand and supply diagram for houses there has been a movement up the supply curve. C The price elasticity of demand for houses is greater than one. D The price elasticity of supply of houses is zero.
1 marks
Answer: B
This question in 9708/11 May/June 2018
Q146 · The diagram shows the demand curve and supply curve for a product 9708/11 May/June 2018
13 The diagram shows the demand curve and supply curve for a product. S X price Y W D O Z quantity Which area represents producer surplus? A OWYZ minus OWY B OWYZ minus OYZ C OXYZ minus OYZ D OXYZ minus WXY
1 marks
Answer: B
This question in 9708/11 May/June 2018
Q147 · India is one of the largest producers of tractors in the world 9708/12 May/June 2018
5 India is one of the largest producers of tractors in the world. S1 and D1 are the original supply and demand curves for Indian tractors. S1 price of tractors S2 P1 P2 D1 O Q1 Q2 quantity of tractors What would cause the supply curve to move to S2? A a rise in the incomes of Indian farmers B a rise in the price of electricity paid by Indian tractor manufacturers C a rise in the price of tractors produced in the US D a rise in the productivity of workers in Indian tractor factories
1 marks
Answer: D
This question in 9708/12 May/June 2018
Q148 · The diagram shows the demand curve for a product 9708/12 May/June 2018
6 The diagram shows the demand curve for a product. price D O quantity Which statement is correct? A Consumer expenditure on the product always rises when price falls. B Demand is less elastic at higher prices than at lower prices. C Price elasticity of demand differs at every price. D Price elasticity of demand equals one at every price.
1 marks
Answer: C
This question in 9708/12 May/June 2018
Q149 · What is likely to affect the position of the demand curve for tickets to pop concerts but… 9708/13 May/June 2018
5 What is likely to affect the position of the demand curve for tickets to pop concerts but not the position of the supply curve? A a change in incomes of potential customers B a change in price of tickets to the concerts C a change in rents charged by venue owners D a change in seating capacity of concert venues
1 marks
Answer: A
This question in 9708/13 May/June 2018
Q150 · In the diagram, D1 is the initial demand curve for student places at universities 9708/11 Oct/Nov 2018
5 In the diagram, D1 is the initial demand curve for student places at universities. fees D2 D1 O student places What could cause the demand curve to shift to D2? A a decrease in student fees for universities B a decrease in the level of youth unemployment C an increase in graduate earnings compared with non-graduate earnings D higher A Level grades demanded for university entrance
1 marks
Answer: C
This question in 9708/11 Oct/Nov 2018
Q151 · What will happen to an industry’s supply curve if new firms enter the industry? 9708/12 Oct/Nov 2018
5 What will happen to an industry’s supply curve if new firms enter the industry? A It will shift to the left at any given price. B It will shift to the right at any given price. C There will be a downward movement along the supply curve. D There will be an upward movement along the supply curve.
1 marks
Answer: B
This question in 9708/12 Oct/Nov 2018
Q152 · D1D1 shows an individual’s initial demand curve for public transport 9708/12 Oct/Nov 2018
6 D1D1 shows an individual’s initial demand curve for public transport. price of D1 public transport D2 D1 O quantity of public transport What would cause the demand curve to shift to D2D1? A The cost of running the individual’s car rises. B The individual is banned from driving. C The price of public transport rises. D The quality of public transport declines.
1 marks
Answer: D
This question in 9708/12 Oct/Nov 2018
Q153 · Two goods X and Y have a positive cross-elasticity of demand and upward-sloping supply… 9708/12 Oct/Nov 2018
7 Two goods X and Y have a positive cross-elasticity of demand and upward-sloping supply curves. What will be the effect of a reduction in the price of good Y? A The demand for good X will increase. B The demand for good Y will decrease. C The price of good X will decrease. D The quantity of good X supplied will increase.
1 marks
Answer: C
This question in 9708/12 Oct/Nov 2018
Q154 · What is not held constant when aggregating individual firms’ supply curves to give the… 9708/13 Oct/Nov 2018
5 What is not held constant when aggregating individual firms’ supply curves to give the short-run market supply curve? A the number of firms in the industry B the price of the product C the prices of factors of production D the state of technology
1 marks
Answer: B
This question in 9708/13 Oct/Nov 2018
Q155 · The diagram shows the demand for a product for which there are only three buyers… 9708/13 Oct/Nov 2018
6 The diagram shows the demand for a product for which there are only three buyers, Freeman, Hardy and Willis. 25 price ($) 20 15 10 5 D 0 0 10 20 30 40 50 quantity The table shows the demand from two of the three buyers. price ($) Freeman’s demand Hardy’s demand 10 24 6 15 15 5 20 6 4 Which statement about the demand for the product from Willis is correct? A It has unitary price elasticity of demand. B It is a downward-sloping straight-line demand curve. C It is a perfectly elastic demand curve. D It is a perfectly inelastic demand curve.
1 marks
Answer: D
This question in 9708/13 Oct/Nov 2018
Q156 · The diagram shows a supply curve for beef 9708/12 Feb/March 2019
5 The diagram shows a supply curve for beef. S price O quantity What explains why the supply curve for beef slopes upwards? A An increase in the demand for beef will bring about an increase in supply. B Farmers’ productivity rises as the price rises. C Increased production leads to a reduction in costs. D The cost of additional beef production rises as output increases.
1 marks
Answer: D
This question in 9708/12 Feb/March 2019
Q157 · The diagram shows the demand curve for a normal product 9708/12 Feb/March 2019
9 The diagram shows the demand curve for a normal product. price W X demand Y Z O quantity Which two points indicates a move from a price inelastic point to a less inelastic point? A W to X B X to W C Y to Z D Z to Y
1 marks
Answer: D
This question in 9708/12 Feb/March 2019
Q158 · How is the market supply of a product in a competitive market obtained? 9708/11 May/June 2019
8 How is the market supply of a product in a competitive market obtained? A by aggregating the supply of all firms producing the product B by averaging the supply of all firms producing the product C by calculating the supply of the typical firm producing the product D by estimating the supply of the largest firm producing the product
1 marks
Answer: A
This question in 9708/11 May/June 2019
Q159 · The diagram shows the demand curve for luxury cars 9708/11 May/June 2019
9 The diagram shows the demand curve for luxury cars. price D1 D2 O quantity The shift in the demand curve D1 to D2 can be explained by A a decrease in air travel. B an increase in advertising by luxury car manufacturers. C an increase in income. D an increase in the price of petrol.
1 marks
Answer: D
This question in 9708/11 May/June 2019
Q160 · The diagram shows the relationship between price (P) and demand (D) for a normal good G 9708/12 May/June 2019
10 The diagram shows the relationship between price (P) and demand (D) for a normal good G. S price of good G P D1 D O Q quantity demanded of good G What would cause a shift to D1? A a decrease in the price of a substitute good B a fall in the level of advertising for the good G C a rise in the price of good G D an increase in the incomes of consumers
1 marks
Answer: D
This question in 9708/12 May/June 2019
Q161 · Which combination of events is most likely to leave the demand curve for a normal good in… 9708/12 May/June 2019
13 Which combination of events is most likely to leave the demand curve for a normal good in the same position? A a decrease in consumer incomes and an increase in the price of a substitute good B a decrease in consumer incomes and an increase in the price of the good C an increase in consumer incomes and an increase in the price of a substitute good D an increase in consumer incomes and an increase in the price of the good
1 marks
Answer: A
This question in 9708/12 May/June 2019
Q162 · In the diagram, D1 and S1 represent the demand for and supply of luxury watches 9708/13 May/June 2019
6 In the diagram, D1 and S1 represent the demand for and supply of luxury watches. Equilibrium is initially at point X. The cost of raw materials for manufacturing watches rises. At the same time the incomes of the rich increase. Which point on the diagram is most likely to represent the new equilibrium? S2 B price S1 A S3 X C D D3 D1 D2 O quantity
1 marks
Answer: B
This question in 9708/13 May/June 2019
Q163 · The diagram shows the demand and supply curves of a normal good (X) 9708/13 May/June 2019
11 The diagram shows the demand and supply curves of a normal good (X). Q1P1 is the initial equilibrium. S2 price S1 P2 P1 D2 D1 O Q1 Q2 quantity Other things being equal, what may cause the change in the market equilibrium to Q2P2? A a fall in household incomes and an increase in interest rates B a rise in workers’ real wages in all sectors of the economy C an increase in income tax and a rise in the specific tax levied on X D an increase in the price of a substitute product for X and a fall in the costs of producing X
1 marks
Answer: B
This question in 9708/13 May/June 2019
Q164 · The diagram represents the market for electric cookers 9708/13 May/June 2019
13 The diagram represents the market for electric cookers. S price Y X D2 D1 O quantity What is most likely to explain the change in the equilibrium from point X to point Y? A a fall in the price of electric cookers B an increase in a specific tax on electric cookers C an increase in the number of households D an increase in the price of electricity
1 marks
Answer: C
This question in 9708/13 May/June 2019
Q165 · The graph shows the demand and supply curves for an industry 9708/11 Oct/Nov 2019
7 The graph shows the demand and supply curves for an industry. S2 S1 price D1 O quantity What would cause a shift in the supply curve from S1 to S2? A an increase in the number of firms in the industry B an increase in the number of workers employed C an increase in the productivity of the workforce D an increase in the wage rates paid to workers
1 marks
Answer: D
This question in 9708/11 Oct/Nov 2019
Q166 · What does the assumption ‘ceteris paribus’ mean when economists analyse the way in which… 9708/11 Oct/Nov 2019
12 What does the assumption ‘ceteris paribus’ mean when economists analyse the way in which the quantity demanded of a good changes? A Changes in quantity demanded can cause changes in any of the other variables. B Consumer preferences are always assumed to remain unchanged. C Only one variable is assumed to change while the others remain the same. D Several variables change simultaneously.
1 marks
Answer: C
This question in 9708/11 Oct/Nov 2019
Q167 · Market demand curves normally slope downwards 9708/12 Oct/Nov 2019
6 Market demand curves normally slope downwards. They may also shift from D1 to either D2 or D3. price of good X D3 D1 D2 O quantity demanded What would cause a movement along D1 for good X and not a shift to either D2 or D3? A advertising of good X increases sales B consumer incomes rise C price of good X falls D price of other goods falls
1 marks
Answer: C
This question in 9708/12 Oct/Nov 2019
Q168 · The diagram shows the European market for diesel fuel and the original equilibrium is at M 9708/13 Oct/Nov 2019
9 The diagram shows the European market for diesel fuel and the original equilibrium is at M. S1 price M G H N J D1 D2 O R T quantity Europeans want low-emission cars and therefore the demand for diesel fuel has decreased from D1 to D2. Which area represents the new producer surplus for companies supplying diesel fuel? A GMNH B JGM C JHN D JNR
1 marks
Answer: C
This question in 9708/13 Oct/Nov 2019
Q169 · A US study, published in July 2014, warned teenagers to reduce the amount of fizzy drink… 9708/13 Oct/Nov 2019
10 A US study, published in July 2014, warned teenagers to reduce the amount of fizzy drink they consume. One can of fizzy drink contains an adult’s entire daily sugar allowance. If the advice were accepted, how might the effect be illustrated on demand and supply diagrams for fizzy drinks and for sugar? diagram for fizzy drinks diagram for sugar A demand curve moves to the left movement up the supply curve B demand curve moves to the left movement down the supply curve C movement up the demand curve supply curve moves to the right D movement up the demand curve supply curve moves to the left
1 marks
Answer: B
This question in 9708/13 Oct/Nov 2019
Q170 · What describes a market supply curve? 9708/11 May/June 2020
5 What describes a market supply curve? A It is downward sloping. B It is the same as the aggregate supply curve. C It is the sum of all firms’ supply curves for a product. D It is the supply of all products within an economy.
1 marks
Answer: C
This question in 9708/11 May/June 2020
Q171 · Shoe manufacturers often use leather to make their most expensive shoes 9708/11 May/June 2020
11 Shoe manufacturers often use leather to make their most expensive shoes. Due to a world shortage of leather, the price of leather has risen. What will be the effect of this price change? A The demand curve for leather shoes will shift to the left. B The demand curve for a substitute for leather shoes will shift to the right. C The supply curve for leather shoes will shift to the right. D The supply curve for a substitute for leather to make expensive shoes will shift to the right.
1 marks
Answer: B
This question in 9708/11 May/June 2020
Q172 · In the diagram, D is the demand curve for an agricultural commodity and S1 is the initial… 9708/12 May/June 2020
5 In the diagram, D is the demand curve for an agricultural commodity and S1 is the initial supply curve. A good harvest causes the supply curve to shift to S2. 6 S1 price 5 ($) 4 S2 3 2 1 D 0 0 1 2 3 4 5 6 quantity (’000 tonnes) By how much will the demand curve have to shift to leave farm incomes unchanged? A 500 tonnes at all prices B 1000 tonnes at all prices C 2000 tonnes at all prices D 4000 tonnes at all prices
1 marks
Answer: B
This question in 9708/12 May/June 2020
Q173 · What is most likely to increase the quantity of houses supplied? 9708/13 May/June 2020
6 What is most likely to increase the quantity of houses supplied? A a policy to help house buyers on modest incomes B a restriction on the level of rent that can be charged C a rise in the tax on materials used for building houses D the removal of a subsidy to house builders
1 marks
Answer: A
This question in 9708/13 May/June 2020
Q174 · Diesel engines are a major cause of air pollution in cities 9708/13 May/June 2020
9 Diesel engines are a major cause of air pollution in cities. A city authority placed a charge on diesel taxis entering the city. What would be the most likely effects on the demand and supply of taxi journeys into the city? demand for supply of taxi journeys taxi journeys A fall fall B fall remain unchanged C remain unchanged fall D rise fall
1 marks
Answer: A
This question in 9708/13 May/June 2020
Q175 · Which combination of the classification of a good and market change will cause the demand… 9708/13 May/June 2020
10 Which combination of the classification of a good and market change will cause the demand curve for the good to shift right? classification of good market change A inferior good income decrease B inferior good price decrease C normal good income decrease D normal good price decrease
1 marks
Answer: A
This question in 9708/13 May/June 2020
Q176 · The diagram shows the market for bus services before and after a government subsidy 9708/13 May/June 2020
15 The diagram shows the market for bus services before and after a government subsidy. supply before subsidy price supply after subsidy G P3 L H P1 J P2 I K demand O Q1 Q2 number of bus journeys Which area on the diagram shows the incidence of the subsidy for the consumer? A P1HIP2 B P1JKP2 C P2IGP3 D P2KLP3
1 marks
Answer: B
This question in 9708/13 May/June 2020
Q177 · The diagram shows the market for eye tests 9708/13 May/June 2020
16 The diagram shows the market for eye tests. price of eye S tests ($) P3 P2 P1 D O Q1 Q2 quantity of eye tests Which policy would enable the government to increase the number of eye tests from OQ1 to OQ2? A a maximum price of OP3 per test B a minimum price of OP2 per test C a subsidy paid to opticians of P3–P2 per test D a subsidy paid to opticians of P3–P1 per test
1 marks
Answer: D
This question in 9708/13 May/June 2020
Q178 · Good X is a substitute for good Y and a complement to good Z 9708/11 Oct/Nov 2020
5 Good X is a substitute for good Y and a complement to good Z. What would happen after a fall in the price of good X? A Only the demand for X will rise. B Demand for X, Y and Z will rise. C Demand for Y will fall and for Z will rise. D Demand for Y will rise and for Z will fall.
1 marks
Answer: C
This question in 9708/11 Oct/Nov 2020
Q179 · A farmer divides his land between growing two crops – wheat and oats 9708/11 Oct/Nov 2020
10 A farmer divides his land between growing two crops – wheat and oats. To increase production of one he must reduce production of the other. What would cause the farmer to increase his supply of wheat? A A subsidy is given for the production of oats. B A unit tax is imposed on the production of wheat. C There is an increase in wages for all farm workers. D There is improved efficiency in the harvesting of wheat.
1 marks
Answer: D
This question in 9708/11 Oct/Nov 2020
Q180 · What would cause the demand curve for vegetables to shift from D1 to D2 as shown? 9708/11 Oct/Nov 2020
11 What would cause the demand curve for vegetables to shift from D1 to D2 as shown? S price P2 P1 D1 D2 O Q1 Q2 quantity A a change in supply from Q1 to Q2 B a poor harvest due to unfavourable weather C a price change from P1 to P2 D an increase in real incomes
1 marks
Answer: D
This question in 9708/11 Oct/Nov 2020
Q181 · The demand curve for new cars in a country shifted to the left 9708/11 Oct/Nov 2020
12 The demand curve for new cars in a country shifted to the left. Which change could have caused such a shift? A an increase in real disposable income B an increase in the cost of borrowing C an increase in the price of new cars D an increase in the price of train travel
1 marks
Answer: B
This question in 9708/11 Oct/Nov 2020
Q182 · What is correct about market supply? 9708/11 Oct/Nov 2020
13 What is correct about market supply? A Market supply can increase only when all individual firms increase their output. B Market supply is effective when consumers have sufficient income to buy the good. C Market supply is the result of aggregating the supply of all individual firms. D Market supply of an inferior good falls as price increases.
1 marks
Answer: C
This question in 9708/11 Oct/Nov 2020
Q183 · Which change does not have an immediate effect on the position of the demand curve for a… 9708/12 Oct/Nov 2020
11 Which change does not have an immediate effect on the position of the demand curve for a product? A a fall in the price of a complementary product B a range of new products entering the market C a rise in the labour costs of its production D an increase in the price of a substitute product
1 marks
Answer: C
This question in 9708/12 Oct/Nov 2020
Q184 · What could not cause a shift in an individual’s demand curve for good Z? 9708/12 Feb/March 2021
5 What could not cause a shift in an individual’s demand curve for good Z? A a change in advertising expenditure on Z B a change in the individual’s income C a change in the individual’s tastes D a change in the price of Z
1 marks
Answer: D
This question in 9708/12 Feb/March 2021
Q185 · A manufacturer reduces the price of its goods after developing a more efficient… 9708/12 Feb/March 2021
9 A manufacturer reduces the price of its goods after developing a more efficient manufacturing process. It makes leather belts that compete against belts made of artificial material. What are the likely outcomes of the change in the manufacturing process? supply of price of leather belts artificial belts A decreases decreases B decreases increases C increases decreases D increases increases
1 marks
Answer: C
This question in 9708/12 Feb/March 2021
Q186 · What leads to a downward shift of a normal supply curve? 9708/12 May/June 2021
7 What leads to a downward shift of a normal supply curve? A a rise in the cost of transporting goods B a rise in the productivity of the labour force C a rise in the rate of sales tax on the good D a rise in the wage rate paid to workers
1 marks
Answer: B
This question in 9708/12 May/June 2021
Q187 · How would an economist establish the market demand curve for a private good? 9708/12 May/June 2021
12 How would an economist establish the market demand curve for a private good? A by adding consumer surplus to total expenditure B by combining individual demand curves horizontally C by combining the price elasticity of individual demands D by multiplying price by quantity demanded
1 marks
Answer: B
This question in 9708/12 May/June 2021
Q188 · When stating the law of demand for a good, economists use the phrase ‘all other things… 9708/13 May/June 2021
5 When stating the law of demand for a good, economists use the phrase ‘all other things being equal’. What is not one of these ‘all other things’? A the income of the consumer B the price of other goods C the price of the good D the tastes of the consumer
1 marks
Answer: C
This question in 9708/13 May/June 2021
Q189 · What will not cause a shift in the market supply curve of a commodity? 9708/13 May/June 2021
6 What will not cause a shift in the market supply curve of a commodity? A a change in technology B a rise in the price of a factor input C a rise in the price of the commodity D the introduction of a specific tax on the commodity
1 marks
Answer: C
This question in 9708/13 May/June 2021
Q190 · The supply curve for fresh fish shifts from S1 to S2 as shown 9708/11 Oct/Nov 2021
5 The supply curve for fresh fish shifts from S1 to S2 as shown. S2 S1 price O quantity What is a possible reason for this change in the supply of fresh fish? A Demand for fresh fish increases due to promotion of the health benefits. B Favourable weather increases the quantity of fish being caught. C Price of fresh fish falls due to a new substitute product becoming popular. D Regulations limit the number of fish being caught to prevent over-fishing.
1 marks
Answer: D
This question in 9708/11 Oct/Nov 2021
Q191 · What could cause a shift in the supply curve of good X and a movement along its supply… 9708/12 Oct/Nov 2021
6 What could cause a shift in the supply curve of good X and a movement along its supply curve? shift in the supply curve movement along the supply curve A a change in demand for good X an increase in the price of a substitute good B a decrease in factor productivity the imposition of a tax on good X C an increase in the price of a an increase in factor productivity complementary good D an increase in the wage rates a change in demand for good X in the industry
1 marks
Answer: D
This question in 9708/12 Oct/Nov 2021
Q192 · The diagram shows the demand and supply curves for bread in a developed economy 9708/12 Oct/Nov 2021
10 The diagram shows the demand and supply curves for bread in a developed economy. Bread is a substitute for pasta and rice. S1 price D2 D1 O quantity What would cause the demand curve for bread to shift from D1 to D2 in a developed economy? A a rise in the price of pasta and rice B a decrease in the real income of consumers C a recession and rising unemployment D a subsidy given to producers of pasta and rice
1 marks
Answer: A
This question in 9708/12 Oct/Nov 2021
Q193 · What could cause an increase in consumer surplus in the market for a good? 9708/13 Oct/Nov 2021
5 What could cause an increase in consumer surplus in the market for a good? an increase in an increase in demand for supply of the good the good A no no B no yes C yes no D yes yes
1 marks
Answer: D
This question in 9708/13 Oct/Nov 2021
Q194 · The diagrams show the effect of a change in the market for good X on the market for good Y 9708/13 Oct/Nov 2021
6 The diagrams show the effect of a change in the market for good X on the market for good Y. S2 S1 S price price P2 P2 P1 P1 D1 D2 D1 O Q2 Q1 O Q1 Q2 quantity quantity change in the market effect on the market for good X for good Y What can be concluded from the diagrams? A X and Y are complements. B X and Y are in joint supply. C X and Y are substitutes. D Y is a derived demand from X.
1 marks
Answer: C
This question in 9708/13 Oct/Nov 2021
Q195 · The diagram shows the average world price of coffee in US cents per pound weight (lb)… 9708/13 Oct/Nov 2021
7 The diagram shows the average world price of coffee in US cents per pound weight (lb) between 1997 and 2005. 150 US cents / lb 125 100 75 50 25 0 1997 2001 2005 year Which event is consistent with the price behaviour shown in the specified time period? A a continuous rise in the price of tea between 1997 and 2001 B the entry to the market of new producers of coffee between 1997 and 2001 C a series of good coffee harvests between 2001 and 2005 D increasing health worries about drinking coffee between 2001 and 2005
1 marks
Answer: B
This question in 9708/13 Oct/Nov 2021
Q196 · The diagram shows a shift in the supply curve for a product from S1 to S2 9708/13 Oct/Nov 2021
8 The diagram shows a shift in the supply curve for a product from S1 to S2. S1 price S2 O quantity What could cause this shift in the supply curve? A an increase in the cost of producing the product B an increase in the income of consumers of the product C an increase in the demand for a product that is jointly supplied D an increase in the price of the product
1 marks
Answer: C
This question in 9708/13 Oct/Nov 2021
Q197 · The diagram shows the demand for and supply of a normal good 9708/13 Oct/Nov 2021
11 The diagram shows the demand for and supply of a normal good. E1 is the initial equilibrium position. price E2 S E1 D O quantity Which changes could result in a new equilibrium E2? A a decrease in both the demand for and the supply of the good B an increase in both the demand for and the supply of the good C an increase in consumer incomes, and a decrease in the supply of the good D an increase in the price of a complement to the good, and an increase in the supply of the good
1 marks
Answer: C
This question in 9708/13 Oct/Nov 2021
Q198 · The diagram shows a supply curve for chicken 9708/12 Feb/March 2022
5 The diagram shows a supply curve for chicken. S price O quantity What explains why the supply curve for chicken slopes upwards? A An increase in the demand for chicken will bring about a rise in supply. B Farmers’ productivity rises as the price rises. C Increased production leads to a reduction in costs. D The cost of additional chicken production rises as output increases.
1 marks
Answer: D
This question in 9708/12 Feb/March 2022
Q199 · Demand curves are drawn ceteris paribus 9708/12 Feb/March 2022
7 Demand curves are drawn ceteris paribus. Which ‘other things’ are not required to remain the same when an individual’s demand curve for ice cream is constructed? A the consumer’s income B the consumer’s tastes and preferences C the price of fresh fruit D the price of ice cream
1 marks
Answer: D
This question in 9708/12 Feb/March 2022
Q200 · A rise in the price of a good is accompanied by an increase in the quantity demanded 9708/12 Feb/March 2022
11 A rise in the price of a good is accompanied by an increase in the quantity demanded. What could explain this? A Consumers spend a high proportion of disposable income on the good. B The price of a complementary good has also increased. C The price of the good is taken to be an indication of the level of quality. D The substitute goods are all very much more expensive.
1 marks
Answer: C
This question in 9708/12 Feb/March 2022
Q201 · What causes the demand curve for an inferior good to shift to the right? 9708/12 Feb/March 2022
12 What causes the demand curve for an inferior good to shift to the right? A a decrease in consumer incomes B a decrease in income tax C a decrease in the price of a substitute good D a decrease in the price of the good
1 marks
Answer: A
This question in 9708/12 Feb/March 2022
Q202 · The diagrams show the effect of a change in the market for good X on the market for good Y 9708/12 Feb/March 2022
13 The diagrams show the effect of a change in the market for good X on the market for good Y. S1 price S2 price S1 D2 D1 D1 O quantity O quantity good X good Y What is the most likely relationship between the two goods? A X and Y are complements. B X and Y are demerit goods. C X and Y are in joint supply. D X and Y are substitutes.
1 marks
Answer: A
This question in 9708/12 Feb/March 2022
Q203 · The producer of a good with a price-elastic demand observes that a rise in its price is… 9708/11 May/June 2022
5 The producer of a good with a price-elastic demand observes that a rise in its price is accompanied by a rise in total revenue. What might explain this? A The good is an inferior good. B The rise in price was due to an increase in demand for the good. C The supply of the good was inadequate to meet the demand. D The supply of the good was price-inelastic.
1 marks
Answer: B
This question in 9708/11 May/June 2022
Q204 · What will increase the producer surplus of farmers that grow carrots? 9708/11 May/June 2022
6 What will increase the producer surplus of farmers that grow carrots? A a decrease in the demand for carrots B a decrease in the price of carrot seed C a decrease in the price of cabbage D a decrease in the subsidy on carrots
1 marks
Answer: B
This question in 9708/11 May/June 2022
Q205 · A popular band is due to perform at a music concert in a venue that has a 5000-seat… 9708/11 May/June 2022
7 A popular band is due to perform at a music concert in a venue that has a 5000-seat capacity. Recent appearances and the release of a new album have made the band even more popular. D1 and S represent the original demand and supply curves for concert tickets and D2 the new demand curve. Which diagram best represents the likely outcome on the market for concert tickets? A B S D1 D2 S price price D2 D1 O 5000 O 5000 quantity quantity C D D1 D2 S D1 D2 price price S O 5000 O 5000 quantity quantity
1 marks
Answer: C
This question in 9708/11 May/June 2022
Q206 · Why does an individual’s demand curve generally slope downwards to the right? 9708/11 May/June 2022
8 Why does an individual’s demand curve generally slope downwards to the right? A The additional satisfaction an individual gets from consuming most goods decreases as consumption increases. B The additional satisfaction an individual gets from consumption decreases as income rises. C The individual has finite income which is used to attempt to satisfy many wants. D For most goods the price charged by producers falls as the quantity purchased increases.
1 marks
Answer: A
This question in 9708/11 May/June 2022
Q207 · What is necessary for consumer surplus to be zero? 9708/11 May/June 2022
10 What is necessary for consumer surplus to be zero? A Demand is perfectly elastic. B Demand is perfectly inelastic. C Supply is perfectly elastic. D Supply is perfectly inelastic.
1 marks
Answer: A
This question in 9708/11 May/June 2022
Q208 · A firm has a successful advertising campaign for a good 9708/12 May/June 2022
8 A firm has a successful advertising campaign for a good. Which combination shows the impact on demand or supply and the associated reason? A a leftward shift in the good’s demand curve, as increased advertising cost raises the price of the product and reduces its demand B a rightward shift in the good’s supply curve, as the advertising cost of the firm increases C a rightward shift in the good’s demand curve, as successful advertising increases demand D a leftward shift in the good’s supply curve, as successful advertising enables firms to sell more
1 marks
Answer: C
This question in 9708/12 May/June 2022
Q209 · Which combination of events is most likely to leave the demand curve for a normal good in… 9708/12 May/June 2022
11 Which combination of events is most likely to leave the demand curve for a normal good in the same position? A a decrease in consumer incomes and an increase in the price of a substitute good B a decrease in consumer incomes and an increase in the price of the good C an increase in consumer incomes and an increase in the price of a substitute good D an increase in consumer incomes and an increase in the price of the good
1 marks
Answer: A
This question in 9708/12 May/June 2022
Q210 · Which change would cause the supply curve of sugar-sweetened drinks to shift to the right? 9708/13 May/June 2022
7 Which change would cause the supply curve of sugar-sweetened drinks to shift to the right? A a fall in the price of sugar B a removal of a subsidy on sugar C an increase in consumer income D an increase of a specific tax on sugar
1 marks
Answer: A
This question in 9708/13 May/June 2022
Q211 · Goods X, Y and Z all have downward-sloping demand curves and upward-sloping supply curves 9708/13 May/June 2022
10 Goods X, Y and Z all have downward-sloping demand curves and upward-sloping supply curves. Good X is in joint supply with good Y and in joint demand with good Z. There is an increase in the demand for good X. What will happen to the prices and sales of goods Y and Z? good Y good Z price sales price sales A fall fall rise rise B fall rise rise rise C rise fall fall rise D rise rise fall fall
1 marks
Answer: B
This question in 9708/13 May/June 2022
Q212 · Goods X and Y are complements and have upward-sloping supply curves 9708/14 May/June 2022
5 Goods X and Y are complements and have upward-sloping supply curves. What will be the effect on the equilibrium price and quantity of good X of an increase in the supply of good Y? price of X quantity of X A decrease decrease B increase decrease C decrease increase D increase increase
1 marks
Answer: D
This question in 9708/14 May/June 2022
Q213 · A change in which factor will be least likely to alter a consumer’s ability to pay for a… 9708/14 May/June 2022
6 A change in which factor will be least likely to alter a consumer’s ability to pay for a product? A a consumer’s income B a consumer’s tastes C a change in the price of the product D a fall in the tax on goods and services
1 marks
Answer: B
This question in 9708/14 May/June 2022
Q214 · In the diagram, D1 and S1 represent the demand for and supply of luxury watches 9708/14 May/June 2022
13 In the diagram, D1 and S1 represent the demand for and supply of luxury watches. Equilibrium is initially at point X. The cost of raw materials for manufacturing watches rises. At the same time, the incomes of the rich increase. Which point on the diagram is most likely to represent the new equilibrium? S2 B price S1 A S3 X C D D3 D1 D2 O quantity
1 marks
Answer: B
This question in 9708/14 May/June 2022
Q215 · When will the demand curve for motorcycles shift to the left? 9708/11 Oct/Nov 2022
5 When will the demand curve for motorcycles shift to the left? A when the price of cars falls B when the price of motorcycles falls C when the tax on motorcycles rises D when the price of public transport rises
1 marks
Answer: A
This question in 9708/11 Oct/Nov 2022
Q216 · The diagram shows the demand curve for housing 9708/11 Oct/Nov 2022
6 The diagram shows the demand curve for housing. price D O quantity What is not assumed to remain constant when drawing this curve? A consumer incomes B expectations about future house prices C the price of houses D the rate of interest charged on loans for house purchase
1 marks
Answer: C
This question in 9708/11 Oct/Nov 2022
Q217 · What does not cause a shift in the supply curve of cars? 9708/11 Oct/Nov 2022
9 What does not cause a shift in the supply curve of cars? A a change in the car producers’ costs of production B a change in the price of fuel used by car owners C a change in the rate of sales tax on cars D a change in the wage rate of workers in the car industry
1 marks
Answer: B
This question in 9708/11 Oct/Nov 2022
Q218 · What is an example of a product in joint demand with a smartphone? 9708/12 Oct/Nov 2022
11 What is an example of a product in joint demand with a smartphone? A an alternative brand of smartphone B a personal computer (PC) C headphones that can be used with a smartphone D the metals used in the manufacture of a smartphone
1 marks
Answer: C
This question in 9708/12 Oct/Nov 2022
Q219 · What is likely to affect the position of the demand curve for tickets to pop concerts but… 9708/12 Oct/Nov 2022
13 What is likely to affect the position of the demand curve for tickets to pop concerts but not the position of the supply curve? A a change in incomes of potential customers B a change in price of tickets to the concerts C a change in rents charged by venue owners D a change in seating capacity of concert venues
1 marks
Answer: A
This question in 9708/12 Oct/Nov 2022
Q220 · The diagrams show the effect of a change in the market for good X on the market for good Y 9708/13 Oct/Nov 2022
10 The diagrams show the effect of a change in the market for good X on the market for good Y. S1 S2 S1 price price D1 D2 D1 O quantity O quantity good X good Y What can be concluded about the goods? A X and Y are complements. B X and Y are in joint supply. C X and Y are substitutes. D Y is a derived demand from X.
1 marks
Answer: B
This question in 9708/13 Oct/Nov 2022
Q221 · The final of a major sports event is held in a stadium which has a fixed capacity of 40… 9708/13 Oct/Nov 2022
11 The final of a major sports event is held in a stadium which has a fixed capacity of 40 000 people. The price for a seat is set at PF, but when the tickets go on sale all tickets are sold very quickly with many disappointed people unable to buy a ticket. Which diagram best represents this? A B S S price price PF PF D D O O 40 000 40 000 quantity quantity C D S S price PF price PF D D O O 40 000 40 000 quantity quantity
1 marks
Answer: B
This question in 9708/13 Oct/Nov 2022
Q222 · Which statement correctly describes the shape of the demand curve for a normal good? 9708/12 Feb/March 2023
9 Which statement correctly describes the shape of the demand curve for a normal good? A It shows an inverse relationship between income and quantity demanded. B It shows an inverse relationship between the price of the good and quantity demanded. C It shows a positive relationship between the price of the good and quantity demanded. D It shows a positive relationship between income and quantity demanded.
1 marks
Answer: B
This question in 9708/12 Feb/March 2023
Q223 · Butter and buttermilk are goods in joint supply 9708/12 Feb/March 2023
11 Butter and buttermilk are goods in joint supply. Supply curves in both markets slope upwards to the right. Health concerns cause people to reduce their consumption of butter. What are the initial consequences of this for supply in the markets for butter and buttermilk? supply of butter supply of buttermilk A move left along supply curve move left along supply curve B move left along supply curve shift left of the supply curve C shift left of the supply curve move left along supply curve D shift left of the supply curve shift left of the supply curve
1 marks
Answer: B
This question in 9708/12 Feb/March 2023
Q224 · The diagram shows the European market for diesel fuel and the original equilibrium is at M 9708/11 May/June 2023
8 The diagram shows the European market for diesel fuel and the original equilibrium is at M. S1 price M G H N J D1 D2 O R T quantity Europeans want low-emission cars and therefore the demand for diesel fuel has decreased from D1 to D2. Which area represents the new producer surplus for companies supplying diesel fuel? A GMNH B JGM C JHN D JNR
1 marks
Answer: C
This question in 9708/11 May/June 2023
Q225 · Golf club membership fees in Singapore have risen as a result of restrictions on travel… 9708/11 May/June 2023
10 Golf club membership fees in Singapore have risen as a result of restrictions on travel to cheaper golf courses in neighbouring countries and the closure of some local courses. The supply of golf club memberships is determined by the current number of courses. If the original equilibrium was at X, which point shows the result of these changes? S2 S1 S3 membership fees B $ C A D X D1 D2 O quantity of memberships
1 marks
Answer: B
This question in 9708/11 May/June 2023
Q226 · The diagram shows the demand and supply curves for solar energy in India 9708/11 May/June 2023
11 The diagram shows the demand and supply curves for solar energy in India. The initial equilibrium point is at X. The Indian government increases the subsidy to solar energy producers. At the same time, there is a rise in the price of alternative sources of energy. What is the new equilibrium position? S2 price of A S1 solar energy S3 D X B D2 C D1 D3 O quantity of solar energy
1 marks
Answer: B
This question in 9708/11 May/June 2023
Q227 · Price plays a number of functions in the allocation of resources 9708/12 May/June 2023
5 Price plays a number of functions in the allocation of resources. Which statement best illustrates the function that relies upon consumer choice (sometimes known as the incentivising function)? A A price fall can show consumers that a good is becoming less popular. B A price fall tends to persuade some producers not to stay in the market for the good. C A price rise means consumers cannot afford to buy so much of a good. D A price rise tends to reduce competitiveness in the market for a good.
1 marks
Answer: B
This question in 9708/12 May/June 2023
Q228 · Which pair of products are substitutes both in consumption and production? 9708/12 May/June 2023
6 Which pair of products are substitutes both in consumption and production? A barley and cotton B gold and silver C soap and toothpaste D spinach and cabbage
1 marks
Answer: D
This question in 9708/12 May/June 2023
Q229 · A change in the price of a good causes an increase in the quantity of the good demanded 9708/12 May/June 2023
9 A change in the price of a good causes an increase in the quantity of the good demanded. What would be the nature of the good and the direction of price change for this to be certain to happen? nature of good price change A inferior fall B inferior rise C normal fall D normal rise
1 marks
Answer: C
This question in 9708/12 May/June 2023
Q230 · The diagram shows the market for electric cars with X as the initial equilibrium 9708/12 May/June 2023
12 The diagram shows the market for electric cars with X as the initial equilibrium. What will be the new equilibrium when the price of electric car batteries falls and consumers become more environmentally aware? D1 D D2 price $ S1 A S B X S2 C D O electric cars
1 marks
Answer: C
This question in 9708/12 May/June 2023
Q231 · What is most likely to cause a shift in the supply curve for rice? 9708/13 May/June 2023
6 What is most likely to cause a shift in the supply curve for rice? A a change in the price of the rice B a change in the price of meat C a change in the size of the rice industry D a change in tastes and preferences for rice
1 marks
Answer: C
This question in 9708/13 May/June 2023
Q232 · What would not cause a shift in the demand curve for a good? 9708/13 May/June 2023
8 What would not cause a shift in the demand curve for a good? A a change in the price of a complement B a change in the price of a substitute C a change in the price of the good itself D a change in consumers’ incomes
1 marks
Answer: C
This question in 9708/13 May/June 2023
Q233 · What does joint supply mean? 9708/13 May/June 2023
9 What does joint supply mean? A A firm can choose between producing a range of different goods. B A good has multiple uses. C A good is a by-product of the production process of another good. D Consumers consider two goods as complements.
1 marks
Answer: C
This question in 9708/13 May/June 2023
Q234 · In the diagram, S1 is the supply curve and D1 is the initial demand for facemask X 9708/11 Oct/Nov 2023
13 In the diagram, S1 is the supply curve and D1 is the initial demand for facemask X. A rival firm produces facemask Y, which is a close substitute. price of S1 facemask X D2 D1 O quantity of facemask X What would cause the demand curve to shift to D2? A a decrease in the costs of the materials to make facemask X B a decrease in the costs of the materials to make facemask Y C an increase in the price of facemask X D an increase in the price of facemask Y
1 marks
Answer: D
This question in 9708/11 Oct/Nov 2023
Q235 · In 2010, poor harvests reduced fruit crops and furniture producers gave big discounts on… 9708/12 Oct/Nov 2023
9 In 2010, poor harvests reduced fruit crops and furniture producers gave big discounts on furniture products. How might these changes have affected the position of the supply curve for the products? fruit furniture producers A no change shift to the left B shift to the left no change C shift to the left shift to the left D shift to the right no change
1 marks
Answer: B
This question in 9708/12 Oct/Nov 2023
Q236 · The diagram shows the market for computers in Pakistan 9708/13 Oct/Nov 2023
5 The diagram shows the market for computers in Pakistan. W supply price Y X demand O Z quantity Which areas represent consumer surplus and consumer expenditure? consumer consumer surplus expenditure A WXY OXY B WXY OXYZ C WYO OXYZ D WYO OYZ
1 marks
Answer: B
This question in 9708/13 Oct/Nov 2023
Q237 · When the incomes of consumers of good X fall by 5%, under which conditions will the… 9708/13 Oct/Nov 2023
7 When the incomes of consumers of good X fall by 5%, under which conditions will the demand curve shift furthest to the right? income elasticity of nature of good X demand for good X A inferior good –0.8 B inferior good –1.2 C normal good +0.9 D normal good +1.5
1 marks
Answer: B
This question in 9708/13 Oct/Nov 2023
Q238 · Good P and good Q are substitutes 9708/13 Oct/Nov 2023
8 Good P and good Q are substitutes. There is a decrease in supply of good P because of a shortage of materials. Which row describes what will happen to demand? good P good Q A contraction extension B contraction shift to right C shift to left shift to left D shift to left shift to right
1 marks
Answer: B
This question in 9708/13 Oct/Nov 2023
Q239 · What is the definition of effective demand? 9708/12 Feb/March 2024
6 What is the definition of effective demand? A demand that is speculative B demand that is supported by the ability to pay C the relationship between price and quantity demanded D the total amount demanded by consumers
1 marks
Answer: B
This question in 9708/12 Feb/March 2024
Q240 · Butter is a normal good 9708/12 Feb/March 2024
10 Butter is a normal good. It is in joint demand with bread and in joint supply with buttermilk. The demand for butter increases because of a rise in consumer incomes. What are the effects of this increase on the prices of bread and buttermilk? price of price of bread buttermilk A decreases decreases B decreases increases C increases decreases D increases increases
1 marks
Answer: C
This question in 9708/12 Feb/March 2024
Q241 · An increase in which factor is likely to cause a shift to the left of the demand curve… 9708/11 May/June 2024
6 An increase in which factor is likely to cause a shift to the left of the demand curve for cinema movies? A expenses for the heating system in the cinema B payments charged by movie scriptwriters C the cost of transport to the cinema D taxes on the incomes of cinema operators
1 marks
Answer: C
This question in 9708/11 May/June 2024
Q242 · Which statement is correct? 9708/11 May/June 2024
8 Which statement is correct? A Demand for an inferior good has a positive relationship to income and a negative relationship to price. B Demand for an inferior good has a negative relationship to income and a negative relationship to price. C Demand for a normal good has a positive relationship to income and a positive relationship to price. D Demand for a normal good has a negative relationship to income and a positive relationship to price.
1 marks
Answer: B
This question in 9708/11 May/June 2024
Q243 · In Asia, instant noodles is an inferior good because dried fruit is a better quality… 9708/12 May/June 2024
9 In Asia, instant noodles is an inferior good because dried fruit is a better quality substitute. The diagram shows the demand for instant noodles. price of instant noodles D2 D1 O quantity of instant noodles What could have caused the shift in the demand curve for instant noodles from D1 to D2? A a fall in the price of dried fruit B a rise in real income C a rise in unemployment D a successful advertising campaign by dried fruit producers
1 marks
Answer: C
This question in 9708/12 May/June 2024
Q244 · Which reason for the increase in demand for a smartphone is an example of joint demand? 9708/12 May/June 2024
11 Which reason for the increase in demand for a smartphone is an example of joint demand? A a fall in its price B a fall in the price of connecting to a network C a fall in the price of parts used to make smartphones D a rise in the price of a substitute
1 marks
Answer: B
This question in 9708/12 May/June 2024
Q245 · What most accurately describes a market supply curve? 9708/13 May/June 2024
10 What most accurately describes a market supply curve? A supply at different income levels, assuming product prices remain unchanged B supply at different levels of factor prices, assuming product prices remain unchanged C supply at different prices, assuming no changes in technology D supply at different time periods, assuming no changes in technology
1 marks
Answer: C
This question in 9708/13 May/June 2024
Q246 · In the diagram, D1 shows an individual’s initial demand curve for public transport 9708/13 May/June 2024
11 In the diagram, D1 shows an individual’s initial demand curve for public transport. price of public transport D2 D1 O quantity of public transport What could cause the demand curve to shift to D2? A The costs of running the individual’s car fall. B The individual is no longer able to drive. C The price of public transport falls. D The public transport services are reduced.
1 marks
Answer: B
This question in 9708/13 May/June 2024
Q247 · In a particular year, 12 000 units of a good are sold at $1 per unit 9708/11 Oct/Nov 2024
6 In a particular year, 12 000 units of a good are sold at $1 per unit. In a later year, 14 000 units are sold at $1.20 per unit. If consumer tastes have remained constant, what could account for the change between the two years? A a decrease in the price of raw materials used by producers B an increase in the price of a substitute good C an increase in the rate of tax imposed on producers D the formation of a monopoly in the production of the good
1 marks
Answer: B
This question in 9708/11 Oct/Nov 2024
Q248 · What is most likely to cause an increase in the consumer surplus in the market for a… 9708/11 Oct/Nov 2024
7 What is most likely to cause an increase in the consumer surplus in the market for a normal good? A an increase in consumer incomes B an increase in the number of substitute goods C an increase in the price of a complementary good D an increase in the price of the good
1 marks
Answer: A
This question in 9708/11 Oct/Nov 2024
Q249 · What is not held constant when aggregating individual firms’ supply curves to give the… 9708/11 Oct/Nov 2024
9 What is not held constant when aggregating individual firms’ supply curves to give the short-run market supply curve? A the number of firms in the industry B the price of the product C the prices of factors of production D the state of technology
1 marks
Answer: B
This question in 9708/11 Oct/Nov 2024
Q250 · D1D1 shows an individual’s initial demand curve for public transport 9708/11 Oct/Nov 2024
11 D1D1 shows an individual’s initial demand curve for public transport. D1 price of public transport D2 D1 O quantity of public transport What would cause the demand curve to shift to D2D1? A The cost of running the individual’s car rises. B The individual is banned from driving. C The price of public transport rises. D The quality of public transport declines.
1 marks
Answer: D
This question in 9708/11 Oct/Nov 2024
Q251 · The graph shows the demand and supply curves for an industry 9708/12 Oct/Nov 2024
6 The graph shows the demand and supply curves for an industry. S2 S1 price D1 O quantity What would cause a shift in the supply curve from S1 to S2? A an increase in the number of firms in the industry B an increase in the number of workers employed C an increase in the productivity of the workforce D an increase in the wage rates paid to workers
1 marks
Answer: D
This question in 9708/12 Oct/Nov 2024
Q252 · What is most likely to cause the demand curve of an inferior good to shift to the right? 9708/12 Oct/Nov 2024
8 What is most likely to cause the demand curve of an inferior good to shift to the right? A a rise in consumers’ incomes B a rise in income tax C a rise in sales tax D a rise in the price of a complement
1 marks
Answer: B
This question in 9708/12 Oct/Nov 2024
Q253 · The diagram shows a shift of the supply curve in a market from S1 to S2 9708/12 Oct/Nov 2024
10 The diagram shows a shift of the supply curve in a market from S1 to S2. S2 price $ S1 P2 s t P1 u v w D z O quantity How will the consumer surplus and producer surplus change? consumer surplus producer surplus A decreases by s increases by s + u – t B decreases by s increases by u + v – w C decreases by s + t increases by s + t – v D decreases by s + t increases by s + z – v
1 marks
Answer: D
This question in 9708/12 Oct/Nov 2024
Q254 · Good X has a substitute, good Y, and a complement, good Z 9708/12 Oct/Nov 2024
11 Good X has a substitute, good Y, and a complement, good Z. The price of good Y decreases and the price of good Z increases. Why might the equilibrium price of good X remain unchanged? A Producers of good X adopt new technology. B Producers of good X receive a subsidy. C Some firms stop production of good X. D The tax on the production of good X is cut.
1 marks
Answer: C
This question in 9708/12 Oct/Nov 2024
Q255 · Shoe manufacturers often use leather to make their most expensive shoes 9708/13 Oct/Nov 2024
6 Shoe manufacturers often use leather to make their most expensive shoes. Due to a world shortage of leather, the price of leather has risen. What will be the effect of this price change? A The demand curve for leather shoes will shift to the left. B The demand curve for a substitute for leather shoes will shift to the right. C The supply curve for leather shoes will shift to the right. D The supply curve for a substitute for leather to make expensive shoes will shift to the right.
1 marks
Answer: B
This question in 9708/13 Oct/Nov 2024
Q256 · Which combination of the classification of a good and market change will cause the demand… 9708/13 Oct/Nov 2024
11 Which combination of the classification of a good and market change will cause the demand curve for the good to shift to the right? classification of good market change A inferior good income decrease B inferior good price decrease C normal good income decrease D normal good price decrease
1 marks
Answer: A
This question in 9708/13 Oct/Nov 2024
Q257 · What is likely to have a greater effect on an individual demand curve than on a market… 9708/12 Feb/March 2025
9 What is likely to have a greater effect on an individual demand curve than on a market demand curve? A changing weather patterns B government policy to promote consumption C growth in population D more expensive substitutes
1 marks
Answer: D
This question in 9708/12 Feb/March 2025
Q258 · What is not a function of the price mechanism? 9708/11 May/June 2025
6 What is not a function of the price mechanism? A to act as a signal to firms when allocating resources B to maximise consumer surplus C to provide an incentive to firms to produce goods D to ration scarce resources
1 marks
Answer: B
This question in 9708/11 May/June 2025
Q259 · The diagram shows a market supply curve (S) 9708/12 Oct/Nov 2025
7 The diagram shows a market supply curve (S). S Y O X What is measured on the X-axis and the Y-axis? X-axis Y-axis A quantity income B quantity price C price income D income quantity
1 marks
Answer: B
This question in 9708/12 Oct/Nov 2025
Q260 · Market demand curves normally slope downwards 9708/13 Oct/Nov 2025
7 Market demand curves normally slope downwards. They may also shift from D1 to either D2 or D3. price of good X D3 D1 D2 O quantity demanded What would cause a movement along D1 for good X and not a shift to either D2 or D3? A advertising of good X increases sales B consumer incomes rise C the price of good X falls D the prices of other goods fall
1 marks
Answer: C
This question in 9708/13 Oct/Nov 2025
Q261 · The diagram shows the demand curve and supply curve for broken rice that is considered to… 9708/13 Oct/Nov 2025
8 The diagram shows the demand curve and supply curve for broken rice that is considered to be an inferior good. The market is in equilibrium at point X with a price of P1 and quantity of Q1. Which point is the new equilibrium if household incomes rise? S price A B X P1 D C D O Q1 quantity
1 marks
Answer: D
This question in 9708/13 Oct/Nov 2025
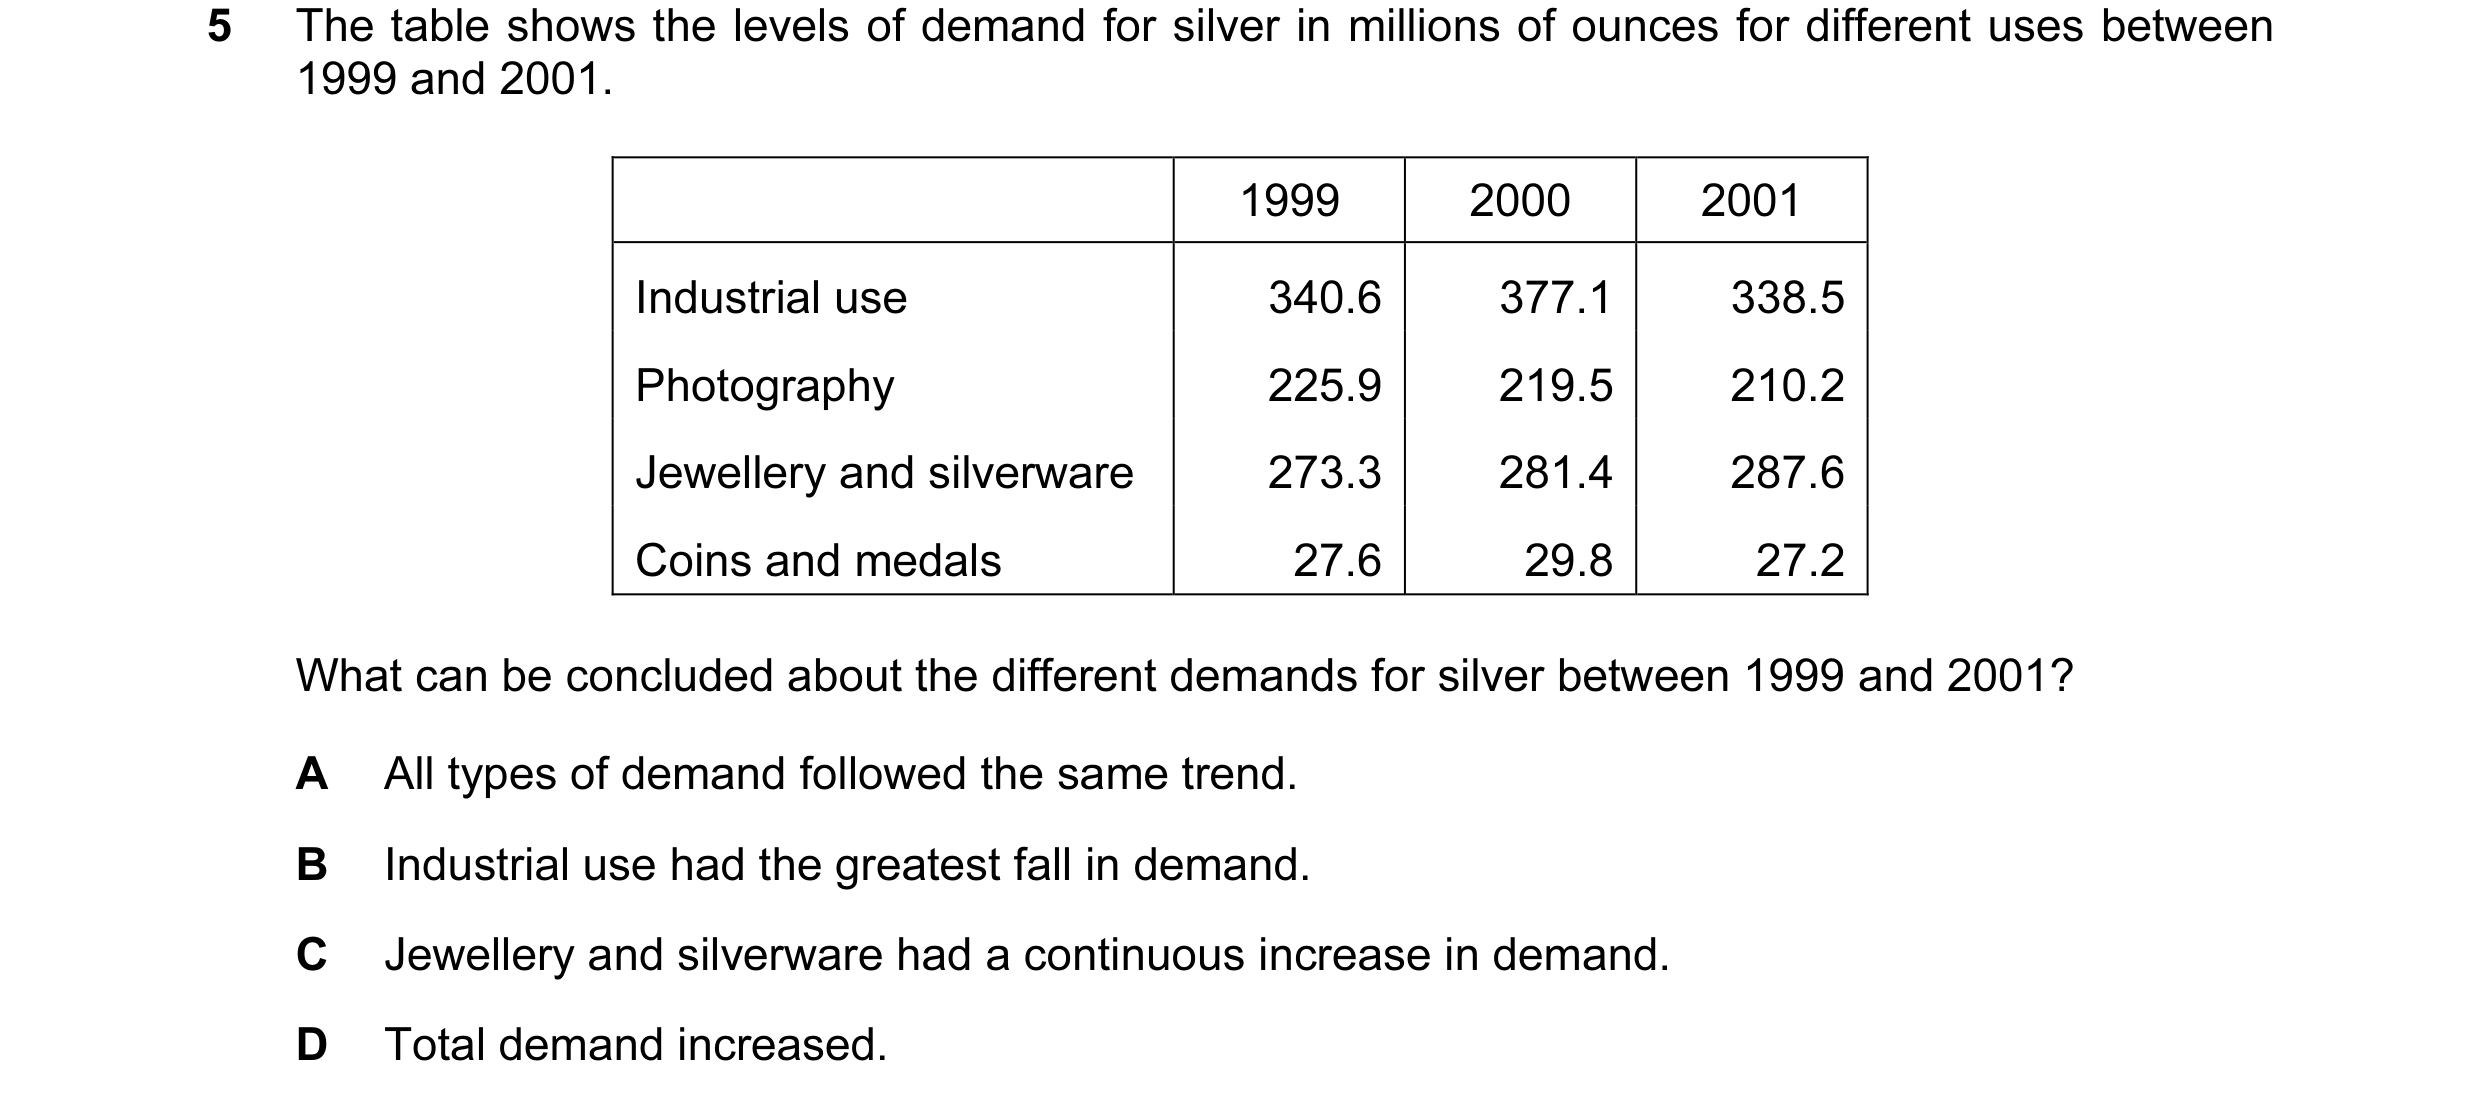

 1 / 76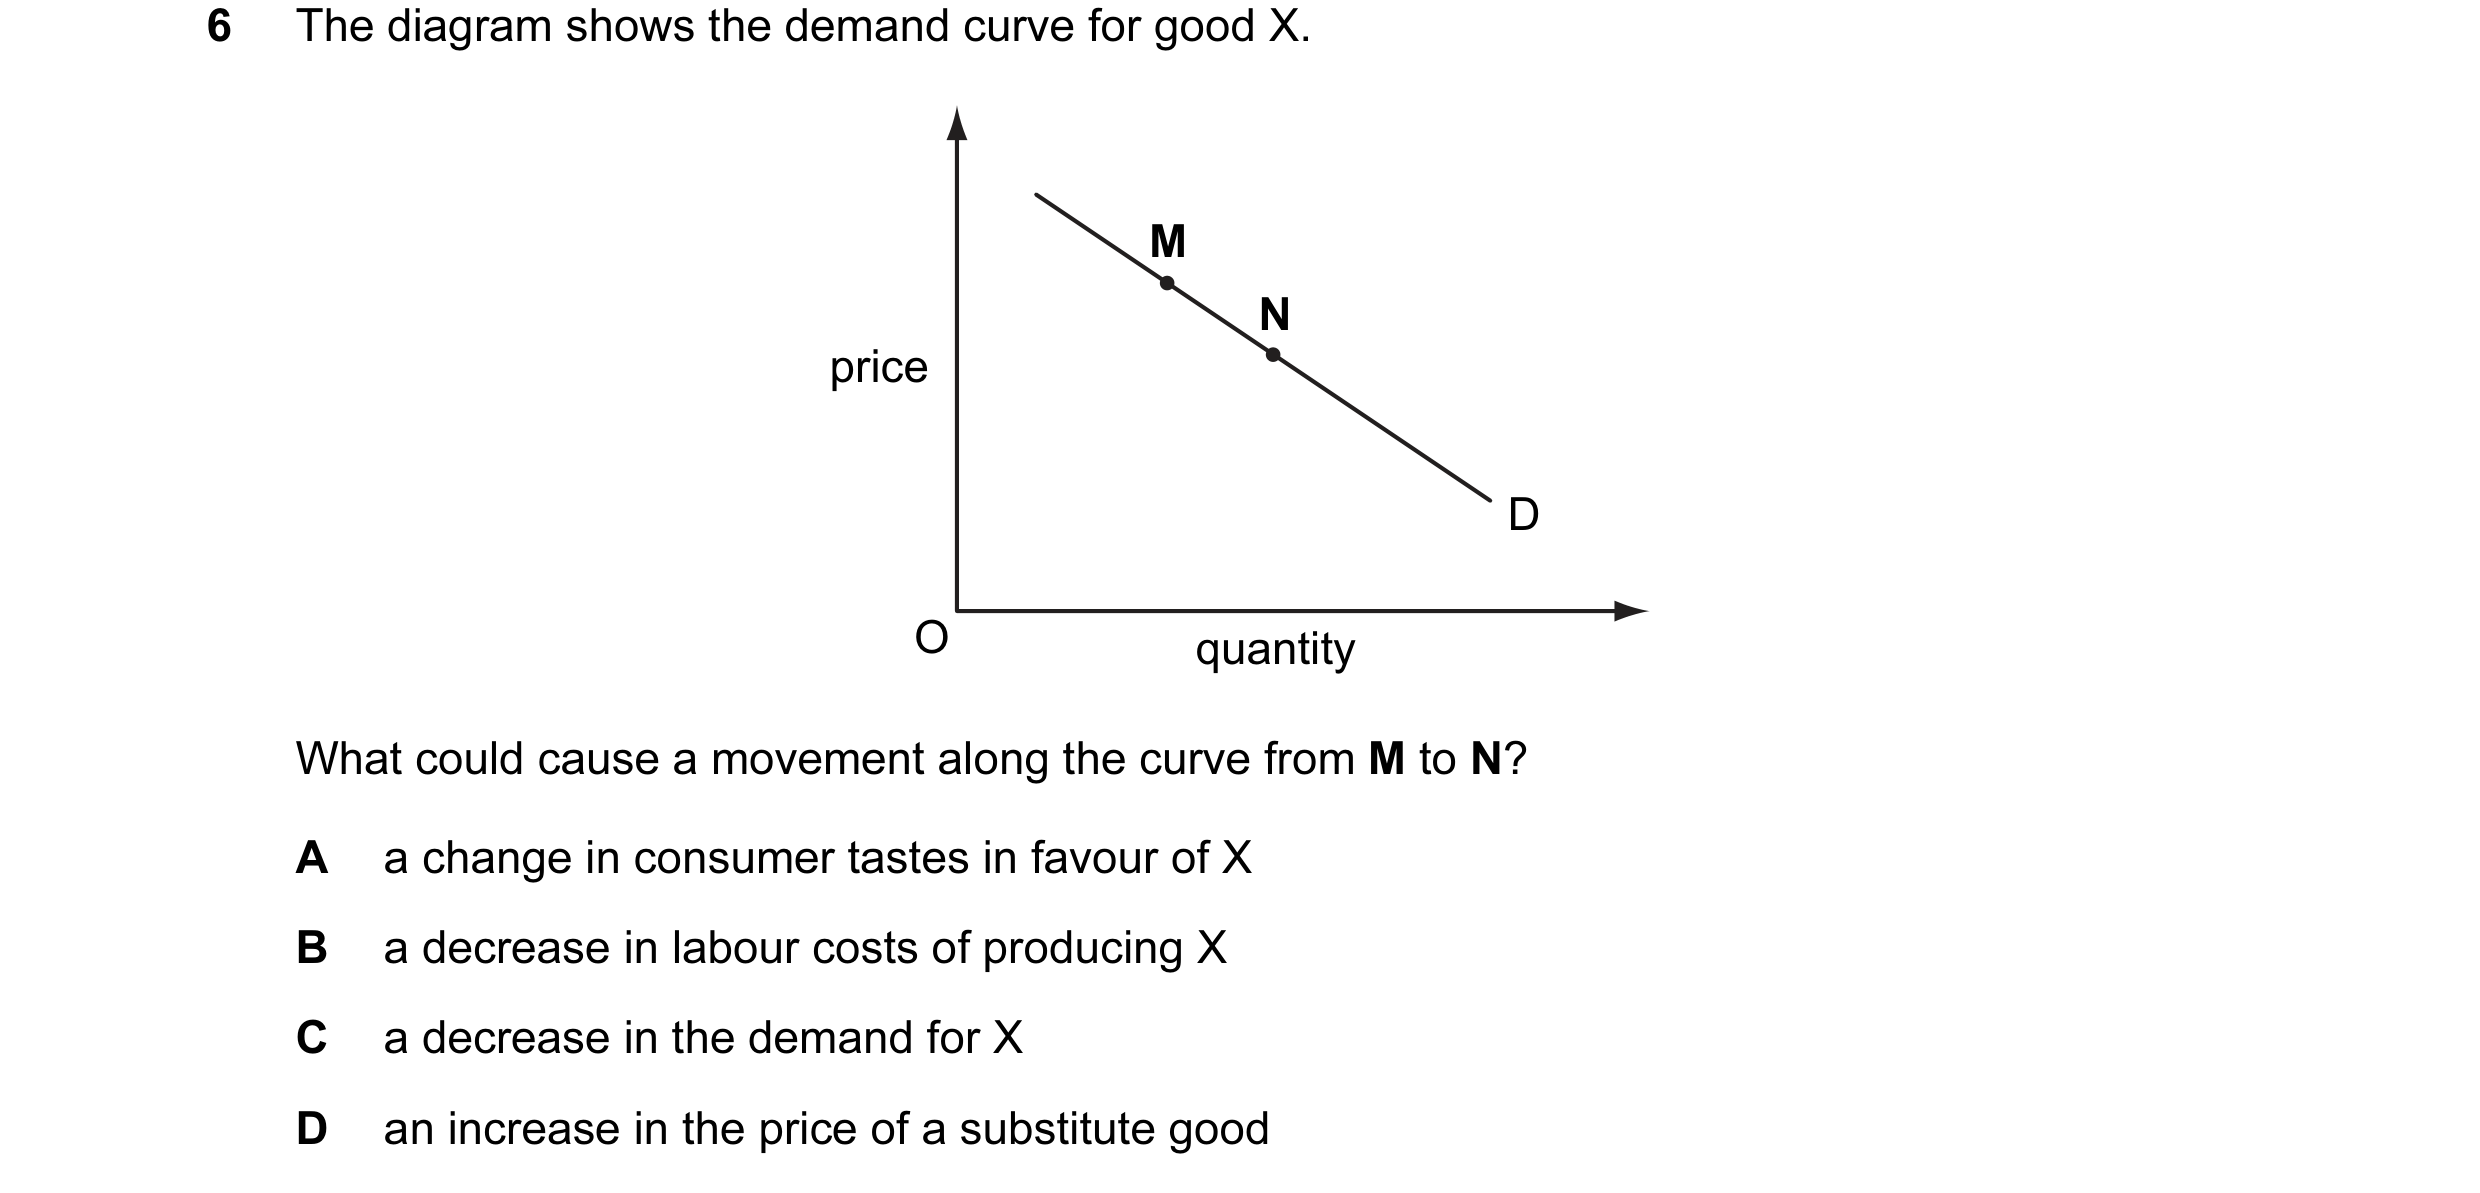
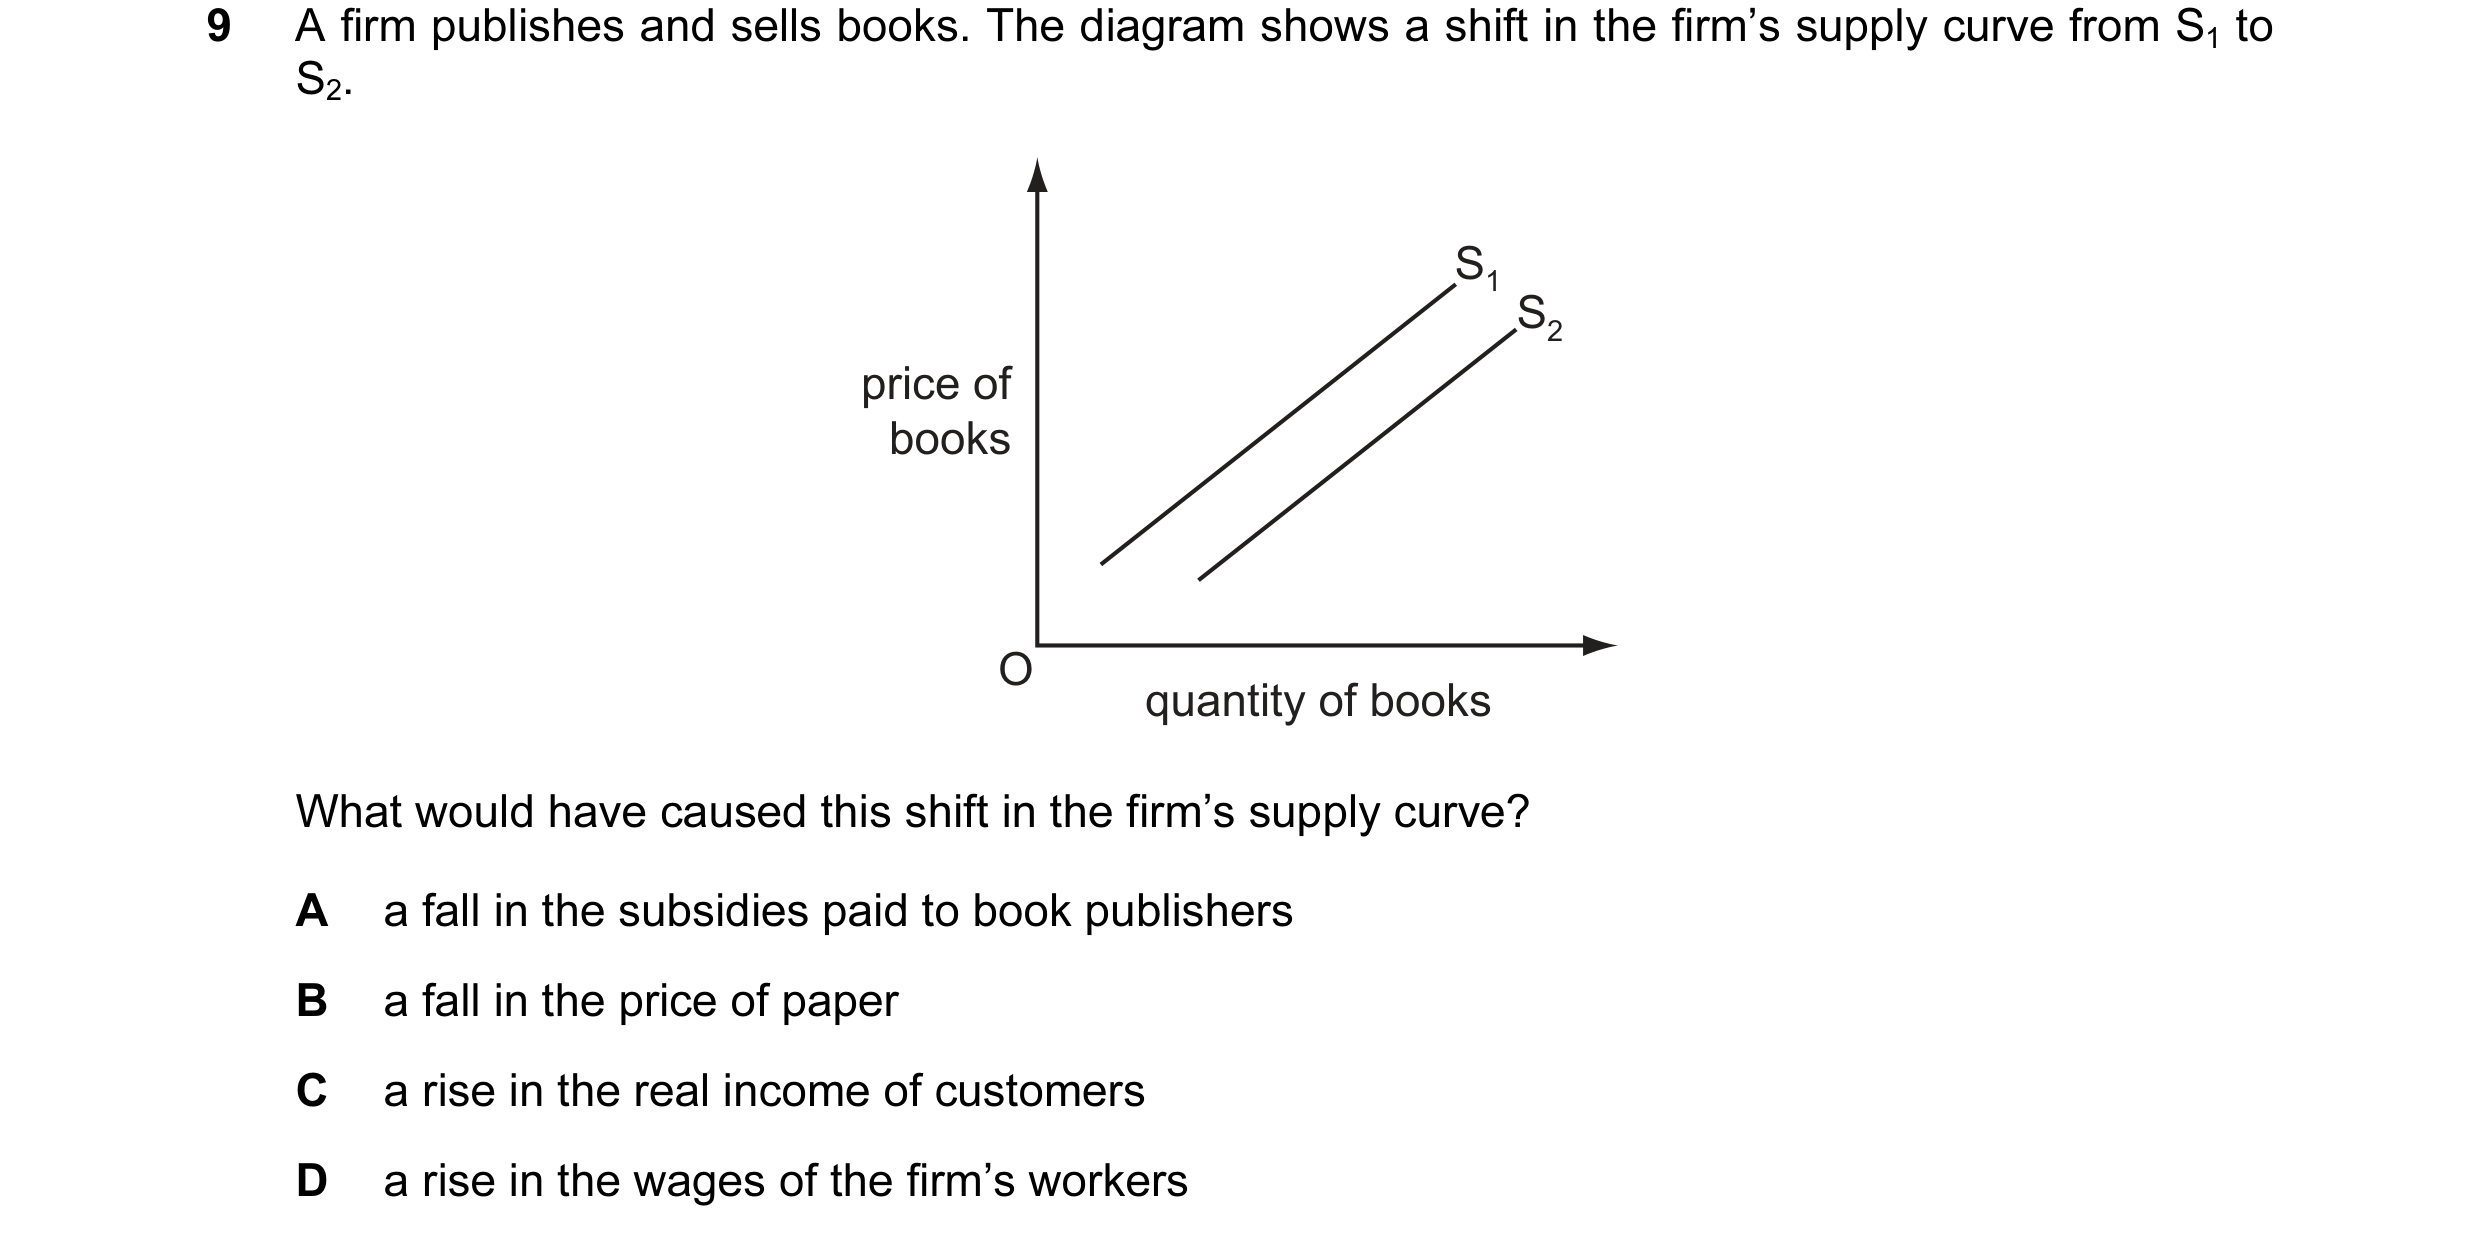
 2 / 76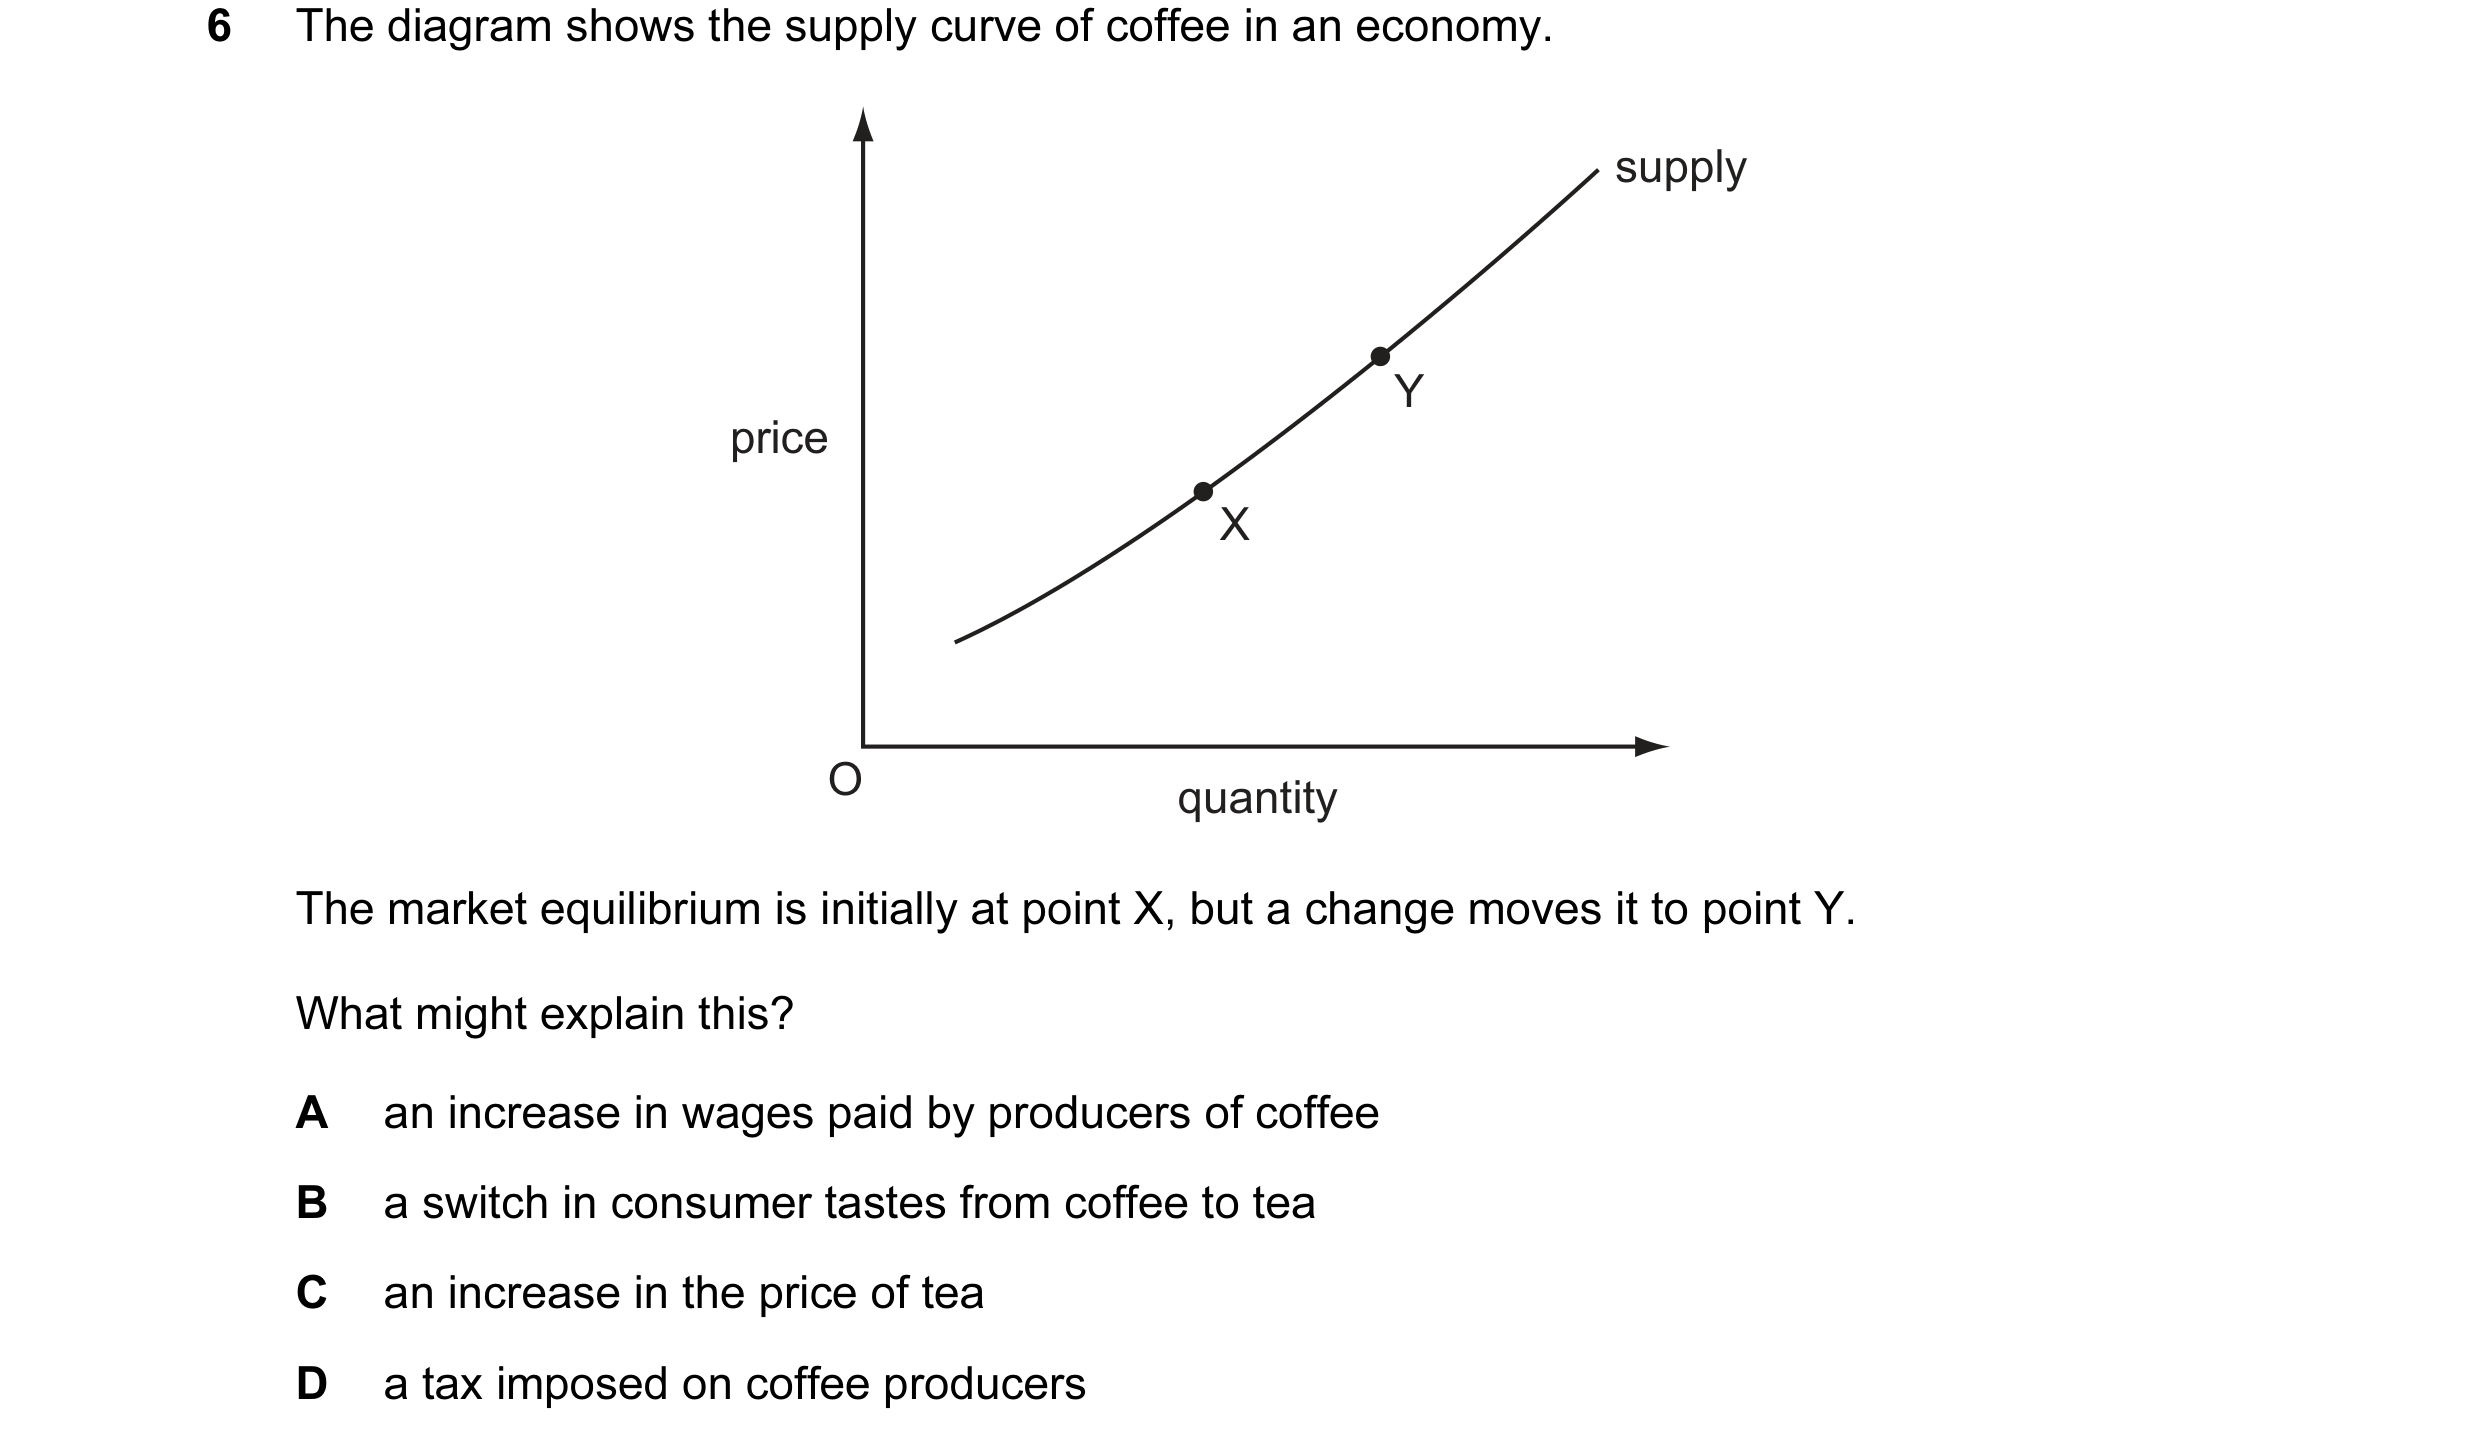

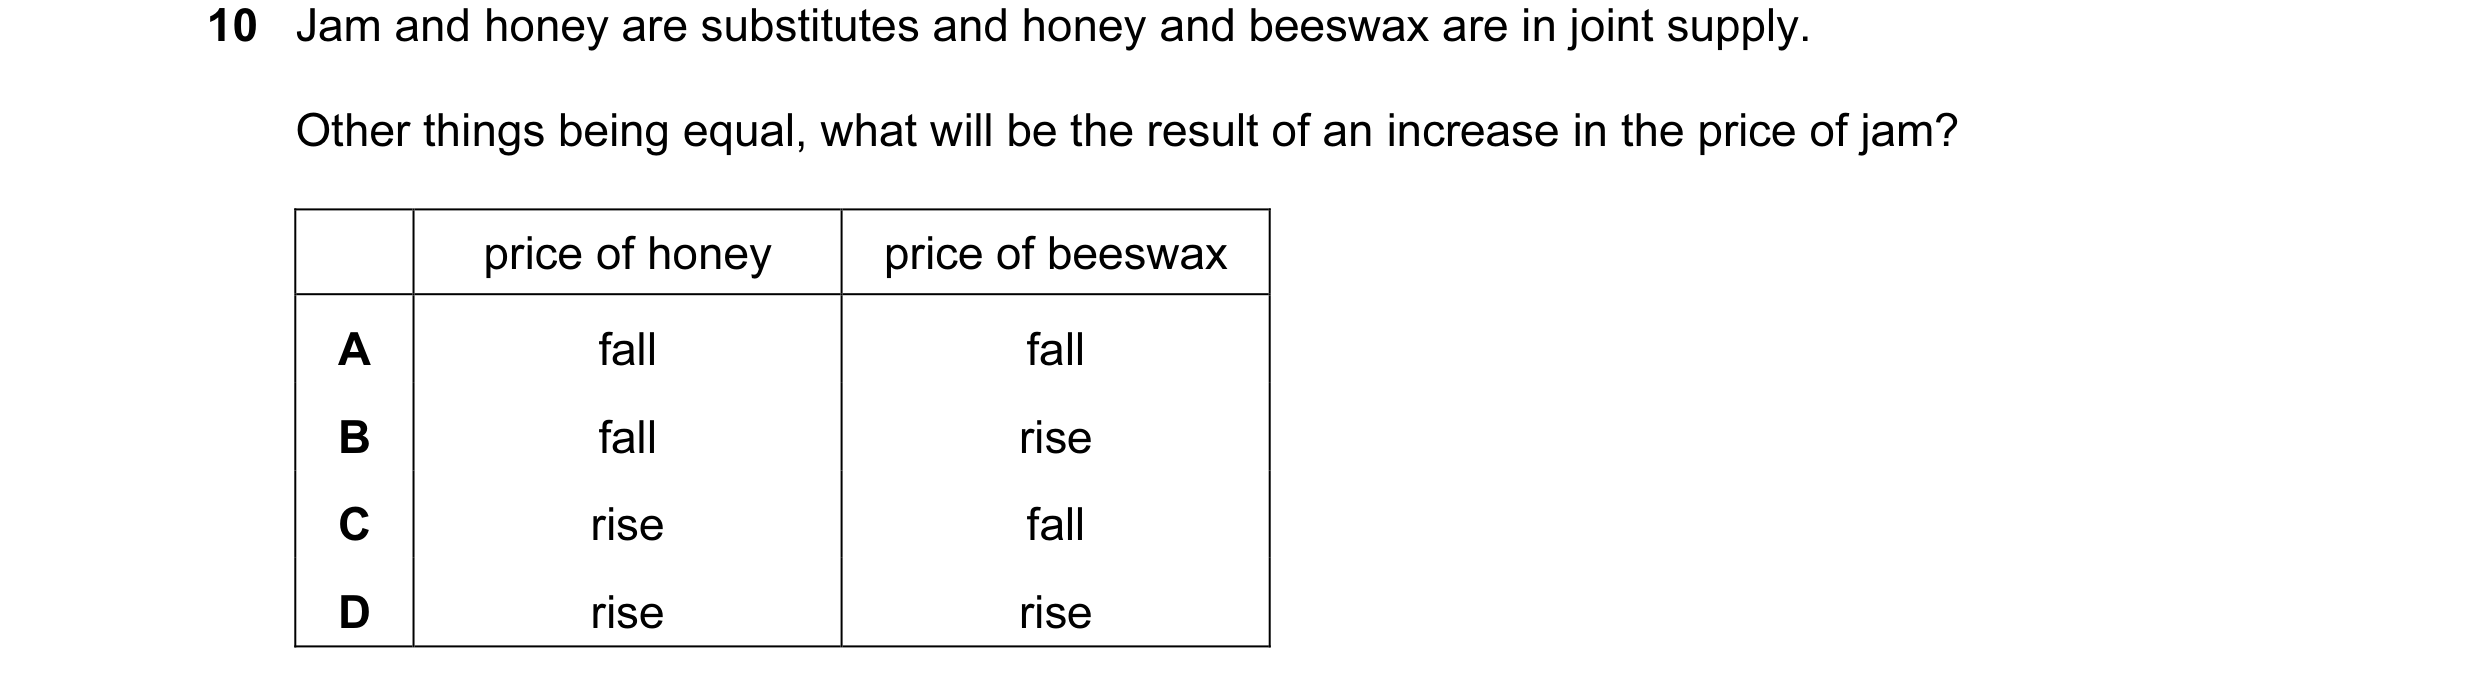 3 / 76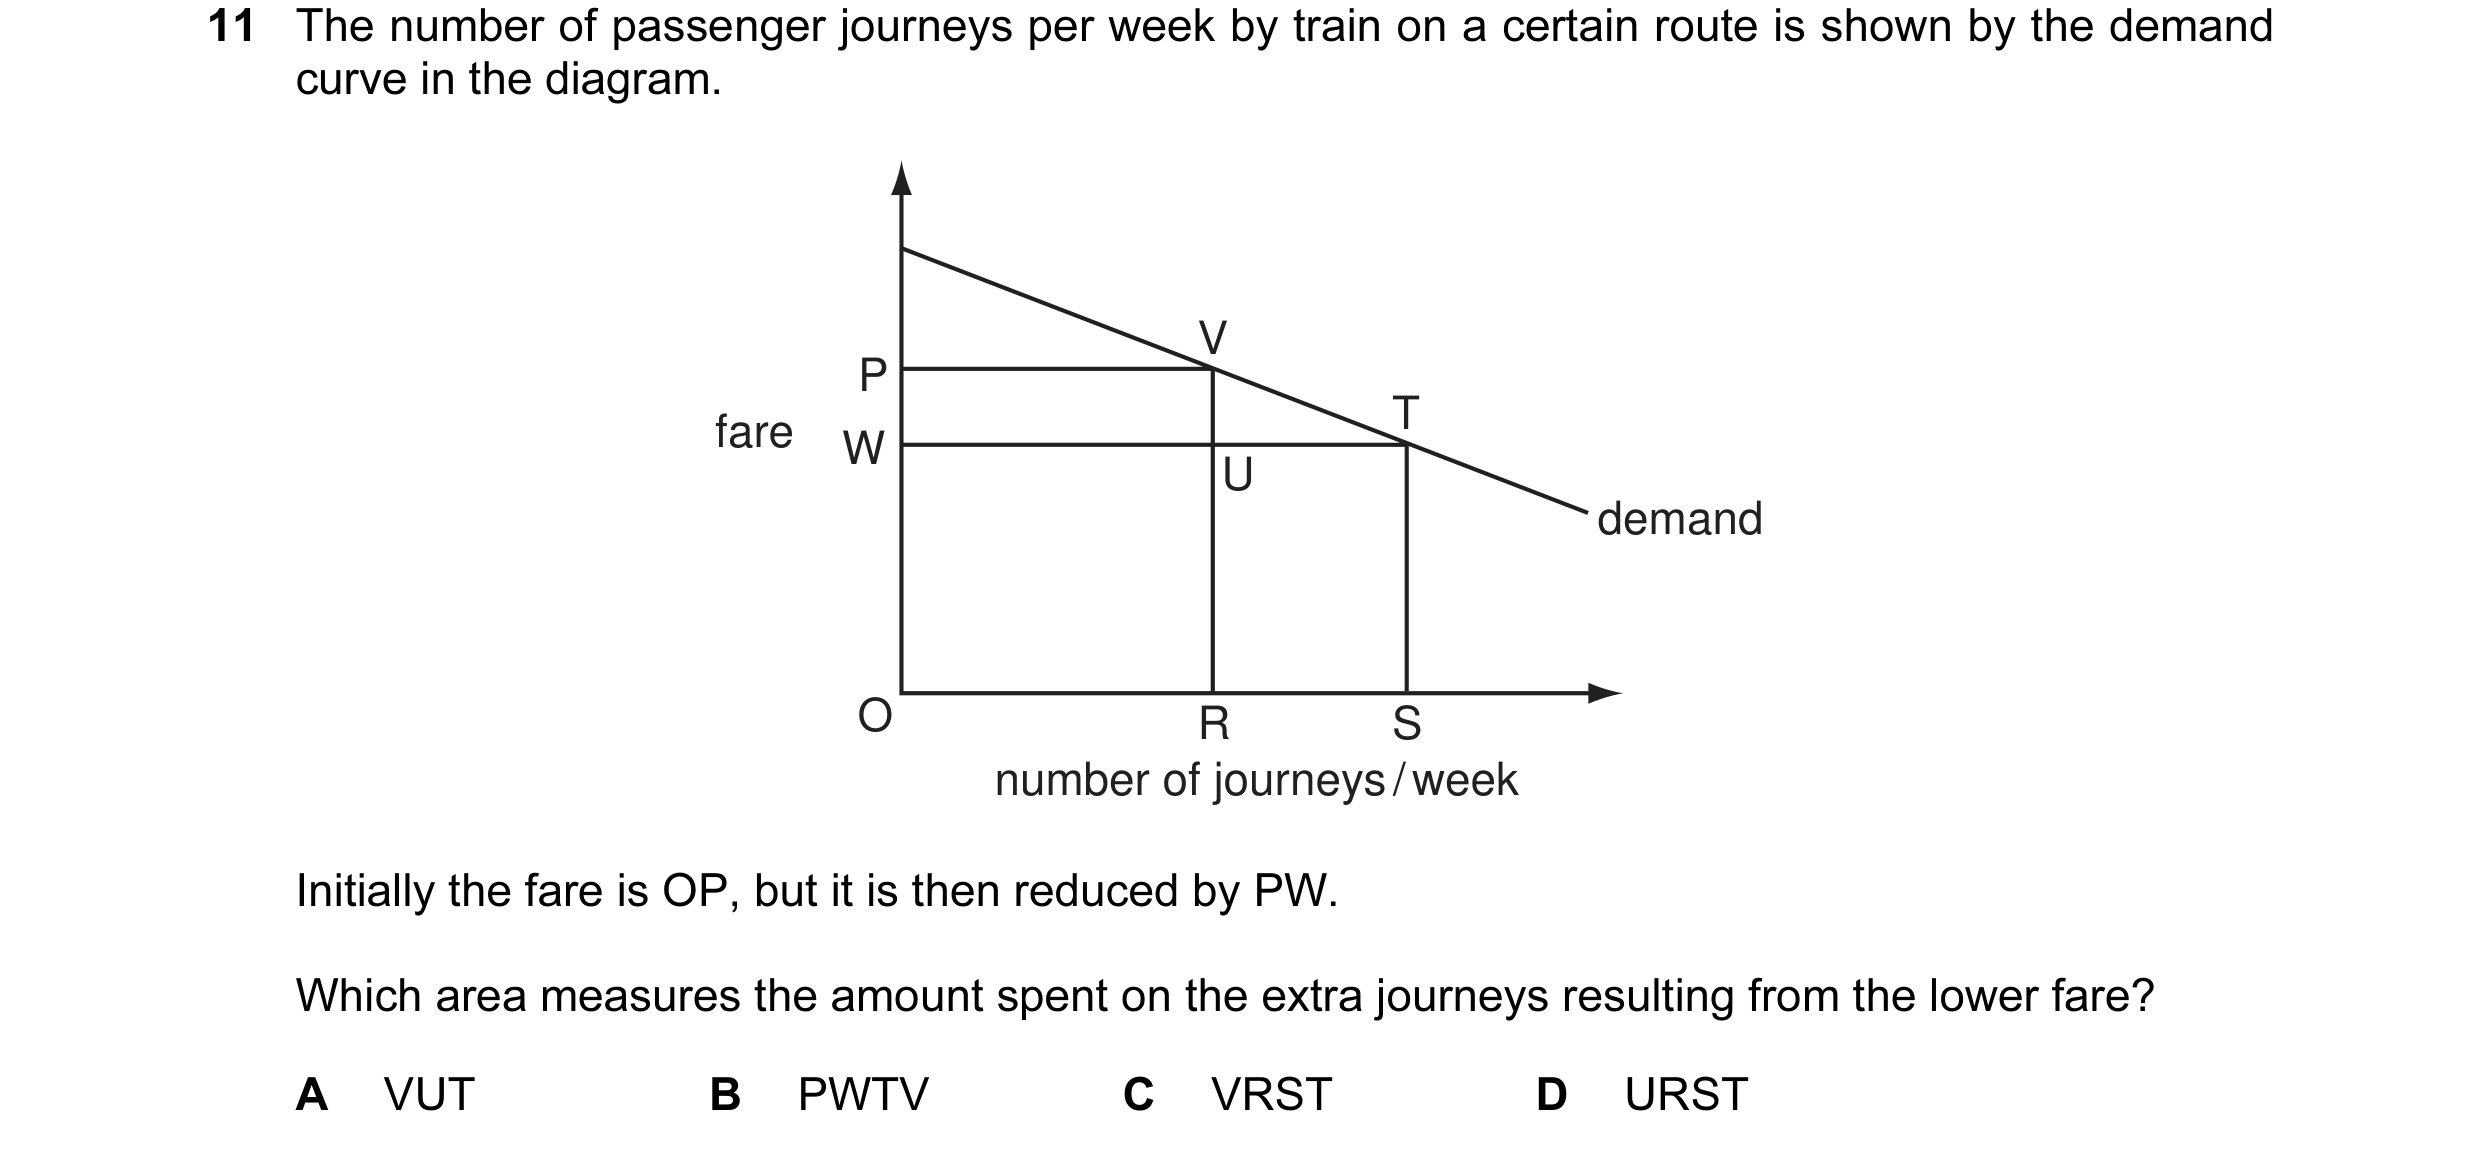
 4 / 76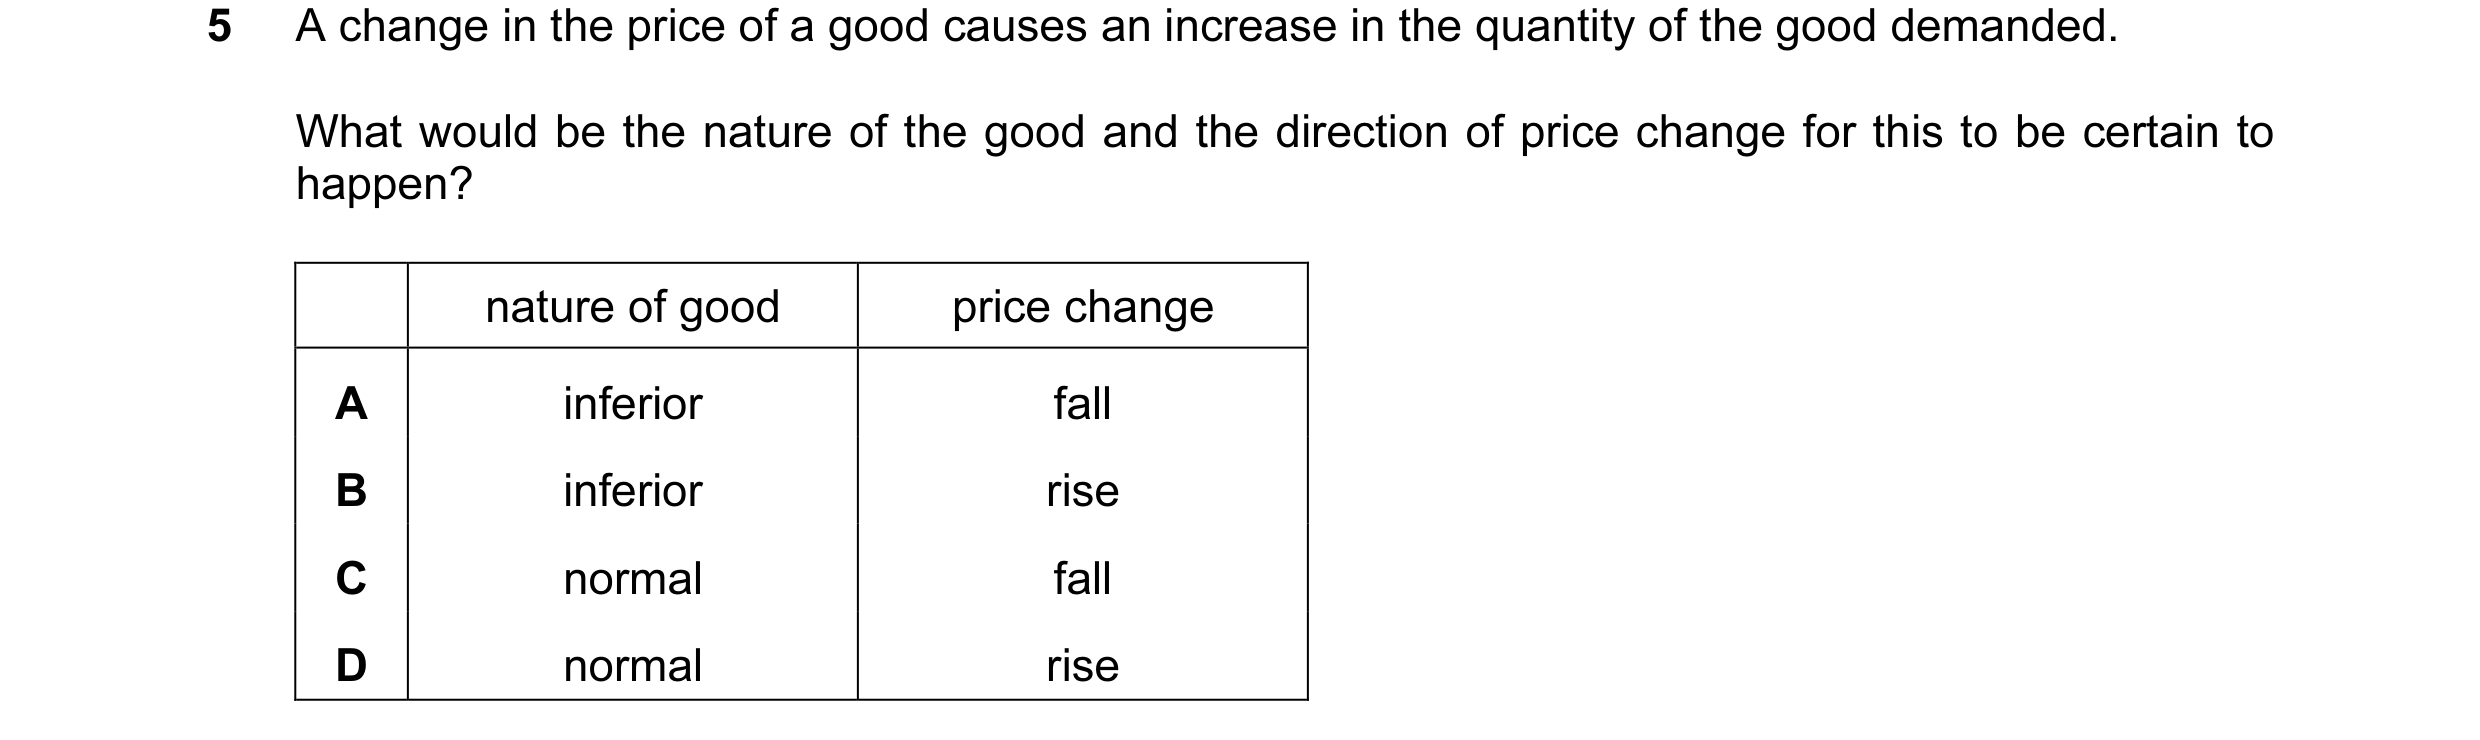
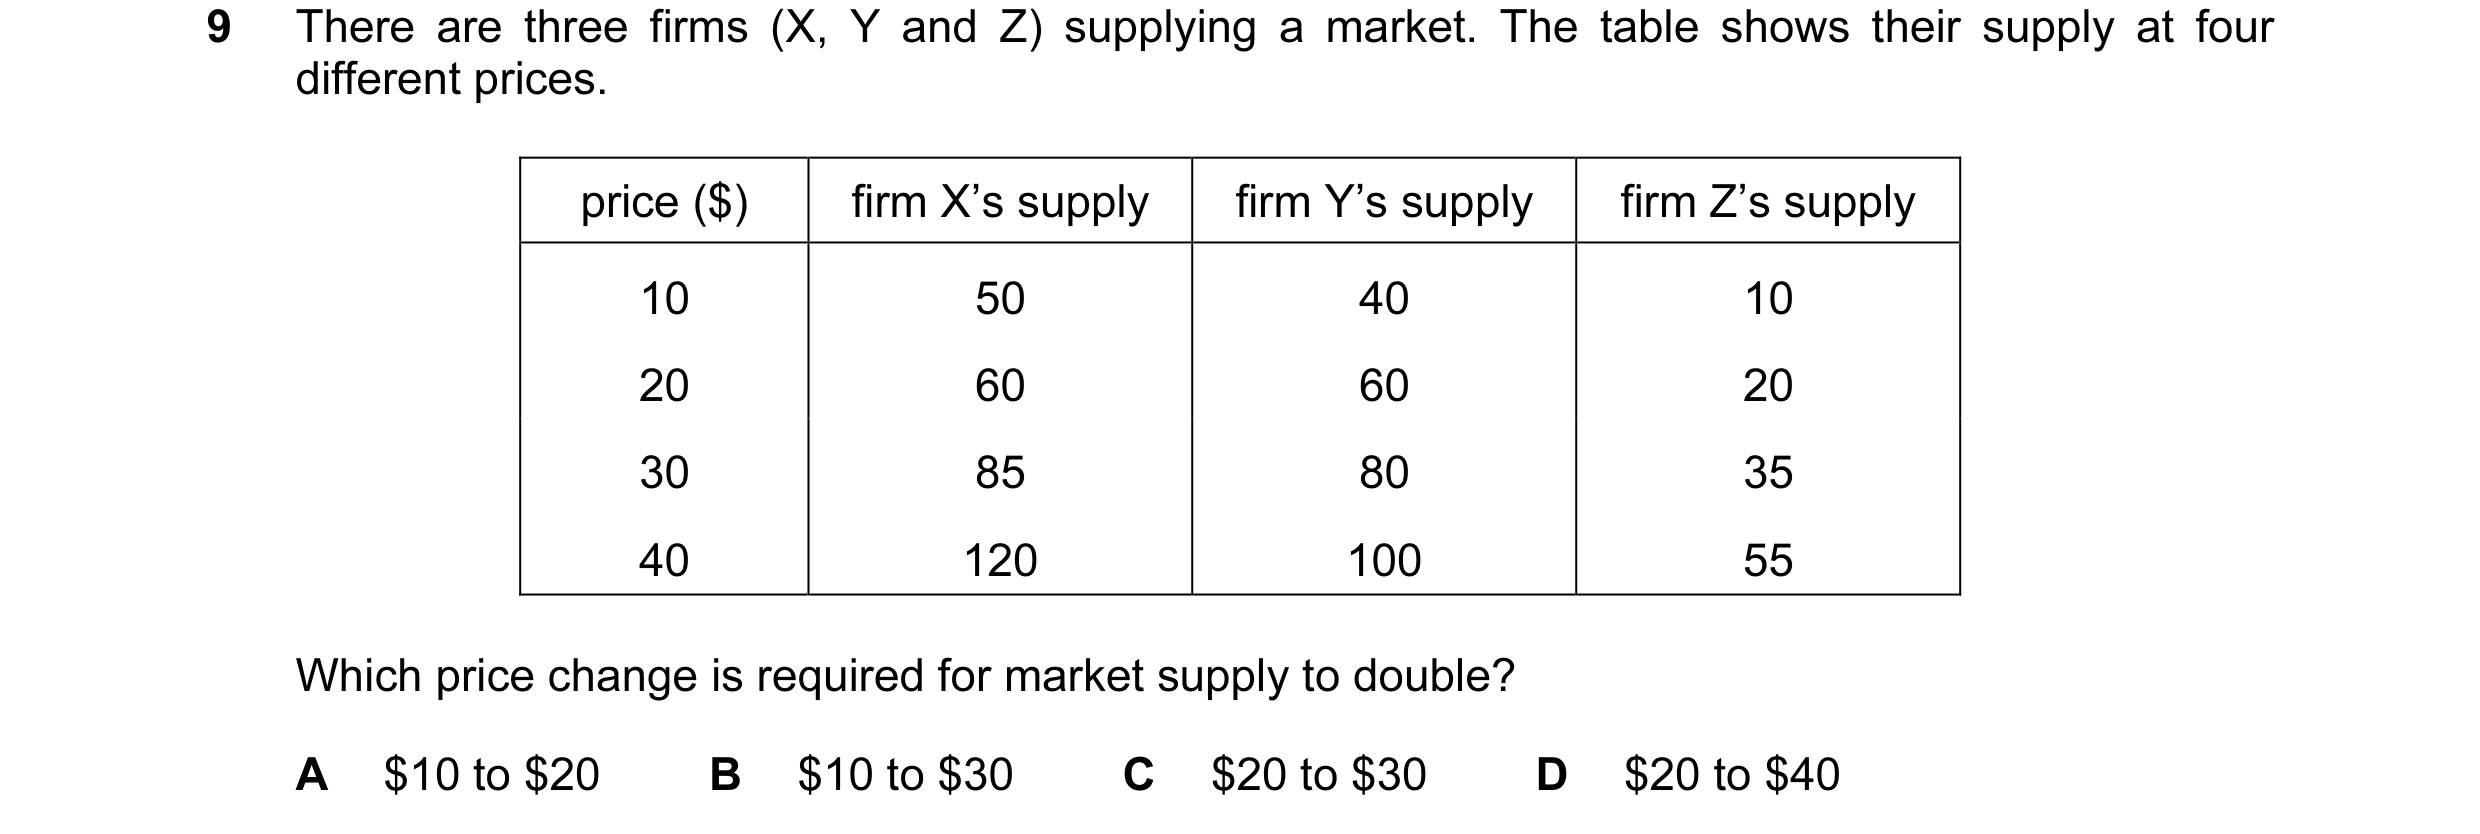
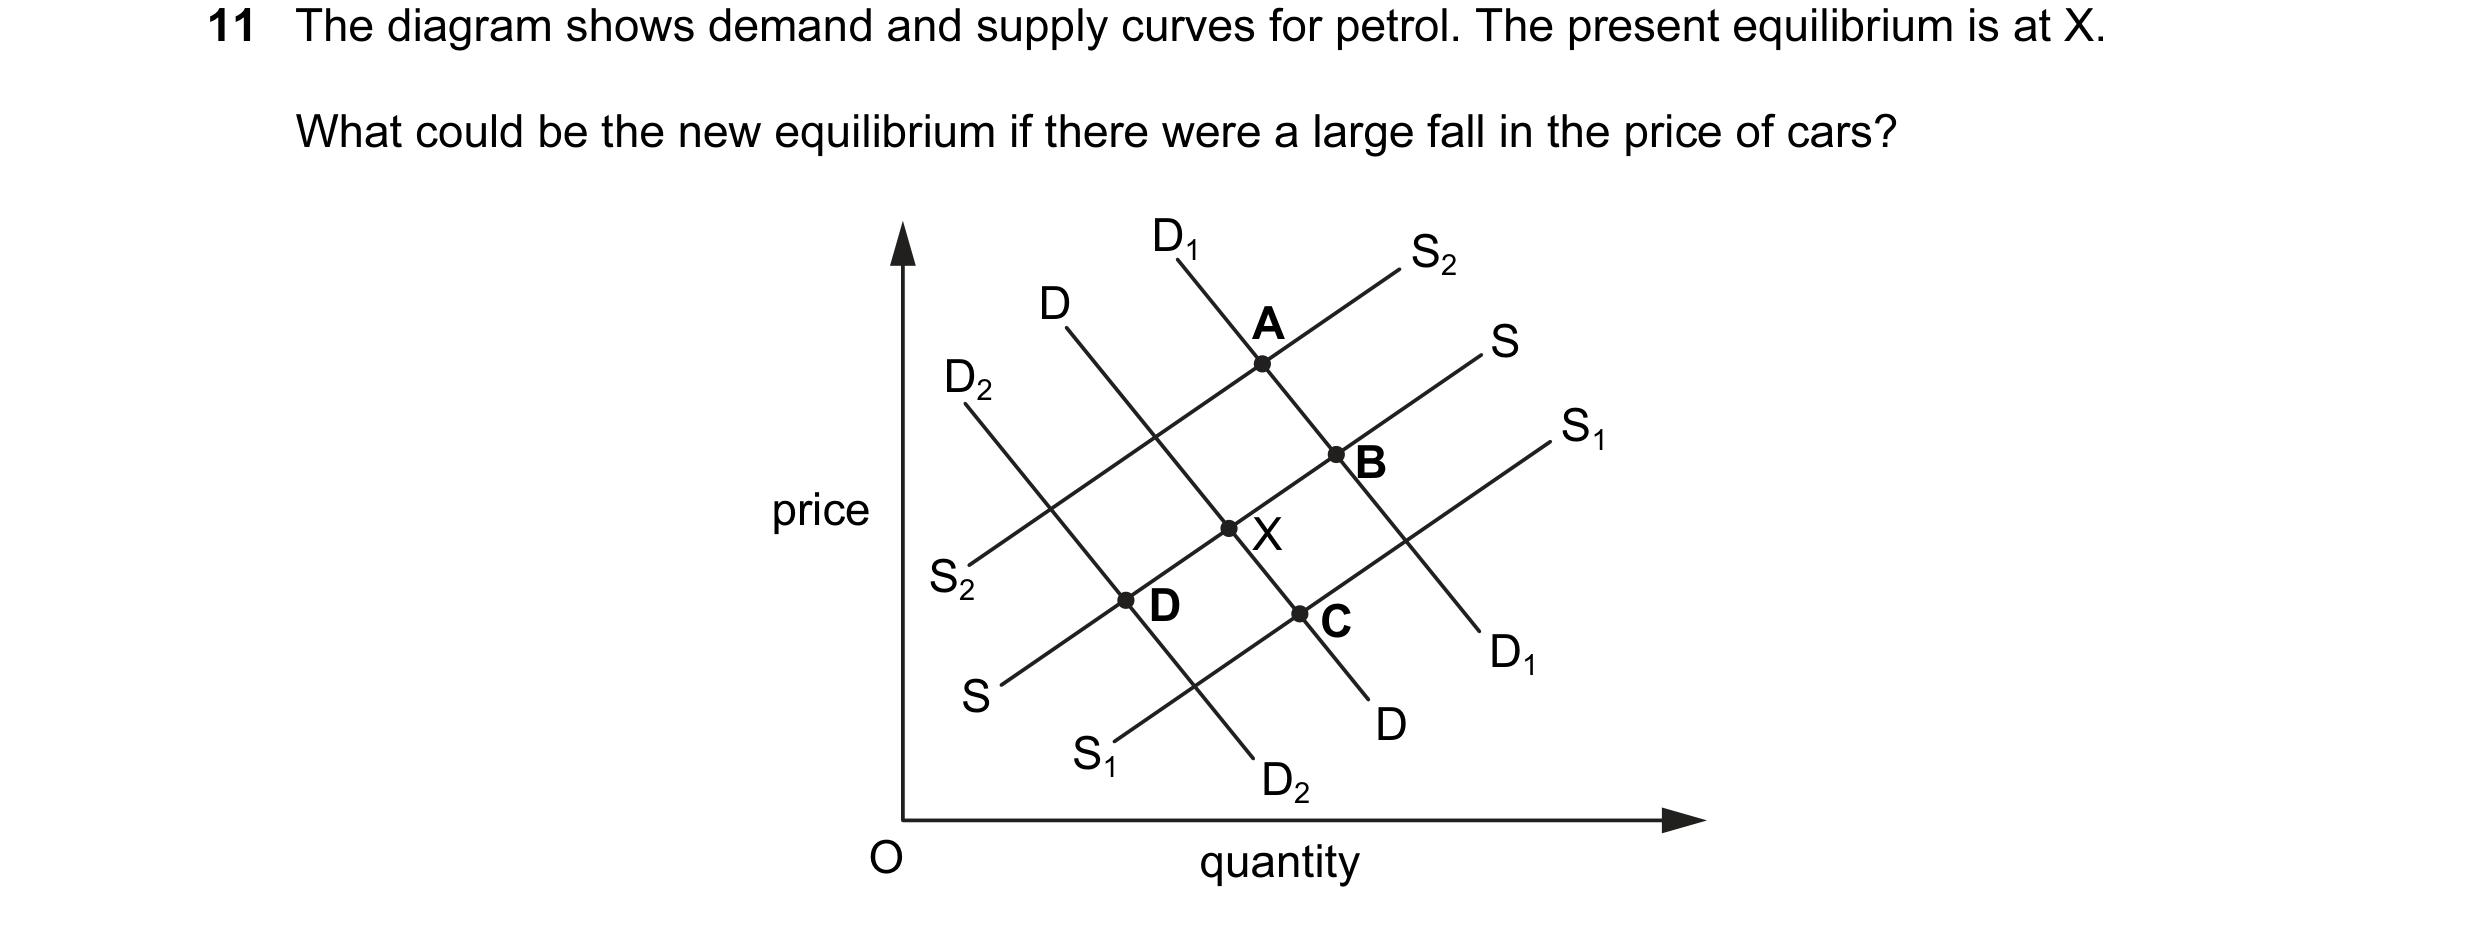 5 / 76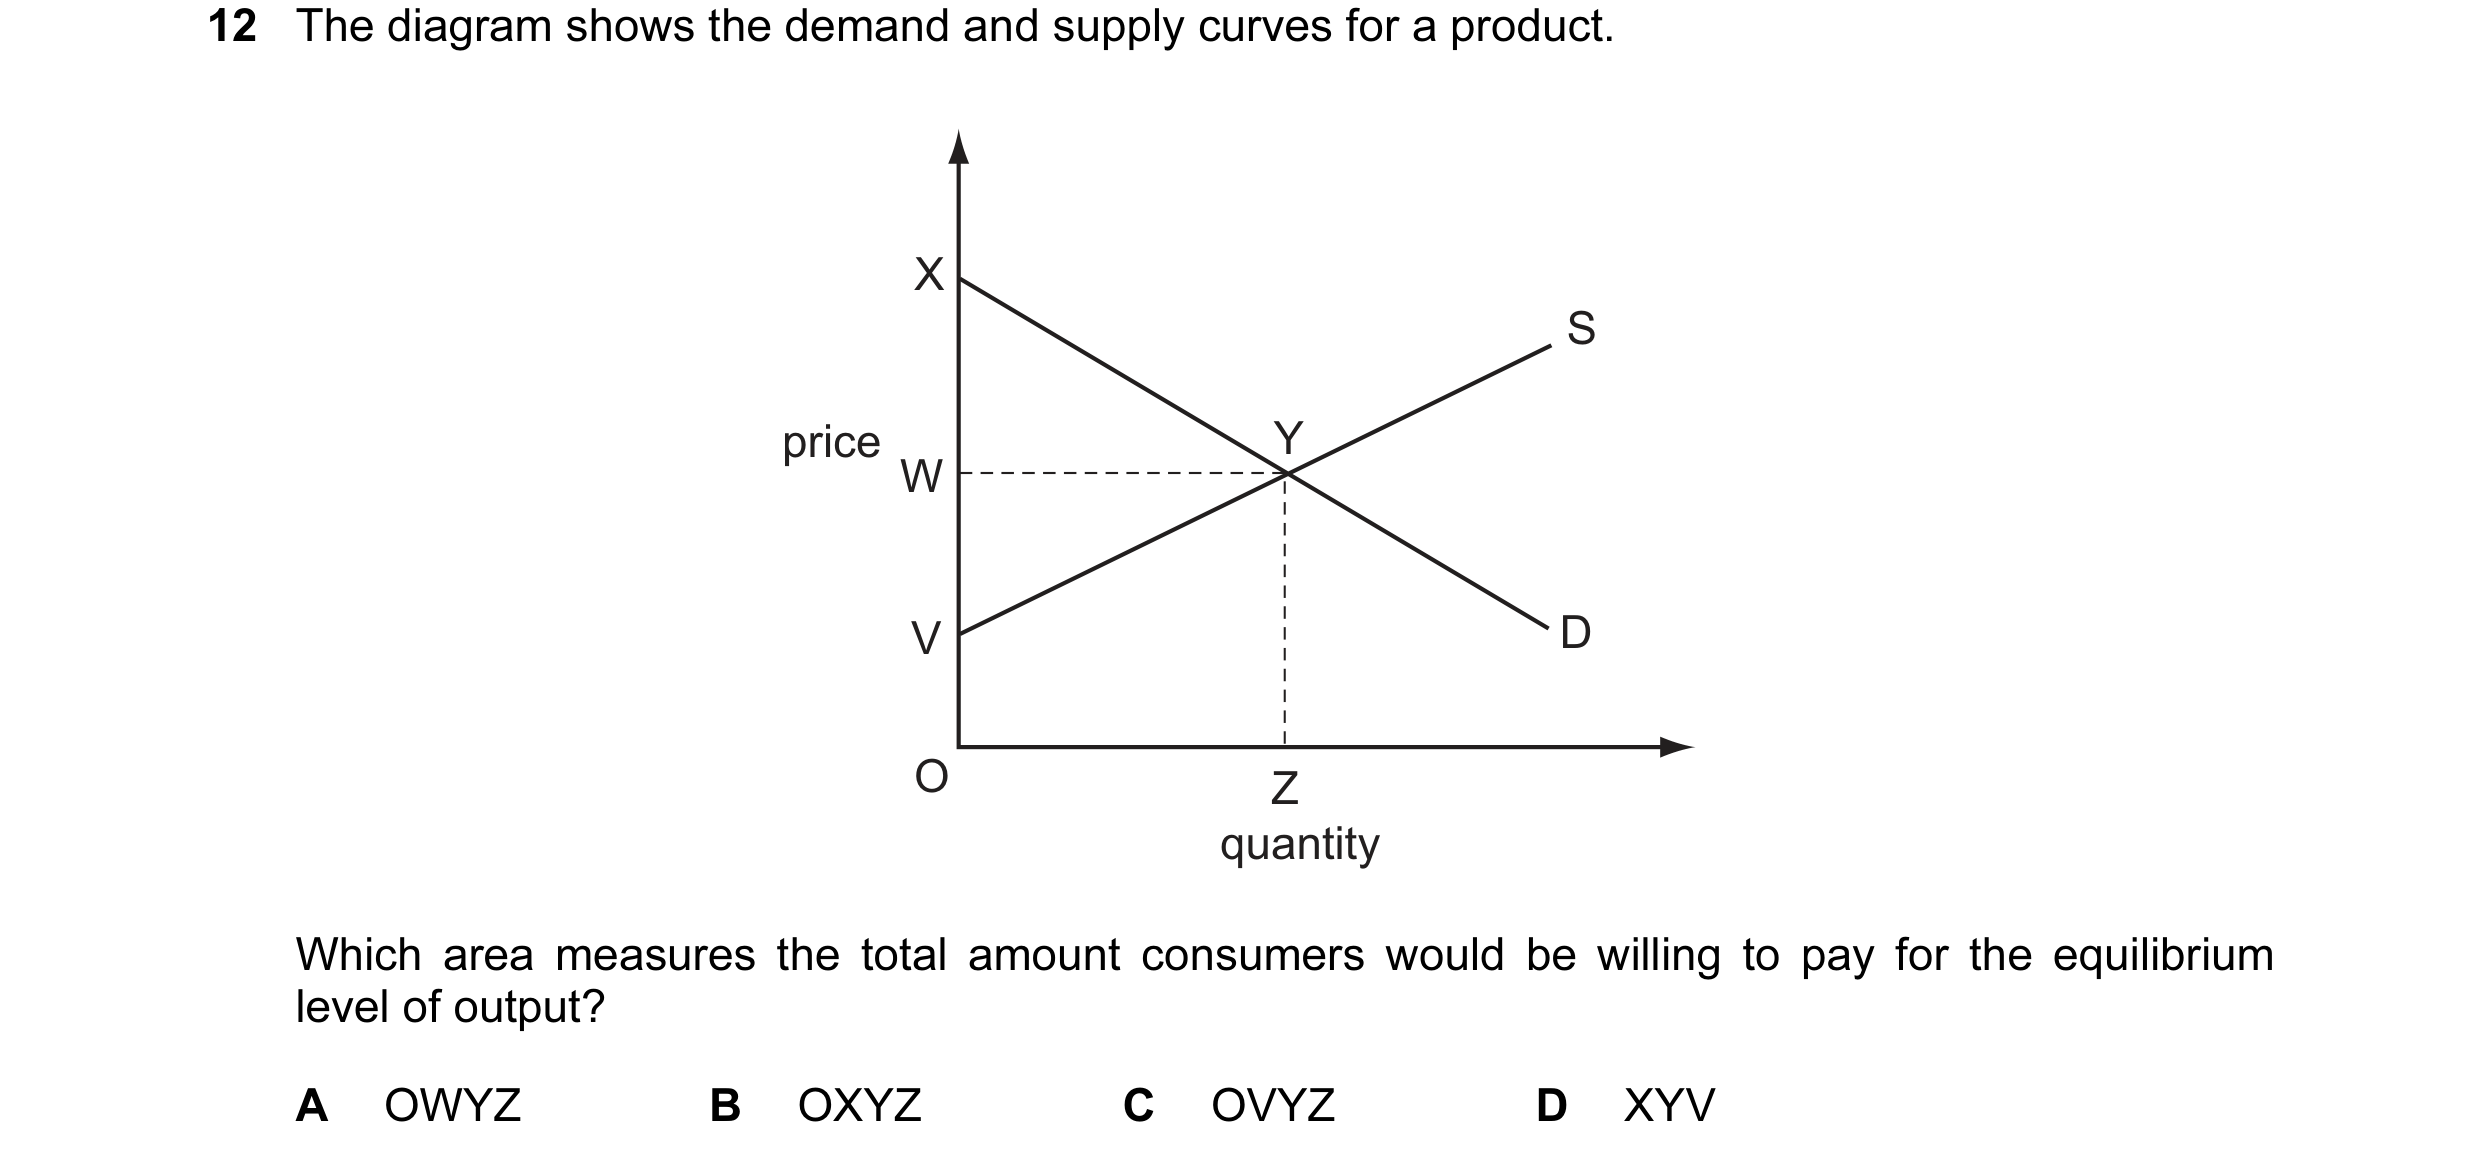
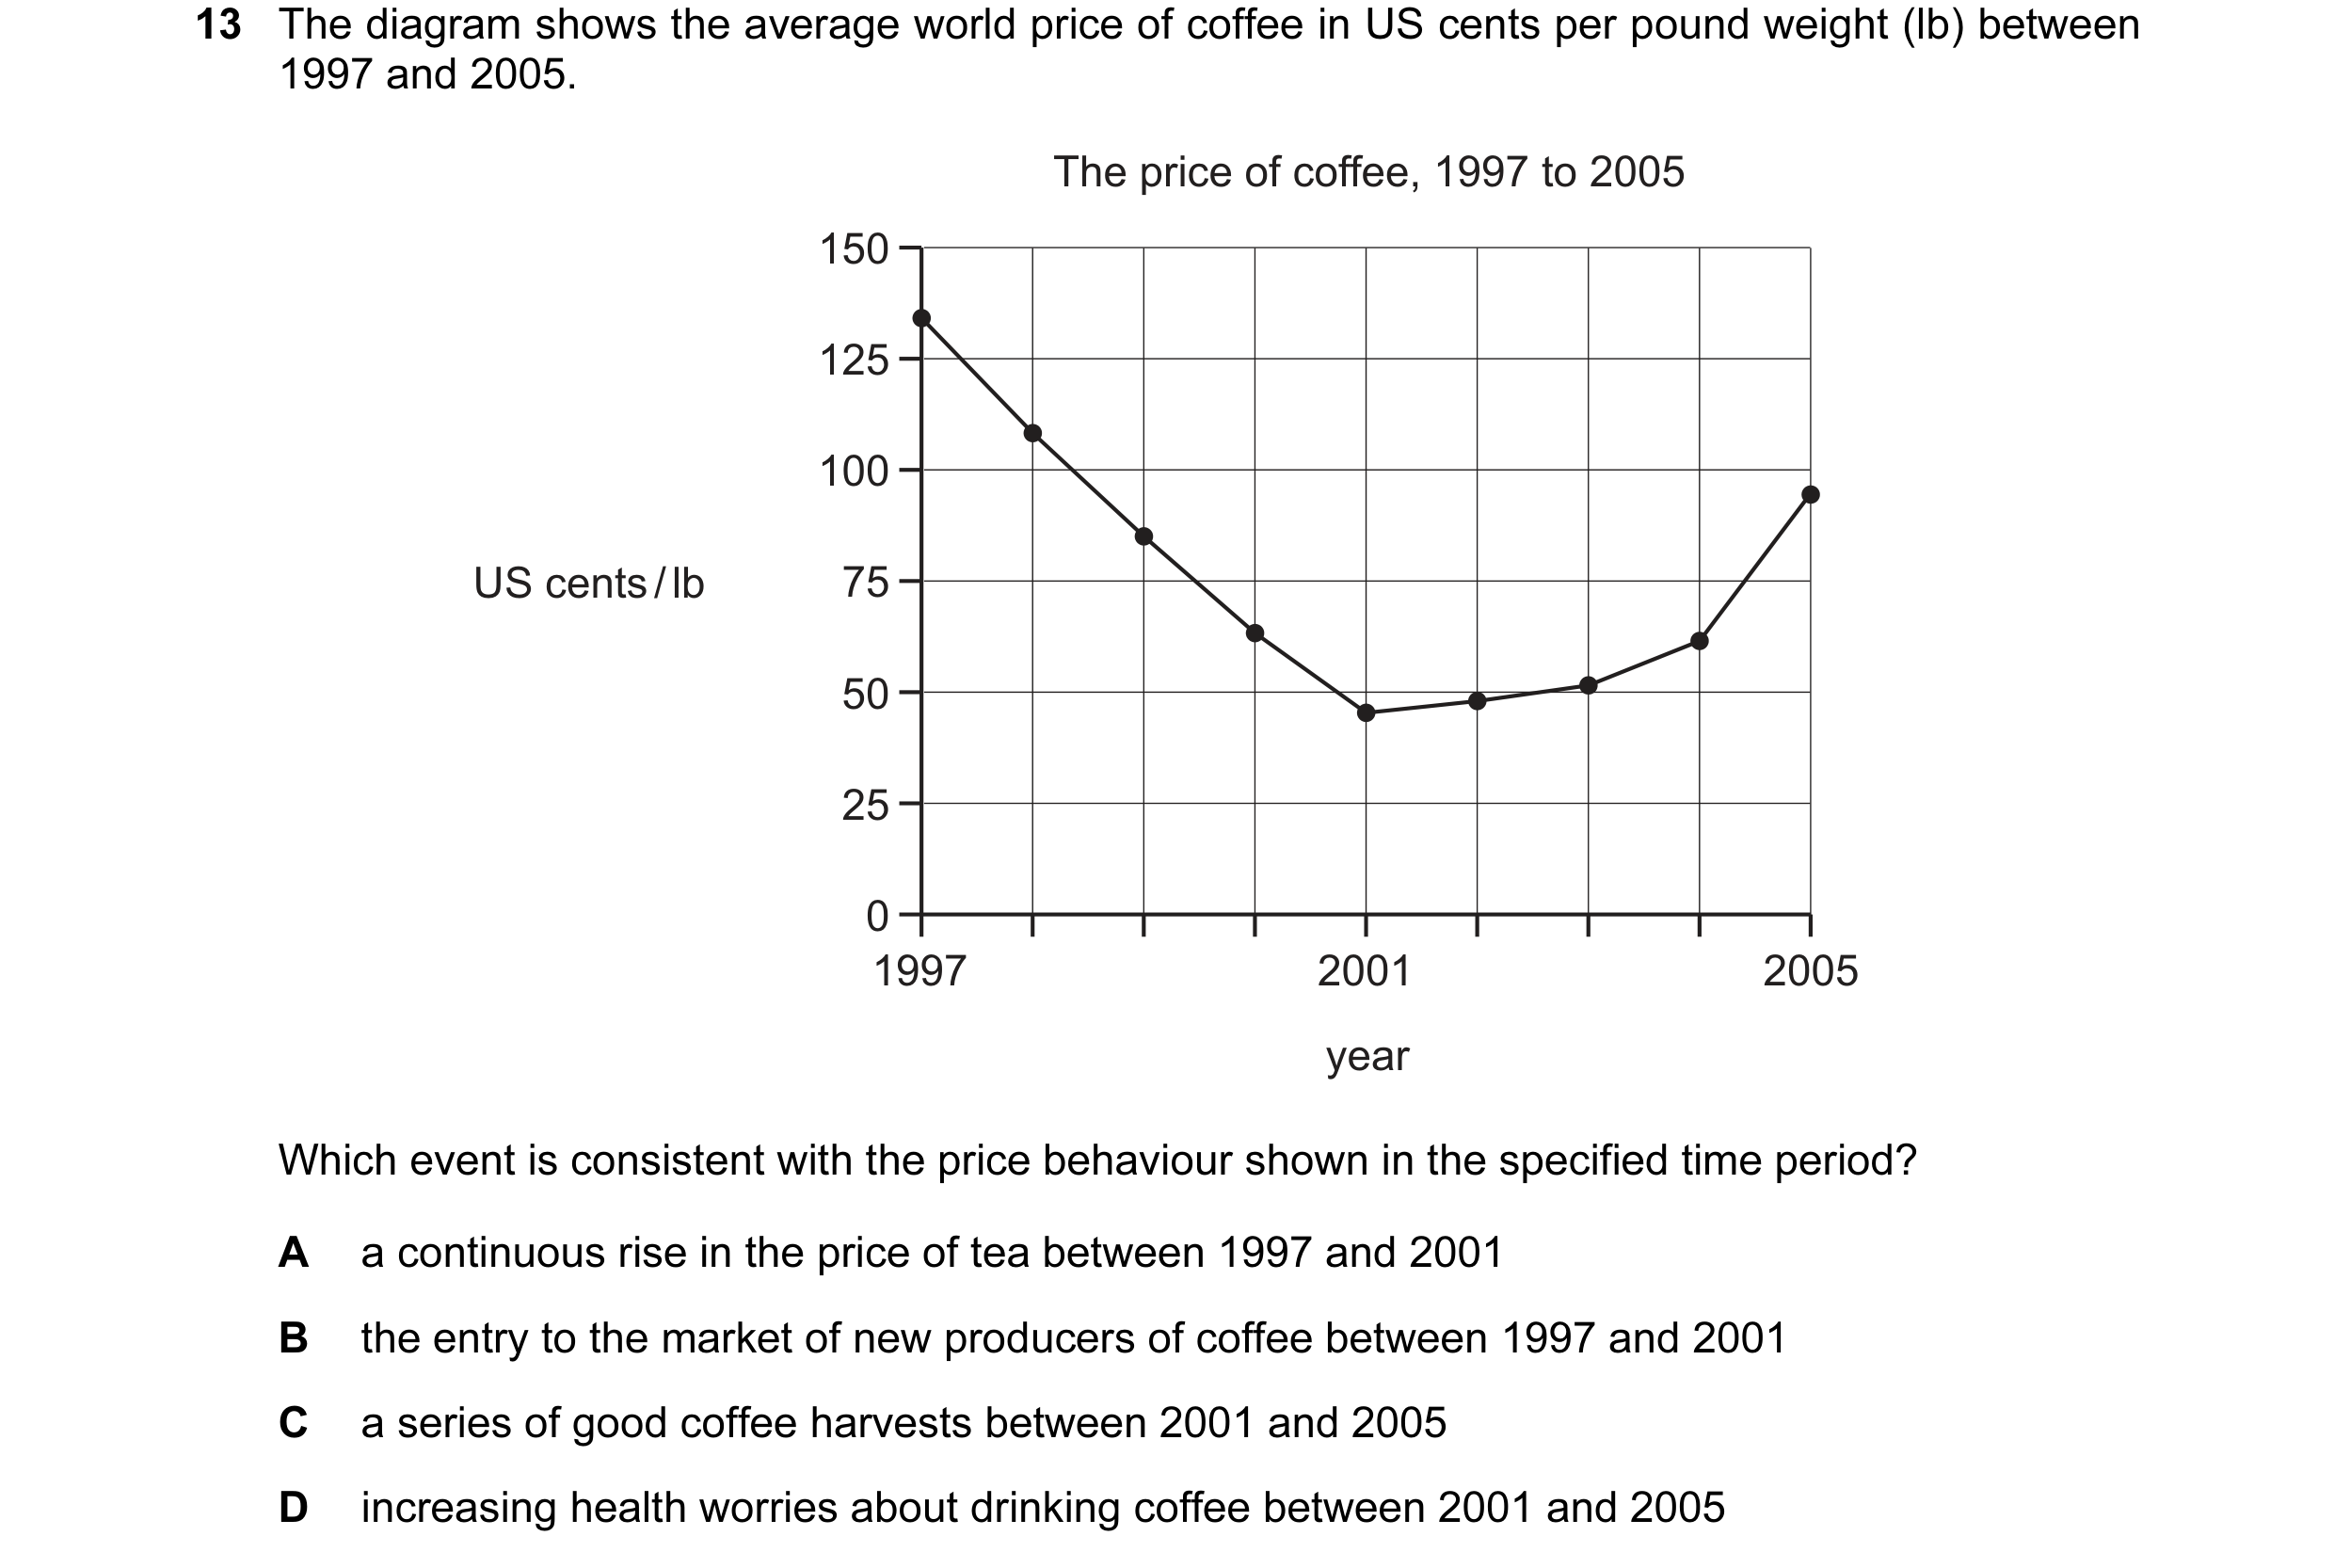
 6 / 76
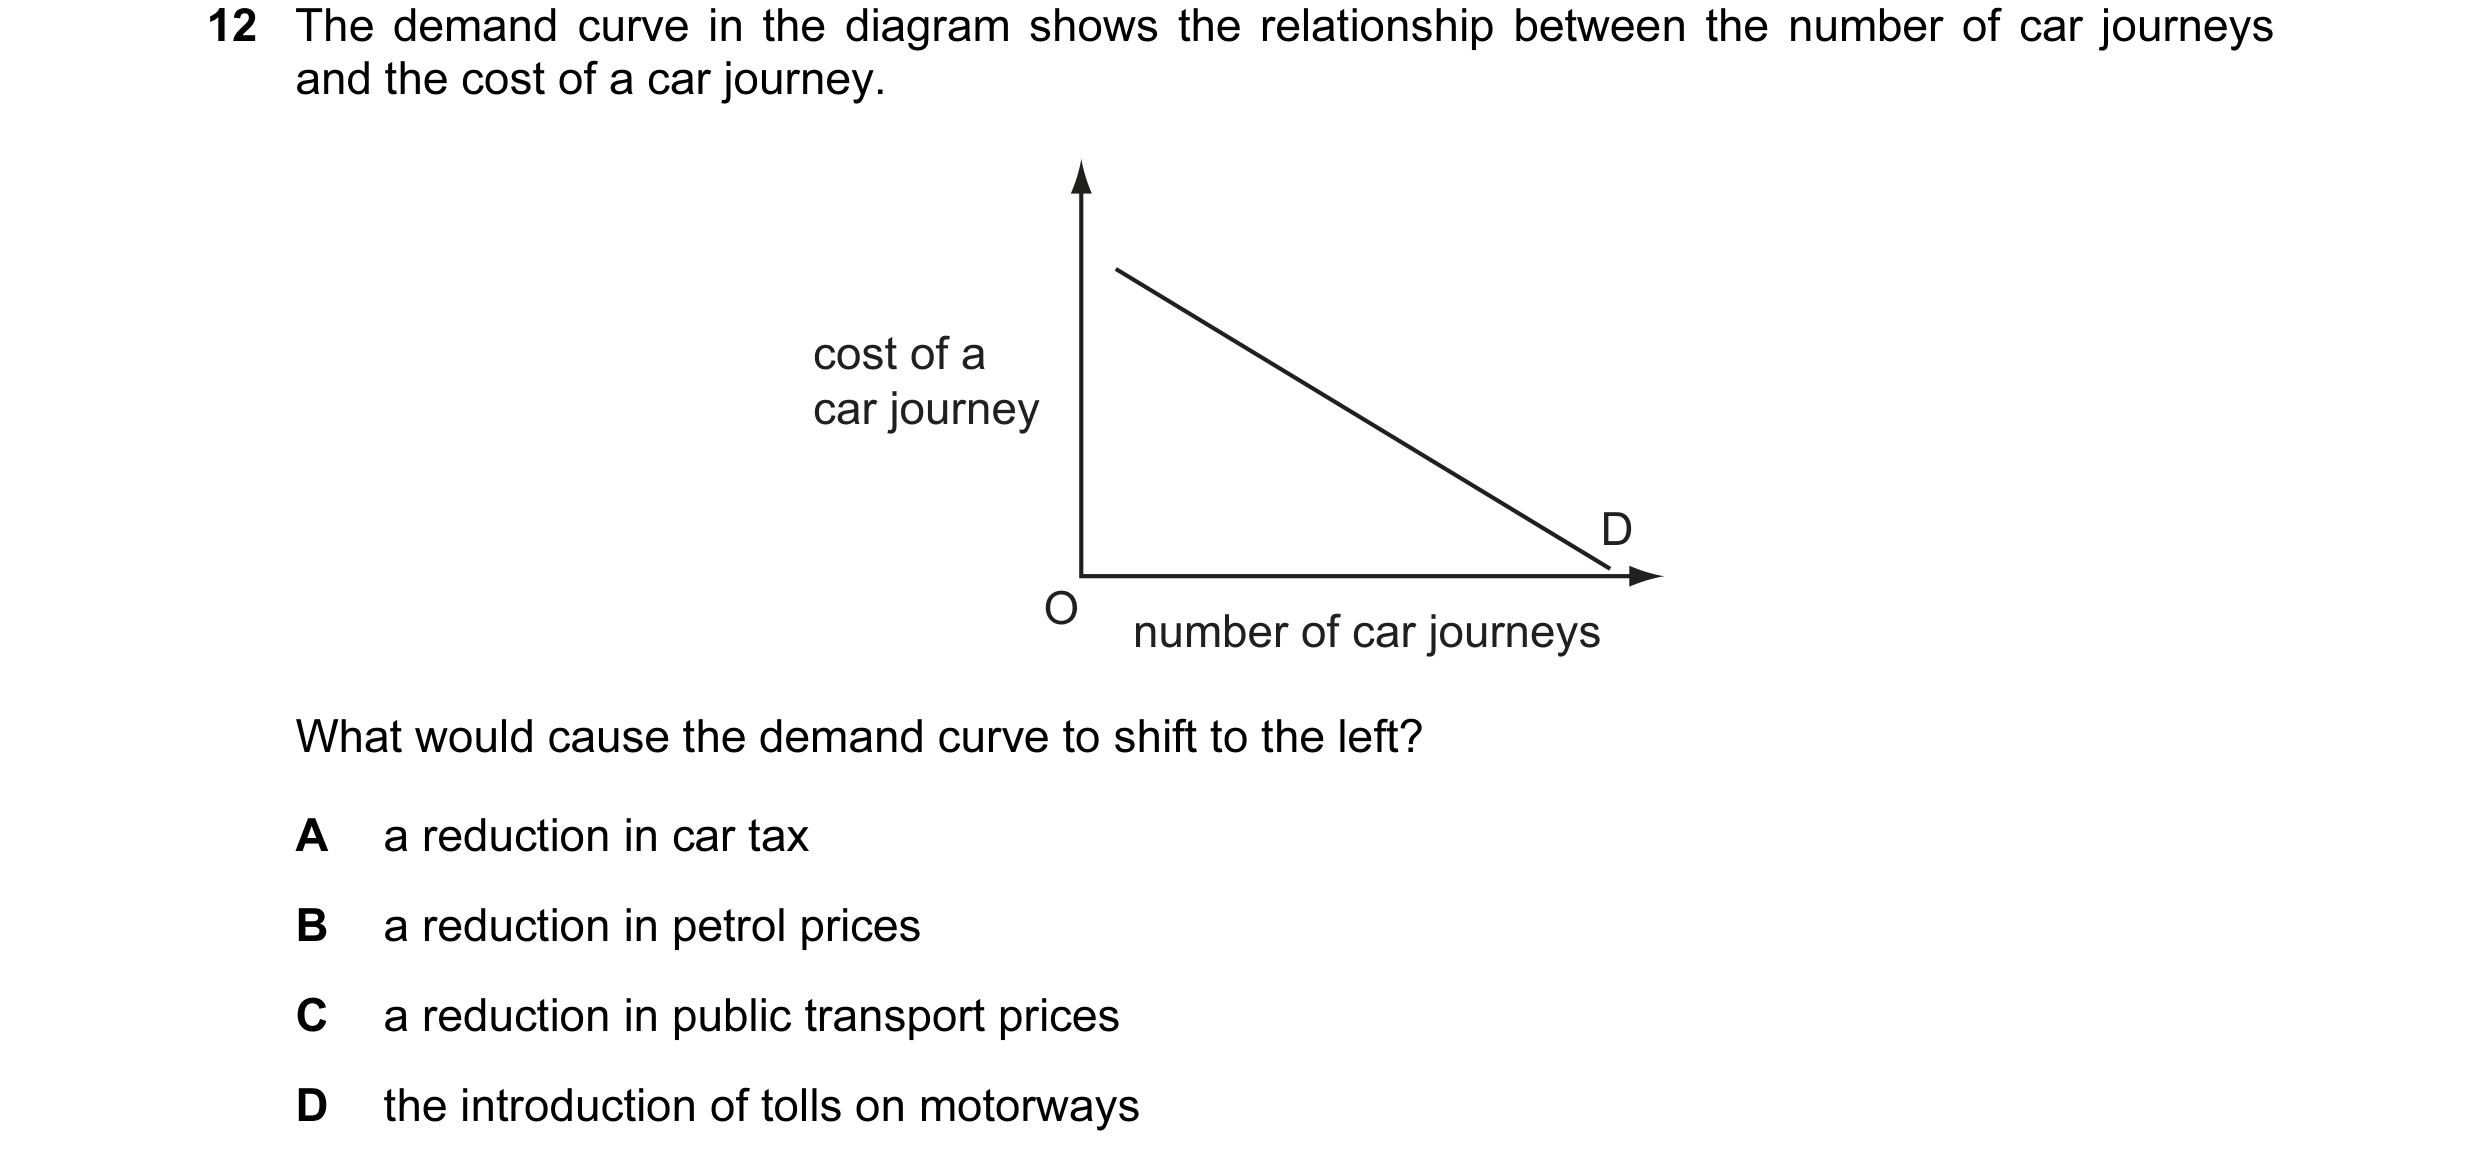
 7 / 76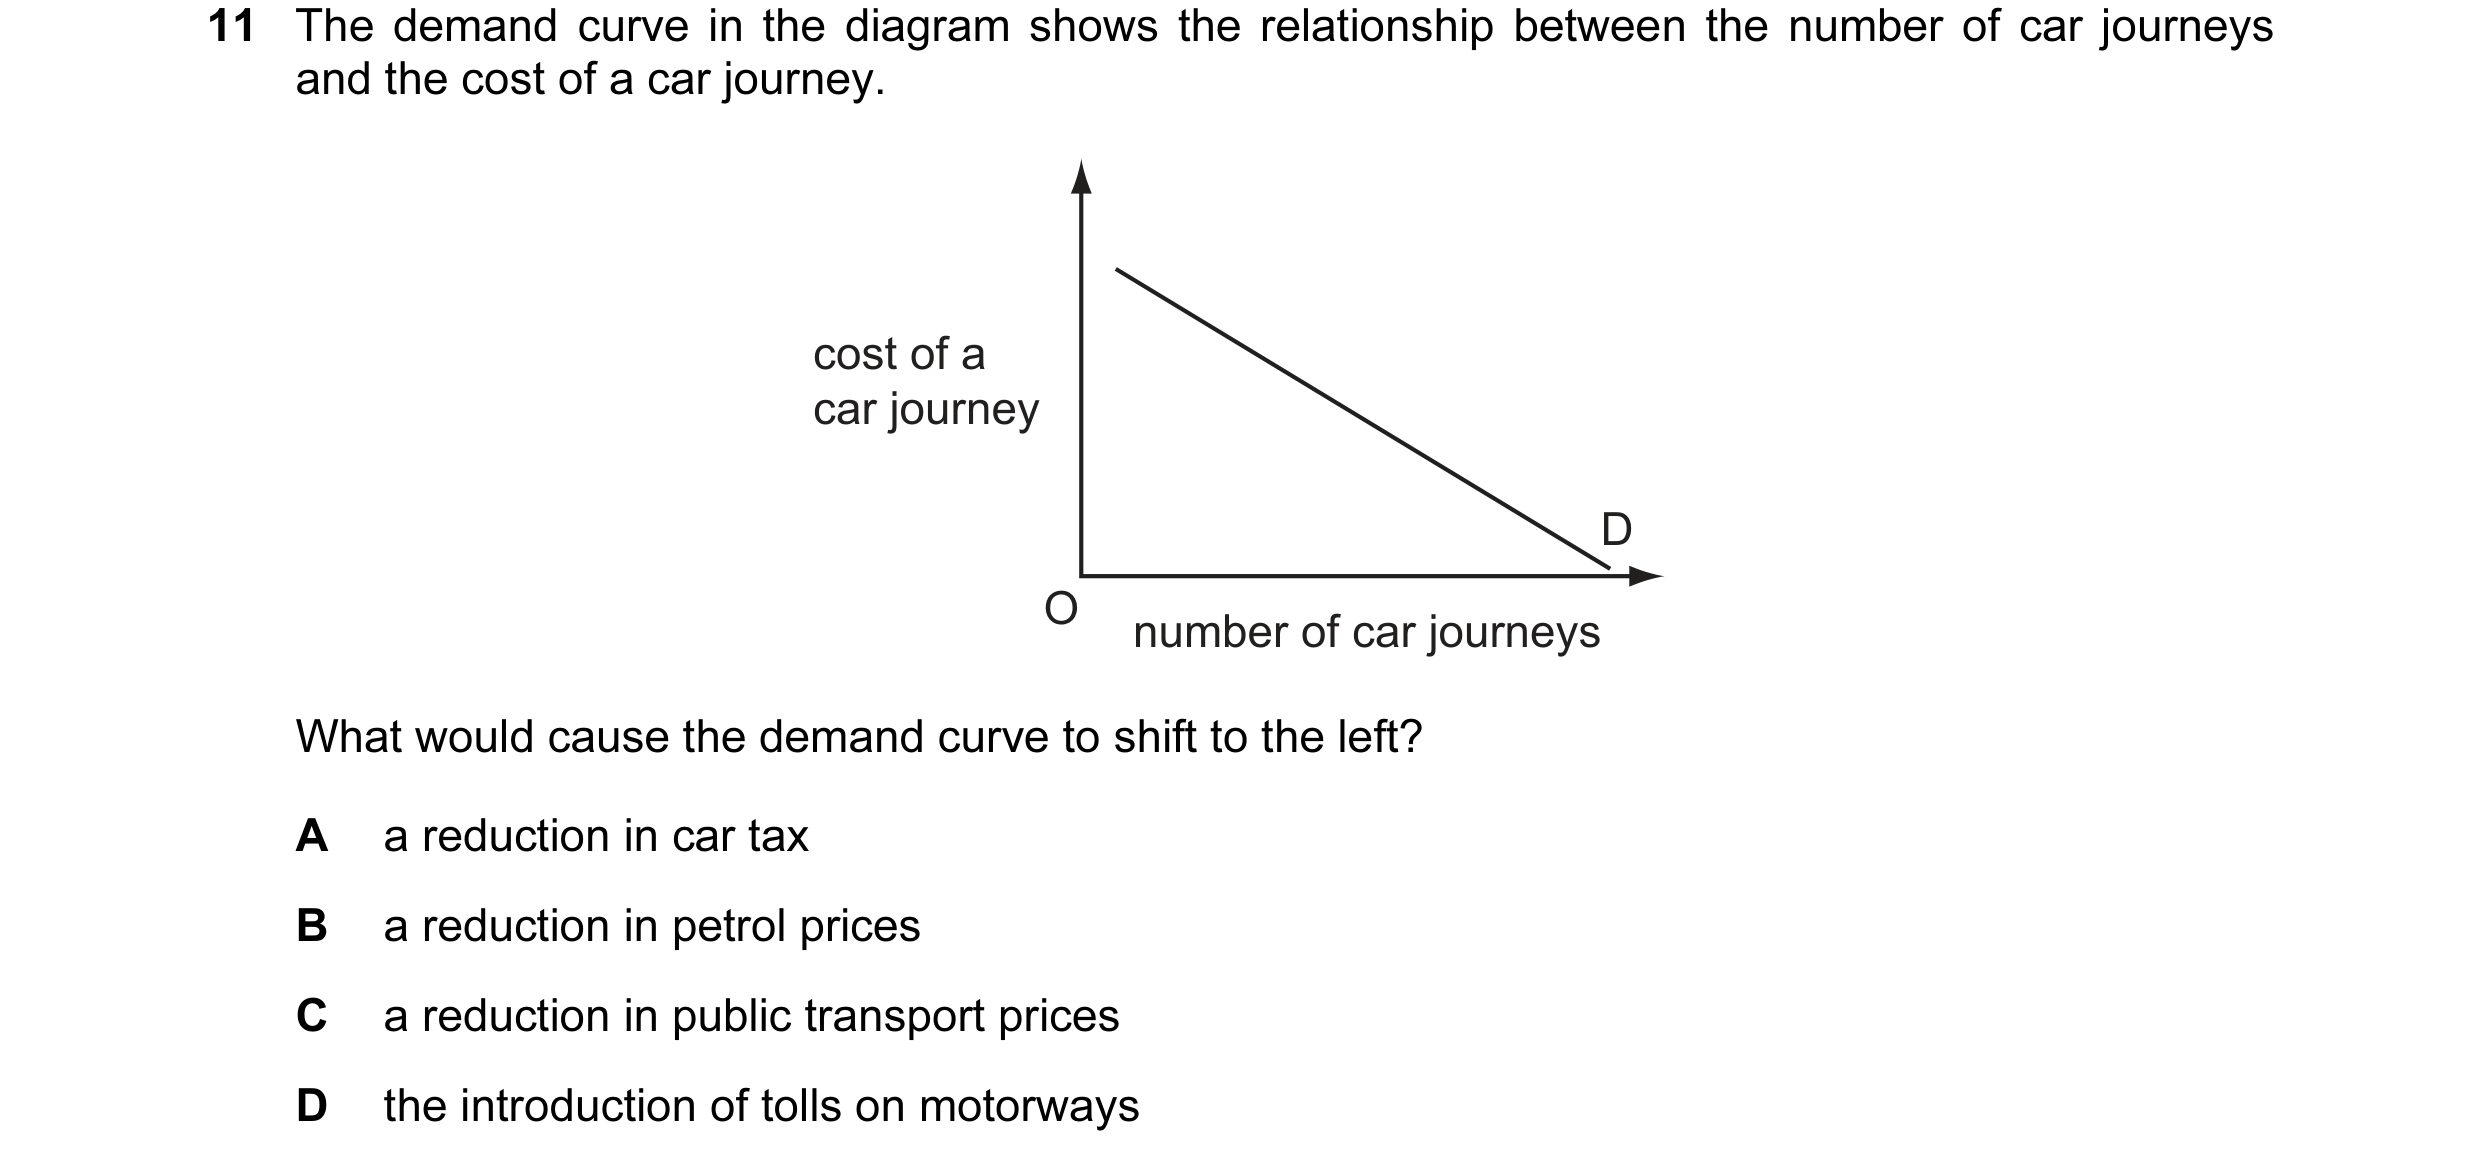
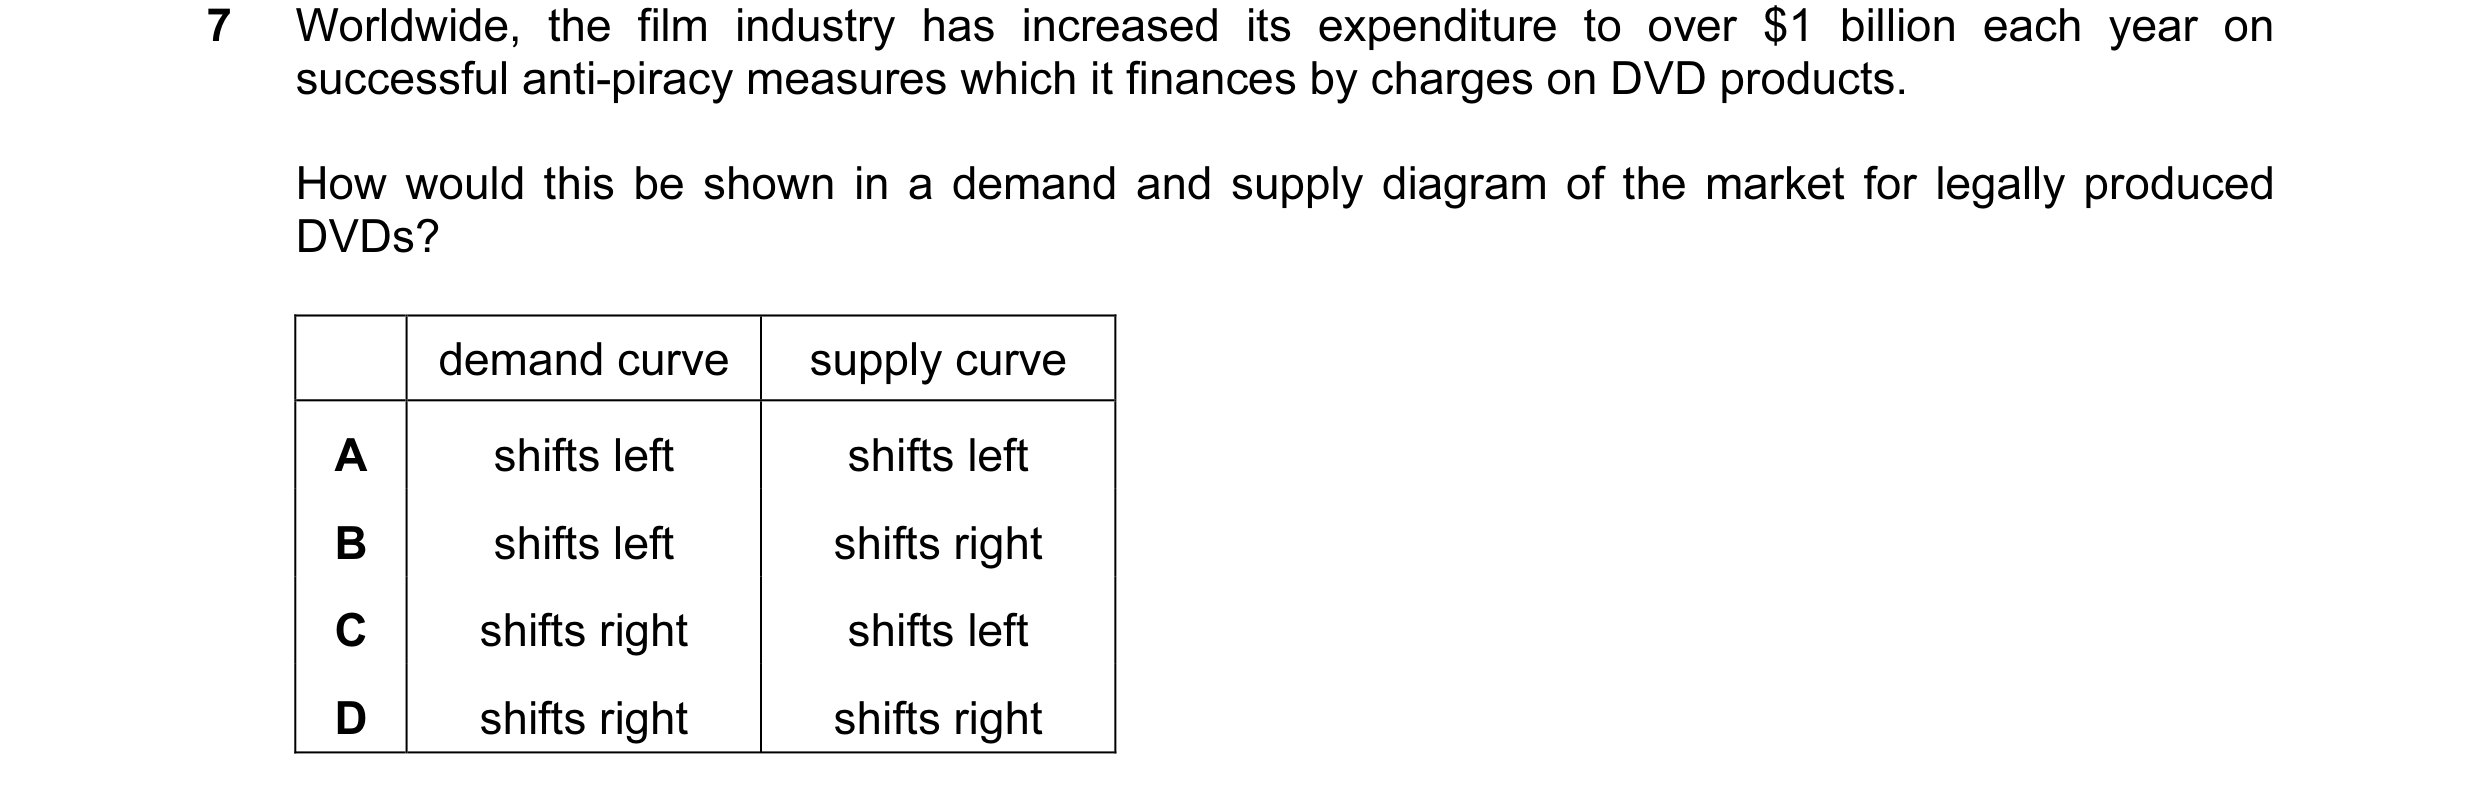
 8 / 76



 9 / 76
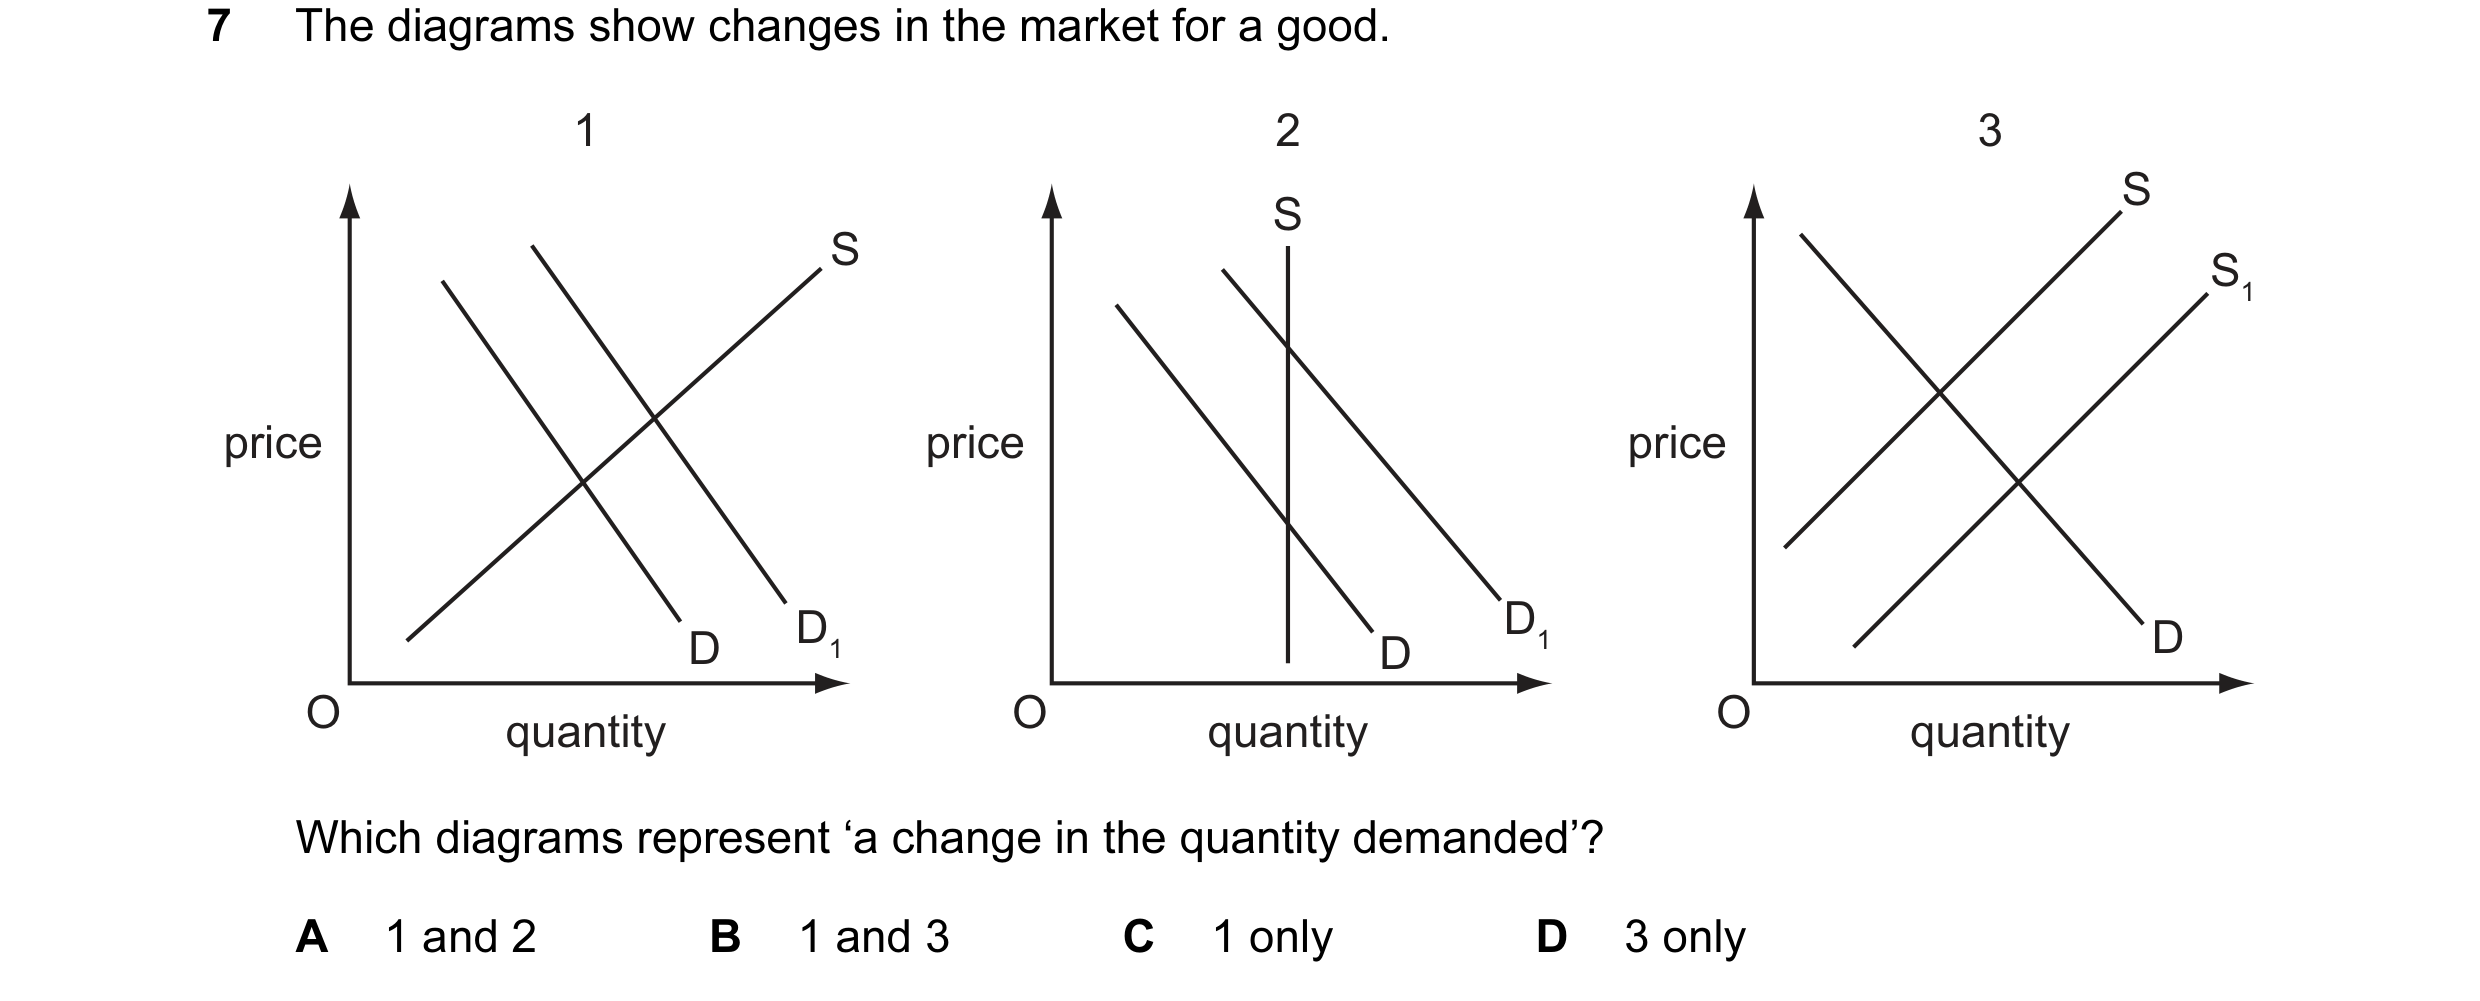
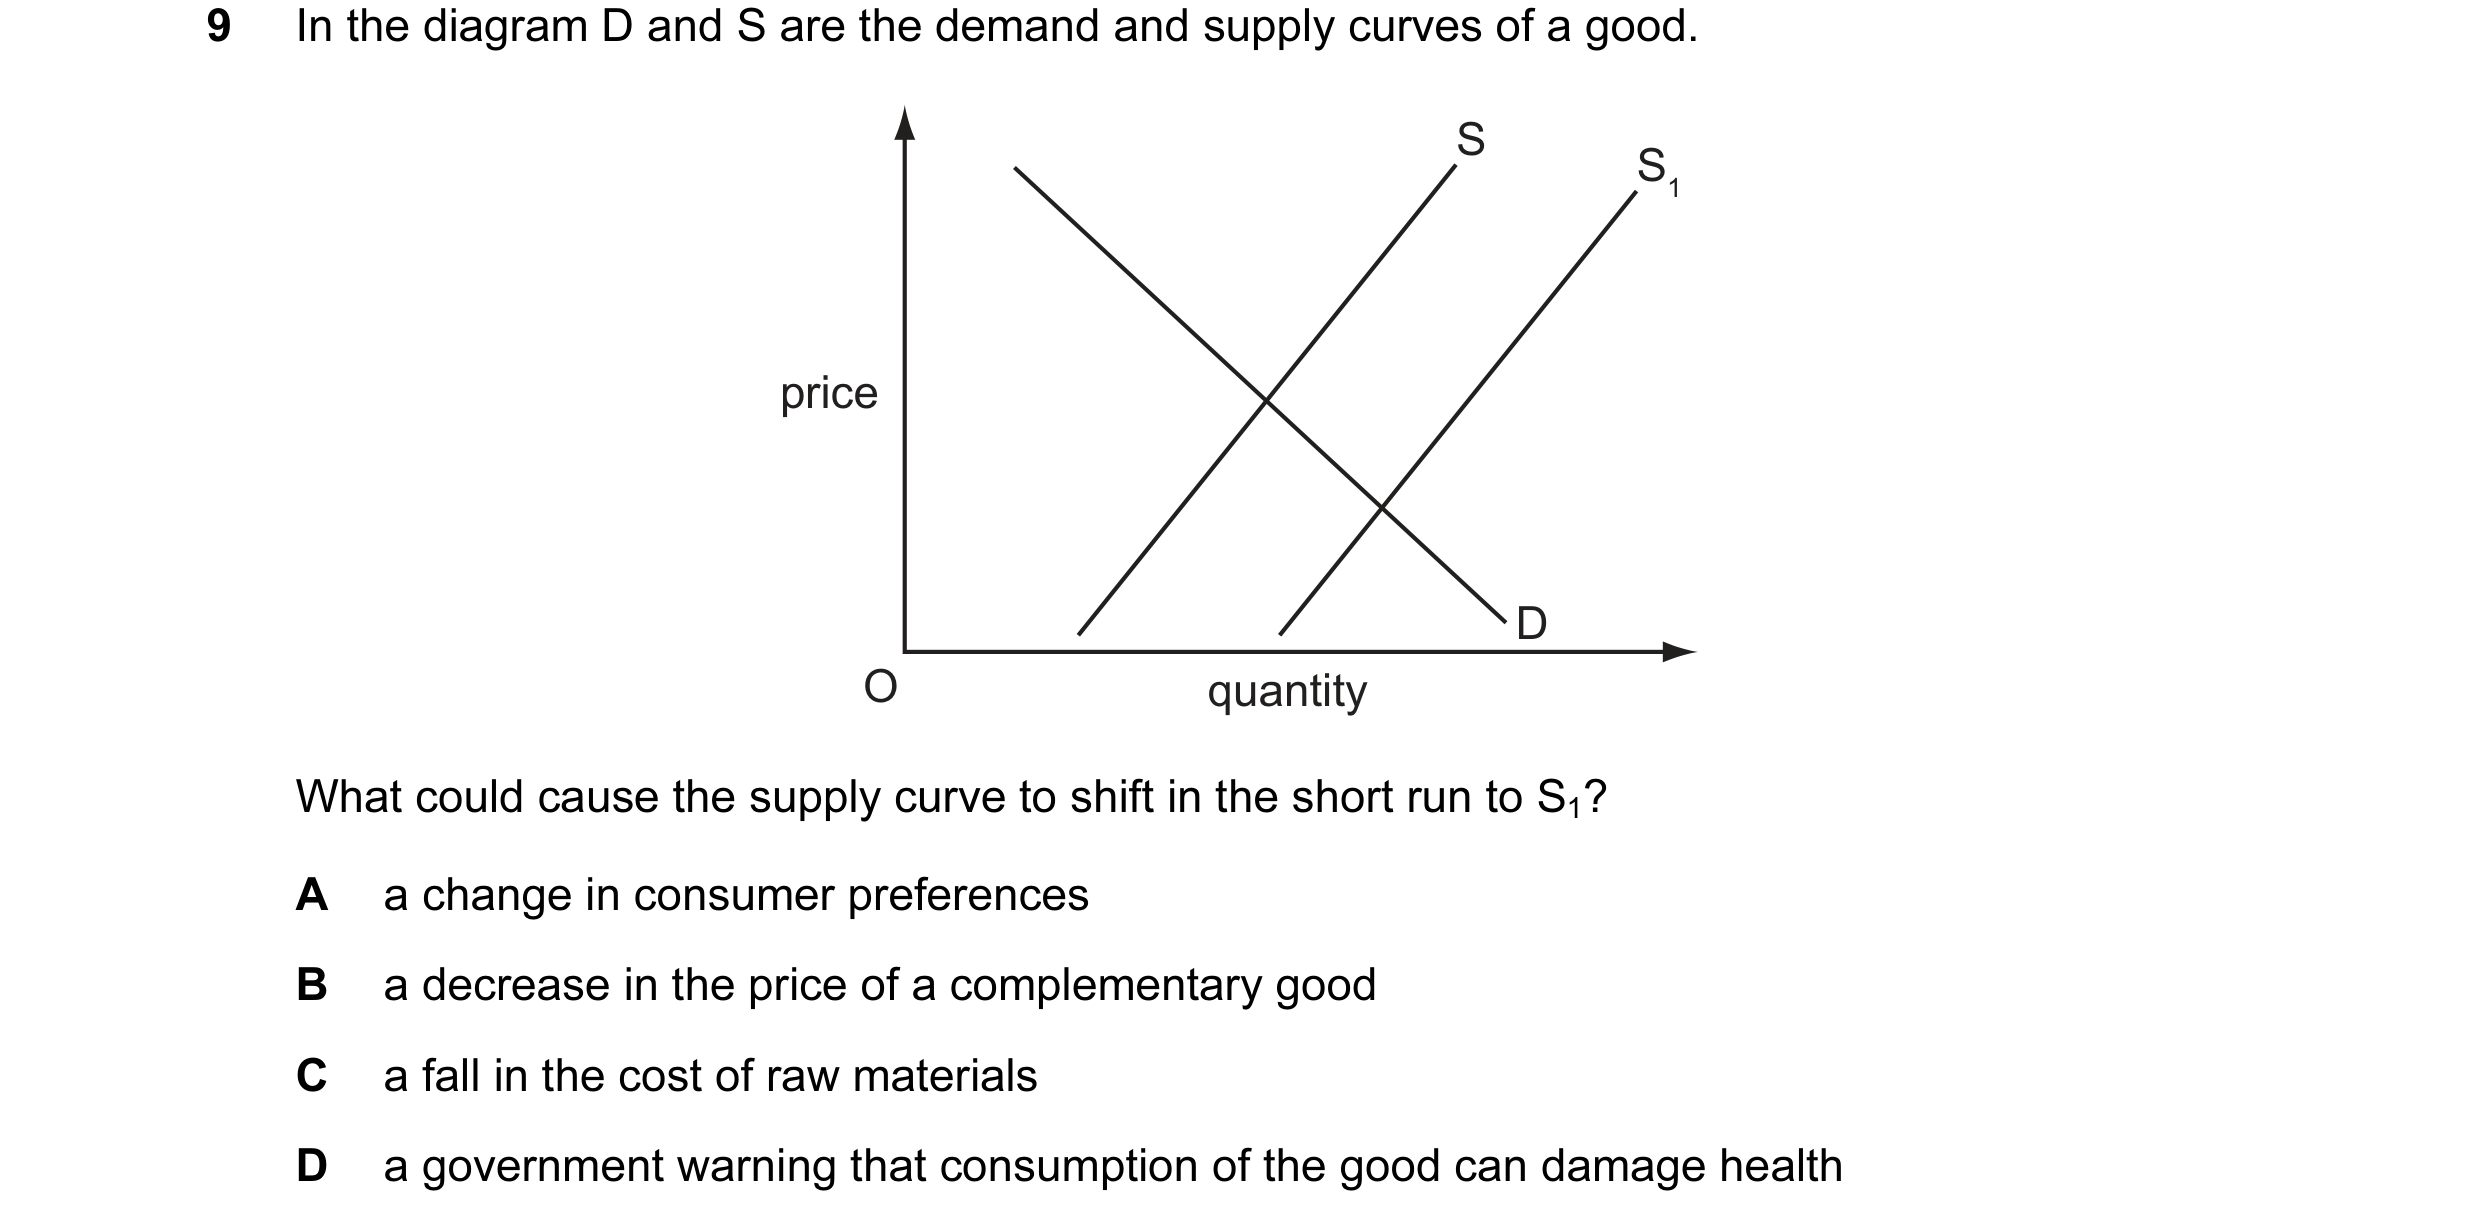
 10 / 76
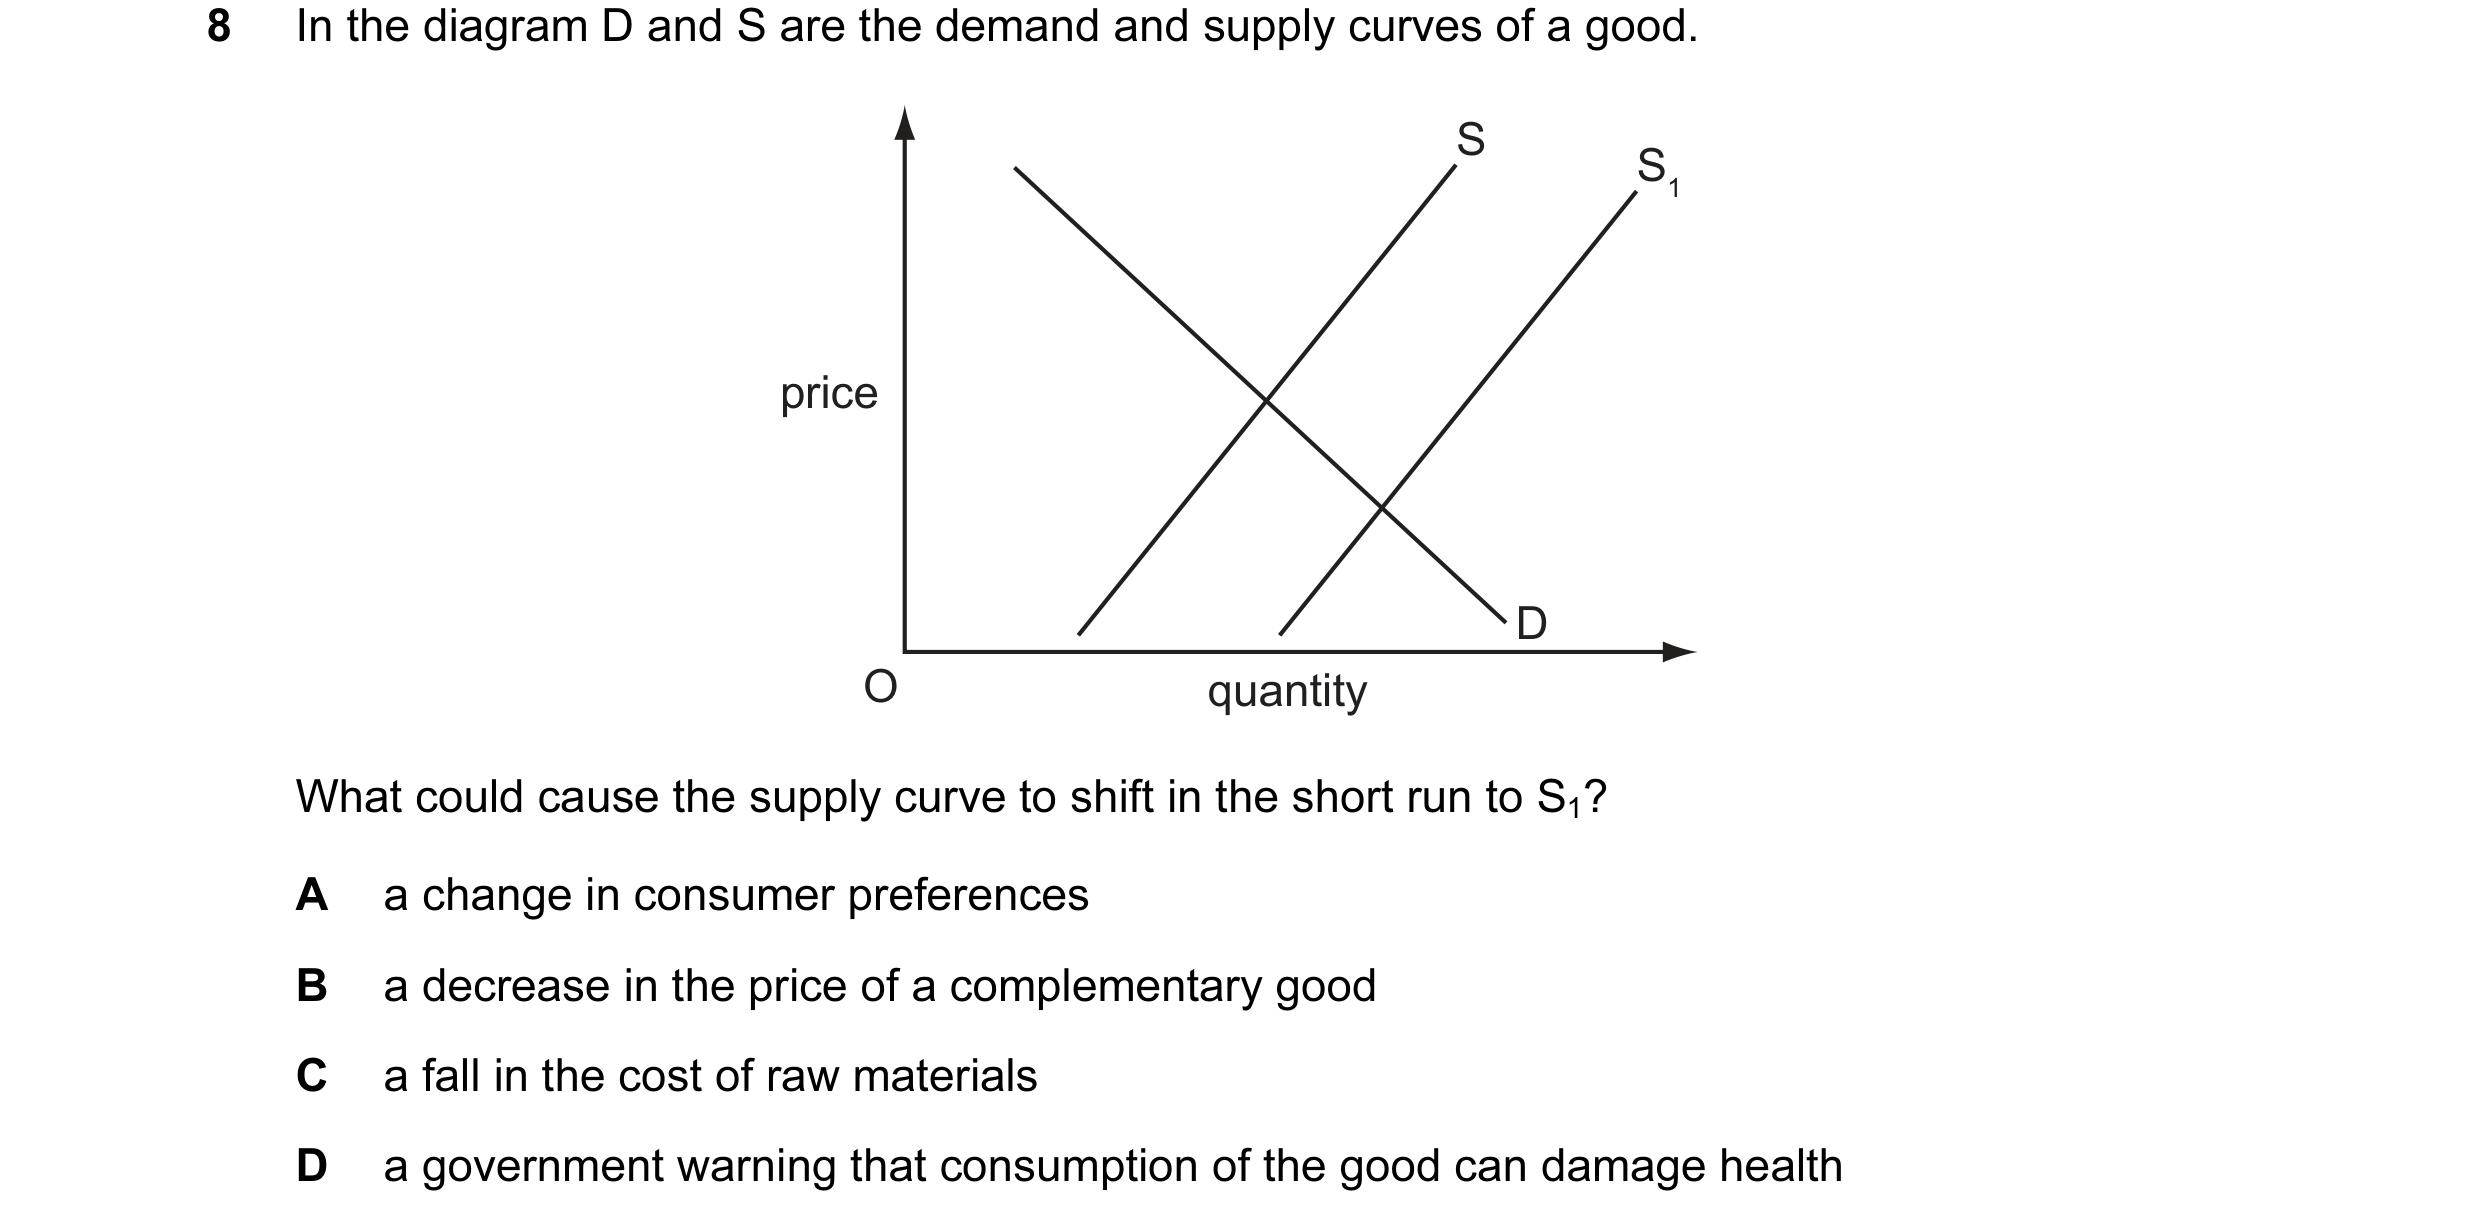

 11 / 76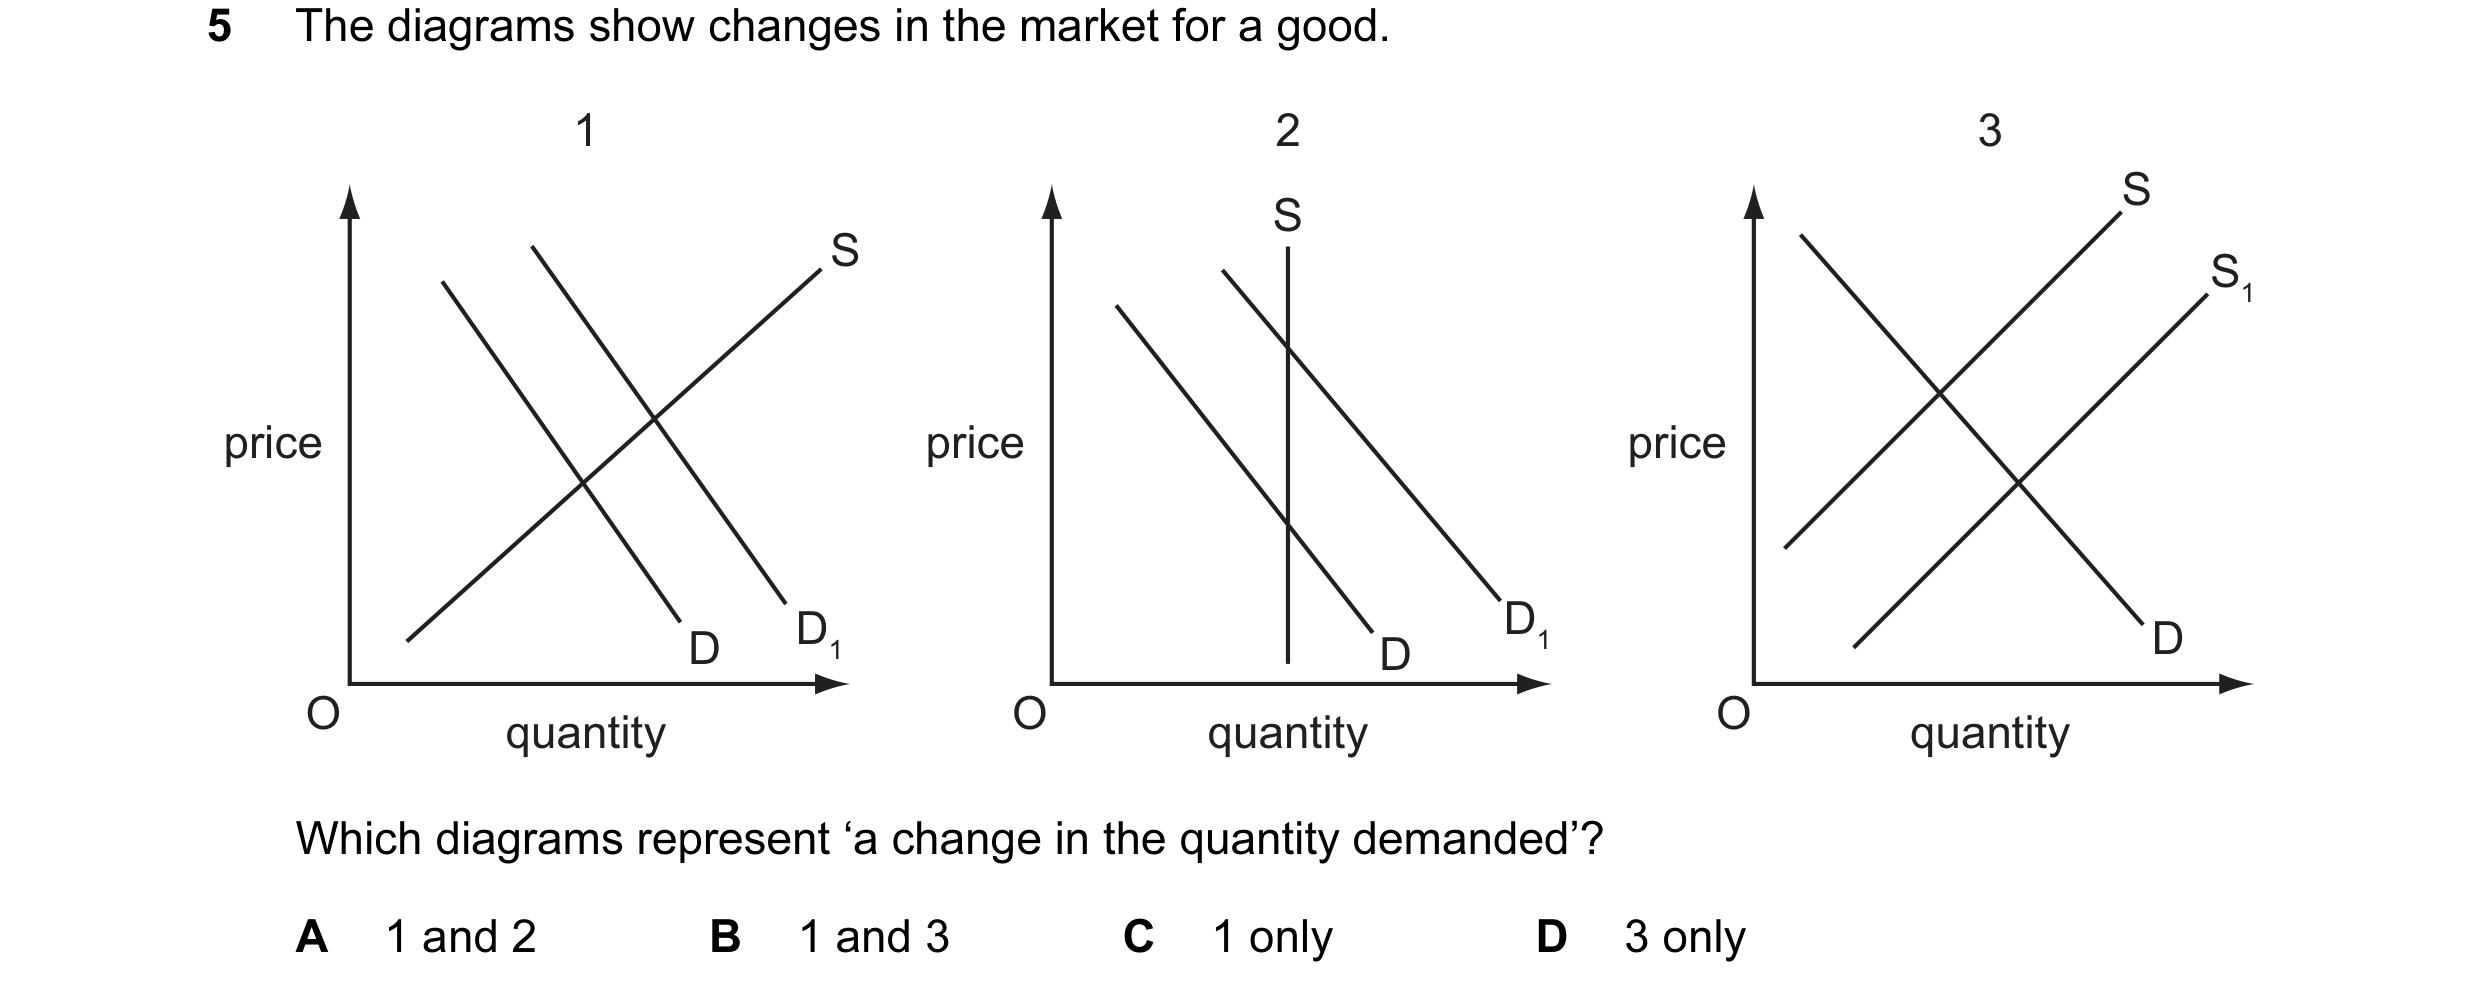
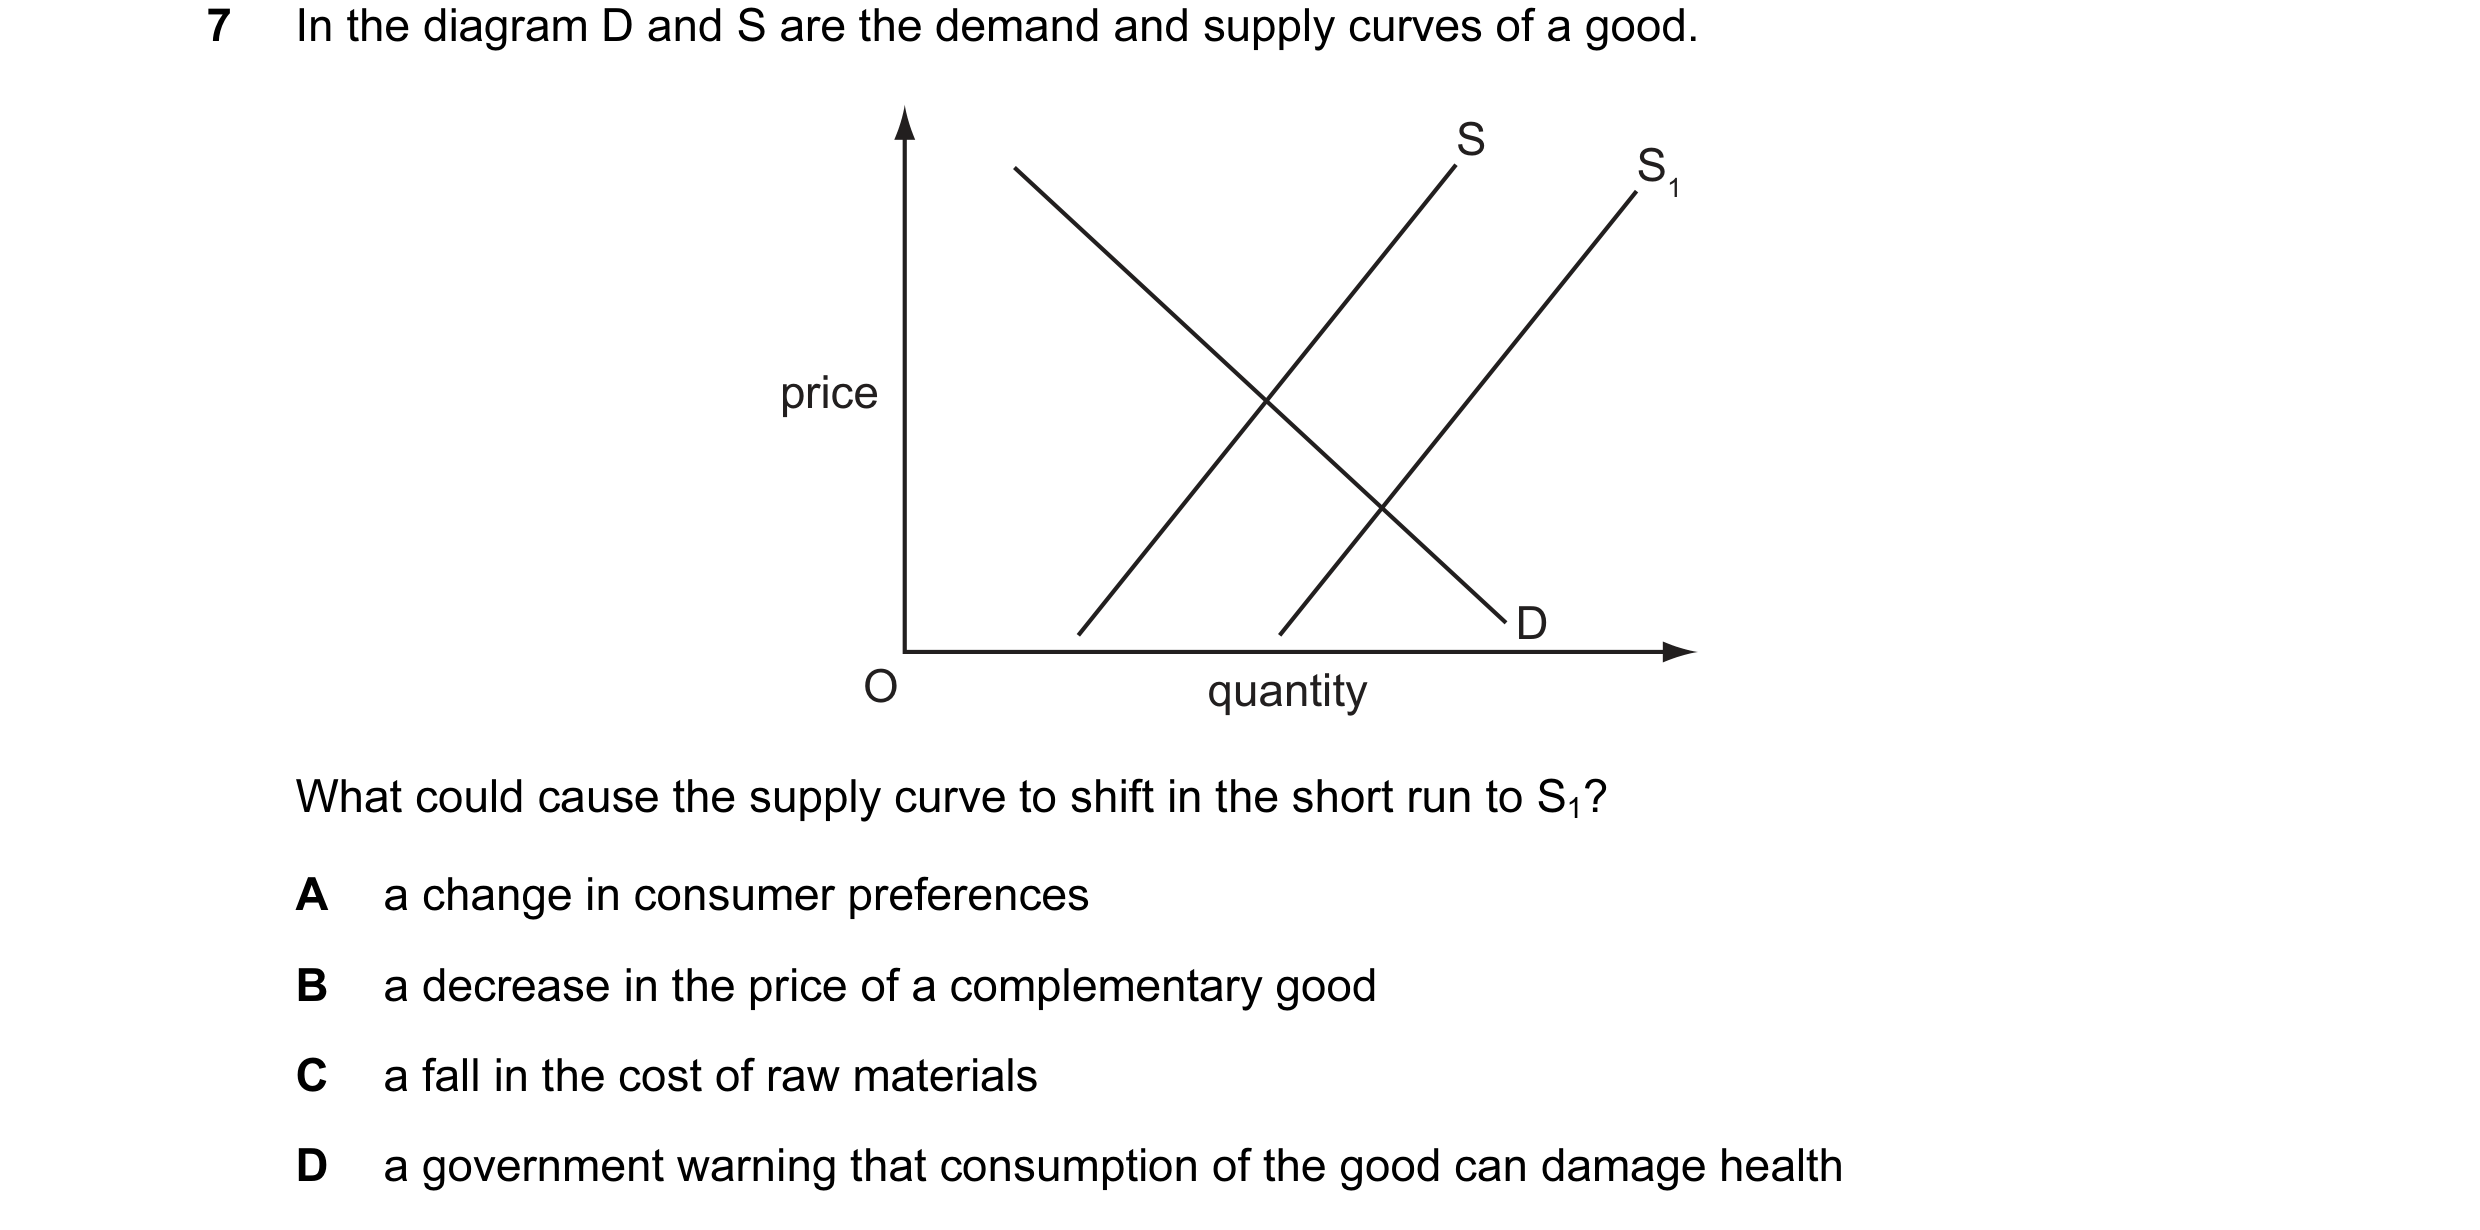 12 / 76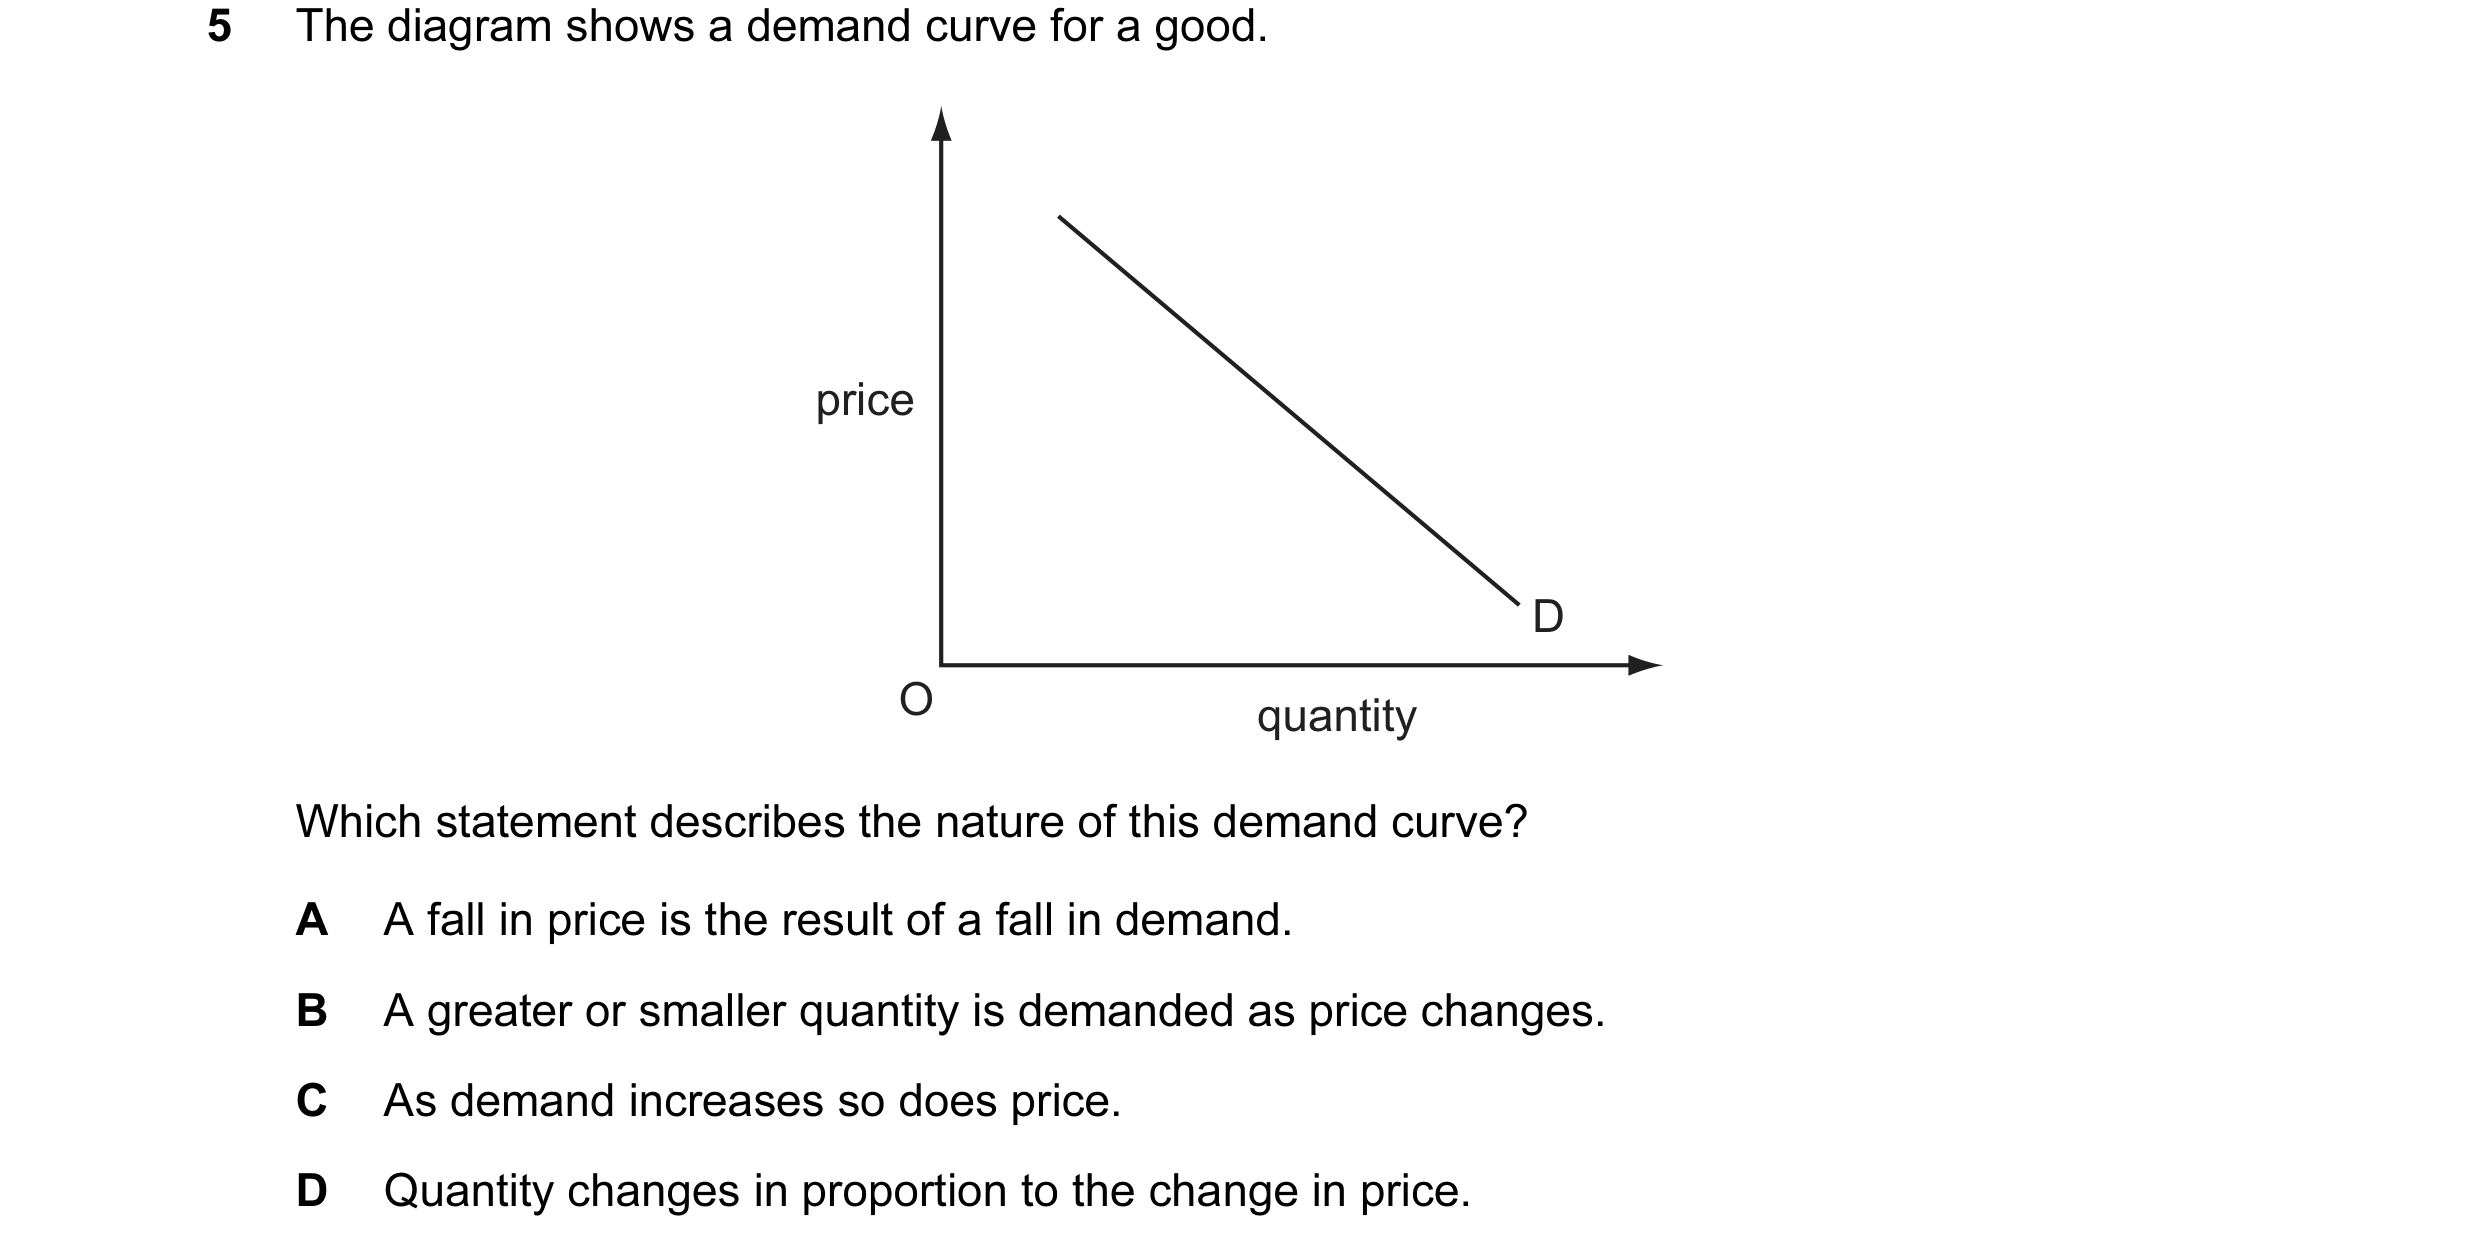

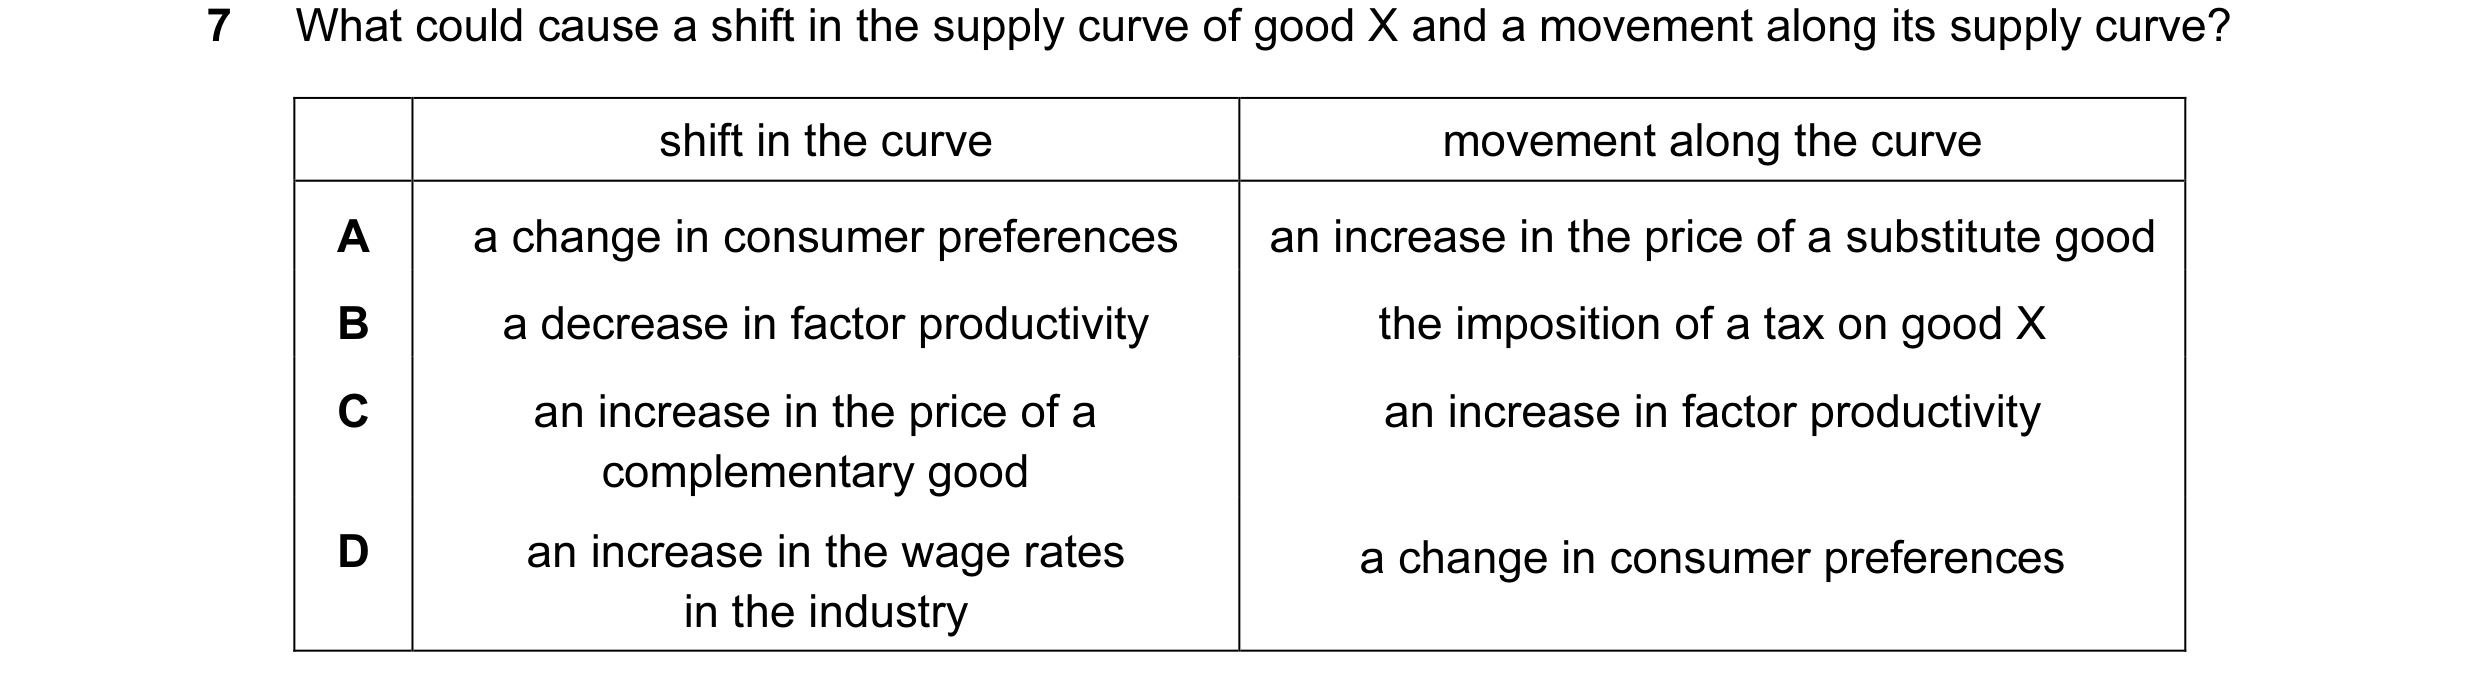 13 / 76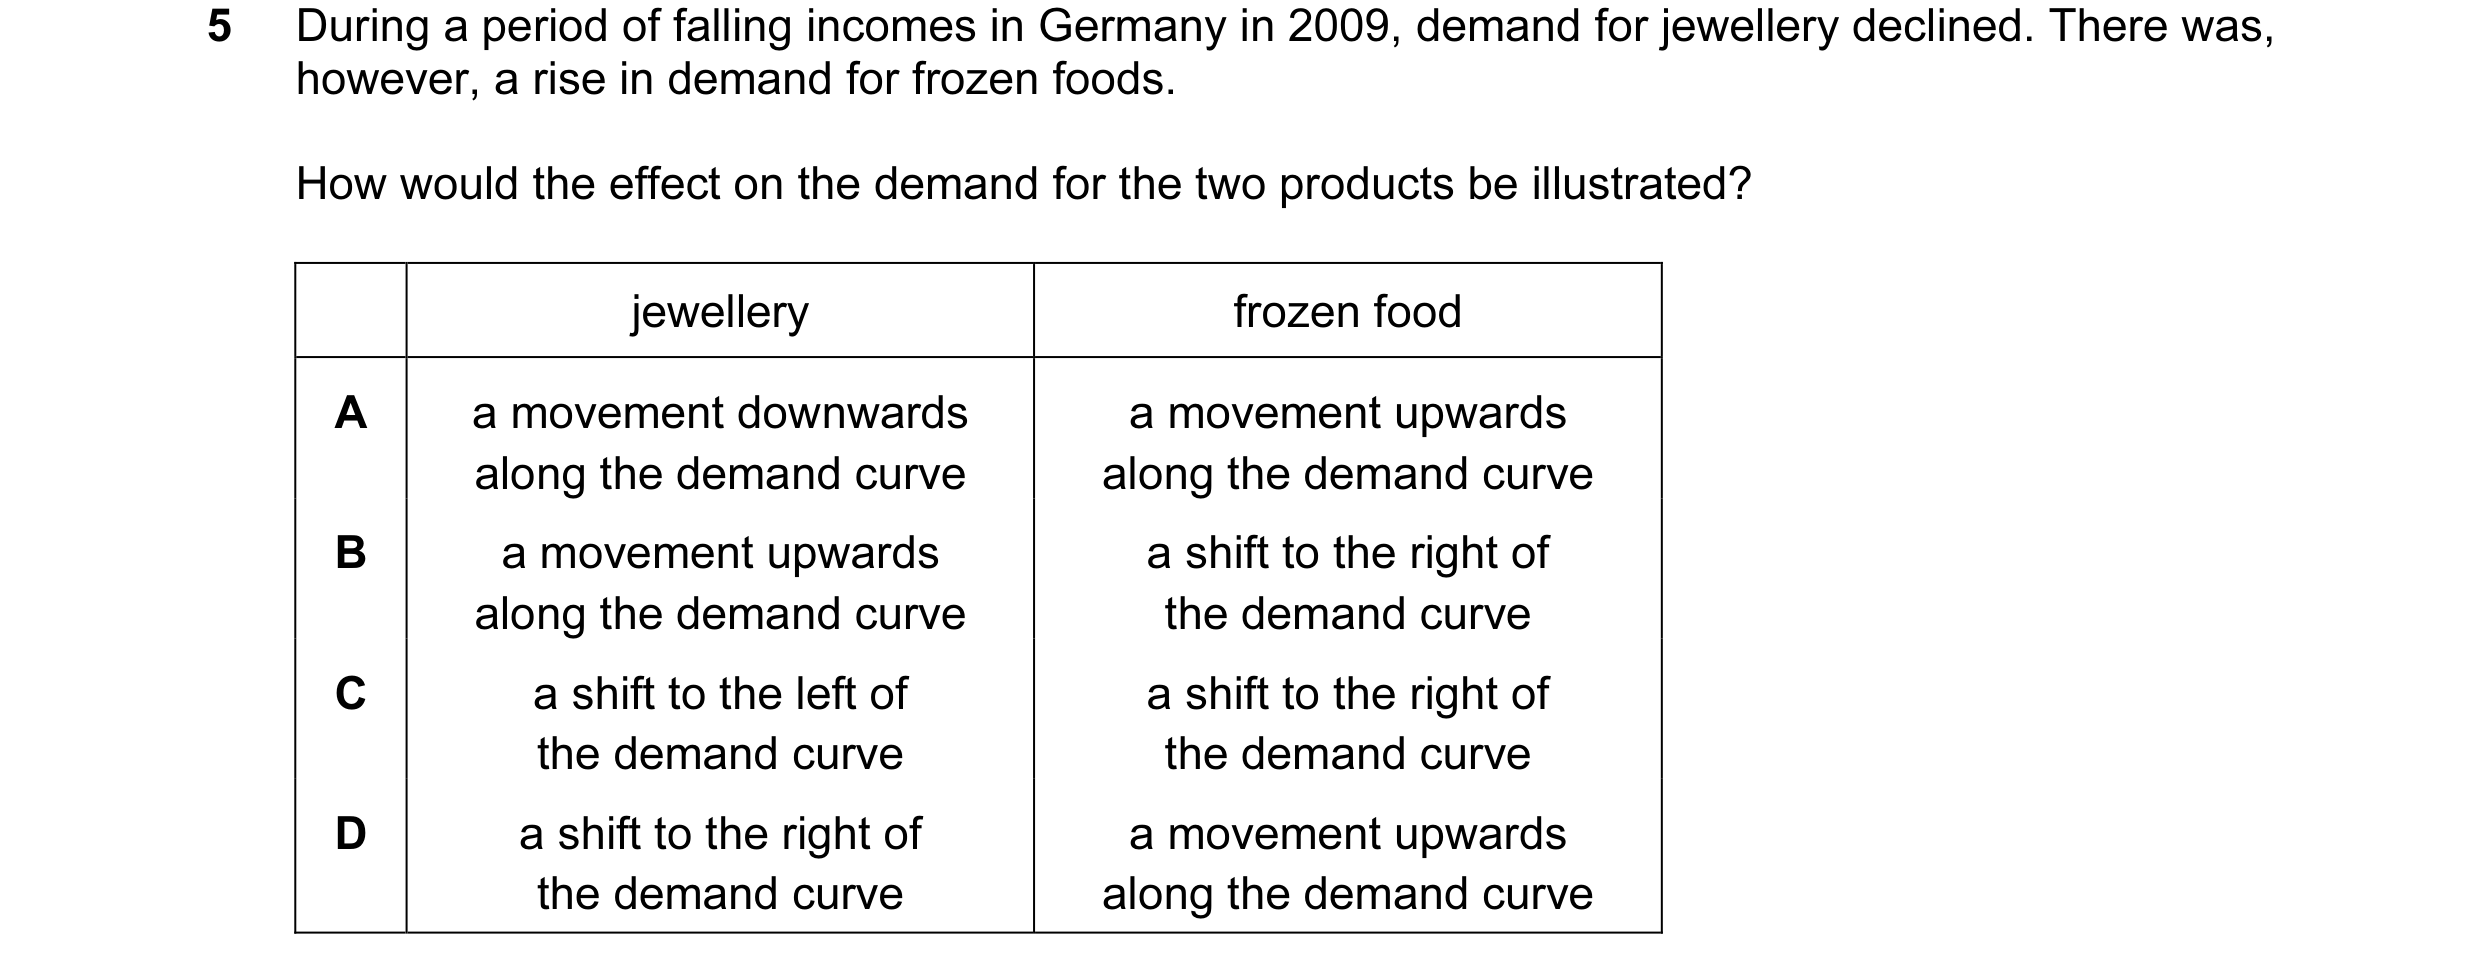
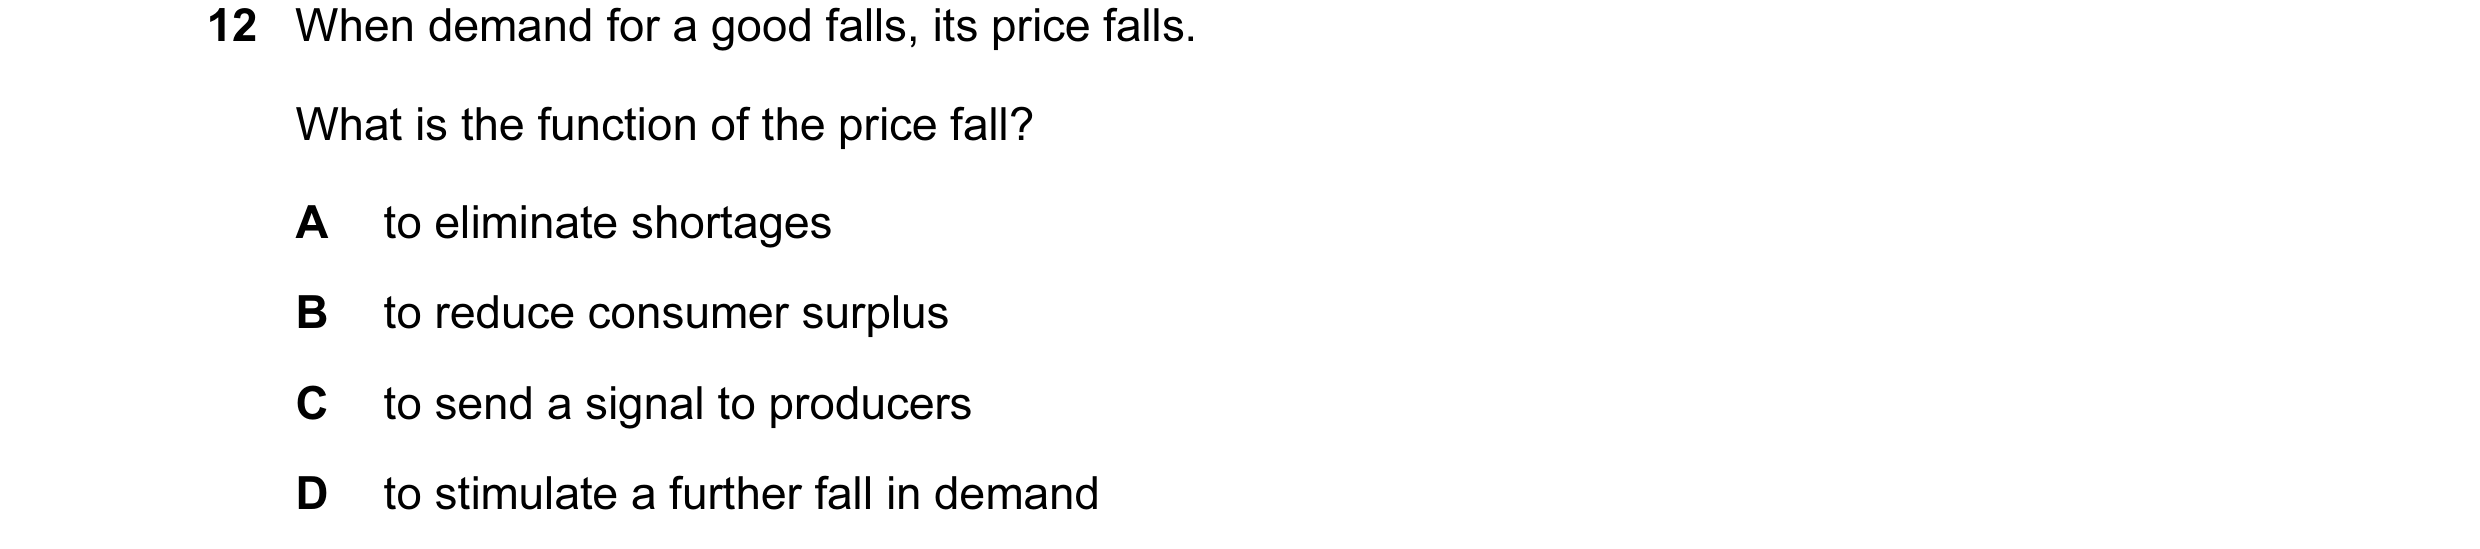
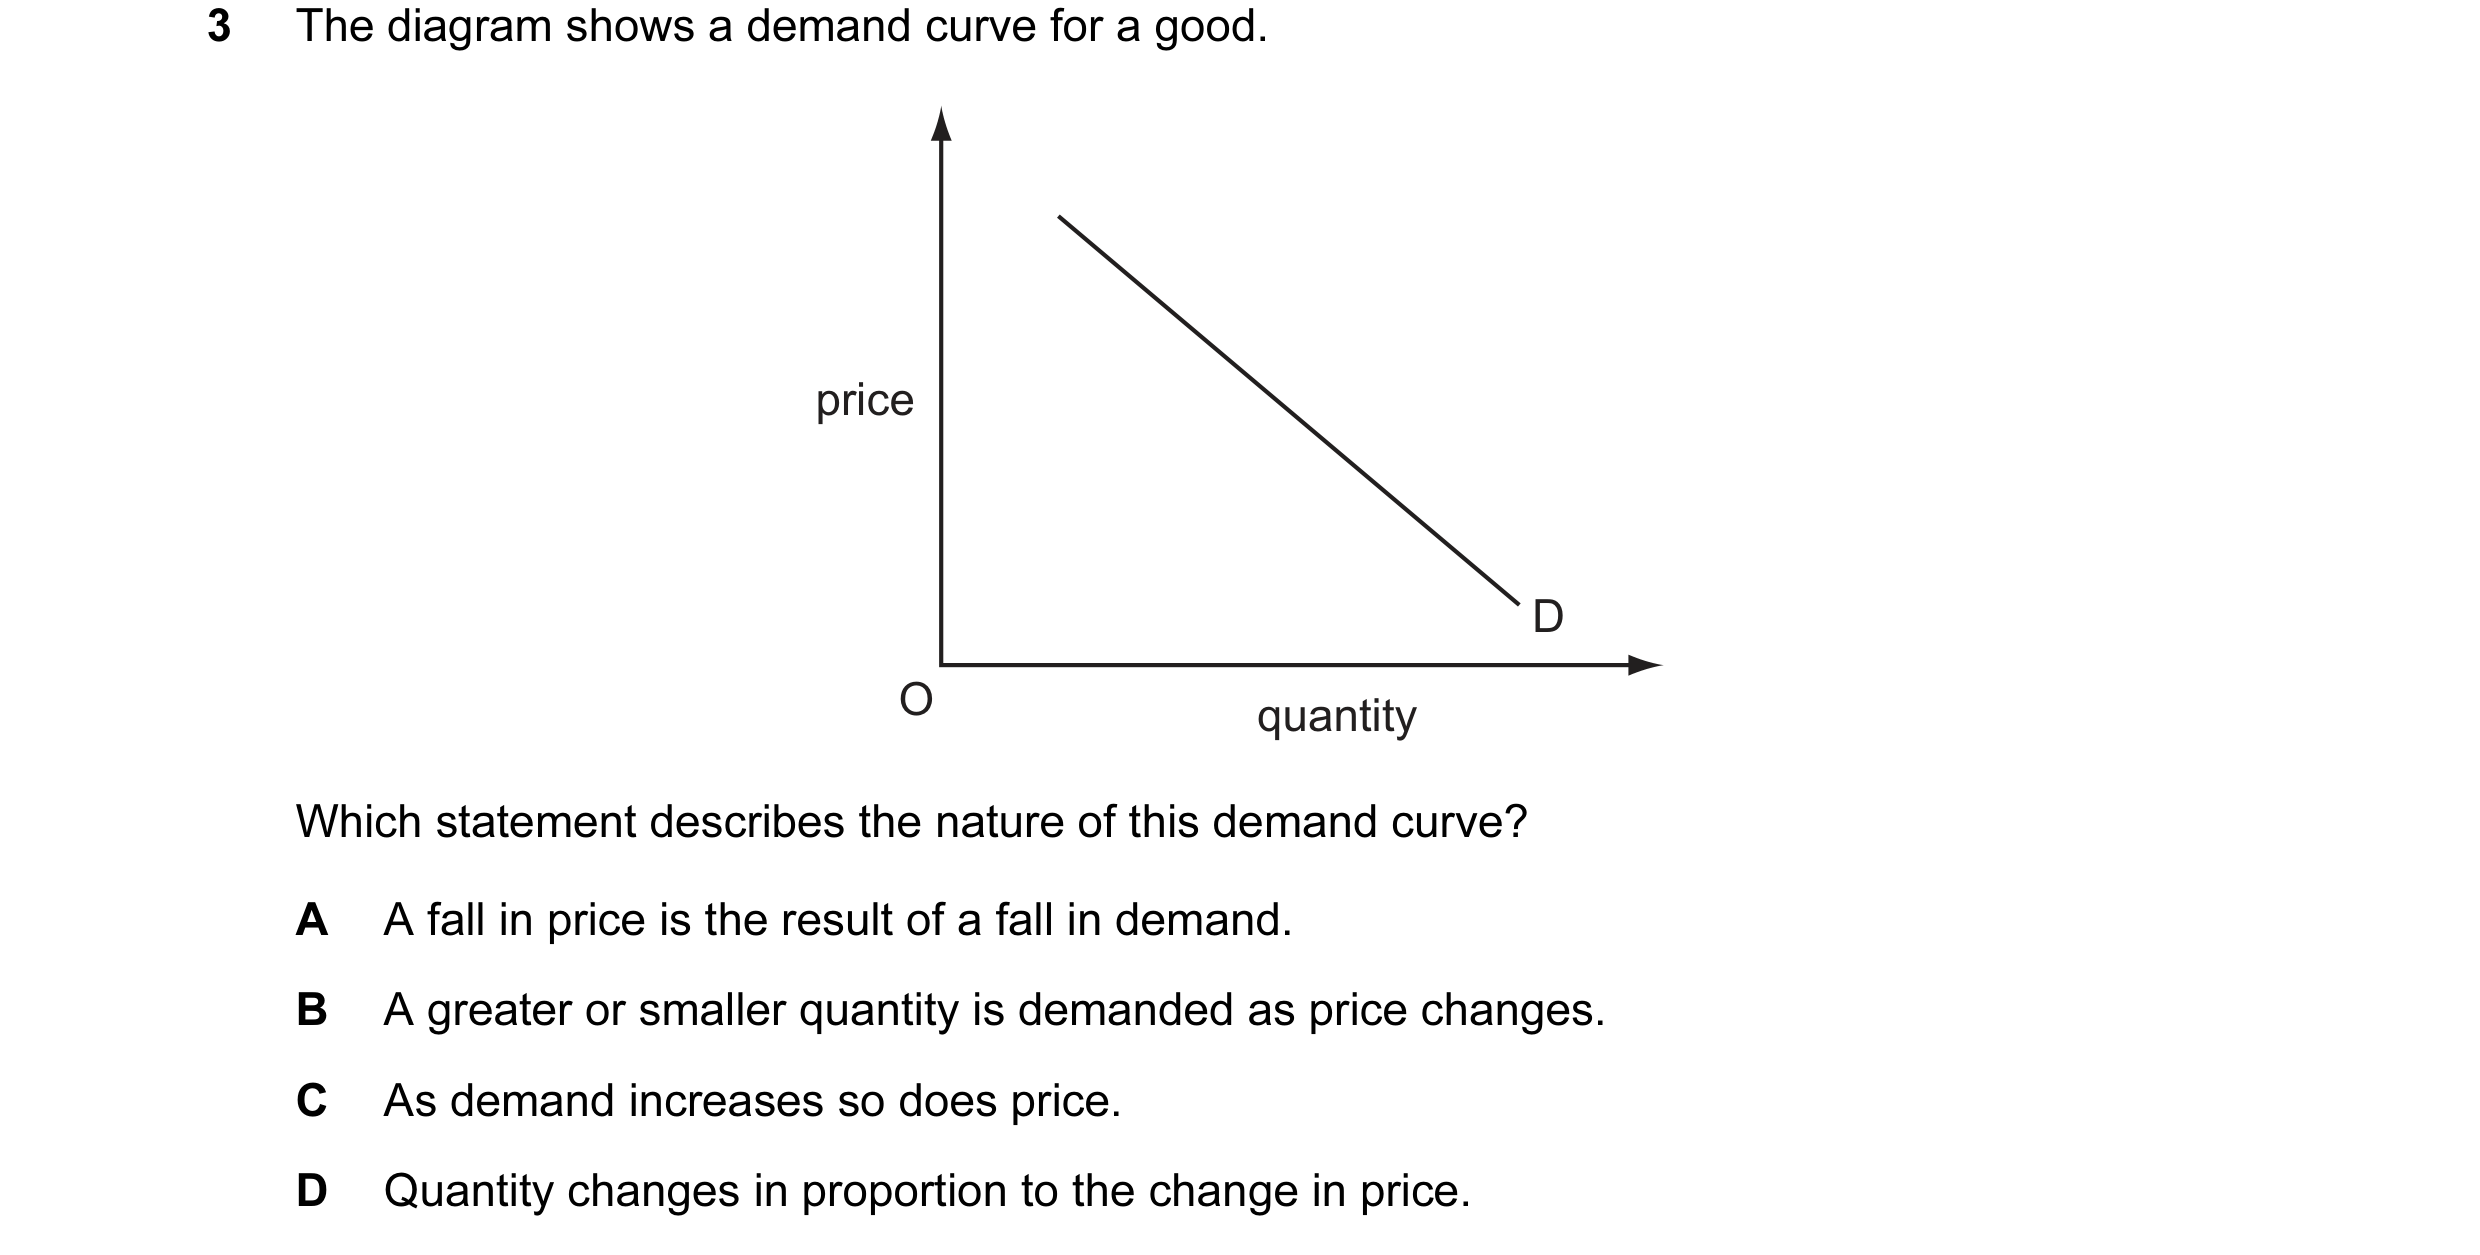
 14 / 76

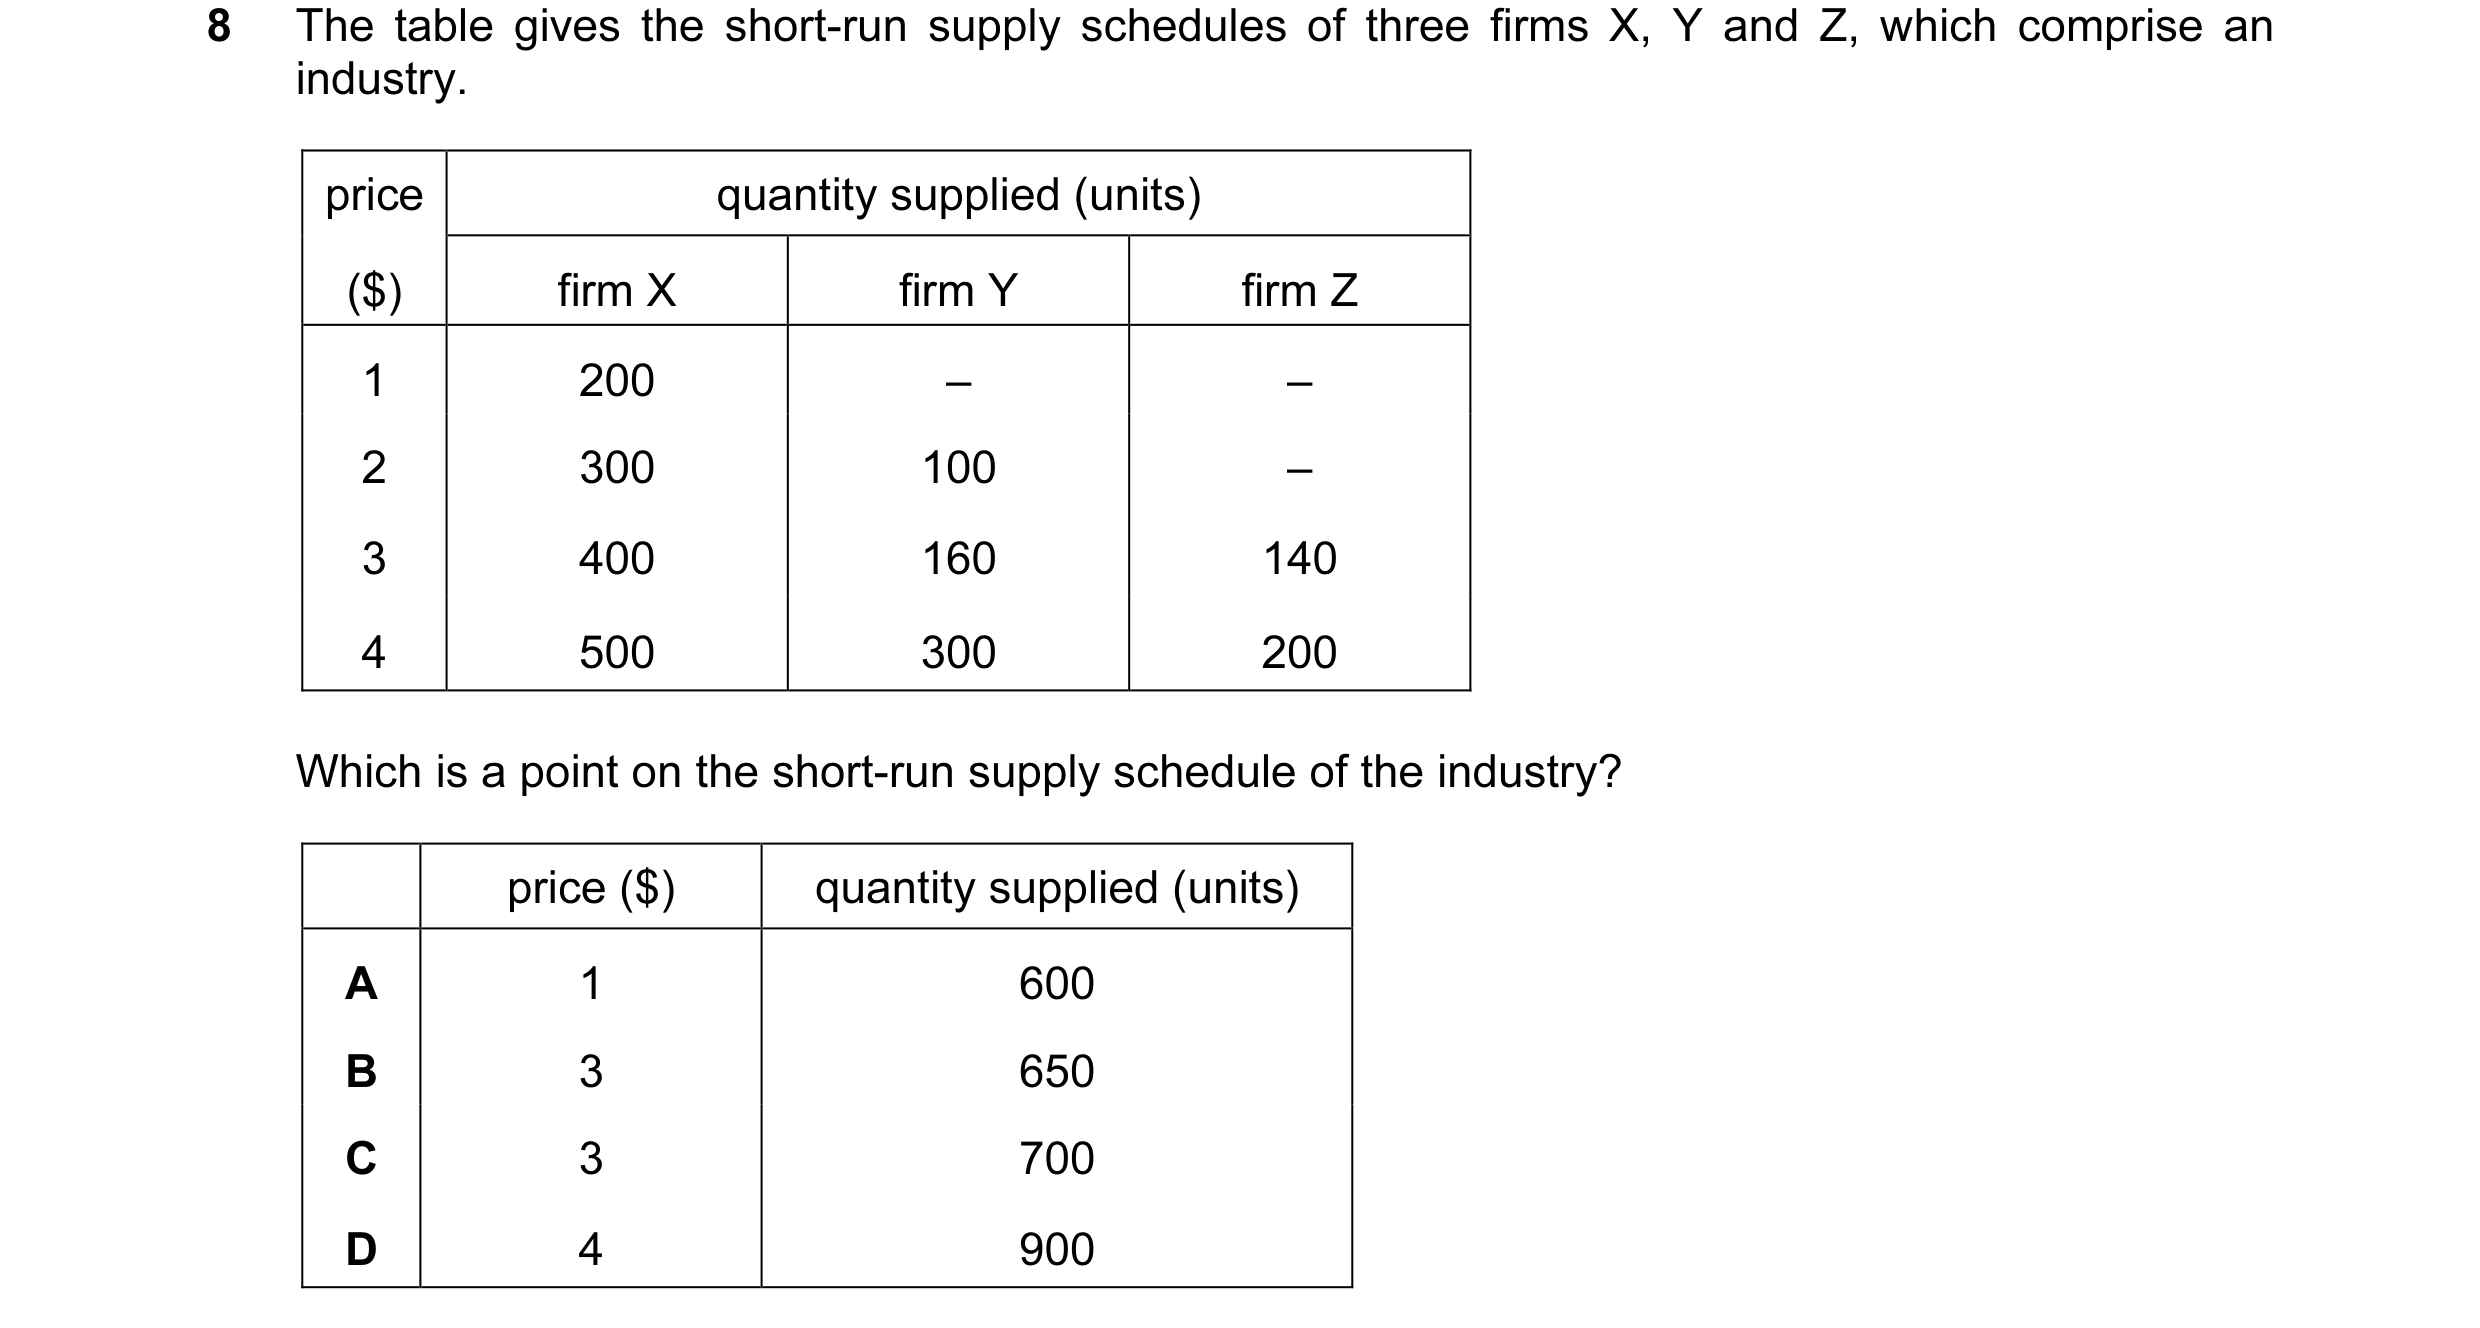 15 / 76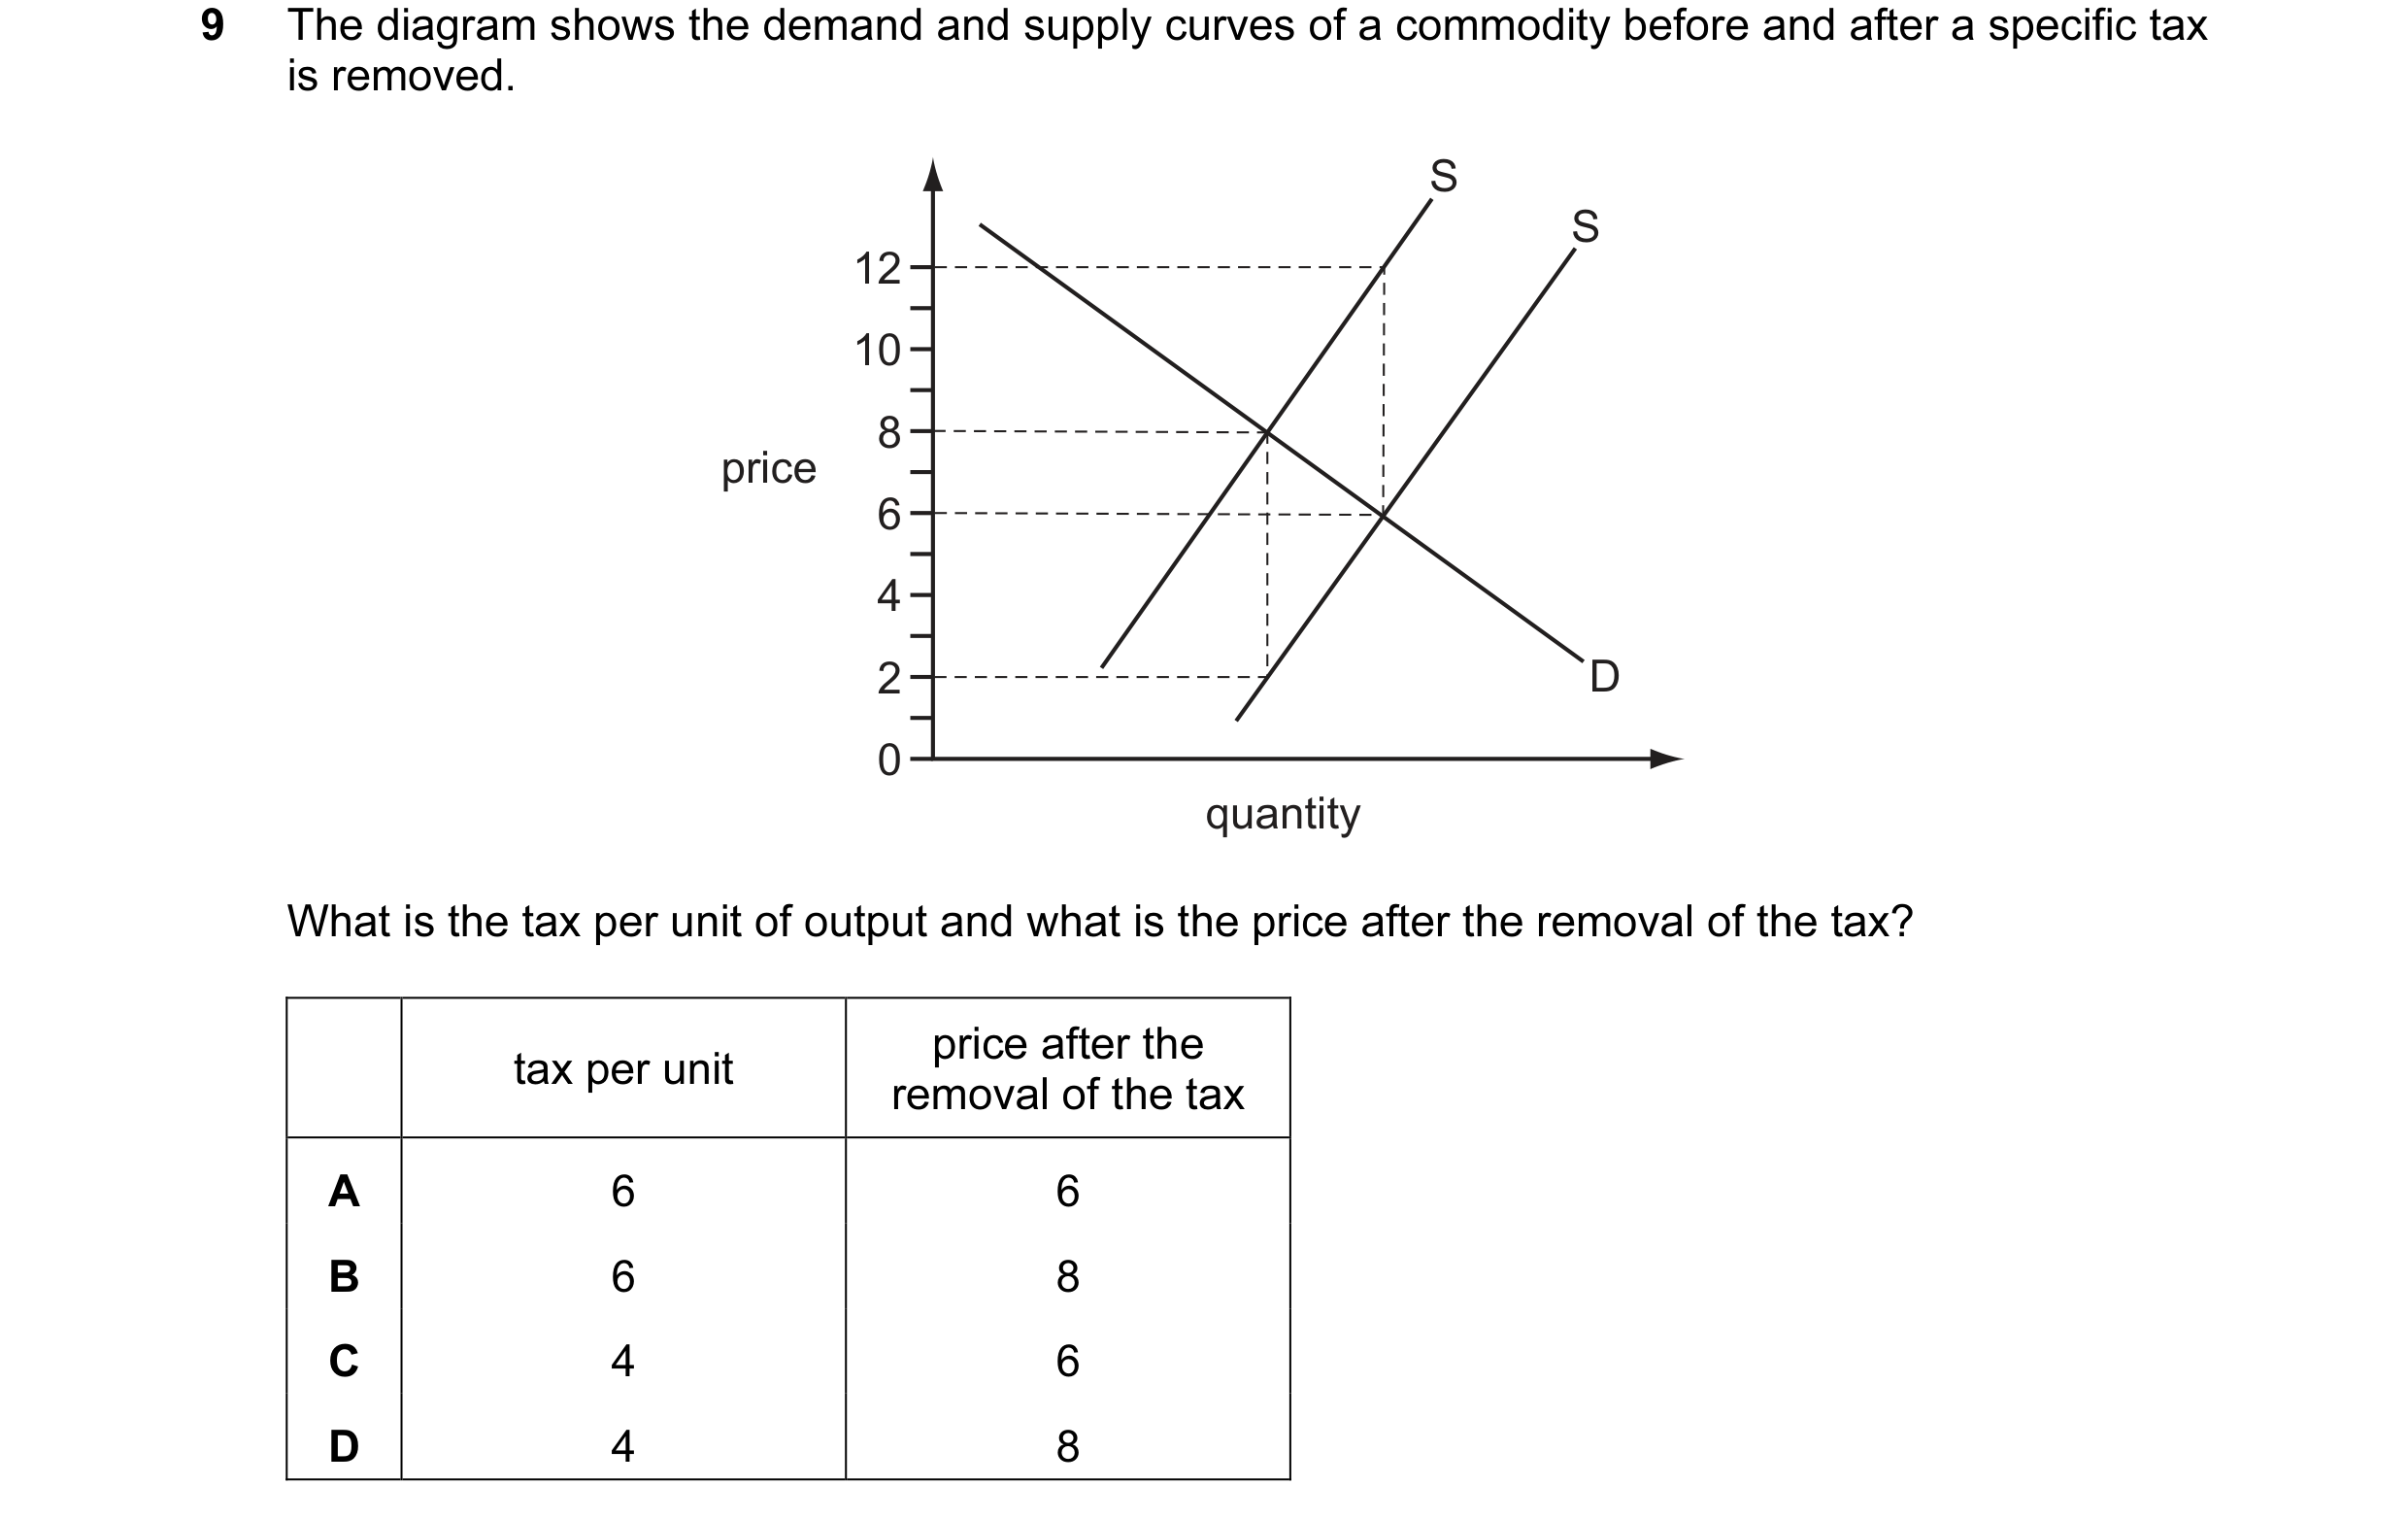

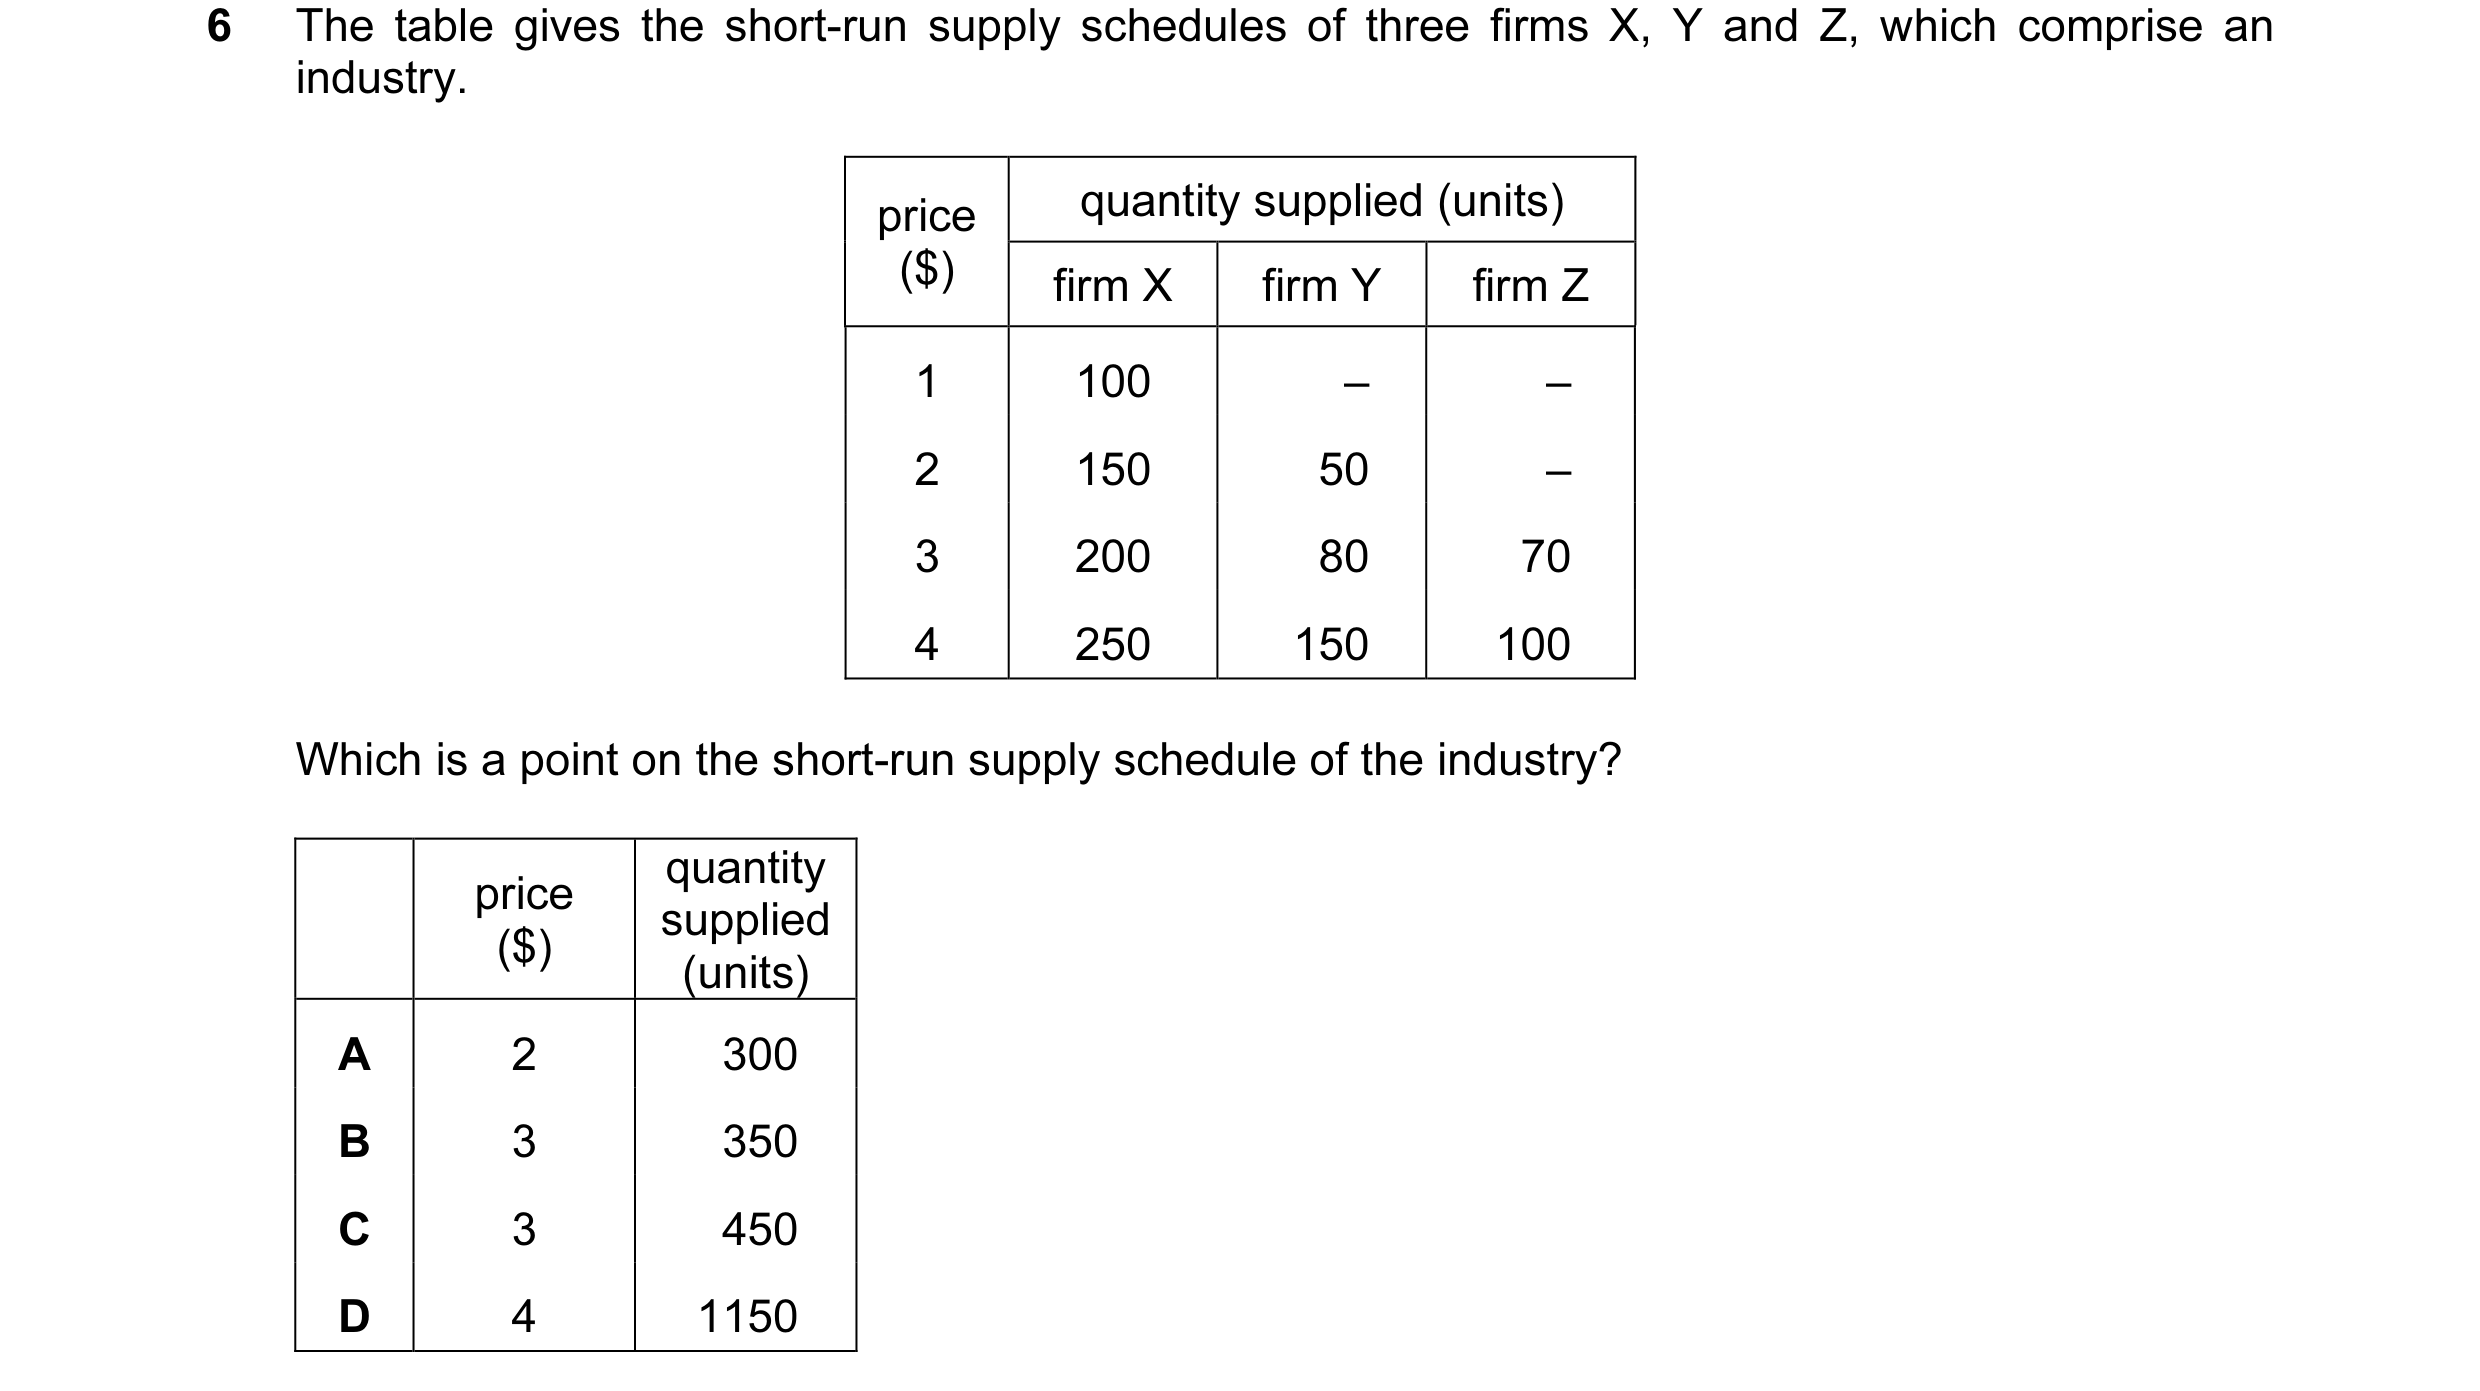 16 / 76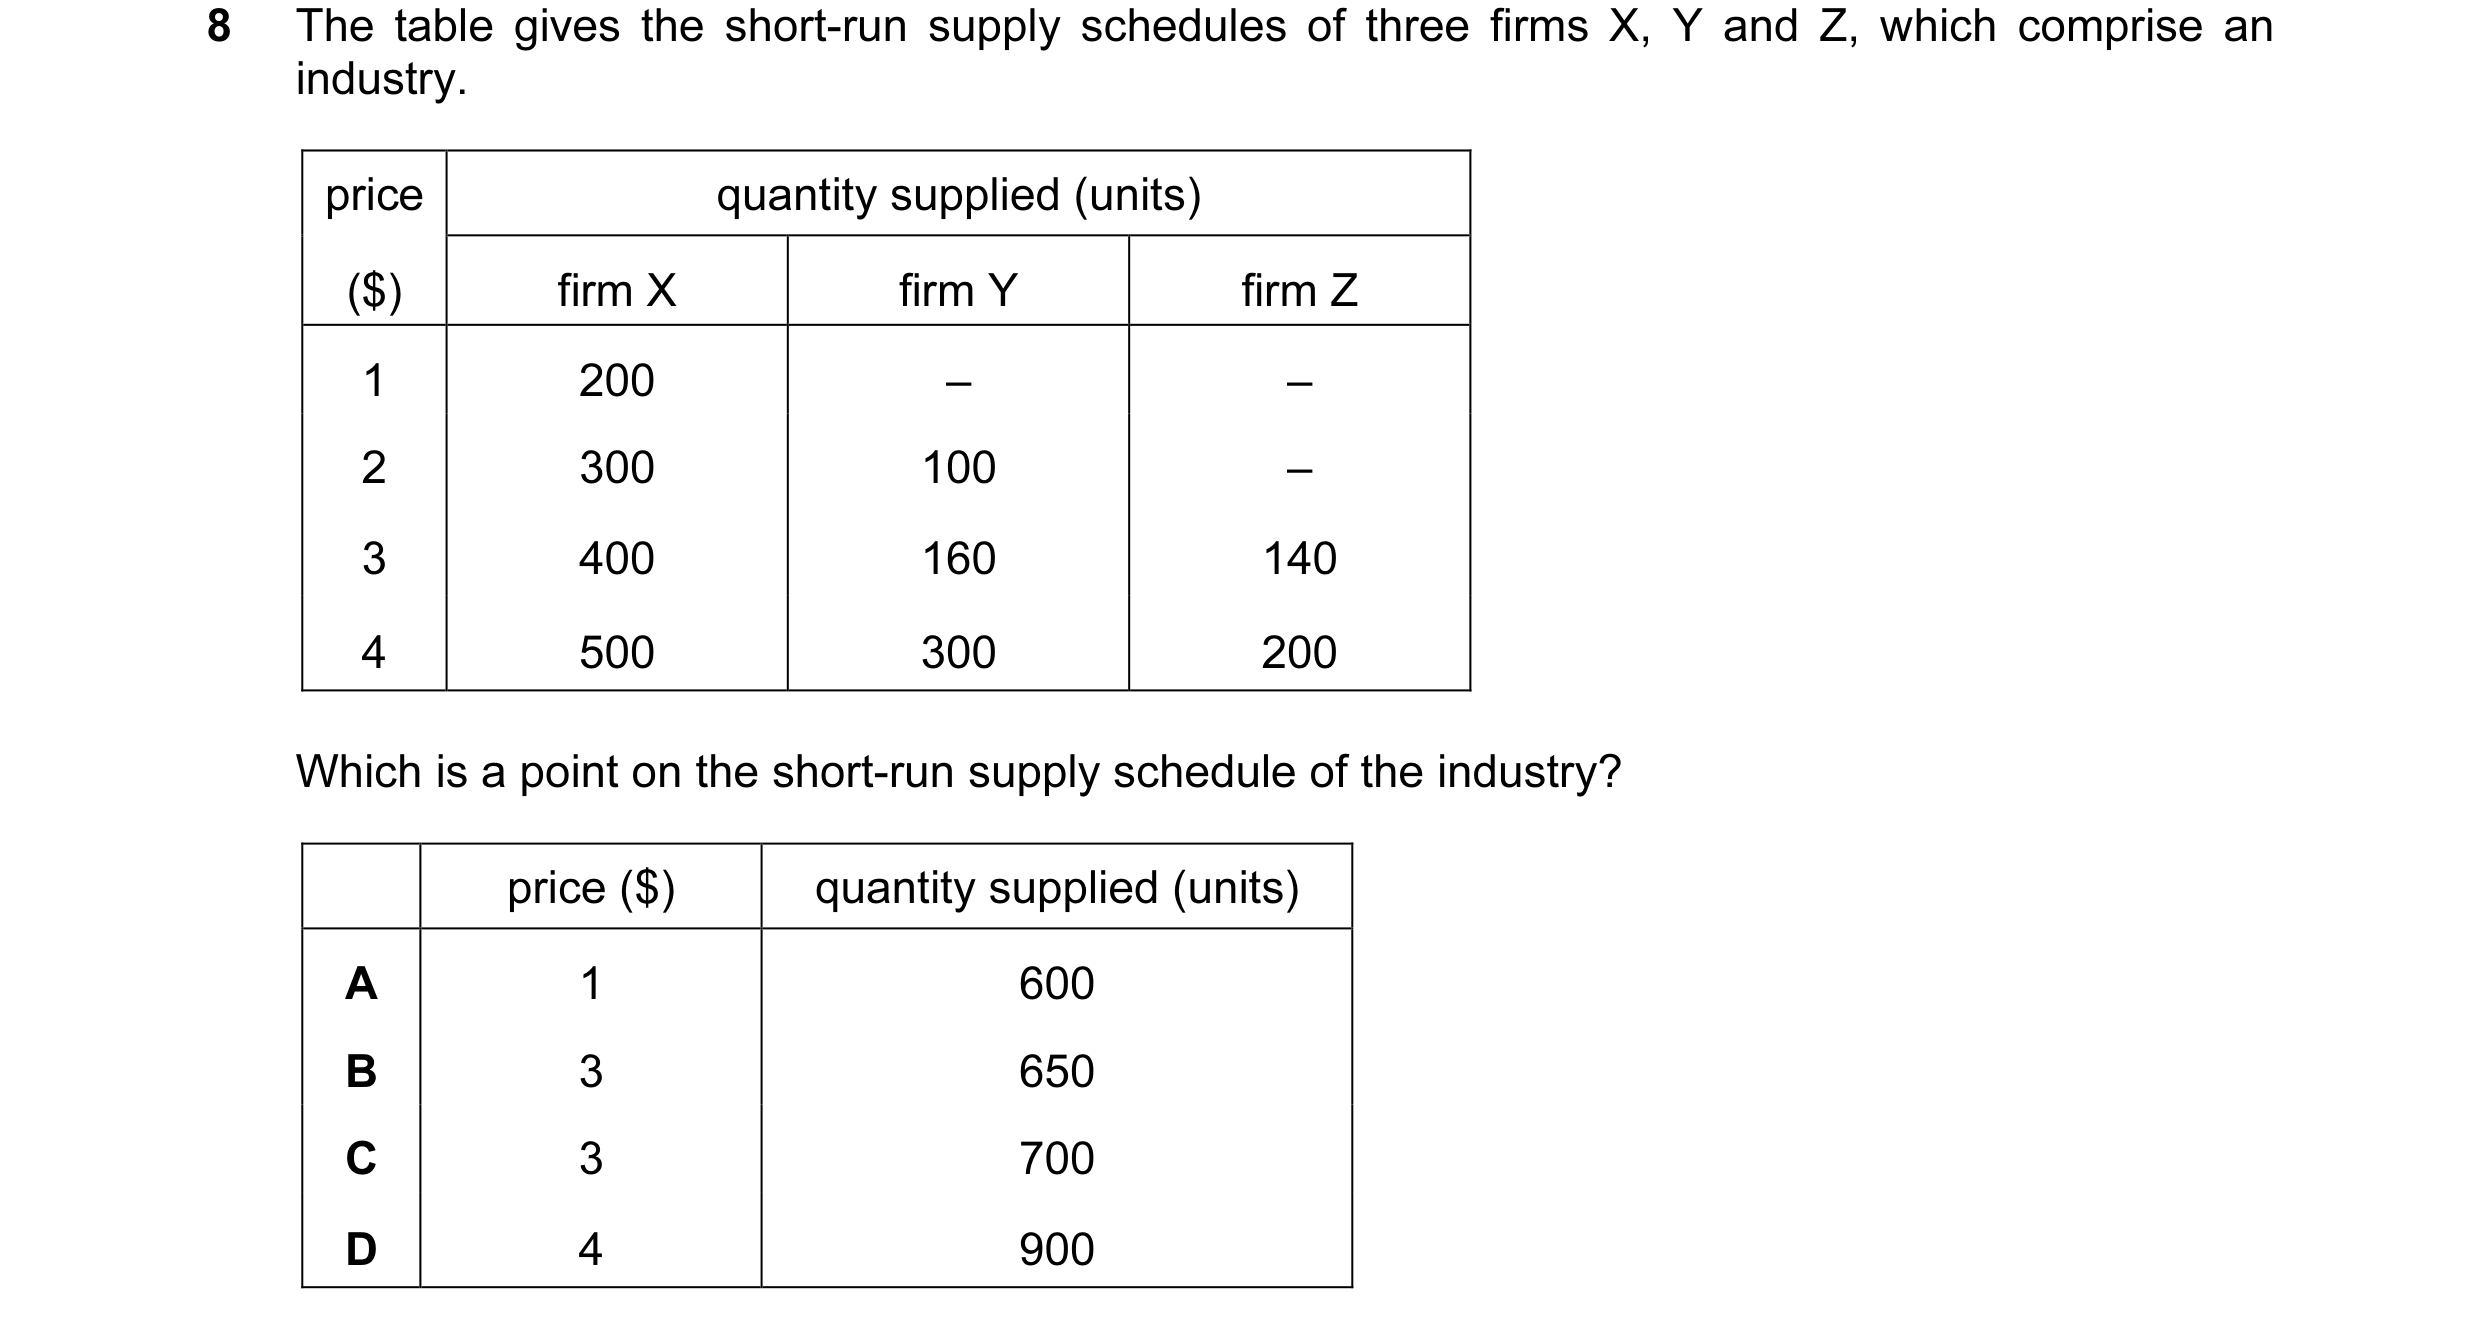

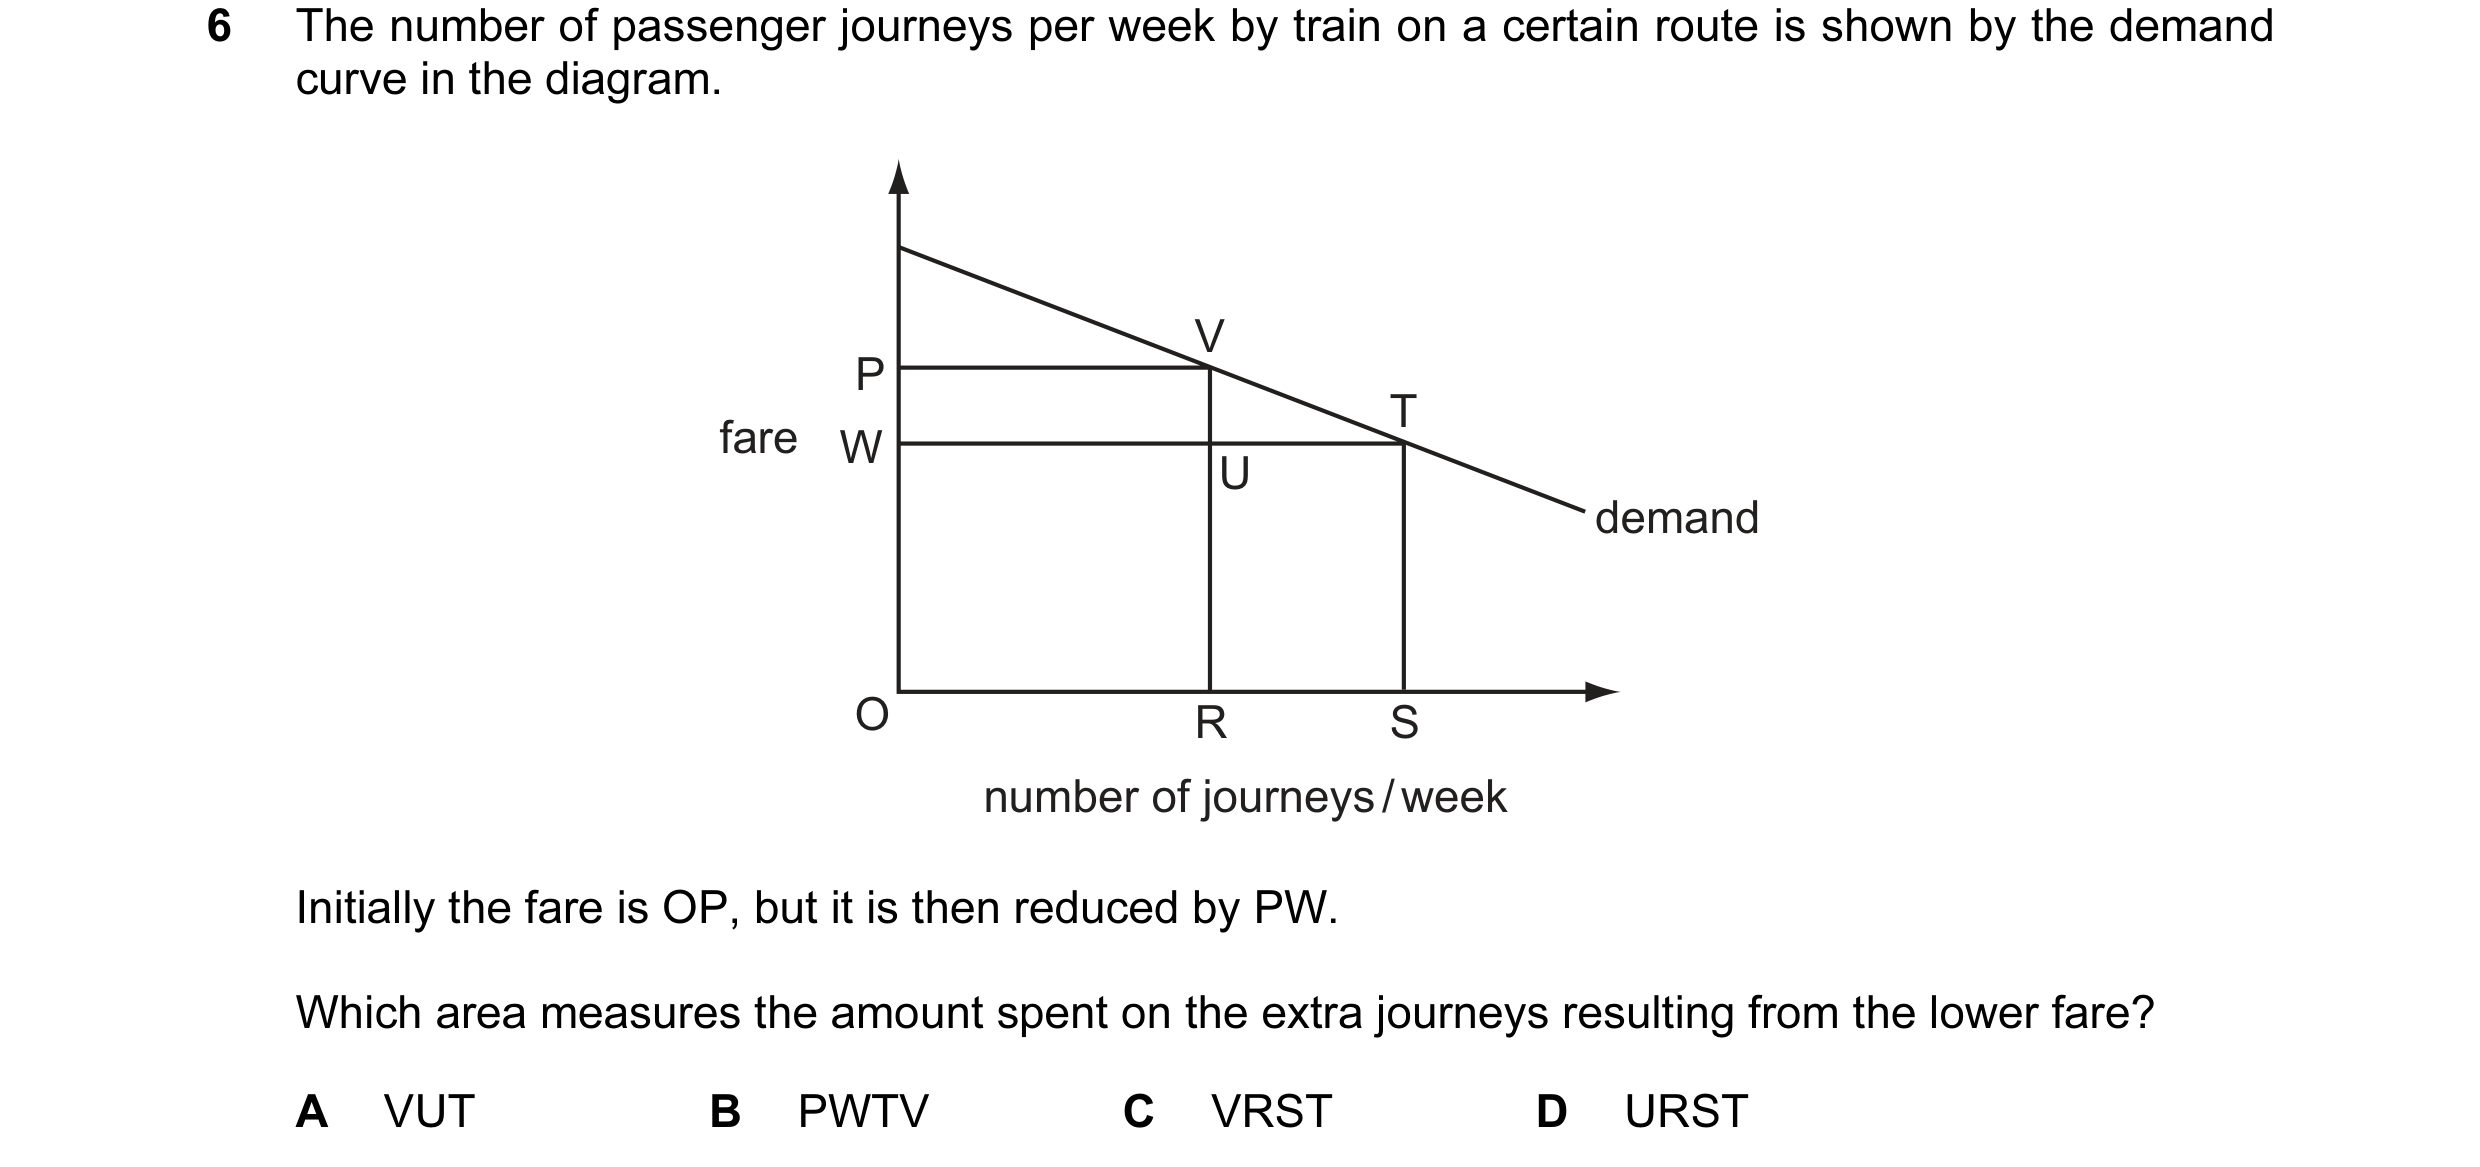 17 / 76

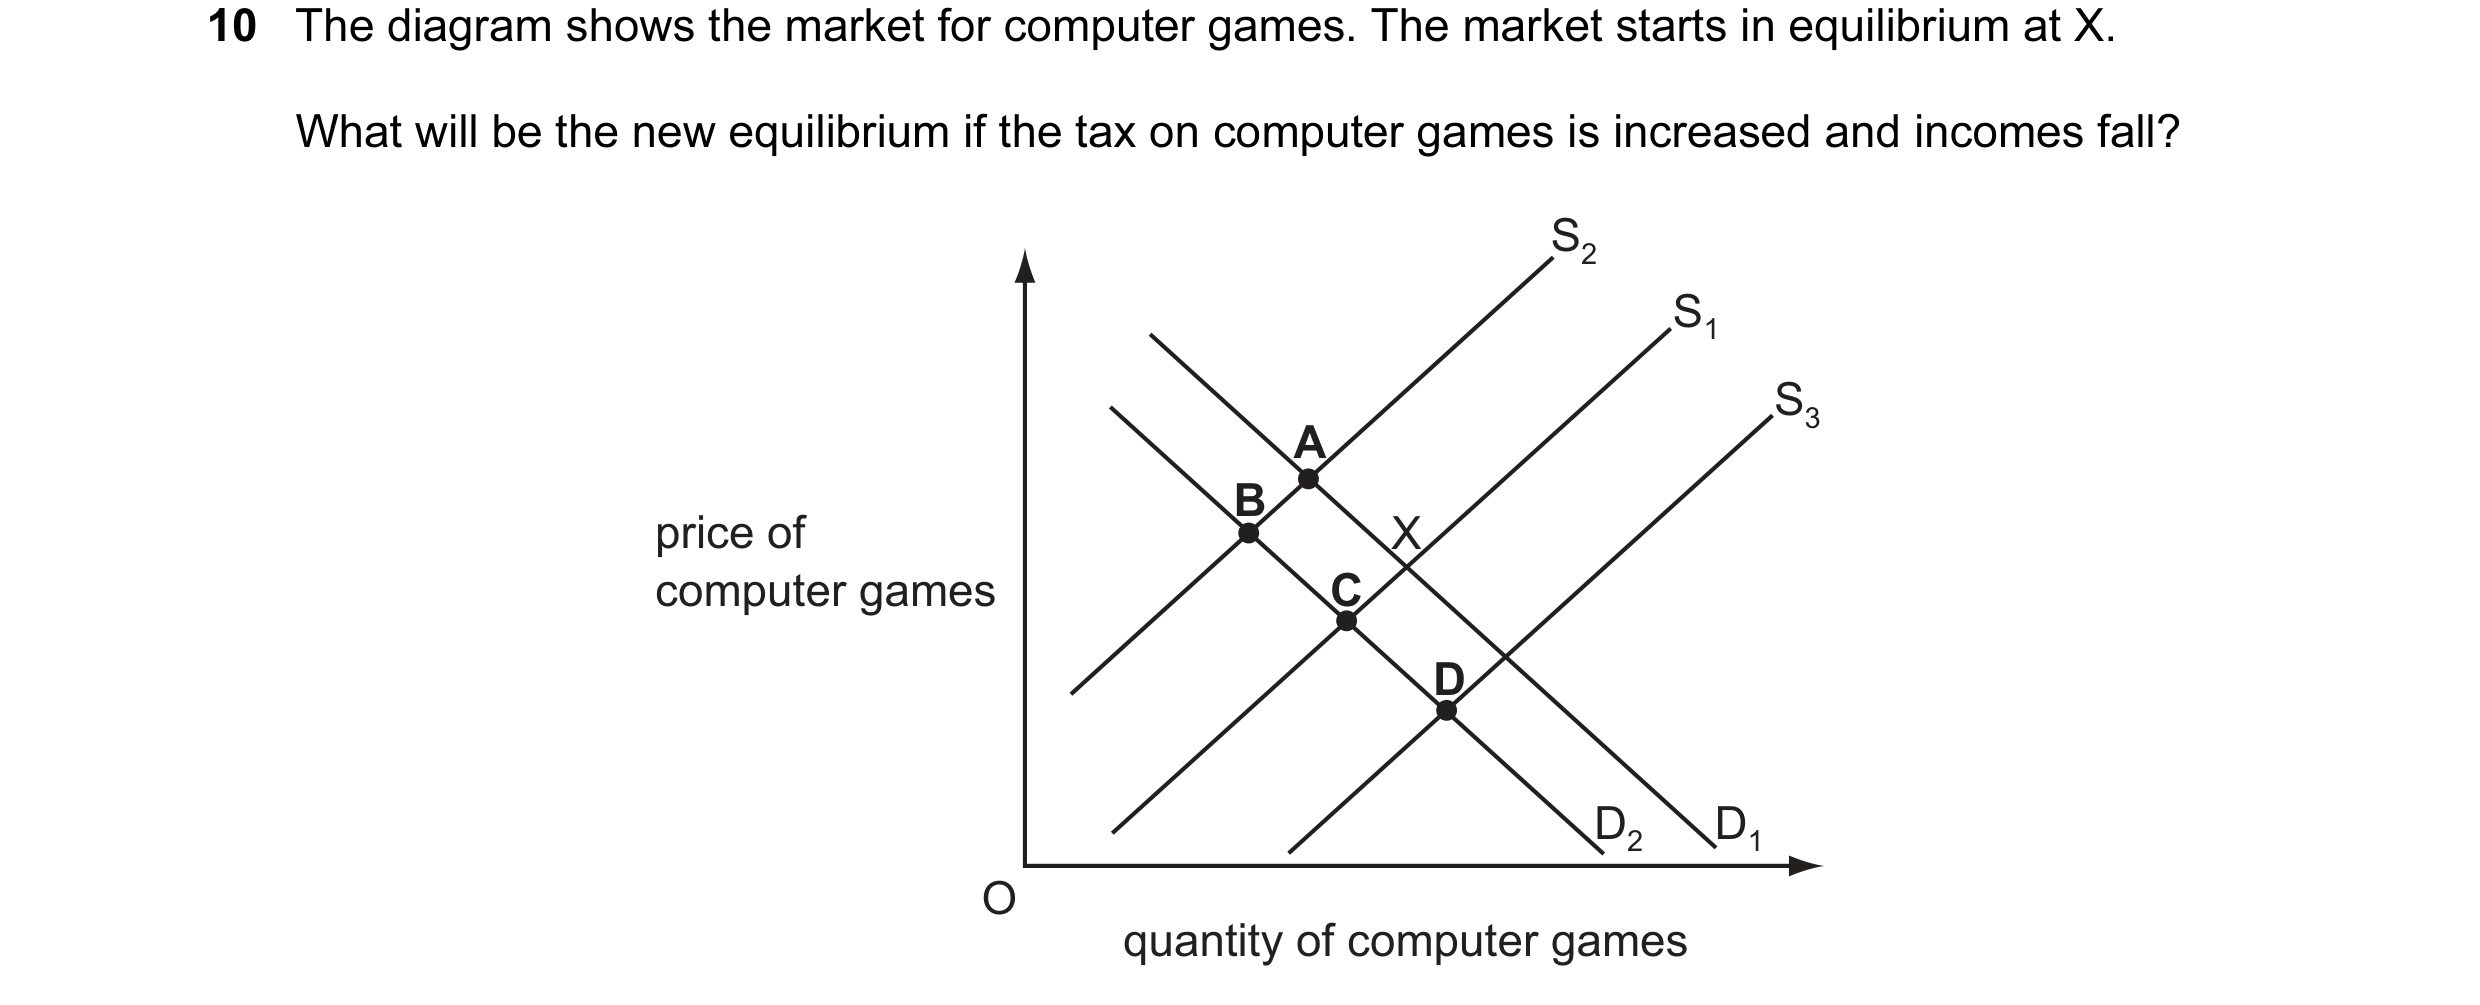
 18 / 76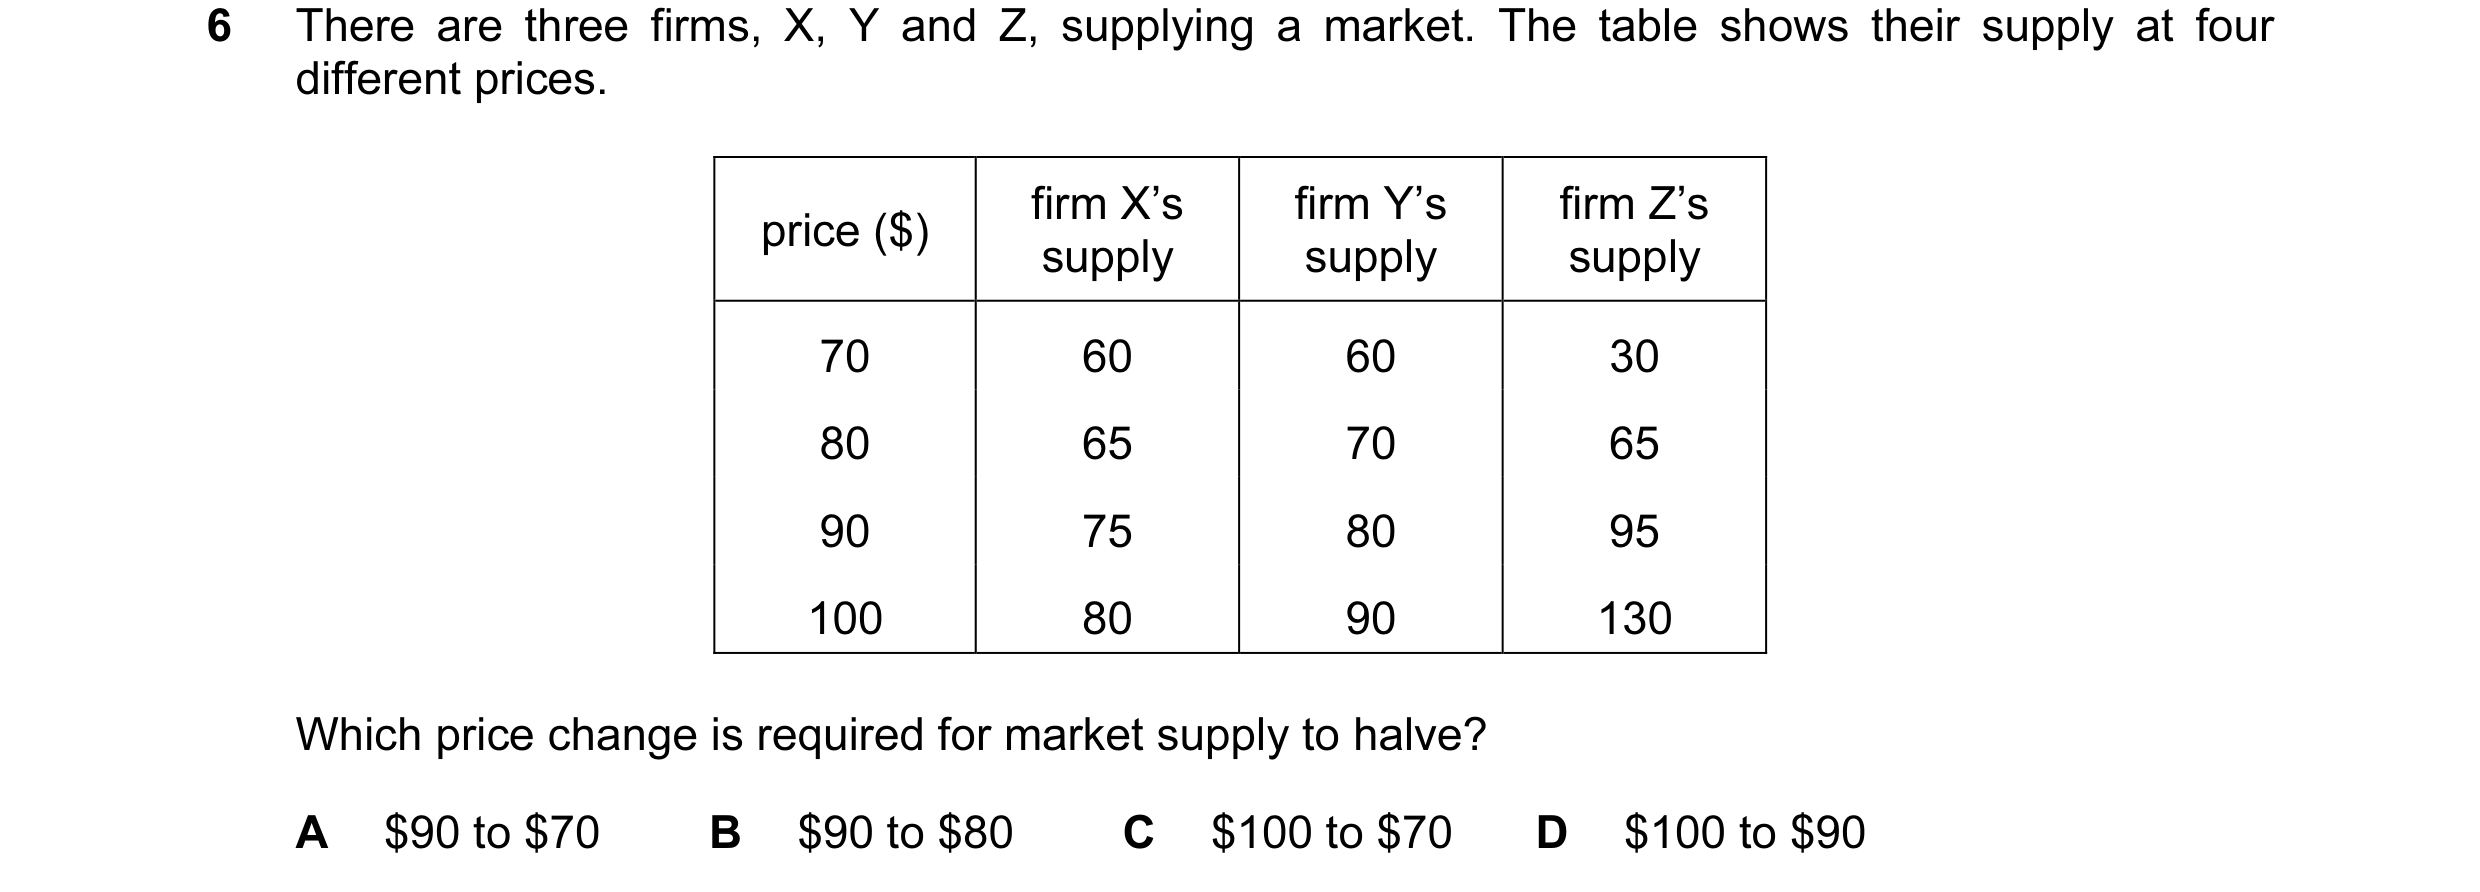
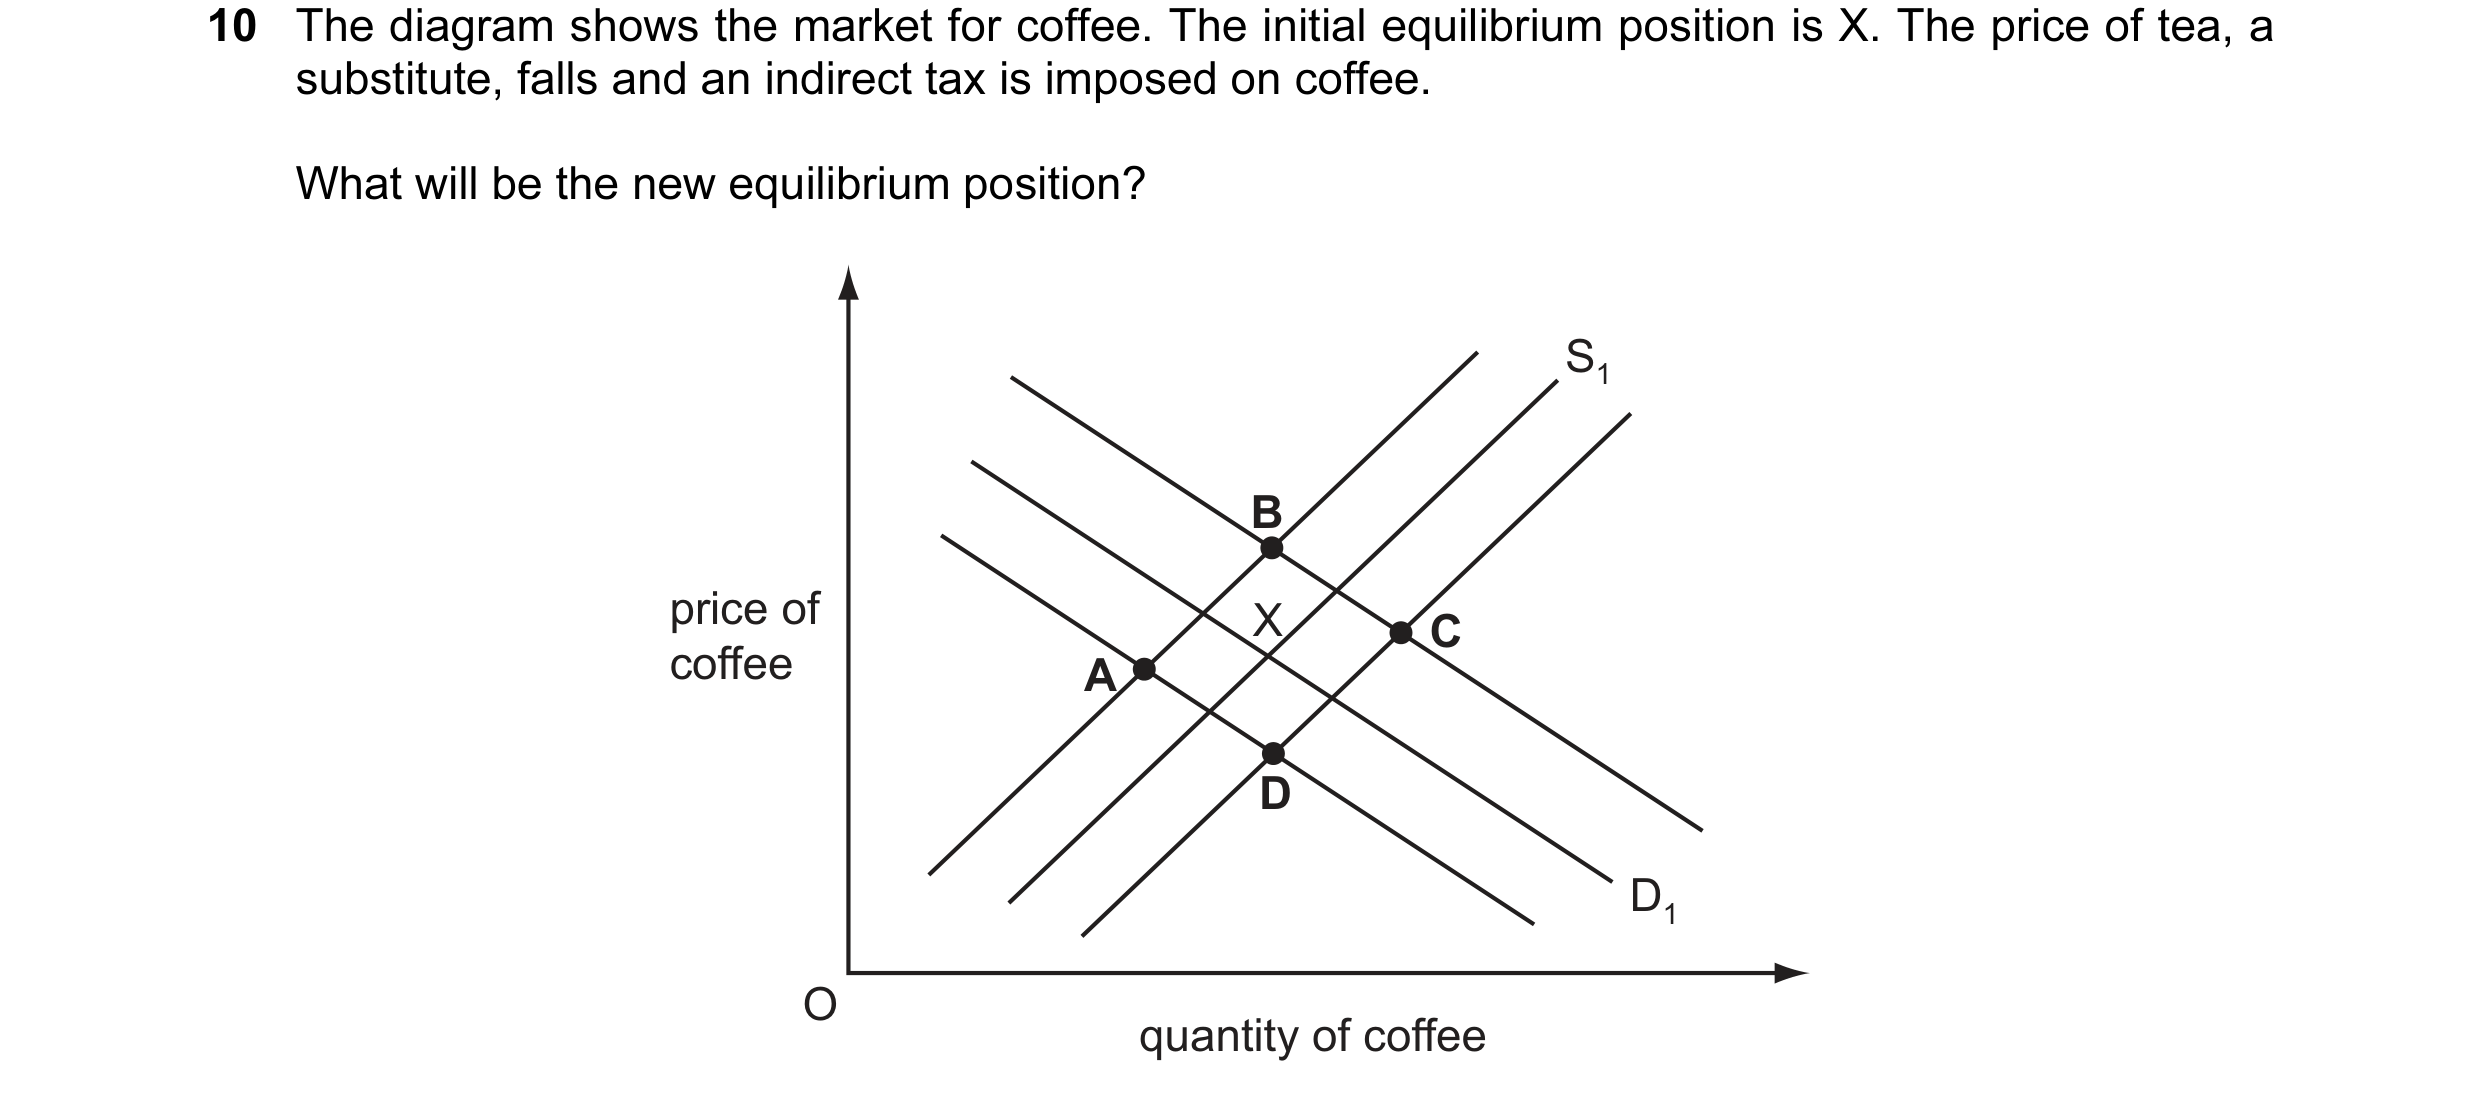
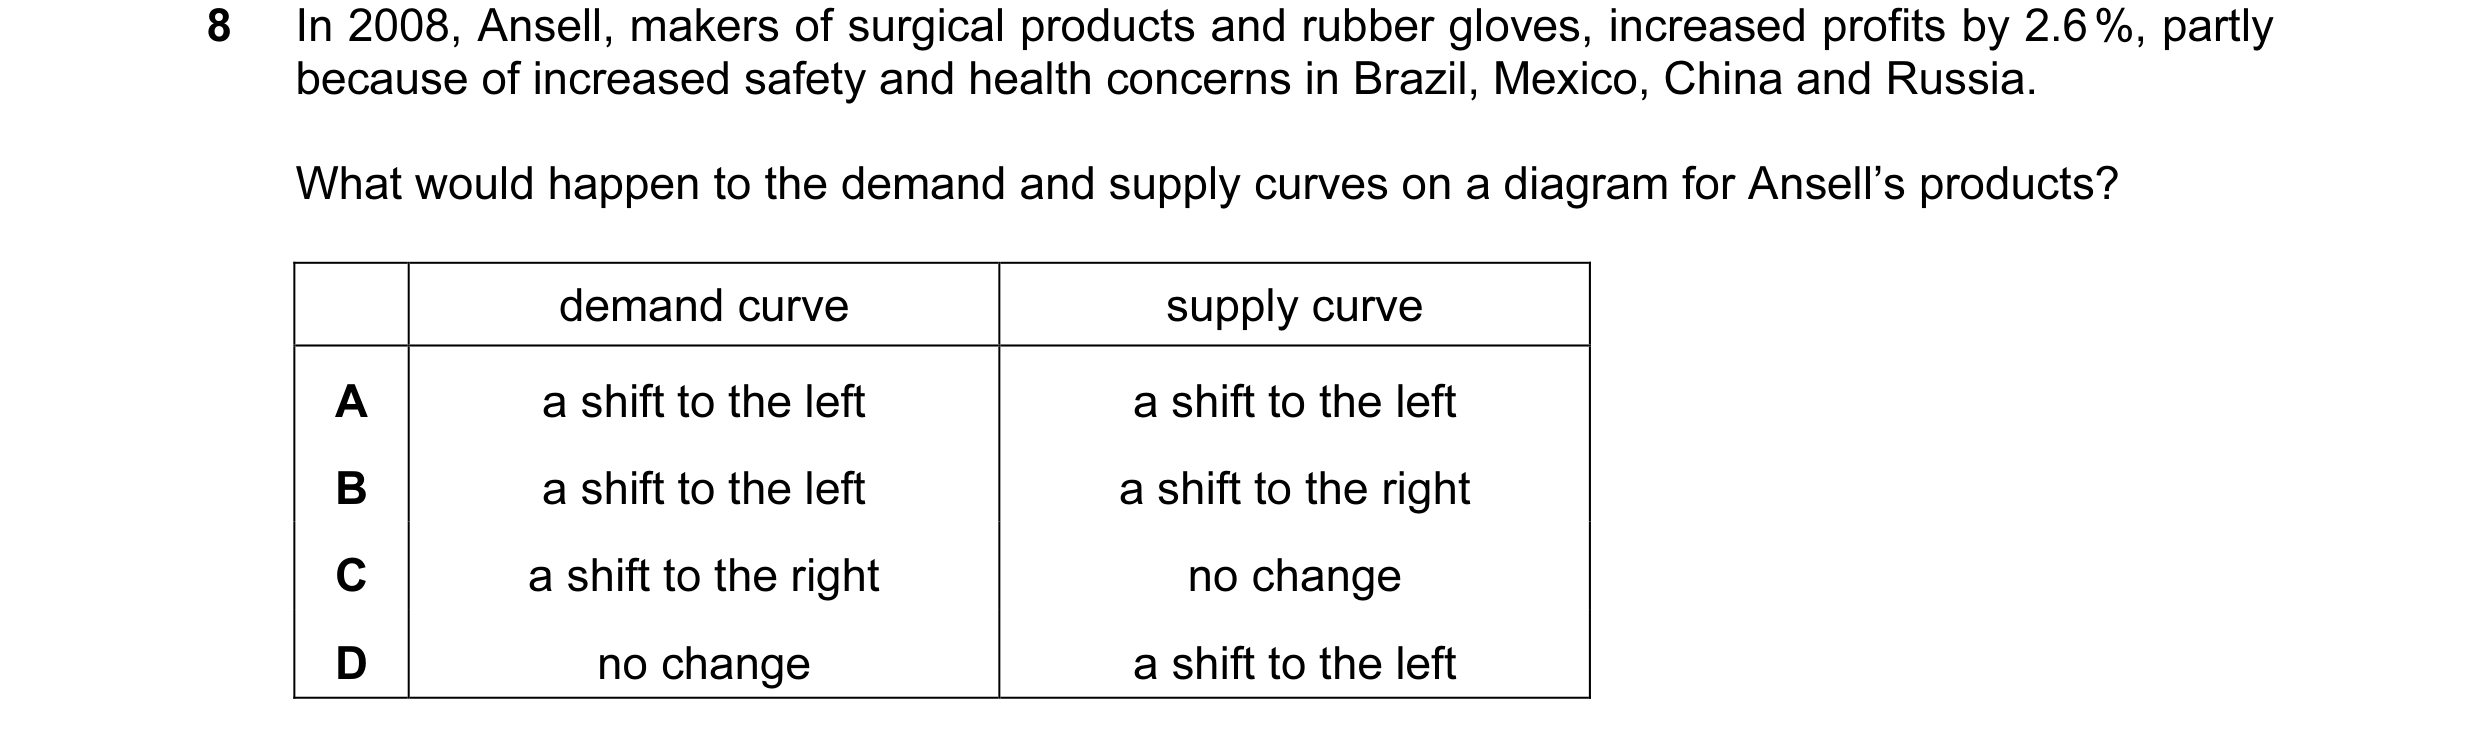 19 / 76
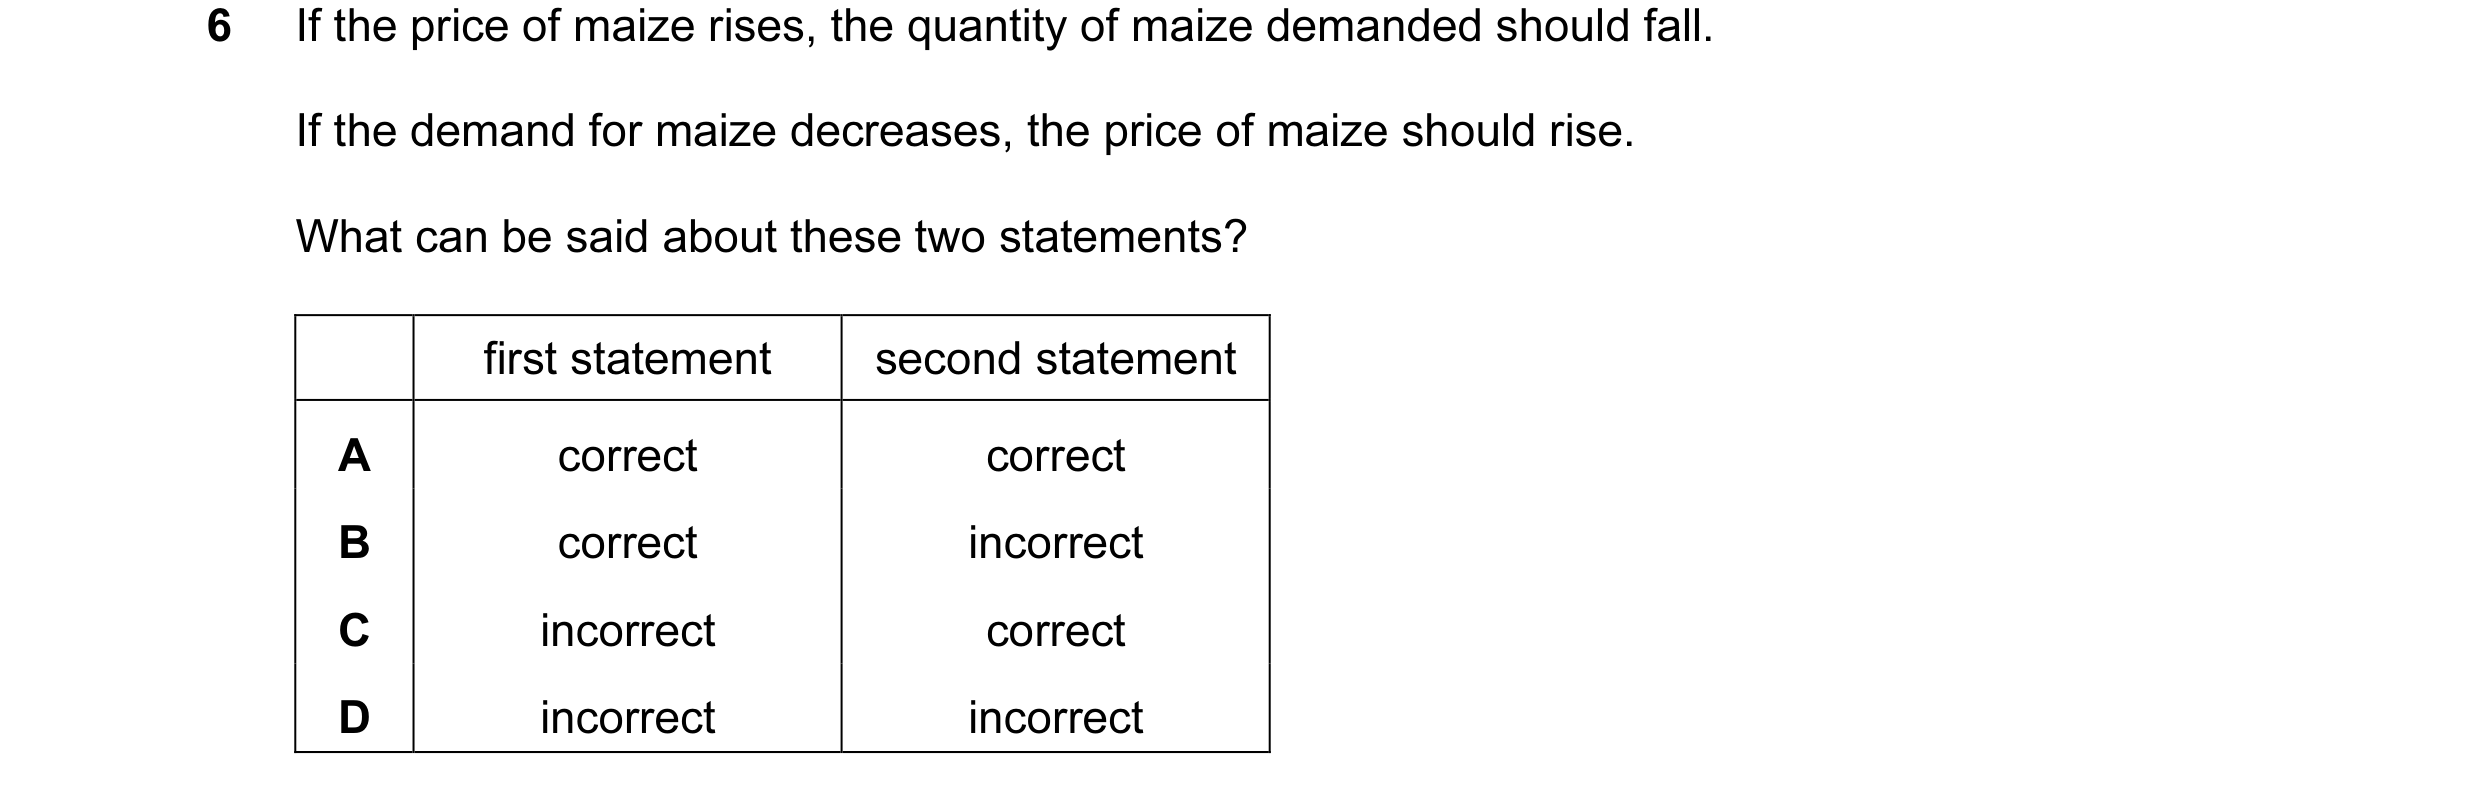

 20 / 76
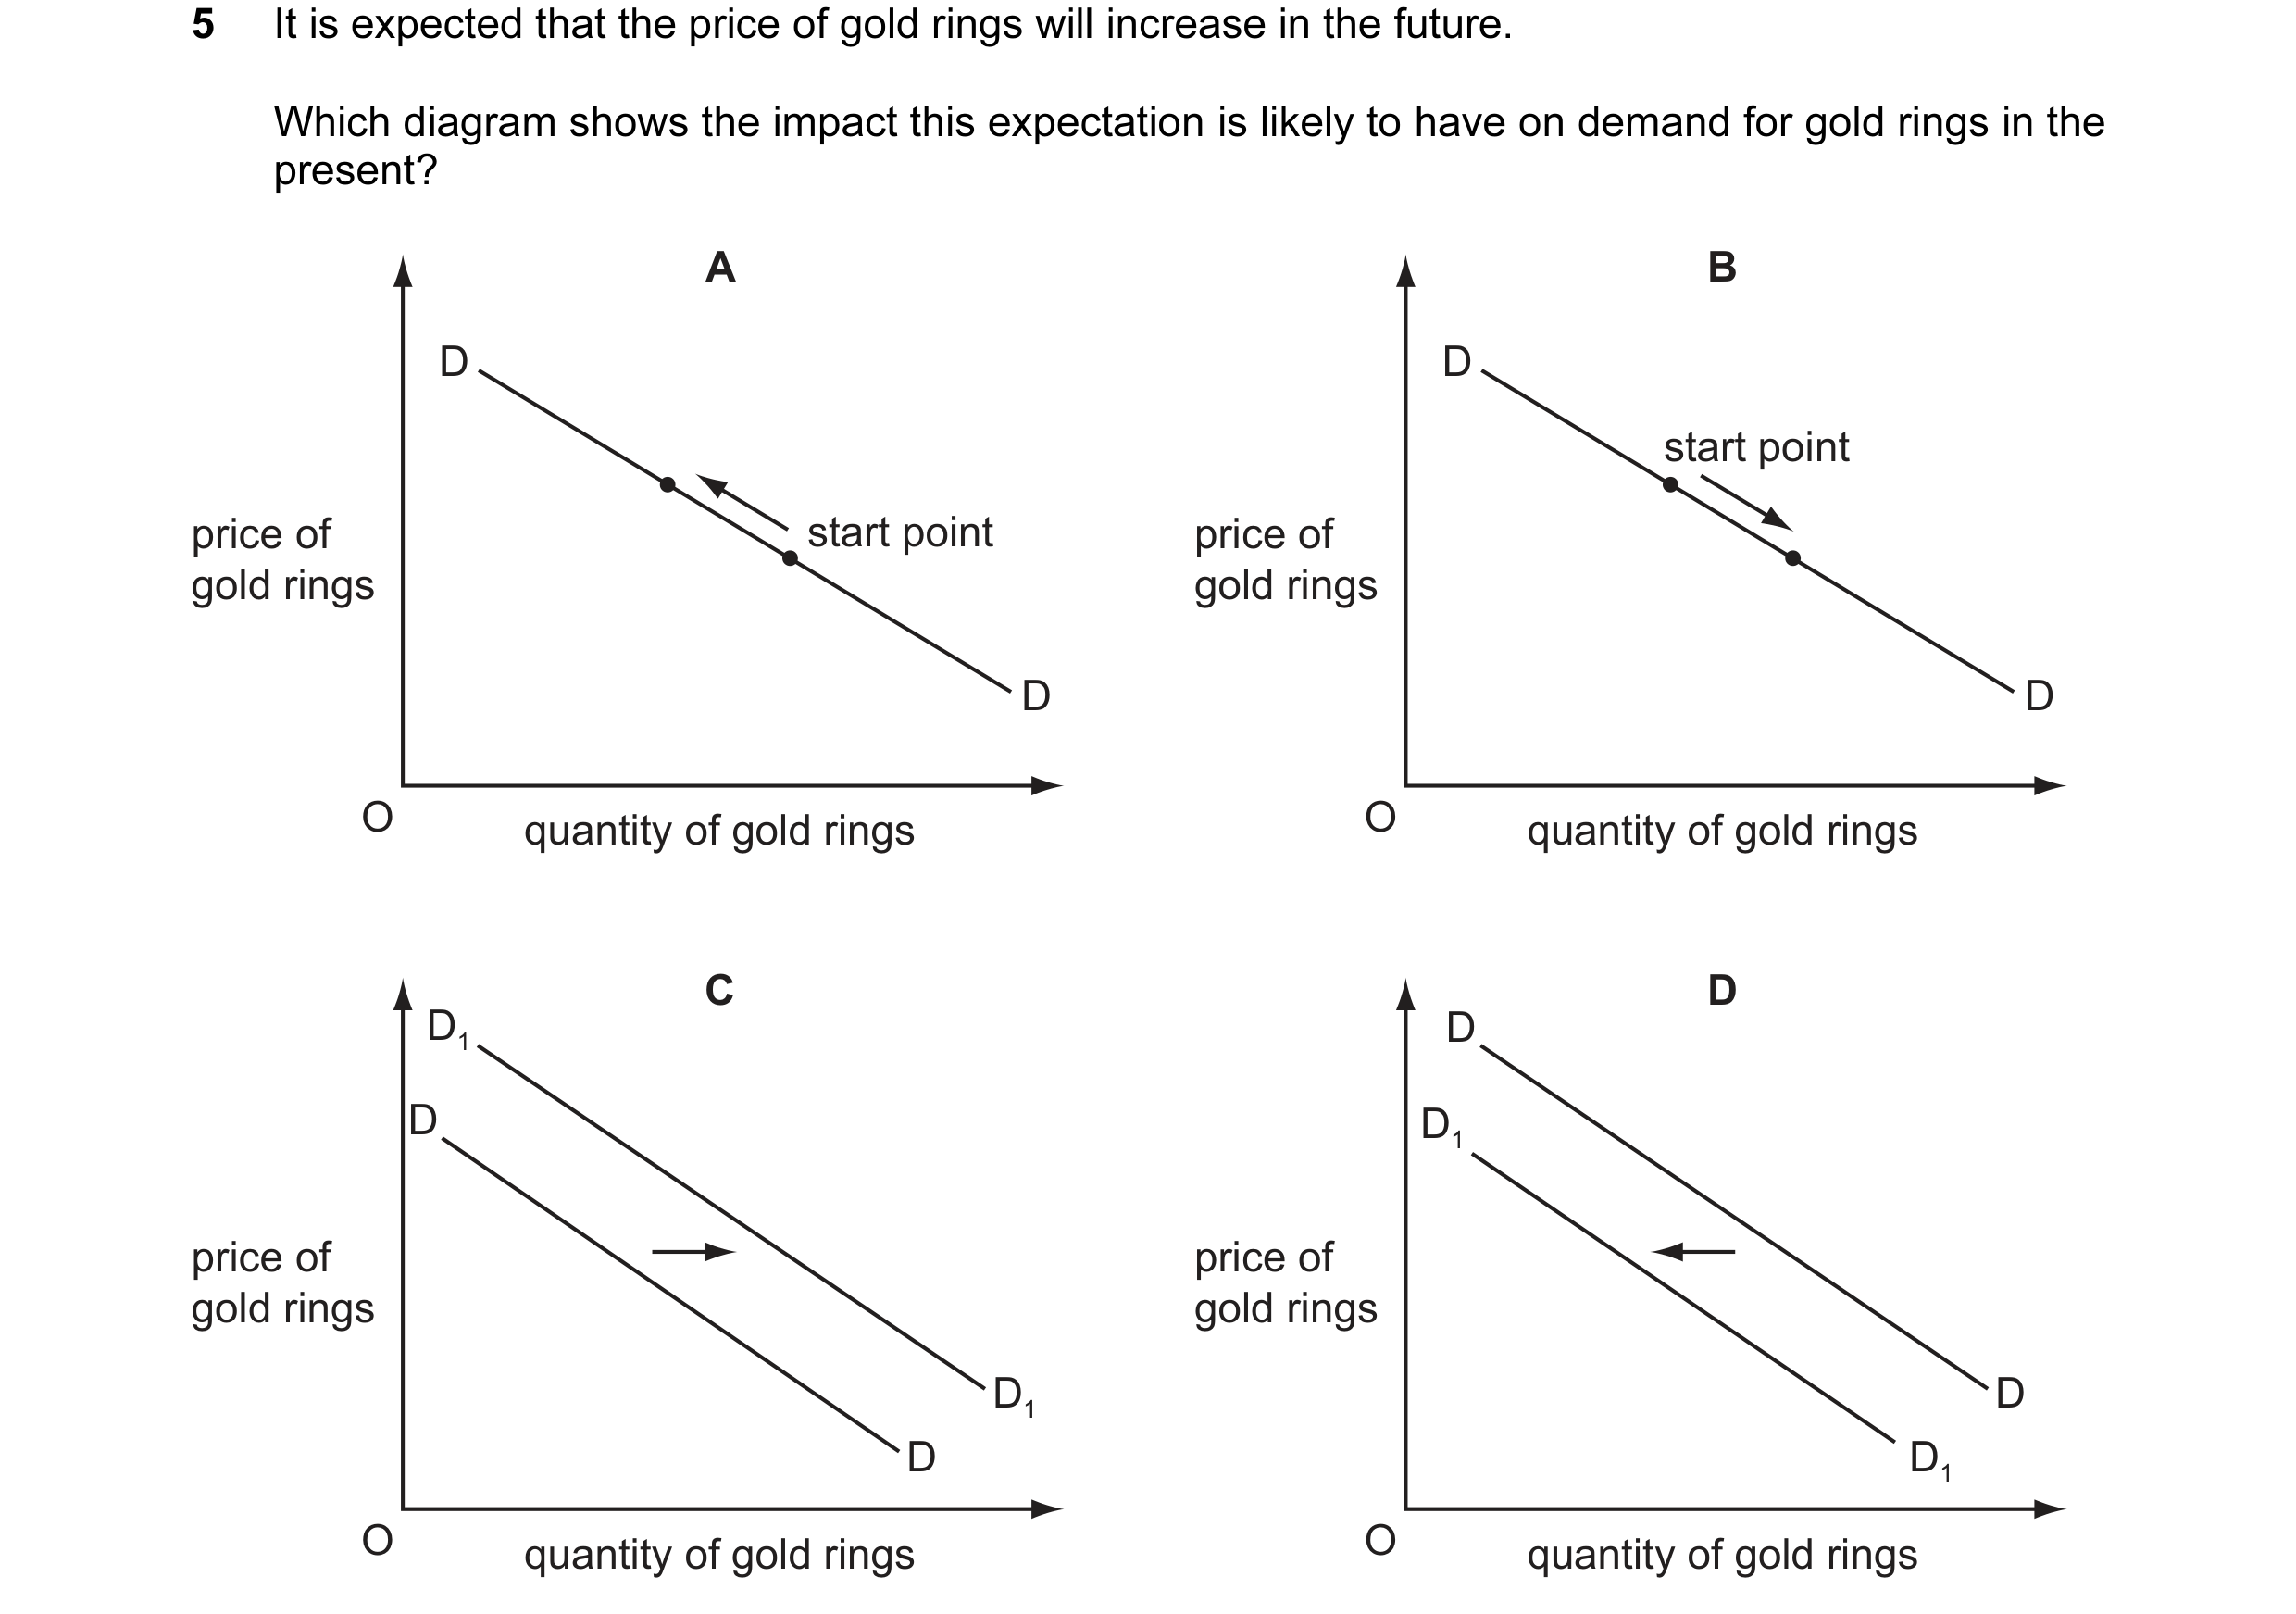 21 / 76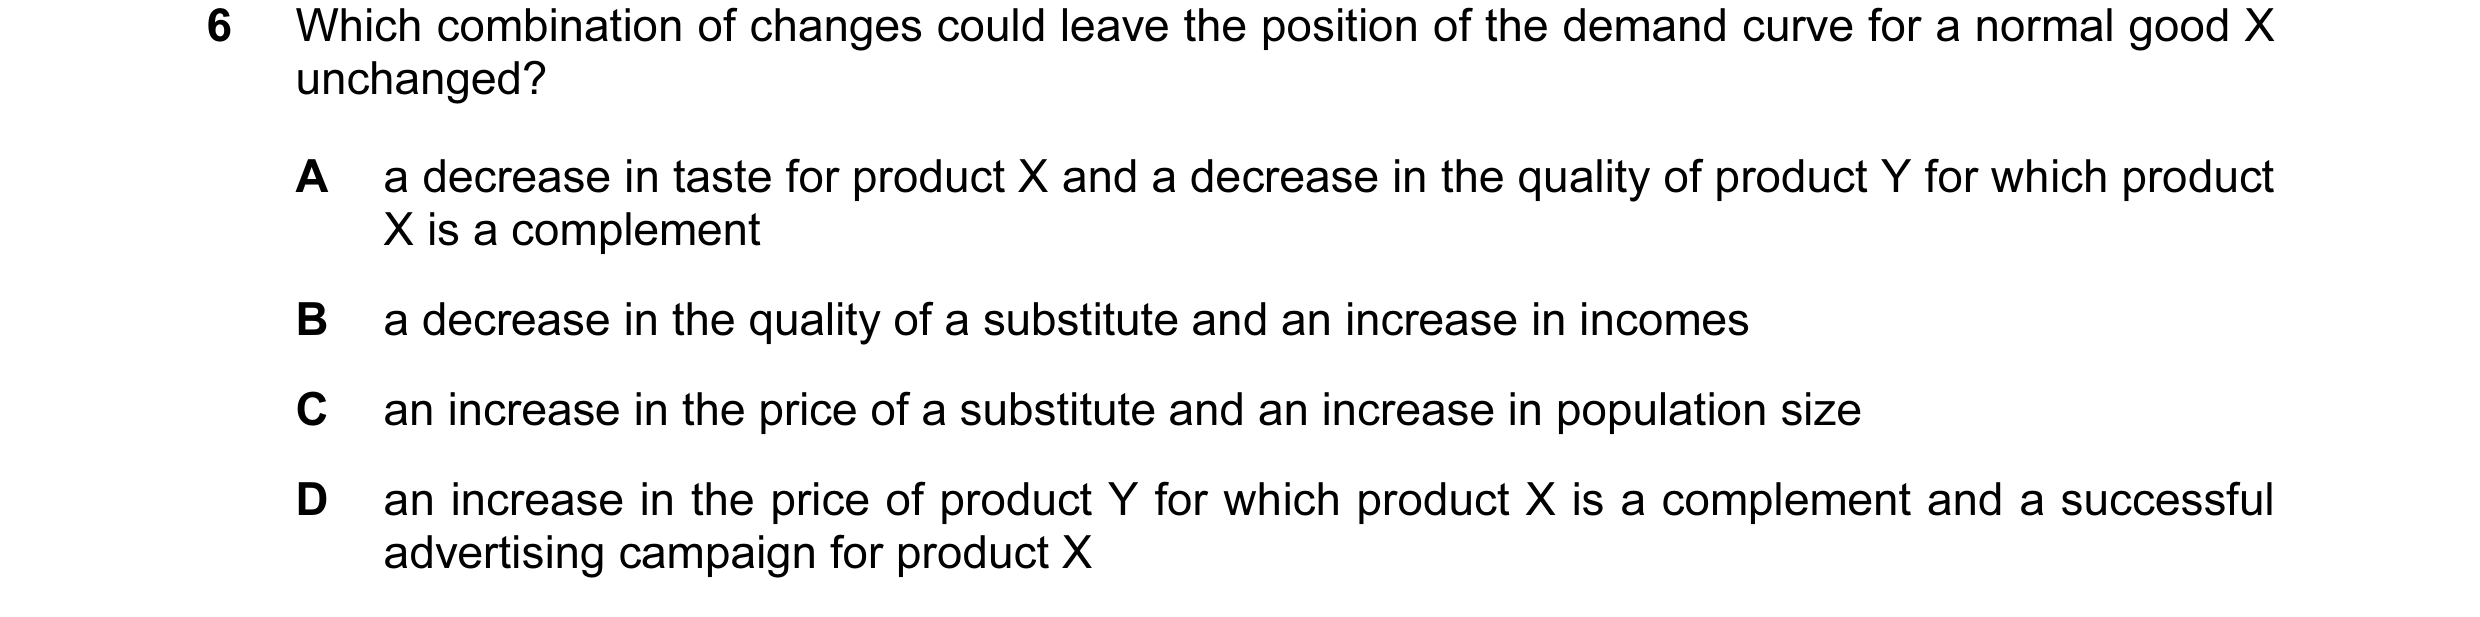
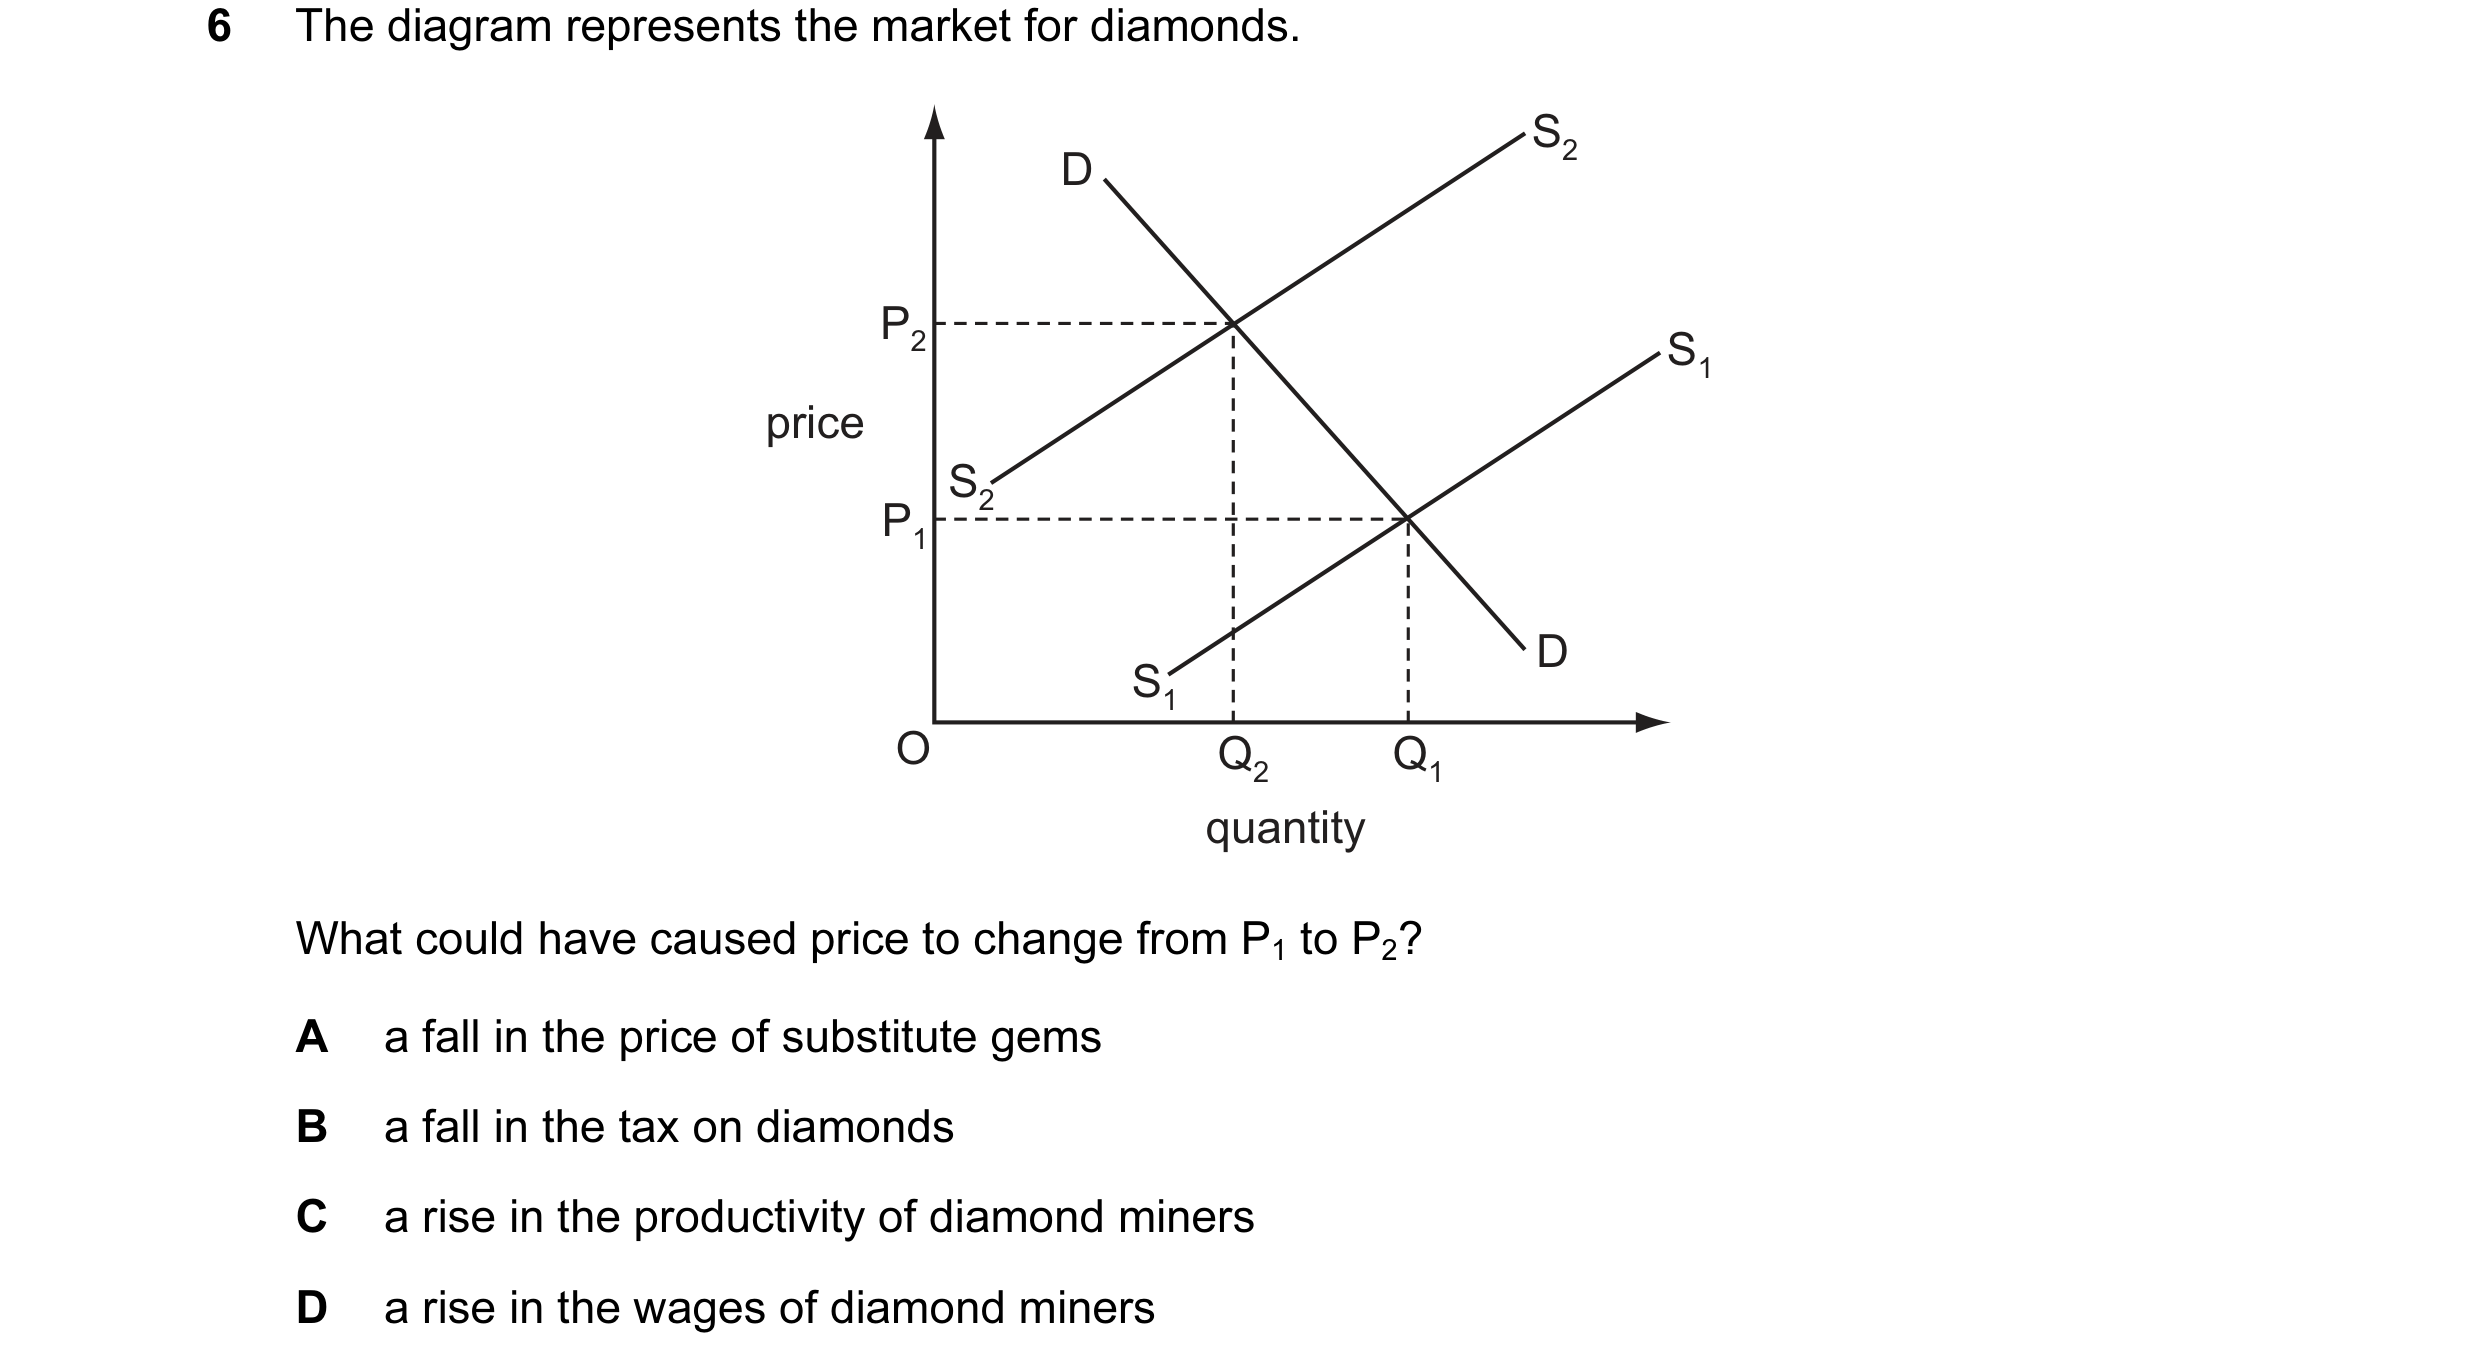
 22 / 76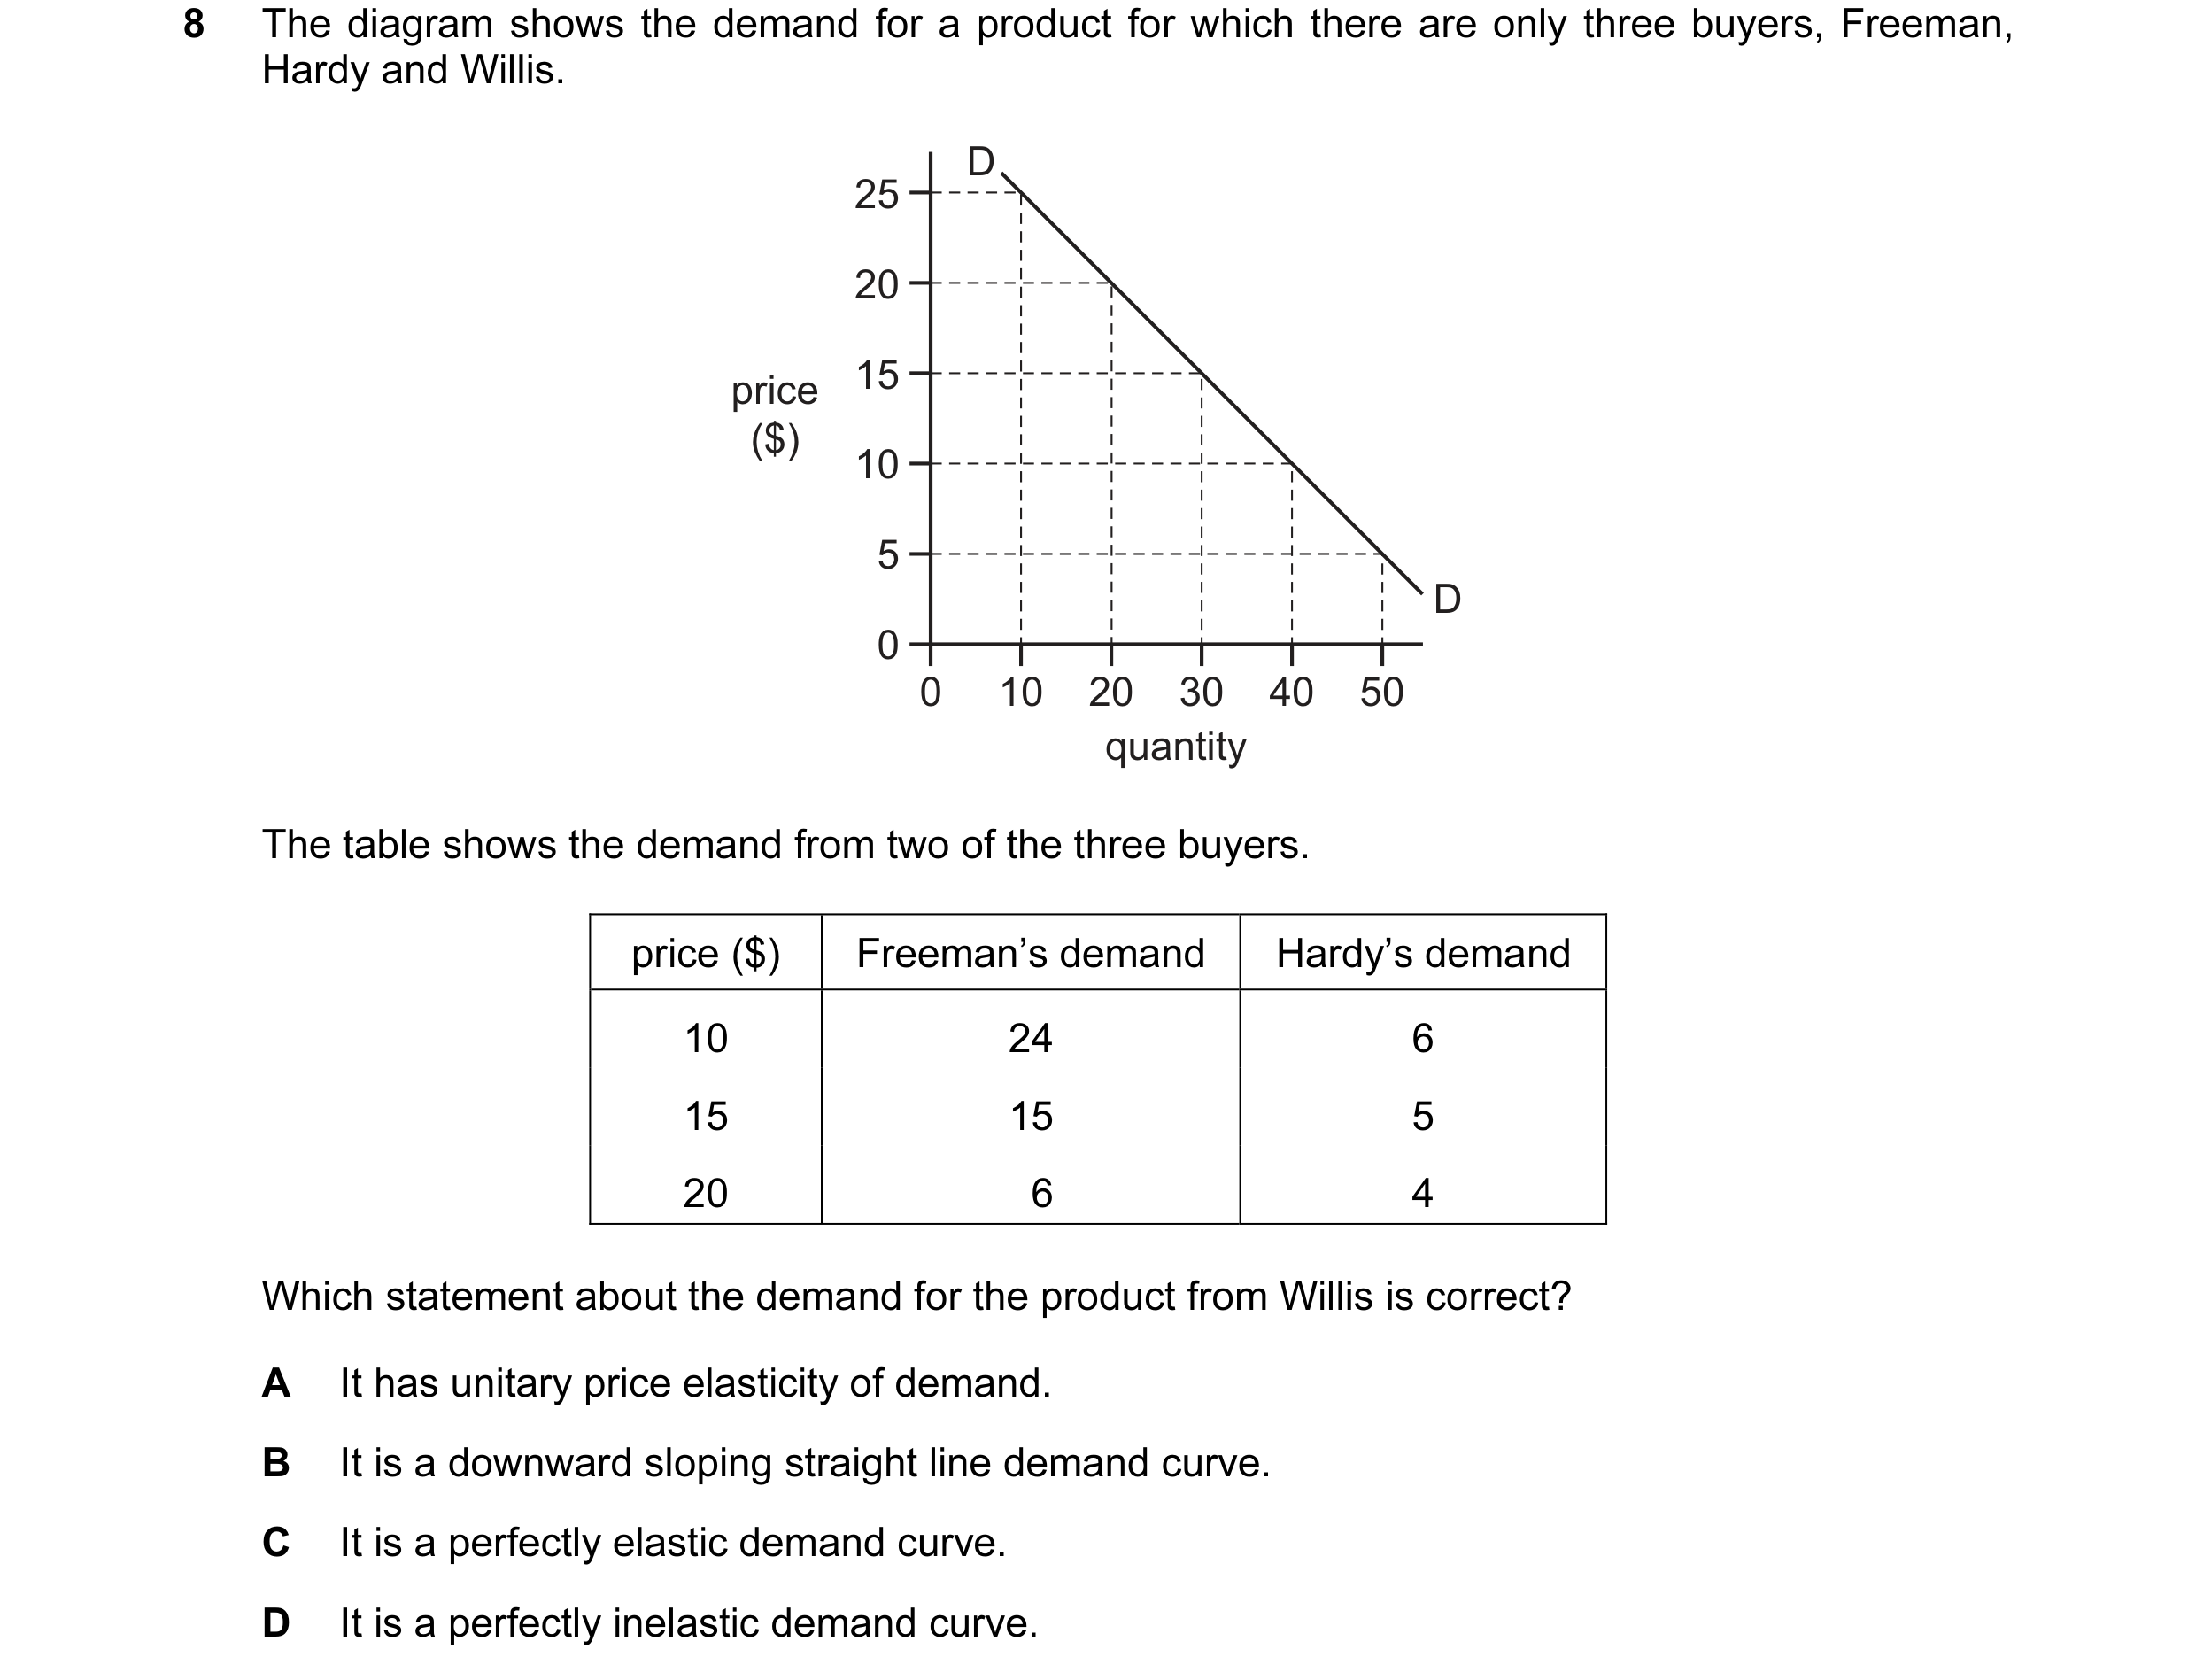
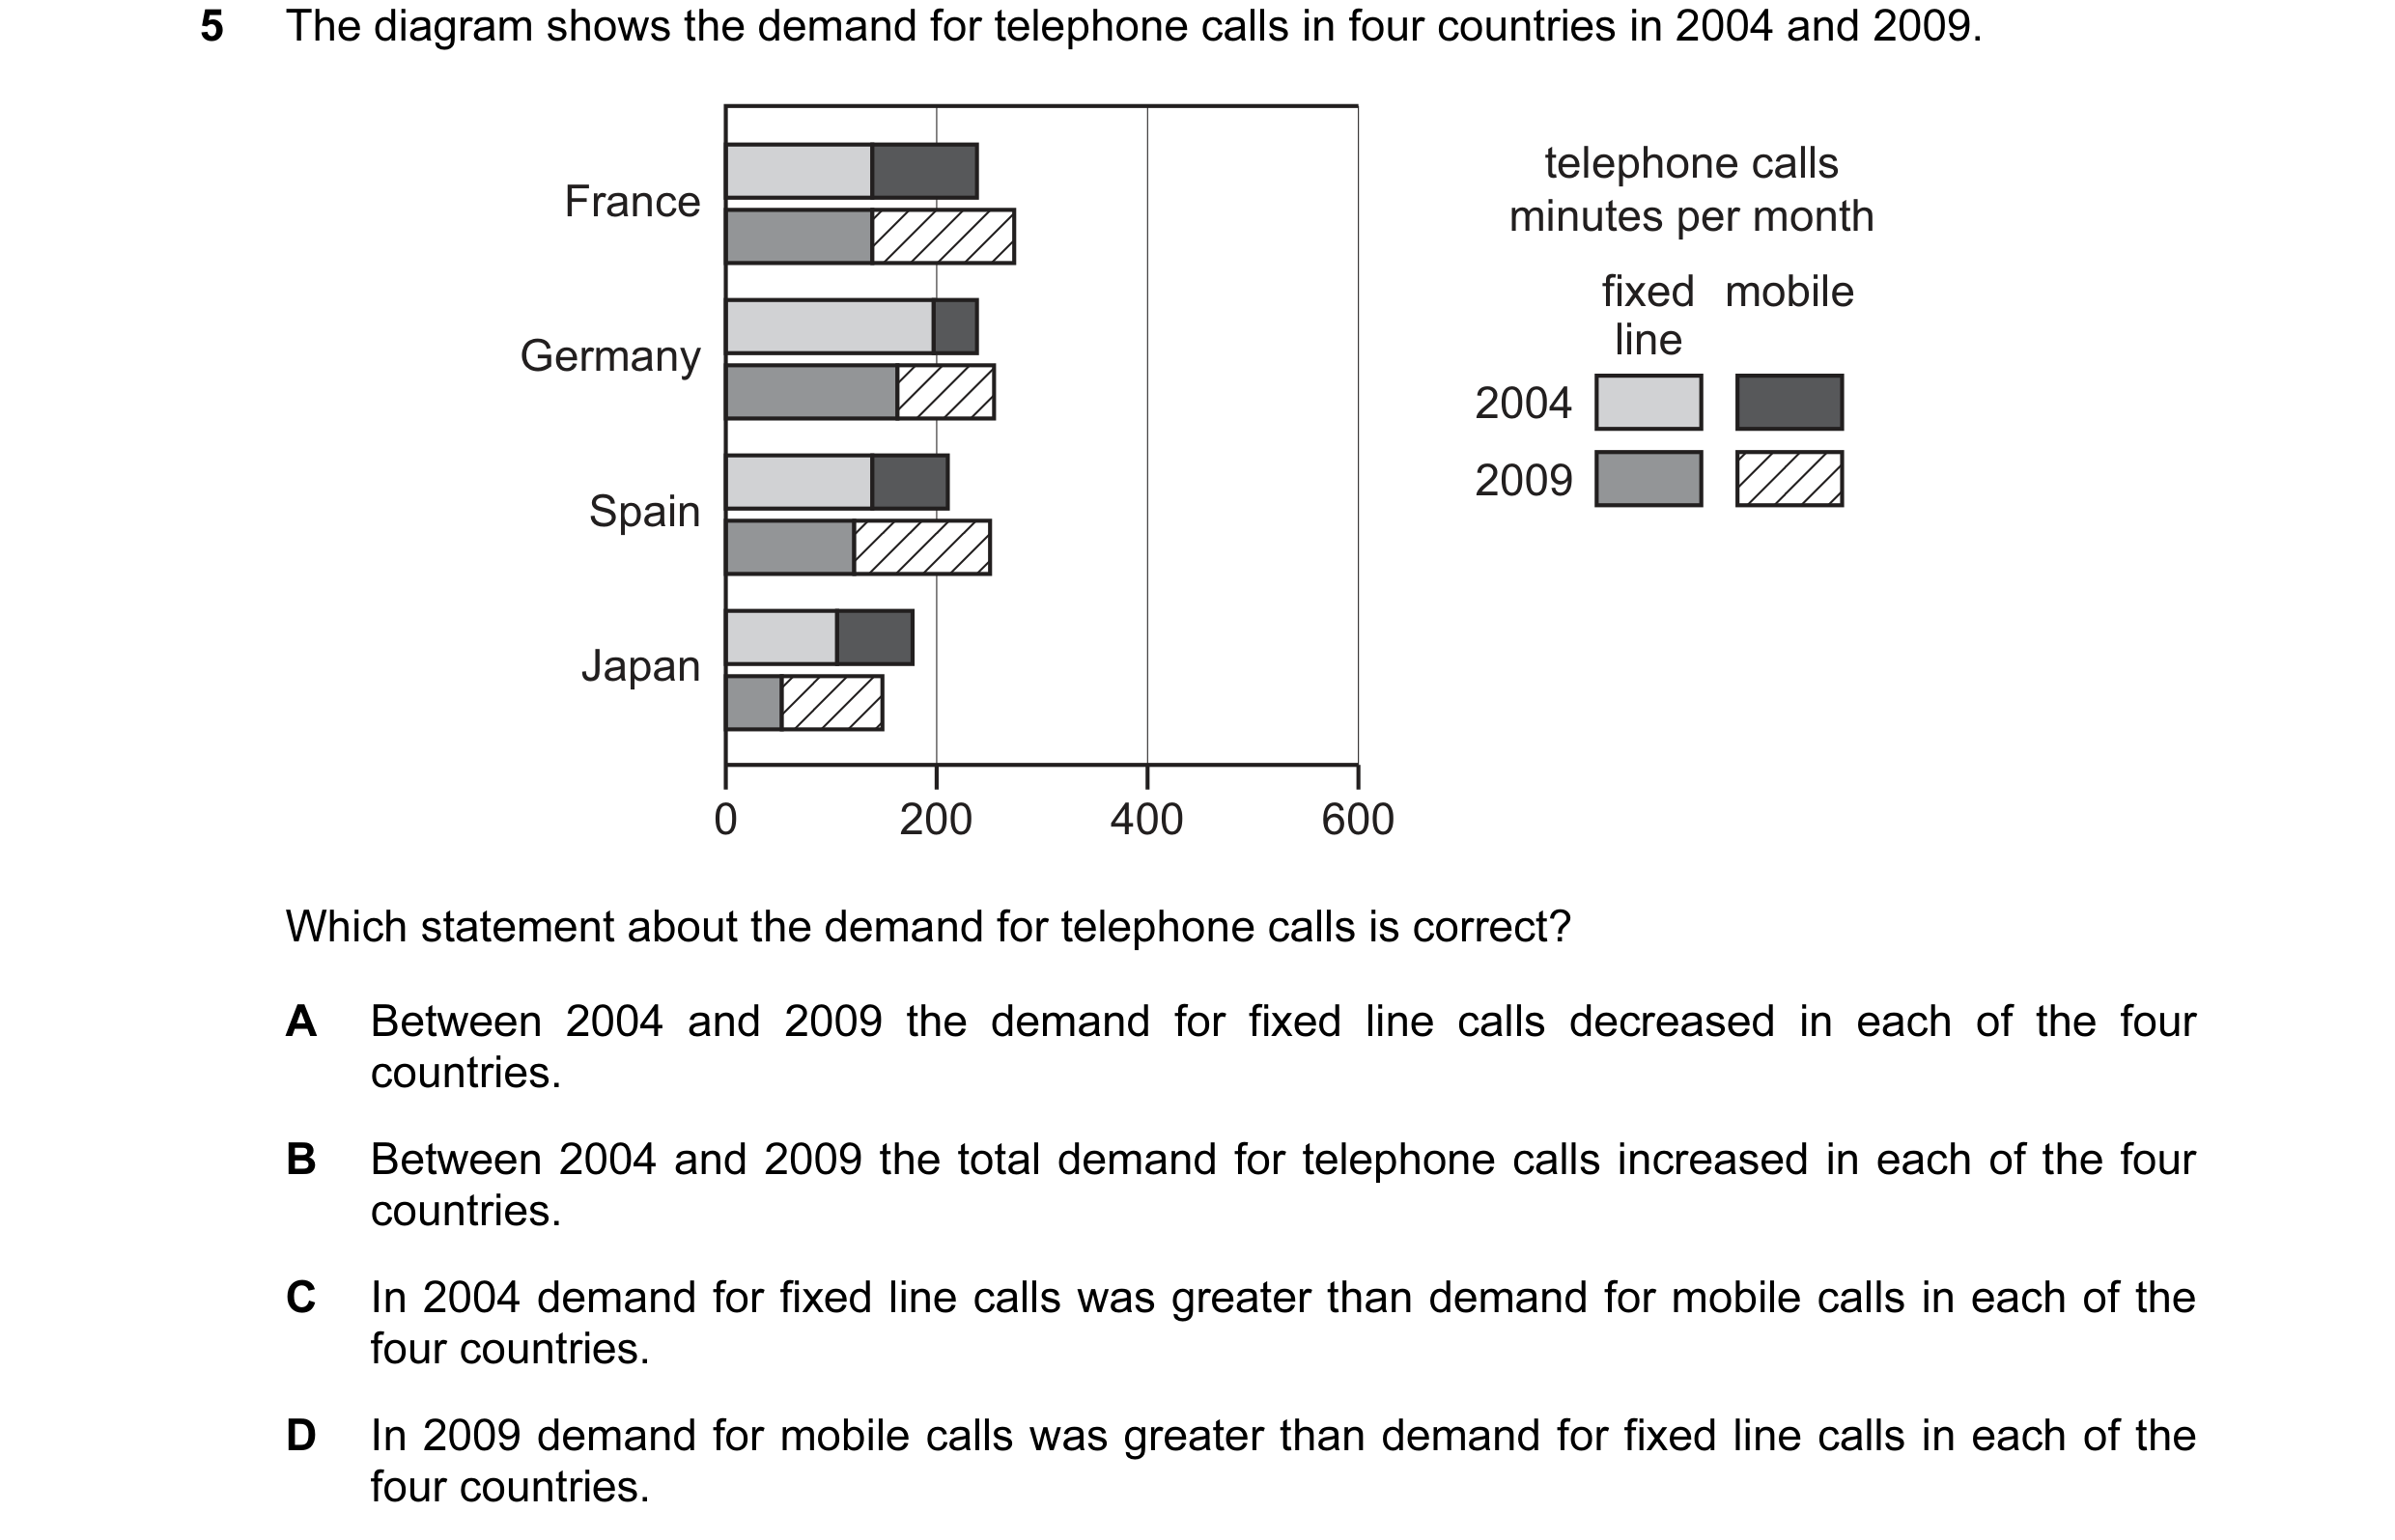 23 / 76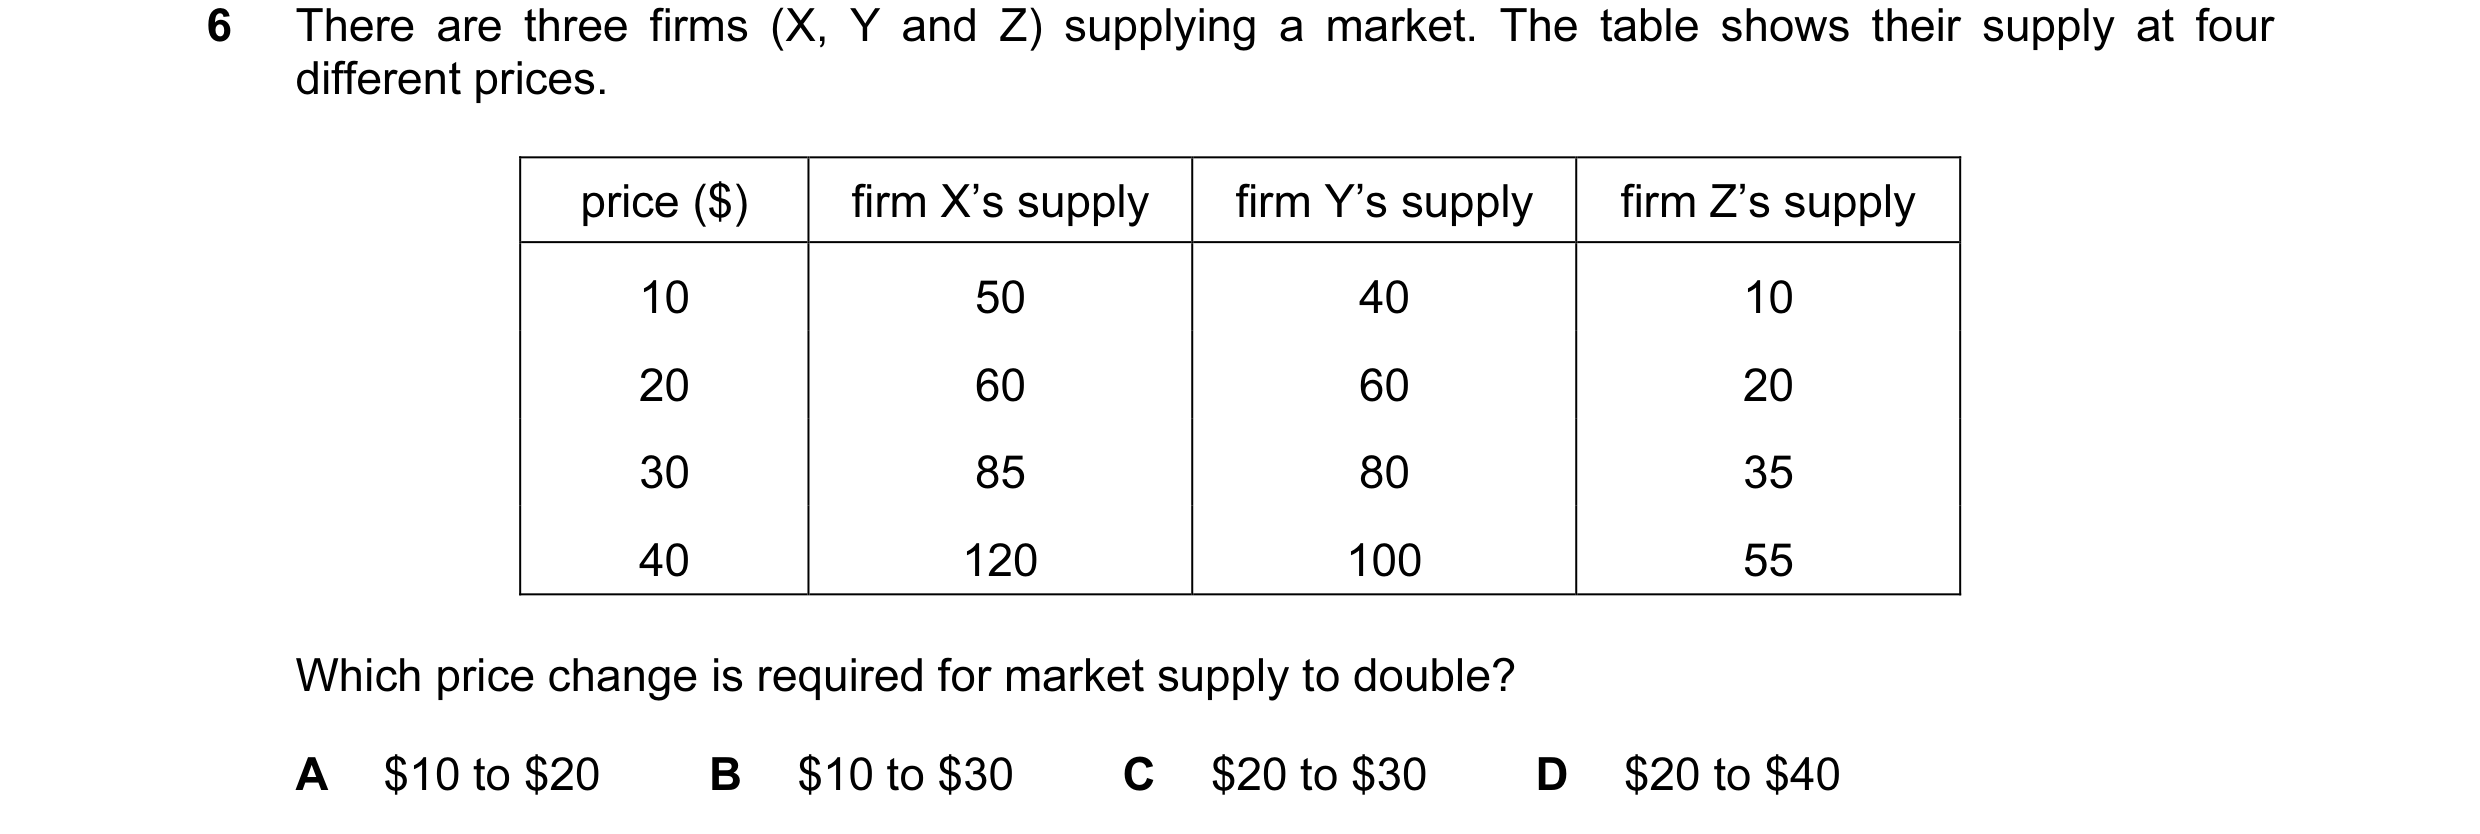
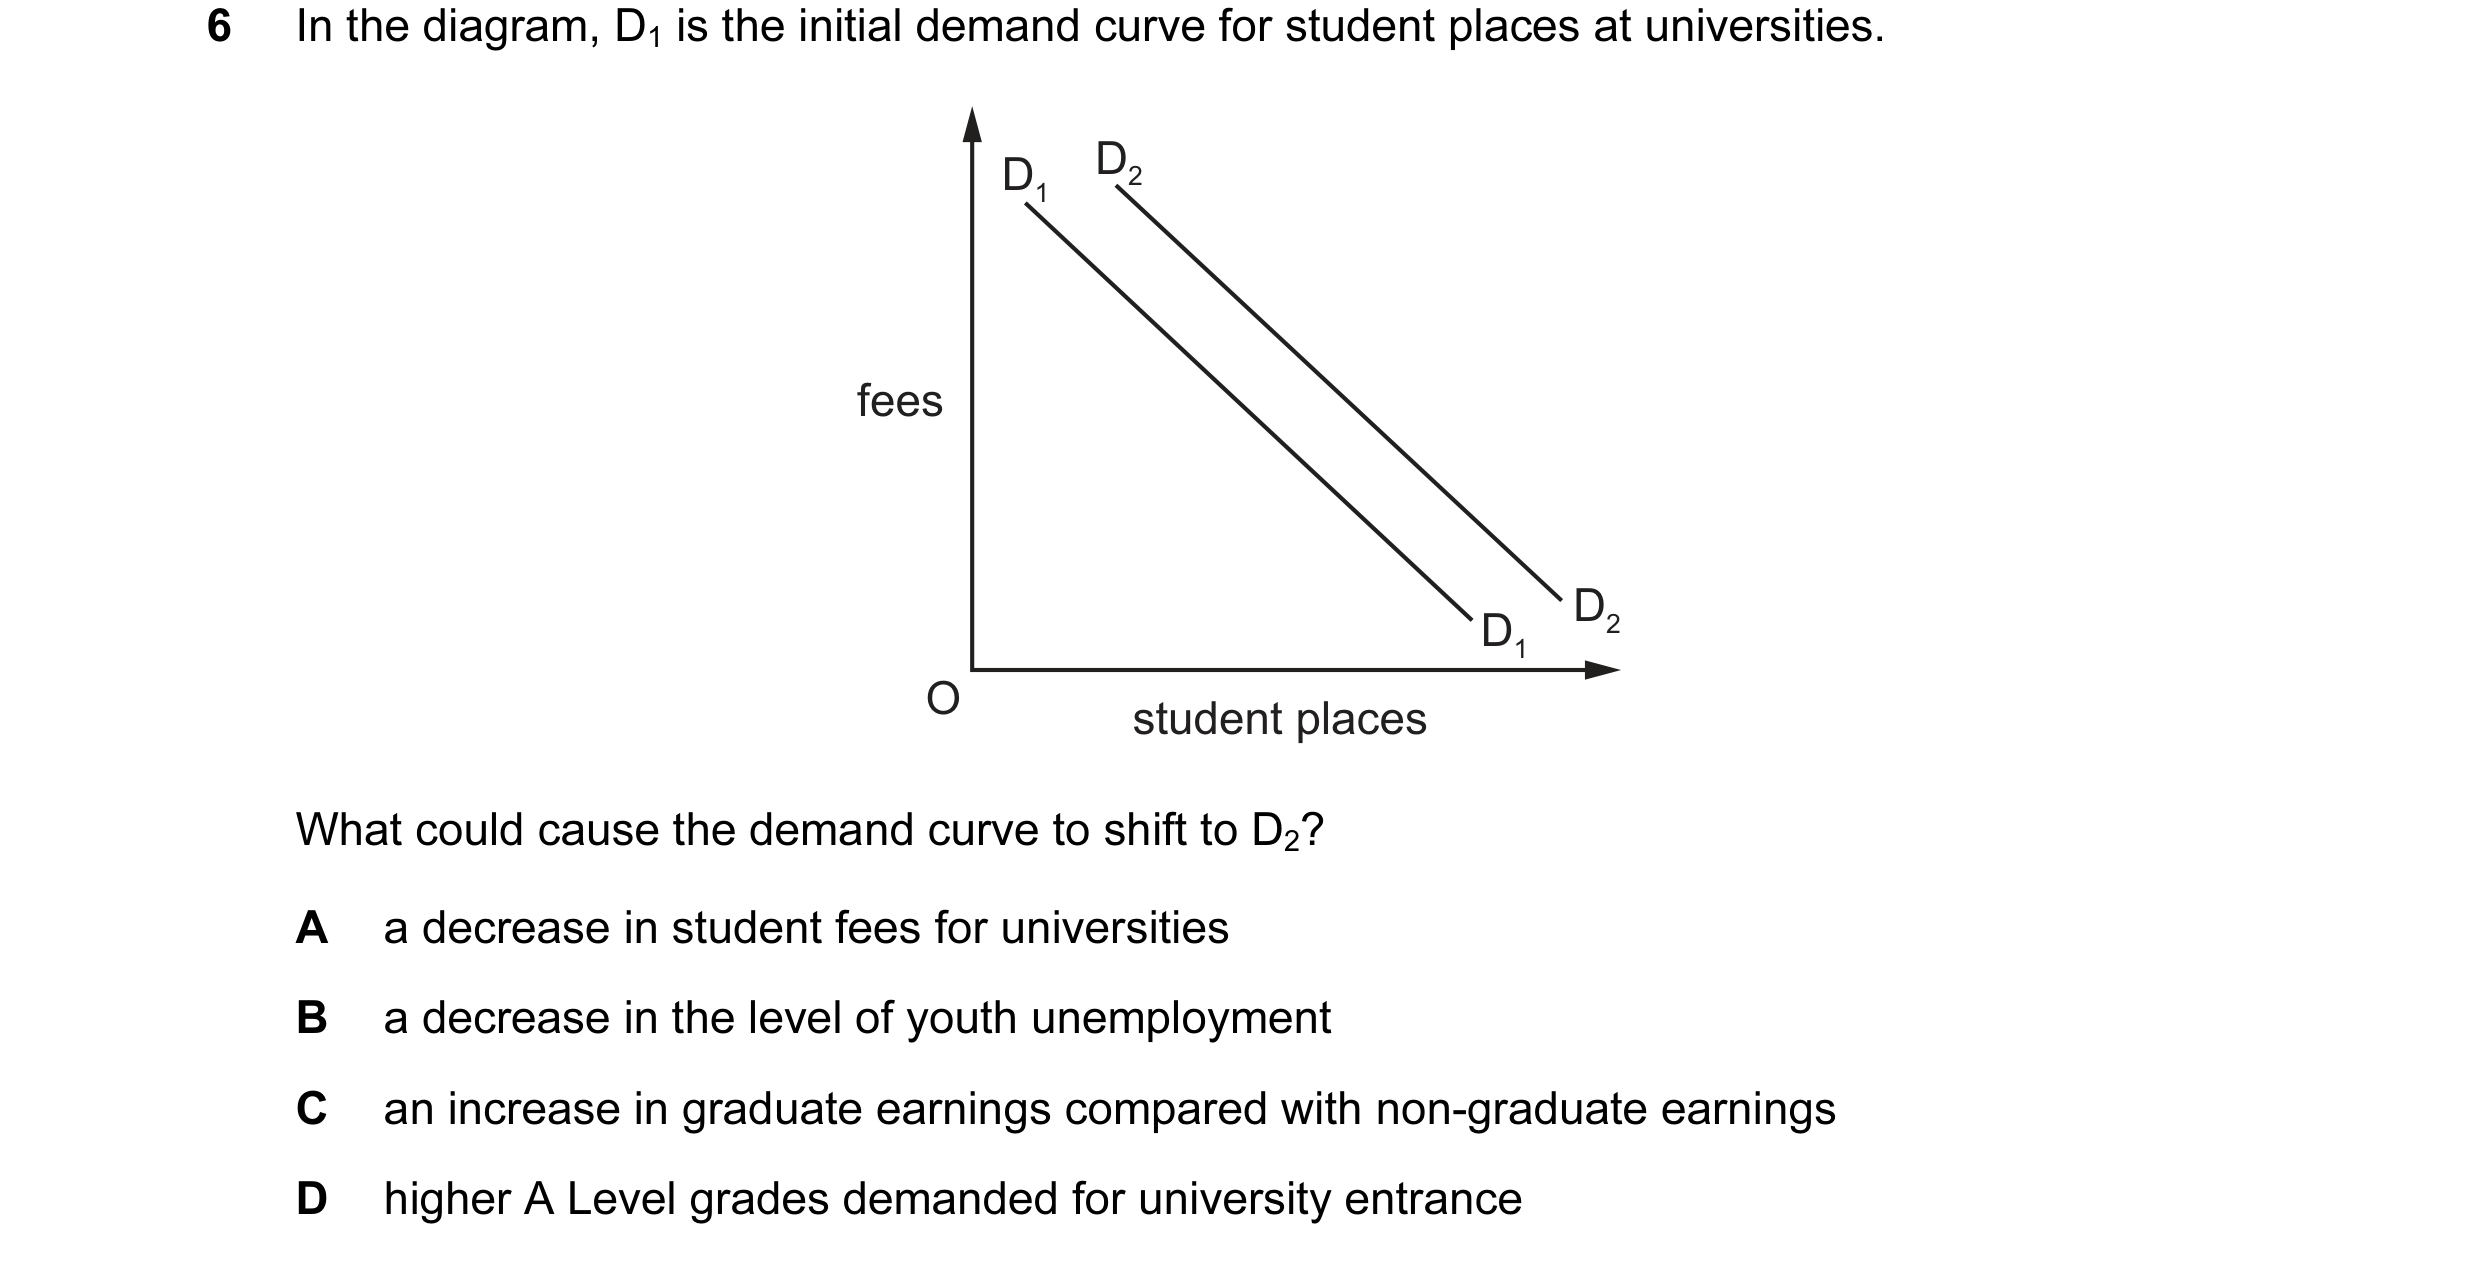
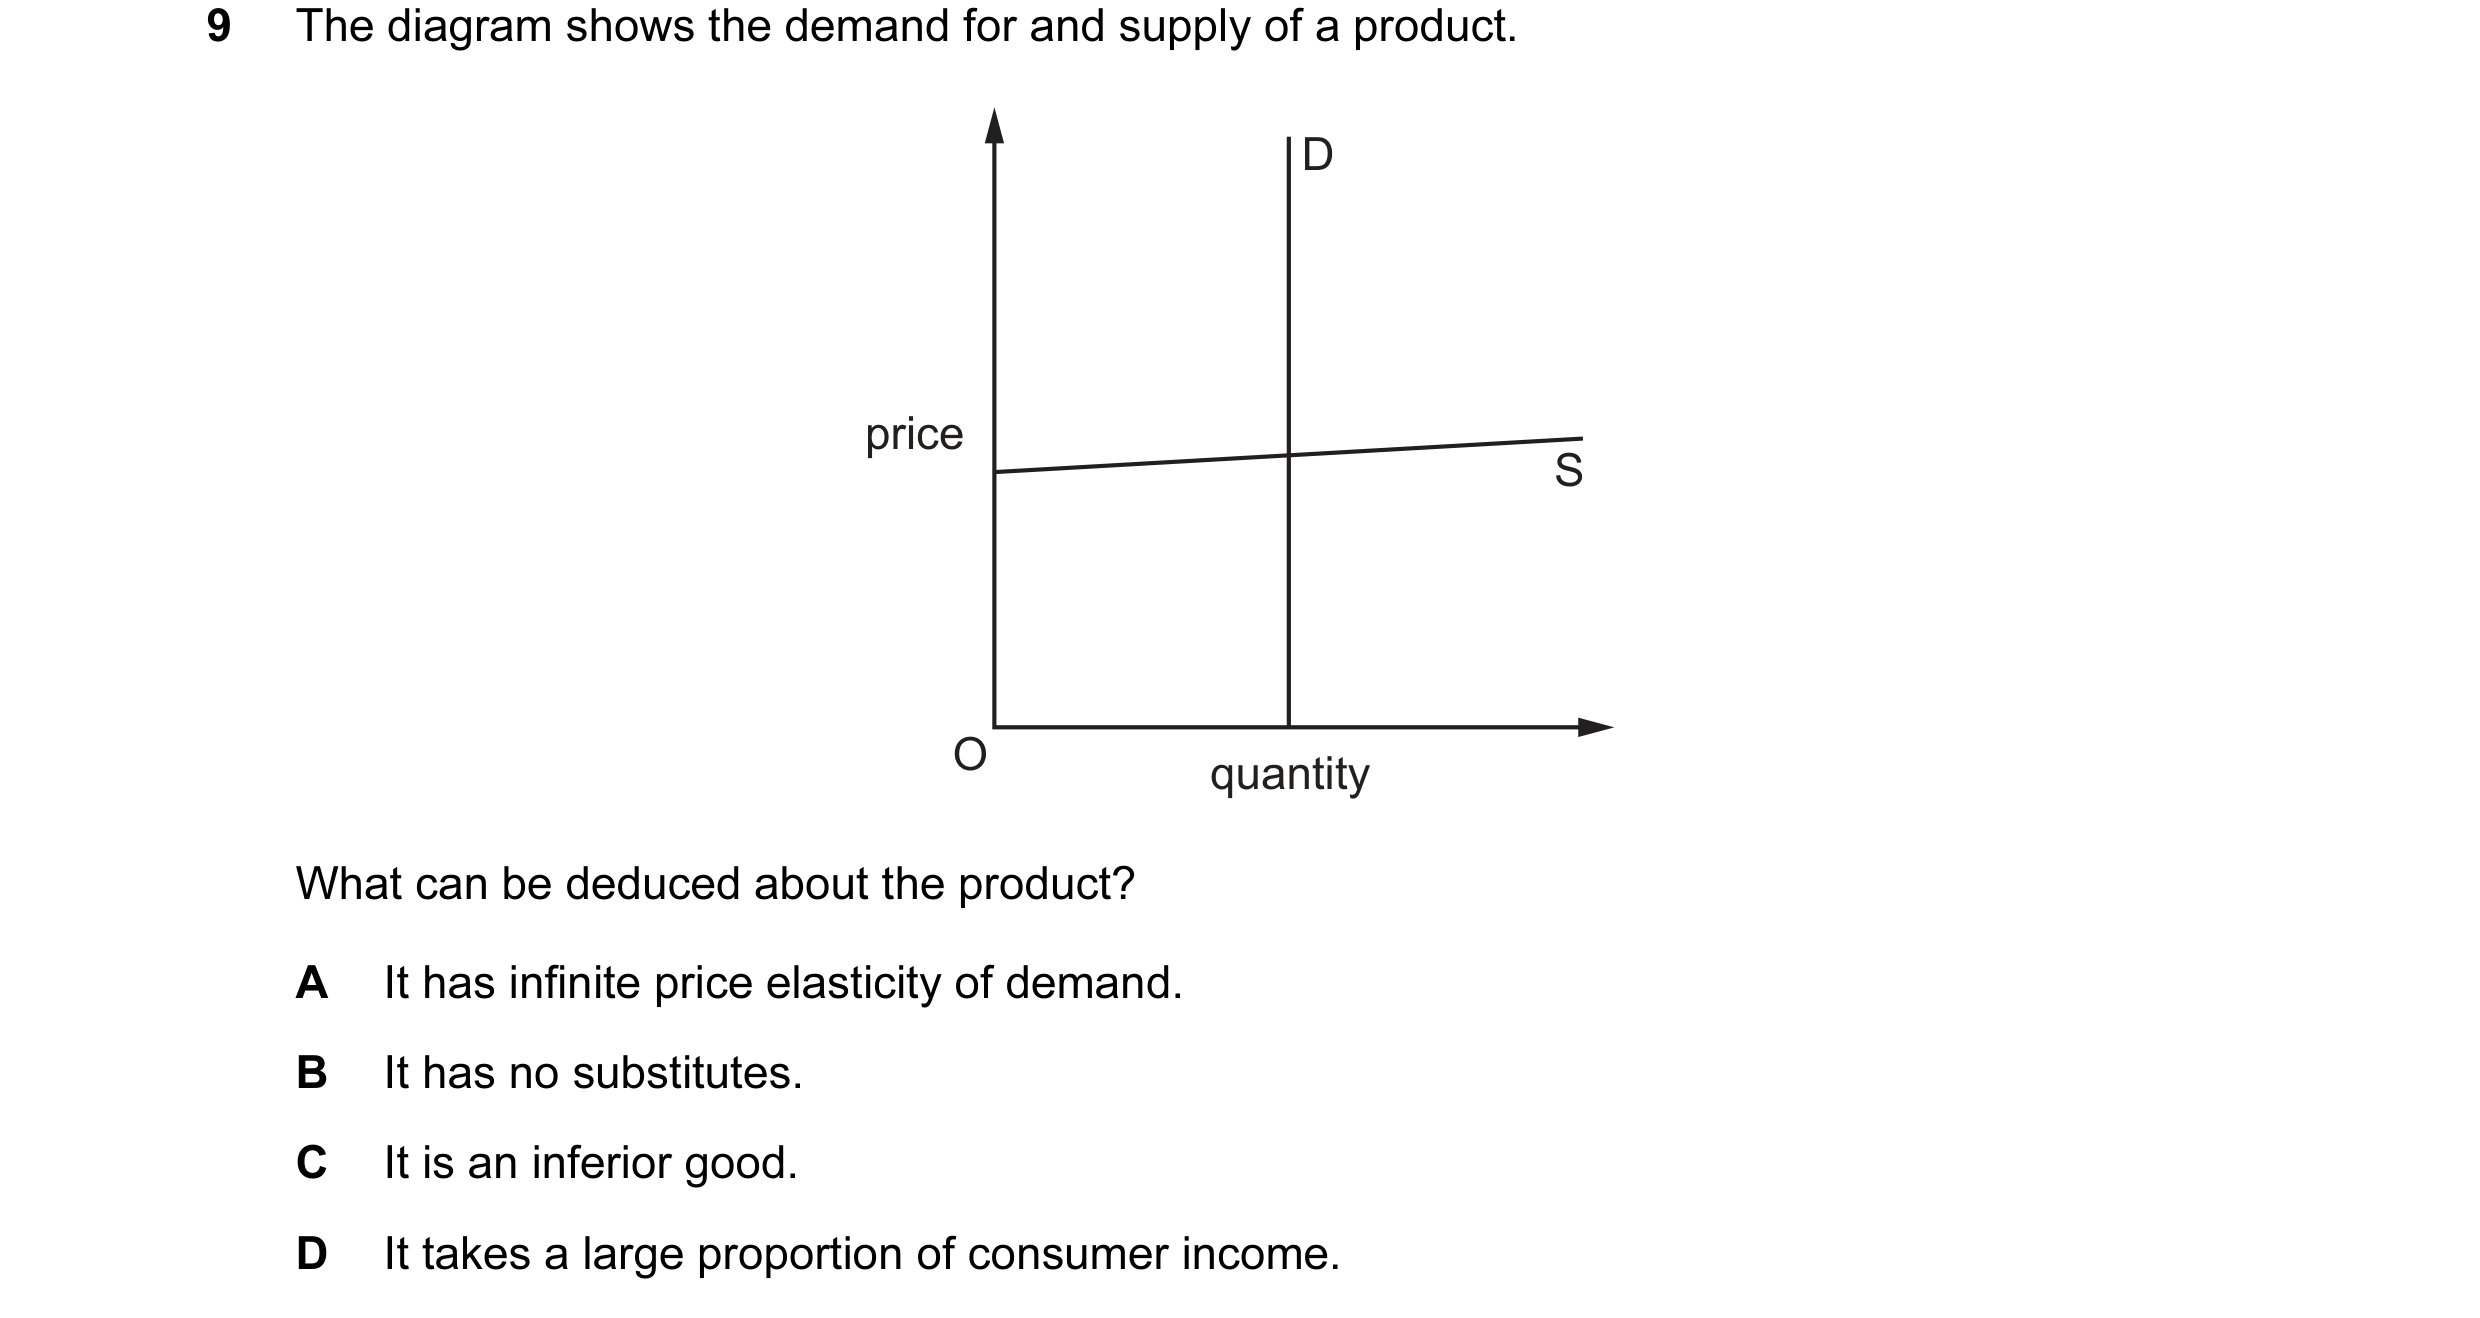 24 / 76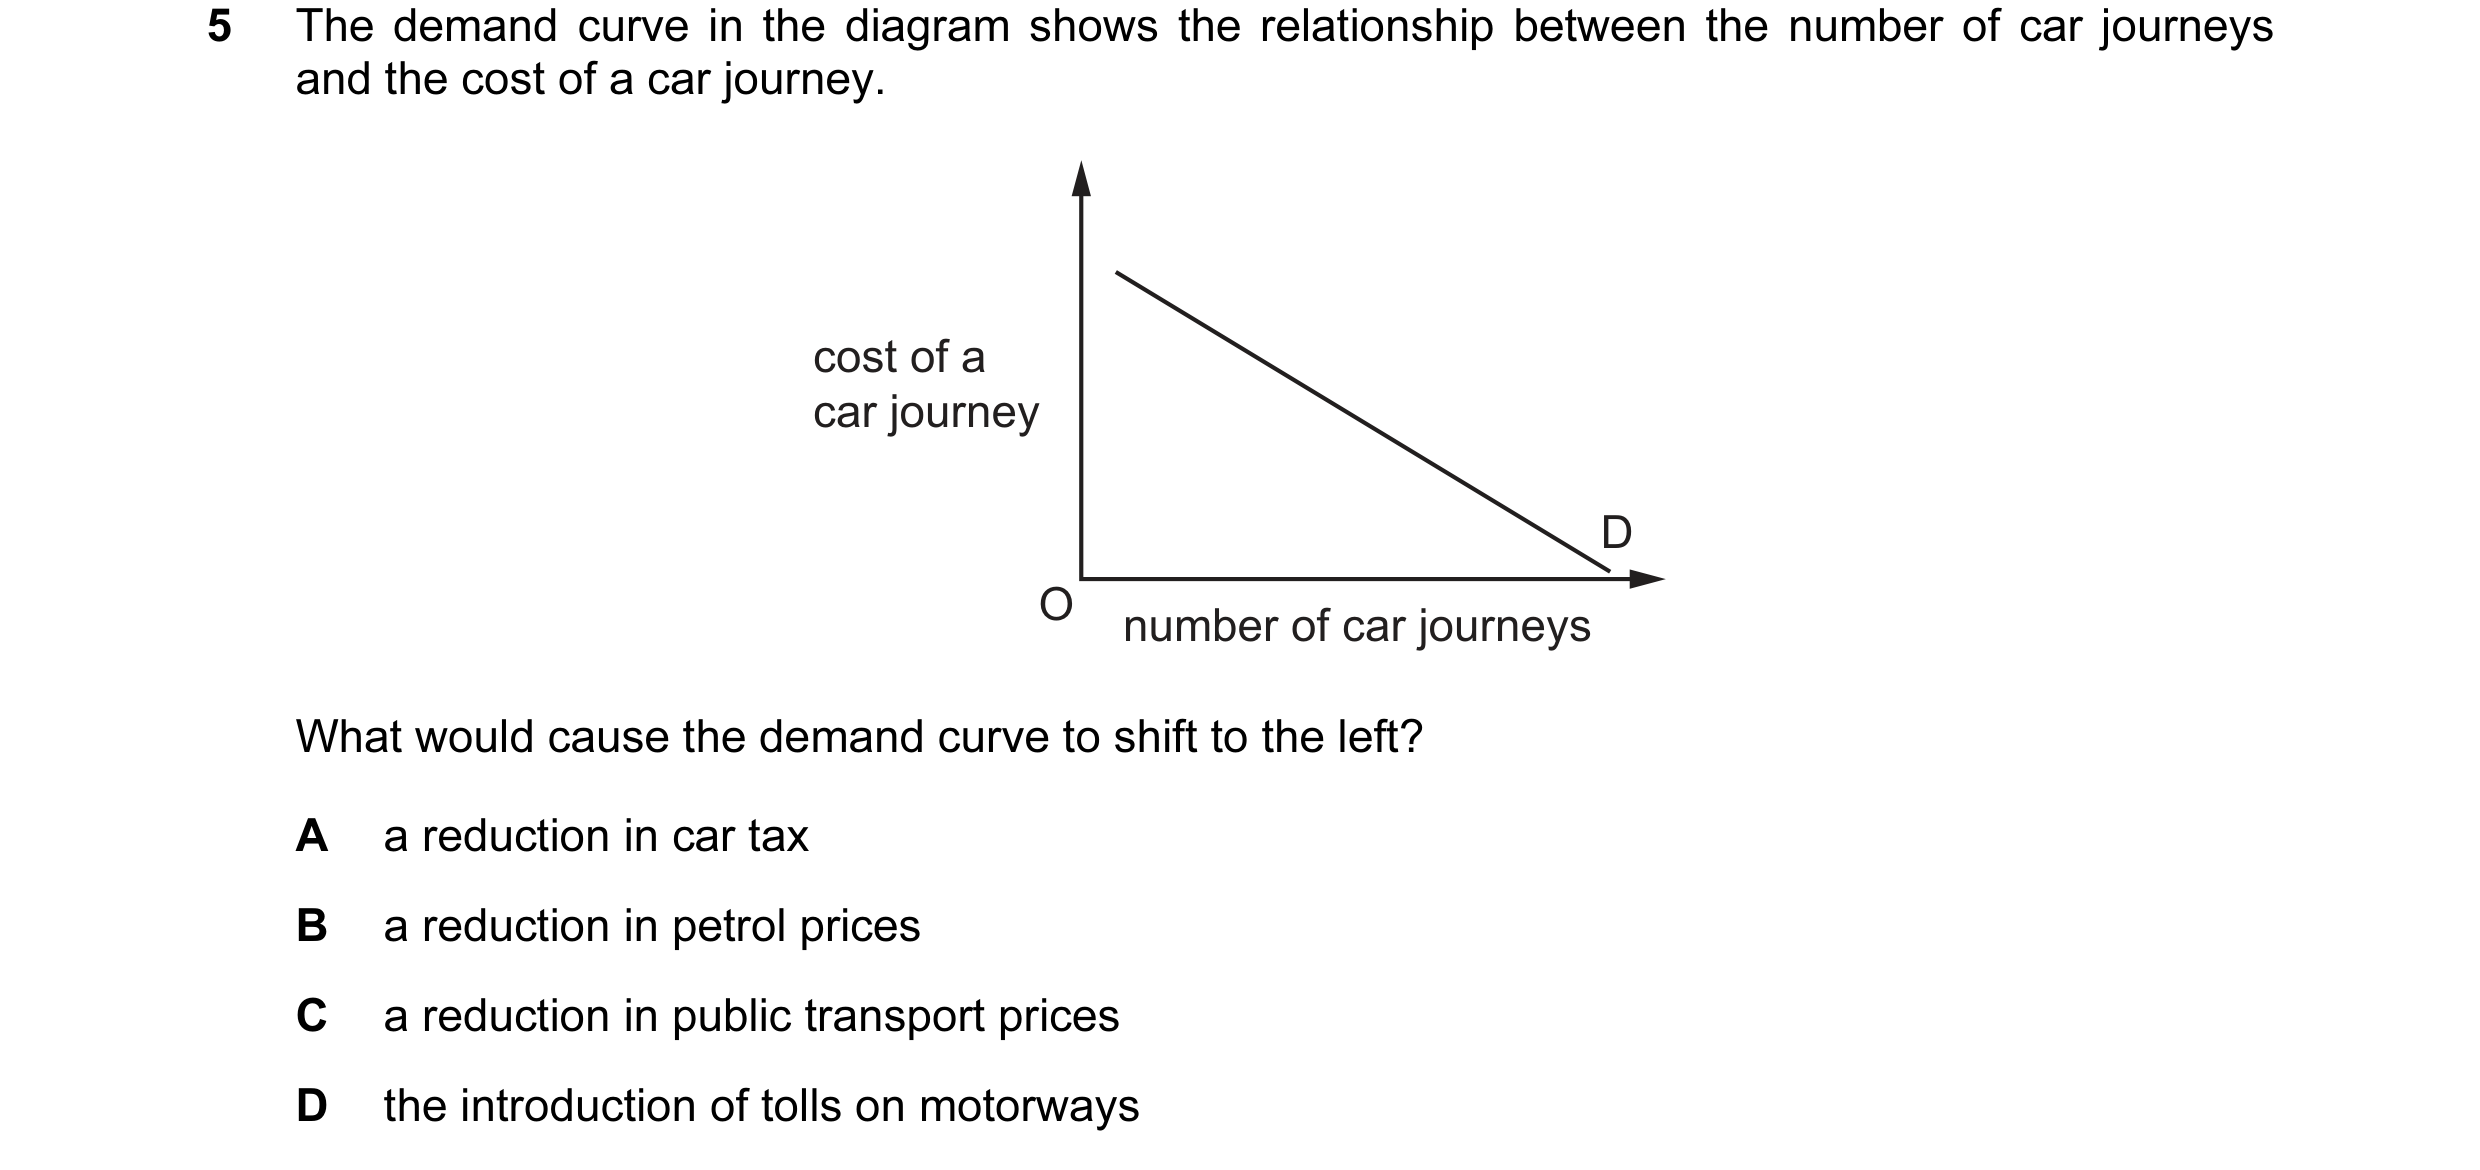



 25 / 76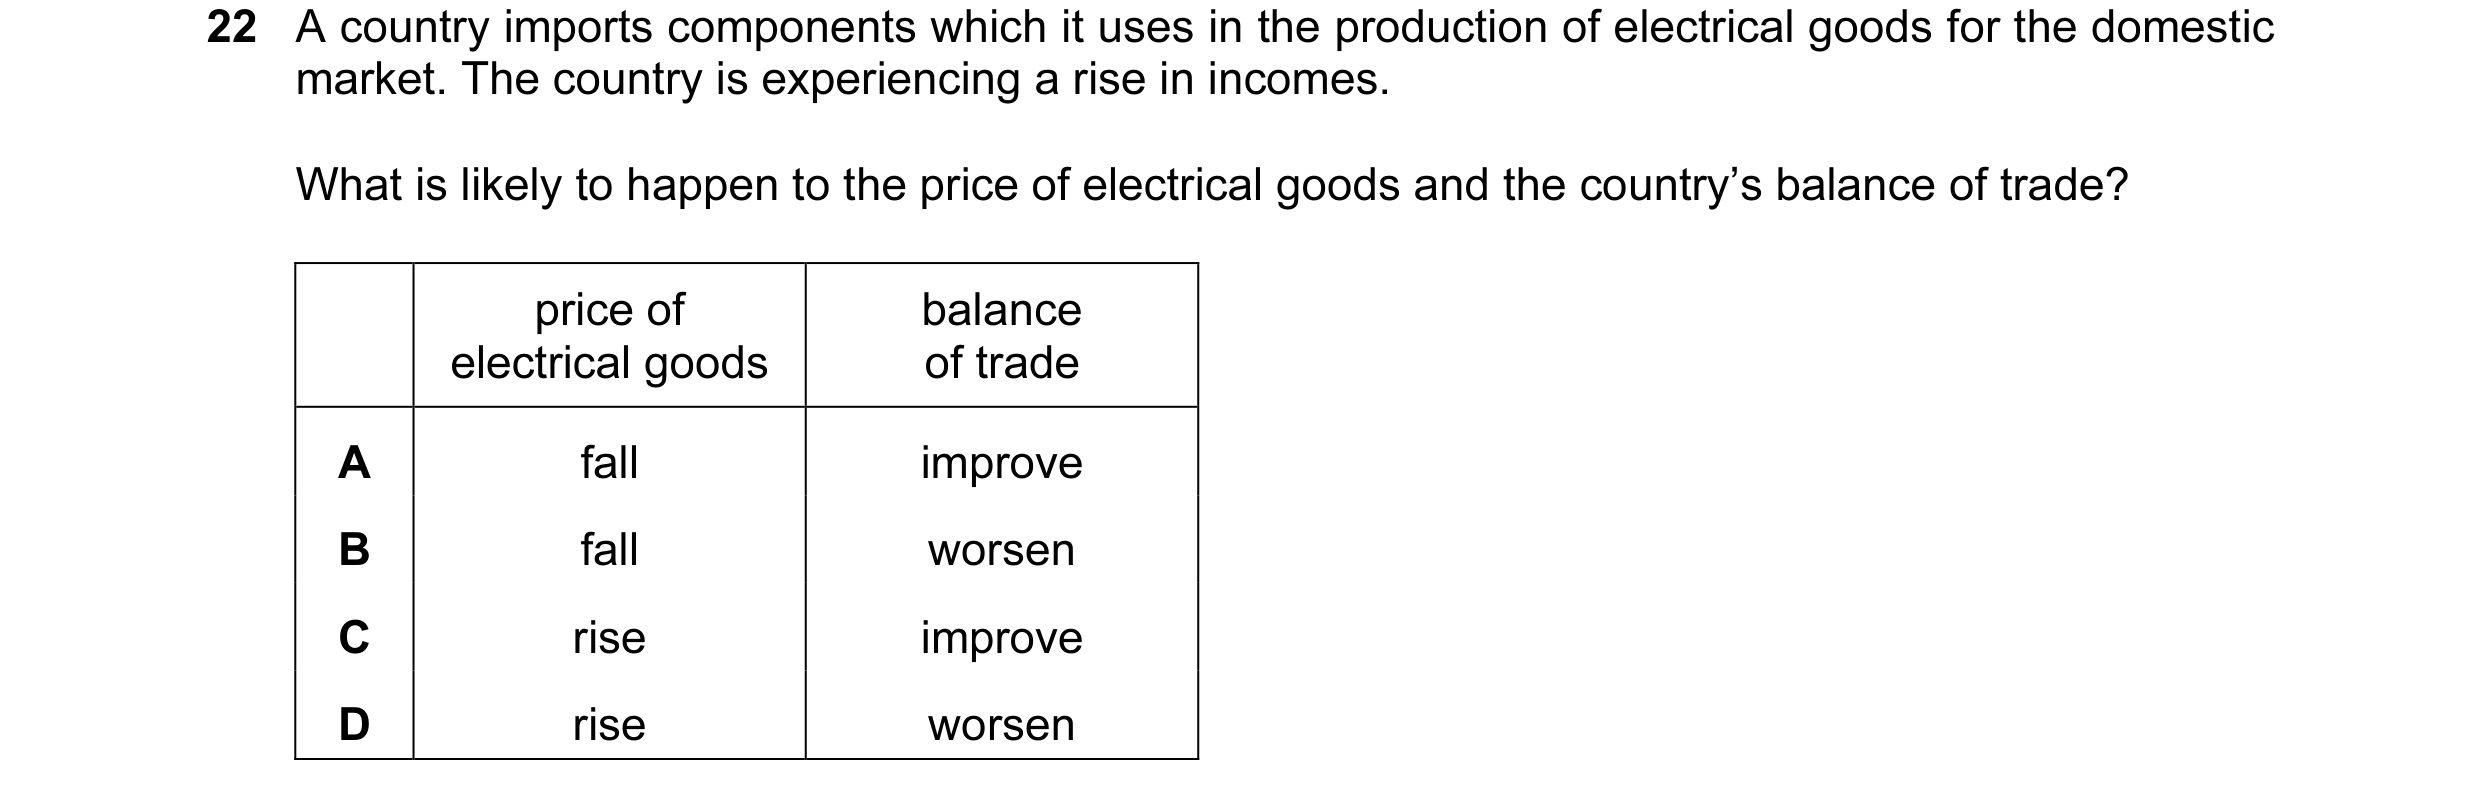
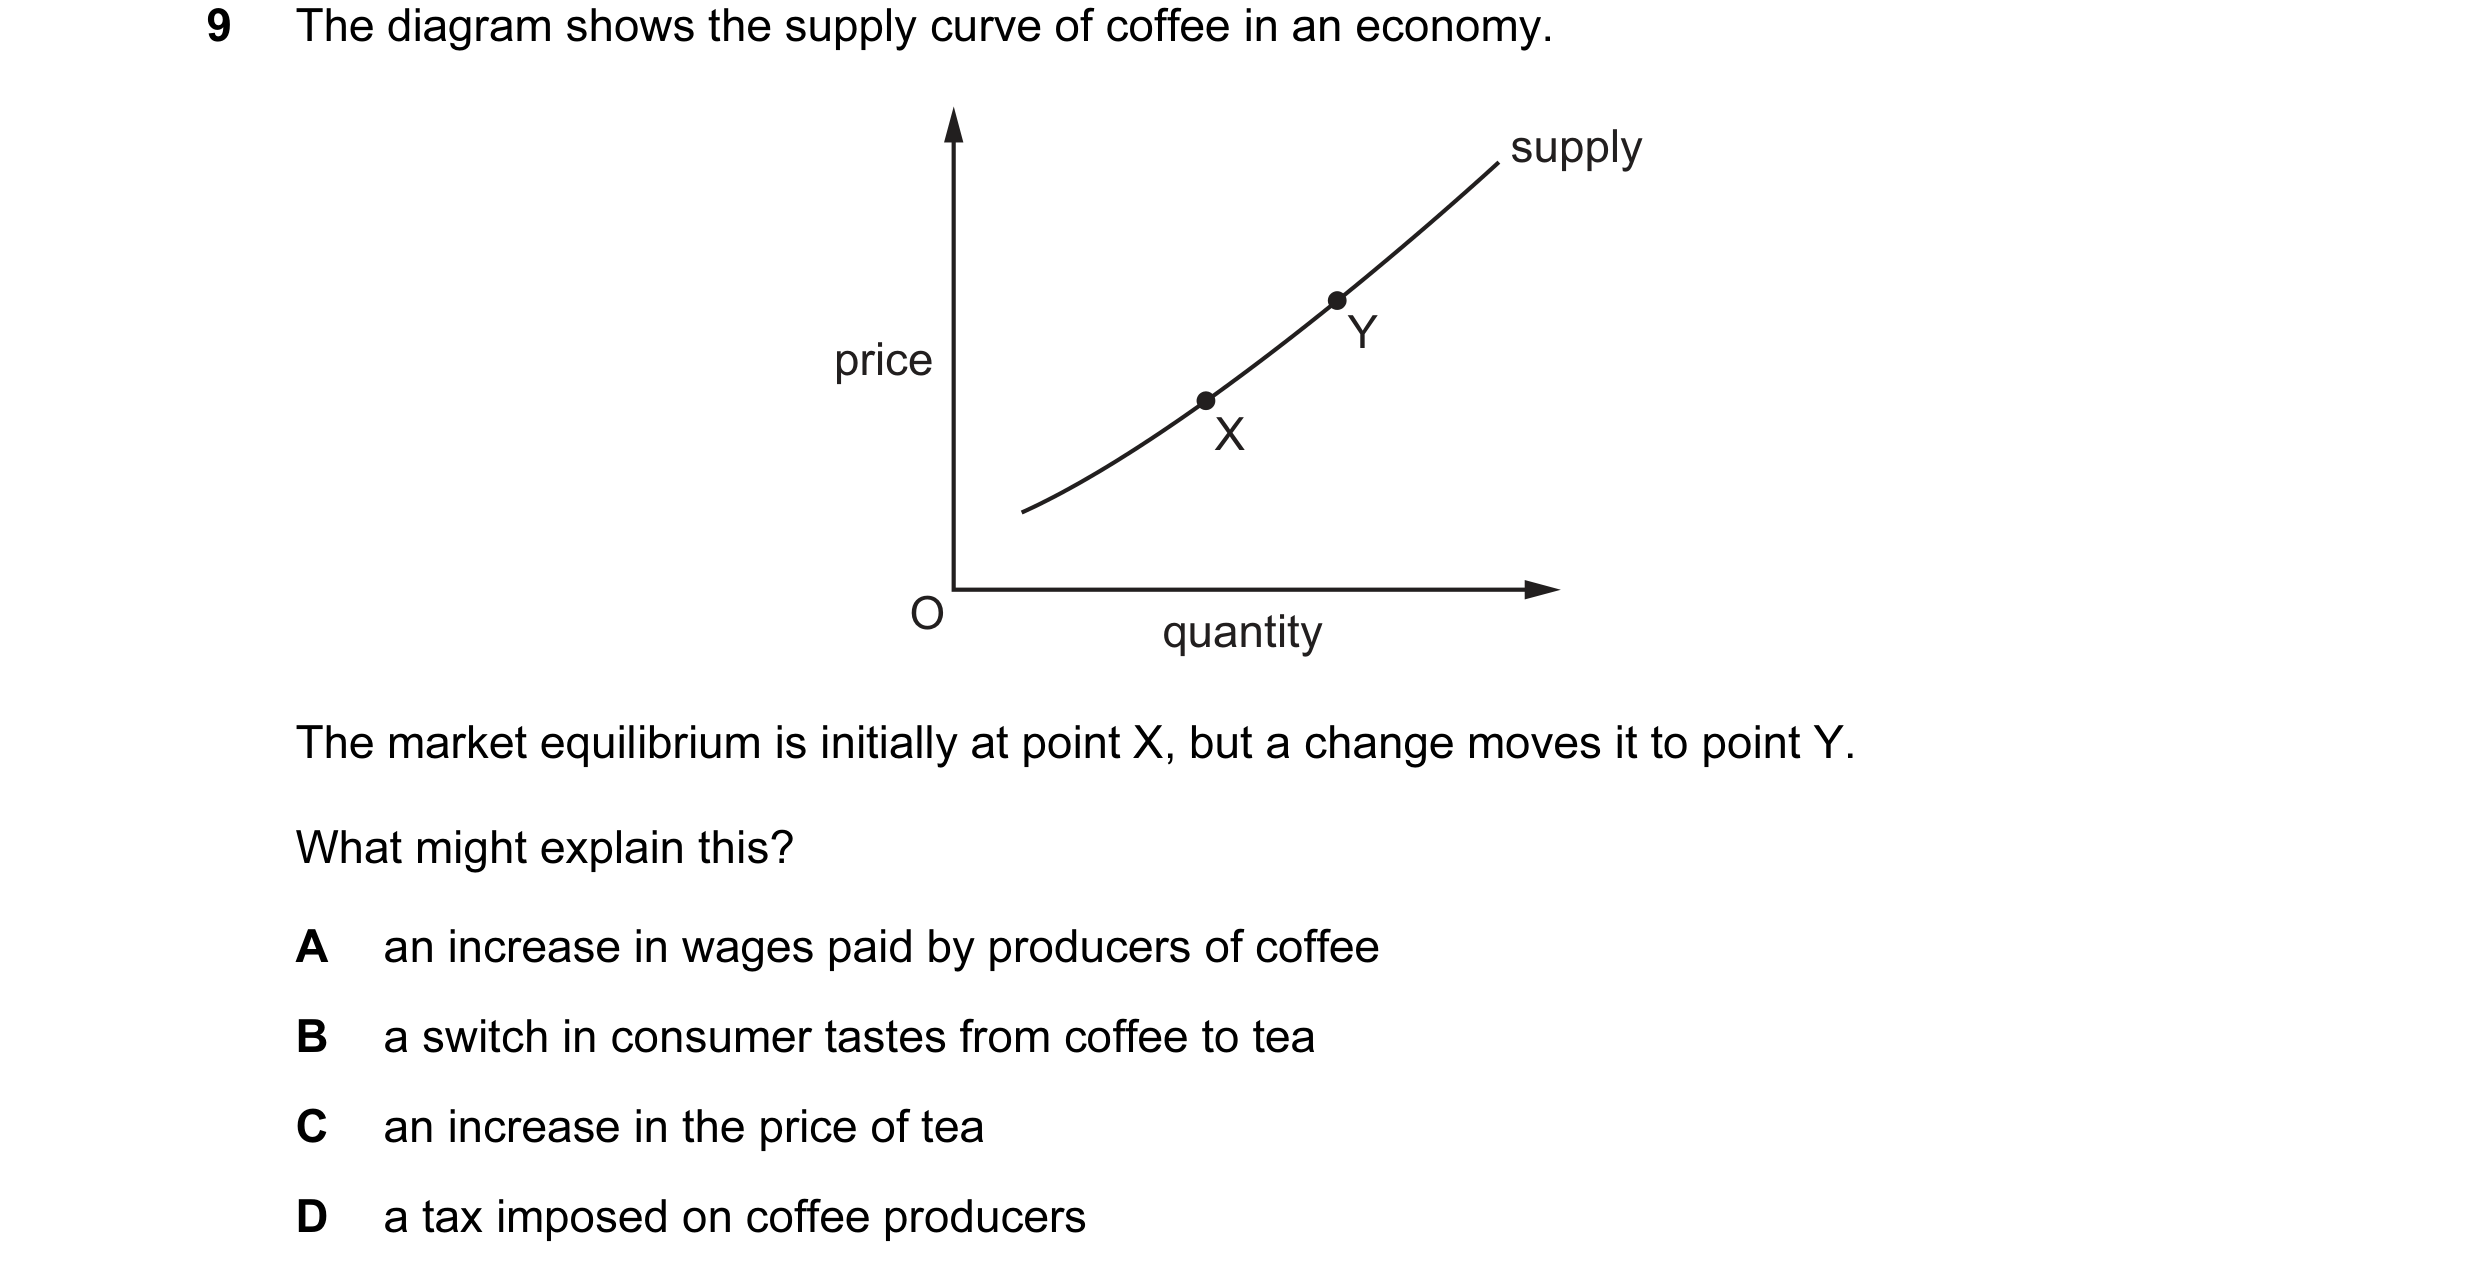 26 / 76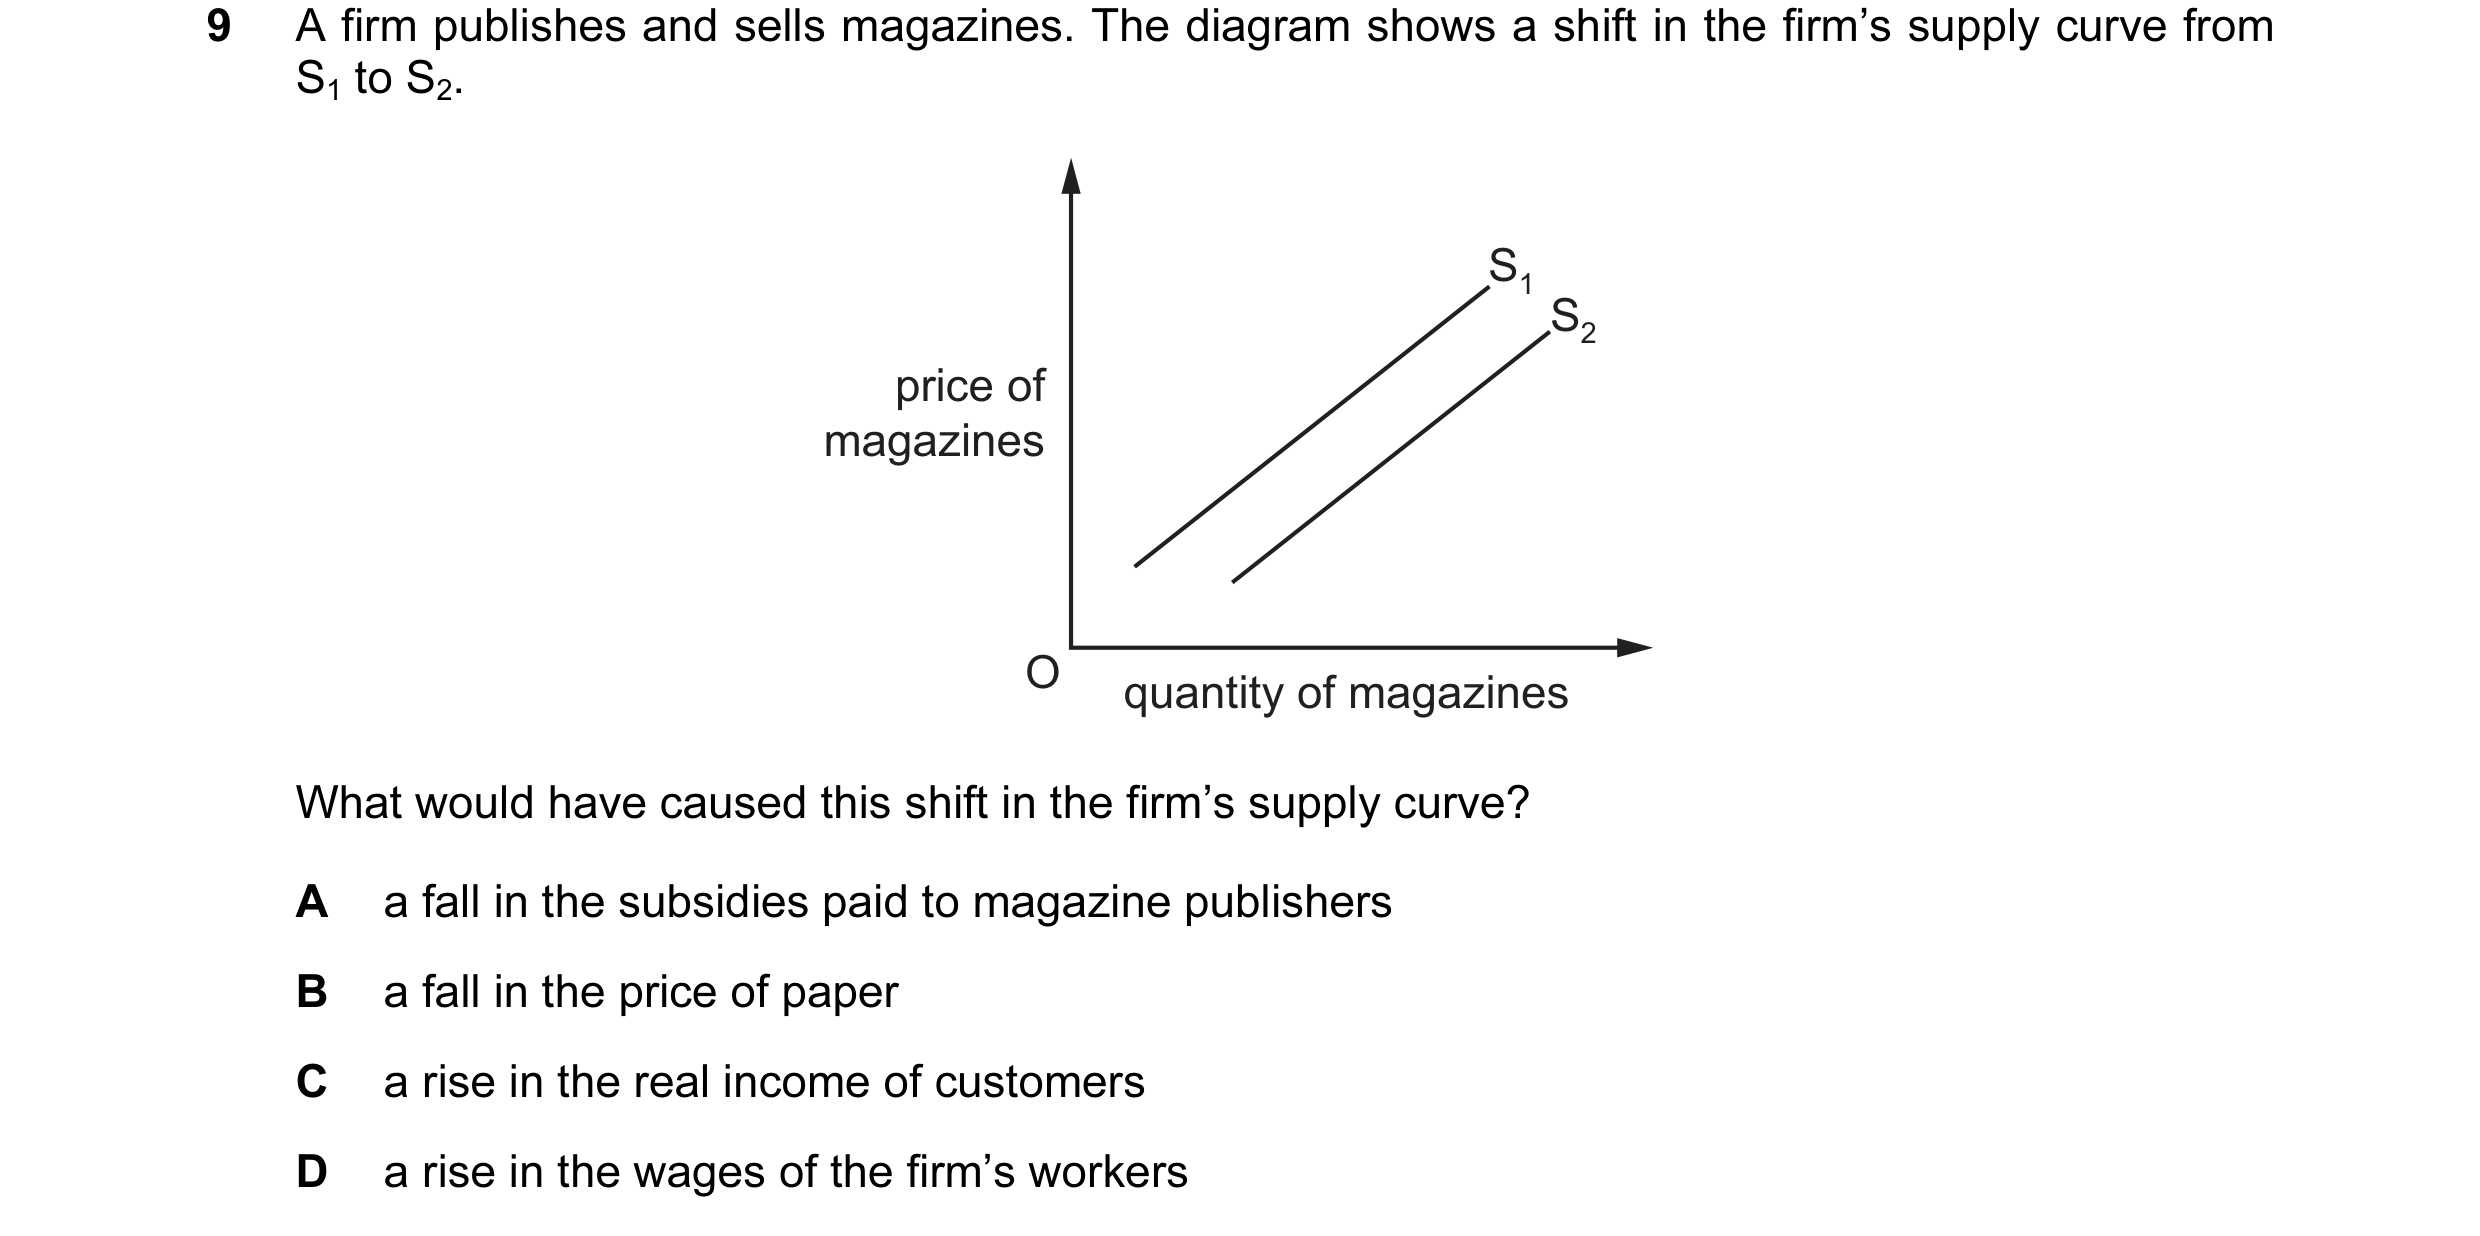
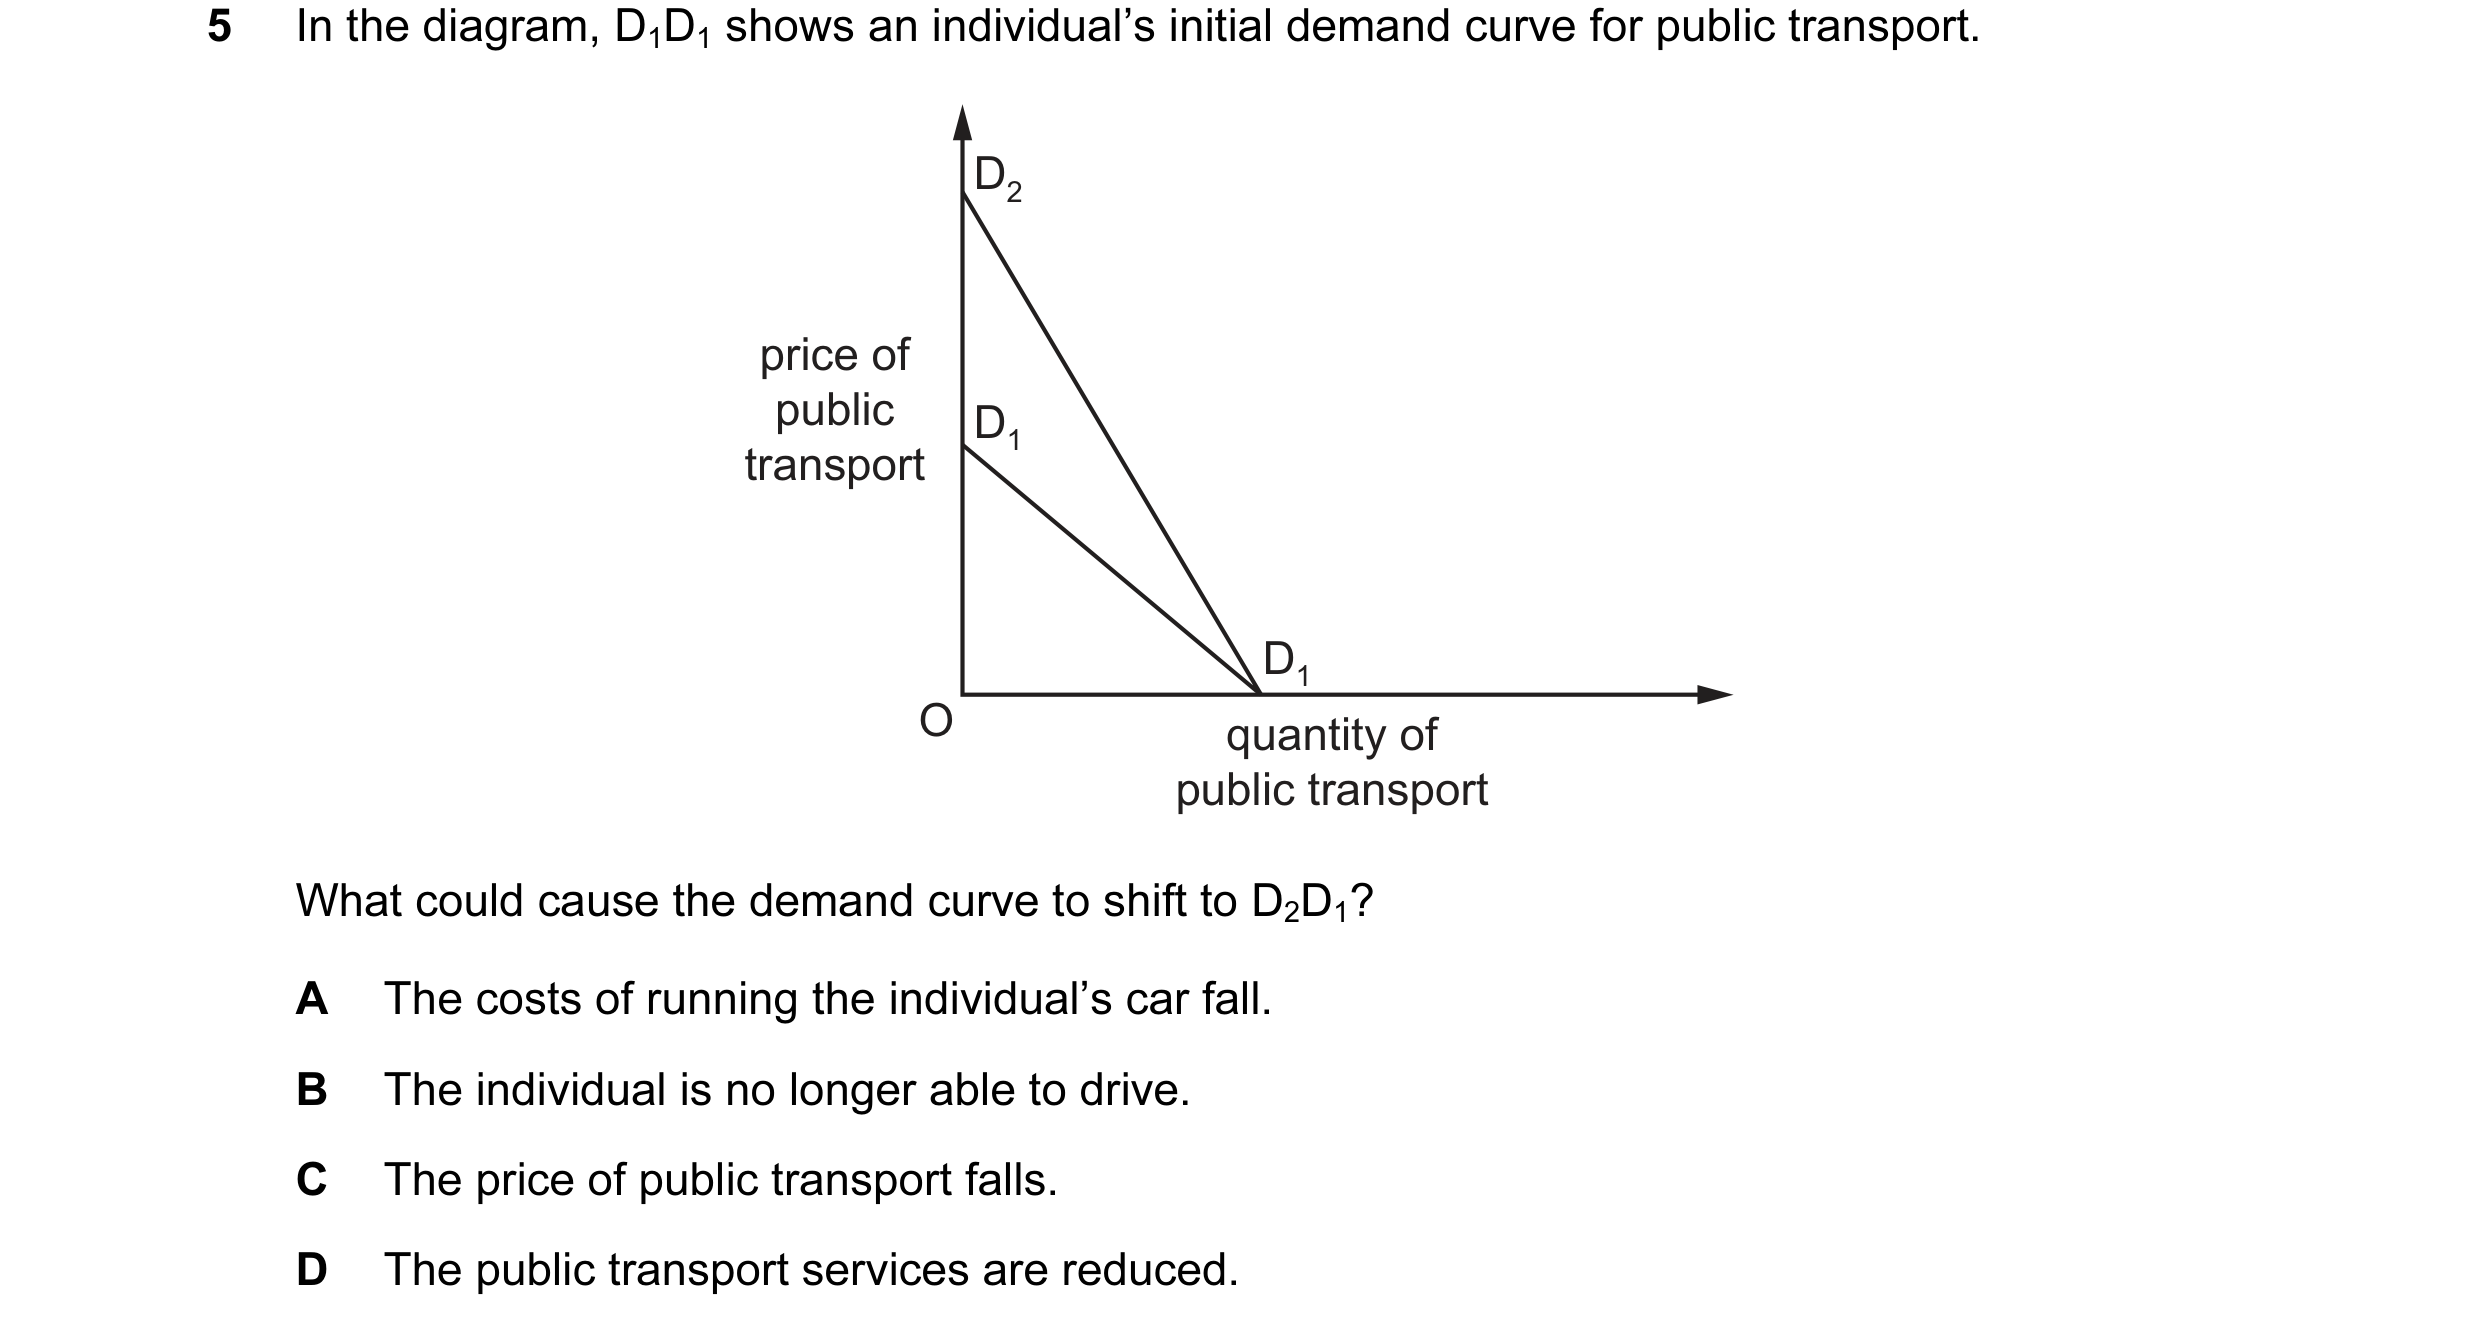 27 / 76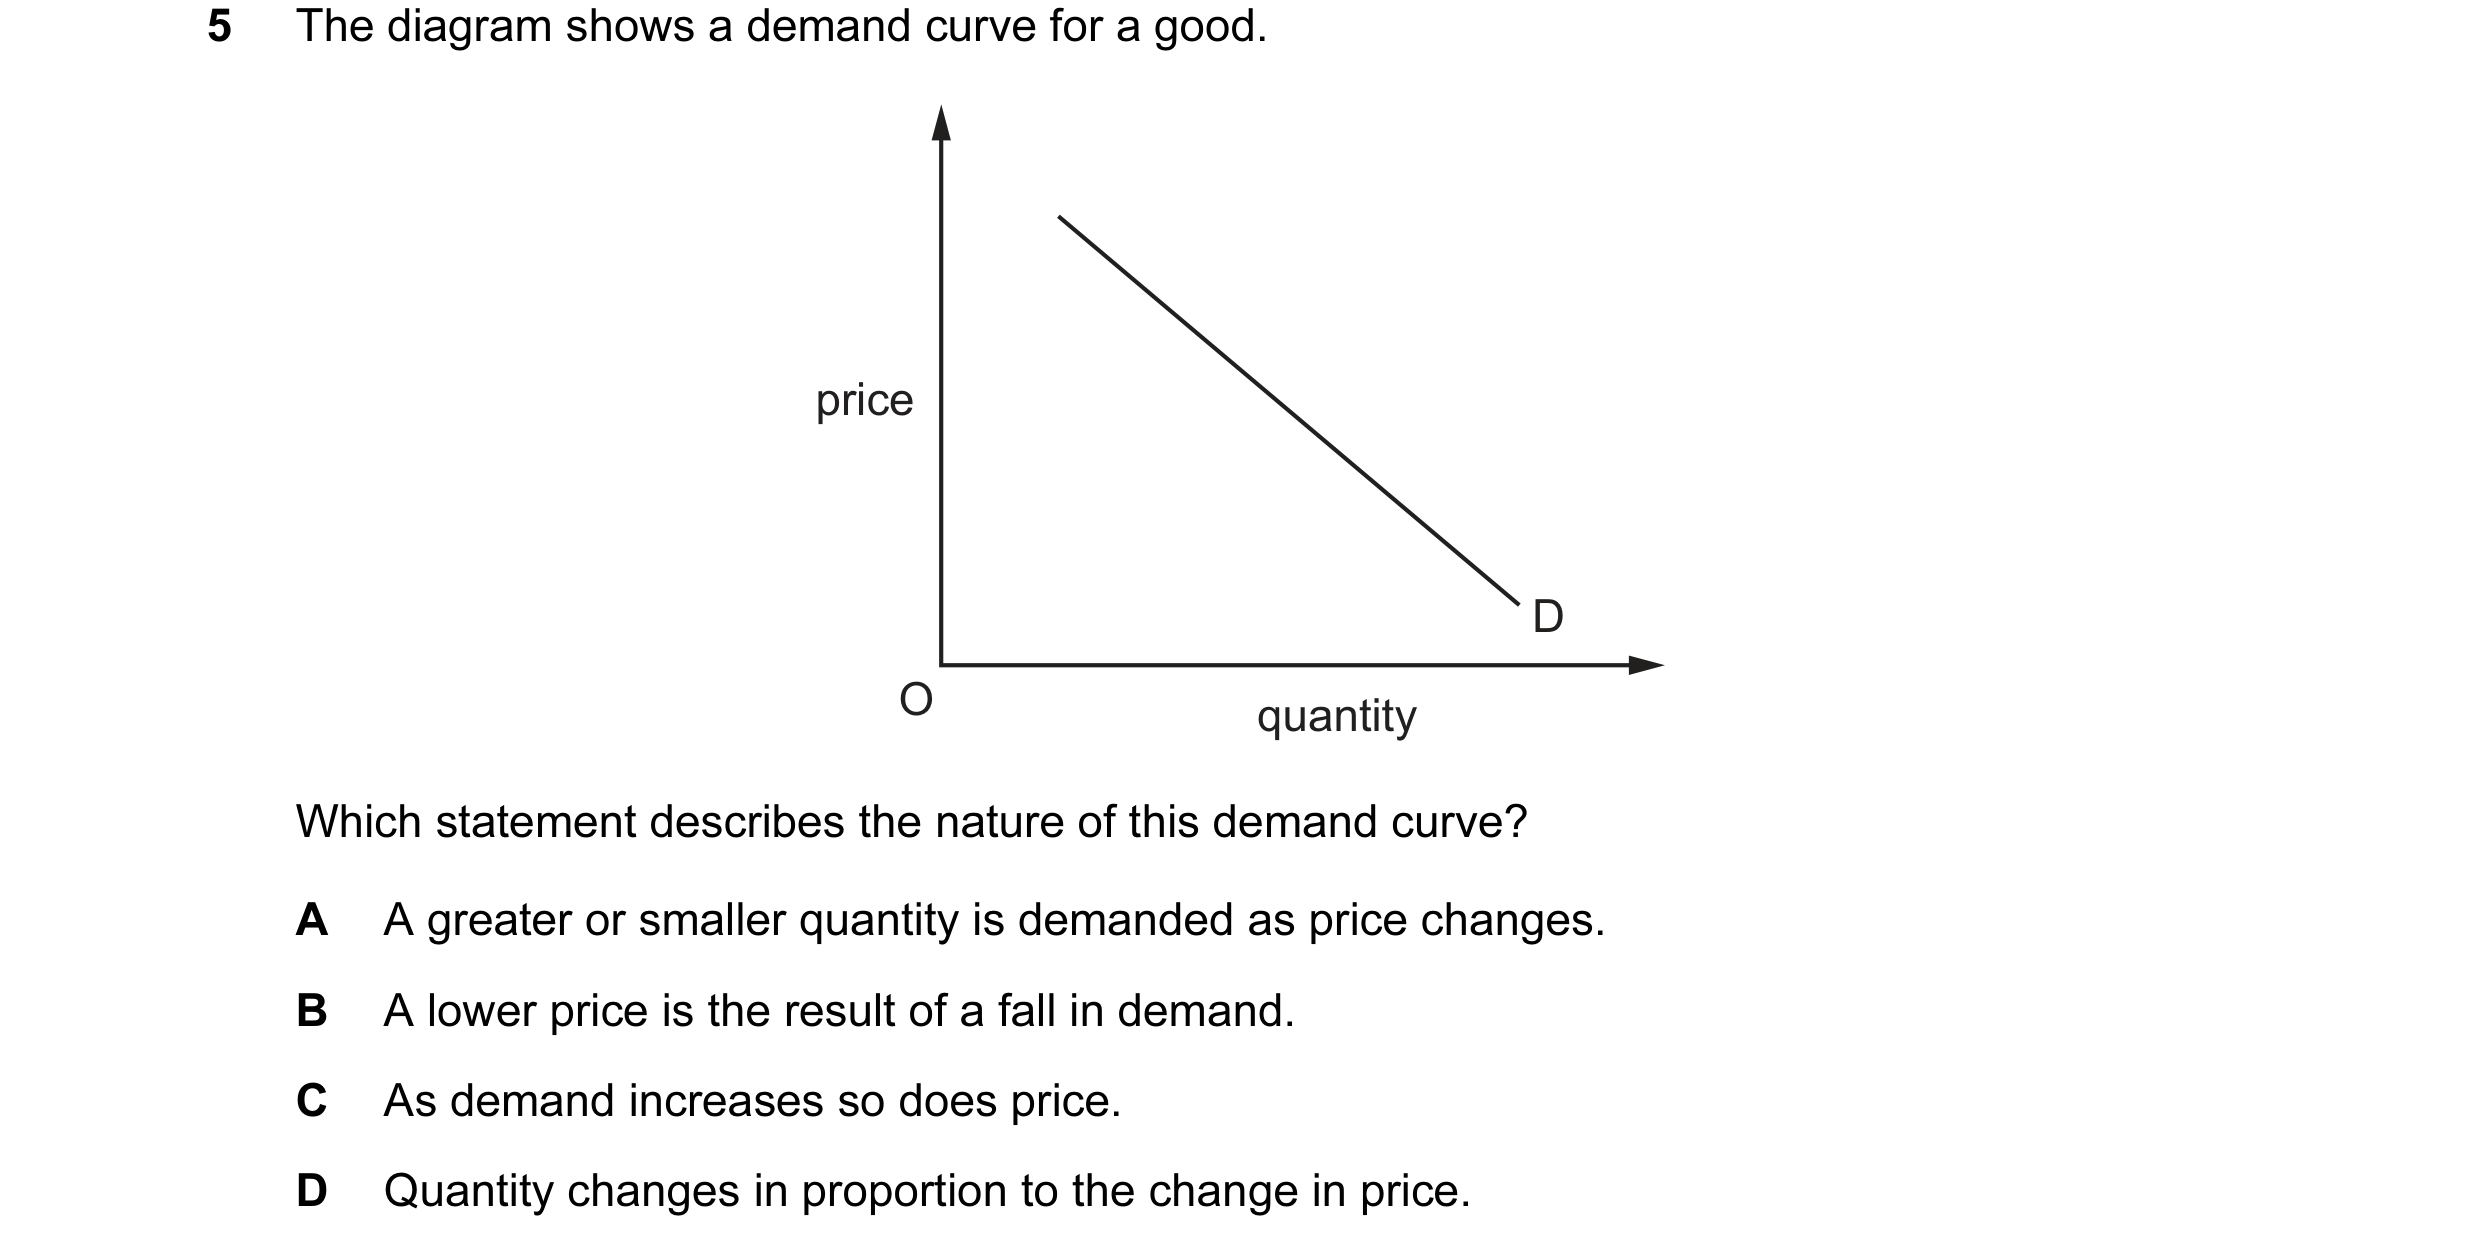
 28 / 76
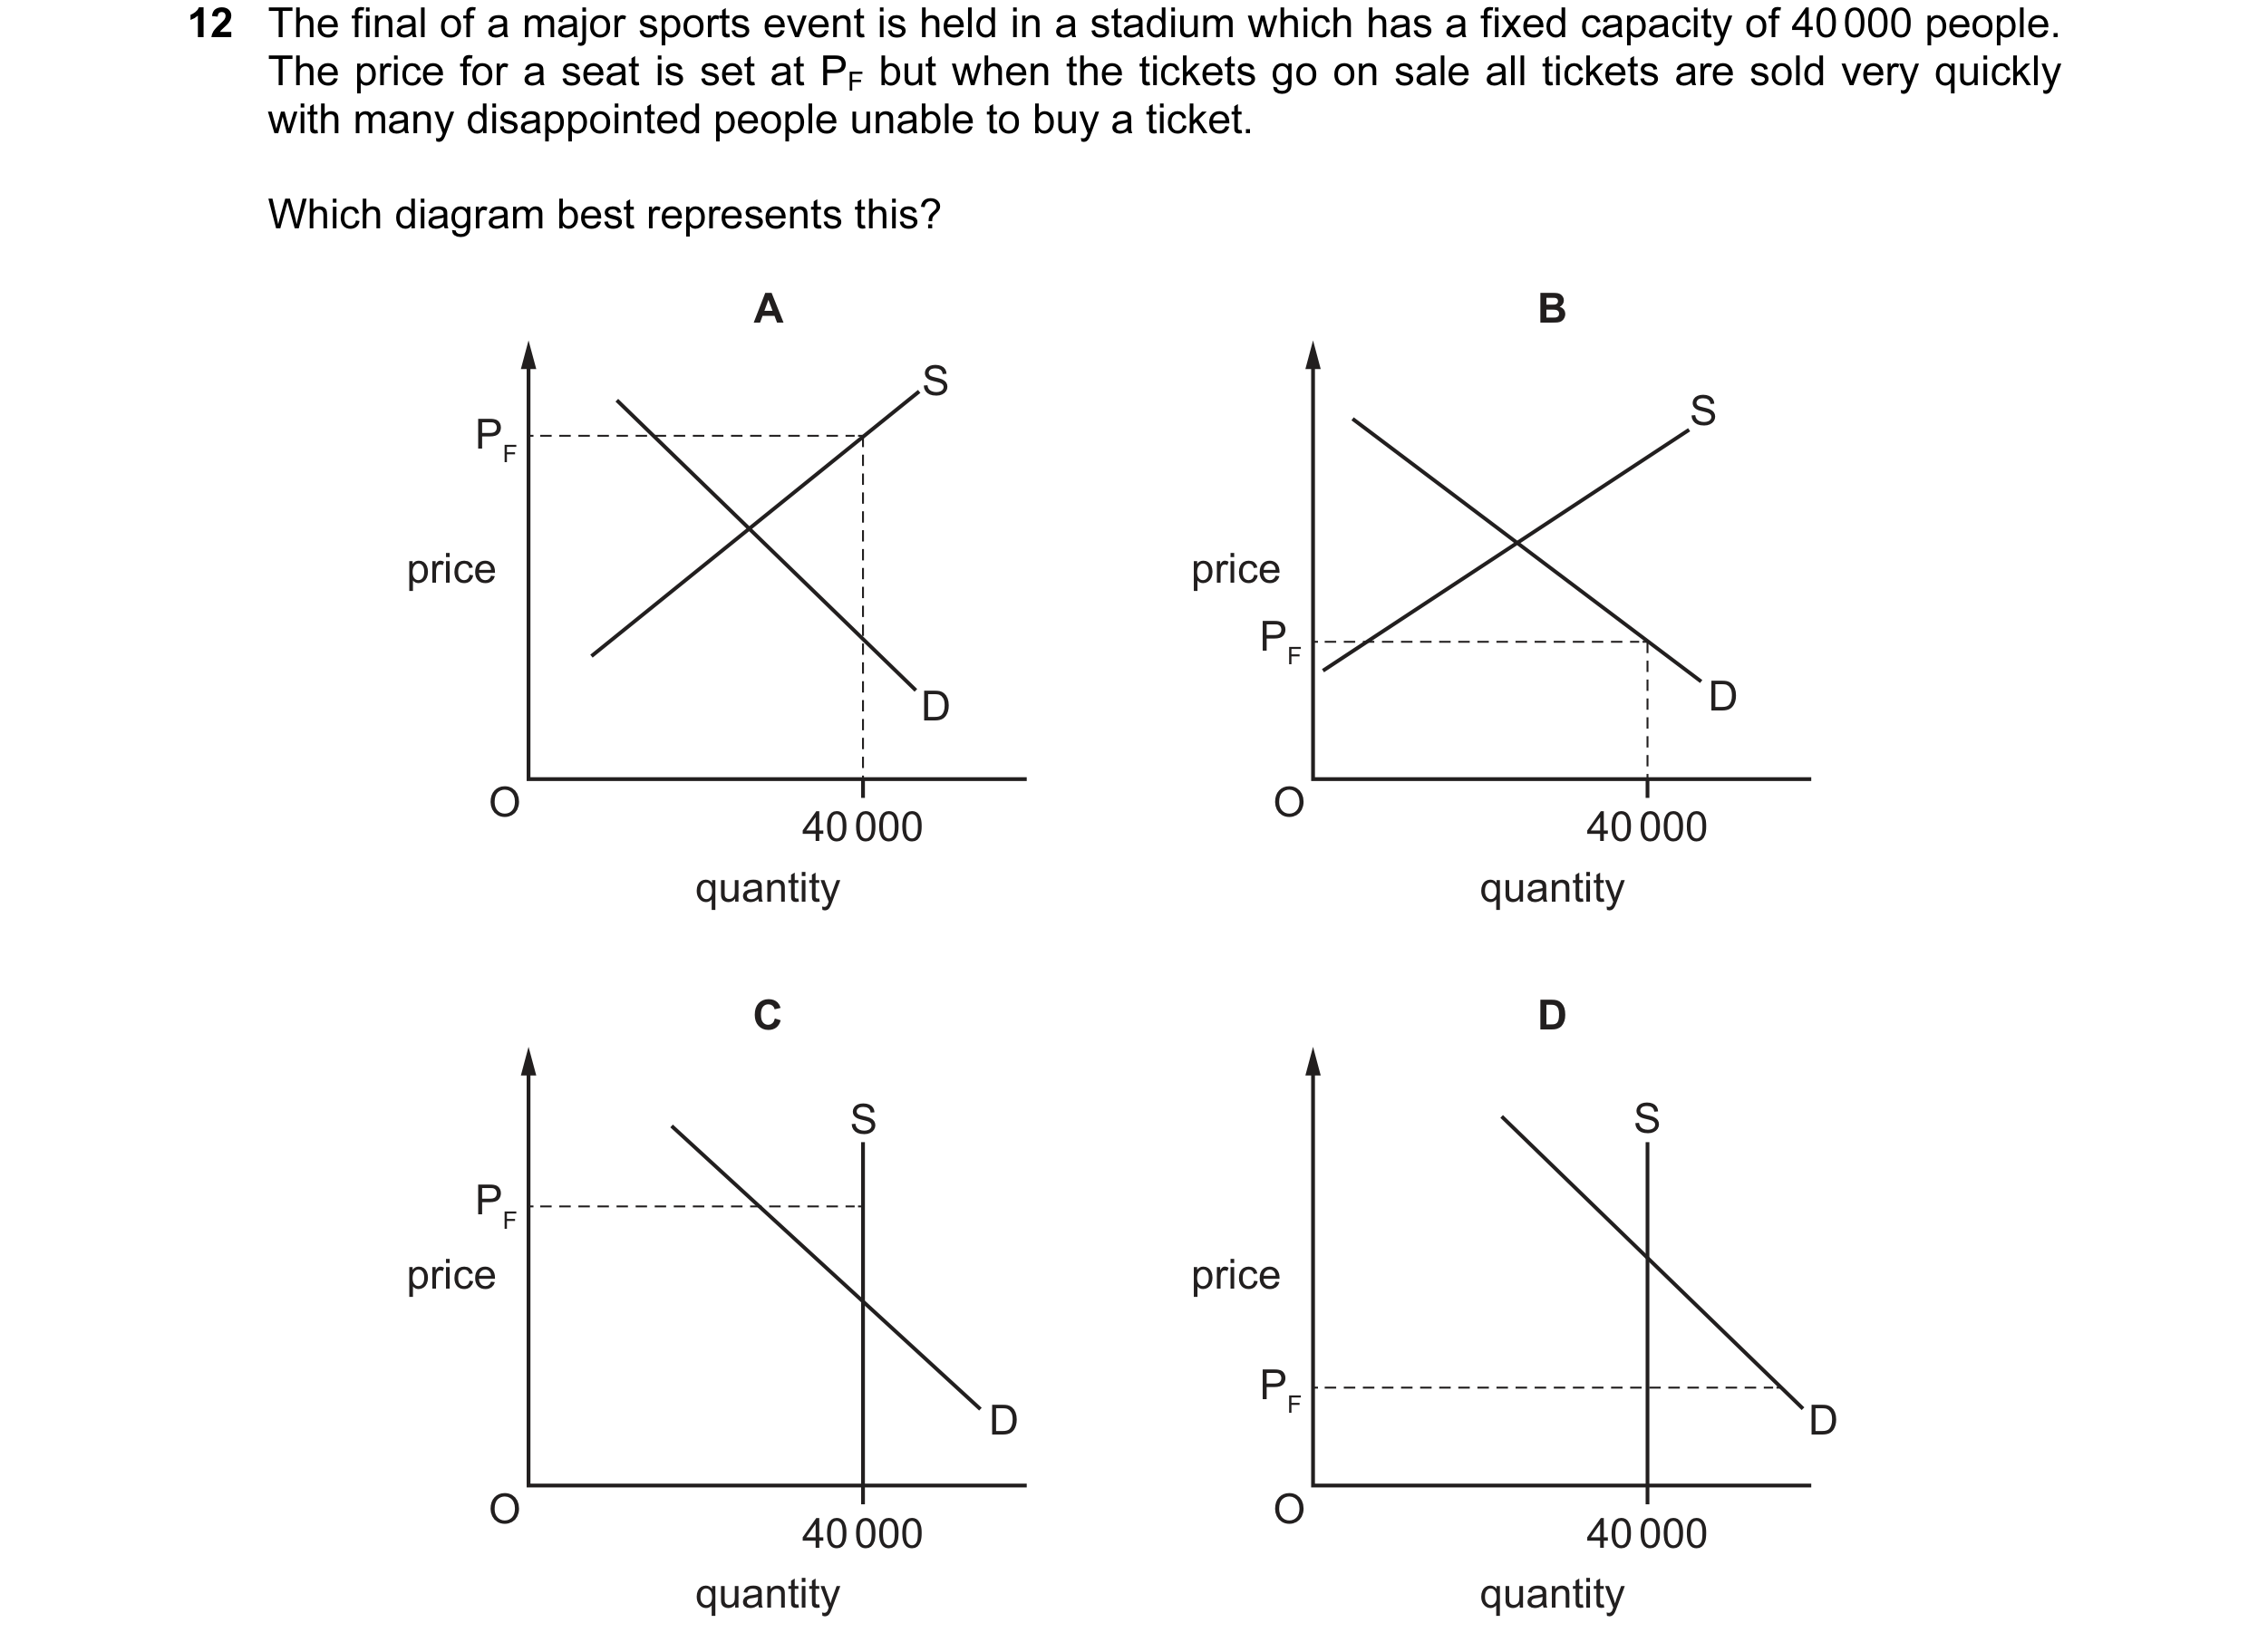 29 / 76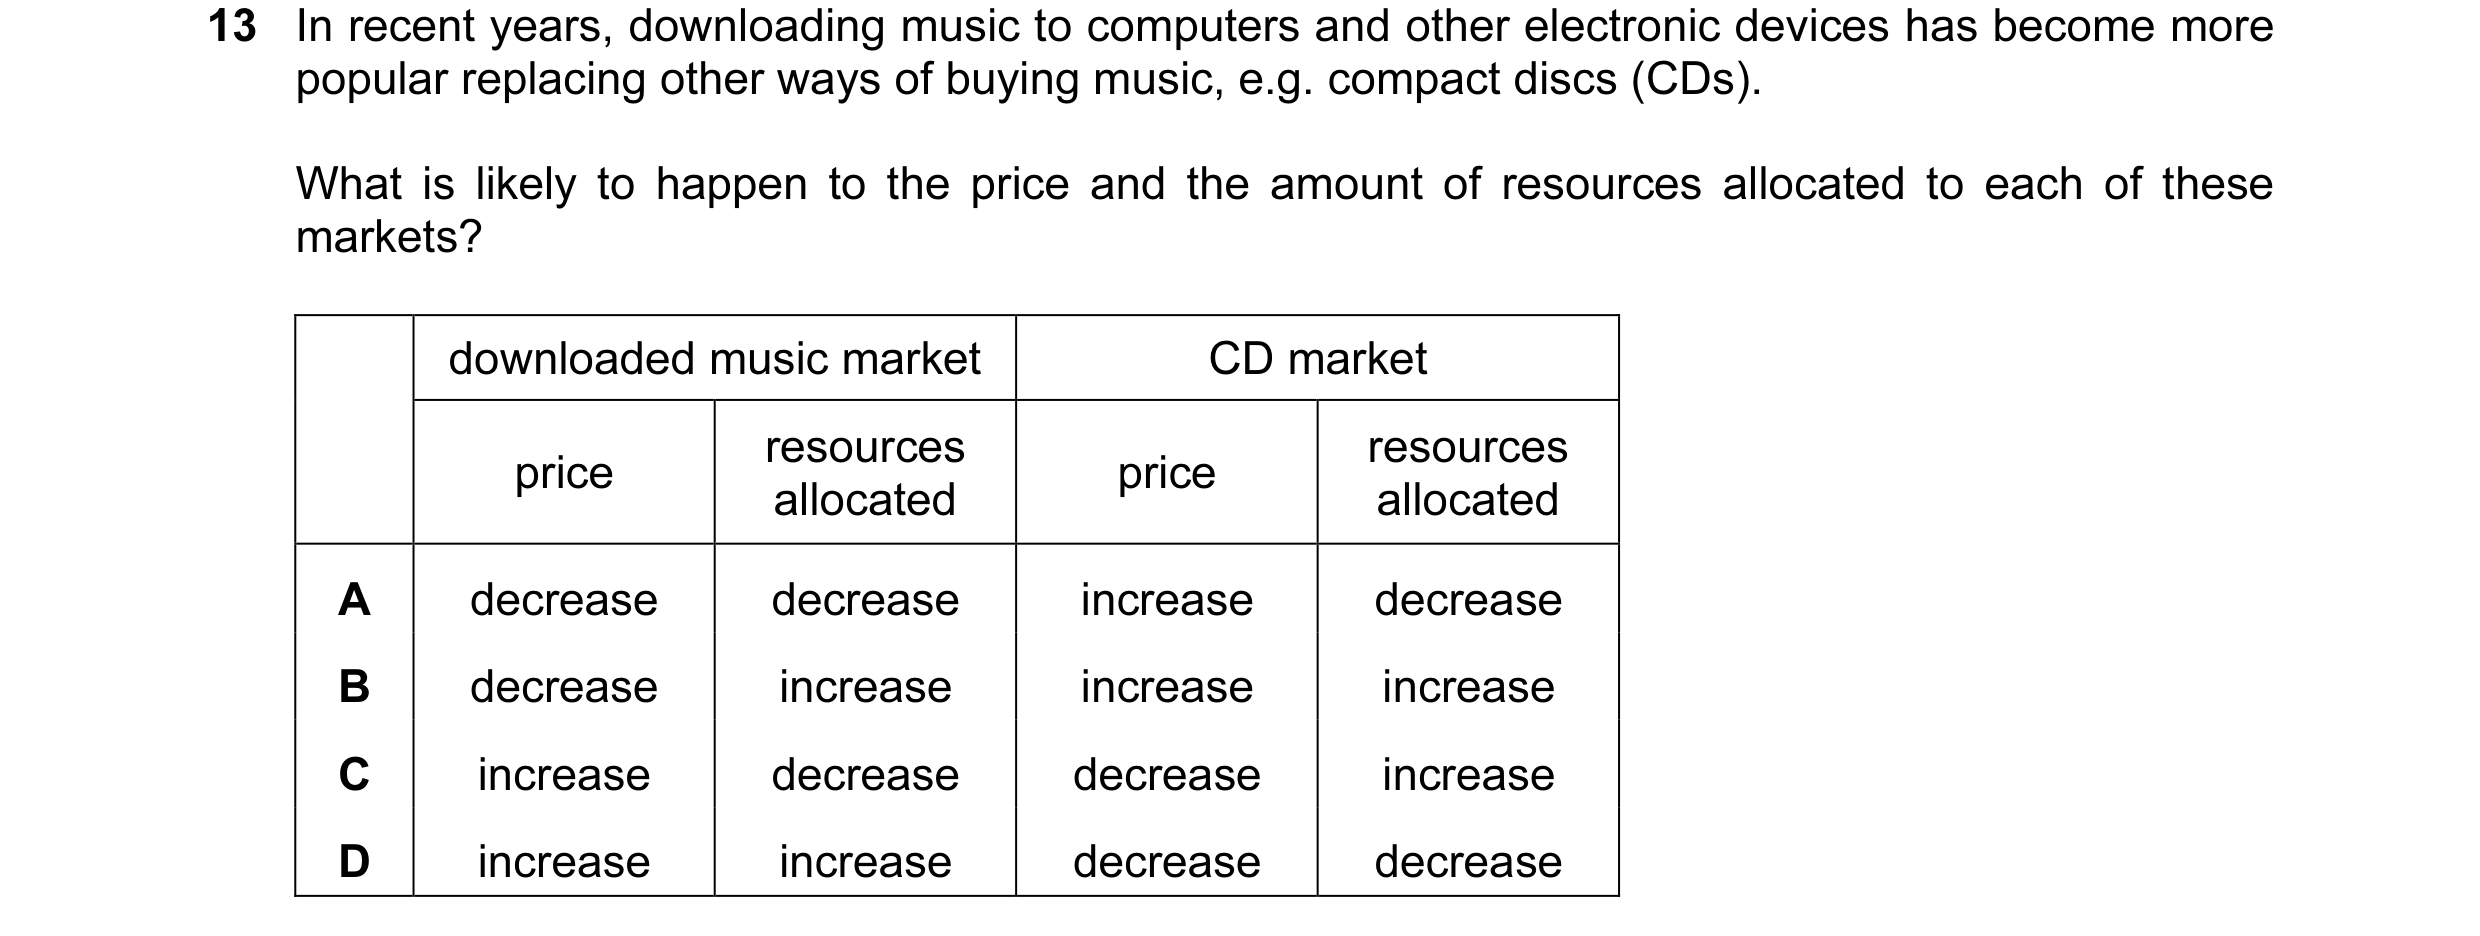
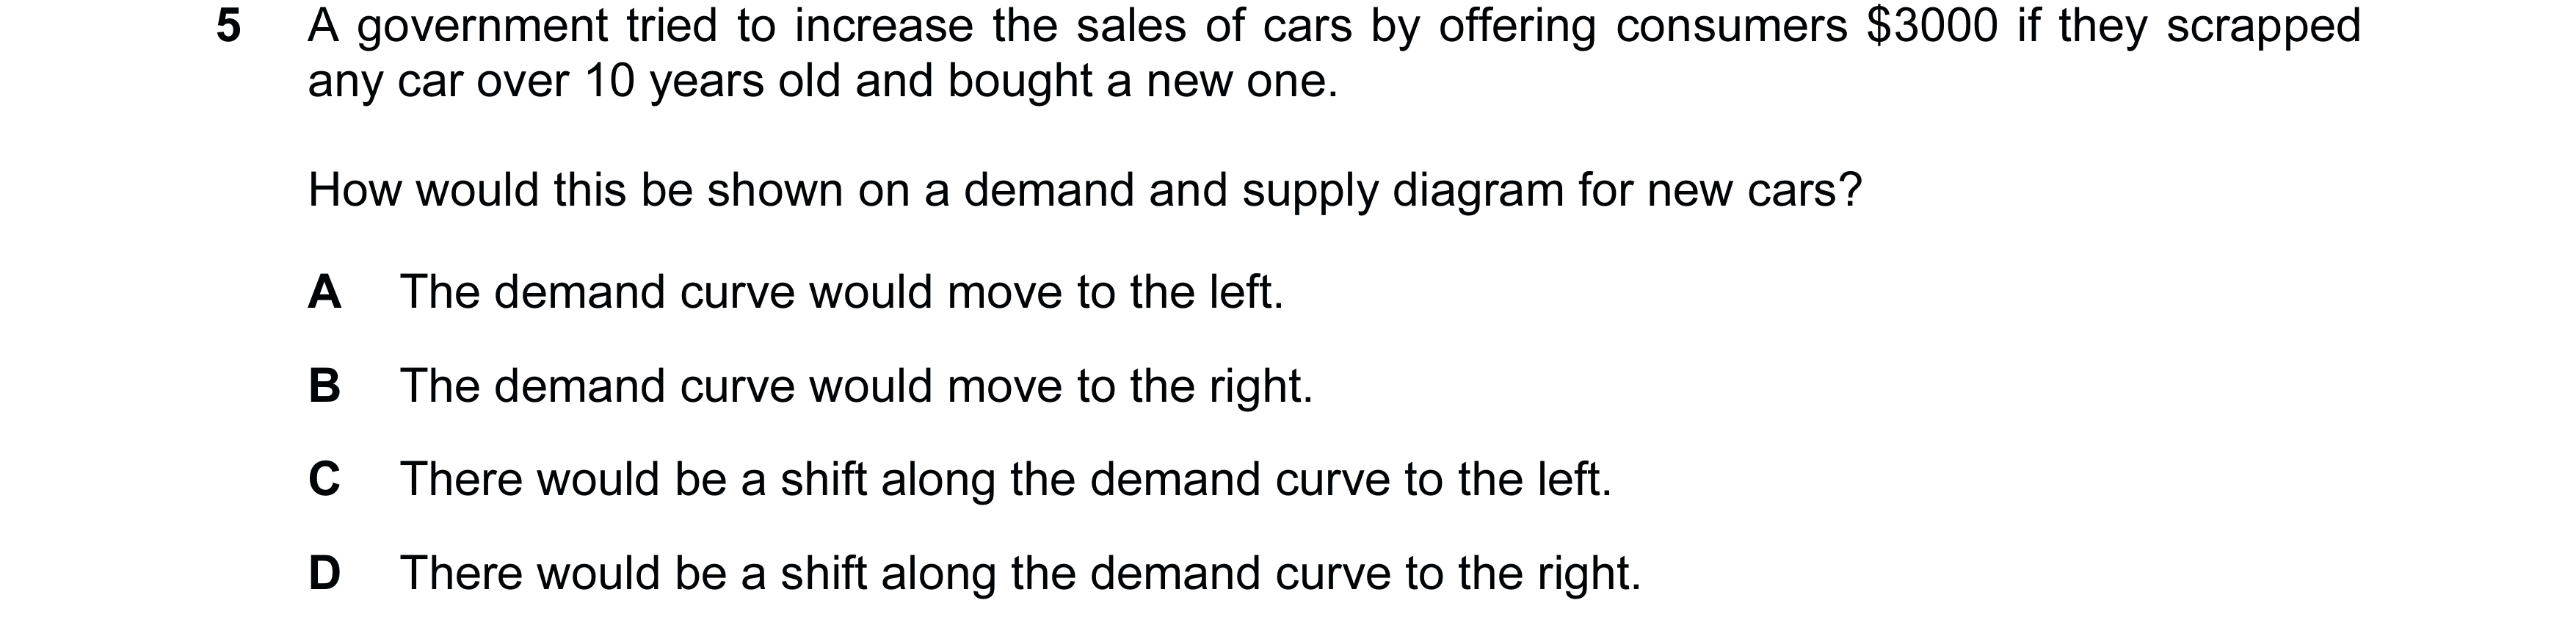
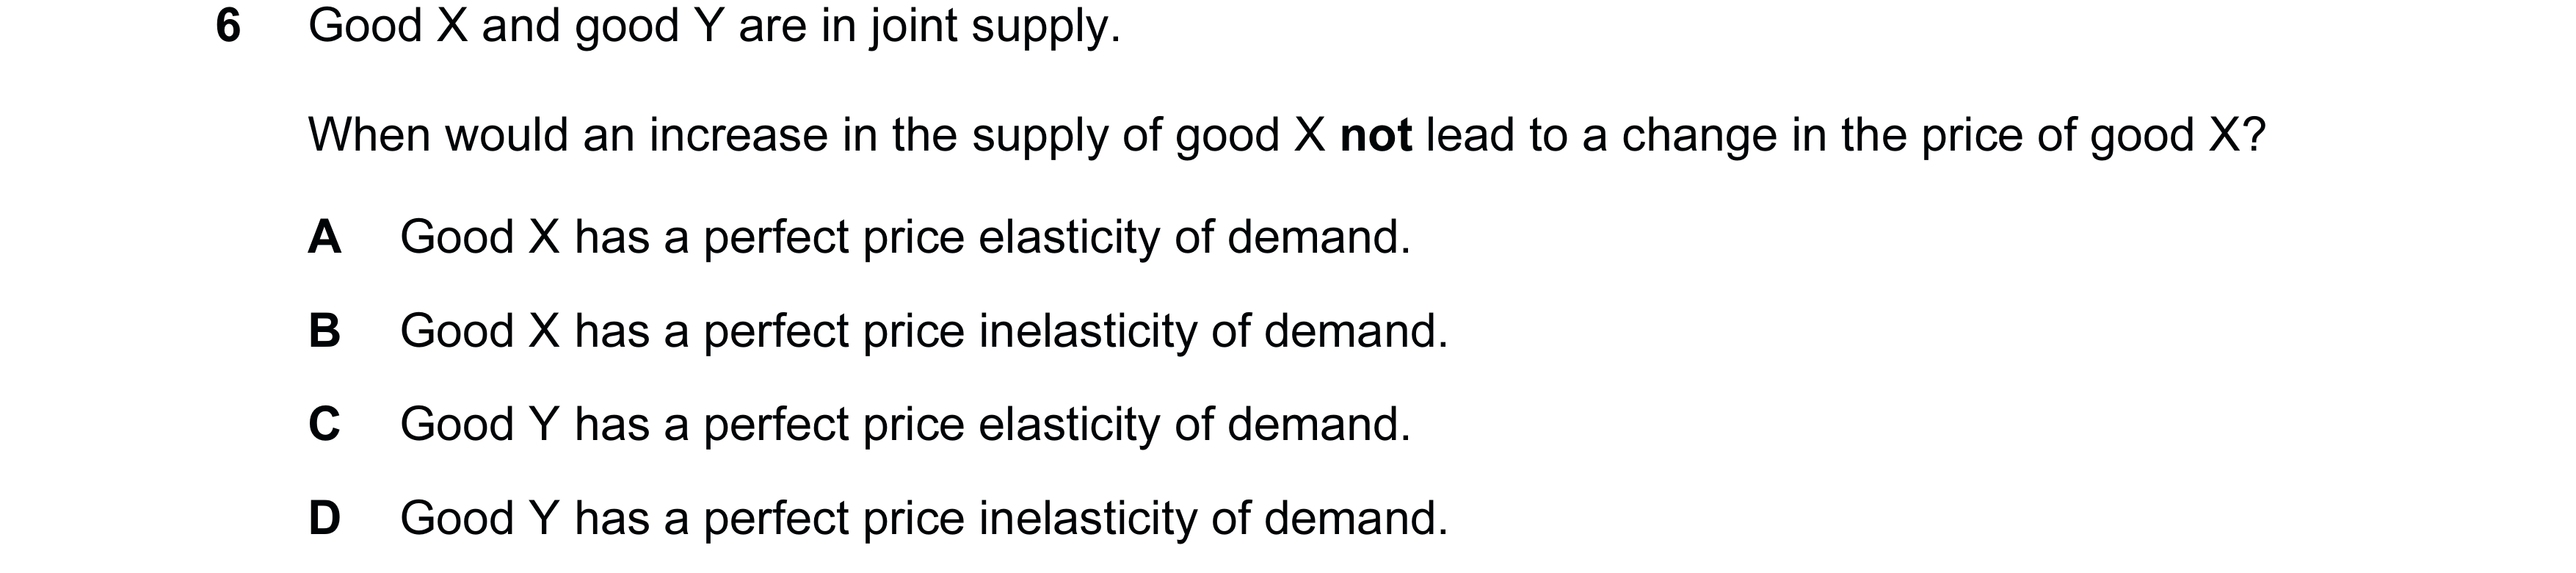
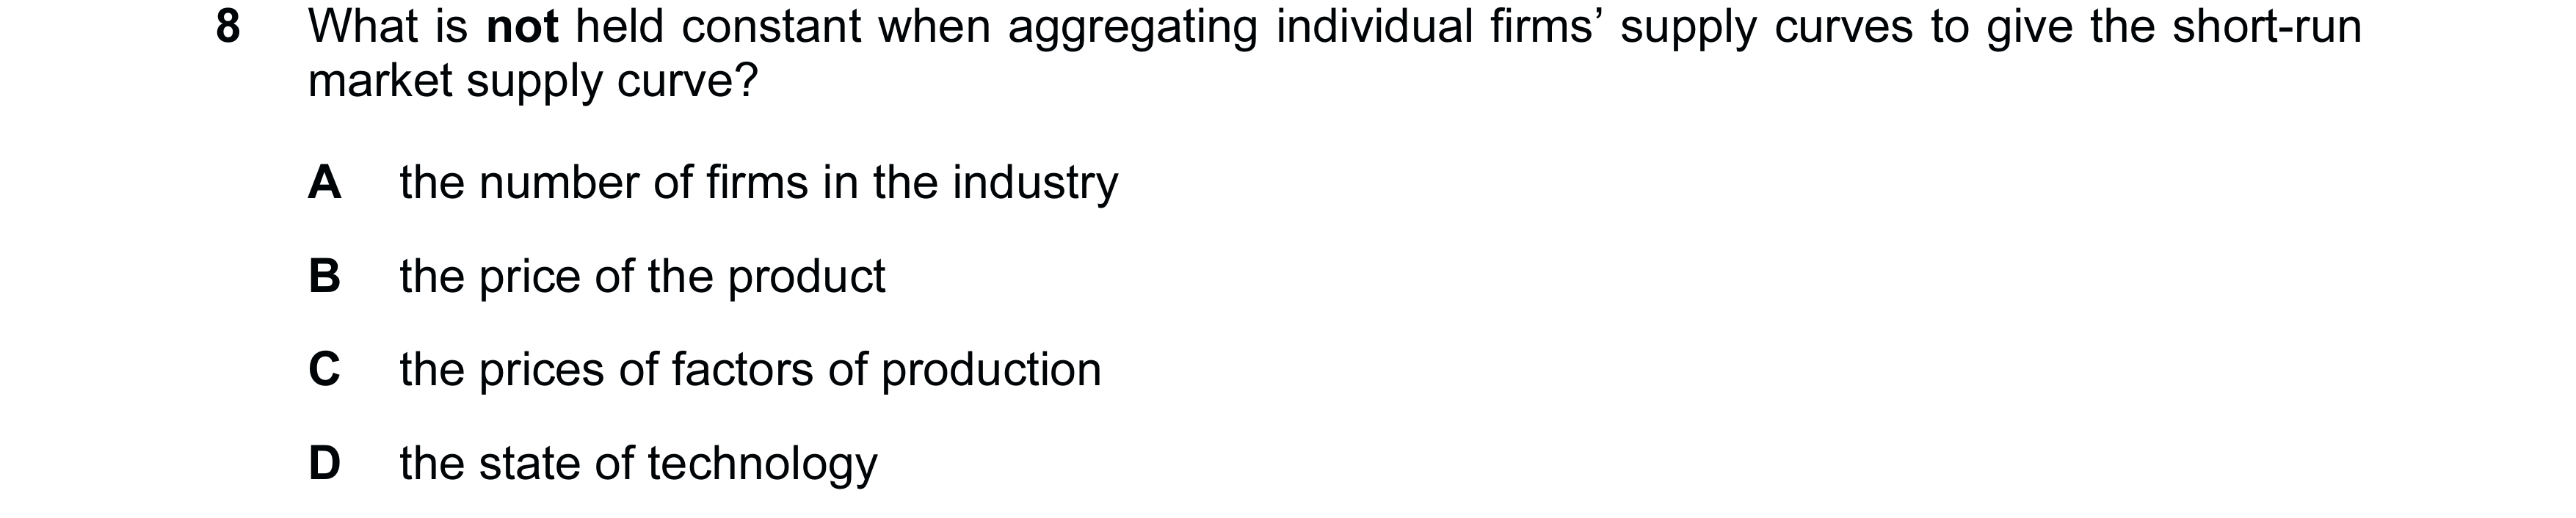 30 / 76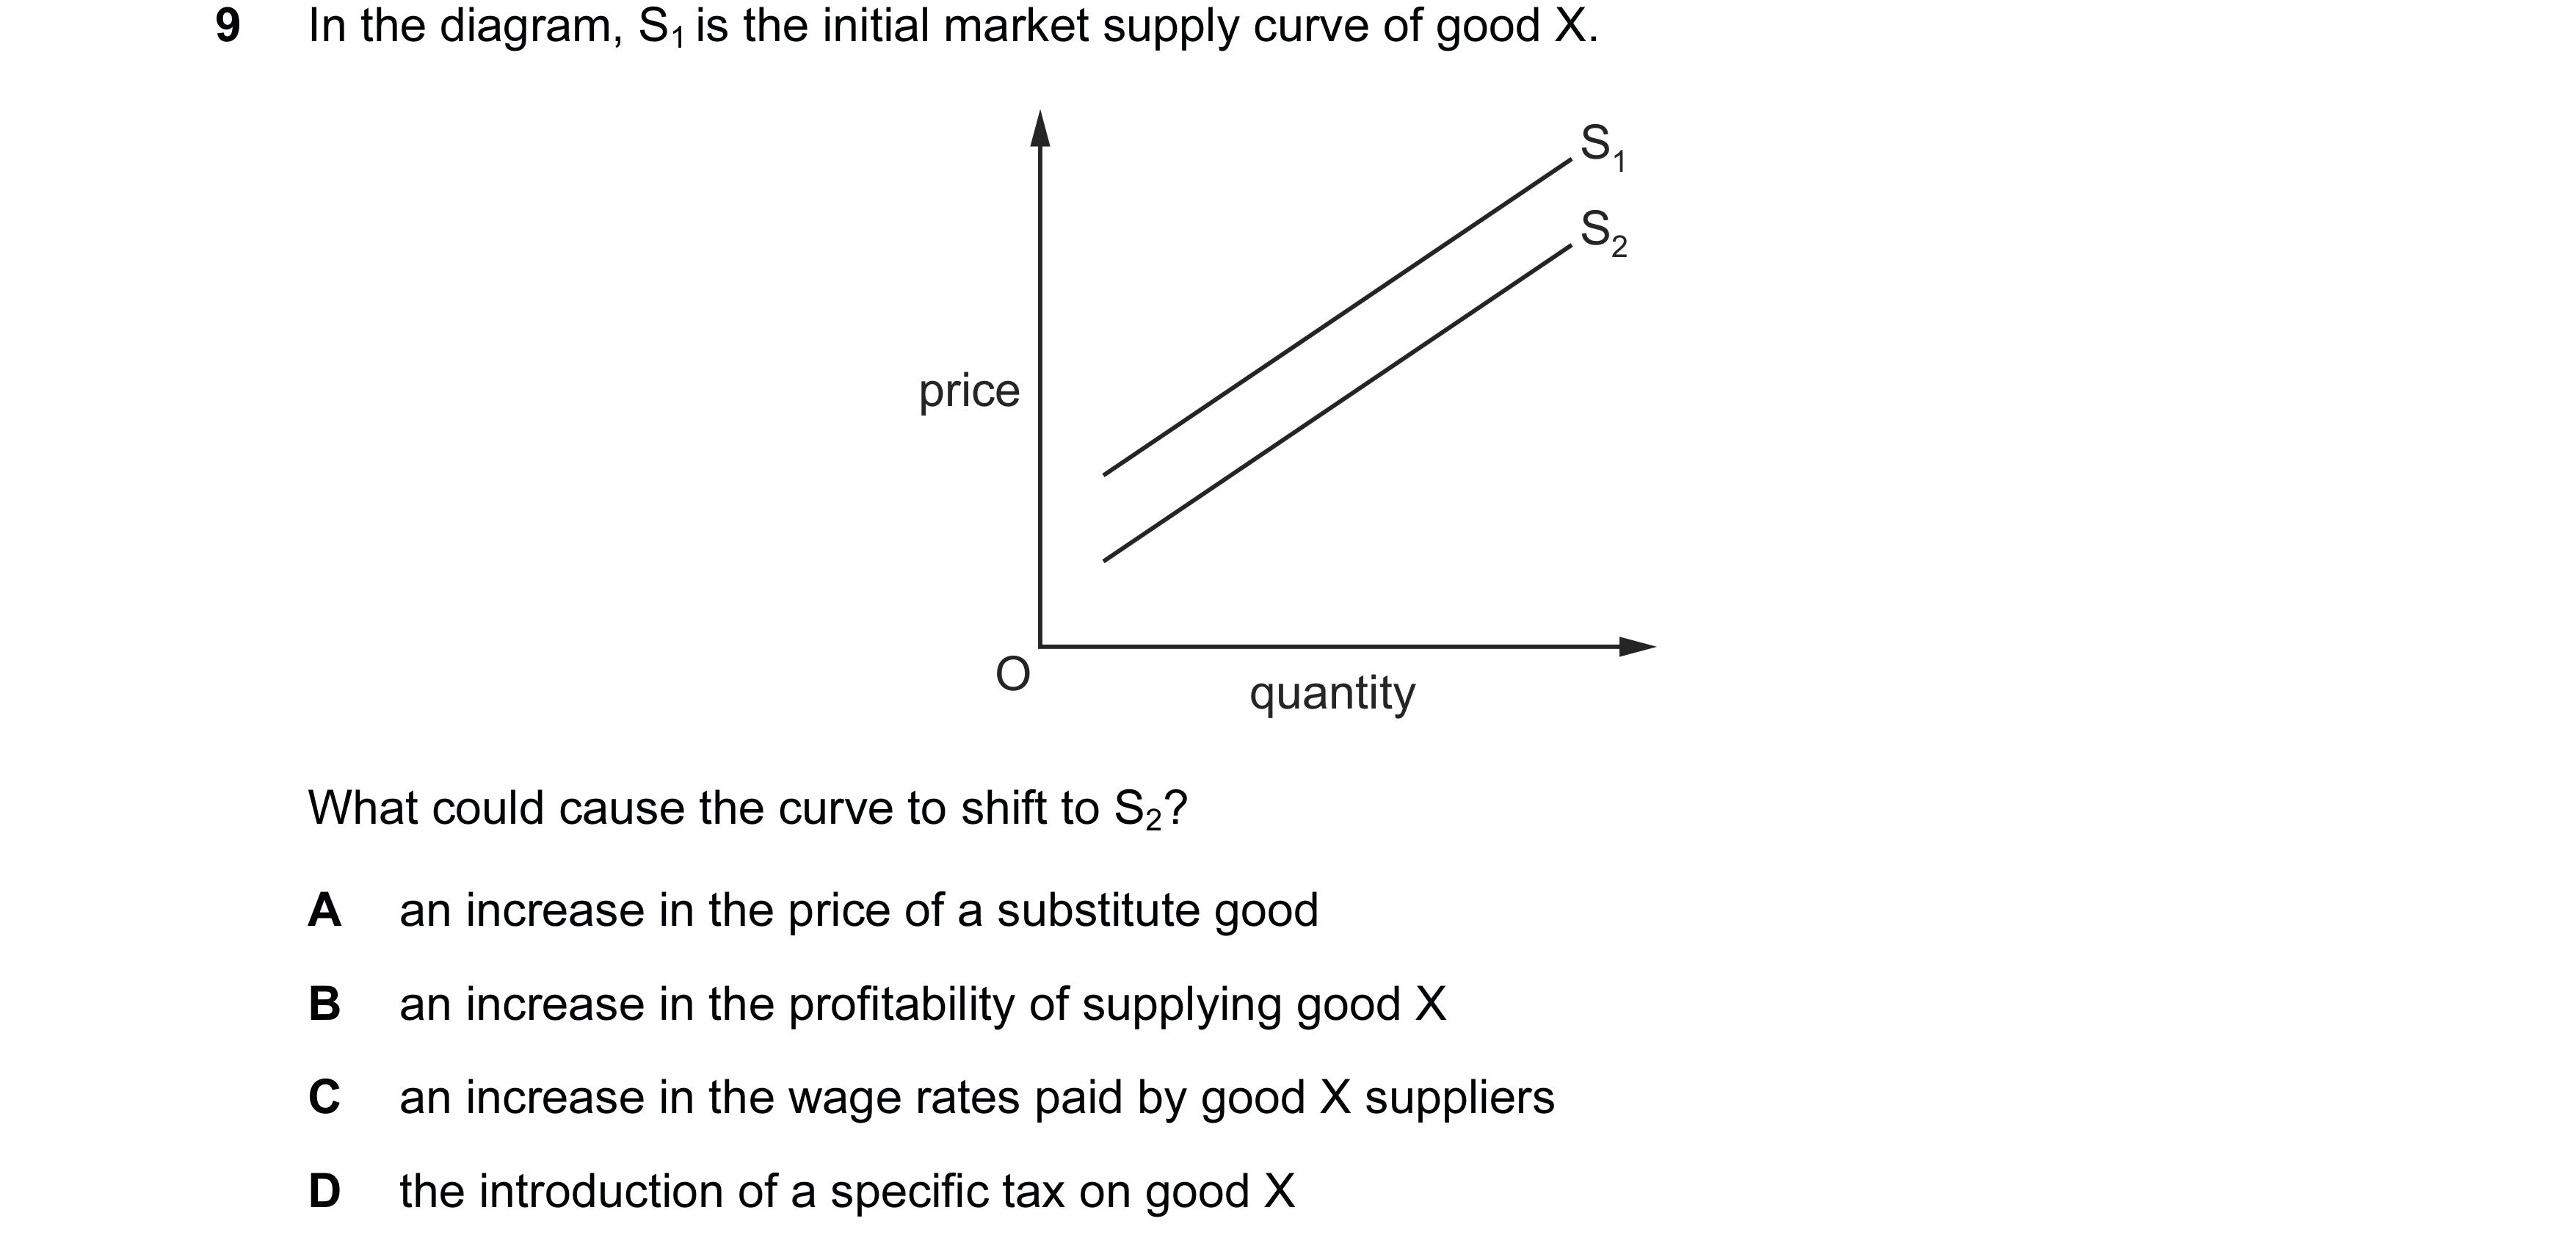
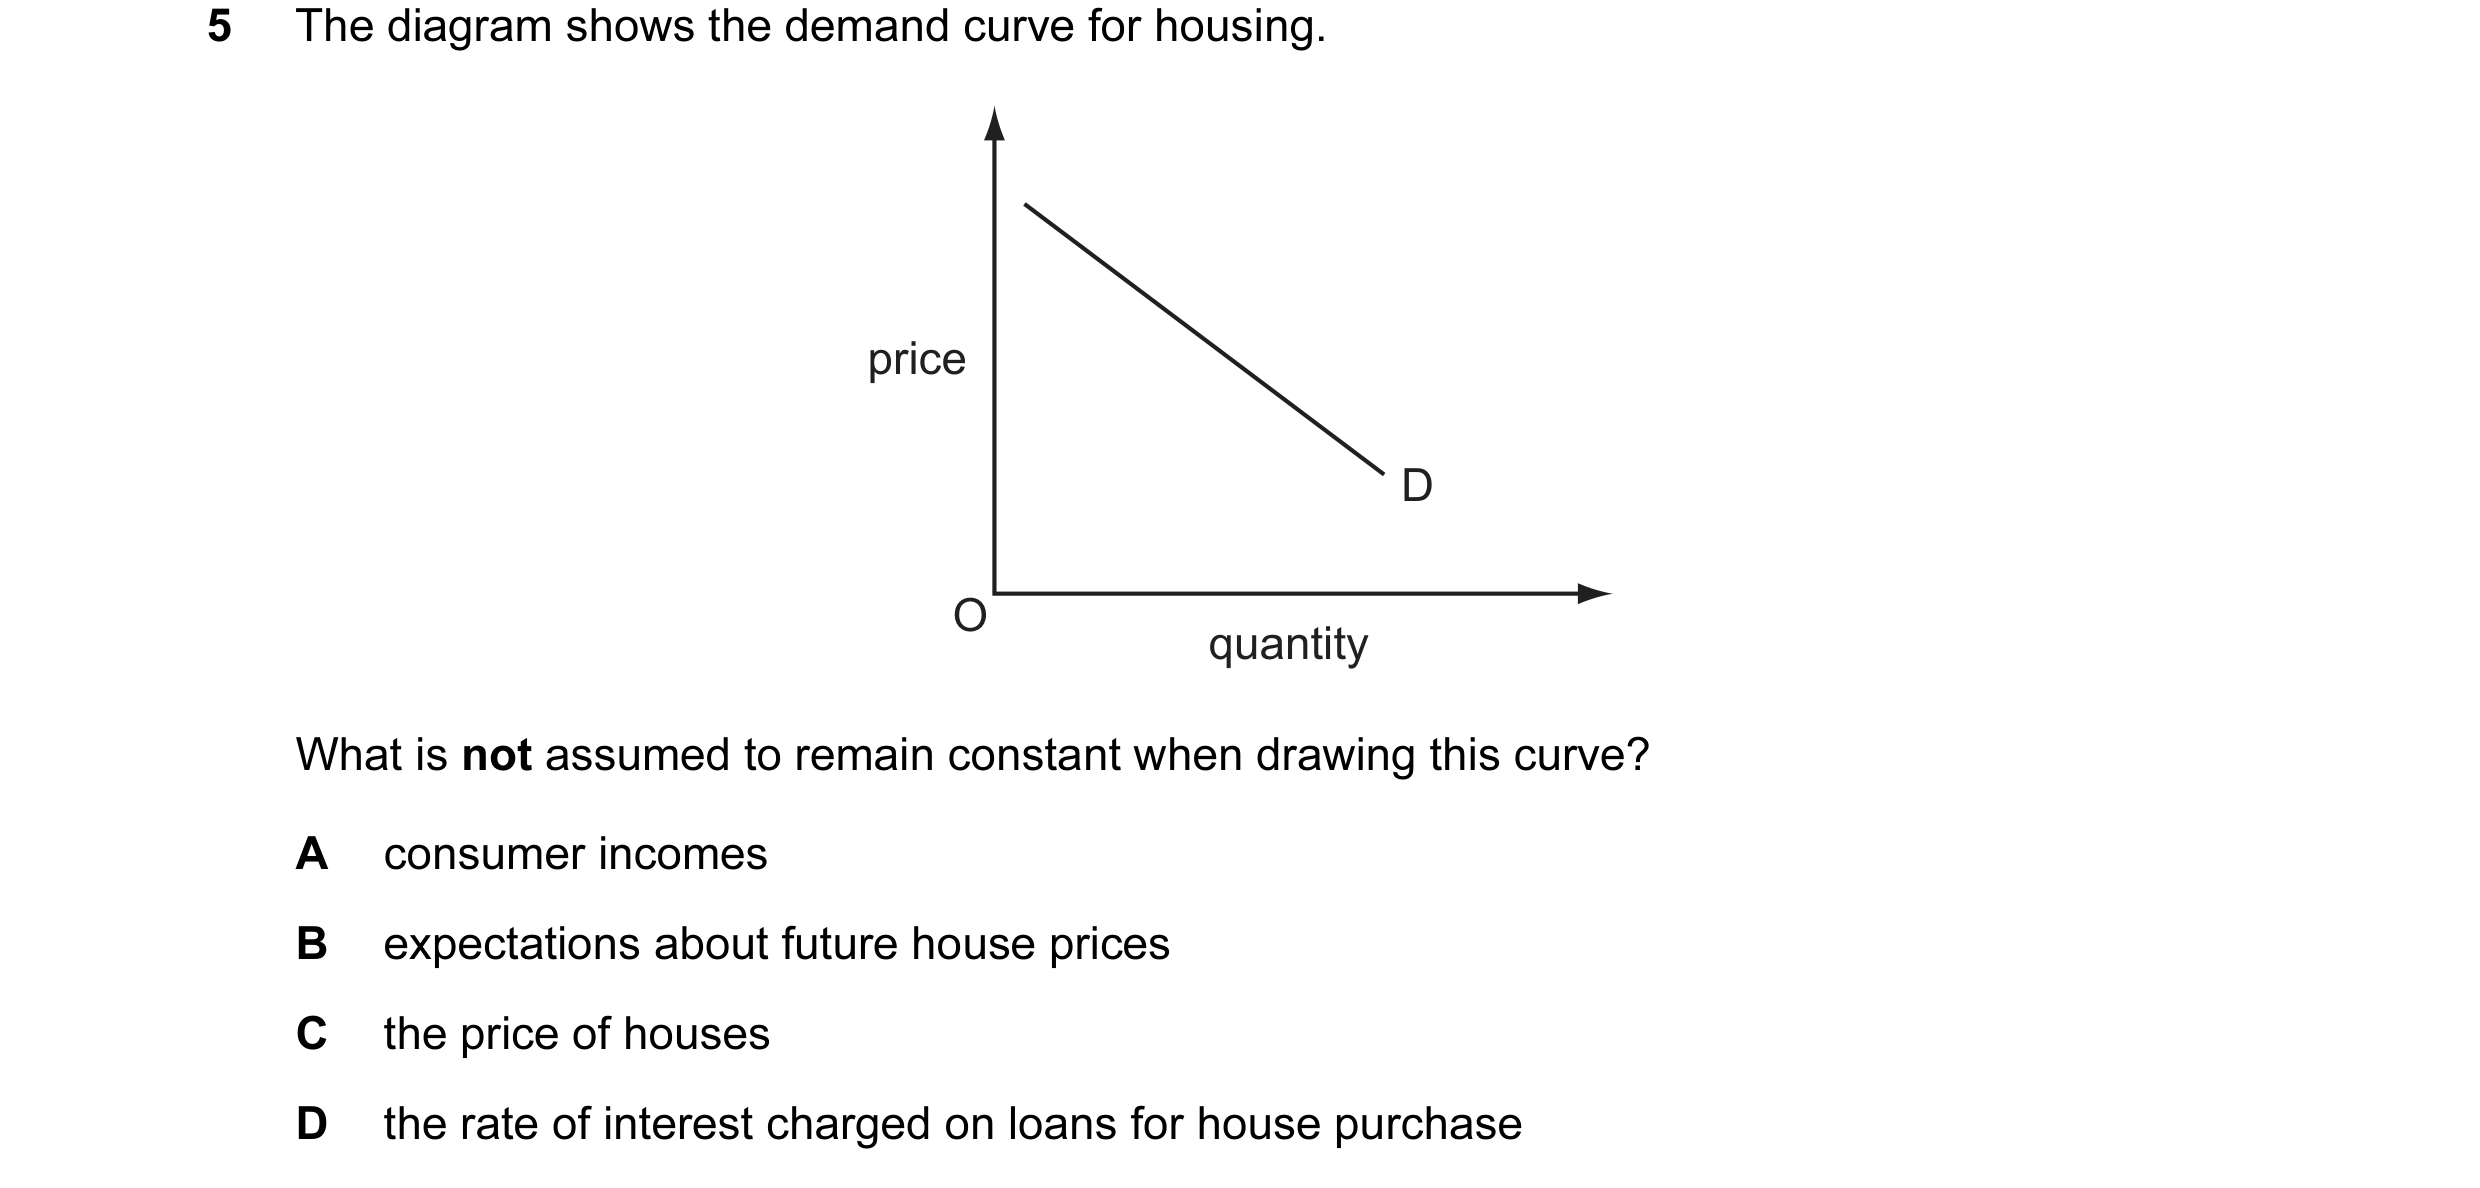
 31 / 76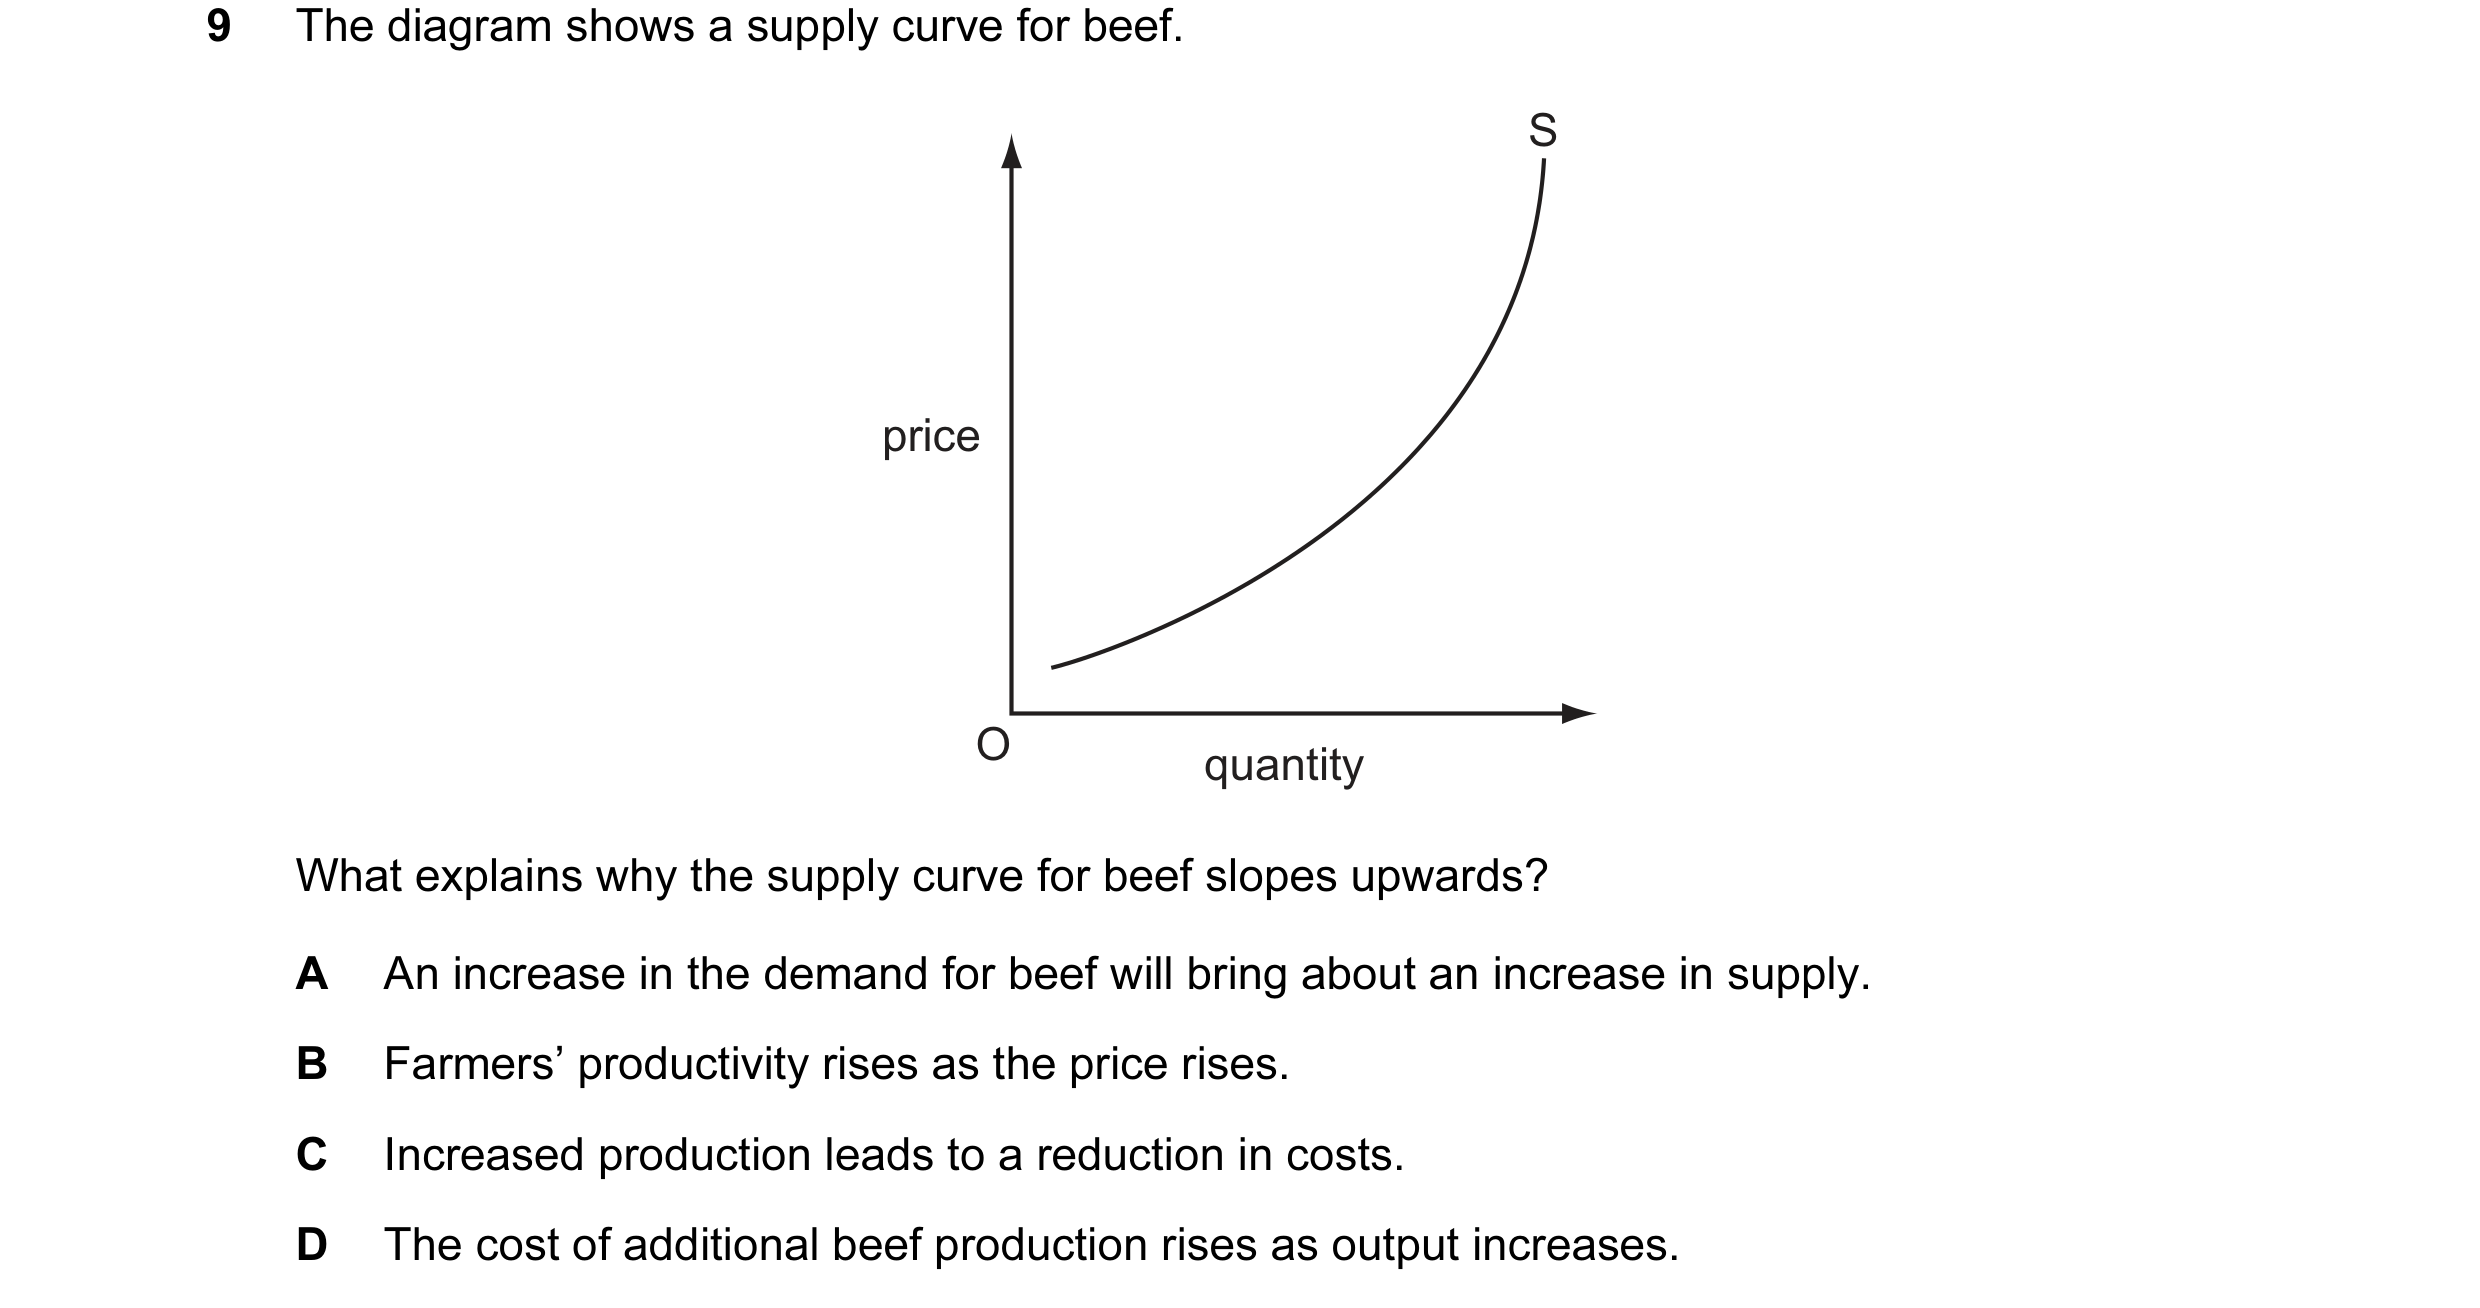

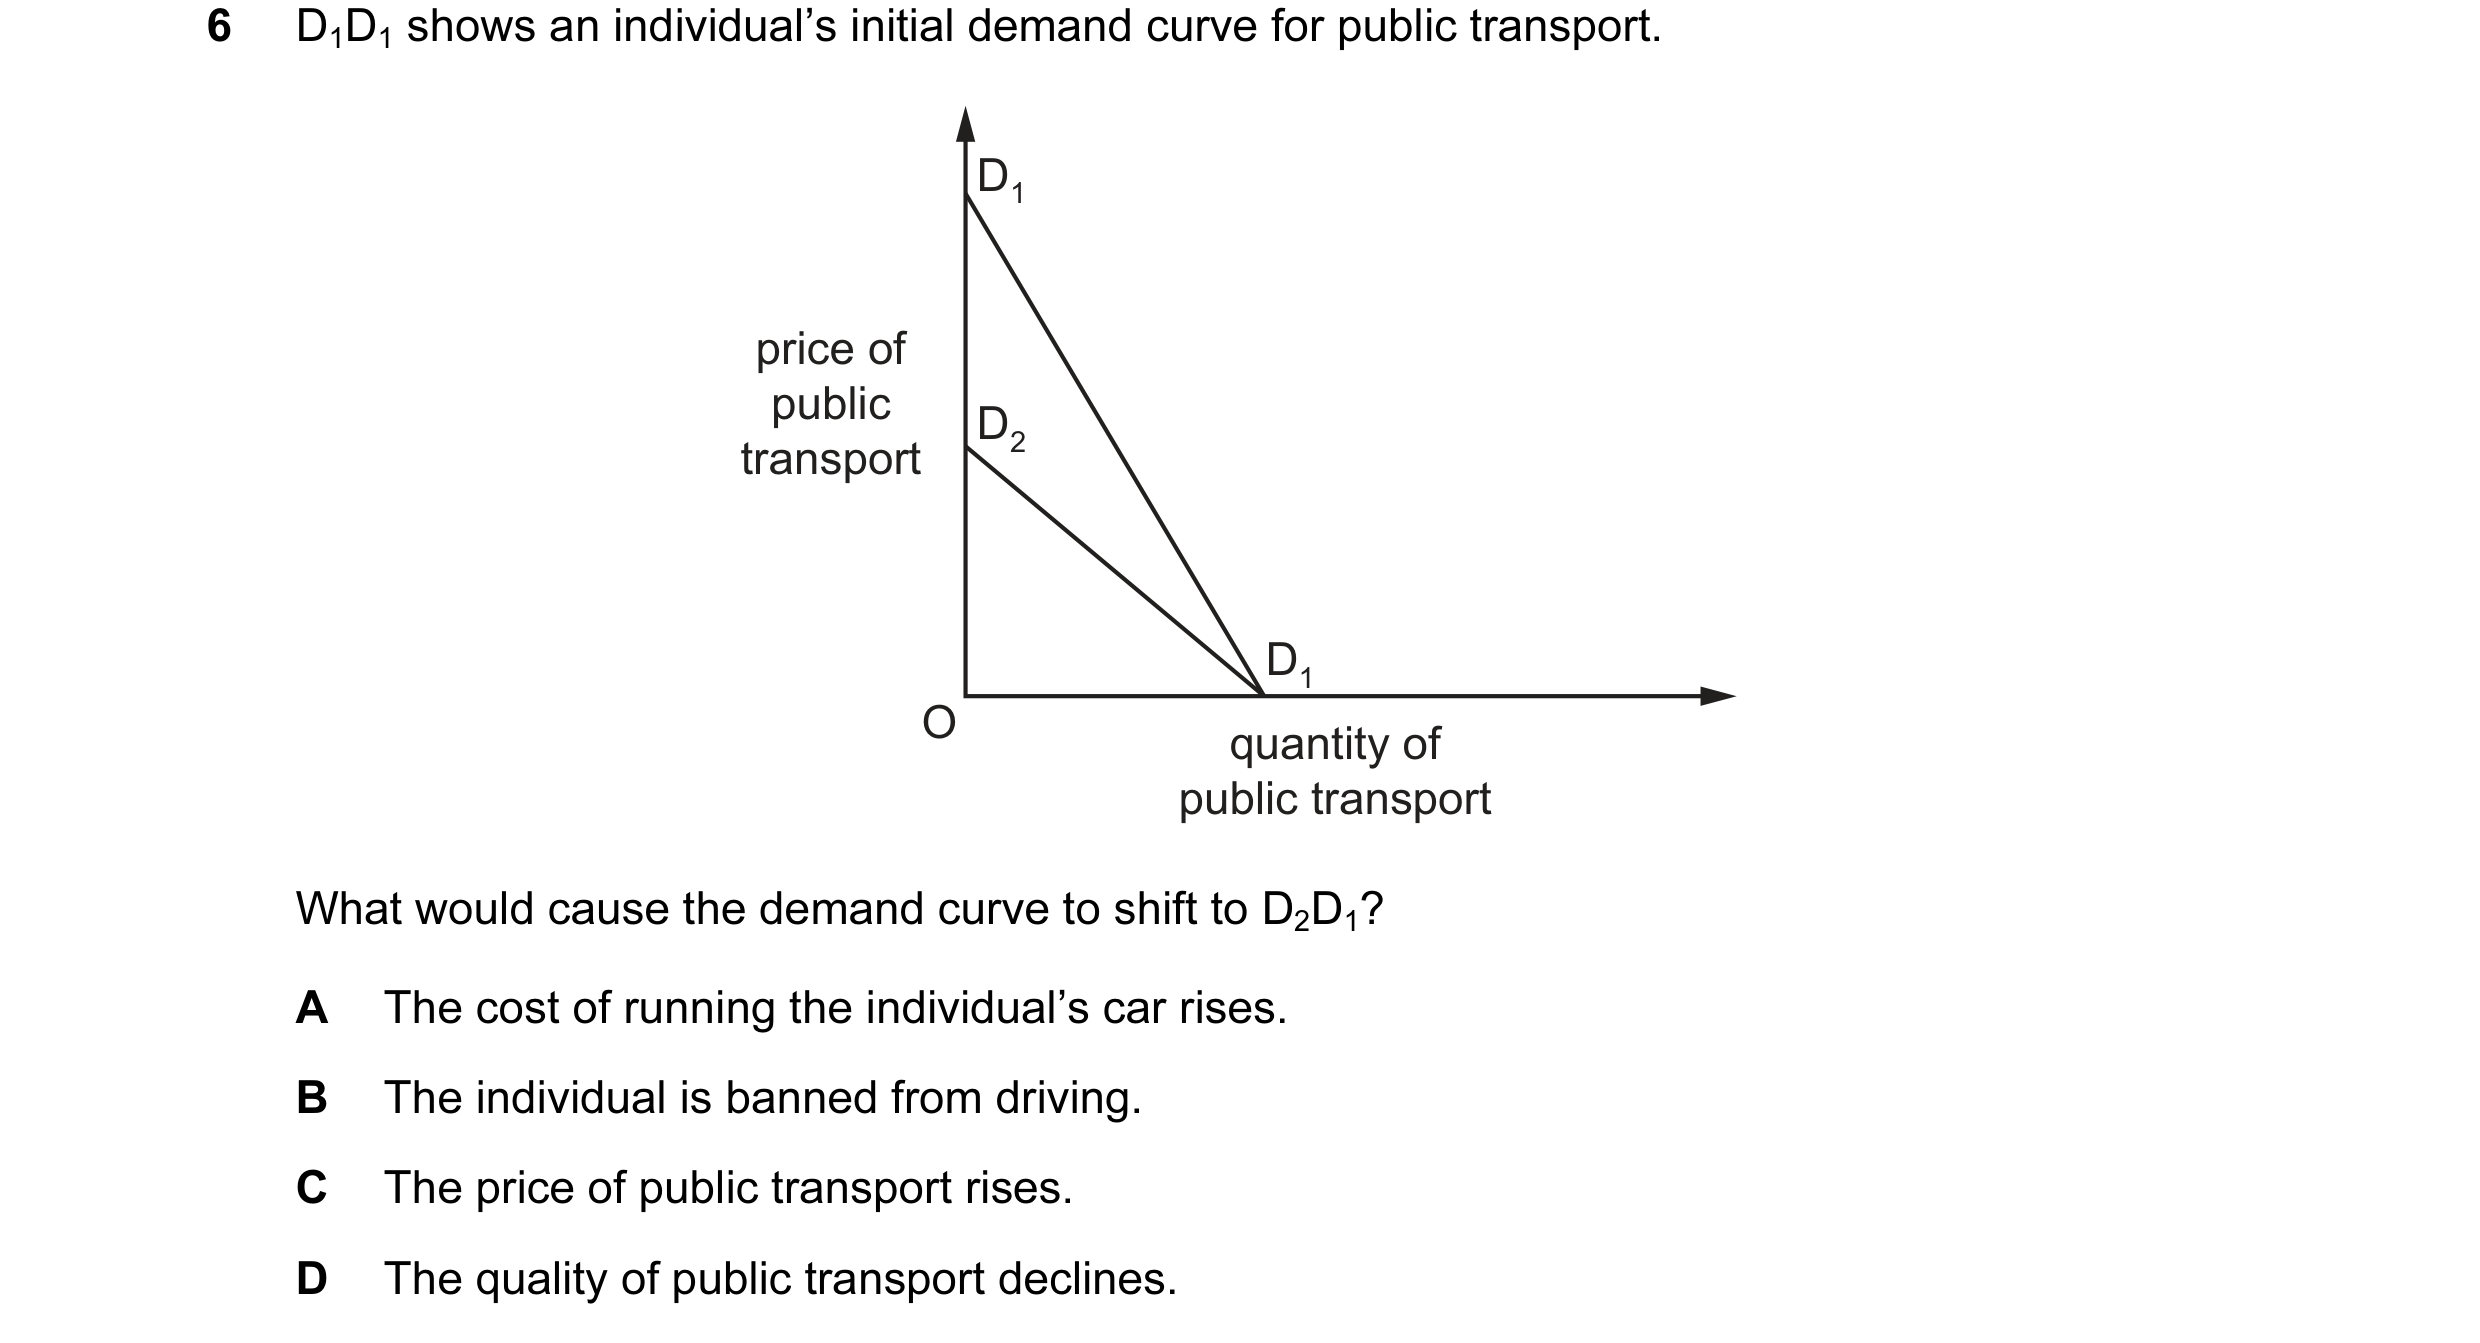 32 / 76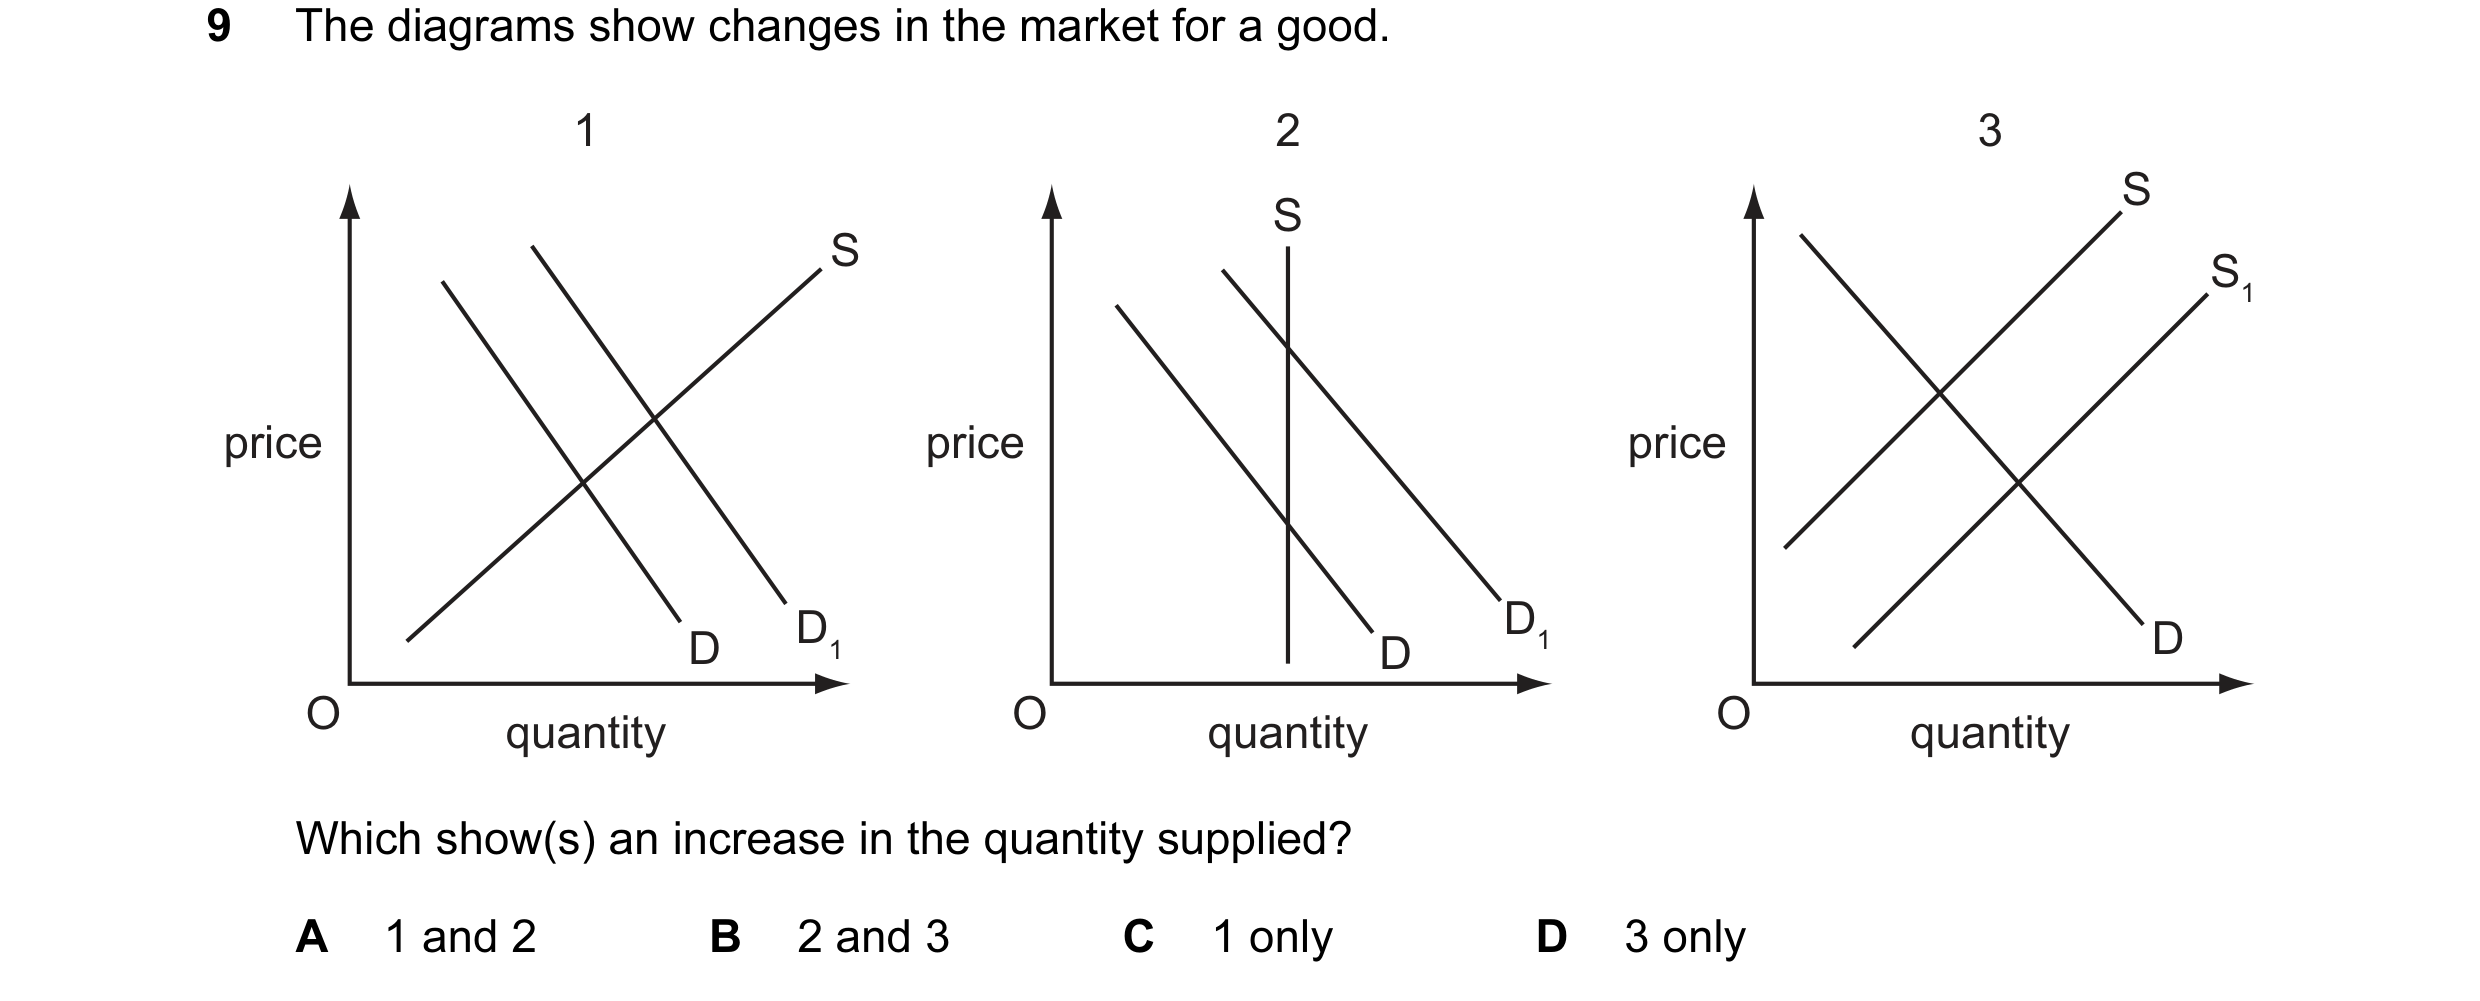

 33 / 76

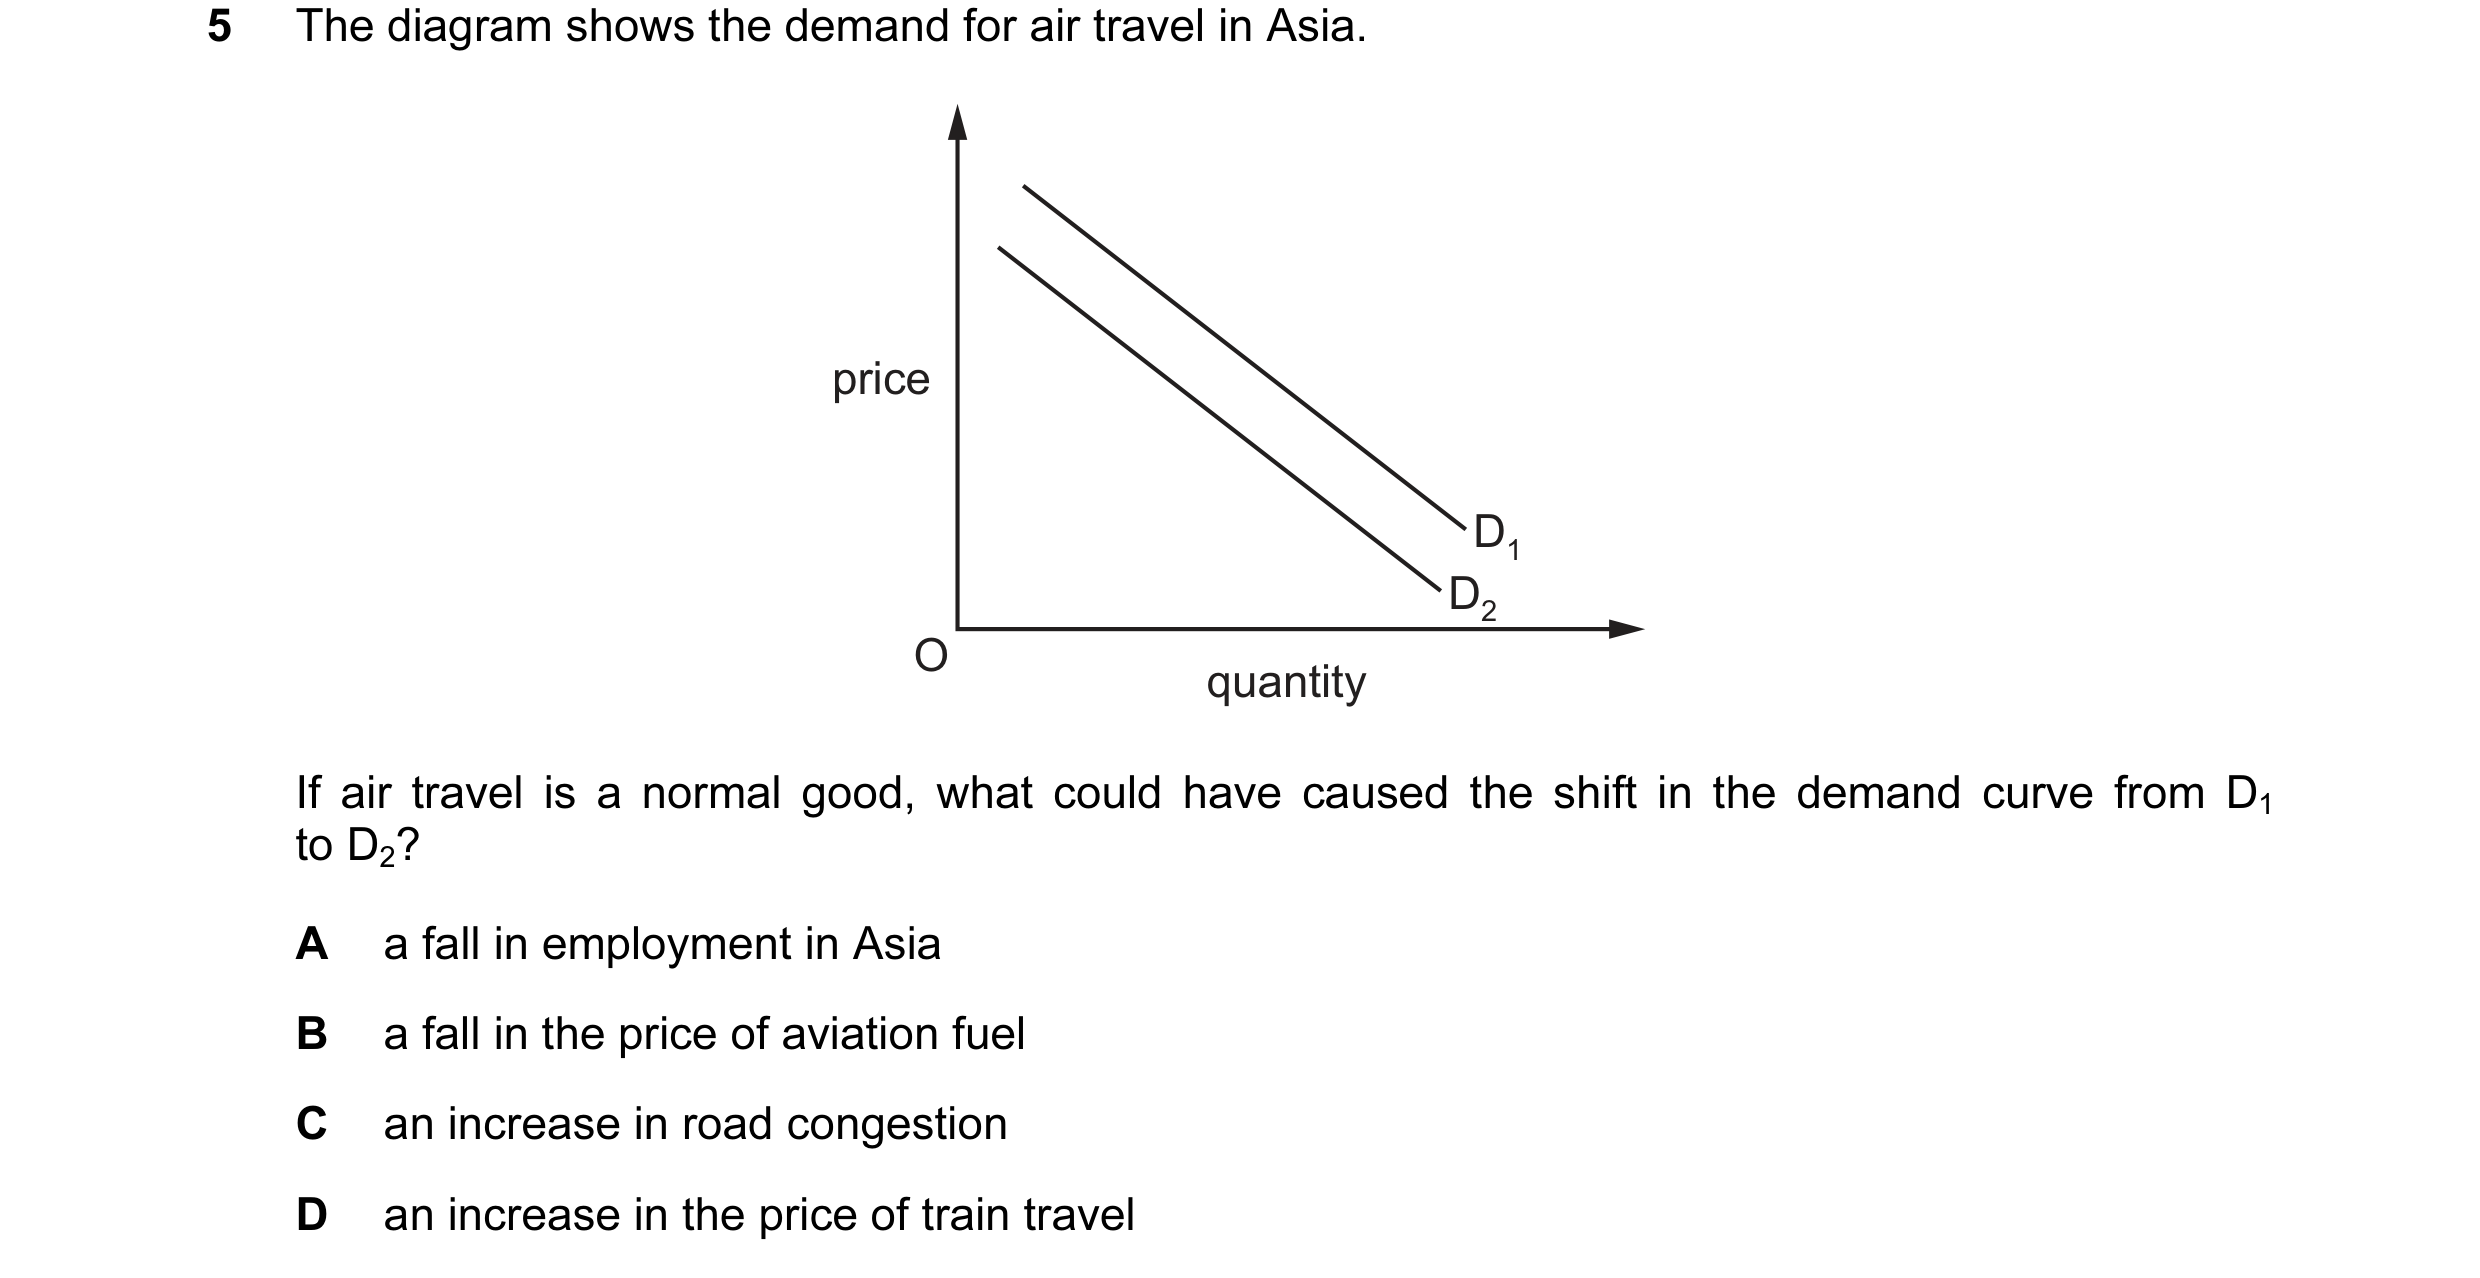
 34 / 76

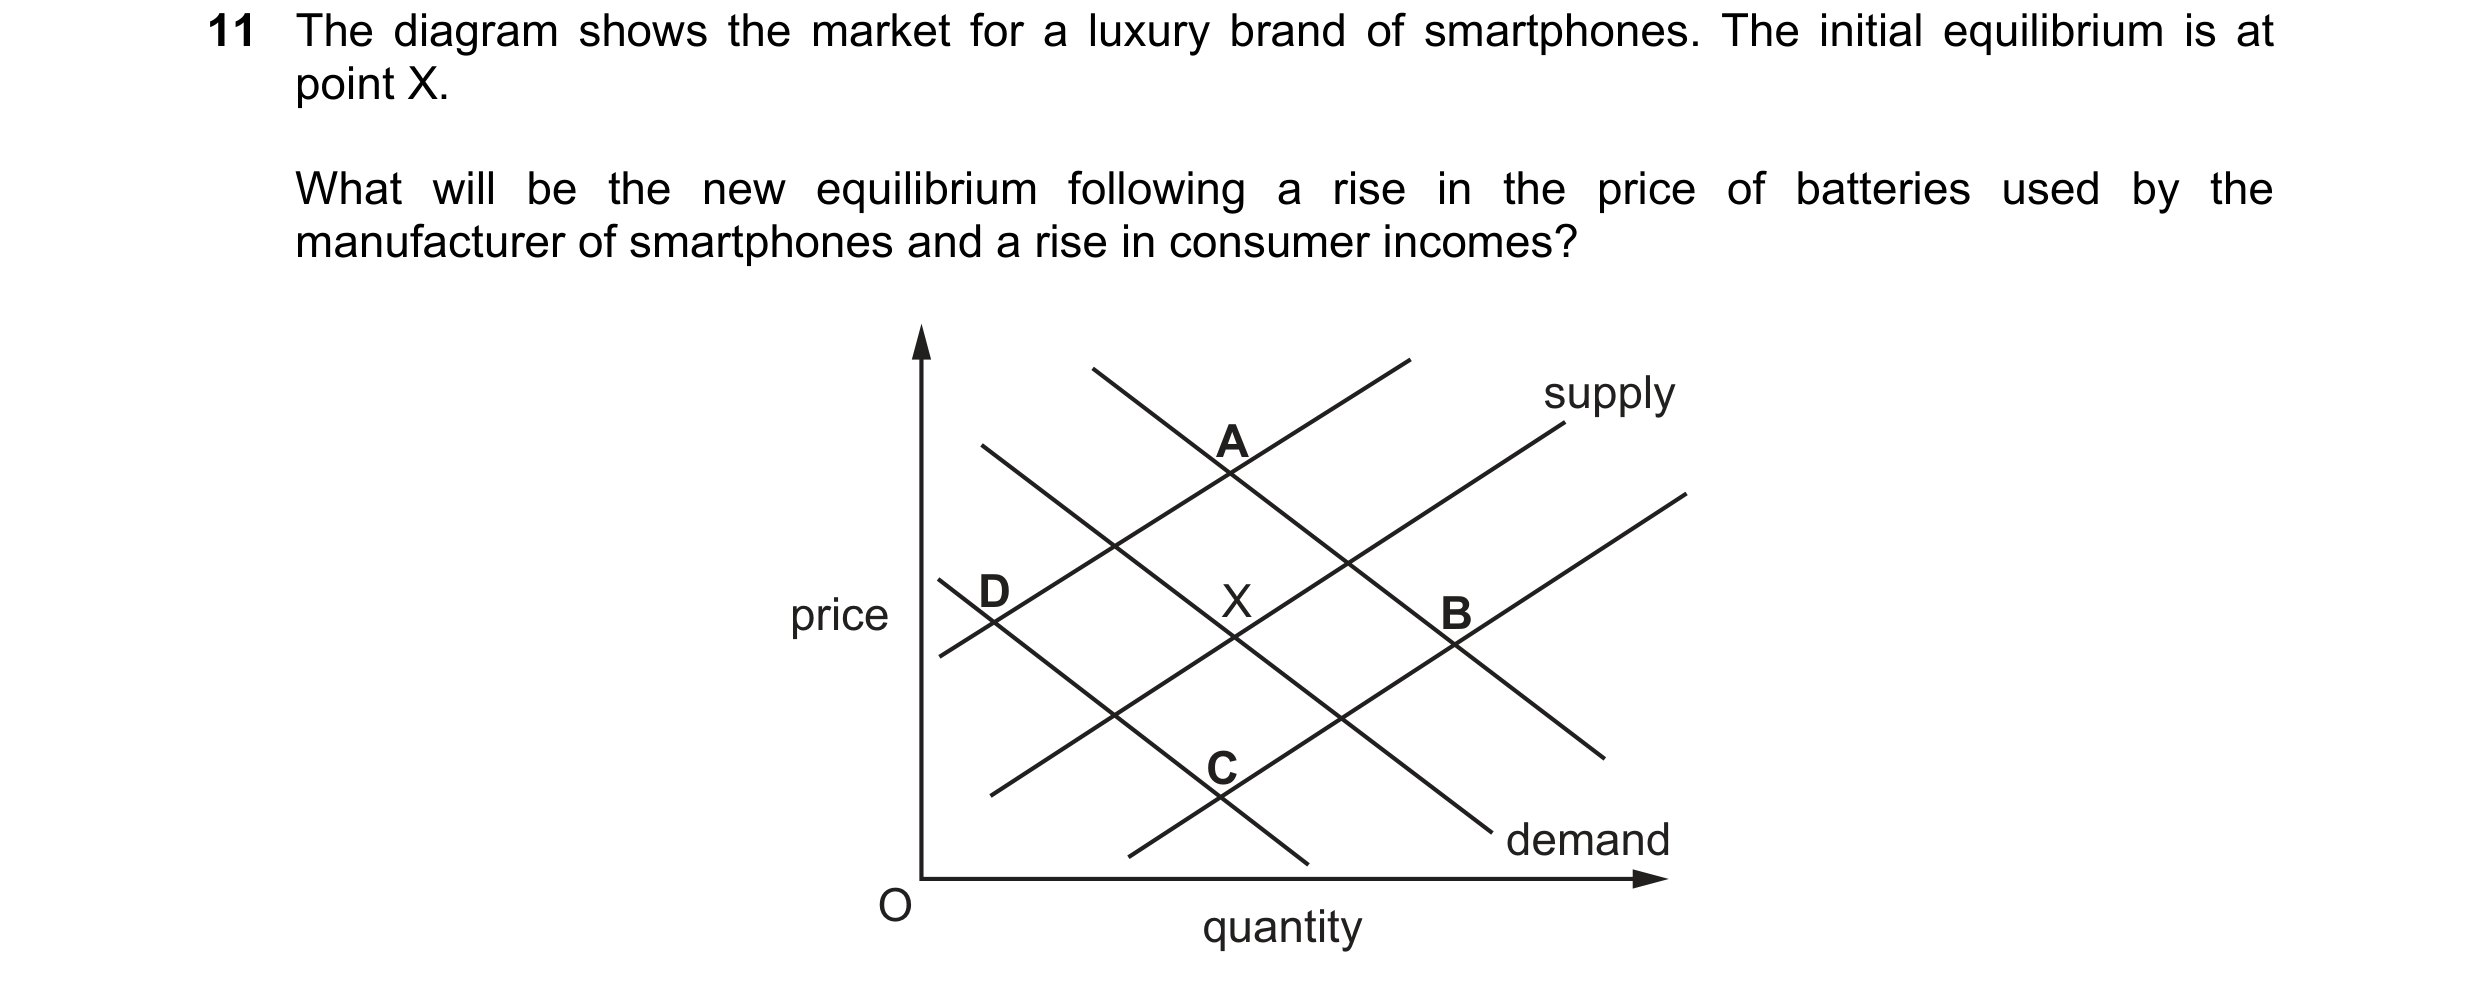

 35 / 76
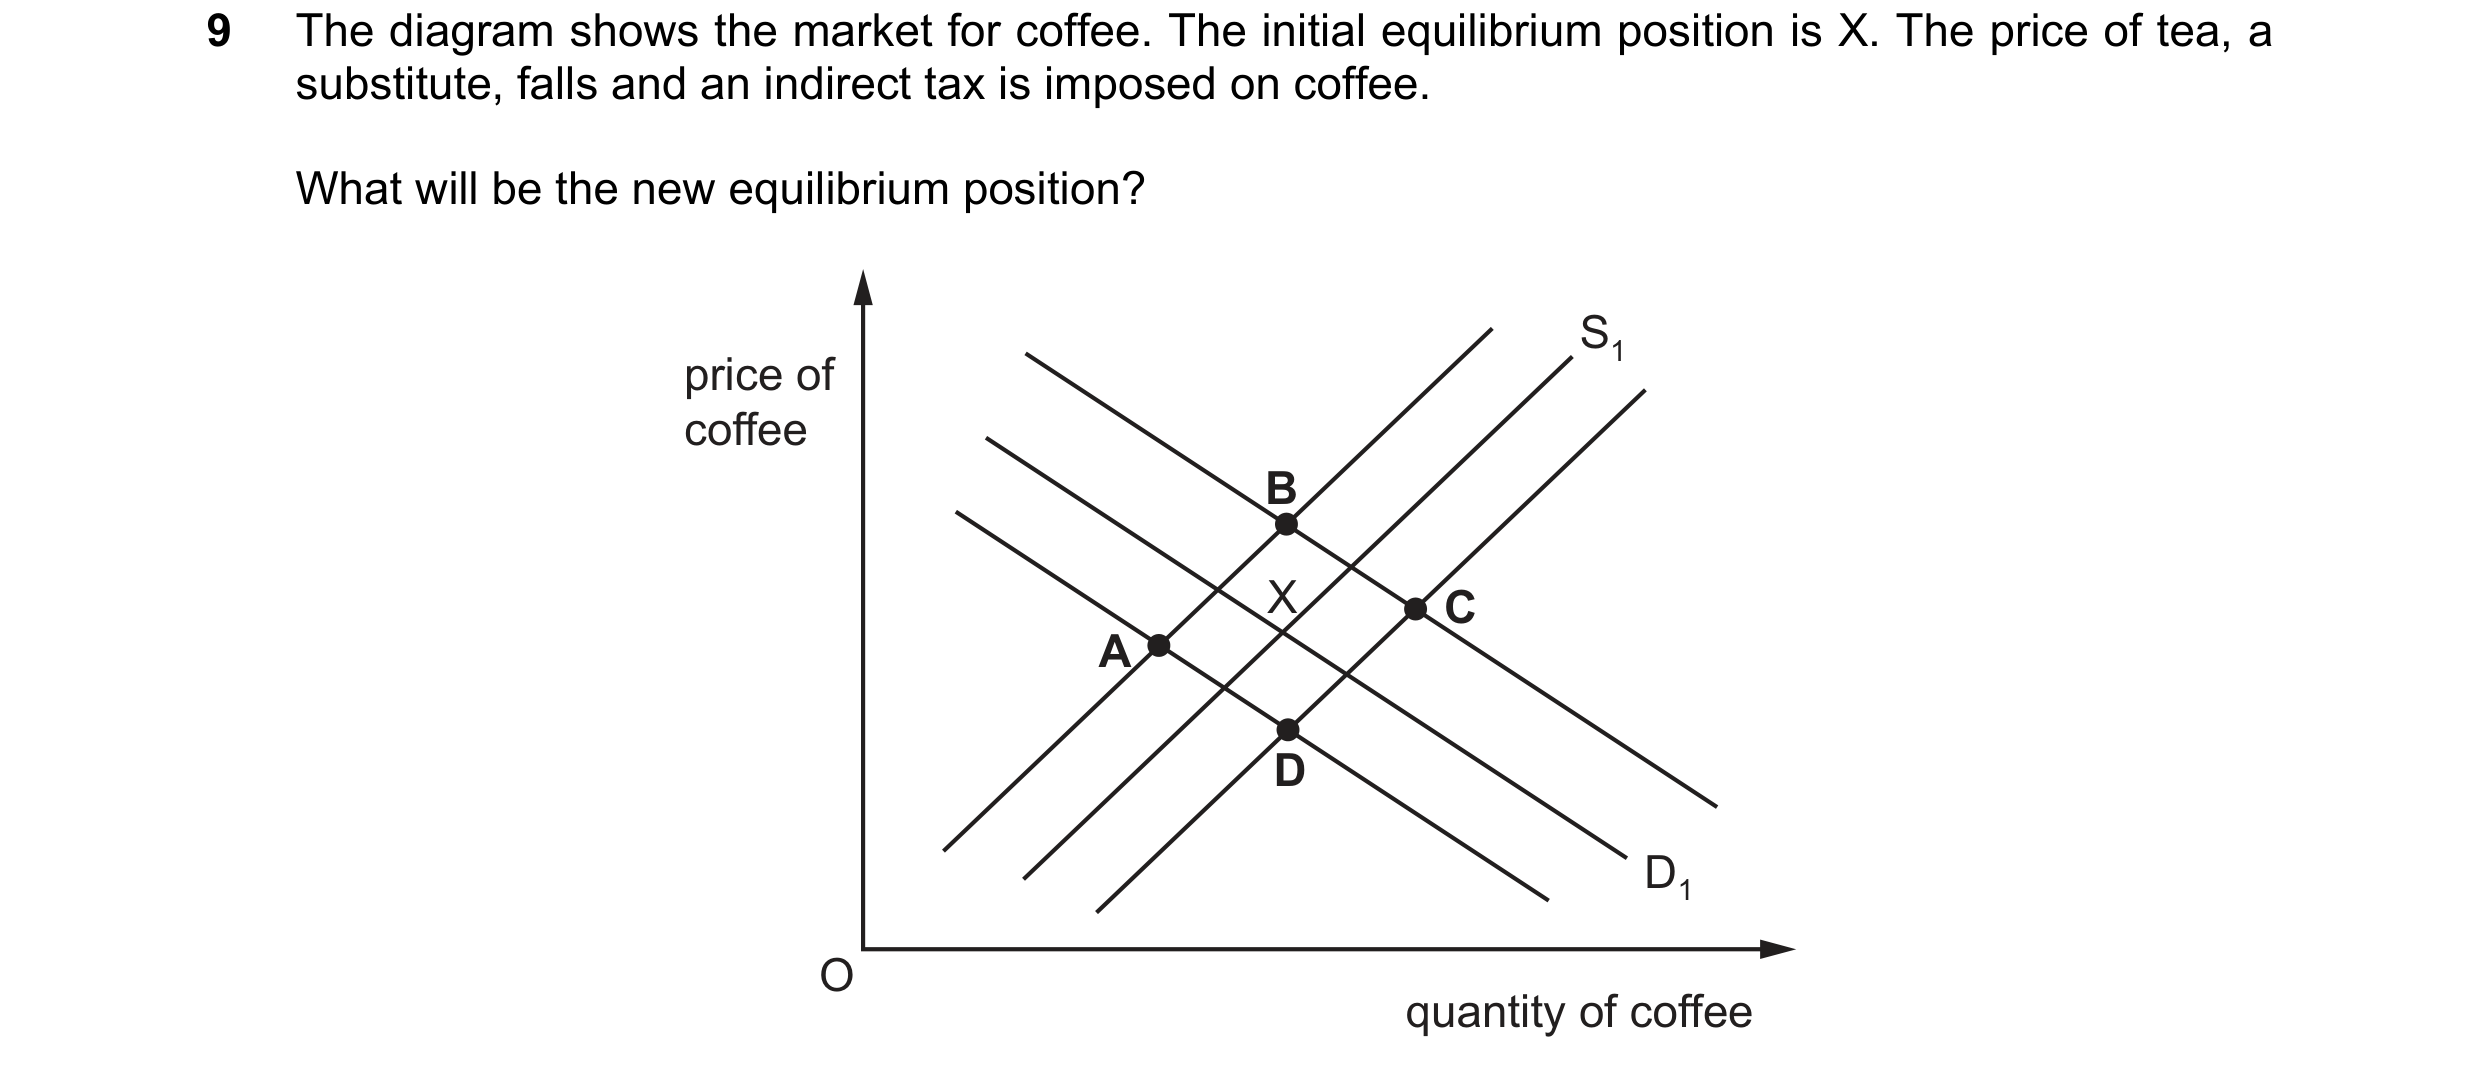
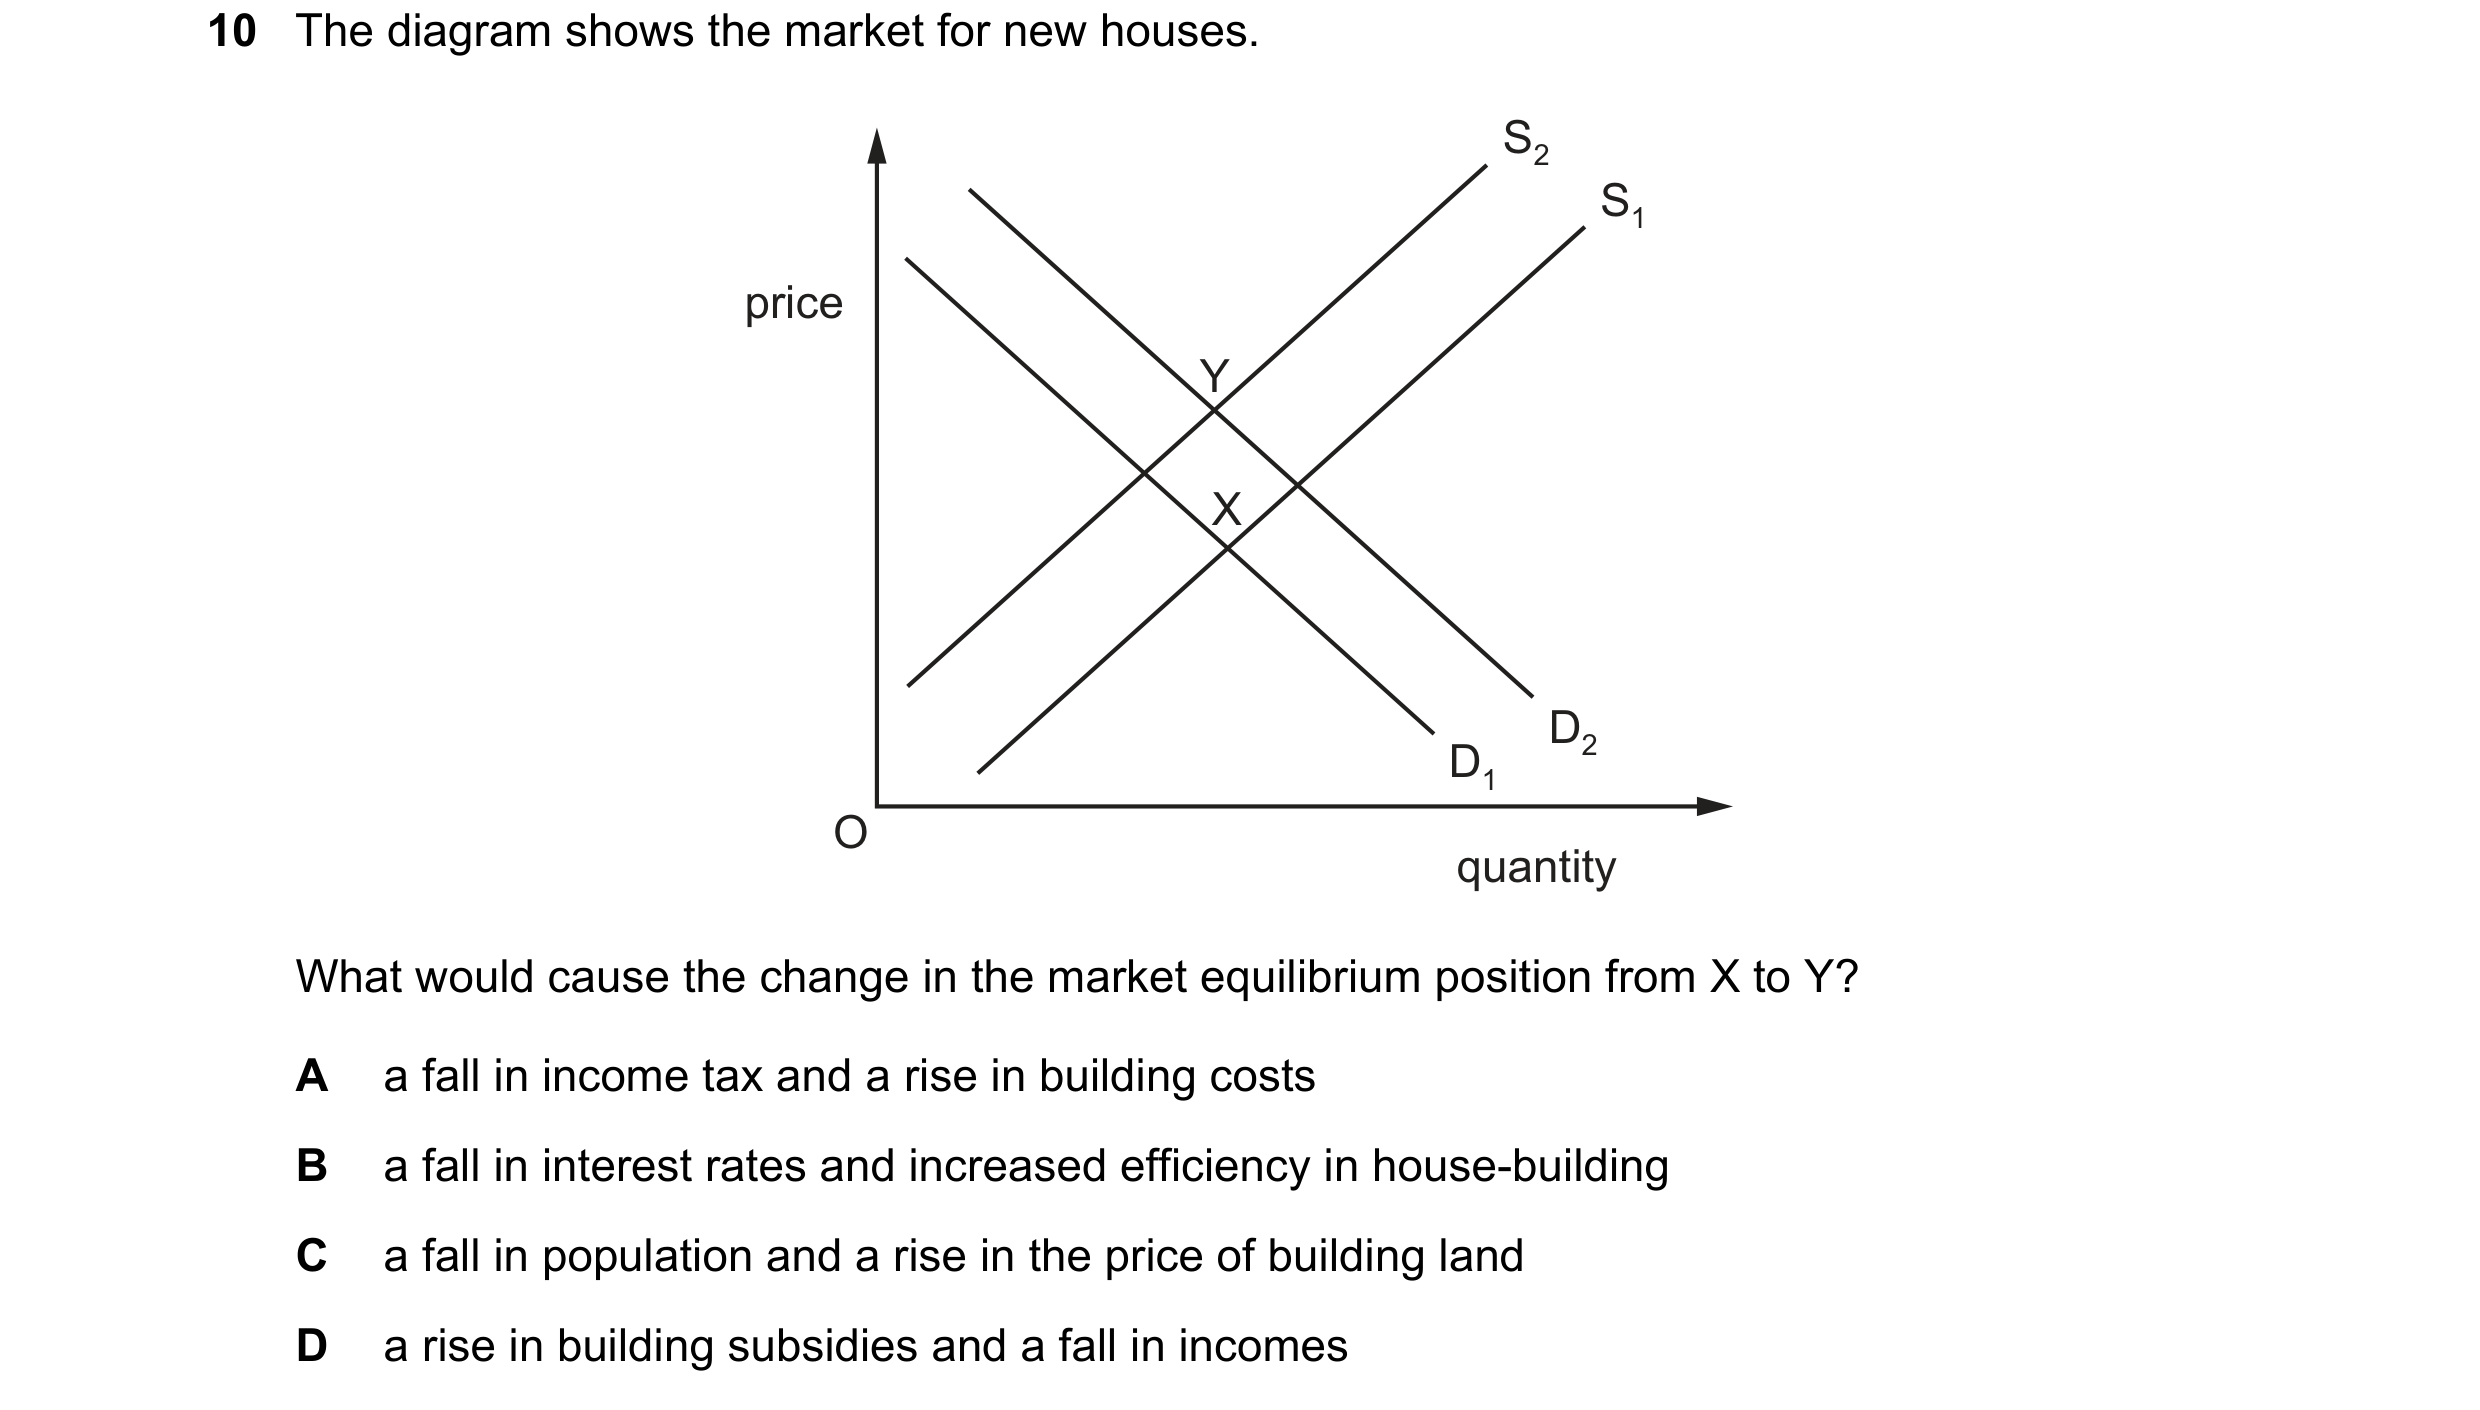 36 / 76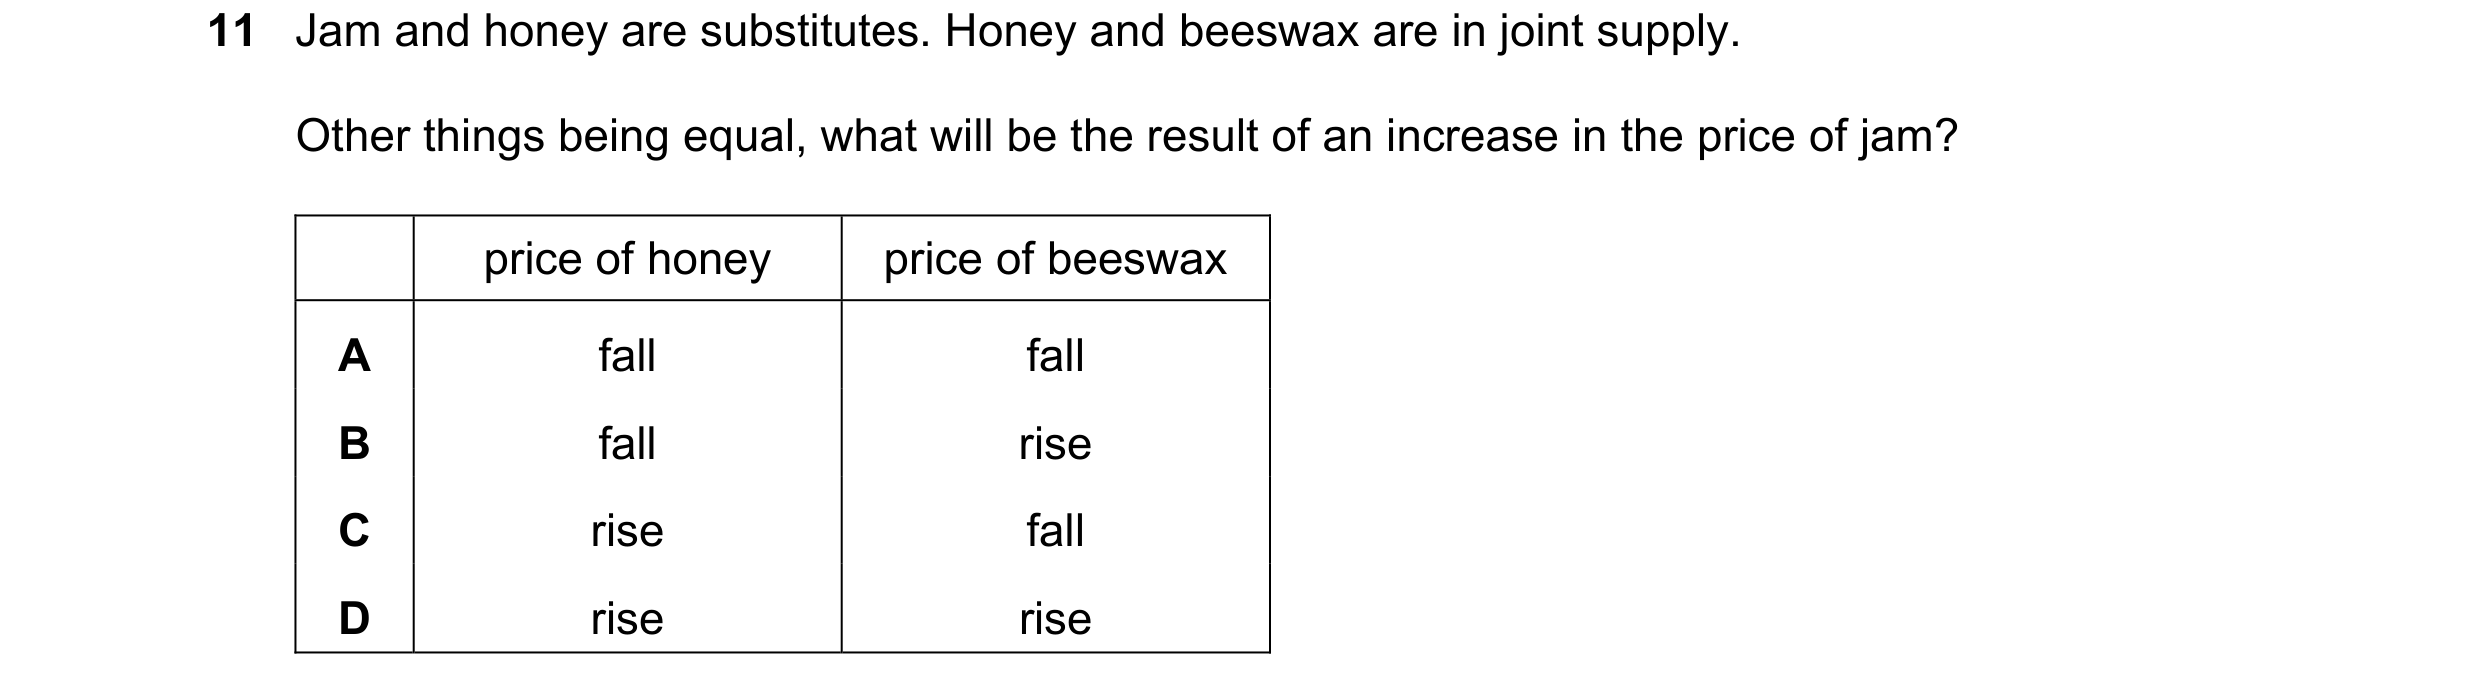
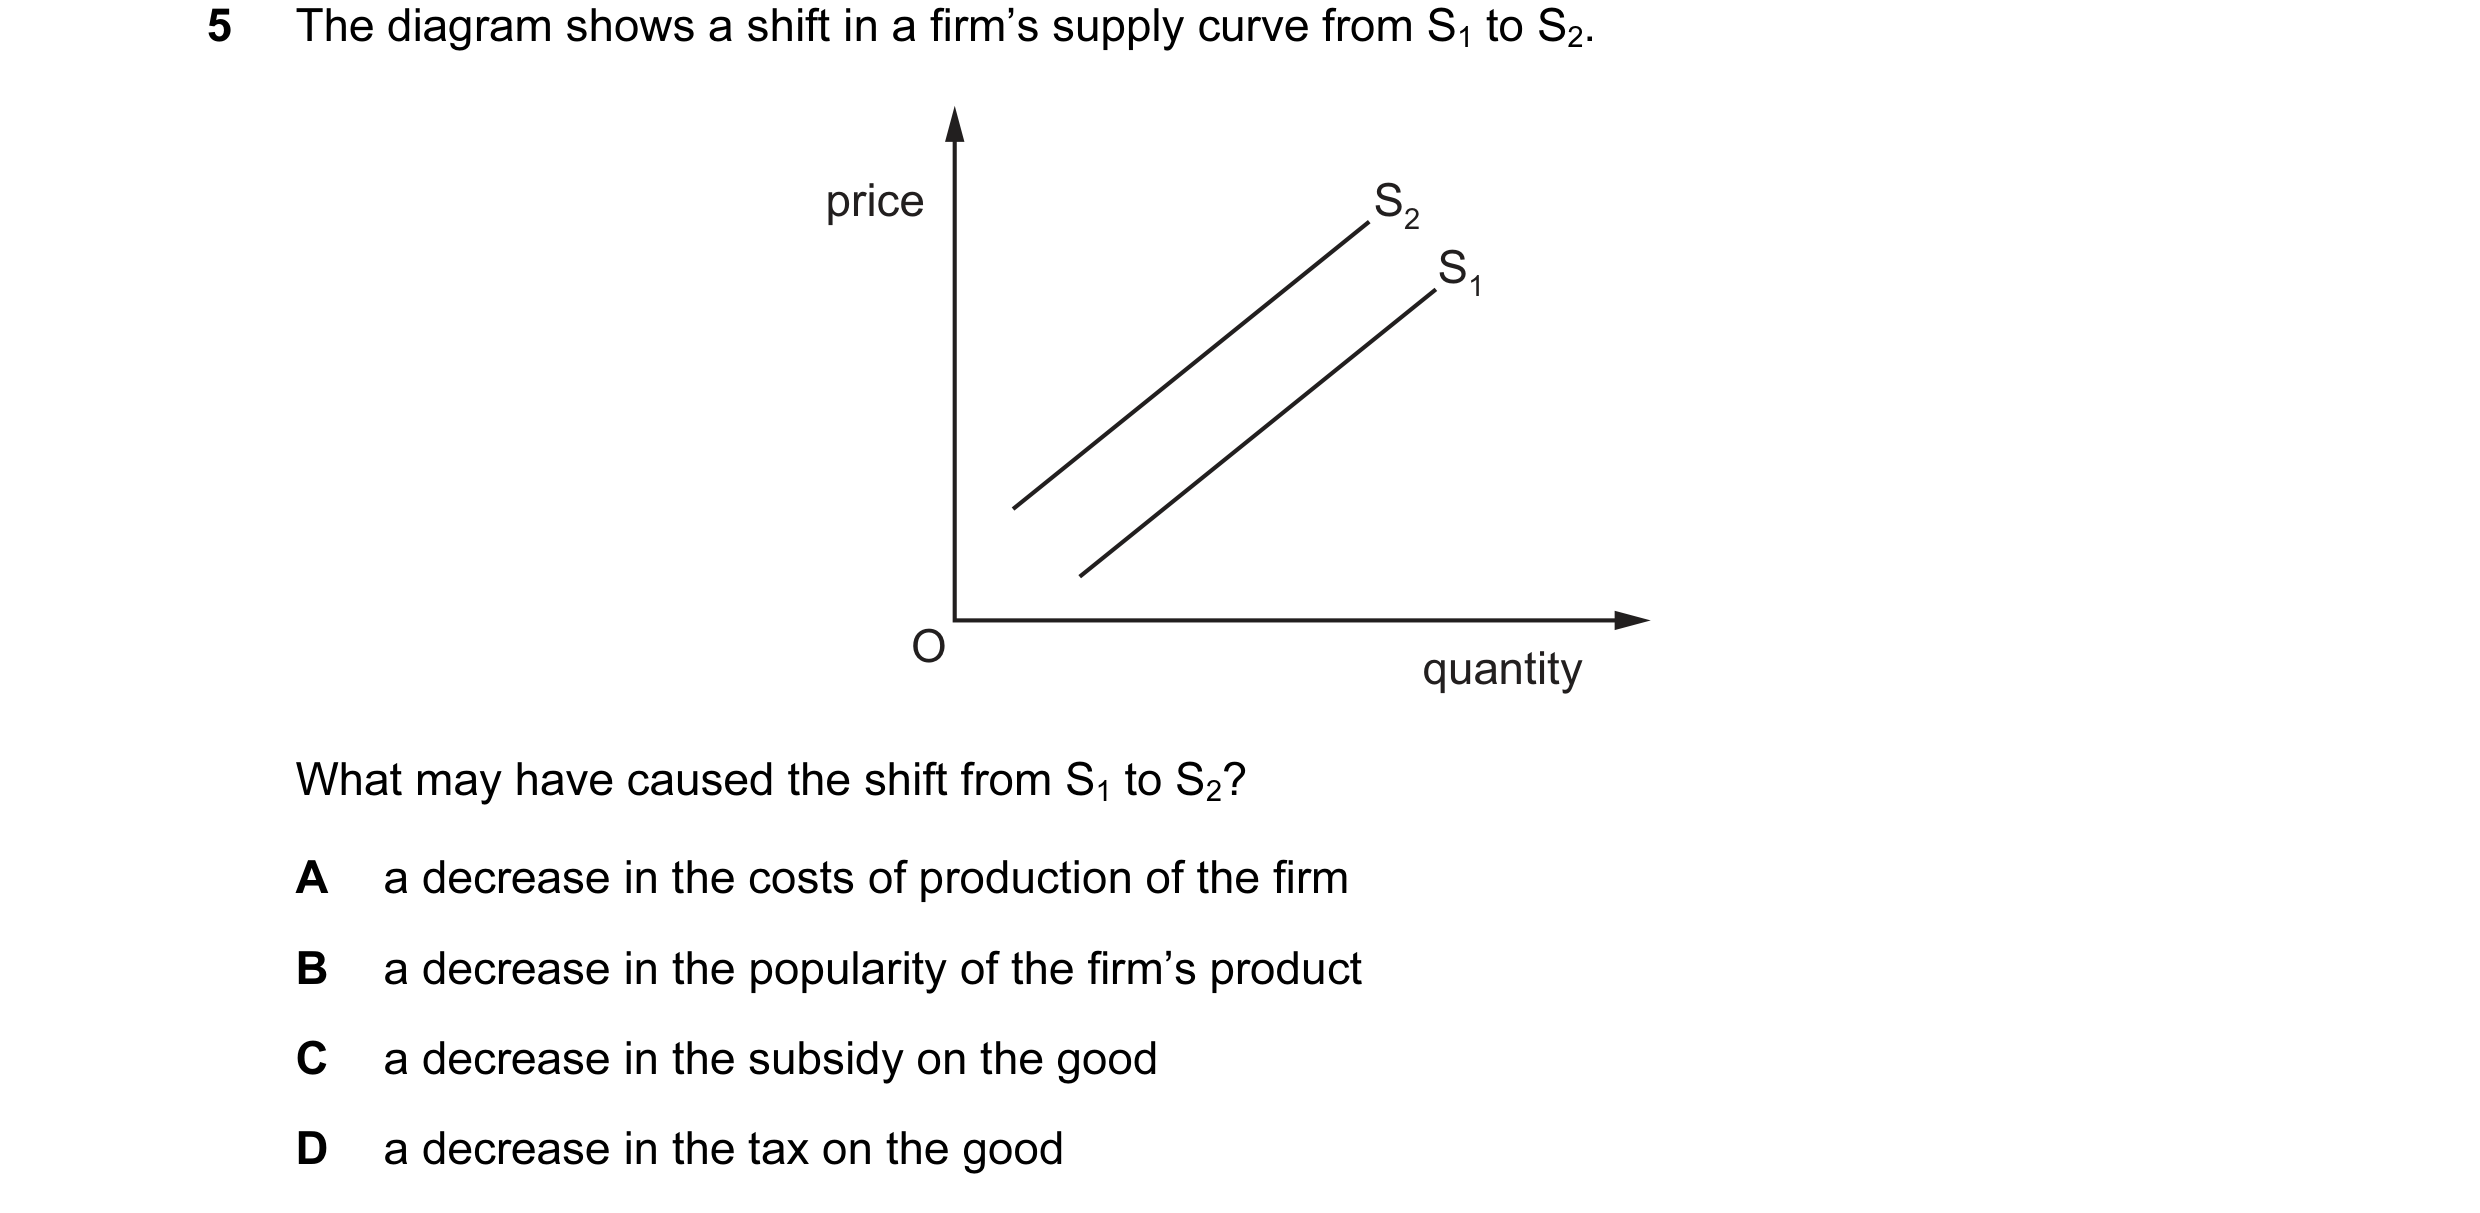
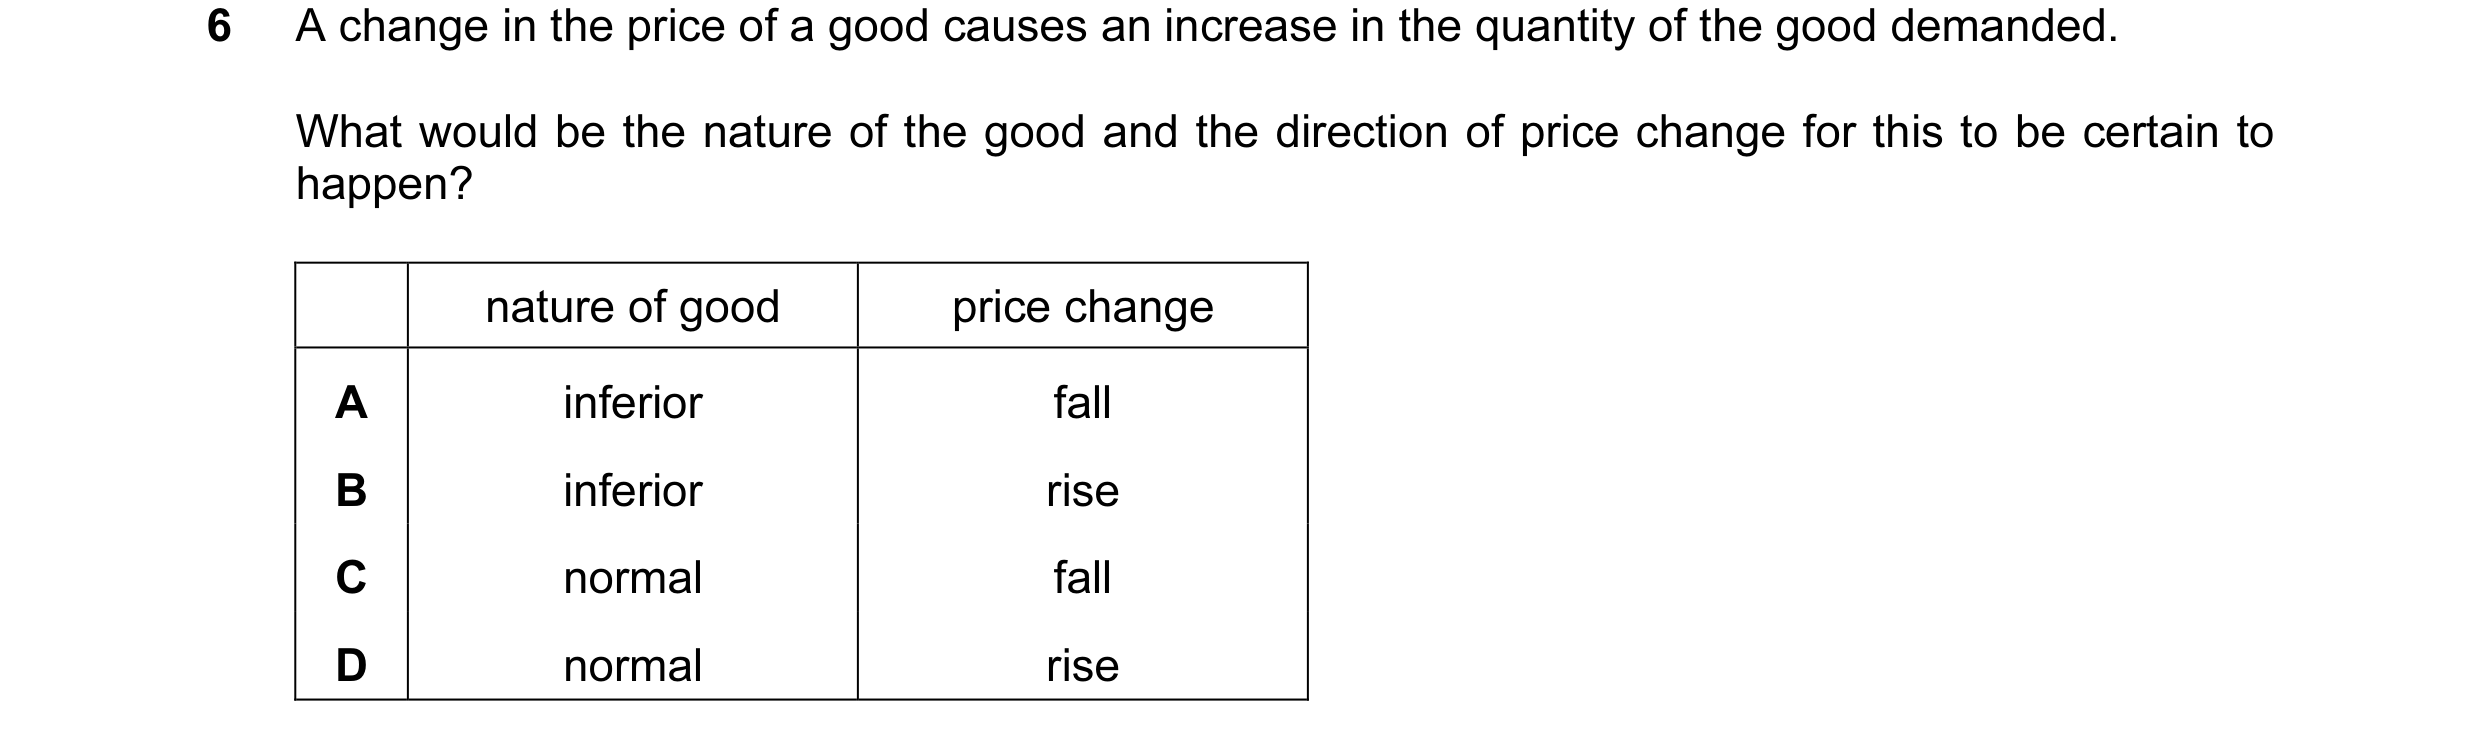
 37 / 76
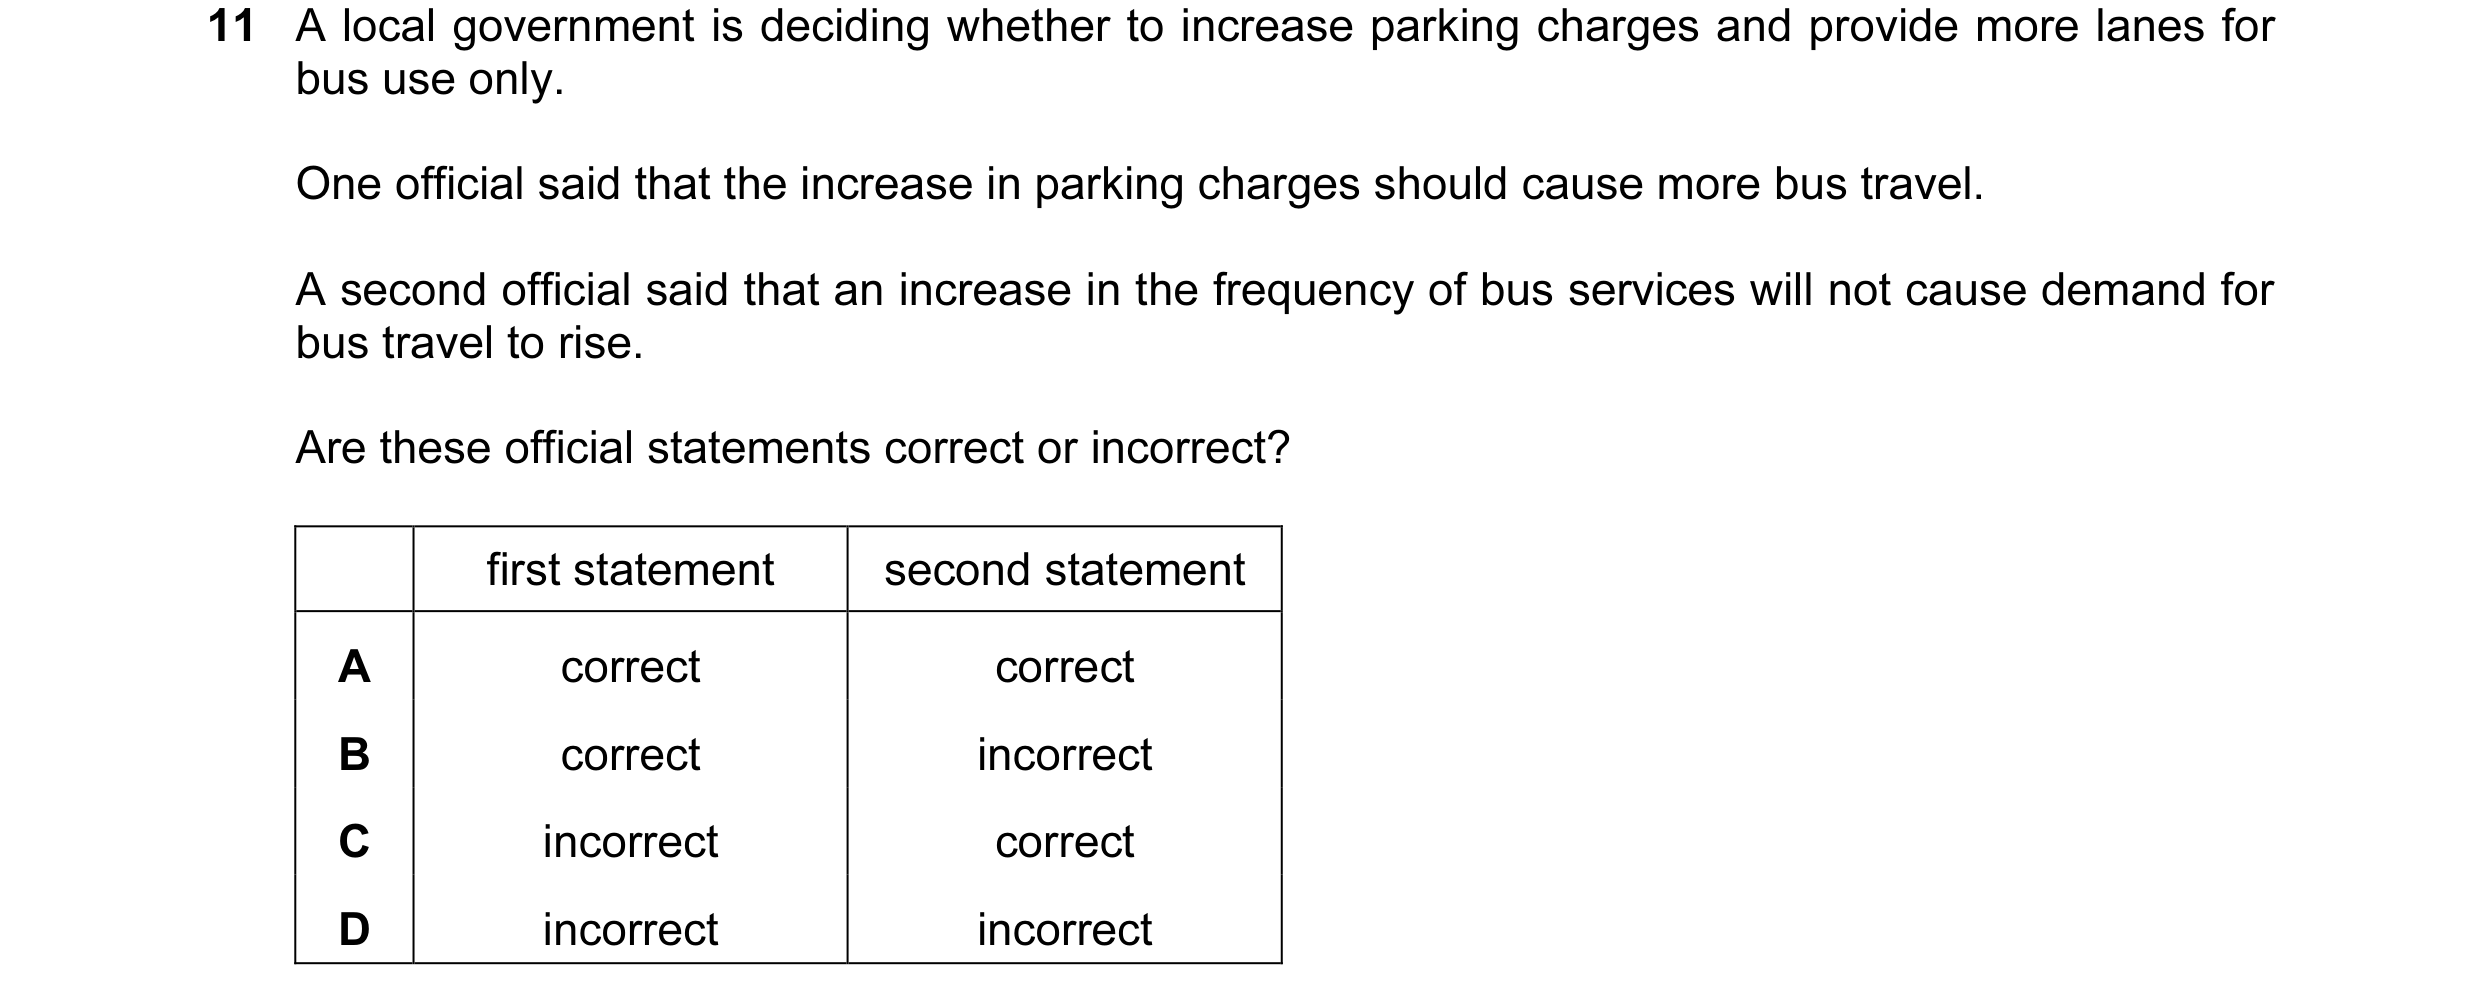
 38 / 76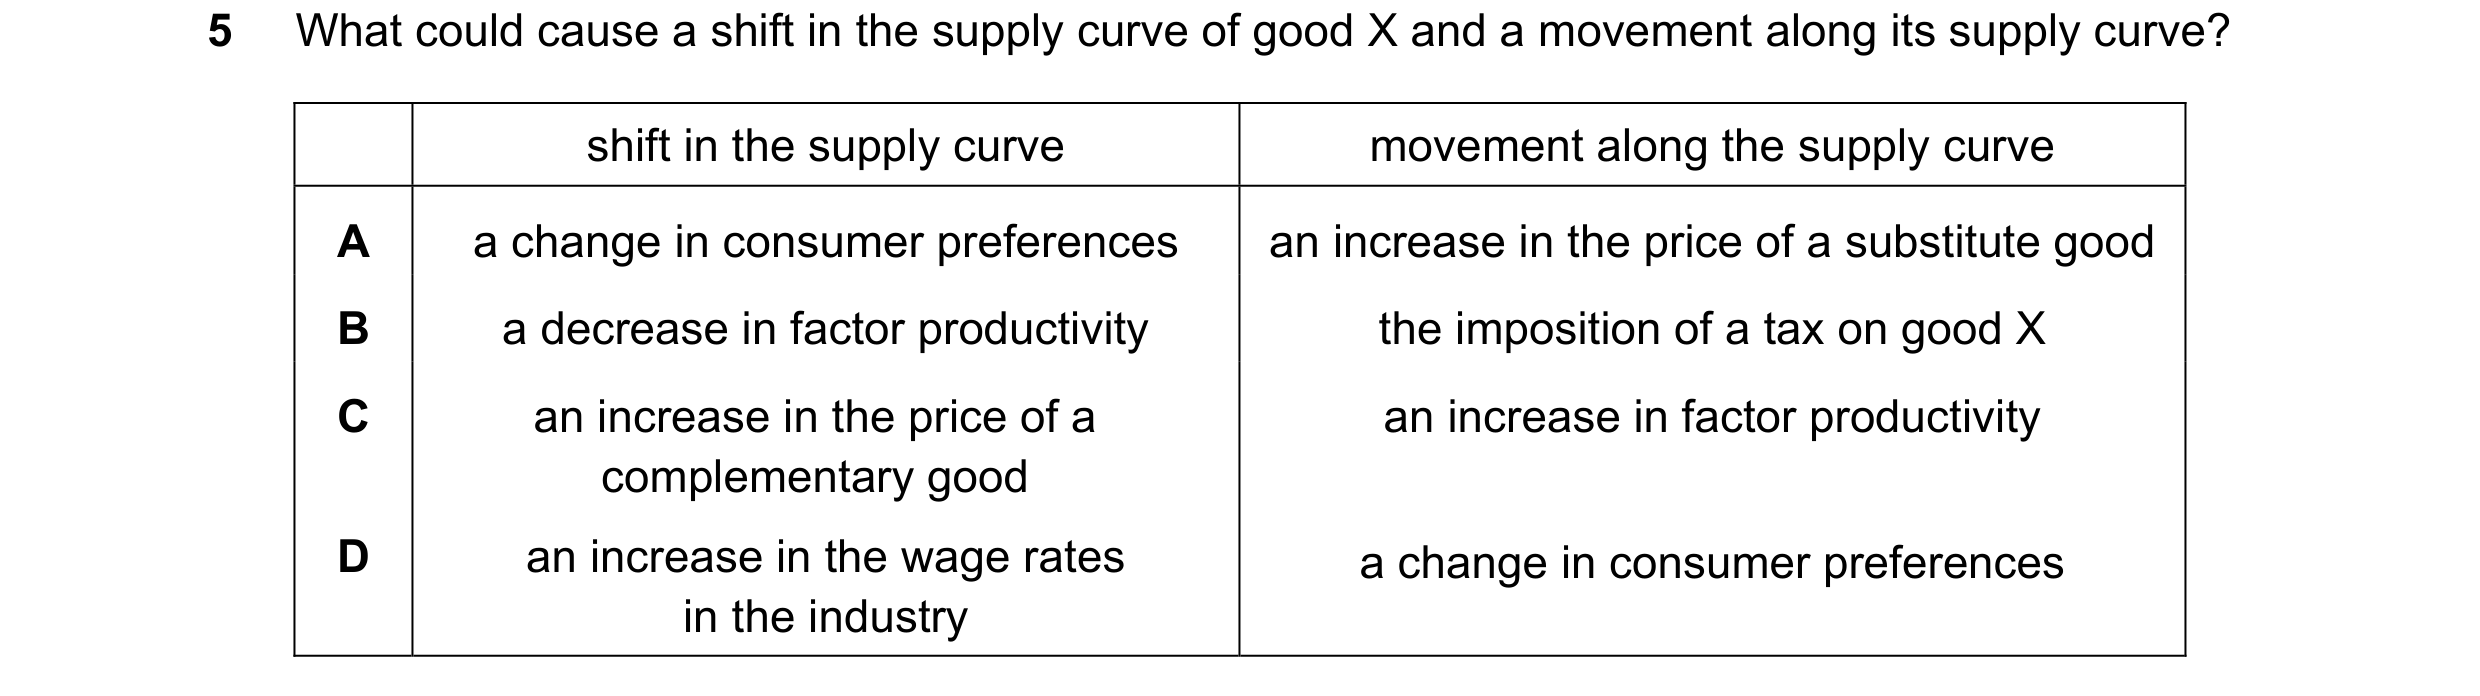


 39 / 76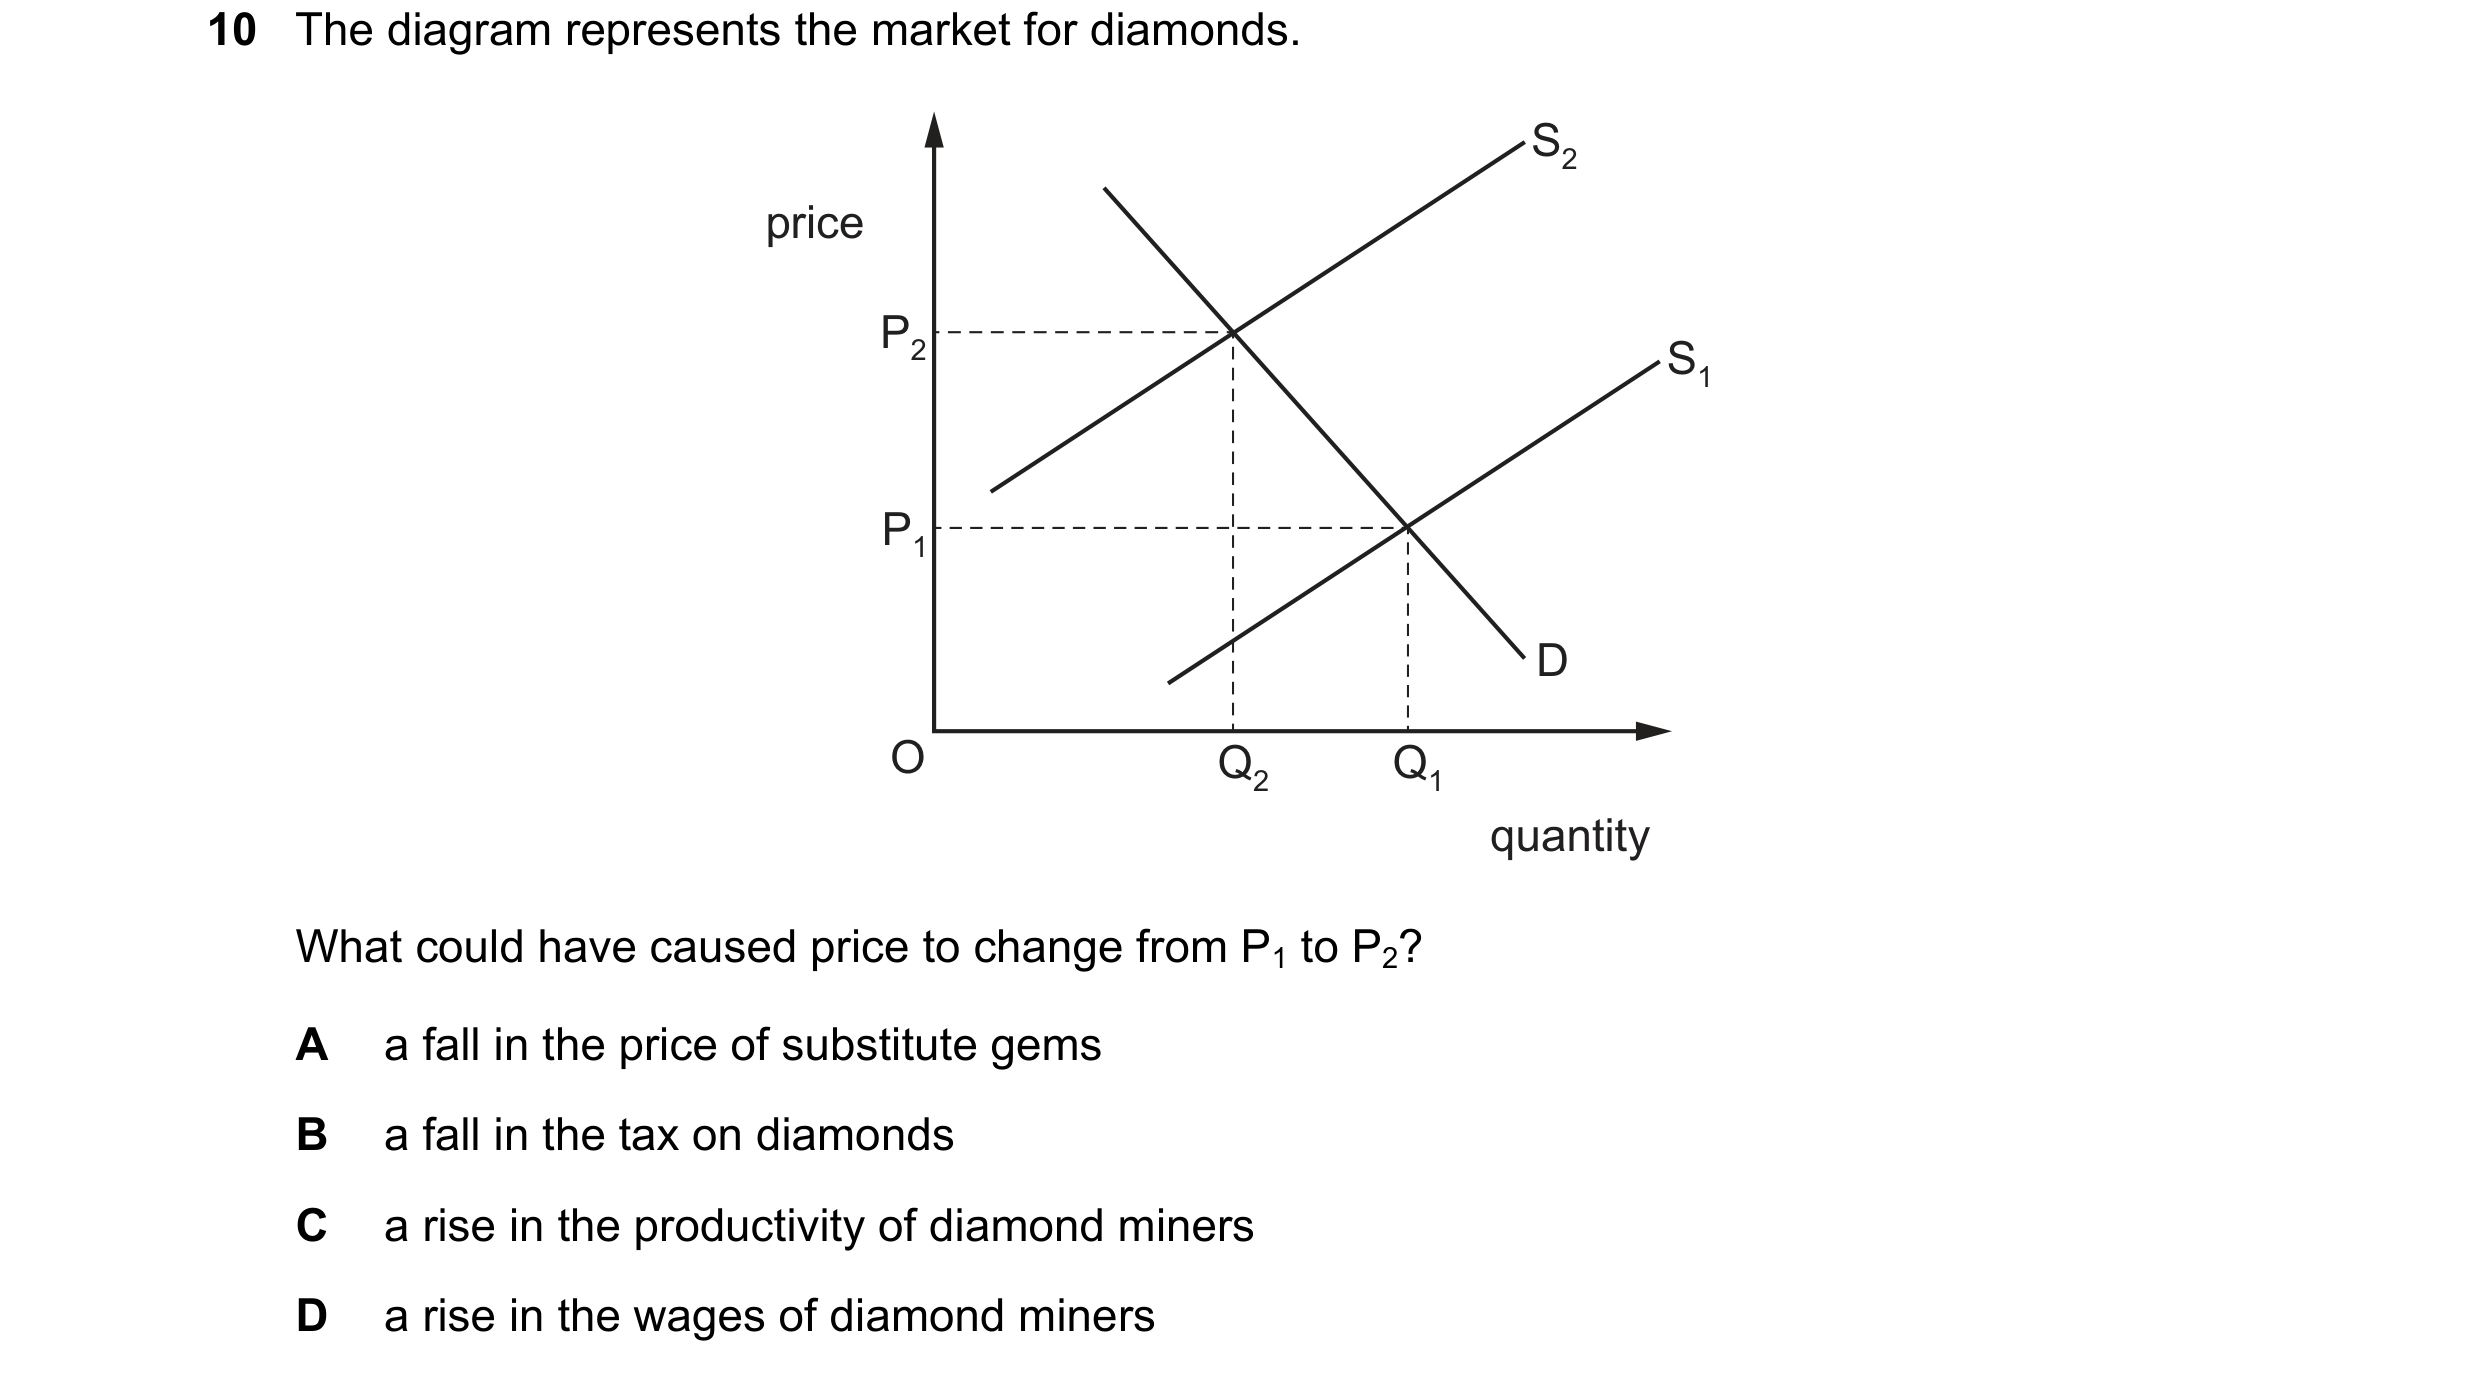
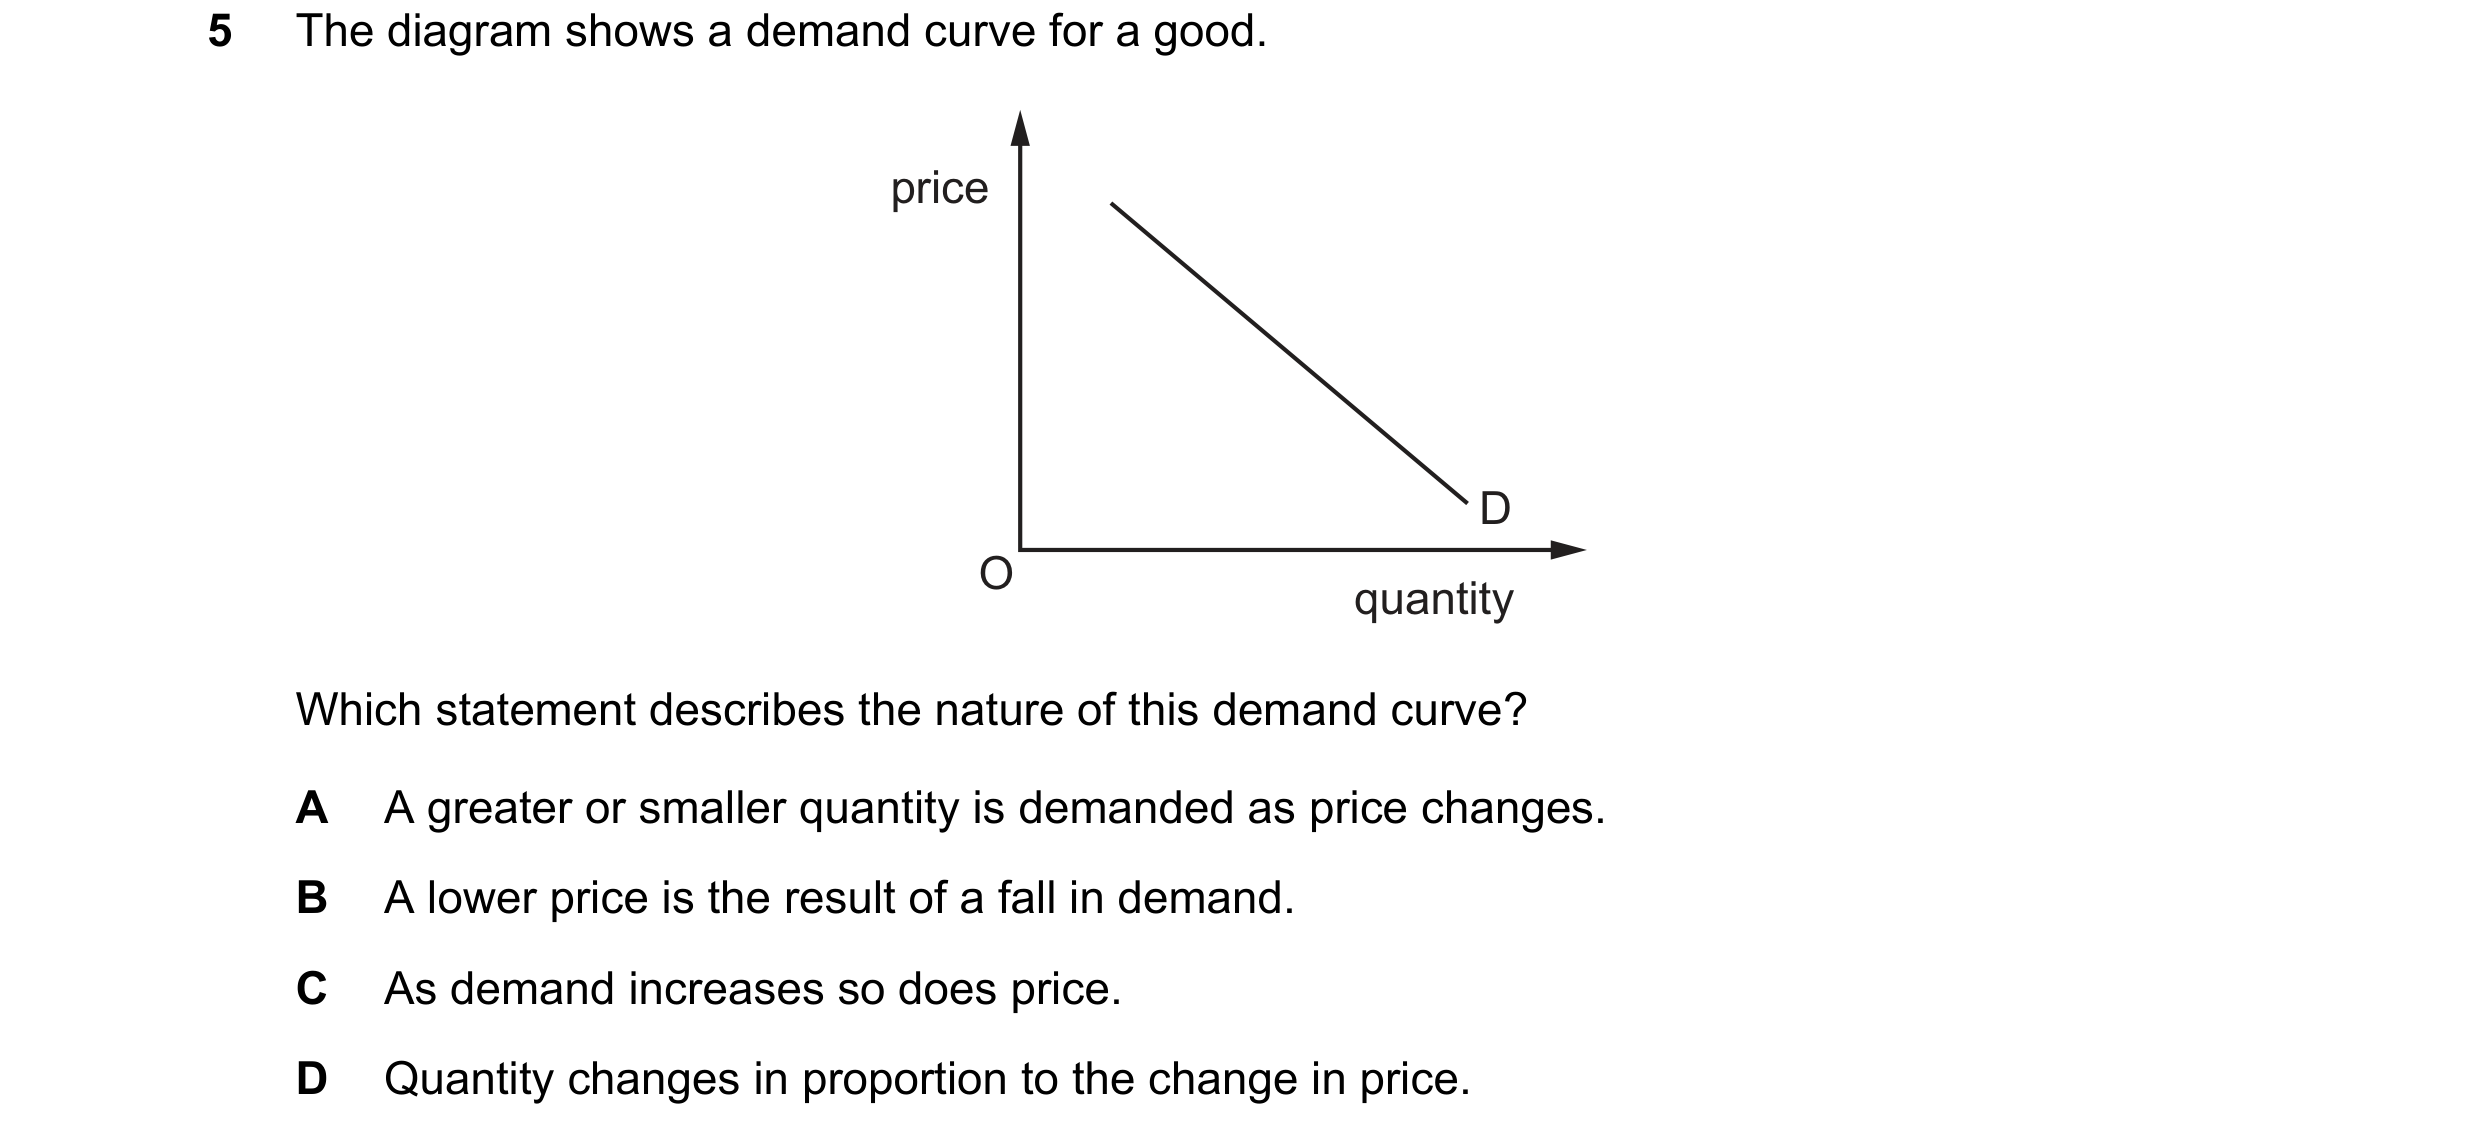 40 / 76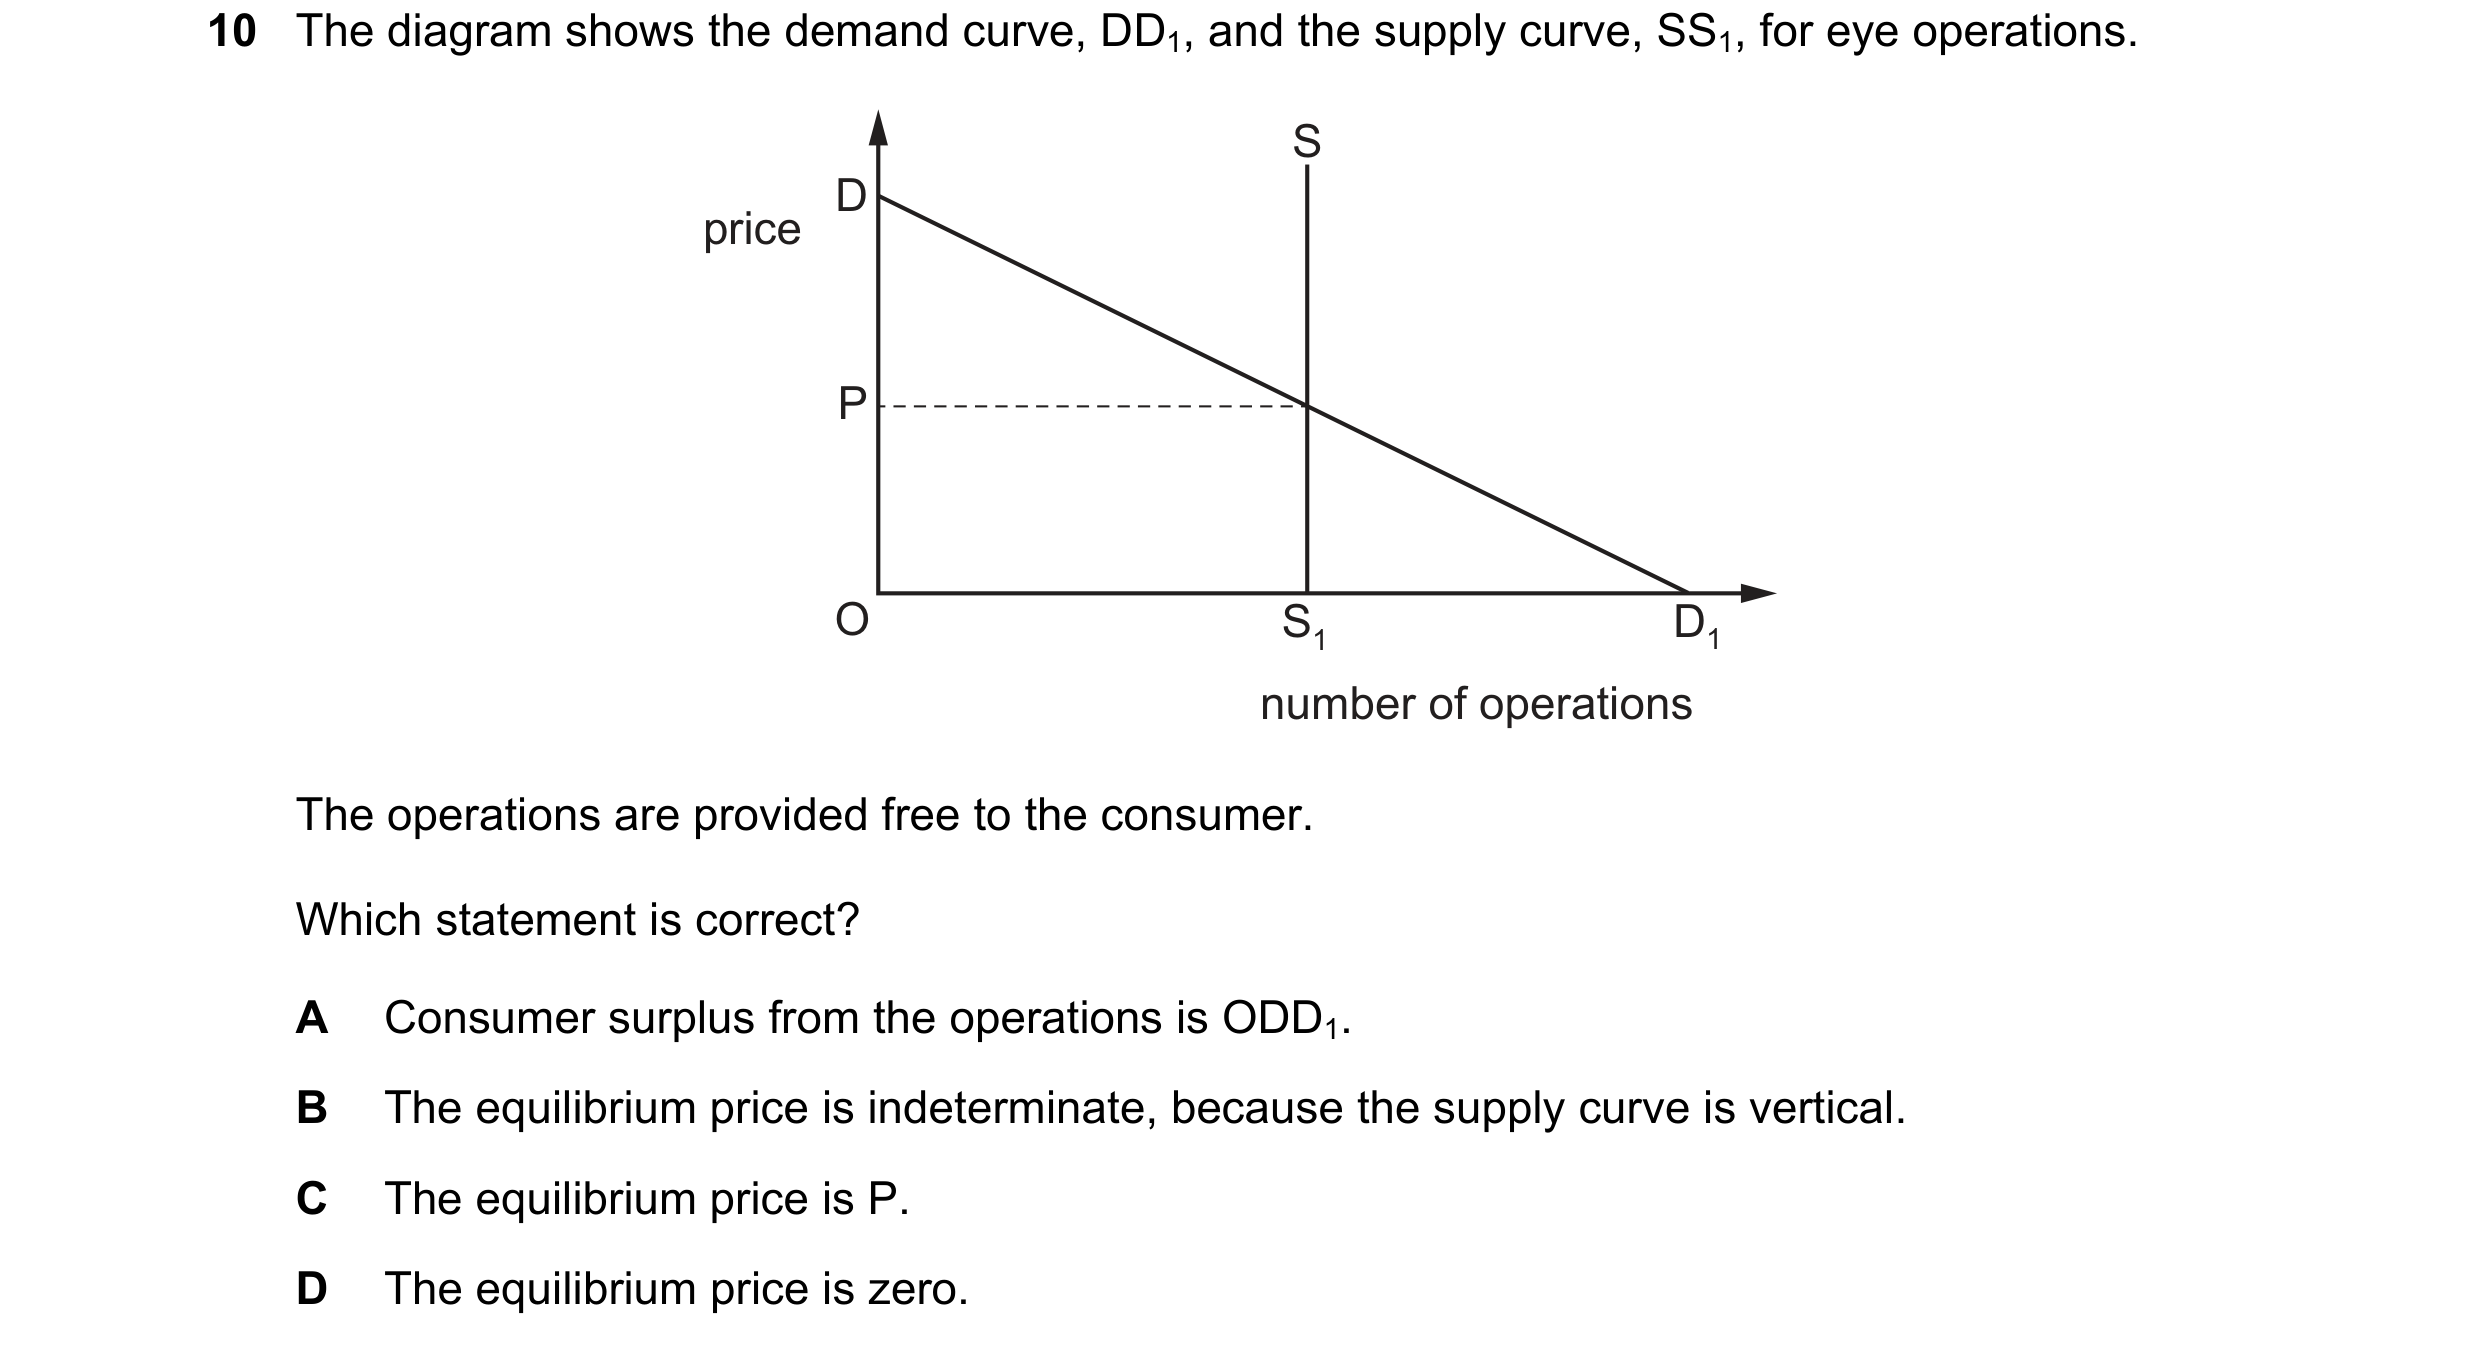
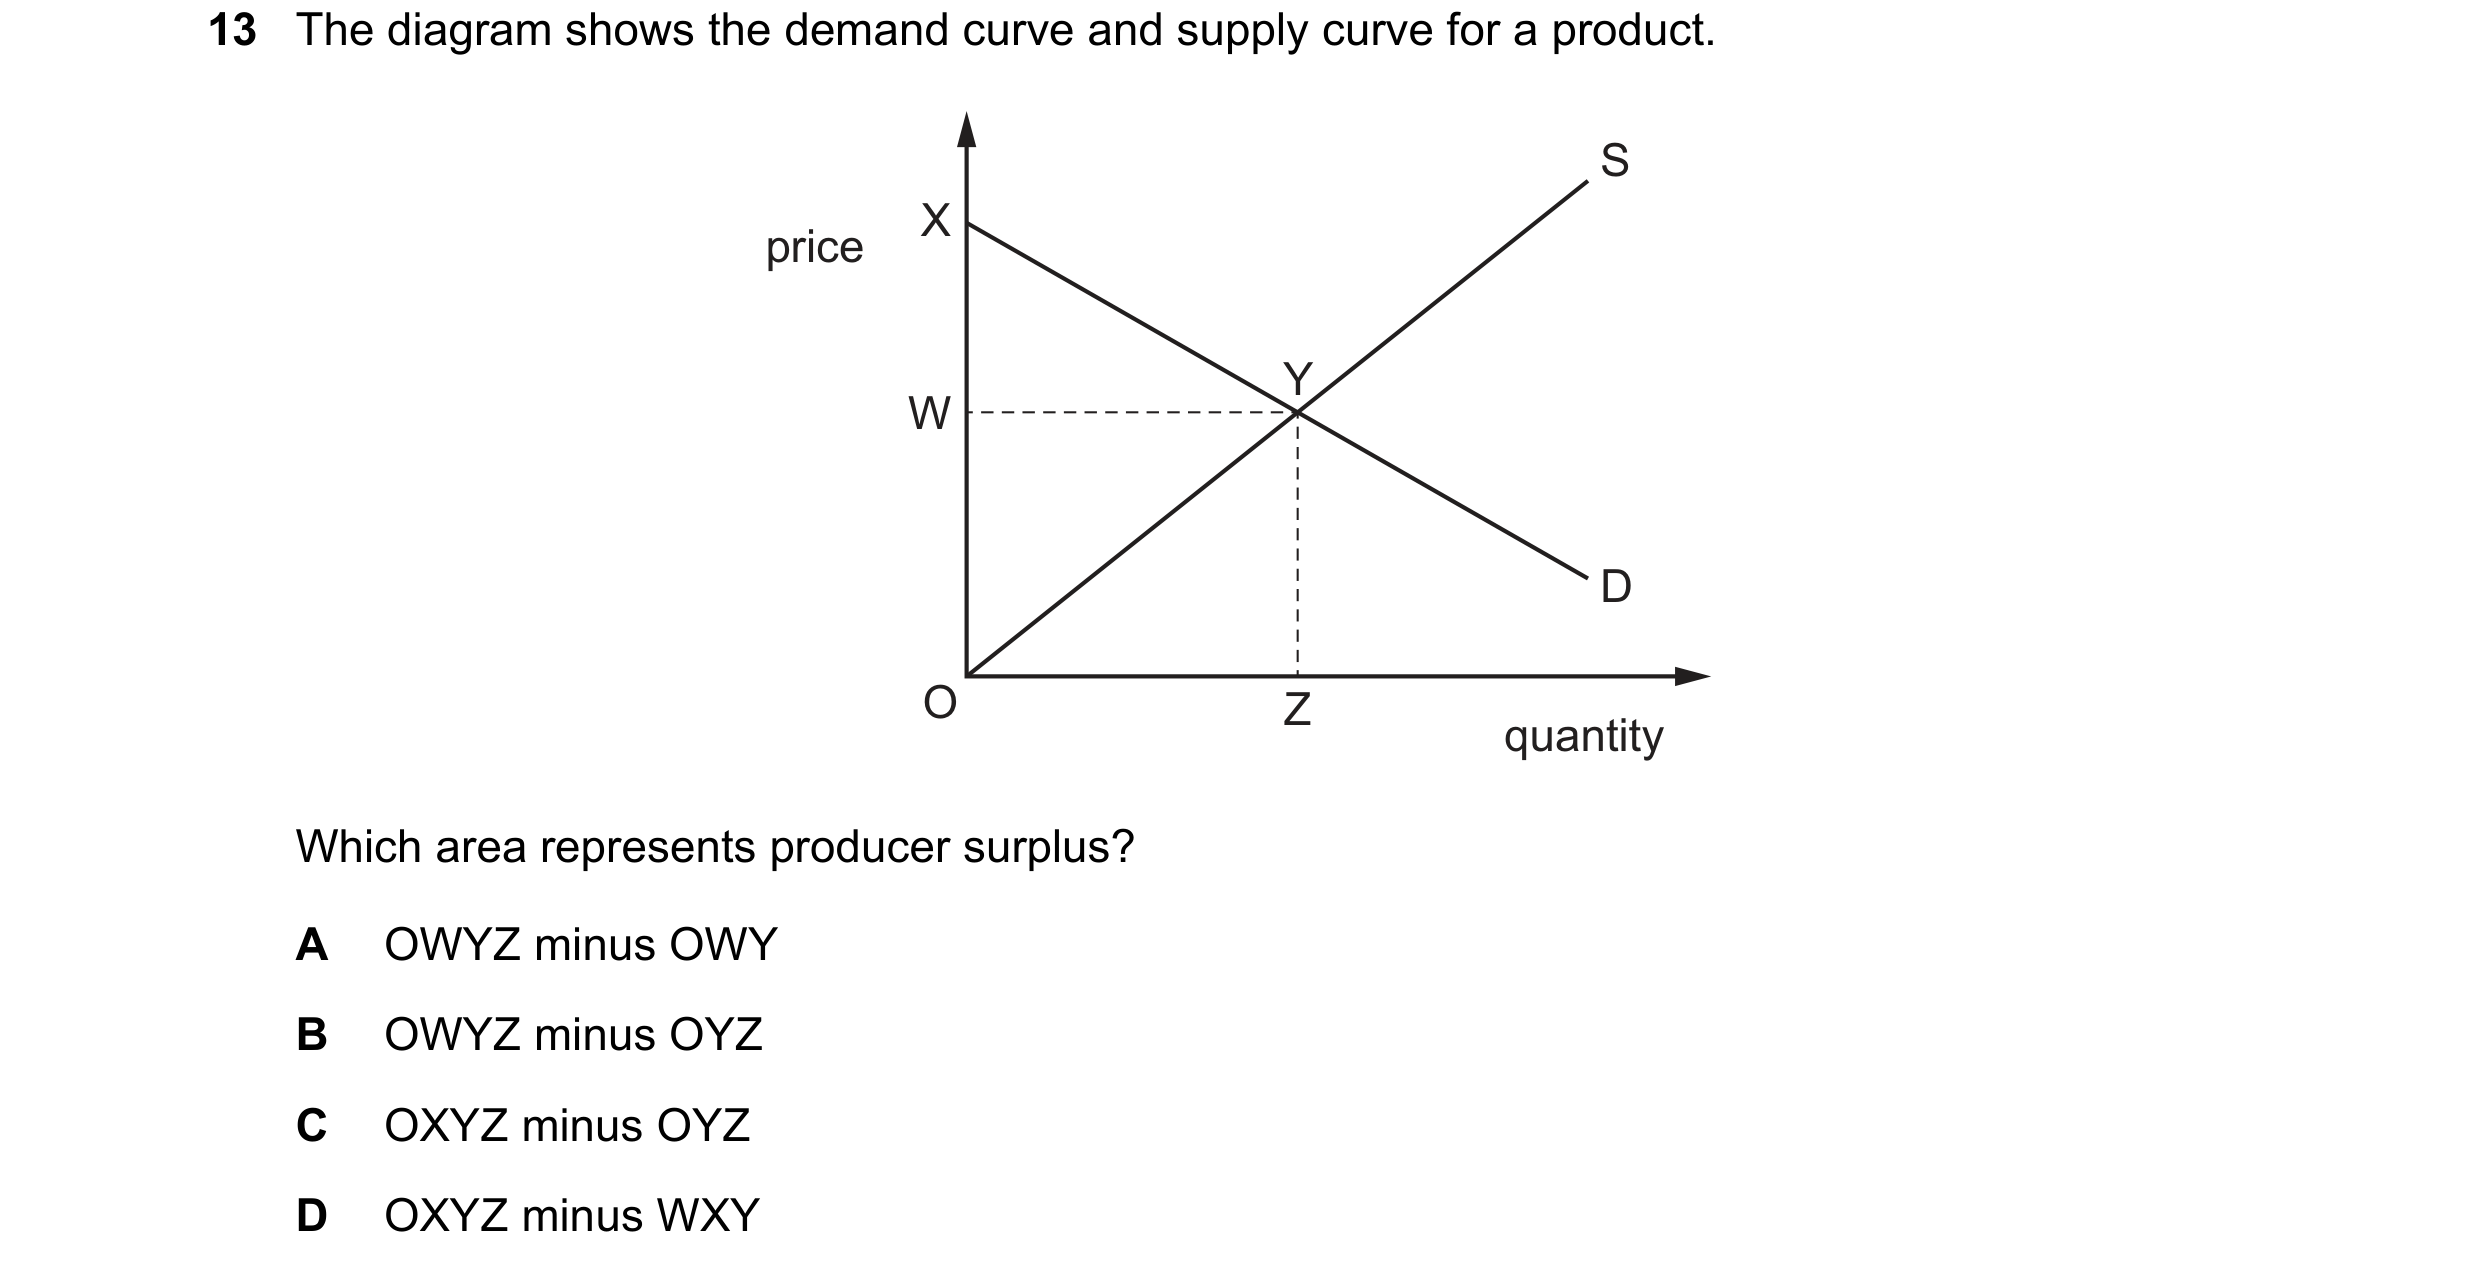 41 / 76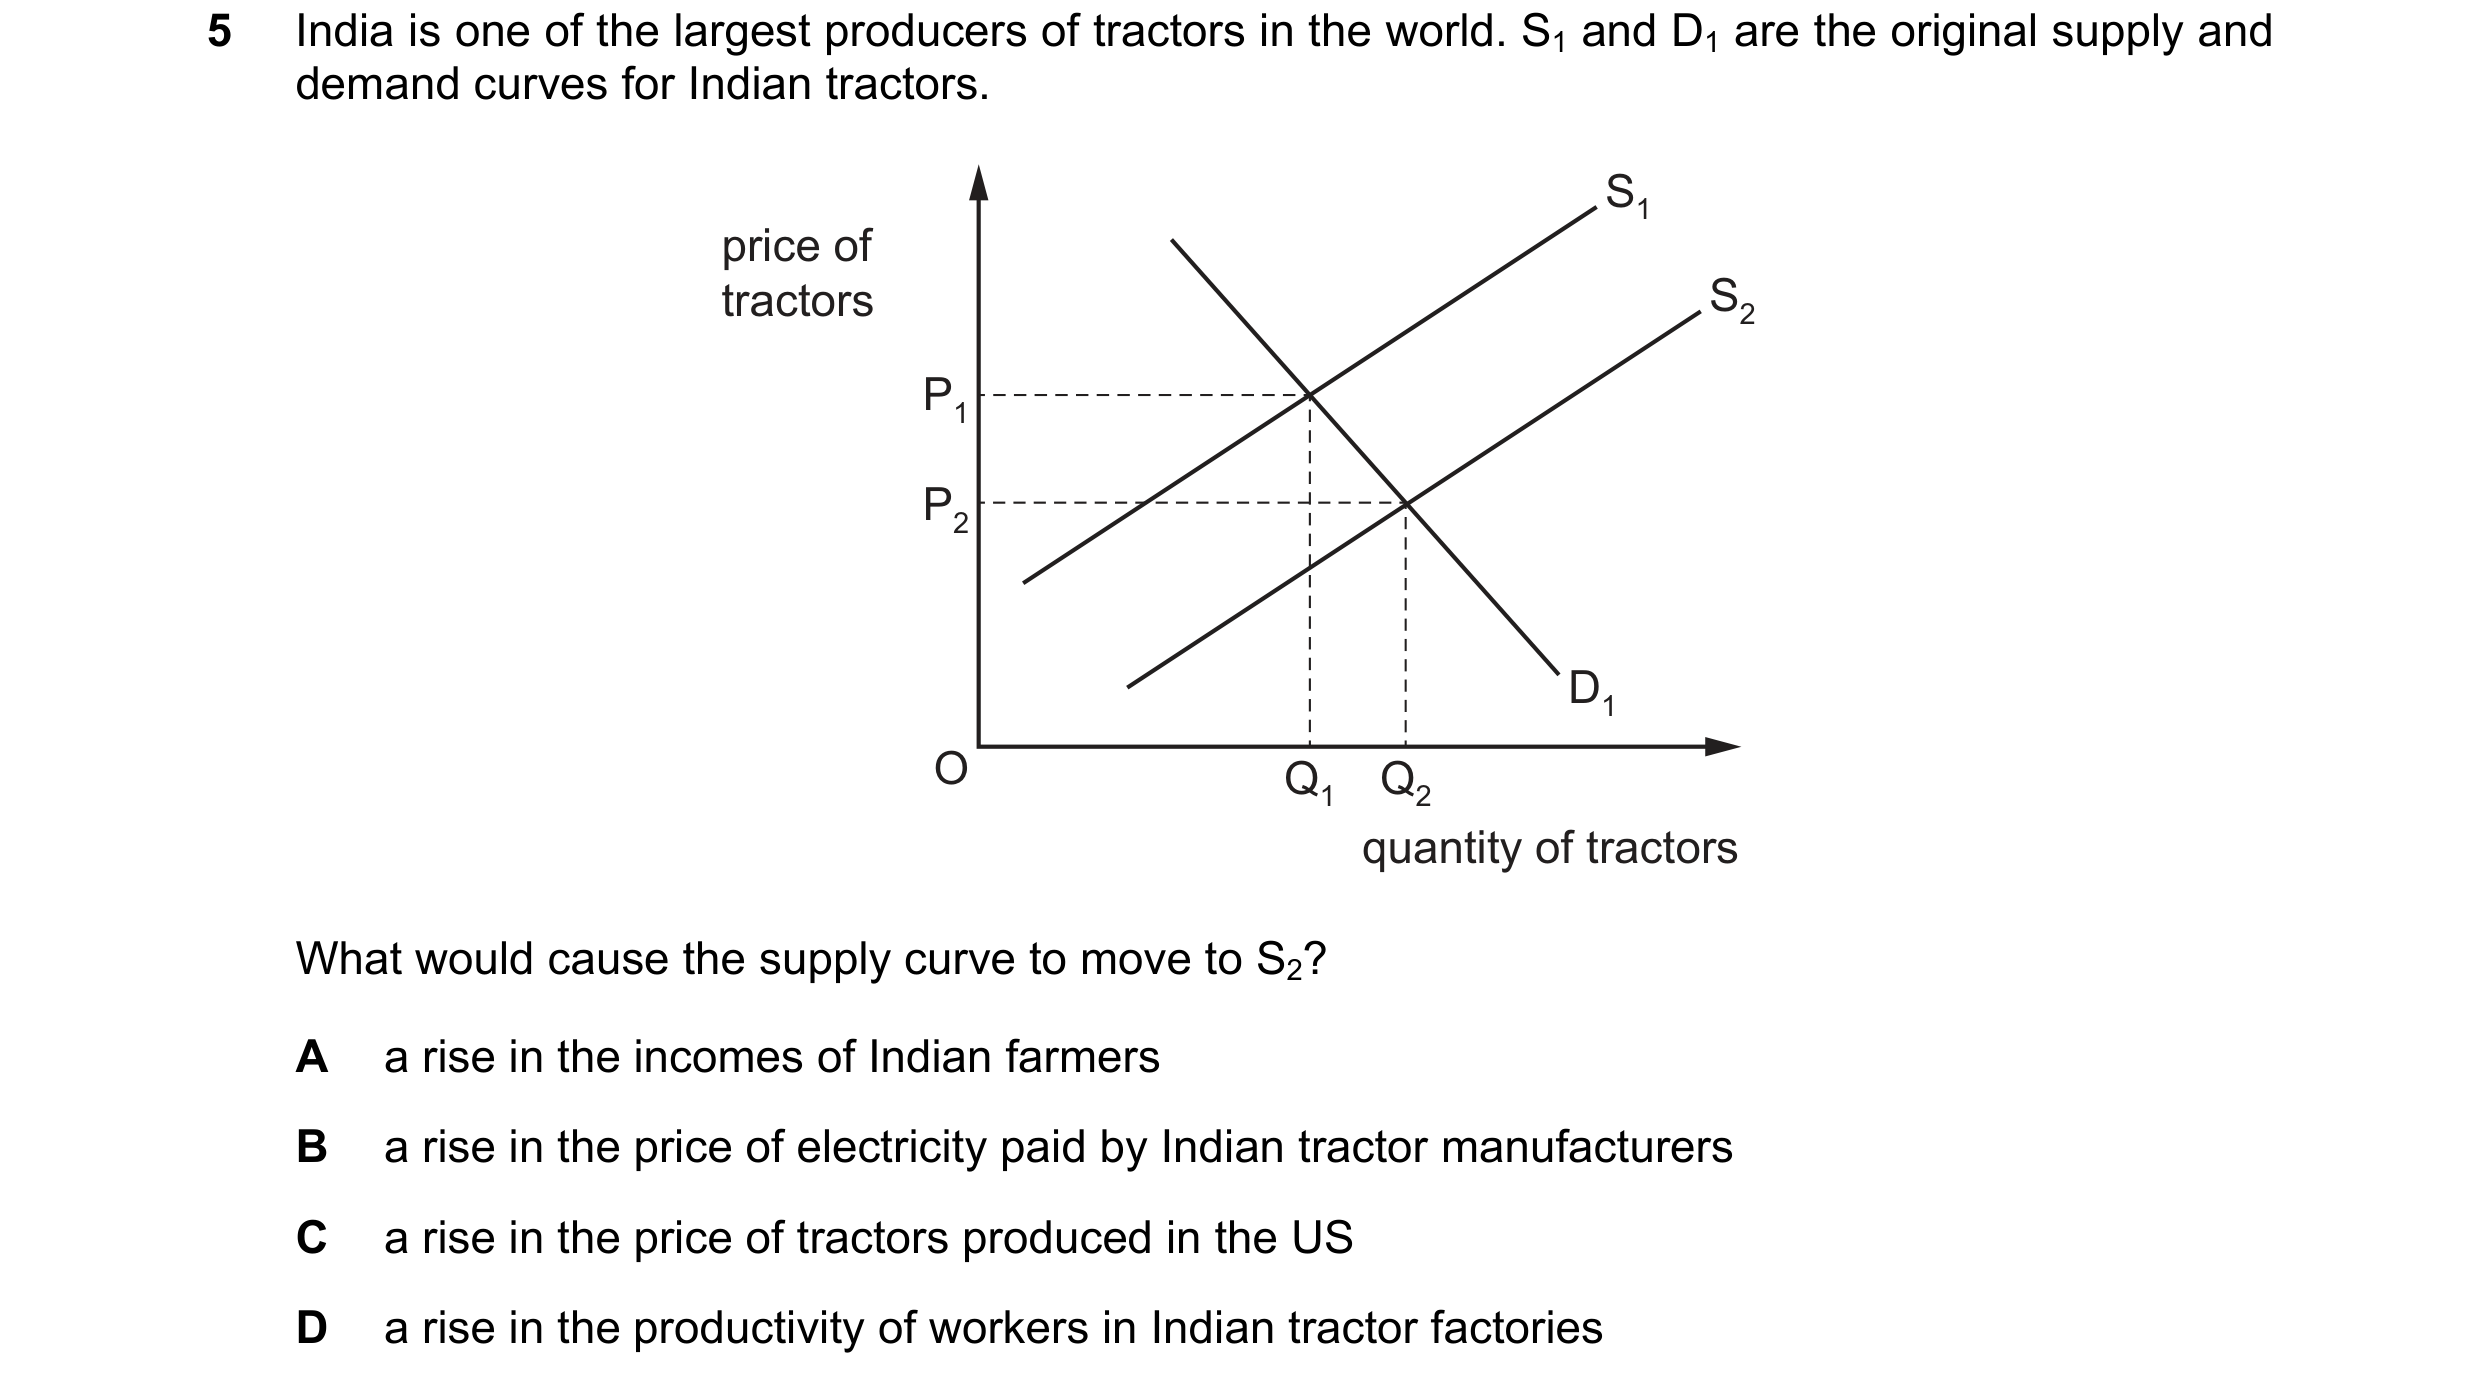
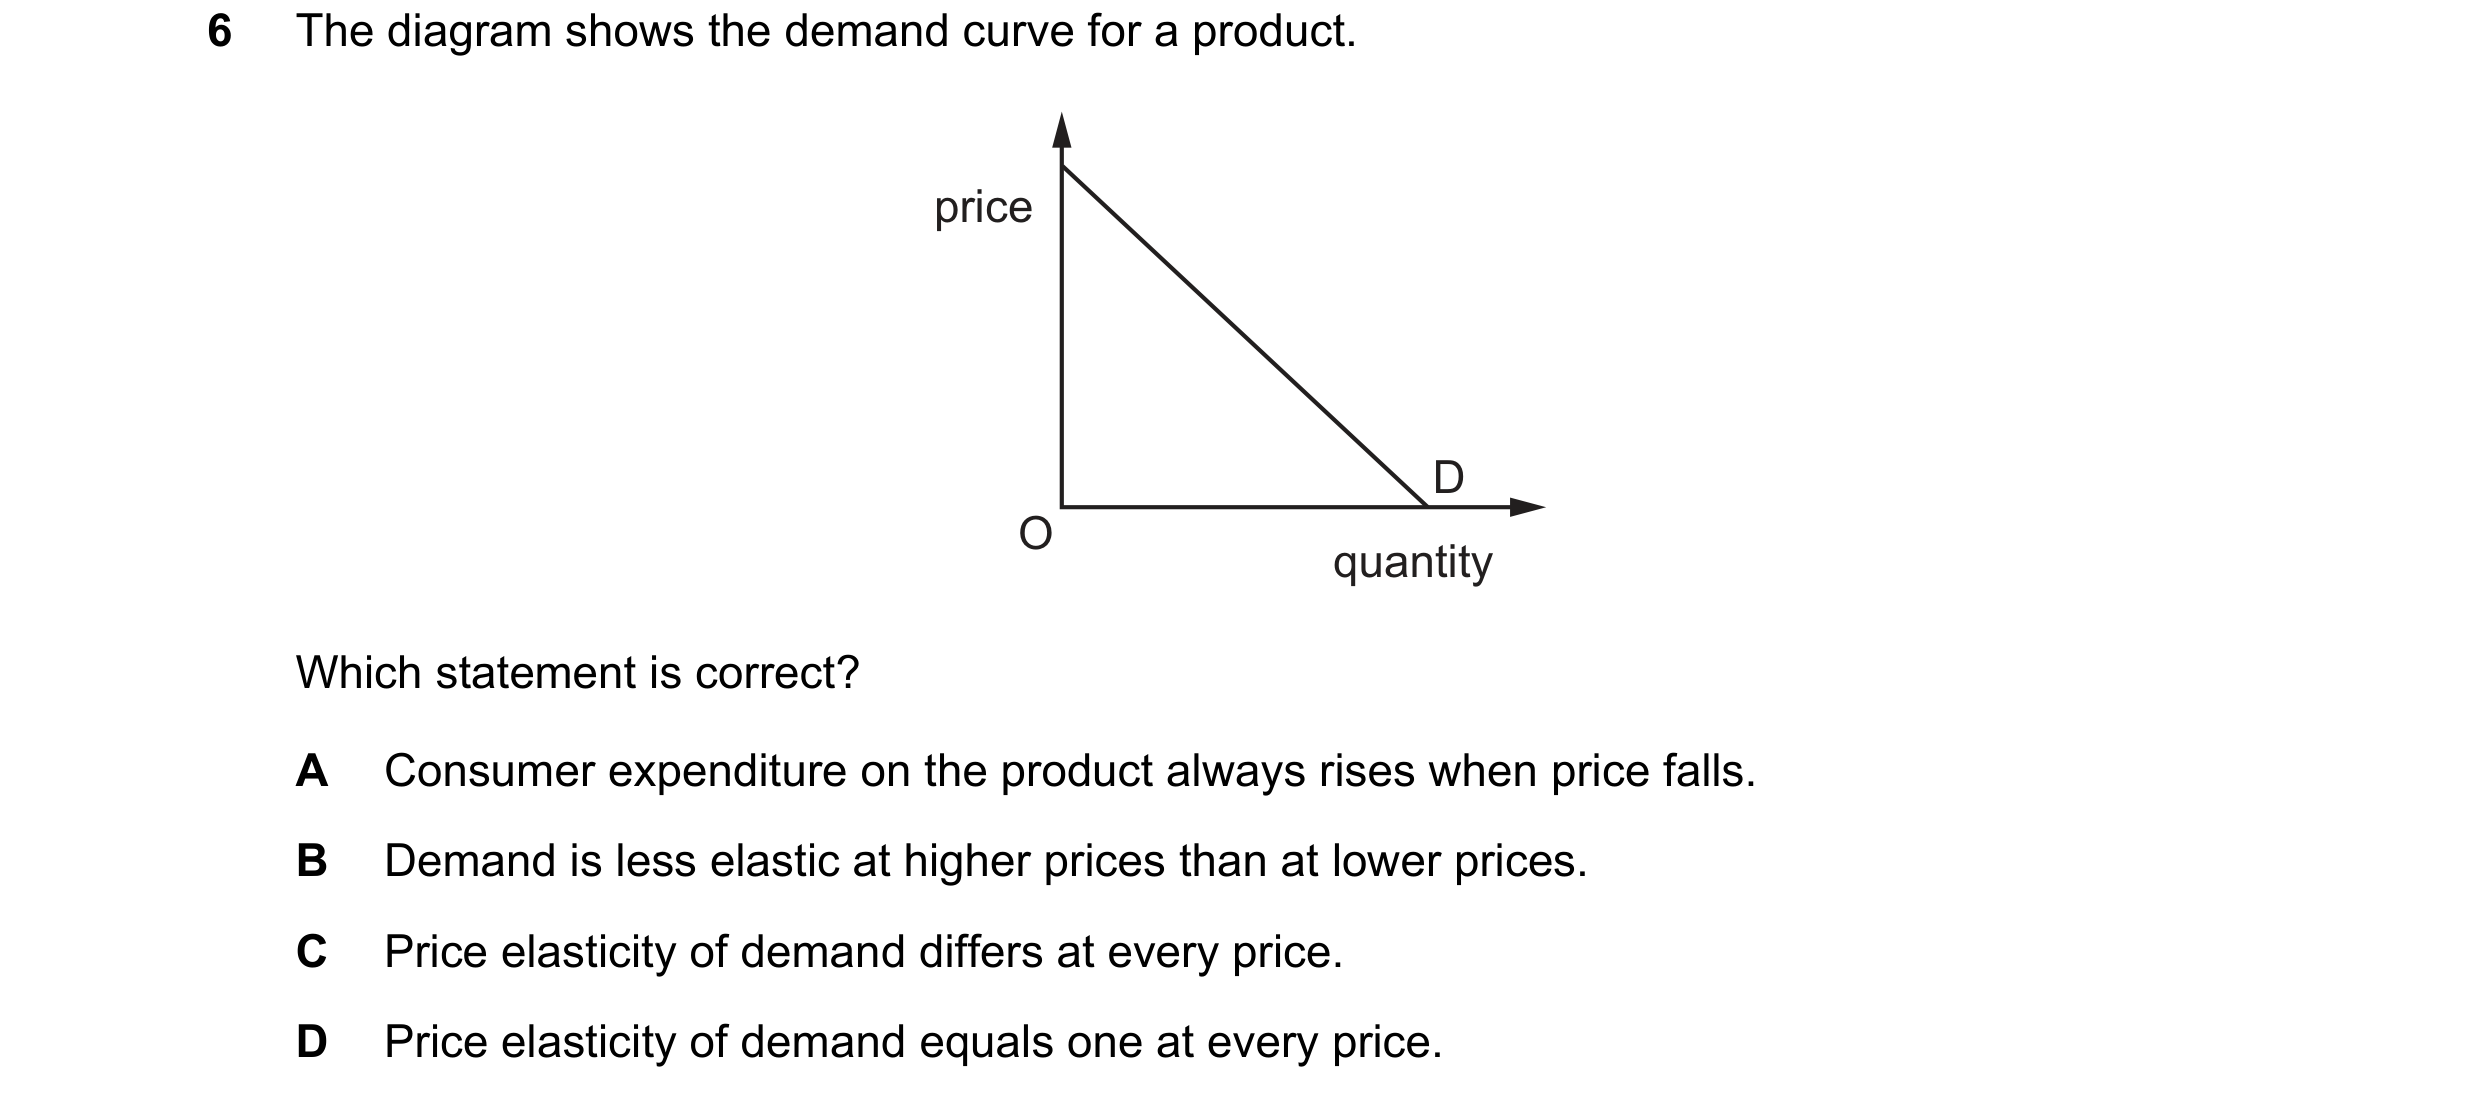
 42 / 76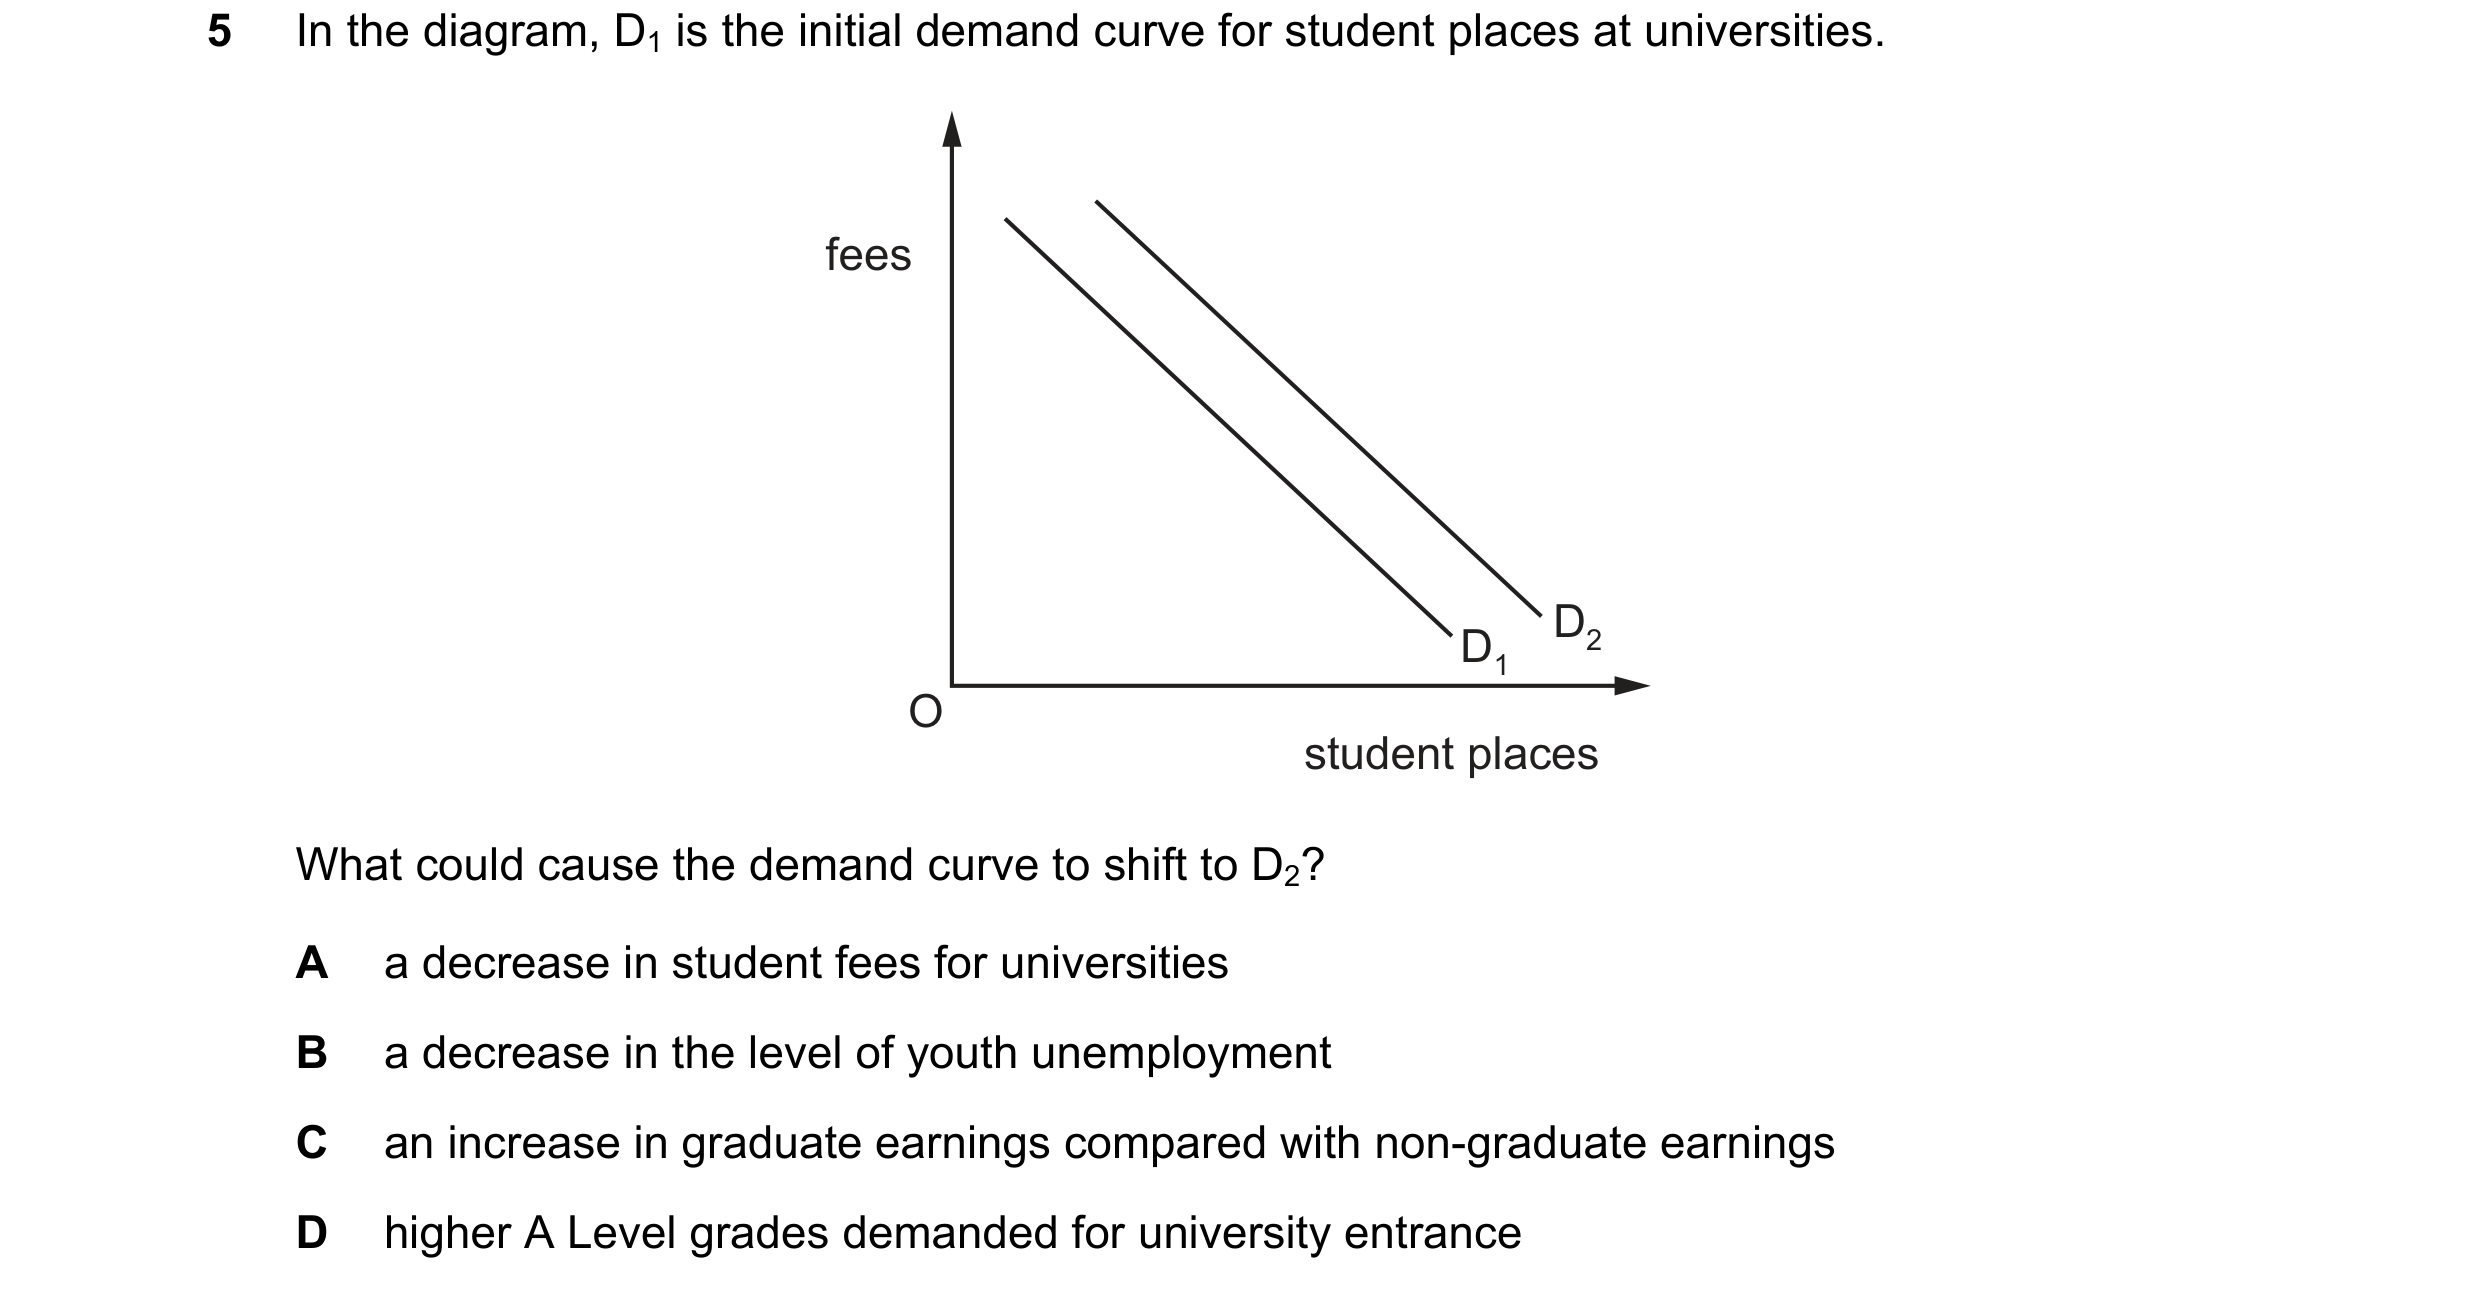

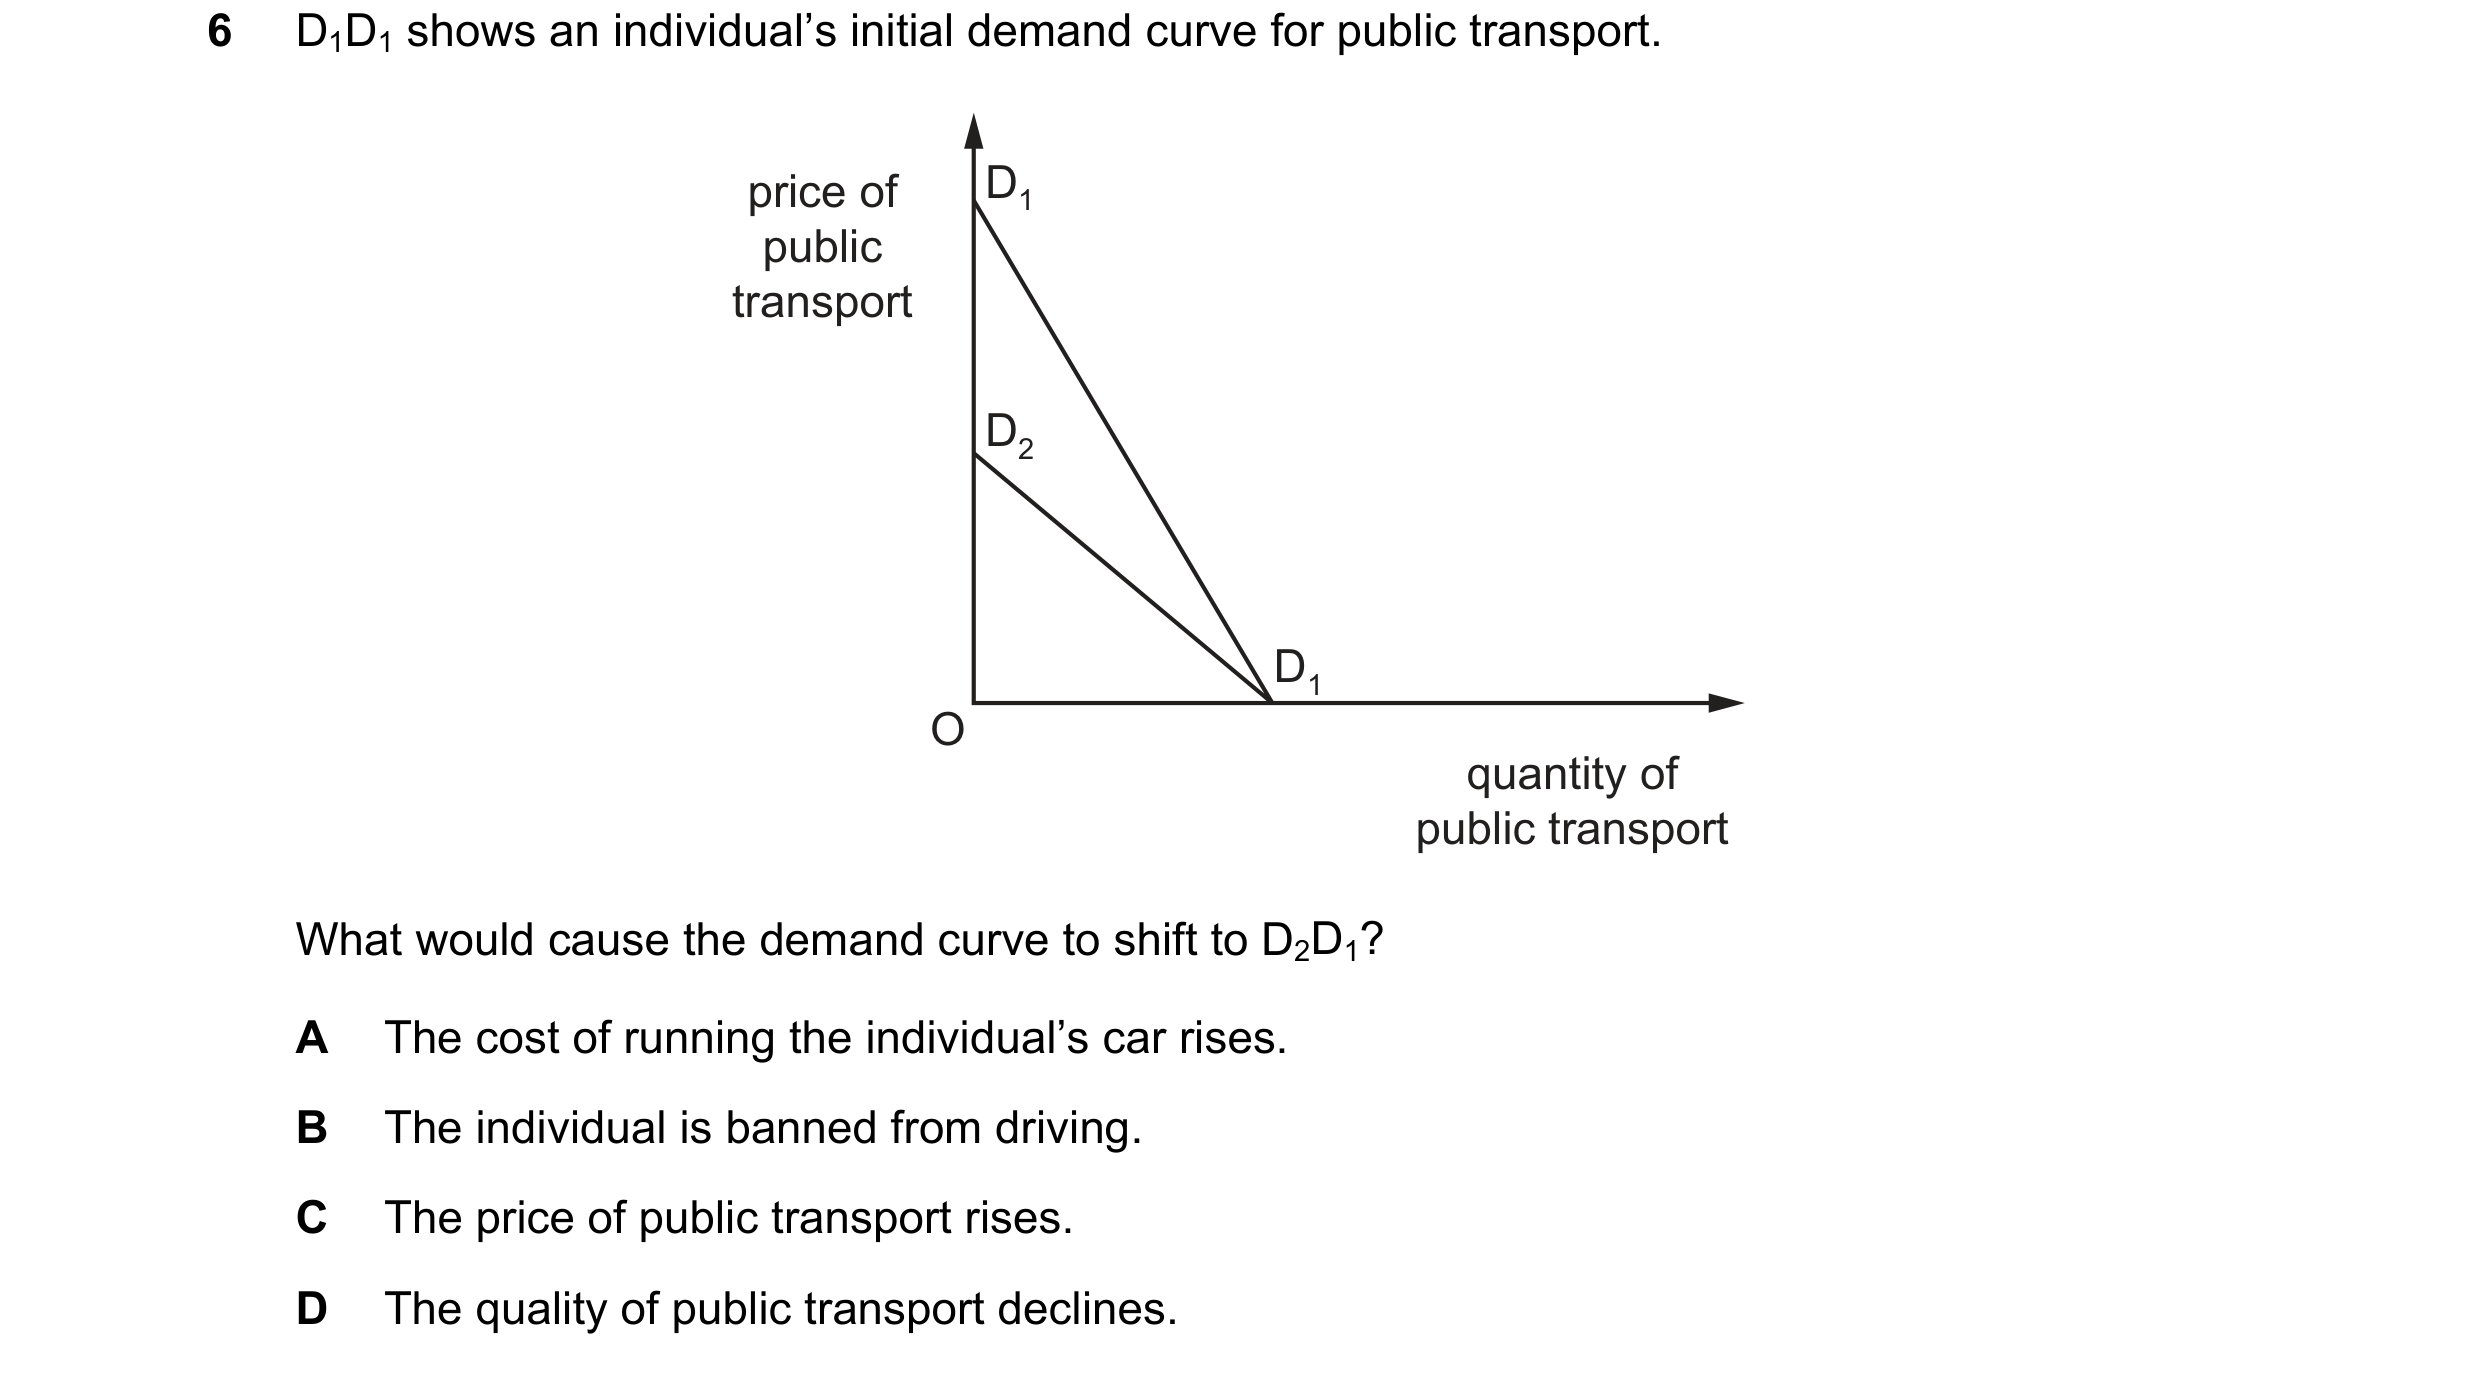 43 / 76
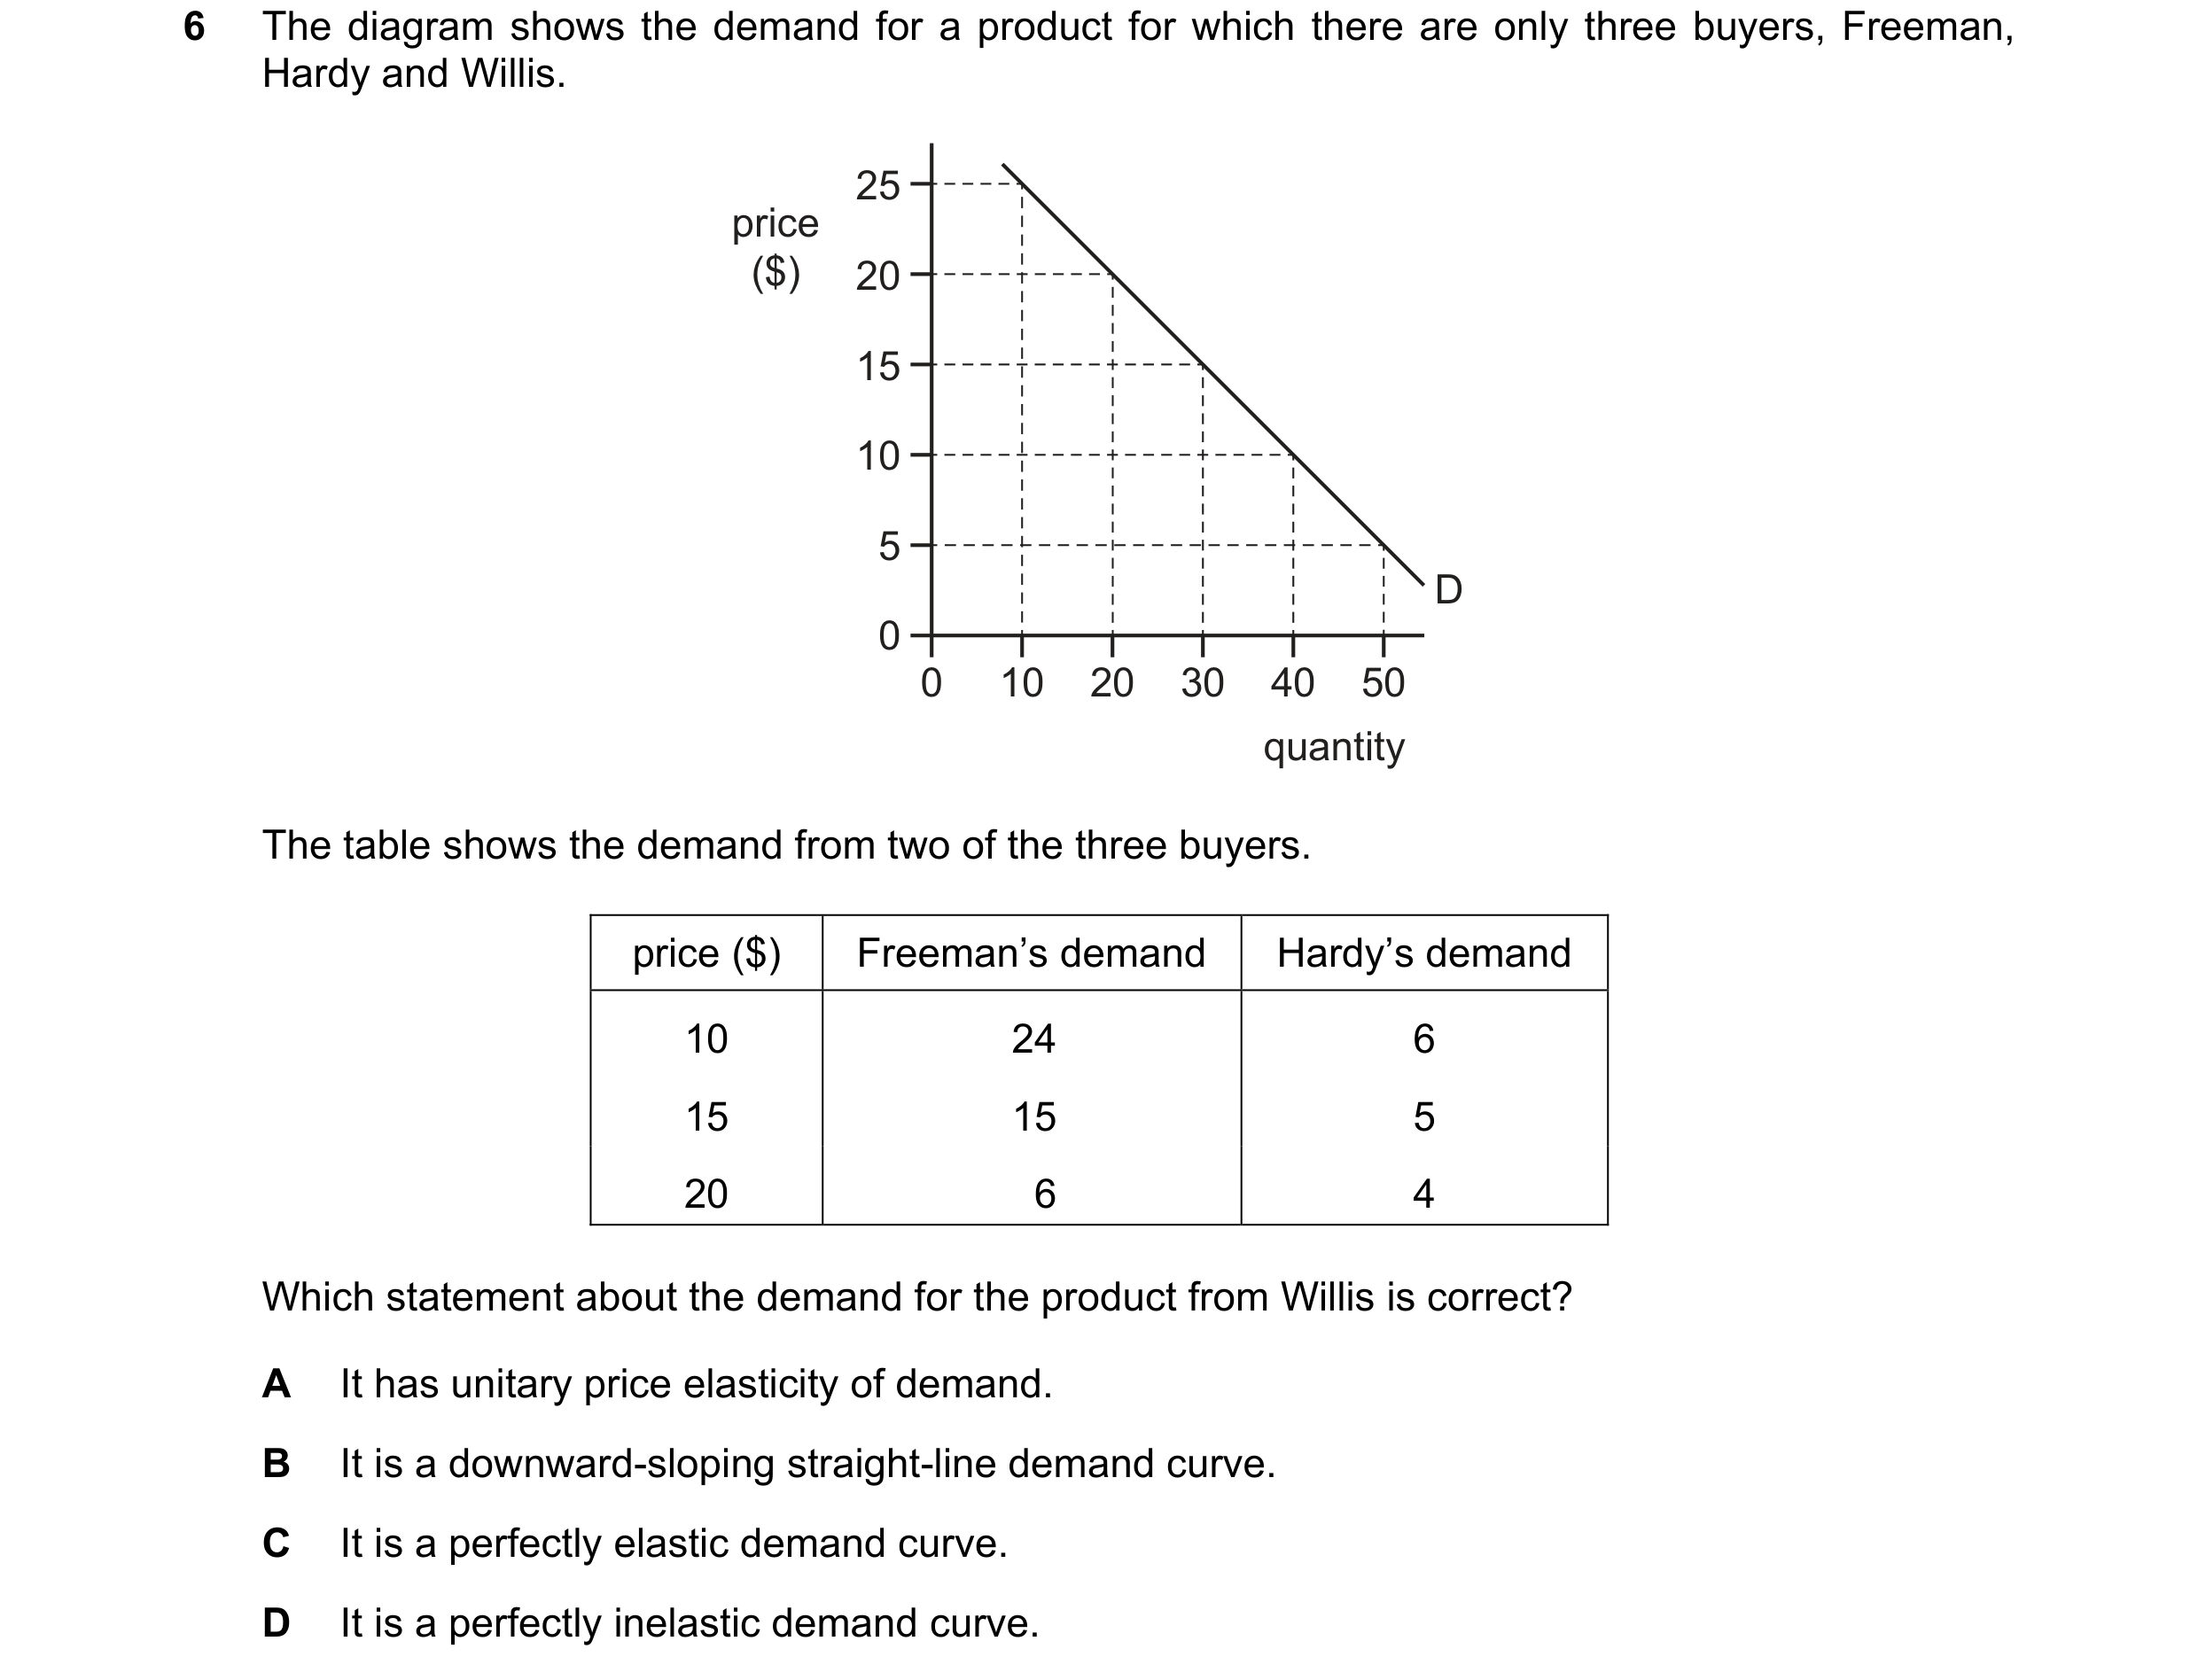 44 / 76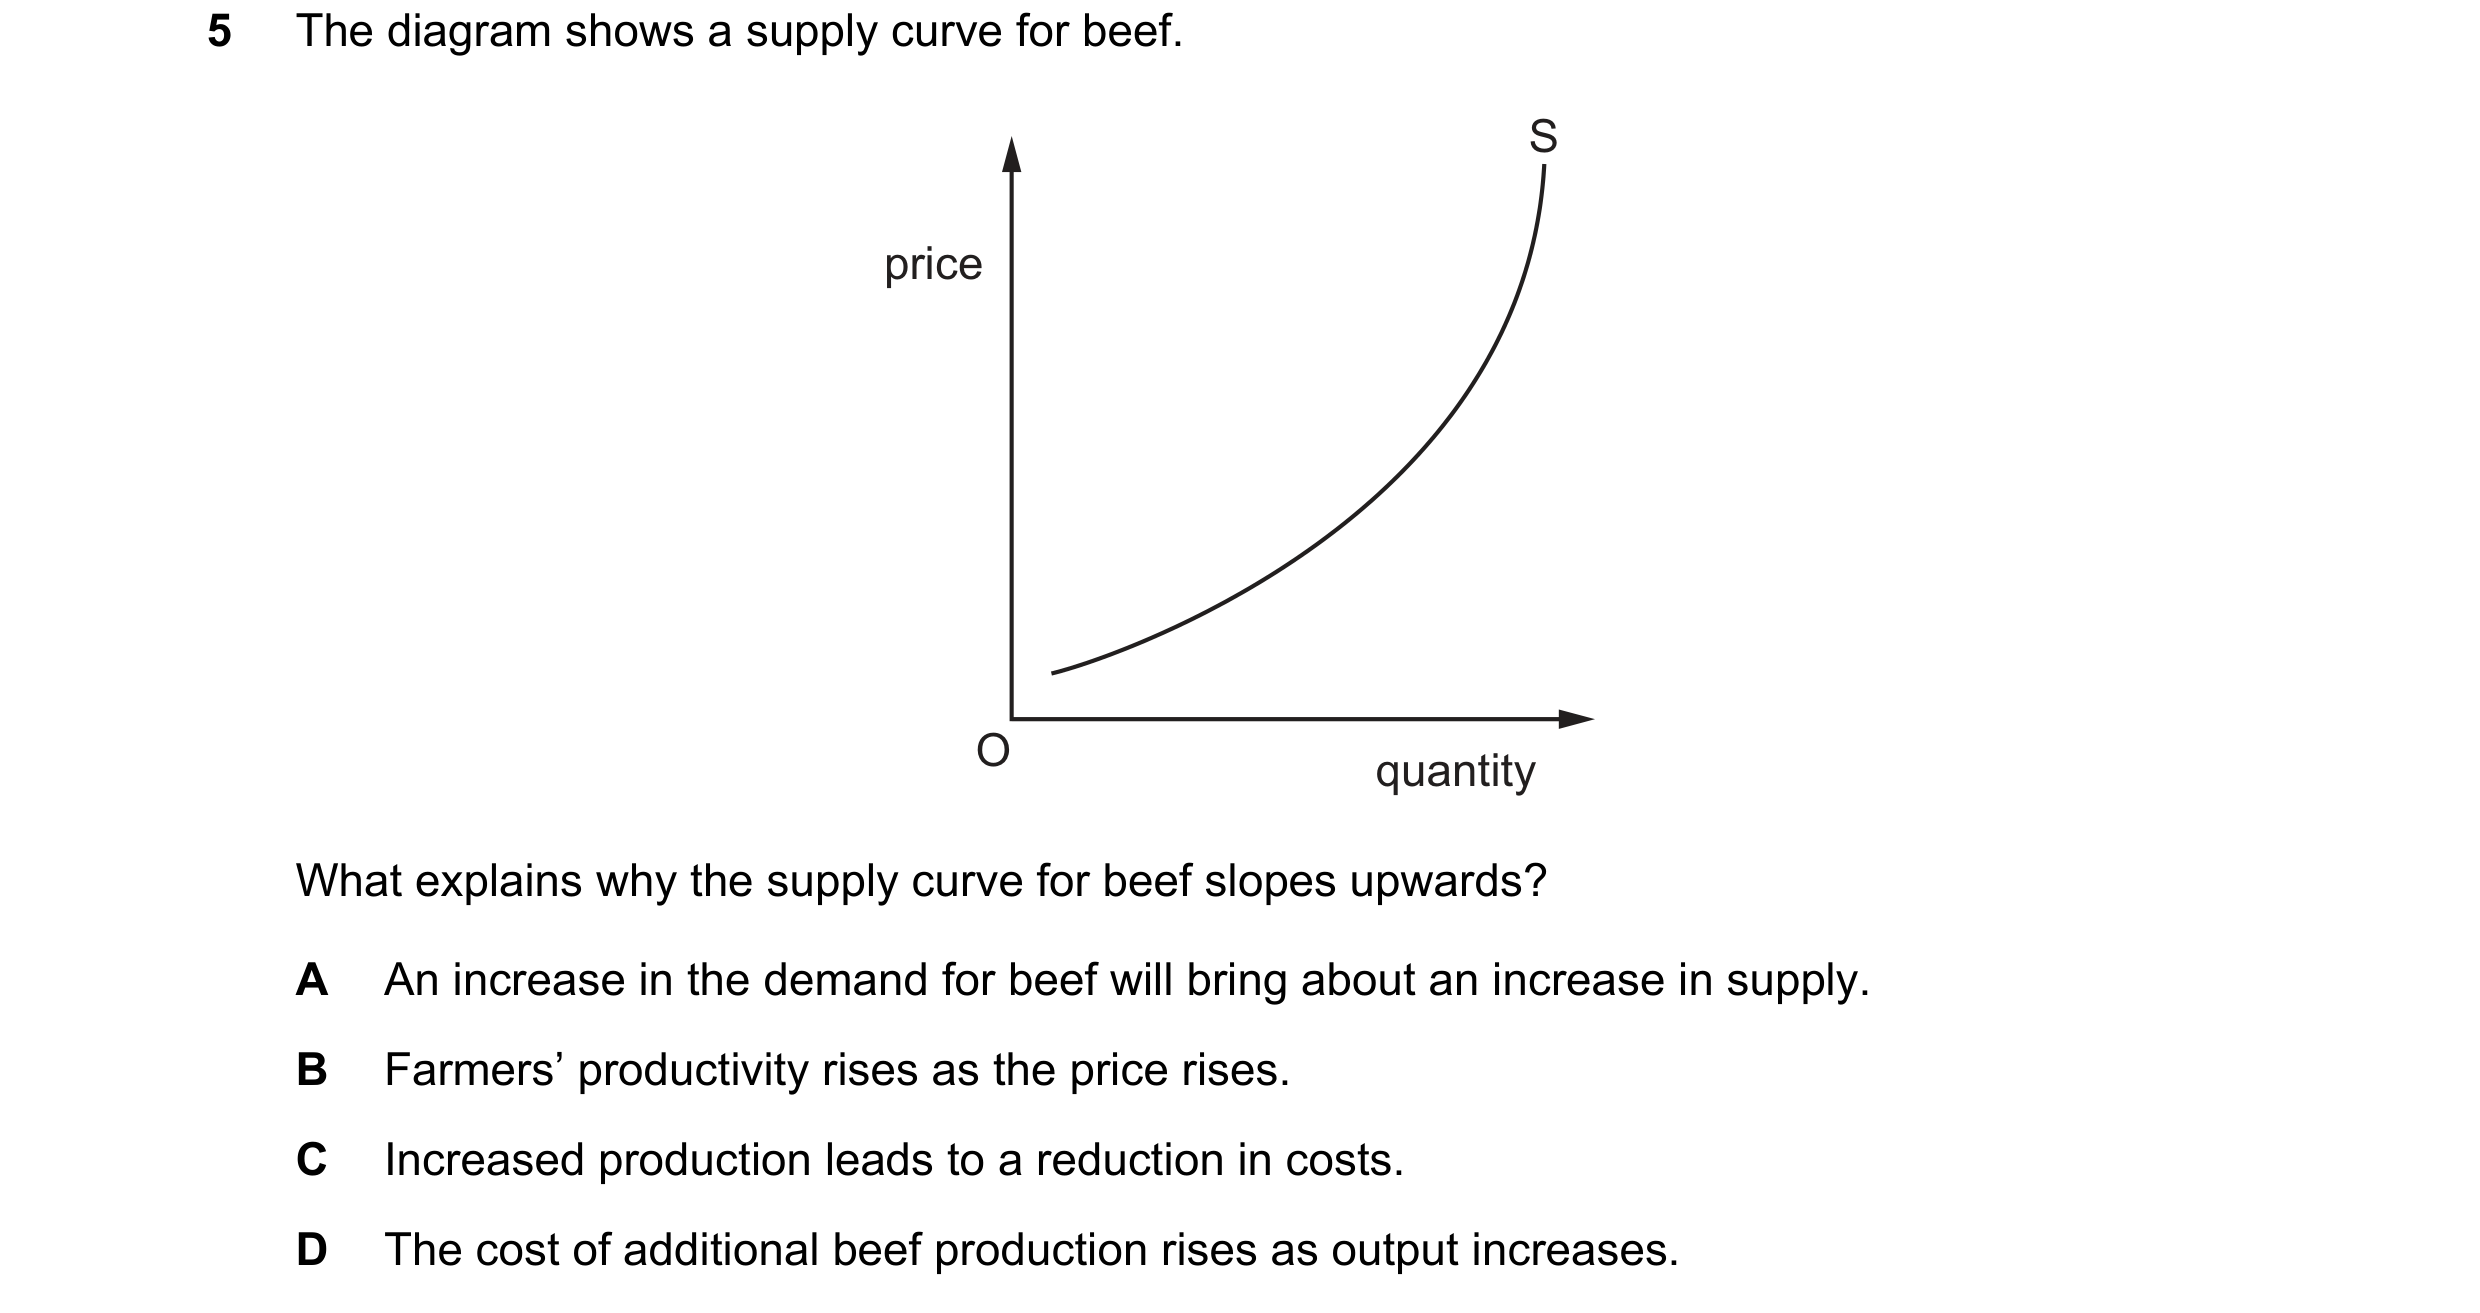
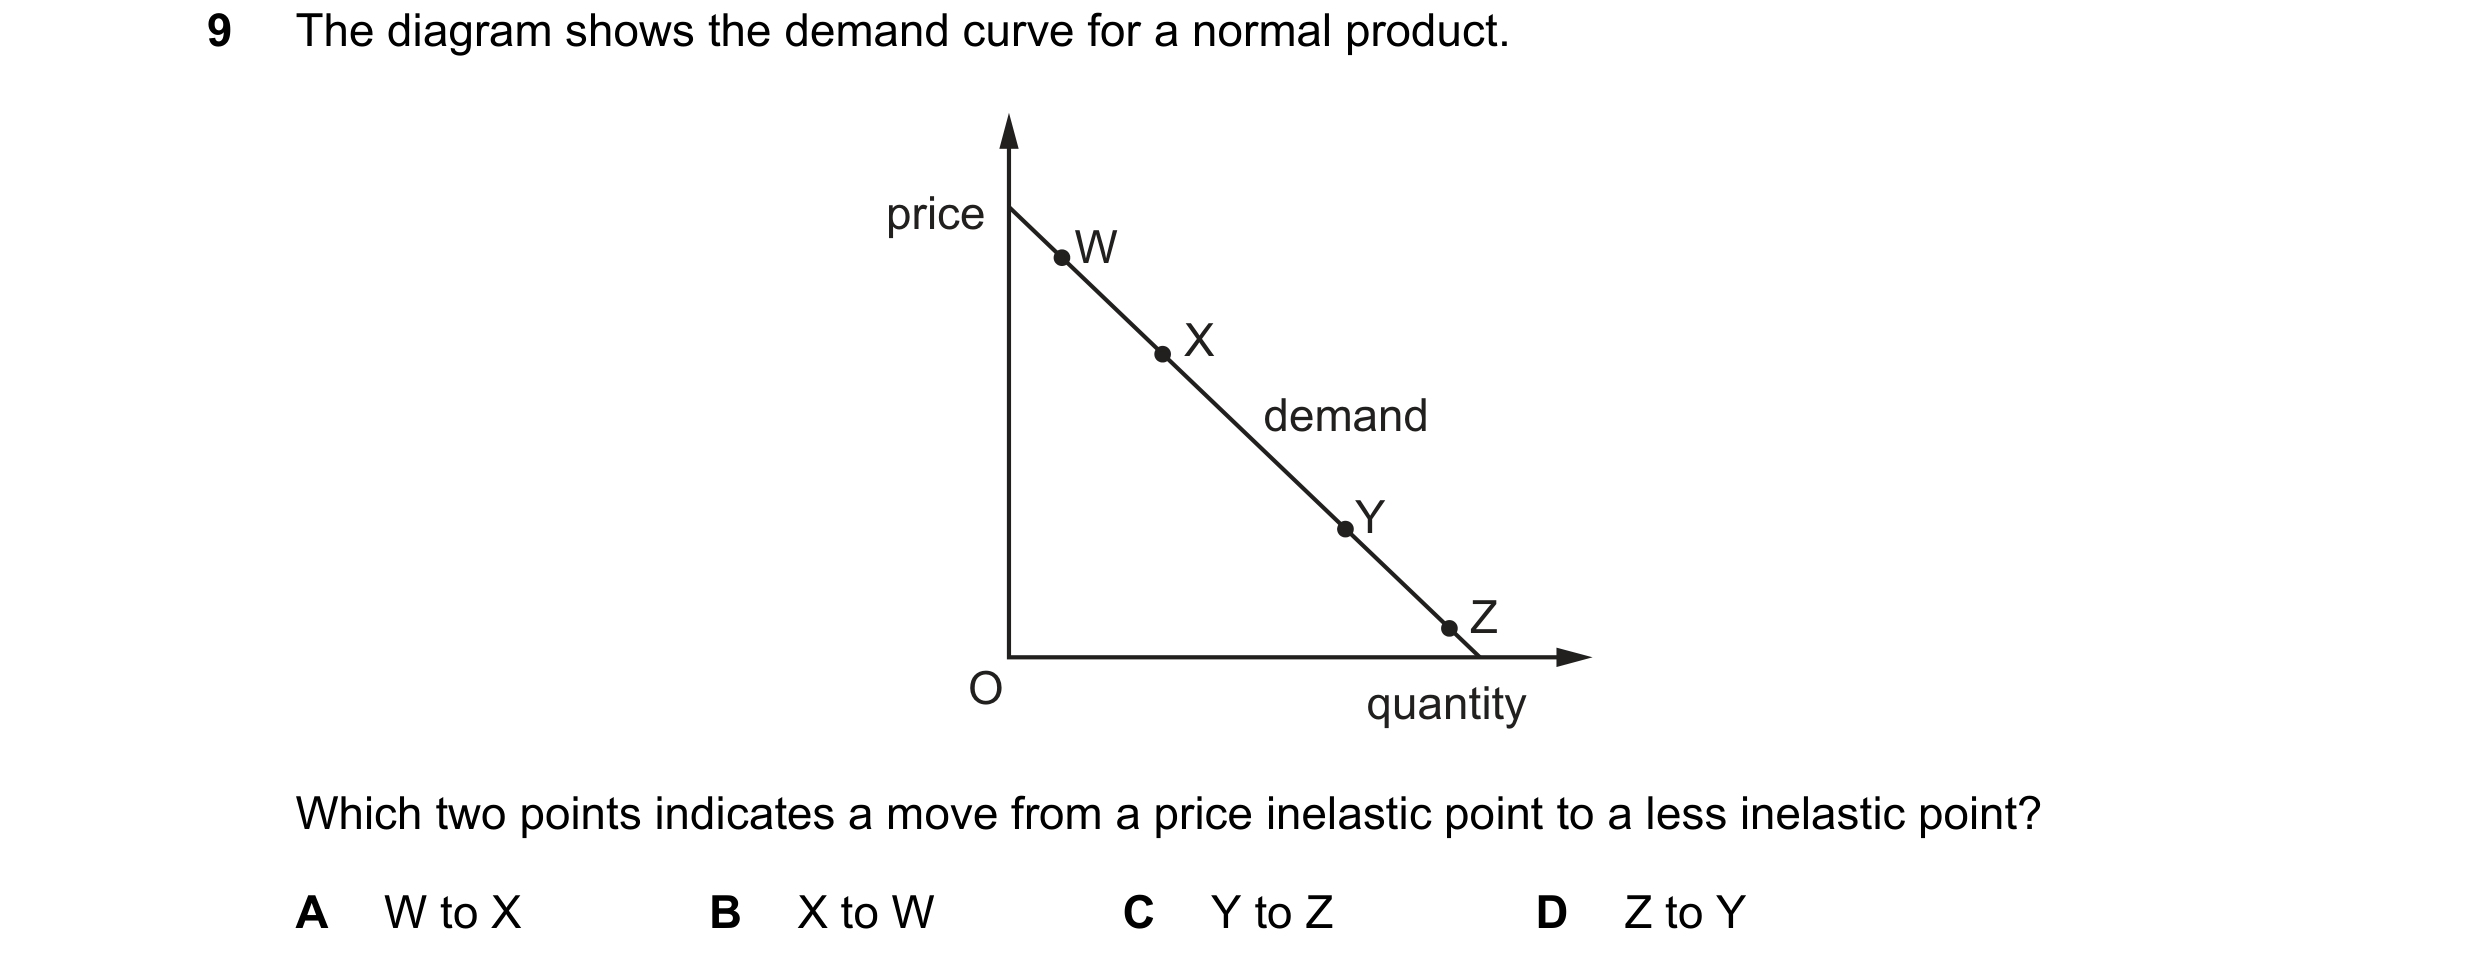
 45 / 76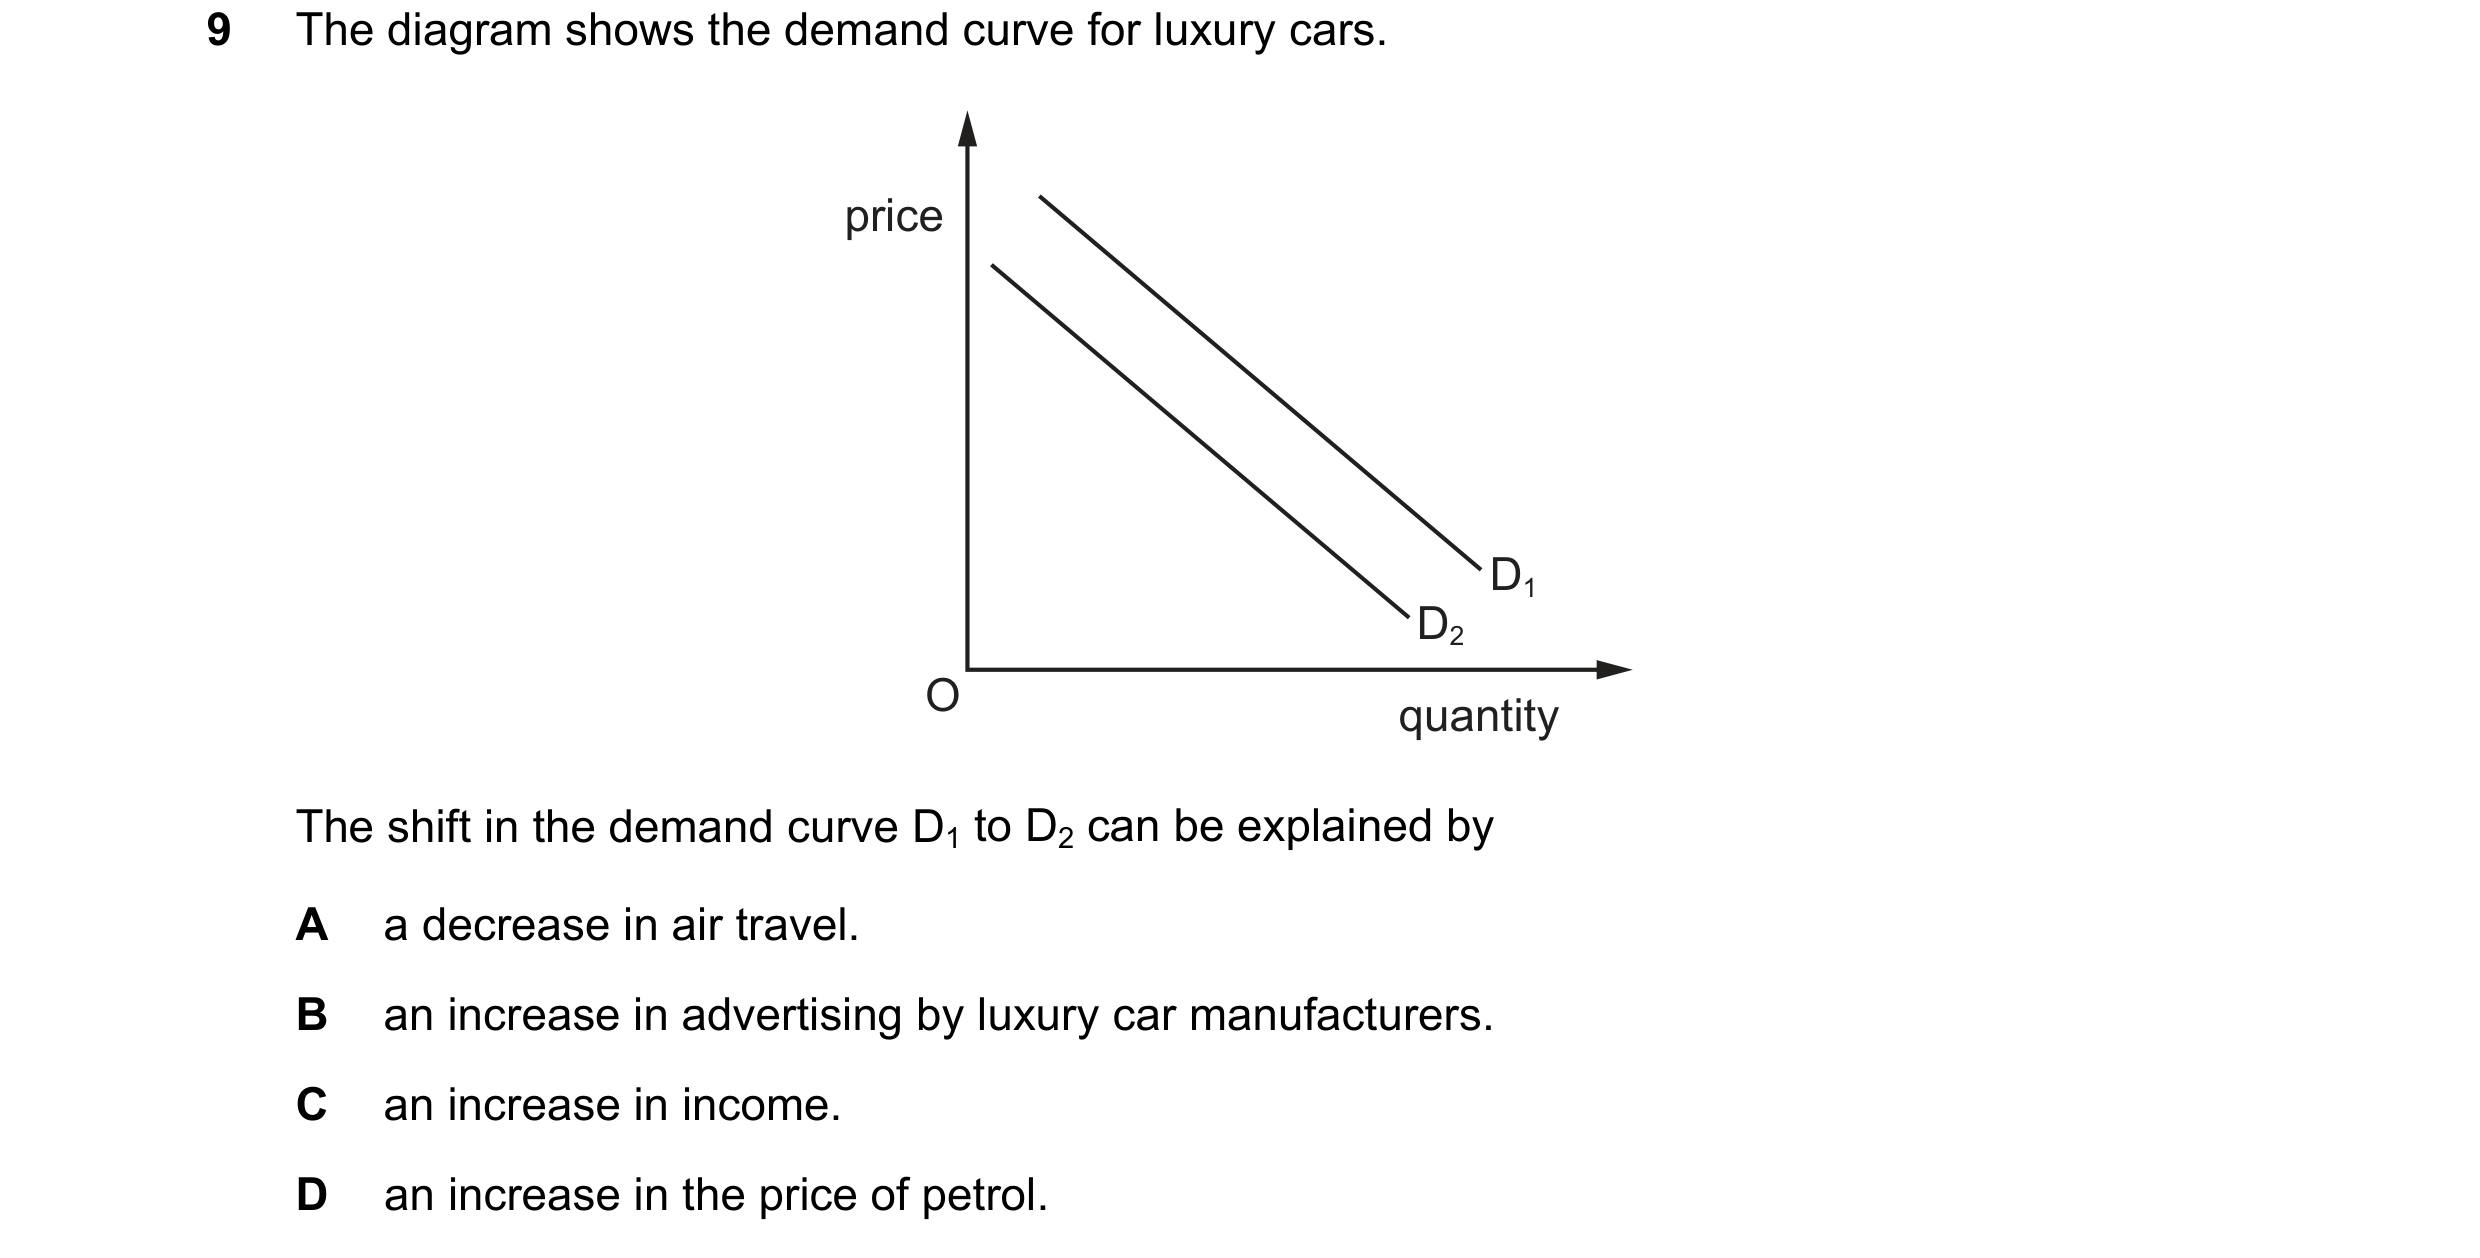
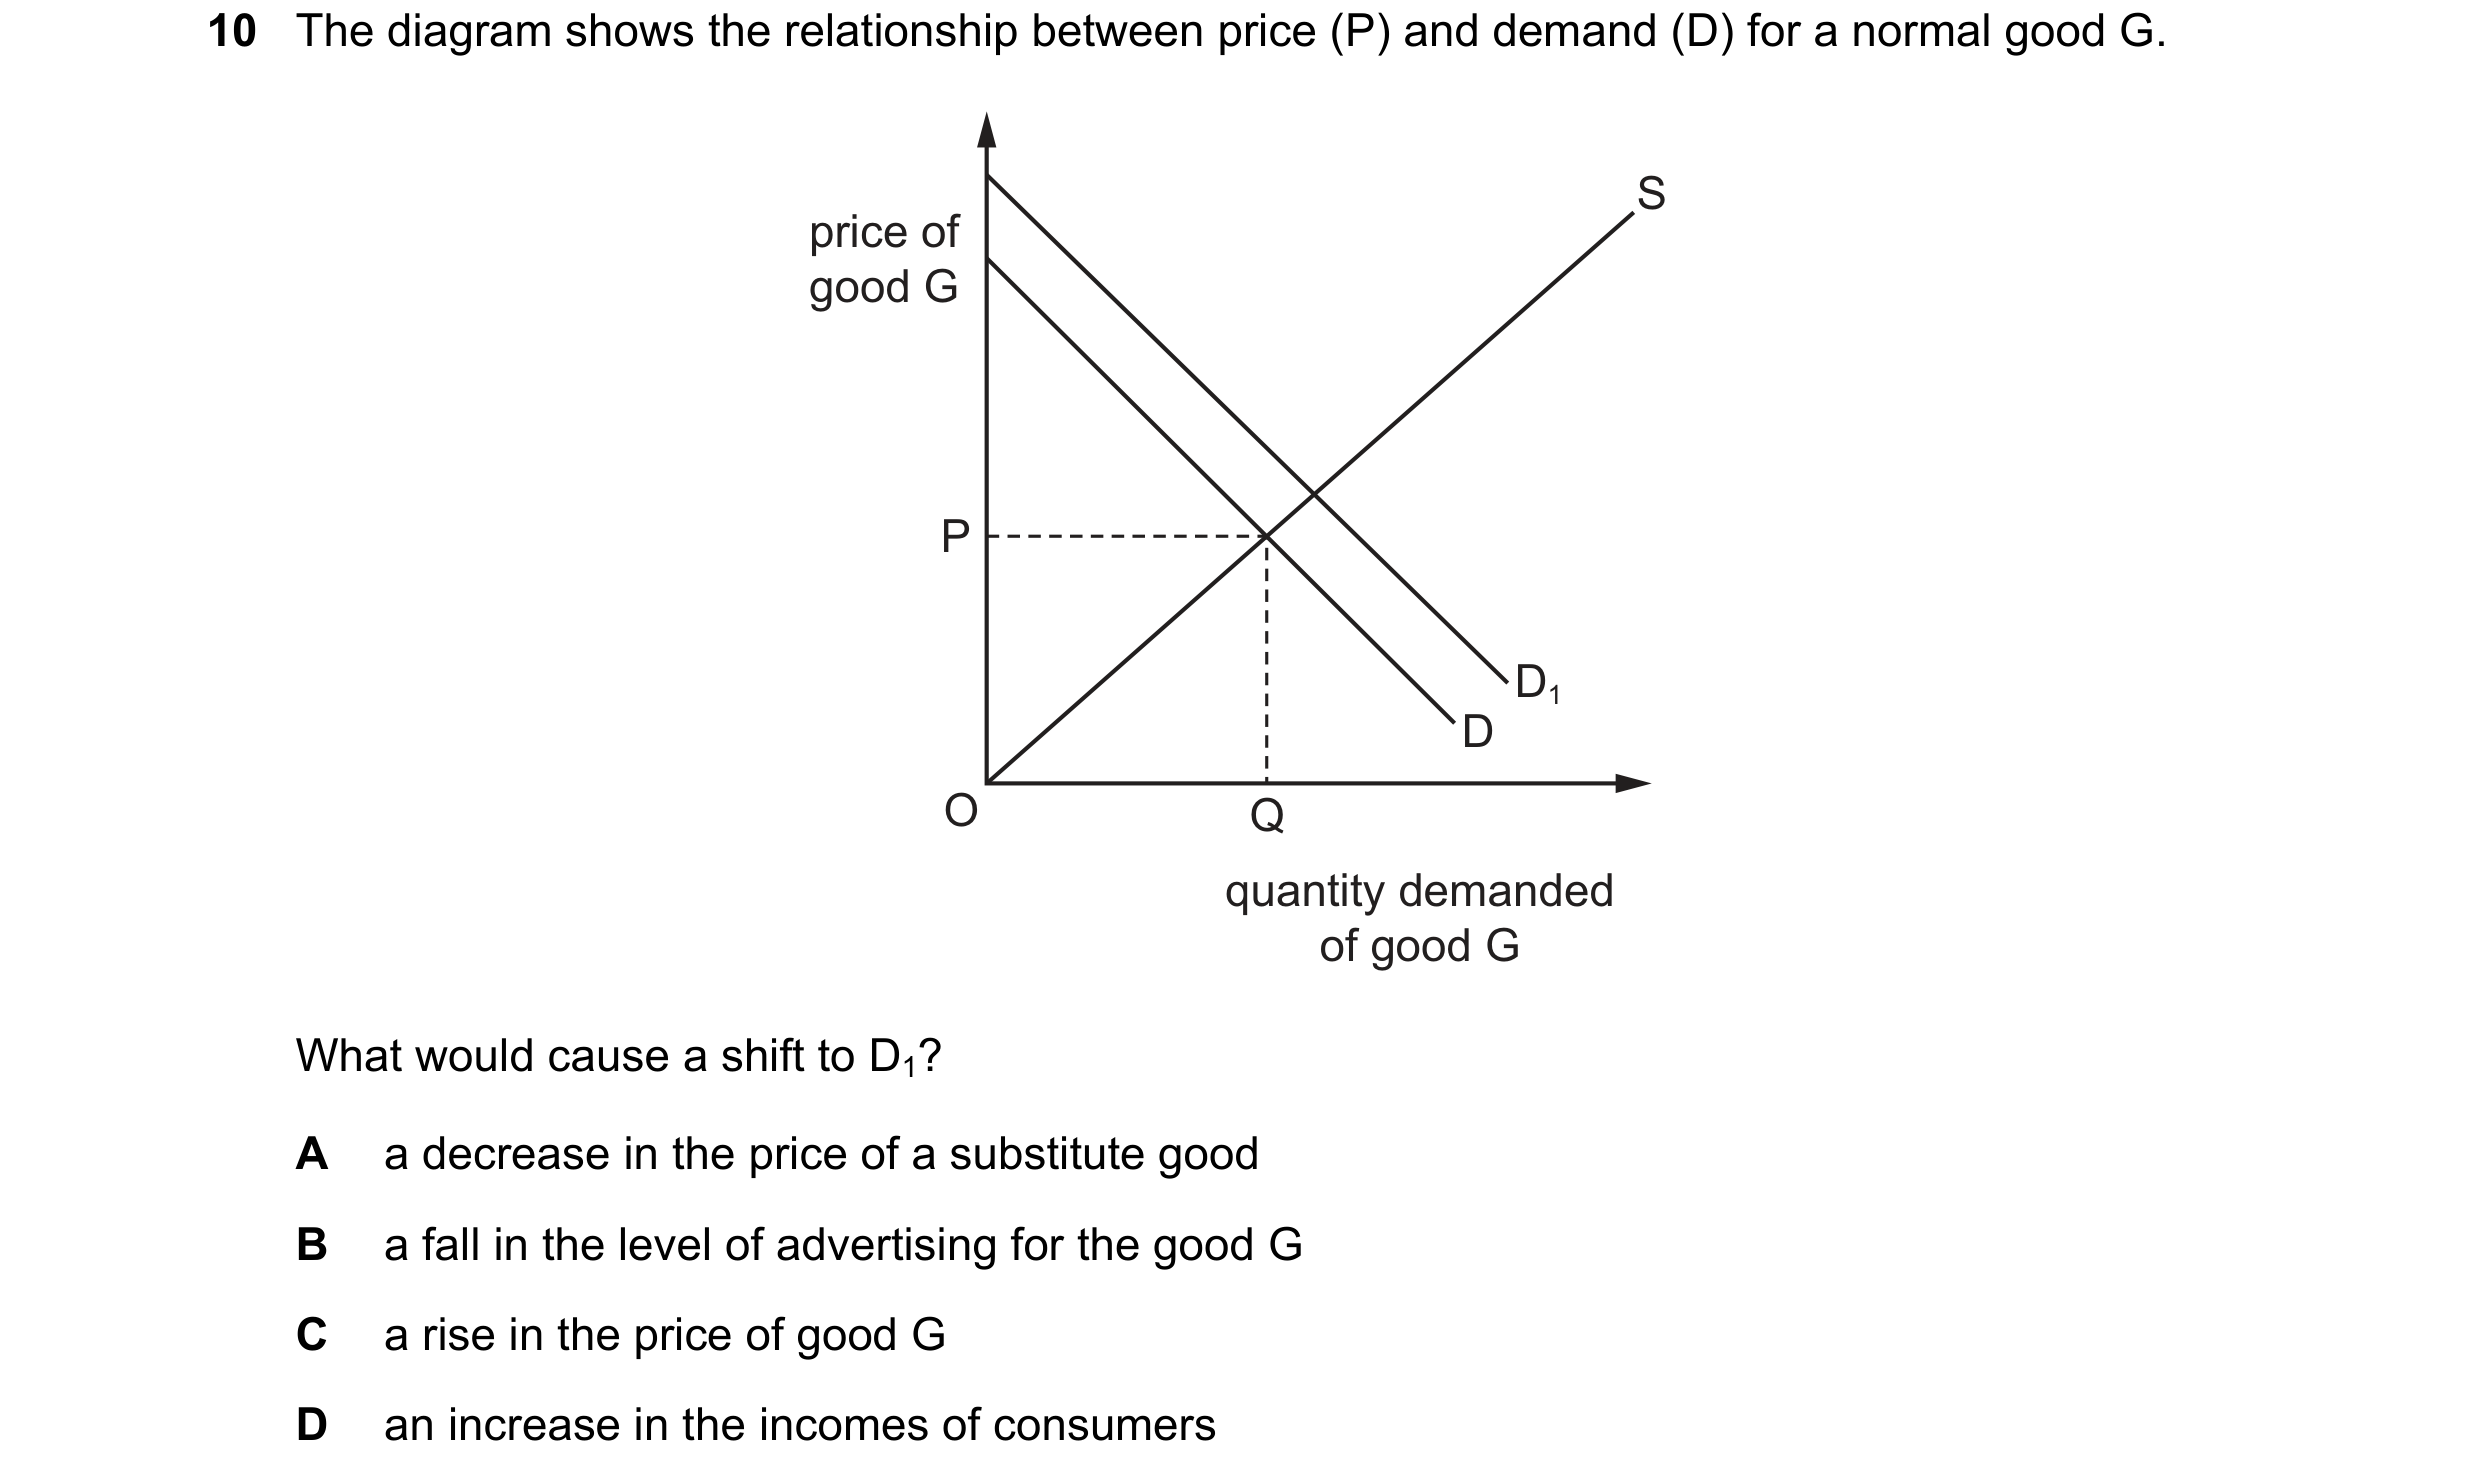
 46 / 76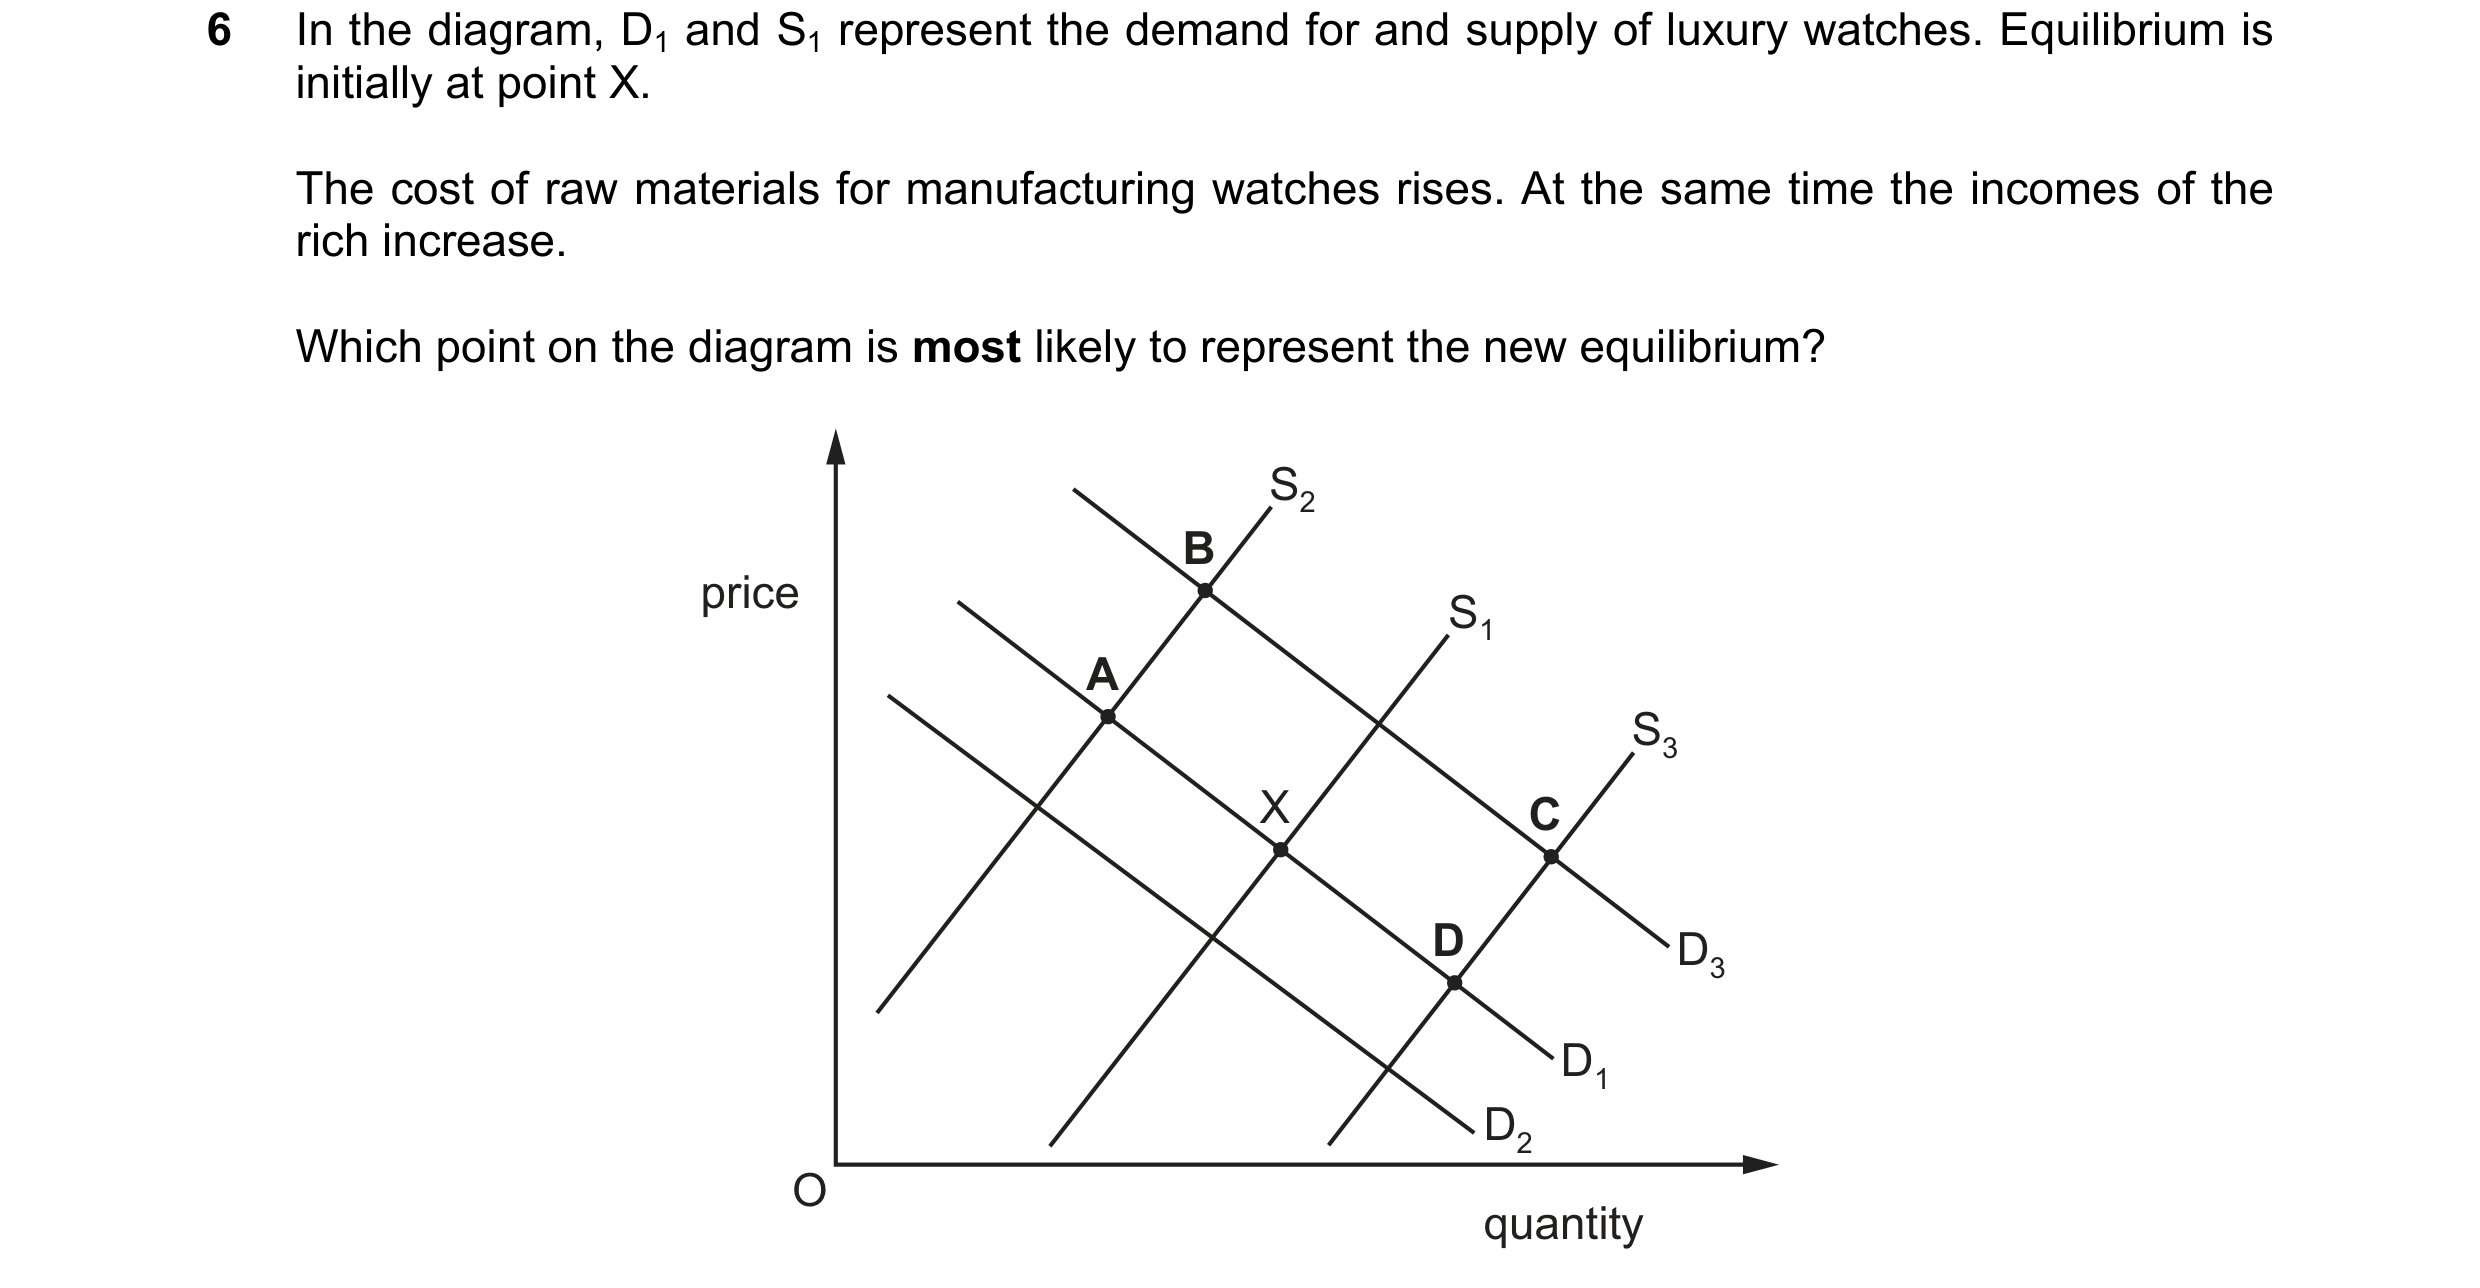
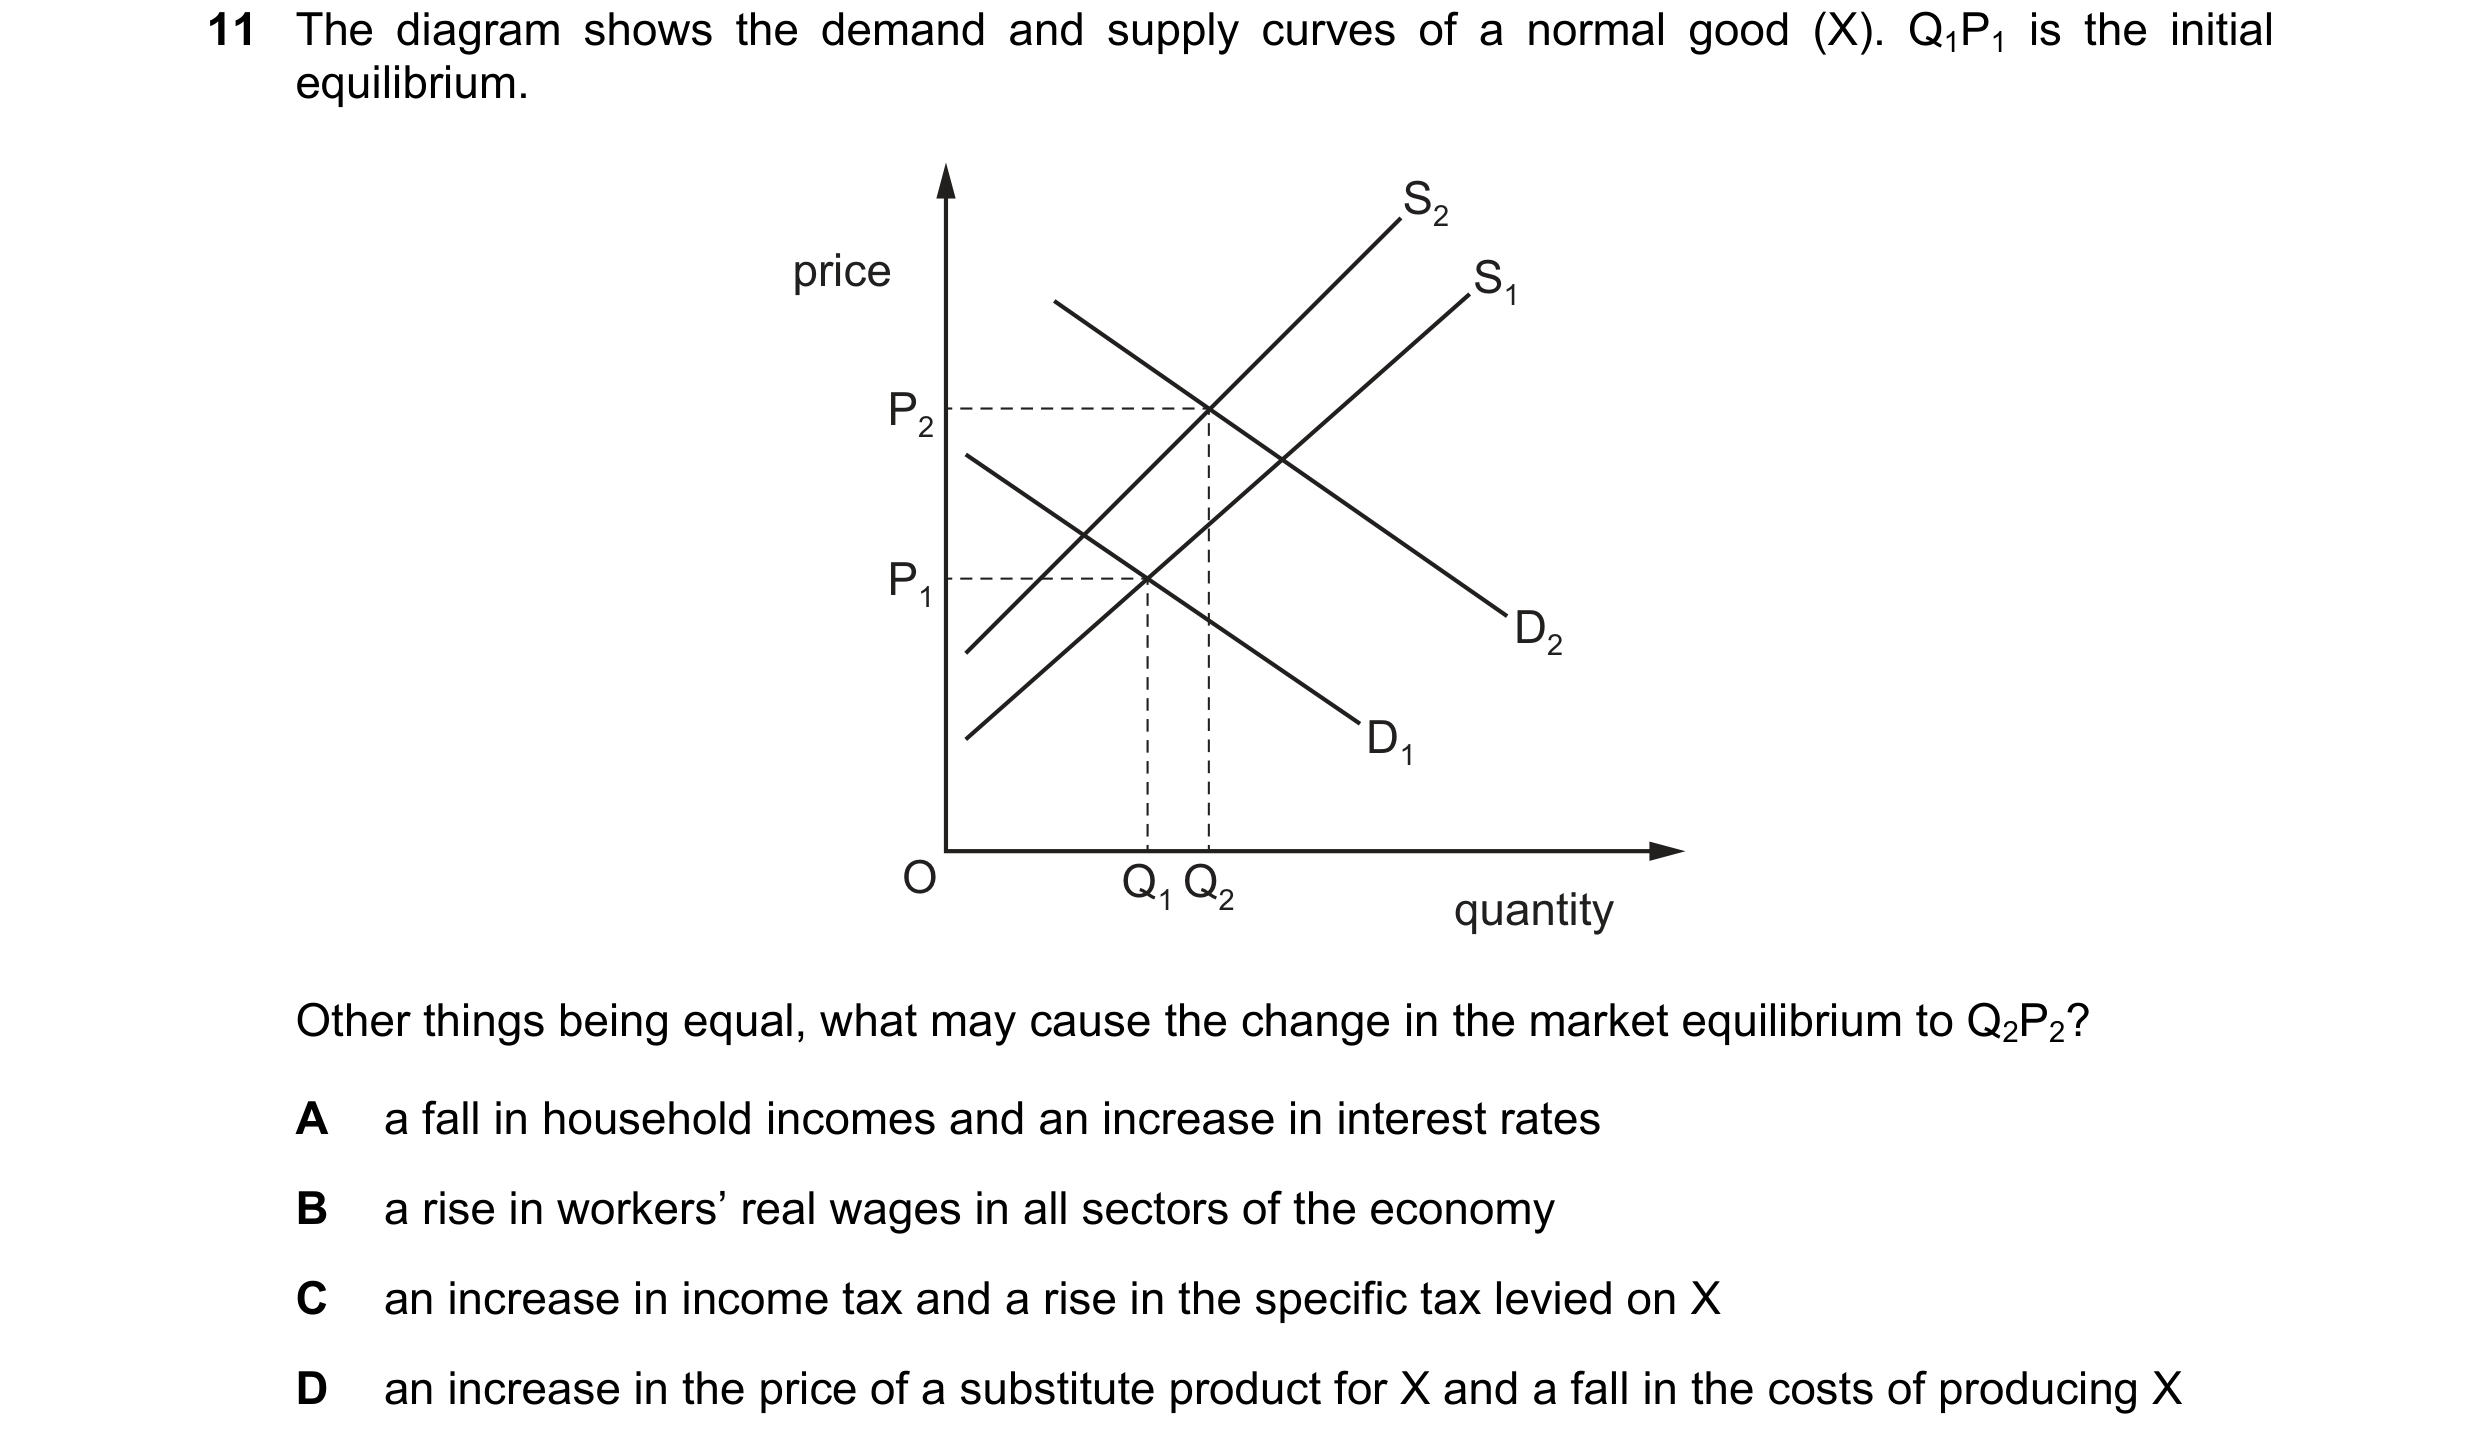 47 / 76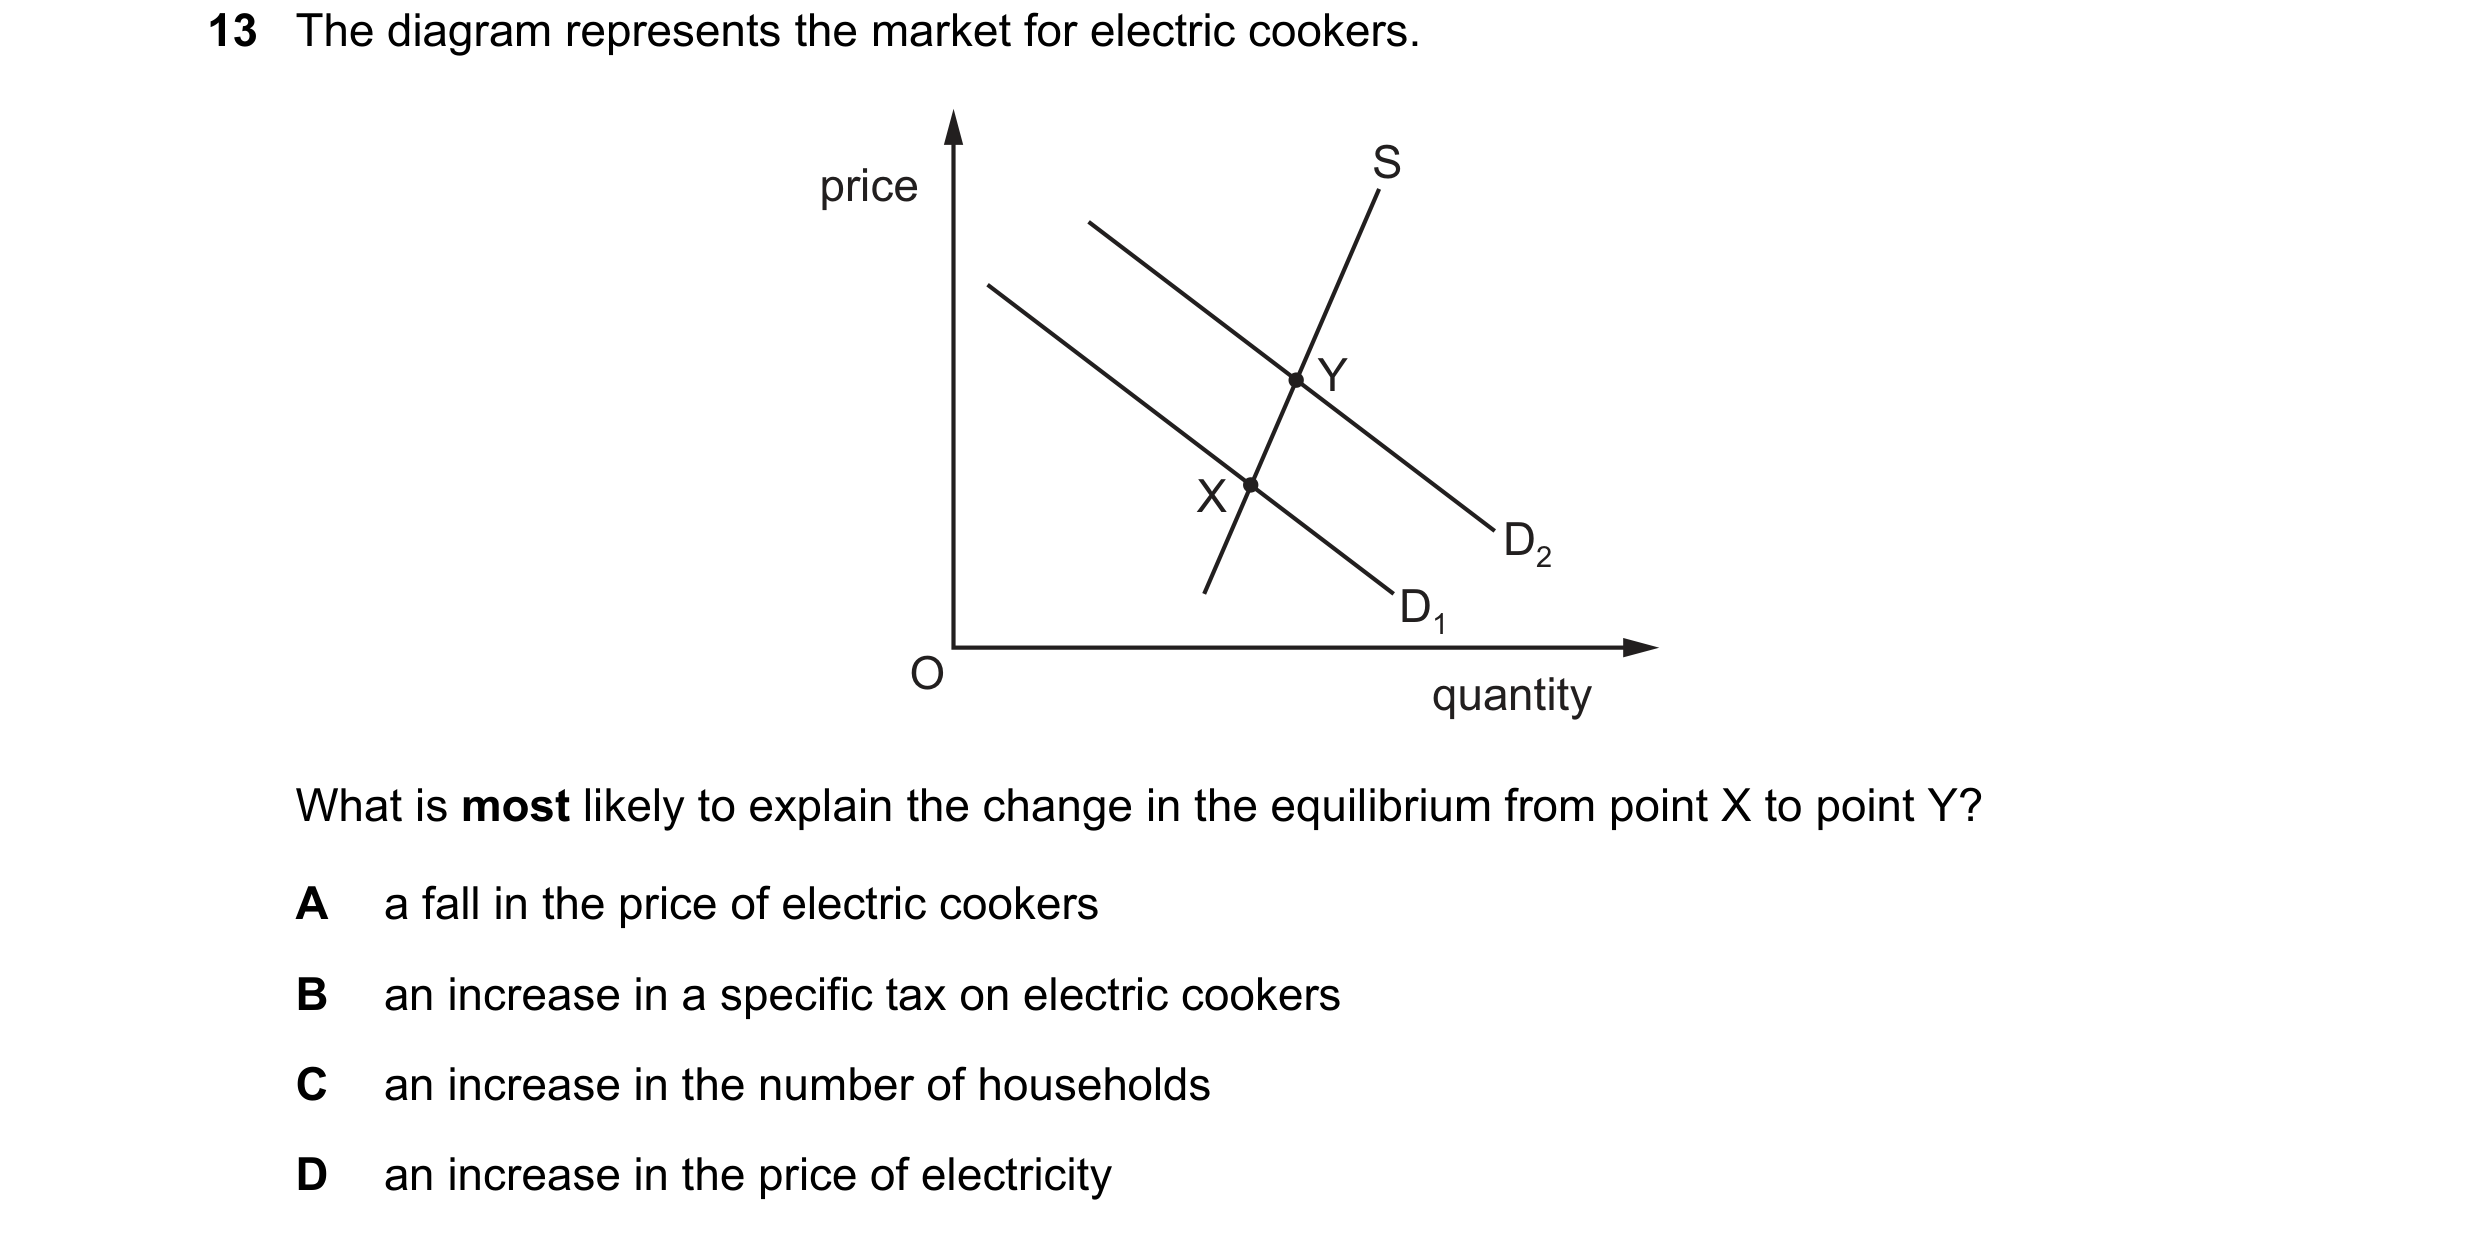
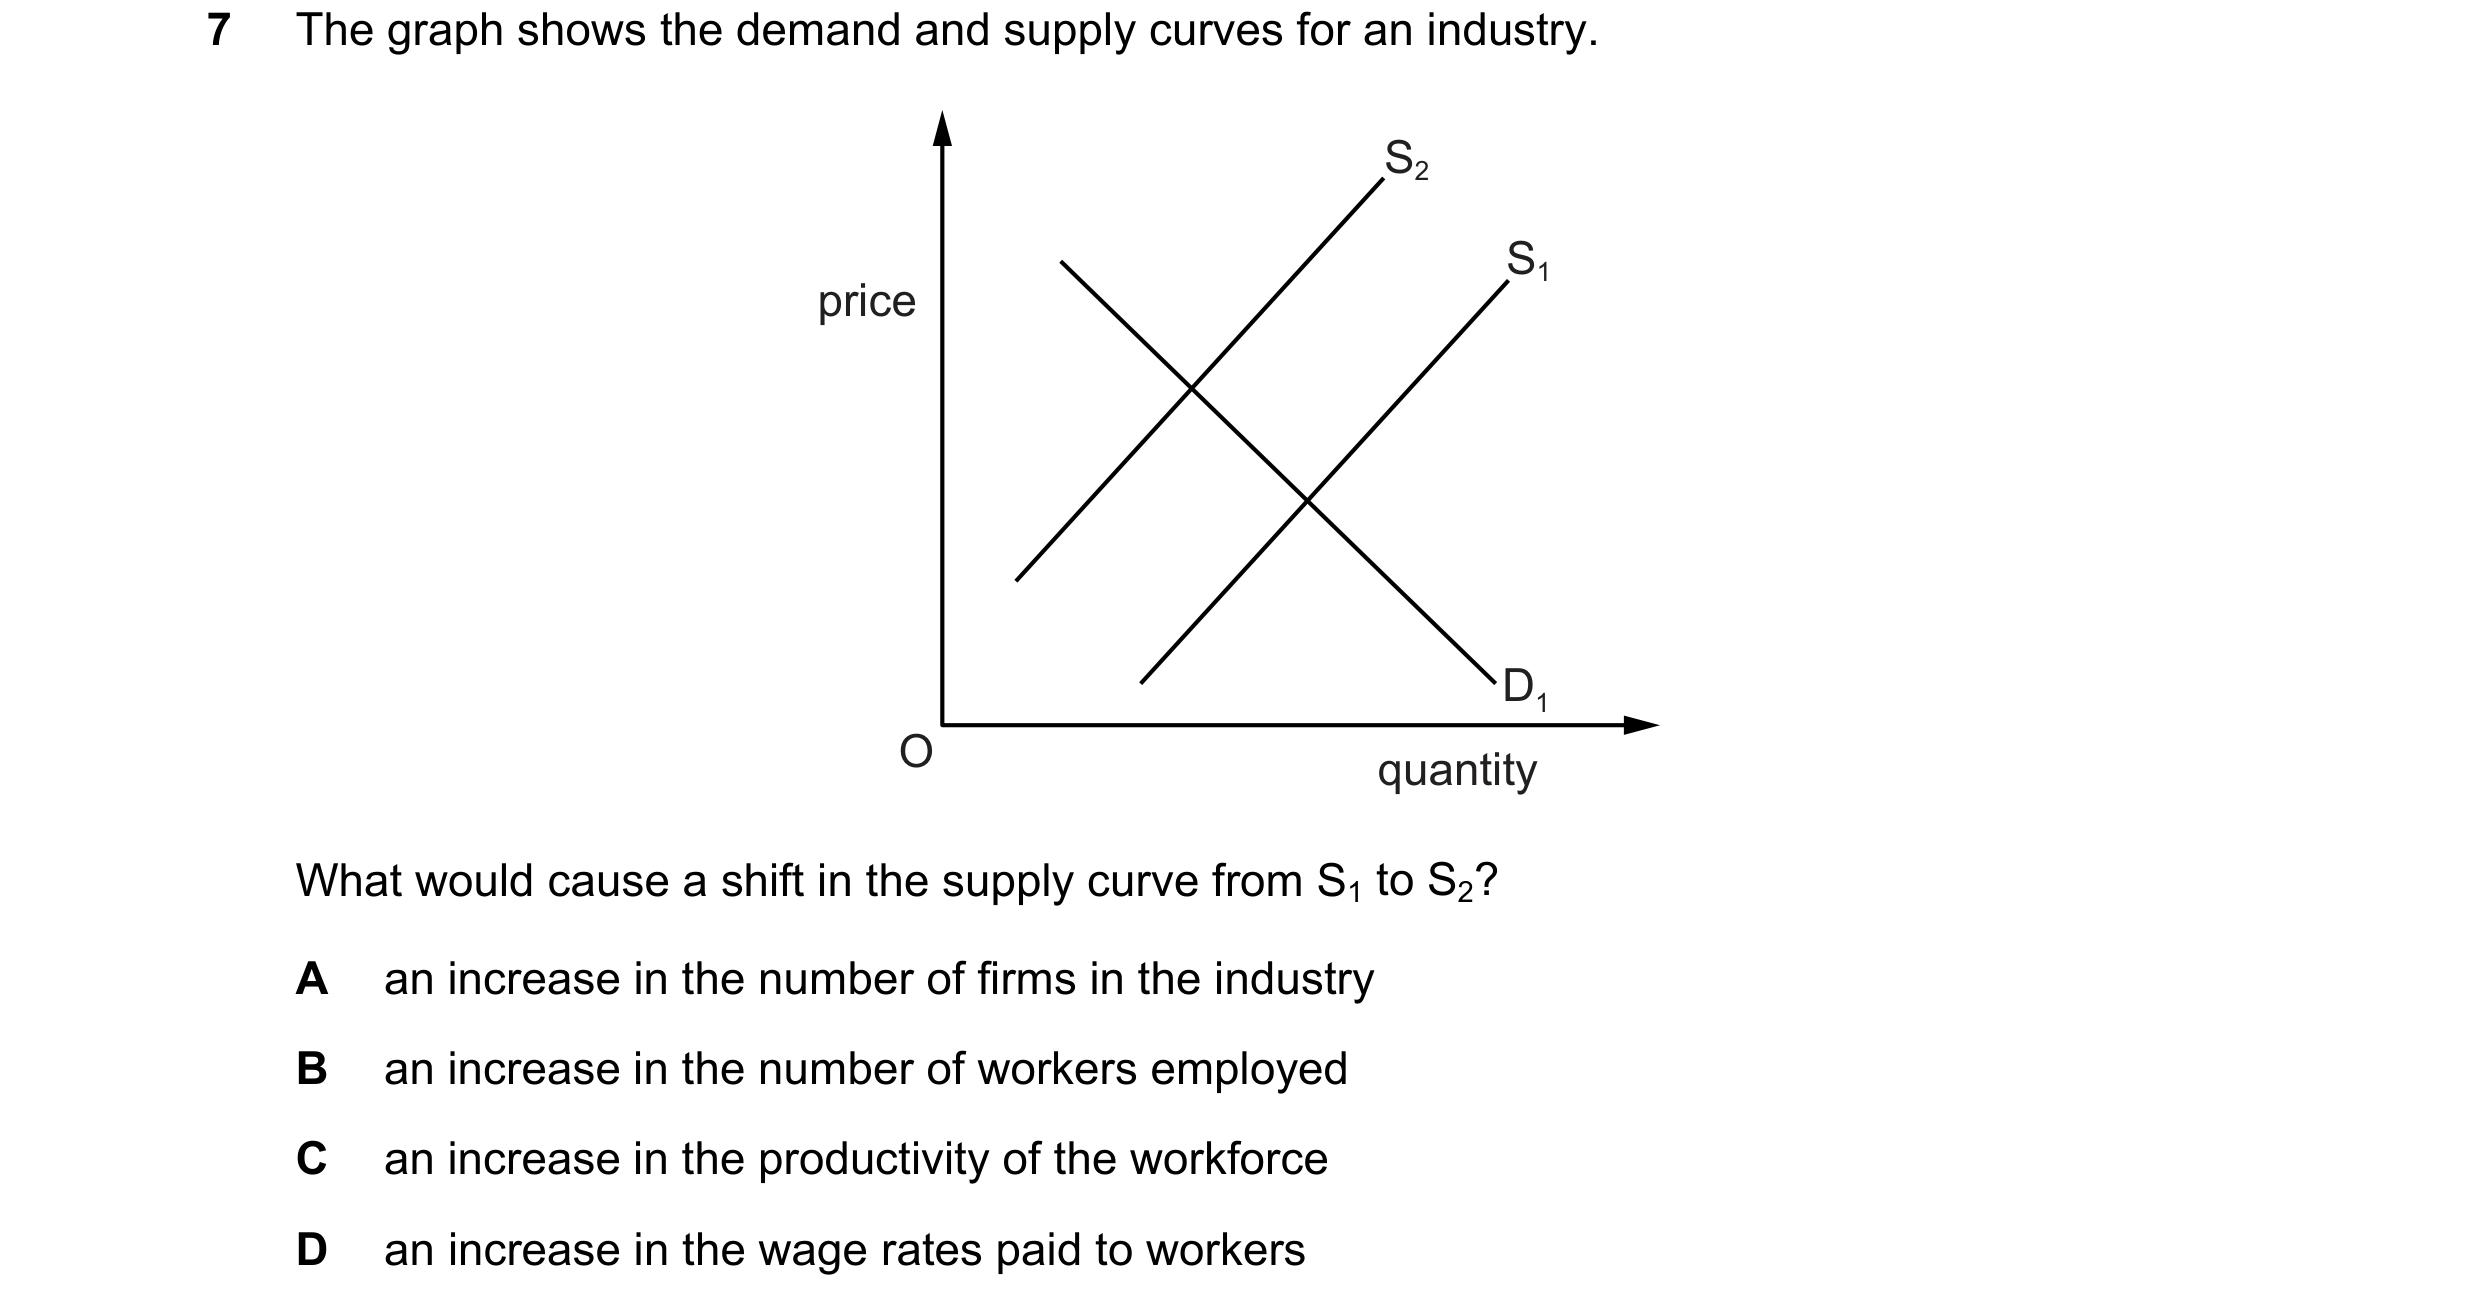
 48 / 76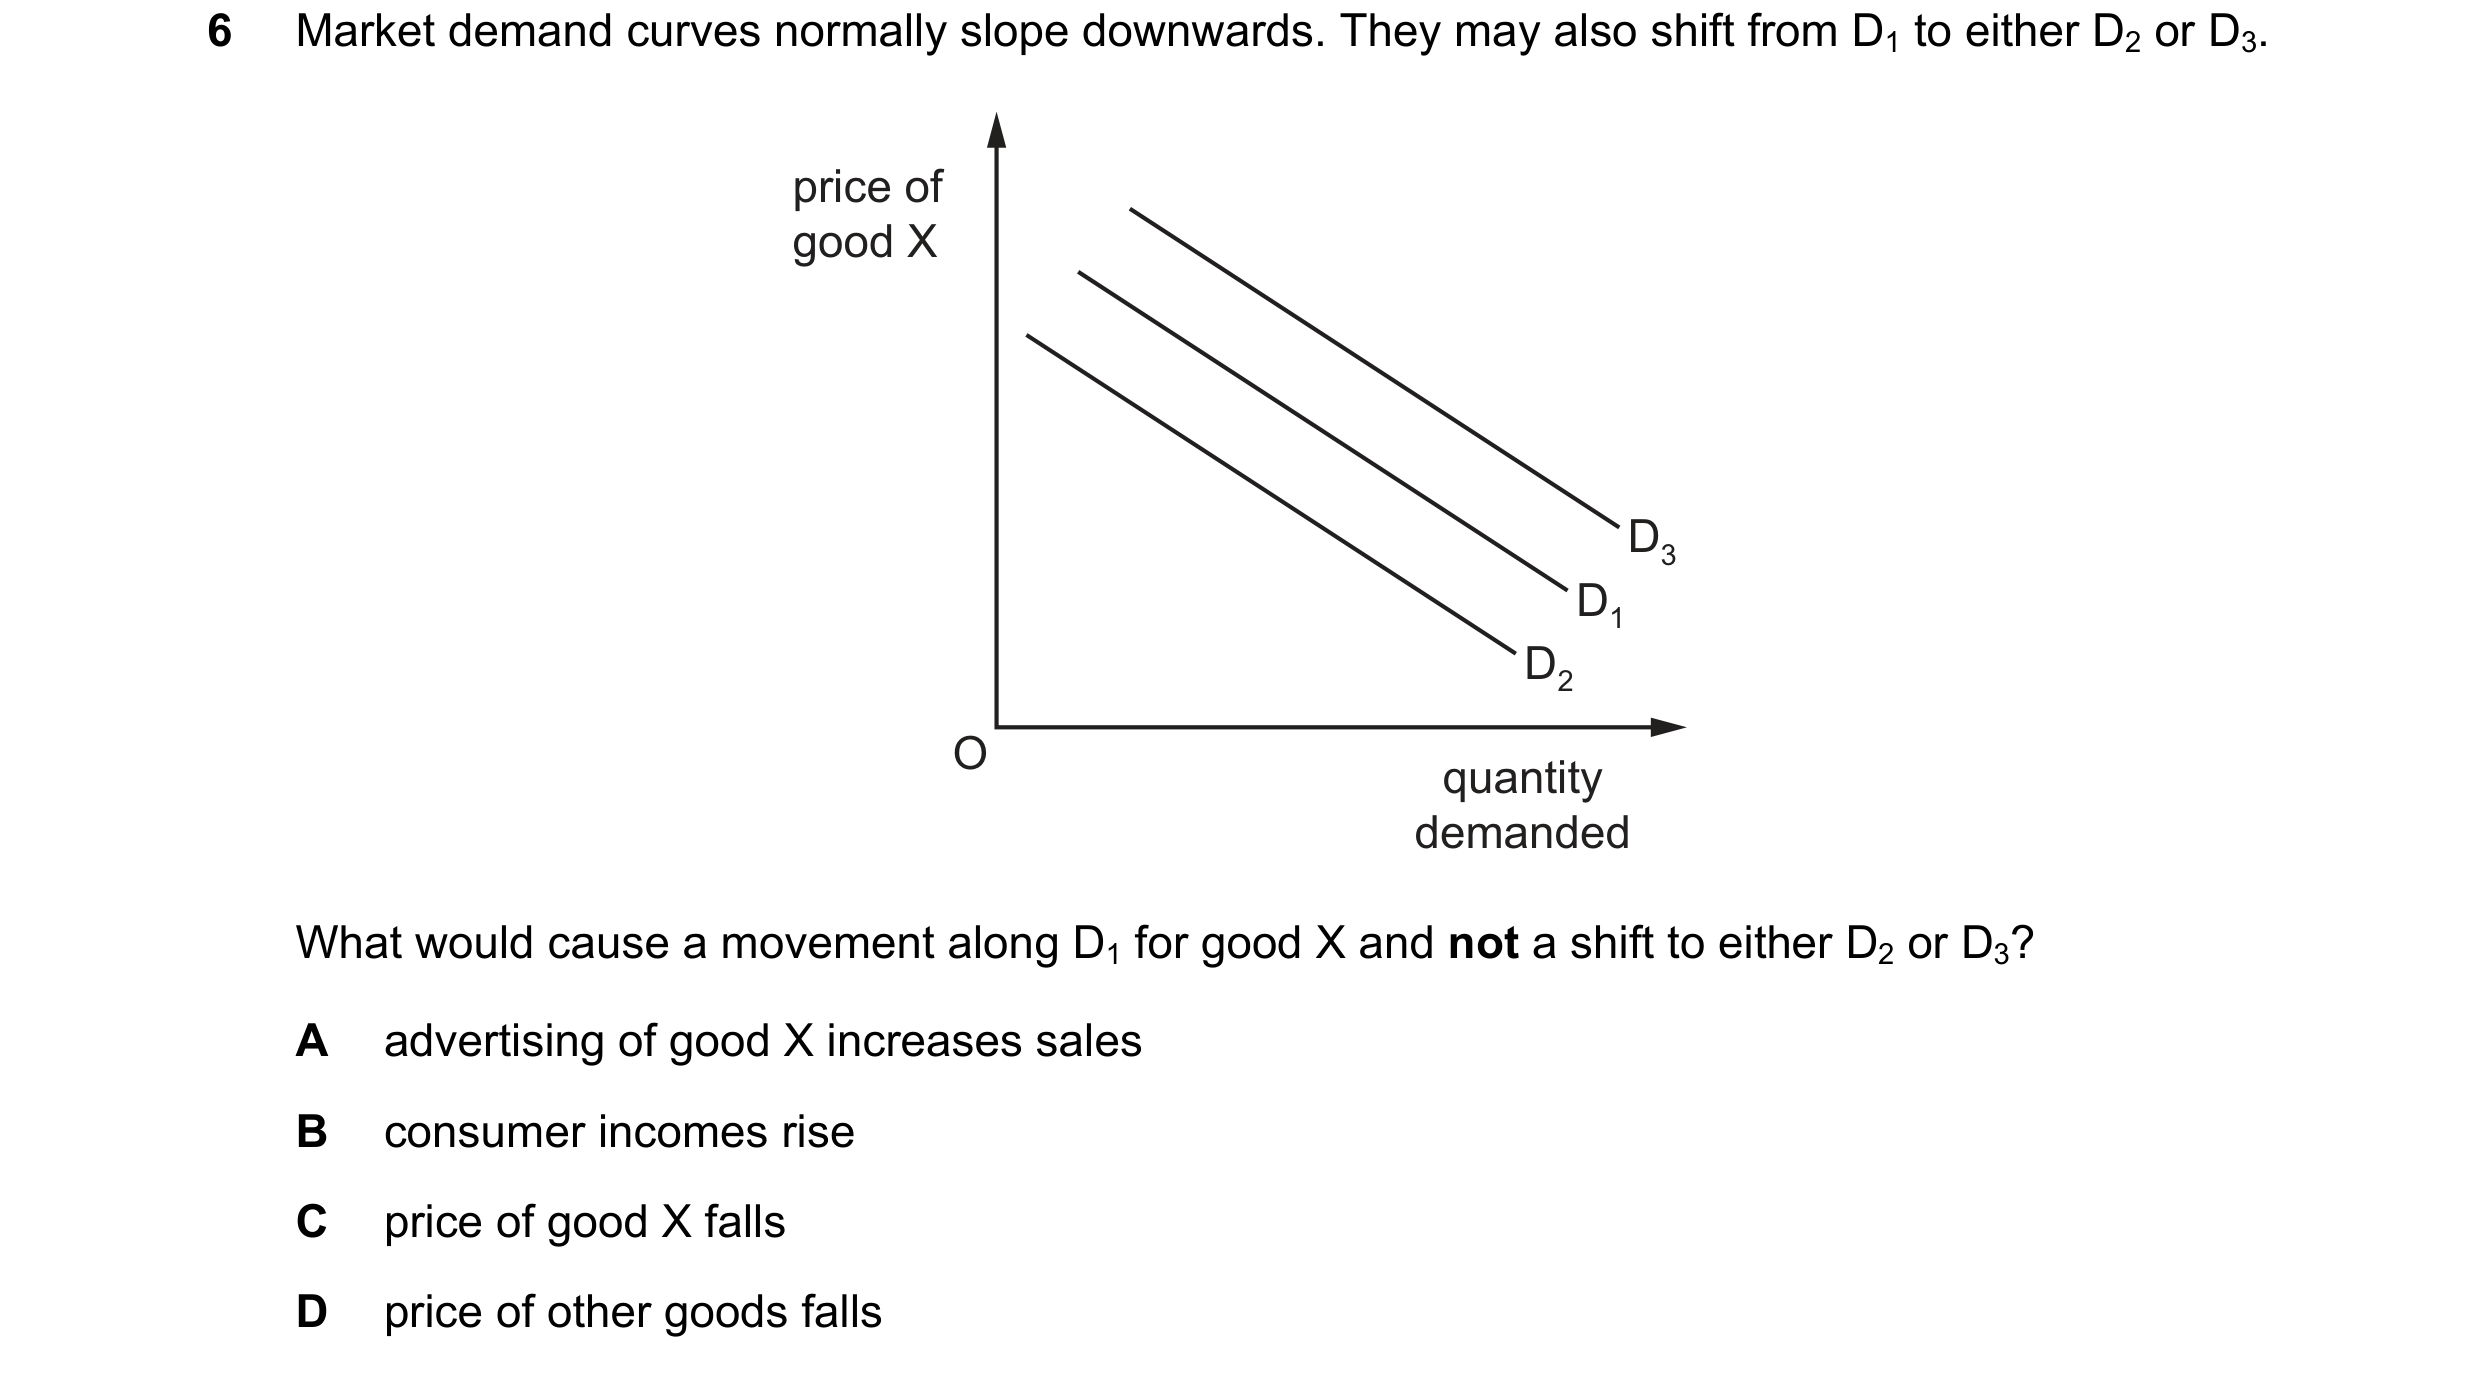
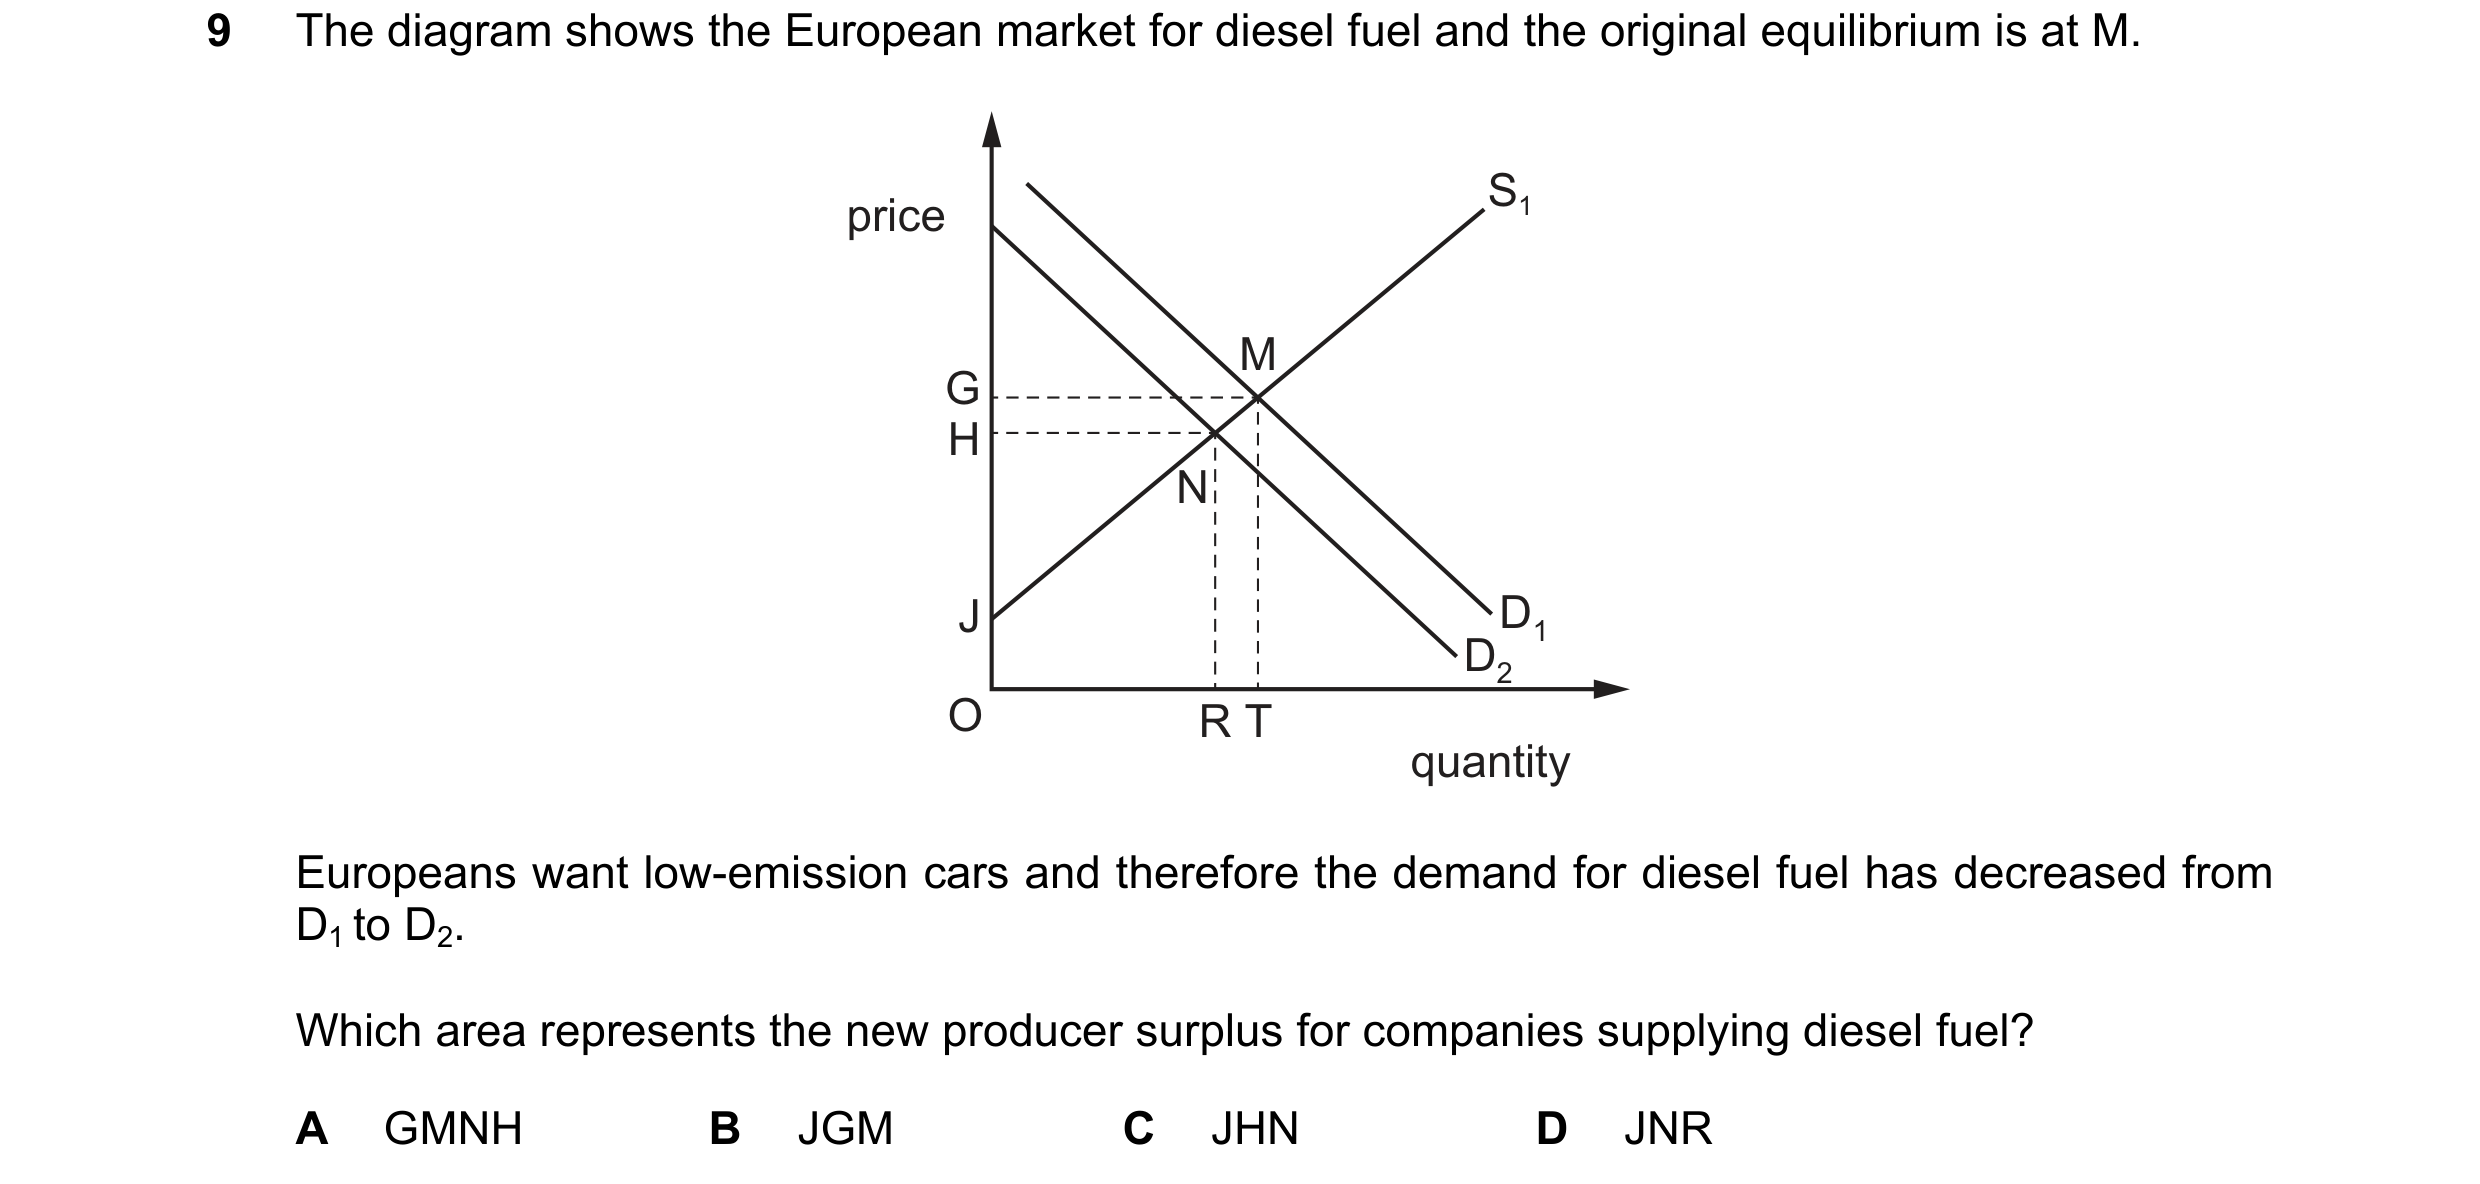
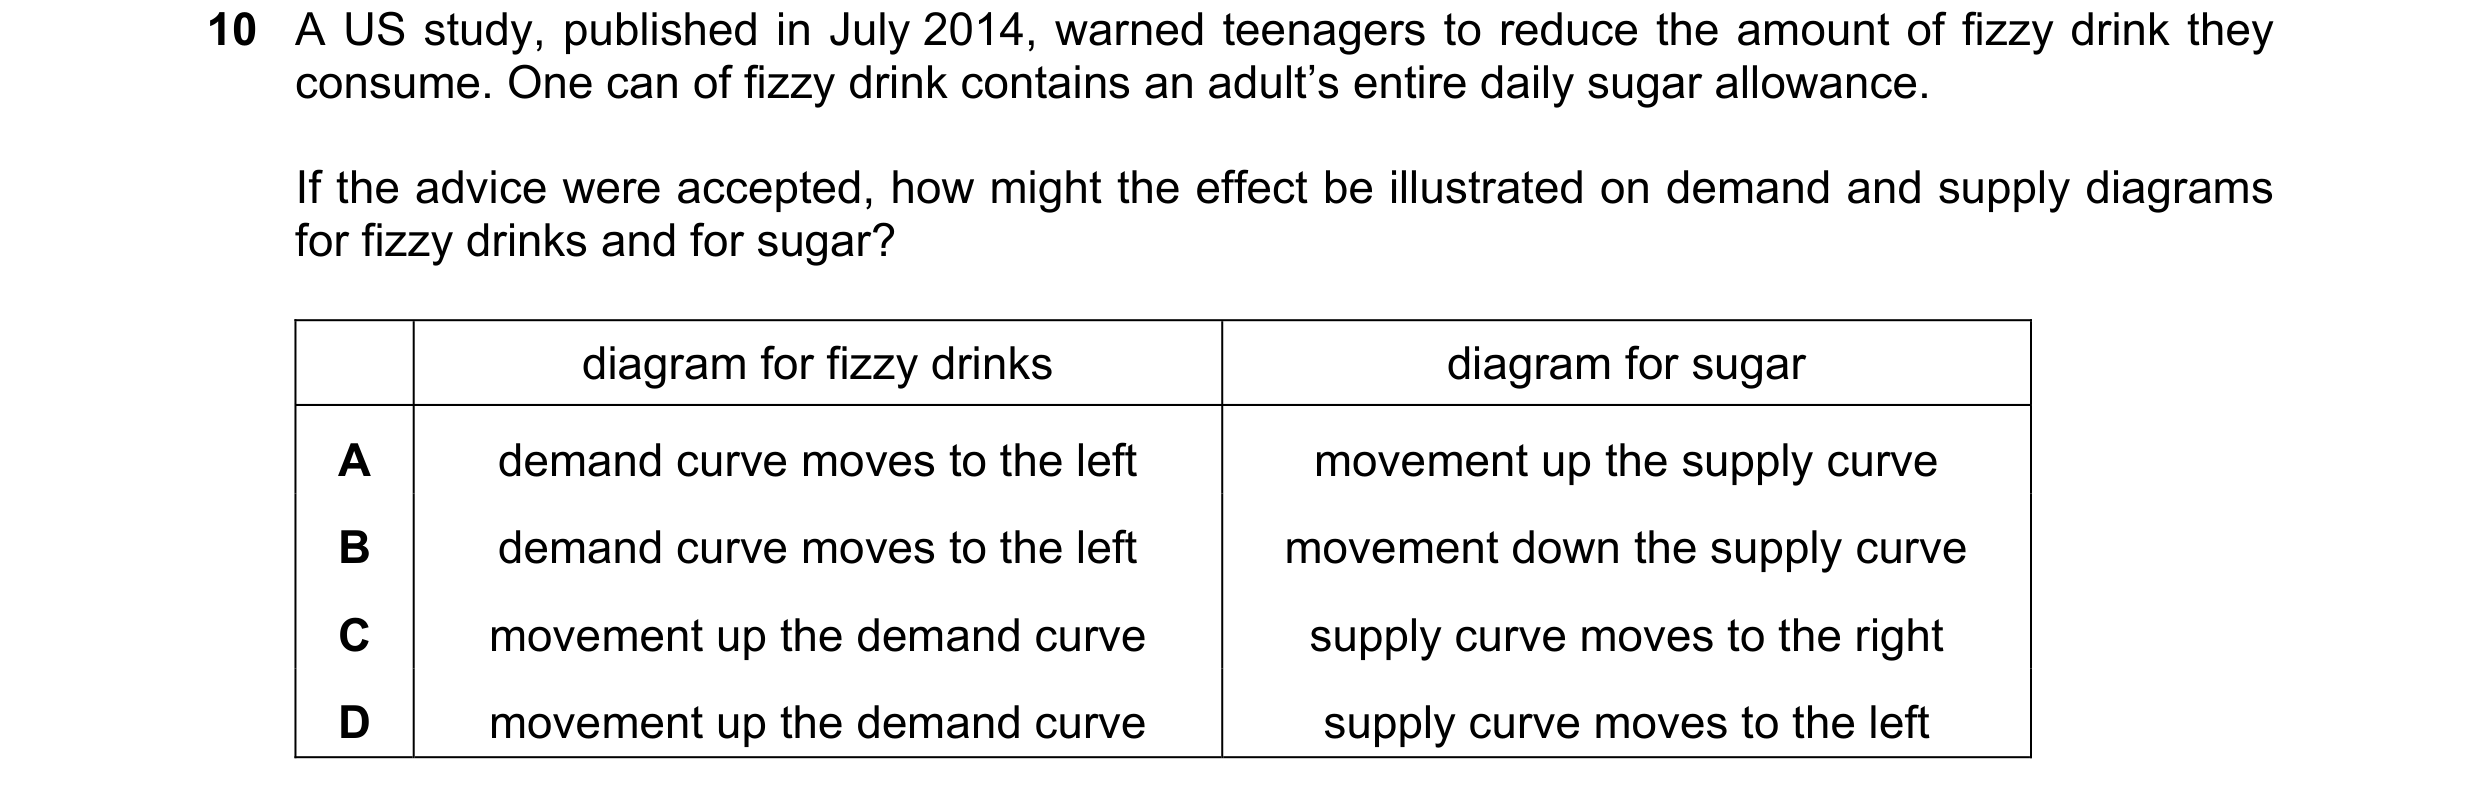 49 / 76
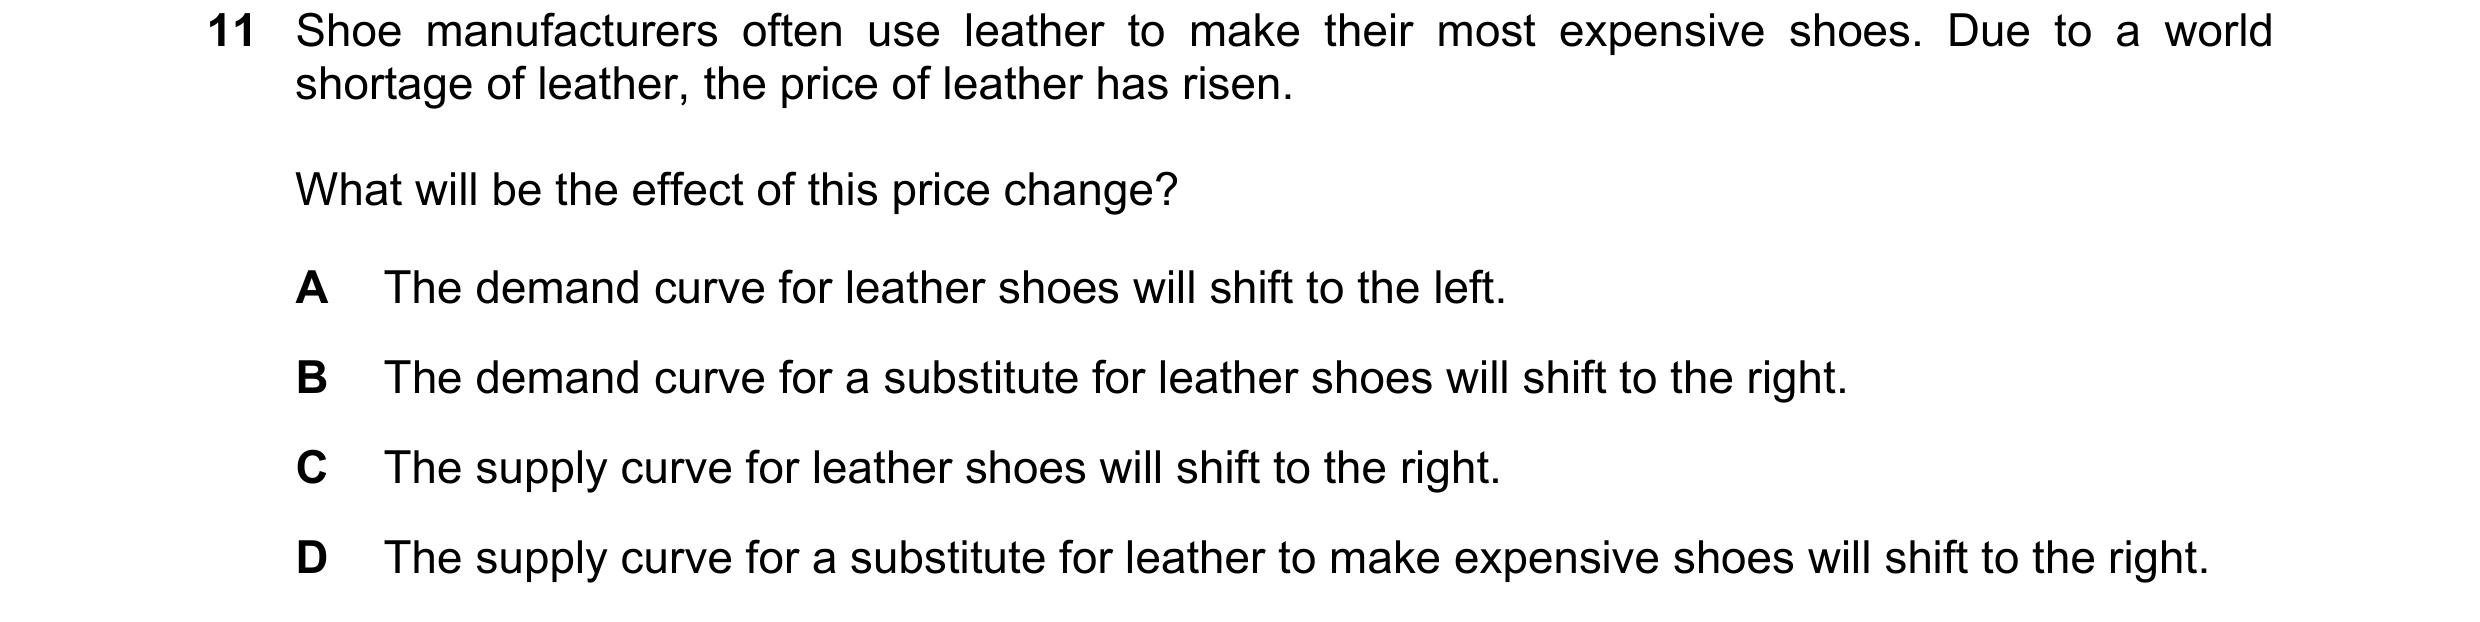
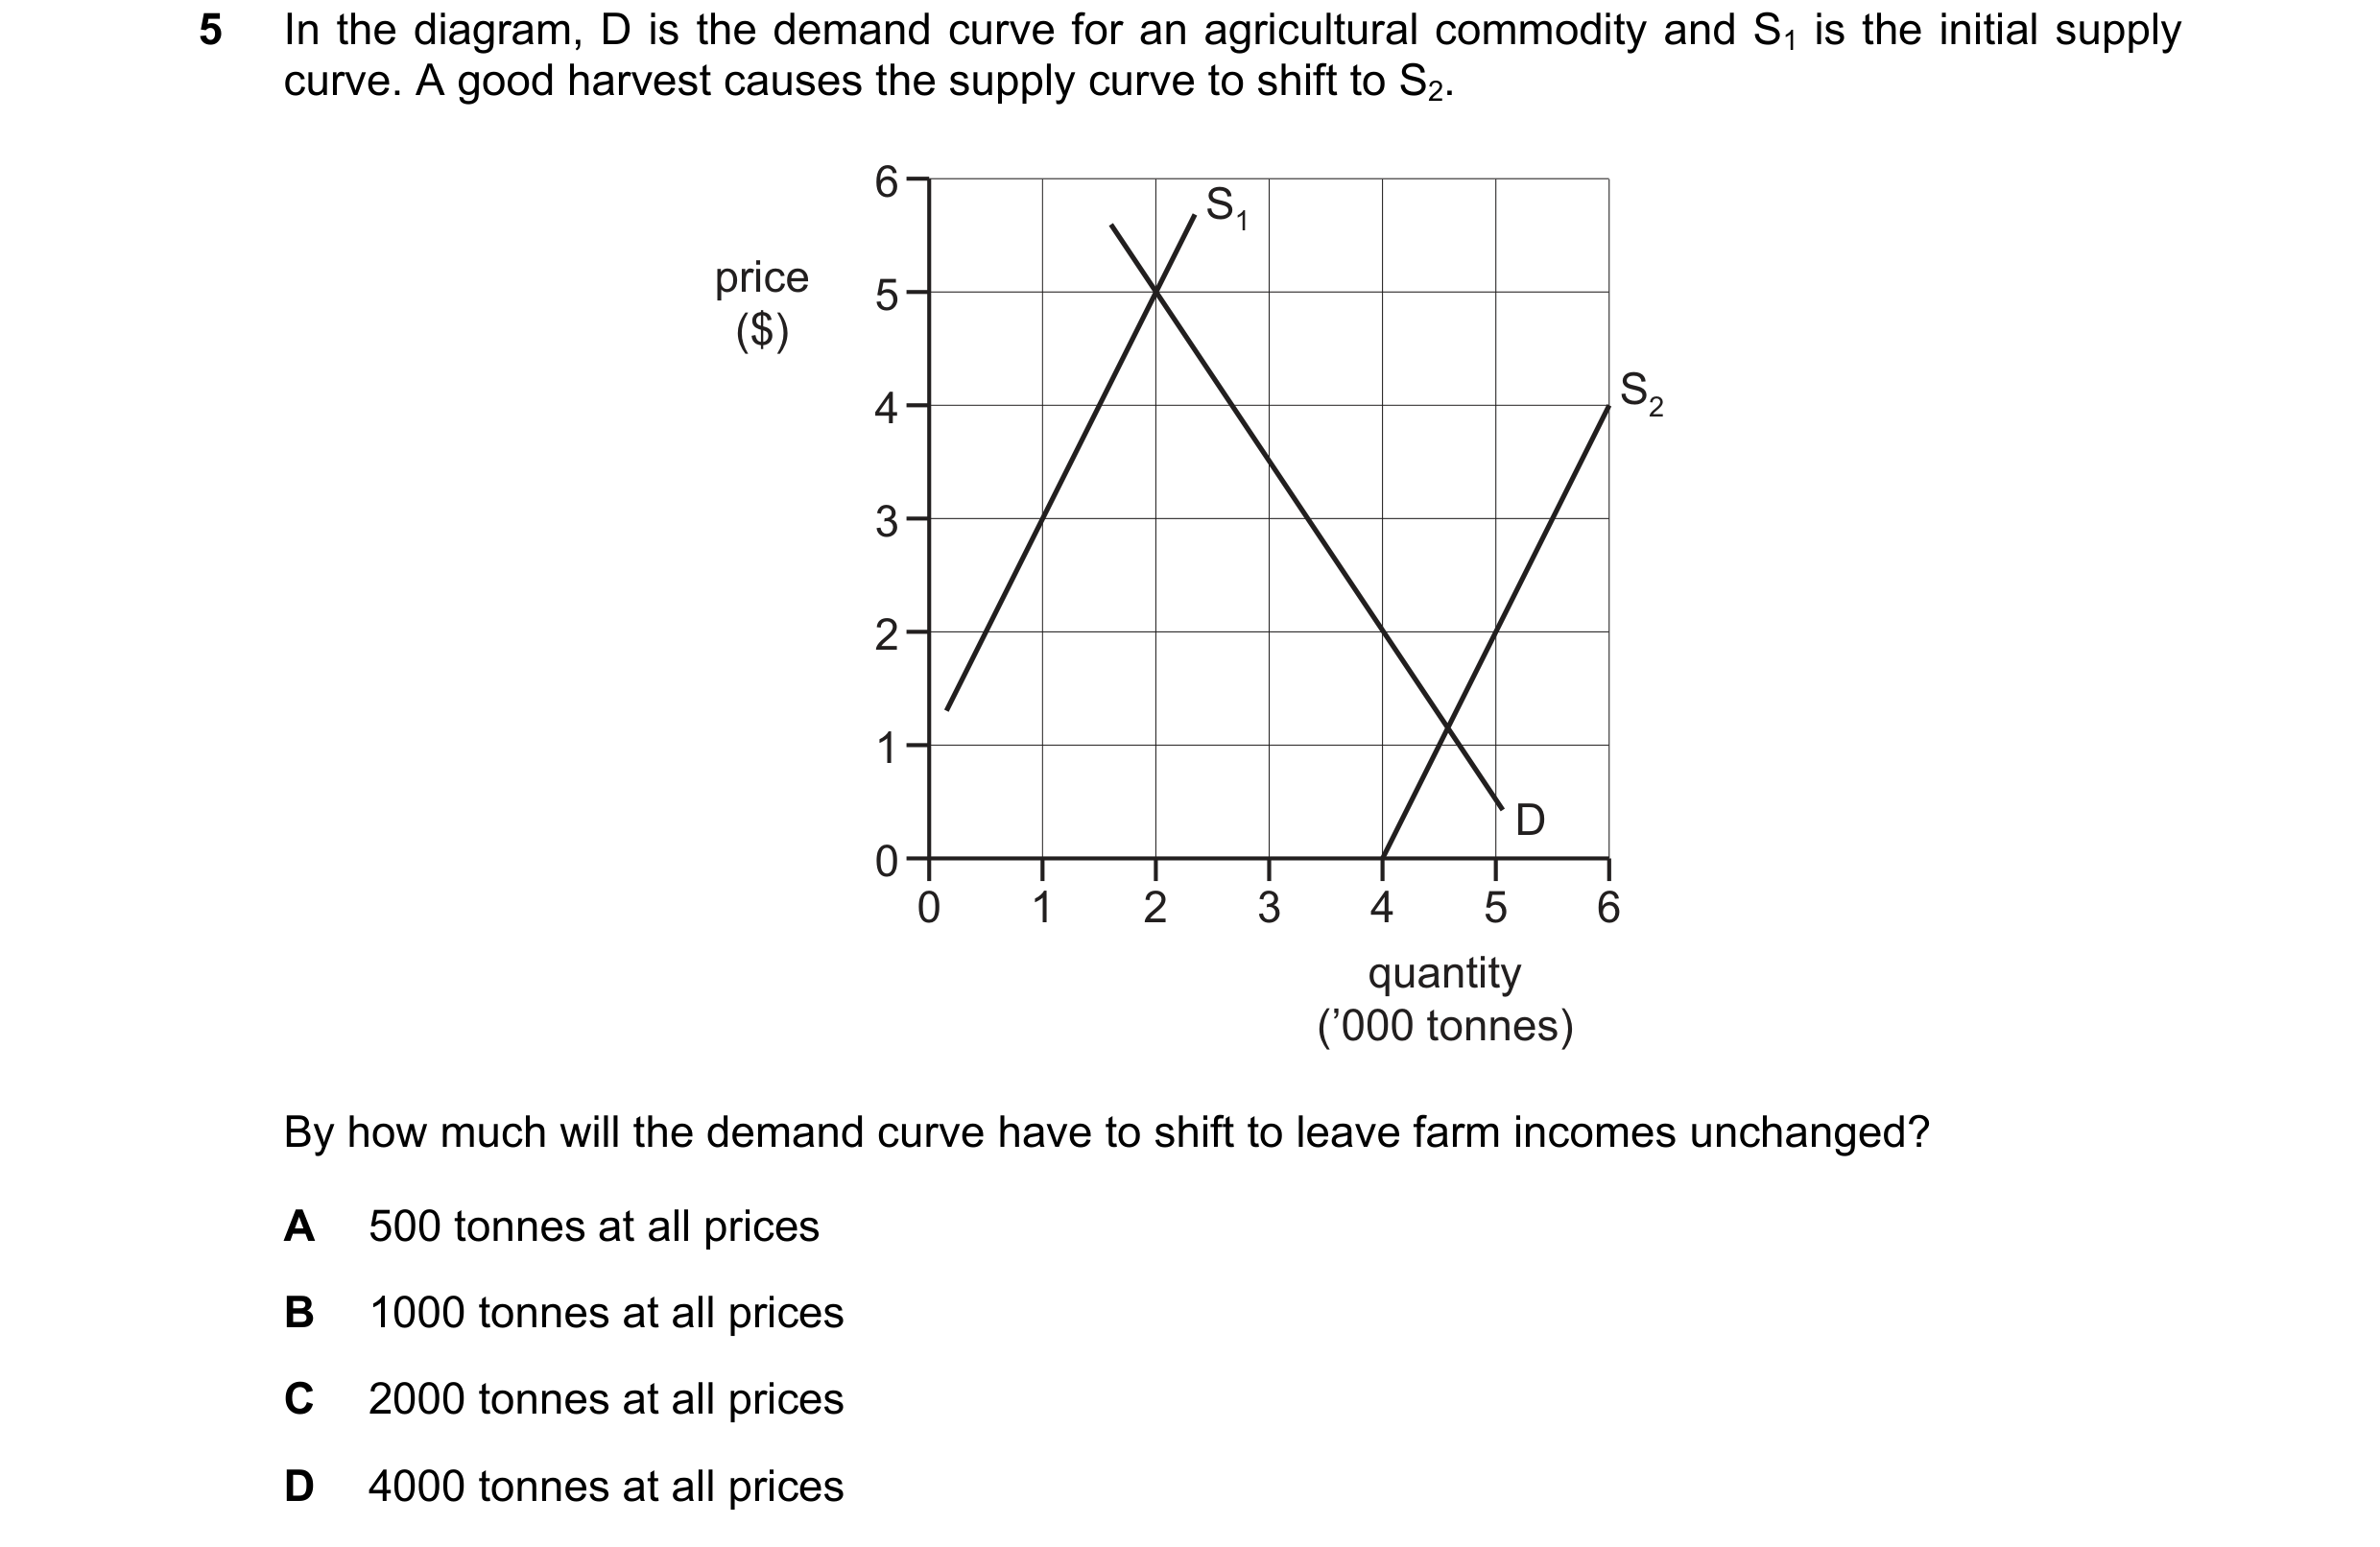
 50 / 76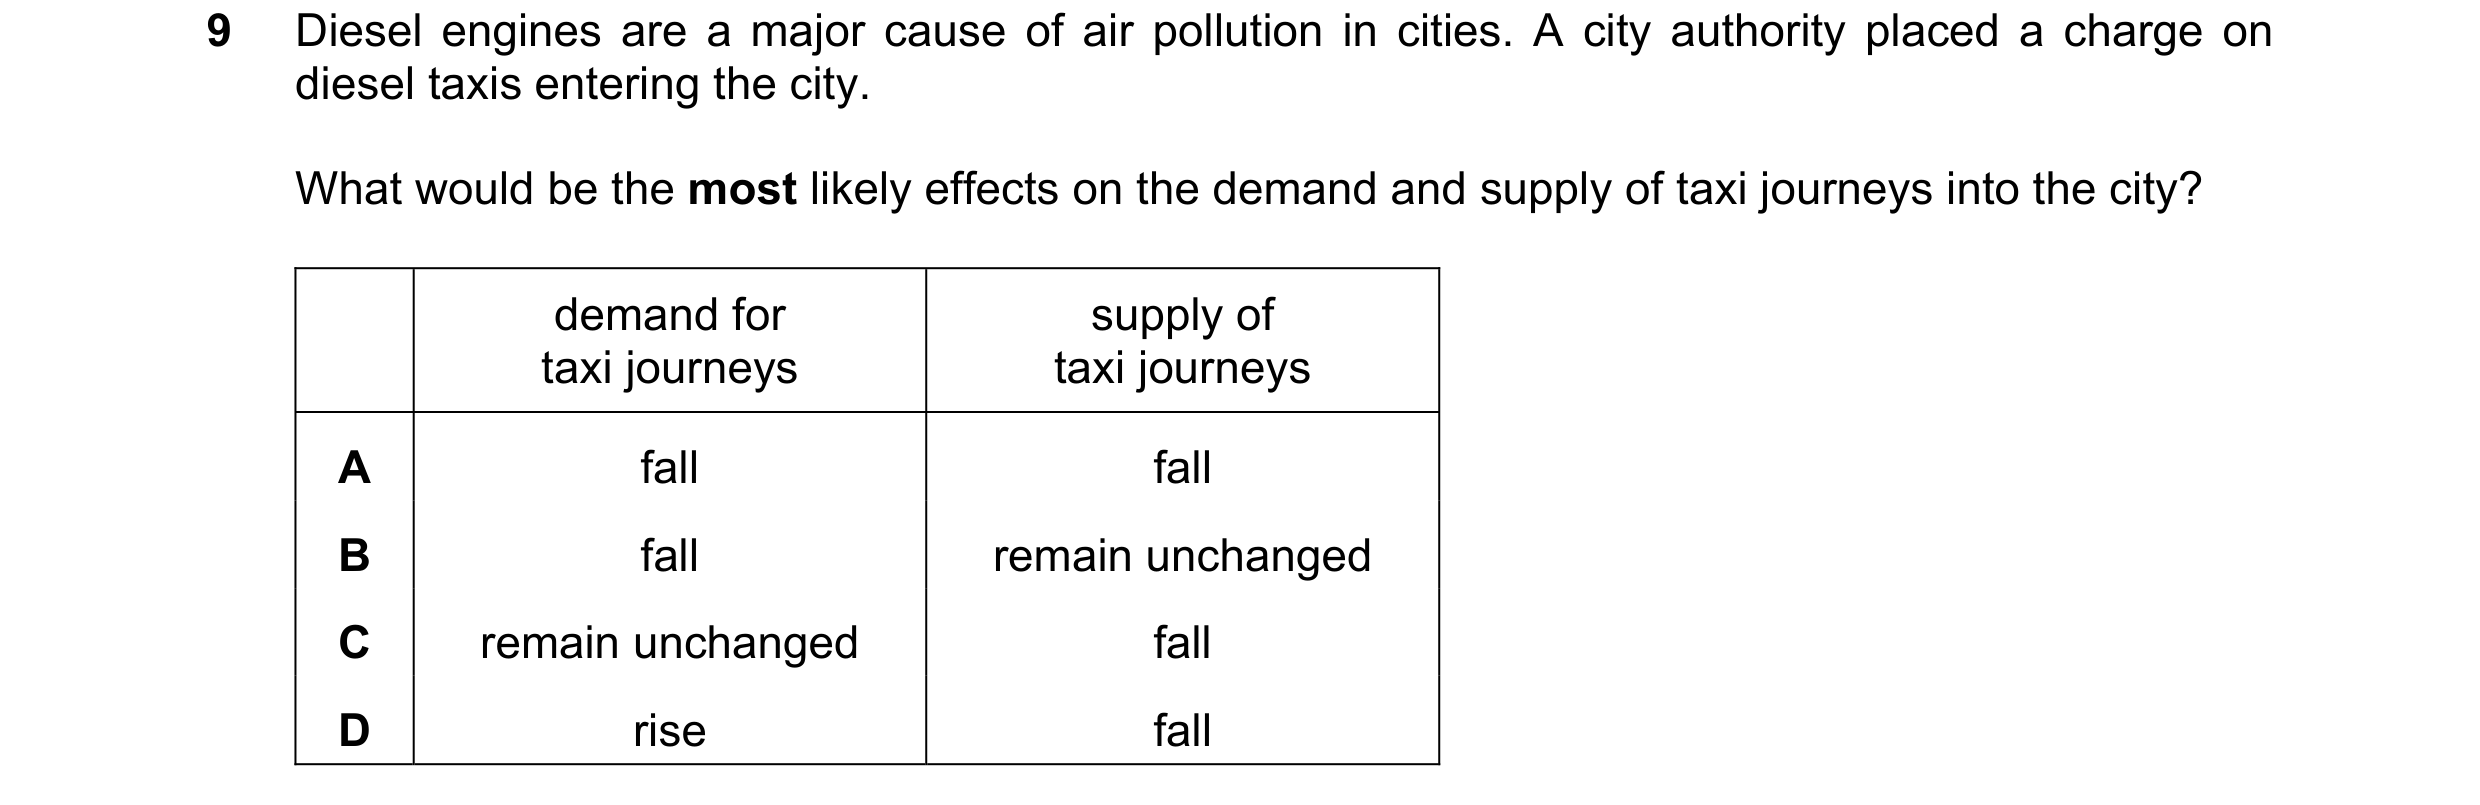
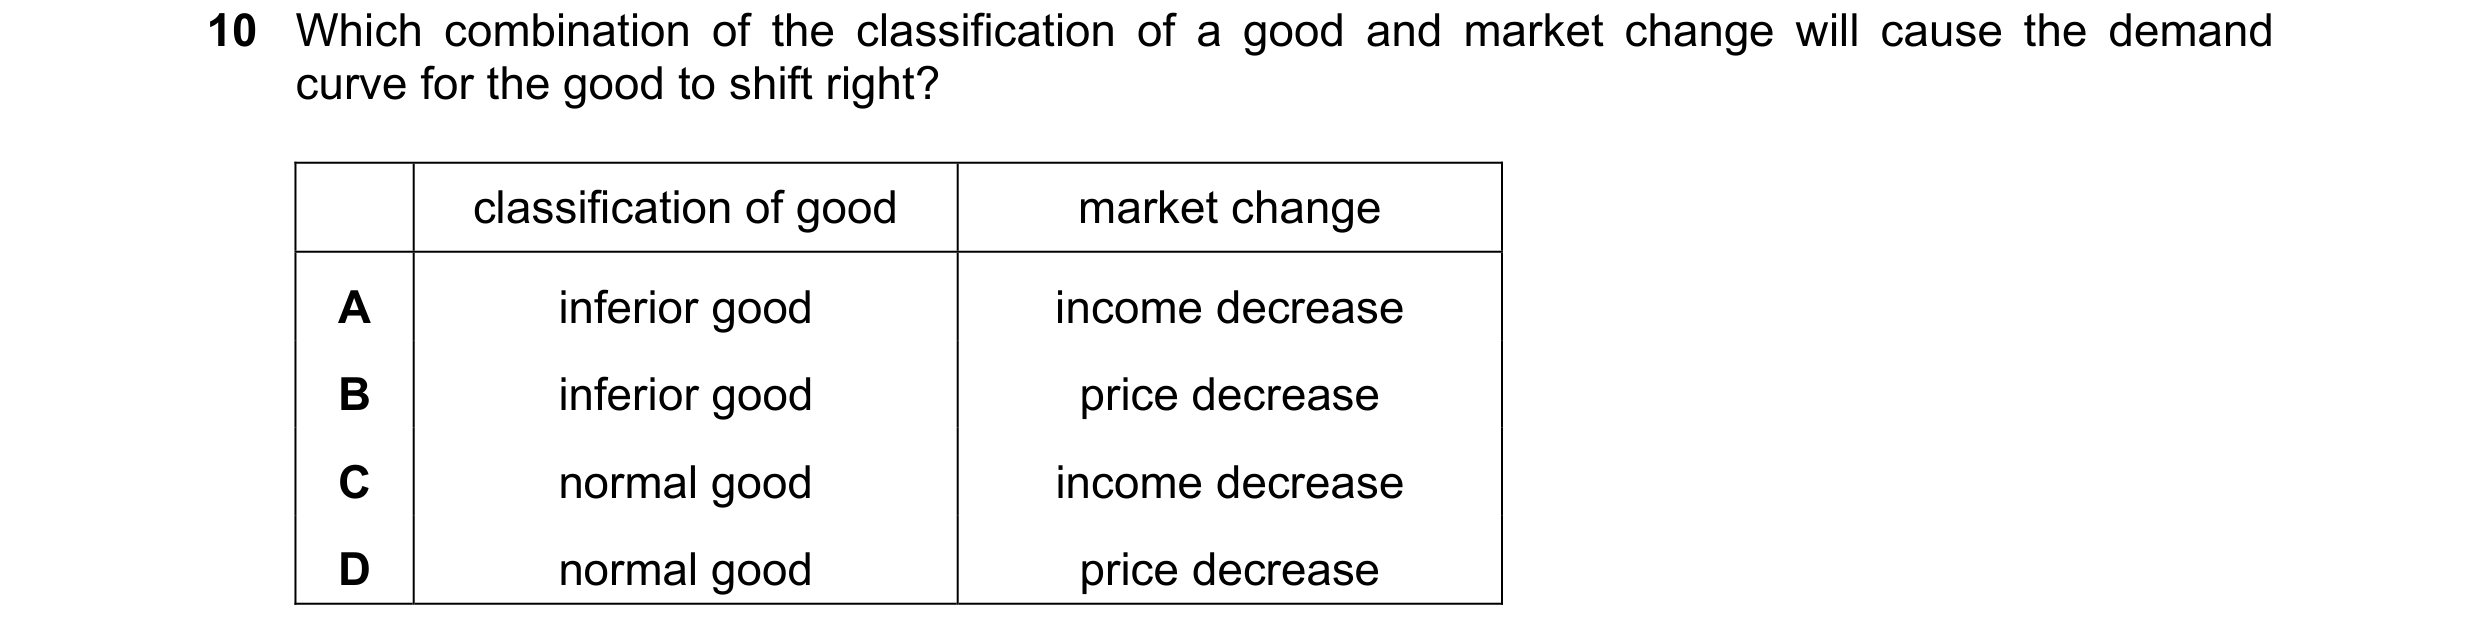
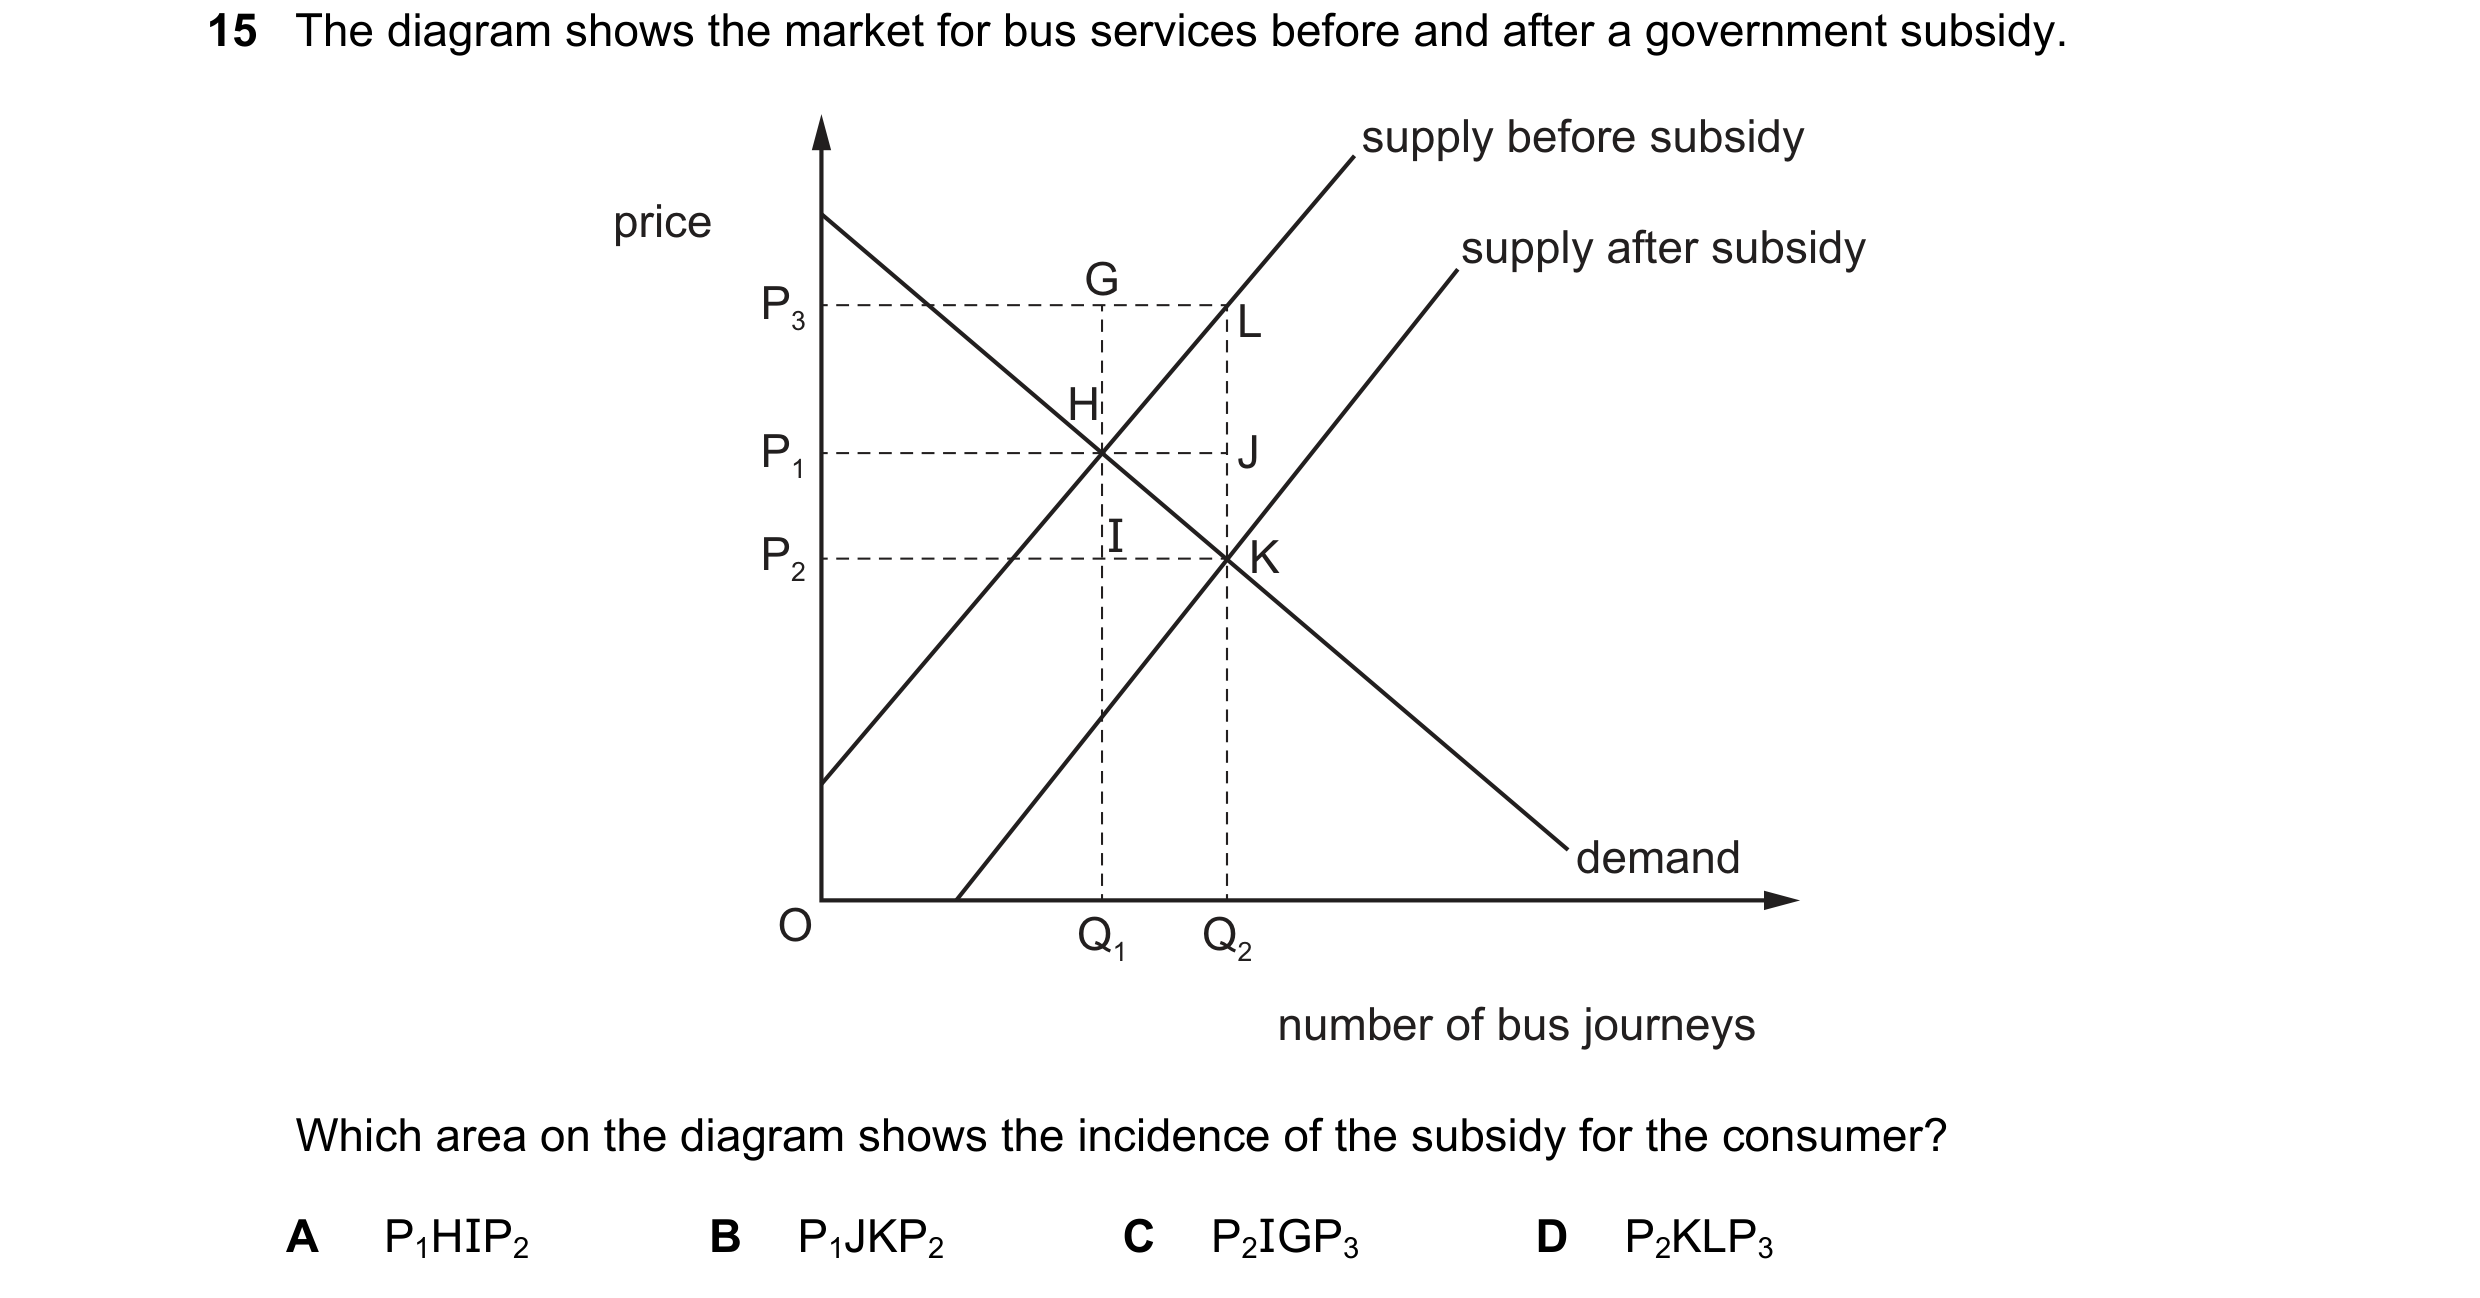 51 / 76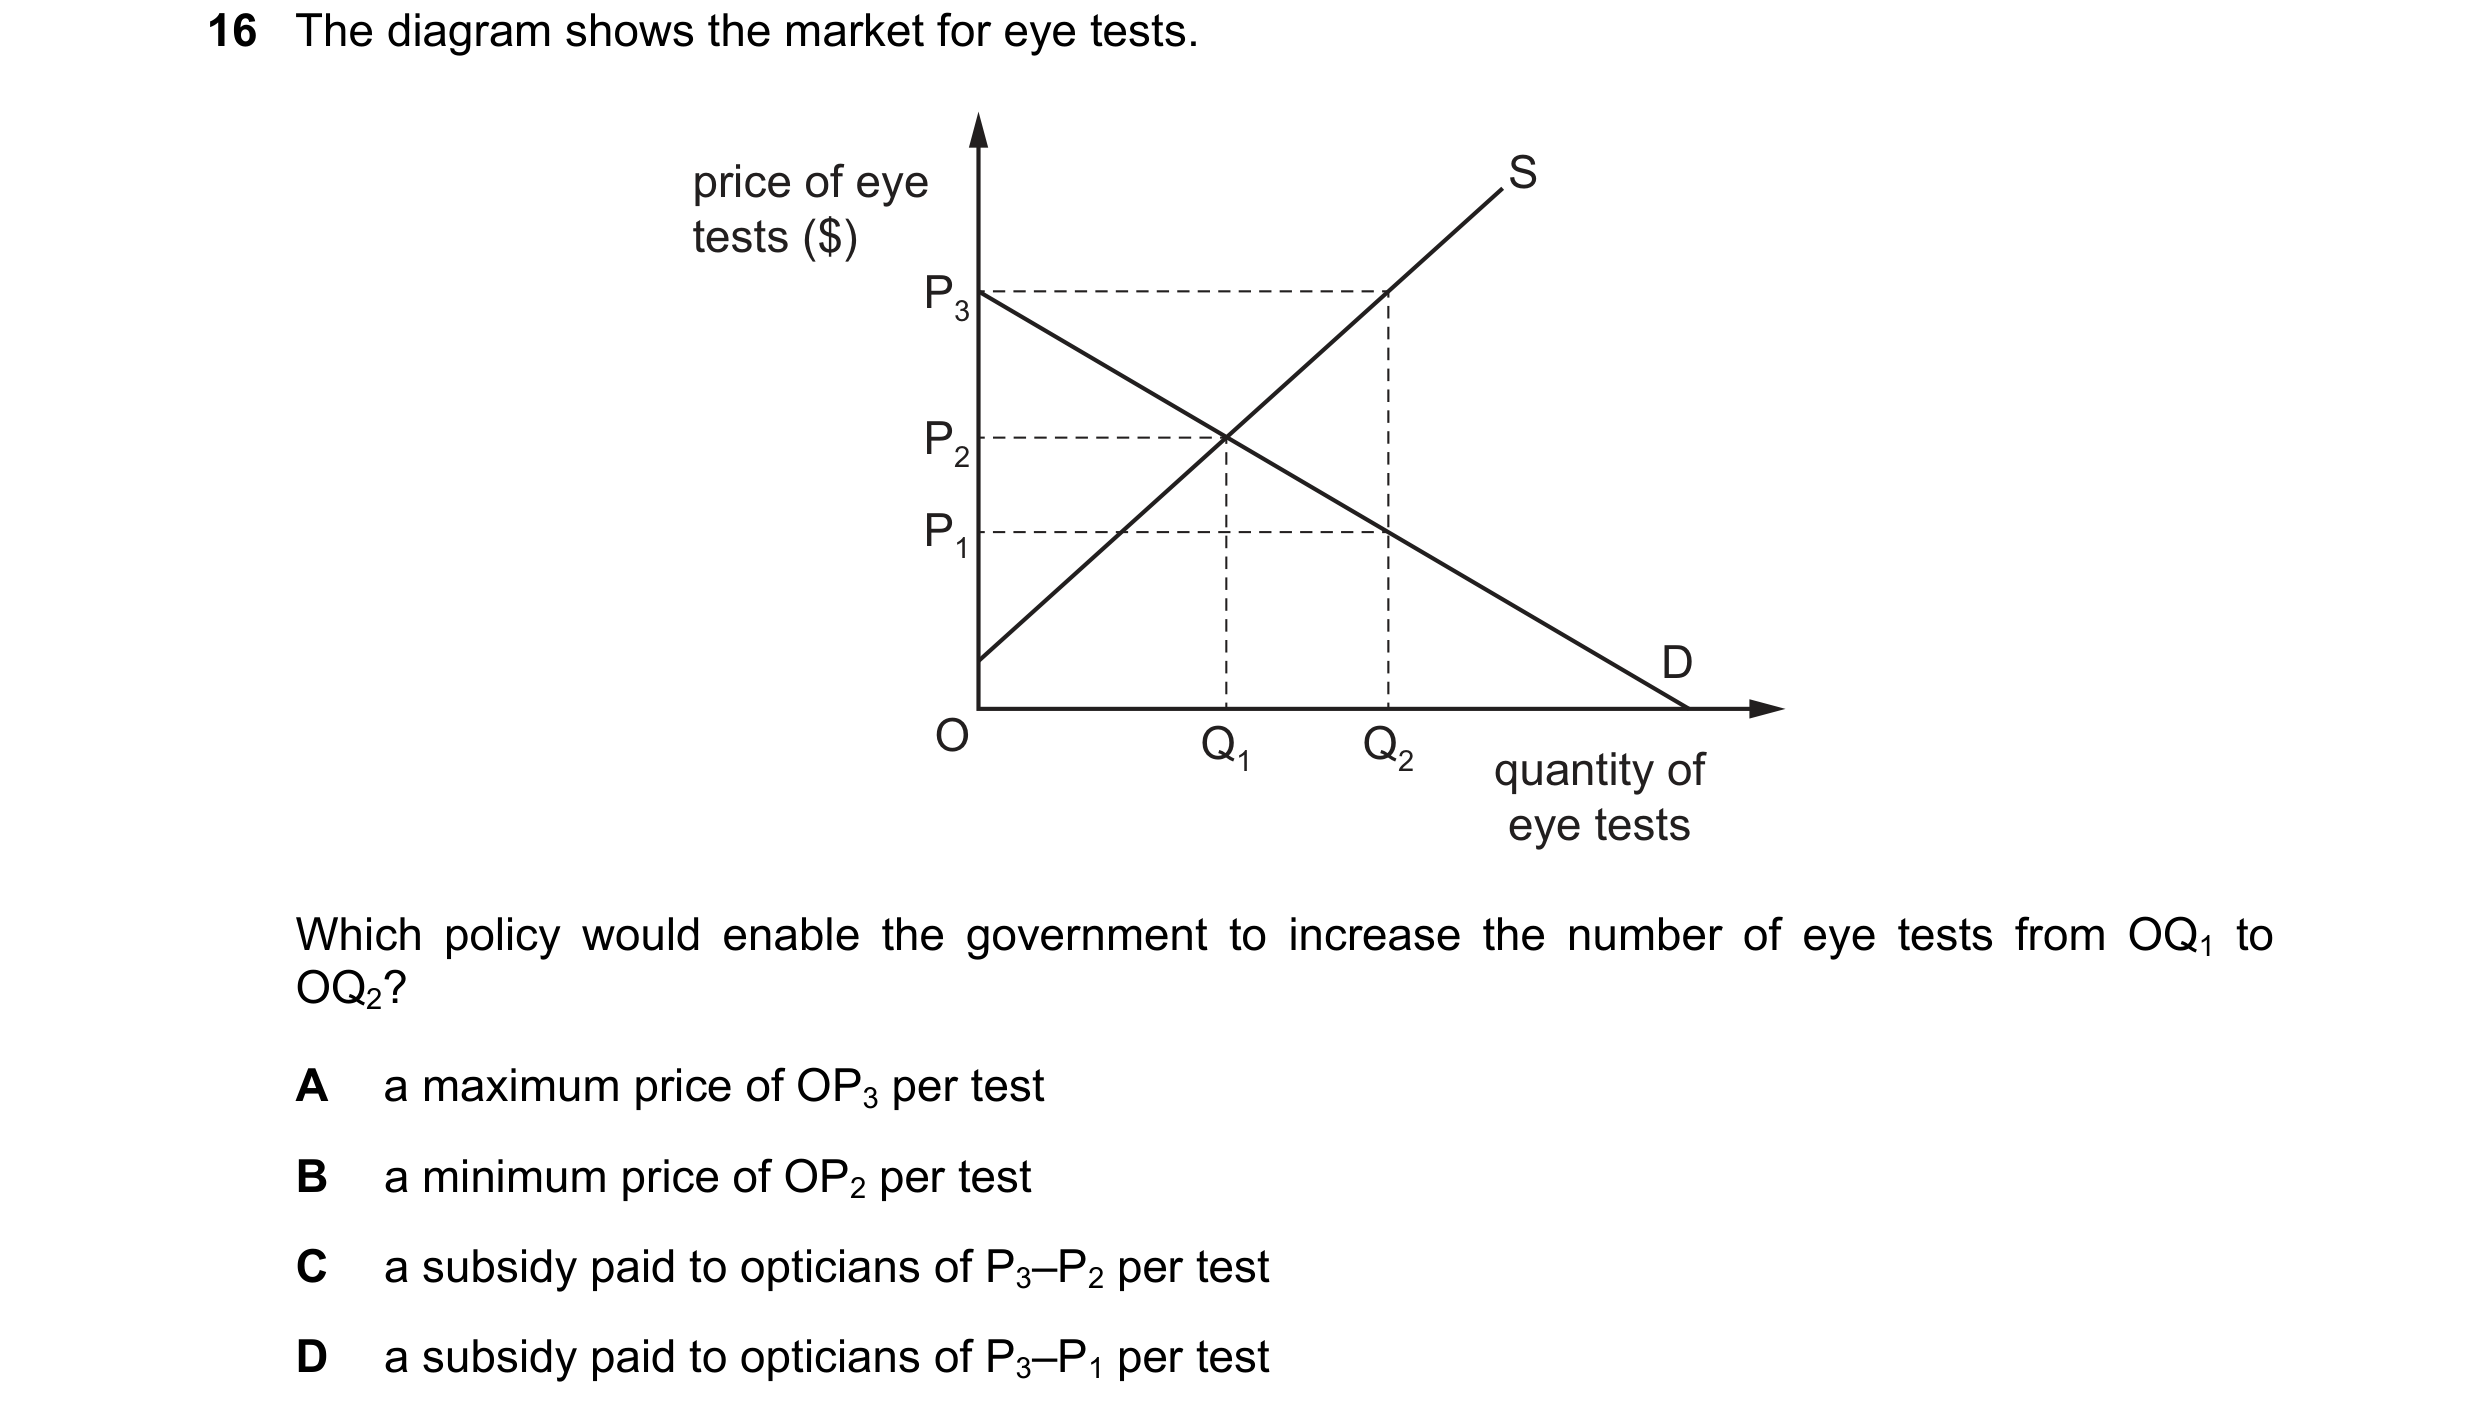
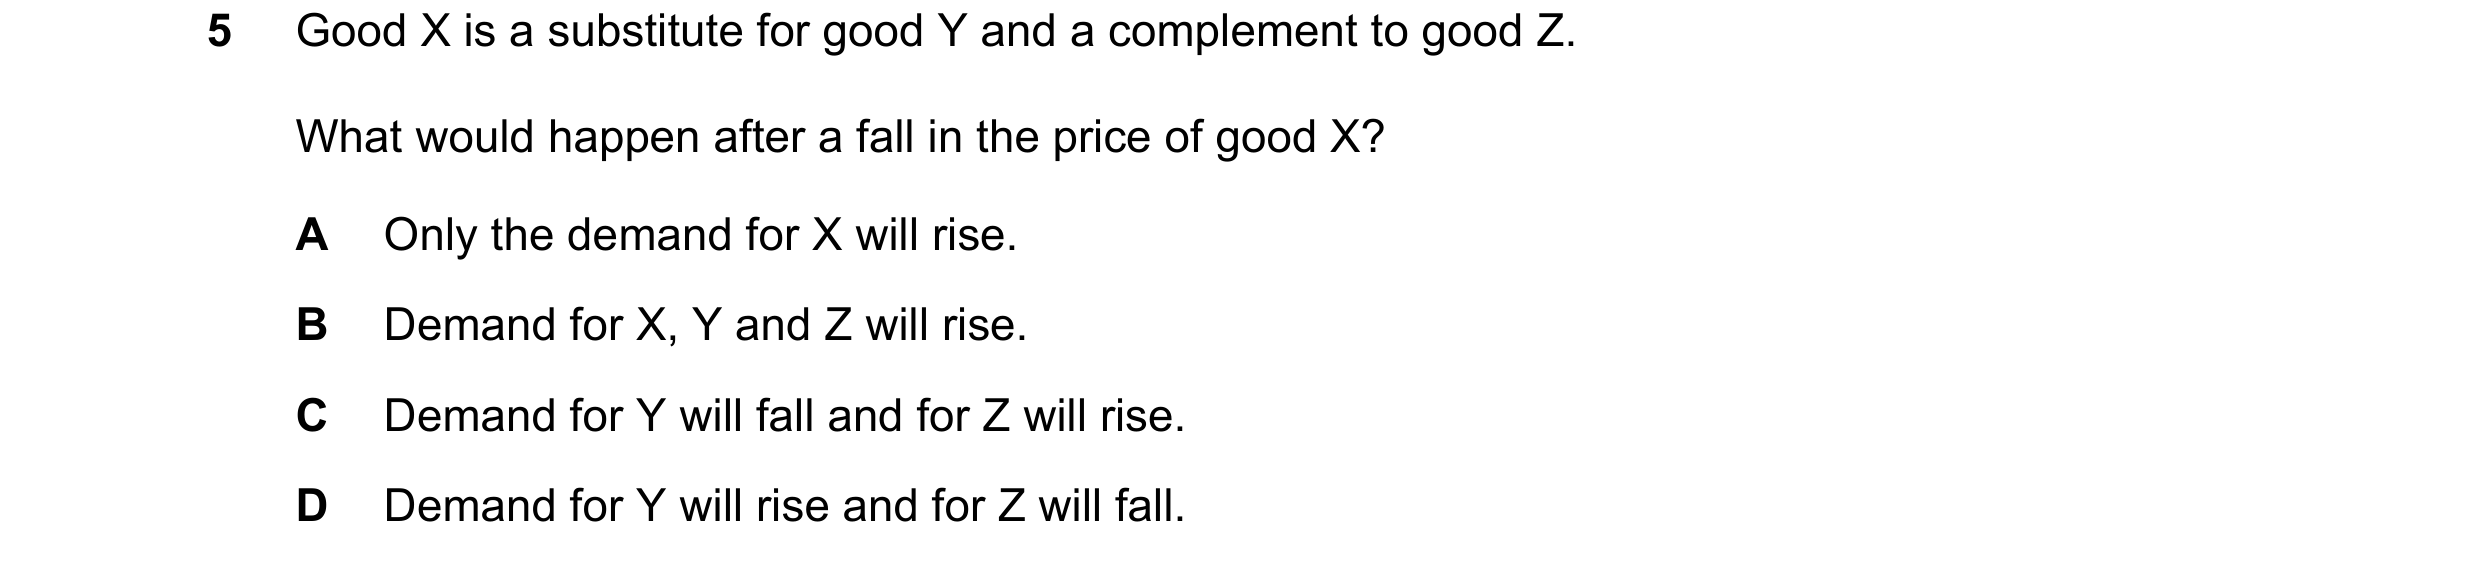
 52 / 76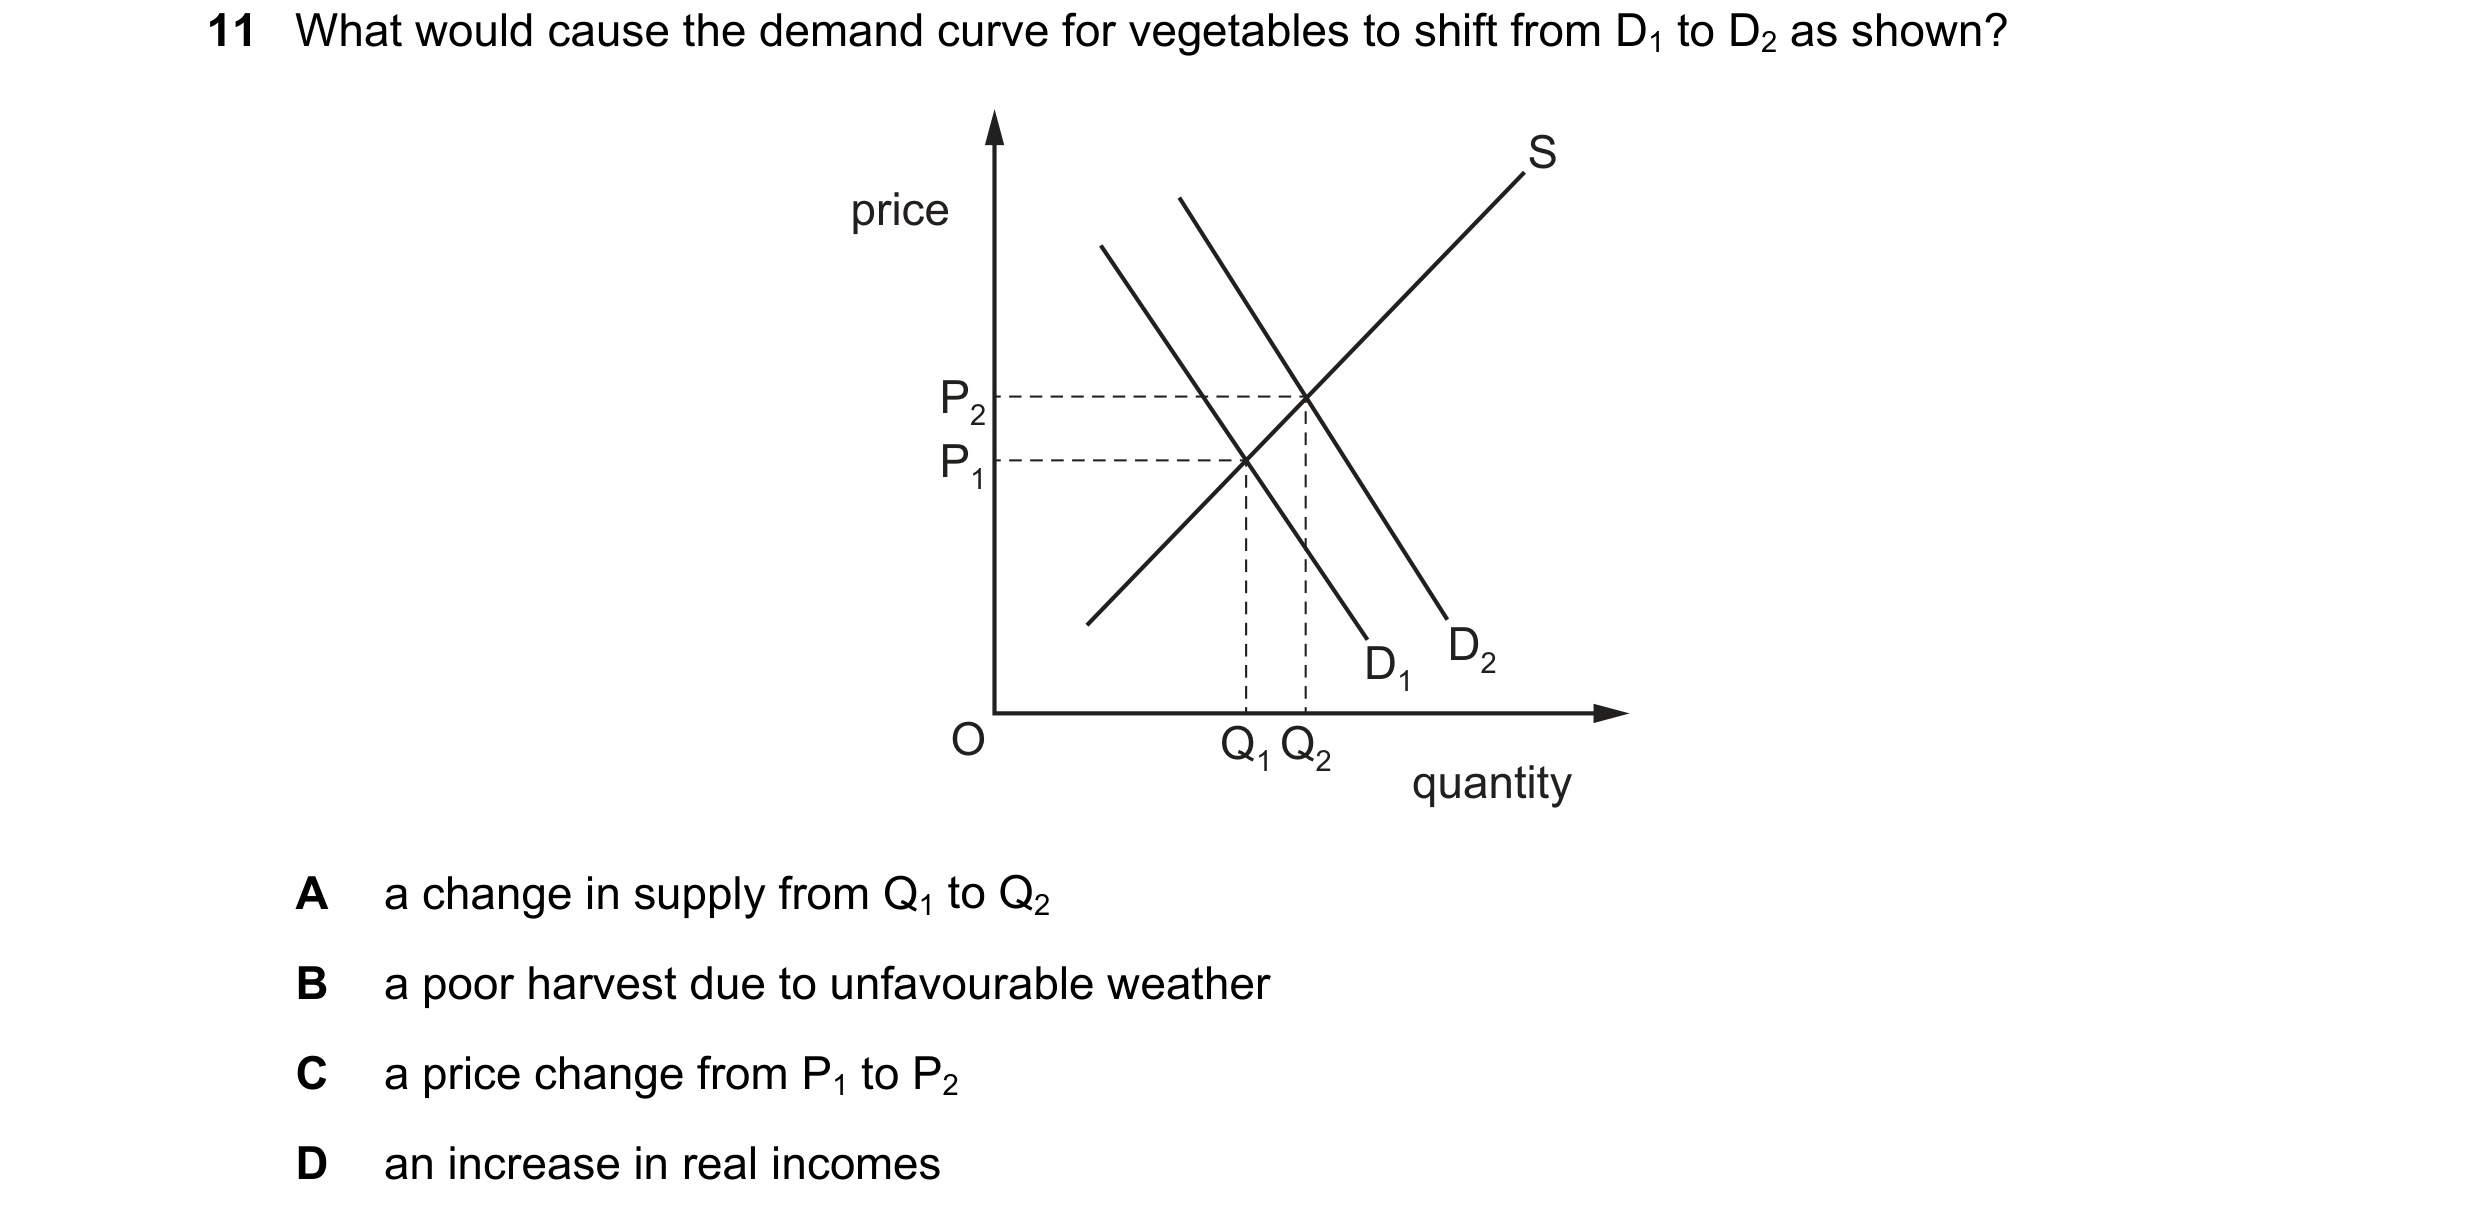
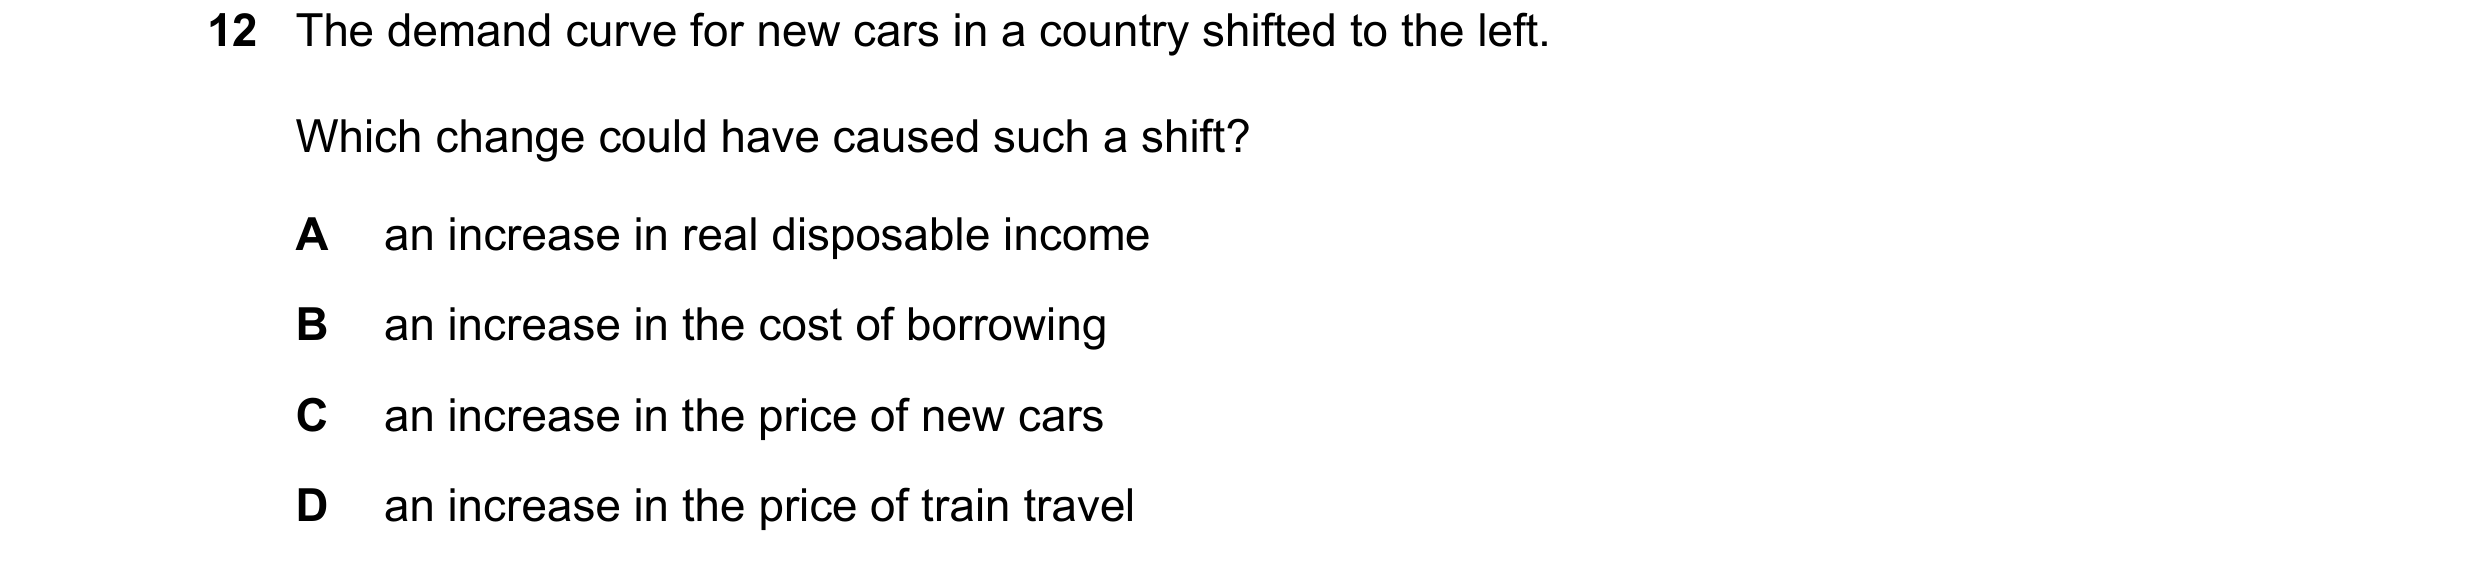

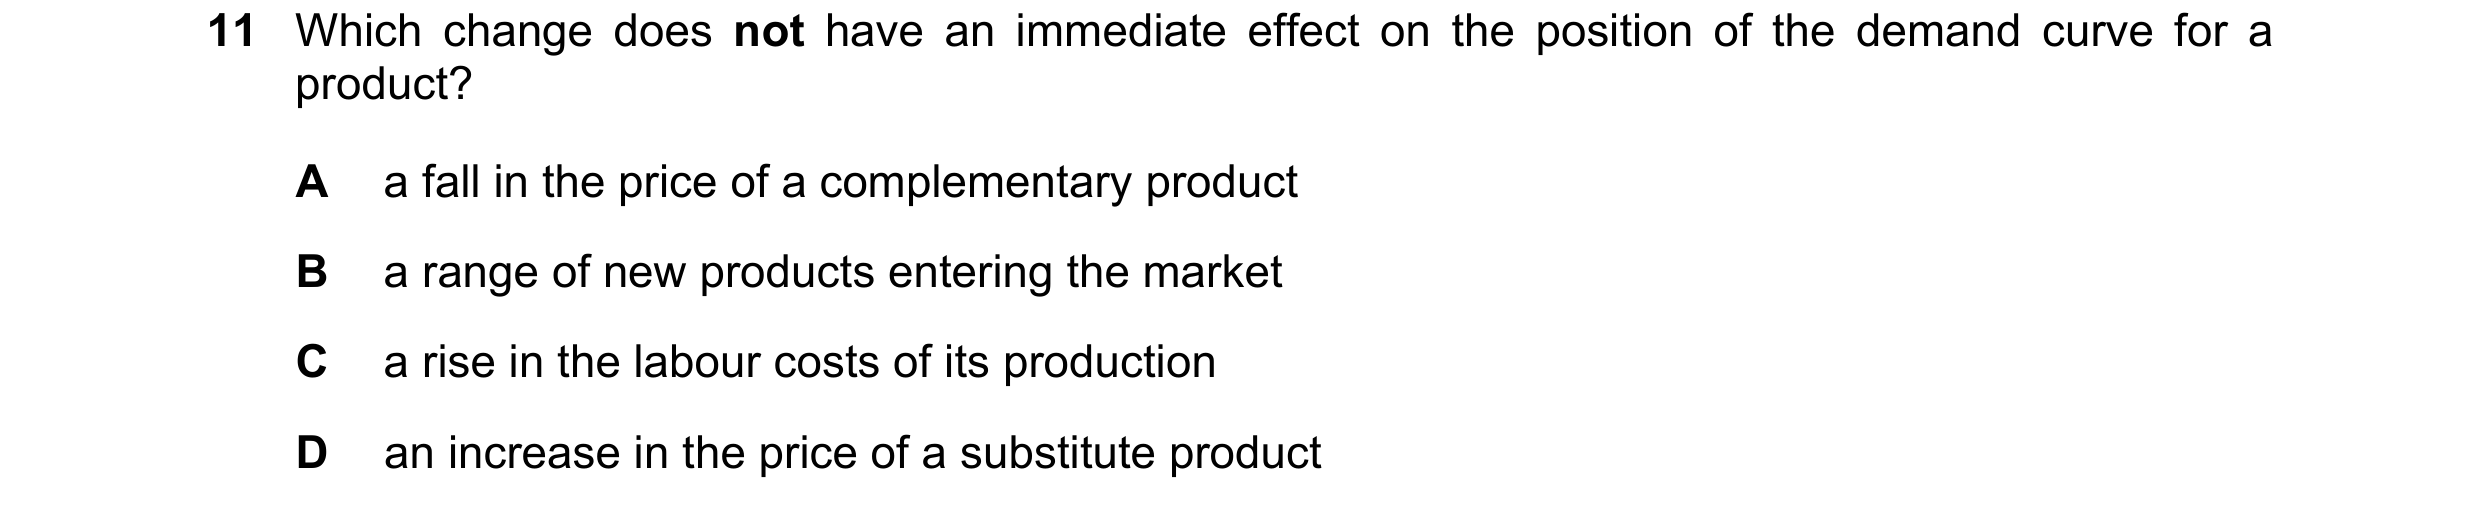
 53 / 76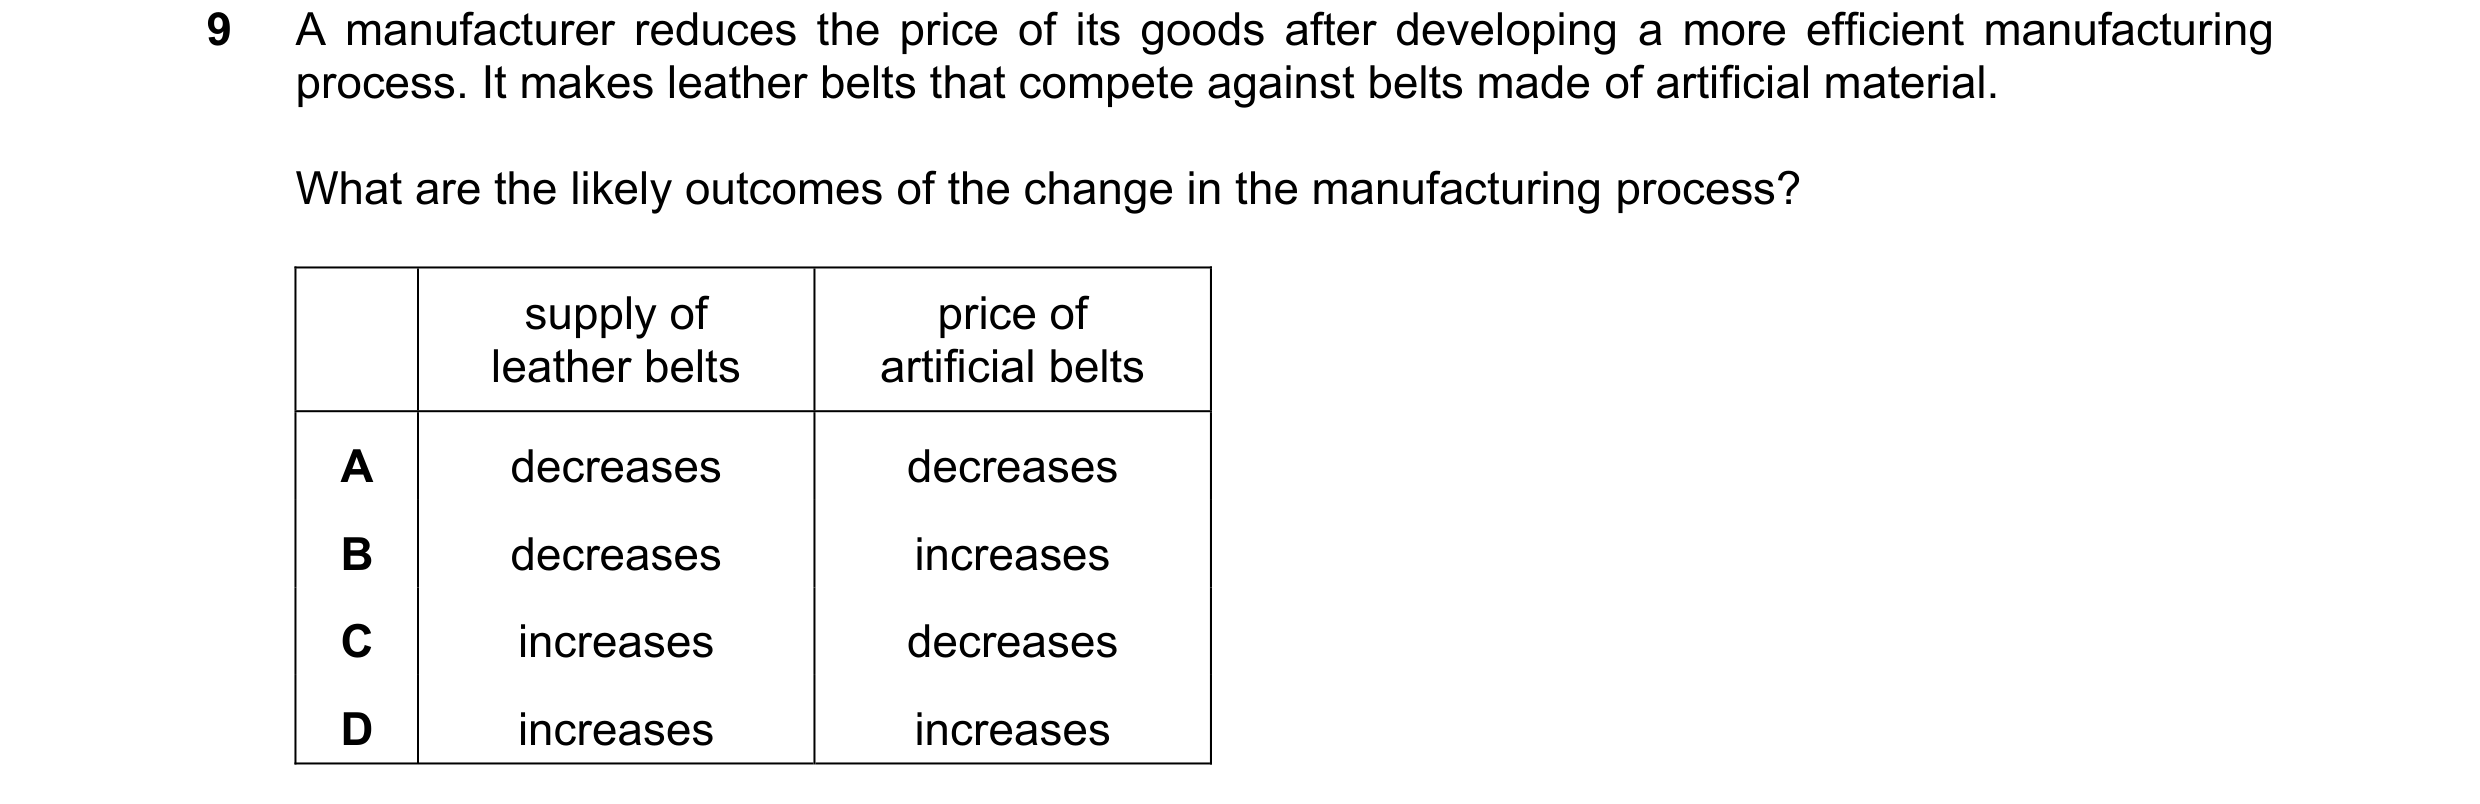


 54 / 76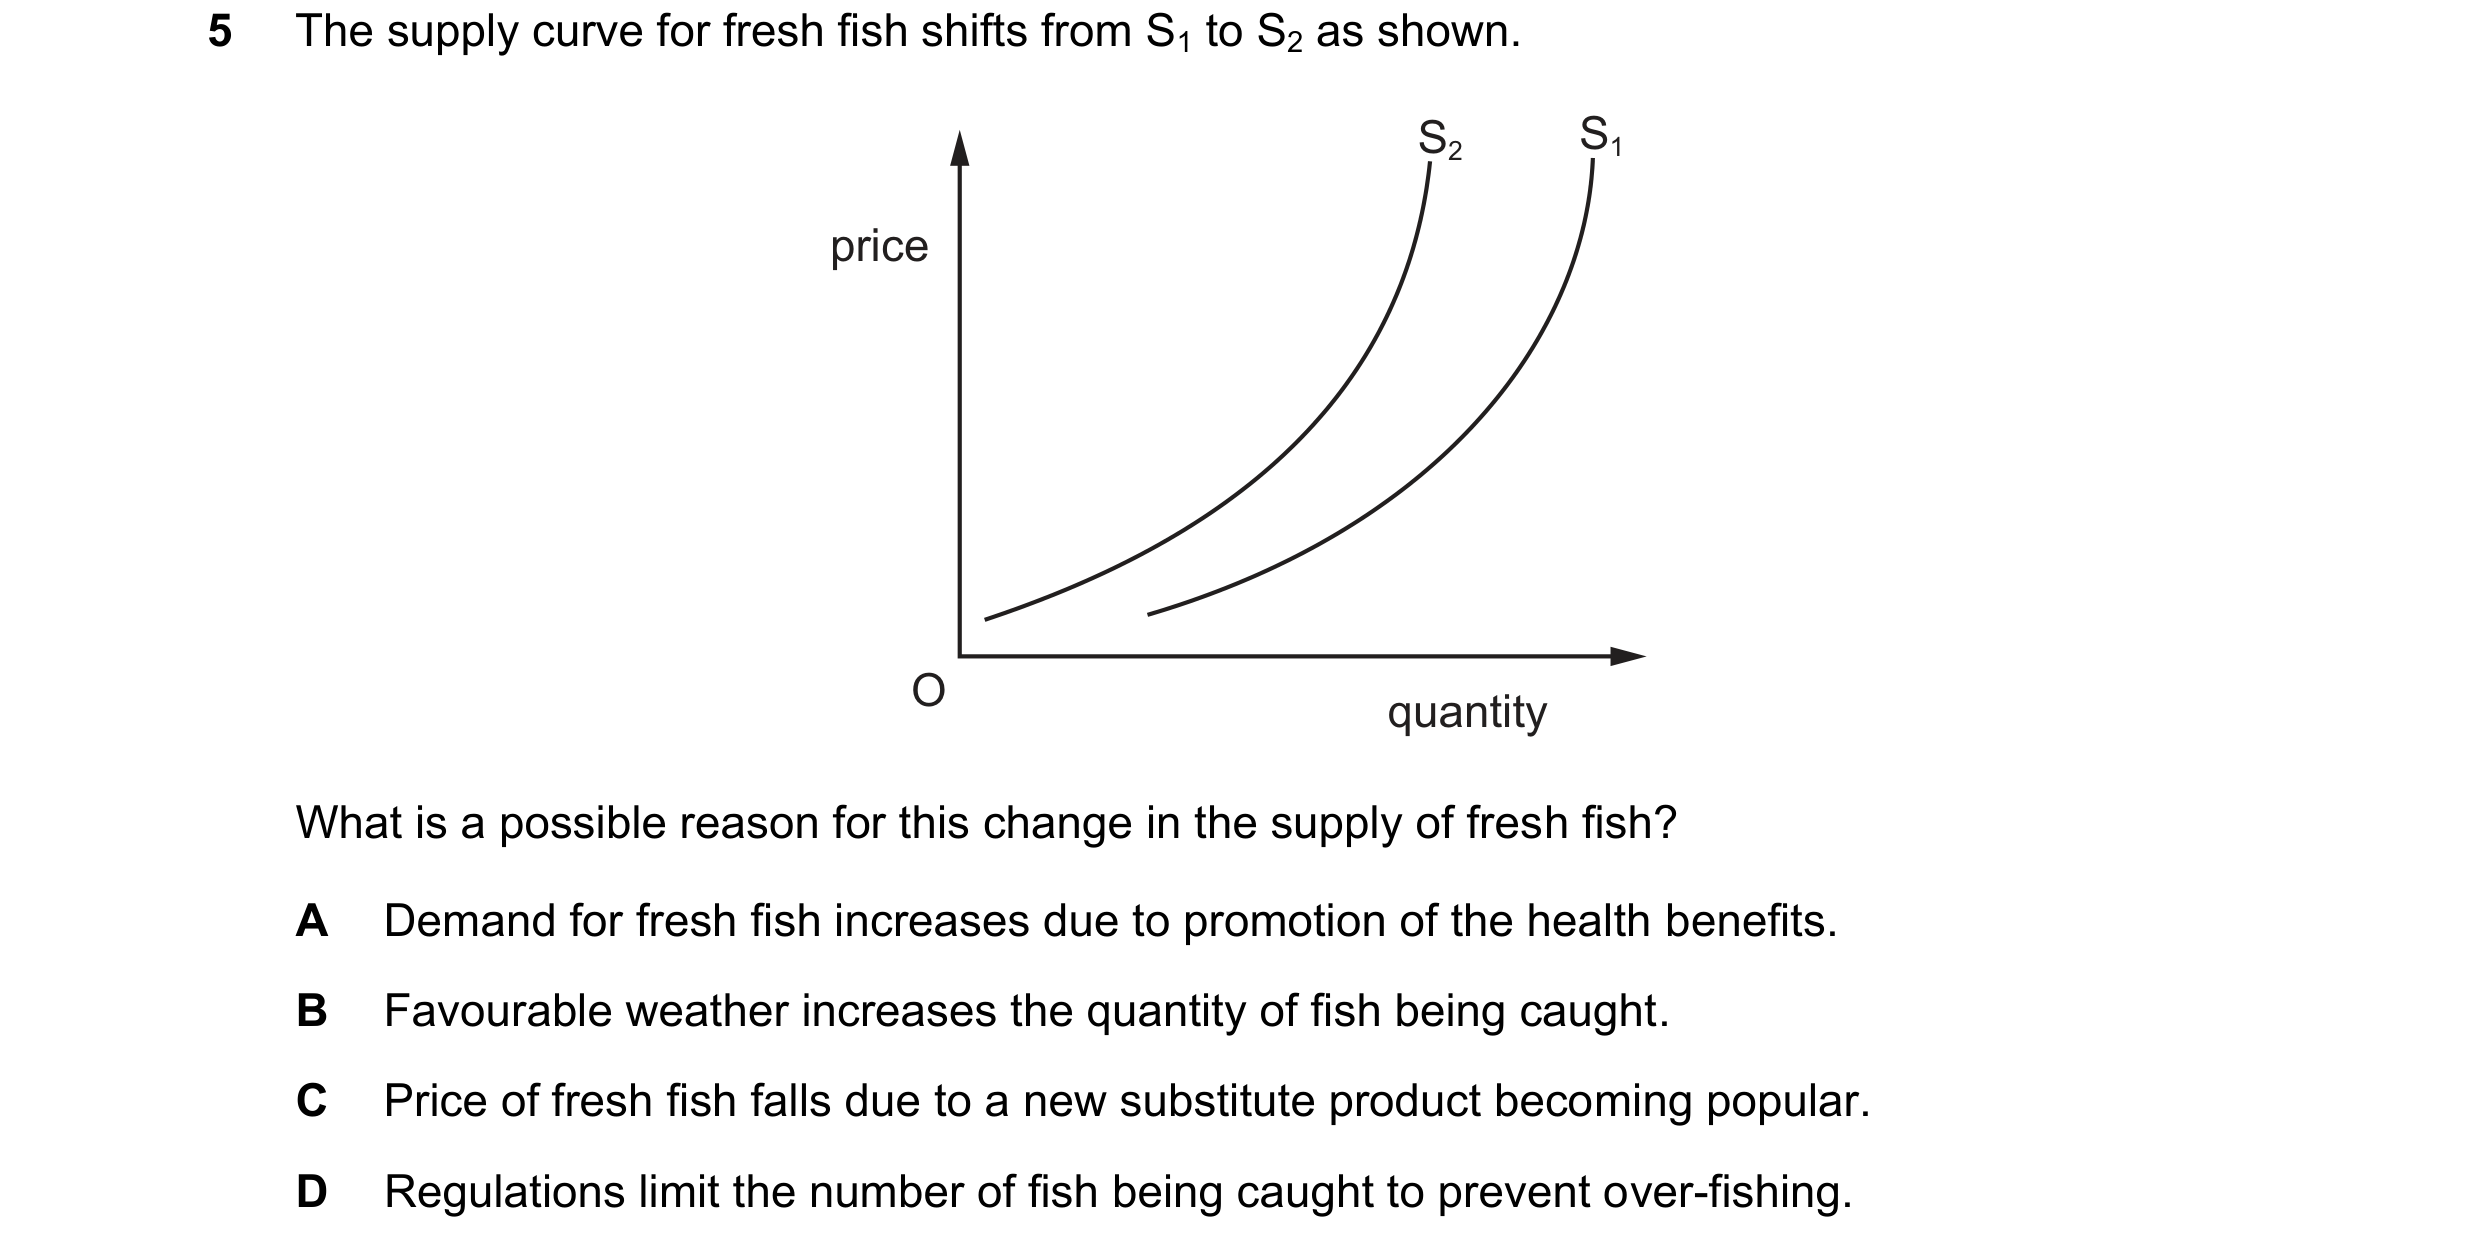
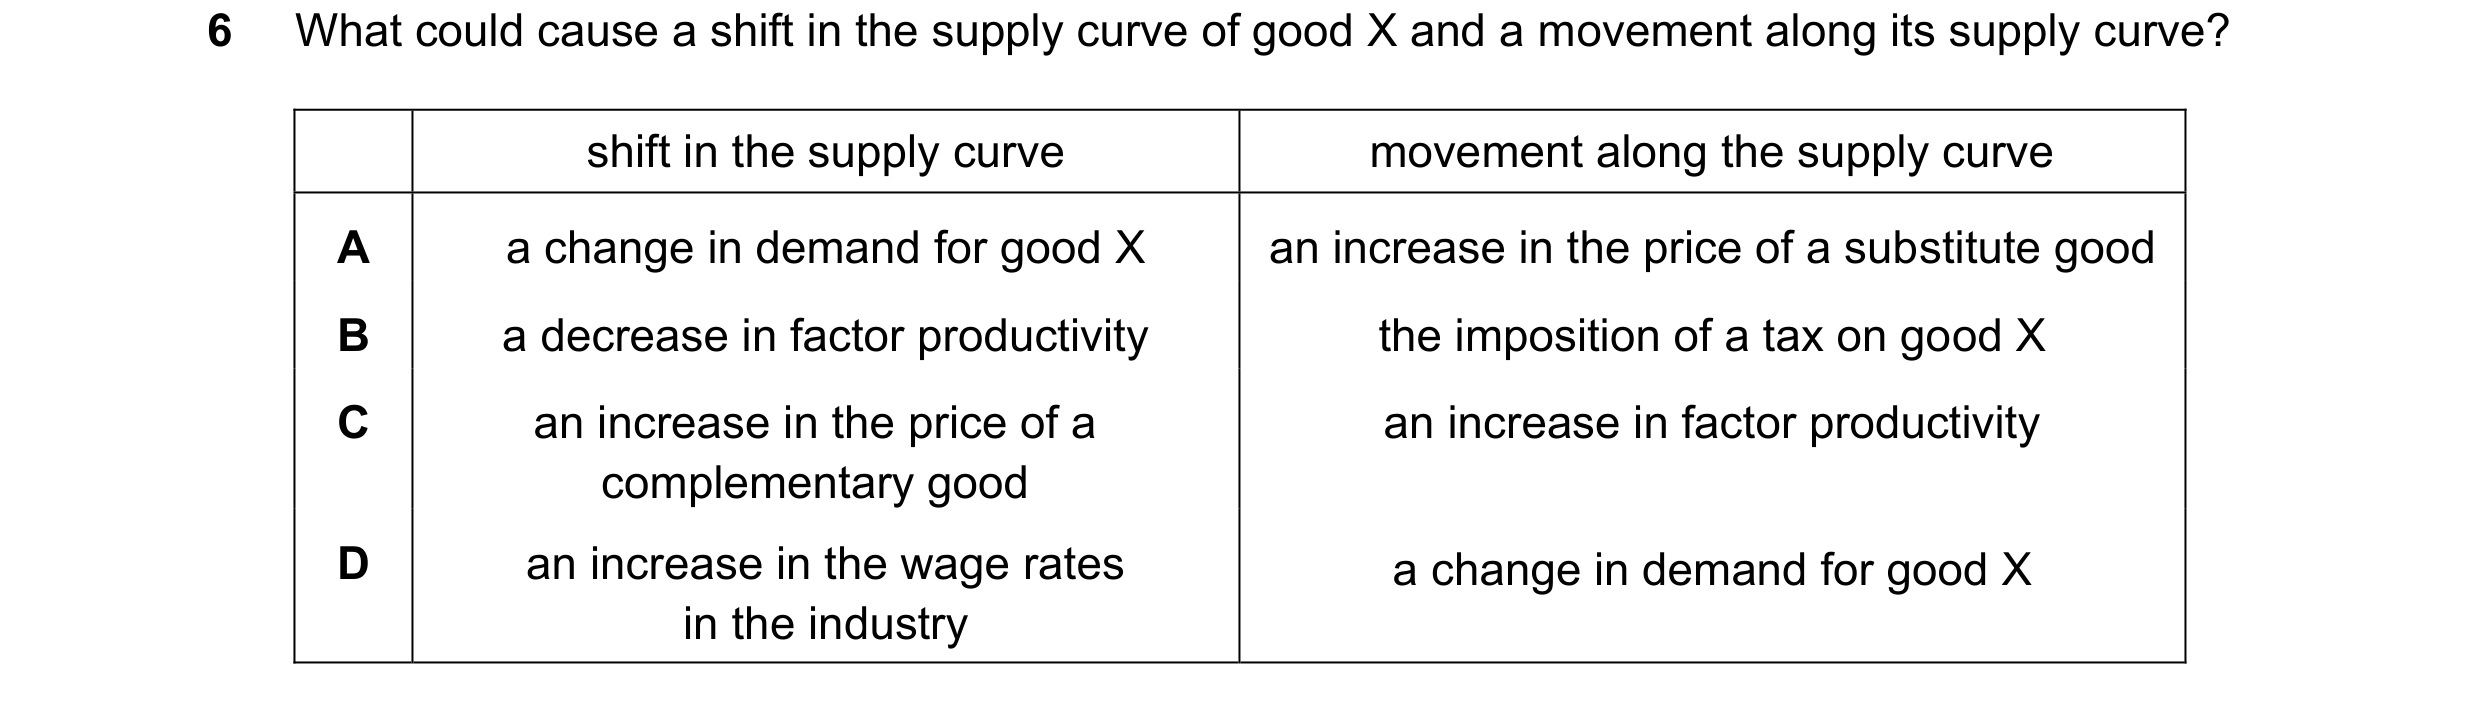
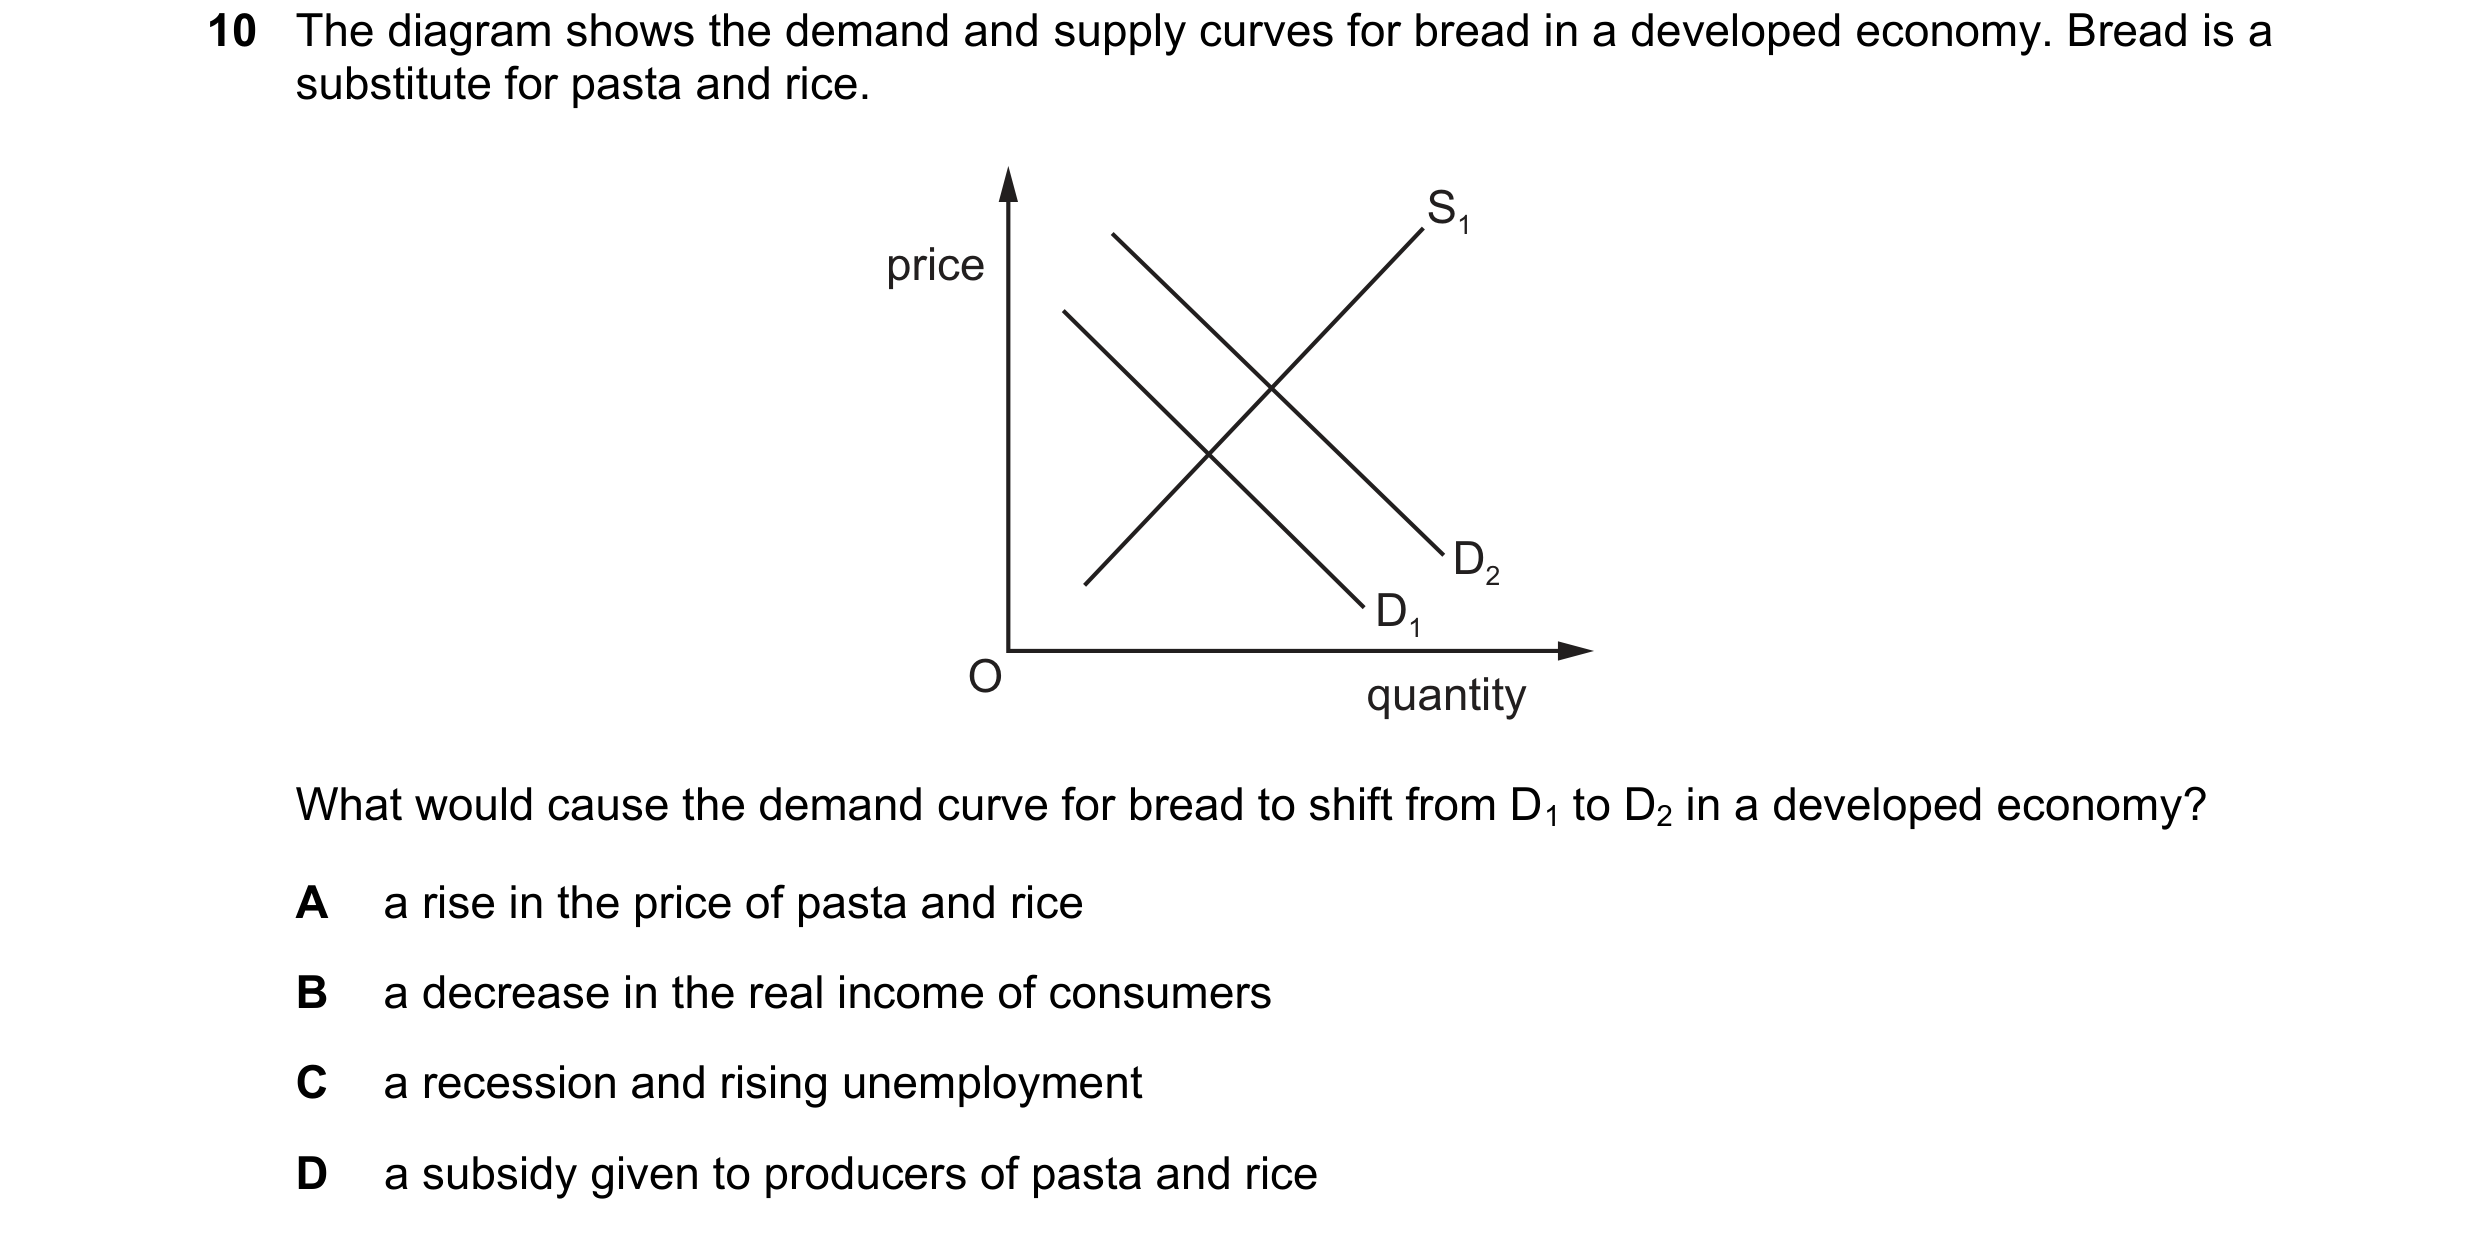 55 / 76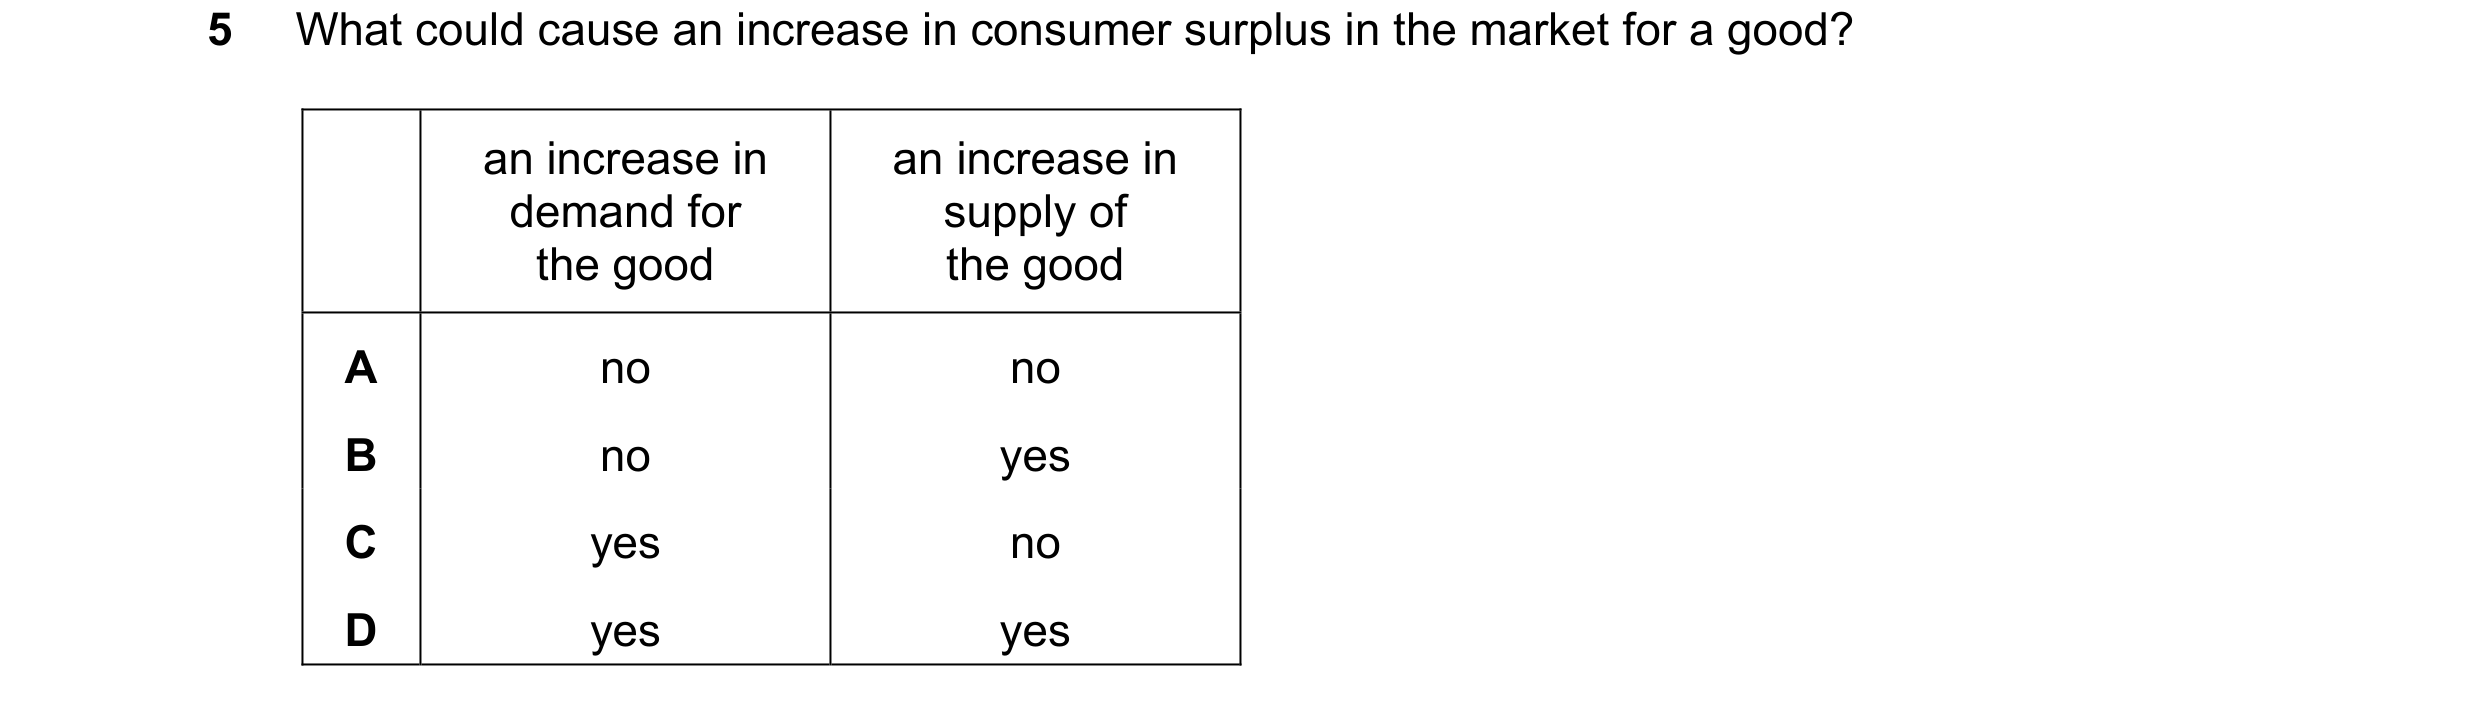
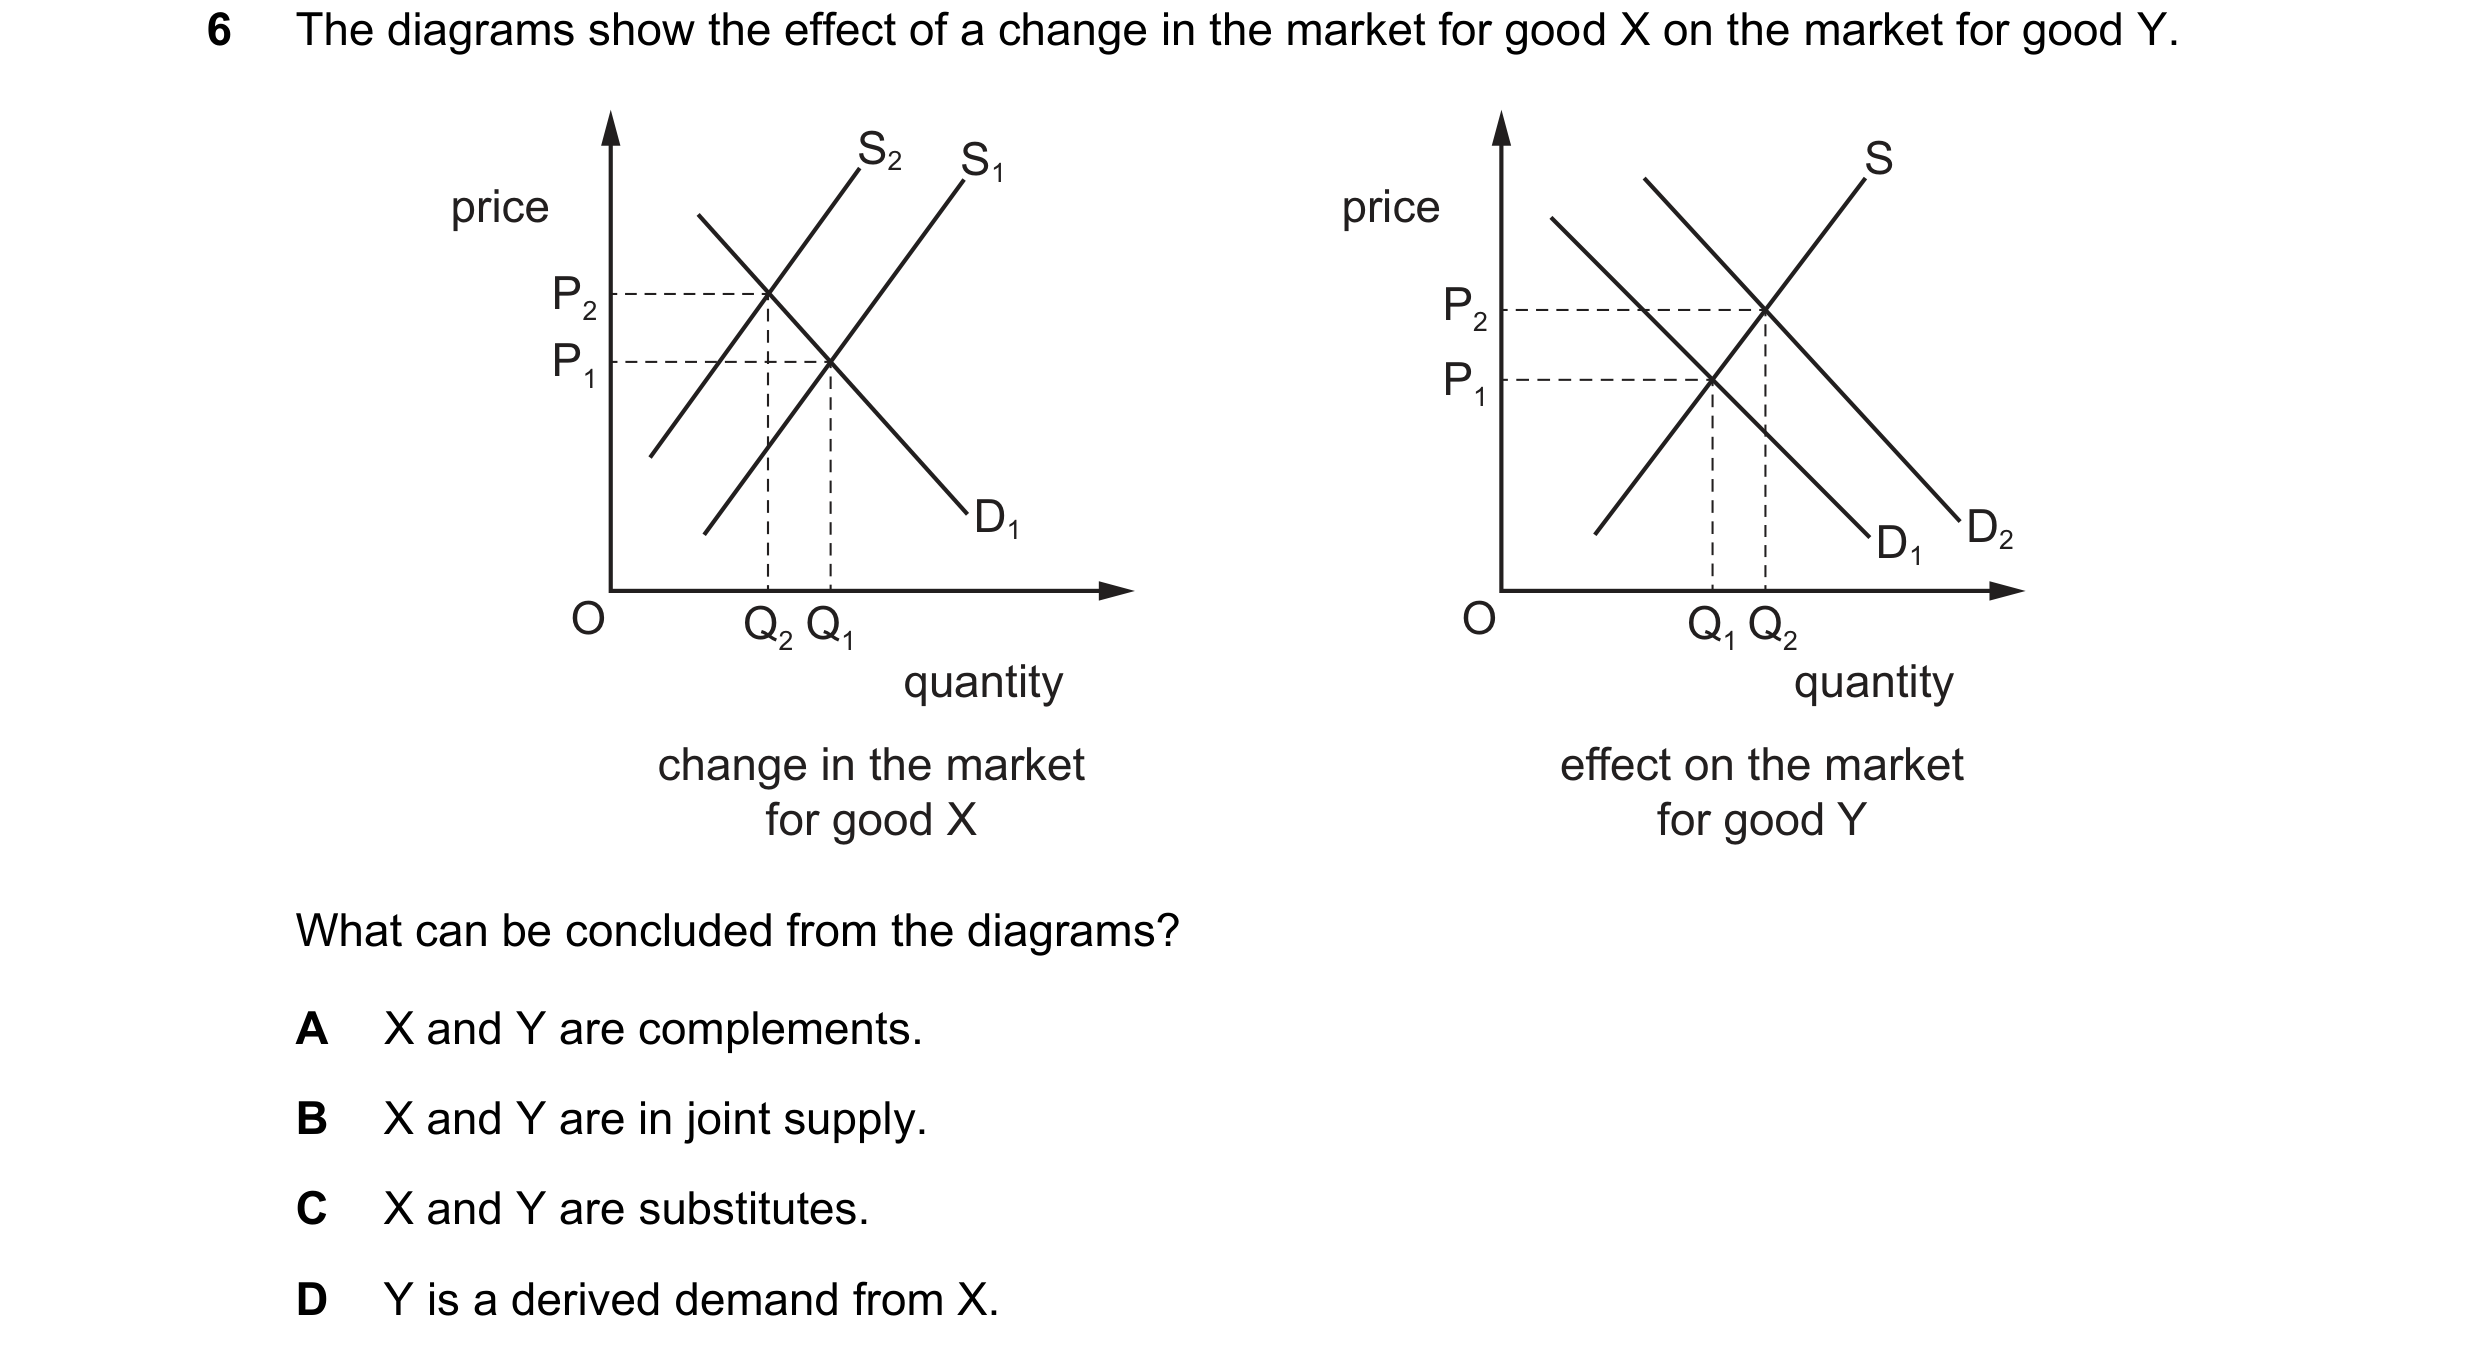 56 / 76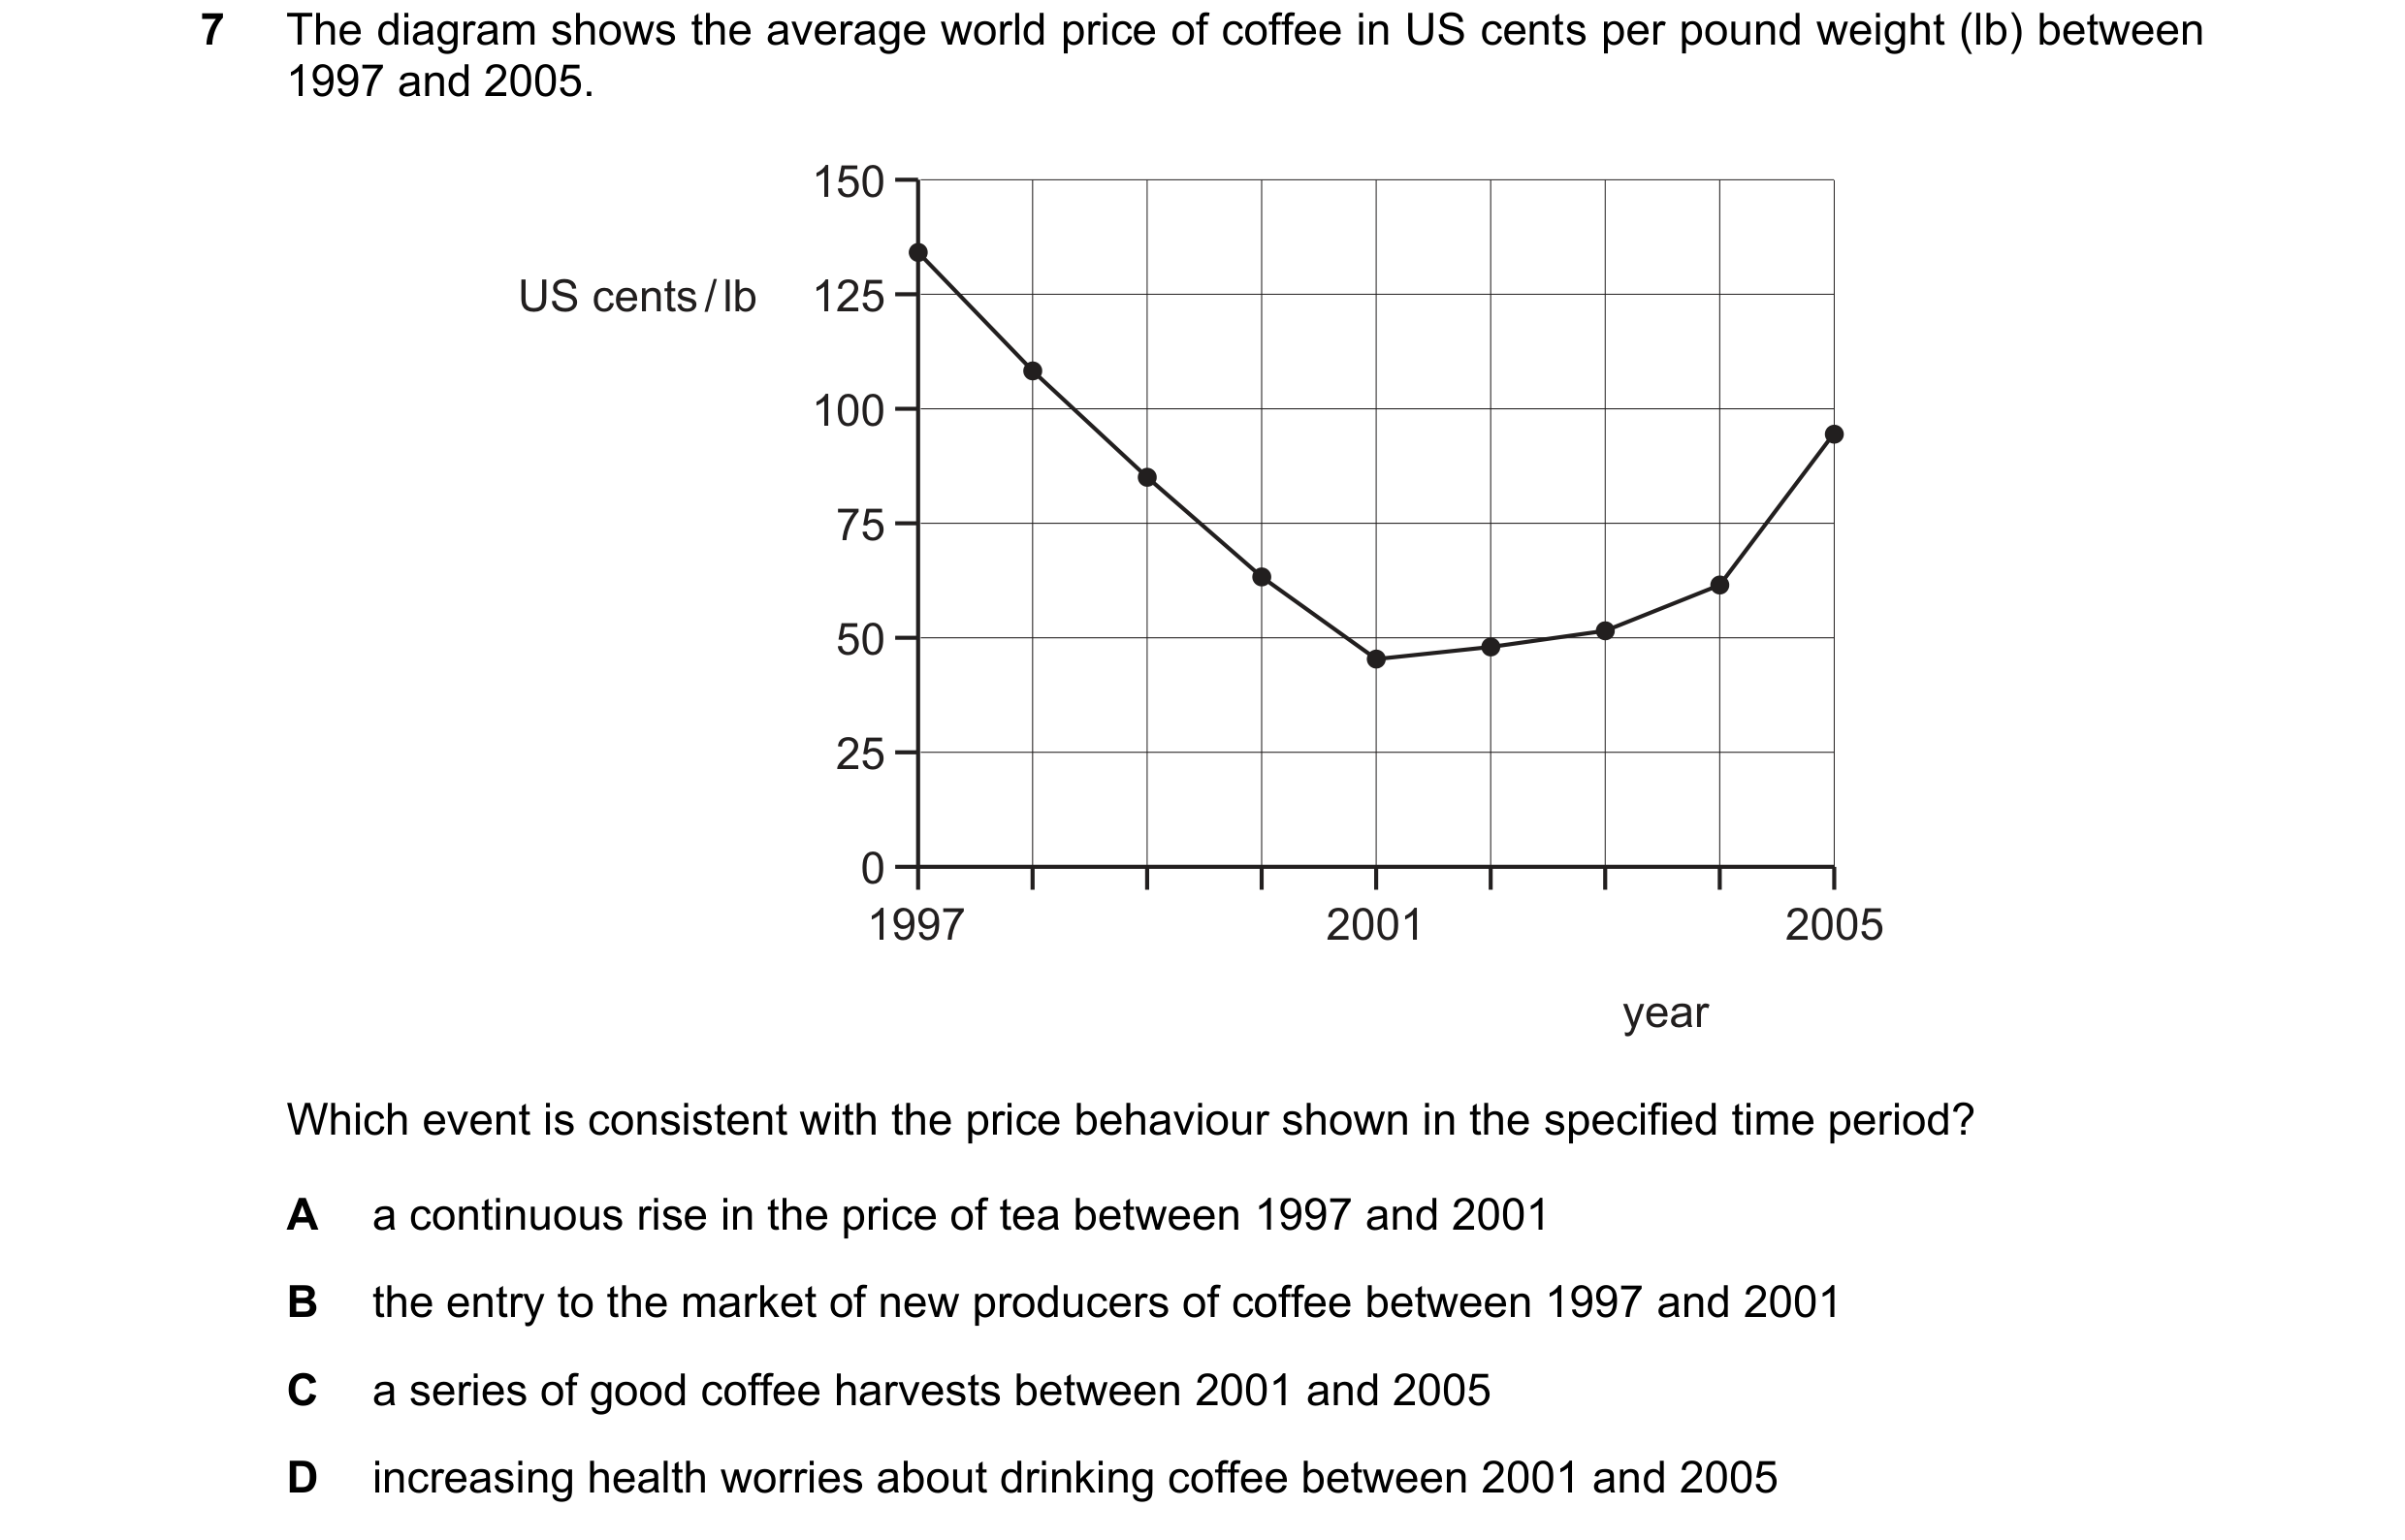
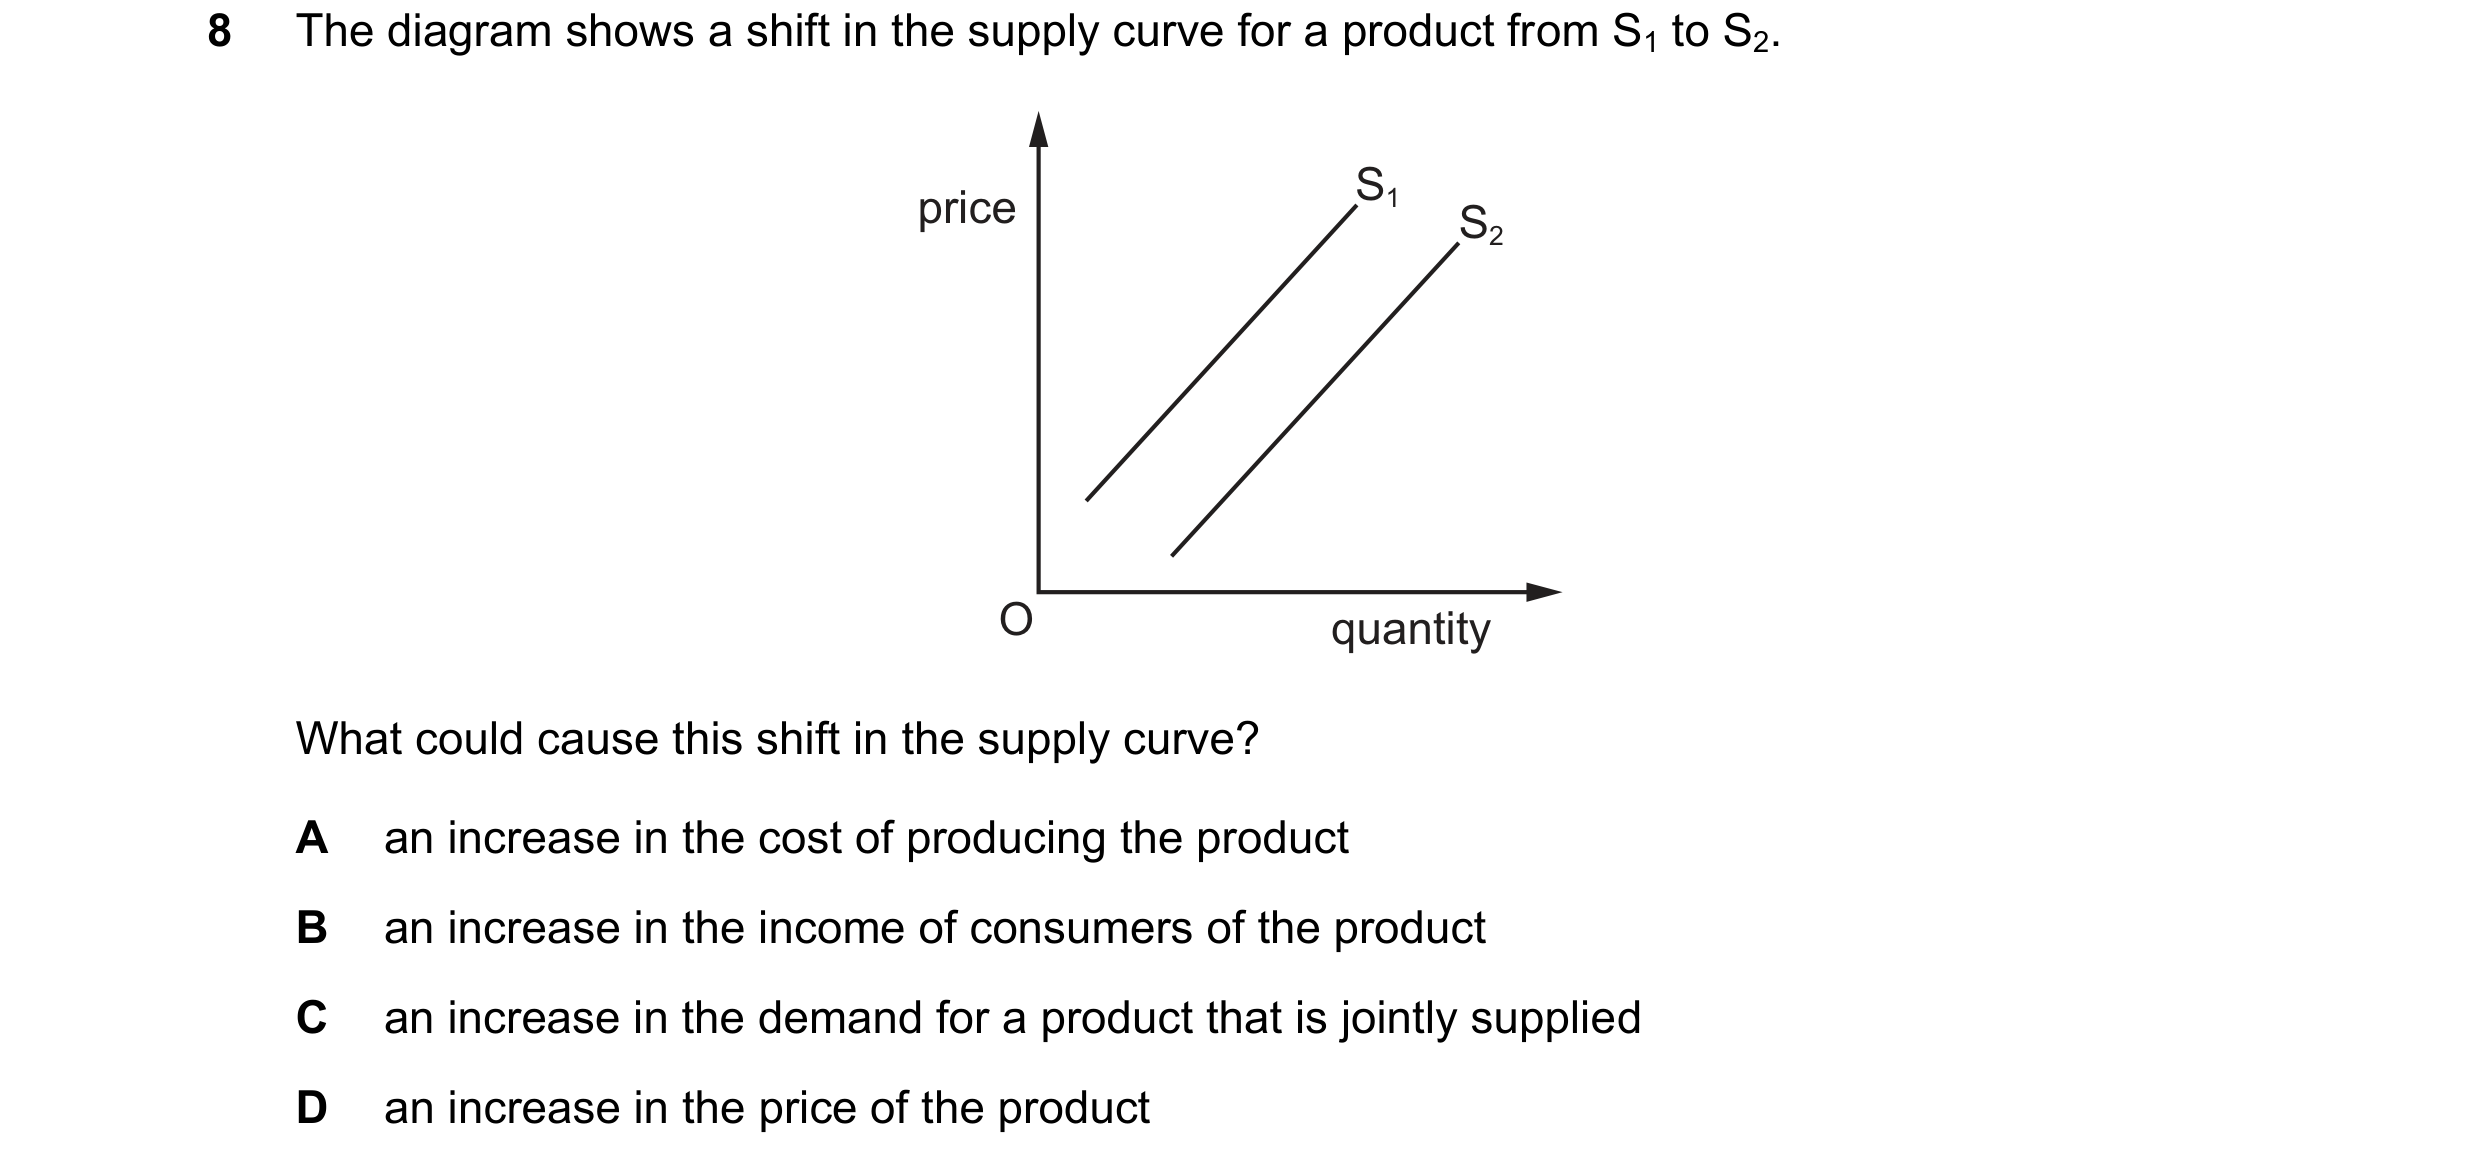 57 / 76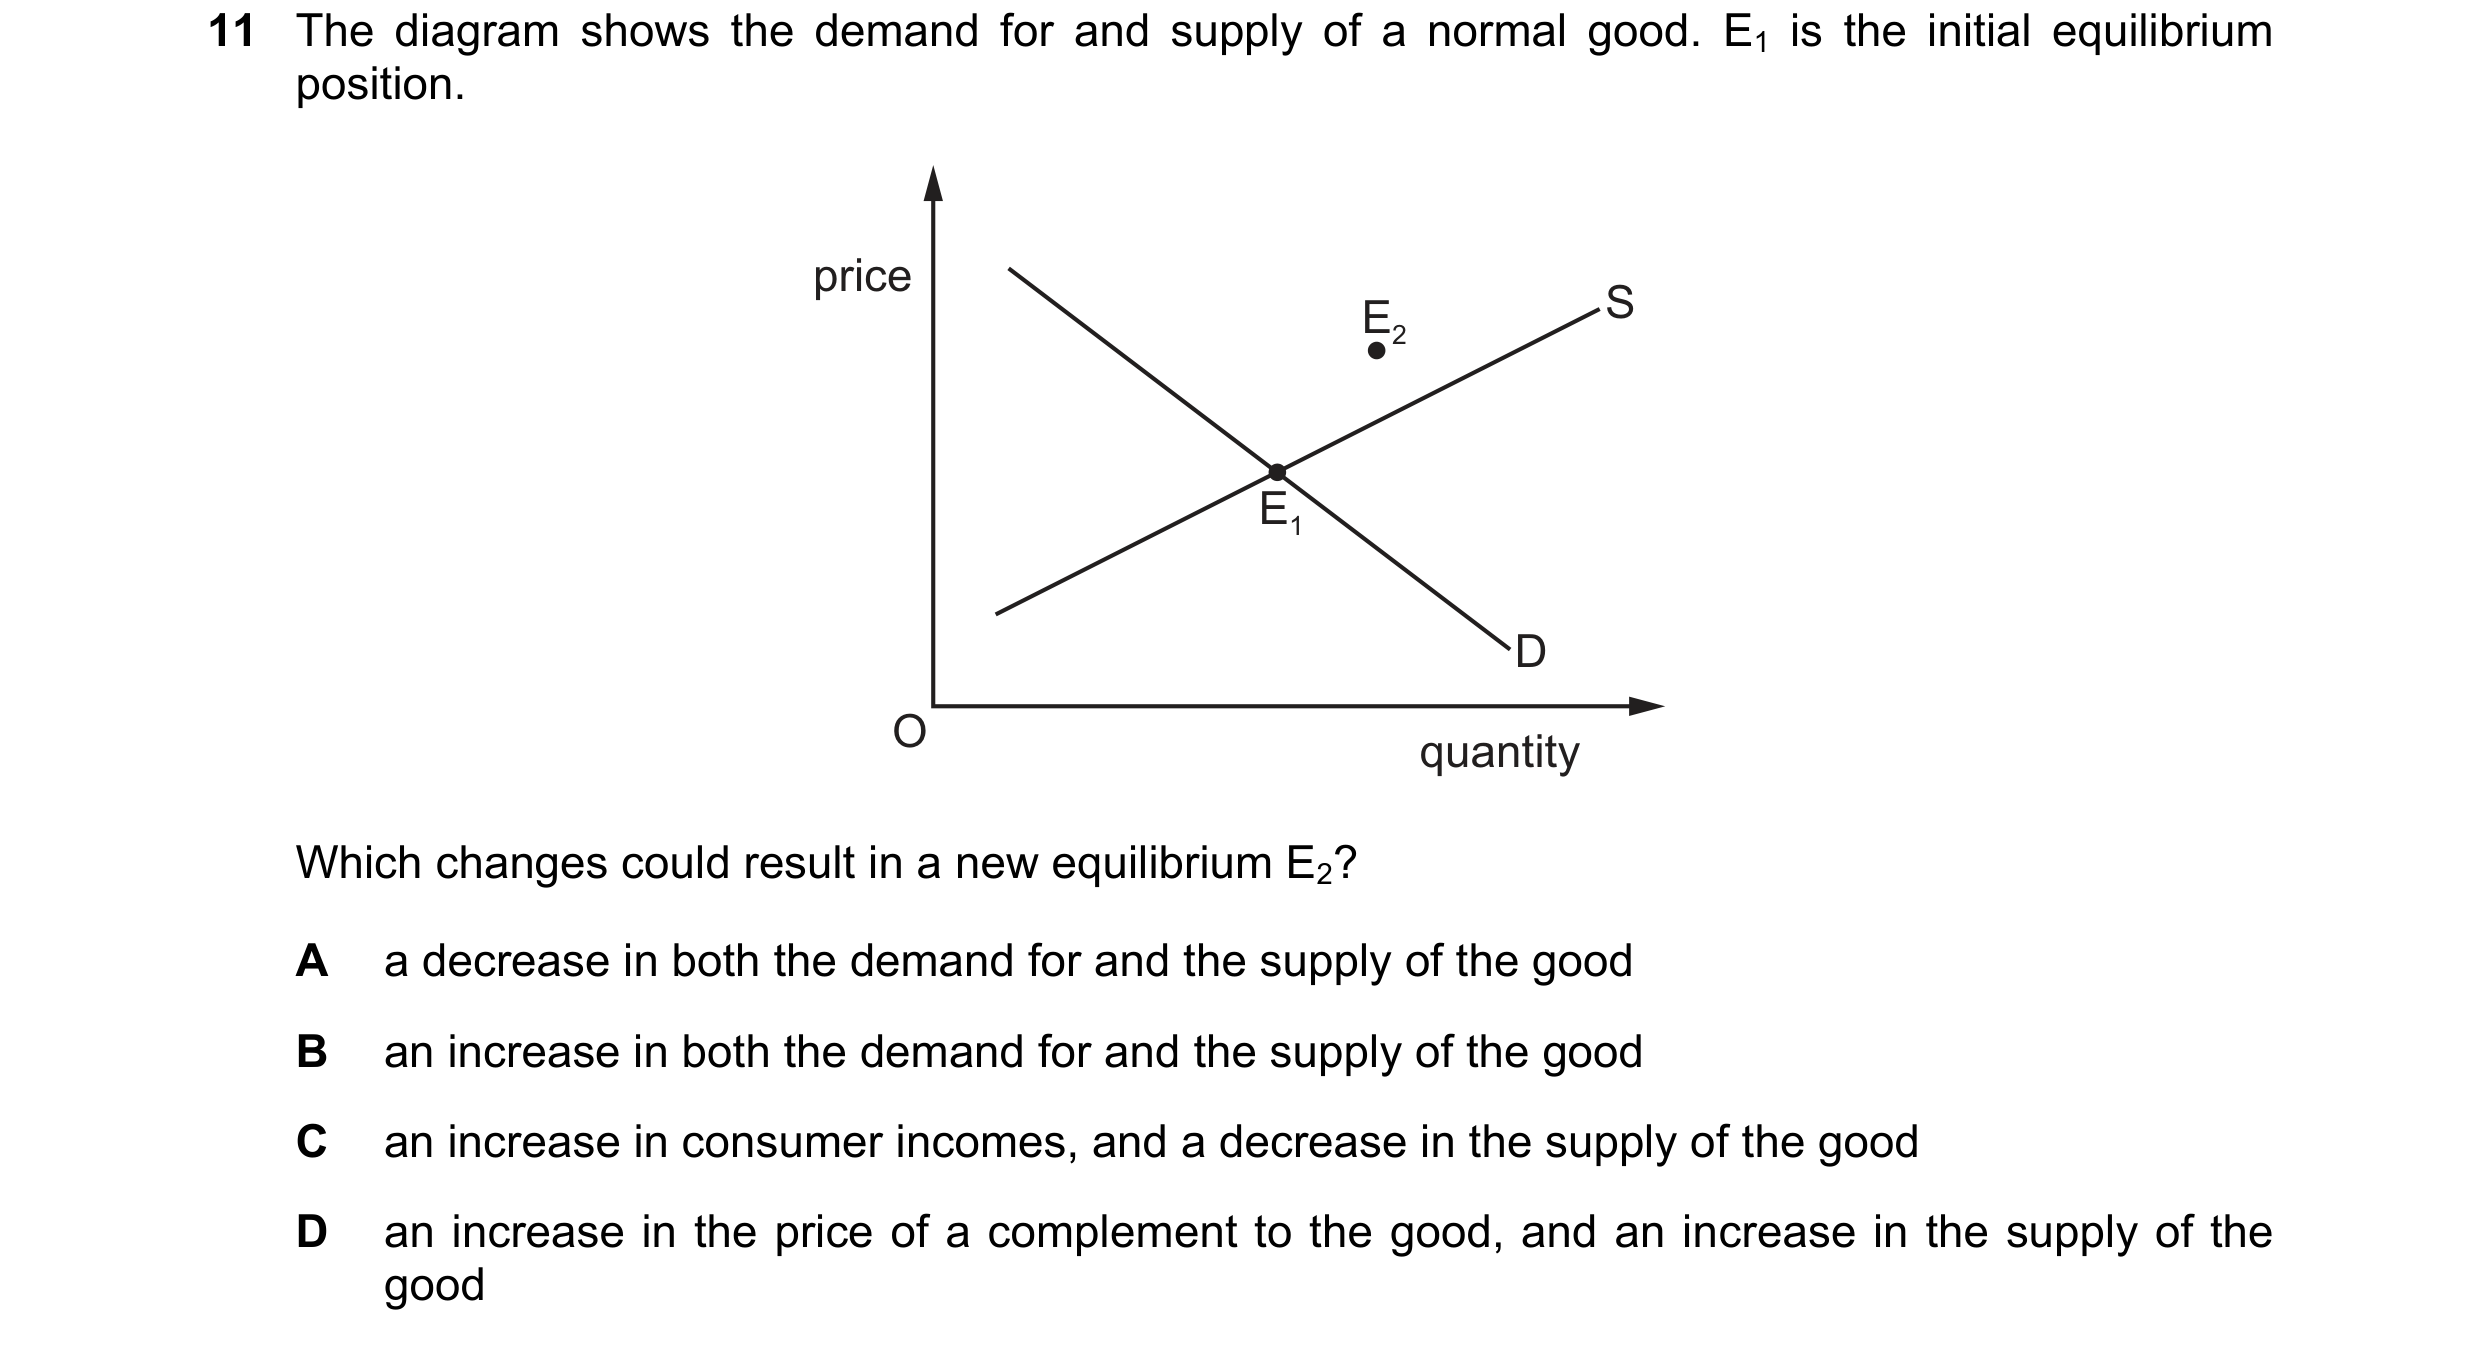
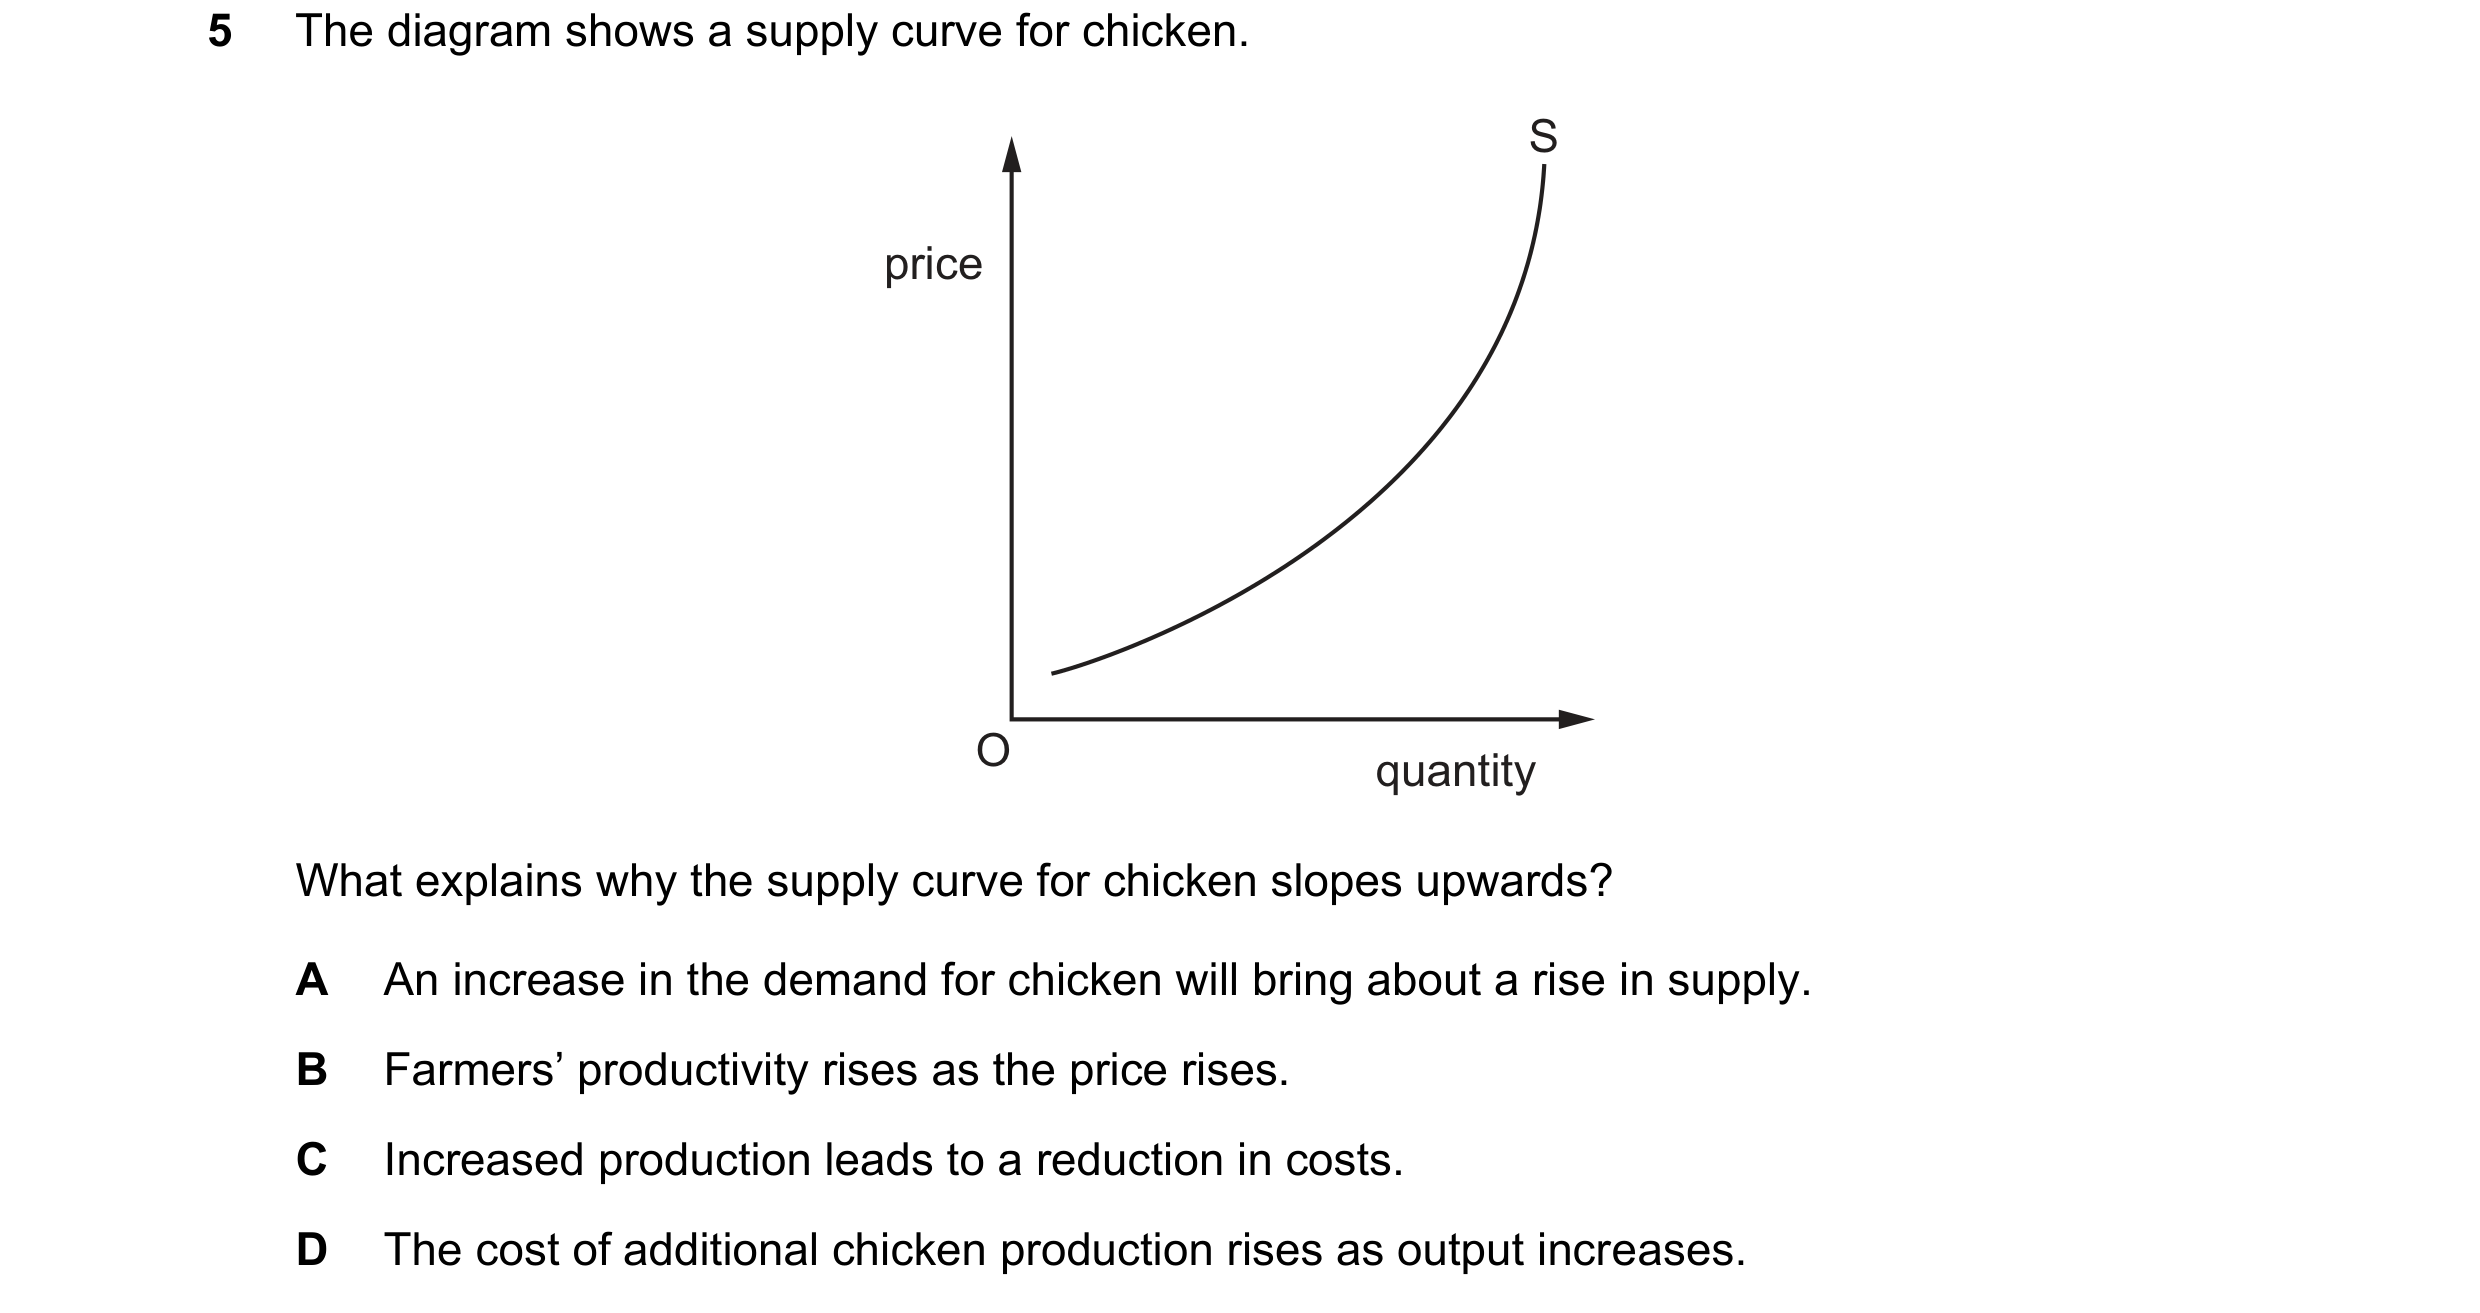
 58 / 76

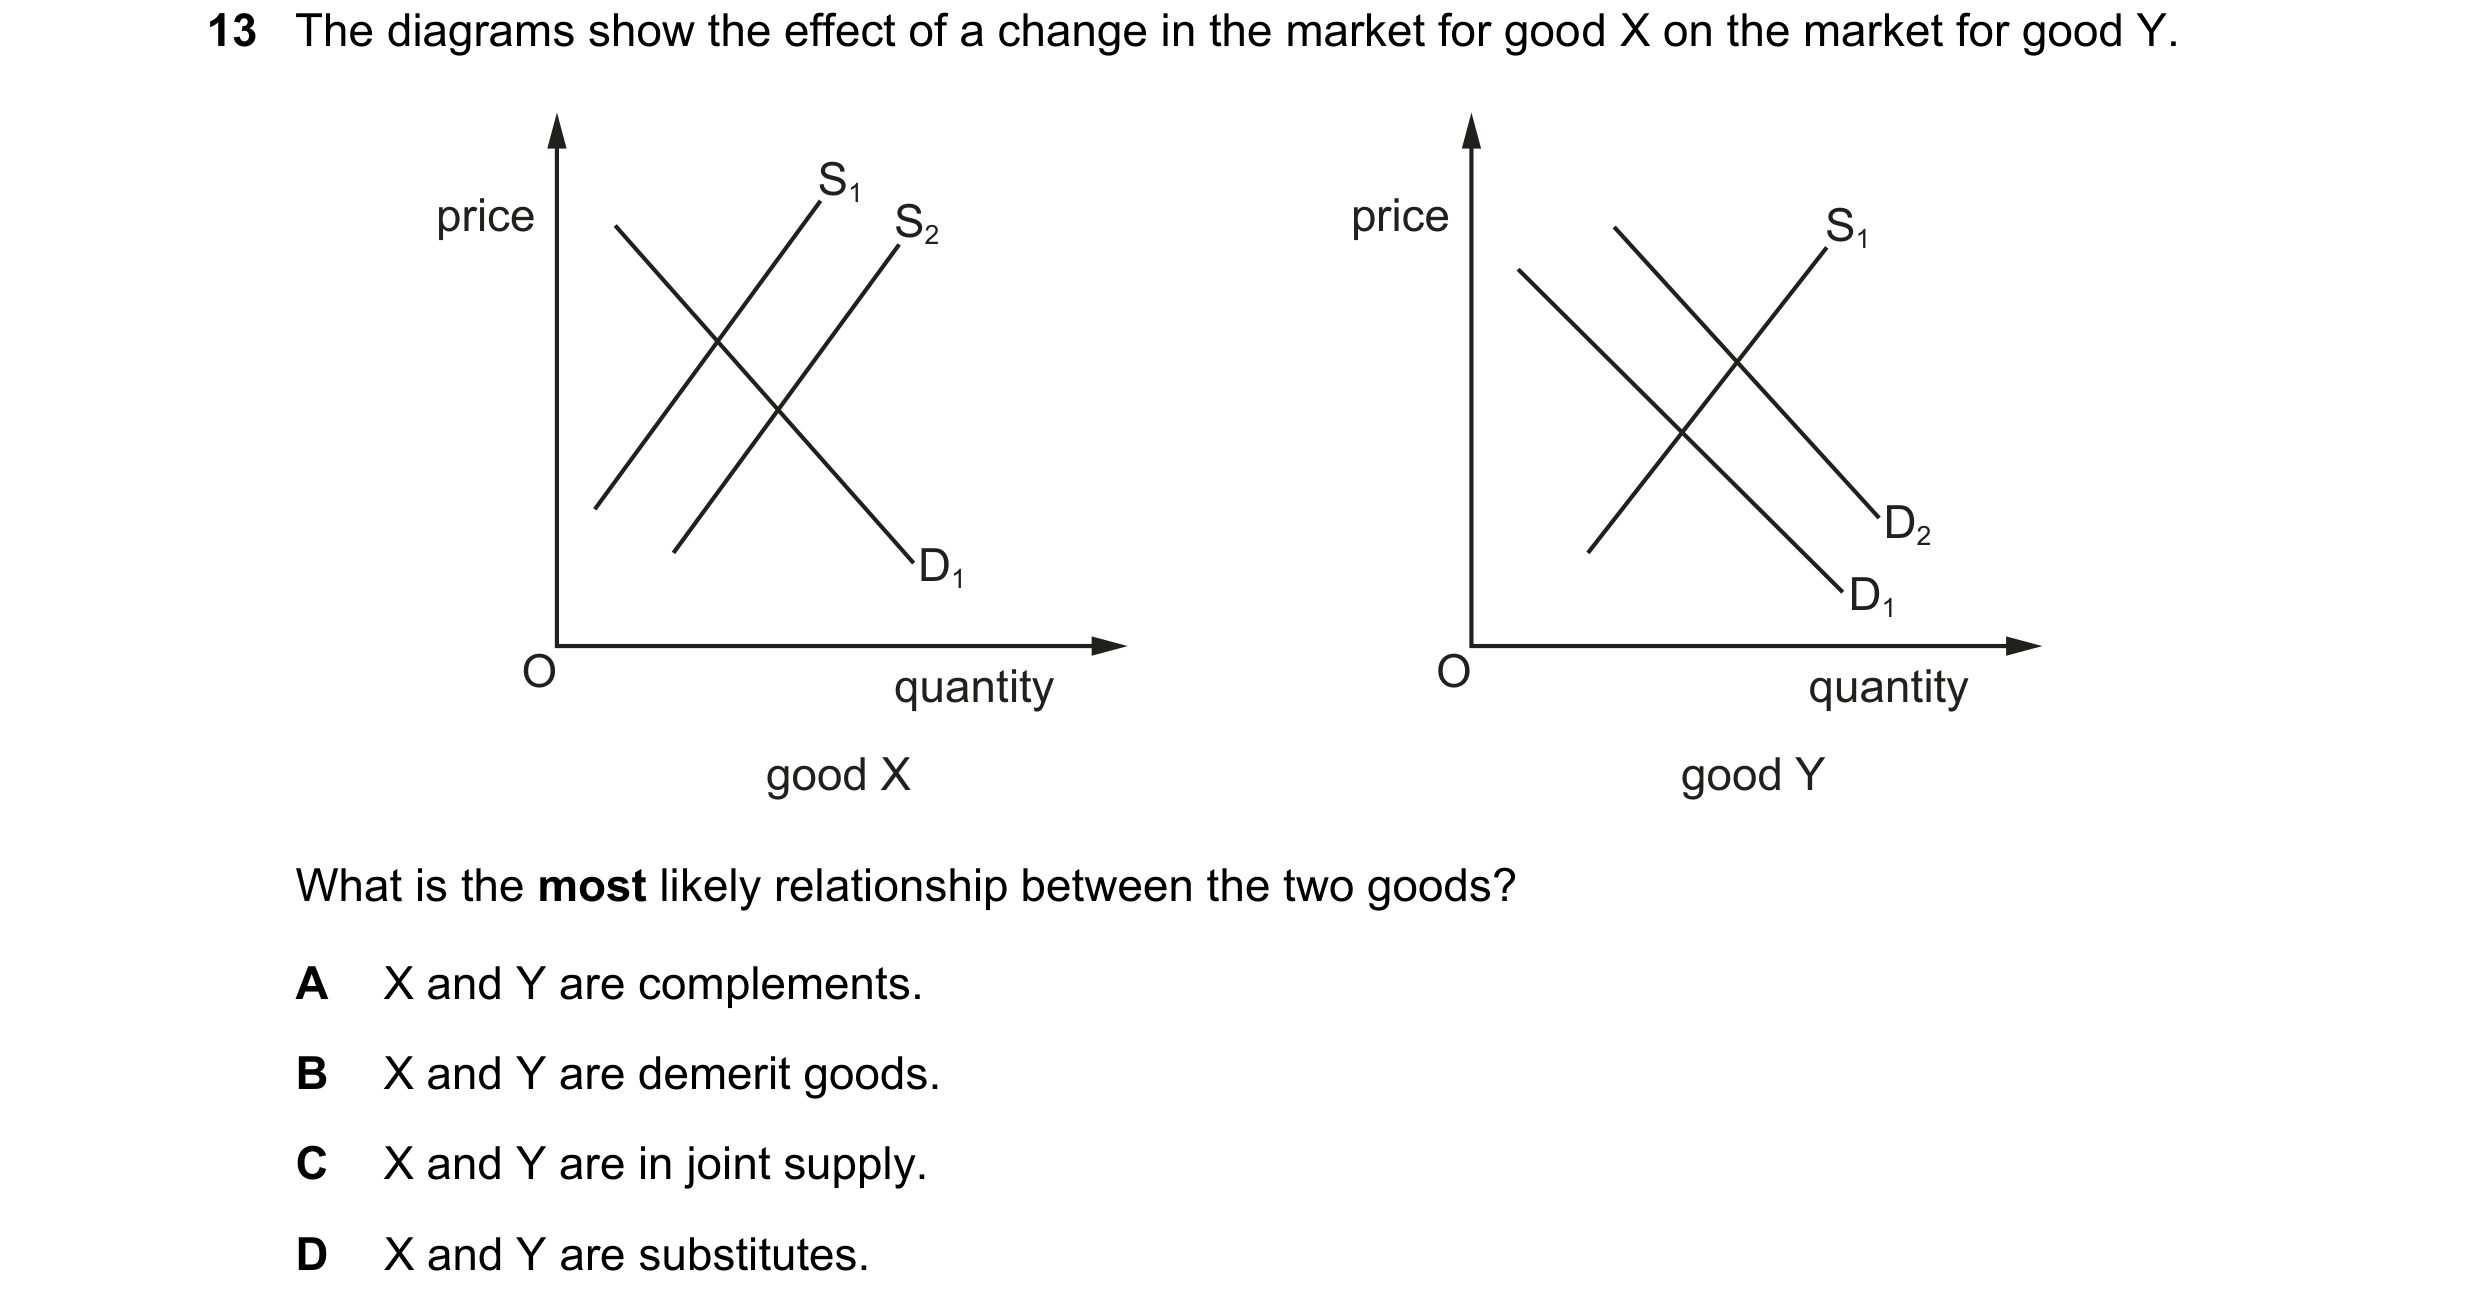
 59 / 76
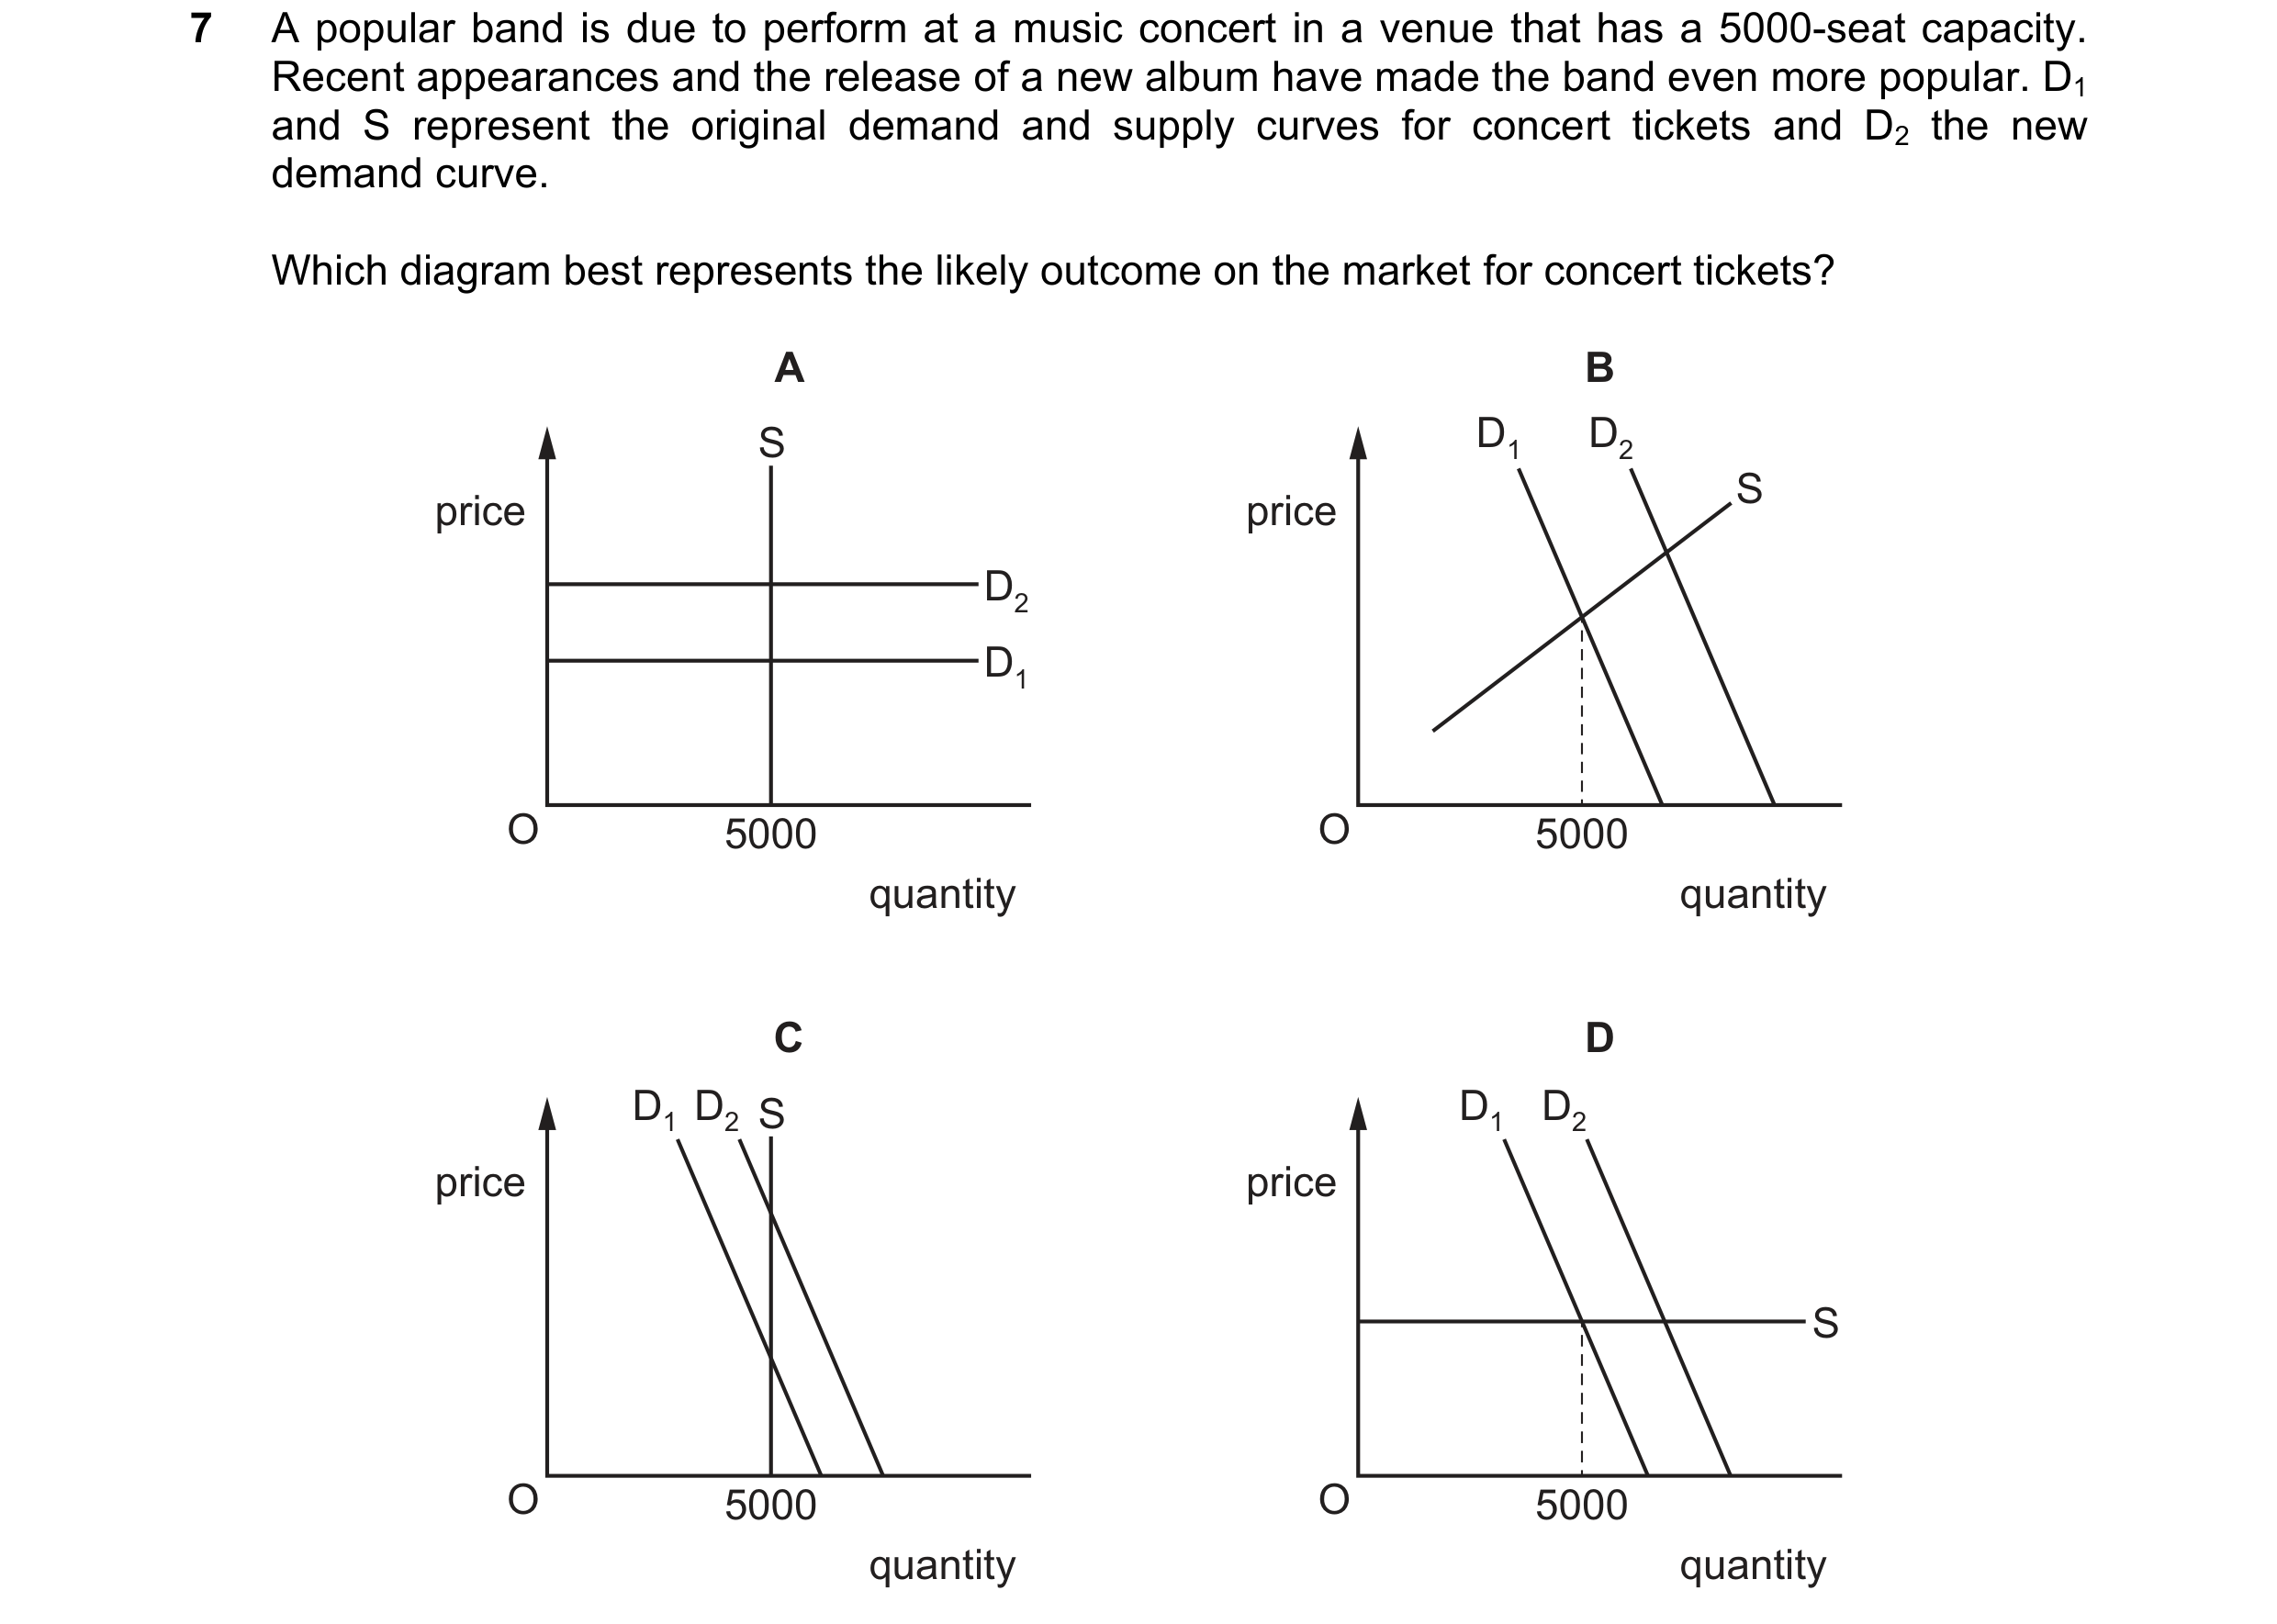
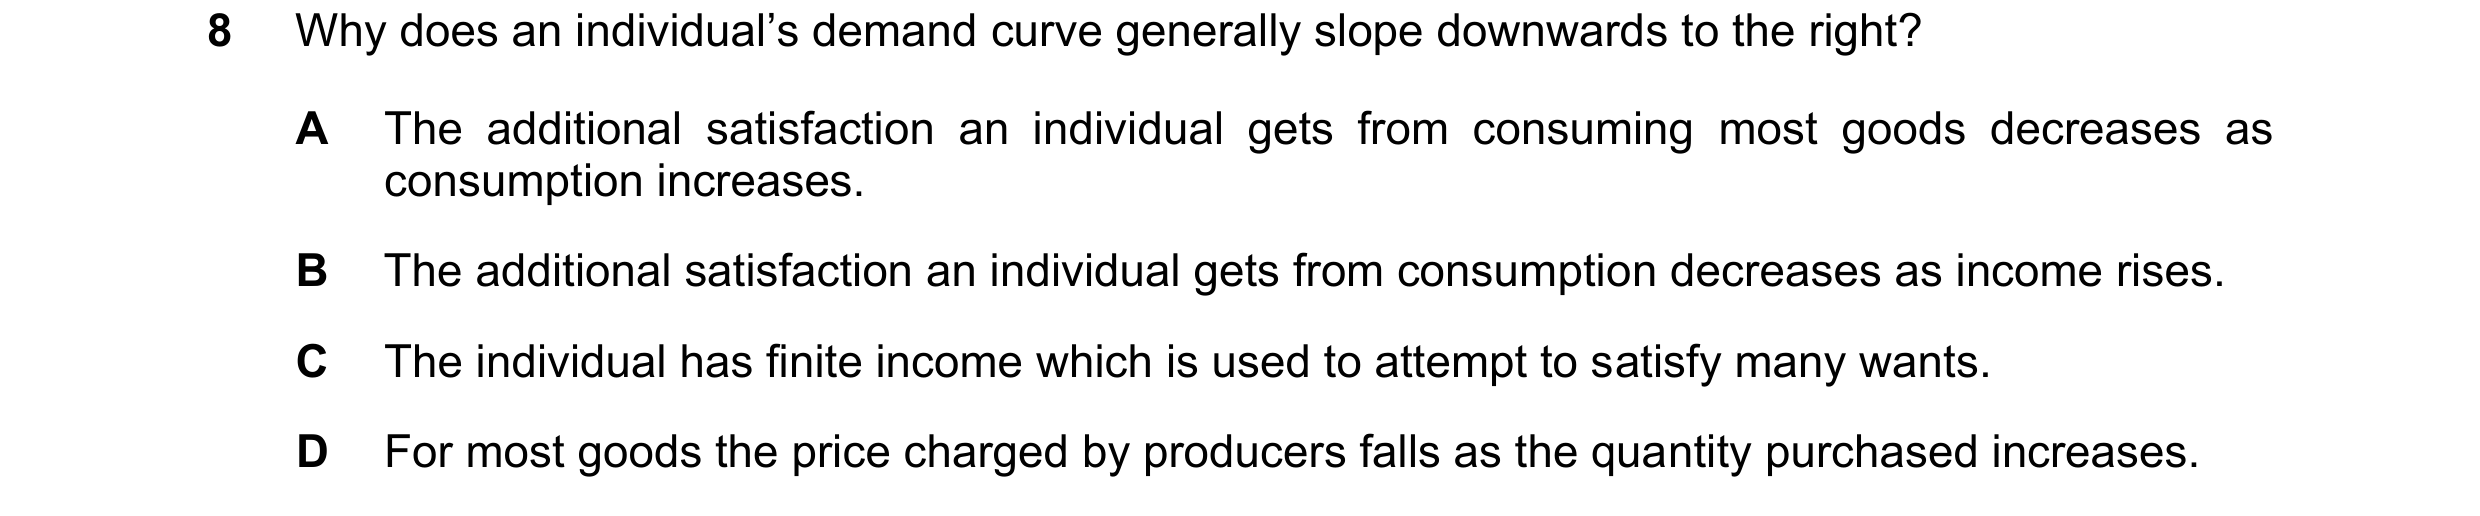
 60 / 76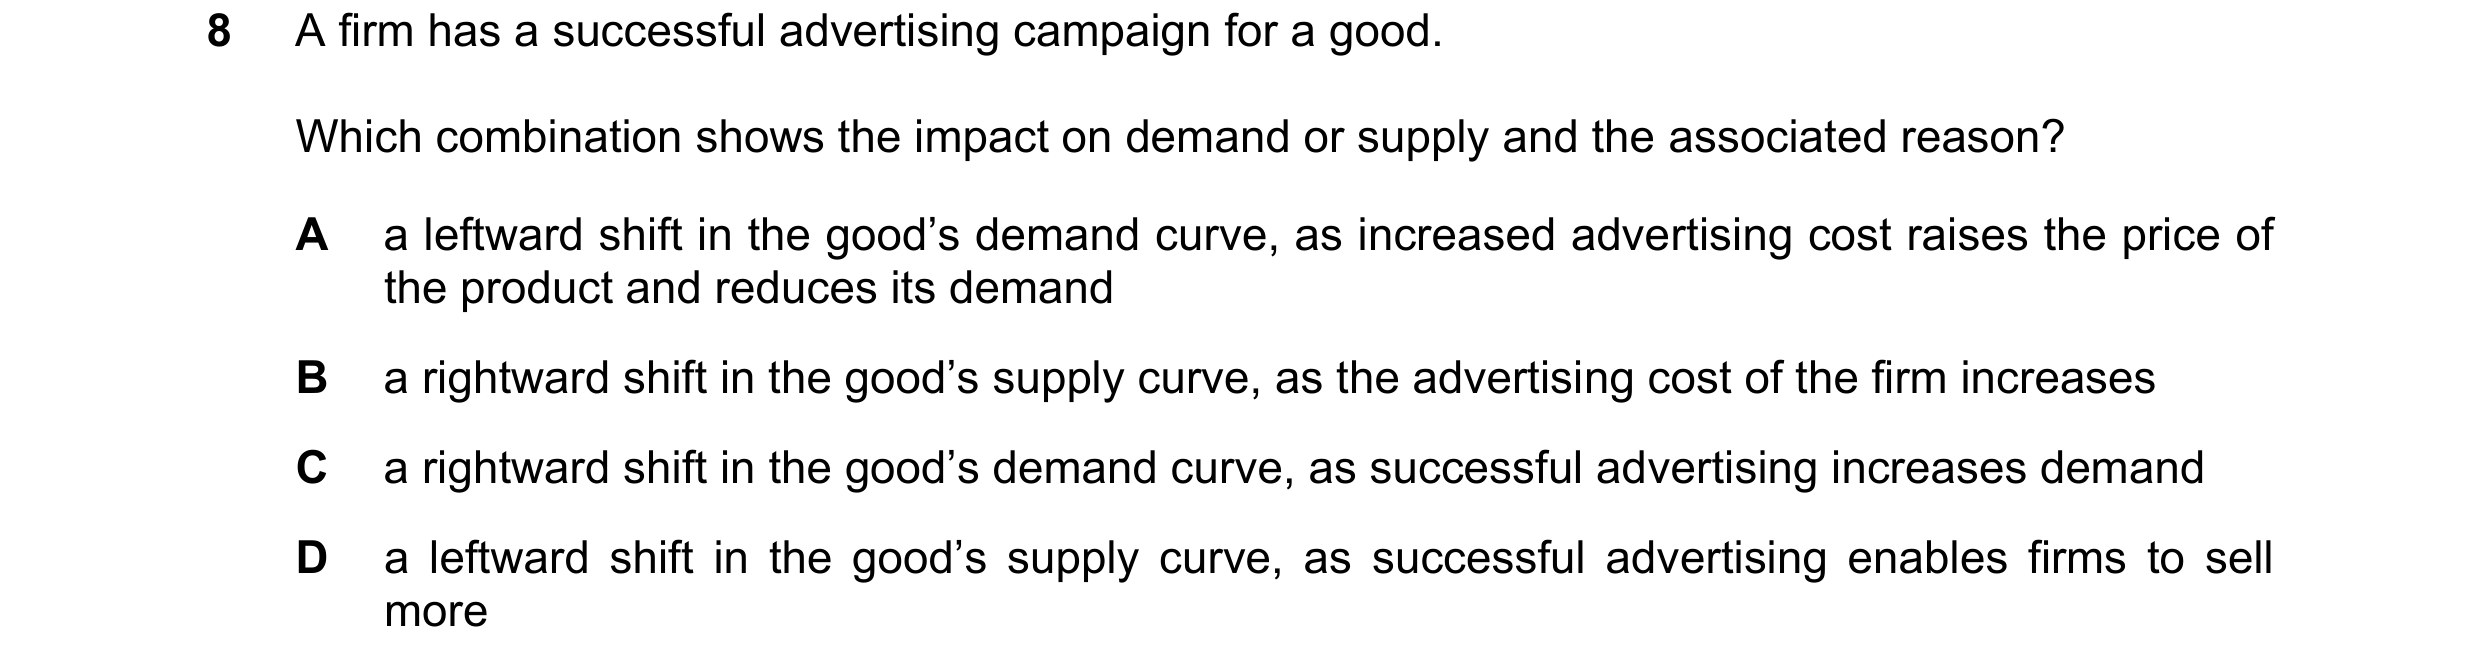
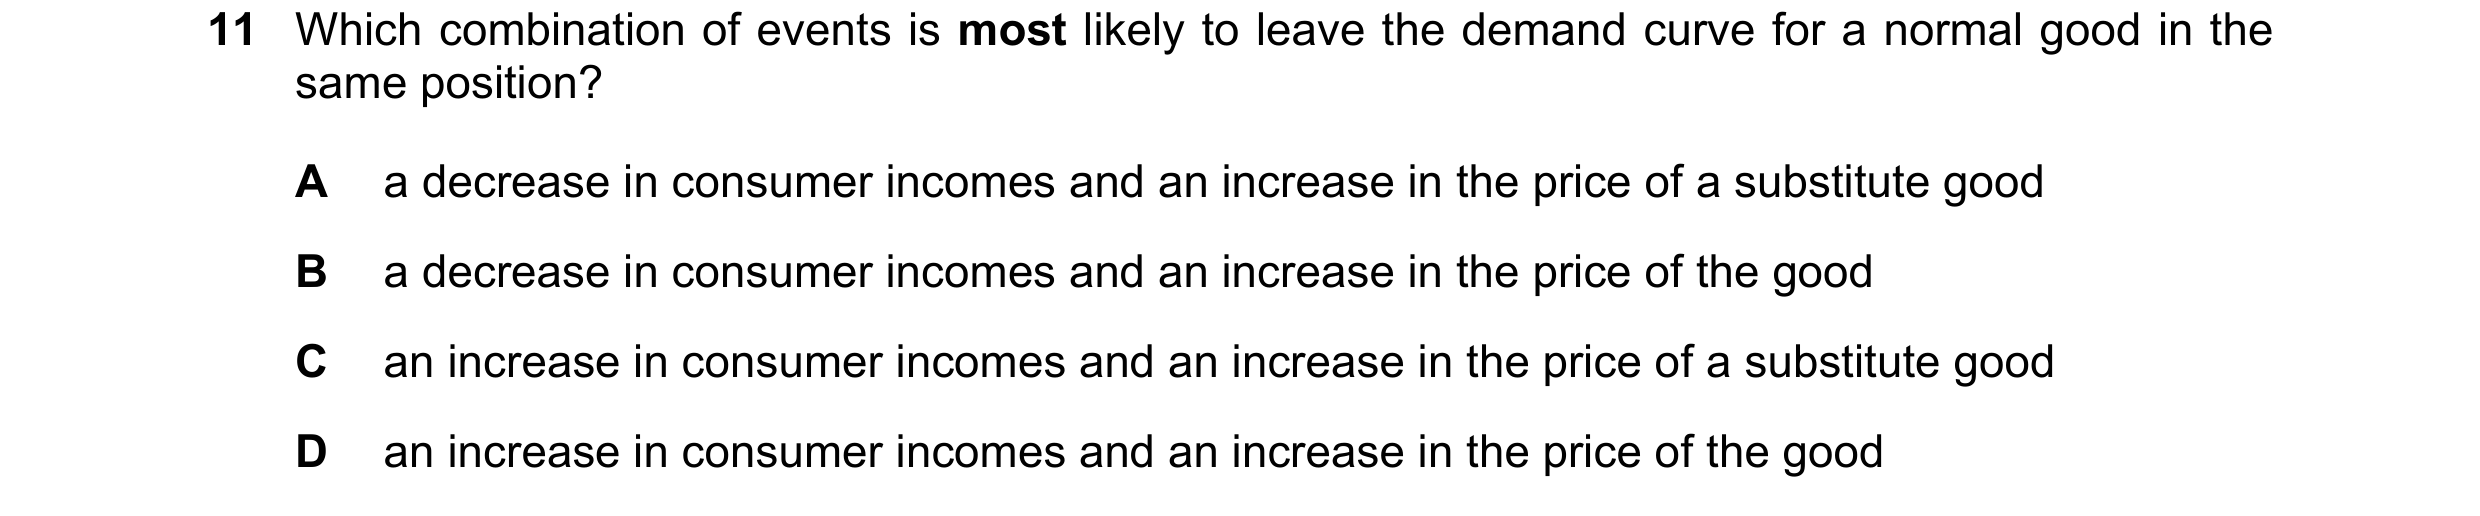

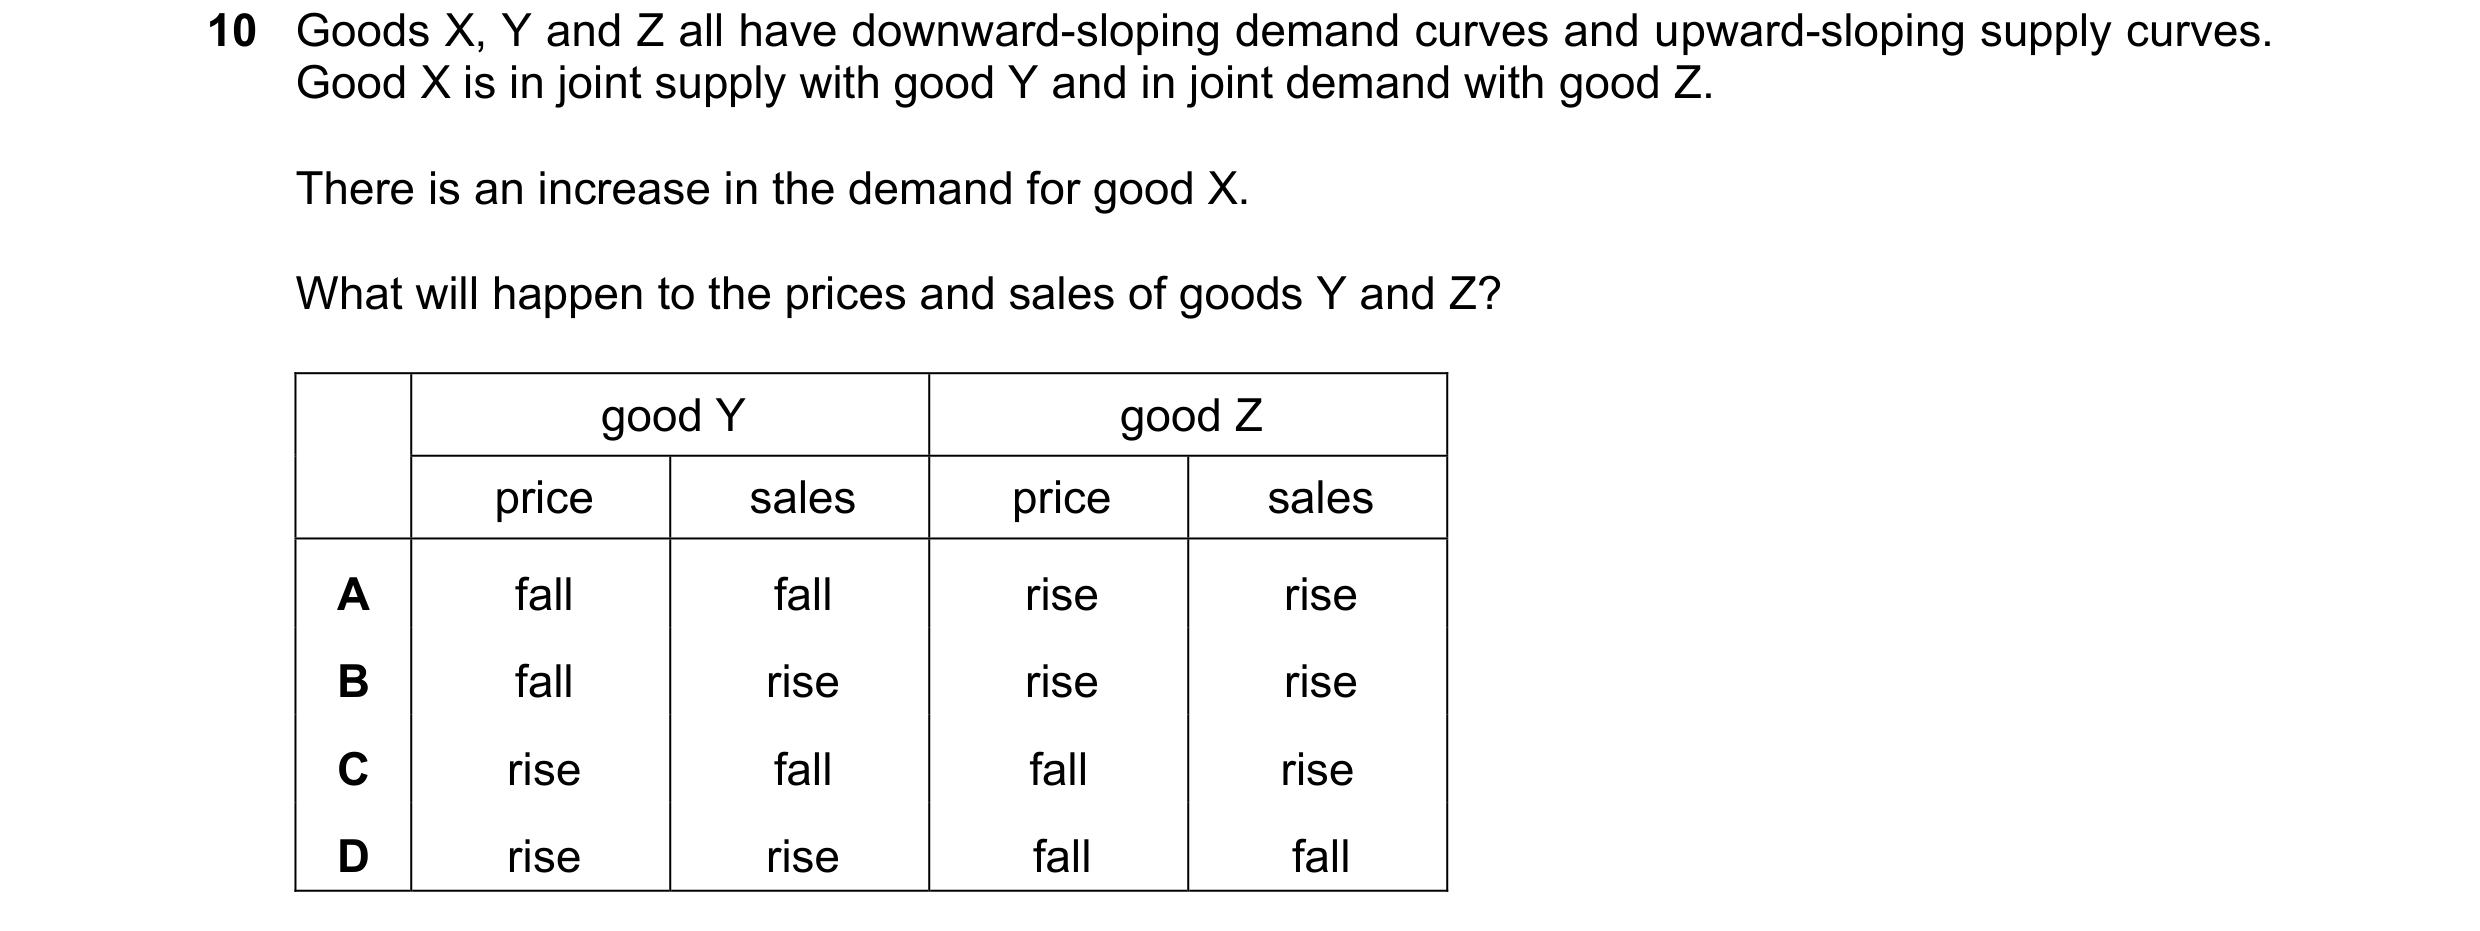 61 / 76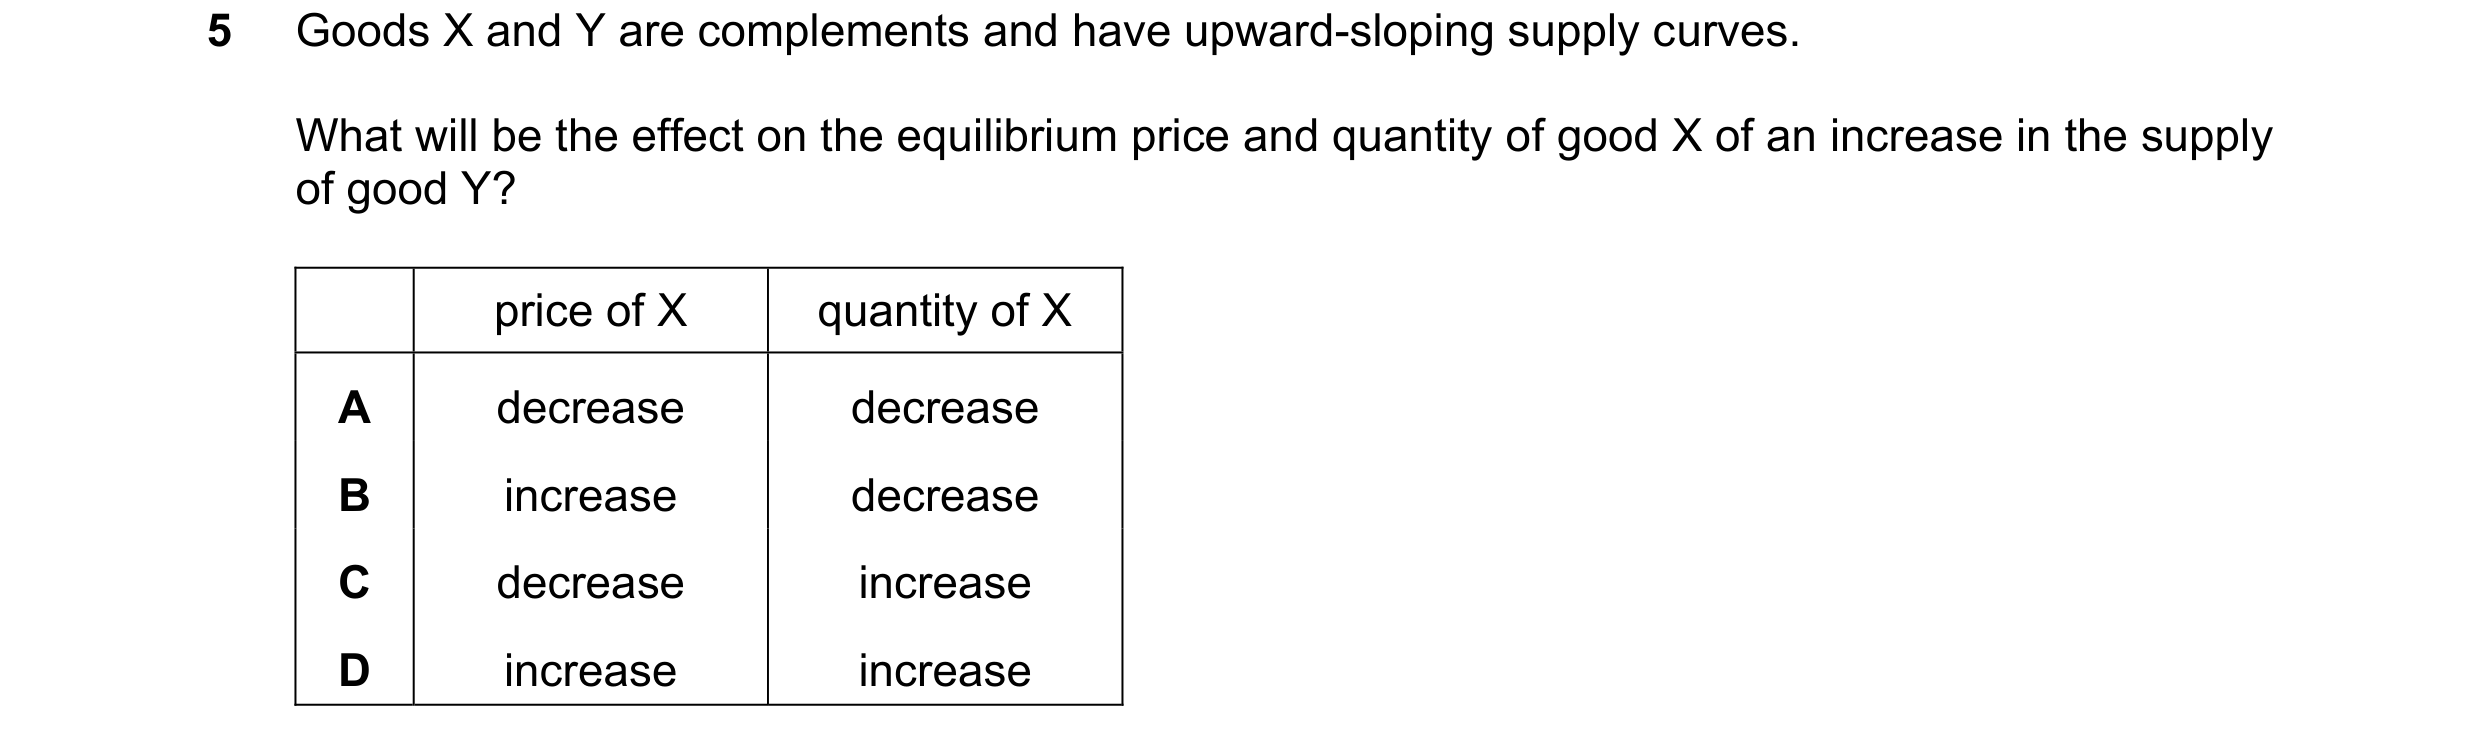

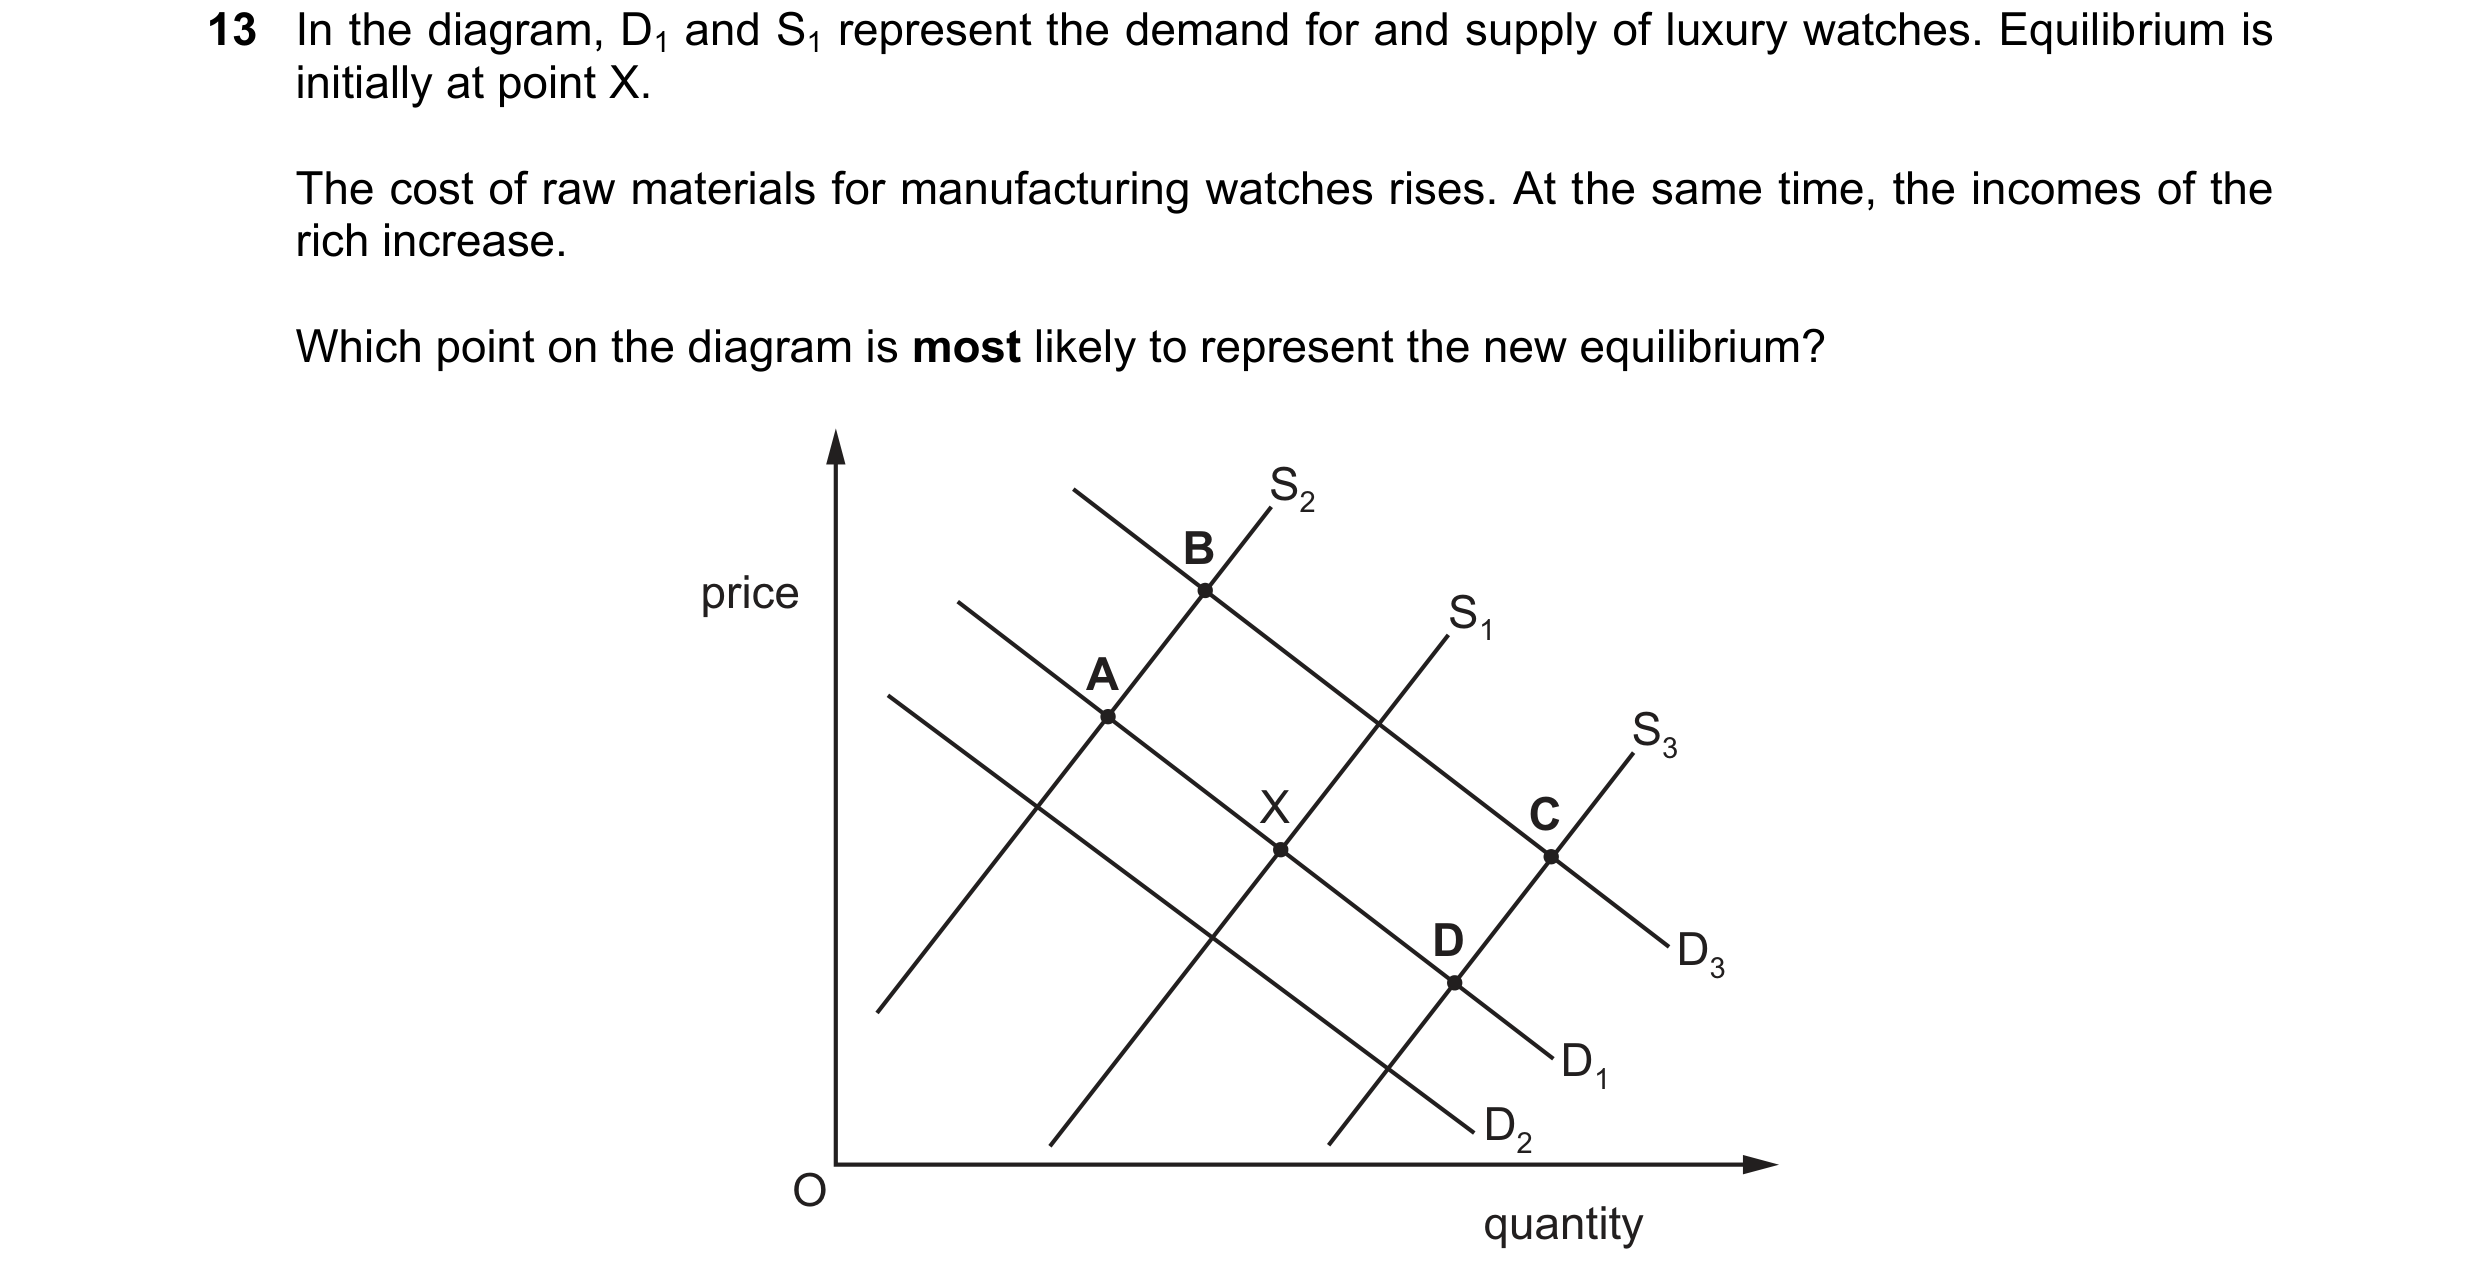
 62 / 76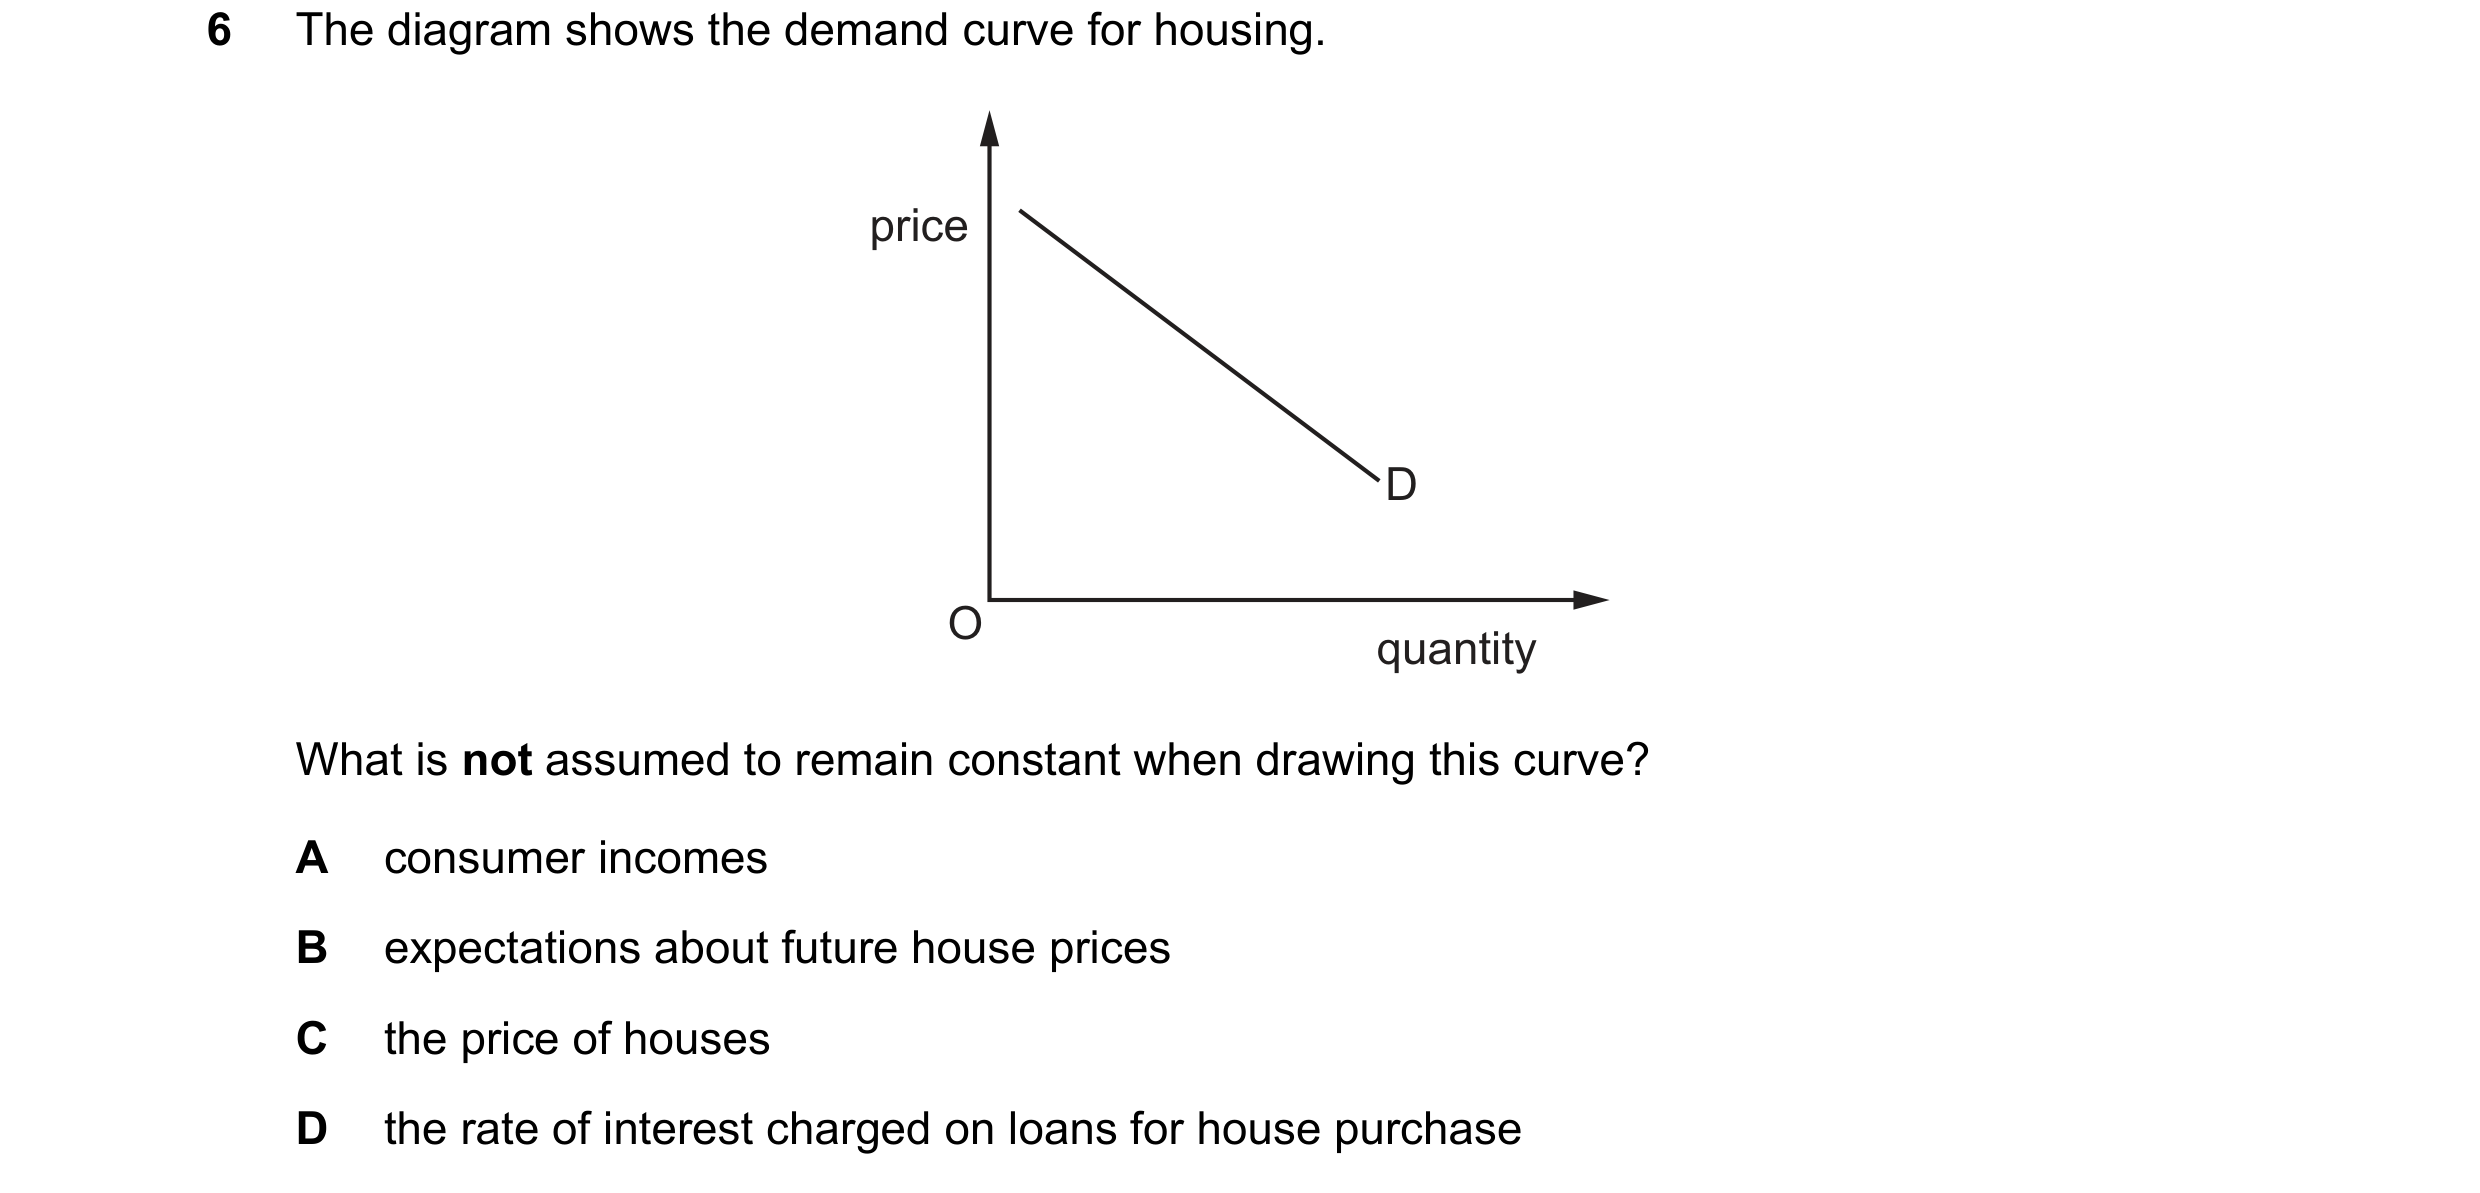


 63 / 76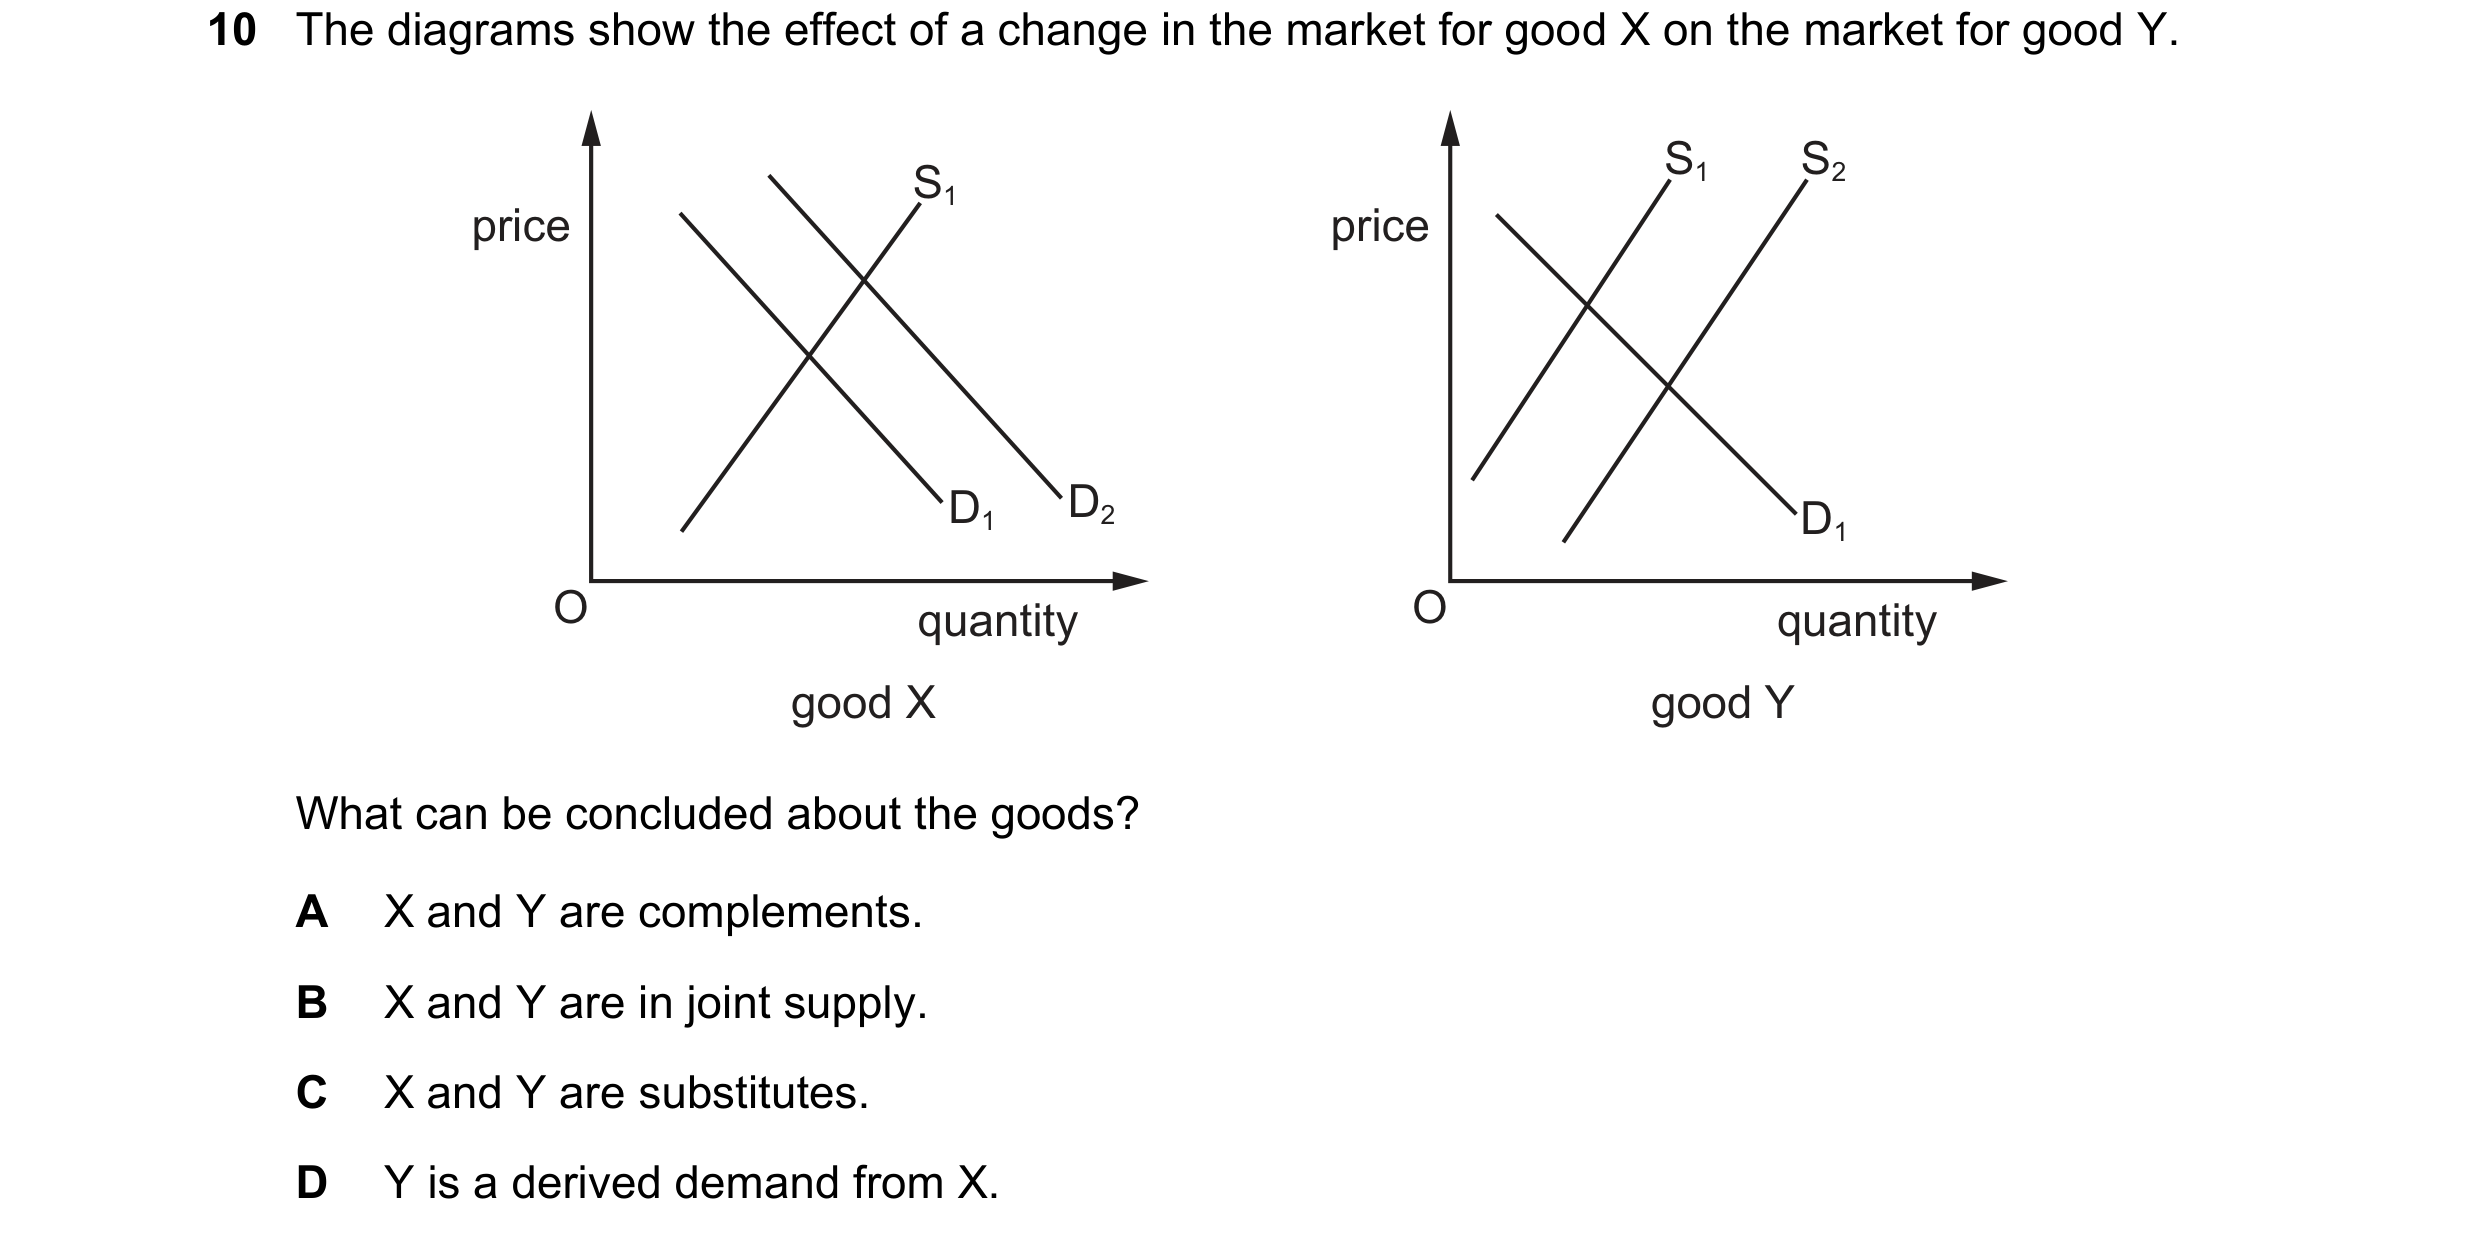
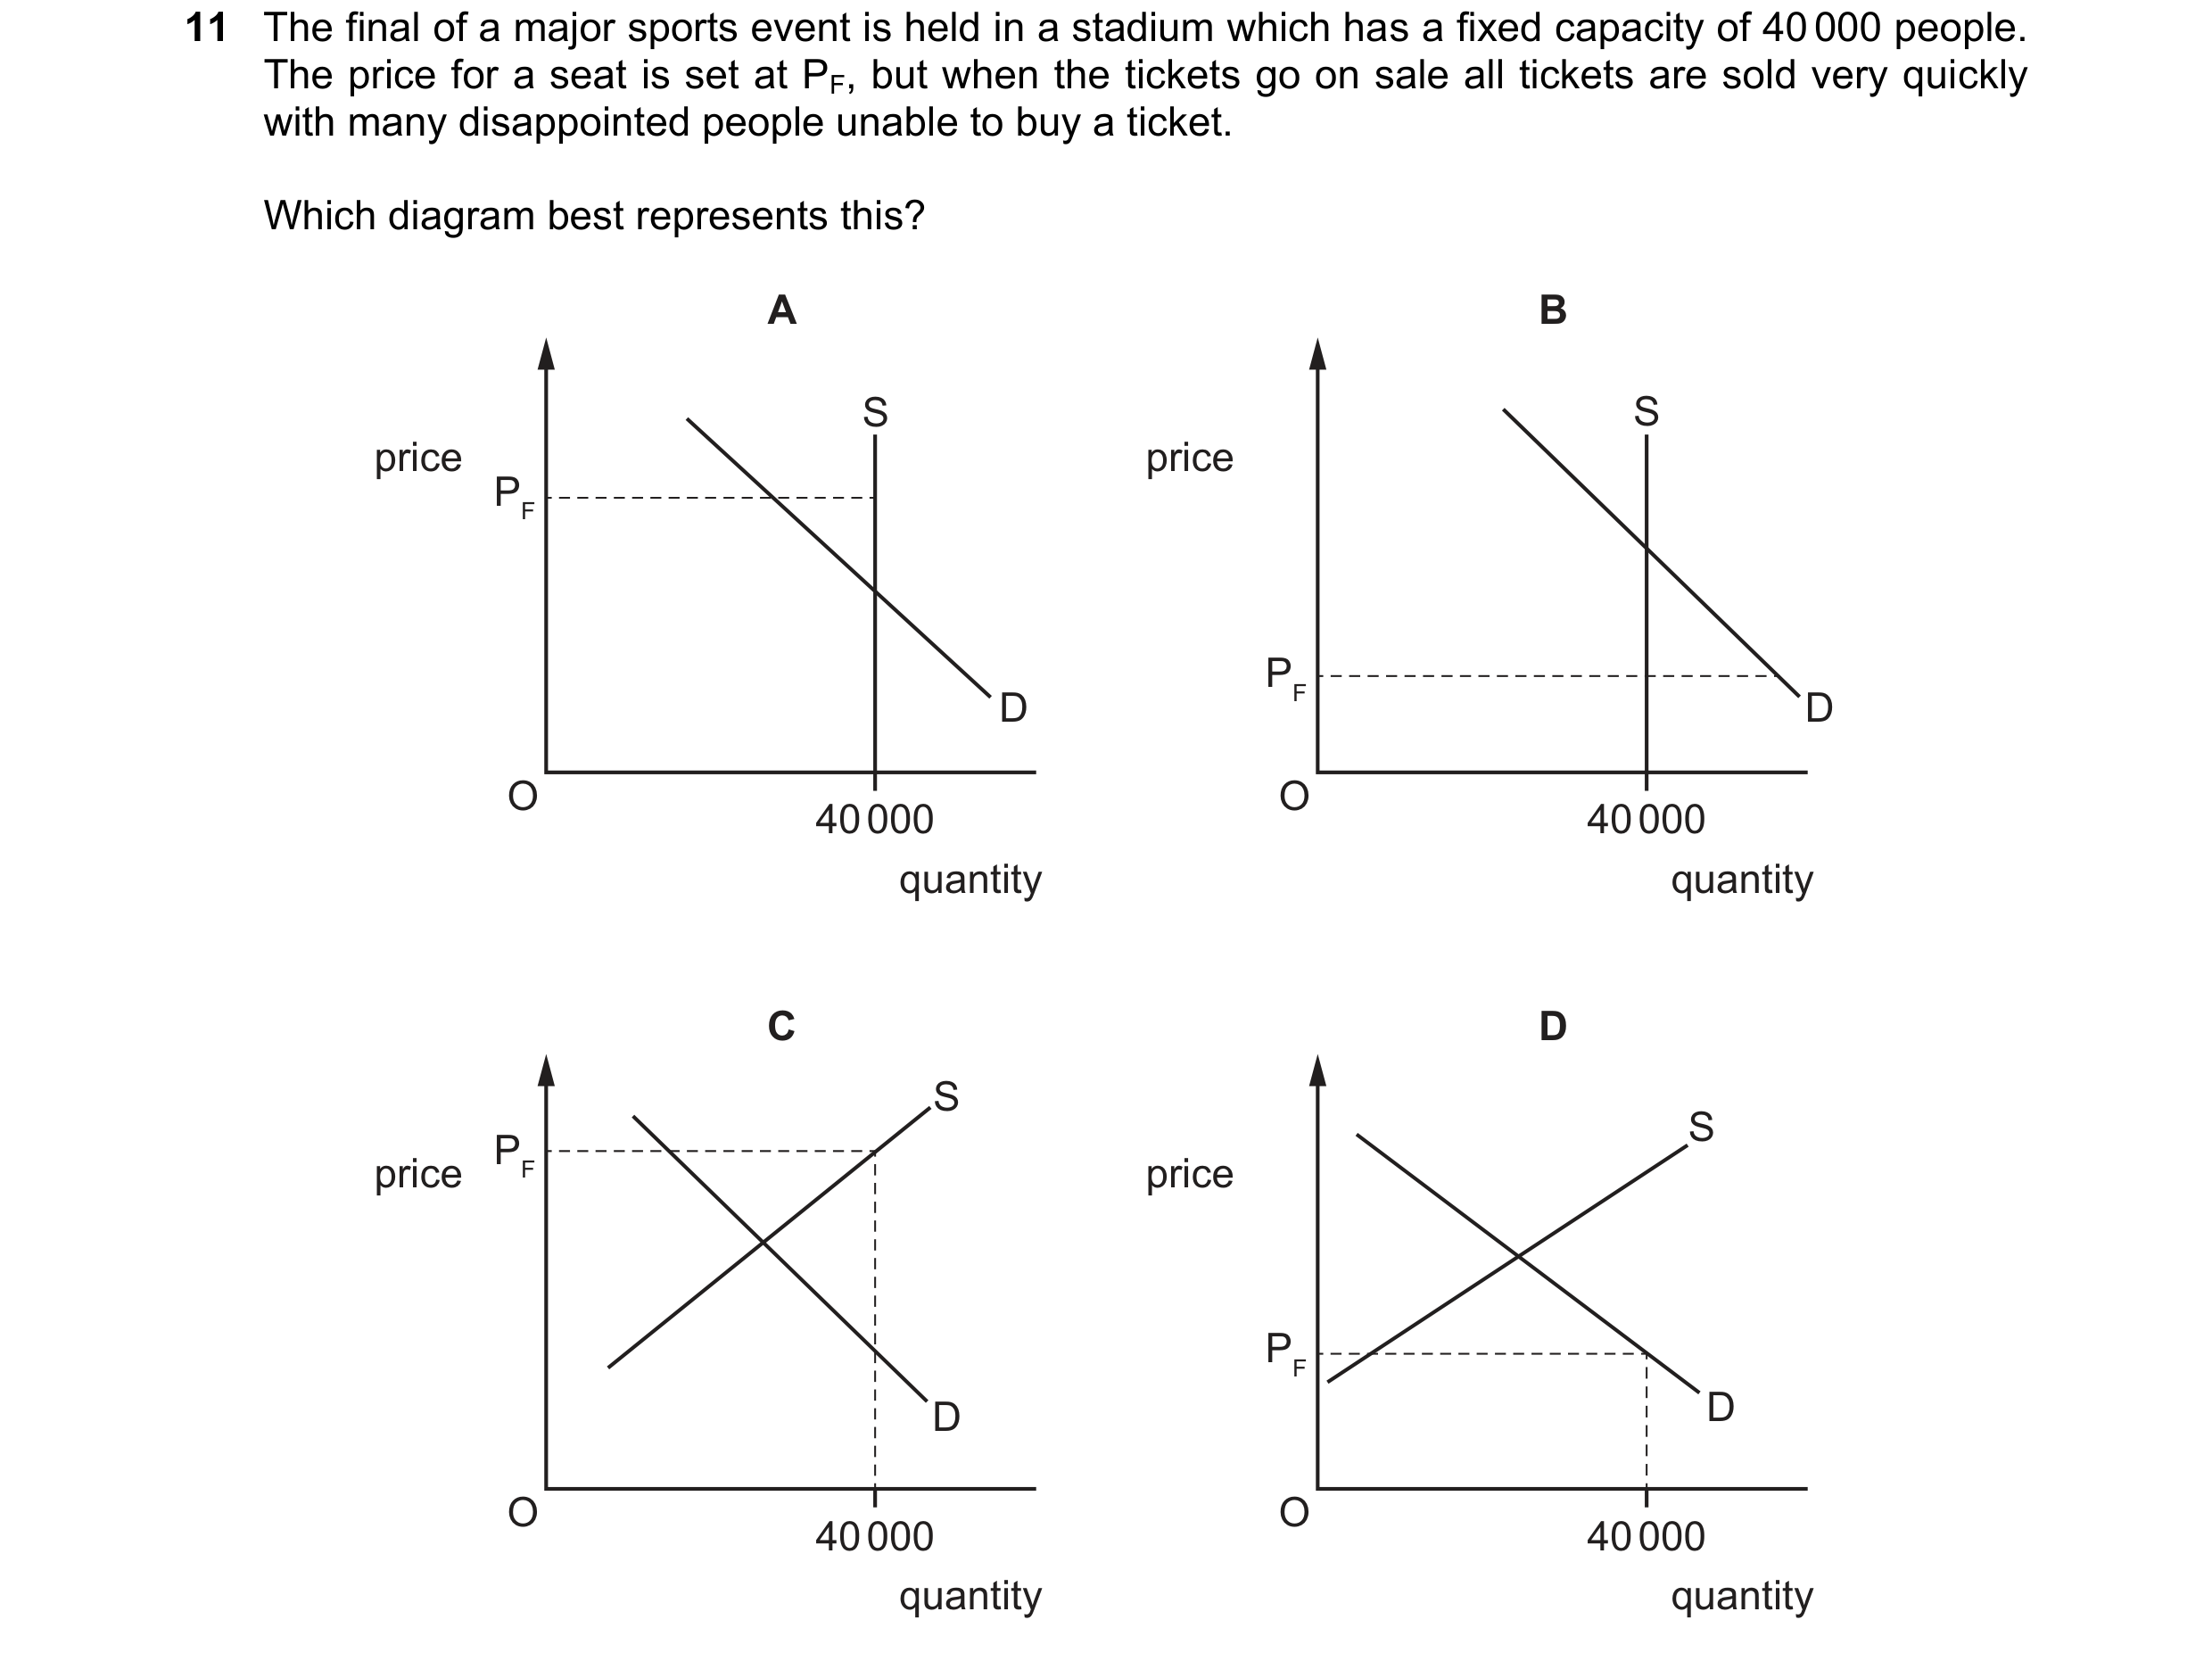 64 / 76
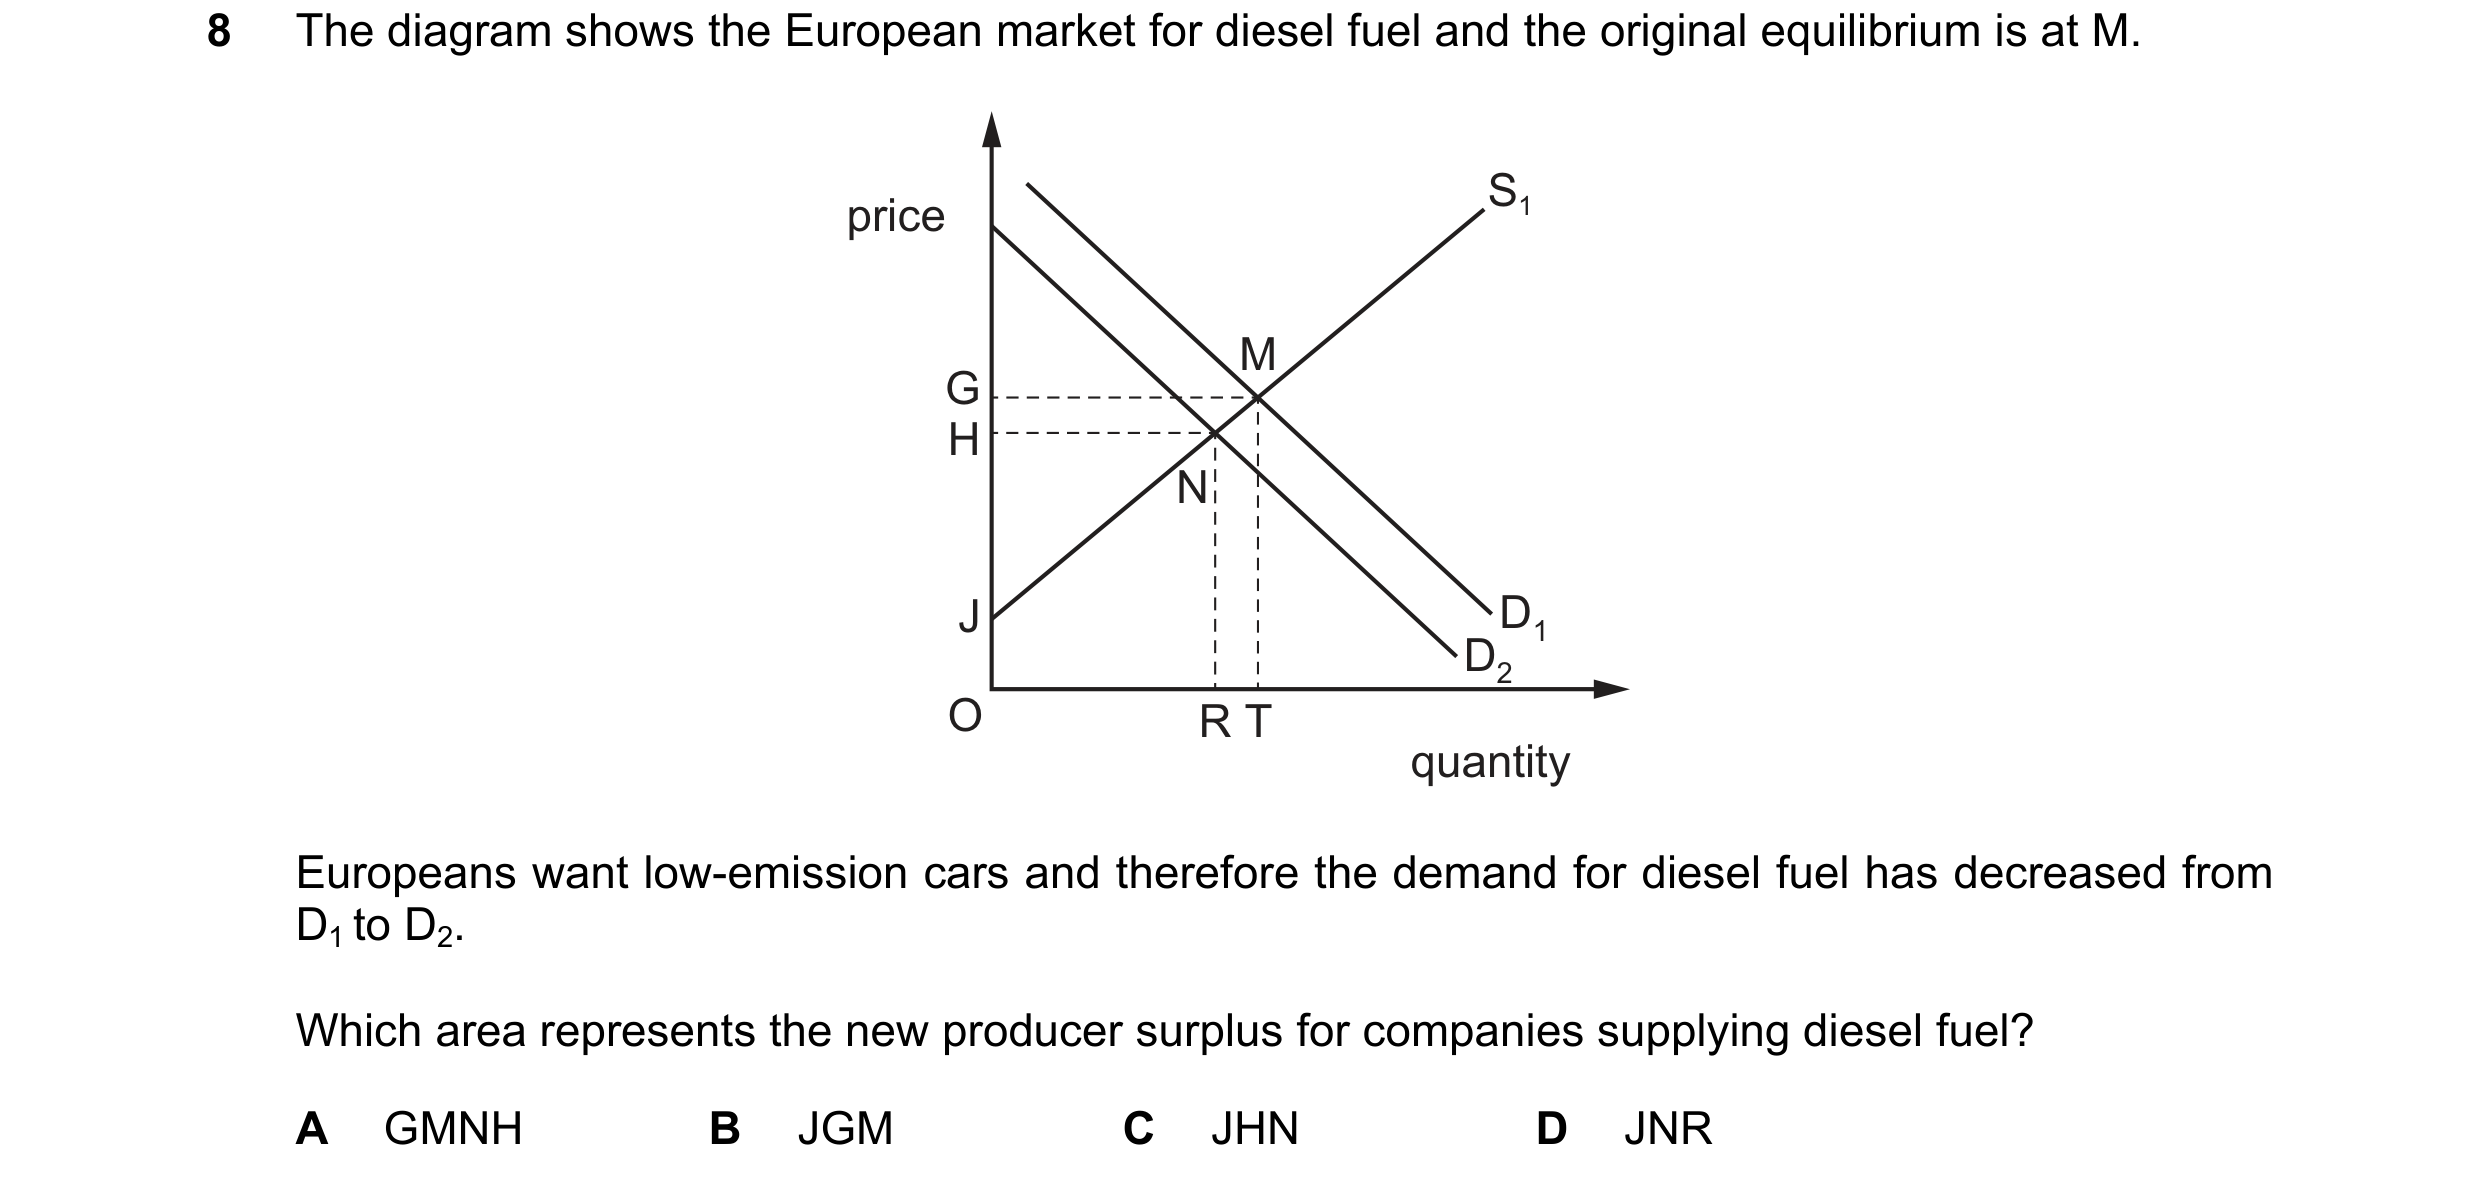 65 / 76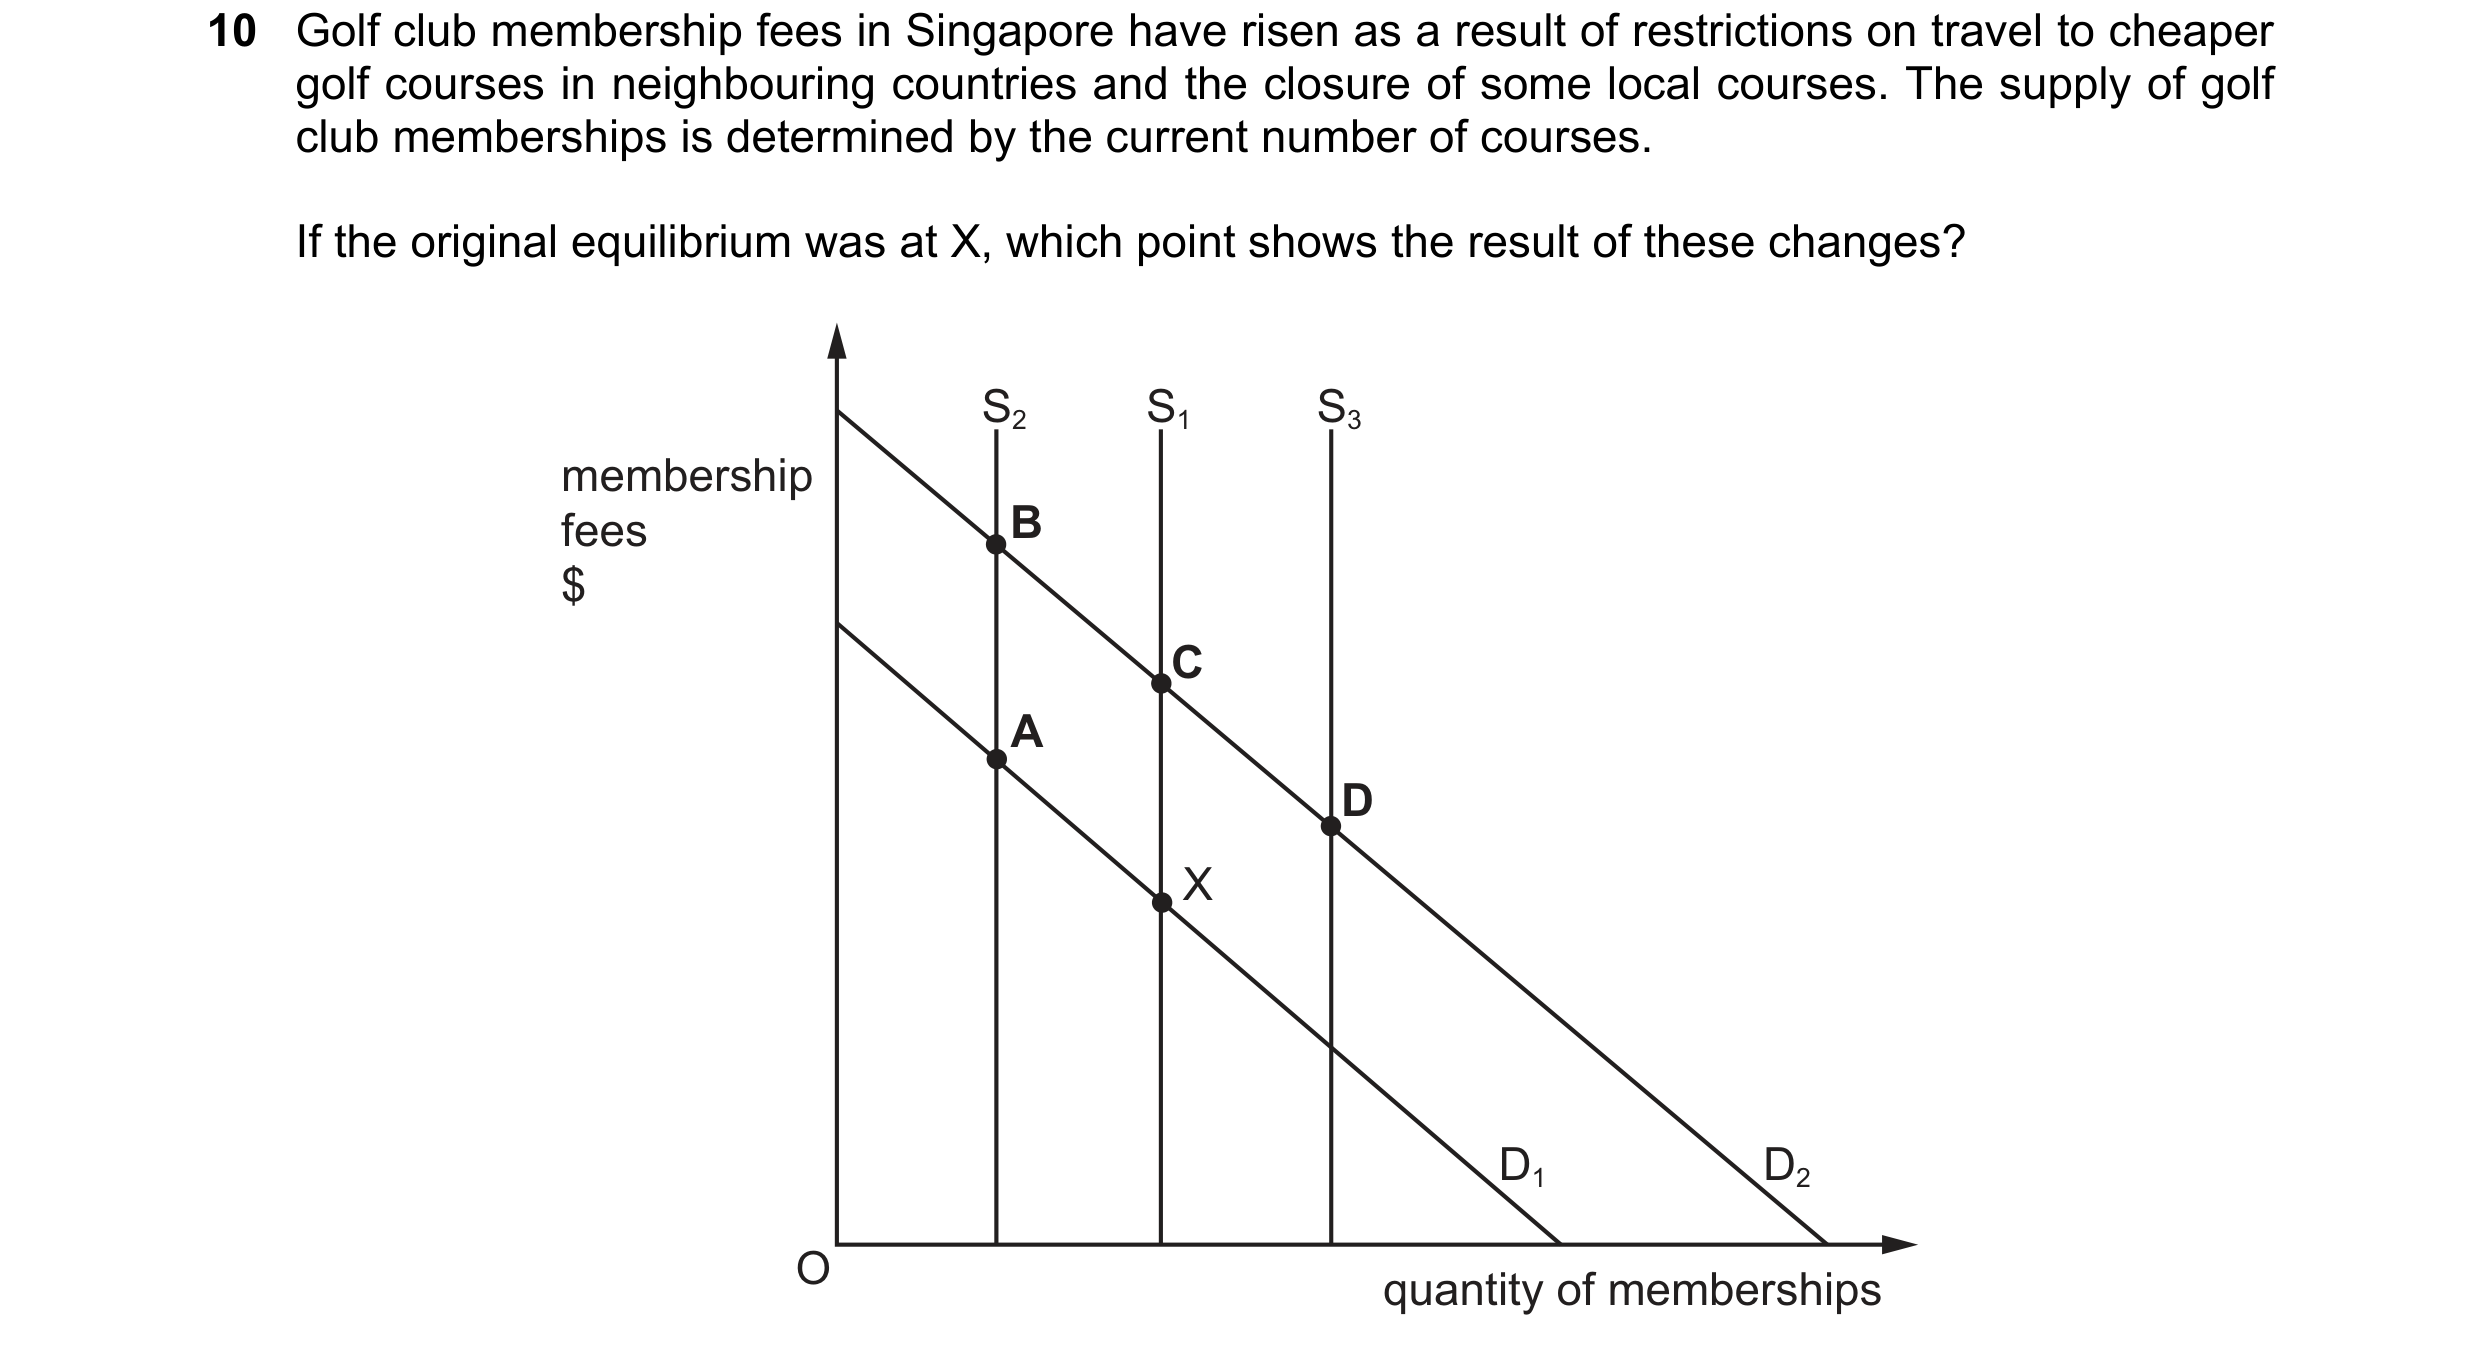
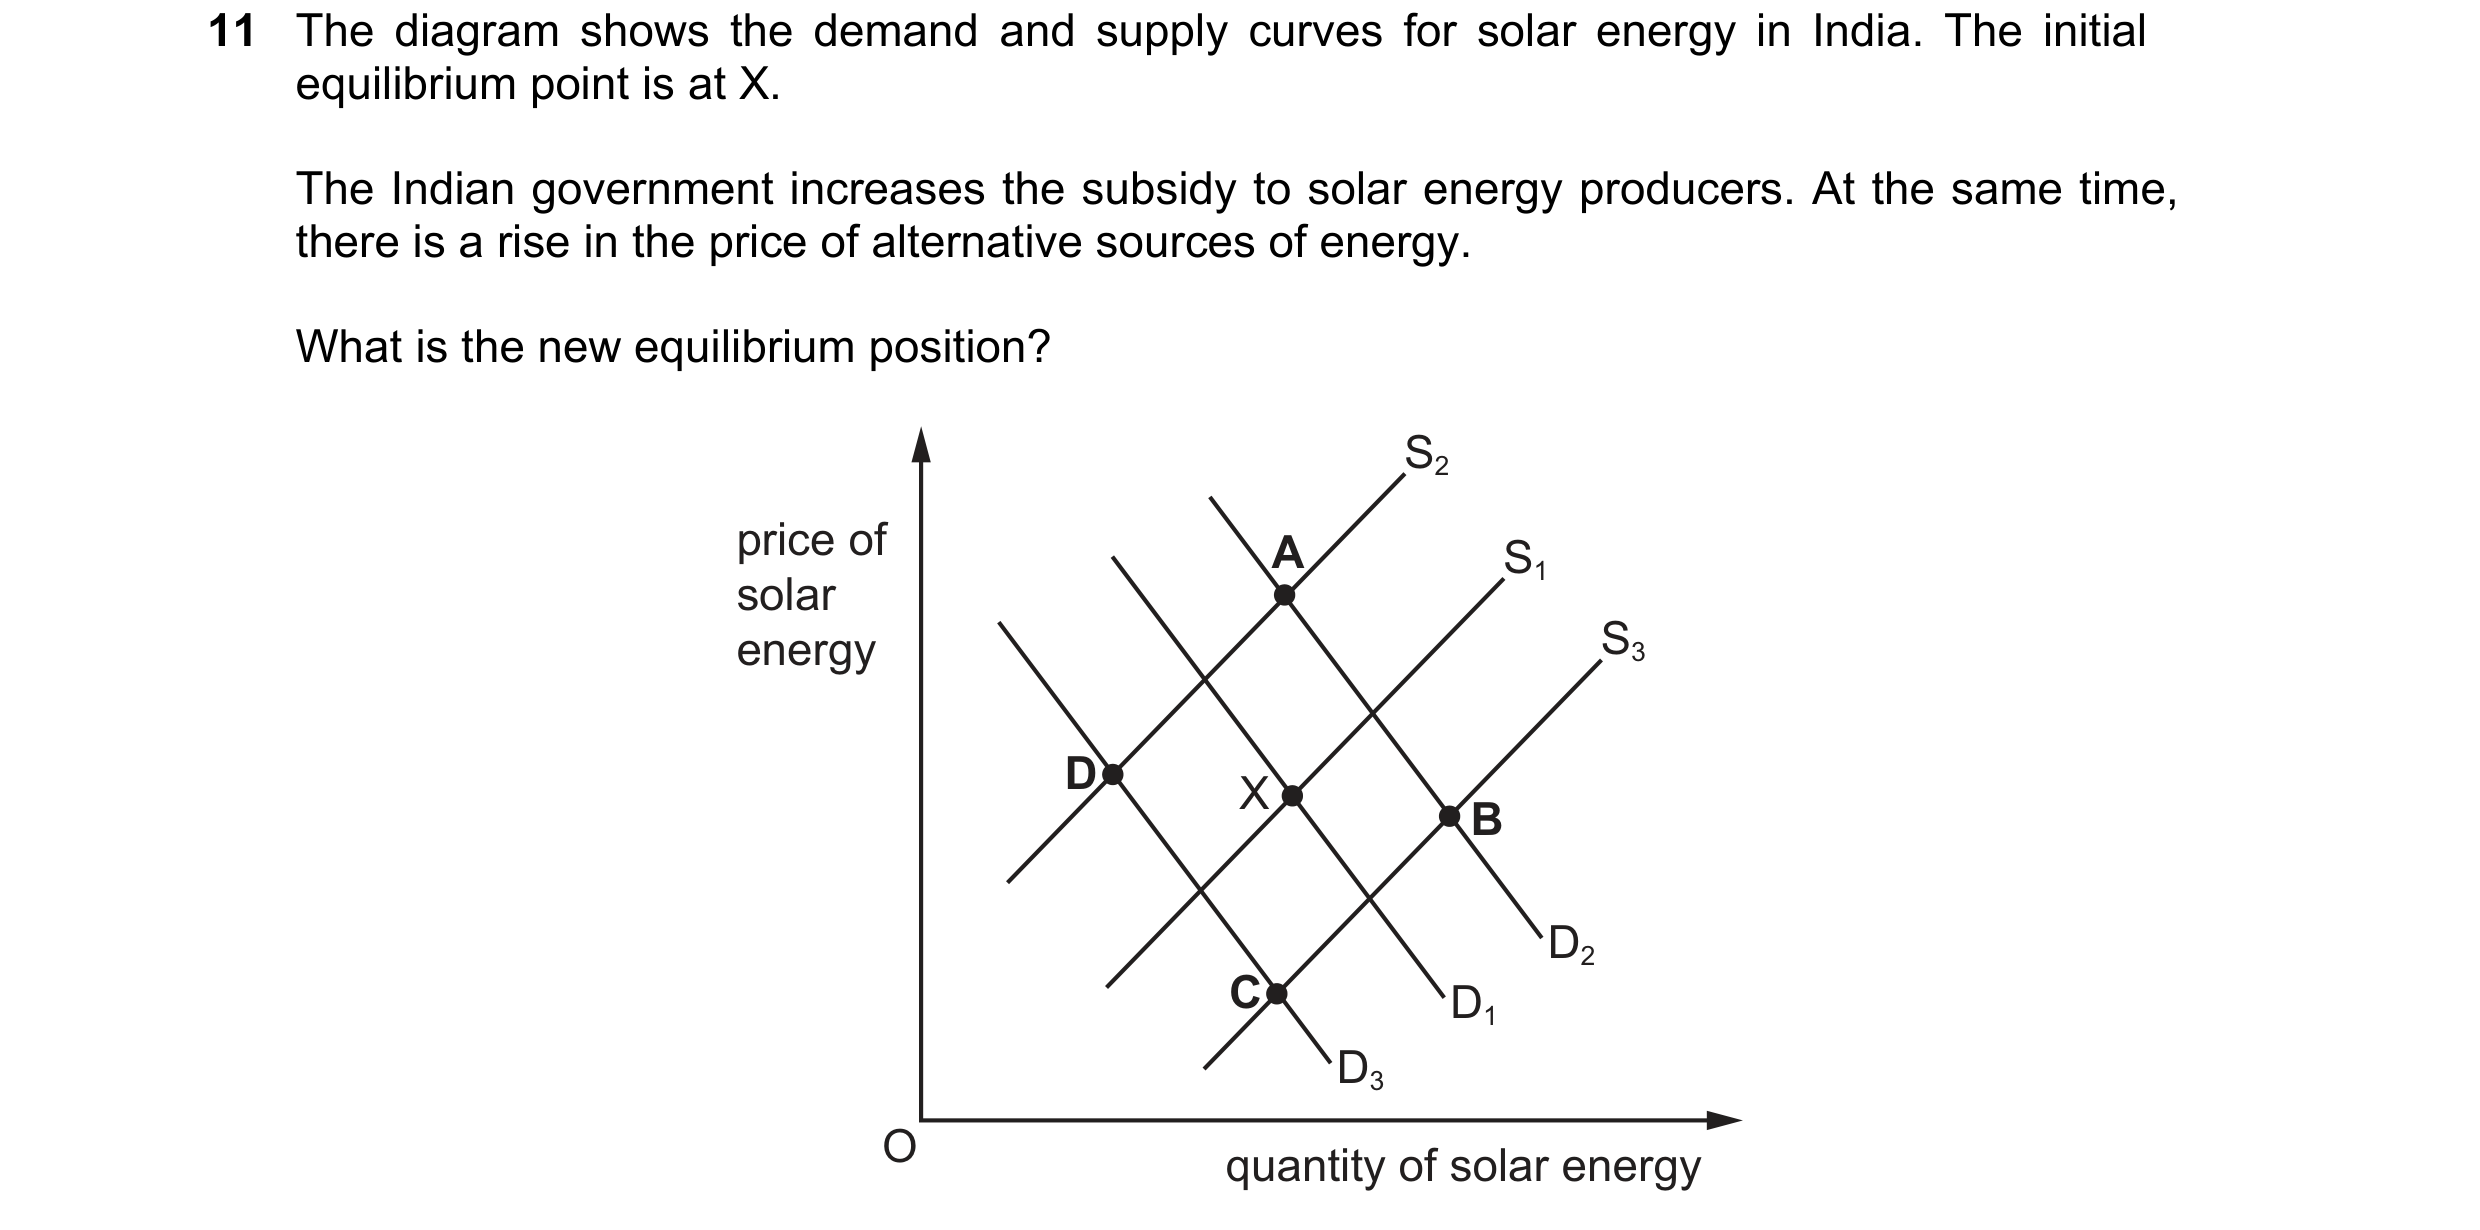
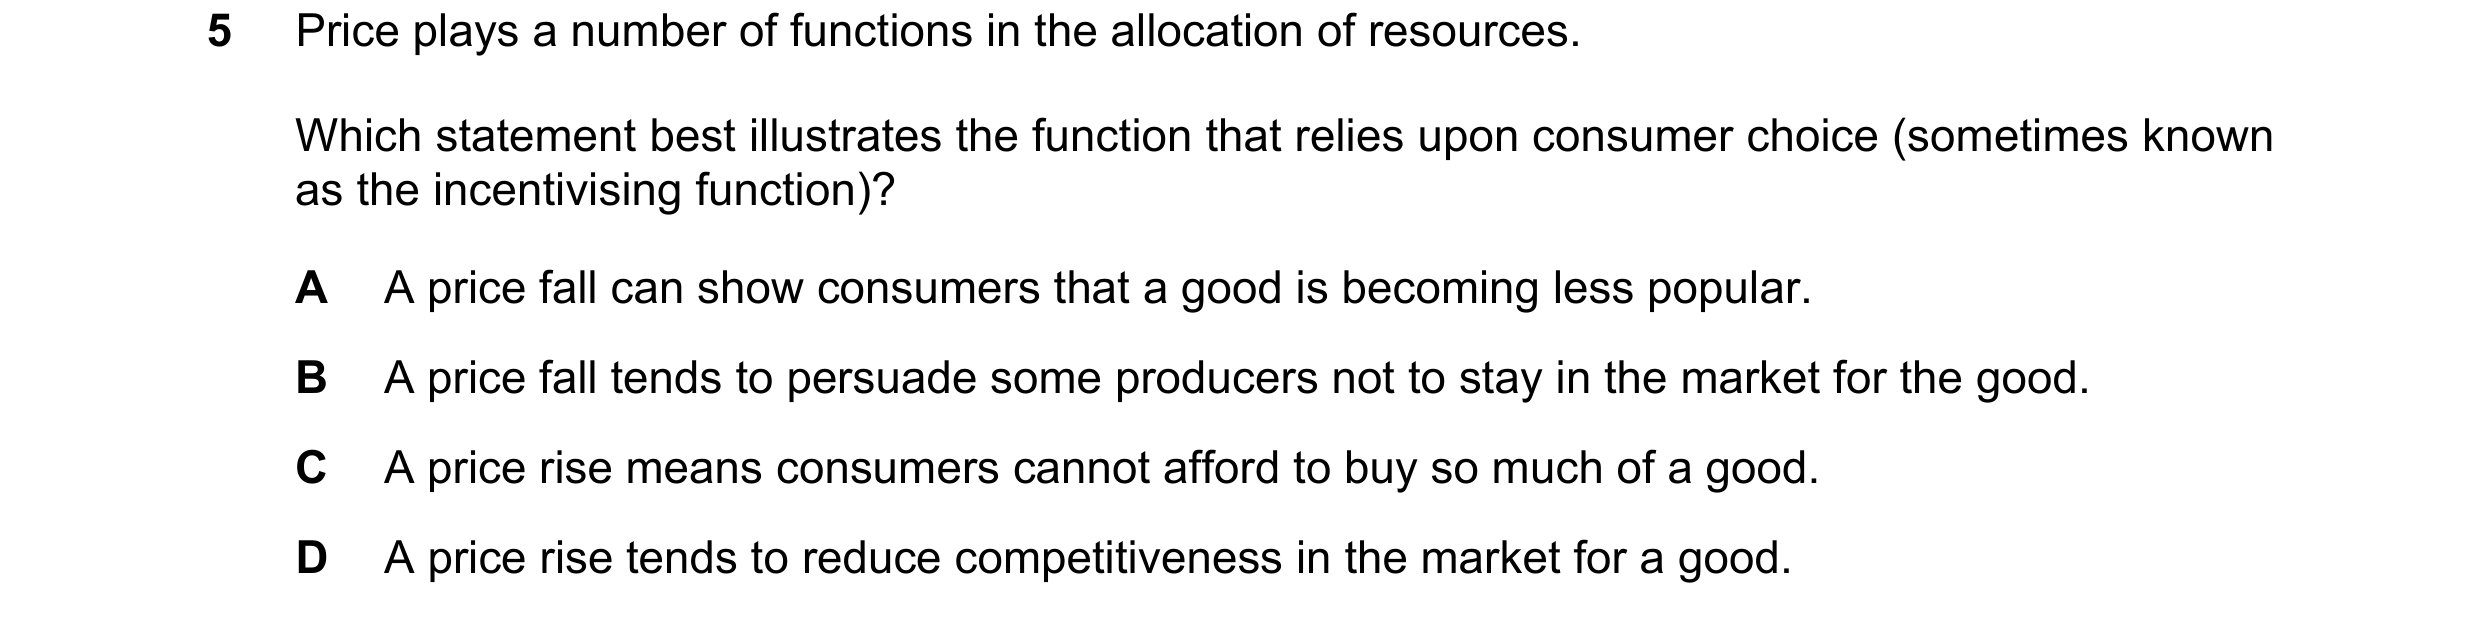 66 / 76
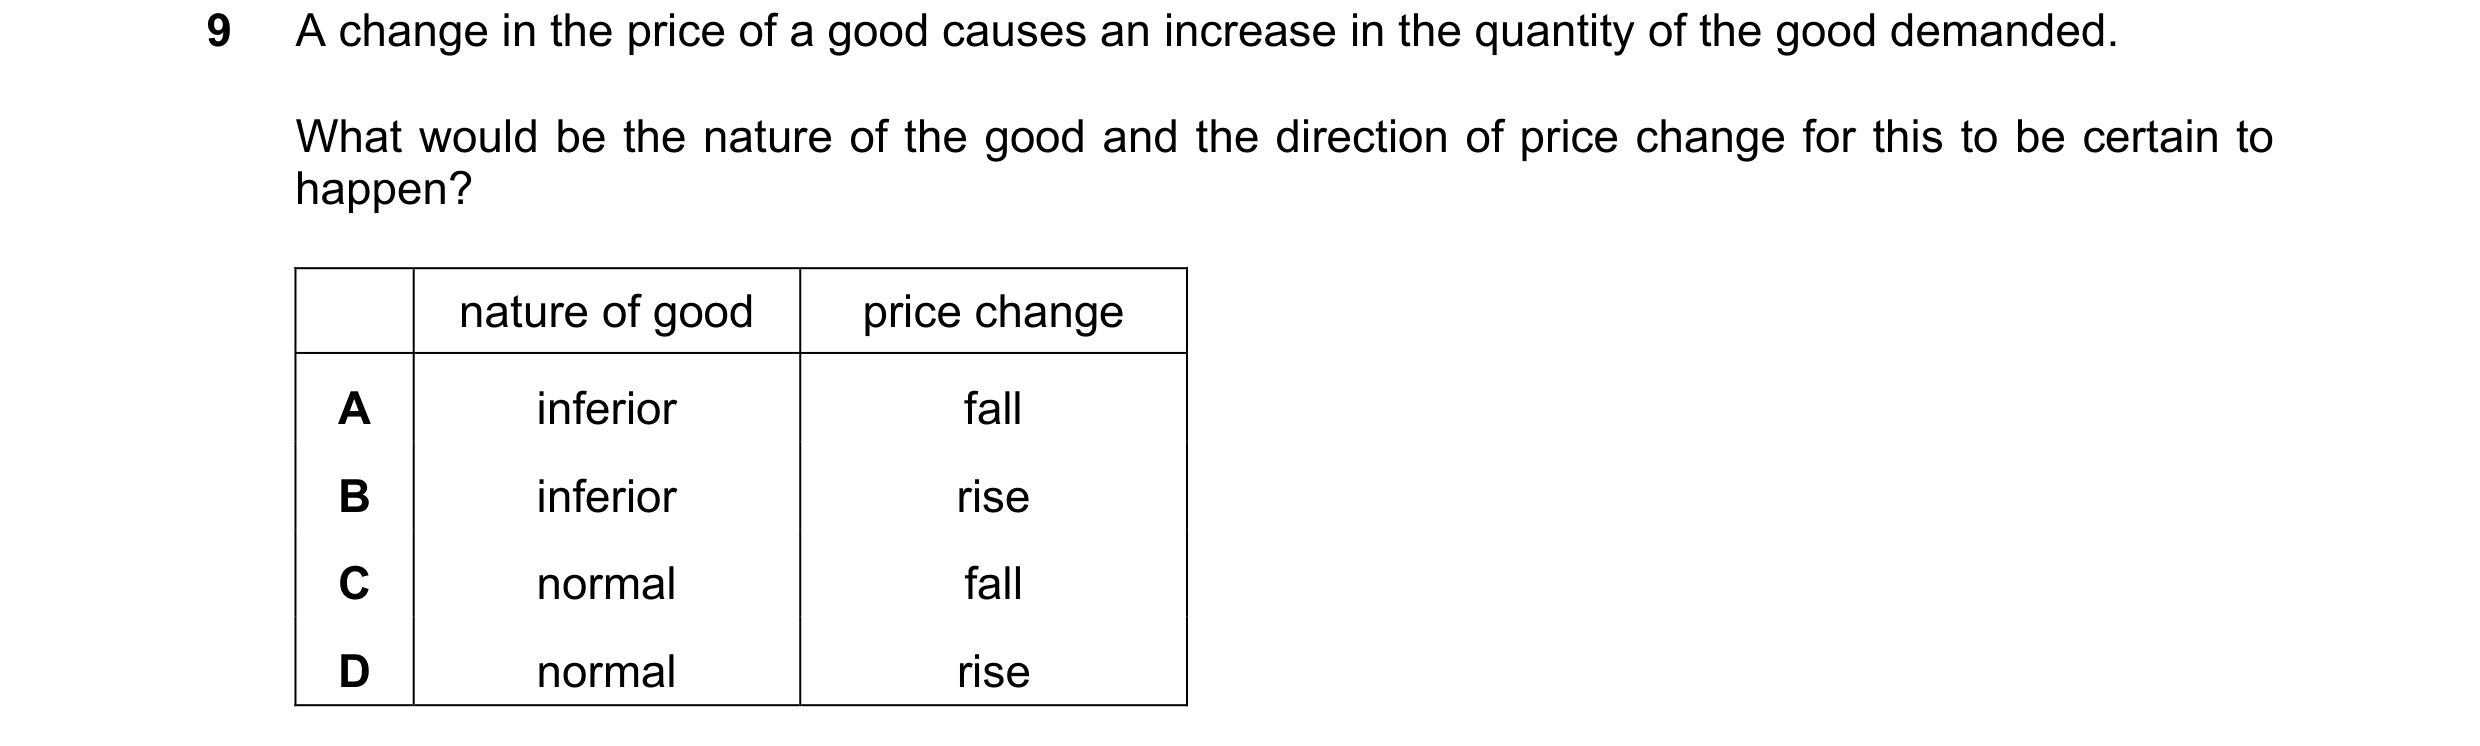
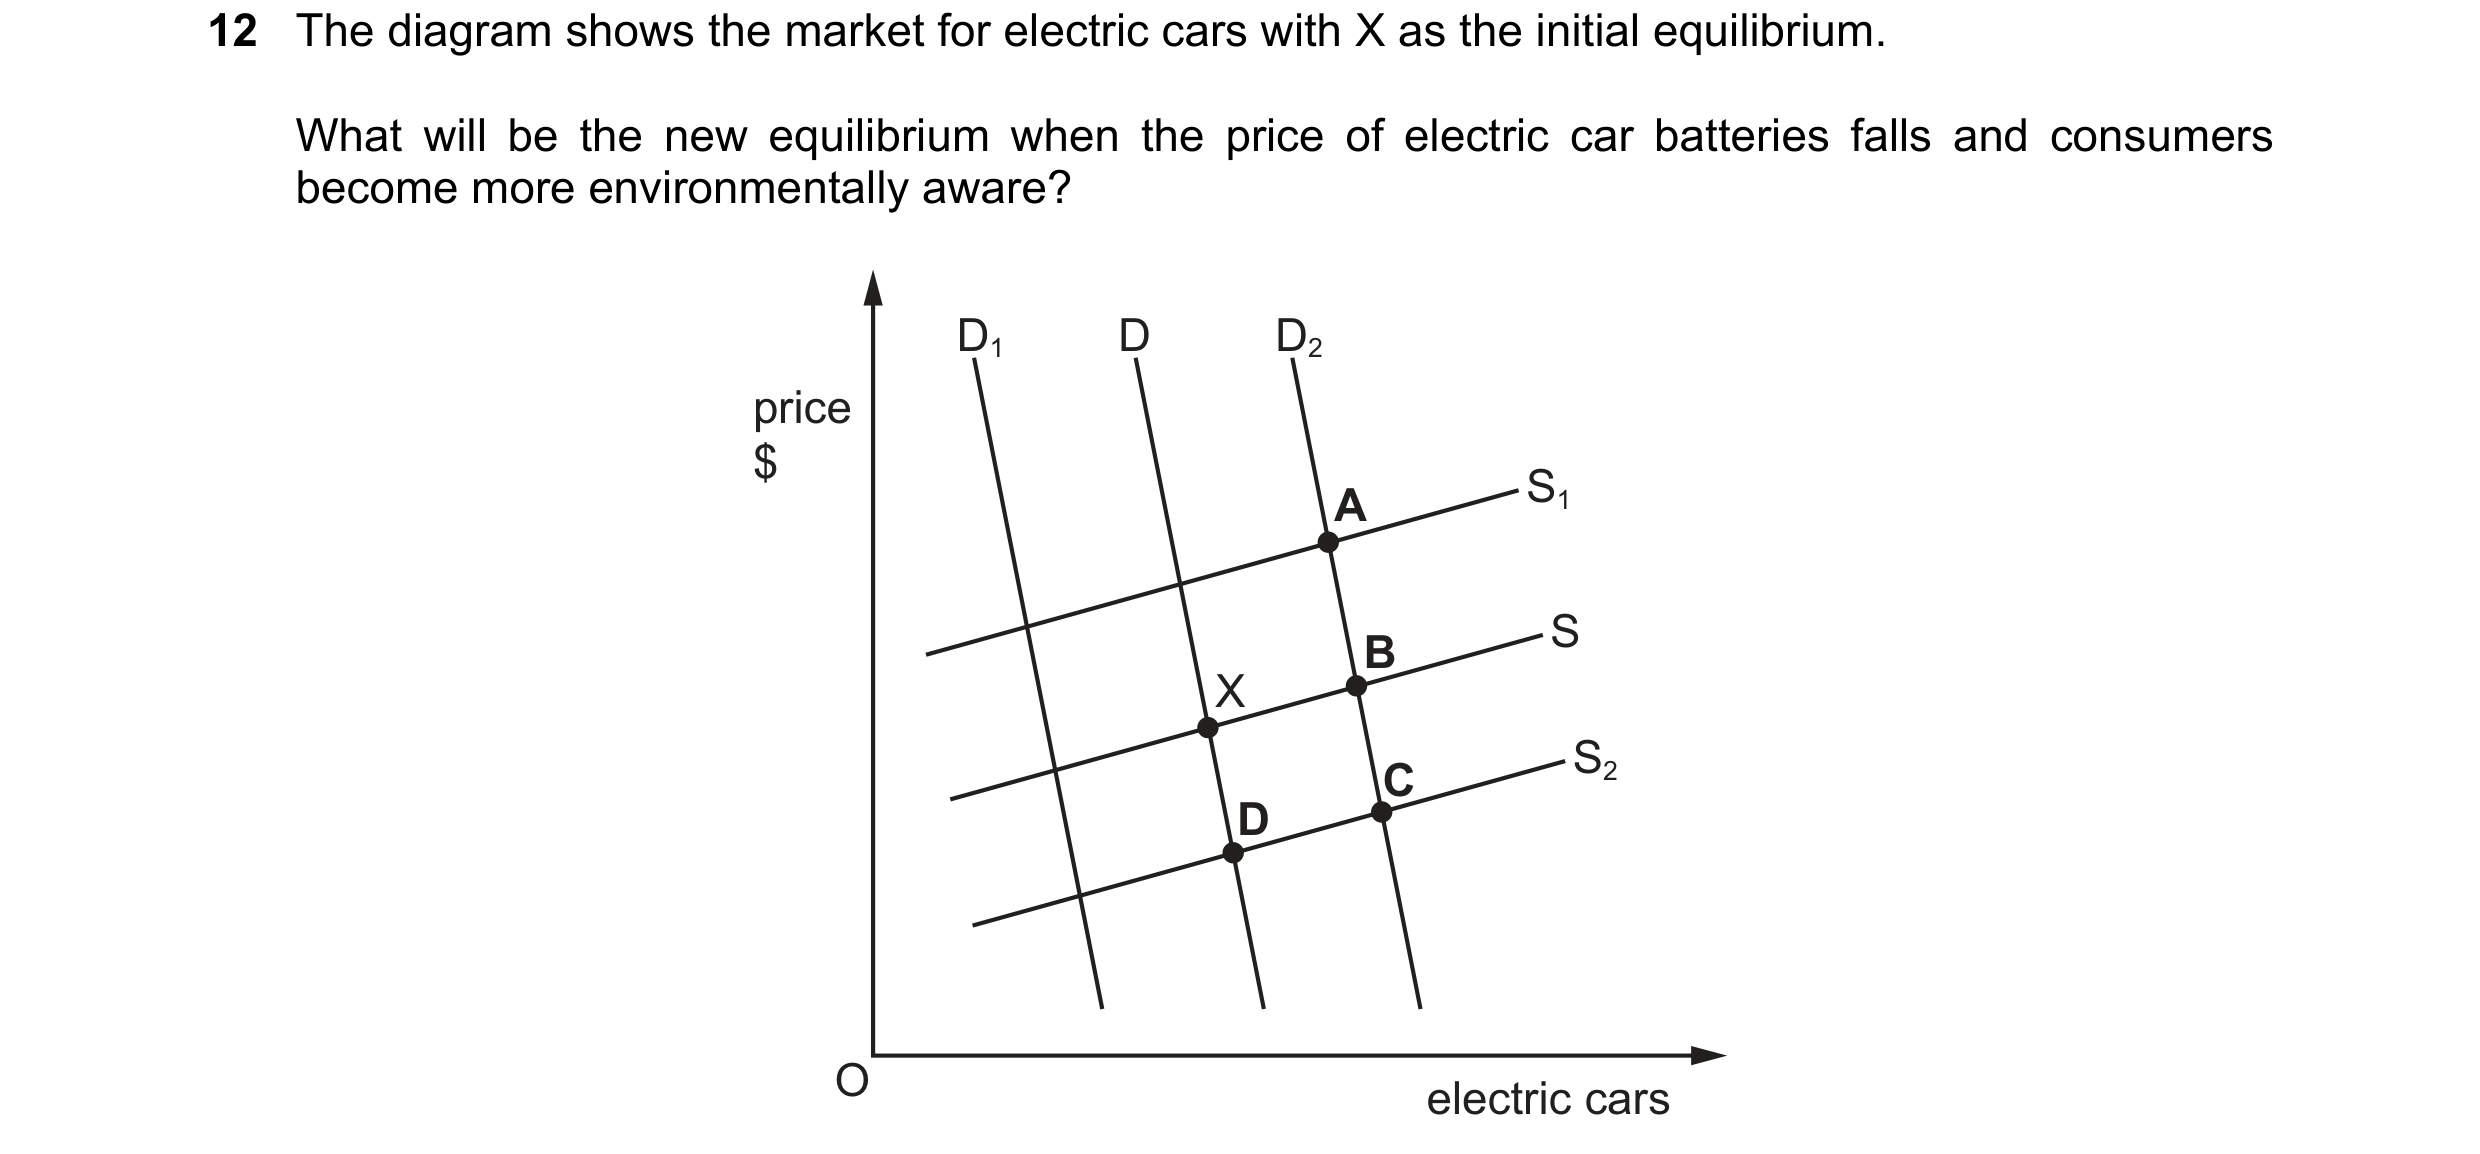
 67 / 76

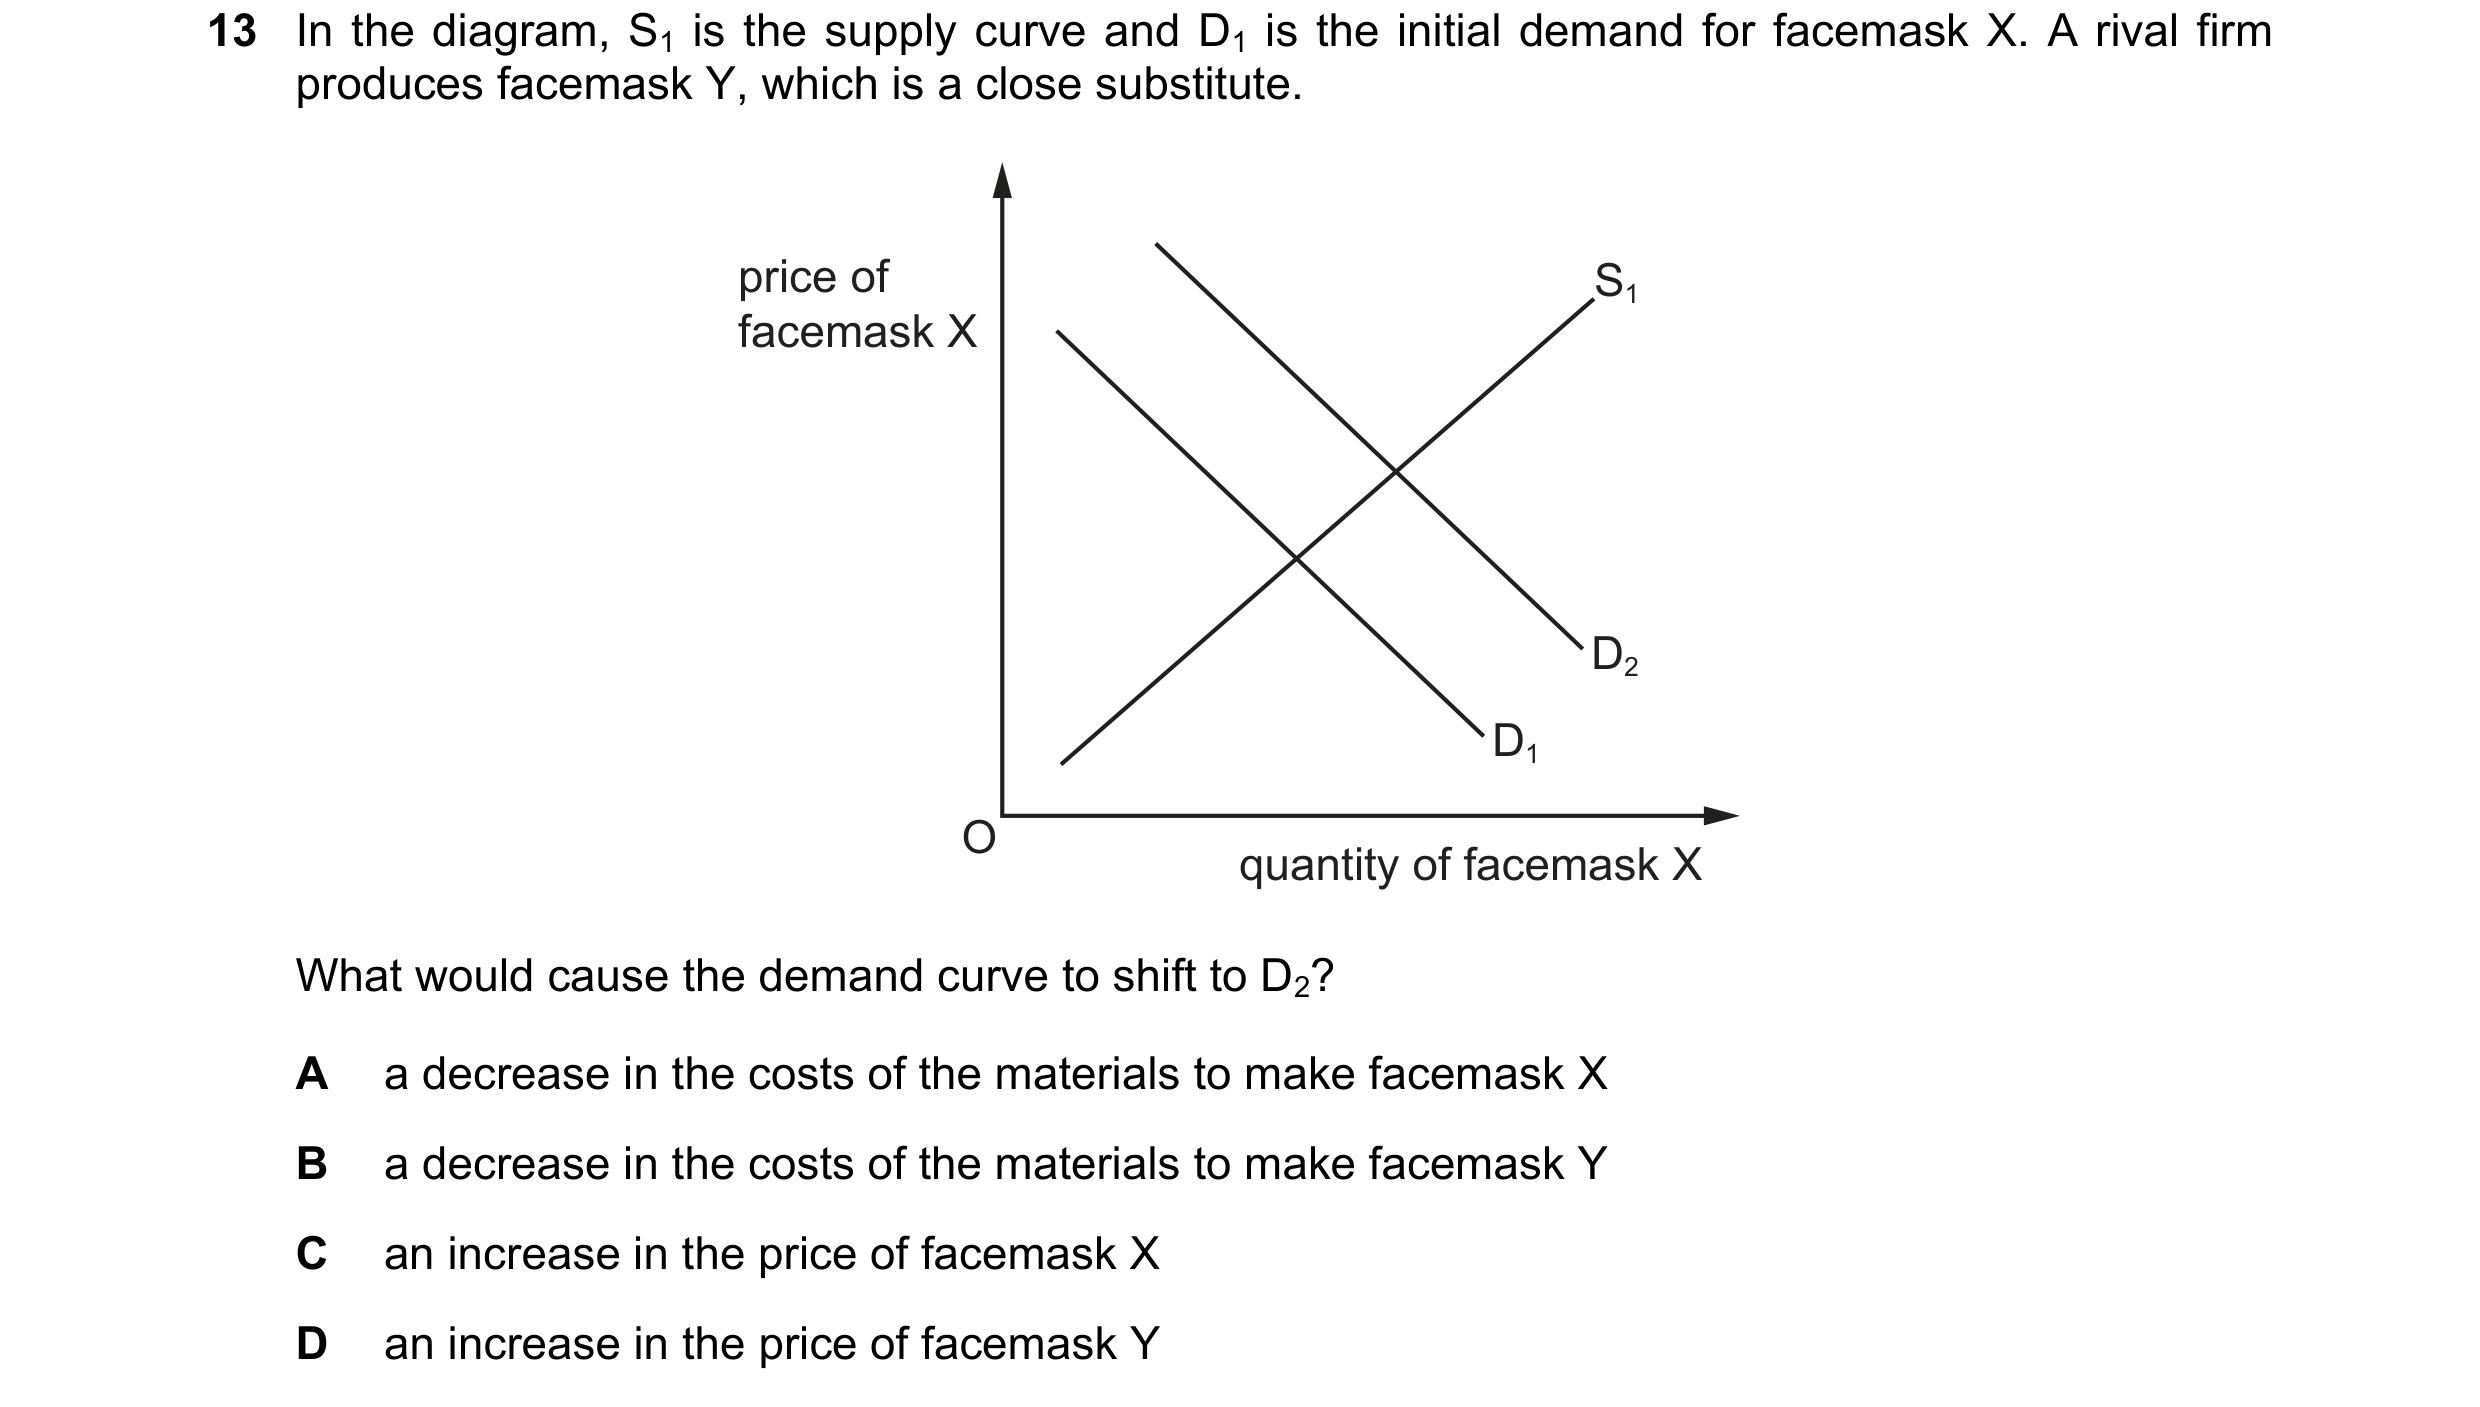
 68 / 76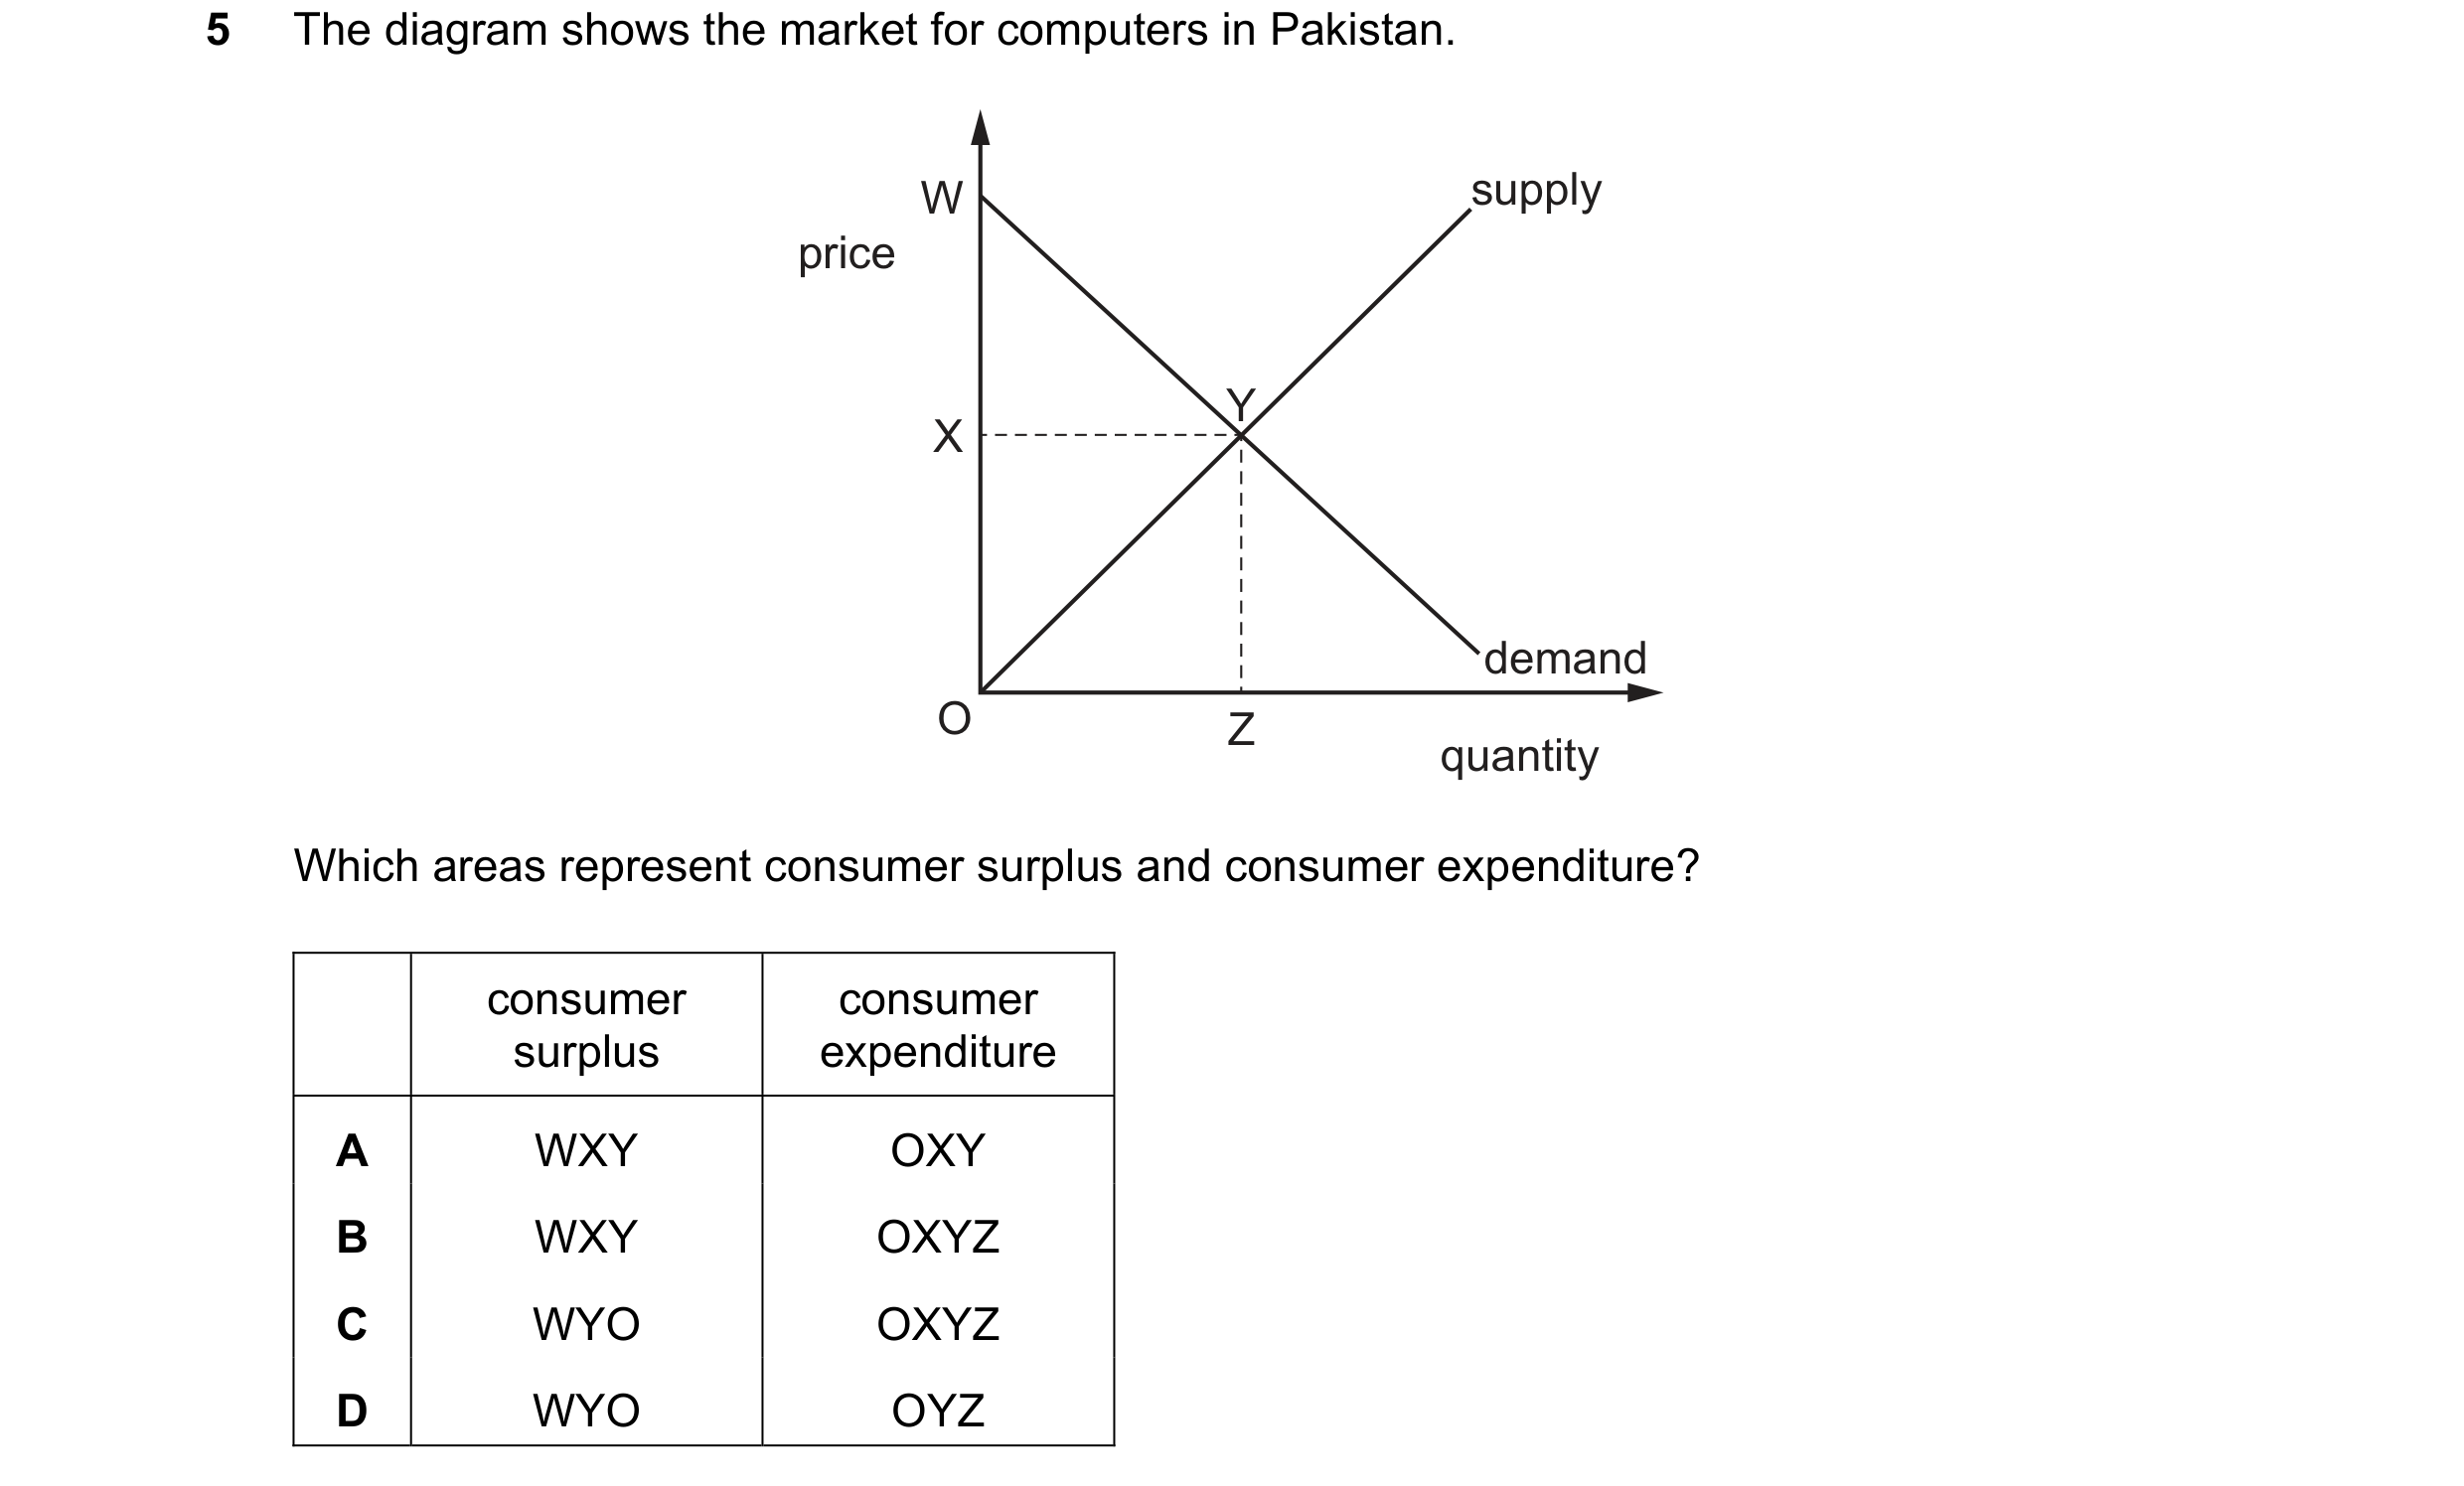
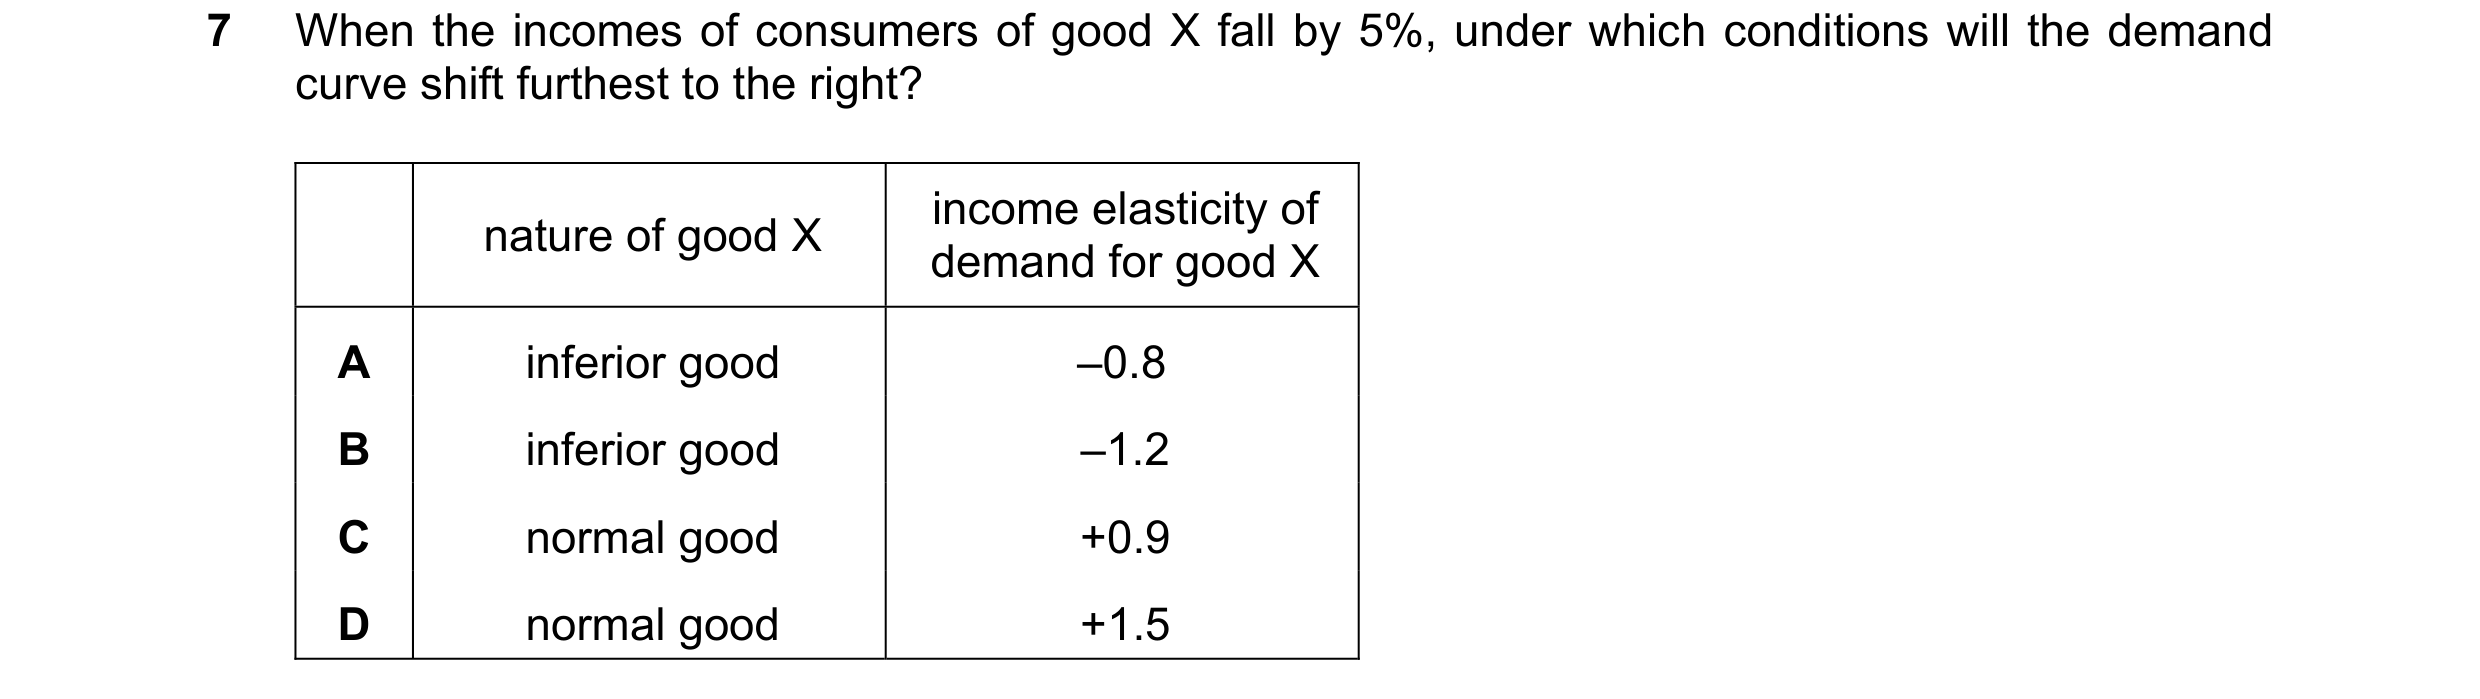
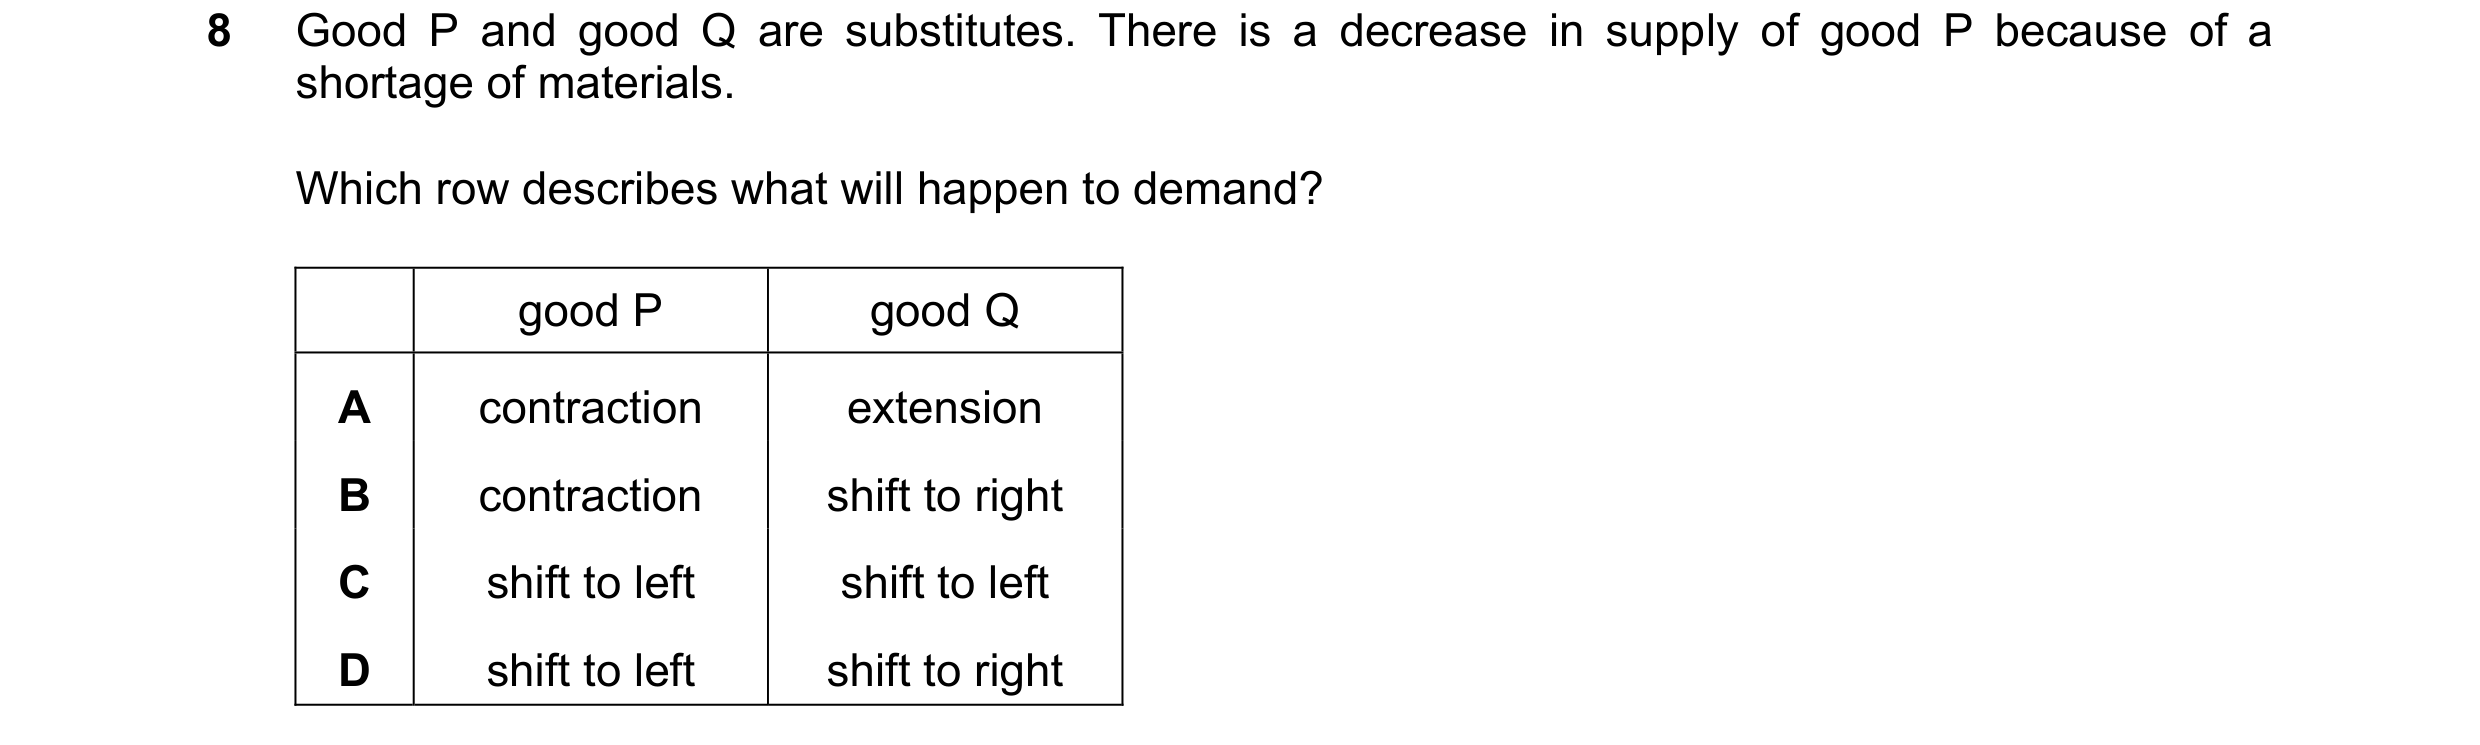 69 / 76
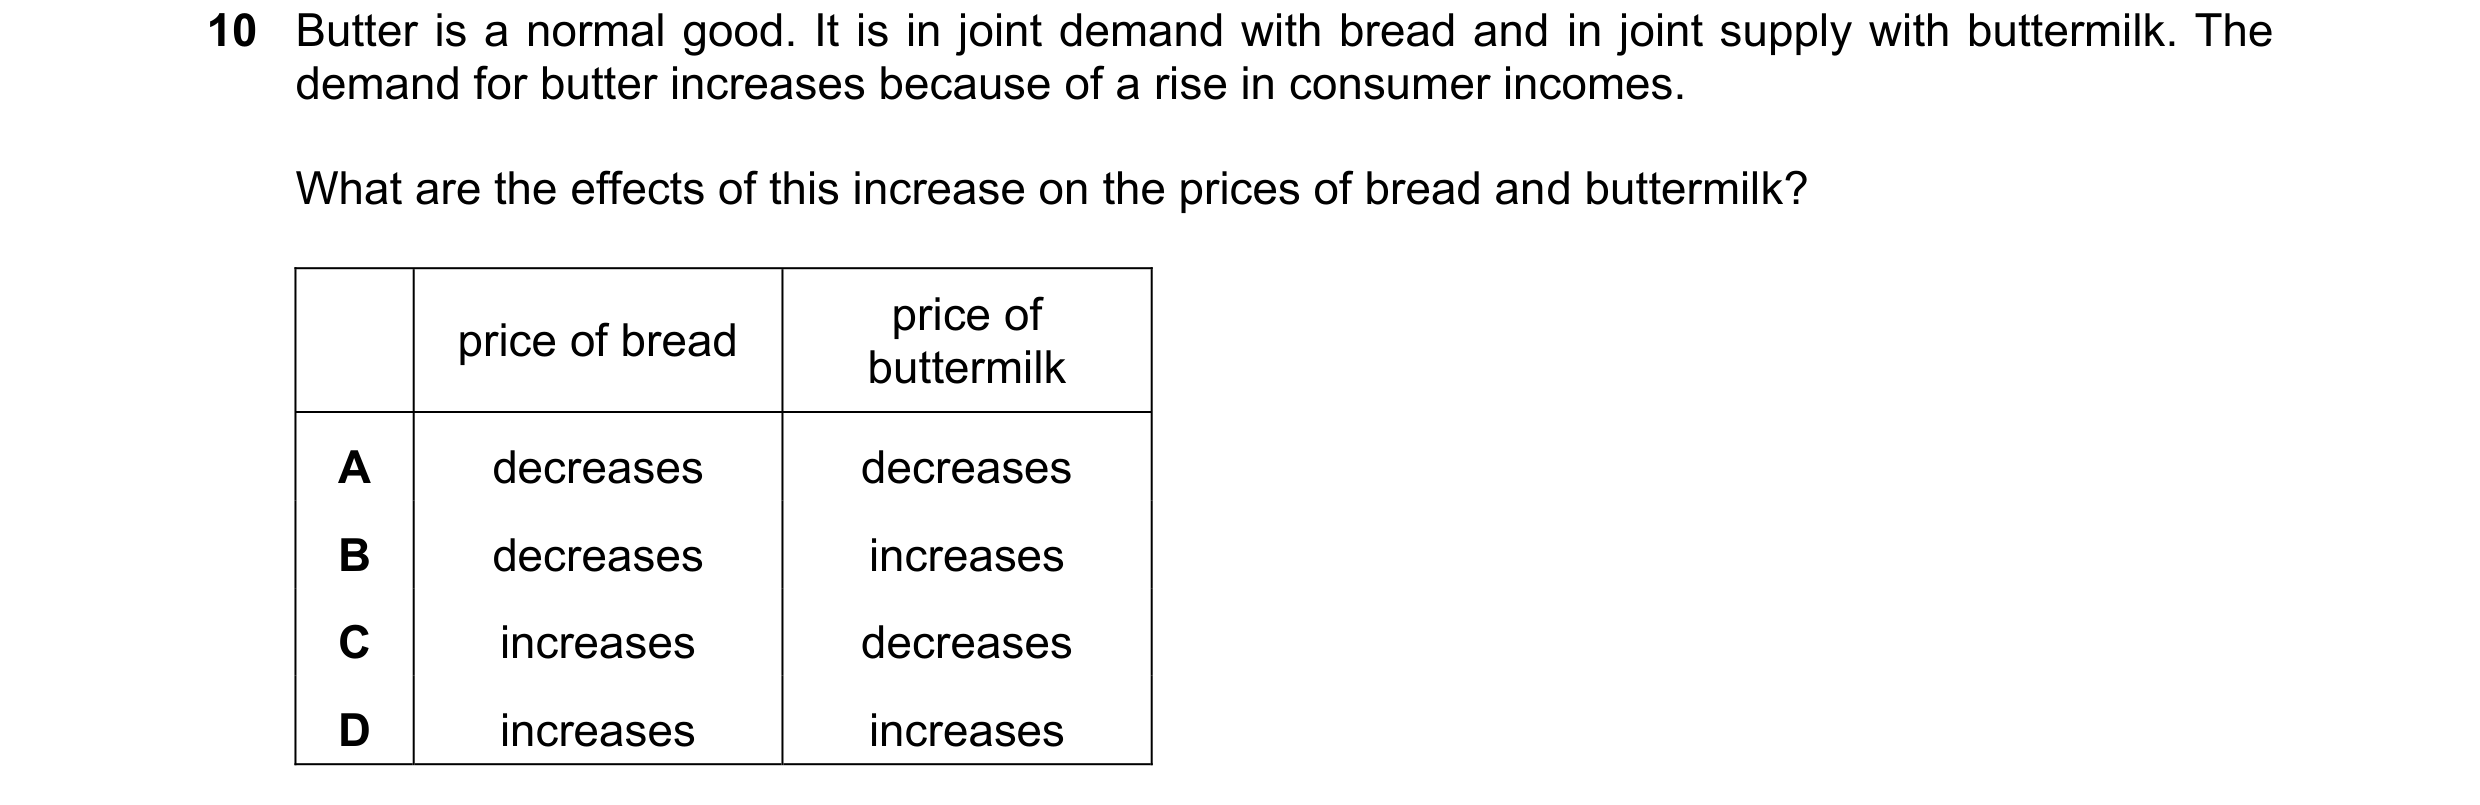
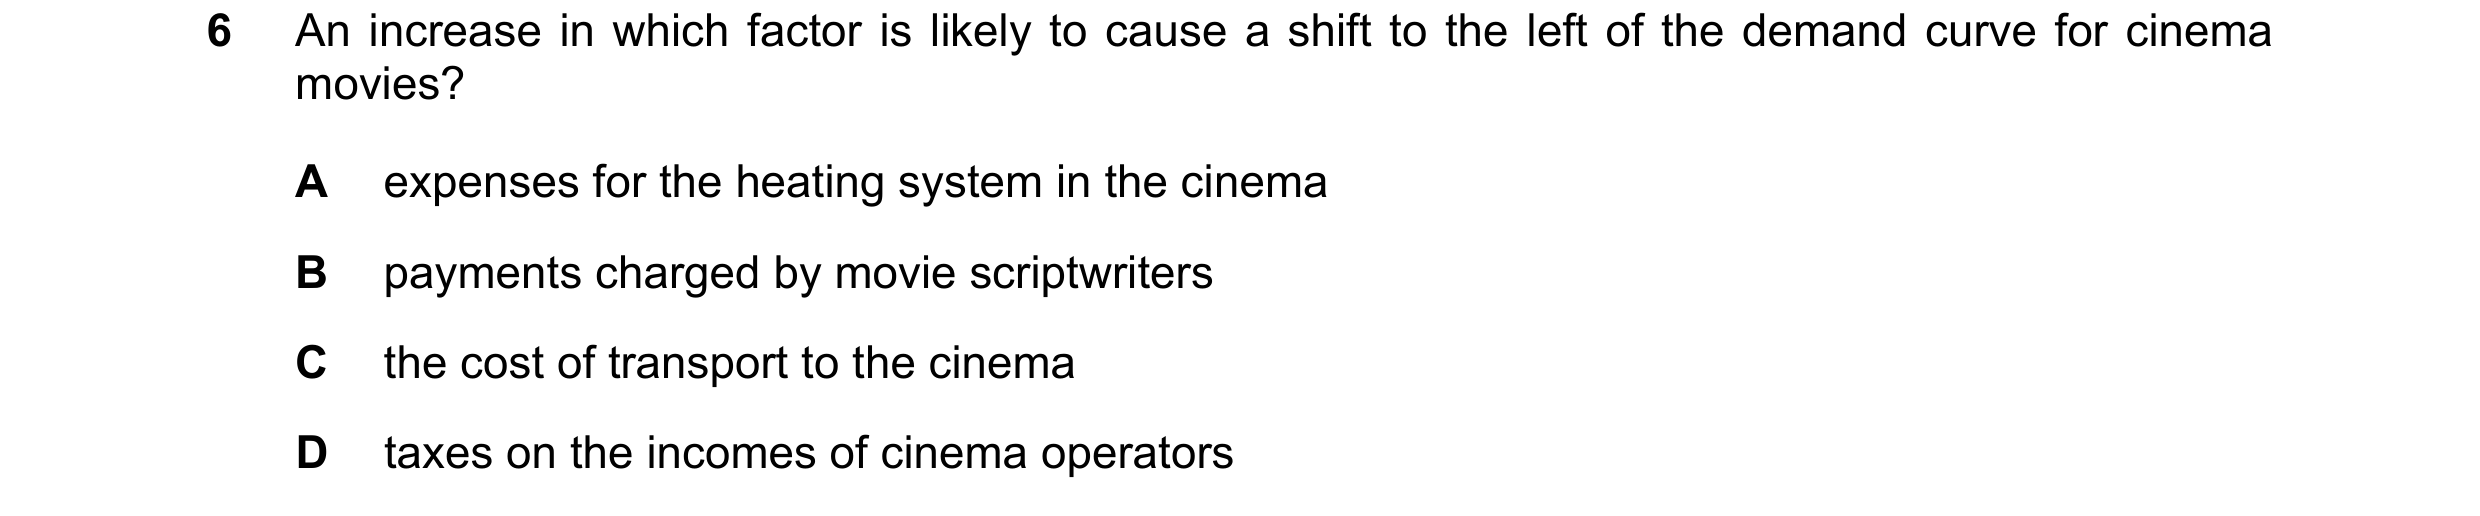
 70 / 76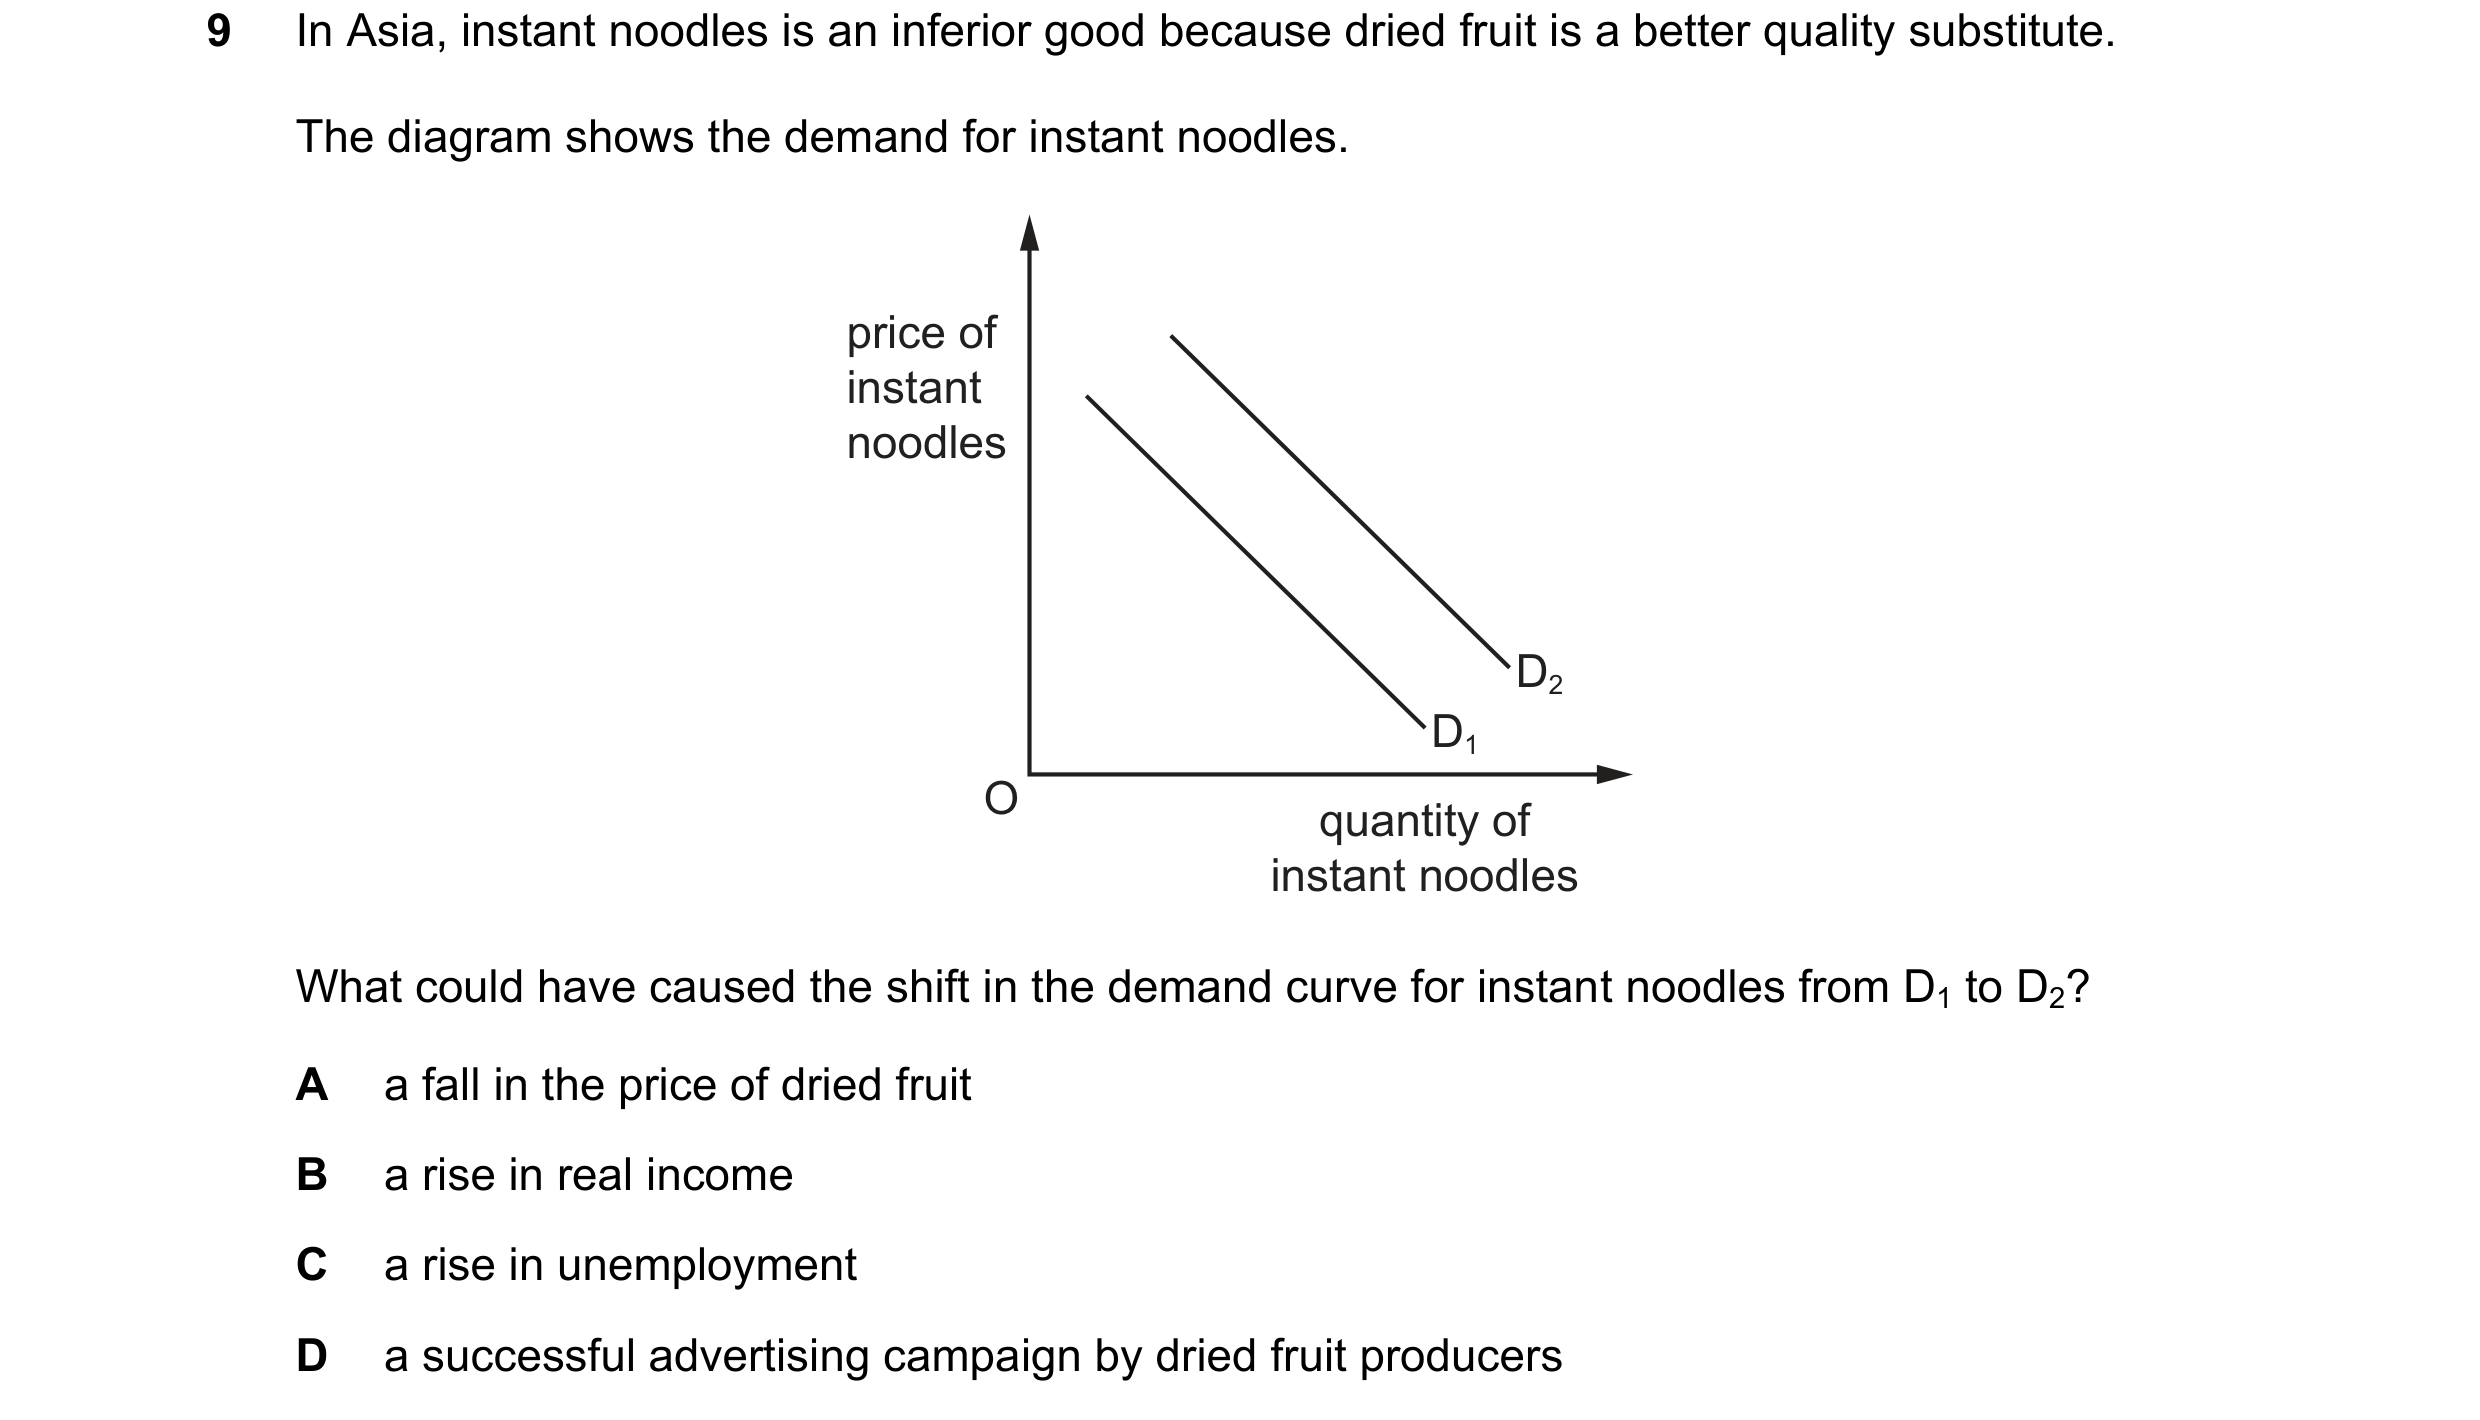

 71 / 76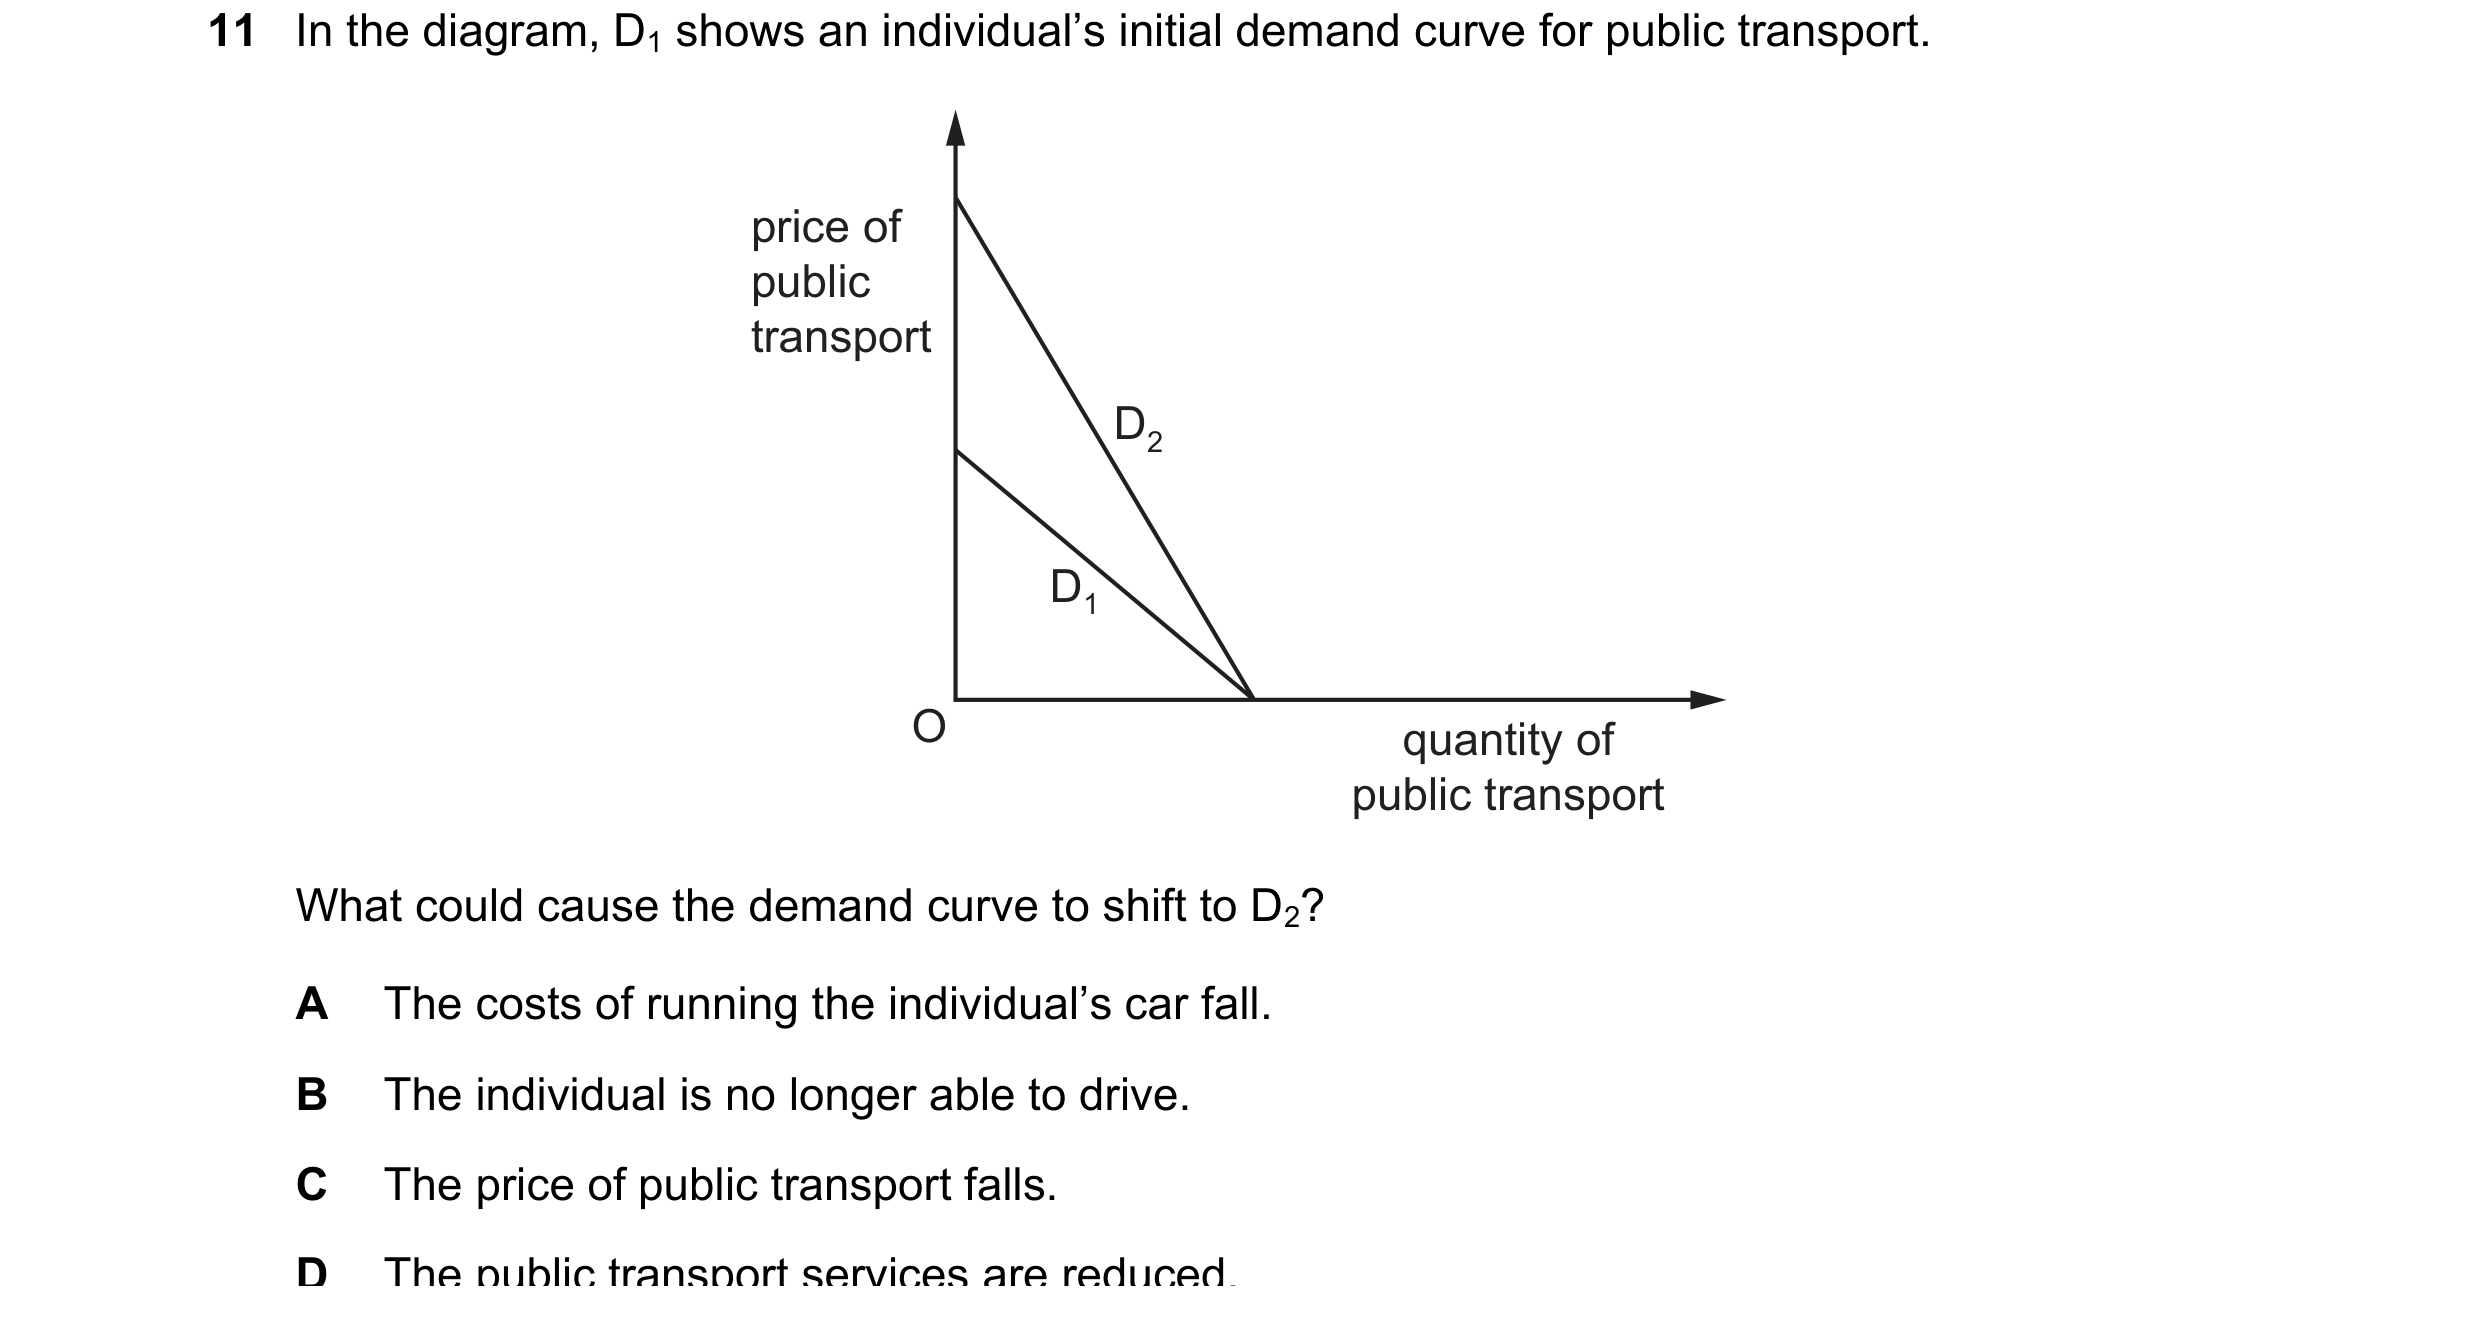
 72 / 76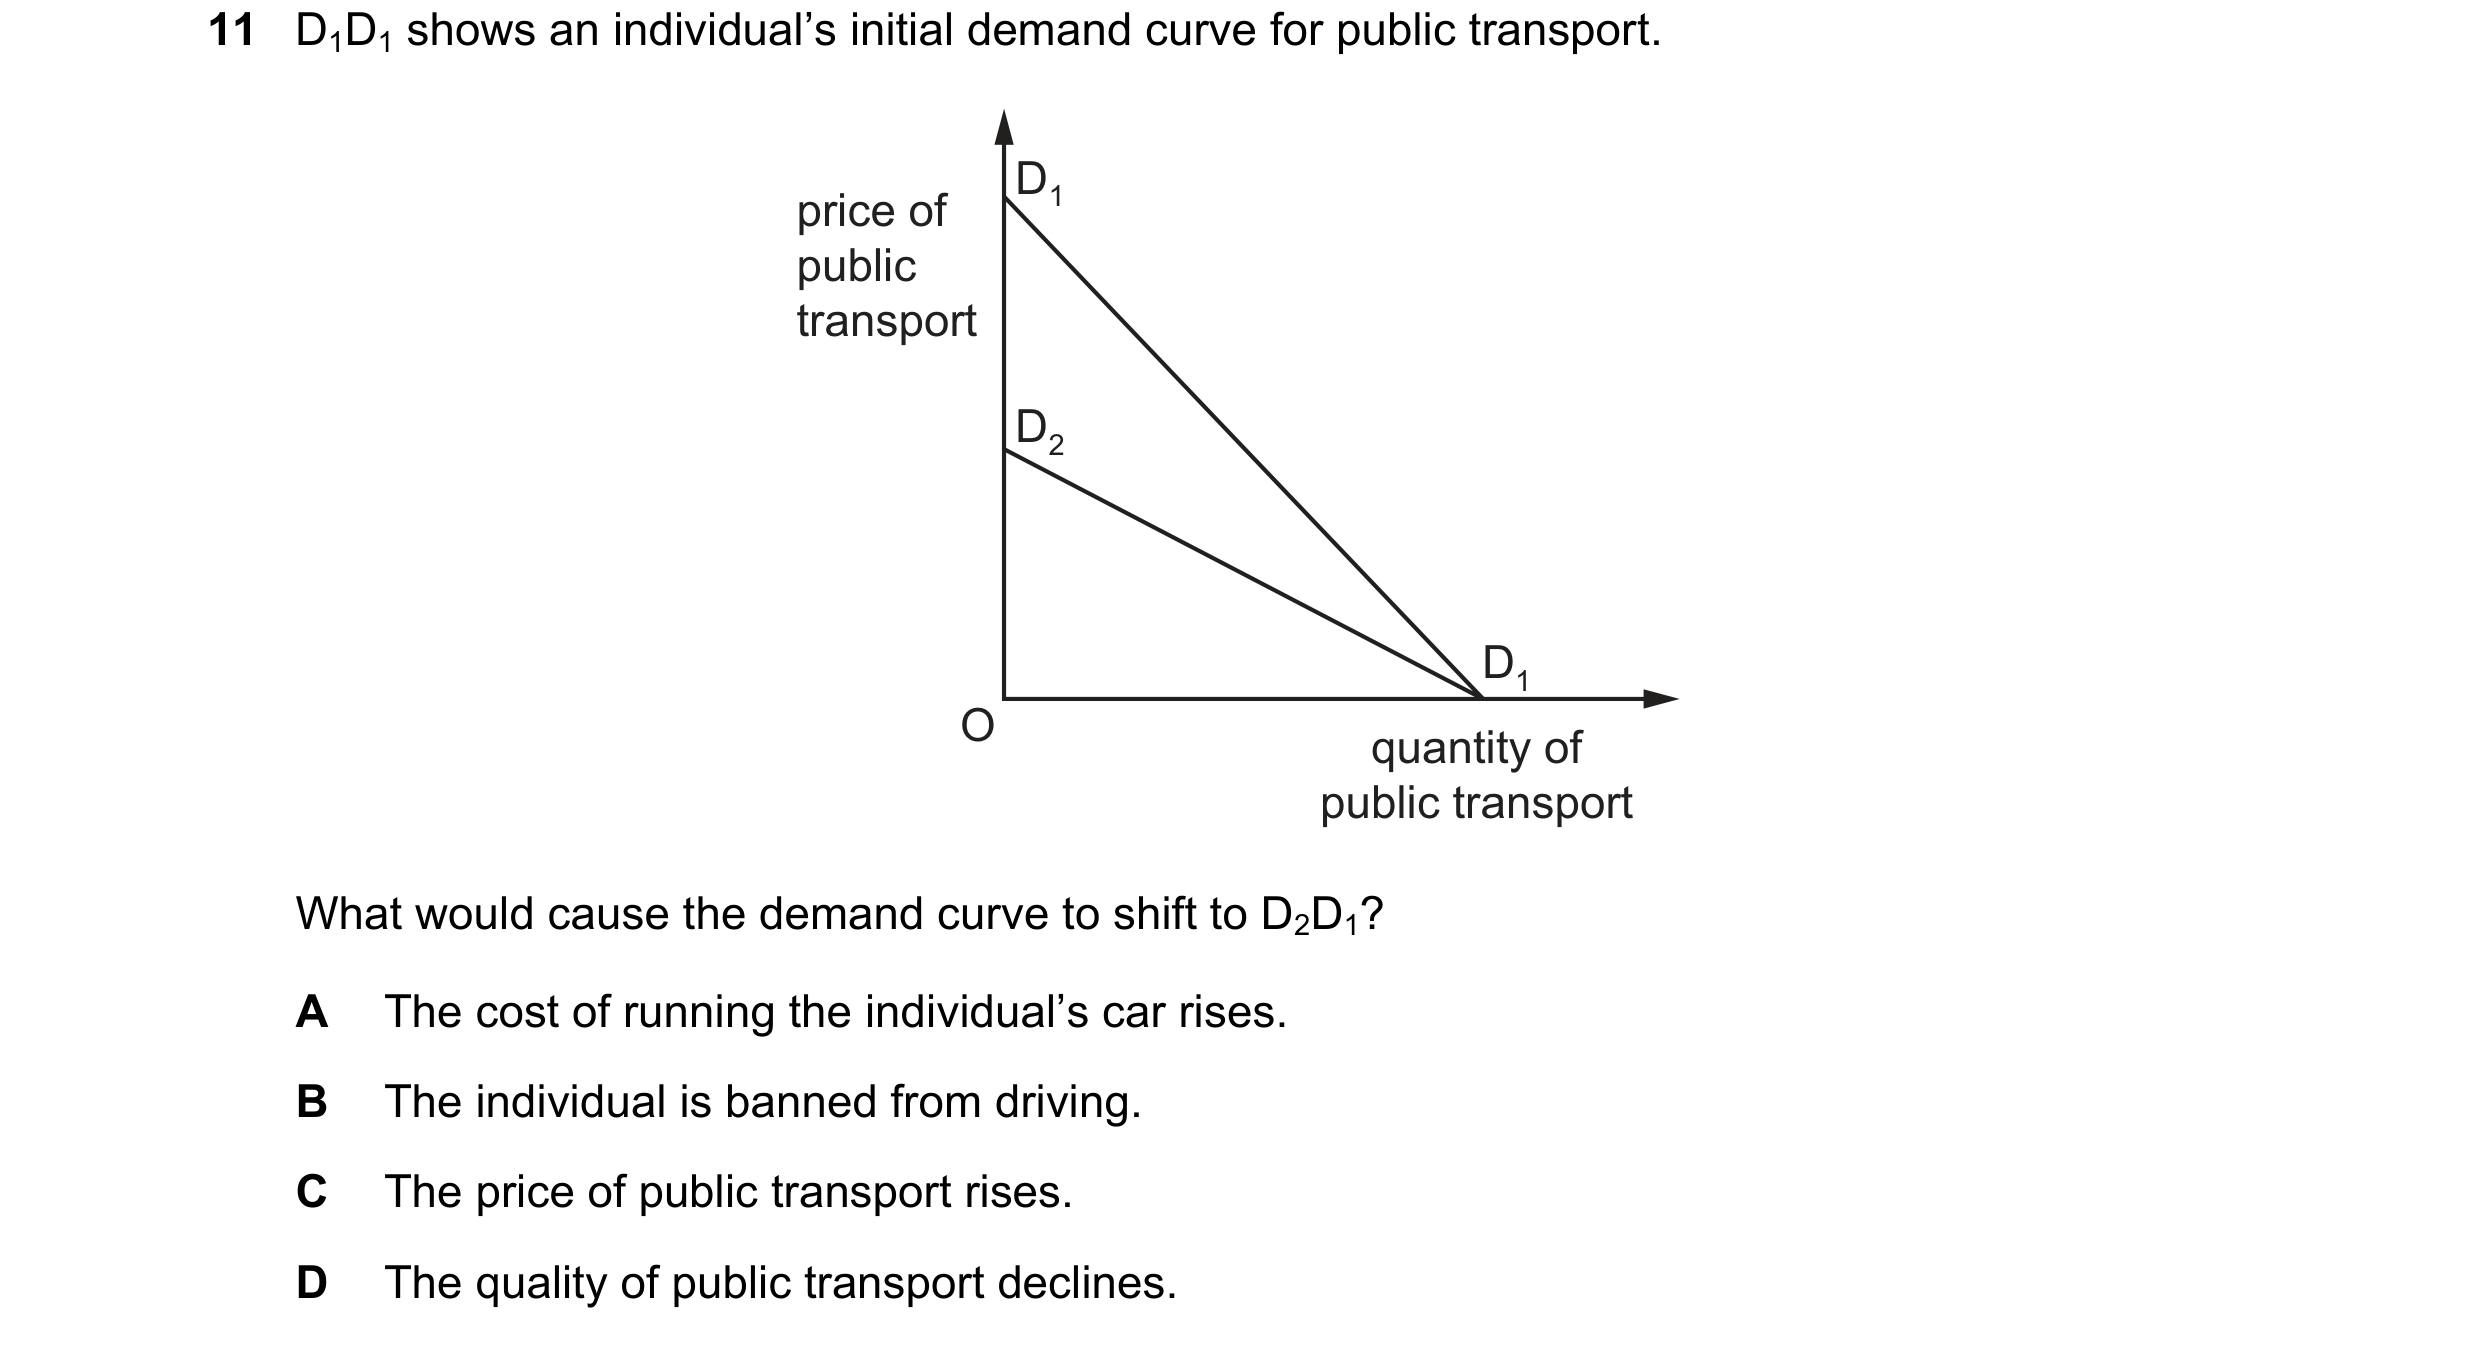
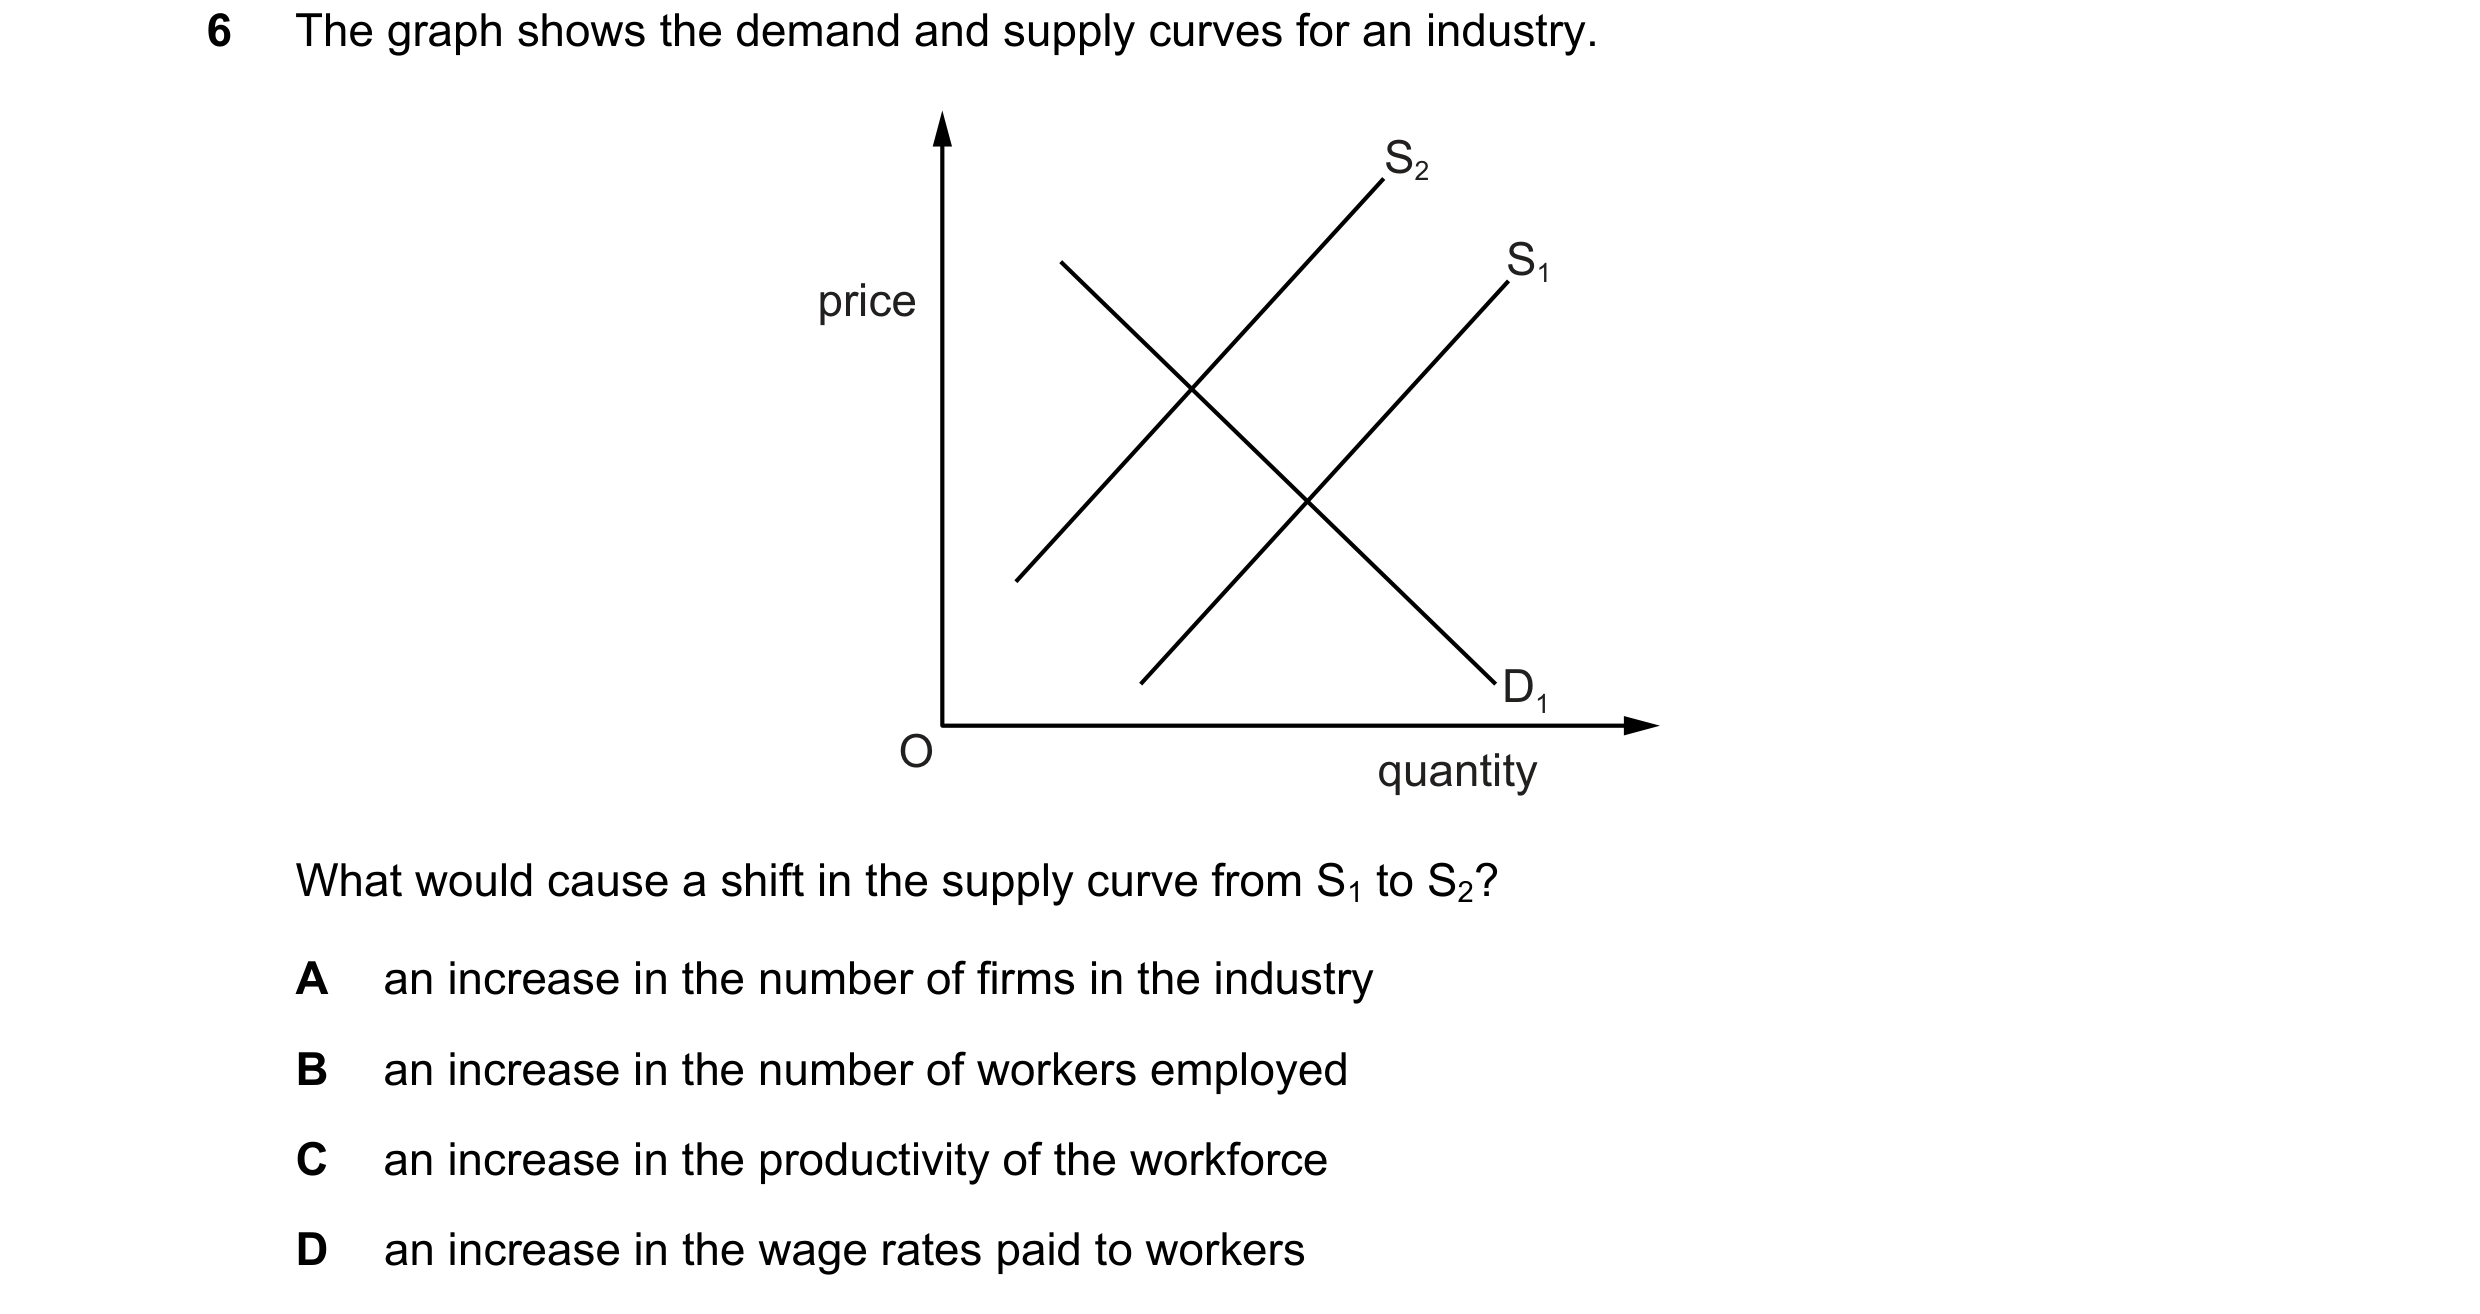
 73 / 76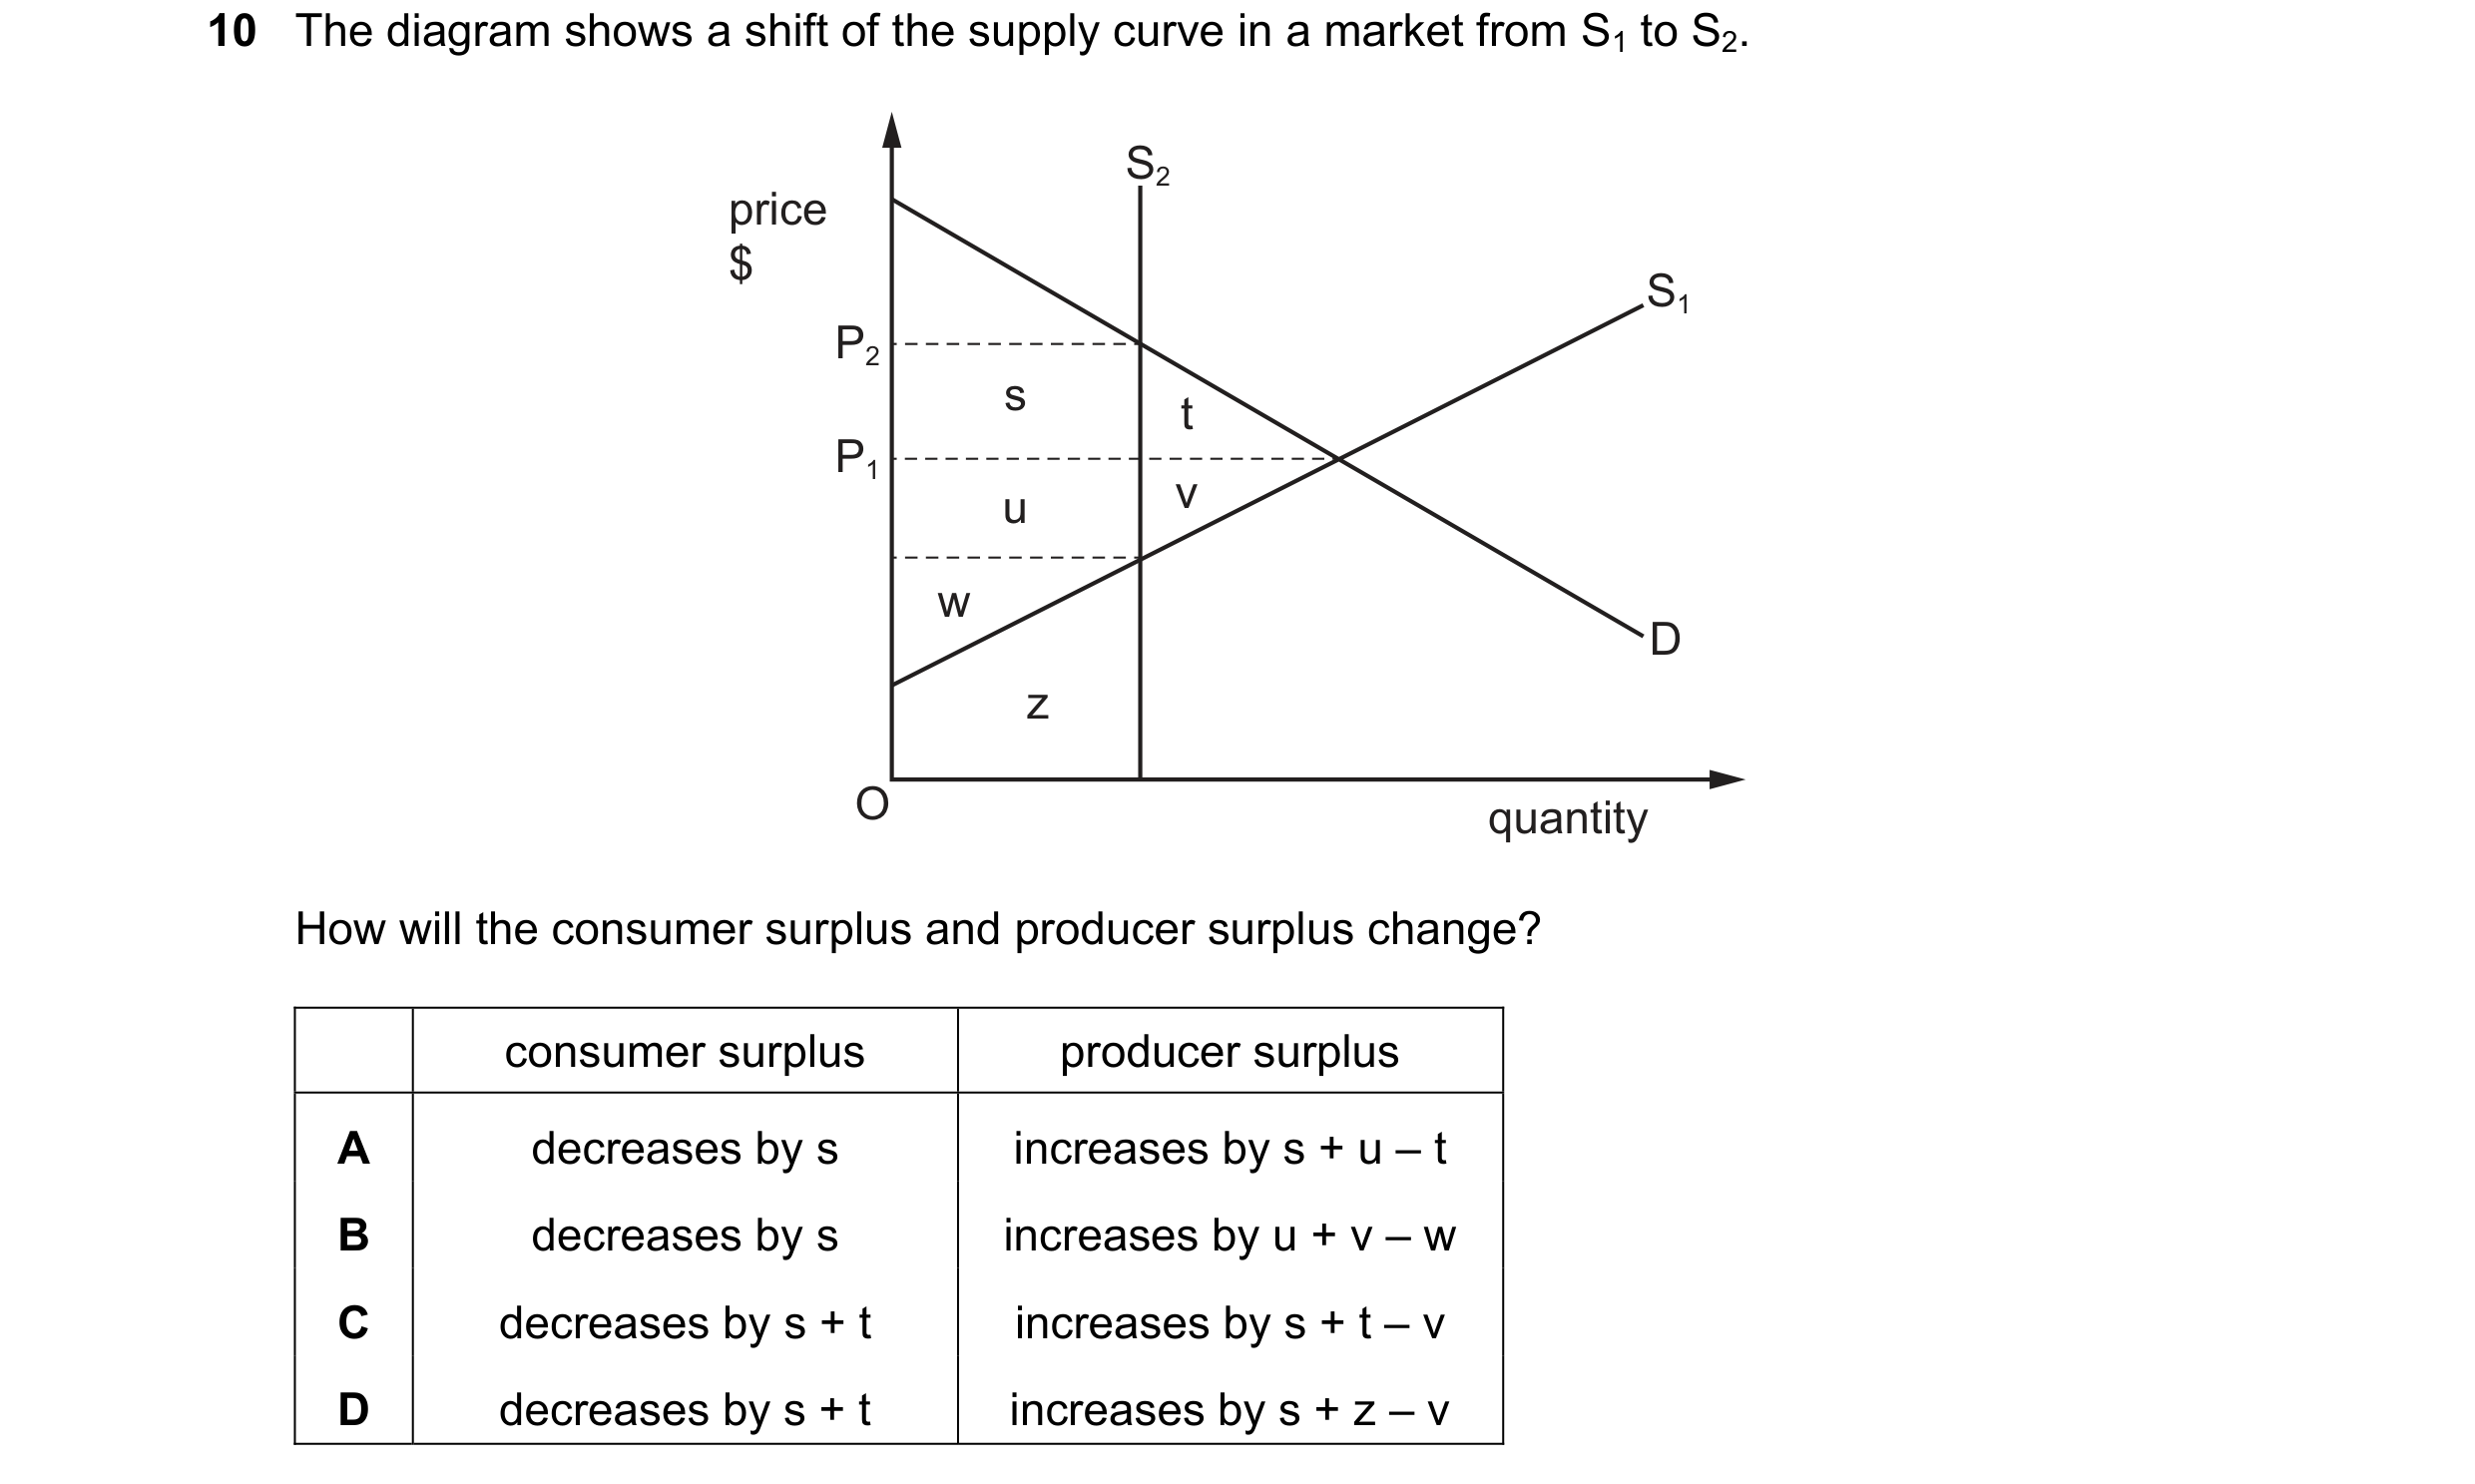
 74 / 76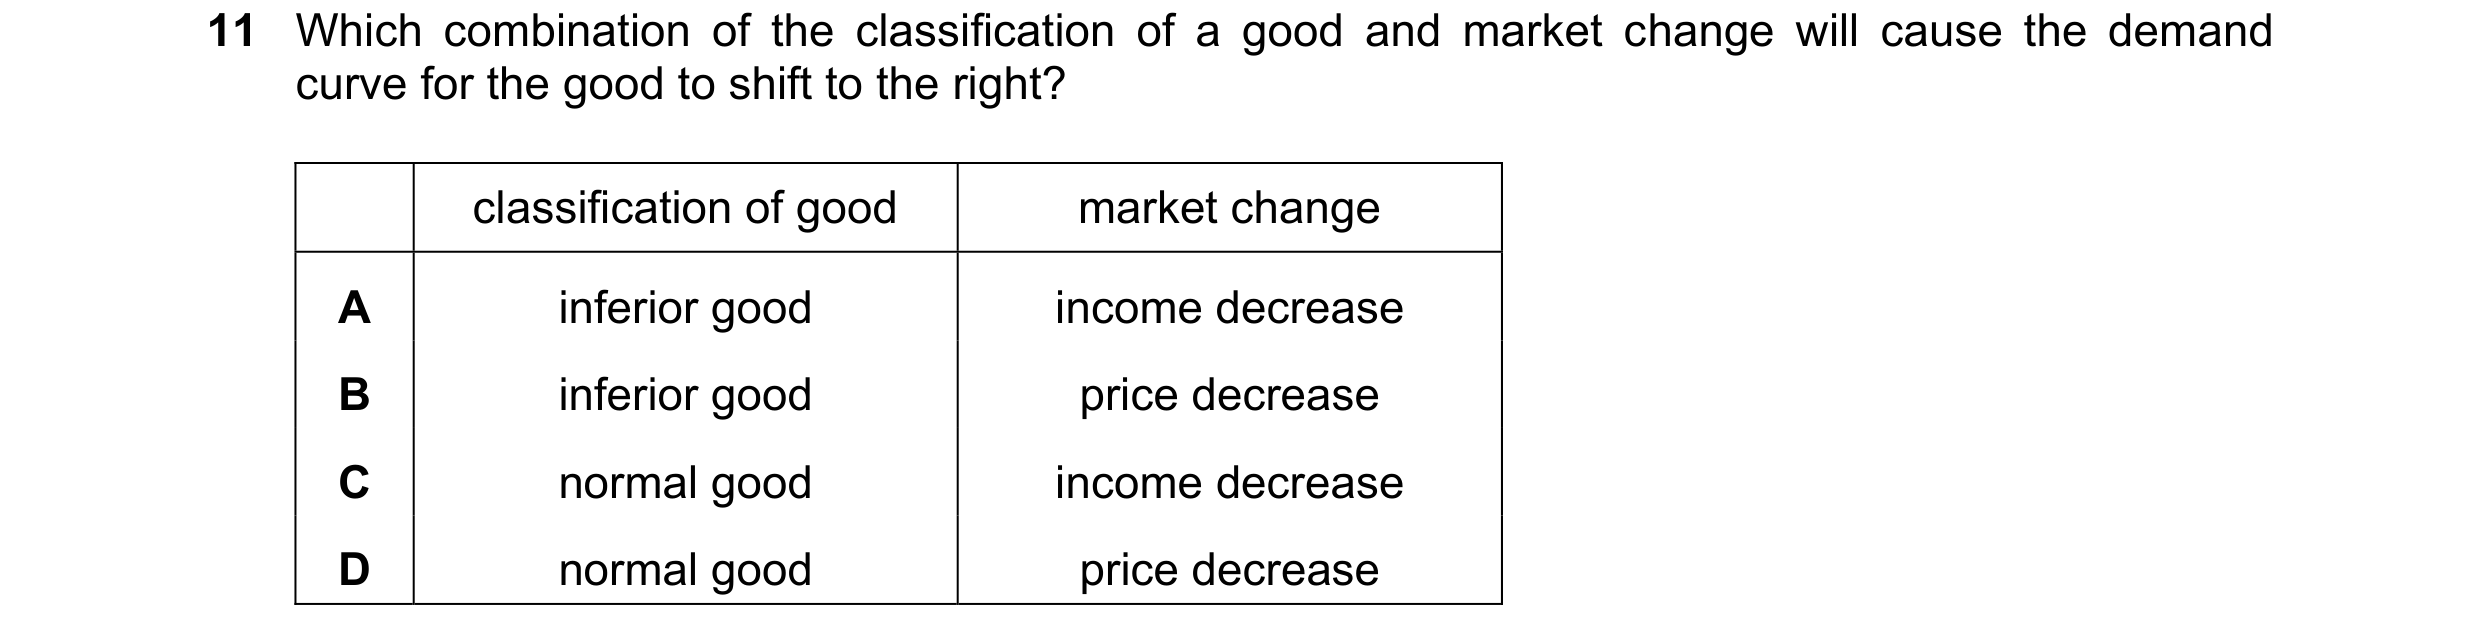

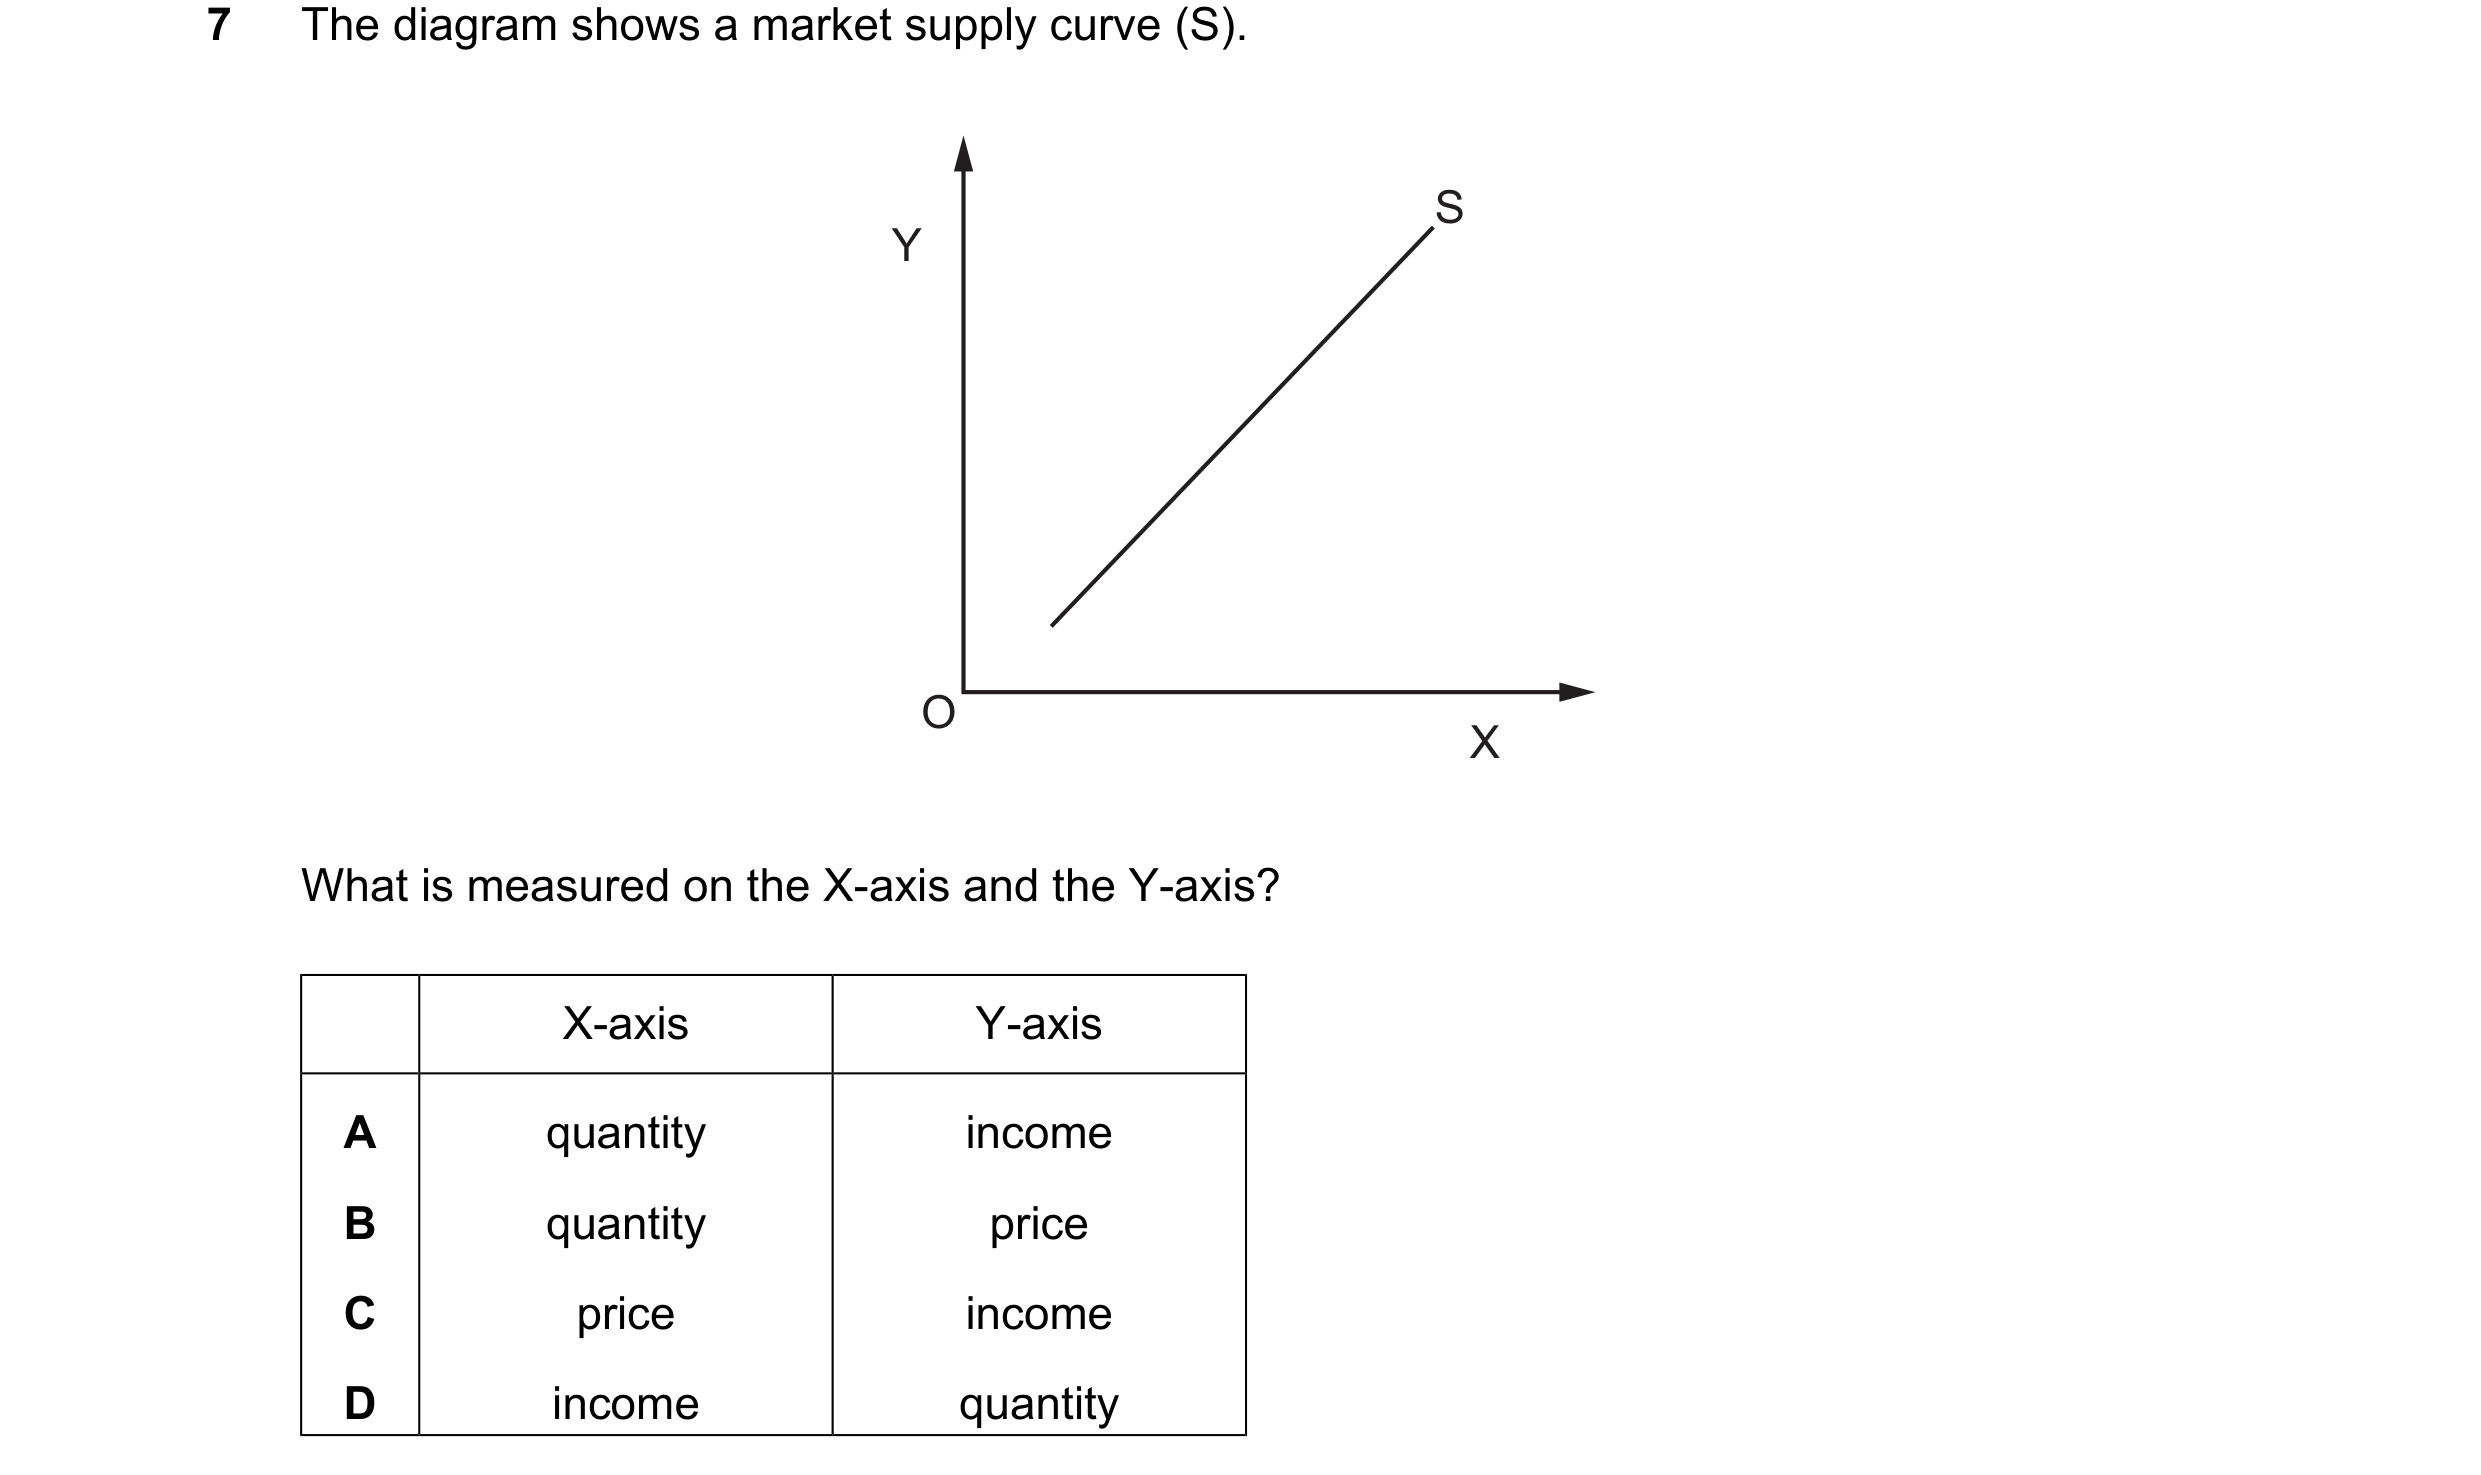 75 / 76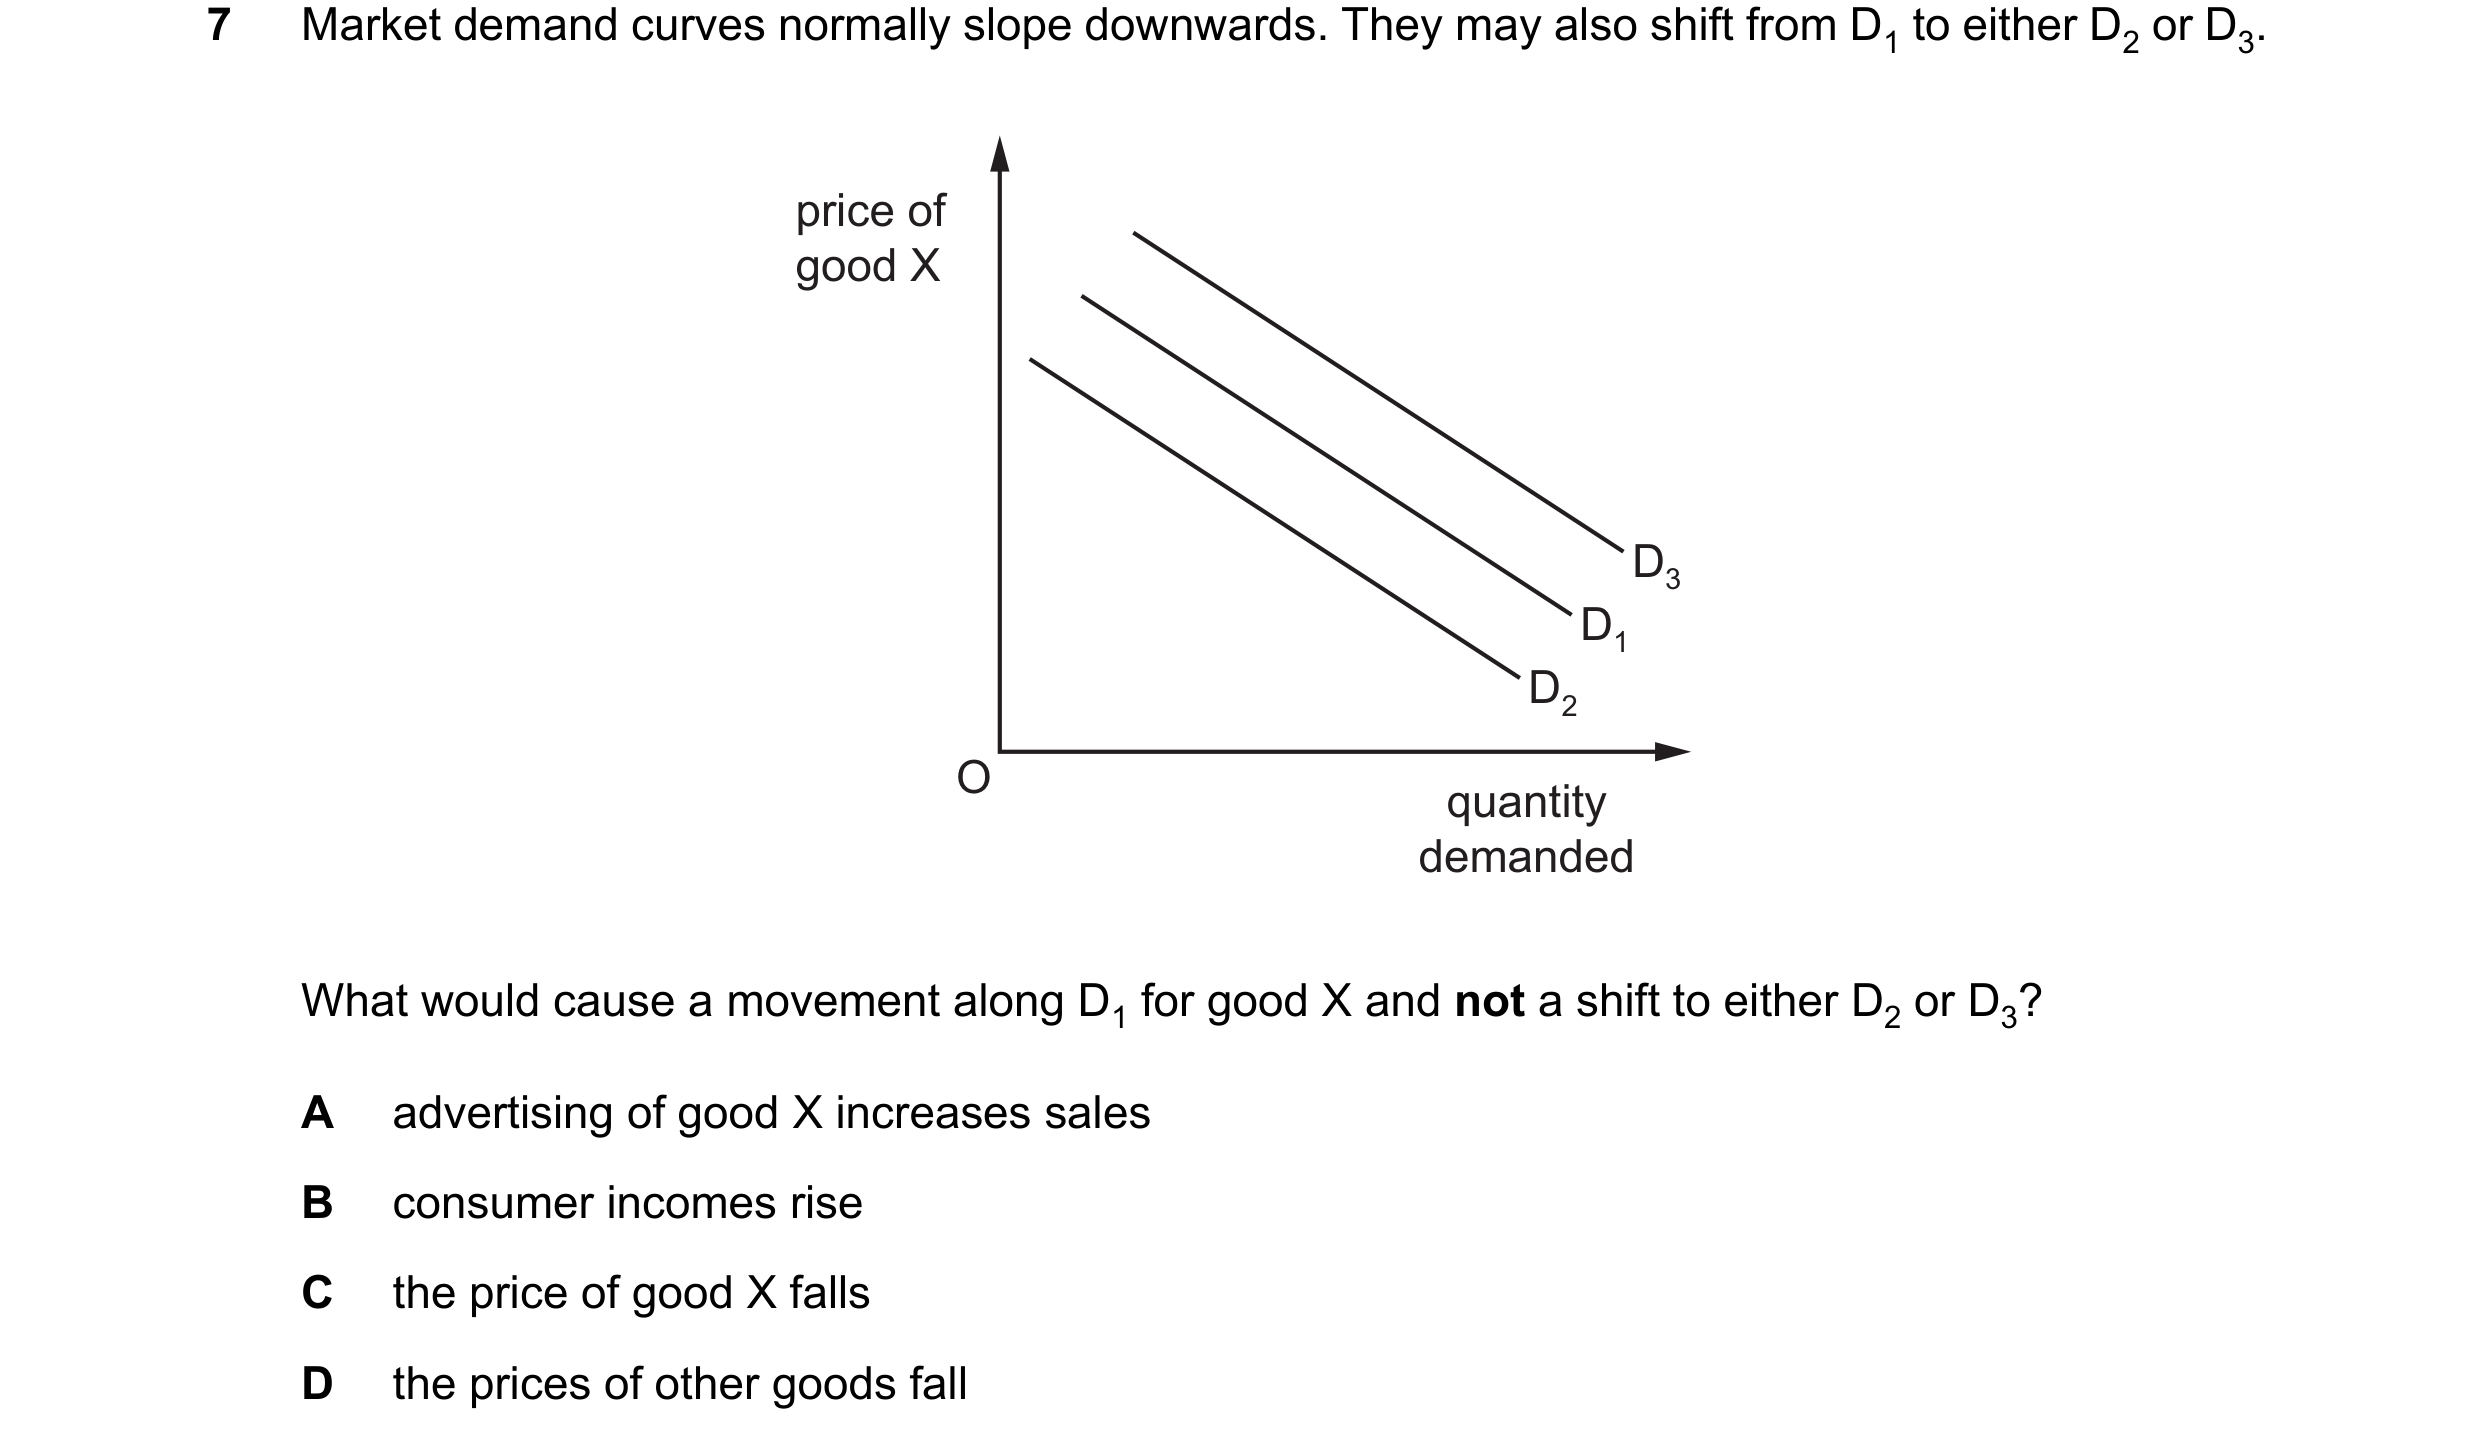
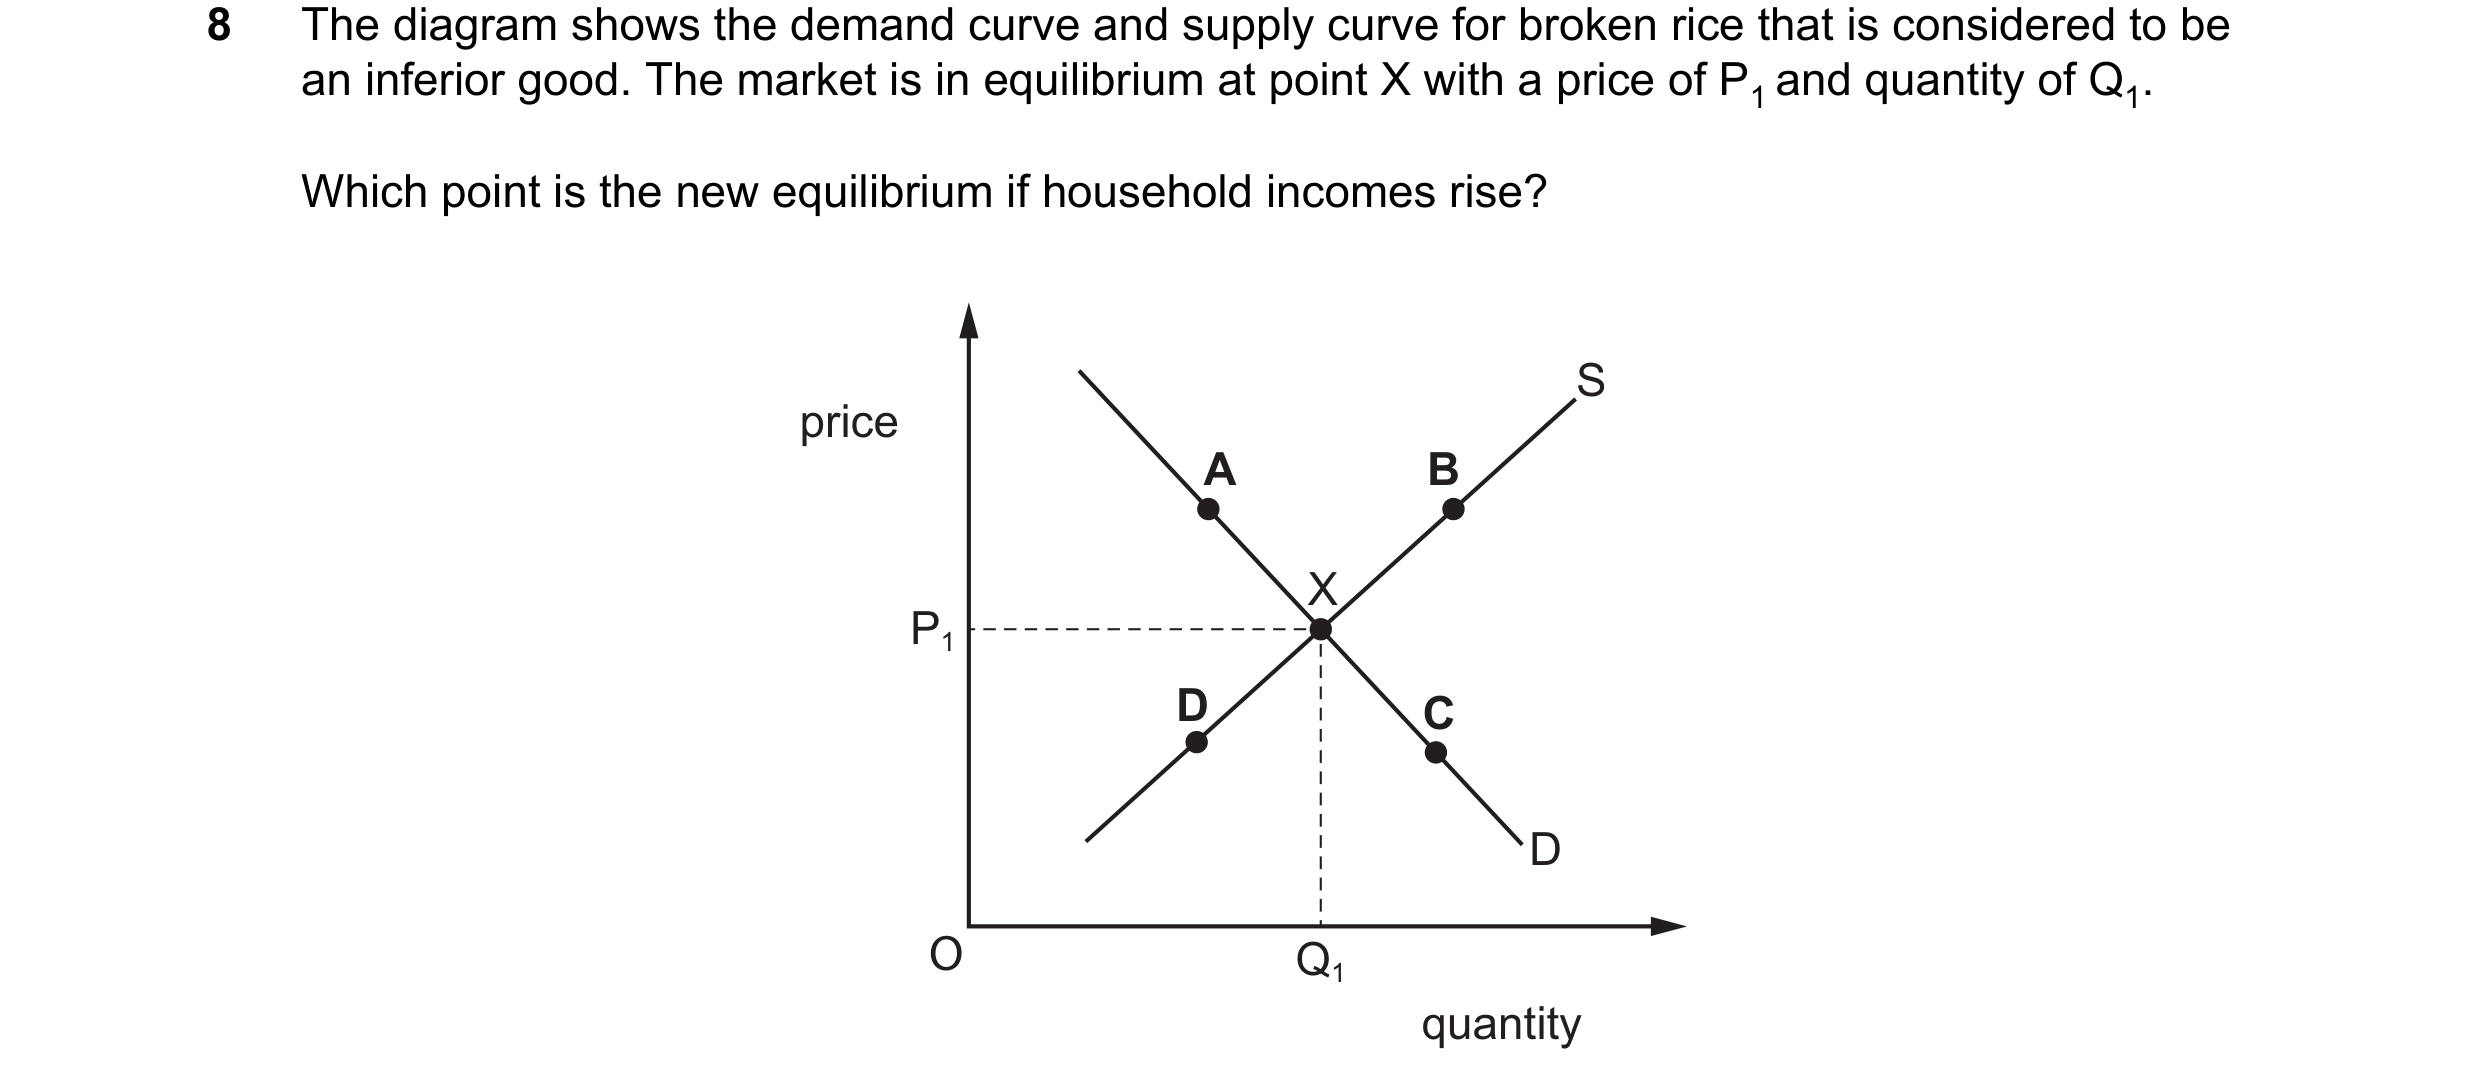 76 / 76