Questions as text
Q1 · Y 10 x –4 0 4 –10 f x = 9 - x 2 ^ h (a) On the diagram, sketch the graph of y = f x for… 0607/41 May/June 2017
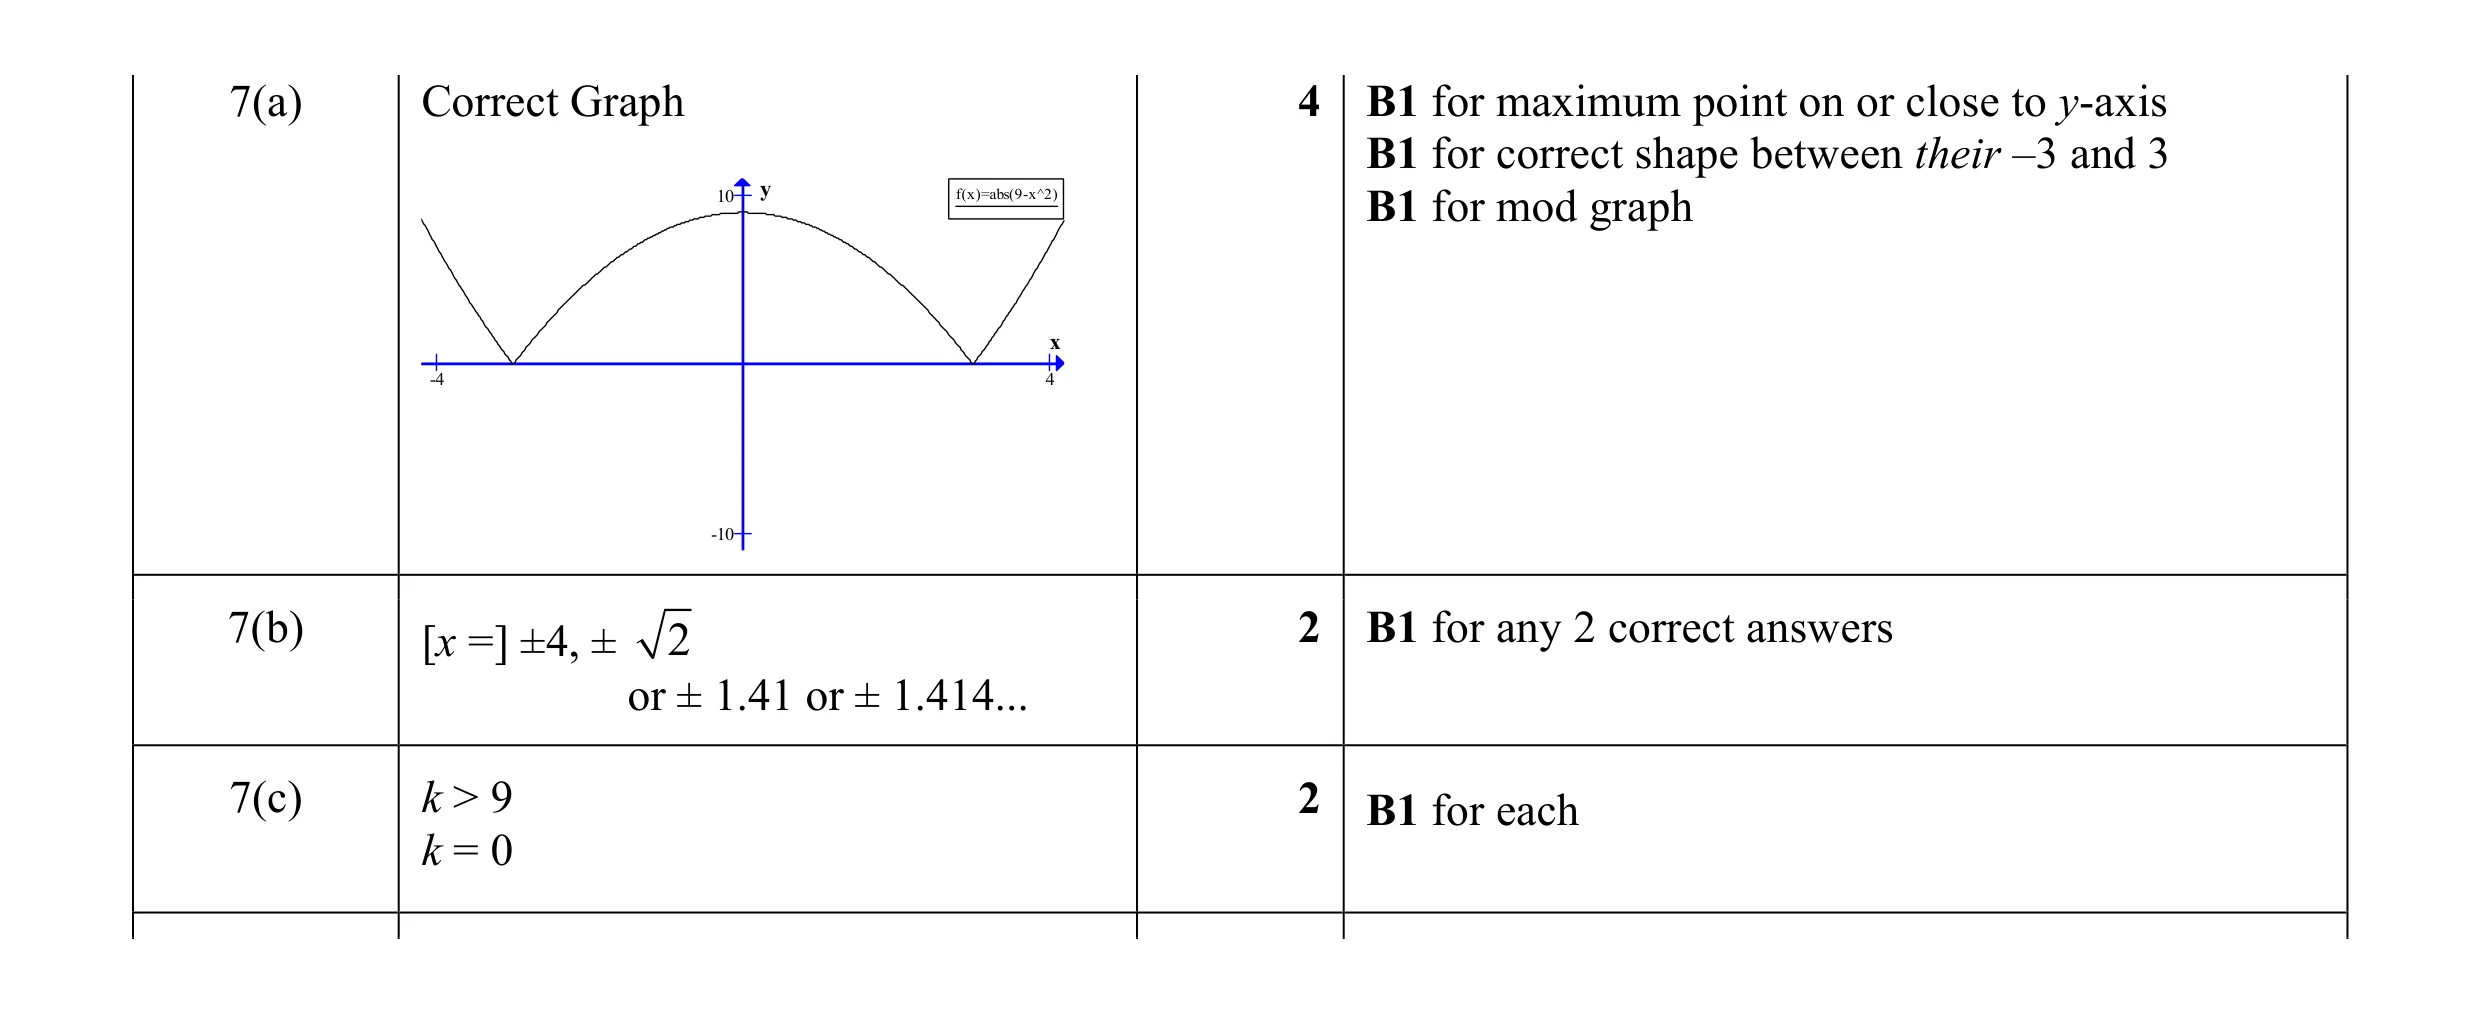
7 y 10 x –4 0 4 –10 f x = 9 - x 2 ^ h (a) On the diagram, sketch the graph of y = f x for values of x between -4 and 4. ^ h, [4] (b) Solve f x = 7 . ^ h … [2] (c) The equation 9 - x 2 = k has two solutions. Find the range of values of k. … [2]
8 marks
Mark scheme: 7(a) Correct Graph 4 B1 for maximum point on or close to y-axis B1 for correct shape between their –3 and 3 10 y f(x)=abs(9-x^2) B1 for mod graph x -4 4 -10 7(b) [x =] ±4, ± 2 2 B1 for any 2 correct answers or ± 1.41 or ± 1.414... 7(c) k > 9 2 B1 for each k = 0
This question in 0607/41 May/June 2017
Q2 · Y 3 x 0 90 180 270 360 –3 f x = 2 sin x + cos x for 0° G x G 360 ° ^ h g x = 2 - log x… 0607/41 May/June 2017
10 y 3 x 0 90 180 270 360 –3 f x = 2 sin x + cos x for 0° G x G 360 ° ^ h g x = 2 - log x for 0° G x G 360° ^ h (a) On the diagram, sketch the graph of y = f x [3] ^ h. (b) On the same diagram, sketch the graph of y = g x [2] ^ h. (c) Solve the equation. 2 sin x + cos x = 2 - log x … [3]
8 marks
Mark scheme: 10(a) Correct Graph 3 M1 for sine graph with one max and one min A1 for x-intercepts at 150 and 330 (approx.) y f(x)=2sin(x)+cos(x) 3 f(x)=2-log(x) A1 for positive y-intercept x 90 180 270 360 3 10(b) Correct Graph with second 2 M1 for correct shape intersection with other graph (if correct) below x-axis 10(c) 6.18 or 6.175... 3 B1 for each 159 or 158.5 to 158.6 320 or 320.3 to 320.4
This question in 0607/41 May/June 2017
Q3 · Y 6 x 0 10 f(x) = x - 5 log x (a) On the diagram, sketch the graph of y = f(x) for 0 1 x… 0607/43 May/June 2017
6 y 6 x 0 10 f(x) = x - 5 log x (a) On the diagram, sketch the graph of y = f(x) for 0 1 x G 10 . [2] (b) Find the co-ordinates of the local minimum point. ( … , … ) [2] (c) Find the range of f(x) for the domain 1 G x G 5 . … [2] (d) Solve the equation f(x) = 2. x = … or x = … [2] (e) Solve the inequality f(x) 1 2. … [1] (f) (i) Find f(0.001), f(0.000 01) and f(0.000 000 1). f(0.001) = … , f(0.000 01) = … , f(0.000 000 1) = … [1] (ii) Complete the statement. The y-axis is … to the graph of y = f(x). [1]
11 marks
Mark scheme: 6(a) Correct sketch 2 B1 for correct shape 6666 5555 4444 3333 2222 1111 0000 0000 2222 4444 6666 8888 10101010 6(b) (2.17, 0.488) or (2.171…, 0.4877…) 2 B1 for each 6(c) 0.488 - f ( x ) - 1.51 2 FT their 0.488 or 0.4877... - f ( x ) - 1.505... B1 for 0.488 - f ( x ) oe or f ( x ) - 1.51 oe 6(d) 0.502 or 0.5015… 2 B1 for each 5.83 or 5.827… 6(e) 0.502 < x < 5.83 1 FT their (d) or 0.5015... < x < 5.827... 6(f)(i) 15.[0] or 15.00… 1 25.[0] or 25.00… 35. [0] or 35.00… 6(f)(ii) [an] asymptote oe 1
This question in 0607/43 May/June 2017
Q4 · Y 5 x –3 0 4 –5 x f (x) = 2 (x - x - 2) (a) On the diagram, sketch the graph of y = f (x)… 0607/42 Oct/Nov 2017
4 y 5 x –3 0 4 –5 x f (x) = 2 (x - x - 2) (a) On the diagram, sketch the graph of y = f (x) for values of x from –3 to 4. [3] (b) Find the two values of x for which f(x) does not exist. … , … [2] (c) When k ! 0 , write down the number of solutions to the equation f (x) = k . … [1] (d) g (x) = 2 -x + 1 (i) On the diagram, sketch the graph of y = g (x) for - 2 G x G 4 . [2] (ii) Write down the equation of the asymptote to the graph of y = g (x) . … [1] (e) Solve the equation f (x) = g (x) . x = … or x = … [2]
11 marks
Mark scheme: 4(a) Correct sketch 3 B1 for correct middle branch B1 for correct left hand branch 4444 B1 for correct right hand branch 2222 3333 -2-2-2-2 -1-1-1-1 0000 0000 1111 2222 3333 4444 -2-2-2-2 -4-4-4-4 4(b) – 1 2 B1 for each 2 4(c) 2 1 4(d)(i) Correct sketch 2 Must intersect y-axis and be above x-axis 4444 B1 for decreasing exponential graph 2222 3333 -2-2-2-2 -1-1-1-1 0000 0000 1111 2222 3333 4444 -2-2-2-2 -4-4-4-4 4(d)(ii) y = 1 oe 1 4(e) – 0.892 or – 0.8919 to – 0.892[0] 2 B1 for each 2.62 or 2.622 to 2.623
This question in 0607/42 Oct/Nov 2017
Q5 · Y 12 0 x 4 –2 f (x) = 10 + x - x 2 for 0 G x G 4 (a) (i) On the diagram, sketch the graph… 0607/43 Oct/Nov 2017
9 y 12 0 x 4 –2 f (x) = 10 + x - x 2 for 0 G x G 4 (a) (i) On the diagram, sketch the graph of y = f (x) . [2] (ii) Write down the co-ordinates of the points where the graph crosses the axes. ( … , … ) or ( … , … ) [2] (iii) Solve f (x) = 1. x = … [1] (b) g (x) = x 2 - 10 log x (i) On the same diagram, sketch the graph of y = g (x) , for 0 1 x G 4 . [2] (ii) Write down the co-ordinates of the minimum point of g (x). ( … , … ) [2] (iii) Solve the equation. f (x) = g (x) … [2] (iv) Solve the equation. f (x - 1) = g (x - 1) … [2]
13 marks
Mark scheme: 9(a)(i) Correct graph 2 B1 for correct shape with a max 9(a)(ii) (0, 10) 2 B1 for each (3.7[0], 0) or (3.701 to 3.702, 0) 9(a)(iii) 3.54 or 3.541… 1 9(b)(i) Correct graph 2 B1 for correct shape with a min 9(b)(ii) (1.47, 0.488) or (1.473 to 1.474, 2 B1 for each 0.4877…) 9(b)(iii) 0.0982 or 0.09819 to 0.09820 2 B1 for each and 2.98 or 2.975 or 2.976 9(b)(iv) 1.1[0] or 1.098… 2 FT their (iii) + 1 3.98 or 3.975 to 3.976 B1 for each
This question in 0607/43 Oct/Nov 2017
Q6 · Y 5 x −5 0 5 −5 x f (x) = 1 - 2 (x - 9 ) (a) On the diagram, sketch the graph of y = f (… 0607/42 May/June 2018
2 y 5 x −5 0 5 −5 x f (x) = 1 - 2 (x - 9 ) (a) On the diagram, sketch the graph of y = f ( x) , for values of x between -5 and 5. [3] (b) Write down the equations of the three asymptotes. … , … , … [3] x (c) The line y = x intersects the curve y = 1 - 2 three times. (x - 9 ) Find the values of the x co-ordinates of the points of intersection. x = … or x = … or x = … [3]
9 marks
Mark scheme: 2(a) Correct sketch 3 B1 for each branch 2(b) y = 1, x = 3, x = − 3 3 B1 for each 2(c) –2.87 or –2.874 to –2.873 3 B1 for each 1.15 or 1.149 to 1.150 If 0 scored SC1 for –2.9, 1.1 and 2.7 2.72 or 2.723 to 2.724
This question in 0607/42 May/June 2018
Q7 · Y 10 x –6 0 6 –10 2x 2 - x + 5 f(x) = ^ 2 h x + x - 6 ^ h (a) On the diagram, sketch the… 0607/43 May/June 2018
5 y 10 x –6 0 6 –10 2x 2 - x + 5 f(x) = ^ 2 h x + x - 6 ^ h (a) On the diagram, sketch the graph of y = f(x) for values of x between -6 and 6. [3] (b) Find the co-ordinates of the local maximum. ( … , … ) [2] (c) Find the equations of the three asymptotes to the graph of y = f(x) . … , … , … [3] (d) The equation f(x) = k has no solutions. Find the range of values of k. … [2] (e) g(x) = x + 1 (i) Solve f(x) = g(x). x = … or x = … [2] (ii) Solve the inequality f(x) 2 g(x). … [2]
14 marks
Mark scheme: 5(a) Correct sketch 3 10 y f(x)=(2x^2 - x + 5)/((x-2)(x+3)) 5 B1 for each branch x -6 -4 -2 2 4 6 -5 -10 5(b) (0.0295, – 0.833) 2 or (0.02948 to 0.02949, –0.8329...) B1 for each 5(c) x = –3, x = 2, y = 2 3 B1 for each 5(d) –0.833 < k ⩽ 2 2 FT their (b) B1 for each inequality 5(e)(i) –5.13, 2.81 2 –5.131..., 2.812 to 2.813 B1 for each 5(e)(ii) –5.13 < x < –3, 2 –5.131..., 2.812 to 2.813 2 < x < 2.81 B1 for each FT their (c) and (e)(i)
This question in 0607/43 May/June 2018
Q8 · Y 50 x 0 –3 5 –50 f ()x = x 3 - 3x 2 - 4x + 1 for - 3 G x G 5 0607/41 Oct/Nov 2018
9 y 50 x 0 –3 5 –50 f ()x = x 3 - 3x 2 - 4x + 1 for - 3 G x G 5 . (a) On the diagram, sketch the graph of y = f ( x) . [2] (b) Write down the co-ordinates of the local minimum. ( … , … ) [2] (c) Find the range of values of k so that f ()x = k has only one solution. … [2] (d) g (x) = 3x 2 - 6x - 4 for - 3 G x G 5 . The graph of y = f ( x) intersects the graph of y = g (x) twice. Solve f (x) 2 g (x) . … [2]
8 marks
Mark scheme: 9(a) Correct sketch 2 B1 for cubic graph with max/min incorrect 9(b) (2.53, –12.1) 2 B1 for each co-ordinate 9(c) k < –12.1 2 B1 for each k > 2.13 FT their –12.1 9(d) –0.726 < x < 1.26 2 B1 for both critical values seen or for [k <] x < 1.26 or for –0.726 < x [ < k]
This question in 0607/41 Oct/Nov 2018
Q9 · Y 30 x –4 0 4 –20 f ()x = x 3 - 12x + 6 (a) On the diagram, sketch the graph of y = f (… 0607/42 Oct/Nov 2018
5 y 30 x –4 0 4 –20 f ()x = x 3 - 12x + 6 (a) On the diagram, sketch the graph of y = f ( x) for -4 G x G 4 . [2] (b) Find the positive zeros of f(x). … [2] (c) Find the co-ordinates of (i) the local maximum, ( … , … ) [1] (ii) the local minimum. ( … , … ) [1] (d) Describe fully the symmetry of the graph of y = f(x). … … [3]
9 marks
Mark scheme: 5(a) Correct sketch 2 y f(x)=x^3-12x+6 30 20 B1 for any cubic with max on left of min 10 x -4 4 -10 -20 5(b) 0.511 or 0.5111... 2 B1 for each 3.18 or 3.180... 5(c)(i) (–2, 22) 1 5(c)(ii) (2, –10) 1 5(d) Rotation[al] 3 B1 for each [Order] 2 [About] (0, 6)
This question in 0607/42 Oct/Nov 2018
Q10 · Y 15 x –6 0 6 –10 (2x - 3) f (x) = (x + 2) (a) On the diagram, sketch the graph of y =… 0607/42 Oct/Nov 2018
12 y 15 x –6 0 6 –10 (2x - 3) f (x) = (x + 2) (a) On the diagram, sketch the graph of y = f(x) for values of x between -6 and 6. [3] (b) Write down the equations of the asymptotes of y = f(x). … … [2] (c) g(x) = 5 - 2x (i) Solve f(x) = g(x). x = … or x = … [2] (ii) Find g(f(x)). Give your answer as a single fraction in its simplest form. … [3]
10 marks
Mark scheme: 12(a) Correct sketch 3 B1 for correct left hand branch without 15 y f(x)=(2x-3)/(x+2) serious curl back 10 5 B2 for correct right-hand branch x or B1 for correct shape right-hand branch but -6 6 with clear intercepts but serious overlap or -5 curl back -10 12(b) x = –2 oe 2 B1 for each y = 2 oe 12(c)(i) –2.81 or –2.812 to –2.811 2 B1 for each or for 2 x 2 + x − 13 = 0 2.31 or 2.311 to 2.312 12(c)(ii) x + 16 3 5( x + 2) − 2(2 x − 3) M2 for x + 2 x + 2 2 x − 3 or M1 for 5 −2 oe x + 2
This question in 0607/42 Oct/Nov 2018
Q11 · Y 6 –2 0 7 x –6 (x + 2) f (x) = (x - 1)(x - 4) (a) On the diagram, sketch the graph of y… 0607/41 May/June 2019
11 y 6 –2 0 7 x –6 (x + 2) f (x) = (x - 1)(x - 4) (a) On the diagram, sketch the graph of y = f ( x) for values of x between -2 and 7. [3] (b) Write down the co-ordinates of the local maximum. ( … , … ) [2] (c) Write down the equation of each of the three asymptotes. … , … , … [3] (d) g ()x = x - 5 (i) Solve the equation f (x) = g (x) . x = … or x = … or x = … [3] (ii) Solve the inequality f (x) 2 g (x) . … [3]
14 marks
Mark scheme: 11(a) Correct sketch 3 B1 for each branch y f(x)=(x+2)/((x-1)(x-4)) 6 4 2 x -2 2 4 6 -2 -4 -6 11(b) (2.24, –1.94) 2 or (2.242 to 2.243, –1.943 to –1.942) B1 for each co-ordinate 11(c) x = 1, x = 4, y = 0 3 B1 for each 11(d)(i) 1.34 or 1.344 to 1.345 3 B1 for each 2.79 or 2.789... 5.87 or 5.866... If 0 scored, SC1 for 1.3, 2.8 and 5.9 11(d)(ii) x < 1 3 B1 for each 1.34 < x < 2.79 FT dep on two solutions to (i) between 1 and 4 < x < 5.87 4. FT dep on solution to (i) > 4
This question in 0607/41 May/June 2019
Q12 · Y 3 0 x 5 x + 1 (a) On the diagram, sketch the graph of y = log for 0 1 x G 5 0607/42 May/June 2019
2 y 3 0 x 5 x + 1 (a) On the diagram, sketch the graph of y = log for 0 1 x G 5 . [2] b x l x + 1 (b) Write down the equations of the asymptotes to the graph of y = log b x l. … … [2] x + 1 (c) Solve the equation log = 0. 5 . b x l x = … [1] x (d) On the same diagram, sketch the graph of y = for 0 1 x G 5 . [1] 2 x + 1 x (e) Solve the equation log = . b x l 2 x = … [1] x x + 1 (f) On your diagram, shade the region where y G 0.5 , y H and y H log [1] 2 b x l.
8 marks
Mark scheme: 2(a) Correct sketch 2 Must not cross axes 1111 0.80.80.80.8 0.60.60.60.6 0.40.40.40.4 B1 for correct shape 0.20.20.20.2 1111 0000 0000 1111 2222 3333 4444 5555 2(b) y = 0, x = 0 2 B1 for each If 0 scored, SC1 for answers x-axis and y-axis 2(c) 0.462 or 0.4624 to 0.4625 1 2(d) Correct sketch 1 3333 2.52.52.52.5 2222 1.51.51.51.5 1111 0.50.50.50.5 0000 0000 1111 2222 3333 4444 5555 2(e) 0.742 or 0.7415 to 0.7416 1 2(f) Region that is below y = 0.5 and 1 above other two graphs.
This question in 0607/42 May/June 2019
Q13 · A stone is thrown vertically upwards from ground level 0607/42 May/June 2019
7 A stone is thrown vertically upwards from ground level. Its height, h metres above ground level, after t seconds, is given by h = 20t - 4.9t 2 . (a) Find the height of the stone after 1 second. … m [1] (b) (i) On the diagram, sketch the graph of h = 20 t - 4.9t 2 for 0 G t G 4.5 . h 25 0 t 4.5 –10 [2] (ii) Complete the statement. The maximum height reached by the stone is … m when t = … s. [2] (iii) Find the length of time the stone is in the air before it hits the ground. … s [1] (iv) Find the length of time the stone is more than 18 m above ground level. … s [3]
9 marks
Mark scheme: 7(a) 15.1 1 7(b)(i) Correct sketch 2 Must pass through origin and cross x-axis 25252525 reasonably close to x = 4, not 4.5. 20202020 15151515 10101010 5555 0000 0000 1111 2222 3333 4444 B1 for correct shape -5-5-5-5 -10-10-10-10 7(b)(ii) [h = ]20.4 or 20.40 to 20.41 2 B1 for each or both correct reversed answers [t =] 2.04 or 2.040 to 2.041 7(b)(iii) 4.08 or 4.081 to 4.082 1 7(b)(iv) 1.4[0] or 1.401 to 1.403 3 B1 for 2.74 or 2.741 to 2.742 B1 for 1.34 or 1.339 to 1.340
This question in 0607/42 May/June 2019
Q14 · Y 6 –270 0 270 x –6 (a) On the diagram, sketch the graph of y = f(x) where 1 f (x) = for… 0607/43 May/June 2019
4 y 6 –270 0 270 x –6 (a) On the diagram, sketch the graph of y = f(x) where 1 f (x) = for values of x between -270 and 270 . cos x [3] (b) Write down the range of f(x). … [2] (c) (i) On the same diagram, sketch the graph of y = g(x) where (720 + x) g (x) = for values of x between -270 and 270 . [2] 2x (ii) Find the values of the x co-ordinates of the points of intersection of the two graphs. x = … or x = … or x = … [3] (iii) Find the equation of each asymptote of the graph of y = g(x). … [2]
12 marks
Mark scheme: 4(a) Correct sketch 3 B1 for correct shape B1 for max and min approx. correct B1 for asymptotes approx. correct 4(b) f( x ) - − 1 and f ( x ) . 1 2 B1 for each 4(c)(i) Correct sketch 2 B1 for each branch 4(c)(ii) –213 or –212.9 to –212.8 3 B1 for each –111 or –111.5 to –111.4 78.6[…] 4(c)(iii) x = 0 2 B1 for each y = 0.5
This question in 0607/43 May/June 2019
Q15 · Y 6 –3 0 3 x –6 (a) On the diagram, sketch the graph of y = f(x), where f ()x = x 2 - 4… 0607/43 May/June 2019
8 y 6 –3 0 3 x –6 (a) On the diagram, sketch the graph of y = f(x), where f ()x = x 2 - 4 for values of x between -3 and 3. [3] (b) Write down the equation of the line of symmetry of the graph. … [1] (c) Write down the zeroes of f(x). … and … [1] (d) (i) Find the value of k when y = k meets the curve y = x 2 - 4 three times. k = … [1] (ii) Find the range of values of k when y = k meets the curve y = x 2 - 4 four times. … [2]
8 marks
Mark scheme: 8(a) Correct sketch 3 B1 for no part of graph below x-axis y f(x)=abs(x^2-4) 5 B1 for symmetry about y-axis 4 3 2 1 x -2 -1 1 2 -1 -2 -3 -4 -5 8(b) x = 0 1 8(c) –2, 2 1 Accept x = –2, x = 2 but not (–2, 0) or (2, 0) 8(d)(i) 4 1 8(d)(ii) 0 < k < 4 cao 2 B1 for 0 and 4 seen or k < 4 or k > 0
This question in 0607/43 May/June 2019
Q16 · Y 4 –3 0 3 x –2 1 f (x) = 3 x ! 0607/41 Oct/Nov 2019
3 y 4 –3 0 3 x –2 1 f (x) = 3 x ! 1 (1 - x ), (a) On the diagram, sketch the graph of y = f ( x) for values of x between - 3 and 3. [3] (b) Write down the range of f(x) for - 3 G x G 0 . … [2] (c) On the same diagram, sketch the graph of y = x2 for - 2 G x G 2 . [1] 1 2 (d) (i) Solve the equation 3 = x . 1 - x x = … [1] 1 2 u w (ii) The equation 3 = x can be written in the form x - x + 1 = 0 . 1 - x Find the value of u and the value of w. u = … w = … [2]
9 marks
Mark scheme: 3(a) Correct sketch 3 B2 for first branch correct, including gradient 4444 zero at y-intercept or B1 for first branch above x-axis, increasing 3333 and crossing y-axis 2222 1111 B1 for second branch correct 3333 -2-2-2-2 -1-1-1-1 0000 0000 1111 2222 3333 -1-1-1-1 -2-2-2-2 3(b) 0.0357 or 0.03571... - f ( x ) - 1 oe 2 B1 for 0 < f ( x ) or f ( x ) - 1 3(c) Correct sketch 1 Vertex at origin 3(d)(i) –[0].809 or –[0].8087... 1 3(d)(ii) [u = ] 5 2 B1 for each [w = ] 2 or SC1 for answers reversed
This question in 0607/41 Oct/Nov 2019
Q17 · F ()x = , x ! 0607/42 Oct/Nov 2019
2 f ()x = , x ! 2 g ()x = x + 2 h ()x = x 2 x - 2 (a) Find f (6 ). … [1] (b) Solve f (x) =- 2. x = … [2] (c) Find h (g (x)). … [1] (d) Solve h (g (x)) = h (x) + 2. x = … [4] (e) Find f - 1 (x). f - 1 ()x = … [3] (f) y 9 x –3 0 3 –3 (i) On the diagram, sketch the graph of y = f (x) and the graph of y = h (x) for values of x between - 3 and 3. [3] (ii) Write down the equation of the line of symmetry of y = h (x). … [1] (iii) Solve f (x) 2 h (x). … [2]
17 marks
Mark scheme: 2(a) 0.25 oe 1 2(b) 1.5 2 1 M1 for 1 = –2(x –2) or −= x – 22 2(c) (x + 2)2 1 2(d) 1 4 B1 for x 2 + 4 x + 4 –0.5 or − 2 M2 for 4 x + 4 = 2 or M1 for their ( c ) = x 2 + 2 or M2 for correct sketch or M1 for any U-shaped parabola 2(e) 1 3 1 1 + 2 oe final answer M2 for x = + 2 or xy = 1 + 2 y or y – 2 = x y x 1 or M1 for x − 2 = or y ( x − 2) = 1 y 1 or x = y − 2 2(f)(i) Correct sketches 3 B1 for correct quadratic shape through origin B2 for correct rectangular hyperbola shape or B1 for one branch 2(f)(ii) x = 0 1 2(f)(iii) 2 < x < 2.21 or 2.205 to 2.206 2 B1 for each part or 2 and 2.21 or 2.205 to 2.206 seen
This question in 0607/42 Oct/Nov 2019
Q18 · Y 4 x –3 0 3 –4 (a) On the diagram, sketch the graph of y = f ( x), where 1 f (x) = for… 0607/42 Oct/Nov 2019
12 y 4 x –3 0 3 –4 (a) On the diagram, sketch the graph of y = f ( x), where 1 f (x) = for values of x between - 3 and 3. x (x - 1)(x + 1) [4] (b) Write down the equations of the asymptotes. … , … , … , … [3] (c) Write down the co-ordinates of the local maximum. ( … , … ) [2] (d) The line y = 2x + 1 intersects the curve y = f (x) twice. Find the value of the x co-ordinate of each point of intersection. x = … or x = … [2]
11 marks
Mark scheme: 12(a) Correct sketch 4 B1 for each branch 12(b) x = 0 3 B2 for three correct x = 1 or B1 for one correct x = –1 y = 0 12(c) (0.577, –2.6[0]) 2 B1 for each or (0.5773 to 0.5774, –2.598…) 12(d) [x = ] –1.24 or –1.242 to –1.241 2 B1 for each [x =] 1.13 or 1.127 to 1.128
This question in 0607/42 Oct/Nov 2019
Q19 · Y 15 x –1.5 0 3 –15 f ()x = 2x 3 - 5x 2 + 3 for - 1.5 G x G 3 (a) On the diagram, sketch… 0607/43 Oct/Nov 2019
3 y 15 x –1.5 0 3 –15 f ()x = 2x 3 - 5x 2 + 3 for - 1.5 G x G 3 (a) On the diagram, sketch the graph of y = f (x). [2] (b) Find the zeros of f(x). … [3] (c) Find the co-ordinates of the local maximum. ( … , … ) [1] (d) Find the co-ordinates of the local minimum. ( … , … ) [2] (e) The equation 2x 3 - 5x 2 + 3 = k has three solutions. Find the range of values of k. … [2]
10 marks
Mark scheme: 3(a) Correct sketch 2 B1 for cubic curve (+ x3) with 2 15 y f(x)=2x^3 -5x^2+3 turning points x -2 -1 1 2 3 -15 3(b) –0.686 or –0.6861..., 3 B1 for each 1, 2.19 or 2.186... If 0 scored, SC1 for three correct but in coordinate form (…, 0) 3(c) (0, 3) 1 3(d) (1.67, –1.63) or 2 B1 for each co-ordinate (1.666 to 1.667, –1.630 to –1.629) 3(e) –1.63 < k < 3 2 FT their y co-ords from (c) and (d) B1 for each
This question in 0607/43 Oct/Nov 2019
Q20 · Y 8 x –8 0 8 –8 3x + 2 f (x) = (x + 2)(x - 3) (a) On the diagram, sketch the graph of y =… 0607/43 Oct/Nov 2019
12 y 8 x –8 0 8 –8 3x + 2 f (x) = (x + 2)(x - 3) (a) On the diagram, sketch the graph of y = f ( x) for values of x between - 8 and 8. [3] (b) Write down the equations of the asymptotes. … , … , … [3] (c) g ()x = x - 2 (i) On the diagram, sketch the graph of y = g (x) for - 6 G x G 8. [1] (ii) Solve f (x) = g (x). x = … or x = … or x = … [3] (iii) Solve f (x) 2 g (x). … [3] Question 13 is printed on the next page.
13 marks
Mark scheme: 12(a) Correct Graph 3 B1 for each branch 8 y f(x)=(3x+2)/((x+2)(x-3)) f(x)=x - 2 x -8 8 -8 12(b) x = –2 3 B1 for each x = 3 y = 0 12(c)(i) Correct line , See (a) 1 12(c)(ii) –2.21 or –2.211... 3 B1 for each 1.1[0] or 1.100... 4.11 or 4.111... 12(c)(iii) x < –2.21 3 FT from (ii) if graphs are correct –2 < x < 1.1[0] B1 for each 3 < x < 4.11
This question in 0607/43 Oct/Nov 2019
Q21 · Y 6 x – 0.5 0 4.5 – 6 f ( )x = x 3 - 6x 2 + 8x for - 0.5 G x G 4.5 (a) On the diagram… 0607/41 May/June 2020
9 y 6 x – 0.5 0 4.5 – 6 f ( )x = x 3 - 6x 2 + 8x for - 0.5 G x G 4.5 (a) On the diagram, sketch the graph of y = f ( x) . [2] (b) Solve the inequality f ( )x 1 0 . … [3] (c) Find the positive value of k when f ( )x = k has two different solutions. k = … [2]
7 marks
This question in 0607/41 May/June 2020
Q22 · Y 9 x – 6 0 2 – 3 1 (a) f ( )x = 2 + x + 2 (i) On the diagram, sketch the graph of y = f… 0607/42 May/June 2020
7 y 9 x – 6 0 2 – 3 1 (a) f ( )x = 2 + x + 2 (i) On the diagram, sketch the graph of y = f ( x) for values of x between - 6 and 2. [2] (ii) Write down the coordinates of the points where the graph crosses the axes. ( … , … ) and ( … , … ) [2] (iii) Write down the equations of the asymptotes of the graph. … , … [2] (b) g ( x) = ( x + 4) 2 On the diagram, sketch the graph of y = g ( x) for - 6 G x G - 1 . [2] (c) Solve the equation. f ( x) = g ( x) … [3] (d) Solve the inequality. f ( x) H g ( x) … [2]
13 marks
Mark scheme: 7(a)(i) 8 y f(x)=2+1/(x+2) 2 B1 for correct ‘hyperbolic shape’ 7 6 B1 for intersects with axes correct 5 4 (approx.) 3 2 1 x -5 -4 -3 -2 -1 1 -1 -2 7(a)(ii) (–2.5, 0) 2 B1 for each (0, 2.5) 7(a)(iii) x = –2 2 B1 for each y = 2 y f(x)=2+1/(x+2)f(x)=(x+4)^2 5 7(b) 4 2 B1 for correct ‘quadratic shape’ 3 B1 for min point at (–4, 0) (approx.) 2 1 -5 -4 -3 -2 -1 1 x -1 -2 -3 -4 -5 7(c) [x =] – 5.30 3 B1 for each correct answer [x =] –3 [x =] –1.70 7(d) −5.30 ≤ x ≤−3 2 B1 for each and −<2 x ≤−1.70
This question in 0607/42 May/June 2020
Q23 · Y 30 x – 3 0 5 – 40 f ( )x = x 3 - 4x 2 - 3x + 18 (a) On the diagram, sketch the graph of… 0607/43 May/June 2020
4 y 30 x – 3 0 5 – 40 f ( )x = x 3 - 4x 2 - 3x + 18 (a) On the diagram, sketch the graph of y = f ( x) for - 3 G x G 5 . [2] (b) Solve the equation f ( )x = 10 . x = … , or x = … , or x = … [3] (c) Write down the coordinates of (i) the local maximum, ( … , … ) [2] (ii) the local minimum. ( … , … ) [1] (d) f ( )x = k has only 1 solution. Find the ranges of values of k . … [2]
10 marks
Mark scheme: 4(a) Correct Sketch 2 With maximum in second quadrant 30 y f(x)=x^3-4x^2-3x+18 and minimum on positive x-axis 20 B1 for cubic graph for +ve x3 10 x -3 -2 -1 1 2 3 4 5 -10 -20 -30 -40 4(b) –1.51 or –1.508 to –1.507 3 B1 for each 1.24 or 1.244... 4.26 or 4.263 to 4.264 4(c)(i) (–0.333, 18.5) or 2 B1 for each coordinate (–0.3333..., 18.51 to 18.52) 4(c)(ii) (3, 0) 1 4(d) k < 0, 2 B1FT for each k > 18.5
This question in 0607/43 May/June 2020
Q24 · Y 5 – 1.5 0 1.5 x – 5 3 1 f ( )x = x - x (a) On the diagram, sketch the graph of y = f (… 0607/41 Oct/Nov 2020
7 y 5 – 1.5 0 1.5 x – 5 3 1 f ( )x = x - x (a) On the diagram, sketch the graph of y = f ( x) , for values of x between - .15 and 1.5 . [3] (b) Write down the equation of the asymptote of the graph. … [1] (c) Solve the equation f ( )x = 2 for values of x between - .15 and 0. x = … or x = … [2] (d) Solve the inequality f ( )x + x 2 G 2 for values of x between - .15 and 1.5 . … [3]
9 marks
Mark scheme: 7(a) Correct sketch 3 B1 for modulus graph B1 for correct for x > 1, or –1 < x < 0 4444 B1 for x = –1 and 1 when y = 0 plotted 2222 correctly. .5.5.5.5 -1-1-1-1 -0.5-0.5-0.5-0.5 0000 0000 0.50.50.50.5 1111 1.51.51.51.5 Maximum 2 marks if sketch not fully -2-2-2-2 correct -4-4-4-4 7(b) x = 0 1 7(c) –1.4[0] or –1.395… 2 B1 for each –0.475 or –0.4746… 7(d) –1.15 ⩽ x ⩽ –0.536 3 B2 for one fully correct inequality or ––1.154 to –1.153...⩽ x ⩽ –0.5357 or B1 for –1.15 ⩽ x ⩽ – k to –0.5356 – k ⩽ x ⩽ –0.536 or 0.536 ⩽ x ⩽ k AND k ⩽ x ⩽ 1.15 0.536 ⩽ x ⩽ 1.15 or M1 for suitable sketch, or 0.5356 to 0.5357 ⩽ x ⩽ 1.153 to e.g. f(x) + x2 ⩽ 2 1.154 or B1 for 4 correct solutions seen
This question in 0607/41 Oct/Nov 2020
Q25 · Y 4 x – 2 0 2 (i) On the diagram, sketch the graph of y = 1.5 -x for - 2 G x G 2 0607/43 Oct/Nov 2020
8 (a) y 4 x – 2 0 2 (i) On the diagram, sketch the graph of y = 1.5 -x for - 2 G x G 2 . [2] (ii) Solve the inequality 0.5 G 1.5 -x G 1. … [3] (iii) Solve the equation 1.5 -x = x 2 for - 2 G x G 2 . … [3] (iv) On your diagram shade the regions where 1.5 -x 1 x 2 for - 2 G x G 2 . [1] (b) y O x - 2x + b The diagram shows a sketch of the graph of y = . x + a The asymptotes of the graph are x = 2 and y =- 2 . The graph passes through the point (0, 2). Find the value of a and the value of b. a = … b = … [3] (c) y y = k M x O x = a x = b f(x) is a function such that • the asymptotes of the graph are x = a , x = b and y = k • when x 1 a , the gradient of the graph is positive • when x 2 b , the gradient of the graph is negative • M is the only local maximum point • the graph does not cross any asymptote. On the diagram sketch the graph of y = f ( x) . [3]
15 marks
Mark scheme: 8(a)(i) Correct sketch4444 2 B1 for exponential shape 3333 2222 1111 2222 -1-1-1-1 0000 0000 1111 2222 8(a)(ii) 0 ≤ x ≤1.71 or 1.709 to 1.710 3 B2 for either correct or B1 for 0 and 1.71 or 1.709 to 1.710 seen 8(a)(iii) –1.3[0] or –1.302... 3 B2 for one correct 0.843 or 0.8429... or B1 for sketch4444 of y = x2 added to diagram 3333 2222 1111 2222 -1-1-1-1 0000 0000 1111 2222 8(a)(iv) Two areas shaded which are above 1 y = 1.5 − x and below y = x2 8(b) [a =] –2 3 B1 for a = –2 [b =] –4 b M1 for = 2 oe a 8(c) Correct4444 sketch 3 B1 for each branch 3333 2222 1111 1111 0000 0000 1111 2222 3333 4444 5555 6666 -1-1-1-1
This question in 0607/43 Oct/Nov 2020
Q26 · Y 13 – 4 0 3 x – 3 1 g ( )x = , x ! 0607/42 Feb/March 2021
7 y 13 – 4 0 3 x – 3 1 g ( )x = , x ! 2 x - 2 (a) On the diagram, sketch the graph of y = g(x) for values of x between - 4 and 3. [3] (b) Write down the equations of the asymptotes of the graph of y = g(x). … … [2] (c) h ( x) = ( x + 1) 2 - 3 Solve the inequality g ( x) 2 h ( x) . … [4]
9 marks
Mark scheme: 7(a) Correct sketch 3 B2 for correct branches but joined or for ‘correct’ but with excessive overlap or ‘curl back’ B1 for one correct branch 7(b) y = 0 B2 B1 for each x = 2 7(c) –2.67 < x < 0.524 B2 B1 for x > −2.67 or x < 0.524 or –2.7 < x < 0.52 2 < x < 2.15 B2 B1 for either x > 2 or x < 2.145… If B0, B0 scored, then SC1 for 2 of the boundaries –2.67, 0.524, 2.15 seen
This question in 0607/42 Feb/March 2021
Q27 · Piero invests $5000 in Bank A and $5000 in Bank B 0607/41 May/June 2021
6 Piero invests $5000 in Bank A and $5000 in Bank B. (a) Bank A pays simple interest at a rate of 6.5% each year. (i) Find the total amount Piero has in Bank A at the end of 4 years. $ … [3] (ii) Find the number of complete years it takes for the total amount that Piero has in Bank A to be greater than $10 000. … [3] (b) Bank B pays compound interest at a rate of 4% each year. (i) Find the total amount Piero has in Bank B at the end of 4 years. $ … [2] (ii) Find the number of complete years it takes for the total amount that Piero has in Bank B to be greater than $10 000. … [4] (c) By sketching suitable graphs, find the number of complete years it takes for the total amount that Piero has in Bank B to be greater than the total amount in Bank A. … [4]
16 marks
Mark scheme: 6(a)(i) 6300 3 M2 for 5000 + 5000 × 6.5 × 4 ÷ 100 oe or M1 for 5000 × 6.5 × 4 ÷ 100 oe implied by 1300 6(a)(ii) 16 3 B2 for 15.4 or 15.38... 5000 × 100 or M2 for oe 5000 × 6.5 5000 × 6.5 ×n or M1 for oe 100 6(b)(i) 5849.29 or 5850 2 4 4 M1 for 5000 × 1 + oe 100 6(b)(ii) 18 4 B3 for 17.7 or 17.67… as answer 10000 4 or M3 for log = n log 1 + 5000 100 oe or correct trials including 17 and 18 or good sketch indicating value between 17 and 18 10000 4 n or M2 for = 1 + oe 5000 100 or at least 3 correct trials with n > 4 or sketch that could lead to solution 4 or M1 for 10000 = 5000 × 1 + oe 100 or at least 2 trials with n > 4 or suitable graph 6(c) Correct sketch M3 M2 for suitable graphs, e.g. y = 1.4x and y = 1 + 0.065x or M1 for one suitable graph, e.g. y = 1.04x or y = 1 + 0.0656x 24 B1
This question in 0607/41 May/June 2021
Q28 · Y 15 – 5 0 5 x – 15 f ( )x = 10 - x 2 (a) On the diagram, sketch the graph of y = f(x)… 0607/42 May/June 2021
4 y 15 – 5 0 5 x – 15 f ( )x = 10 - x 2 (a) On the diagram, sketch the graph of y = f(x) for - 5 G x G 5 . [2] (b) Solve the equation f(x) = 6. … [2] (c) Solve f ( )x 2 6 . … [3] (d) Find the values of k for which f(x) = k has exactly two solutions. … [2]
9 marks
Mark scheme: 4(a) Correct sketch 2 B1 for correct middle section 4(b) ± 4 2 B1 for 2 correct solutions ± 2 4(c) x < –4 3 B1 for each –2 < x < 2 x > 4 4(d) 0 2 B1 for each [k ] > 10
This question in 0607/42 May/June 2021
Q29 · Y 5 – 5 0 5 x – 5 x 2 + 3 f ( x) = ( 1 - x)( x + 3) (a) On the diagram, sketch the graph… 0607/42 May/June 2021
13 y 5 – 5 0 5 x – 5 x 2 + 3 f ( x) = ( 1 - x)( x + 3) (a) On the diagram, sketch the graph of y = f(x) for values of x between -5 and 5. [3] (b) Find the equations of the asymptotes parallel to the y-axis. … [2] (c) Solve f(x) = 2x + 3. … [3]
8 marks
Mark scheme: 13(a) Correct sketch 3 B1 for each branch 13(b) x = 1, 2 B1 for each x = –3 13(c) –3.79 or –3.791... 3 B1 for each –1 0.791 or 0.7912 to 0.7913 If 0 scored SC1 for y = 2x + 3 sketched and cutting both axes
This question in 0607/42 May/June 2021
Q30 · Y 5 – 5 0 5 x – 5 4 f ( )x = x - x (a) On the diagram, sketch the graph of y = f(x) for… 0607/43 May/June 2021
1 y 5 – 5 0 5 x – 5 4 f ( )x = x - x (a) On the diagram, sketch the graph of y = f(x) for values of x between -5 and 5. [2] (b) Find the zeros of f(x). x = … or x = … [2] (c) Solve the equation f(x) = 2. x = … or x = … [2] (d) g(x) = f(x + 2) (i) On the same diagram, sketch the graph of y = g(x) for values of x between -5 and 5. [2] (ii) Describe fully the single transformation that maps the graph of y = f(x) onto the graph of y = g(x). … … [2]
10 marks
Mark scheme: Question Answer Marks Partial Marks 1(a) Correct sketch 2 B1 for each branch 4444 or B1 for correct but branches joined 2222 -4-4-4-4 -2-2-2-2 0000 0000 2222 4444 -2-2-2-2 -4-4-4-4 1(b) –2, 2 2 B1 for each 1(c) –1.24 or –1.236... 2 B1 for each 3.24 or 3.236... 1(d)(i) Correct sketch 2 B1 for each branch 4444 or B1 FT their f(x) translated in x direction 2222 -4-4-4-4 -2-2-2-2 0000 0000 2222 4444 -2-2-2-2 -4-4-4-4 1(d)(ii) − 2 2 B1 for each Translation 0
This question in 0607/43 May/June 2021
Q31 · Y 10 0 x 2.5 f ( x) = x x, x 2 0 (a) On the diagram, sketch the graph of y = f(x) for 0 1… 0607/43 May/June 2021
9 y 10 0 x 2.5 f ( x) = x x, x 2 0 (a) On the diagram, sketch the graph of y = f(x) for 0 1 x G 2.5 . [2] (b) Find the coordinates of the local minimum point. ( … , … ) [2] (c) (i) Find x when f(x) = 3x. … [3] (ii) Solve f ( )x H 3x . … [2]
9 marks
Mark scheme: 9(a) Correct sketch 2 B1 for correct shape but cutting either axis or without minimum 9(b) (0.368, 0.692) 2 B1 for each or (0.3678 to 0.3679, 0.6922...) 9(c)(i) 0.237 or 0.2369 to 0.2370 3 M1 for correct line sketched 2.31 or 2.311 … B1 for one correct 9(c)(ii) [0 <] x ⩽ 0.237 or 0.2369 to 2 B1 for each 0.2370 x ⩾ 2.31 or 2.311…
This question in 0607/43 May/June 2021
Q32 · Y 5 – 2 0 2 x – 5 f ( x) = 3 x - x 3 for - 2 G x G 2 (a) On the diagram, sketch the graph… 0607/43 Oct/Nov 2021
8 y 5 – 2 0 2 x – 5 f ( x) = 3 x - x 3 for - 2 G x G 2 (a) On the diagram, sketch the graph of y = f ( x) . [2] (b) Find the coordinates of the local maximum. ( … , … ) [1] (c) Write down the x-coordinates of the points where the curve meets the x-axis. x = … , x = … , x = … [2] (d) (i) Describe fully the single transformation that maps y = f ( x) onto y = f ( x + 1) . … … [2] (ii) Solve f ( x) = f ( x + 1) for - 2 G x G 2 . … [2] (iii) Solve f ( x) H f ( x + 1) for - 2 G x G 2 . … [2]
11 marks
Mark scheme: 8(a) Correct sketch 2 B1 for negative cubic graph with 2 turning y f(x)=3x-x^3 points x 8(b) (1, 2) 1 8(c) –1.73 or –1.732… oe 2 B1 for two correct 0 1.73 or 1.732… oe 8(d)(i) Translation 2 B1 for each − 1 0 8(d)(ii) –1.46 or –1.457… 2 B1 for each but without y-coords. 0.457 or 0.4574… or M1 for graph of y = 3( x + 1) − ( x + 1) 3 oe 8(d)(iii) [–2 ⩽] x ⩽ –1.46 2 B1 for each 0.457 ⩽ x [⩽ 2] or for x ⩽ –1.46 and 0.457 ⩽ x
This question in 0607/43 Oct/Nov 2021
Q33 · Y 12 x – 4 0 4 – 12 f ( )x = 4 - x 2 for - 4 G x G 4 (a) On the diagram, sketch the graph… 0607/42 Feb/March 2022
7 y 12 x – 4 0 4 – 12 f ( )x = 4 - x 2 for - 4 G x G 4 (a) On the diagram, sketch the graph of y = f ( x) . [2] (b) Write down the zeros of f(x). … [2] (c) Write down the coordinates of the local maximum. ( … , … ) [1] (d) The equation 4 - x 2 = k has 4 solutions and k is an integer. Write down a possible value of k. k = … [1] (e) (i) On the diagram, sketch the graph of y = 2x . [1] (ii) Solve the equation 4 - x 2 = 2x . … [2] (iii) On the diagram, shade the regions where y H 0, y G 2x and y G 4 - x 2 . [2]
11 marks
Mark scheme: 7(a) Correct sketch 2 10101010 5555 M1 for a modulus graph or 4444 -2-2-2-2 0000 0000 2222 4444 for graph of y = 4 – x2 -5-5-5-5 -10-10-10-10 7(b) –2, 2 2 B1 for each If 0 scored, SC1 for (2, 0) and (–2, 0) 7(c) (0, 4) 1 7(d) 1 or 2 or 3 1 7(e)(i) Correct sketch 1 10101010 5555 4444 -2-2-2-2 0000 0000 2222 4444 -5-5-5-5 -10-10-10-10 7(e)(ii) 1.24 or 1.236..., 3.24 or 3.236... 2 B1 for each or B1 for both seen e.g. 1.24 ⩽ x ⩽ 3.24 or with y coords included or for 1.23 and 3.23 7(e)(iii) Two correct regions above x-axis and 2 B1 for one correct and no wrong or for one correct below both graphs and one incomplete
This question in 0607/42 Feb/March 2022
Q34 · Y 5 – 3 0 1 x – 5 1 f ( x) = 2 x + 4 - 2 x (a) On the diagram, sketch the graph of y = f… 0607/41 May/June 2022
3 y 5 – 3 0 1 x – 5 1 f ( x) = 2 x + 4 - 2 x (a) On the diagram, sketch the graph of y = f ( x) for values of x between - 3 and 1. [3] (b) Write down the equation of the asymptote of the graph. … [1] (c) Find the coordinates of the local maximum. ( … , … ) [1] (d) g( )x = x 3 - 5x for - 3 G x G 1. Solve f ( x) G g( x) . … [4]
9 marks
Mark scheme: 3(a) correct sketch 3 B2 for correct branches but joined or touching y-axis B1 for one correct branch 3(b) x = 0 1 3(c) (−1, 1) 1 3(d) −2.31 ⩽ x < 0 and 0 < x ⩽ 0.388 4 B3 for −2.3 ⩽ x ⩽ 0.388 or −2.31 ⩽ x ⩽ 0.39 or B2 for –2.3 ⩽ x ⩽ 0.39 or –2.31 ⩽ x or x ⩽ 0.388 or B1 for – 2.31 or 0.388 seen or for correct sketch
This question in 0607/41 May/June 2022
Q35 · Y 4 – 4 0 4 x – 4 (a) On the diagram, sketch the graph of y = f( x) , where f( )x = 4 - 2… 0607/42 May/June 2022
4 y 4 – 4 0 4 x – 4 (a) On the diagram, sketch the graph of y = f( x) , where f( )x = 4 - 2 x for values of x between - 4 and 4. [3] (b) Write down the x-coordinates of the points where the graph meets the x-axis. x = … and x = … [1] (c) On the diagram, sketch the graph of y = g( x) , where g ( x) = 0 .25 x 2 for values of x between - 4 and 4. [2] (d) Write down the equation of the line of symmetry of the graph of y = g( x) . … [1] (e) Find the value of the x-coordinate of each point of intersection of the two graphs. x = … and x = … [2] (f) On your diagram shade the region defined by f( x) H g( x). [1]
10 marks
Mark scheme: 4(a) Correct sketch 3 B1 for inverted ‘v’ B1 for symmetrical about y-axis 4 4(b) –2, 2 1 4(c) Correct sketch 2 Must touch x-axis at origin and without serious curl backs B1 for a u-shaped parabola 4(d) x = 0 1 4(e) –1.66 or –1.657 to –1.656 2 B1 for each 1.66 or 1.656 to 1.657 4(f) Correct region shaded 1 Dependent on at least B2 in (a) and at least B1 in (c)
This question in 0607/42 May/June 2022
Q36 · Y 20 x 0 – 3 3 – 10 f ( x) = x 3 - 5x + 3 for - 3 G x G 3 (a) On the diagram, sketch the… 0607/43 May/June 2022
5 y 20 x 0 – 3 3 – 10 f ( x) = x 3 - 5x + 3 for - 3 G x G 3 (a) On the diagram, sketch the graph of y = f ( x) . [2] (b) Find the coordinates of the local maximum. ( … , … ) [2] (c) Describe fully the symmetry of the graph of y = f ( x) . … … [3] (d) Find the zeros of the graph of y = f ( x) . … [3] (e) g ( x) = x 2 - 2x + 2 for - 3 G x G 3 (i) On the same diagram, sketch the graph of y = g ( x) . [2] (ii) Use your graphs to solve x 3 - x 2 - 3x + 1 = 0 . … [3]
15 marks
Mark scheme: 5(a) Correct Sketch 2 B1 for any cubic 5(b) (–1.29, 7.3[0]) 2 –1.291 to –1.290... 7.303... B1 for each 5(c) Rotational 3 B1 for each Order 2 (0, 3) 5(d) –2.49 or –2.491 to –2.490 3 B1 for each 0.657 or 0.6566... If 0 scored SC1 for –2.5, 0.66 and 1.8 1.83 or 1.834... 5(e)(i) Correct Sketch with y intercept 2 B1 for any U shaped quadratic below the y-intercept of f(x) 5(e)(ii) –1.48 or –1.481... 3 B1 for each 0.311 or 0.3111... If 0 scored, SC1 for –1.5, 0.31 and 2.2 2.17 or 2.170...
This question in 0607/43 May/June 2022
Q37 · Y 4 x 0 –1 5 – 4 (a) On the diagram, sketch the graph of y = f ( x) , where 1 f ( x) =… 0607/41 Oct/Nov 2022
5 y 4 x 0 –1 5 – 4 (a) On the diagram, sketch the graph of y = f ( x) , where 1 f ( x) = for values of x between - 1 and 5. [3] ( x - 1)( x - 2)( x - 3) (b) Write down the y‑coordinate of the point where the curve meets the y‑axis. y = … [1] (c) Write down the equations of all the asymptotes to the graph of y = f ( x) . … [3] (d) On the diagram, sketch the graph of y = g ( x) , where g ( x) = x - 1 , for values of x between - 1 and 5 . [1] (e) Find the x‑coordinate of each point of intersection of the two graphs. x = … or x = … [2] (f) Solve the inequality f ( x) 2 g ( x) . … [3]
13 marks
Mark scheme: 5(a) Correct sketch f(x)=1/((x-1)(x-2)(x-3)) 3 B1 for graph in 4 sections B1 for rectangular hyperbola type on outside 2 sections not crossing x-axis B1 for 2 quadratic type sections (one inverted) Max 2 marks if not fully correct 5(b) 1 1 –0.167 or –0.1667 to –0.1666 or − 6 5(c) x = 1, x = 2, x = 3, y = 0 3 B2 for 3 correct or B1 for 1 correct If 0 scored, SC1 for all four with 5(d) 1 Can be good freehand, cutting negative y-axis and positive x-axis 5(e) x = 0.487 or 0.4871… 2 B1 for each x = 3.18 or 3.178 to 3.179 5(f) [–1 < ] x < 0.487 3 B1 FT their(e) for each 1 < x < 2 3 < x < 3.18
This question in 0607/41 Oct/Nov 2022
Q38 · Y 8 – 5 0 5 x – 9 5 f ( x) = x + ( x - 2)( x + 3) (a) Sketch the graph of y = f ( x) for… 0607/42 Oct/Nov 2022
11 y 8 – 5 0 5 x – 9 5 f ( x) = x + ( x - 2)( x + 3) (a) Sketch the graph of y = f ( x) for values of x between - 5 and 5. [4] (b) Write down the equations of the asymptotes parallel to the y-axis. … [2] (c) (i) Find the coordinates of the local maximum. ( … , … ) [2] (ii) Find the coordinates of the local minimum. ( … , … ) [2] (iii) Write down the range of values of k for which f ( x) = k has exactly one solution. … [2] (d) g ( x) =- 4 - x (i) Solve the equation f ( x) = g ( x) . … [3] (ii) Find the solutions to the inequality f ( x) 2 g ( x) . … [3] Question 12 is printed on the next page.
18 marks
Mark scheme: 11(a) Correct sketch 4 B1 for each outside branch B2 for middle branch with offset maximum or B1 if not offset or if offset crosses x- axis 11(b) x = 2, x = –3 2 B1 for each 11(c)(i) (1.03, –0.249) 2 1.029... –0.2491 to –0.2490 B1 for each coordinate 11(c)(ii) (2.99, 3.83) 2 2.986... 3.833... B1 for each coordinate 11(c)(iii) –0.249 < k < 3.83 2 B1FT for each 11(d)(i) –3.35 or –3.347..., –1.52 or –1.520... 3 B1 for each 1.87 or 1.867... If 0 scored, SC1 for y = –4 – x sketched on diagram or for –3.3, –1.5, and 1.9 or if y-coordinates also given 11(d)(ii) –3.35 < x < –3, 3 B1FT for each –1.52 < x < 1.87, x > 2
This question in 0607/42 Oct/Nov 2022
Q39 · Y 1 – 5 0 5 x – 3 1 1 f ( x) = - 2 x x (a) On the diagram, sketch the graph of y = f ( x)… 0607/43 Oct/Nov 2022
2 y 1 – 5 0 5 x – 3 1 1 f ( x) = - 2 x x (a) On the diagram, sketch the graph of y = f ( x) for values of x between - 5 and 5. [2] (b) Find f ( - 2) . … [1] (c) Solve the equation f ( x) = 0 . x = … [1] (d) Find the maximum value of f(x). … [1] (e) Write down the equation of each asymptote. … [2] (f) (i) Solve the equation. 1 1 2 - = x - 2 2 x x … [3] 1 1 2 4 2 (ii) The equation - 2 = x - 2 can be rearranged to the form x + ax + bx + c = 0 . x x Find the values of a, b and c. a = … b = … c = … [2]
12 marks
Mark scheme: 2(a) Correct sketch 2 No intersections with y-axis B1 for each branch with no large curl back or feathering. Right hand branch with a maximum or level. 2(b) –[0].75 oe 1 2(c) 1 1 2(d) 0.25 oe 1 Not coordinates 2(e) x = 0 2 B1 for each y = 0 2(f)(i) 0.525 or 0.5248 to 0.5249 3 B2 for one correct or M1 for sketch of y = x2 – 2 added 1.49 or 1.490... to diagram 2(f)(ii) [a =] –2 2 B1 for x −=1 x 4 − 2 x 2 oe [b =] –1 [c =] 1
This question in 0607/43 Oct/Nov 2022
Q40 · Y 5 – 5 0 5 x – 5 x 2 f ( )x = 2 - 2 x - x - 2 (a) On the diagram, sketch the graph of y… 0607/42 Feb/March 2023
6 y 5 – 5 0 5 x – 5 x 2 f ( )x = 2 - 2 x - x - 2 (a) On the diagram, sketch the graph of y = f ( x) for values of x between -5 and 5. [4] (b) Write down the equations of the two vertical asymptotes. … , … [2] (c) Write down the coordinates of the local minimum point. ( … , … ) [1] (d) On the diagram, sketch the graph of y = g ( x) , where g ( )x = 3 - x for - 2 G x G 5 . [1] (e) (i) Solve the equation f ( x) = g ( x) . … [2] (ii) Solve the inequality f ( x) 2 g ( x) . … [3]
13 marks
Mark scheme: 6(a) 4 B4 for fully correct curve or B3 for ‘correct’ curve with overlaps. or B2 for 2 sections correct or B1 for 1 section correct 6(b) x = –1, x = 2 2 B1 for each 6(c) (0, 2) 1 6(d) 1 Must intersect curve 3 times 6(e)(i) x = –0.861 or –0.8608… 2 B1 for one correct x = 0.746 or 0.7458… x = 3.11 or 3.114 to 3.115 If 0 scored SC1 for –0.86, 0.75, 3.1 6(e)(ii) –1 < x < –0.861 3 FT their (i) 0.746 < x < 2 B1 for each x > 3.11
This question in 0607/42 Feb/March 2023
Q41 · Henryk invests $5000 in Bank A and $5000 in Bank B 0607/42 Feb/March 2023
9 Henryk invests $5000 in Bank A and $5000 in Bank B. (a) Bank A pays compound interest at a rate of 3.5% each year. (i) Find the total amount Henryk has in Bank A at the end of 4 years. $ … [2] (ii) Calculate the number of complete years it takes for the value of Henryk’s investment of $5000 in Bank A to be first greater than $8000. … [4] (b) Bank B pays simple interest at a rate of 4% each year. (i) Find the total amount Henryk has in Bank B at the end of 4 years. $ … [3] (ii) Calculate the number of complete years it takes for the value of Henryk’s investment of $5000 in Bank B to be $8000. … [2] (c) At the end of x complete years, the total amount that Henryk has in Bank A is greater than the total amount he has in Bank B. Given that 5 1 x 1 10 , use a graphical method to find the value of x. x = … [4]
15 marks
Mark scheme: 9(a)(i) 5737.62 2 M1 for 5000 × 1.0354 oe 9(a)(ii) 14 4 B3 for 13.6 to 13.7 OR 8000 M3 for n log1.035 = log oe 5000 or good sketch indicating value between 13 and 14 or correct trials reaching 13 and 14 n 8000 or M2 for 1.035 = oe 5000 or exponential sketch or at least 3 correct trials with n > 4 or M1 for 5000 × 1.035n = 8000 oe or at least 2 correct trials If 0 scored, SC3 for answer 2 coming from use of 1.35 9(b)(i) 5800 3 5000 4 4 M2 for 5000 + oe 100 5000 4 4 or M1 for oe 100 9(b)(ii) 15 2 5000 4 n M1 for 5000 + = 8000 oe 100 9(c) 9 4 B3 for 8.556… or 8.56 OR M1 for 5000 1.035 n = 5000(1 + 0.04 n ) oe soi M1 for sketch of 1.035n M1 for sketch of 1 + 0.04n
This question in 0607/42 Feb/March 2023
Q42 · Y 1 0 x 360 –1 f ( x) = cos x° for 0 G x G 360 (a) On the diagram, sketch the graph of y… 0607/41 May/June 2023
3 y 1 0 x 360 –1 f ( x) = cos x° for 0 G x G 360 (a) On the diagram, sketch the graph of y = f ( x) . [2] (b) Find the zeros of f ( )x . … [2] (c) (i) Solve the equation f ( x) = 0.5 . … [2] (ii) Solve the inequality f ( x) 1 0 .5 . … [2] (iii) On the diagram, shade the regions that satisfy the inequalities y 1 0.5 and y 2 f ( x) . [1] (d) The equation f ( )x = k has four solutions. Complete the statement to show the range of possible values of k. … 1 k 1 … [1]
10 marks
Mark scheme: 3(a) Correct sketch 2 B1 for correct shape but inaccurate or different domain 3(b) 90, 270 2 B1 for each –1 if y cords (0) included 3(c)(i) 60, 120, 240, 300 2 B1 for two or three correct with no extras or four correct with extras –1 if y cords (0.5) included 3(c)(ii) 60 < x < 120, 240 < x < 300 2 B1 for each 3(c)(iii) Correct areas shaded, 1 i.e. below y = 0.5 and above y = f(x) 3(d) 0 [ < k < ] 1 1
This question in 0607/41 May/June 2023
Q43 · Y 9 x – 6 0 6 – 9 x 2 + 3 x f ( x) = ( x - 2)( x + 1) (a) On the diagram sketch the graph… 0607/42 May/June 2023
6 y 9 x – 6 0 6 – 9 x 2 + 3 x f ( x) = ( x - 2)( x + 1) (a) On the diagram sketch the graph of y = f ( x) for values of x between - 6 and 6. [3] (b) Write down the equations of the asymptotes parallel to the y‑axis. … [2] (c) Find the zeros of the graph of y = f ( x) . … [2] (d) g ( x) = x - 3 (i) On the diagram sketch the graph of y = g ( x) for - 6 G x G 6 . [1] (ii) Use your graphs to solve f ( x) = g ( x) . … [3] (iii) Solve g ( x) 2 f ( x) . … [3]
14 marks
Mark scheme: 6(a) Correct Sketch 3 B1 for each branch correct 6(b) x = 2, x = –1 2 B1 for each 6(c) –3, 0 2 B1 for each 6(d)(i) Correct Sketch 1 6(d)(ii) –1.16 or –1.162... 3 B1 for each 1 5.16 or 5.162... 6(d)(iii) –1.16 < x < –1 3 B1FT from their (d)(ii) and their (b) for each. 1< x < 2 FT dep on answers to (d)(ii) that lead to three x > 5.16 equivalent inequalities Same accuracy as (d)(ii)
This question in 0607/42 May/June 2023
Q44 · Y 2 – 90 0 90 x – 2 f ( x) = 2 cos ( x - 45)° - 1 for values of x between - 90 and 90 0607/43 May/June 2023
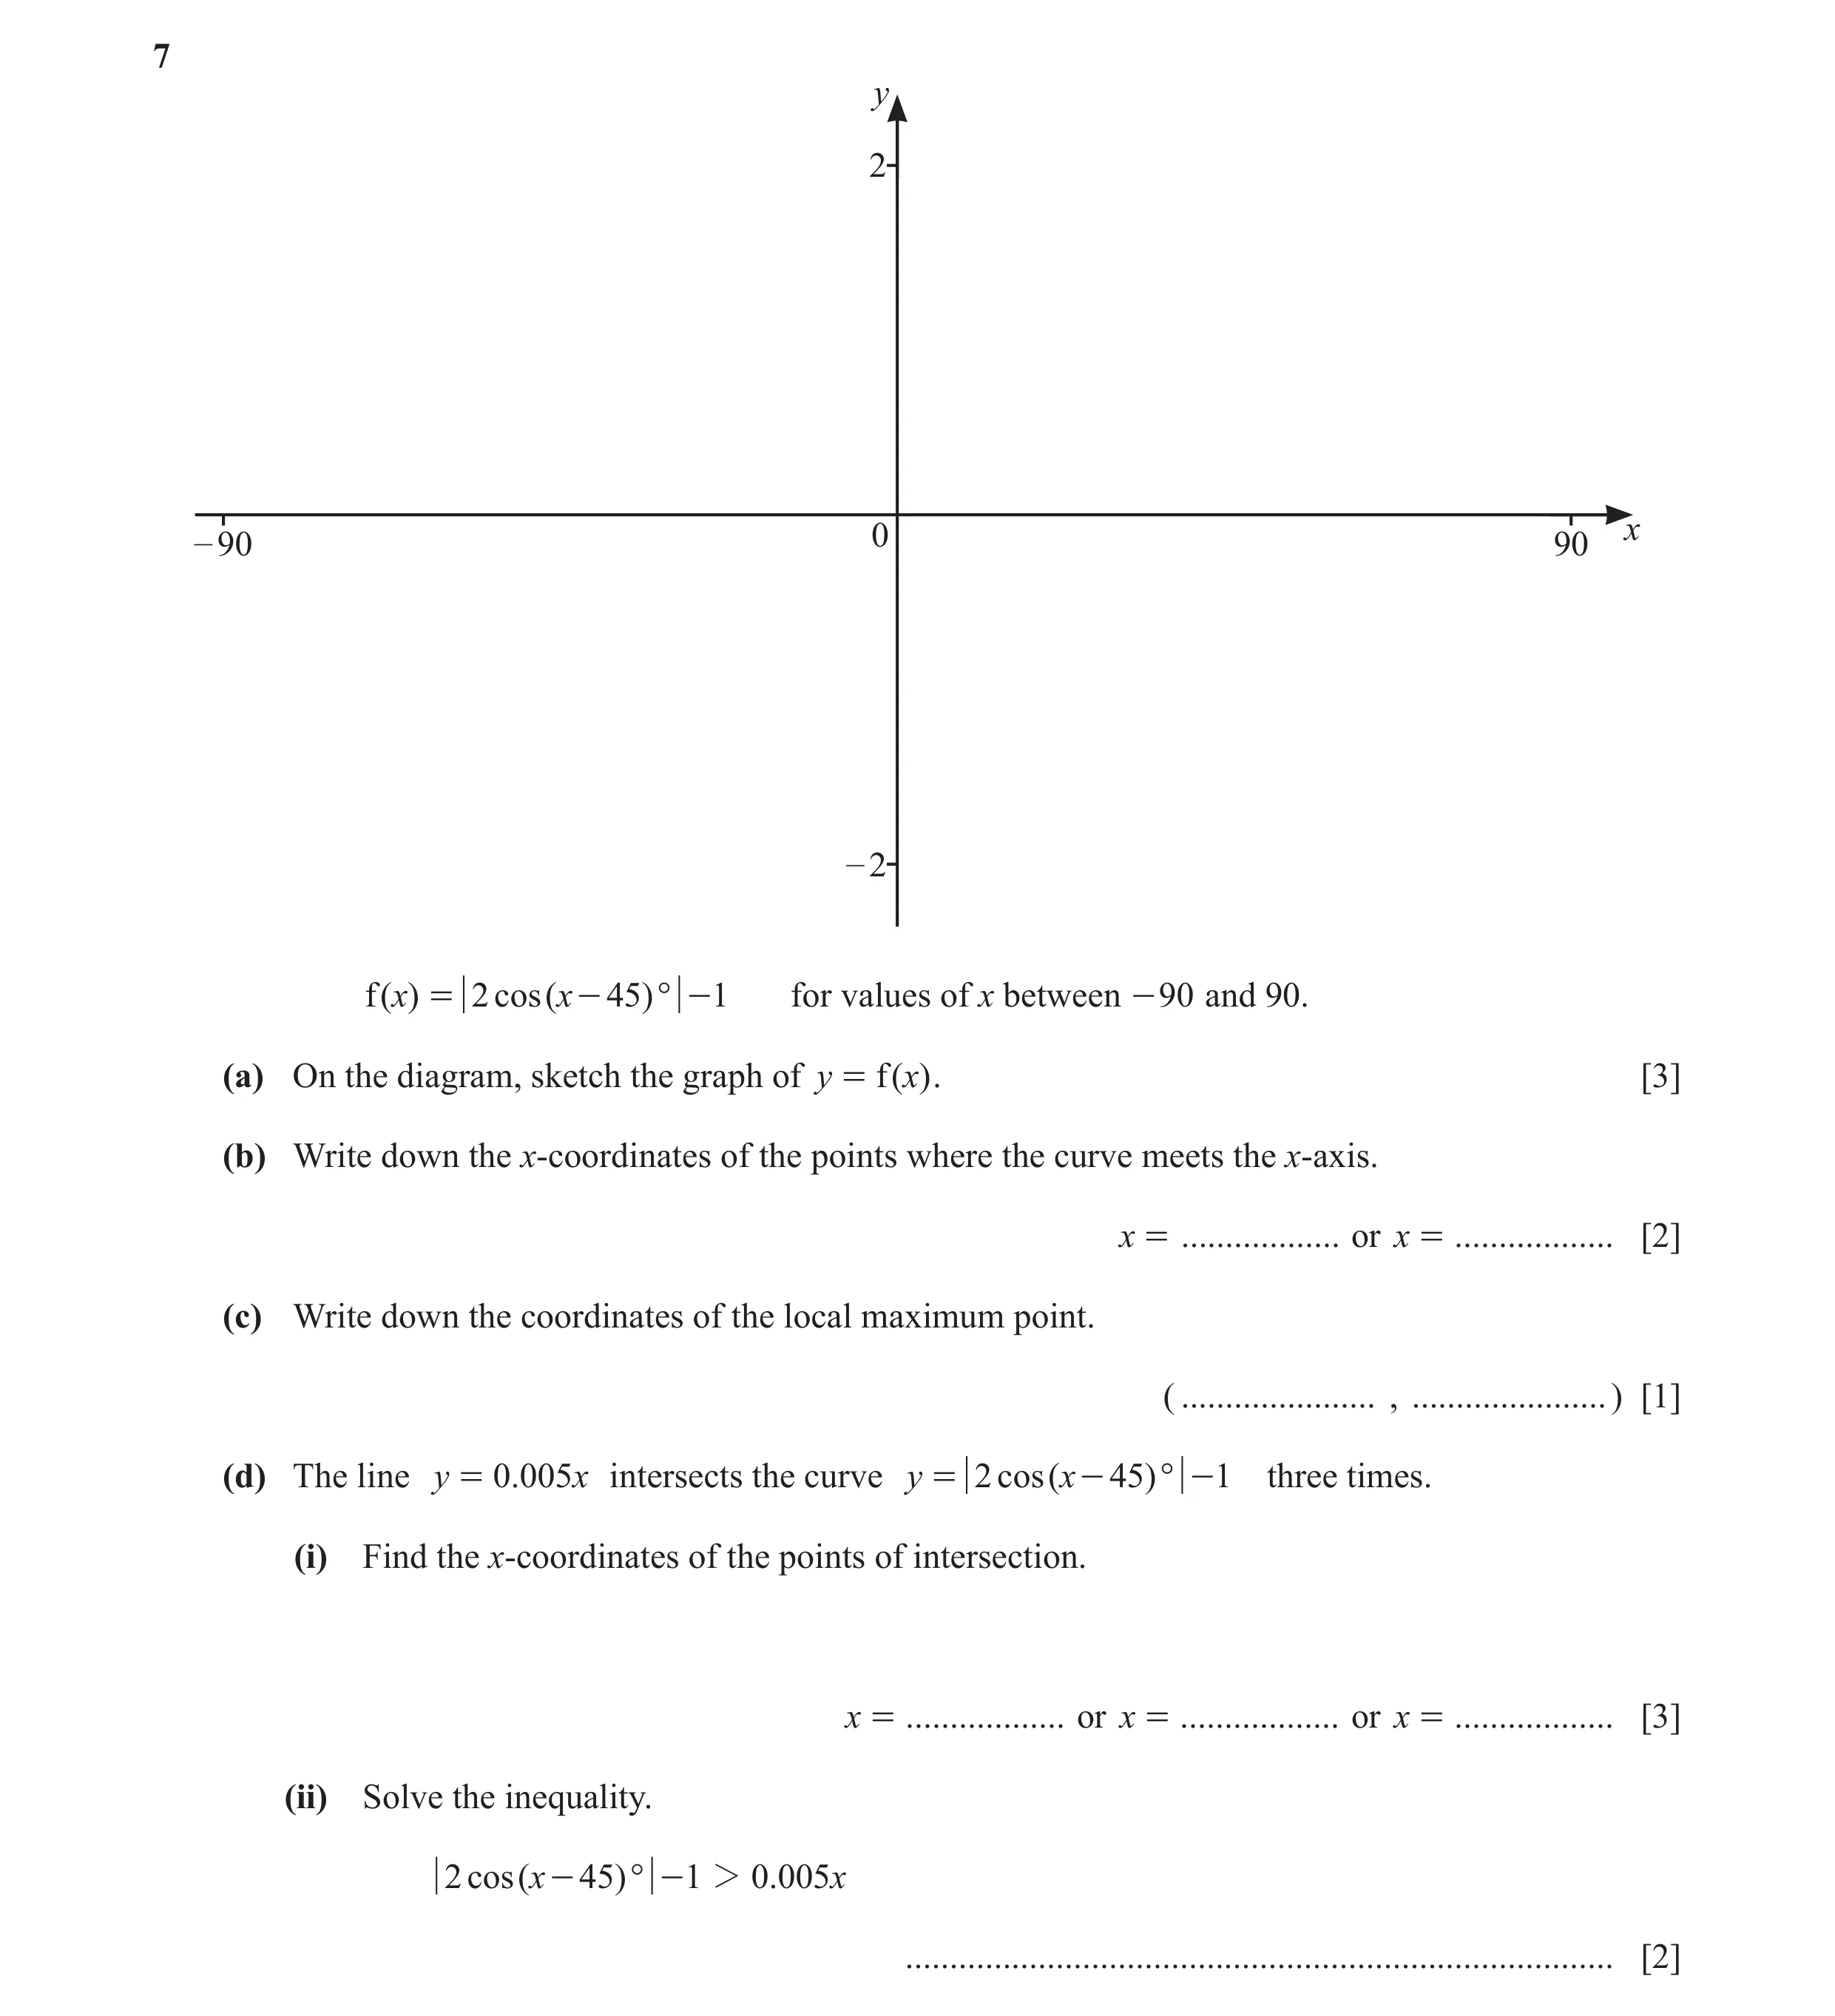
7 y 2 – 90 0 90 x – 2 f ( x) = 2 cos ( x - 45)° - 1 for values of x between - 90 and 90. (a) On the diagram, sketch the graph of y = f ( x) . [3] (b) Write down the x‑coordinates of the points where the curve meets the x‑axis. x = … or x = … [2] (c) Write down the coordinates of the local maximum point. ( … , … ) [1] (d) The line y = 0.005 x intersects the curve y = 2 cos ( x - 45 )° - 1 three times. (i) Find the x‑coordinates of the points of intersection. x = … or x = … or x = … [3] (ii) Solve the inequality. 2 cos ( x - 45)° - 1 2 0.005x … [2]
11 marks
Mark scheme: y f(x)=abs(2cos(x-0.785))-1 1.8 7(a) 1.6 3 Correct graph 1.4 1.2 1 0.8 B1 for 1 max in first quadrant 0.6 0.4 0.2 x B1 for V shape at approx x = –45 -1.7 -1.6 -1.5 -1.4 -1.3 -1.2 -1.1 -1 -0.9 -0.8 -0.7 -0.6 -0.5 -0.4 -0.3 -0.2 -0.1 0.1 0.2 0.3 0.4 0.5 0.6 0.7 0.8 0.9 1 1.1 1.2 1.3 1.4 1.5 1.6 1.7 -0.2 -0.4 -0.6 -0.8 -1 -1.2 -1.4 -1.6 -1.8 7(b) –75, 2 B1 for each –15 7(c) (45, 1) 1 7(d)(i) –64.8 or –64.76... 3 B1 for each –17.9 or – 17.92... or for –65, –18, 89 88.8 or 88.78 … If 0 scored SC1 for sketch of y = 0.005x 7(d)(ii) x < –64.8 2 FT –17.9 < x < 88.8 B1 for one correct
This question in 0607/43 May/June 2023
Q45 · Y 8 0 x – 6 7 – 5 1 (i) On the diagram sketch the lines y =- x + 3 , 2y = x + 5 and y = x… 0607/42 Oct/Nov 2023
5 (a) y 8 0 x – 6 7 – 5 1 (i) On the diagram sketch the lines y =- x + 3 , 2y = x + 5 and y = x for - 6 G x G 7 . 2 [4] (ii) Show, by shading, the region that satisfies these inequalities. 1 y 2- x + 3 2y 1 x + 5 y 2 x [2] 2 (b) y 9 0 x – 1 4.7 – 10 f ( x) = ( x - 2) 3 - 5x + 12 for - 1 G x G 4.7 (i) On the diagram, sketch the graph of y = f ( x) . [2] (ii) Write down the coordinates of the local maximum. ( … , … ) [2] (iii) The equation ( x - 2) 3 - 5x + 12 = k has exactly 2 solutions. Find the values of k. k = … or k = … [2] (iv) g ( x) =- ( x - 1) 2 for - 1 G x G 4.7 On the diagram, sketch the graph of y = g ( x) . [2] (v) Solve f ( x) = g ( x) . x = … [1]
15 marks
Mark scheme: 5(a)(i) correct sketch 4 B1 for correct sketch of 2 y = x + 5 1 B1 for correct sketch of y = − x + 3 2 B1 for correct sketch of y = x passing through (0,0) B1 for all intersections in 1st quadrant 5(a)(ii) correct region indicated 2 FT their lines B1 for region satisfying 2 inequalities or for shading shown but region not clearly indicated 5(b)(i) correct sketch 2 M1 for positive cubic curve with a maximum and minimum 5(b)(ii) (0.709, 6.3[0]) 2 B1 for one correct coordinate 5(b)(iii) –2.3[0], their 6.3[0] 2 B1 for each
This question in 0607/42 Oct/Nov 2023
Q46 · Y 40 0 x -3 4 -40 f ( x) = 2x 3 - 3x 2 - 12x + 7 for -3 G x G 4 (a) Sketch the graph of y… 0607/43 Oct/Nov 2023
4 y 40 0 x -3 4 -40 f ( x) = 2x 3 - 3x 2 - 12x + 7 for -3 G x G 4 (a) Sketch the graph of y = f ( x) . [2] (b) Solve f ( x) = 0 . … [3] (c) Find the values of k for which f ( x) = k has exactly two solutions. k = … or k = … [2] (d) Find the range of values of x for which the gradient of f ( x) is negative. … [2]
9 marks
Mark scheme: 4(a) Correct sketch 2 B1 for any cubic with positive x3 4(b) –2.12 or –2.116... 3 B1 for each 0.537 or 0.5370... 3.08 or 3.079... 4(c) 14 and –13 cao 2 B1 for each or B1 for both14 and -13 seen 4(d) –1 < x < 2 2 B1 for each
This question in 0607/43 Oct/Nov 2023
Q47 · Y 1.5 x -180 0 180 -1.5 f ( x) = ( sin x°) 2 (a) On the diagram, sketch the graph of y =… 0607/42 Feb/March 2024
1 y 1.5 x -180 0 180 -1.5 f ( x) = ( sin x°) 2 (a) On the diagram, sketch the graph of y = f ( x) for - 180 G x G 180 . [2] (b) Write down the amplitude and period of f(x). Amplitude … Period … [2] (c) g ( x) = 0 .002 x + 0 .5 (i) On the diagram, sketch the graph of y = g ( x) for - 180 G x G 180 . [2] (ii) Solve g ( x) = f ( x) for - 180 G x G 180 . … [4] (iii) Solve g ( x) 1 f ( x) for - 180 G x G 180 . … [2]
12 marks
Mark scheme: Question Answer Marks Partial Marks 1(a) Correct curve 2 B1 if cusp at (0, 0) or ‘correct curve’ but height clearly incorrect. 1(b) 0.5 2 B1 for each 180 1(c)(i) Correct sketch 2 maximum of 1 mark if it does not intersect curve 4 times B1 for positive gradient and positive y- intercept 1(c)(ii) –154 or –154.0... 4 B1 for each –40.4 or –40.36 to –40.35 Max 3 if y coordinates included. 50.9 or 50.87... 121 or 120.5 to 120.6 1(c)(iii) –154 < x < –40.4 2 FT from (c)(ii) 50.9 < x < 121 B1 for each Same accuracy as (ii)
This question in 0607/42 Feb/March 2024
Q48 · Y 3 – 3 0 3 x – 3 f( x) = 2 - 1 - 0 .5 x 2 (a) On the diagram, sketch the graph of y = f(… 0607/41 May/June 2024
6 y 3 – 3 0 3 x – 3 f( x) = 2 - 1 - 0 .5 x 2 (a) On the diagram, sketch the graph of y = f( x) , for values of x between - 3 and 3. [3] (b) The graph cuts the x-axis at points A and B. Work out the length AB. AB = … [2] (c) Solve f( x) = 0 .5 . … [2] (d) Write down the coordinates of the minimum point of the graph. ( … , … ) [1] (e) The equation f( )x = k has two solutions. Find the range of values of k. … [2]
10 marks
Mark scheme: 6(a) Correct sketch 3 B2 if peaks below y = 1 (by eye) or rounded at peaks not cusps or outside branches convex from below. or B1 for graph symmetrical about y-axis and in all 4 quadrants 6(b) 4.9[0] or 4.898 to 4.899 2 B1 for 2.45 or –2.45 or 2.449... or –2.449… seen 6(c) –2.24 or –2.236… 2 B1 for each or for both values seen 2.24 or 2.236… 6(d) (0, 1) 1 6(e) k =2 2 B1 for each k < 1
This question in 0607/41 May/June 2024
Q49 · Y NOT TO SCALE Height of stone (metres) O G x Horizontal distance (metres) Vic throws a… 0607/42 May/June 2024
3 (a) y NOT TO SCALE Height of stone (metres) O G x Horizontal distance (metres) Vic throws a stone from point O. The stone travels through the air and lands at point G. The sketch graph shows the path of the stone. x 2 The equation of the path of the stone is y = x - . 10 Draw this graph on your calculator to answer the following questions. (i) Find the height of the stone when x = 7 . … m [1] (ii) Find the maximum height of the stone. … m [1] (iii) Find the distance OG. … m [1] (iv) There are two points in the path of the stone where its height is 2 m. Find the horizontal distance between these two points. … m [2] (b) y 8 – 3 0 3 x – 5 x 1 f ( x) = 2 - , x ! 0 x (i) On the diagram, sketch the graph of y = f ( x) for values of x between -3 and 3. [3] (ii) Write down the equation of each asymptote. … [2] (iii) f ( )x = k has two solutions. Find the range of values of k. … [1] (iv) g ( )x = 3 - x (a) On the diagram, sketch the graph of y = g ( x) for values of x between -3 and 3. [2] (b) Solve the equation f ( )x = 3 - x . … [2]
15 marks
Mark scheme: 3(a)(i) 2.1 oe 1 3(a)(ii) 2.5 oe 1 3(a)(iii) 10 1 3(a)(iv) 4.47 to 4.48 2 B1 for 7.24 or 7.236... or for 2.76 or 2.763 to 2.764 or 5 + 5 or 5 – 5 seen 3(b)(i) Correct sketch 3 B2 for both branches correct but joined or with excessive feathering or curl-backs or B1 for one correct branch 3(b)(ii) x = 0 2 B1 for each y = 0 3(b)(iii) k > 0 cao 1 3(b)(iv)(a) Correct sketch 2 B1 for negative gradient and positive y-intercept or B1 for passing through (3, 0) 3(b)(iv)(b) –0.382 or –0.3824 to –0.3823 2 B1 for each 1.3[0] or 1.302... or B1 for both correct values used in an inequality in x only
This question in 0607/42 May/June 2024
Q50 · Y 20 – 5 0 2 x – 20 f ( x) = 5 + 2x - 4x 2 - x 3 for - 5 G x G 2 (a) On the diagram… 0607/43 May/June 2024
5 y 20 – 5 0 2 x – 20 f ( x) = 5 + 2x - 4x 2 - x 3 for - 5 G x G 2 (a) On the diagram, sketch the graph of y = f ( x) . [2] (b) Find the zeros of f ( x) . … [3] (c) Write down the coordinates of the local minimum. ( … , … ) [2] (d) The point ( a, b) lies on the graph of y = f ( x) where the gradient is positive. Find the range of values for a. … [2] (e) The equation 5 + 2 x - 4 x 2 - x 3 = k has exactly one solution. Write down a possible value of the integer k. … [1]
10 marks
Mark scheme: 5(a) Correct sketch 2 With minimum in 3rd quadrant and maximum in 1st quadrant B1 for any cubic with negative x3 5(b) –4.19 or –4.193 to –4.192 3 B1 for each –1 1.19 or 1.192 to 1.193 or B1 for –1 and B1 for –4.2 and 1.2 5(c) (–2.9[0], –10.1) 2 B1 for each coordinate or (–2.897 to –2.896, –10.05...) 5(d) their –2.9[0] < a < 0.23[0] 2 –2.896 to 2.897 , 0.2301... B1 for 0.23[0] seen or their –2.9[0] < a < k 5(e) Integer ⩽ –11 or ⩾ 6 1
This question in 0607/43 May/June 2024
Q51 · F ( x) = 5 - x g ( x) = 3 ( x + 1) h ( x) = sin xc for 0 G x G 180 2 (a) Find f ( 3) 0607/43 May/June 2024
10 f ( x) = 5 - x g ( x) = 3 ( x + 1) h ( x) = sin xc for 0 G x G 180 2 (a) Find f ( 3) . … [1] (b) Solve f ( x) = 2 . x = … [2] (c) Find and simplify f ( g ( x) ) . … [2] (d) Find g -1( )x . g -1( )x = … [2] (e) Find h ( g ( 29)) . … [2] (f) Using a graphical method, solve h ( g ( x)) = 1 - 0. 01x . y 2 0 x 180 – 2 … [5]
14 marks
Mark scheme: 10(a) 1 1 3 oe 2 10(b) 6 2 1 M1 for 5 – x = 2 2 10(c) 1 1 7 x3 2 1 3 1 x or oe Final answer M1 for 5 (3( x 1)) oe 2 2 2 2 10(d) x 3 2 y oe Final answer M1 for x = 3(y + 1) or x + 1 = or y – 3 = 3x 3 3 10(e) 1 2 B1 for h(90) or M1 for sin(3(x + 1)) oe 10(f) sin(3(x + 1)) soi 1 Correct sketches e.g. 2 or a single graph of h(g(x)) – 1 + 0.01x B1 for each graph 17.5 or 17.52... 2 B1 for 1 correct. 48.7 or 48.71... 115.9 or 115.94...
This question in 0607/43 May/June 2024
Q52 · Y 4 x 0 -2 4 - 4 1 f ( x) = ( 2x - 3)( 2x + 1) (a) On the diagram, sketch the graph of y… 0607/41 Oct/Nov 2024
9 y 4 x 0 -2 4 - 4 1 f ( x) = ( 2x - 3)( 2x + 1) (a) On the diagram, sketch the graph of y = f ( x) for values of x between - 2 and 4. [3] (b) Write down the equations of the asymptotes parallel to the y-axis. … [2] (c) Write down the coordinates of the local maximum. ( … , … ) [2] (d) The line y = x - 2 intersects the curve y = f ( x) three times. Find the x-coordinate of each point of intersection. x = … or x = … or x = … [3] (e) Solve the inequality f ( )x H x - 2 . … [3]
13 marks
Mark scheme: 9(a) Correct sketch 3 B1 for correct shape with 3 branches B1 for the local maximum in correct position, not above x-axis B1 for graph with no excessive overlaps, gaps or curl backs, the upper branches not crossing the x-axis 9(b) x = –0.5 x = 1.5 2 B1 for each 9(c) (0.5, –0.25) 2 B1 for each 9(d) –0.448 1.3[0] 2.15 3 B1 for each If 0 scored, SC1 for –0.45, 1.3 and 2.1 9(e) [ −2 ] x −0.5 3 B1 for each, strict inequality on the asymptote −0.448 x 1.30 values – only penalised once 1.5 x 2.15
This question in 0607/41 Oct/Nov 2024
Q53 · Y 17 0 x -3 3 -13 3 3 2 f ( )x = x - 4x + 2 g ( )x = + x x (a) On the diagram, sketch the… 0607/43 Oct/Nov 2024
4 y 17 0 x -3 3 -13 3 3 2 f ( )x = x - 4x + 2 g ( )x = + x x (a) On the diagram, sketch the graph of y = f ( x) for values of x between -3 and 3. [2] (b) Find the solutions of f ( )x = 0 . x = … , x = … , x = … [3] (c) On the diagram, sketch the graph of y = g ( x) for values of x between -3 and 3. [3] (d) Write down the equation of the asymptote of the graph of y = g ( x) . … [1] (e) Solve f ( x) G g ( x) . … [4]
13 marks
Mark scheme: 4(a) correct sketch 2 M1 for positive cubic shape 4(b) –2.21 0.539 1.68 3 B1 for each correct or –2.214… 0.5391… 1.675… penalise 1 mark if y co-ordinates included if 0 scored SC1 for –2.2, 0.54 and 1.7 4(c) correct sketch 3 For full marks there must be exactly one intersection in the first quadrant B2 for both branches but joined or touching the y axis or B1 for one correct branch on either side of y axis 4(d) x = 0 1 4(e) [ −3] ⩽ x ⩽ –1.96 or –1.959…. 4 B2 for x ⩽ –1.96 0 < x ⩽ 2.48 or 2.482…to 2.483 or B1 for –1.96 seen B2 for 0 < x ⩽ 2.48 or B1 for 2.48 seen
This question in 0607/43 Oct/Nov 2024
Q54 · Y 2 – 3 0 3 x – 2 1 f ( )x = x 2 + 1 (a) On the diagram, sketch the graph of y = f ( x)… 0607/42 Feb/March 2025
8 y 2 – 3 0 3 x – 2 1 f ( )x = x 2 + 1 (a) On the diagram, sketch the graph of y = f ( x) for values of x between -3 and 3. [2] (b) Solve f ( )x 1 x 2 + x - 1. … [4]
6 marks
Mark scheme: 8(a) correct sketch 2 B1 for correct shape but: touching x axis or maximum not on y-axis or too high or too low or distinct curl-up at one or both ends or curvature incorrect on one side. 8(b) x < –1.73 or x < –1.725… 4 B2 for x < –1.73 or x < –1.725… x > 0.852 or x > 0.8524 to 0.8525 or B1 for –1.73 to –1.72 seen B2 for x > 0.852 or x > 0.8524 to 0.8525 or B1 for 0.85 or 0.852 to 0.853 seen If 0 scored SC1 for sketch of positive quadratic
This question in 0607/42 Feb/March 2025
Q55 · Y 20 x – 10 0 10 – 20 x 3 f ( x) = ( x + 2)( x - 3) (a) Sketch the graph of y = f ( x)… 0607/41 May/June 2025
11 y 20 x – 10 0 10 – 20 x 3 f ( x) = ( x + 2)( x - 3) (a) Sketch the graph of y = f ( x) for values of x between -10 and 10. [3] (b) Find the coordinates of the local minimum. ( … , … ) [2] (c) Write down the equations of the asymptotes to the graph of y = f ( x) that are parallel to the y-axis. … [2] (d) Solve f ( )x 2 x + 7 . … [4]
11 marks
Mark scheme: 11(a) Correct sketch 3 No gaps or overlaps B1 for either LH branch or RH branch correct shape (Ignore any joining with middle section for this mark) B1 for middle section correct - must pass through origin with no obvious max or min (ignore any joining with outer branches) 11(b) (5.36, 8.87) 2 B1 for each If 0 scored SC1 for 5.35 and 8.86 11(c) x = –2 2 B1 for each x = 3 11(d) –2 < x < –1.78 4 B1 for –1.78 seen 3 < x < 3.94 B1 for 3.94 seen B1 for each inequality If 0 scored SC1 for straight line with positive gradient, with positive y-intercept and cutting curve twice
This question in 0607/41 May/June 2025
Q56 · Y 10 – 3 0 3 x – 10 4x - 3 f ( )x = 2x + 1 (a) (i) Sketch the graph of y = f ( )x for… 0607/42 May/June 2025
11 y 10 – 3 0 3 x – 10 4x - 3 f ( )x = 2x + 1 (a) (i) Sketch the graph of y = f ( )x for values of x between -3 and 3. [3] (ii) Write down the equations of the 2 asymptotes of the graph of y = f ( )x . … , … [2] (iii) Write down the coordinates of the points where the graph crosses the axes. ( … , … ) ( … , … ) [2] (b) Solve the inequality. 4 x - 3 2 2 - x 2 x + 1 … [4]
11 marks
Mark scheme: 11(a)(i) Correct sketch 3 Both branches correct; without branches joined, 10101010 excessive feathering, curl backs, overlaps or gaps. RH branch cutting axes correctly B1 for LH branch correct shape 5555 B1 for RH branch correct shape 0000 3333 -2-2-2-2 -1-1-1-1 0000 1111 2222 3333 -5-5-5-5 -10-10-10-10 11(a)(ii) y = 2 2 B1 for each x = –0.5 oe 11(a)(iii) (0, –3) 2 B1 for each (0.75, 0) oe 11(b) −1.85 x −0.5 4 B1 for –1.85 x 1.35 B1 for 1.35 B1 for their −1.85 x −0.5 B1 for x their1.35 If 0 scored, SC1 for ruled line with positive y- intercept, negative gradient and intersecting both branches OR SC1 for 2 x 2 + x − 5 oe
This question in 0607/42 May/June 2025
Q57 · Use a graphical method to solve 5 # 0 0607/42 May/June 2025
13 Use a graphical method to solve 5 # 0. 8 x = 2x + 7 . Give your answer correct to 2 decimal places. x = … [3]
3 marks
Mark scheme: 13 Correct sketch e.g. M2 M1 for exponential graph –0.63 B1
This question in 0607/42 May/June 2025
Q58 · Y 10 x -3 0 3 -10 3 2 f ( )x = - x x (a) On the diagram, sketch the graph of y = f ( x)… 0607/43 May/June 2025
8 y 10 x -3 0 3 -10 3 2 f ( )x = - x x (a) On the diagram, sketch the graph of y = f ( x) for values of x between -3 and 3. [3] (b) Find the zero of f ( )x . … [1] (c) Find the equation of the asymptote to the graph. … [1] (d) Find the coordinates of the local maximum point. ( … , … ) [2] (e) The equation f ( )x = k has one solution. Find the range of values of k. … [1]
8 marks
Mark scheme: 8(a) Correct sketch 10101010 3 Both branches correct, without excessive gaps, curl backs, overlaps or feathering. 5555 Max point in 3rd quadrant and intersection with x-axis between 1 and 2. 3333 -2-2-2-2 -1-1-1-1 0000 0000 1111 2222 3333 B1 each branch correct shape (if joined B1 B1) -5-5-5-5 8(b) 1.44 or 1.442... 1 8(c) x = 0 1 8(d) (–1.14, –3.93) 2 B1 for each or for (–1.1, –3.9) 8(e) k > –3.93 1 FT their y-coordinate in part (d)
This question in 0607/43 May/June 2025
Q59 · Y 5 x 0 – 5 5 – 5 2x f ( x) = x + 2 (a) On the diagram, sketch the graph of y = f ( x)… 0607/41 Oct/Nov 2025
8 y 5 x 0 – 5 5 – 5 2x f ( x) = x + 2 (a) On the diagram, sketch the graph of y = f ( x) for values of x between -5 and 5. [3] (b) Find the coordinates of the local minimum. ( … , … ) [2] (c) Solve f ( x) = 3 . … [2] (d) Write down a value of k for which f ( x) = k has only one solution. … [1] (e) Find the range of values of k for which f ( x) = k has no solutions. … [2]
10 marks
Mark scheme: 8(a) Correct sketch 3 B1 for either branch with correct shape B1 for two branches of the correct shape not crossing the x-axis B1 for no excessive overlaps, gaps, curlbacks or feathering If sketch not fully correct, a maximum of 2 marks 8(b) (– 0.557, 0.471) or 2 B1 for each coordinate (– 0.5573…, 0.4710…) or B1 for (– 0.56, 0.47) 8(c) – 1.91 or –1.911… 2 B1 for each 4.22 or 4.222… or B1 for both correct with y-coordinates included or both correct in an inequality or B1 for – 1.9 and 4.2 8(d) their 0.471 or for k < 0 1 8(e) 0 ⩽ k < their 0.471 oe 2 B1 for either inequality
This question in 0607/41 Oct/Nov 2025
Q60 · Y 4 0 x – 4 4 – 4 1 (a) f ( x) = - 1 ( 2x - 1)( x + 1) (i) On the diagram, sketch the… 0607/42 Oct/Nov 2025
8 y 4 0 x – 4 4 – 4 1 (a) f ( x) = - 1 ( 2x - 1)( x + 1) (i) On the diagram, sketch the graph of y = f ( x) for values of x between -4 and 4. [3] (ii) Write down the x-intercepts. … [2] (iii) Write down the equations of the asymptotes parallel to the y-axis. … [2] (b) g ( x) = 0. 5 ( x + 1) On the diagram, sketch the graph of y = g ( x) for values of x between -4 and 4. [1] (c) Solve the inequality f ( x) H g ( x) . … [3]
11 marks
Mark scheme: 8(a)(i) Correct sketch 3 B1 for correct outer branches both crossing x-axis B1 for middle branch in correct position B1 graph in 3 sections with no excessive overlaps (except if penalised already in second B1) or gaps or curlback If sketch not correct max of 2 marks 8(a)(ii) –1.28 –1.281 to –1.280 2 B1 for each 0.781 0.7807 to 0.7808 or for –1.3 and 0.78 8(a)(iii) x = –1 2 B1 for each x = 0.5 oe 8(b) Correct line 1 8(c) x − 2.84 –2.837 to –2.836 3 B1 for each, strict inequality on the −1.33 x −1 –1.327… asymptote values, only penalised once. If 0 scored SC1 for 2 correct intersections 0.5 x 0.664 0.6640… –2.8…, –1.3…, 0.66… seen in an inequality
This question in 0607/42 Oct/Nov 2025
![Question 1: y 10 x –4 0 4 –10 f x = 9 - x 2 ^ h (a) On the diagram, sketch the graph of y = f x for values of x between -4 and 4. ^ h, [4] (b) Solve f …](https://img.pastlit.com/crops/484c9d1d-657c-4a4b-afac-eebbda9b3f0f/q7.webp) 1 / 67
1 / 67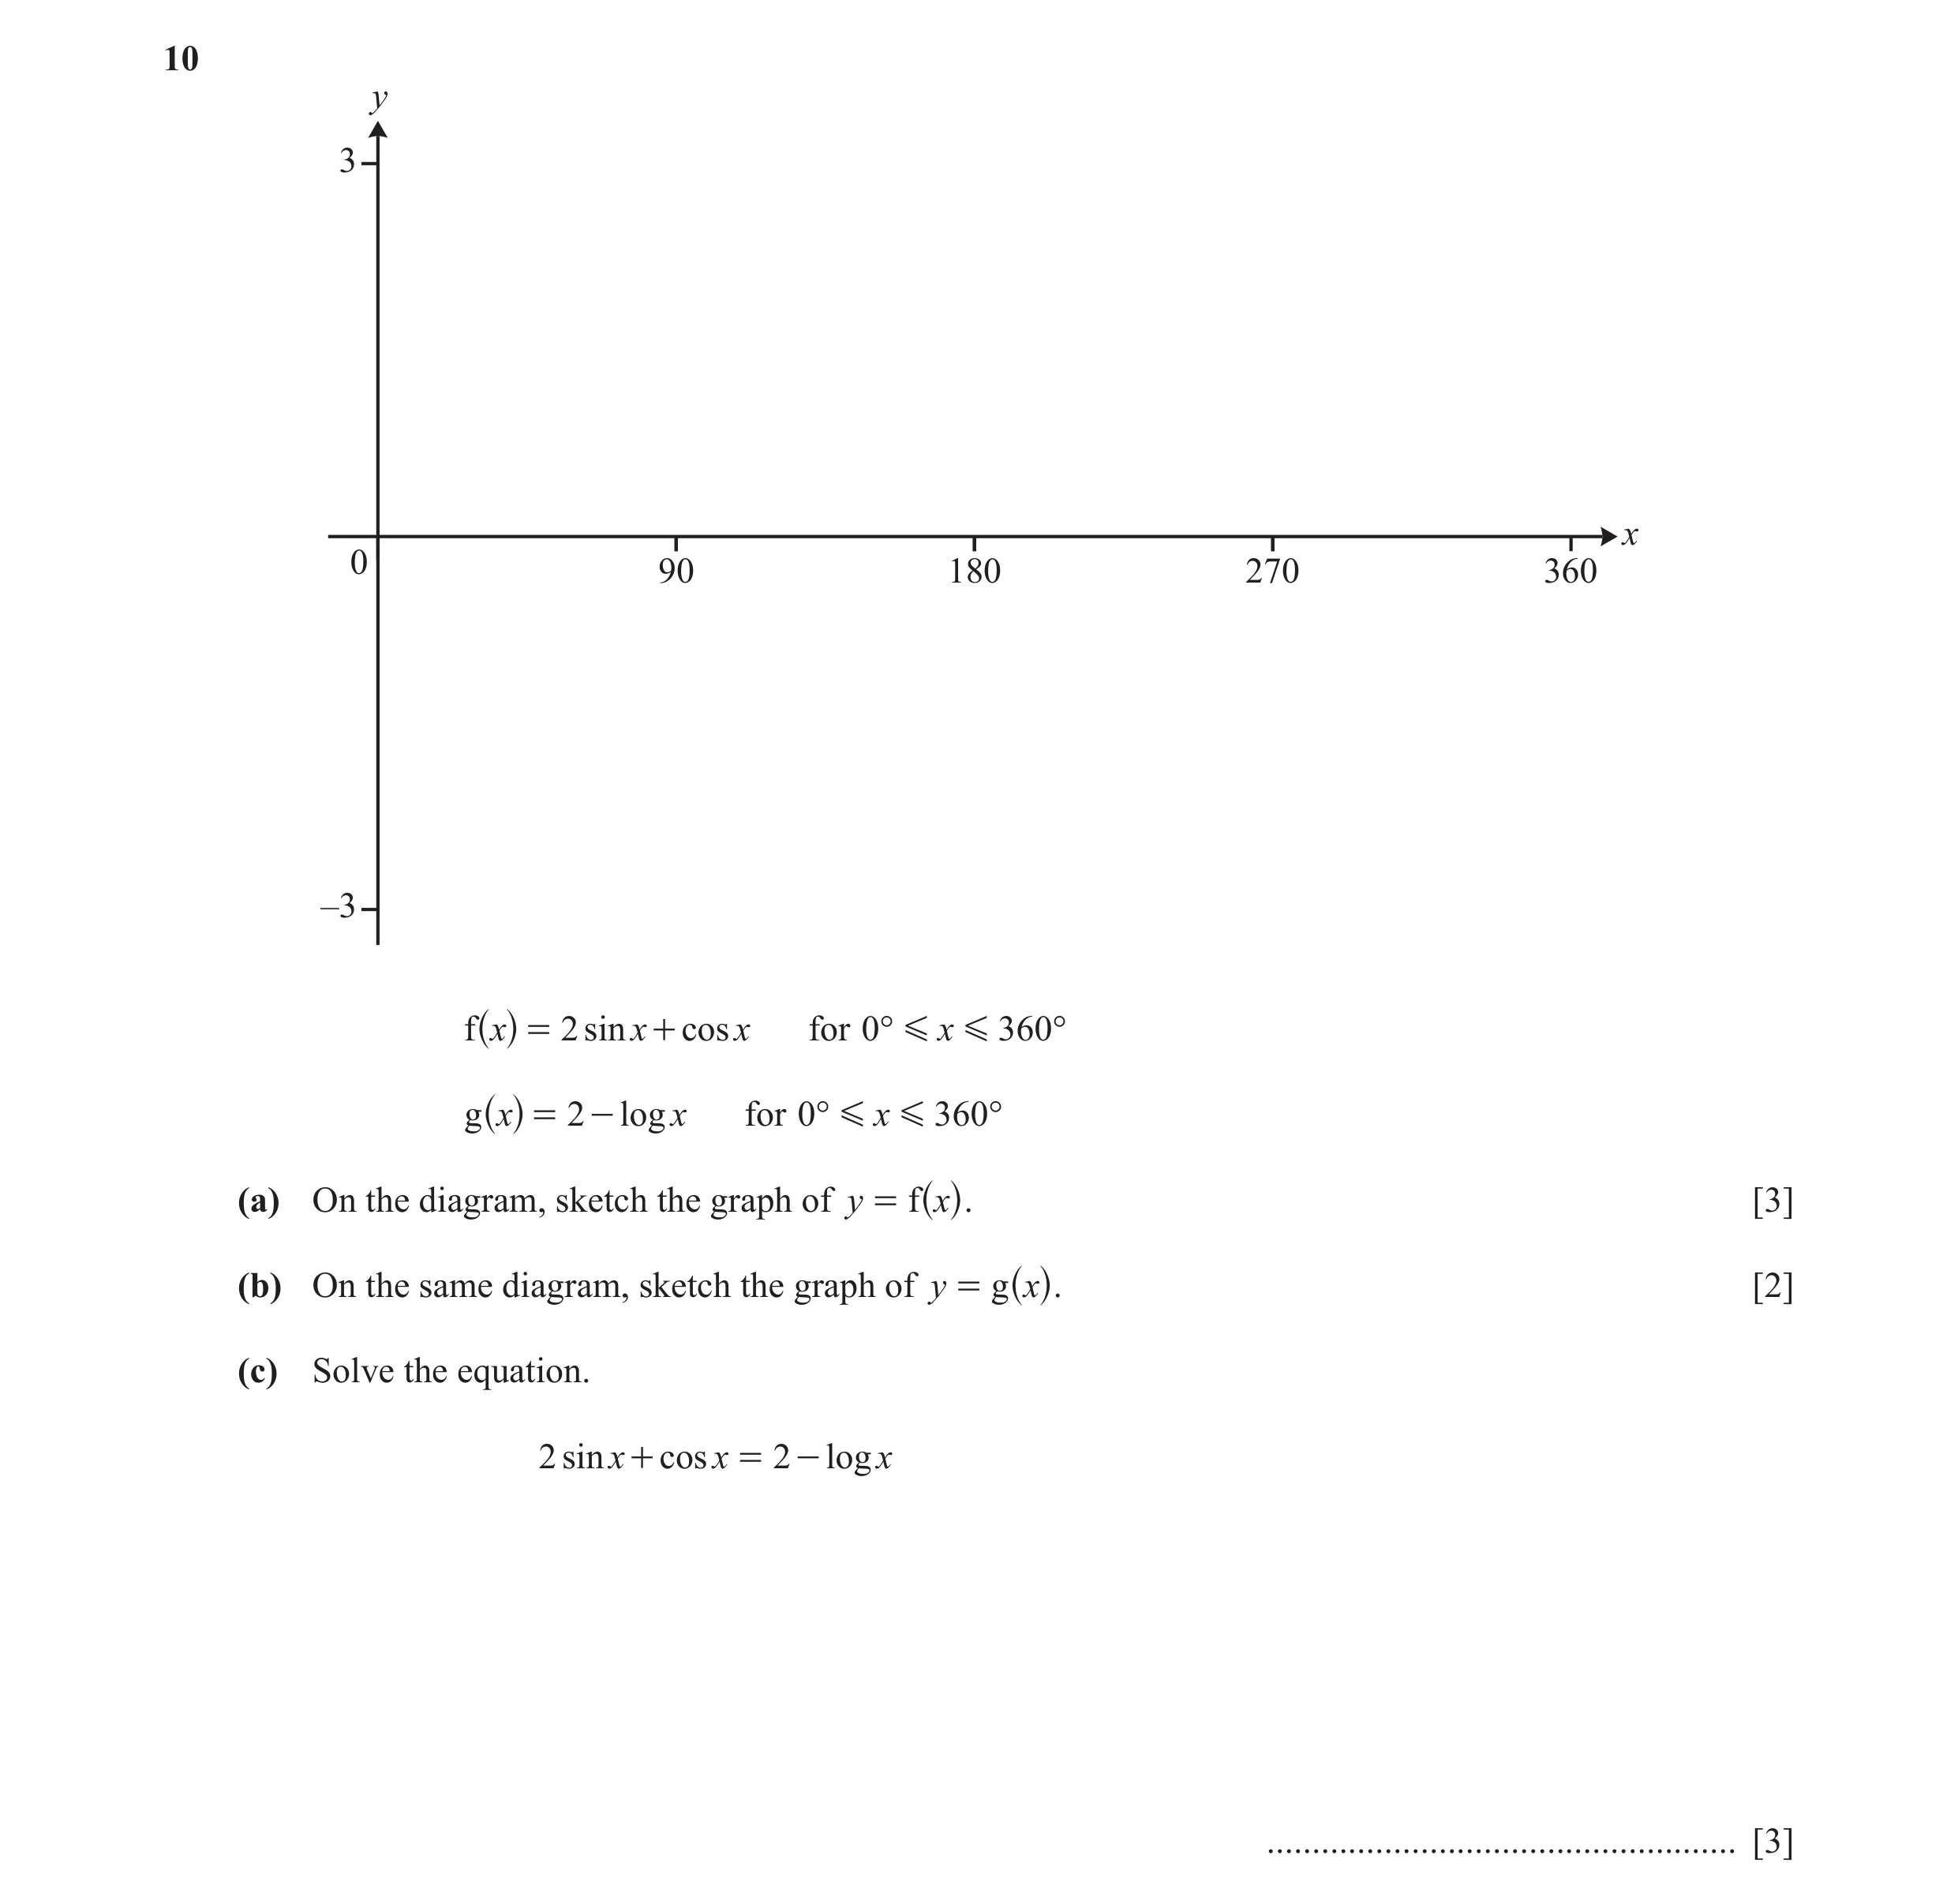 2 / 67
![Question 3: y 6 x 0 10 f(x) = x - 5 log x (a) On the diagram, sketch the graph of y = f(x) for 0 1 x G 10 . [2] (b) Find the co-ordinates of the local …](https://img.pastlit.com/crops/e2d280d6-dfc3-446a-a80a-6728e314af28/q6.webp) 3 / 67
3 / 67![Question 4: y 5 x –3 0 4 –5 x f (x) = 2 (x - x - 2) (a) On the diagram, sketch the graph of y = f (x) for values of x from –3 to 4. [3] (b) Find the tw…](https://img.pastlit.com/crops/1f52b08e-a417-40e9-ab91-e7929d723d57/q4.webp) 4 / 67
4 / 67![Question 5: y 12 0 x 4 –2 f (x) = 10 + x - x 2 for 0 G x G 4 (a) (i) On the diagram, sketch the graph of y = f (x) . [2] (ii) Write down the co-ordinat…](https://img.pastlit.com/crops/6adb789a-abcc-4dfe-a194-f988a84ee243/q9.webp)
![Question 6: y 5 x −5 0 5 −5 x f (x) = 1 - 2 (x - 9 ) (a) On the diagram, sketch the graph of y = f ( x) , for values of x between -5 and 5. [3] (b) Wri…](https://img.pastlit.com/crops/4a4d3c77-ddfd-47e3-a979-04ab09eb9e28/q2.webp) 6 / 67
6 / 67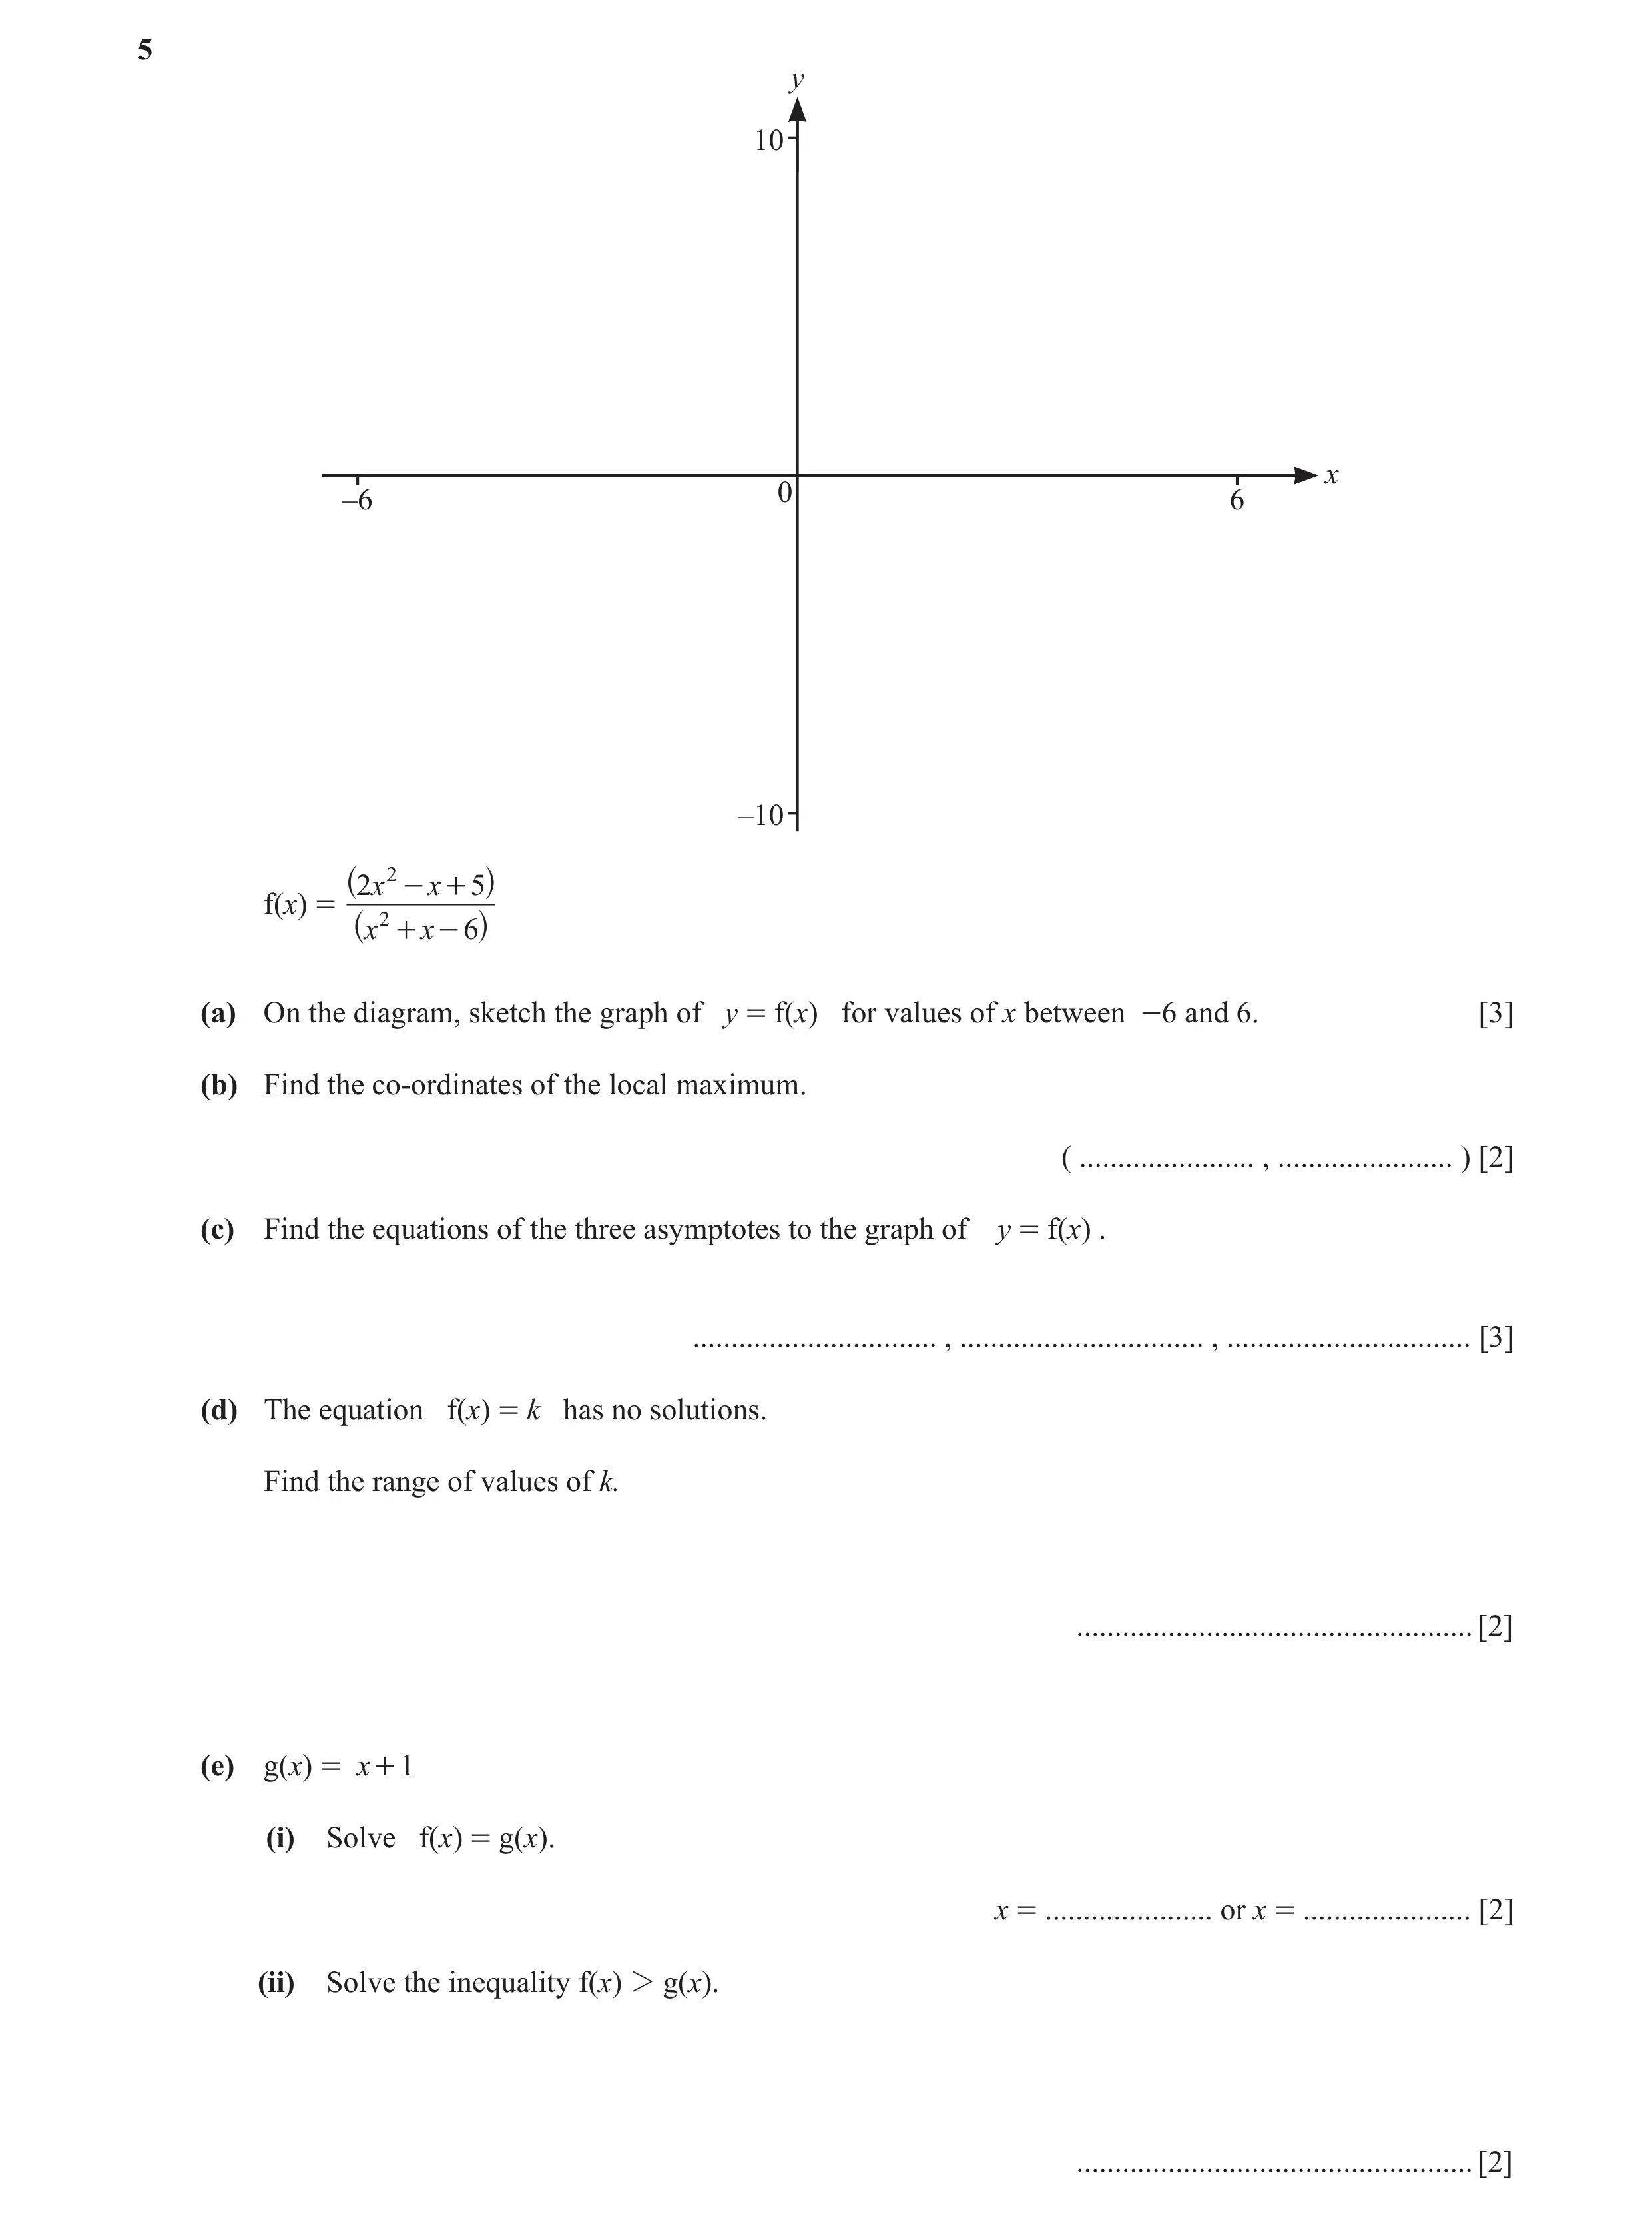 7 / 67
![Question 8: y 50 x 0 –3 5 –50 f ()x = x 3 - 3x 2 - 4x + 1 for - 3 G x G 5 . (a) On the diagram, sketch the graph of y = f ( x) . [2] (b) Write down the…](https://img.pastlit.com/crops/f0ca2eae-4d15-495f-81b6-70ddbd196247/q9.webp) 8 / 67
8 / 67![Question 9: y 30 x –4 0 4 –20 f ()x = x 3 - 12x + 6 (a) On the diagram, sketch the graph of y = f ( x) for -4 G x G 4 . [2] (b) Find the positive zeros…](https://img.pastlit.com/crops/f087cf99-e494-4936-a76c-139454080cf6/q5.webp) 9 / 67
9 / 67![Question 10: y 15 x –6 0 6 –10 (2x - 3) f (x) = (x + 2) (a) On the diagram, sketch the graph of y = f(x) for values of x between -6 and 6. [3] (b) Write…](https://img.pastlit.com/crops/f087cf99-e494-4936-a76c-139454080cf6/q12.webp) 10 / 67
10 / 67![Question 11: y 6 –2 0 7 x –6 (x + 2) f (x) = (x - 1)(x - 4) (a) On the diagram, sketch the graph of y = f ( x) for values of x between -2 and 7. [3] (b)…](https://img.pastlit.com/crops/73ce2179-1507-4170-9646-3503f51b9597/q11.webp) 11 / 67
11 / 67![Question 12: y 3 0 x 5 x + 1 (a) On the diagram, sketch the graph of y = log for 0 1 x G 5 . [2] b x l x + 1 (b) Write down the equations of the asympto…](https://img.pastlit.com/crops/ed013b83-cad4-487f-b363-27664282279b/q2.webp) 12 / 67
12 / 67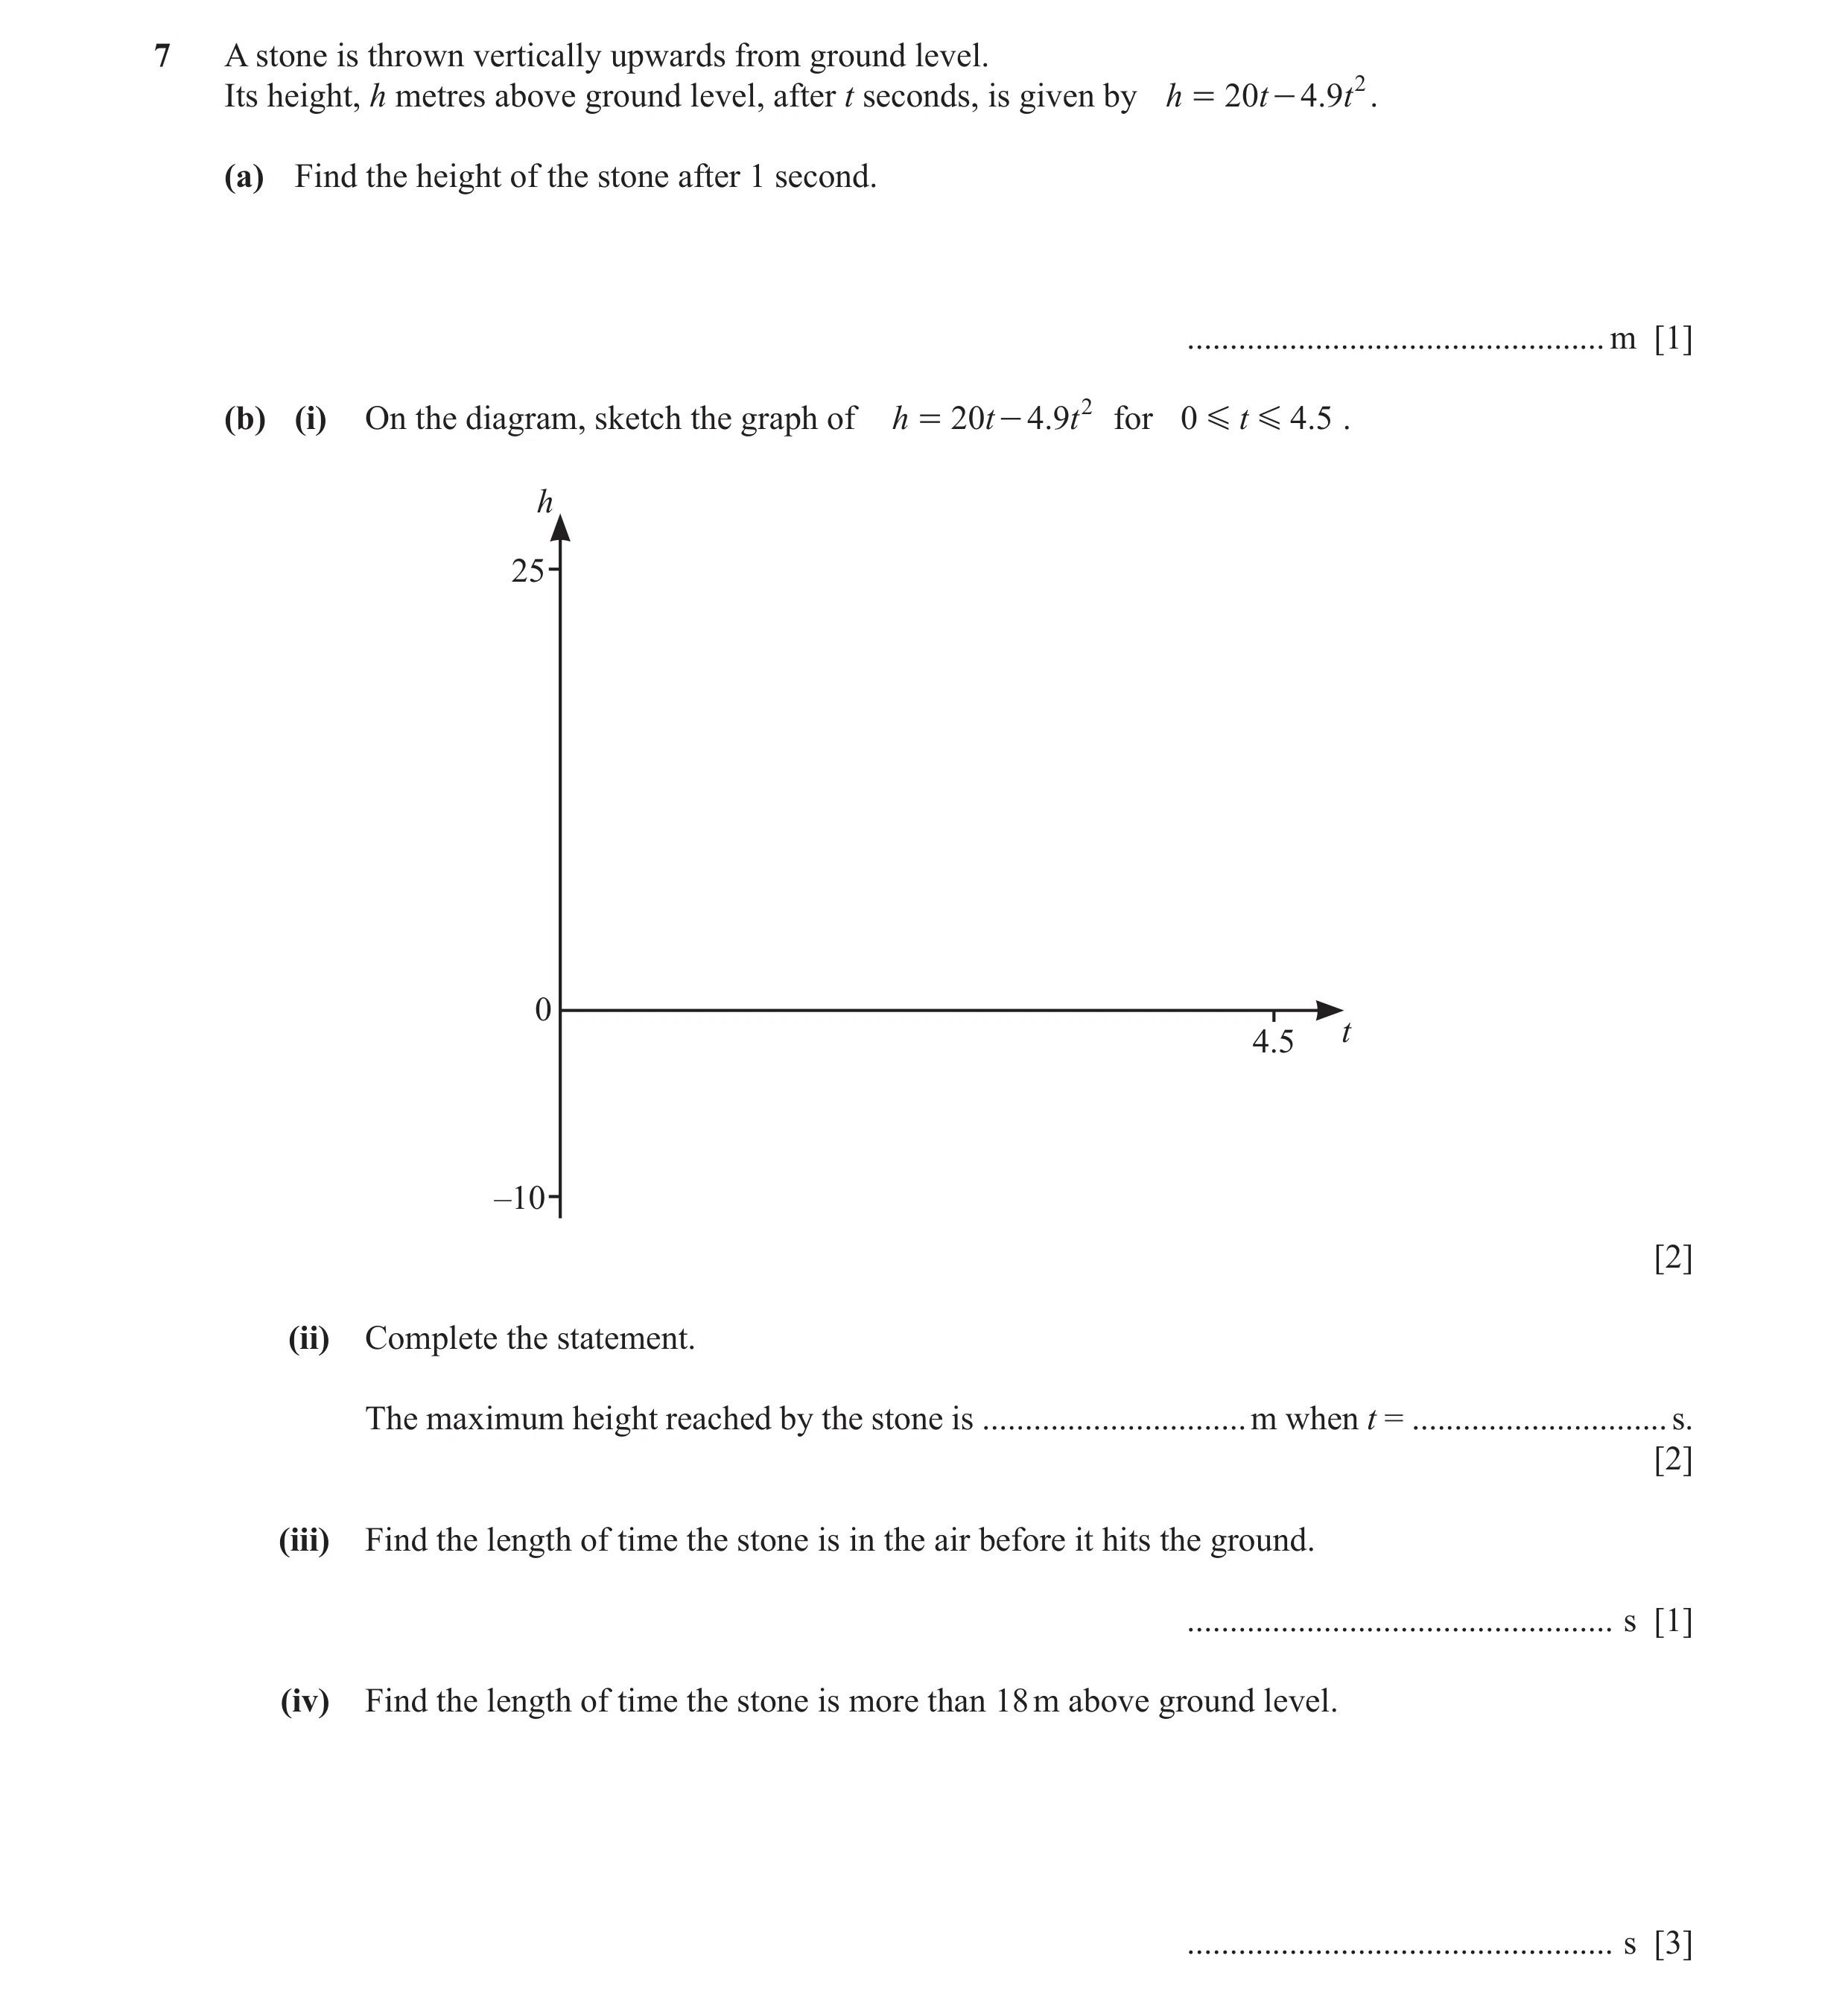 13 / 67
![Question 14: y 6 –270 0 270 x –6 (a) On the diagram, sketch the graph of y = f(x) where 1 f (x) = for values of x between -270 and 270 . cos x [3] (b) W…](https://img.pastlit.com/crops/802bc314-abf0-45ac-8900-48a1c2fc1e2f/q4.webp) 14 / 67
14 / 67![Question 15: y 6 –3 0 3 x –6 (a) On the diagram, sketch the graph of y = f(x), where f ()x = x 2 - 4 for values of x between -3 and 3. [3] (b) Write dow…](https://img.pastlit.com/crops/802bc314-abf0-45ac-8900-48a1c2fc1e2f/q8.webp) 15 / 67
15 / 67![Question 16: y 4 –3 0 3 x –2 1 f (x) = 3 x ! 1 (1 - x ), (a) On the diagram, sketch the graph of y = f ( x) for values of x between - 3 and 3. [3] (b) W…](https://img.pastlit.com/crops/f7f76c9a-70f0-4f75-9f22-f71c2a04bbd6/q3.webp) 16 / 67
16 / 67![Question 17: f ()x = , x ! 2 g ()x = x + 2 h ()x = x 2 x - 2 (a) Find f (6 ). .................................................... [1] (b) Solve f (x) =…](https://img.pastlit.com/crops/4753797a-683d-4d64-9050-854c4b4a6bf7/q2.webp)
![Question 18: y 4 x –3 0 3 –4 (a) On the diagram, sketch the graph of y = f ( x), where 1 f (x) = for values of x between - 3 and 3. x (x - 1)(x + 1) [4]…](https://img.pastlit.com/crops/4753797a-683d-4d64-9050-854c4b4a6bf7/q12.webp) 19 / 67
19 / 67![Question 19: y 15 x –1.5 0 3 –15 f ()x = 2x 3 - 5x 2 + 3 for - 1.5 G x G 3 (a) On the diagram, sketch the graph of y = f (x). [2] (b) Find the zeros of …](https://img.pastlit.com/crops/89141344-e270-4675-8984-1bad38442a79/q3.webp) 20 / 67
20 / 67![Question 20: y 8 x –8 0 8 –8 3x + 2 f (x) = (x + 2)(x - 3) (a) On the diagram, sketch the graph of y = f ( x) for values of x between - 8 and 8. [3] (b)…](https://img.pastlit.com/crops/89141344-e270-4675-8984-1bad38442a79/q12.webp) 21 / 67
21 / 67![Question 21: y 6 x – 0.5 0 4.5 – 6 f ( )x = x 3 - 6x 2 + 8x for - 0.5 G x G 4.5 (a) On the diagram, sketch the graph of y = f ( x) . [2] (b) Solve the i…](https://img.pastlit.com/crops/d96717a8-51ec-49c1-b3b9-d2d63513fcfe/q9.webp) 22 / 67
22 / 67![Question 22: y 9 x – 6 0 2 – 3 1 (a) f ( )x = 2 + x + 2 (i) On the diagram, sketch the graph of y = f ( x) for values of x between - 6 and 2. [2] (ii) W…](https://img.pastlit.com/crops/9802356d-780b-4be5-b48d-7985069be94b/q7.webp) 23 / 67
23 / 67![Question 23: y 30 x – 3 0 5 – 40 f ( )x = x 3 - 4x 2 - 3x + 18 (a) On the diagram, sketch the graph of y = f ( x) for - 3 G x G 5 . [2] (b) Solve the eq…](https://img.pastlit.com/crops/55531e92-3a07-4e01-93ea-a83e4be55718/q4.webp) 24 / 67
24 / 67![Question 24: y 5 – 1.5 0 1.5 x – 5 3 1 f ( )x = x - x (a) On the diagram, sketch the graph of y = f ( x) , for values of x between - .15 and 1.5 . [3] (…](https://img.pastlit.com/crops/e81a60cd-c2ce-4efd-b2f5-64632c266bcc/q7.webp) 25 / 67
25 / 67![Question 25: (a) y 4 x – 2 0 2 (i) On the diagram, sketch the graph of y = 1.5 -x for - 2 G x G 2 . [2] (ii) Solve the inequality 0.5 G 1.5 -x G 1. ....…](https://img.pastlit.com/crops/c1682ce7-7004-48f5-a553-e846709c547a/q8.webp)
![Question 26: y 13 – 4 0 3 x – 3 1 g ( )x = , x ! 2 x - 2 (a) On the diagram, sketch the graph of y = g(x) for values of x between - 4 and 3. [3] (b) Wri…](https://img.pastlit.com/crops/96f86af9-b117-4d29-a973-9cdd9773b93a/q7.webp) 28 / 67
28 / 67
![Question 28: y 15 – 5 0 5 x – 15 f ( )x = 10 - x 2 (a) On the diagram, sketch the graph of y = f(x) for - 5 G x G 5 . [2] (b) Solve the equation f(x) = …](https://img.pastlit.com/crops/694f5ff6-d7ee-42a5-b05a-9e23dd2b52bf/q4.webp) 31 / 67
31 / 67![Question 29: y 5 – 5 0 5 x – 5 x 2 + 3 f ( x) = ( 1 - x)( x + 3) (a) On the diagram, sketch the graph of y = f(x) for values of x between -5 and 5. [3] …](https://img.pastlit.com/crops/694f5ff6-d7ee-42a5-b05a-9e23dd2b52bf/q13.webp) 32 / 67
32 / 67![Question 30: y 5 – 5 0 5 x – 5 4 f ( )x = x - x (a) On the diagram, sketch the graph of y = f(x) for values of x between -5 and 5. [2] (b) Find the zero…](https://img.pastlit.com/crops/8dcc3938-8ab0-49dc-92a5-1ee2f702d52c/q1.webp) 33 / 67
33 / 67![Question 31: y 10 0 x 2.5 f ( x) = x x, x 2 0 (a) On the diagram, sketch the graph of y = f(x) for 0 1 x G 2.5 . [2] (b) Find the coordinates of the loc…](https://img.pastlit.com/crops/8dcc3938-8ab0-49dc-92a5-1ee2f702d52c/q9.webp) 34 / 67
34 / 67![Question 32: y 5 – 2 0 2 x – 5 f ( x) = 3 x - x 3 for - 2 G x G 2 (a) On the diagram, sketch the graph of y = f ( x) . [2] (b) Find the coordinates of t…](https://img.pastlit.com/crops/3b41bfb5-851c-4bbb-b662-471615fa4596/q8.webp) 35 / 67
35 / 67![Question 33: y 12 x – 4 0 4 – 12 f ( )x = 4 - x 2 for - 4 G x G 4 (a) On the diagram, sketch the graph of y = f ( x) . [2] (b) Write down the zeros of f…](https://img.pastlit.com/crops/cf69a19c-2eb3-4d8a-b8f2-8241c5df22be/q7.webp) 36 / 67
36 / 67![Question 34: y 5 – 3 0 1 x – 5 1 f ( x) = 2 x + 4 - 2 x (a) On the diagram, sketch the graph of y = f ( x) for values of x between - 3 and 1. [3] (b) Wr…](https://img.pastlit.com/crops/96b06246-de38-4446-9003-fdaf39ad4eaa/q3.webp) 37 / 67
37 / 67![Question 35: y 4 – 4 0 4 x – 4 (a) On the diagram, sketch the graph of y = f( x) , where f( )x = 4 - 2 x for values of x between - 4 and 4. [3] (b) Writ…](https://img.pastlit.com/crops/ae1d0f2c-e36d-4534-a537-da04a3656f07/q4.webp) 38 / 67
38 / 67![Question 36: y 20 x 0 – 3 3 – 10 f ( x) = x 3 - 5x + 3 for - 3 G x G 3 (a) On the diagram, sketch the graph of y = f ( x) . [2] (b) Find the coordinates…](https://img.pastlit.com/crops/58458fb3-4fc8-463e-ab91-9503591c55c3/q5.webp) 39 / 67
39 / 67![Question 37: y 4 x 0 –1 5 – 4 (a) On the diagram, sketch the graph of y = f ( x) , where 1 f ( x) = for values of x between - 1 and 5. [3] ( x - 1)( x -…](https://img.pastlit.com/crops/ddd11990-a76b-48a6-b616-6e702751ea62/q5.webp) 40 / 67
40 / 67![Question 38: y 8 – 5 0 5 x – 9 5 f ( x) = x + ( x - 2)( x + 3) (a) Sketch the graph of y = f ( x) for values of x between - 5 and 5. [4] (b) Write down …](https://img.pastlit.com/crops/b12f2f85-7b1b-4ede-ac89-d2fc695d452b/q11.webp)
![Question 39: y 1 – 5 0 5 x – 3 1 1 f ( x) = - 2 x x (a) On the diagram, sketch the graph of y = f ( x) for values of x between - 5 and 5. [2] (b) Find f…](https://img.pastlit.com/crops/b1c6253c-bcbe-4c33-9614-2f00e9d25aa9/q2.webp)
![Question 40: y 5 – 5 0 5 x – 5 x 2 f ( )x = 2 - 2 x - x - 2 (a) On the diagram, sketch the graph of y = f ( x) for values of x between -5 and 5. [4] (b)…](https://img.pastlit.com/crops/450d362e-2f74-40e0-b252-9d6d341f7fcc/q6.webp) 44 / 67
44 / 67
![Question 42: y 1 0 x 360 –1 f ( x) = cos x° for 0 G x G 360 (a) On the diagram, sketch the graph of y = f ( x) . [2] (b) Find the zeros of f ( )x . ....…](https://img.pastlit.com/crops/9de25c6e-d93d-4815-8c28-1cb03f0bc1ea/q3.webp) 47 / 67
47 / 67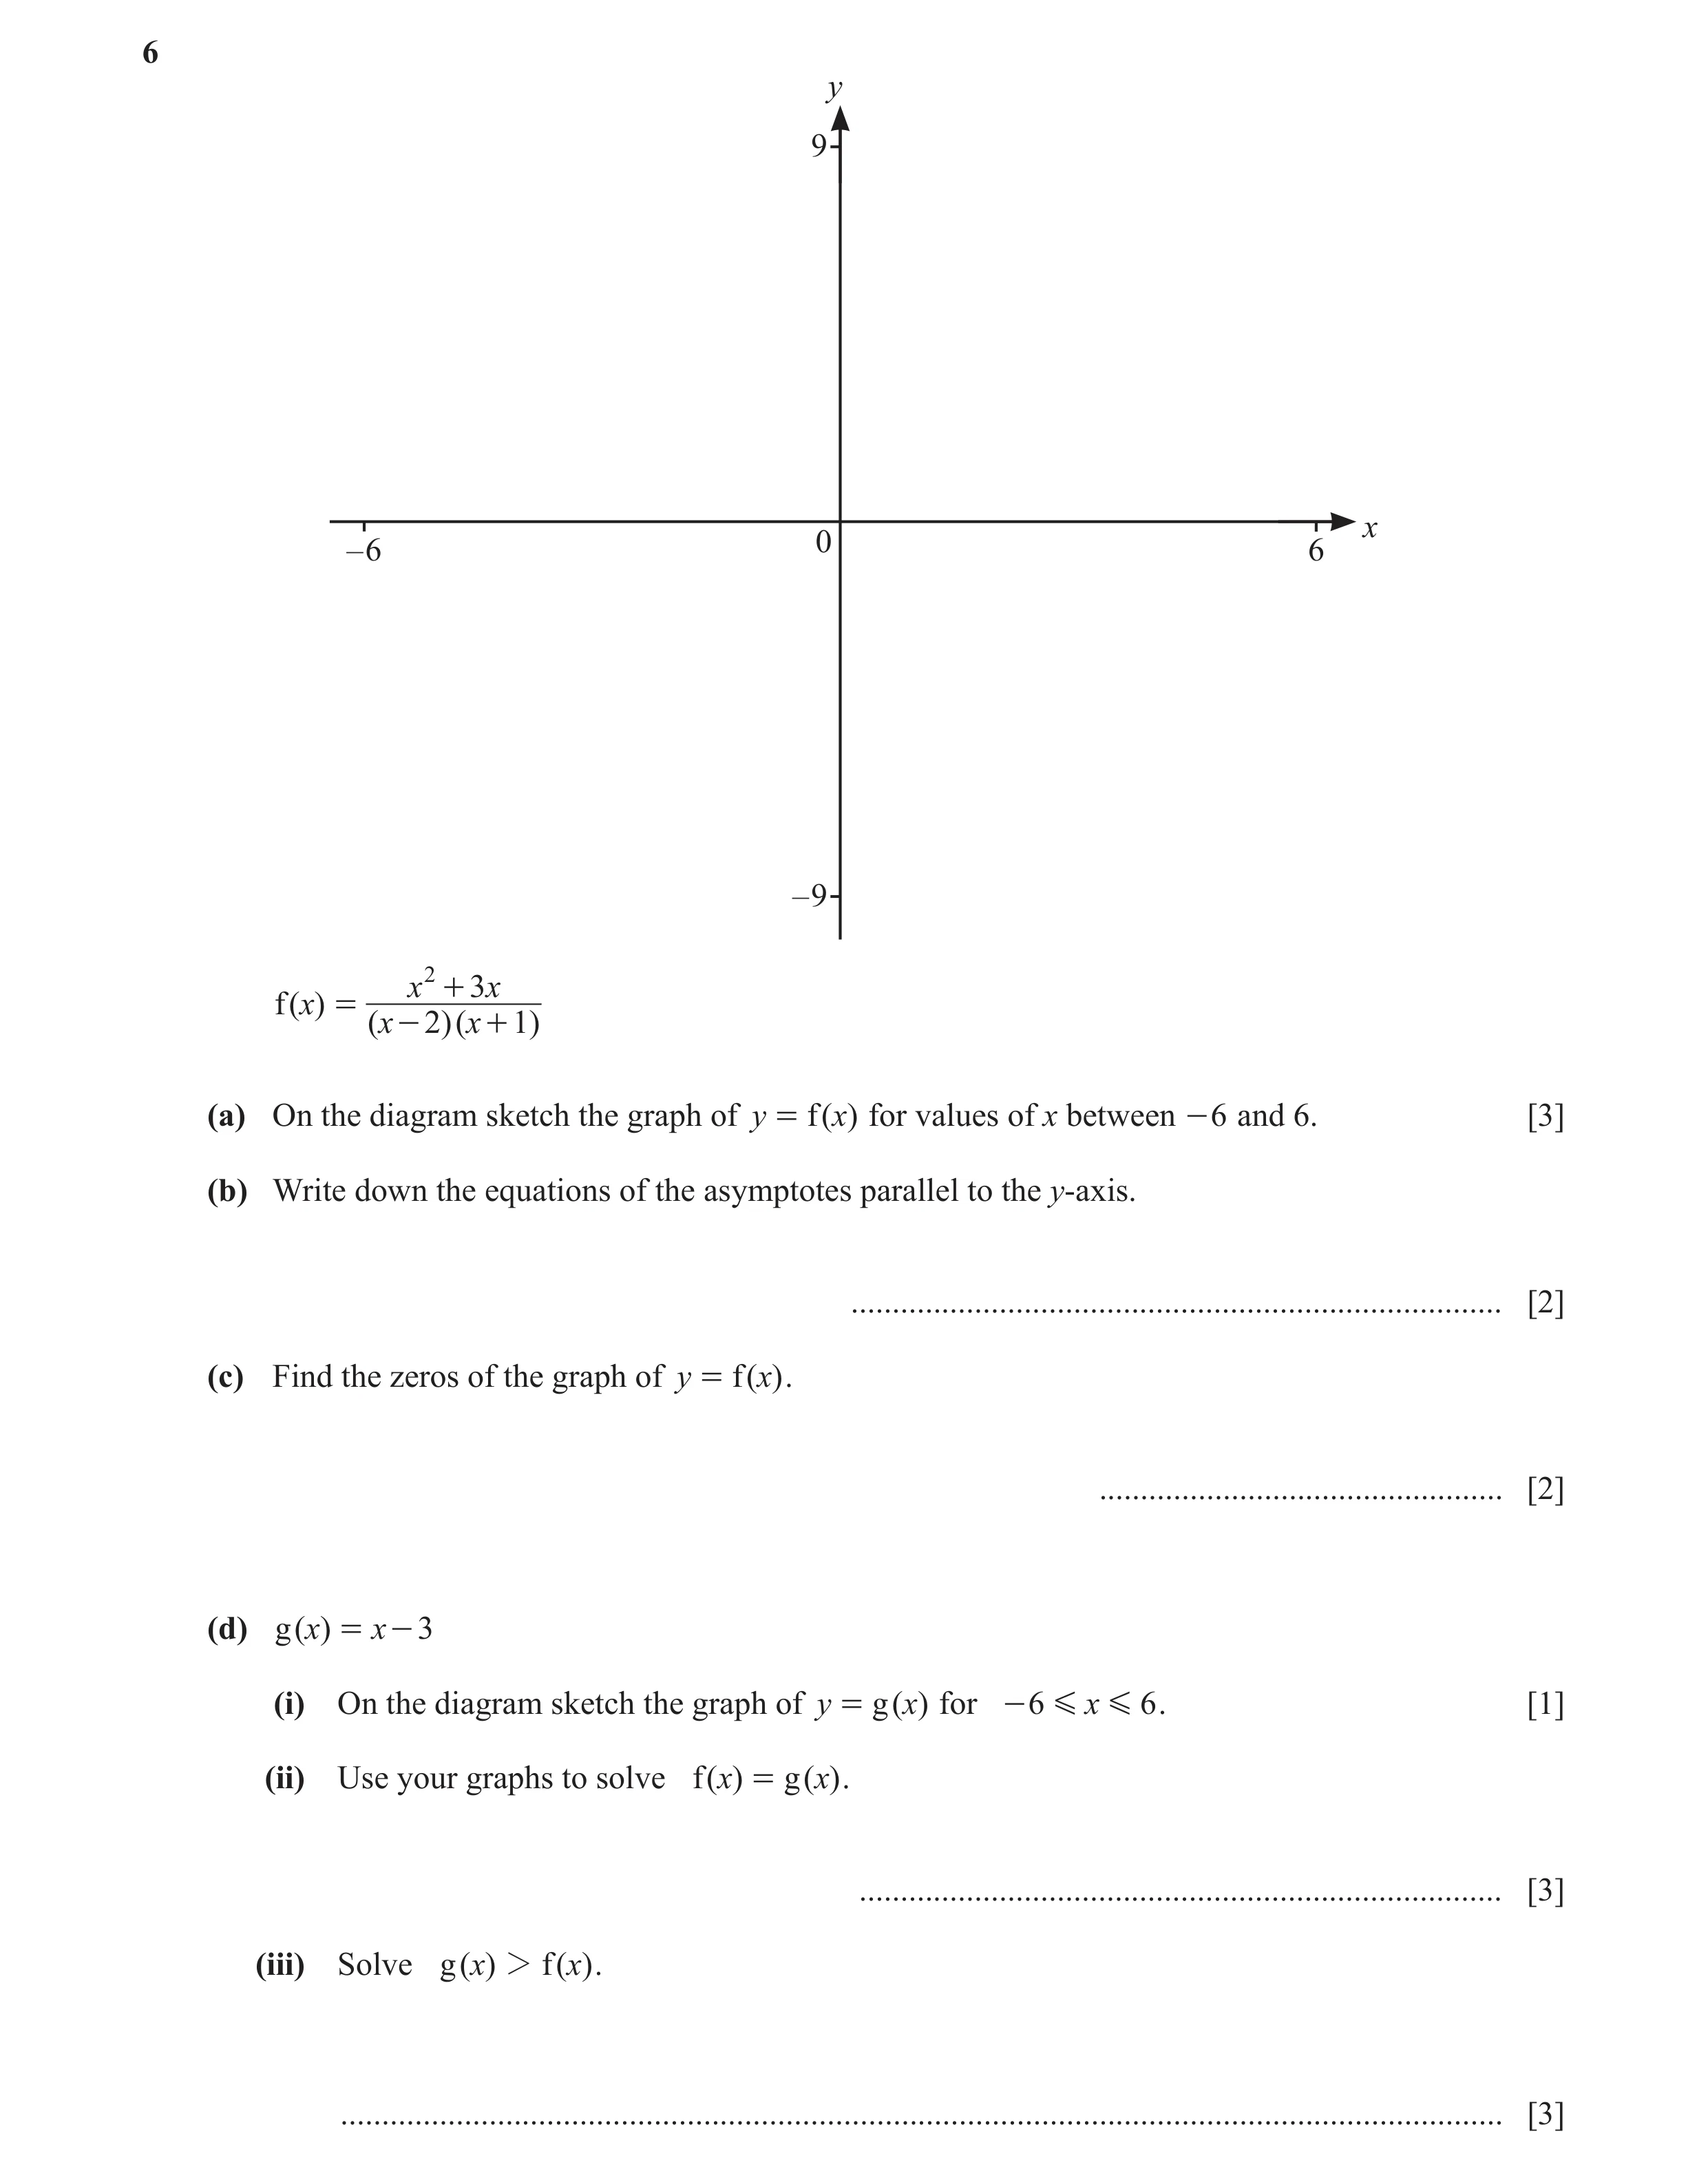 48 / 67
 49 / 67
![Question 45: (a) y 8 0 x – 6 7 – 5 1 (i) On the diagram sketch the lines y =- x + 3 , 2y = x + 5 and y = x for - 6 G x G 7 . 2 [4] (ii) Show, by shading…](https://img.pastlit.com/crops/65f5d4f0-7b50-40a9-9fc3-902e1bb878ec/q5.webp)
![Question 46: y 40 0 x -3 4 -40 f ( x) = 2x 3 - 3x 2 - 12x + 7 for -3 G x G 4 (a) Sketch the graph of y = f ( x) . [2] (b) Solve f ( x) = 0 . ...........…](https://img.pastlit.com/crops/18f57dcb-09d7-44a9-bb01-0ecf04a21bf1/q4.webp) 52 / 67
52 / 67![Question 47: y 1.5 x -180 0 180 -1.5 f ( x) = ( sin x°) 2 (a) On the diagram, sketch the graph of y = f ( x) for - 180 G x G 180 . [2] (b) Write down th…](https://img.pastlit.com/crops/09f24b2f-d38d-419a-8126-d97f63aec9bf/q1.webp) 53 / 67
53 / 67![Question 48: y 3 – 3 0 3 x – 3 f( x) = 2 - 1 - 0 .5 x 2 (a) On the diagram, sketch the graph of y = f( x) , for values of x between - 3 and 3. [3] (b) T…](https://img.pastlit.com/crops/11d3225c-27ac-4814-834f-1f3db09561ed/q6.webp) 54 / 67
54 / 67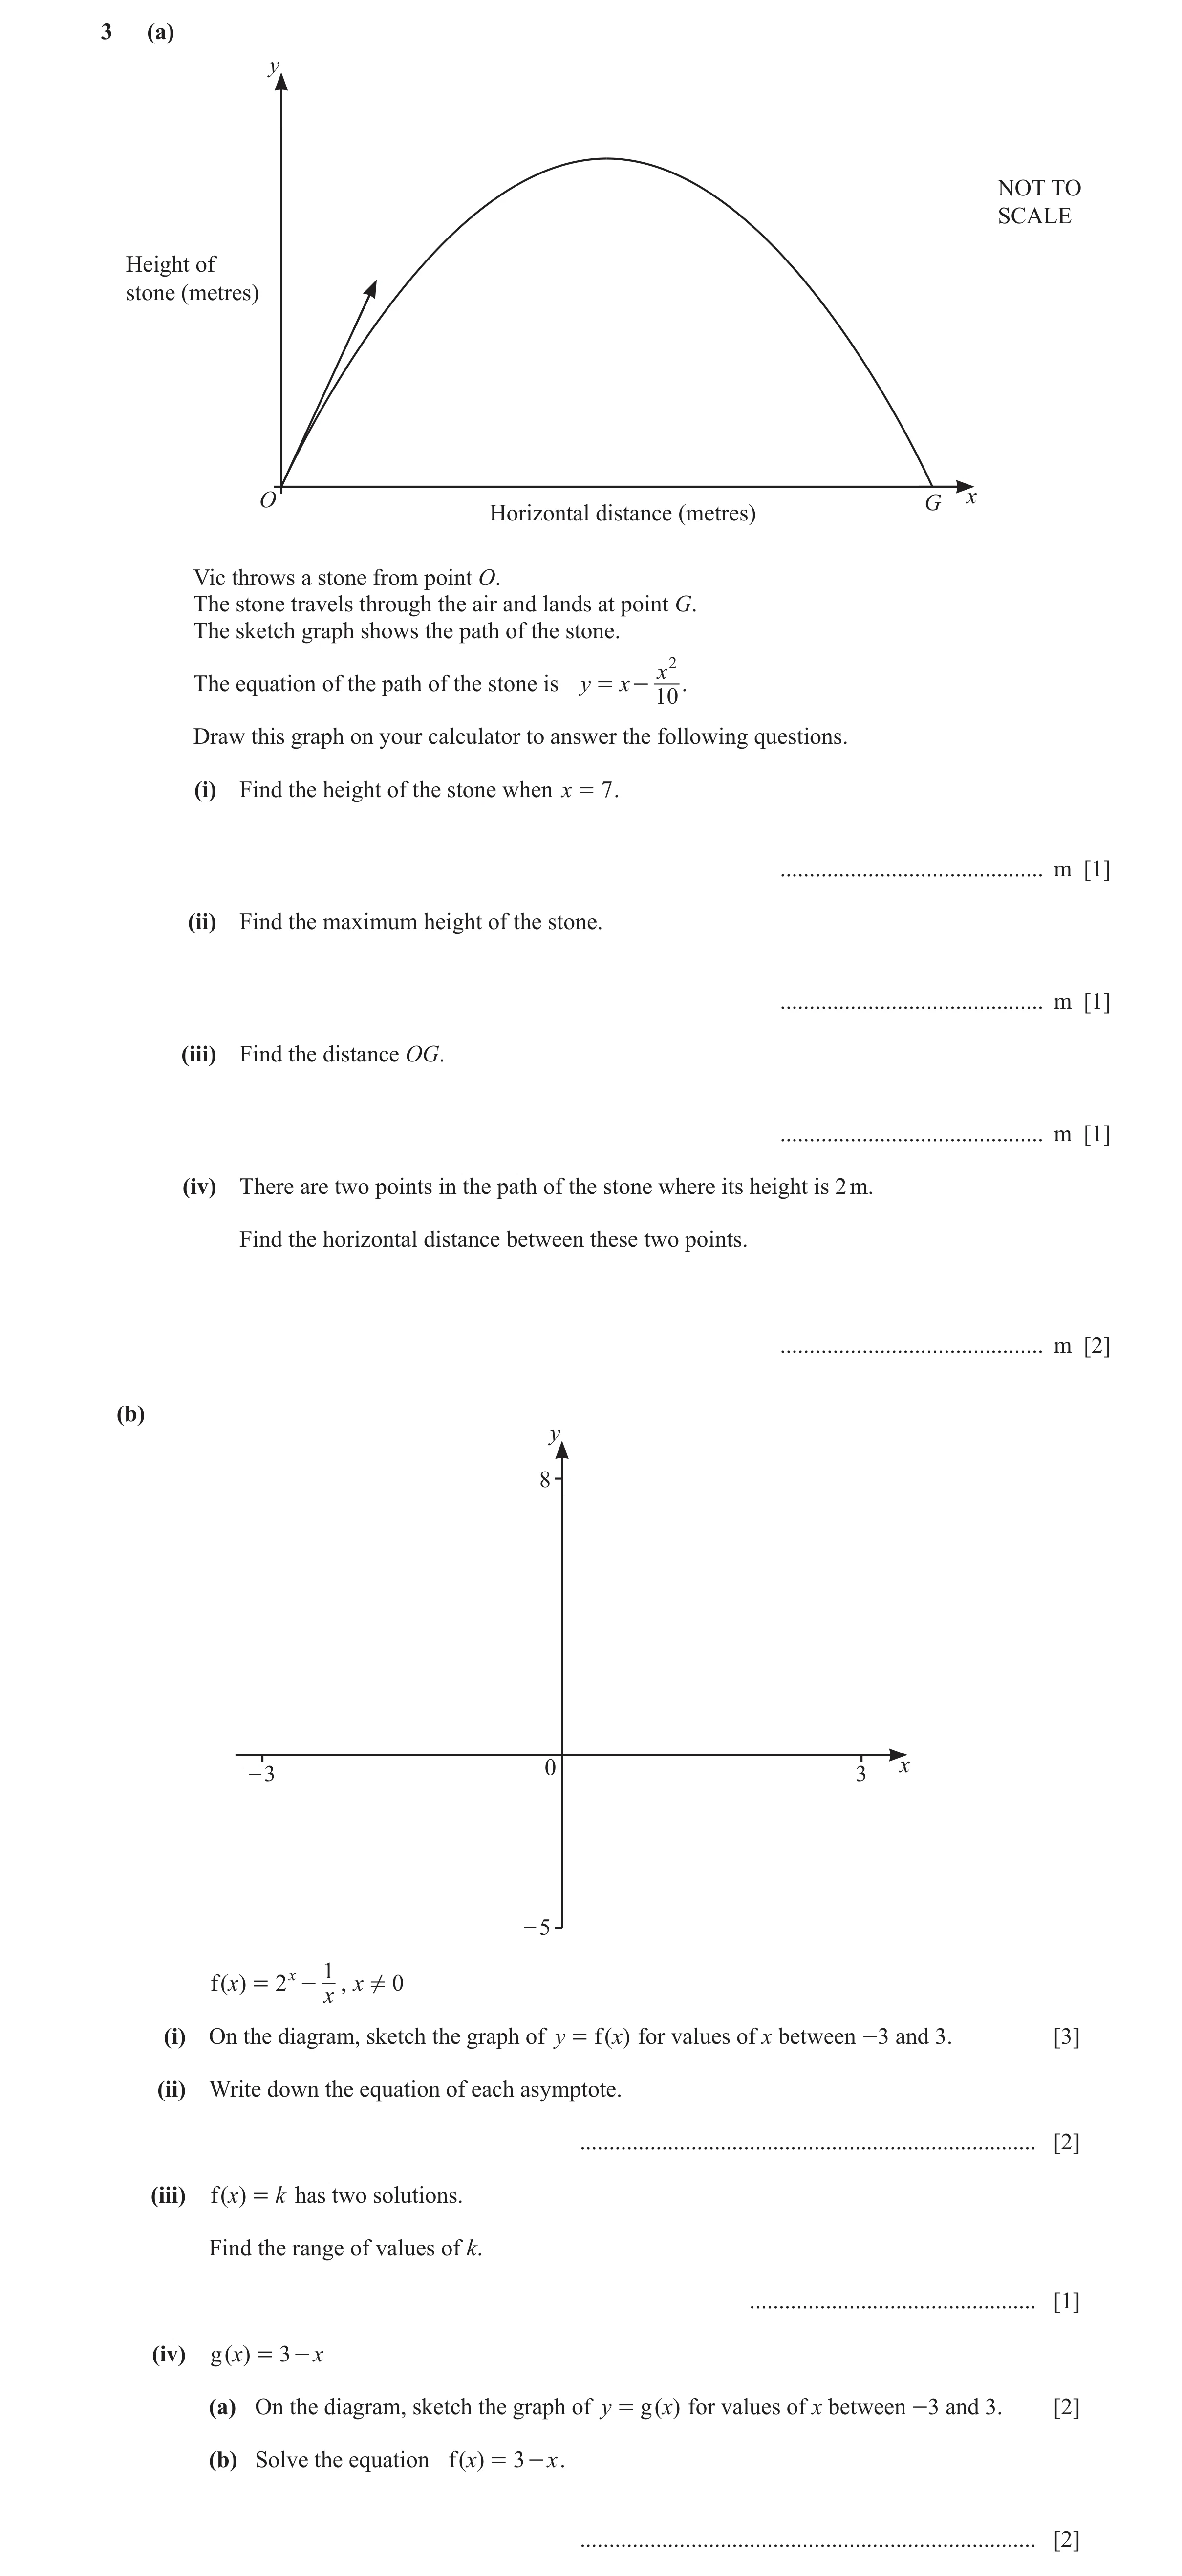
![Question 50: y 20 – 5 0 2 x – 20 f ( x) = 5 + 2x - 4x 2 - x 3 for - 5 G x G 2 (a) On the diagram, sketch the graph of y = f ( x) . [2] (b) Find the zero…](https://img.pastlit.com/crops/62cf51d3-d7a0-4d45-9ee8-53d11b36056d/q5.webp) 57 / 67
57 / 67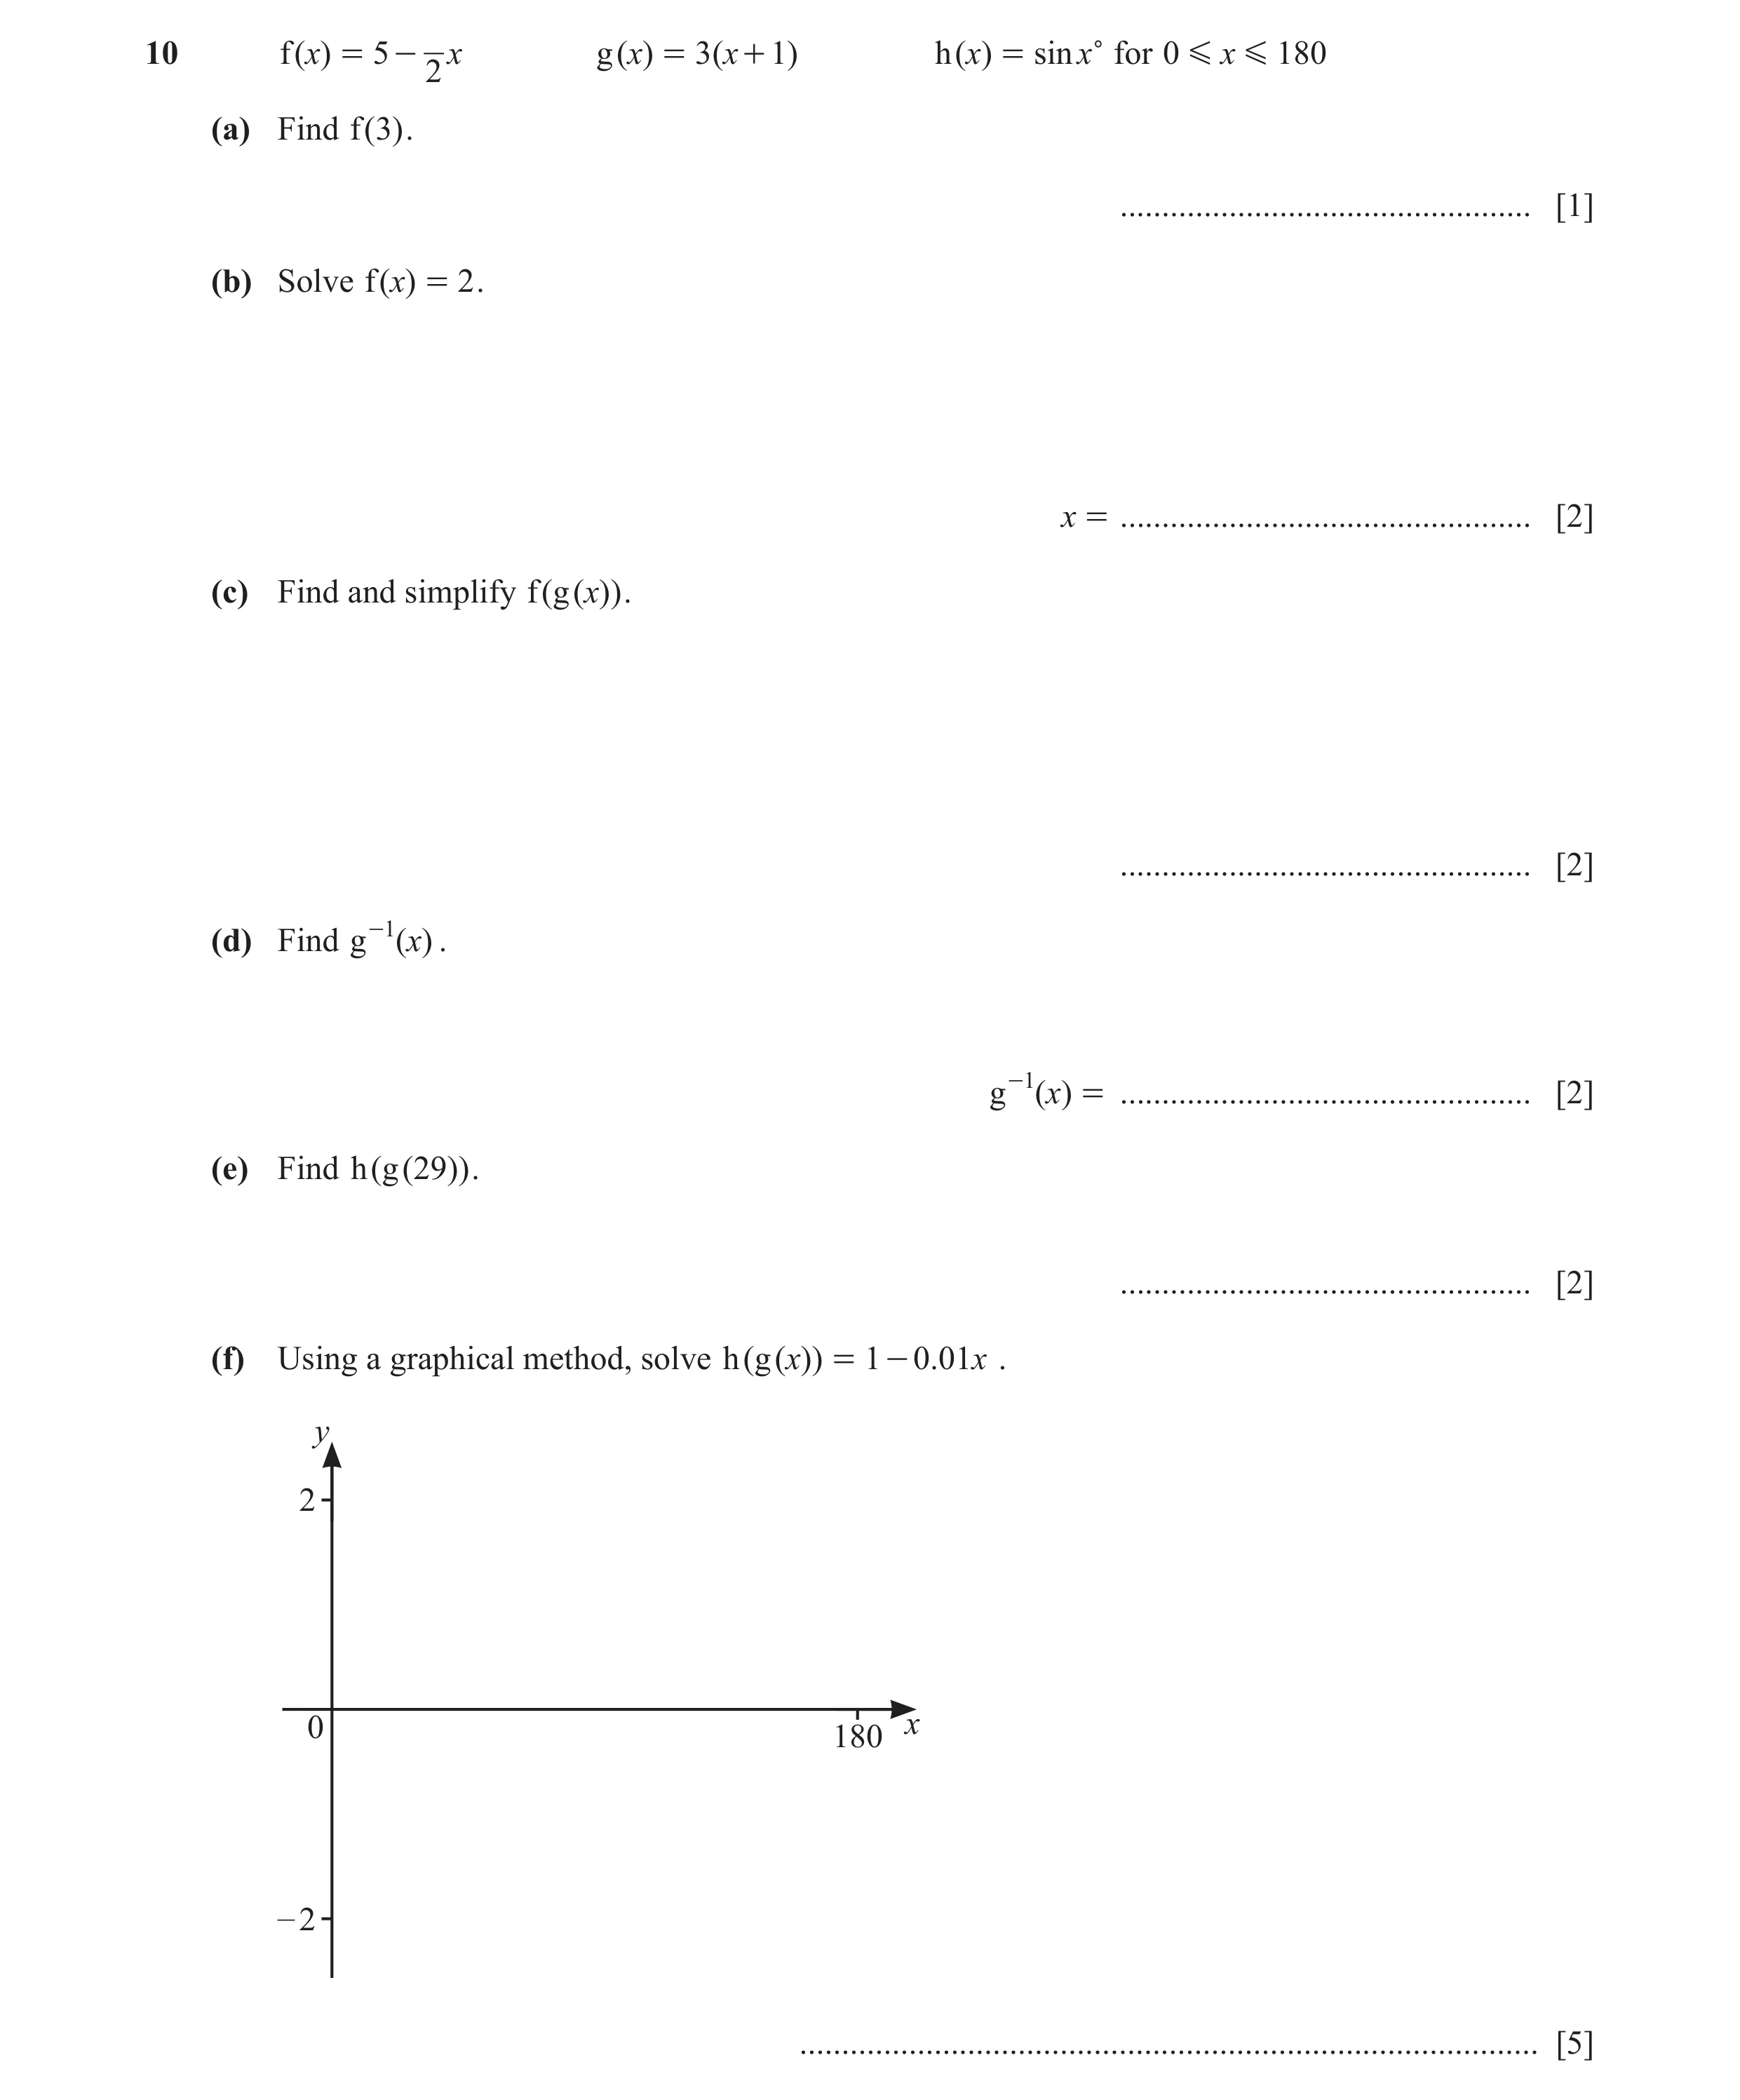 58 / 67
![Question 52: y 4 x 0 -2 4 - 4 1 f ( x) = ( 2x - 3)( 2x + 1) (a) On the diagram, sketch the graph of y = f ( x) for values of x between - 2 and 4. [3] (b…](https://img.pastlit.com/crops/92343082-f18c-4d64-9a67-1b579b228ff2/q9.webp) 59 / 67
59 / 67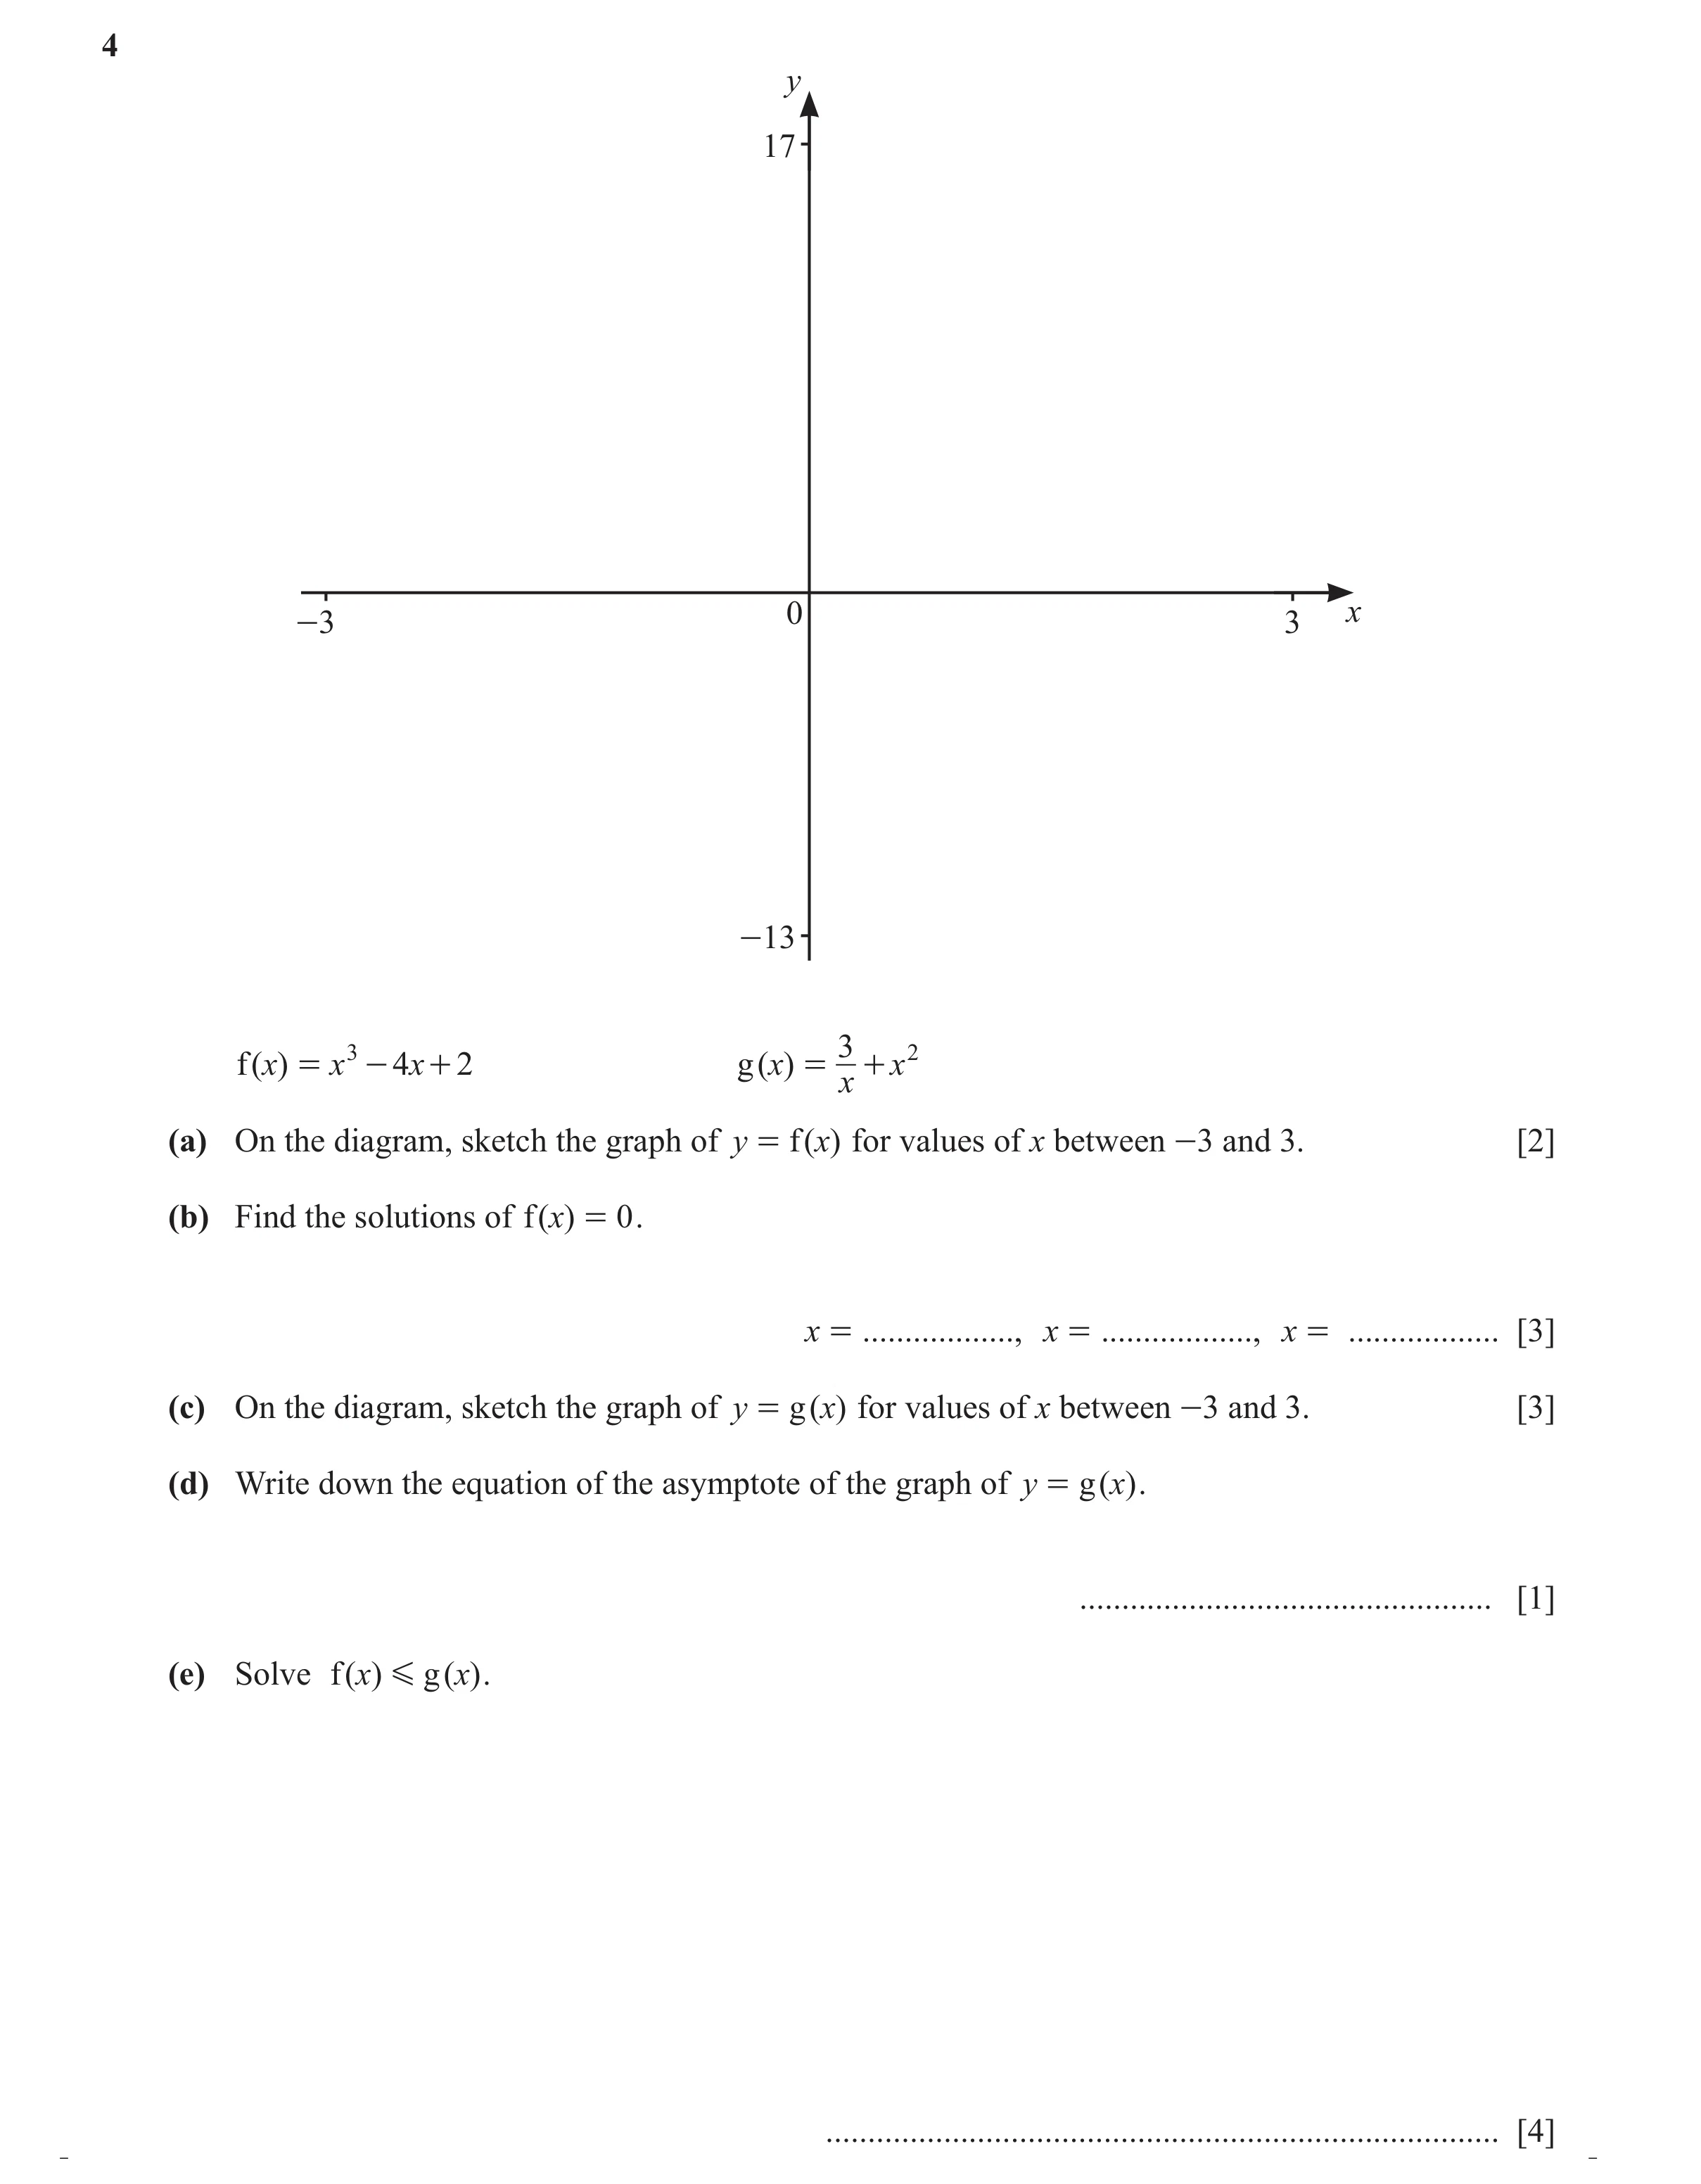 60 / 67
![Question 54: y 2 – 3 0 3 x – 2 1 f ( )x = x 2 + 1 (a) On the diagram, sketch the graph of y = f ( x) for values of x between -3 and 3. [2] (b) Solve f (…](https://img.pastlit.com/crops/aca9d155-4423-49fd-8e15-138a6360866d/q8.webp) 61 / 67
61 / 67![Question 55: y 20 x – 10 0 10 – 20 x 3 f ( x) = ( x + 2)( x - 3) (a) Sketch the graph of y = f ( x) for values of x between -10 and 10. [3] (b) Find the…](https://img.pastlit.com/crops/77e7fd2f-200b-42e4-ace4-dee1f30059d5/q11.webp) 62 / 67
62 / 67![Question 56: y 10 – 3 0 3 x – 10 4x - 3 f ( )x = 2x + 1 (a) (i) Sketch the graph of y = f ( )x for values of x between -3 and 3. [3] (ii) Write down the…](https://img.pastlit.com/crops/7b7eea01-d789-4369-94f6-f31fa8ba3f11/q11.webp) 63 / 67
63 / 67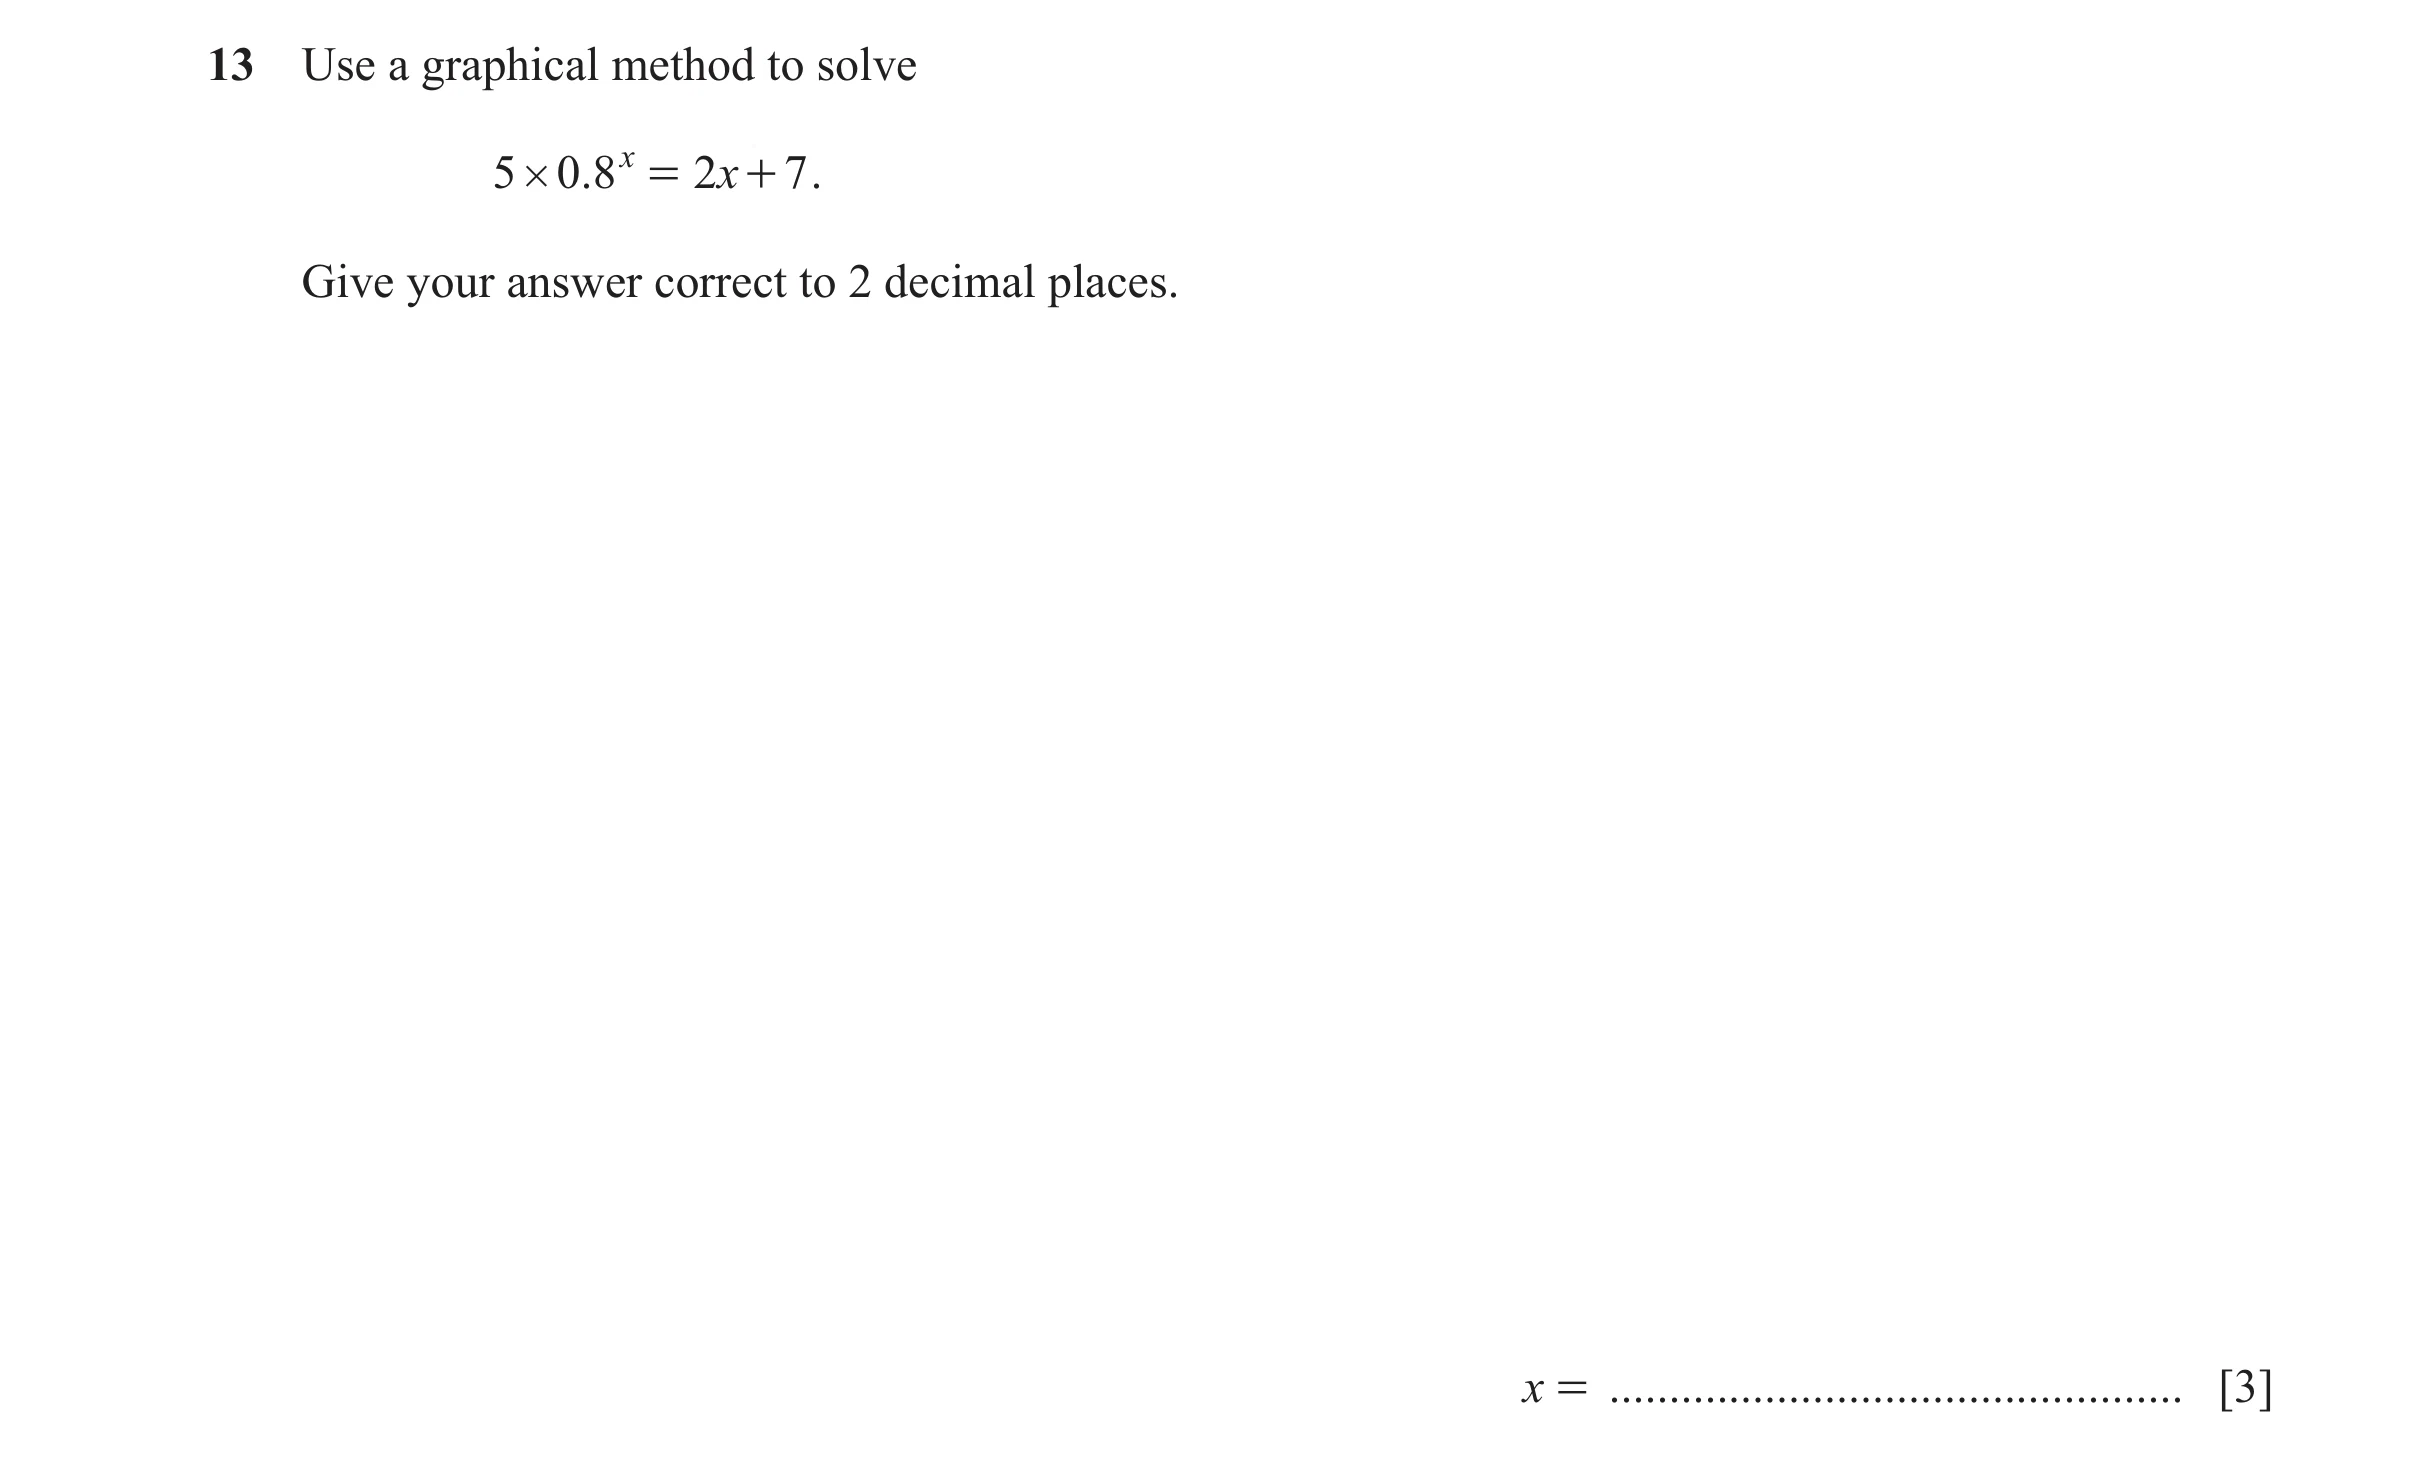 64 / 67
![Question 58: y 10 x -3 0 3 -10 3 2 f ( )x = - x x (a) On the diagram, sketch the graph of y = f ( x) for values of x between -3 and 3. [3] (b) Find the …](https://img.pastlit.com/crops/765bf273-787a-48ec-b90a-815bb45442af/q8.webp) 65 / 67
65 / 67![Question 59: y 5 x 0 – 5 5 – 5 2x f ( x) = x + 2 (a) On the diagram, sketch the graph of y = f ( x) for values of x between -5 and 5. [3] (b) Find the c…](https://img.pastlit.com/crops/c669d187-a7d9-4fb8-9959-70af908a37e1/q8.webp) 66 / 67
66 / 67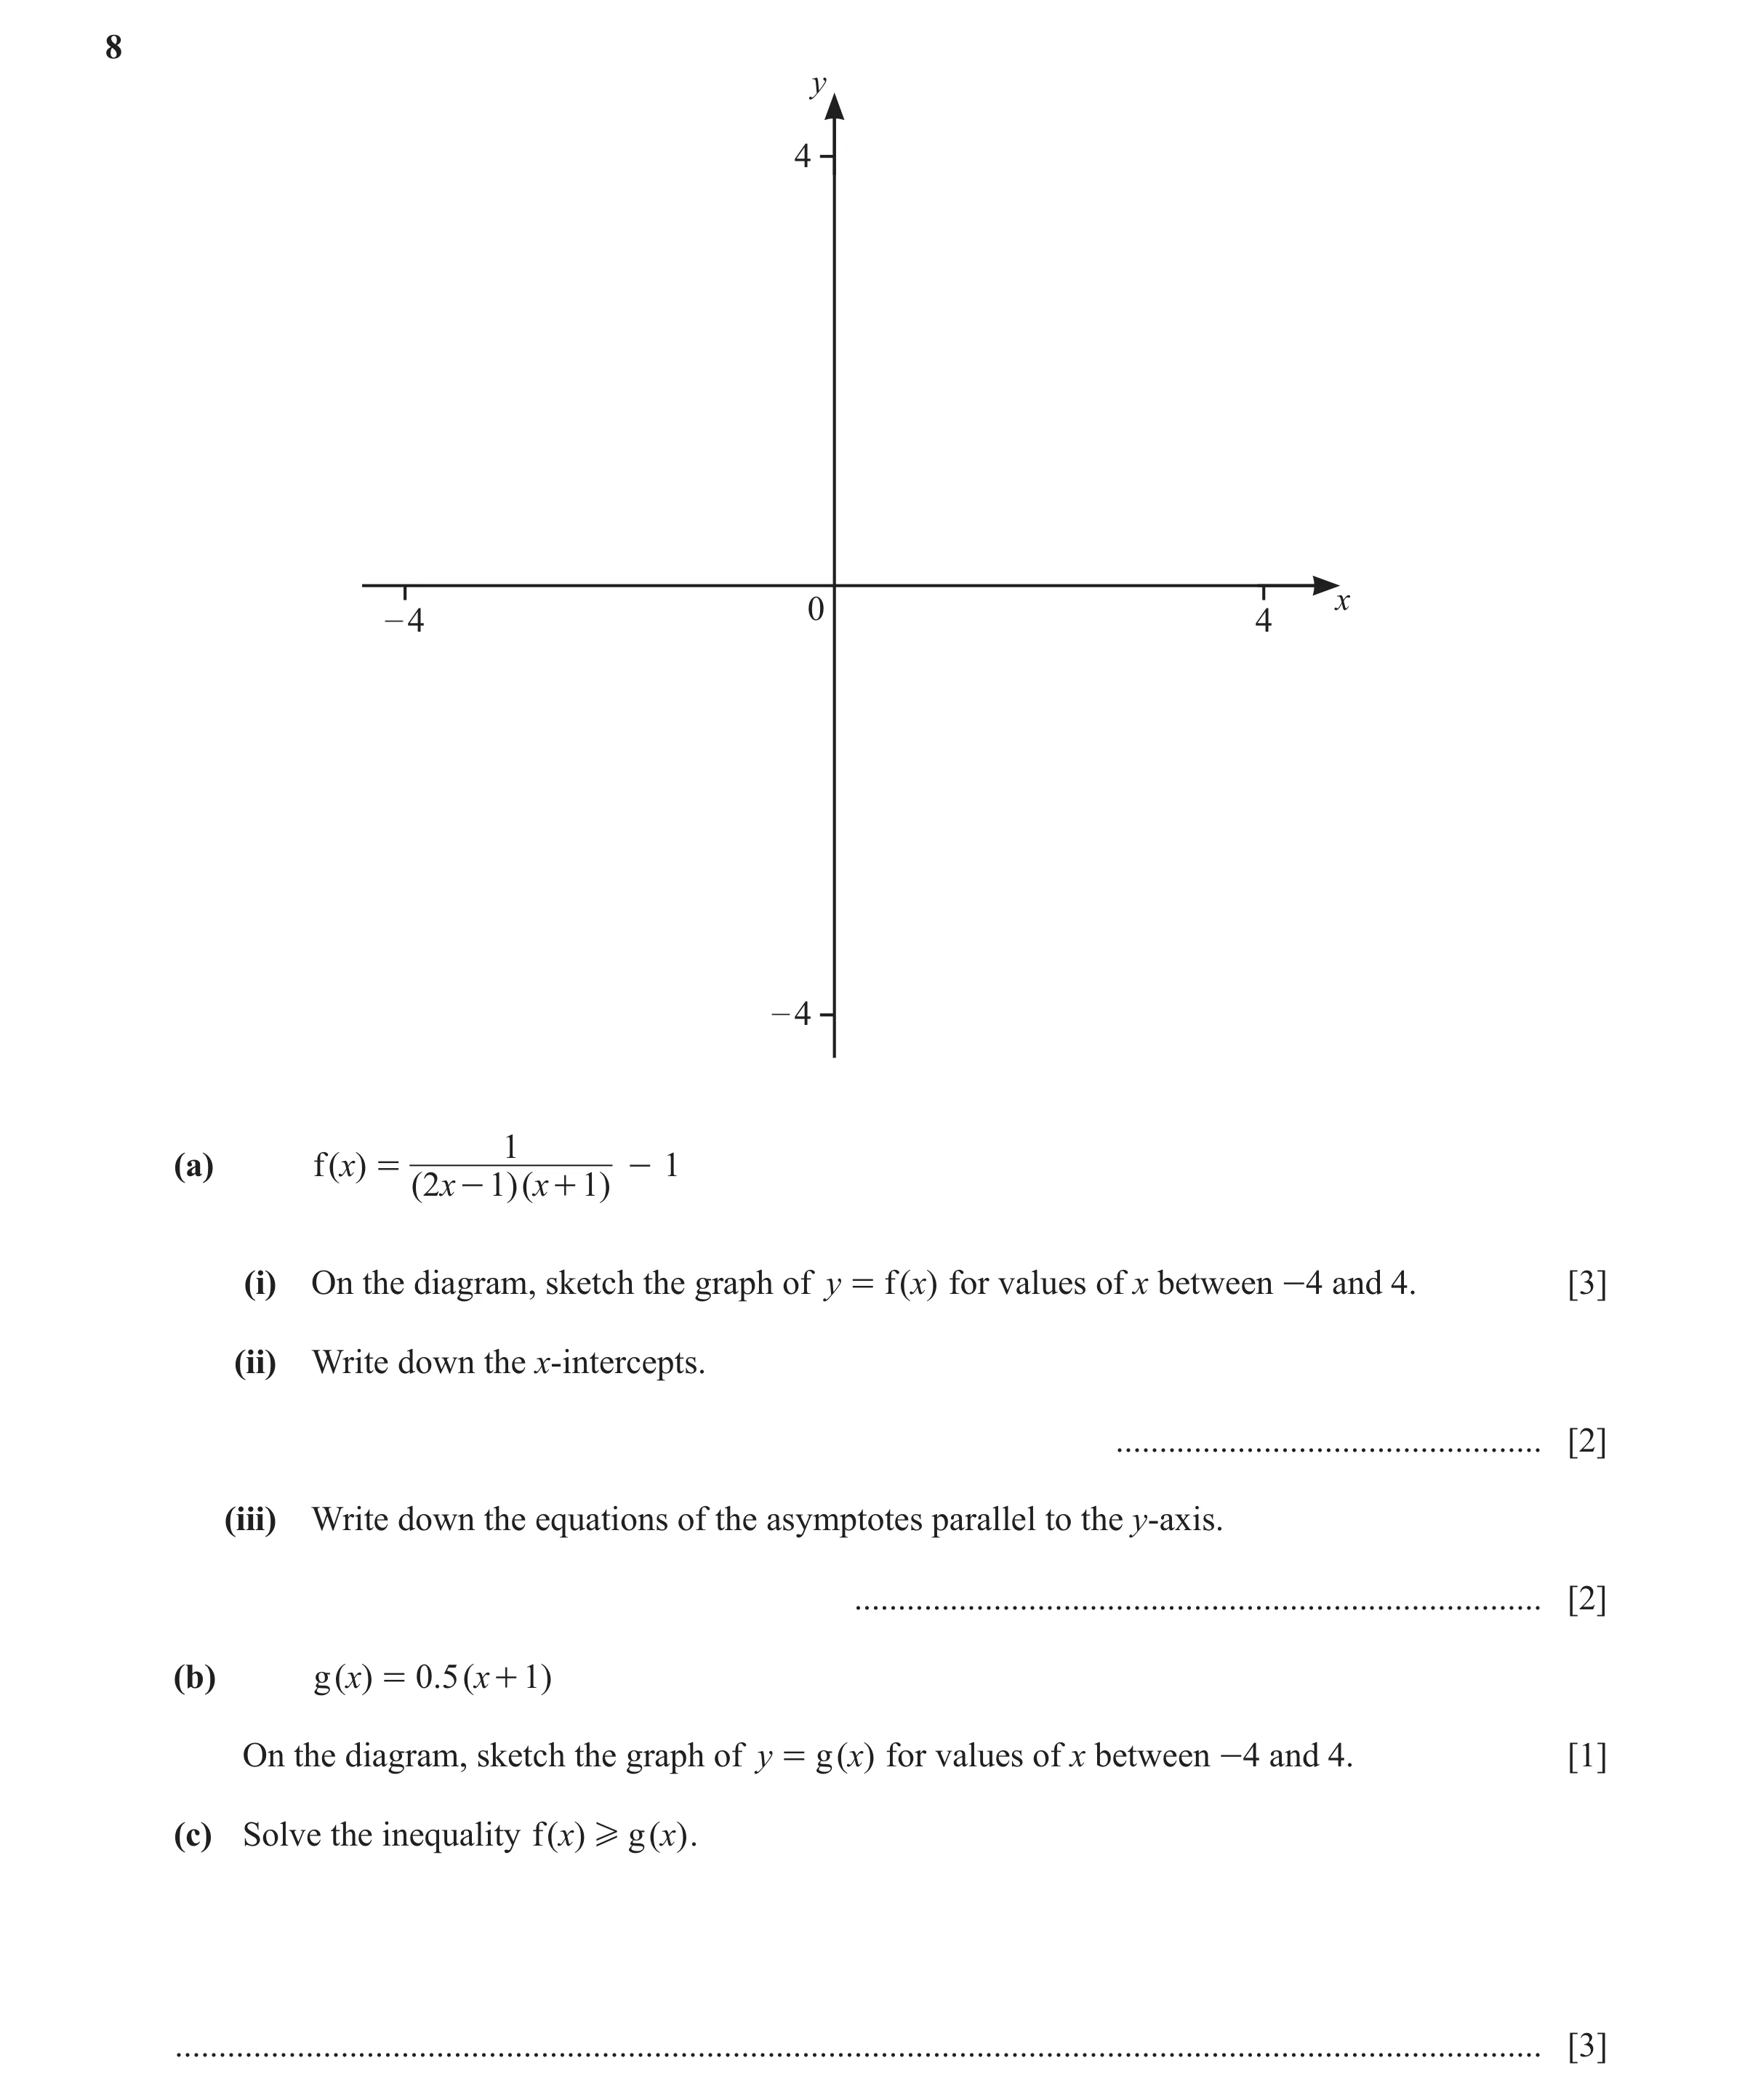 67 / 67
 8
8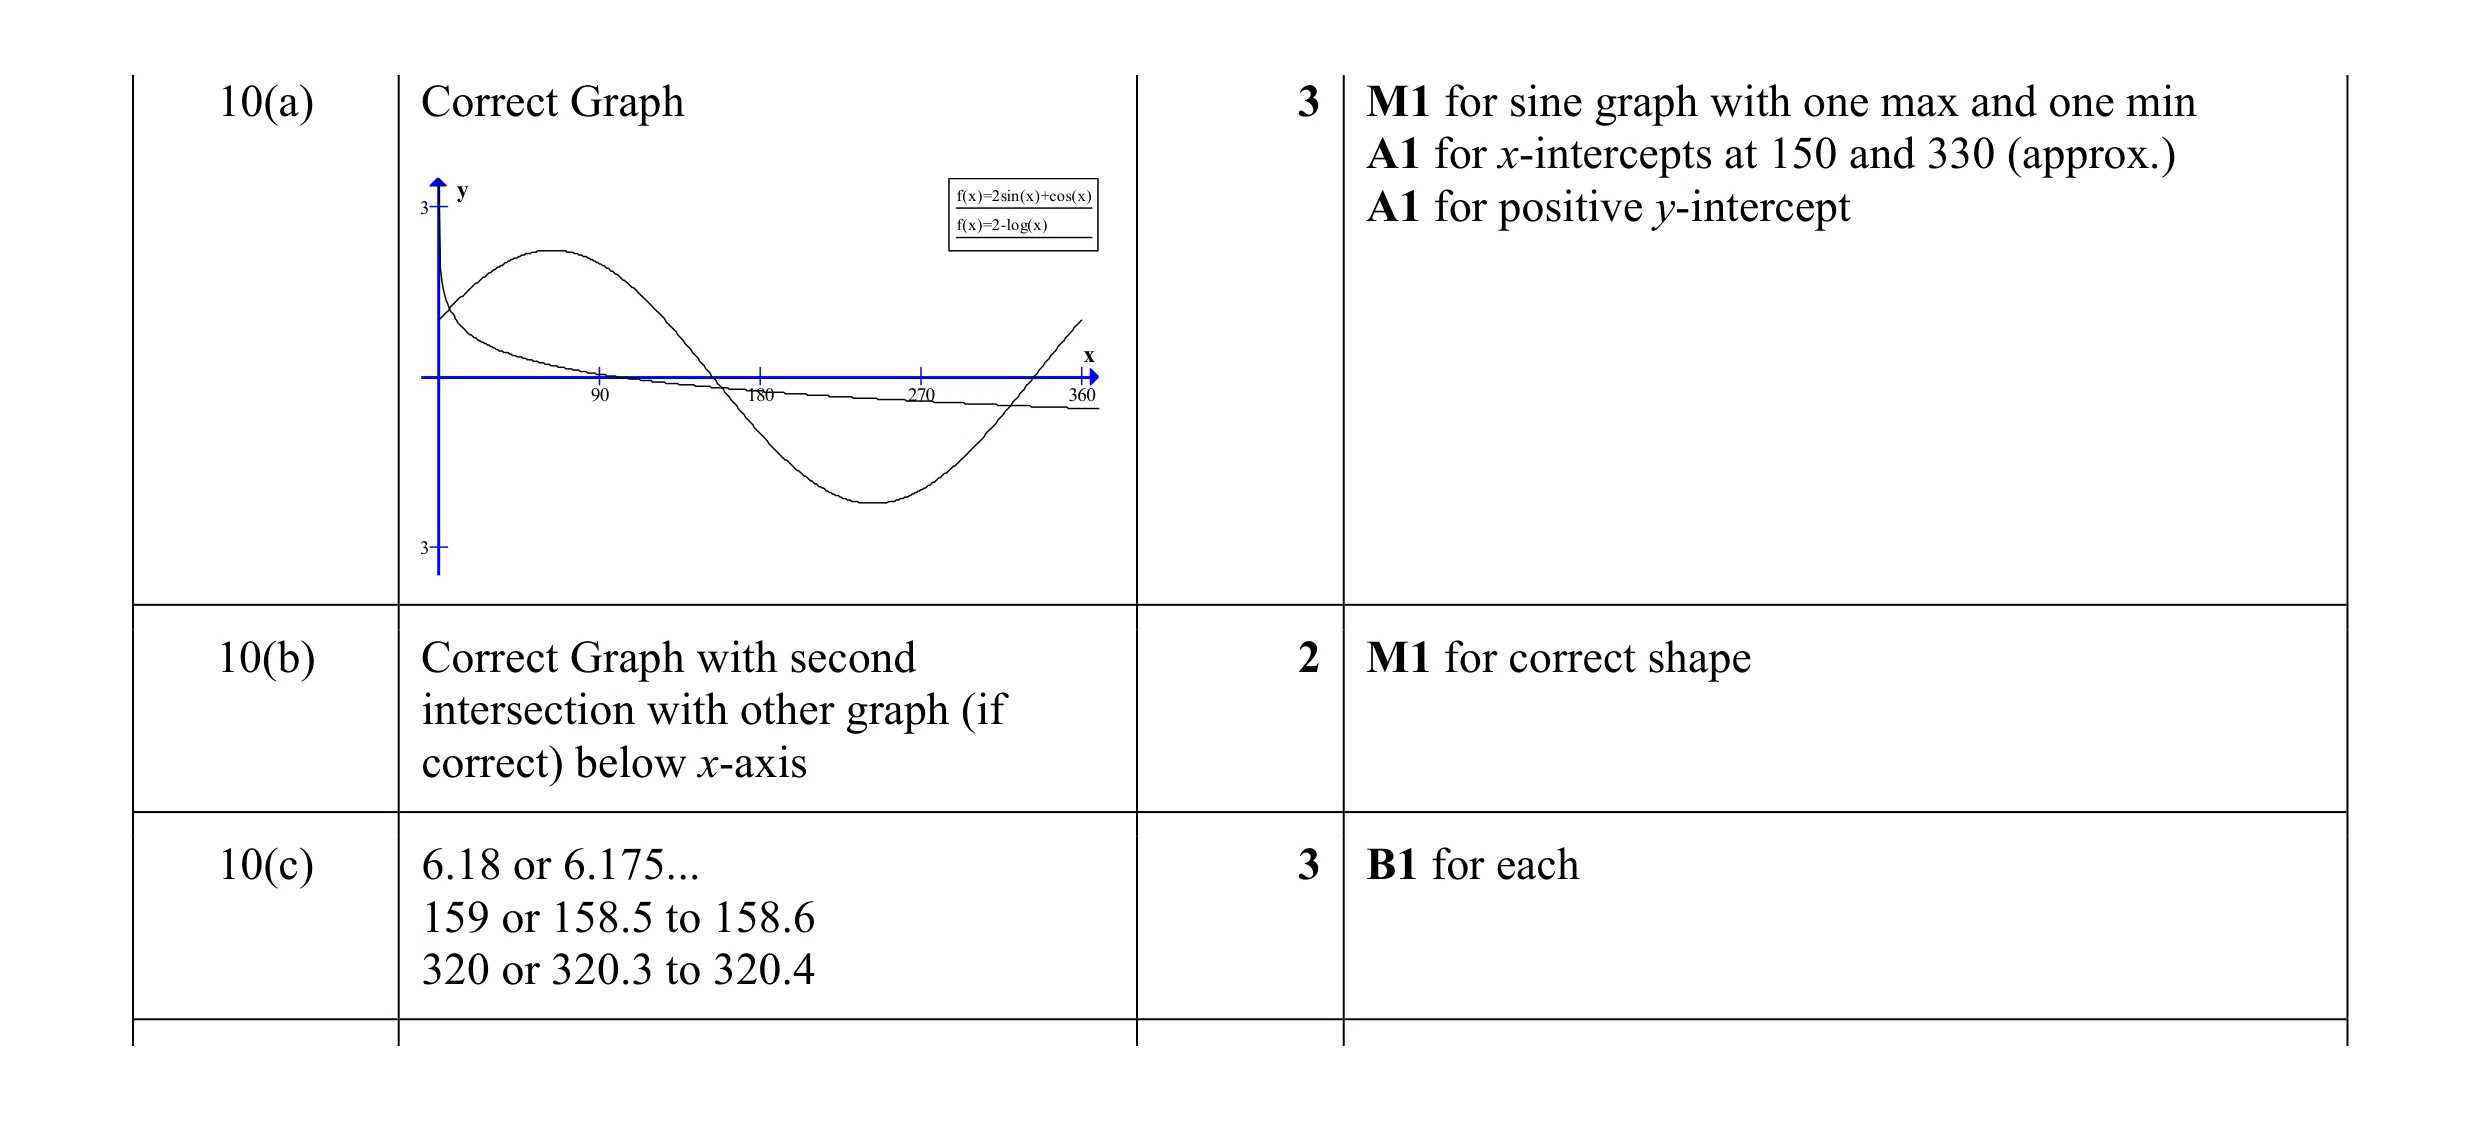 8
8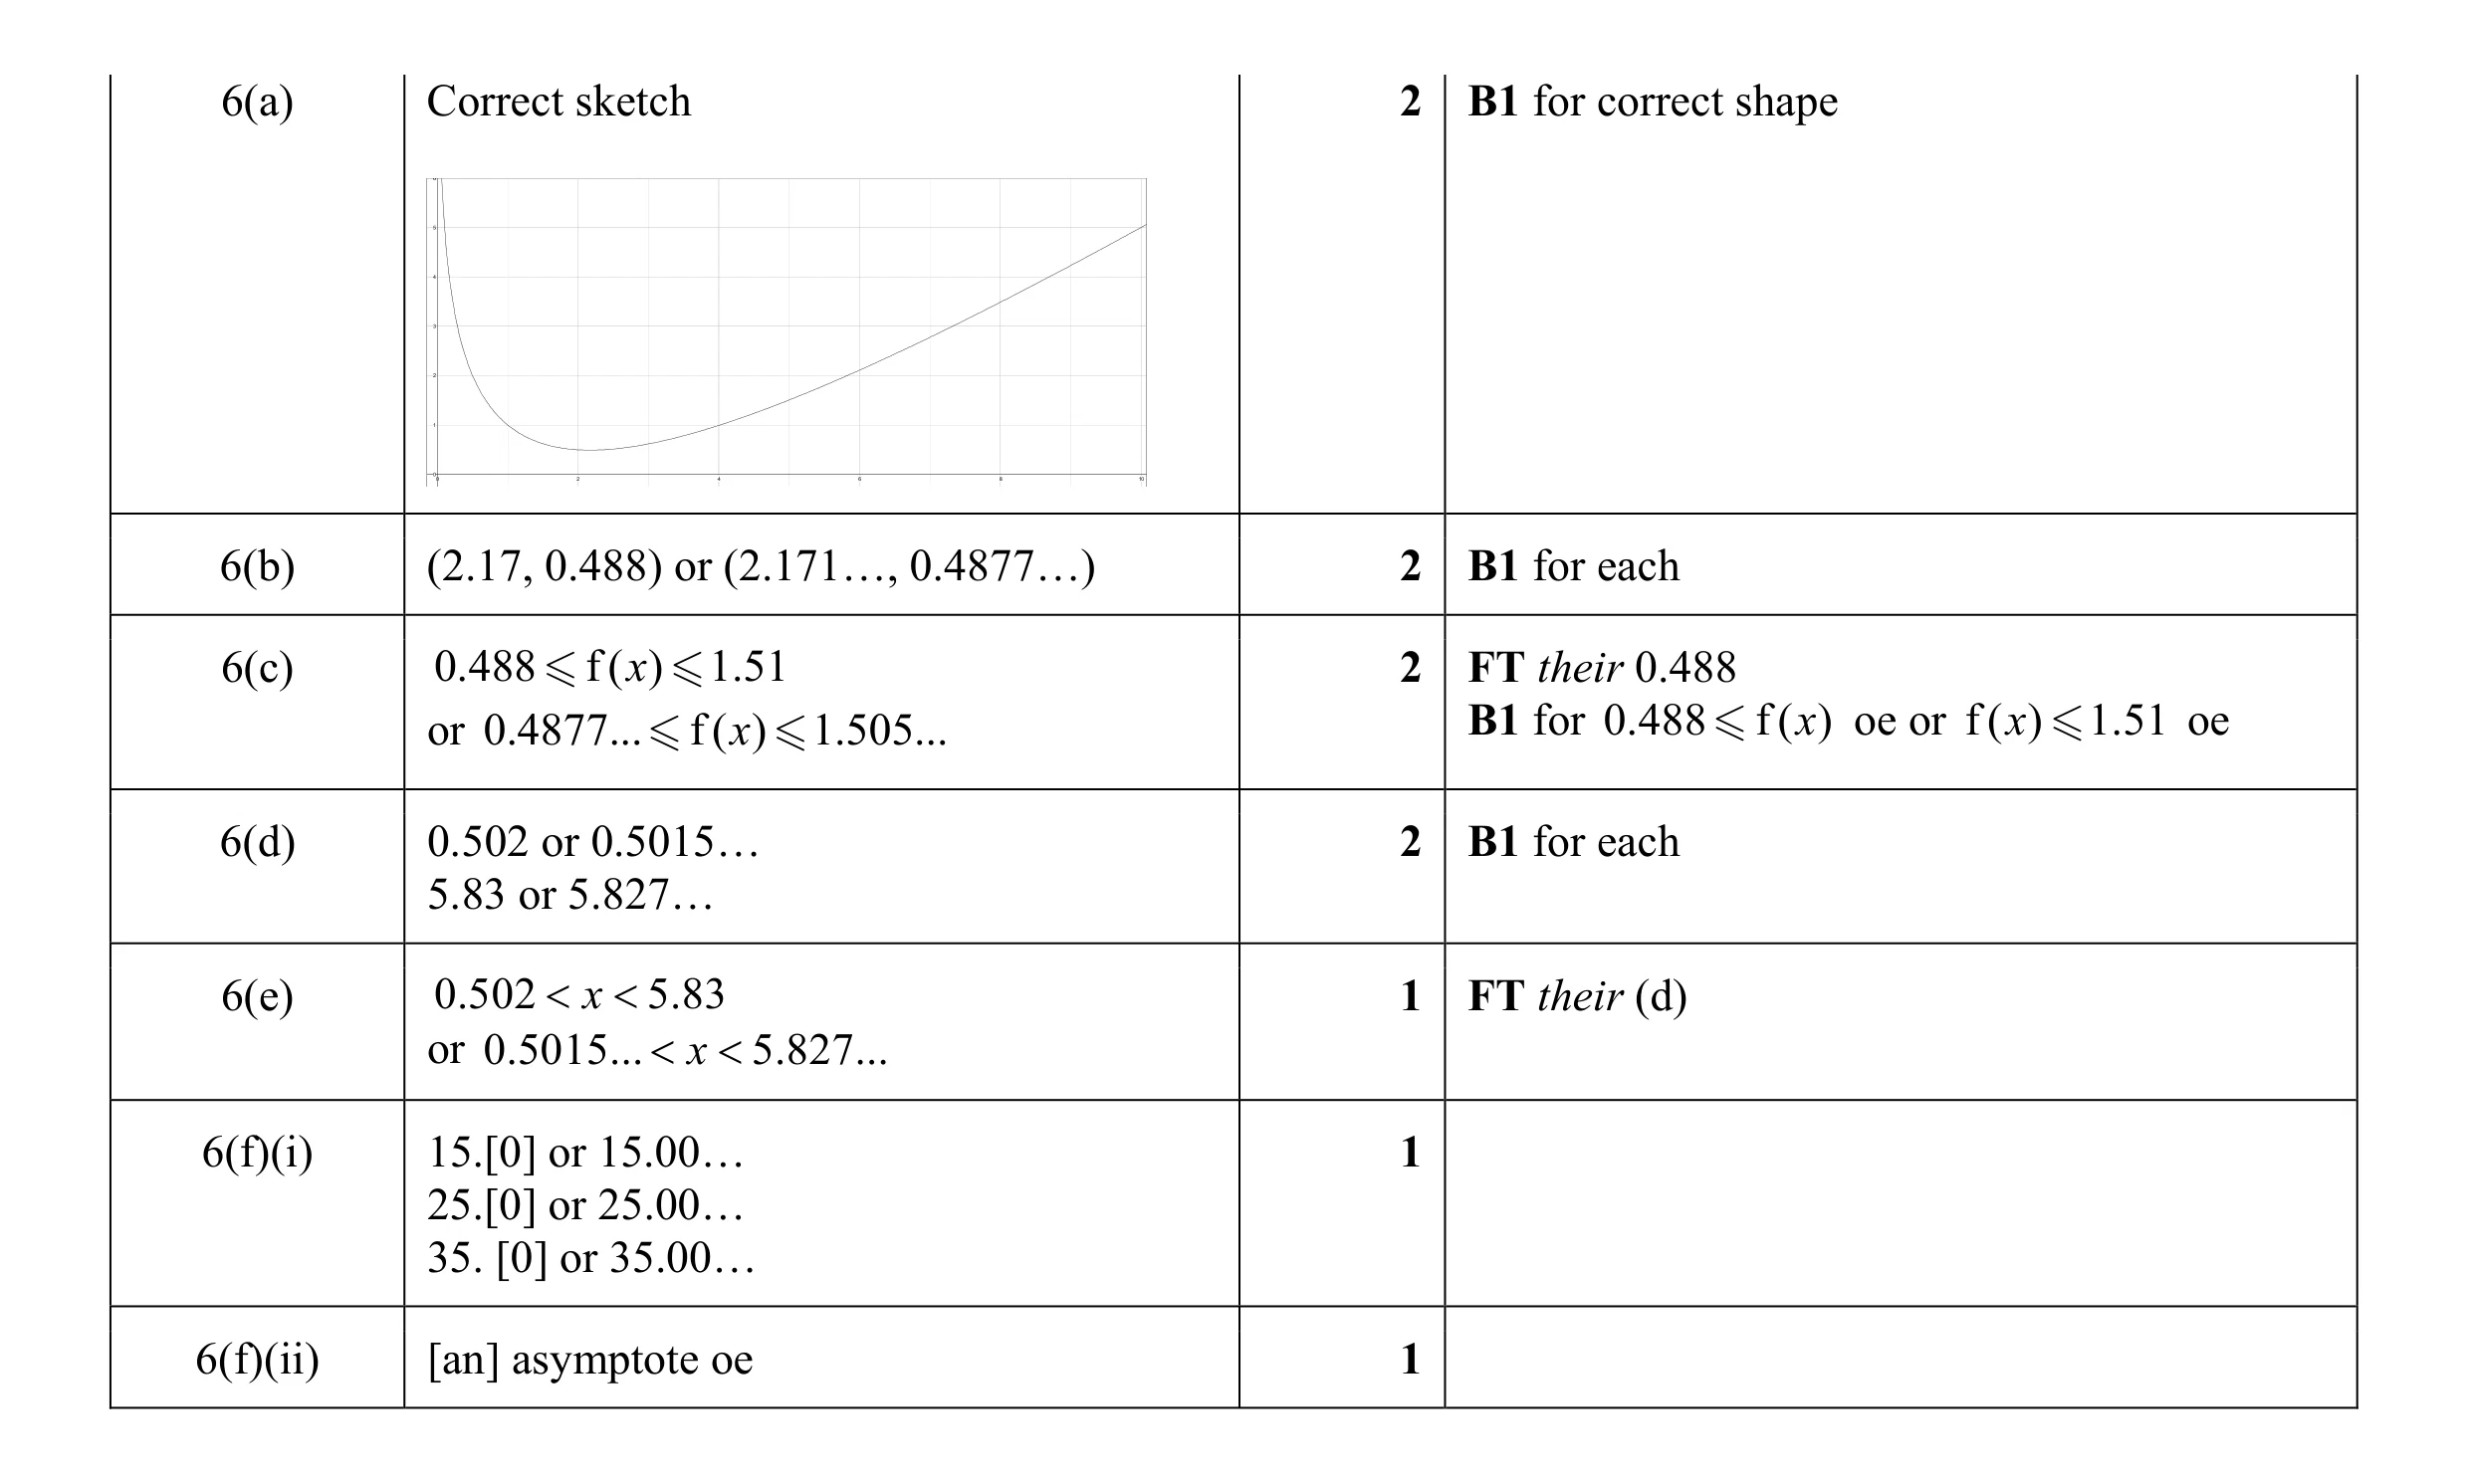 11
11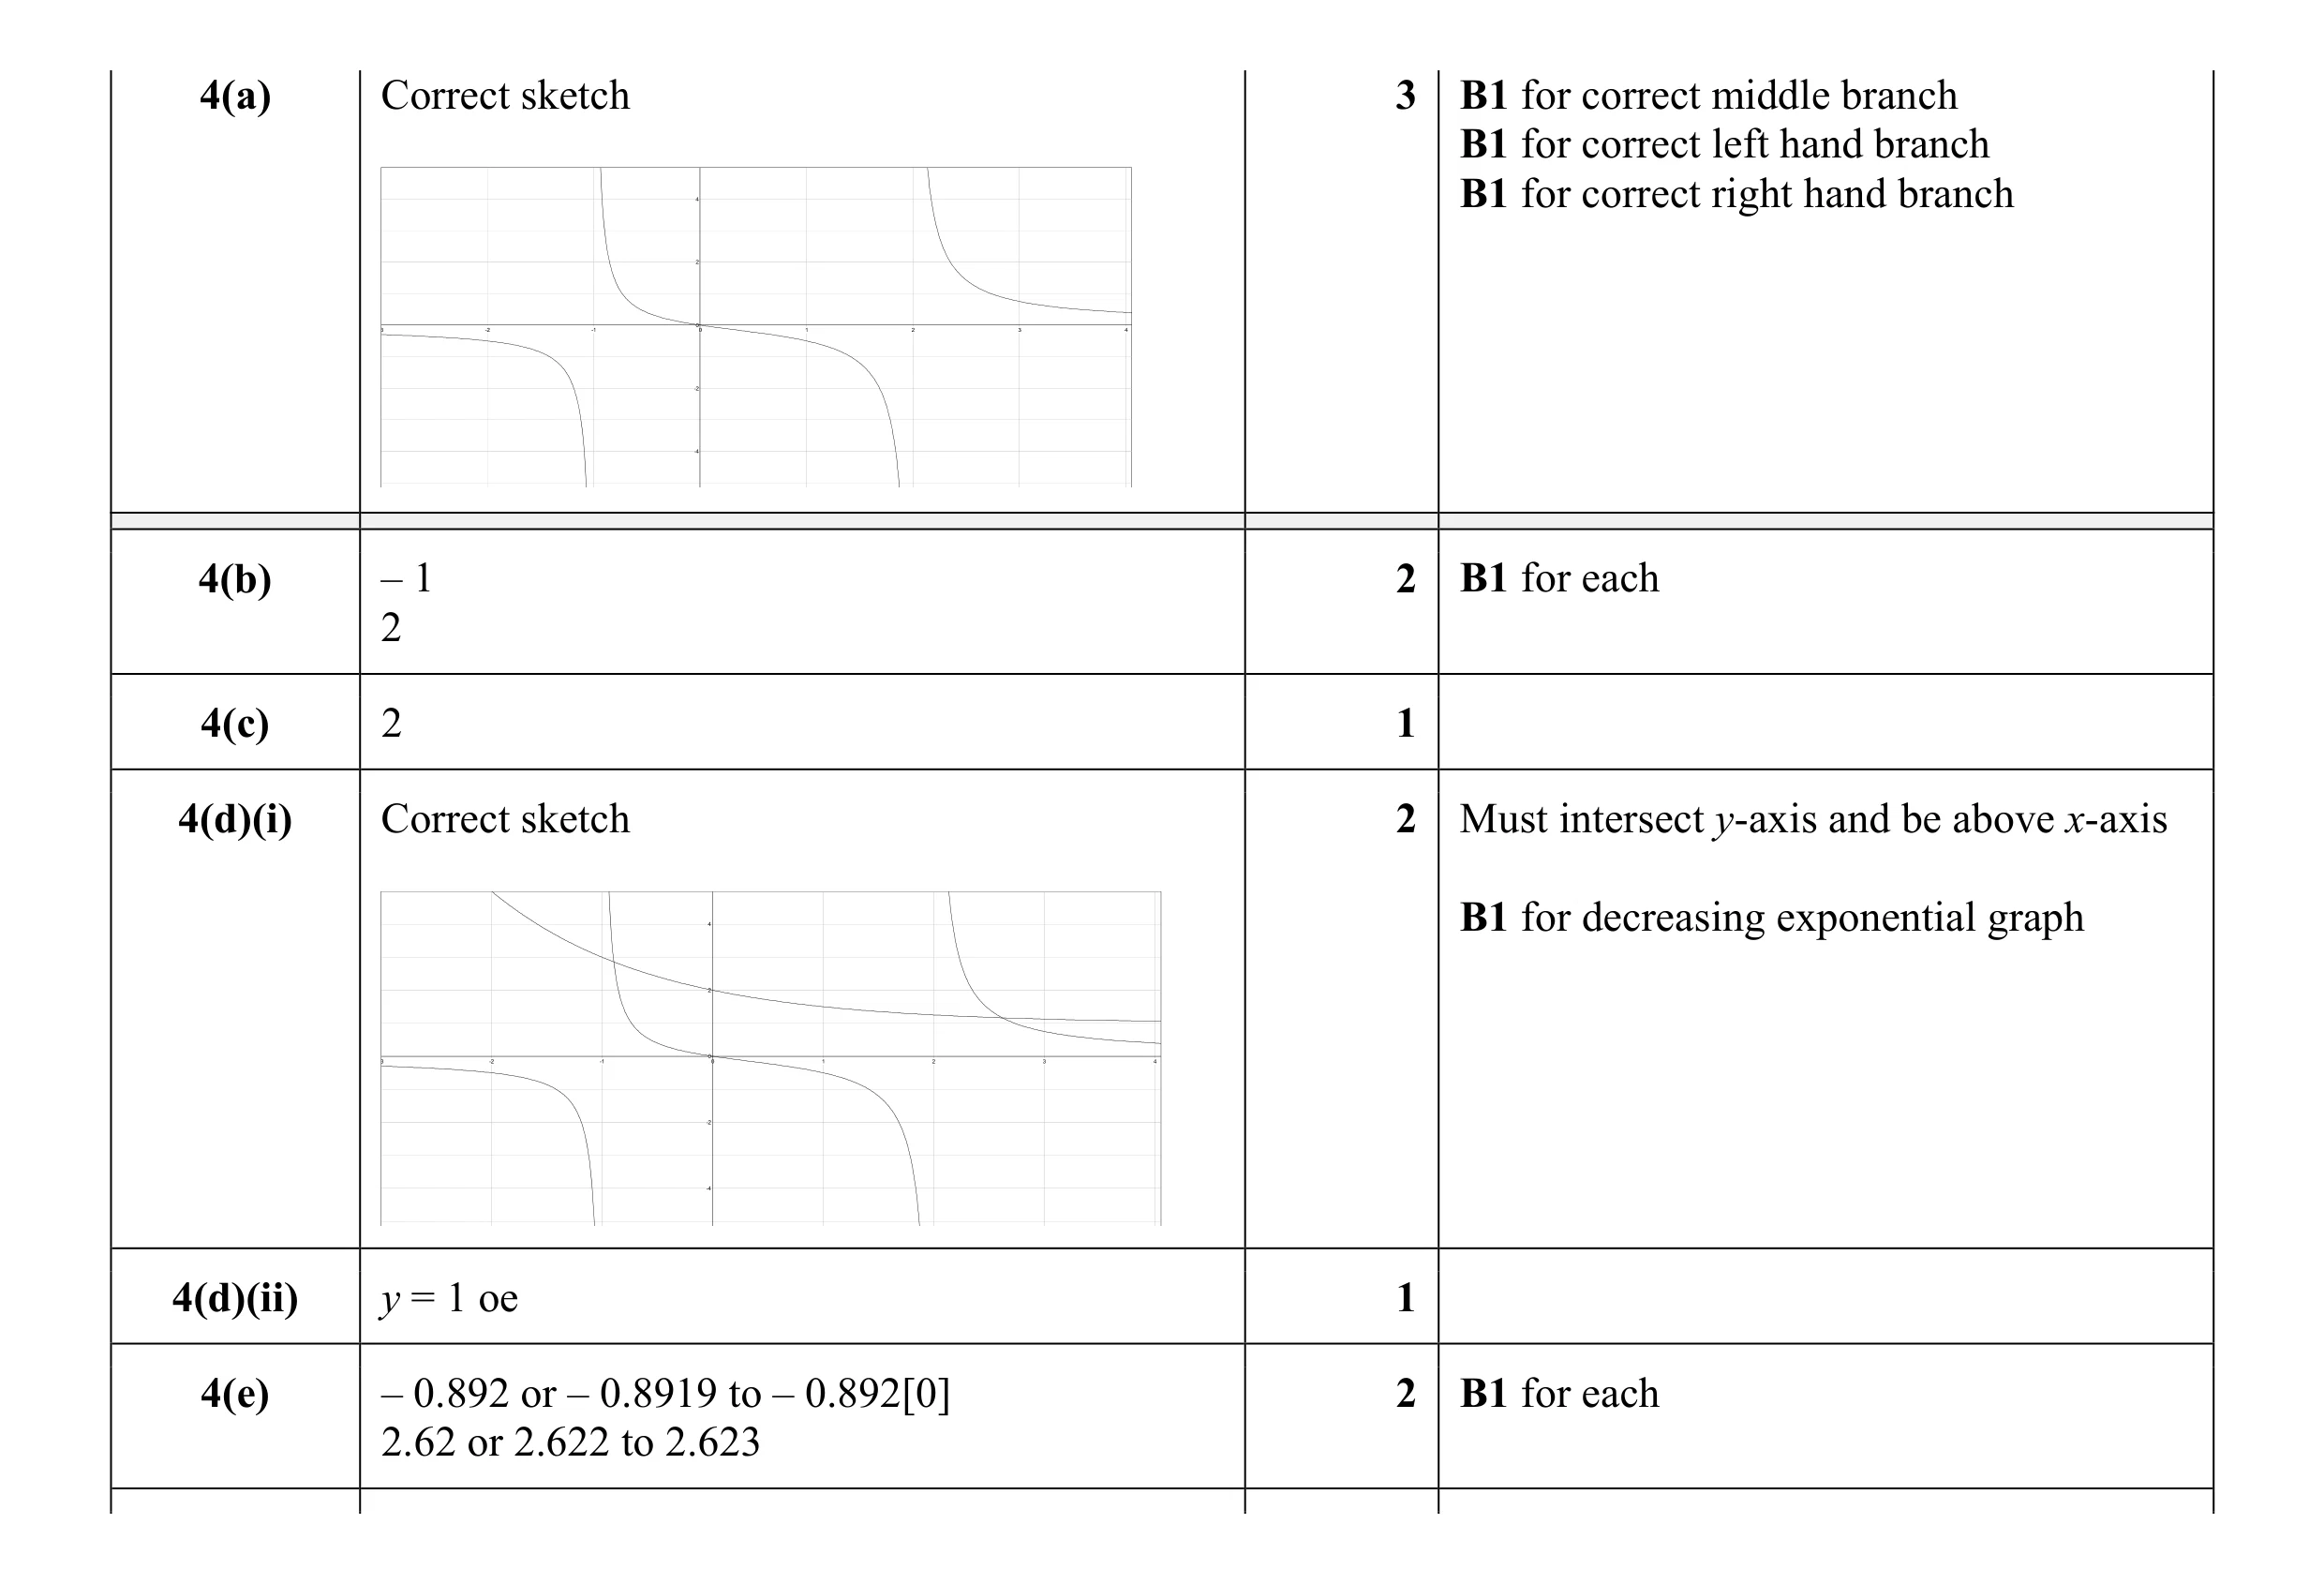 11
11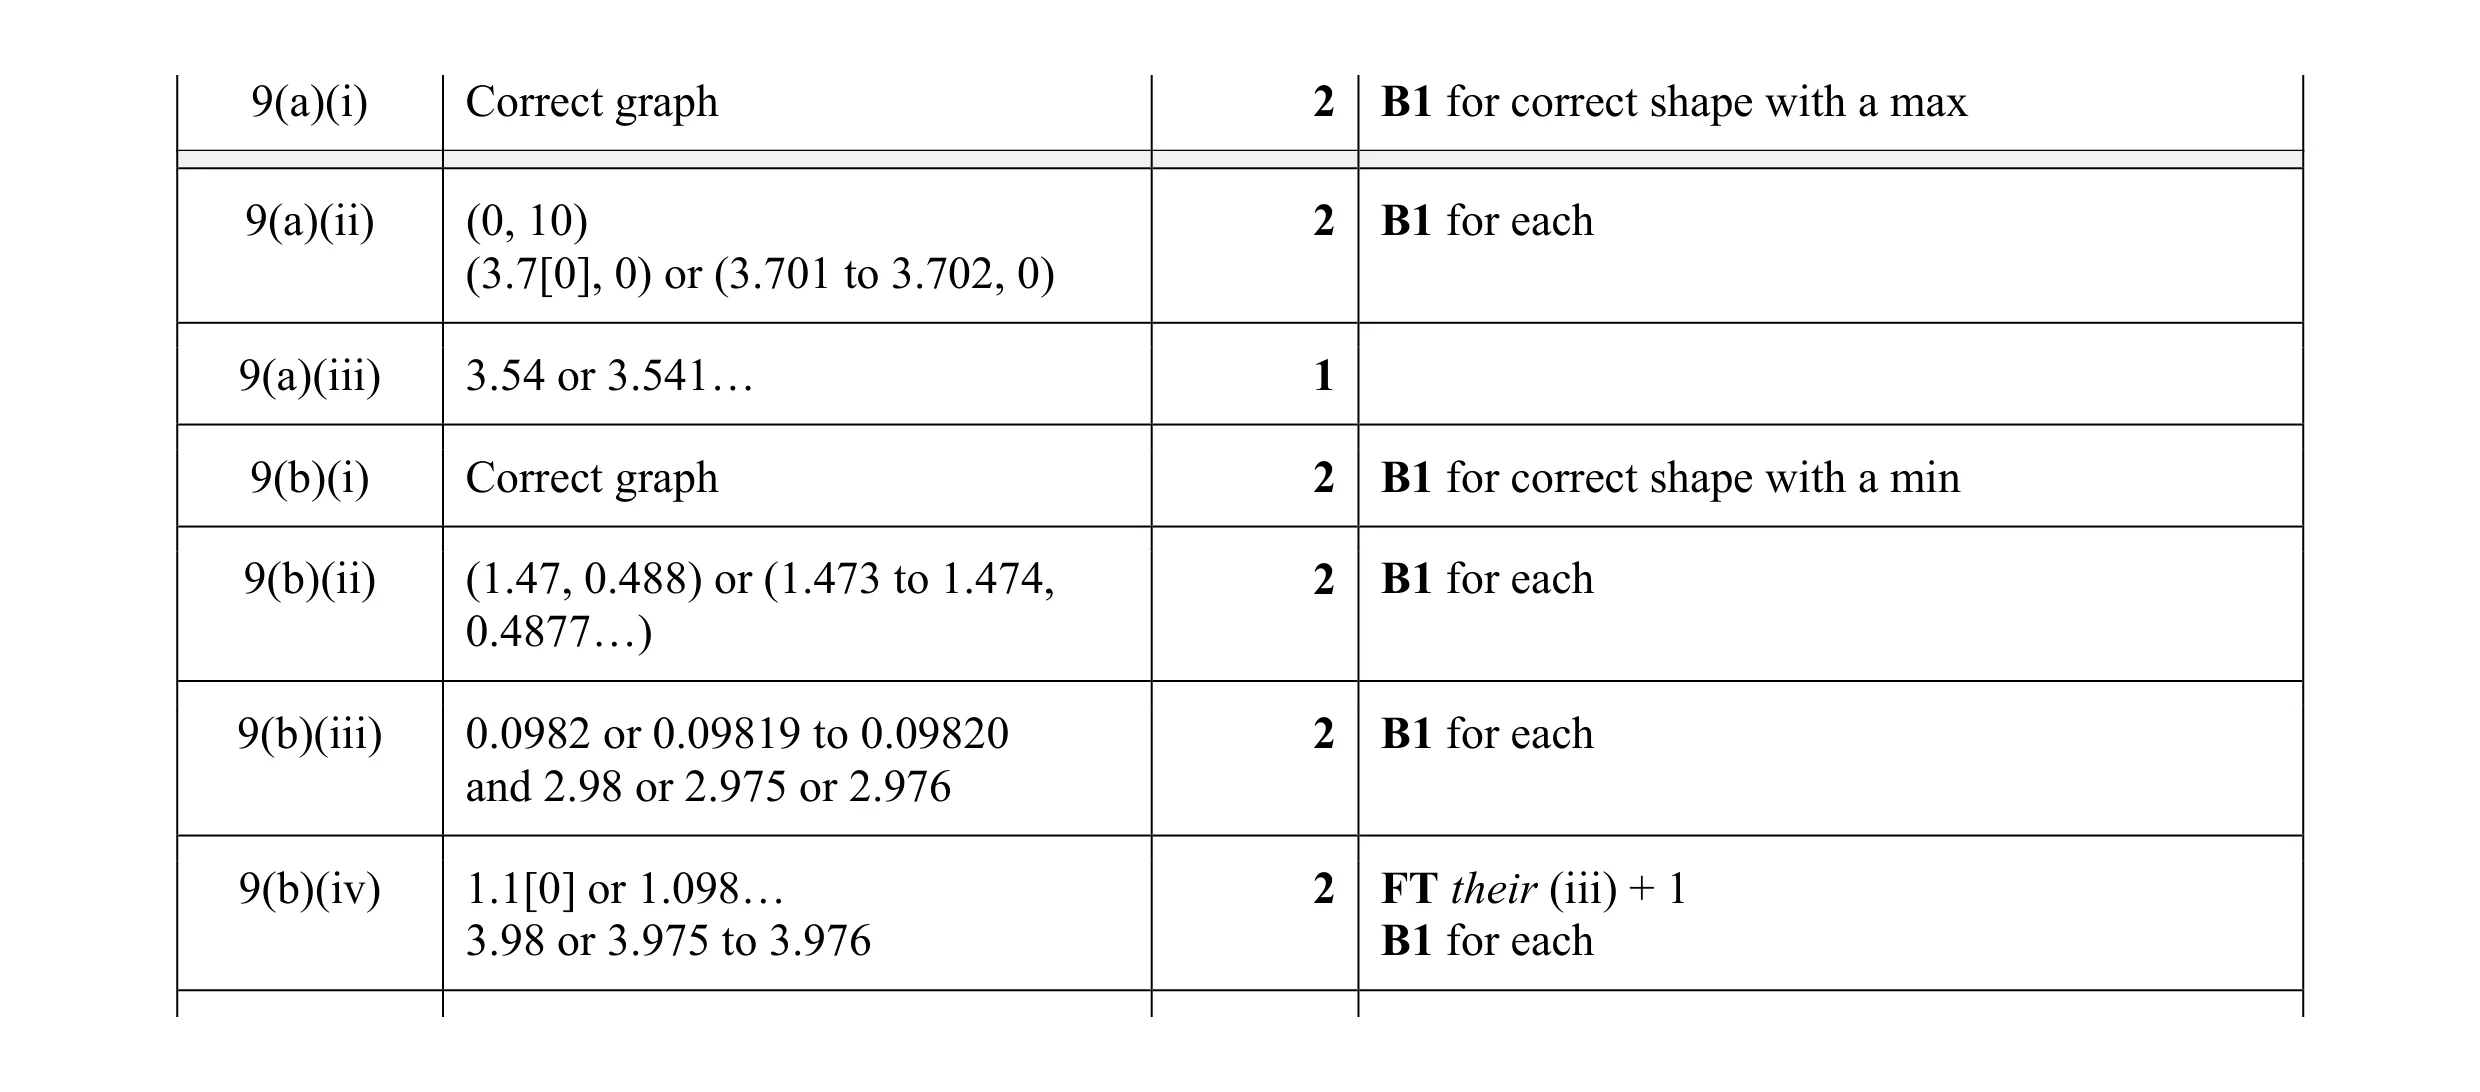 13
13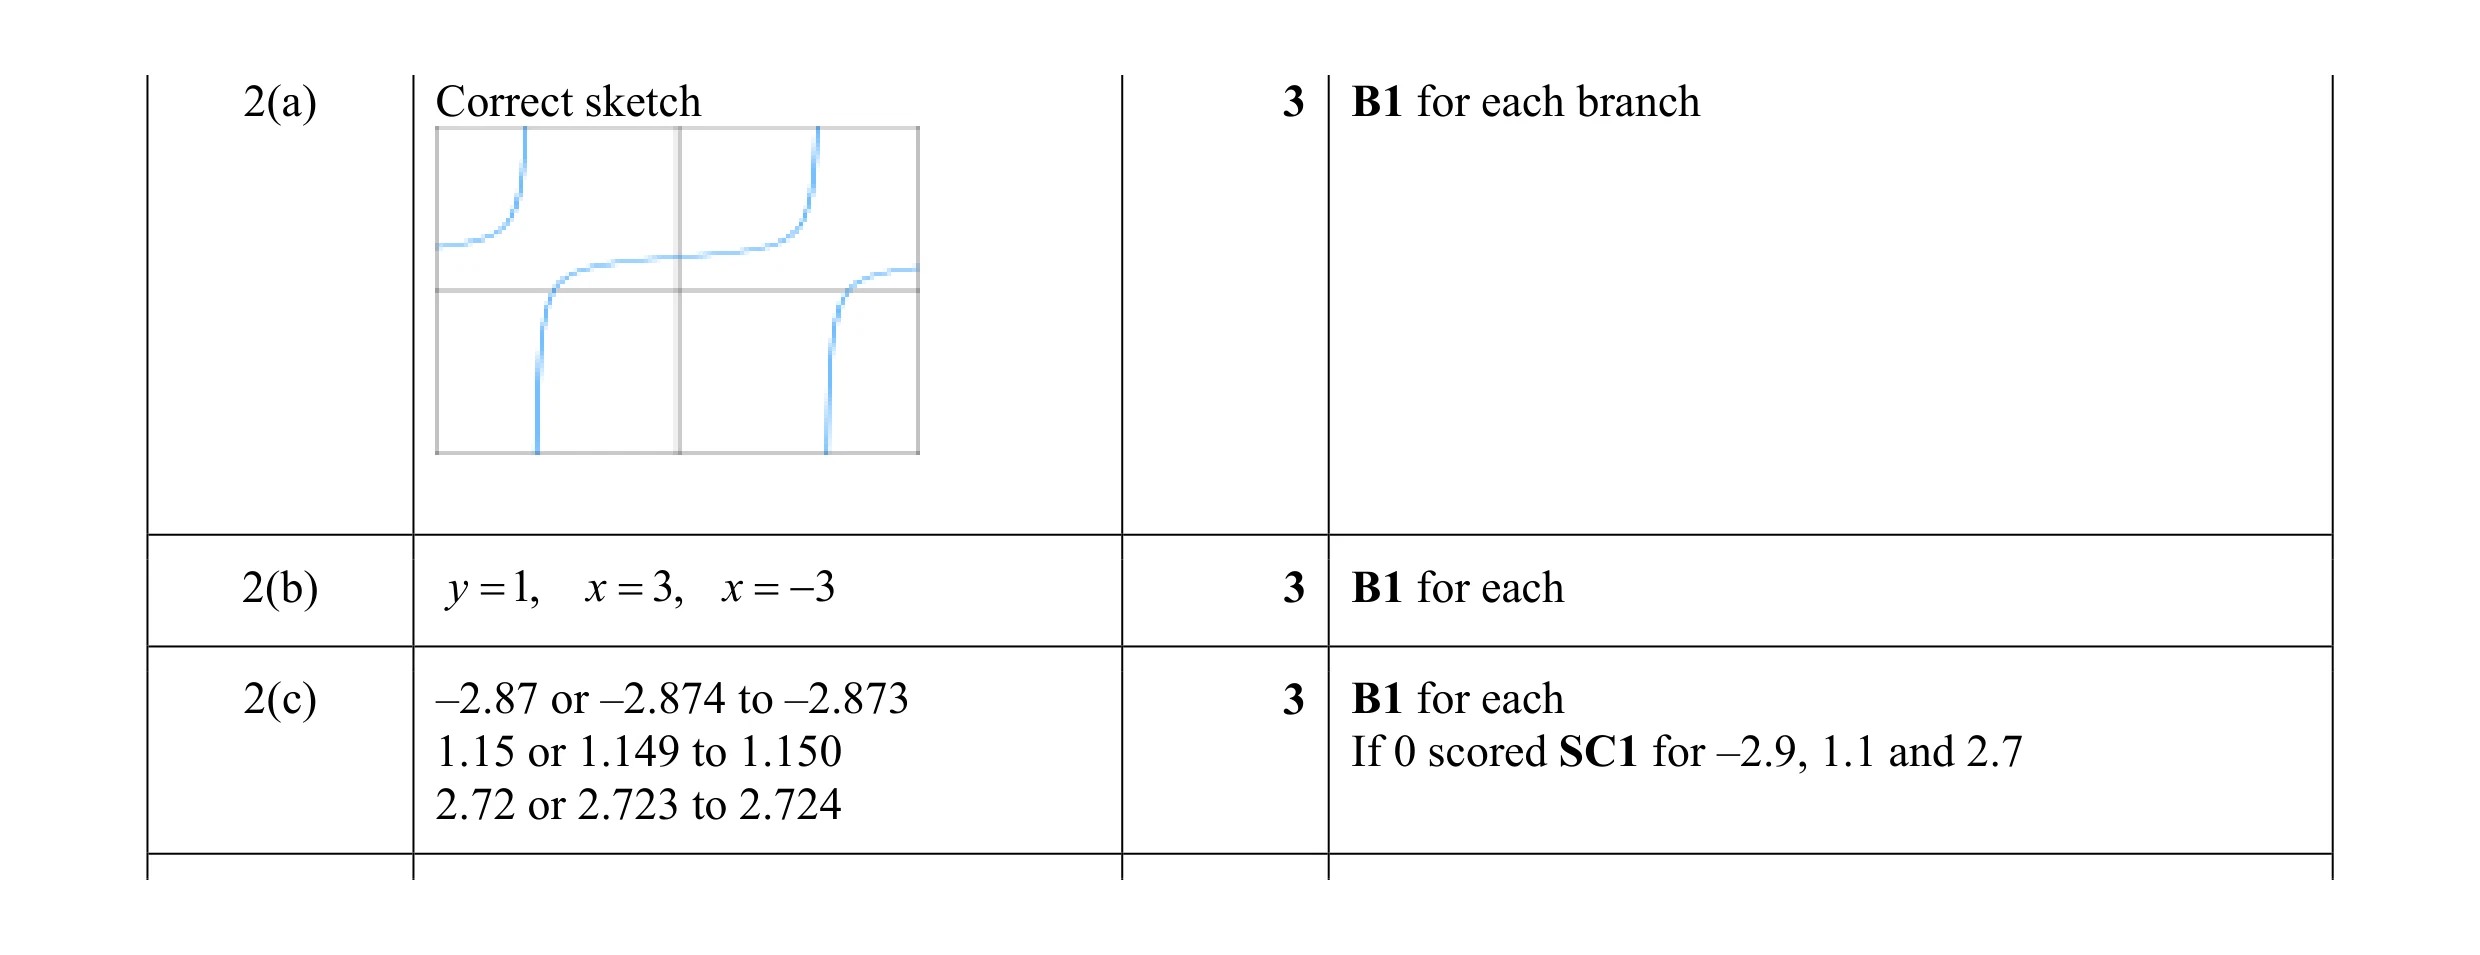 9
9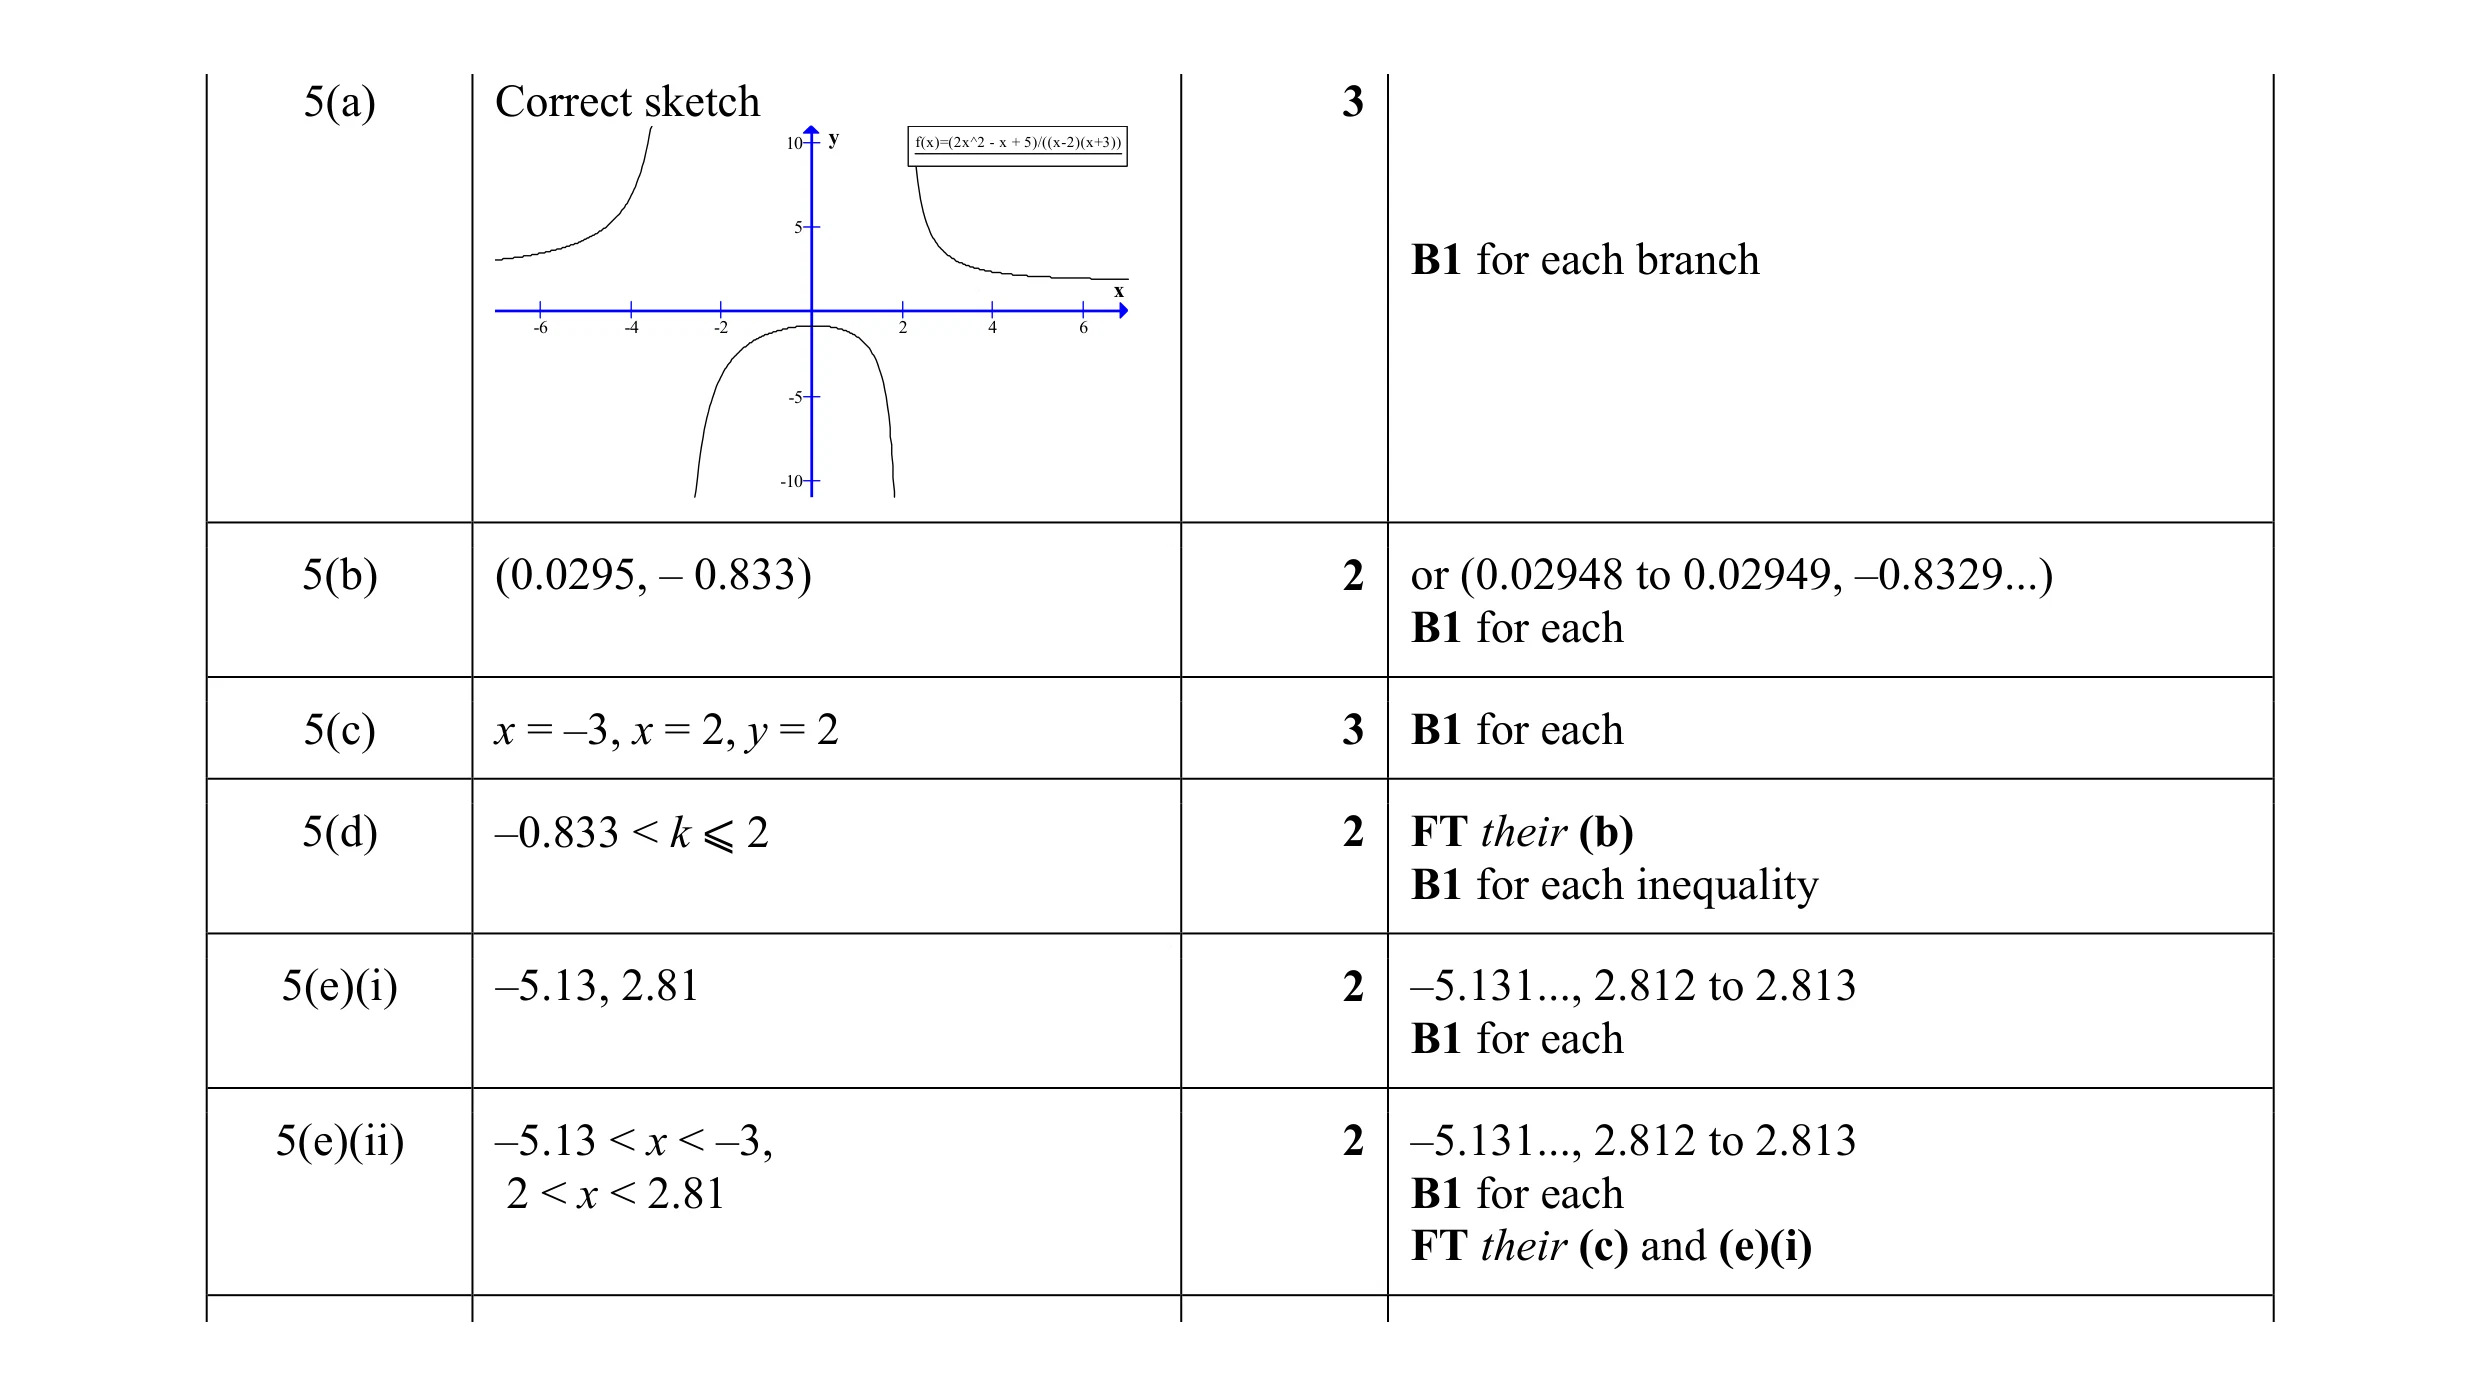 14
14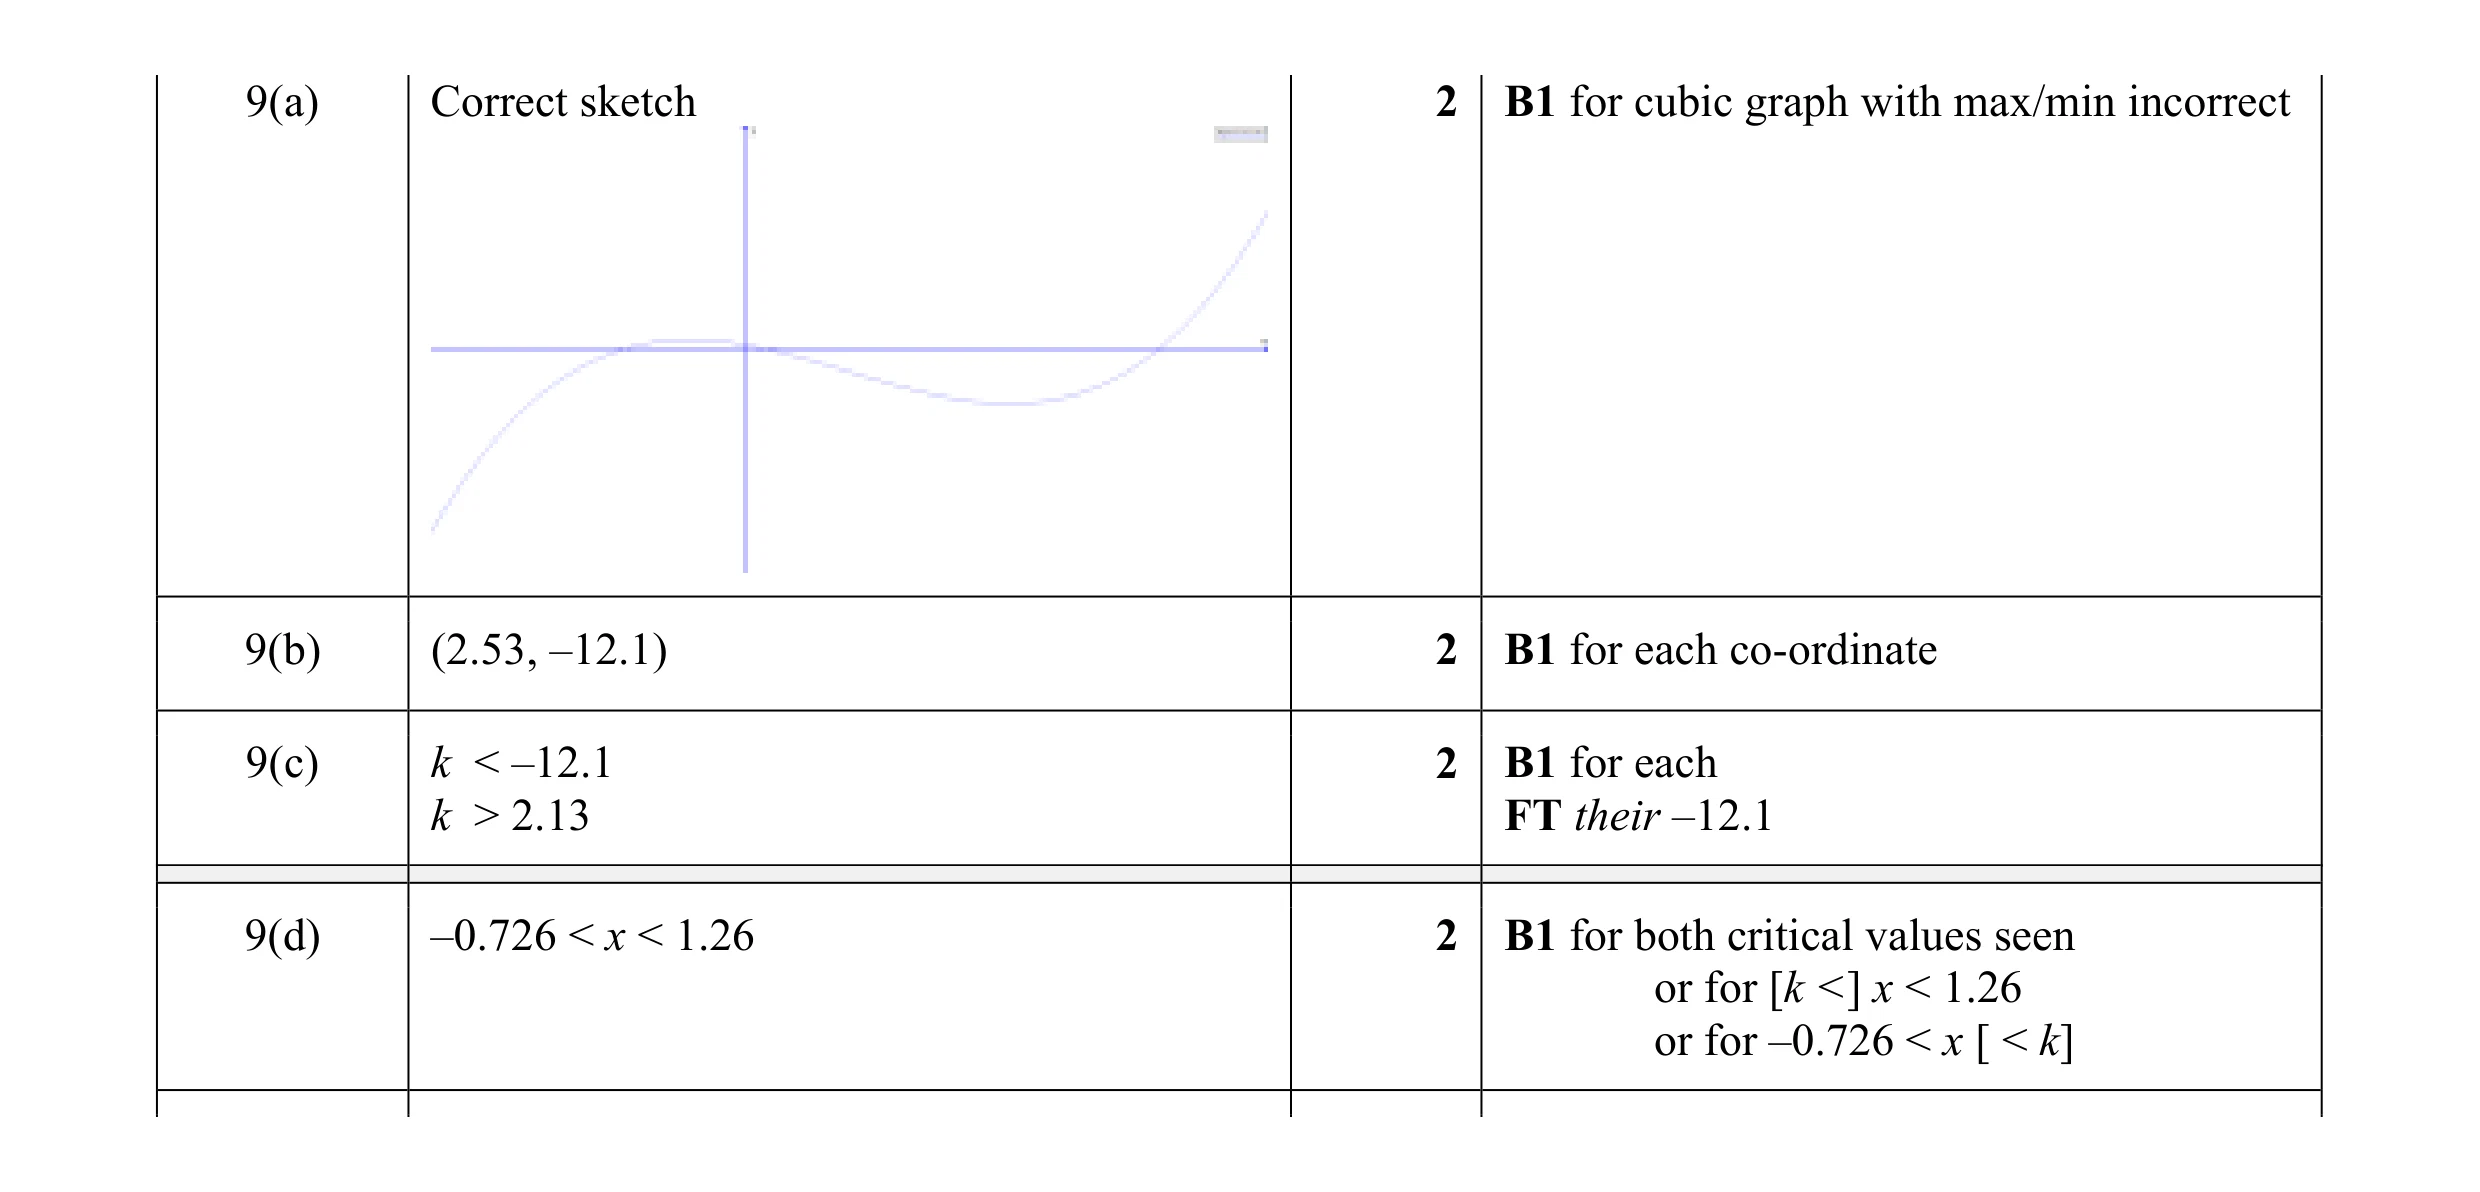 8
8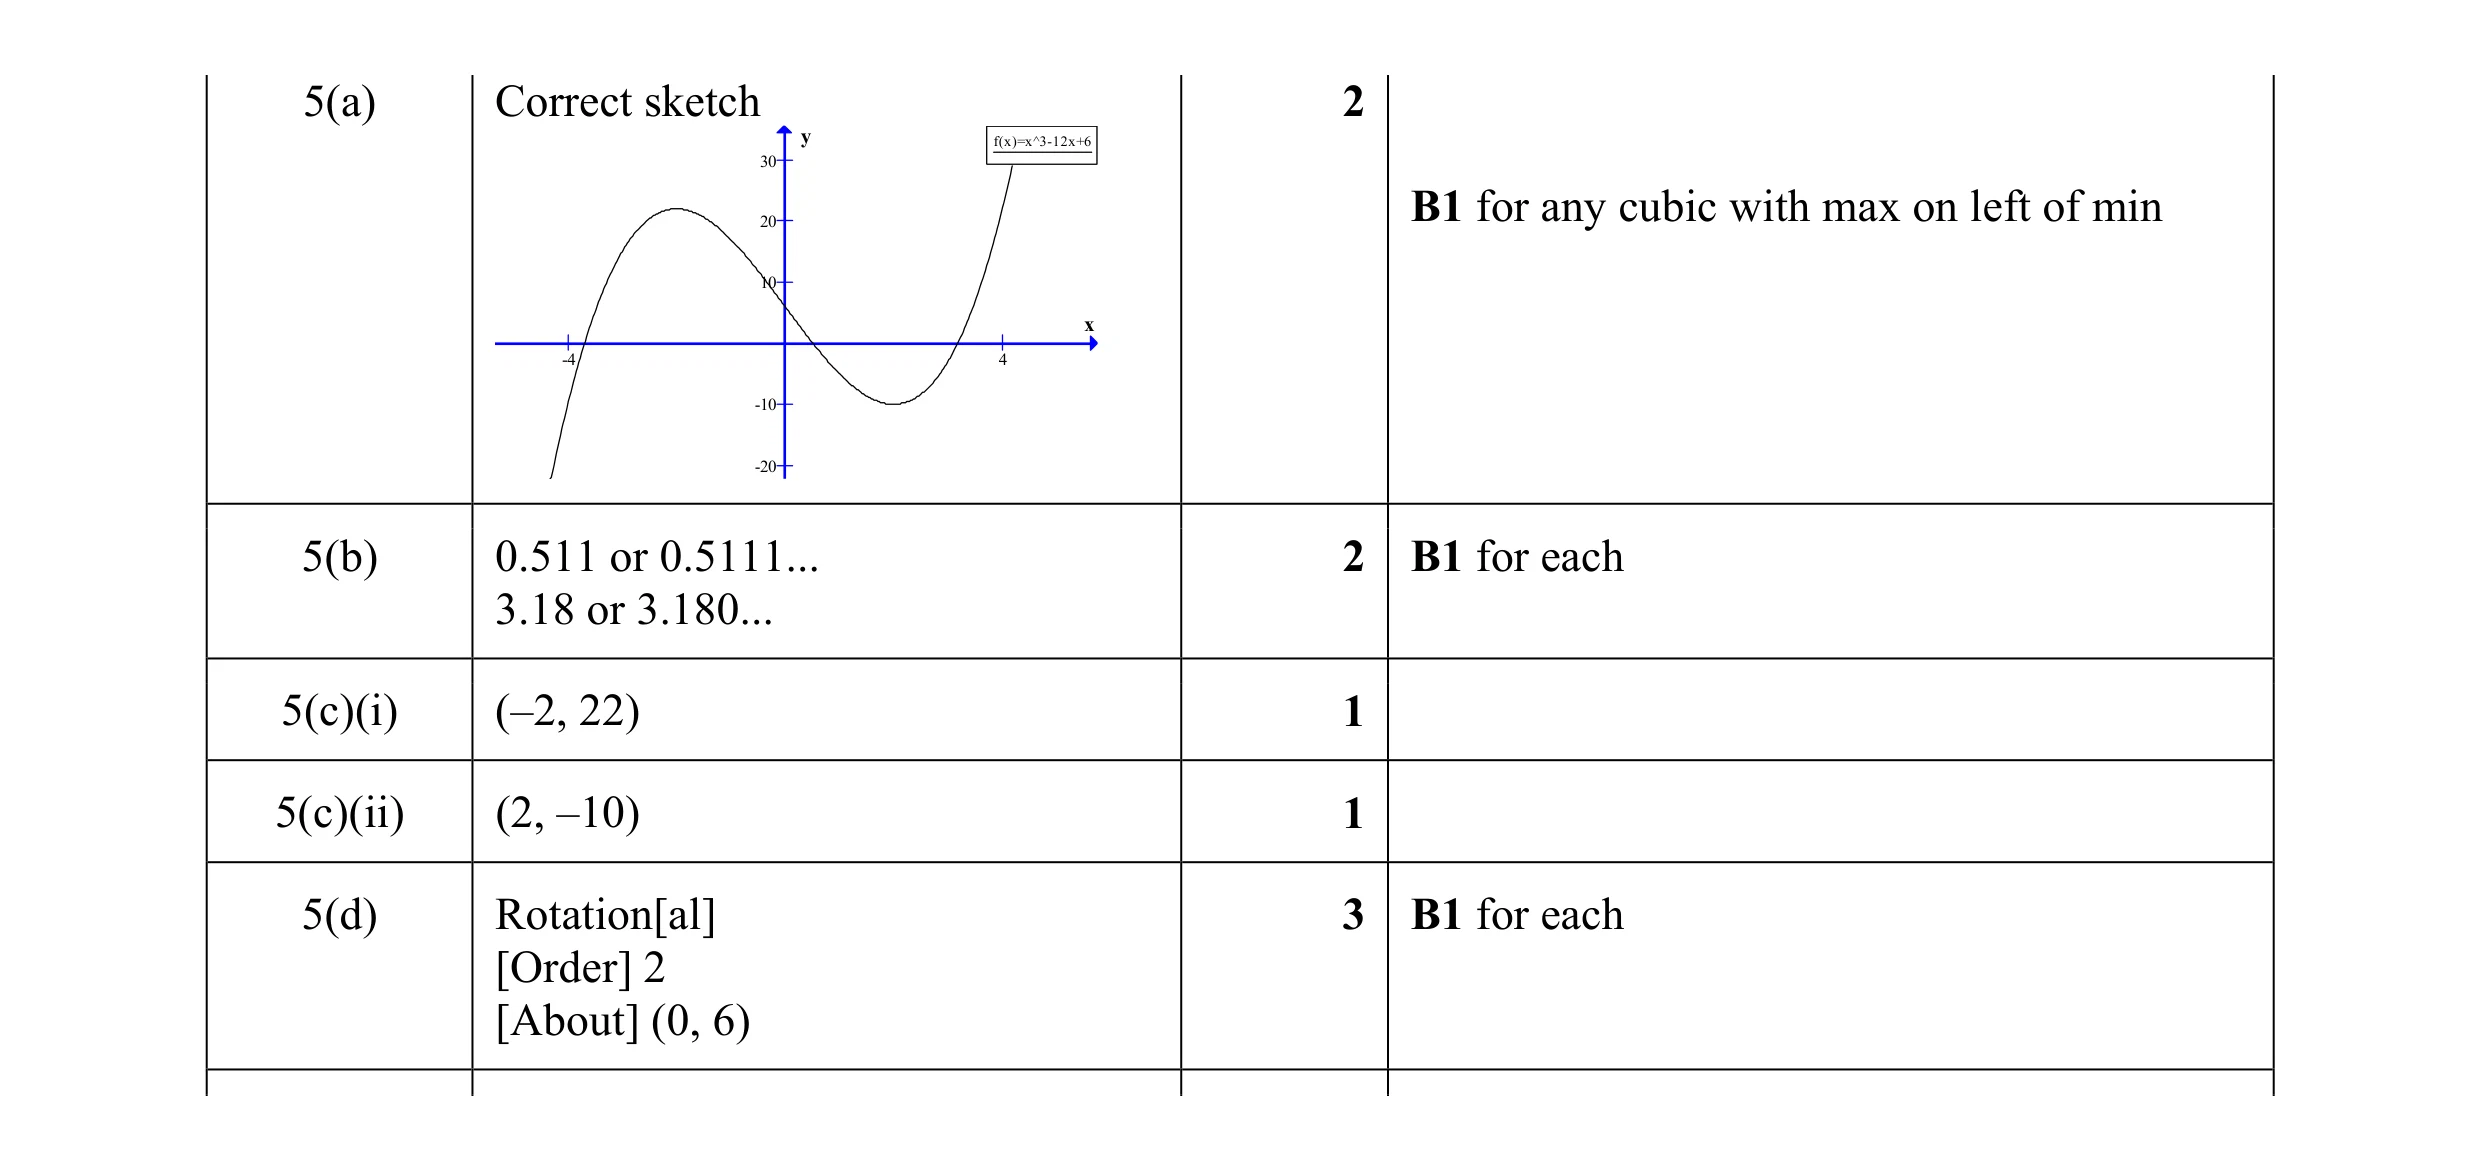 9
9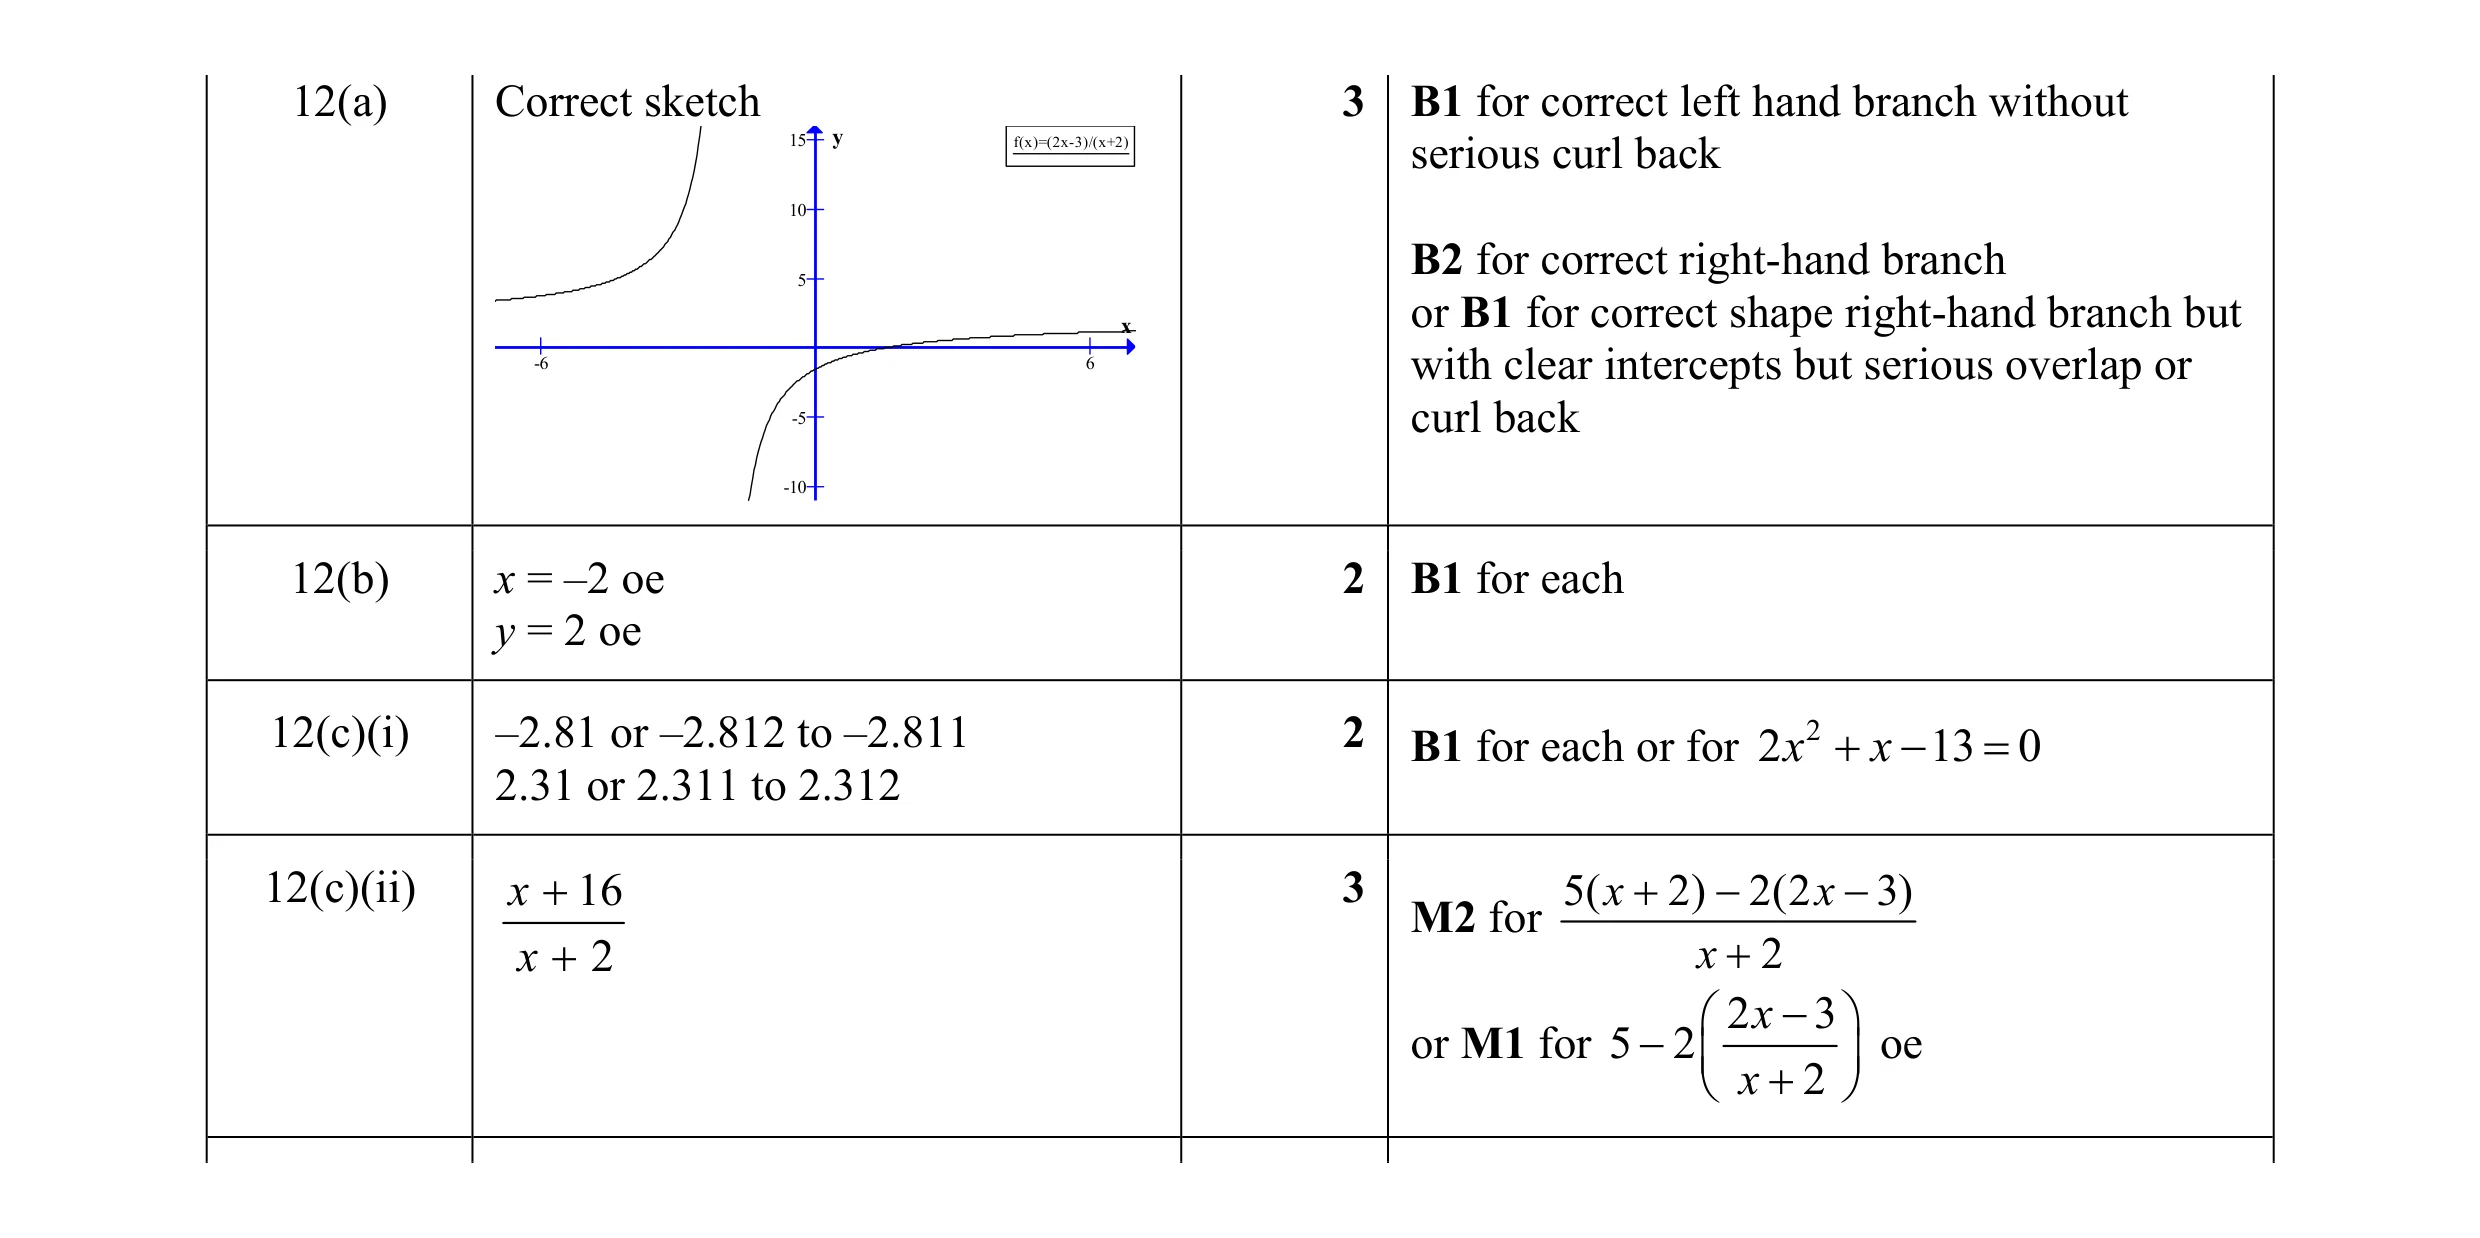 10
10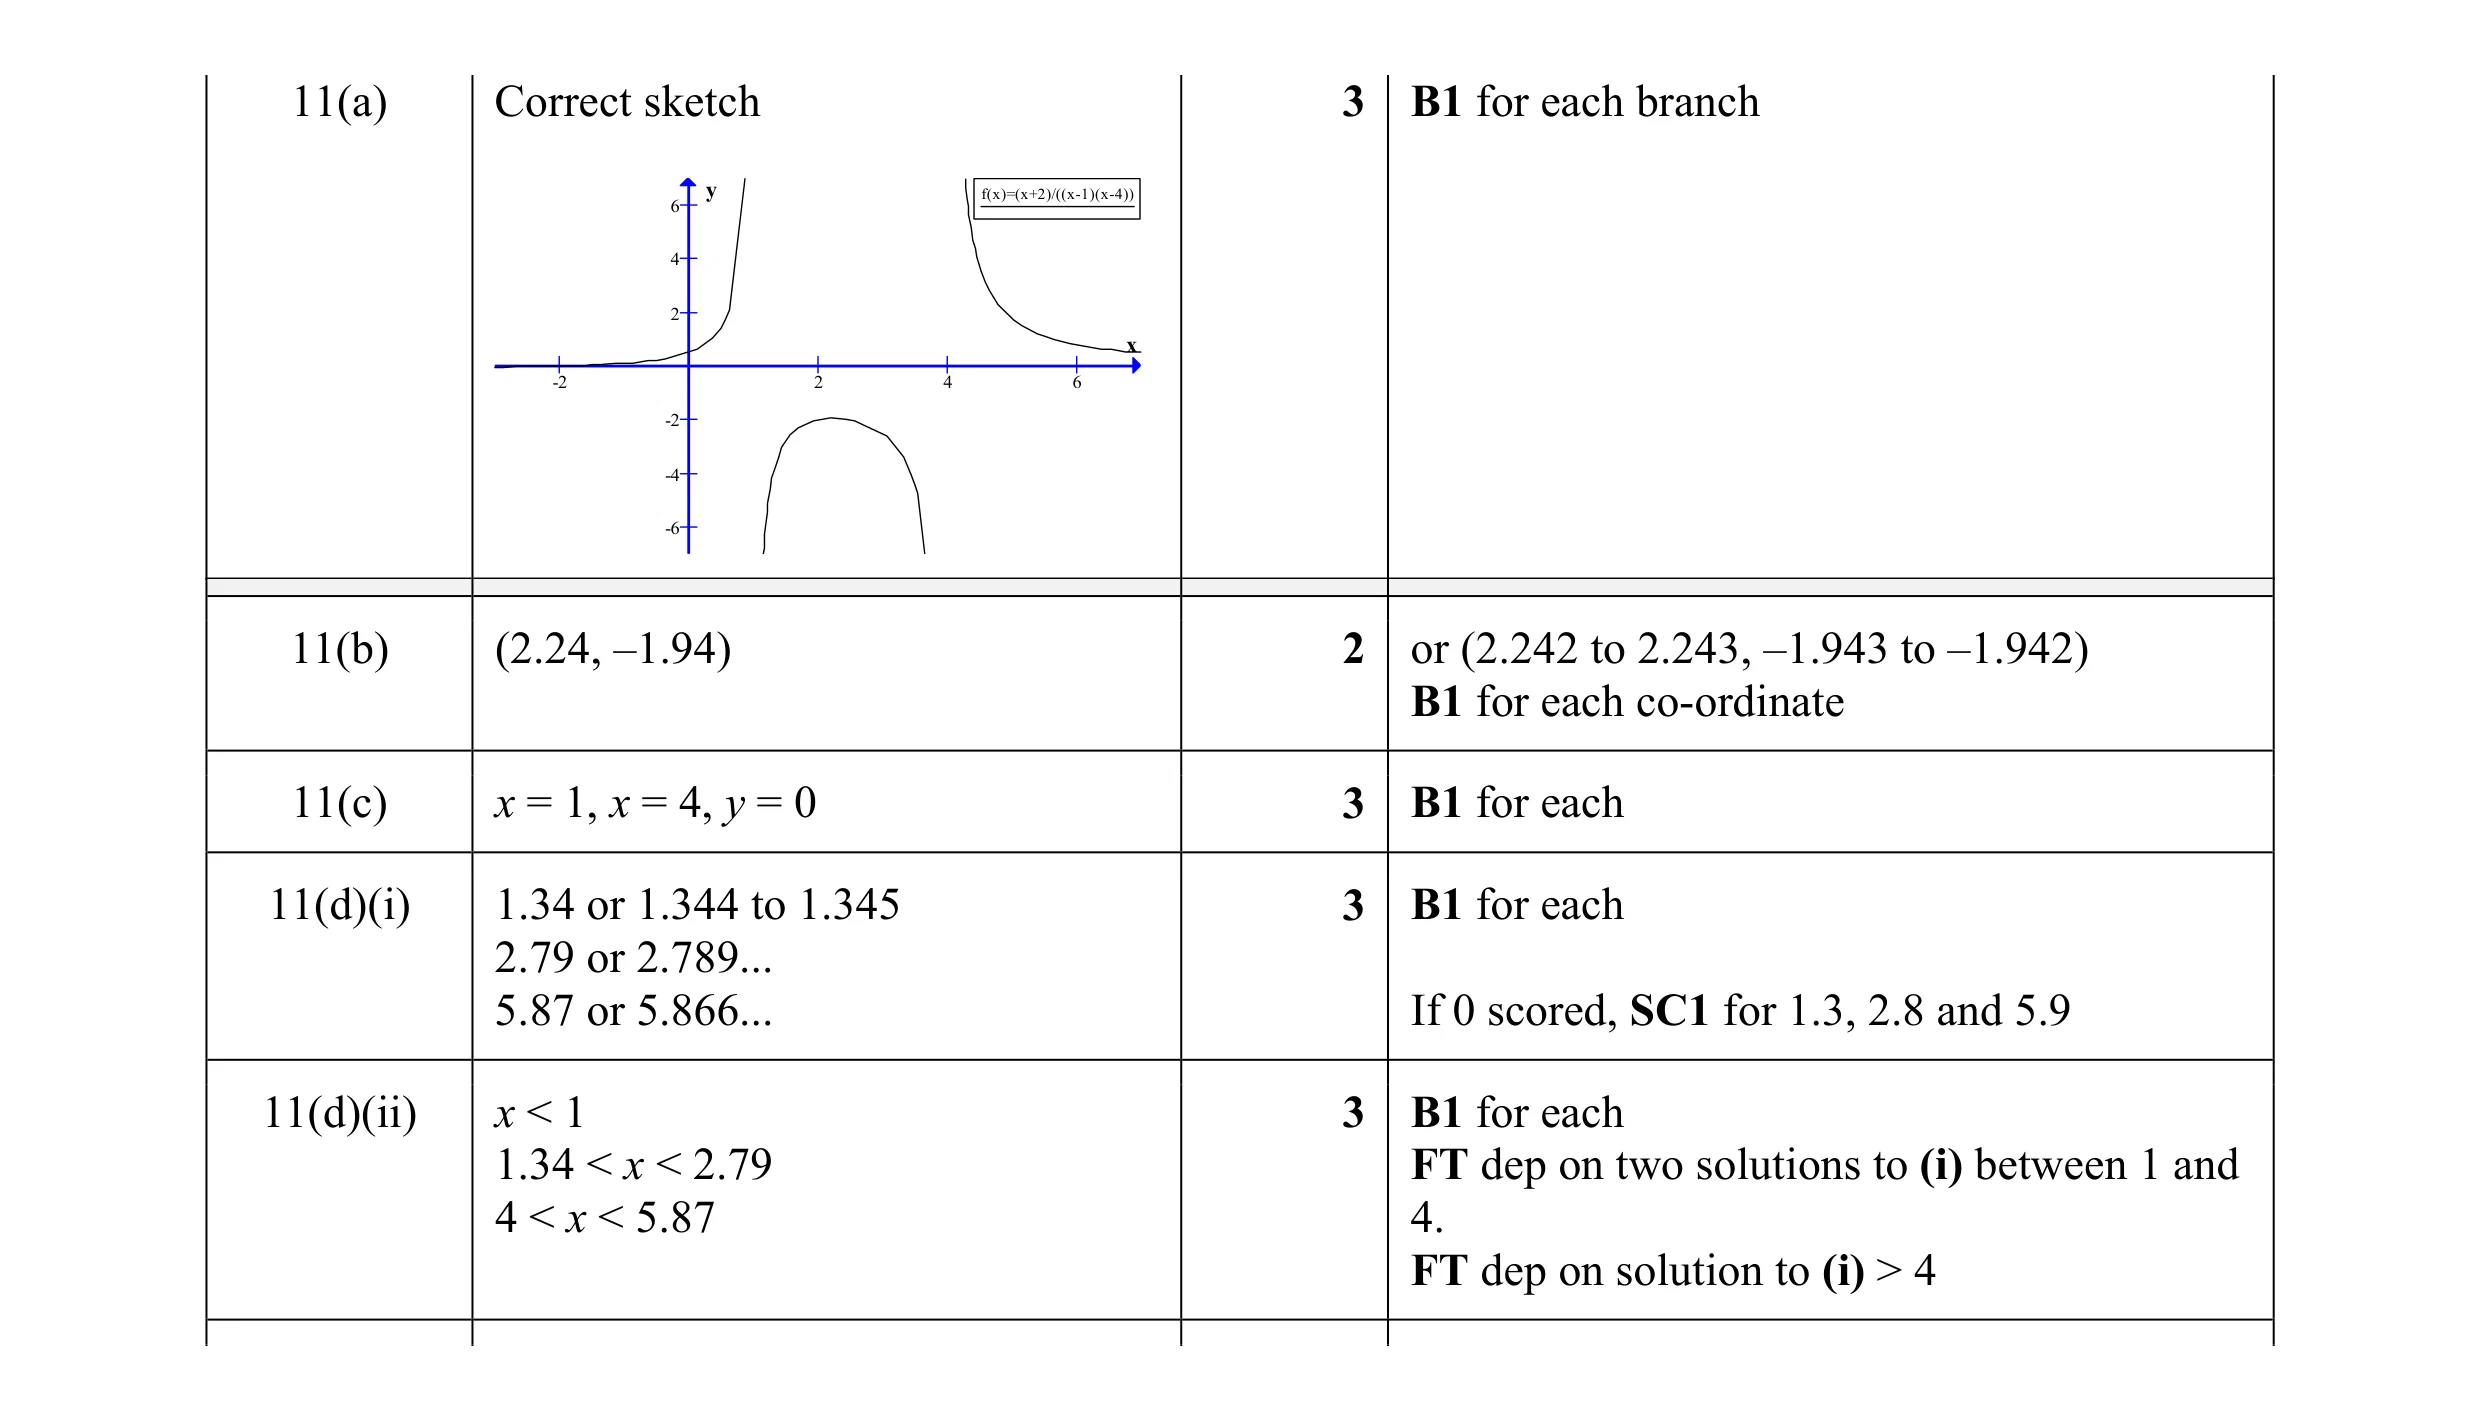 14
14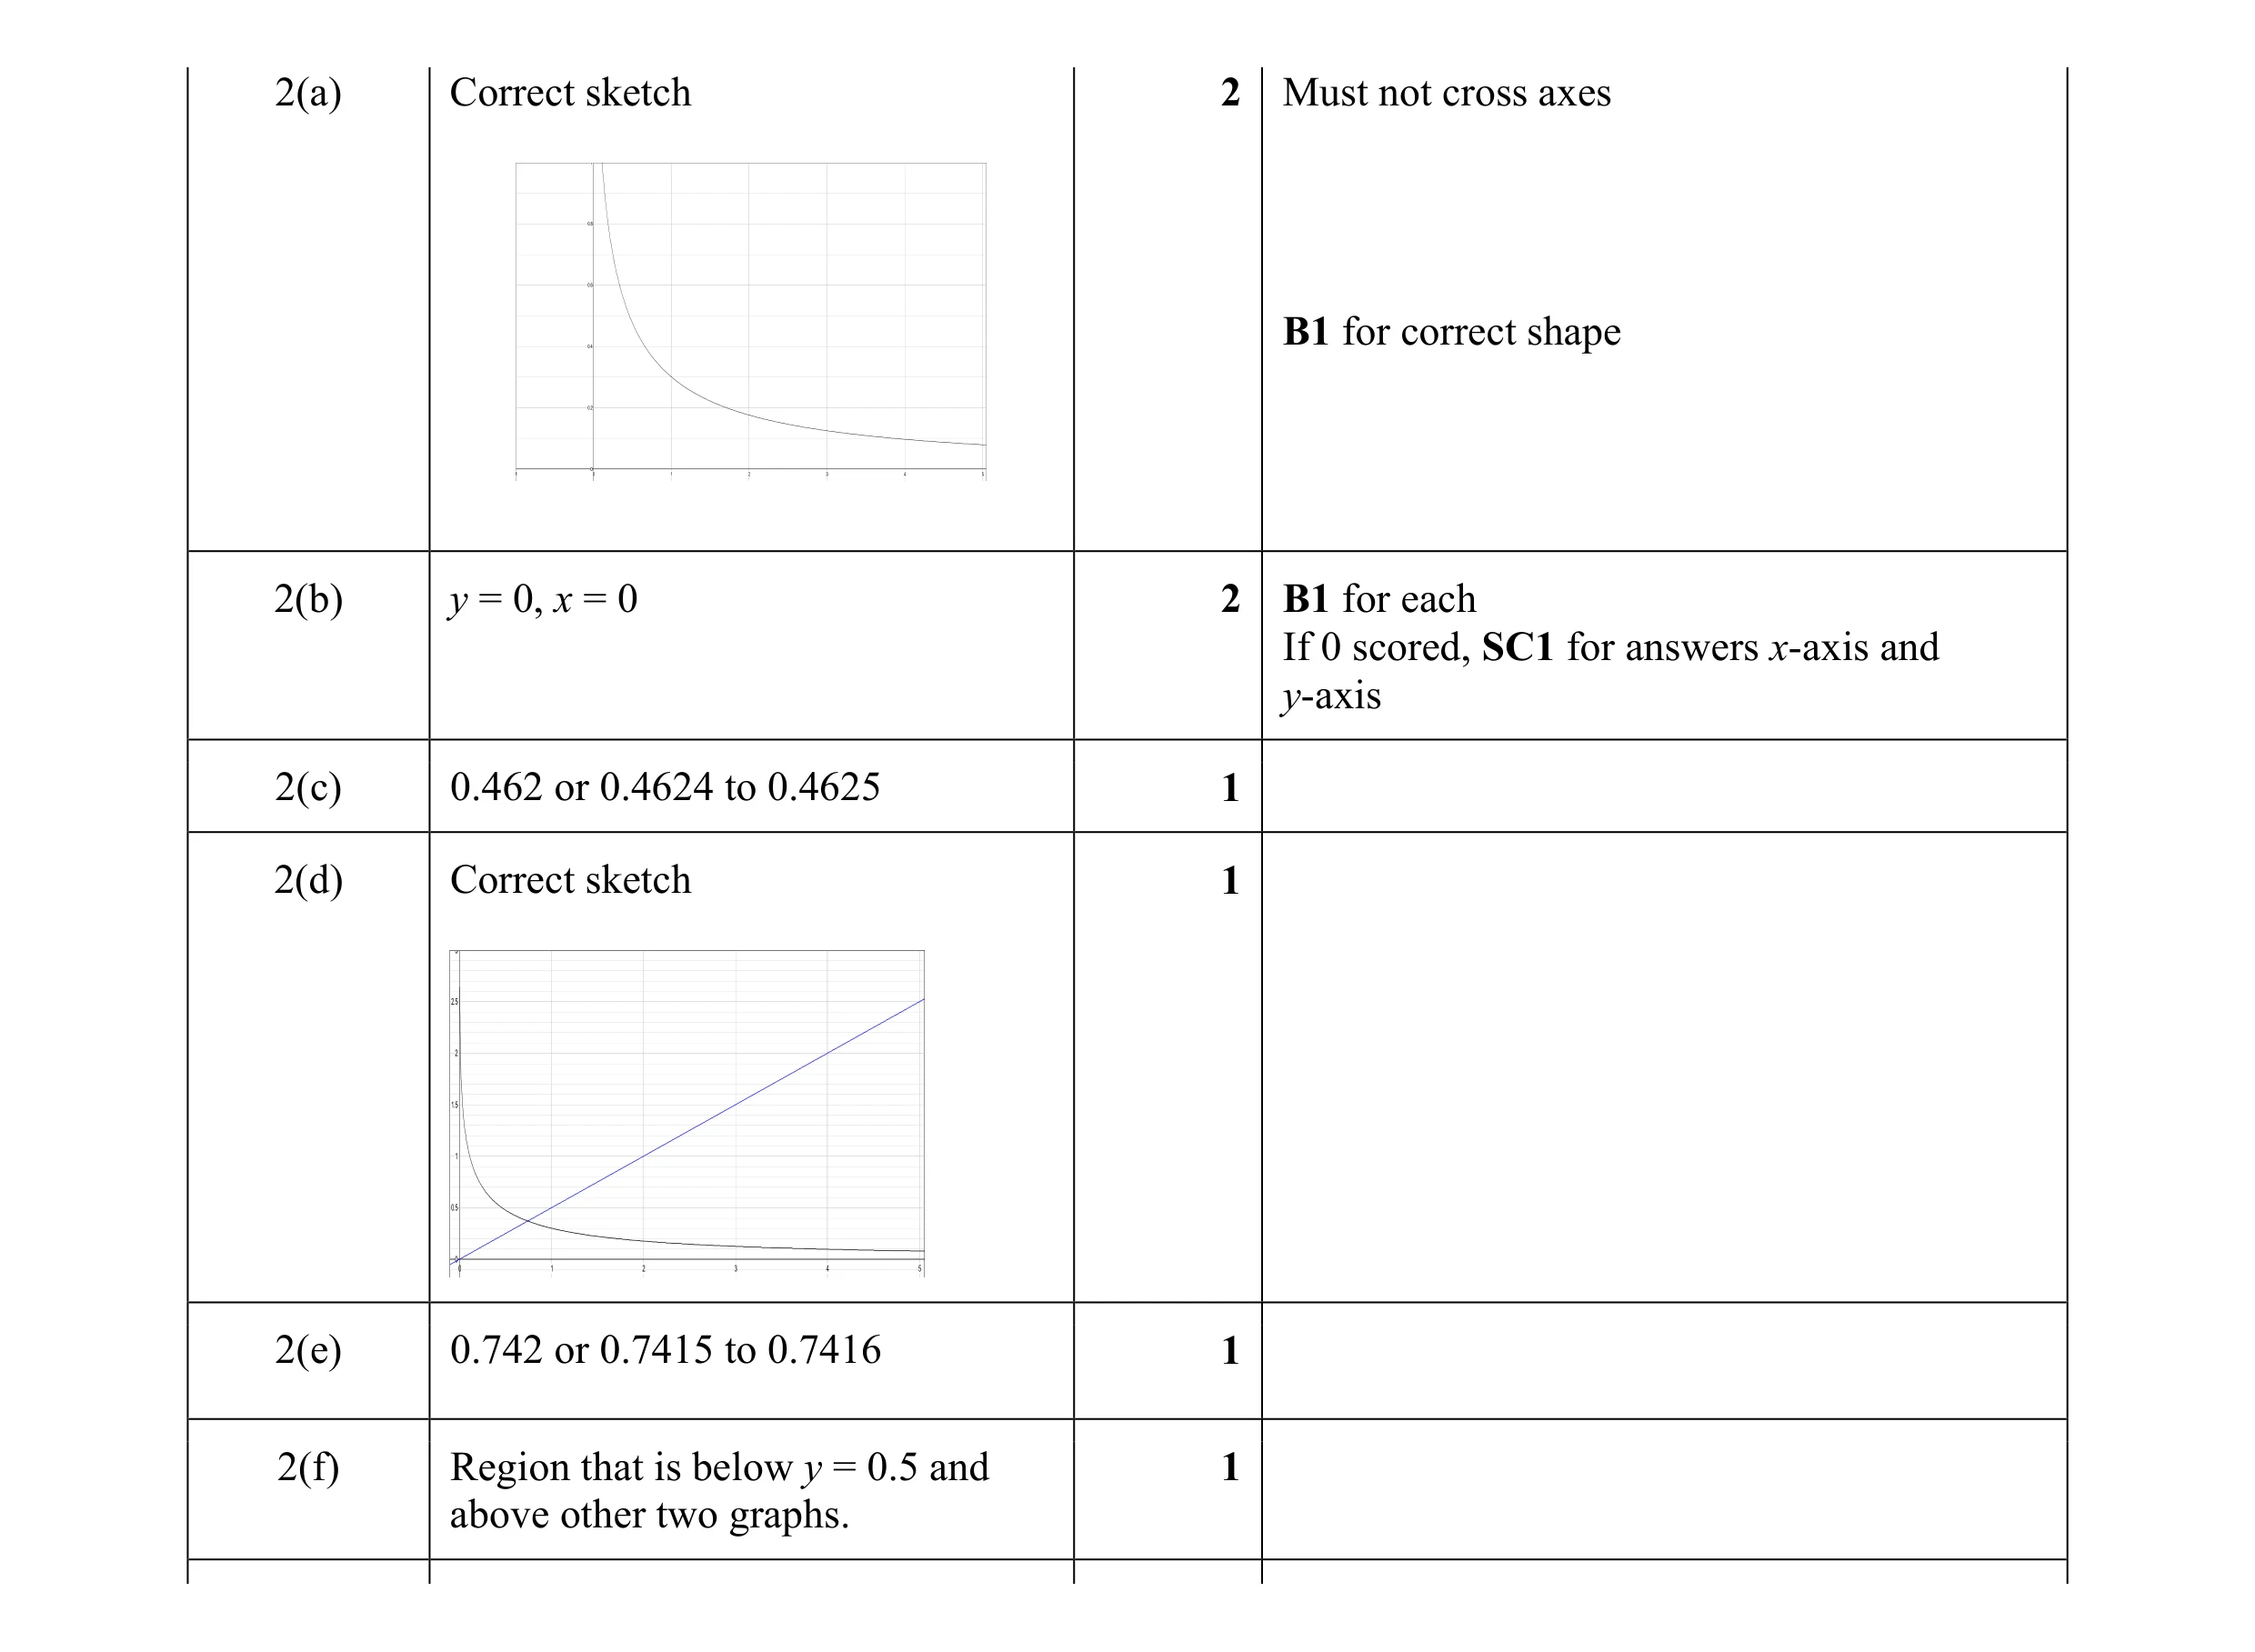 8
8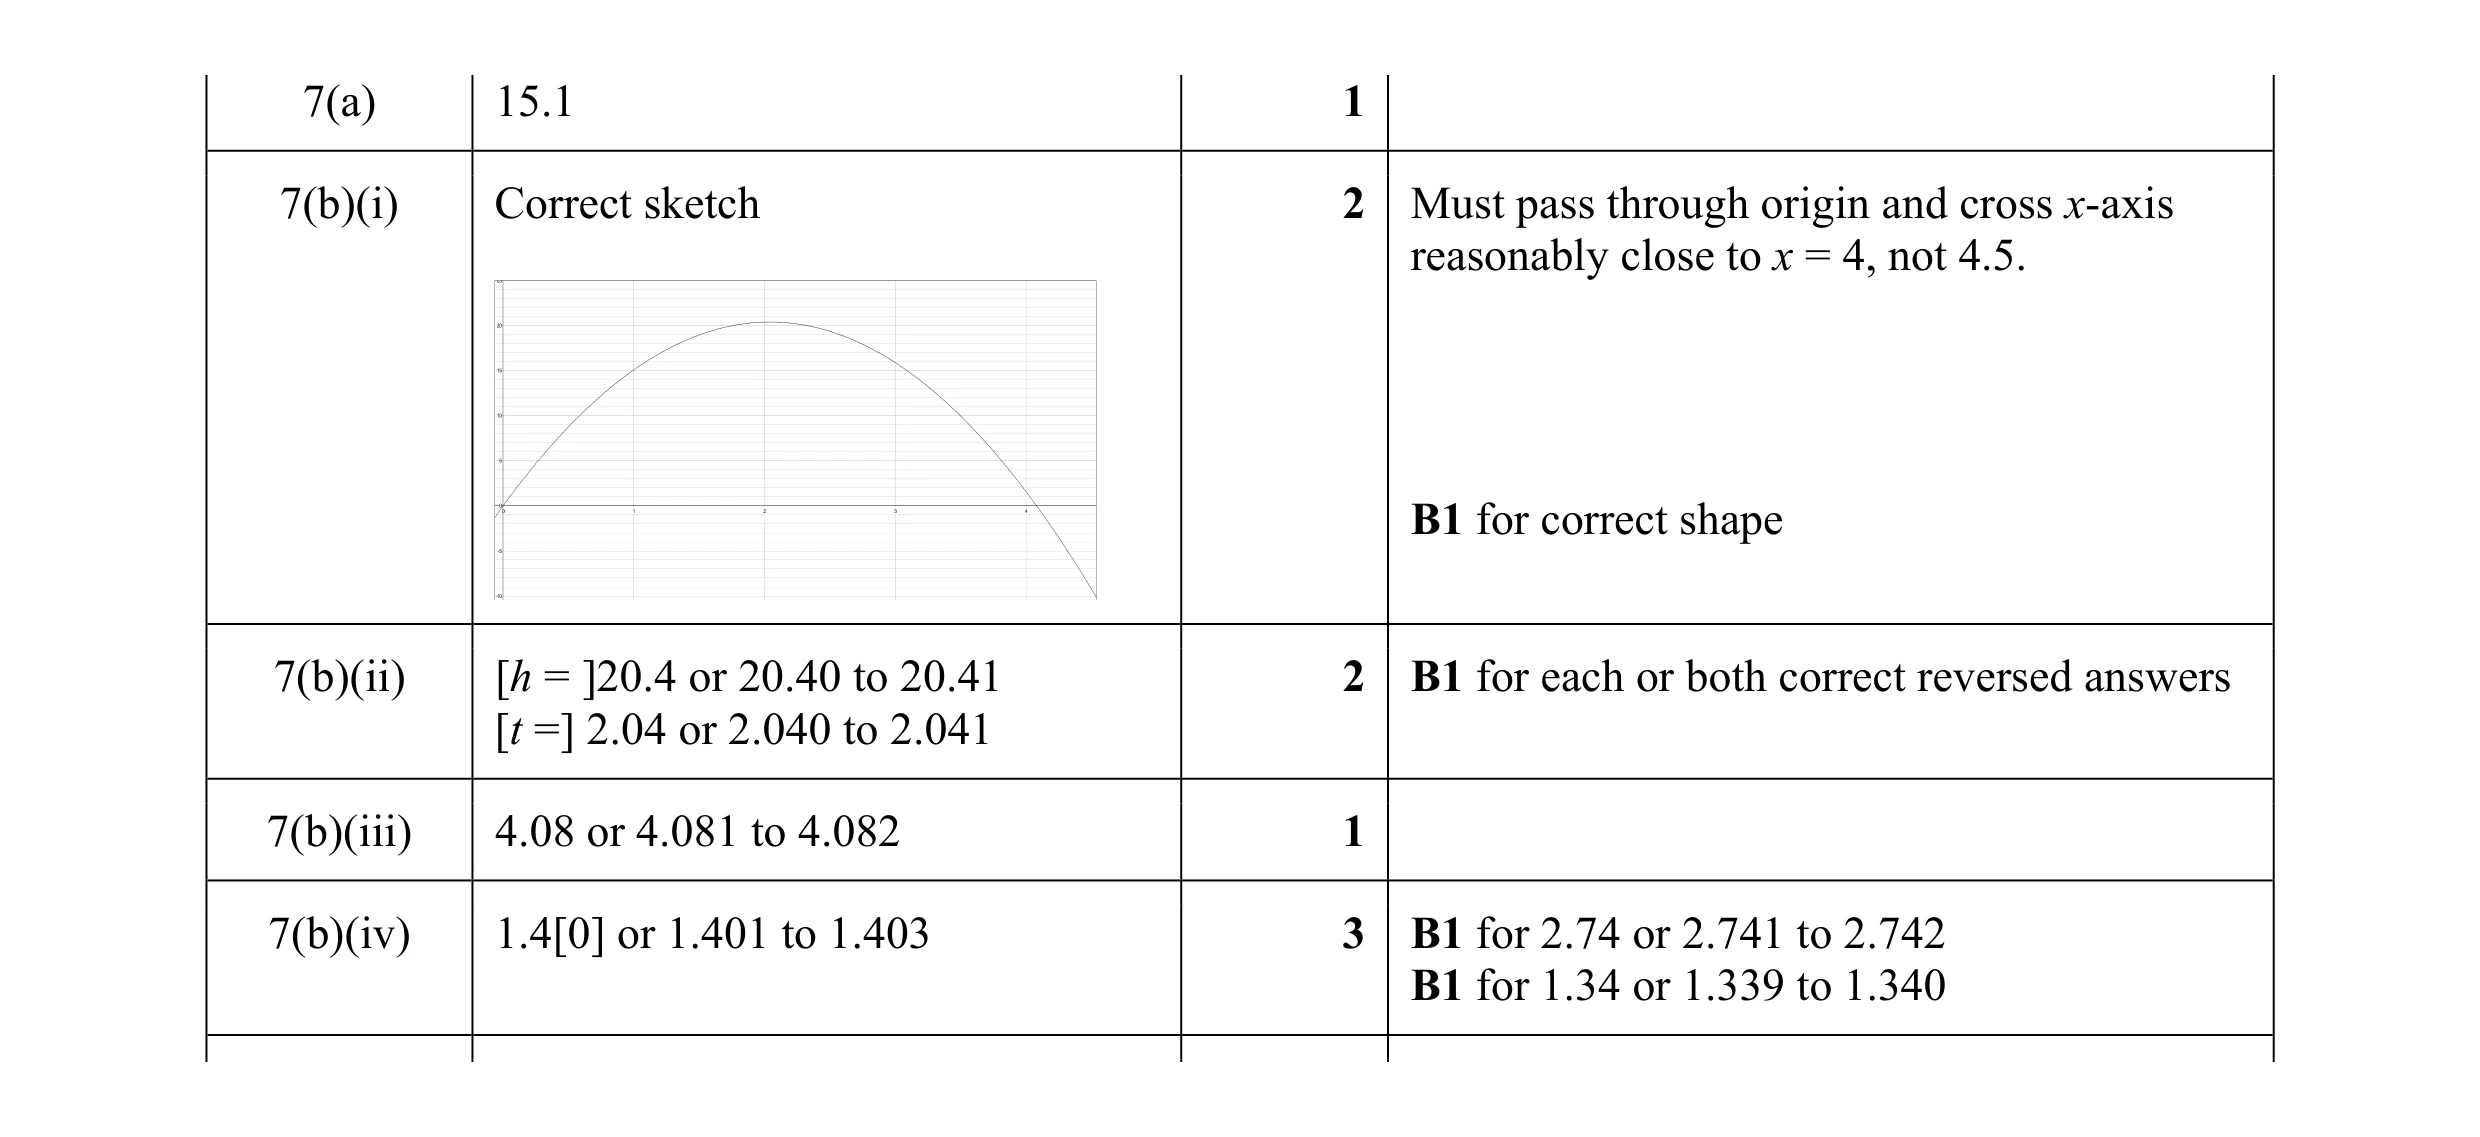 9
9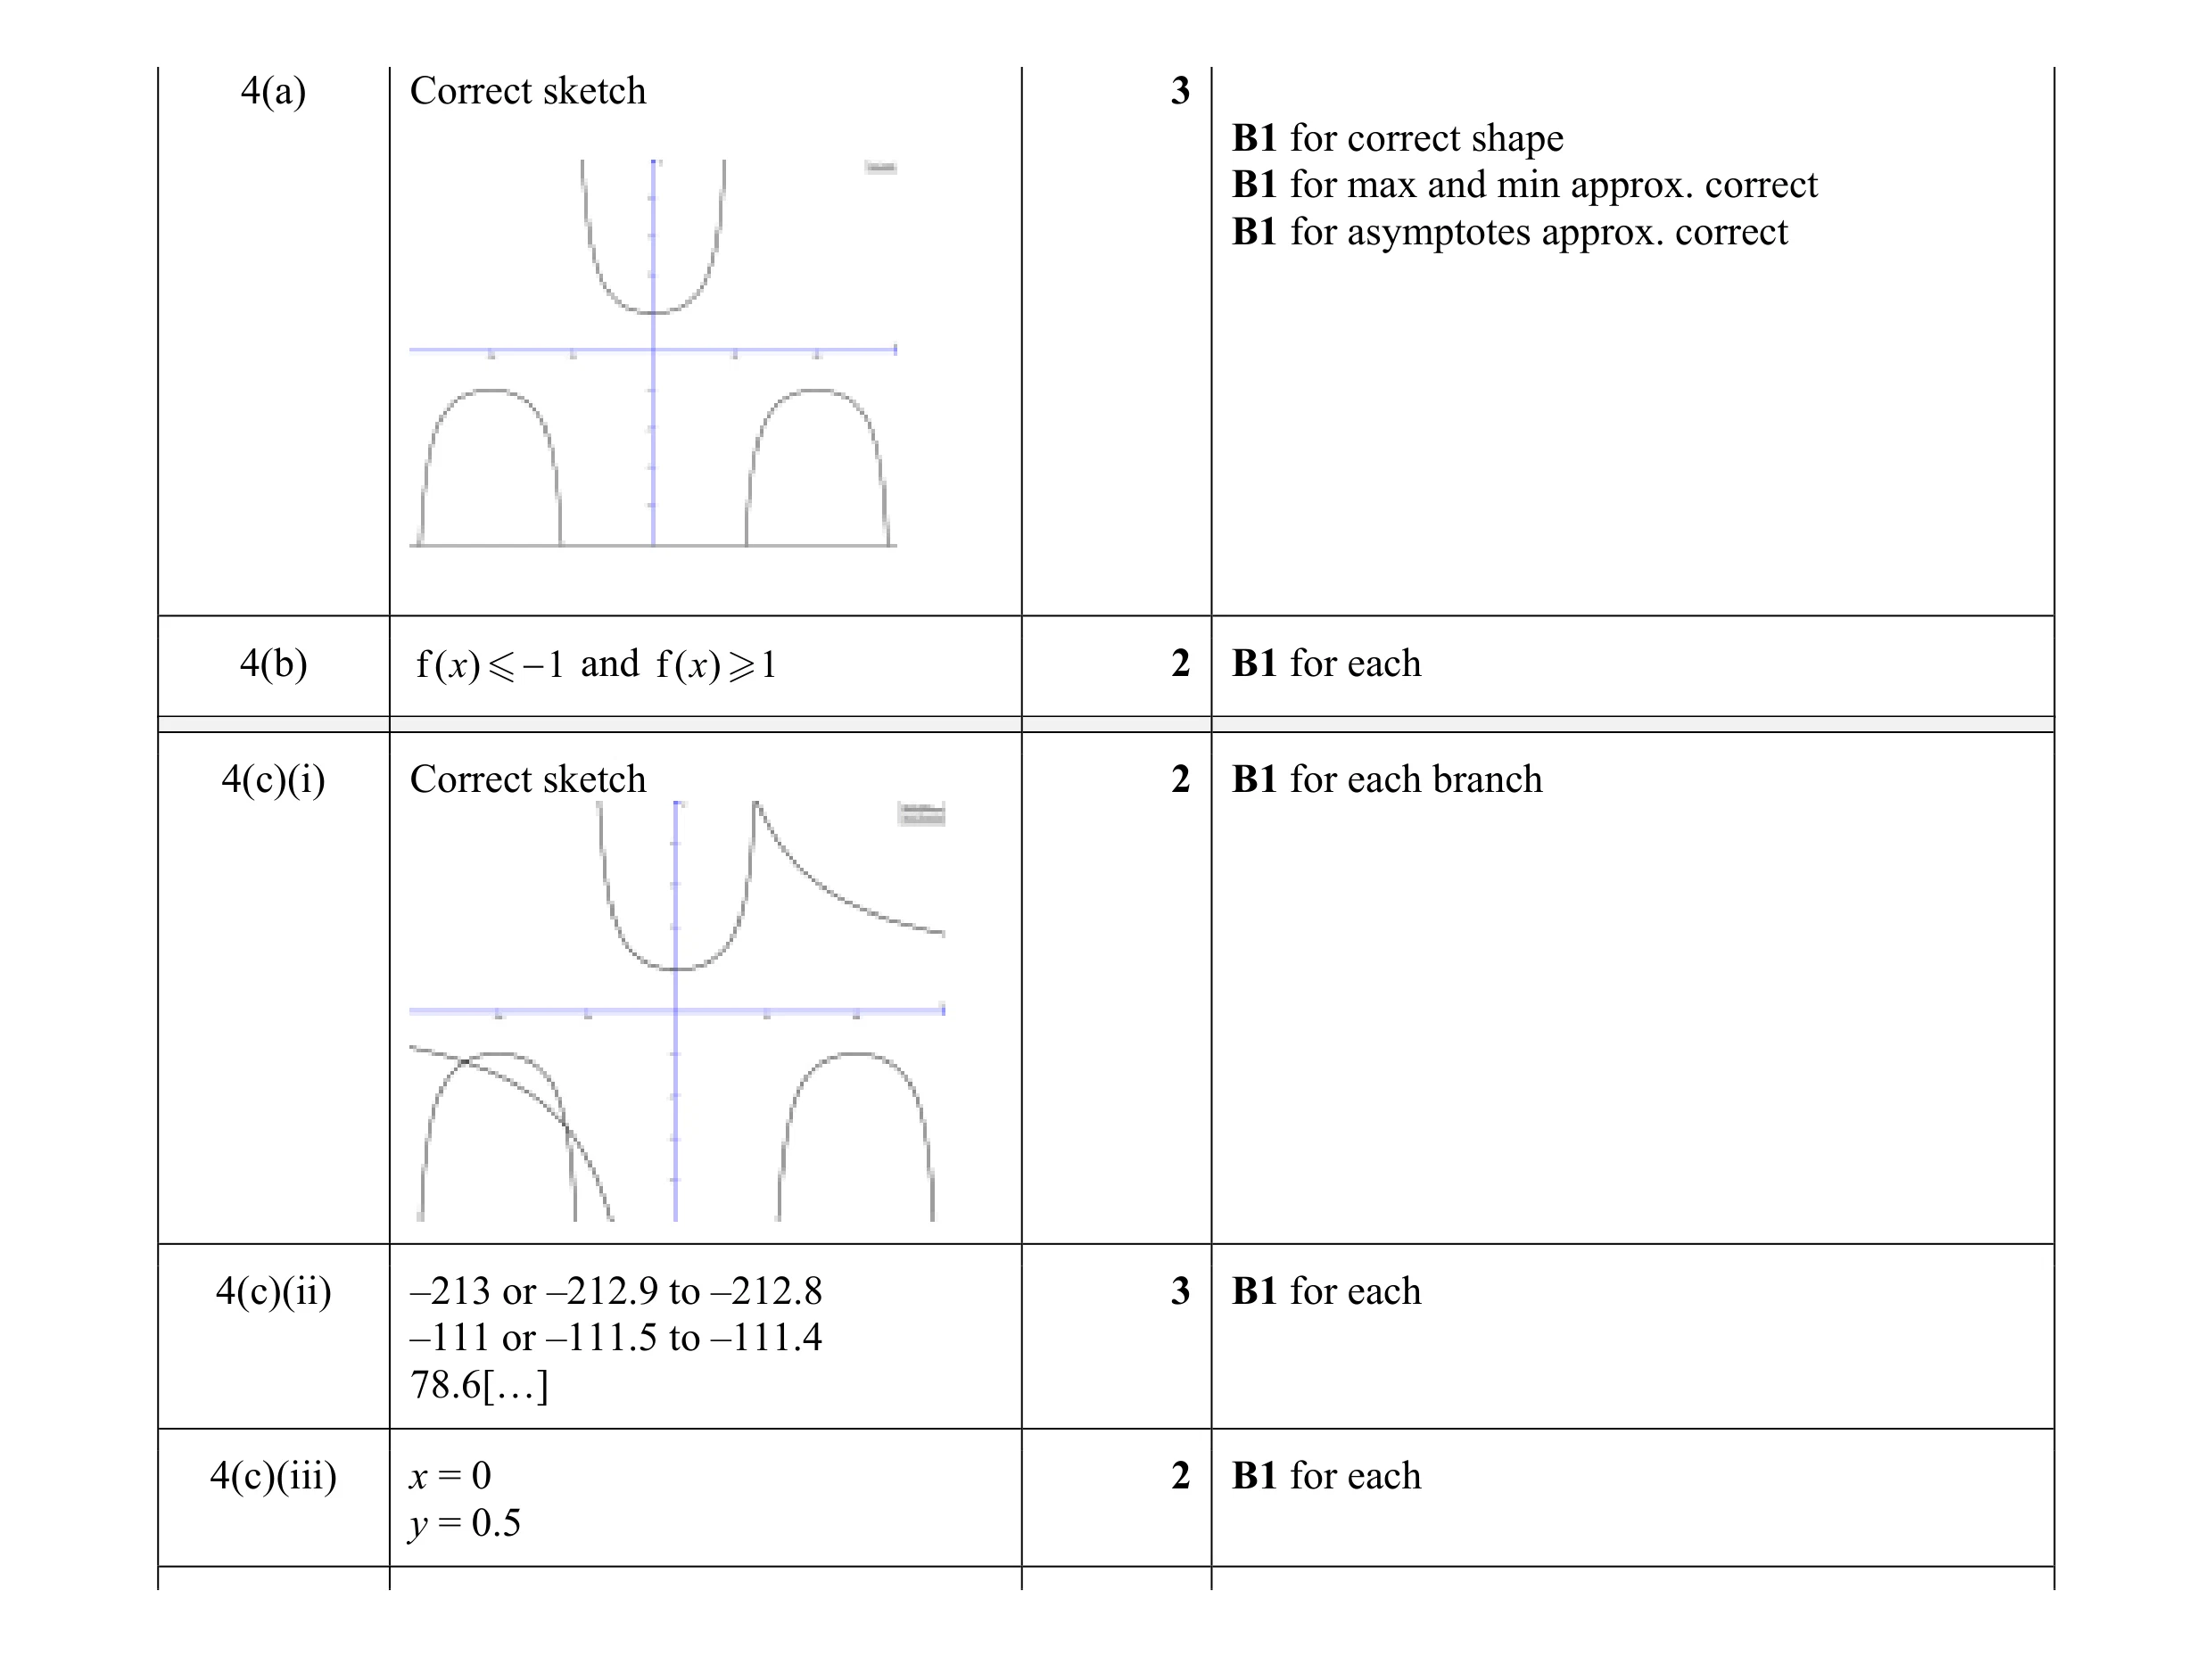 12
12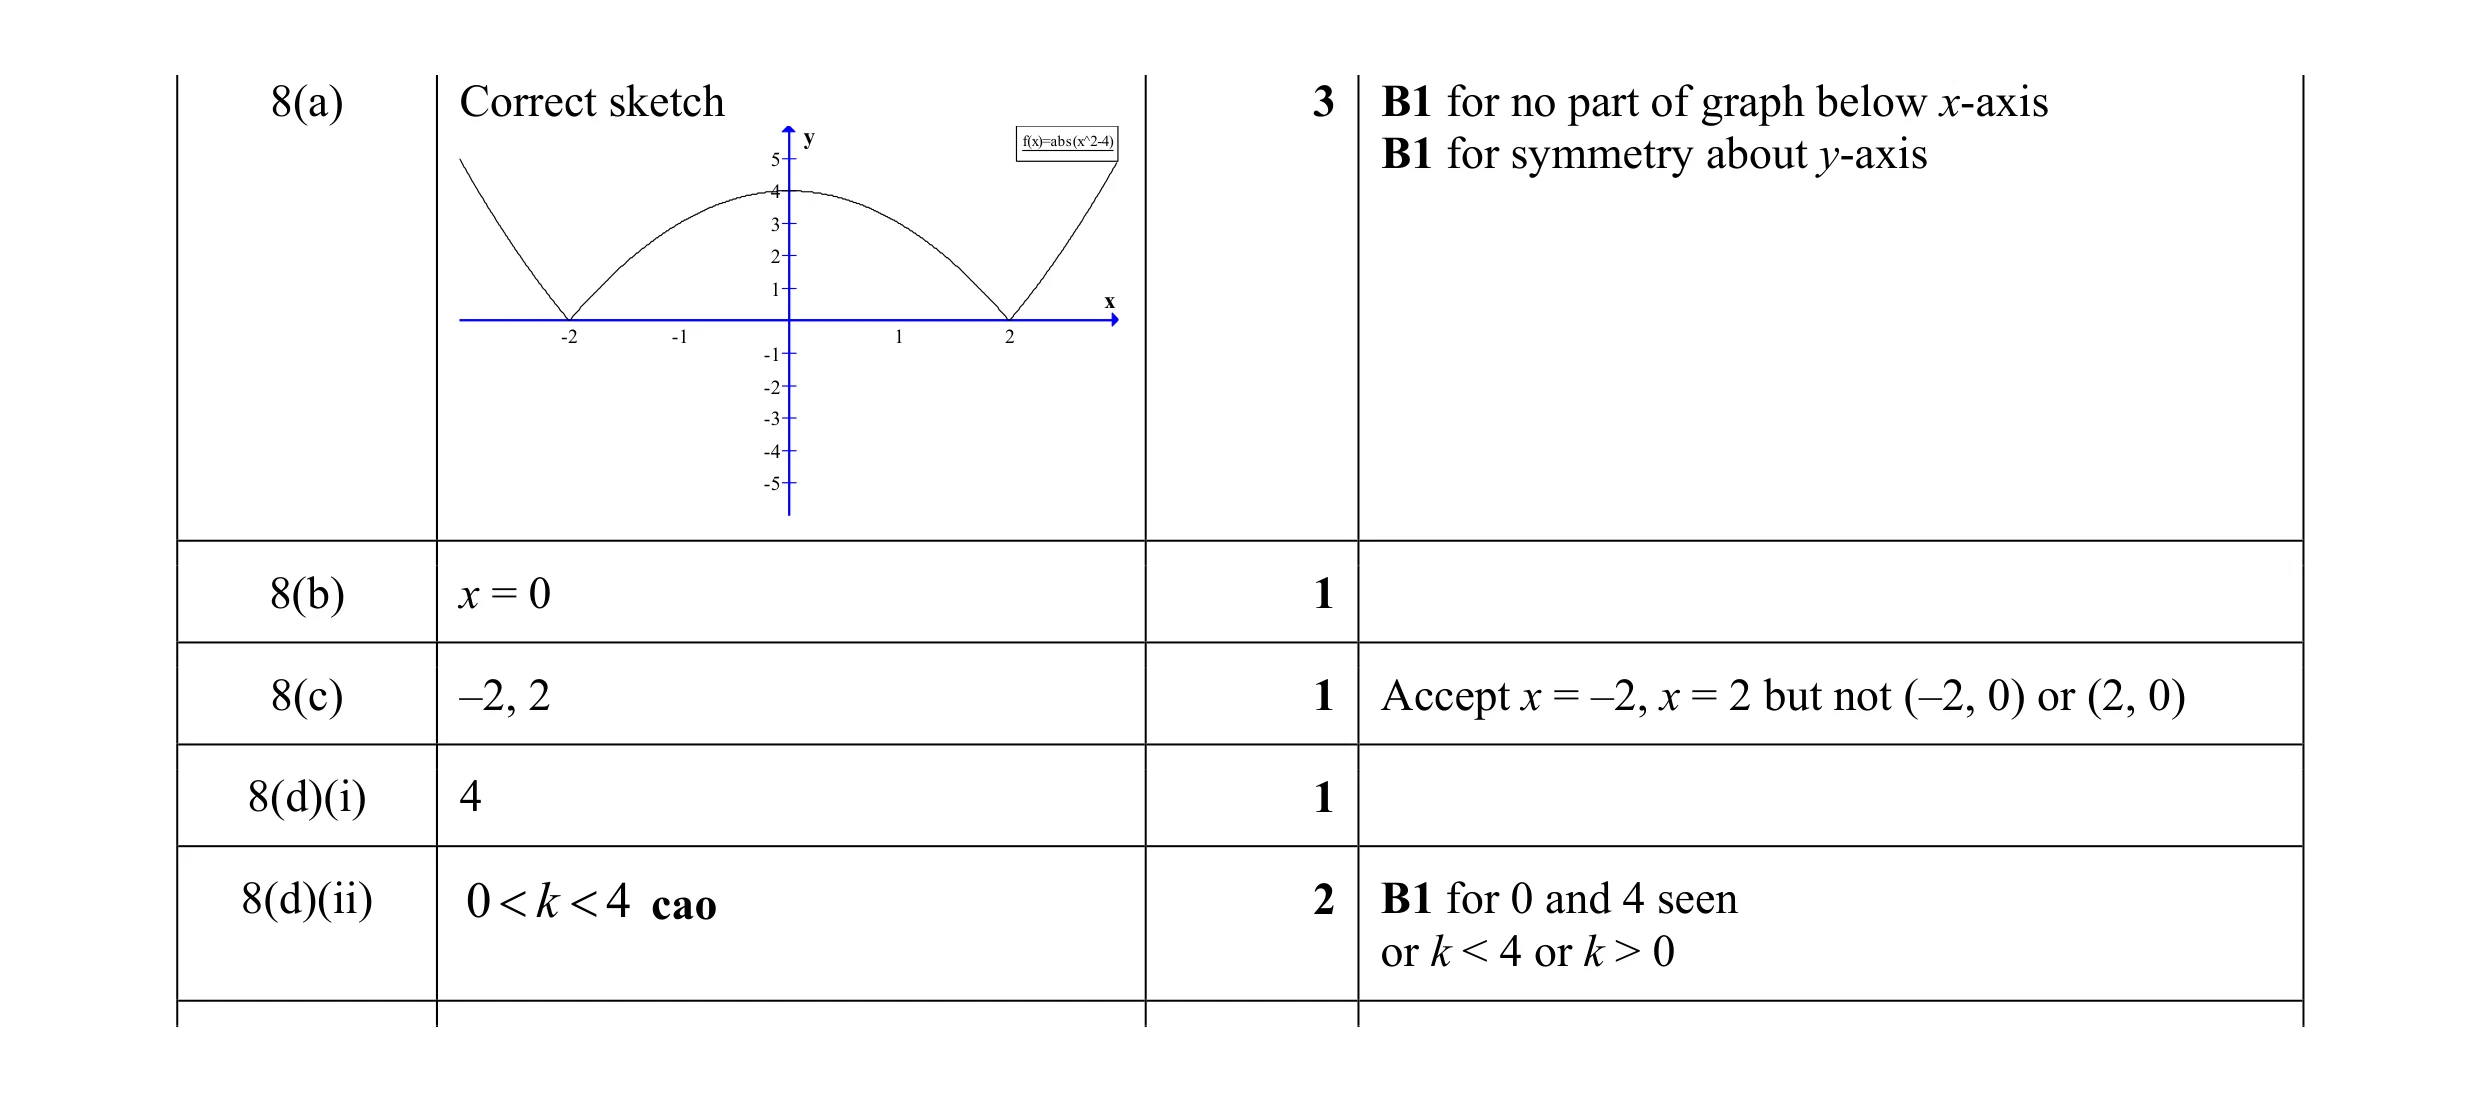 8
8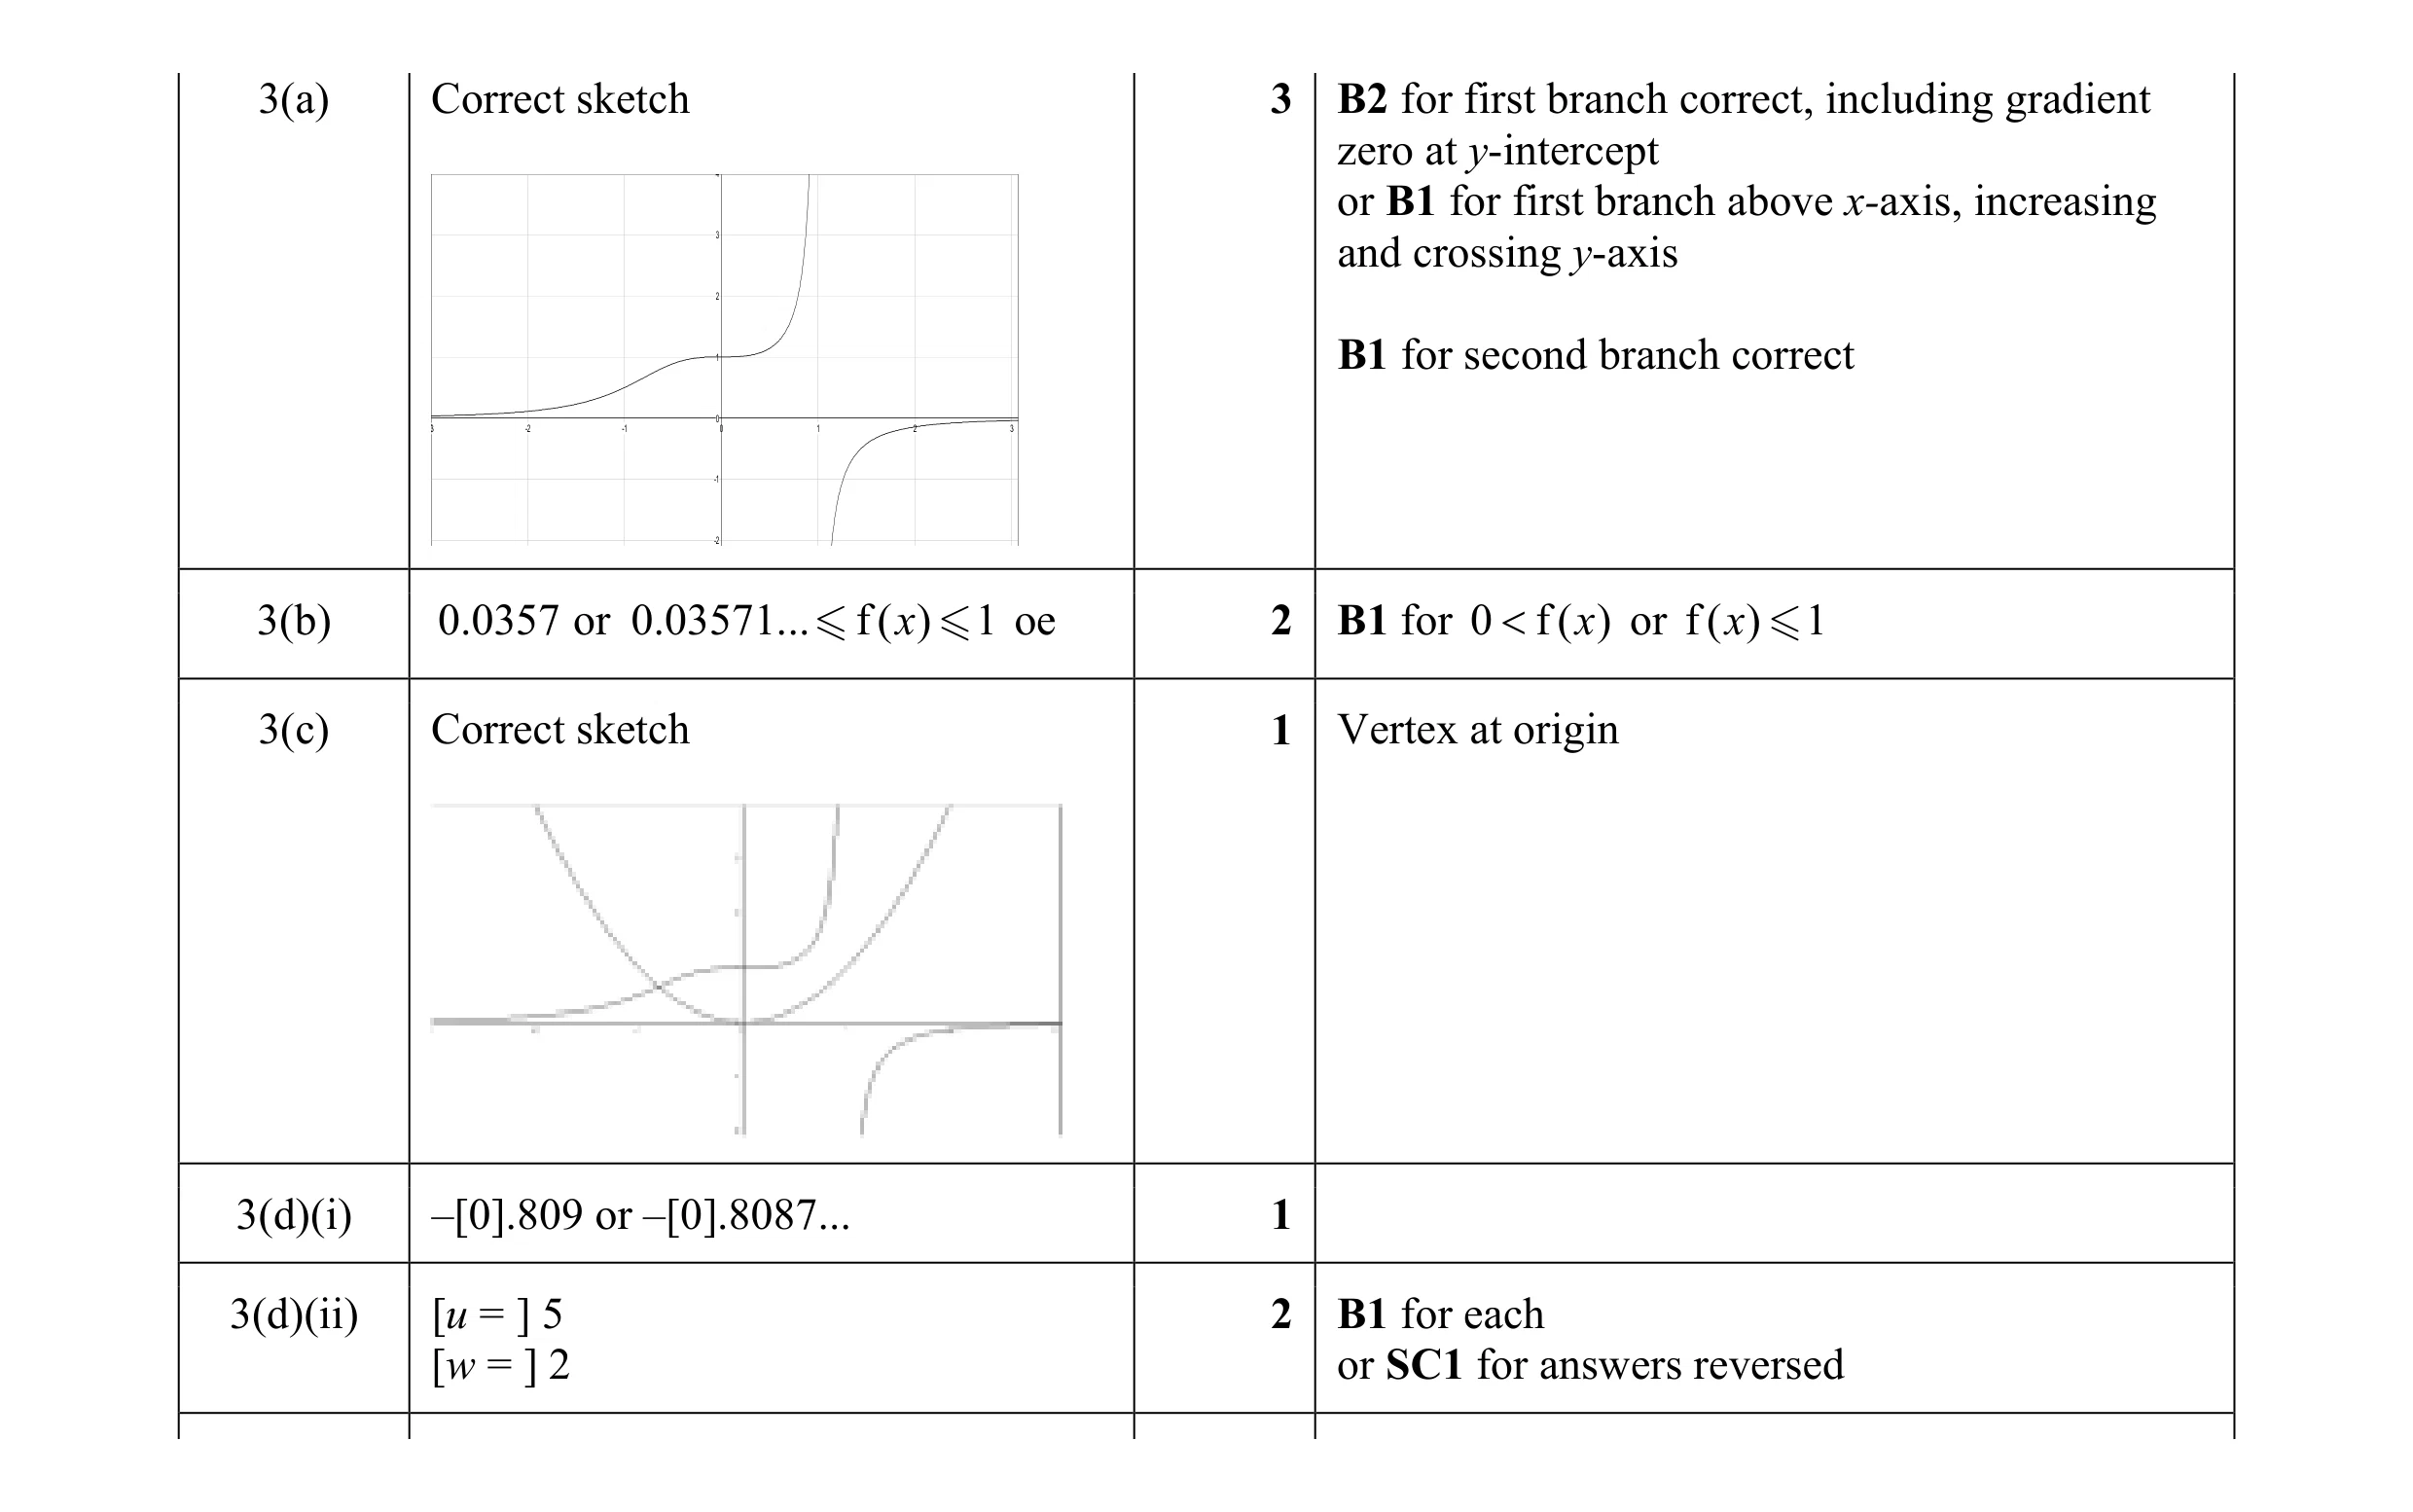 9
9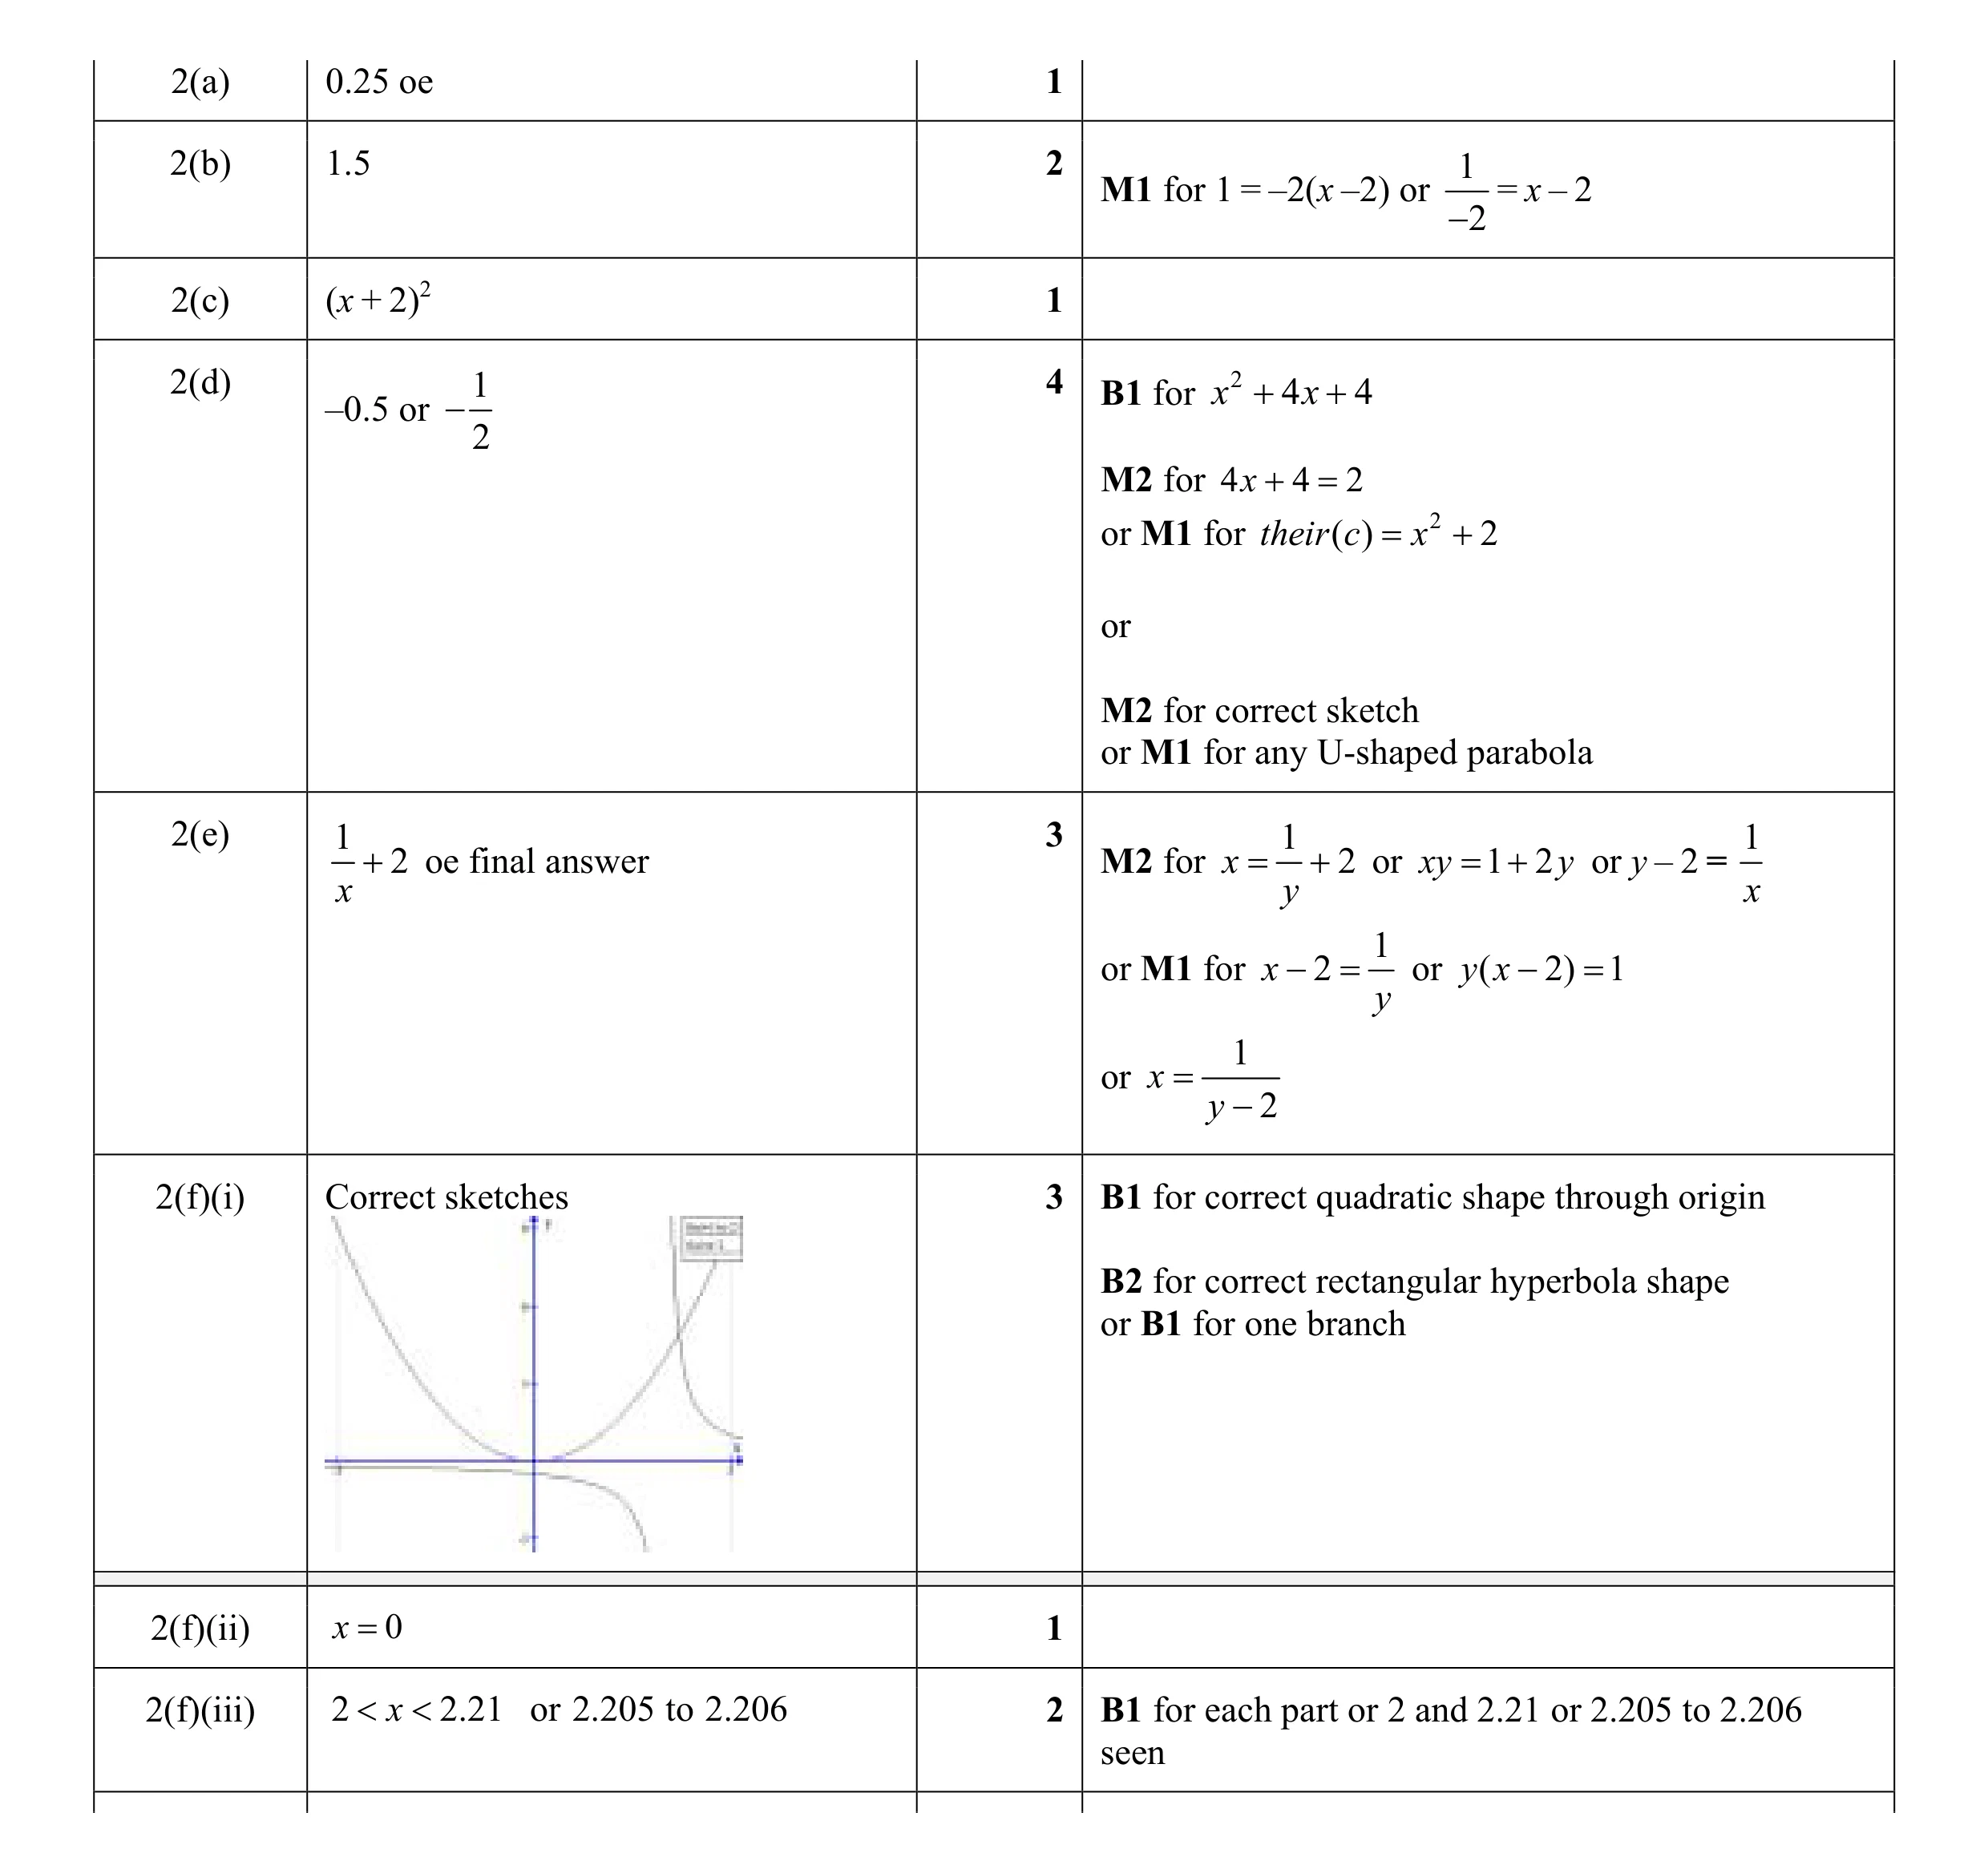 17
17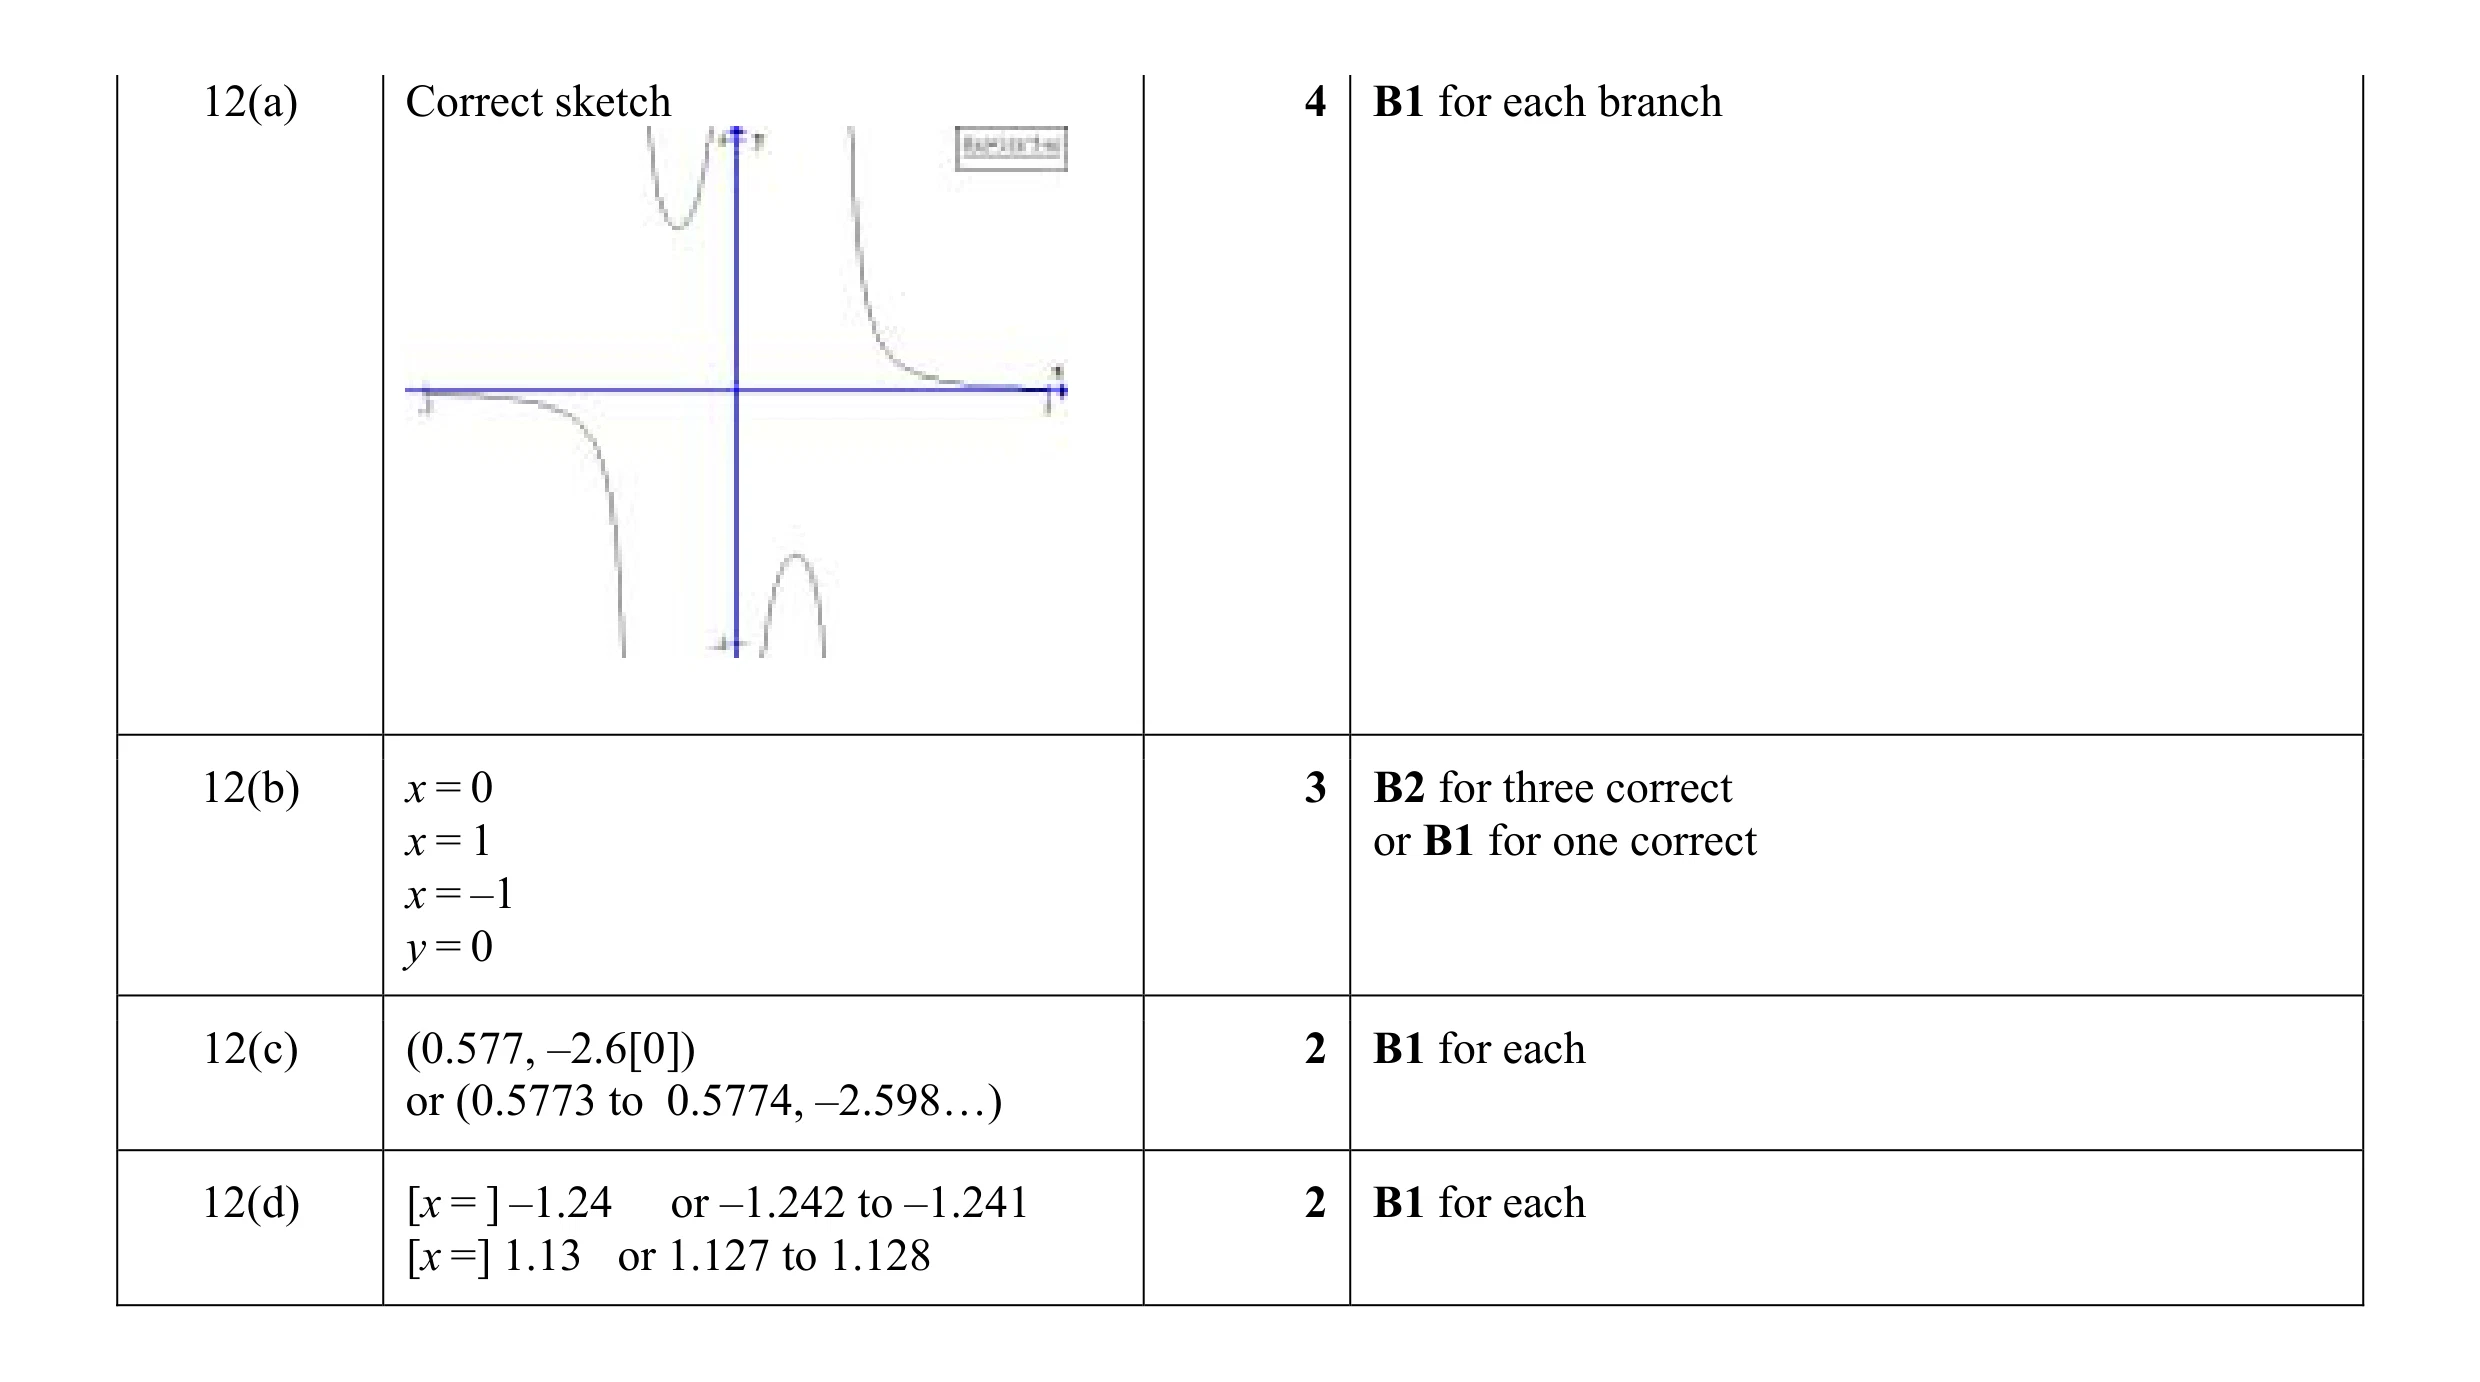 11
11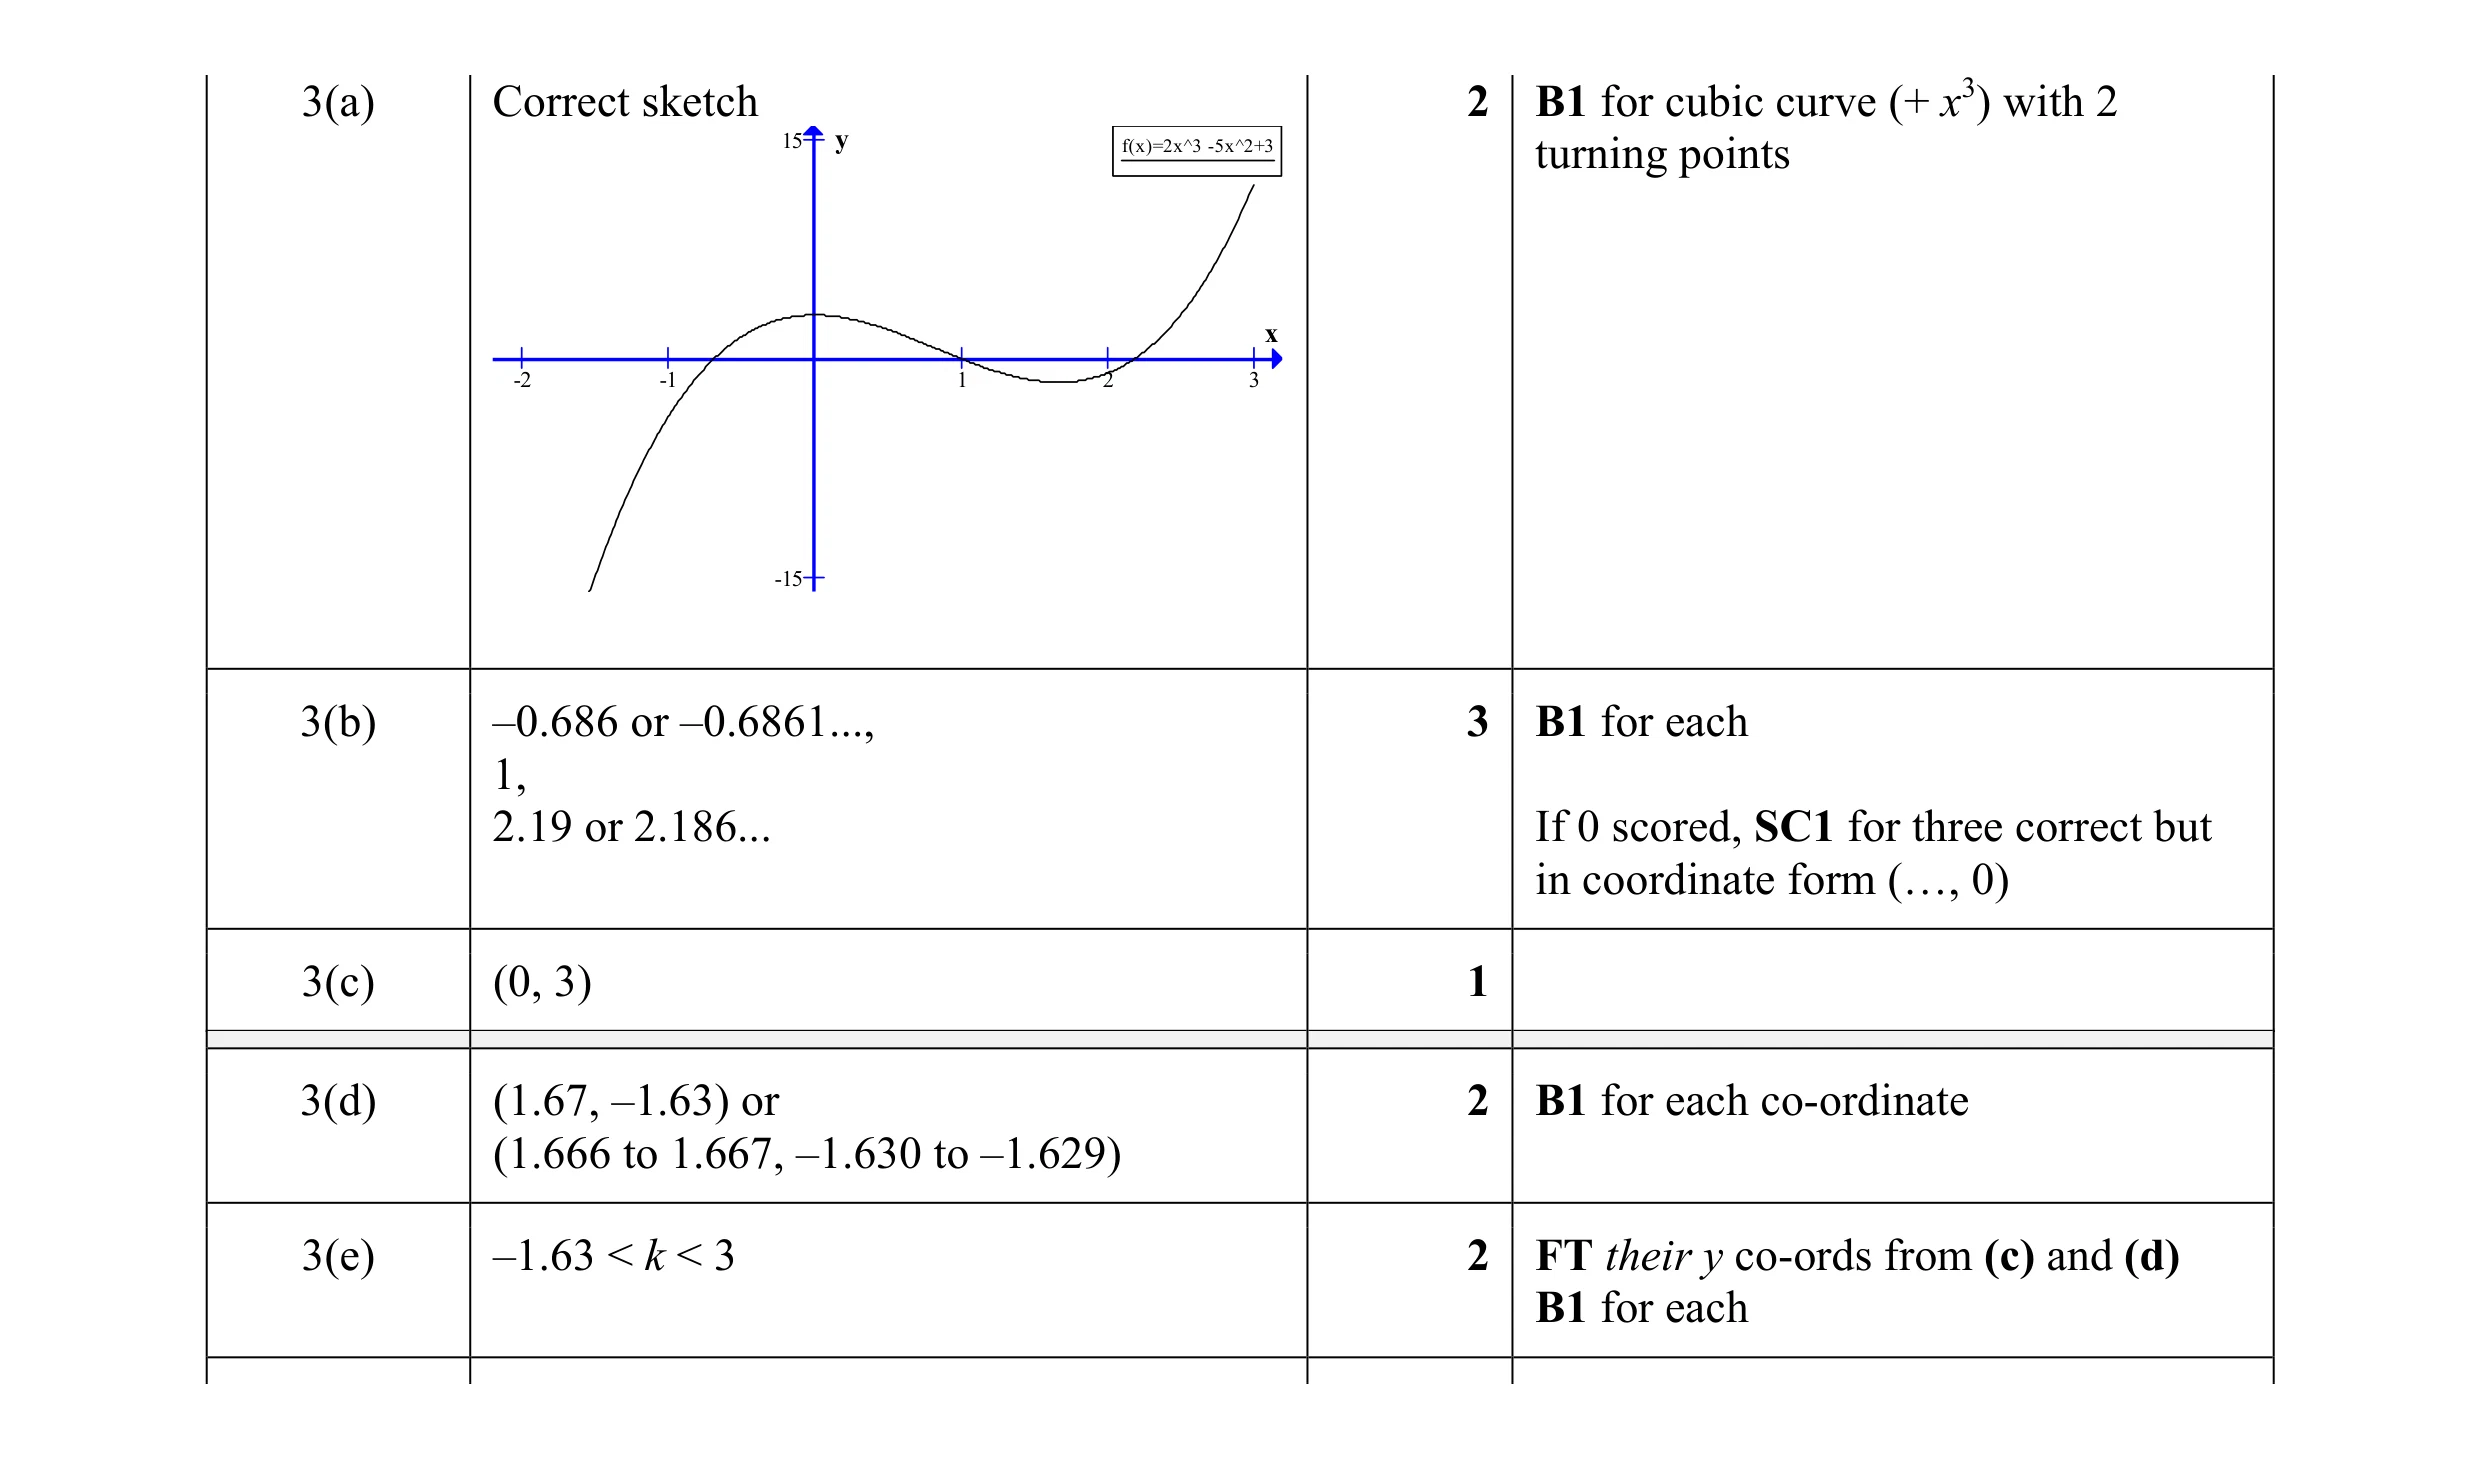 10
10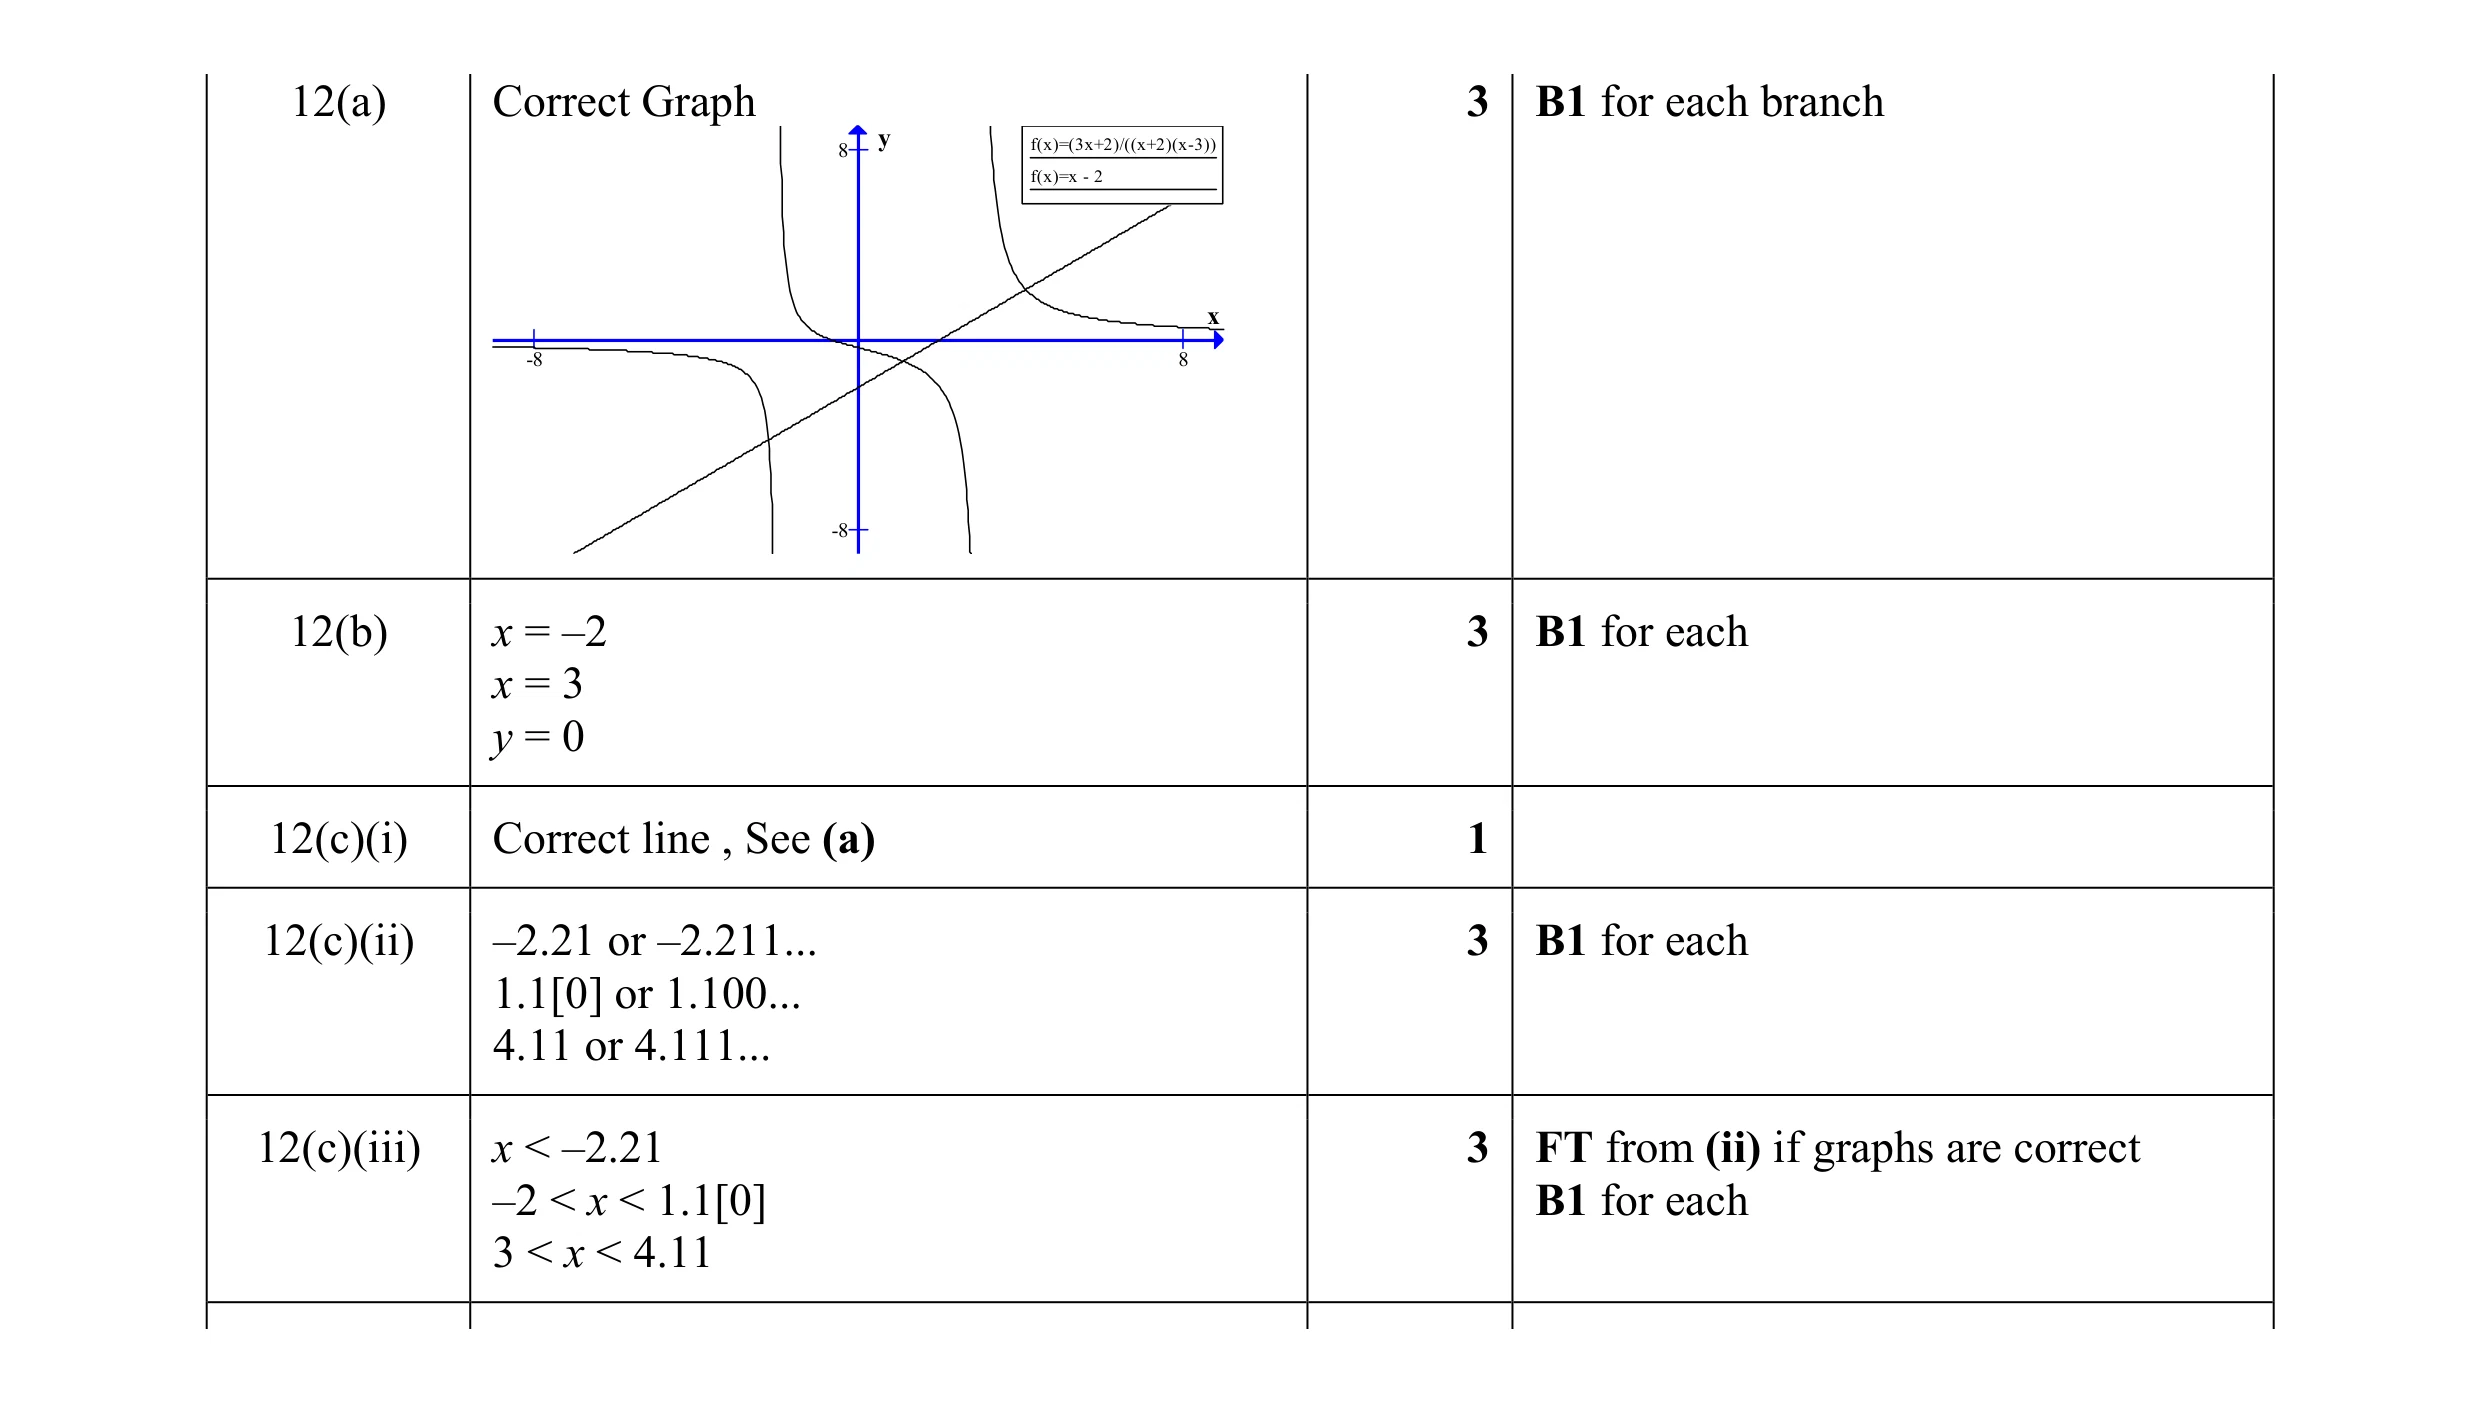 13
13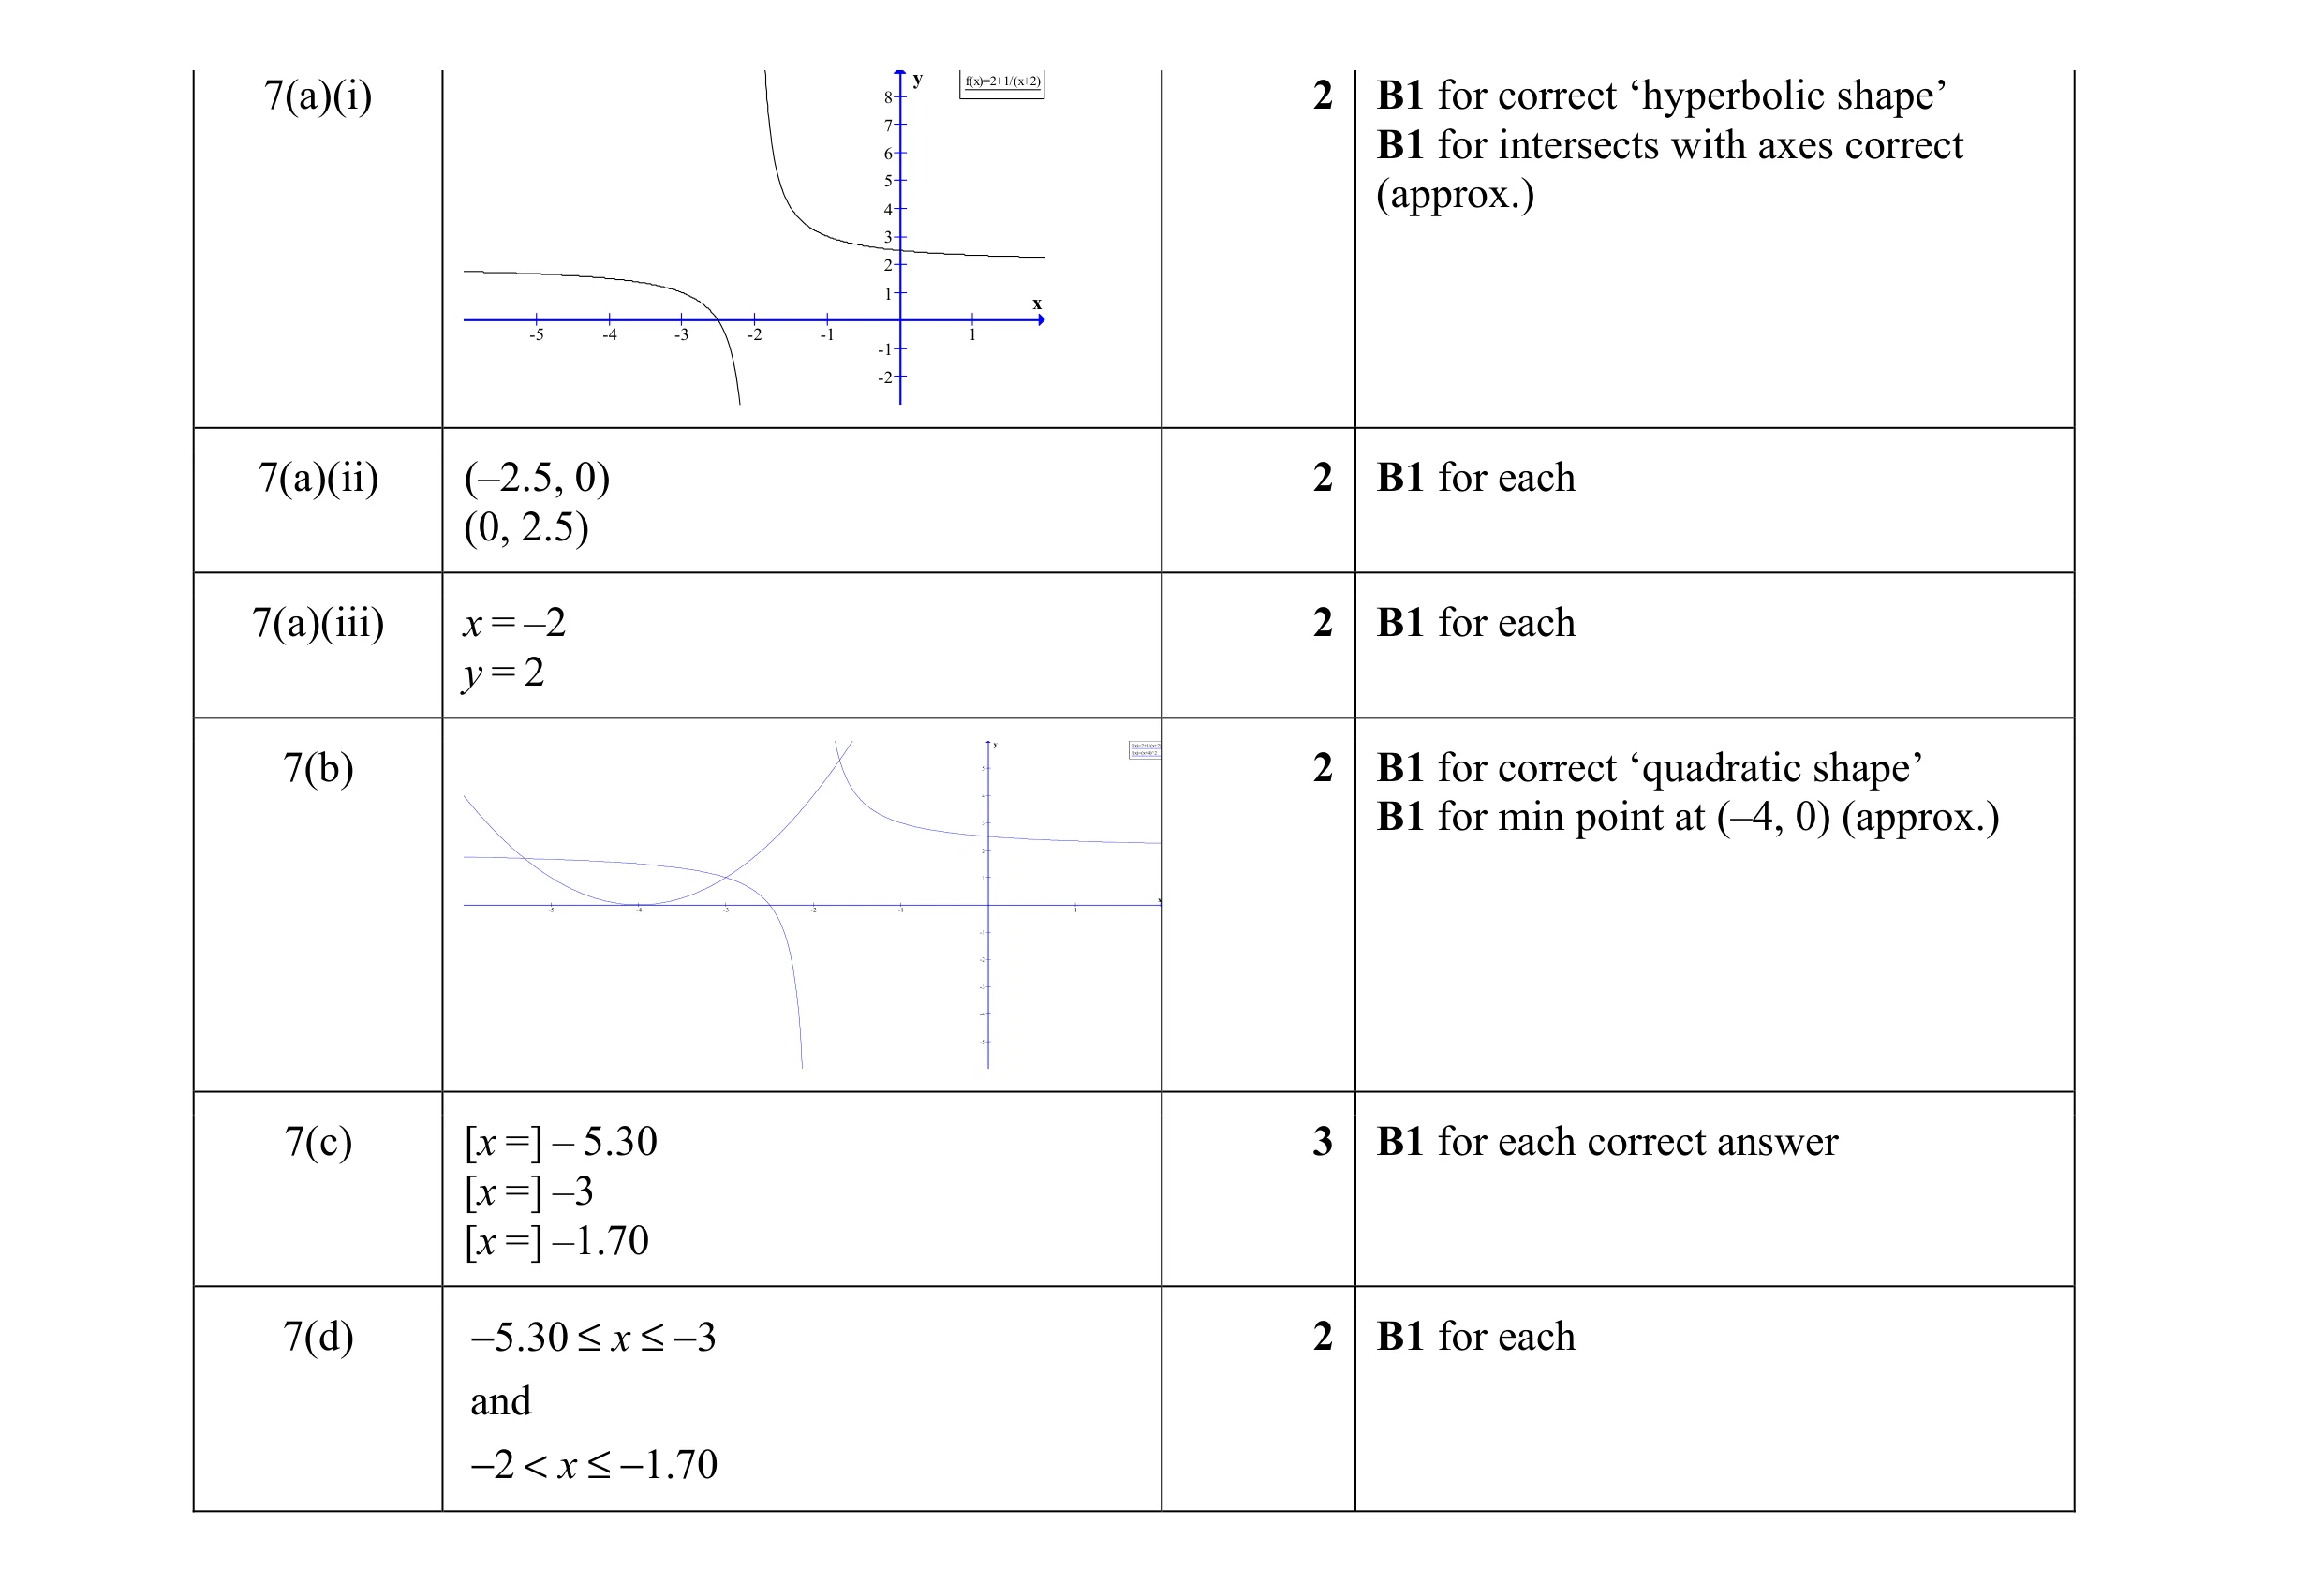 13
13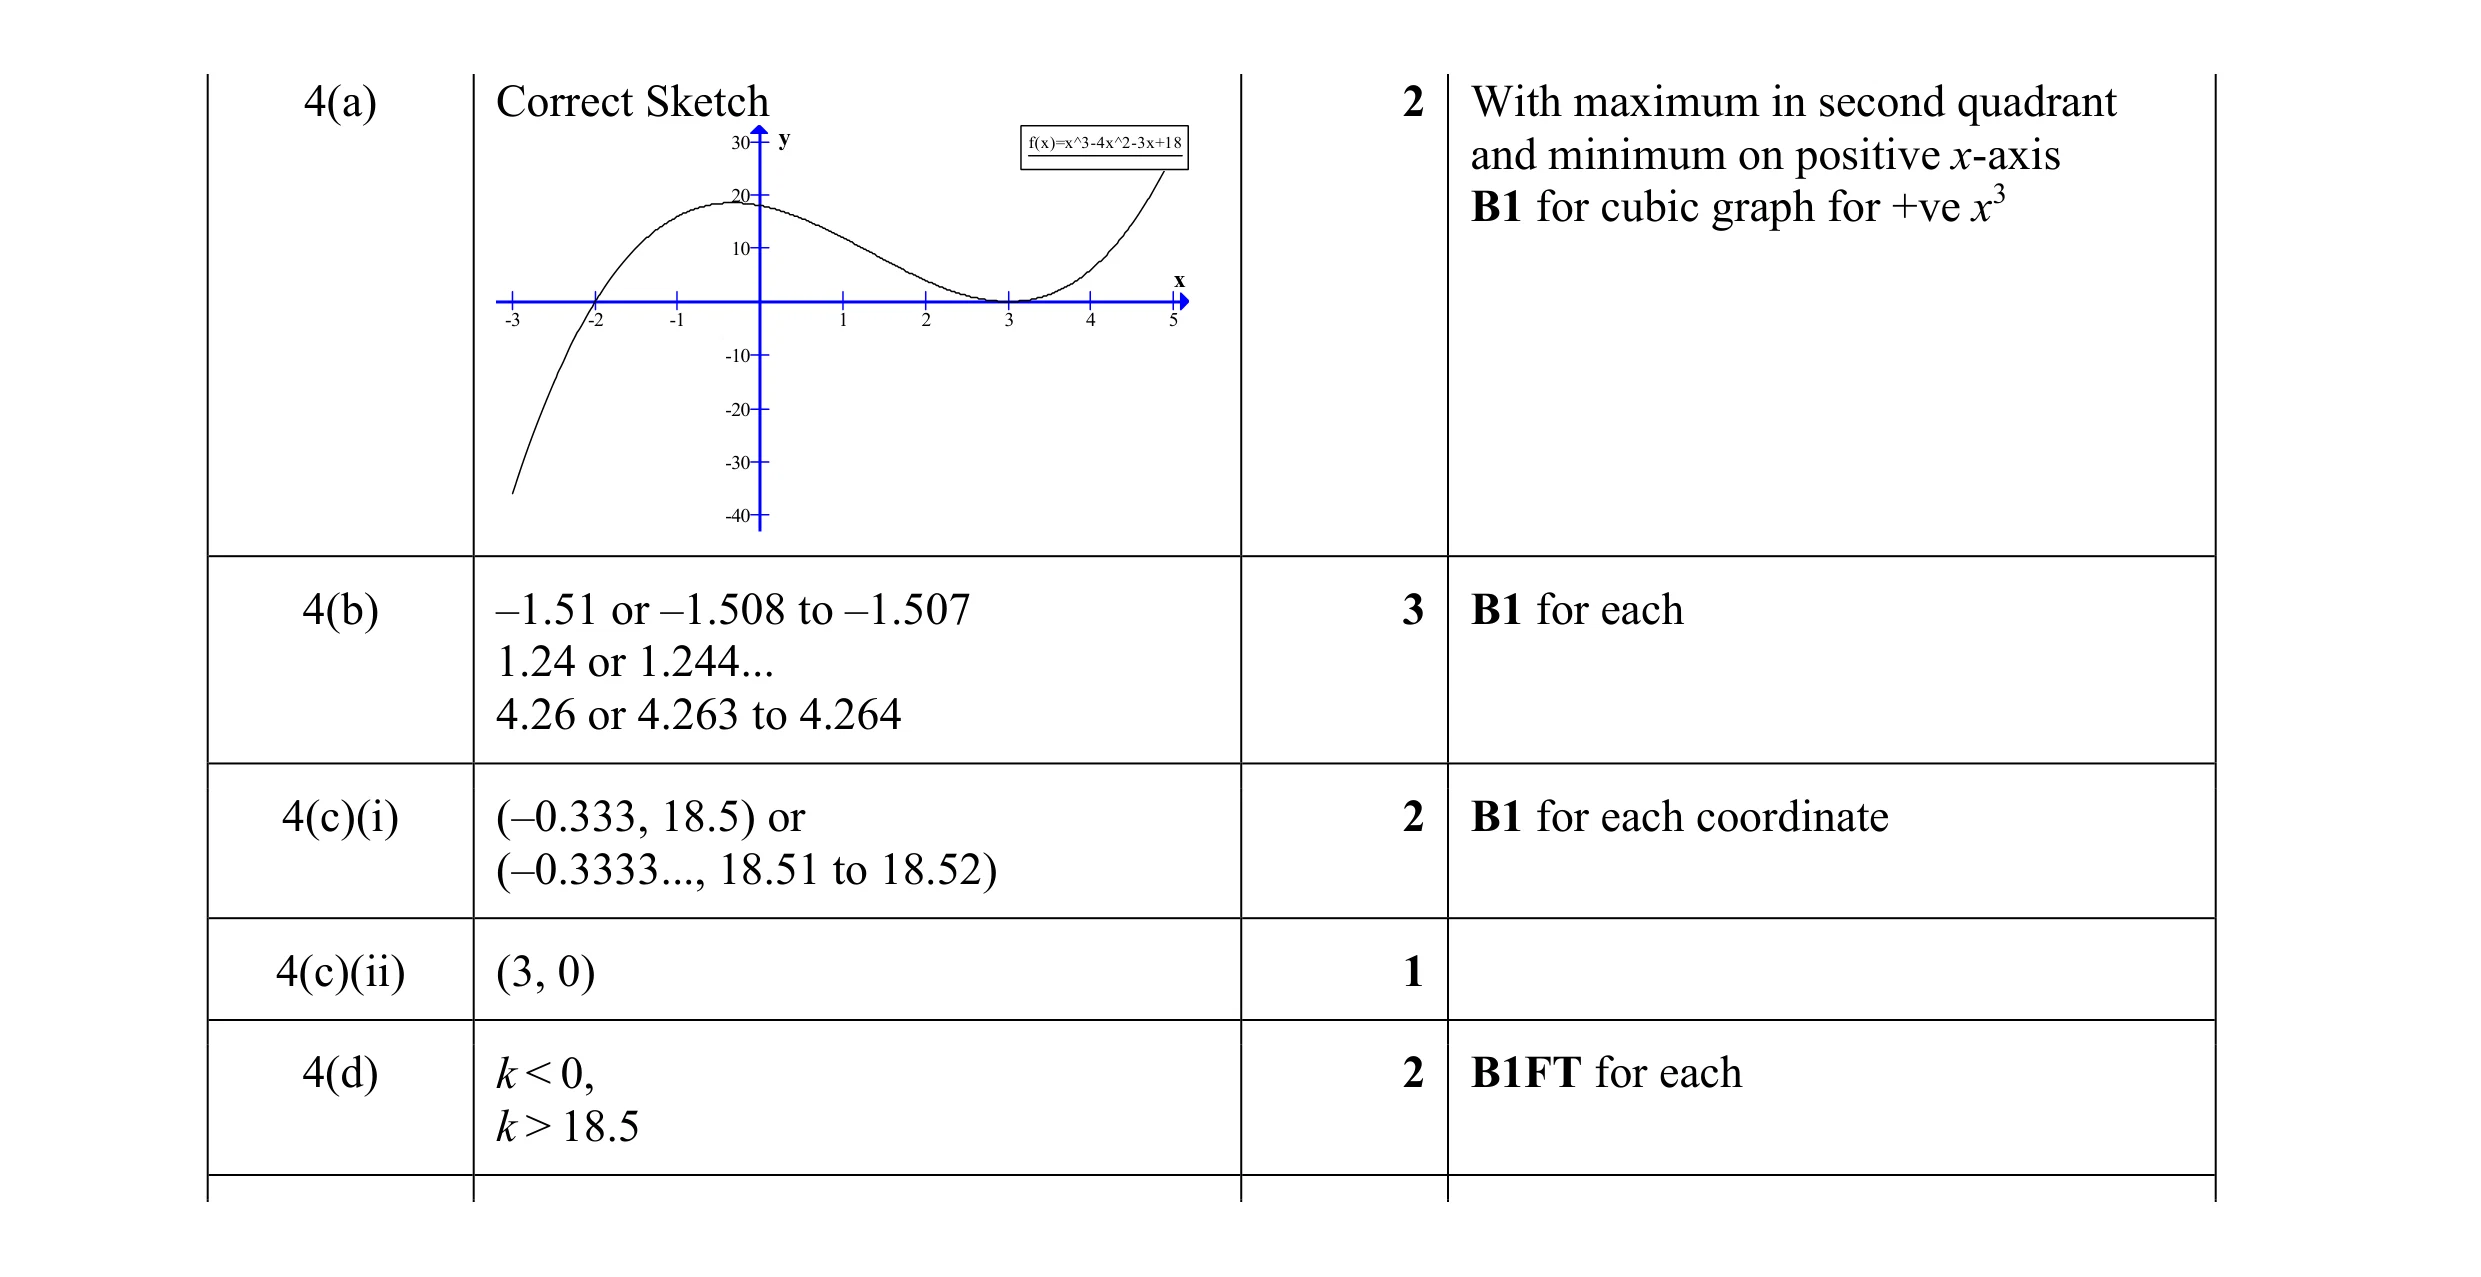 10
10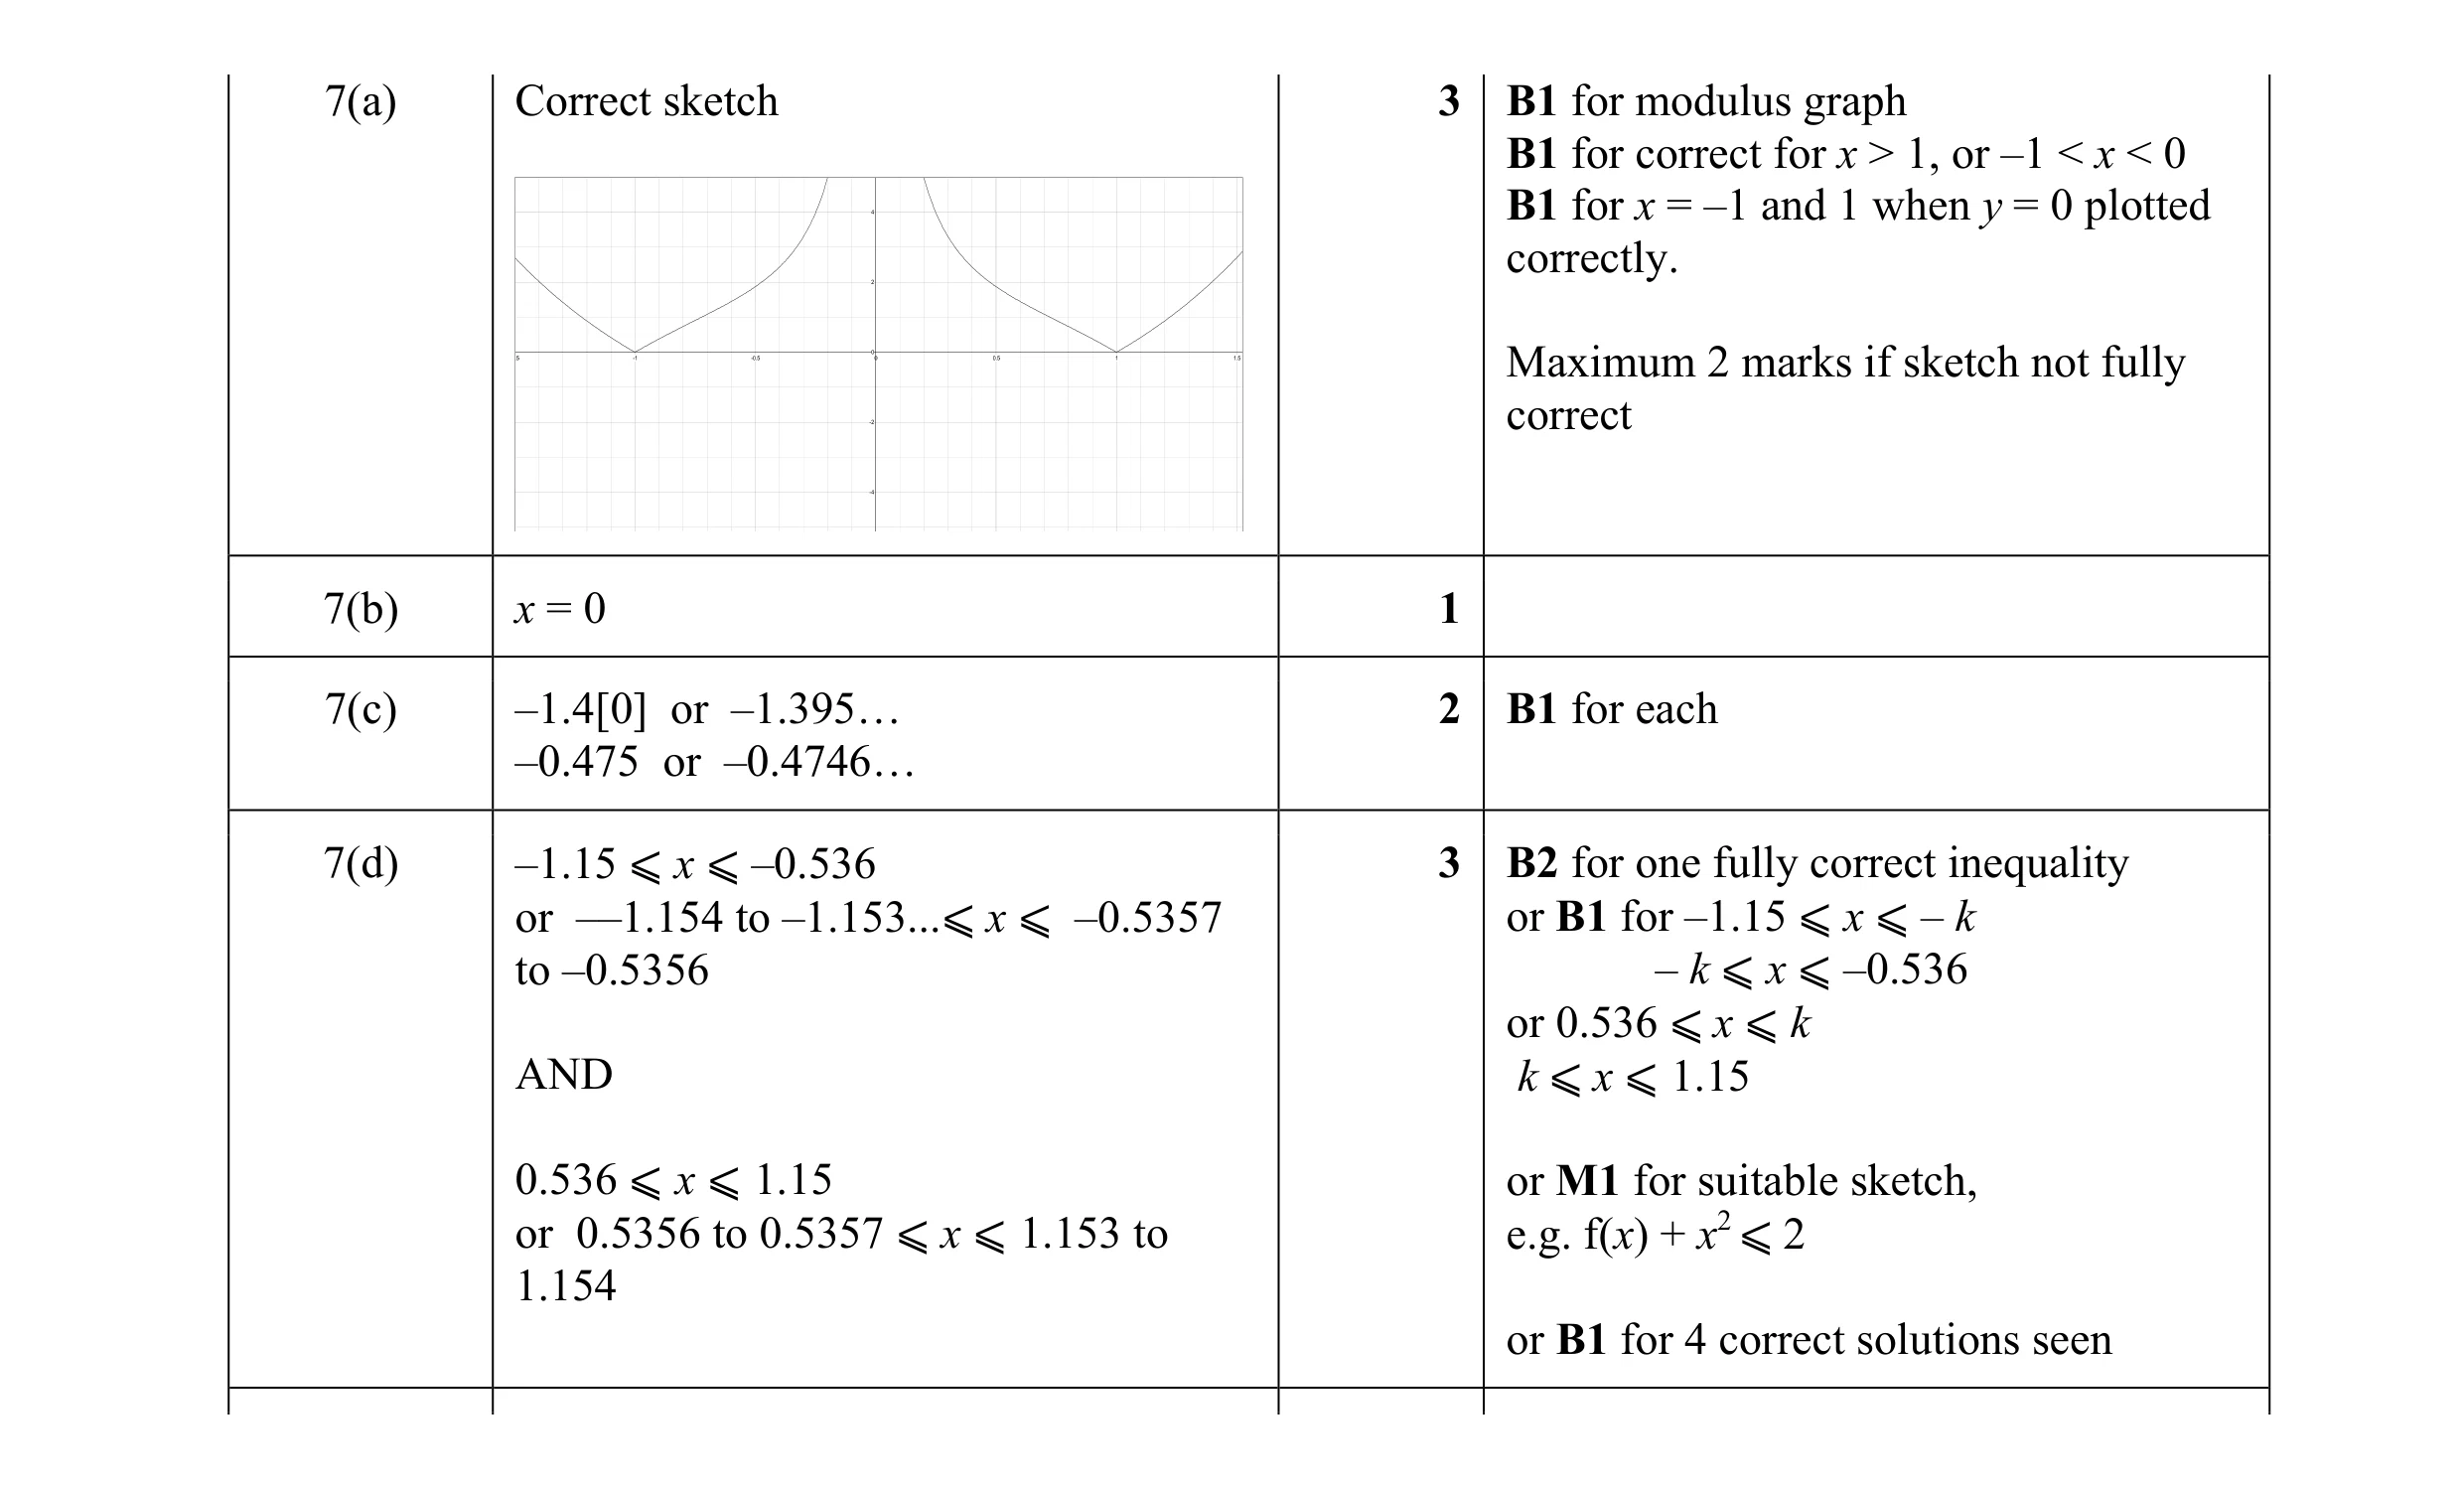 9
9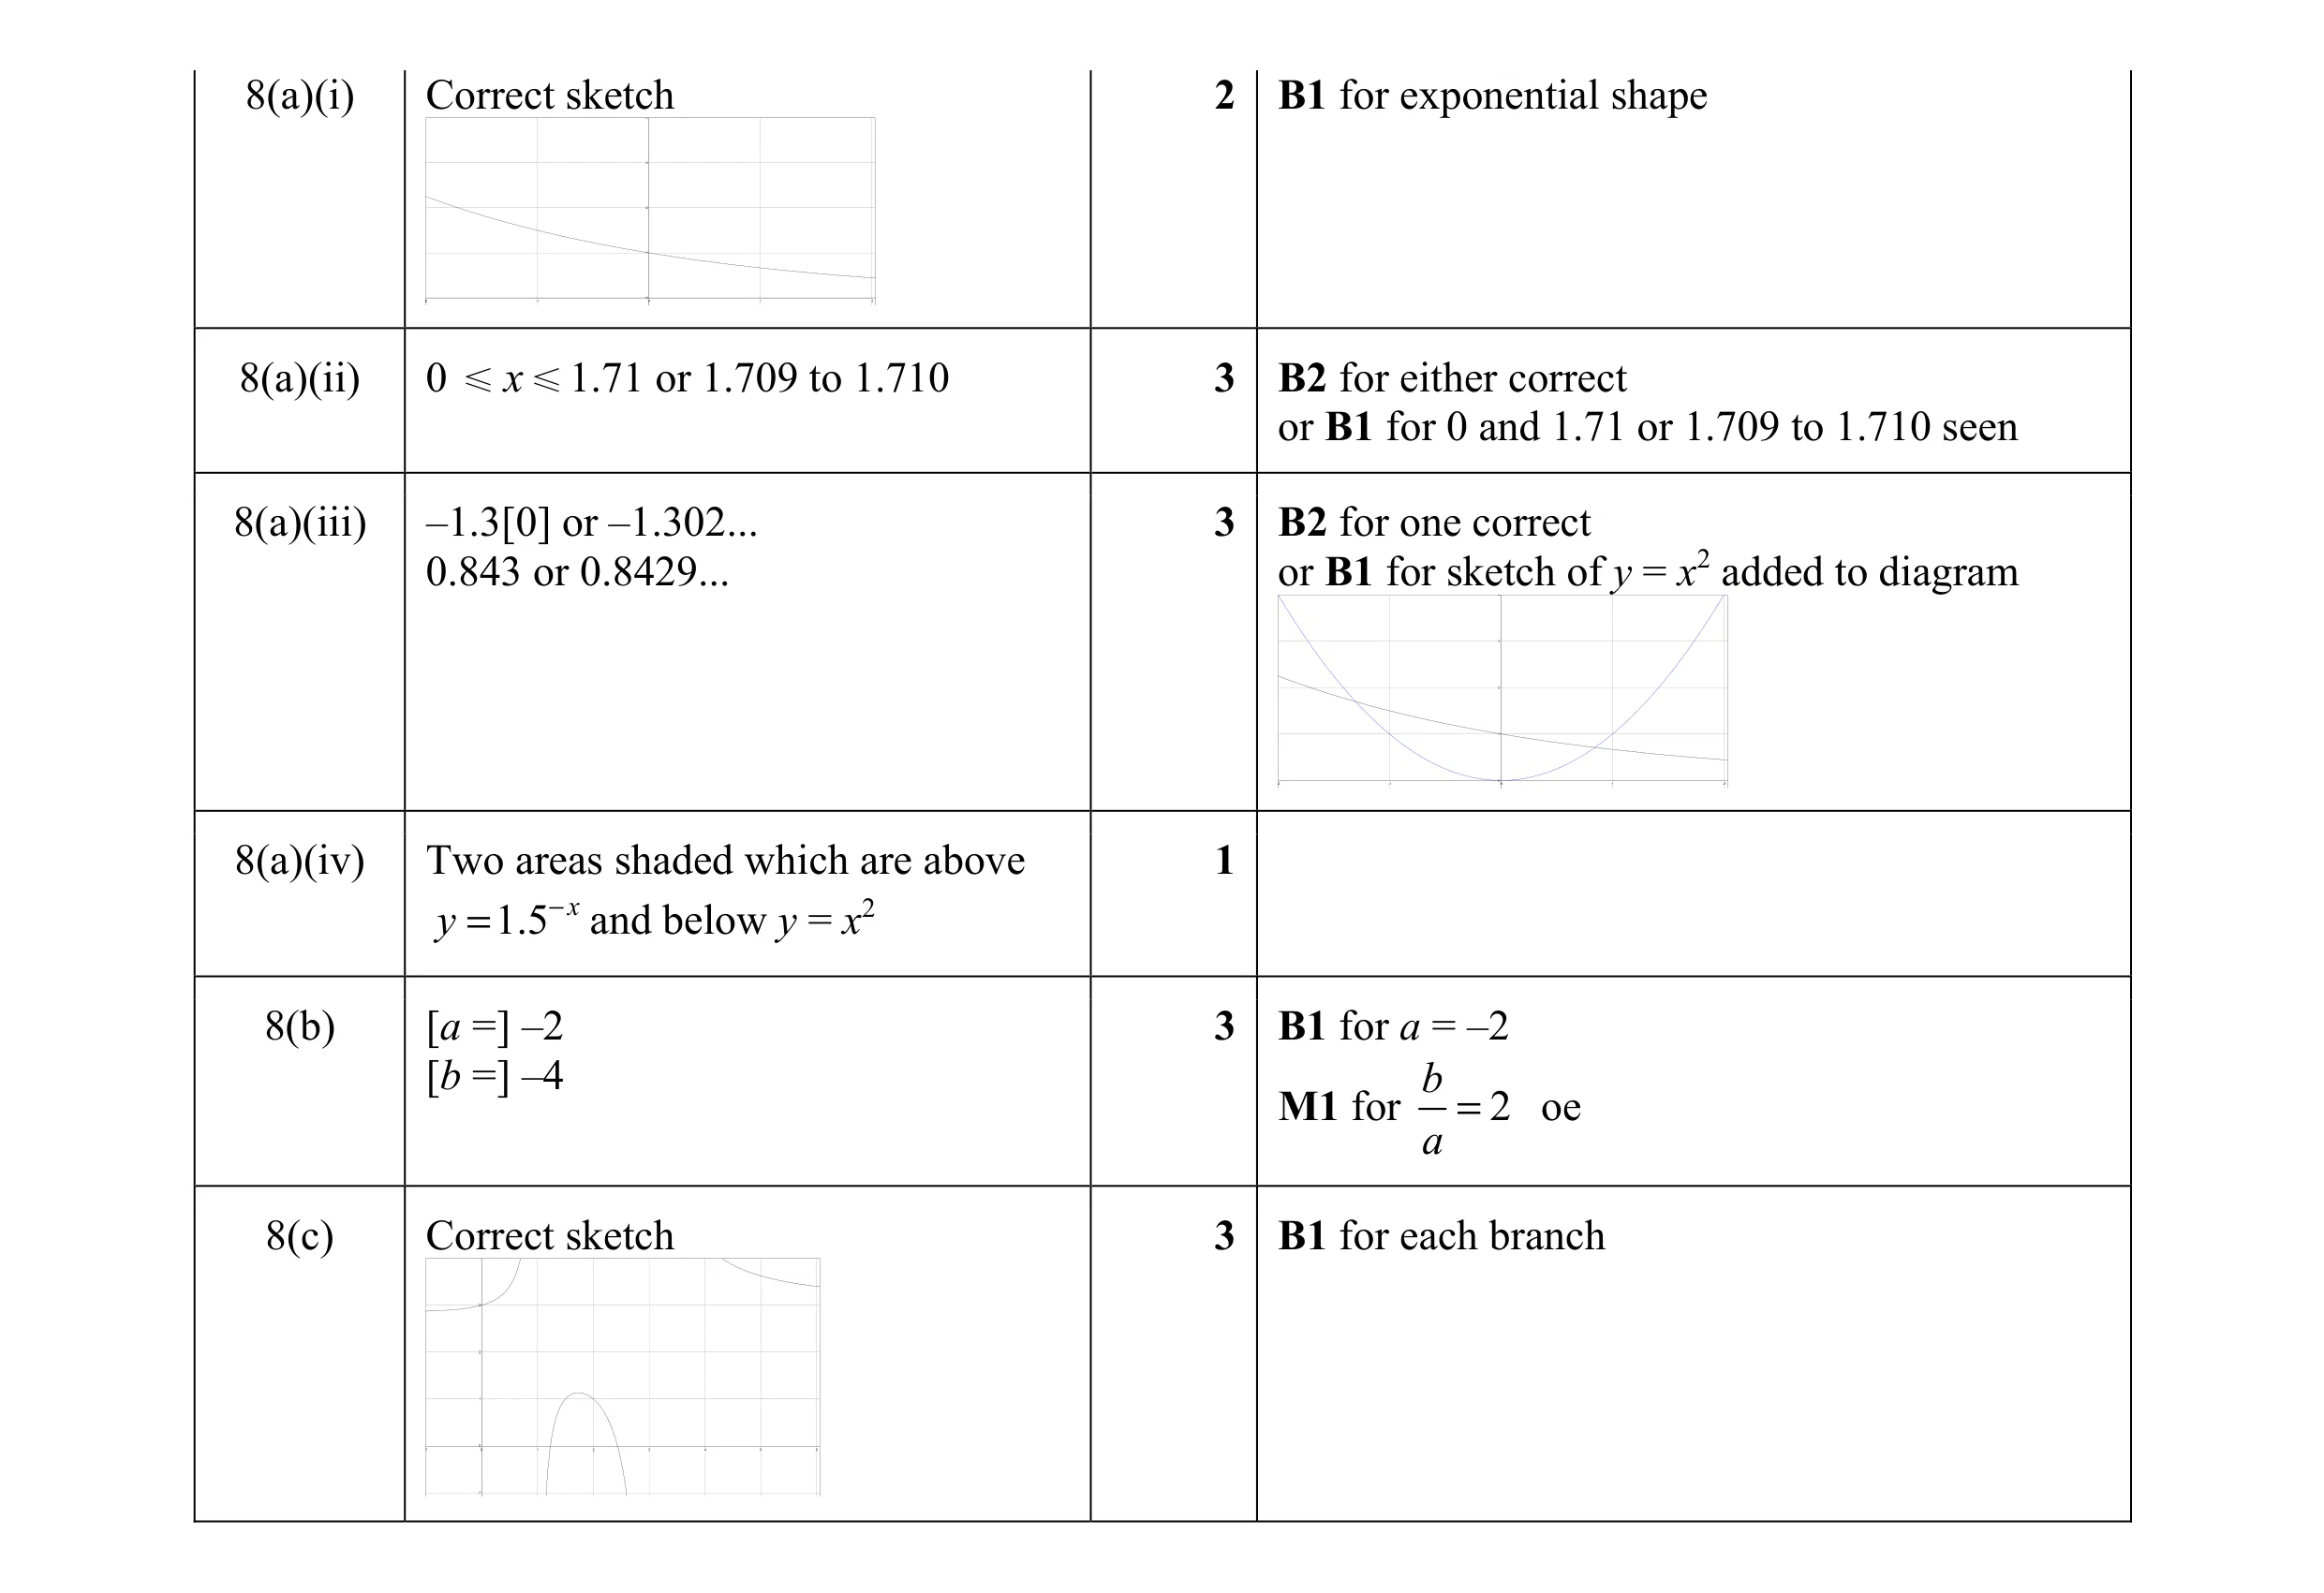 15
15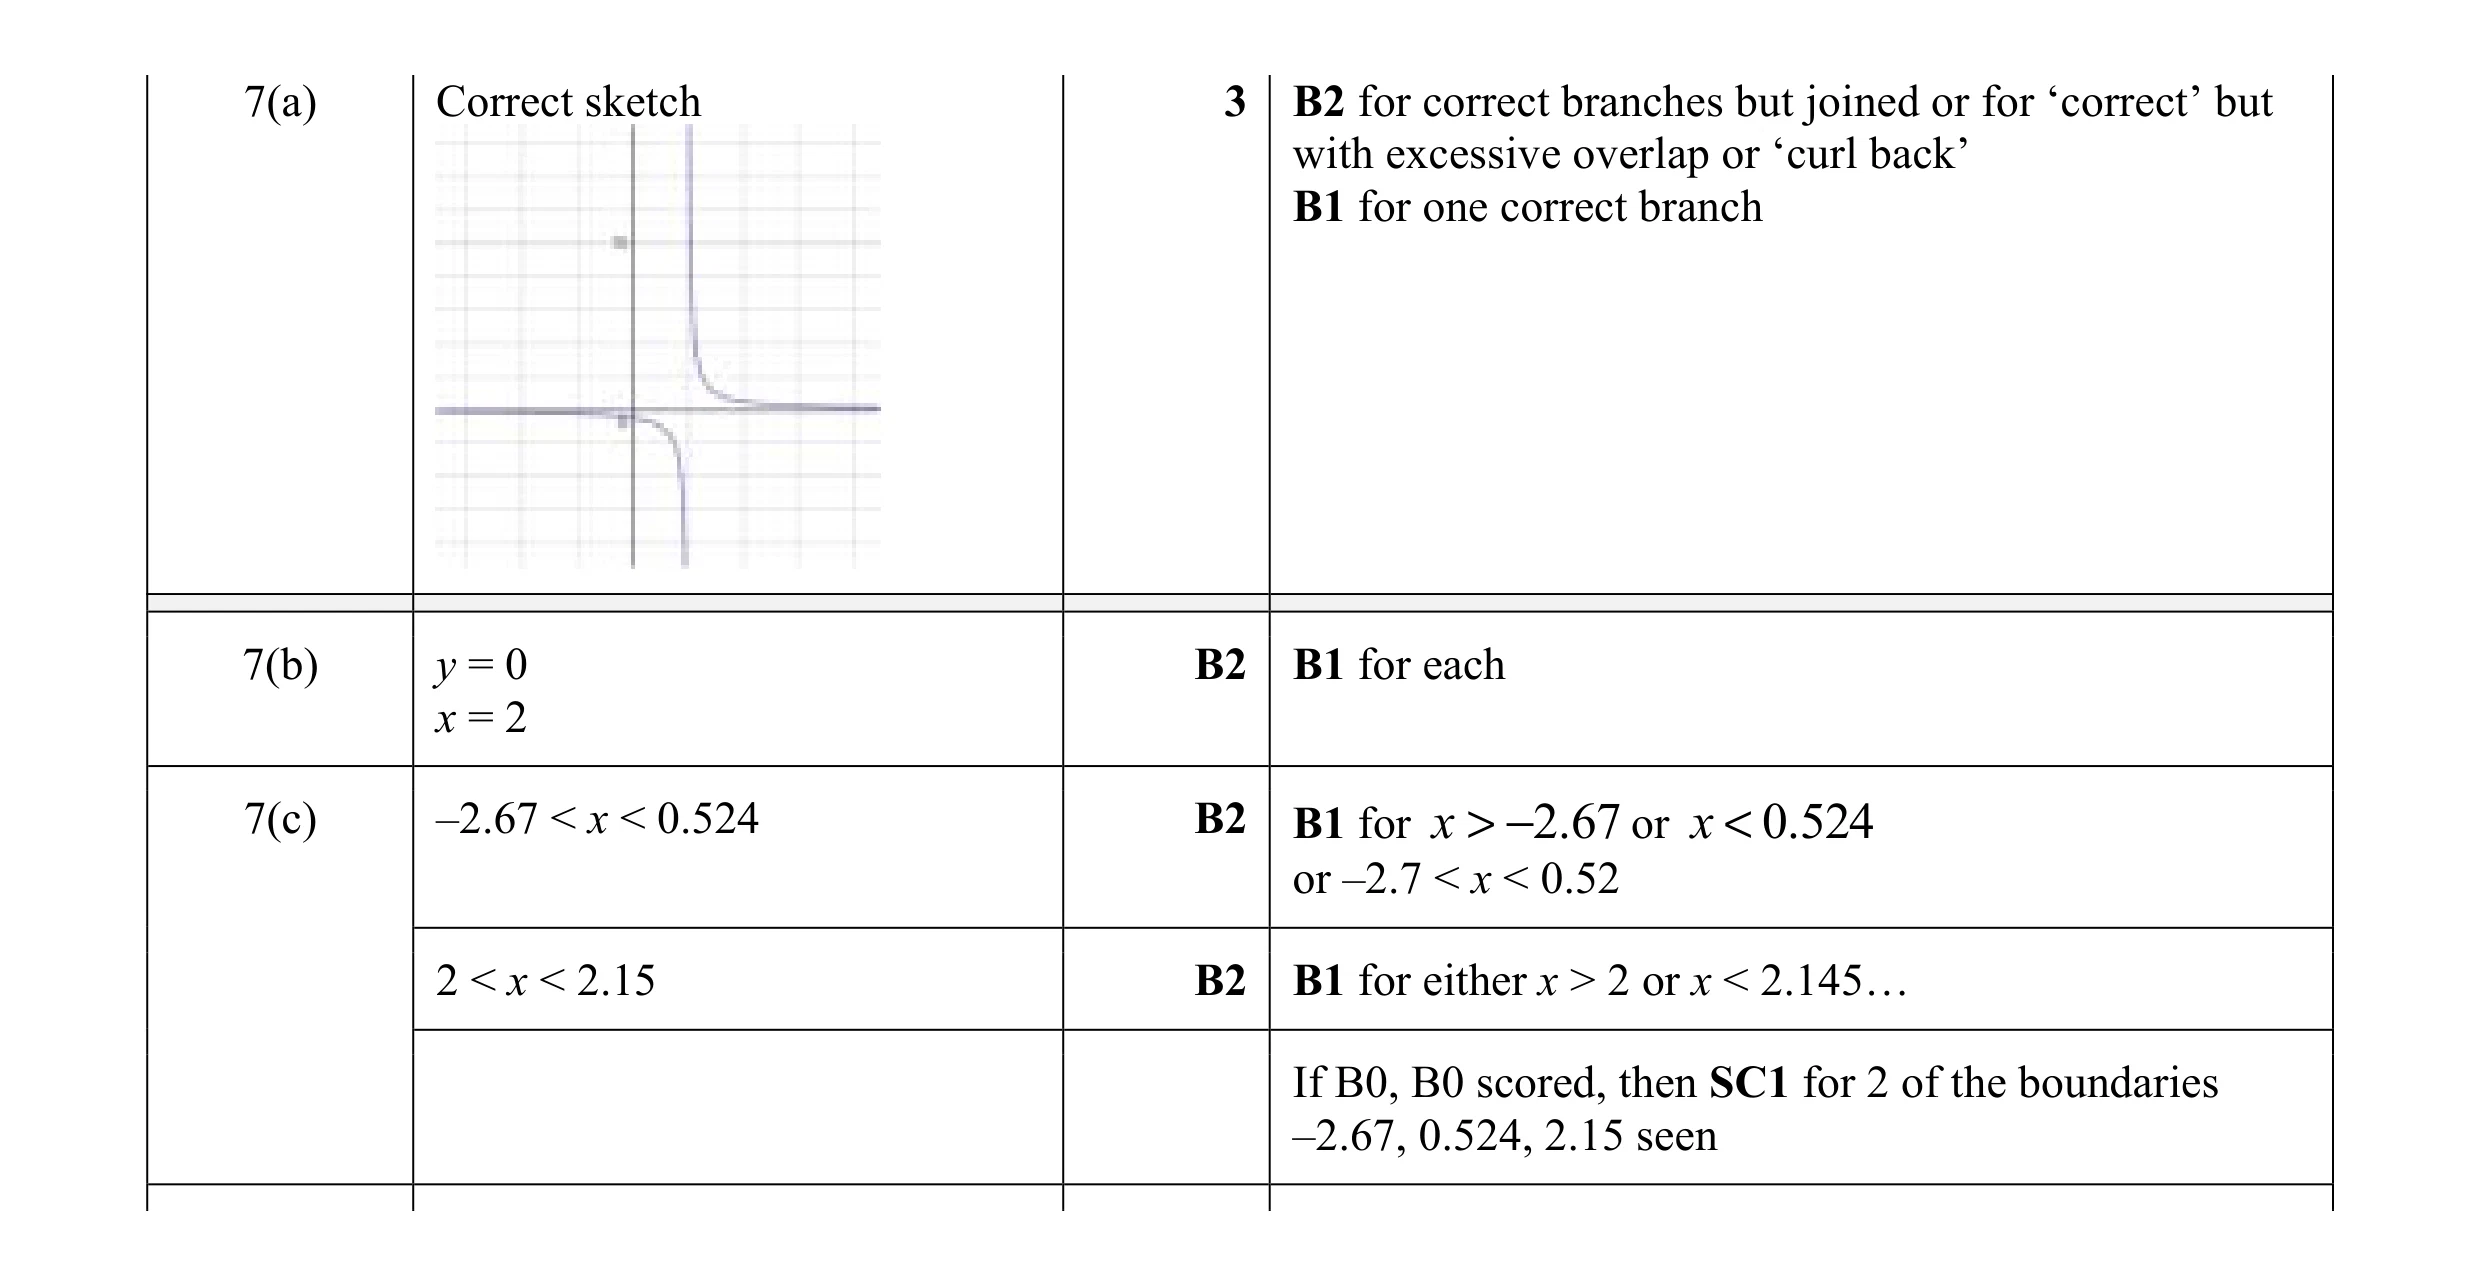 9
9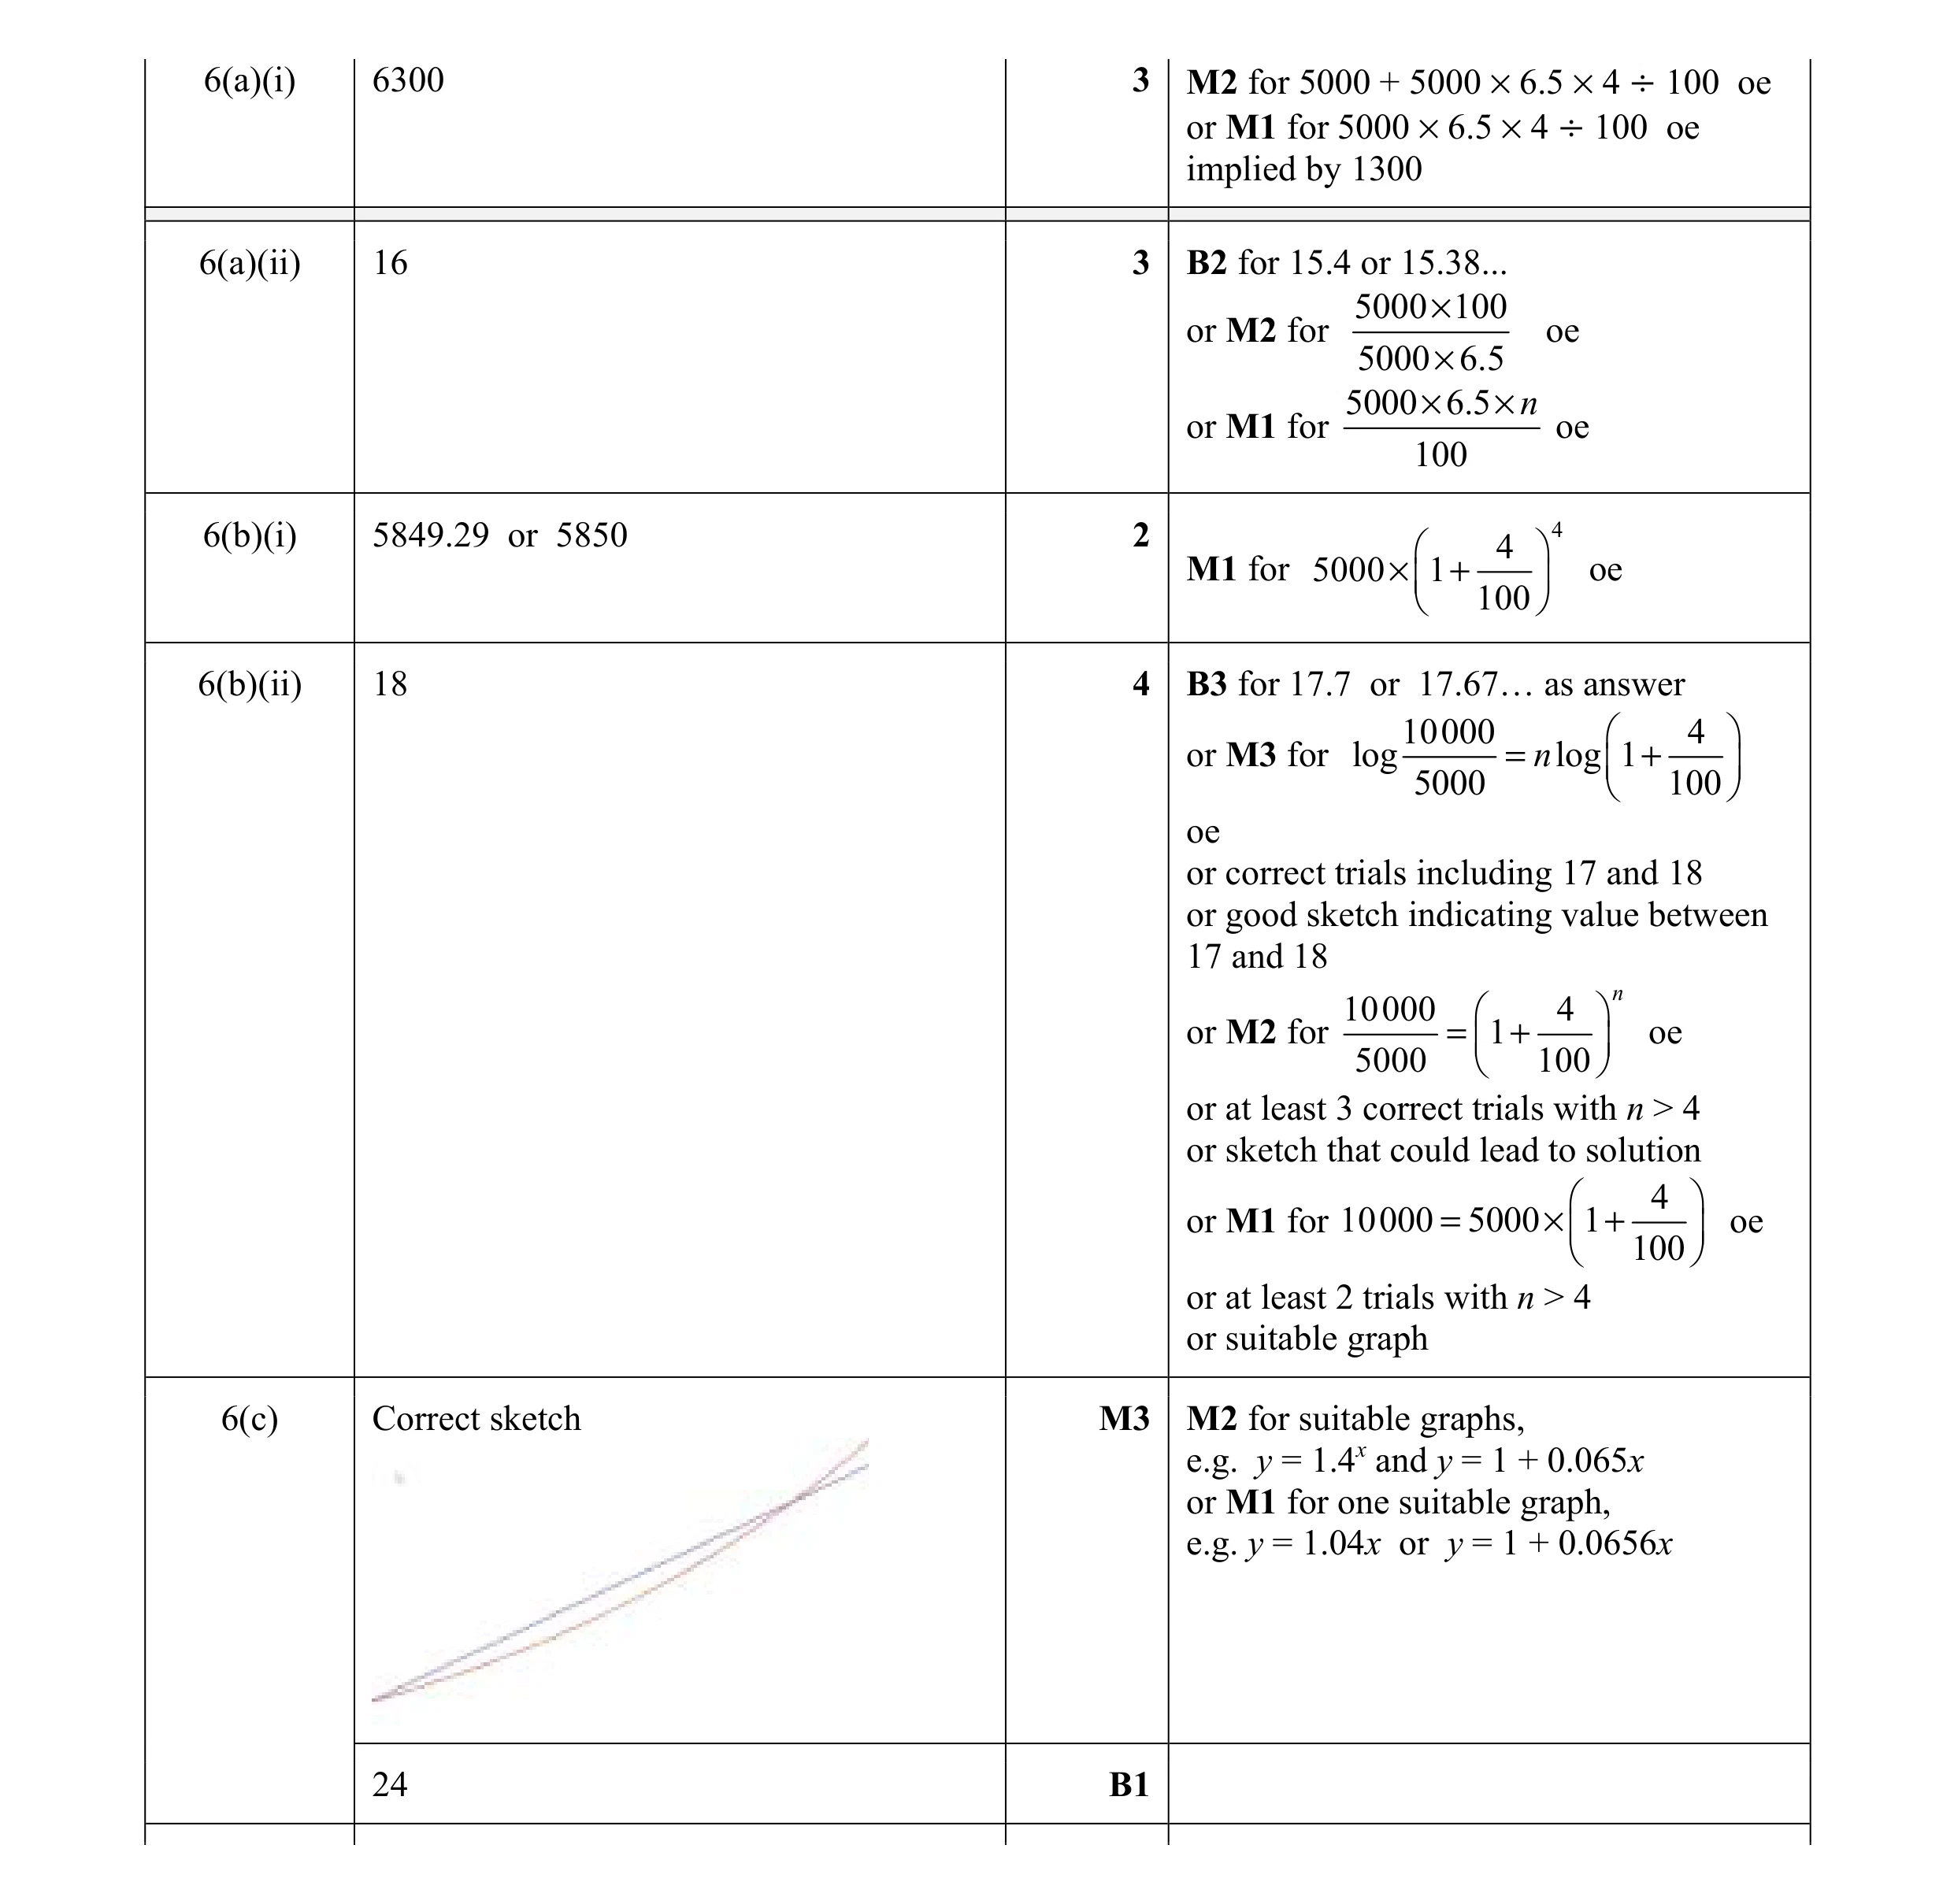 16
16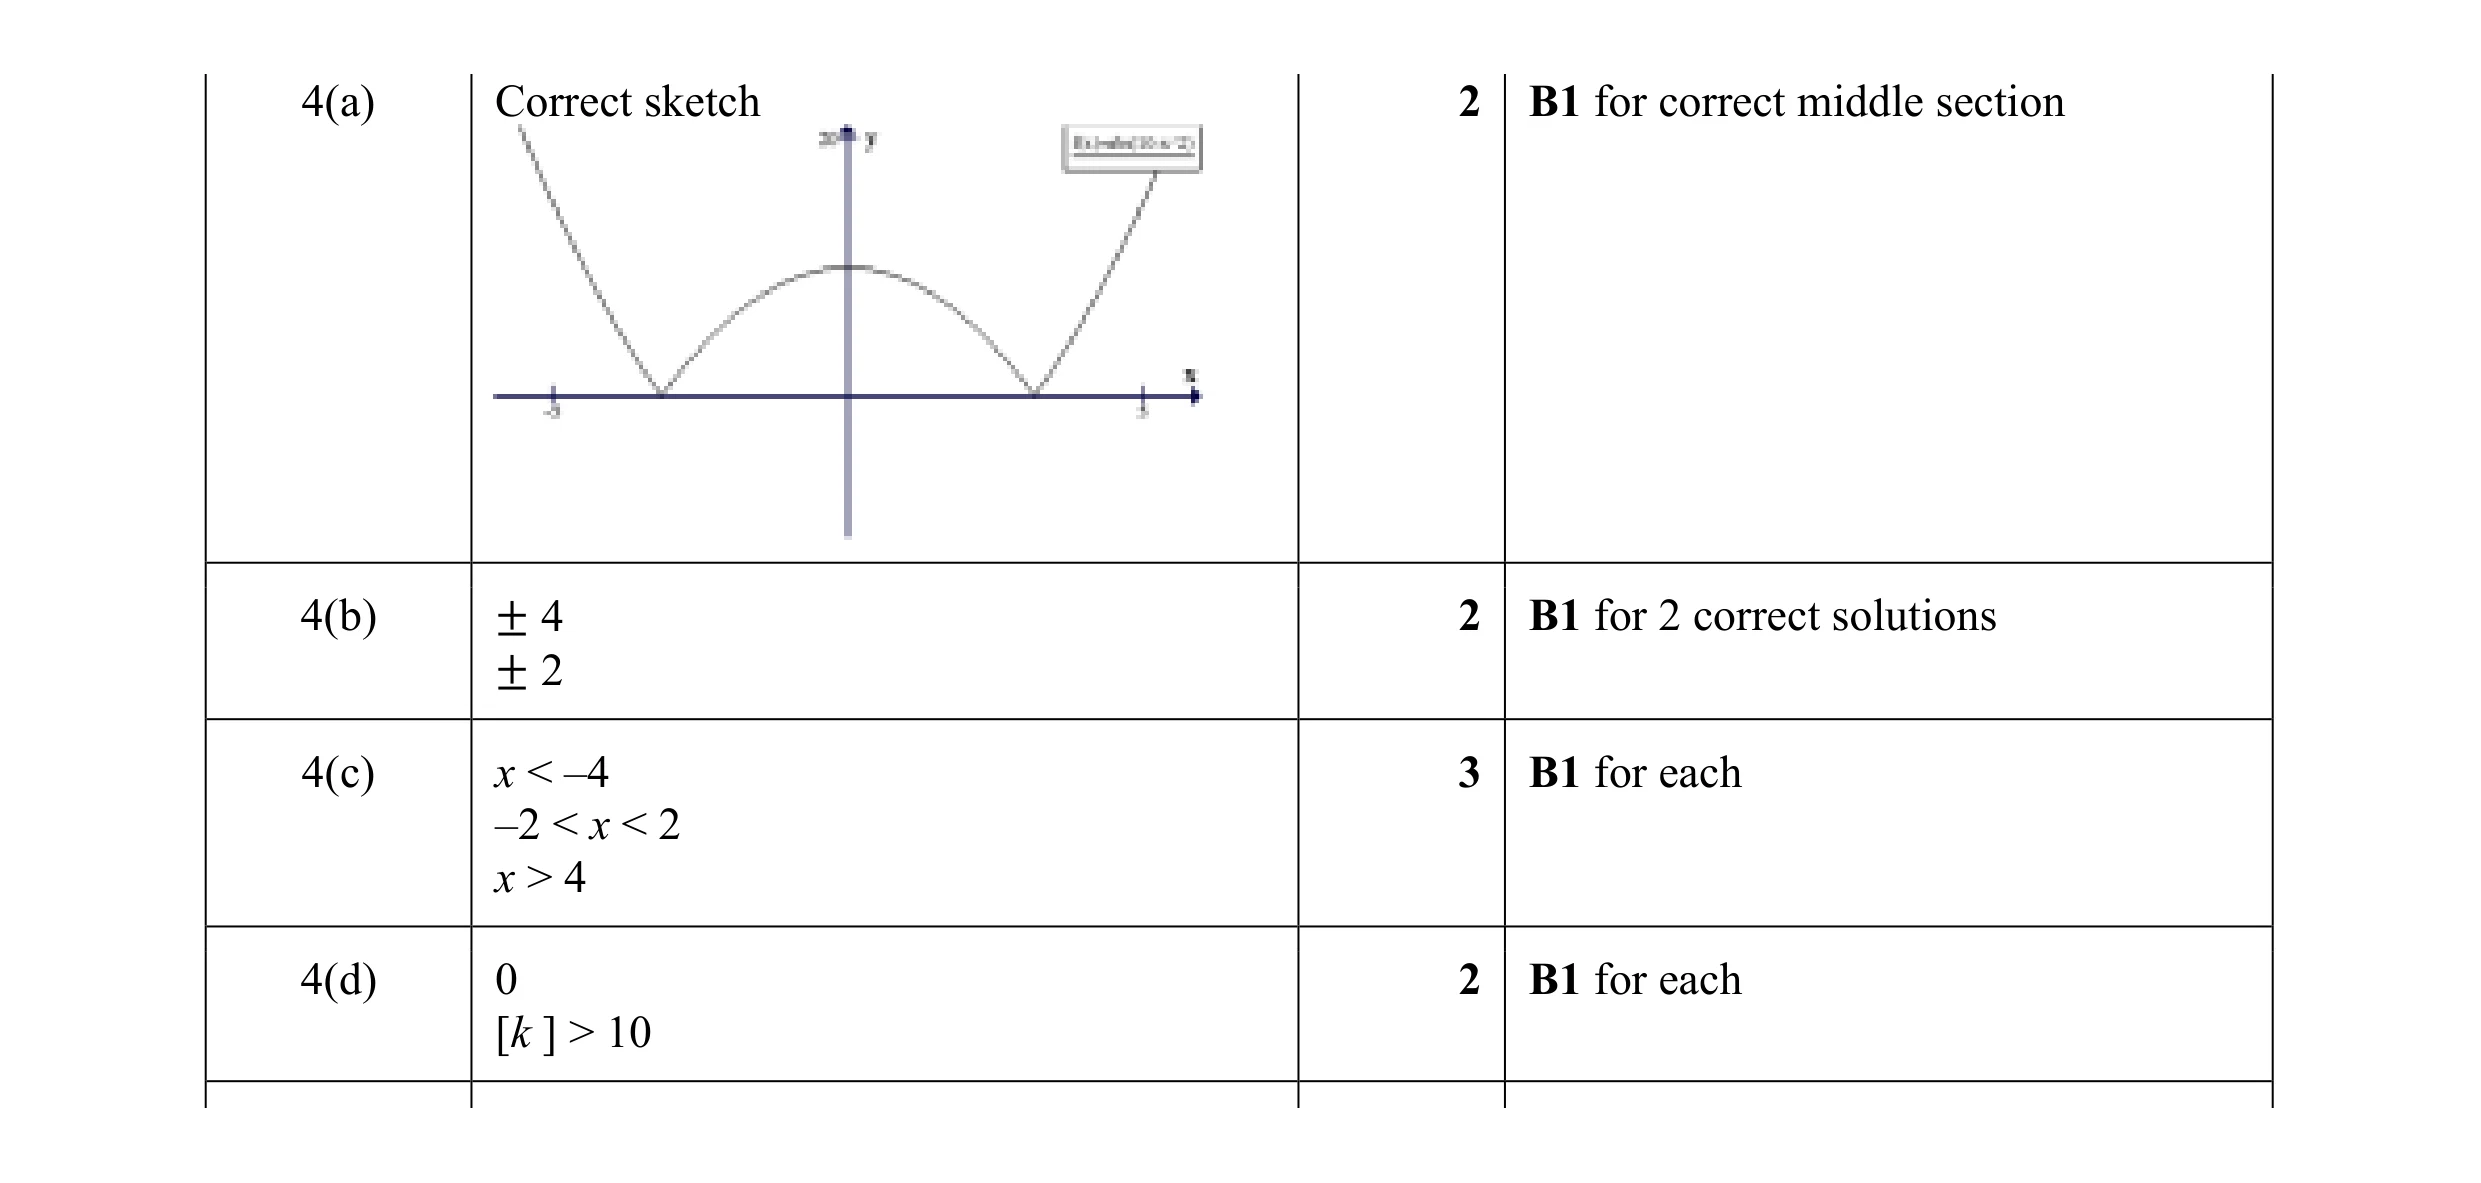 9
9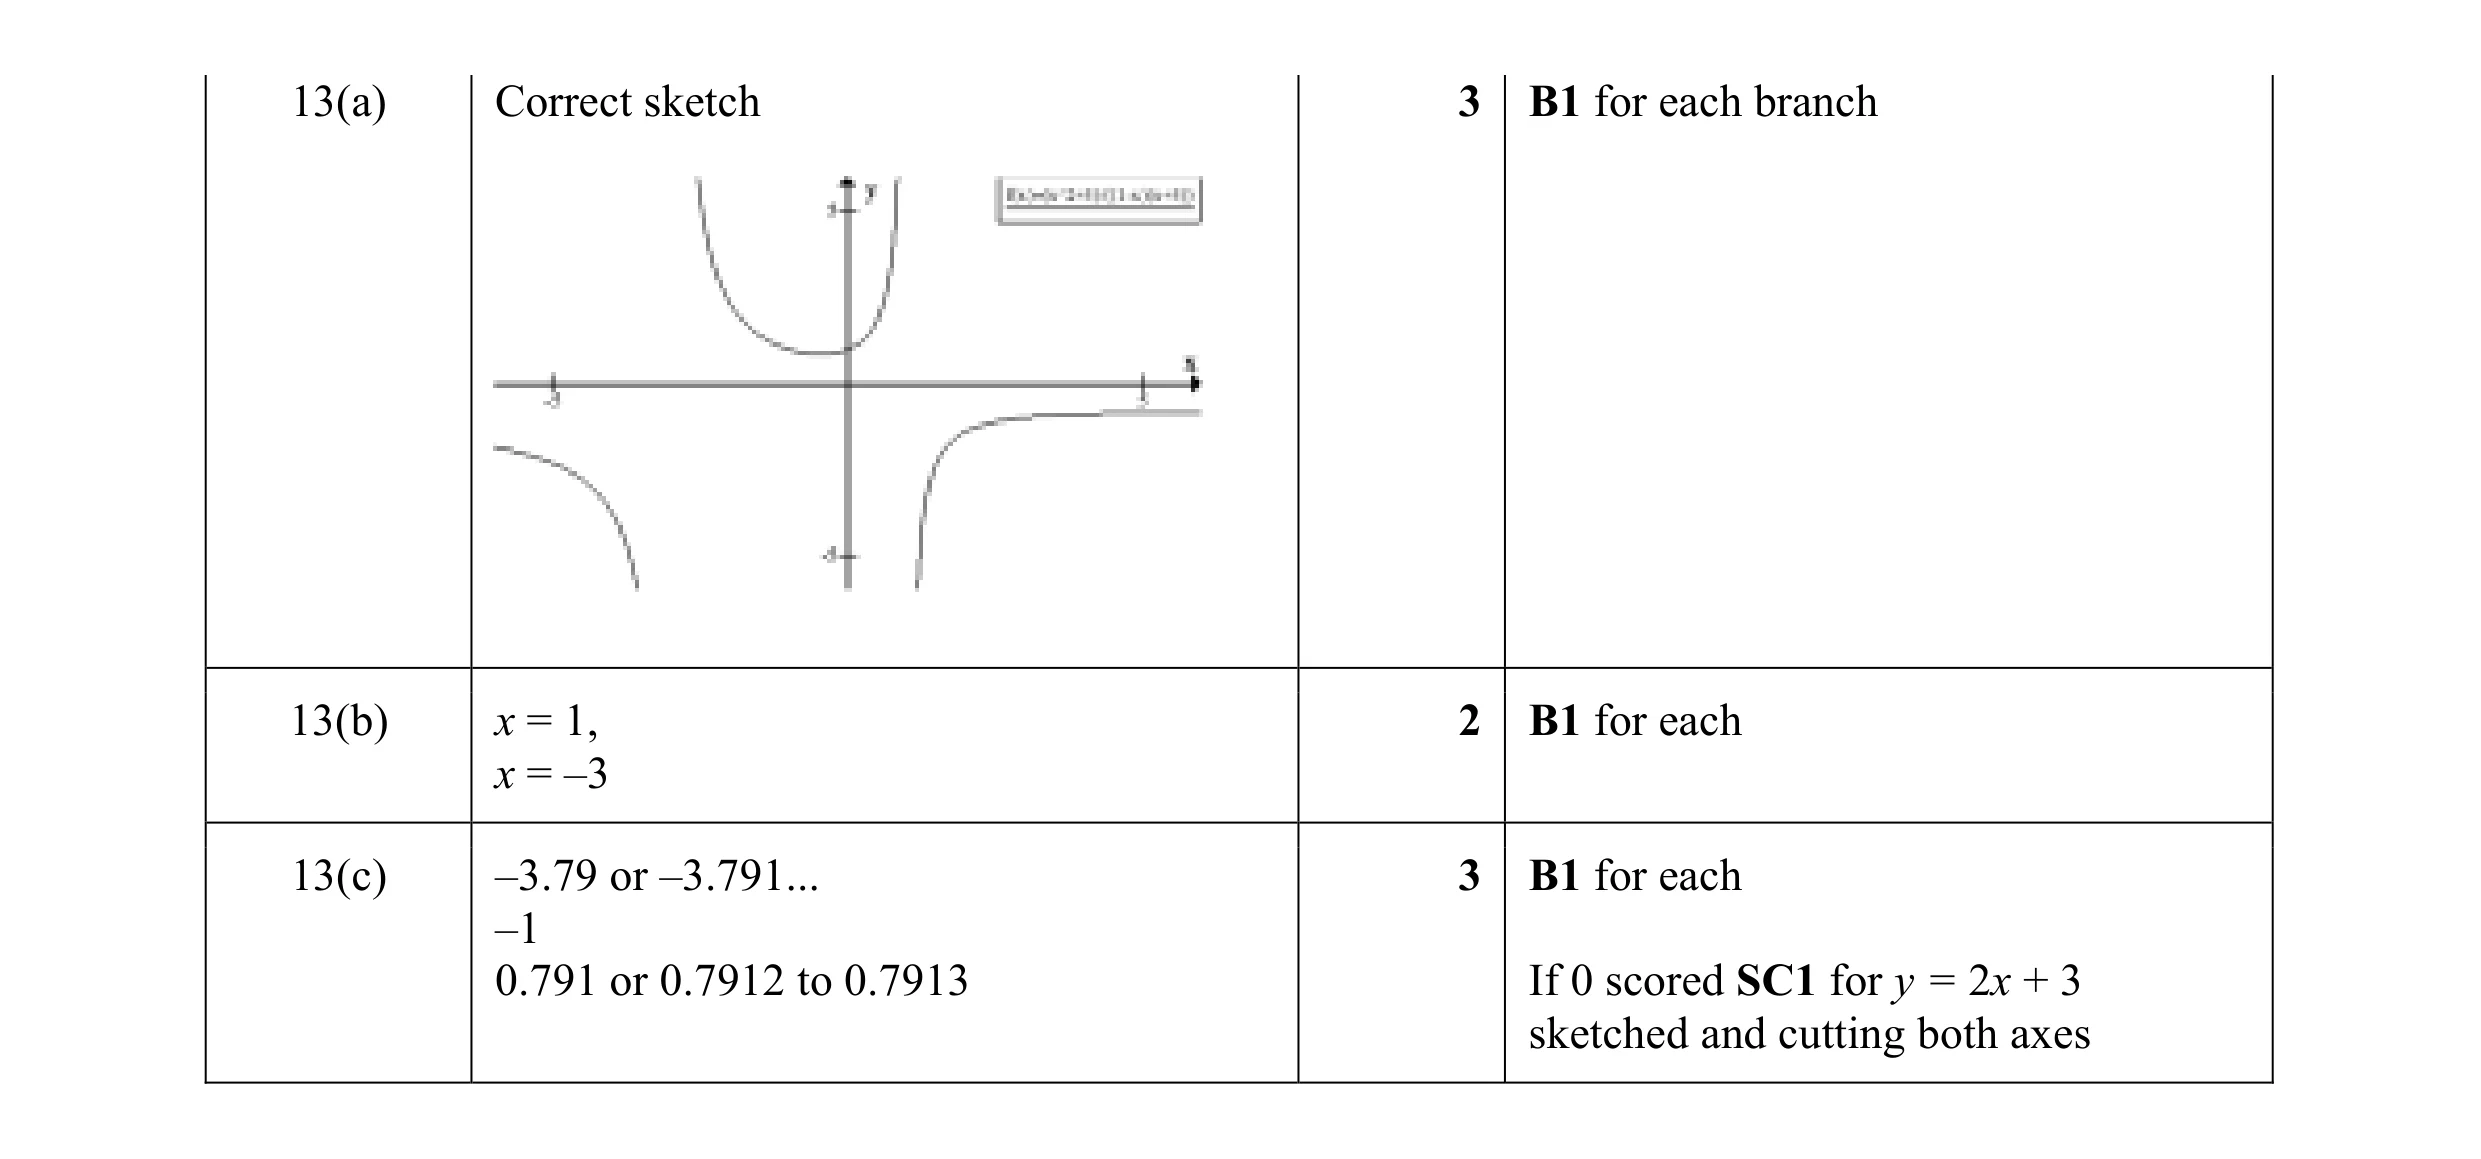 8
8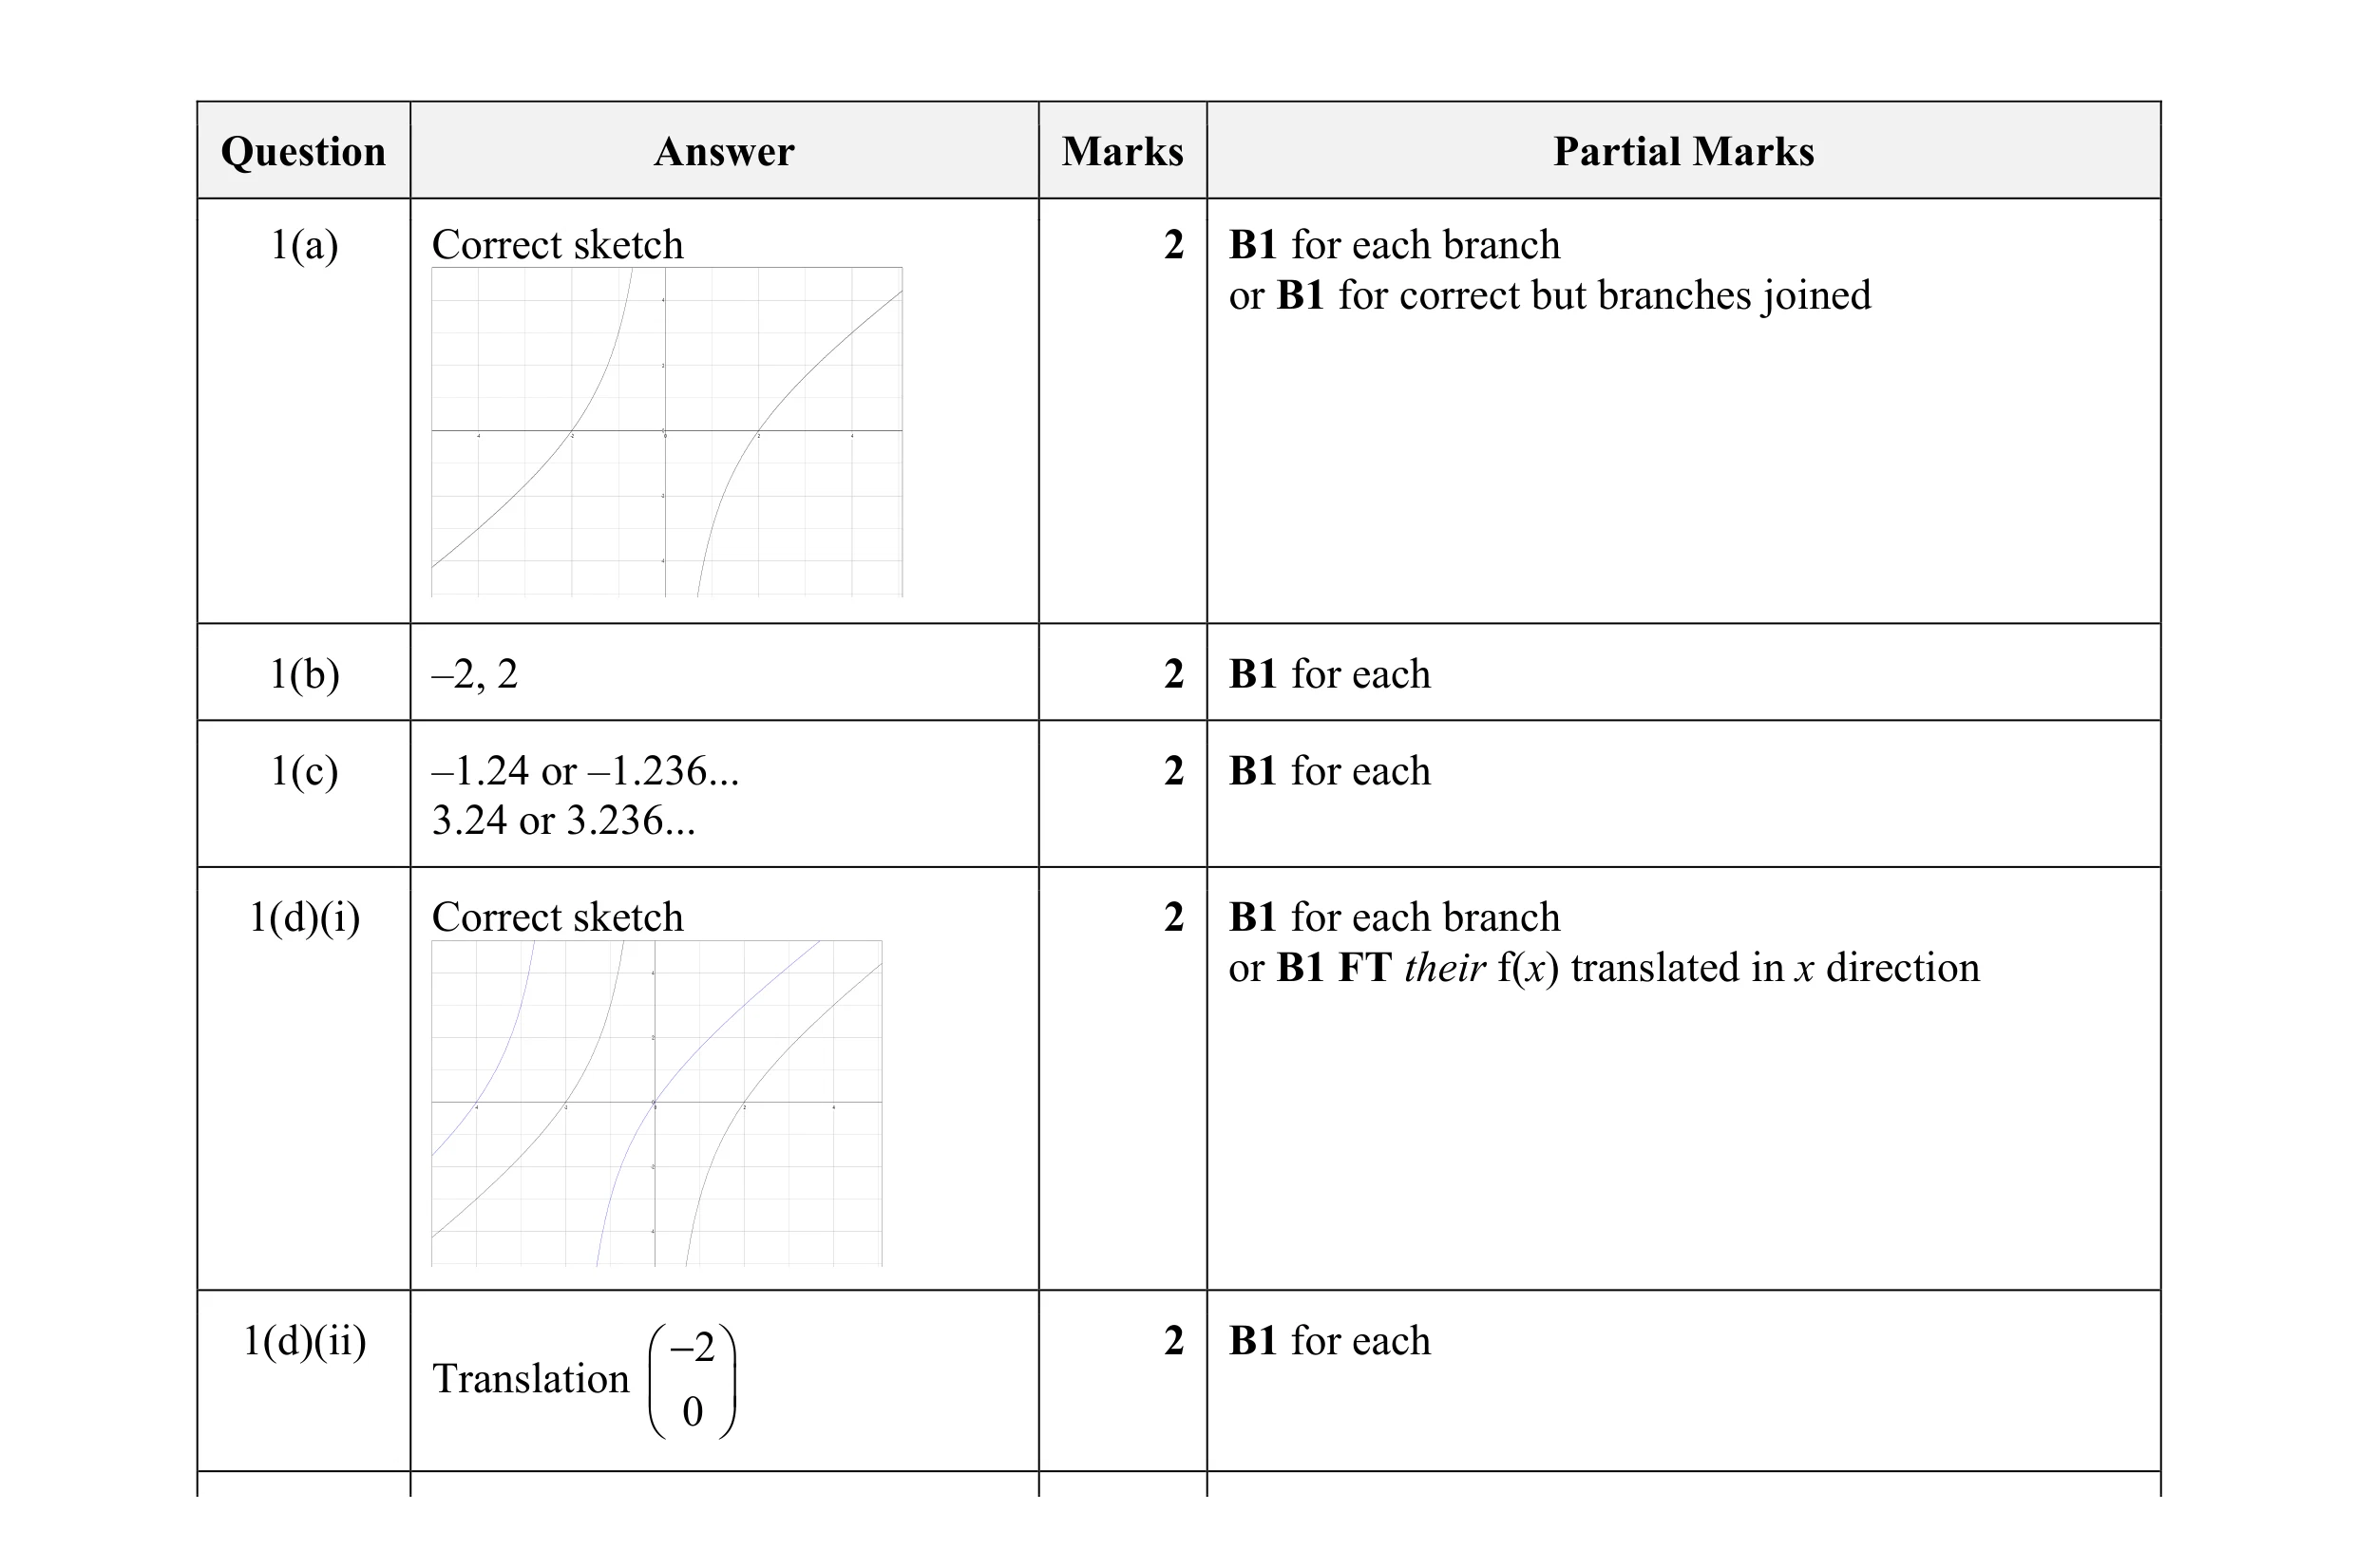 10
10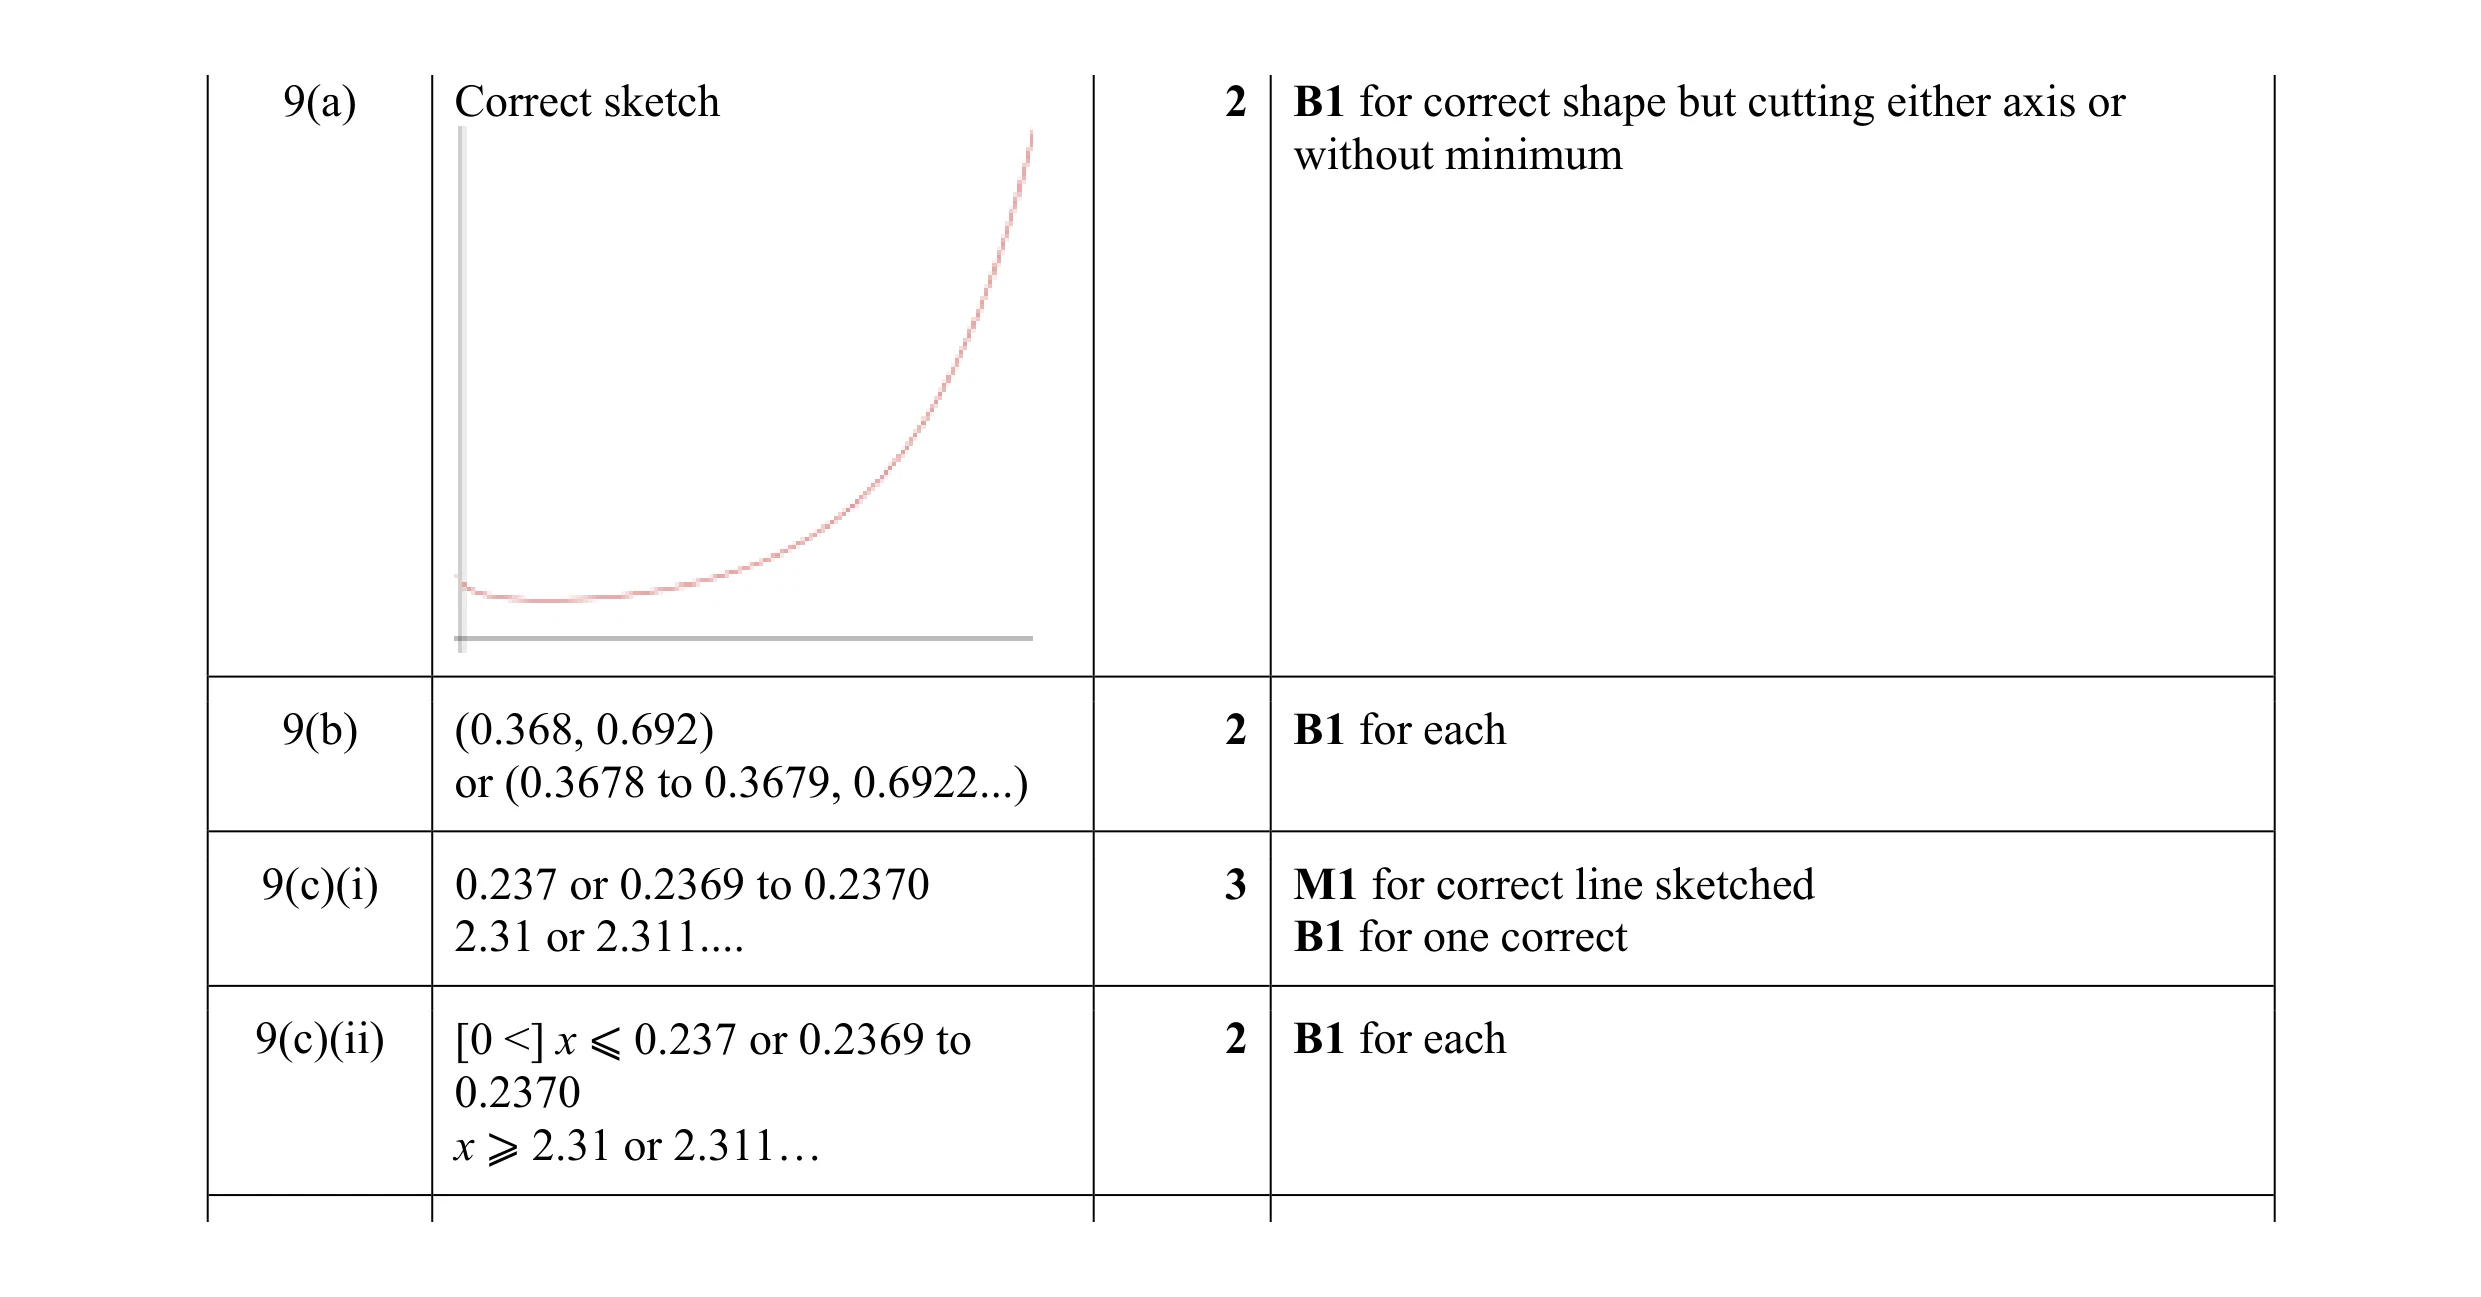 9
9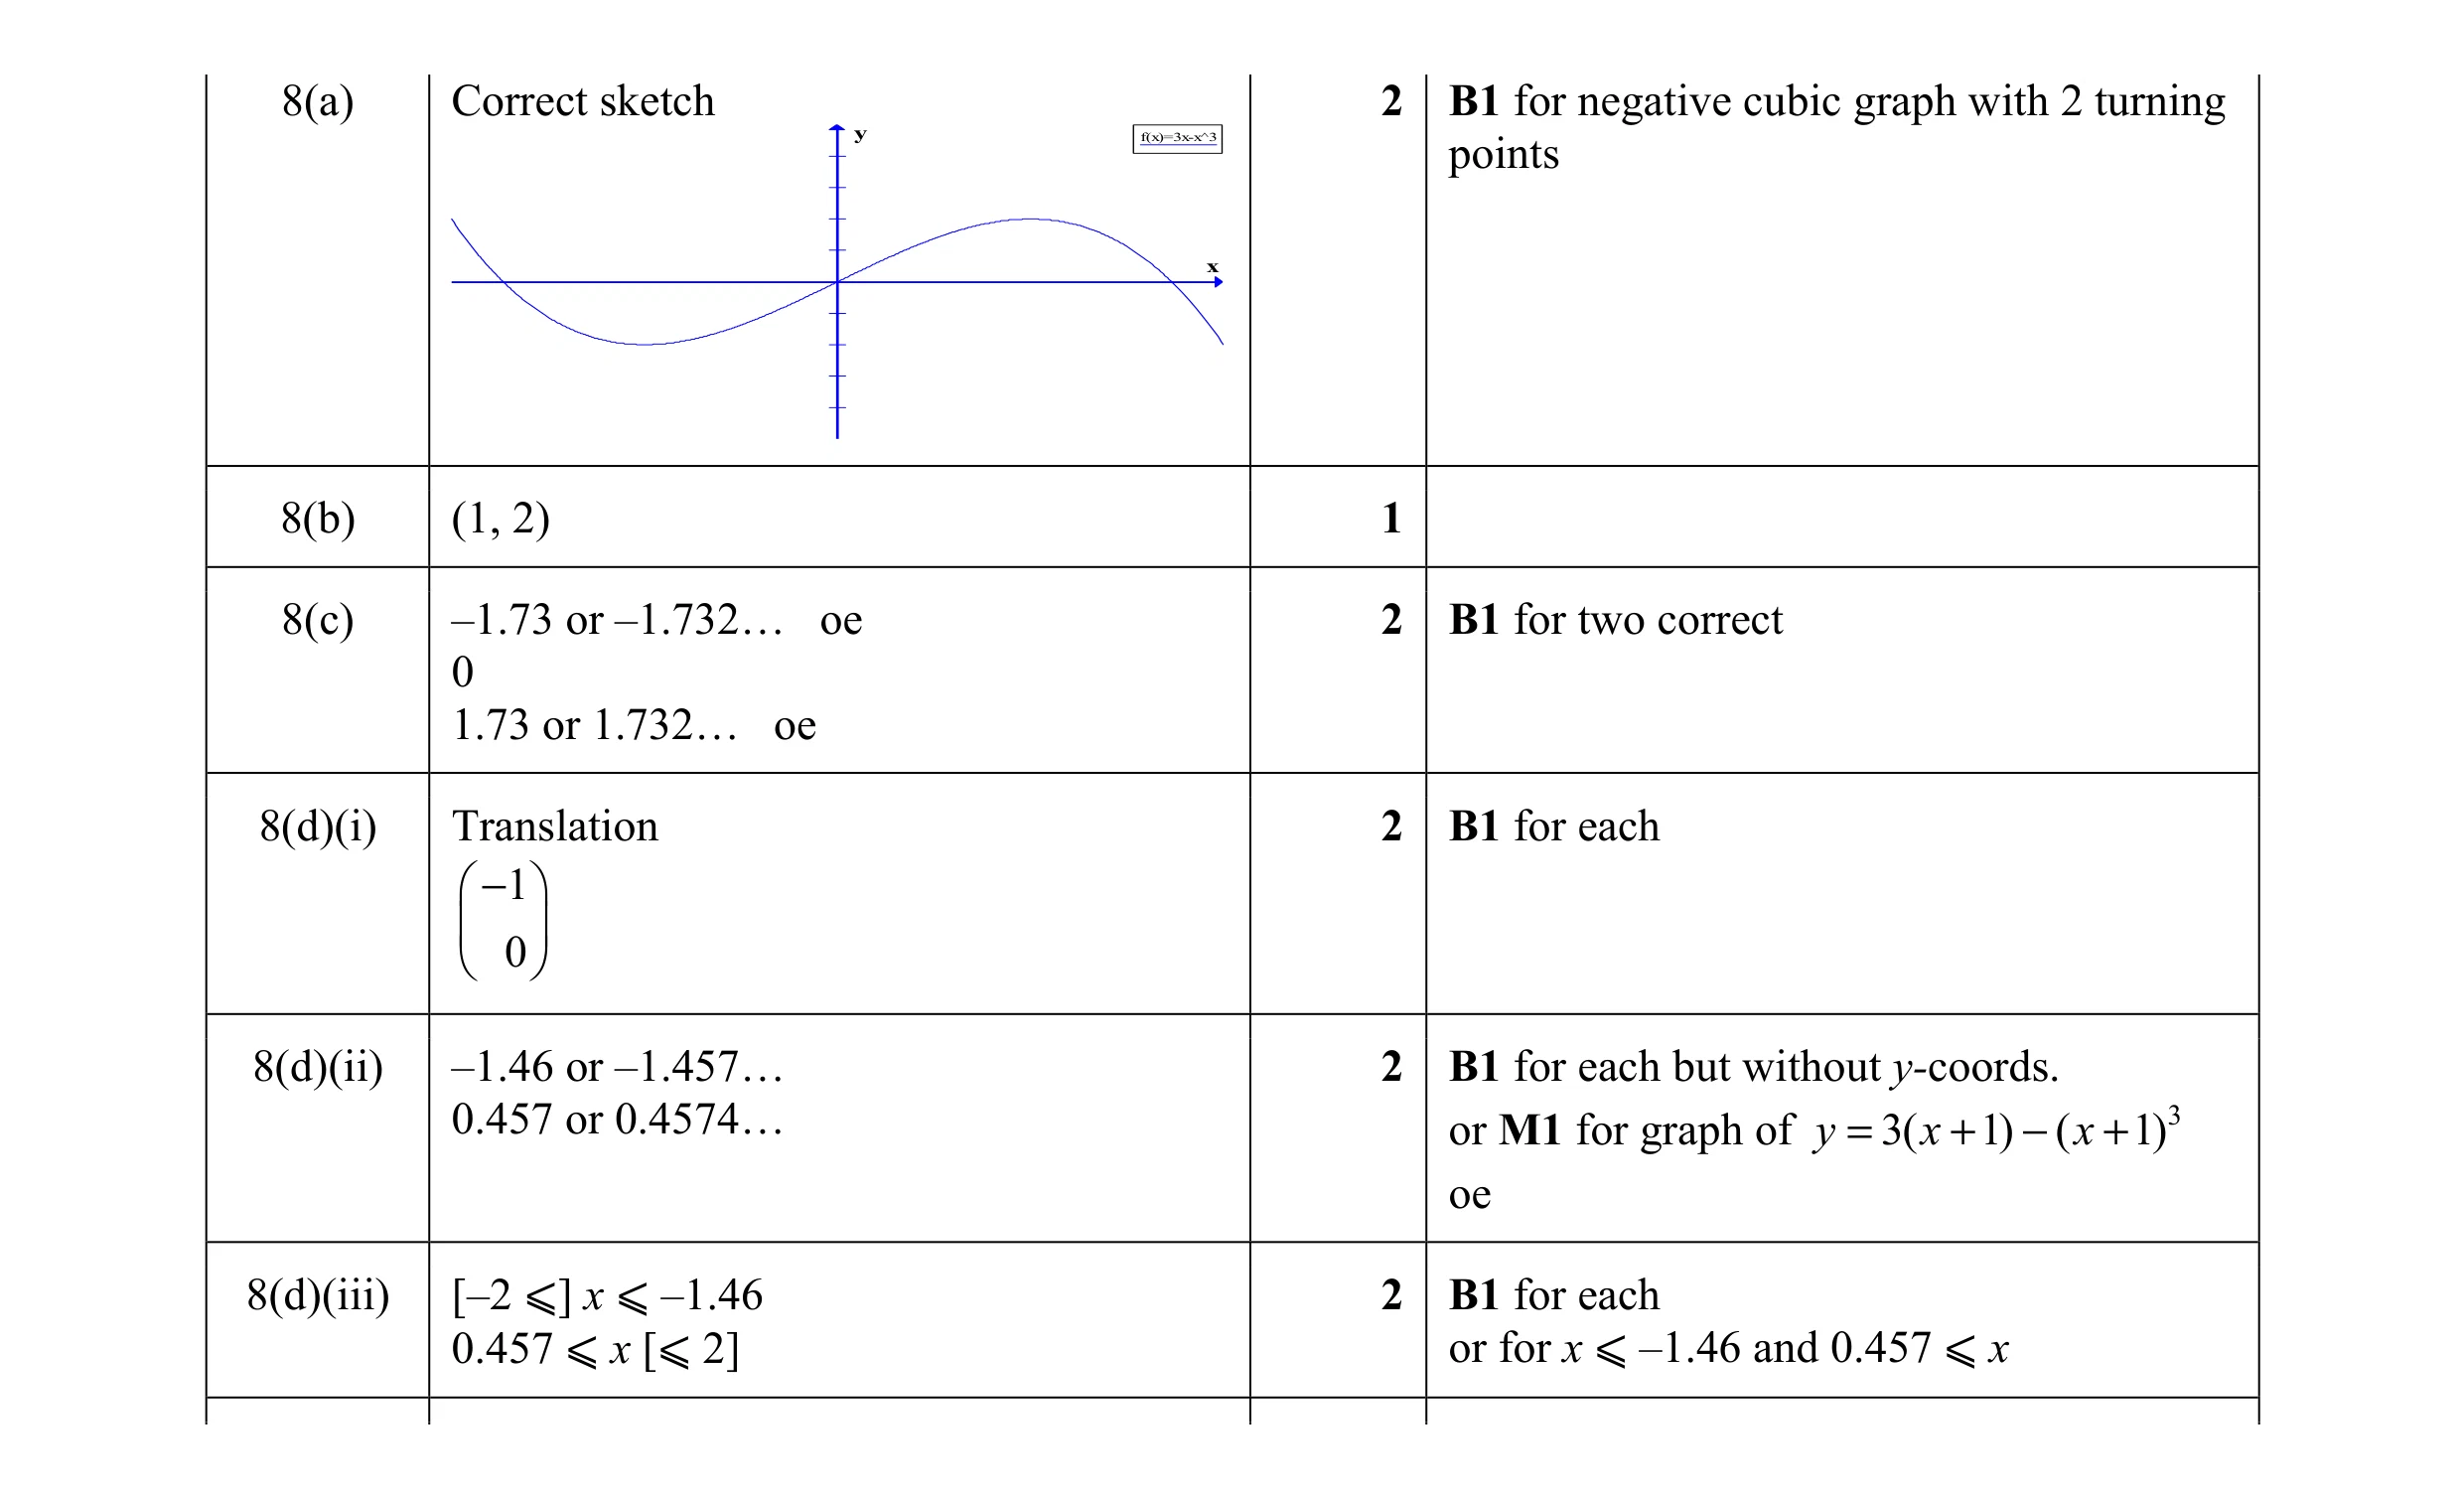 11
11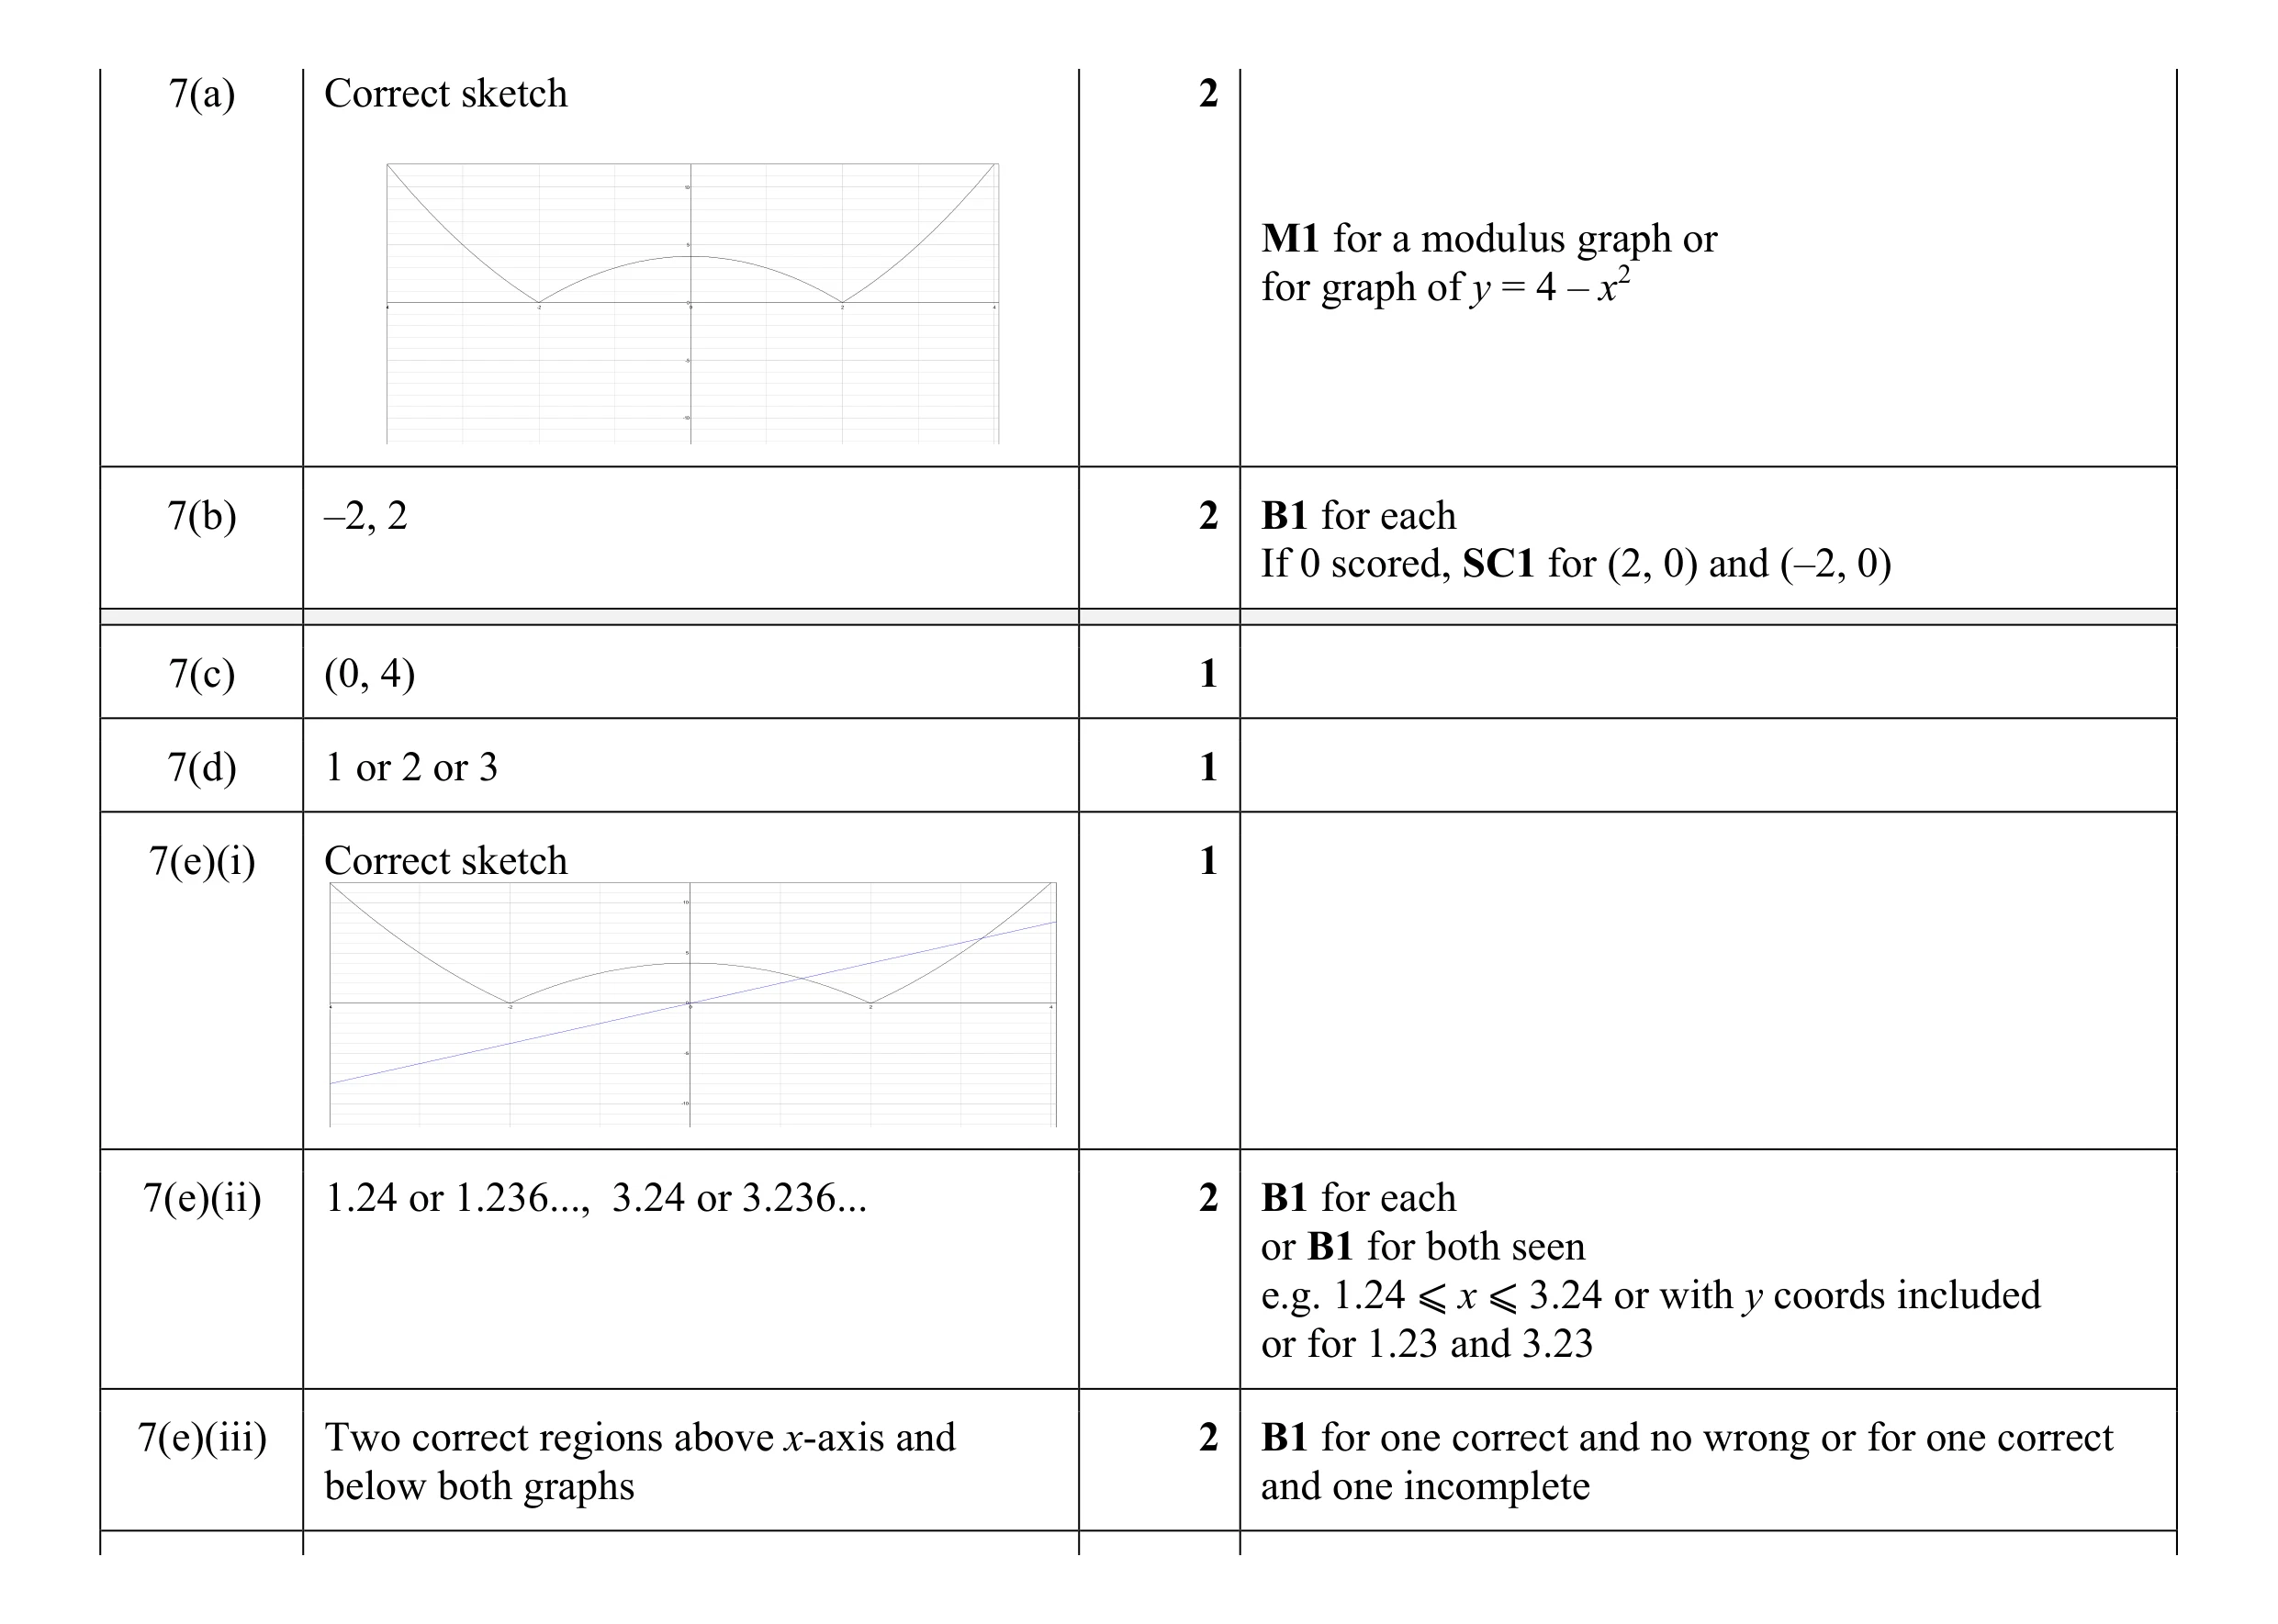 11
11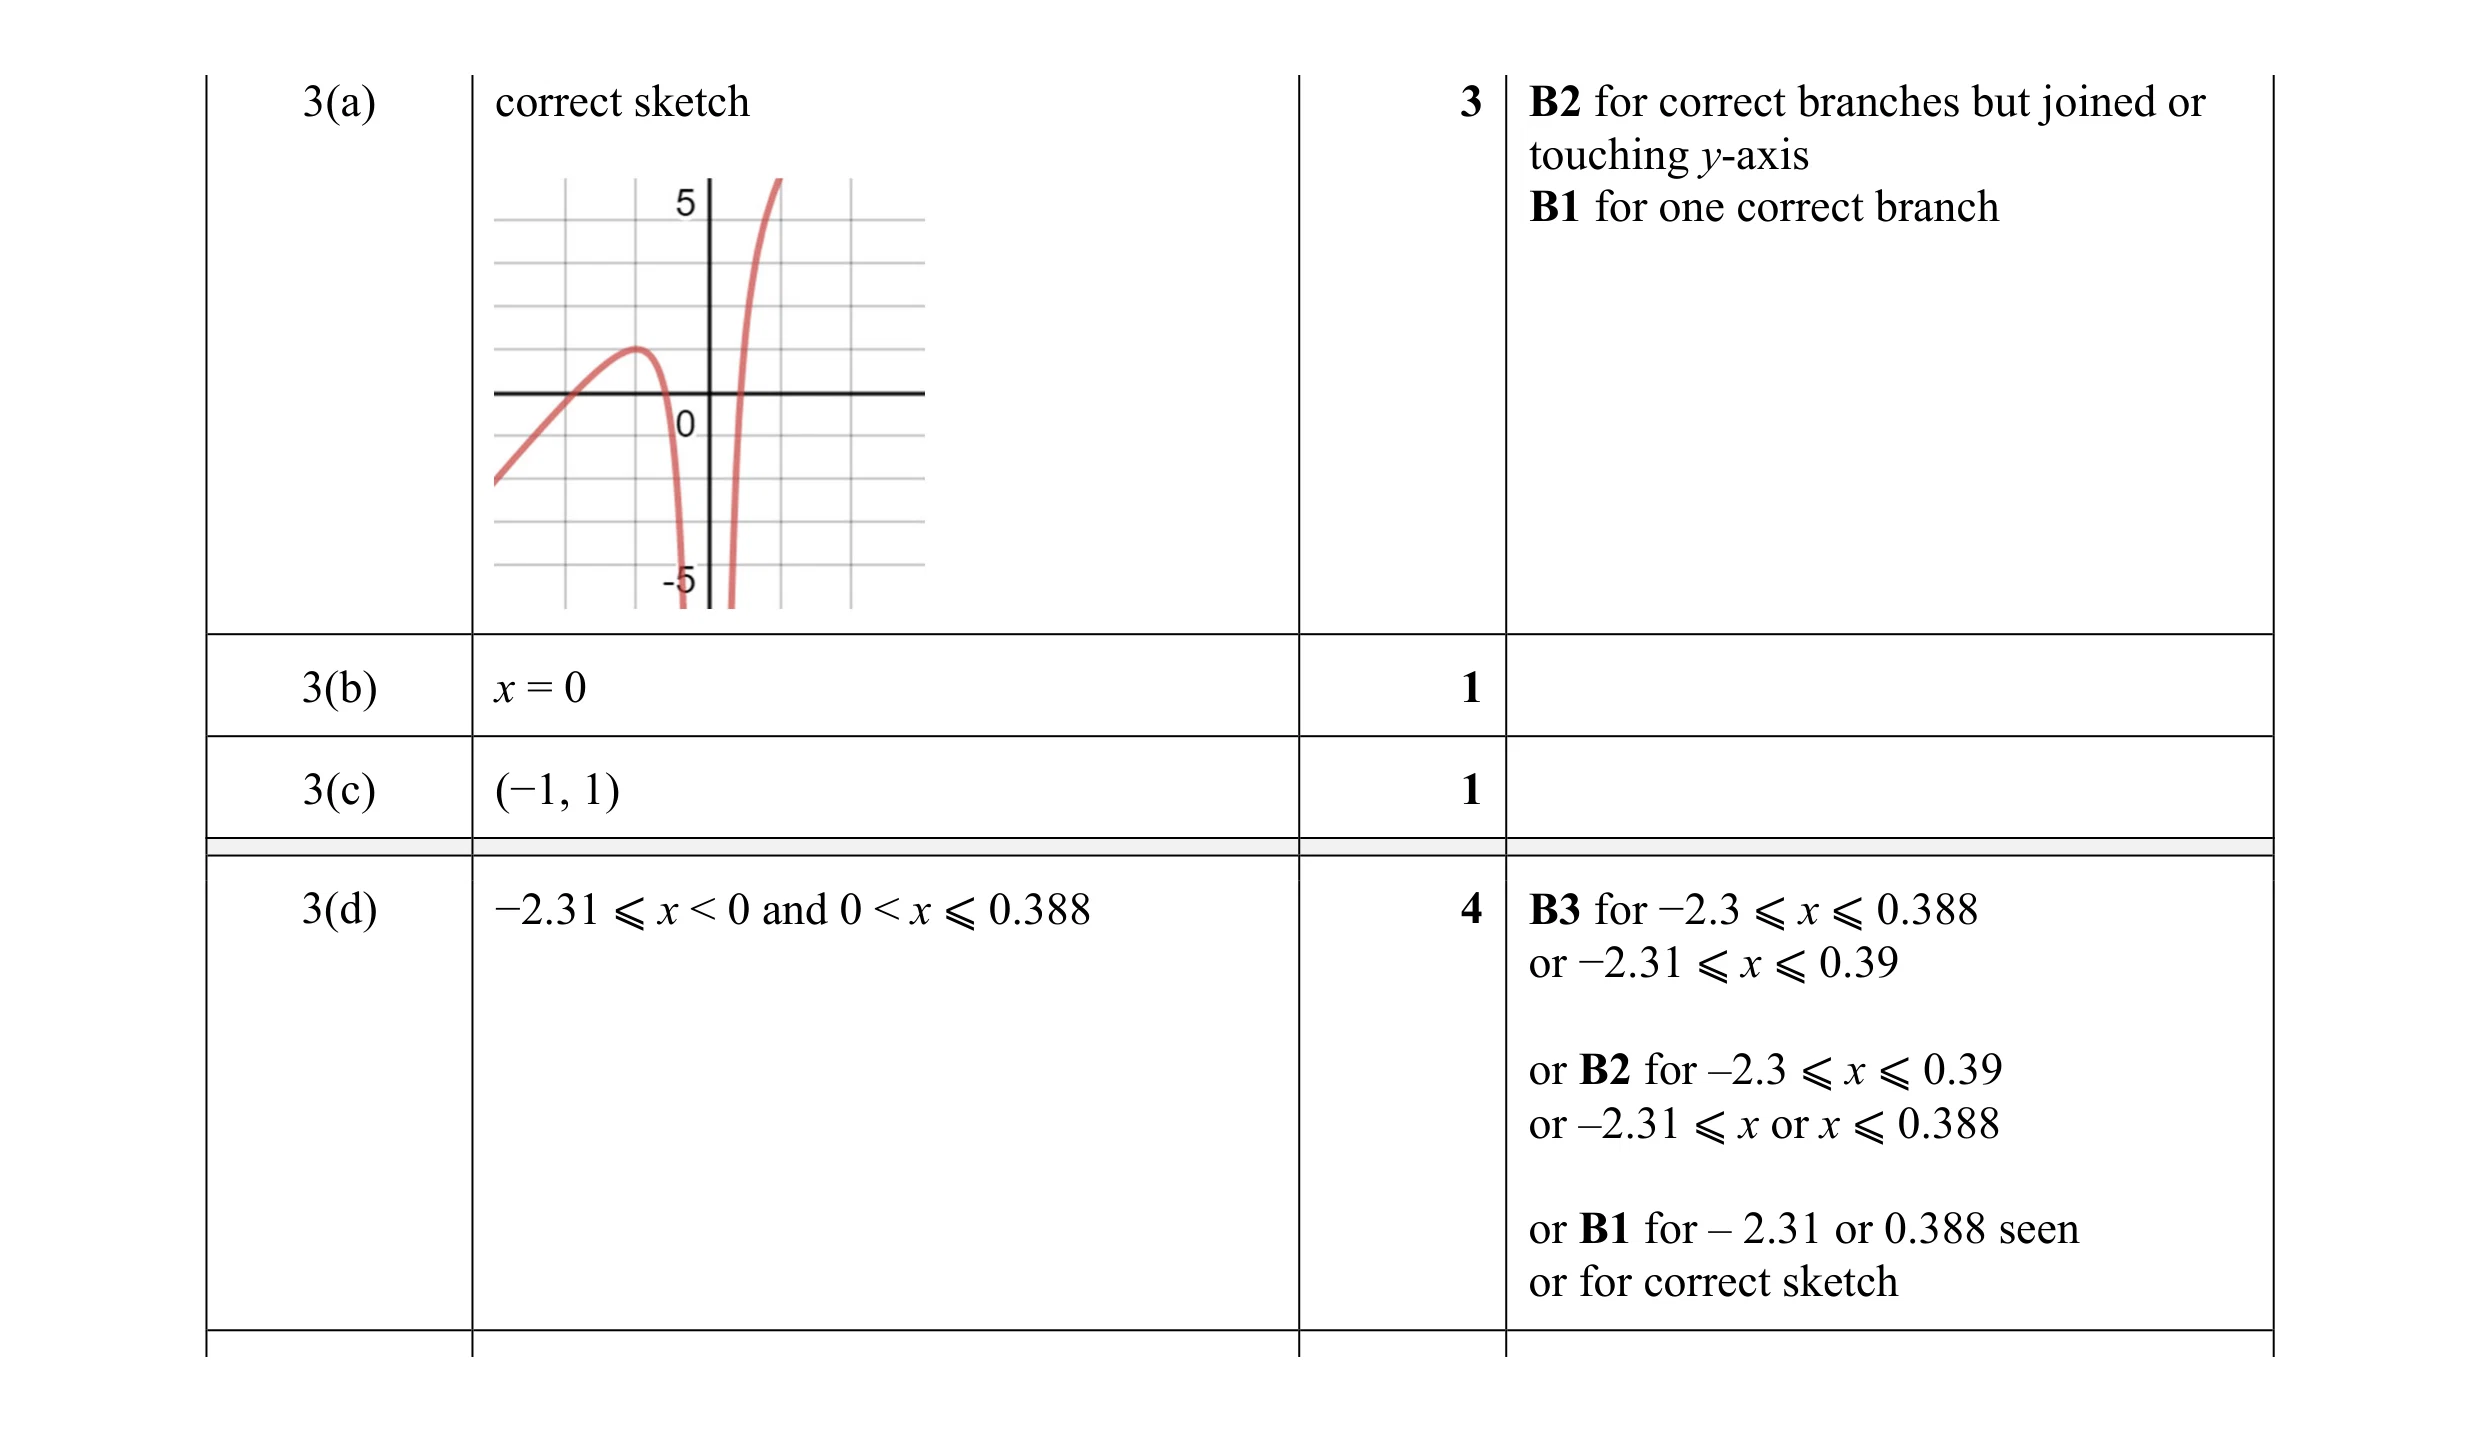 9
9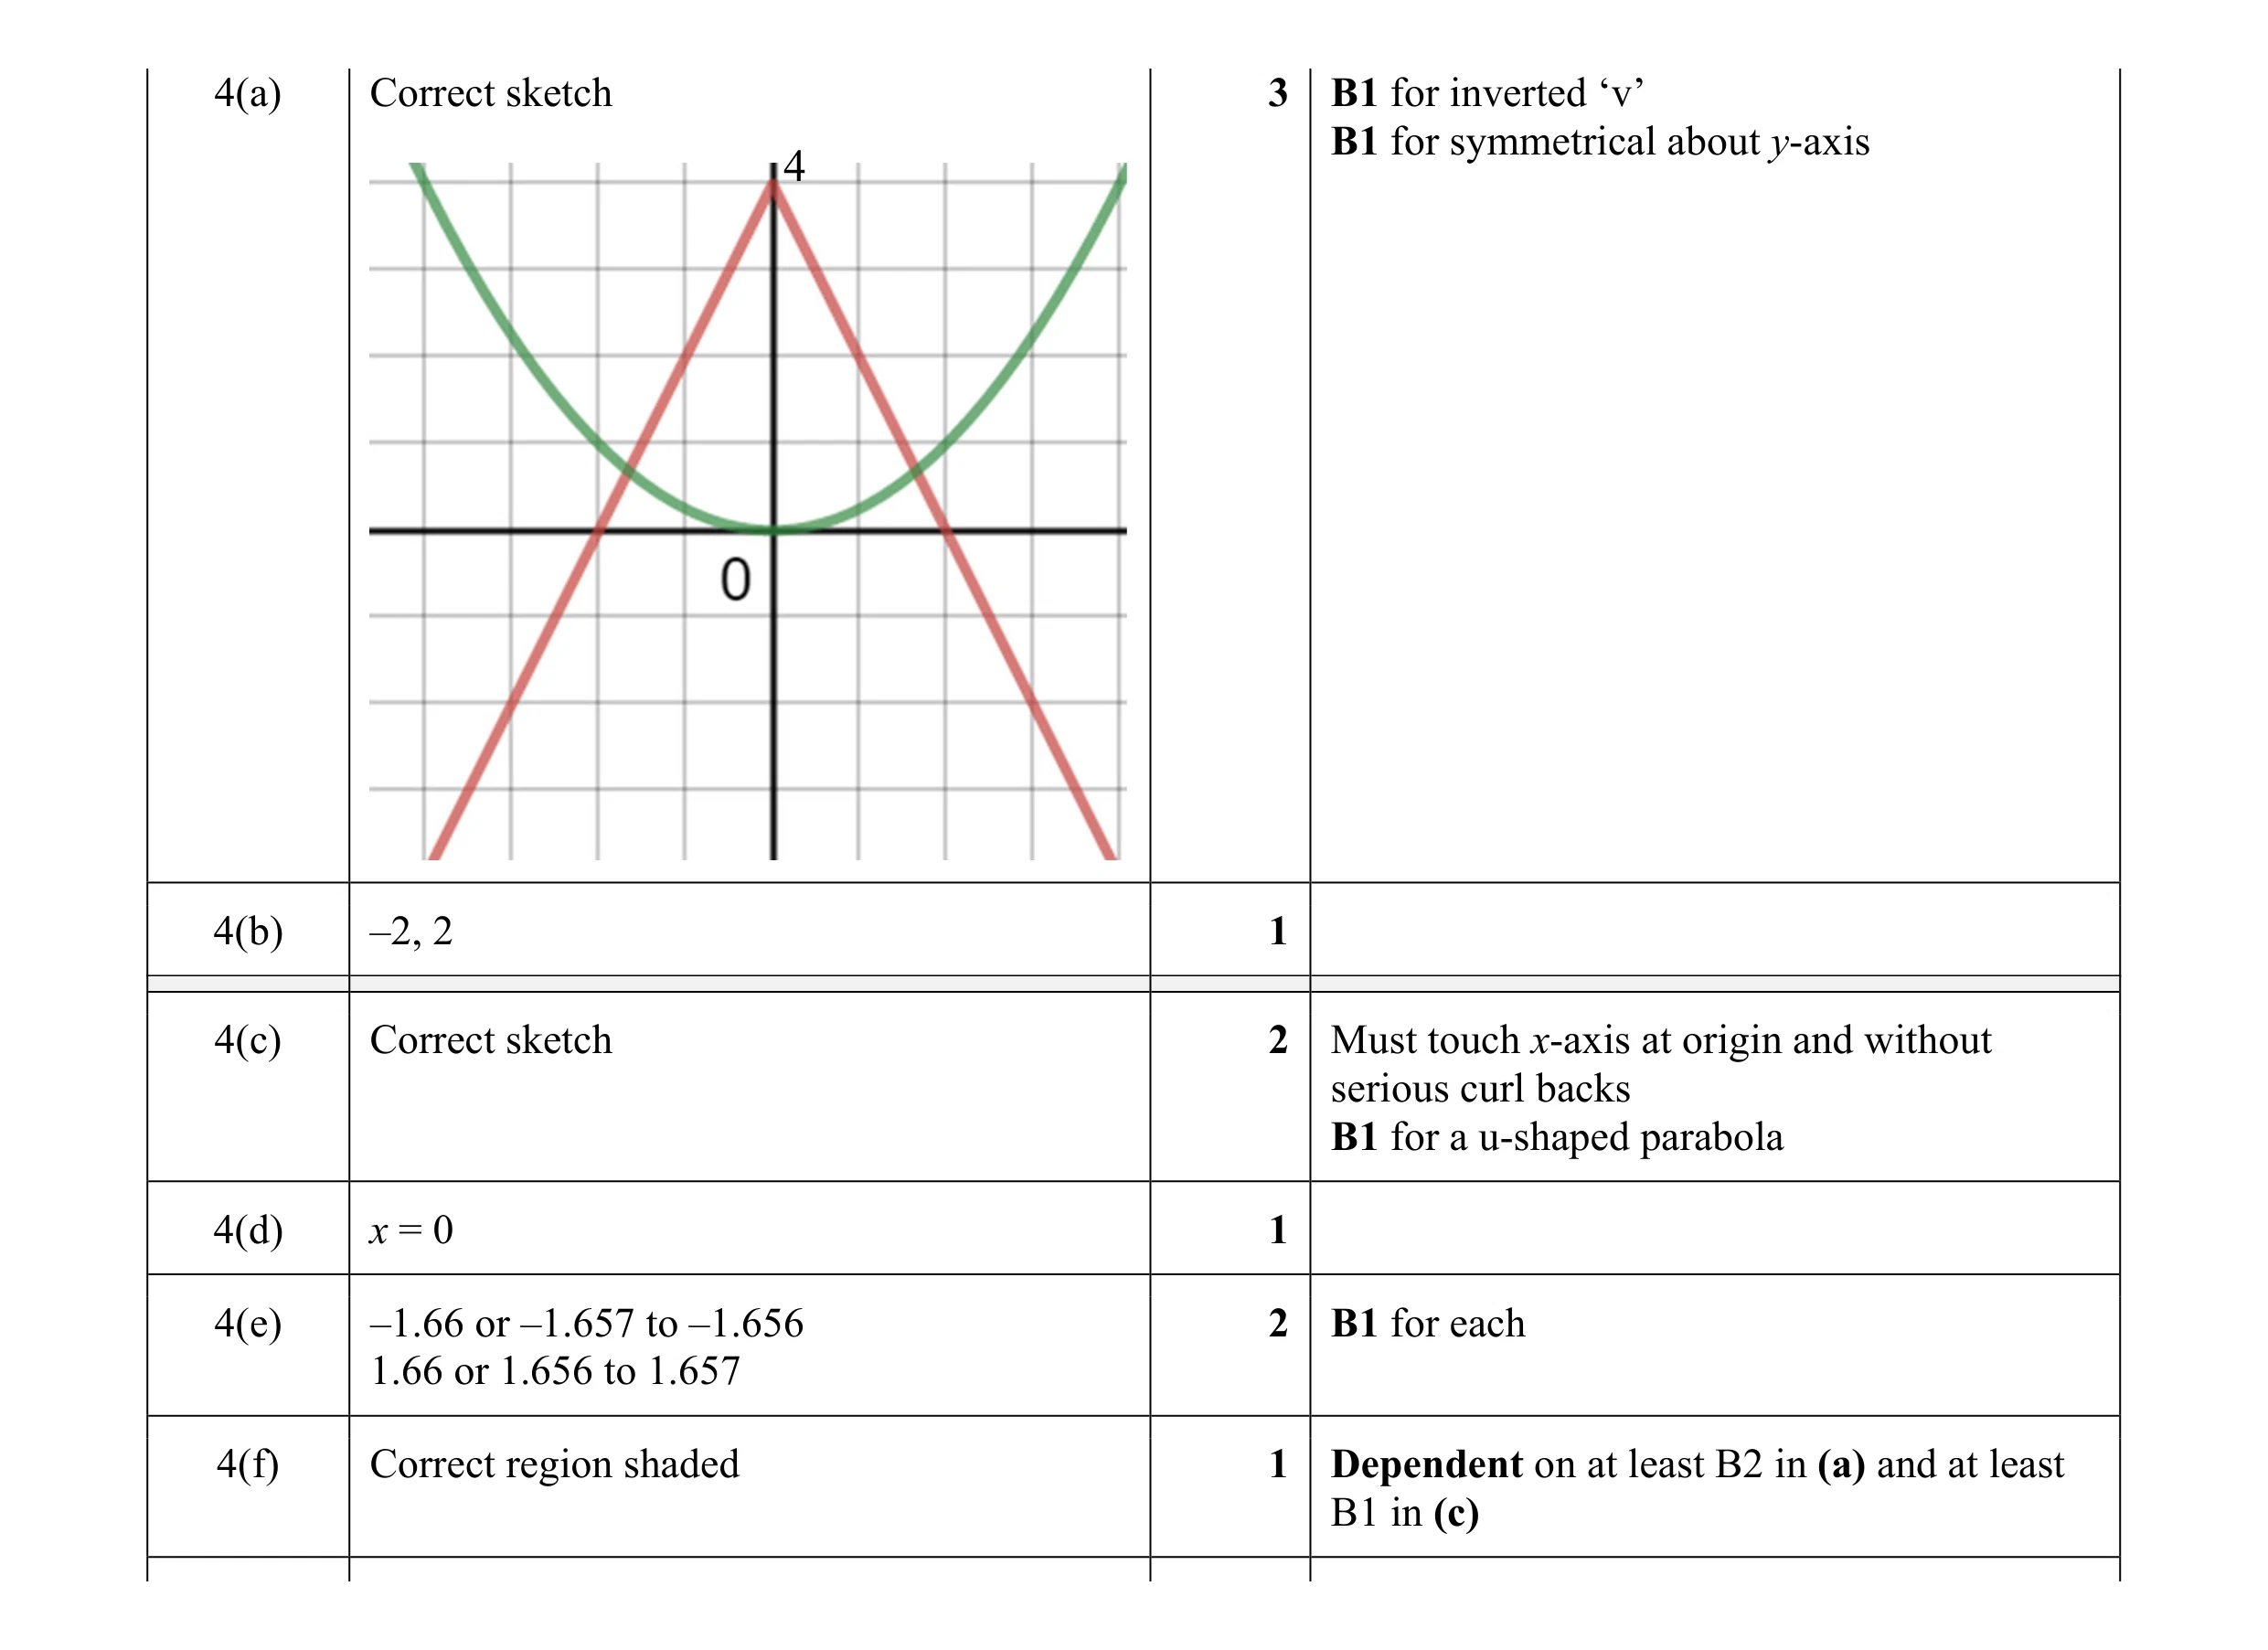 10
10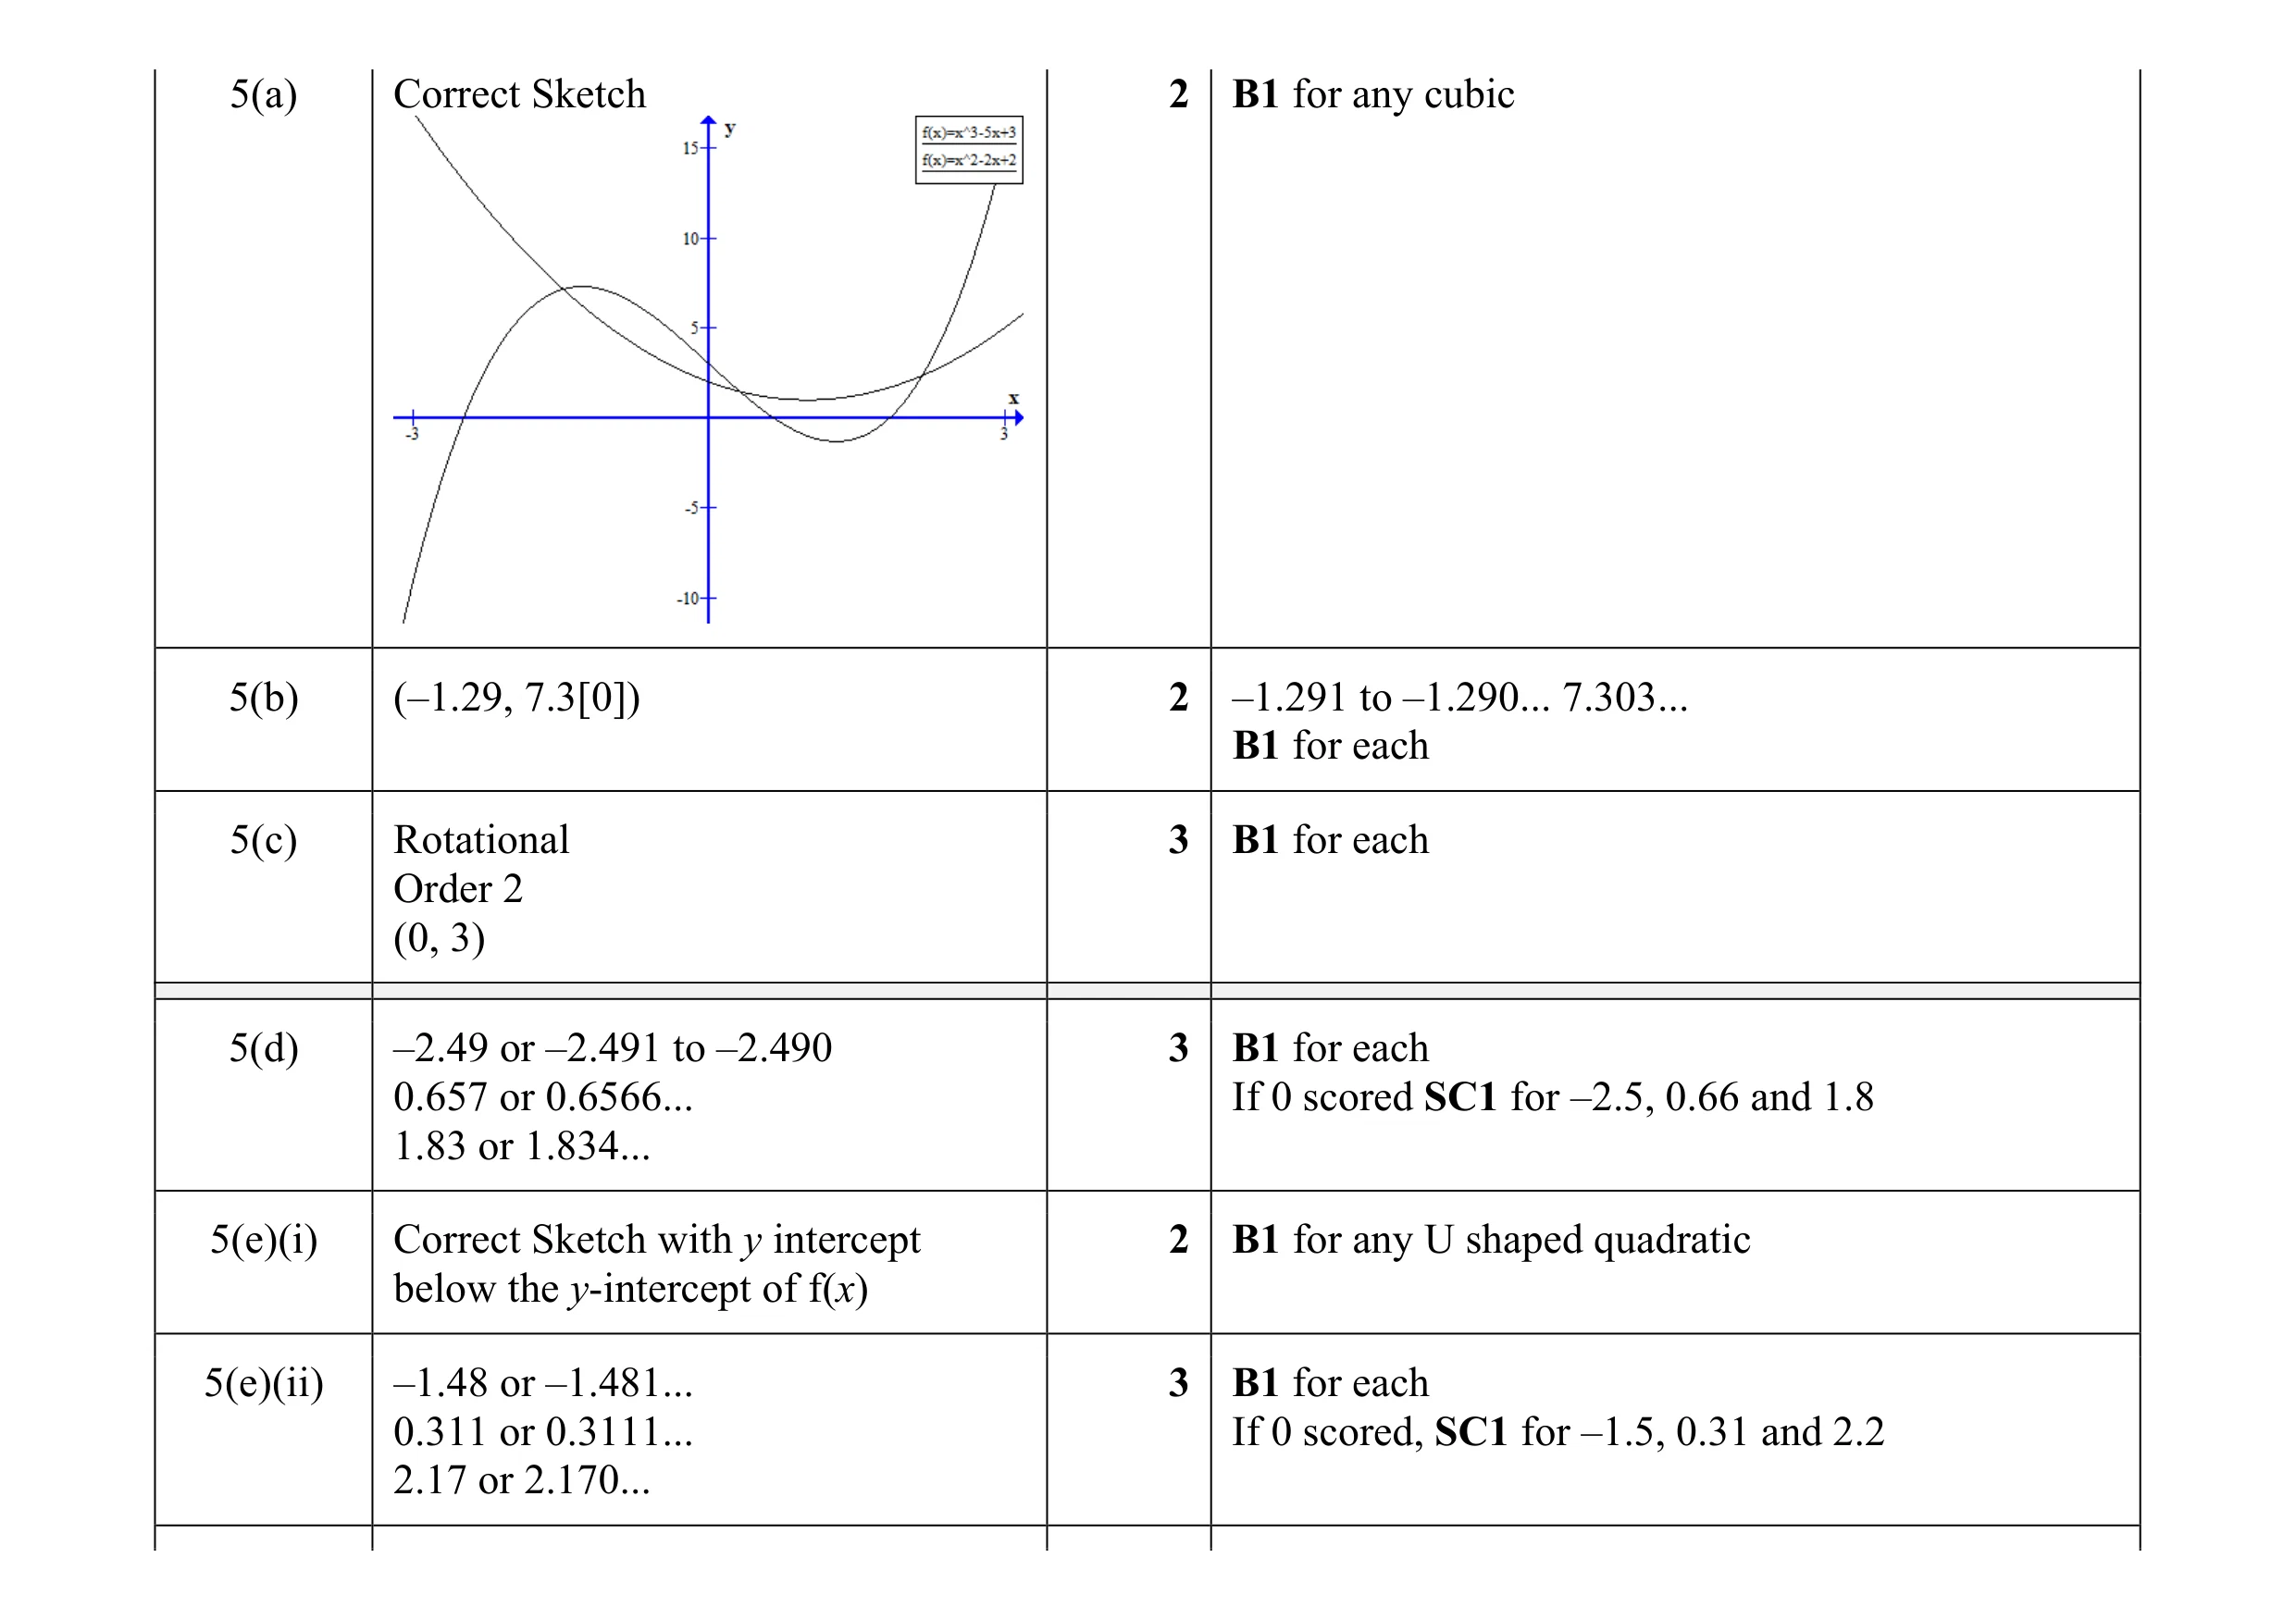 15
15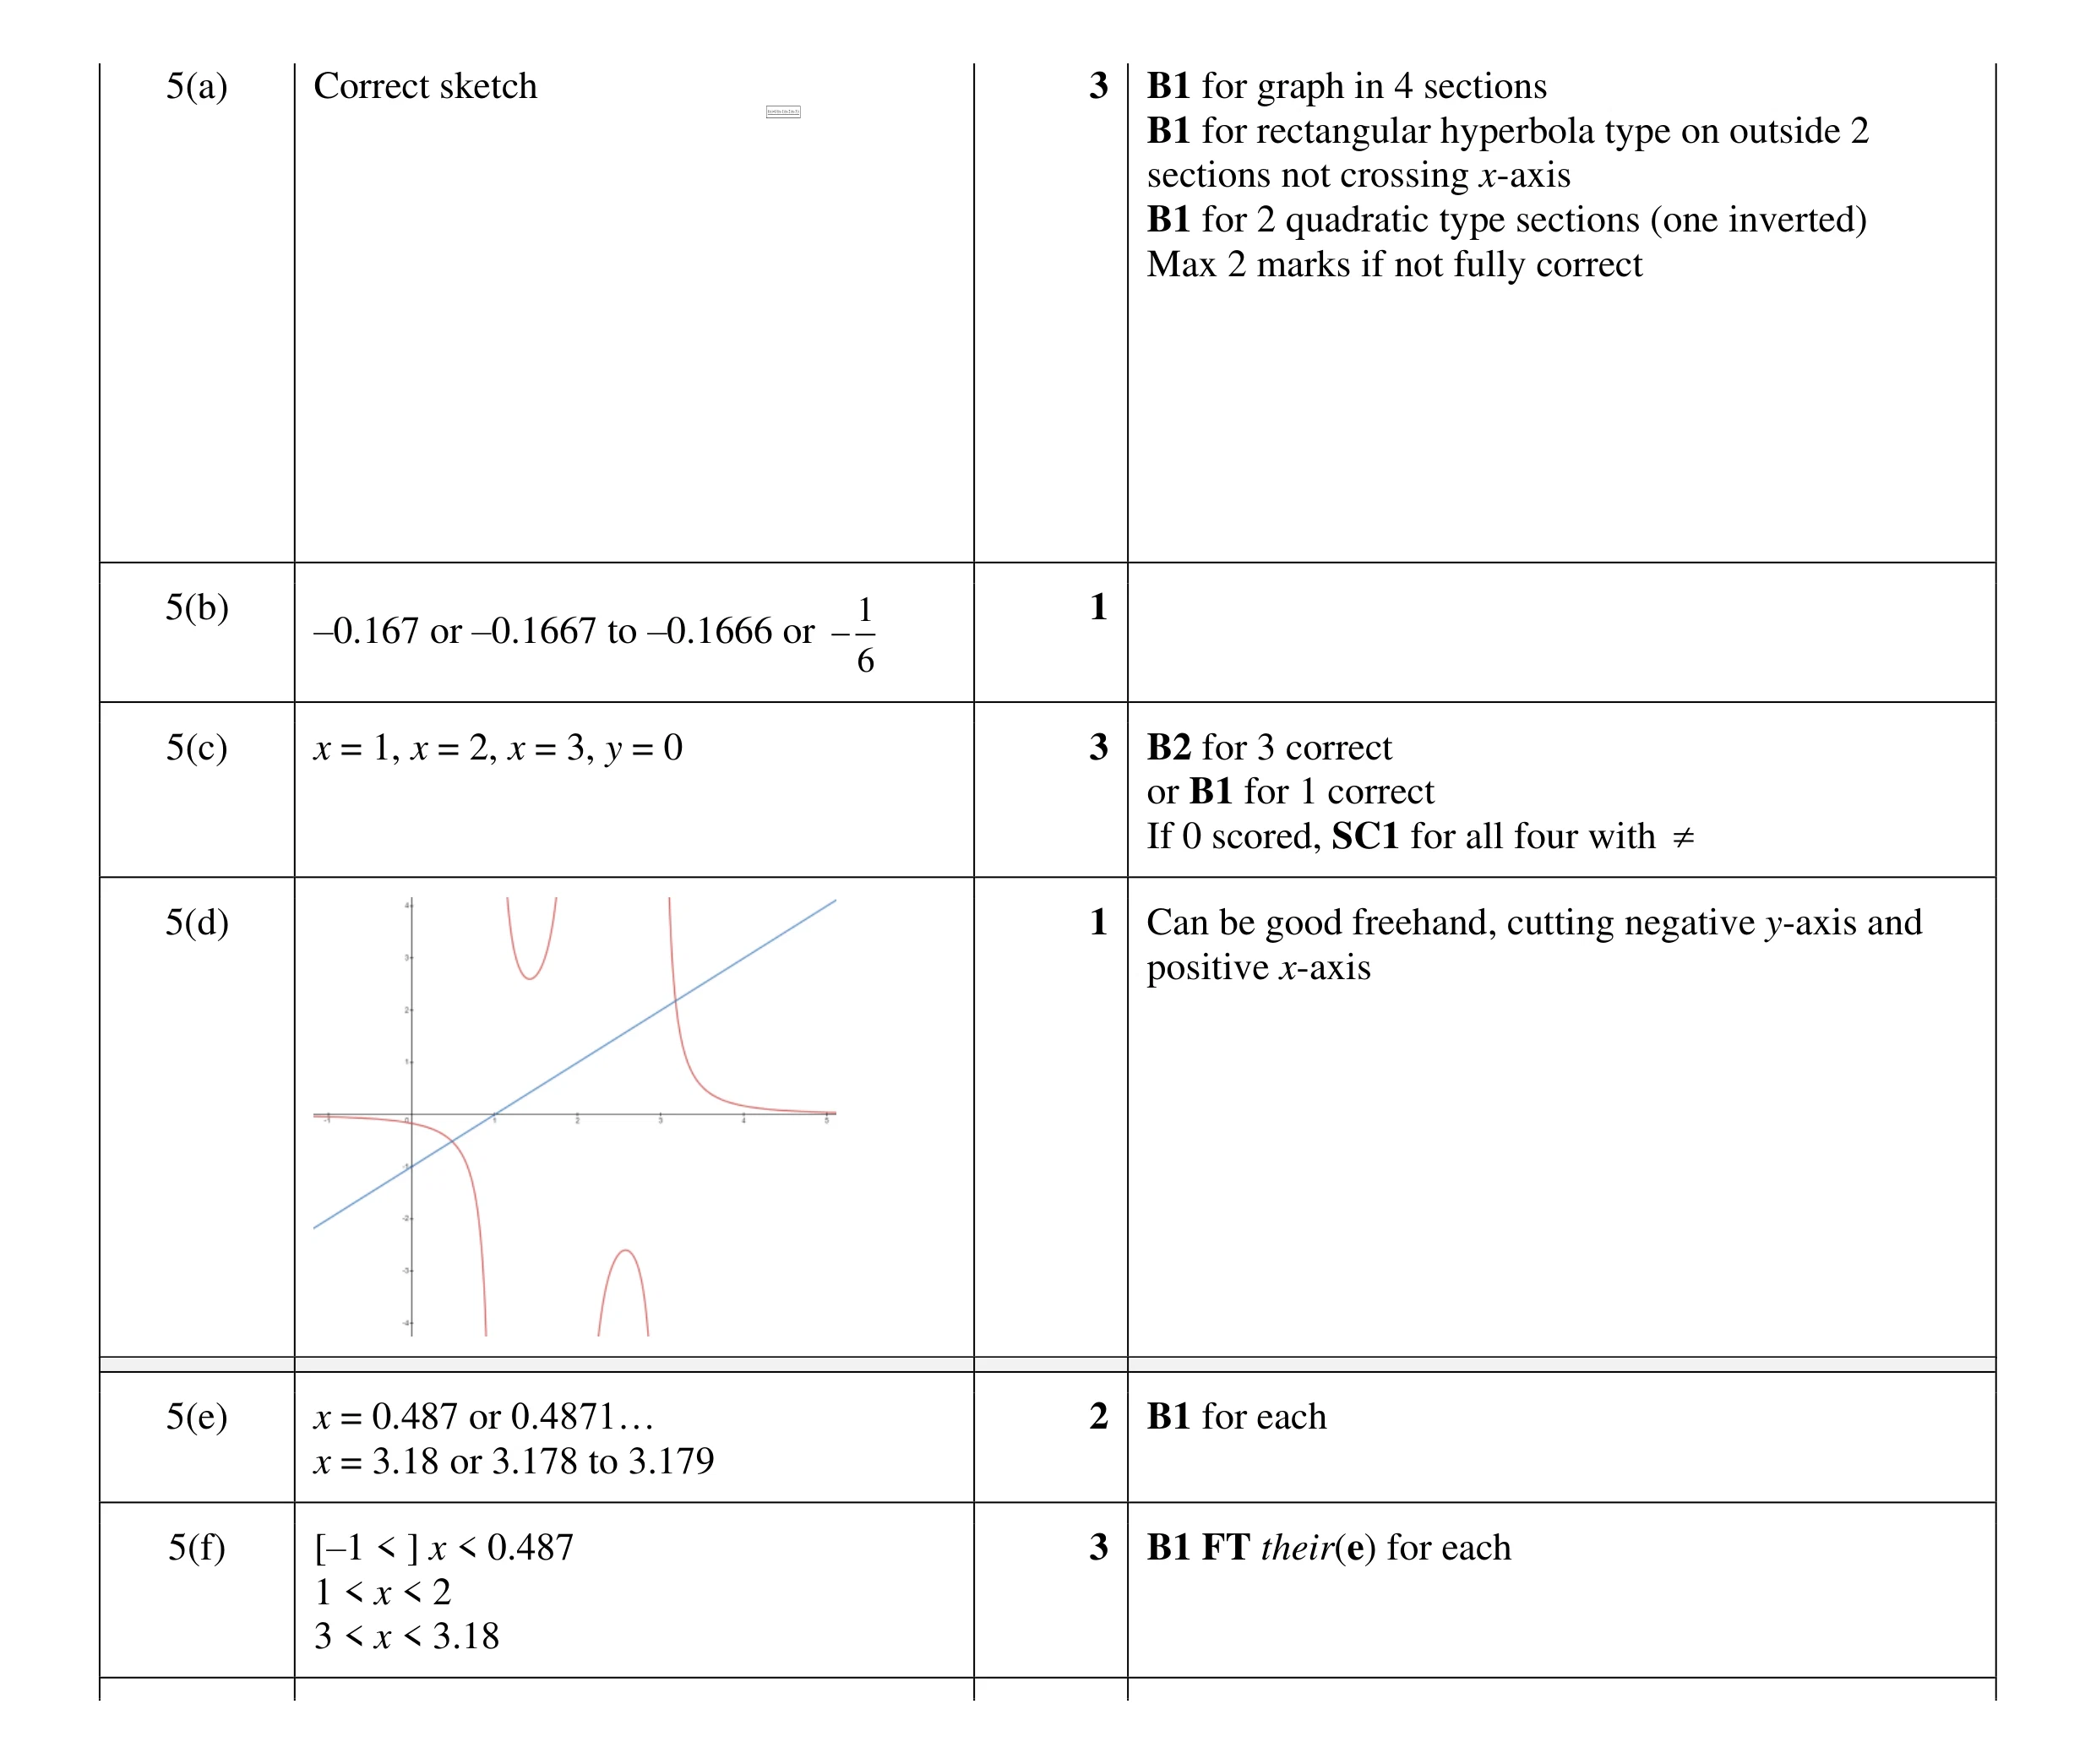 13
13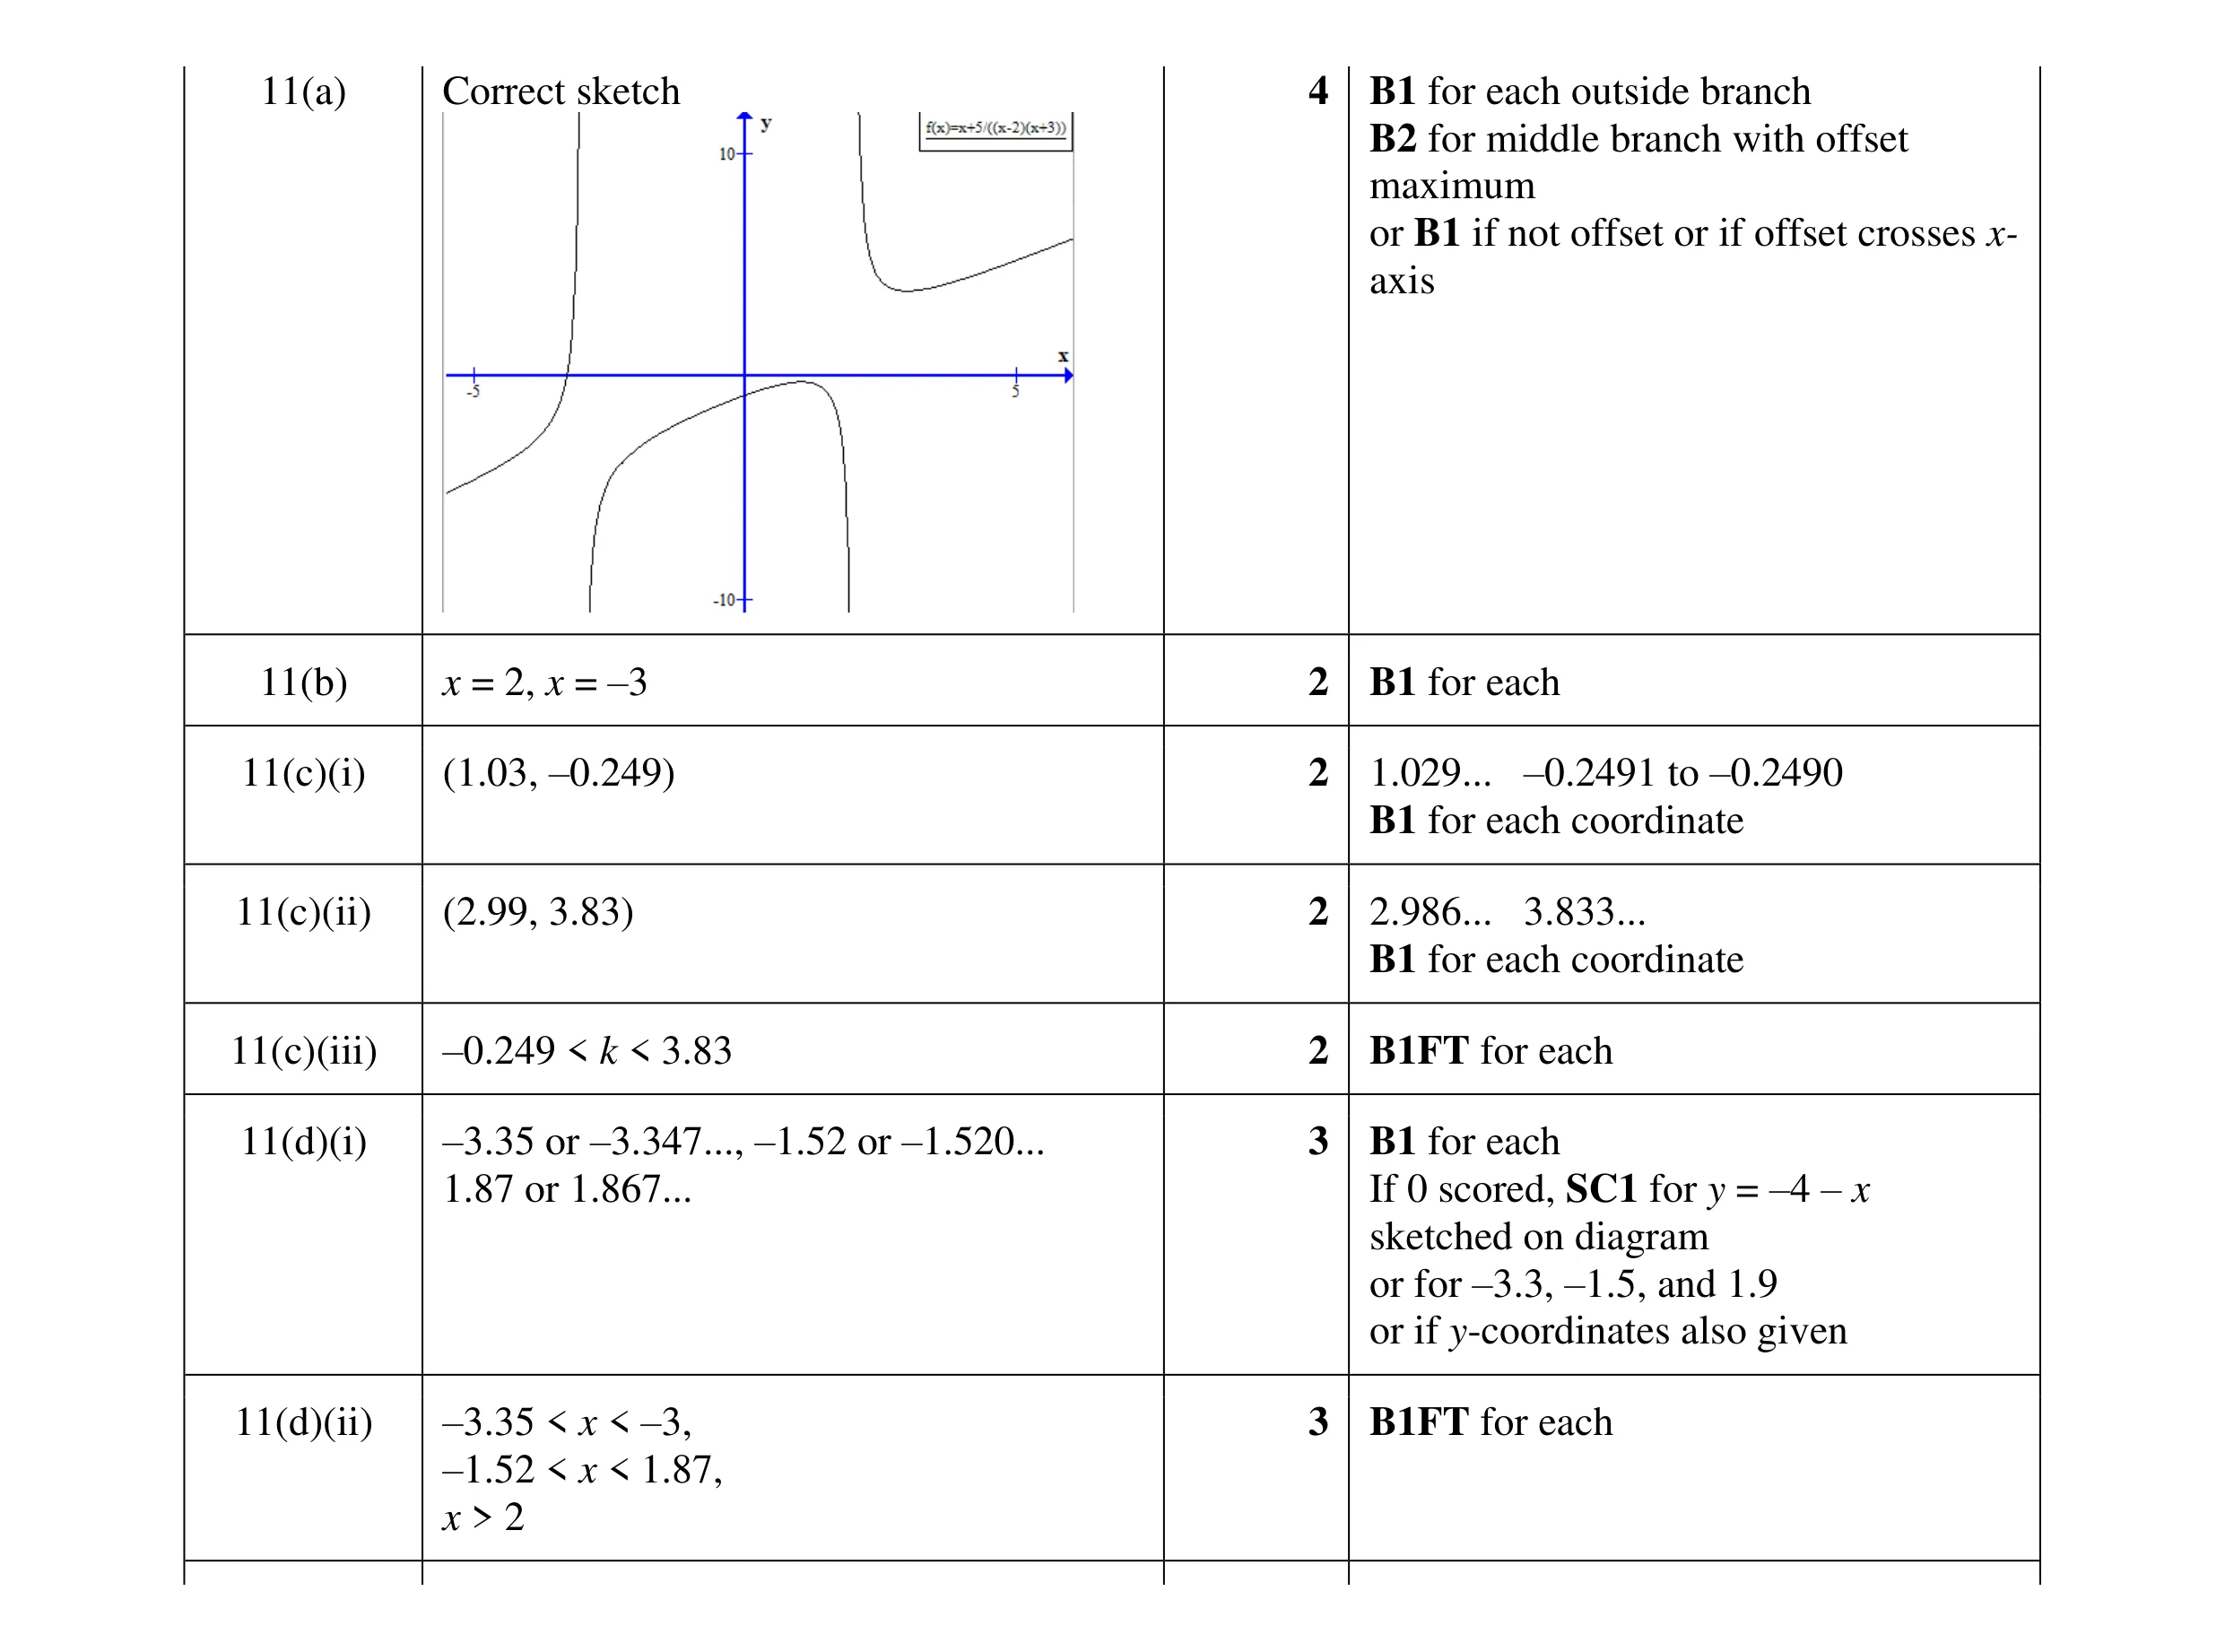 18
18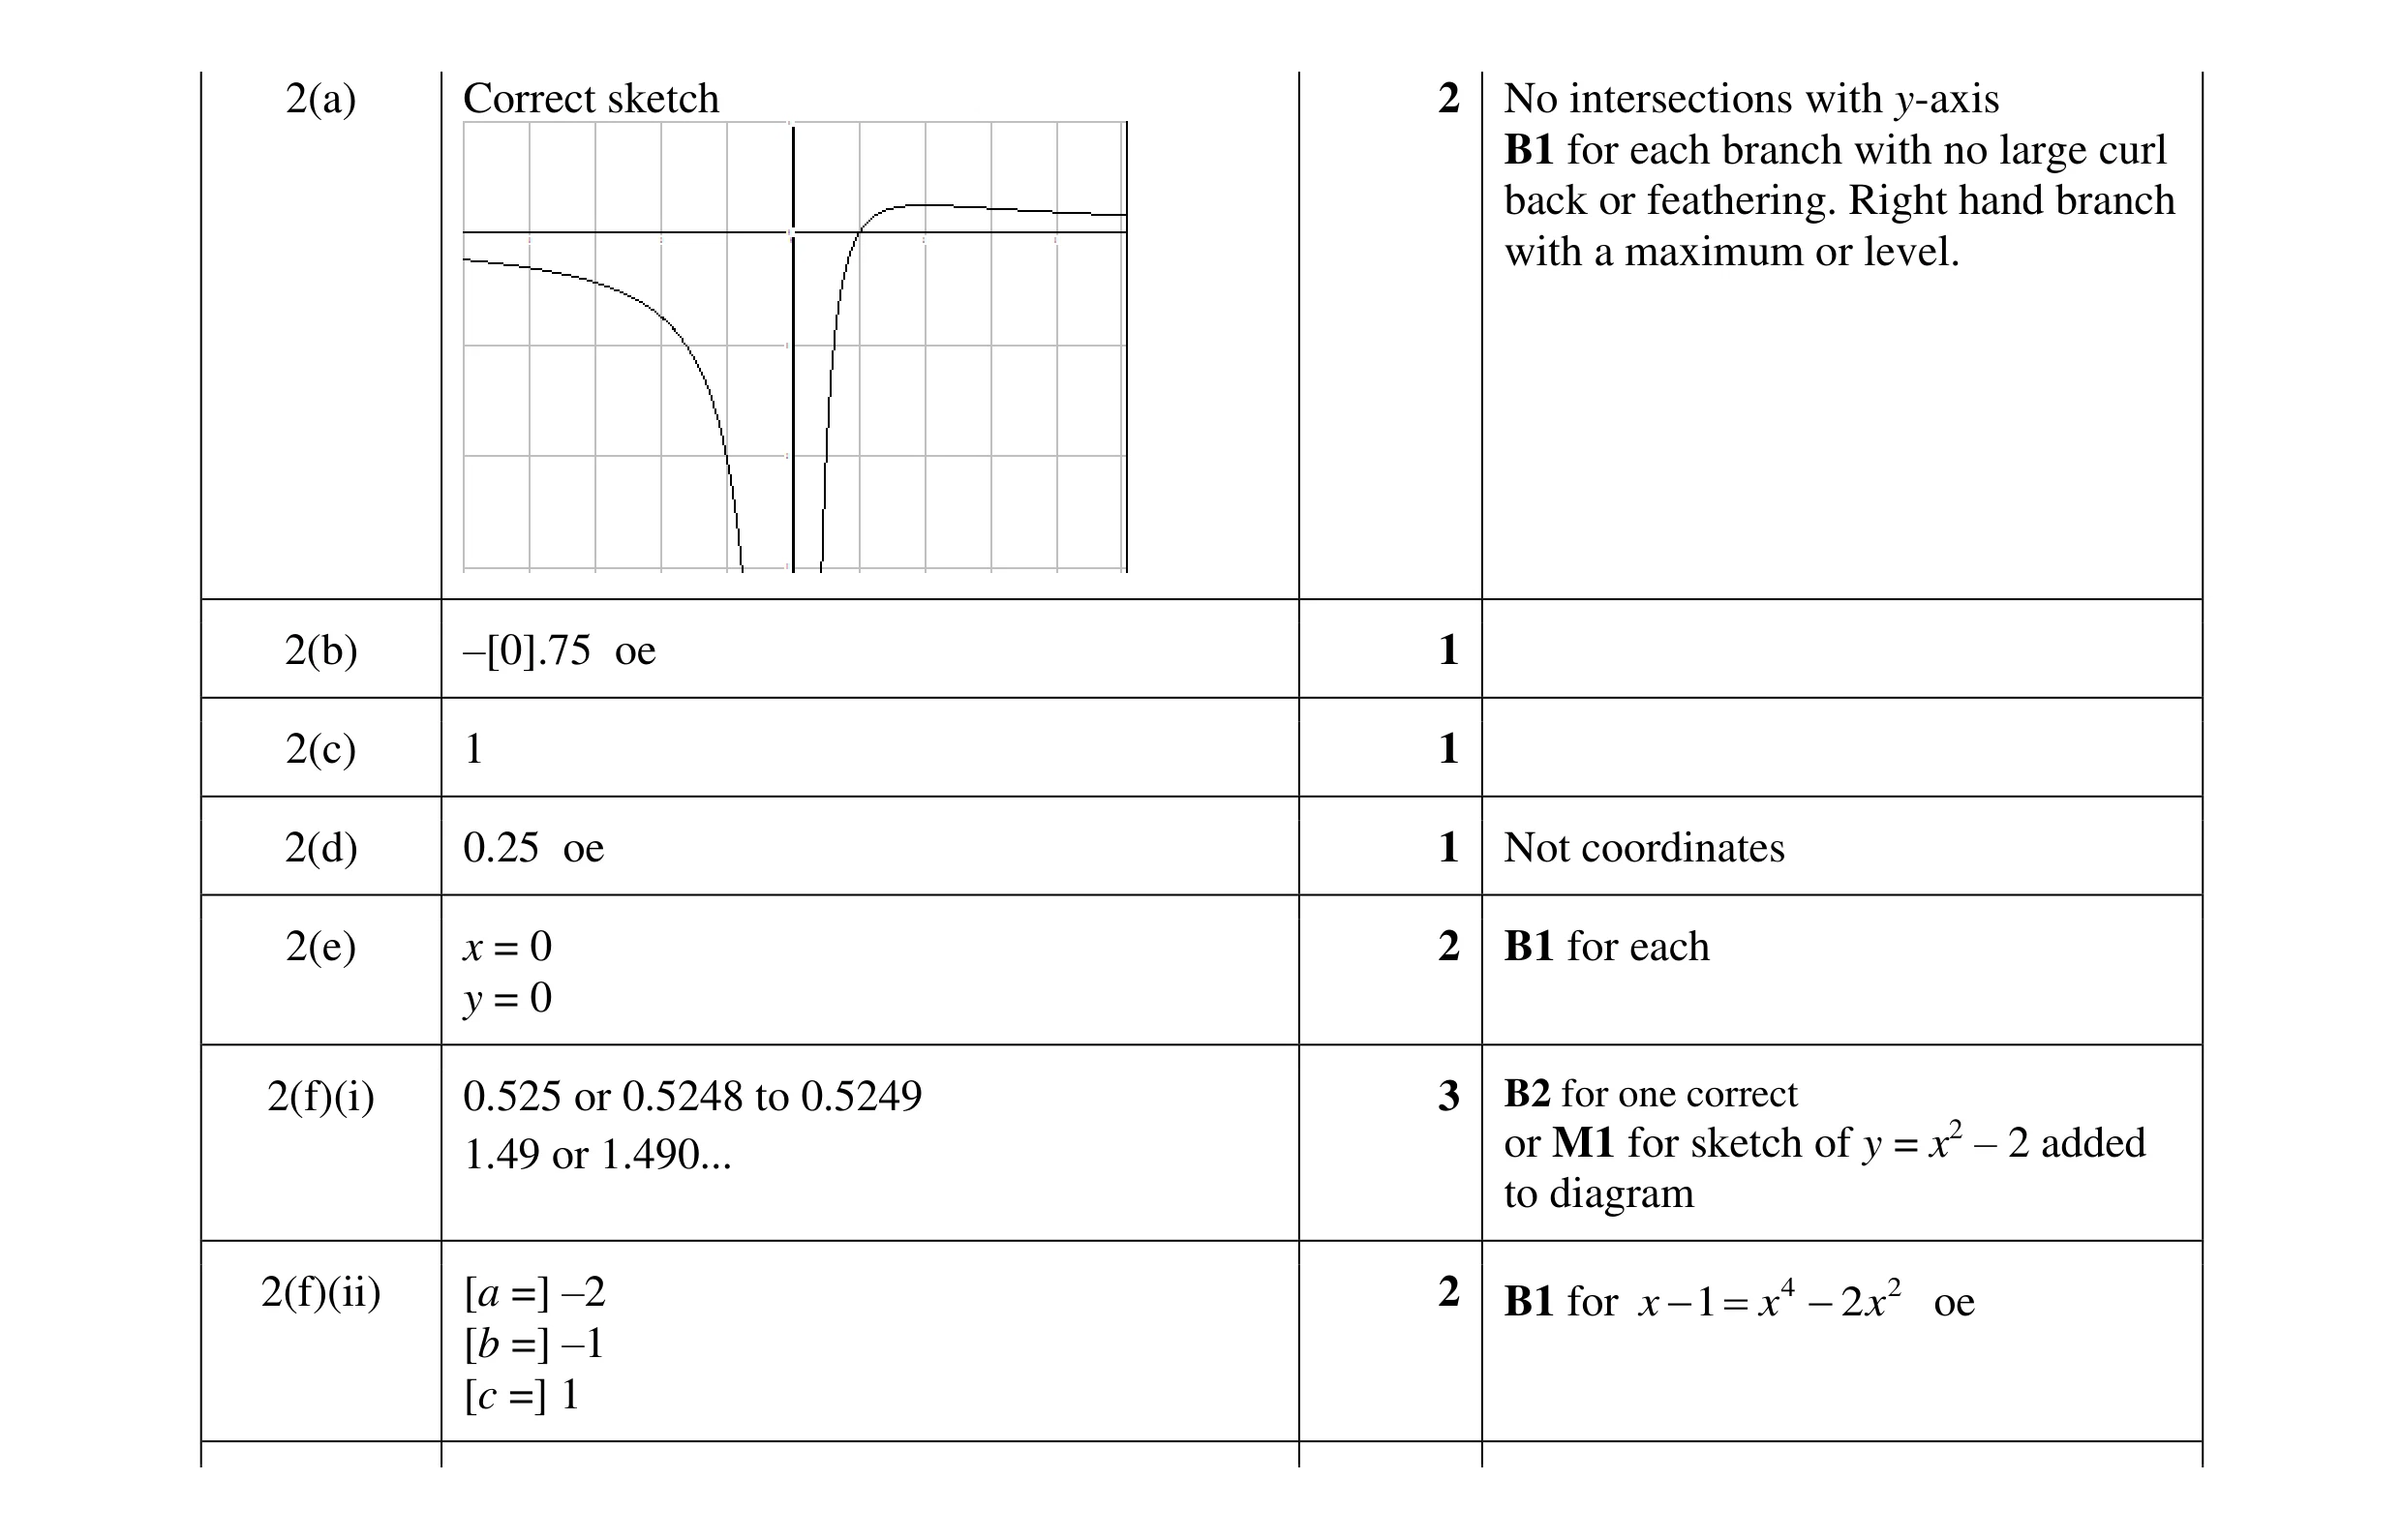 12
12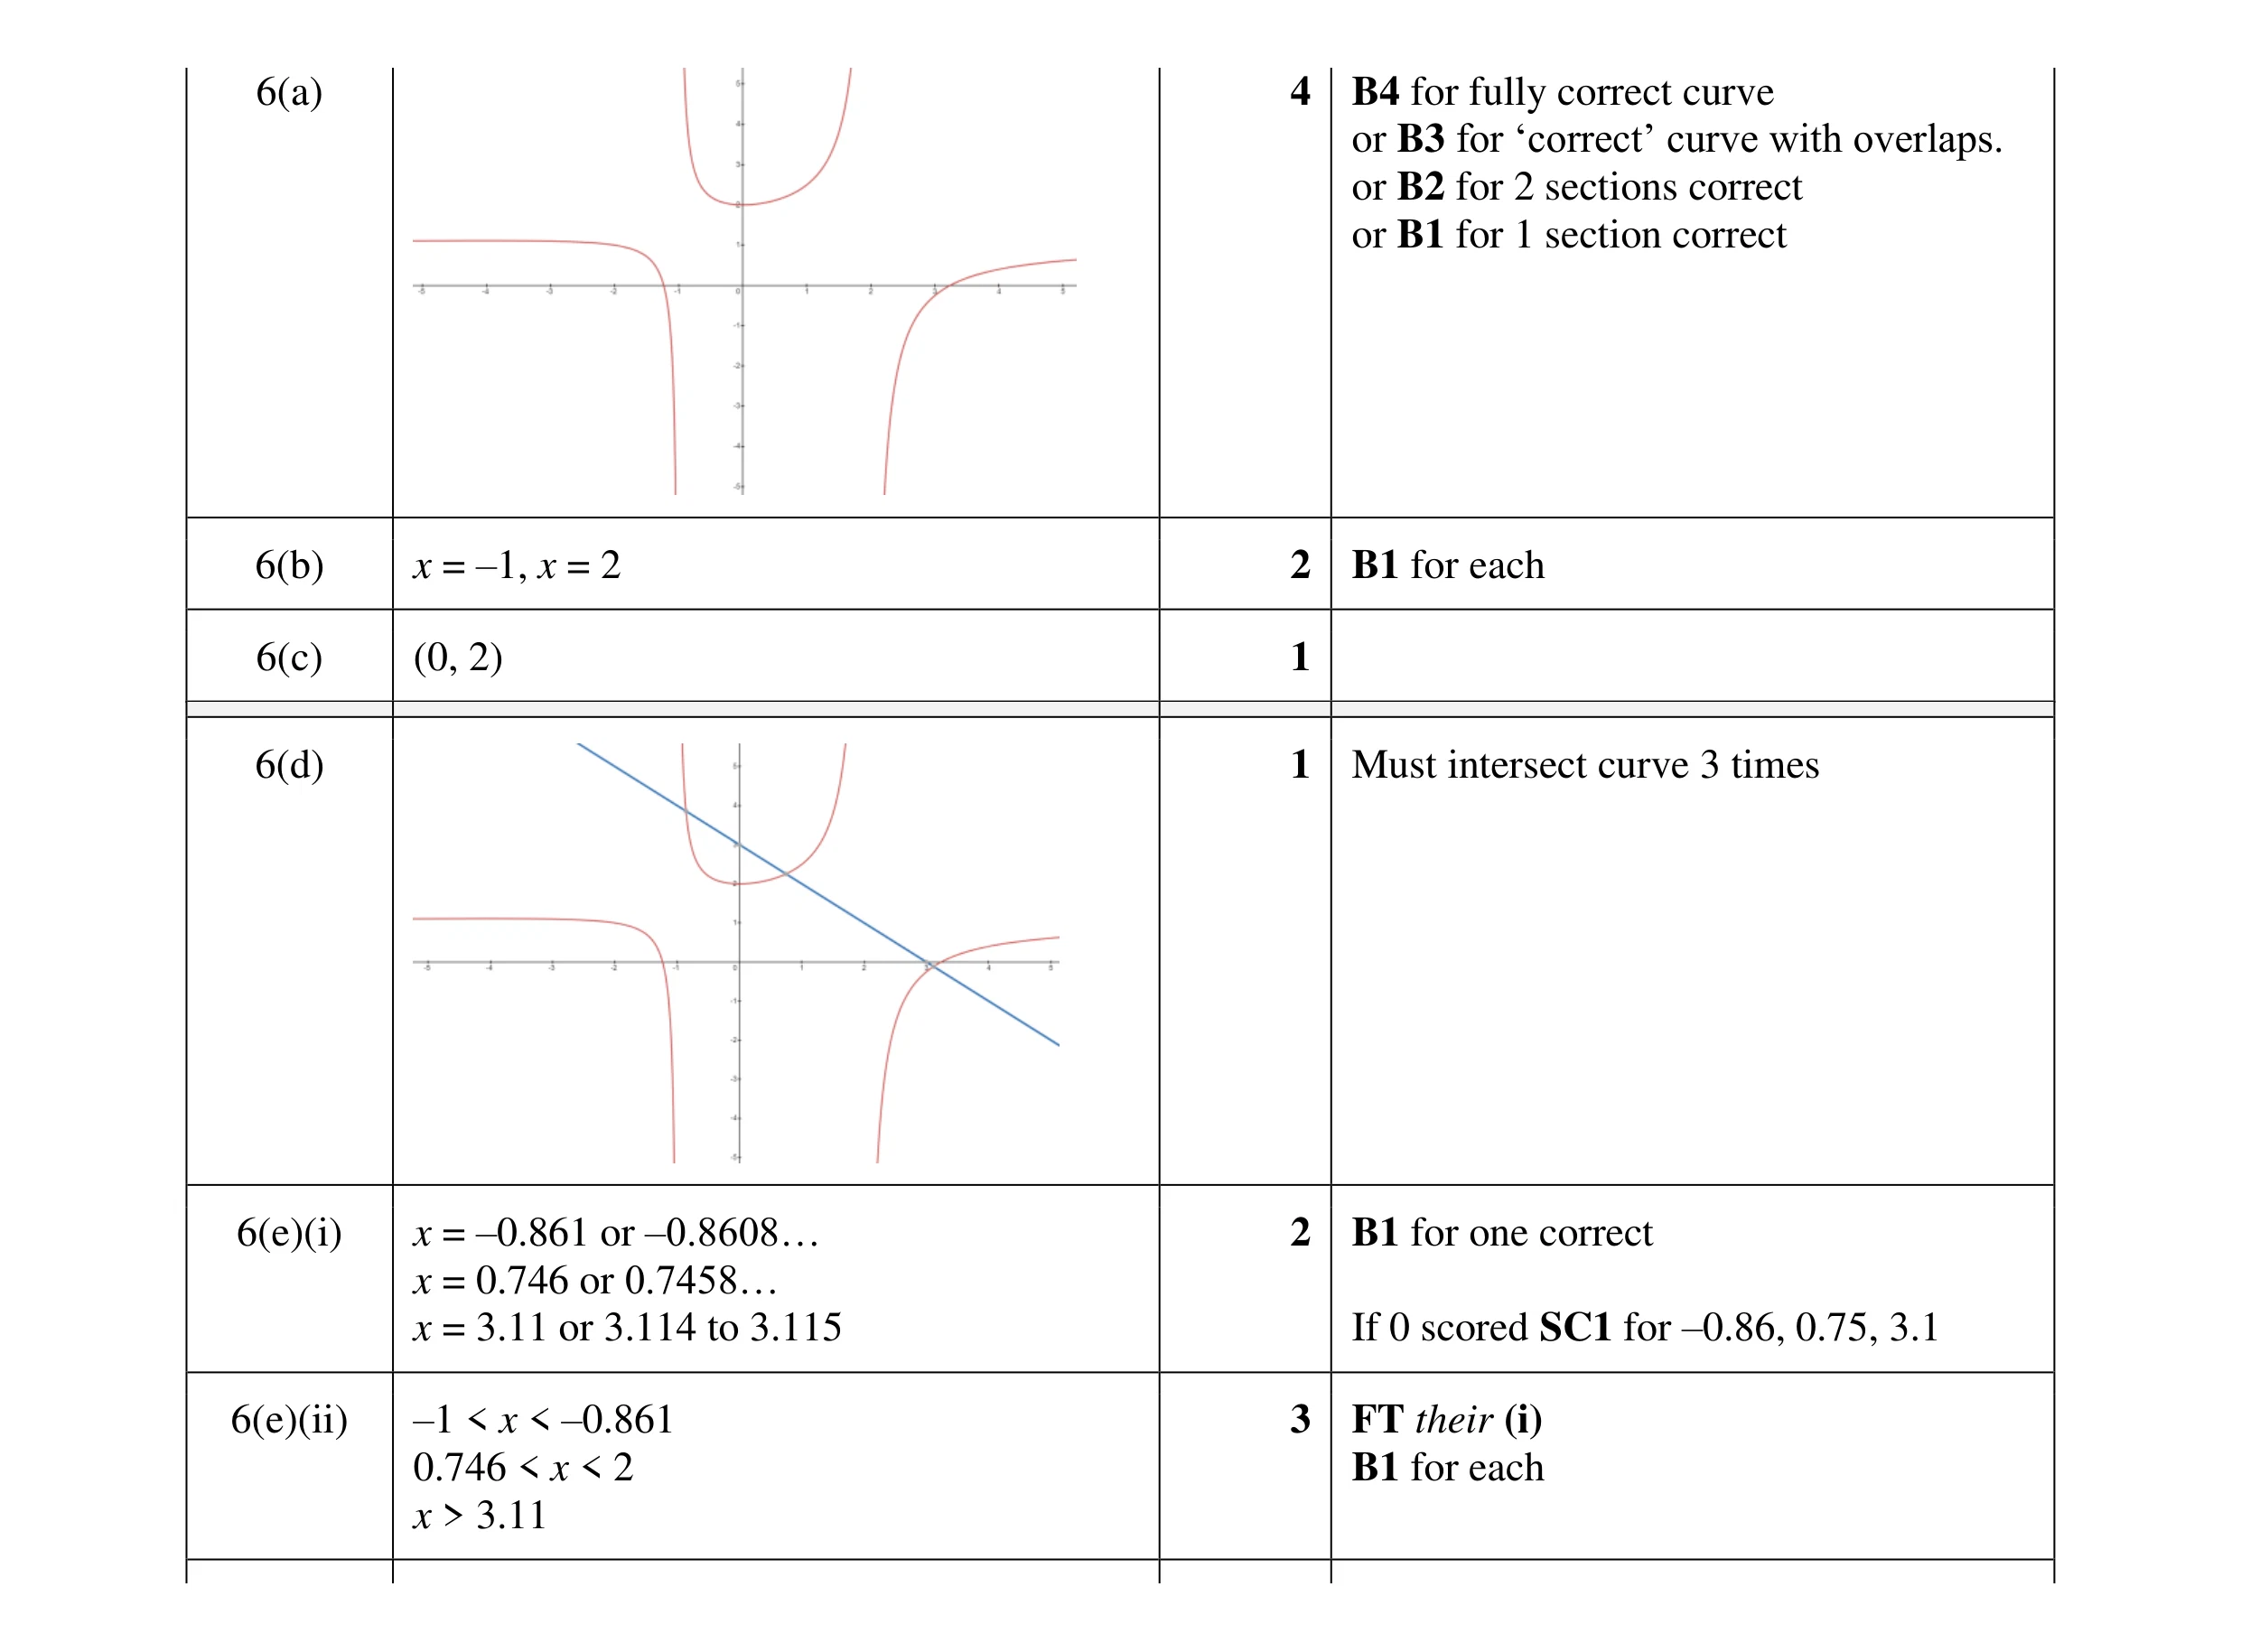 13
13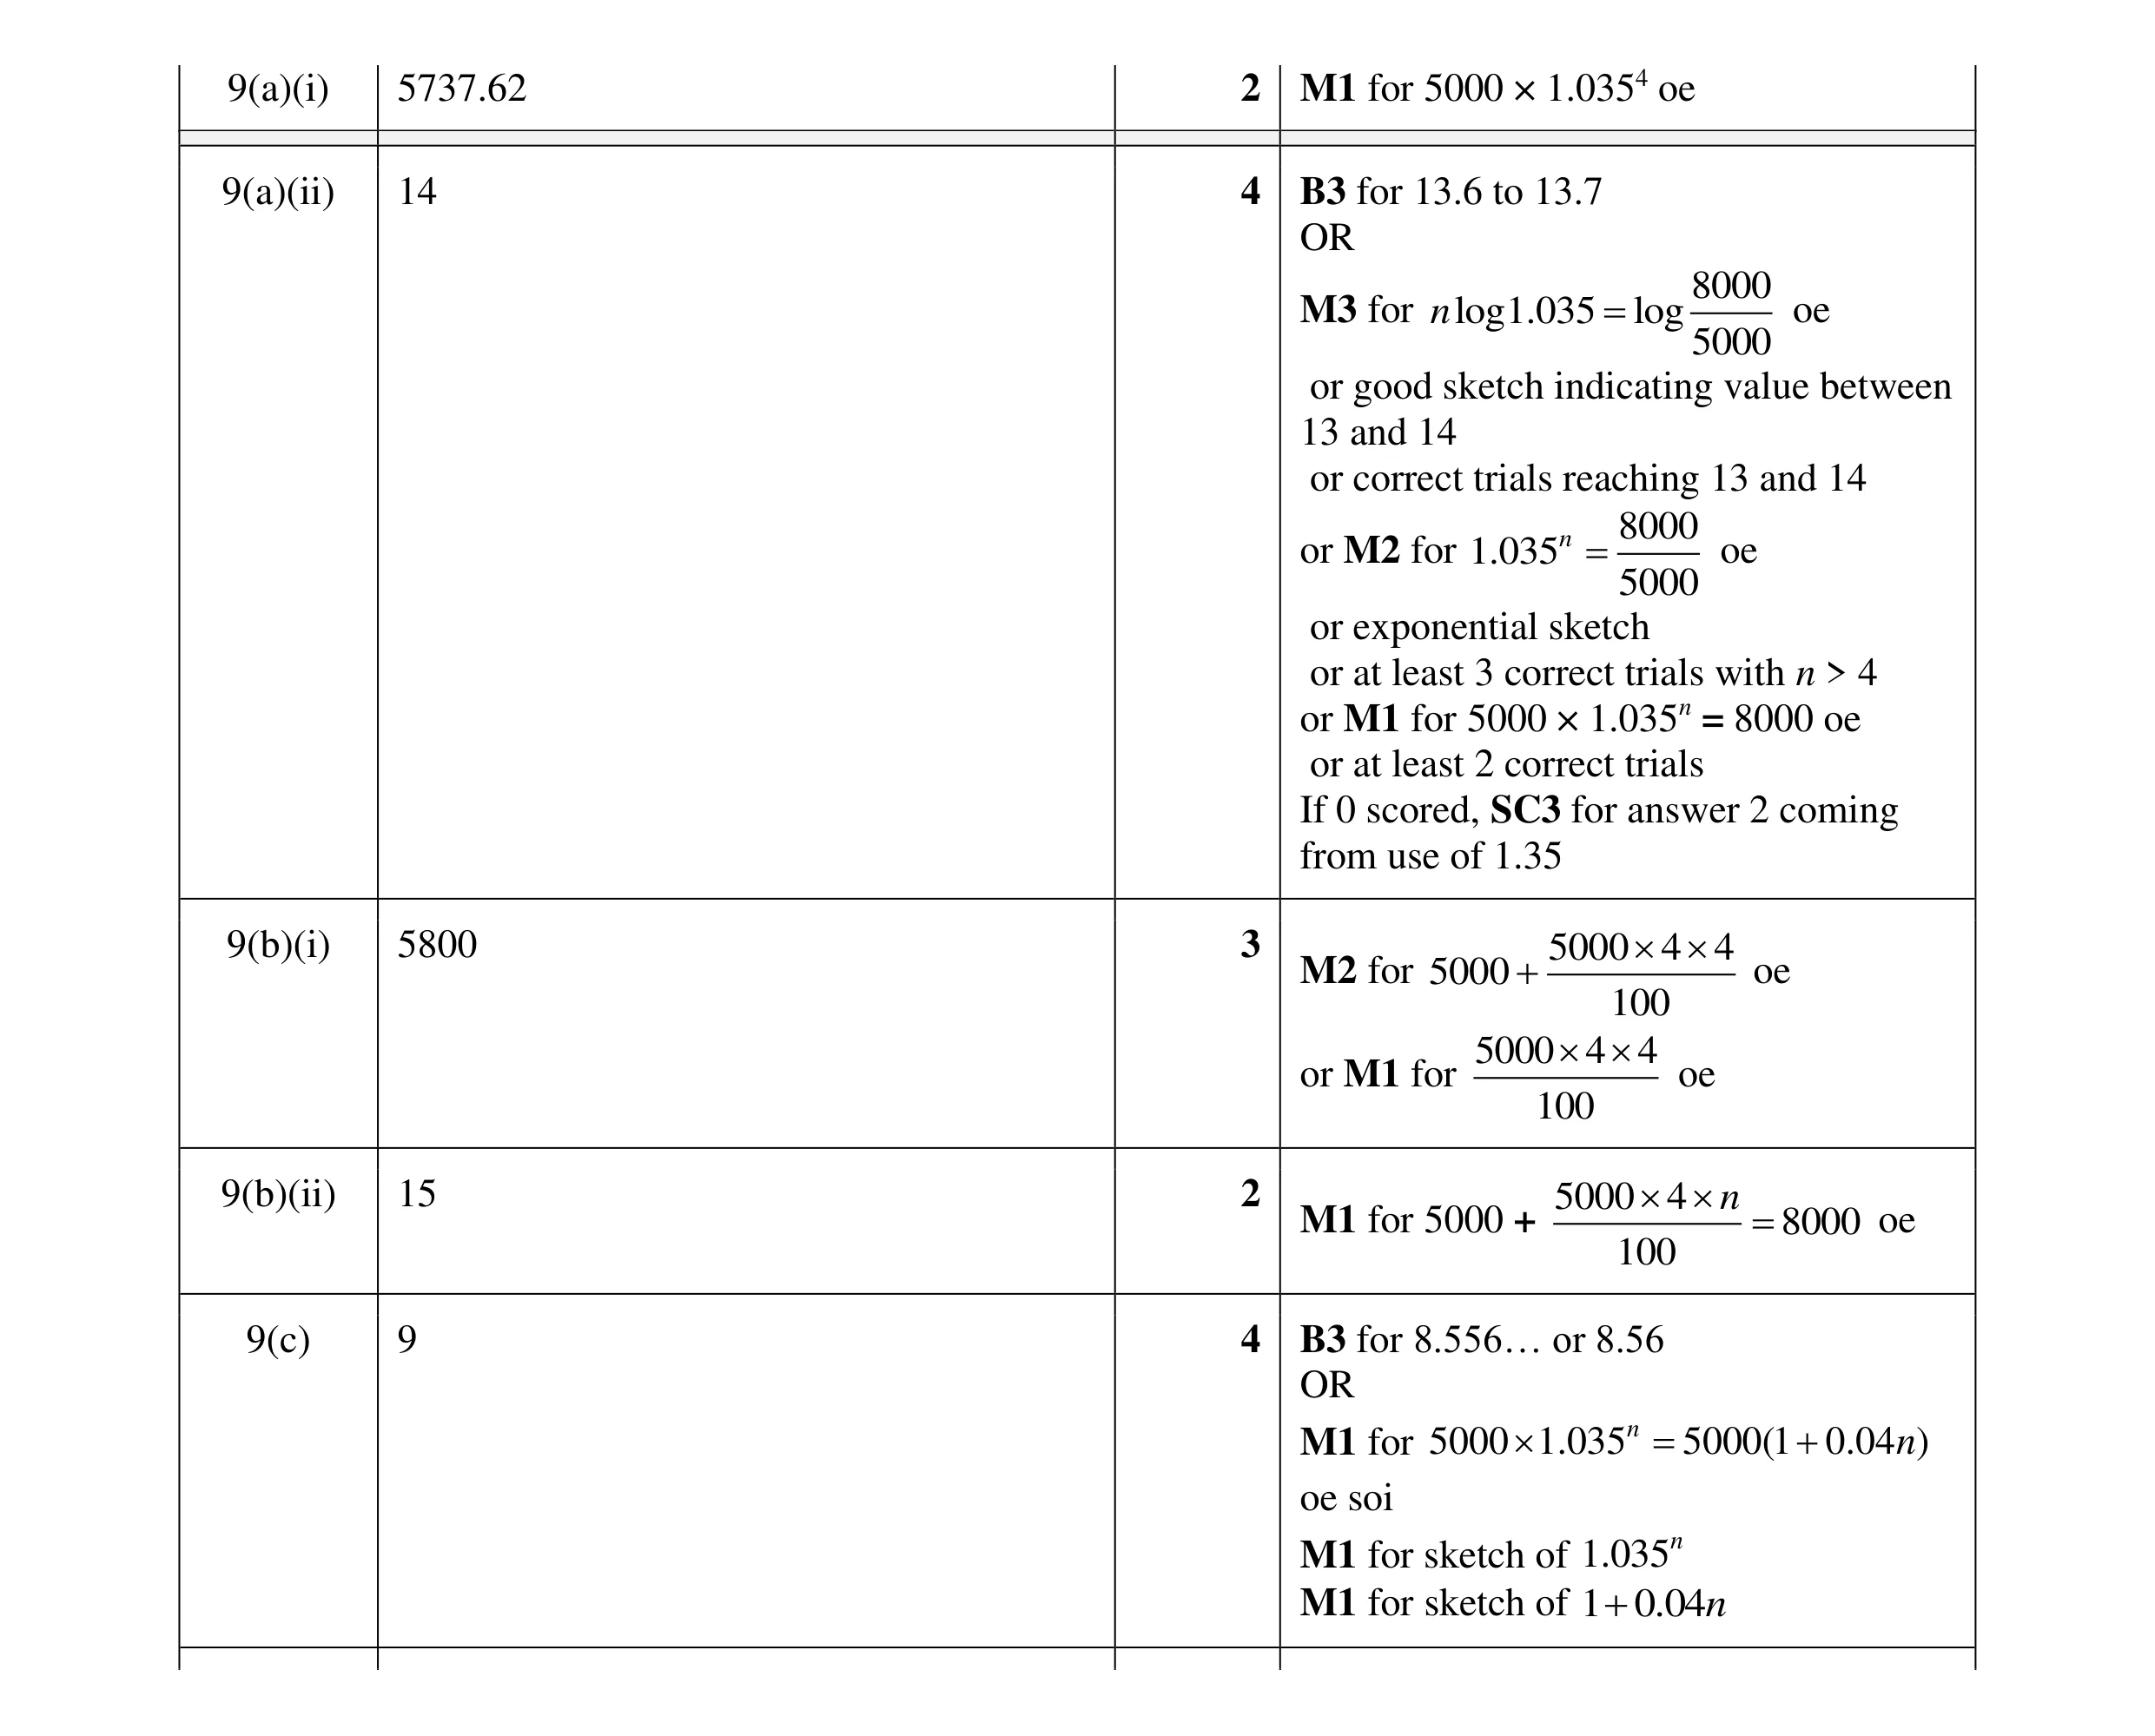 15
15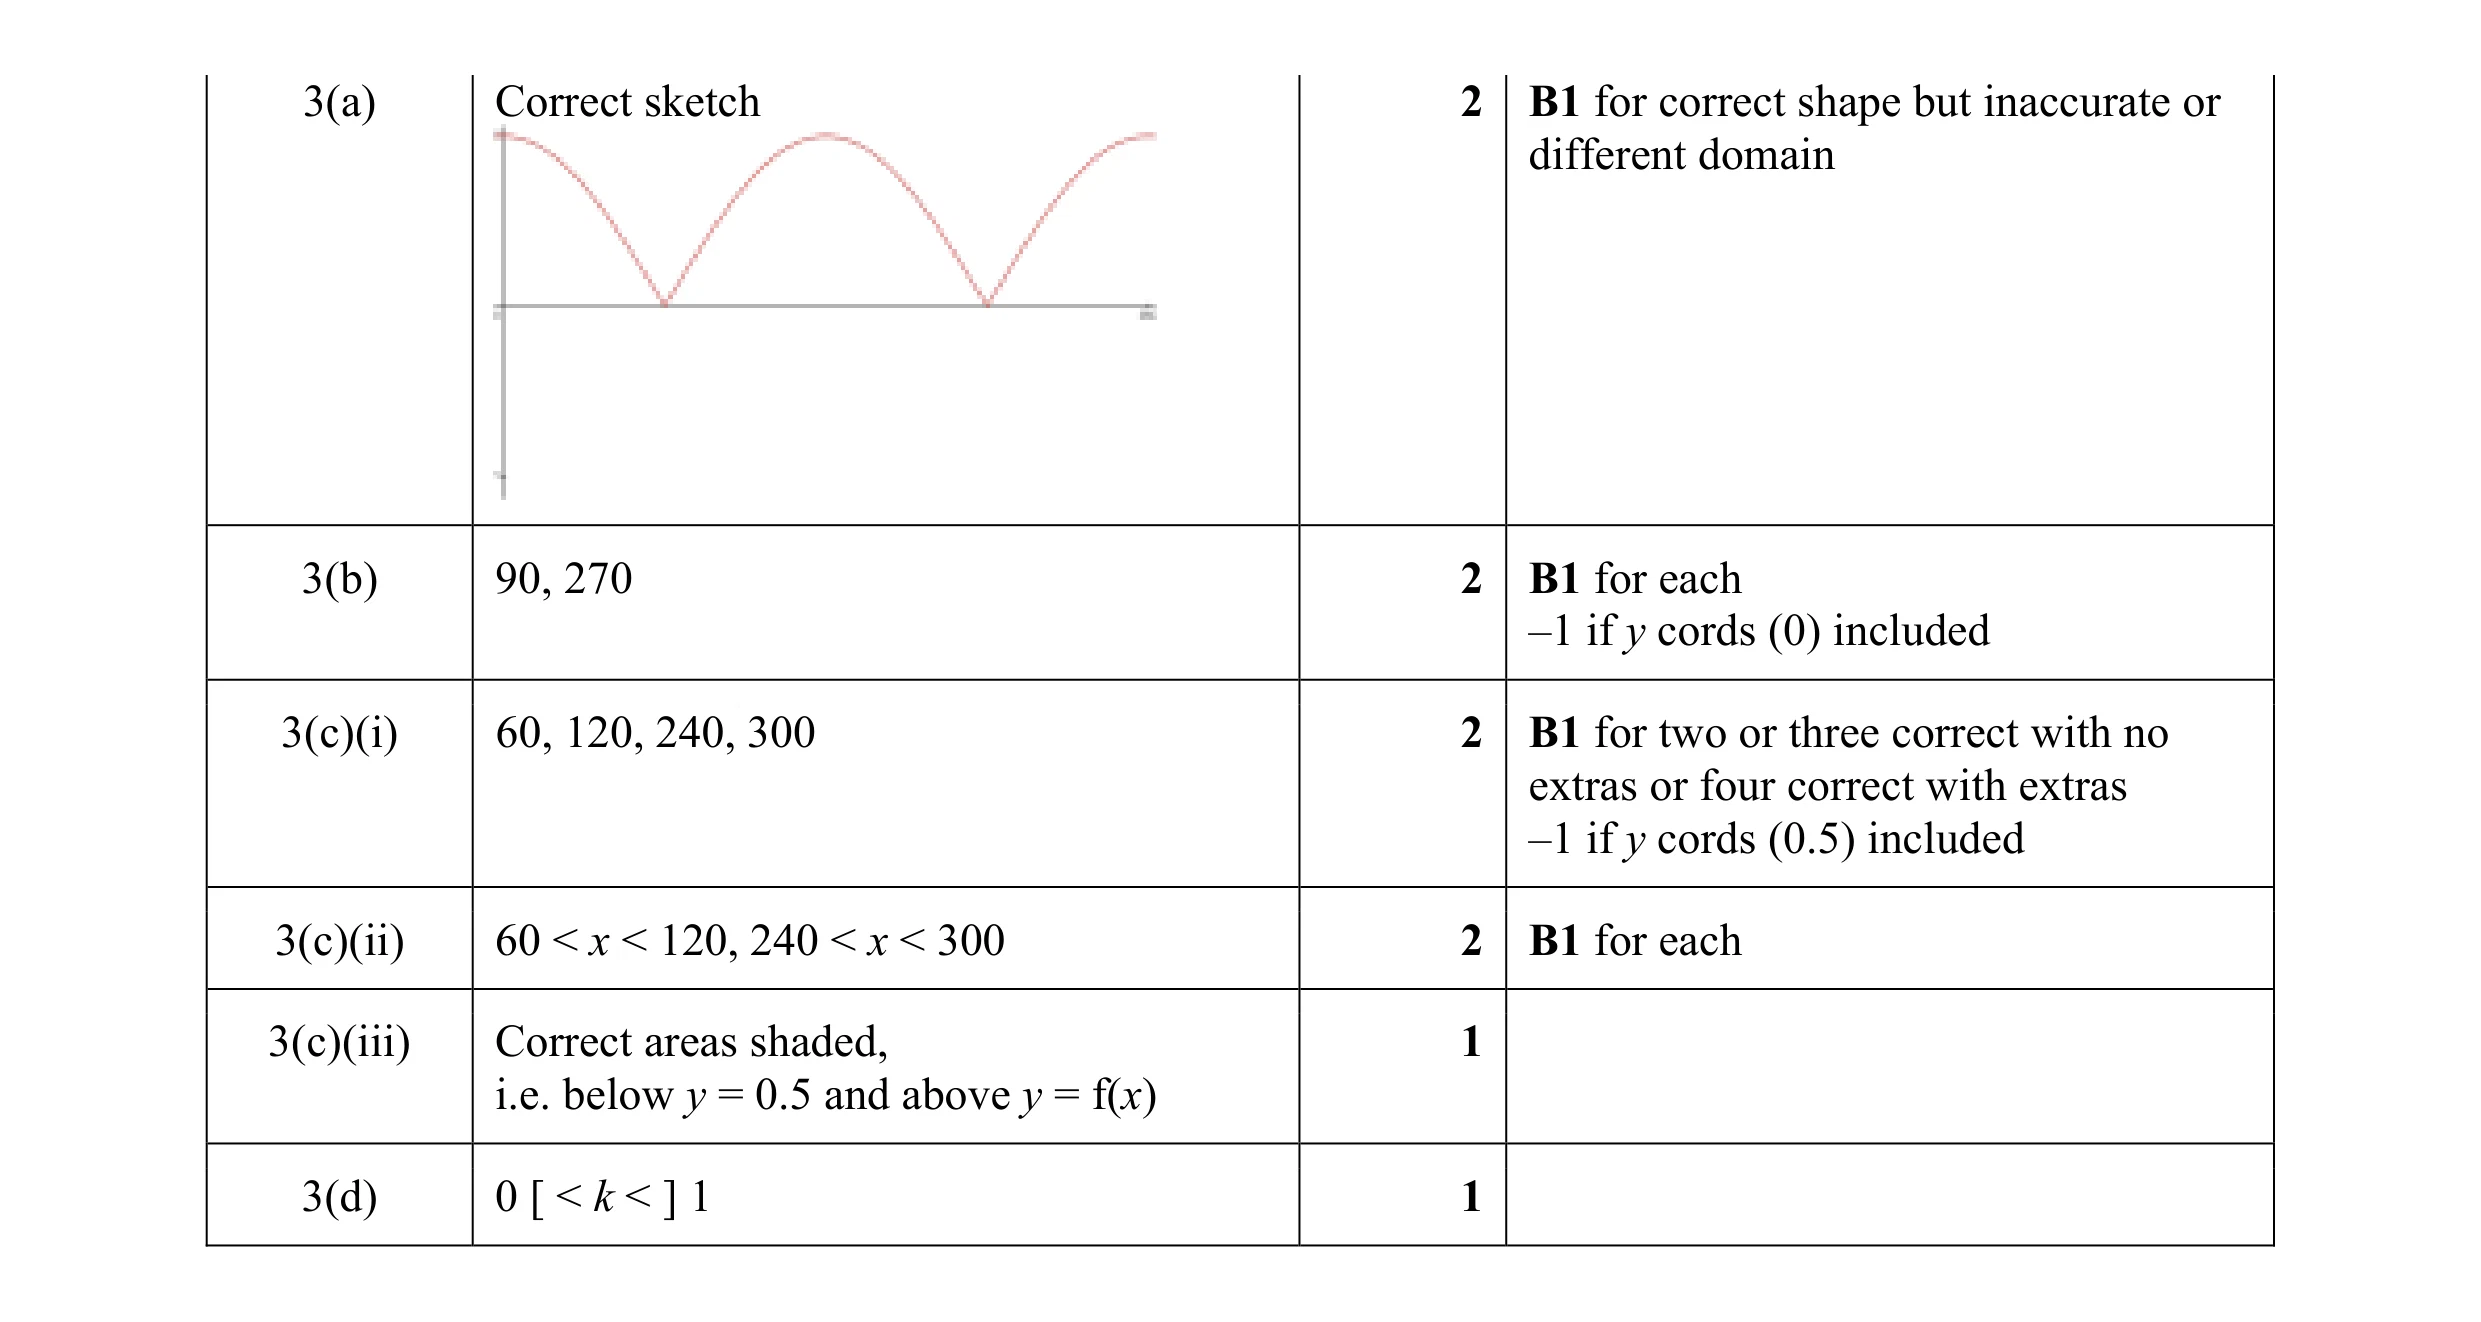 10
10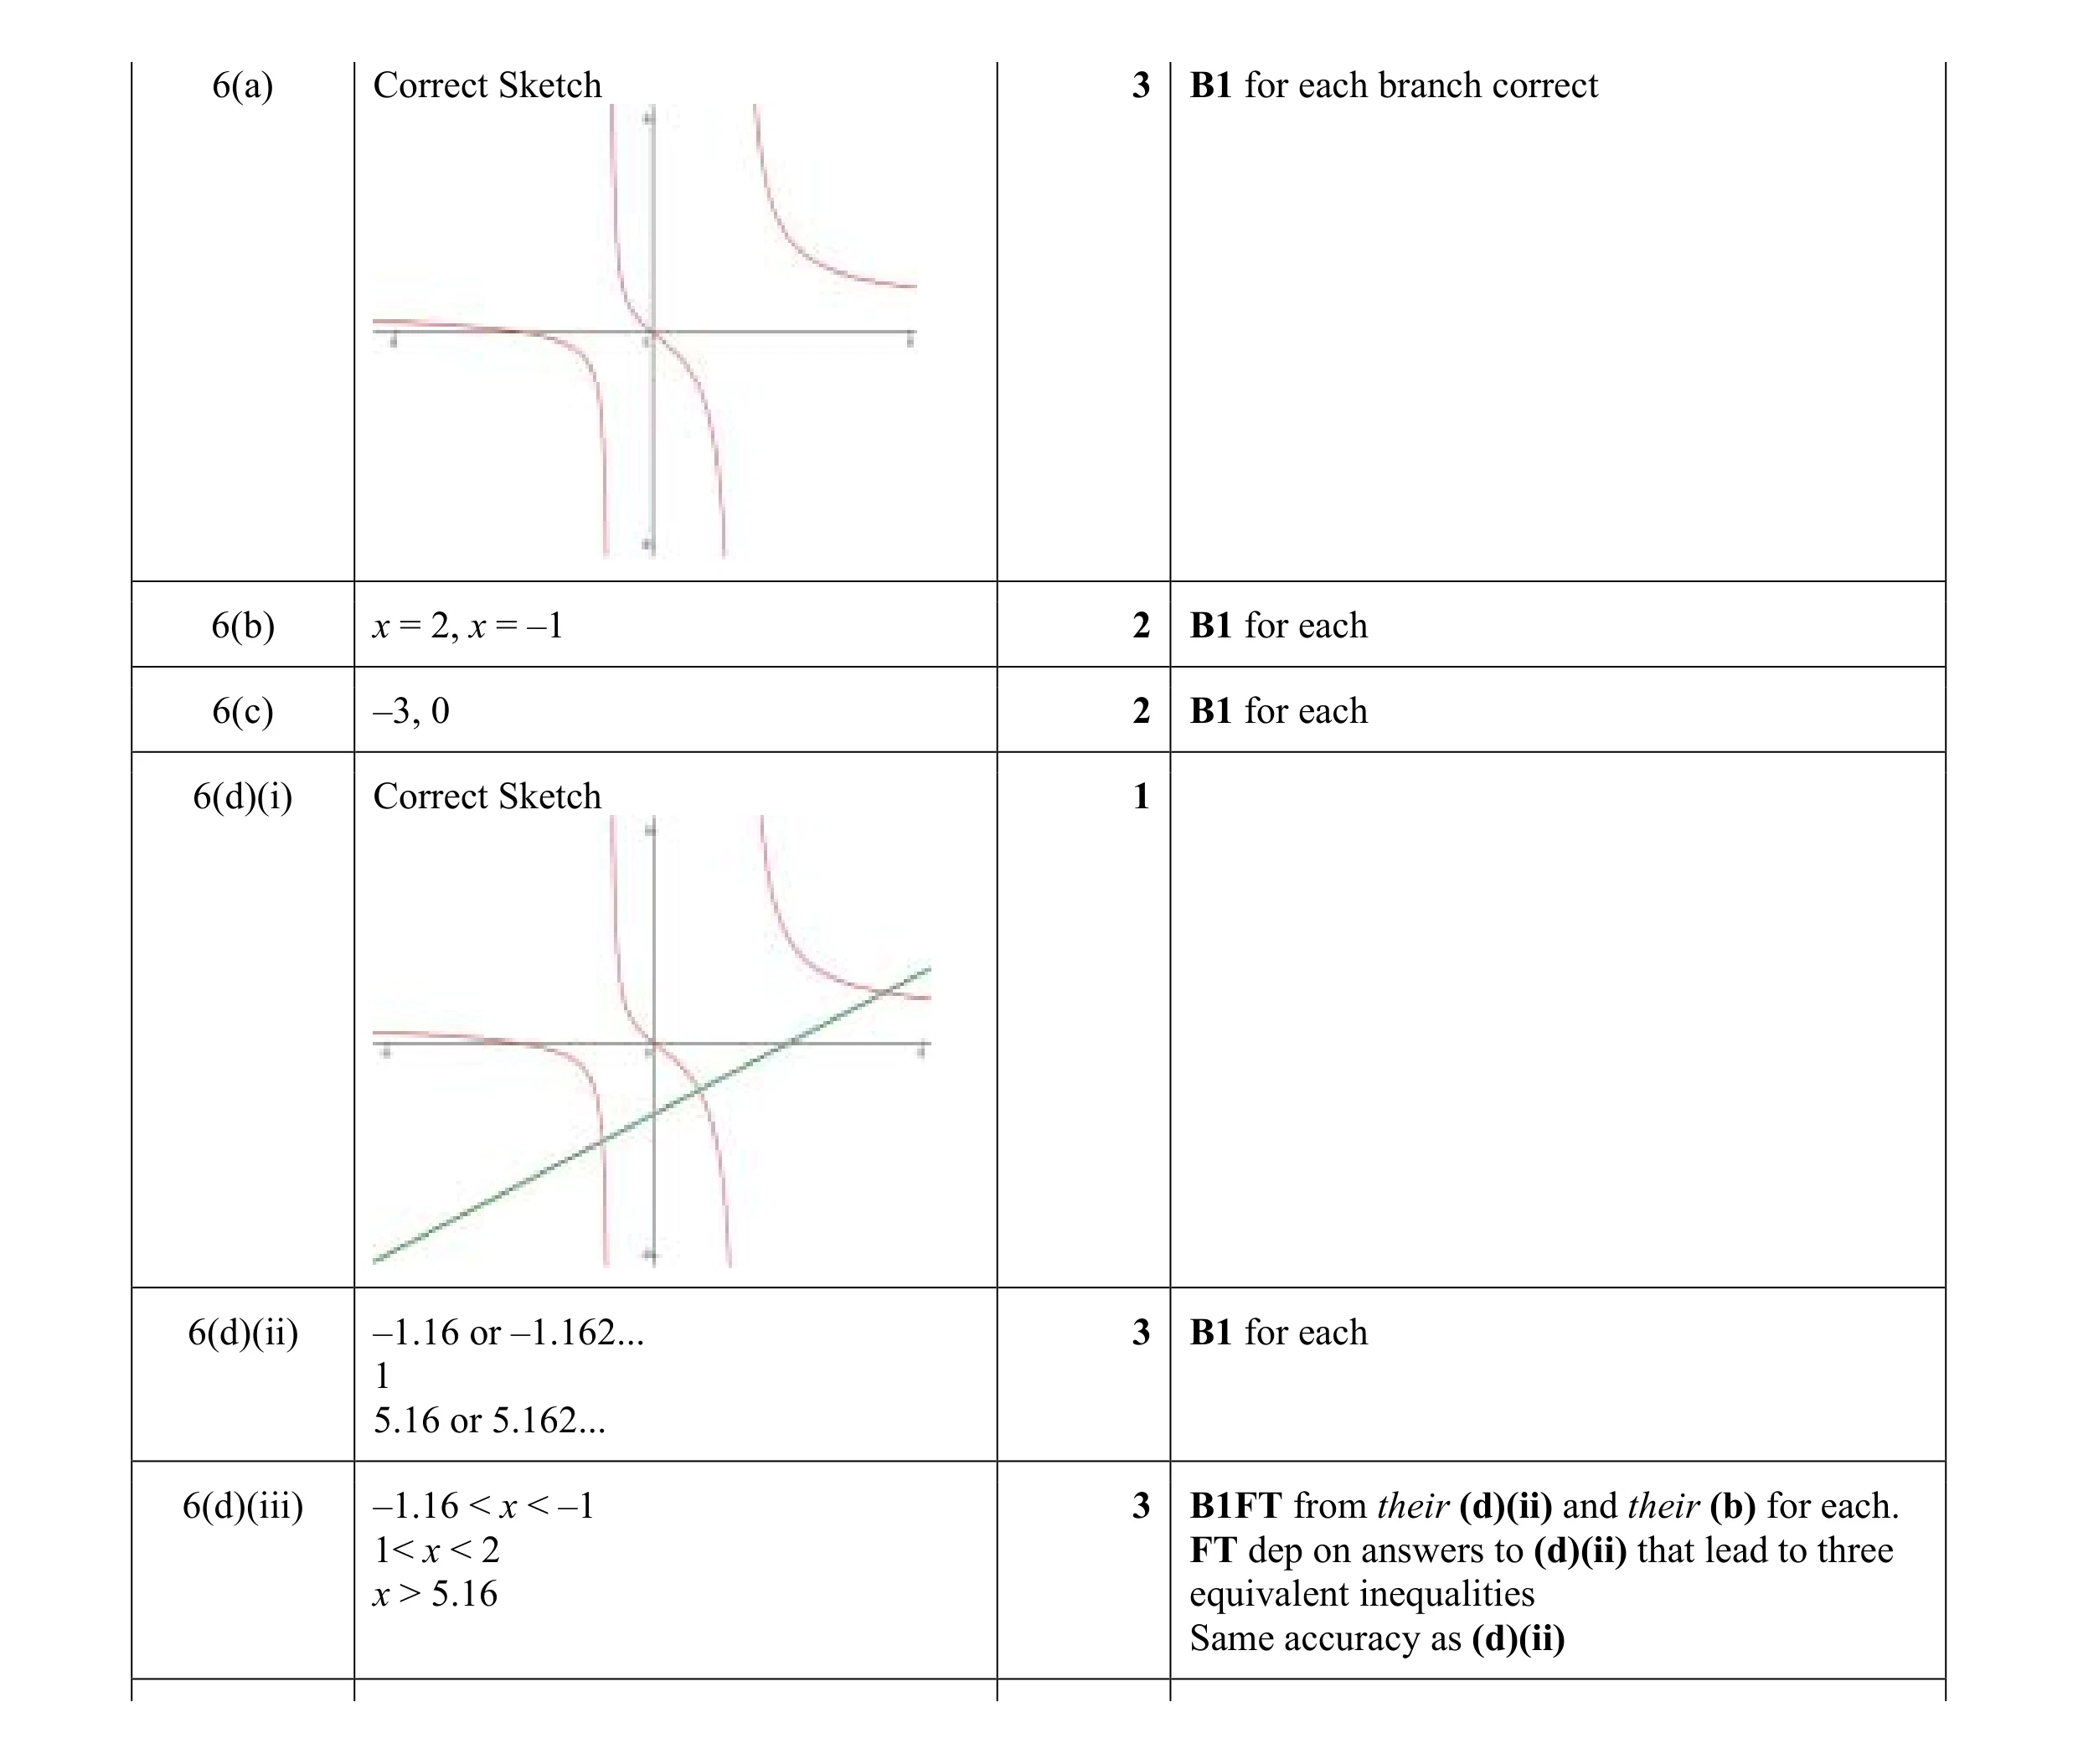 14
14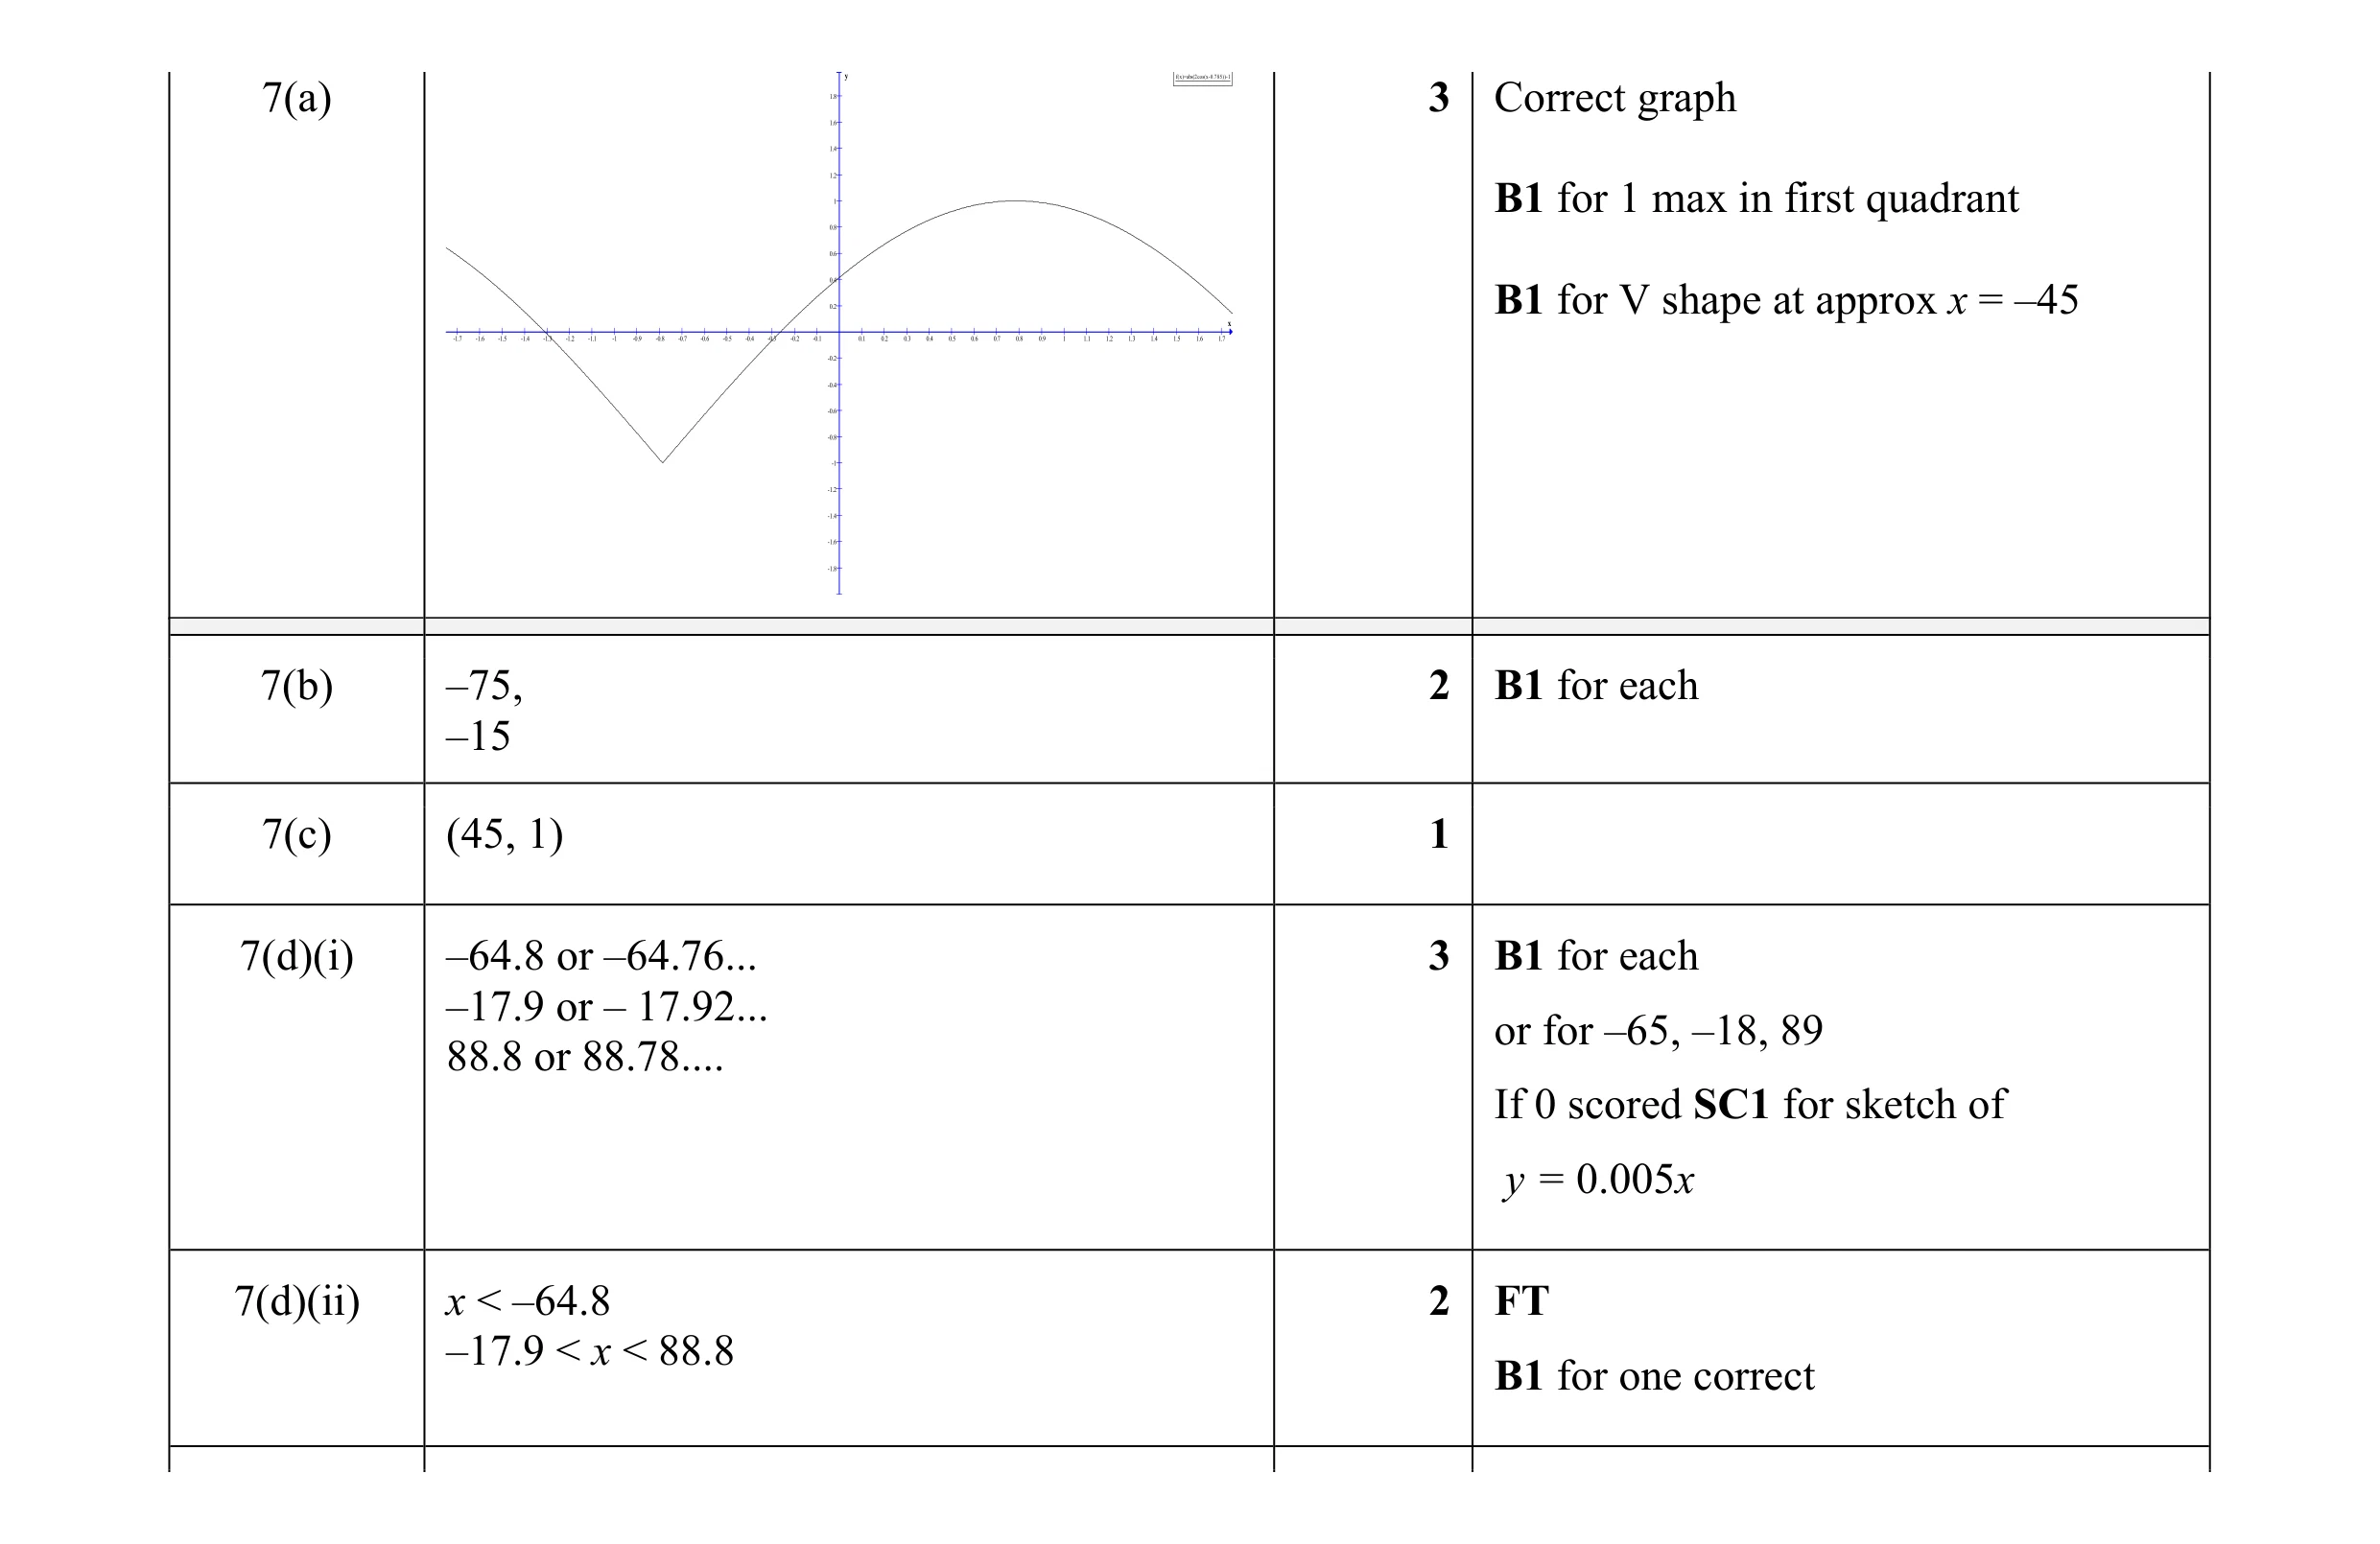 11
11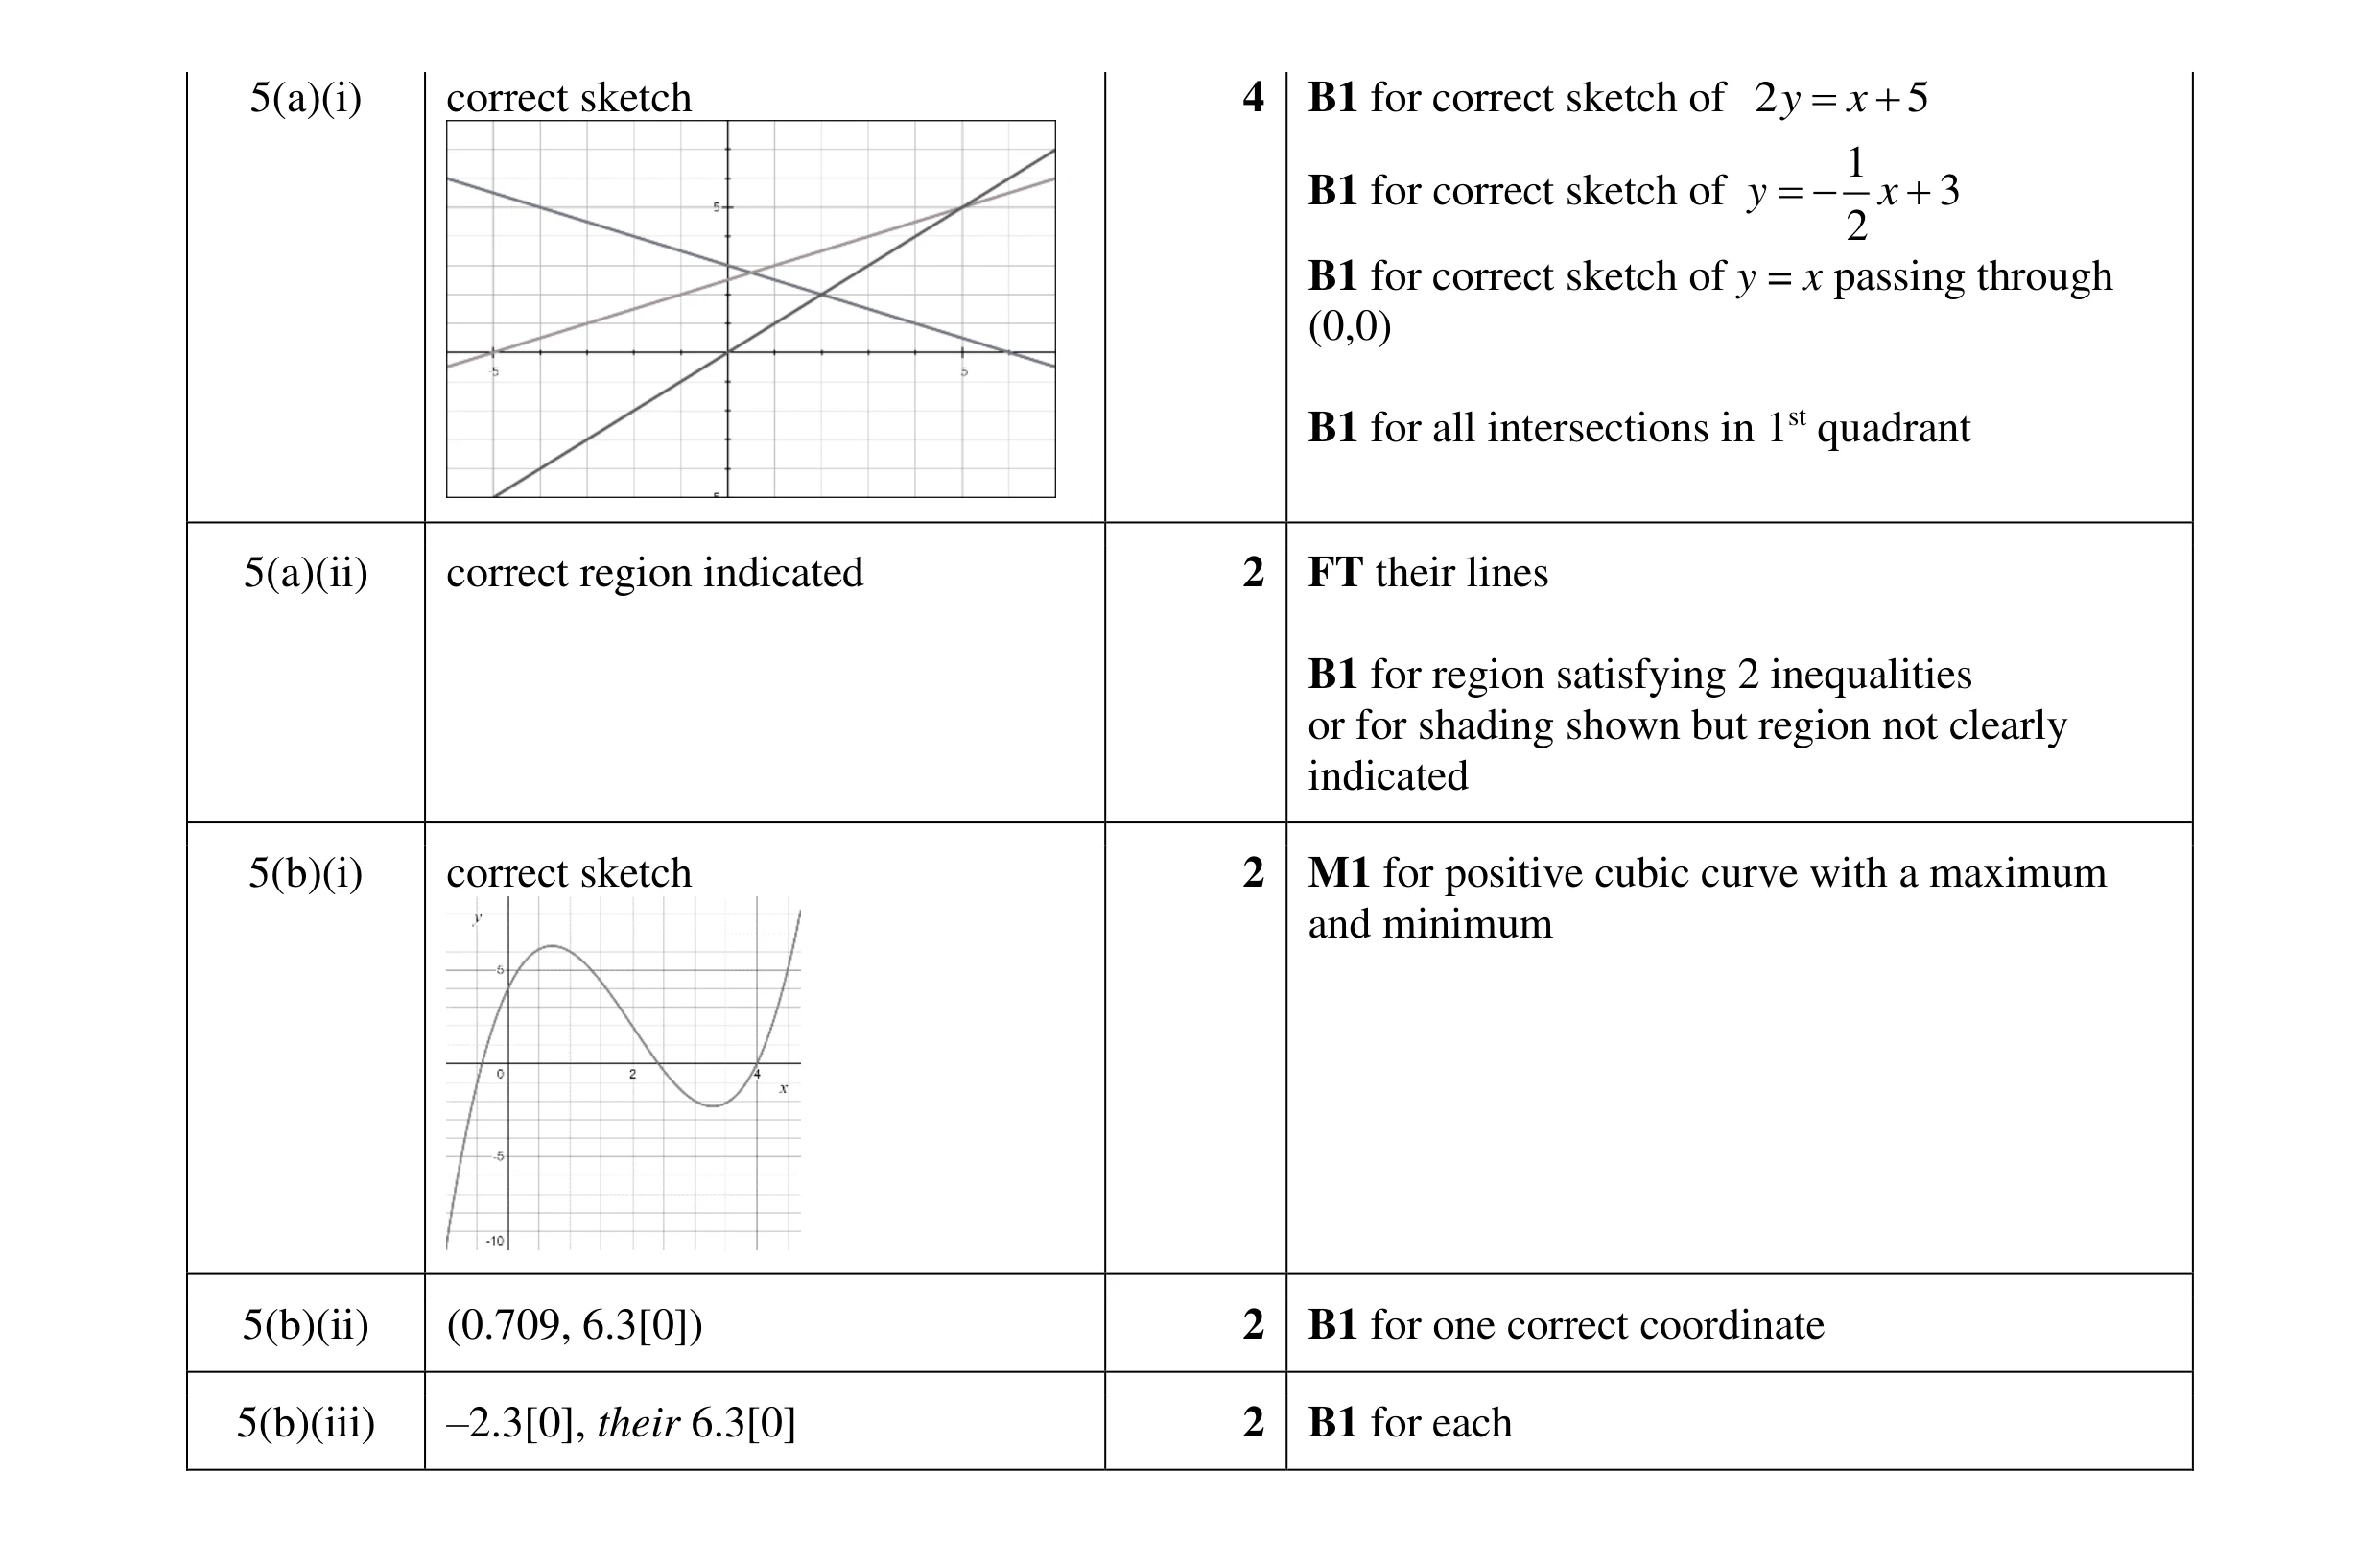 15
15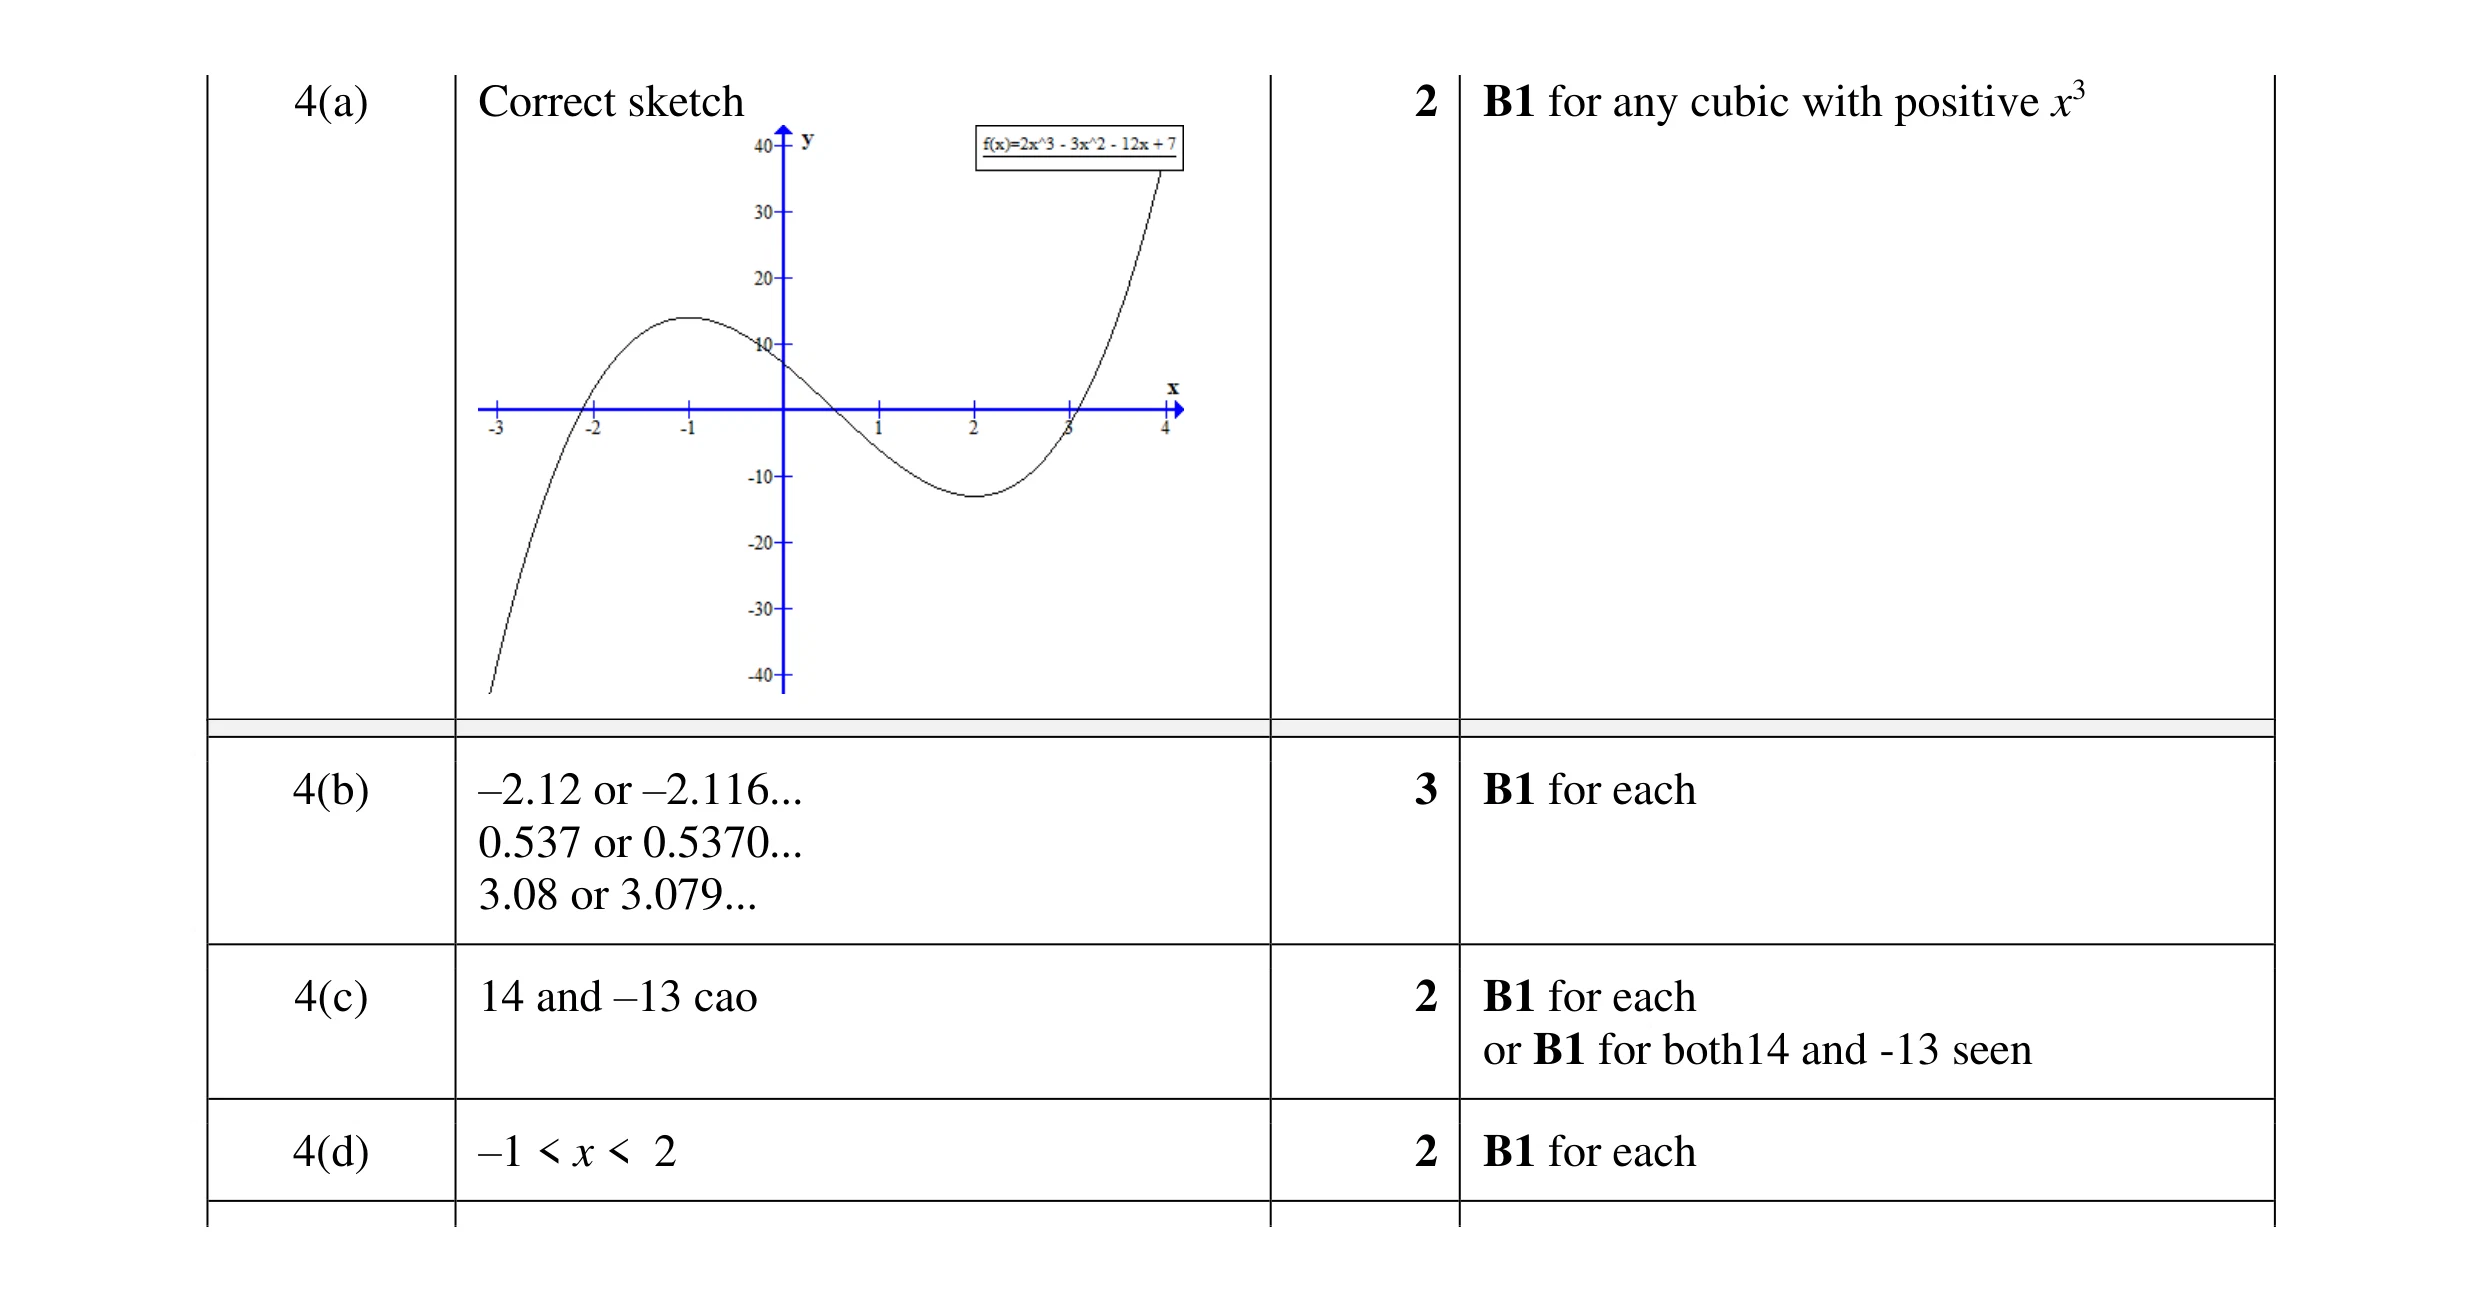 9
9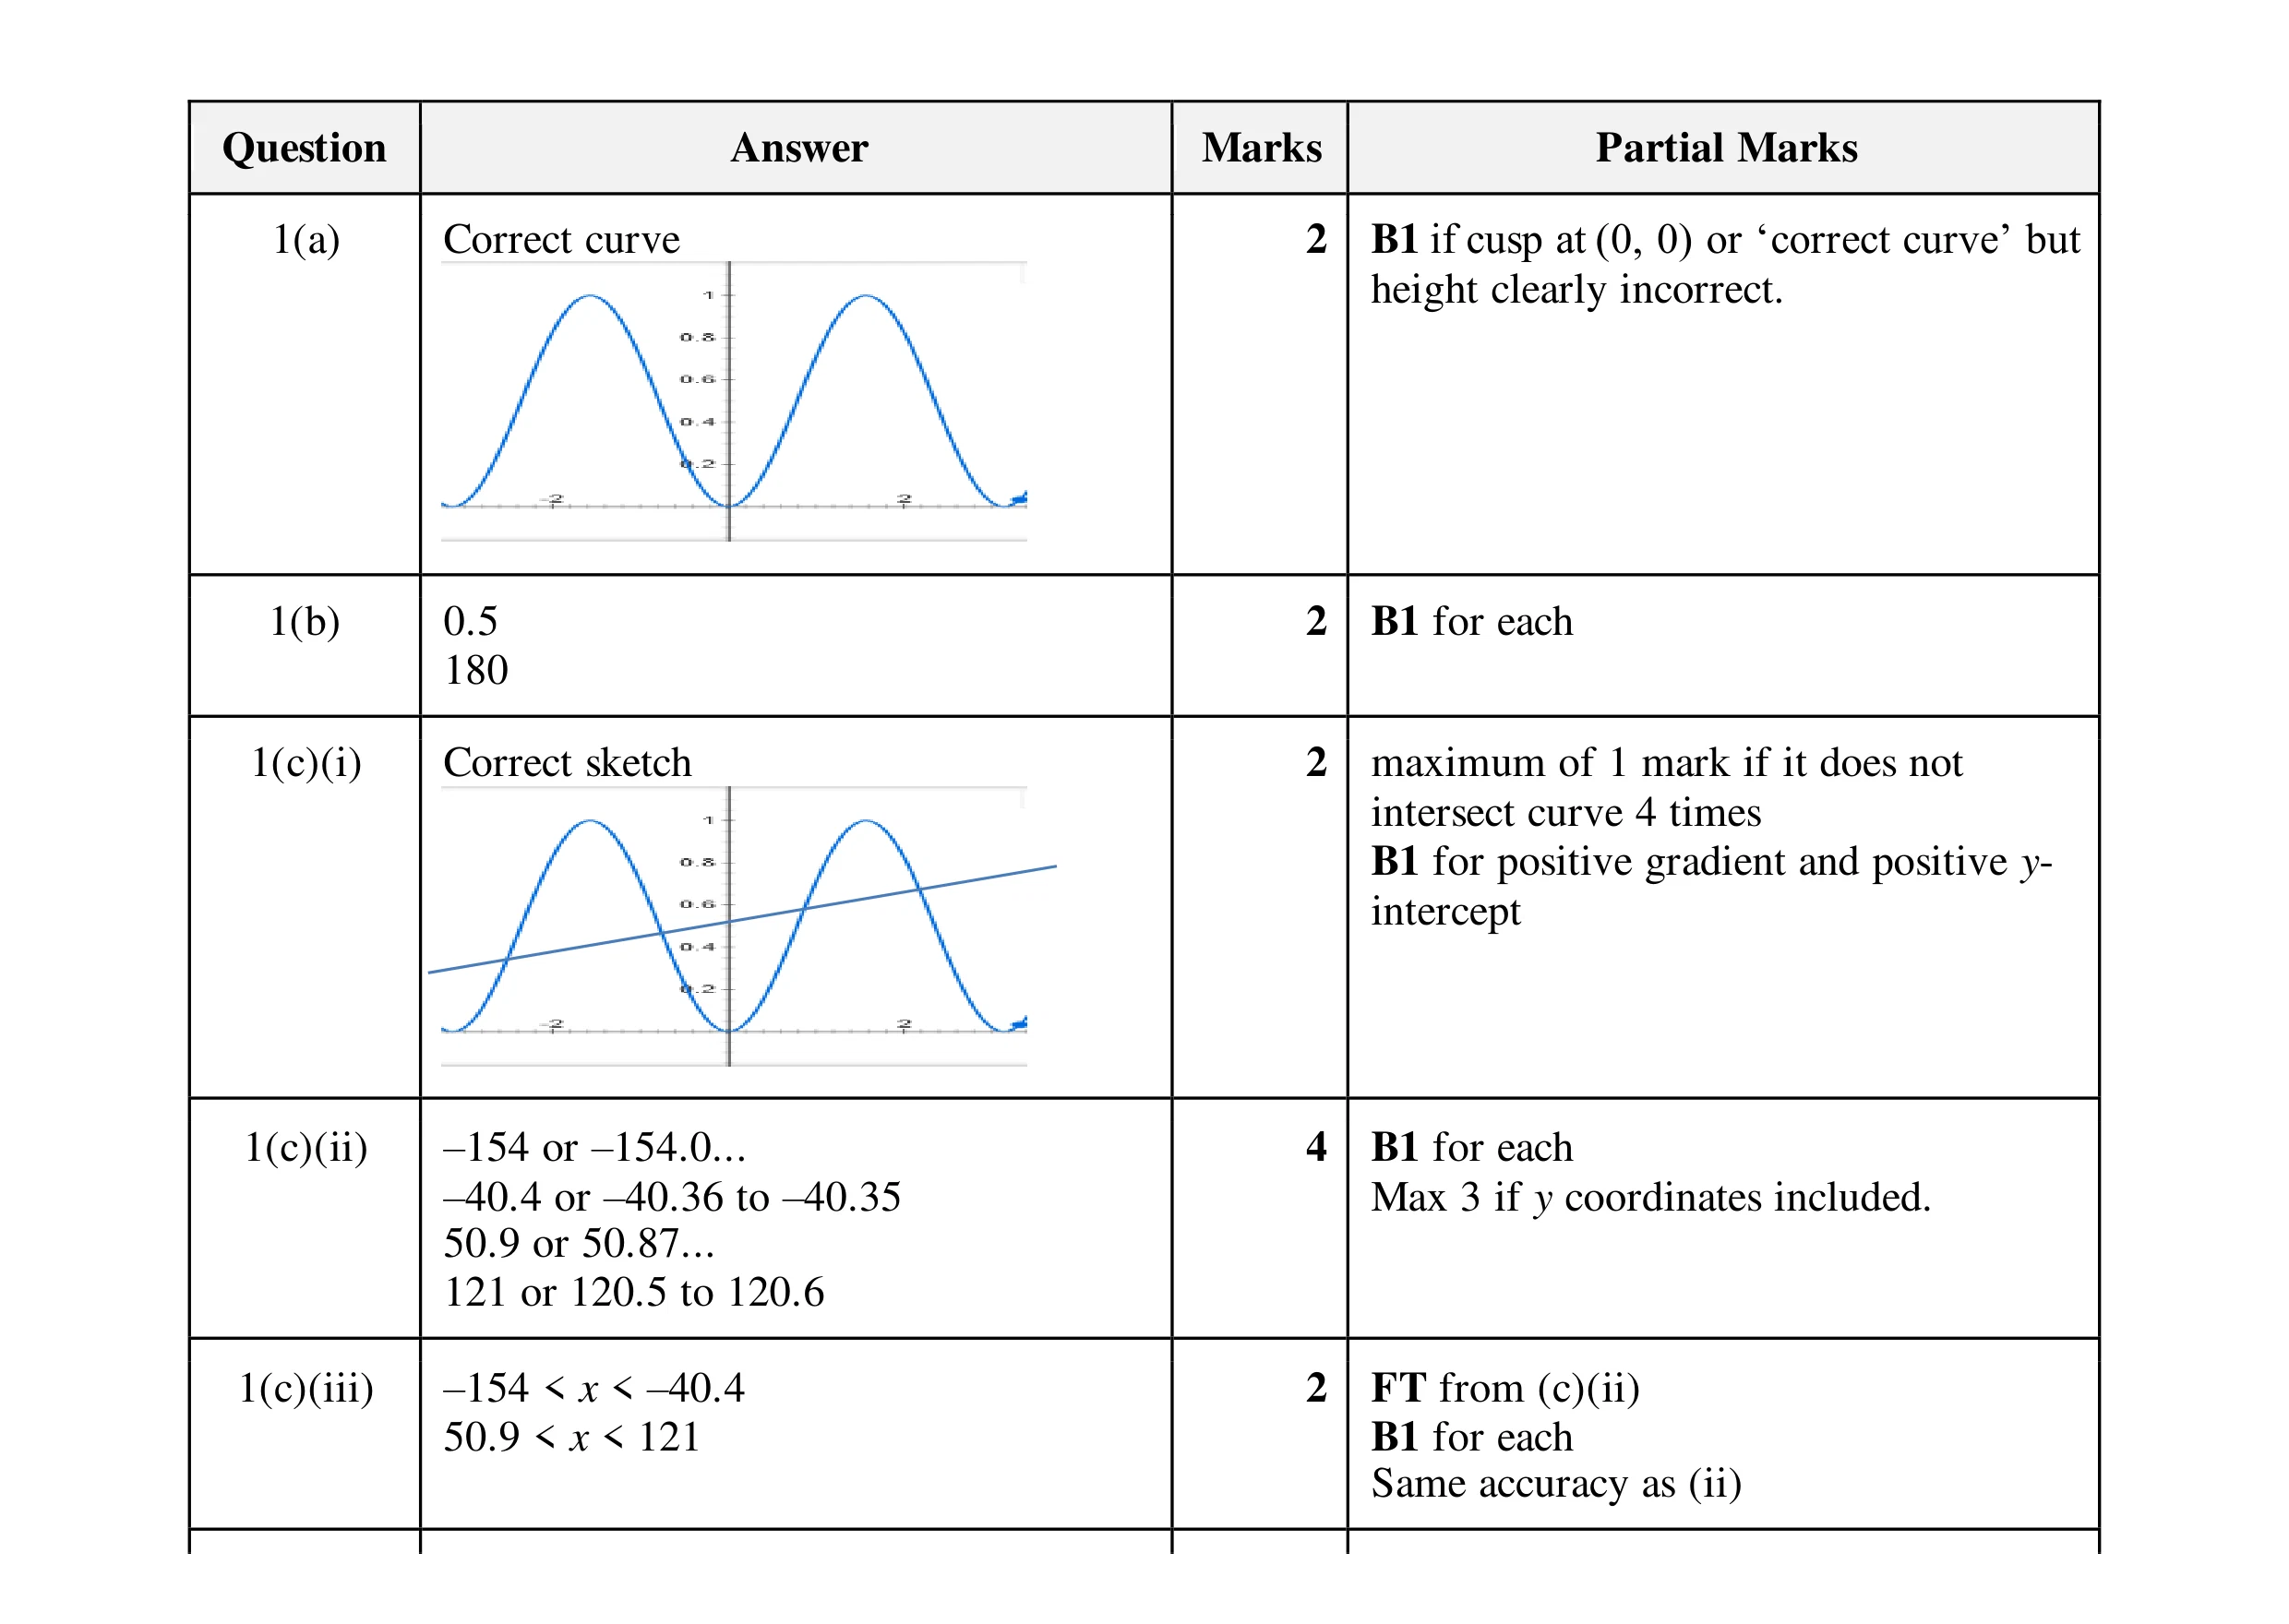 12
12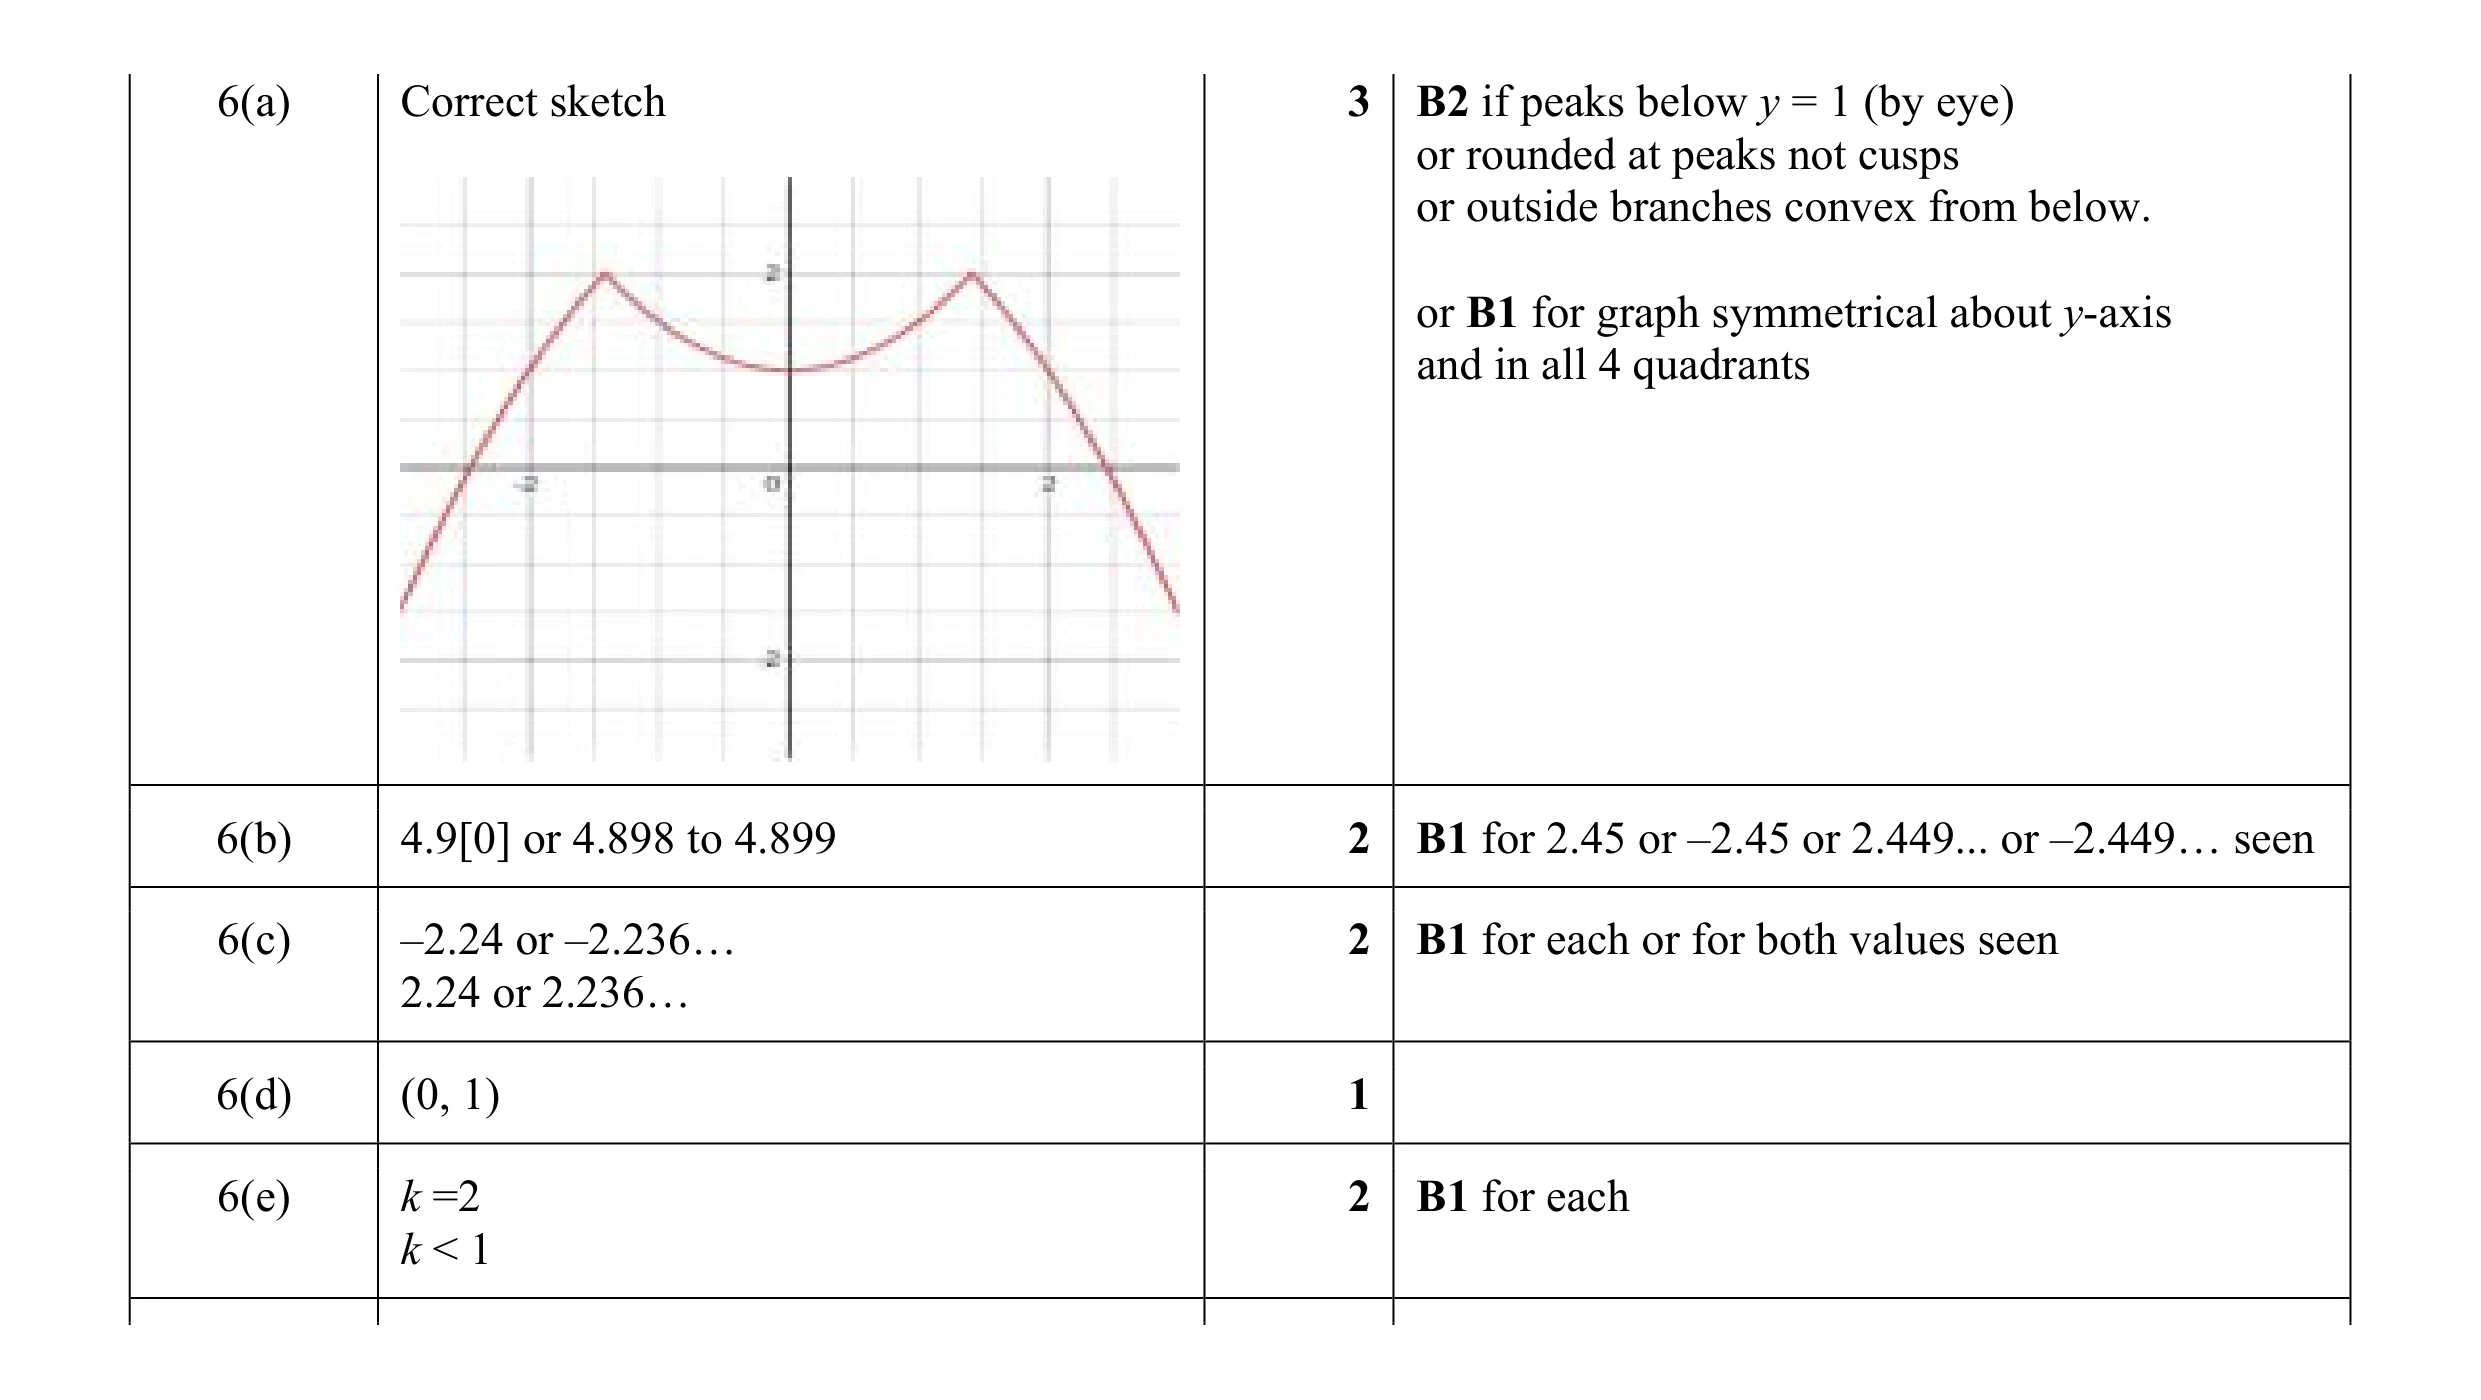 10
10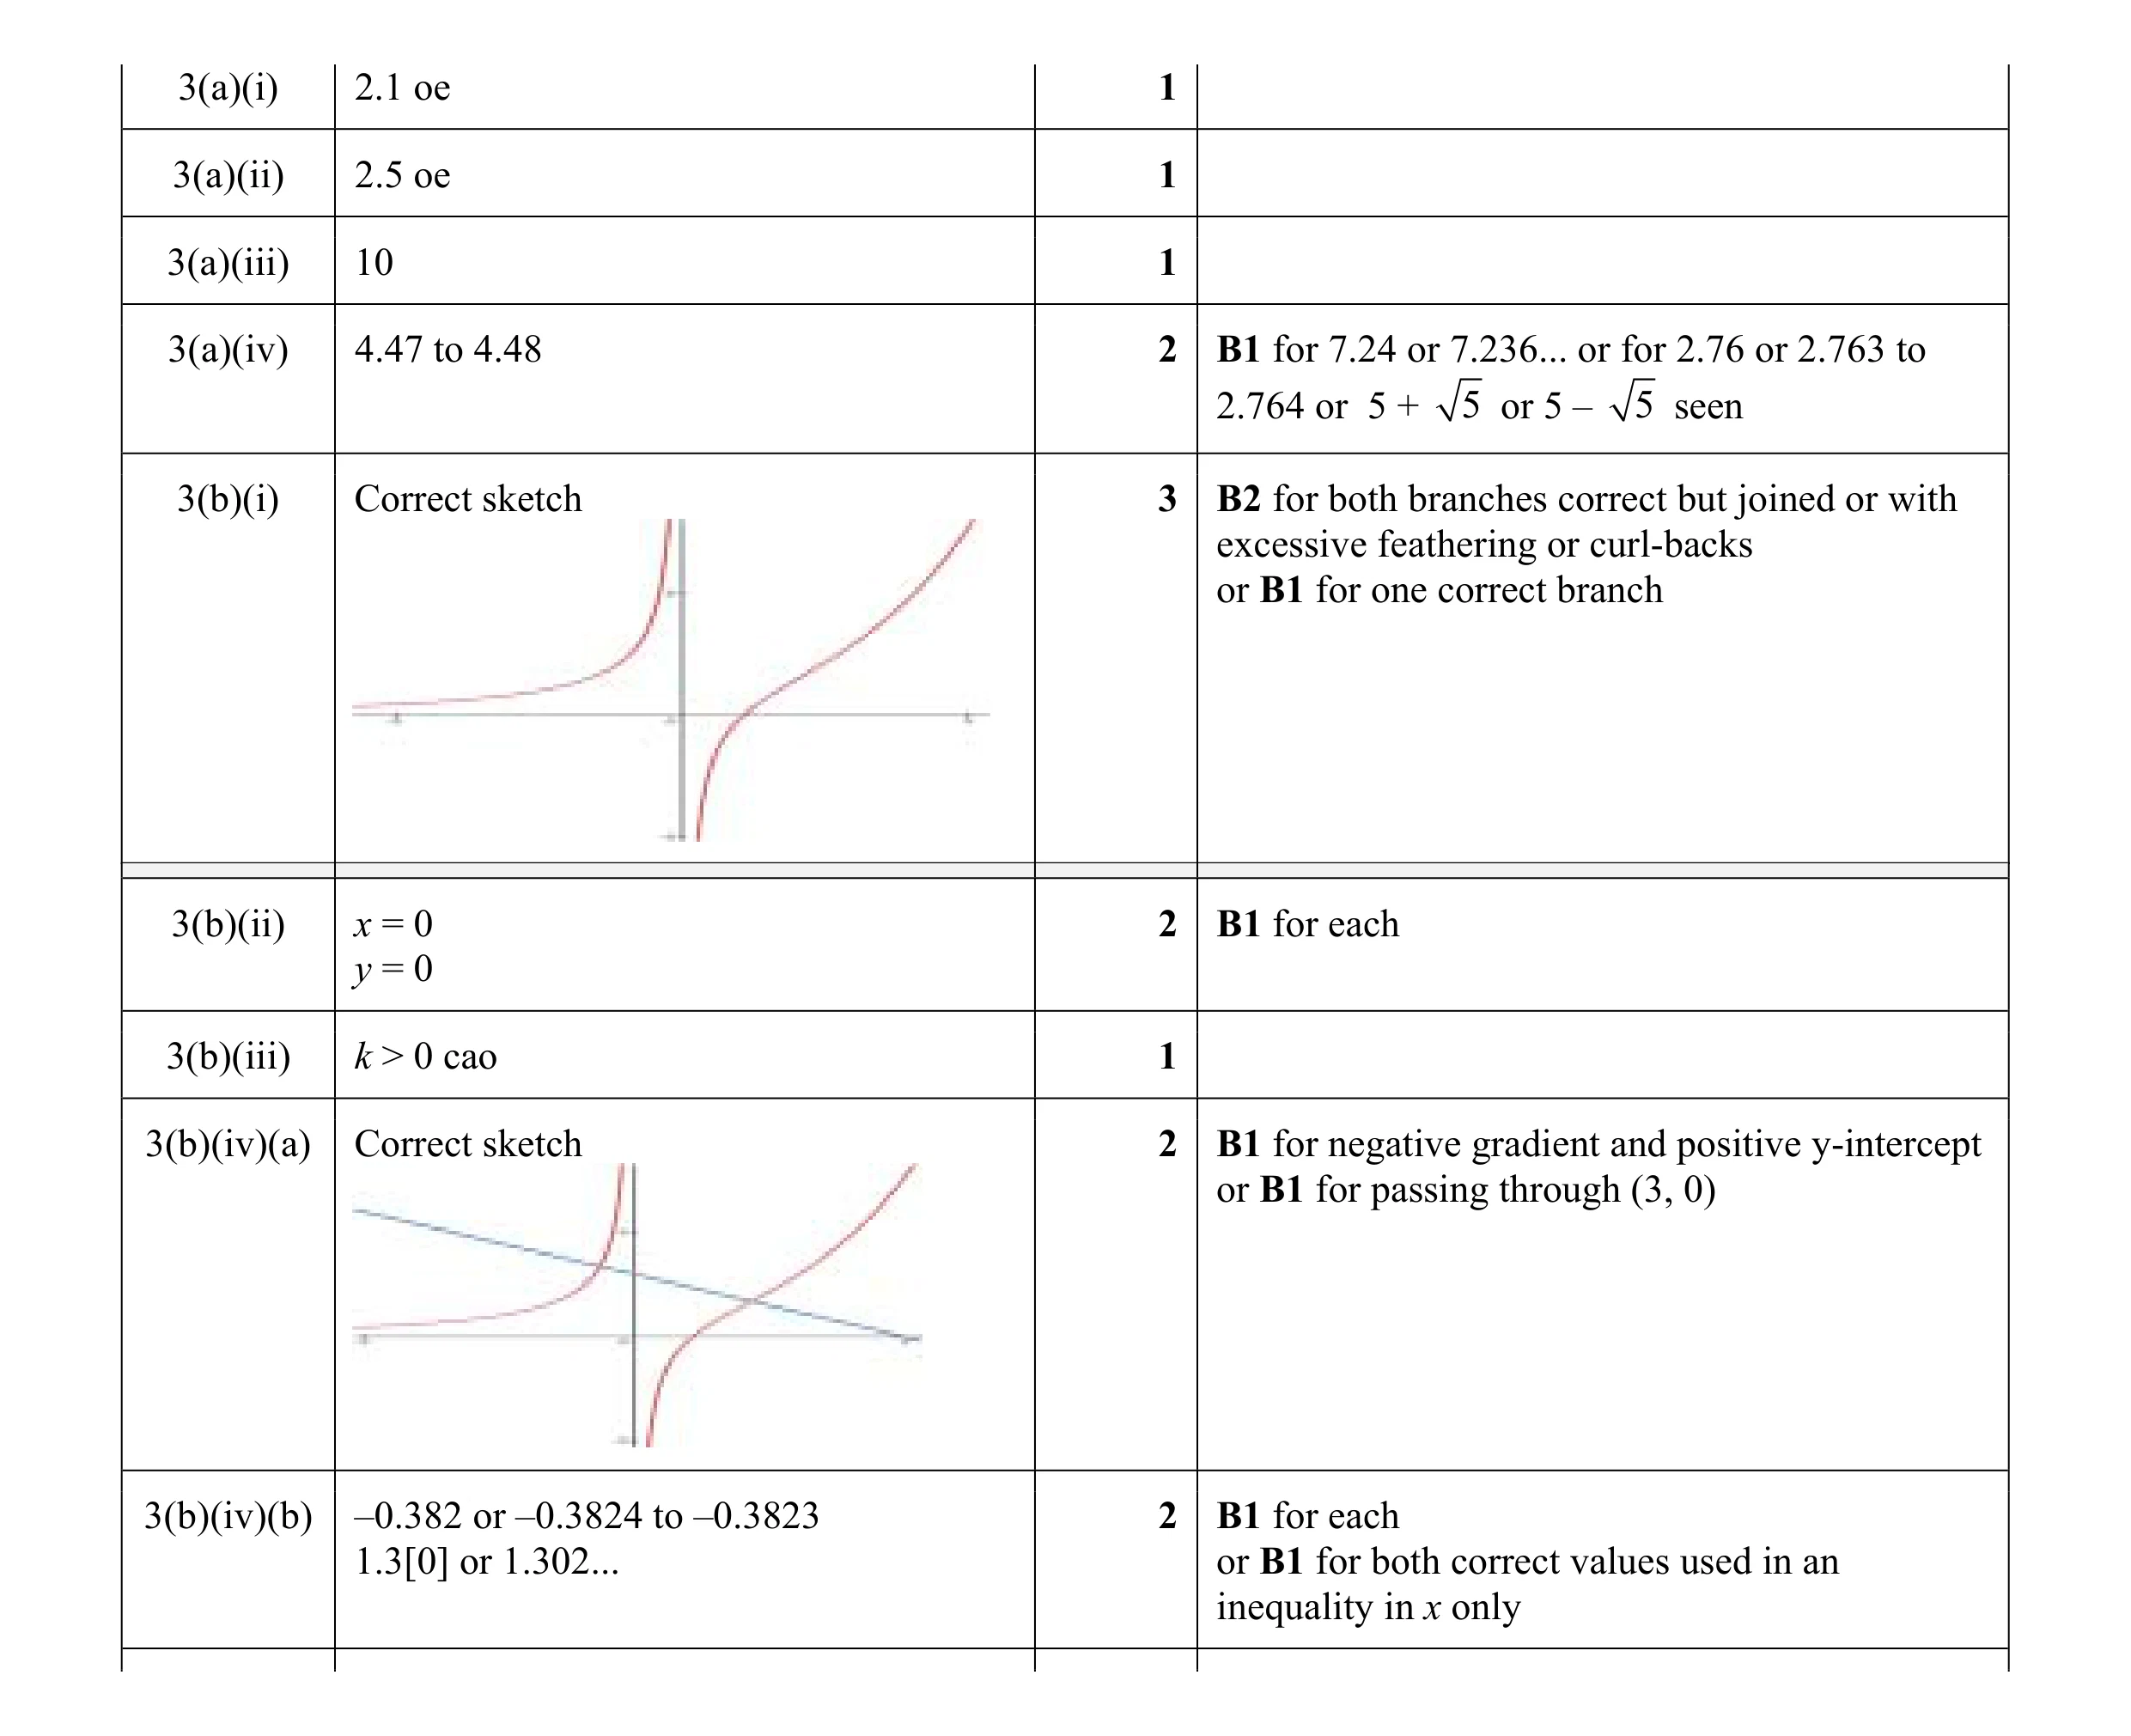 15
15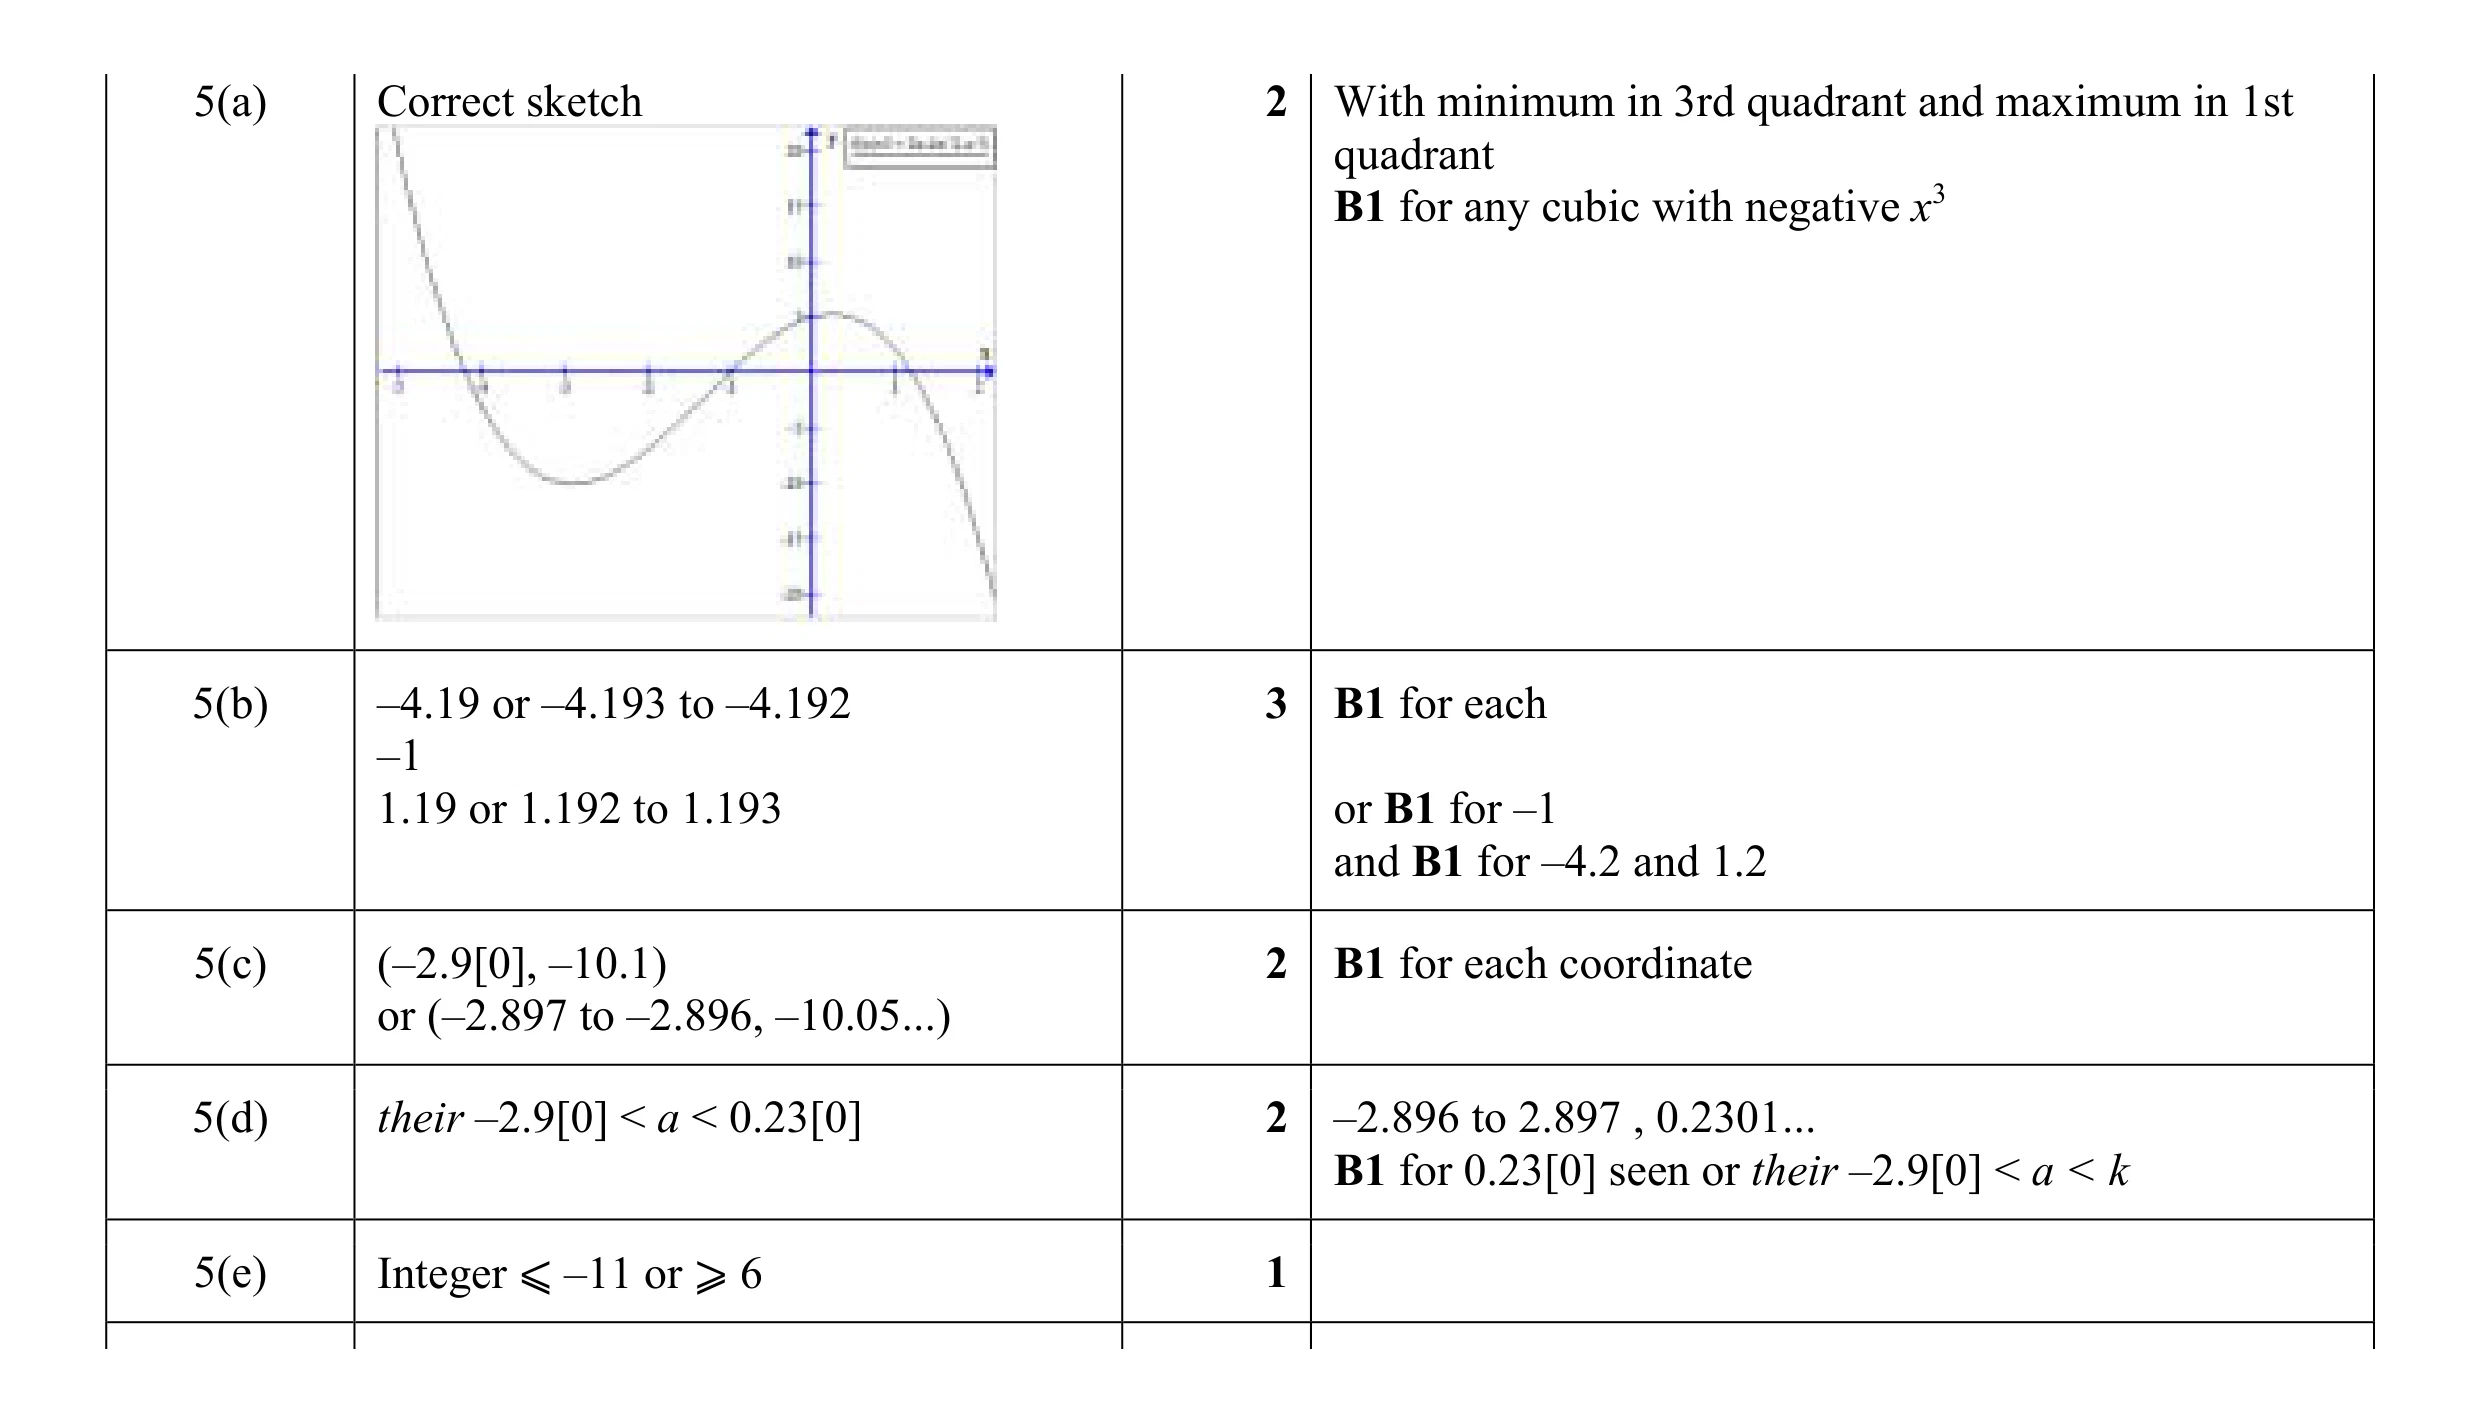 10
10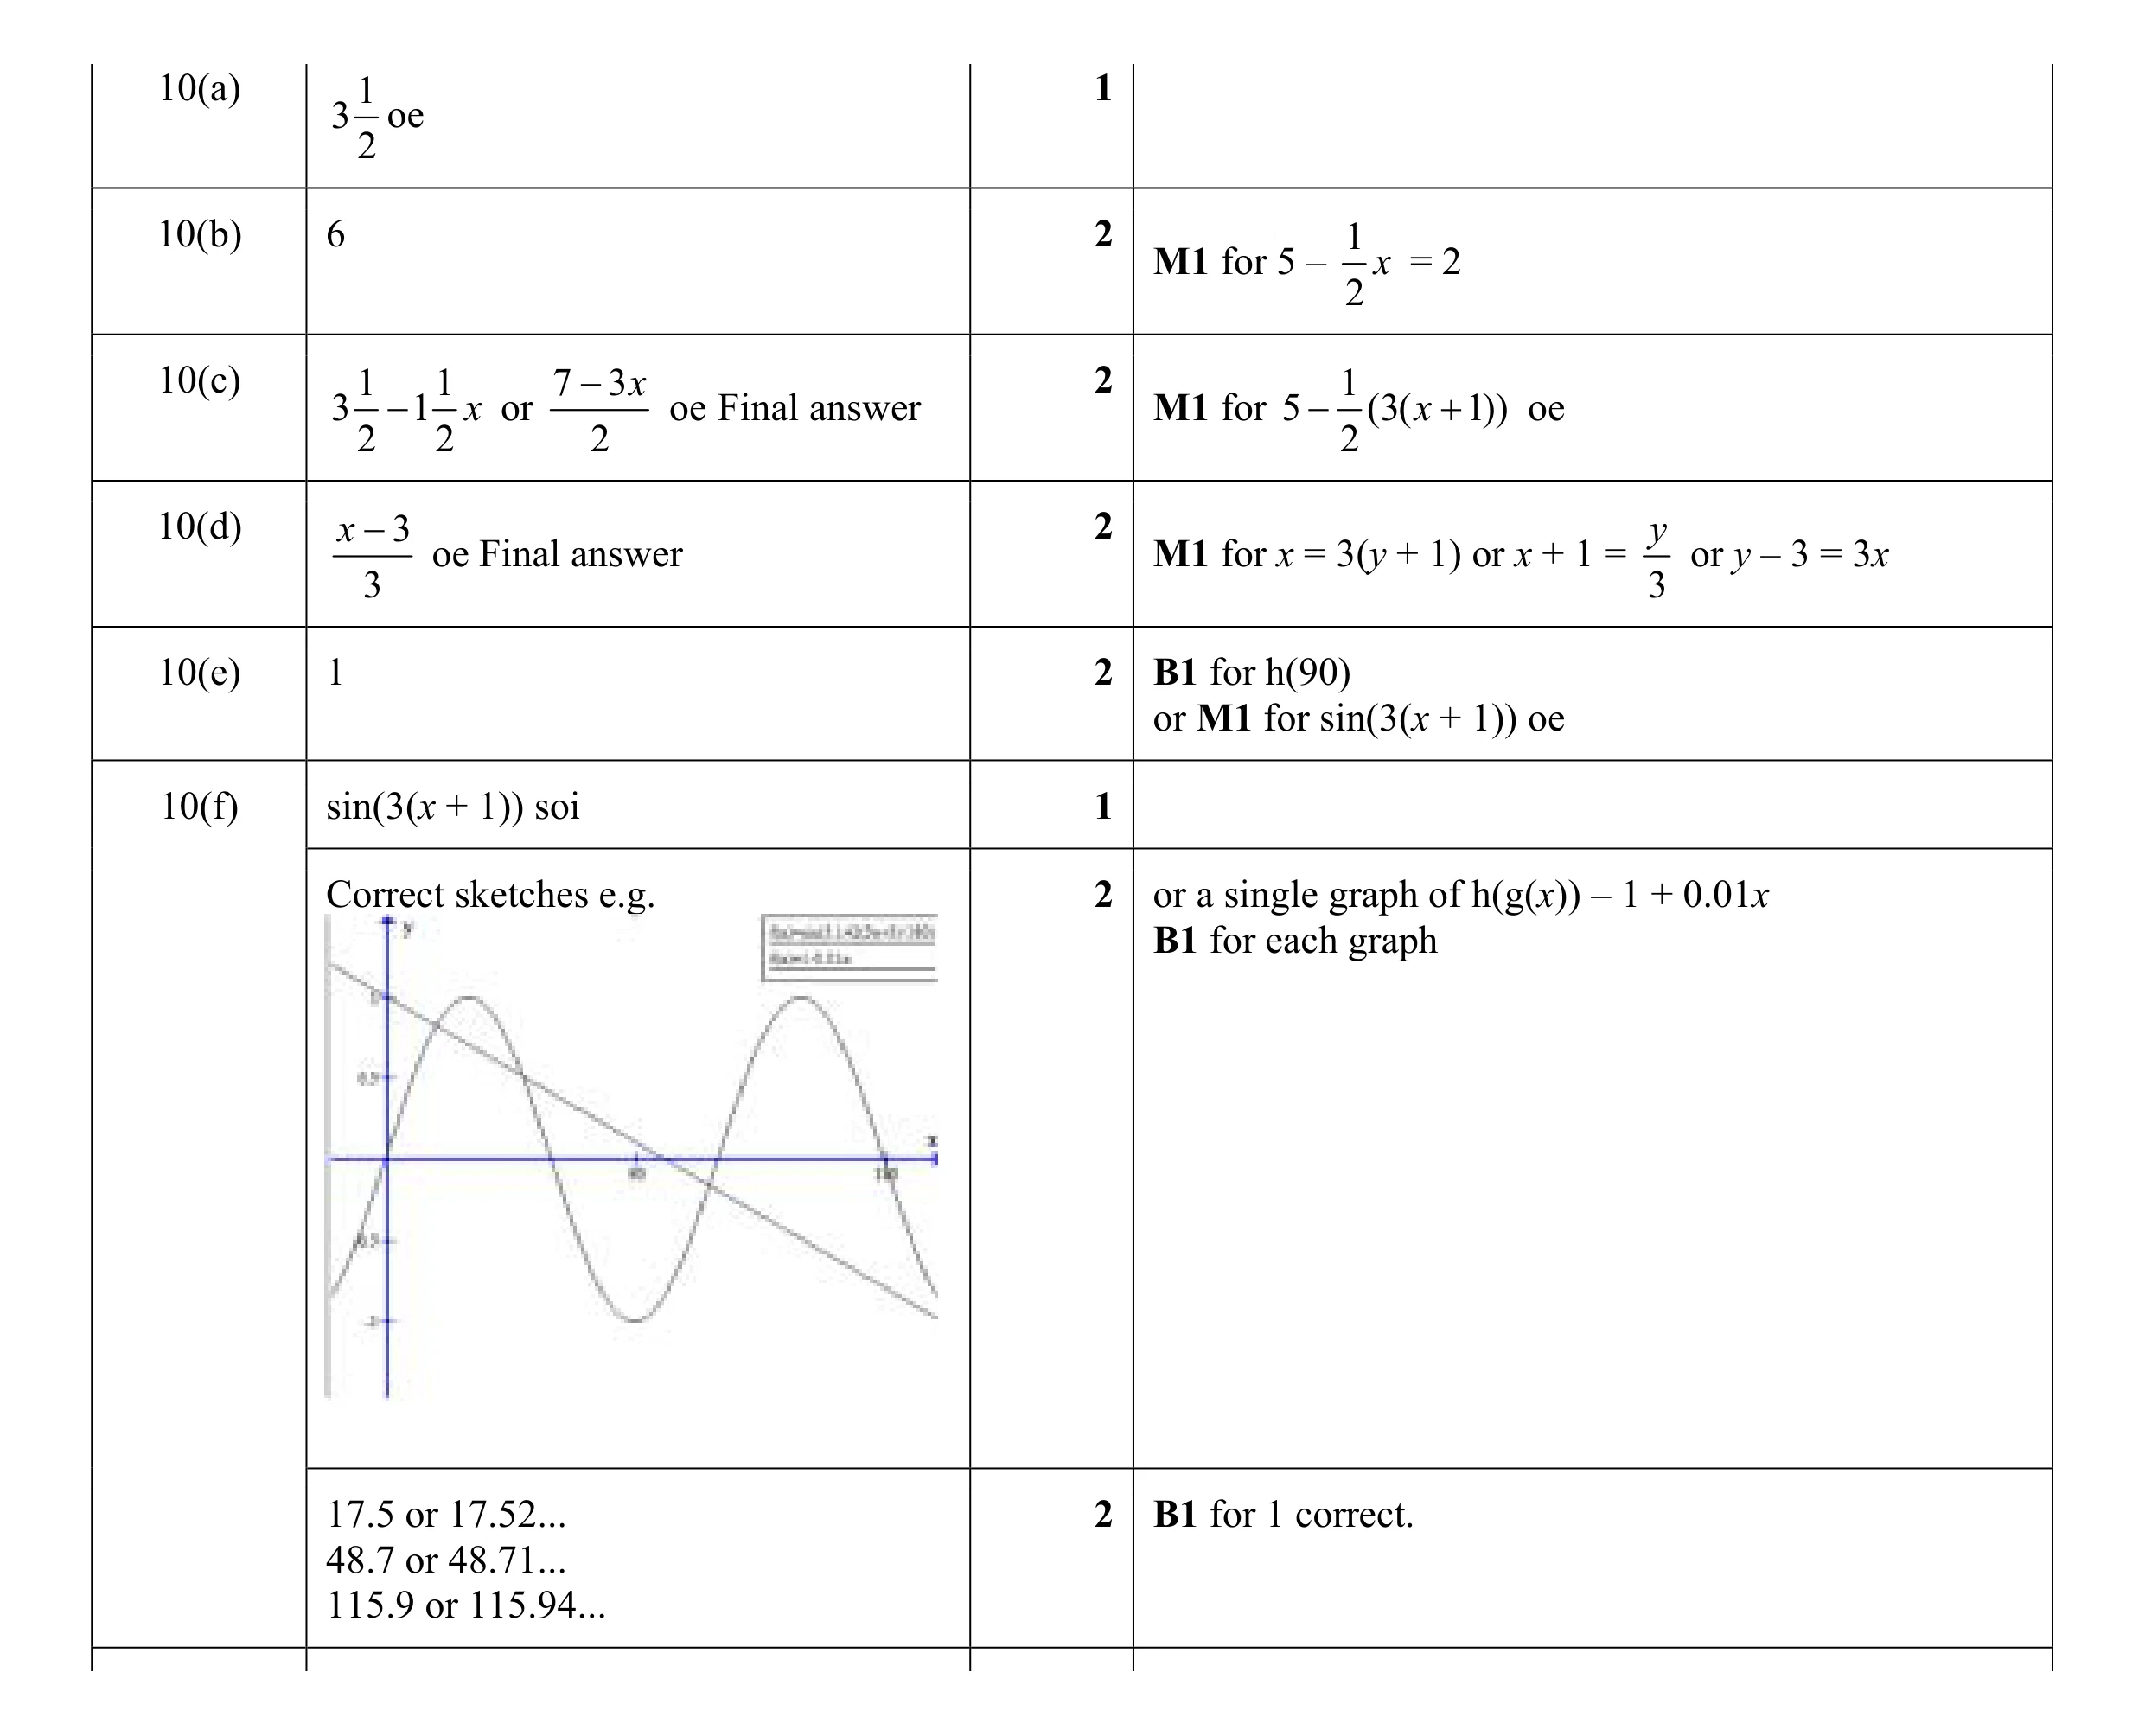 14
14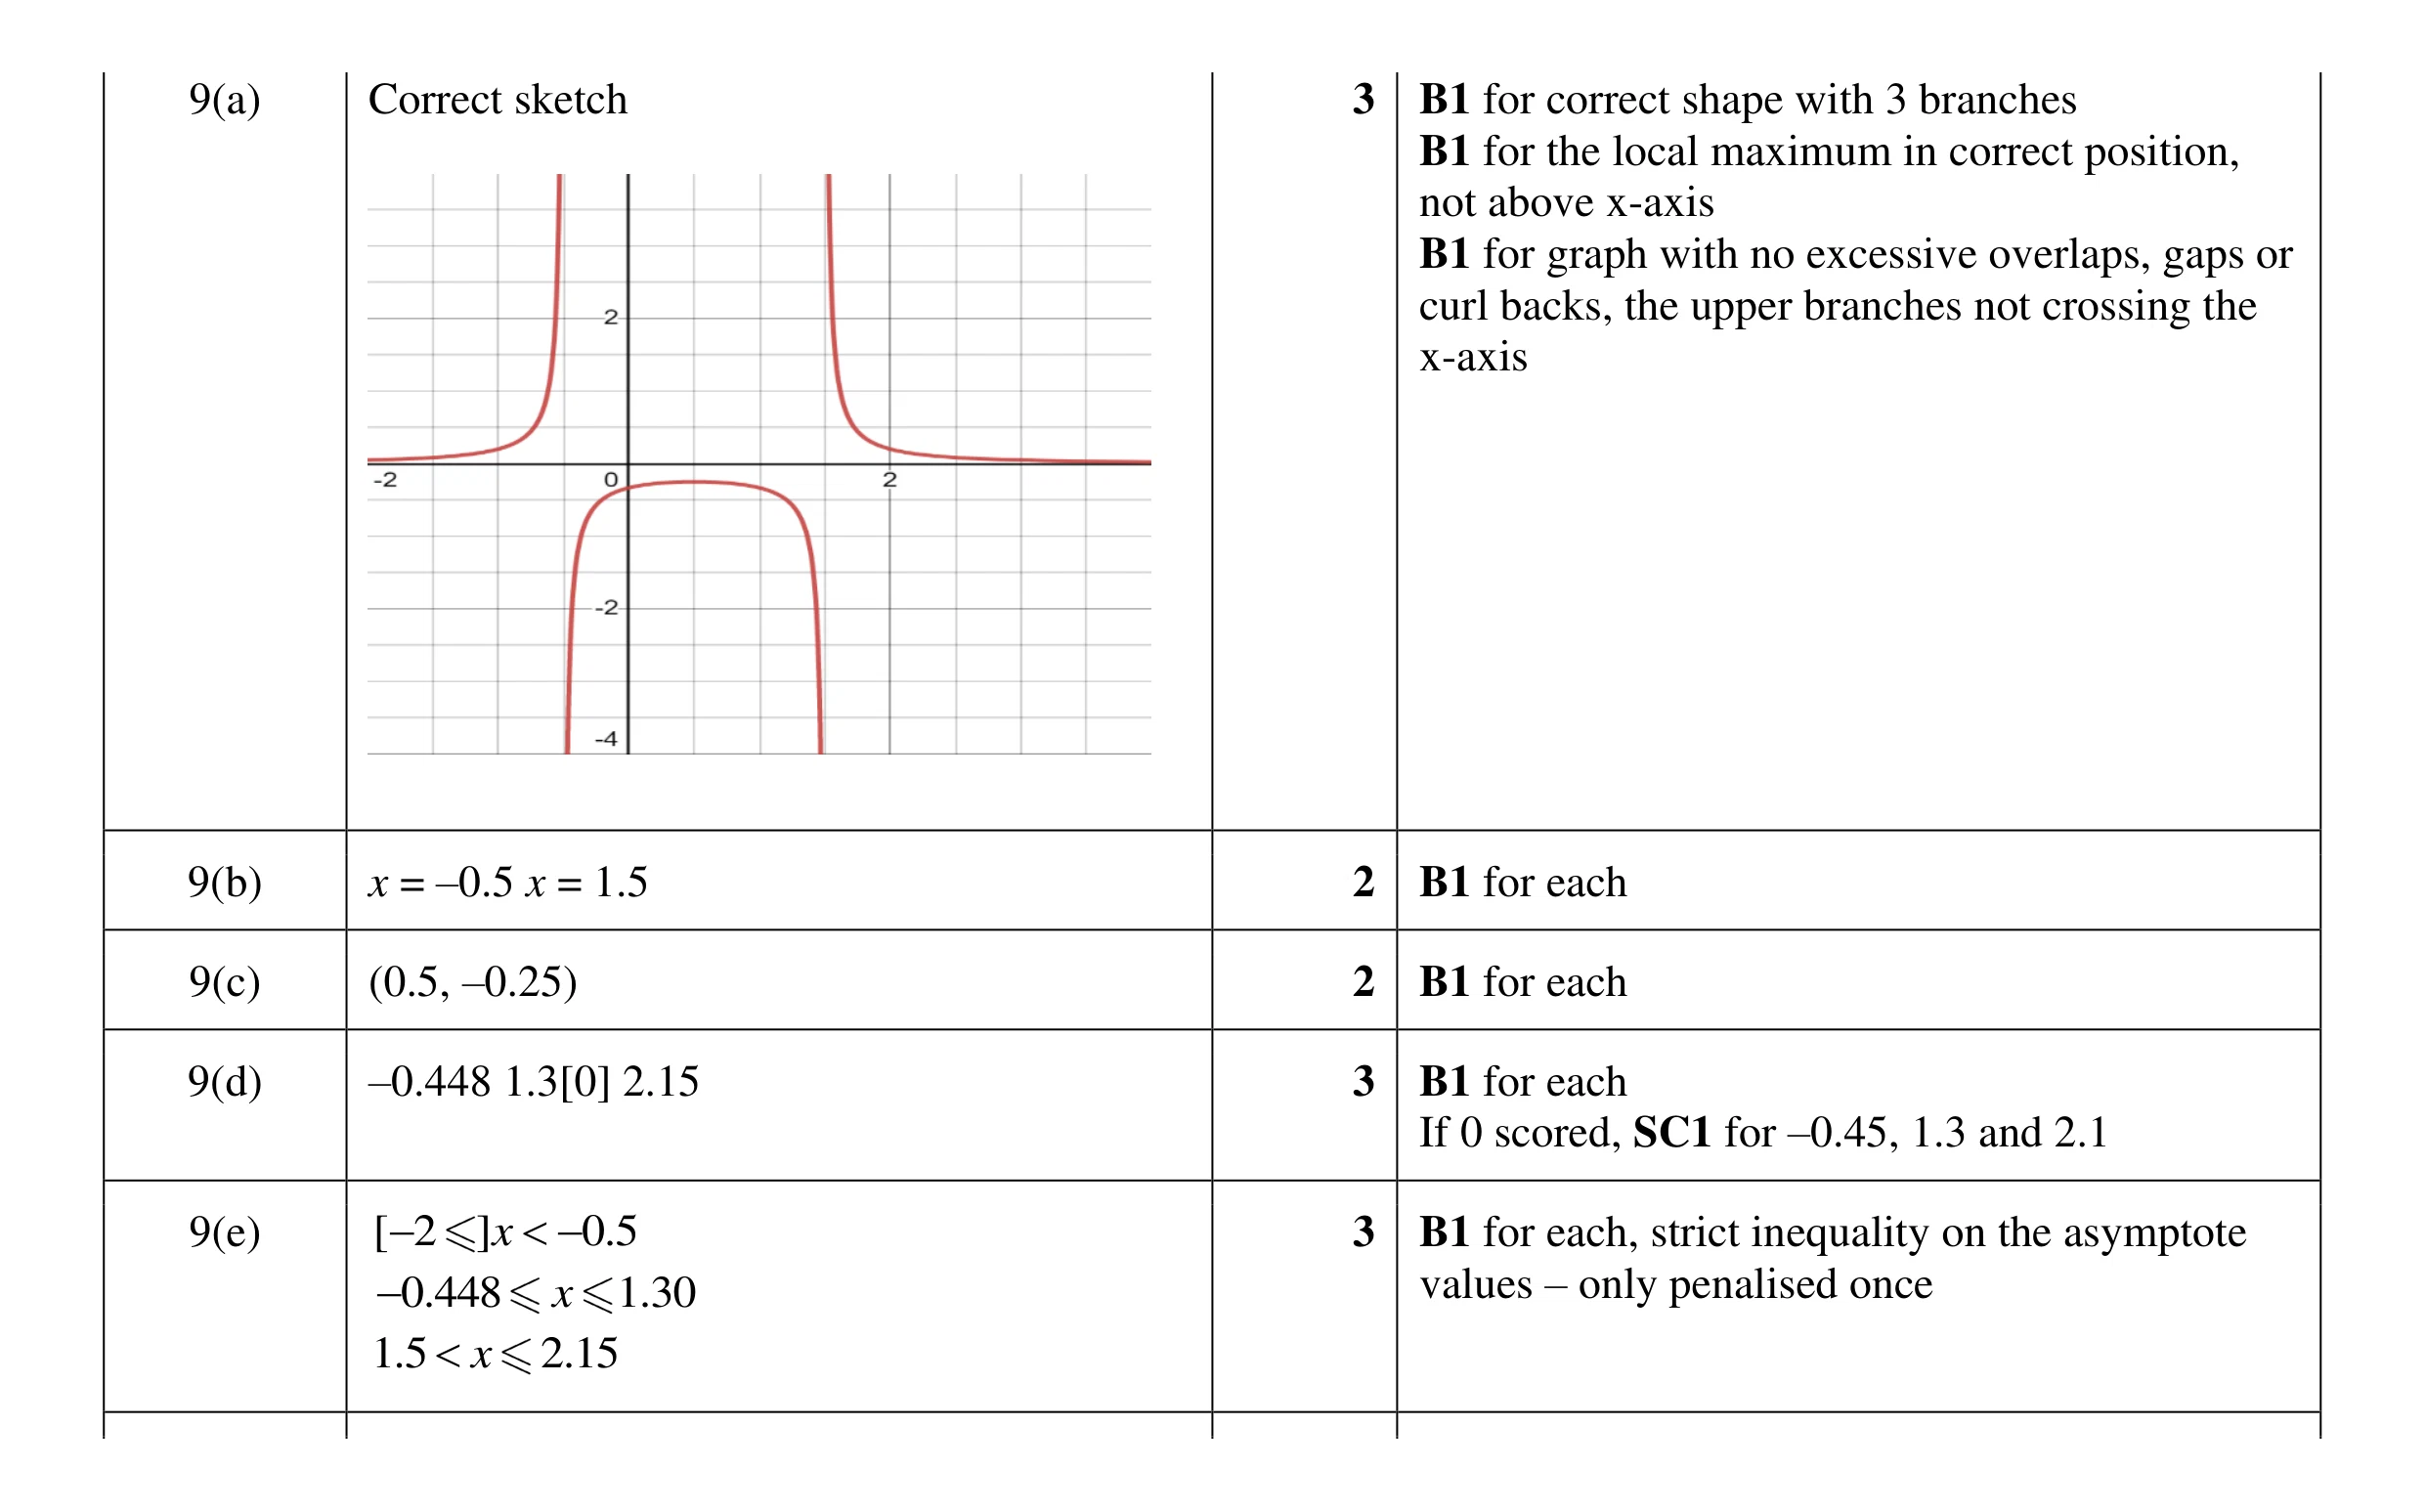 13
13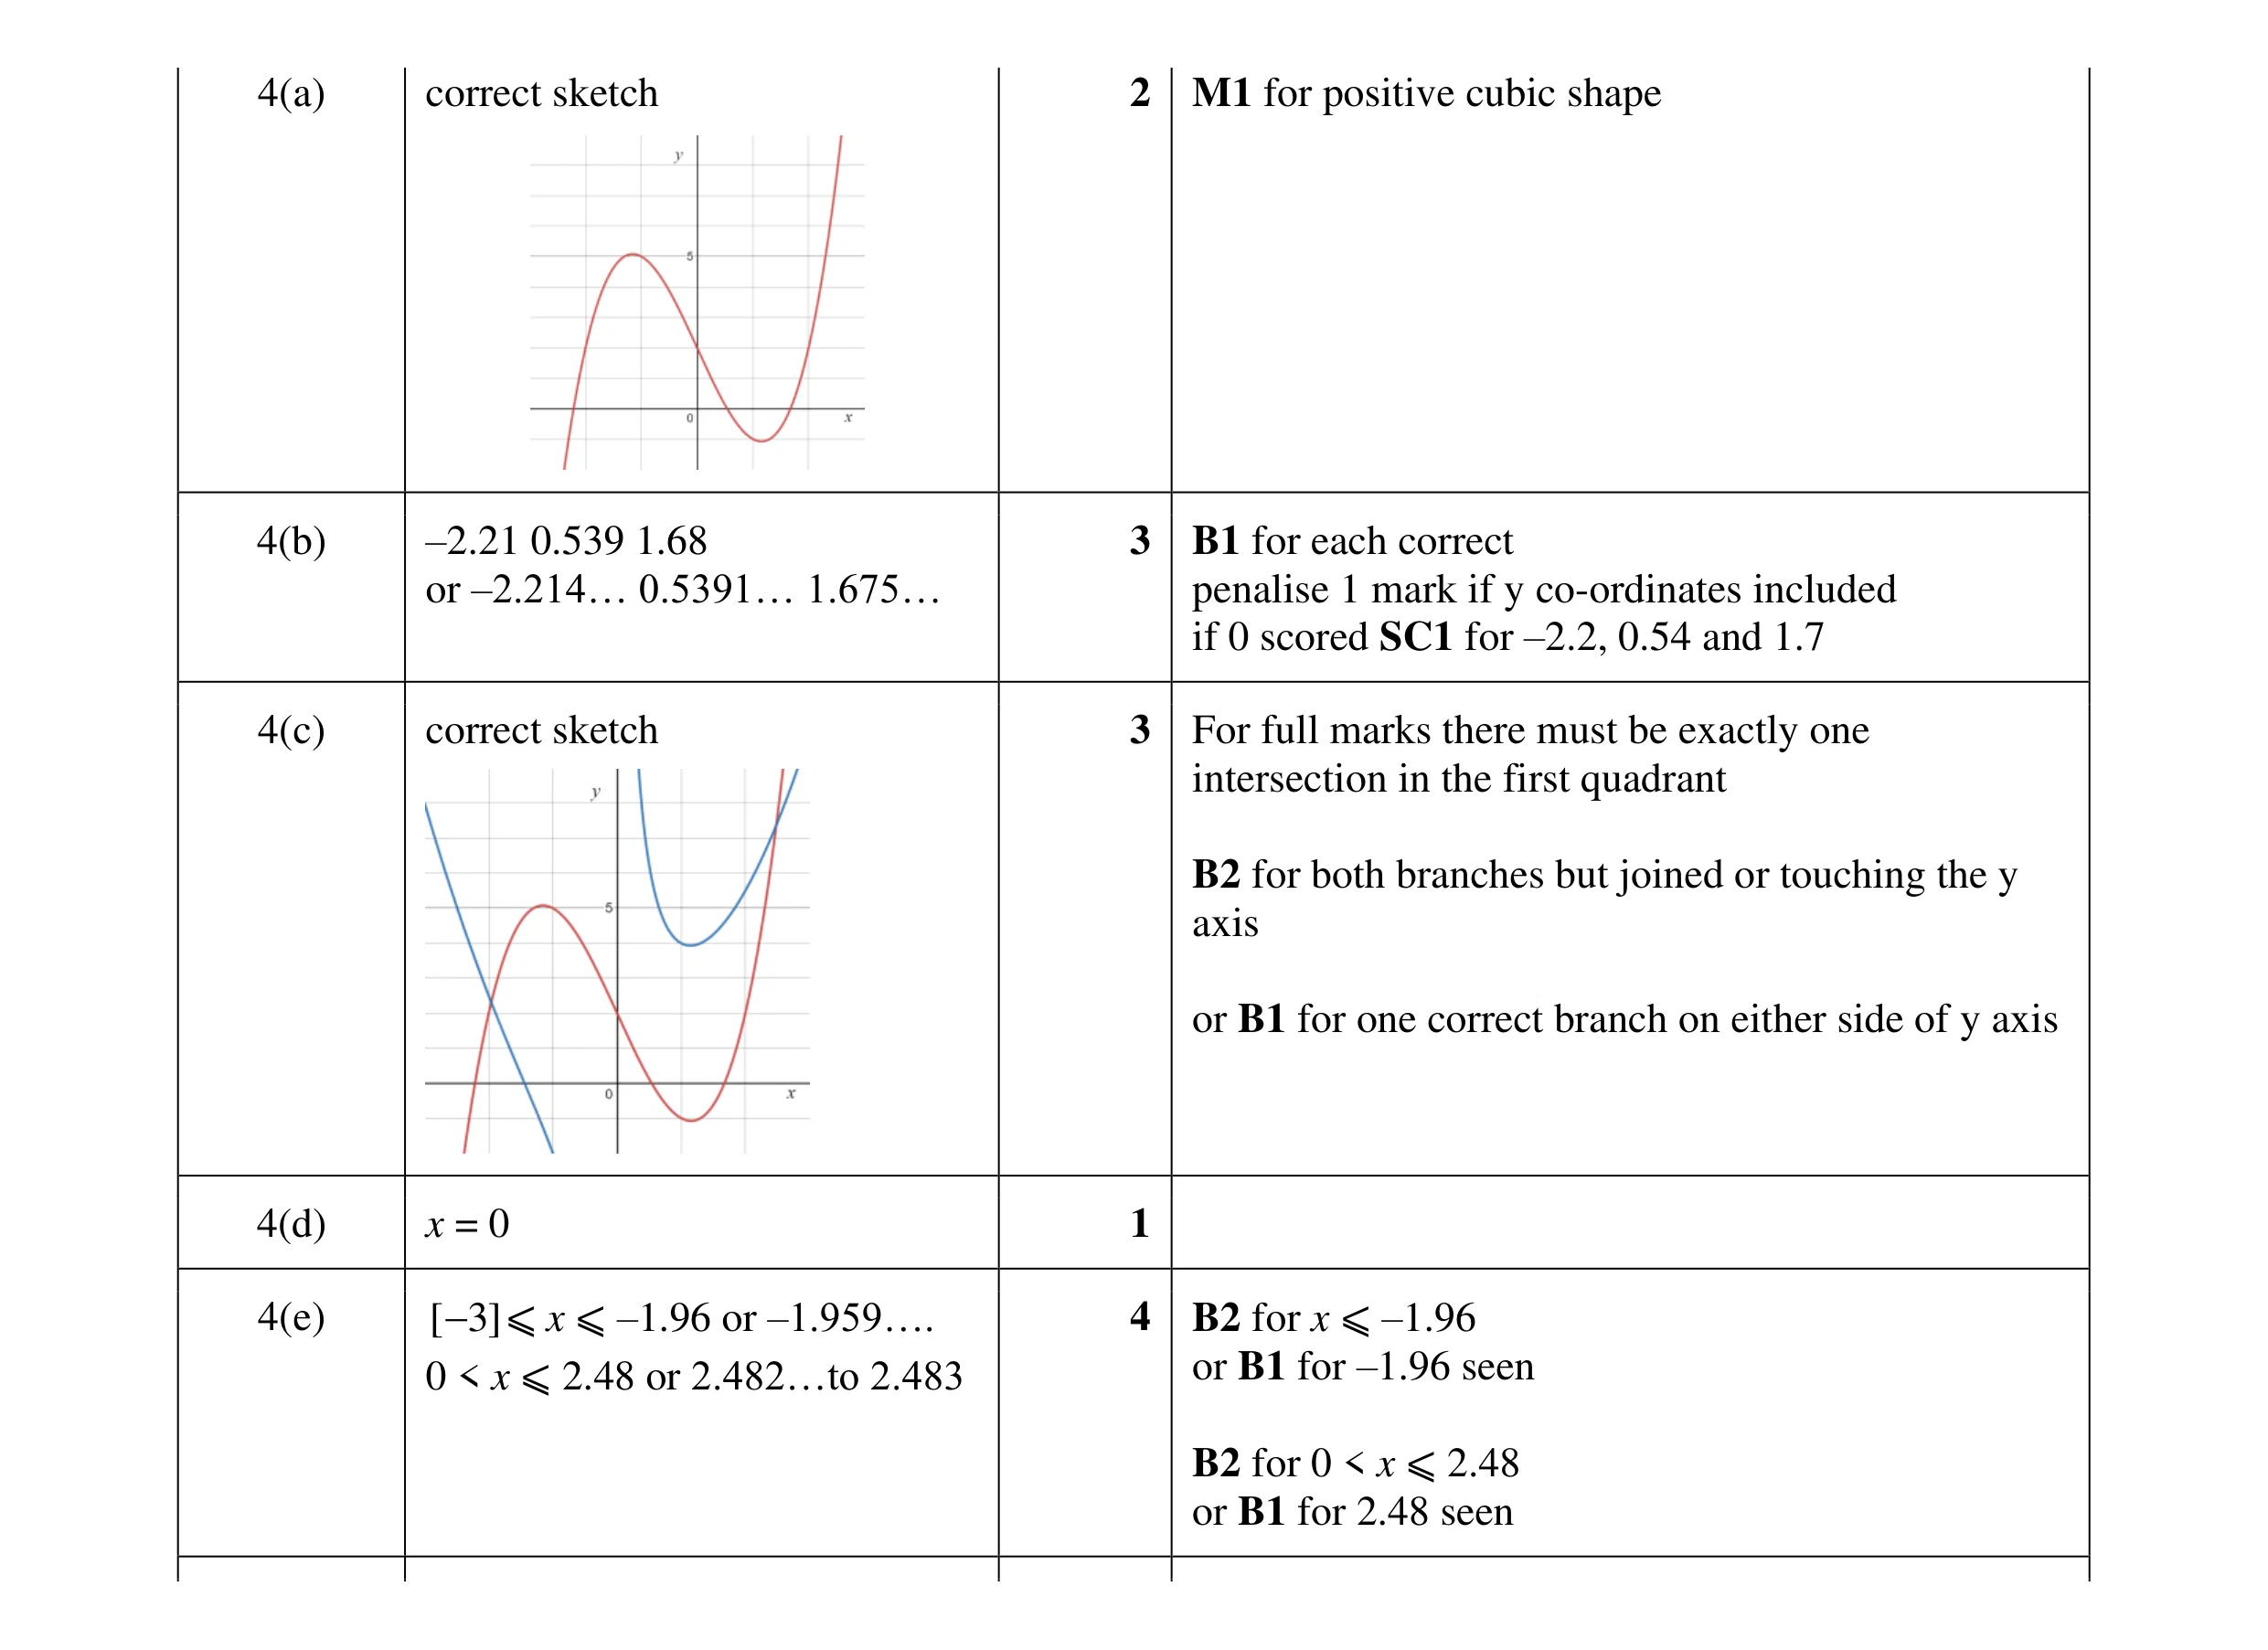 13
13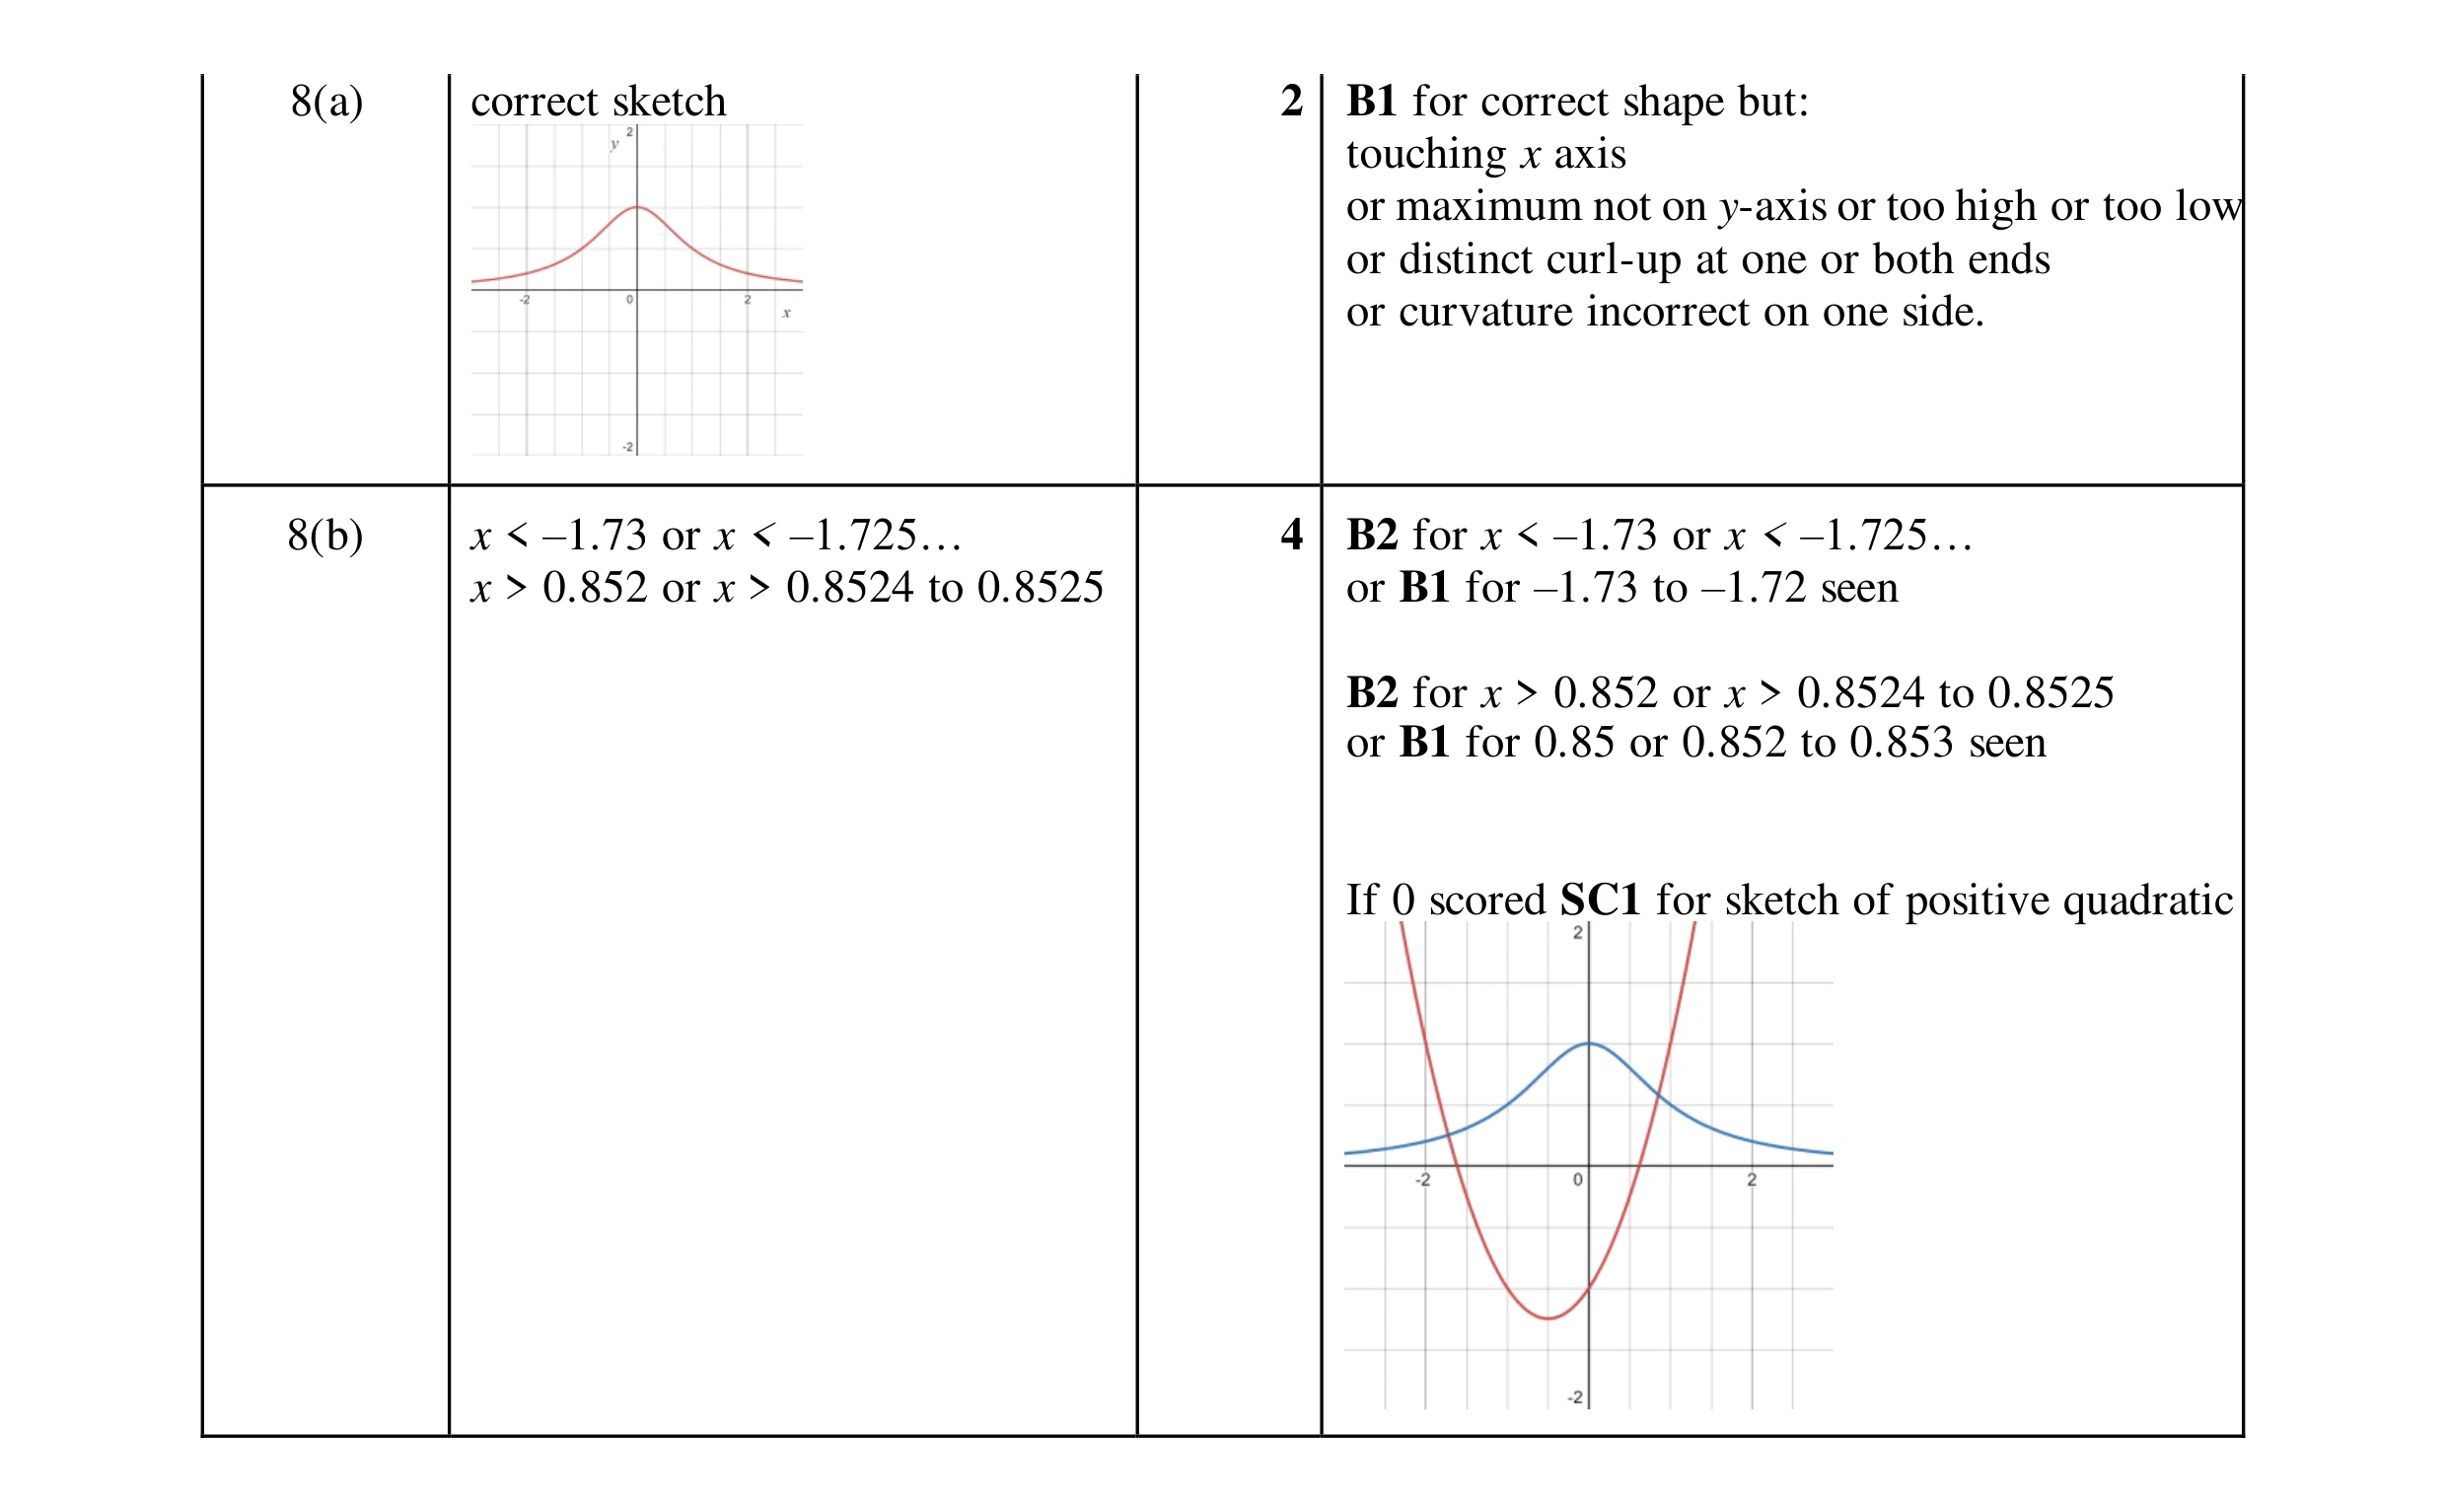 6
6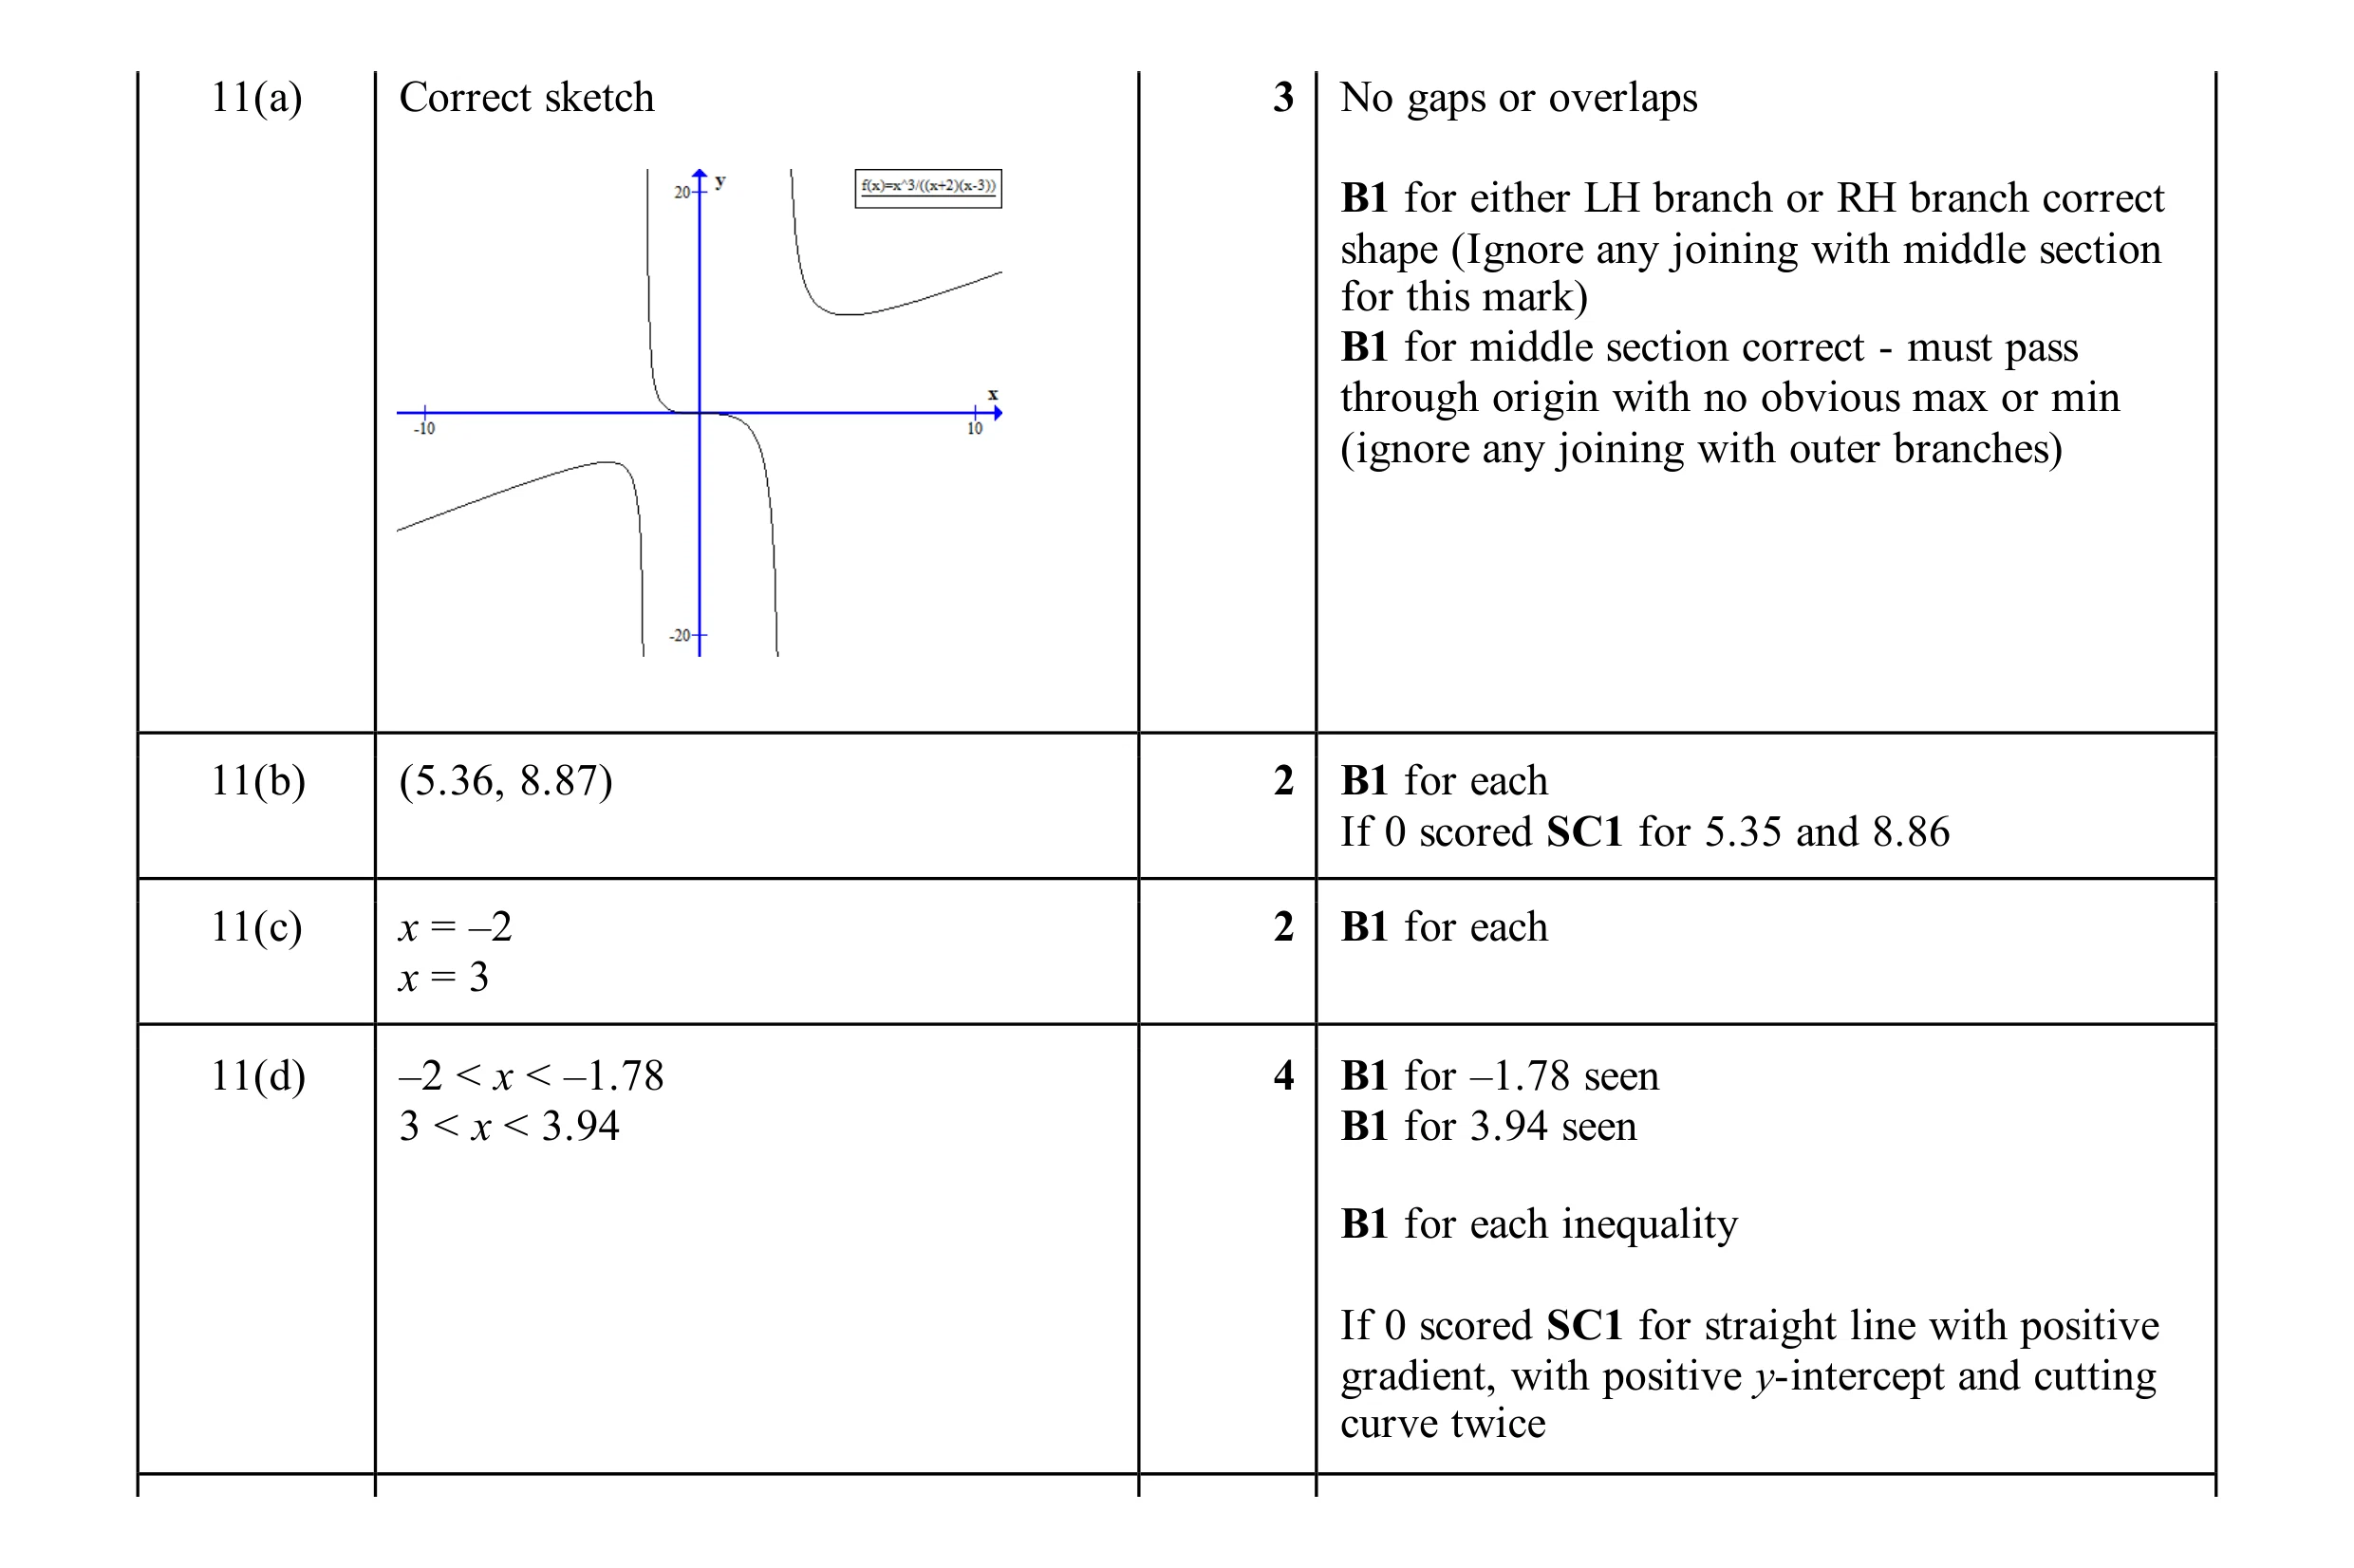 11
11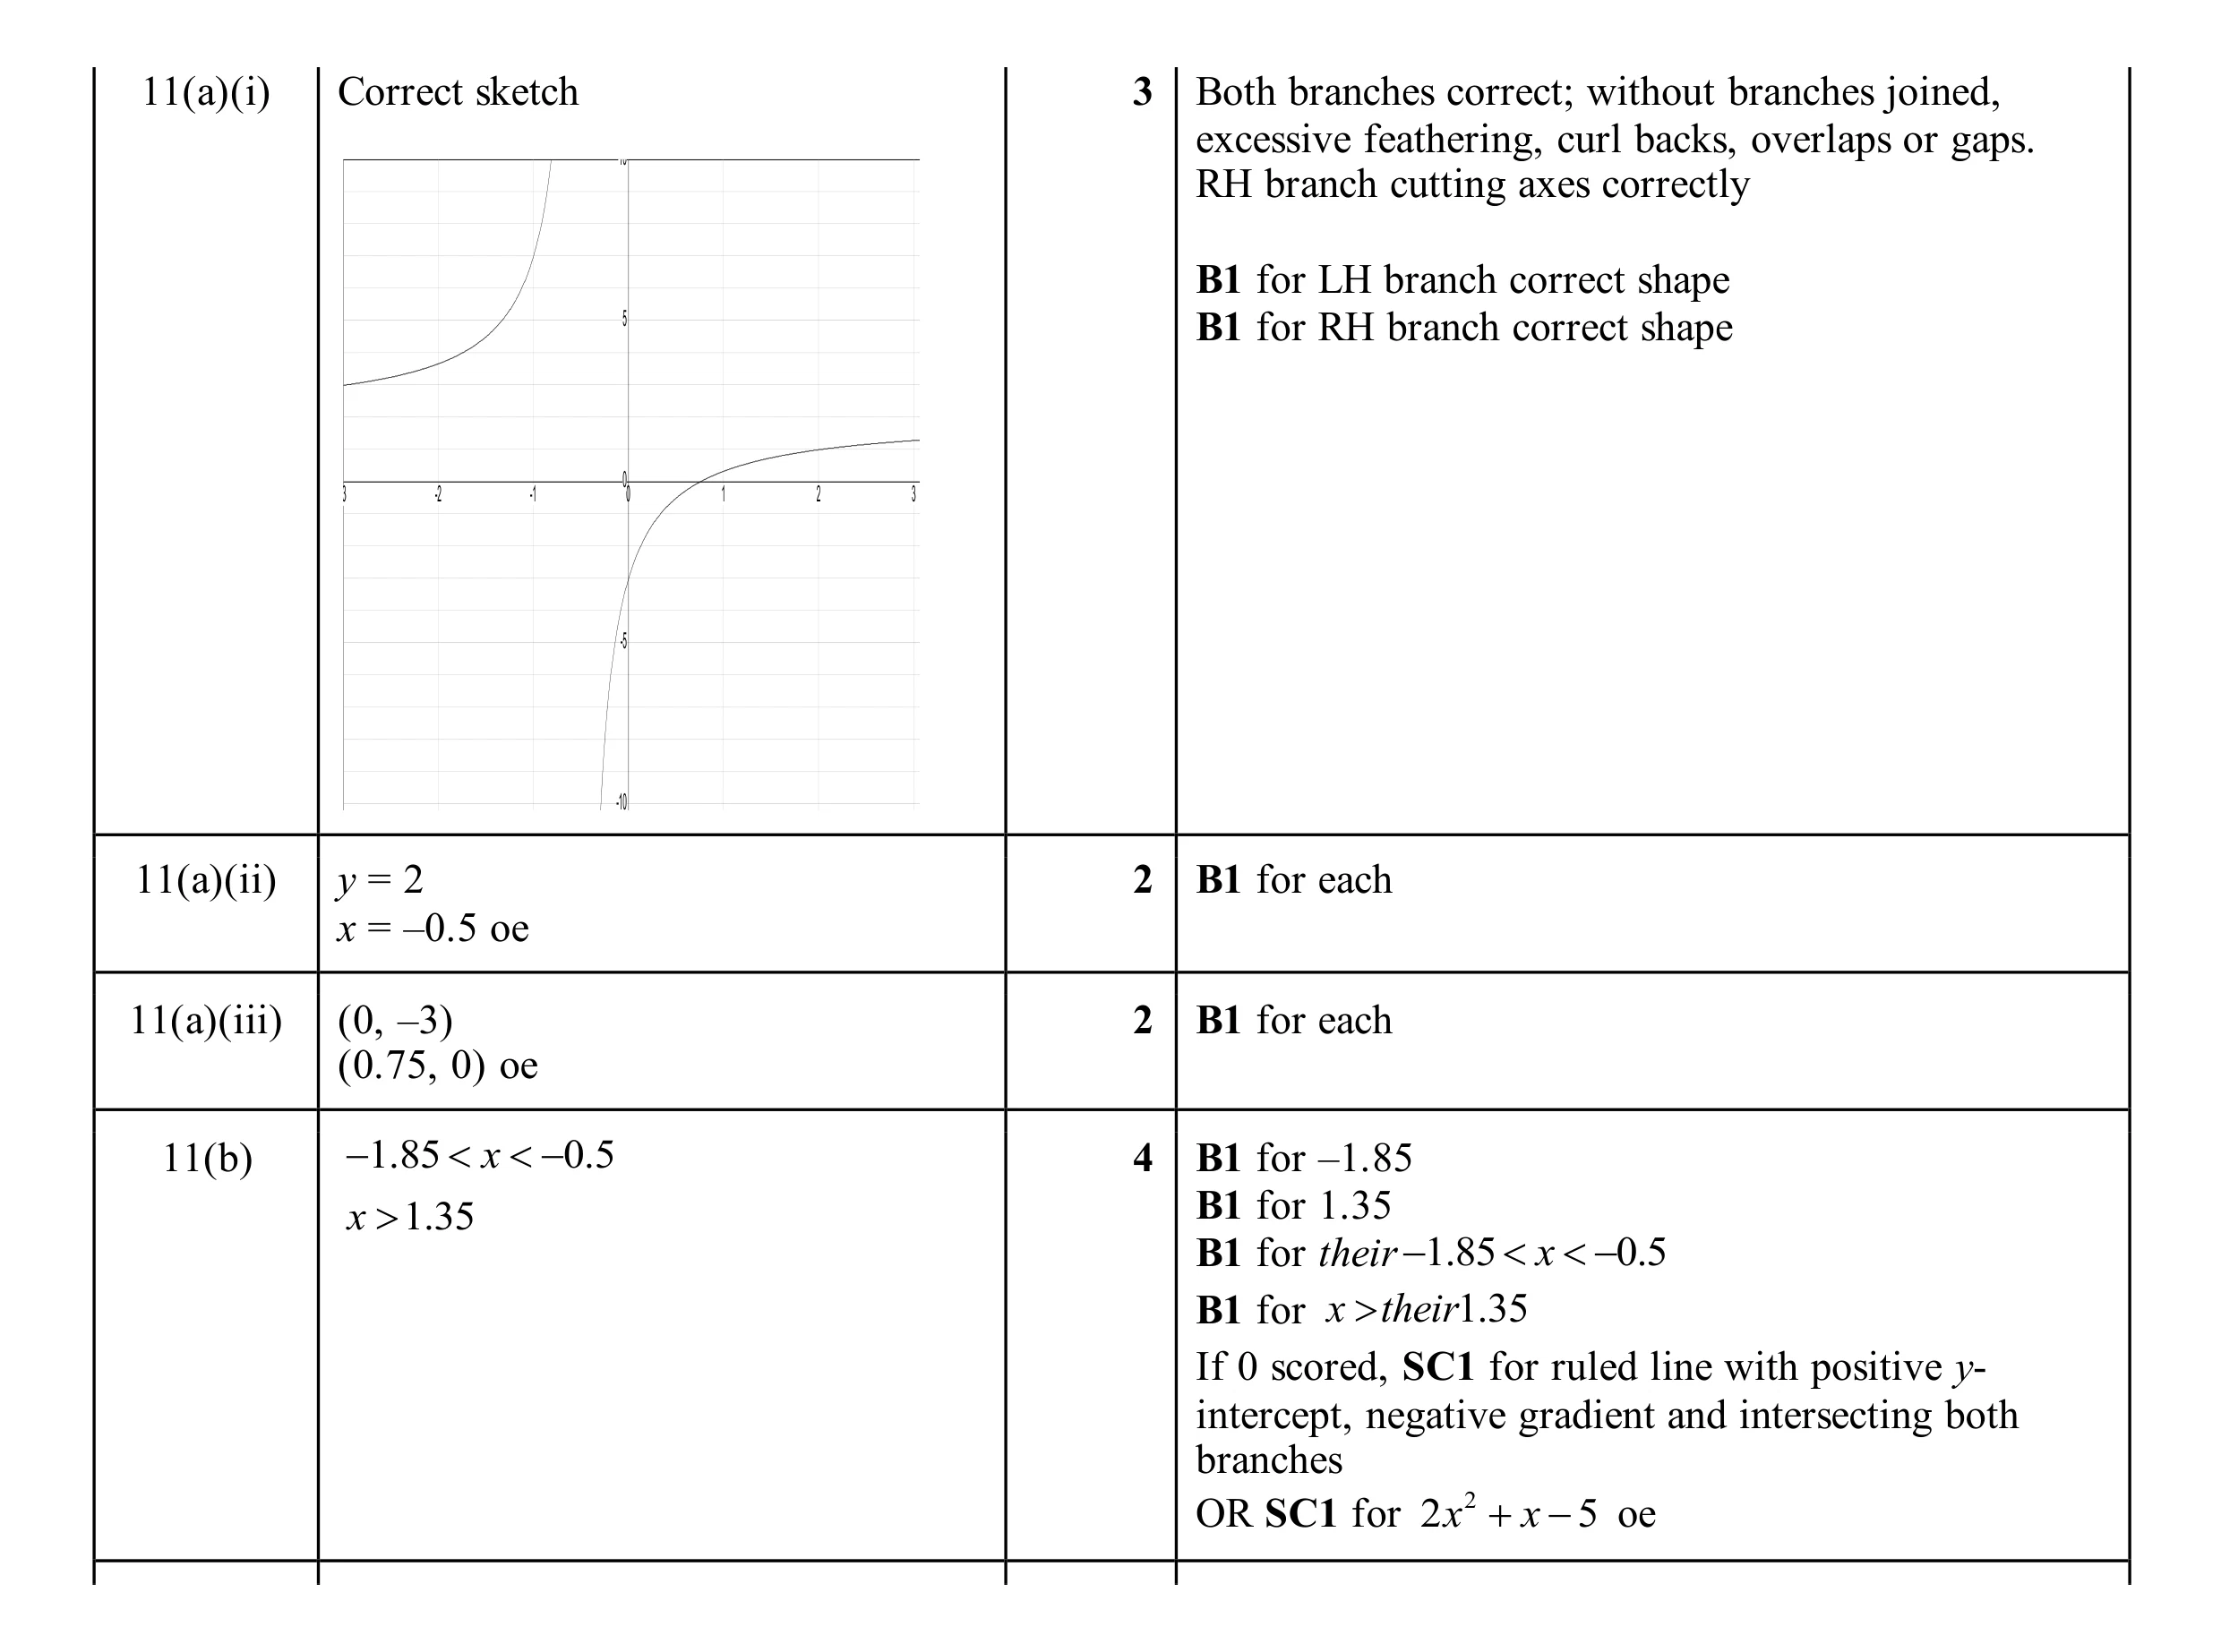 11
11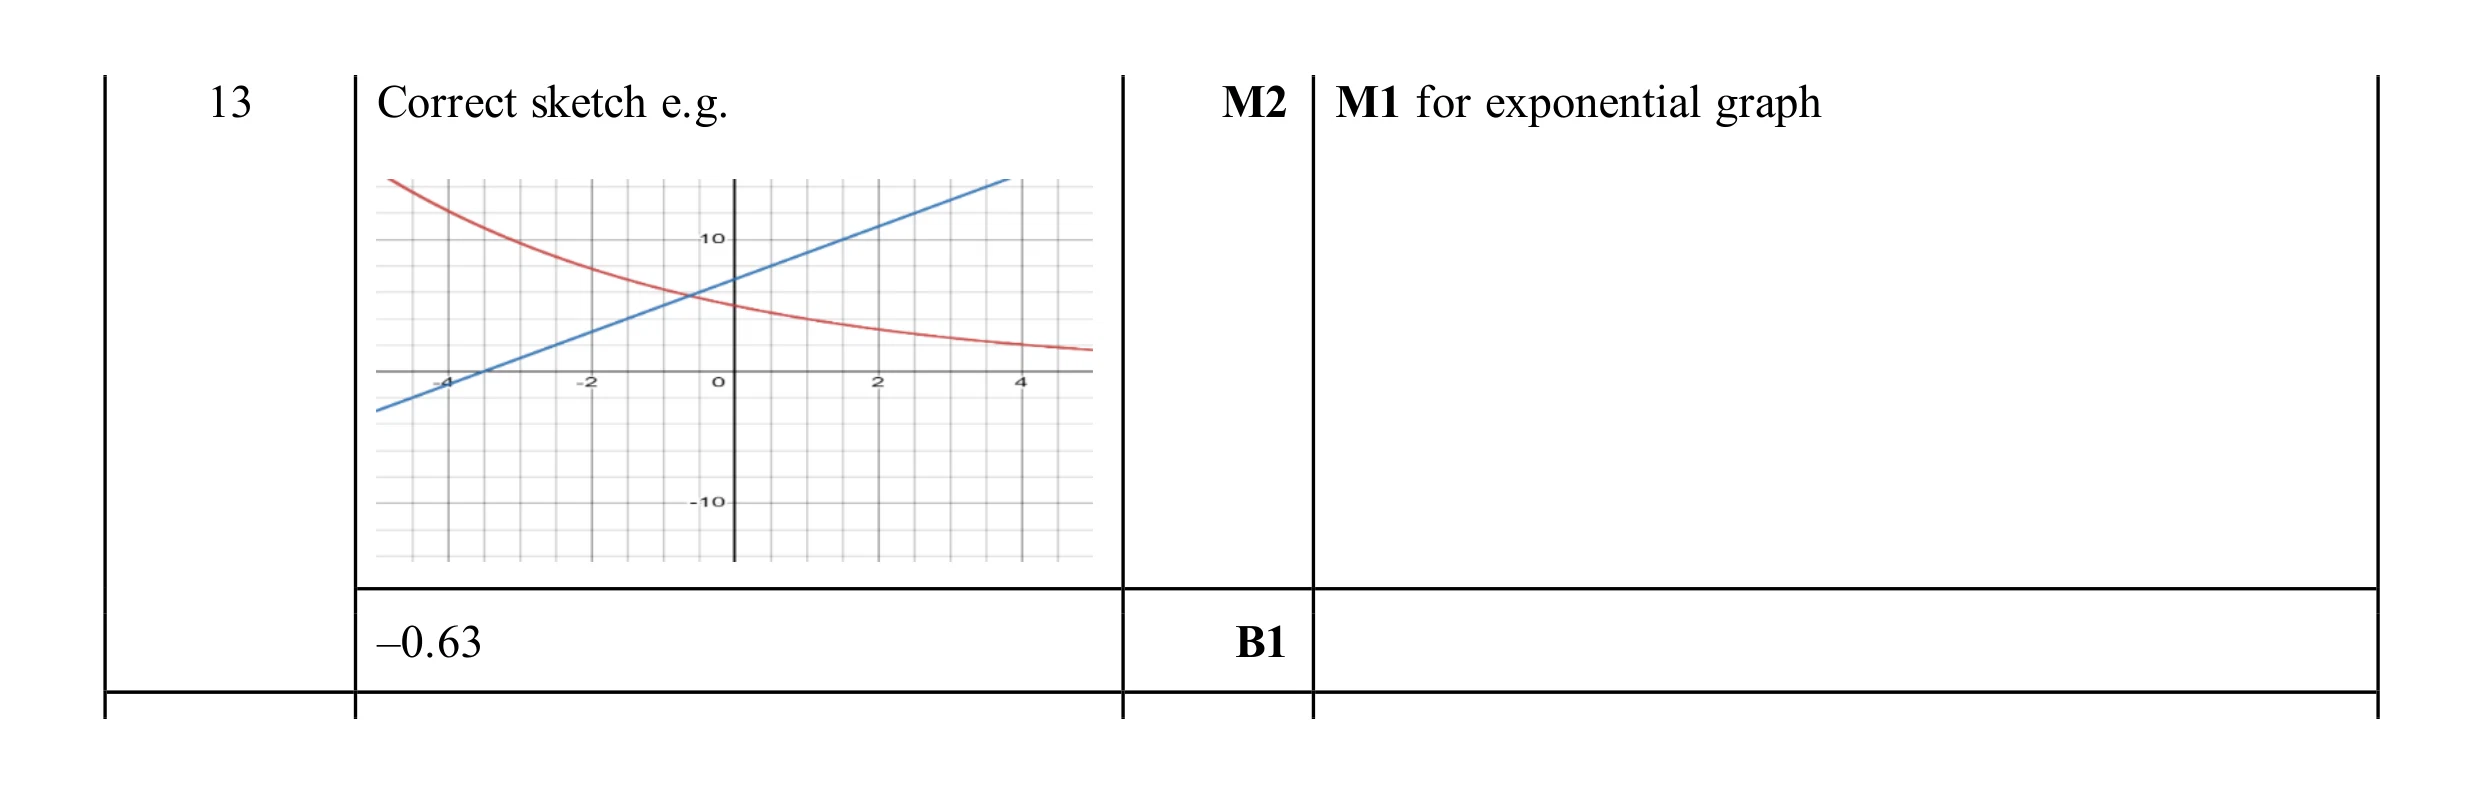 3
3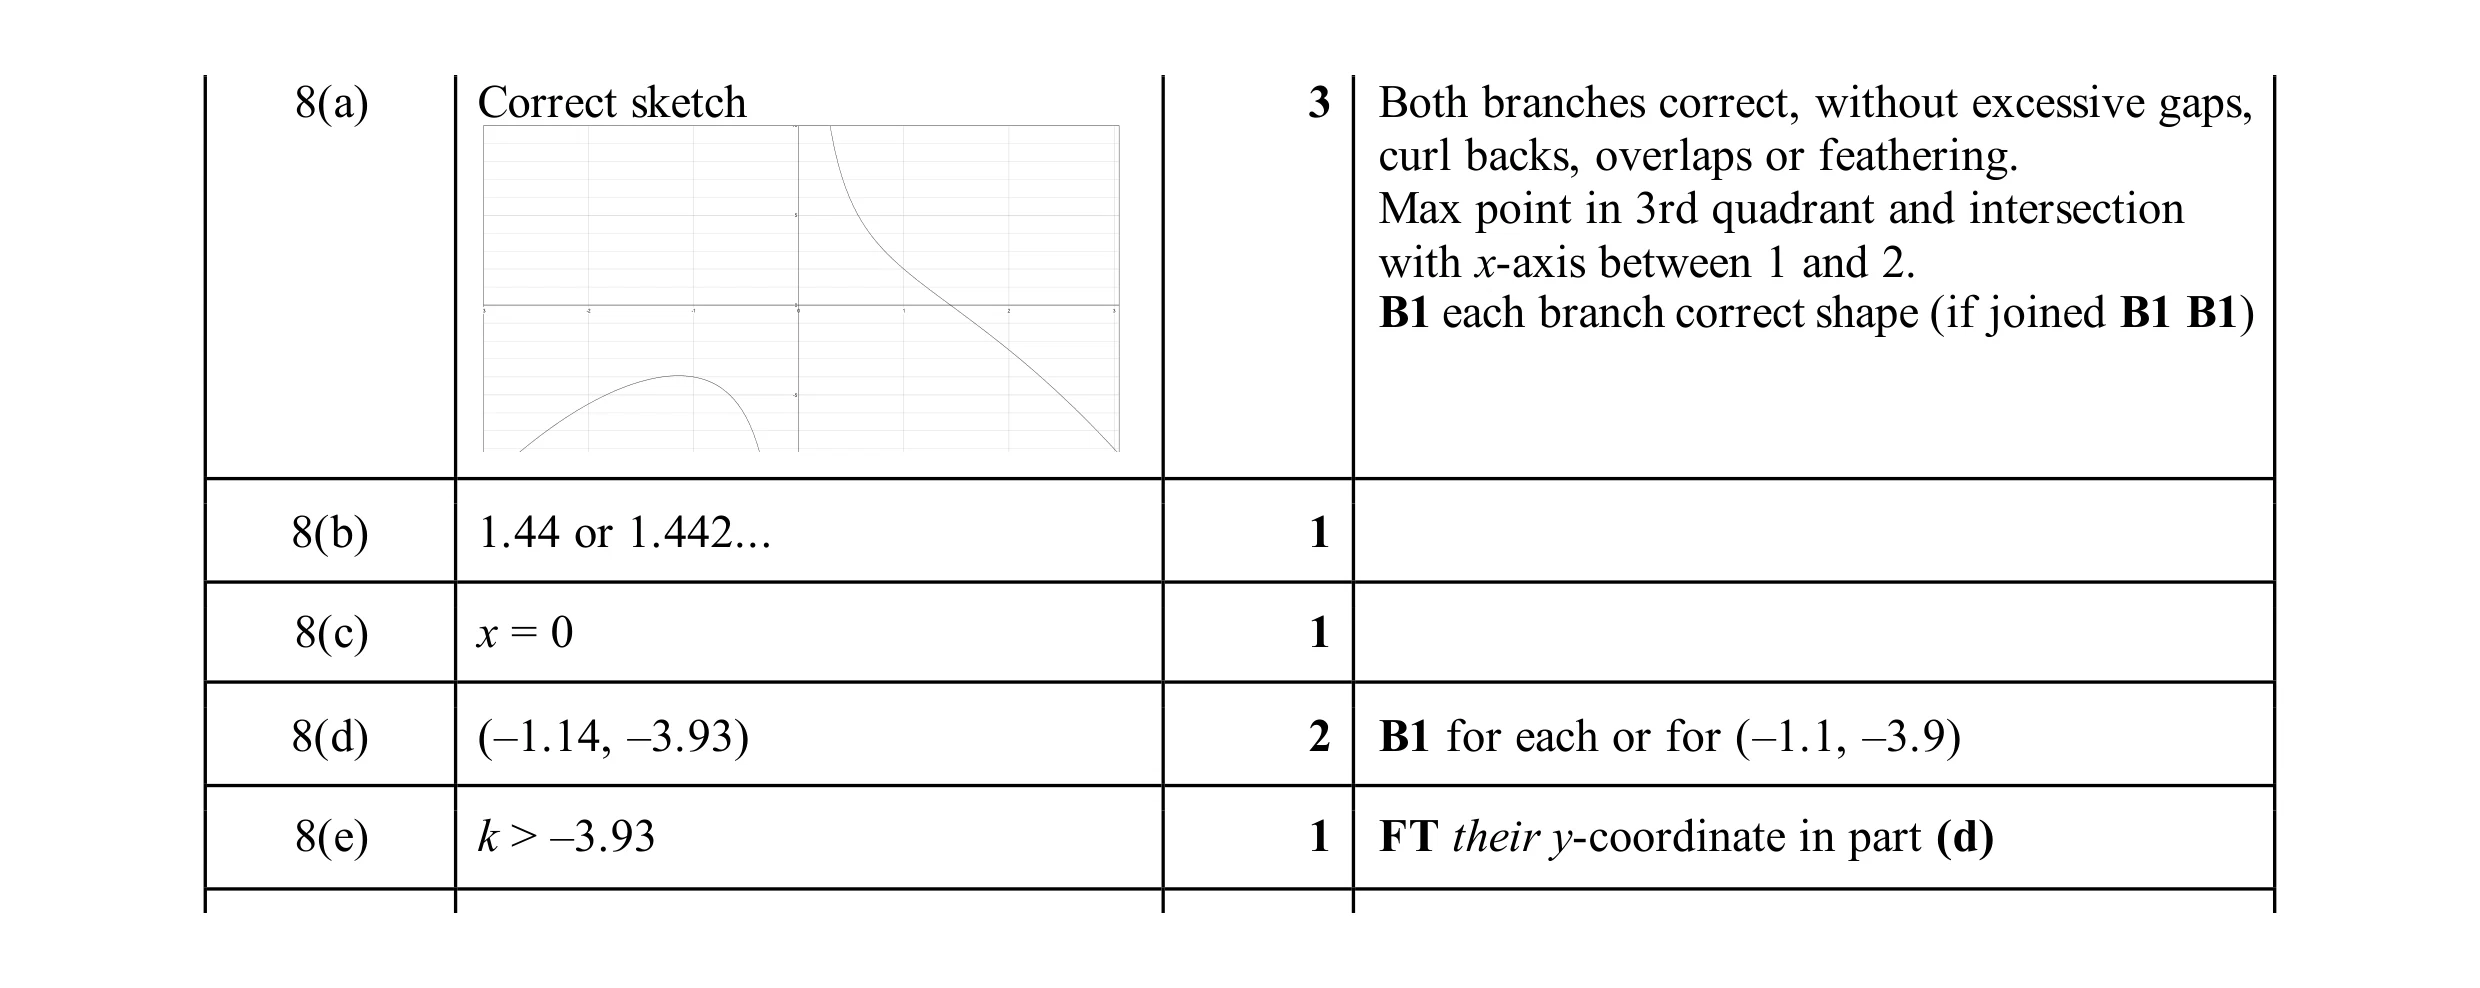 8
8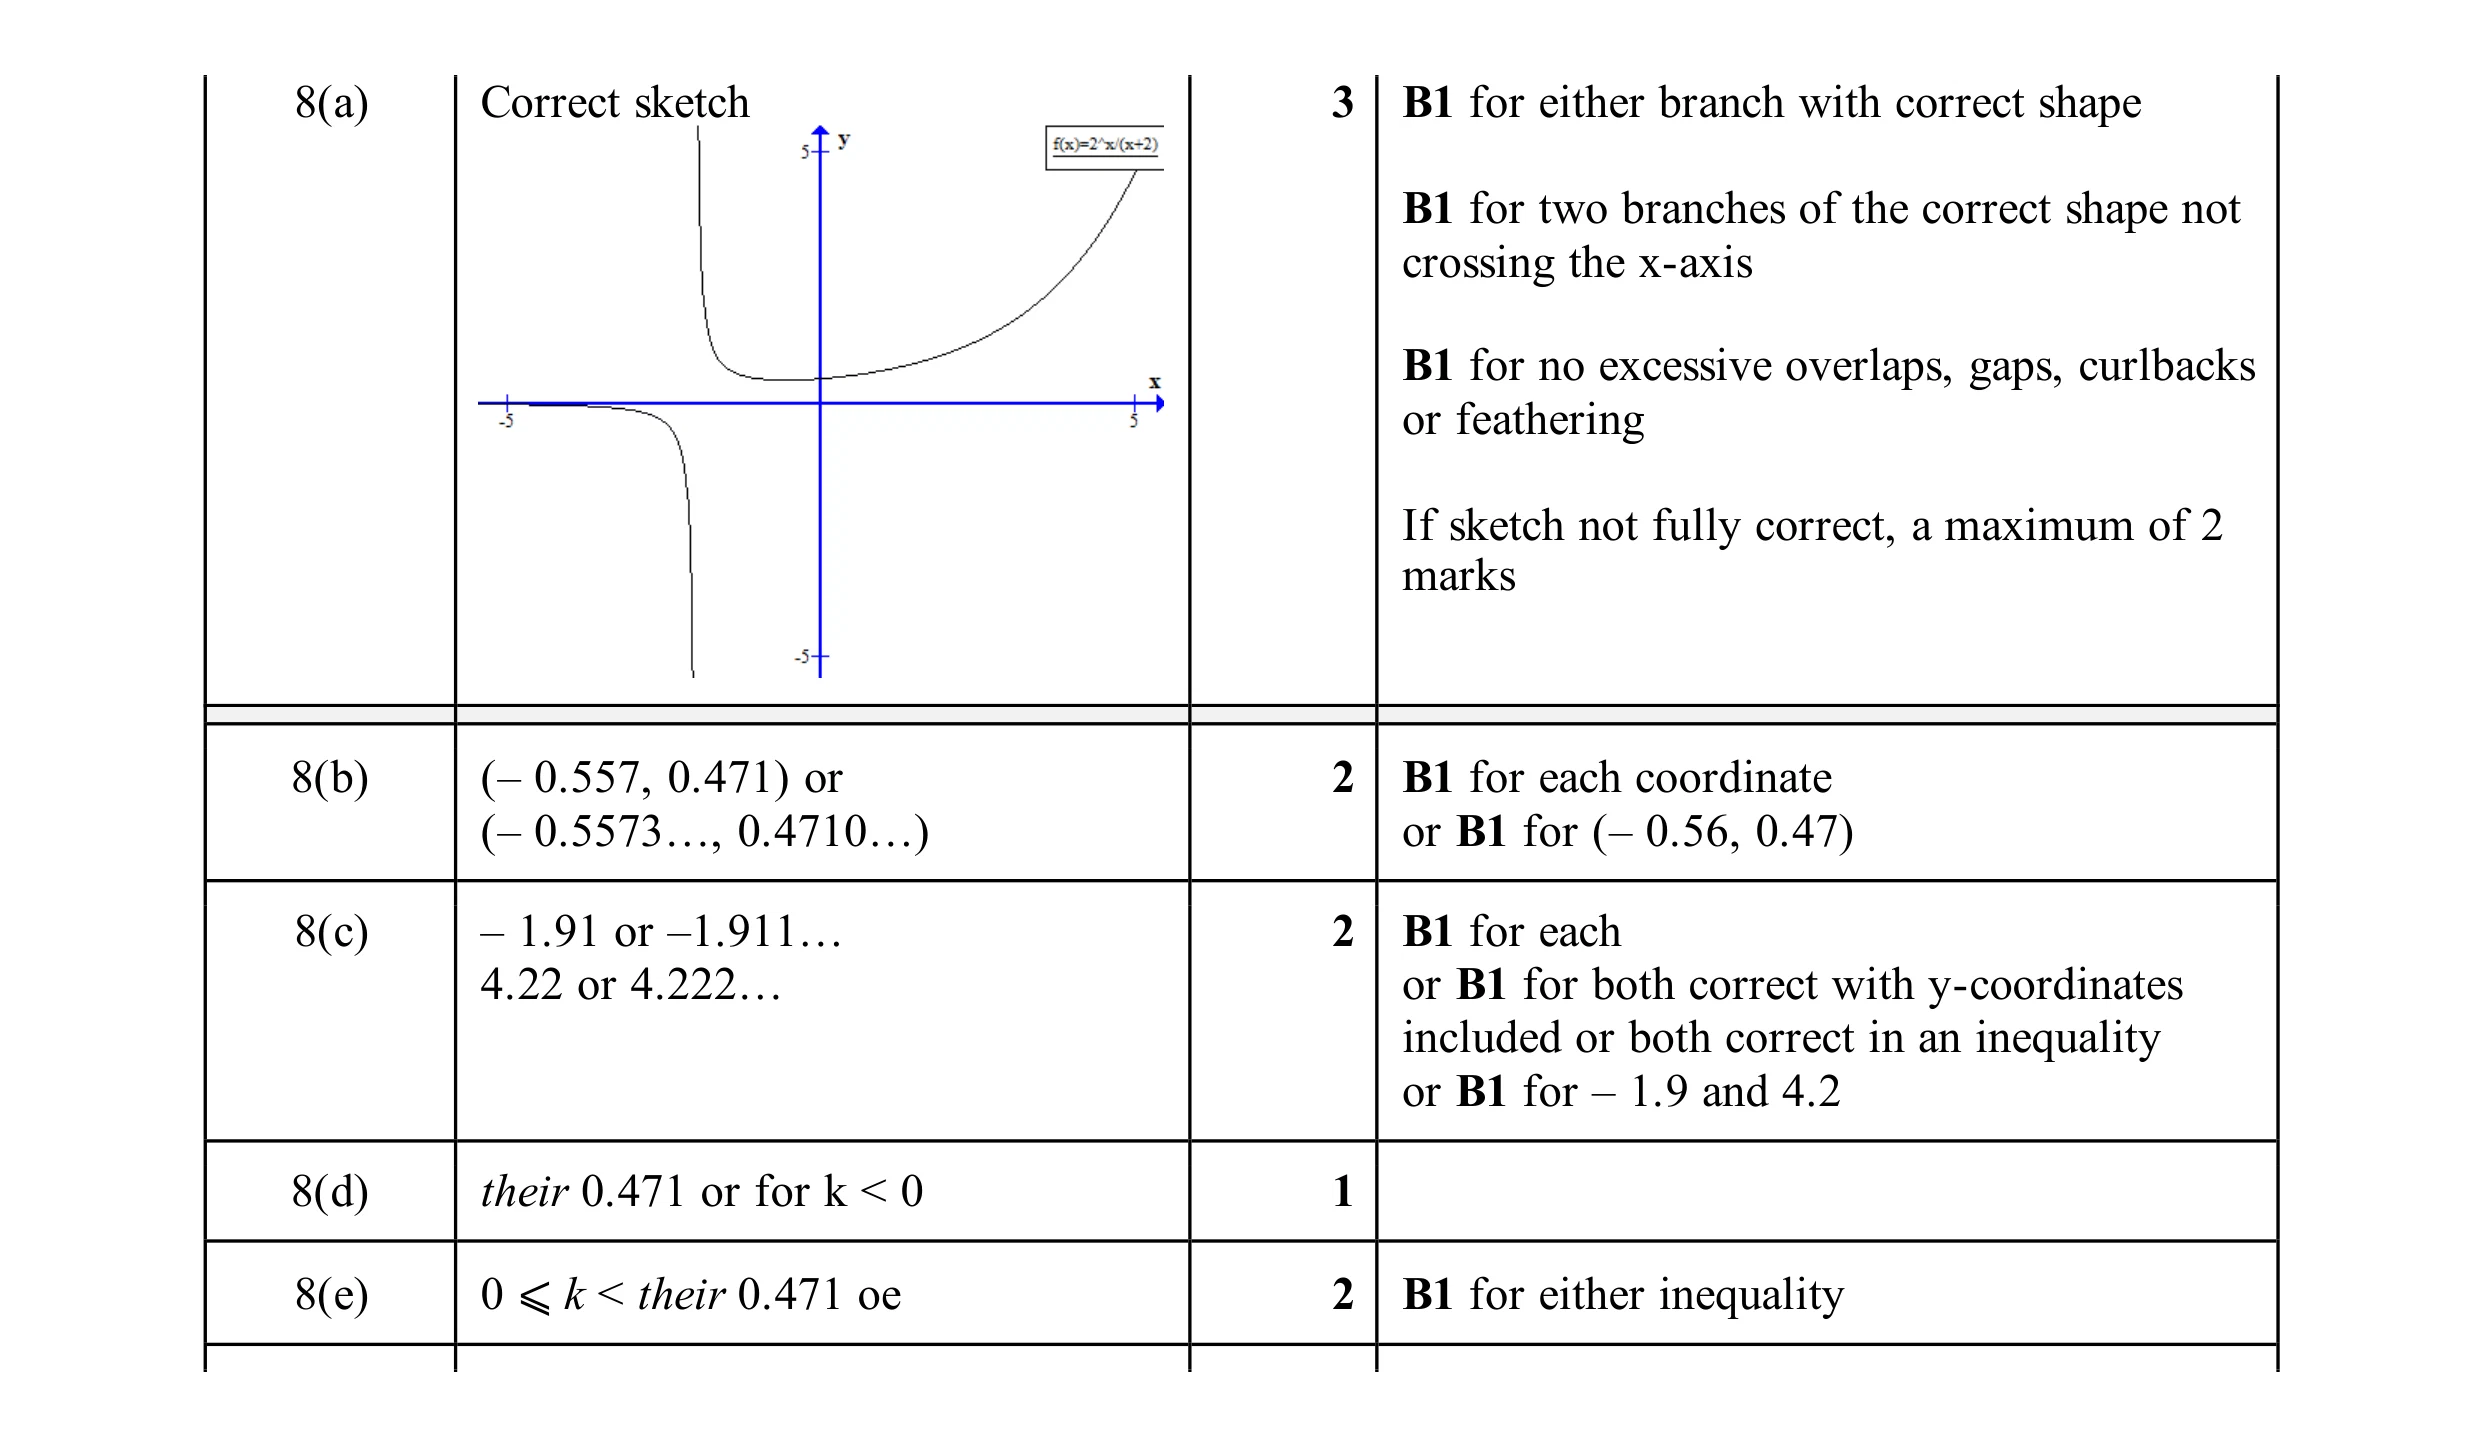 10
10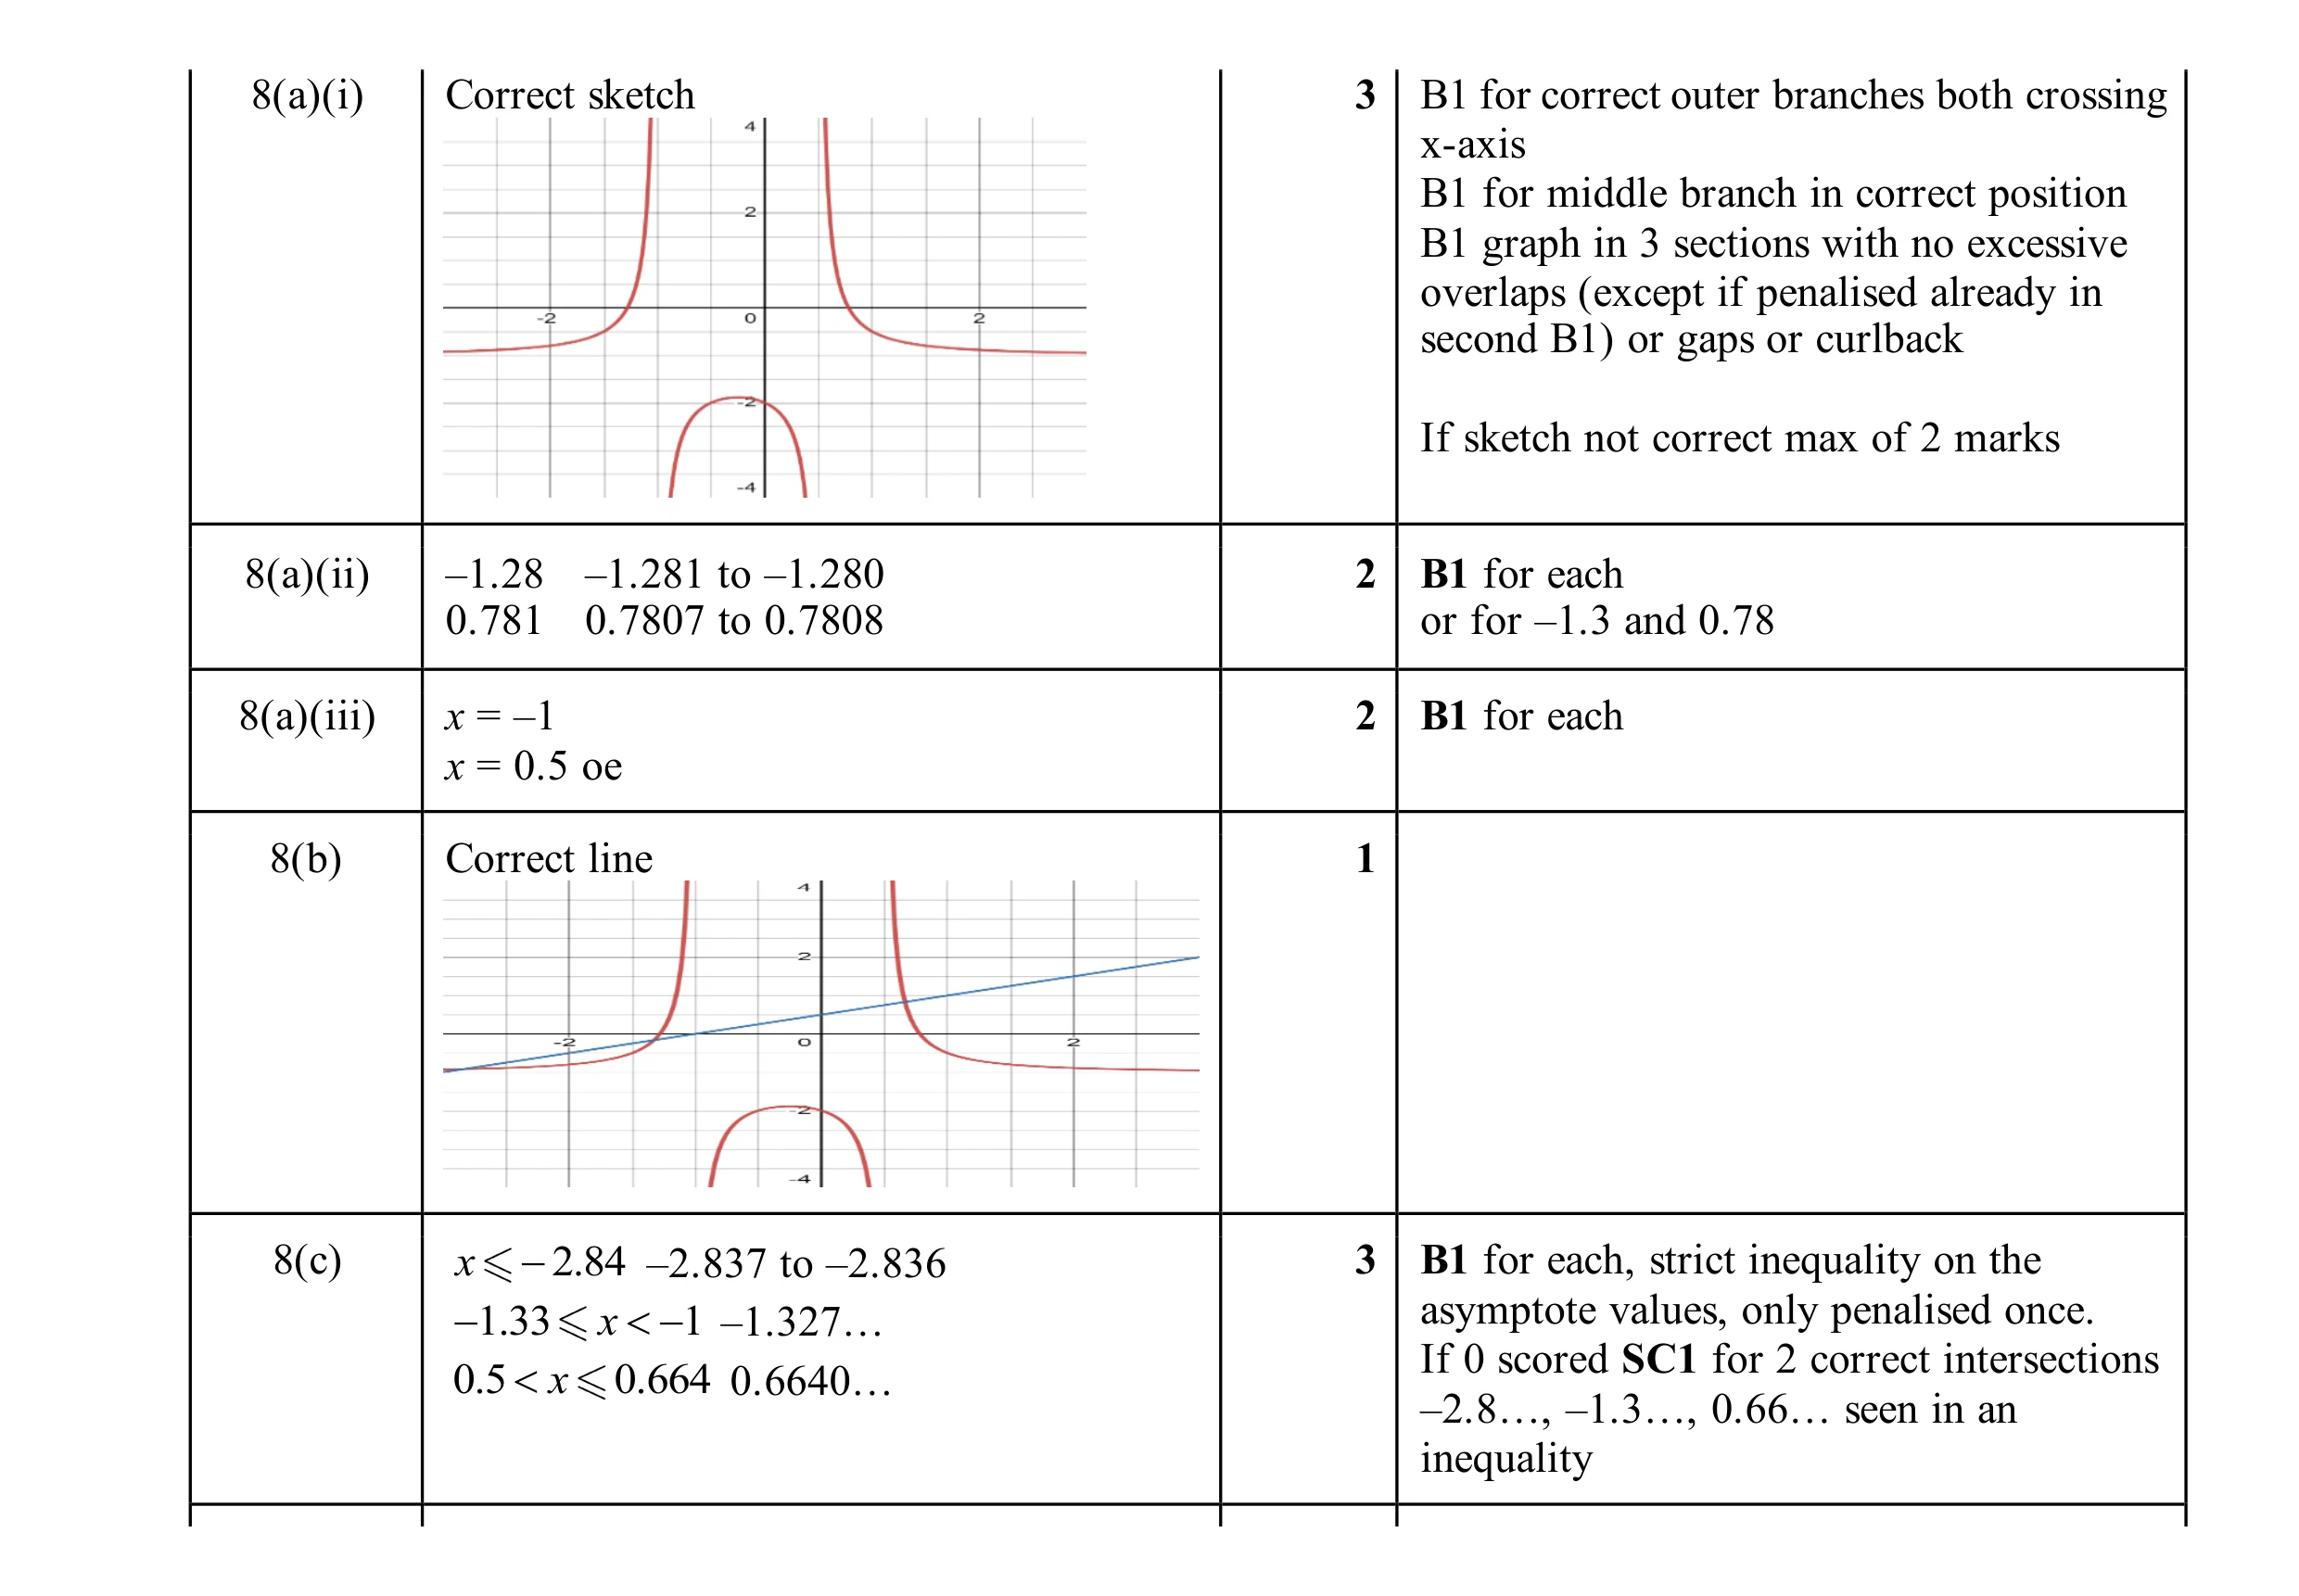 11
11