Cambridge IGCSE Mathematics - International 0607 — 2020 May/June Paper 4 · Variant 3
0607/43/M/J/20 · 12 questions · 120 marks · ≈135 min
The question paper and its mark scheme, free to read here and free to download. This is Cambridge’s own paper, exactly as it was sat.
Question paper20 pages
Mark scheme8 pages
Answers below. Sit the paper first if you are practising.
Questions as text
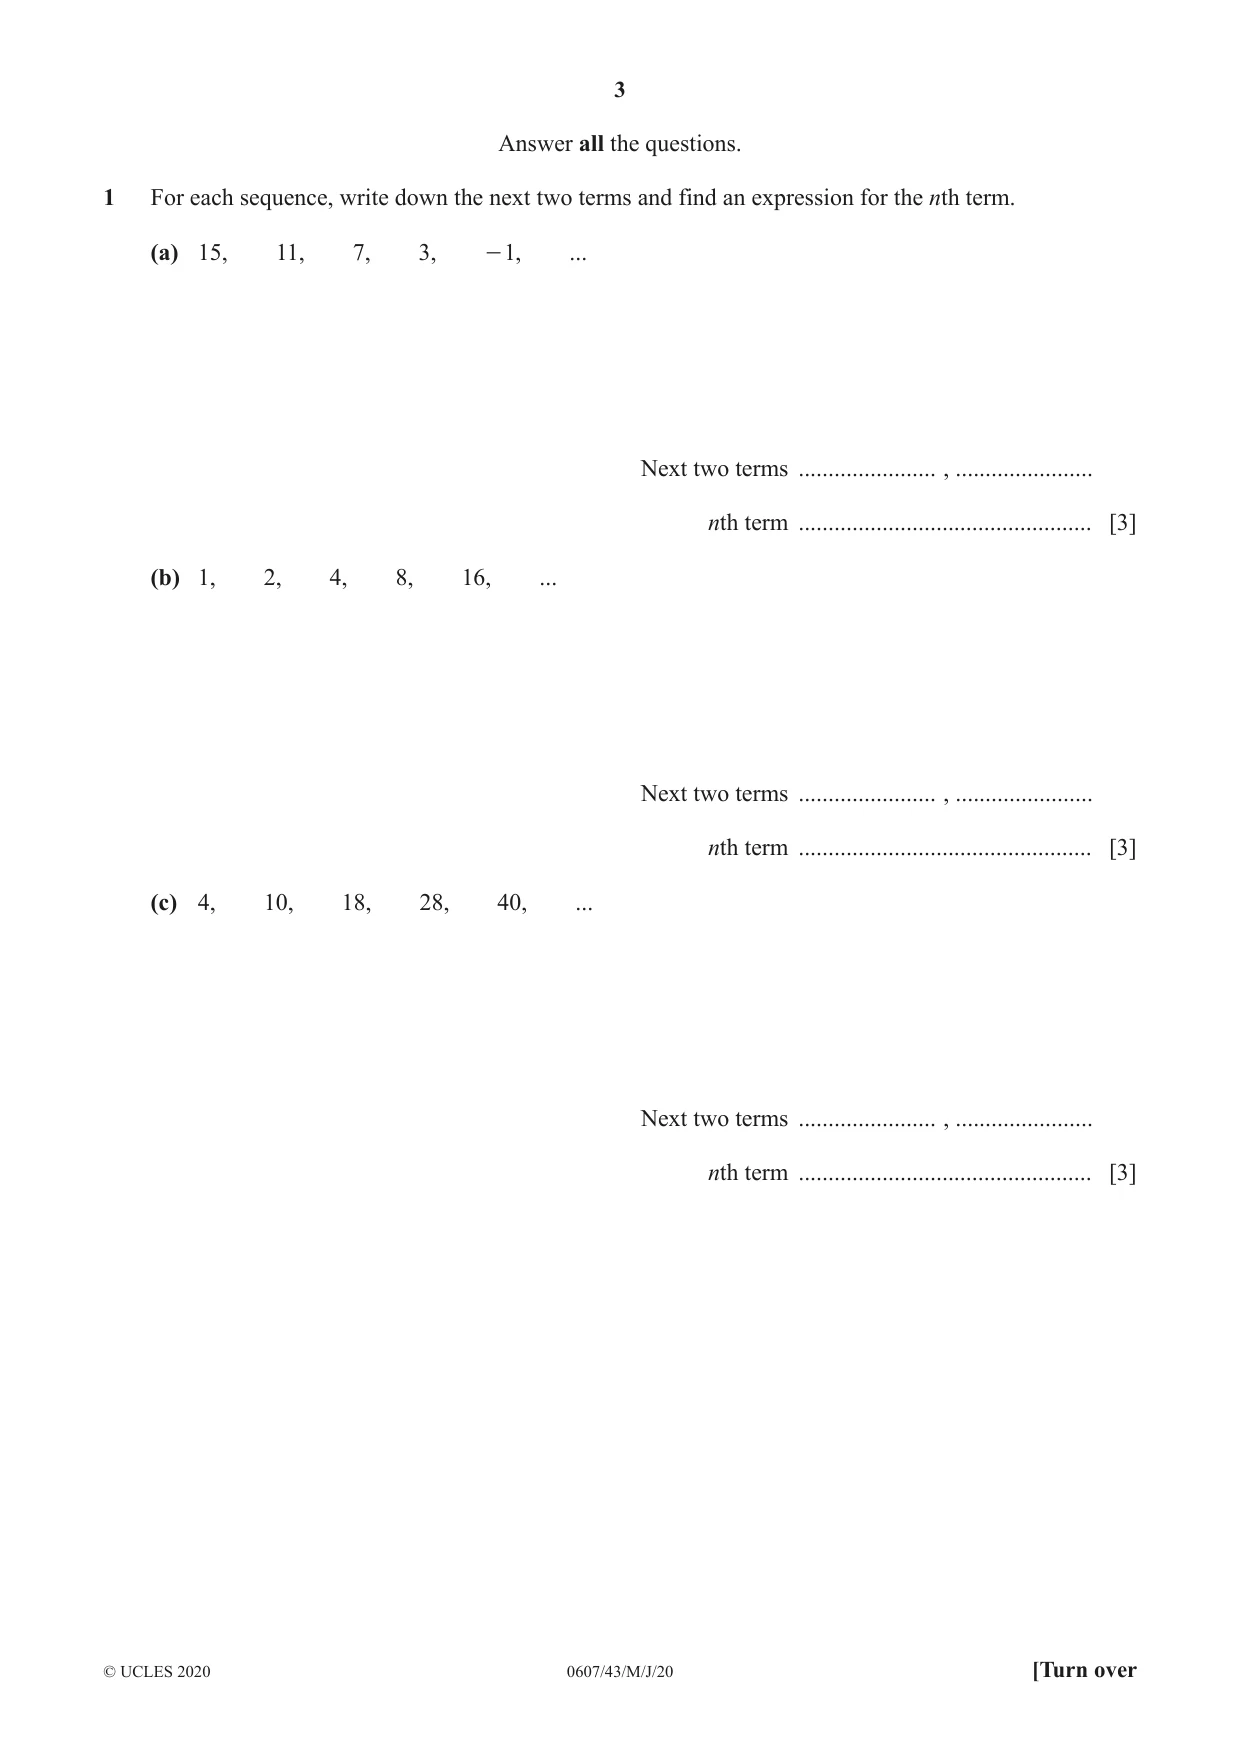
Q1 · For each sequence, write down the next two terms and find an expression for the nth term
1 For each sequence, write down the next two terms and find an expression for the nth term. (a) 15, 11, 7, 3, - 1, ... Next two terms ....................... , ....................... nth term ................................................. [3] (b) 1, 2, 4, 8, 16, ... Next two terms ....................... , ....................... nth term ................................................. [3] (c) 4, 10, 18, 28, 40, ... Next two terms ....................... , ....................... nth term ................................................. [3]
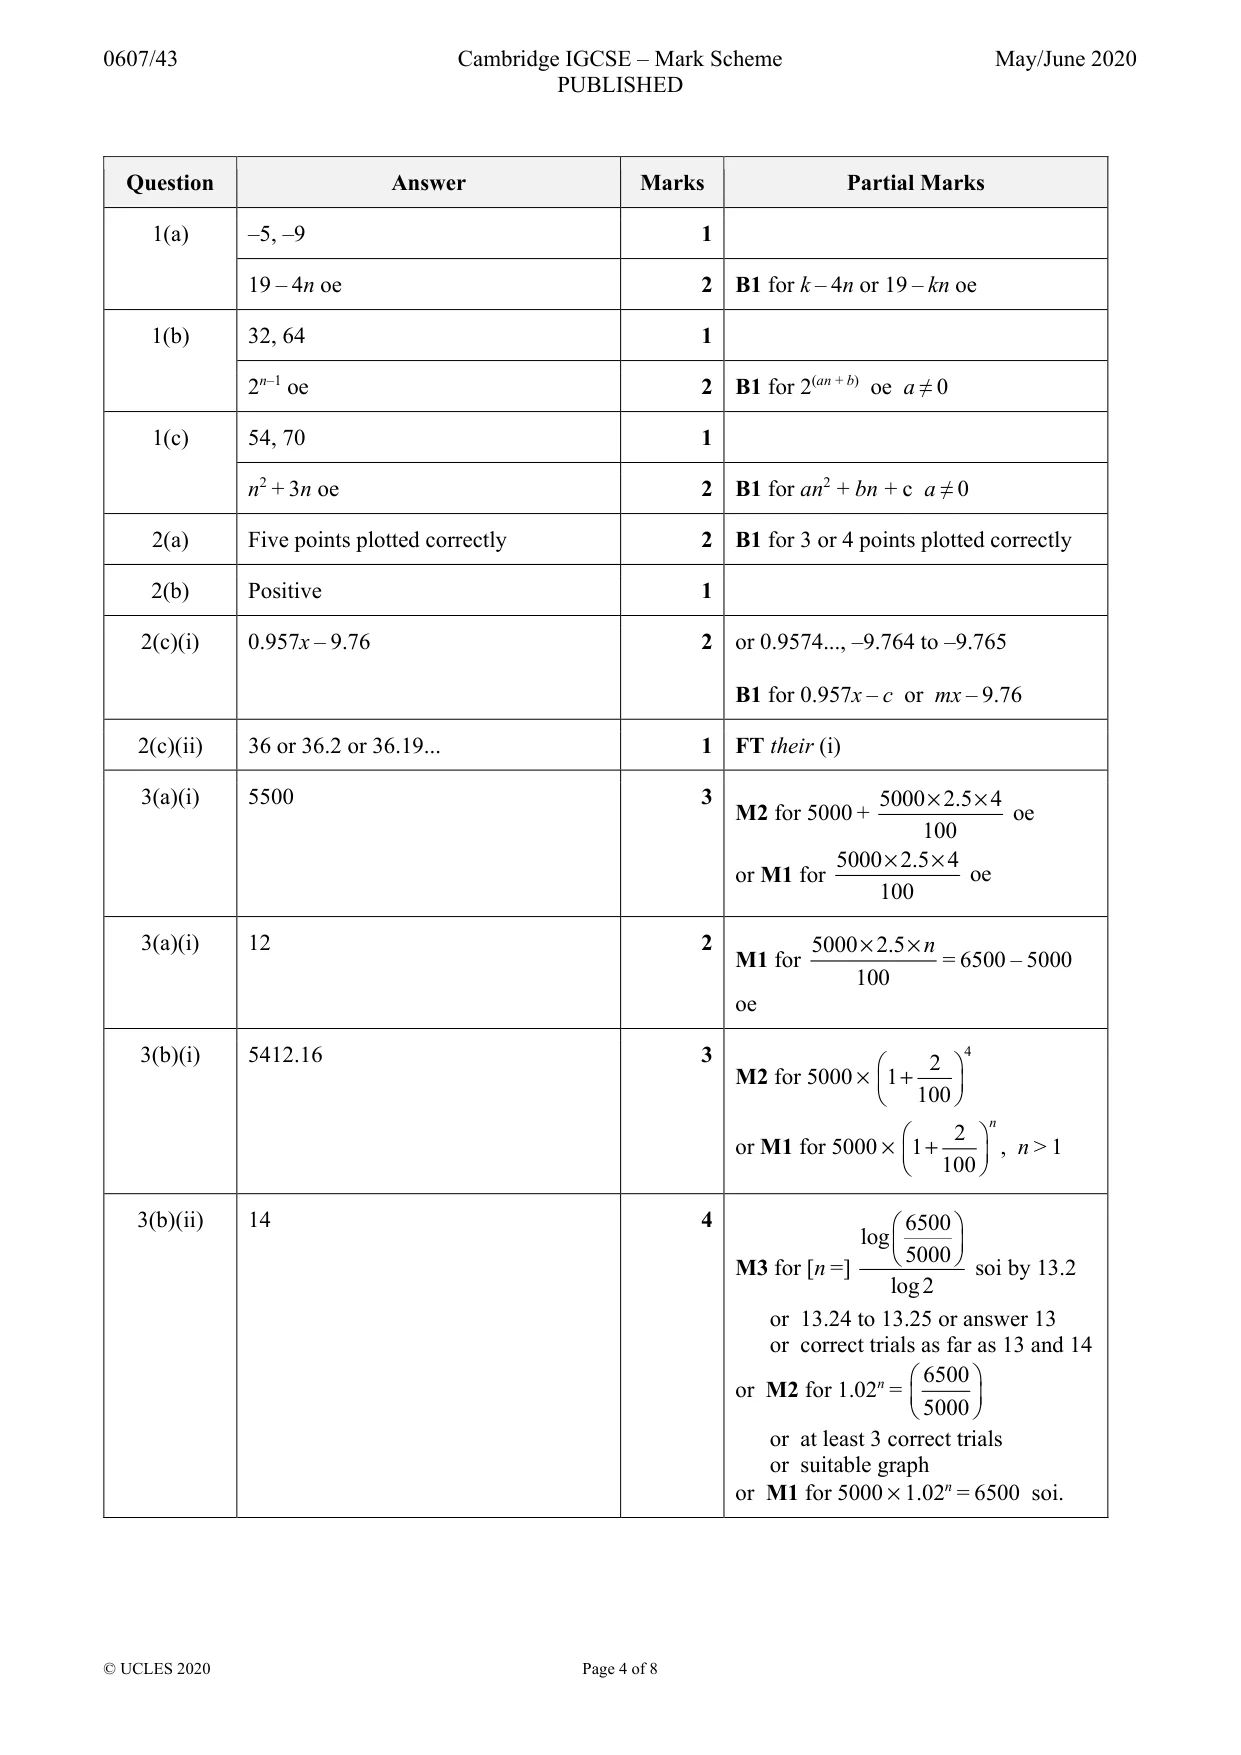
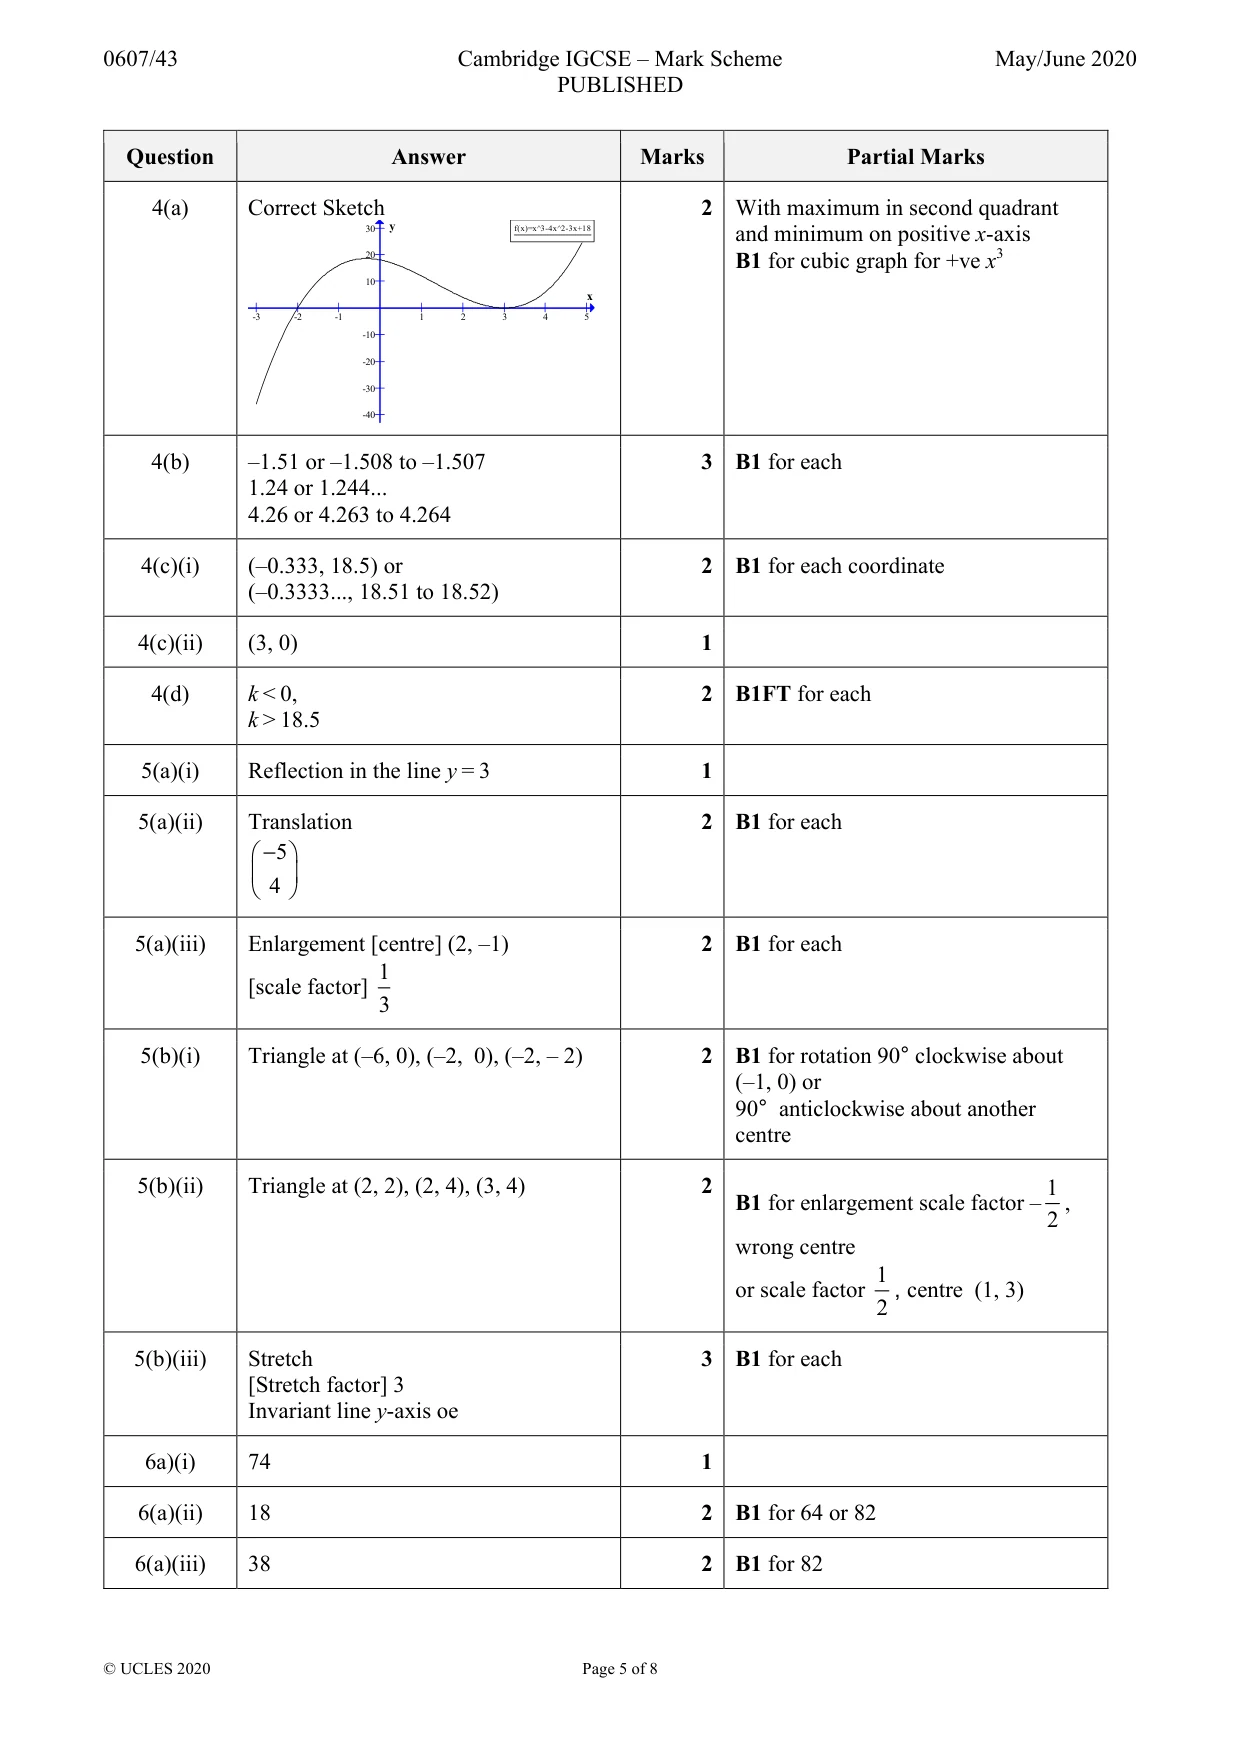
Mark scheme: Question Answer Marks Partial Marks 1(a) –5, –9 1 19 – 4n oe 2 B1 for k – 4n or 19 – kn oe 1(b) 32, 64 1 2n–1 oe 2 B1 for 2(an + b) oe a ≠ 0 1(c) 54, 70 1 n2 + 3n oe 2 B1 for an2 + bn + c a ≠ 0
Q2 · 10 students take a language examination
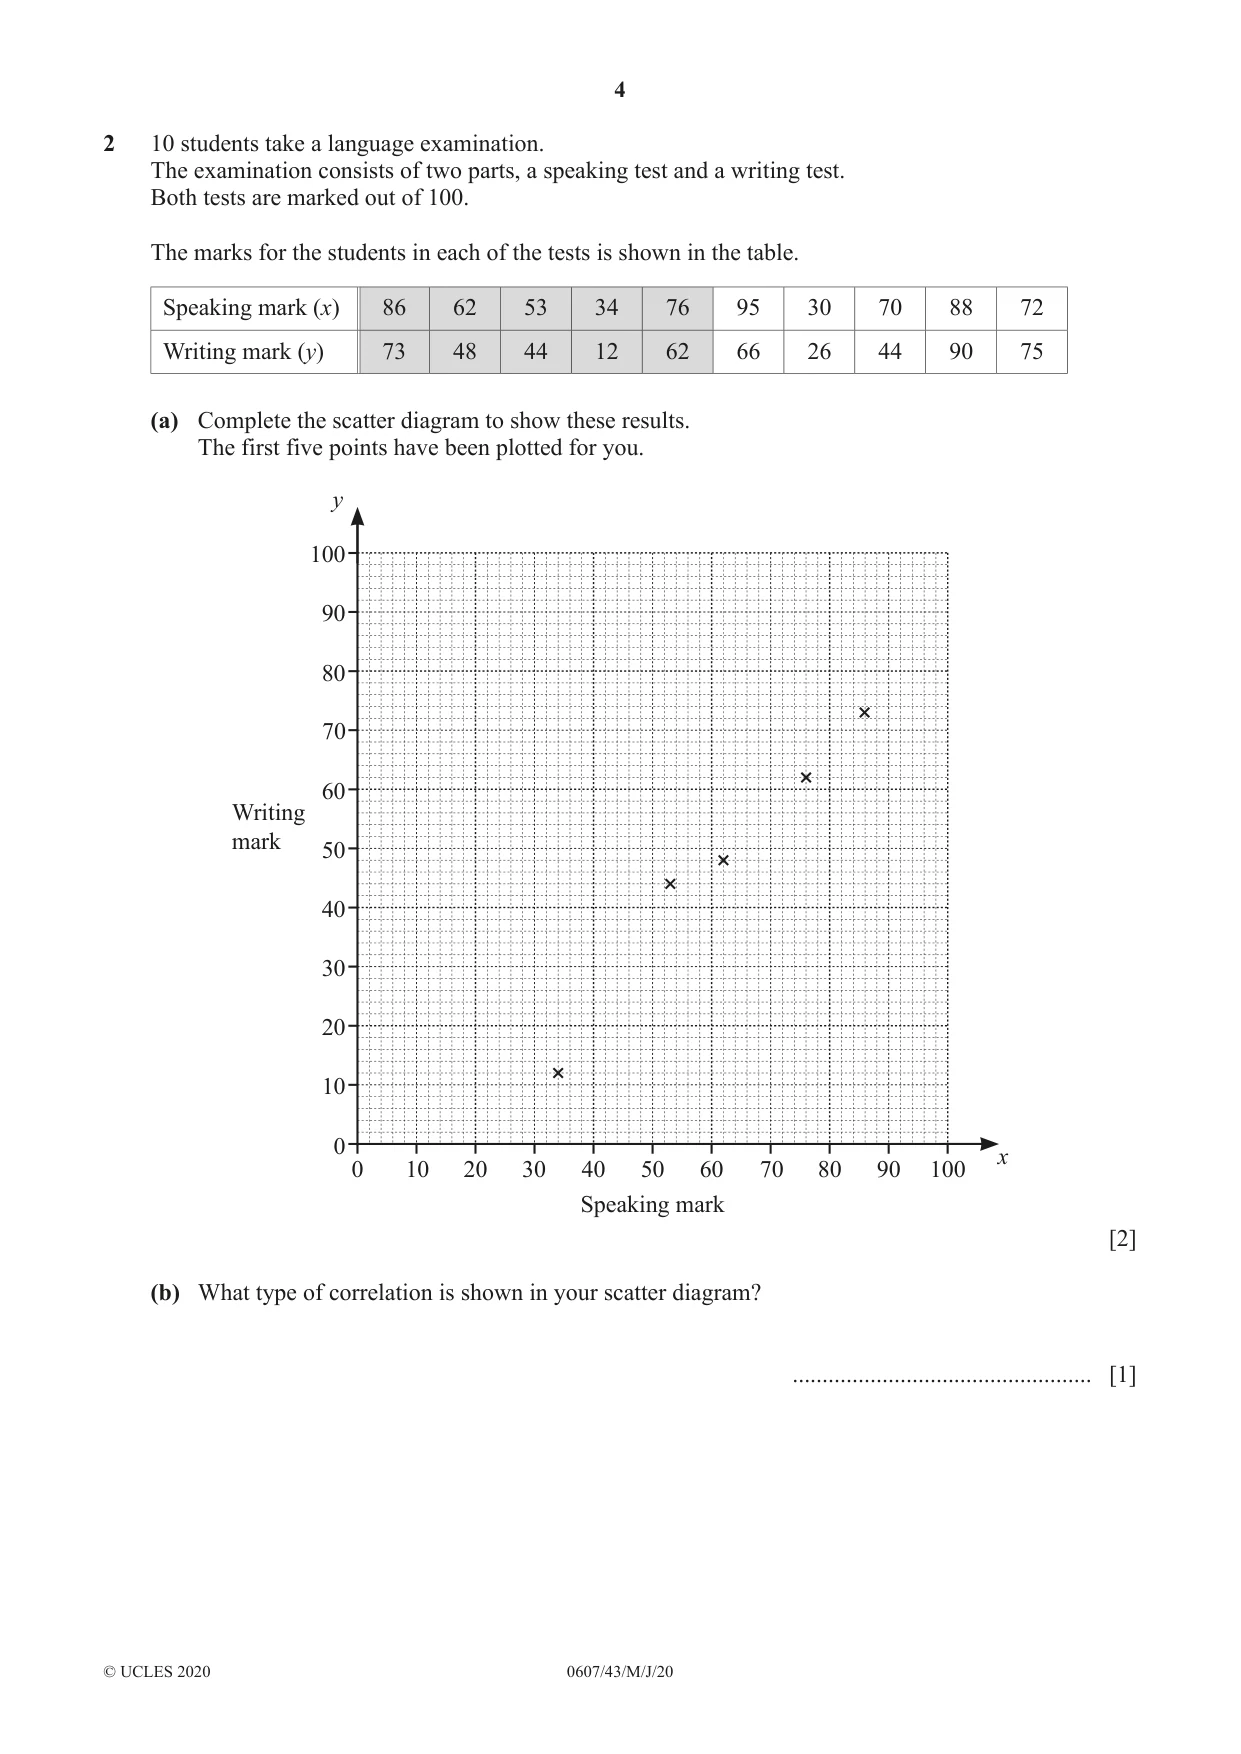
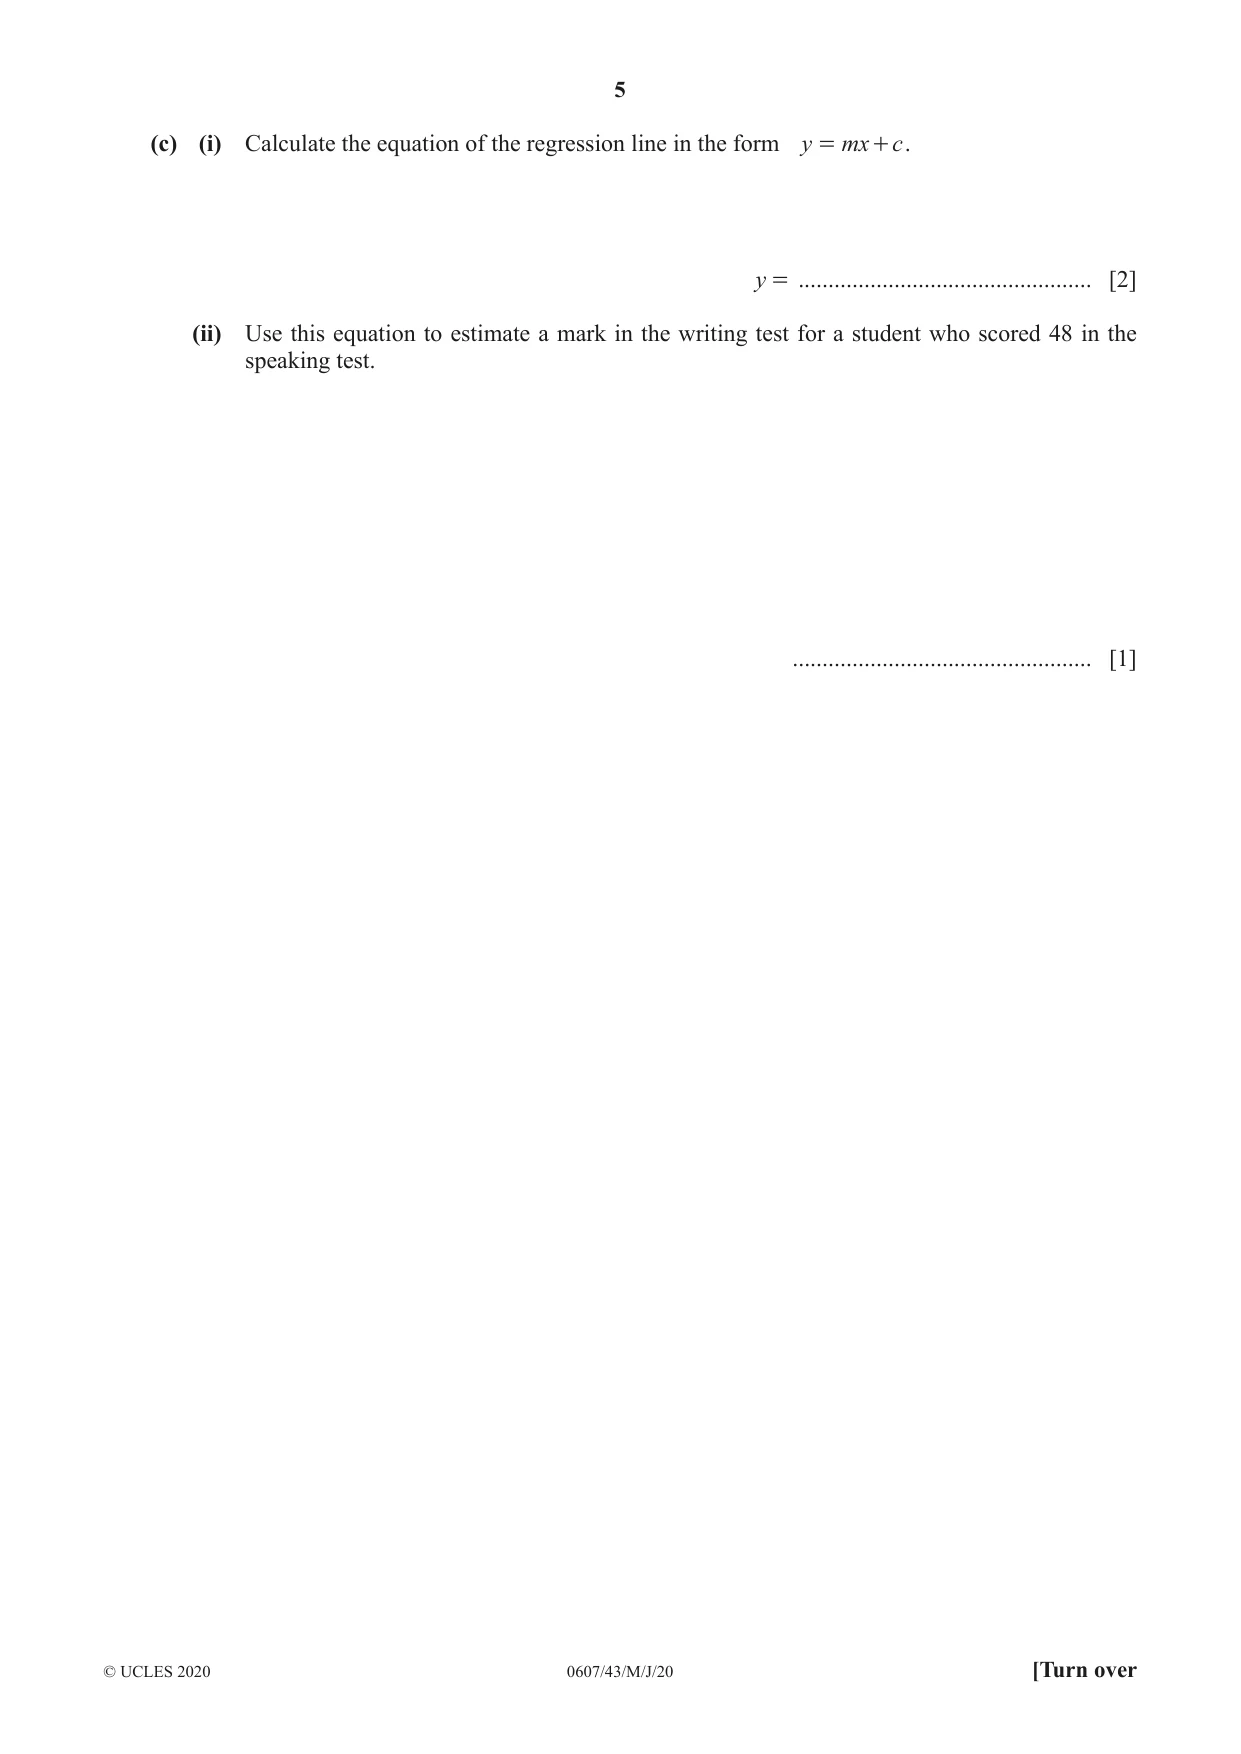
2 10 students take a language examination. The examination consists of two parts, a speaking test and a writing test. Both tests are marked out of 100. The marks for the students in each of the tests is shown in the table. Speaking mark (x) 86 62 53 34 76 95 30 70 88 72 Writing mark (y) 73 48 44 12 62 66 26 44 90 75 (a) Complete the scatter diagram to show these results. The first five points have been plotted for you. y 100 90 80 70 60 Writing mark 50 40 30 20 10 0 x 0 10 20 30 40 50 60 70 80 90 100 Speaking mark [2] (b) What type of correlation is shown in your scatter diagram? .................................................. [1] (c) (i) Calculate the equation of the regression line in the form y = mx + c . y = ................................................. [2] (ii) Use this equation to estimate a mark in the writing test for a student who scored 48 in the speaking test. .................................................. [1]
Mark scheme: 2(a) Five points plotted correctly 2 B1 for 3 or 4 points plotted correctly 2(b) Positive 1 2(c)(i) 0.957x – 9.76 2 or 0.9574..., –9.764 to –9.765 B1 for 0.957x – c or mx – 9.76 2(c)(ii) 36 or 36.2 or 36.19... 1 FT their (i)
Q3 · Riaz invests $5000 at a rate of 2.5% per year simple interest
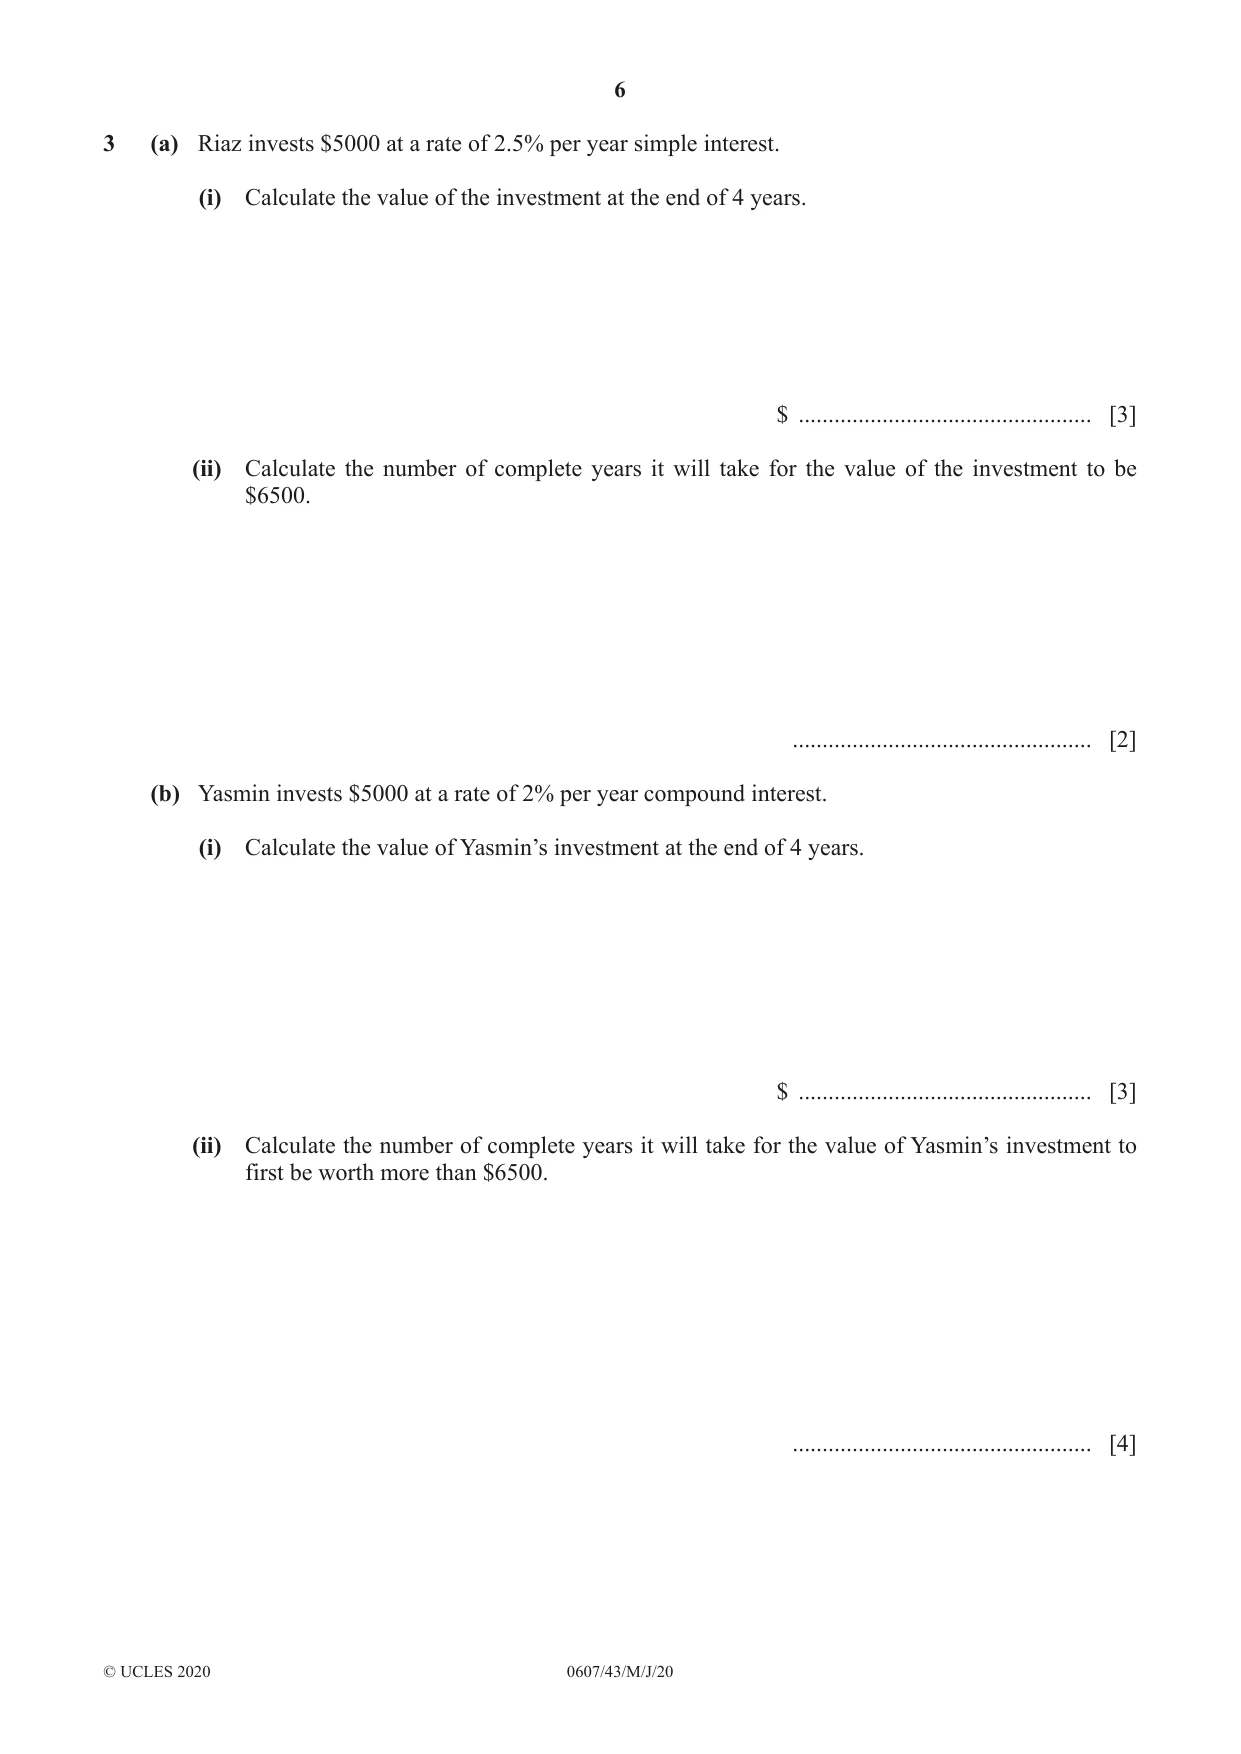
3 (a) Riaz invests $5000 at a rate of 2.5% per year simple interest. (i) Calculate the value of the investment at the end of 4 years. $ ................................................. [3] (ii) Calculate the number of complete years it will take for the value of the investment to be $6500. .................................................. [2] (b) Yasmin invests $5000 at a rate of 2% per year compound interest. (i) Calculate the value of Yasmin’s investment at the end of 4 years. $ ................................................. [3] (ii) Calculate the number of complete years it will take for the value of Yasmin’s investment to first be worth more than $6500. .................................................. [4]
Mark scheme: 3(a)(i) 5500 3 5000 × 2.5 × 4 M2 for 5000 + oe 100 5000 × 2.5 × 4 or M1 for oe 100 3(a)(i) 12 2 5000 × 2.5 × n M1 for = 6500 – 5000 100 oe 3(b)(i) 5412.16 3 4 2 M2 for 5000 × 1 + 100 2 n or M1 for 5000 × 1 + , n > 1 100 3(b)(ii) 14 4 6500 log 5000 M3 for [n =] soi by 13.2 log2 or 13.24 to 13.25 or answer 13 or correct trials as far as 13 and 14 6500 or M2 for 1.02n = 5000 or at least 3 correct trials or suitable graph or M1 for 5000 × 1.02n = 6500 soi.
Q4 · Y 30 x – 3 0 5 – 40 f ( )x = x 3 - 4x 2 - 3x + 18 (a) On the diagram, sketch the graph of…
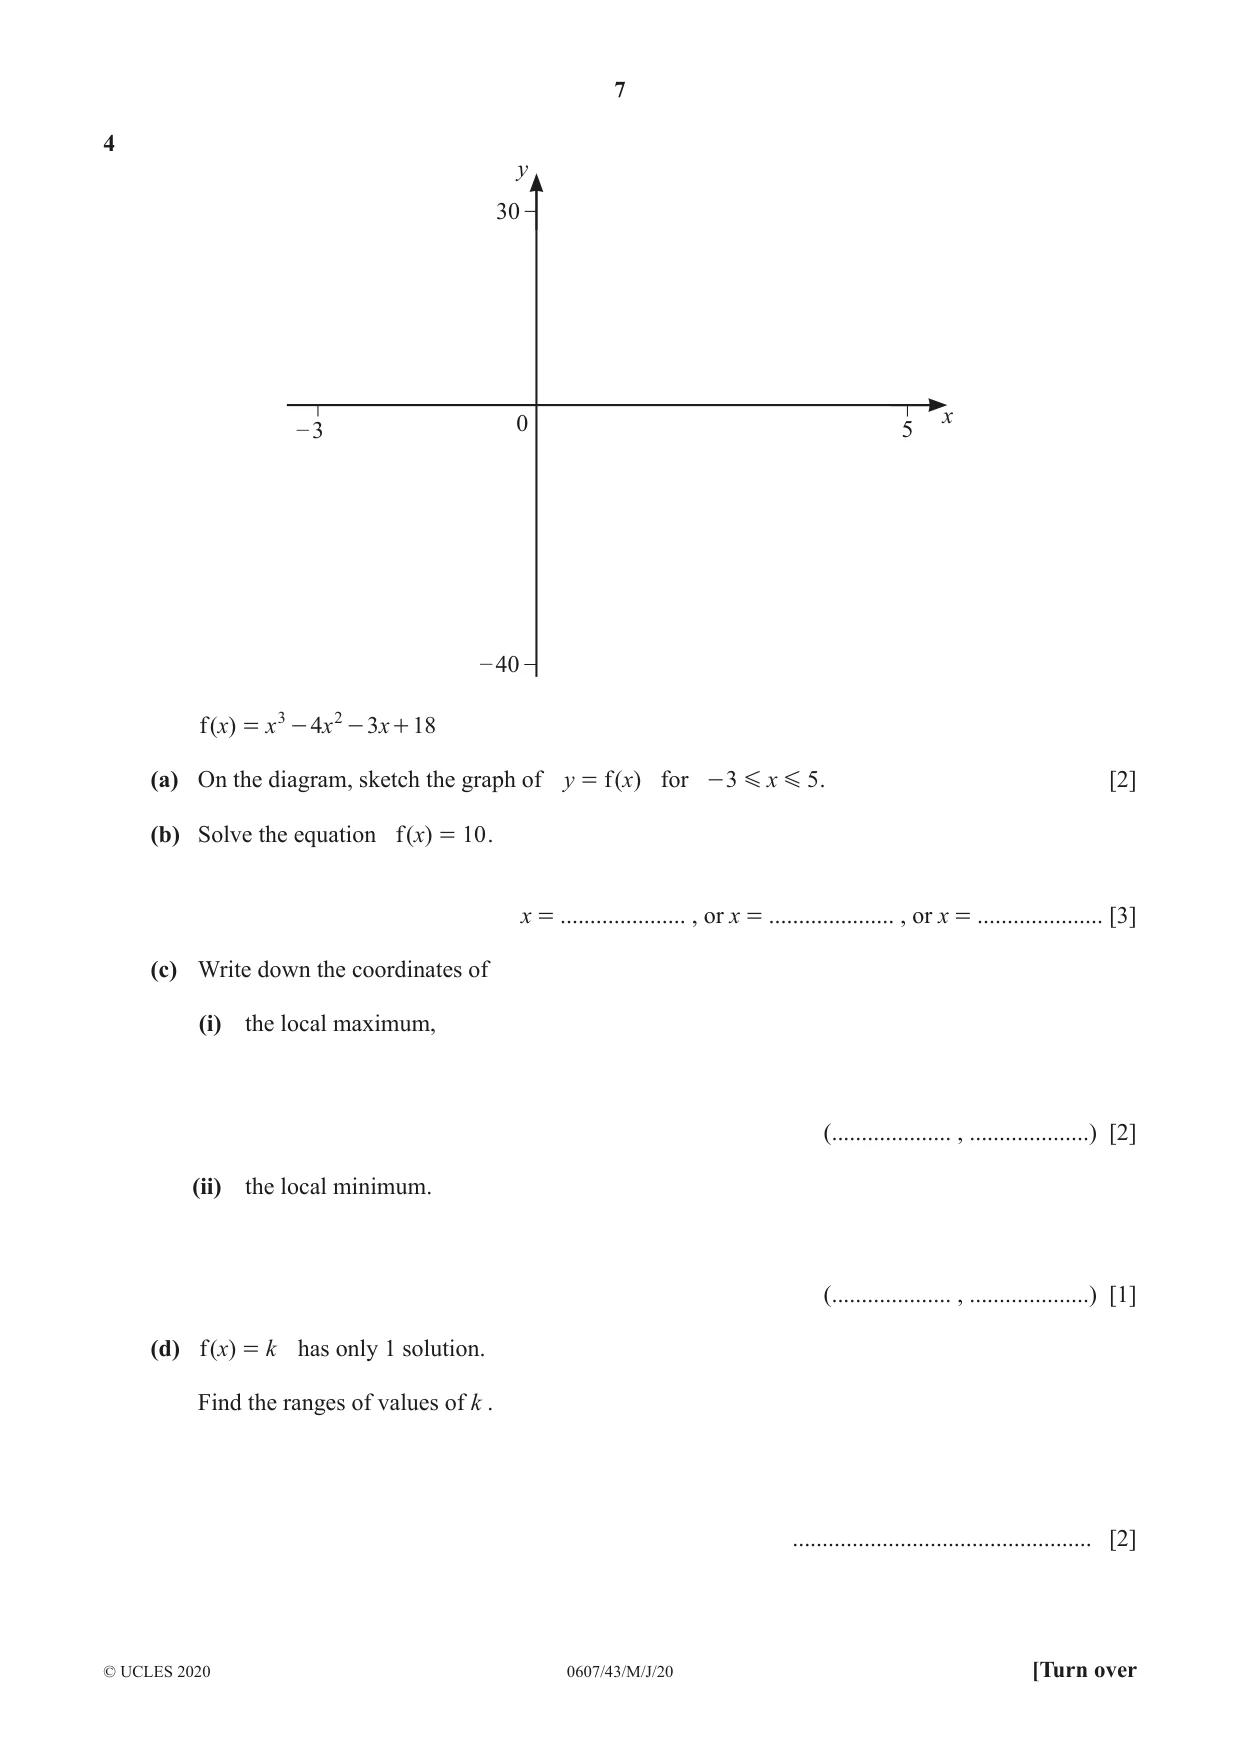
4 y 30 x – 3 0 5 – 40 f ( )x = x 3 - 4x 2 - 3x + 18 (a) On the diagram, sketch the graph of y = f ( x) for - 3 G x G 5 . [2] (b) Solve the equation f ( )x = 10 . x = ..................... , or x = ..................... , or x = ..................... [3] (c) Write down the coordinates of (i) the local maximum, (.................... , ....................) [2] (ii) the local minimum. (.................... , ....................) [1] (d) f ( )x = k has only 1 solution. Find the ranges of values of k . .................................................. [2]
Mark scheme: 4(a) Correct Sketch 2 With maximum in second quadrant 30 y f(x)=x^3-4x^2-3x+18 and minimum on positive x-axis 20 B1 for cubic graph for +ve x3 10 x -3 -2 -1 1 2 3 4 5 -10 -20 -30 -40 4(b) –1.51 or –1.508 to –1.507 3 B1 for each 1.24 or 1.244... 4.26 or 4.263 to 4.264 4(c)(i) (–0.333, 18.5) or 2 B1 for each coordinate (–0.3333..., 18.51 to 18.52) 4(c)(ii) (3, 0) 1 4(d) k < 0, 2 B1FT for each k > 18.5
Q5 · A reflection in the line y = 3 maps triangle A onto triangle B
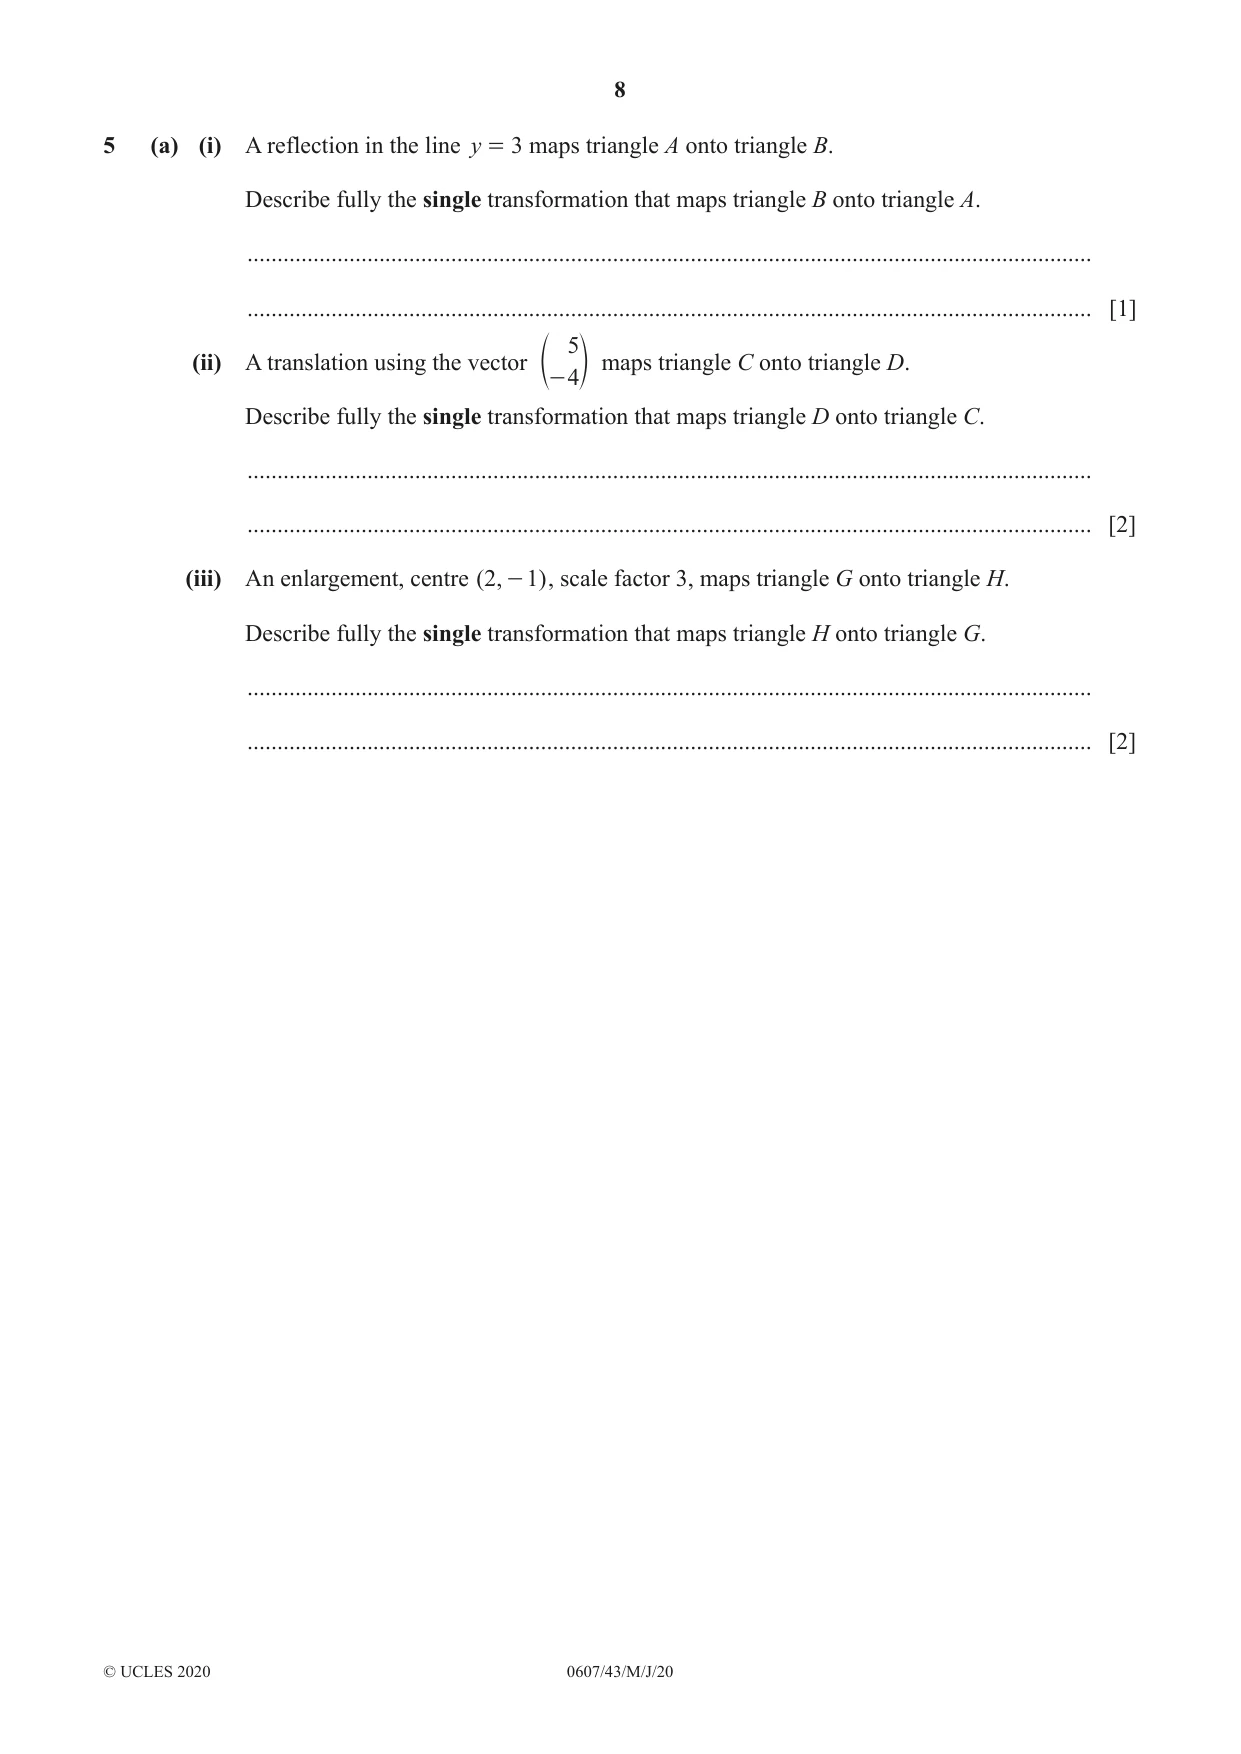
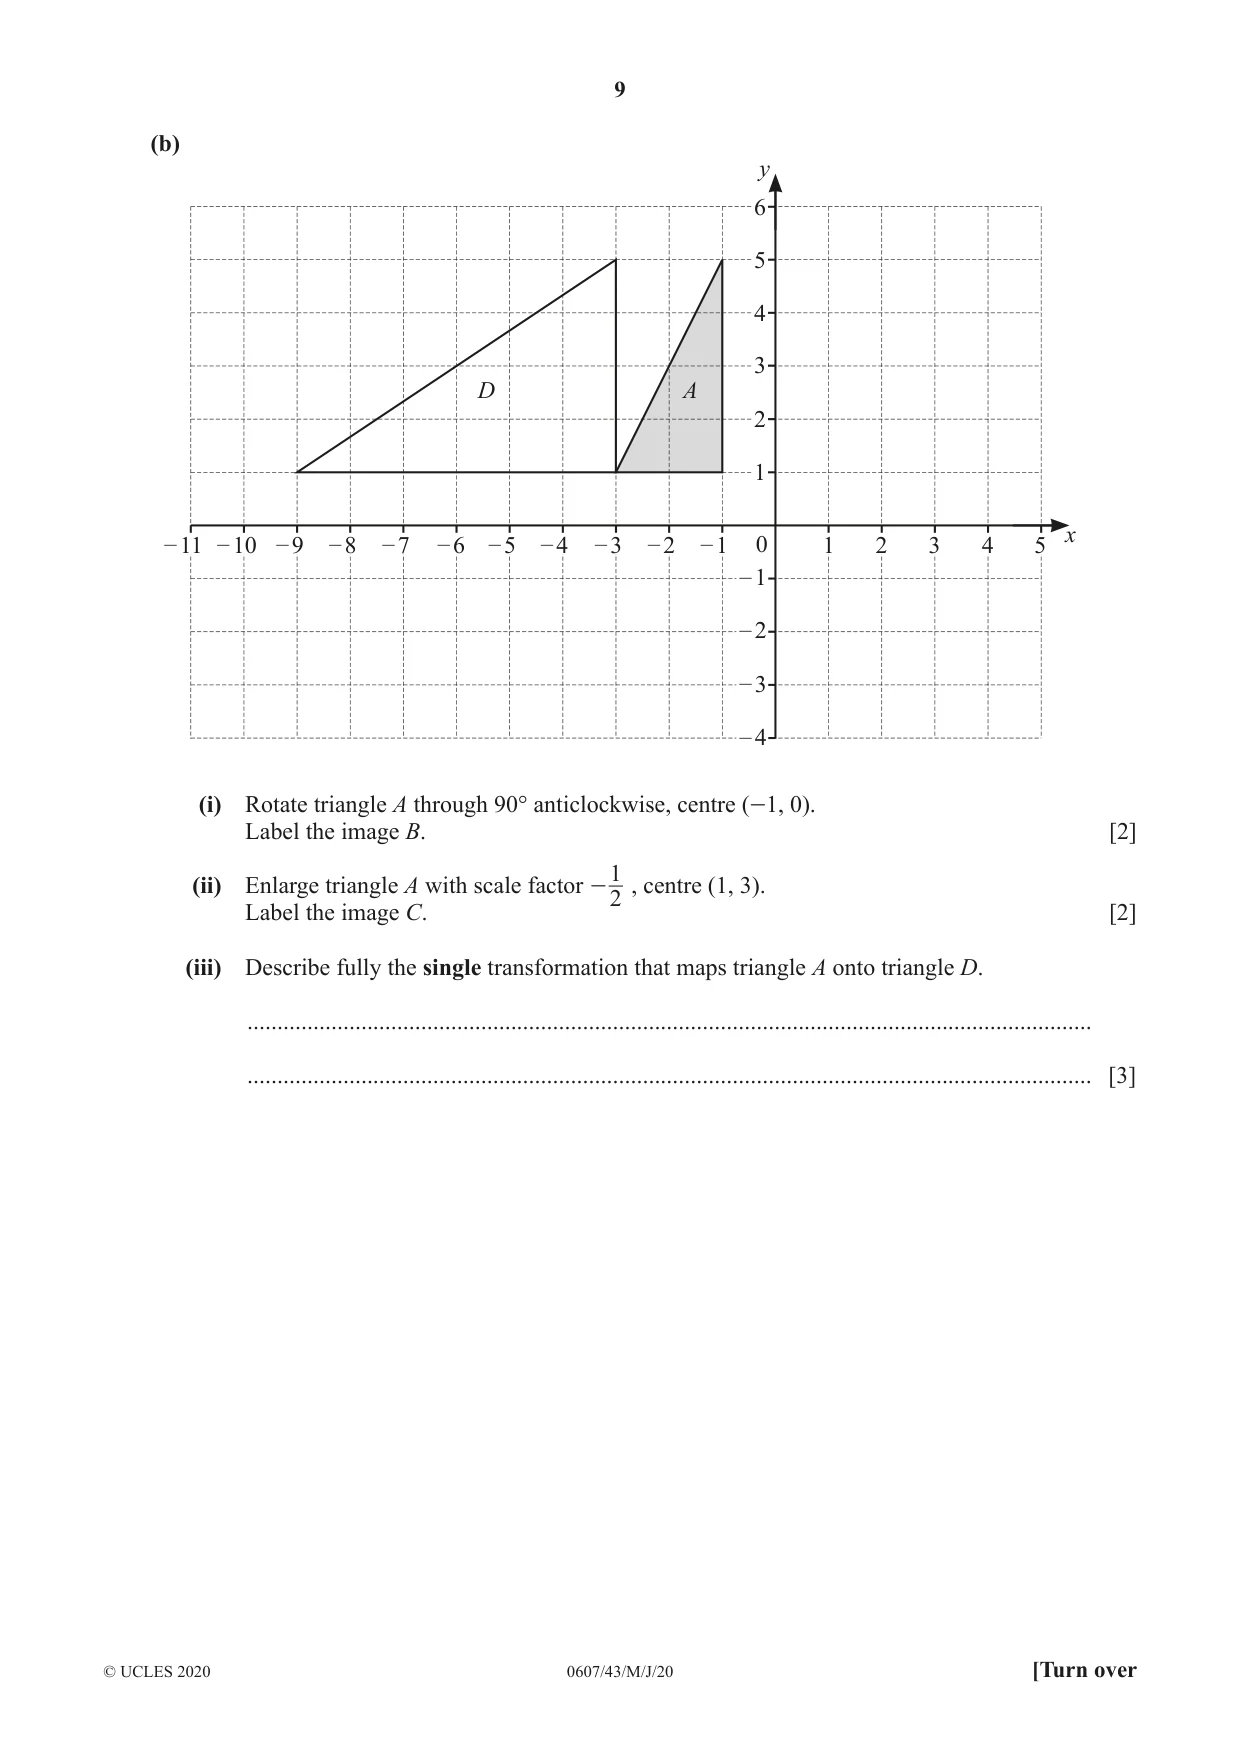
5 (a) (i) A reflection in the line y = 3 maps triangle A onto triangle B. Describe fully the single transformation that maps triangle B onto triangle A. ............................................................................................................................................. ............................................................................................................................................. [1] 5 (ii) A translation using the vector maps triangle C onto triangle D. e- 4o Describe fully the single transformation that maps triangle D onto triangle C. ............................................................................................................................................. ............................................................................................................................................. [2] (iii) An enlargement, centre ( 2, - 1) , scale factor 3, maps triangle G onto triangle H. Describe fully the single transformation that maps triangle H onto triangle G. ............................................................................................................................................. ............................................................................................................................................. [2] (b) y 6 5 4 3 D A 2 1 x – 11 – 10 – 9 – 8 – 7 – 6 – 5 – 4 – 3 – 2 – 1 0 1 2 3 4 5 – 1 – 2 – 3 – 4 (i) Rotate triangle A through 90° anticlockwise, centre (-1, 0). Label the image B. [2] 1 (ii) Enlarge triangle A with scale factor - , centre (1, 3). 2 Label the image C. [2] (iii) Describe fully the single transformation that maps triangle A onto triangle D. ............................................................................................................................................. ............................................................................................................................................. [3]
Mark scheme: 5(a)(i) Reflection in the line y = 3 1 5(a)(ii) Translation 2 B1 for each − 5 4 5(a)(iii) Enlargement [centre] (2, –1) 2 B1 for each 1 [scale factor] 3 5(b)(i) Triangle at (–6, 0), (–2, 0), (–2, – 2) 2 B1 for rotation 90° clockwise about (–1, 0) or 90° anticlockwise about another centre 5(b)(ii) Triangle at (2, 2), (2, 4), (3, 4) 2 1 B1 for enlargement scale factor – , 2 wrong centre 1 or scale factor , centre (1, 3) 2 5(b)(iii) Stretch 3 B1 for each [Stretch factor] 3 Invariant line y-axis oe 6a)(i) 74 1
Q6 · The cumulative frequency graph shows the heights, in centimetres, of 120 plants in…
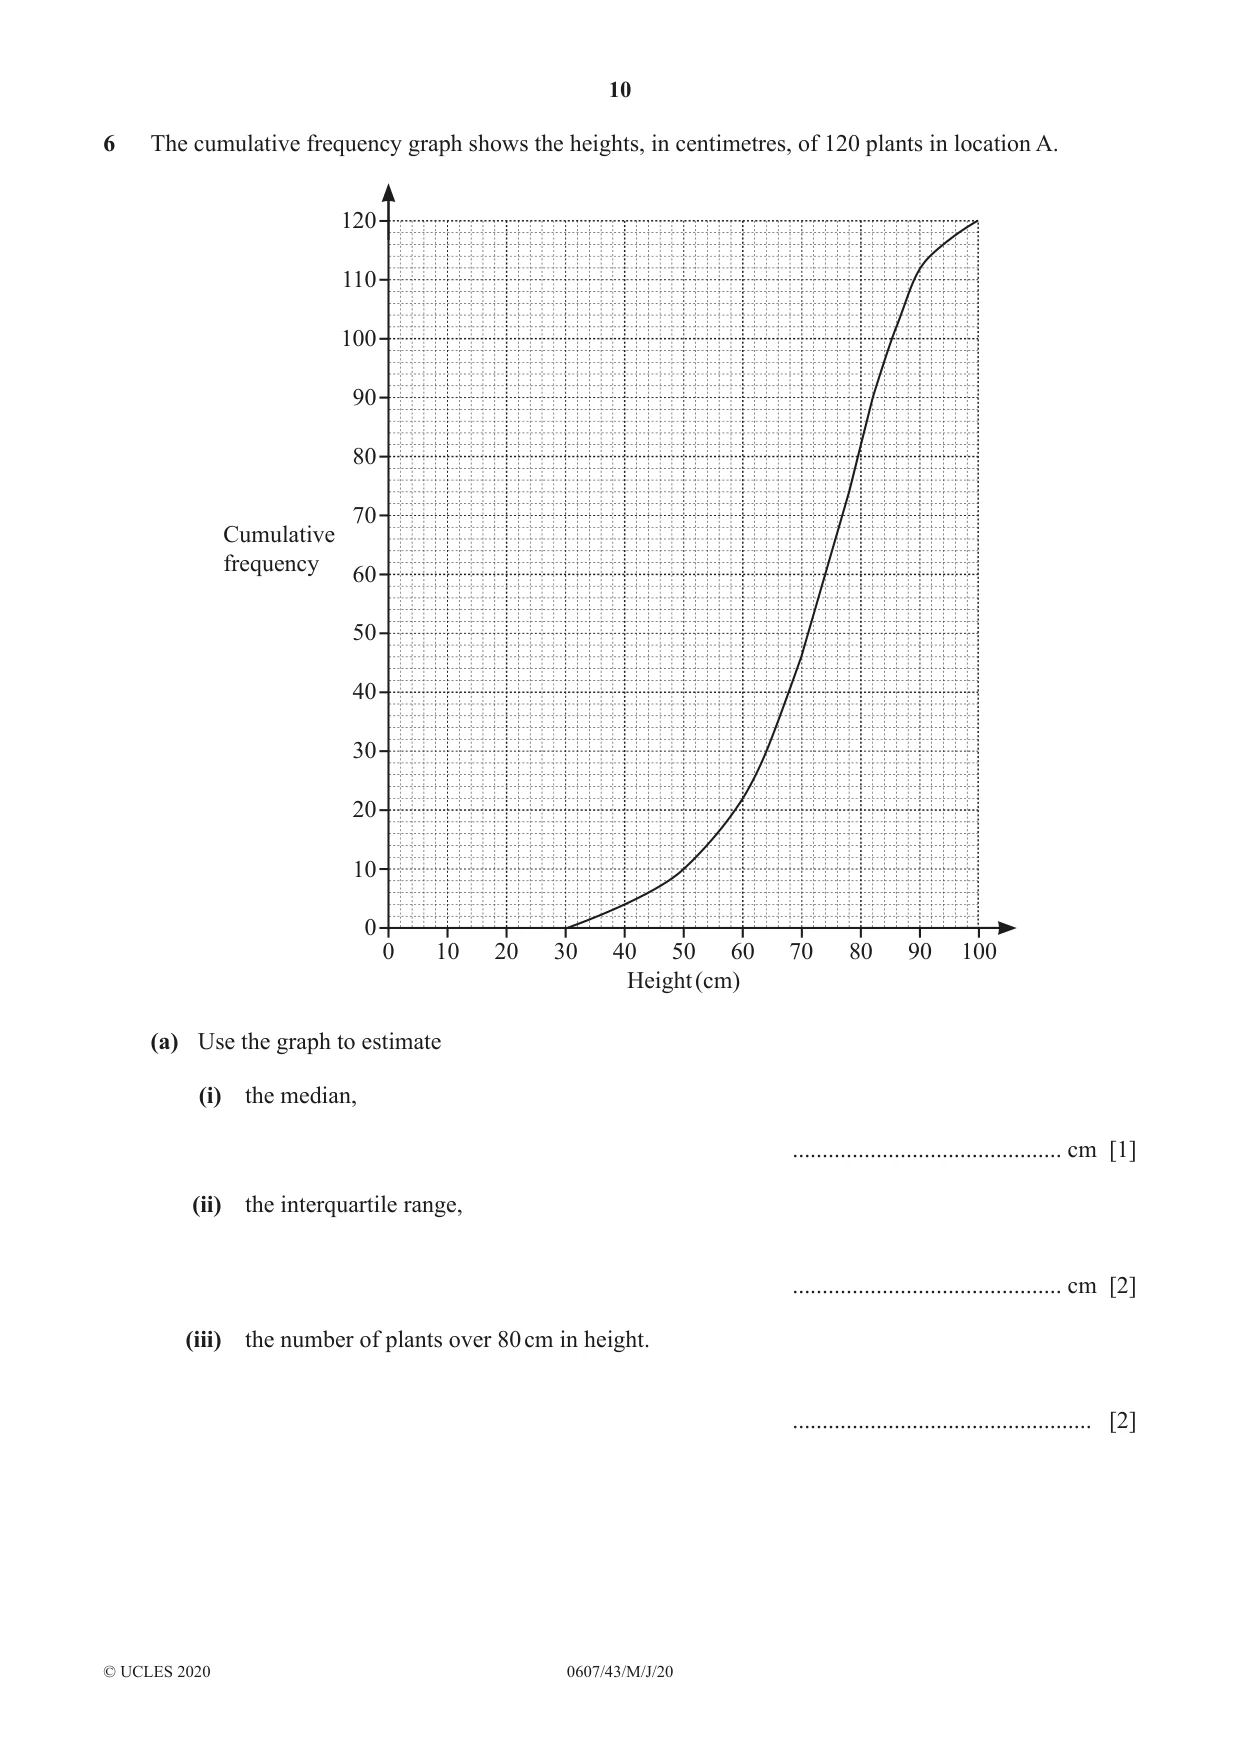
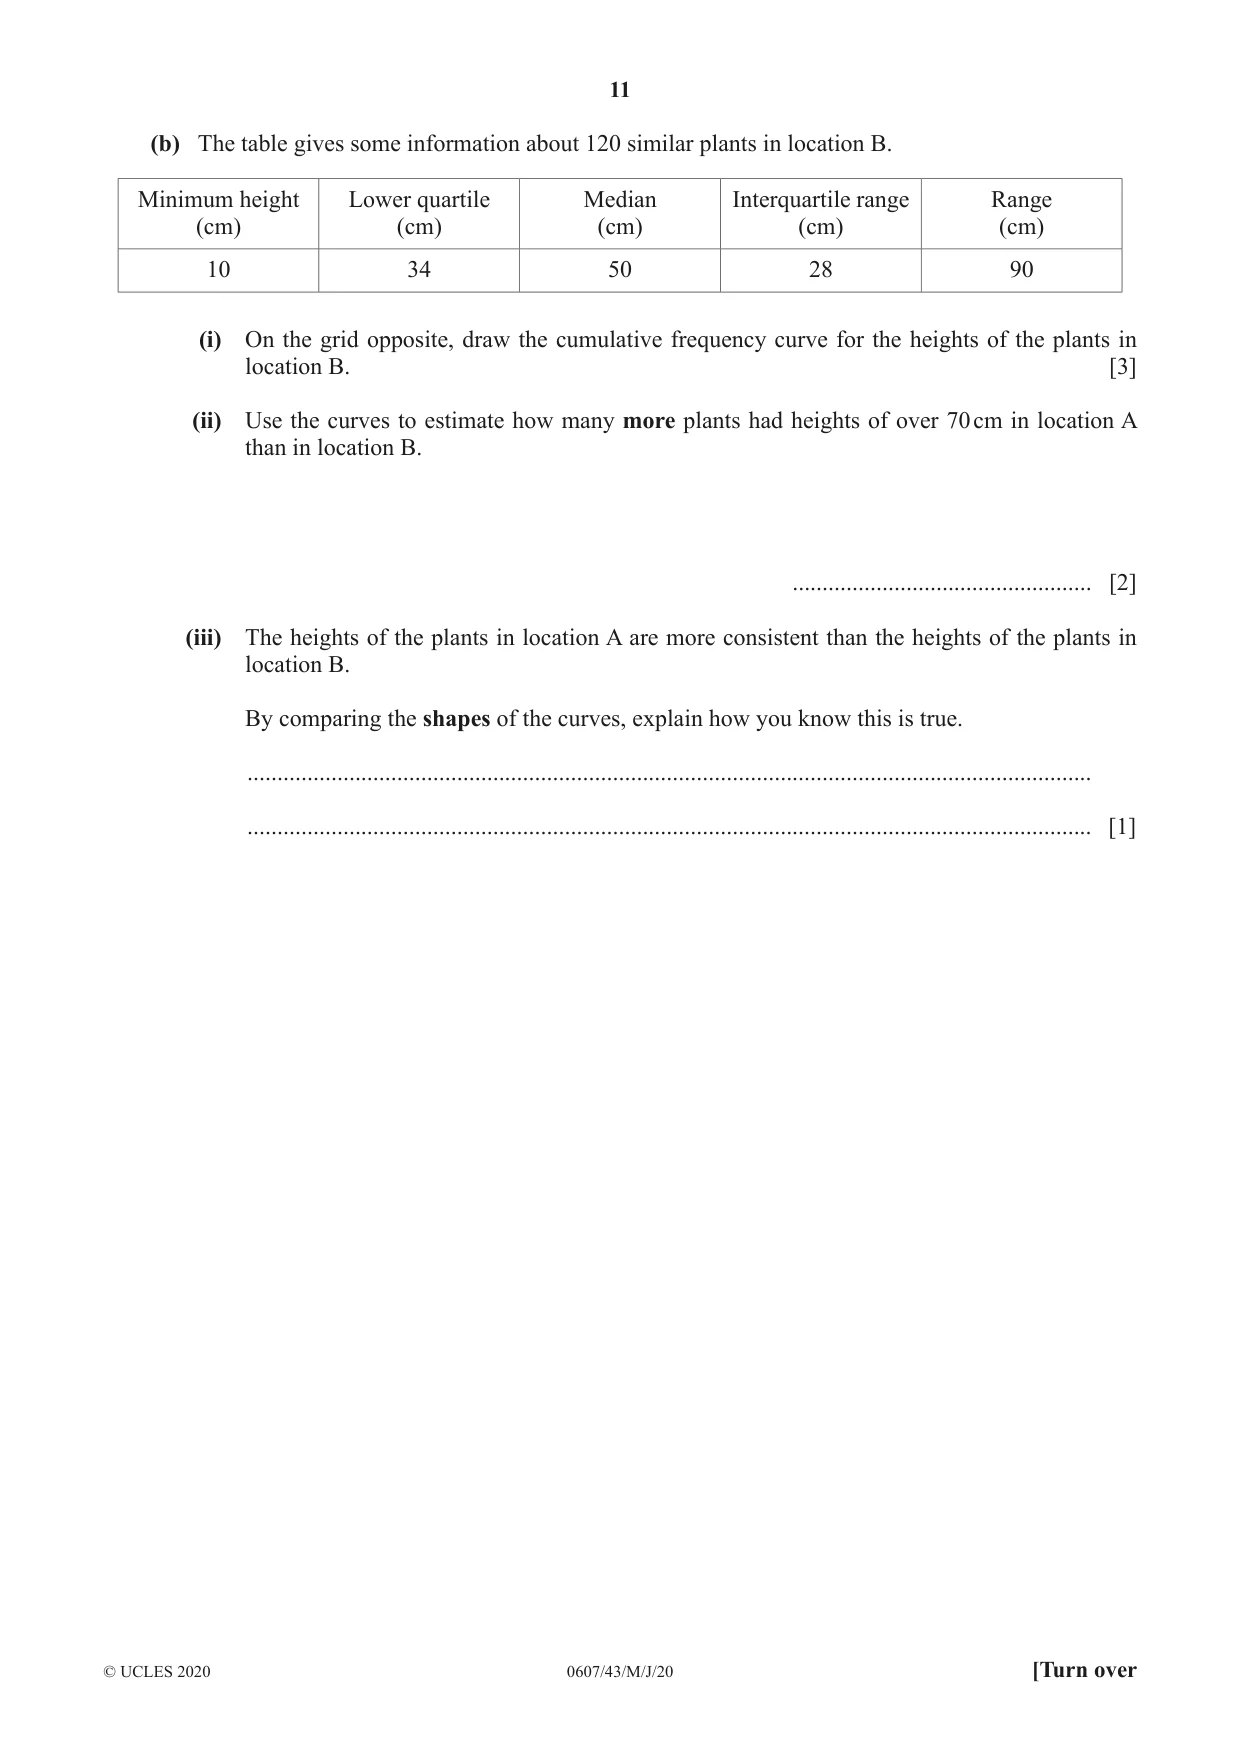
6 The cumulative frequency graph shows the heights, in centimetres, of 120 plants in location A. 120 110 100 90 80 70 Cumulative frequency 60 50 40 30 20 10 0 0 10 20 30 40 50 60 70 80 90 100 Height (cm) (a) Use the graph to estimate (i) the median, ............................................. cm [1] (ii) the interquartile range, ............................................. cm [2] (iii) the number of plants over 80 cm in height. .................................................. [2] (b) The table gives some information about 120 similar plants in location B. Minimum height Lower quartile Median Interquartile range Range (cm) (cm) (cm) (cm) (cm) 10 34 50 28 90 (i) On the grid opposite, draw the cumulative frequency curve for the heights of the plants in location B. [3] (ii) Use the curves to estimate how many more plants had heights of over 70 cm in location A than in location B. .................................................. [2] (iii) The heights of the plants in location A are more consistent than the heights of the plants in location B. By comparing the shapes of the curves, explain how you know this is true. ............................................................................................................................................. ............................................................................................................................................. [1]
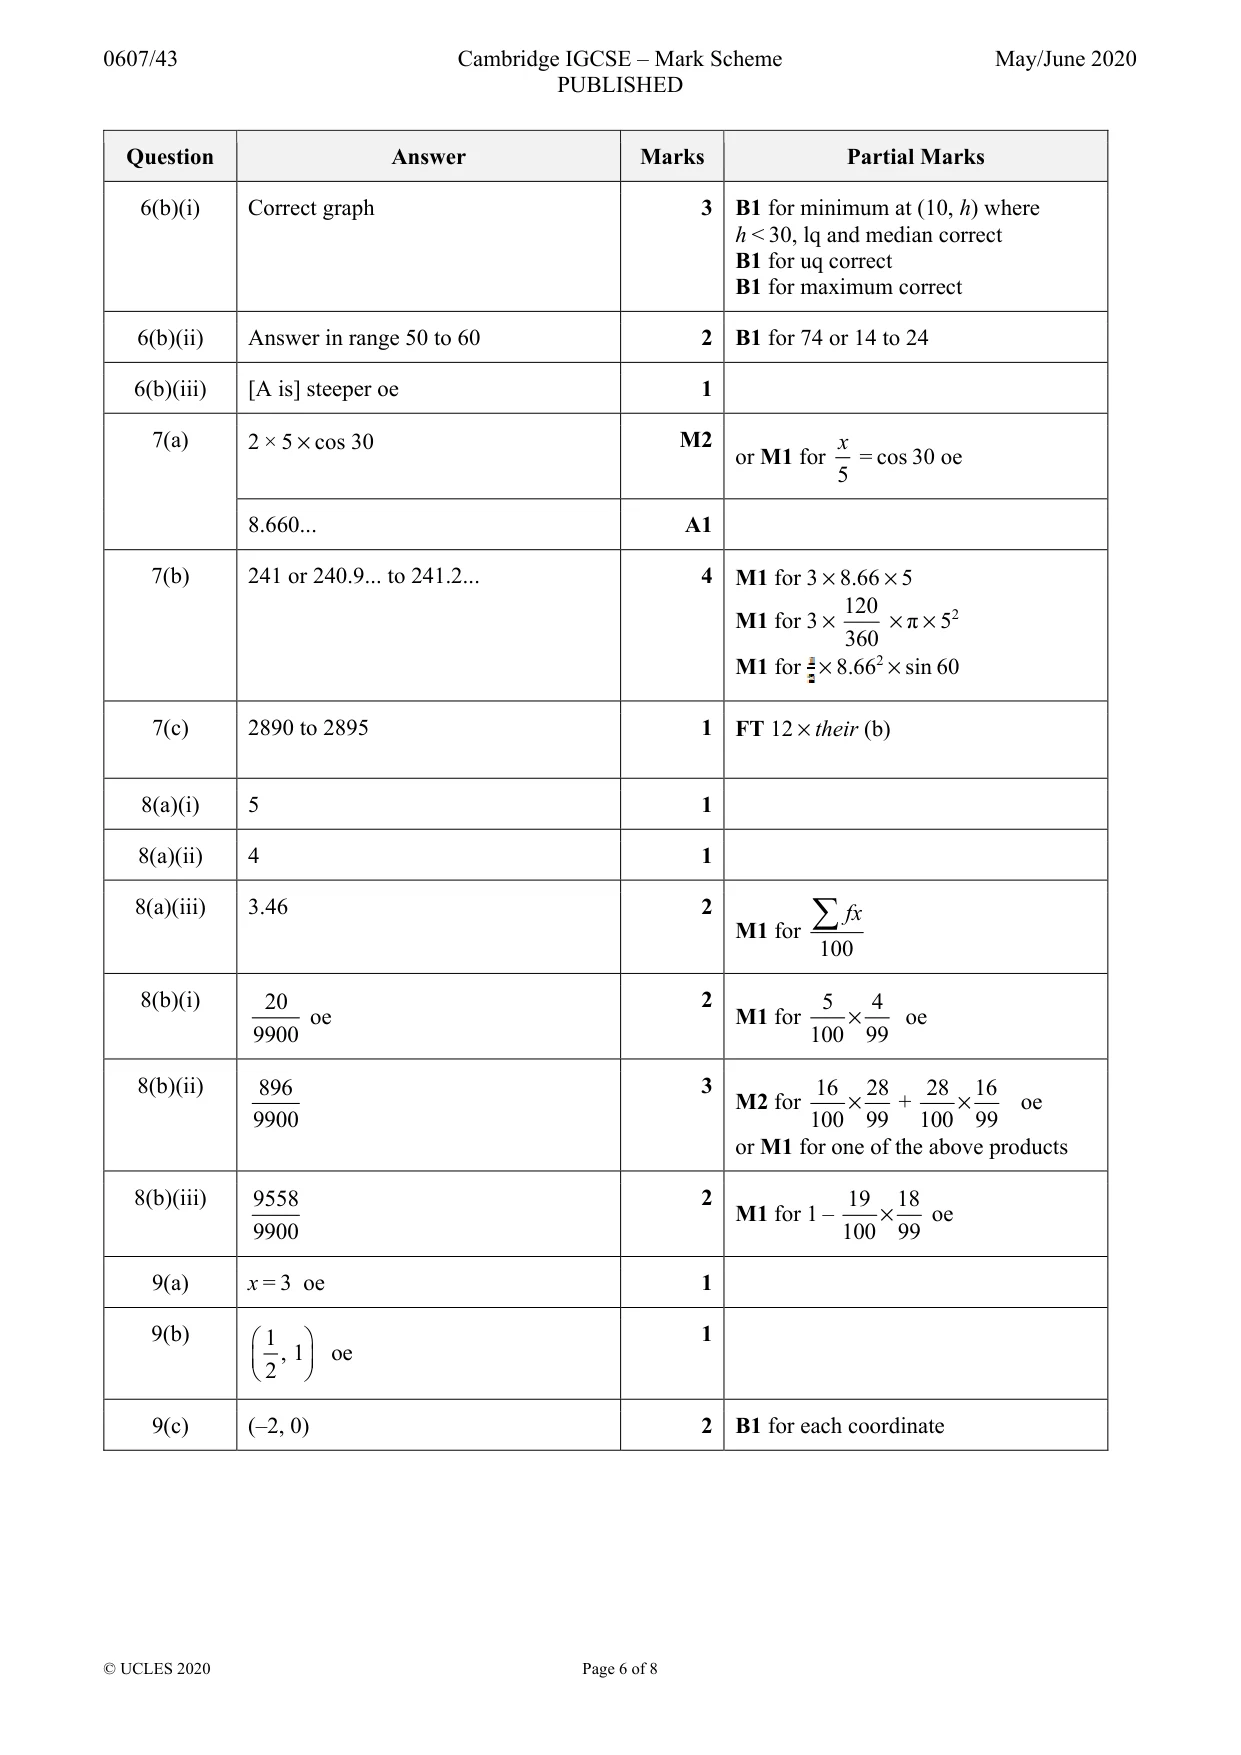
Mark scheme: 6(a)(ii) 18 2 B1 for 64 or 82 6(a)(iii) 38 2 B1 for 82 6(b)(i) Correct graph 3 B1 for minimum at (10, h) where h < 30, lq and median correct B1 for uq correct B1 for maximum correct 6(b)(ii) Answer in range 50 to 60 2 B1 for 74 or 14 to 24 6(b)(iii) [A is] steeper oe 1
Q7 · The diagram shows a radio in the shape of a prism
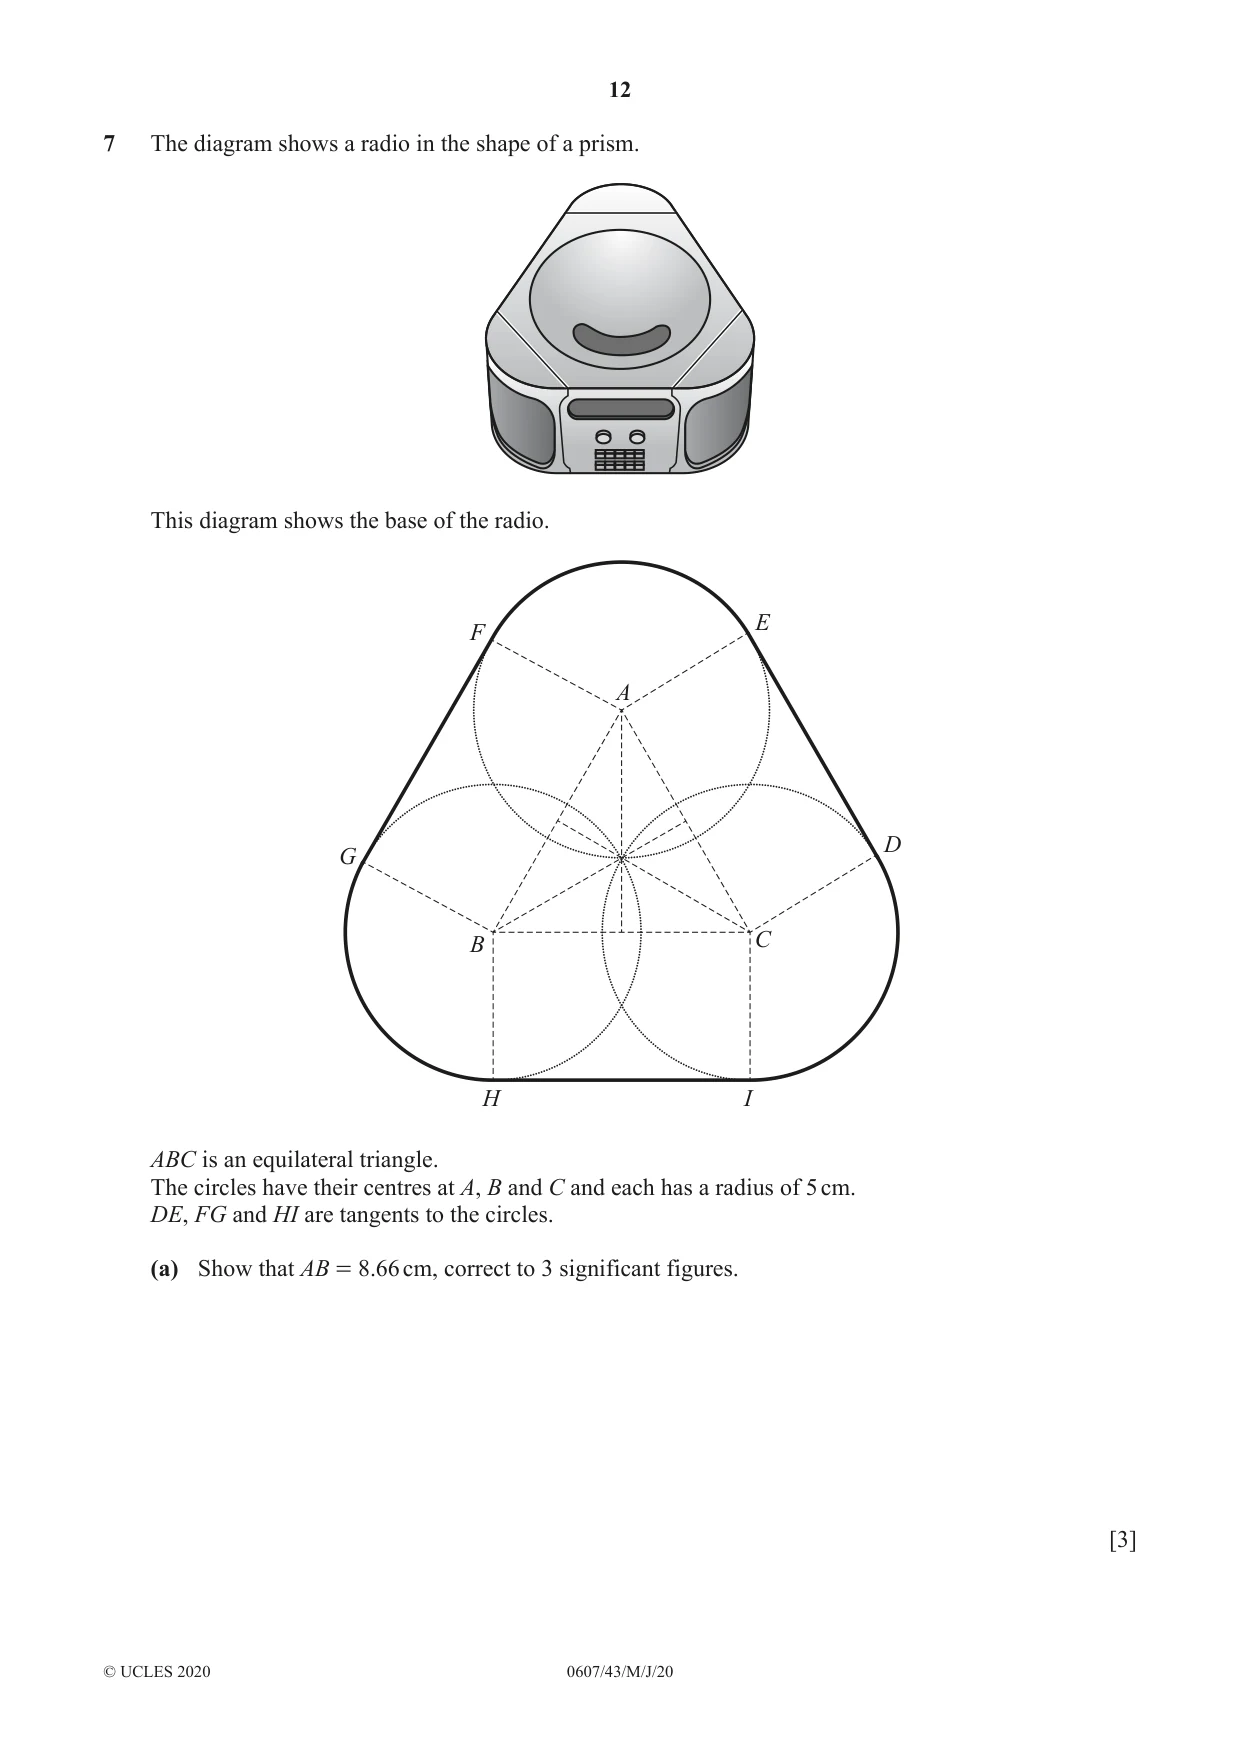
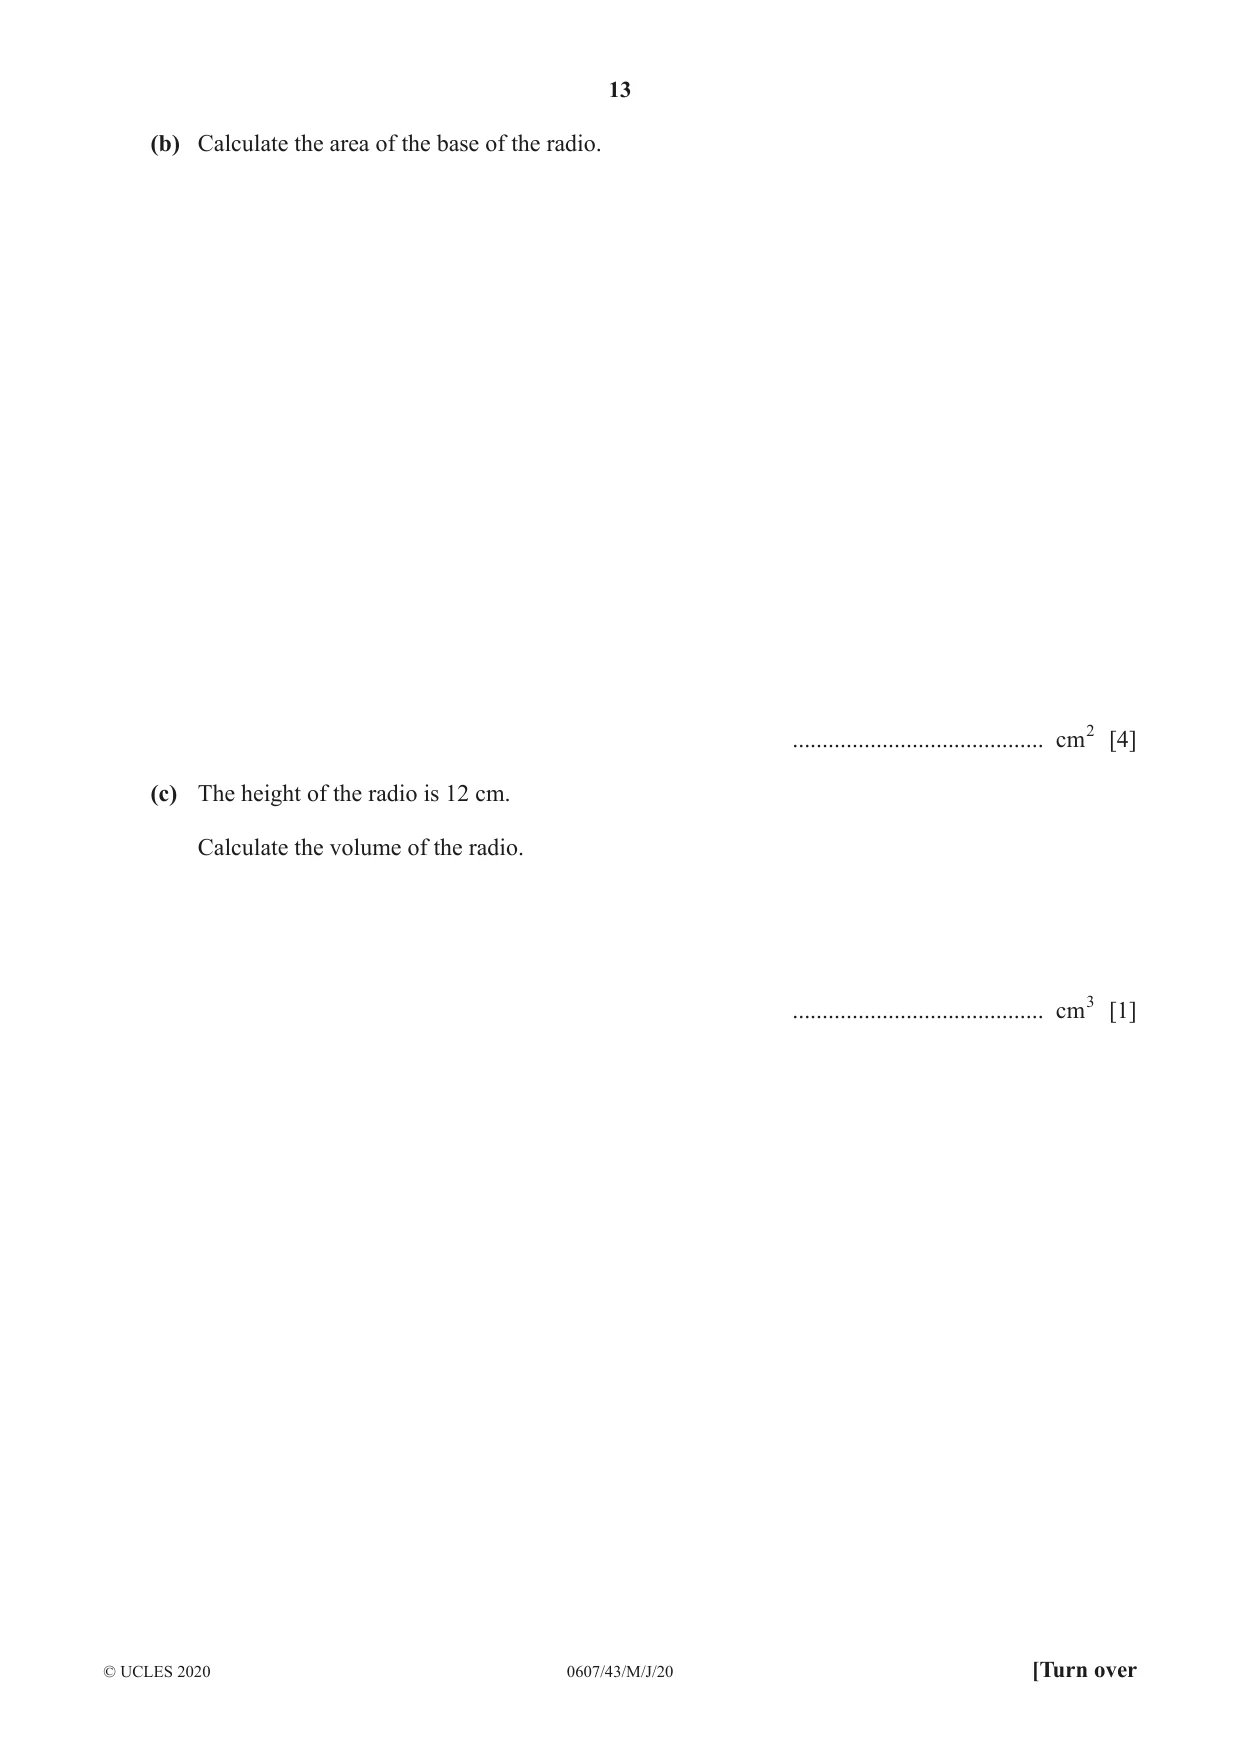
7 The diagram shows a radio in the shape of a prism. This diagram shows the base of the radio. E F A D G B C H I ABC is an equilateral triangle. The circles have their centres at A, B and C and each has a radius of 5 cm. DE, FG and HI are tangents to the circles. (a) Show that AB = 8.66 cm, correct to 3 significant figures. [3] (b) Calculate the area of the base of the radio. .......................................... cm2 [4] (c) The height of the radio is 12 cm. Calculate the volume of the radio. .......................................... cm3 [1]
Mark scheme: 7(a) 2 × 5 × cos 30 M2 x or M1 for = cos 30 oe 5 8.660... A1 7(b) 241 or 240.9... to 241.2... 4 M1 for 3 × 8.66 × 5 120 M1 for 3 × × π × 52 360 M1 for × 8.662 × sin 60 7(c) 2890 to 2895 1 FT 12 × their (b)
Q8 · The number of people living in each house in a street of 100 houses is recorded
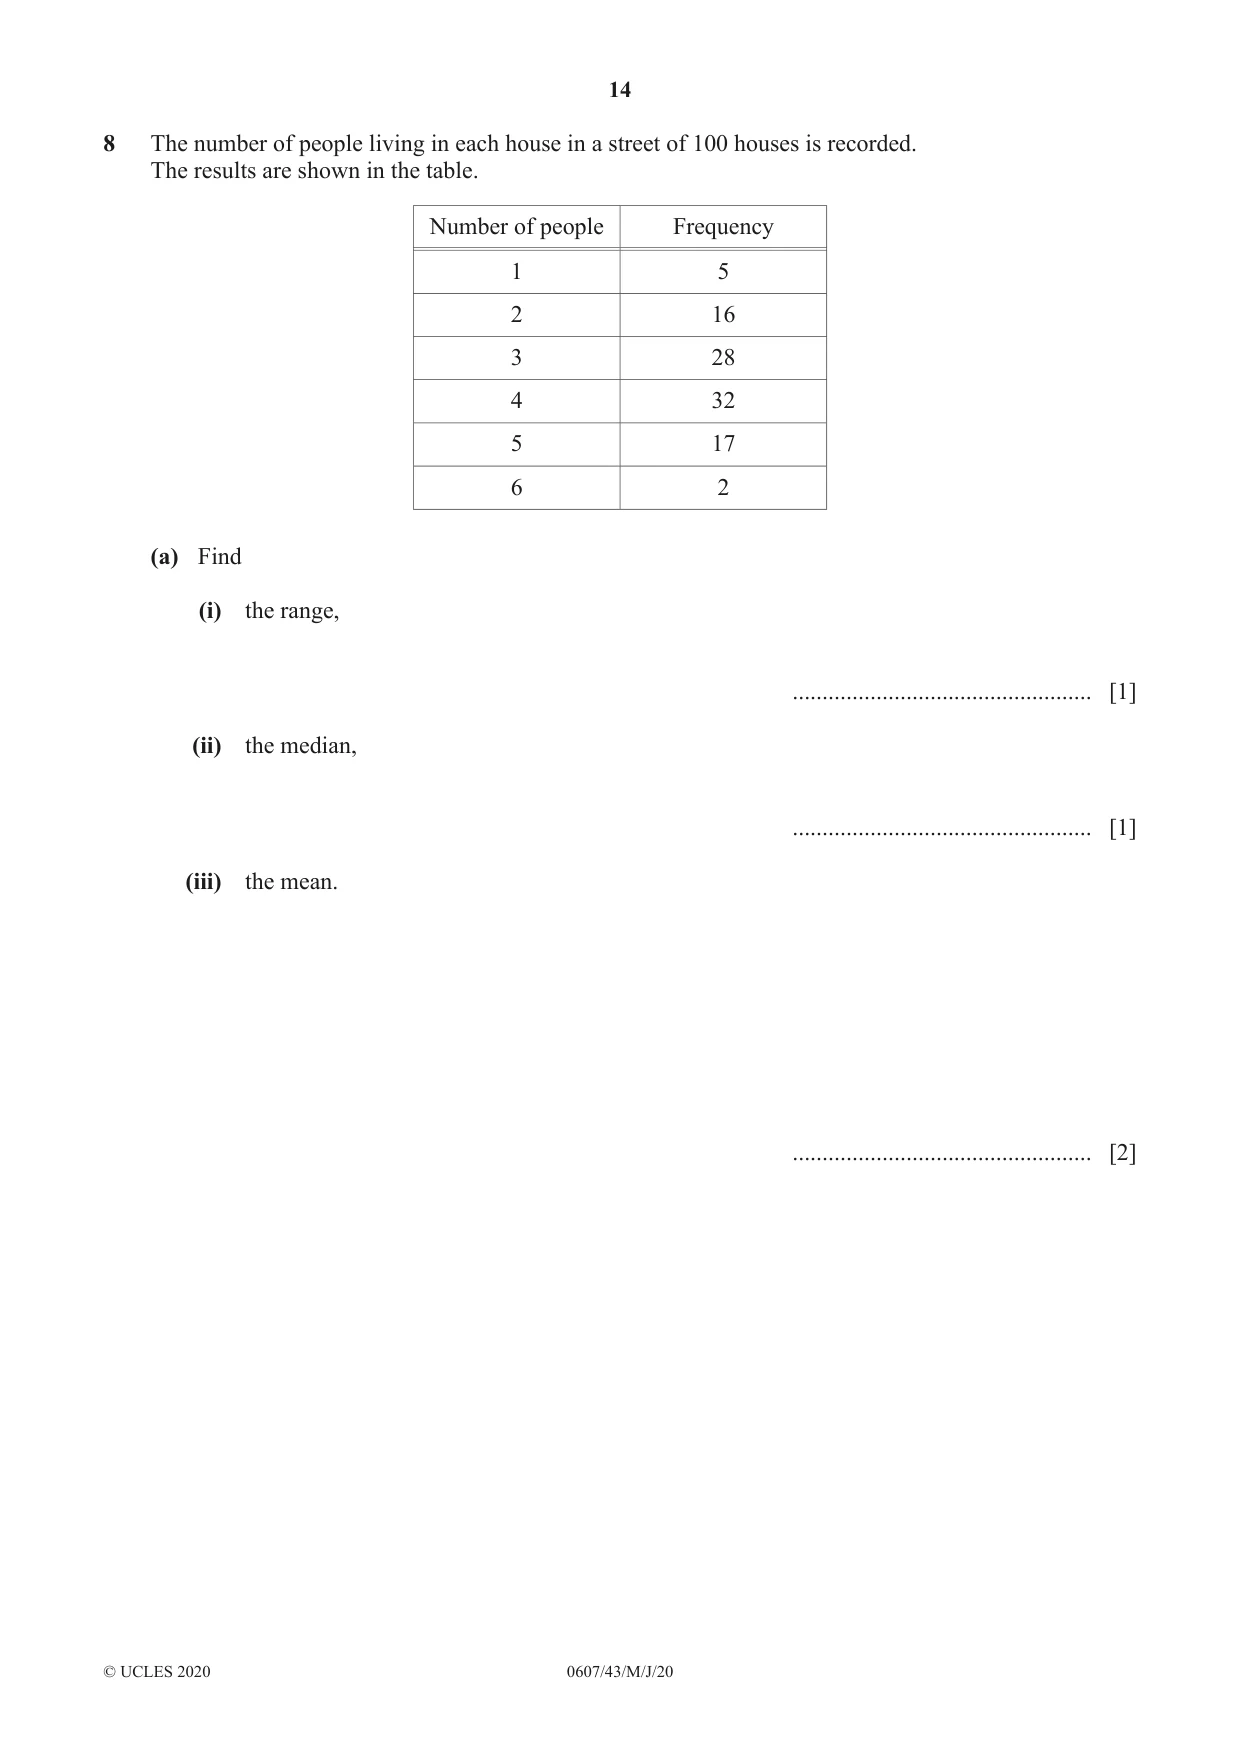
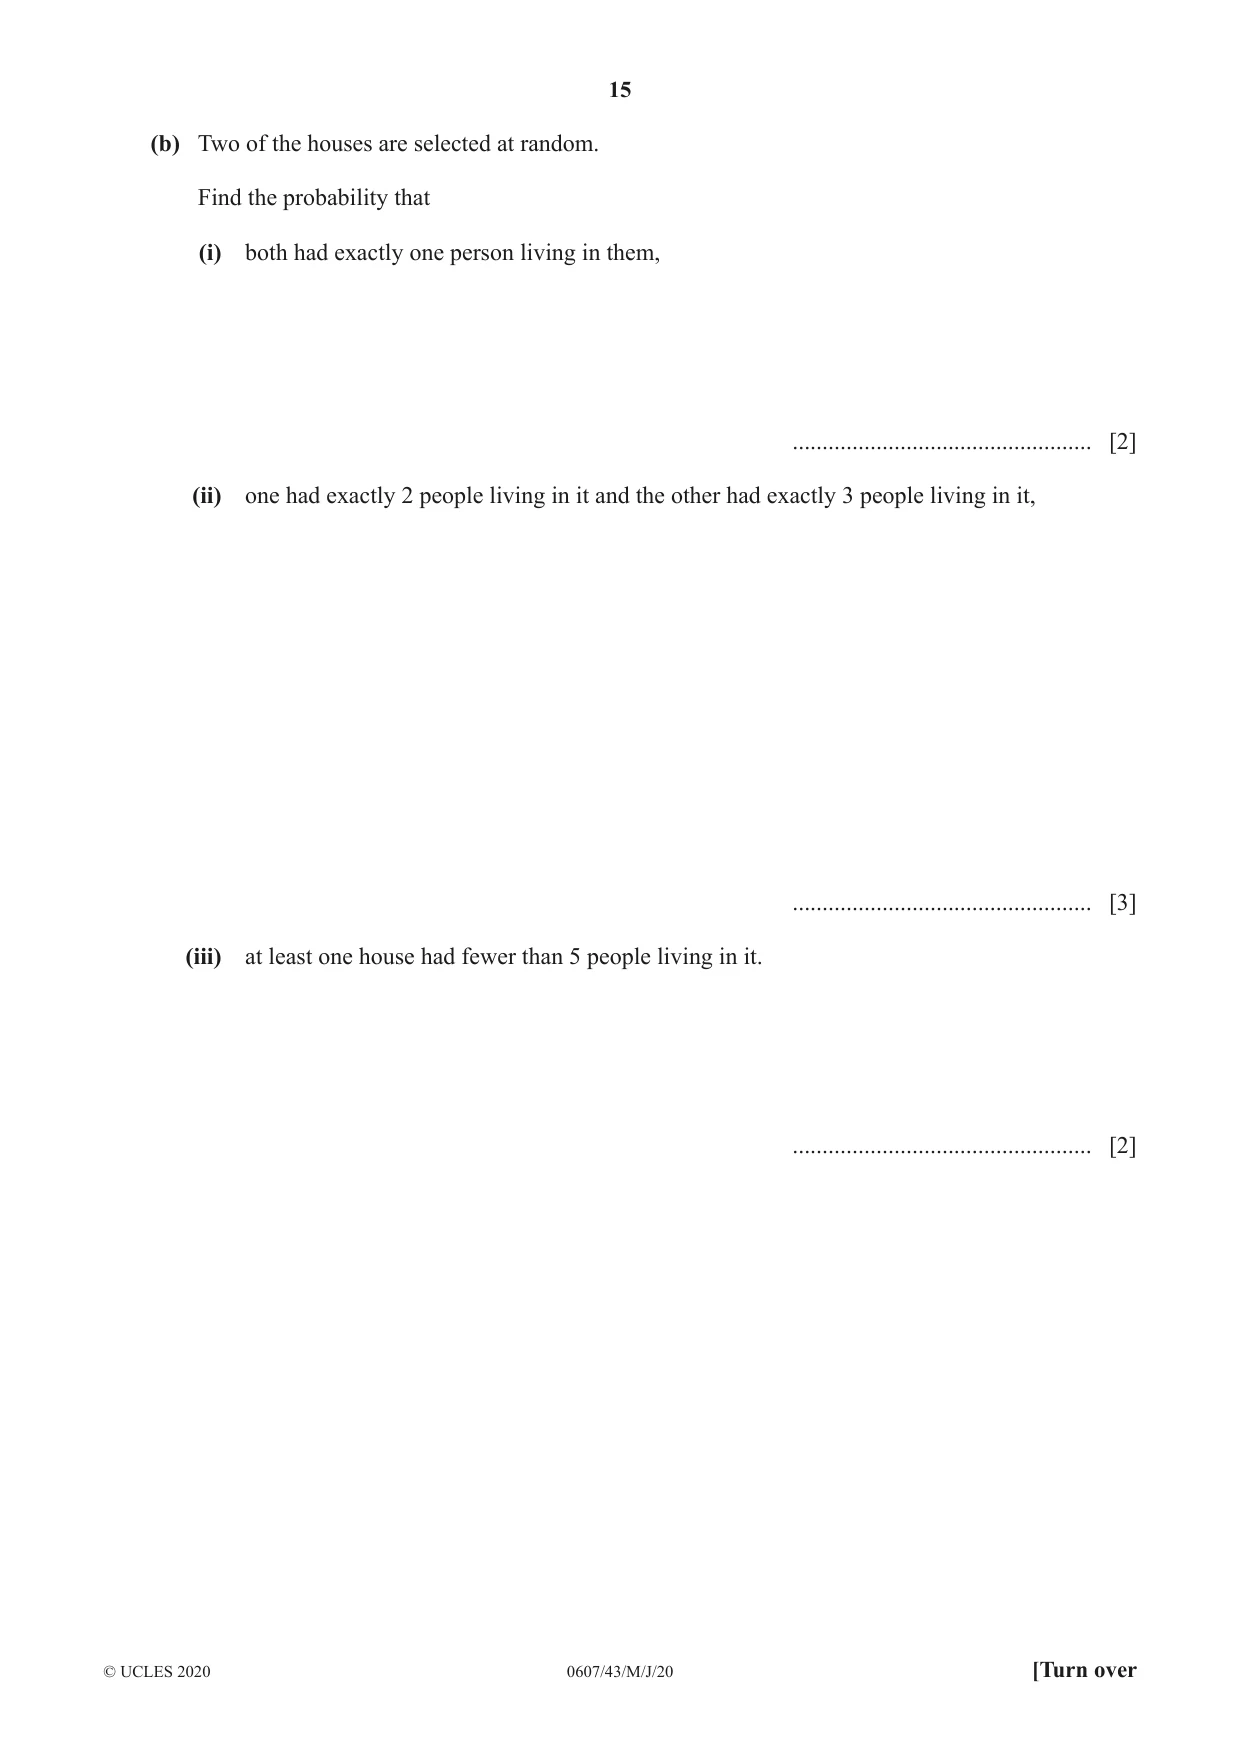
8 The number of people living in each house in a street of 100 houses is recorded. The results are shown in the table. Number of people Frequency 1 5 2 16 3 28 4 32 5 17 6 2 (a) Find (i) the range, .................................................. [1] (ii) the median, .................................................. [1] (iii) the mean. .................................................. [2] (b) Two of the houses are selected at random. Find the probability that (i) both had exactly one person living in them, .................................................. [2] (ii) one had exactly 2 people living in it and the other had exactly 3 people living in it, .................................................. [3] (iii) at least one house had fewer than 5 people living in it. .................................................. [2]
Mark scheme: 8(a)(i) 5 1 8(a)(ii) 4 1 fx8(a)(iii) 3.46 2 M1 for 100 8(b)(i) 20 2 5 4 oe M1 for × oe 9900 100 99 8(b)(ii) 896 3 16 28 28 16 M2 for × + × oe 9900 100 99 100 99 or M1 for one of the above products 8(b)(iii) 9558 2 19 18 M1 for 1 – × oe 9900 100 99
Q9 · Y A NOT TO SCALE B O x C A is the point (-2, 6), B is the point (3, 2) and C is the point…
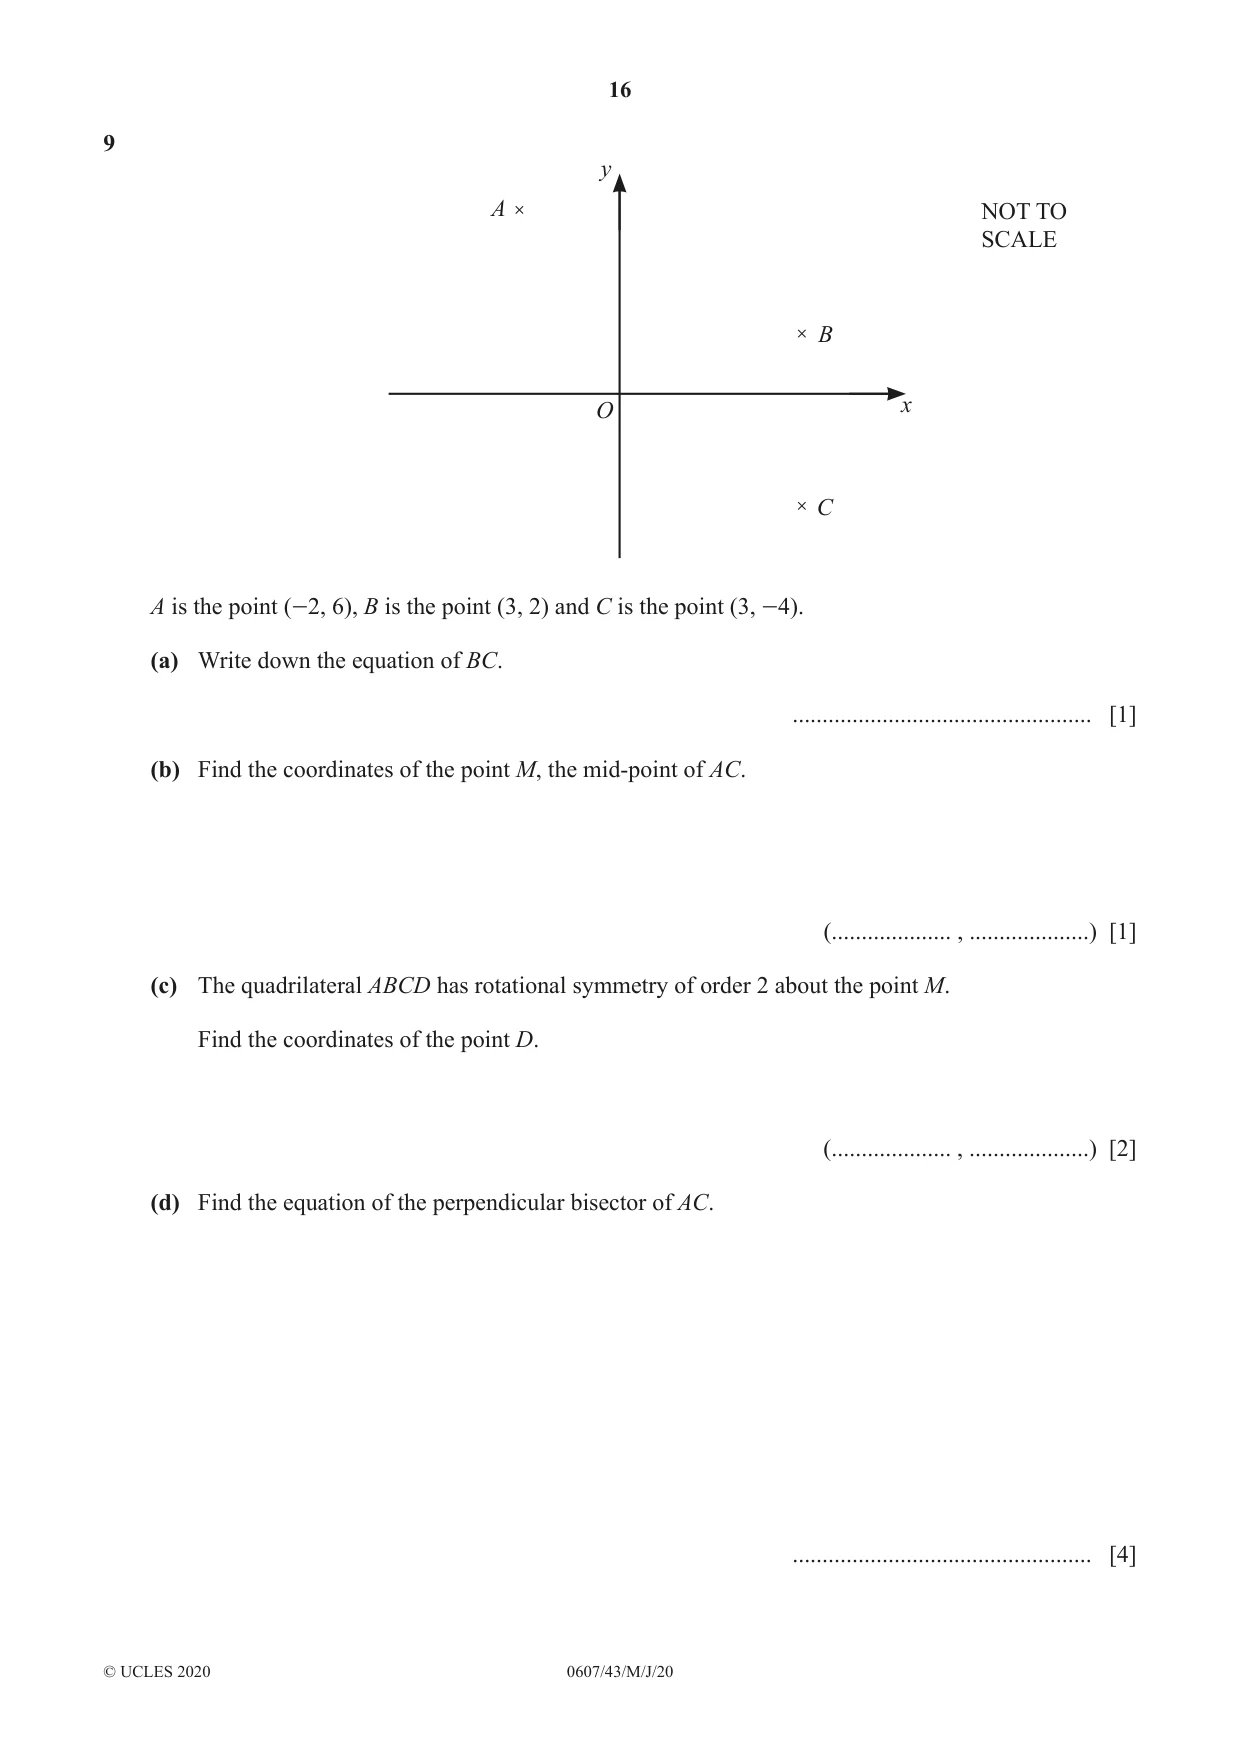
9 y A NOT TO SCALE B O x C A is the point (-2, 6), B is the point (3, 2) and C is the point (3, -4). (a) Write down the equation of BC. .................................................. [1] (b) Find the coordinates of the point M, the mid-point of AC. (.................... , ....................) [1] (c) The quadrilateral ABCD has rotational symmetry of order 2 about the point M. Find the coordinates of the point D. (.................... , ....................) [2] (d) Find the equation of the perpendicular bisector of AC. .................................................. [4]
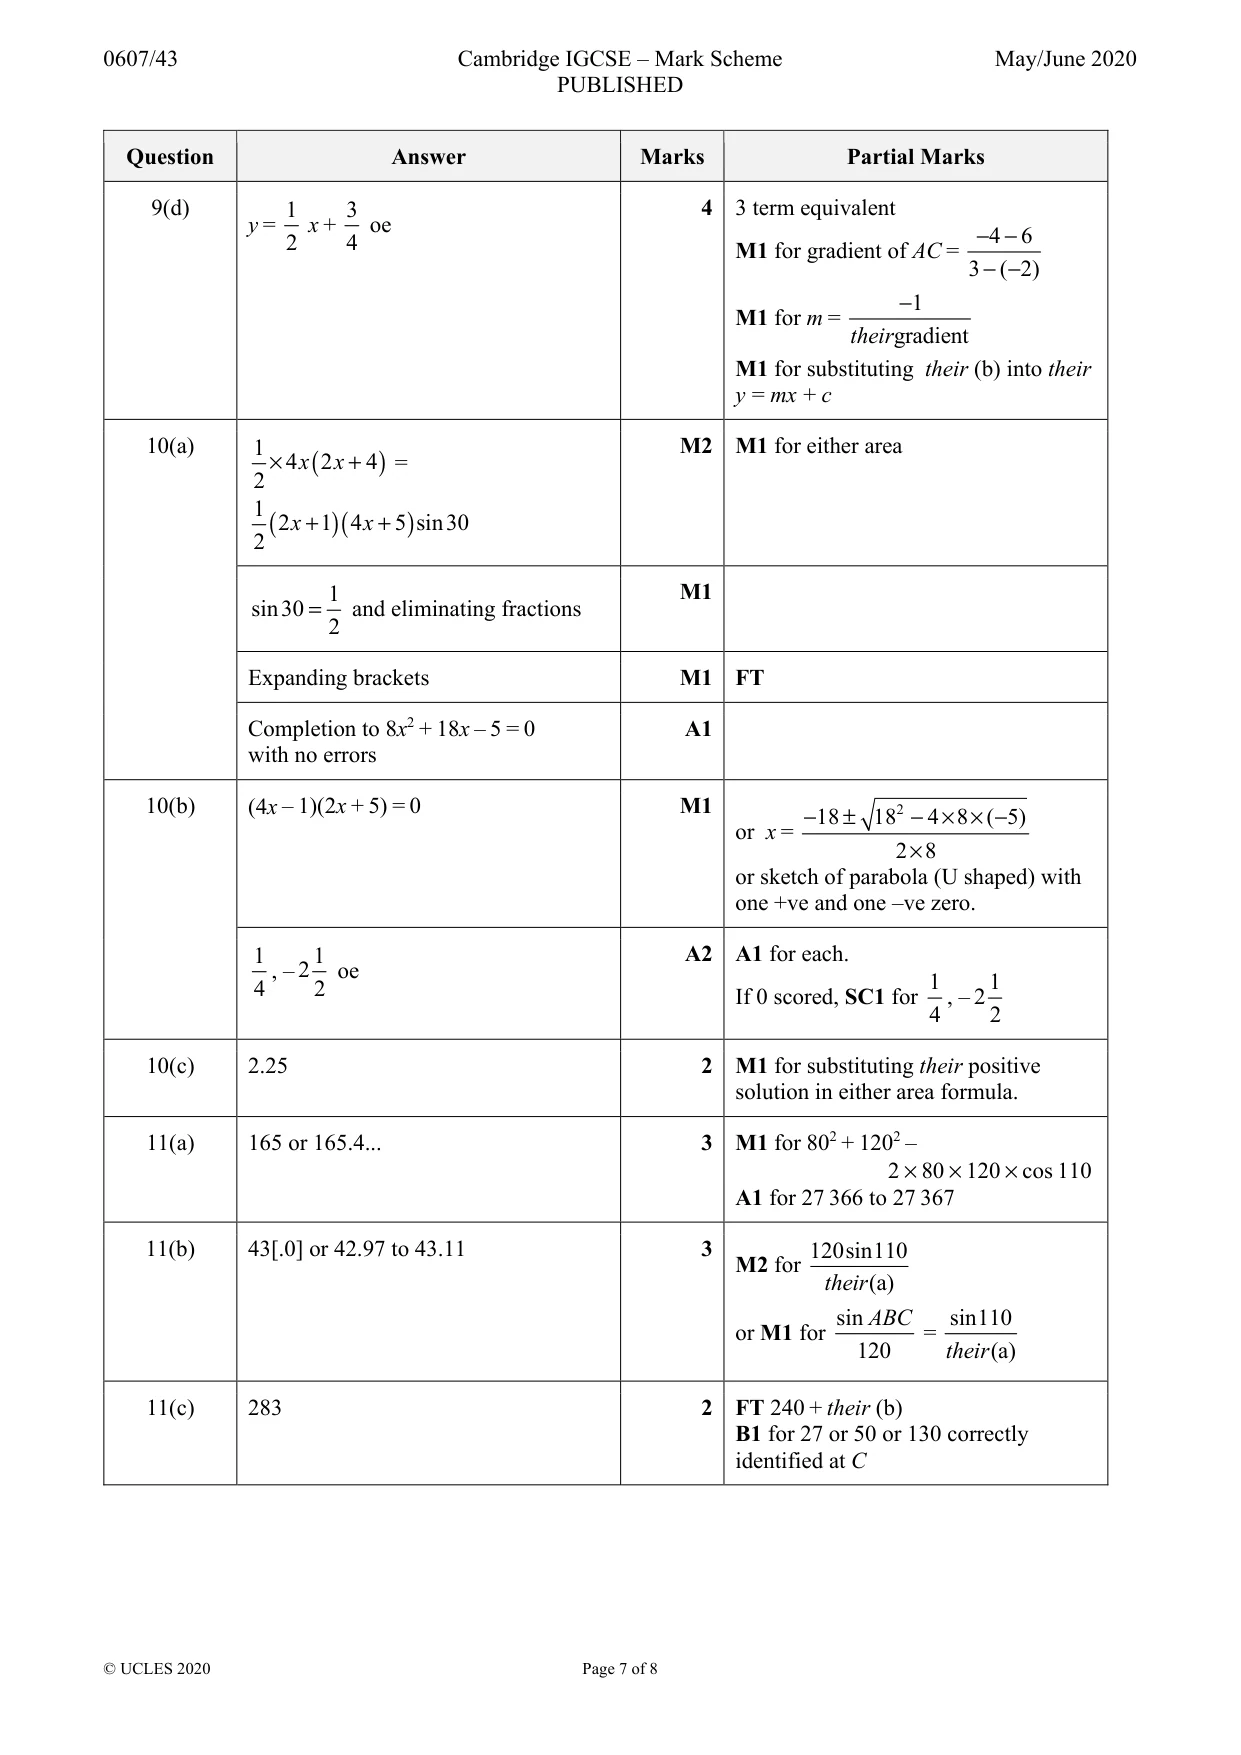
Mark scheme: 9(a) x = 3 oe 1 9(b) 1 1 , 1 oe 2 9(c) (–2, 0) 2 B1 for each coordinate 9(d) 1 3 4 3 term equivalent y = x + oe −−4 6 2 4 M1 for gradient of AC = 3 −−( 2) −1 M1 for m = theirgradient M1 for substituting their (b) into their y = mx + c
Q10 · In this question, all lengths are in centimetres
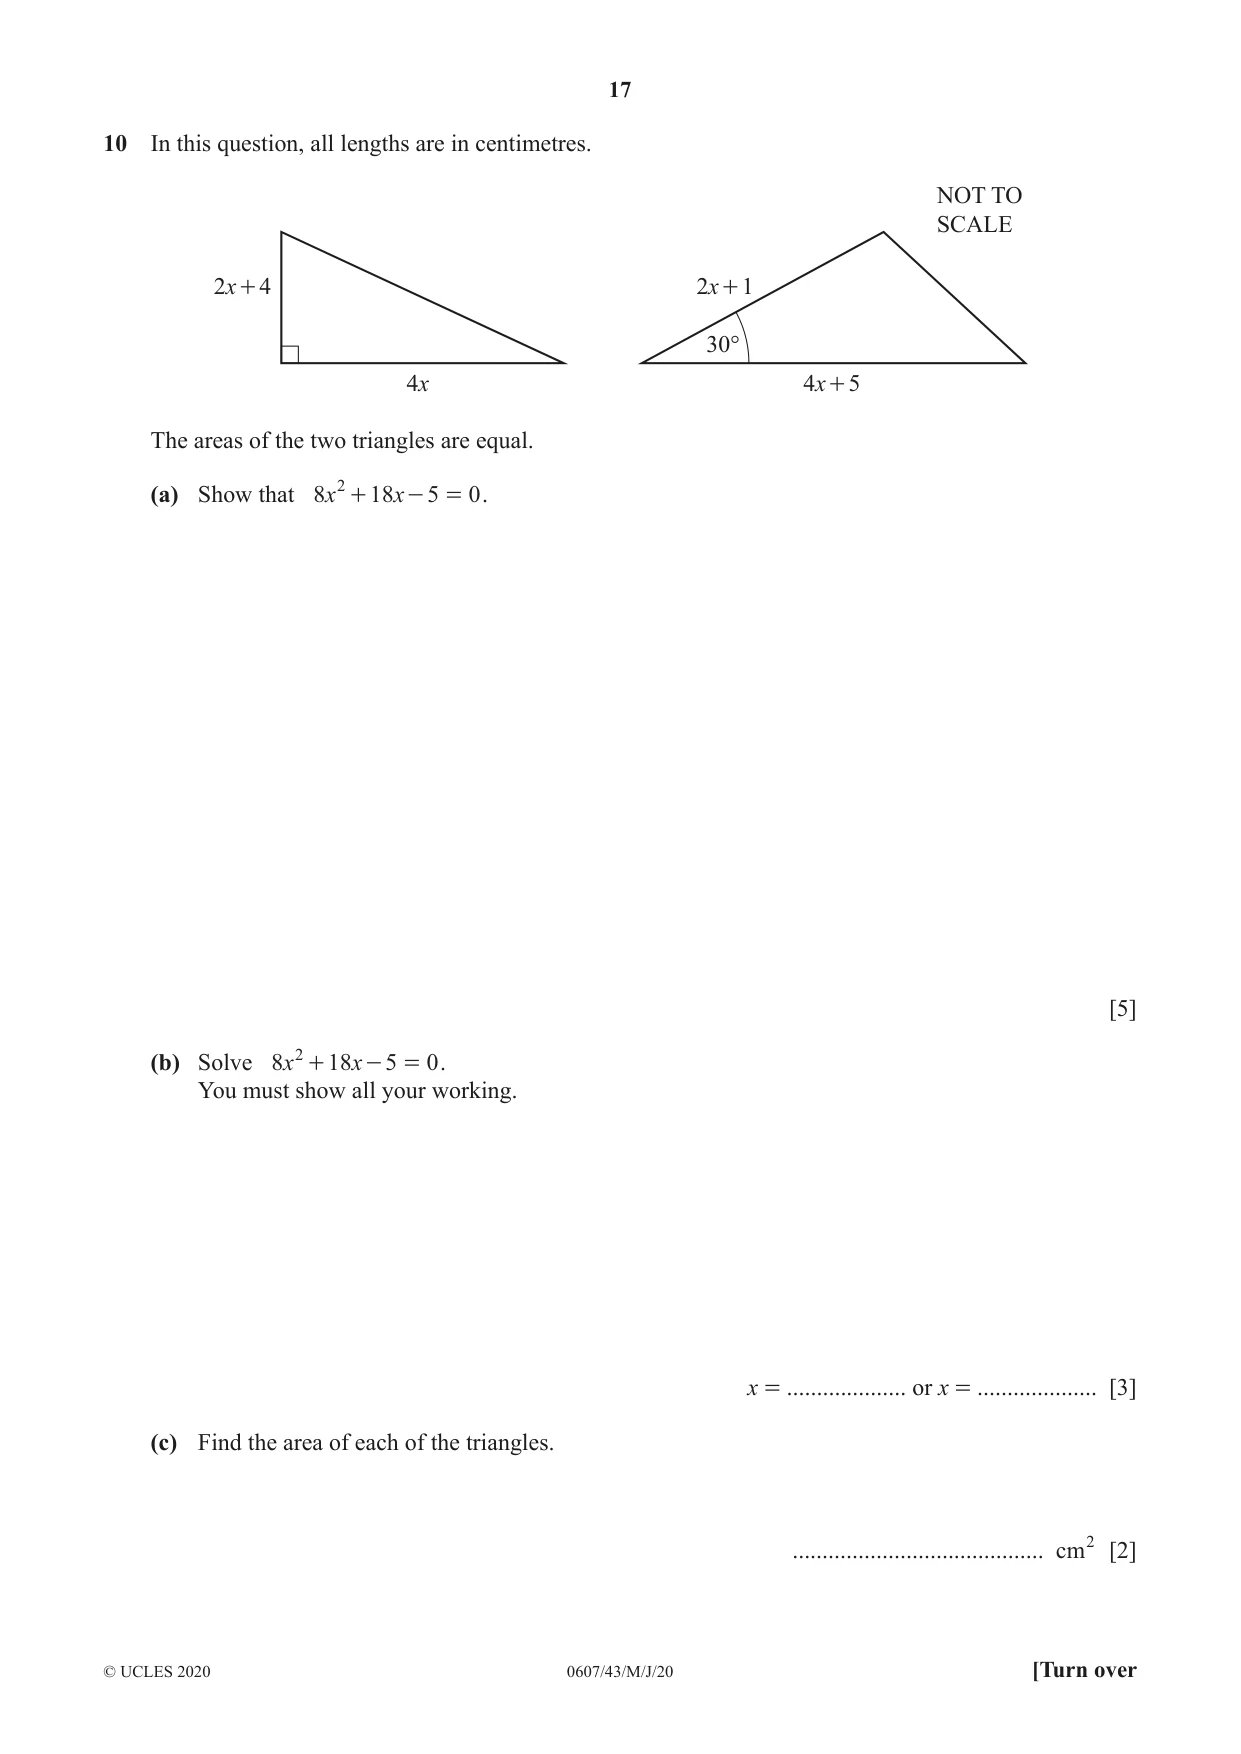
10 In this question, all lengths are in centimetres. NOT TO SCALE 2x + 4 2x + 1 30° 4x 4x + 5 The areas of the two triangles are equal. (a) Show that 8x 2 + 18 x - 5 = 0 . [5] (b) Solve 8x 2 + 18 x - 5 = 0 . You must show all your working. x = .................... or x = .................... [3] (c) Find the area of each of the triangles. .......................................... cm2 [2]
Mark scheme: 10(a) 1 M2 M1 for either area × 4 x ( 2 x + 4 ) = 2 1 ( 2 x + 1)( 4 x + 5 ) sin30 2 1 M1 sin30 = and eliminating fractions 2 Expanding brackets M1 FT Completion to 8x2 + 18x – 5 = 0 A1 with no errors 10(b) (4x – 1)(2x + 5) = 0 M1 2 − 18 ± 18 − 4 × 8 × ( − 5) or x = 2 × 8 or sketch of parabola (U shaped) with one +ve and one –ve zero. 1 1 A2 A1 for each. , – 2 oe 1 1 4 2 If 0 scored, SC1 for , – 2 4 2 10(c) 2.25 2 M1 for substituting their positive solution in either area formula.
Q11 · North A NOT TO SCALE 110° 80 km 120 km North B C The diagram shows the positions of three…
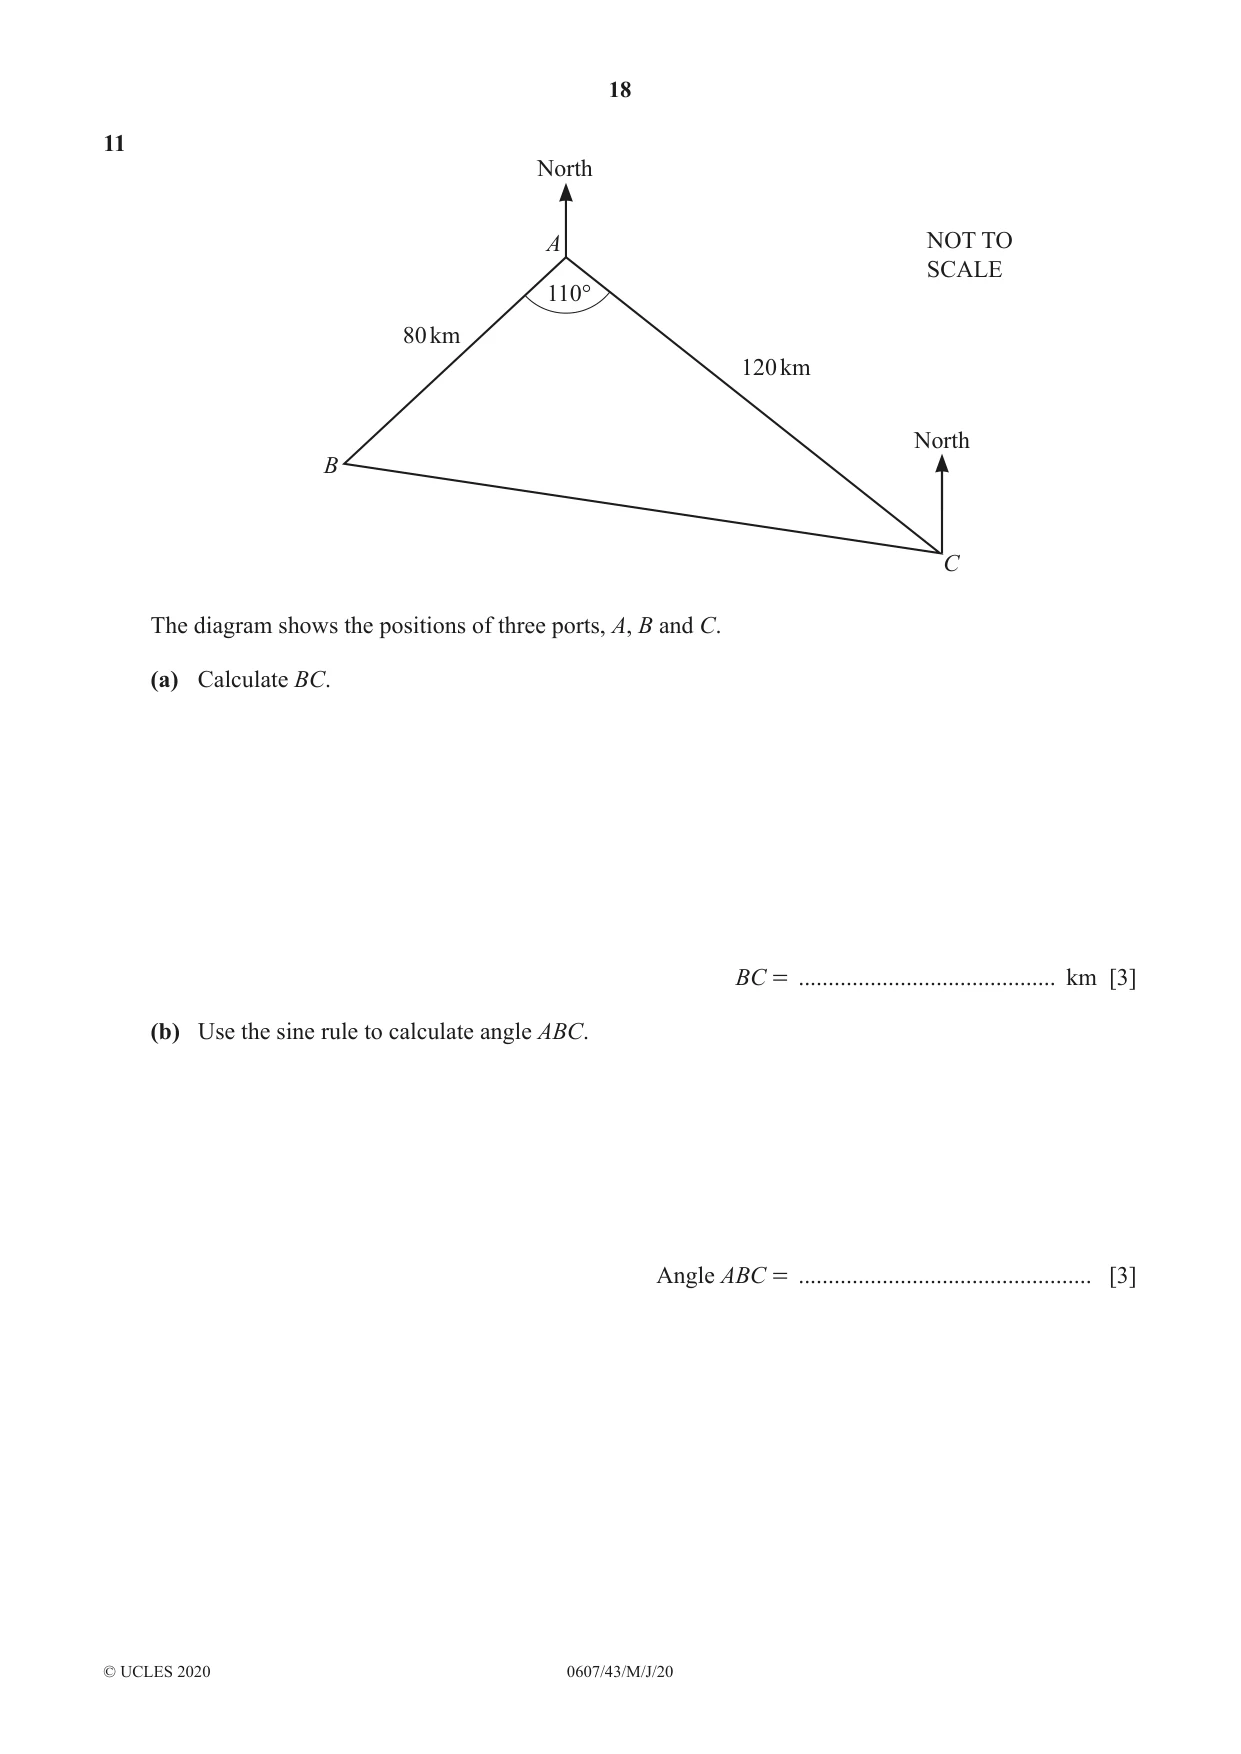
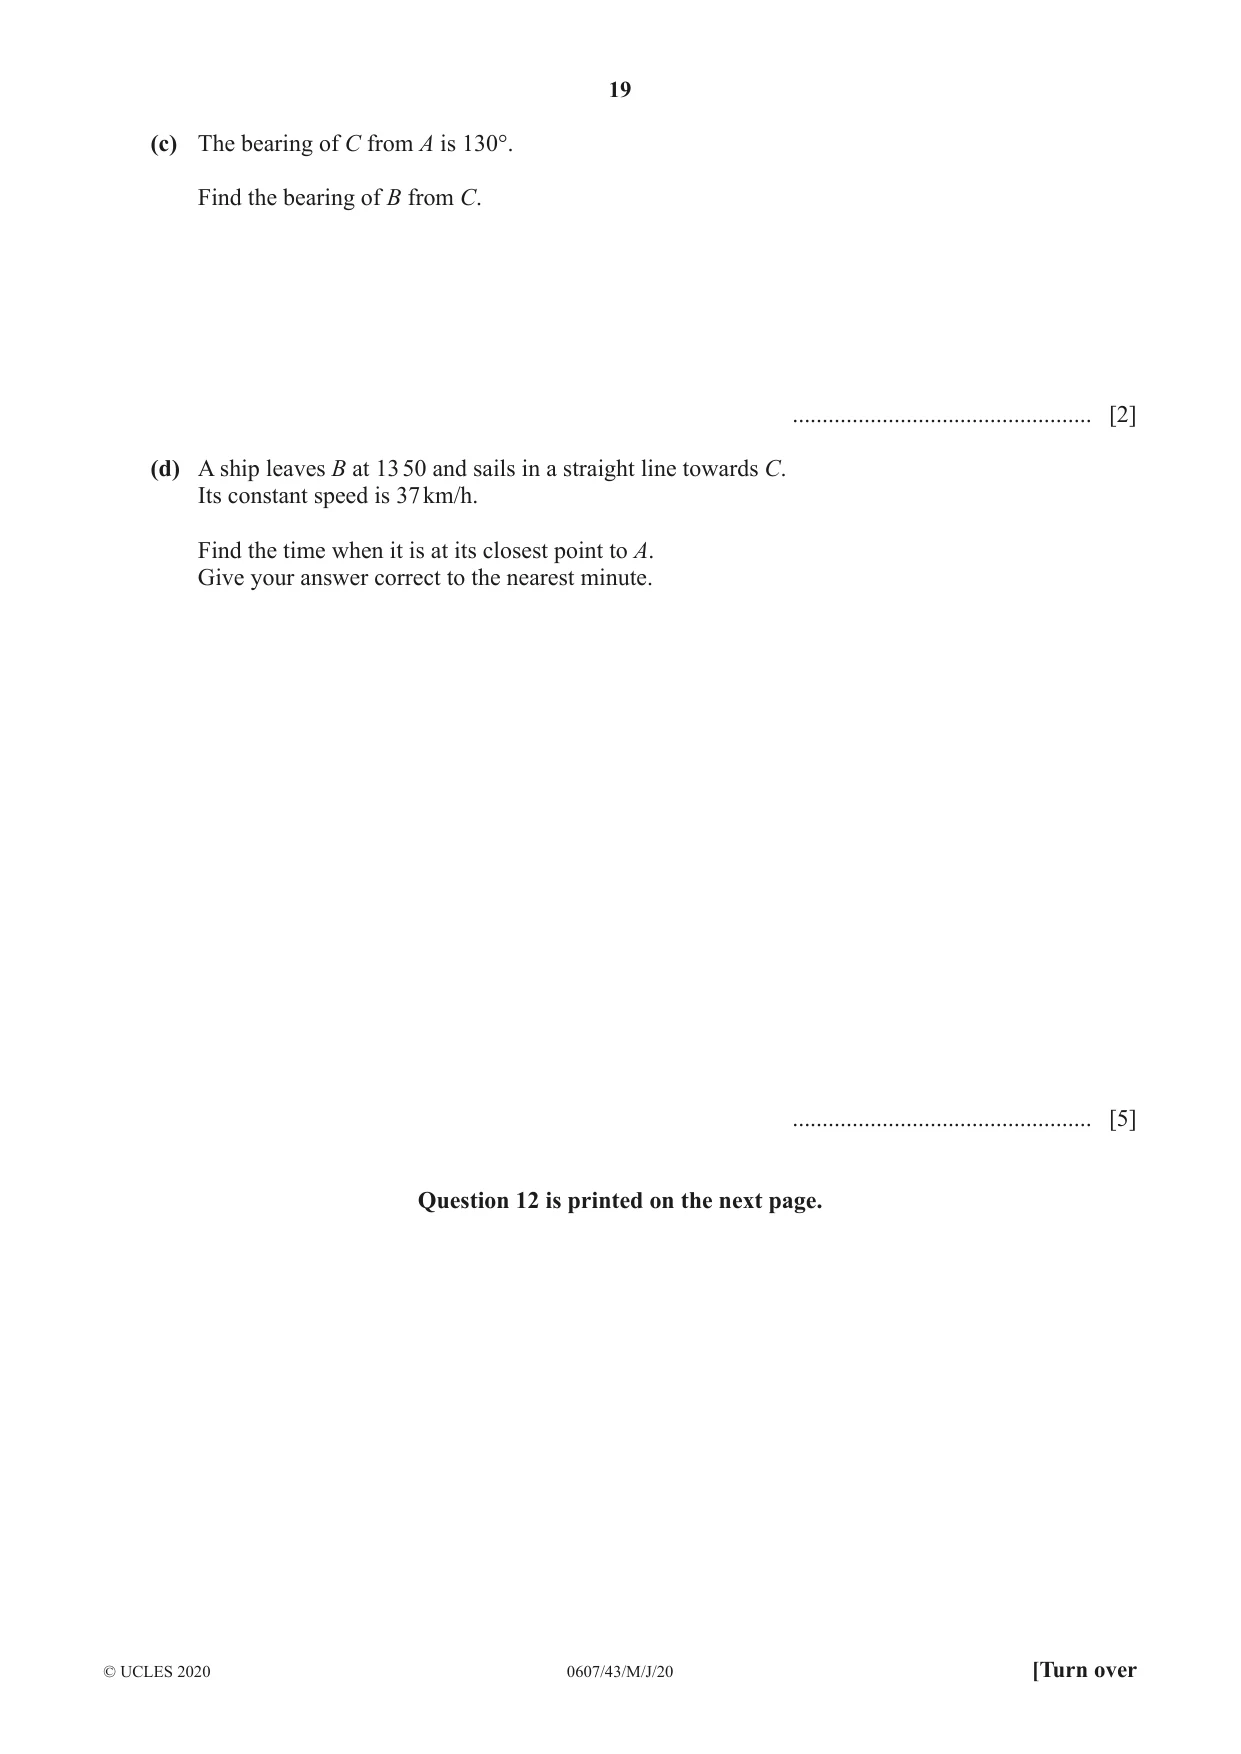
11 North A NOT TO SCALE 110° 80 km 120 km North B C The diagram shows the positions of three ports, A, B and C. (a) Calculate BC. BC = ........................................... km [3] (b) Use the sine rule to calculate angle ABC. Angle ABC = ................................................. [3] (c) The bearing of C from A is 130°. Find the bearing of B from C. .................................................. [2] (d) A ship leaves B at 13 50 and sails in a straight line towards C. Its constant speed is 37 km/h. Find the time when it is at its closest point to A. Give your answer correct to the nearest minute. .................................................. [5] Question 12 is printed on the next page.
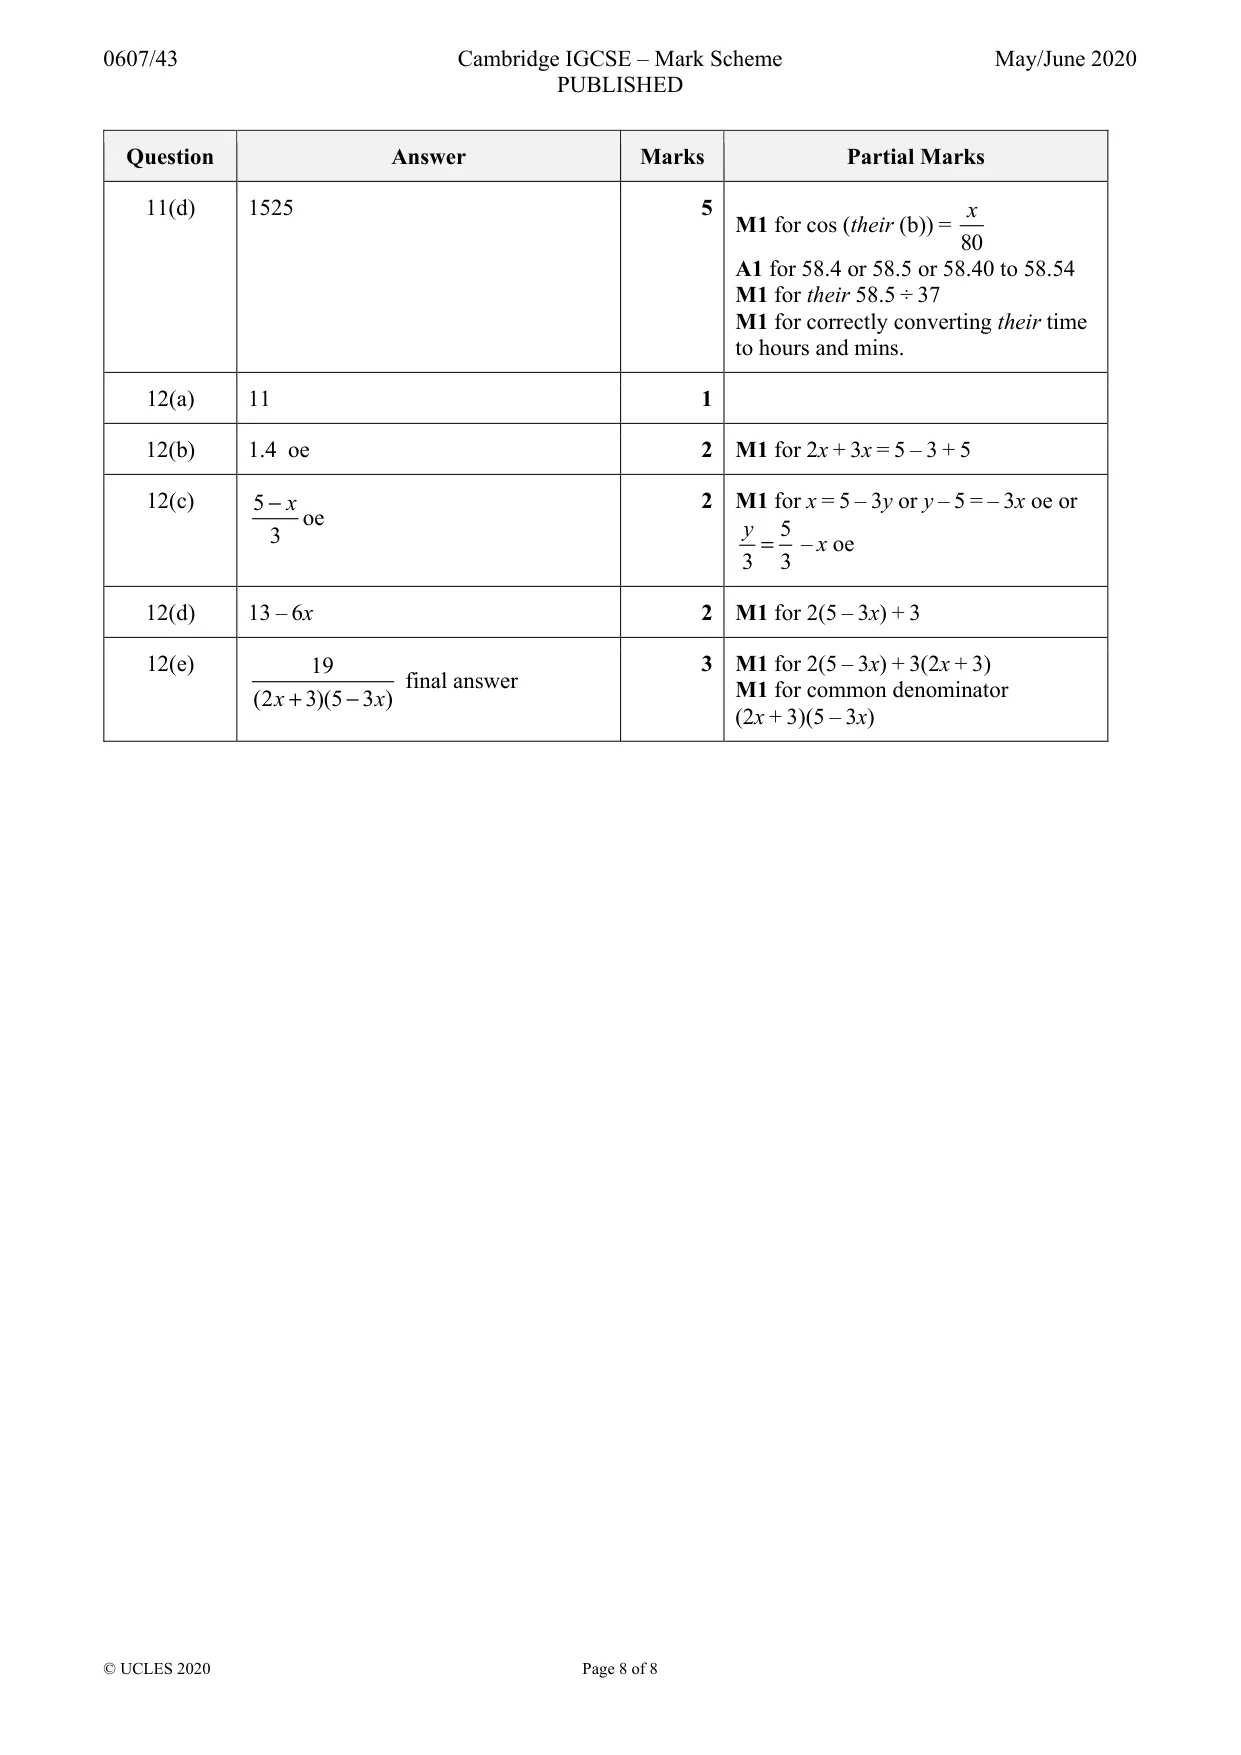
Mark scheme: 11(a) 165 or 165.4... 3 M1 for 802 + 1202 – 2 × 80 × 120 × cos 110 A1 for 27 366 to 27 367 11(b) 43[.0] or 42.97 to 43.11 3 120sin110 M2 for their (a) sin ABC sin110 or M1 for = 120 their (a) 11(c) 283 2 FT 240 + their (b) B1 for 27 or 50 or 130 correctly identified at C 11(d) 1525 5 x M1 for cos (their (b)) = 80 A1 for 58.4 or 58.5 or 58.40 to 58.54 M1 for their 58.5 ÷ 37 M1 for correctly converting their time to hours and mins.
Q12 · F ( x) = 2x + 3 g ( )x = 5 - 3 x (a) Find f ( 4)
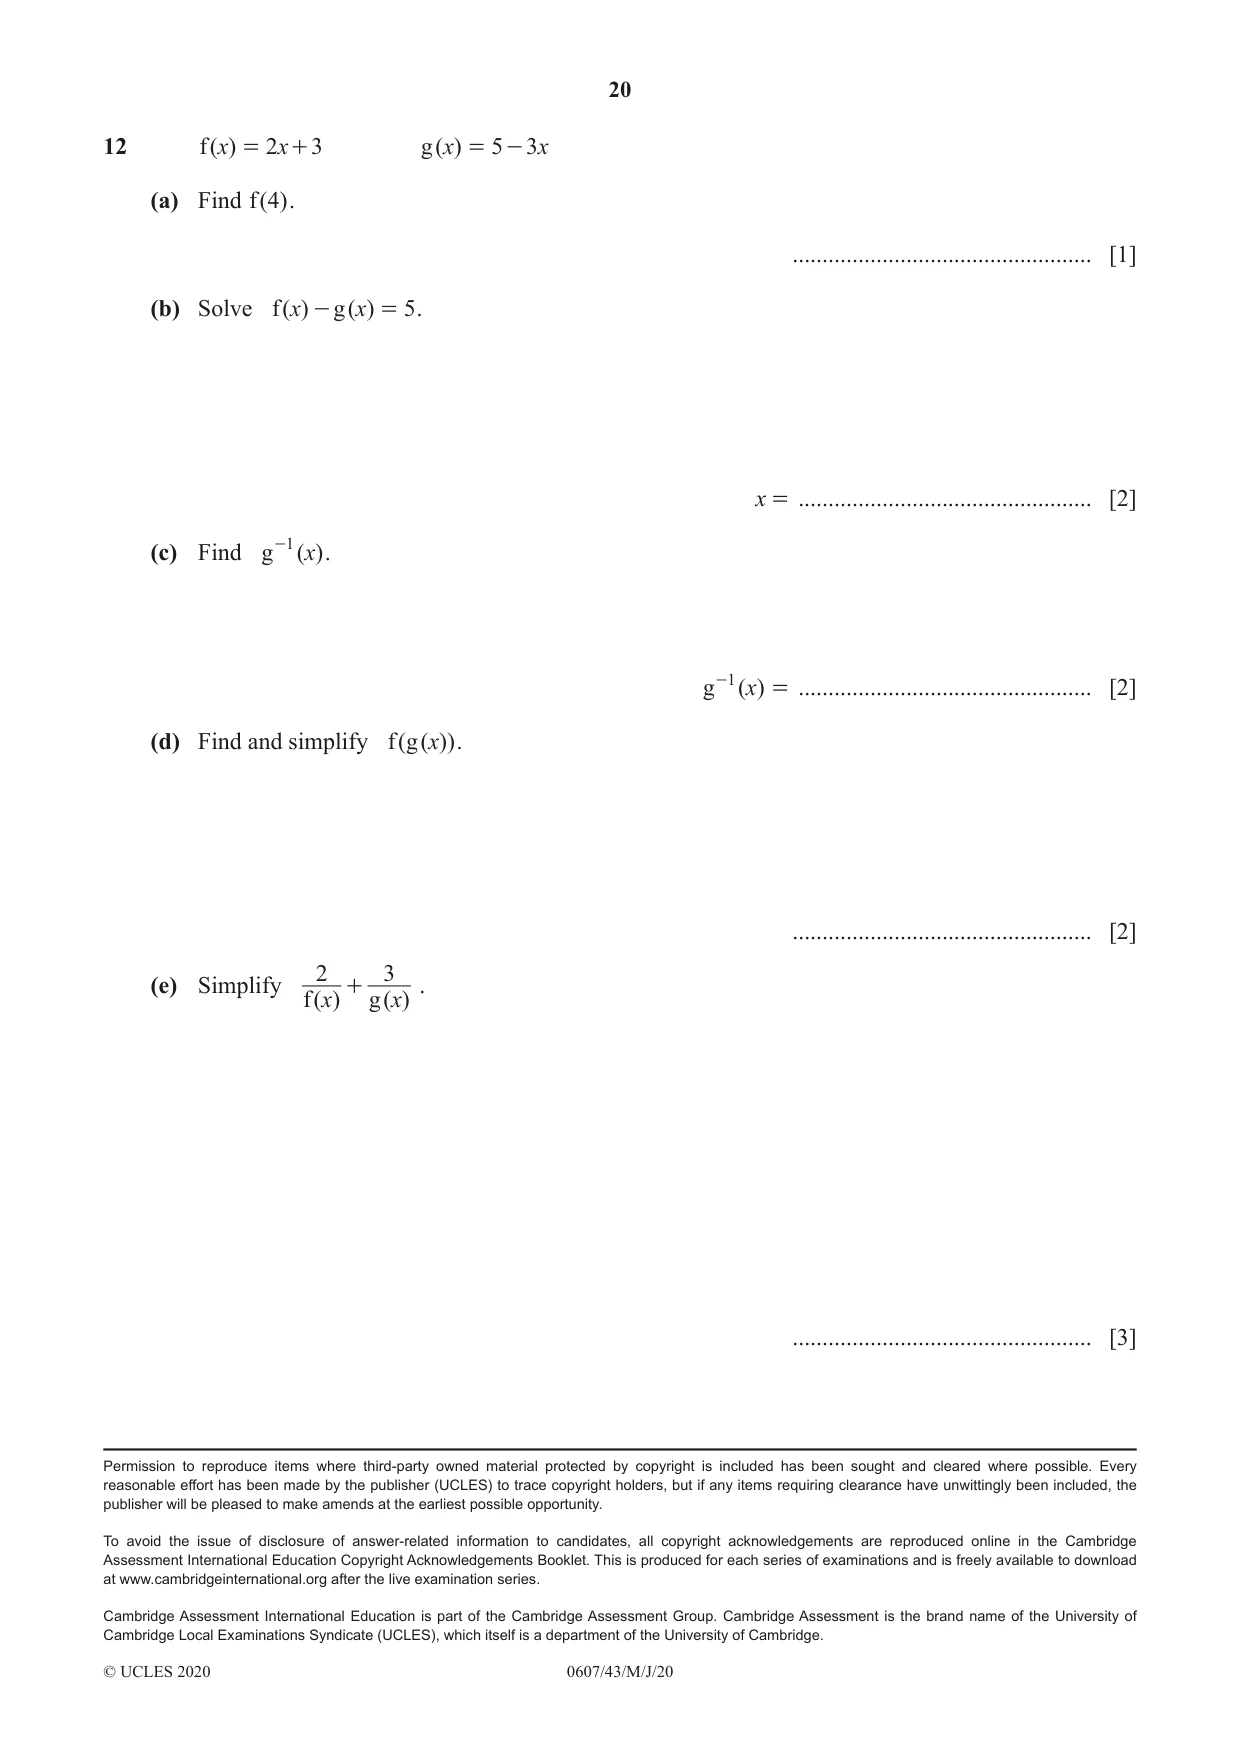
12 f ( x) = 2x + 3 g ( )x = 5 - 3 x (a) Find f ( 4) . .................................................. [1] (b) Solve f ( x) - g ( x) = 5 . x = ................................................. [2] (c) Find g -1 ( )x . g -1 ( )x = ................................................. [2] (d) Find and simplify f ( g ( x)) . .................................................. [2] 2 3 (e) Simplify + . f ( x) g ( x) .................................................. [3]
Mark scheme: 12(a) 11 1 12(b) 1.4 oe 2 M1 for 2x + 3x = 5 – 3 + 5 12(c) 5 − x 2 M1 for x = 5 – 3y or y – 5 = – 3x oe or oe 3 y 5 = – x oe 3 3 12(d) 13 – 6x 2 M1 for 2(5 – 3x) + 3 12(e) 19 3 M1 for 2(5 – 3x) + 3(2x + 3) final answer M1 for common denominator (2 x + 3)(5 − 3 x ) (2x + 3)(5 – 3x)
What was in this paper
The subtopics covered by these 12 questions, and how many questions each got. Open one in a new tab to see every Cambridge question on it.