Cambridge IGCSE Mathematics - International 0607 — 2024 May/June Paper 4 · Variant 1
0607/41/M/J/24 · 11 questions · 120 marks · ≈135 min
The question paper and its mark scheme, free to read here and free to download. This is Cambridge’s own paper, exactly as it was sat.
Question paper20 pages
Mark scheme9 pages
Answers below. Sit the paper first if you are practising.
Questions as text
Question 1
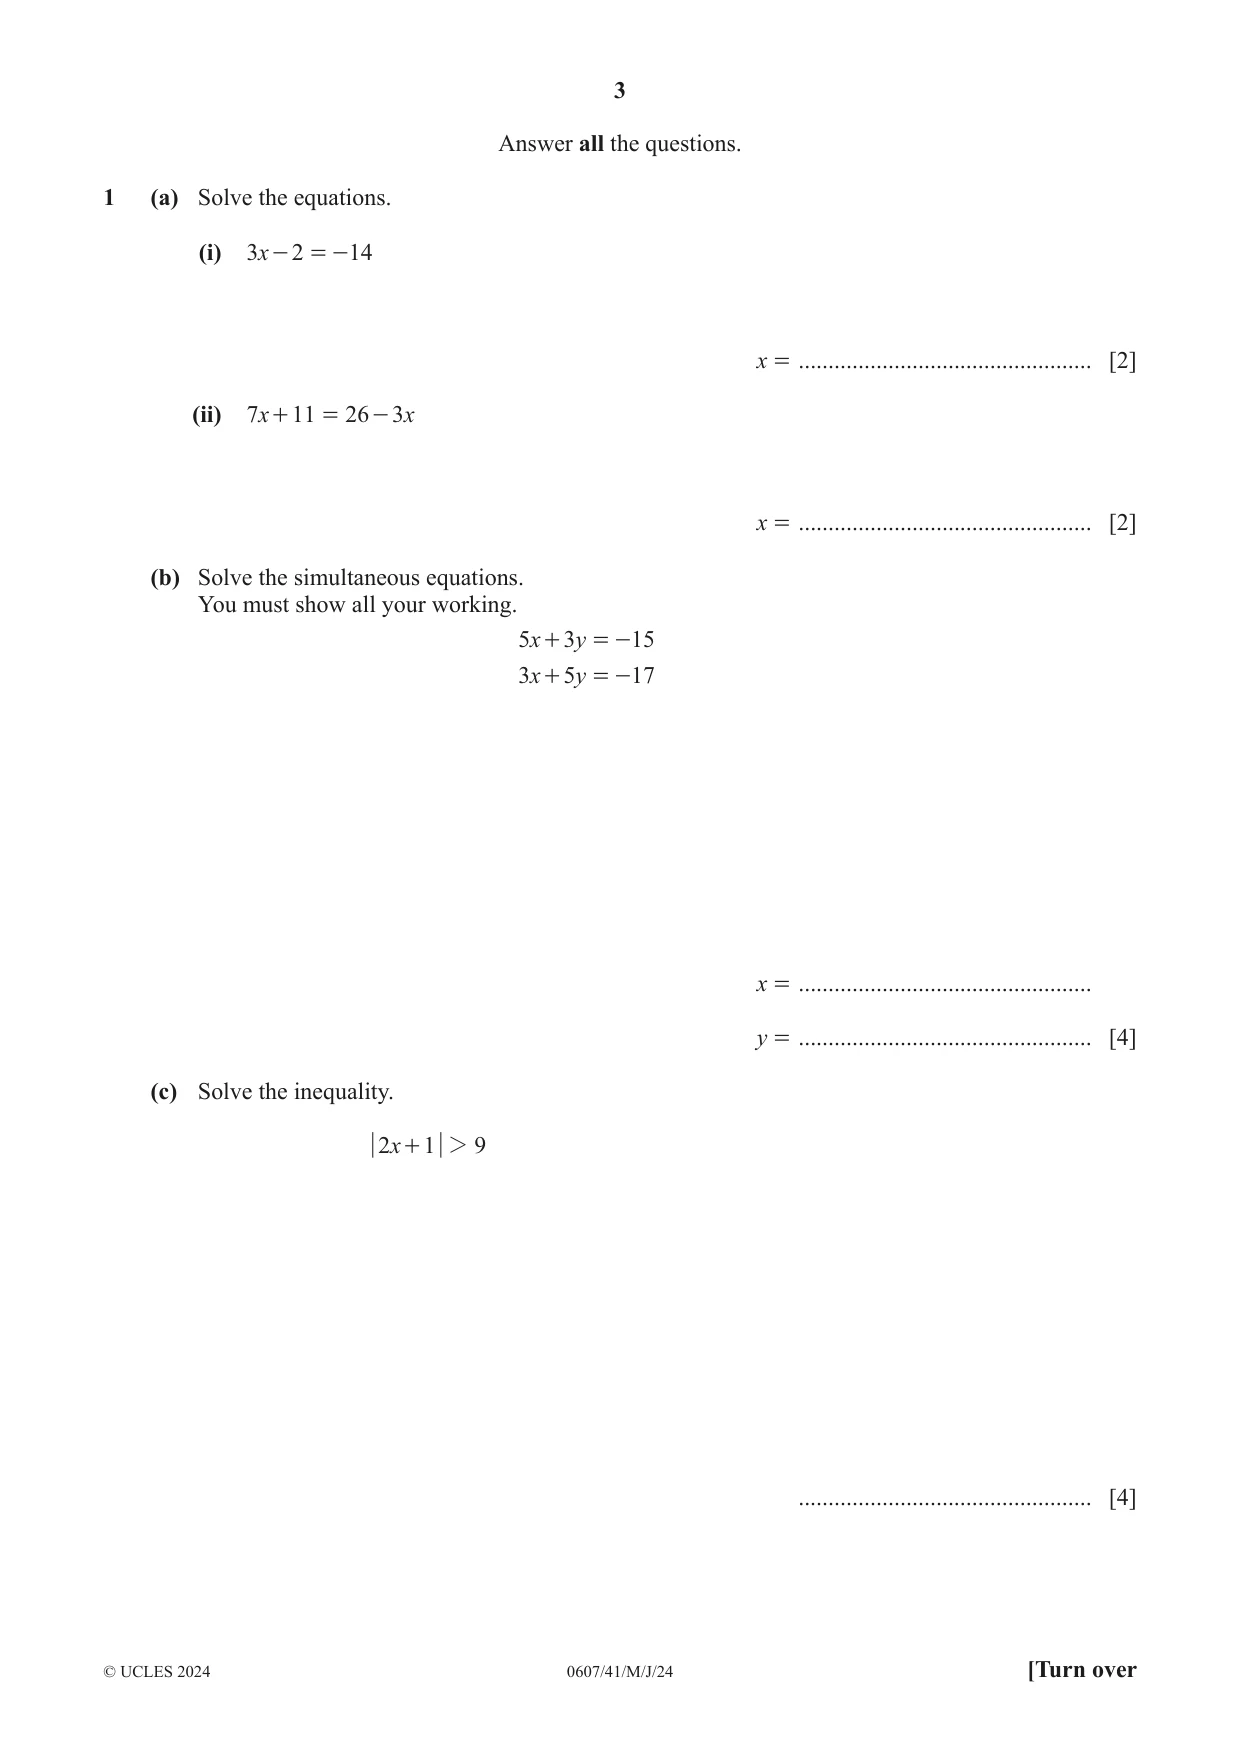
1 (a) Solve the equations. (i) 3x - 2 = - 14 x = ................................................. [2] (ii) 7x + 11 = 26 - 3 x x = ................................................. [2] (b) Solve the simultaneous equations. You must show all your working. 5x + 3y = - 15 3x + 5y = - 17 x = ................................................. y = ................................................. [4] (c) Solve the inequality. 2x + 1 2 9 ................................................. [4]
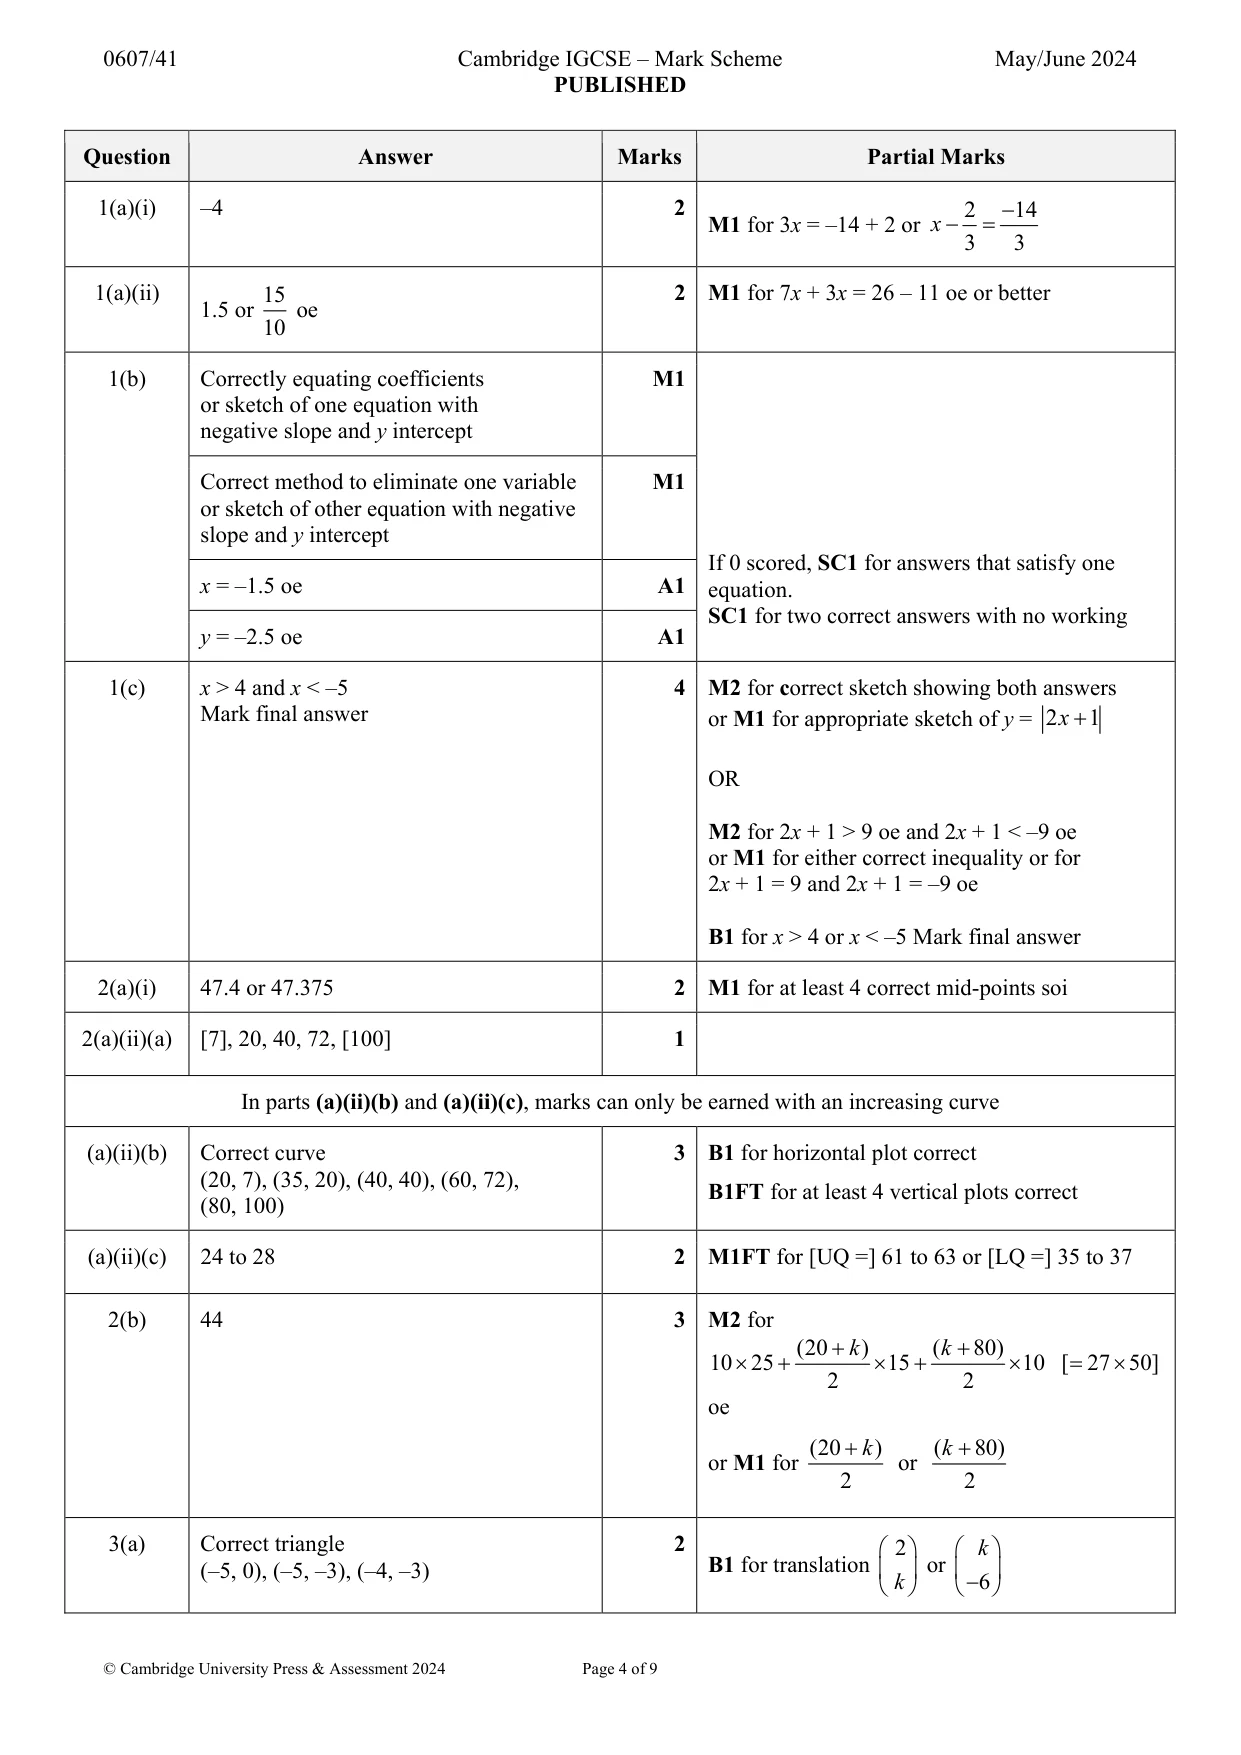
Mark scheme: Question Answer Marks Partial Marks 1(a)(i) –4 2 2 14 M1 for 3x = –14 + 2 or x 3 3 1(a)(ii) 15 2 M1 for 7x + 3x = 26 – 11 oe or better 1.5 or oe 10 1(b) Correctly equating coefficients M1 or sketch of one equation with negative slope and y intercept Correct method to eliminate one variable M1 or sketch of other equation with negative slope and y intercept If 0 scored, SC1 for answers that satisfy one x = –1.5 oe A1 equation. SC1 for two correct answers with no working y = –2.5 oe A1 1(c) x > 4 and x < –5 4 M2 for correct sketch showing both answers Mark final answer or M1 for appropriate sketch of y = 2 x 1 OR M2 for 2x + 1 > 9 oe and 2x + 1 < –9 oe or M1 for either correct inequality or for 2x + 1 = 9 and 2x + 1 = –9 oe B1 for x > 4 or x < –5 Mark final answer
Q2 · The heights, x cm, of 100 plants are shown in the table
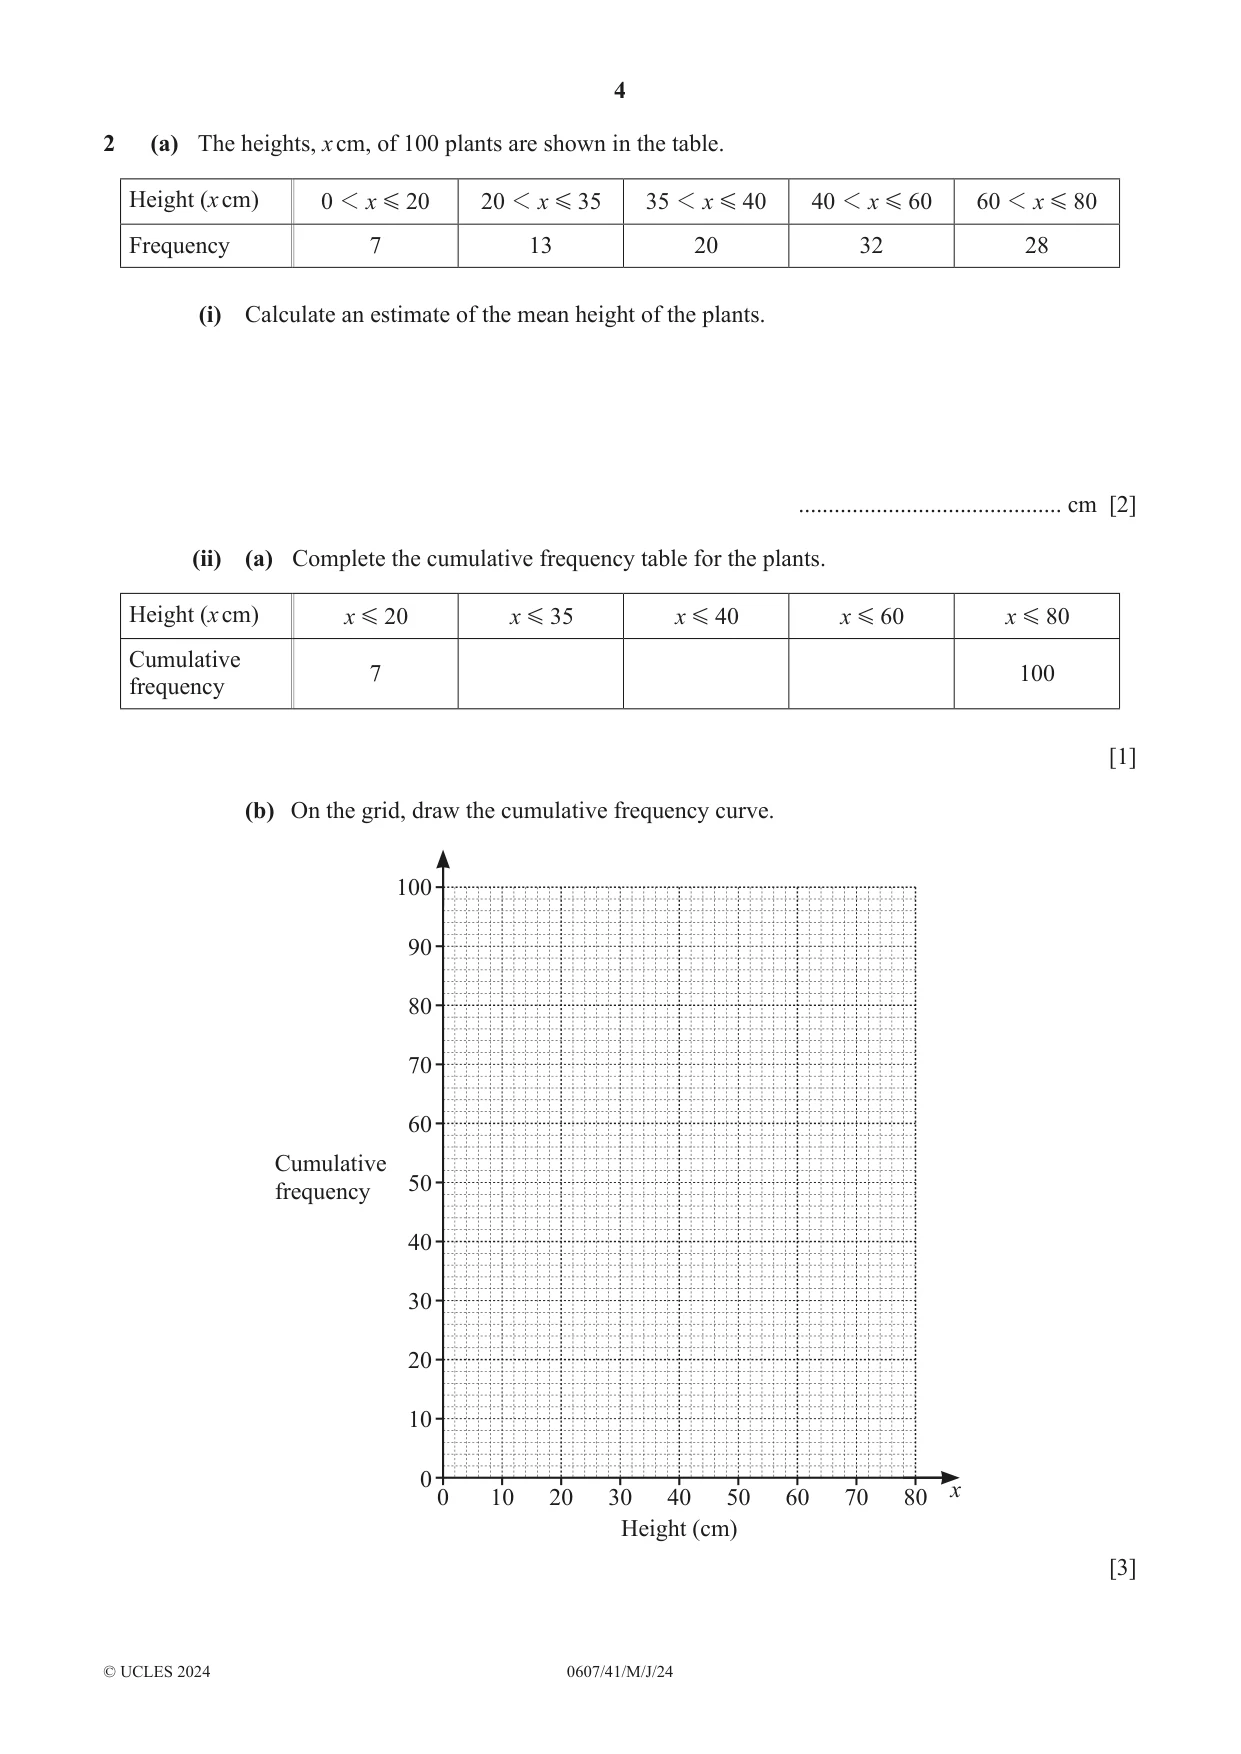
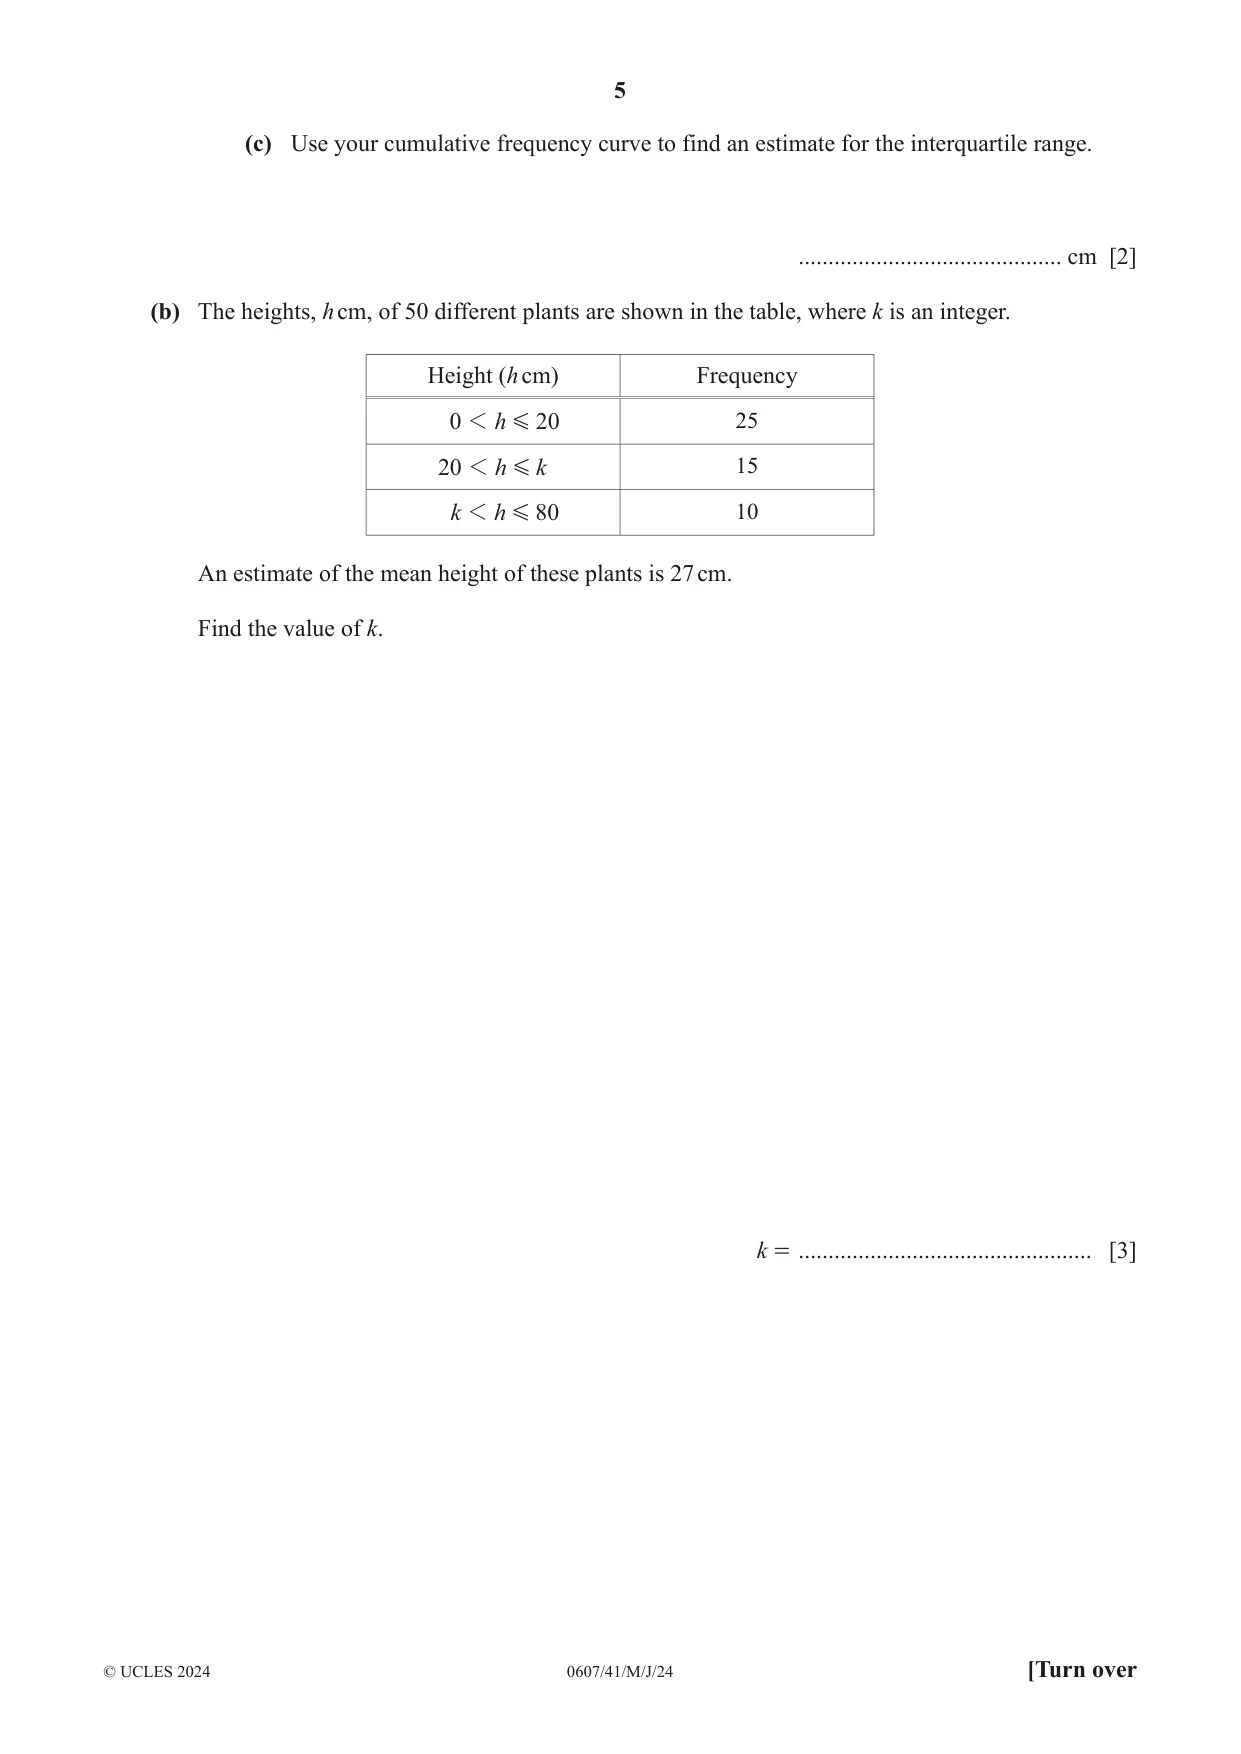
2 (a) The heights, x cm, of 100 plants are shown in the table. Height (x cm) 0 1 x G 20 20 1 x G 35 35 1 x G 40 40 1 x G 60 60 1 x G 80 Frequency 7 13 20 32 28 (i) Calculate an estimate of the mean height of the plants. ............................................ cm [2] (ii) (a) Complete the cumulative frequency table for the plants. Height (x cm) x G 20 x G 35 x G 40 x G 60 x G 80 Cumulative 7 100 frequency [1] (b) On the grid, draw the cumulative frequency curve. 100 90 80 70 60 Cumulative 50 frequency 40 30 20 10 0 x 0 10 20 30 40 50 60 70 80 Height (cm) [3] (c) Use your cumulative frequency curve to find an estimate for the interquartile range. ............................................ cm [2] (b) The heights, h cm, of 50 different plants are shown in the table, where k is an integer. Height (h cm) Frequency 0 1 h G 20 25 20 1 h G k 15 k 1 h G 80 10 An estimate of the mean height of these plants is 27 cm. Find the value of k. k = ................................................. [3]
Mark scheme: 2(a)(i) 47.4 or 47.375 2 M1 for at least 4 correct mid-points soi 2(a)(ii)(a) [7], 20, 40, 72, [100] 1 In parts (a)(ii)(b) and (a)(ii)(c), marks can only be earned with an increasing curve (a)(ii)(b) Correct curve 3 B1 for horizontal plot correct (20, 7), (35, 20), (40, 40), (60, 72), B1FT for at least 4 vertical plots correct (80, 100) (a)(ii)(c) 24 to 28 2 M1FT for [UQ =] 61 to 63 or [LQ =] 35 to 37 2(b) 44 3 M2 for (20 k ) ( k 80) 10 25 15 10 [ 27 50] 2 2 oe (20 k ) ( k 80) or M1 for or 2 2
Q3 · Y 9 8 7 6 5 4 A 3 2 1 – 9 – 8 – 7 – 6 – 5 – 4 – 3 – 2 – 1 0 1 2 3 4 5 6 7 8 9 x – 1 – 2…
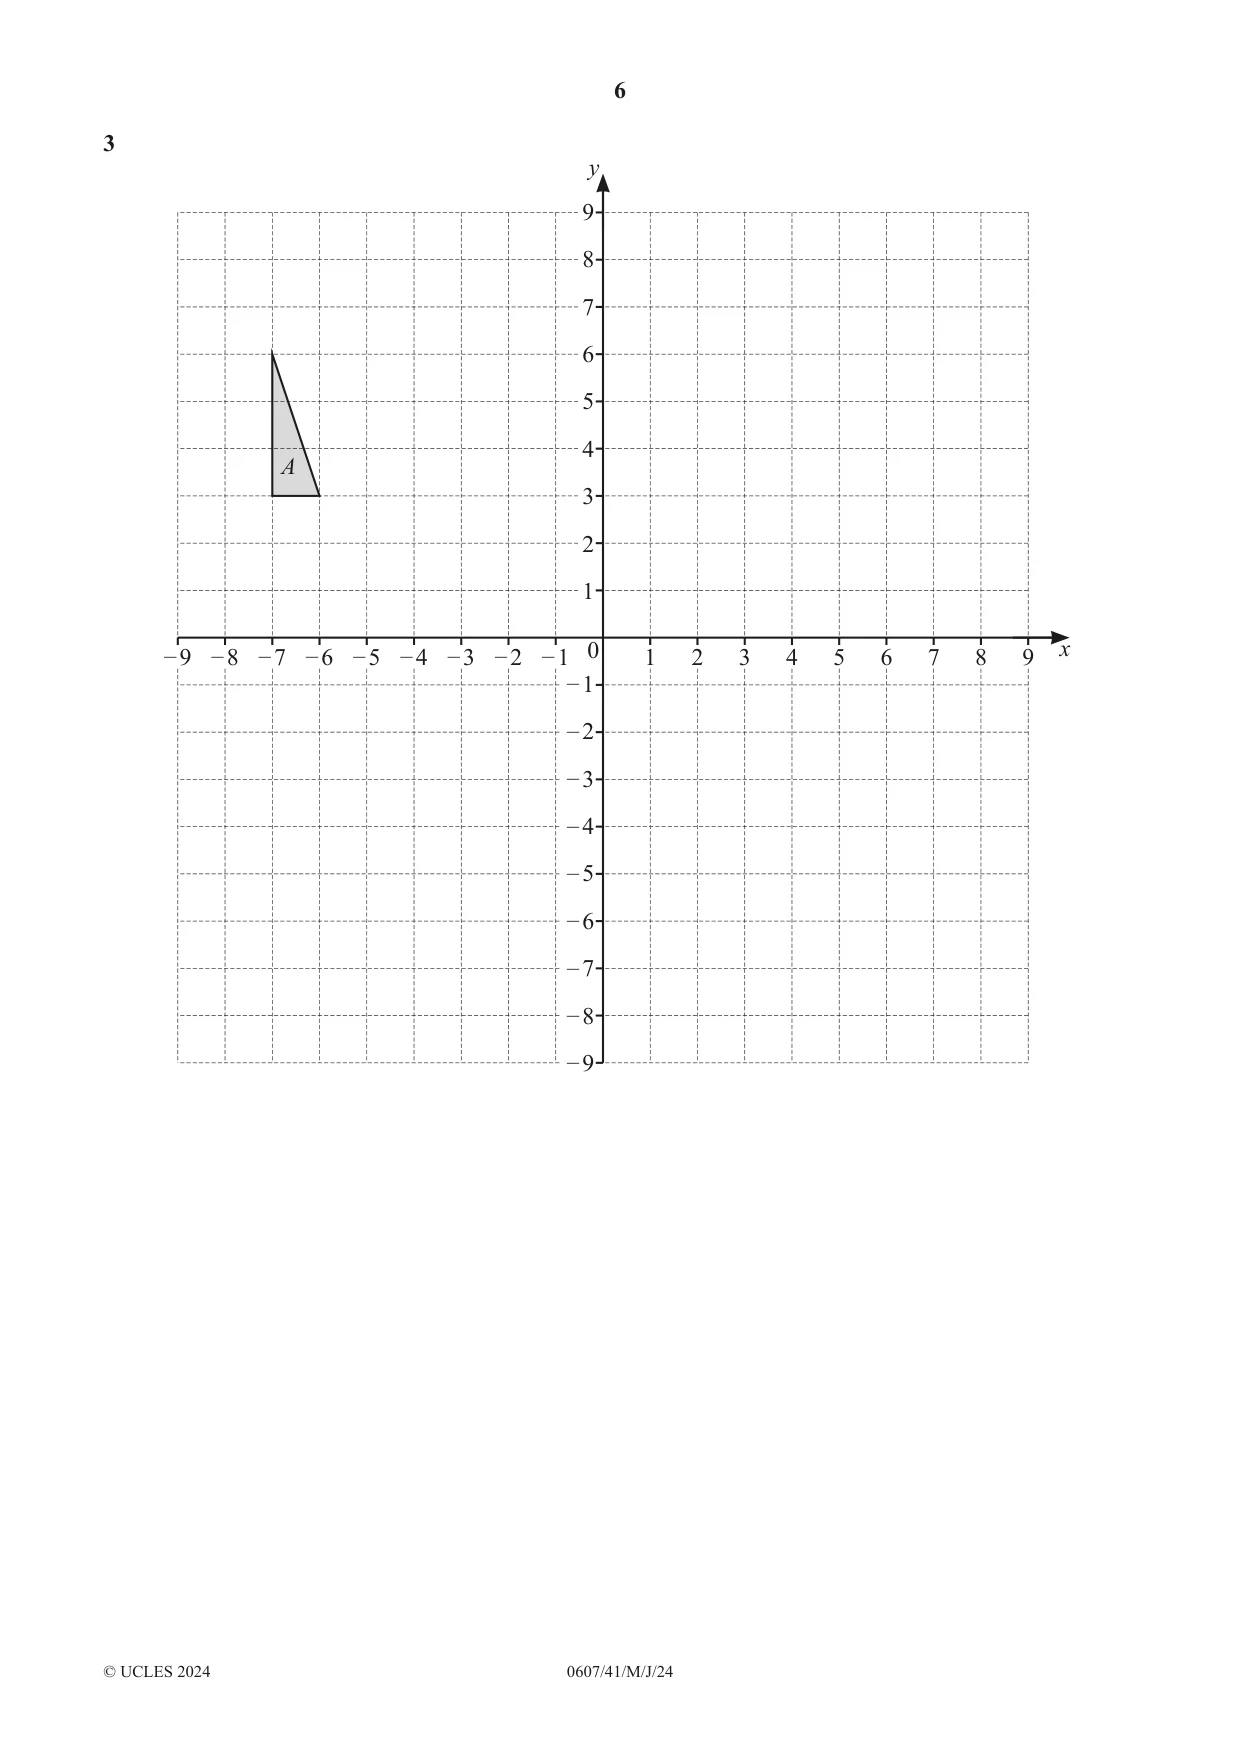
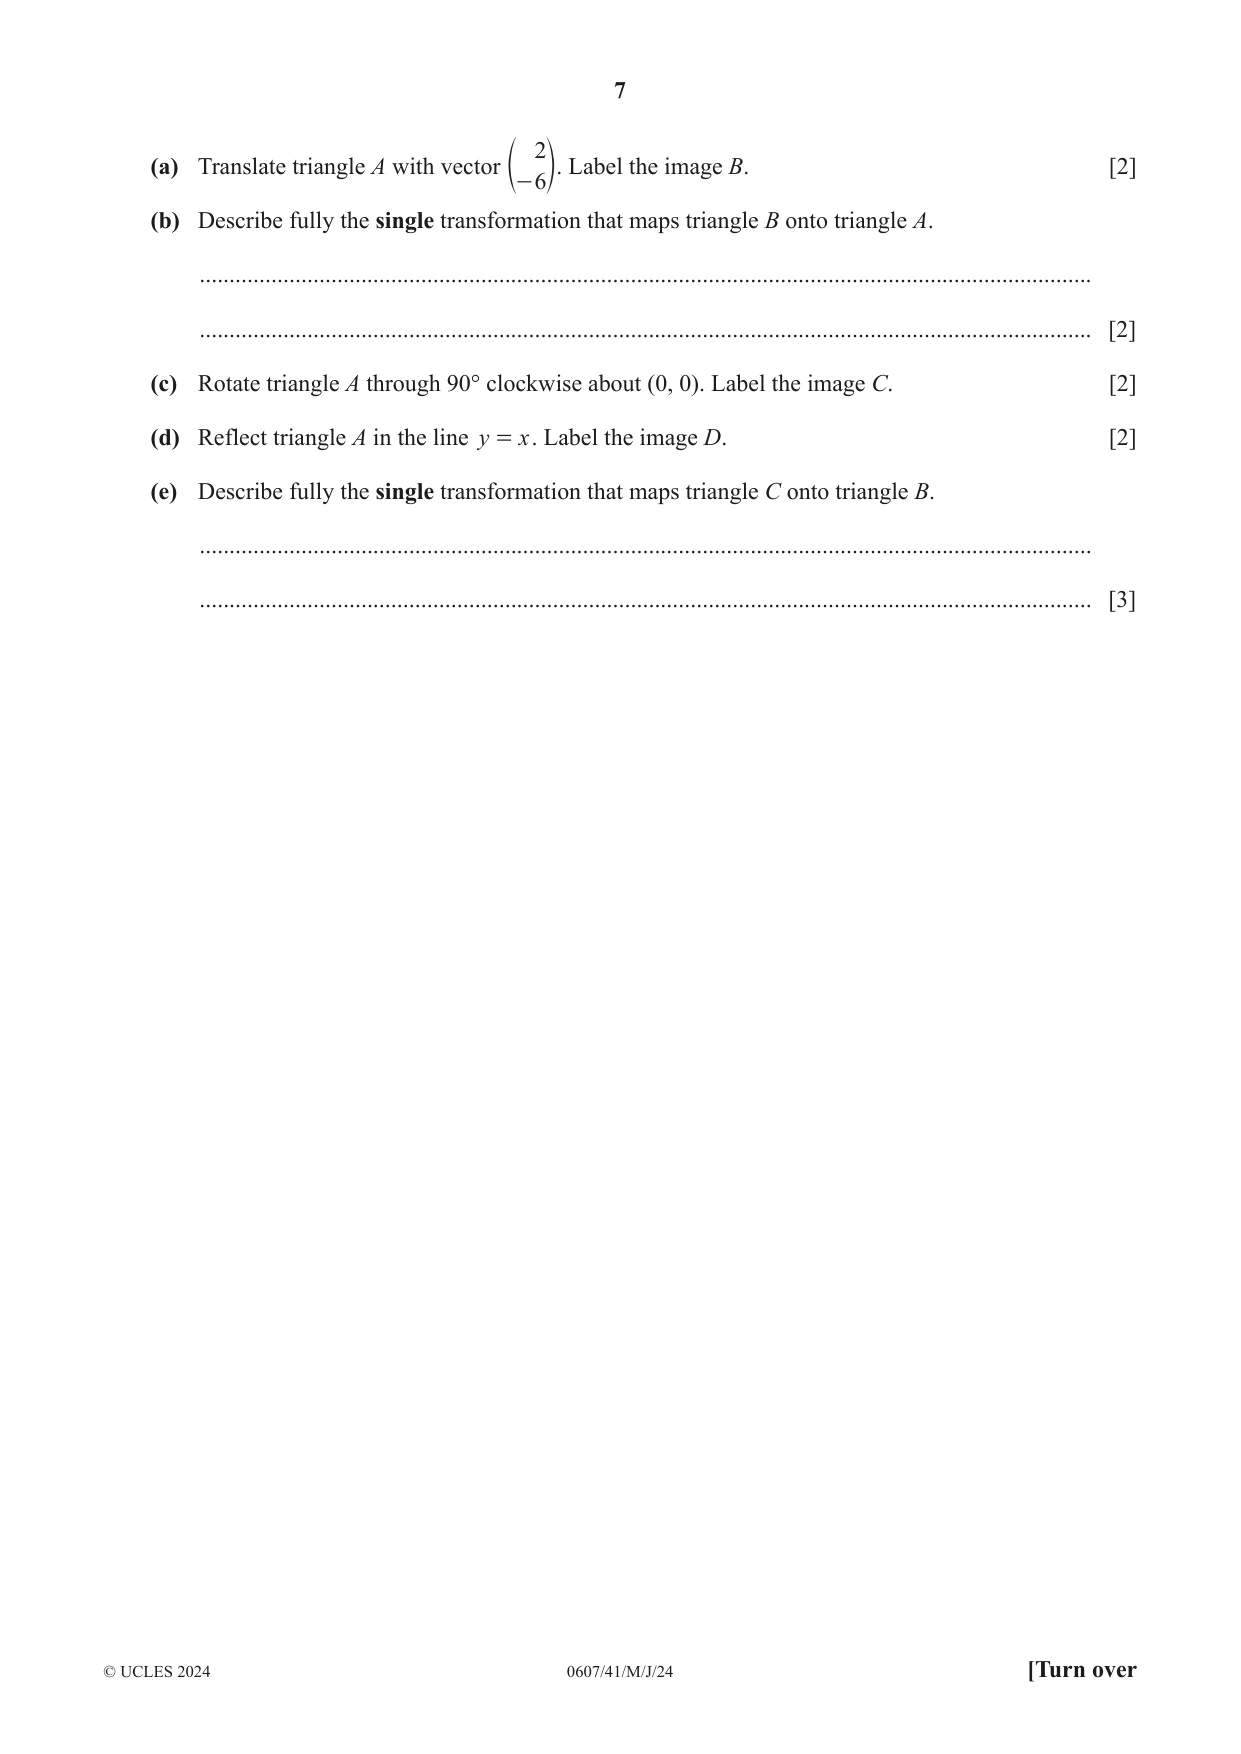
3 y 9 8 7 6 5 4 A 3 2 1 – 9 – 8 – 7 – 6 – 5 – 4 – 3 – 2 – 1 0 1 2 3 4 5 6 7 8 9 x – 1 – 2 – 3 – 4 – 5 – 6 – 7 – 8 – 9 2 (a) Translate triangle A with vector Label the image B. [2] e- 6o. (b) Describe fully the single transformation that maps triangle B onto triangle A. ..................................................................................................................................................... ..................................................................................................................................................... [2] (c) Rotate triangle A through 90° clockwise about (0, 0). Label the image C. [2] (d) Reflect triangle A in the line y = x . Label the image D. [2] (e) Describe fully the single transformation that maps triangle C onto triangle B. ..................................................................................................................................................... ..................................................................................................................................................... [3]
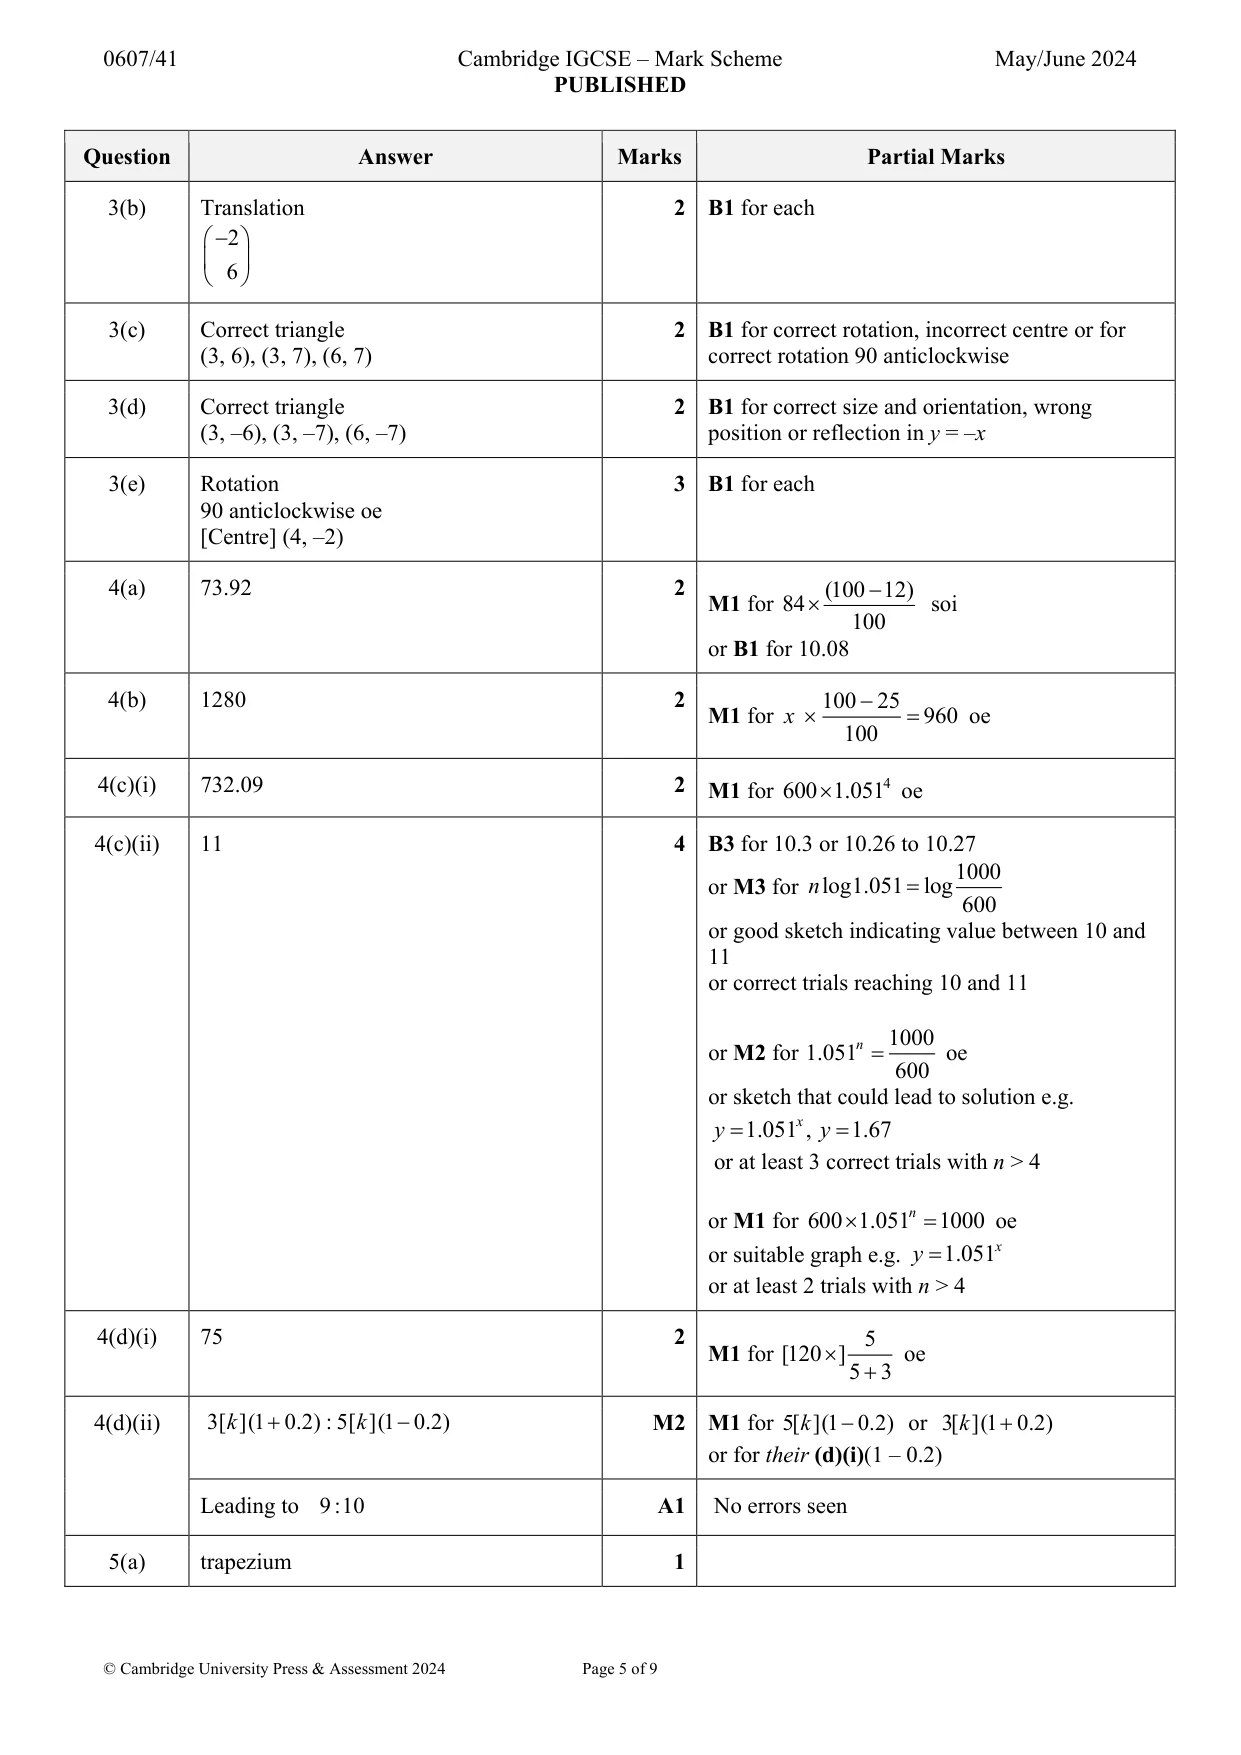
Mark scheme: 3(a) Correct triangle 2 2 k (–5, 0), (–5, –3), (–4, –3) B1 for translation or k 6 3(b) Translation 2 B1 for each 2 6 3(c) Correct triangle 2 B1 for correct rotation, incorrect centre or for (3, 6), (3, 7), (6, 7) correct rotation 90 anticlockwise 3(d) Correct triangle 2 B1 for correct size and orientation, wrong (3, –6), (3, –7), (6, –7) position or reflection in y = –x 3(e) Rotation 3 B1 for each 90 anticlockwise oe [Centre] (4, –2)
Q4 · The price of a coat is $84
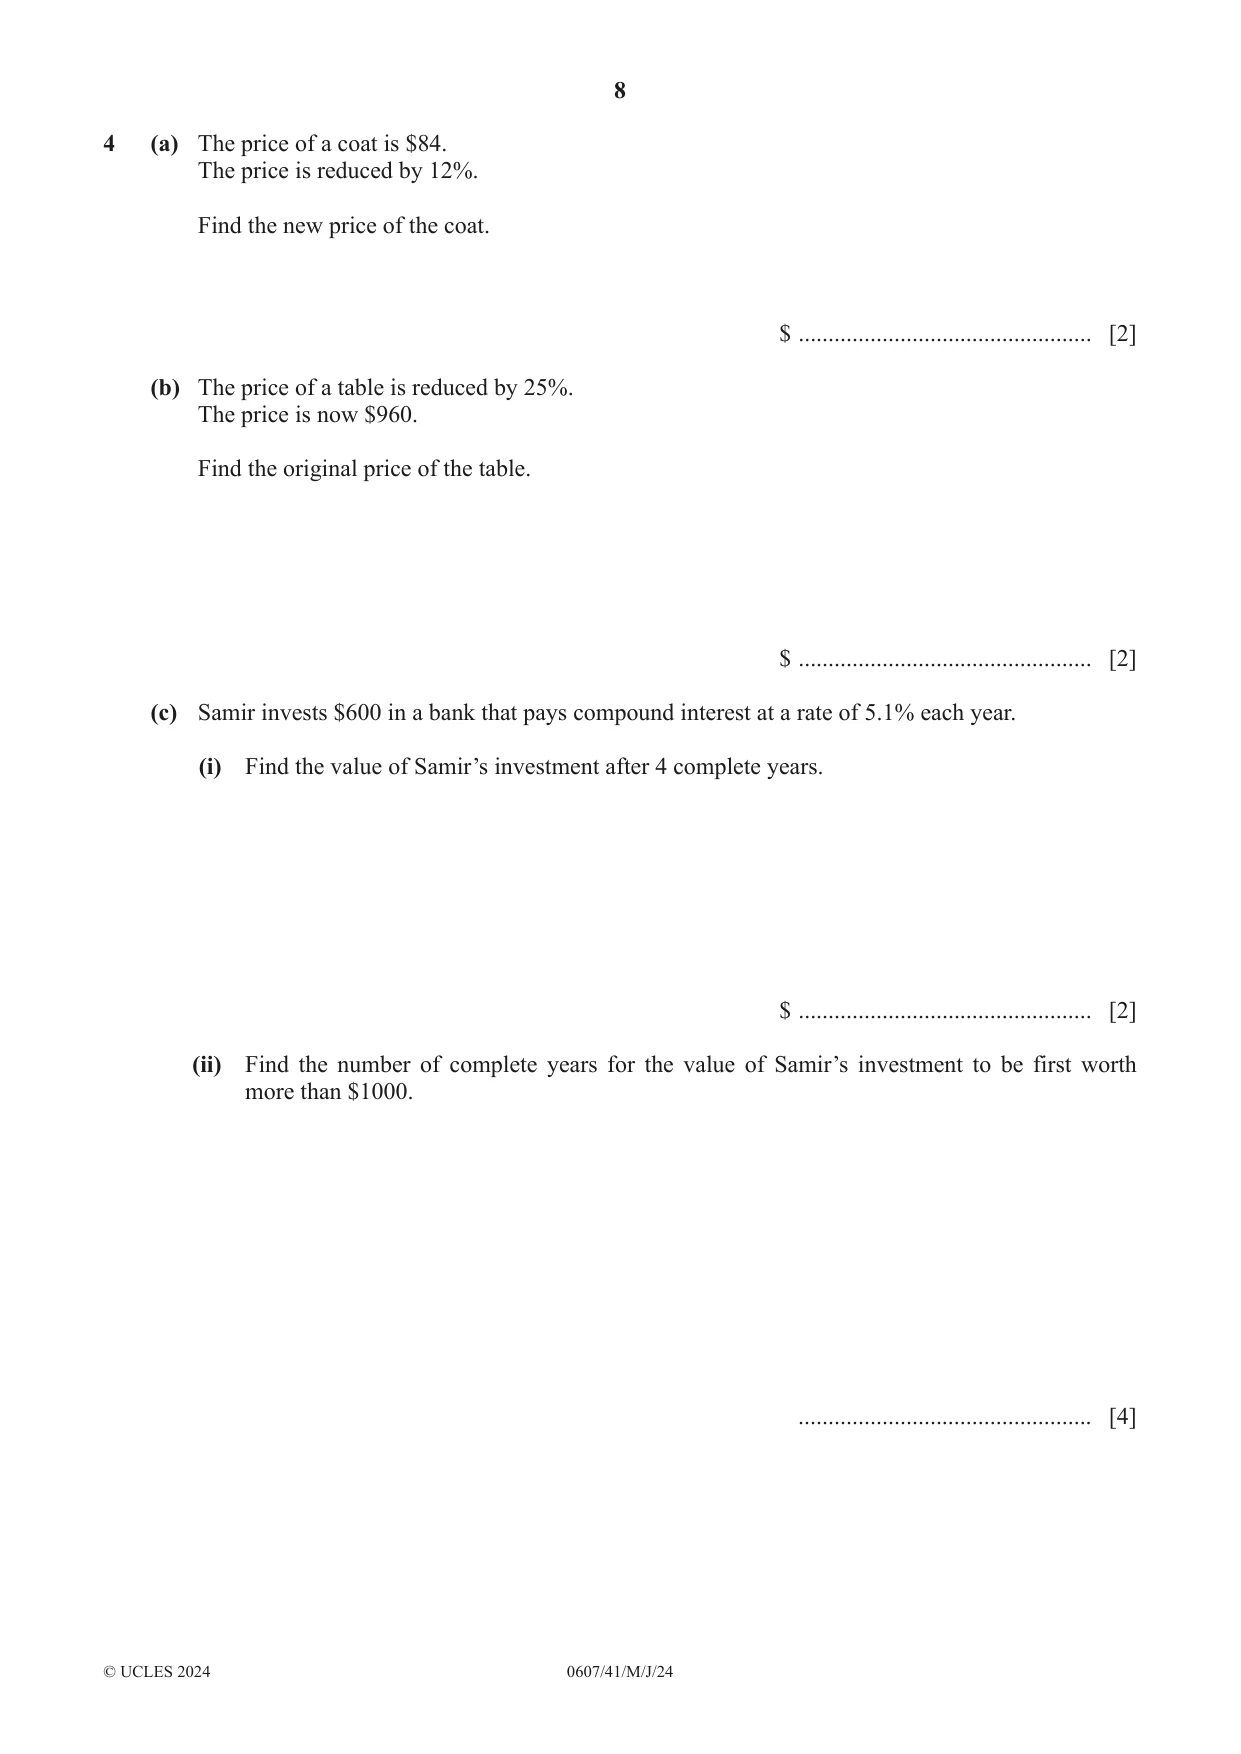
4 (a) The price of a coat is $84. The price is reduced by 12%. Find the new price of the coat. $ ................................................. [2] (b) The price of a table is reduced by 25%. The price is now $960. Find the original price of the table. $ ................................................. [2] (c) Samir invests $600 in a bank that pays compound interest at a rate of 5.1% each year. (i) Find the value of Samir’s investment after 4 complete years. $ ................................................. [2] (ii) Find the number of complete years for the value of Samir’s investment to be first worth more than $1000. ................................................. [4] (d) Amir and Bob work together and share their earnings in the ratio 3 : 5. (i) Find the amount Bob receives when their earnings are $120. $ ................................................. [2] (ii) They decide to change the ratio for all further earnings. Amir’s share of the earnings is increased by 20% of his original share. Bob’s share of the earnings is decreased by 20% of his original share. Show that the ratio of their earnings is now 9 : 10. [3]
Mark scheme: 4(a) 73.92 2 (100 12) M1 for 84 soi 100 or B1 for 10.08 4(b) 1280 2 100 25 M1 for x 960 oe 100 4(c)(i) 732.09 2 M1 for 600 1.0514 oe 4(c)(ii) 11 4 B3 for 10.3 or 10.26 to 10.27 1000 or M3 for n log1.051 log 600 or good sketch indicating value between 10 and 11 or correct trials reaching 10 and 11 n 1000 or M2 for 1.051 oe 600 or sketch that could lead to solution e.g. y 1.051x , y 1.67 or at least 3 correct trials with n > 4 or M1 for 600 1.051n 1000 oe or suitable graph e.g. y 1.051x or at least 2 trials with n > 4 4(d)(i) 75 2 5 M1 for [120 ]5 3 oe 4(d)(ii) 3[ k ](1 0.2) : 5[ k ](1 0.2) M2 M1 for 5[ k ](1 0.2) or 3[ k ](1 0.2) or for their (d)(i)(1 – 0.2) Leading to 9:10 A1 No errors seen
Q5 · A NOT TO B SCALE 61° 22° D O P C A, B, C and D lie on a circle, centre O
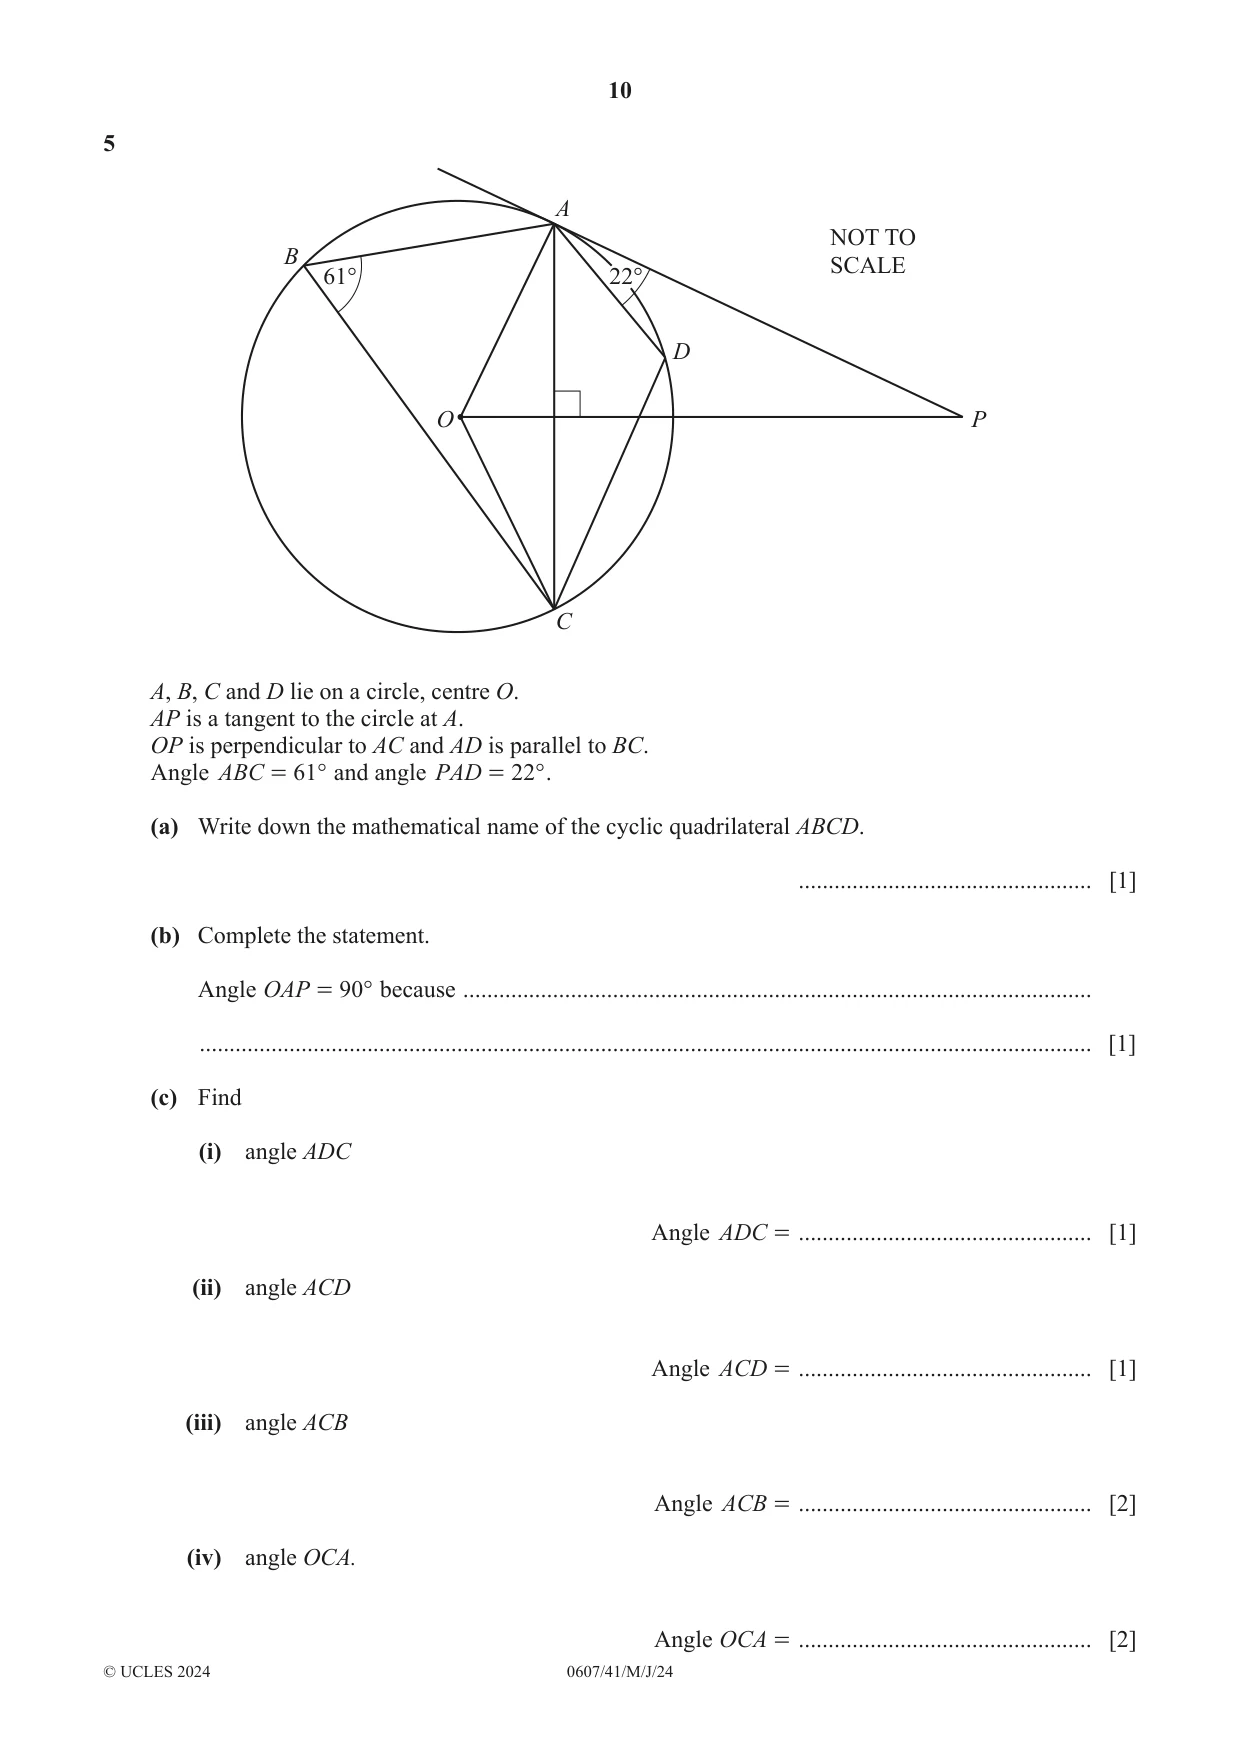
5 A NOT TO B SCALE 61° 22° D O P C A, B, C and D lie on a circle, centre O. AP is a tangent to the circle at A. OP is perpendicular to AC and AD is parallel to BC. Angle ABC = 61° and angle PAD = 22° . (a) Write down the mathematical name of the cyclic quadrilateral ABCD. ................................................. [1] (b) Complete the statement. Angle OAP = 90° because ......................................................................................................... ..................................................................................................................................................... [1] (c) Find (i) angle ADC Angle ADC = ................................................. [1] (ii) angle ACD Angle ACD = ................................................. [1] (iii) angle ACB Angle ACB = ................................................. [2] (iv) angle OCA. Angle OCA = ................................................. [2]
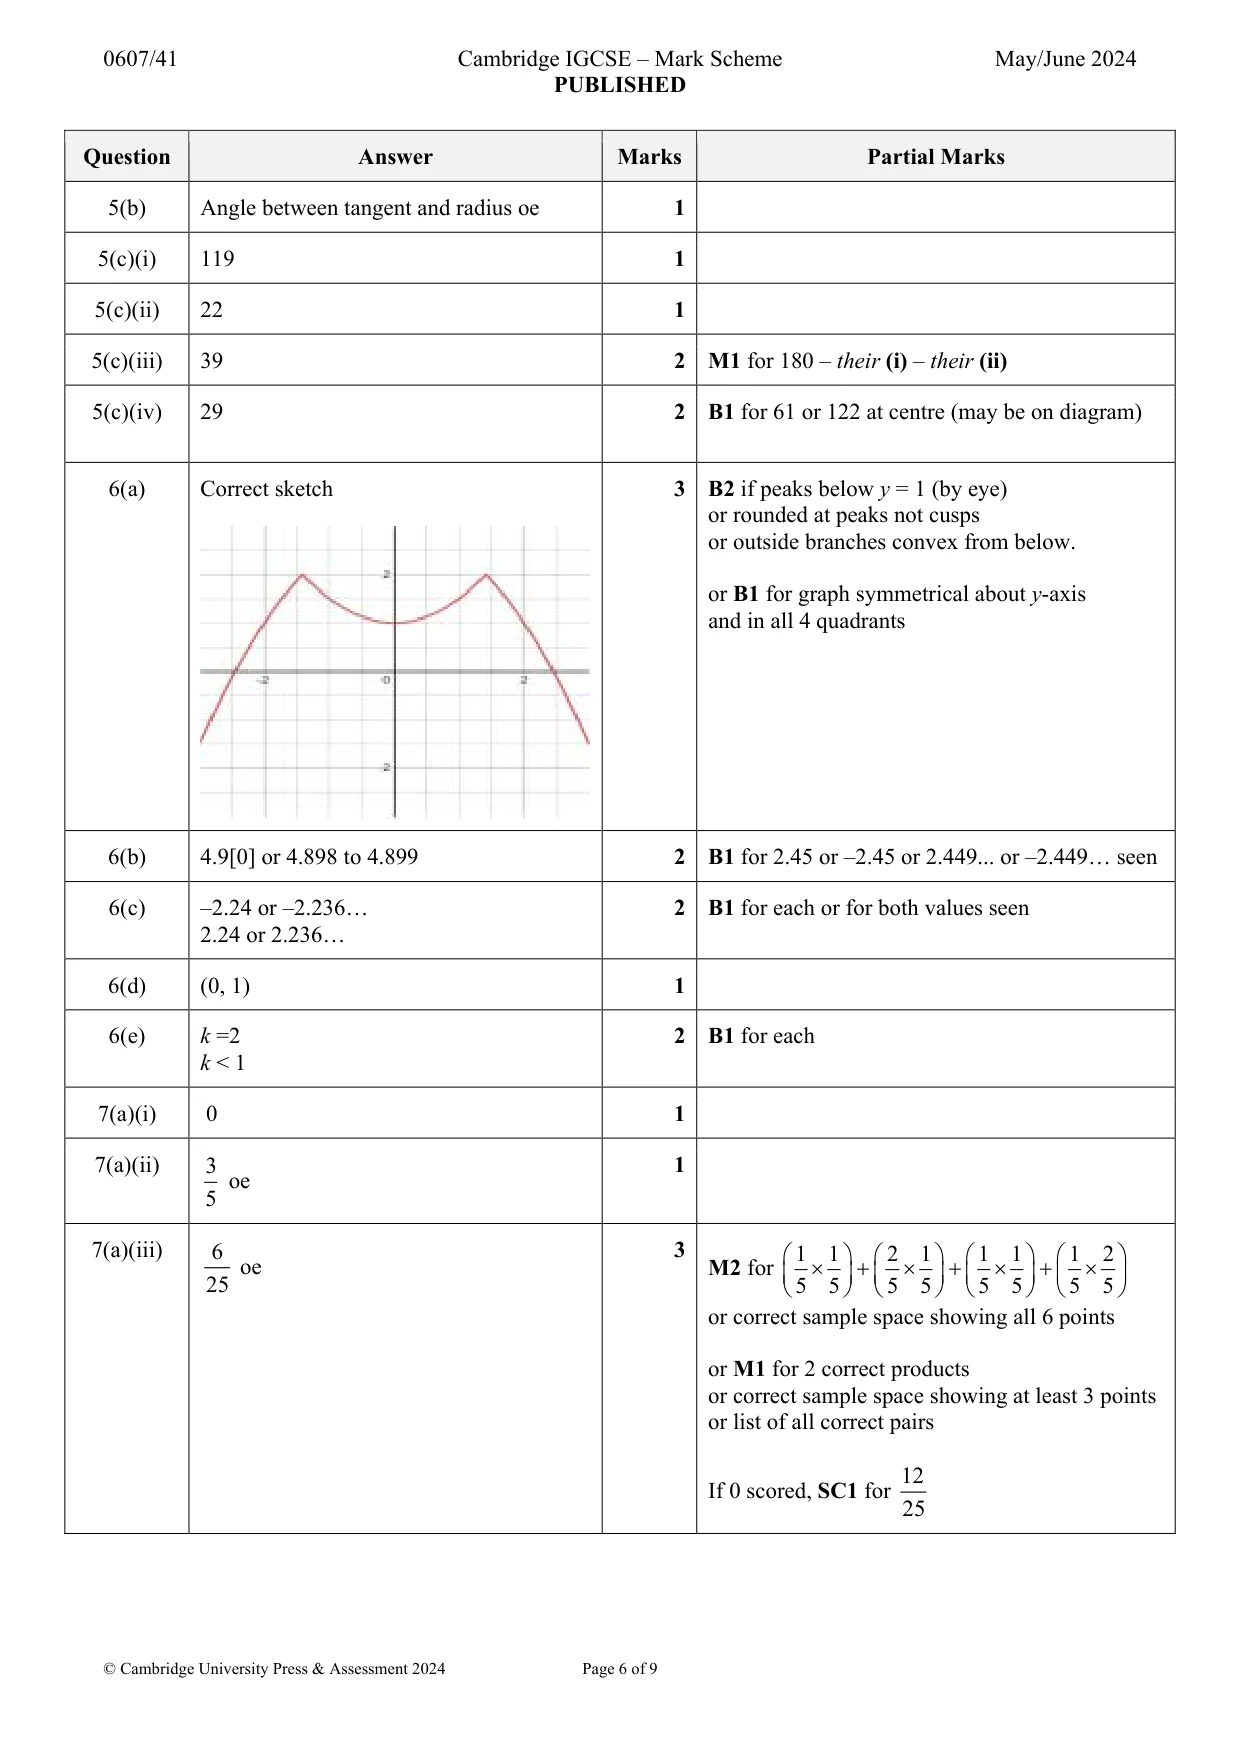
Mark scheme: 5(a) trapezium 1 5(b) Angle between tangent and radius oe 1 5(c)(i) 119 1 5(c)(ii) 22 1 5(c)(iii) 39 2 M1 for 180 – their (i) – their (ii) 5(c)(iv) 29 2 B1 for 61 or 122 at centre (may be on diagram)
Q6 · Y 3 – 3 0 3 x – 3 f( x) = 2 - 1 - 0 .5 x 2 (a) On the diagram, sketch the graph of y = f(…
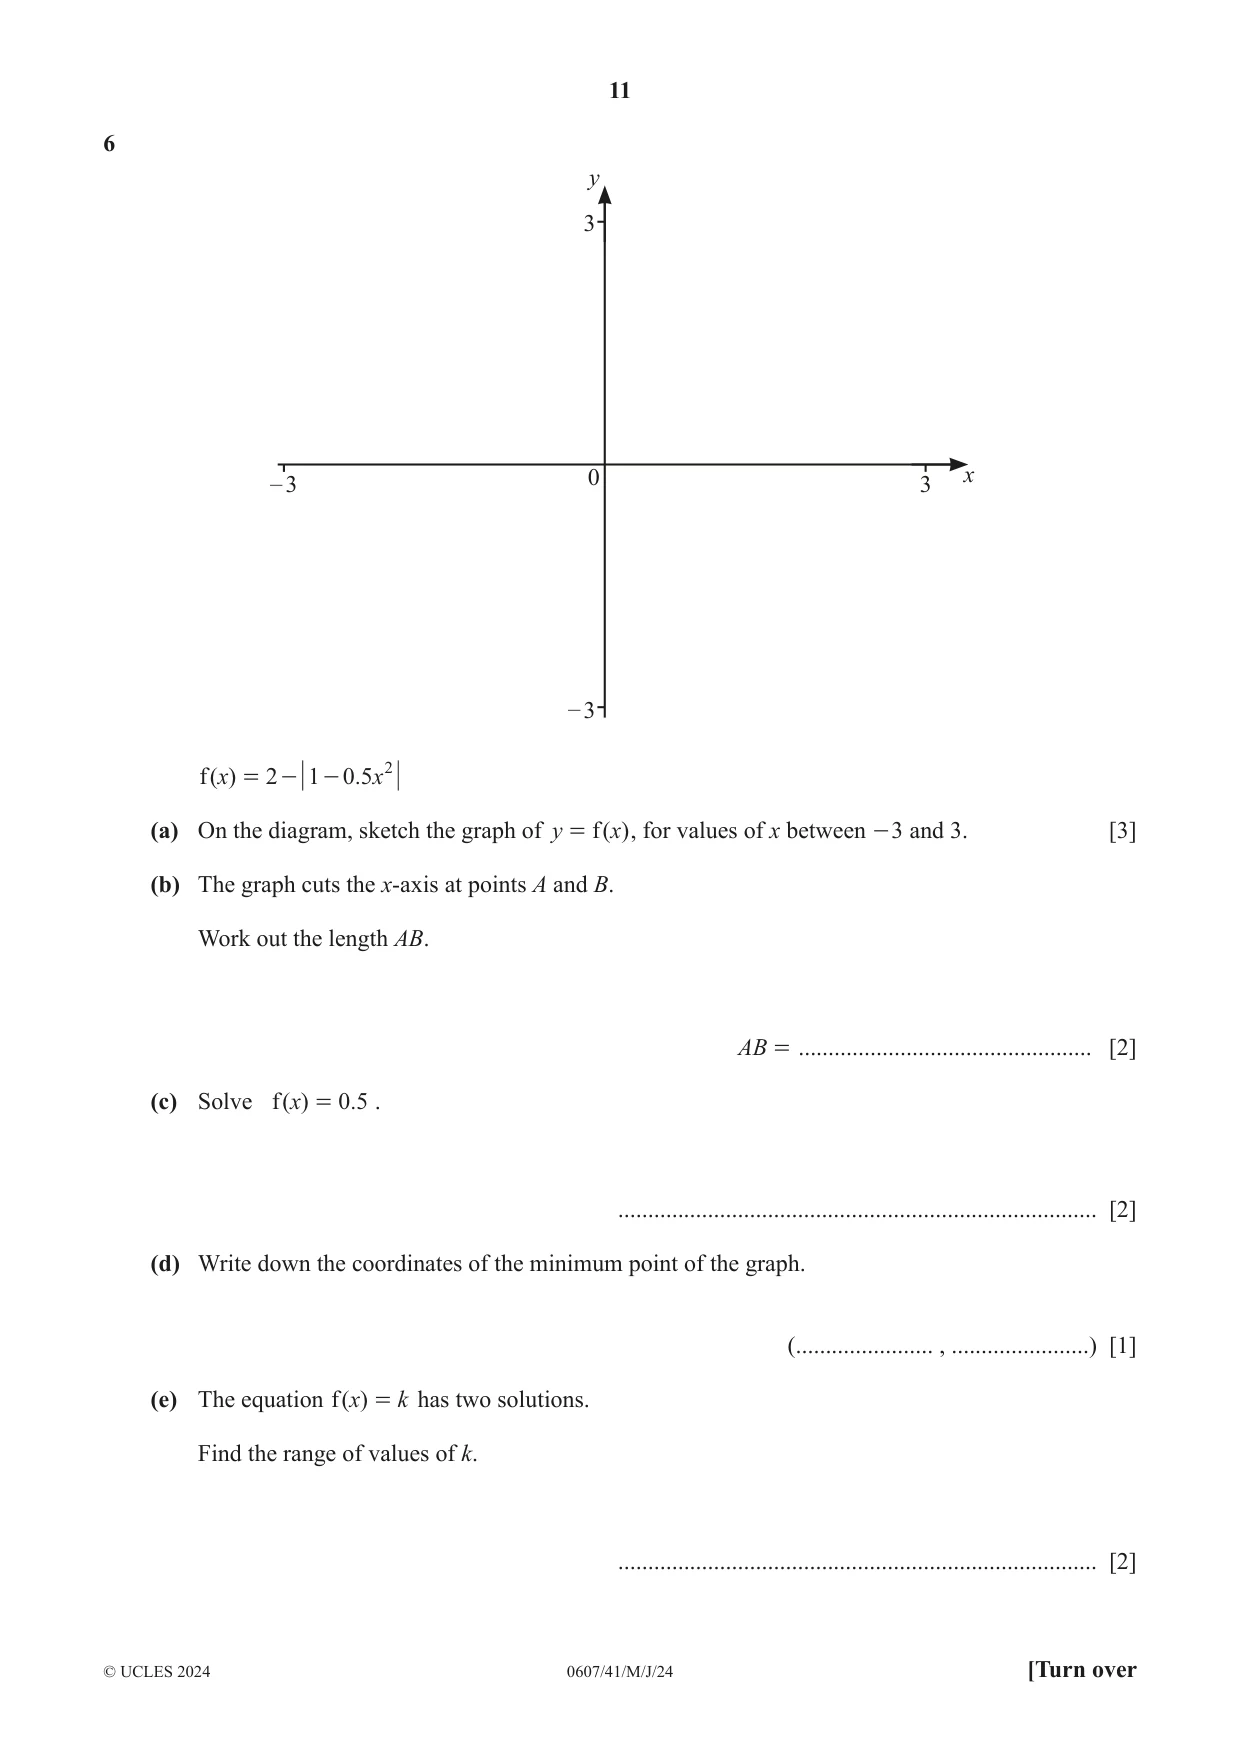
6 y 3 – 3 0 3 x – 3 f( x) = 2 - 1 - 0 .5 x 2 (a) On the diagram, sketch the graph of y = f( x) , for values of x between - 3 and 3. [3] (b) The graph cuts the x-axis at points A and B. Work out the length AB. AB = ................................................. [2] (c) Solve f( x) = 0 .5 . ................................................................................ [2] (d) Write down the coordinates of the minimum point of the graph. (....................... , .......................) [1] (e) The equation f( )x = k has two solutions. Find the range of values of k. ................................................................................ [2]
Mark scheme: 6(a) Correct sketch 3 B2 if peaks below y = 1 (by eye) or rounded at peaks not cusps or outside branches convex from below. or B1 for graph symmetrical about y-axis and in all 4 quadrants 6(b) 4.9[0] or 4.898 to 4.899 2 B1 for 2.45 or –2.45 or 2.449... or –2.449… seen 6(c) –2.24 or –2.236… 2 B1 for each or for both values seen 2.24 or 2.236… 6(d) (0, 1) 1 6(e) k =2 2 B1 for each k < 1
Q7 · Spinner A and spinner B are each fair 5-sided spinners
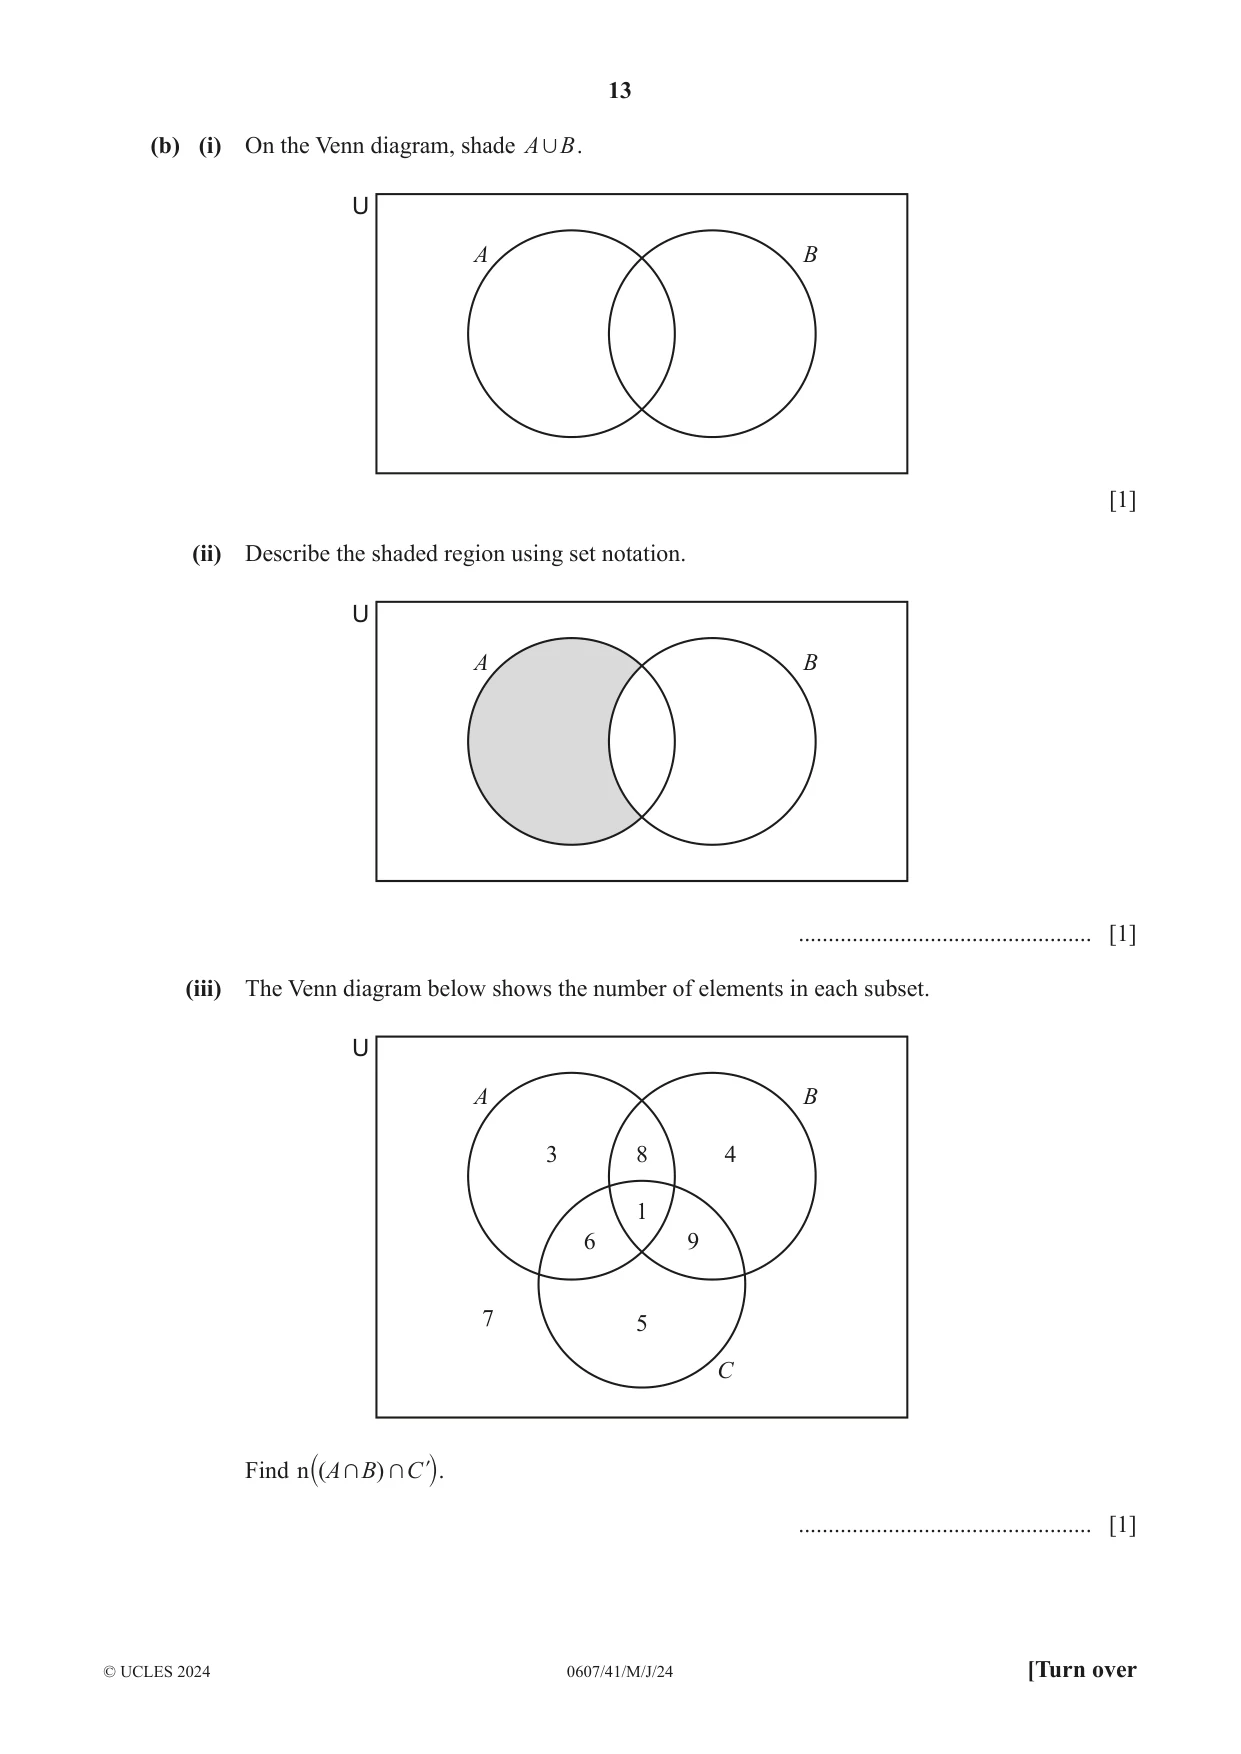
7 (a) Spinner A and spinner B are each fair 5-sided spinners. Spinner A is numbered 1, 2, 2, 3, 4. Spinner B is numbered 1, 2, 3, 4, 4. The two spinners are each spun once and the number on each spinner is recorded. Find the probability that (i) the number on spinner A is 6 ................................................. [1] (ii) the number on spinner B is not 4 ................................................. [1] (iii) the number on spinner A is the same as the number on spinner B ................................................. [3] (iv) the sum of the two numbers is 6. ................................................. [3] (b) (i) On the Venn diagram, shade A , B . U A B [1] (ii) Describe the shaded region using set notation. U A B ................................................. [1] (iii) The Venn diagram below shows the number of elements in each subset. U A B 3 8 4 1 6 9 7 5 C Find n ( A + B) + C l ` j. ................................................. [1]
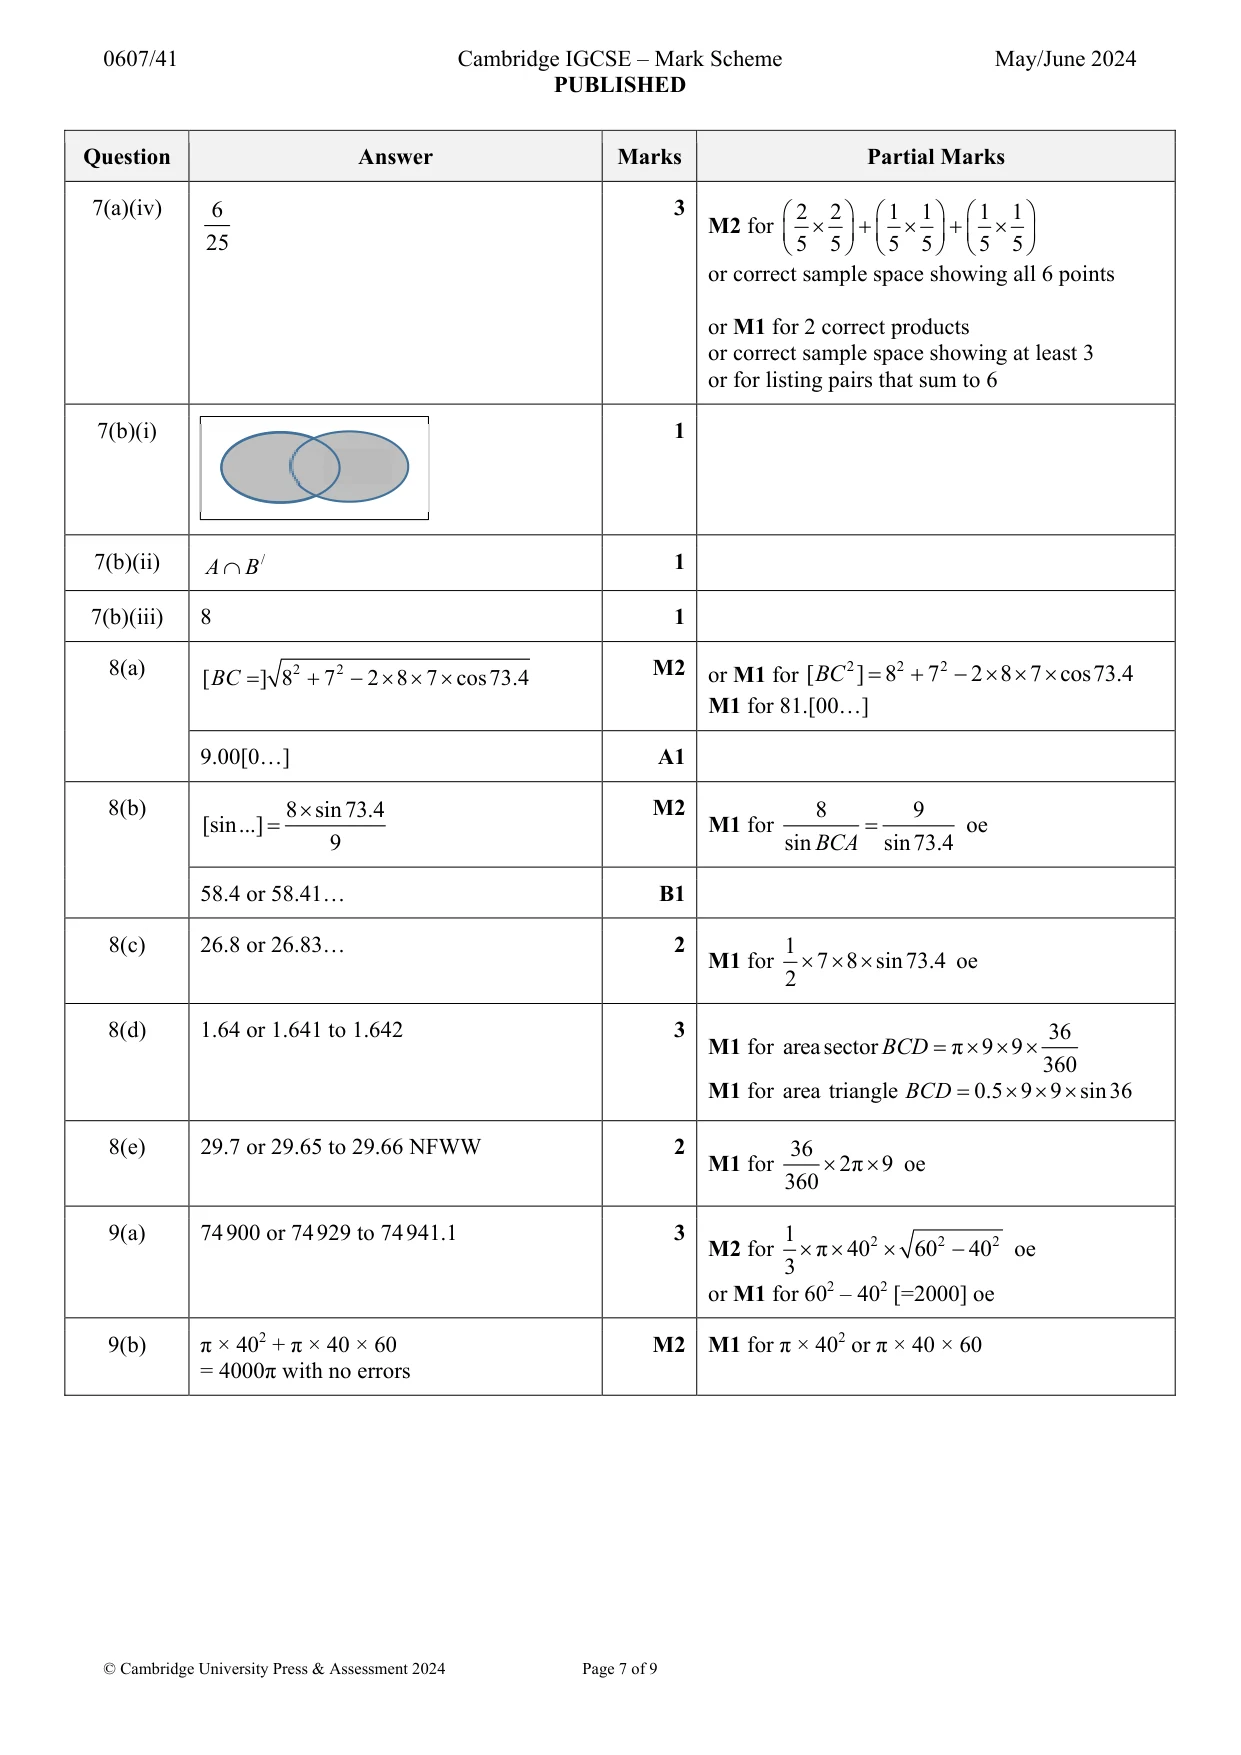
Mark scheme: 7(a)(i) 0 1 7(a)(ii) 3 1 oe 5 7(a)(iii) 6 3 1 1 2 1 1 1 1 2 oe M2 for 25 5 5 5 5 5 5 5 5 or correct sample space showing all 6 points or M1 for 2 correct products or correct sample space showing at least 3 points or list of all correct pairs 12 If 0 scored, SC1 for 25 7(a)(iv) 6 3 2 2 1 1 1 1 M2 for 25 5 5 5 5 5 5 or correct sample space showing all 6 points or M1 for 2 correct products or correct sample space showing at least 3 or for listing pairs that sum to 6 7(b)(i) 1 7(b)(ii) A B / 1 7(b)(iii) 8 1
Q8 · 8 m A B 73.4° NOT TO 36° SCALE 7 m C D The diagram shows a shape ABDC formed from…
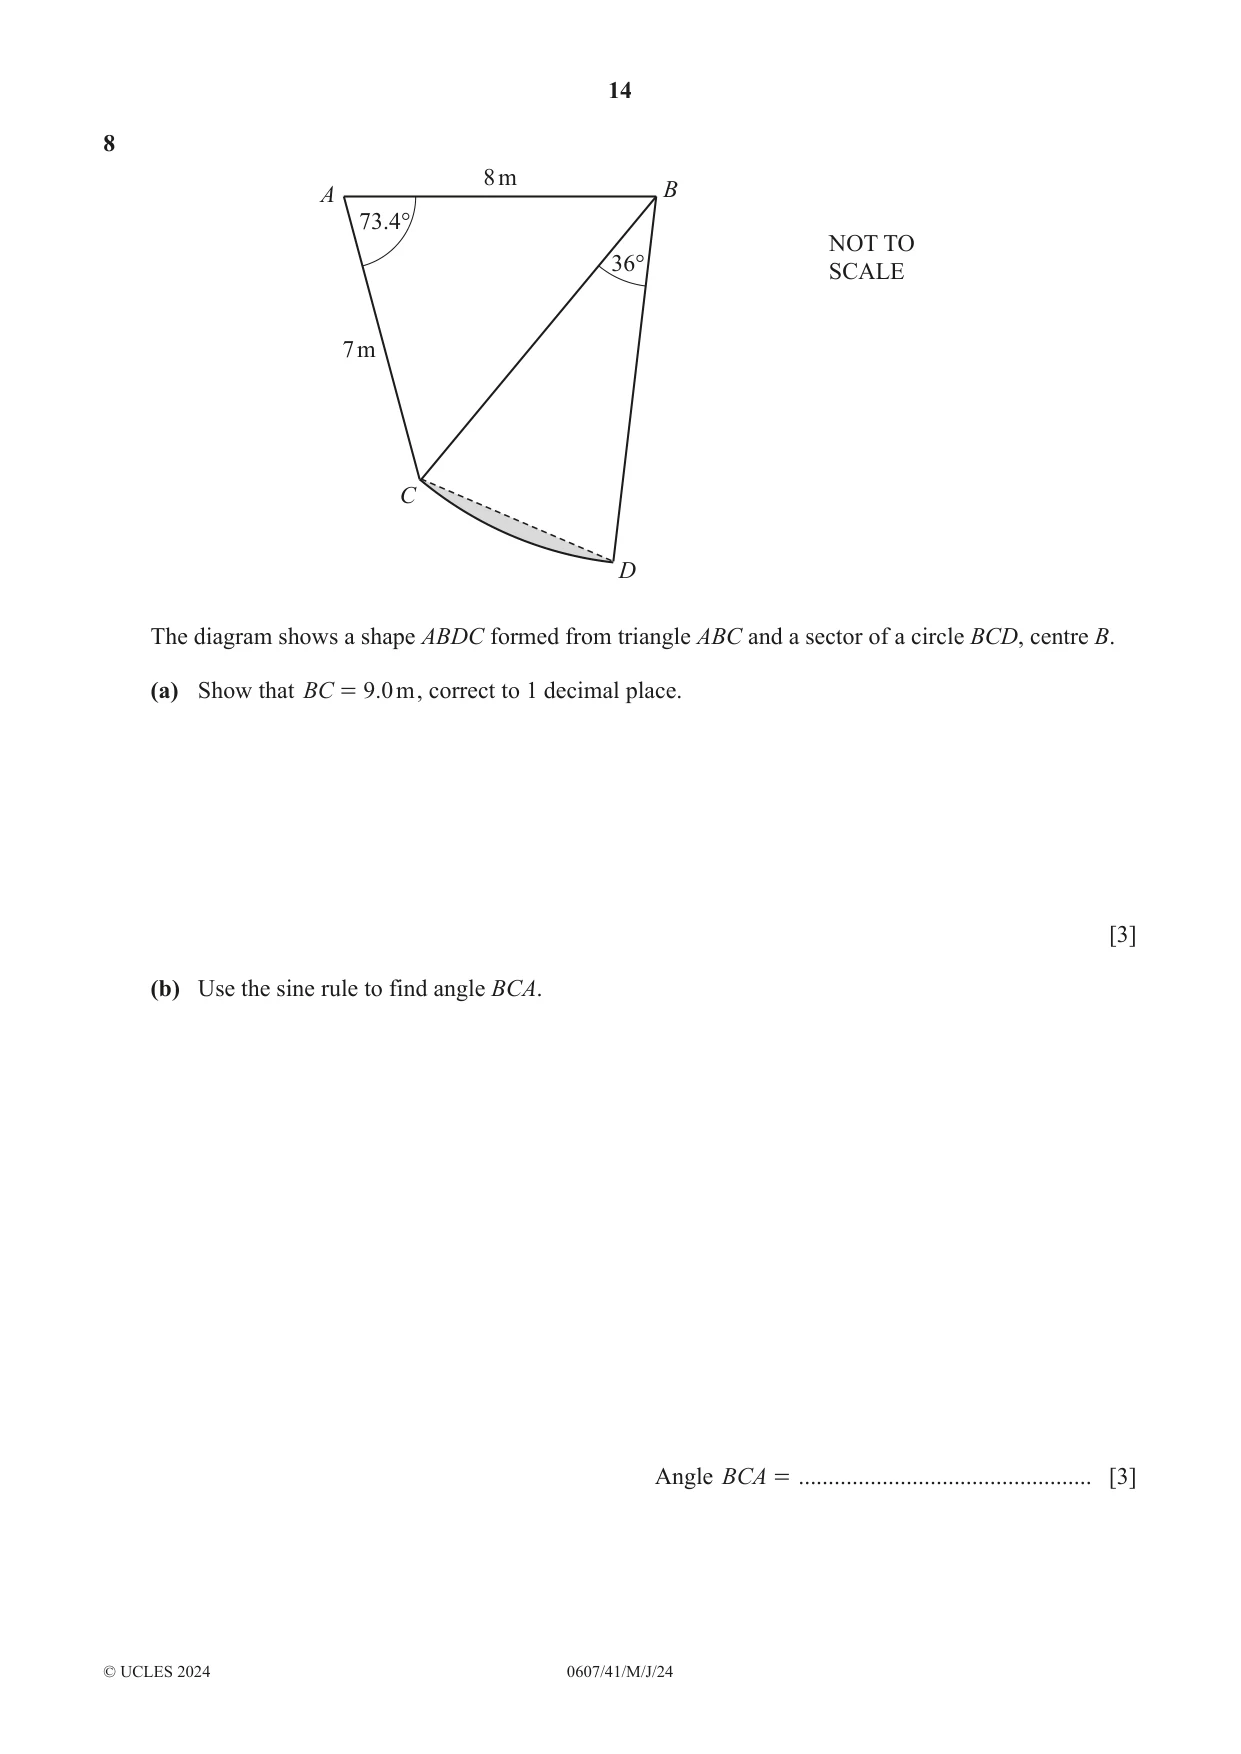
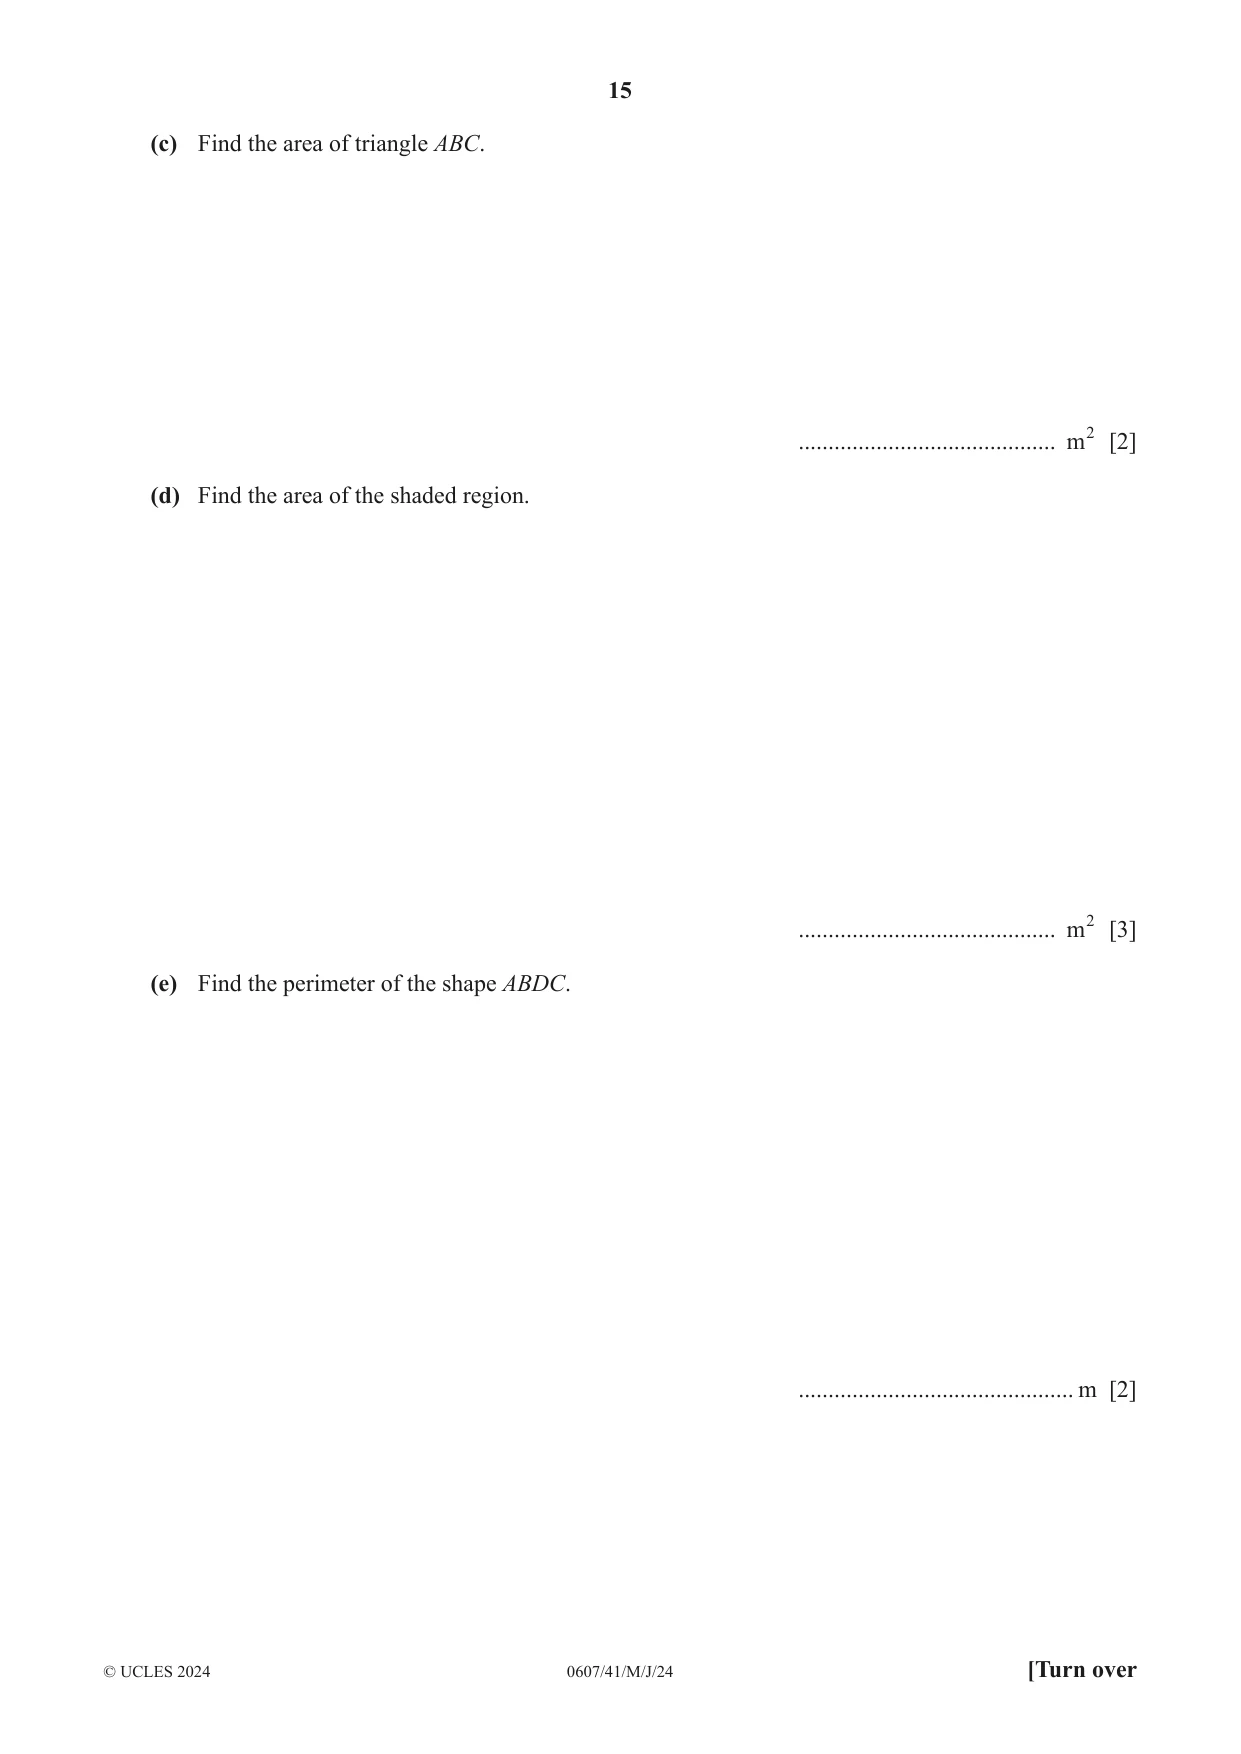
8 8 m A B 73.4° NOT TO 36° SCALE 7 m C D The diagram shows a shape ABDC formed from triangle ABC and a sector of a circle BCD, centre B. (a) Show that BC = 9.0 m , correct to 1 decimal place. [3] (b) Use the sine rule to find angle BCA. Angle BCA = ................................................. [3] (c) Find the area of triangle ABC. ........................................... m2 [2] (d) Find the area of the shaded region. ........................................... m2 [3] (e) Find the perimeter of the shape ABDC. .............................................. m [2]
Mark scheme: 8(a) M2 or M1 for [ BC 2 ] 82 7 2 2 8 7 cos73.4 [ BC ] 8 2 7 2 2 8 7 cos73.4 M1 for 81.[00…] 9.00[0…] A1 8(b) 8 sin73.4 M2 8 9 [sin...] M1 for oe 9 sin BCA sin73.4 58.4 or 58.41… B1 8(c) 26.8 or 26.83… 2 1 M1 for 7 8 sin73.4 oe 2 8(d) 1.64 or 1.641 to 1.642 3 36 M1 for areasector BCD π 9 9 360 M1 for area triangle BCD 0.5 9 9 sin36 8(e) 29.7 or 29.65 to 29.66 NFWW 2 36 M1 for 2π 9 oe 360
Q9 · NOT TO SCALE 60 cm 40 cm The diagram shows a solid cone with base radius 40 cm and slant…
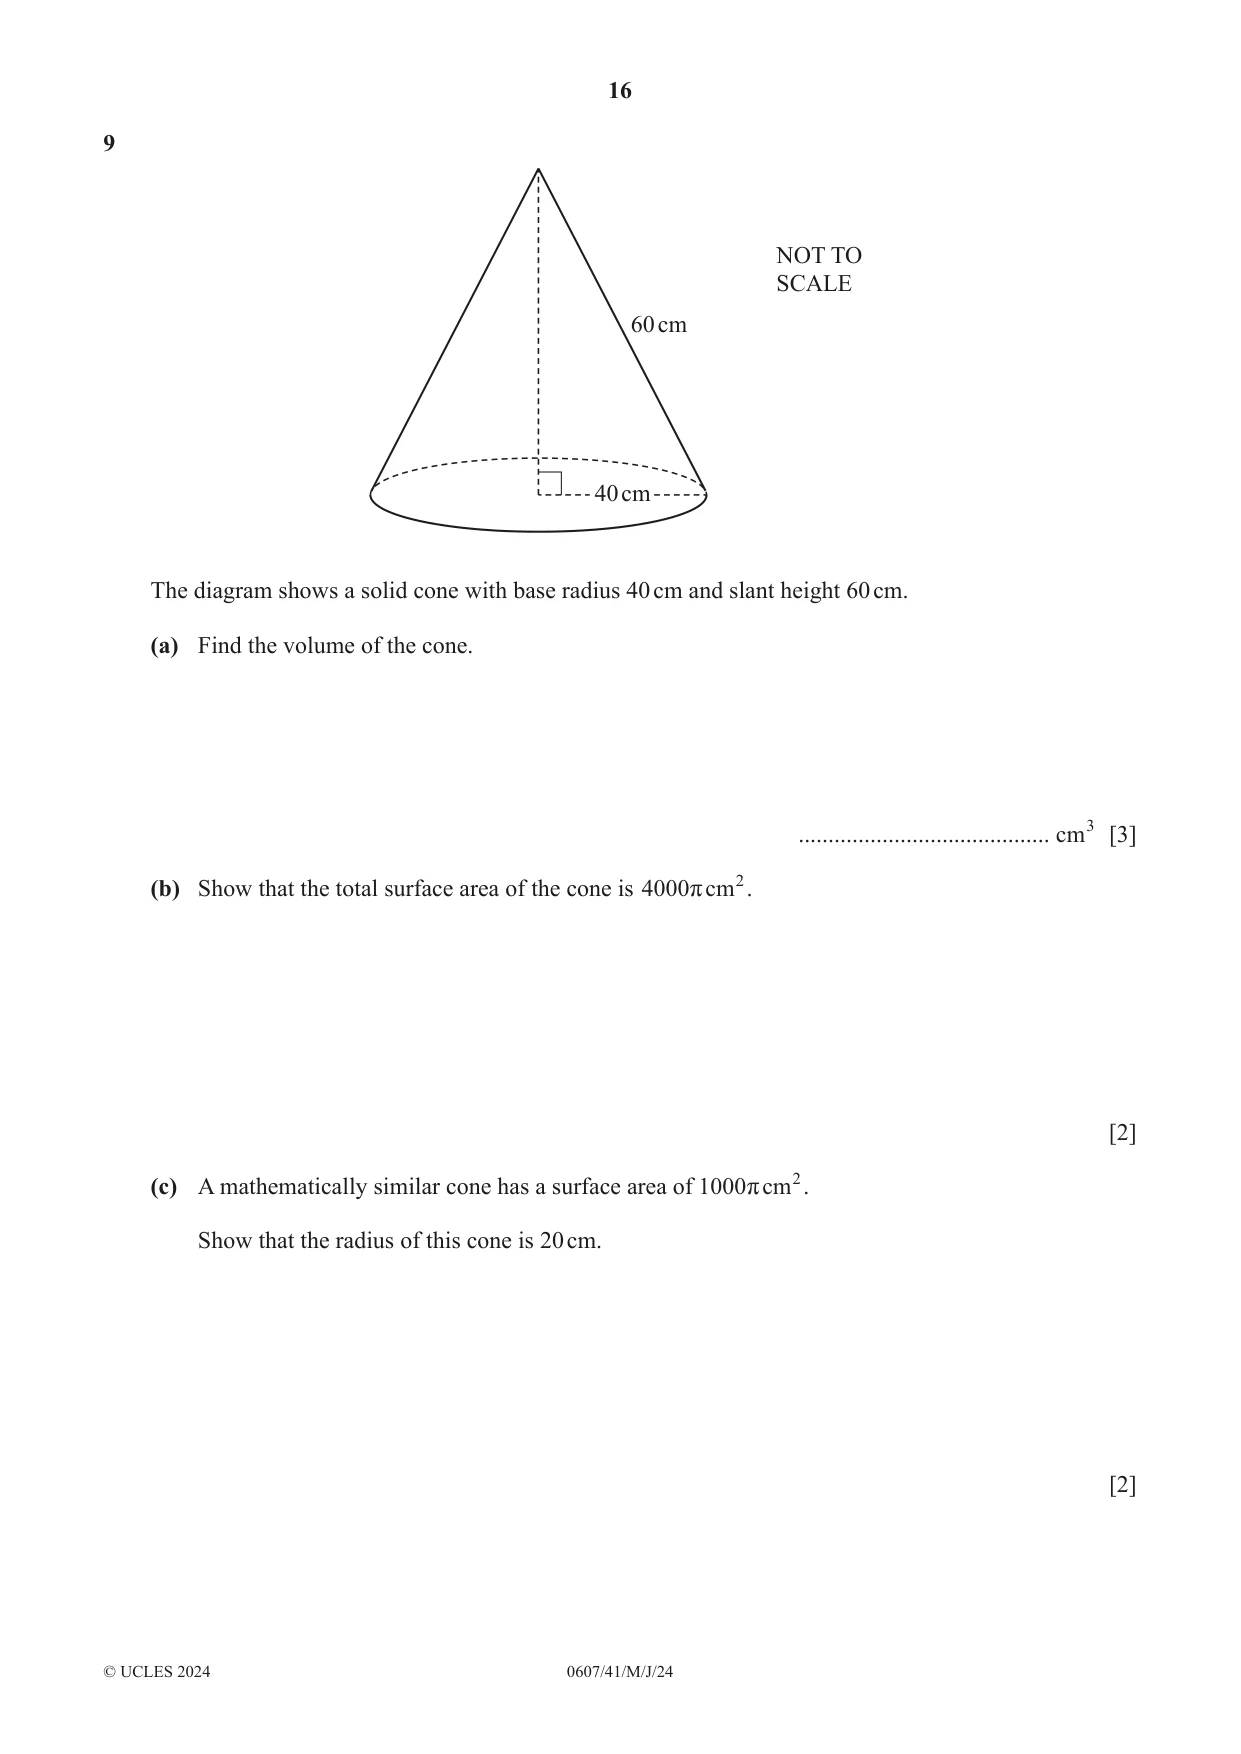
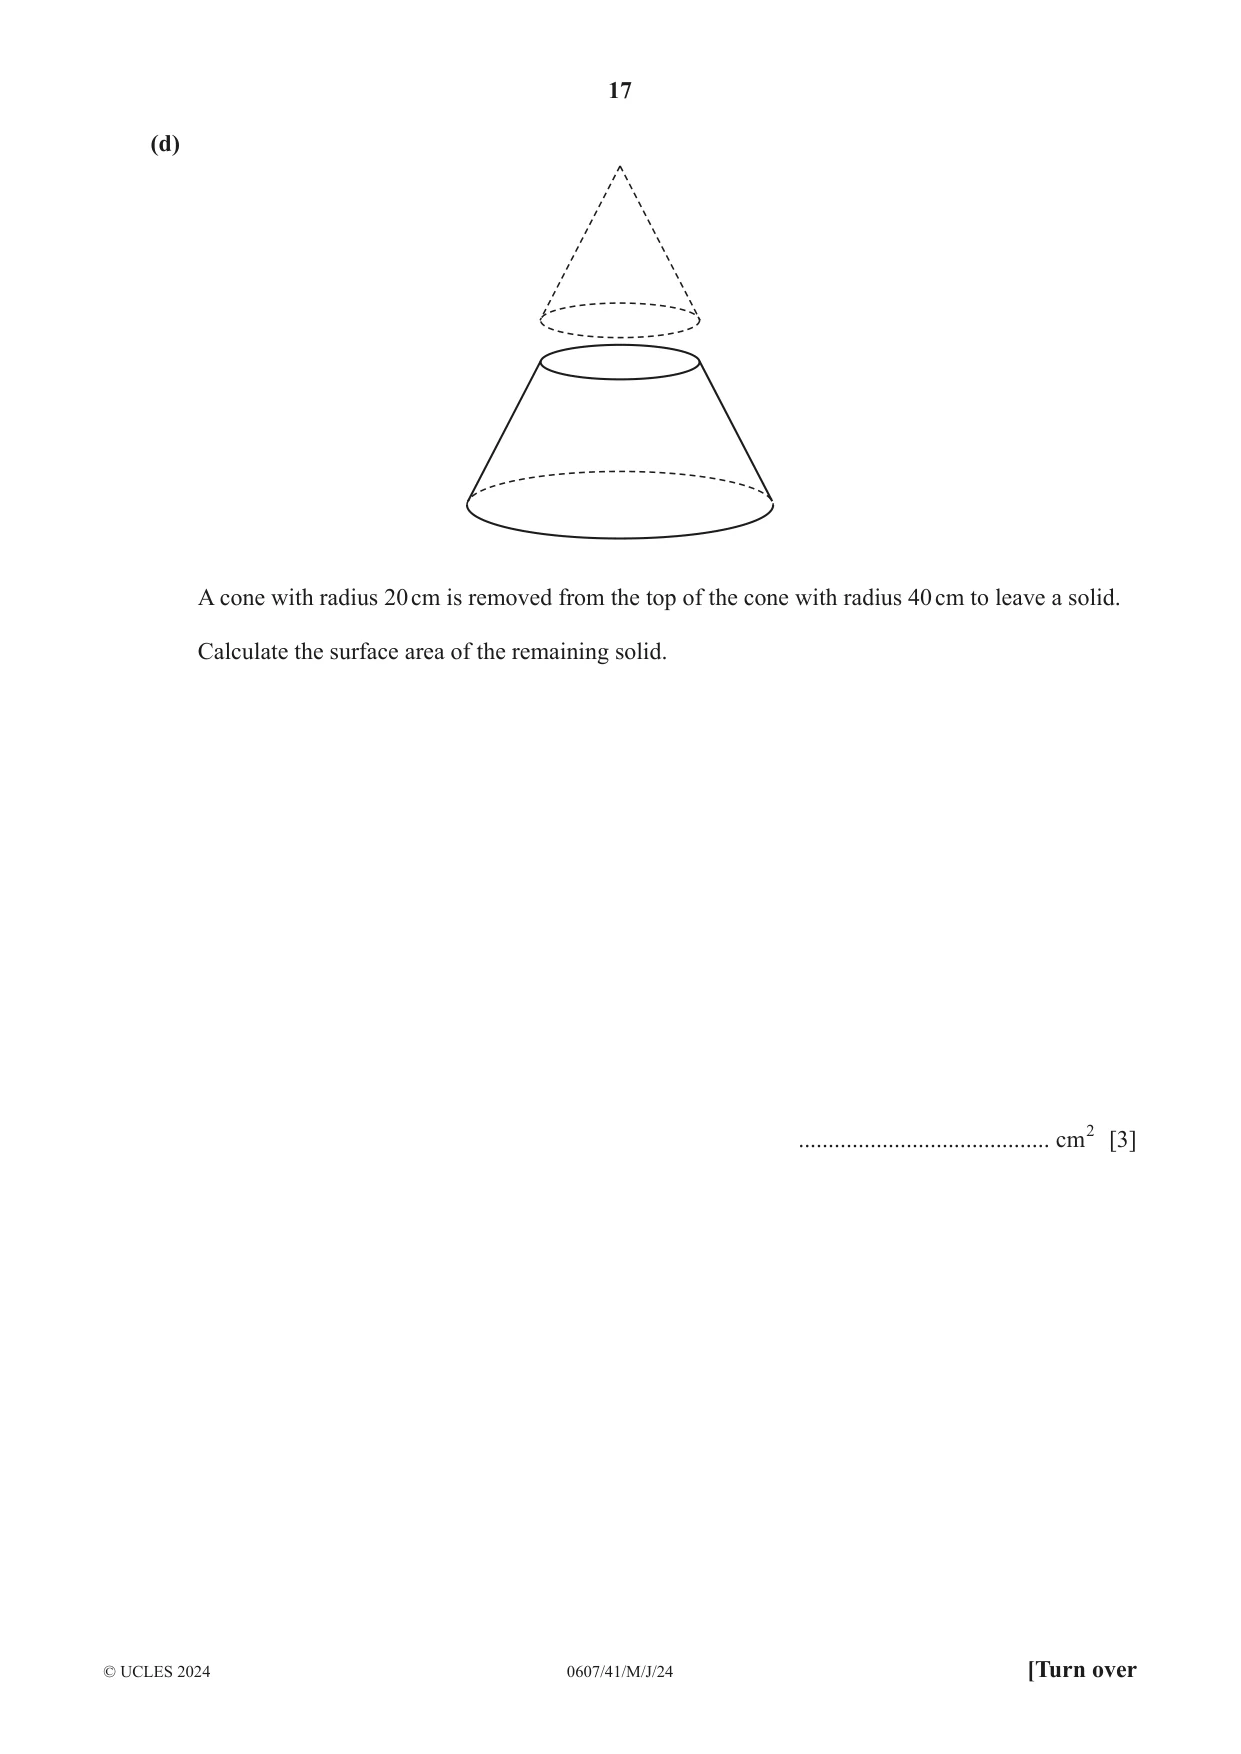
9 NOT TO SCALE 60 cm 40 cm The diagram shows a solid cone with base radius 40 cm and slant height 60 cm. (a) Find the volume of the cone. .......................................... cm3 [3] (b) Show that the total surface area of the cone is 4000 r cm 2 . [2] (c) A mathematically similar cone has a surface area of 1000 r cm 2 . Show that the radius of this cone is 20 cm. [2] (d) A cone with radius 20 cm is removed from the top of the cone with radius 40 cm to leave a solid. Calculate the surface area of the remaining solid. .......................................... cm2 [3]
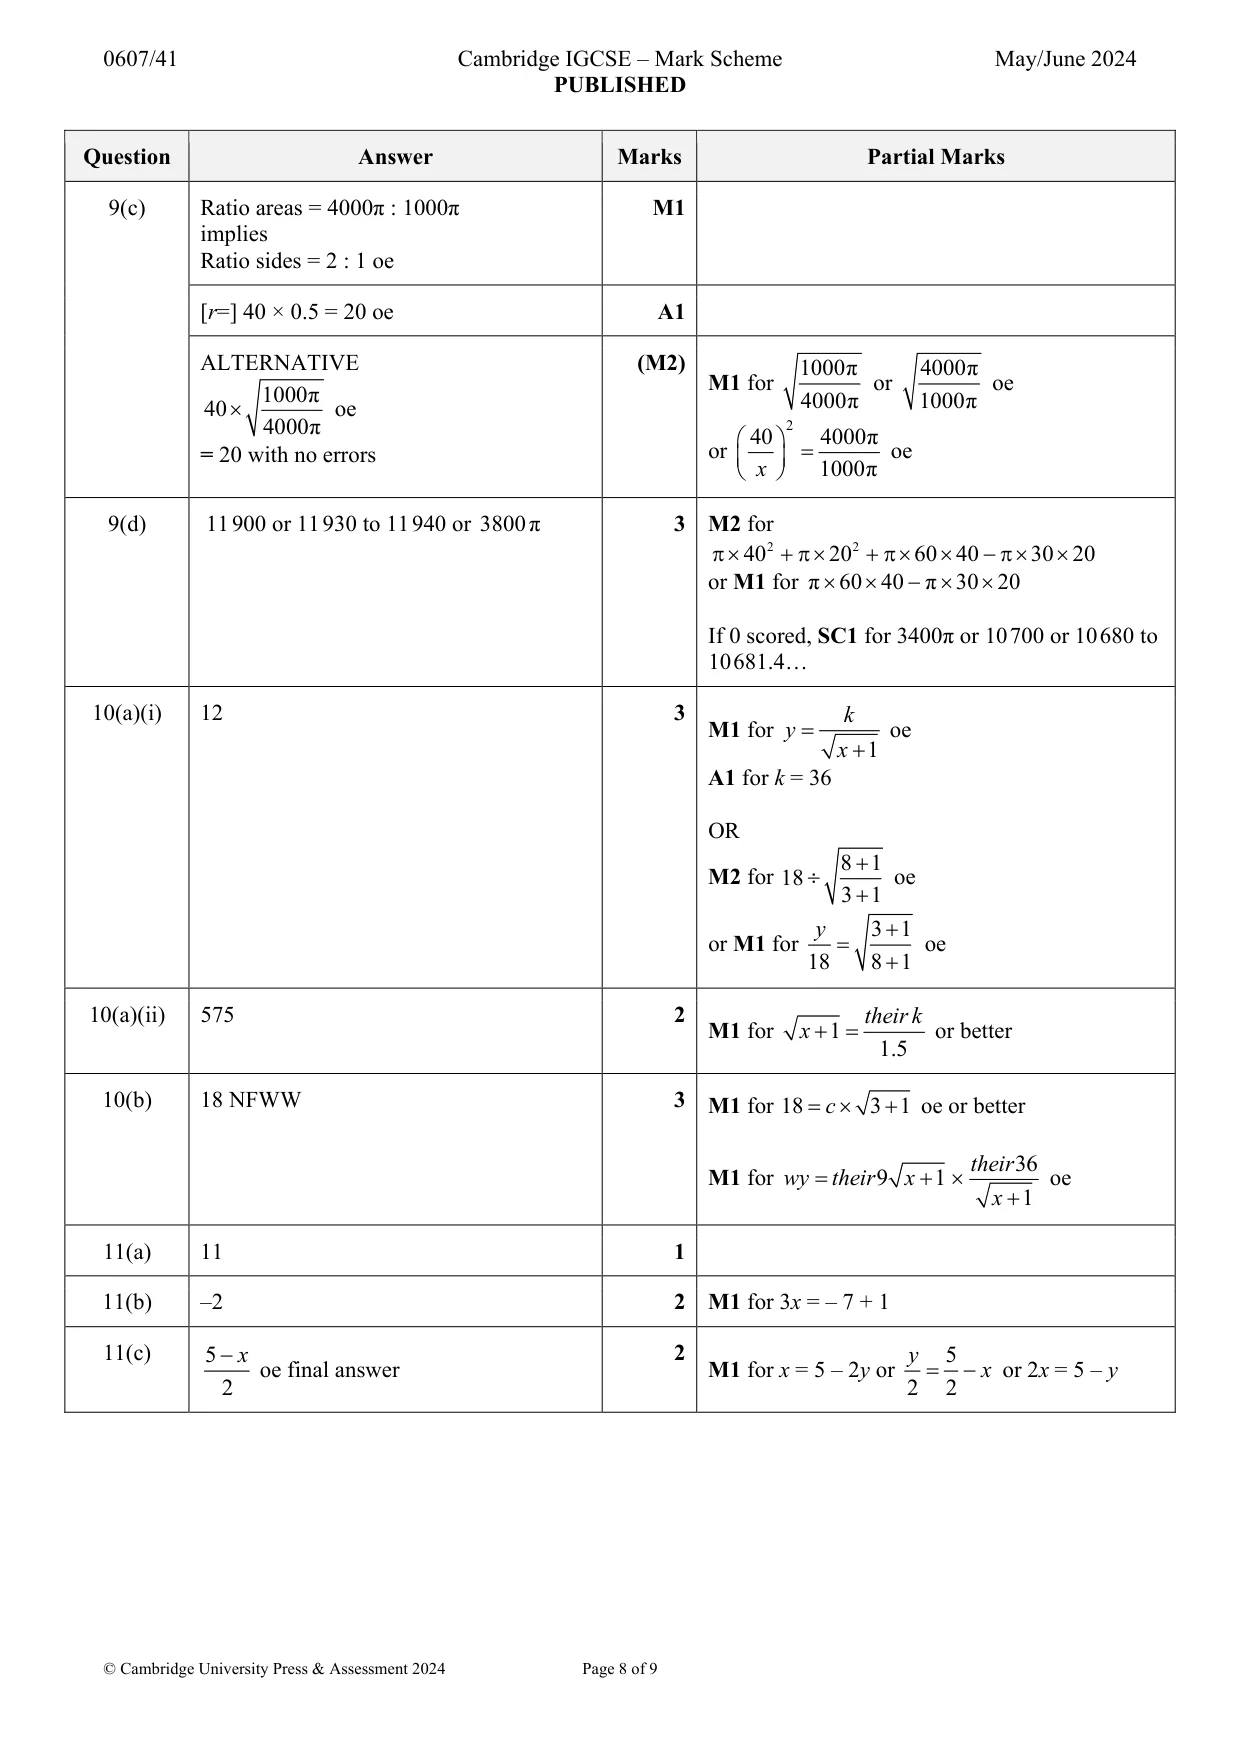
Mark scheme: 9(a) 74 900 or 74 929 to 74 941.1 3 1 2 2 2 M2 for π 40 60 40 oe 3 or M1 for 602 – 402 [=2000] oe 9(b) π × 402 + π × 40 × 60 M2 M1 for π × 402 or π × 40 × 60 = 4000π with no errors 9(c) Ratio areas = 4000π : 1000π M1 implies Ratio sides = 2 : 1 oe [r=] 40 × 0.5 = 20 oe A1 ALTERNATIVE (M2) 1000π 4000π M1 for or oe 1000π 4000π 1000π 40 oe 4000π 2 40 4000π oe = 20 with no errors or x 1000π 9(d) 11 900 or 11 930 to 11 940 or 3800π 3 M2 for 40 2 20 2 60 40 30 20 or M1 for π 60 40 π 30 20 If 0 scored, SC1 for 3400π or 10 700 or 10 680 to 10 681.4…
Q10 · Y varies inversely as the square root of ( x + 1)
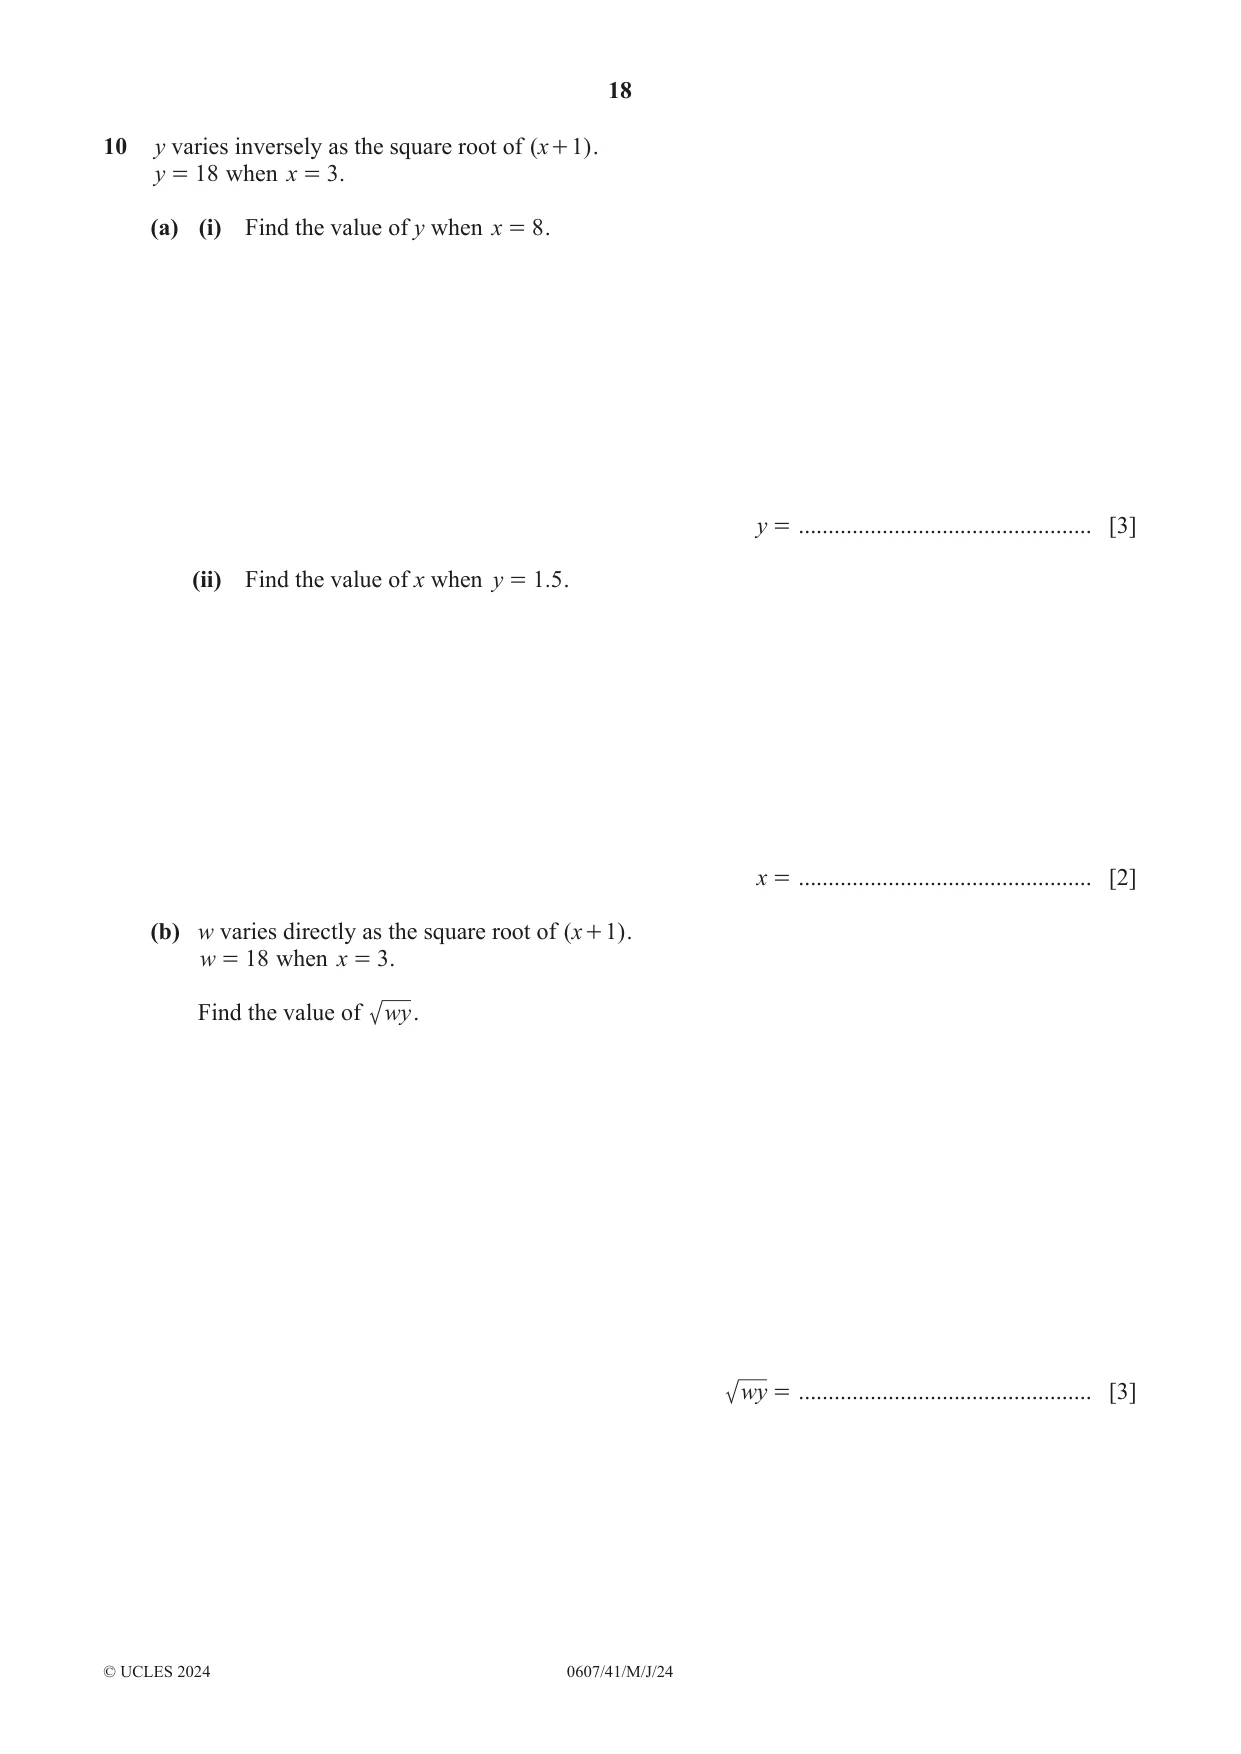
10 y varies inversely as the square root of ( x + 1) . y = 18 when x = 3 . (a) (i) Find the value of y when x = 8 . y = ................................................. [3] (ii) Find the value of x when y = 1.5 . x = ................................................. [2] (b) w varies directly as the square root of ( x + 1) . w = 18 when x = 3 . Find the value of wy. wy = ................................................. [3]
Mark scheme: 10(a)(i) 12 3 k M1 for y oe x 1 A1 for k = 36 OR 8 1 M2 for 18 oe 3 1 y 3 1 or M1 for oe 18 8 1 10(a)(ii) 575 2 k M1 for x their1 or better 1.5 10(b) 18 NFWW 3 M1 for 18 c 3 1 oe or better their 36 M1 for wy their 9 x 1 oe x 1
Q11 · F( )x = 3 x - 1 g( )x = 5 - 2 x h( x) = , x !
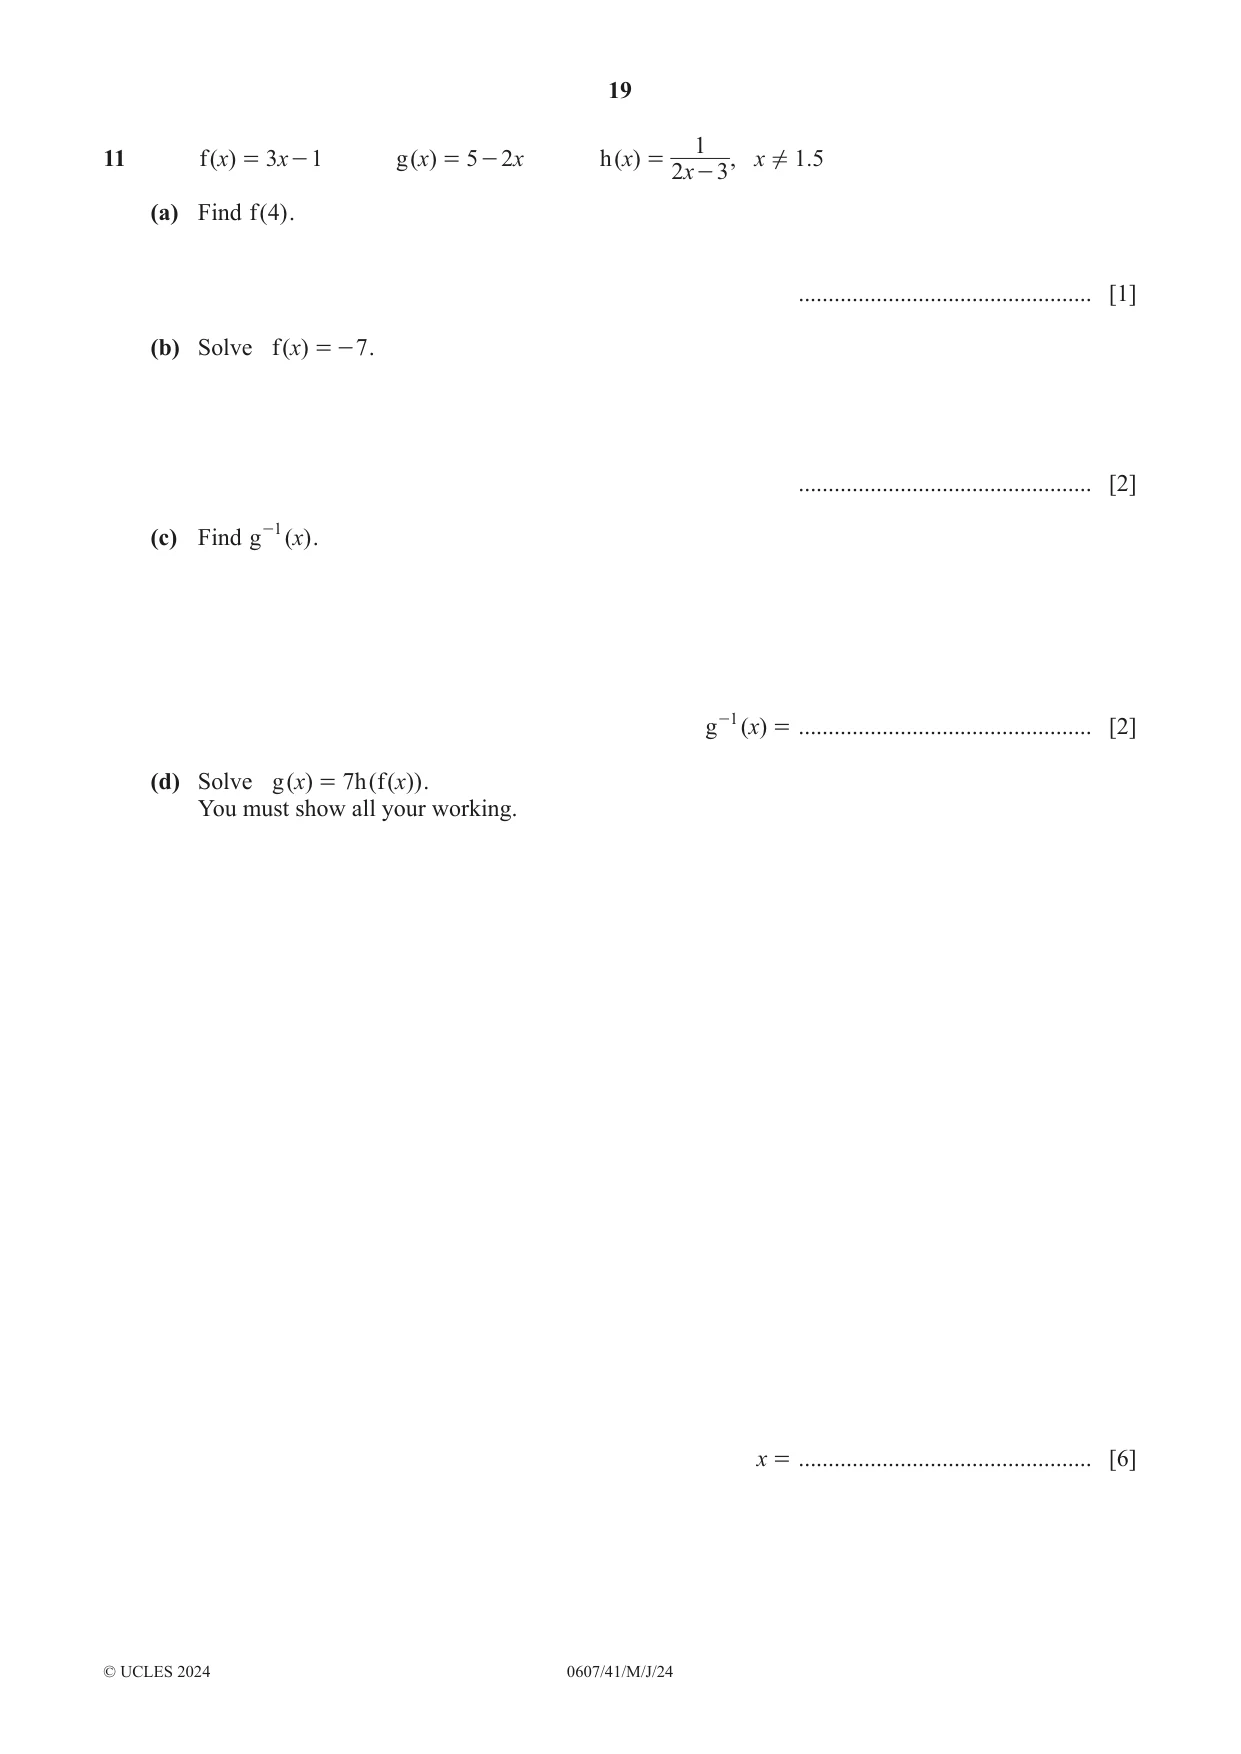
11 f( )x = 3 x - 1 g( )x = 5 - 2 x h( x) = , x ! 1 .5 2x - 3 (a) Find f( 4) . ................................................. [1] (b) Solve f( )x = - 7 . ................................................. [2] (c) Find g -1 ( )x . g -1 ( )x = ................................................. [2] (d) Solve g( x) = 7 h(f( x)) . You must show all your working. x = ................................................. [6]
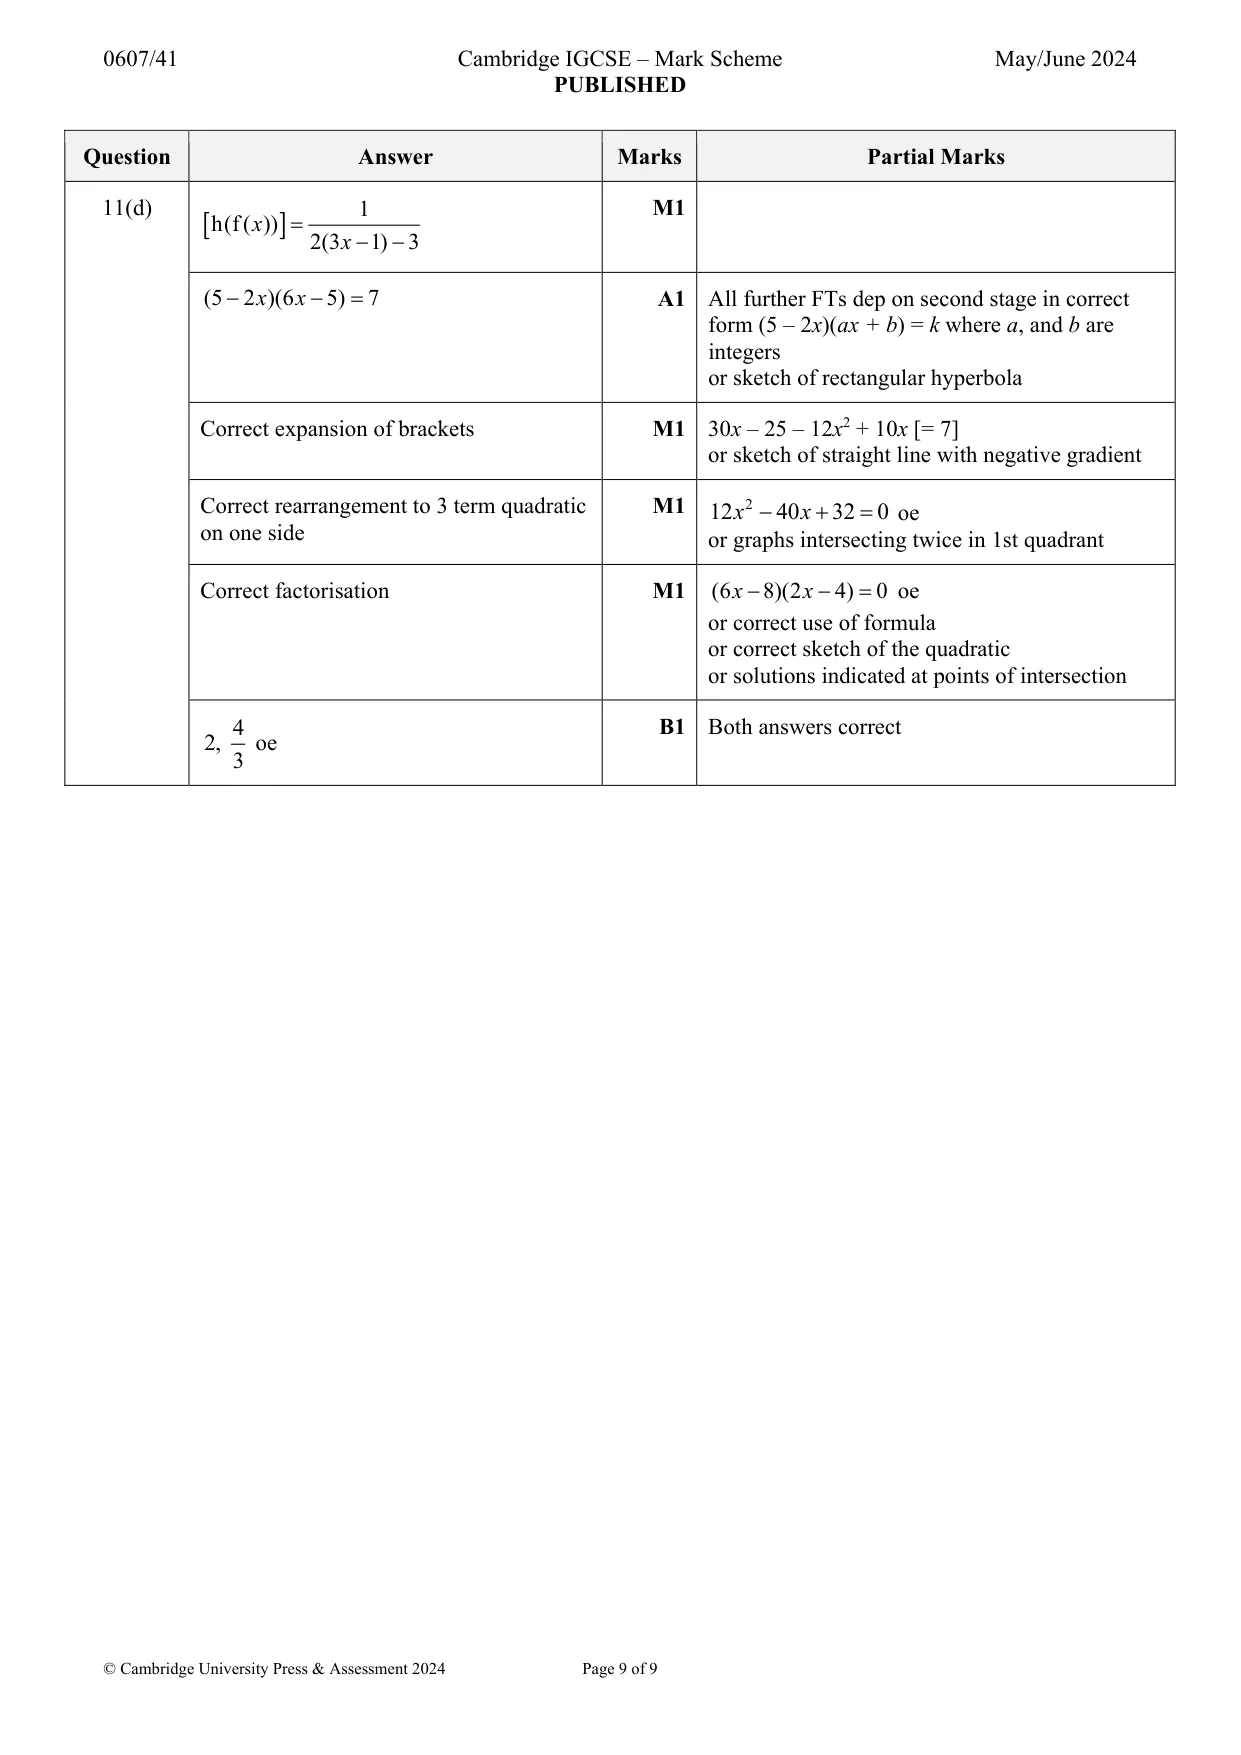
Mark scheme: 11(a) 11 1 11(b) –2 2 M1 for 3x = – 7 + 1 11(c) 5 x 2 y 5 oe final answer M1 for x = 5 – 2y or x or 2x = 5 – y 2 2 2 11(d) 1 M1 h(f ( x )) 2(3 x 1) 3 (5 2 x )(6 x 5) 7 A1 All further FTs dep on second stage in correct form (5 – 2x)(ax + b) = k where a, and b are integers or sketch of rectangular hyperbola Correct expansion of brackets M1 30x – 25 – 12x2 + 10x [= 7] or sketch of straight line with negative gradient Correct rearrangement to 3 term quadratic M1 12 x 2 40 x 32 0 oe on one side or graphs intersecting twice in 1st quadrant Correct factorisation M1 (6 x 8)(2 x 4) 0 oe or correct use of formula or correct sketch of the quadratic or solutions indicated at points of intersection 4 B1 Both answers correct 2, oe 3
What was in this paper
The subtopics covered by these 11 questions, and how many questions each got. Open one in a new tab to see every Cambridge question on it.
What you needed in this session
Cambridge’s own grade thresholds for 2024 May/June, Paper 4 · Variant 1. A higher threshold means an easier paper — the bar moves with how the cohort did.