Questions as text
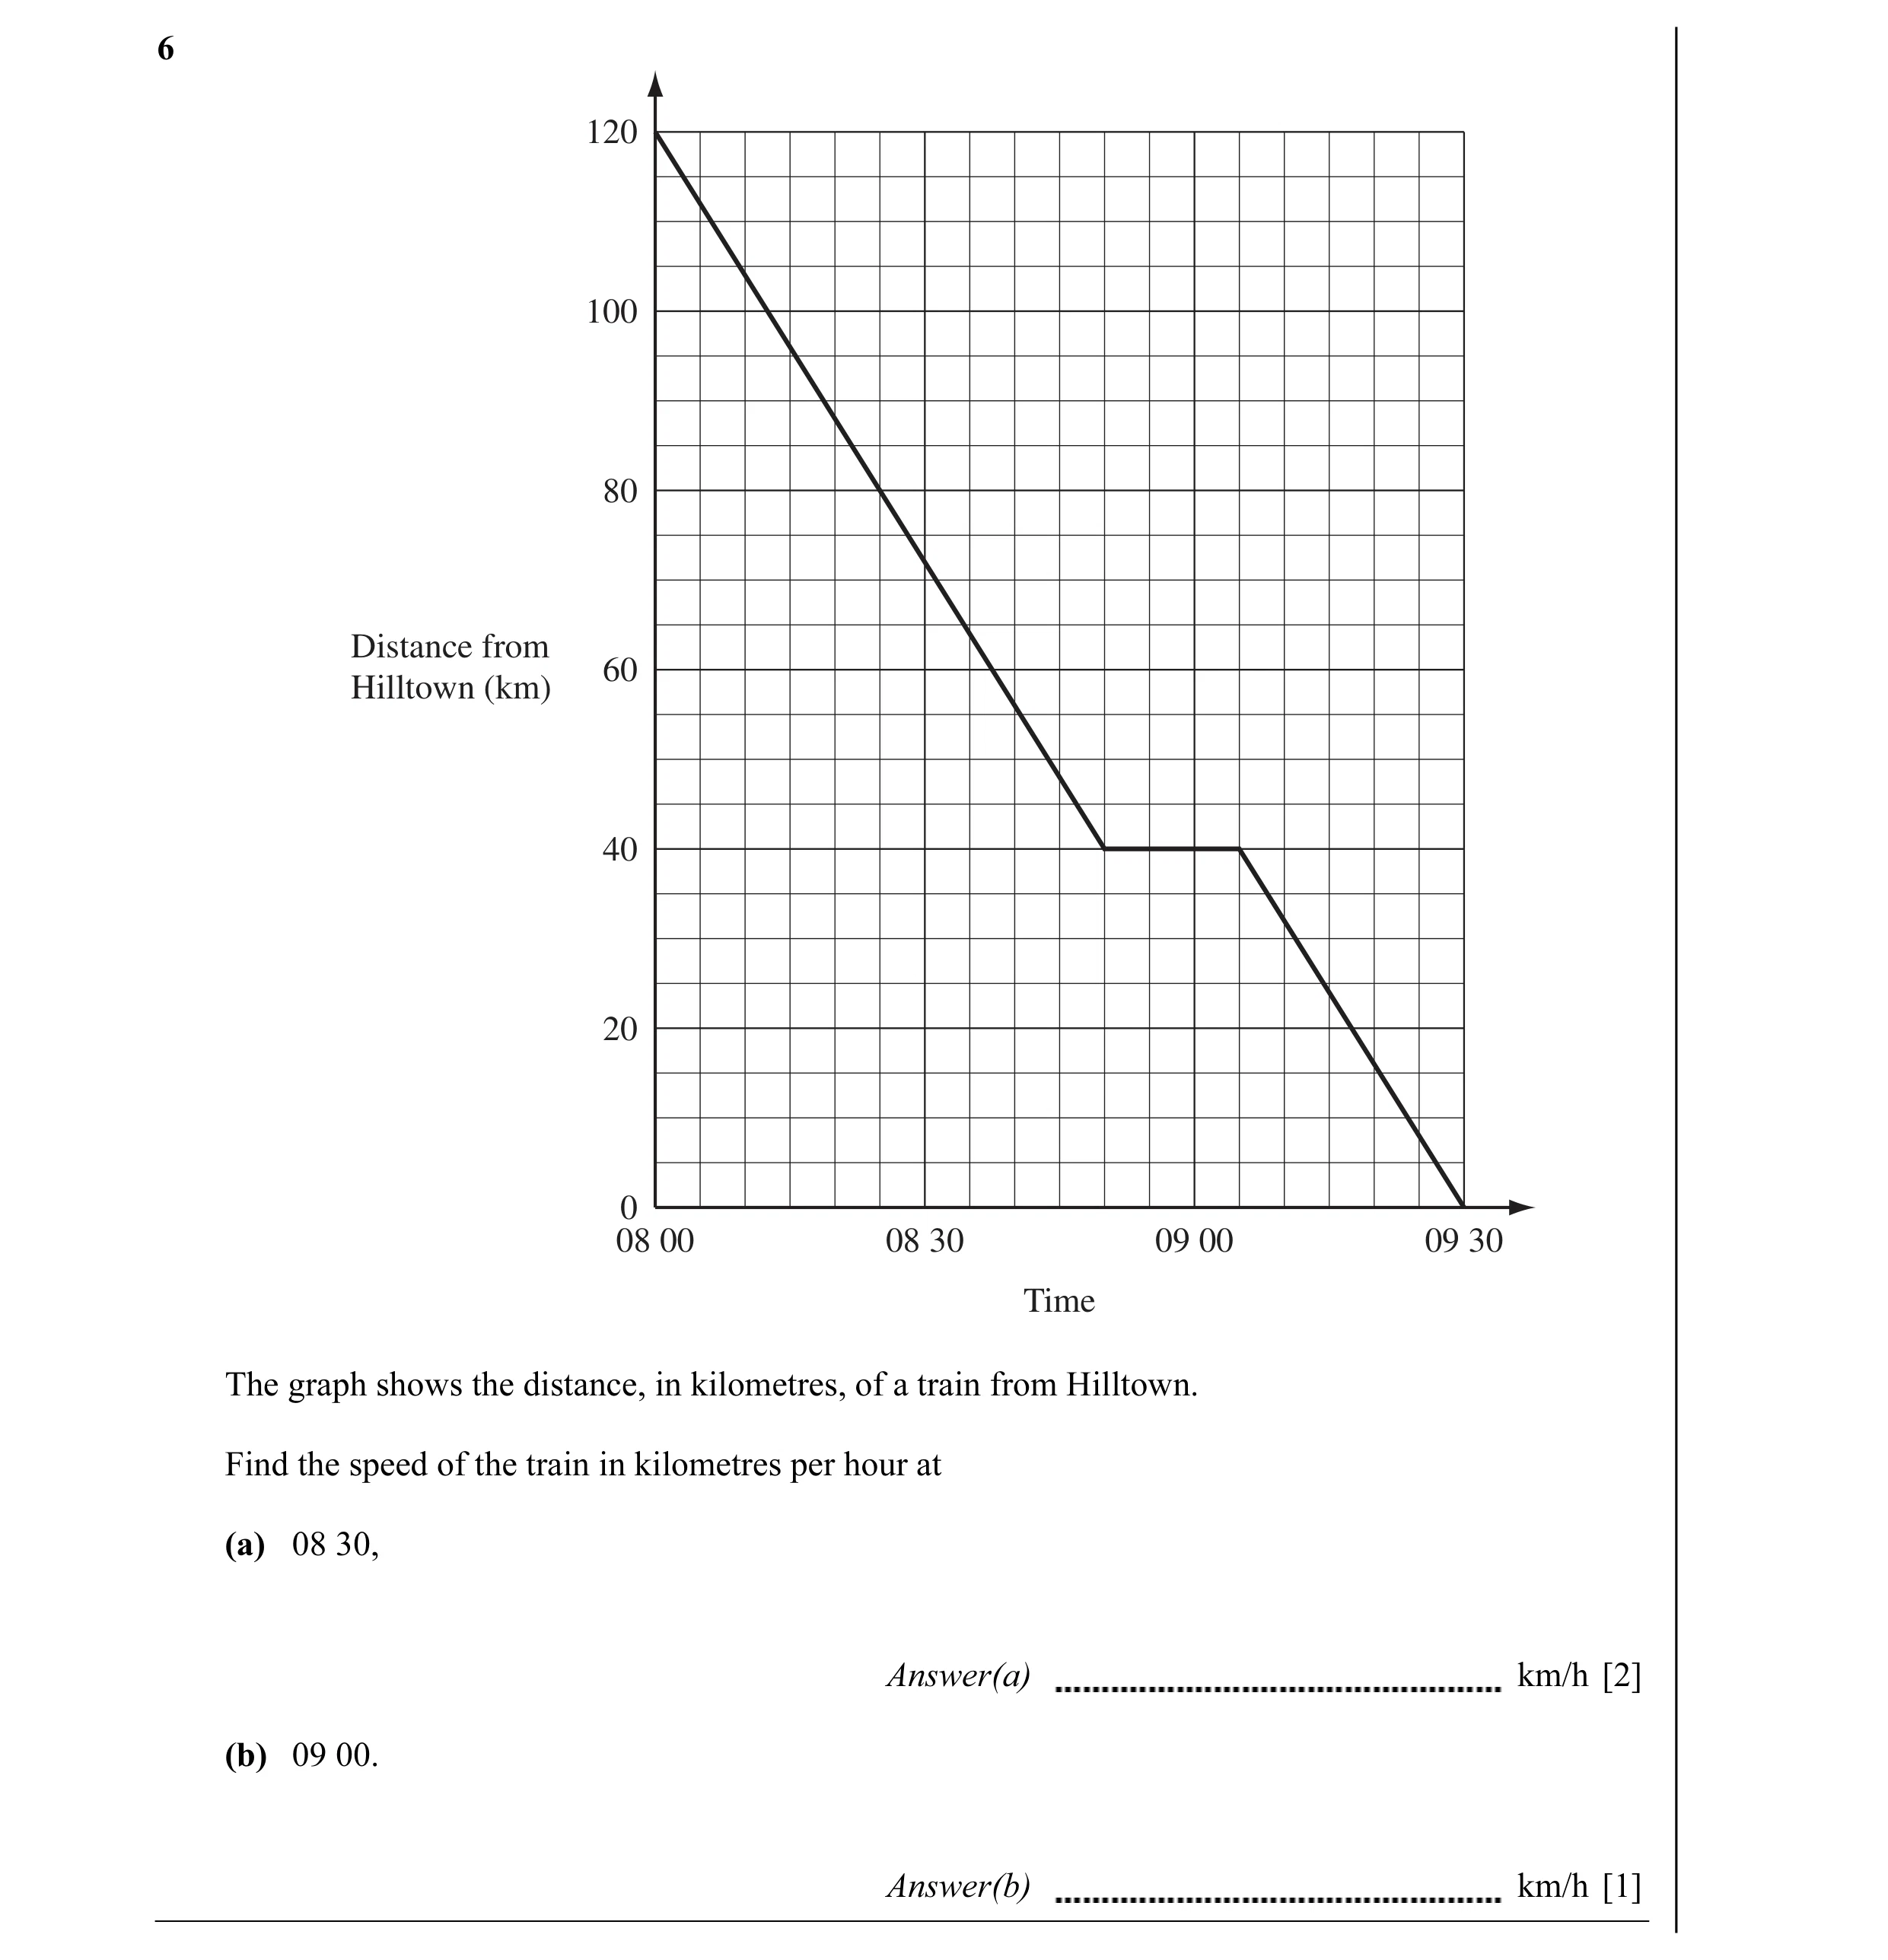
Q1 · 120 100 80 Distance from 60 Hilltown (km) 40 20 0 08 00 08 30 09 00 09 30 Time The graph… 0580/21 Oct/Nov 2004
6 120 100 80 Distance from 60 Hilltown (km) 40 20 0 08 00 08 30 09 00 09 30 Time The graph shows the distance, in kilometres, of a train from Hilltown. Find the speed of the train in kilometres per hour at (a) 08 30, Answer(a) km/h [2] (b) 09 00. Answer(b) km/h [1]
3 marks
Mark scheme: 6 (a) (-)96 2* B1 answers in the range 90 to 100 or 1.5 to 1.7 (b) 0 1
This question in 0580/21 Oct/Nov 2004
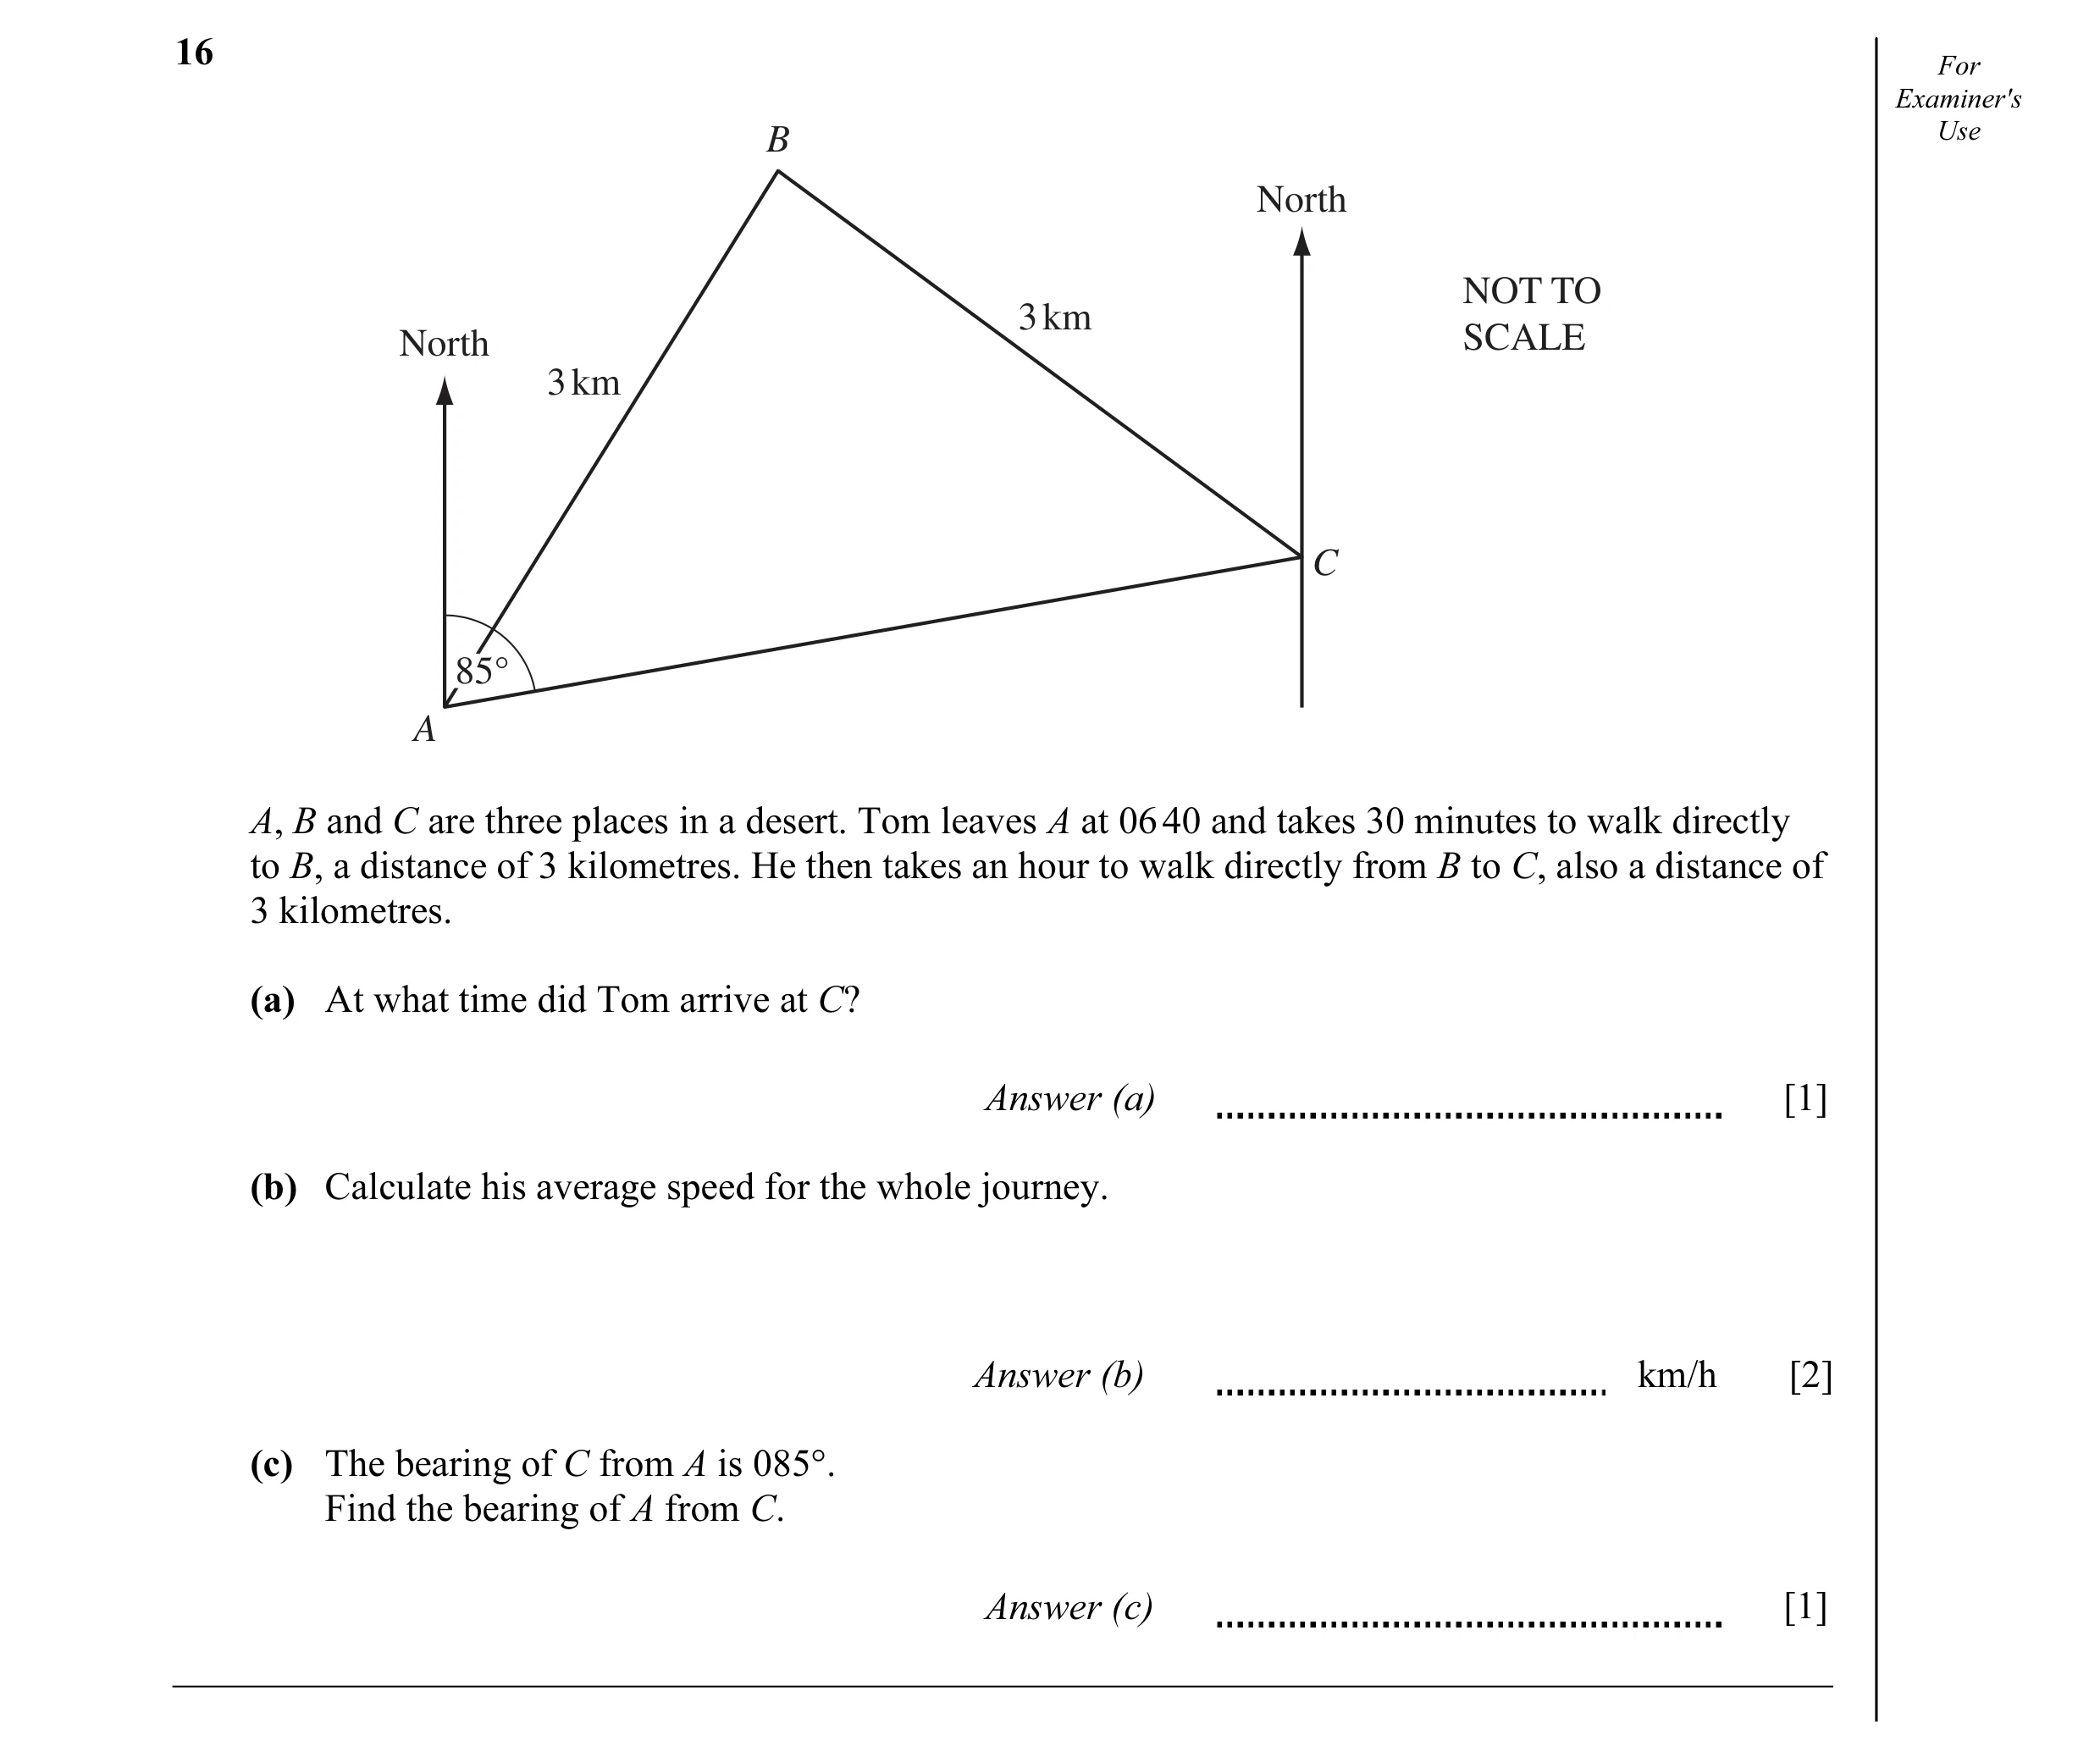
Q2 · For Examiner's B Use North NOT TO 3 km North SCALE 3 km C 85° A A, B and C are three… 0580/21 Oct/Nov 2009
16 For Examiner's B Use North NOT TO 3 km North SCALE 3 km C 85° A A, B and C are three places in a desert. Tom leaves A at 06 40 and takes 30 minutes to walk directly to B, a distance of 3 kilometres. He then takes an hour to walk directly from B to C, also a distance of 3 kilometres. (a) At what time did Tom arrive at C? Answer (a) [1] (b) Calculate his average speed for the whole journey. Answer (b) km/h [2] (c) The bearing of C from A is 085°. Find the bearing of A from C. Answer (c) [1]
4 marks
Mark scheme: 16 (a) (0)810 or 8:10 etc. 1 (b) 4 2 M1 (3 + 3)/(1 + 0.5) (c) 265 1
This question in 0580/21 Oct/Nov 2009
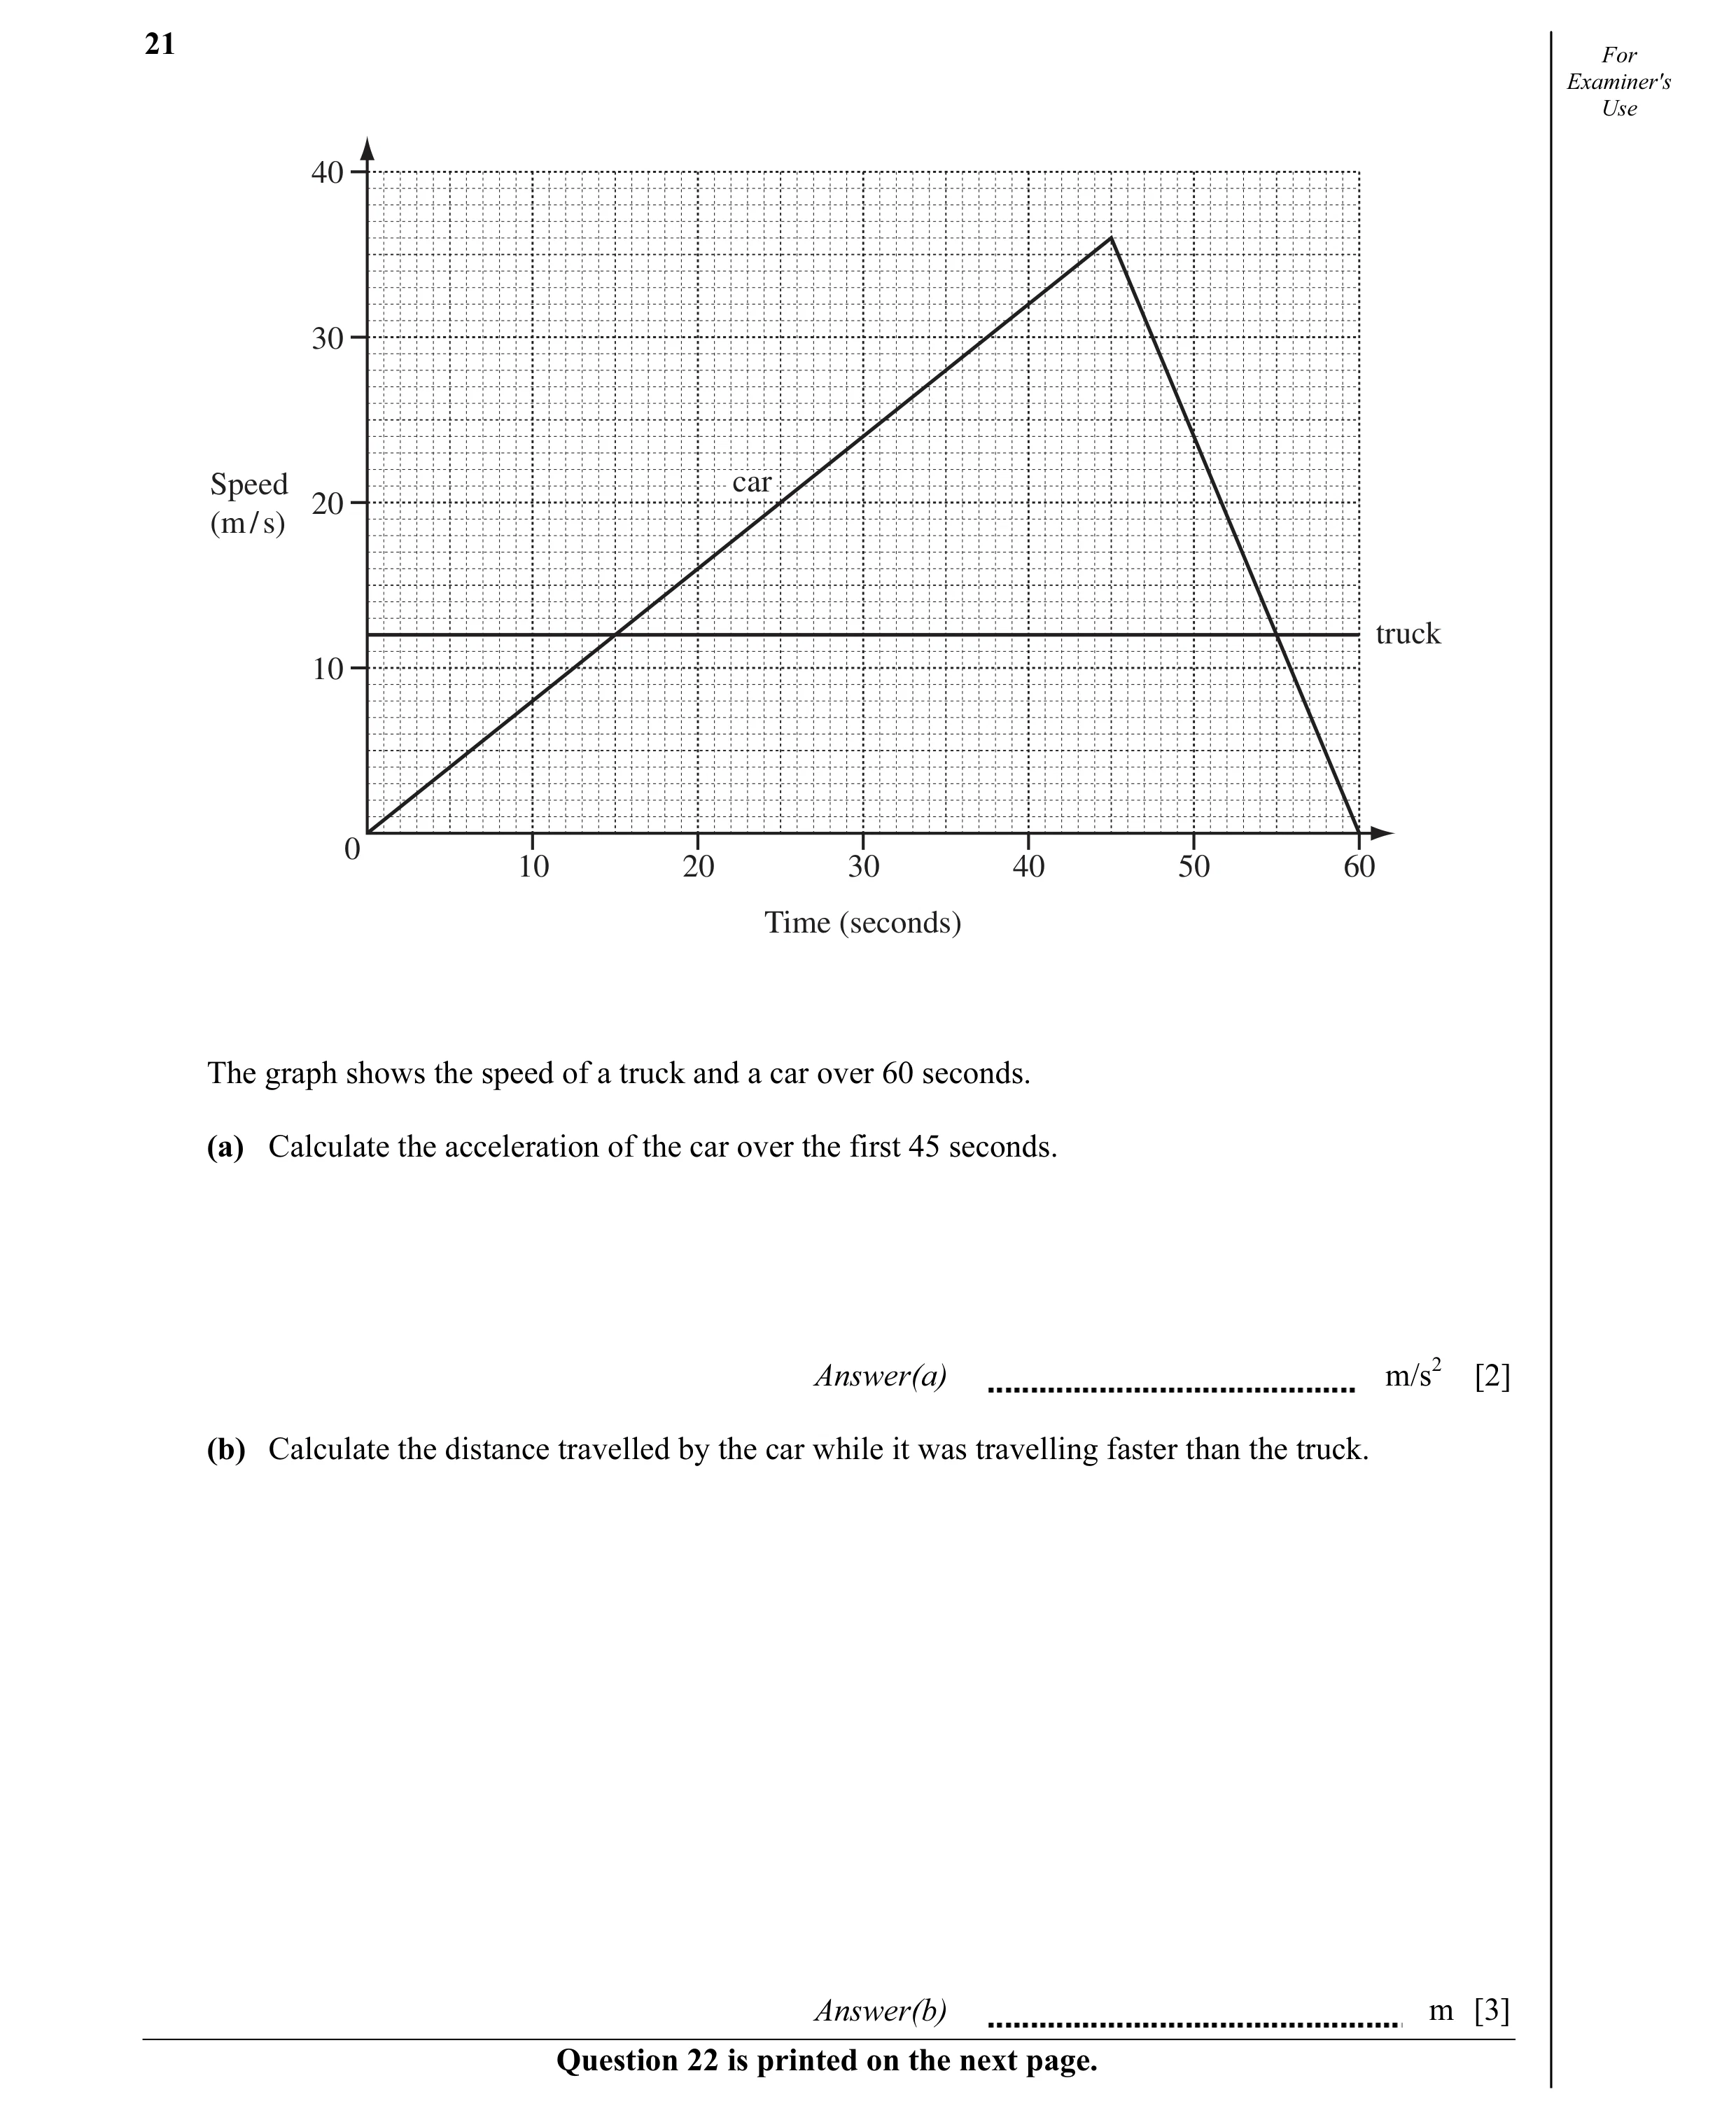
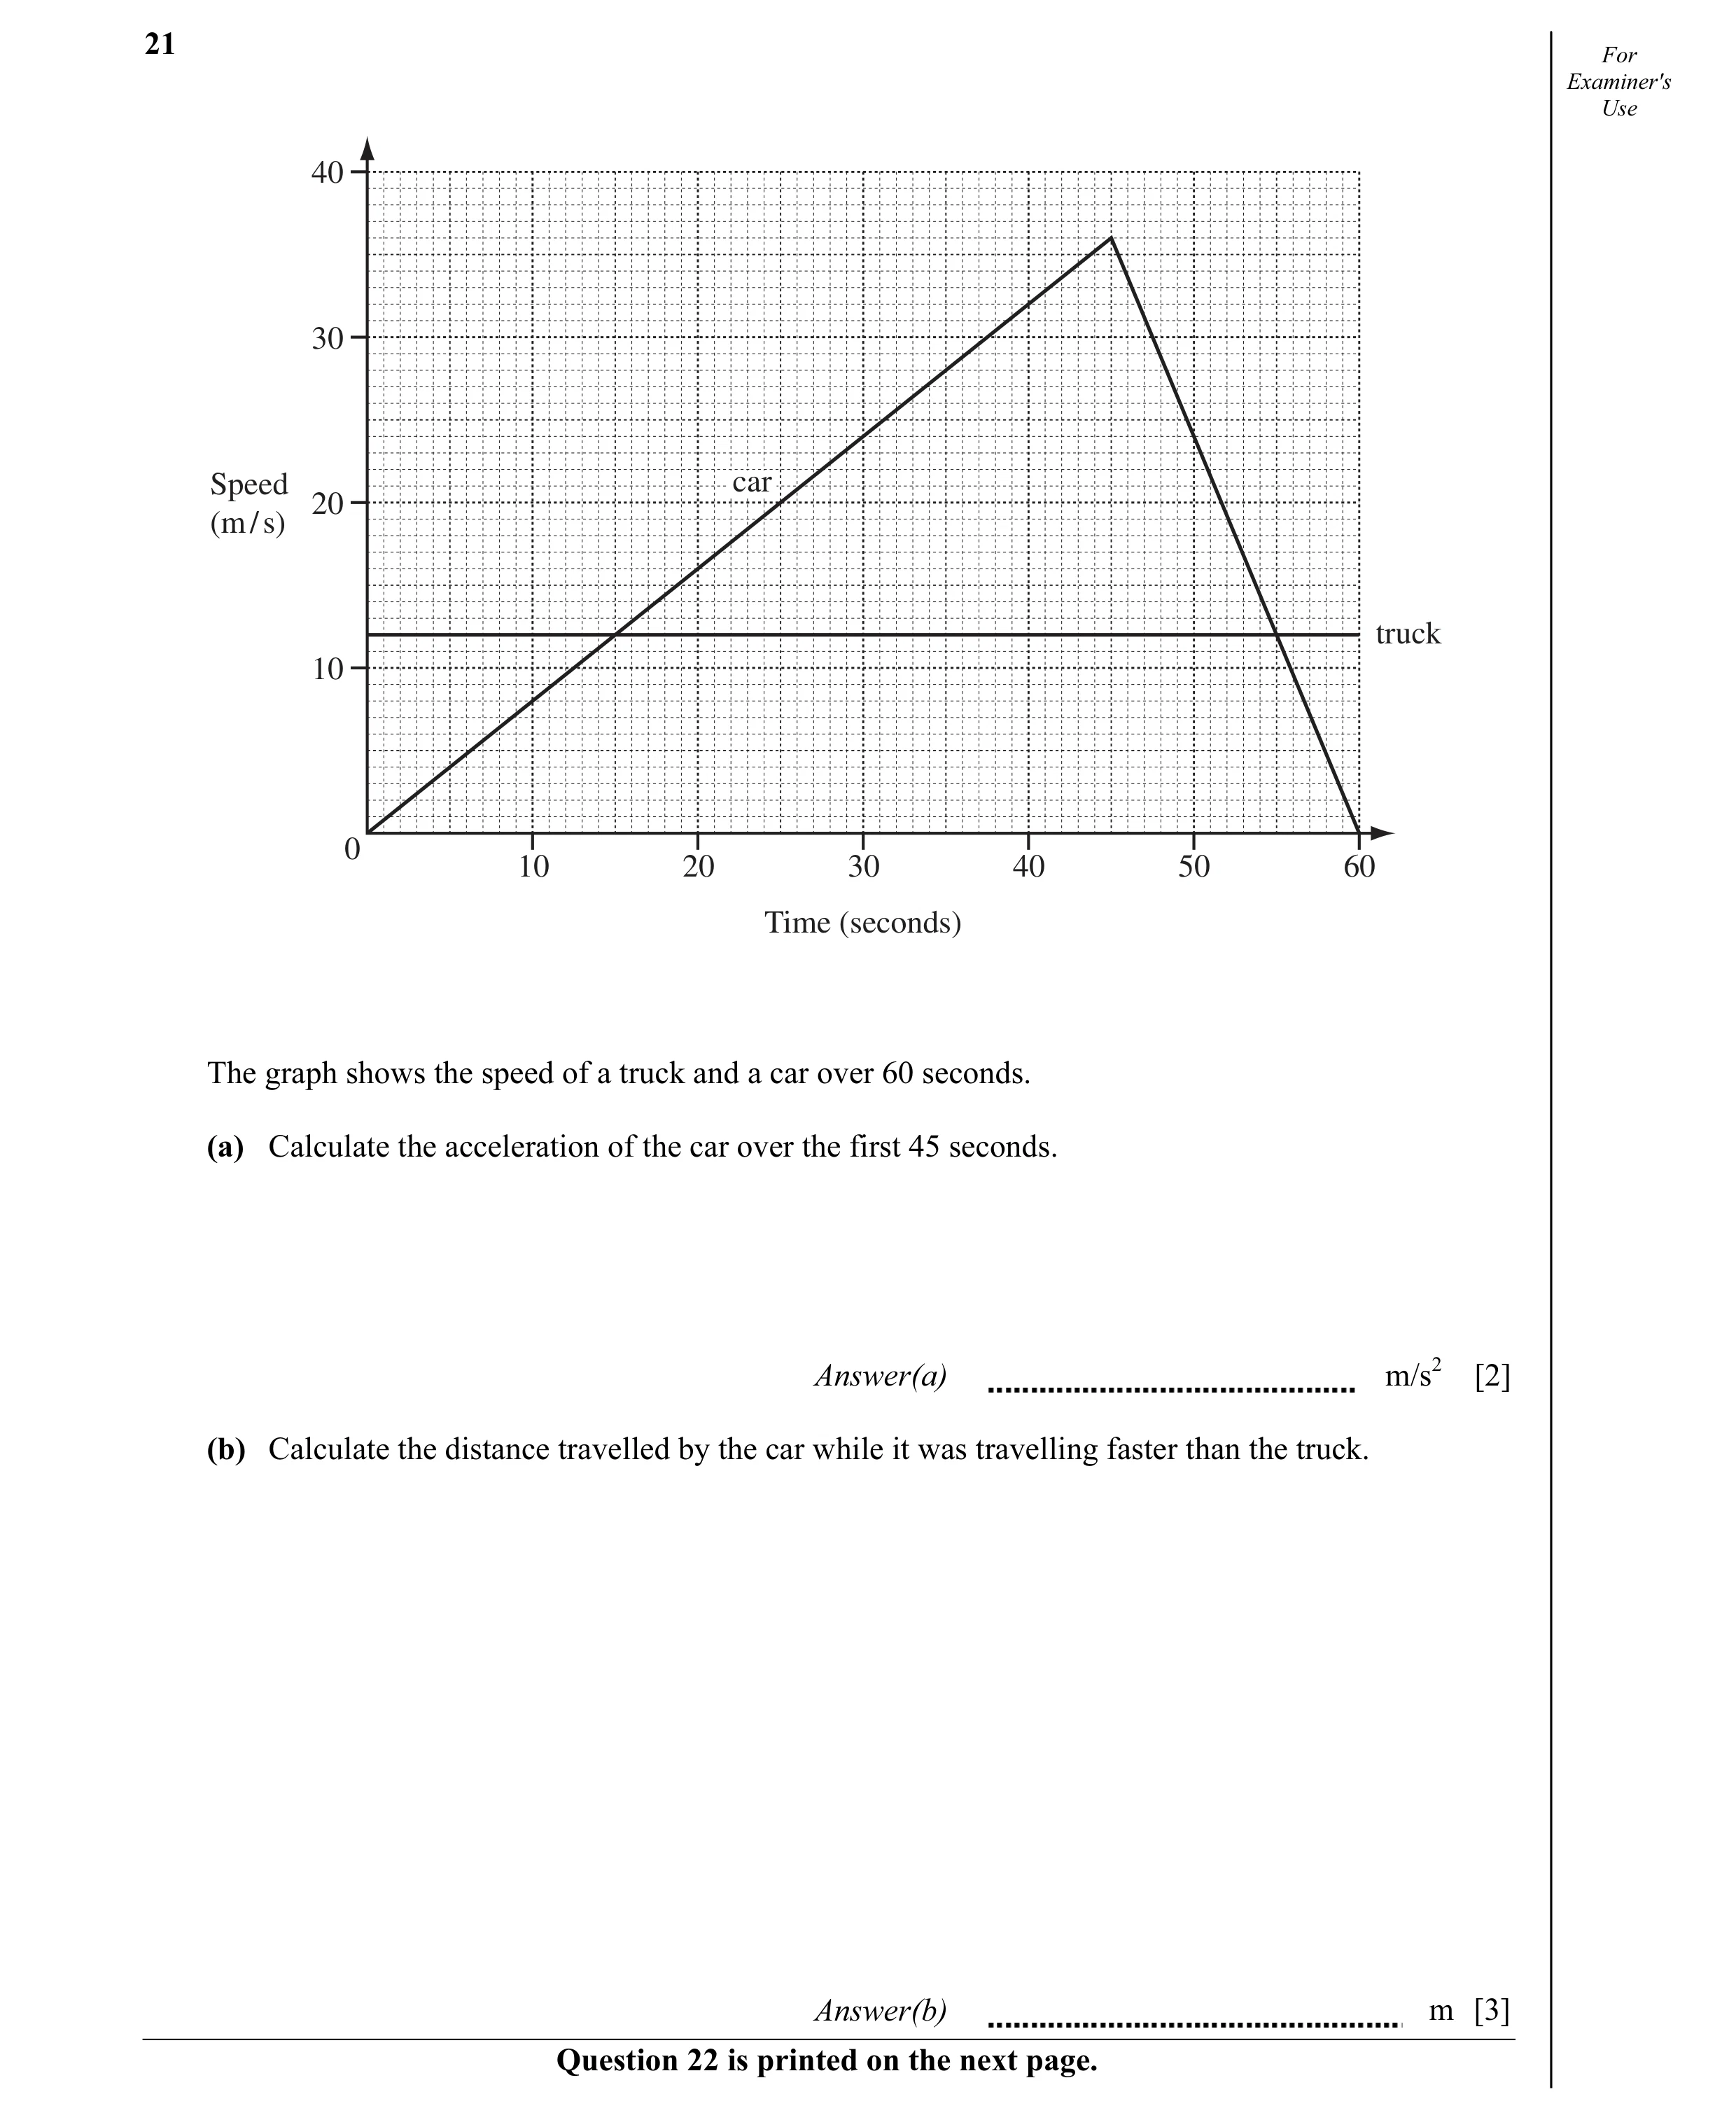
Q3 · For Examiner's Use 40 30 Speed car 20 (m / s) truck 10 0 10 20 30 40 50 60 Time (seconds)… 0580/21 Oct/Nov 2009
21 For Examiner's Use 40 30 Speed car 20 (m / s) truck 10 0 10 20 30 40 50 60 Time (seconds) The graph shows the speed of a truck and a car over 60 seconds. (a) Calculate the acceleration of the car over the first 45 seconds. Answer(a) m/s2 [2] (b) Calculate the distance travelled by the car while it was travelling faster than the truck. Answer(b) m [3] Question 22 is printed on the next page.
5 marks
Mark scheme: 21 (a) 0.8 or 4/5 cao 2 M1 speed/time (b) 960 www 3 M1 30 × (12 + 36)/2 M1 12 × 40 M1 10 × (12 + 36)/2 M1 ½ × 40 × 24 IGCSE – October/November 2009 0580 21
This question in 0580/21 Oct/Nov 2009
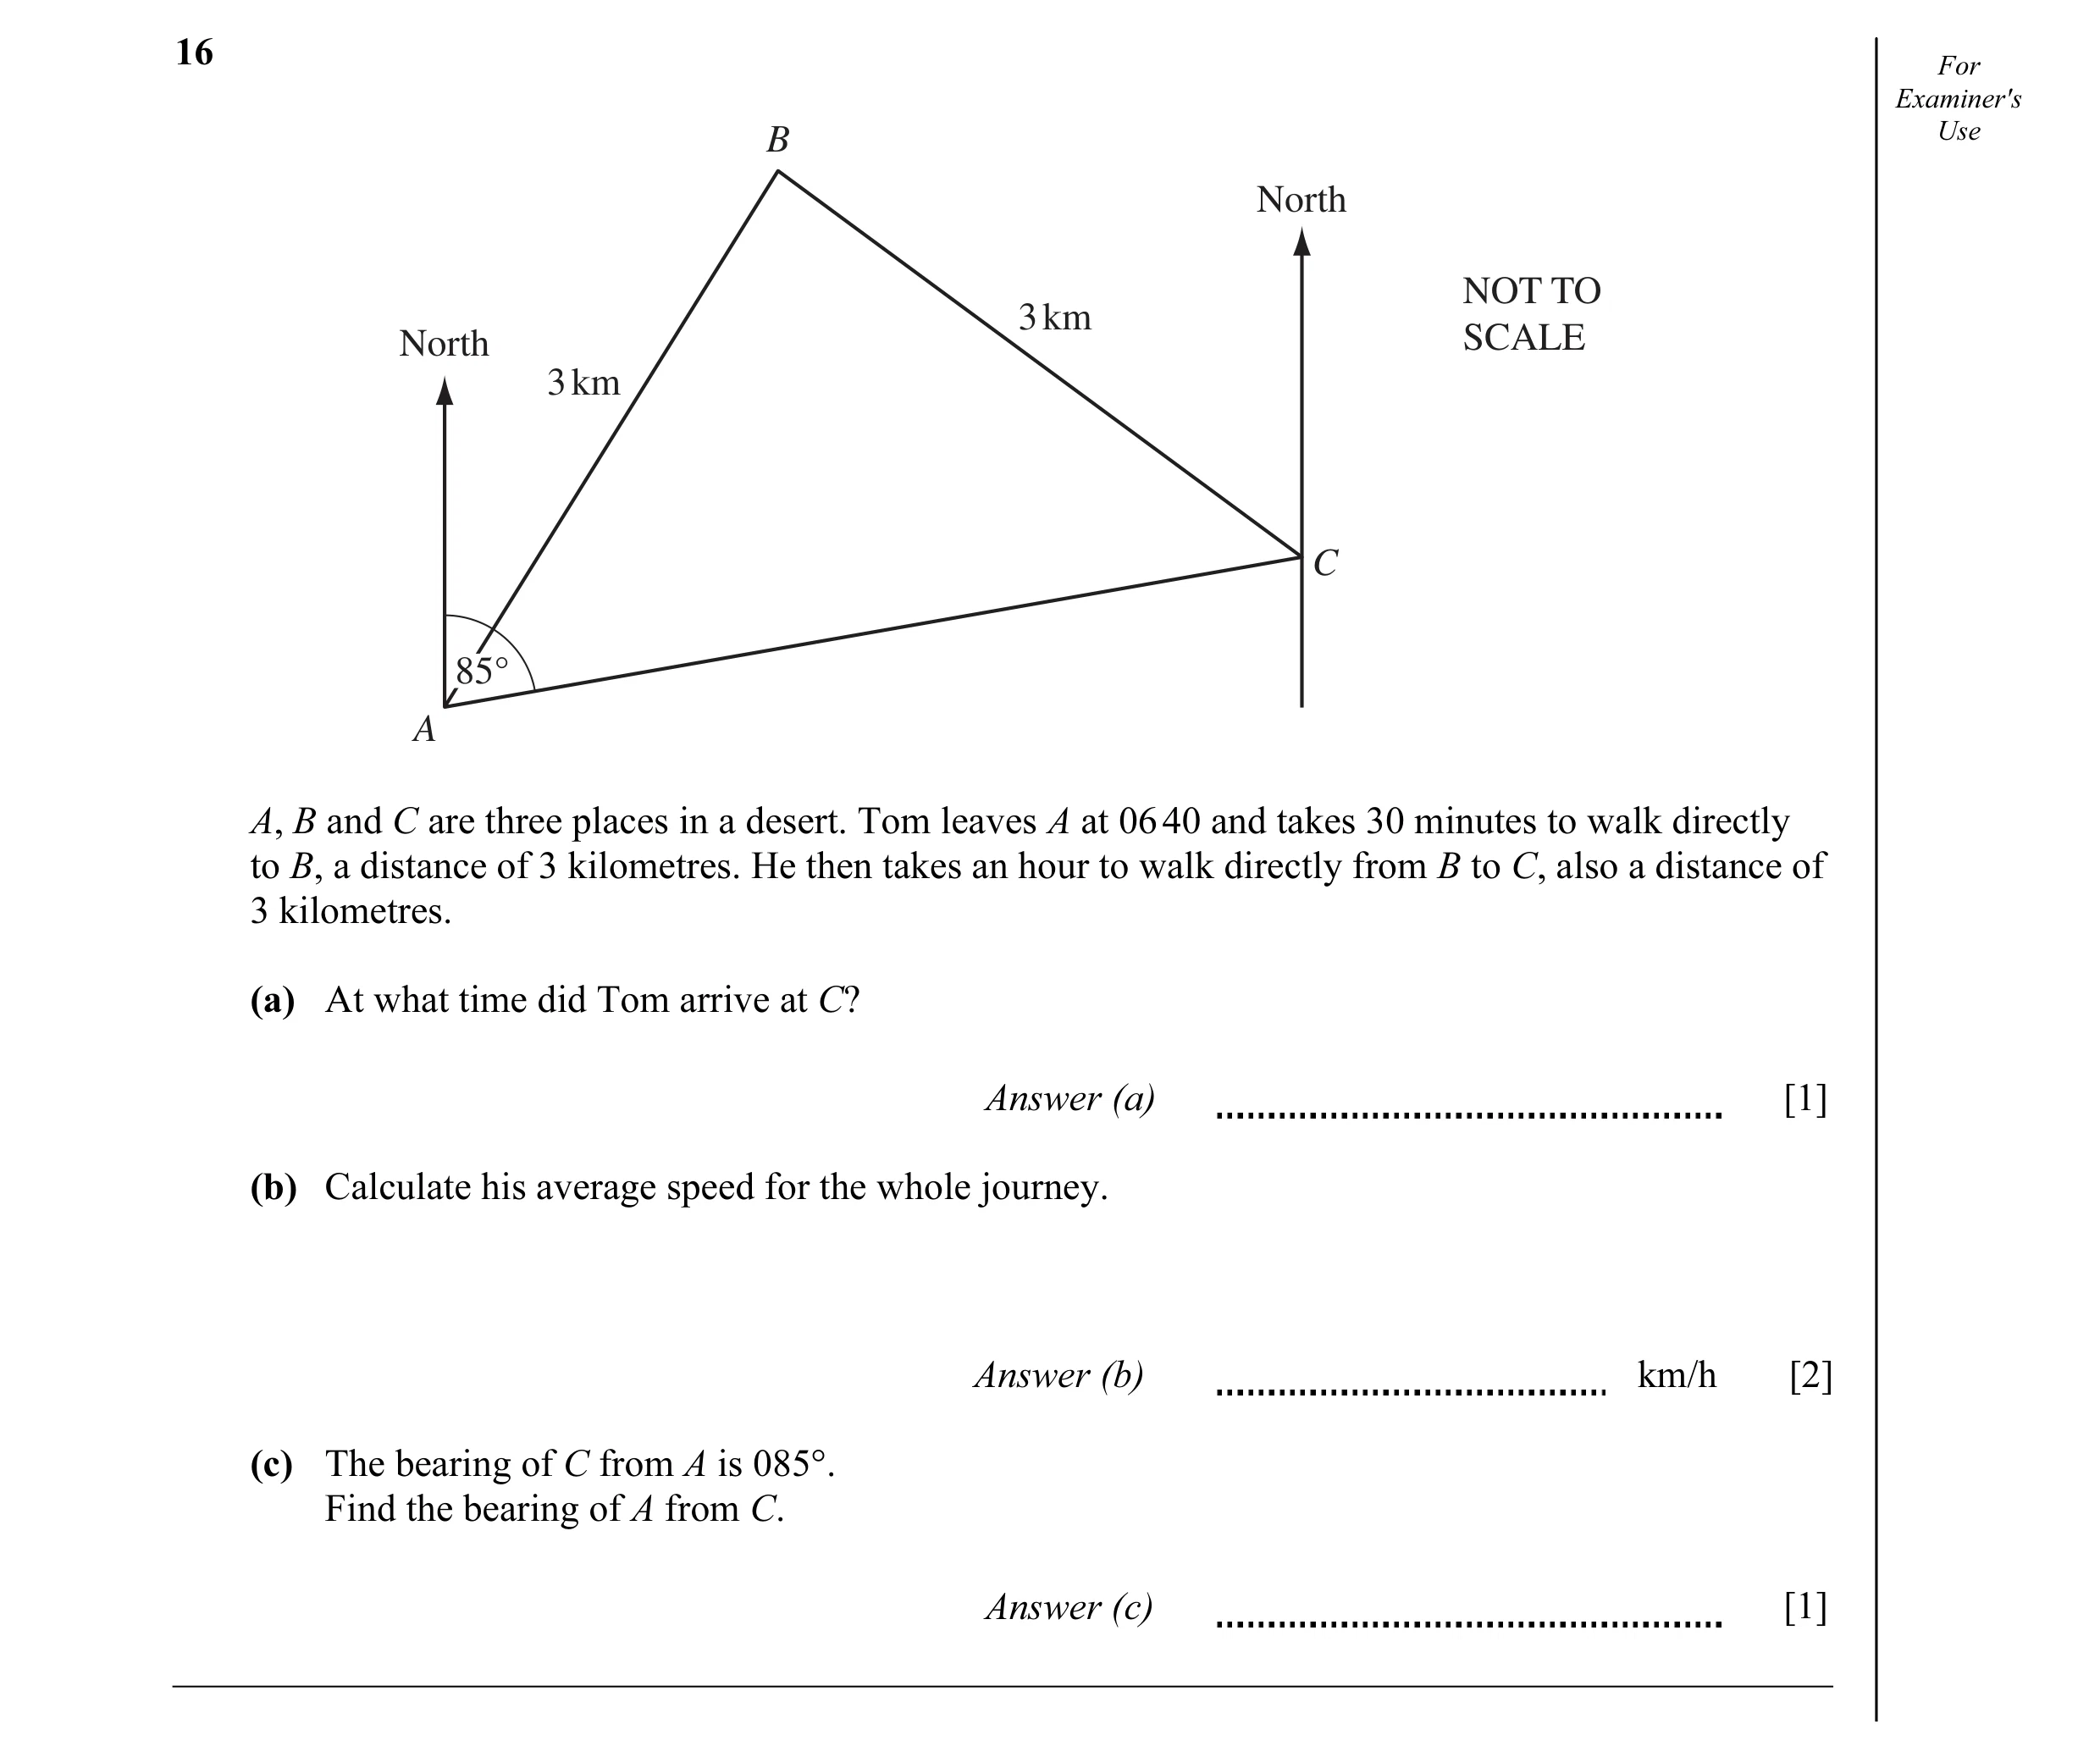
Q4 · For Examiner's B Use North NOT TO 3 km North SCALE 3 km C 85° A A, B and C are three… 0580/22 Oct/Nov 2009
16 For Examiner's B Use North NOT TO 3 km North SCALE 3 km C 85° A A, B and C are three places in a desert. Tom leaves A at 06 40 and takes 30 minutes to walk directly to B, a distance of 3 kilometres. He then takes an hour to walk directly from B to C, also a distance of 3 kilometres. (a) At what time did Tom arrive at C? Answer (a) [1] (b) Calculate his average speed for the whole journey. Answer (b) km/h [2] (c) The bearing of C from A is 085°. Find the bearing of A from C. Answer (c) [1]
4 marks
Mark scheme: 16 (a) (0)810 or 8:10 etc. 1 (b) 4 2 M1 (3 + 3)/(1 + 0.5) (c) 265 1
This question in 0580/22 Oct/Nov 2009
Q5 · For Examiner's Use 40 30 Speed car 20 (m / s) truck 10 0 10 20 30 40 50 60 Time (seconds)… 0580/22 Oct/Nov 2009
21 For Examiner's Use 40 30 Speed car 20 (m / s) truck 10 0 10 20 30 40 50 60 Time (seconds) The graph shows the speed of a truck and a car over 60 seconds. (a) Calculate the acceleration of the car over the first 45 seconds. Answer(a) m/s2 [2] (b) Calculate the distance travelled by the car while it was travelling faster than the truck. Answer(b) m [3] Question 22 is printed on the next page.
5 marks
Mark scheme: 21 (a) 0.8 or 4/5 cao 2 M1 speed/time (b) 960 www 3 M1 30 × (12 + 36)/2 M1 12 × 40 M1 10 × (12 + 36)/2 M1 ½ × 40 × 24 IGCSE – October/November 2009 0580 22
This question in 0580/22 Oct/Nov 2009
Q6 · A person in a car, travelling at 108 kilometres per hour, takes 1 second to go past a… 0580/21 May/June 2010
4 A person in a car, travelling at 108 kilometres per hour, takes 1 second to go past a building on the side of the road. Calculate the length of the building in metres. Answer m [2]
2 marks
Mark scheme: 4 30 2 M1 108 × 1000 / (60 × 60) 4 3
This question in 0580/21 May/June 2010
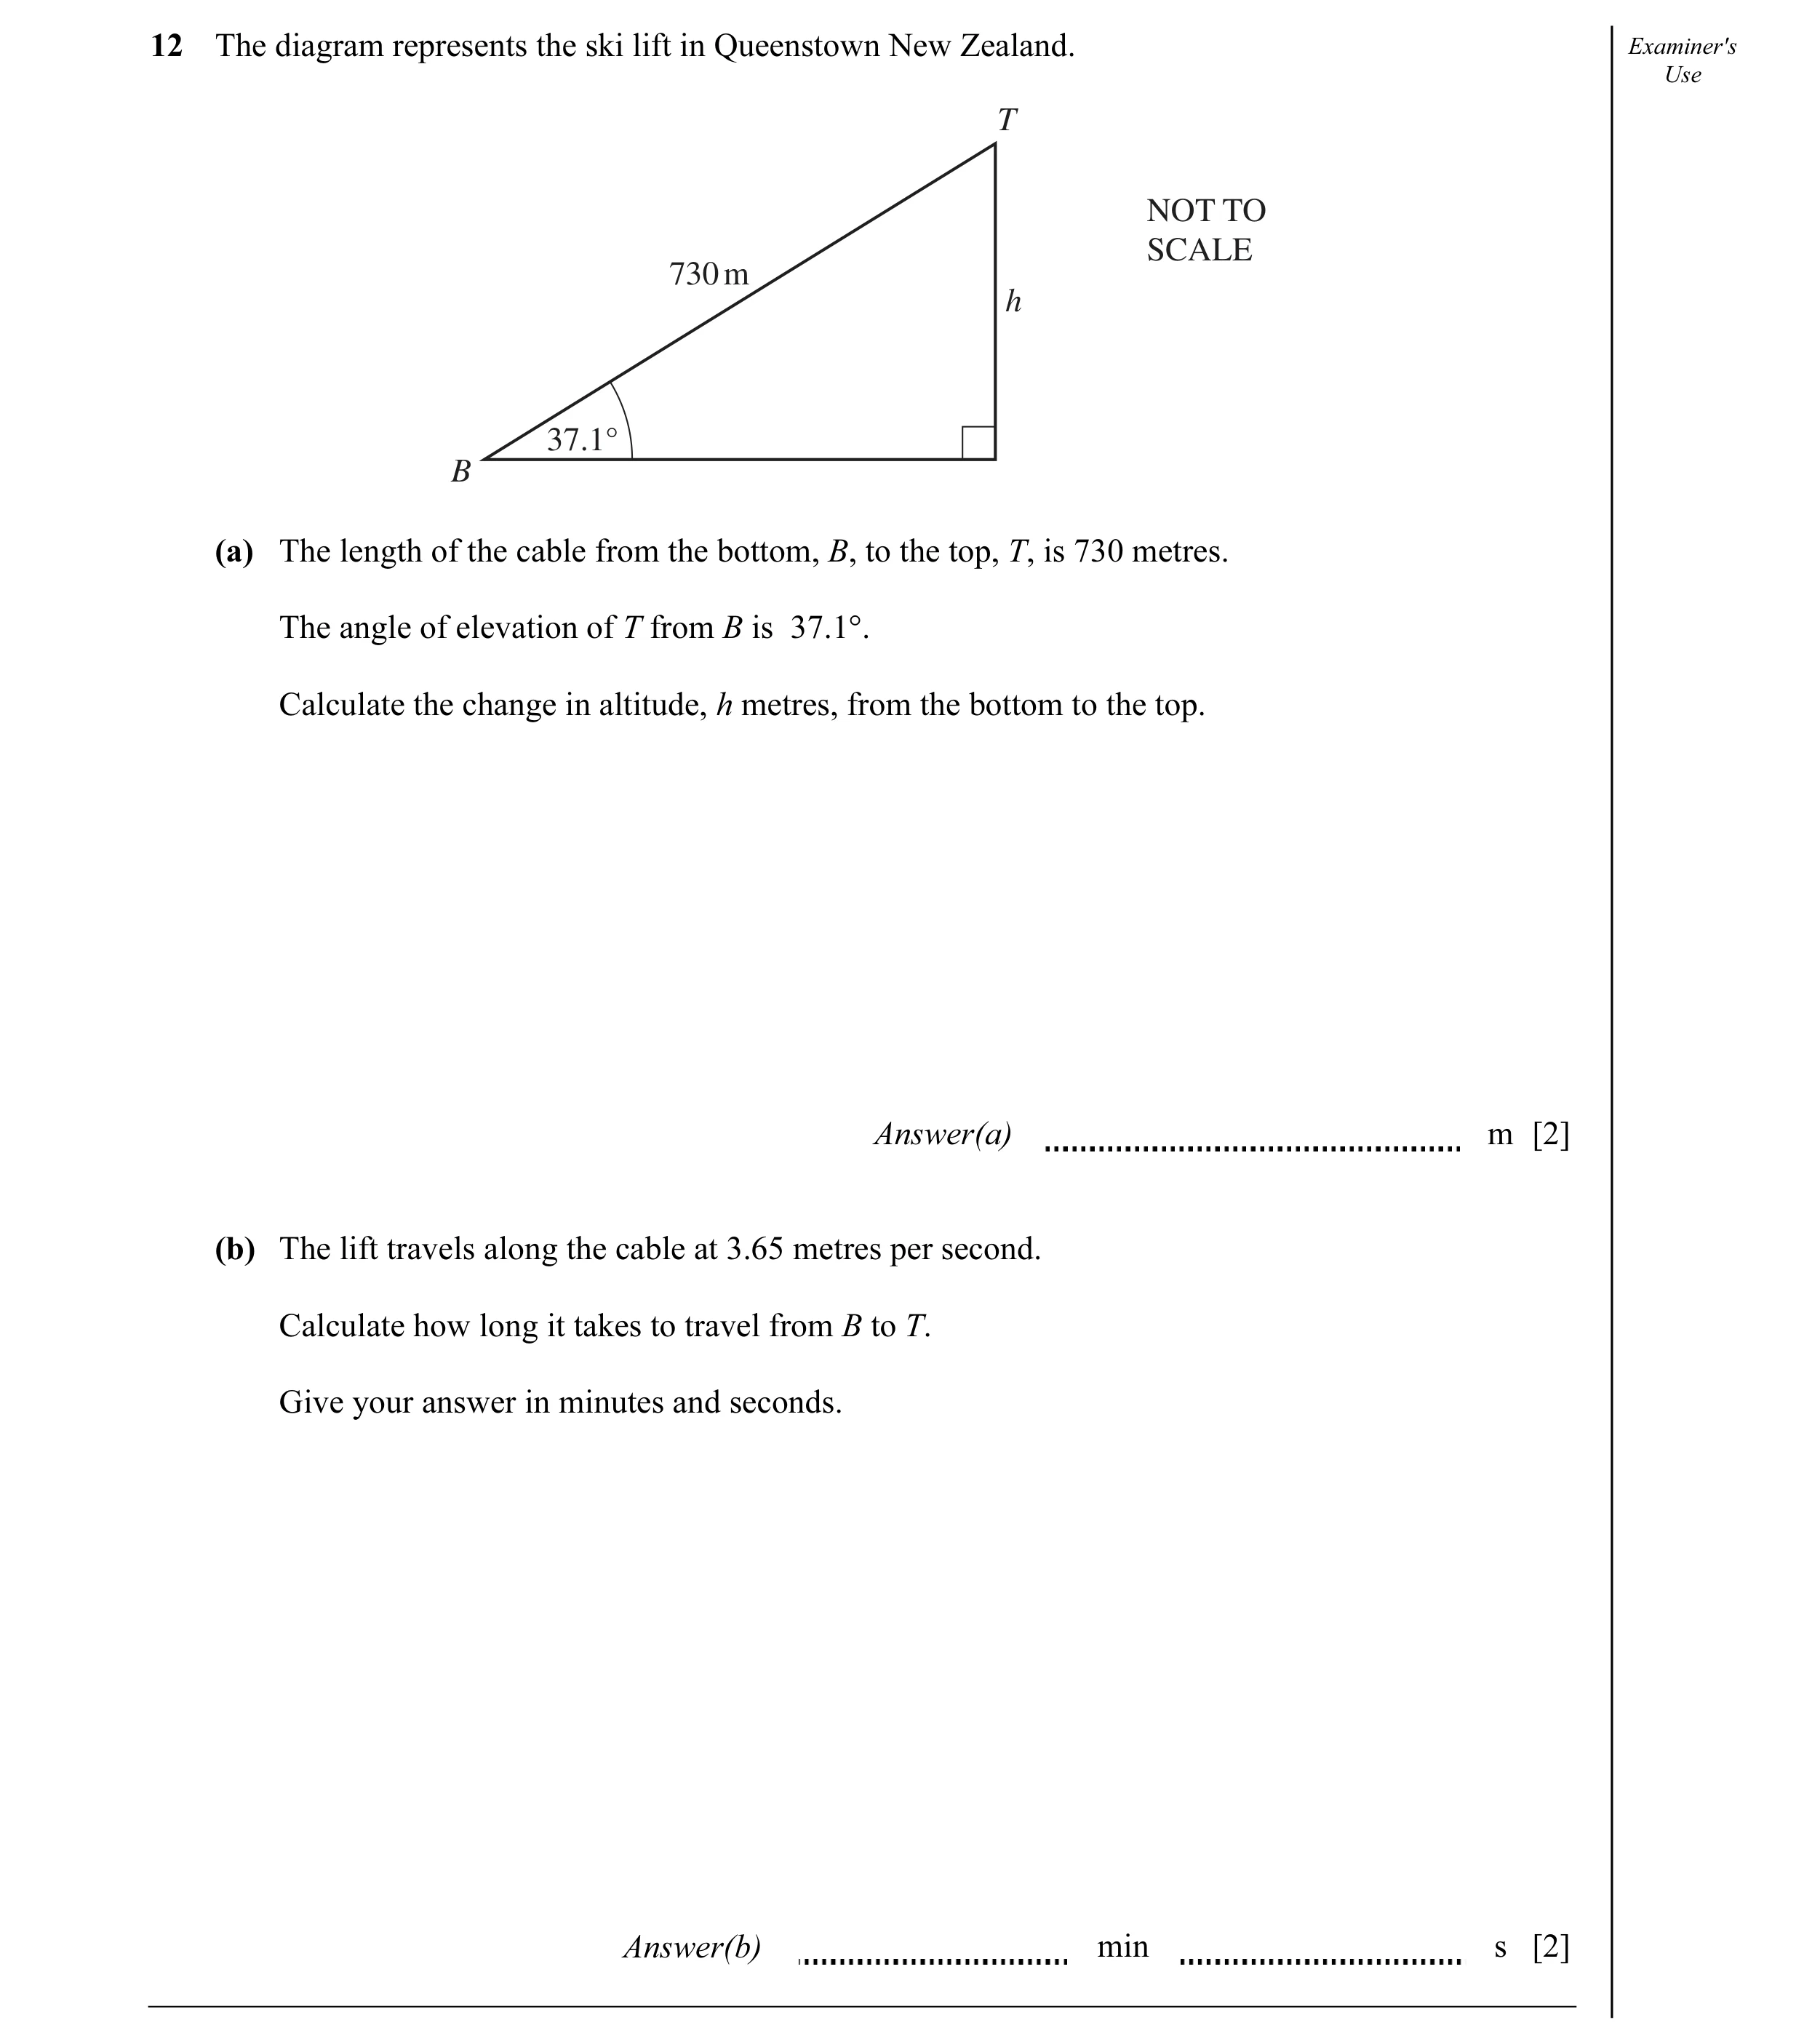
Q7 · The diagram represents the ski lift in Queenstown New Zealand 0580/22 May/June 2010
12 The diagram represents the ski lift in Queenstown New Zealand. Examiner's Use T NOT TO SCALE 730 m h 37.1° B (a) The length of the cable from the bottom, B, to the top, T, is 730 metres. The angle of elevation of T from B is 37.1°. Calculate the change in altitude, h metres, from the bottom to the top. Answer(a) m [2] (b) The lift travels along the cable at 3.65 metres per second. Calculate how long it takes to travel from B to T. Give your answer in minutes and seconds. Answer(b) min s [2]
4 marks
Mark scheme: h 12 (a) 440 2 M1 sin 37.1 or cos 52.9 = oe 730 730 (b) 3 min 20 sec 2 M1 .365 6x 3 6x 3
This question in 0580/22 May/June 2010
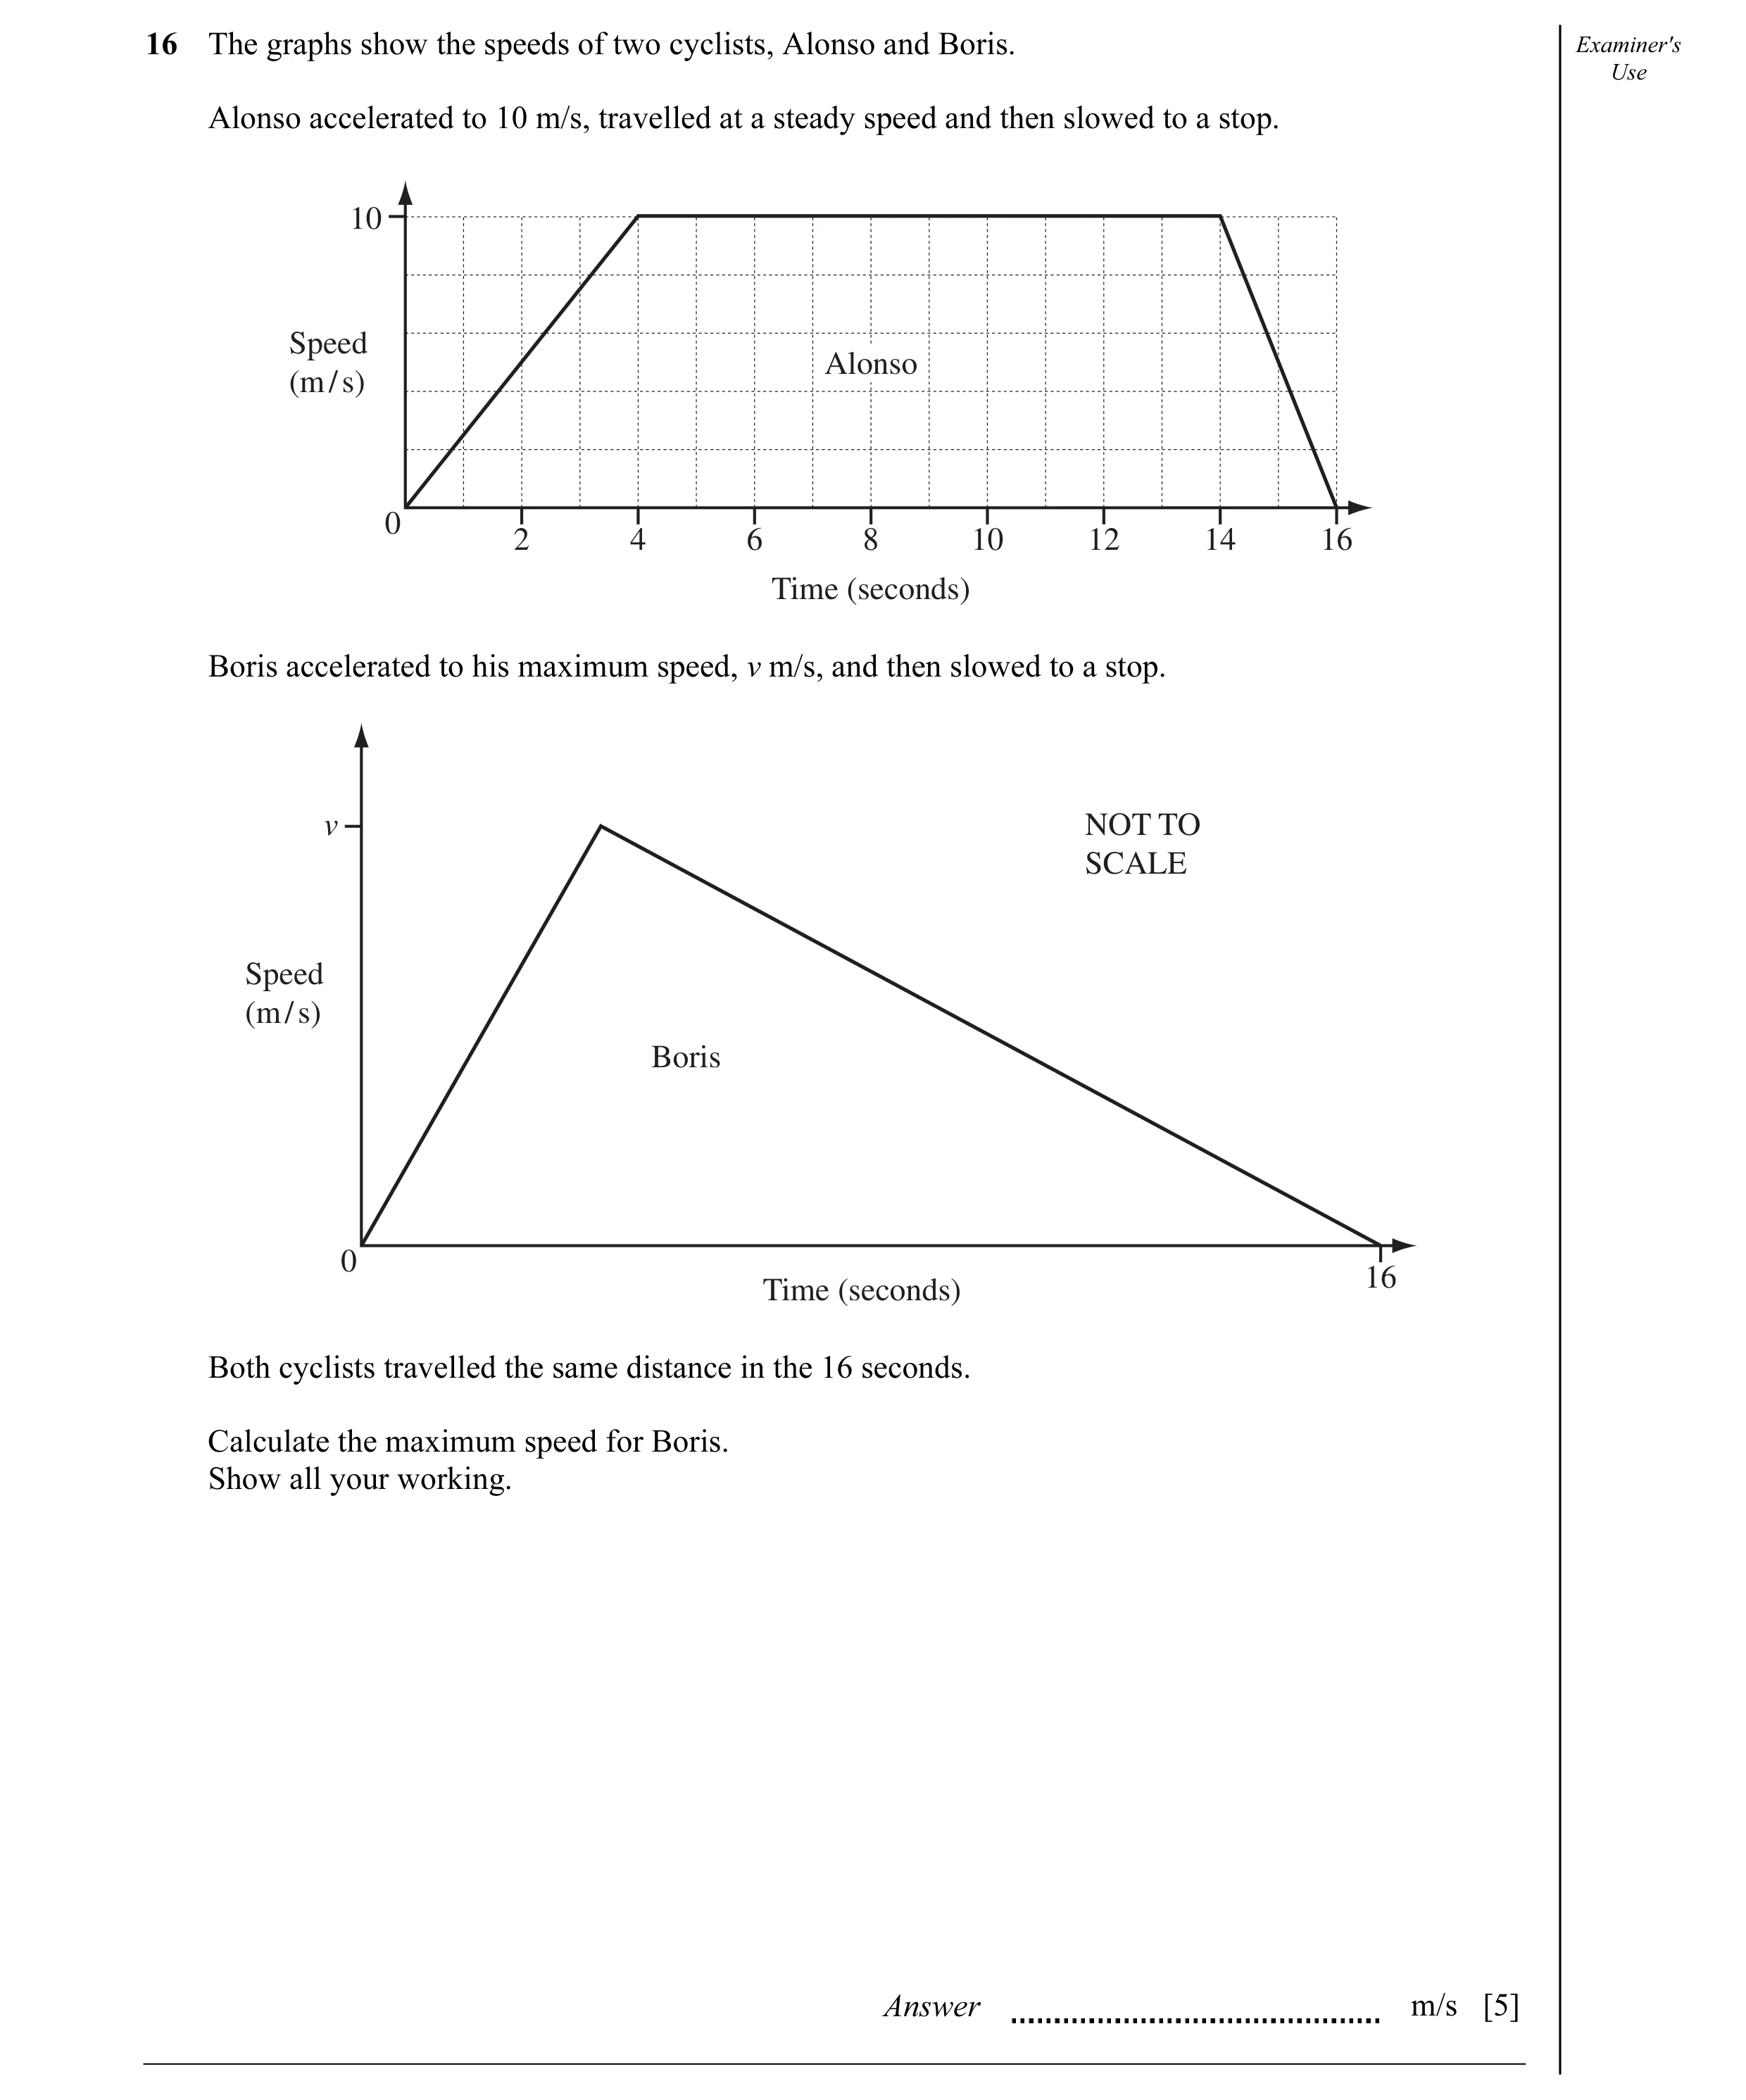
Q8 · The graphs show the speeds of two cyclists, Alonso and Boris 0580/22 May/June 2010
16 The graphs show the speeds of two cyclists, Alonso and Boris. Examiner's Use Alonso accelerated to 10 m/s, travelled at a steady speed and then slowed to a stop. 10 Speed Alonso (m / s) 0 2 4 6 8 10 12 14 16 Time (seconds) Boris accelerated to his maximum speed, v m/s, and then slowed to a stop. v NOT TO SCALE Speed (m / s) Boris 0 16 Time (seconds) Both cyclists travelled the same distance in the 16 seconds. Calculate the maximum speed for Boris. Show all your working. Answer m/s [5]
5 marks
Mark scheme: 1 16 16 or 16.3 5 M1 finding the area under graph A1 130 4 1 M1 × 16 × v 2 M1 equating and solving
This question in 0580/22 May/June 2010
Q9 · The maximum speed of a car is 252 km/h 0580/23 May/June 2010
4 The maximum speed of a car is 252 km/h. Change this speed into metres per second. Answer m/s [2]
2 marks
Mark scheme: 4 70 2 M1 for 252 × 1000 ÷ 60 ÷ 60 oe
This question in 0580/23 May/June 2010
Q10 · V 3 NOT TO SCALE Speed (m / s) t 0 4 15 Time (seconds) The diagram shows the speed-time… 0580/23 May/June 2010
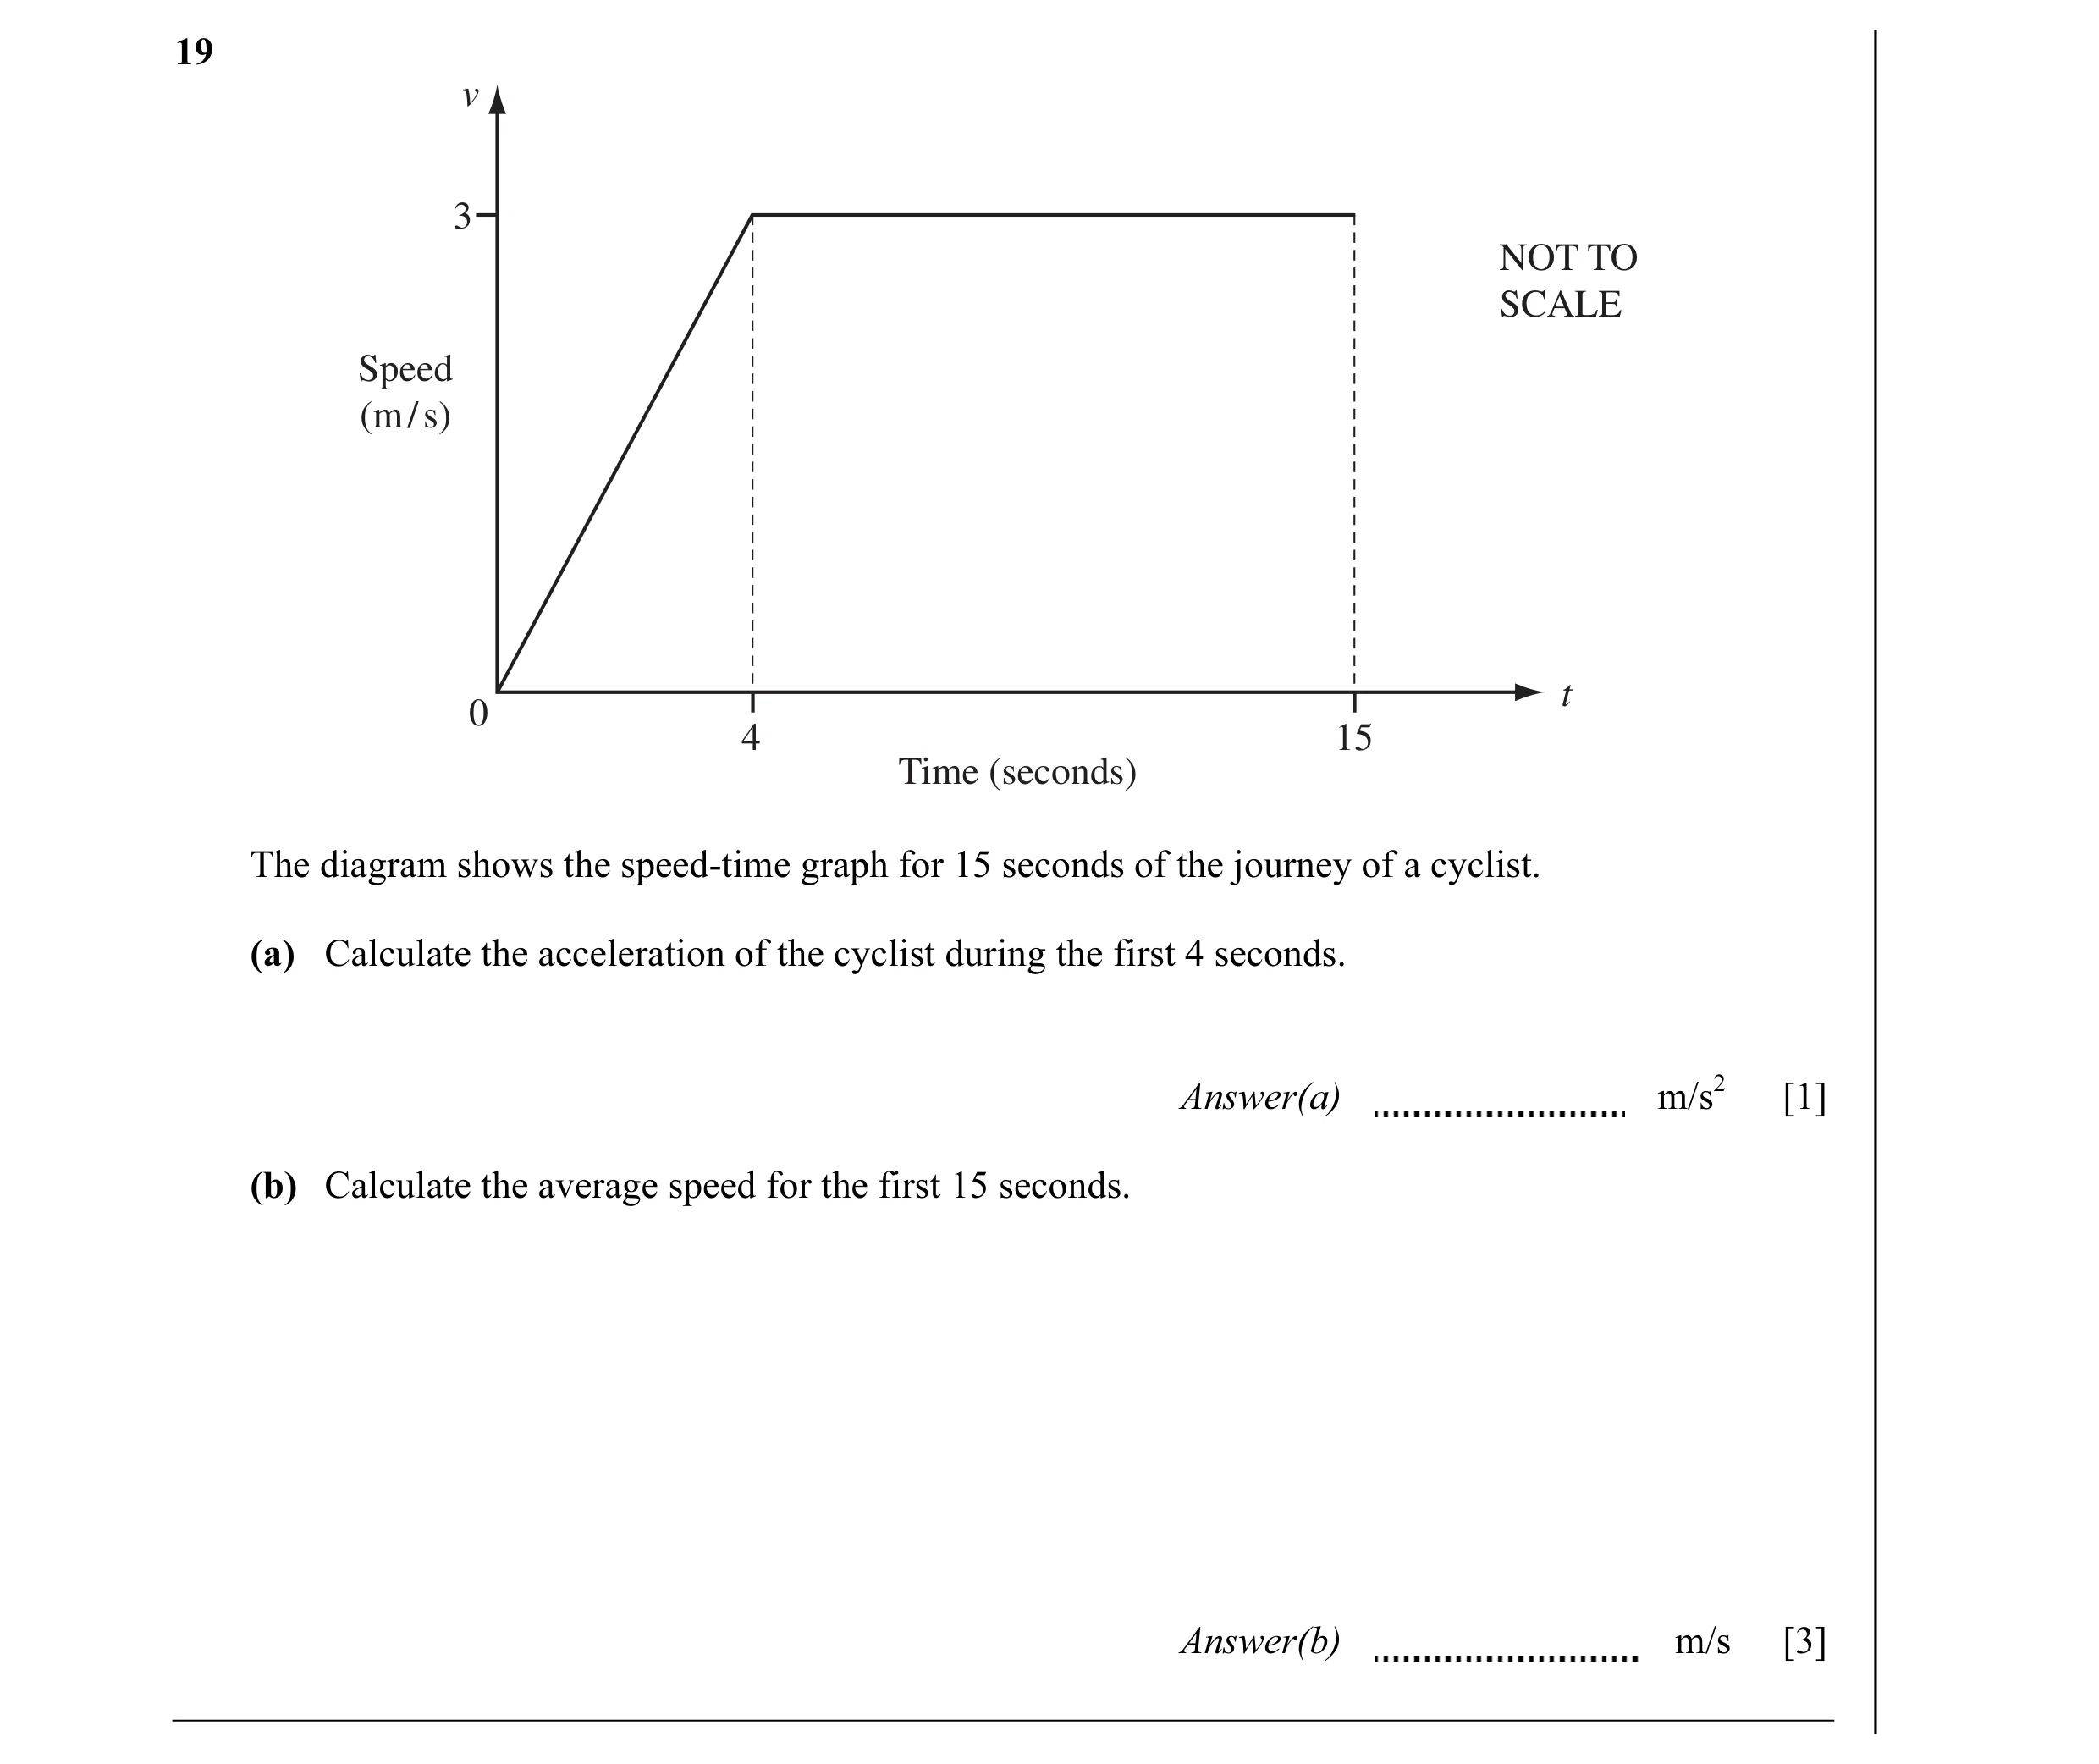
19 v 3 NOT TO SCALE Speed (m / s) t 0 4 15 Time (seconds) The diagram shows the speed-time graph for 15 seconds of the journey of a cyclist. (a) Calculate the acceleration of the cyclist during the first 4 seconds. Answer(a) m/s2 [1] (b) Calculate the average speed for the first 15 seconds. Answer(b) m/s [3]
4 marks
Mark scheme: 3 19 (a) or 0.75 1 4 (b) 2.6 3 M1 for finding the area under the graph or M1 for their 39 ÷ 15
This question in 0580/23 May/June 2010
Q11 · For 60 Examiner's Use 50 40 Speed 30 (m / s) 20 10 t 0 5 10 15 20 25 30 35 Time (seconds)… 0580/21 Oct/Nov 2010
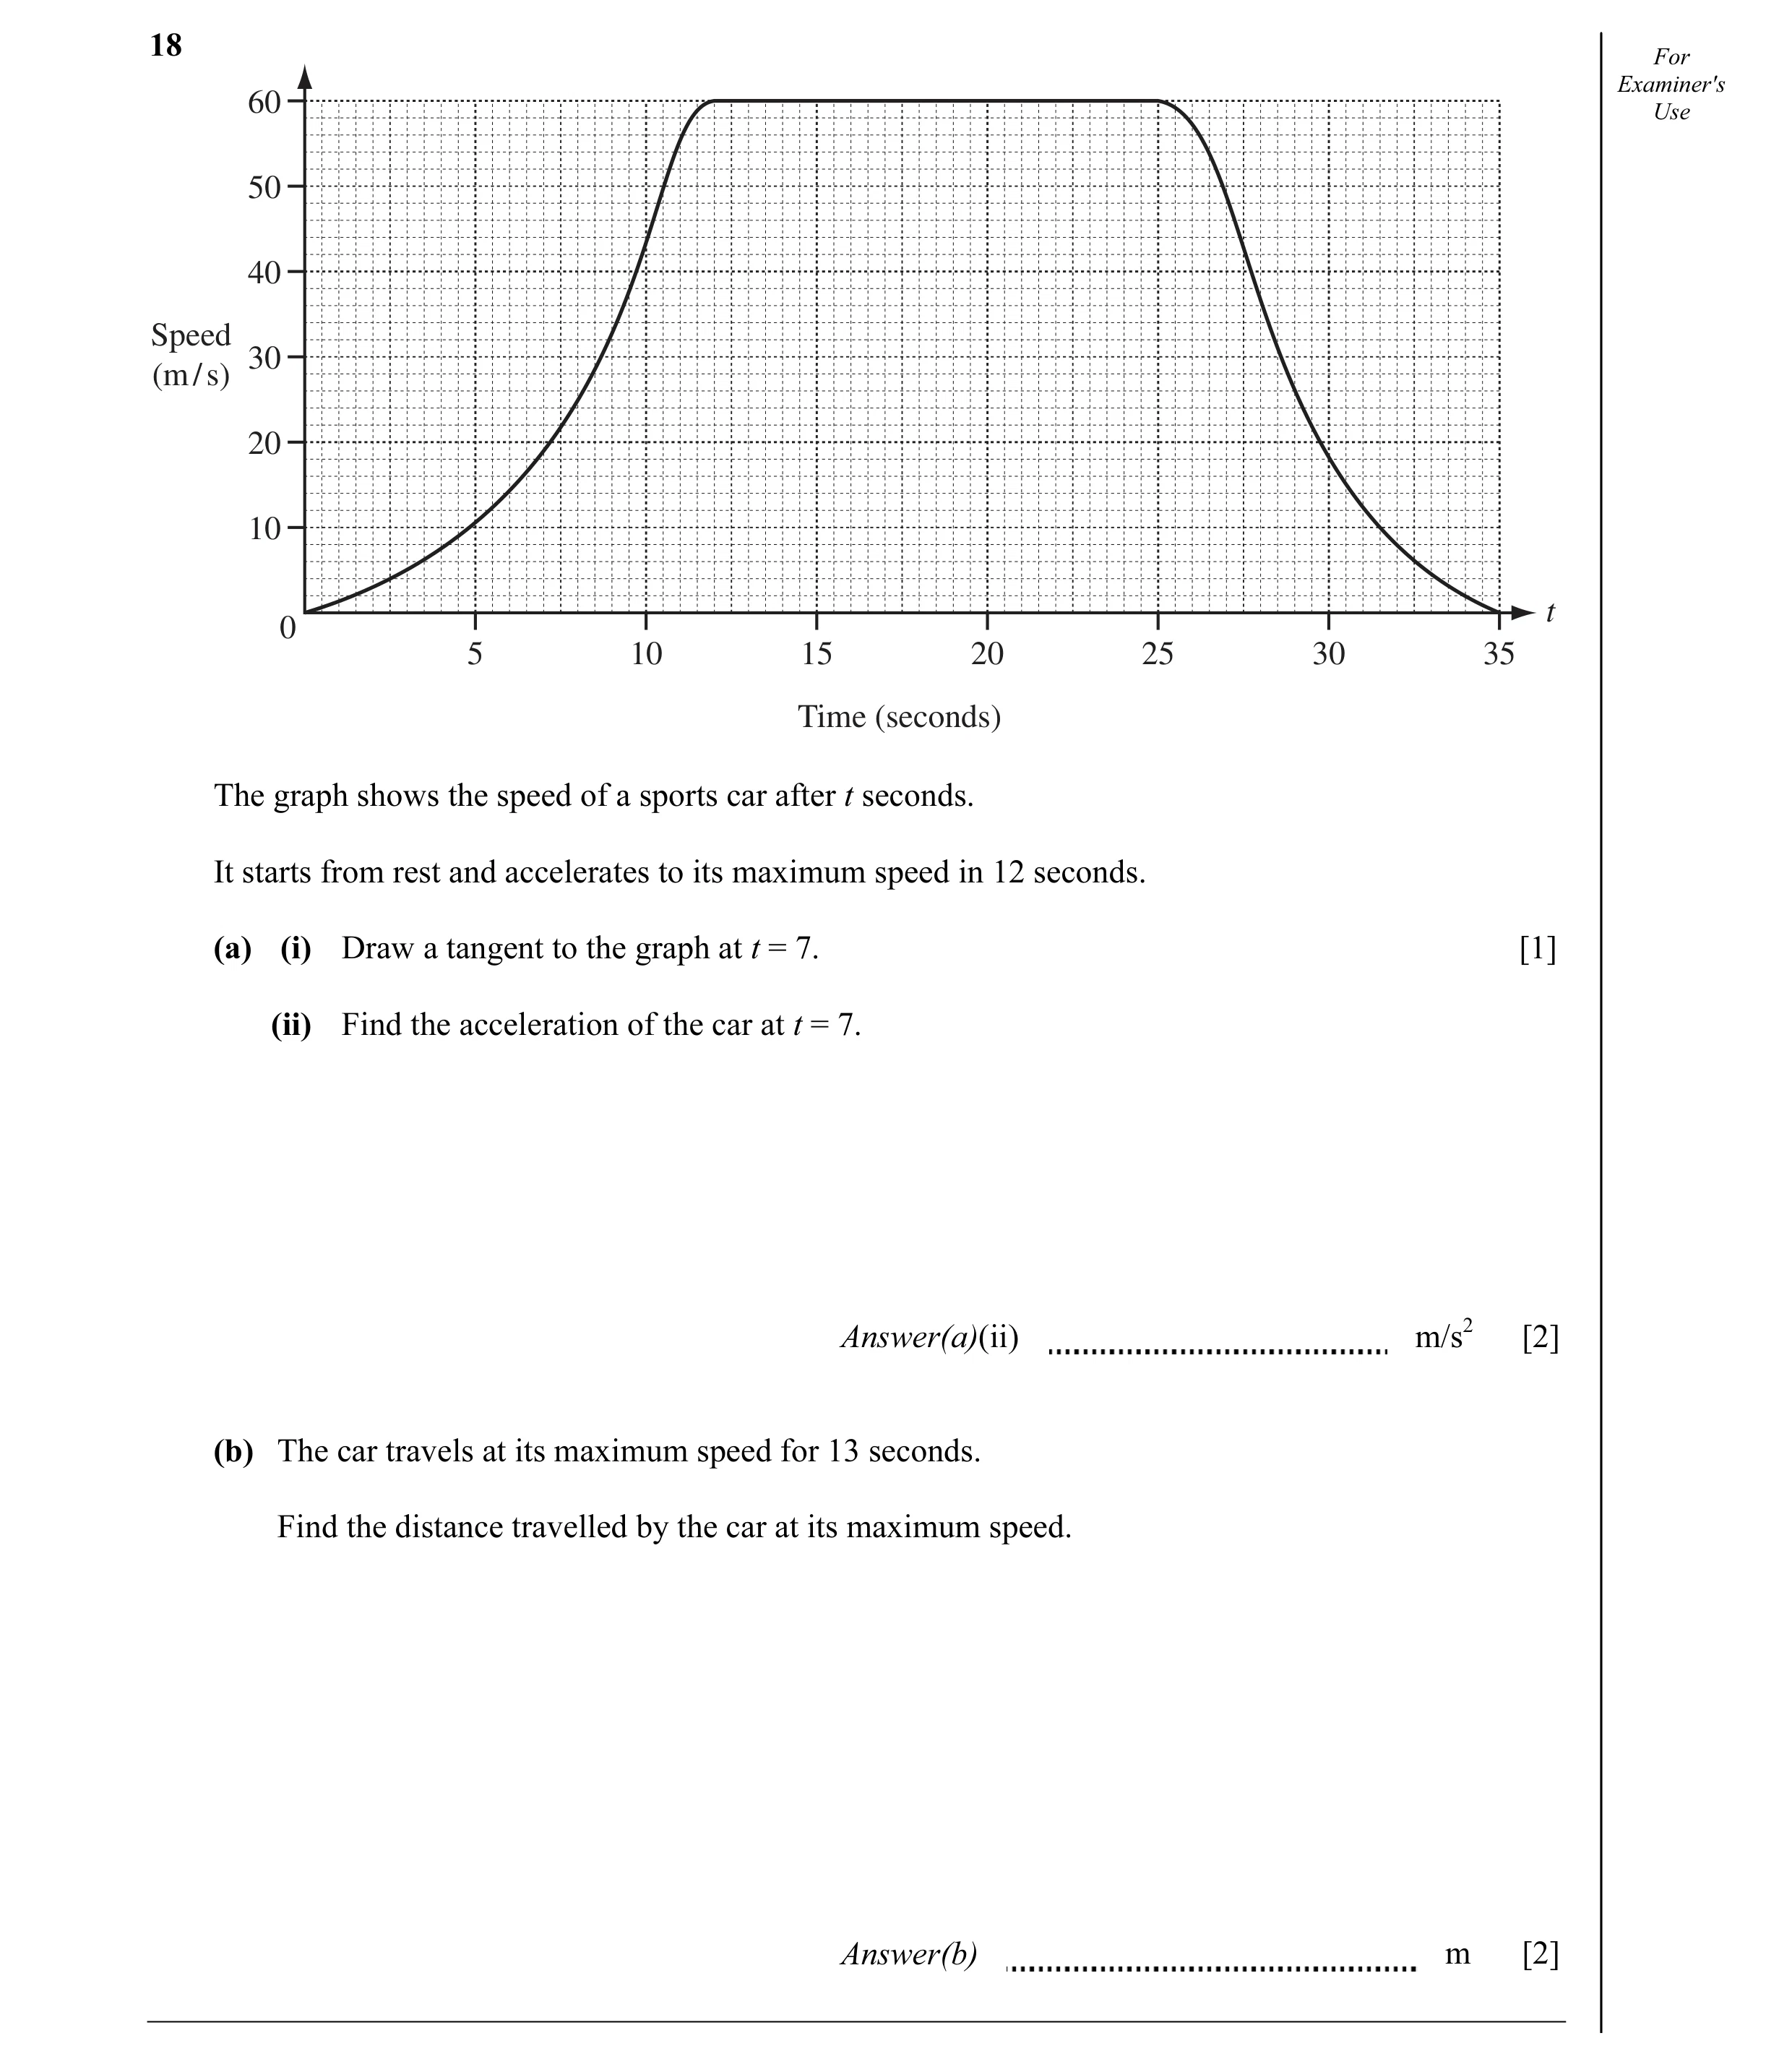
18 For 60 Examiner's Use 50 40 Speed 30 (m / s) 20 10 t 0 5 10 15 20 25 30 35 Time (seconds) The graph shows the speed of a sports car after t seconds. It starts from rest and accelerates to its maximum speed in 12 seconds. (a) (i) Draw a tangent to the graph at t = 7. [1] (ii) Find the acceleration of the car at t = 7. Answer(a)(ii) m/s2 [2] (b) The car travels at its maximum speed for 13 seconds. Find the distance travelled by the car at its maximum speed. Answer(b) m [2]
5 marks
Mark scheme: 18 (a) (i) Tangent 1 Correct tangent drawn (ii) 4.4 to 6 2 dep M1 attempting to find gradient of their tangent (b) 780 2 M1 evidence of finding the area under the graph ONLY from t = 12 to t = 25
This question in 0580/21 Oct/Nov 2010
Q12 · Reina went on holiday to New Zealand 0580/21 Oct/Nov 2010
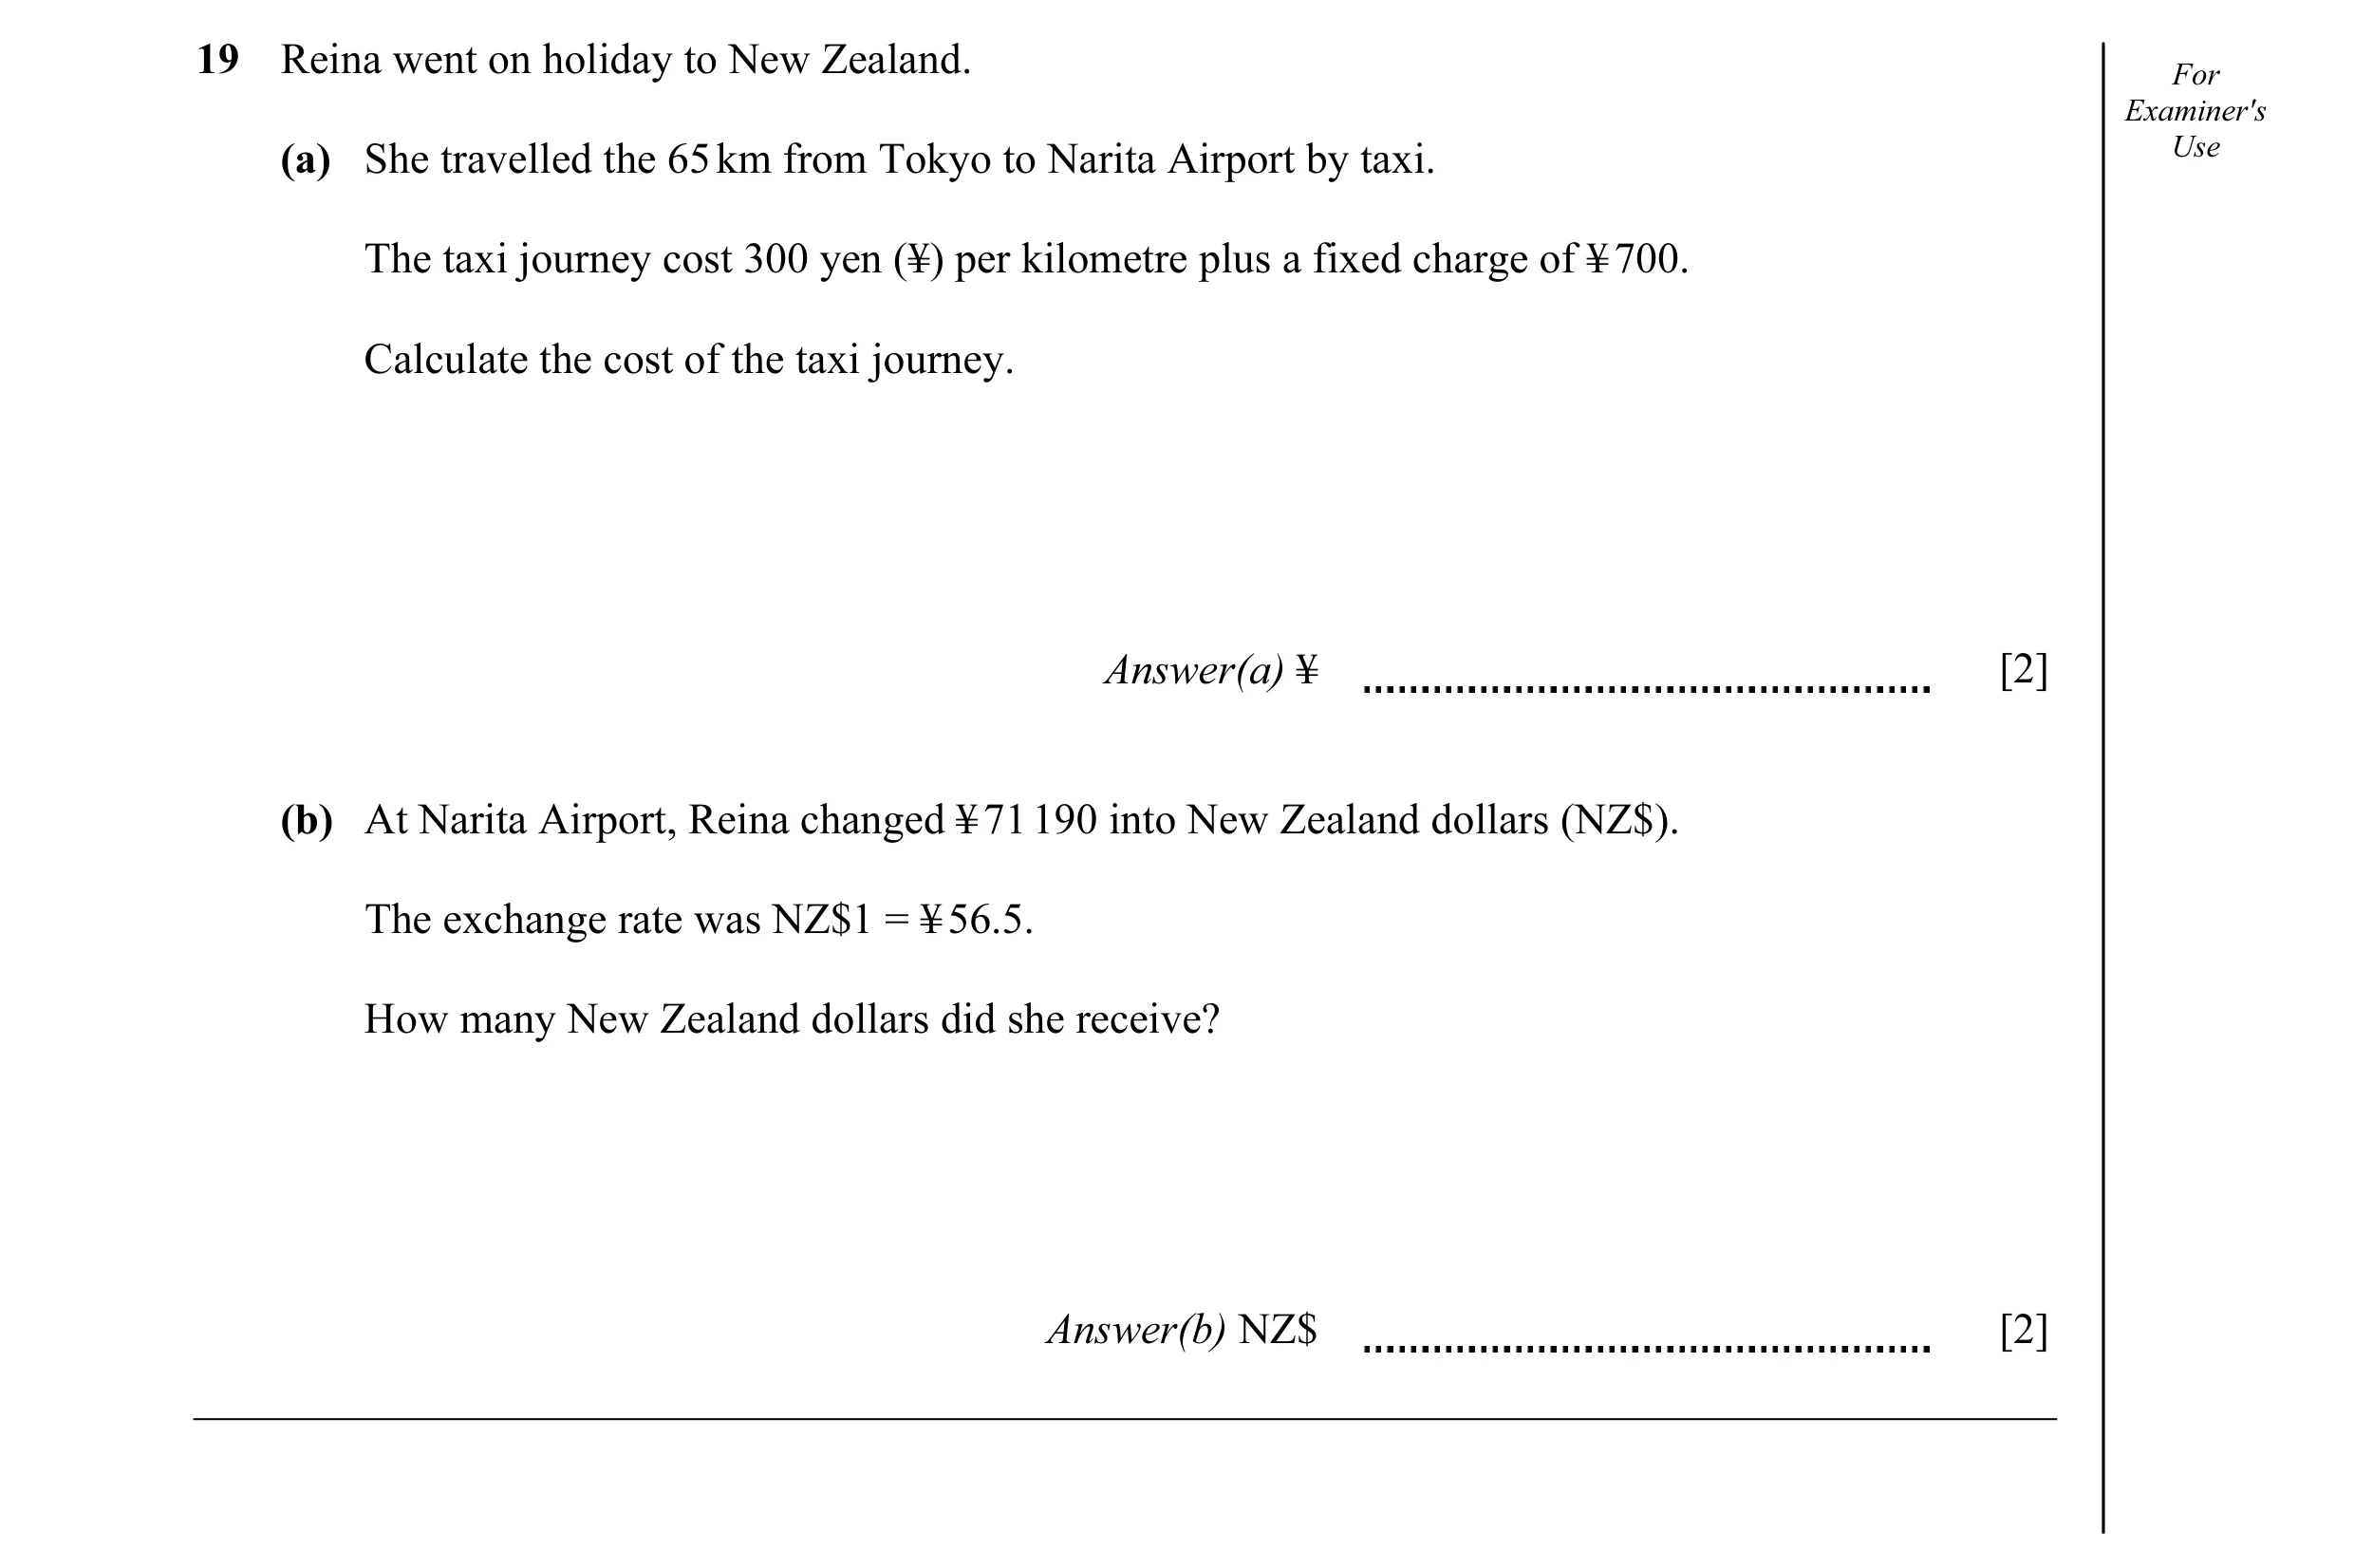
19 Reina went on holiday to New Zealand. For Examiner's (a) She travelled the 65 km from Tokyo to Narita Airport by taxi. Use The taxi journey cost 300 yen (¥) per kilometre plus a fixed charge of ¥ 700. Calculate the cost of the taxi journey. Answer(a) ¥ [2] (b) At Narita Airport, Reina changed ¥ 71 190 into New Zealand dollars (NZ$). The exchange rate was NZ$1 = ¥ 56.5. How many New Zealand dollars did she receive? Answer(b) NZ$ [2]
4 marks
Mark scheme: 19 (a) 20200 2 M1 65 × 300 + 700 (b) 1260 2 M1 71190 / 56.5 8 ± k
This question in 0580/21 Oct/Nov 2010
Q13 · An animal starts from rest and accelerates to its top speed in 7 seconds 0580/22 Oct/Nov 2010
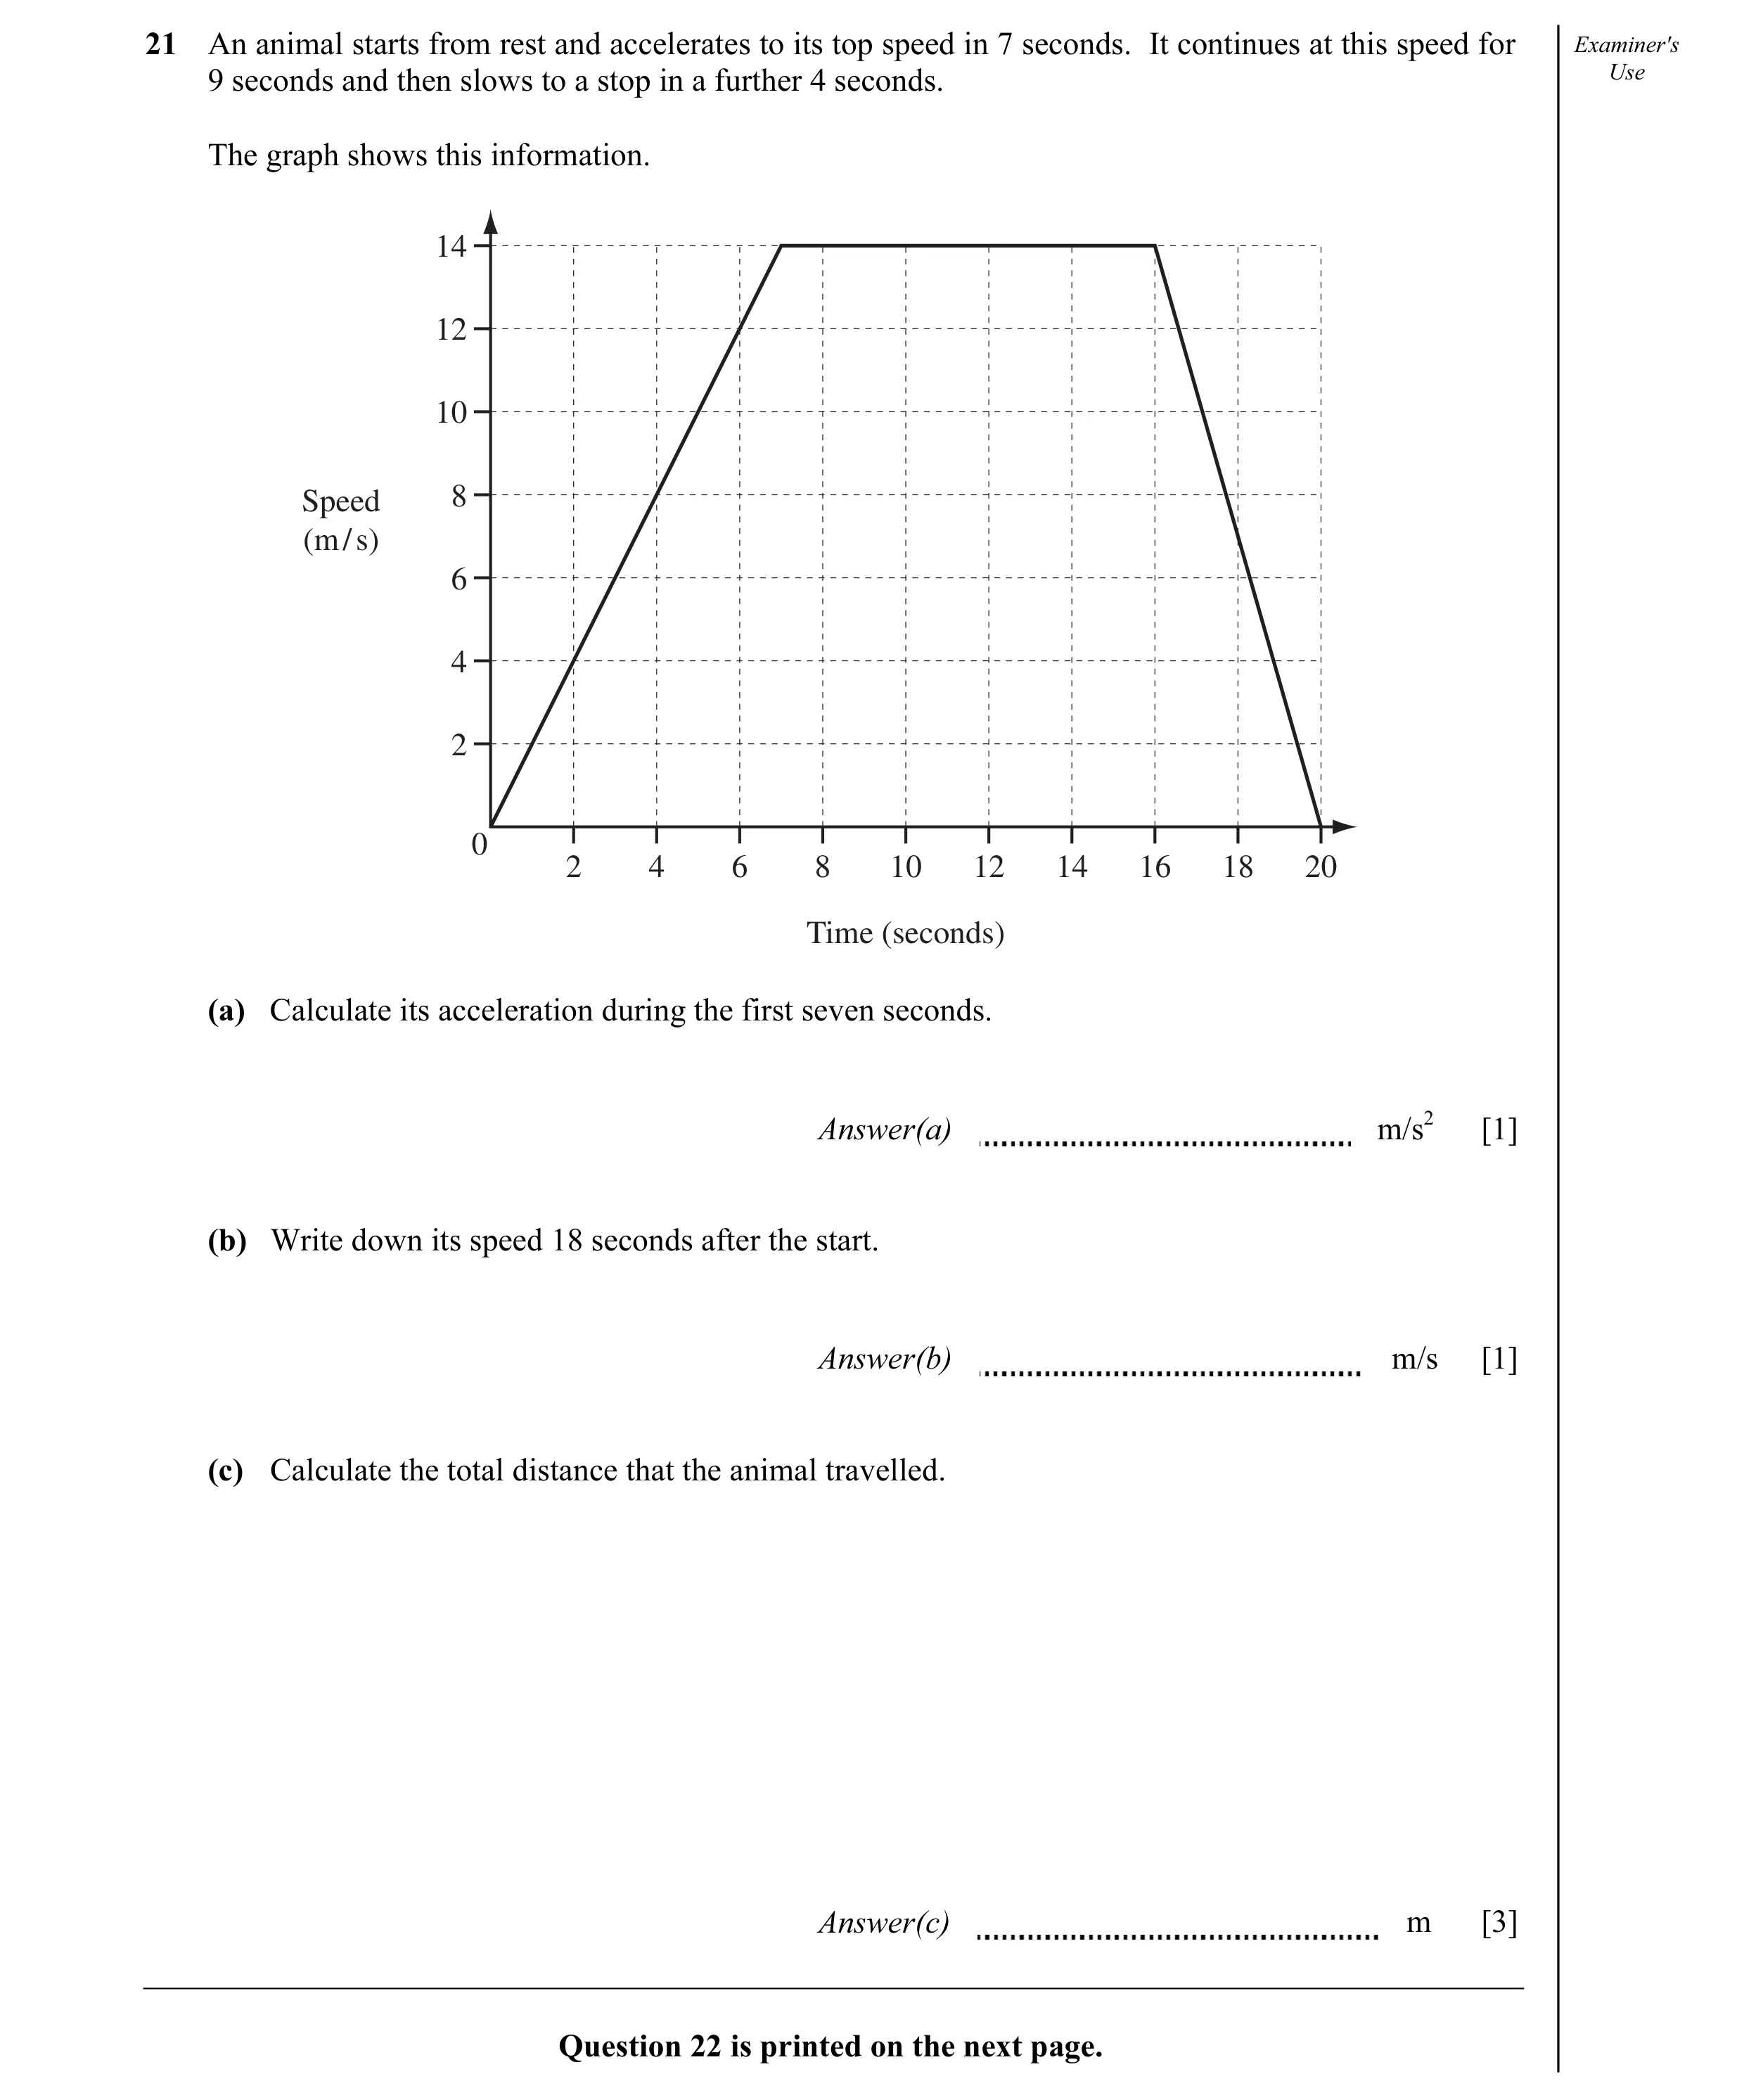
21 An animal starts from rest and accelerates to its top speed in 7 seconds. It continues at this speed for Examiner's 9 seconds and then slows to a stop in a further 4 seconds. Use The graph shows this information. 14 12 10 Speed 8 (m / s) 6 4 2 0 2 4 6 8 10 12 14 16 18 20 Time (seconds) (a) Calculate its acceleration during the first seven seconds. Answer(a) m/s2 [1] (b) Write down its speed 18 seconds after the start. Answer(b) m/s [1] (c) Calculate the total distance that the animal travelled. Answer(c) m [3] Question 22 is printed on the next page.
5 marks
Mark scheme: 21 (a) 2 1 (b) 6.7 to 7.3 1 (c) 203 3 M1 intention to find area under the graph 1 1 M1 × 7 × 14 + 9 × 14 + × 4 × 14 oe 2 2
This question in 0580/22 Oct/Nov 2010
Q14 · In France, the cost of one kilogram of apricots is €3.38 0580/23 Oct/Nov 2010
7 In France, the cost of one kilogram of apricots is €3.38 . In the UK, the cost of one kilogram of apricots is £4.39 . £1 = €1.04 . Calculate the difference between these prices. Give your answer in pounds (£). Answer £ [2]
2 marks
Mark scheme: 7 1.14 2 M1 3.38 ÷ 1.04 (= 3.25) or M1 4.39 × 1.04
This question in 0580/23 Oct/Nov 2010
Q15 · Priyantha completes a 10 km run in 55 minutes 20 seconds 0580/23 Oct/Nov 2010
14 Priyantha completes a 10 km run in 55 minutes 20 seconds. Calculate Priyantha’s average speed in km/h. Answer km/h [3]
3 marks
Mark scheme: 70 14 10.8 or 10 3 M1 figs 10 ÷ time 83 M1 10 ÷ 0.92r, 0.922 or 83/90 8 − 2
This question in 0580/23 Oct/Nov 2010
Q16 · For 20 Examiner's Use 18 16 14 12 Speed 10 (m / s) 8 6 4 2 0 10 20 30 40 Time (seconds)… 0580/23 Oct/Nov 2010
21 For 20 Examiner's Use 18 16 14 12 Speed 10 (m / s) 8 6 4 2 0 10 20 30 40 Time (seconds) The graph shows 40 seconds of a car journey. The car travelled at a constant speed of 20 m/s, decelerated to 8 m/s then accelerated back to 20 m/s. Calculate (a) the deceleration of the car, Answer(a) m/s2 [1] (b) the total distance travelled by the car during the 40 seconds. Answer(b) m [3]
4 marks
Mark scheme: 21 (a) 2.4 oe 1 (b) 680 3 M1 an area found 1 M1 40 × 20 – × 20 × 12 oe 2
This question in 0580/23 Oct/Nov 2010
Q17 · A hummingbird beats its wings 24 times per second 0580/21 May/June 2011
5 A hummingbird beats its wings 24 times per second. ForFor Examiner'sExaminer's (a) Calculate the number of times the hummingbird beats its wings in one hour. UseUse Answer(a) [1] (b) Write your answer to part (a) in standard form. Answer(b) [1]
2 marks
Mark scheme: ( ) 5 (a) 86400 1 (b) 8.64 × 10⁴ 1ft 3
This question in 0580/21 May/June 2011
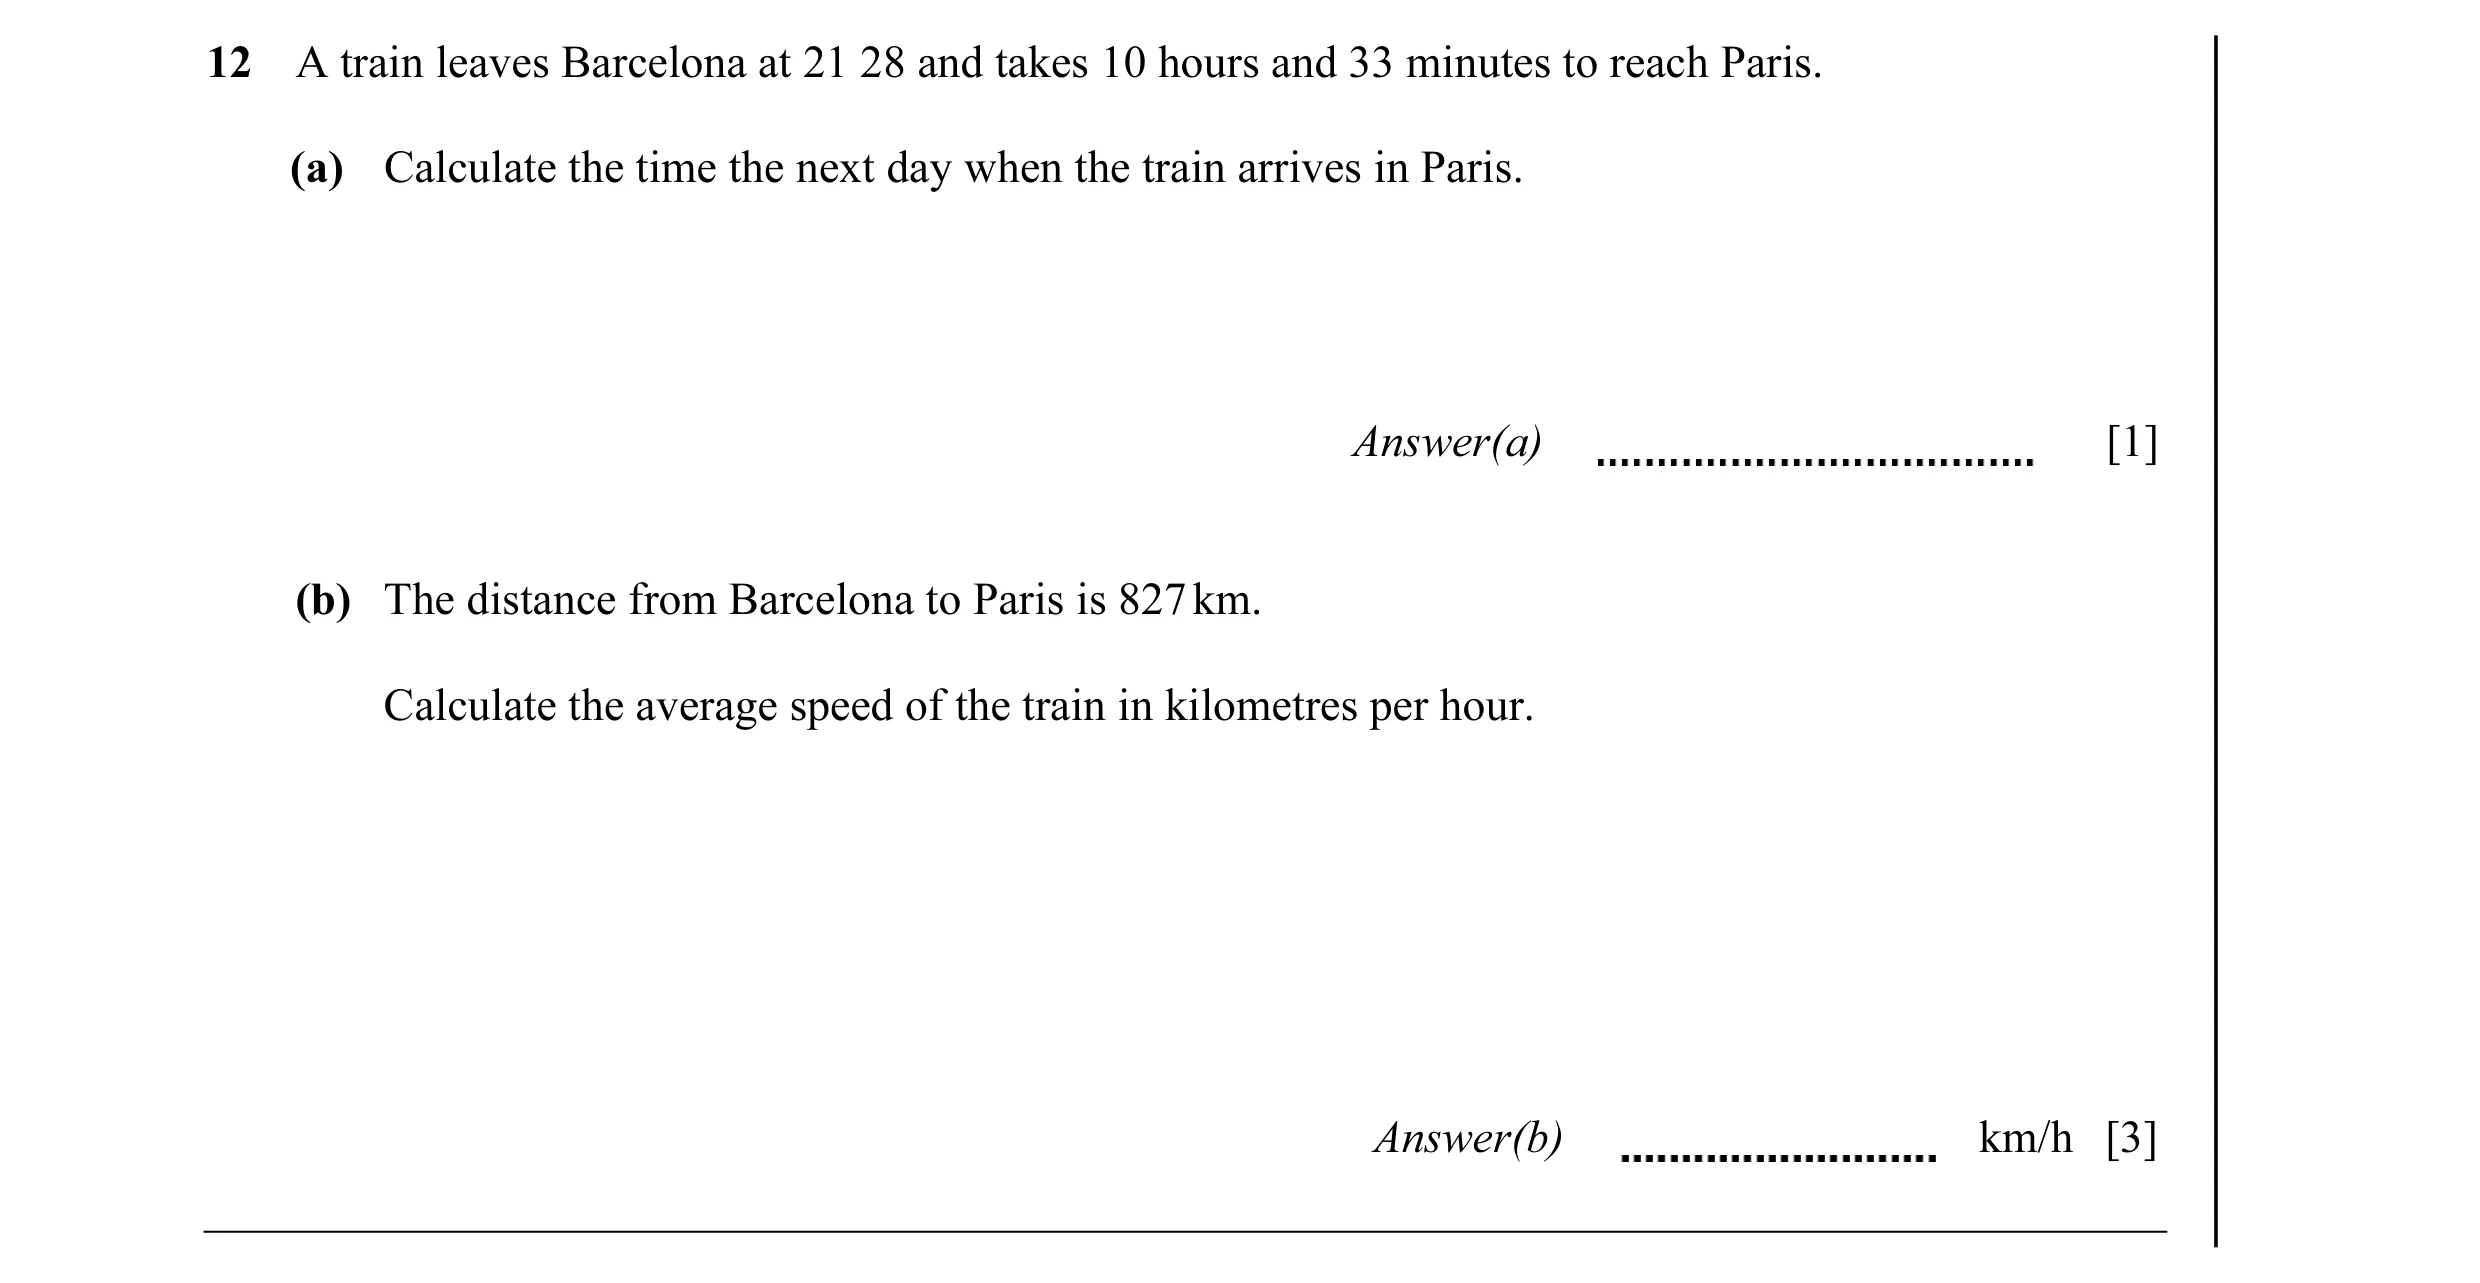
Q18 · A train leaves Barcelona at 21 28 and takes 10 hours and 33 minutes to reach Paris 0580/21 May/June 2011
12 A train leaves Barcelona at 21 28 and takes 10 hours and 33 minutes to reach Paris. (a) Calculate the time the next day when the train arrives in Paris. Answer(a) [1] (b) The distance from Barcelona to Paris is 827 km. Calculate the average speed of the train in kilometres per hour. Answer(b) km/h [3]
4 marks
Mark scheme: ( ) 12 (a) (0)8(.)01 (am) 1 Not 8.01pm (b) 78.4 or 78.38 to 78.39 3 M2 for 827 ÷ 10.55 or M1 for figs 827 ÷ their time 2 7 × 20 000
This question in 0580/21 May/June 2011
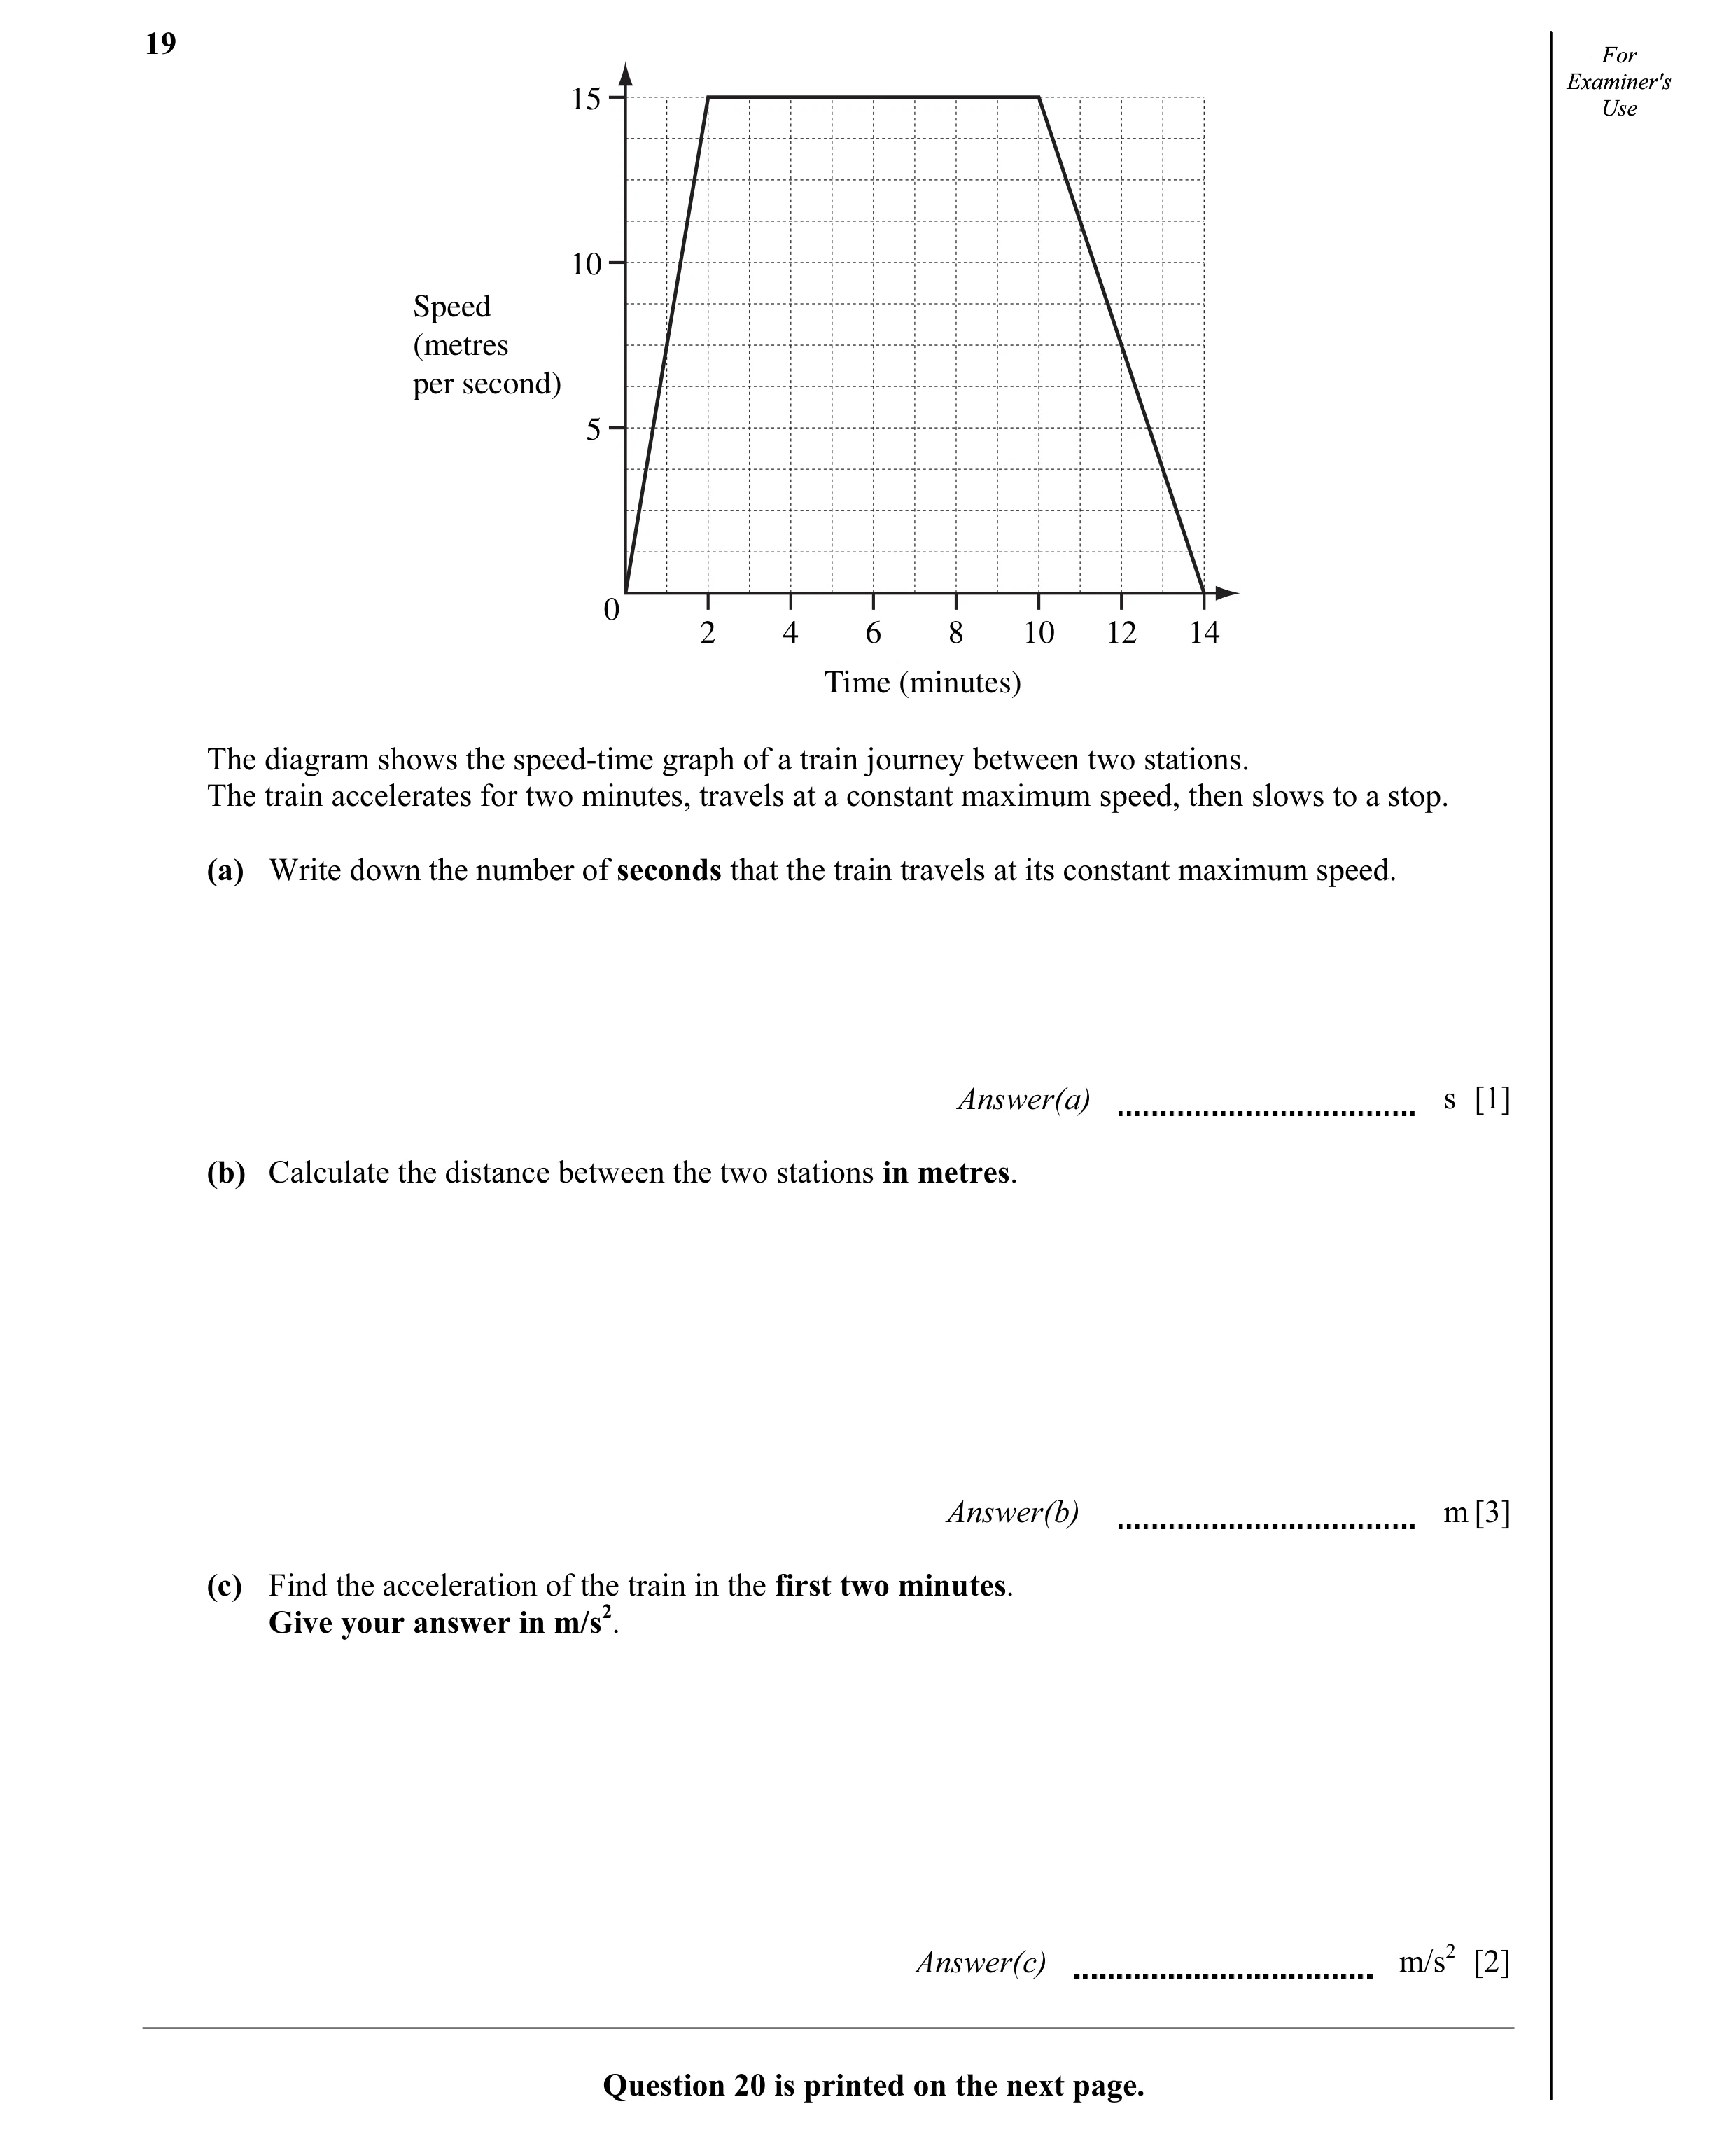
Q19 · ForFor 15 Examiner'sExaminer's UseUse 10 Speed (metres per second) 5 0 2 4 6 8 10 12 14… 0580/21 May/June 2011
19 ForFor 15 Examiner'sExaminer's UseUse 10 Speed (metres per second) 5 0 2 4 6 8 10 12 14 Time (minutes) The diagram shows the speed-time graph of a train journey between two stations. The train accelerates for two minutes, travels at a constant maximum speed, then slows to a stop. (a) Write down the number of seconds that the train travels at its constant maximum speed. Answer(a) s [1] (b) Calculate the distance between the two stations in metres. Answer(b) m [3] (c) Find the acceleration of the train in the first two minutes. Give your answer in m/s2. Answer(c) m/s2 [2] Question 20 is printed on the next page.
6 marks
Mark scheme: p p 19 (a) 480 1 (b) 9900 3 M1 for attempt at area under graph M1 for 0.5 × 15 × (their (a) + 14 × 60) oe or 0.5 × 15 × (8 + 14) oe 1 2 M1 for numerical vertical/horizontal or numerical (c) 0.125 or 8 use of v = u + at but t ≤ 120 or t ≤ 2
This question in 0580/21 May/June 2011
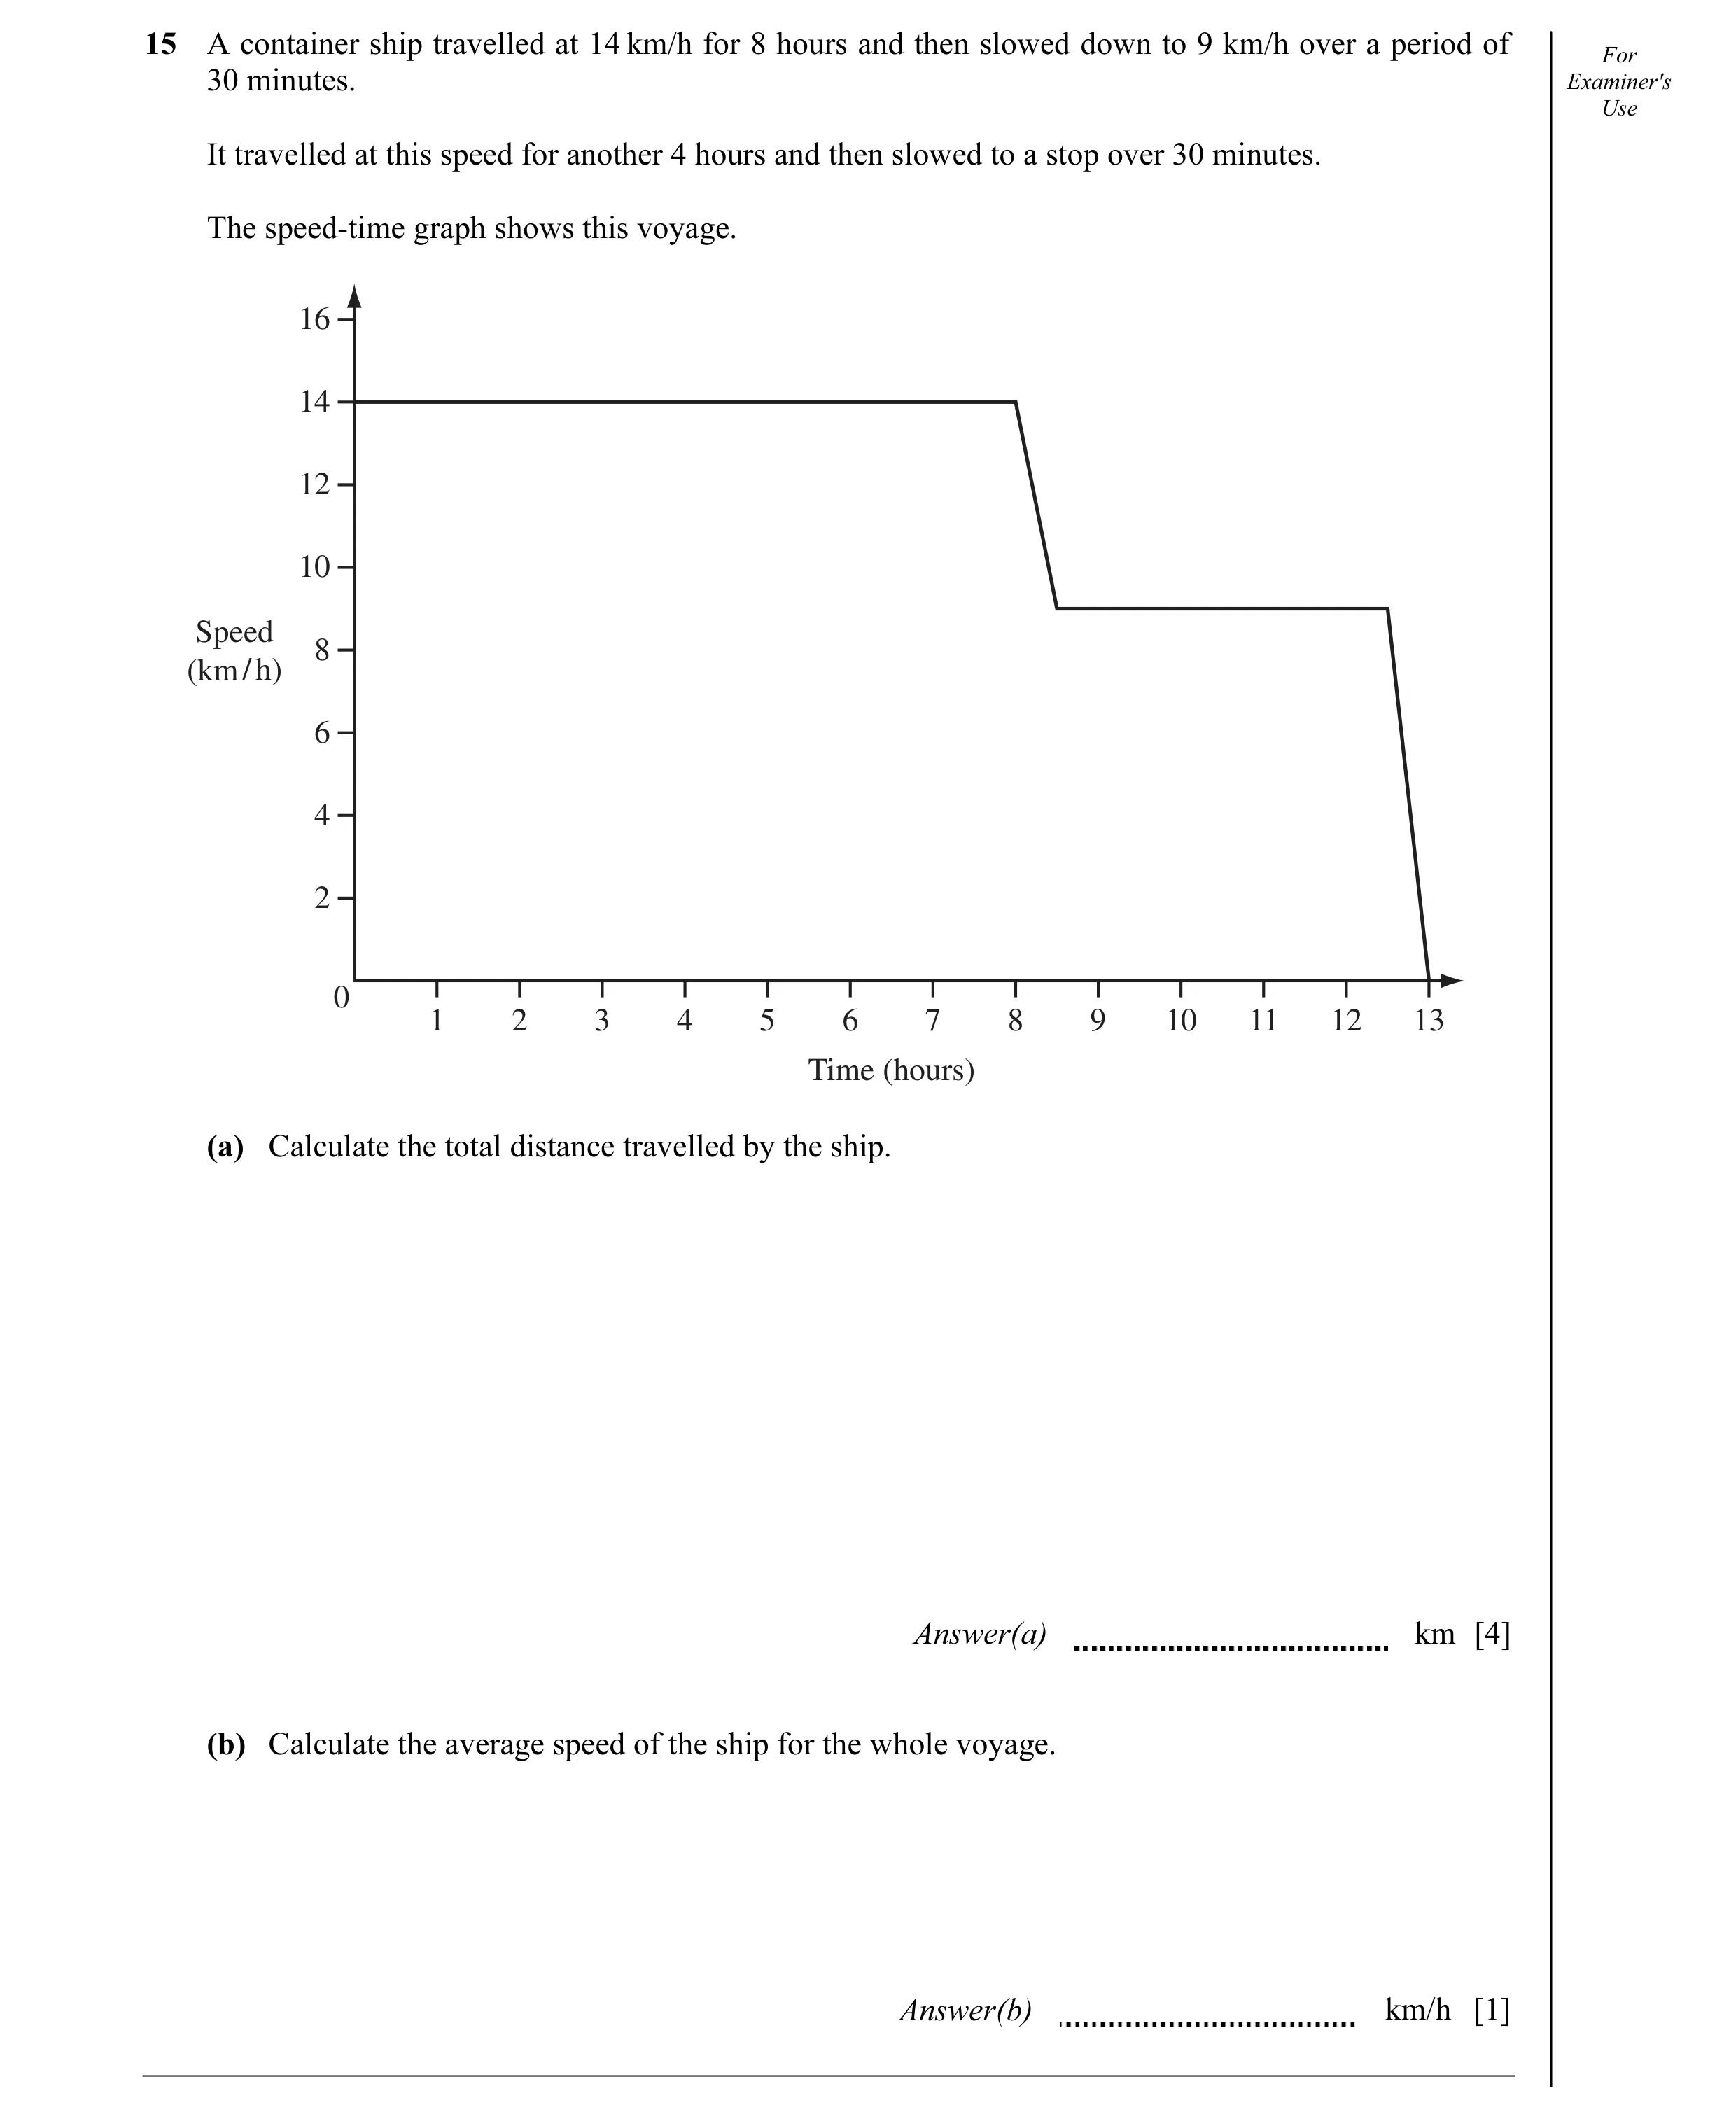
Q20 · A container ship travelled at 14 km/h for 8 hours and then slowed down to 9 km/h over a… 0580/21 Oct/Nov 2011
15 A container ship travelled at 14 km/h for 8 hours and then slowed down to 9 km/h over a period of For 30 minutes. Examiner's Use It travelled at this speed for another 4 hours and then slowed to a stop over 30 minutes. The speed-time graph shows this voyage. 16 14 12 10 Speed 8 (km / h) 6 4 2 0 1 2 3 4 5 6 7 8 9 10 11 12 13 Time (hours) (a) Calculate the total distance travelled by the ship. Answer(a) km [4] (b) Calculate the average speed of the ship for the whole voyage. Answer(b) km/h [1]
5 marks
Mark scheme: 15 (a) 156 4 M1 intention to find area under graph B2 completely correct area statement or B1 two areas found correctly (or one trapezium area) (b) 12 1ft Their (a)/13
This question in 0580/21 Oct/Nov 2011
Q21 · A cruise ship travels at 22 knots 0580/22 Oct/Nov 2011
8 A cruise ship travels at 22 knots. [1 knot is 1.852 kilometres per hour.] Convert this speed into metres per second. Answer m/s [3]
3 marks
Mark scheme: 8 11.3 3 M2 22 × 1.852 × 1000/3600 oe or M1 22 × figs 1852 or 22 × 1000/3600 ( ) ( )
This question in 0580/22 Oct/Nov 2011
Q22 · For Examiner's Use 40 NOT TO Speed SCALE (m / s) 0 5 10 15 Time (minutes) The diagram… 0580/23 Oct/Nov 2011
23 For Examiner's Use 40 NOT TO Speed SCALE (m / s) 0 5 10 15 Time (minutes) The diagram shows the speed-time graph for the first 15 minutes of a train journey. The train accelerates for 5 minutes and then continues at a constant speed of 40 metres/second. (a) Calculate the acceleration of the train during the first 5 minutes. Give your answer in m/s2. Answer(a) m/s2 [2] (b) Calculate the average speed for the first 15 minutes of the train journey. Give your answer in m/s. Answer(b) m/s [3]
5 marks
Mark scheme: 2 23 (a) 0.133 (3…) or 2 M1 for 40 ÷ 300 seen 15 1 (b) 33 or 33.3 3 M1 for area under graph attempted 3 M1 for correct total area statement
This question in 0580/23 Oct/Nov 2011
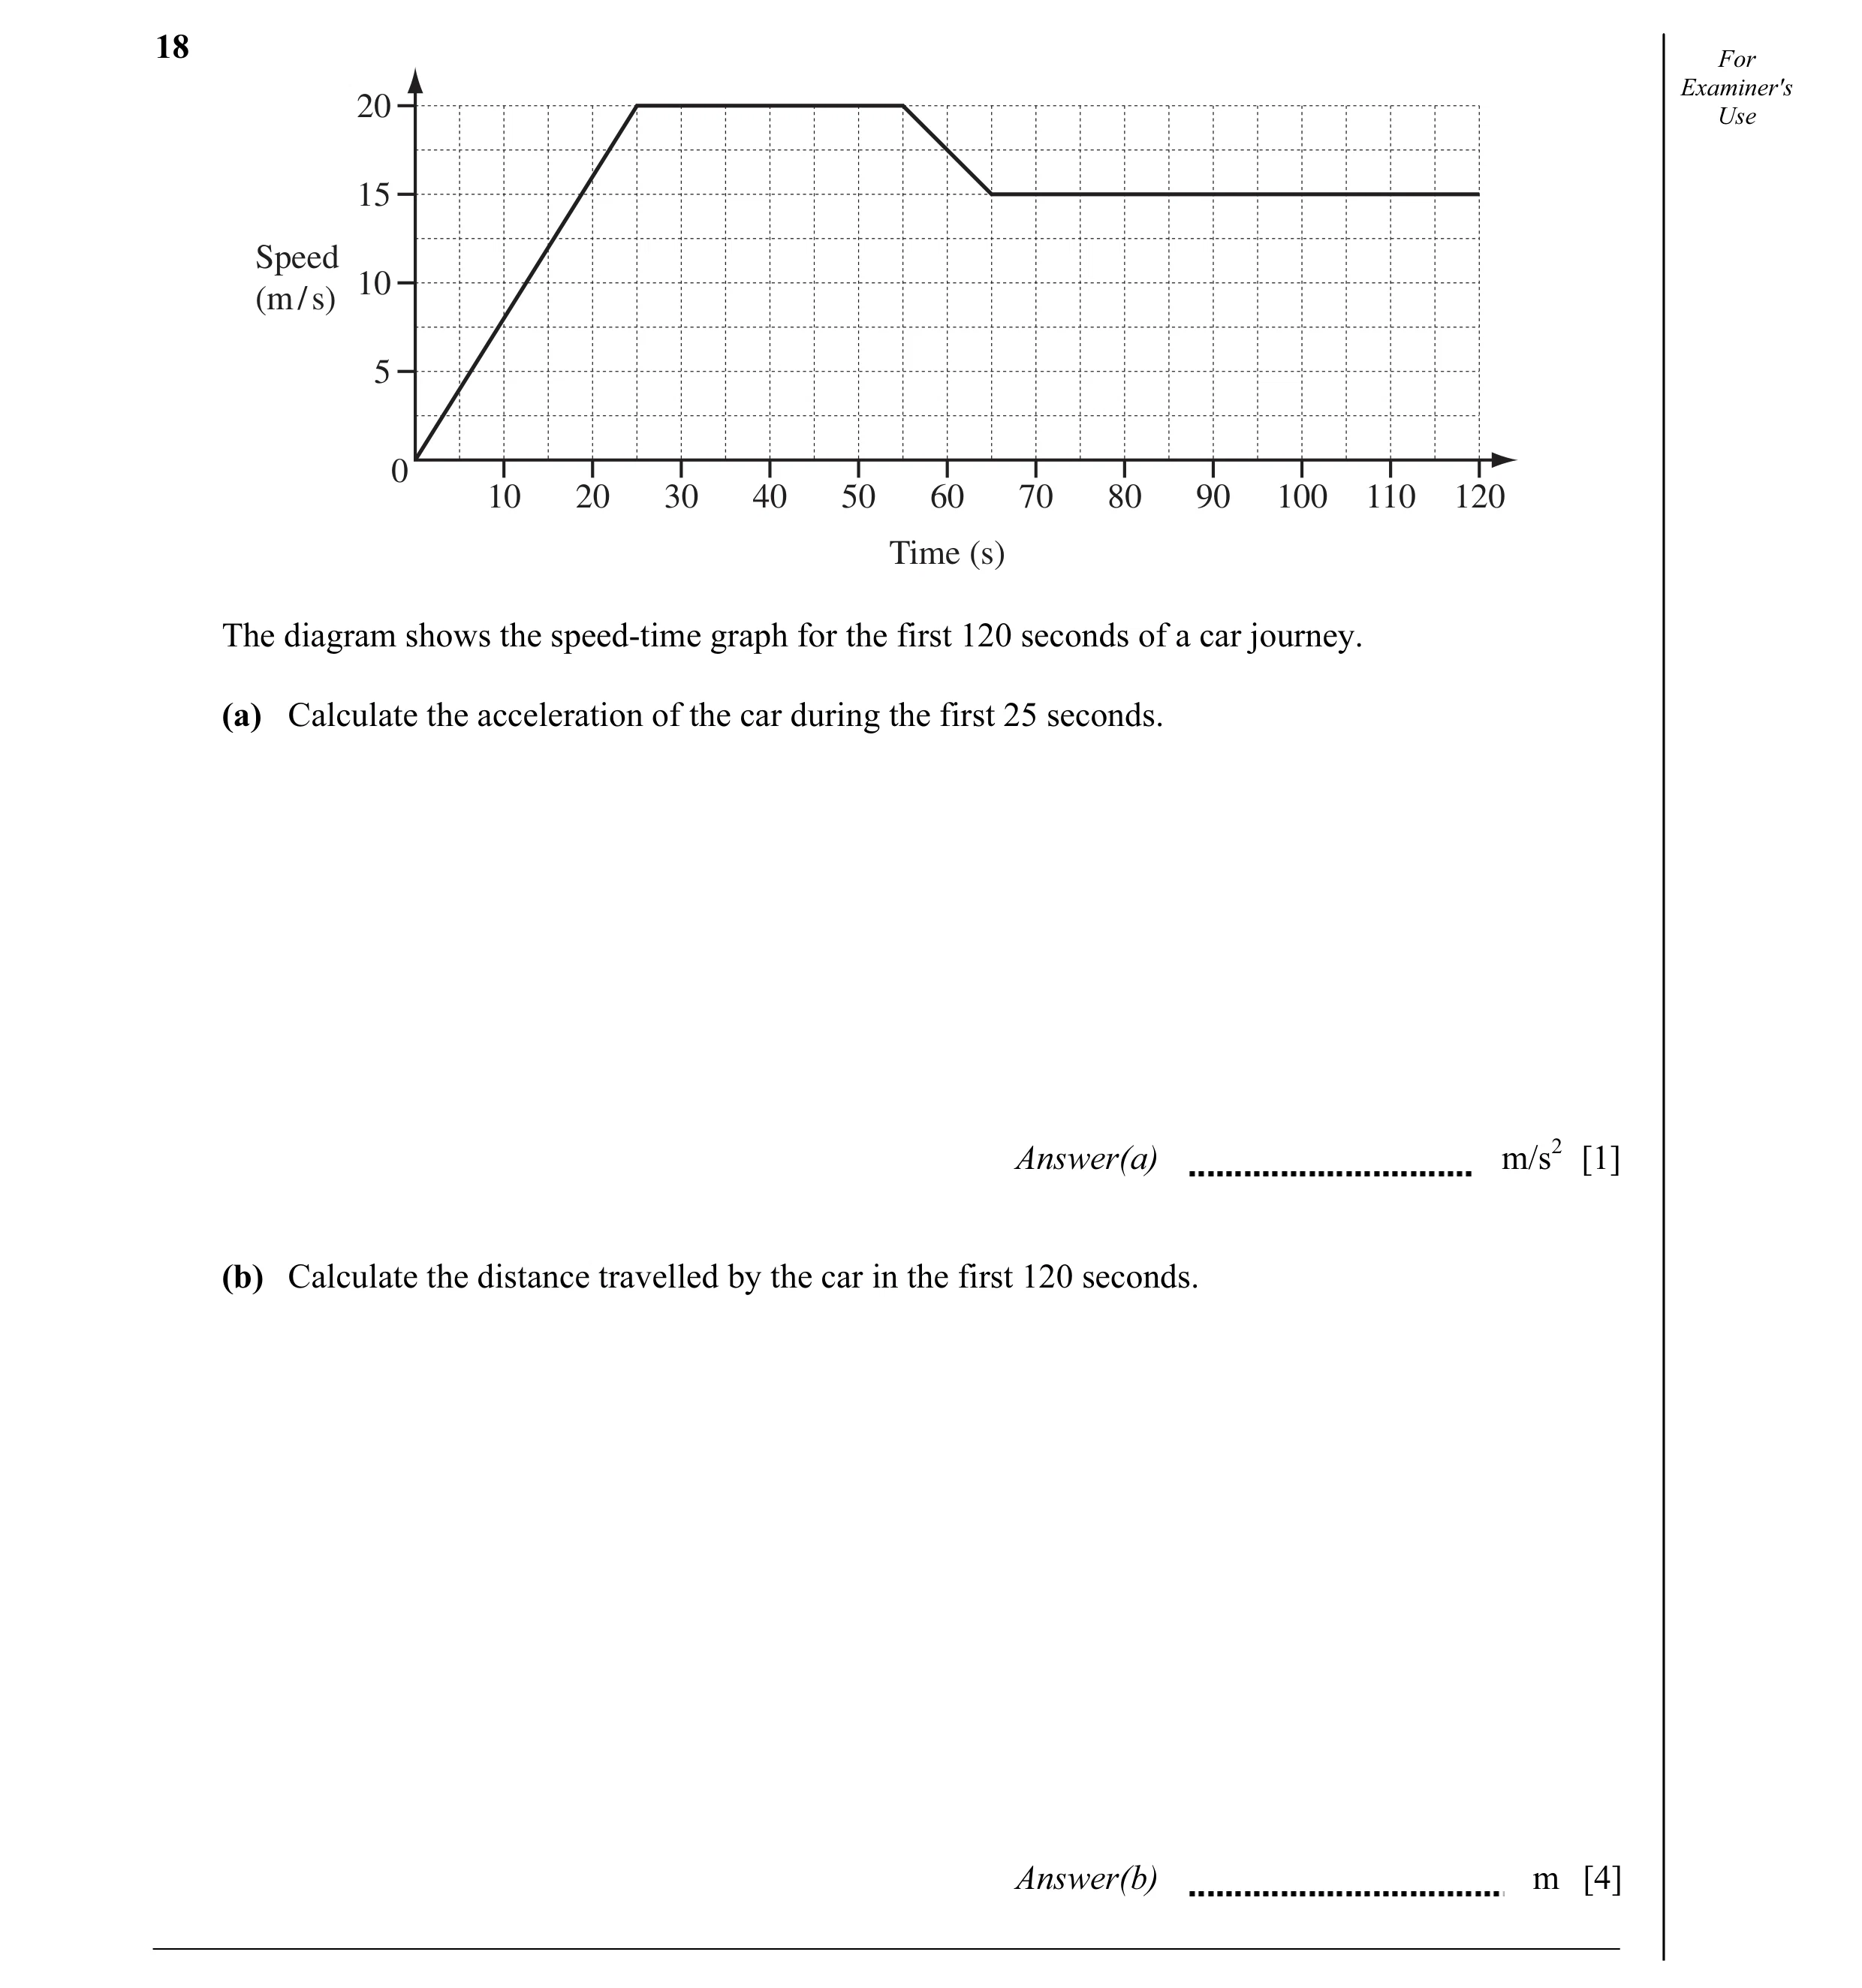
Q23 · For 20 Examiner's Use 15 Speed 10 (m / s) 5 0 10 20 30 40 50 60 70 80 90 100 110 120 Time… 0580/21 May/June 2012
18 For 20 Examiner's Use 15 Speed 10 (m / s) 5 0 10 20 30 40 50 60 70 80 90 100 110 120 Time (s) The diagram shows the speed-time graph for the first 120 seconds of a car journey. (a) Calculate the acceleration of the car during the first 25 seconds. Answer(a) m/s2 [1] (b) Calculate the distance travelled by the car in the first 120 seconds. Answer(b) m [4]
5 marks
Mark scheme: 18 (a) 0.8 1 (b) 1850 4 M1 for area = distance travelled M1 for two correct area statements M1 for complete correct area statement IGCSE – May/June 2012 0580 21
This question in 0580/21 May/June 2012
Q24 · For Examiner's 500 Use 400 300 Speed (m / min) 200 100 0 10 20 30 40 50 60 Time (min) The… 0580/22 May/June 2012
10 For Examiner's 500 Use 400 300 Speed (m / min) 200 100 0 10 20 30 40 50 60 Time (min) The diagram shows the speed-time graph for a boat journey. (a) Work out the acceleration of the boat in metres / minute2. Answer(a) m / min 2 [1] (b) Calculate the total distance travelled by the boat. Give your answer in kilometres. Answer(b) km [2]
3 marks
Mark scheme: 10 (a) 50 1 (b) 15 2 M1 finding area under graph SC1 15000 2
This question in 0580/22 May/June 2012
Q25 · Hans invests $750 for 8 years at a rate of 2% per year simple interest 0580/23 May/June 2012
2 Hans invests $750 for 8 years at a rate of 2% per year simple interest. Calculate the interest Hans receives. Answer $ [2]
2 marks
Mark scheme: M1 for oe seen or SC1 870 as final 2 120 2 100 answer
This question in 0580/23 May/June 2012
Q26 · For 120 Examiner's Use 100 80 Speed 60(km / h) 40 20 0 0.5 1 1.5 2 2.5 3 3.5 Time… 0580/23 May/June 2012
19 For 120 Examiner's Use 100 80 Speed 60(km / h) 40 20 0 0.5 1 1.5 2 2.5 3 3.5 Time (minutes) The diagram shows the speed-time graph for part of a car journey. The speed of the car is shown in kilometres / hour. Calculate the distance travelled by the car during the 3.5 minutes shown in the diagram. Give your answer in kilometres. Answer km [4]
4 marks
Mark scheme: 19 6(.00) www 4 M1 use of area = distance M1 complete, correct set of area statements, ignoring units M1 changing min to hours or km/h to km/min IGCSE – May/June 2012 0580 23
This question in 0580/23 May/June 2012
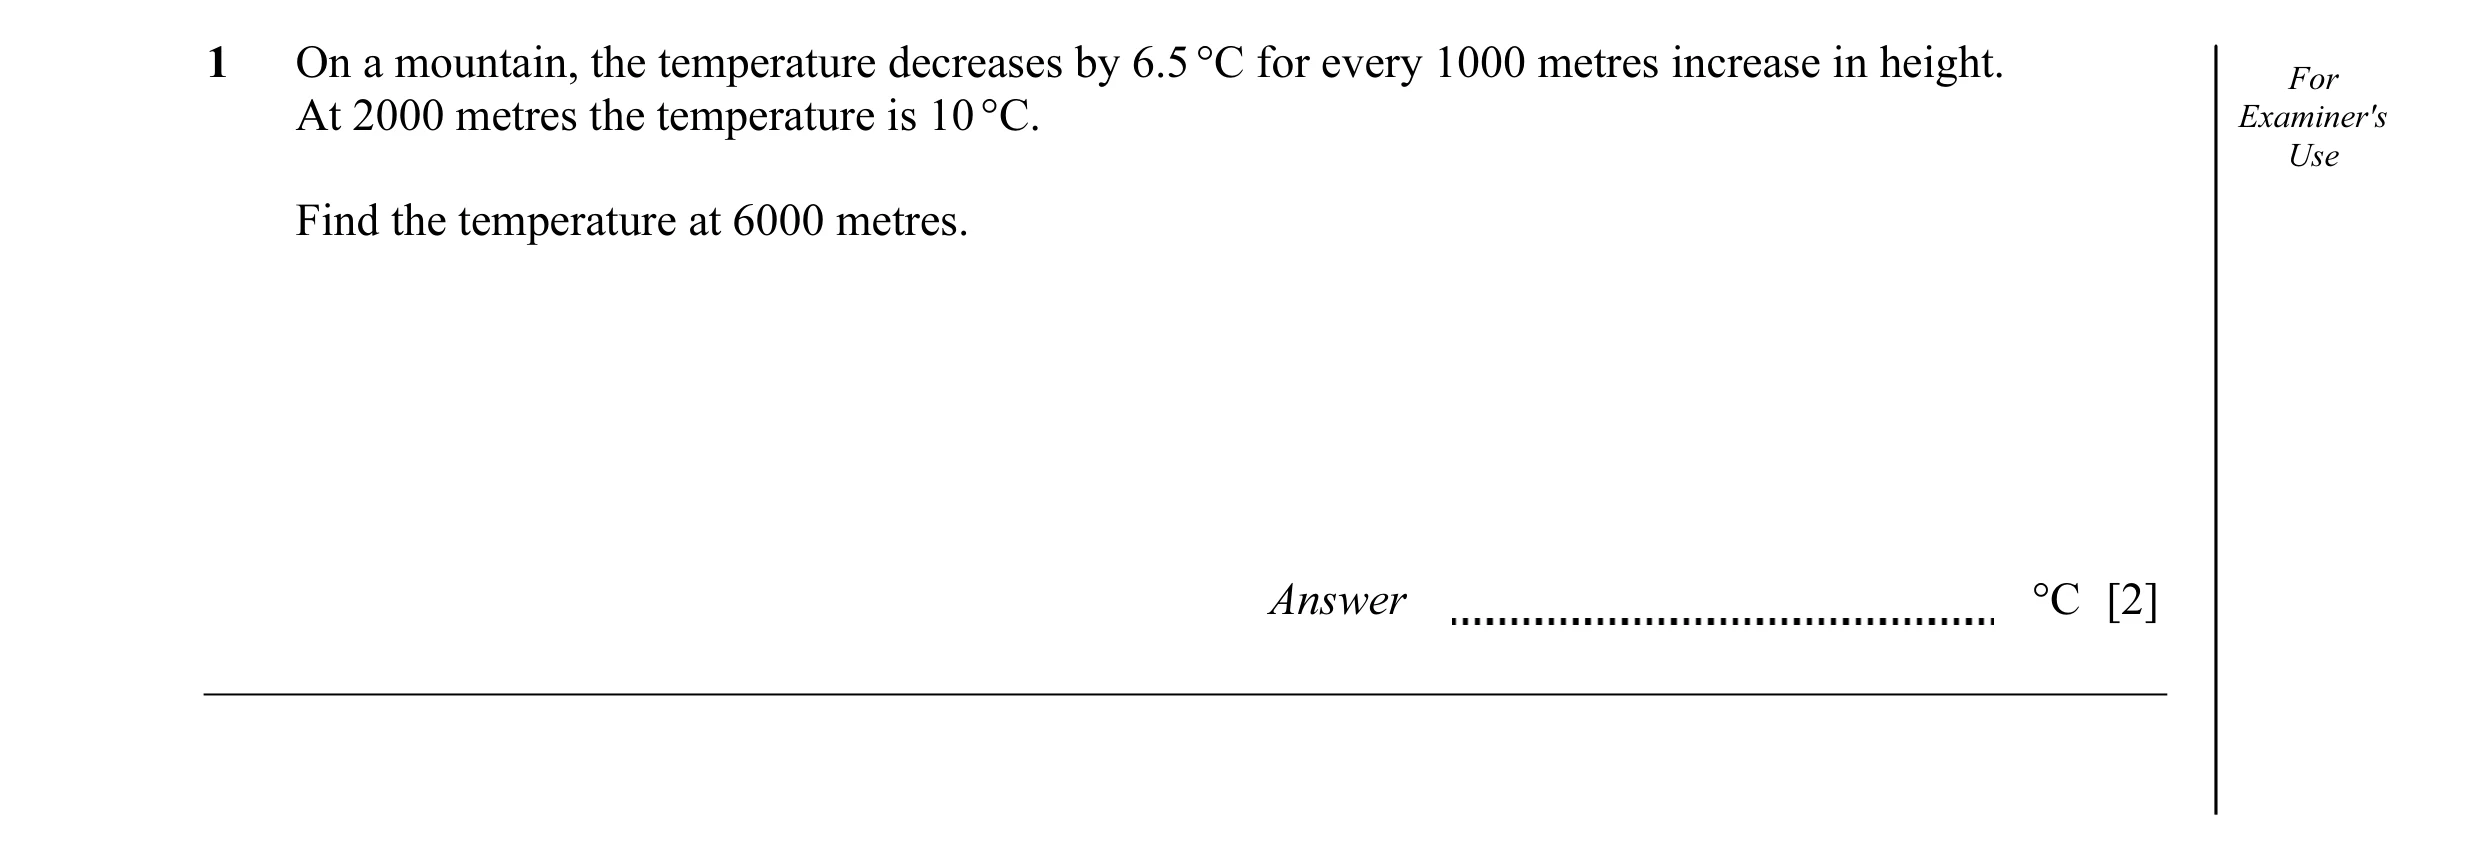
Q27 · On a mountain, the temperature decreases by 6.5 °C for every 1000 metres increase in… 0580/21 Oct/Nov 2012
1 On a mountain, the temperature decreases by 6.5 °C for every 1000 metres increase in height. For At 2000 metres the temperature is 10 °C. Examiner's Use Find the temperature at 6000 metres. Answer °C [2]
2 marks
Mark scheme: Qu. Answers Mark Part Marks 1 –16 2 M1 for 4 × 6.5 23 2139
This question in 0580/21 Oct/Nov 2012
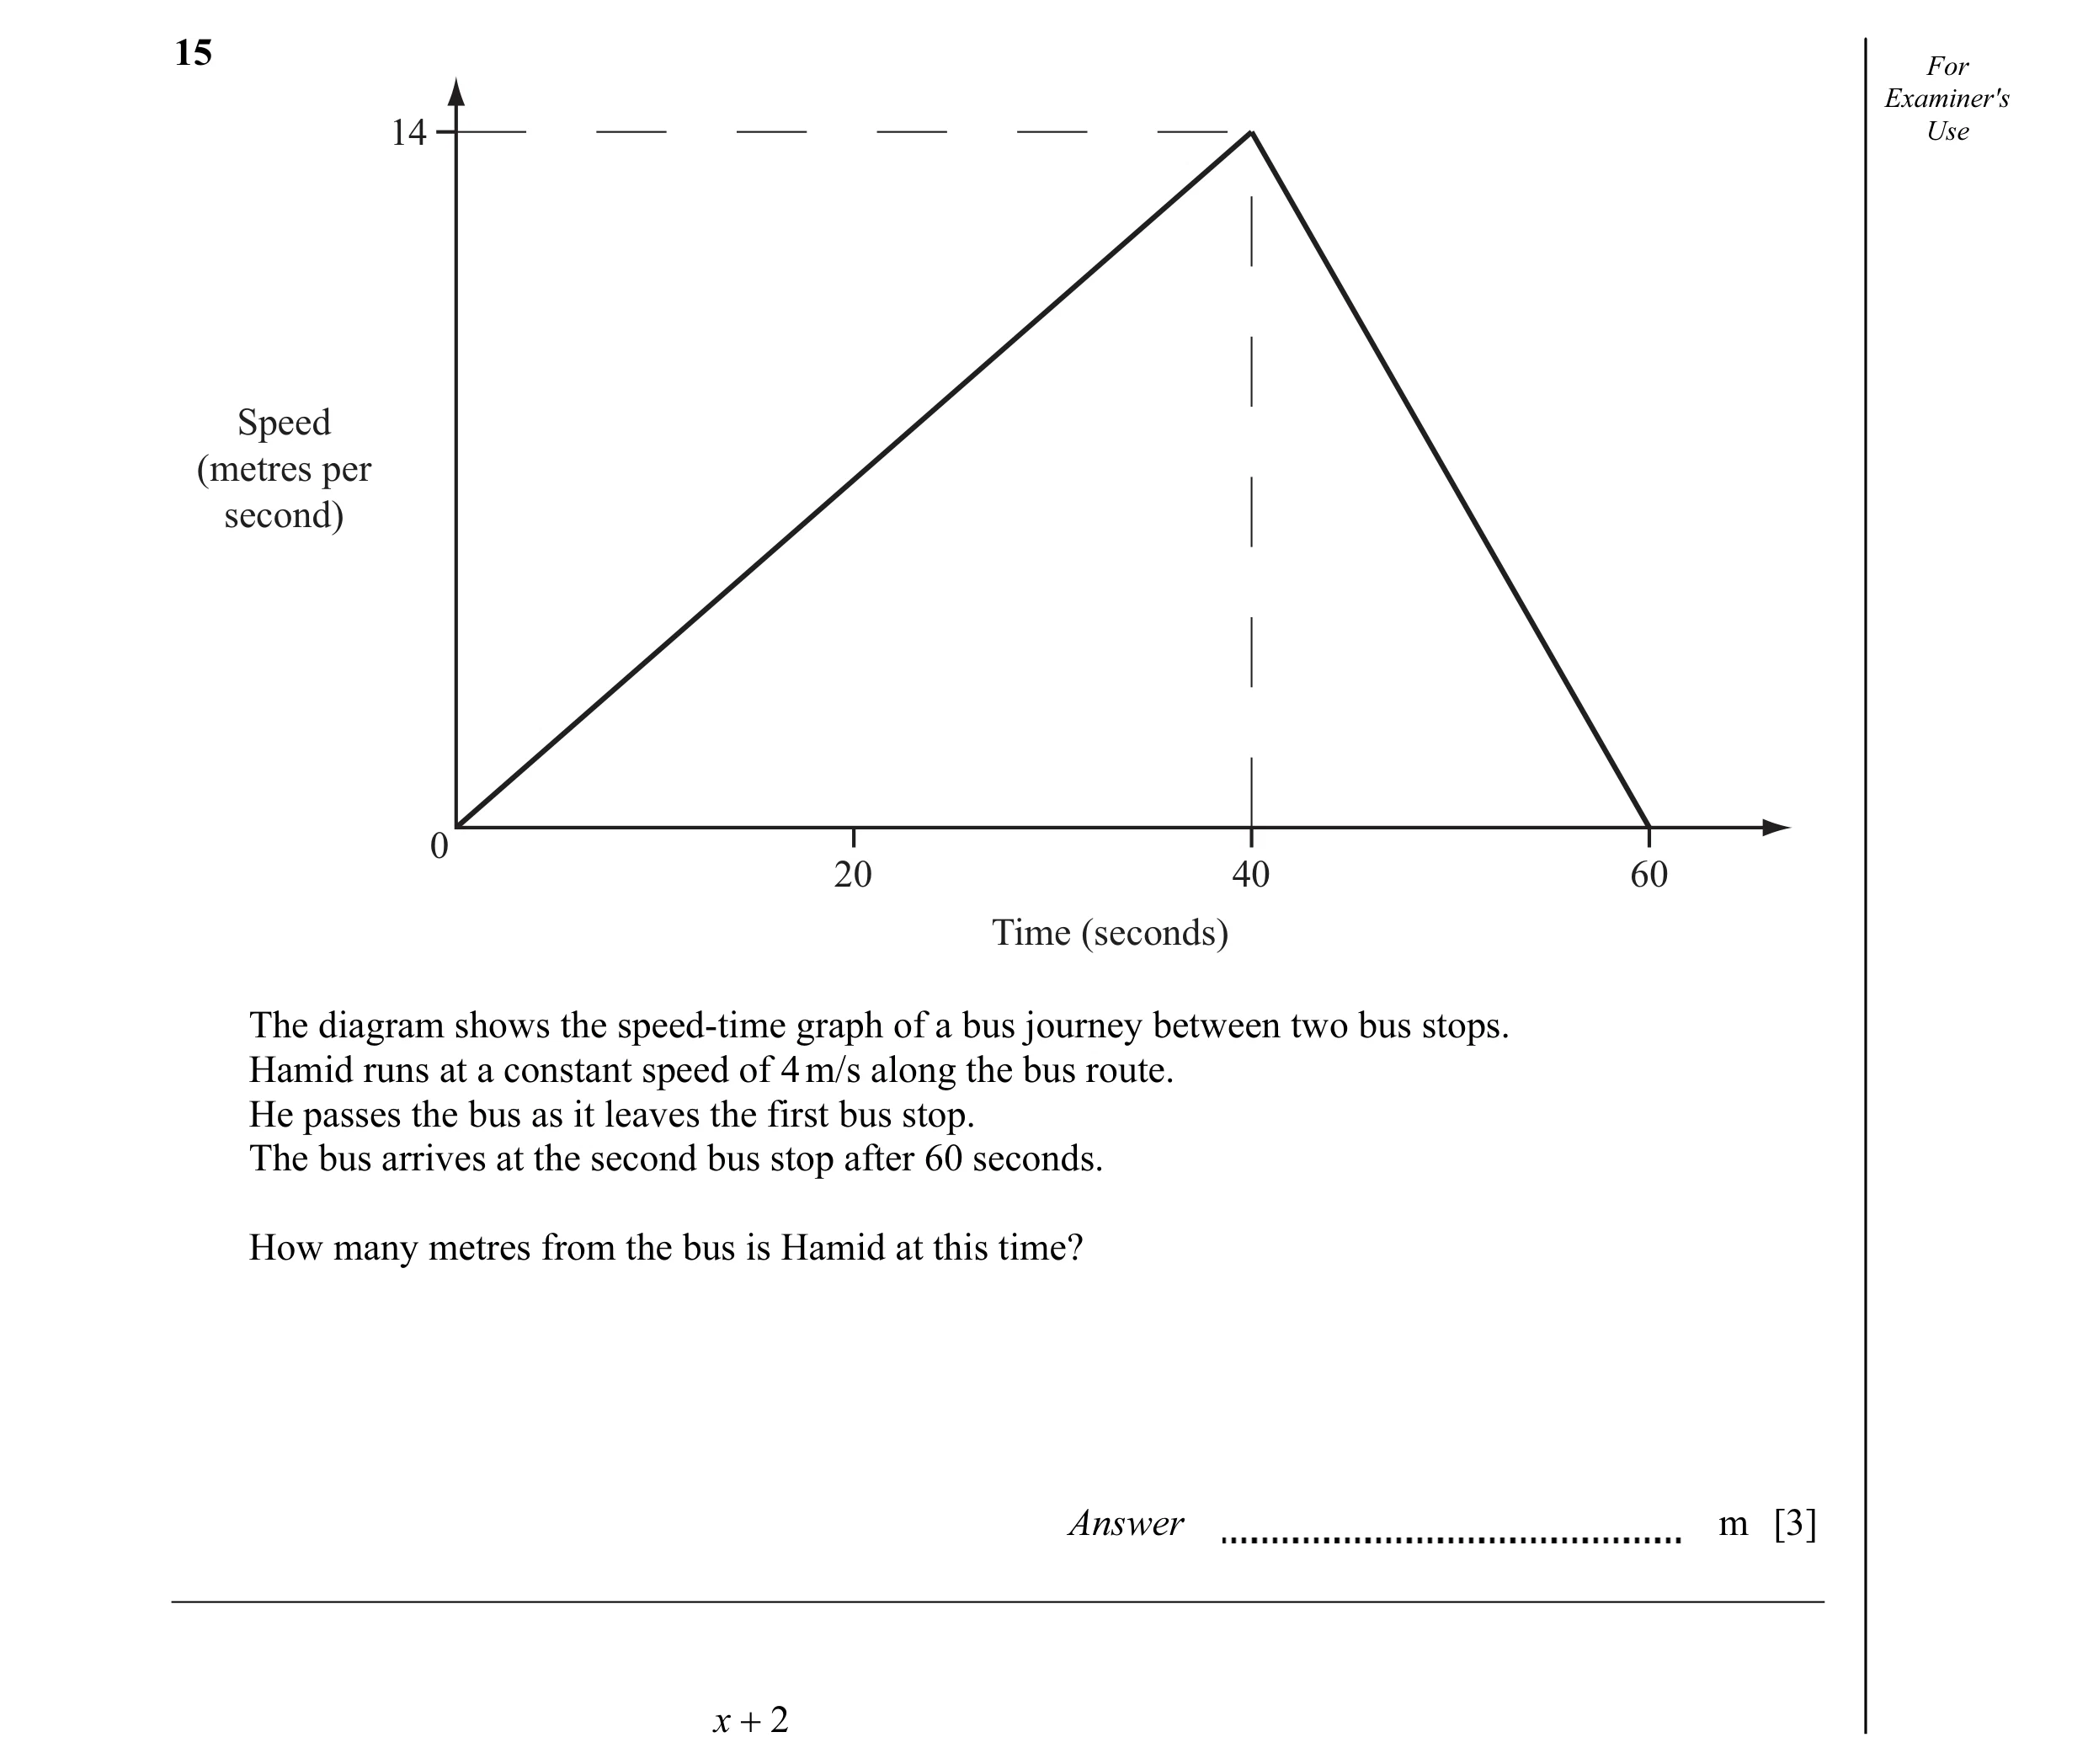
Q28 · For Examiner's 14 Use Speed (metres per second) 0 20 40 60 Time (seconds) The diagram… 0580/21 Oct/Nov 2012
15 For Examiner's 14 Use Speed (metres per second) 0 20 40 60 Time (seconds) The diagram shows the speed-time graph of a bus journey between two bus stops. Hamid runs at a constant speed of 4 m/s along the bus route. He passes the bus as it leaves the first bus stop. The bus arrives at the second bus stop after 60 seconds. How many metres from the bus is Hamid at this time? Answer m [3] x + 2
3 marks
Mark scheme: 15 180 www 3 M1 ½ × 60 × 14 oe M1 their 420 – 4 × 60
This question in 0580/21 Oct/Nov 2012
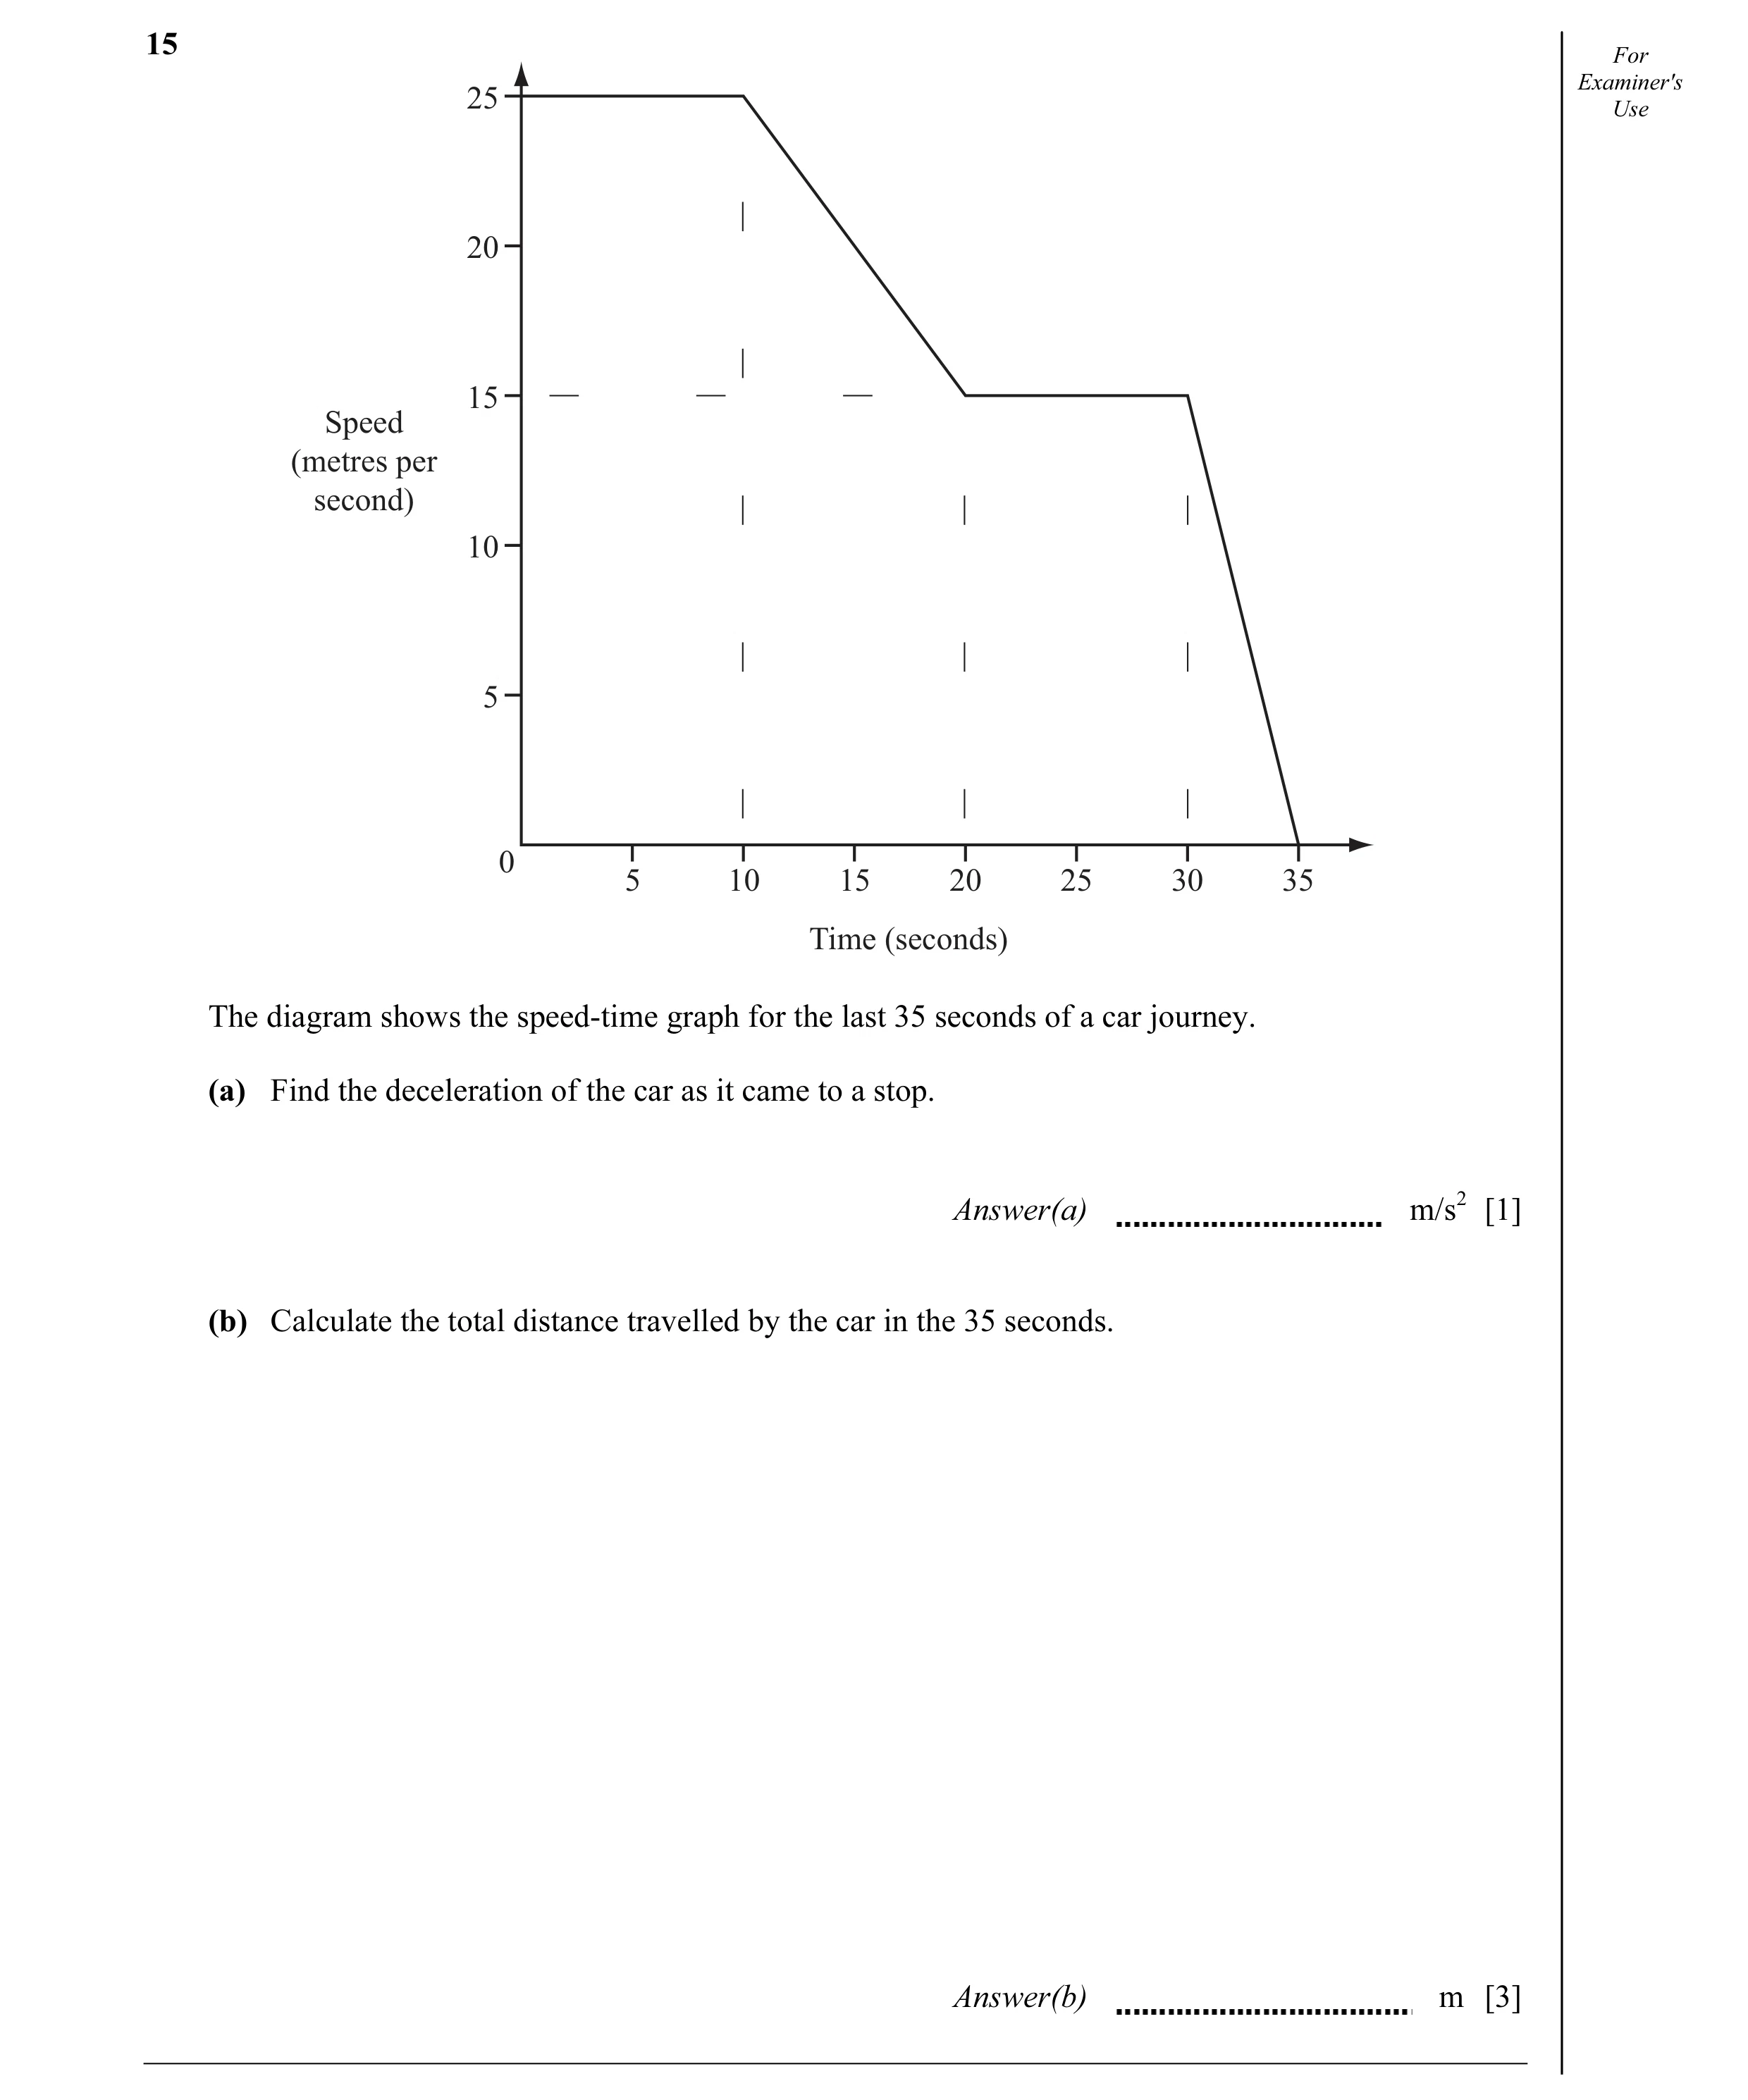
Q29 · For Examiner's 25 Use 20 15 Speed (metres per second) 10 5 0 5 10 15 20 25 30 35 Time… 0580/22 Oct/Nov 2012
15 For Examiner's 25 Use 20 15 Speed (metres per second) 10 5 0 5 10 15 20 25 30 35 Time (seconds) The diagram shows the speed-time graph for the last 35 seconds of a car journey. (a) Find the deceleration of the car as it came to a stop. Answer(a) m/s2 [1] (b) Calculate the total distance travelled by the car in the 35 seconds. Answer(b) m [3]
4 marks
Mark scheme: 15 (a) 3 1 (b) 637.5 3 M1 finding area under graph M1dep all correct area statements
This question in 0580/22 Oct/Nov 2012
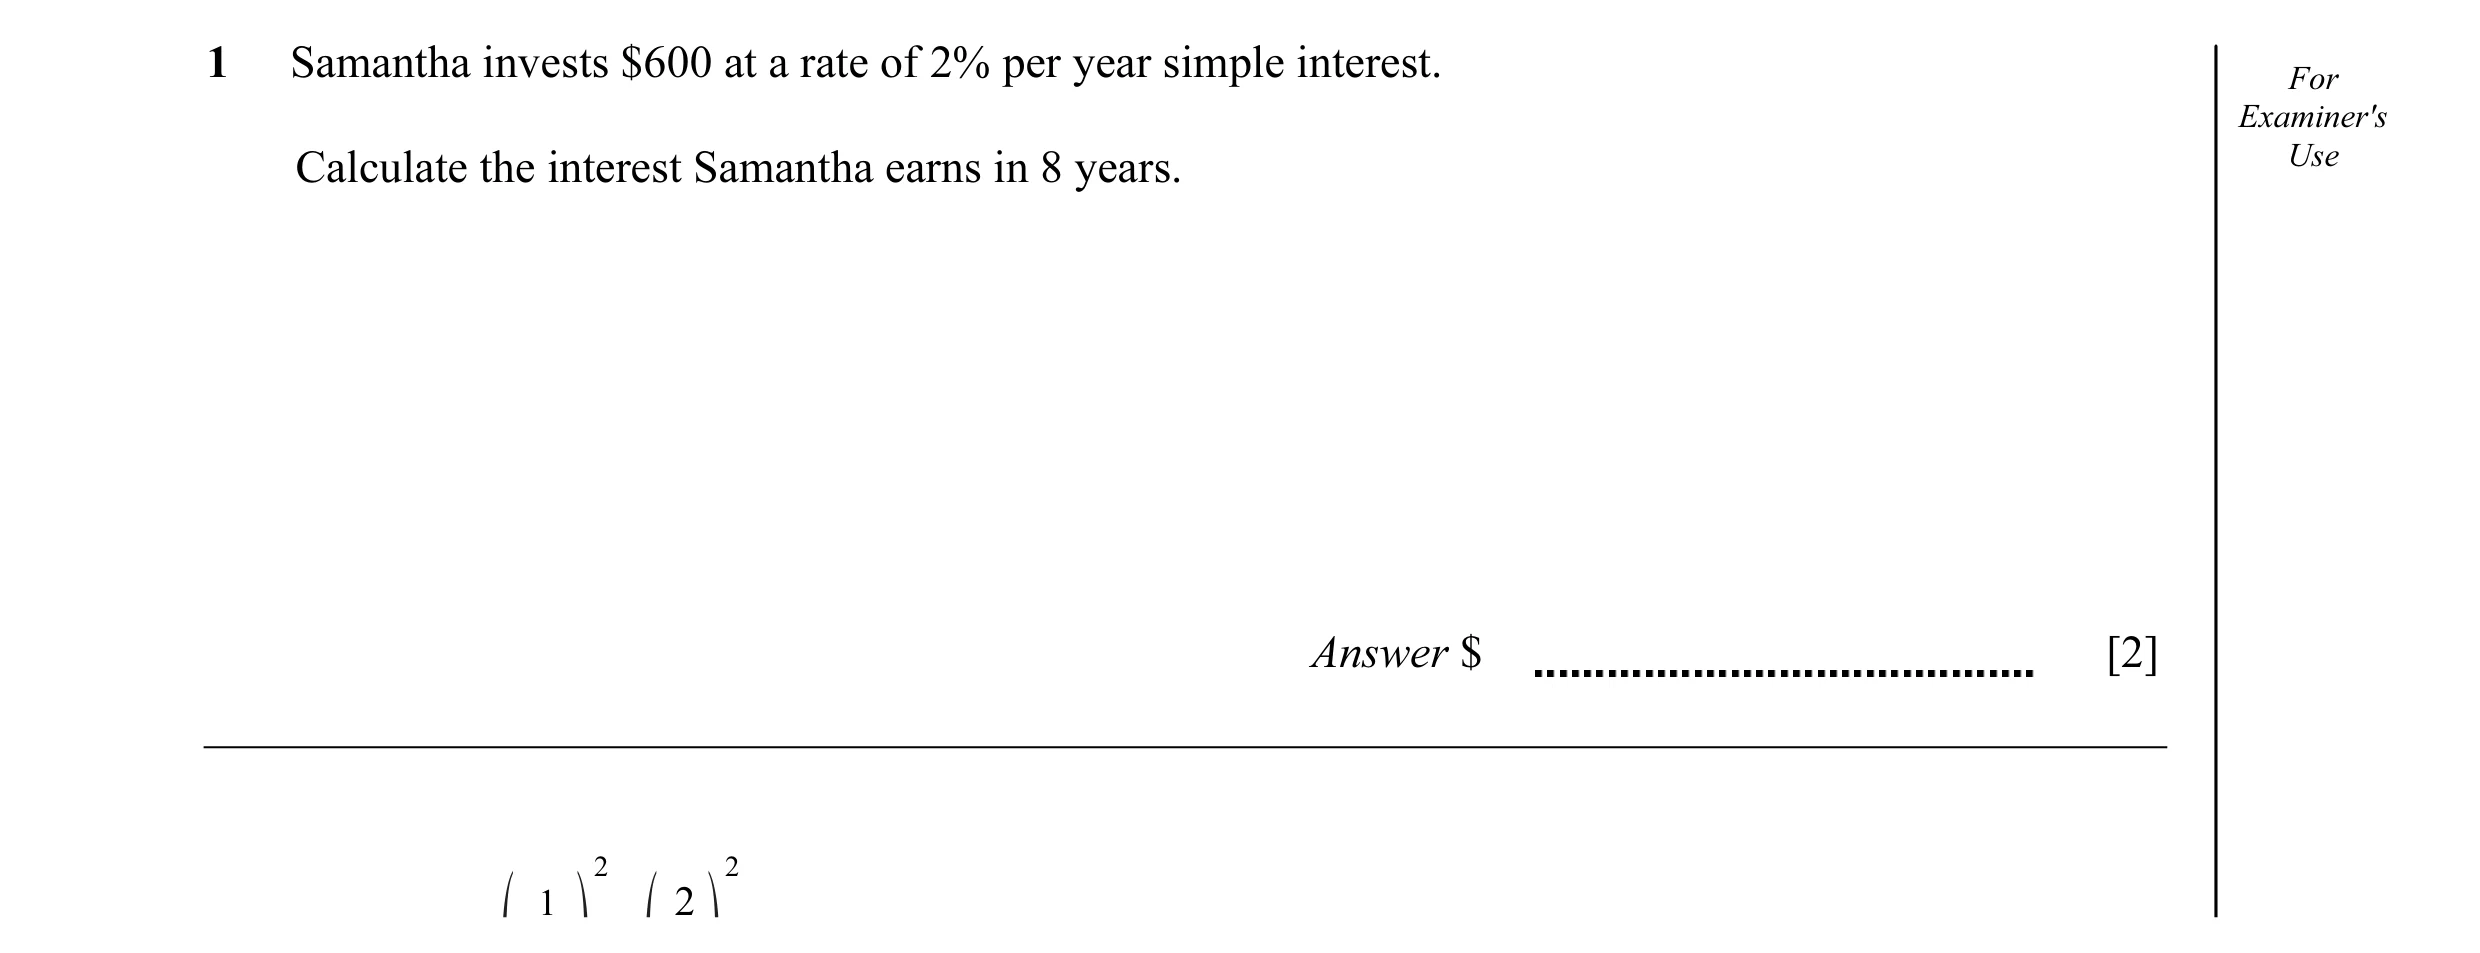
Q30 · Samantha invests $600 at a rate of 2% per year simple interest 0580/23 Oct/Nov 2012
1 Samantha invests $600 at a rate of 2% per year simple interest. For Examiner's Use Calculate the interest Samantha earns in 8 years. Answer $ [2] 2 2 1 2
2 marks
Mark scheme: 600 × 2 × 8 1 96 2 M1 for oe 100 If zero SC1 696 1 4
This question in 0580/23 Oct/Nov 2012
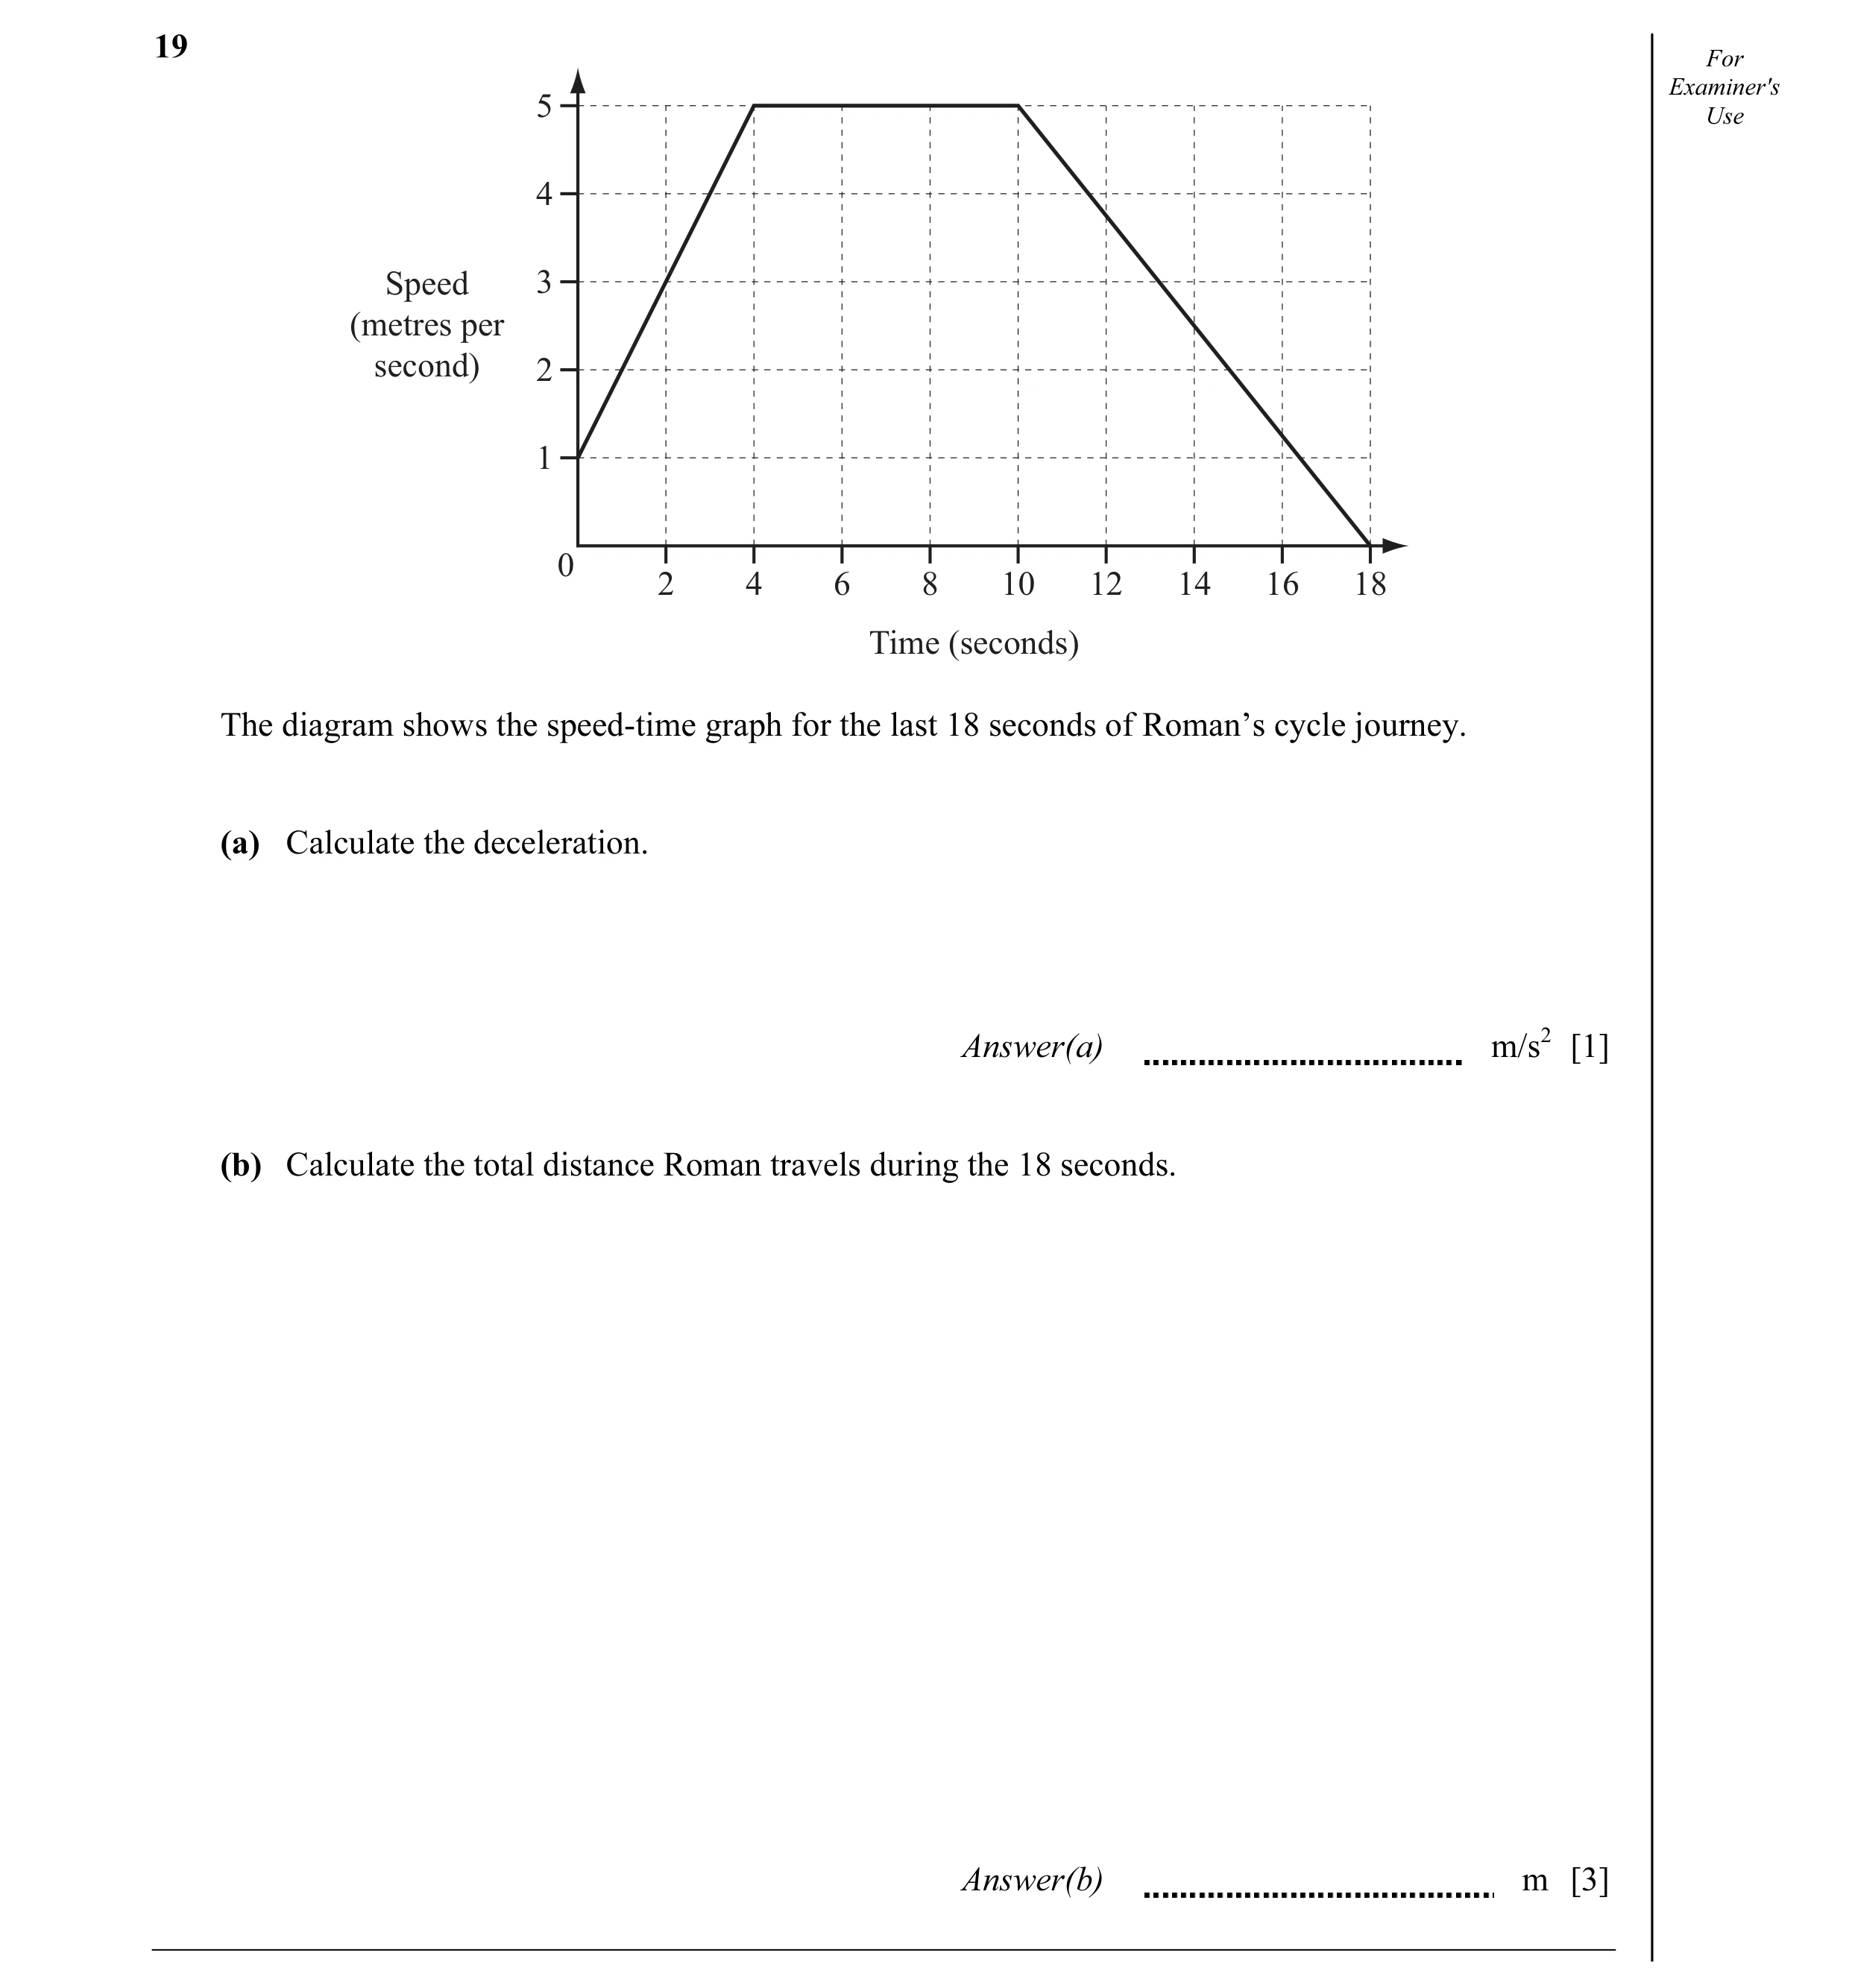
Q31 · For Examiner's 5 Use 4 Speed 3 (metres per second) 2 1 0 2 4 6 8 10 12 14 16 18 Time… 0580/23 Oct/Nov 2012
19 For Examiner's 5 Use 4 Speed 3 (metres per second) 2 1 0 2 4 6 8 10 12 14 16 18 Time (seconds) The diagram shows the speed-time graph for the last 18 seconds of Roman’s cycle journey. (a) Calculate the deceleration. Answer(a) m/s2 [1] (b) Calculate the total distance Roman travels during the 18 seconds. Answer(b) m [3]
4 marks
Mark scheme: 19 (a) 0.625 or 5/8 1 (b) 62 3 M1 for area under graph implied M1 for correct, complete, area statement
This question in 0580/23 Oct/Nov 2012
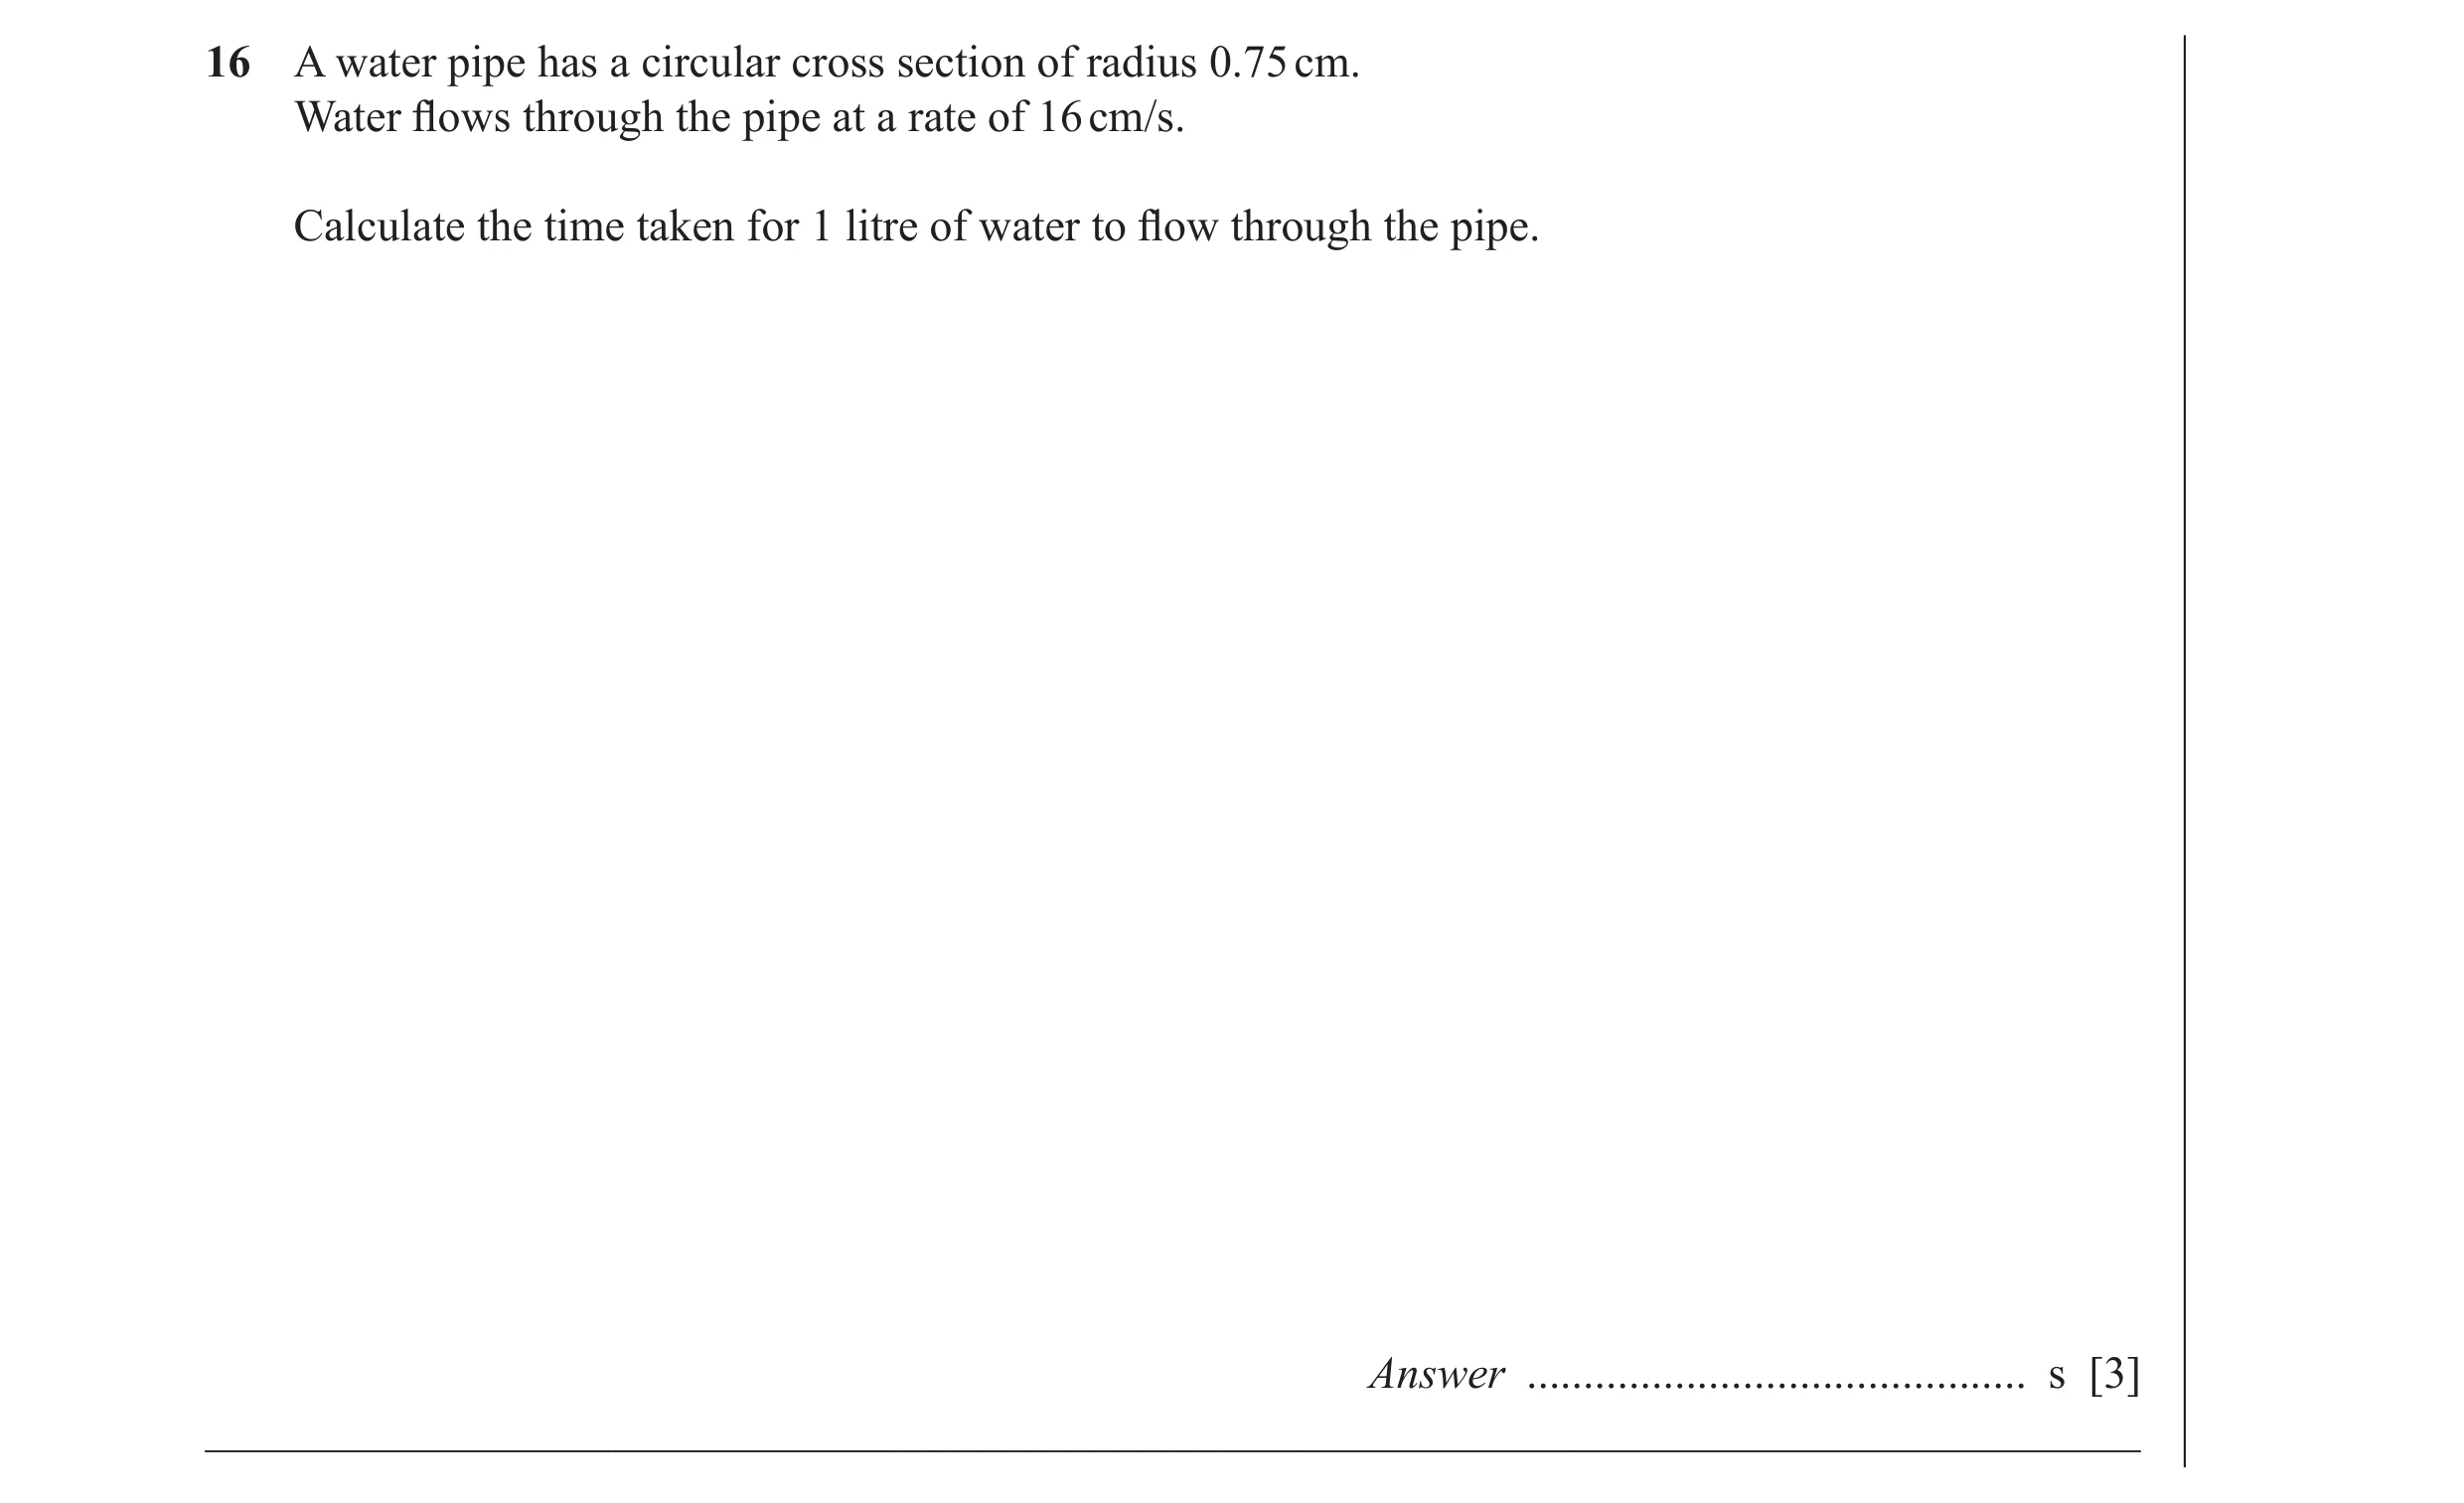
Q32 · A water pipe has a circular cross section of radius 0.75 cm 0580/21 May/June 2013
16 A water pipe has a circular cross section of radius 0.75 cm. Water fl ows through the pipe at a rate of 16 cm/s. Calculate the time taken for 1 litre of water to fl ow through the pipe. Answer … s [3] _____________________________________________________________________________________
3 marks
Mark scheme: 16 35.4 or 35.36 to 35.37 3 M2 for 1000 ÷ (π × 0.752 ×16) oe or M1 for π × 0.752 ×16 oe or 1000 ÷ ( π × .0 75 2 )
This question in 0580/21 May/June 2013
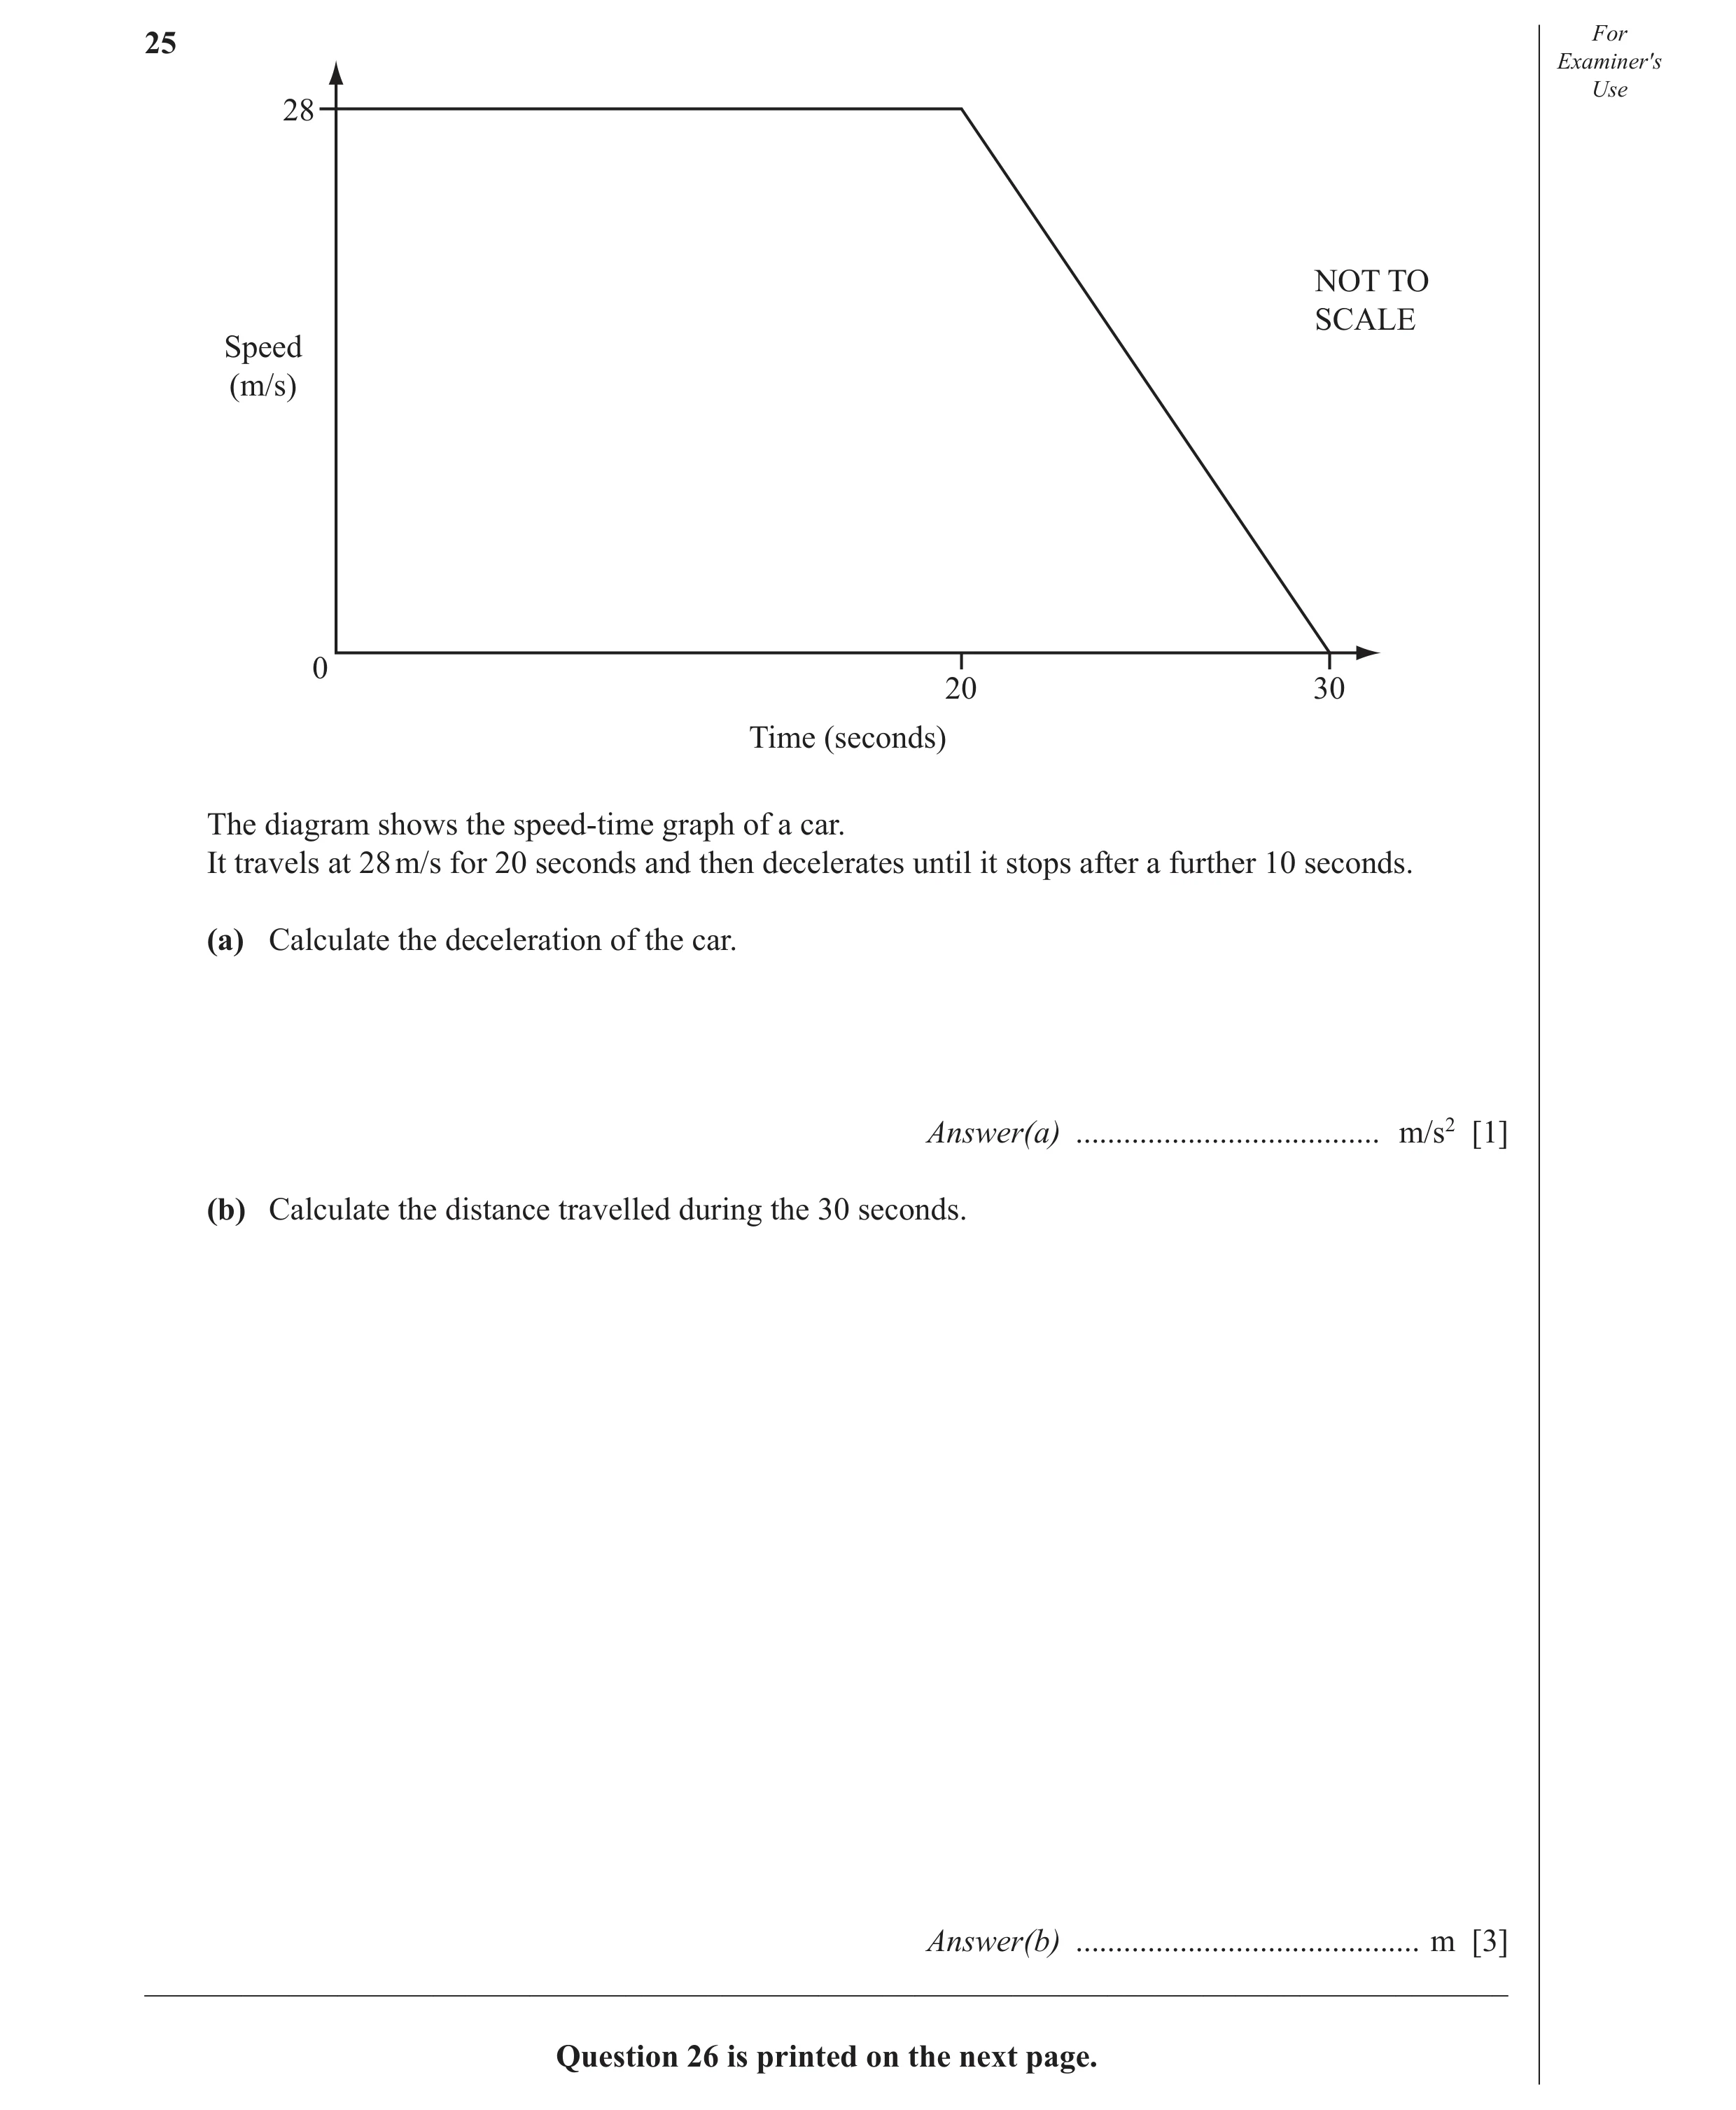
Q33 · For Examiner′s Use 28 NOT TO SCALE Speed (m/s) 0 20 30 Time (seconds) The diagram shows… 0580/21 May/June 2013
25 For Examiner′s Use 28 NOT TO SCALE Speed (m/s) 0 20 30 Time (seconds) The diagram shows the speed-time graph of a car. It travels at 28 m/s for 20 seconds and then decelerates until it stops after a further 10 seconds. (a) Calculate the deceleration of the car. Answer(a) … m/s2 [1] (b) Calculate the distance travelled during the 30 seconds. Answer(b) … m [3] _____________________________________________________________________________________ Question 26 is printed on the next page.
4 marks
Mark scheme: 25 (a) 1 2.8 oe (b) 3 M2 for ½(20 + 30) × 28 oe 700 or M1 for a correct area statement 2 2
This question in 0580/21 May/June 2013
Q34 · Emily invests $x at a rate of 3% per year simple interest 0580/21 Oct/Nov 2013
8 Emily invests $x at a rate of 3% per year simple interest. For Examiner′s After 5 years she has $20.10 interest. Use Find the value of x. Answer x = … [3] _____________________________________________________________________________________
3 marks
Mark scheme: 20 1. × 100 8 134 3 M2 for oe 3 × 5 x × 3 × 5 or M1 for = 20 1. 100 or 3% = 4.02 oe If 0 scored SC1 for answer of figs 134 n 1
This question in 0580/21 Oct/Nov 2013
Q35 · Convert 144 km/h into metres per second 0580/21 Oct/Nov 2013
19 (a) Convert 144 km/h into metres per second. Answer(a) … m/s [2] (b) A train of length 120 m is travelling at 144 km/h. It passes under a bridge of width 20 m. Find the time taken for the whole train to pass under the bridge. Give your answer in seconds. Answer(b) … s [2] _____________________________________________________________________________________
4 marks
Mark scheme: 144 × 1000 19 (a) 40 2 M1 for oe 60 × 60 (b) 3.5 2FT FT 140 ÷ their (a) M1 for dist ÷ their (a) or dist ÷ 40 60 × 60 or dist × 144 × 1000 or B1 for 140 seen
This question in 0580/21 Oct/Nov 2013
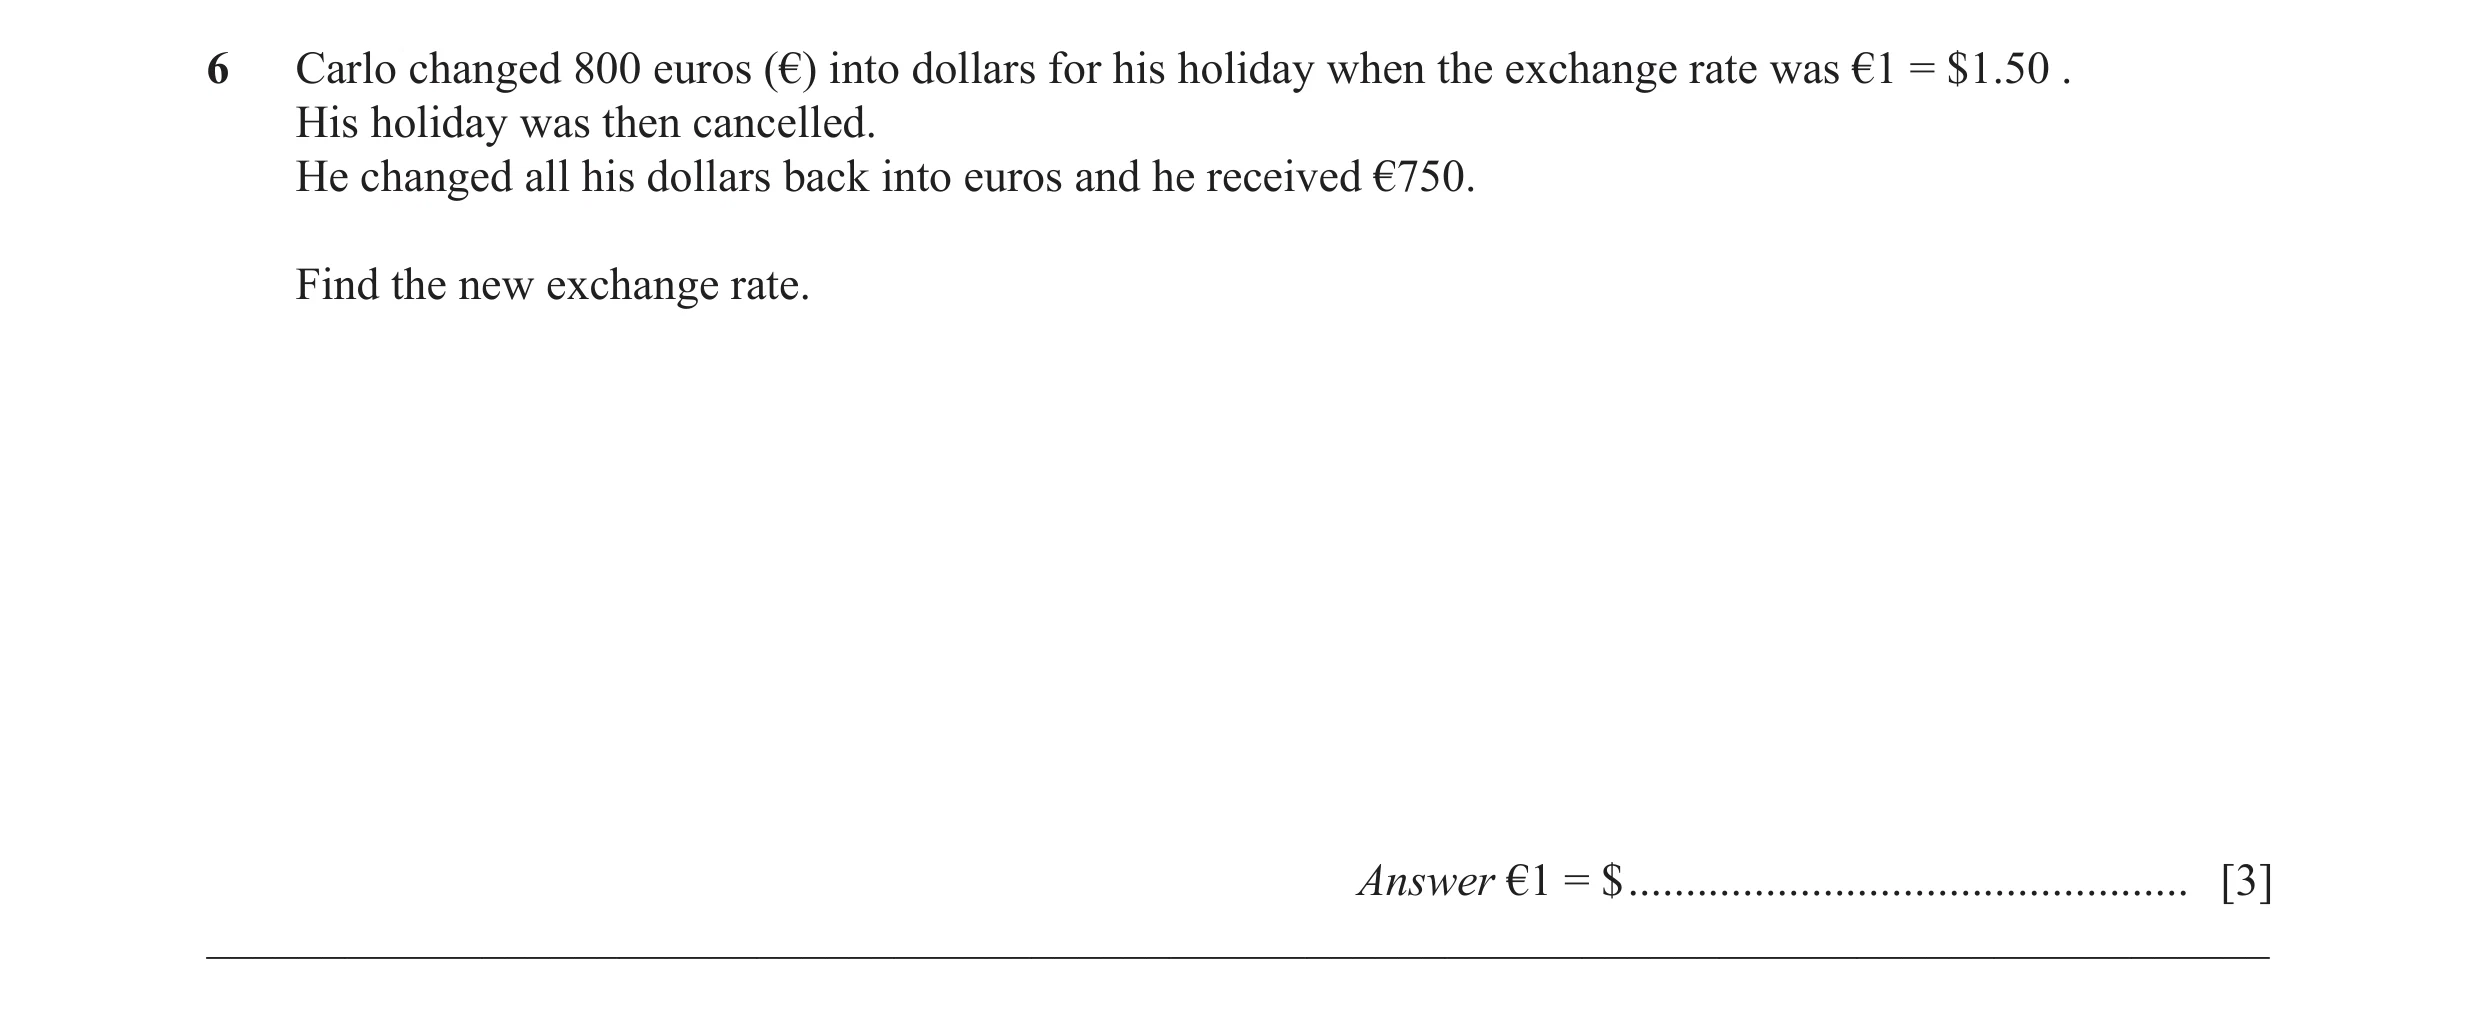
Q36 · Carlo changed 800 euros (€) into dollars for his holiday when the exchange rate was €1 =… 0580/21 May/June 2014
6 Carlo changed 800 euros (€) into dollars for his holiday when the exchange rate was €1 = $1.50 . His holiday was then cancelled. He changed all his dollars back into euros and he received €750. Find the new exchange rate. Answer €1 = $ … [3] __________________________________________________________________________________________
3 marks
Mark scheme: 6 1.6[0] 3 M1 for 800 × 1.5 and M1 for their 1200 ÷ 750
This question in 0580/21 May/June 2014
Q37 · A train takes 65 minutes to travel 52 km 0580/23 Oct/Nov 2014
5 A train takes 65 minutes to travel 52 km. Calculate the average speed of the train in kilometres per hour. Answer … km/h [2] __________________________________________________________________________________________
2 marks
Mark scheme: 5 48 2 M1 for 52 ÷ 65 [× 60] oe implied by 0.8 19
This question in 0580/23 Oct/Nov 2014
Q38 · Fritz drives a distance of 381 km in 2 hours and 18 minutes 0580/22 Feb/March 2015
19 Fritz drives a distance of 381 km in 2 hours and 18 minutes. He then drives 75 km at a constant speed of 30 km/h. Calculate his average speed for the whole journey. Answer … km/h [4] __________________________________________________________________________________________
4 marks
Mark scheme: 18 19 95 4 B1 for 2.3 or 2 60 M1 for 75 ÷ 30 (= 2.5) 381 + 75 M1 for their 3.2 + their 5.2
This question in 0580/22 Feb/March 2015
Q39 · The diagram shows a channel for water 0580/22 May/June 2015
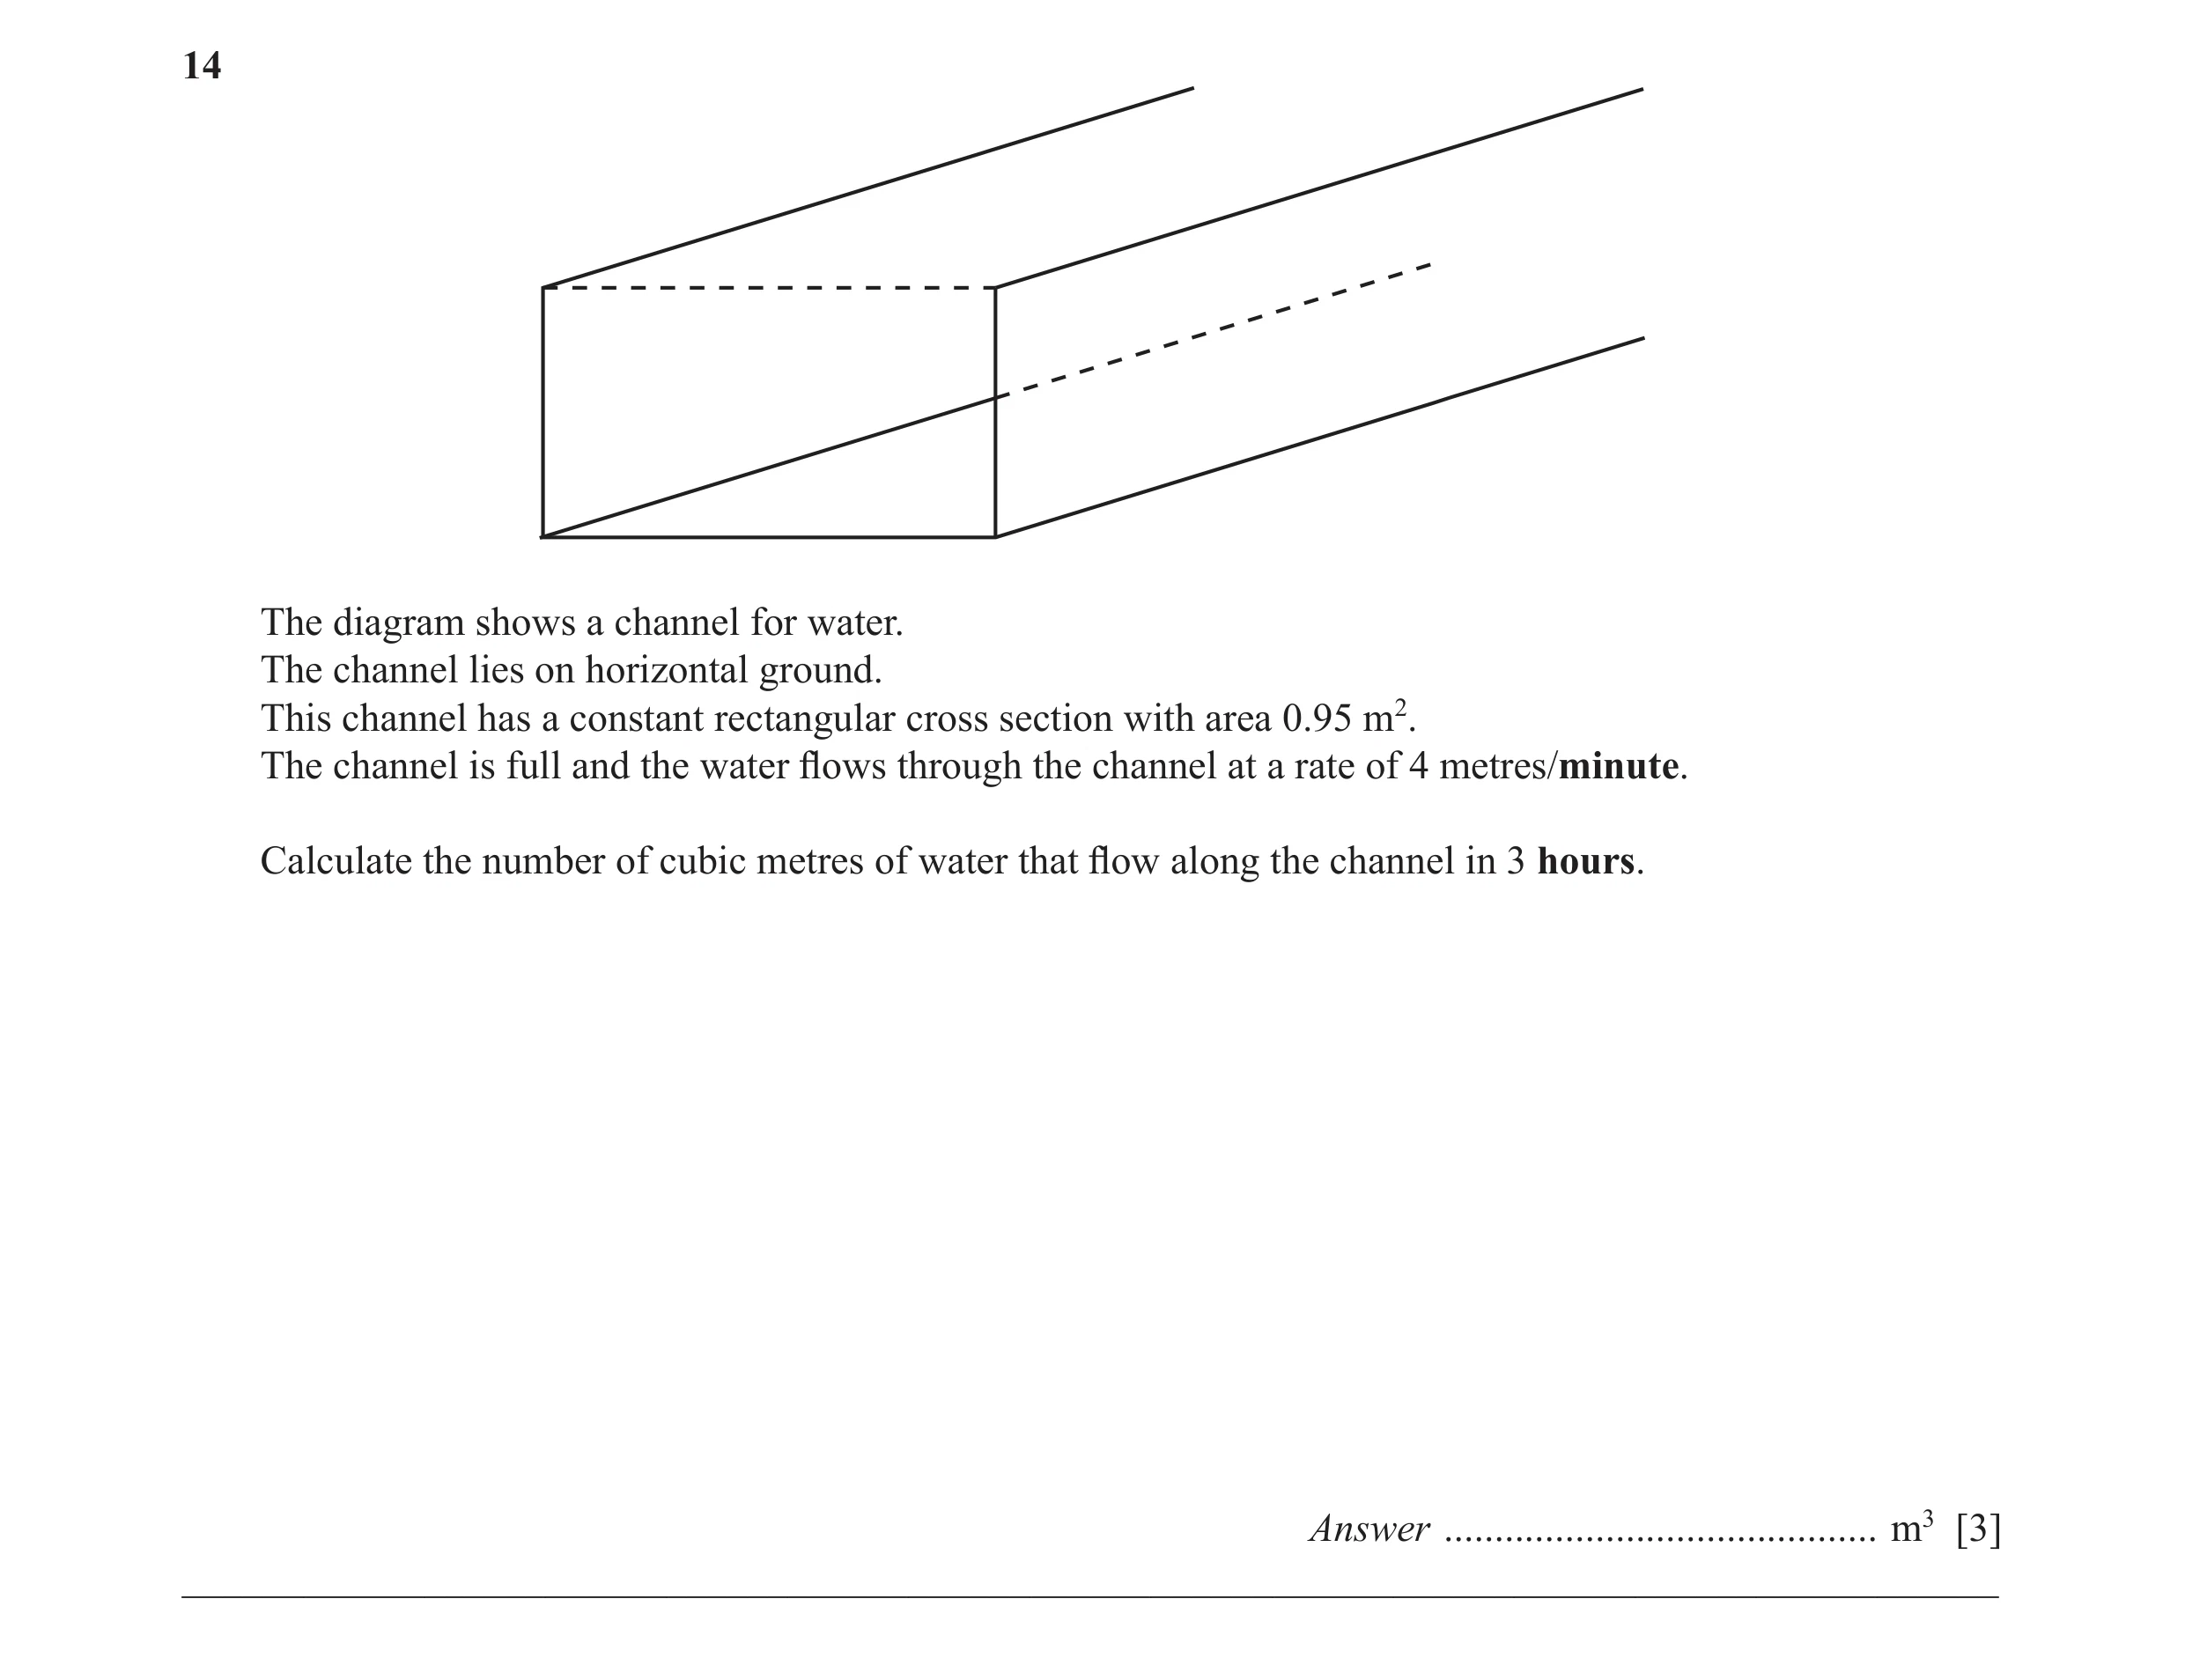
14 The diagram shows a channel for water. The channel lies on horizontal ground. This channel has a constant rectangular cross section with area 0.95 m2. The channel is full and the water flows through the channel at a rate of 4 metres/minute. Calculate the number of cubic metres of water that flow along the channel in 3 hours. Answer … m3 [3] __________________________________________________________________________________________
3 marks
Mark scheme: 14 684 3 M2 for 0.95 × 4 × 3 × 60 or M1 for 0.95 × 4 [× 3] or 4 × 3 × 60 or 0.95 × 3 × 60 or 0.95 × 4 × 60
This question in 0580/22 May/June 2015
Q40 · 20 18 16 14 12 Speed 10 (m/s) 8 6 4 2 0 10 20 30 40 50 60 70 80 90 100 110 120 Time (s)… 0580/22 May/June 2015
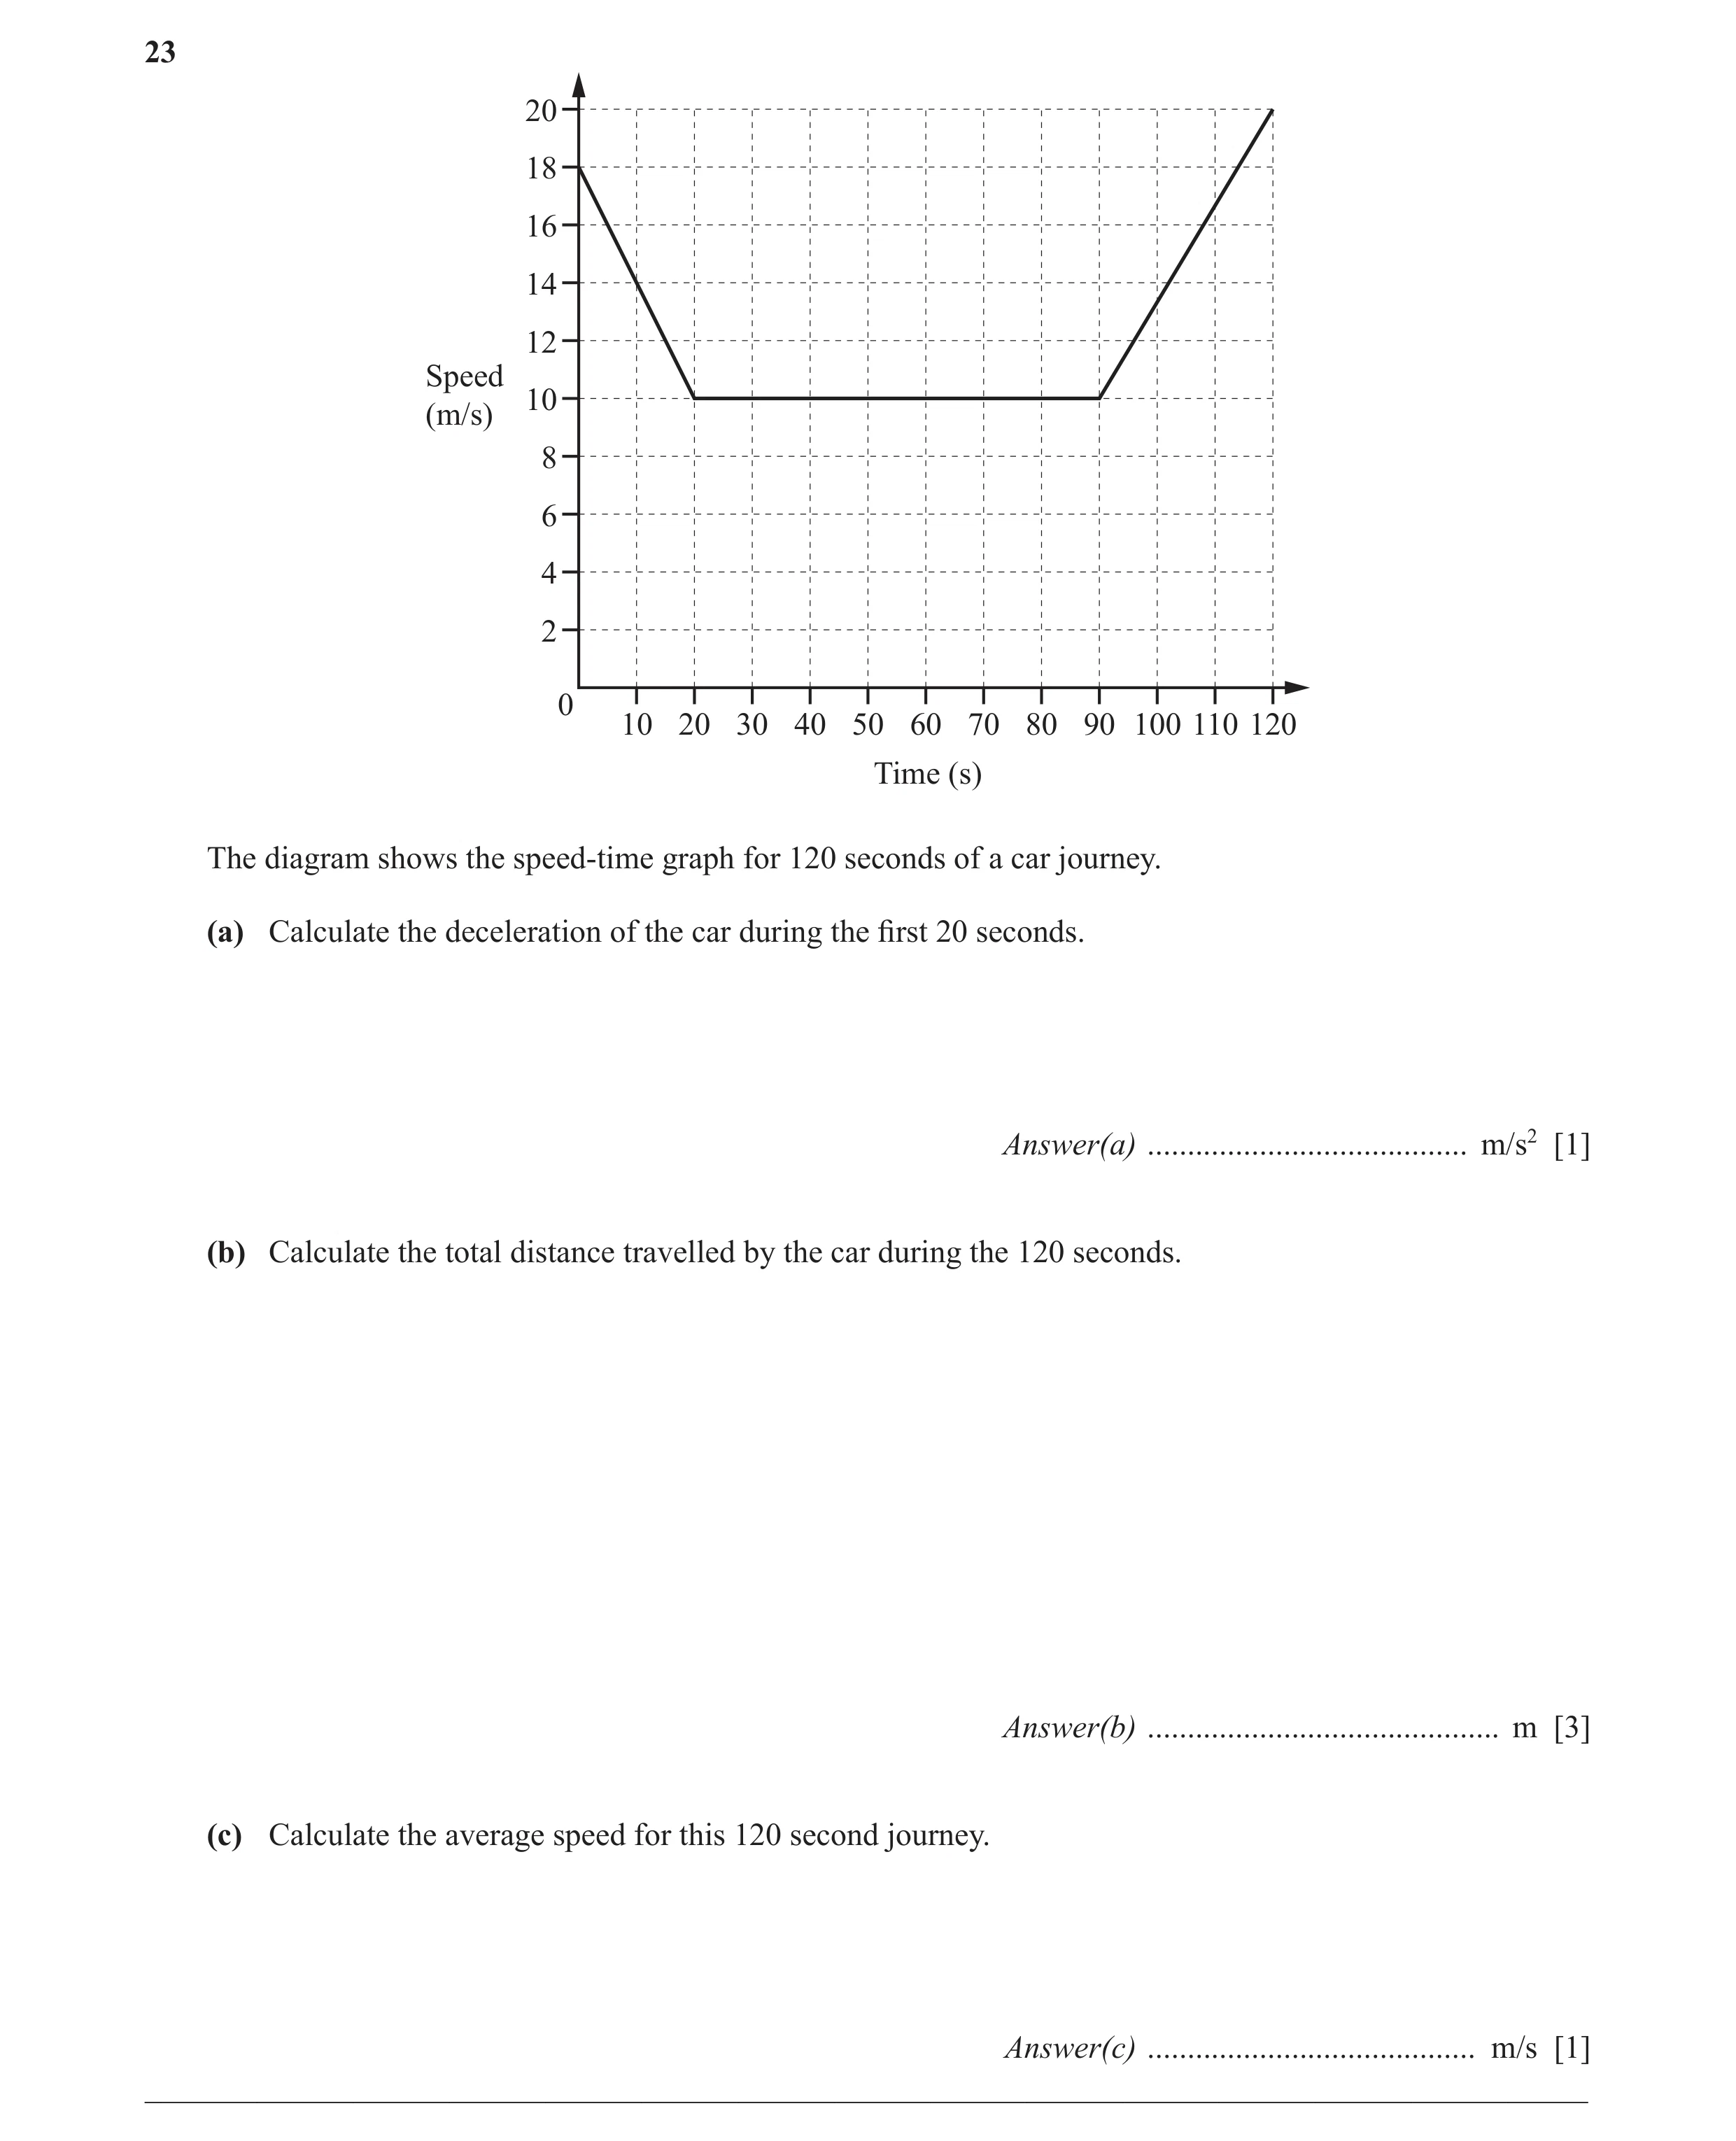
23 20 18 16 14 12 Speed 10 (m/s) 8 6 4 2 0 10 20 30 40 50 60 70 80 90 100 110 120 Time (s) The diagram shows the speed-time graph for 120 seconds of a car journey. (a) Calculate the deceleration of the car during the first 20 seconds. Answer(a) … m/s2 [1] (b) Calculate the total distance travelled by the car during the 120 seconds. Answer(b) … m [3] (c) Calculate the average speed for this 120 second journey. Answer(c) … m/s [1] __________________________________________________________________________________________
5 marks
Mark scheme: 2 23 (a) 0.4 or 1 5 (b) 1430 3 M2 for correct, complete, area statement 1 1 e.g. 120 × 10 + × 20 × 8 + × 30 × 10 oe 2 2 or M1 for one area calculation 1 1 e.g. 10 × 120 or × 20 × 8 or × 30 × 10 2 2 (c) 11.9 or 11.91 to 11.92 1FT their (b) ÷ 120
This question in 0580/22 May/June 2015
Q41 · 10 NOT TO SCALE Speed (m/s) 0 u 3u Time (seconds) A car starts from rest and accelerates… 0580/23 May/June 2015
12 10 NOT TO SCALE Speed (m/s) 0 u 3u Time (seconds) A car starts from rest and accelerates for u seconds until it reaches a speed of 10 m/s. The car then travels at 10 m/s for 2u seconds. The diagram shows the speed-time graph for this journey. The distance travelled by the car in the first 3u seconds is 125 m. (a) Find the value of u. Answer(a) u = … [3] (b) Find the acceleration in the first u seconds. Answer(b) … m/s2 [1]
4 marks
Mark scheme: u × 10 12 (a) 5 3 M2 for + 2u × 10 = 125 oe 2 or M1 for evidence that area represents u × 10 distance e.g. , 2u × 10 or 3u × 10 2 (b) 2 1FT FT 10 ÷ their u correctly evaluated
This question in 0580/23 May/June 2015
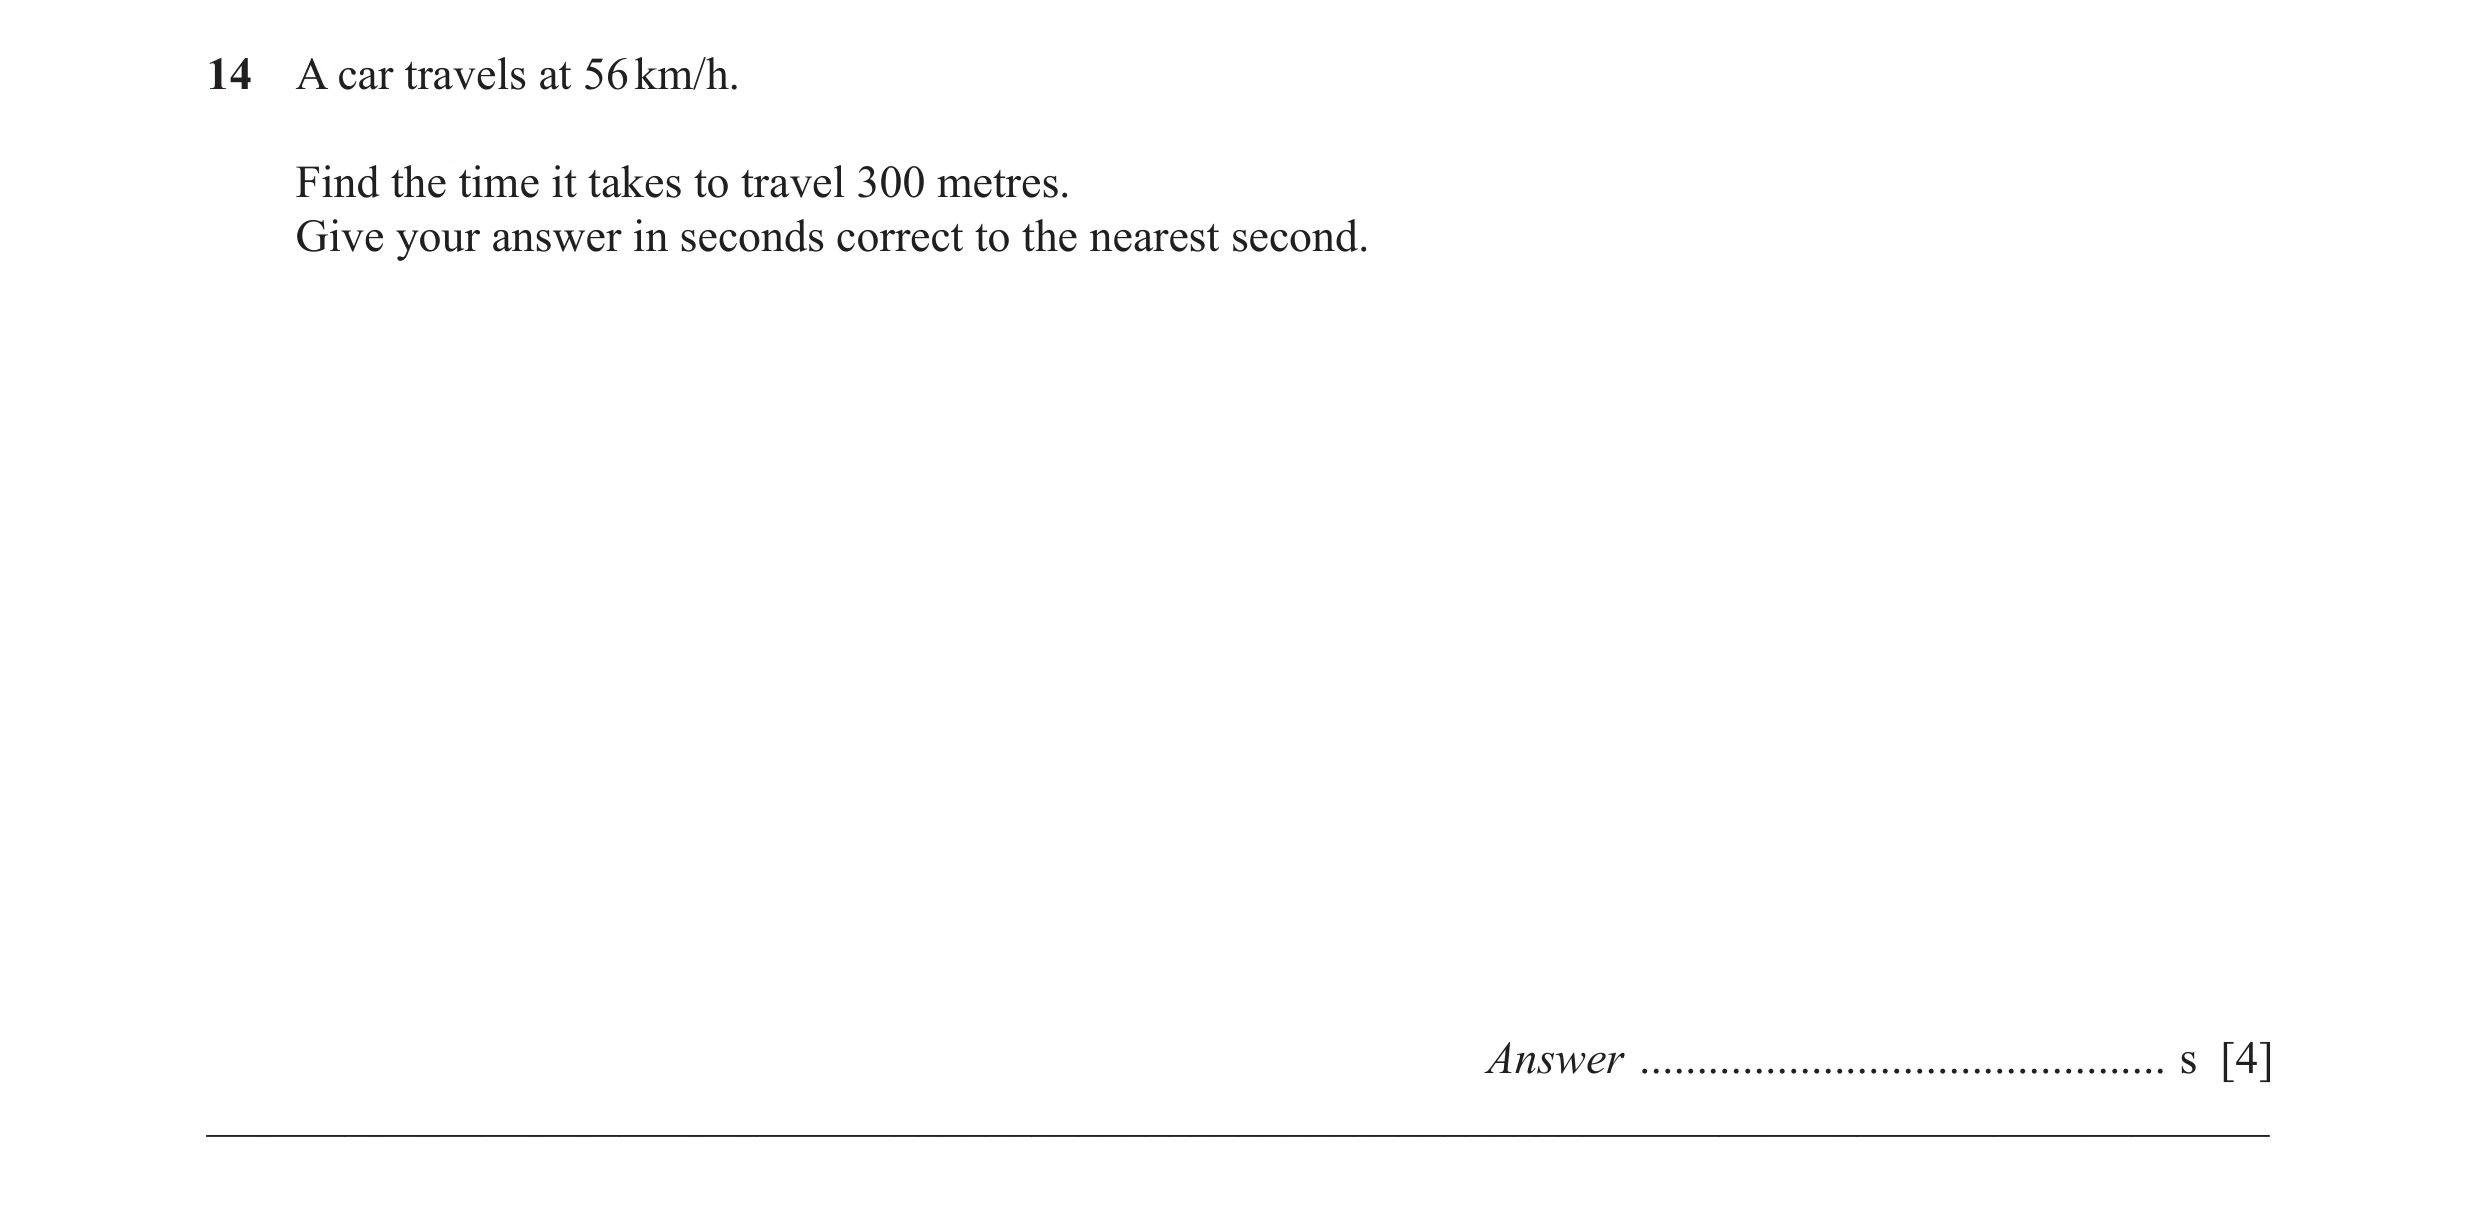
Q42 · A car travels at 56 km/h 0580/21 Oct/Nov 2015
14 A car travels at 56 km/h. Find the time it takes to travel 300 metres. Give your answer in seconds correct to the nearest second. Answer … s [4] __________________________________________________________________________________________
4 marks
Mark scheme: 14 & &
This question in 0580/21 Oct/Nov 2015
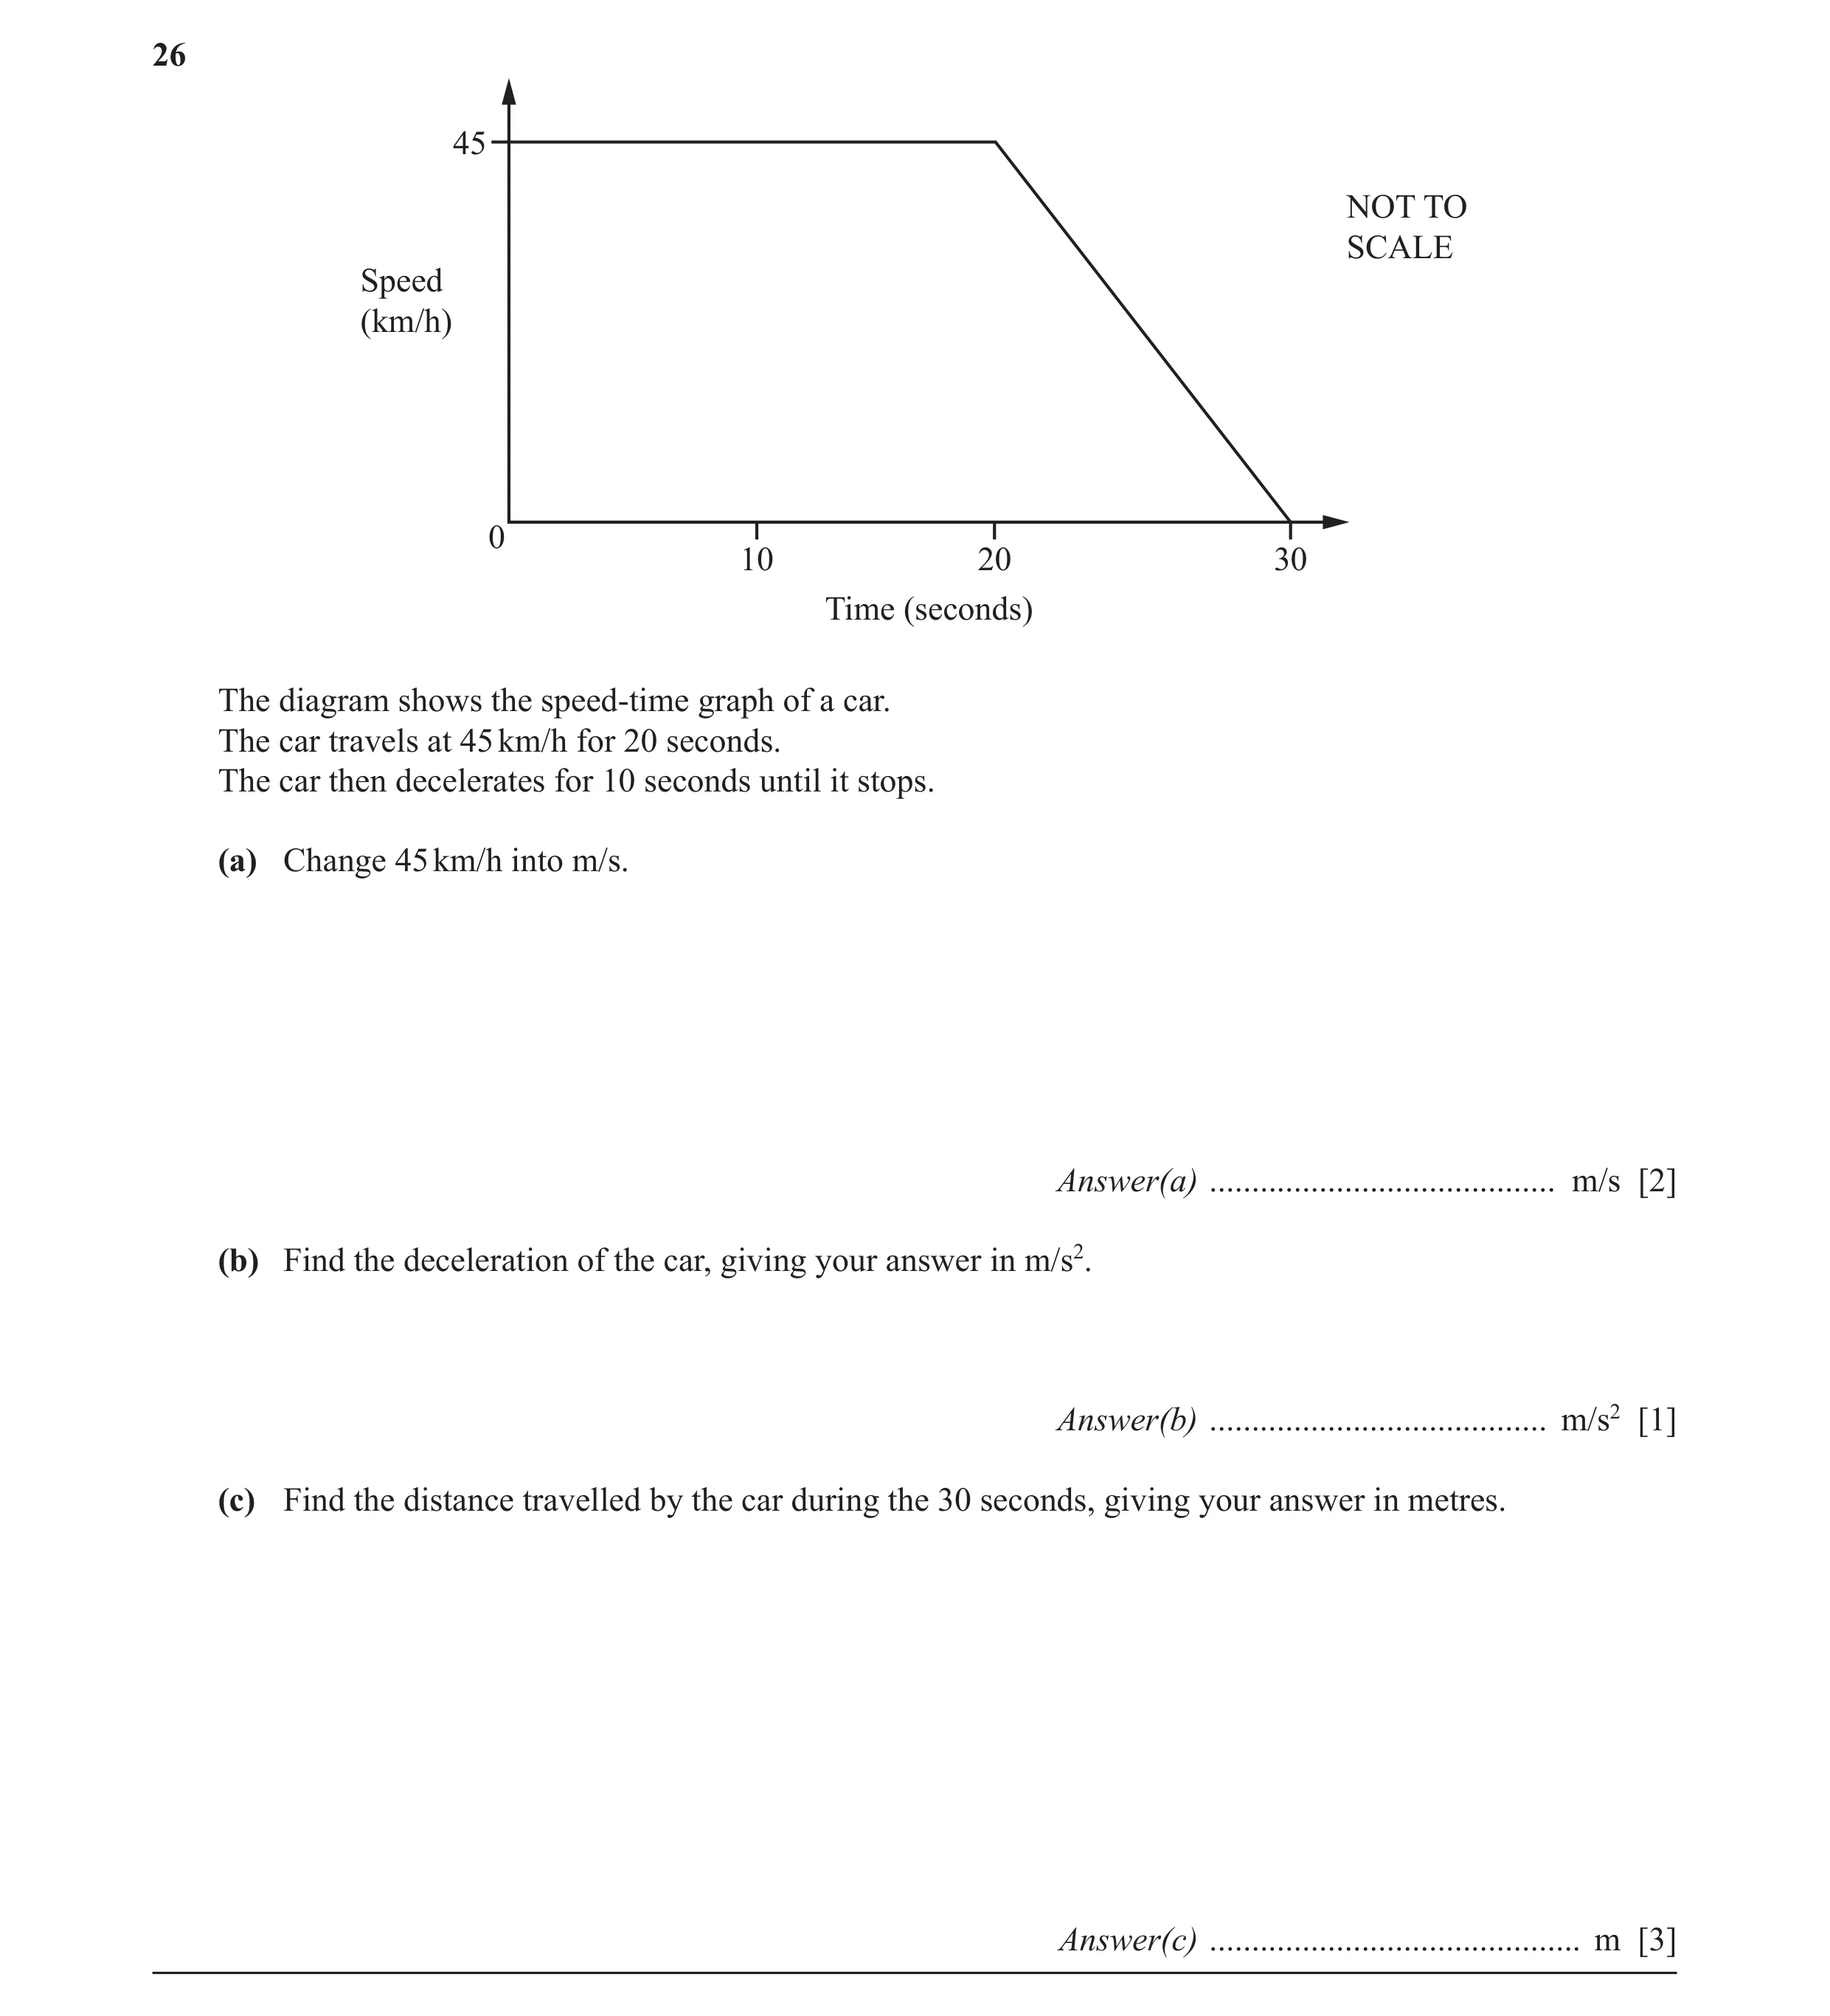
Q43 · 45 NOT TO SCALE Speed (km/h) 0 10 20 30 Time (seconds) The diagram shows the speed-time… 0580/23 Oct/Nov 2015
26 45 NOT TO SCALE Speed (km/h) 0 10 20 30 Time (seconds) The diagram shows the speed-time graph of a car. The car travels at 45 km/h for 20 seconds. The car then decelerates for 10 seconds until it stops. (a) Change 45 km/h into m/s. Answer(a) … m/s [2] (b) Find the deceleration of the car, giving your answer in m/s2. Answer(b) … m/s2 [1] (c) Find the distance travelled by the car during the 30 seconds, giving your answer in metres. Answer(c) … m [3]
6 marks
Mark scheme: 26 (a) 12.5 oe 2 M1 for 45 × 1000 ÷ 60 ÷ 60 oe (b) 1.25 oe 1FT FT their (a) ÷ 10 (c) 312.5 oe 3FT FT for 25 × their (a) M2 for 20 × their 12.5 + 0.5 × 10 × their 12.5 oe or M1 for one correct relevant area calculation or SC2 for final answer 1125
This question in 0580/23 Oct/Nov 2015
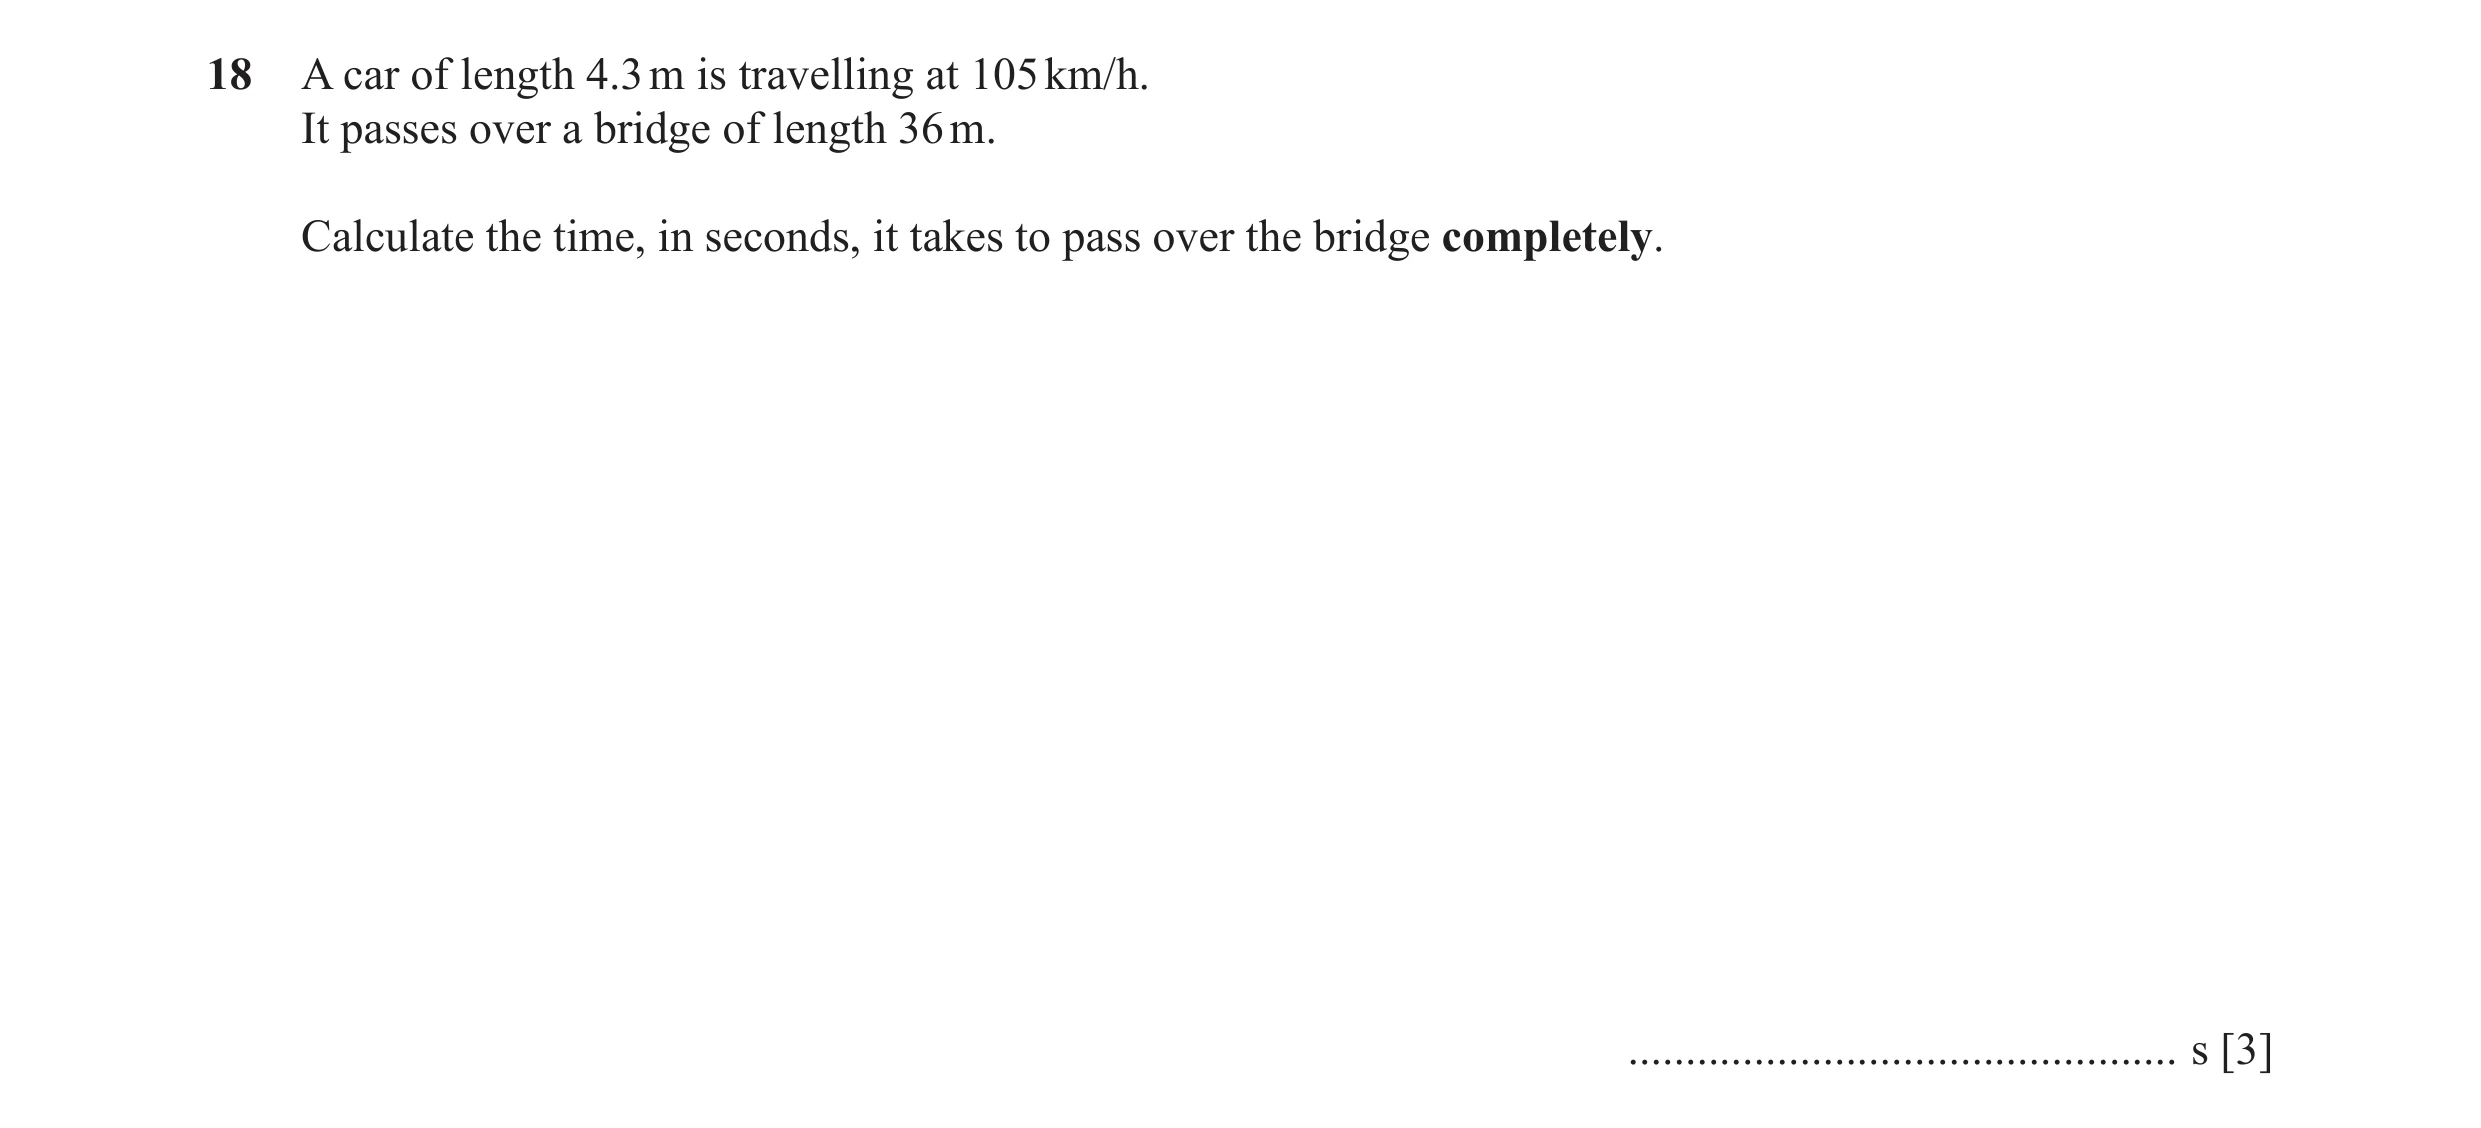
Q44 · A car of length 4.3 m is travelling at 105 km/h 0580/21 May/June 2016
18 A car of length 4.3 m is travelling at 105 km/h. It passes over a bridge of length 36 m. Calculate the time, in seconds, it takes to pass over the bridge completely. … s [3]
3 marks
Mark scheme: 1000 18 1.38 or 1.381 to 1.382 3 M2 for (36 + 4.3) ÷ (105 × ) oe 60 × 60 1000 or M1 for 105 × or for a distance ÷ a speed 60 × 60 or SC2 for answer 1.23(4...) 5 2 1 1 2 3
This question in 0580/21 May/June 2016
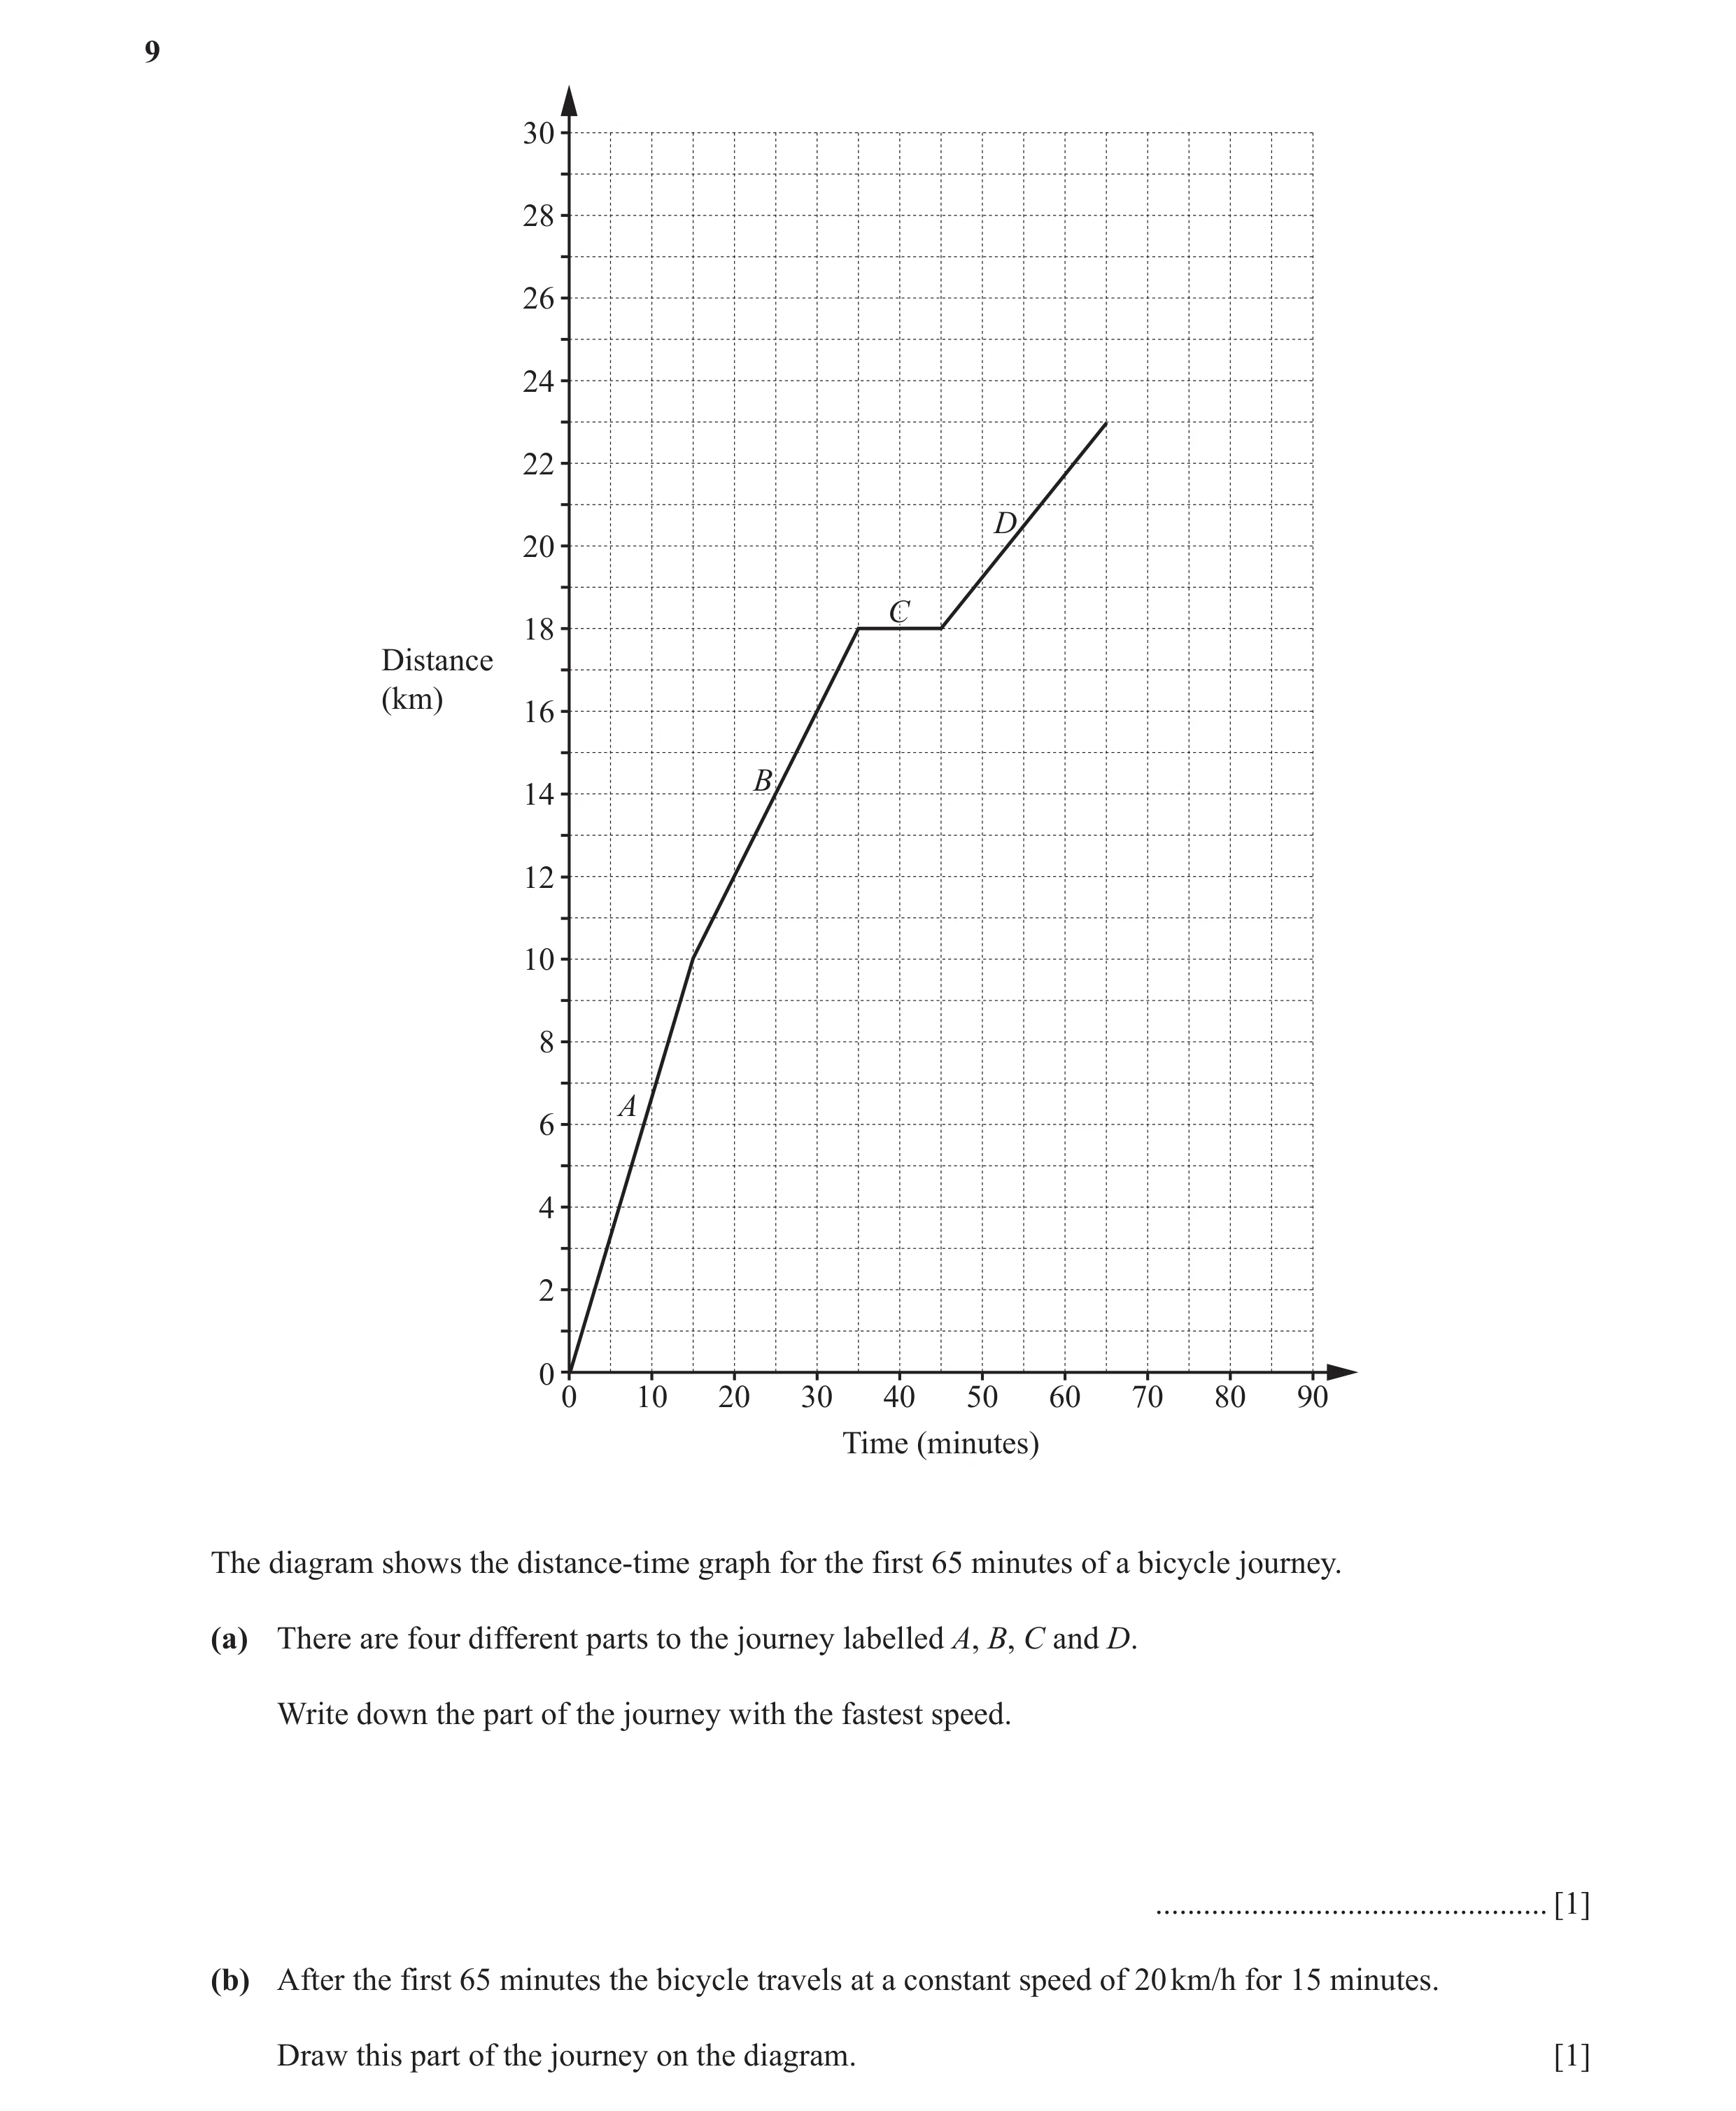
Q45 · 30 28 26 24 22 D 20 C 18 Distance (km) 16 B 14 12 10 8 A 6 4 2 0 0 10 20 30 40 50 60 70… 0580/23 Oct/Nov 2016
9 30 28 26 24 22 D 20 C 18 Distance (km) 16 B 14 12 10 8 A 6 4 2 0 0 10 20 30 40 50 60 70 80 90 Time (minutes) The diagram shows the distance-time graph for the first 65 minutes of a bicycle journey. (a) There are four different parts to the journey labelled A, B, C and D. Write down the part of the journey with the fastest speed. … [1] (b) After the first 65 minutes the bicycle travels at a constant speed of 20 km/h for 15 minutes. Draw this part of the journey on the diagram. [1]
2 marks
Mark scheme: 9 (a) A 1 (b) A ruled line joining (65, 23) to 1 (80, 28)
This question in 0580/23 Oct/Nov 2016
Q46 · The speed-time graph shows the first 60 seconds of a train journey 0580/22 Feb/March 2017
16 The speed-time graph shows the first 60 seconds of a train journey. 15 10 Speed (m/s) 5 0 0 20 40 60 Time (s) (a) Find the acceleration of the train. … m/s2 [1] (b) Calculate the distance the train has travelled in this time. Give your answer in kilometres. … km [3]
4 marks
Mark scheme: 16 (a) 1 1 0.25 or 4 (b) 0.45 3 B2 for 4550 or 1 M2 for × 60 × 15 ÷÷ 1000 22 1 or M1 foor × 60 × 115 2 If 0 scoreed SC1 for ccorrect conveersion of their disttance in metrres to kilomeetres
This question in 0580/22 Feb/March 2017
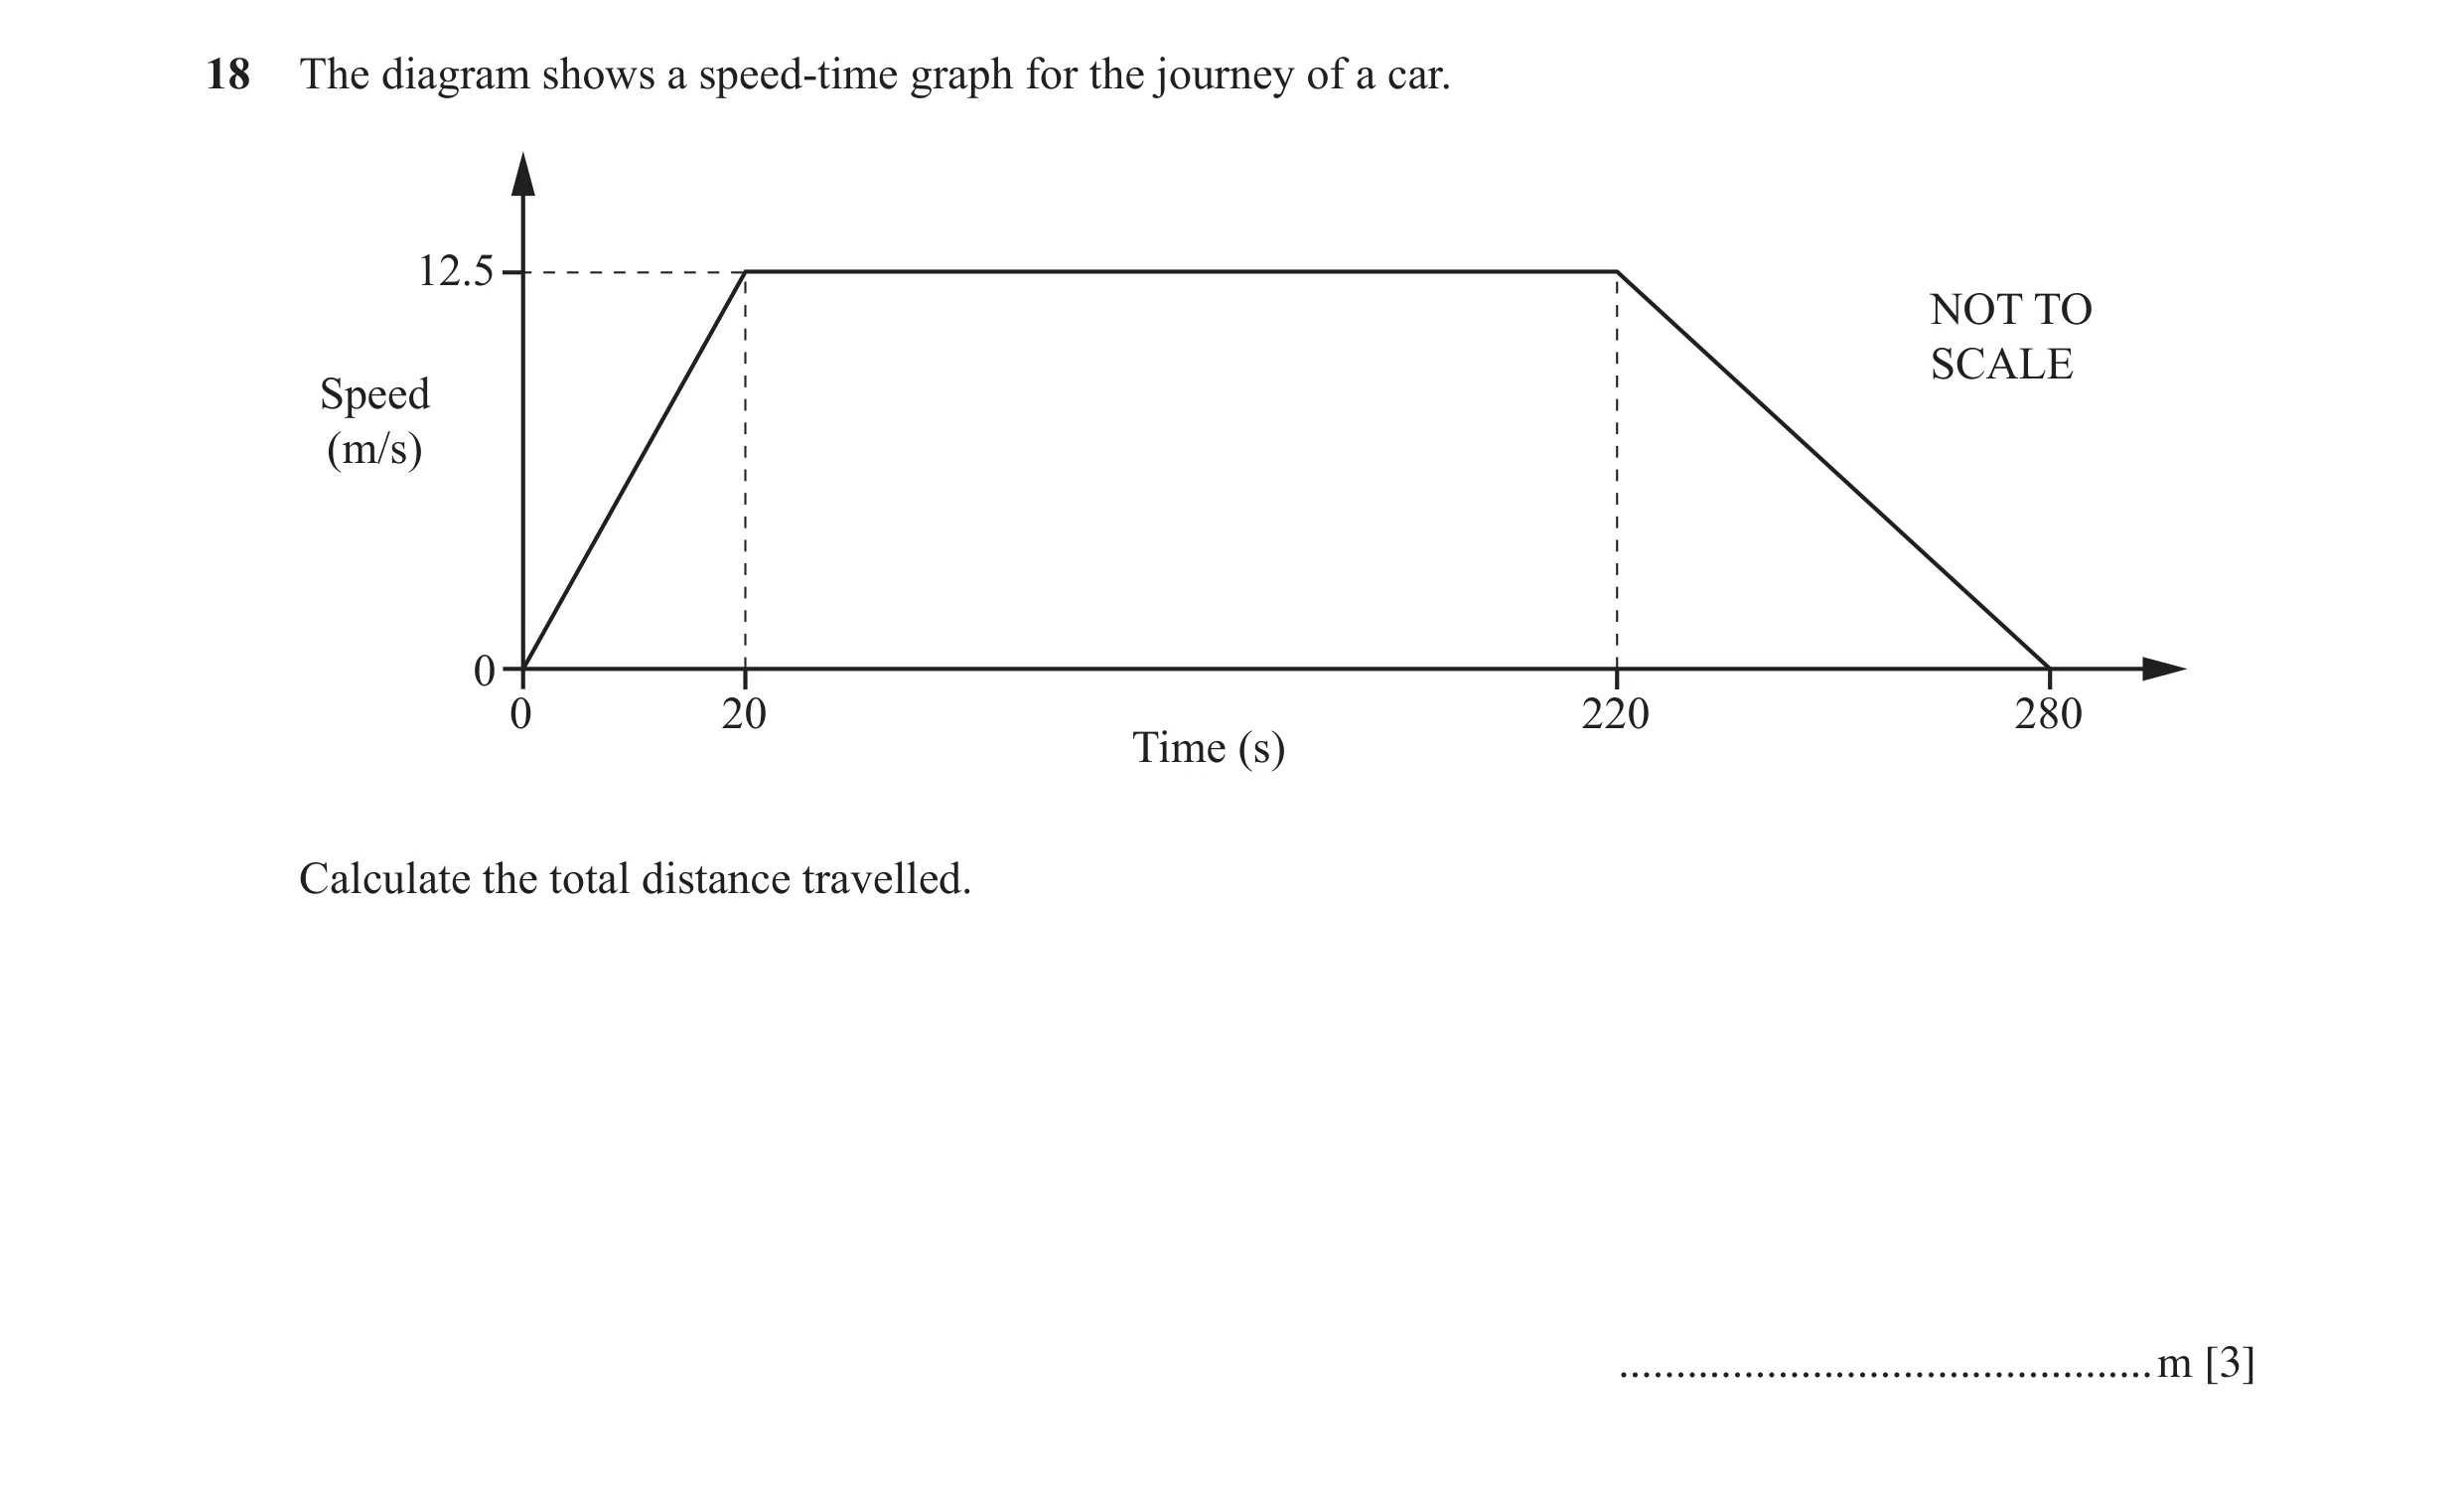
Q47 · The diagram shows a speed-time graph for the journey of a car 0580/23 May/June 2017
18 The diagram shows a speed-time graph for the journey of a car. 12.5 NOT TO SCALE Speed (m/s) 0 0 20 220 280 Time (s) Calculate the total distance travelled. … m [3]
3 marks
Mark scheme: 18 3000 3 1 M2 for 12.5 × ( 200 + 280 ) oe 2 or M1 for part area
This question in 0580/23 May/June 2017
Q48 · Amar cycles at a speed of 18 km/h 0580/22 Oct/Nov 2017
8 Amar cycles at a speed of 18 km/h. It takes him 55 minutes to cycle between two villages. Calculate the distance between the two villages. … km [2]
2 marks
Mark scheme: 8 16.5 2 55 M1 for 60 or speed × time (numerical)
This question in 0580/22 Oct/Nov 2017
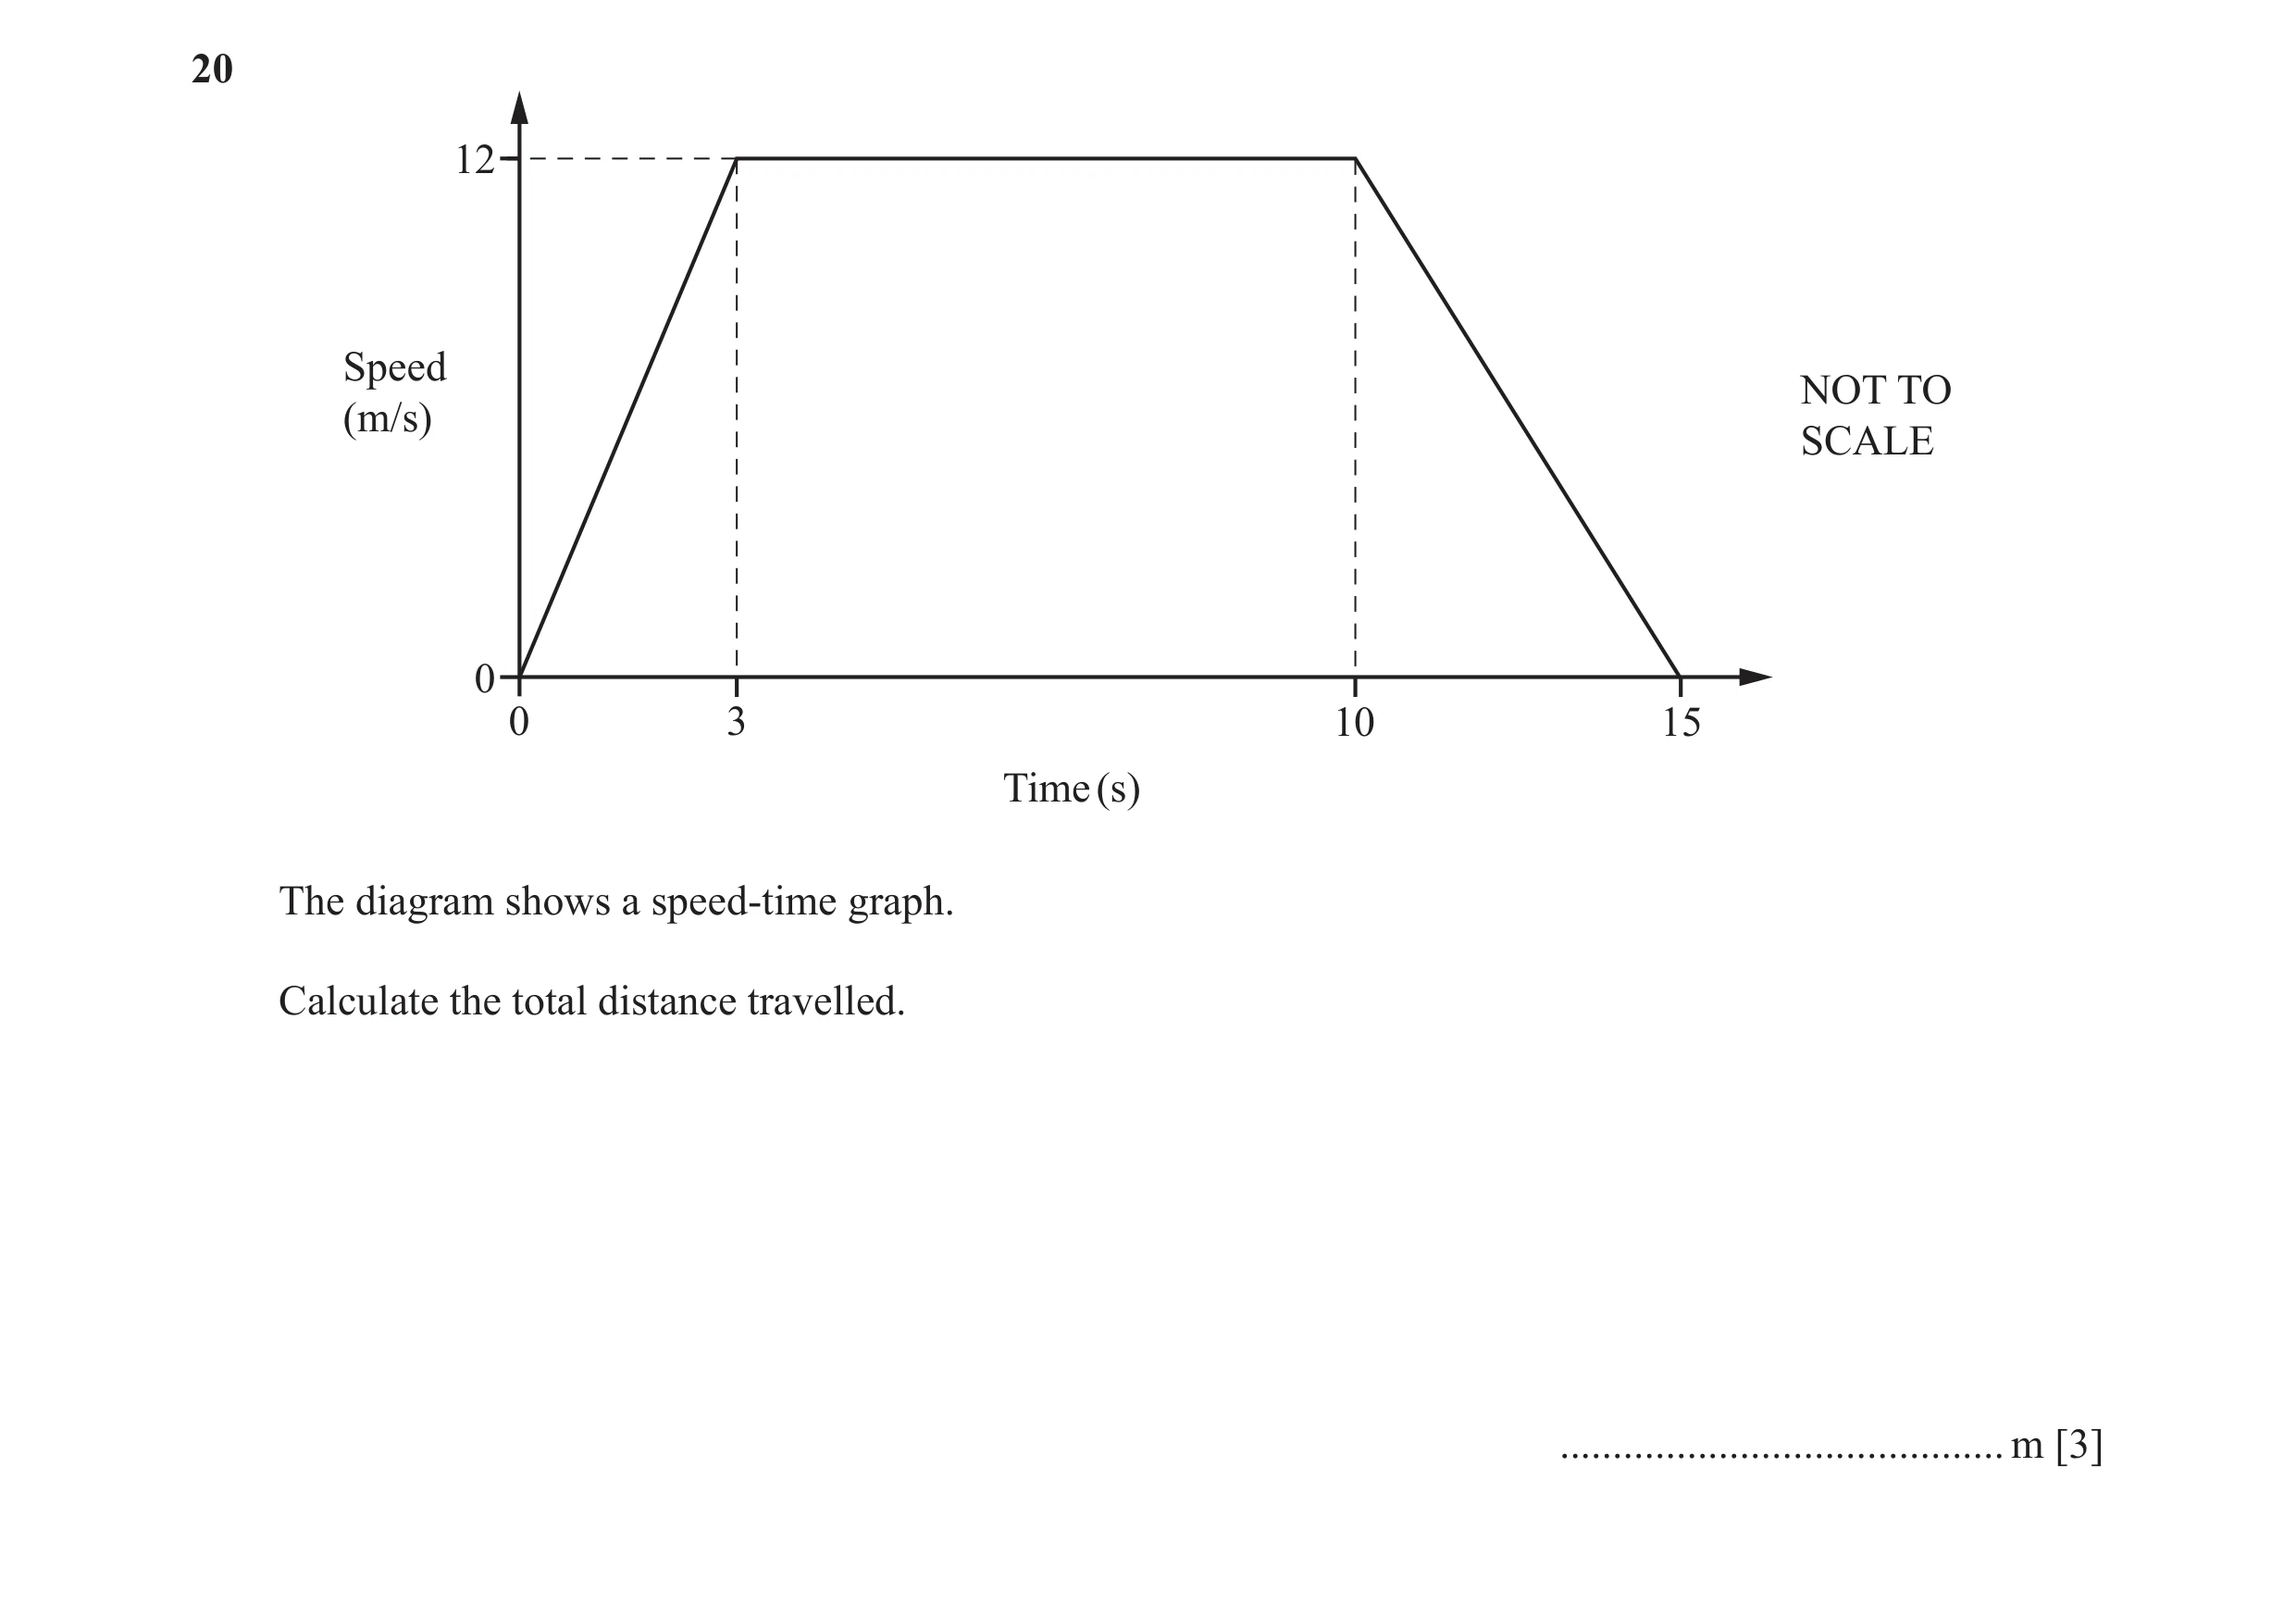
Q49 · 12 Speed NOT TO (m/s) SCALE 0 0 3 10 15 Time (s) The diagram shows a speed-time graph 0580/22 Oct/Nov 2017
20 12 Speed NOT TO (m/s) SCALE 0 0 3 10 15 Time (s) The diagram shows a speed-time graph. Calculate the total distance travelled. … m [3]
3 marks
Mark scheme: 20 132 3 1 M2 for (7 + 15) ×12 2 or M1 for any correct area
This question in 0580/22 Oct/Nov 2017
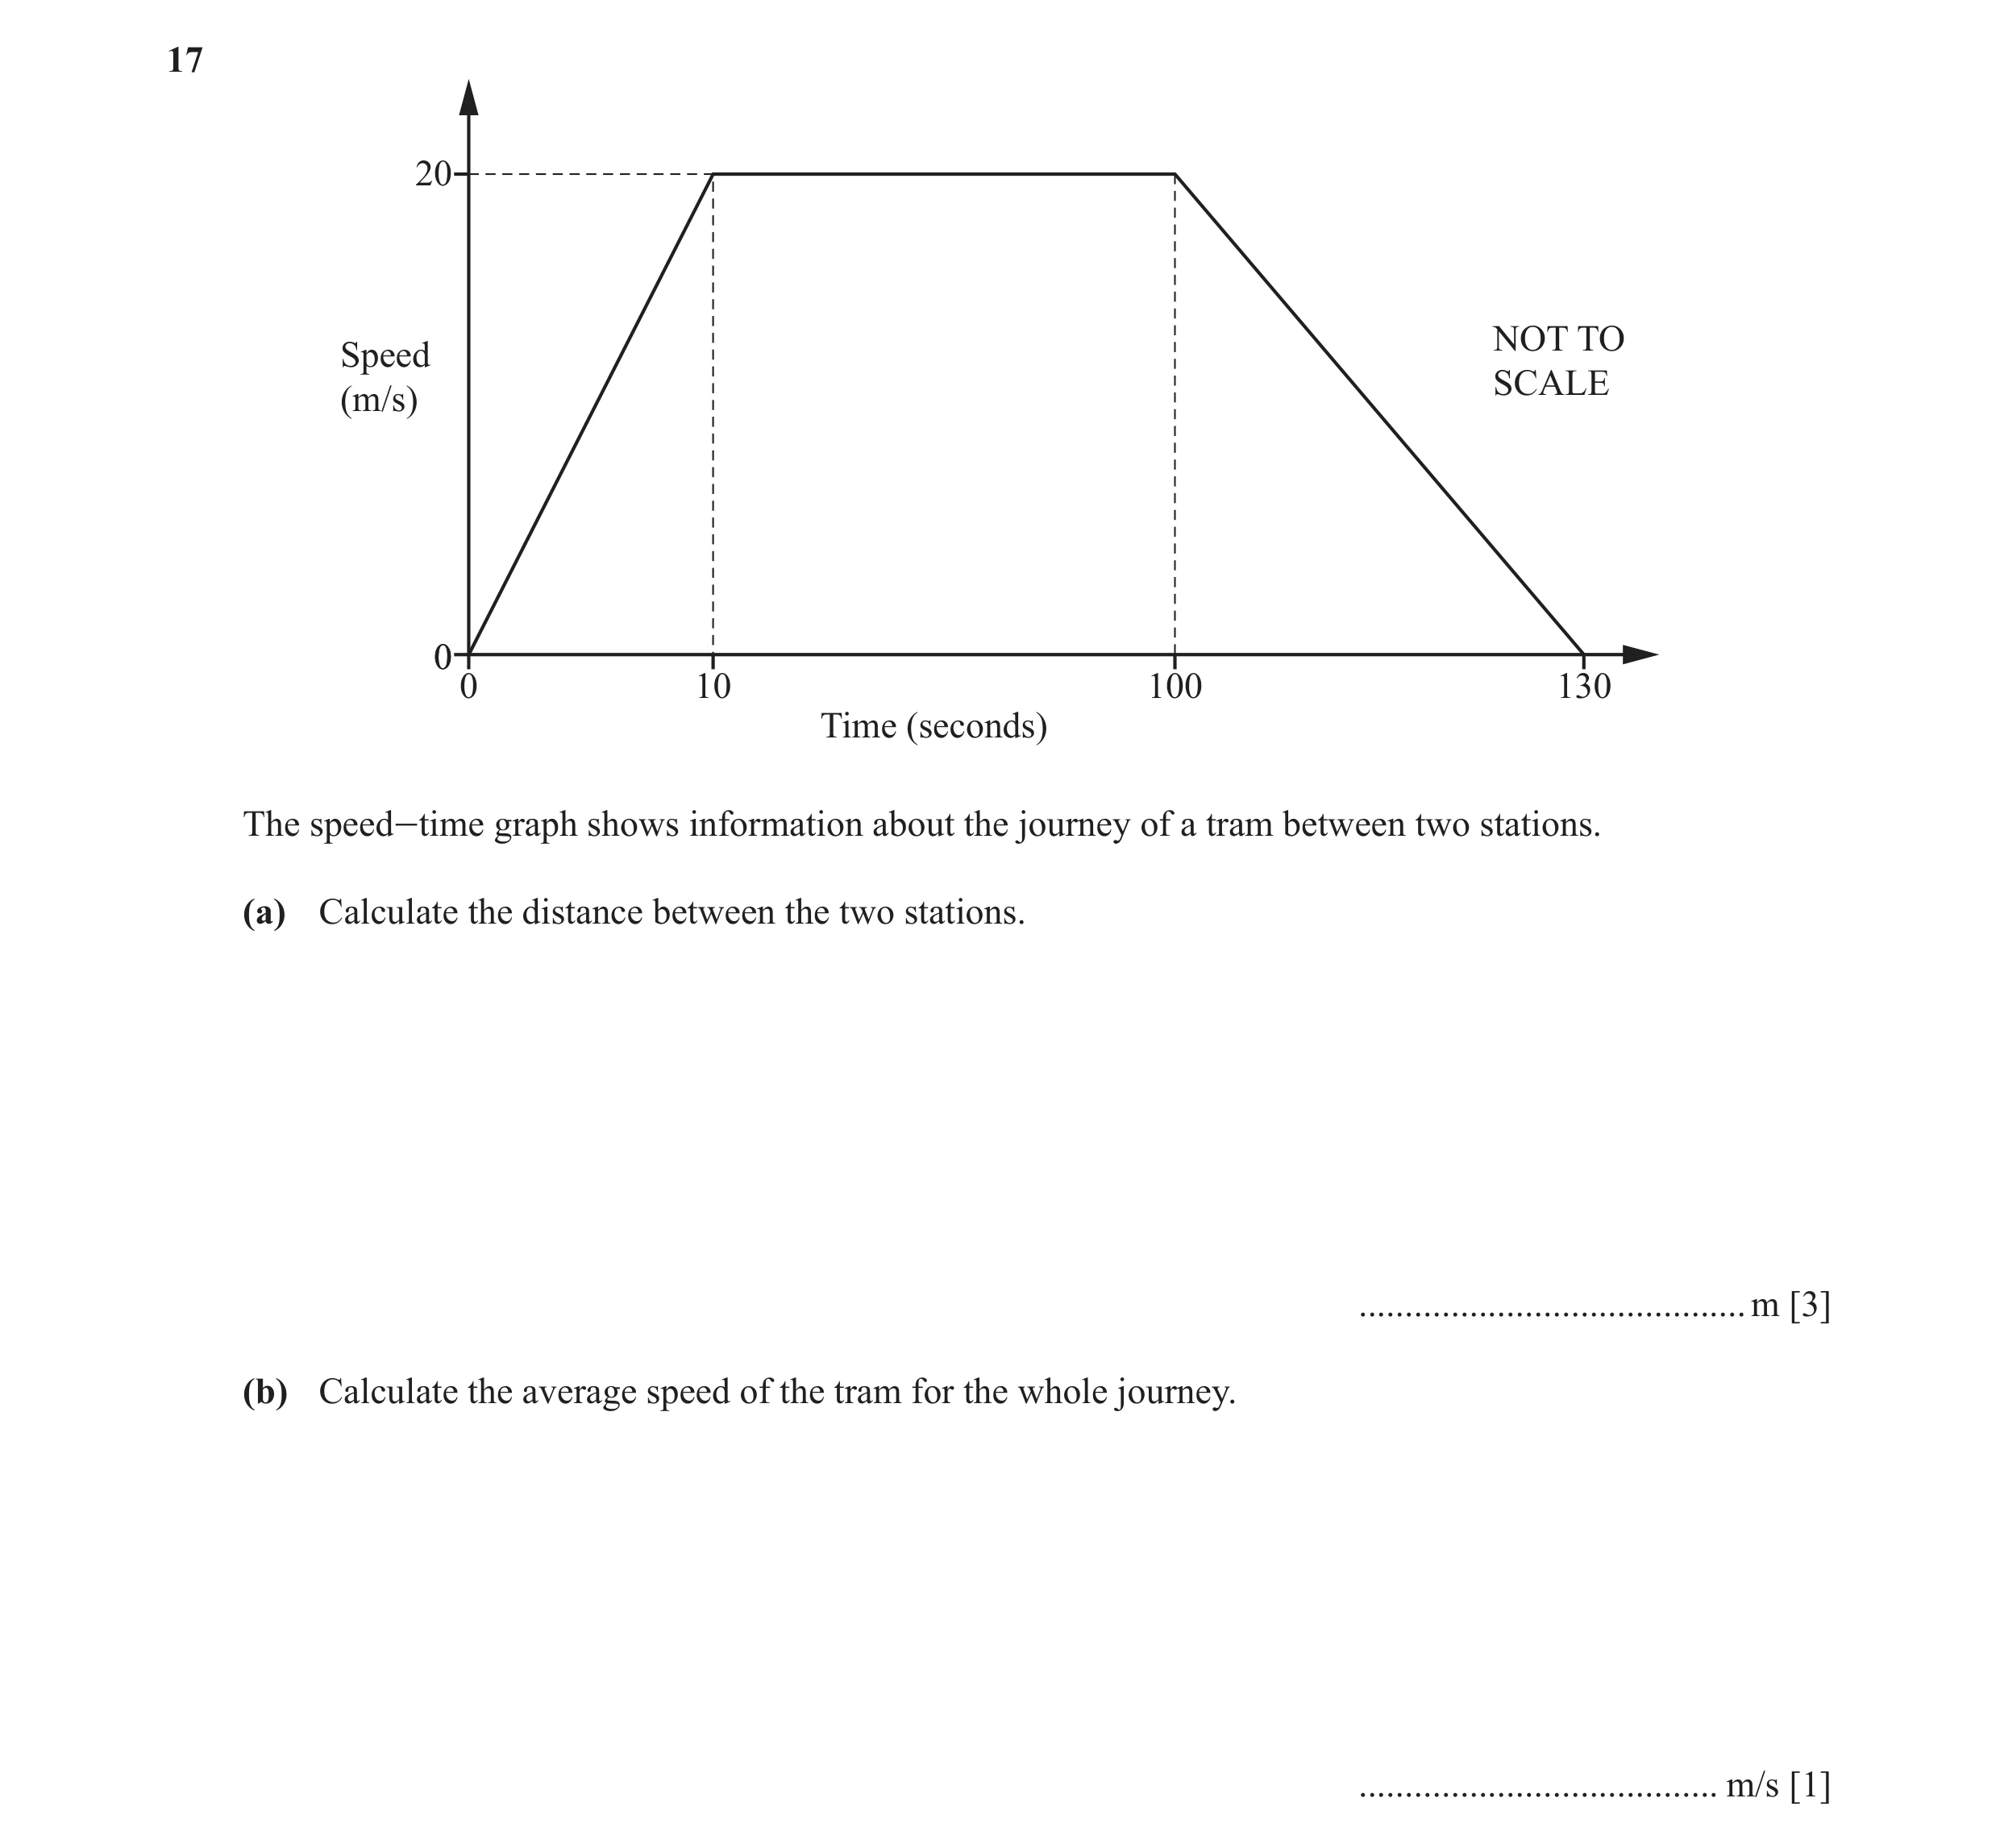
Q50 · 20 NOT TO Speed SCALE (m/s) 0 0 10 100 130 Time (seconds) The speed-time graph shows… 0580/21 May/June 2018
17 20 NOT TO Speed SCALE (m/s) 0 0 10 100 130 Time (seconds) The speed-time graph shows information about the journey of a tram between two stations. (a) Calculate the distance between the two stations. … m [3] (b) Calculate the average speed of the tram for the whole journey. … m/s [1]
4 marks
Mark scheme: 17(a) 2200 3 M2 for 12 ( 90 + 130 ) × 20 or 1 2 (10 × 20) + (90 × 20) + 12 (30 × 20) or M1 for one area 17(b) 16.9 or 16.92… 1 FT their (a) ÷ 130
This question in 0580/21 May/June 2018
Q51 · The diagram shows information about the first 8 seconds of a car journey 0580/22 May/June 2018
17 The diagram shows information about the first 8 seconds of a car journey. v NOT TO SCALE Speed (m/s) 0 0 6 8 Time (seconds) The car travels with constant acceleration reaching a speed of v m/s after 6 seconds. The car then travels at a constant speed of v m/s for a further 2 seconds. The car travels a total distance of 150 metres. Work out the value of v. v = … [3]
3 marks
Mark scheme: 17 30 3 M2 for ½ (8 + 2) × v [ = 150] oe or M1 for ½ × 6 × v or 2 × v oe
This question in 0580/22 May/June 2018
Q52 · Liz takes 65 seconds to run 400 m 0580/23 May/June 2018
3 Liz takes 65 seconds to run 400 m. Calculate her average speed. … m/s [1]
1 marks
Mark scheme: 3 6.15 or 6.153 to 6.154 or 1 2 6 13
This question in 0580/23 May/June 2018
Q53 · 90 NOT TO SCALE Speed (km/h) 0 0 40 60 Time (seconds) The diagram shows the speed–time… 0580/23 May/June 2018
24 90 NOT TO SCALE Speed (km/h) 0 0 40 60 Time (seconds) The diagram shows the speed–time graph for 60 seconds of a car journey. (a) Change 90 km/h to m/s. … m/s [2] (b) Find the deceleration of the car in m/s2. … m/s2 [1] (c) Find the distance travelled, in metres, in the 60 seconds. … m [2]
5 marks
Mark scheme: 24(a) 25 2 90 × 1000 M1 for oe 60 × 60 24(b) 1.25 1 their (a) FT correctly evaluated 20 24(c) 1250 2 2FT for their (a) × 50 correctly evaluated or M1 for one area e.g. ½(40 + 60) × 25, 25 × 40, ½ × 25 × 20 ½(40 + 60) × 90, 90 × 40, ½ × 90 × 20 ½(40 + 60) × their 25, their 25 × 40, ½ × their 25 × 20
This question in 0580/23 May/June 2018
Q54 · North B NOT TO SCALE A The bearing of A from B is 227° 0580/21 Oct/Nov 2018
6 North B NOT TO SCALE A The bearing of A from B is 227°. Find the bearing of B from A. … [2]
2 marks
Mark scheme: 6 [0]47 2 B1 for 133 or 47 seen or M1 for 227 – 180 oe
This question in 0580/21 Oct/Nov 2018
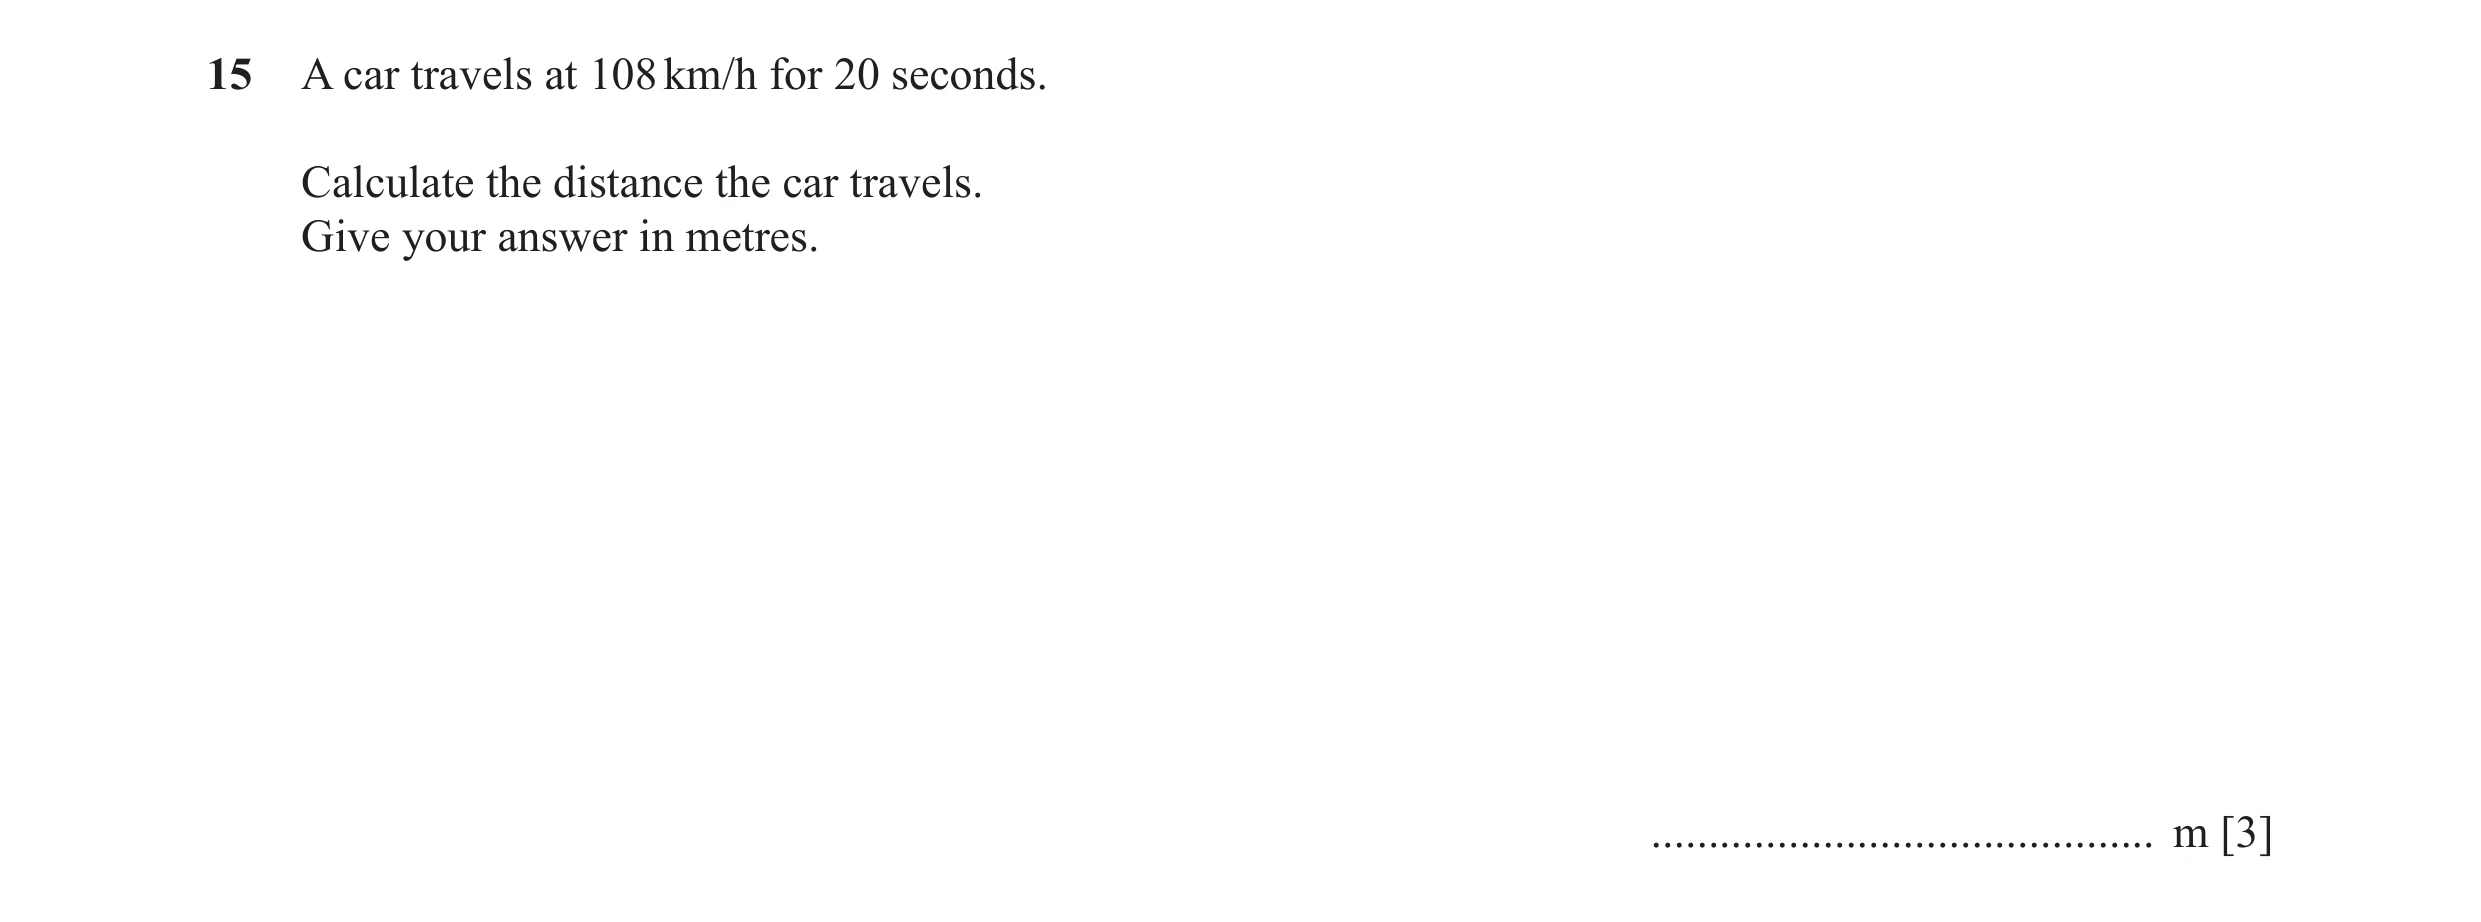
Q55 · A car travels at 108 km/h for 20 seconds 0580/23 Oct/Nov 2018
15 A car travels at 108 km/h for 20 seconds. Calculate the distance the car travels. Give your answer in metres. … m [3]
3 marks
Mark scheme: 15 600 3 108 × 1000 × 20 M2 for oe 60 × 60 108 × 1000 or M1 for oe 60 × 60 or for figs108 × time oe
This question in 0580/23 Oct/Nov 2018
Q56 · 12 NOT TO Speed SCALE (m/s) 0 0 10 T Time (seconds) The diagram shows the speed−time… 0580/23 Oct/Nov 2018
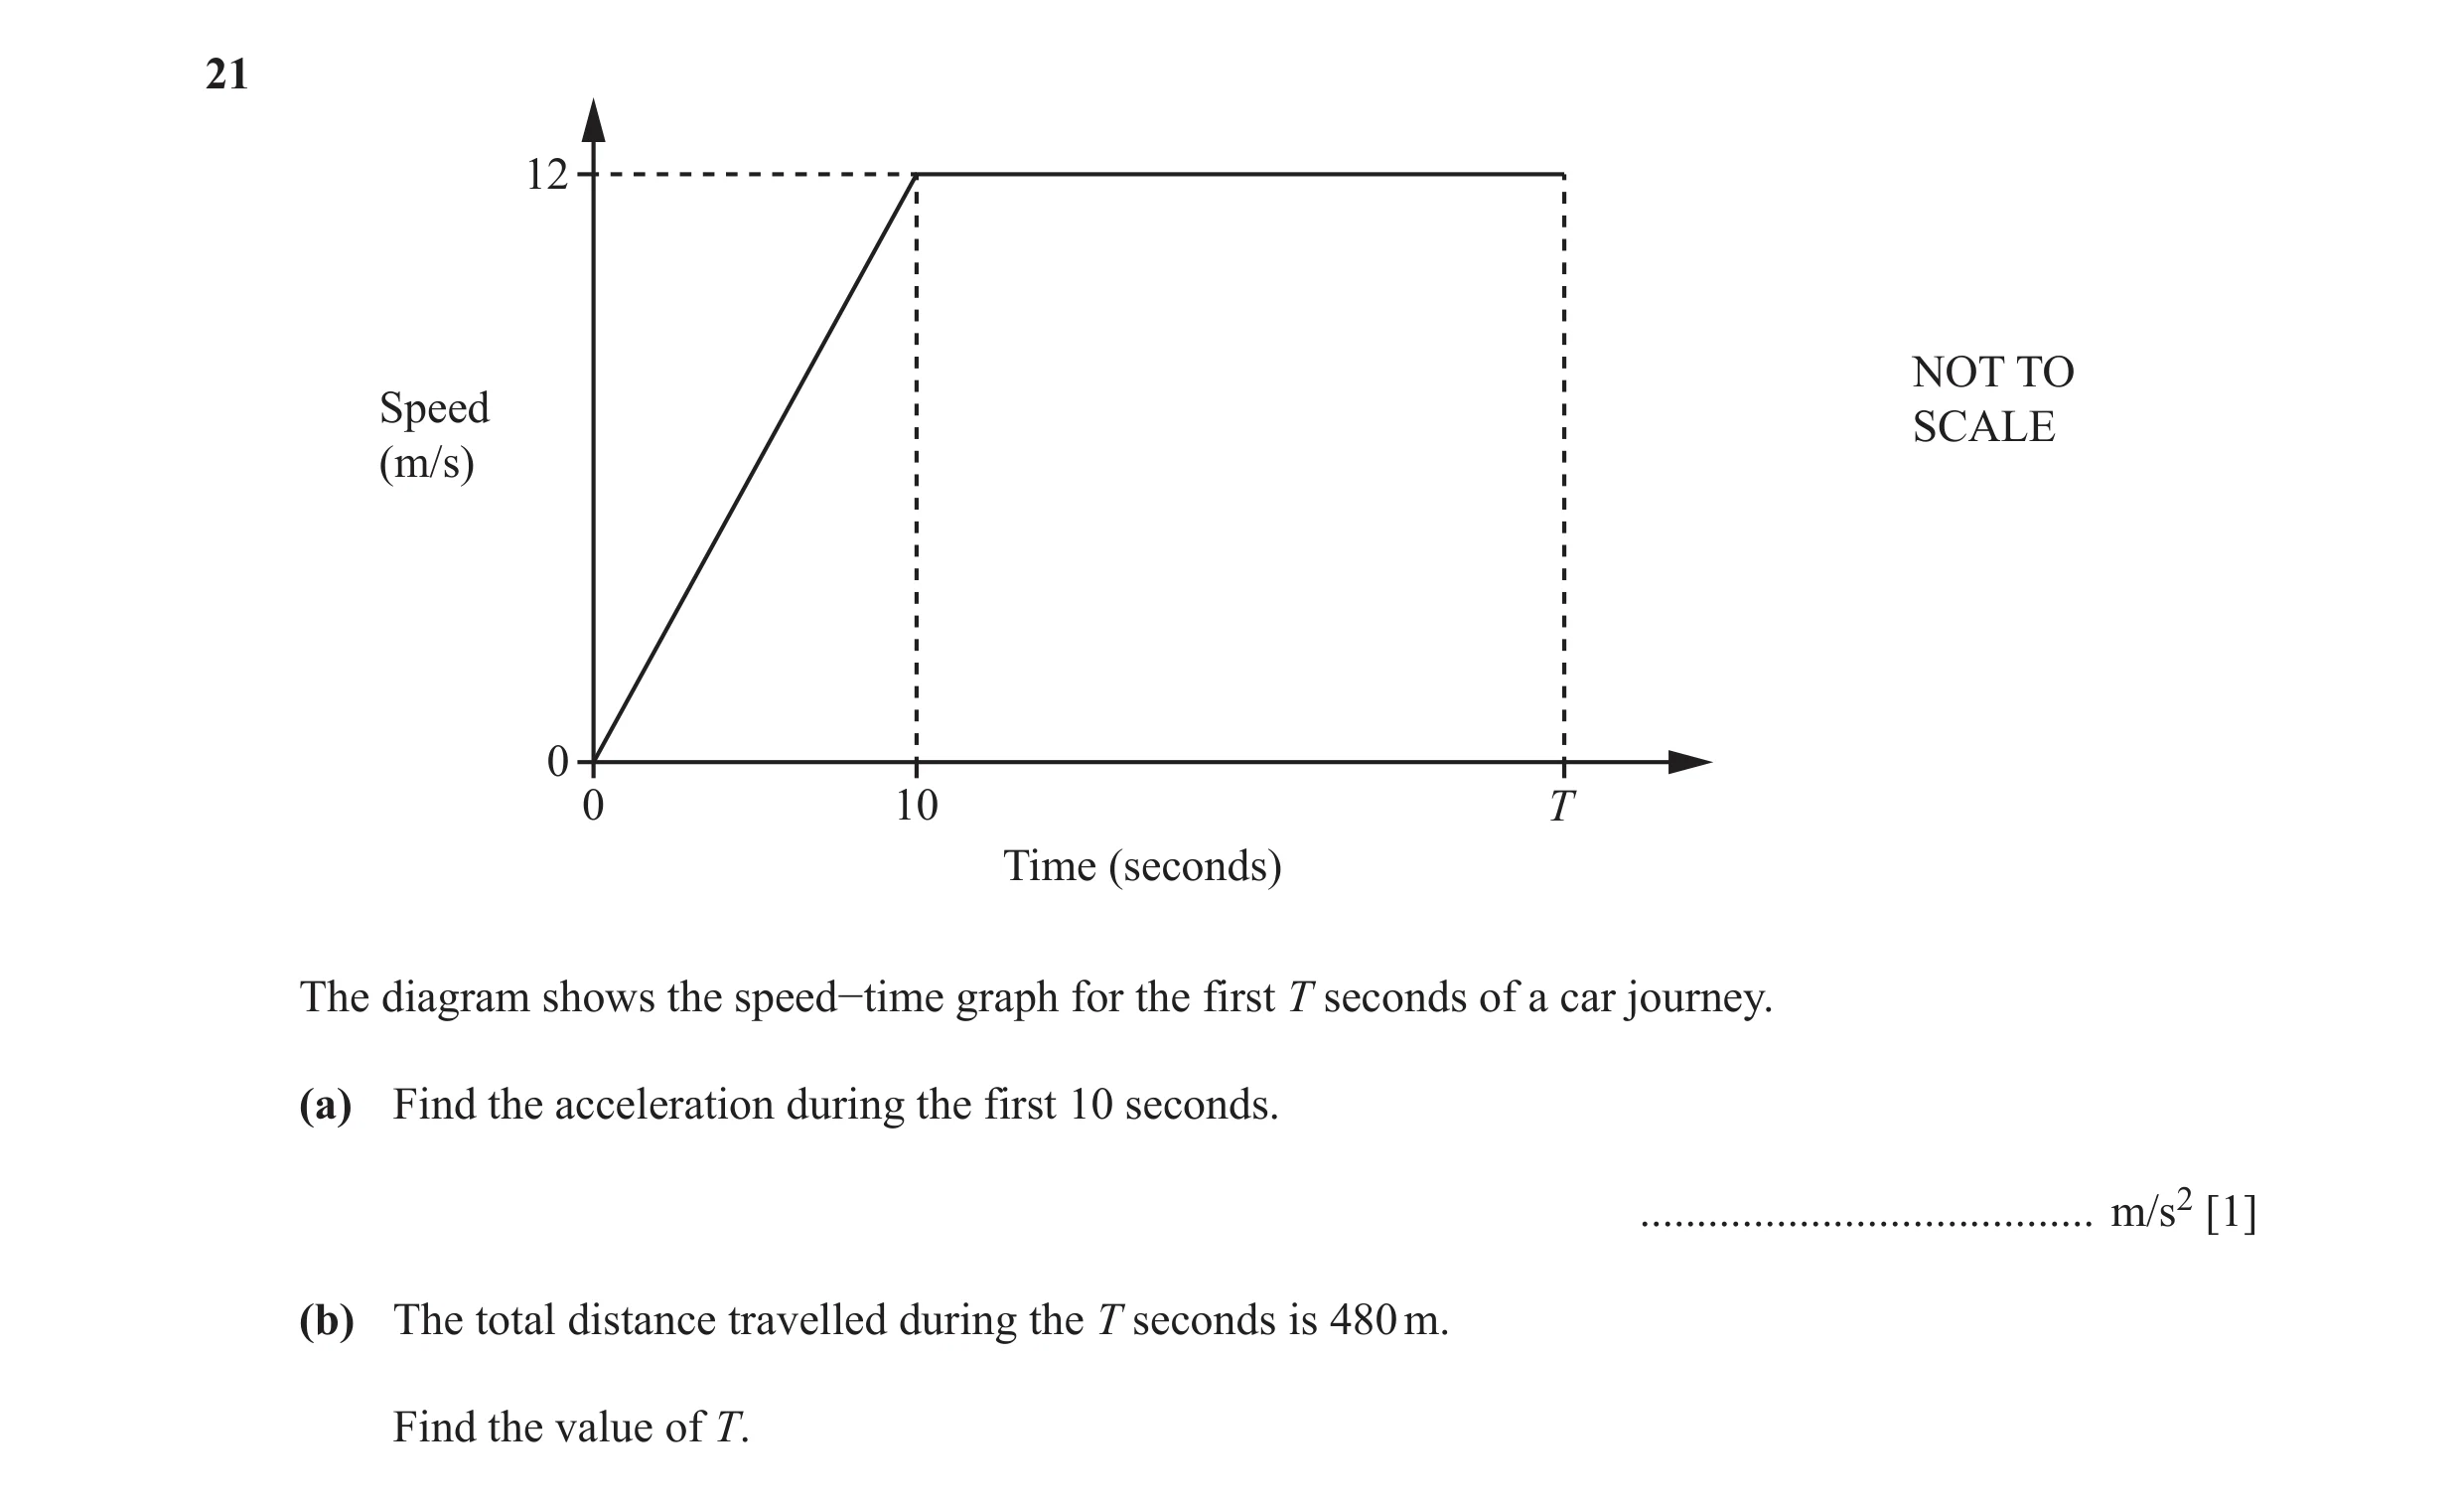
21 12 NOT TO Speed SCALE (m/s) 0 0 10 T Time (seconds) The diagram shows the speed−time graph for the first T seconds of a car journey. (a) Find the acceleration during the first 10 seconds. … m/s2 [1] (b) The total distance travelled during the T seconds is 480 m. Find the value of T.
4 marks
Mark scheme: 21(a) 1.2 1 21(b) 45 3 1 M2 for × 10 × 12 + 12(T − 10)[ = 480] oe 2 or M1 for one relevant area OR 1 M1 for 480 − ×10×12 implied by 420 2 420 M1 for [+ 10] 12
This question in 0580/23 Oct/Nov 2018
Q57 · 25 NOT TO Speed SCALE (m/s) 0 0 15 50 Time (s) The speed–time graph shows the first 50… 0580/22 Feb/March 2019
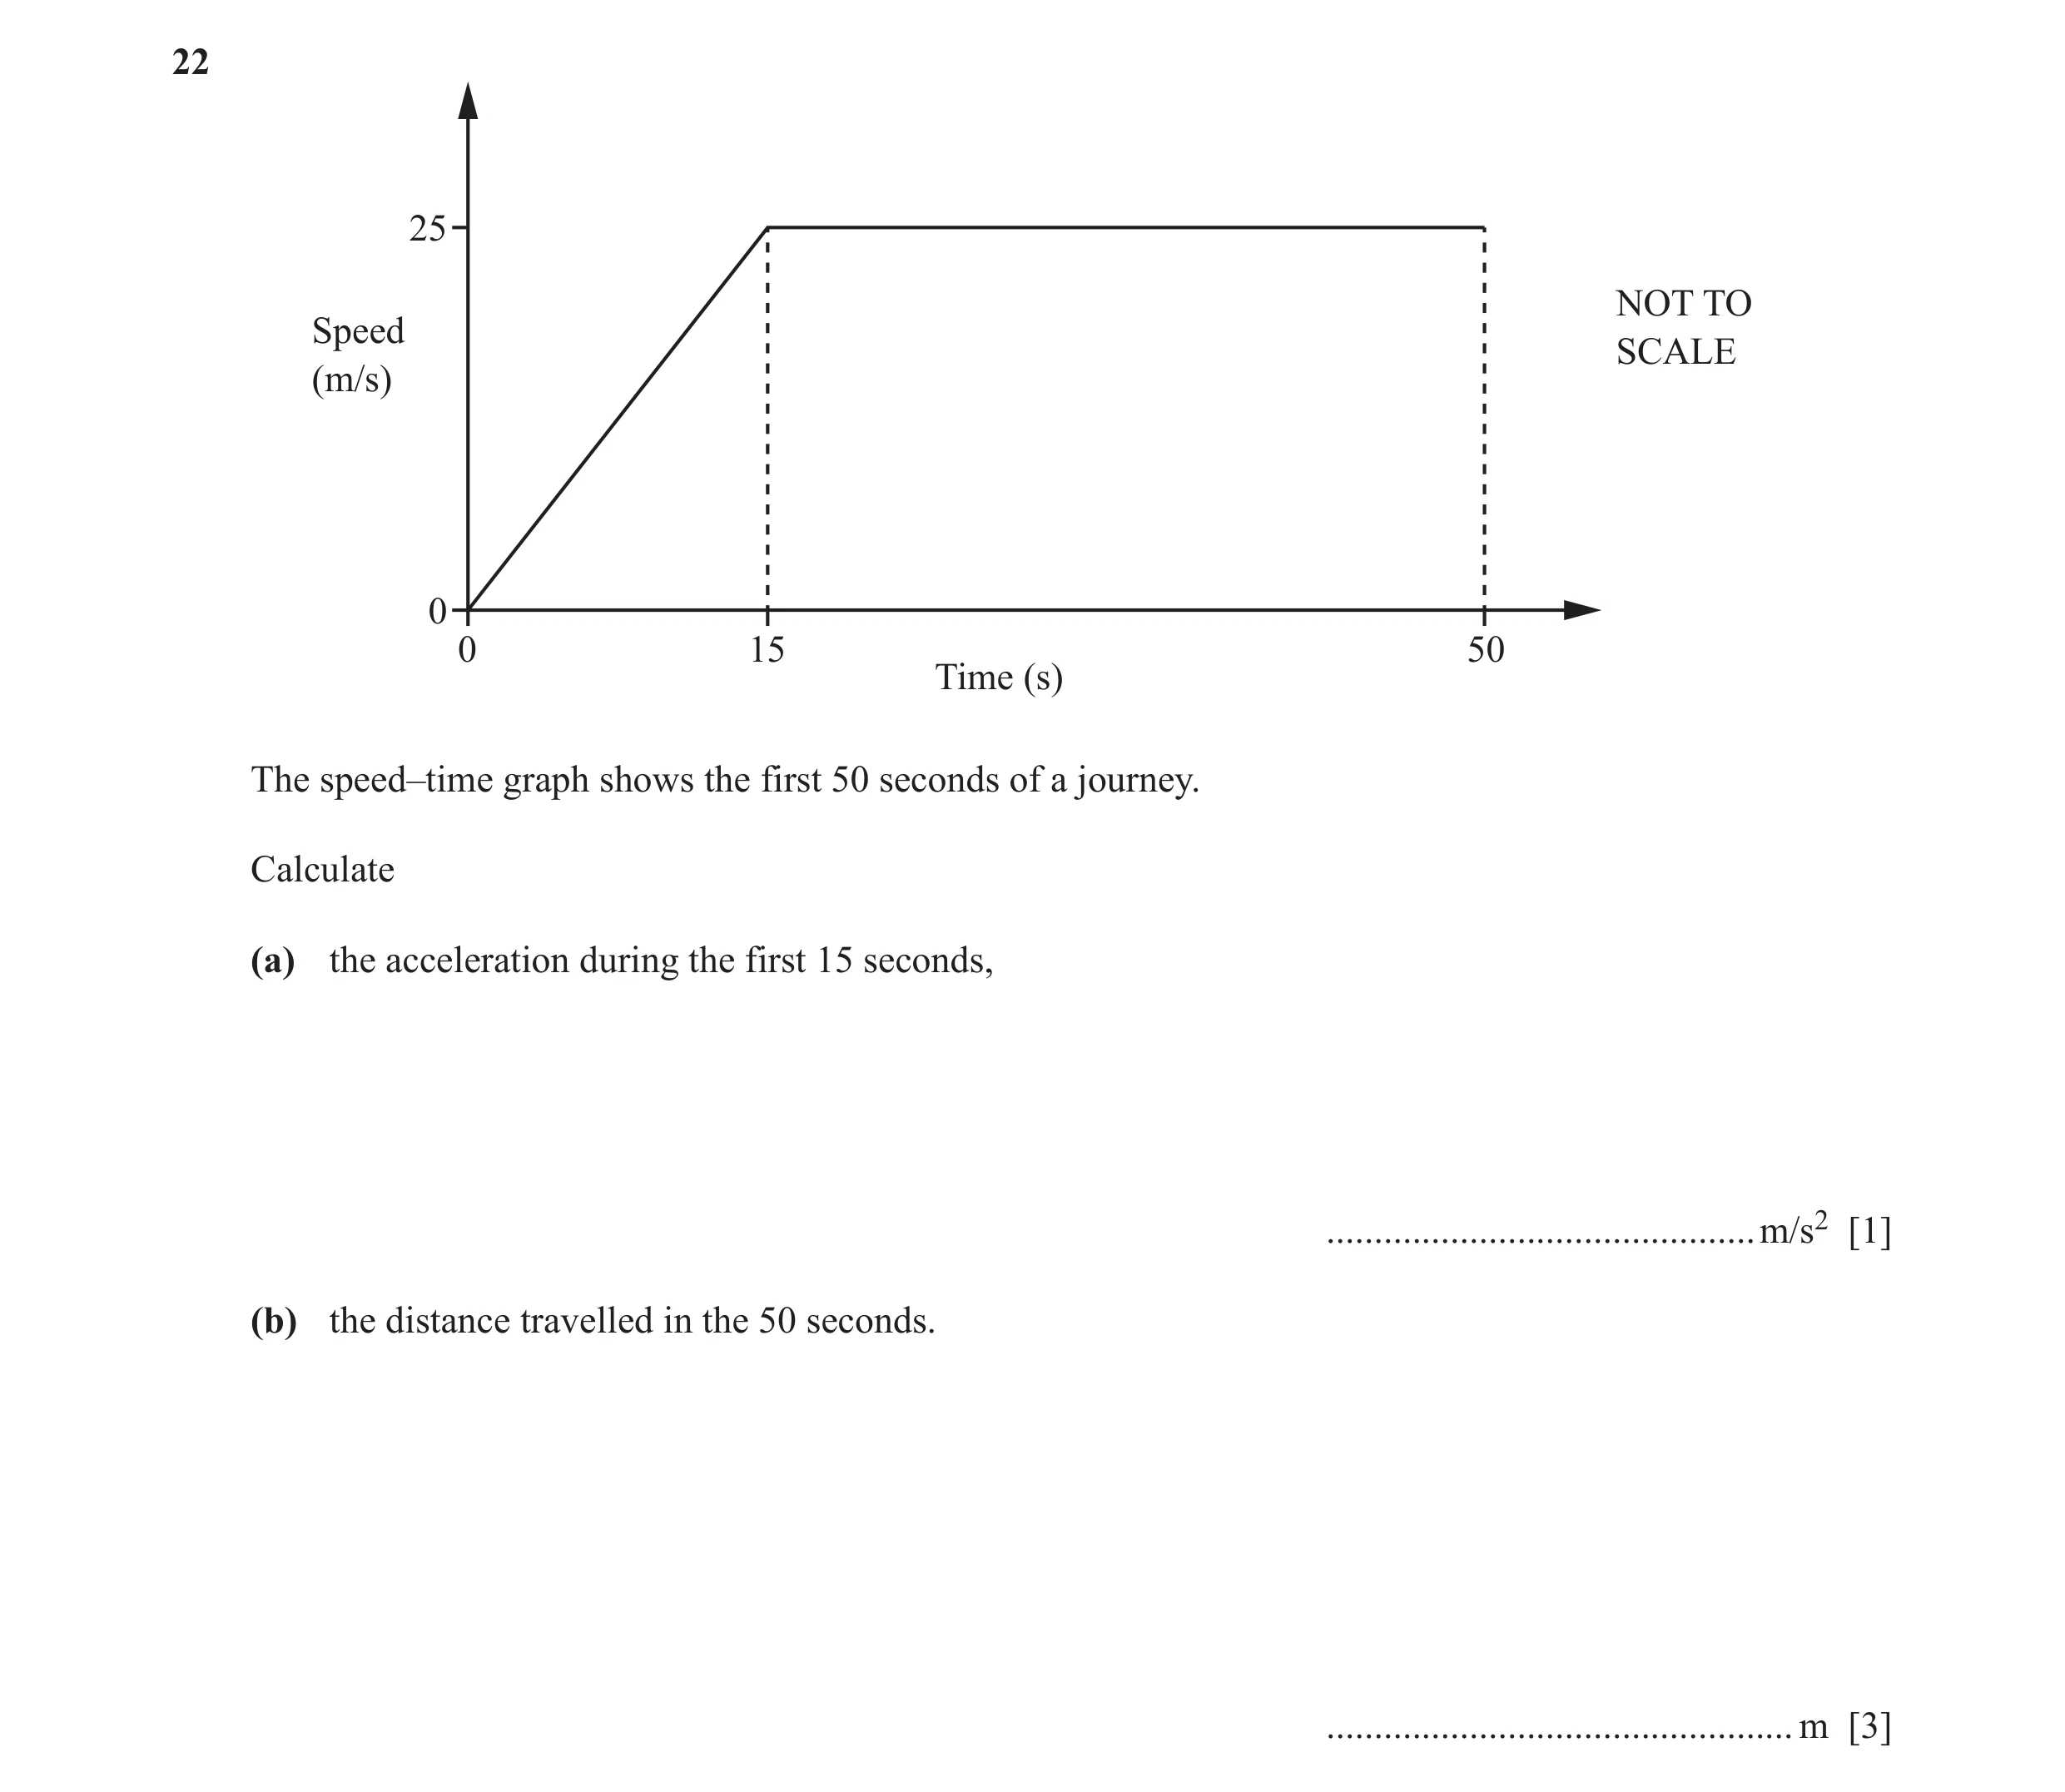
22 25 NOT TO Speed SCALE (m/s) 0 0 15 50 Time (s) The speed–time graph shows the first 50 seconds of a journey. Calculate (a) the acceleration during the first 15 seconds, … m/s2 [1] (b) the distance travelled in the 50 seconds. … m [3]
4 marks
Mark scheme: 22(a) 2 1 13 or 1.67 or 1.666 to 1.667 22(b) 1062.5 3 25 M2 for ( 50 + 35 ) oe 2 or M1 for one area
This question in 0580/22 Feb/March 2019
Q58 · 20 NOT TO Speed SCALE (m/s) 0 0 60 70 Time (seconds) The diagram shows information about… 0580/21 May/June 2019
24 20 NOT TO Speed SCALE (m/s) 0 0 60 70 Time (seconds) The diagram shows information about the final 70 seconds of a car journey. (a) Find the deceleration of the car between 60 and 70 seconds. … m/s2 [1] (b) Find the distance travelled by the car during the 70 seconds. … m [3]
4 marks
Mark scheme: 24(a) 2 1 24(b) 1300 3 20 M2 for × (60 + 70) oe 2 or M1 for any relevant area
This question in 0580/21 May/June 2019
Q59 · The distance between Prague and Vienna is 254 kilometres 0580/22 May/June 2019
5 The distance between Prague and Vienna is 254 kilometres. The local time in Prague is the same as the local time in Vienna. A train leaves Prague at 15 20 and arrives in Vienna at 19 50 the same day. Calculate the average speed of the train. … km/h [2]
2 marks
Mark scheme: 5 56.4 or 56.44… 2 254 254 M1 for or [× 60 ] their 4.5 their 270
This question in 0580/22 May/June 2019
Q60 · Paula invests $600 at a rate of r % per year simple interest 0580/21 Oct/Nov 2019
9 Paula invests $600 at a rate of r % per year simple interest. At the end of 10 years, the total interest earned is $90. Find the value of r. r = … [2]
2 marks
Mark scheme: 9 1.5 2 600 × r × 10 M1 for = 90 oe or better 100
This question in 0580/21 Oct/Nov 2019
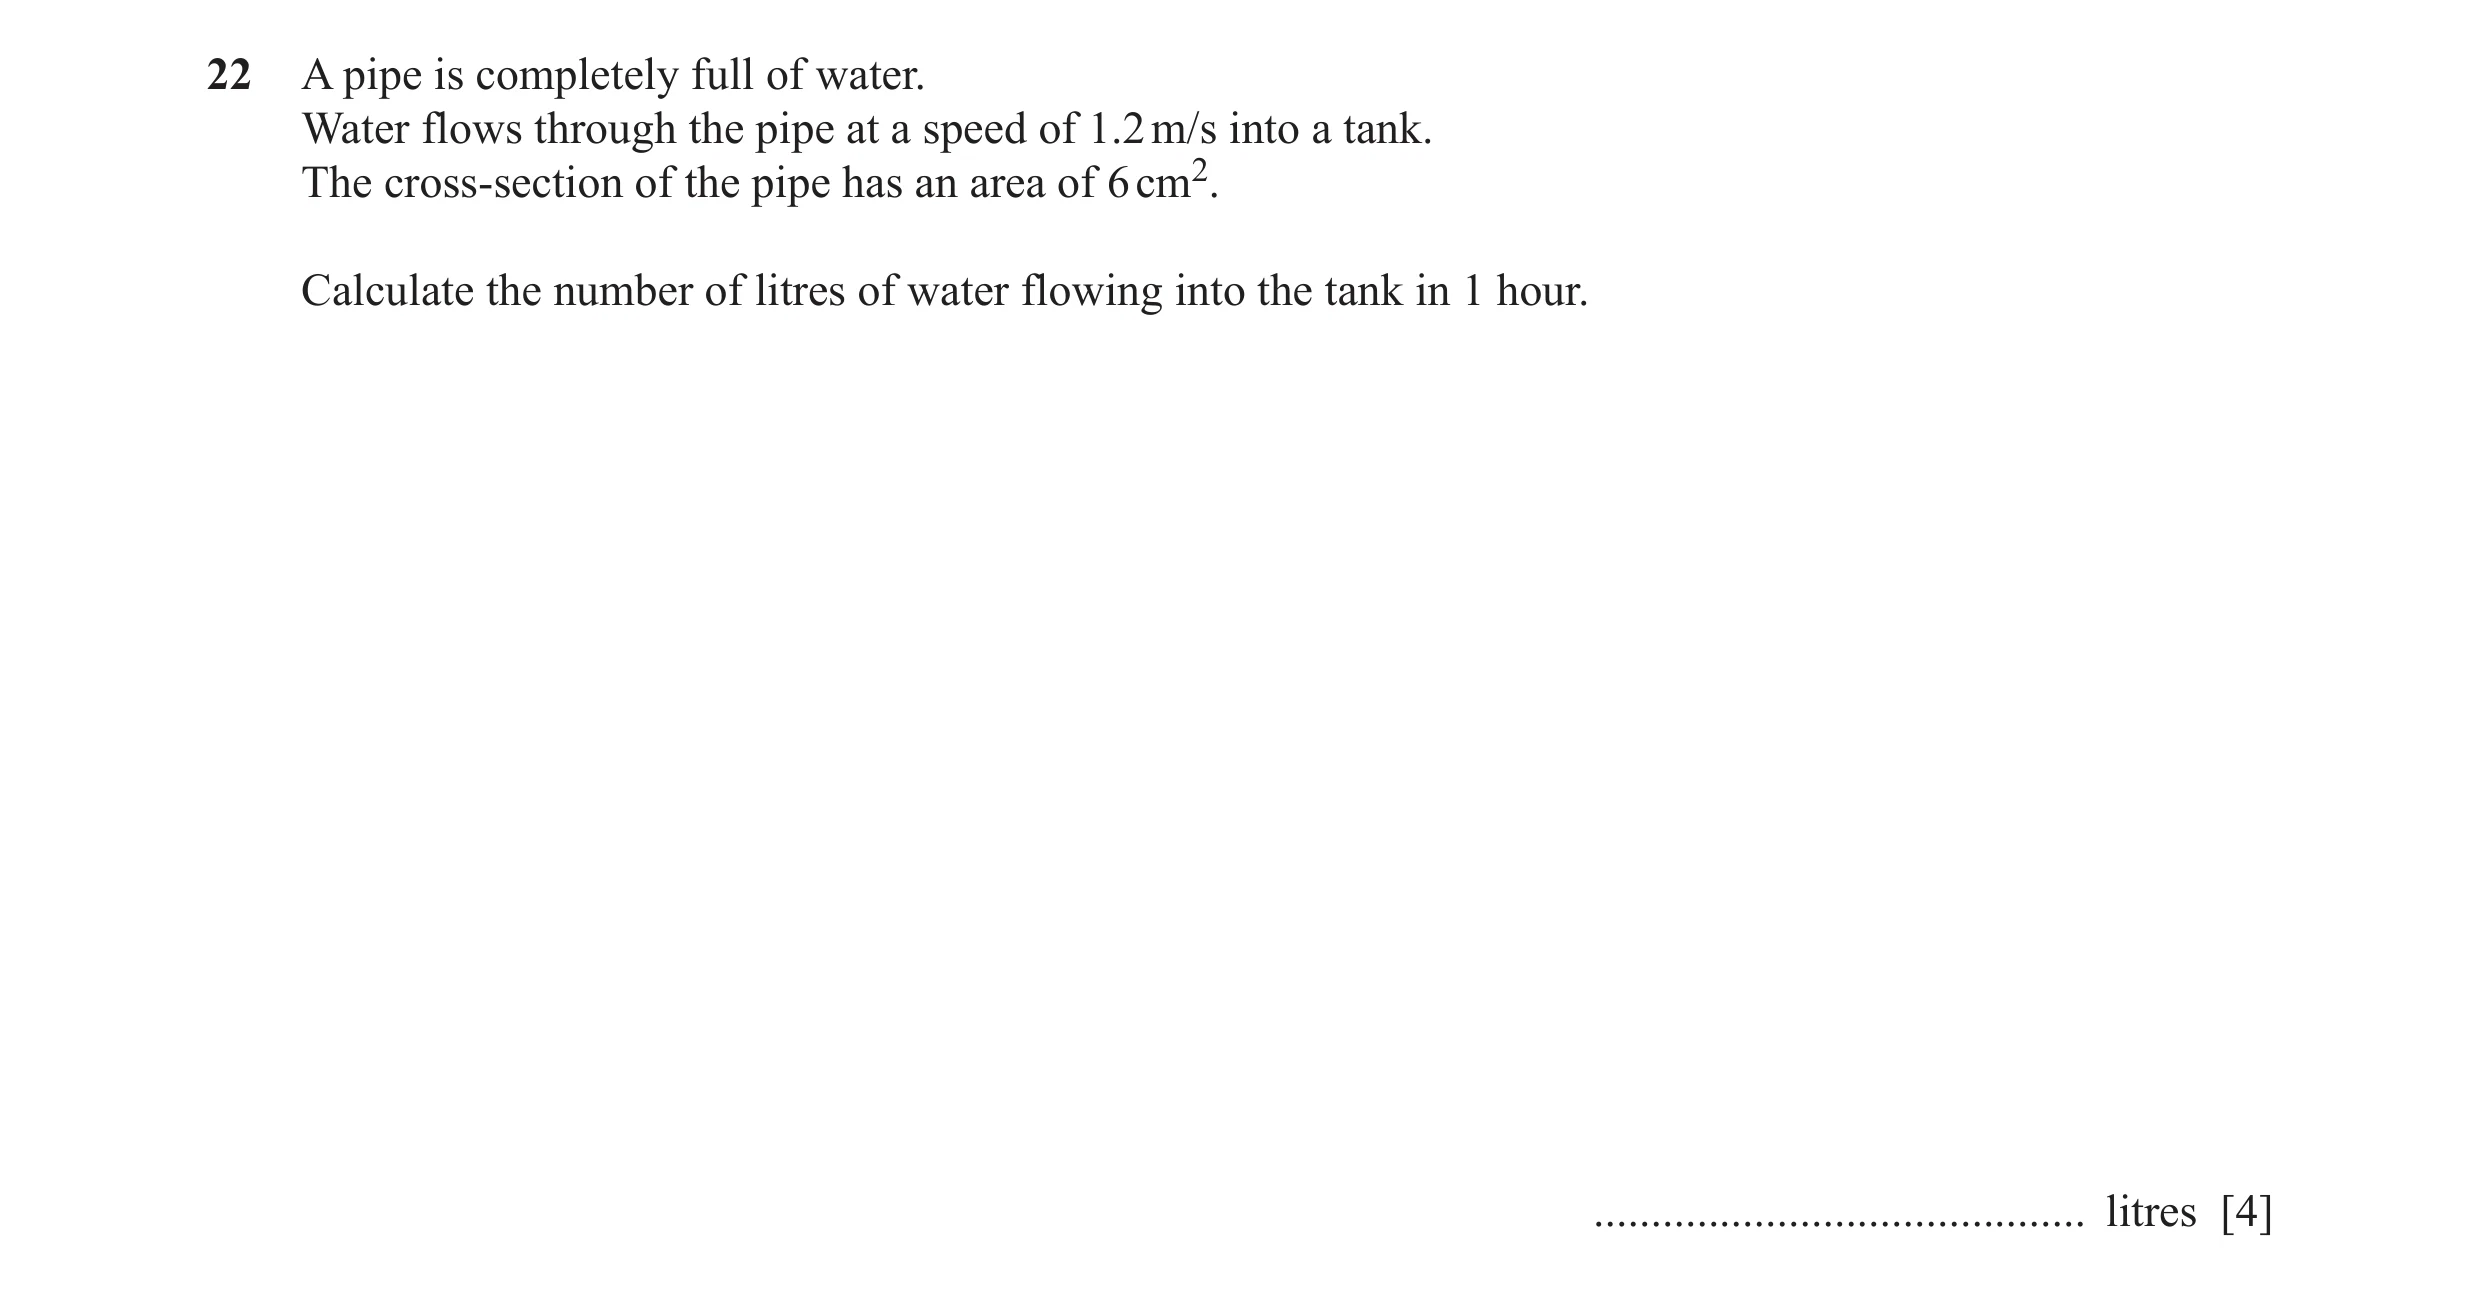
Q61 · A pipe is completely full of water 0580/21 Oct/Nov 2019
22 A pipe is completely full of water. Water flows through the pipe at a speed of 1.2 m/s into a tank. The cross-section of the pipe has an area of 6 cm2. Calculate the number of litres of water flowing into the tank in 1 hour. … litres [4]
4 marks
Mark scheme: 22 2592 4 M3 for 1.2 × 100 × 60 × 60 × 6 ÷ 1000 oe or M2 for 1.2 × 60 × 60 × 6 oe or M1 for figs 12 × figs 6 or 60 × 60 or correct conversion e.g. their value in cm3 ÷ 1000 their value in m3× 1000 1.2× 100 6 ÷ 10 000
This question in 0580/21 Oct/Nov 2019
Q62 · 20 Speed NOT TO (m/s) SCALE 0 0 15 Time (seconds) A car travels at 20 m/s for 15 seconds… 0580/21 Oct/Nov 2019
26 20 Speed NOT TO (m/s) SCALE 0 0 15 Time (seconds) A car travels at 20 m/s for 15 seconds before it comes to rest by decelerating at 2.5 m/s2. Find the total distance travelled. … m [5]
5 marks
Mark scheme: 26 380 5 B2 for time = 8, implied by 23 on t-axis 20 20 or M1 for = 5.2 or = 2.5 or t t − 15 0 − 20 = − 2.5 oe t − 15 1 M2 for (their 23 + 15) × 20 or 2 1 20 × 15 + × their 8 × 20 oe 2 or M1 for any relevant area found
This question in 0580/21 Oct/Nov 2019
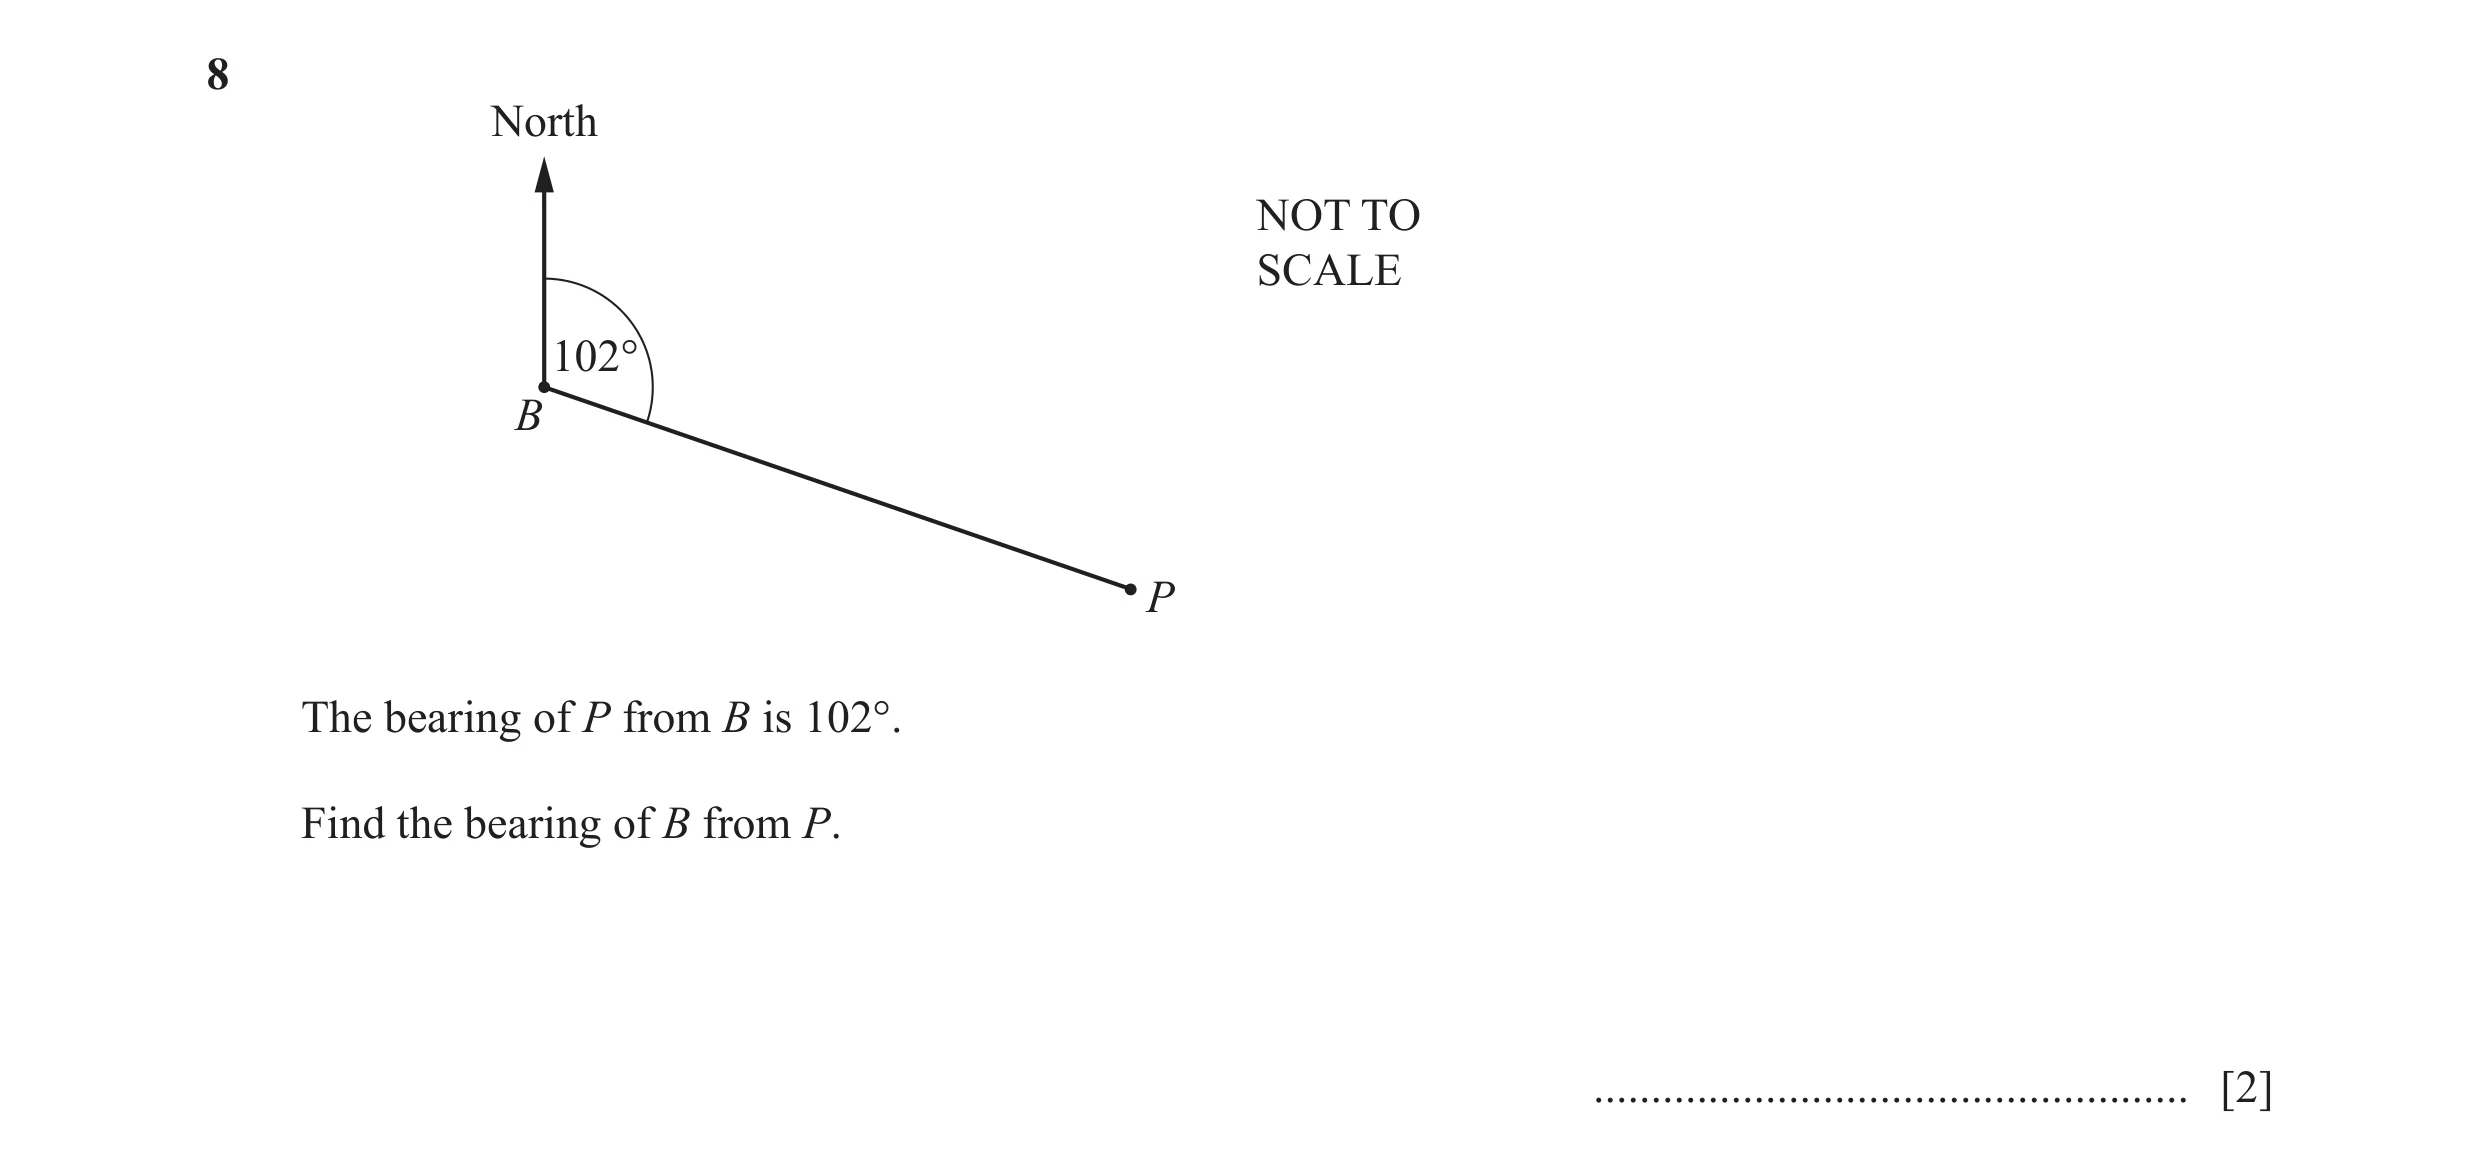
Q63 · North NOT TO SCALE 102° B P The bearing of P from B is 102° 0580/22 Oct/Nov 2019
8 North NOT TO SCALE 102° B P The bearing of P from B is 102°. Find the bearing of B from P. … [2]
2 marks
Mark scheme: 8 282 2 M1 for 180 + 102 or 360 – (180 – 102)
This question in 0580/22 Oct/Nov 2019
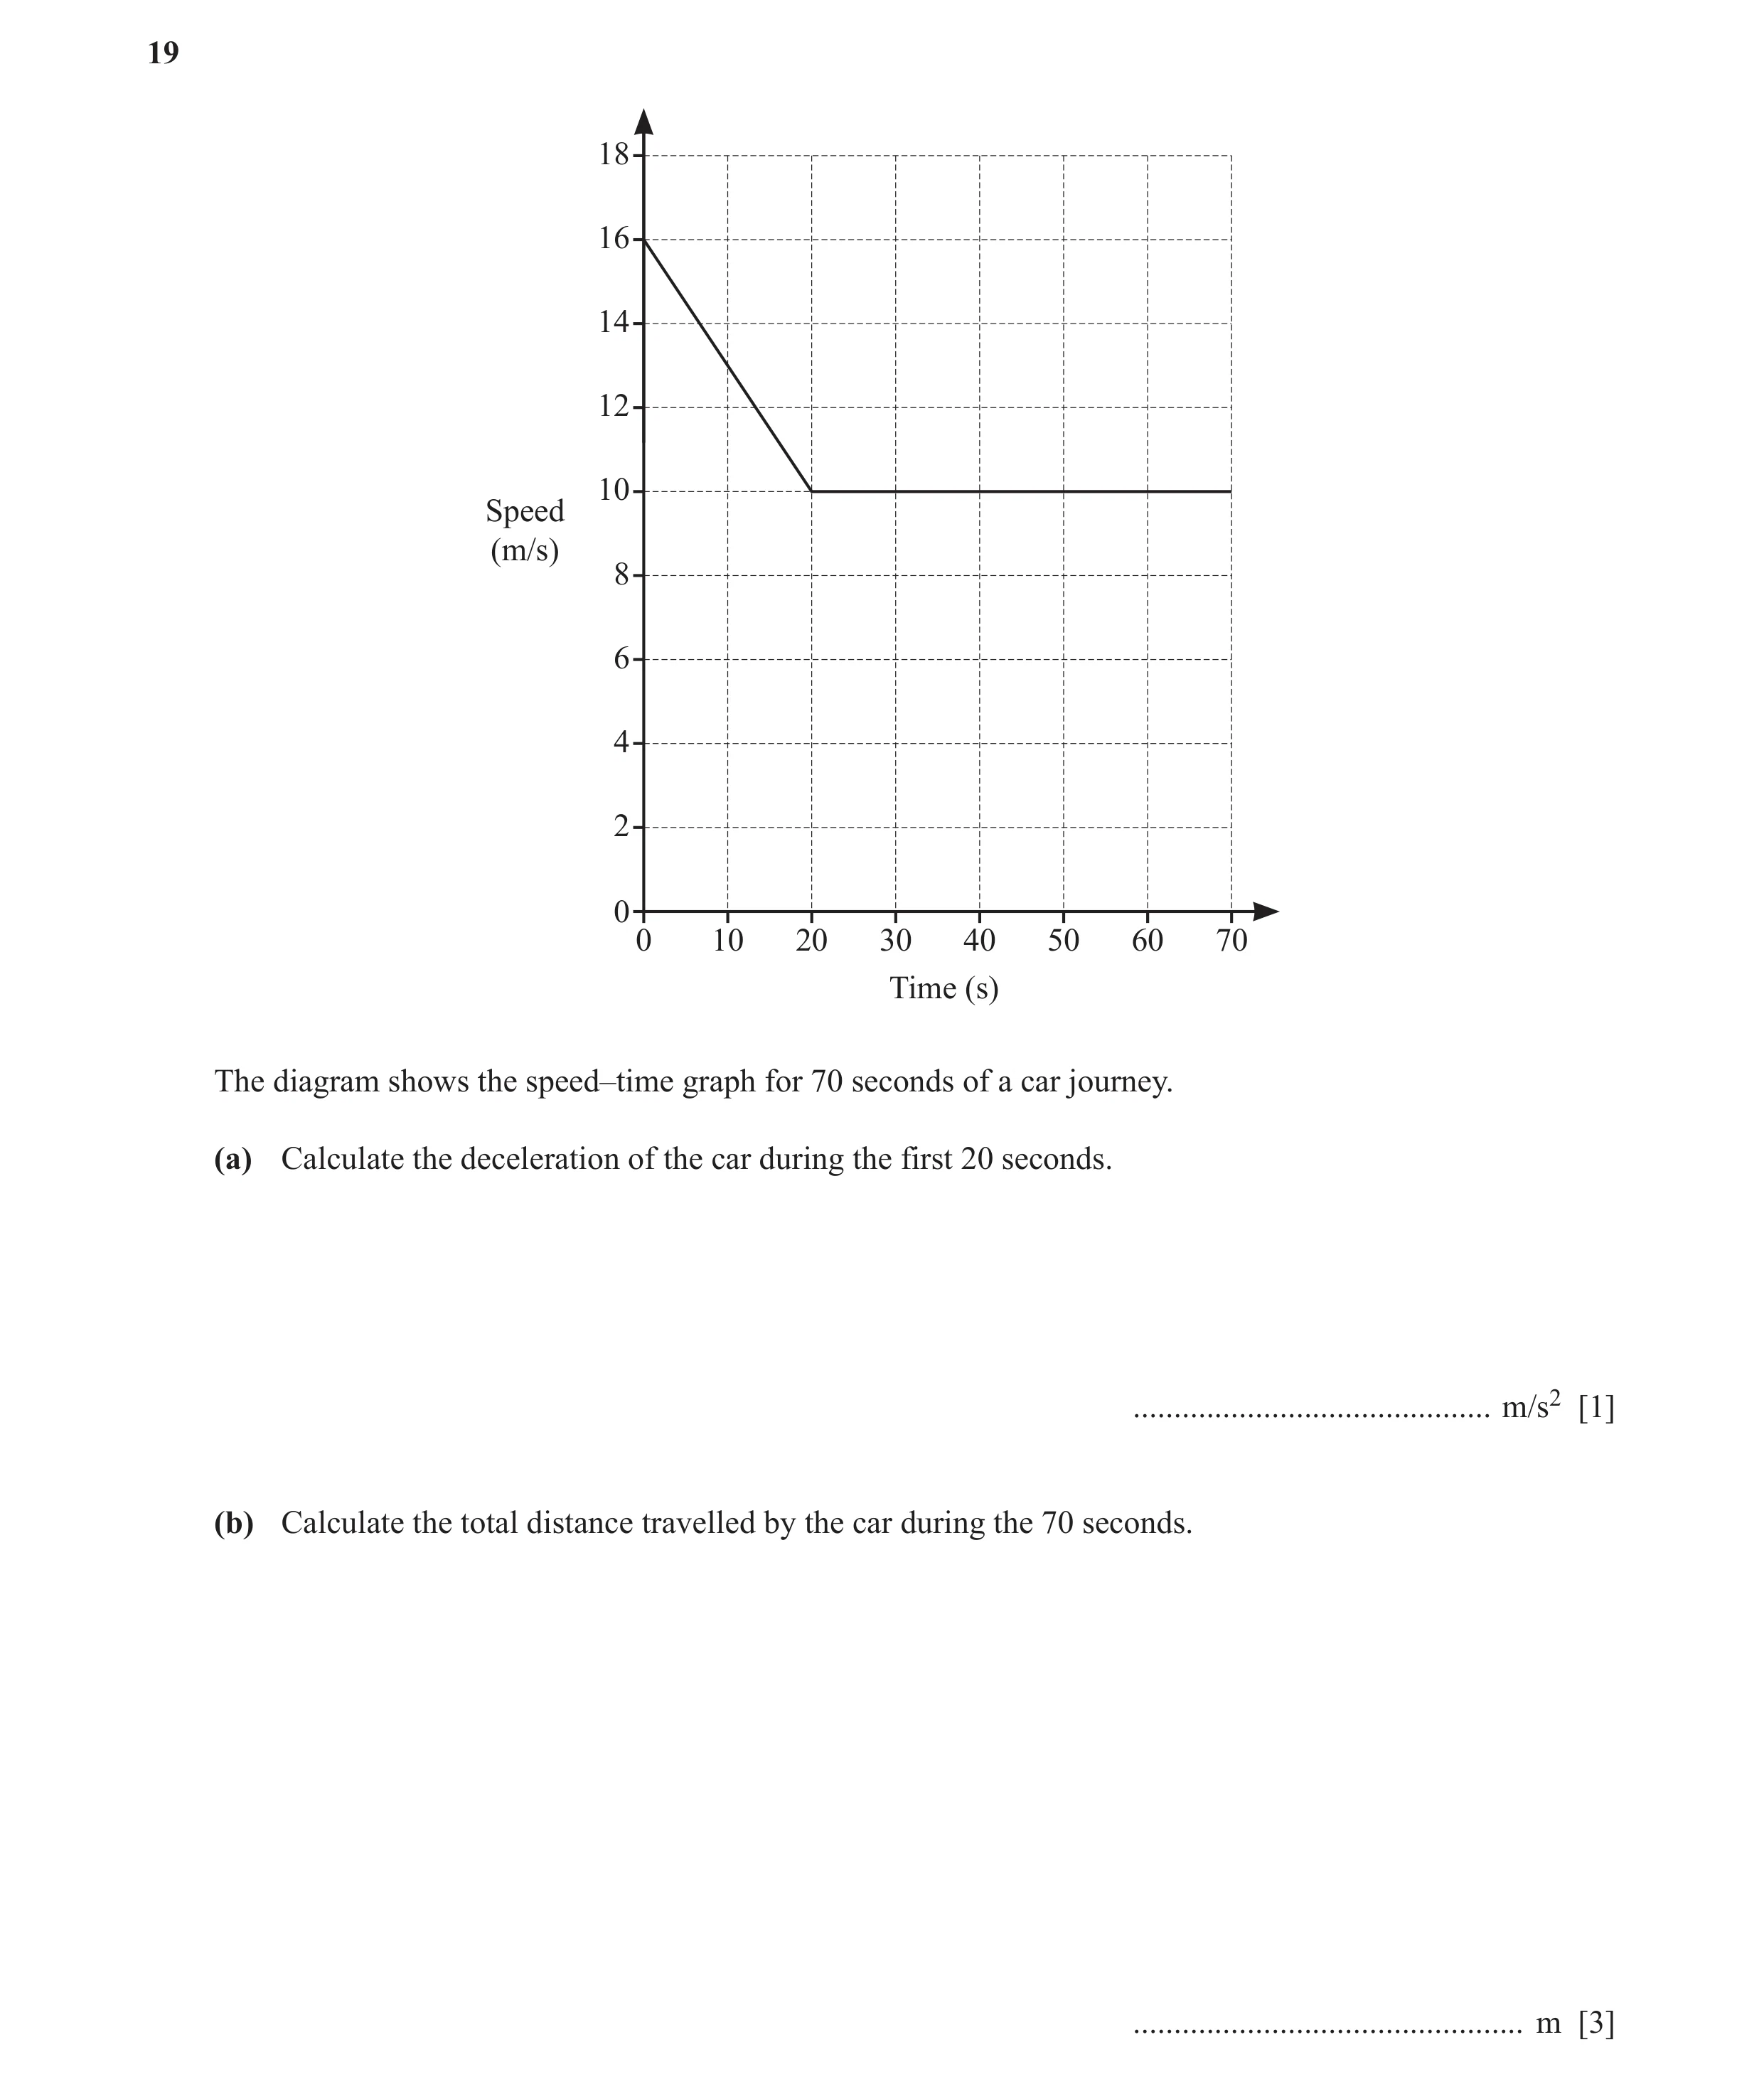
Q64 · 18 16 14 12 10 Speed (m/s) 8 6 4 2 0 0 10 20 30 40 50 60 70 Time (s) The diagram shows… 0580/23 Oct/Nov 2019
19 18 16 14 12 10 Speed (m/s) 8 6 4 2 0 0 10 20 30 40 50 60 70 Time (s) The diagram shows the speed–time graph for 70 seconds of a car journey. (a) Calculate the deceleration of the car during the first 20 seconds. … m/s2 [1] (b) Calculate the total distance travelled by the car during the 70 seconds. … m [3]
4 marks
Mark scheme: 19(a) 3 1 0.3 or 10 19(b) 760 3 M2 for correct complete area statement 1 e.g. 70 × 10 + × 20 × 6 oe 2 or M1 for one of these area calculations 1 70 × 10, × 20 × 6, 50 × 10 or 2 1 × (16 + 10) × 20 2
This question in 0580/23 Oct/Nov 2019
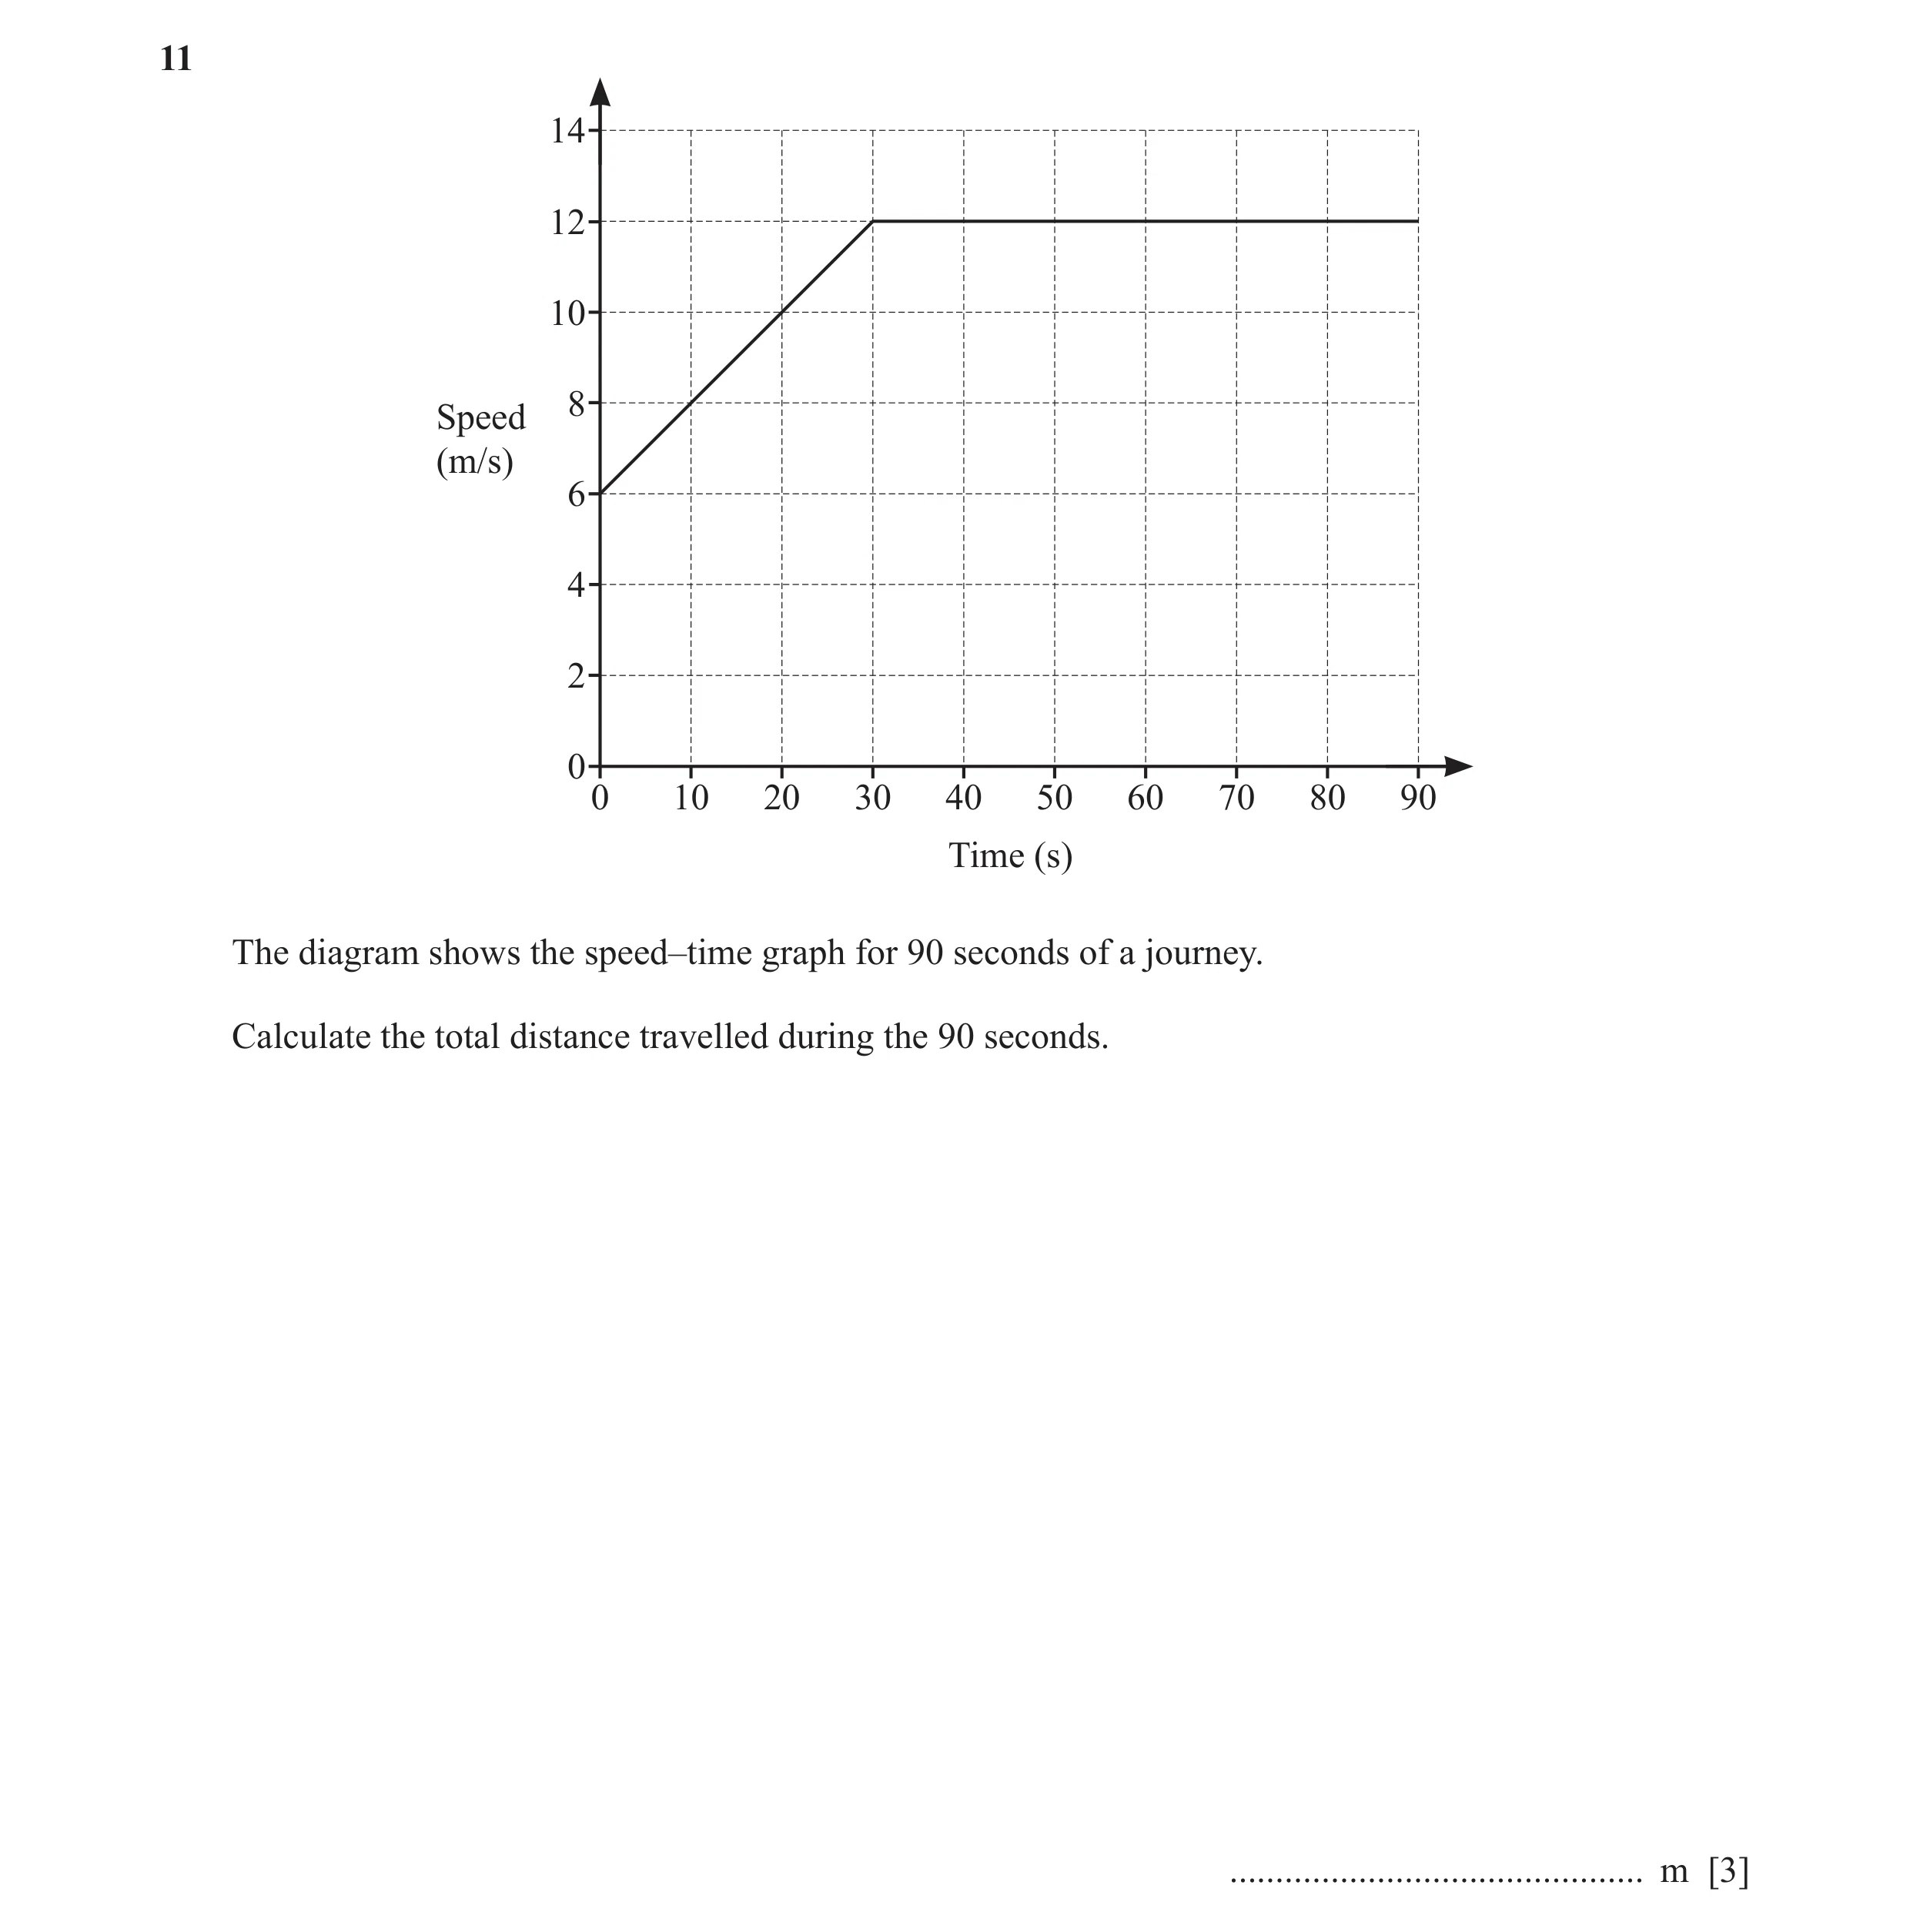
Q65 · 14 12 10 8 Speed (m/s) 6 4 2 0 0 10 20 30 40 50 60 70 80 90 Time (s) The diagram shows… 0580/21 May/June 2020
11 14 12 10 8 Speed (m/s) 6 4 2 0 0 10 20 30 40 50 60 70 80 90 Time (s) The diagram shows the speed–time graph for 90 seconds of a journey. Calculate the total distance travelled during the 90 seconds. … m [3]
3 marks
Mark scheme: 11 990 3 M2 for correct complete area statement ଵ e.g. × 30 × (6 + 12) + 60 × 12 oe ଶ or M1 for one area calculation
This question in 0580/21 May/June 2020
Q66 · A train of length 105 m takes 11 seconds to pass completely through a station of length… 0580/22 May/June 2020
17 A train of length 105 m takes 11 seconds to pass completely through a station of length 225 m. Calculate the speed of the train in km/h. … km/h [3]
3 marks
Mark scheme: 17 108 3 M1 for (105 + 225) ÷ 11 60 × 60 M1 for their speed × 1000
This question in 0580/22 May/June 2020
Q67 · A train journey takes 5 hours 54 minutes 0580/23 May/June 2020
4 A train journey takes 5 hours 54 minutes. (a) The journey starts at 09 15. Find the time that the journey ends. … [1] (b) The average speed of the train for this journey is 80 km/h. Calculate the distance travelled. … km [2]
3 marks
Mark scheme: 4(a) 15 09 1 Accept 3 09 pm 4(b) 472 2 M1 for 80 × their time oe or B1 for time = 5.9
This question in 0580/23 May/June 2020
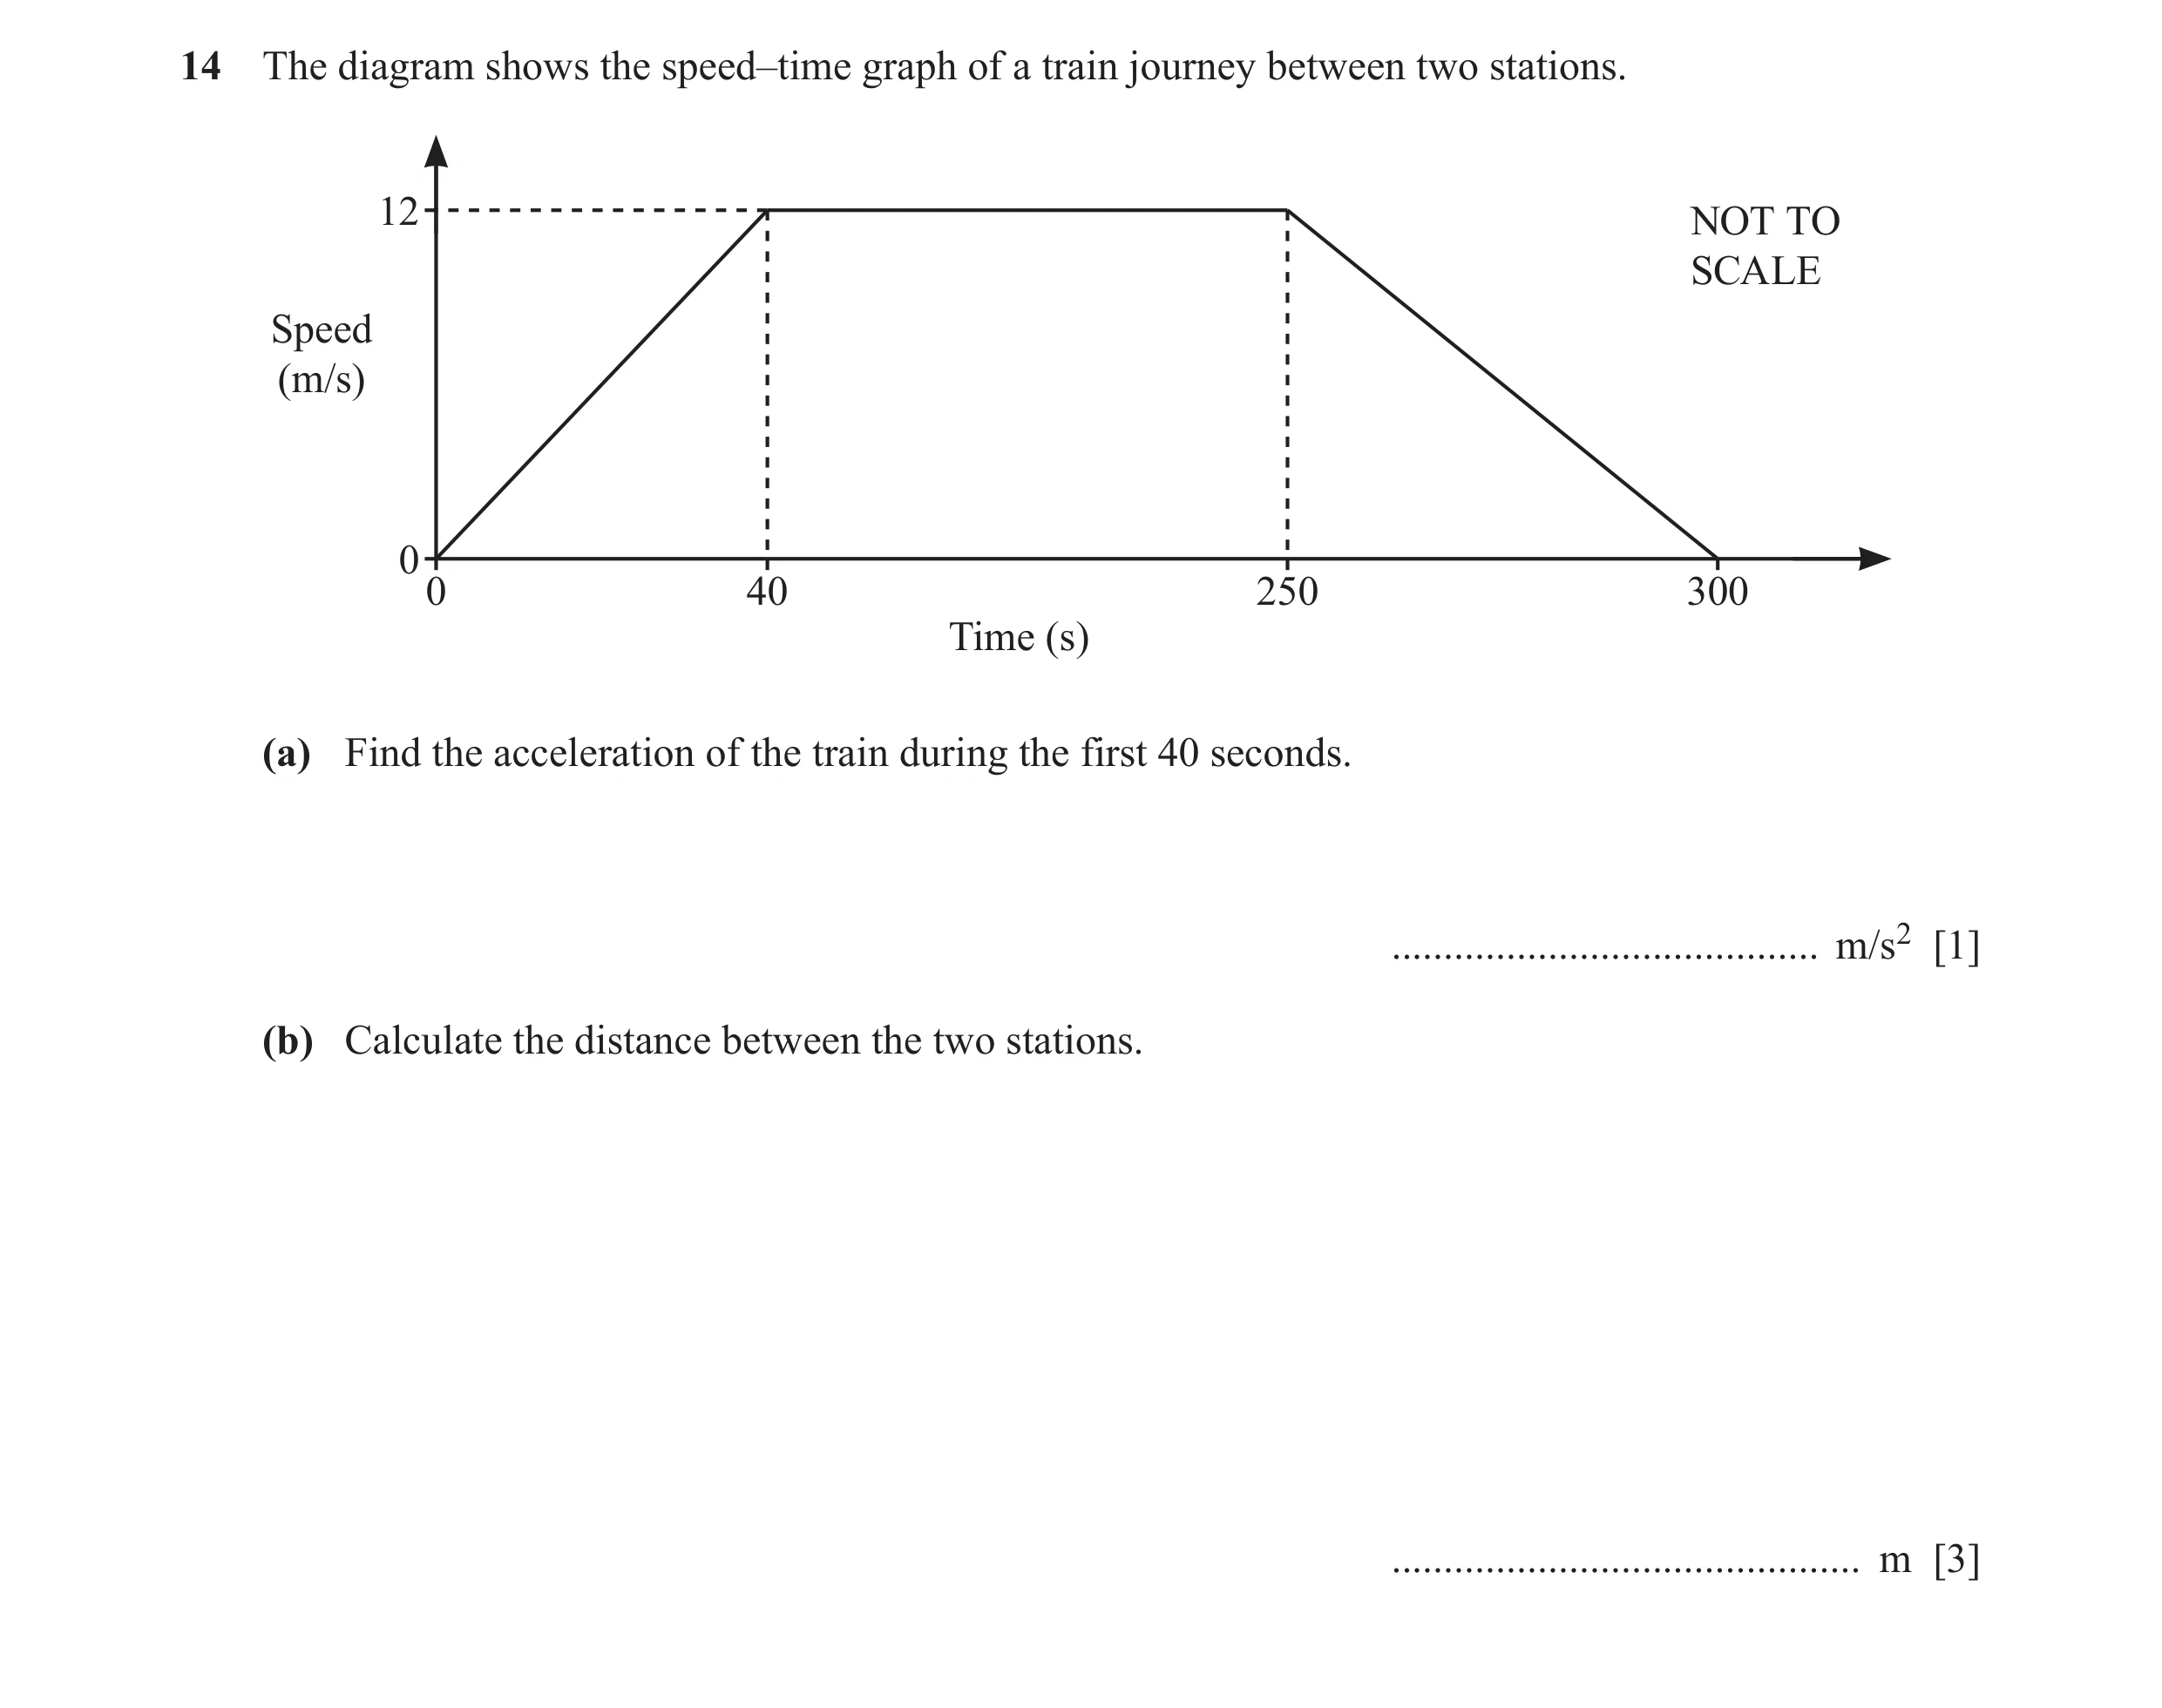
Q68 · The diagram shows the speed–time graph of a train journey between two stations 0580/23 May/June 2020
14 The diagram shows the speed–time graph of a train journey between two stations. 12 NOT TO SCALE Speed (m/s) 0 0 40 250 300 Time (s) (a) Find the acceleration of the train during the first 40 seconds. … m/s2 [1] (b) Calculate the distance between the two stations. … m [3]
4 marks
Mark scheme: 14(a) 0.3 oe 1 14(b) 3060 3 1 M2 for ( 300 + 210 ) × 12 oe 2 or M1 for one correct part area
This question in 0580/23 May/June 2020
Q69 · Paddy and Anna each invest $2000 for 5 years 0580/23 May/June 2020
16 Paddy and Anna each invest $2000 for 5 years. Paddy earns simple interest at a rate of 1.25% per year. Anna earns compound interest at a rate of r % per year. At the end of 5 years, Paddy’s investment is worth the same as Anna’s investment. Calculate the value of r. r = … [5]
5 marks
Mark scheme: 16 1.22 or 1.219 to 1.22 5 2000 × 5 × 1.25 M1 for SI = 100 2000 + their125 M3 for 5 2000 or M2 for 2000 k 5 = 2000 + their SI or M1 for CI = 2000k 5
This question in 0580/23 May/June 2020
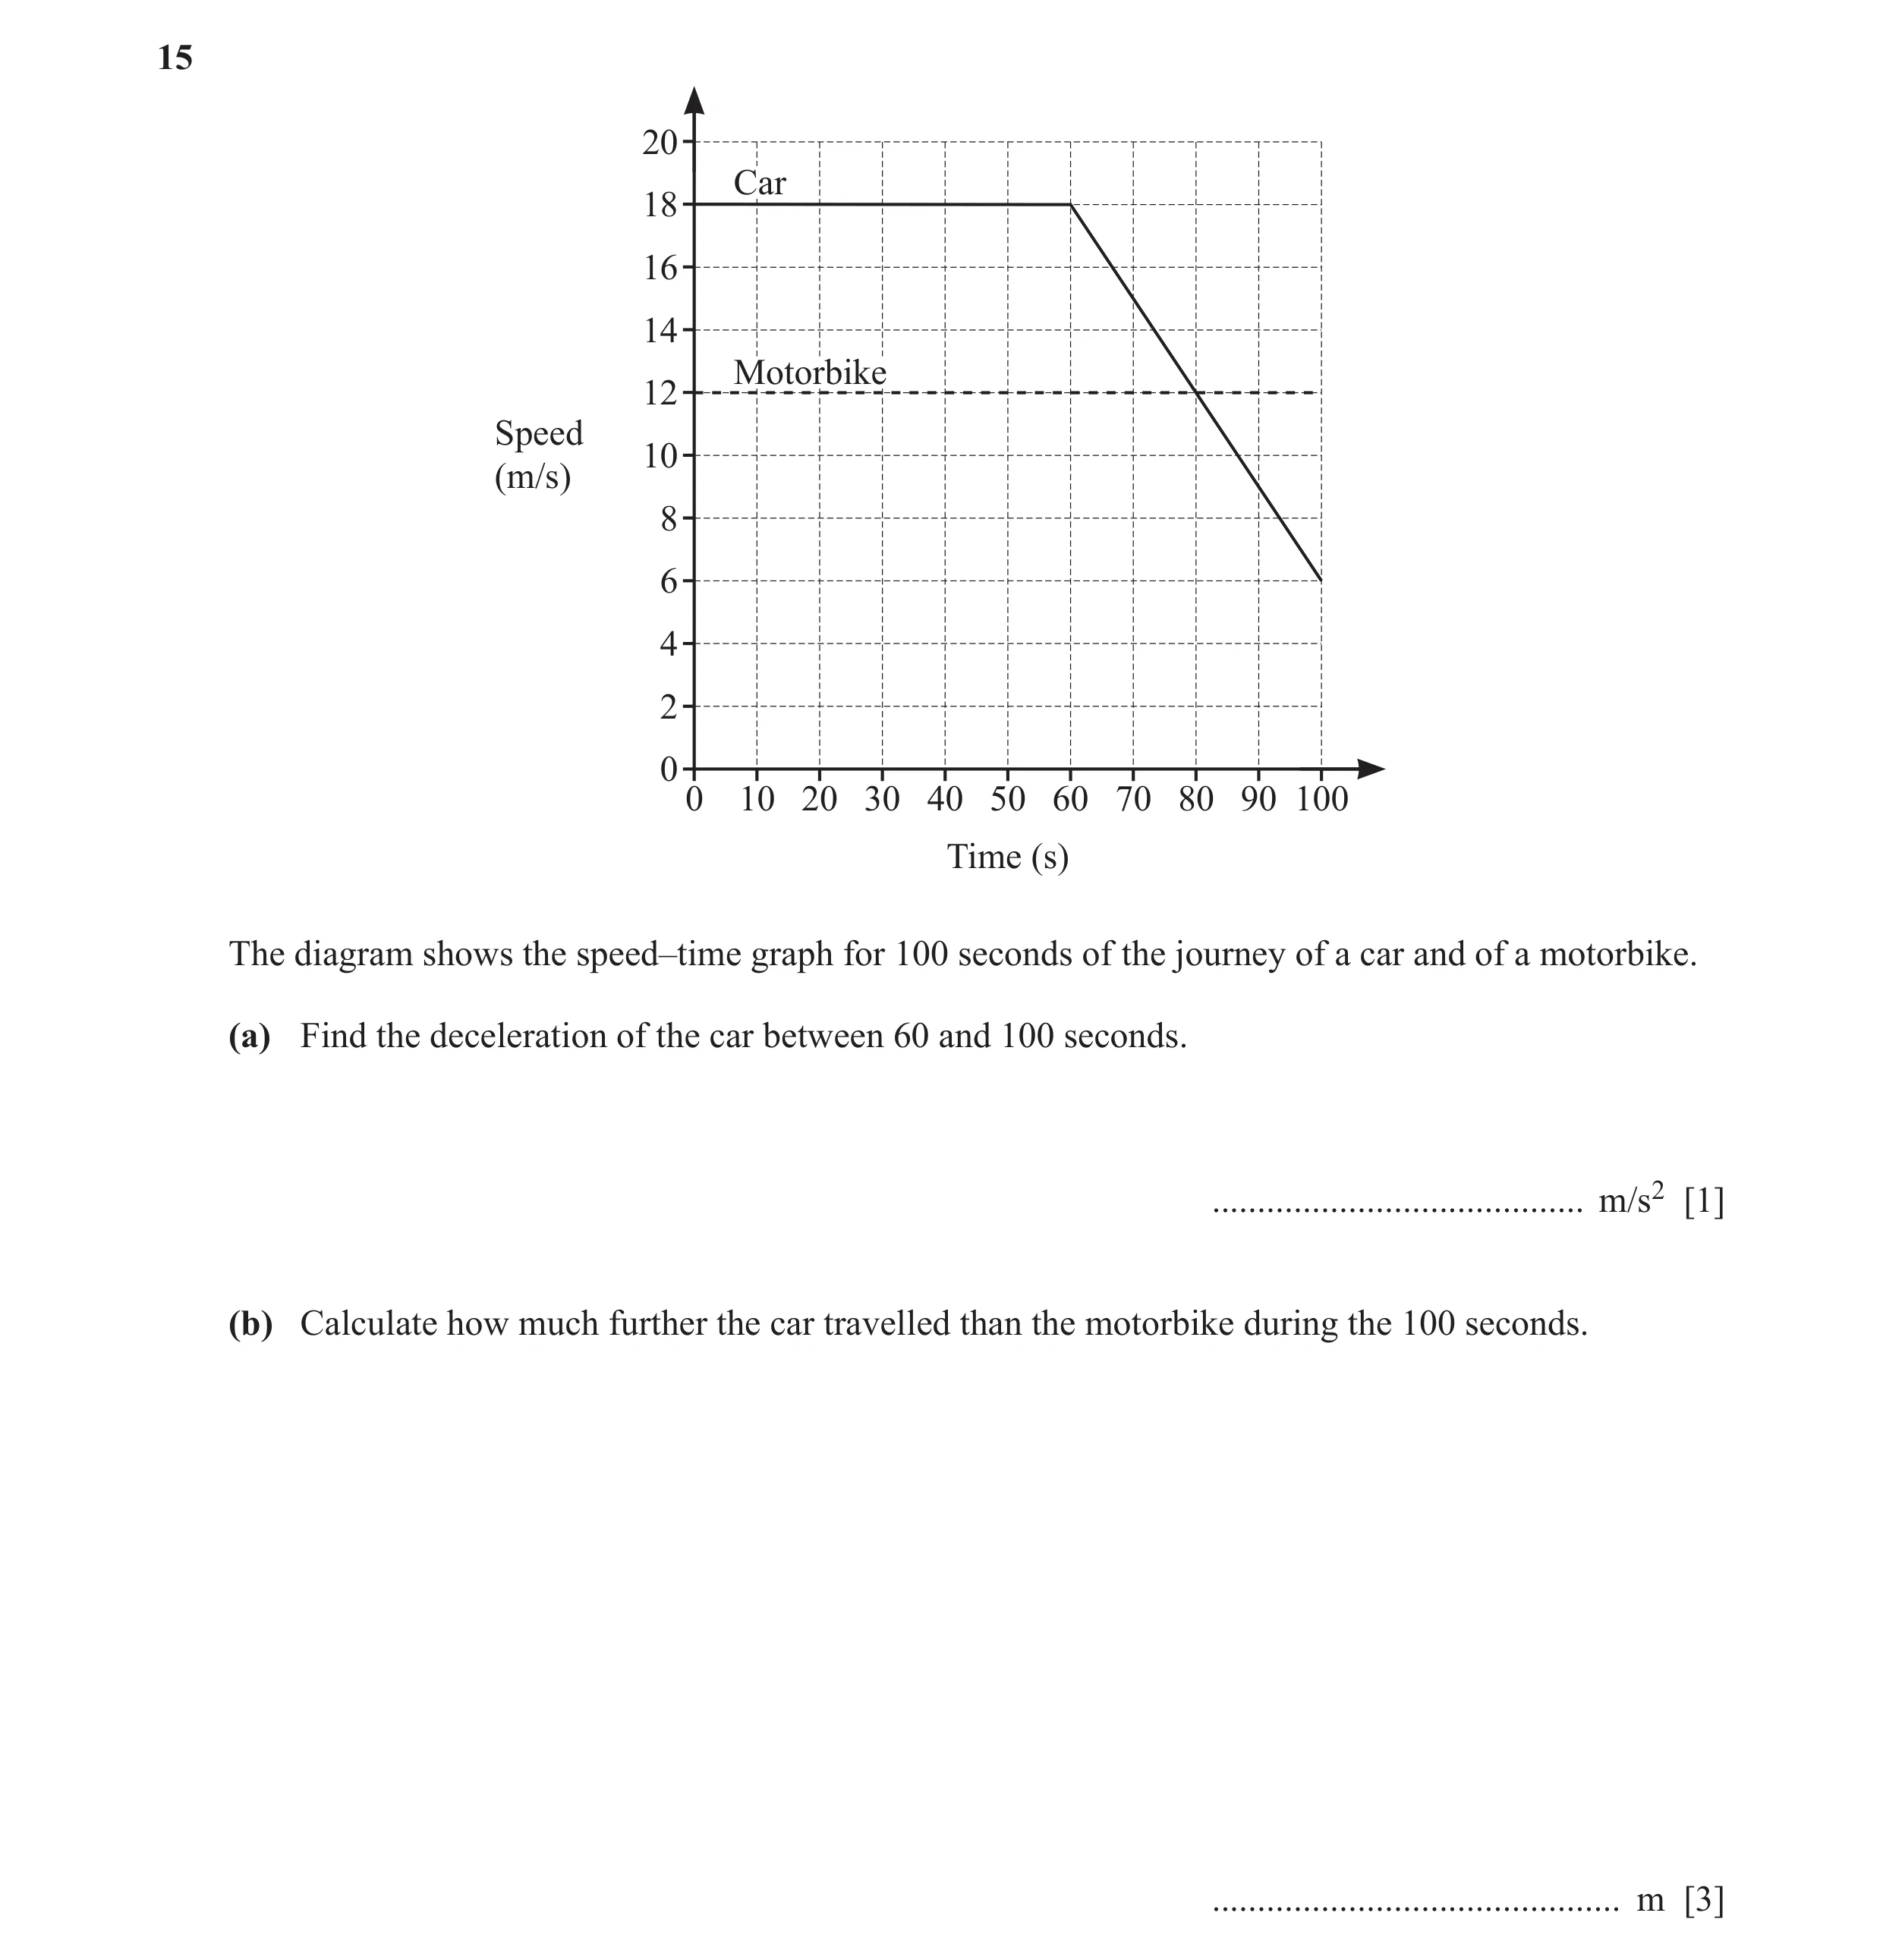
Q70 · 20 Car 18 16 14 Motorbike 12 Speed 10 (m/s) 8 6 4 2 0 0 10 20 30 40 50 60 70 80 90 100… 0580/21 Oct/Nov 2020
15 20 Car 18 16 14 Motorbike 12 Speed 10 (m/s) 8 6 4 2 0 0 10 20 30 40 50 60 70 80 90 100 Time (s) The diagram shows the speed–time graph for 100 seconds of the journey of a car and of a motorbike. (a) Find the deceleration of the car between 60 and 100 seconds. … m/s2 [1] (b) Calculate how much further the car travelled than the motorbike during the 100 seconds. … m [3]
4 marks
Mark scheme: 15(a) 0.3 1 15(b) 360 3 M2 for correct complete area statement e.g. 1 18 × 60 + × 40 × (18 + 6) – 12 × 100 2 1 1 or × 6 × (60 + 80) – × 6 × 20 2 2 or for answer 420 or M1 for one area calculation
This question in 0580/21 Oct/Nov 2020
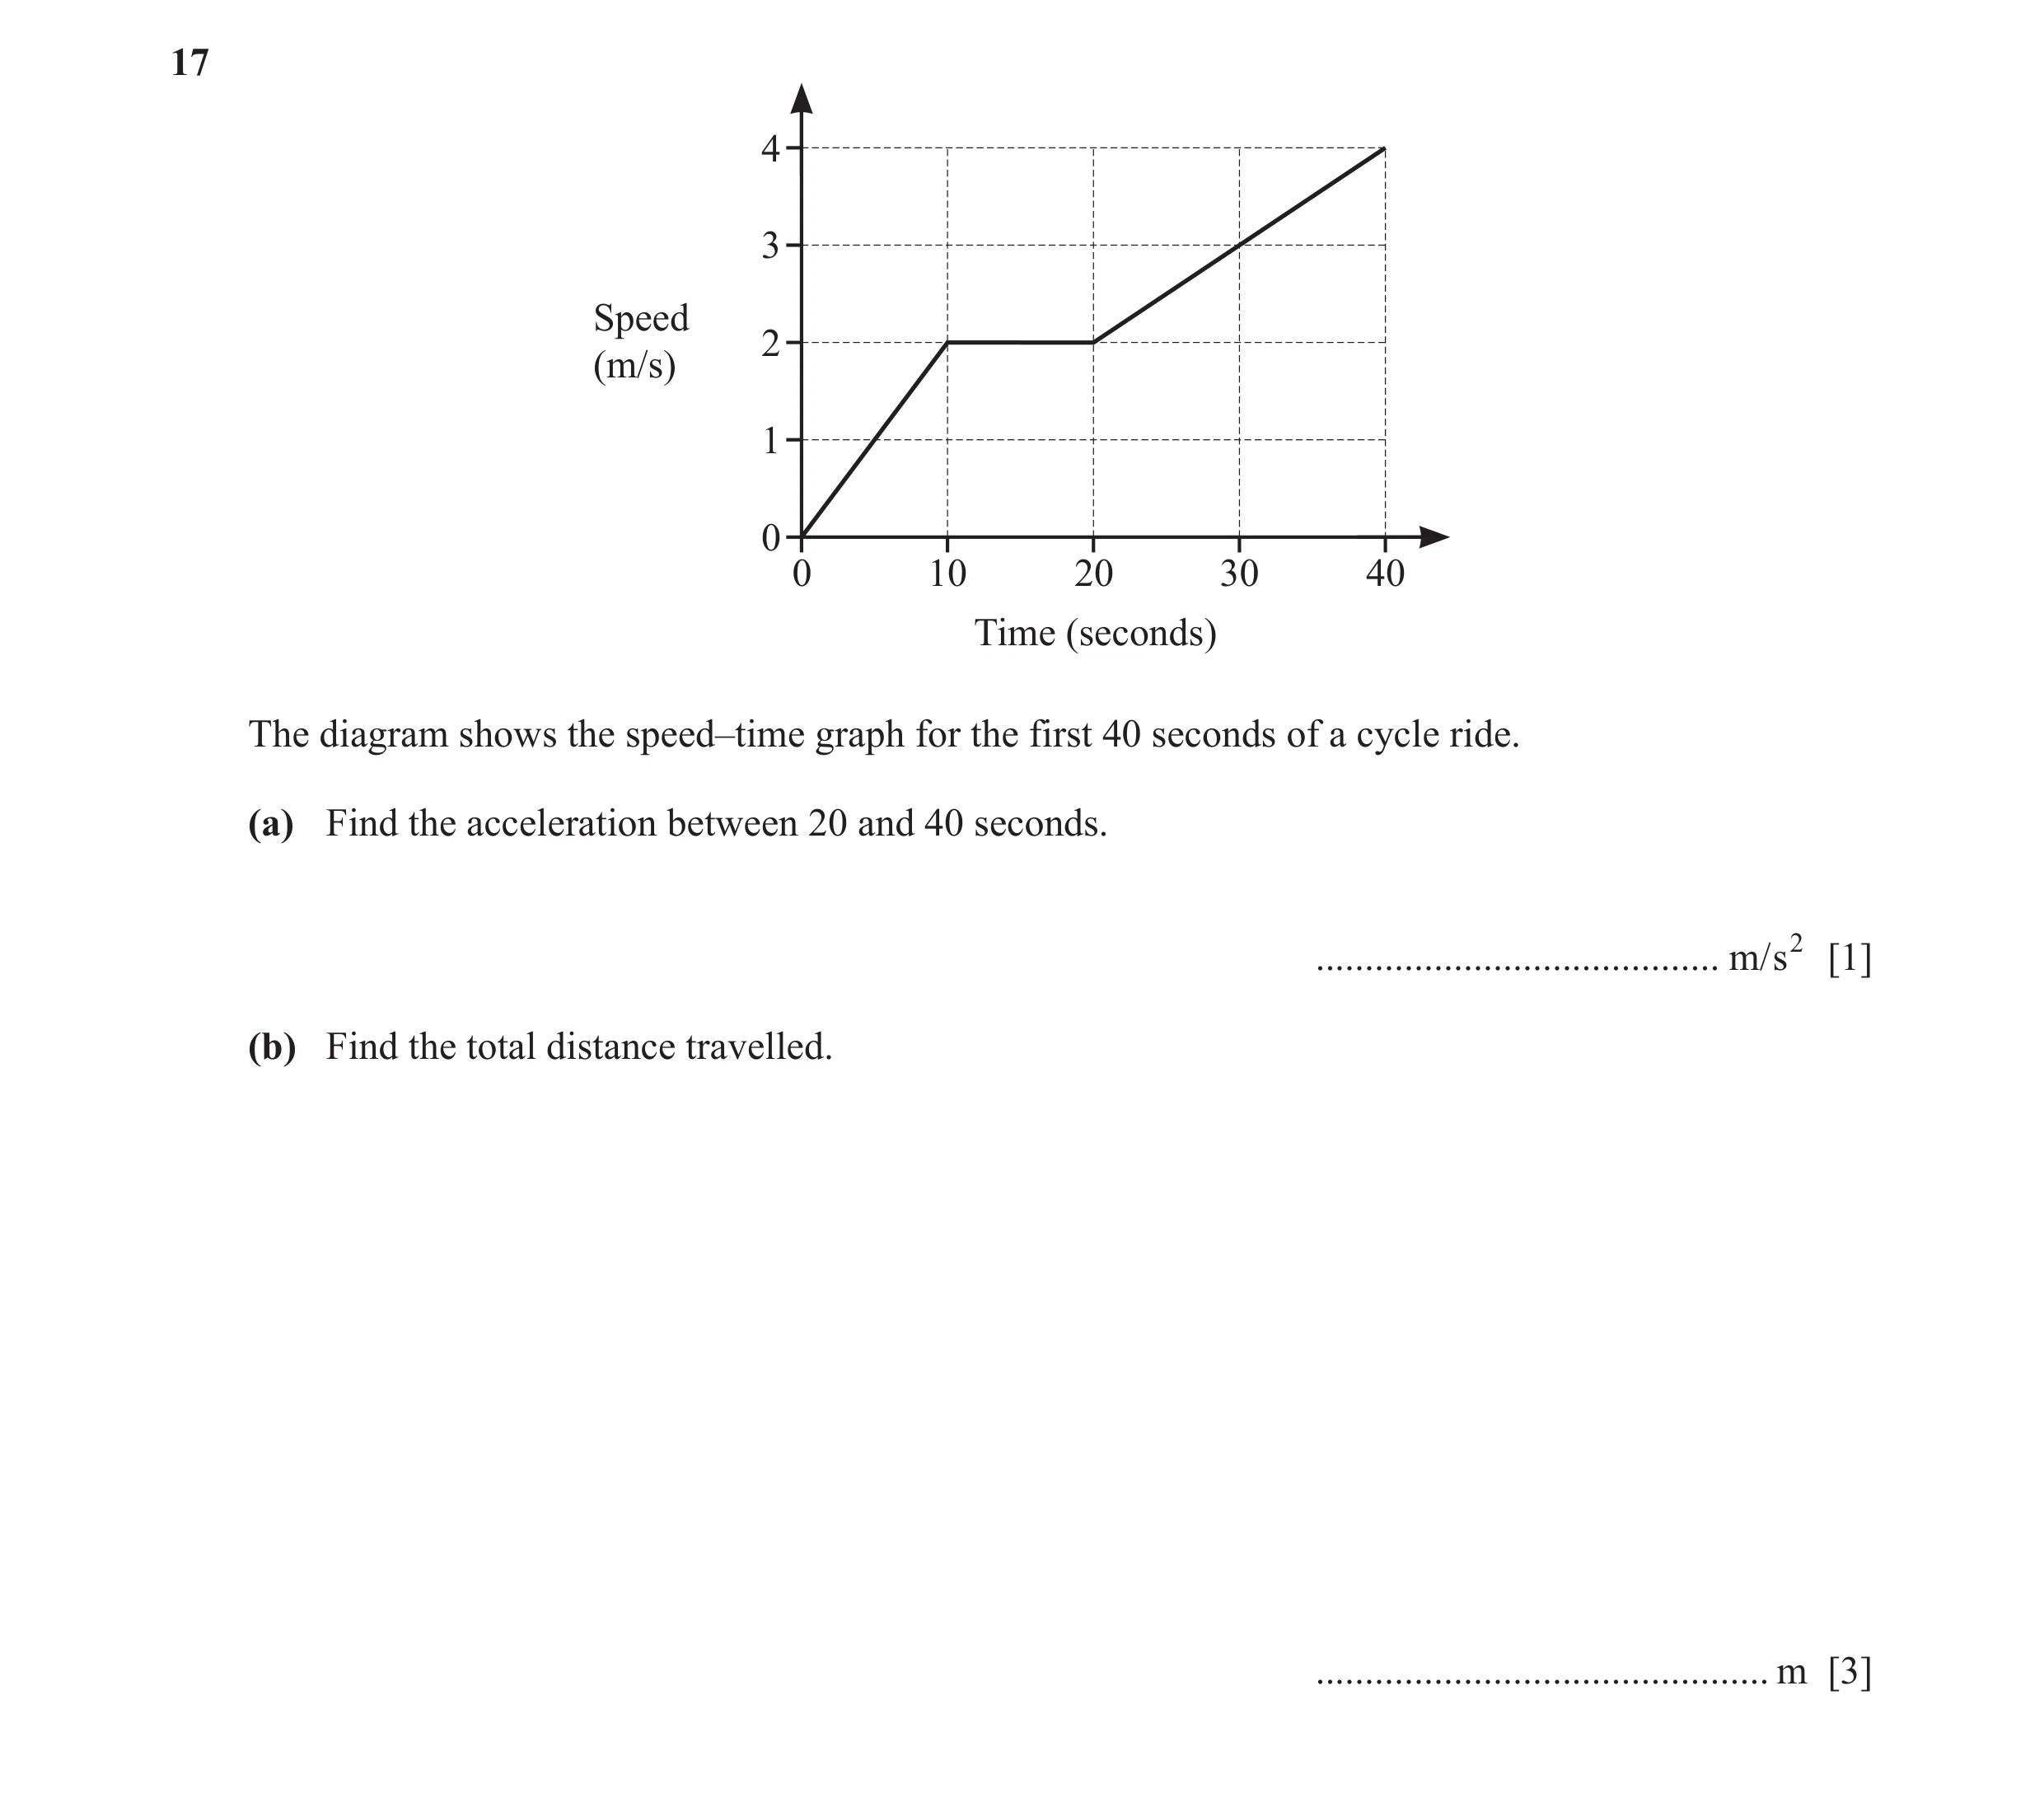
Q71 · 4 3 Speed 2 (m/s) 1 0 0 10 20 30 40 Time (seconds) The diagram shows the speed–time graph… 0580/22 Oct/Nov 2020
17 4 3 Speed 2 (m/s) 1 0 0 10 20 30 40 Time (seconds) The diagram shows the speed–time graph for the first 40 seconds of a cycle ride. (a) Find the acceleration between 20 and 40 seconds. … m/s2 [1] (b) Find the total distance travelled. … m [3]
4 marks
Mark scheme: 17(a) 1 1 0.1 or 10 17(b) 90 3 M2 for 1 1 × 10 × 2 + 10 × 2 + ( 2 + 4 ) × 20 oe 2 2 or M1 for one area calculation or indicated on diagram
This question in 0580/22 Oct/Nov 2020
Q72 · V + 10 NOT TO SCALE Speed v (m/s) 0 0 24 40 Time (seconds) The diagram shows the… 0580/23 Oct/Nov 2020
19 v + 10 NOT TO SCALE Speed v (m/s) 0 0 24 40 Time (seconds) The diagram shows the speed–time graph for the final 40 seconds of a car journey. At the start of the 40 seconds the speed is v m/s. (a) Find the acceleration of the car during the first 24 seconds. … m/s2 [1] (b) The total distance travelled during the 40 seconds is 1.24 kilometres. Find the value of v. v = … [4]
5 marks
Mark scheme: 19(a) 5 1 or 0.417 or 0.4166 to 0.4167 12 19(b) 32.5 4 M3 for 1 1 ( v + v + 10 ) × 24 + × 16 ( v + 10 ) = 1240 2 2 oe OR 1 M2 for ( v + v + 10 ) × 24 oe and 2 1 × 16 ( v + 10 ) oe 2 or M1 for one area expression M1 for correctly solving their (av + b = 1240) oe (a ≠ 0, b ≠ 0)
This question in 0580/23 Oct/Nov 2020
Q73 · Jo invests $600 for 7 years at a rate of 1.5% per year simple interest 0580/23 May/June 2021
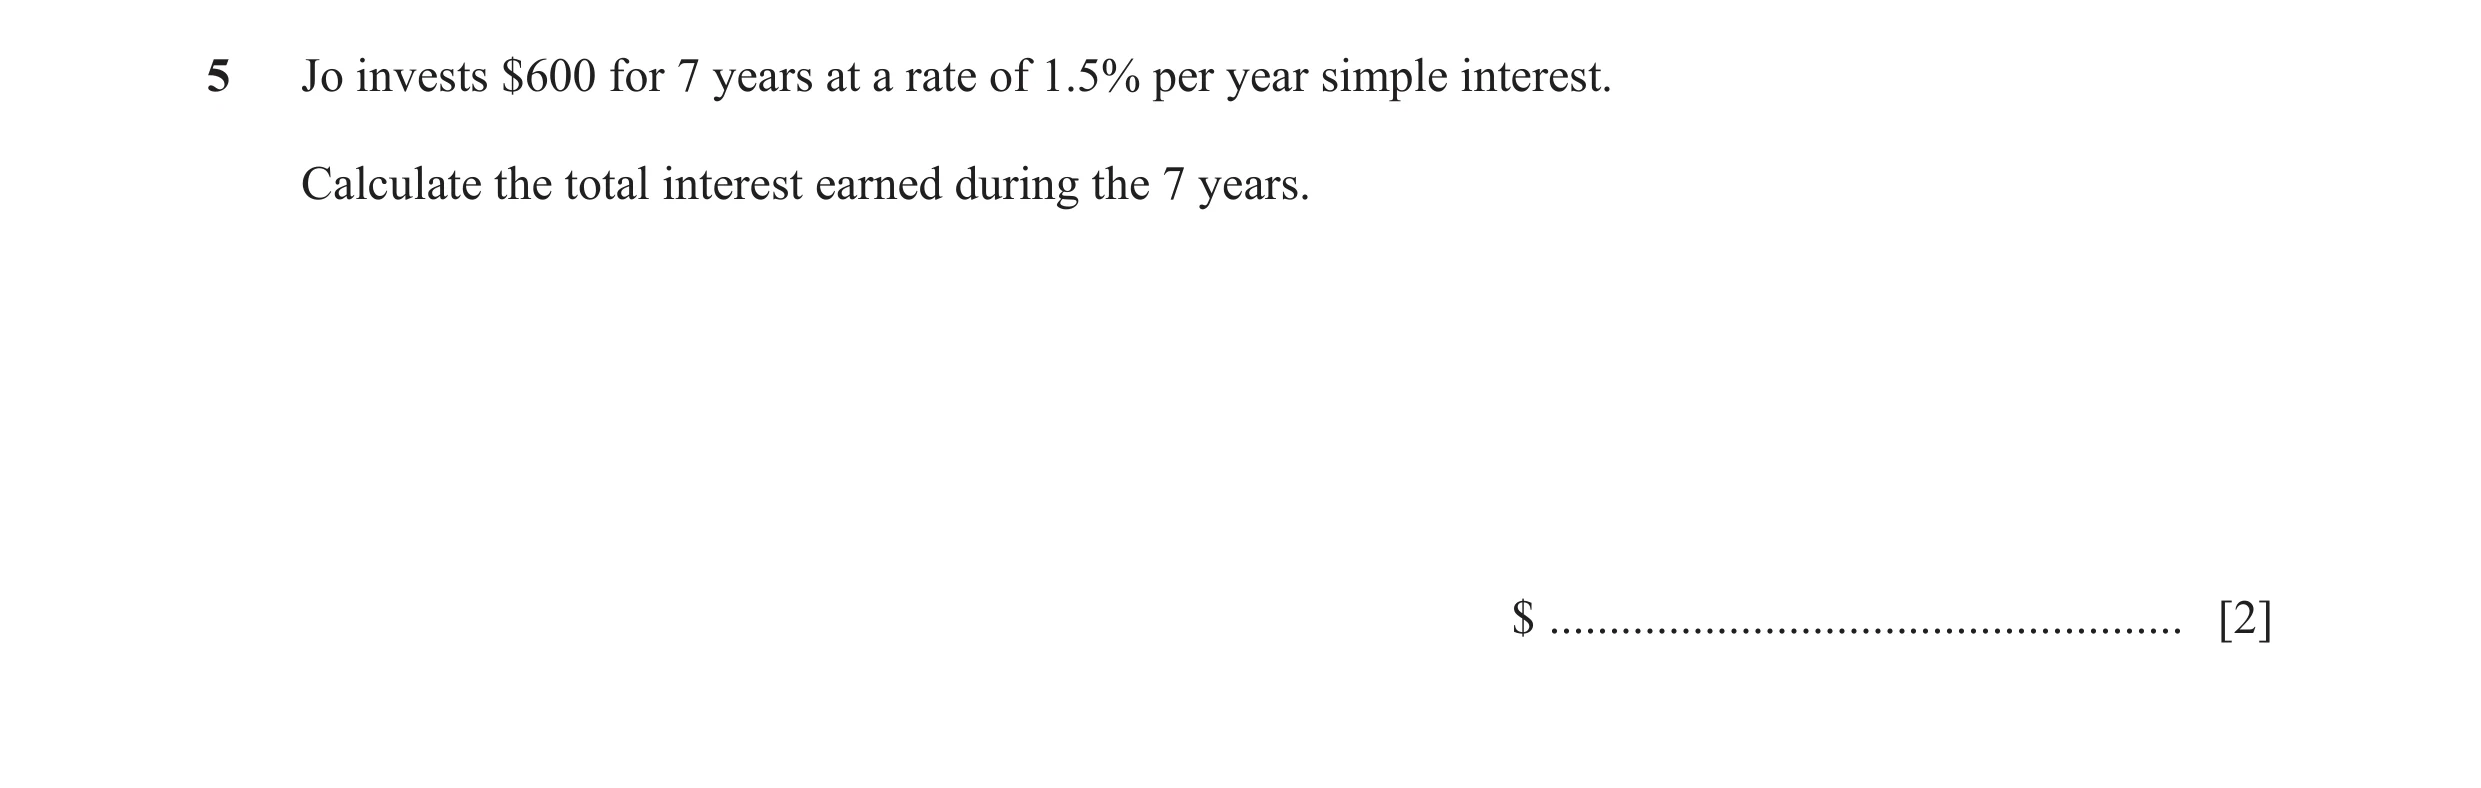
5 Jo invests $600 for 7 years at a rate of 1.5% per year simple interest. Calculate the total interest earned during the 7 years. $ … [2]
2 marks
Mark scheme: 5 63 2 1.5 M1 for 600 × oe or better 100 If 0 scored SC1 for answer 663
This question in 0580/23 May/June 2021
Q74 · A car starts from rest and accelerates at a rate of 3 m/s 2 for 4 seconds 0580/23 May/June 2021
18 A car starts from rest and accelerates at a rate of 3 m/s 2 for 4 seconds. The car then travels at a constant speed for 10 seconds. V Speed NOT TO (m/s) SCALE 00 4 14 Time (seconds) The diagram shows the speed–time graph for this journey. (a) Find the value of V. V = … [1] (b) Calculate the total distance travelled by the car during the 14 seconds. … m [2]
3 marks
Mark scheme: 18(a) 12 1 18(b) 144 2 FT 12 × their V M1 for any relevant area FT their V
This question in 0580/23 May/June 2021
Q75 · Beatrice walks 1 km at a speed of 4 km/h and then 2 km at a speed of 4.5 km/h 0580/23 Oct/Nov 2021
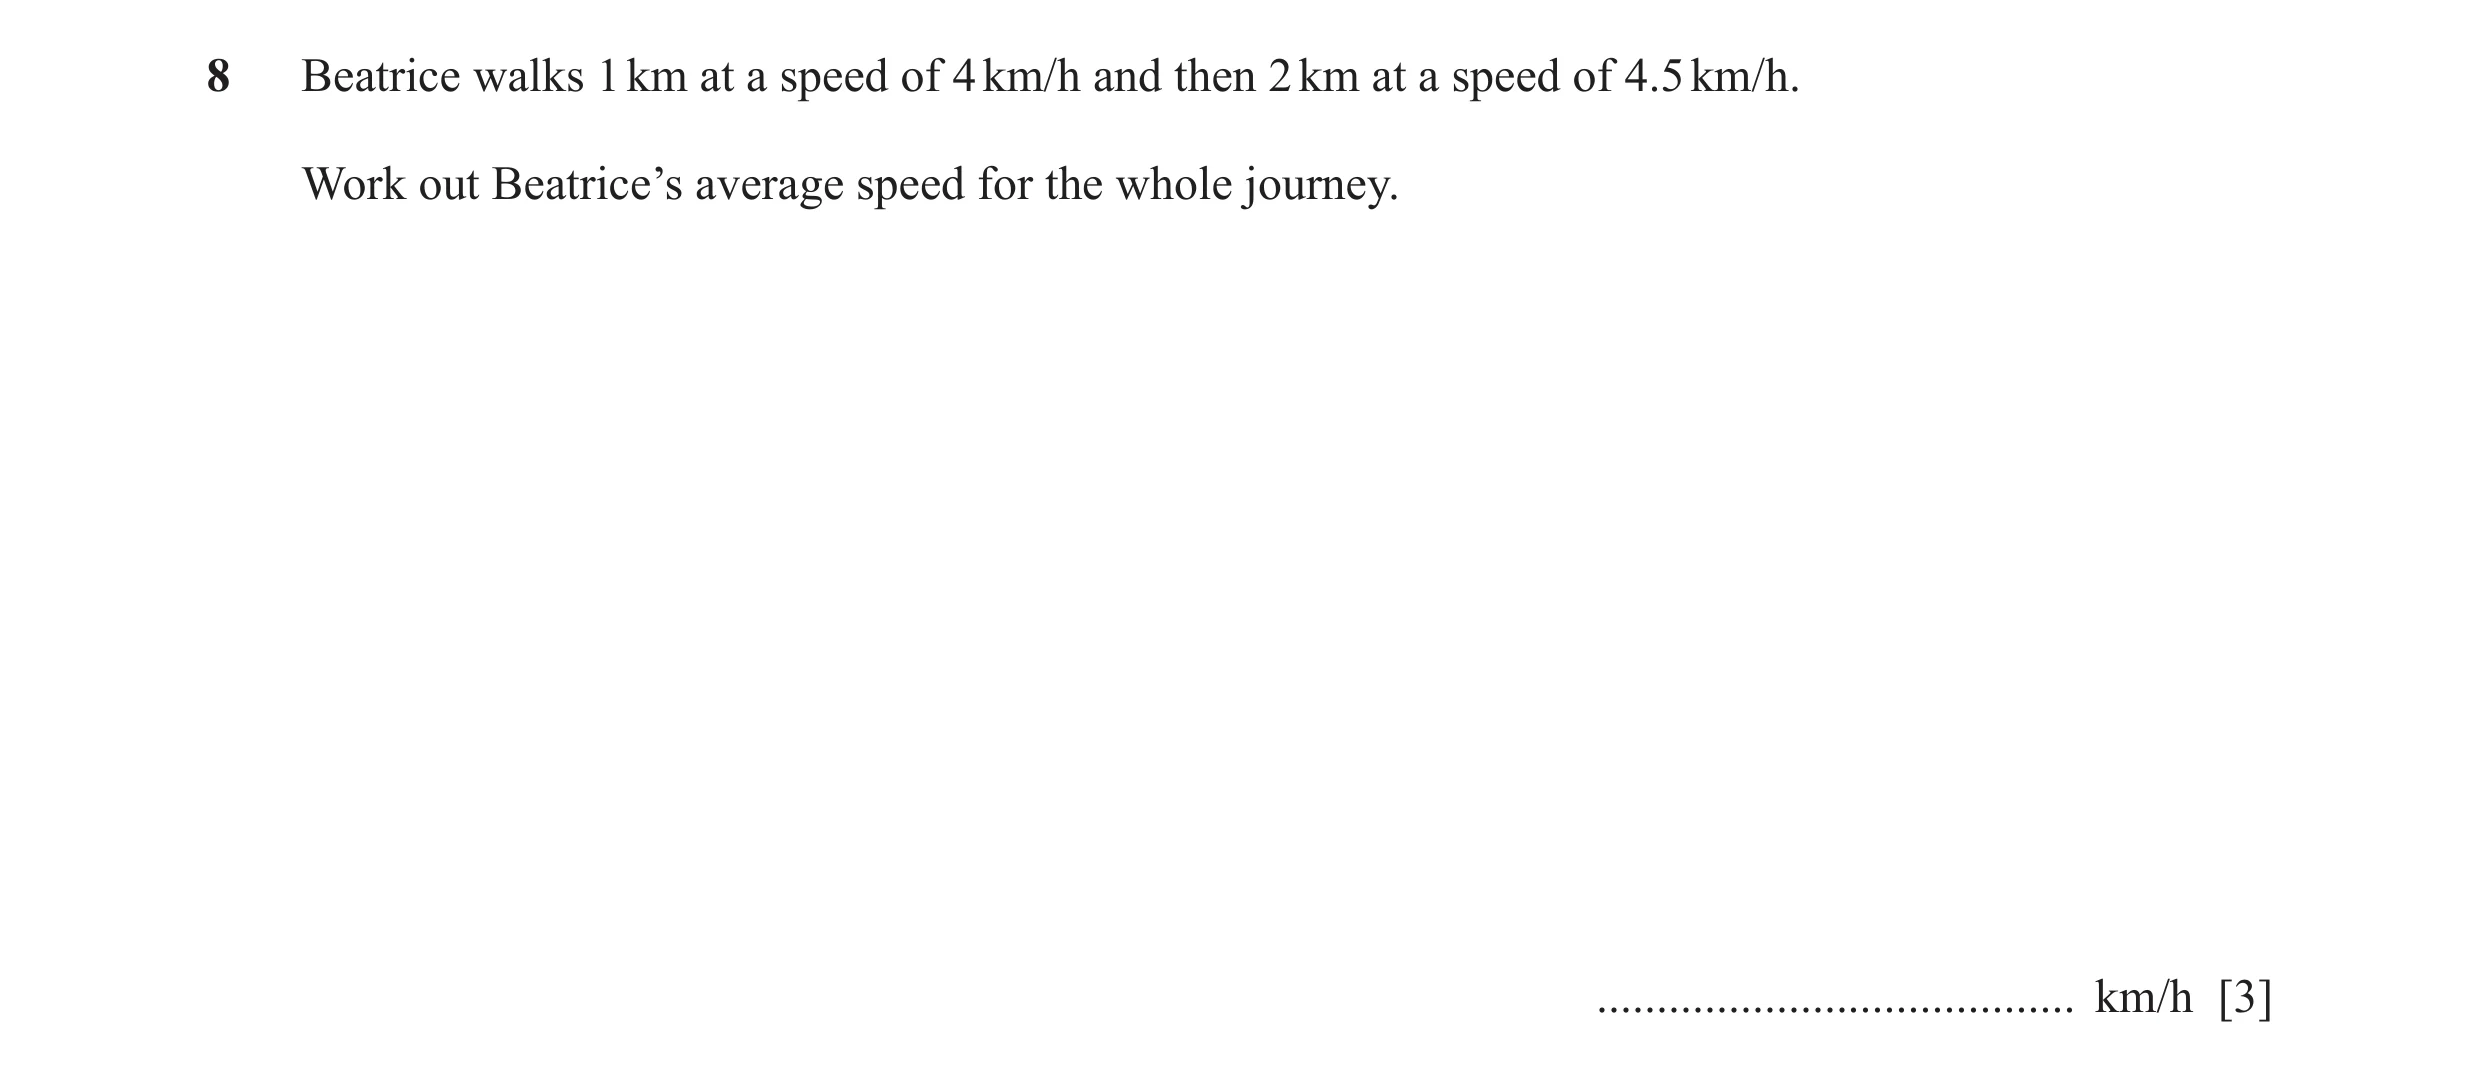
8 Beatrice walks 1 km at a speed of 4 km/h and then 2 km at a speed of 4.5 km/h. Work out Beatrice’s average speed for the whole journey. … km/h [3]
3 marks
Mark scheme: 8 4.32 3 1 2 B1 for oe or oe seen 4 4.5 1 + 2 M1 dep on B1 for oe their 14 + their 4.52
This question in 0580/23 Oct/Nov 2021
Q76 · A train passes through a station at a speed of 108 km/h 0580/21 May/June 2022
14 A train passes through a station at a speed of 108 km/h. The length of the station is 120 m. The train takes 7 seconds to completely pass through the station. Work out the length of the train. … m [3]
3 marks
Mark scheme: 14 90 3 B2 for 210 or 0.09 km OR M1 for speed × time seen M1 for correct conversion of both km to m and between h and s
This question in 0580/21 May/June 2022
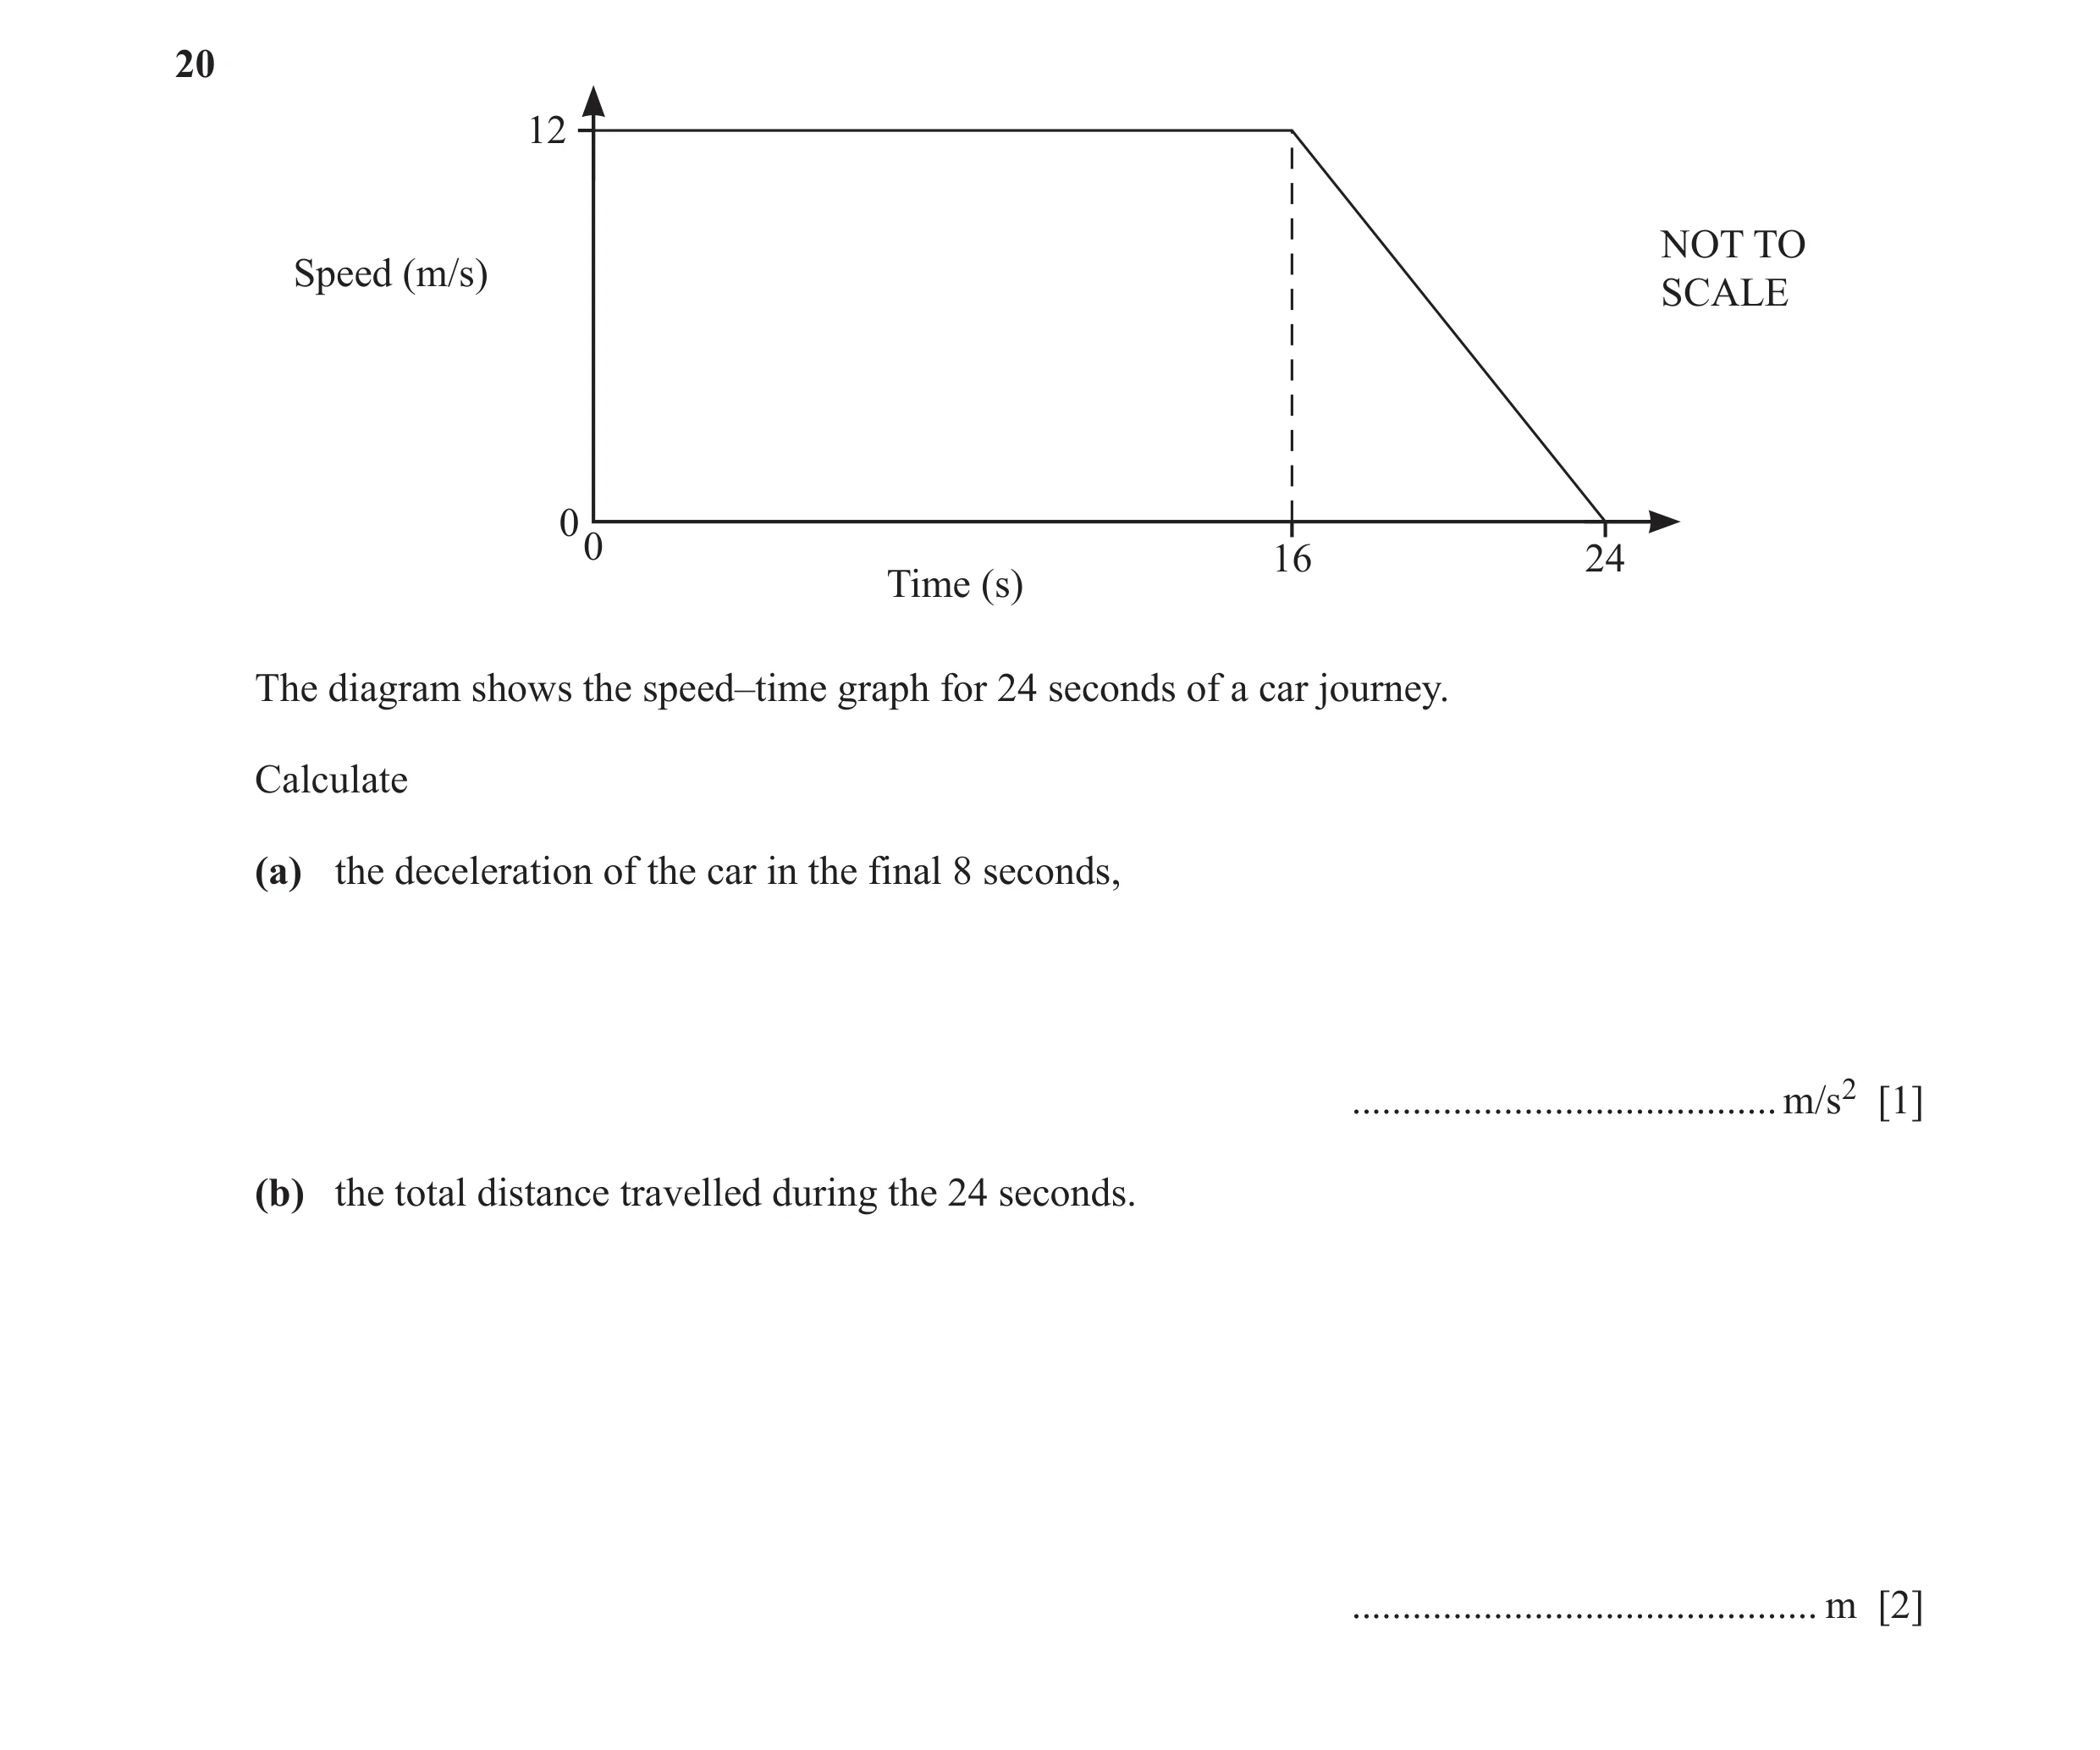
Q77 · 12 NOT TO Speed (m/s) SCALE 0 0 16 24 Time (s) The diagram shows the speed–time graph for… 0580/21 May/June 2022
20 12 NOT TO Speed (m/s) SCALE 0 0 16 24 Time (s) The diagram shows the speed–time graph for 24 seconds of a car journey. Calculate (a) the deceleration of the car in the final 8 seconds, … m/s2 [1] (b) the total distance travelled during the 24 seconds. … m [2]
3 marks
Mark scheme: 20(a) 1 1 1.5 or 12 20(b) 240 2 M1 for one correct area
This question in 0580/21 May/June 2022
Q78 · Annette cycles a distance of 70 km from Midville to Newtown 0580/22 May/June 2022
12 Annette cycles a distance of 70 km from Midville to Newtown. Leaving Midville, she cycles for 1 hour 30 minutes at a constant speed of 20 km/h and then stops for 30 minutes. She then continues the journey to Newtown at a constant speed of 16 km/h. 80 60 Distance (km) 40 20 0 0 1 2 3 4 5 Time (h) (a) On the grid, draw the distance–time graph for the journey. [3] (b) Calculate the average speed for the whole journey. … km/h [3]
6 marks
Mark scheme: 12(a) correct graph 3 B1 for line from (0, 0) to (1.5, 30) B1 for horizontal line from (their 1.5, their 30) for 0.5 hours B1 for a line from (their 2, their 30) ending at distance 70 with a gradient of 16 Provided it fits on the grid and their 30 is <70 12(b) 15.6 or 15.55 to 15.56 3 M2 for 70 (their final time in hours) nfww 70 – their 30 (final time =) 1.5 + 0.5 + 16 or 4.5 or their final time from graph or M1 for 70 any time
This question in 0580/22 May/June 2022
Q79 · Change 300 m / min to km / h 0580/23 May/June 2022
9 Change 300 m / min to km / h. … km / h [2]
2 marks
Mark scheme: 9 18 2 300 60 M1 for oe 1000 or B1 for figs 18 in their answer
This question in 0580/23 May/June 2022
Q80 · 14 Speed (m/s) NOT TO SCALE 0 0 5 15 Time (seconds) The diagram shows the speed–time… 0580/21 Oct/Nov 2022
13 14 Speed (m/s) NOT TO SCALE 0 0 5 15 Time (seconds) The diagram shows the speed–time graph of the first 15 seconds of a car journey. (a) Find the acceleration of the car during the first 5 seconds. … m/s2 [1] (b) Find the distance travelled during the 15 seconds. … m [2]
3 marks
Mark scheme: 13(a) 2.8 oe 1 13(b) 175 2 M1 for a correct relevant area calculation e.g. 1 (15 – 5) 14 or 5 14 oe or better 2
This question in 0580/21 Oct/Nov 2022
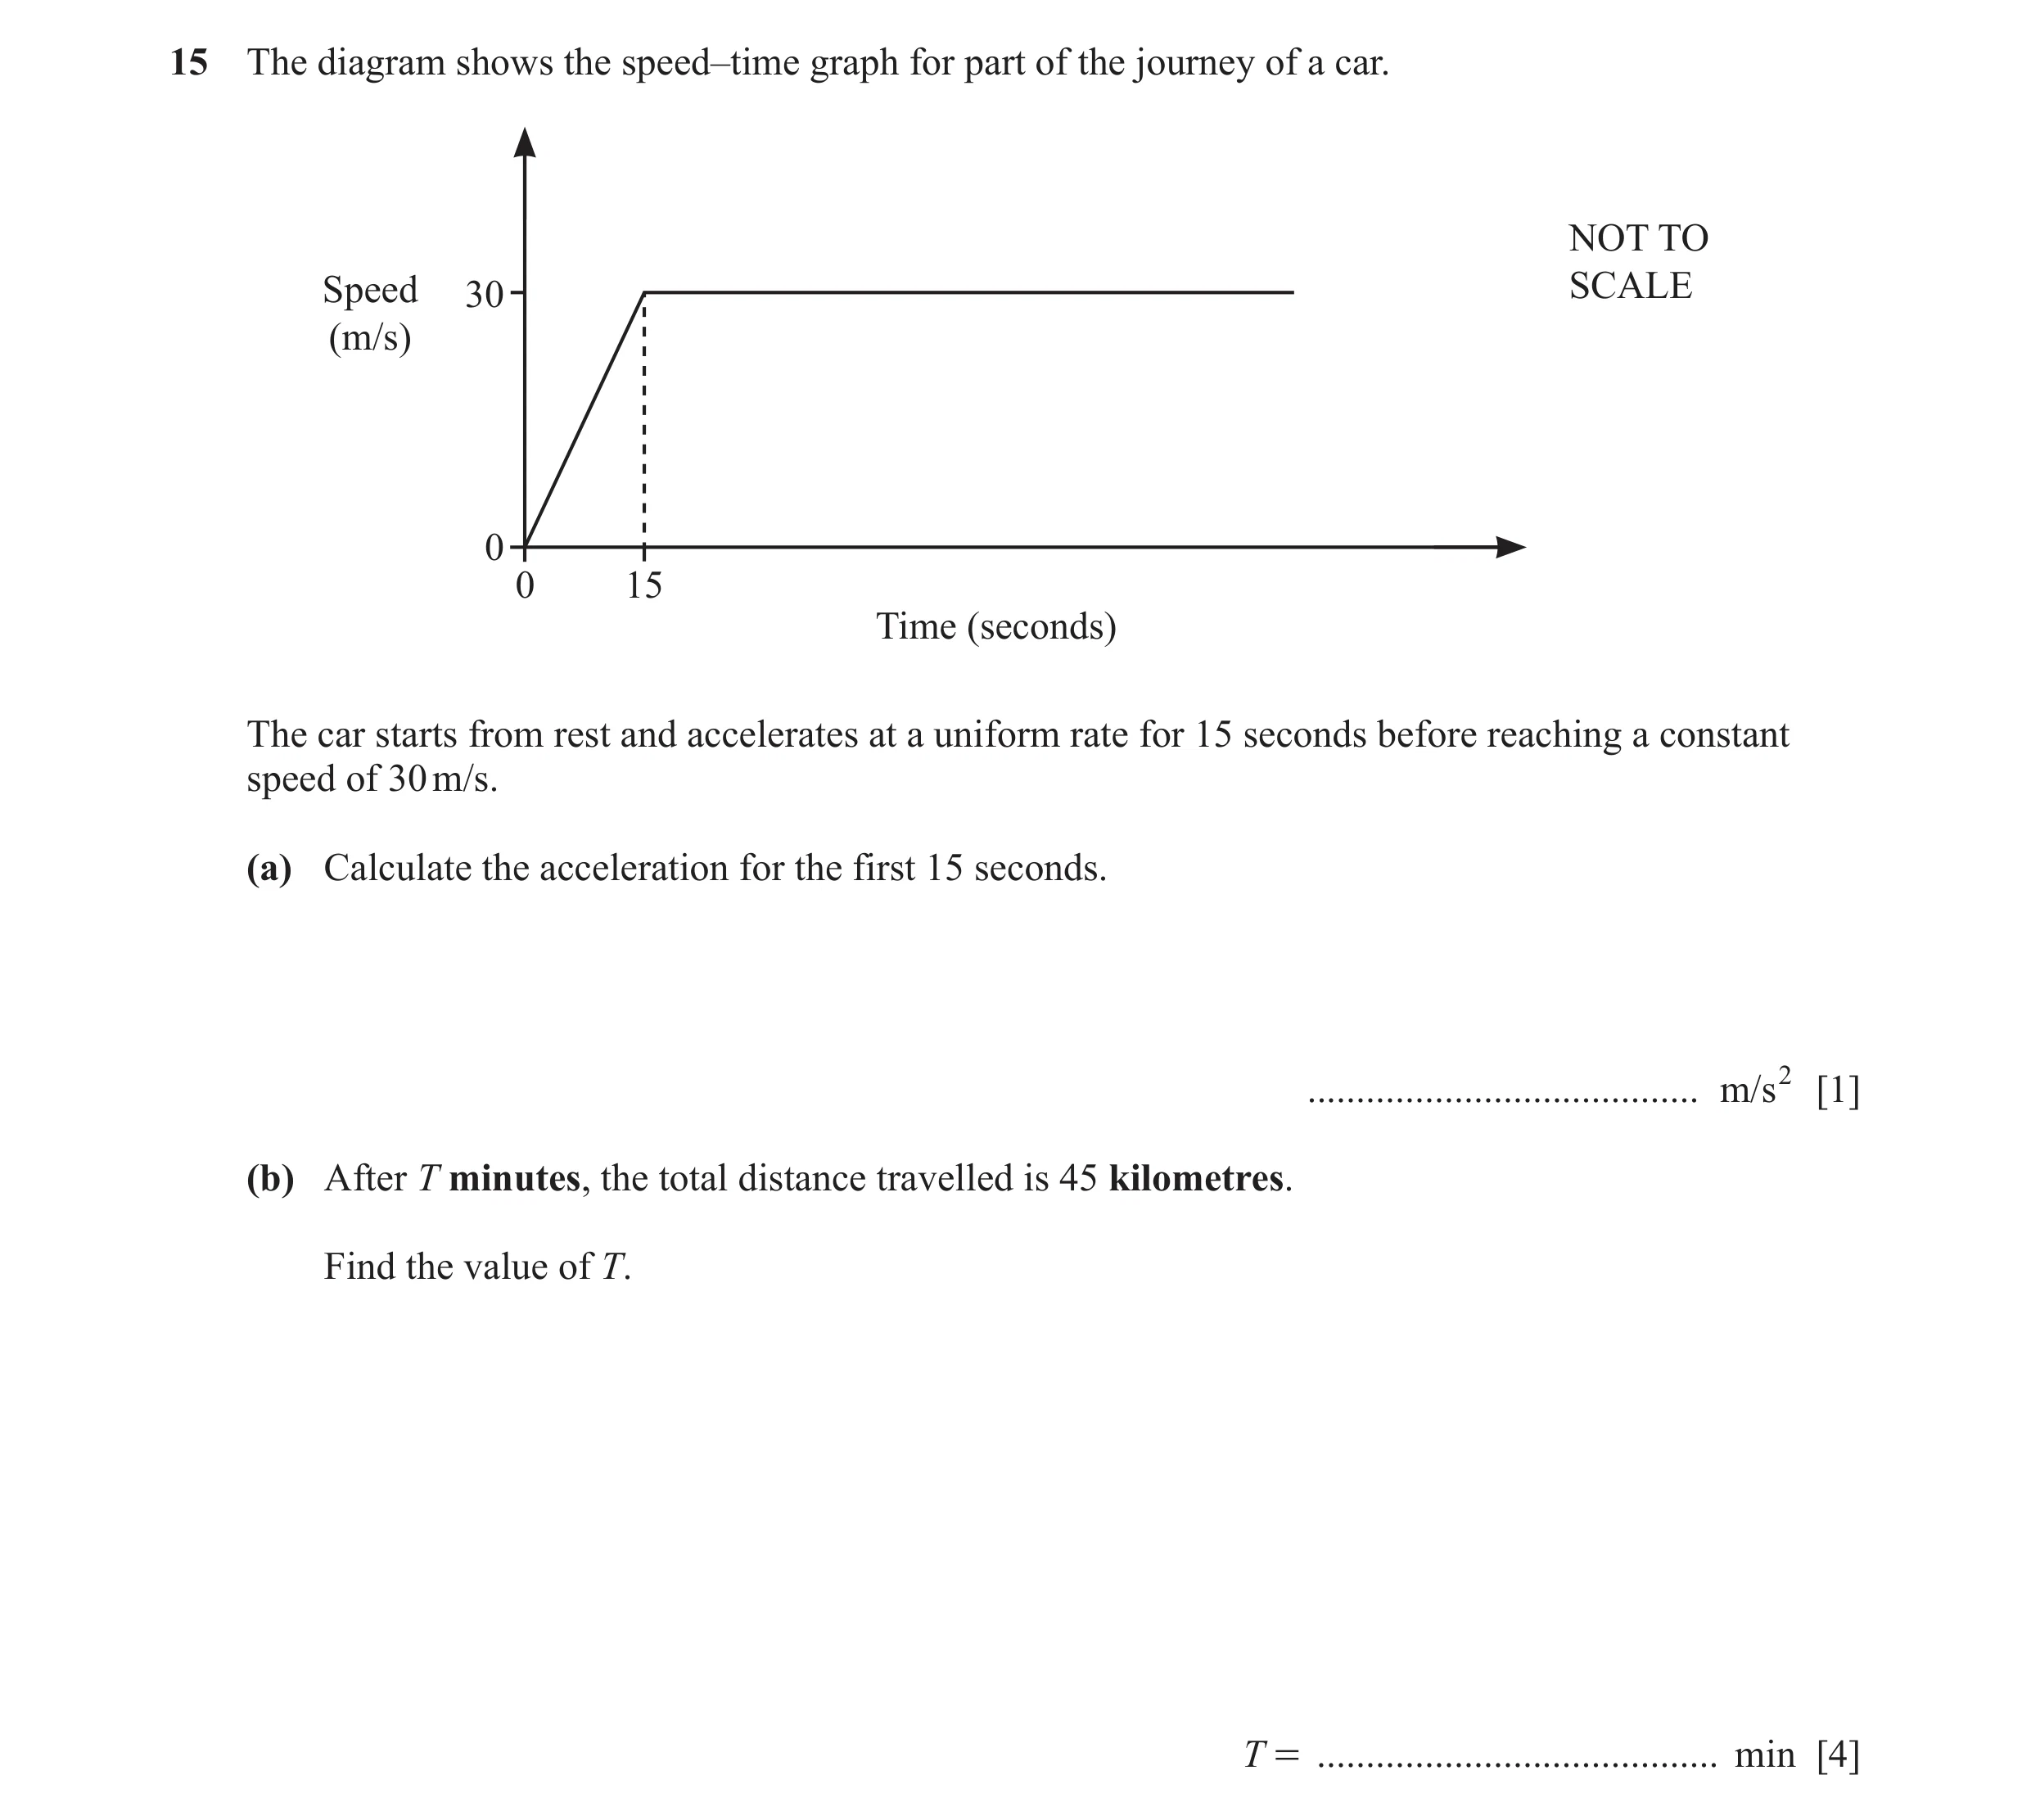
Q81 · The diagram shows the speed–time graph for part of the journey of a car 0580/23 Oct/Nov 2022
15 The diagram shows the speed–time graph for part of the journey of a car. NOT TO Speed 30 SCALE (m/s) 0 0 15 Time (seconds) The car starts from rest and accelerates at a uniform rate for 15 seconds before reaching a constant speed of 30 m/s. (a) Calculate the acceleration for the first 15 seconds. … m/s2 [1] (b) After T minutes, the total distance travelled is 45 kilometres. Find the value of T. T = … min [4]
5 marks
Mark scheme: 15(a) 2 1 15(b) 25.125 4 15 30 M3 for + 30 ( k − 15 ) = figs 45 oe 2 OR B2 for 44 775 or 44.775 OR 15 30 M1 for or 30 ( k − 15 ) oe 2 B1 for 45 000 or 0.225 or 0.03
This question in 0580/23 Oct/Nov 2022
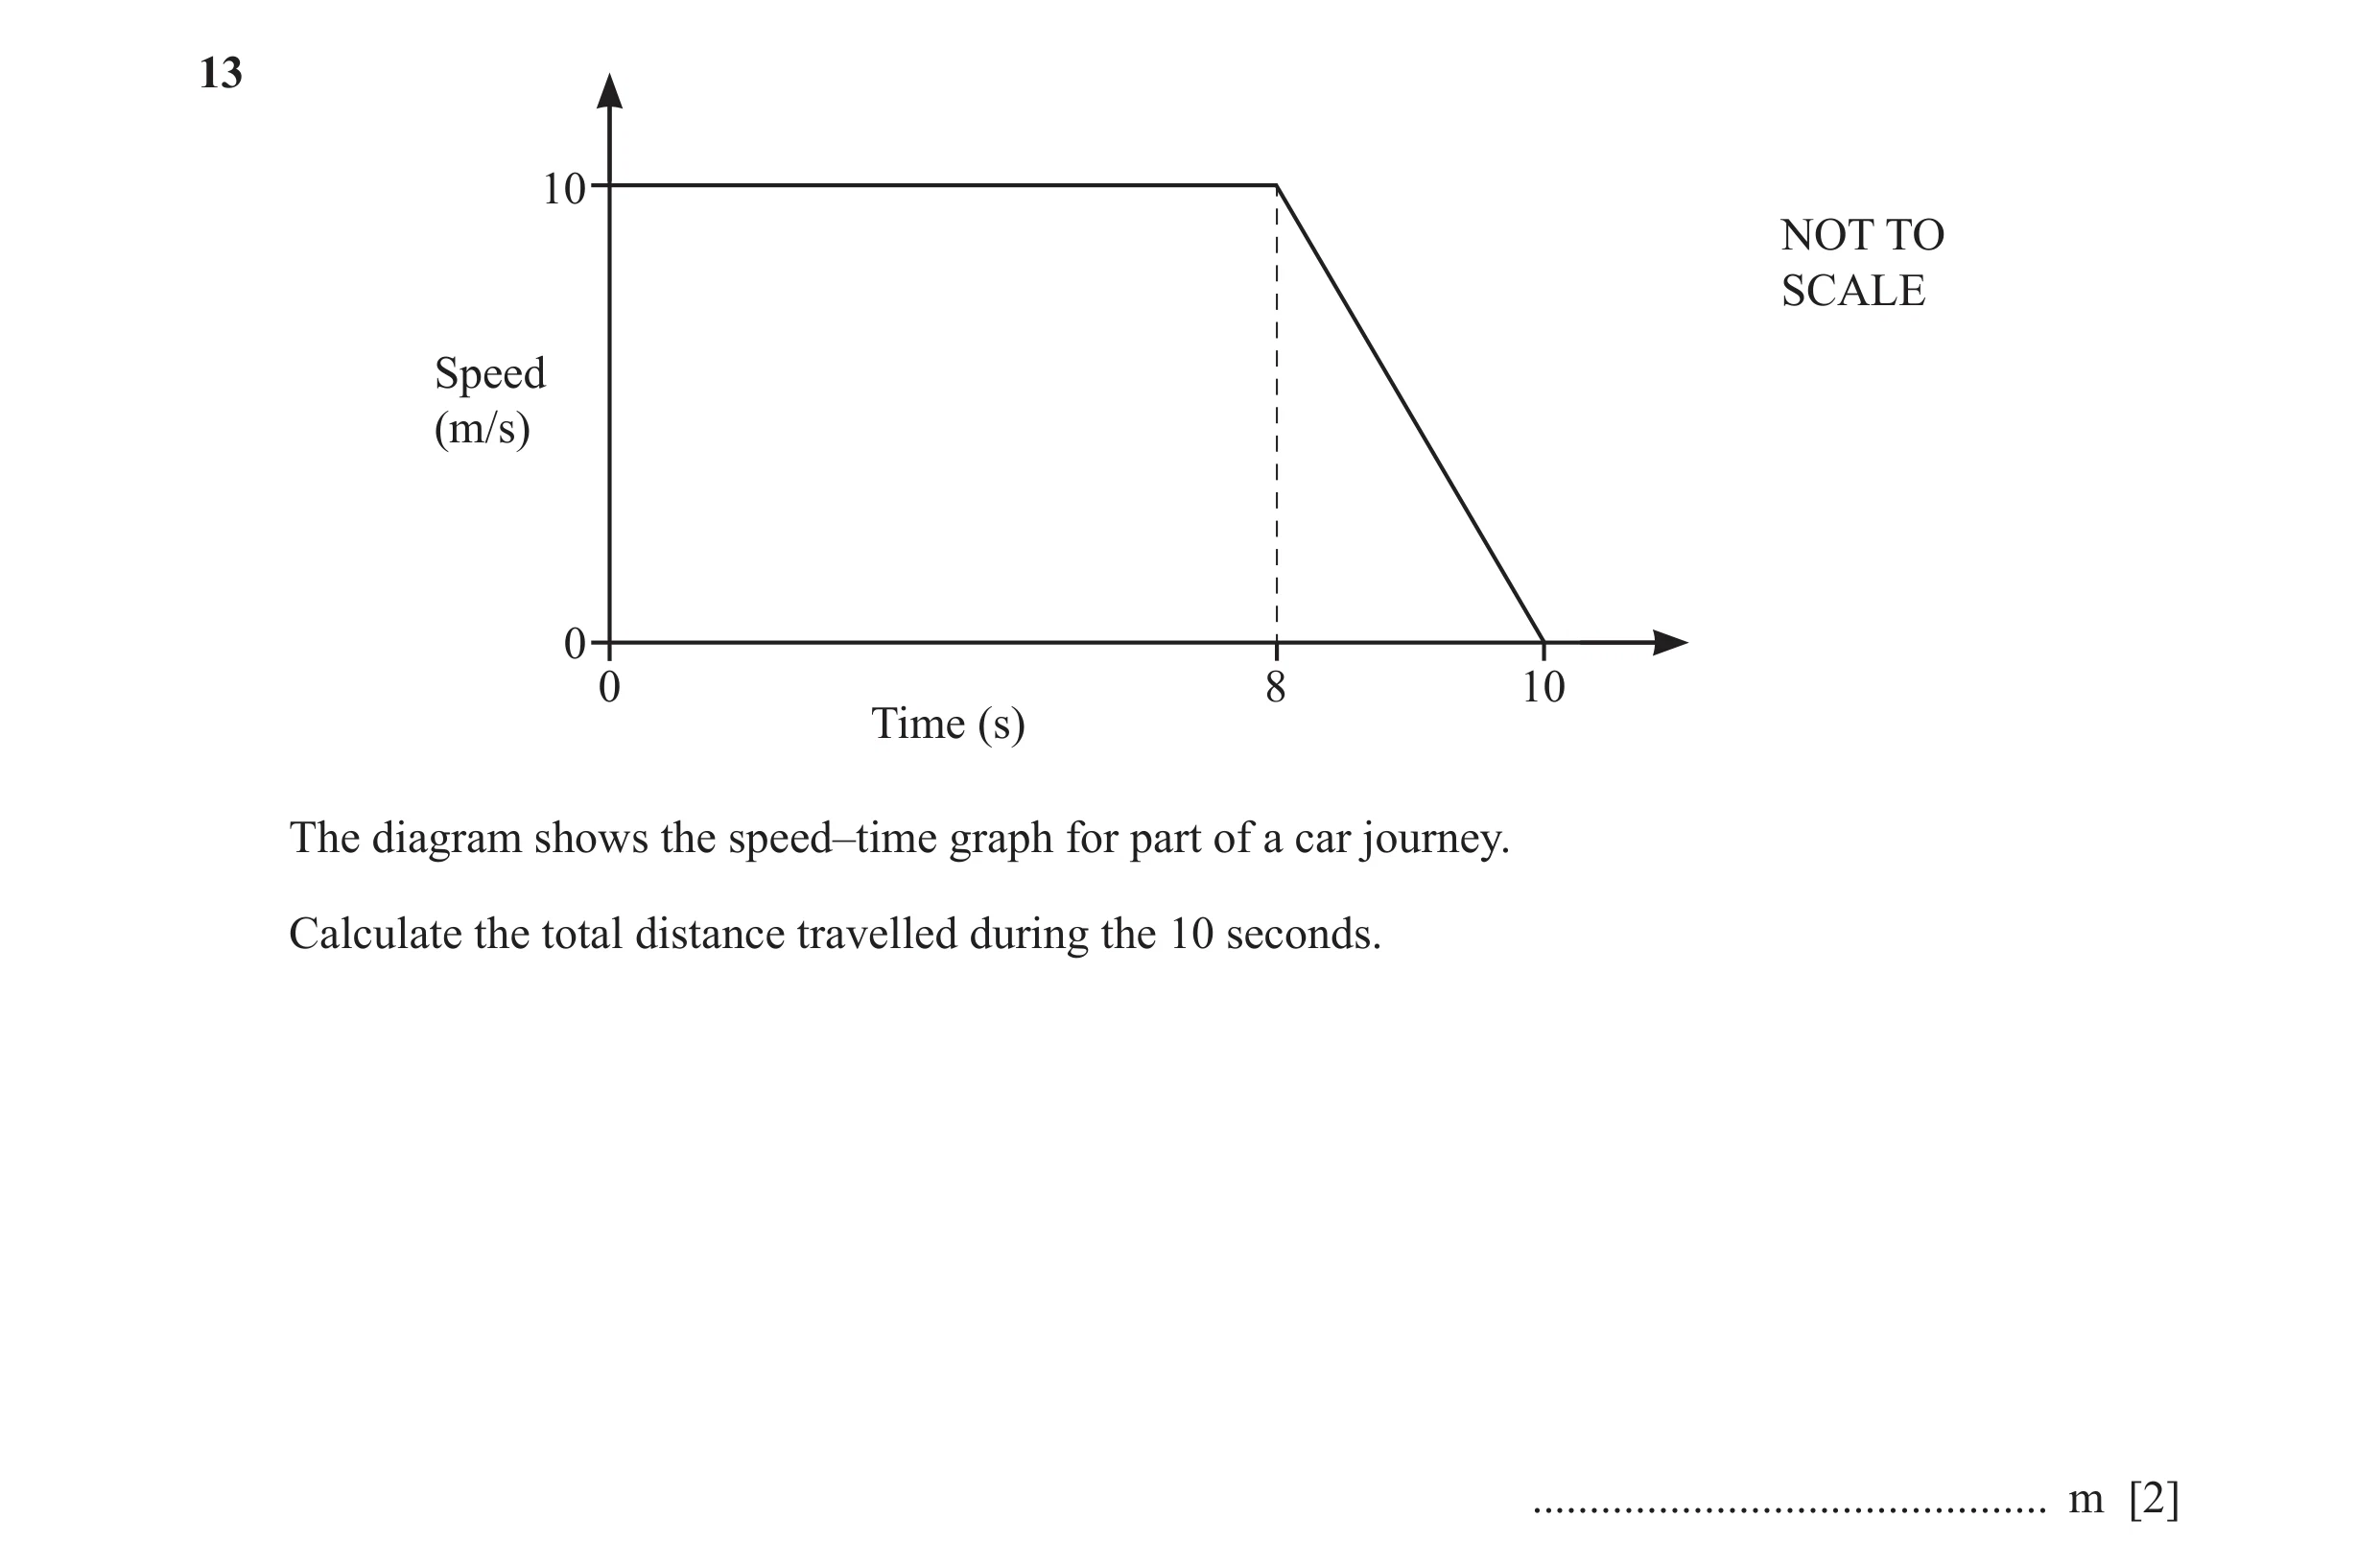
Q82 · 10 NOT TO SCALE Speed (m/s) 0 0 8 10 Time (s) The diagram shows the speed–time graph for… 0580/22 Feb/March 2023
13 10 NOT TO SCALE Speed (m/s) 0 0 8 10 Time (s) The diagram shows the speed–time graph for part of a car journey. Calculate the total distance travelled during the 10 seconds. … m [2]
2 marks
Mark scheme: 13 90 2 M1 for a correct area calculation e.g. 8 × 10 or 0.5 × 2 × 10 or better
This question in 0580/22 Feb/March 2023
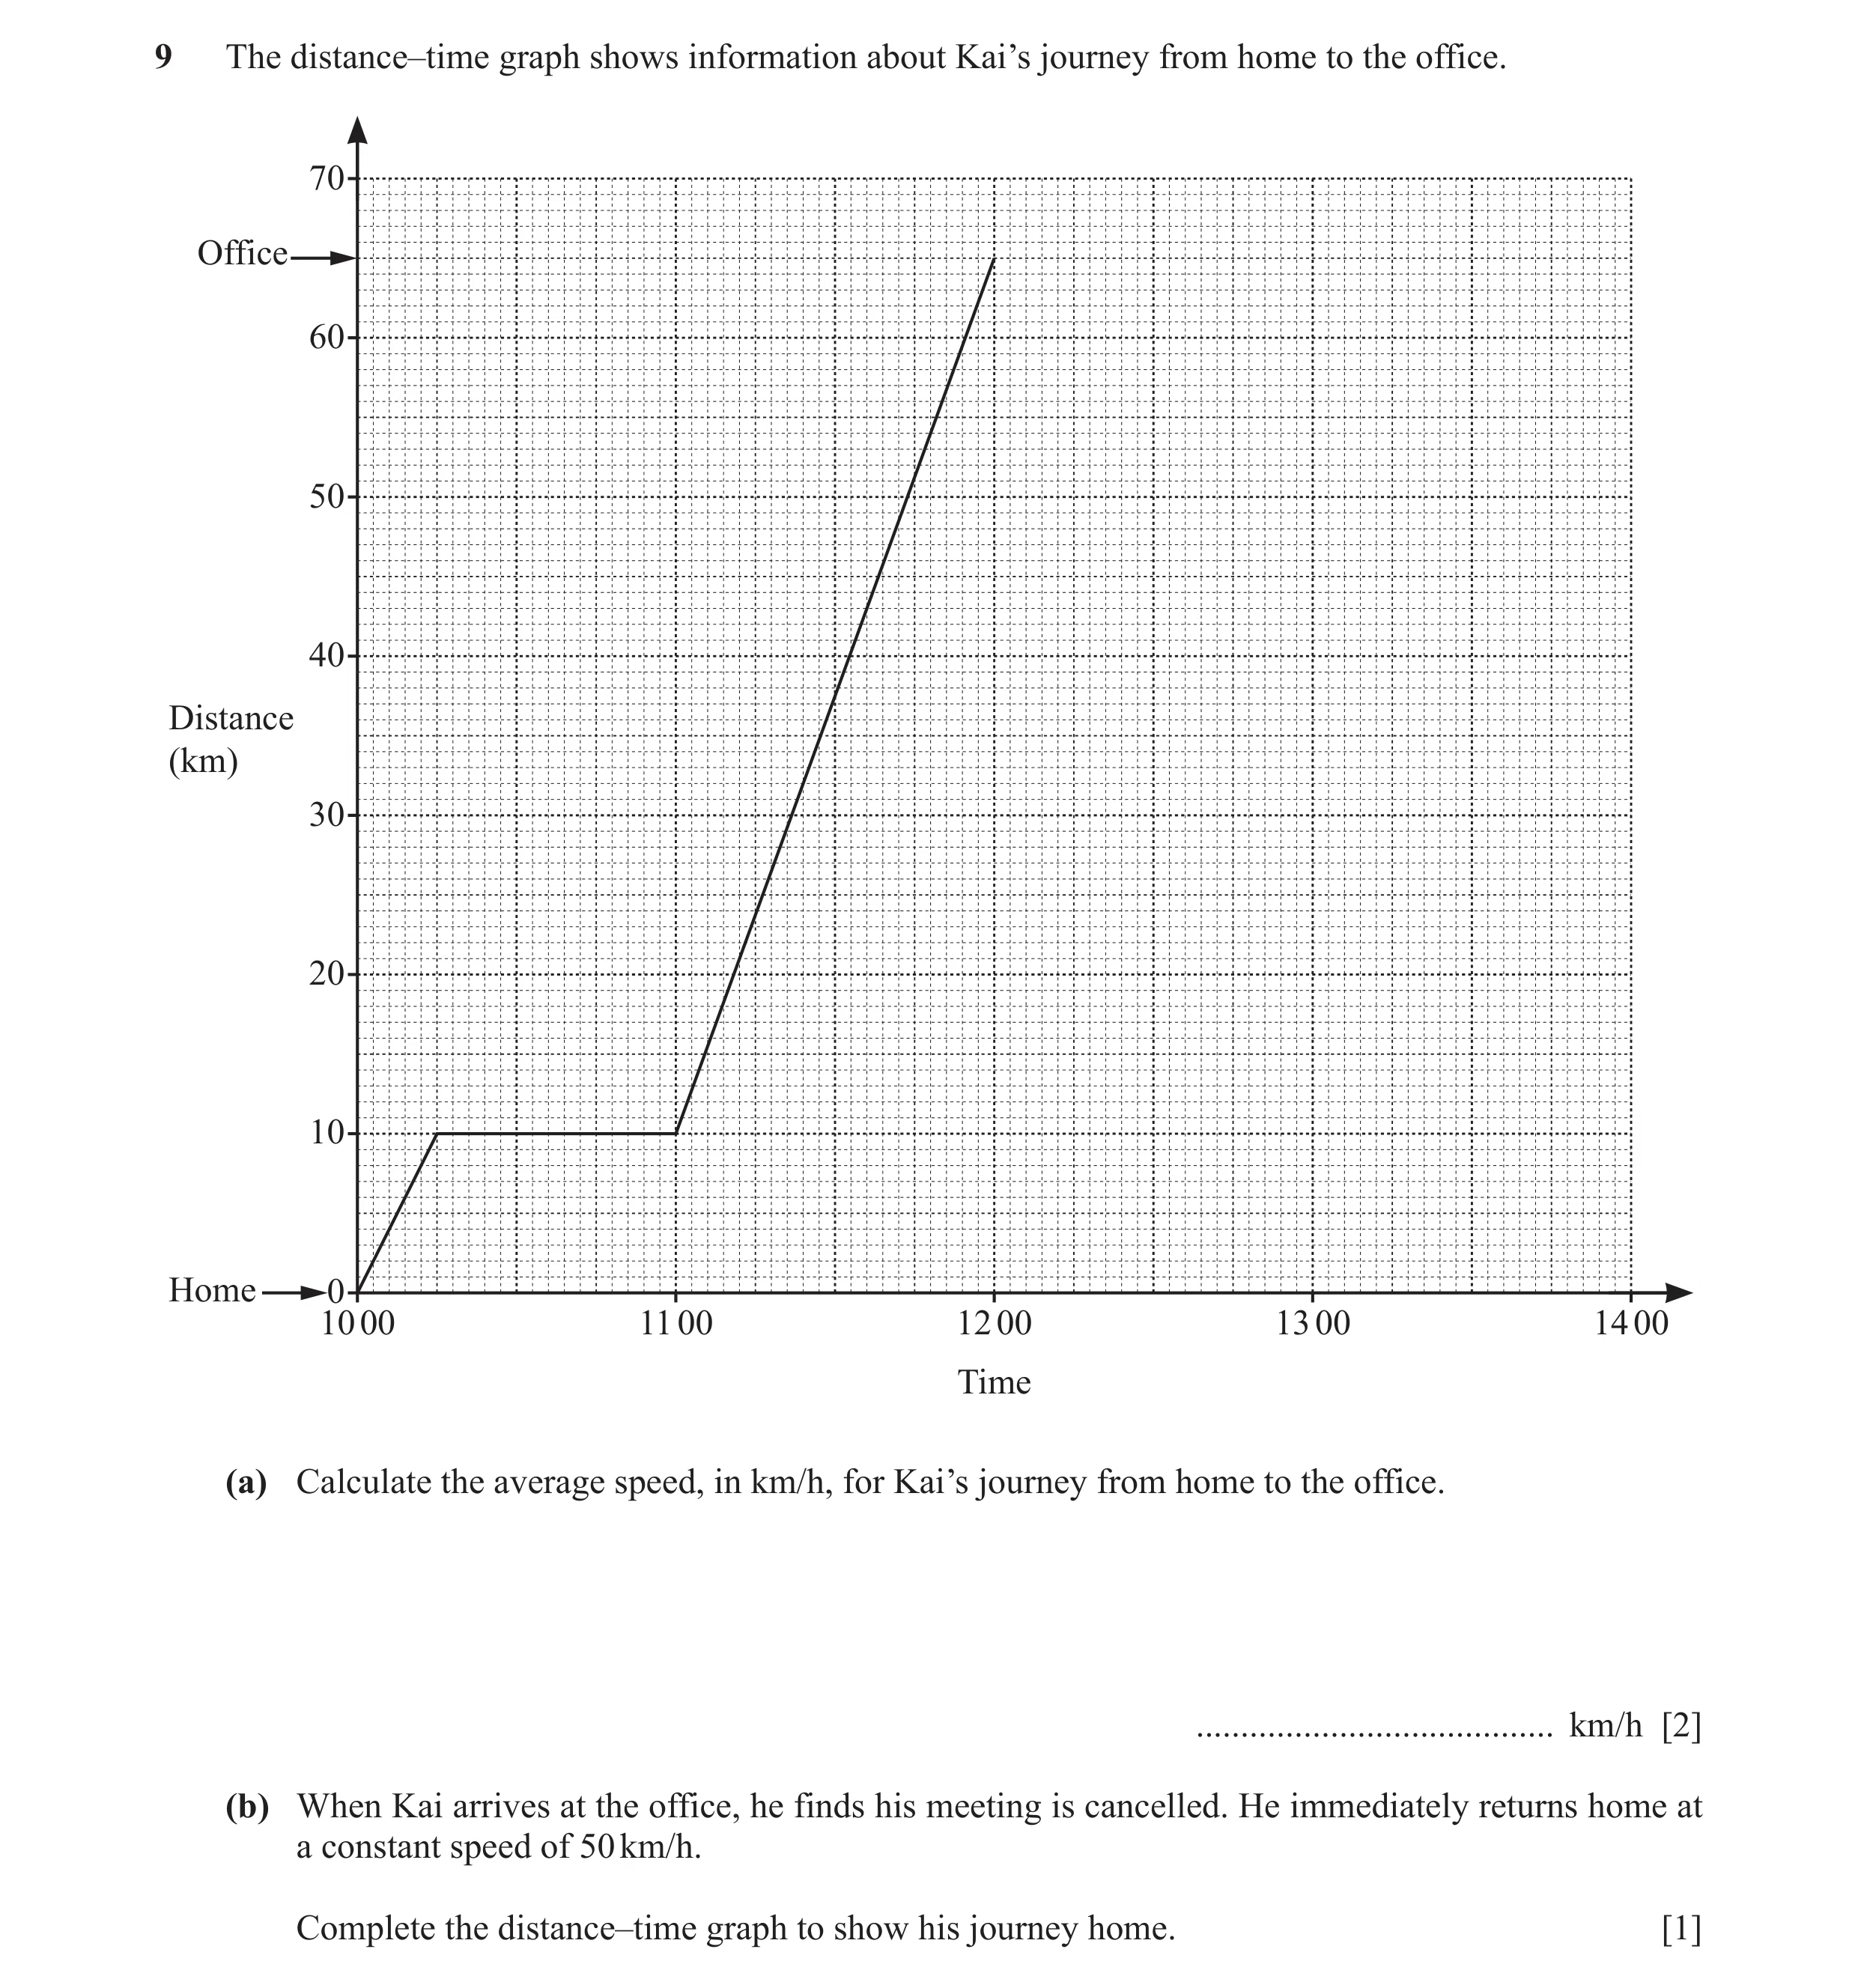
Q83 · The distance–time graph shows information about Kai’s journey from home to the office 0580/23 May/June 2023
9 The distance–time graph shows information about Kai’s journey from home to the office. 70 Office 60 50 40 Distance (km) 30 20 10 Home 0 10 00 11 00 12 00 13 00 14 00 Time (a) Calculate the average speed, in km/h, for Kai’s journey from home to the office. … km/h [2] (b) When Kai arrives at the office, he finds his meeting is cancelled. He immediately returns home at a constant speed of 50 km/h. Complete the distance–time graph to show his journey home. [1]
3 marks
Mark scheme: 9(a) 32.5 2 65 their distance M1 for or theirtime 2 9(b) correct ruled line 1 from (12 00, 65) to (13 18, 0)
This question in 0580/23 May/June 2023
Q84 · The table shows some information about Amir’s shopping 0580/21 Oct/Nov 2023
4 The table shows some information about Amir’s shopping. Fruit Cost per kilogram Number of kilograms Amir buys Cost Oranges $2.35 3.2 $ … Bananas 2.8 $ … $ … Total $13.54 Complete the table. [3]
3 marks
Mark scheme: 4 3 B1 for 7.52 B1 for 6.02 or B1FT for 13.54 – their 7.52 correctly evaluated provided their 7.52 < 13.54 B1FT for their 6.02 ÷ 2.8 correctly evaluated
This question in 0580/21 Oct/Nov 2023
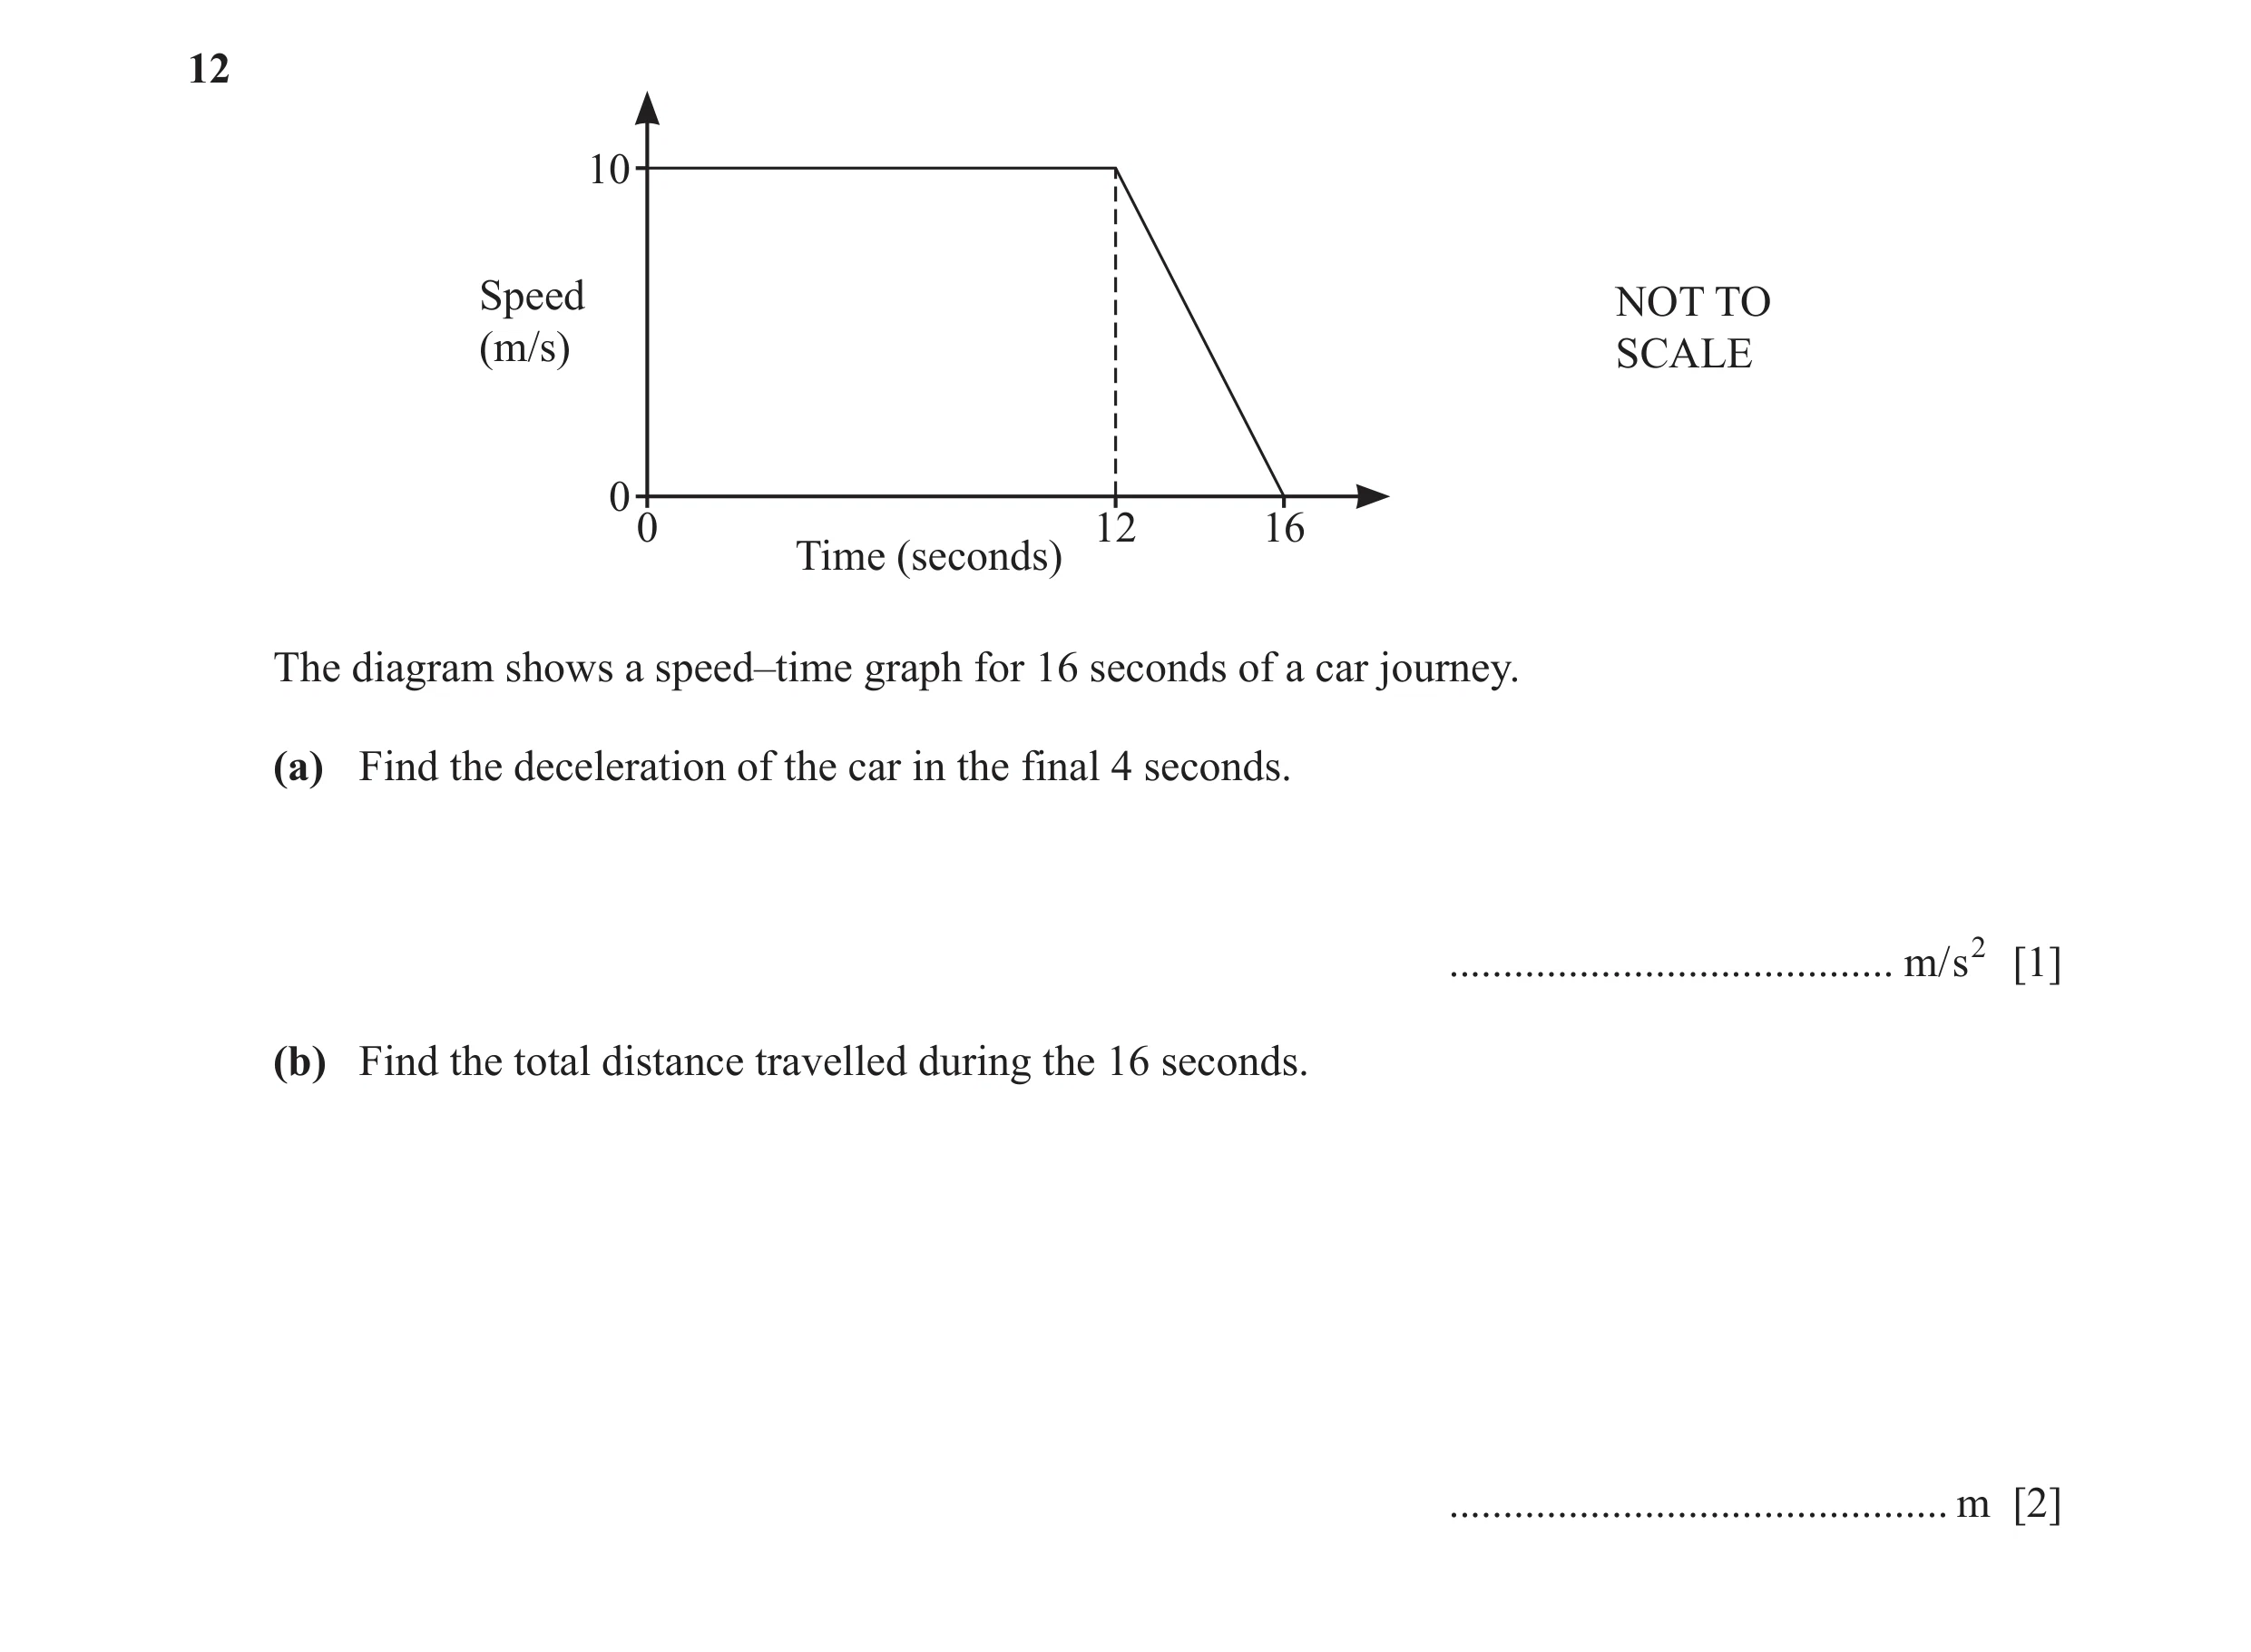
Q85 · 10 Speed NOT TO (m/s) SCALE 00 12 16 Time (seconds) The diagram shows a speed–time graph… 0580/22 Oct/Nov 2023
12 10 Speed NOT TO (m/s) SCALE 00 12 16 Time (seconds) The diagram shows a speed–time graph for 16 seconds of a car journey. (a) Find the deceleration of the car in the final 4 seconds. … m/s2 [1] (b) Find the total distance travelled during the 16 seconds. … m [2]
3 marks
Mark scheme: 12(a) 2.5 oe 1 12(b) 140 2 M1 for a correct area 1 e.g. 10 × 12, 4 10 , 0.5 × (16 + 12) × 10 2
This question in 0580/22 Oct/Nov 2023
Q86 · The bearing of B from A is 107° 0580/22 Feb/March 2024
13 The bearing of B from A is 107°. Calculate the bearing of A from B. … [2]
2 marks
Mark scheme: 13 287 2 M1 for 360 – (180 – 107) oe or indicates correct angle on a diagram
This question in 0580/22 Feb/March 2024
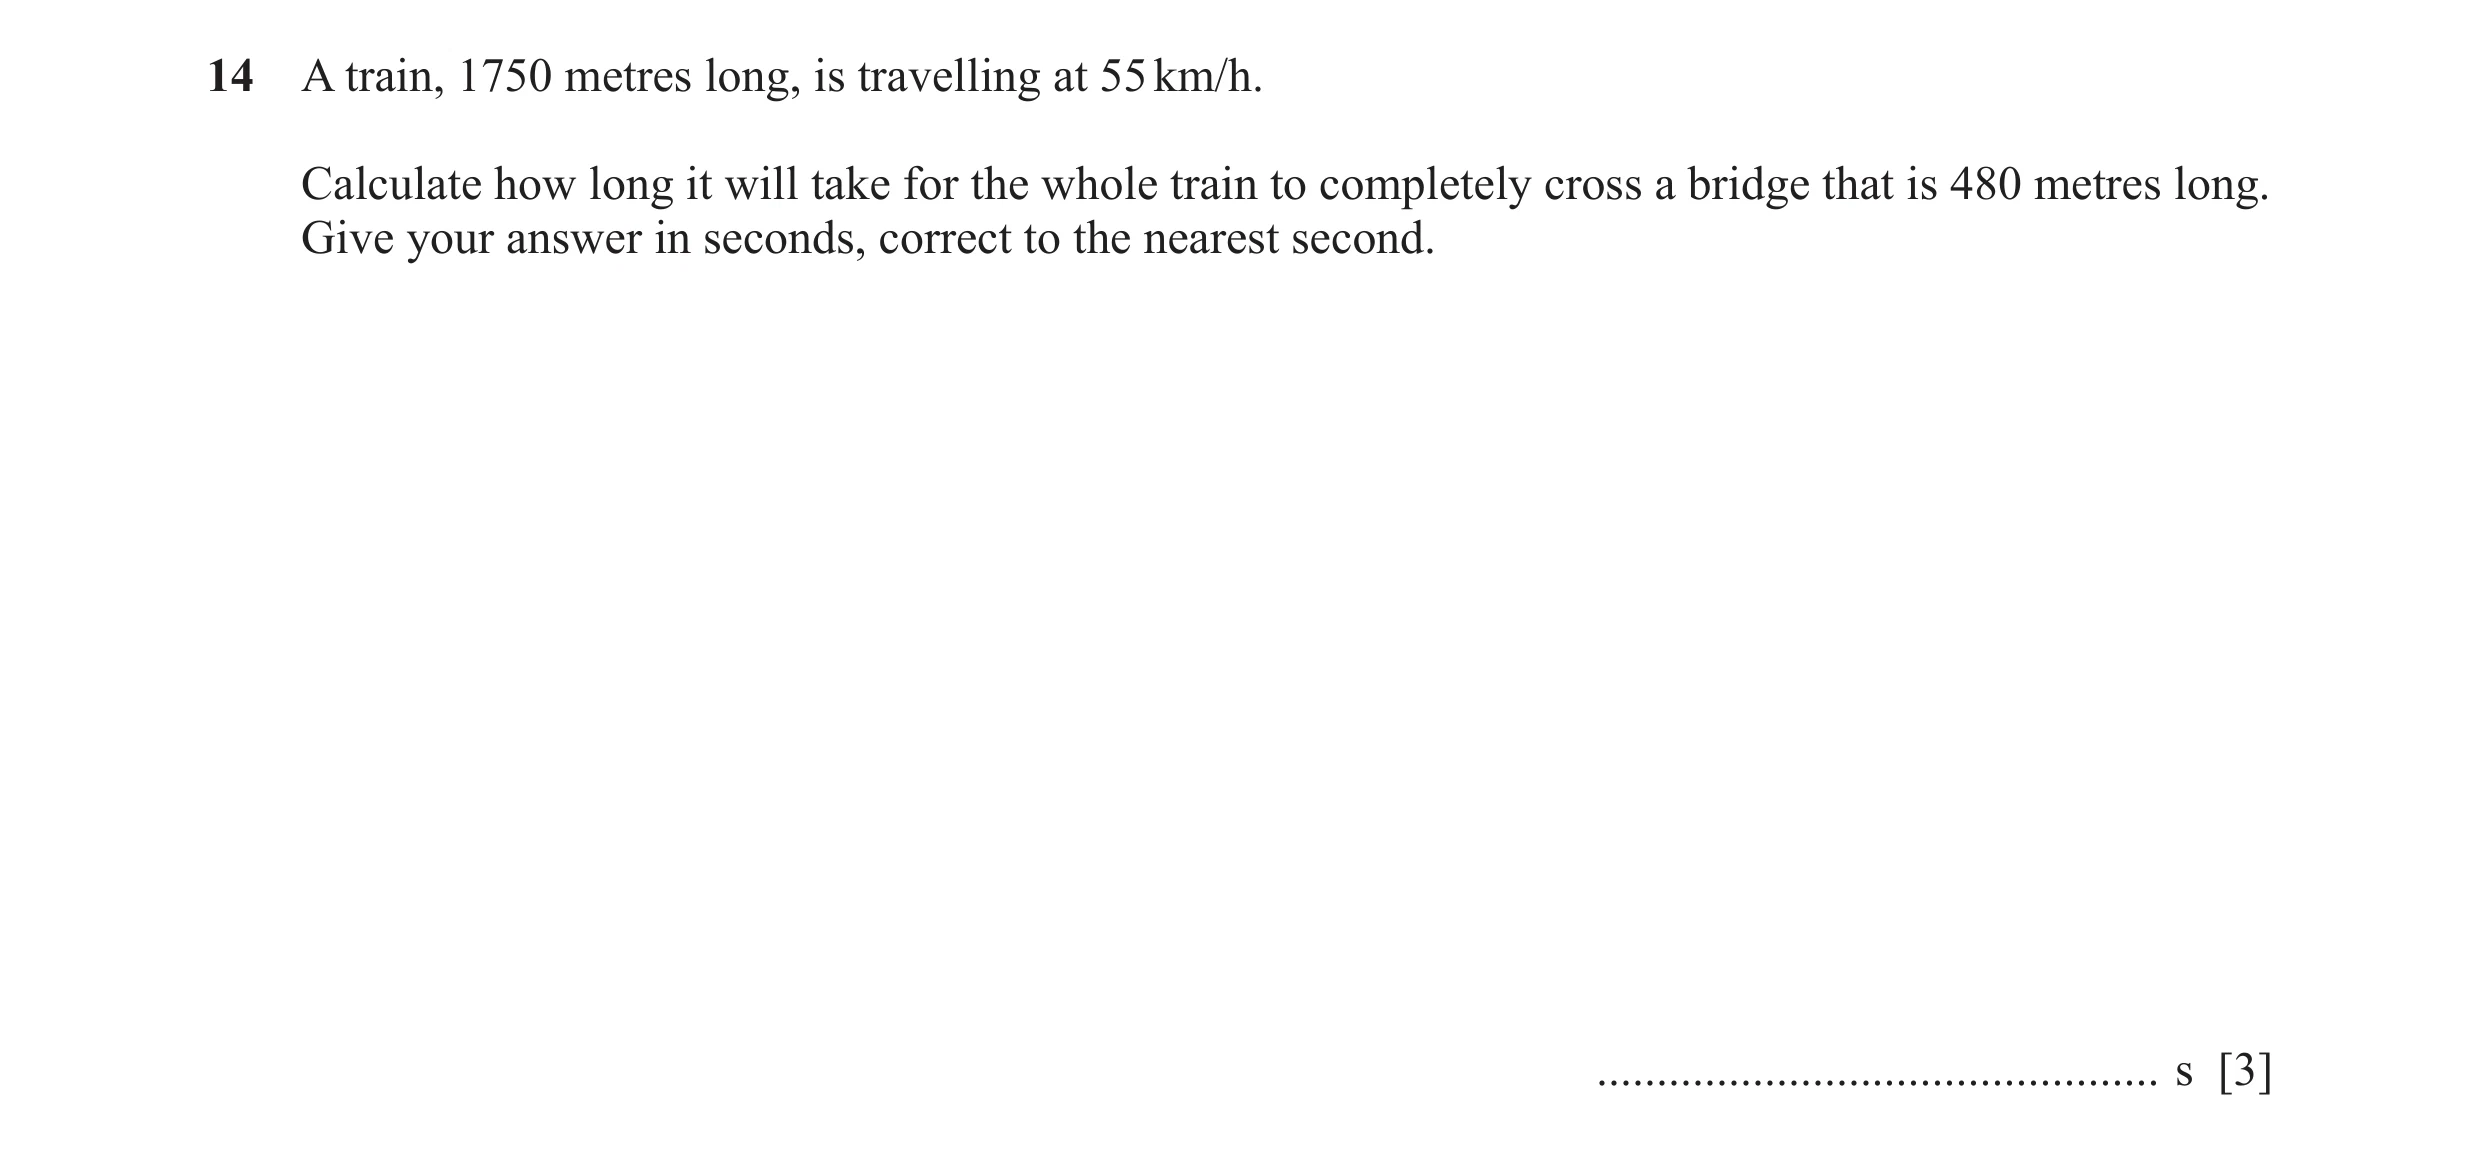
Q87 · A train, 1750 metres long, is travelling at 55 km/h 0580/22 Feb/March 2024
14 A train, 1750 metres long, is travelling at 55 km/h. Calculate how long it will take for the whole train to completely cross a bridge that is 480 metres long. Give your answer in seconds, correct to the nearest second. … s [3]
3 marks
Mark scheme: 14 146 cao 3 1750 + 480 M2 for 60 60 oe 55 1000 or M1 for distance = 1750 + 480 oe 55 1000 or oe soi 60 60 or correctly writing their whole number of seconds from a more accurate answer seen
This question in 0580/22 Feb/March 2024
Q88 · 15 Speed (m/s) NOT TO SCALE 0 20 140 190 Time (seconds) The speed–time graph shows… 0580/22 Feb/March 2024
19 15 Speed (m/s) NOT TO SCALE 0 20 140 190 Time (seconds) The speed–time graph shows information about a bus journey. Calculate the total distance travelled by the bus. … m [3]
3 marks
Mark scheme: 19 2325 3 M2 for correct method for total area 1 e.g. 15 (190 + 120 ) 2 or M1 for correct method for one area e.g. 1 20 15 , (140 – 20) × 15 or 2 1 (190 − 140 ) 15 oe 2
This question in 0580/22 Feb/March 2024
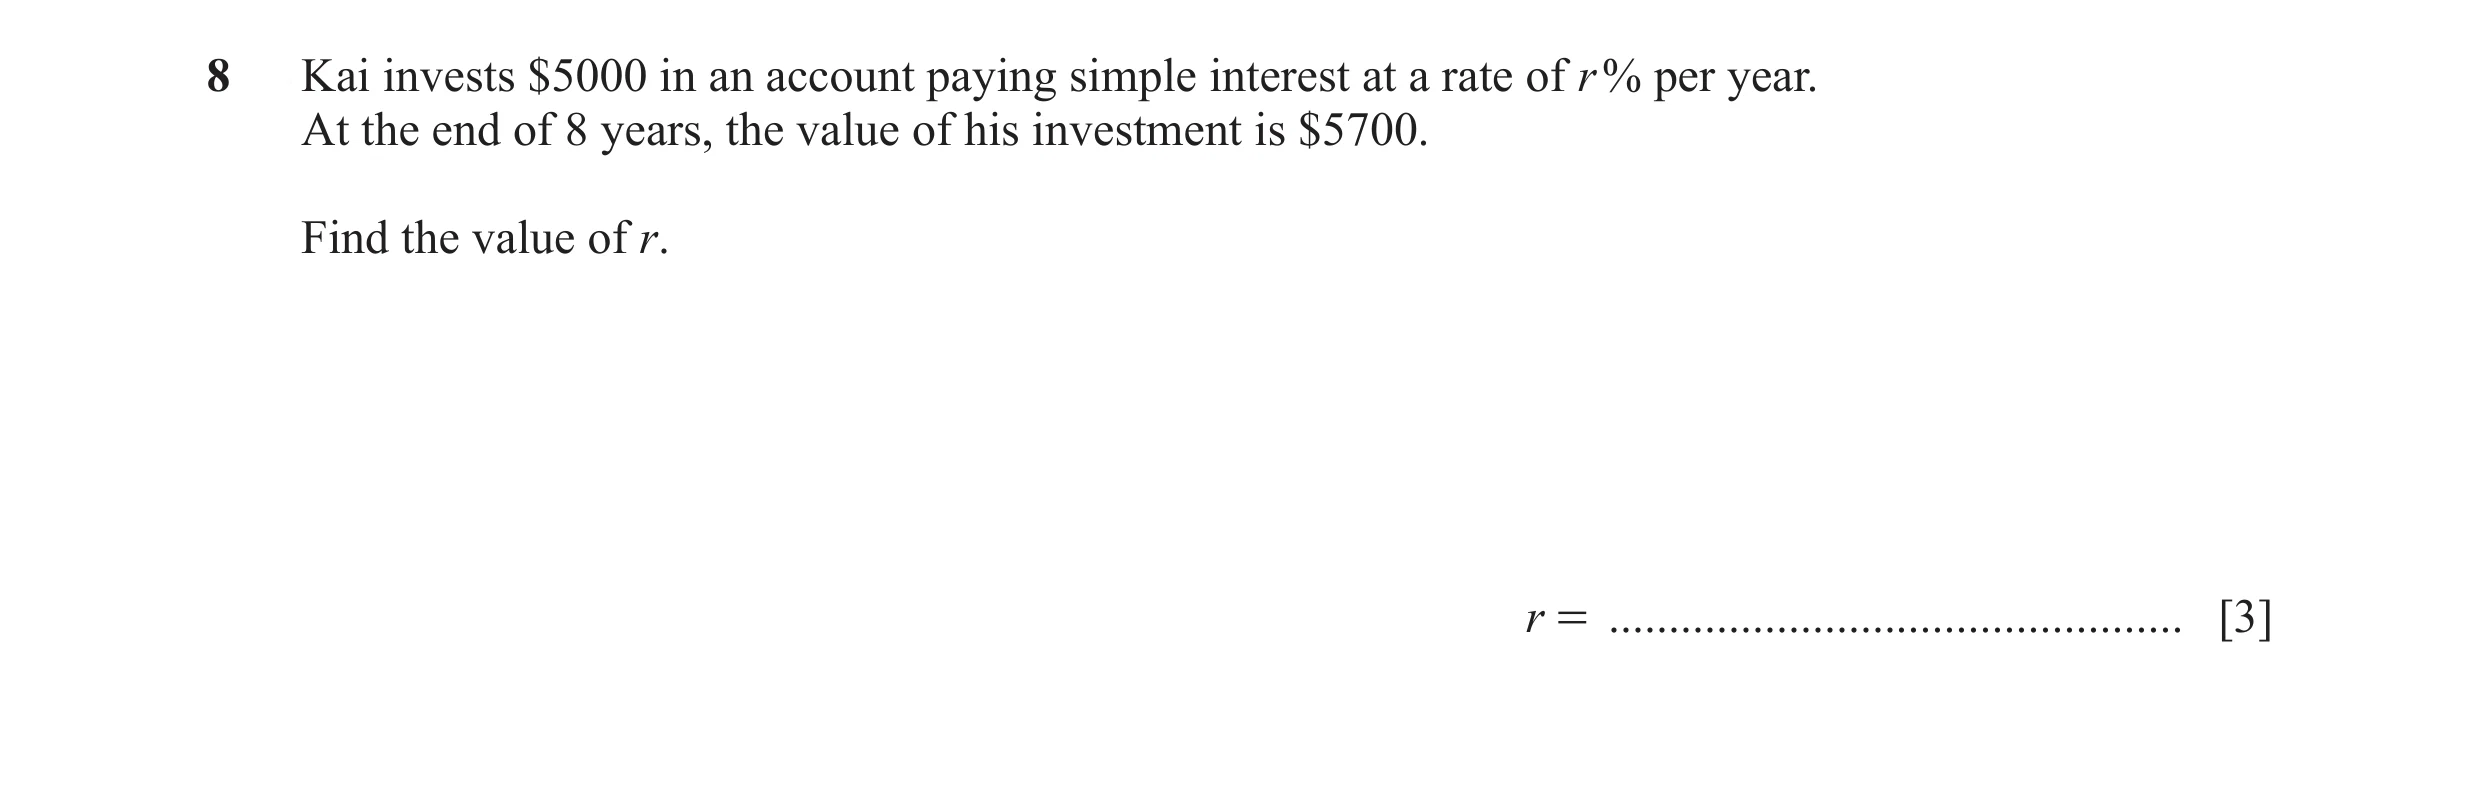
Q89 · Kai invests $5000 in an account paying simple interest at a rate of r % per year 0580/22 May/June 2024
8 Kai invests $5000 in an account paying simple interest at a rate of r % per year. At the end of 8 years, the value of his investment is $5700. Find the value of r. r = … [3]
3 marks
Mark scheme: 8 1.75 3 5700 5000 100 M2 for oe 5000 8 5700 5000 1 00 or oe 5000 8 5000 8 r or M1 for [5700 – 5000] oe 100 or B1 for 87.5 or 0.14 or 1.14 If 0 scored SC1 for answer 14.25
This question in 0580/22 May/June 2024
Q90 · The speed–time graph shows information about a car journey 0580/22 May/June 2024
16 The speed–time graph shows information about a car journey. 16 NOT TO Speed SCALE (m/s) 0 0 30 240 320 Time (s) (a) Find the deceleration of the car between 240 and 320 seconds. … m / s2 [1] (b) Calculate the total distance the car travels during the 320 seconds. … m [3]
4 marks
Mark scheme: 16(a) 0.2 oe 1 16(b) 4240 3 1 M2 for 210 320 16 oe 2 or M1 for one area correct
This question in 0580/22 May/June 2024
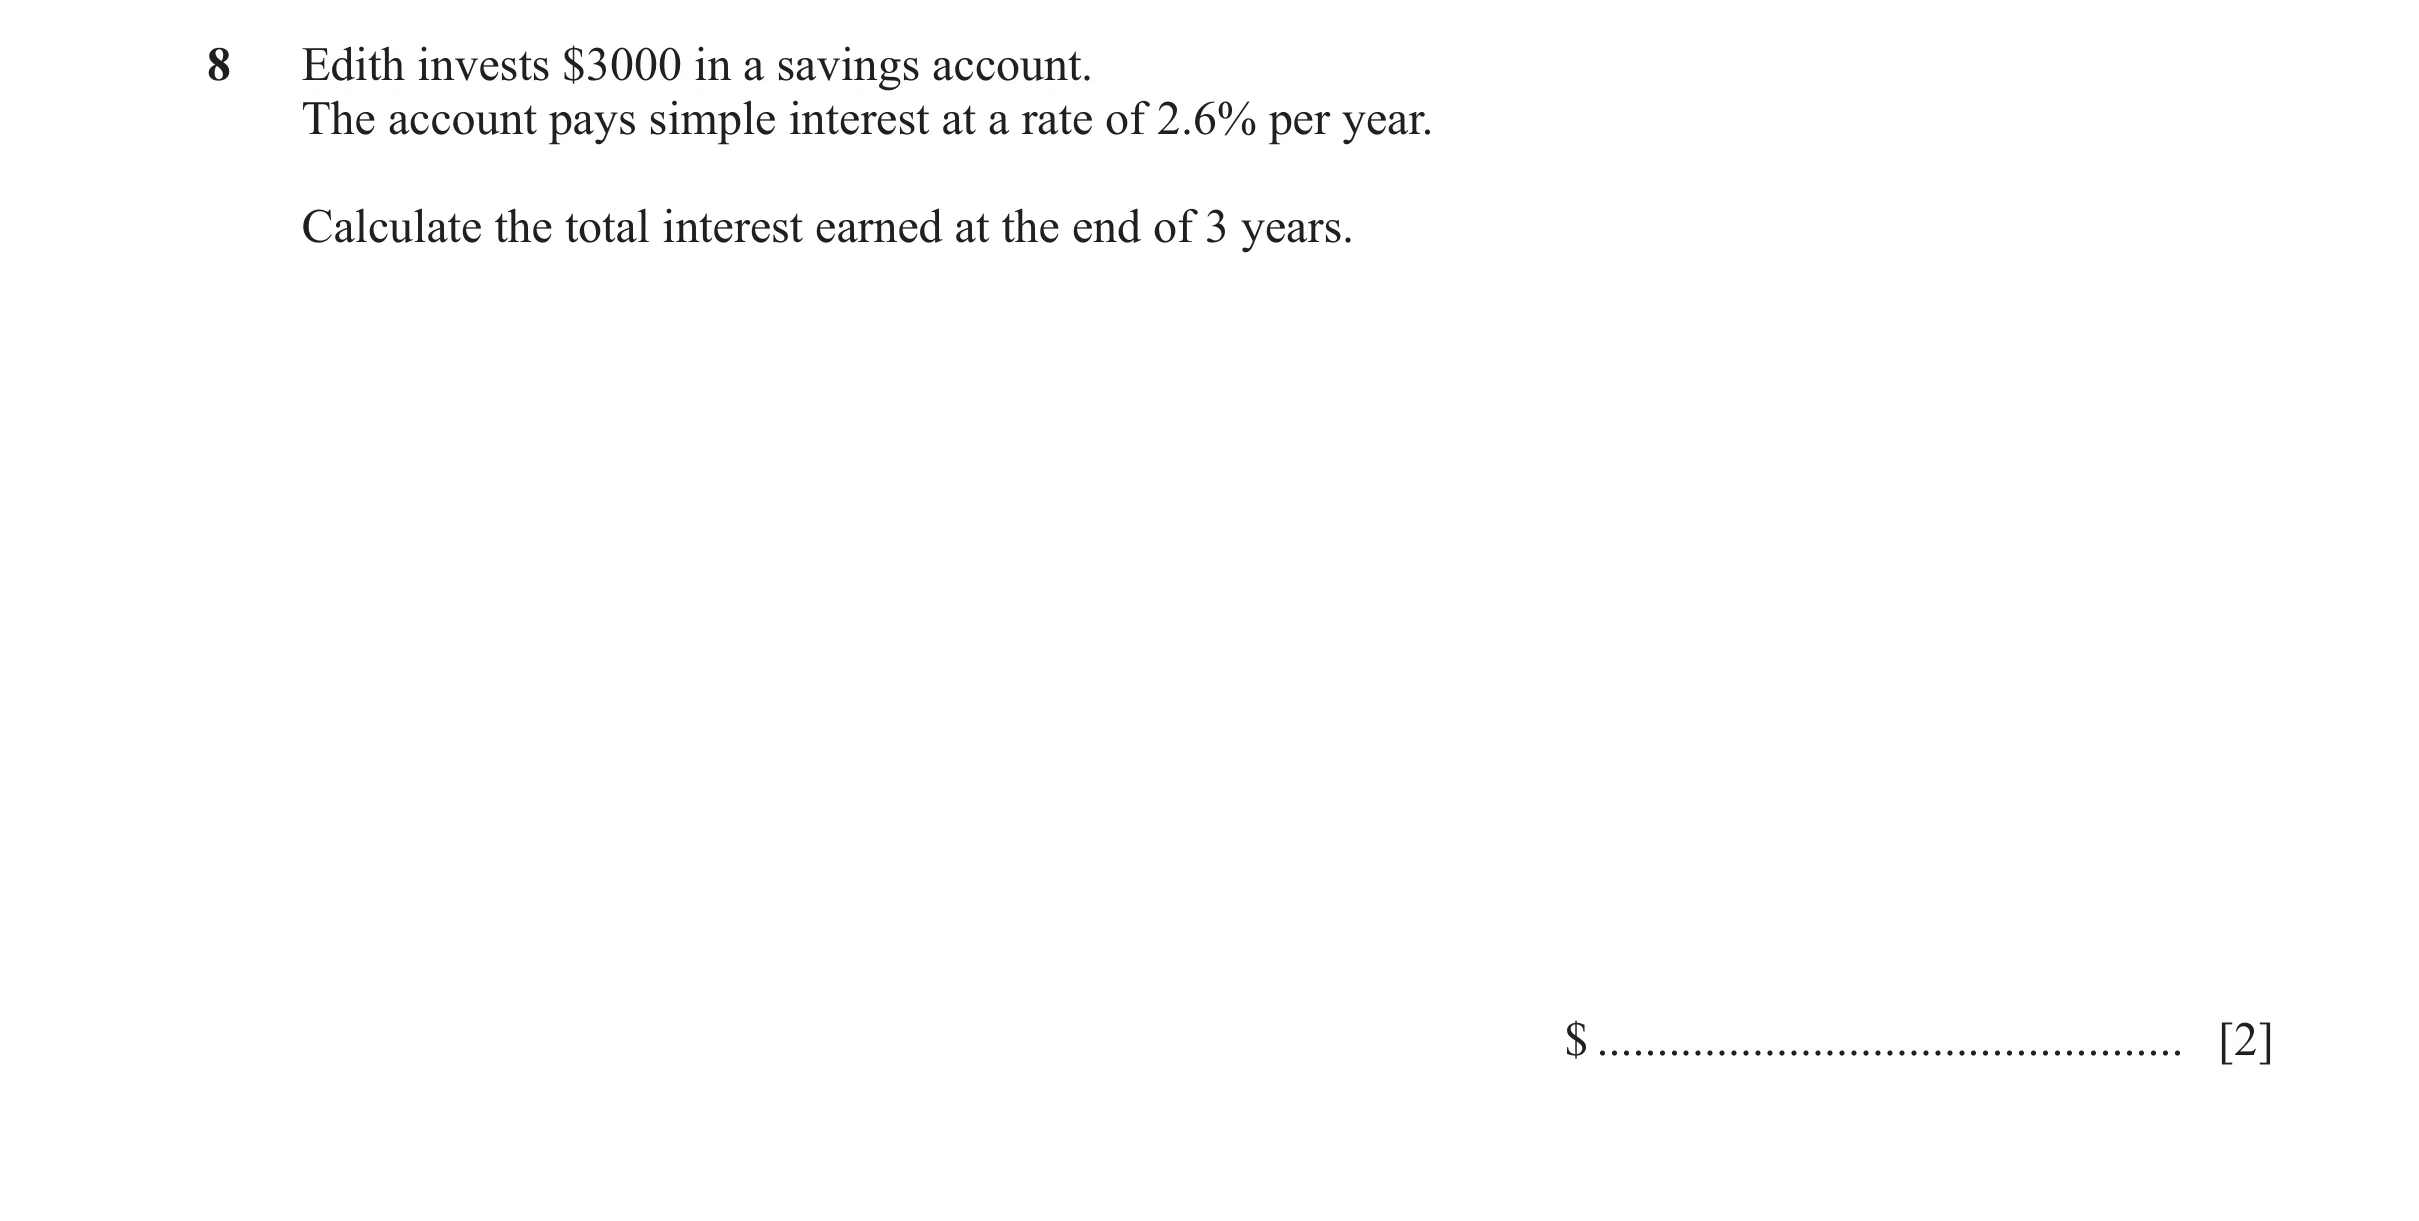
Q91 · Edith invests $3000 in a savings account 0580/21 Oct/Nov 2024
8 Edith invests $3000 in a savings account. The account pays simple interest at a rate of 2.6% per year. Calculate the total interest earned at the end of 3 years. $ … [2]
2 marks
Mark scheme: 8 234 2 3000 2.6 3 M1 for 100
This question in 0580/21 Oct/Nov 2024
Q92 · 20 NOT TO SCALE Speed (m/s) 00 10 17 Time (seconds) The diagram shows the speed–time… 0580/22 Oct/Nov 2024
14 20 NOT TO SCALE Speed (m/s) 00 10 17 Time (seconds) The diagram shows the speed–time graph for 17 seconds of a car journey. (a) Find the acceleration of the car during the first 10 seconds. … m/s2 [1] (b) Calculate the total distance travelled by the car during the 17 seconds. … m [3]
4 marks
Mark scheme: 14(a) 2 1 14(b) 240 3 M2 for correct complete area statement 1 e.g. × 20 × 10 + 7 × 20 oe 2 or M1 for one correct area
This question in 0580/22 Oct/Nov 2024
Q93 · Oranges cost 220 rupees per kilogram 0580/22 Feb/March 2025
1 Oranges cost 220 rupees per kilogram. Work out the cost of 9 kg of these oranges. … rupees [1]
1 marks
Mark scheme: Question Answer Marks Partial Marks 1 1980 1
This question in 0580/22 Feb/March 2025
Q94 · One day, Anya runs 12 km at a speed of x km/h 0580/21 May/June 2025
18 One day, Anya runs 12 km at a speed of x km/h. The next day she walks 10 km at a speed of ( x - 4 ) km/h. (a) Write down an expression, in terms of x, for the time she spends running. … h [1] (b) Write down an expression, in terms of x, for the time she spends walking. … h [1] (c) The time Anya spends walking is 1 hour more than the time she spends running. Write an equation in terms of x and show that it simplifies to x 2 - 2 x - 48 = 0 . [4] (d) Use factorisation to solve the equation x 2 - 2 x - 48 = 0 . x = … or x = … [3] (e) Find the time Anya spends running. … h [1]
10 marks
Mark scheme: 18(a) 12 1 x 18(b) 10 1 x − 4 18(c) 10 12 M1 their – their = 1 oe x − 4 x 10x – 12x + 48 = x2 – 4x M2 Correctly multiplying their brackets and clearing algebraic fractions 12 e.g. ( x − 4 ) + 1 = 10 x 48 leading to 12 − + x − 4 = 10 and then x 12 x − 48 + x 2 − 4 x = 10 x or M1 for correctly clearing, or correctly collecting into a single fraction, two fractions both with different algebraic denominators e.g. 10x – 12(x – 4) = x(x – 4) or 10 x − 12 ( x − 4 ) [= 1] x ( x − 4 ) Leading to 0 = x2 – 2x – 48 A1 With no errors or omissions seen, dep on M3 18(d) (x + 6)(x – 8) M2 M1 for x(x – 8) + 6(x – 8) or x(x + 6) – 8(x + 6) or (x + a)(x + b) where ab = –48 or a + b = –2 –6, 8 B1 18(e) 1 1 12 1.5 or 1 FT 2 their 8
This question in 0580/21 May/June 2025
 1 / 67
 2 / 67
 3 / 67
 4 / 67
 5 / 67
 6 / 67
 7 / 67
![Question 9: The maximum speed of a car is 252 km/h. Change this speed into metres per second. Answer m/s [2]](https://img.pastlit.com/crops/3ecced64-07b7-4bee-814b-19011f11df9b/q4.webp)
 8 / 67
 9 / 67
 10 / 67
 11 / 67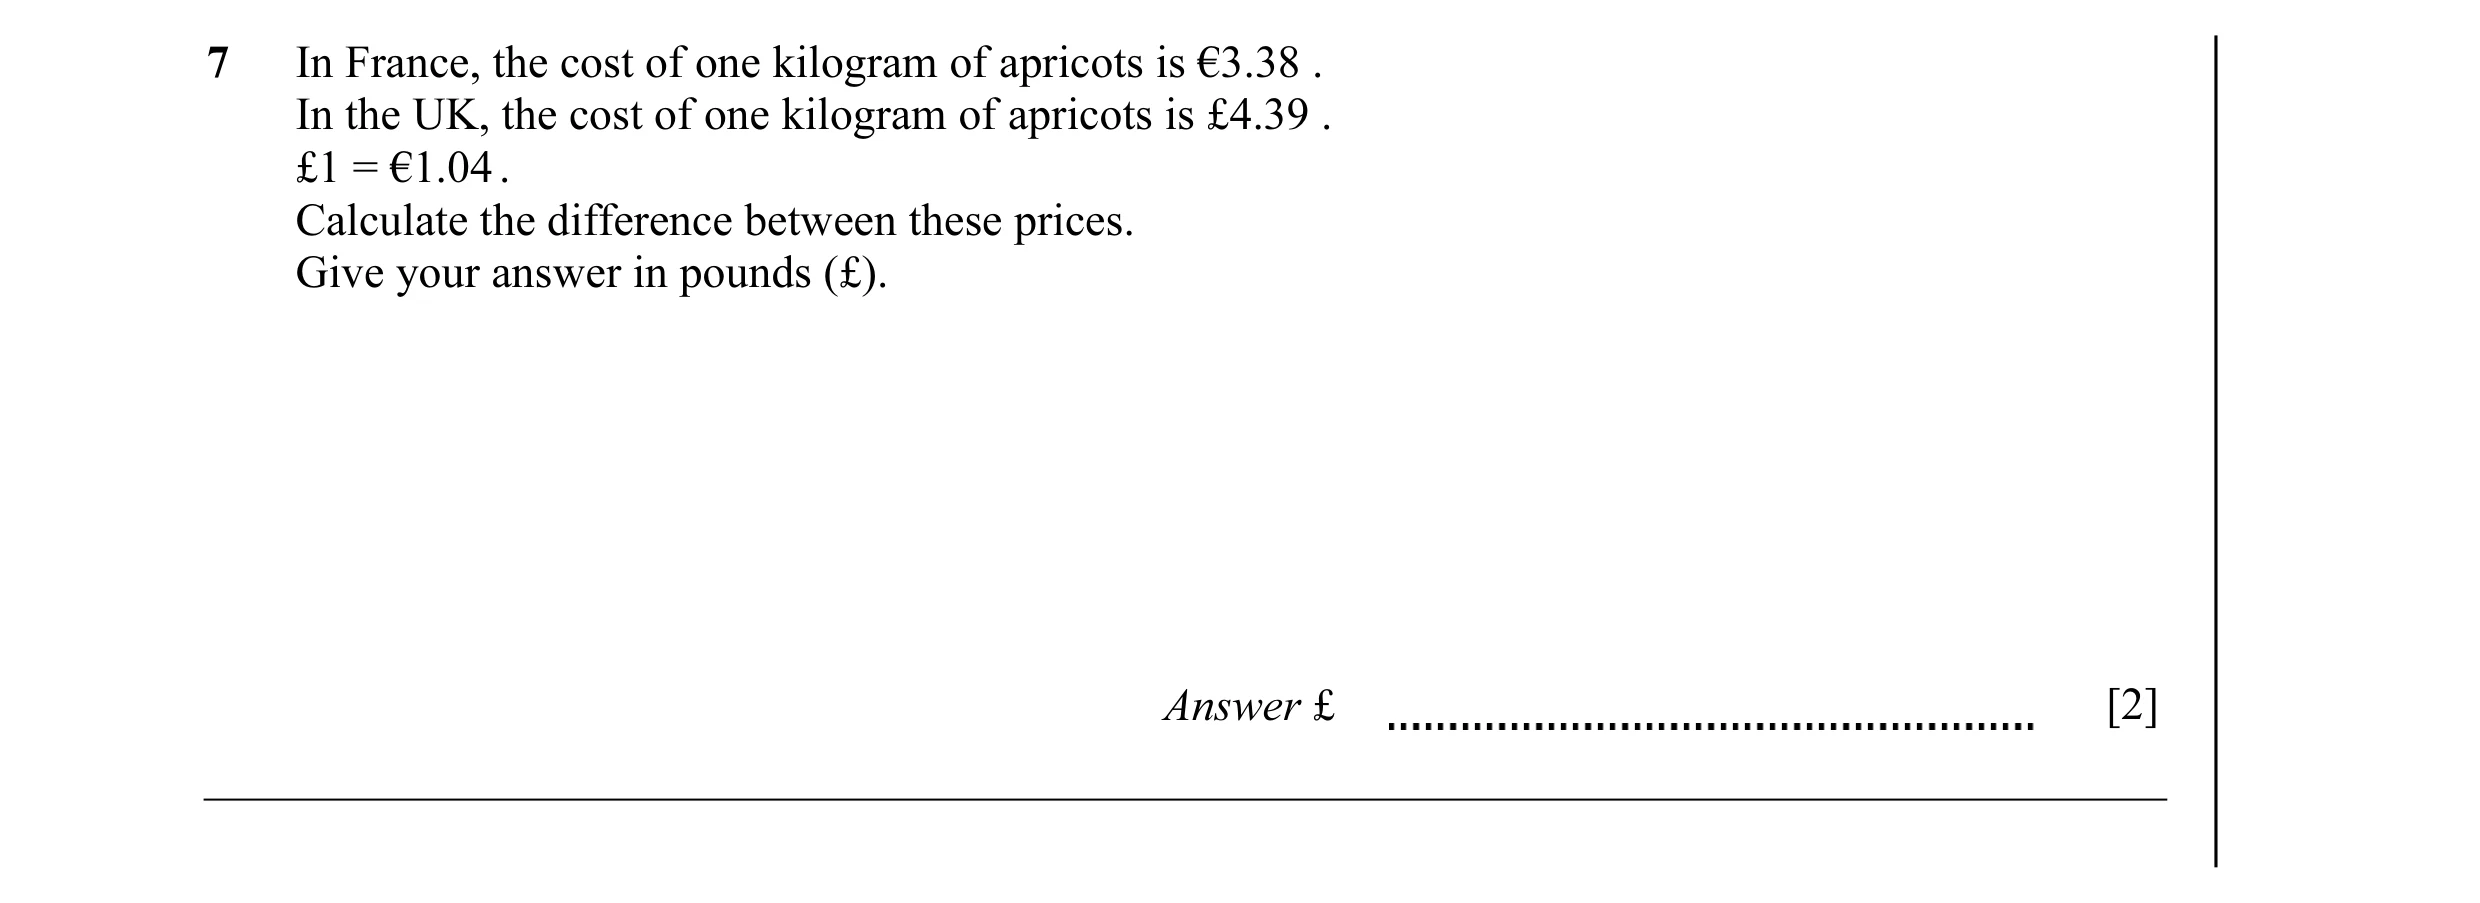
![Question 15: Priyantha completes a 10 km run in 55 minutes 20 seconds. Calculate Priyantha’s average speed in km/h. Answer km/h [3]](https://img.pastlit.com/crops/e2834dac-0216-4836-829f-5ce9e730fc3f/q14.webp) 12 / 67
12 / 67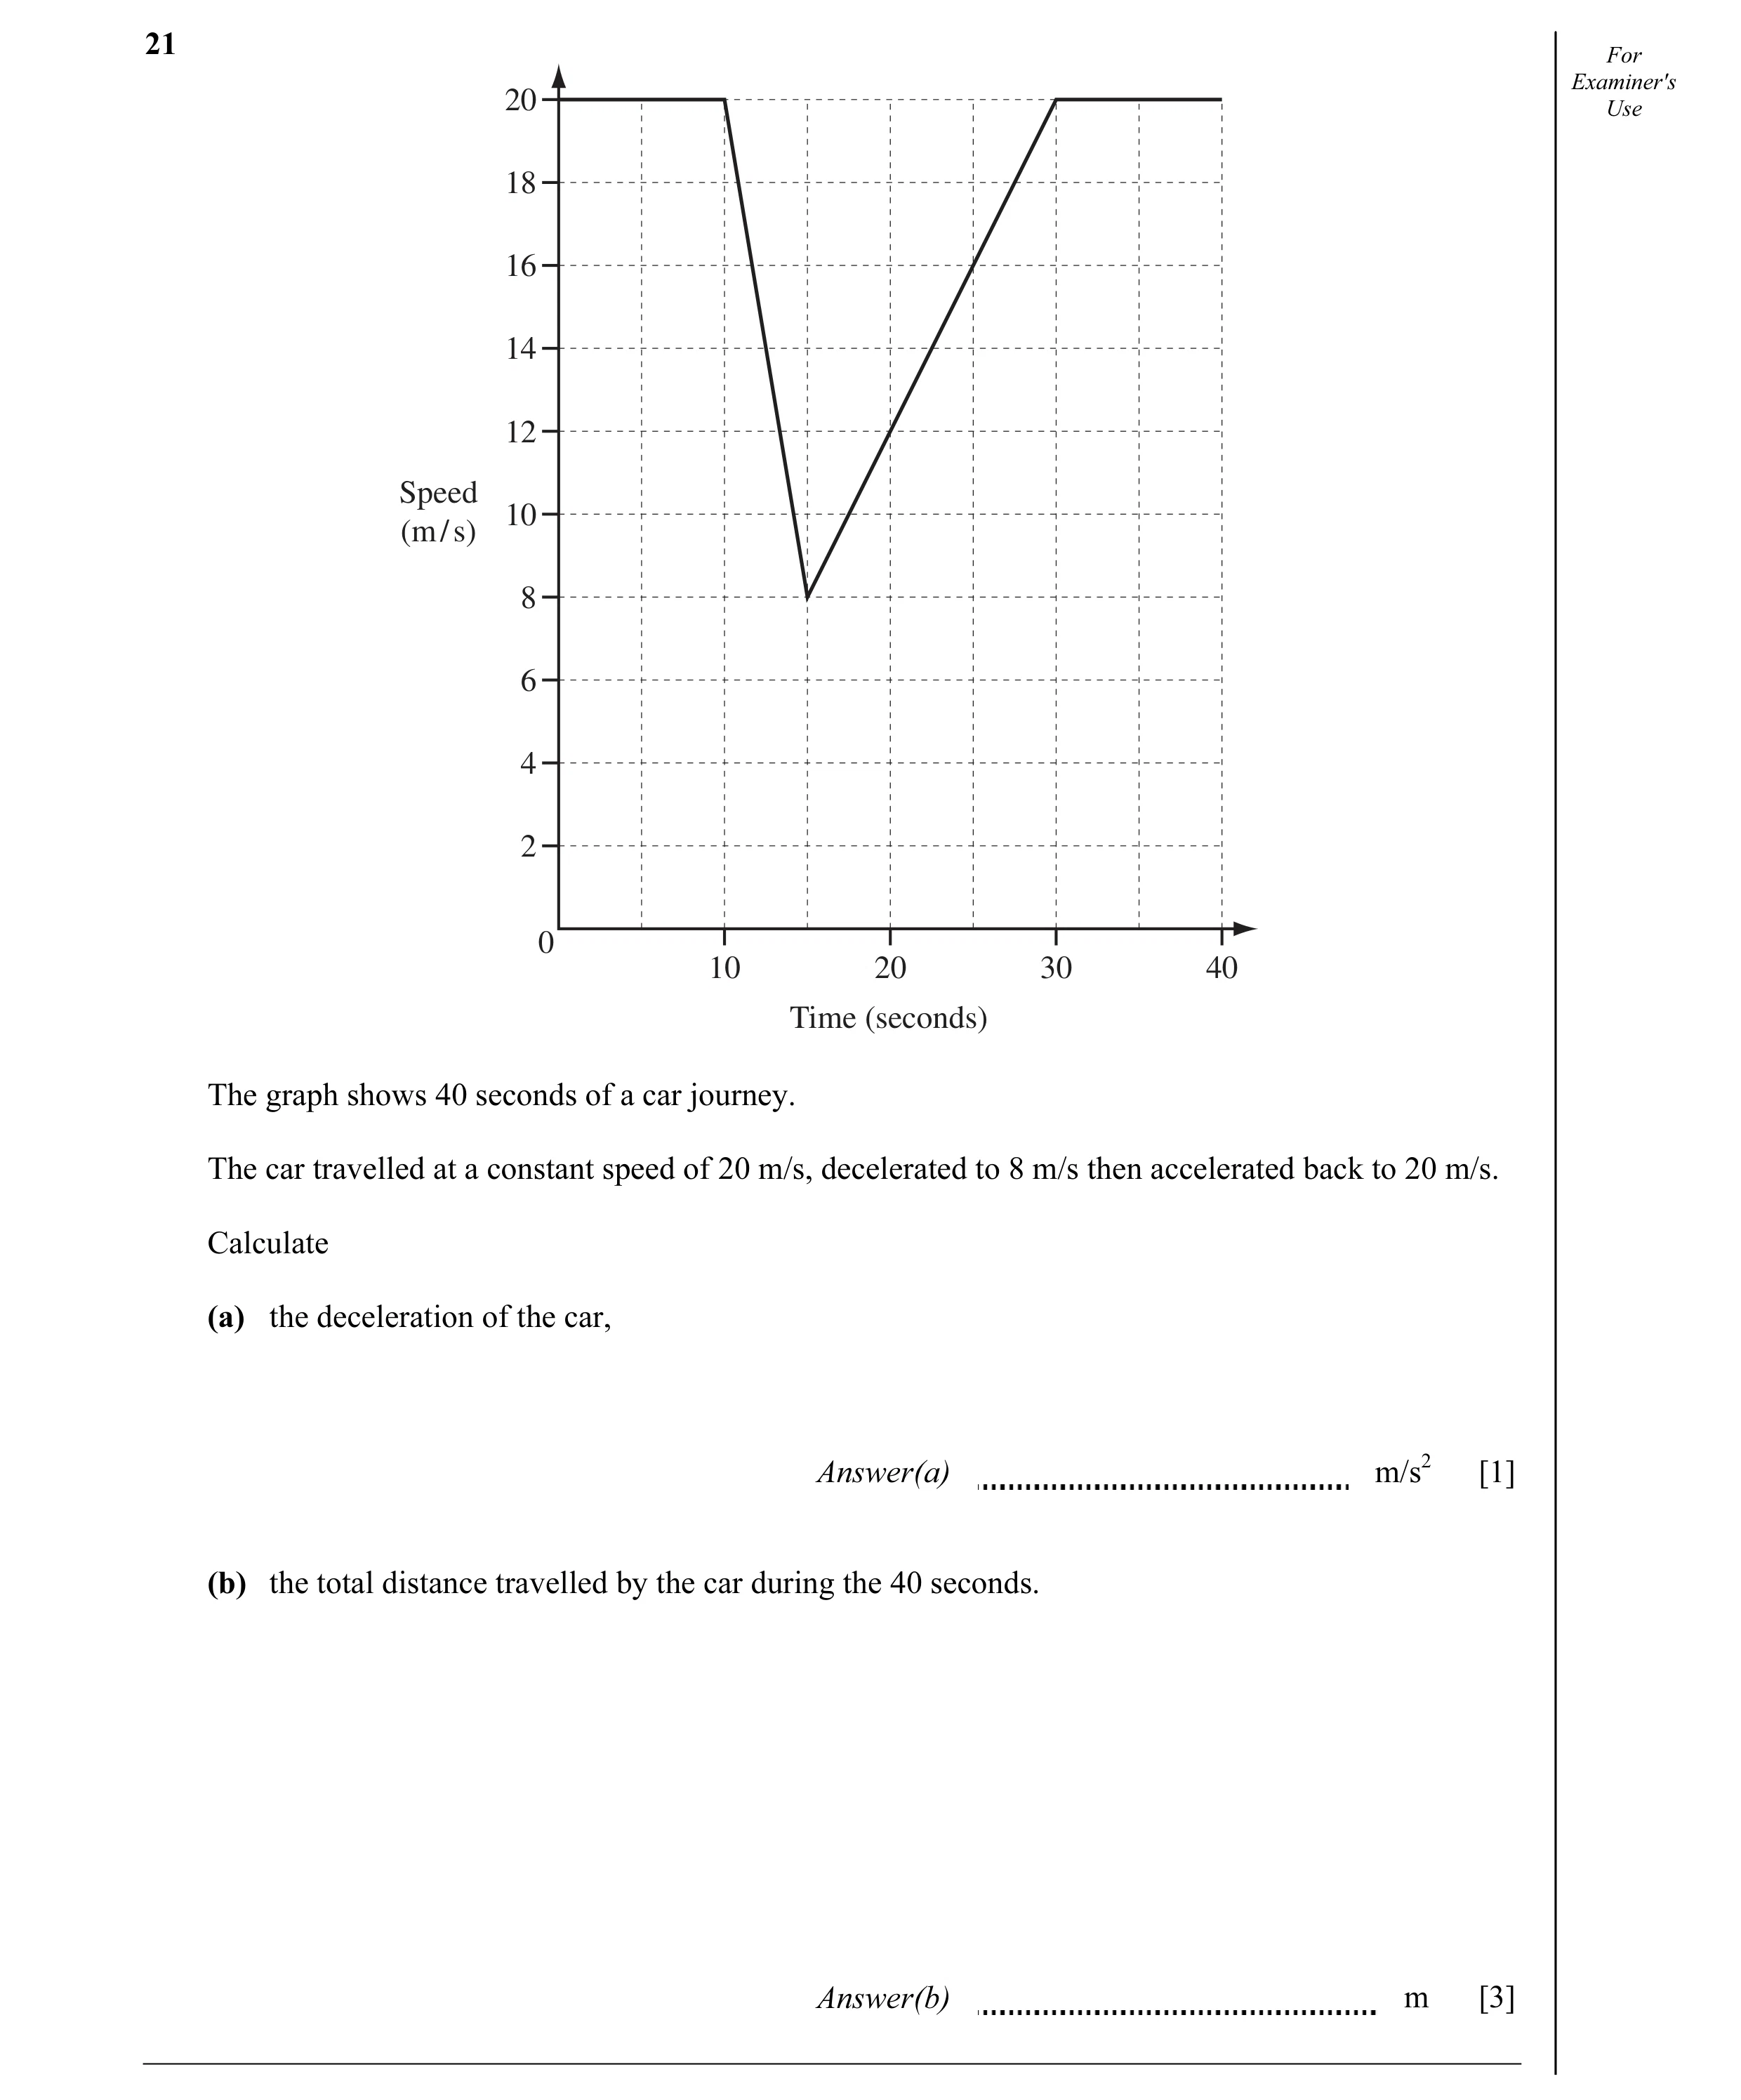 13 / 67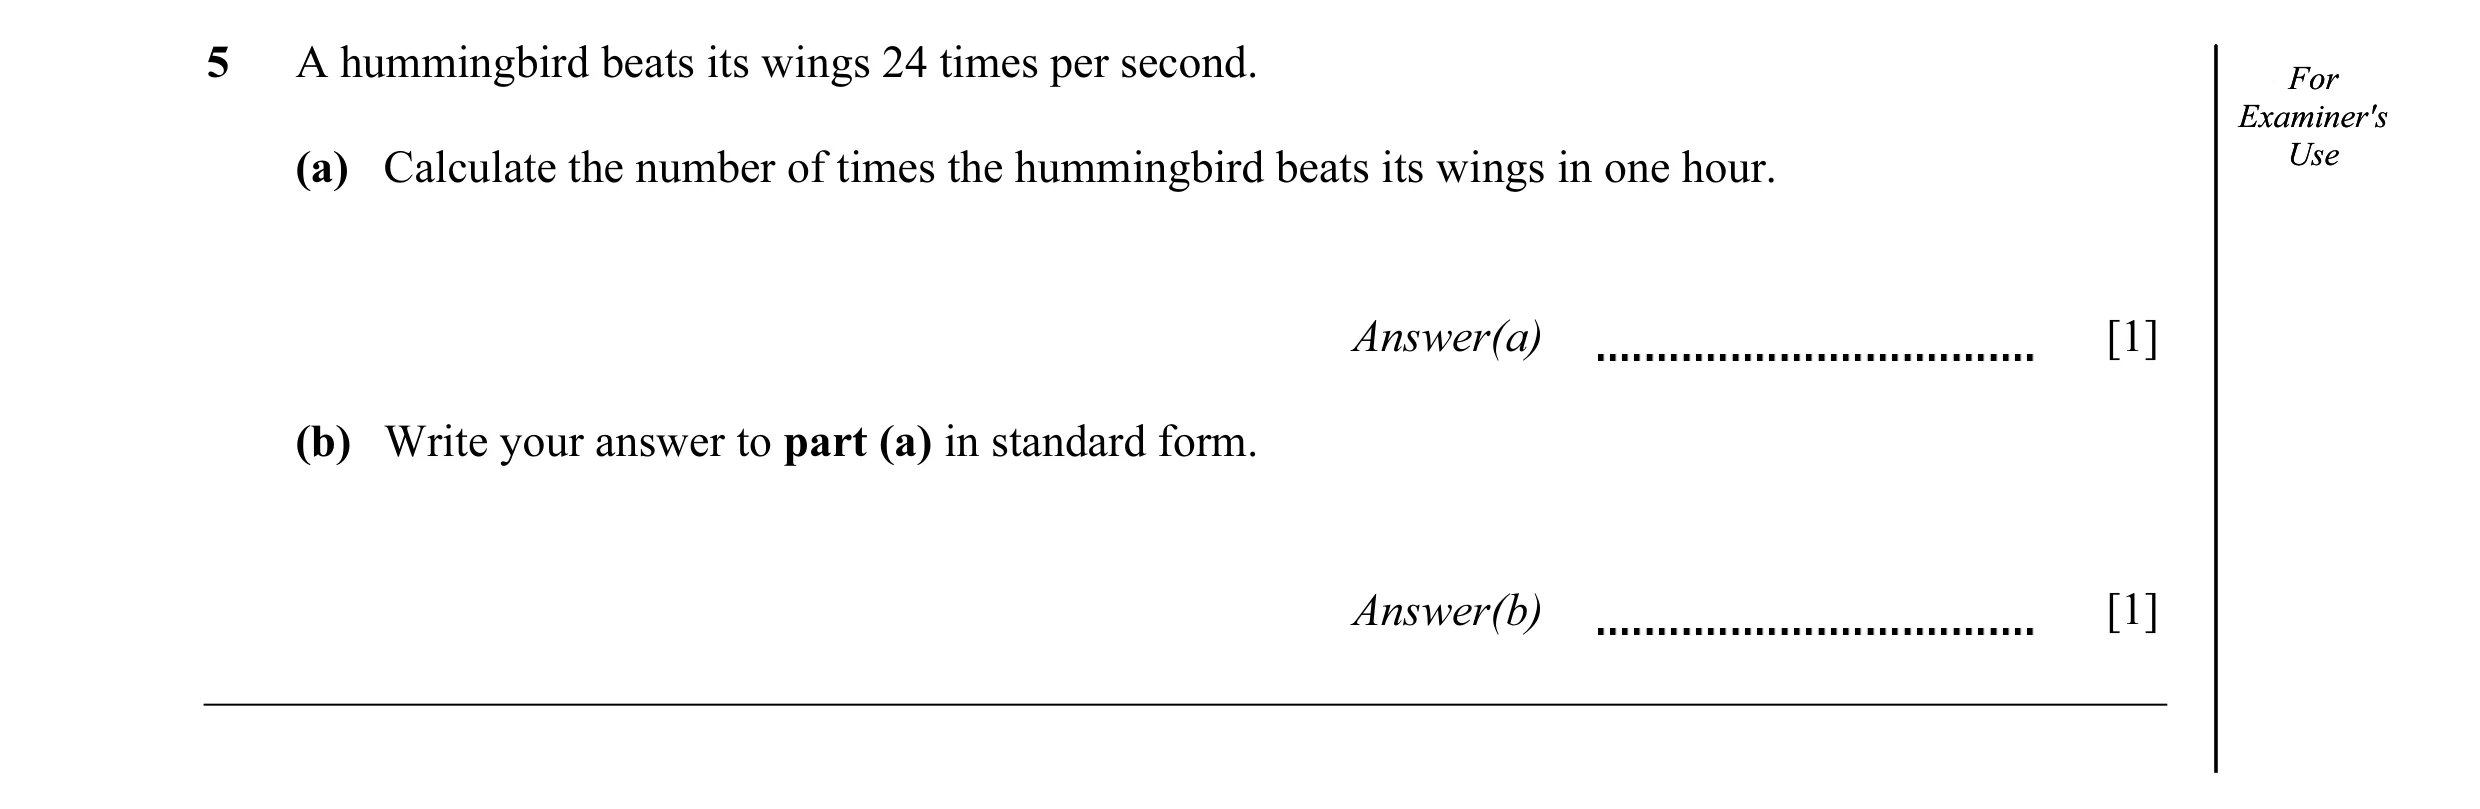
 14 / 67
 15 / 67
 16 / 67
![Question 21: A cruise ship travels at 22 knots. [1 knot is 1.852 kilometres per hour.] Convert this speed into metres per second. Answer m/s [3]](https://img.pastlit.com/crops/798ef607-6d89-4be5-9995-3dd1d508fb59/q8.webp) 17 / 67
17 / 67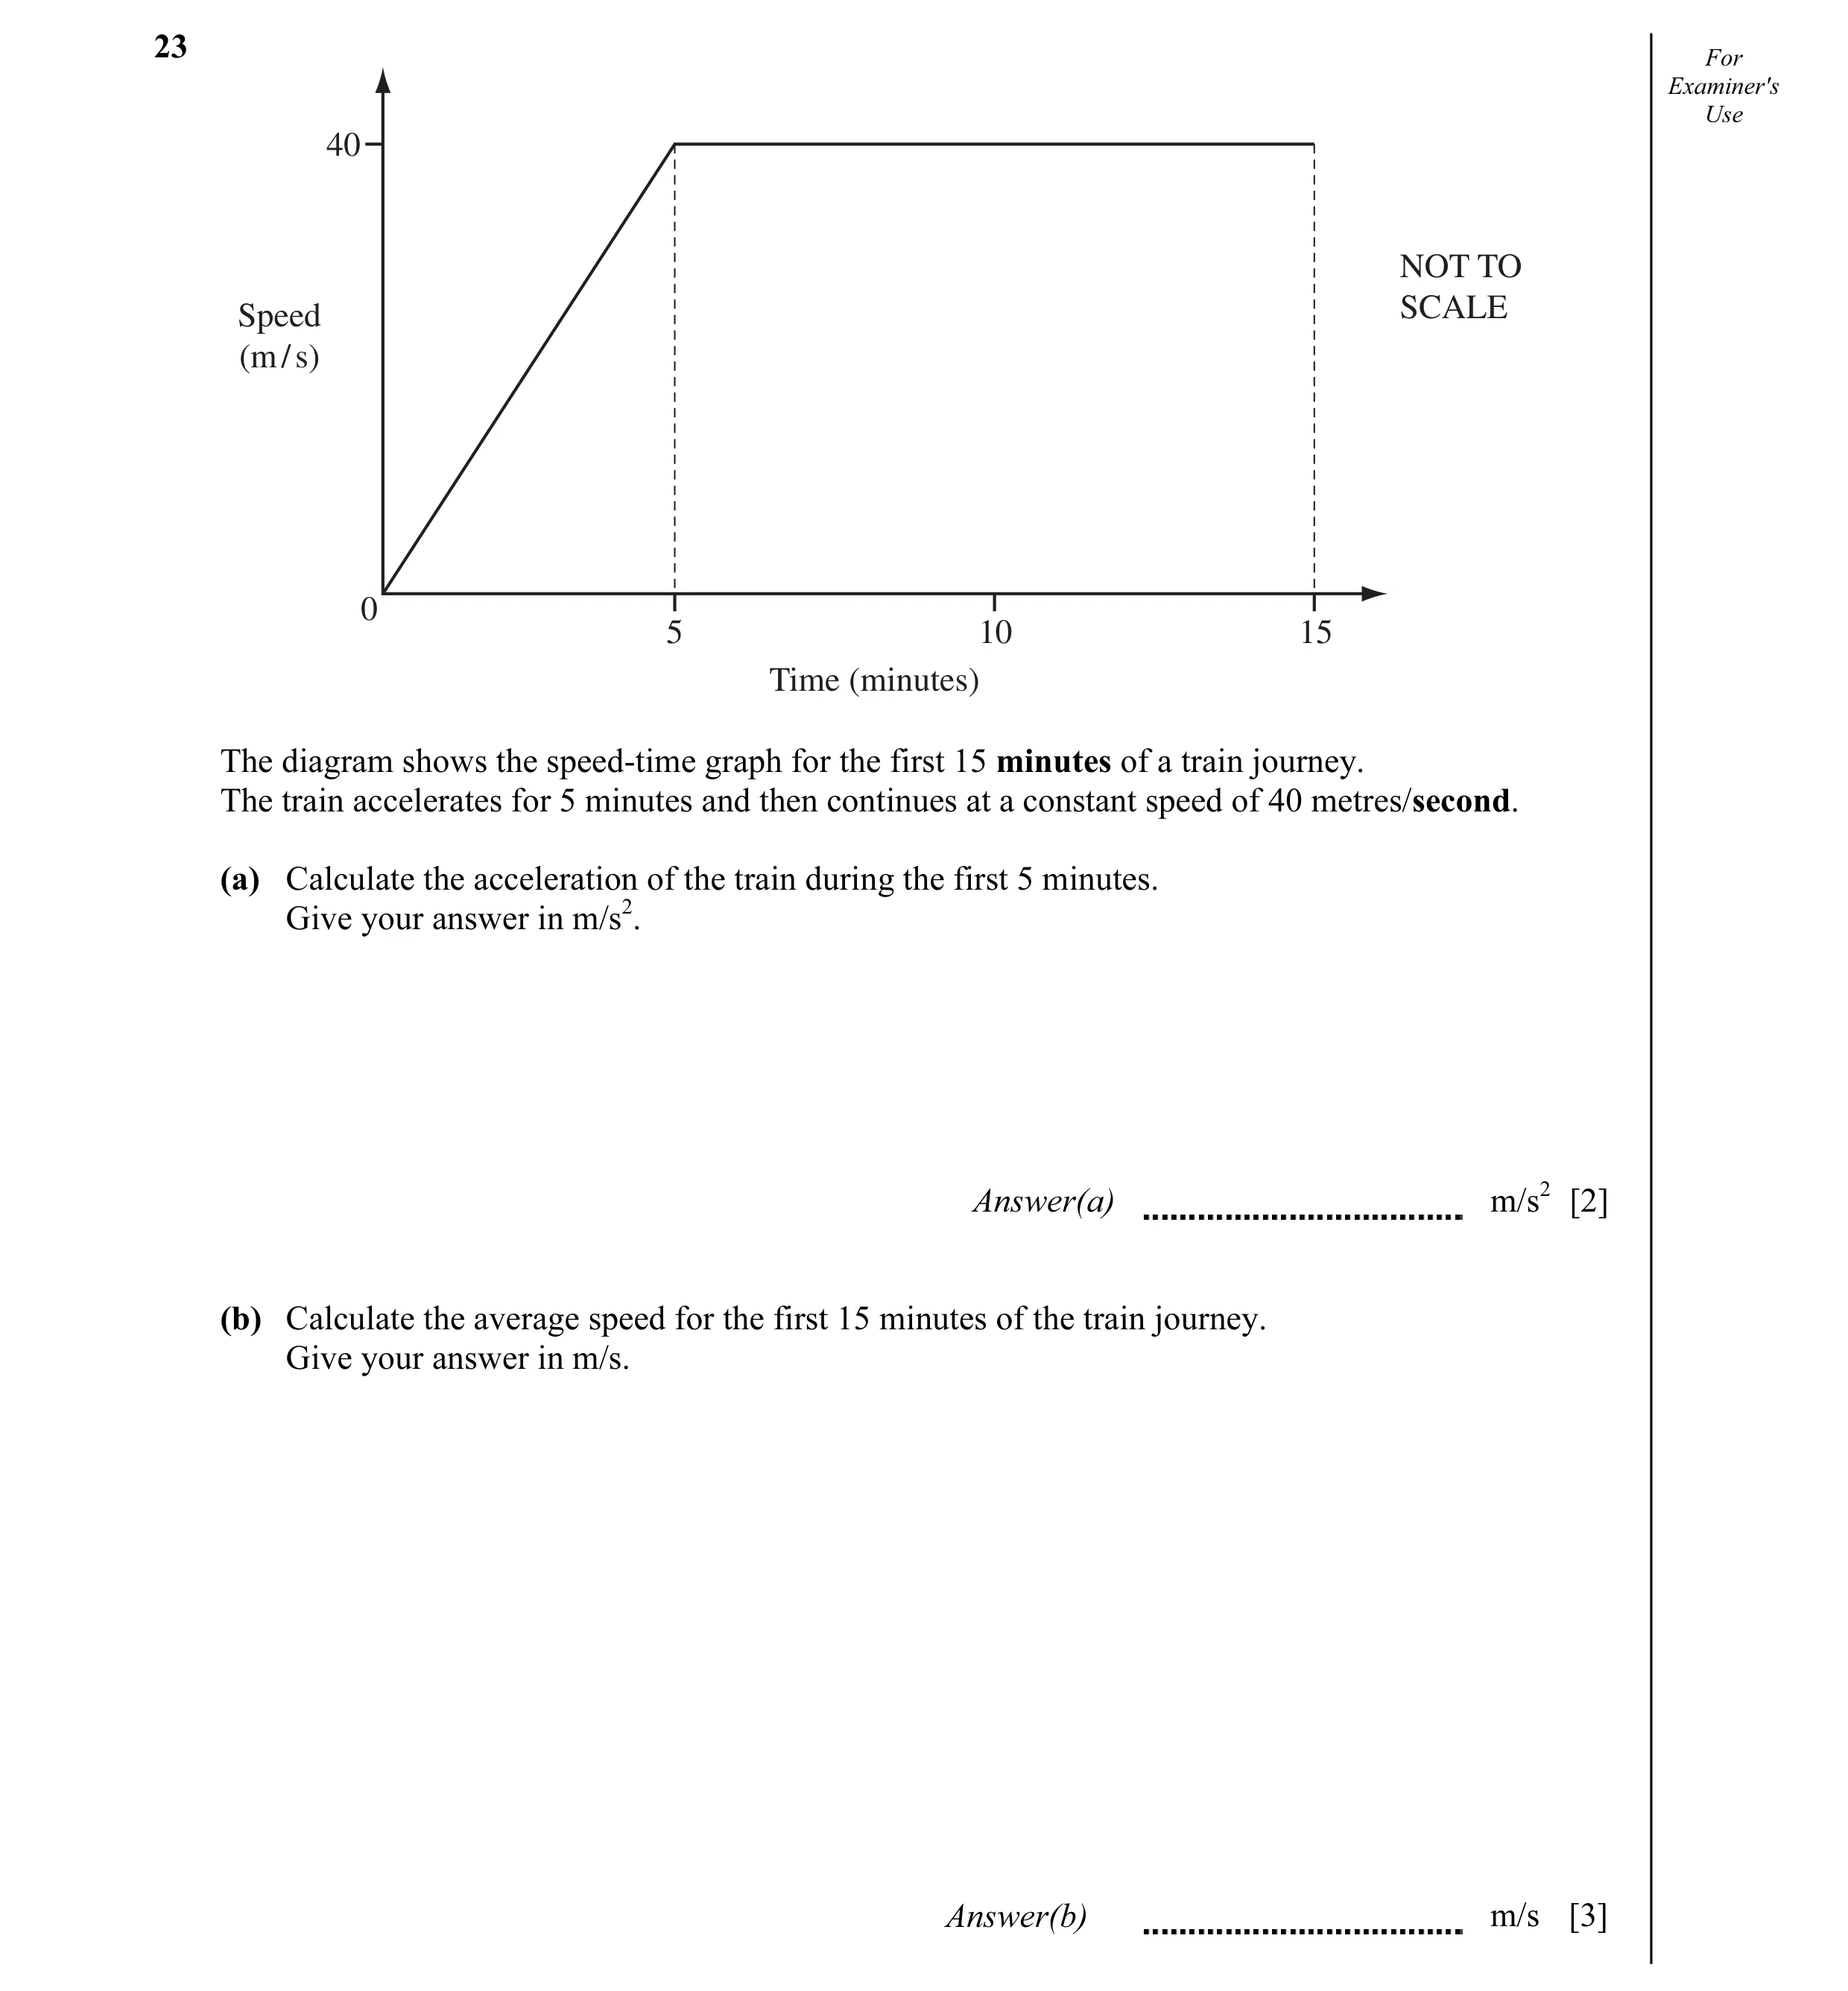 18 / 67
 19 / 67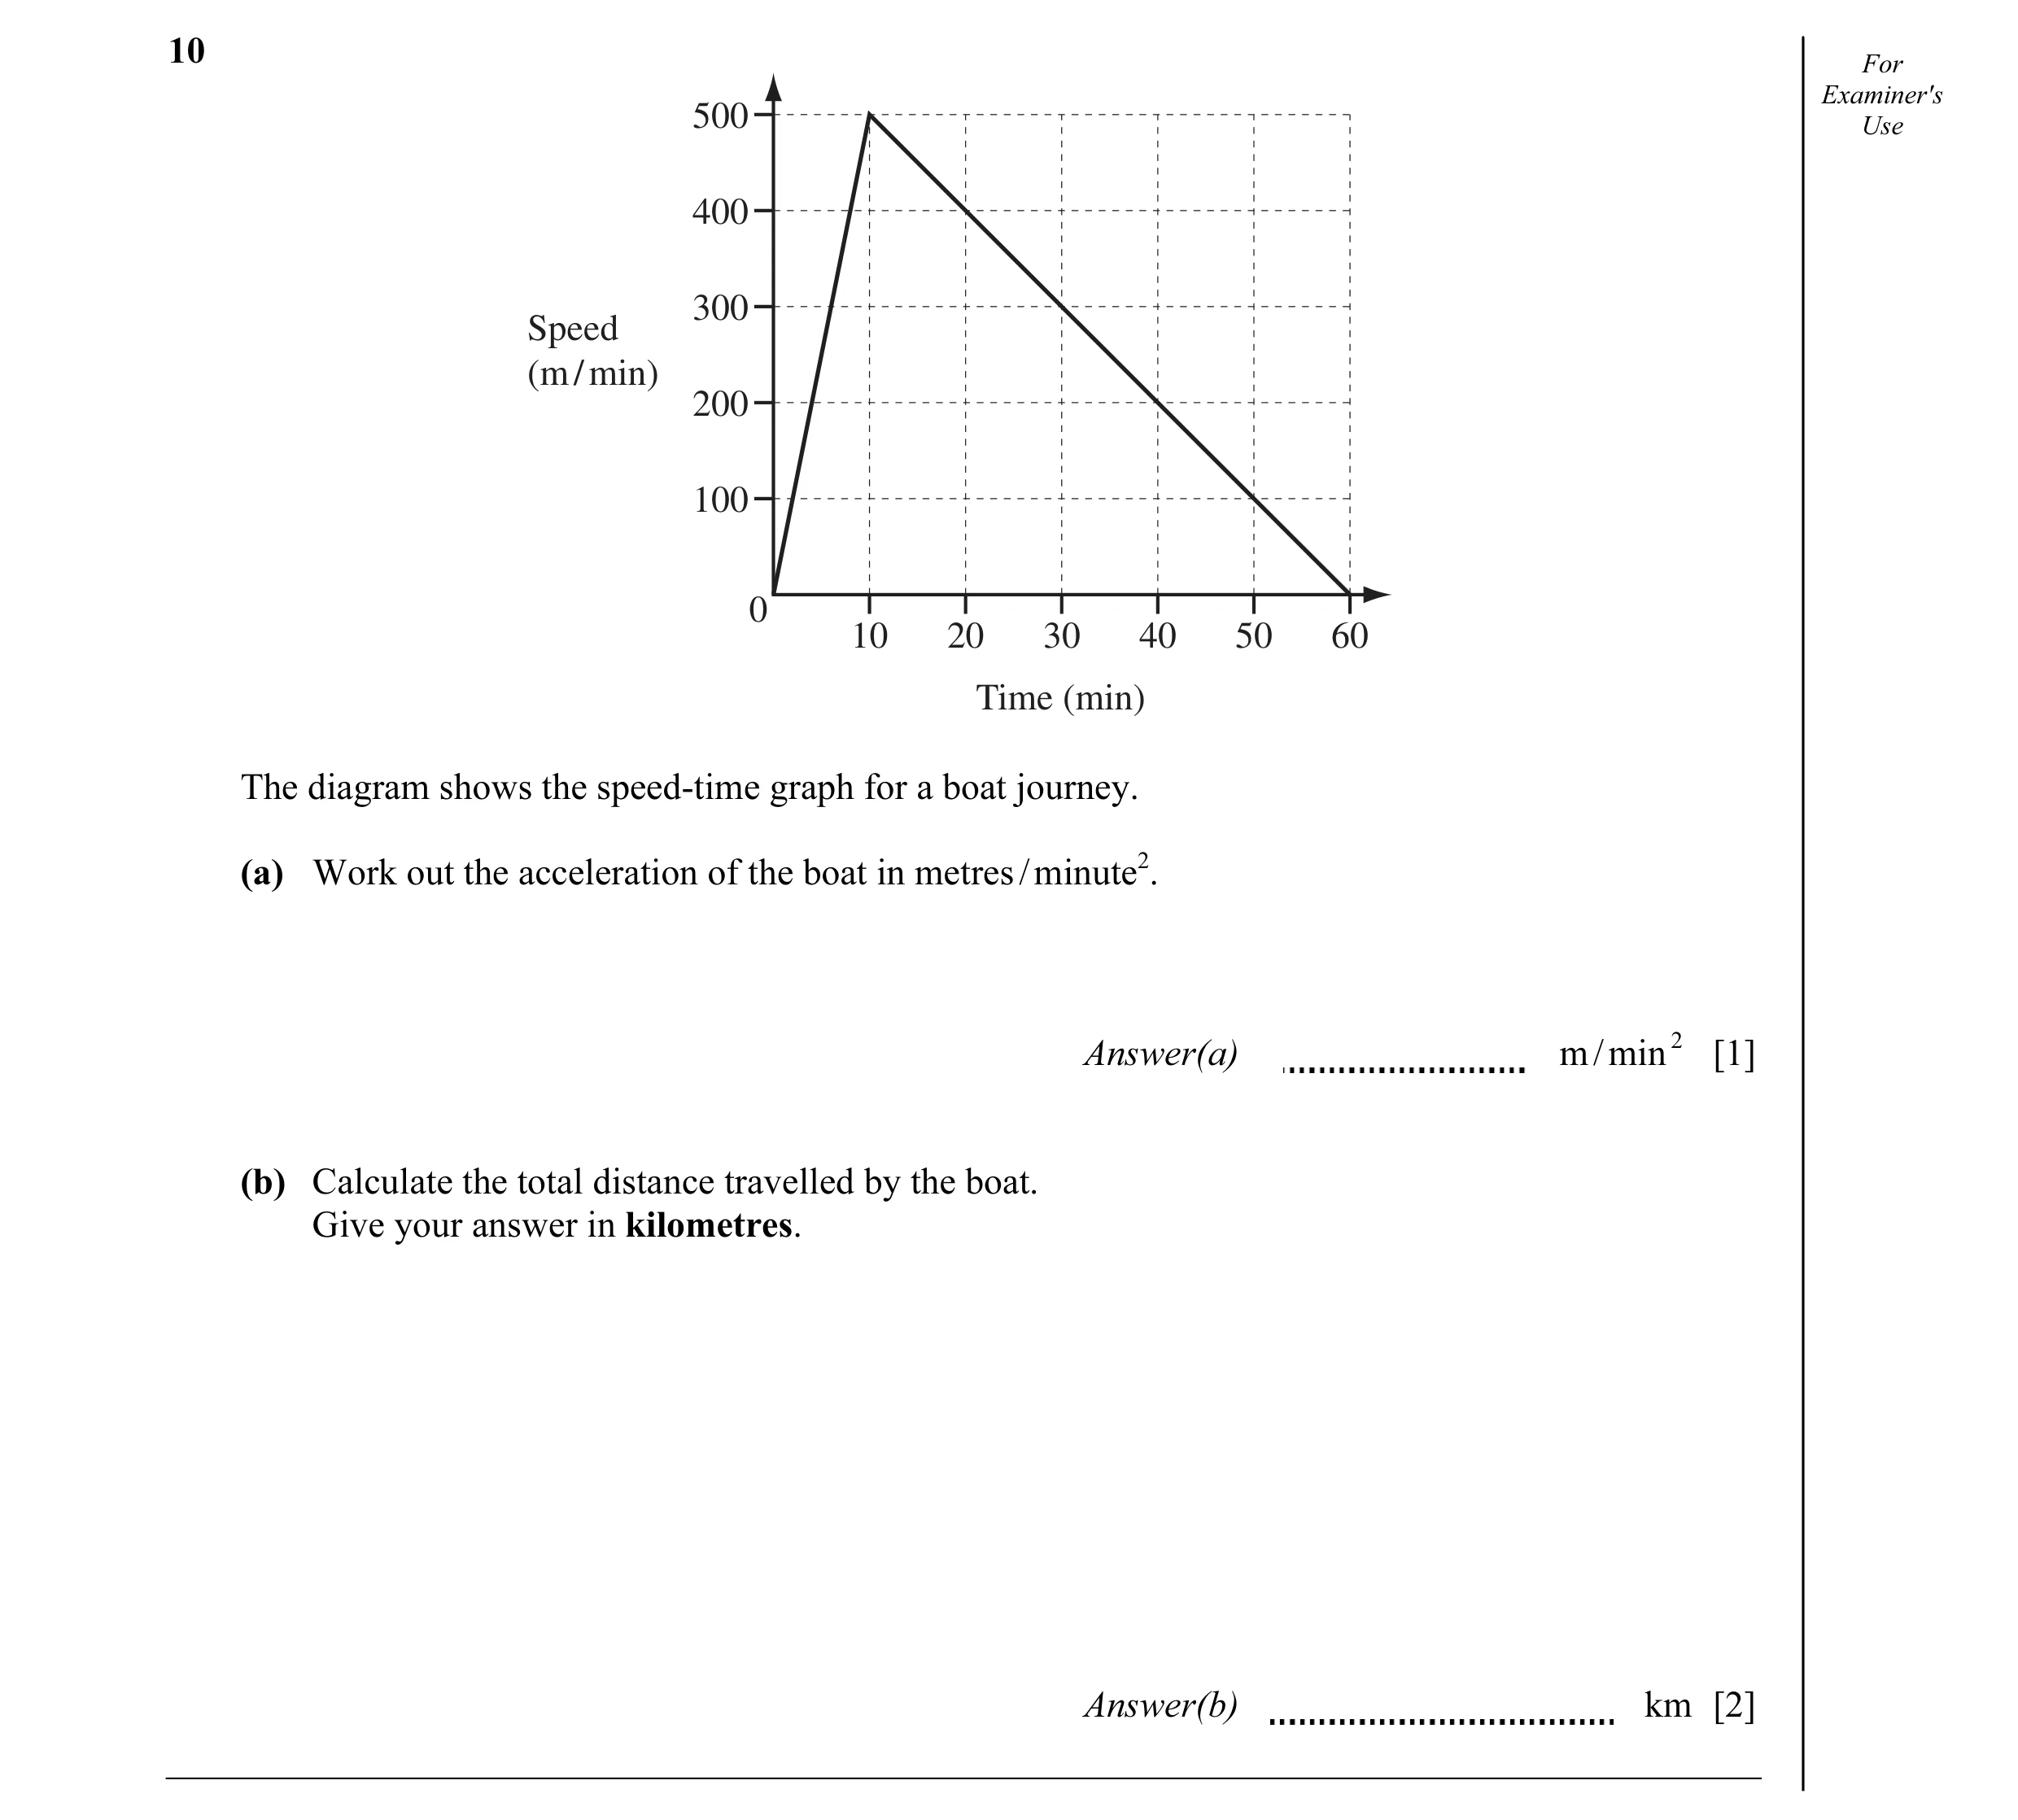
![Question 25: Hans invests $750 for 8 years at a rate of 2% per year simple interest. Calculate the interest Hans receives. Answer $ [2]](https://img.pastlit.com/crops/7d2ecca1-d244-4252-a128-f49d8668c0e9/q2.webp) 20 / 67
20 / 67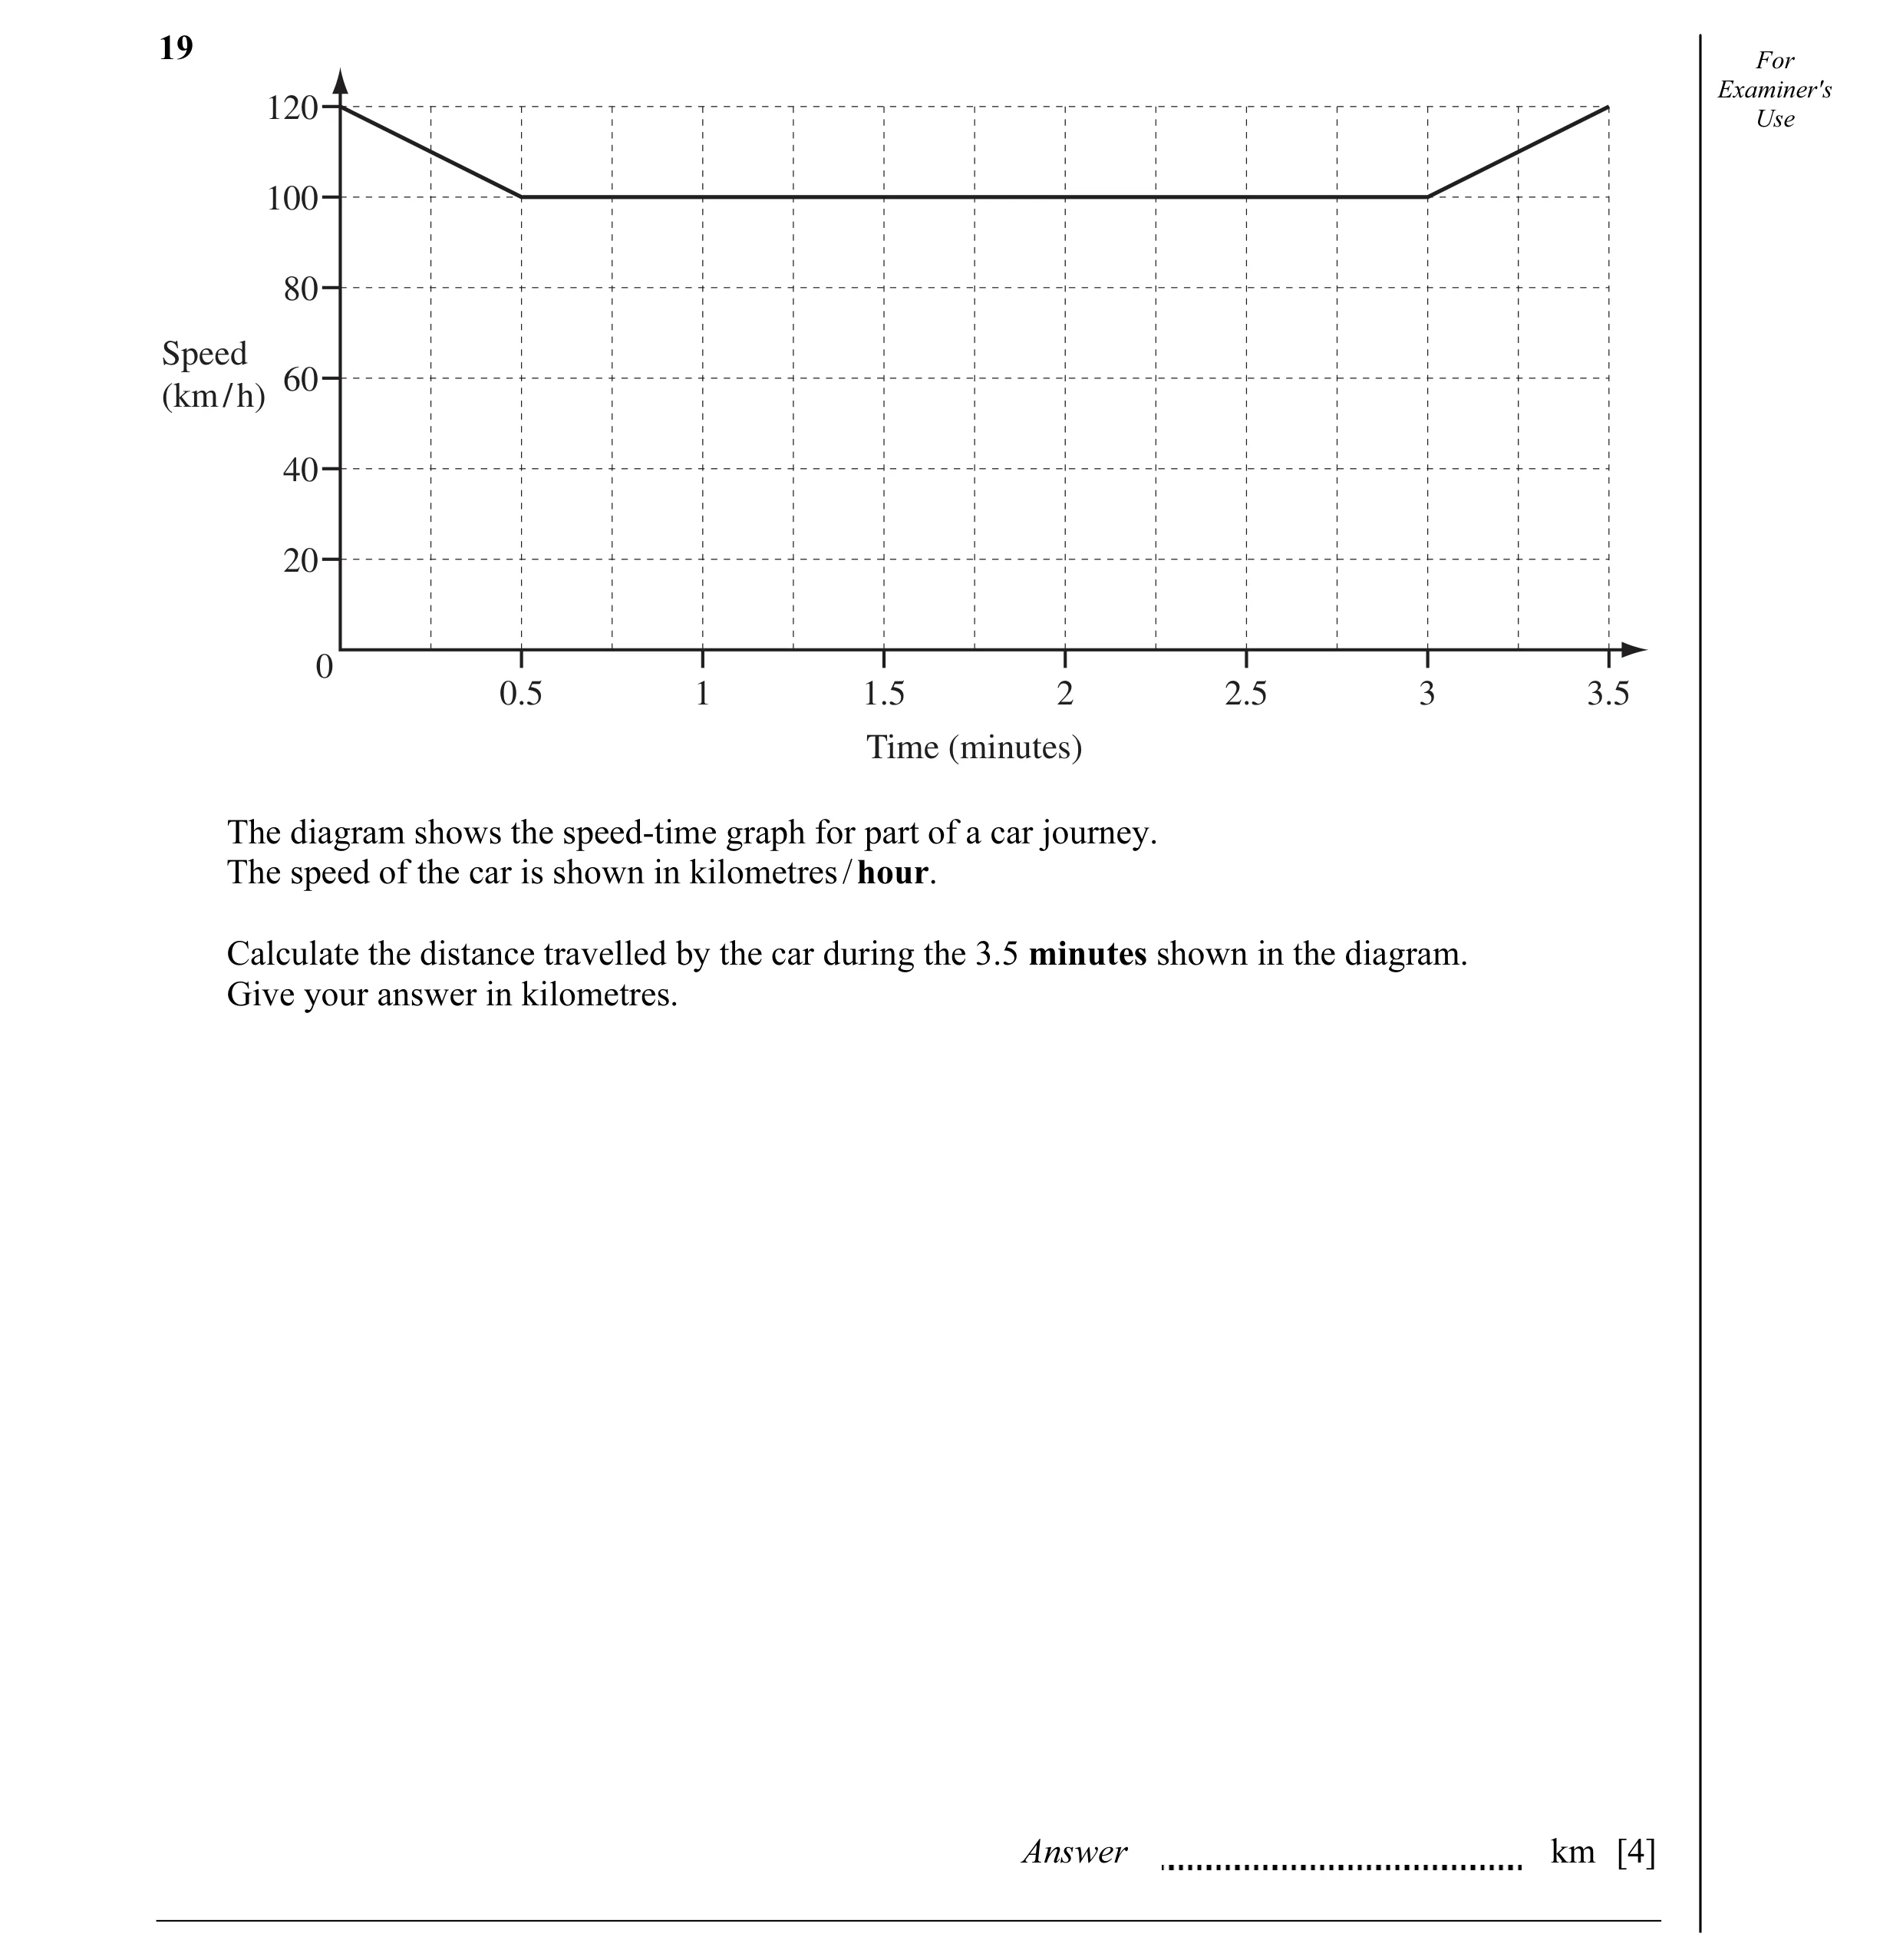
 21 / 67
 22 / 67
 23 / 67
 24 / 67
 25 / 67
 26 / 67
 27 / 67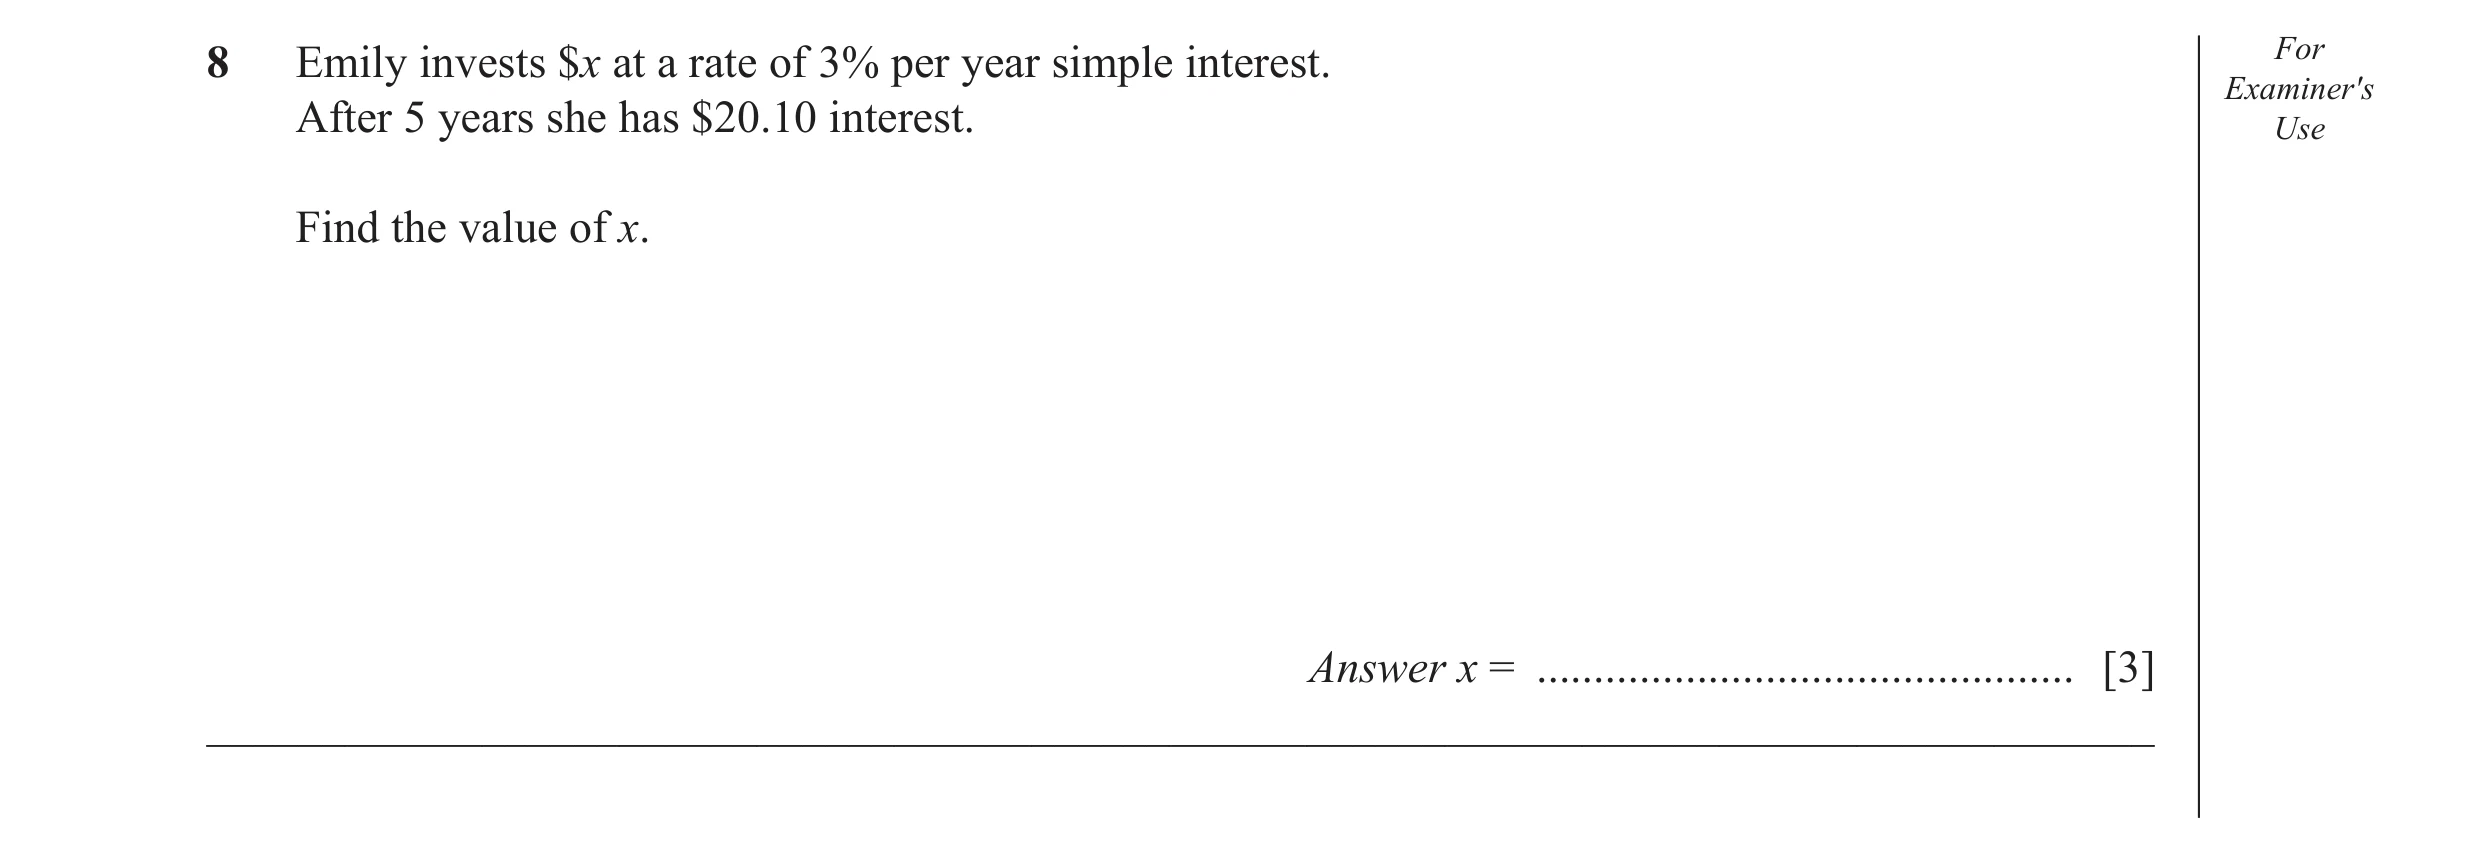
![Question 35: (a) Convert 144 km/h into metres per second. Answer(a) ........................................ m/s [2] (b) A train of length 120 m is trav…](https://img.pastlit.com/crops/a385f721-8b37-4c4d-a456-46a3c1e40d20/q19.webp)
 28 / 67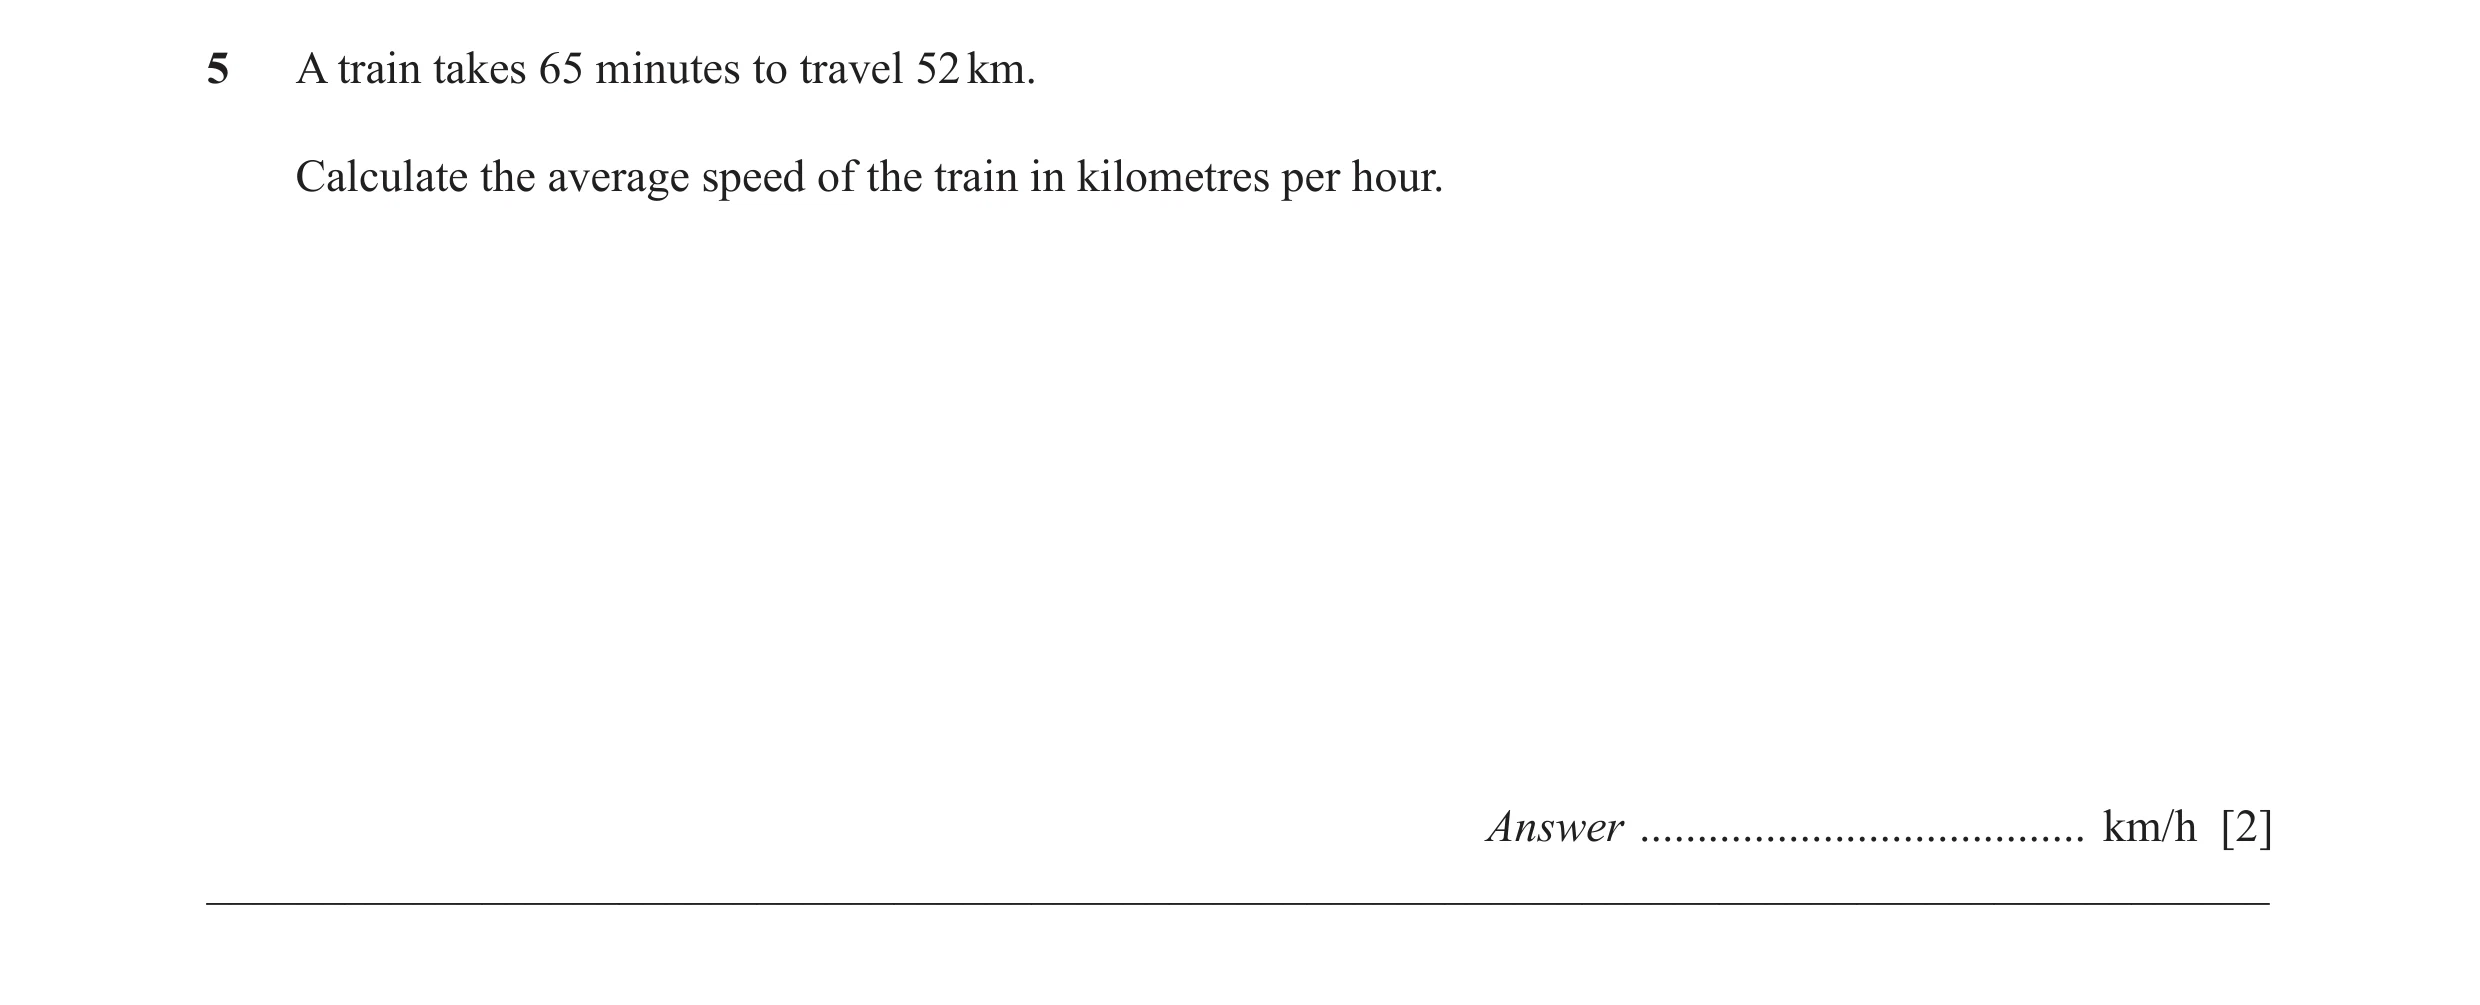
 29 / 67
 30 / 67
 31 / 67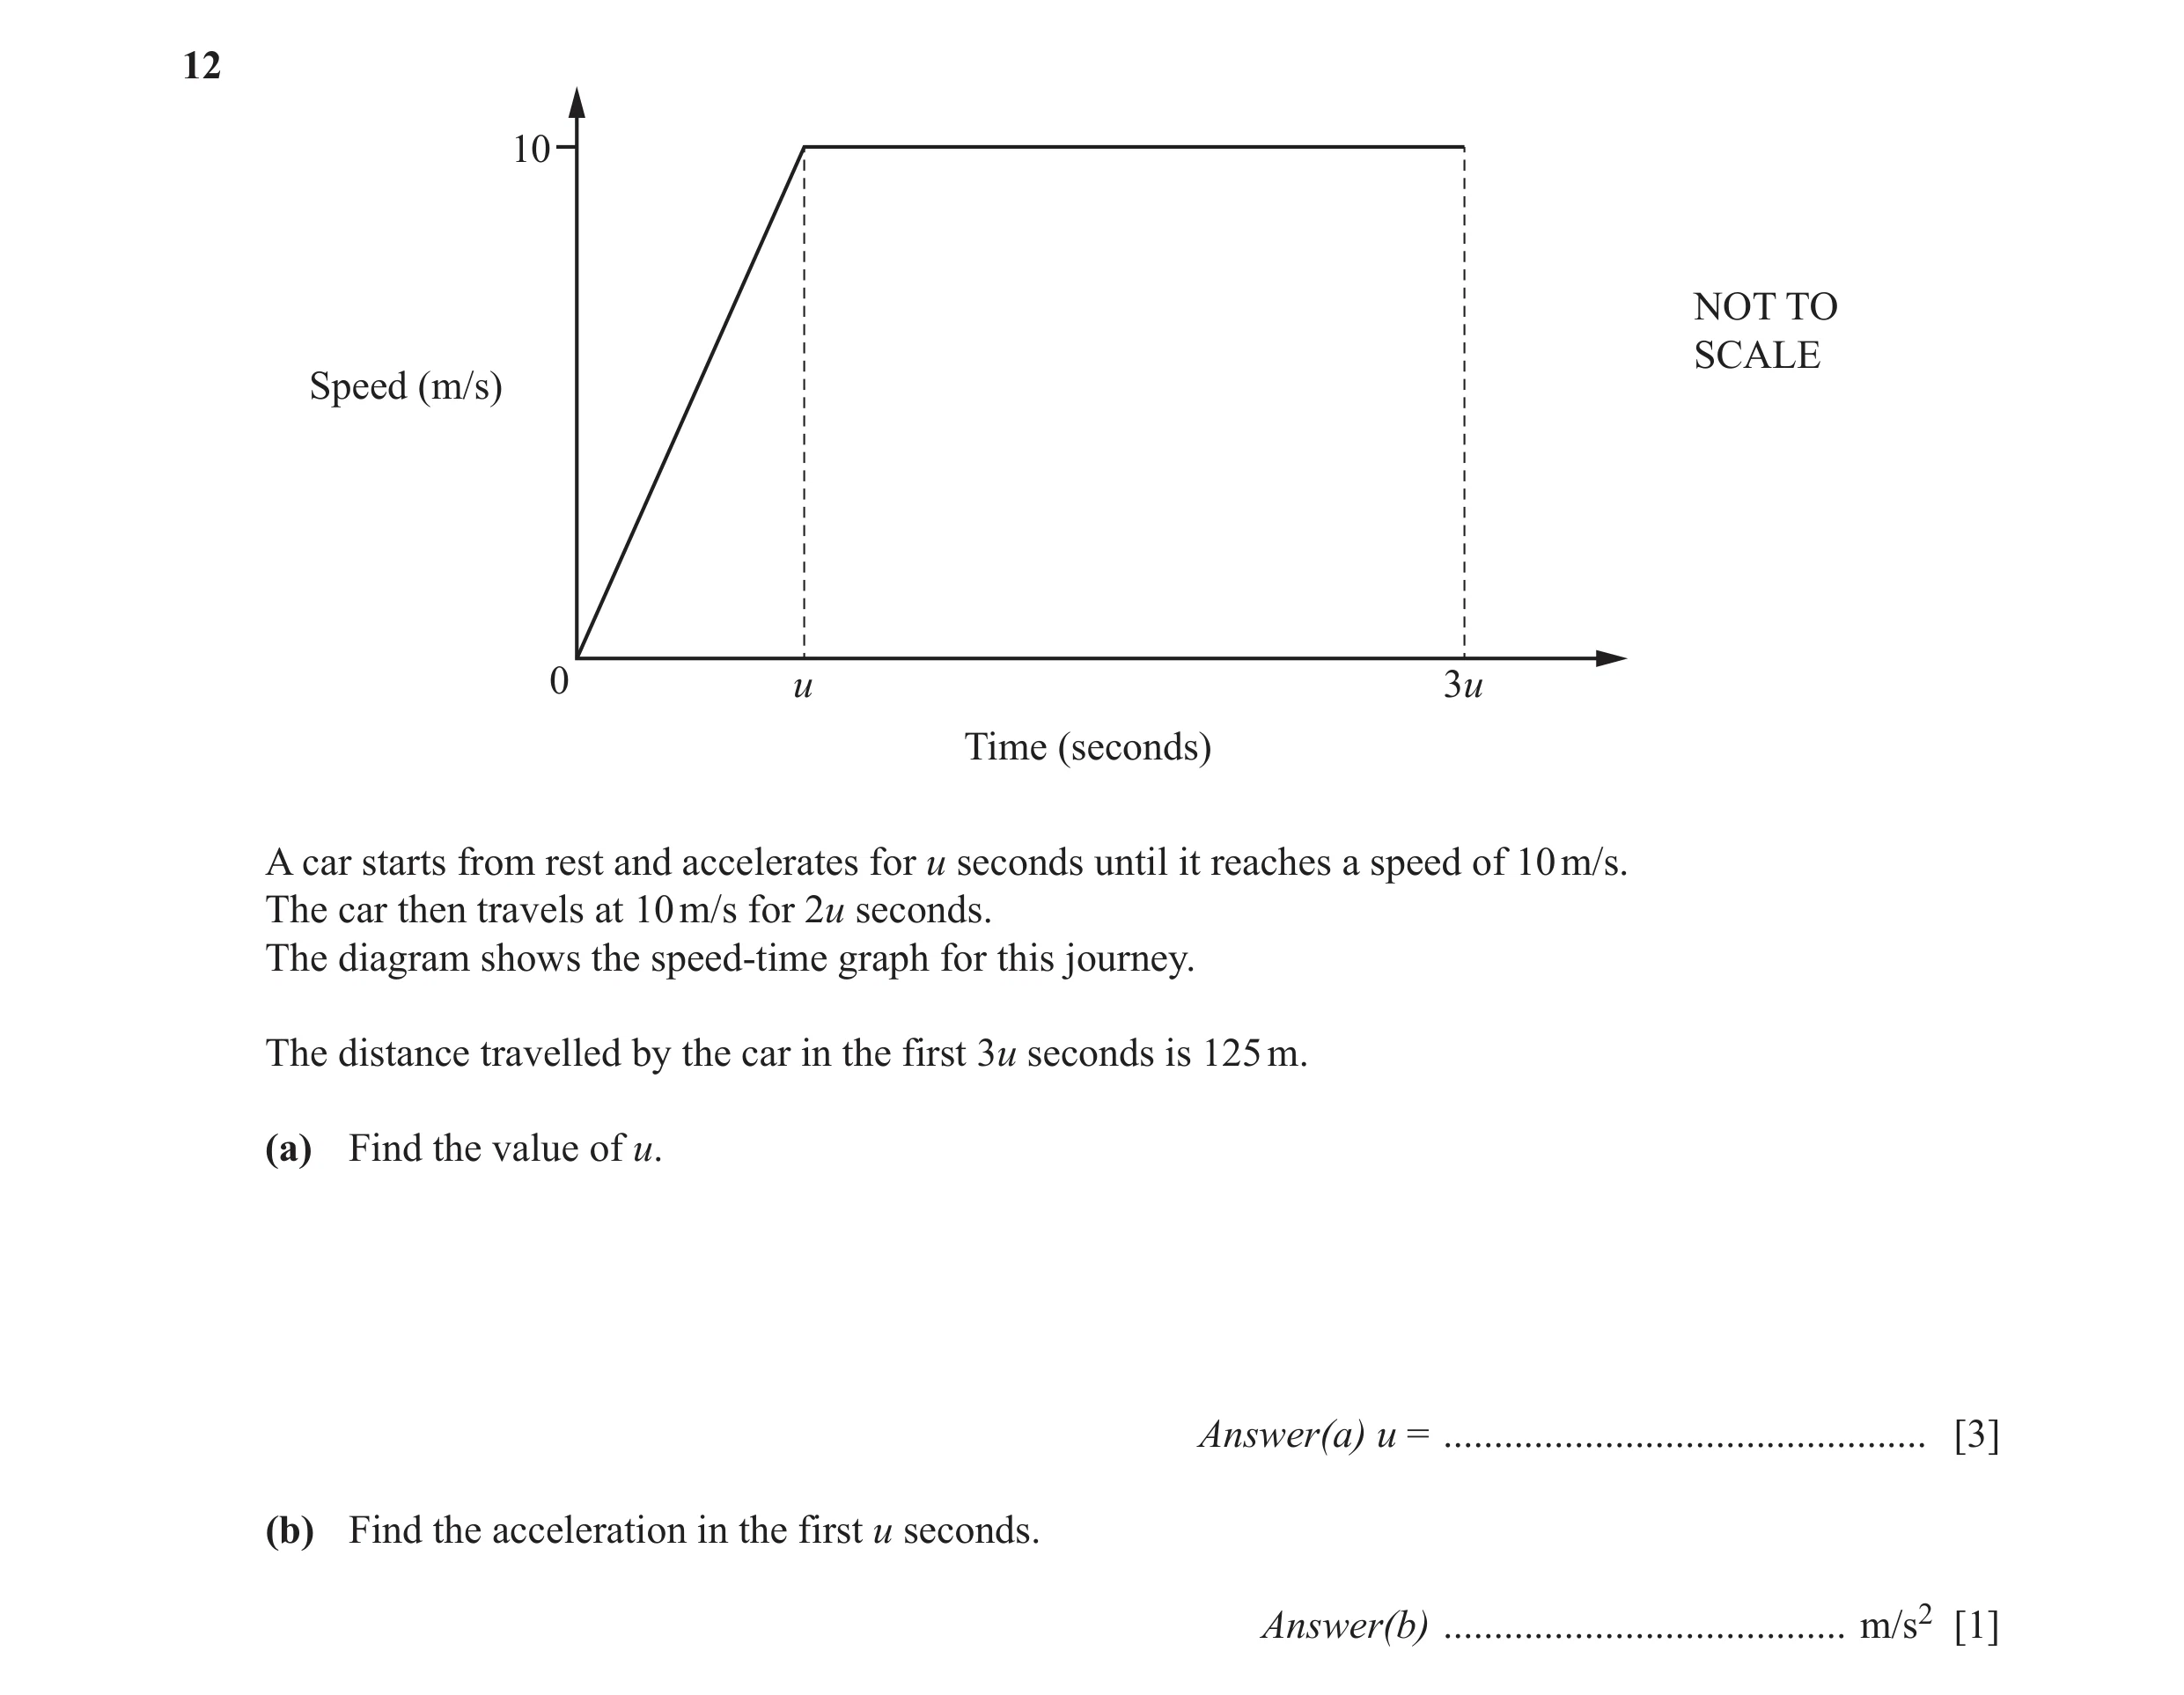
 32 / 67
 33 / 67
 34 / 67
 35 / 67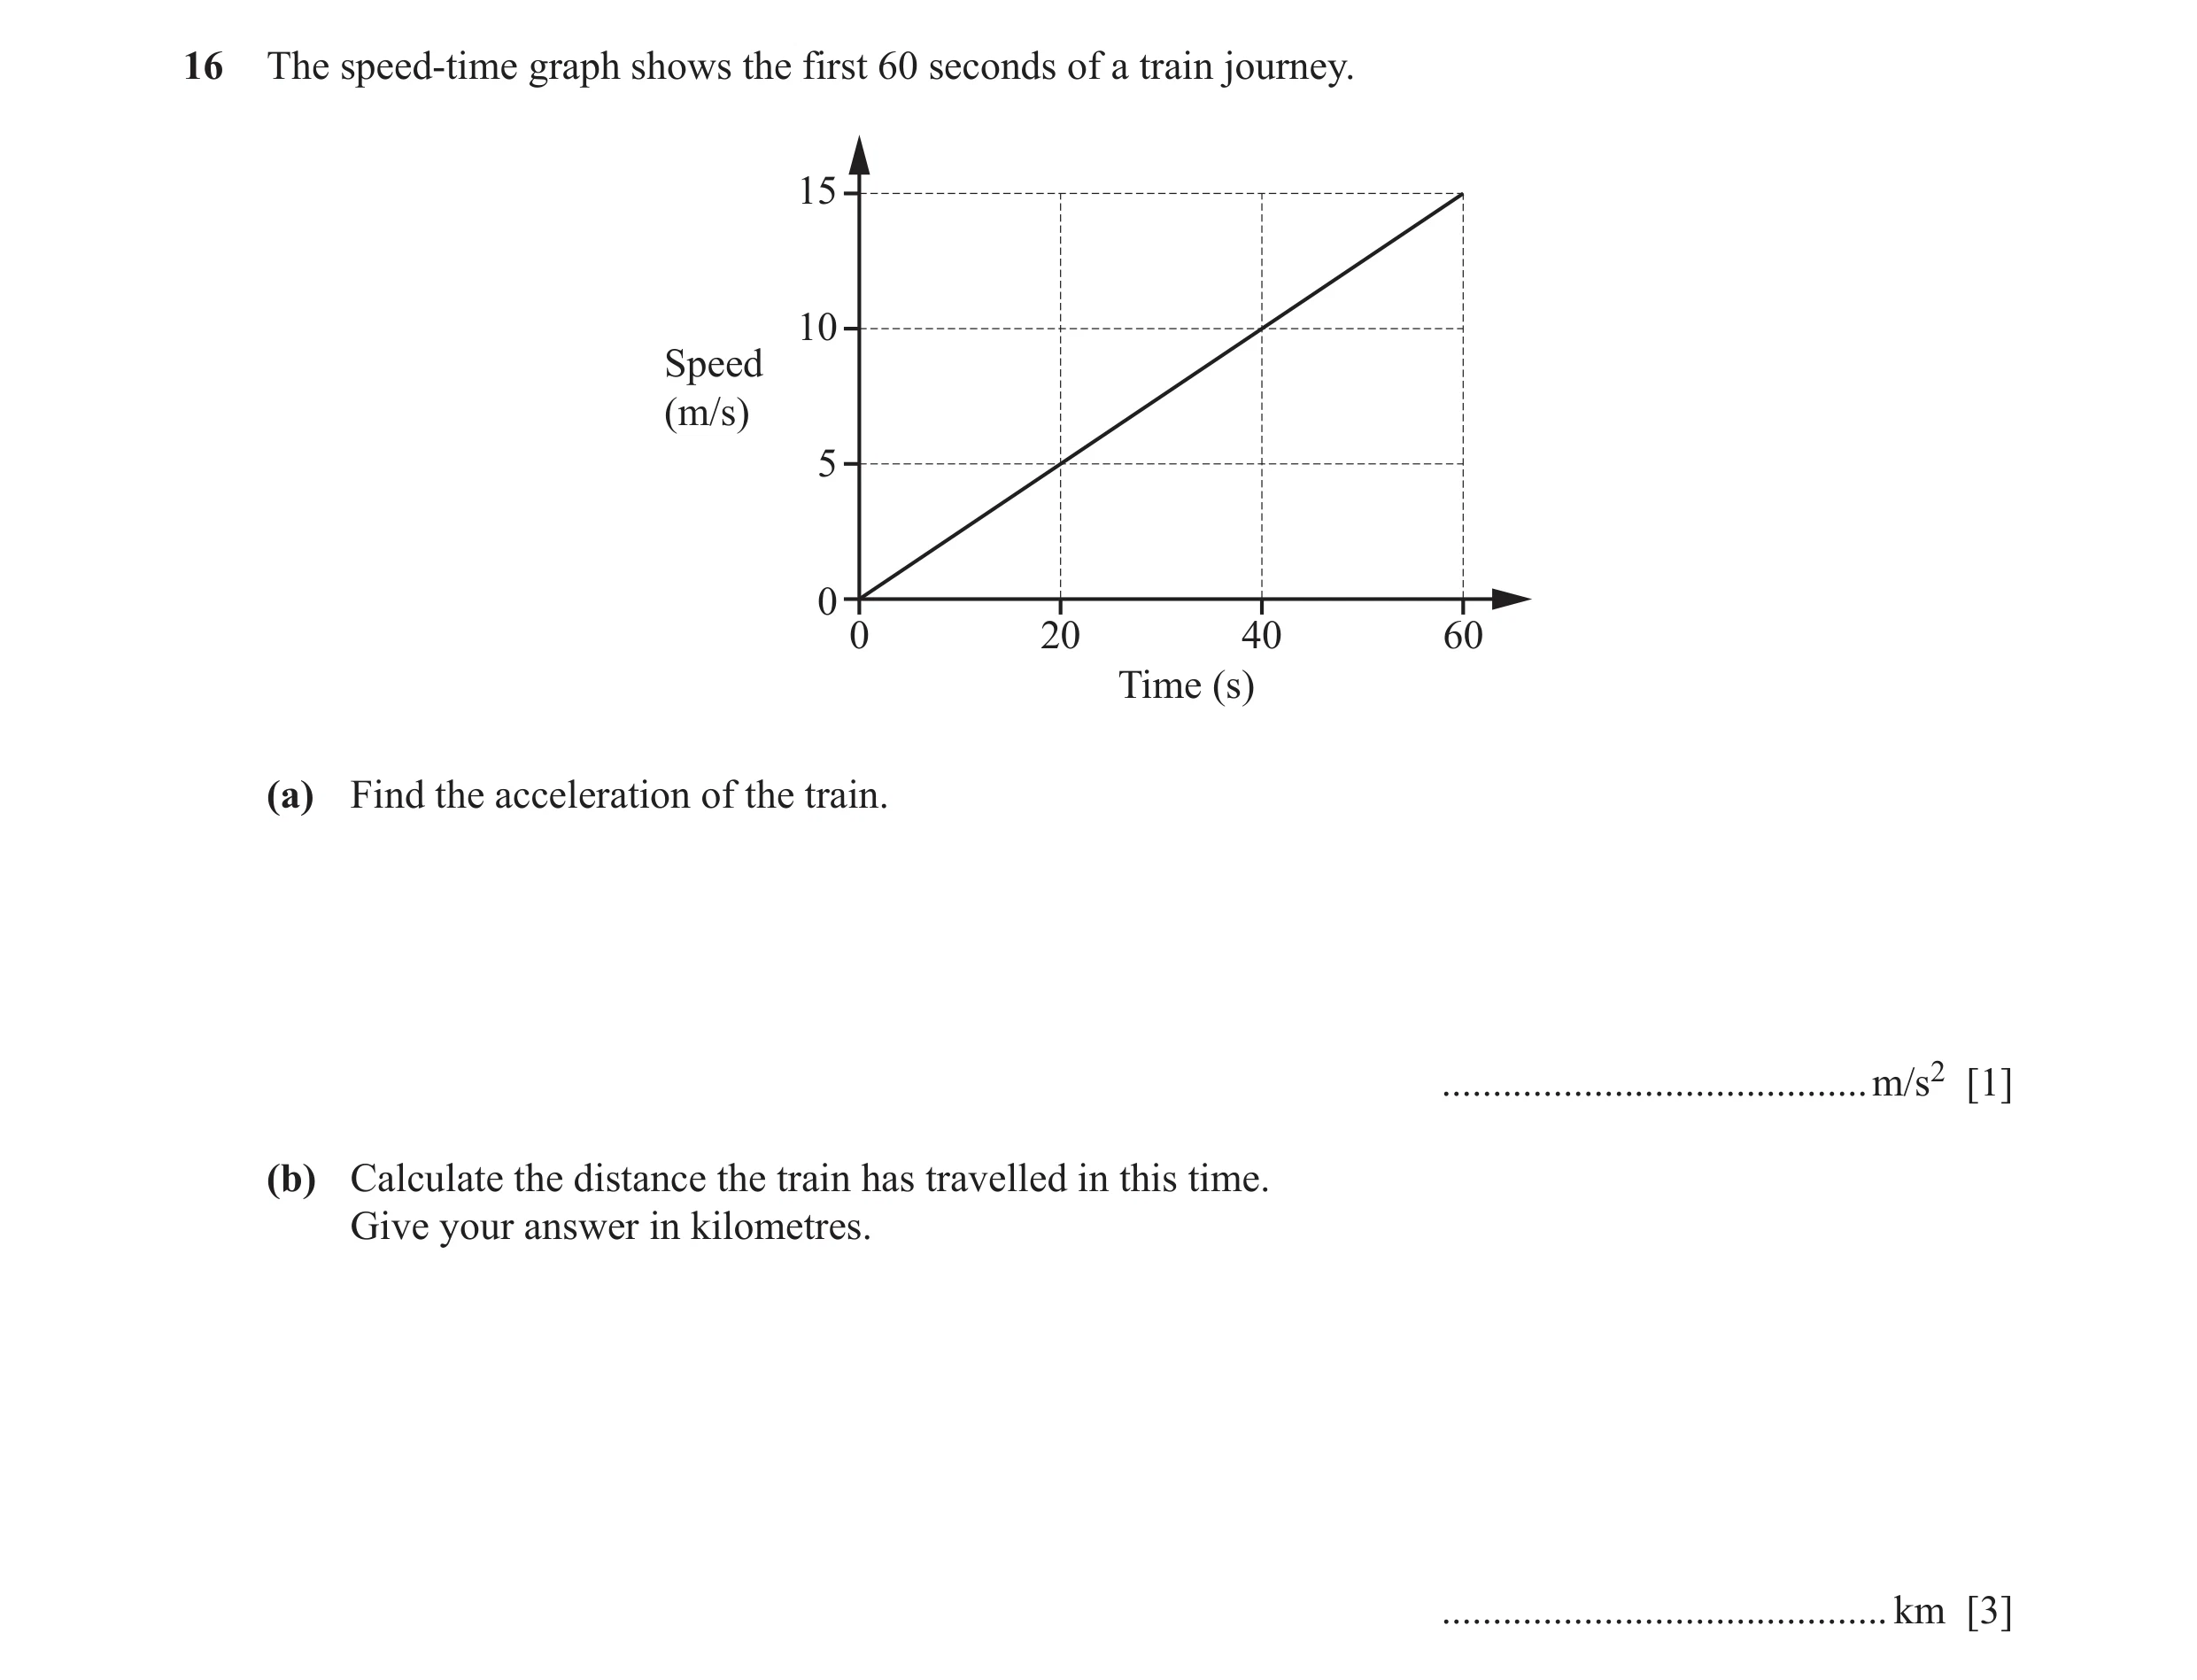
 36 / 67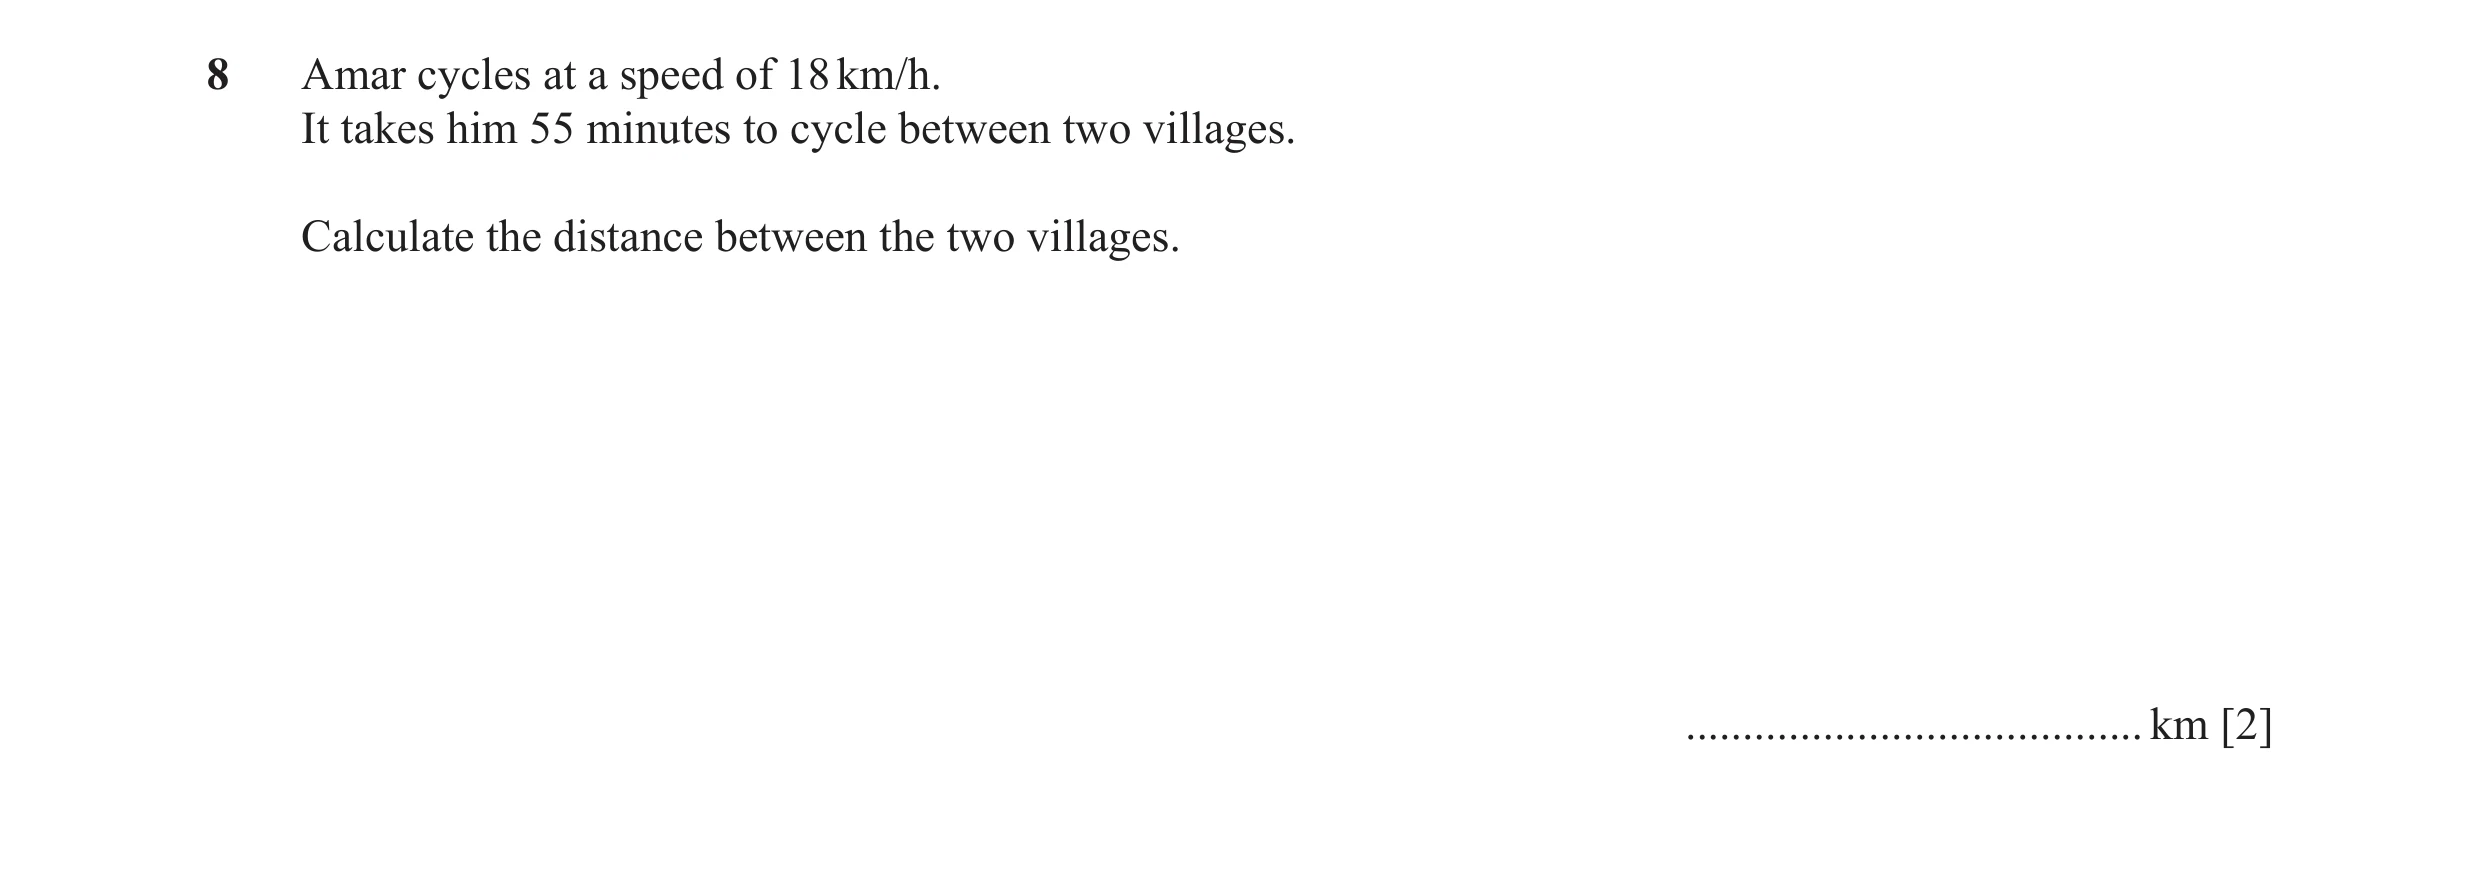
 37 / 67
 38 / 67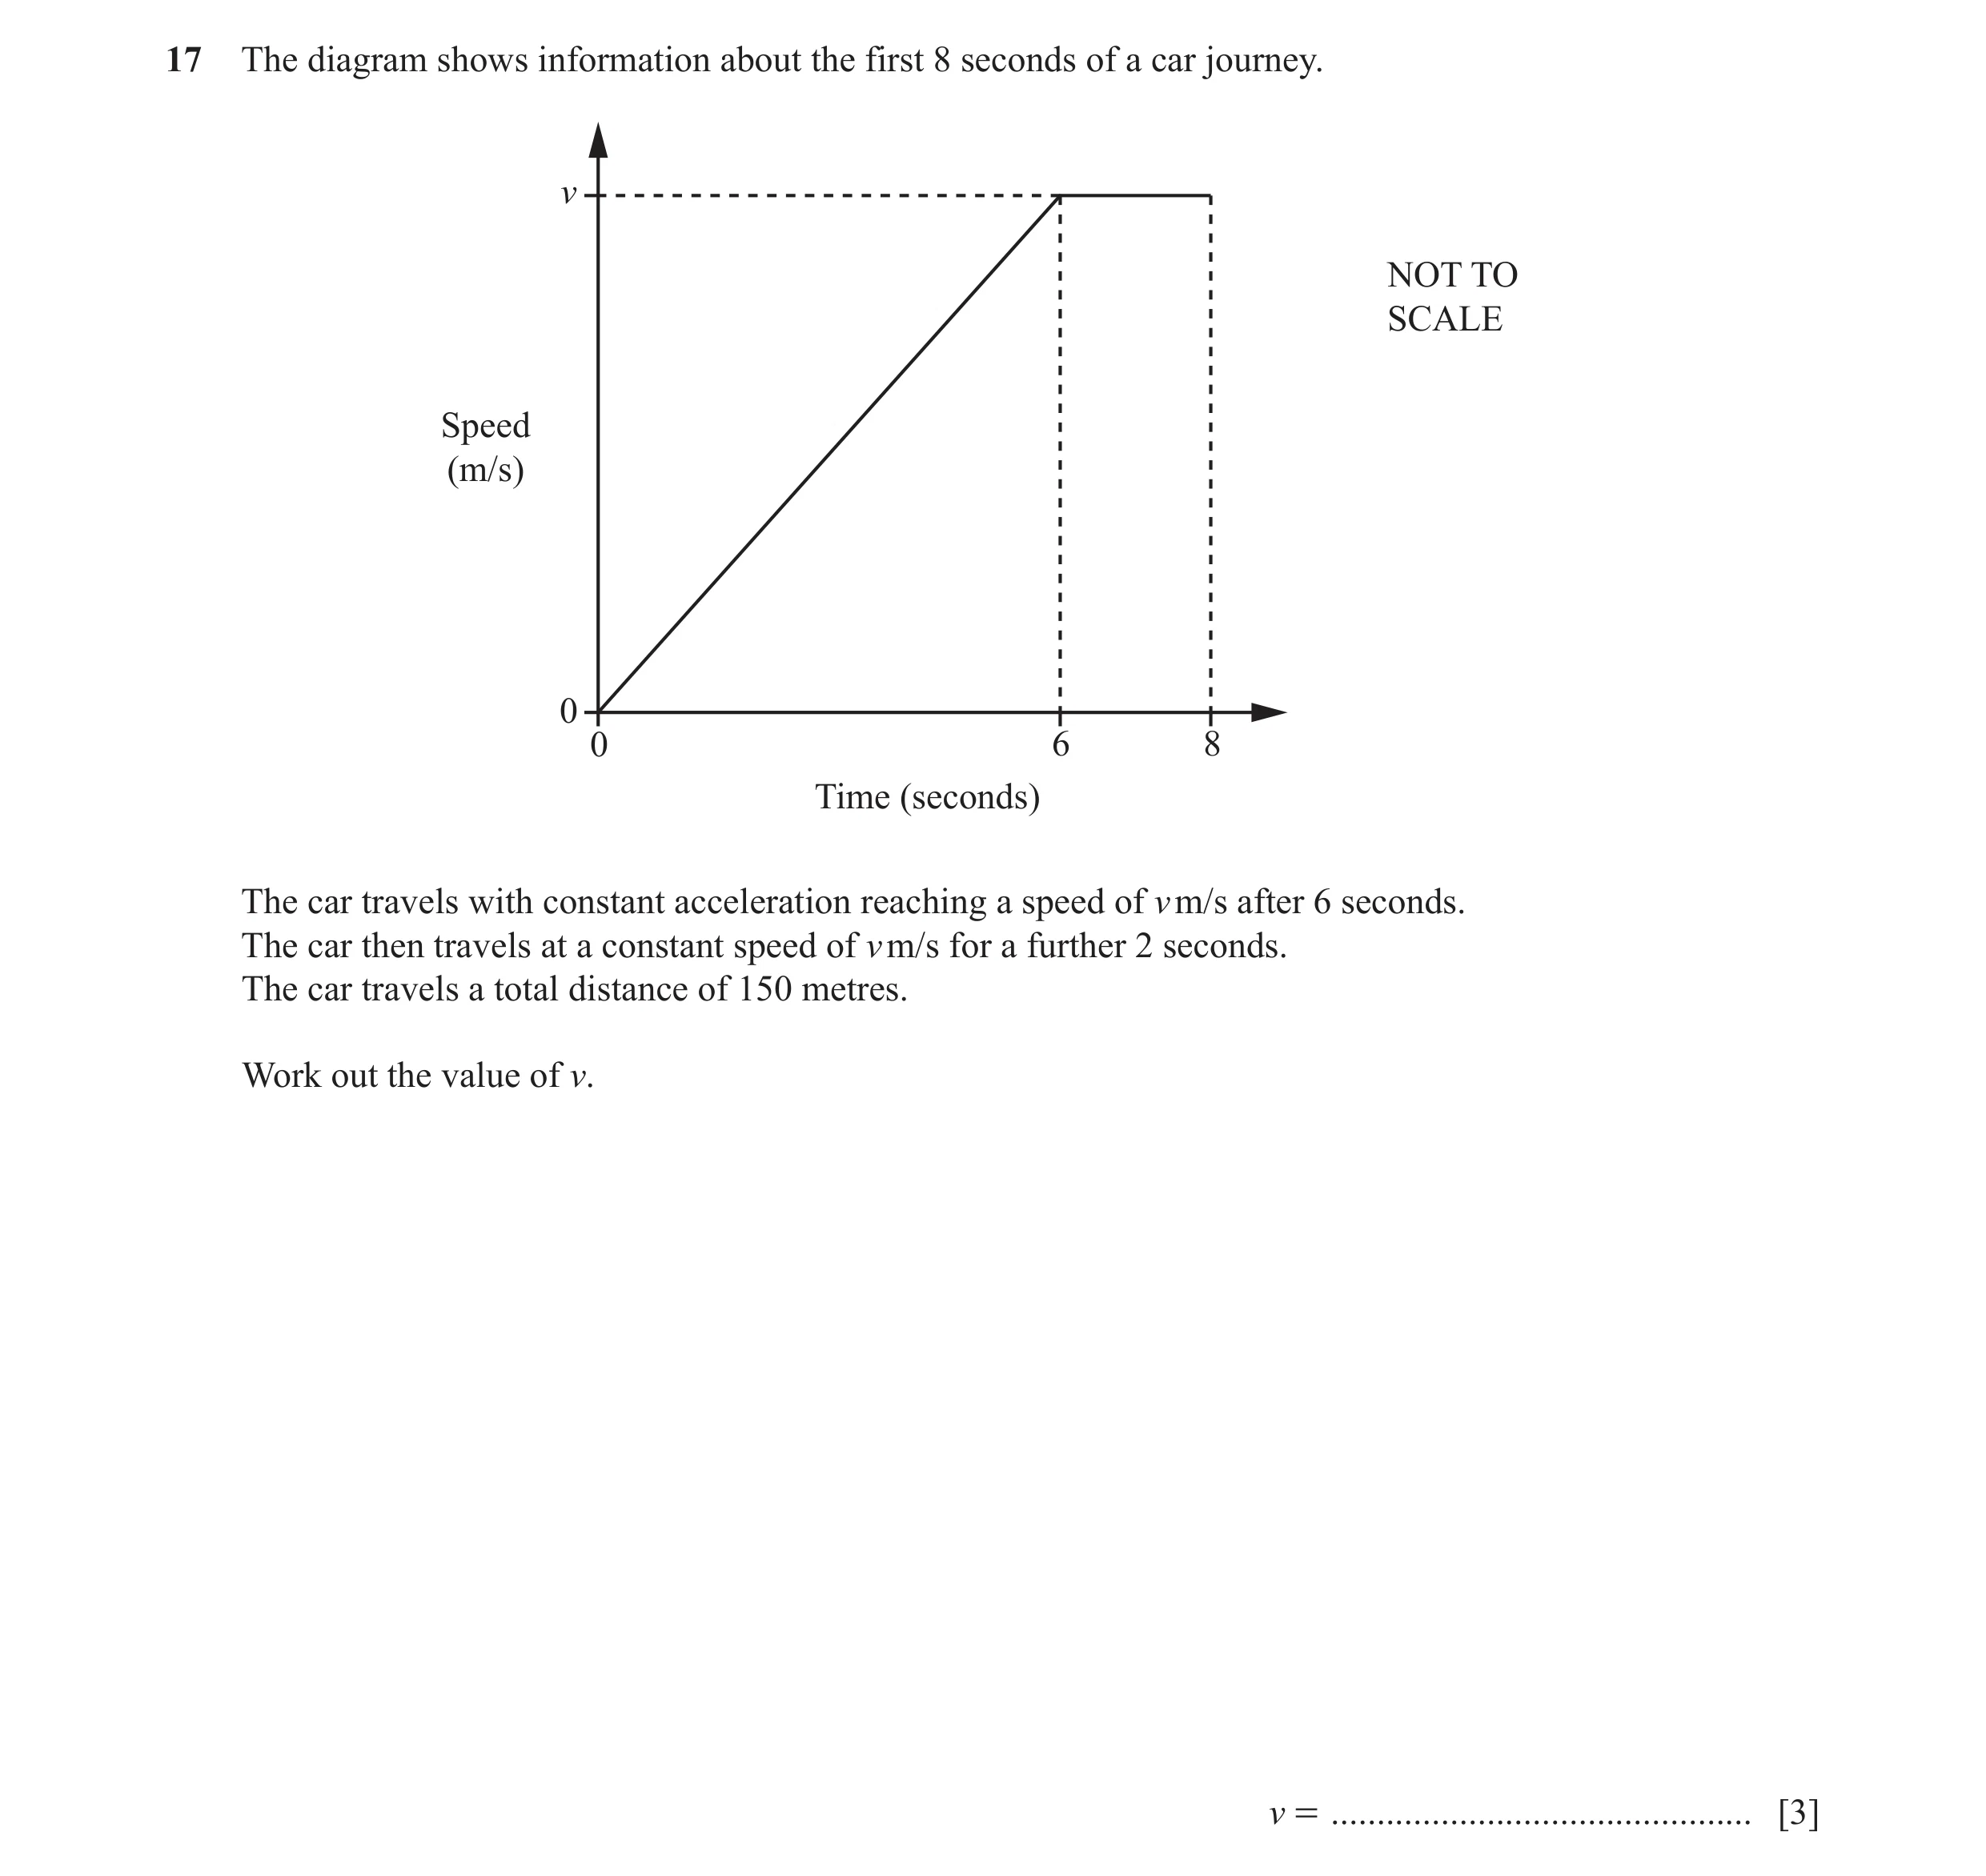
![Question 52: Liz takes 65 seconds to run 400 m. Calculate her average speed. .......................................... m/s [1]](https://img.pastlit.com/crops/6e0dc1f2-2cde-44da-a2ab-92b6d0285837/q3.webp) 39 / 67
39 / 67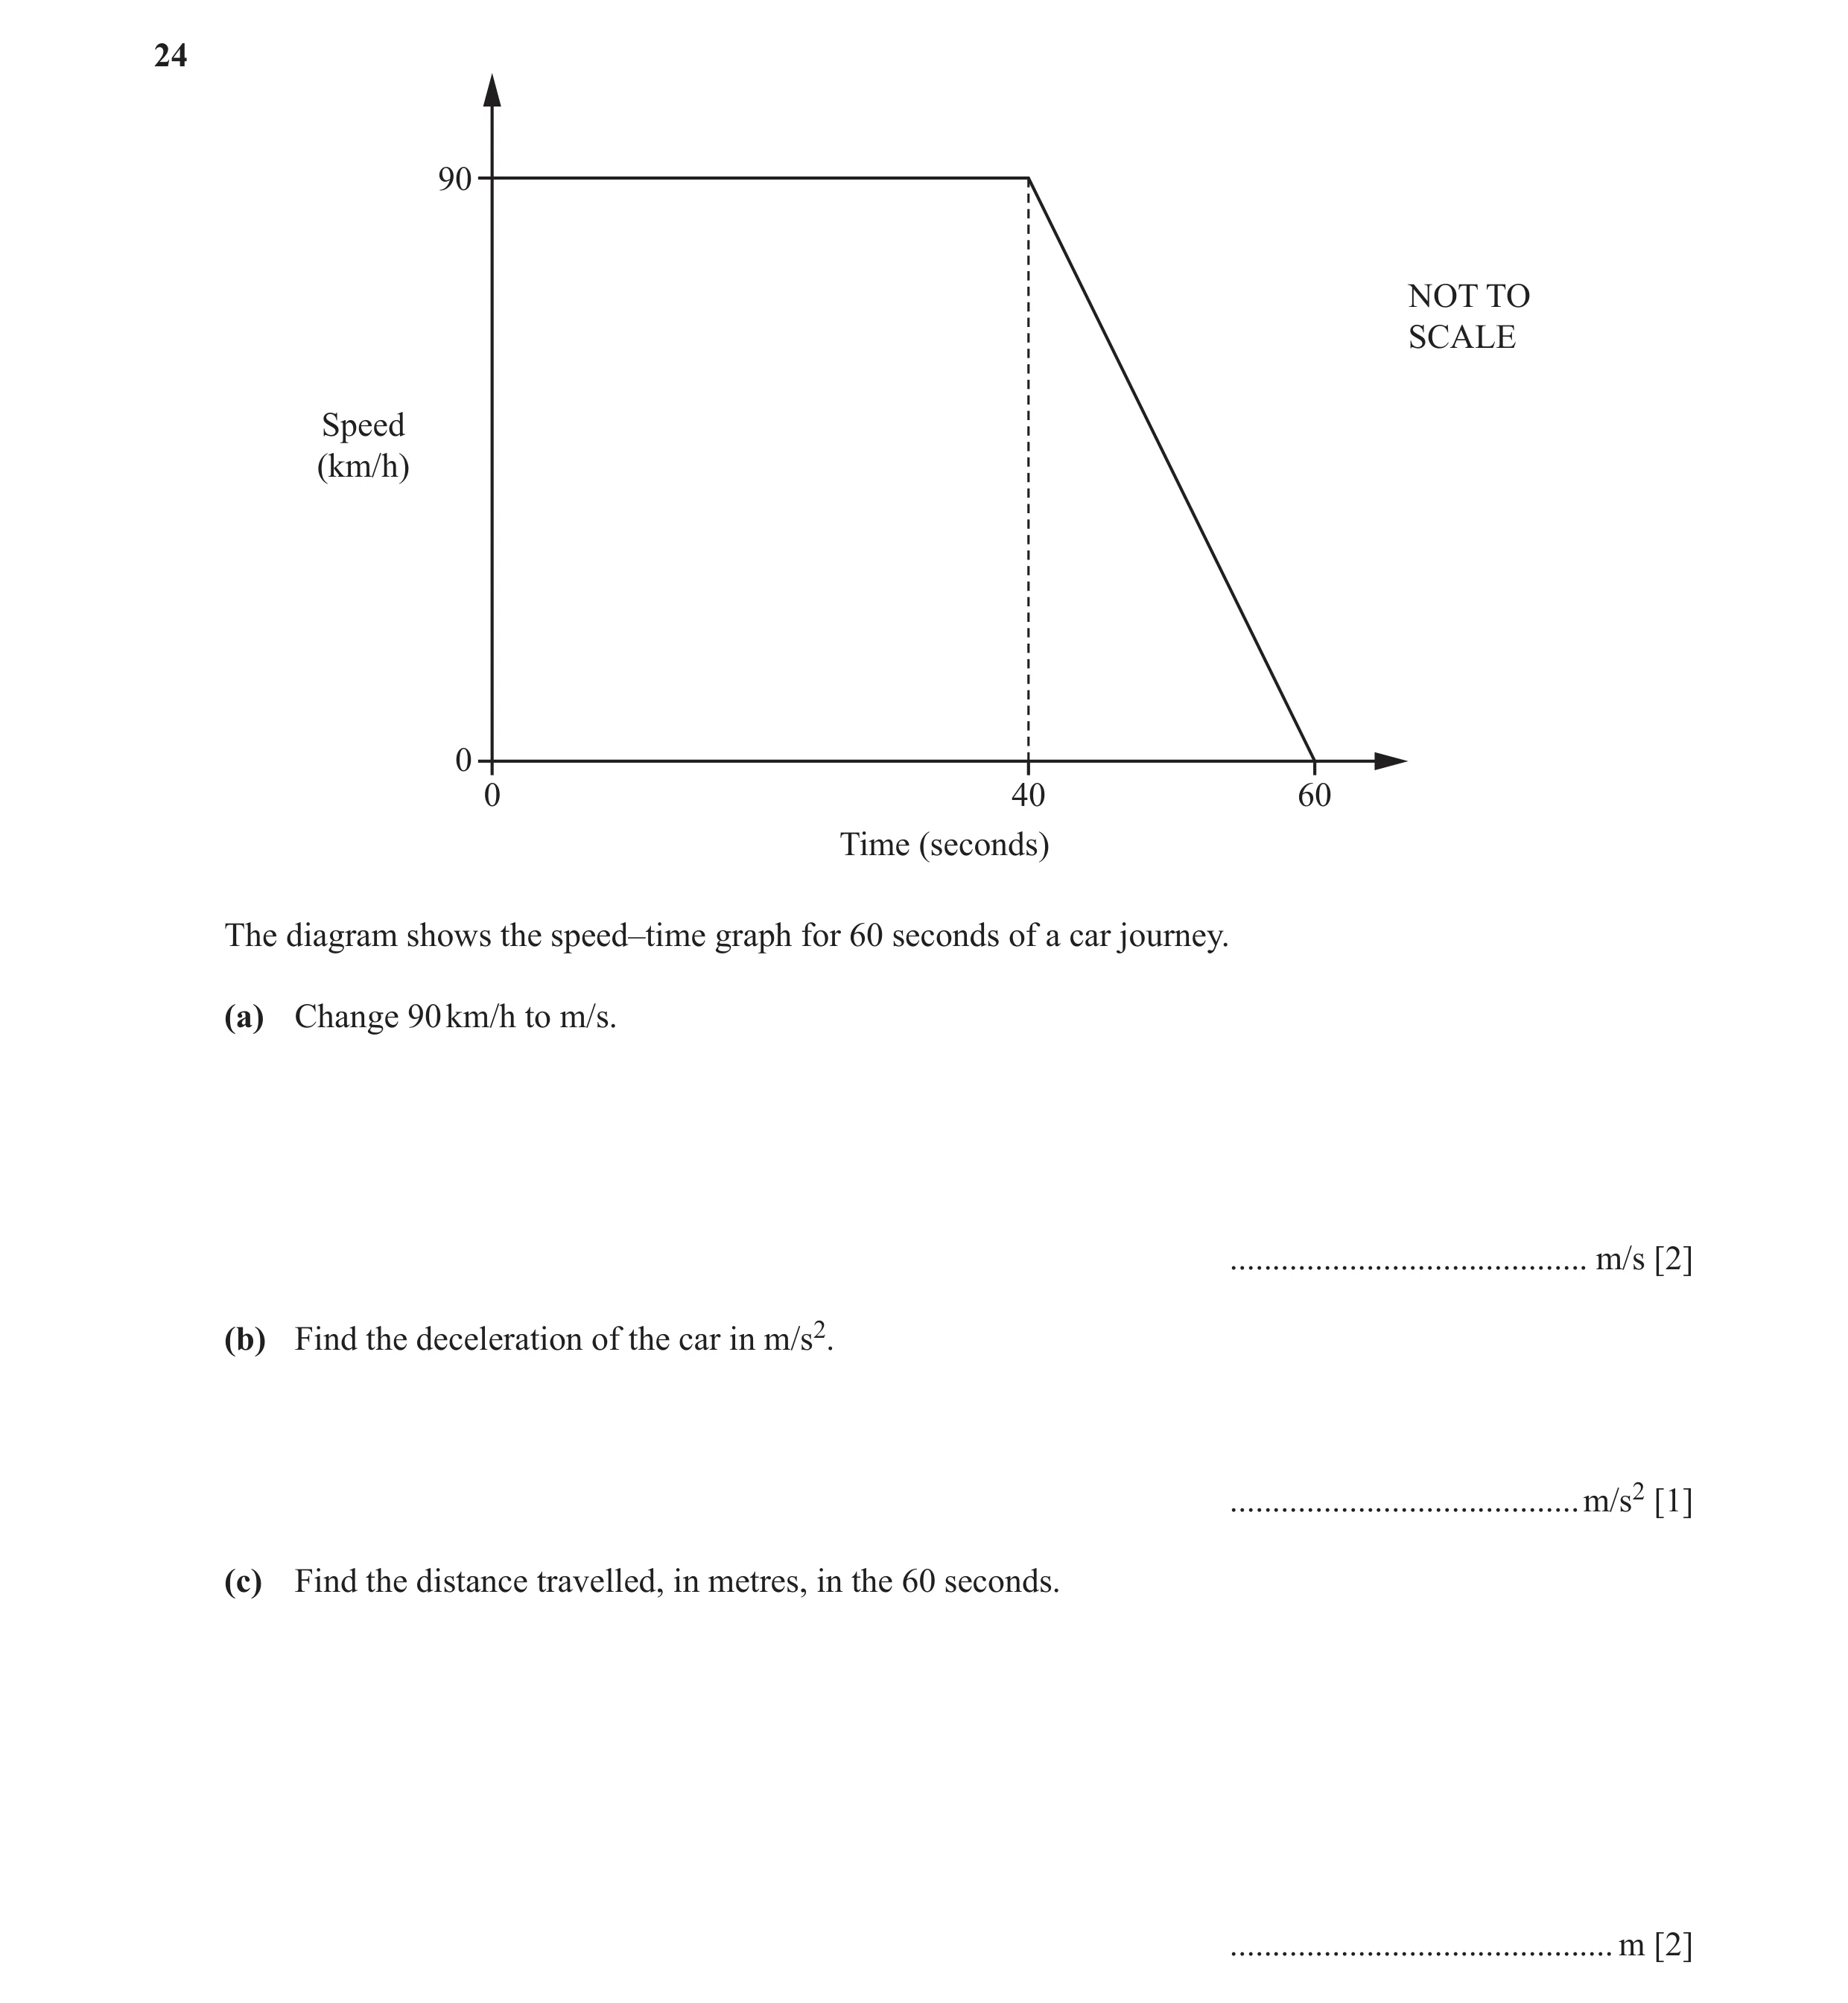 40 / 67
![Question 54: North B NOT TO SCALE A The bearing of A from B is 227°. Find the bearing of B from A. ................................................. [2]](https://img.pastlit.com/crops/af298087-6708-4727-a500-b922ddfec1c6/q6.webp)
 41 / 67
 42 / 67
 43 / 67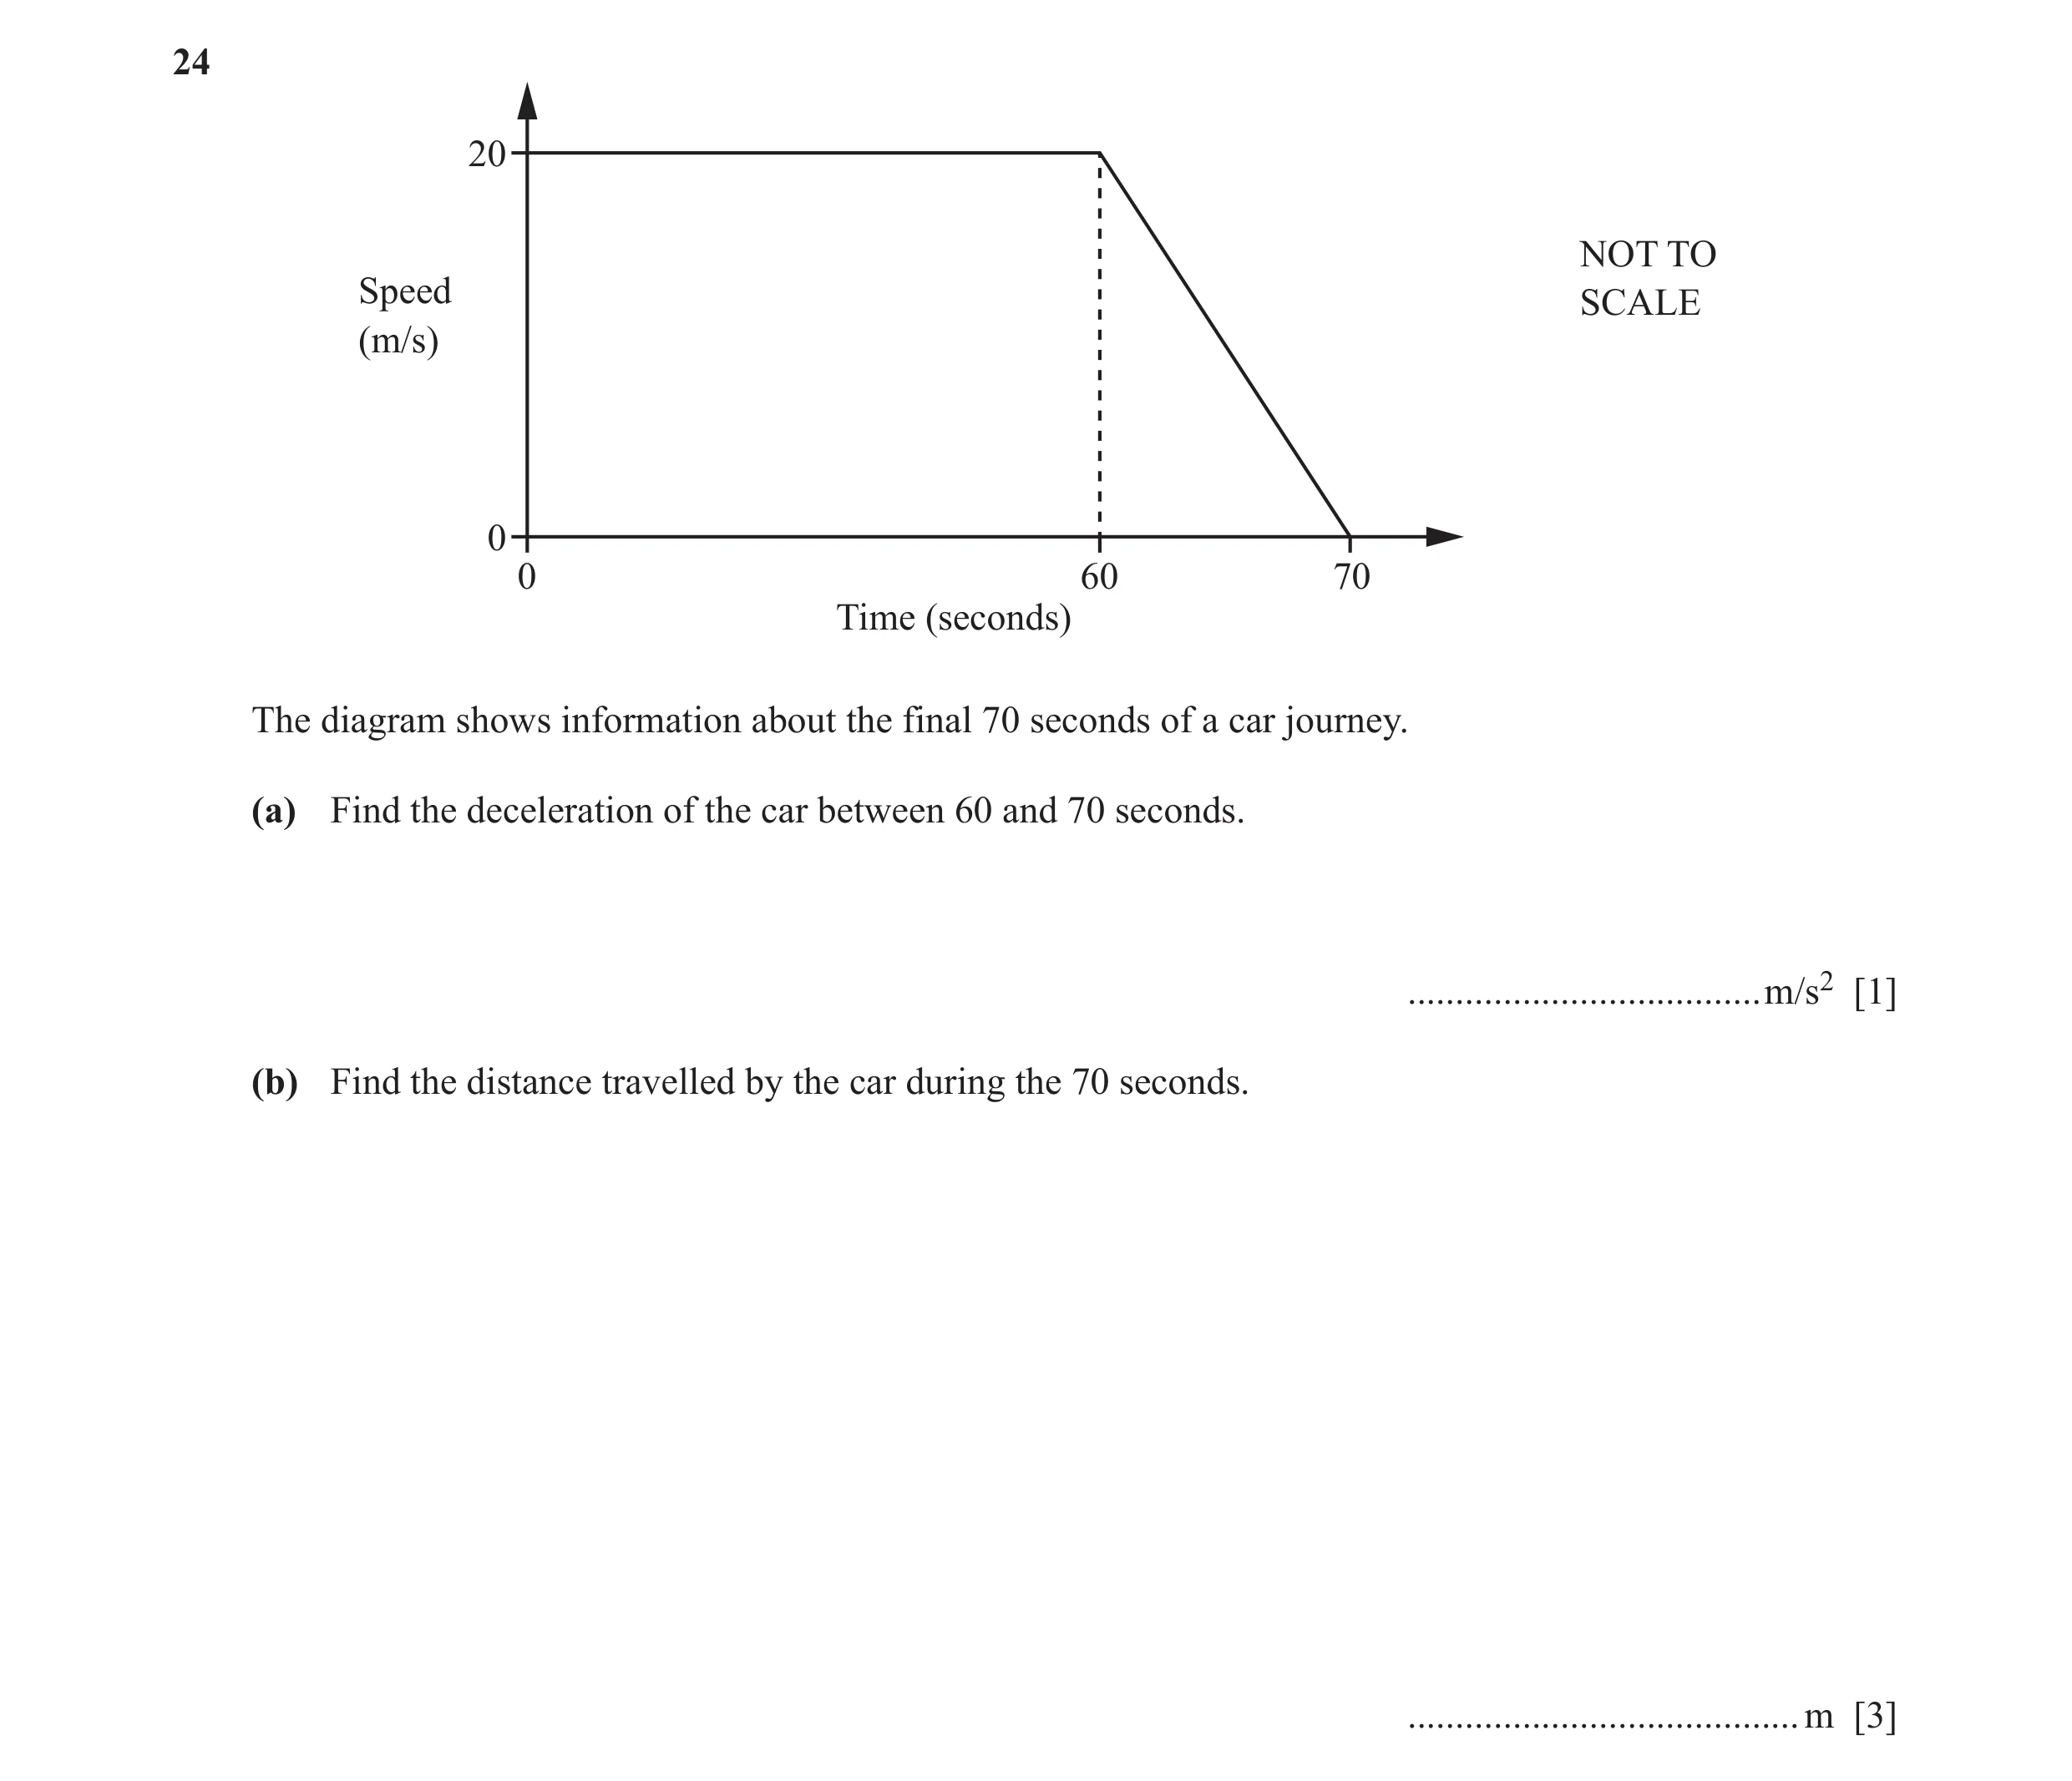
 44 / 67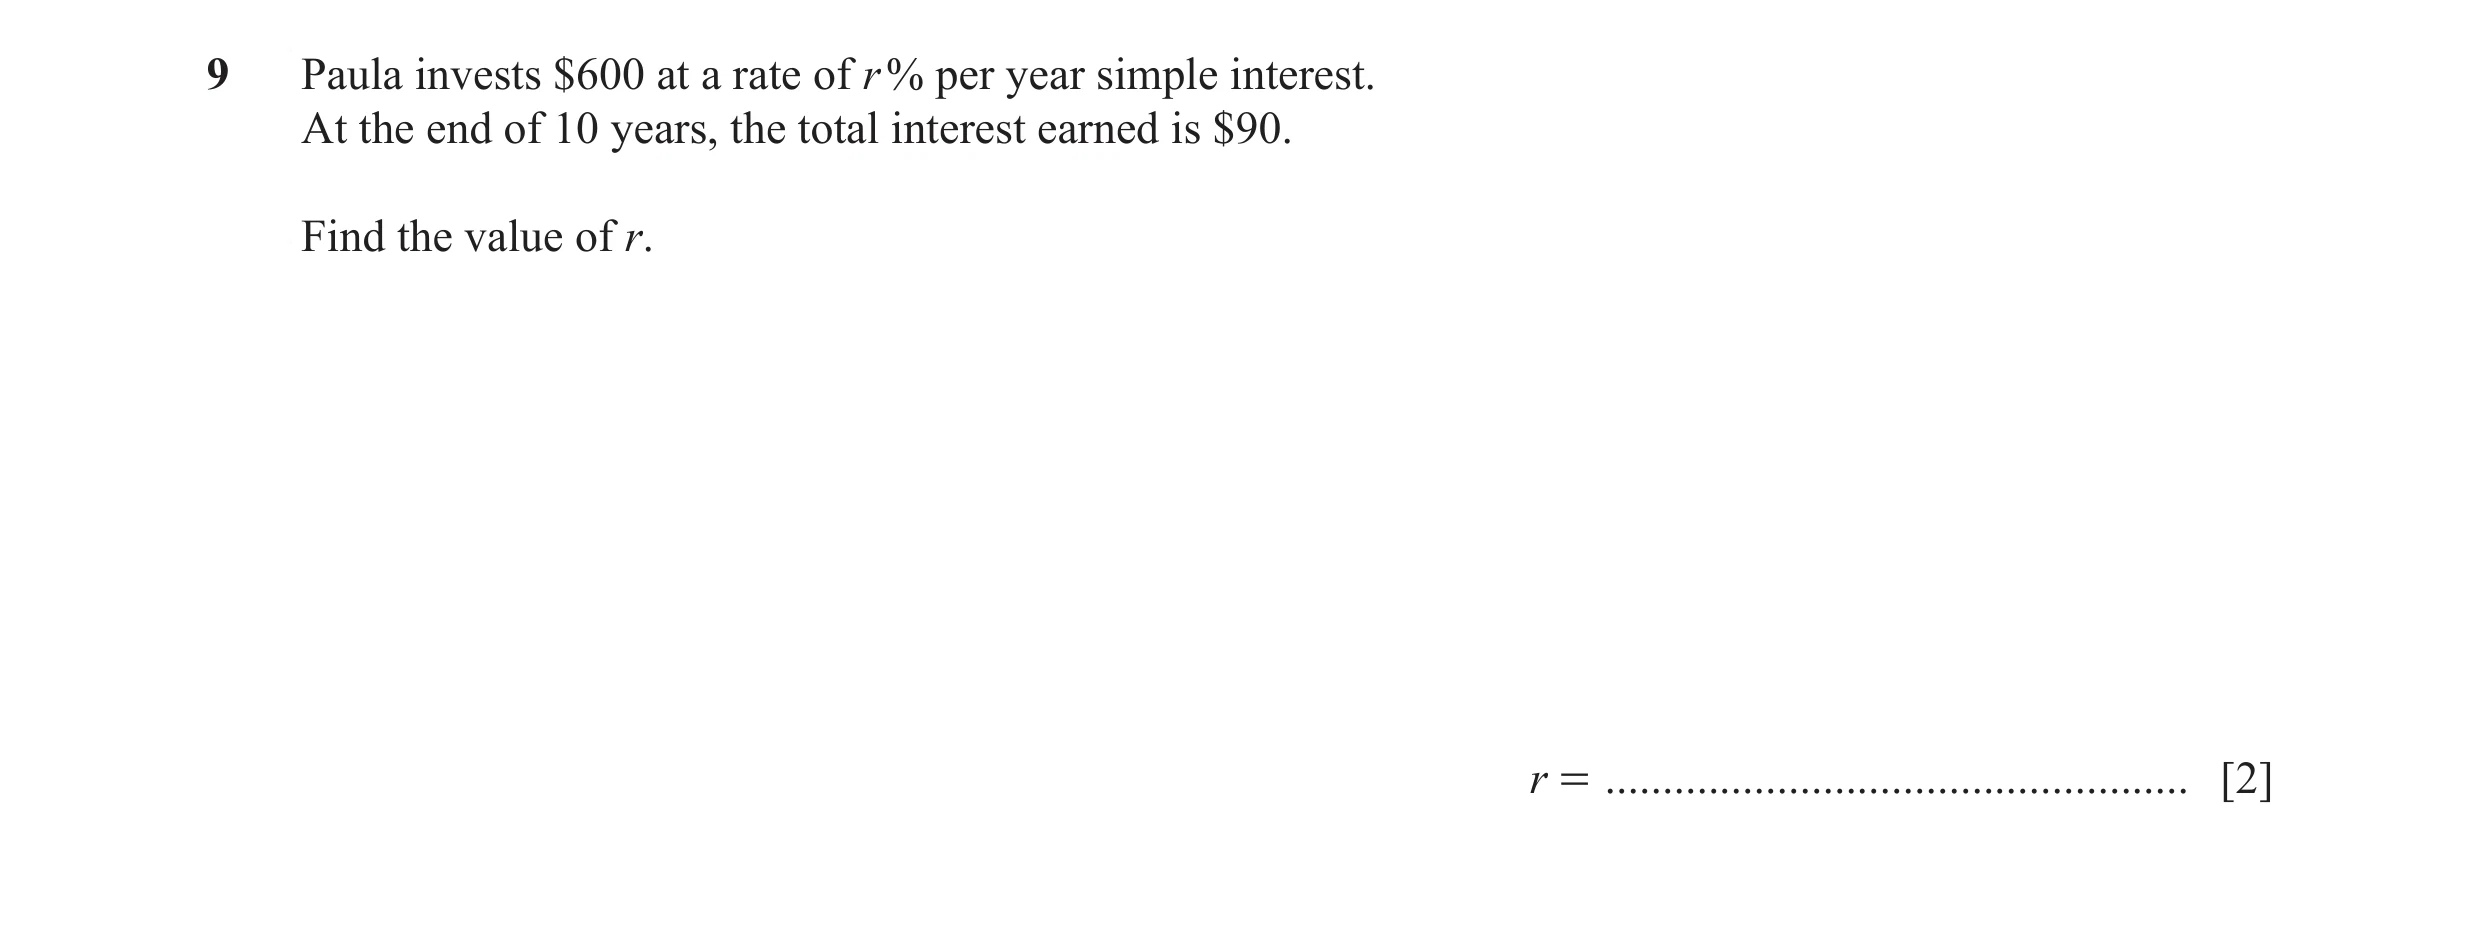
 45 / 67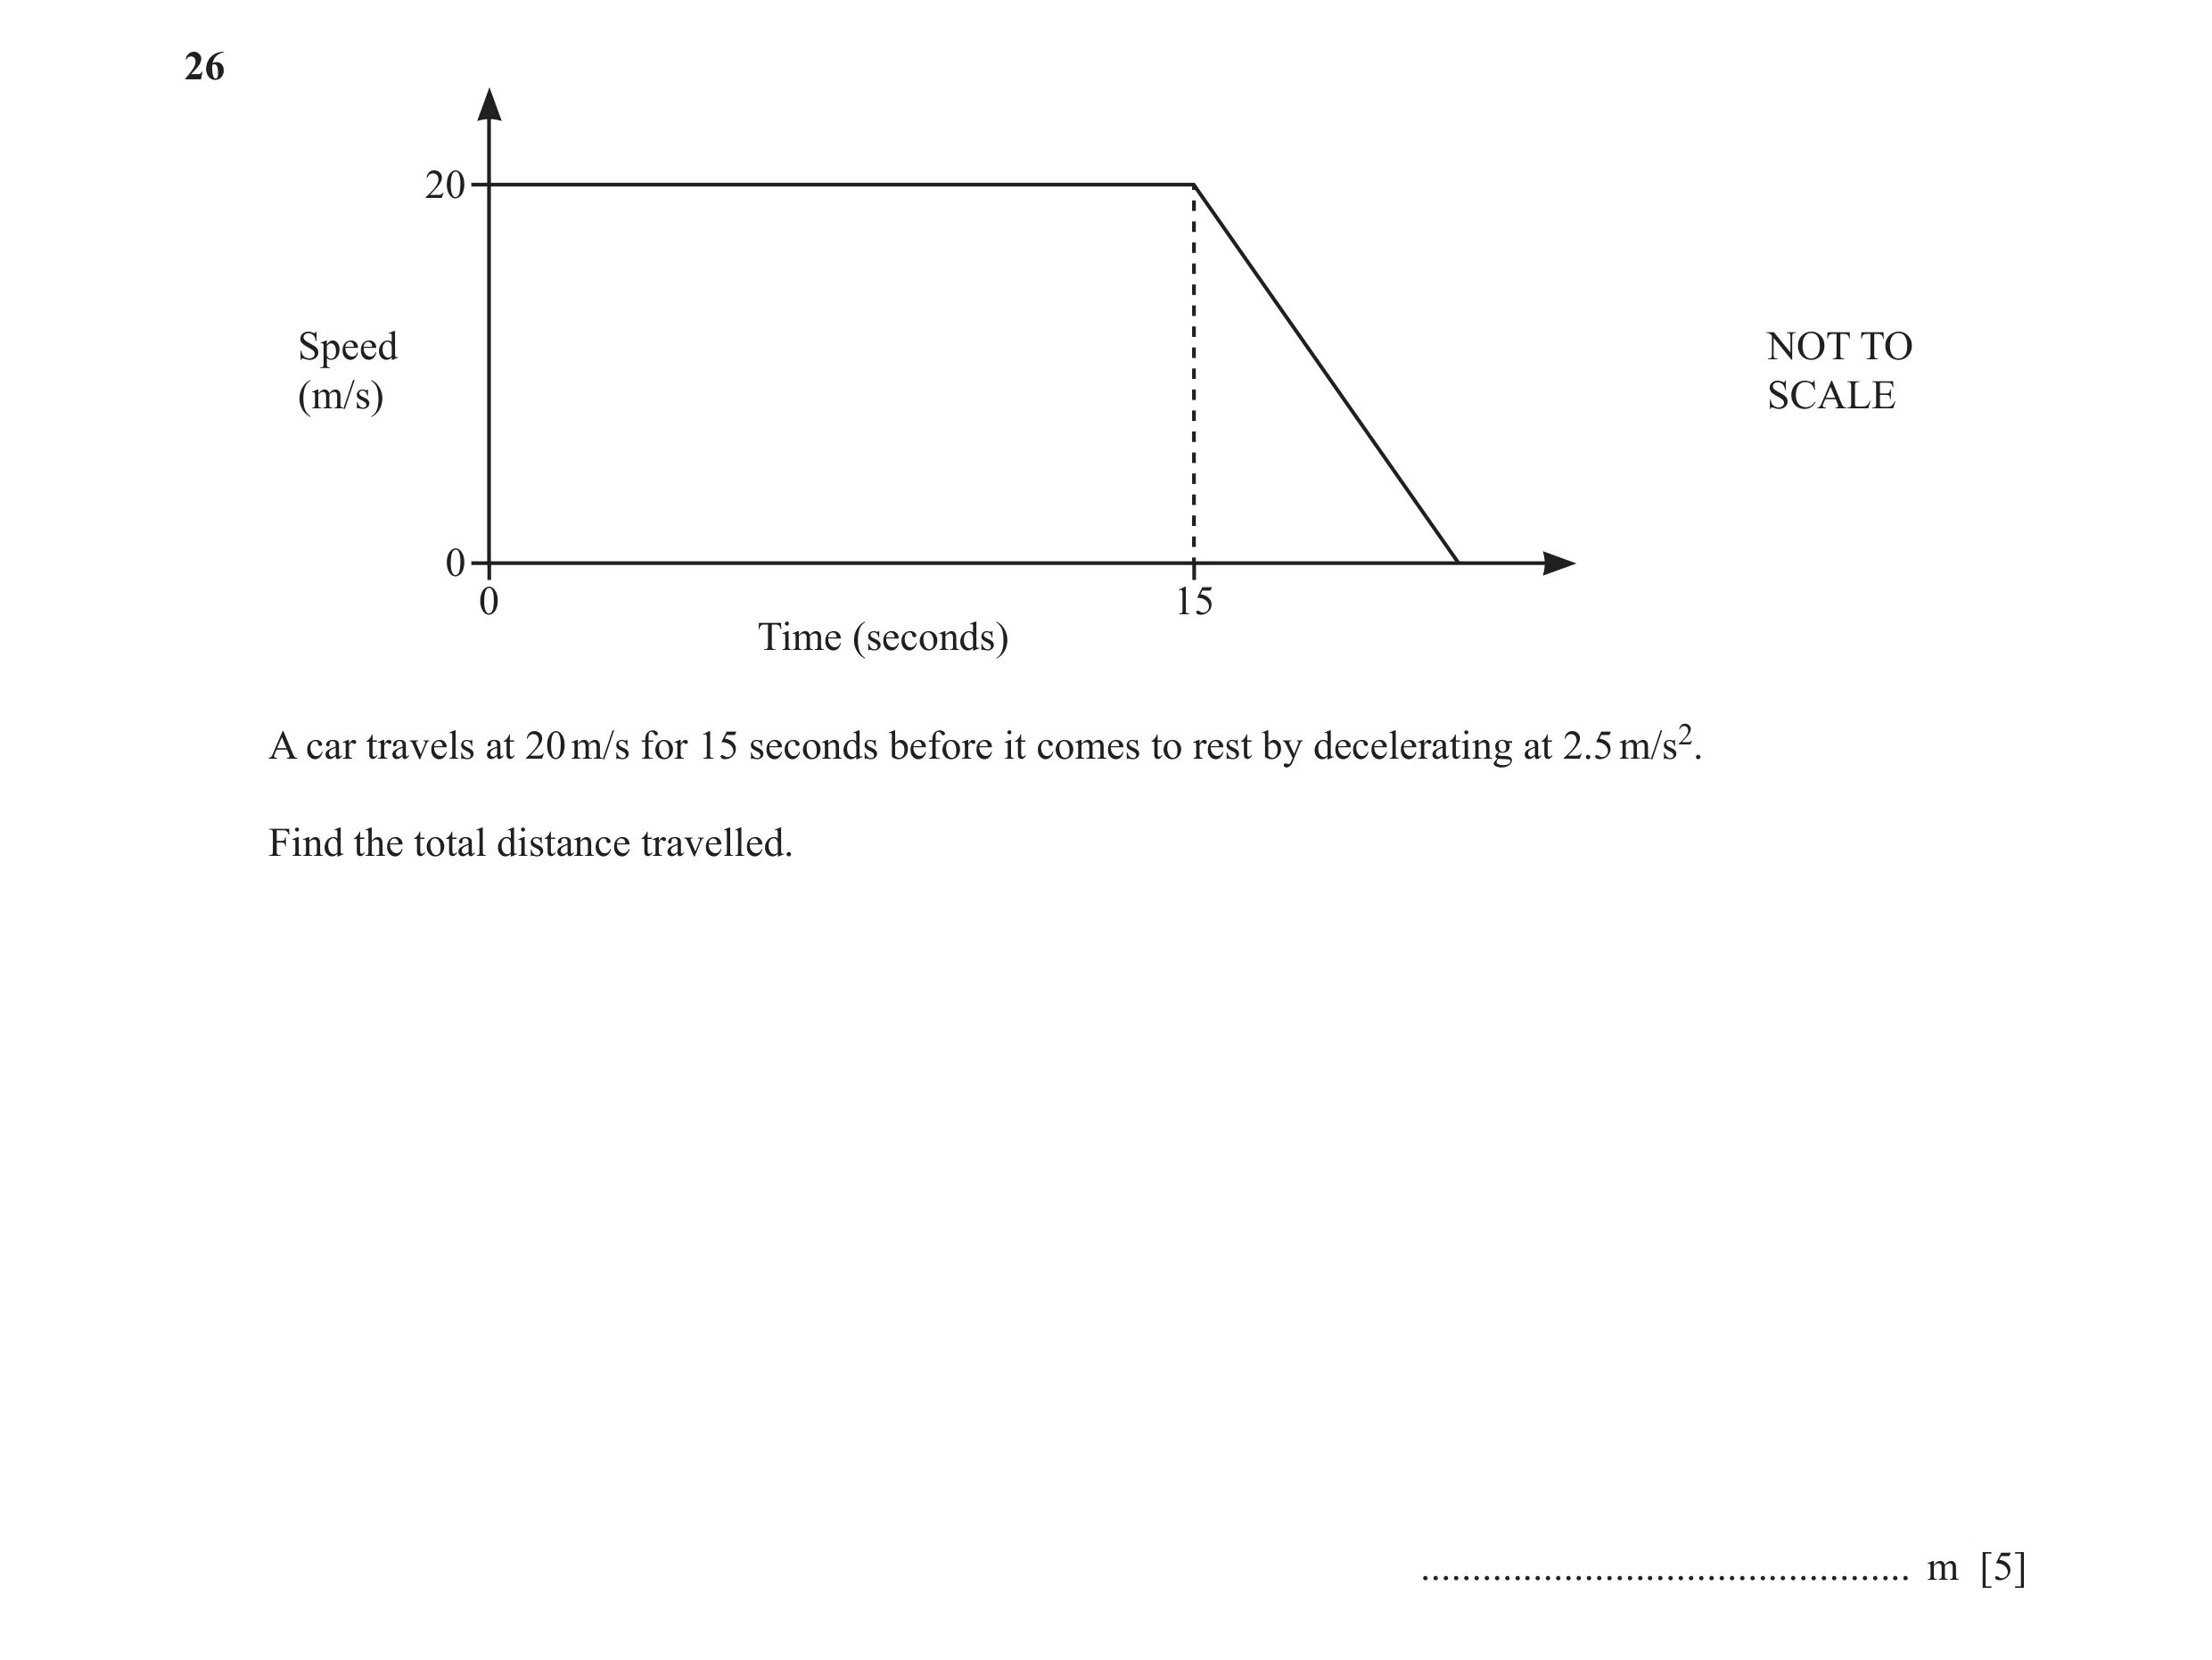
 46 / 67
 47 / 67
 48 / 67
 49 / 67
 50 / 67
 51 / 67
 52 / 67
 53 / 67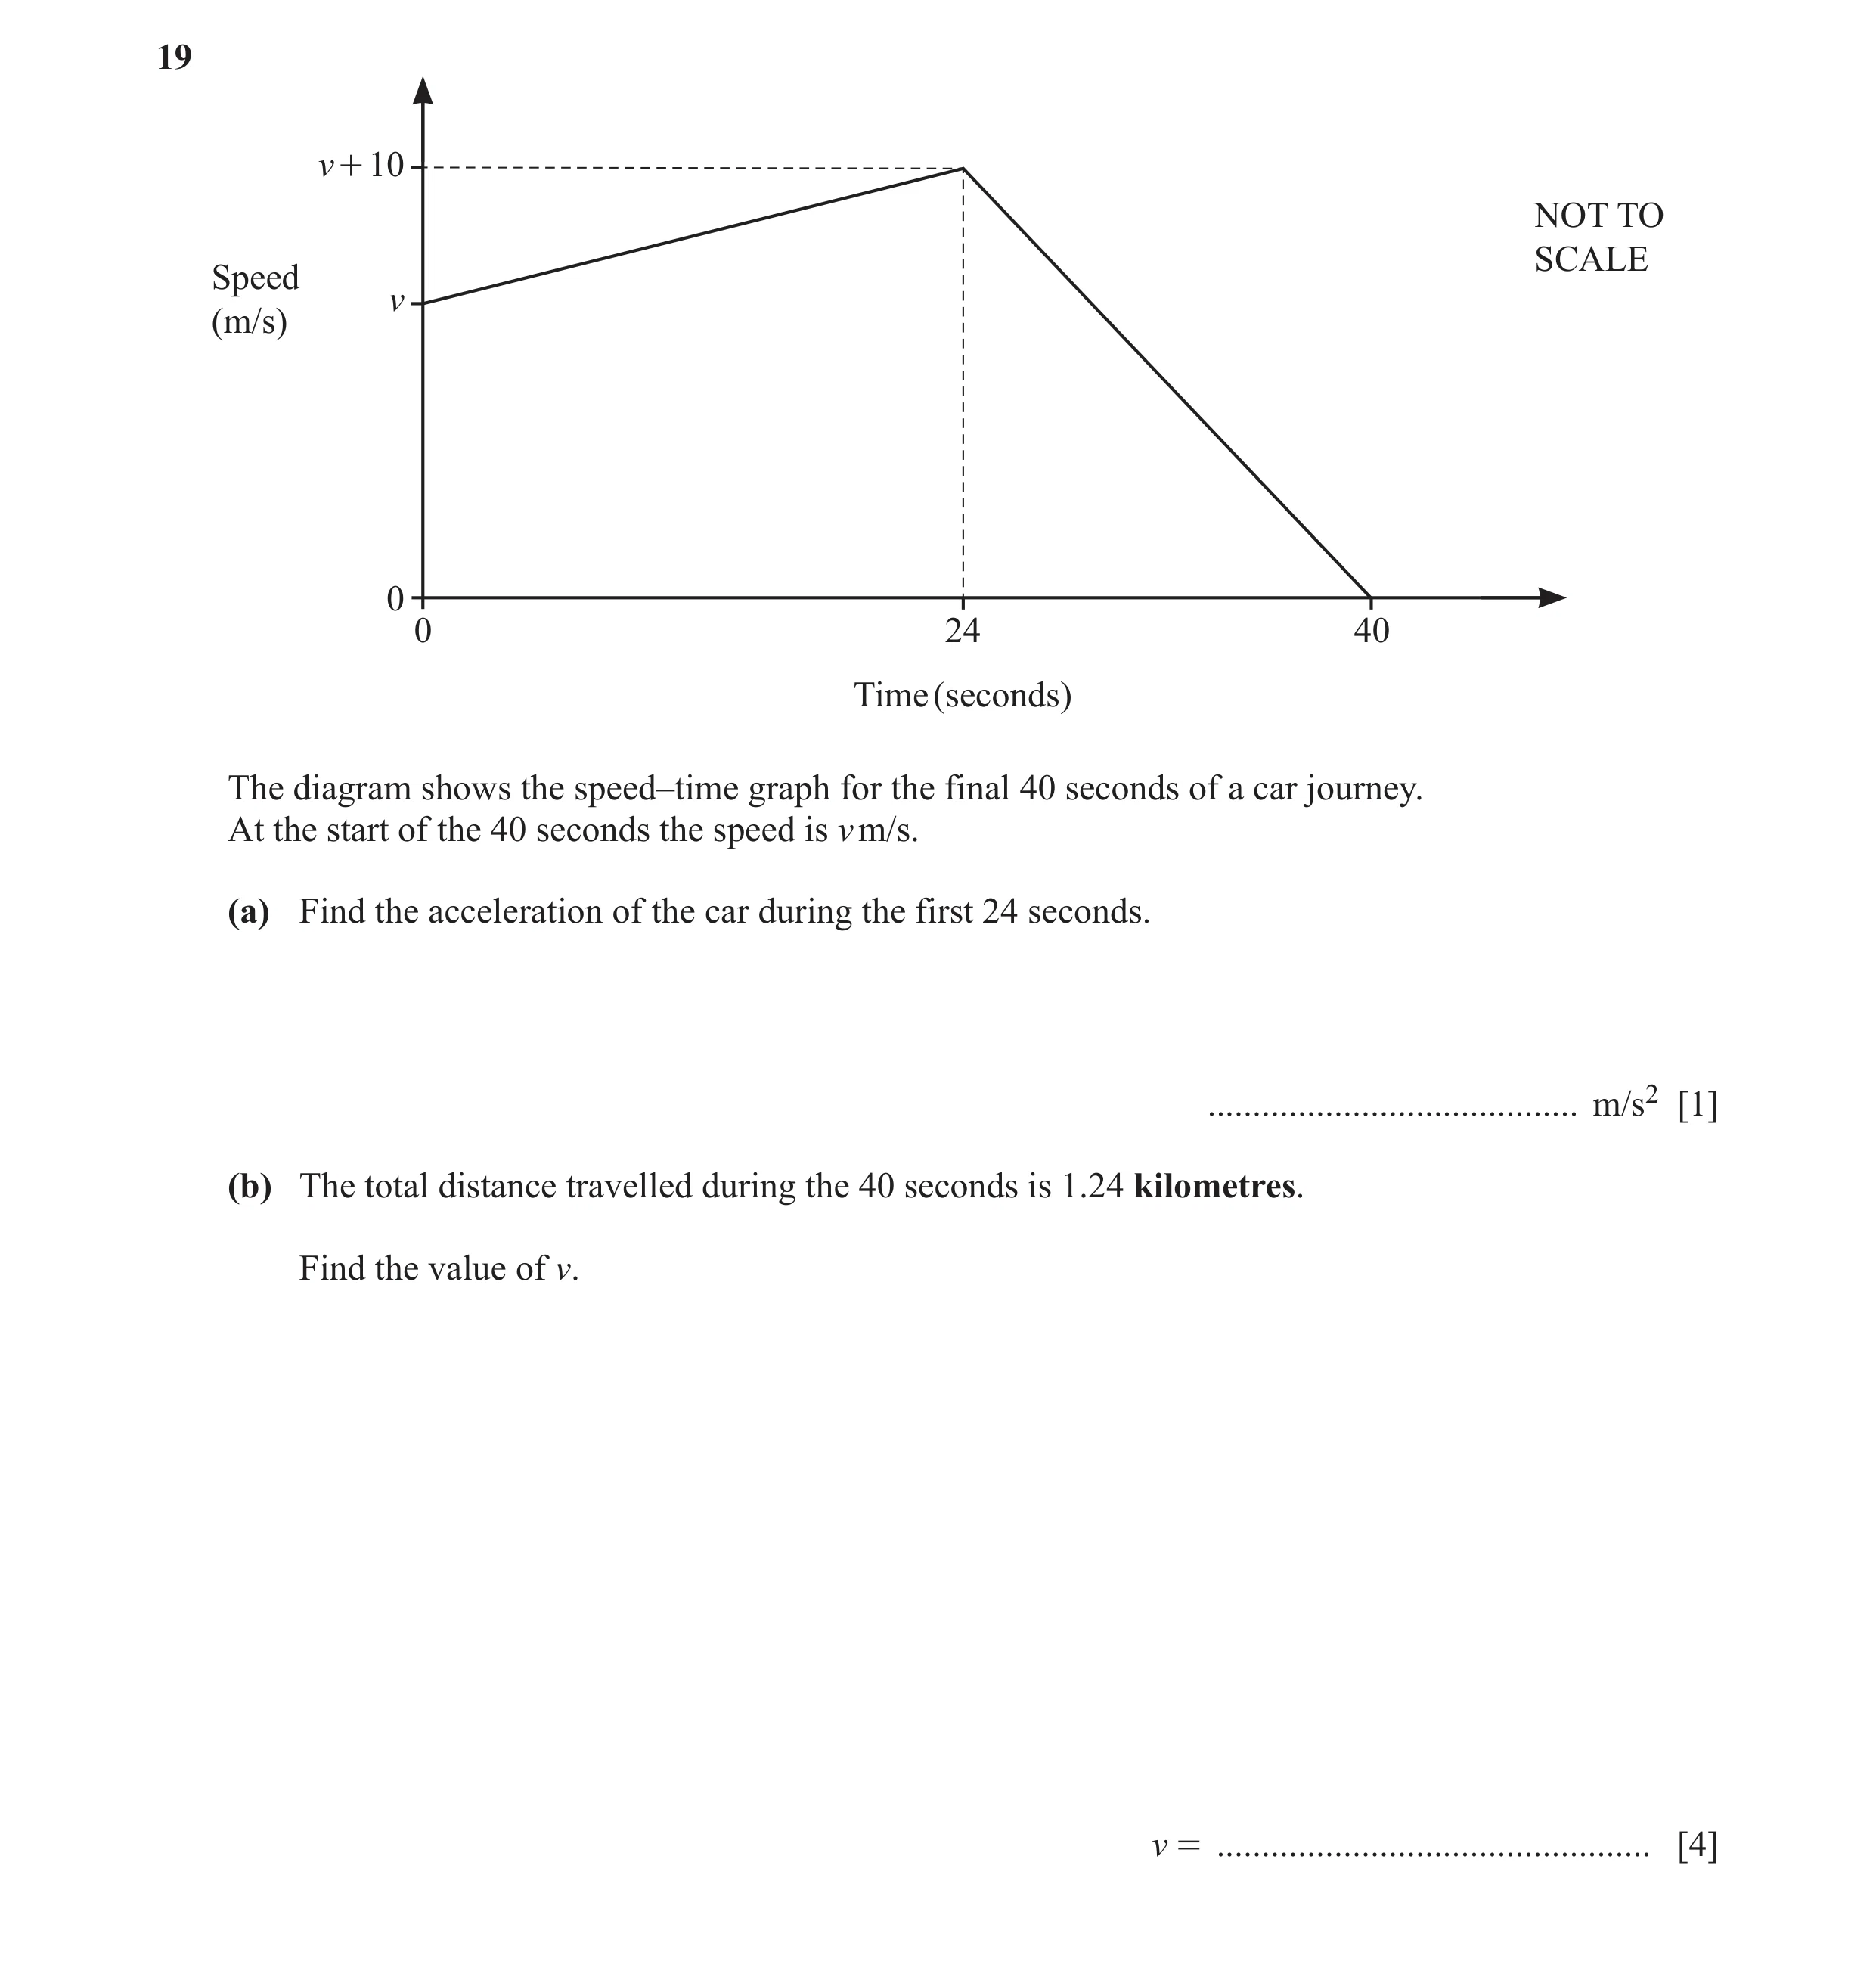
 54 / 67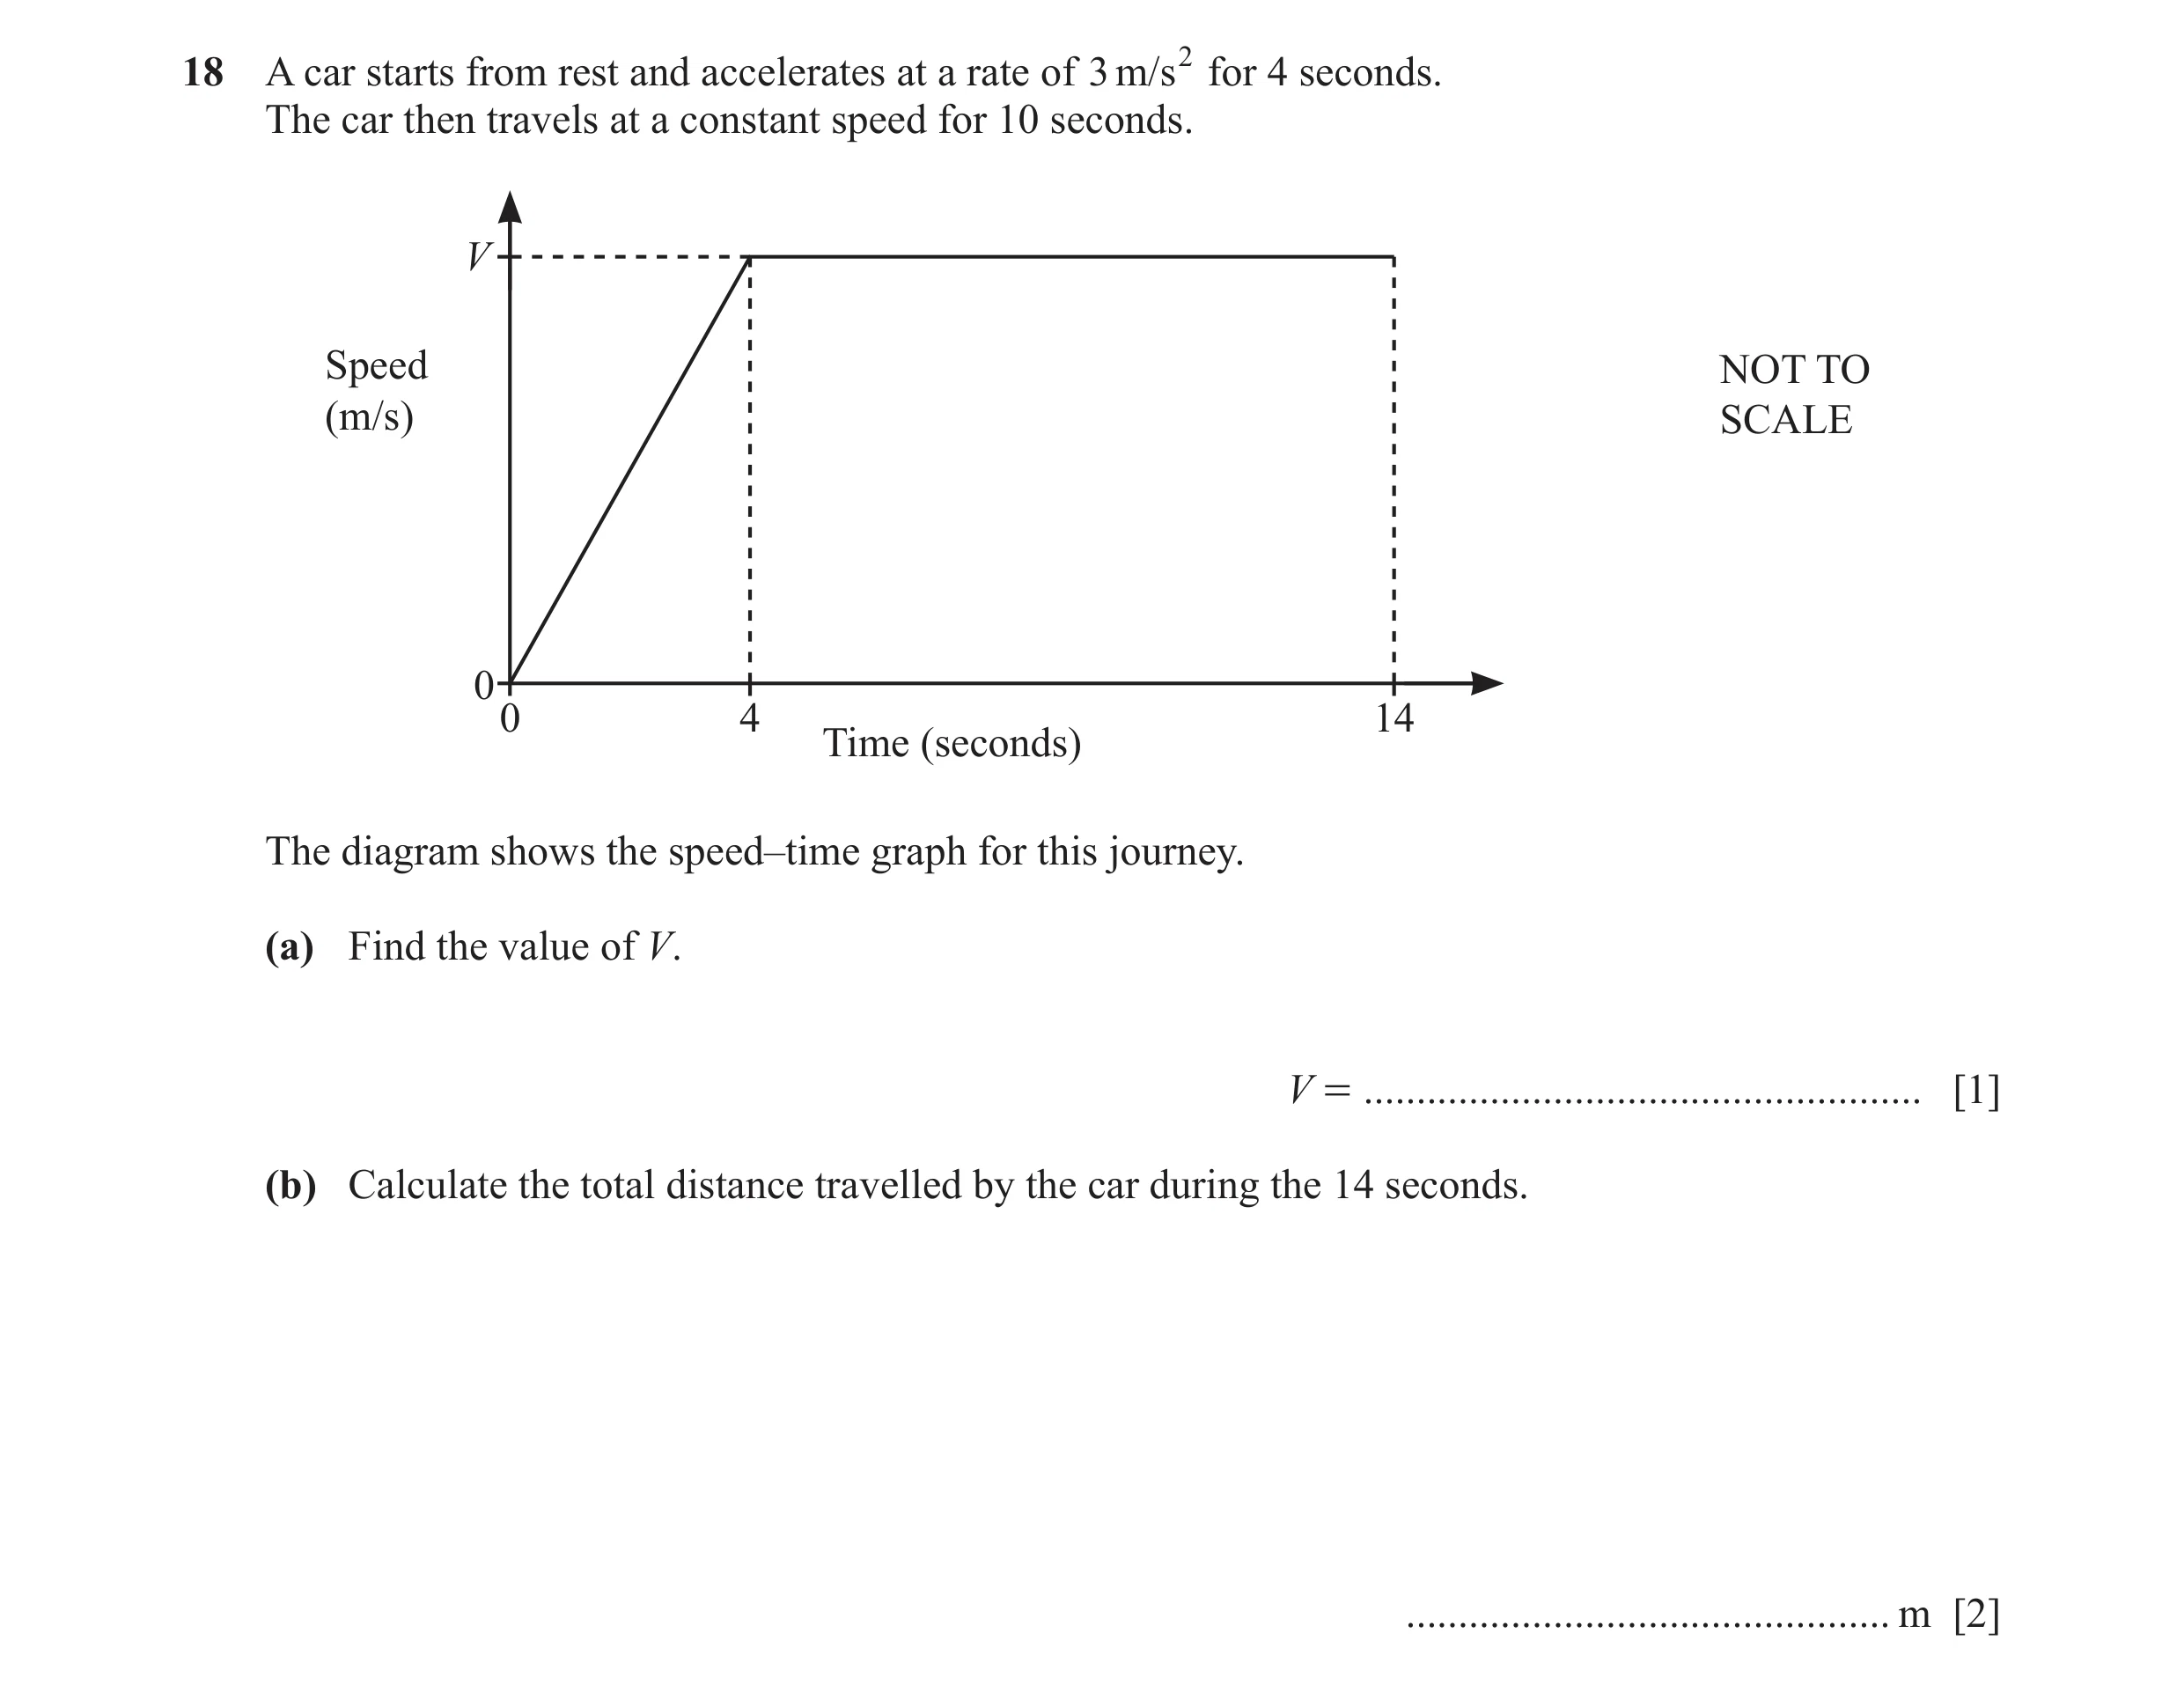
 55 / 67
 56 / 67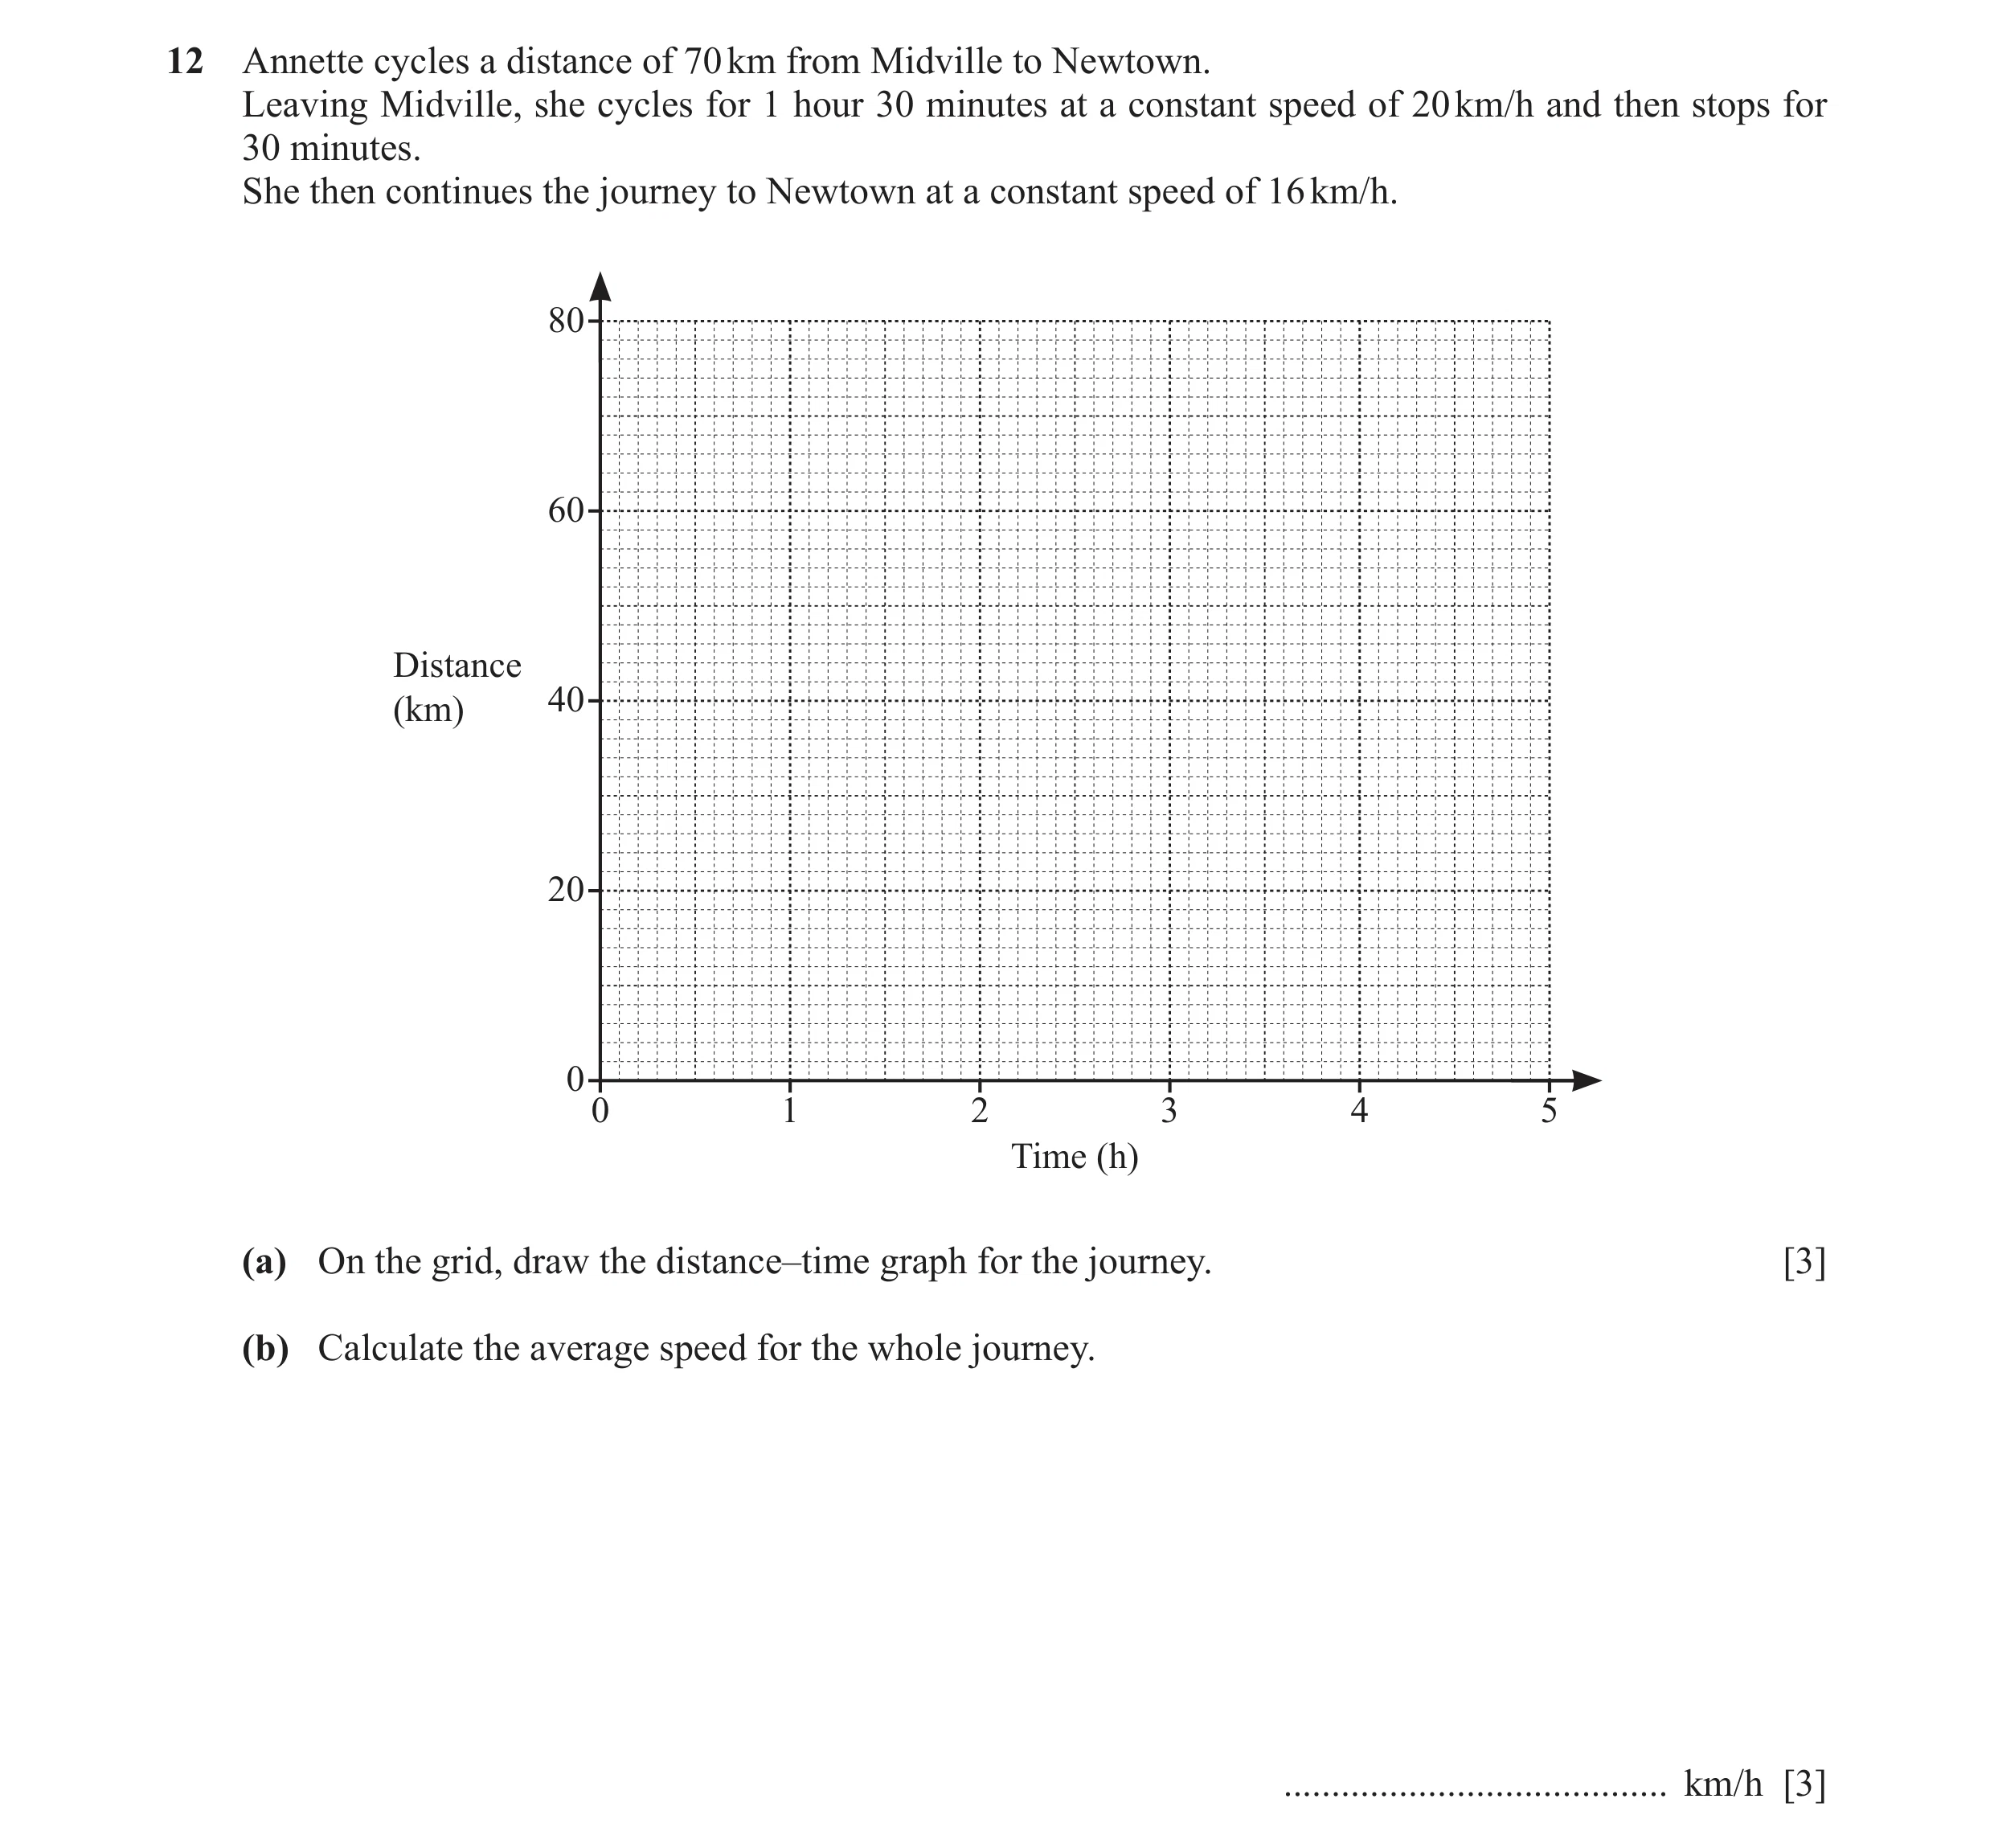
![Question 79: Change 300 m / min to km / h. ....................................... km / h [2]](https://img.pastlit.com/crops/e0be5ca8-d9fb-4976-addd-9c0e1d225995/q9.webp) 57 / 67
57 / 67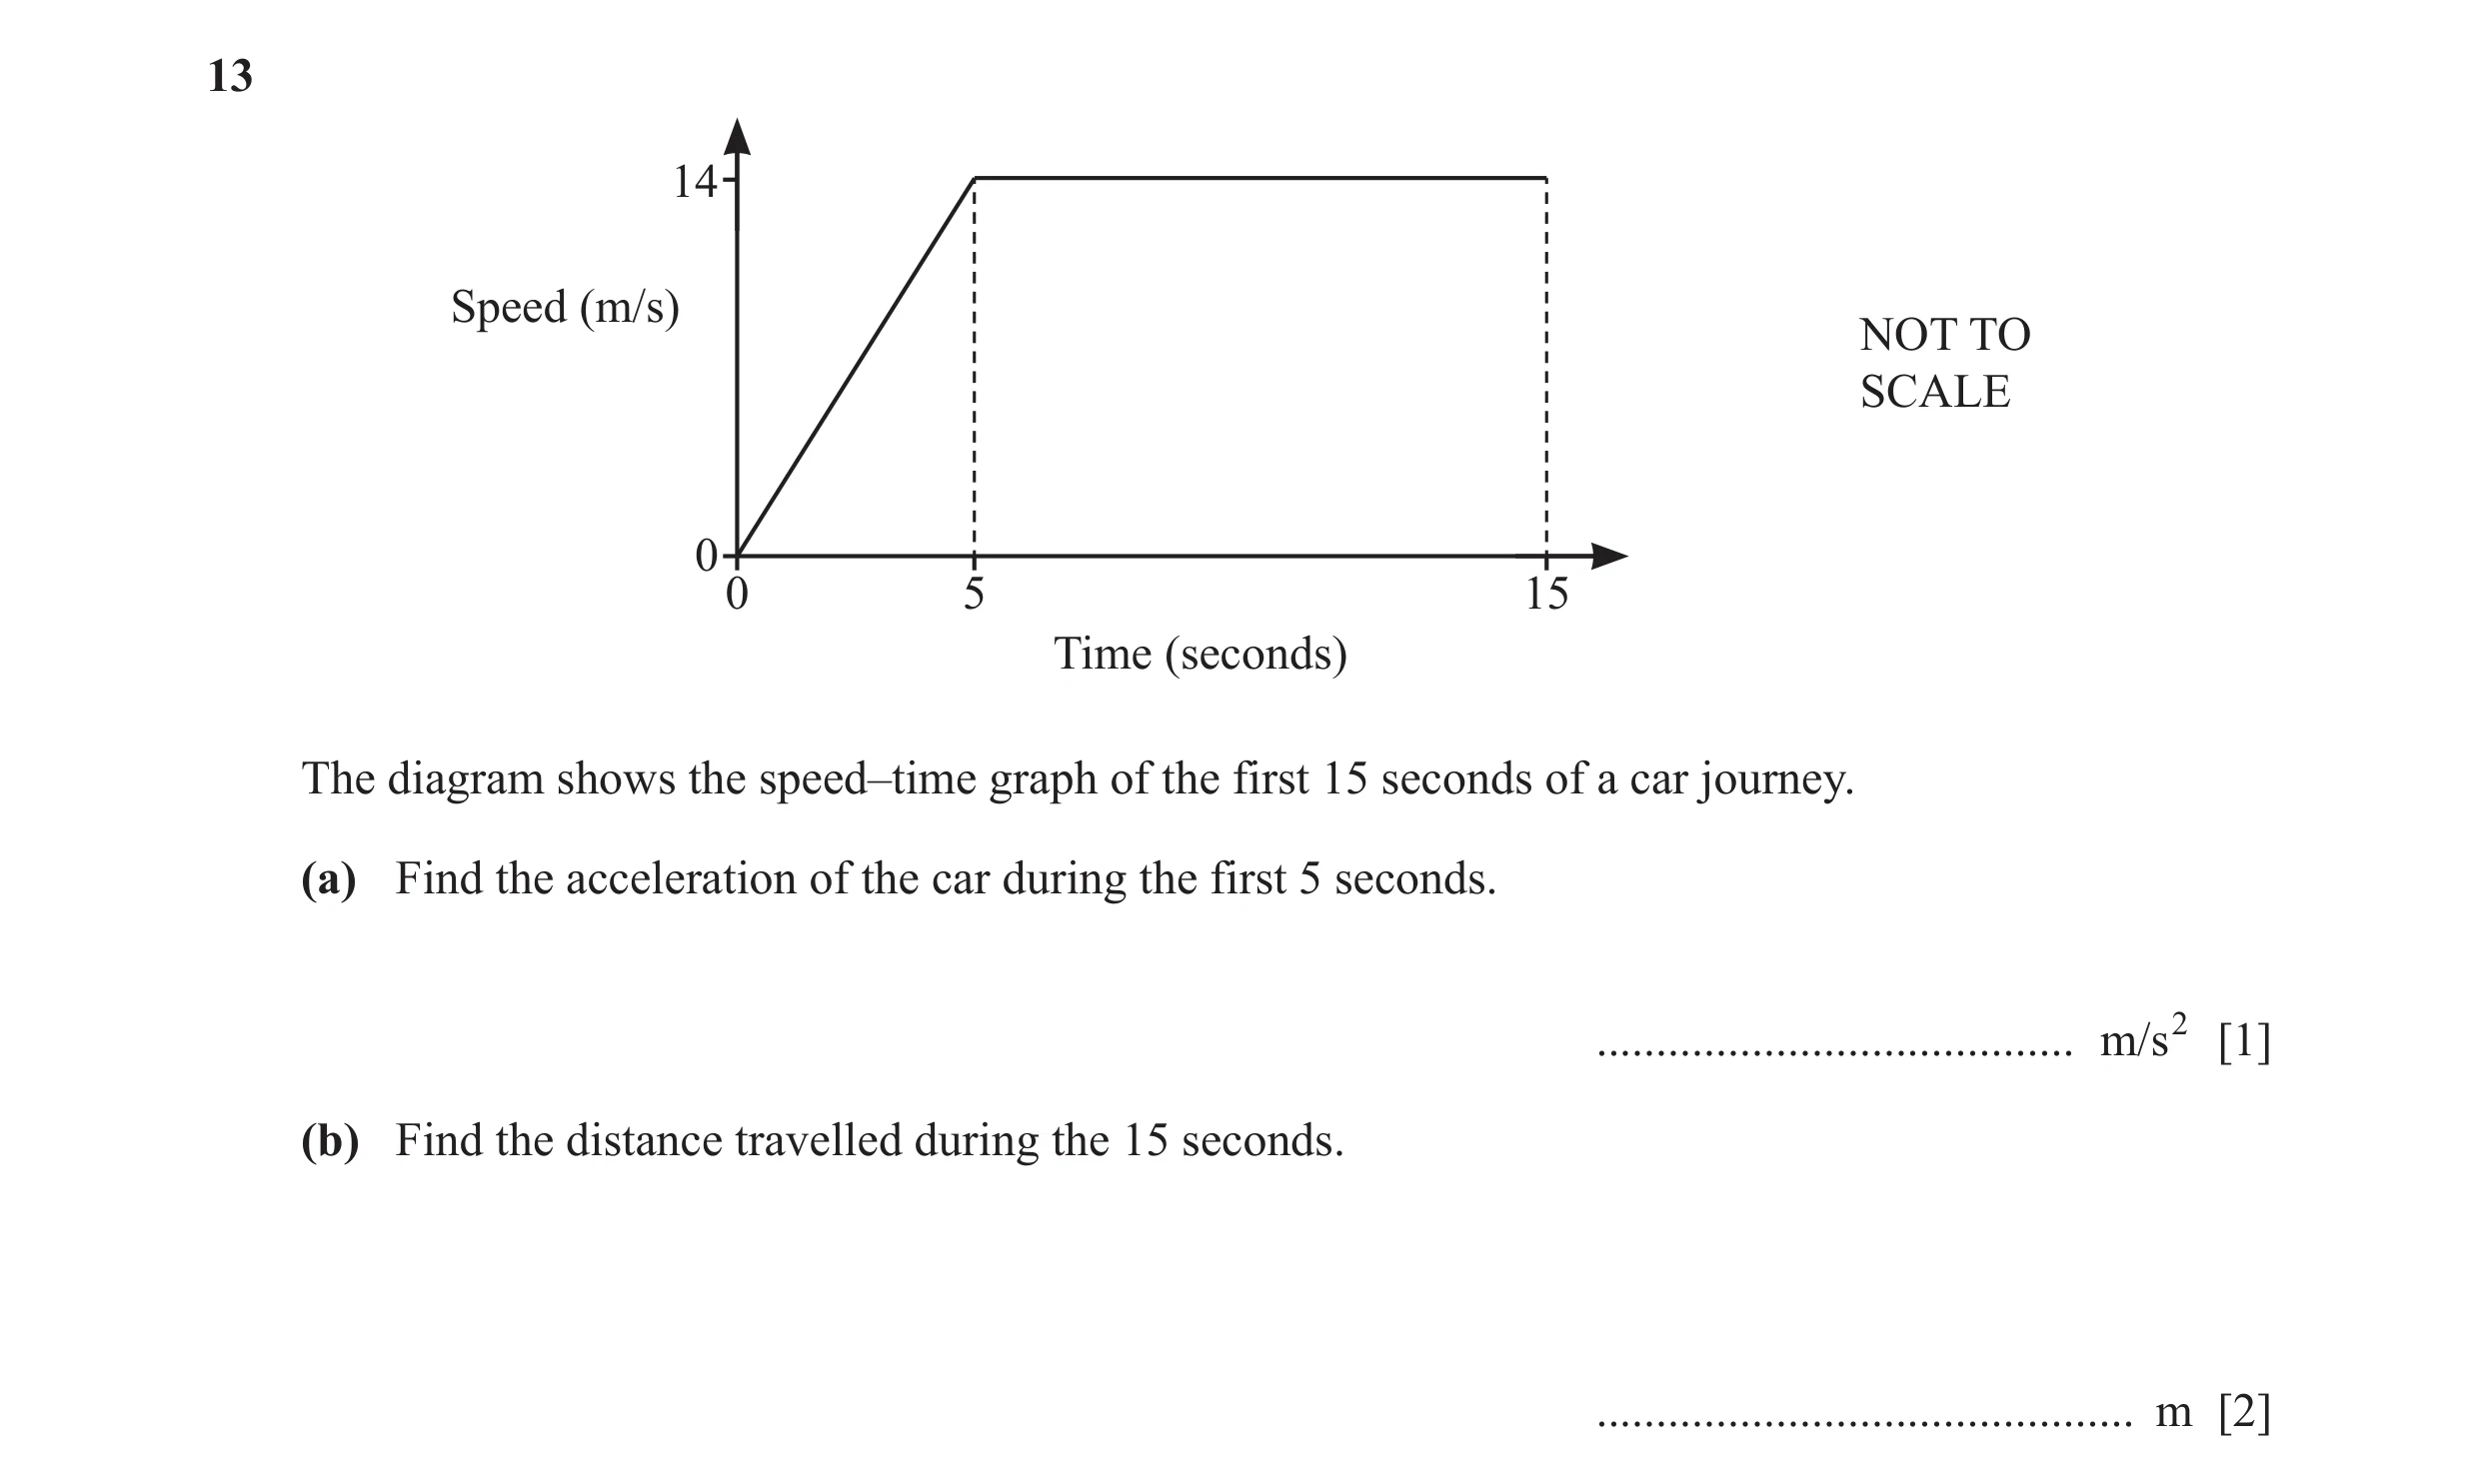 58 / 67
 59 / 67
 60 / 67
 61 / 67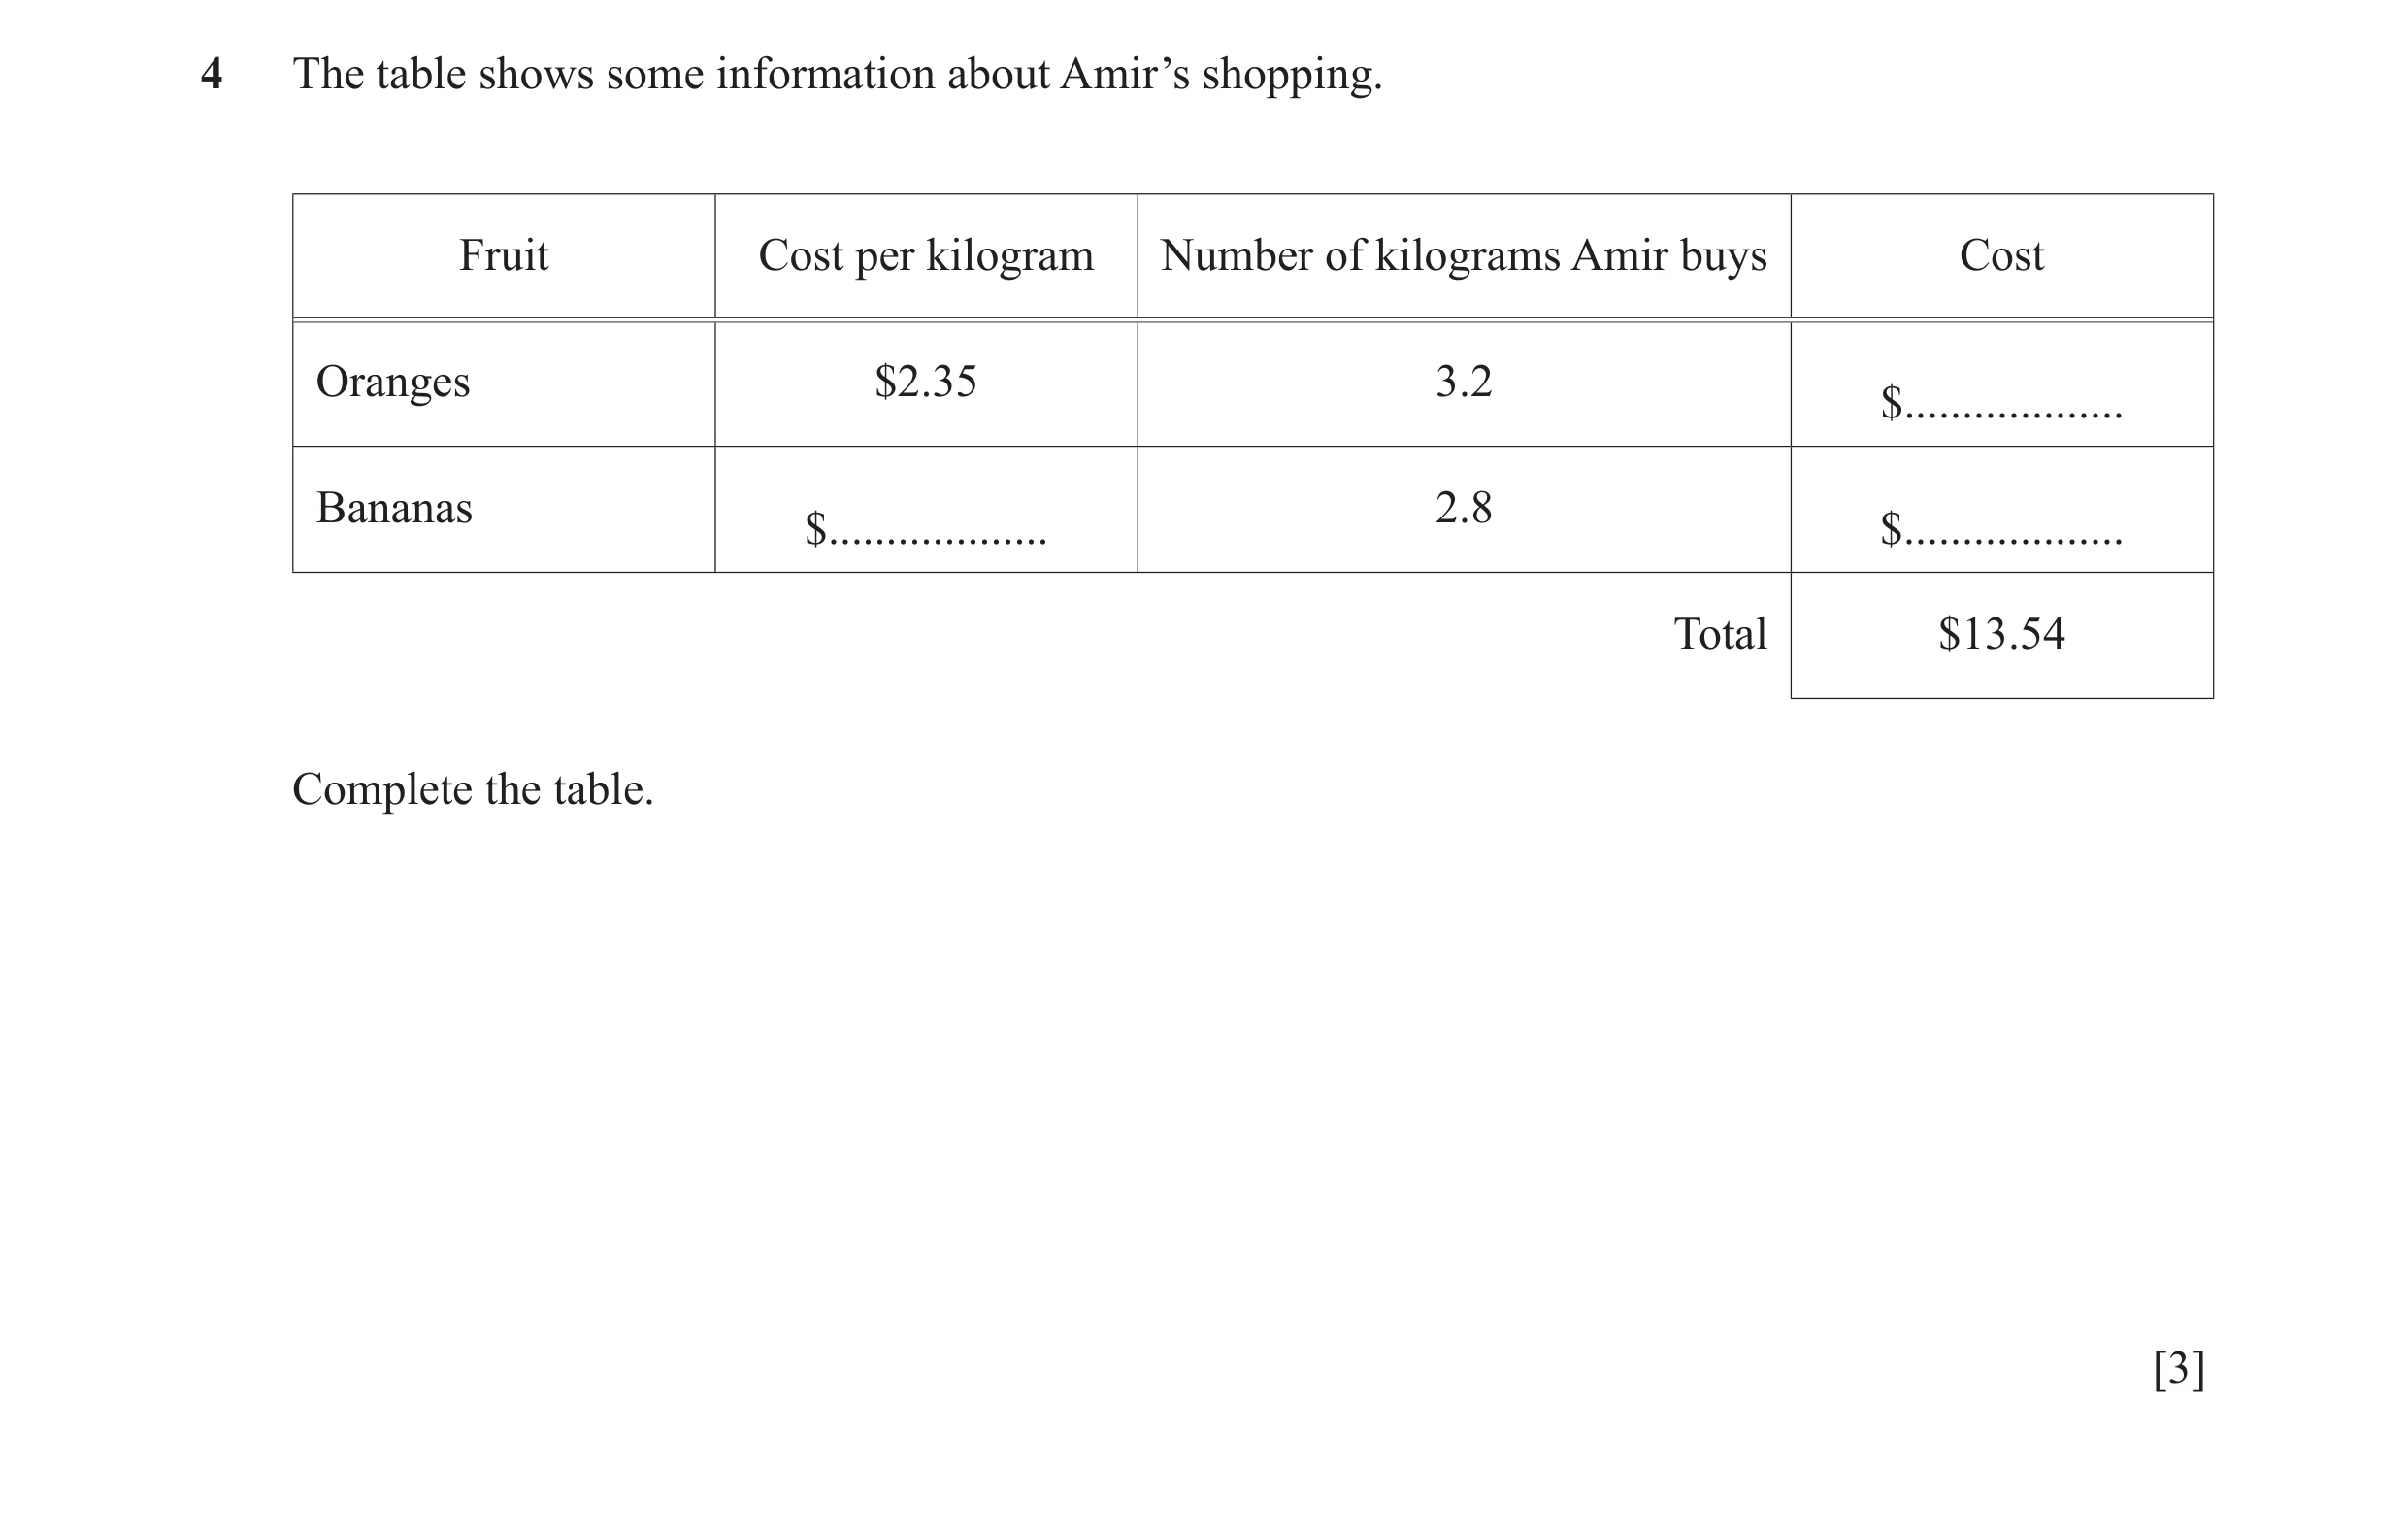
 62 / 67
![Question 86: The bearing of B from A is 107°. Calculate the bearing of A from B. ................................................. [2]](https://img.pastlit.com/crops/ffce0d1f-92f4-44a4-84e1-42f039d0ff4c/q13.webp)
 63 / 67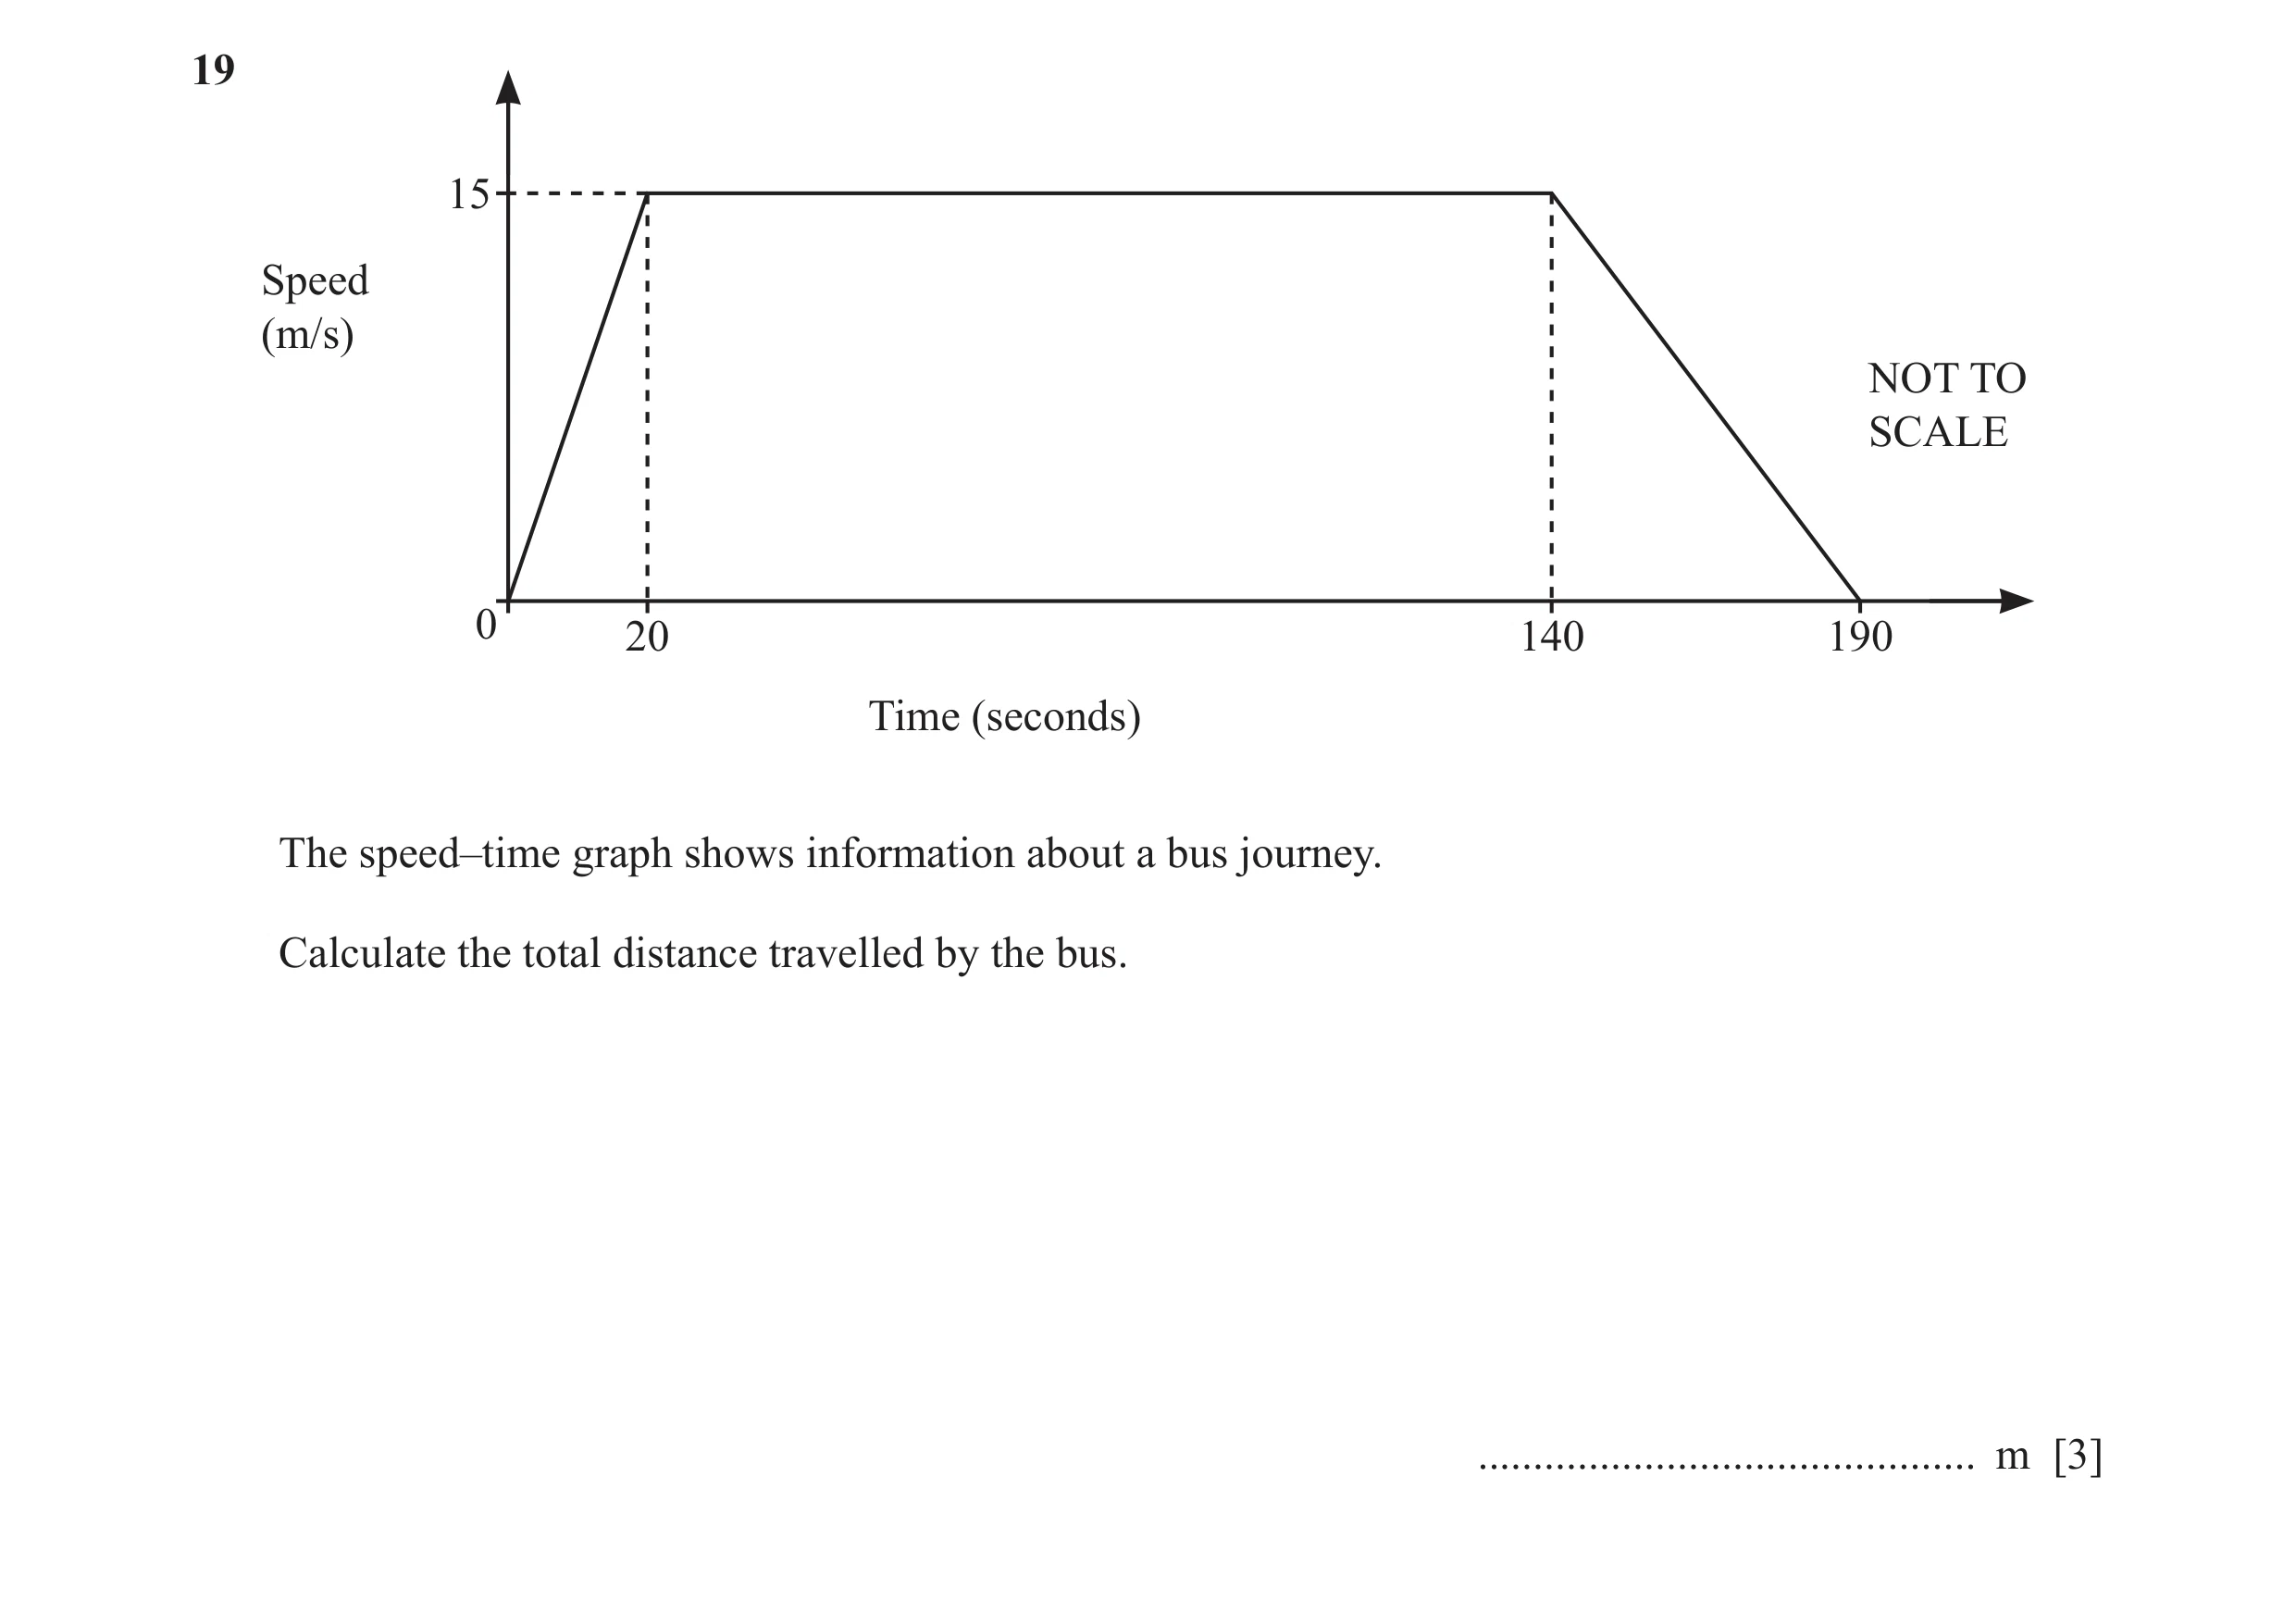
 64 / 67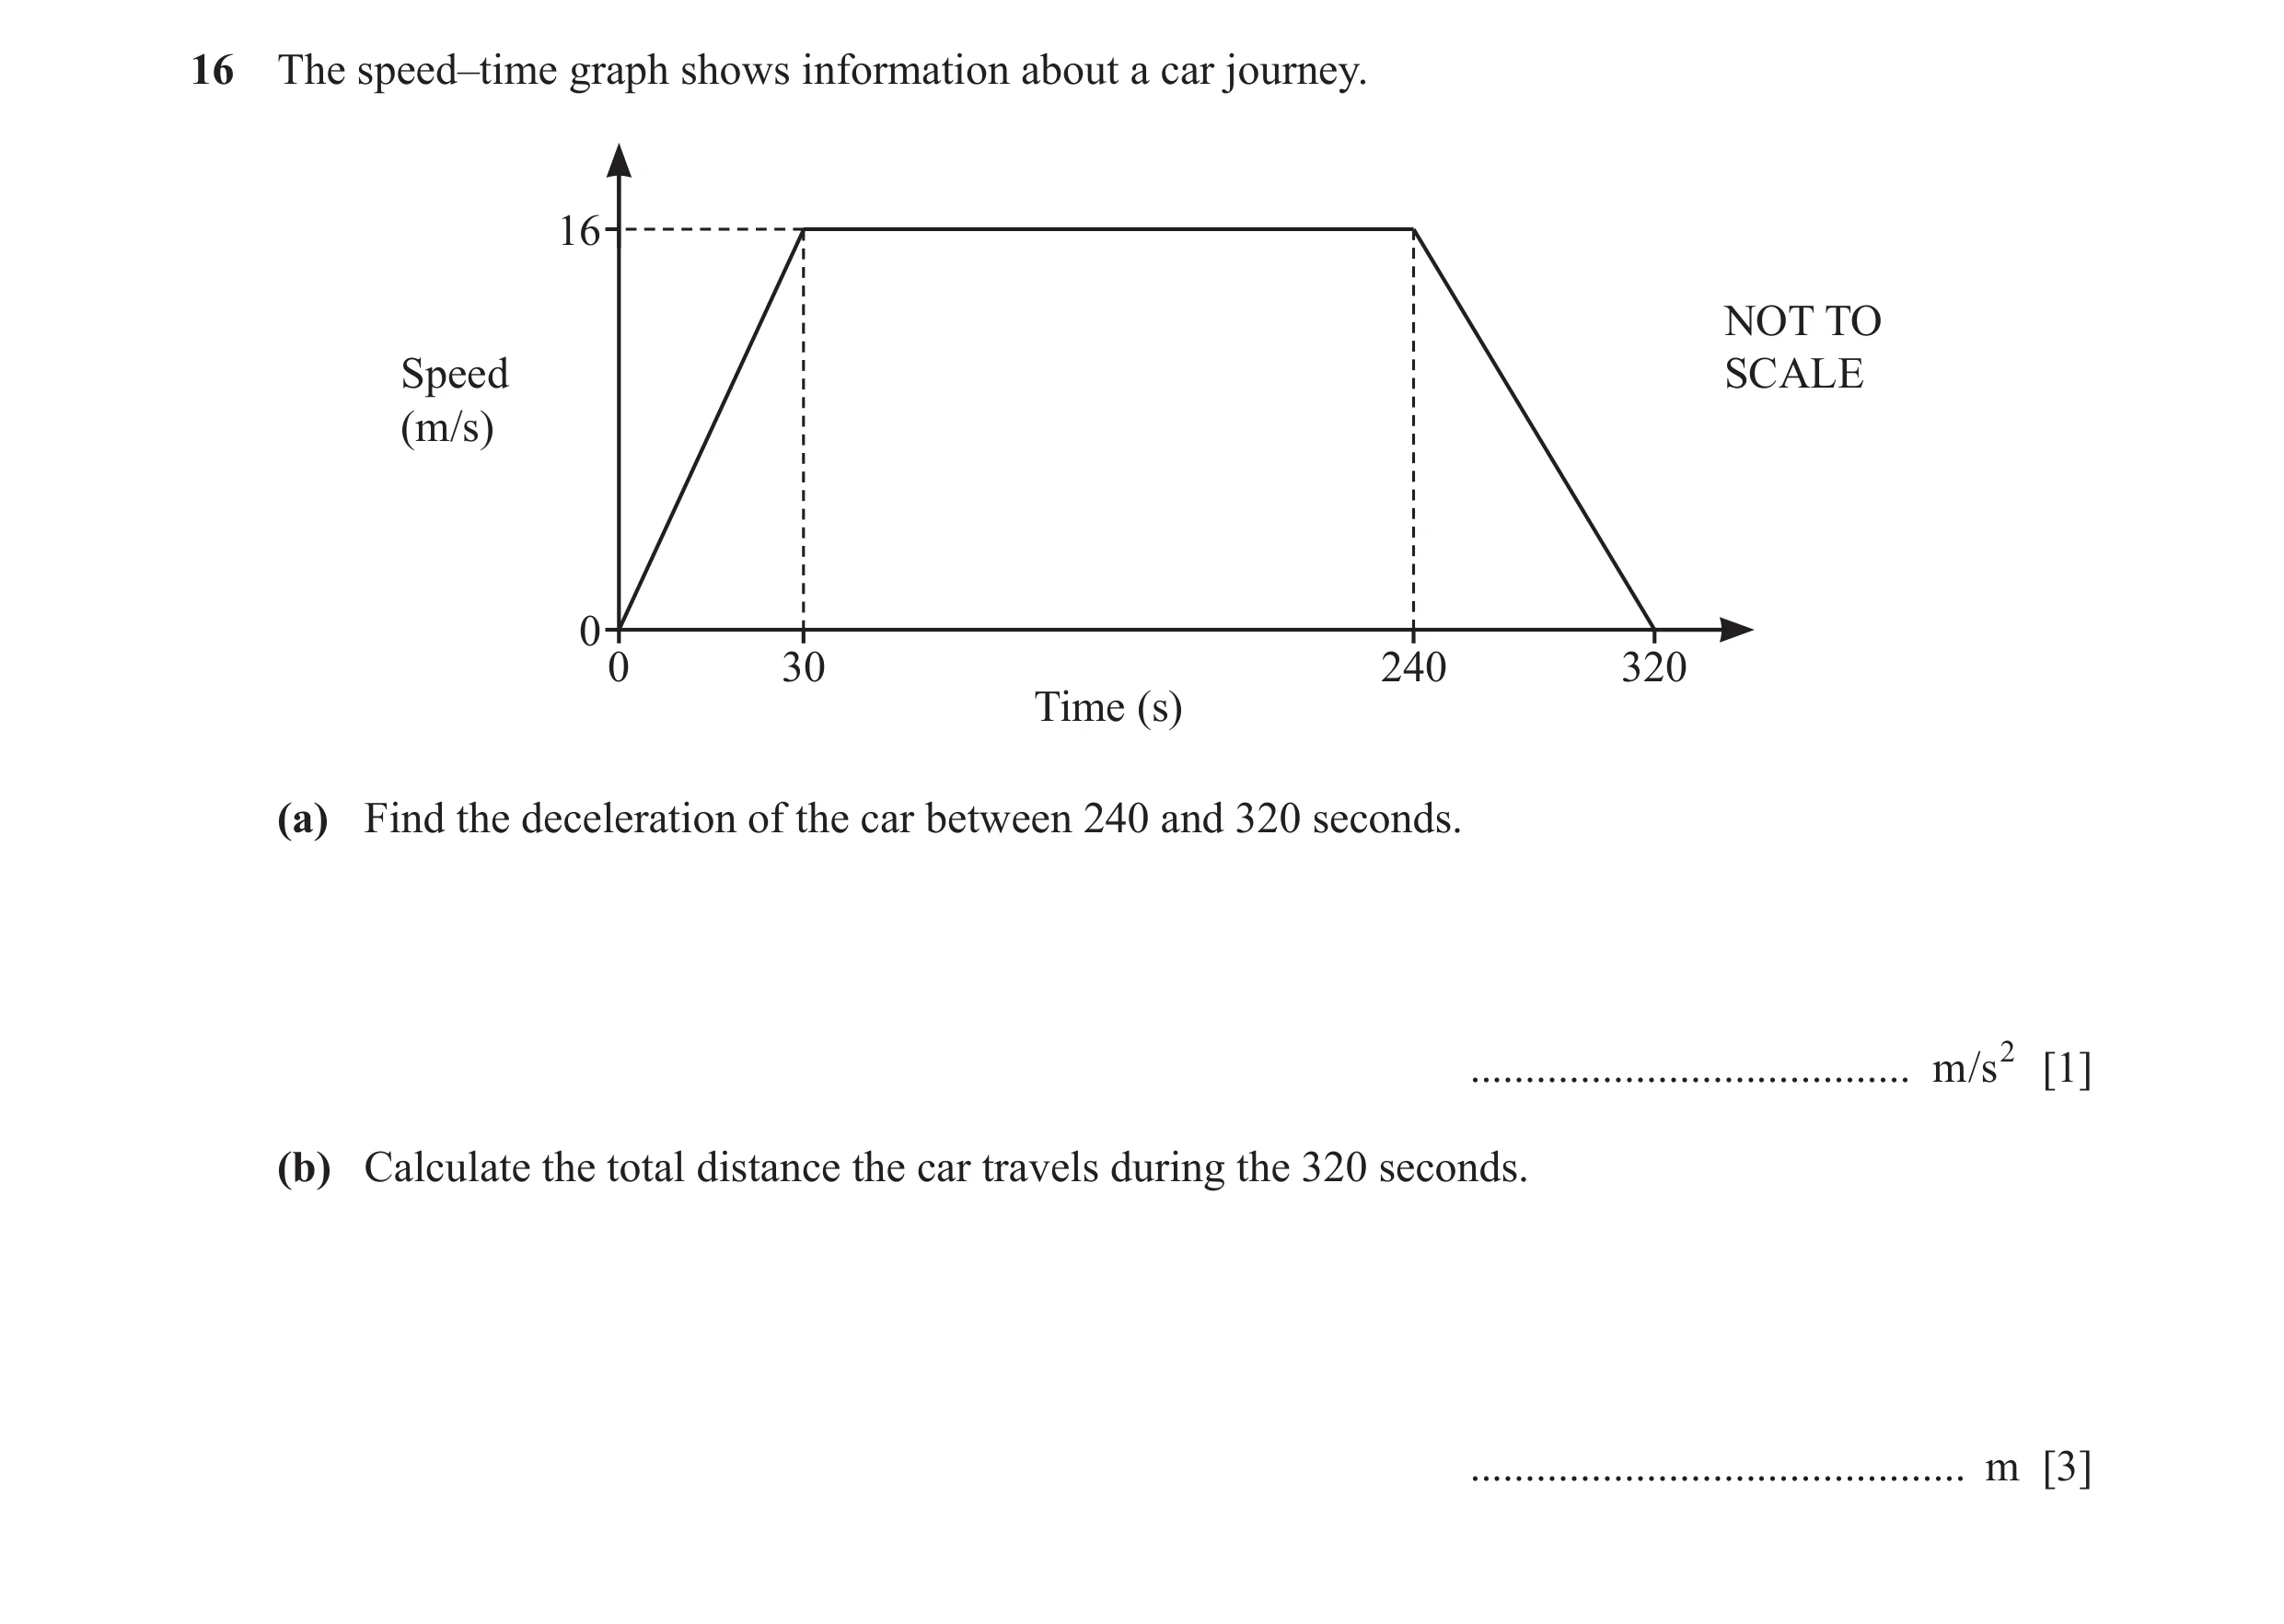
 65 / 67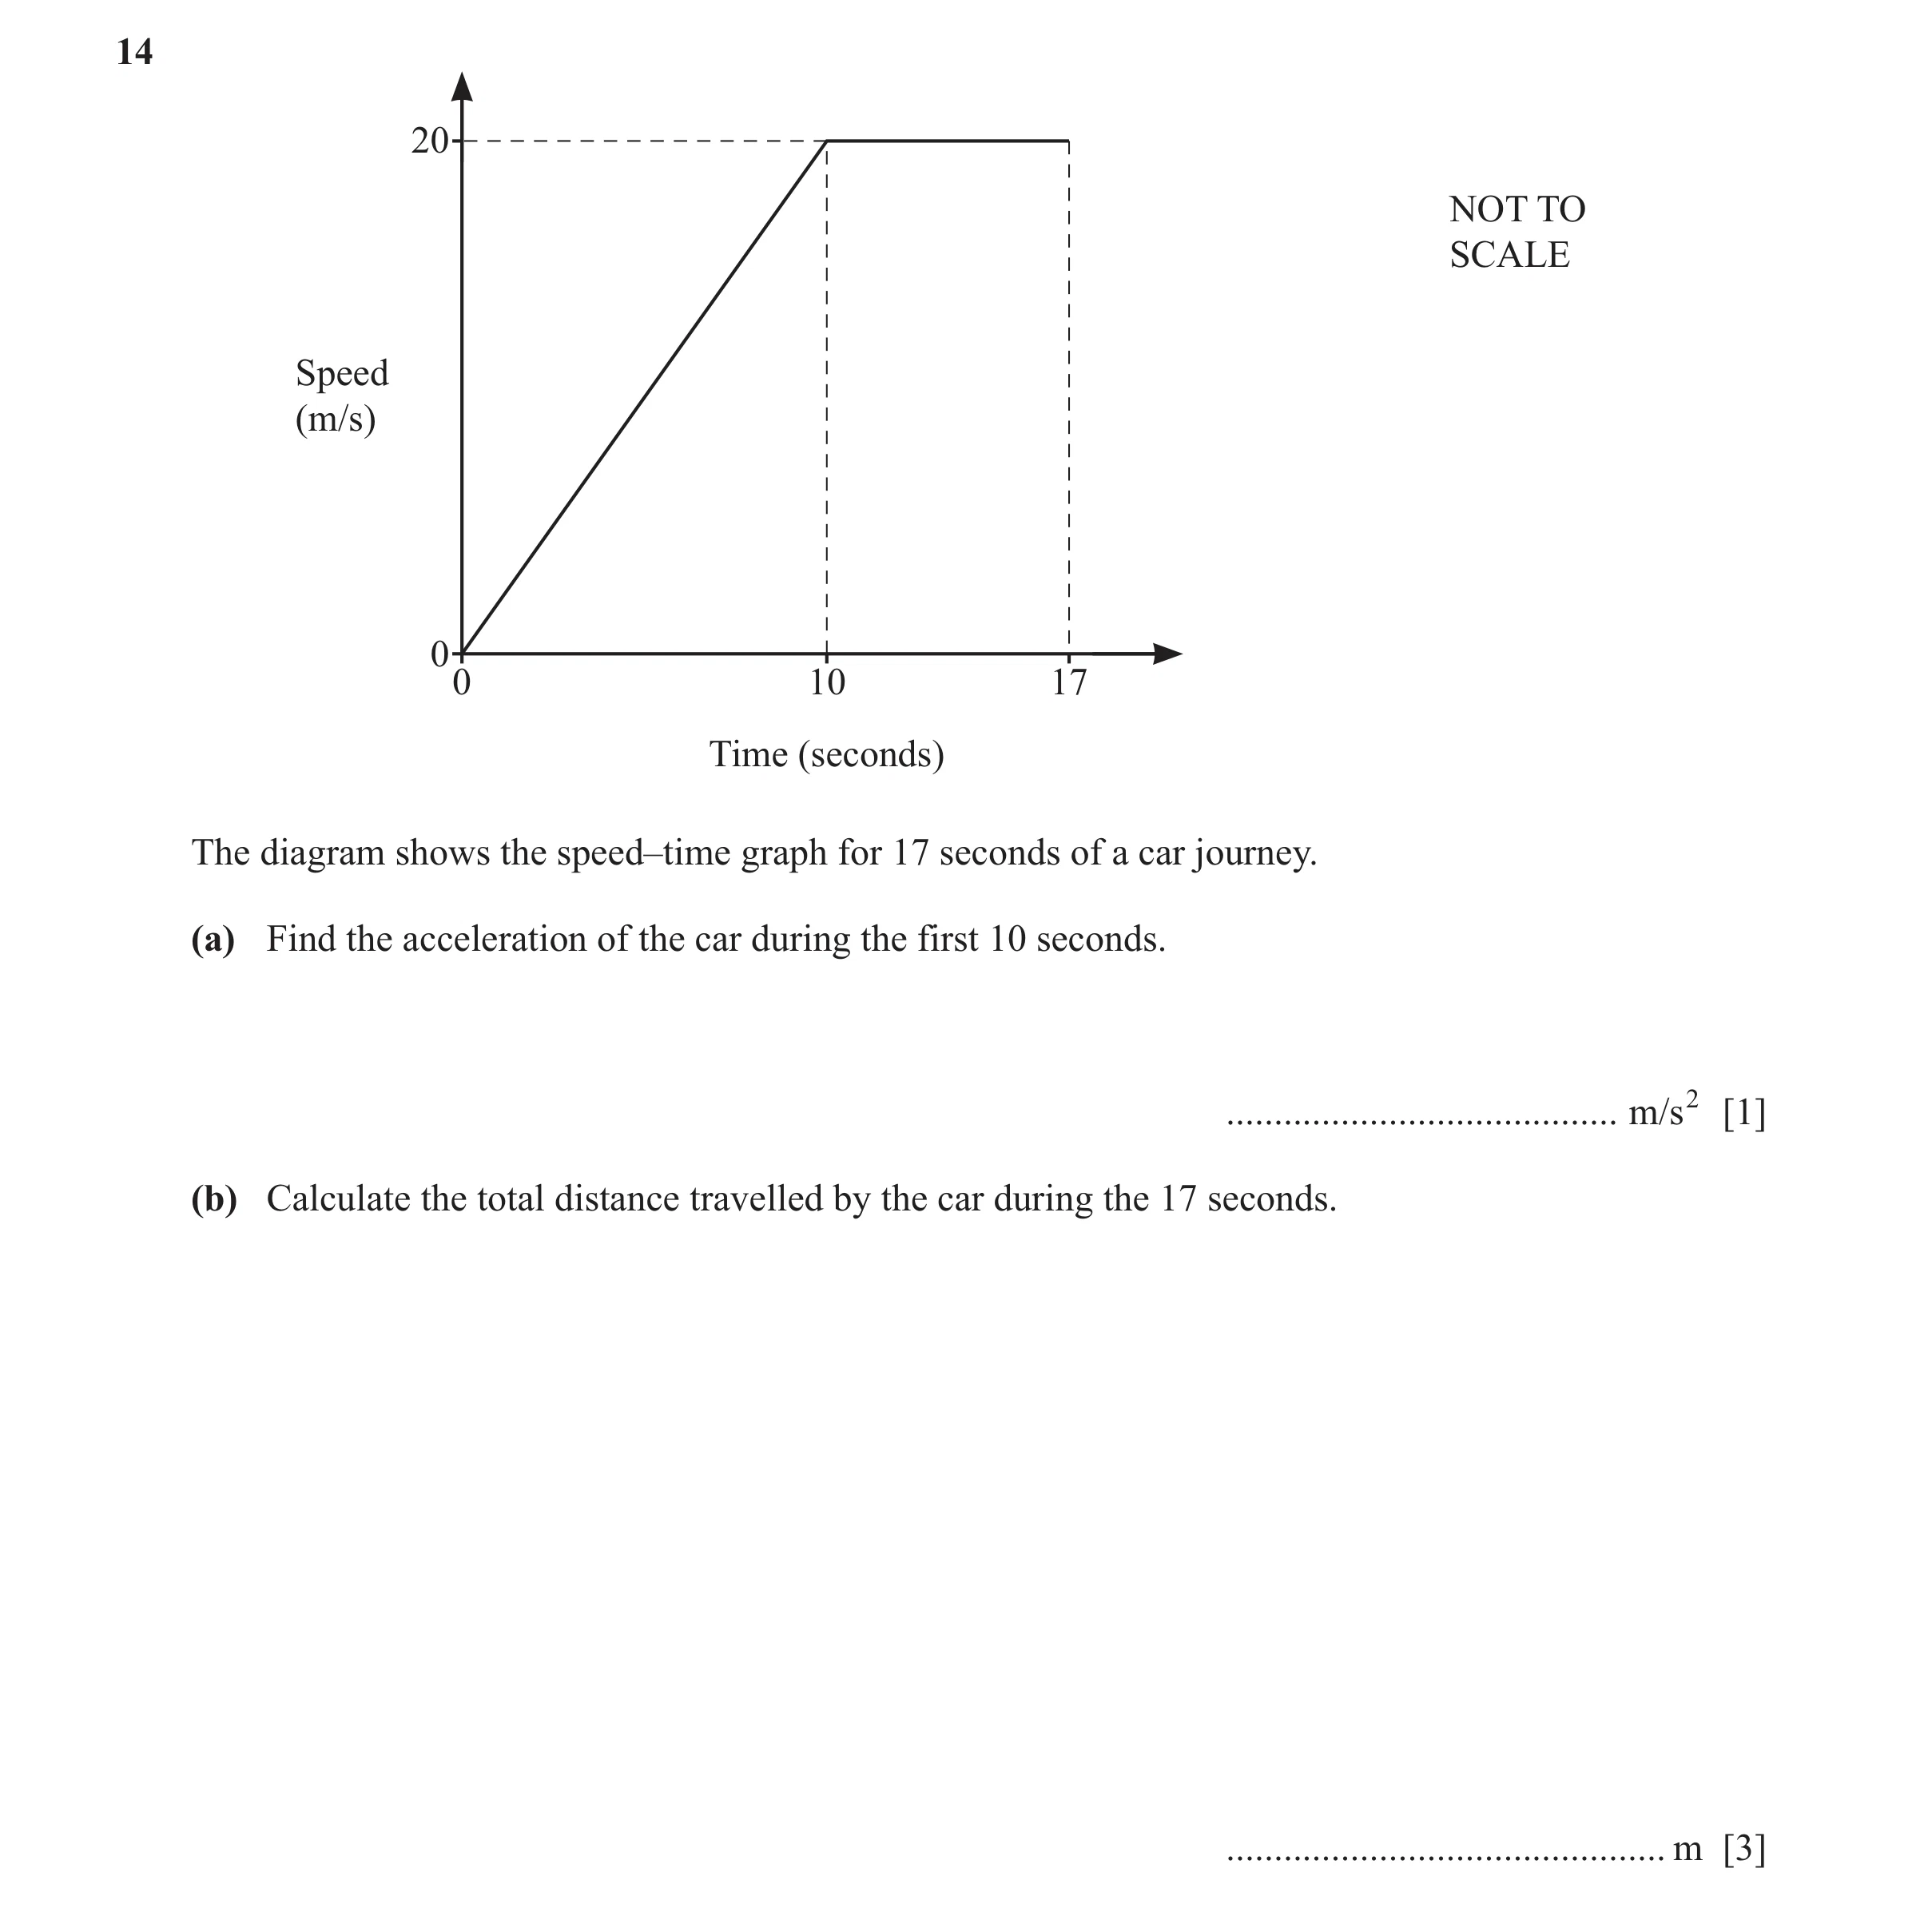
![Question 93: Oranges cost 220 rupees per kilogram. Work out the cost of 9 kg of these oranges. ...................................... rupees [1]](https://img.pastlit.com/crops/4caa3010-5506-4e5a-91ba-d201f22207da/q1.webp) 66 / 67
66 / 67 67 / 67
 3
3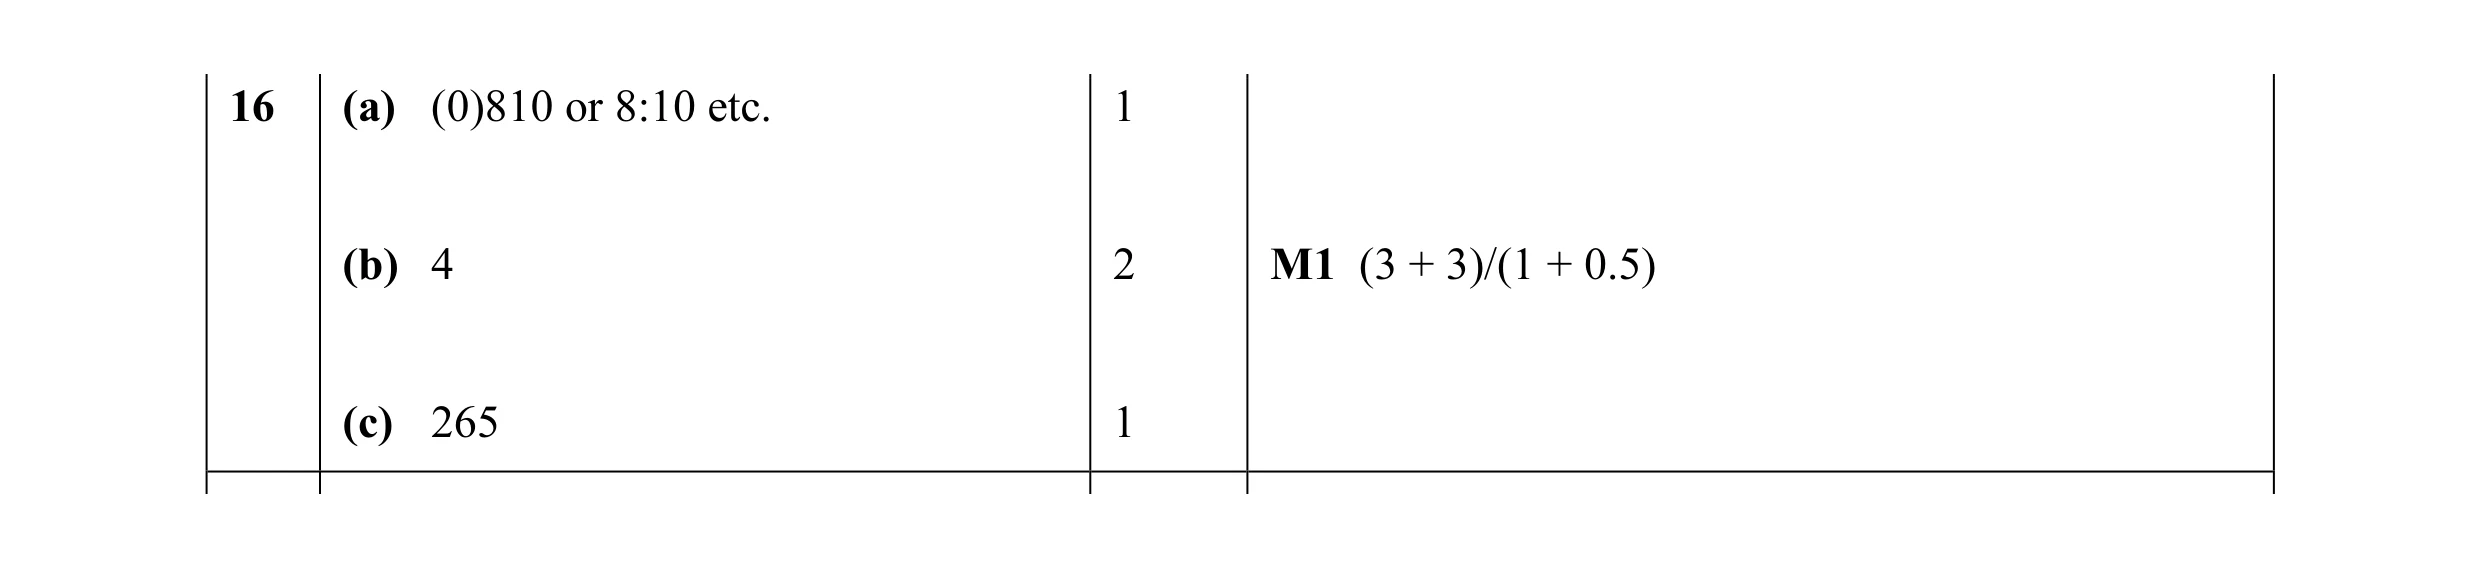 4
4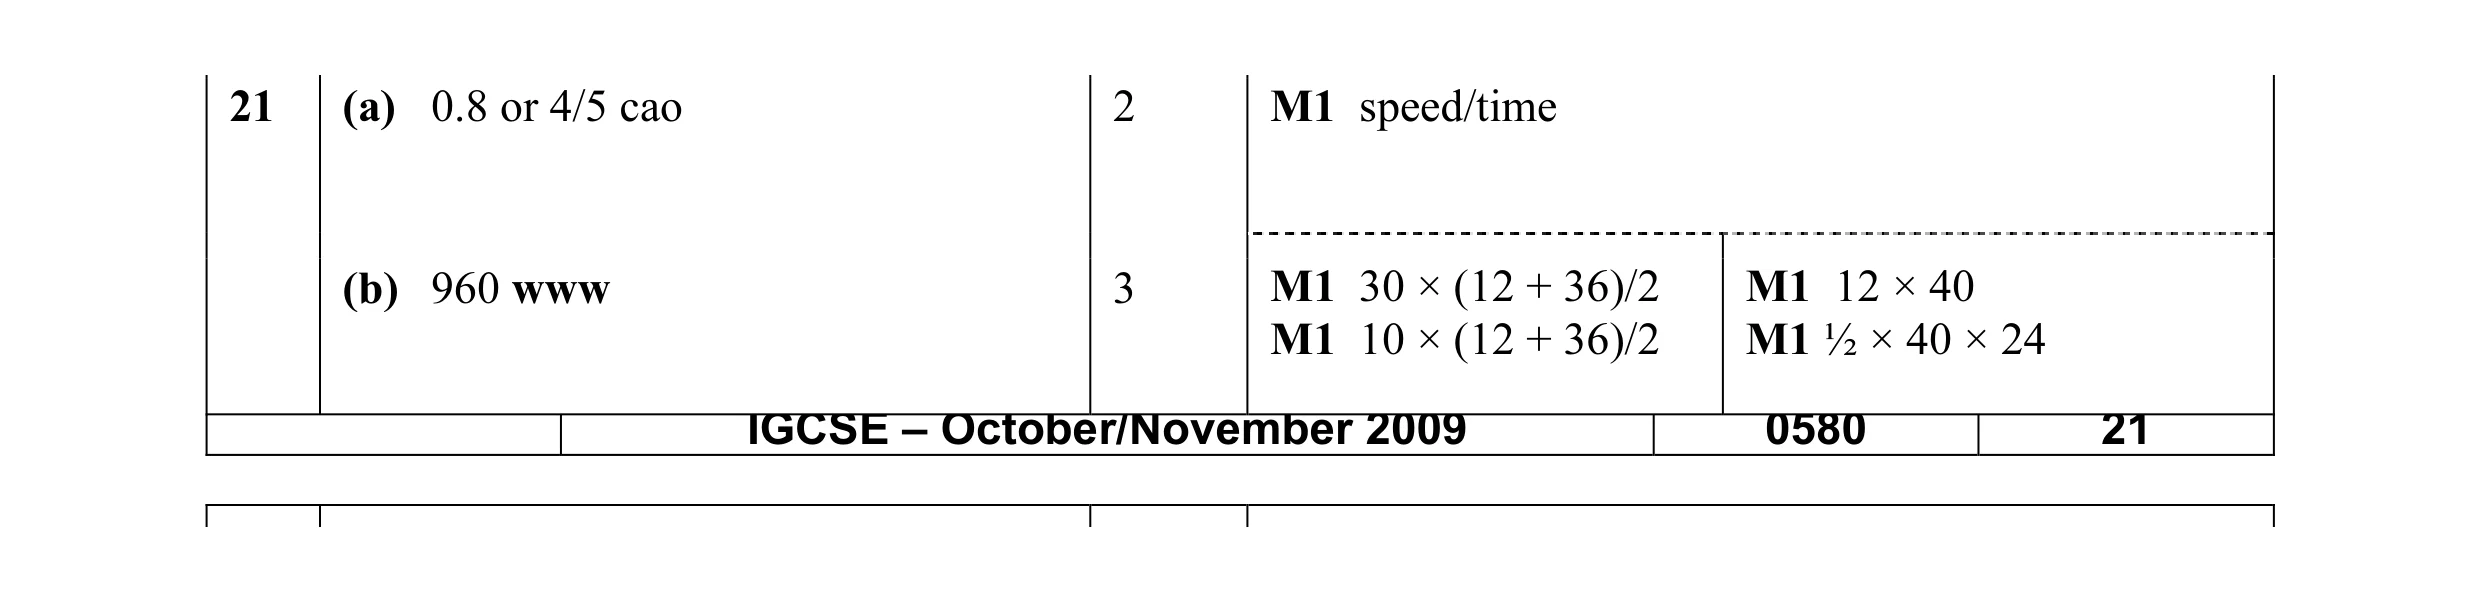 5
5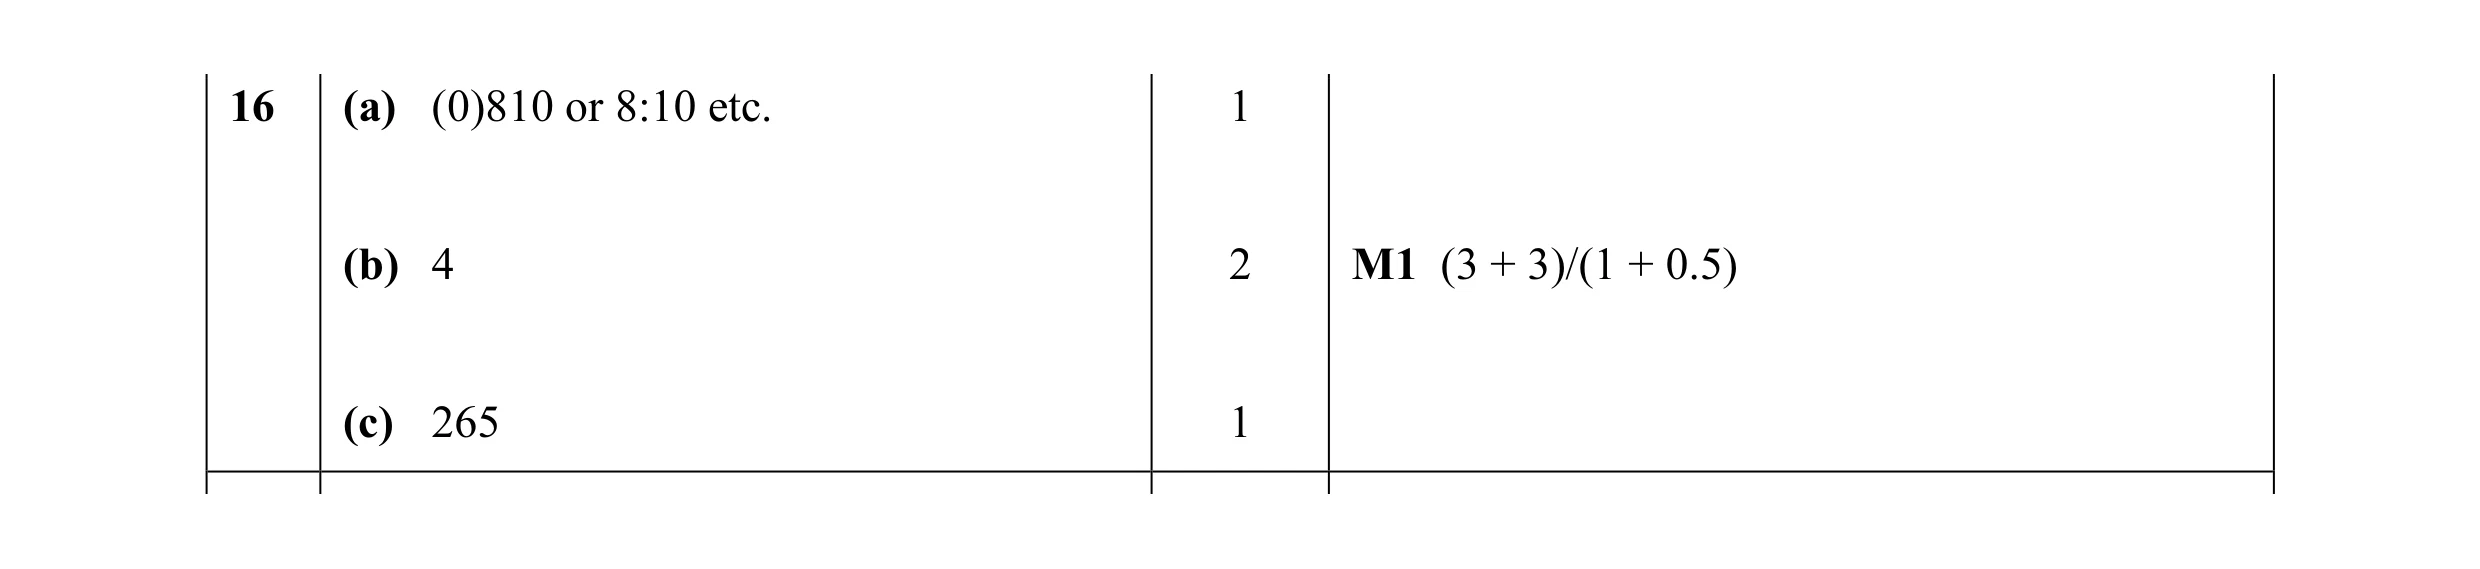 4
4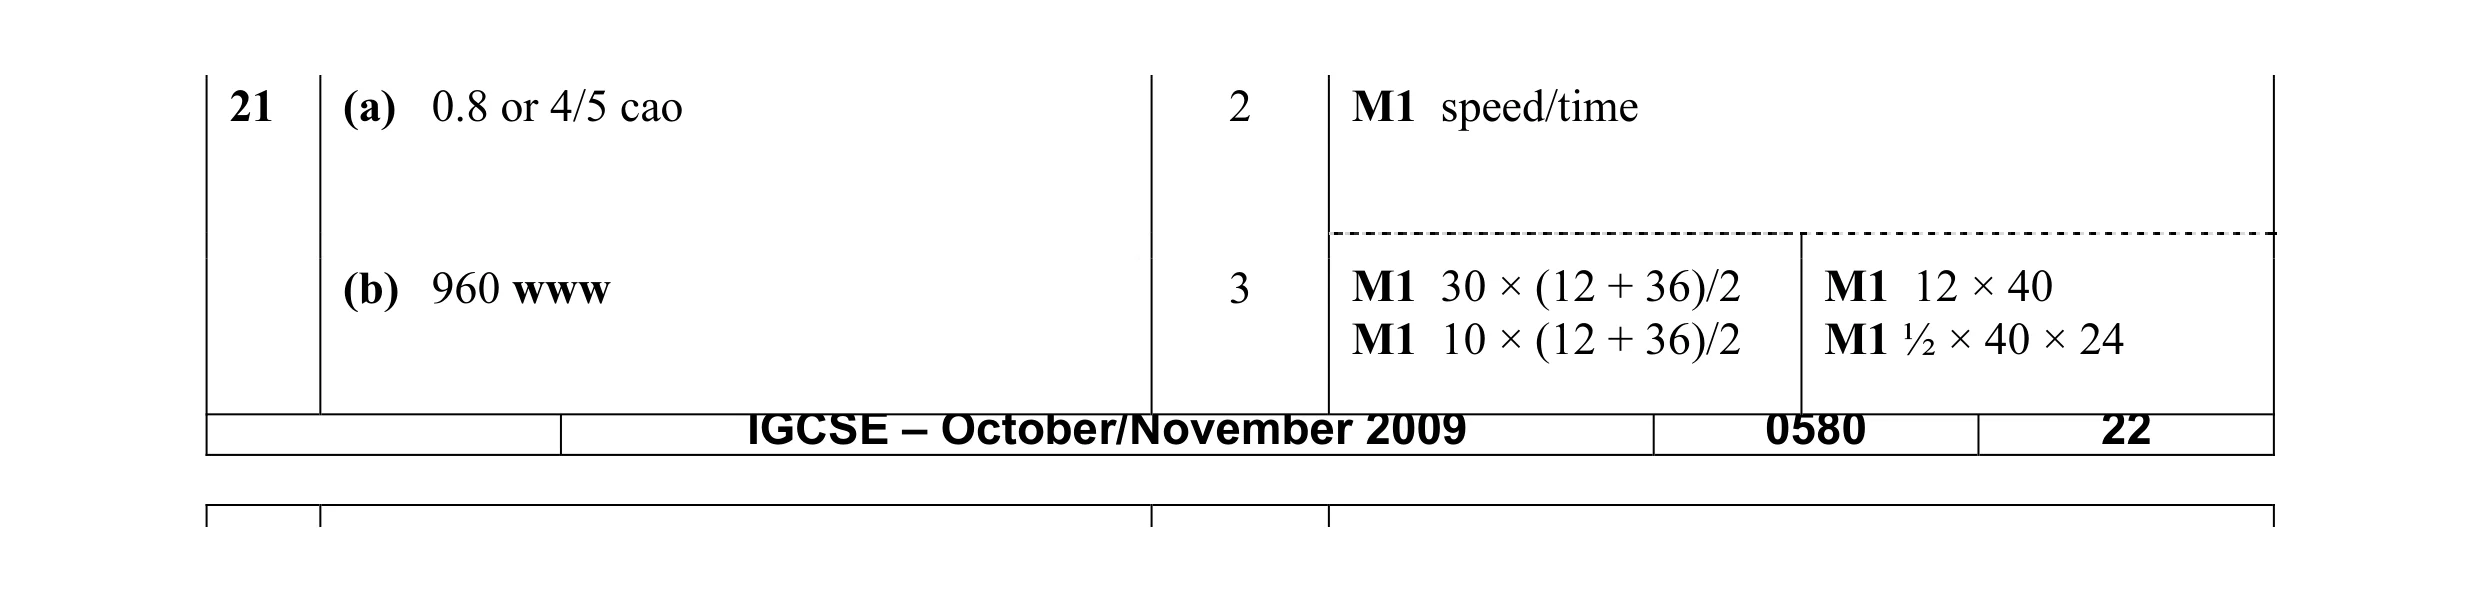 5
5 2
2 4
4 5
5 2
2 4
4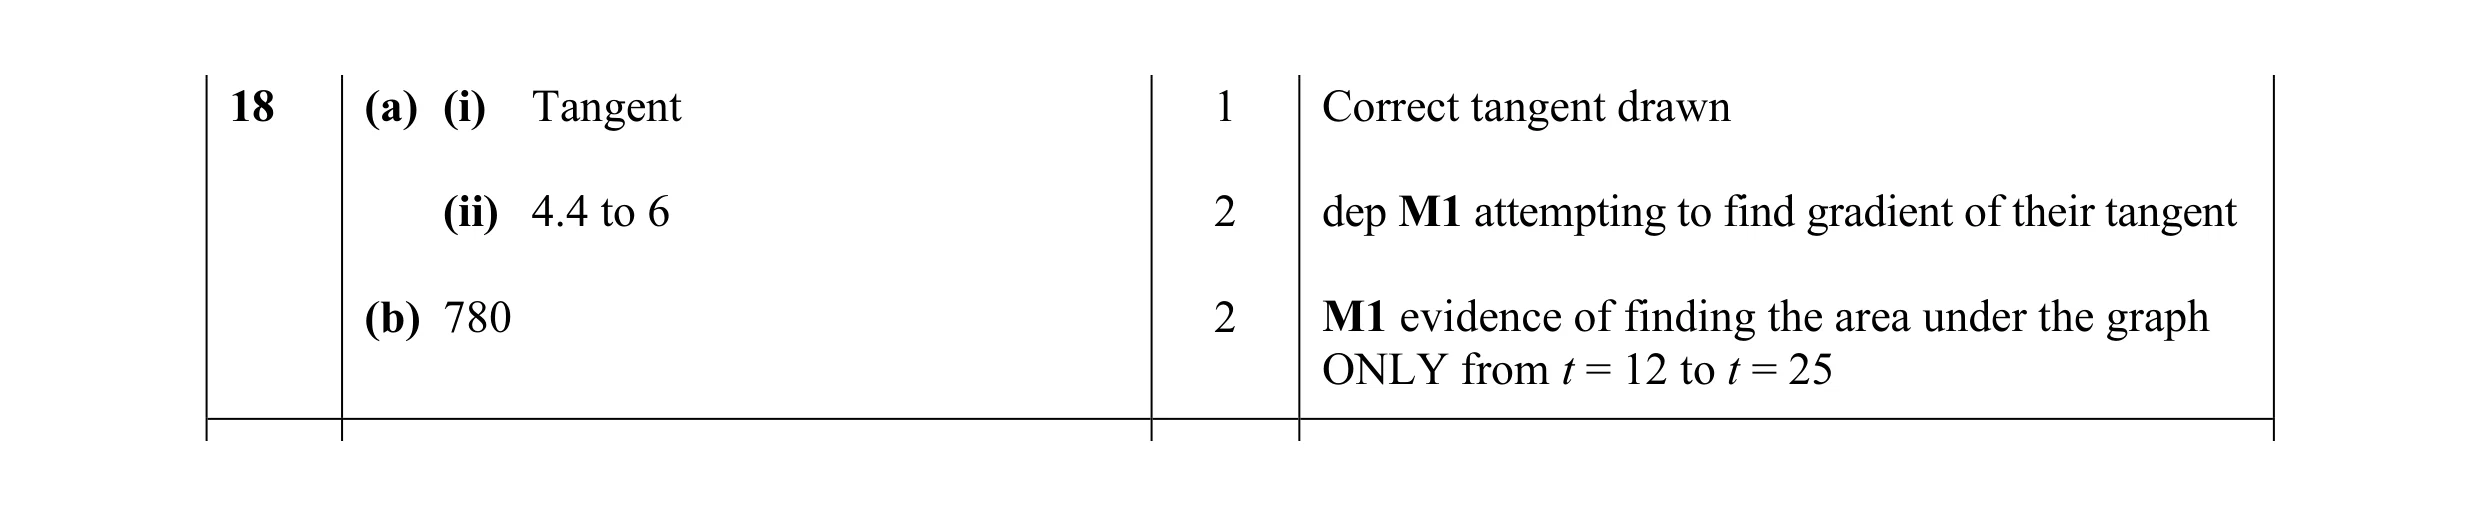 5
5 4
4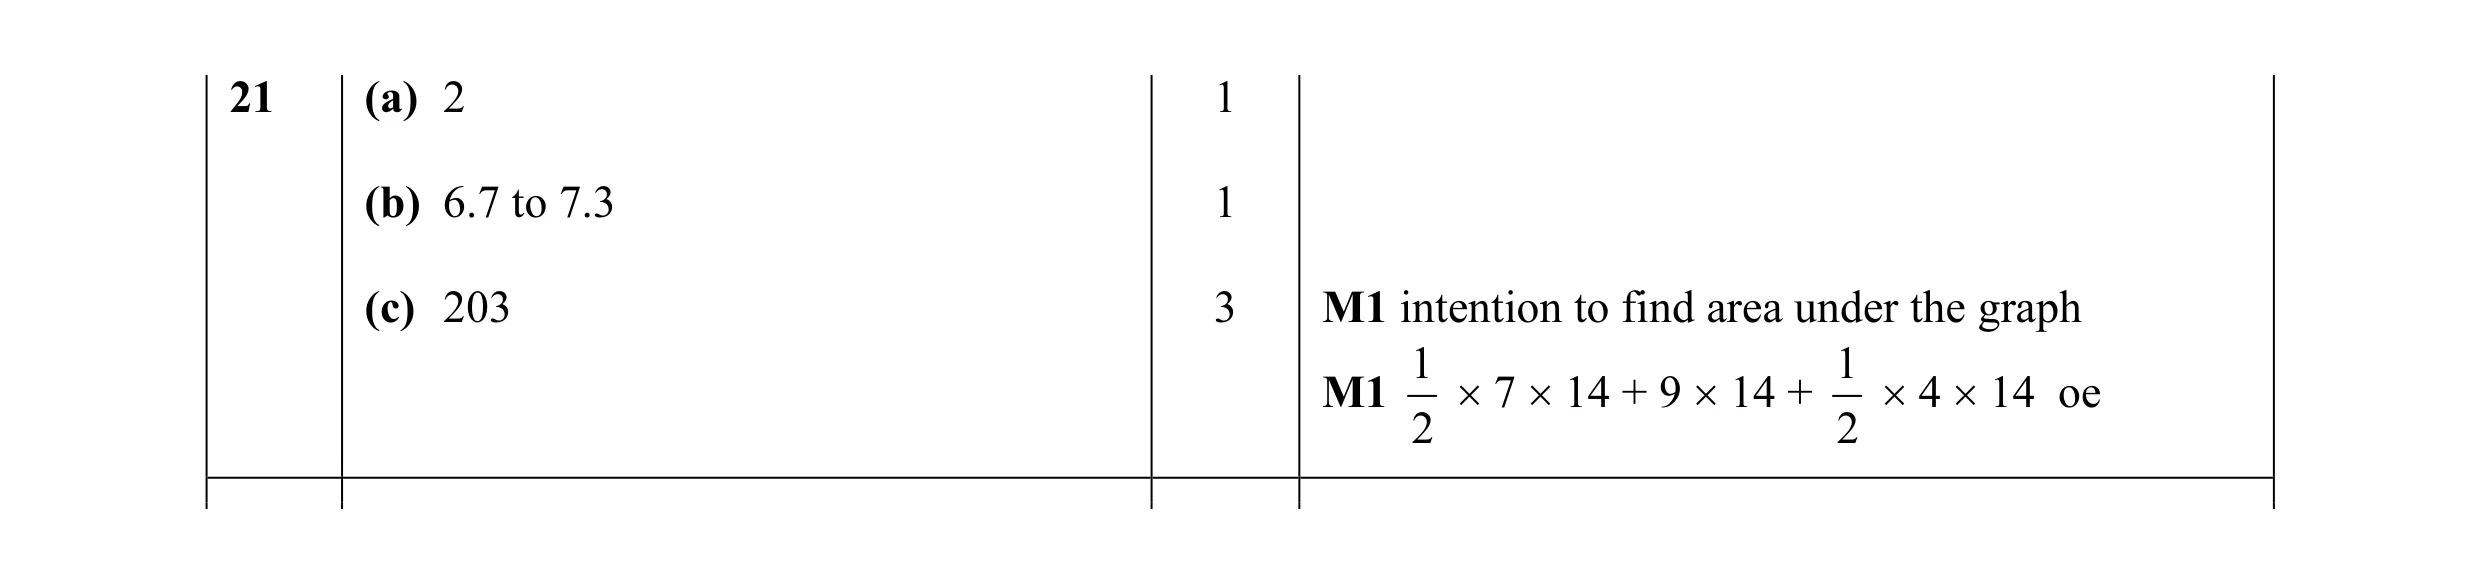 5
5 2
2 3
3 4
4 2
2 4
4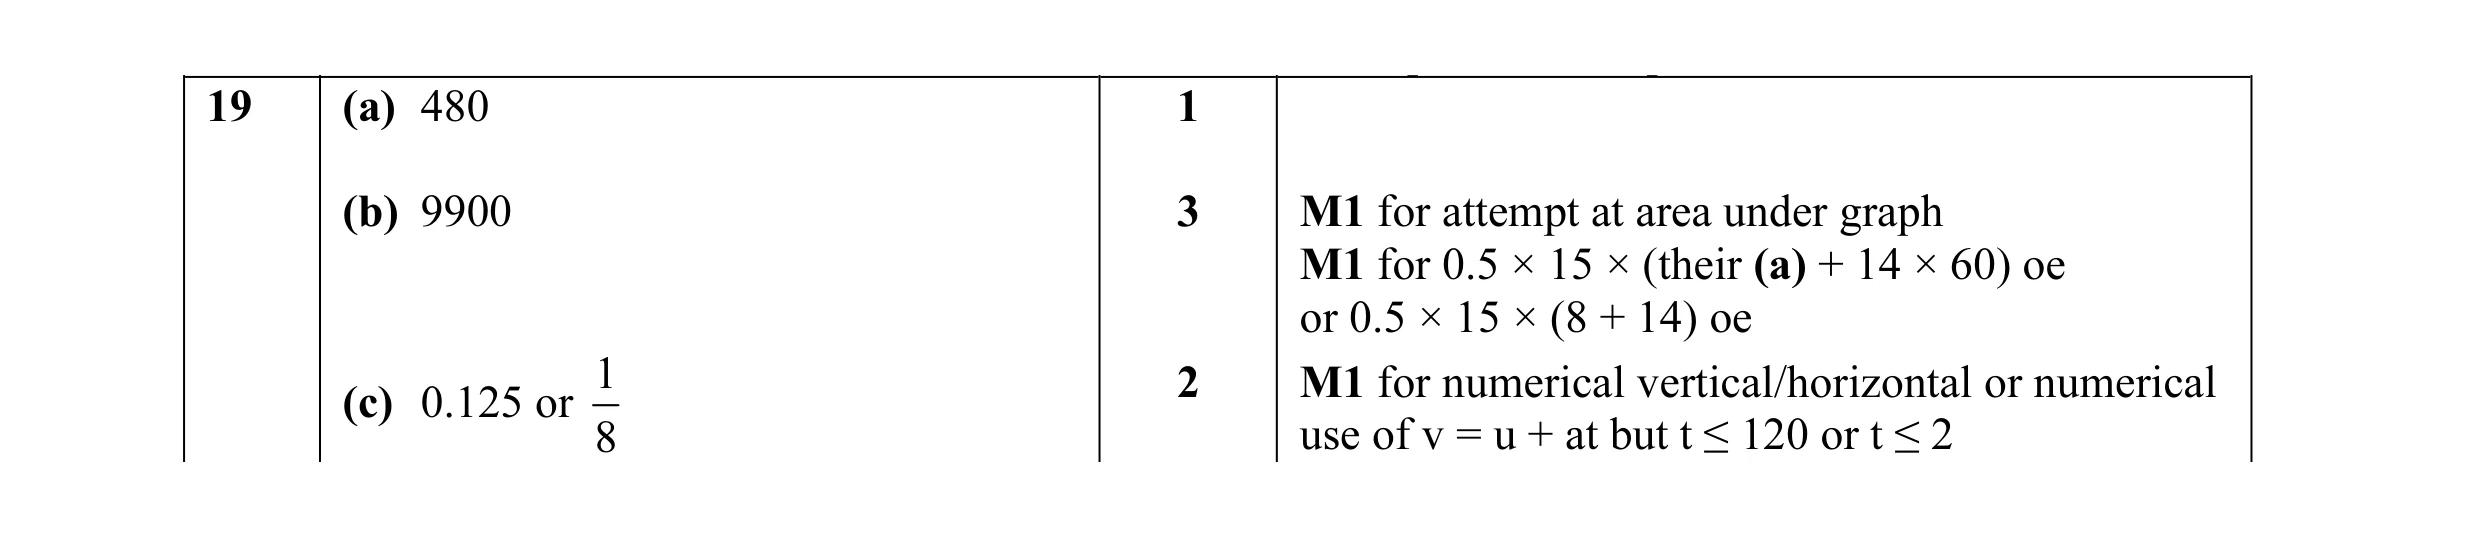 6
6 5
5 3
3 5
5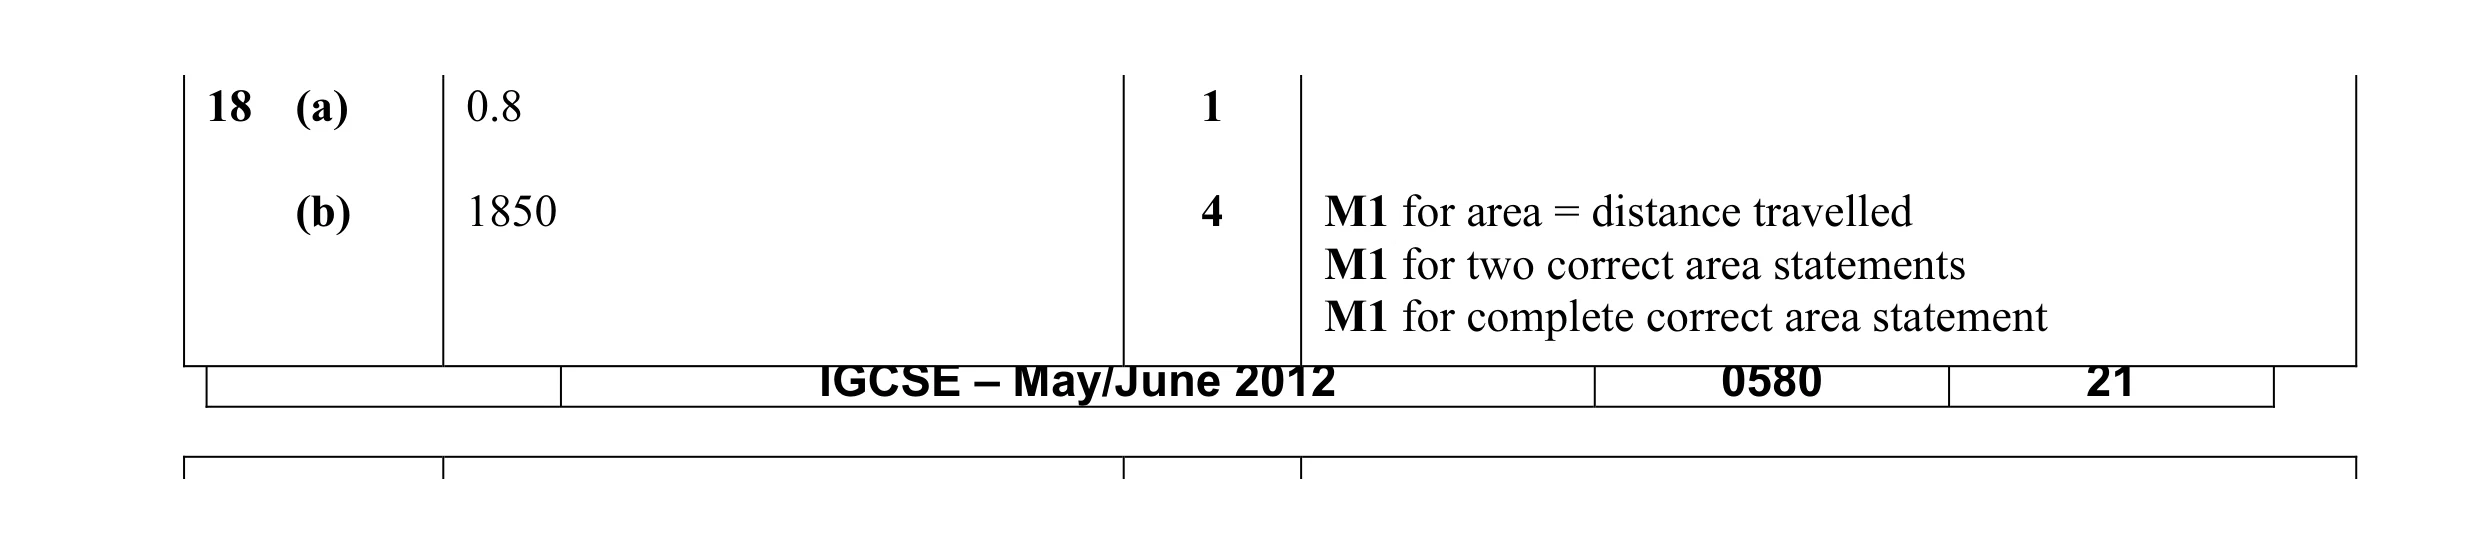 5
5 3
3 2
2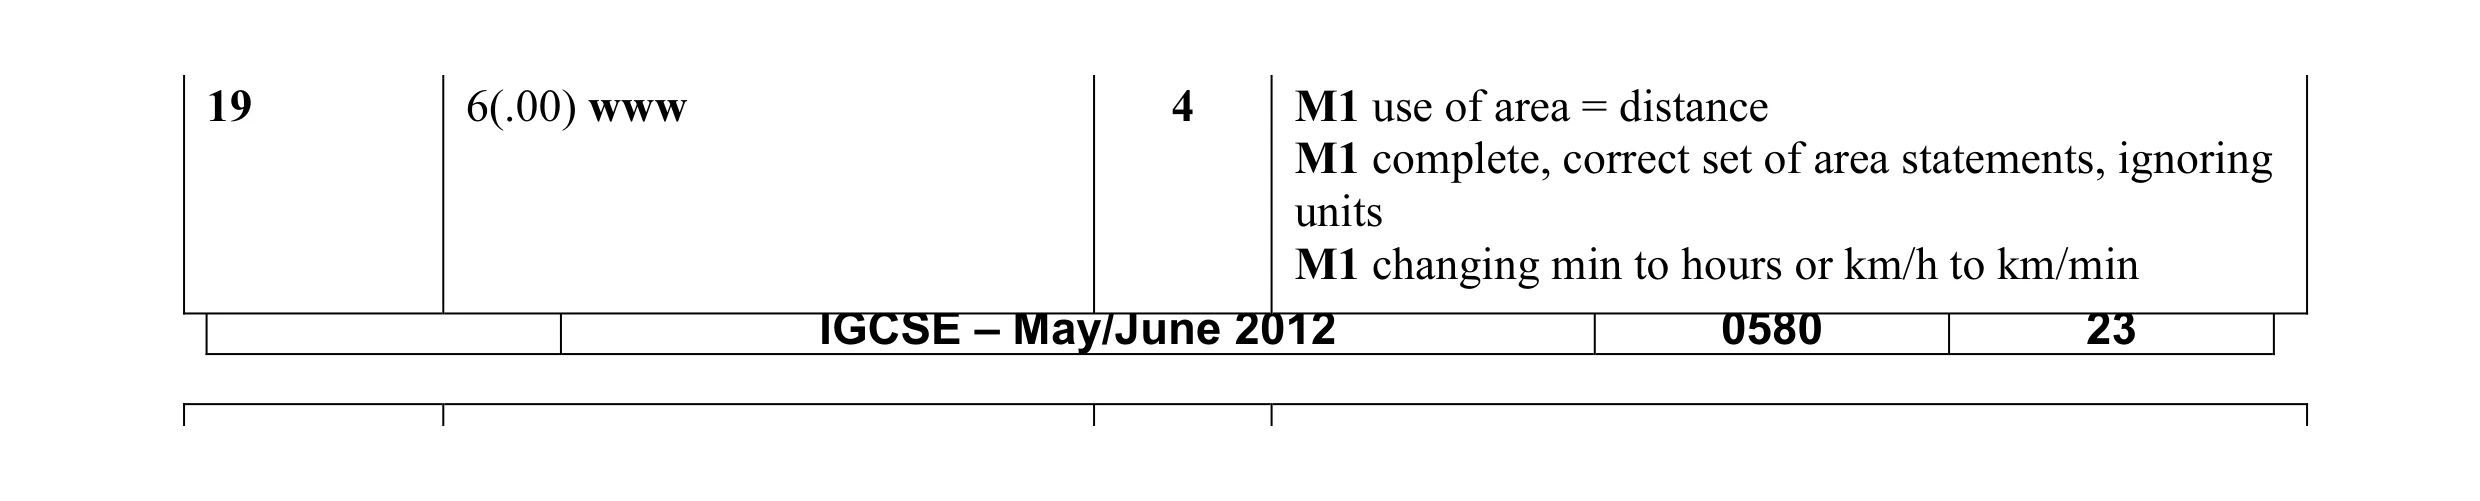 4
4 2
2 3
3 4
4 2
2 4
4 3
3 4
4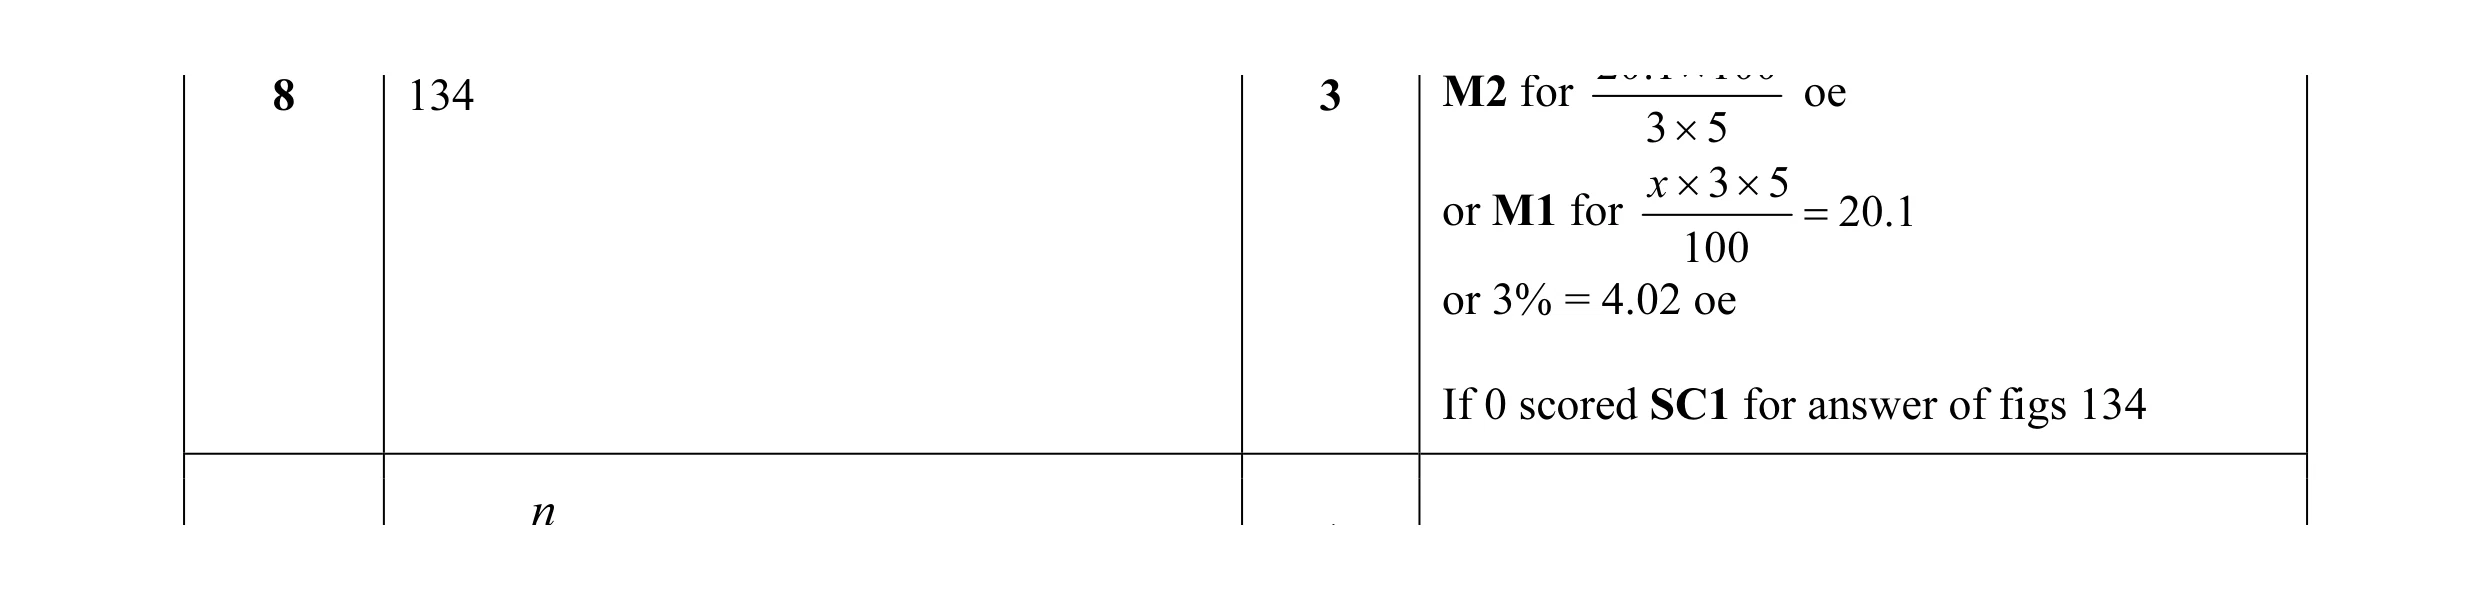 3
3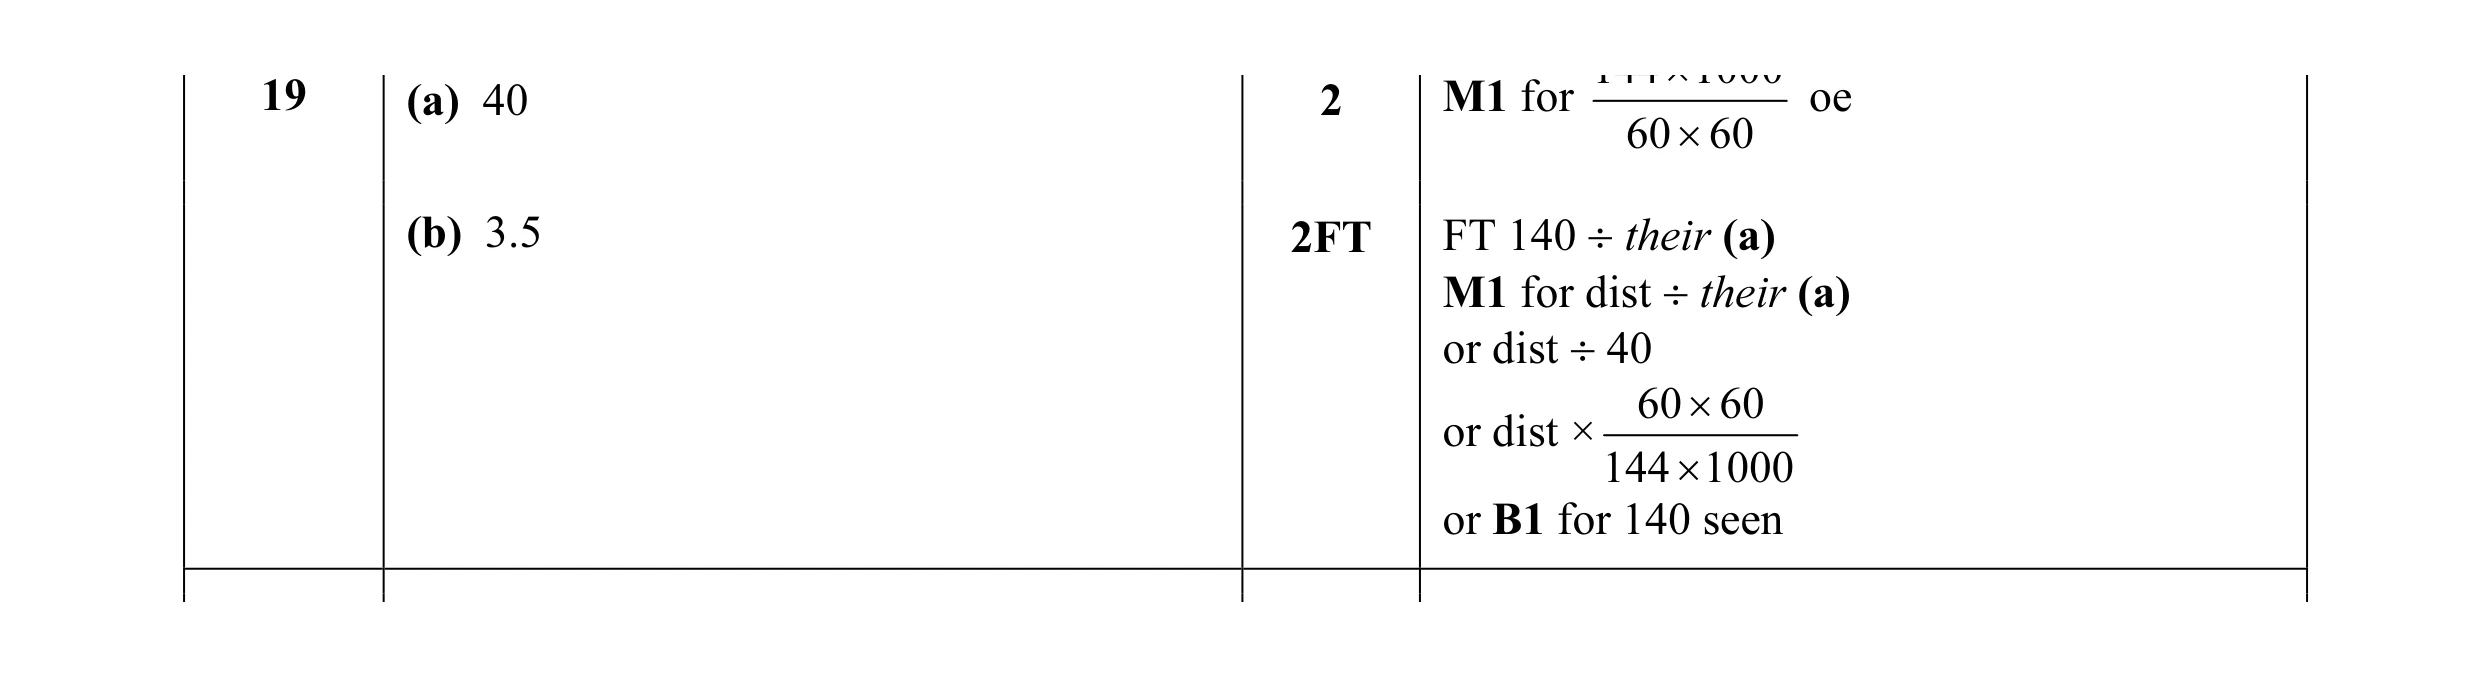 4
4 3
3 2
2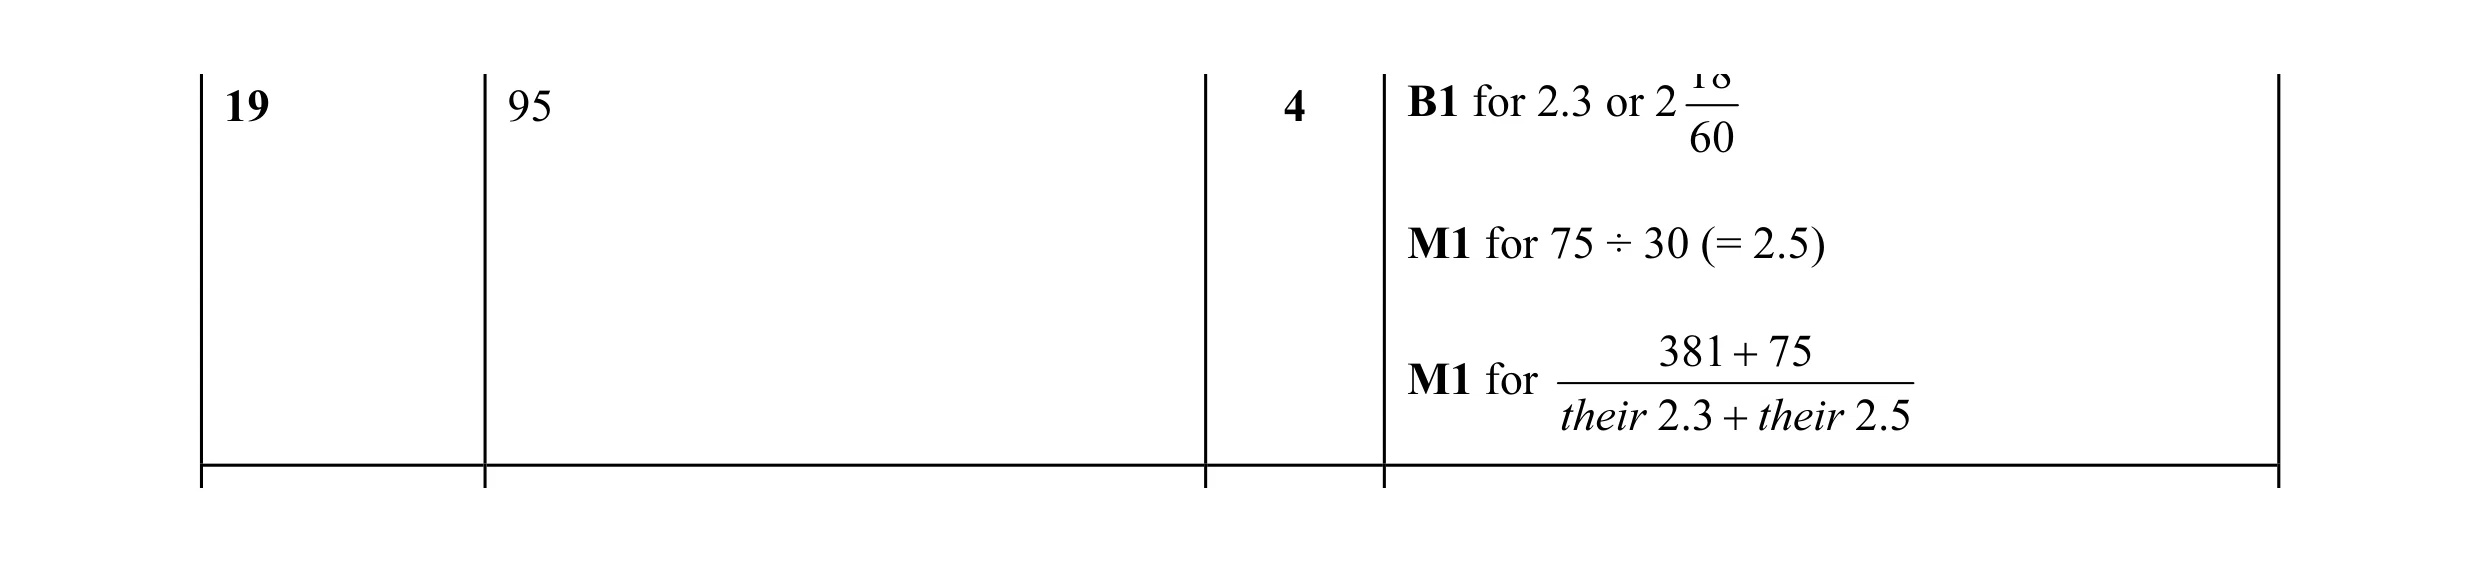 4
4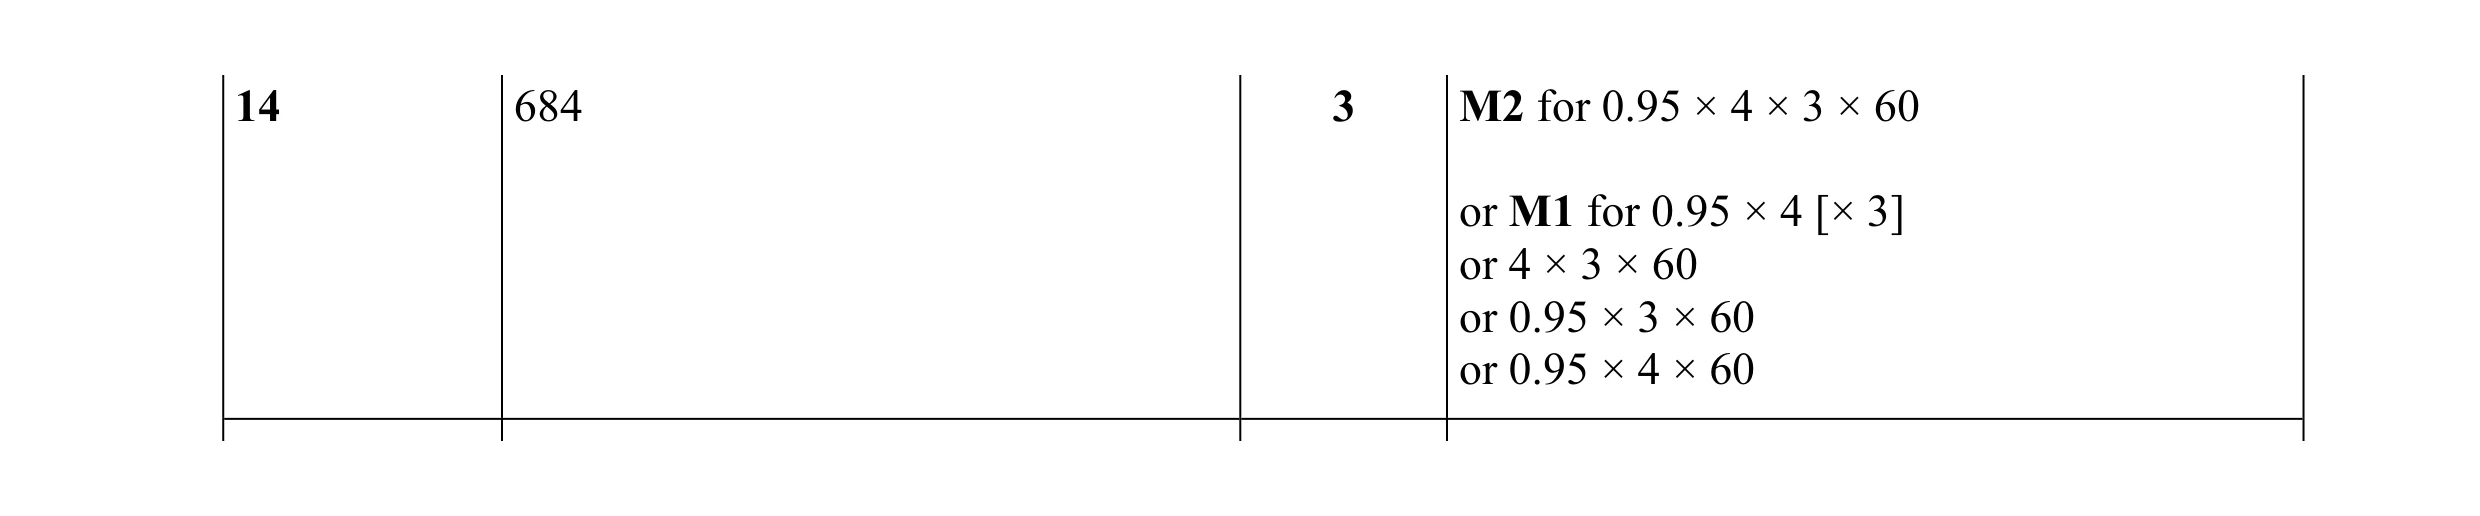 3
3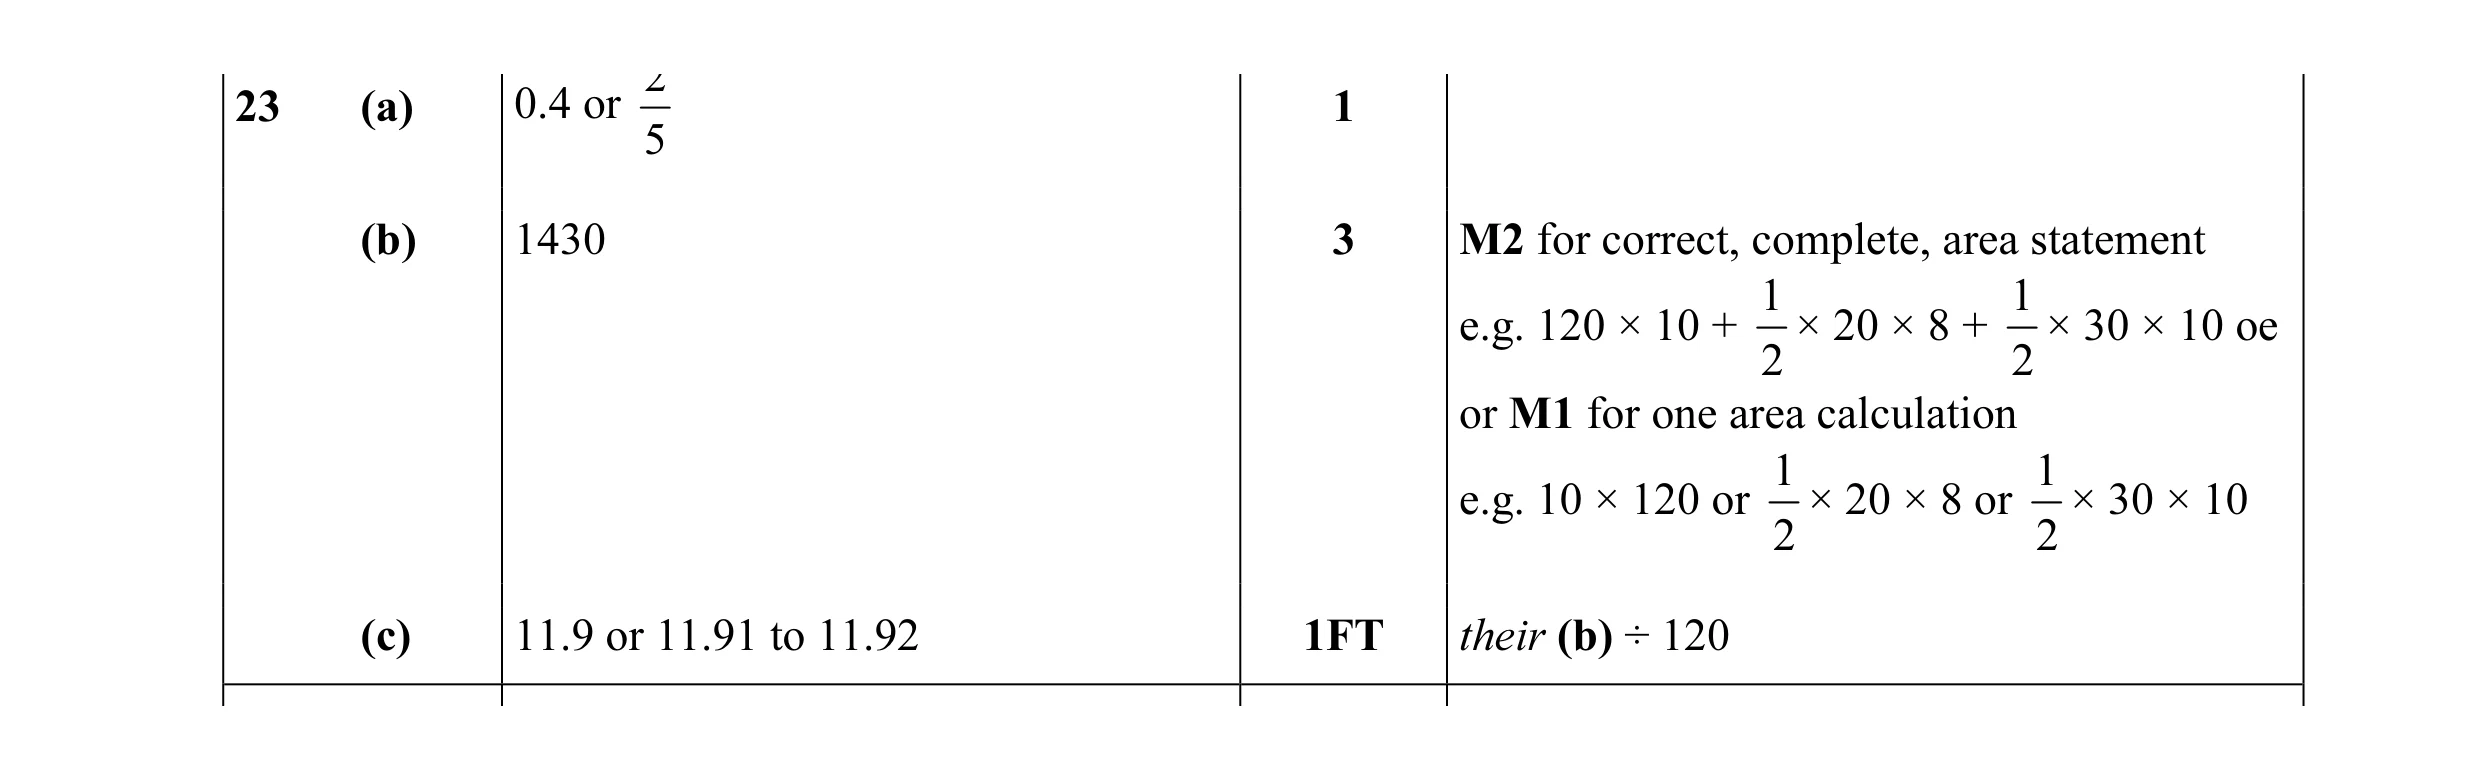 5
5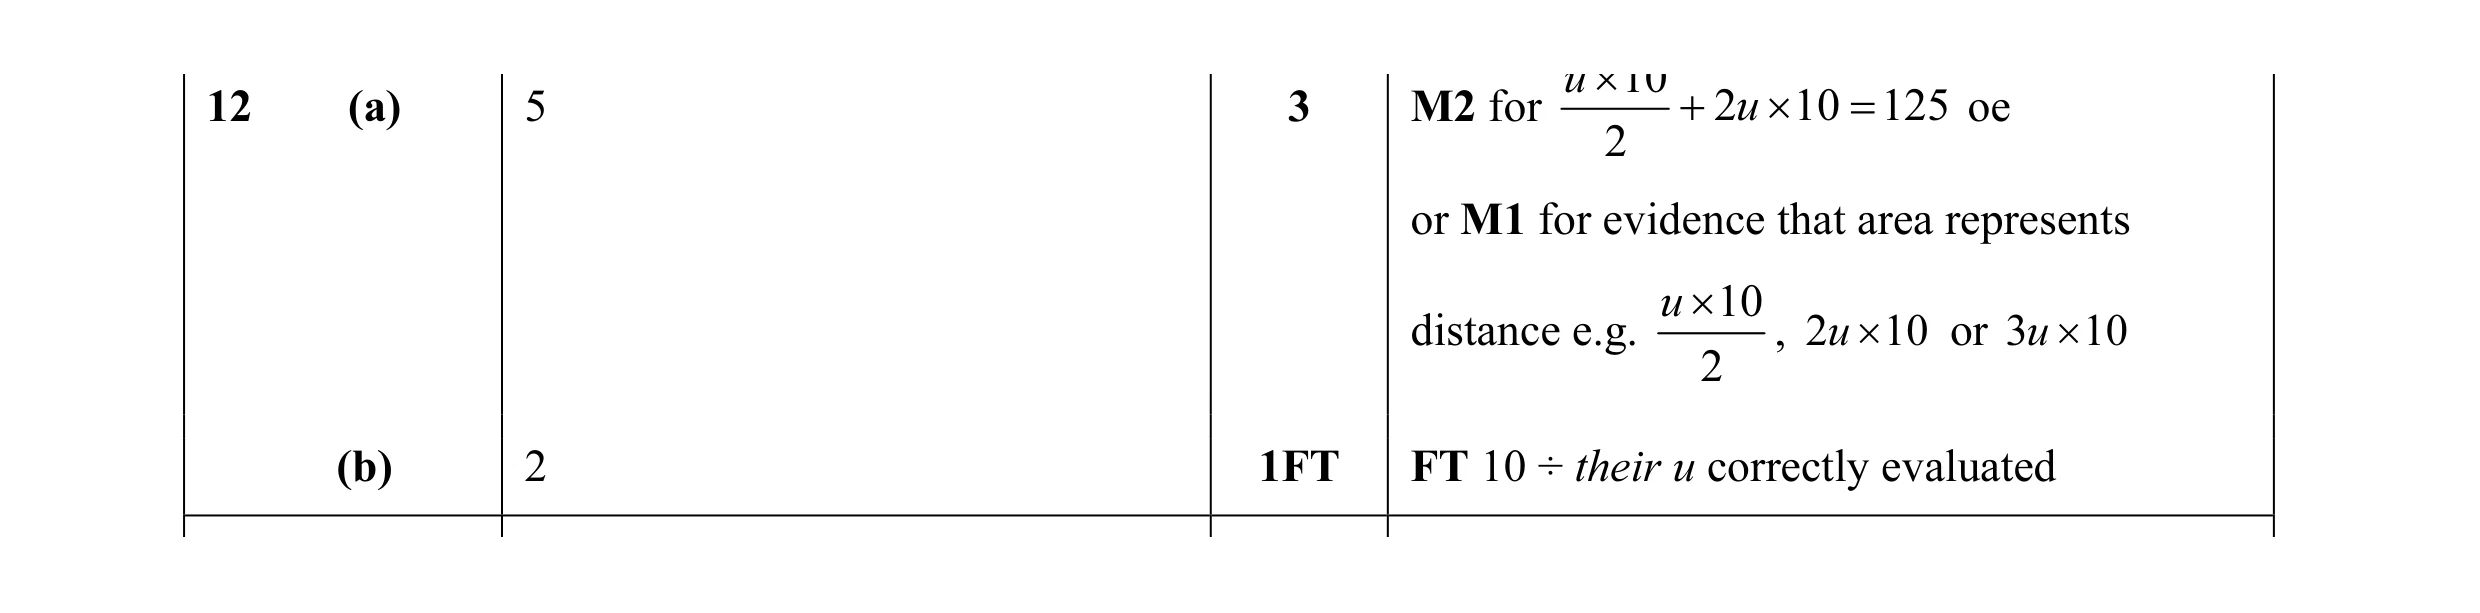 4
4 4
4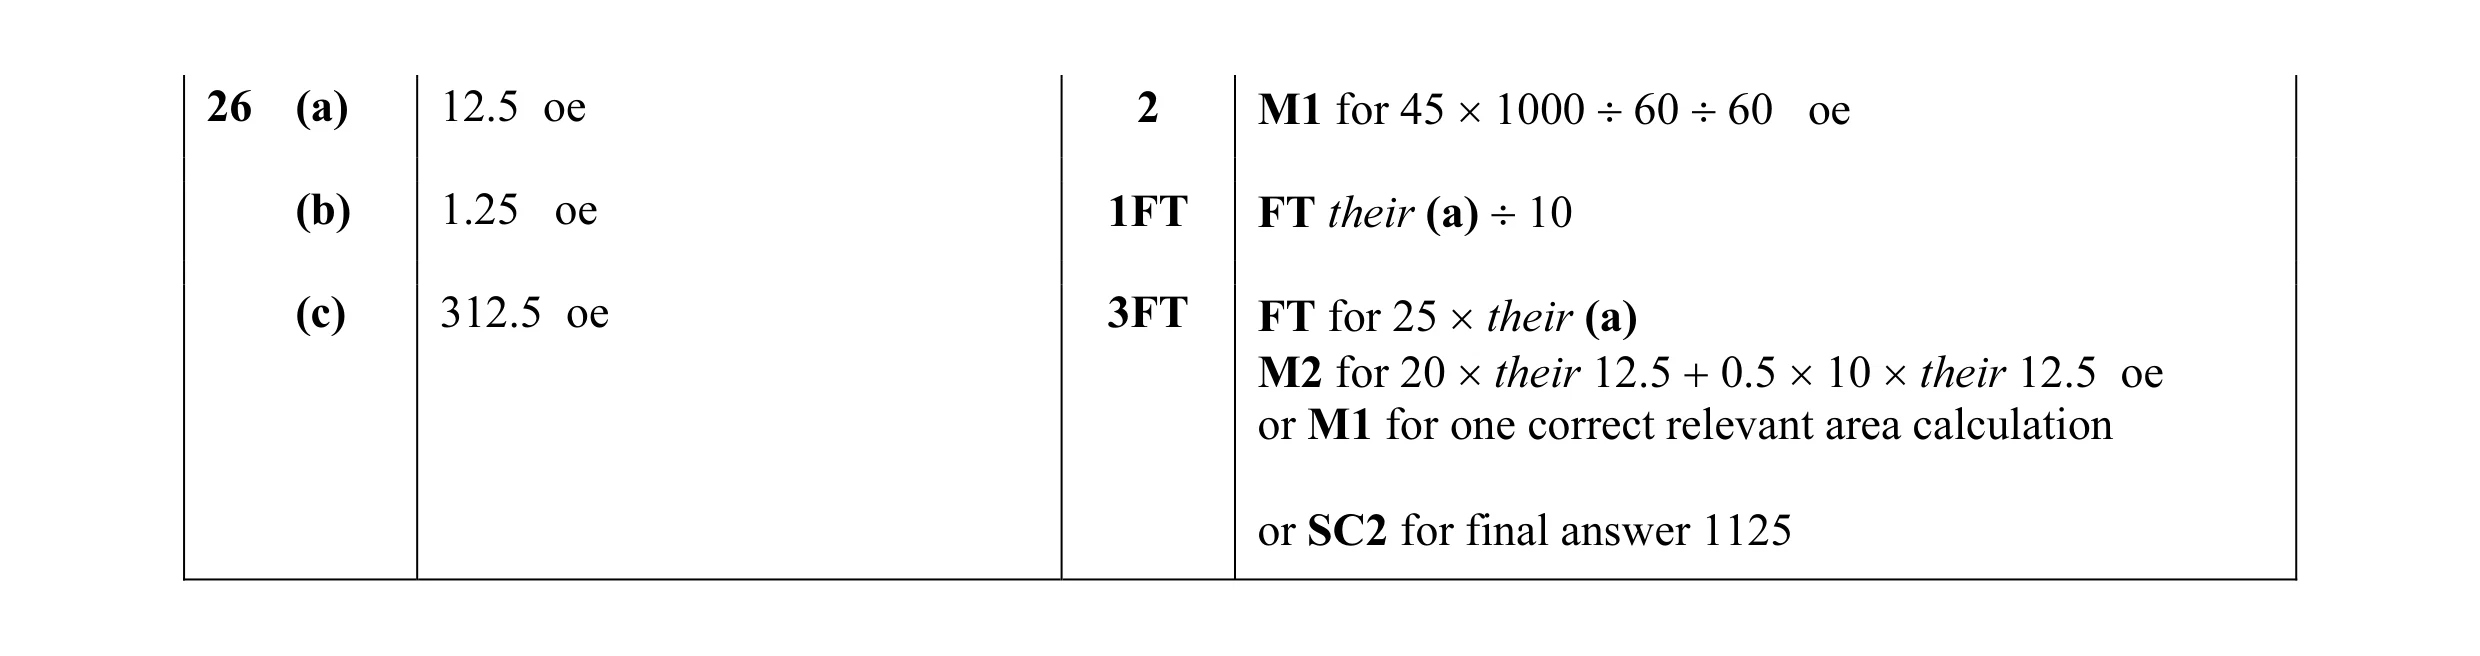 6
6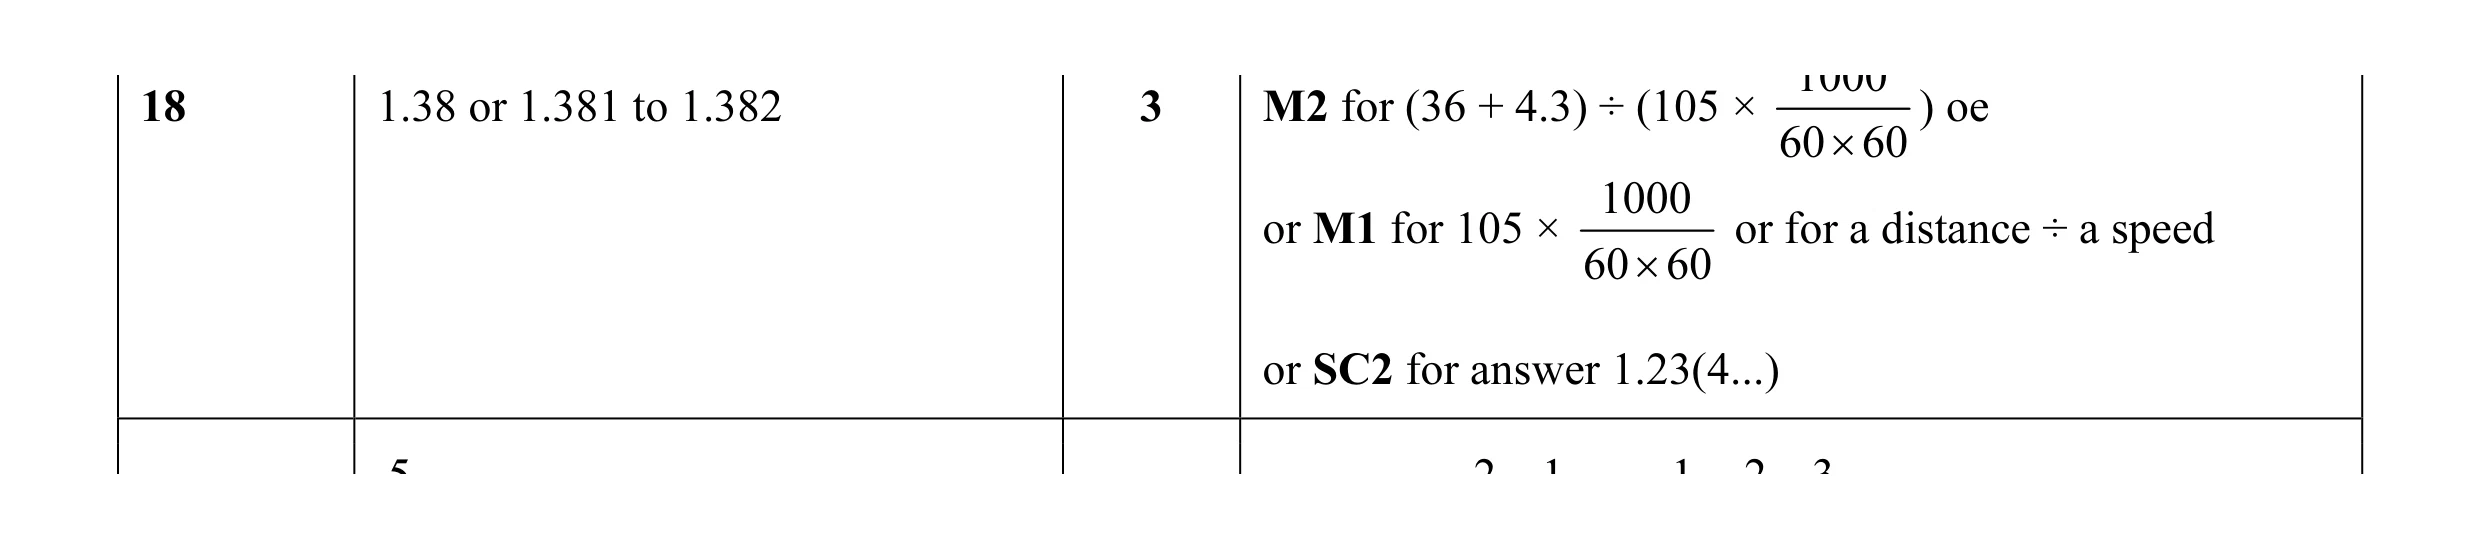 3
3 2
2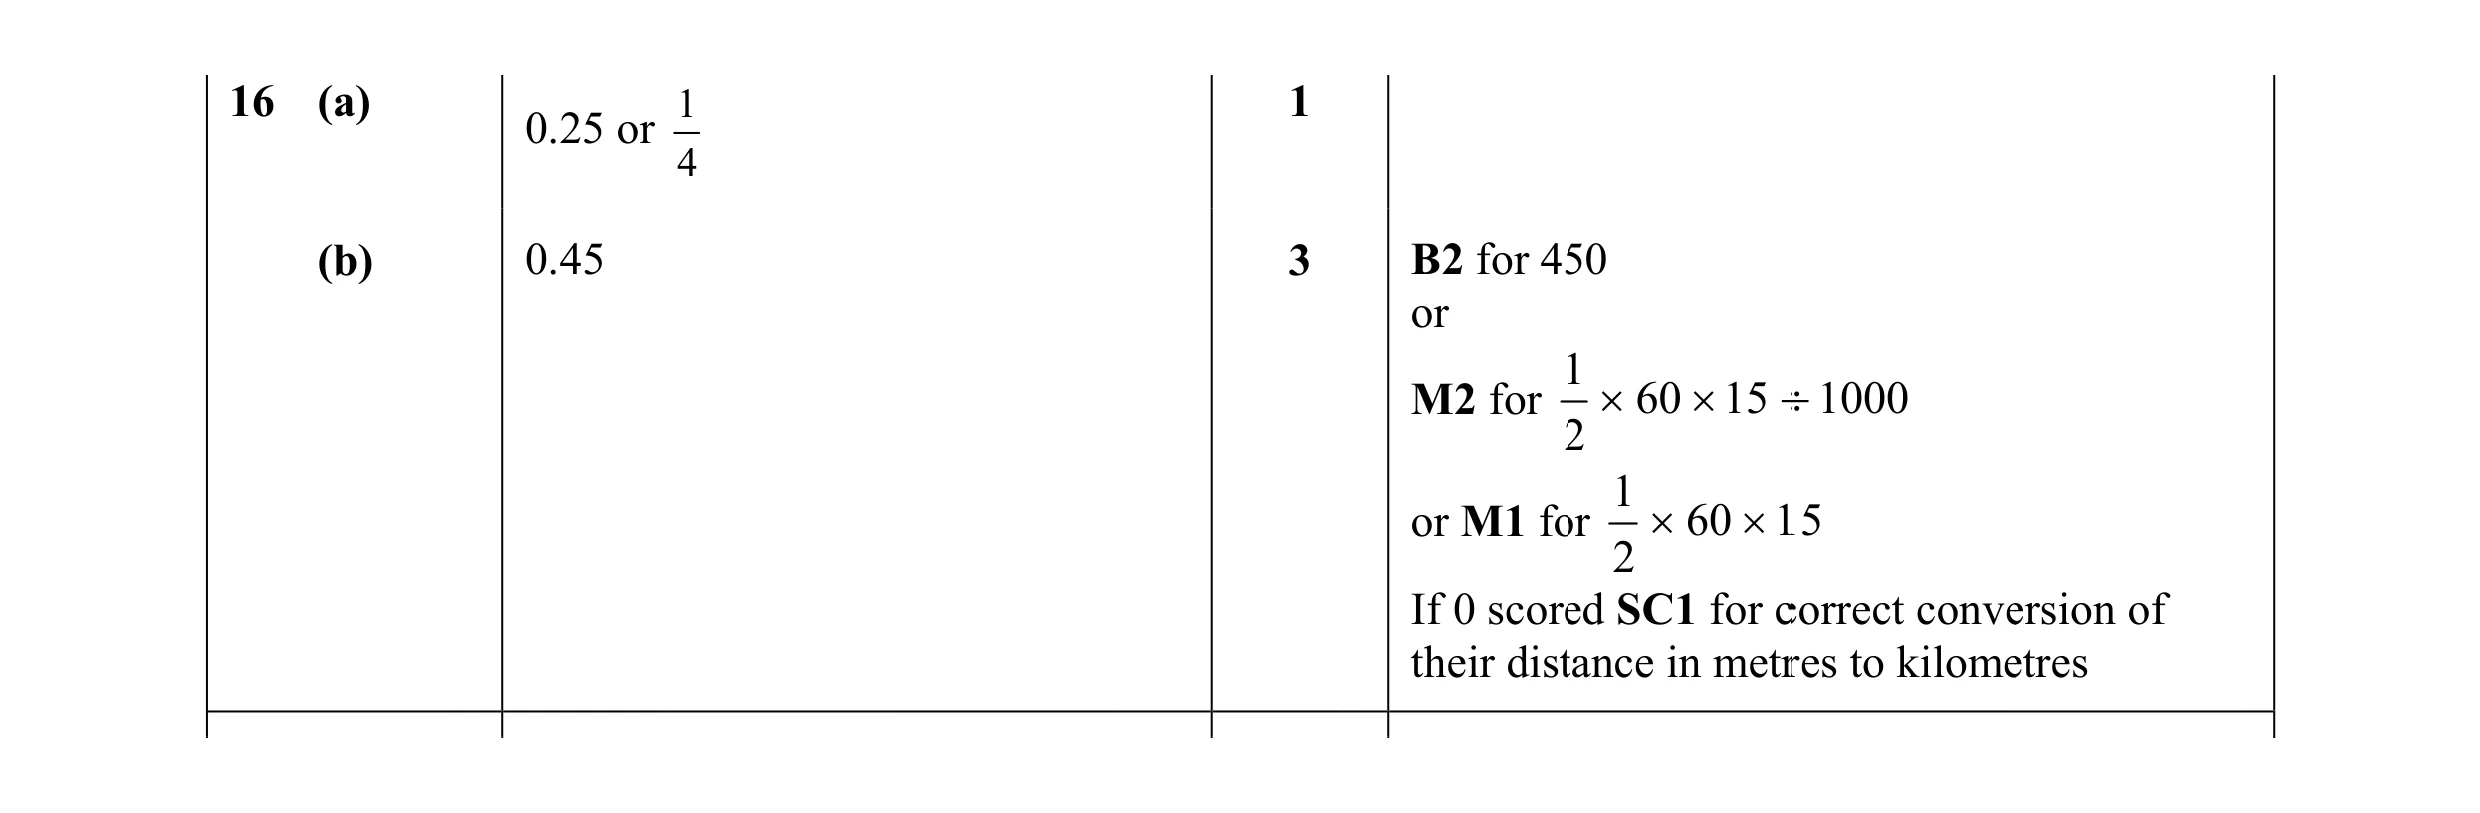 4
4 3
3 2
2 3
3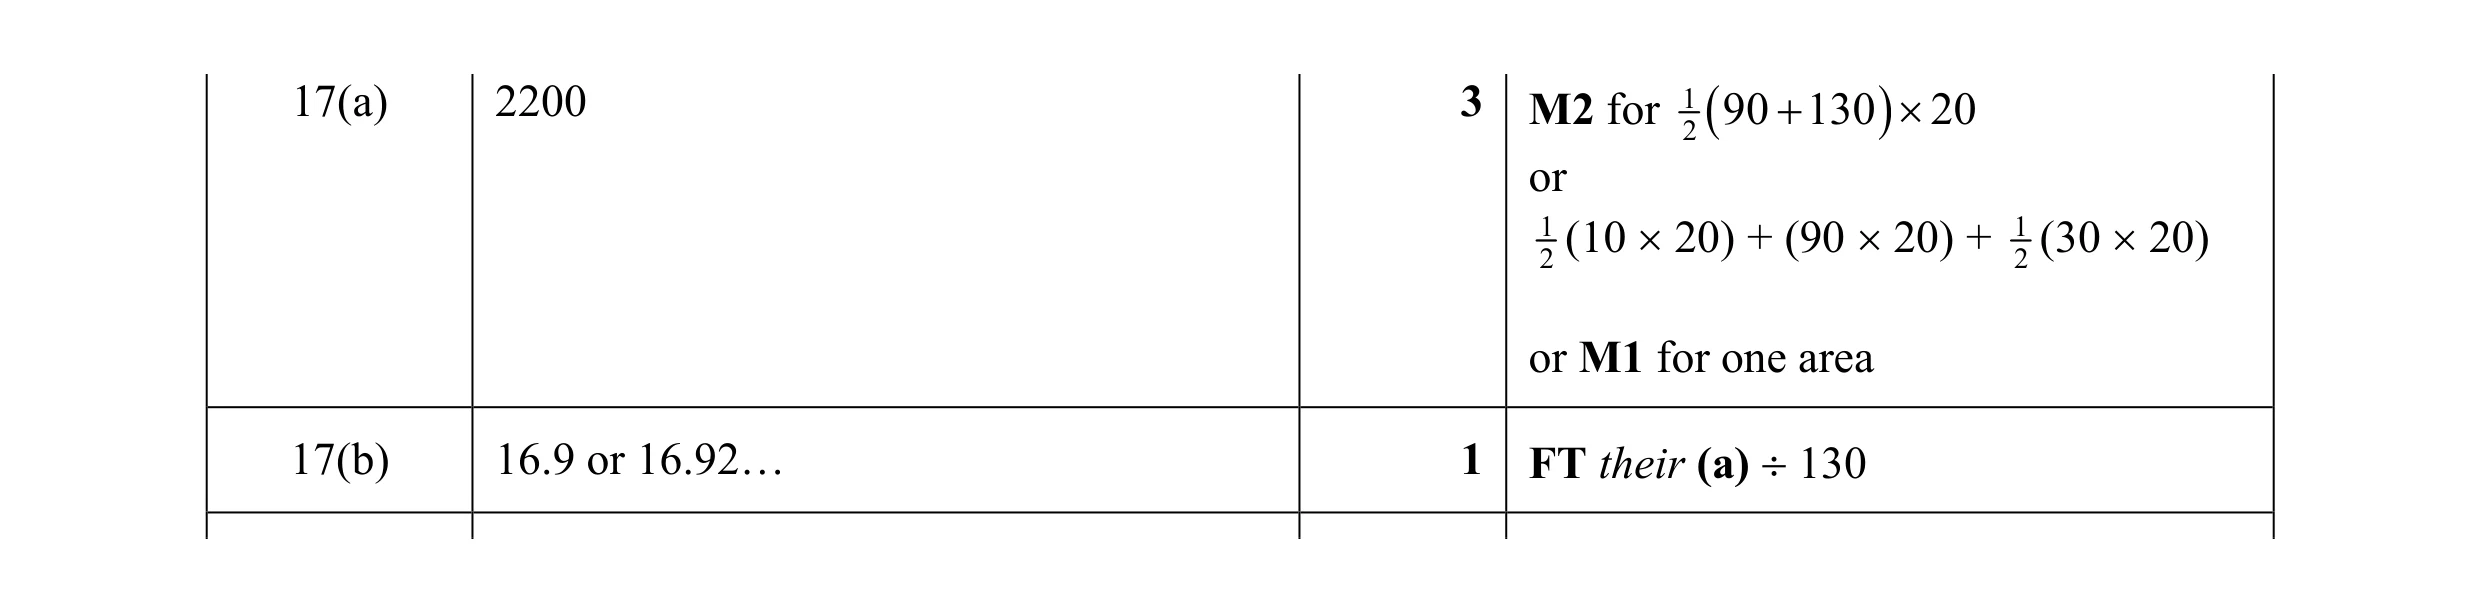 4
4 3
3 1
1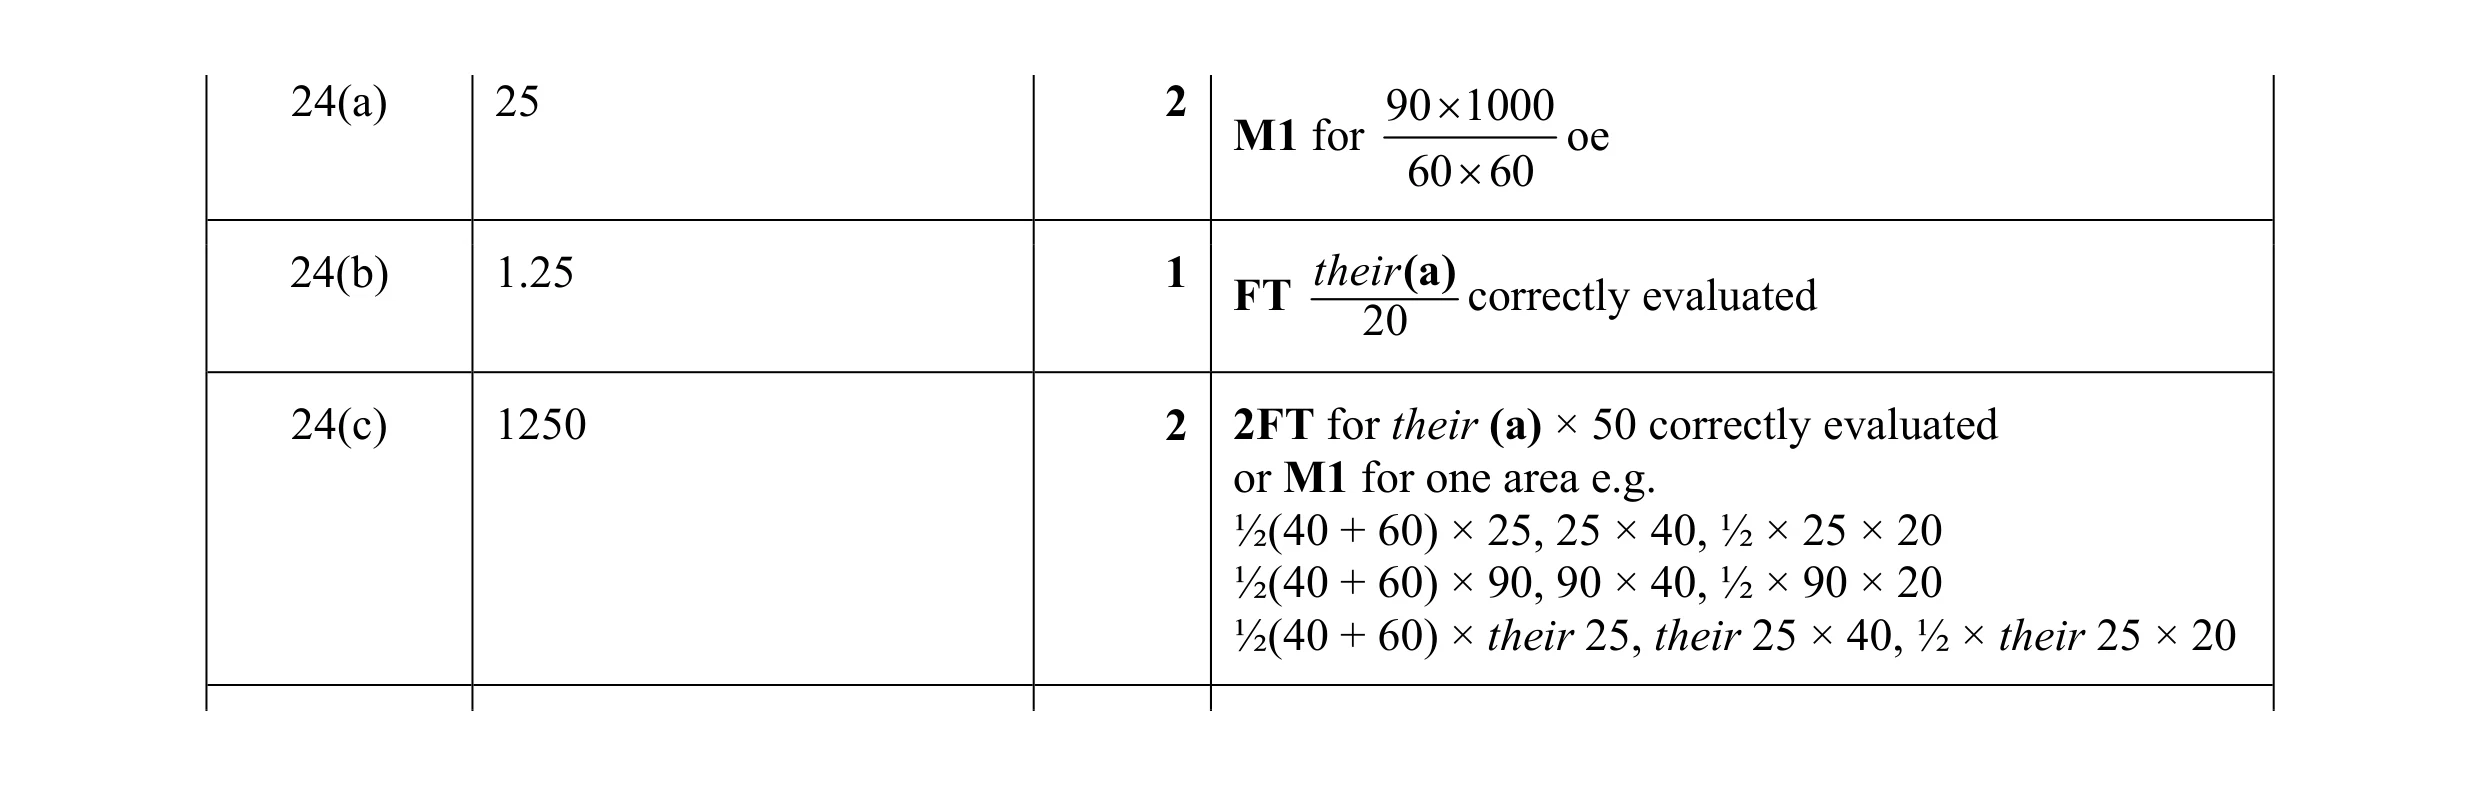 5
5 2
2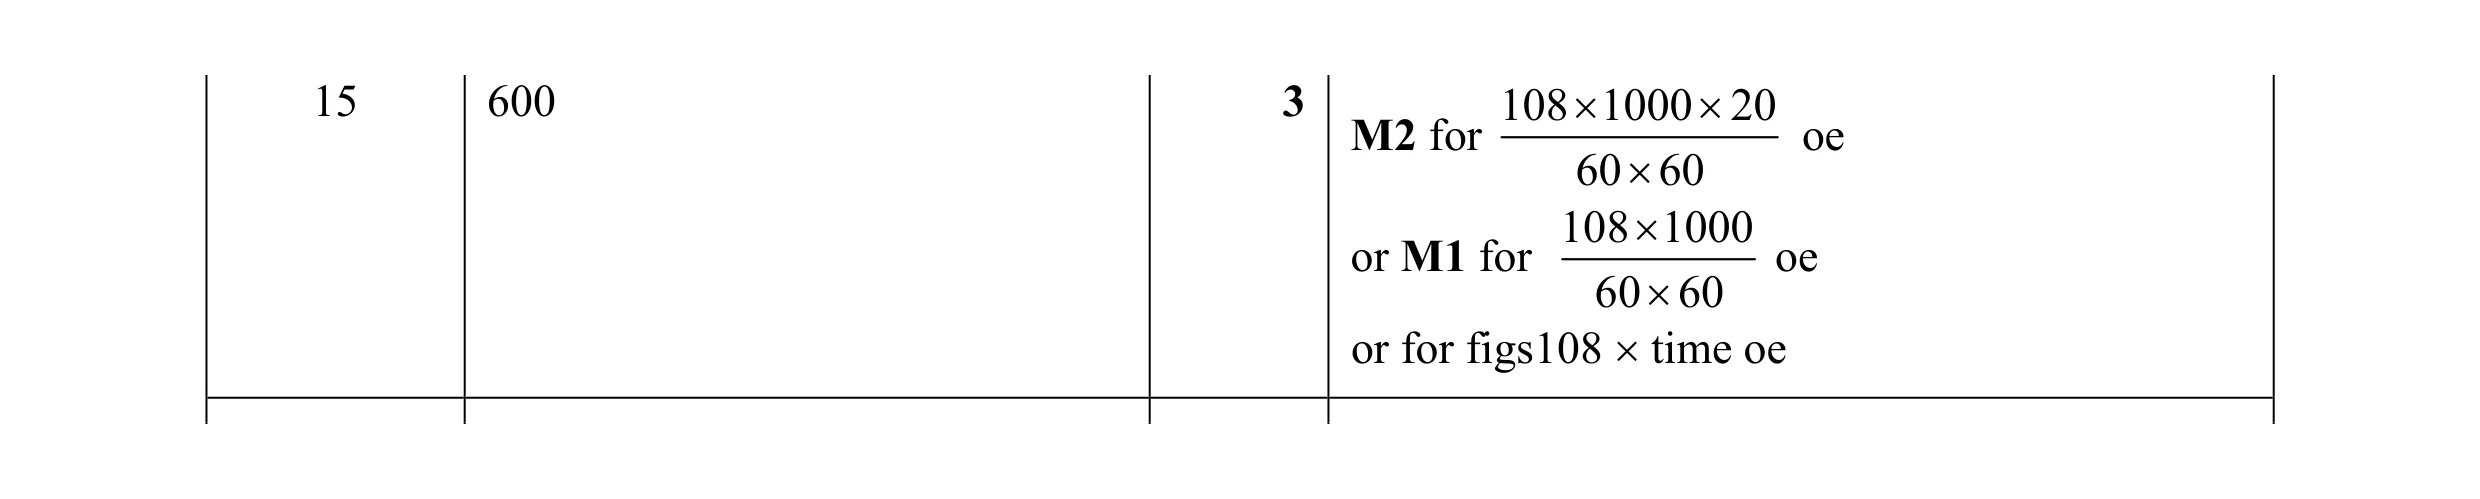 3
3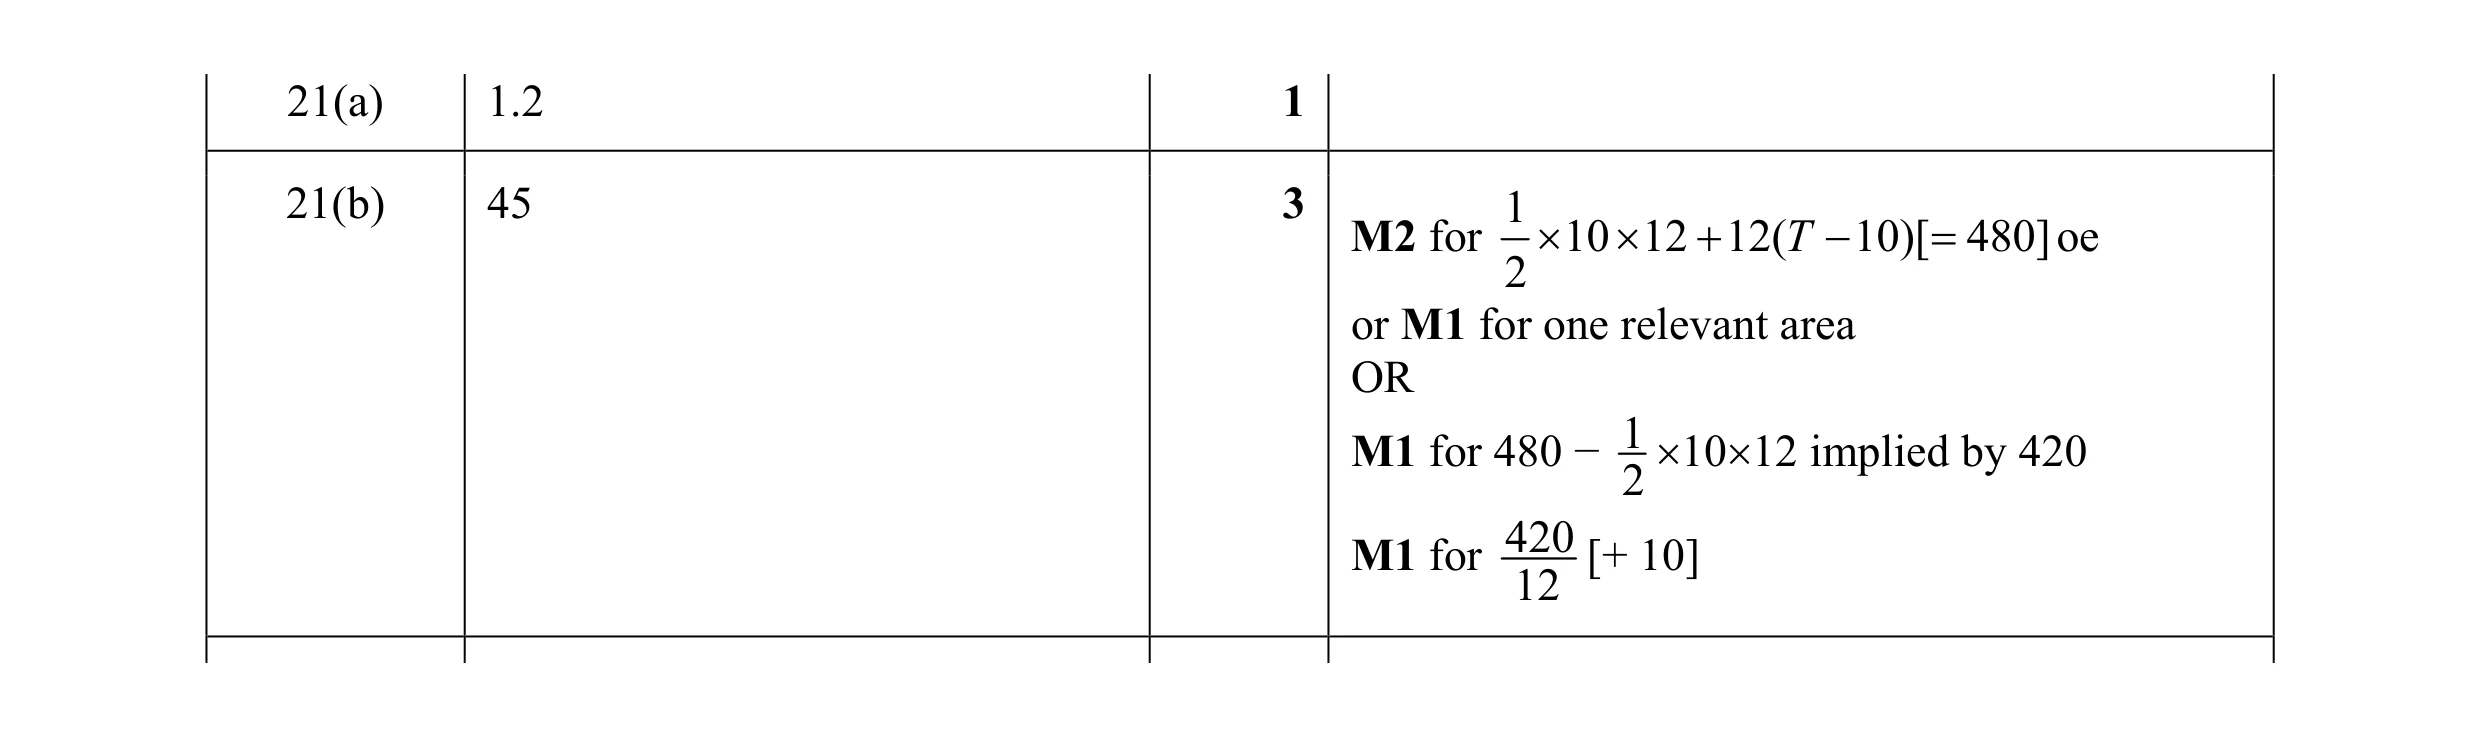 4
4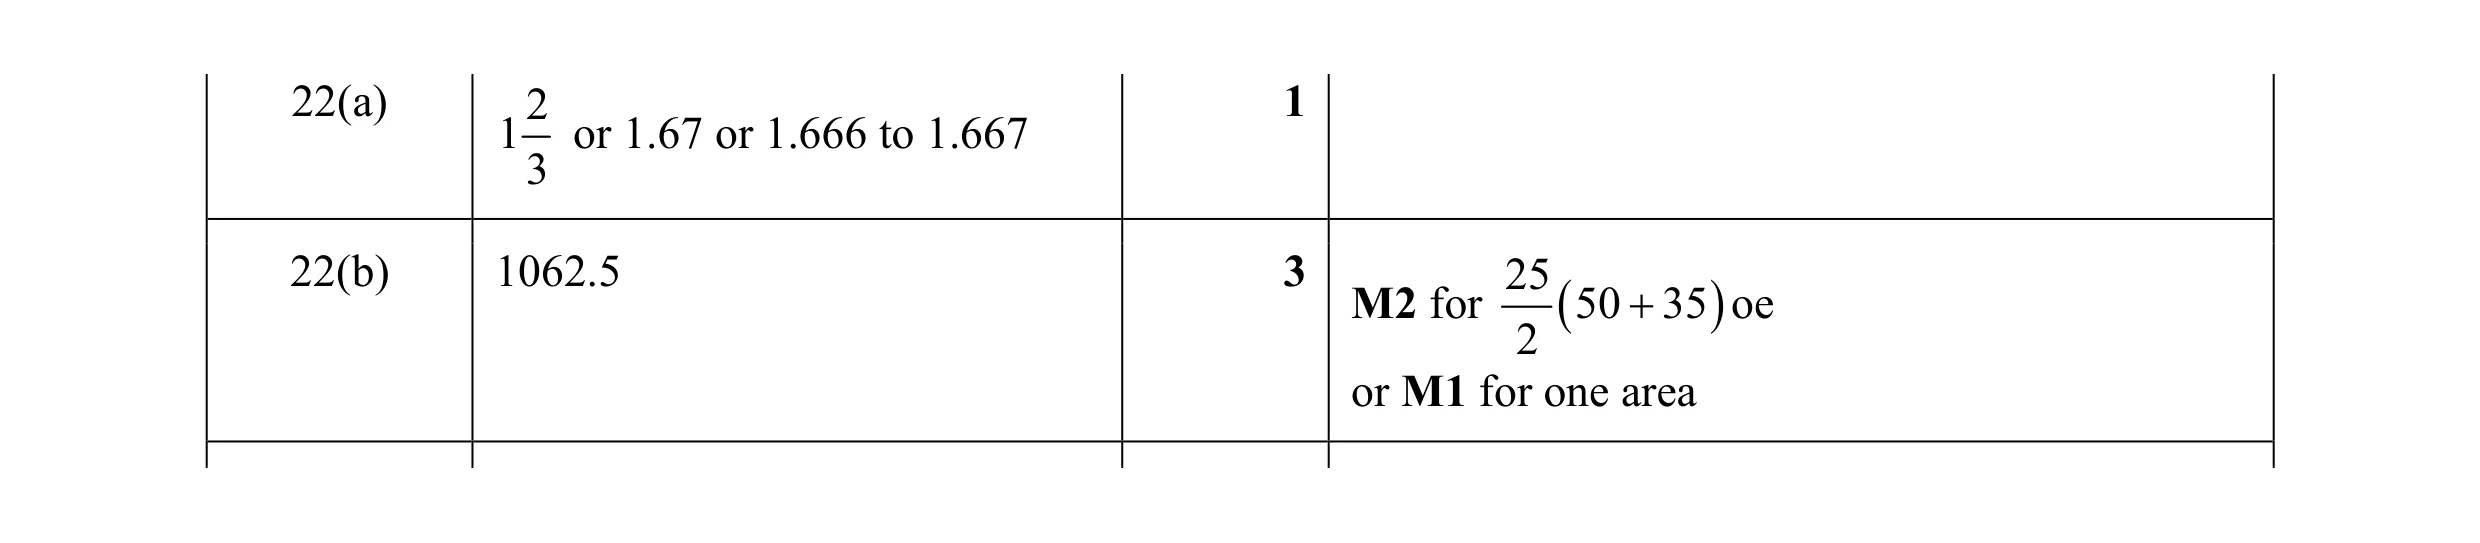 4
4 4
4 2
2 2
2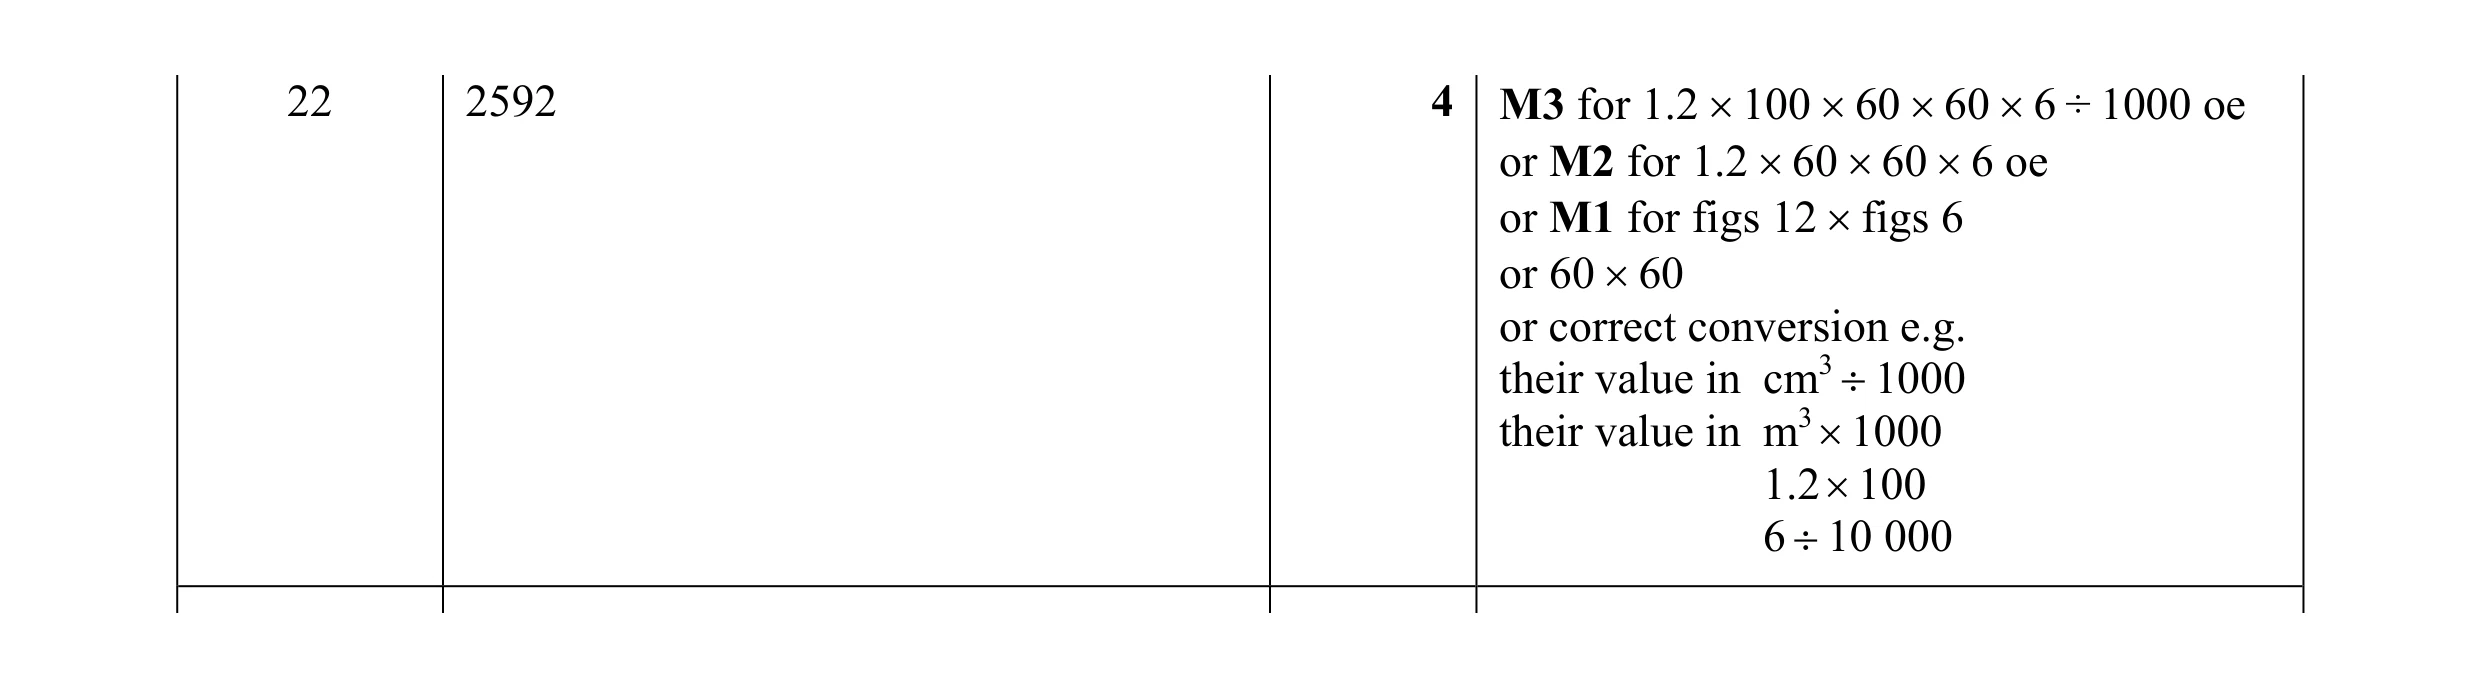 4
4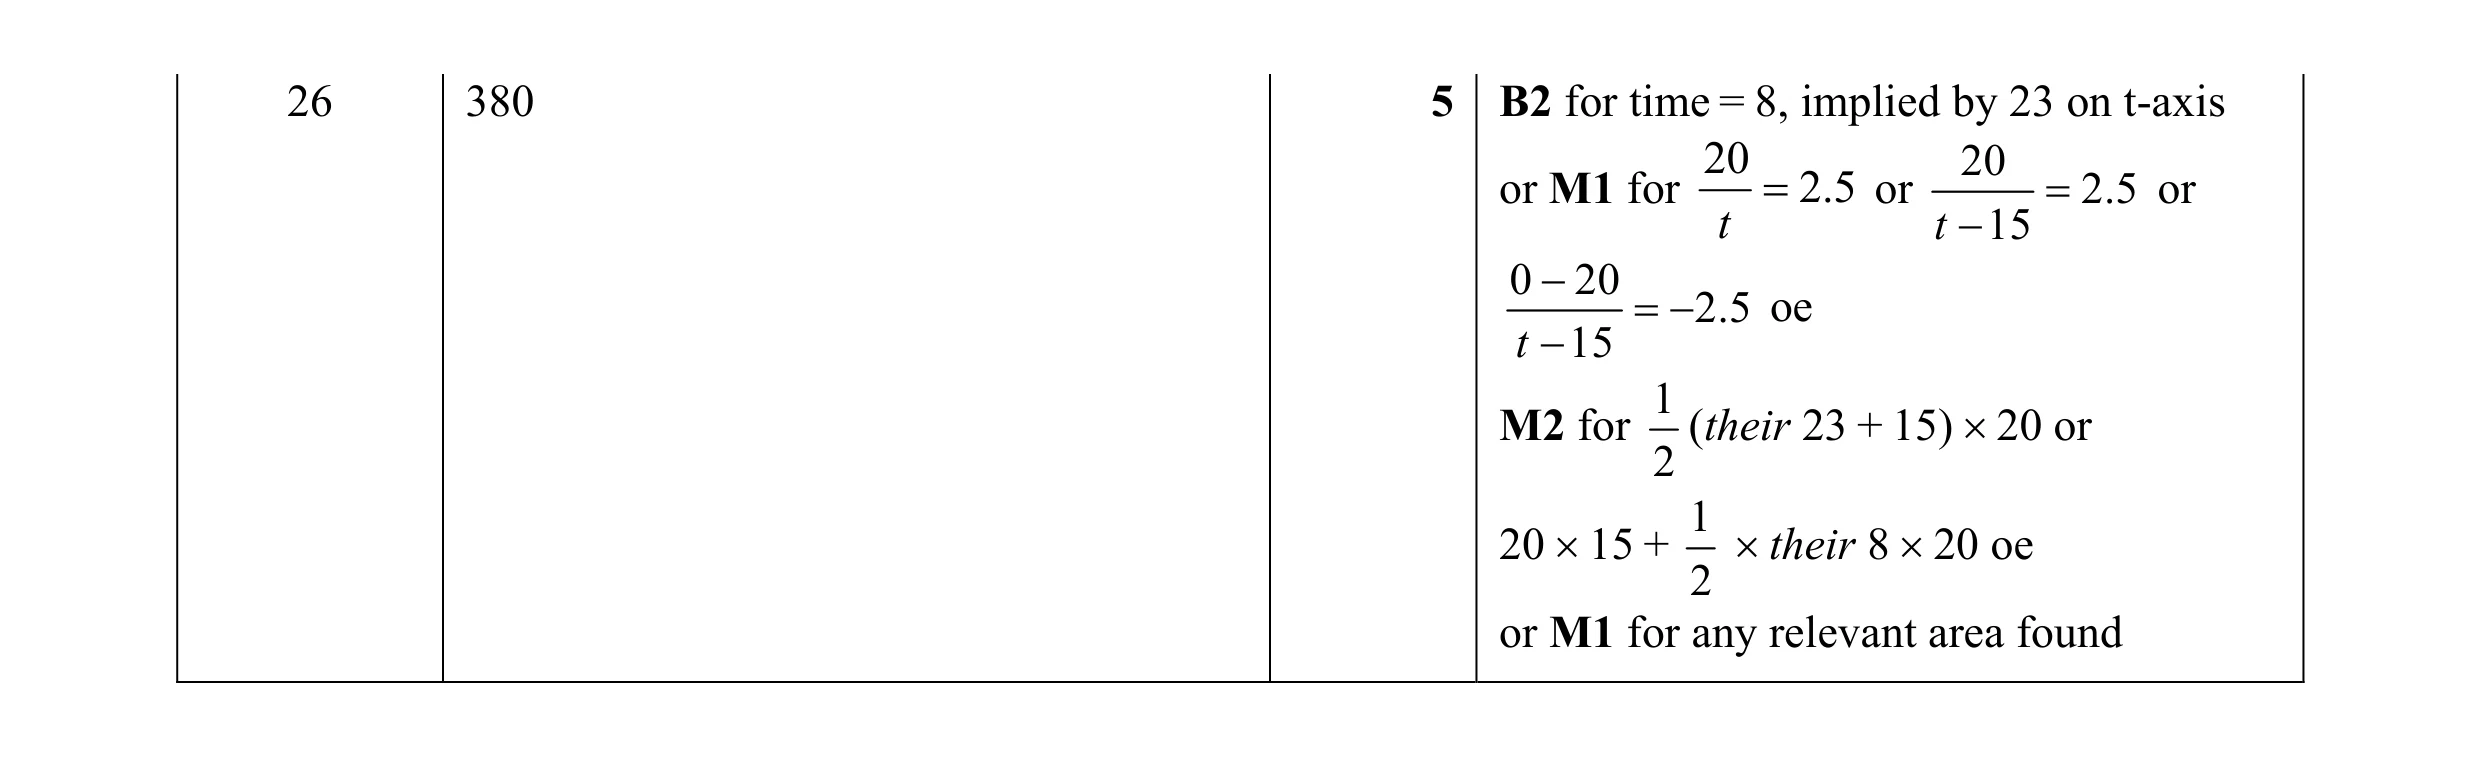 5
5 2
2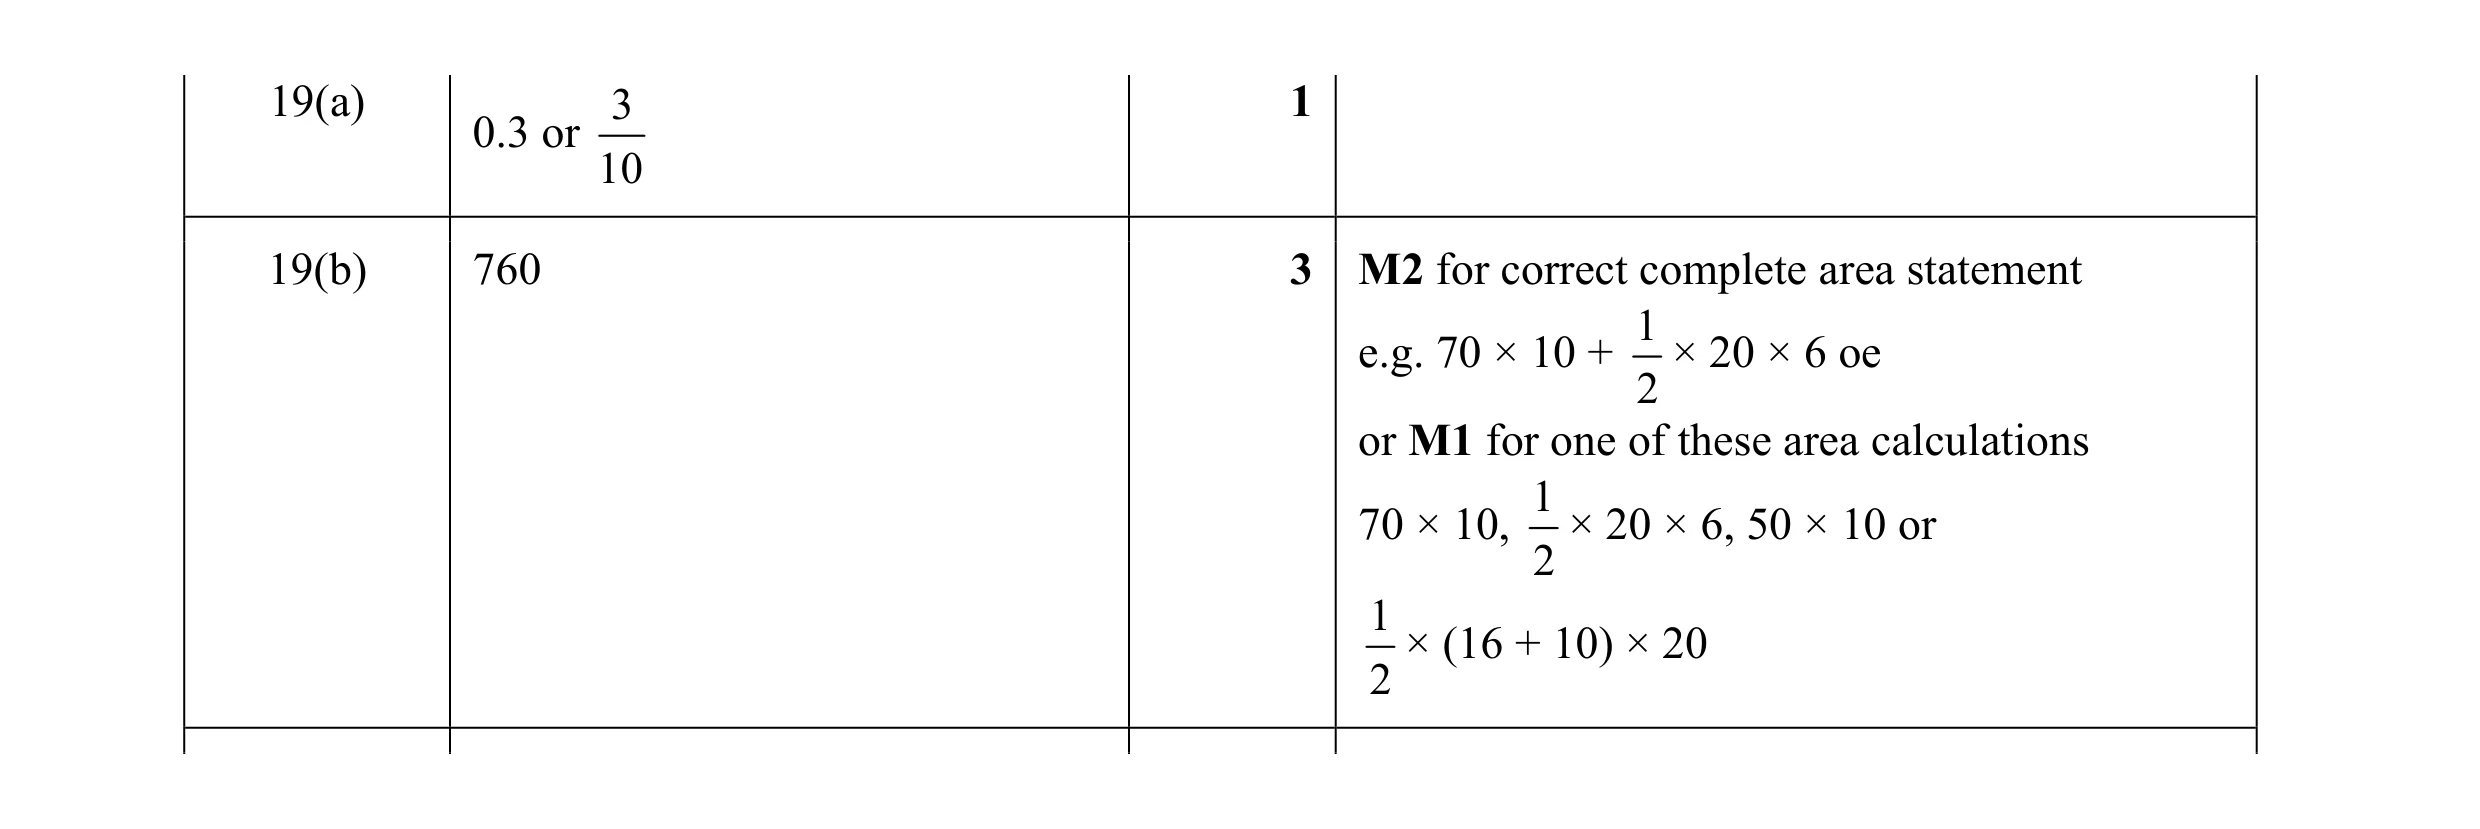 4
4 3
3 3
3 3
3 4
4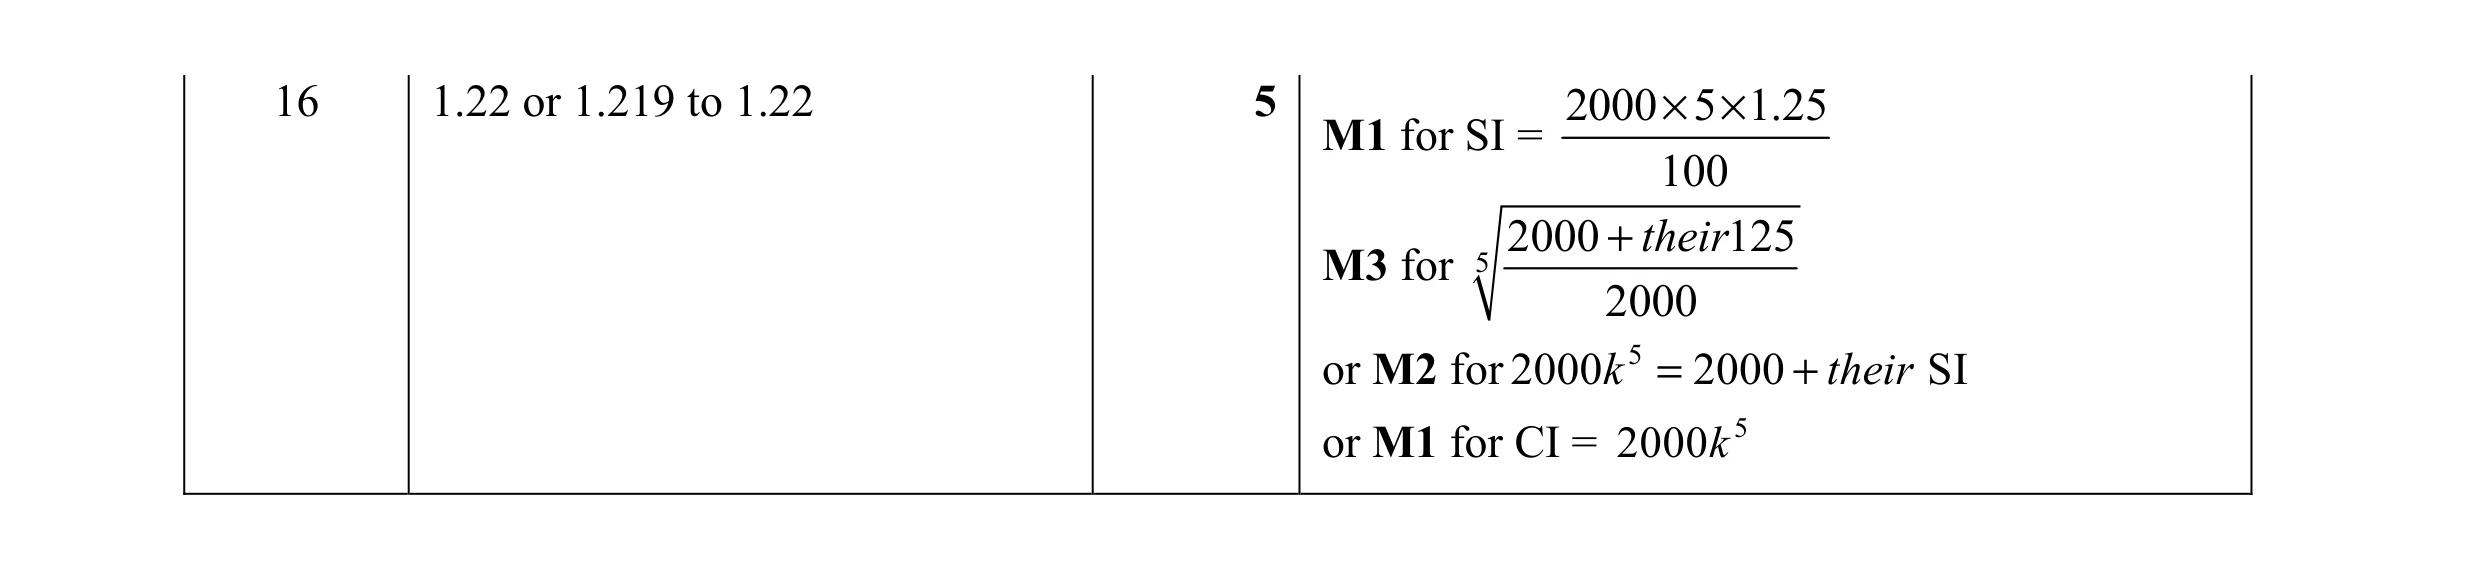 5
5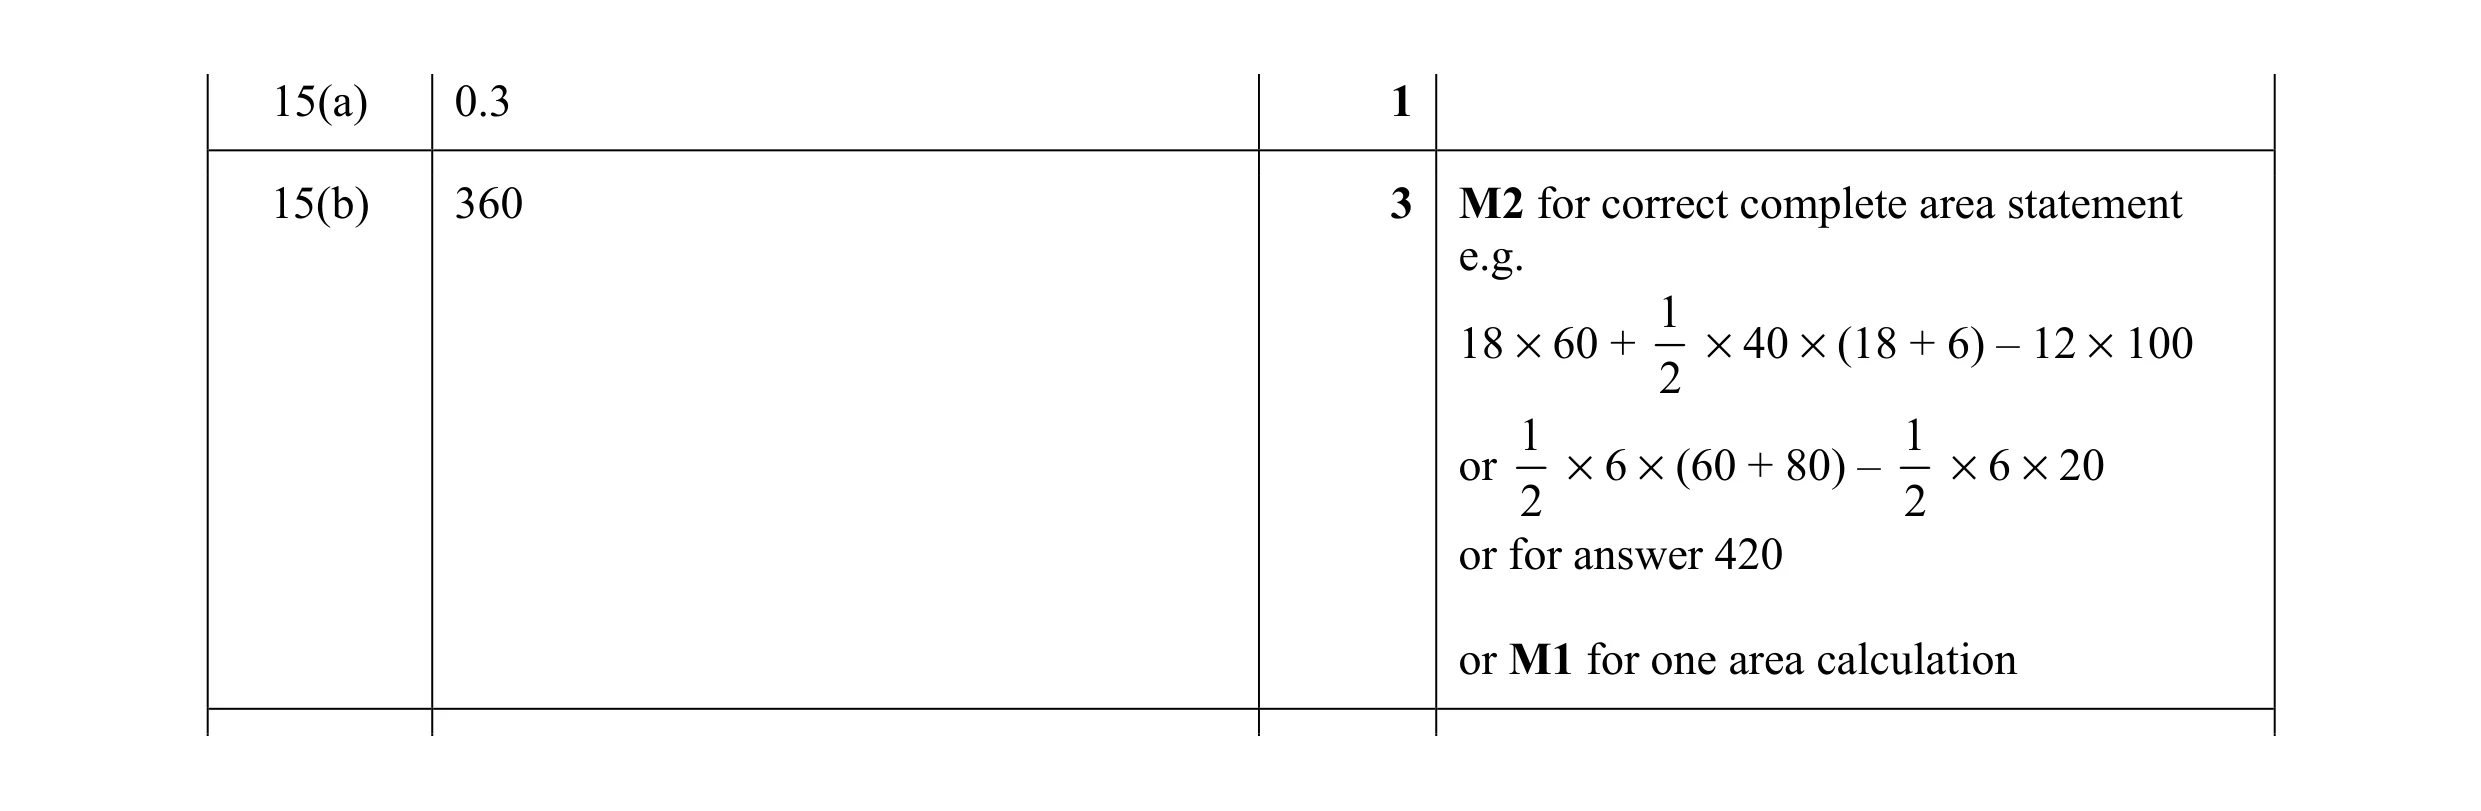 4
4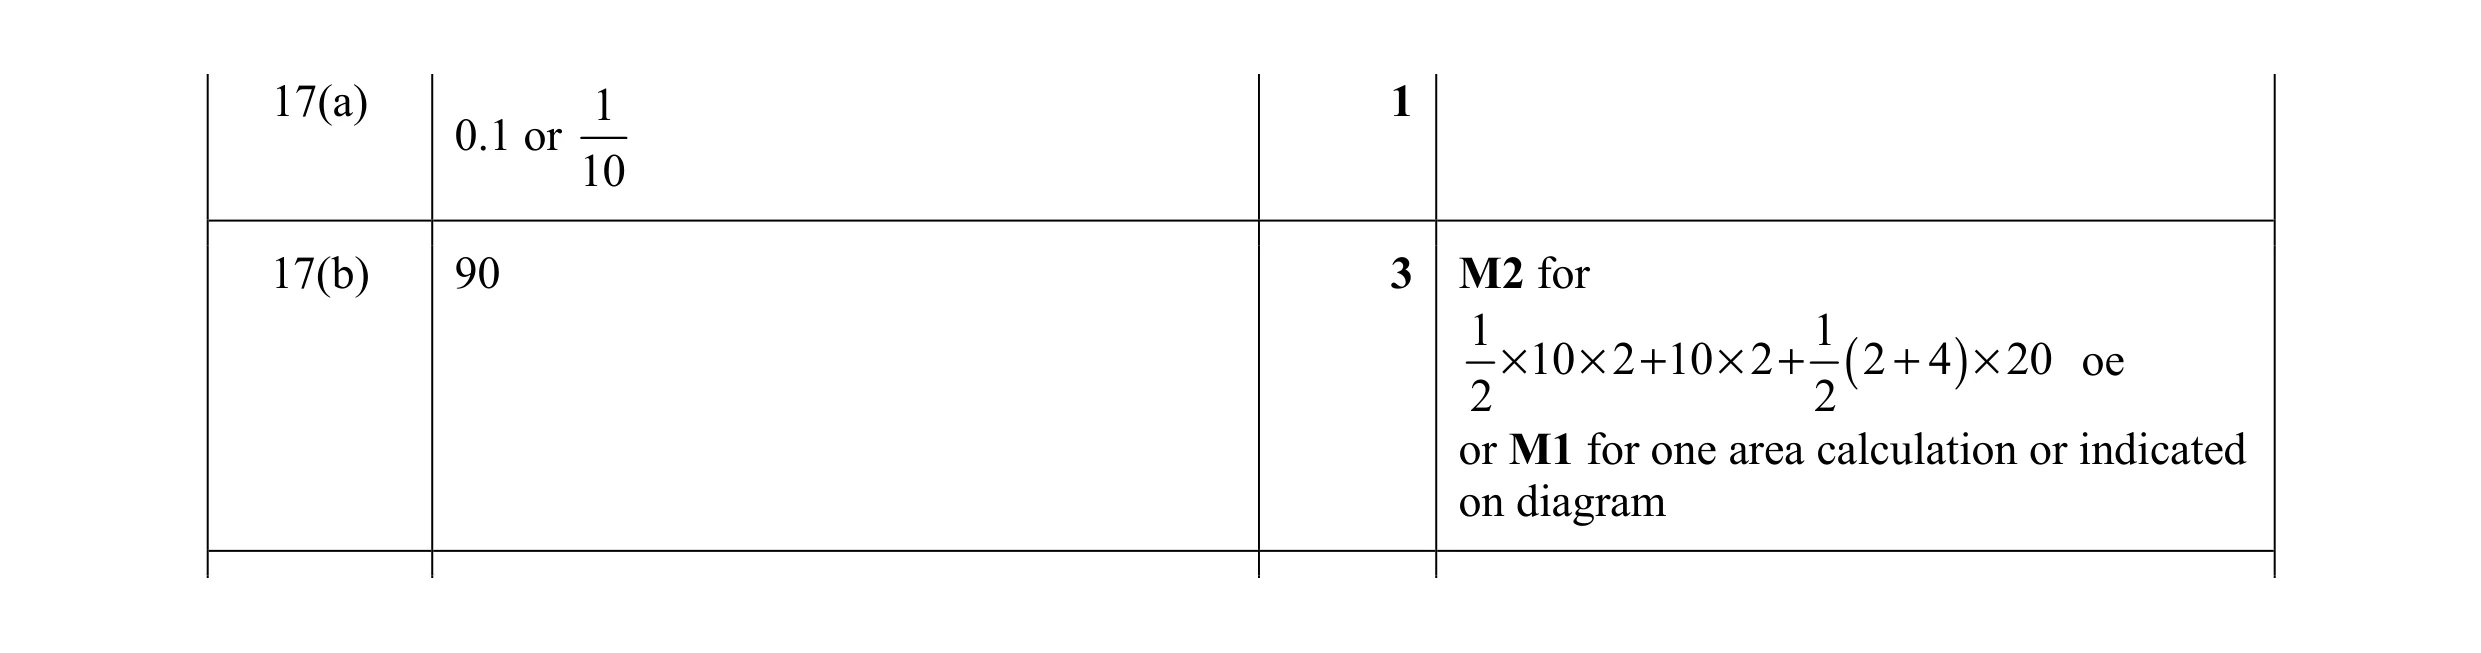 4
4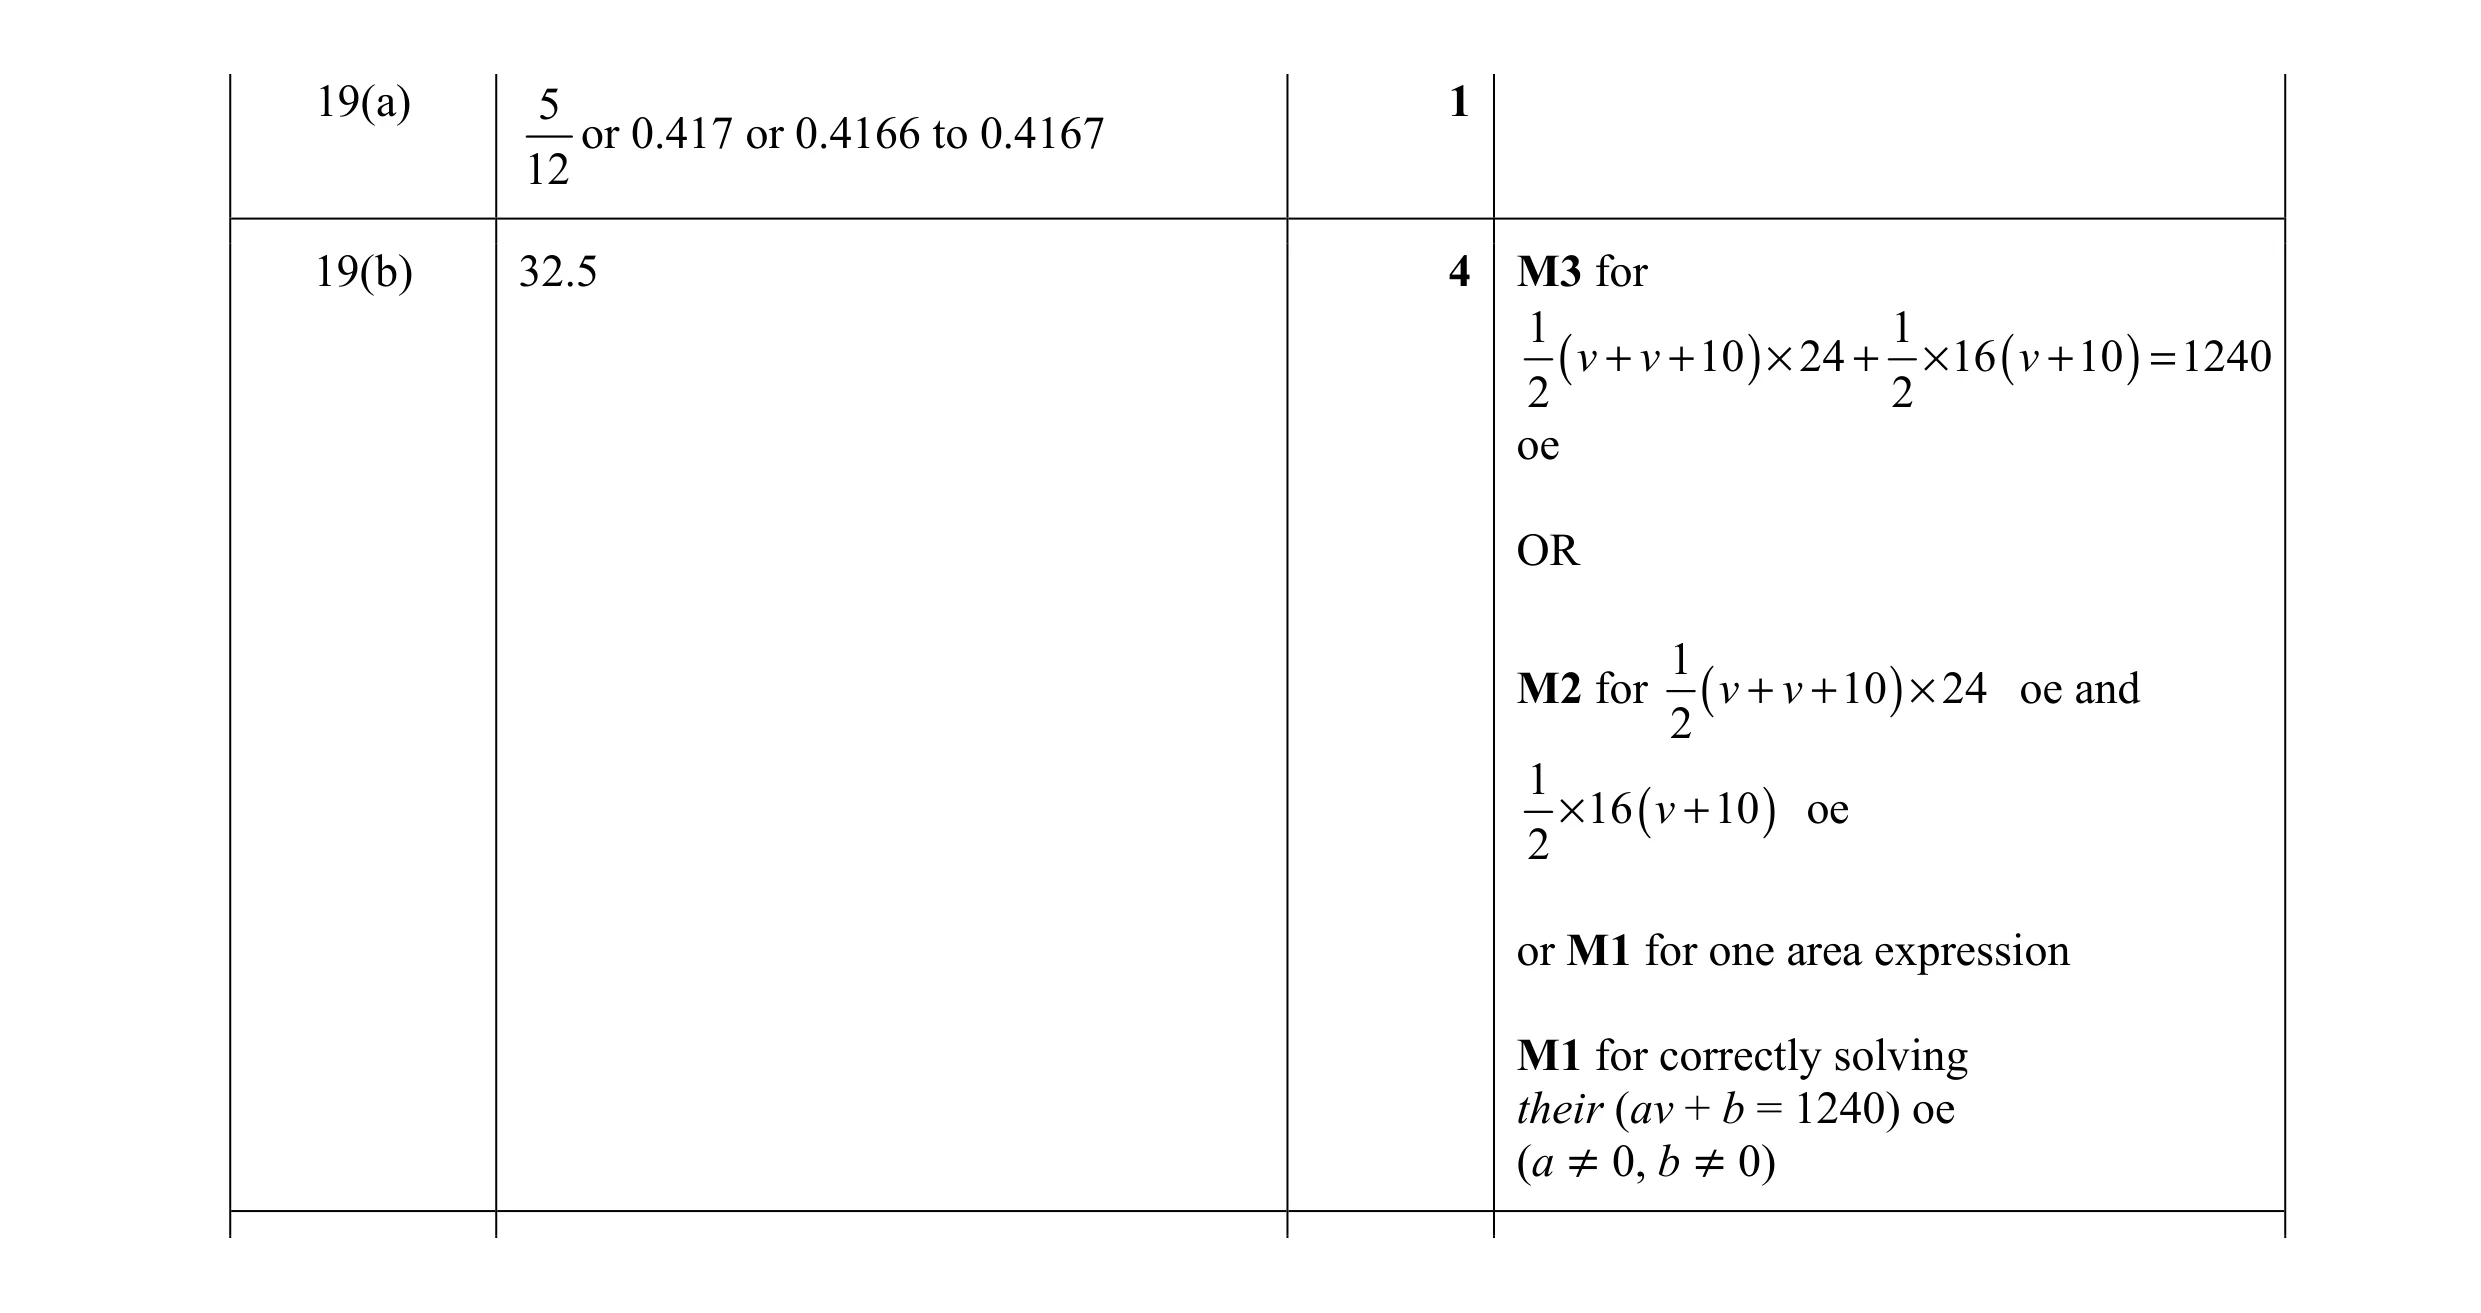 5
5 2
2 3
3 3
3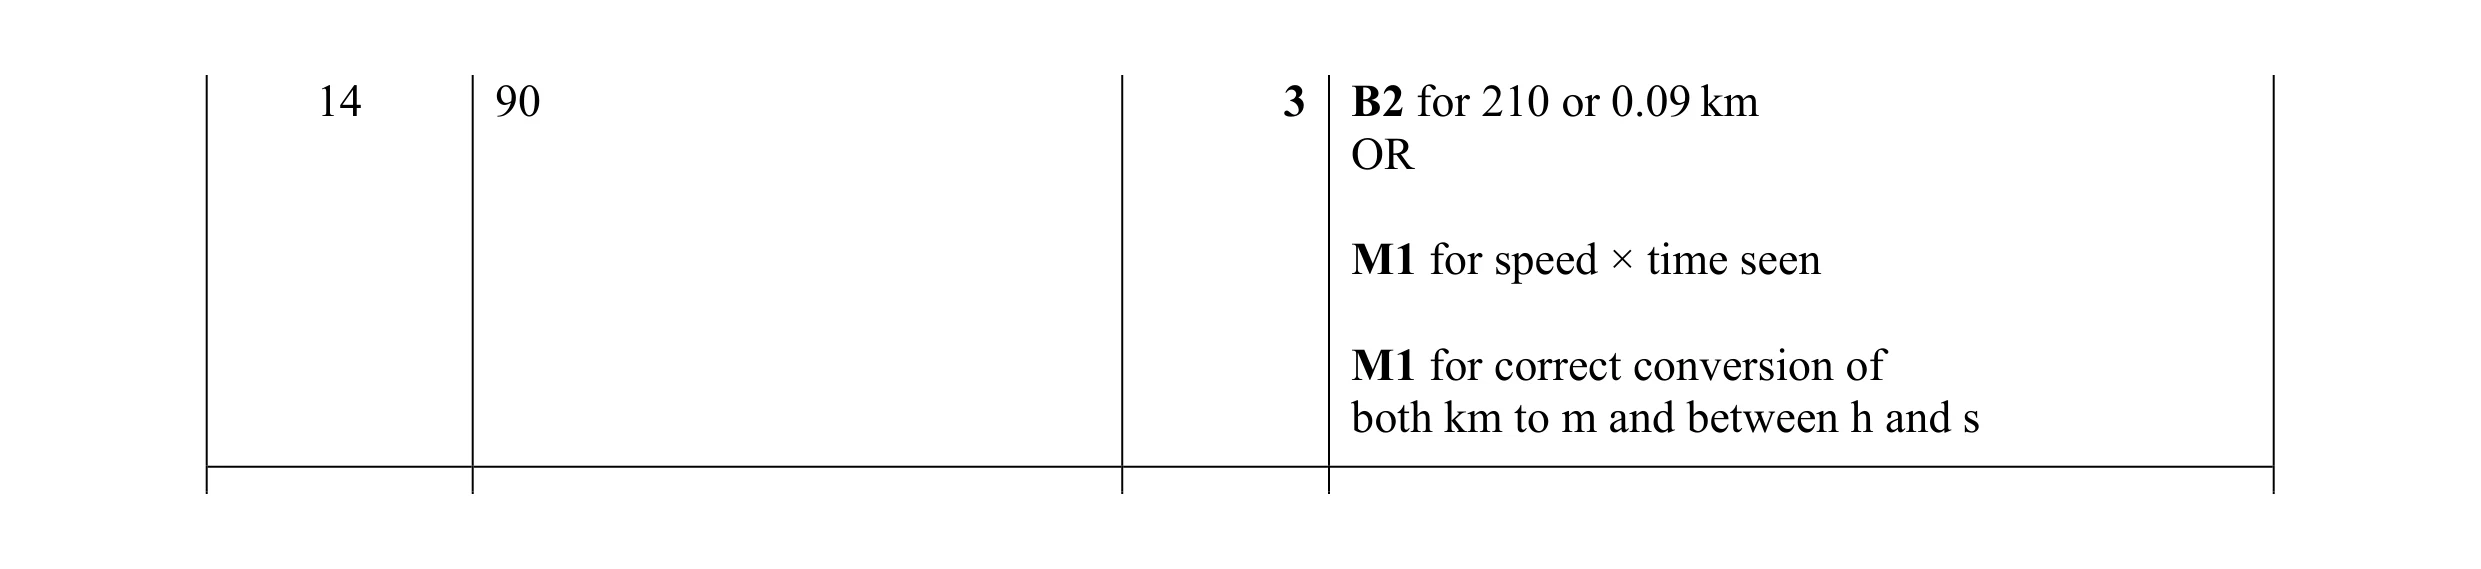 3
3 3
3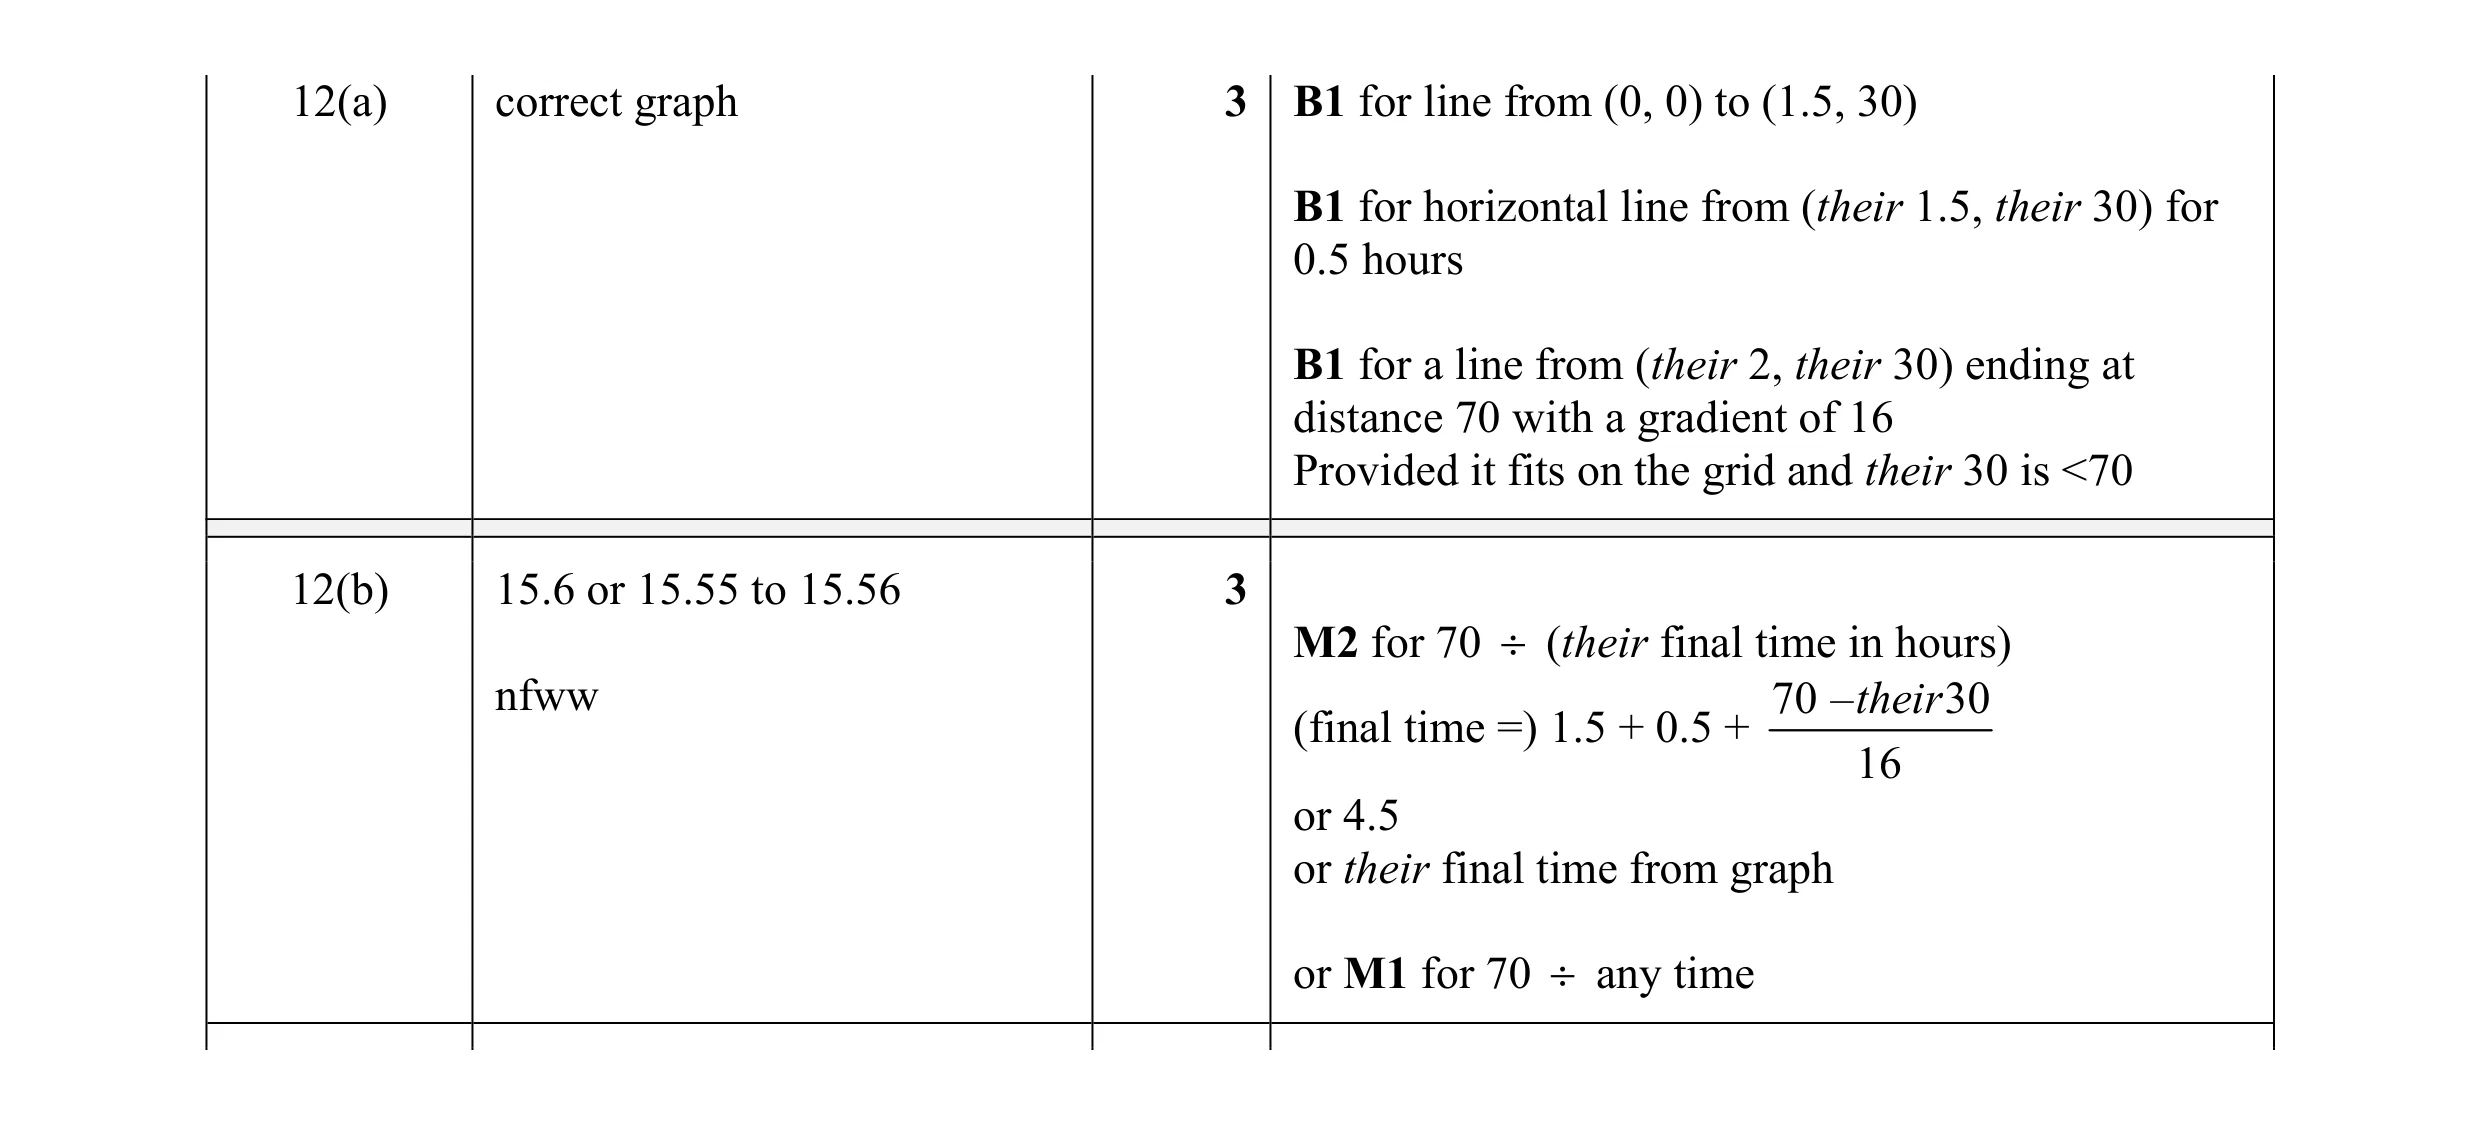 6
6 2
2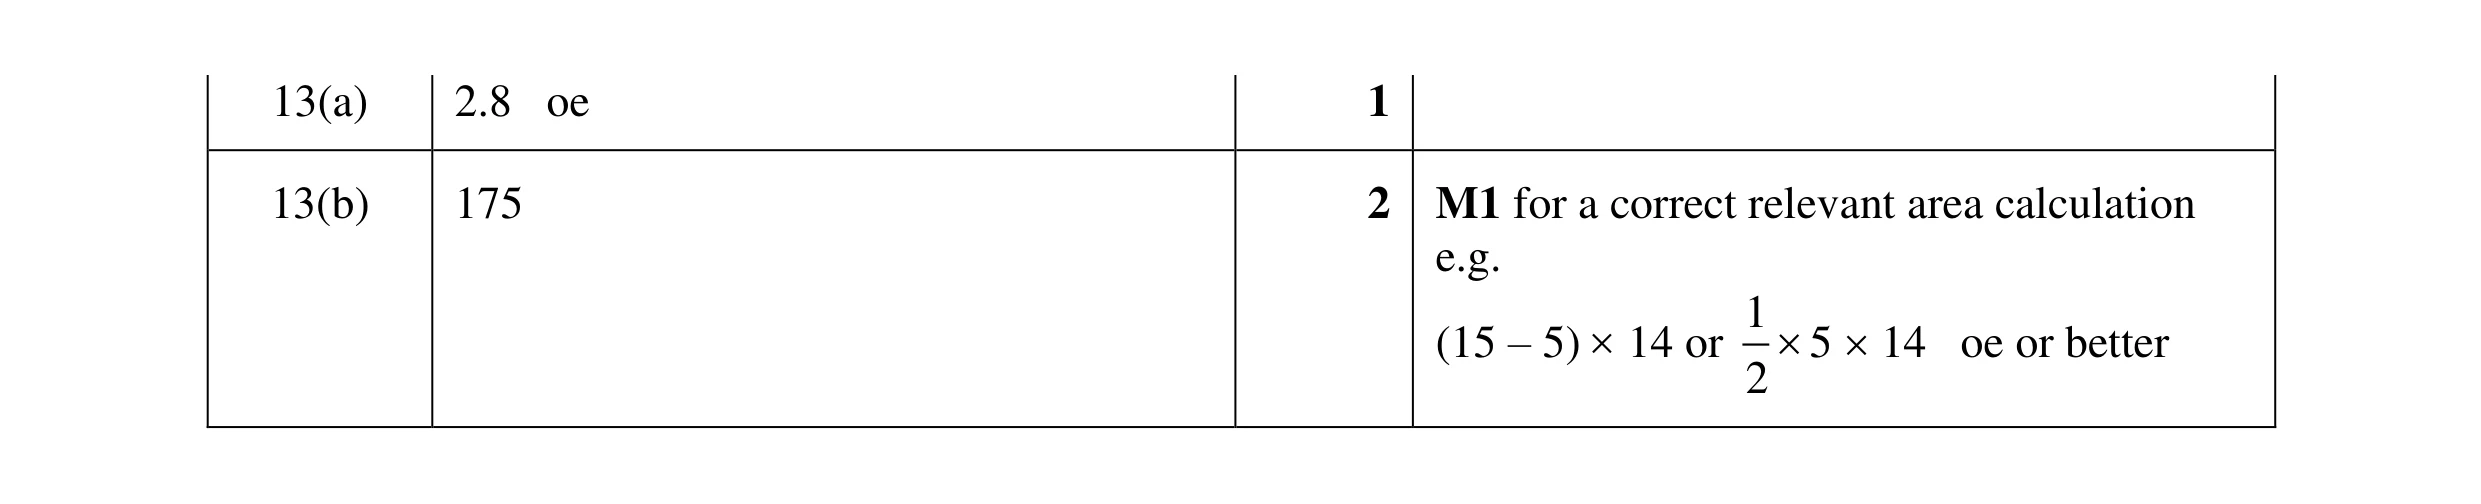 3
3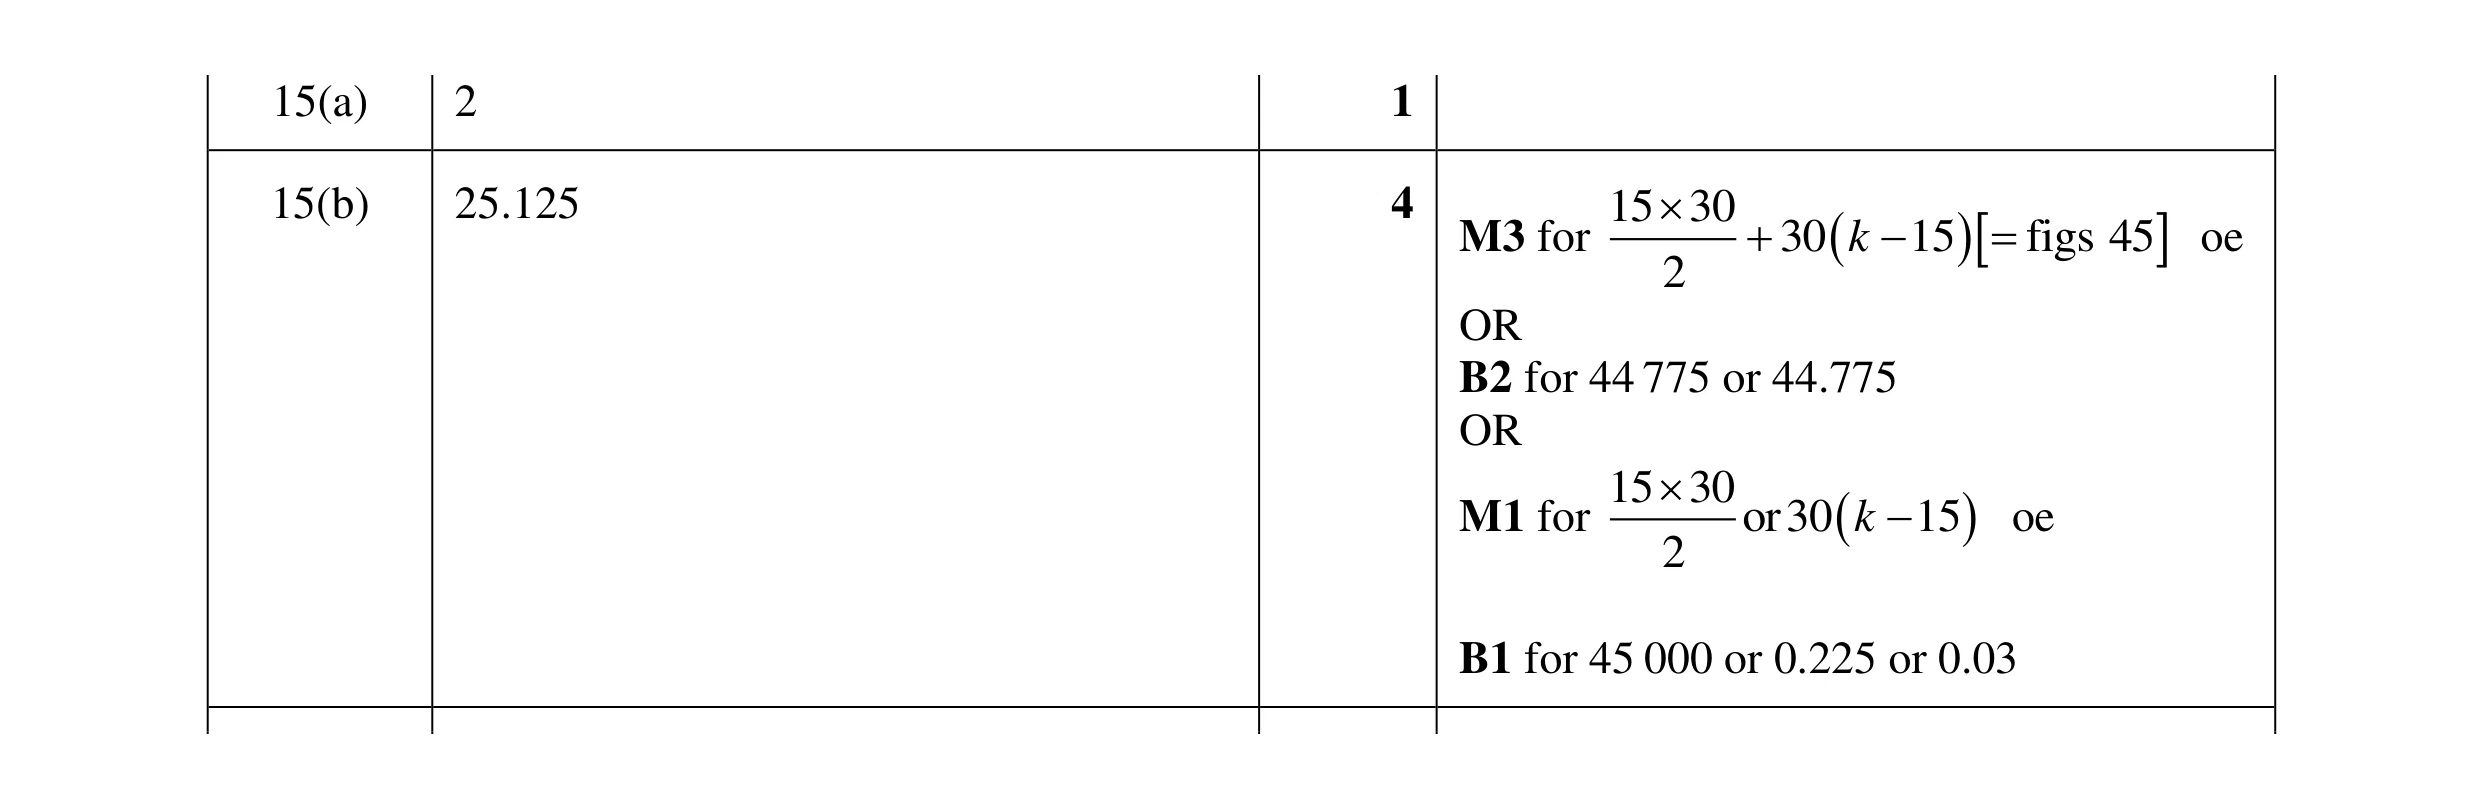 5
5 2
2 3
3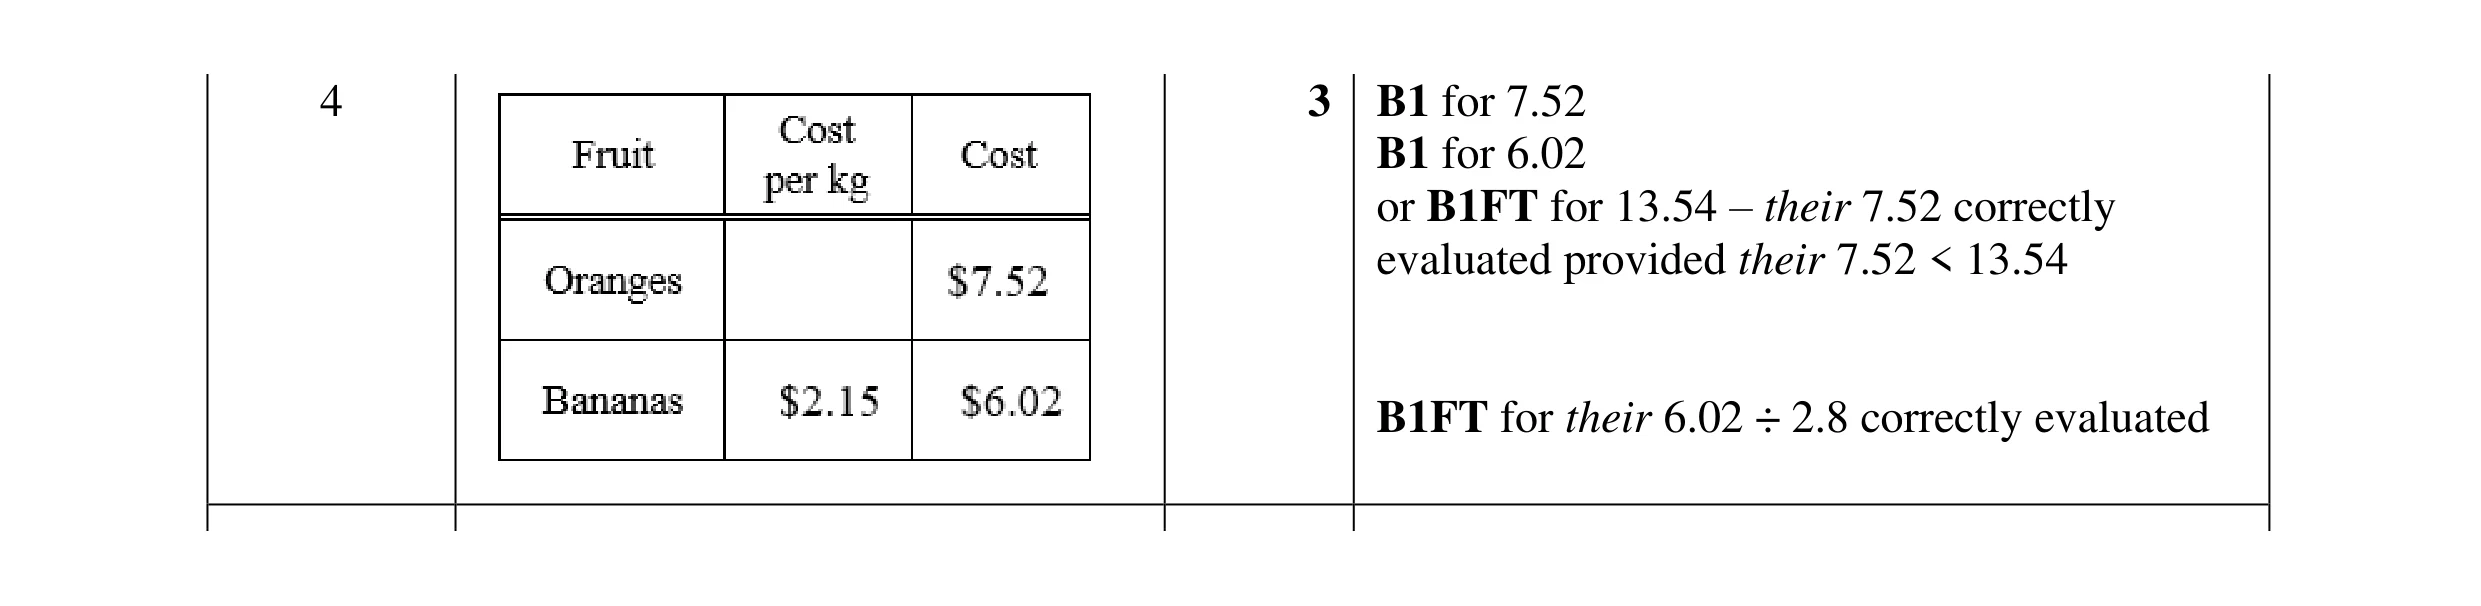 3
3 3
3 2
2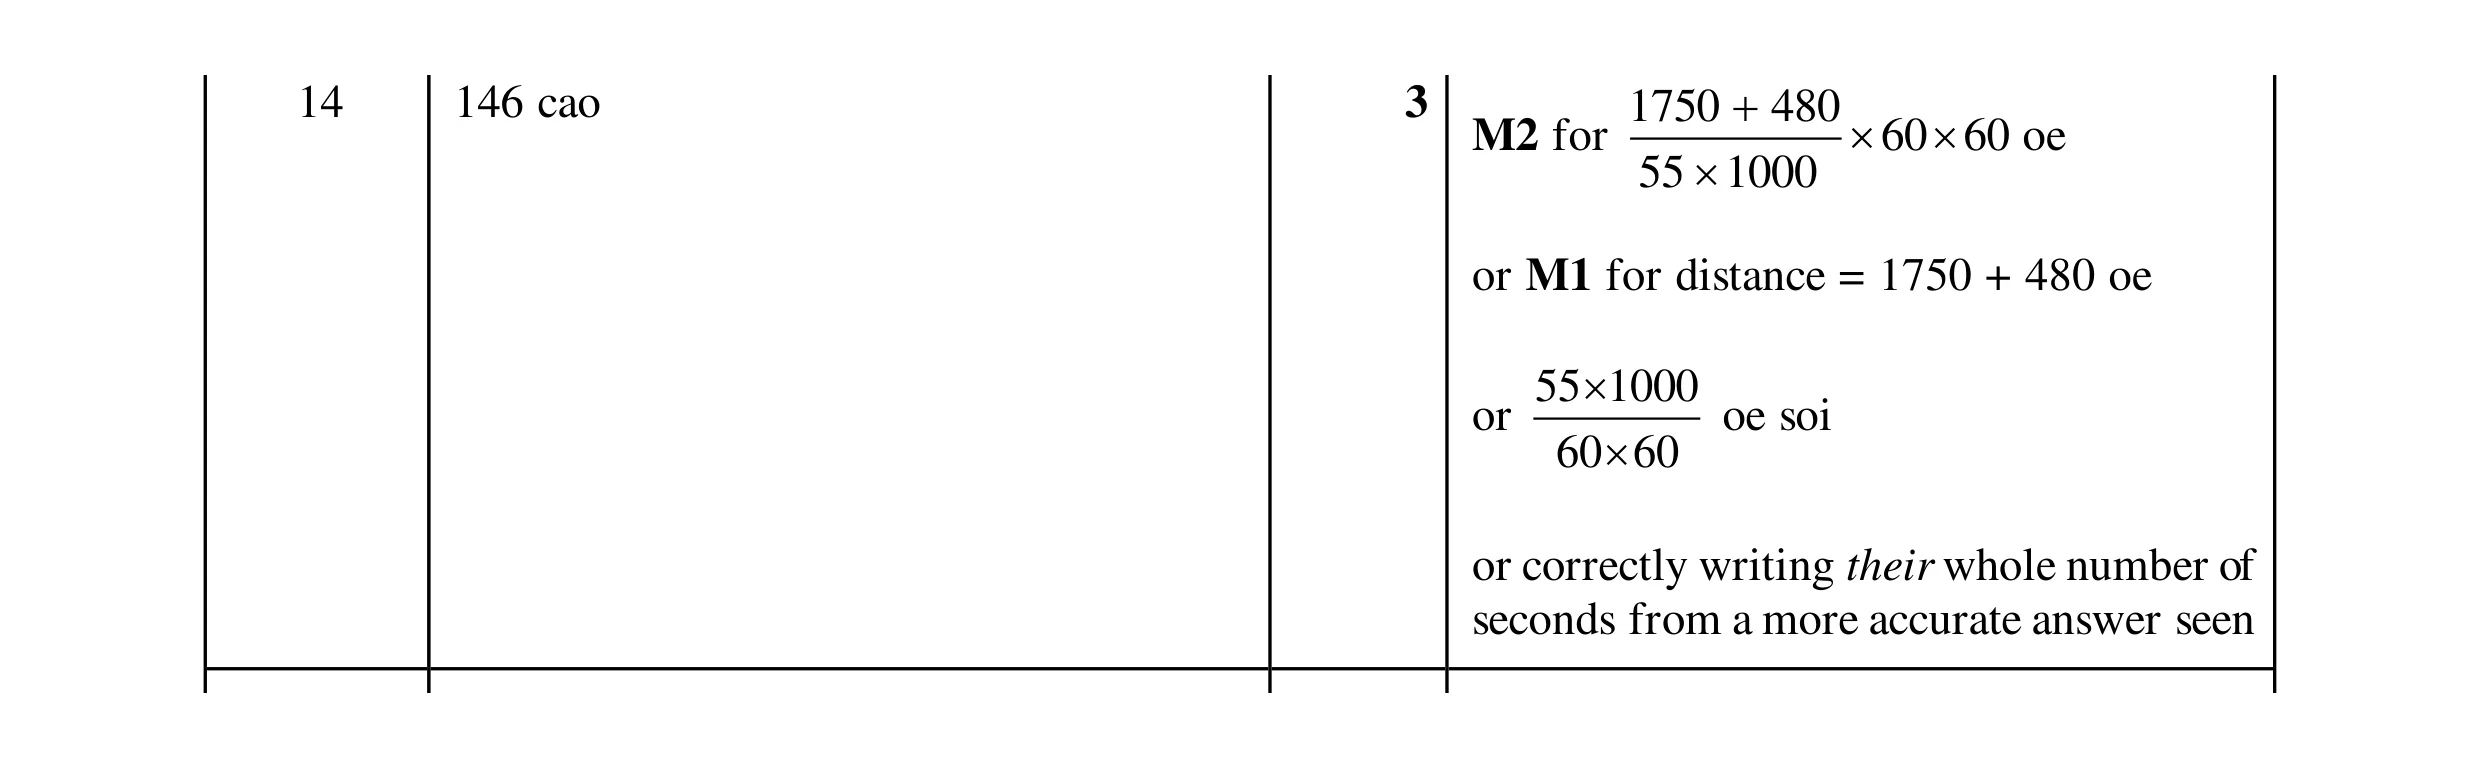 3
3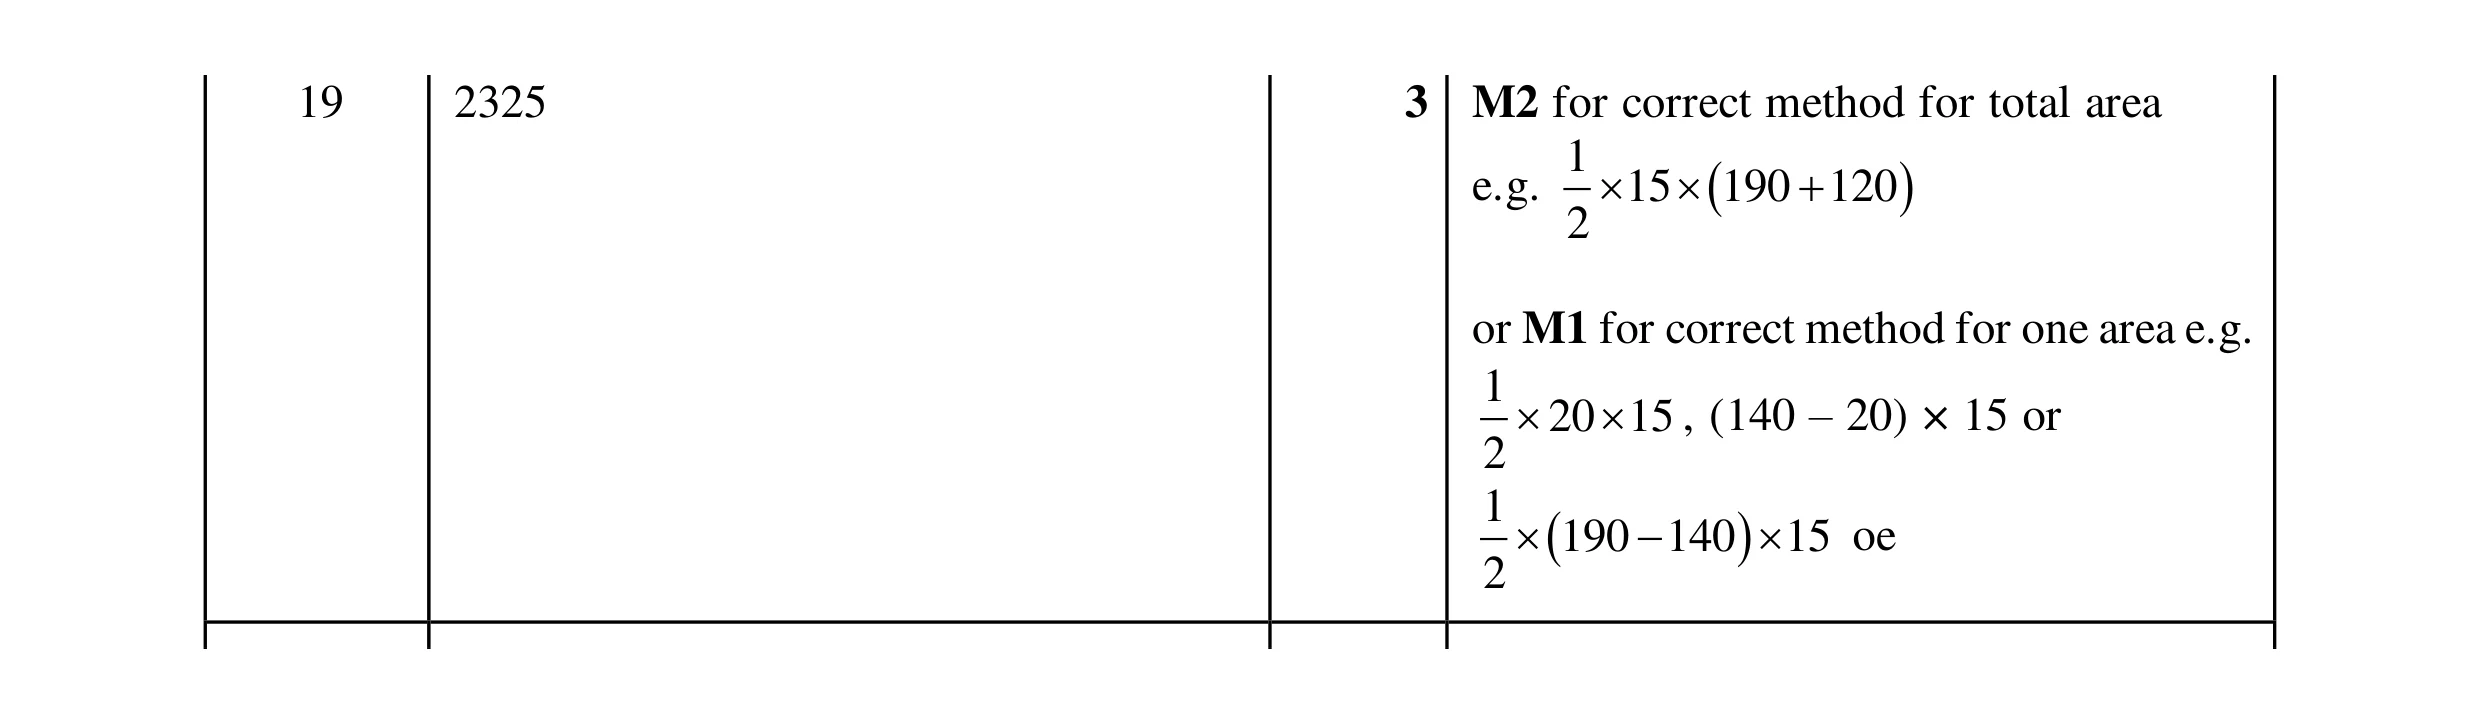 3
3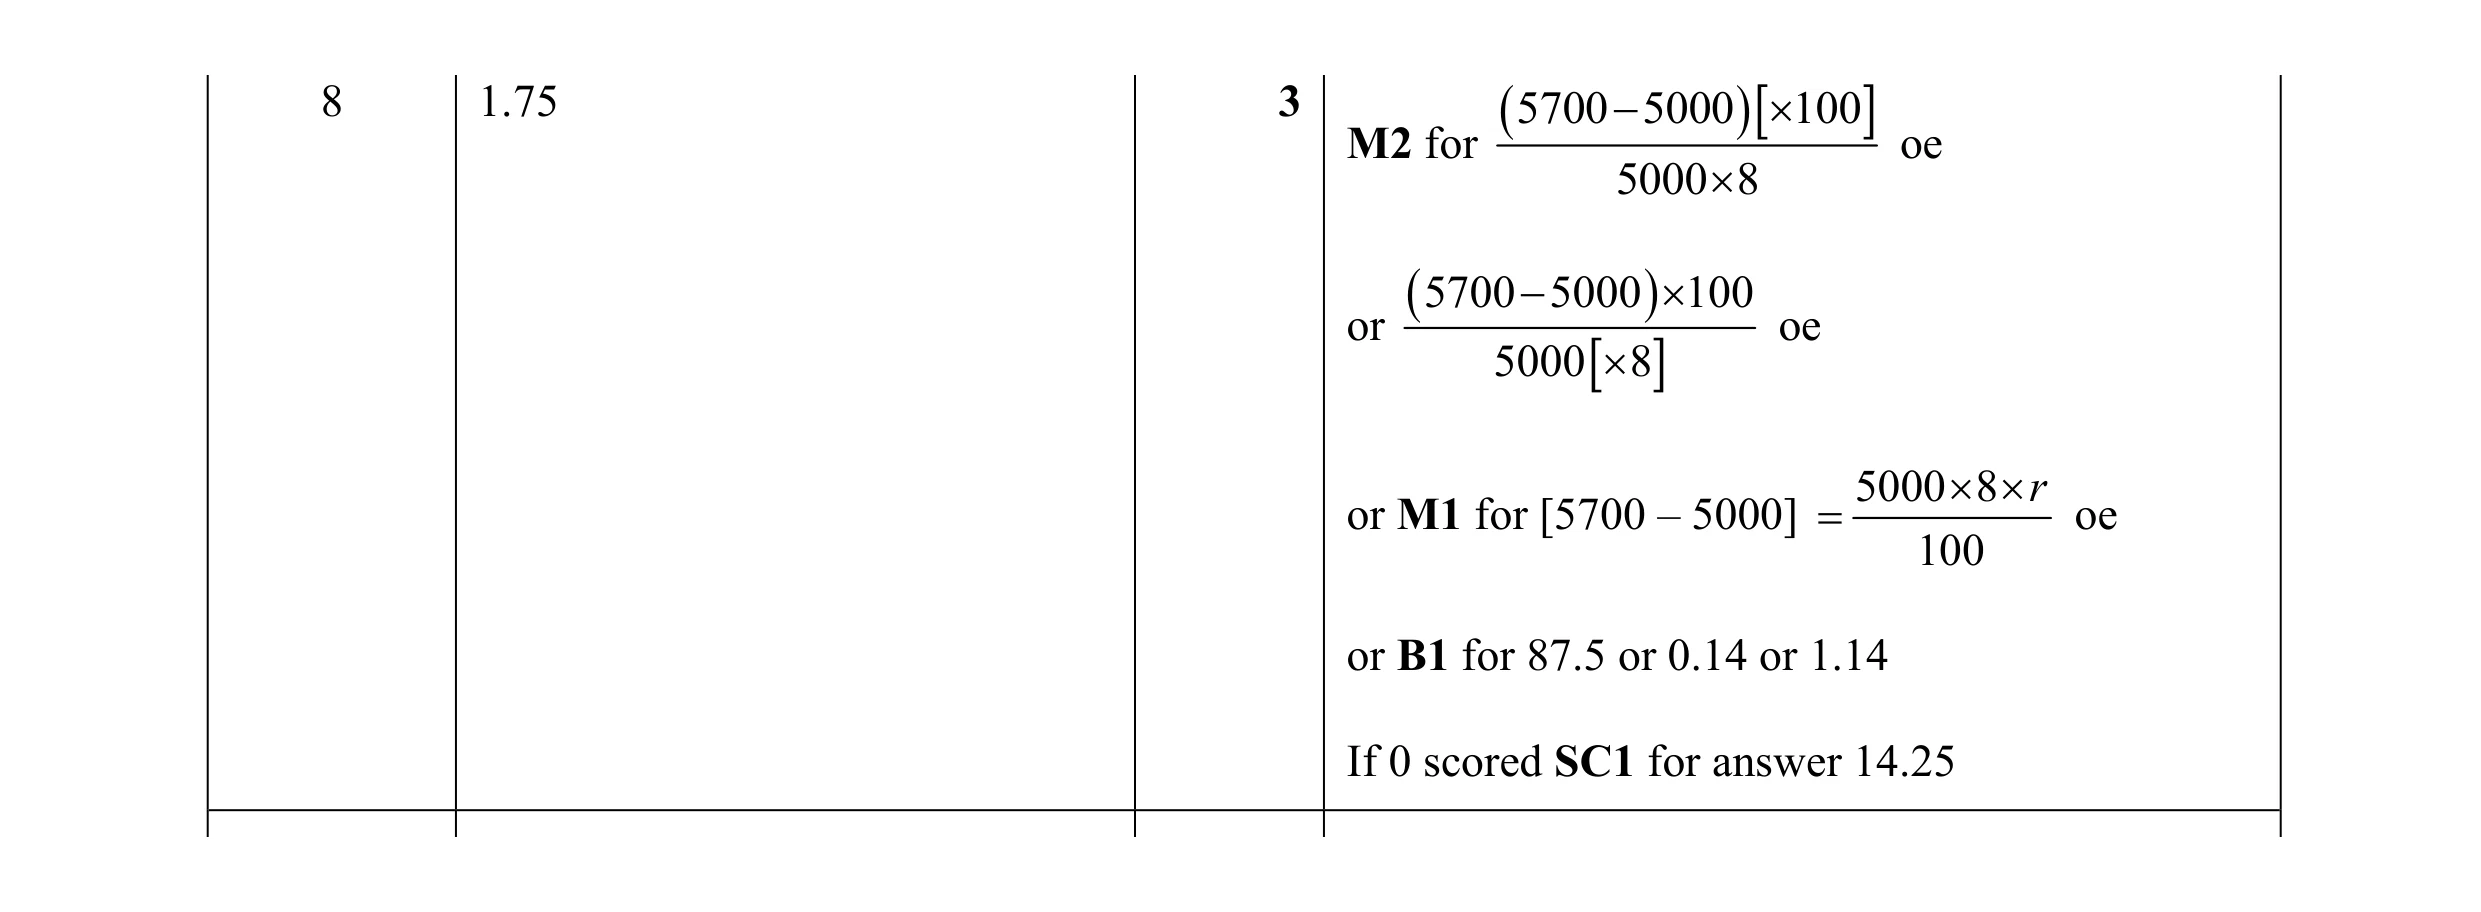 3
3 4
4 2
2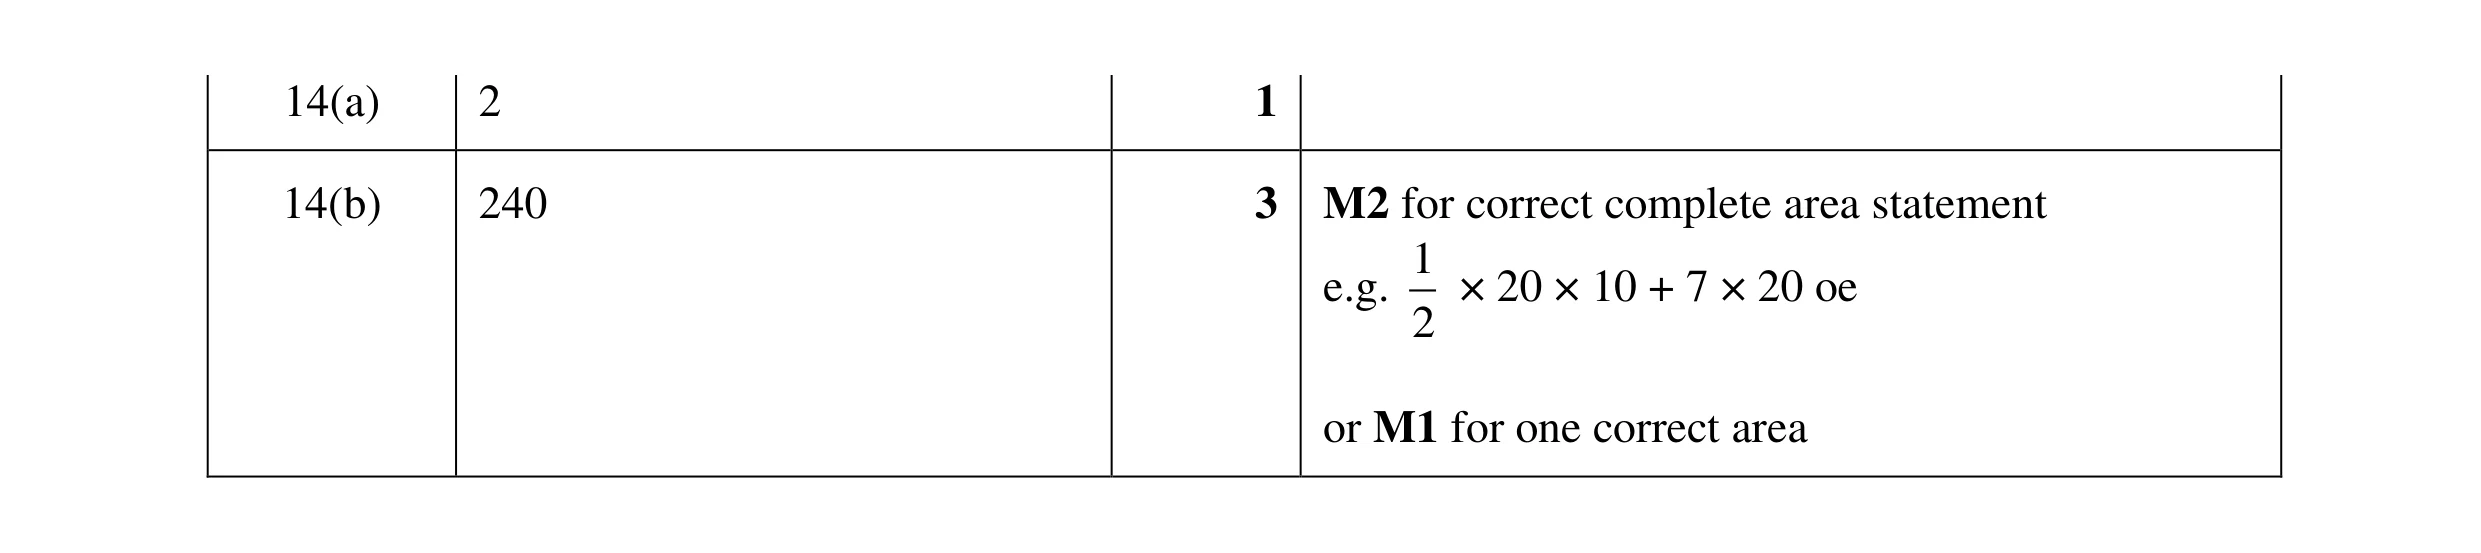 4
4 1
1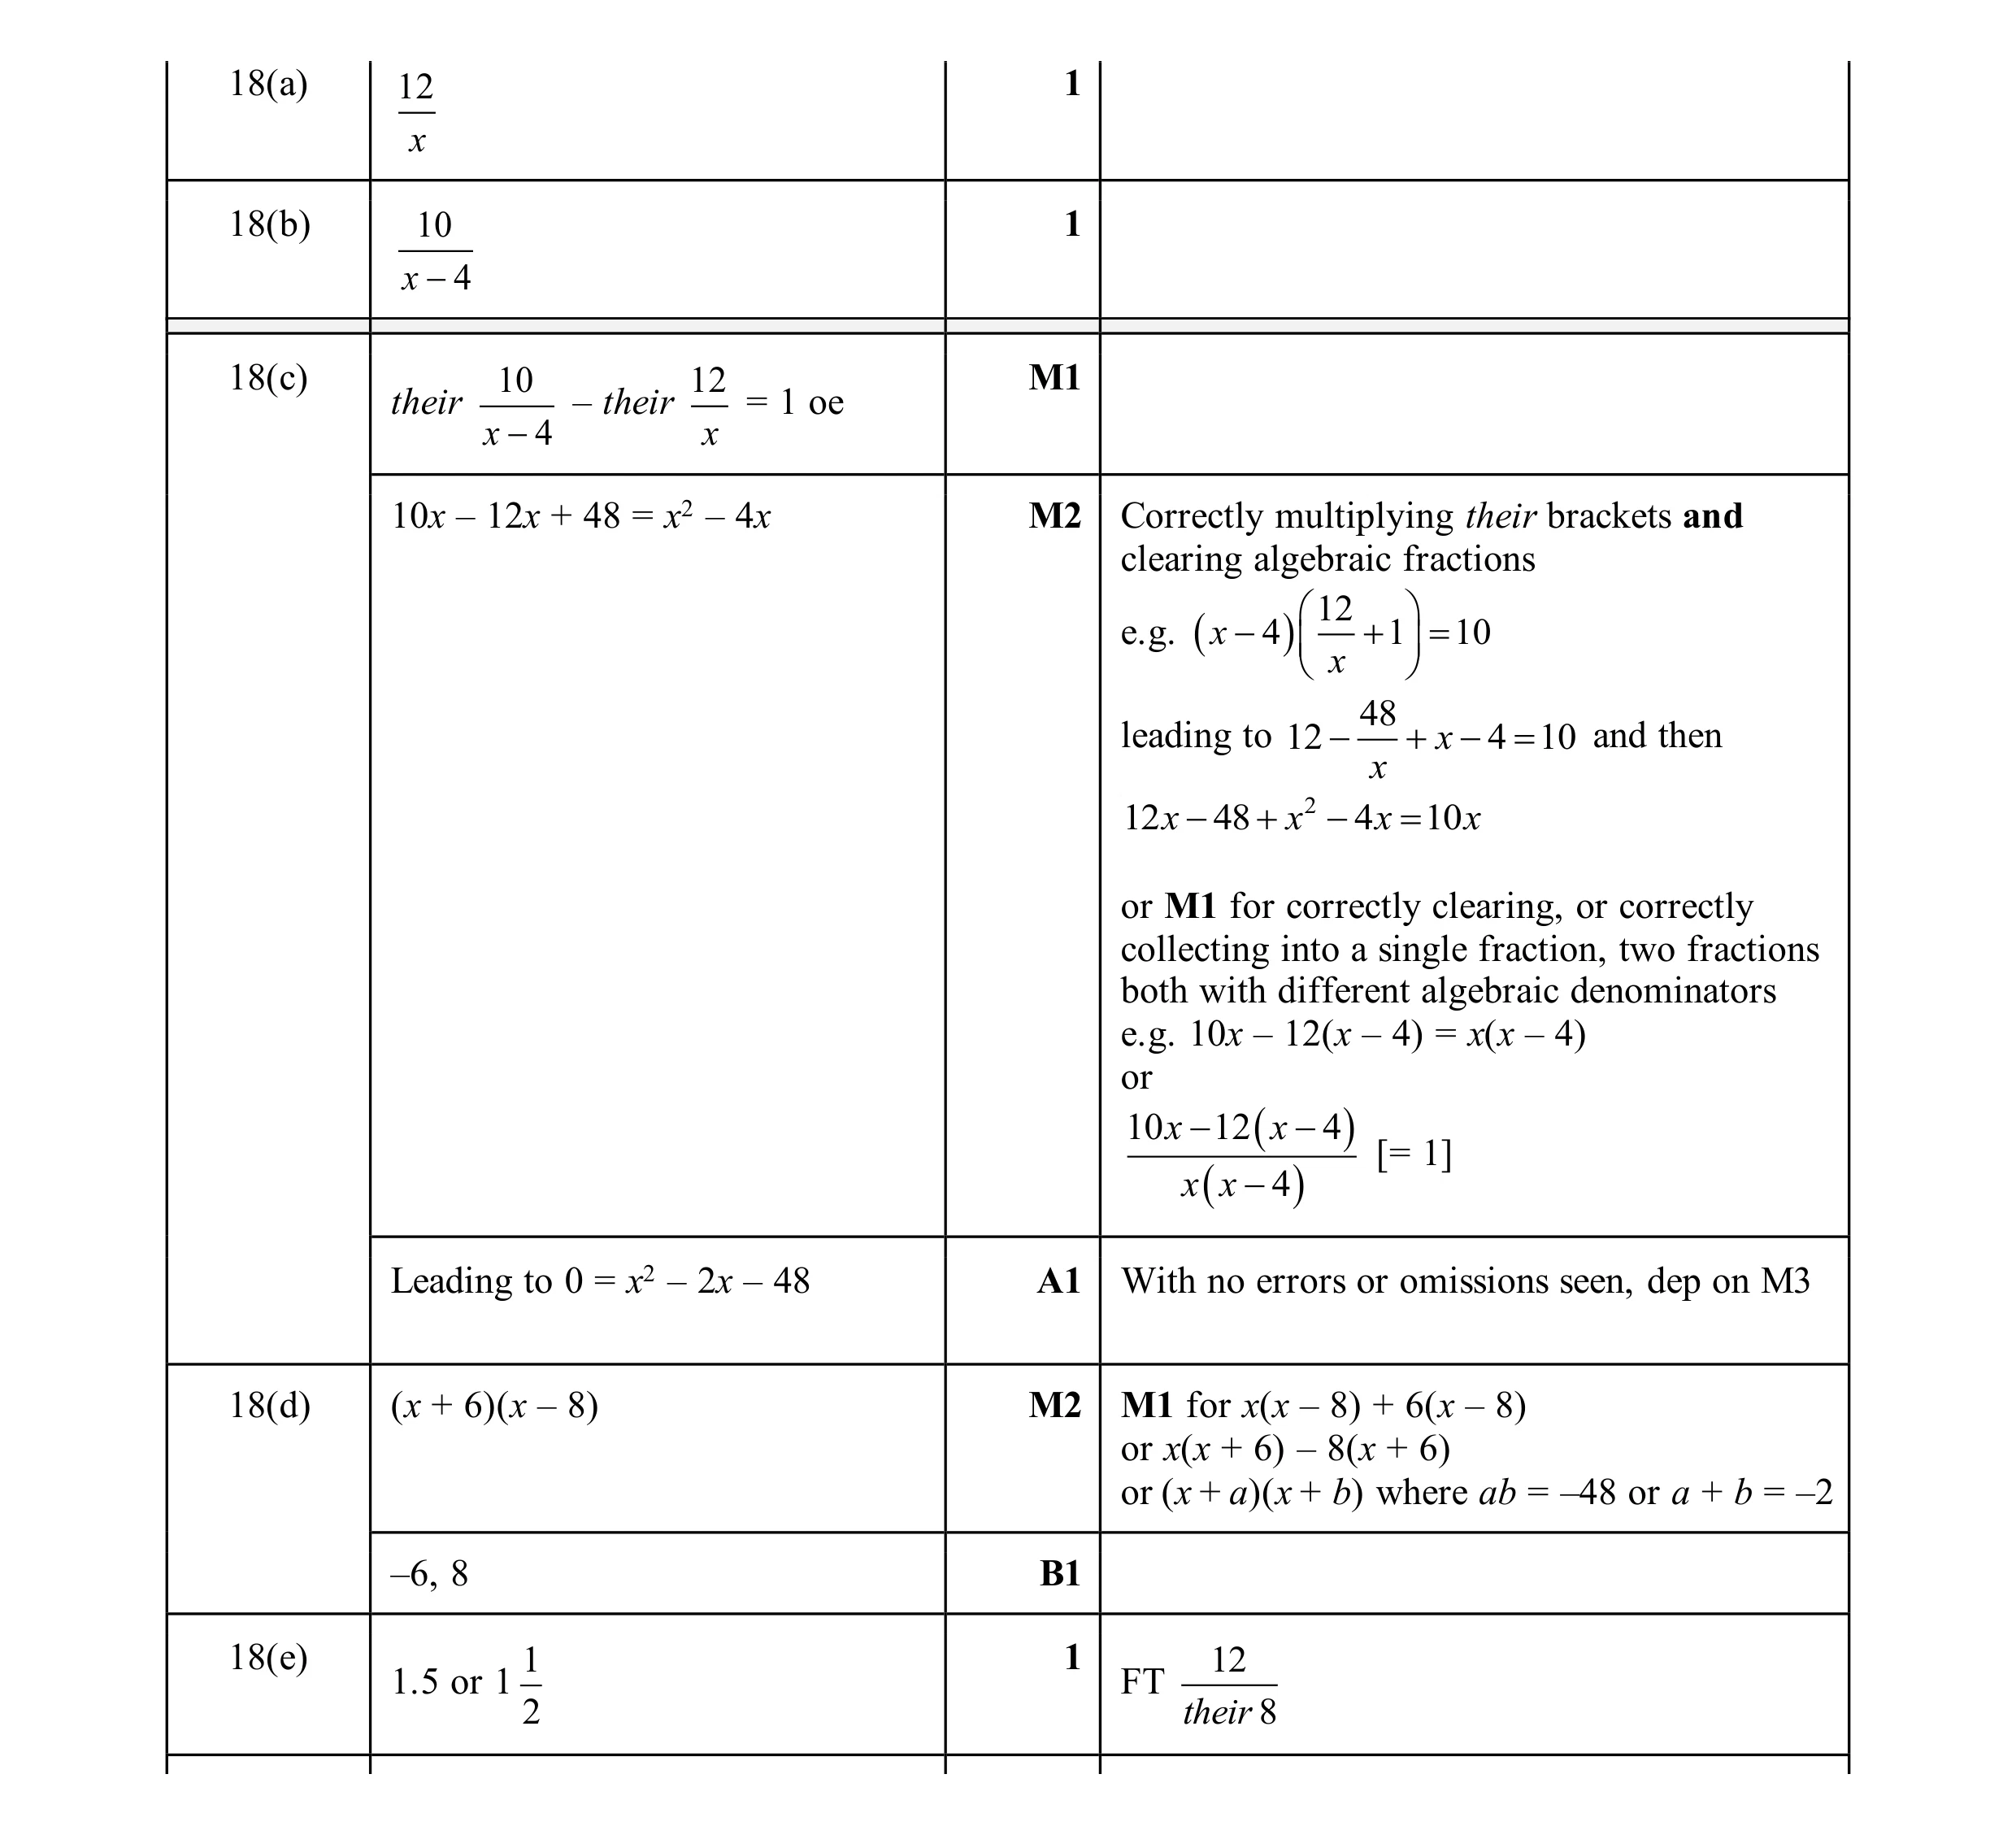 10
10