Cambridge IGCSE Mathematics 0580 — 2018 May/June Paper 2 · Variant 2
0580/22/M/J/18 · 25 questions · 70 marks · ≈79 min
The question paper and its mark scheme, free to read here and free to download. This is Cambridge’s own paper, exactly as it was sat.
Question paper16 pages
Mark scheme5 pages
Answers below. Sit the paper first if you are practising.
Questions as text
Q1 · One morning, Marcia works from 08 20 to 11 15
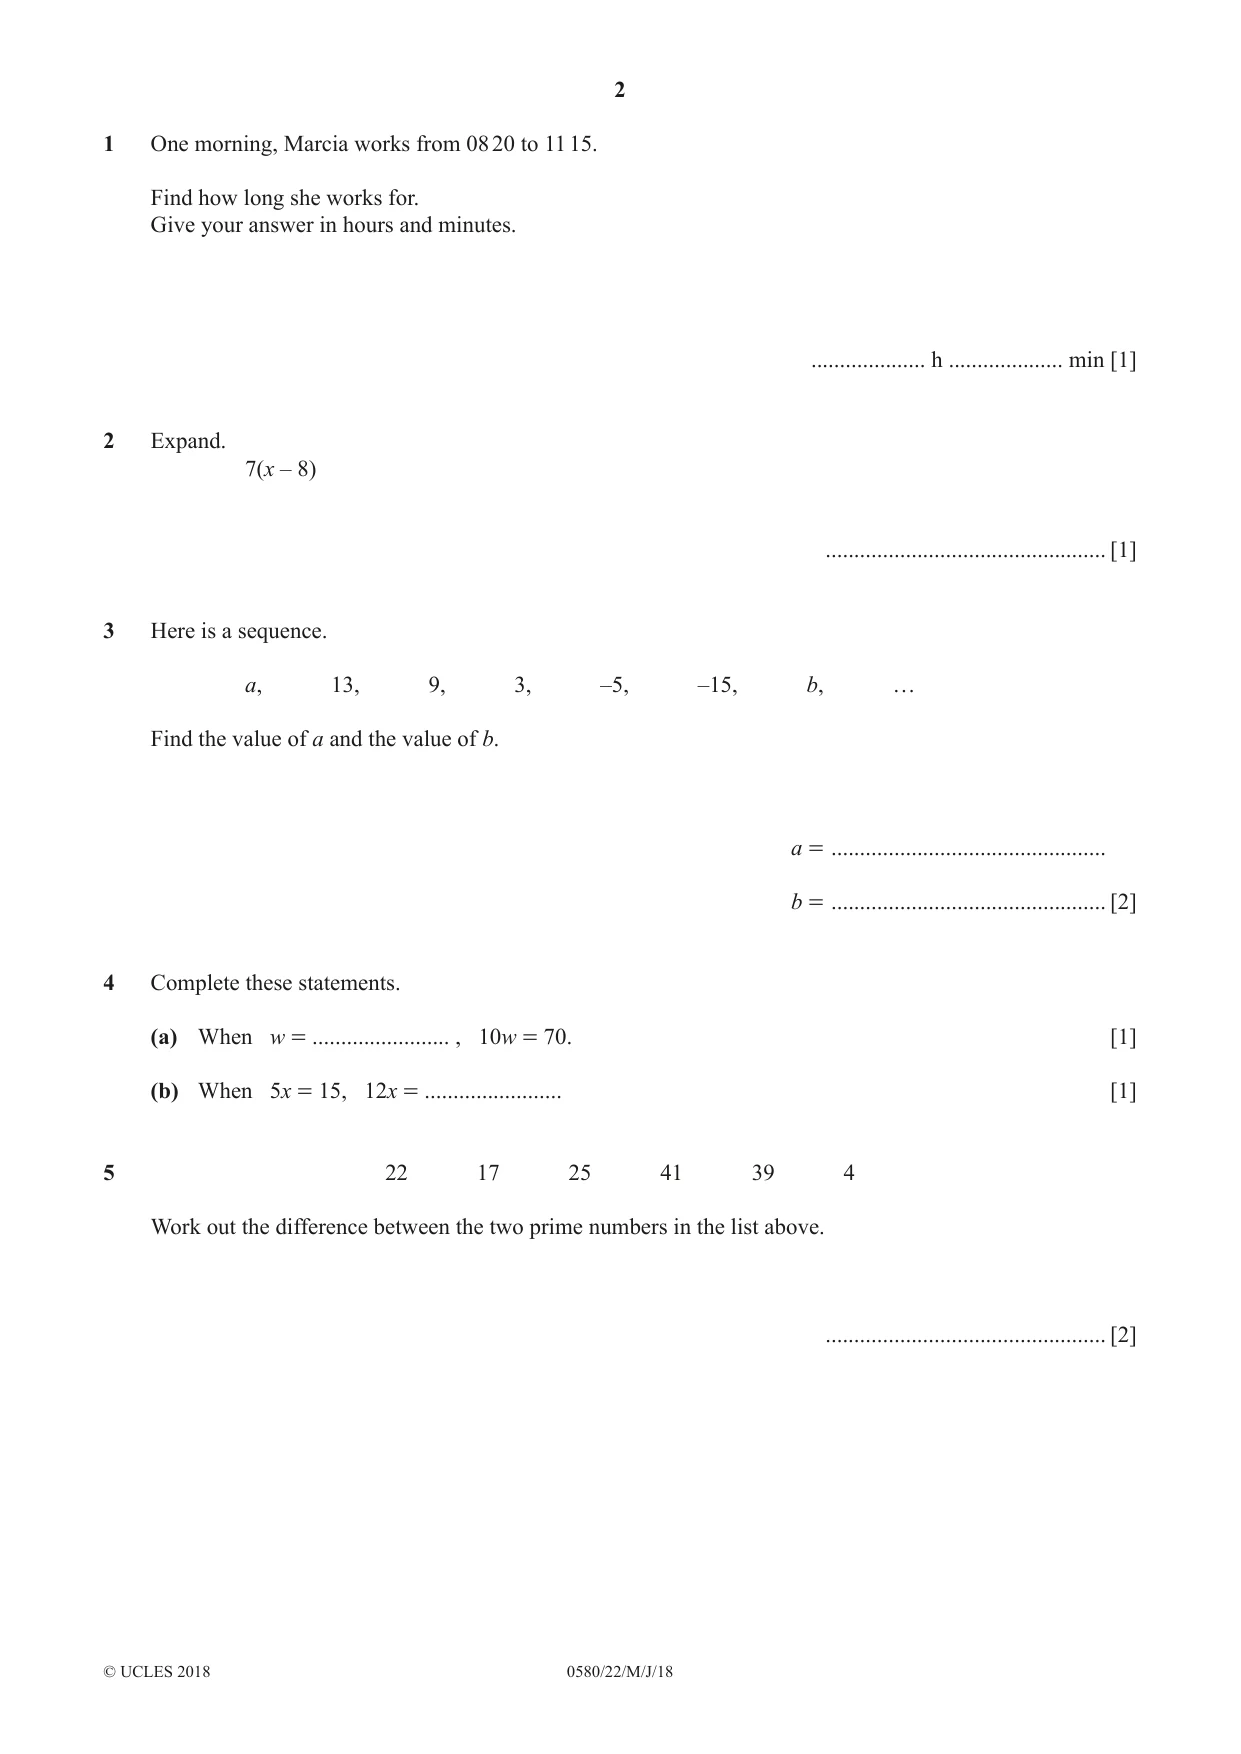
1 One morning, Marcia works from 08 20 to 11 15. Find how long she works for. Give your answer in hours and minutes. .................... h .................... min [1]
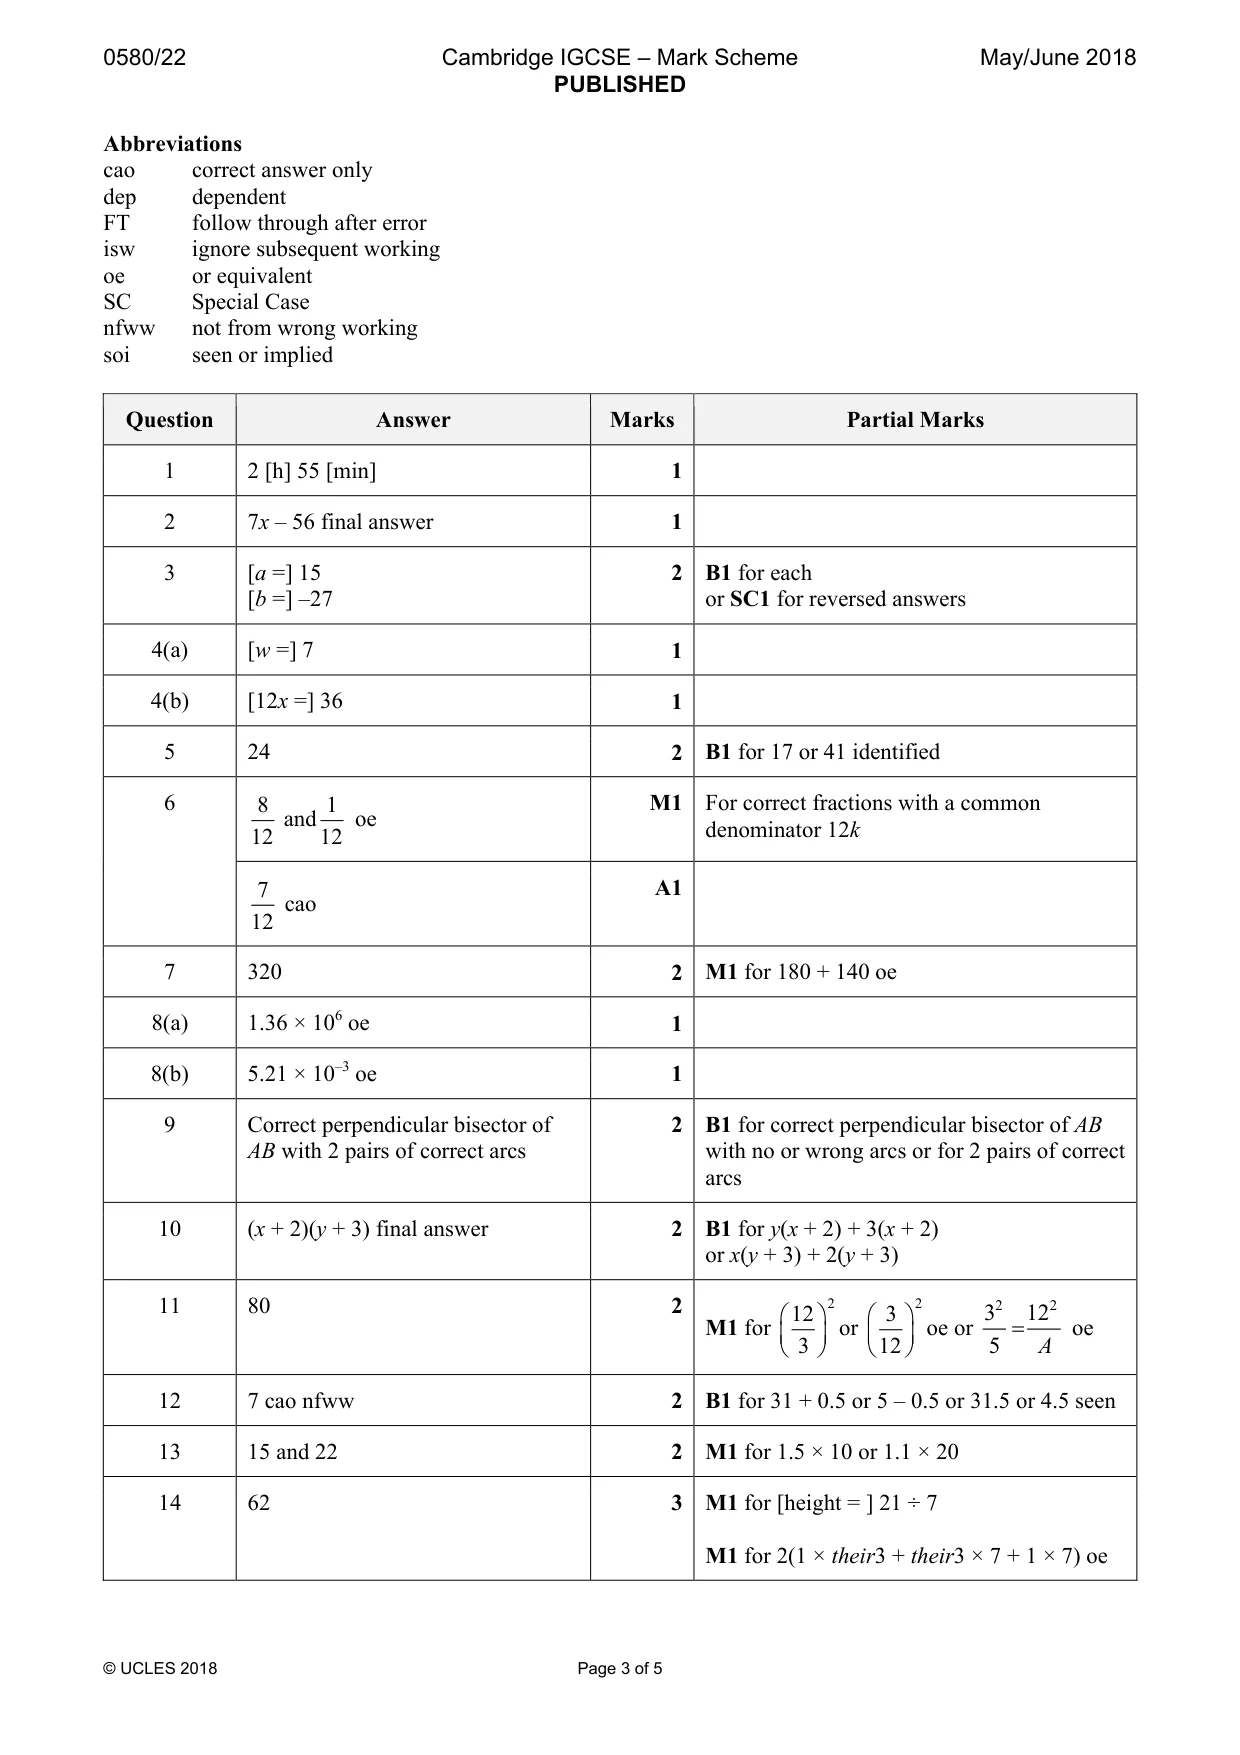
Mark scheme: Question Answer Marks Partial Marks 1 2 [h] 55 [min] 1
Question 2
2 Expand. 7(x – 8) ................................................. [1]
Mark scheme: 2 7x – 56 final answer 1
Q3 · Here is a sequence
3 Here is a sequence. a, 13, 9, 3, –5, –15, b, … Find the value of a and the value of b. a = ................................................ b = ................................................ [2]
Mark scheme: 3 [a =] 15 2 B1 for each [b =] –27 or SC1 for reversed answers
Question 4
4 Complete these statements. (a) When w = ........................ , 10w = 70. [1] (b) When 5x = 15, 12x = ........................ [1]
Mark scheme: 4(a) [w =] 7 1 4(b) [12x =] 36 1
Q5 · 22 17 25 41 39 4 Work out the difference between the two prime numbers in the list above
5 22 17 25 41 39 4 Work out the difference between the two prime numbers in the list above. ................................................. [2]
Mark scheme: 5 24 2 B1 for 17 or 41 identified
Q6 · 16 Without using your calculator, work out -
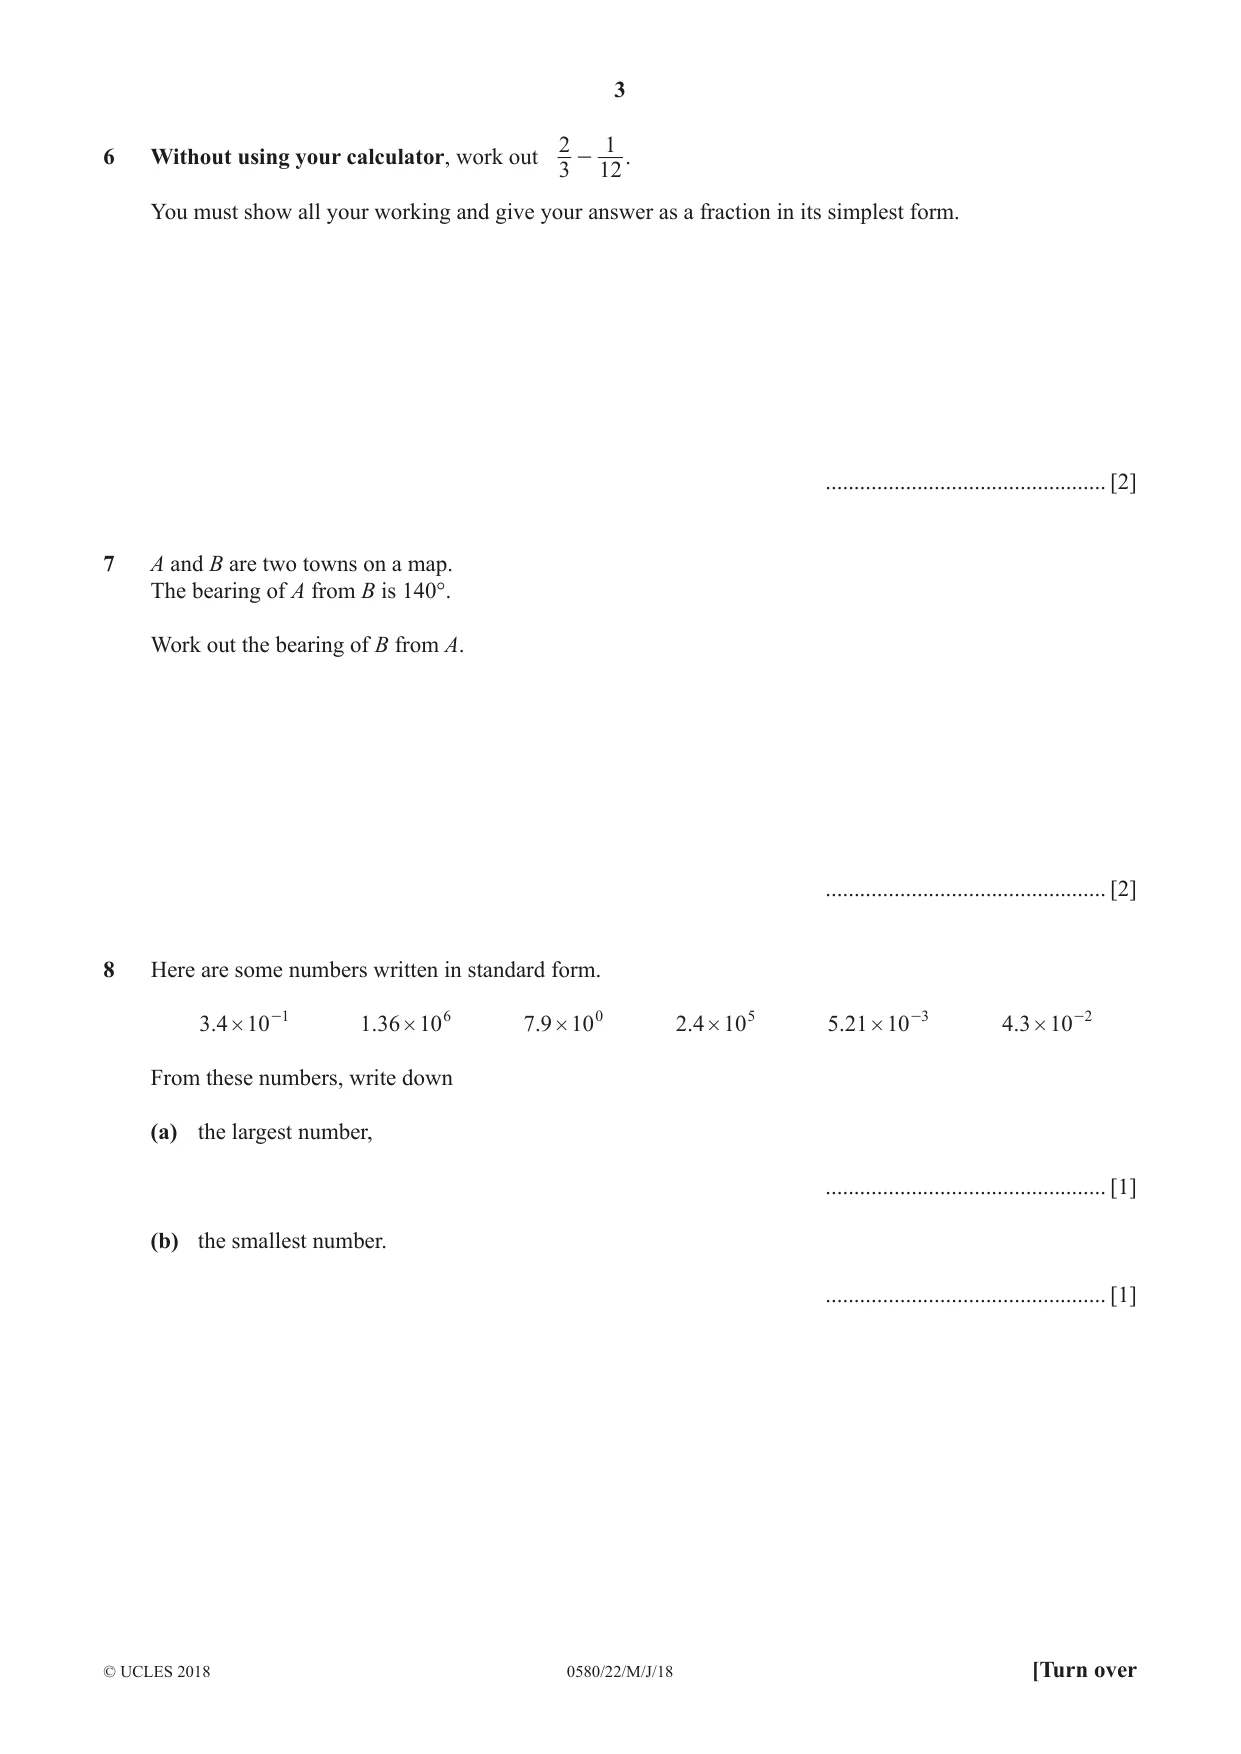
2 16 Without using your calculator, work out - . 3 12 You must show all your working and give your answer as a fraction in its simplest form. ................................................. [2]
Mark scheme: 6 8 1 M1 For correct fractions with a common and oe denominator 12k 12 12 7 A1 cao 12
Q7 · A and B are two towns on a map
7 A and B are two towns on a map. The bearing of A from B is 140°. Work out the bearing of B from A. ................................................. [2]
Mark scheme: 7 320 2 M1 for 180 + 140 oe
Q8 · Here are some numbers written in standard form
8 Here are some numbers written in standard form. .34 # 10 -1 .136 # 106 .79 # 100 .24 # 105 .521 # 10 -3 .43 # 10 -2 From these numbers, write down (a) the largest number, ................................................. [1] (b) the smallest number. ................................................. [1]
Mark scheme: 8(a) 1.36 × 10⁶ oe 1 8(b) 5.21 × 10⁻³ oe 1
Q9 · Using a straight edge and compasses only, construct the locus of points that are…
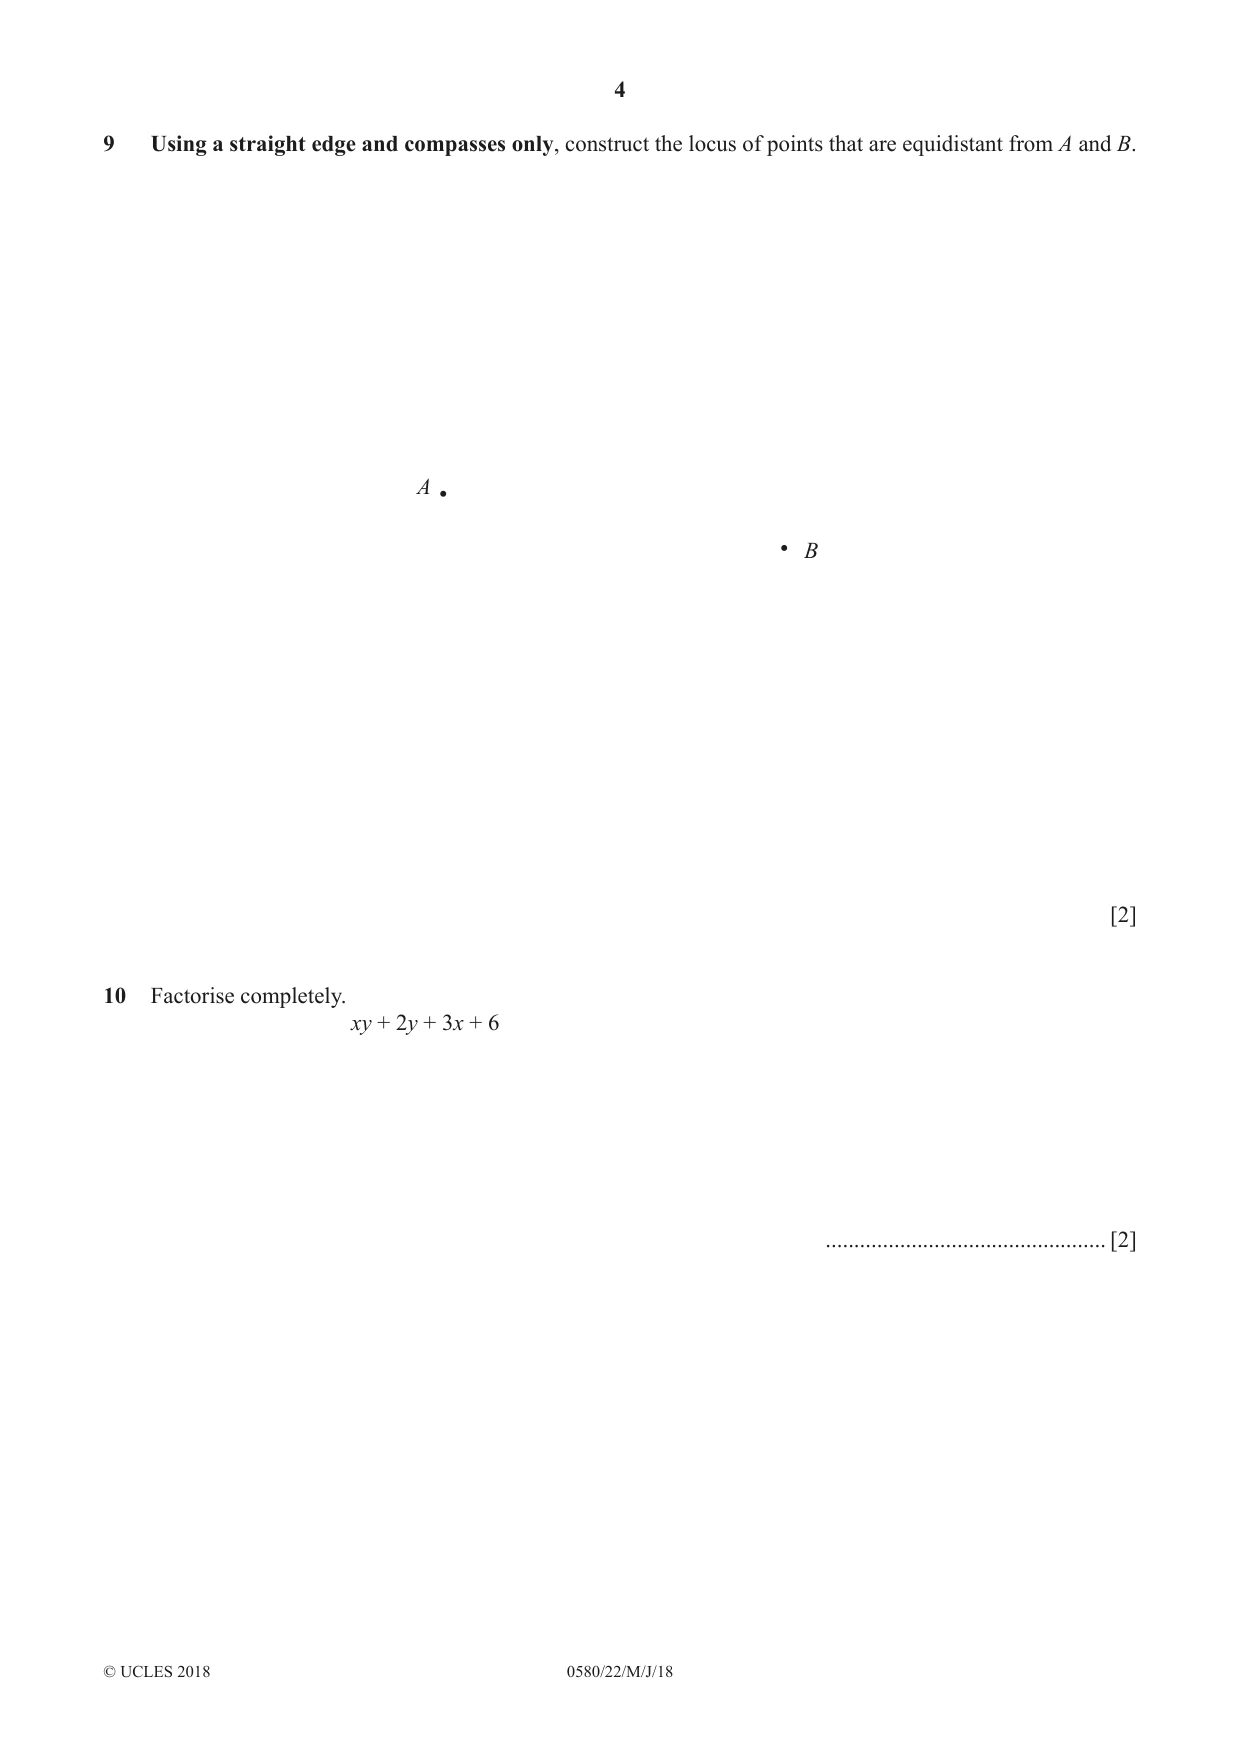
9 Using a straight edge and compasses only, construct the locus of points that are equidistant from A and B. A B [2]
Mark scheme: 9 Correct perpendicular bisector of 2 B1 for correct perpendicular bisector of AB AB with 2 pairs of correct arcs with no or wrong arcs or for 2 pairs of correct arcs
Question 10
10 Factorise completely. xy + 2y + 3x + 6 ................................................. [2]
Mark scheme: 10 (x + 2)(y + 3) final answer 2 B1 for y(x + 2) + 3(x + 2) or x(y + 3) + 2(y + 3)
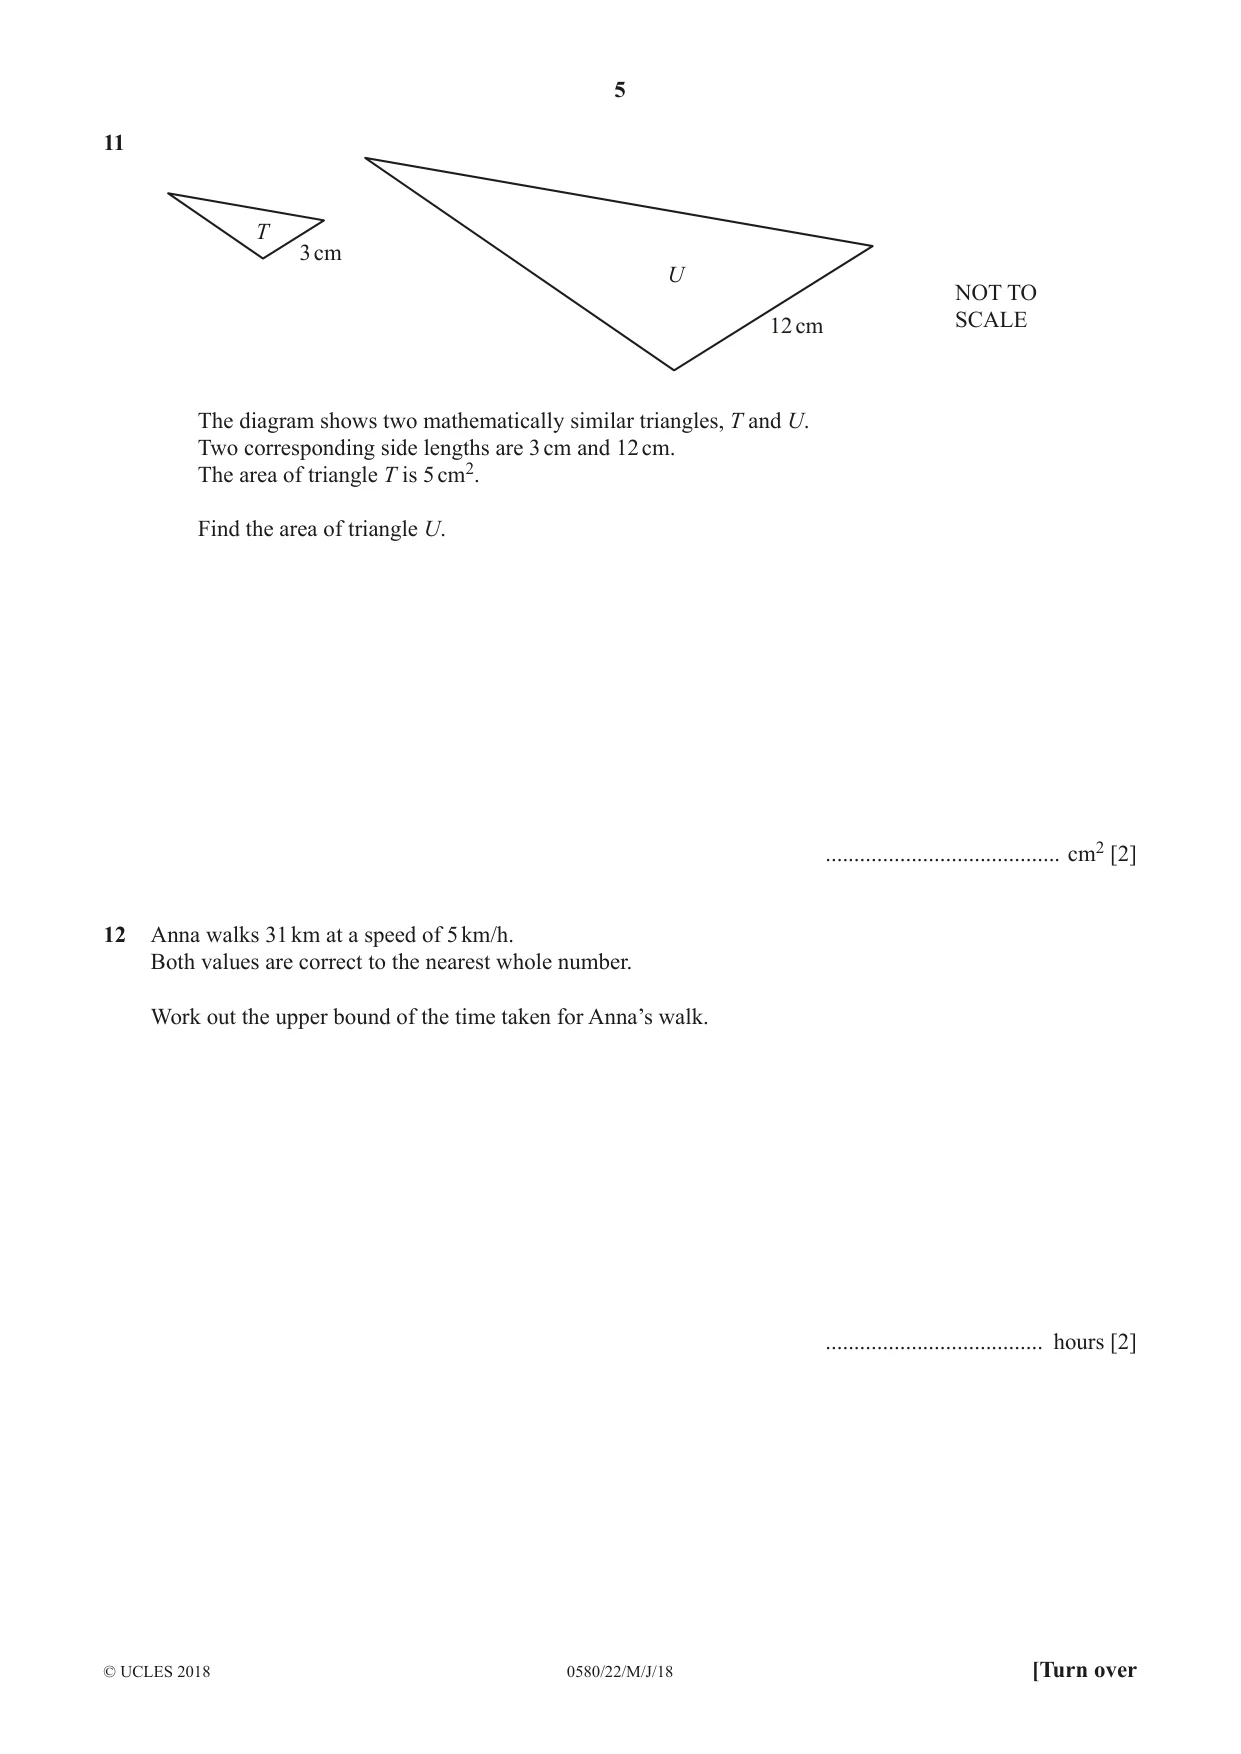
Q11 · T 3 cm U NOT TO 12 cm SCALE The diagram shows two mathematically similar triangles, T and…
11 T 3 cm U NOT TO 12 cm SCALE The diagram shows two mathematically similar triangles, T and U. Two corresponding side lengths are 3 cm and 12 cm. The area of triangle T is 5 cm2. Find the area of triangle U. ......................................... cm2 [2]
Mark scheme: 11 80 2 2 2 2 2 12 3 3 12 M1 for or oe or = oe 3 12 5 A
Q12 · Anna walks 31 km at a speed of 5 km/h
12 Anna walks 31 km at a speed of 5 km/h. Both values are correct to the nearest whole number. Work out the upper bound of the time taken for Anna’s walk. ...................................... hours [2]
Mark scheme: 12 7 cao nfww 2 B1 for 31 + 0.5 or 5 – 0.5 or 31.5 or 4.5 seen
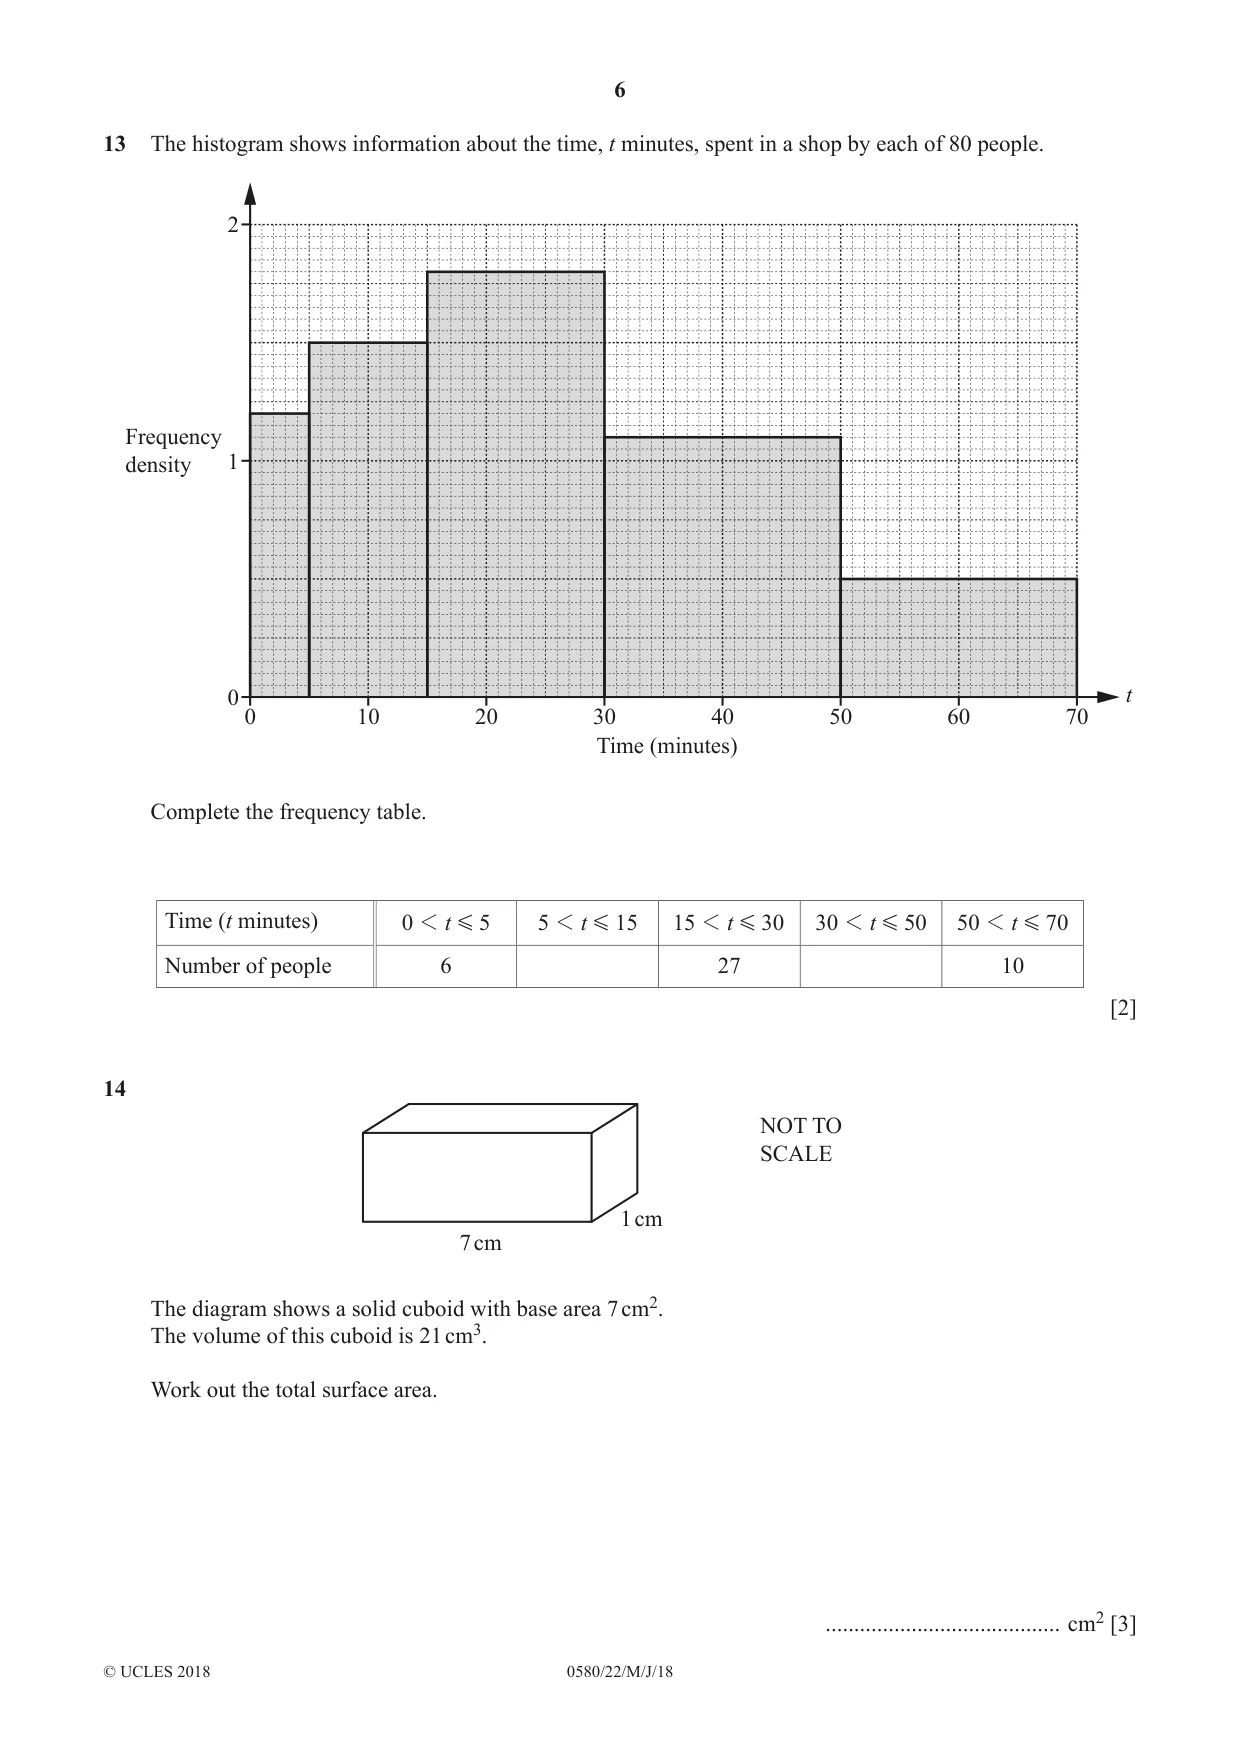
Q13 · The histogram shows information about the time, t minutes, spent in a shop by each of 80…
13 The histogram shows information about the time, t minutes, spent in a shop by each of 80 people. 2 Frequency density 1 0 t 0 10 20 30 40 50 60 70 Time (minutes) Complete the frequency table. Time (t minutes) 0 1 t G 5 5 1 t G 15 15 1 t G 30 30 1 t G 50 50 1 t G 70 Number of people 6 27 10 [2]
Mark scheme: 13 15 and 22 2 M1 for 1.5 × 10 or 1.1 × 20
Q14 · NOT TO SCALE 1 cm 7 cm The diagram shows a solid cuboid with base area 7 cm2
14 NOT TO SCALE 1 cm 7 cm The diagram shows a solid cuboid with base area 7 cm2. The volume of this cuboid is 21 cm3. Work out the total surface area. ......................................... cm2 [3]
Mark scheme: 14 62 3 M1 for [height = ] 21 ÷ 7 M1 for 2(1 × their3 + their3 × 7 + 1 × 7) oe
Q15 · Find the volume of a cylinder of radius 5 cm and height 8 cm
15 Find the volume of a cylinder of radius 5 cm and height 8 cm. Give the units of your answer. .............................. ................ [3]
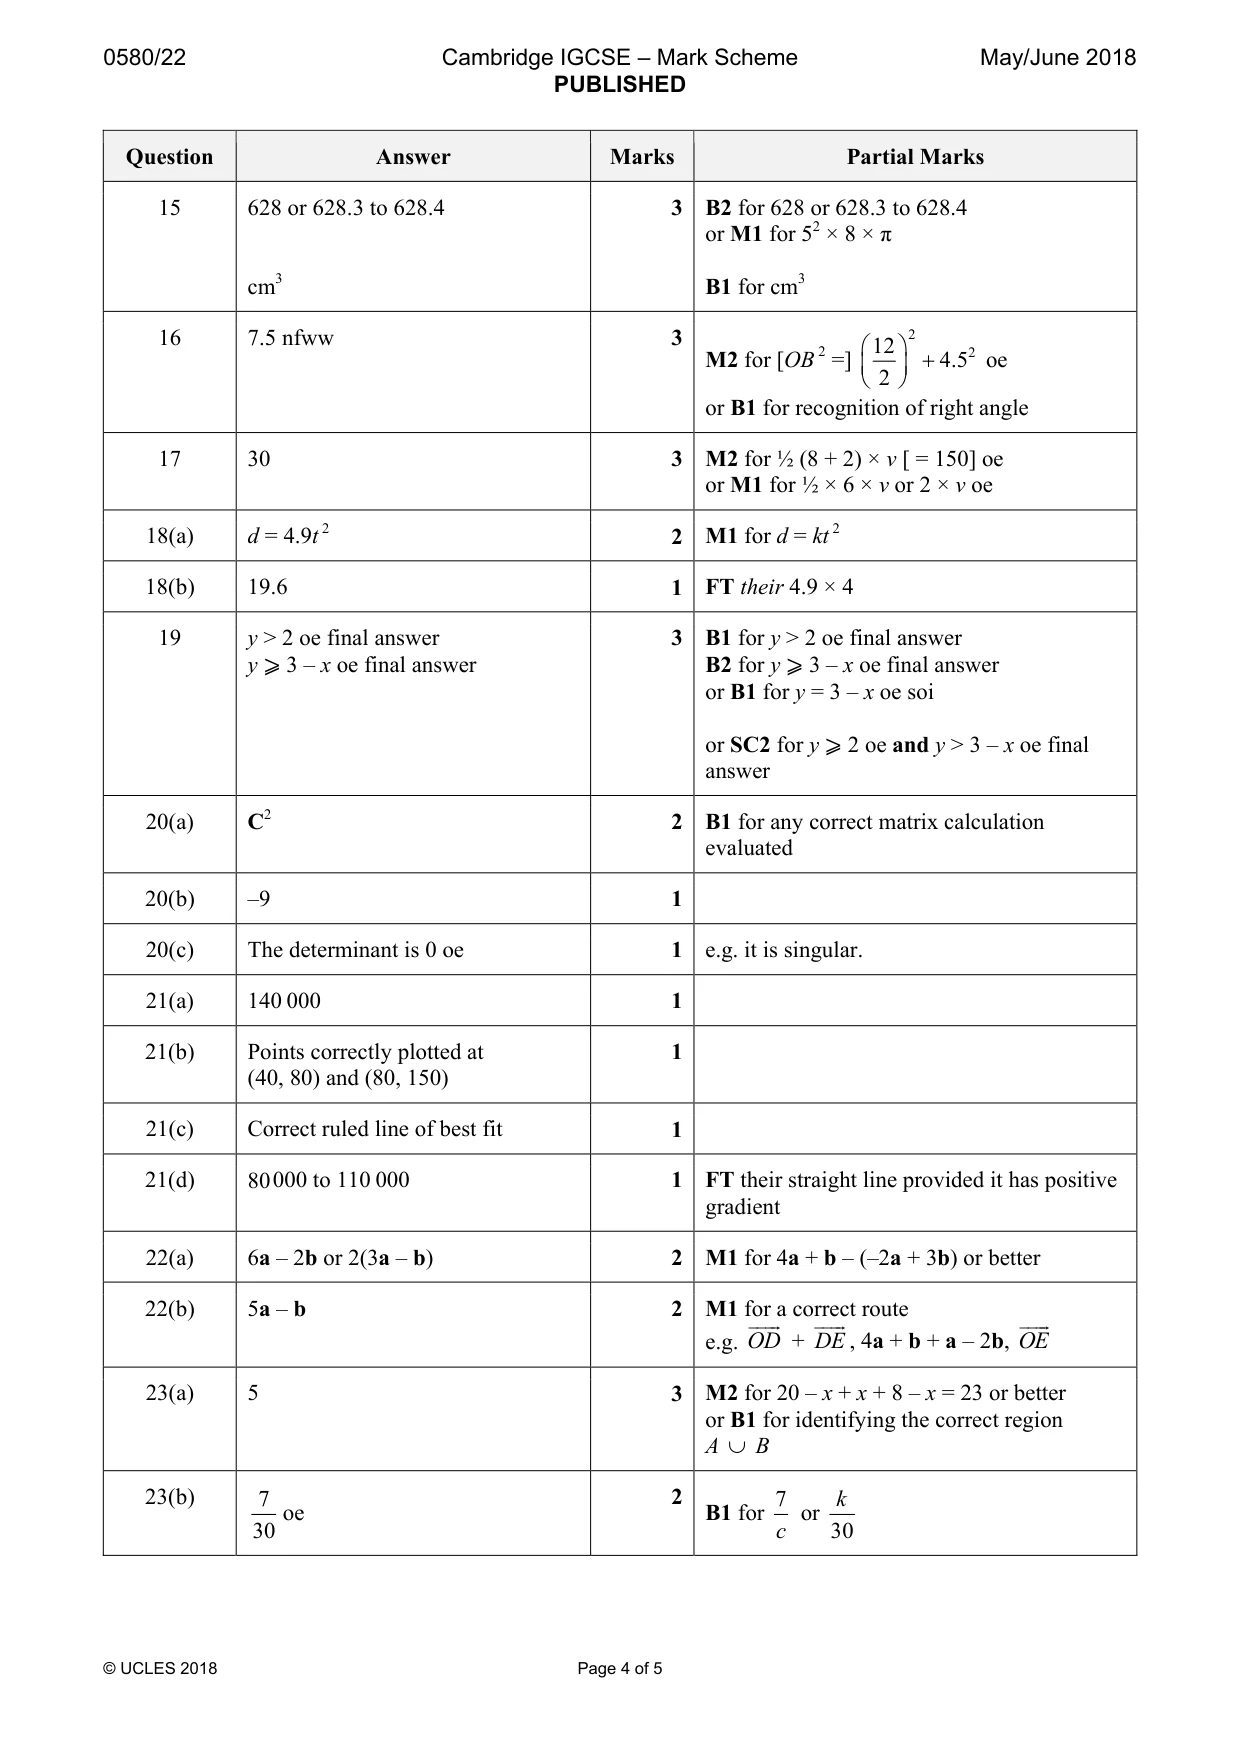
Mark scheme: 15 628 or 628.3 to 628.4 3 B2 for 628 or 628.3 to 628.4 or M1 for 52 × 8 × π cm3 B1 for cm3
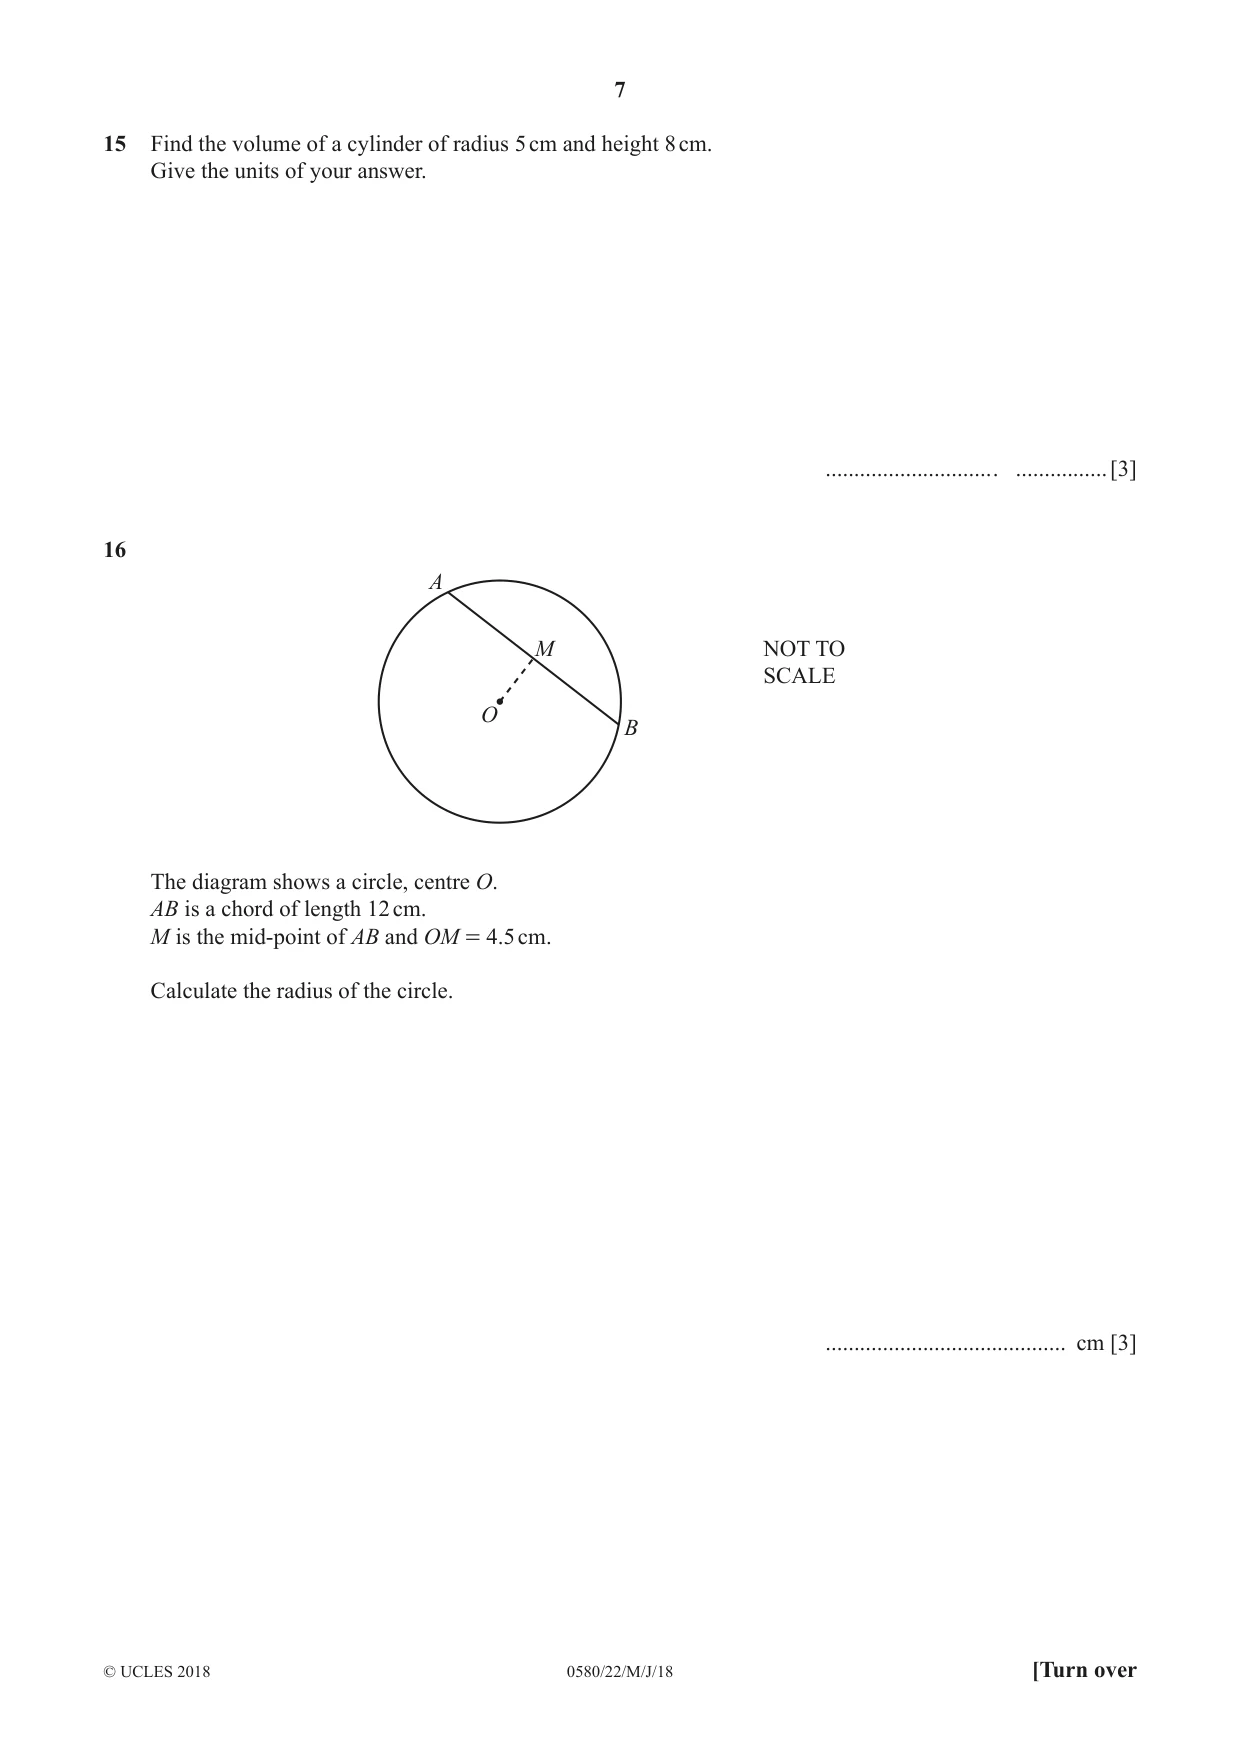
Q16 · A M NOT TO SCALE O B The diagram shows a circle, centre O
16 A M NOT TO SCALE O B The diagram shows a circle, centre O. AB is a chord of length 12 cm. M is the mid-point of AB and OM = 4.5 cm. Calculate the radius of the circle. .......................................... cm [3]
Mark scheme: 16 7.5 nfww 3 2 2 12 2 4.5 oe M2 for [OB =] + 2 or B1 for recognition of right angle
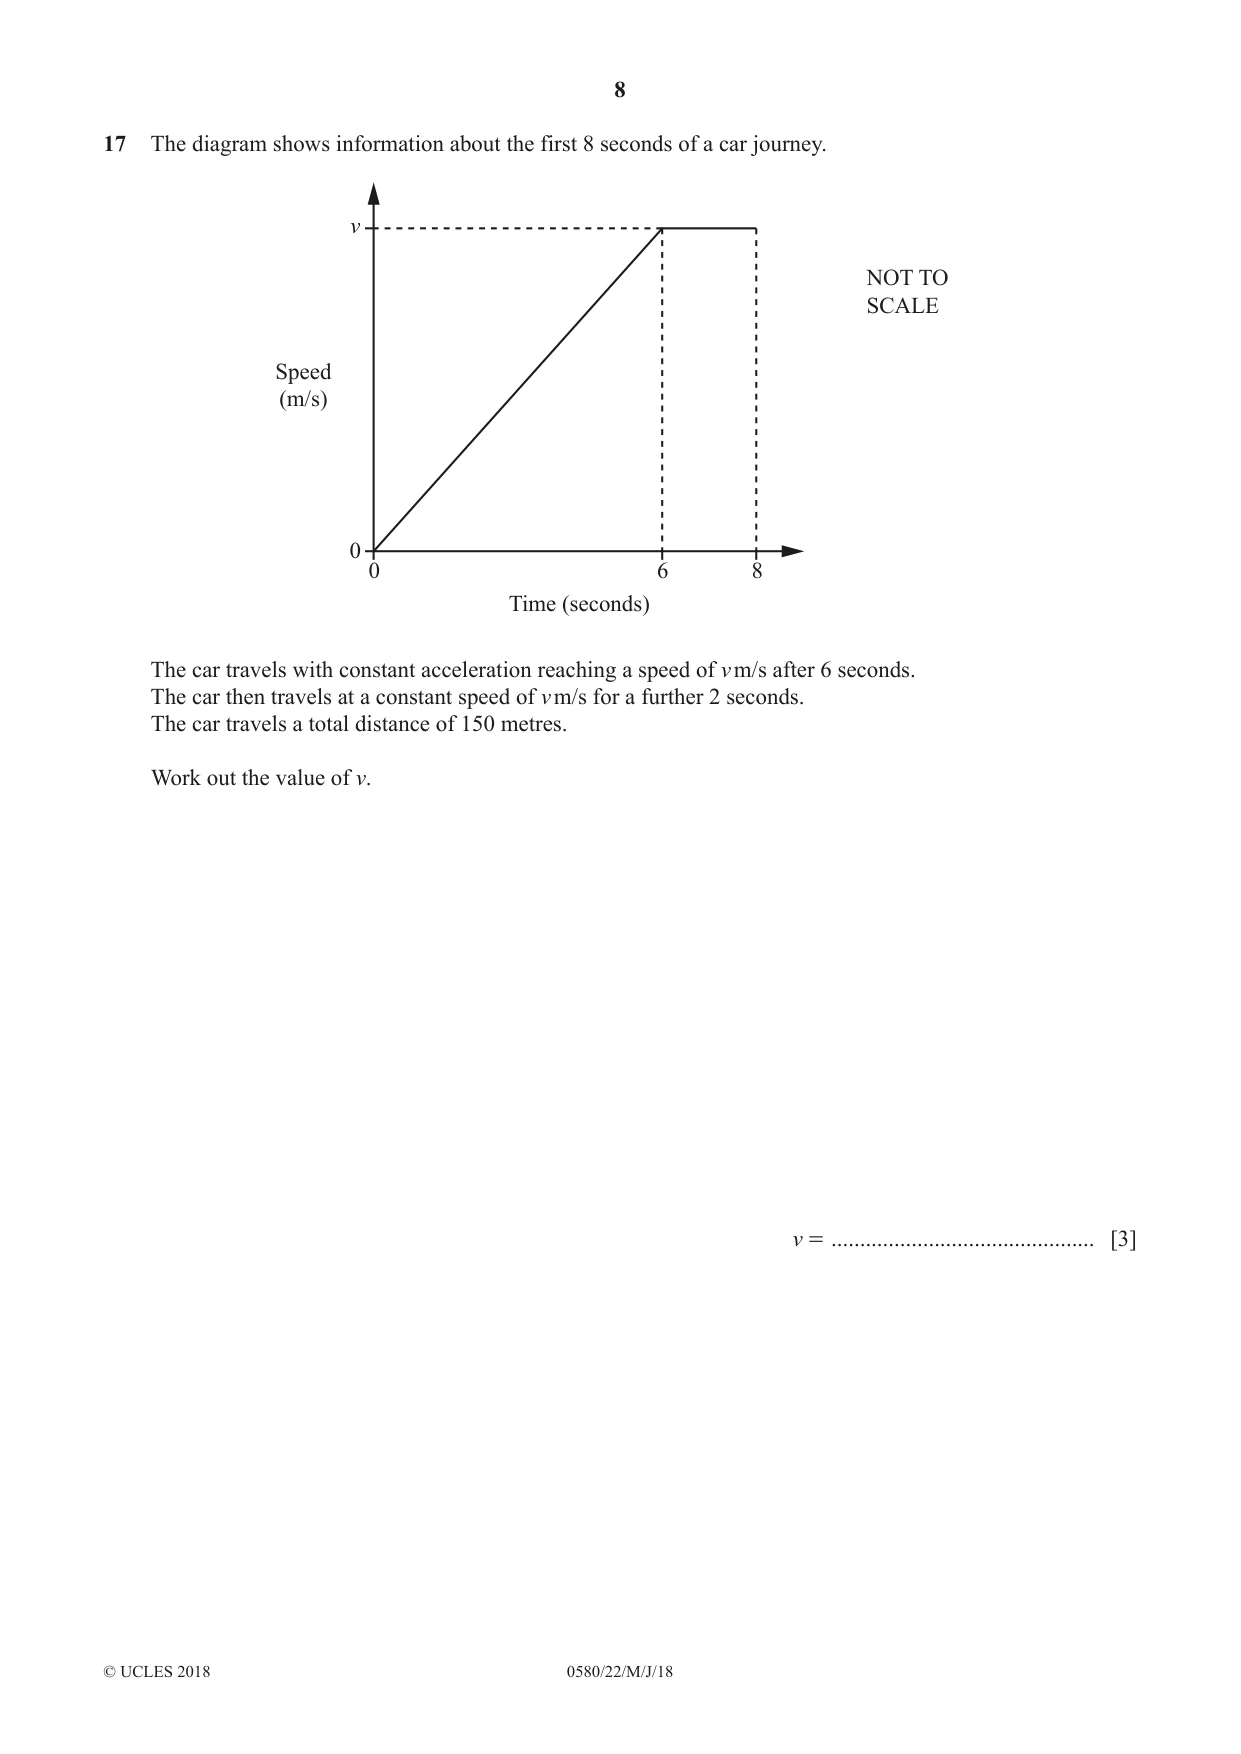
Q17 · The diagram shows information about the first 8 seconds of a car journey
17 The diagram shows information about the first 8 seconds of a car journey. v NOT TO SCALE Speed (m/s) 0 0 6 8 Time (seconds) The car travels with constant acceleration reaching a speed of v m/s after 6 seconds. The car then travels at a constant speed of v m/s for a further 2 seconds. The car travels a total distance of 150 metres. Work out the value of v. v = .............................................. [3]
Mark scheme: 17 30 3 M2 for ½ (8 + 2) × v [ = 150] oe or M1 for ½ × 6 × v or 2 × v oe
Q18 · A ball falls d metres in t seconds
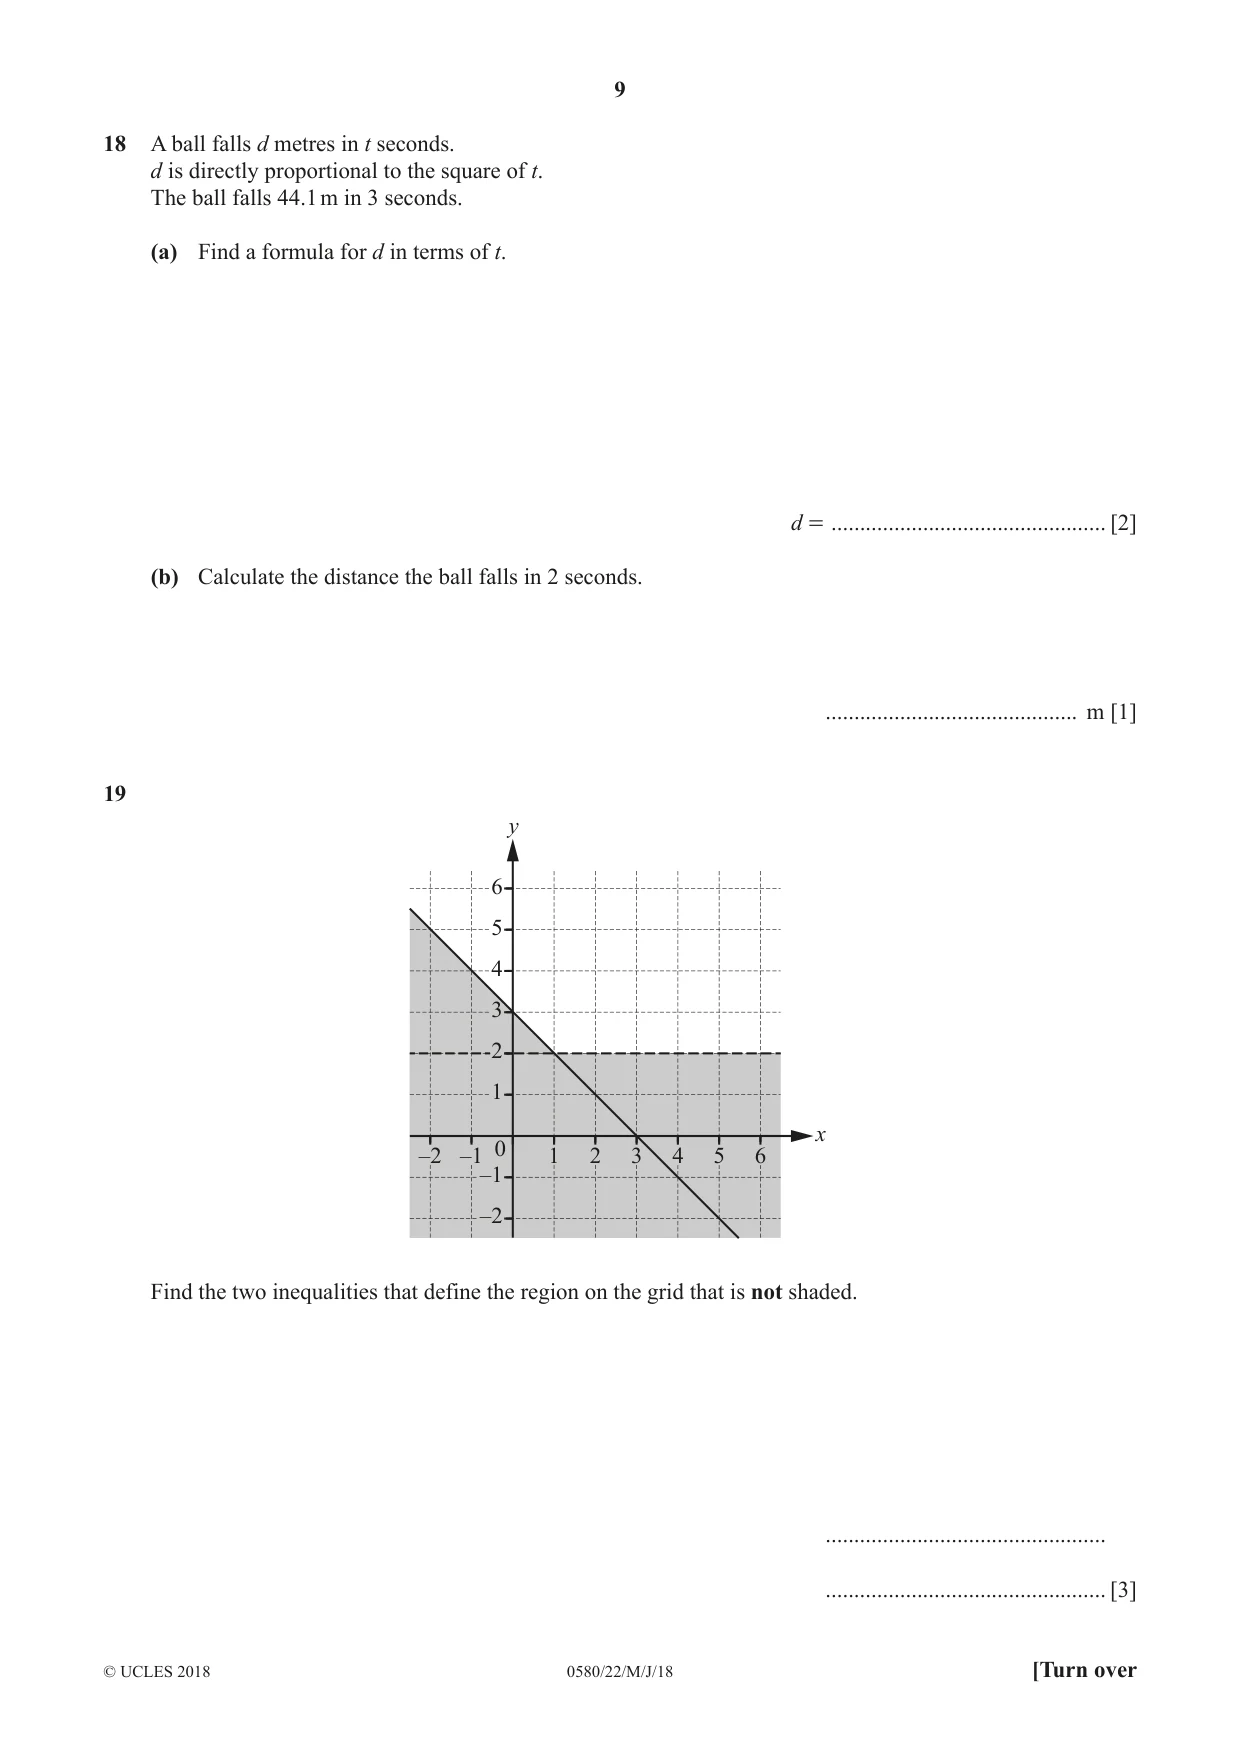
18 A ball falls d metres in t seconds. d is directly proportional to the square of t. The ball falls 44.1 m in 3 seconds. (a) Find a formula for d in terms of t. d = ................................................ [2] (b) Calculate the distance the ball falls in 2 seconds. ............................................ m [1]
Mark scheme: 18(a) d = 4.9t 2 2 M1 for d = kt 2 18(b) 19.6 1 FT their 4.9 × 4
Q19 · Y 6 5 4 3 2 1 x 0 –2 –1 1 2 3 4 5 6 –1 –2 Find the two inequalities that define the…
19 y 6 5 4 3 2 1 x 0 –2 –1 1 2 3 4 5 6 –1 –2 Find the two inequalities that define the region on the grid that is not shaded. ................................................. ................................................. [3]
Mark scheme: 19 y > 2 oe final answer 3 B1 for y > 2 oe final answer y ⩾ 3 – x oe final answer B2 for y ⩾ 3 – x oe final answer or B1 for y = 3 – x oe soi or SC2 for y ⩾ 2 oe and y > 3 – x oe final answer
Q20 · 1 0 1 1 1 1 0 20 A = B = C = I = c 9 9m c 9 8m c 3 3m c 0 1m (a) Here are four matrix…
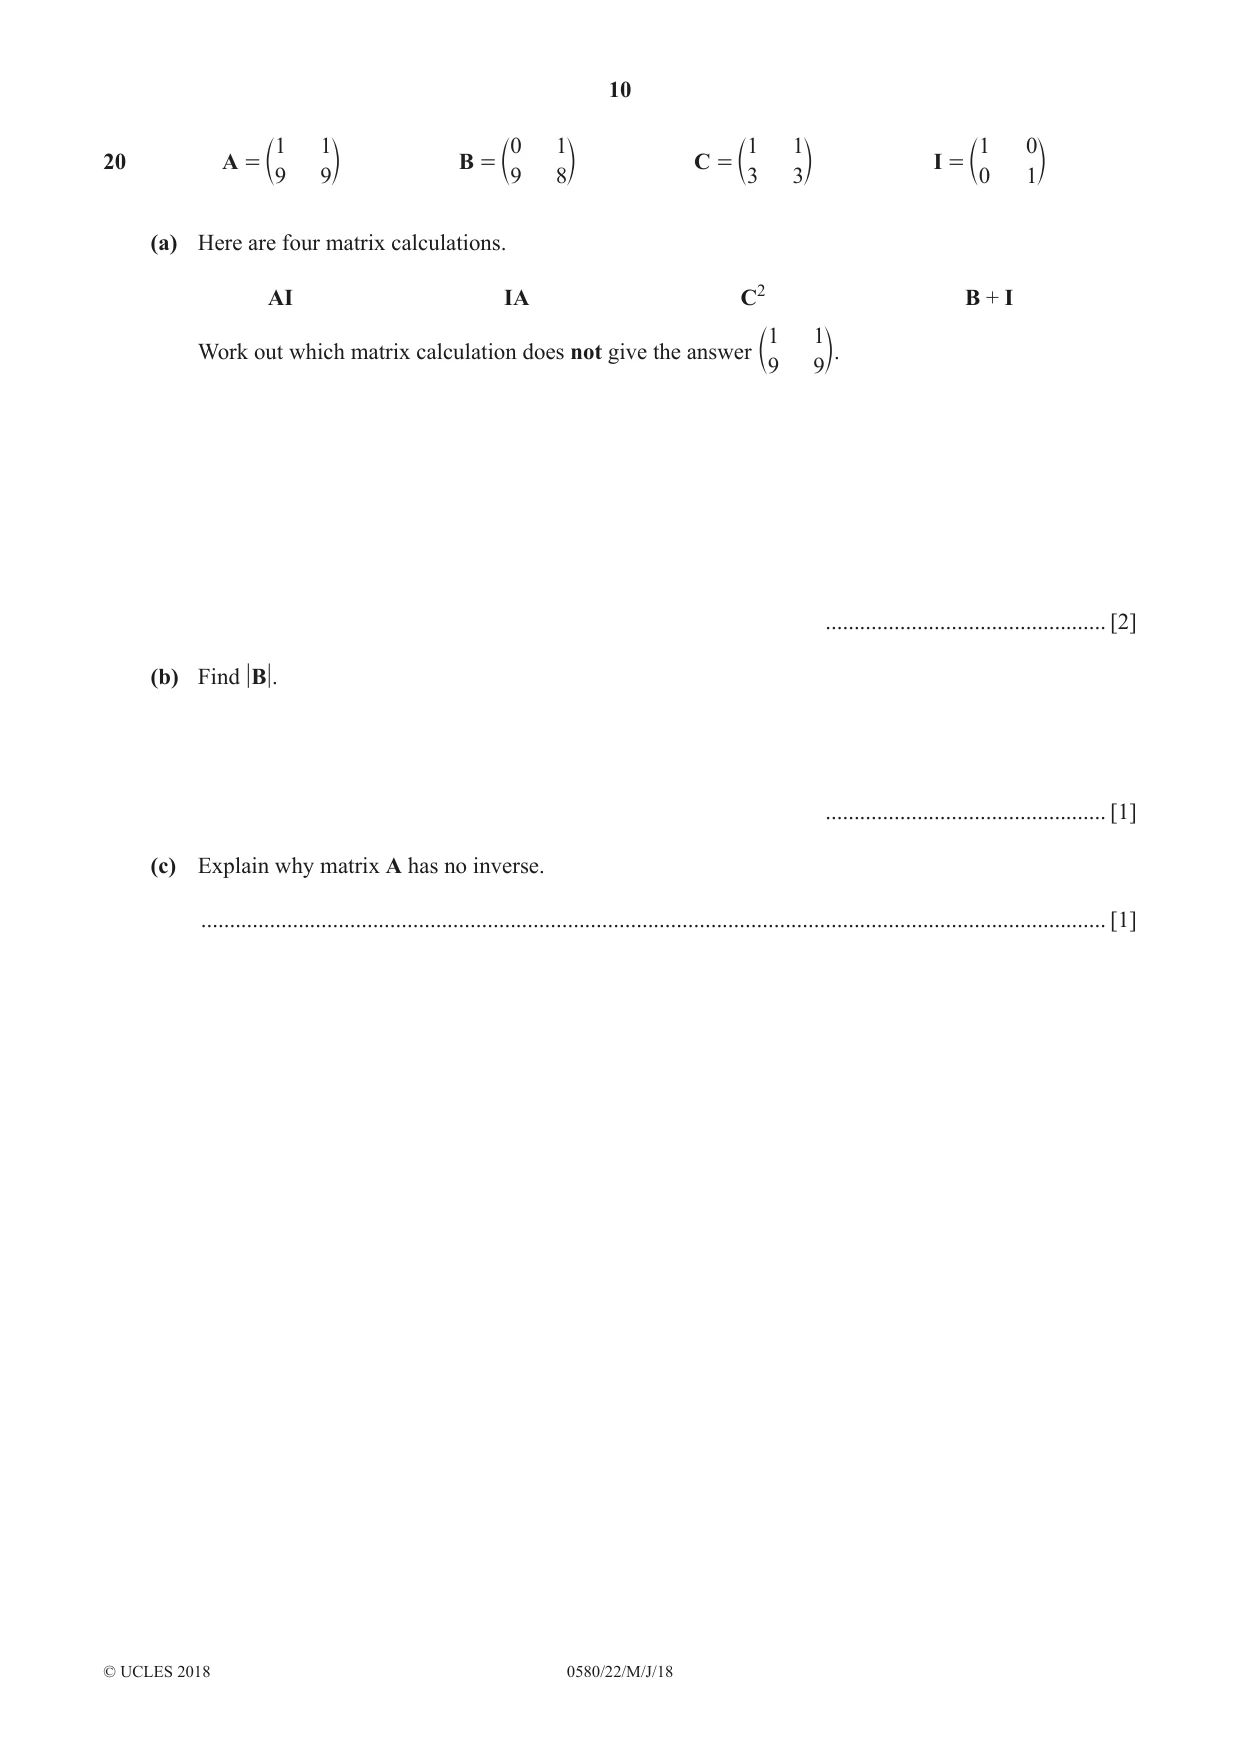
1 1 0 1 1 1 1 0 20 A = B = C = I = c 9 9m c 9 8m c 3 3m c 0 1m (a) Here are four matrix calculations. AI IA C2 B + I 1 1 Work out which matrix calculation does not give the answer c 9 9m. ................................................. [2] (b) Find B . ................................................. [1] (c) Explain why matrix A has no inverse. .............................................................................................................................................................. [1]
Mark scheme: 20(a) C2 2 B1 for any correct matrix calculation evaluated 20(b) –9 1 20(c) The determinant is 0 oe 1 e.g. it is singular.
Q21 · The scatter diagram shows the value, in thousands of dollars, of eight houses in 1996 and…
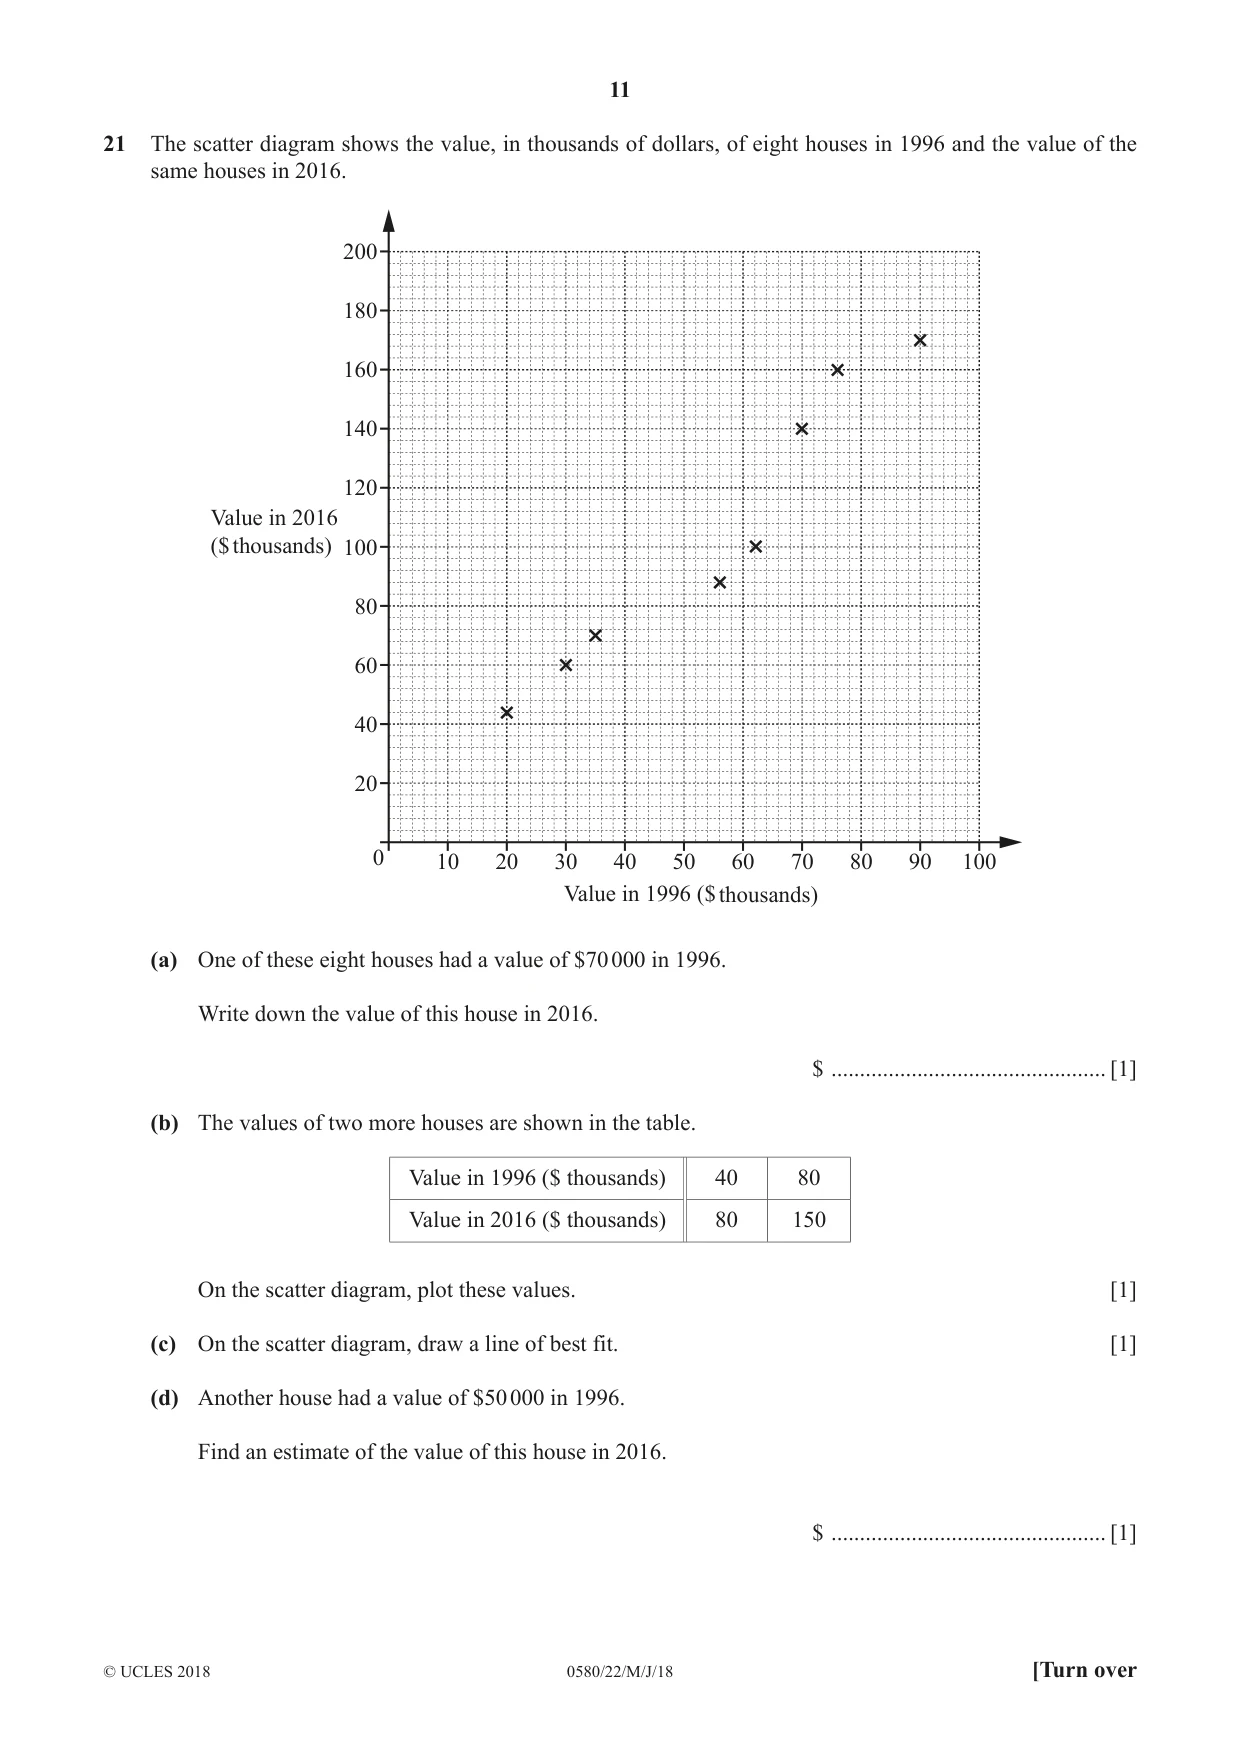
21 The scatter diagram shows the value, in thousands of dollars, of eight houses in 1996 and the value of the same houses in 2016. 200 180 160 140 120 Value in 2016 ($ thousands) 100 80 60 40 20 0 10 20 30 40 50 60 70 80 90 100 Value in 1996 ($ thousands) (a) One of these eight houses had a value of $70 000 in 1996. Write down the value of this house in 2016. $ ................................................ [1] (b) The values of two more houses are shown in the table. Value in 1996 ($ thousands) 40 80 Value in 2016 ($ thousands) 80 150 On the scatter diagram, plot these values. [1] (c) On the scatter diagram, draw a line of best fit. [1] (d) Another house had a value of $50 000 in 1996. Find an estimate of the value of this house in 2016. $ ................................................ [1]
Mark scheme: 21(a) 140 000 1 21(b) Points correctly plotted at 1 (40, 80) and (80, 150) 21(c) Correct ruled line of best fit 1 21(d) 80 000 to 110 000 1 FT their straight line provided it has positive gradient
Q22 · C NOT TO –2a + 3b SCALE D 4a + b a – 2b O E In the diagram, O is the origin, OC =- 2 a +…
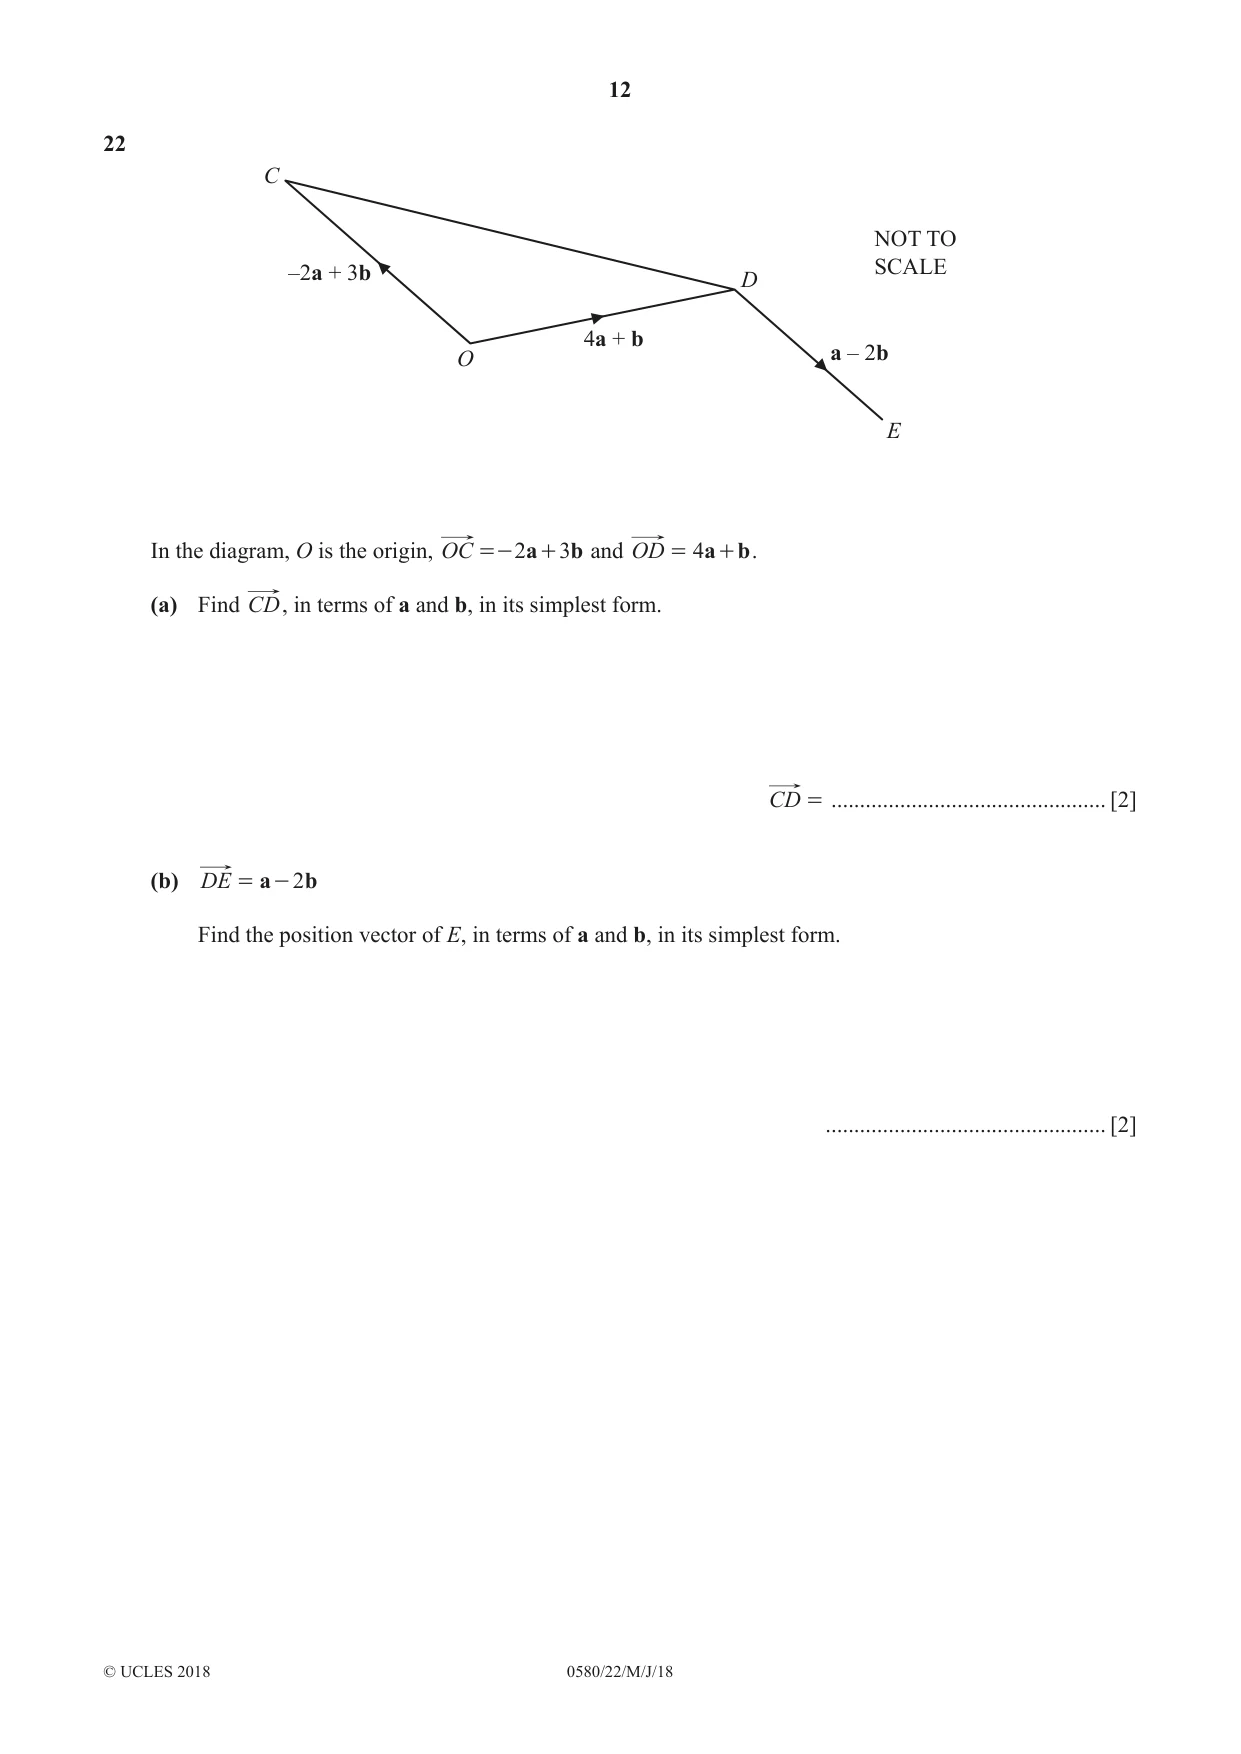
22 C NOT TO –2a + 3b SCALE D 4a + b a – 2b O E In the diagram, O is the origin, OC =- 2 a + 3b and OD = 4 a + b . (a) Find CD, in terms of a and b, in its simplest form. CD = ................................................ [2] (b) DE = a - 2 b Find the position vector of E, in terms of a and b, in its simplest form. ................................................. [2]
Mark scheme: 22(a) 6a – 2b or 2(3a – b) 2 M1 for 4a + b – (–2a + 3b) or better 22(b) 5a – b 2 M1 for a correct route JJJG JJJG JJJG e.g. OD + DE , 4a + b + a – 2b, OE
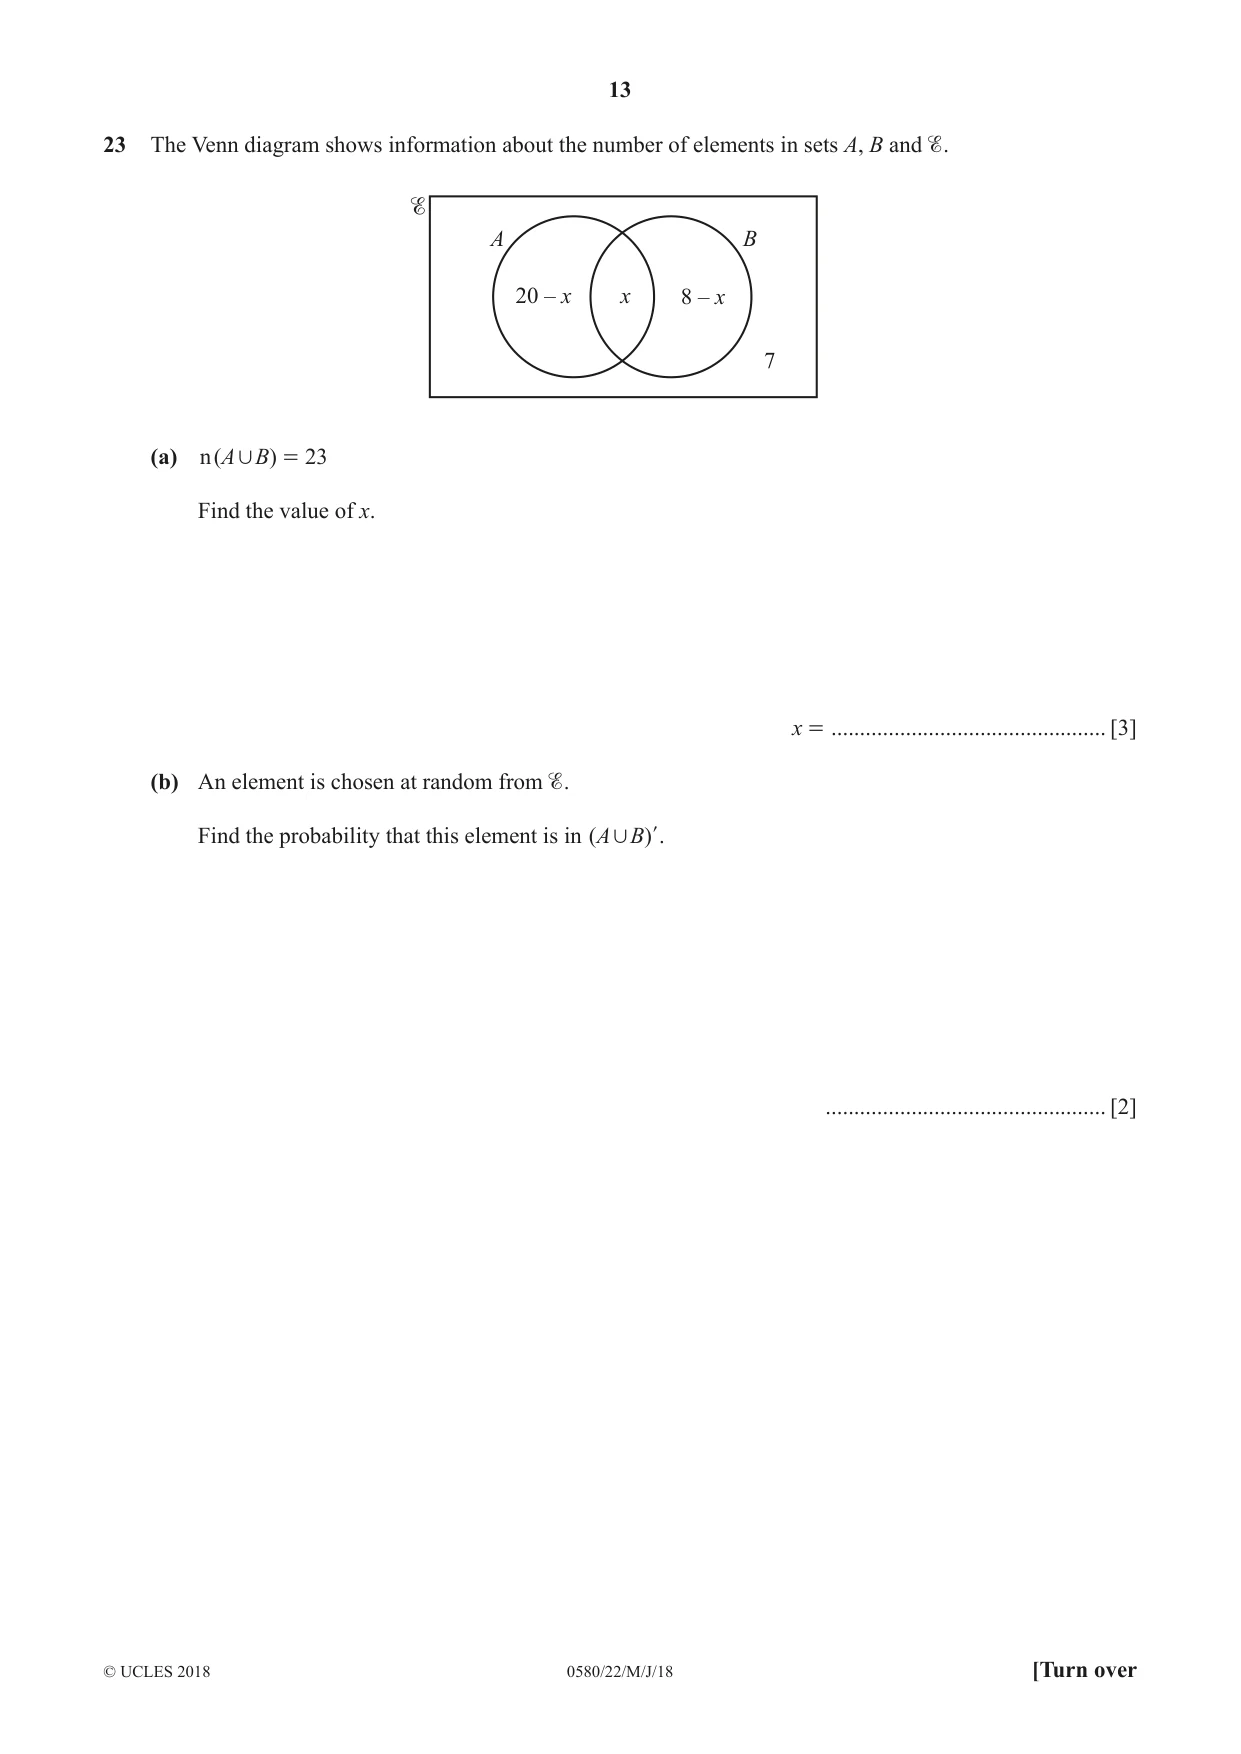
Q23 · The Venn diagram shows information about the number of elements in sets A, B and
23 The Venn diagram shows information about the number of elements in sets A, B and . A B 20 – x x 8 – x 7 (a) n (A , B) = 23 Find the value of x. x = ................................................ [3] (b) An element is chosen at random from . Find the probability that this element is in (A , B) l. ................................................. [2]
Mark scheme: 23(a) 5 3 M2 for 20 – x + x + 8 – x = 23 or better or B1 for identifying the correct region A ∪ B 23(b) 7 2 7 k oe B1 for or 30 c 30
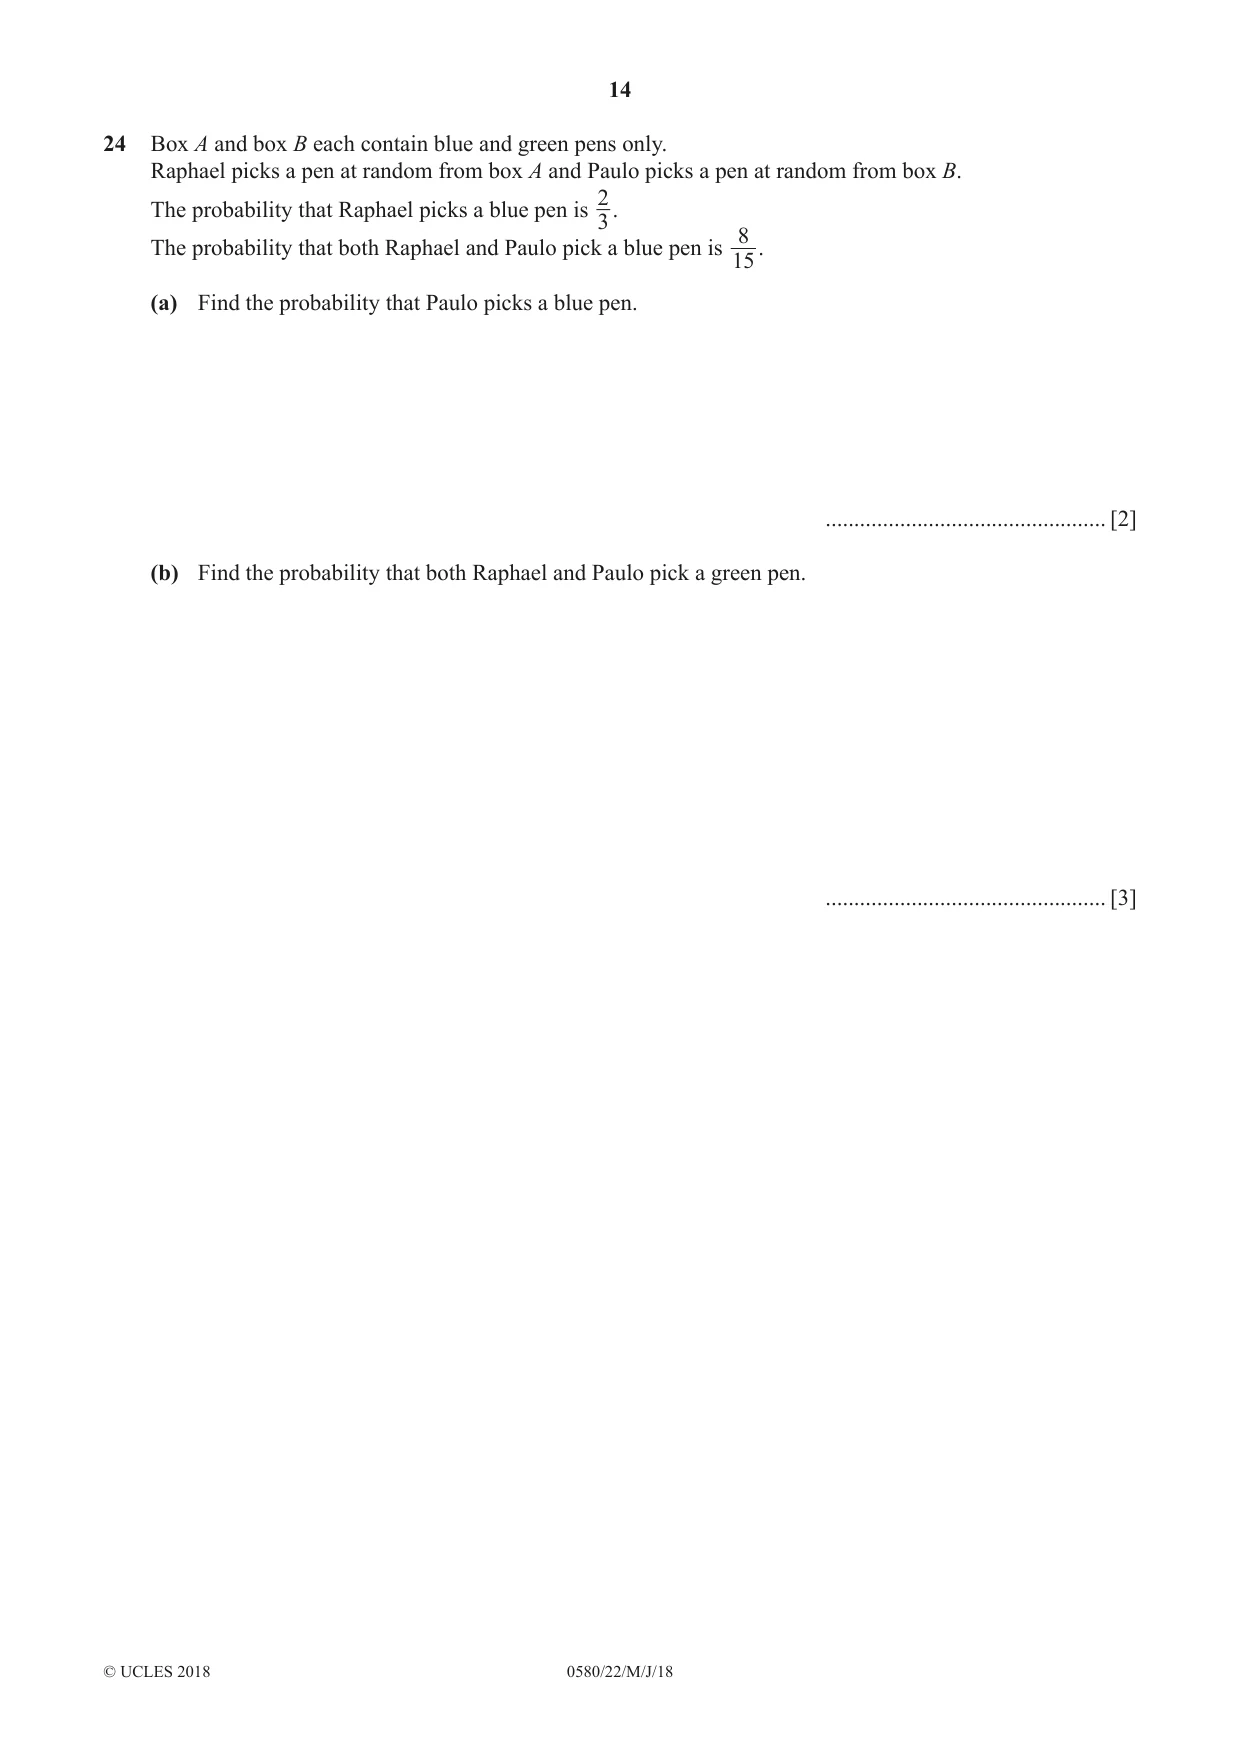
Q24 · Box A and box B each contain blue and green pens only
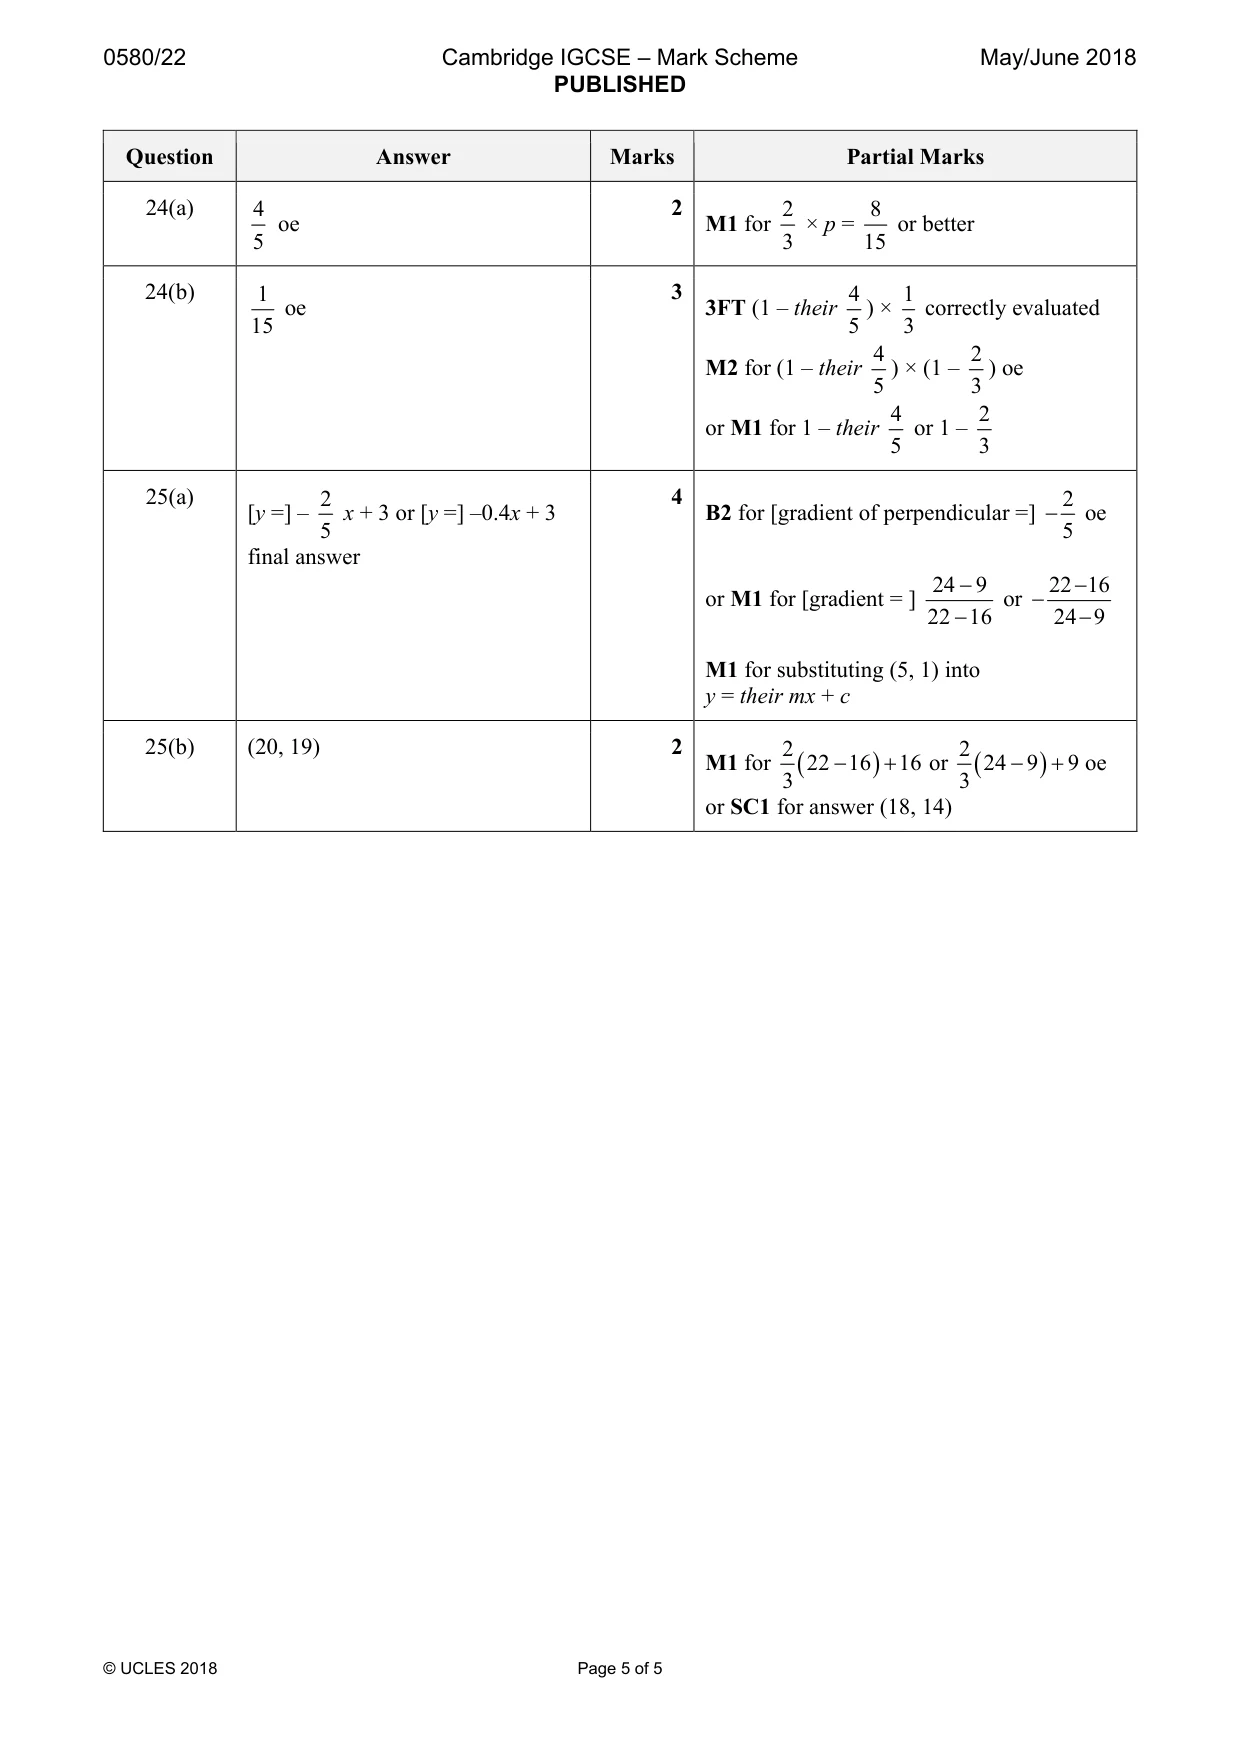
24 Box A and box B each contain blue and green pens only. Raphael picks a pen at random from box A and Paulo picks a pen at random from box B. 2 The probability that Raphael picks a blue pen is . 3 8 The probability that both Raphael and Paulo pick a blue pen is . 15 (a) Find the probability that Paulo picks a blue pen. ................................................. [2] (b) Find the probability that both Raphael and Paulo pick a green pen. ................................................. [3]
Mark scheme: 24(a) 4 2 2 8 oe M1 for × p = or better 5 3 15 24(b) 1 3 4 1 oe 3FT (1 – their ) × correctly evaluated 15 5 3 4 2 M2 for (1 – their ) × (1 – ) oe 5 3 4 2 or M1 for 1 – their or 1 – 5 3
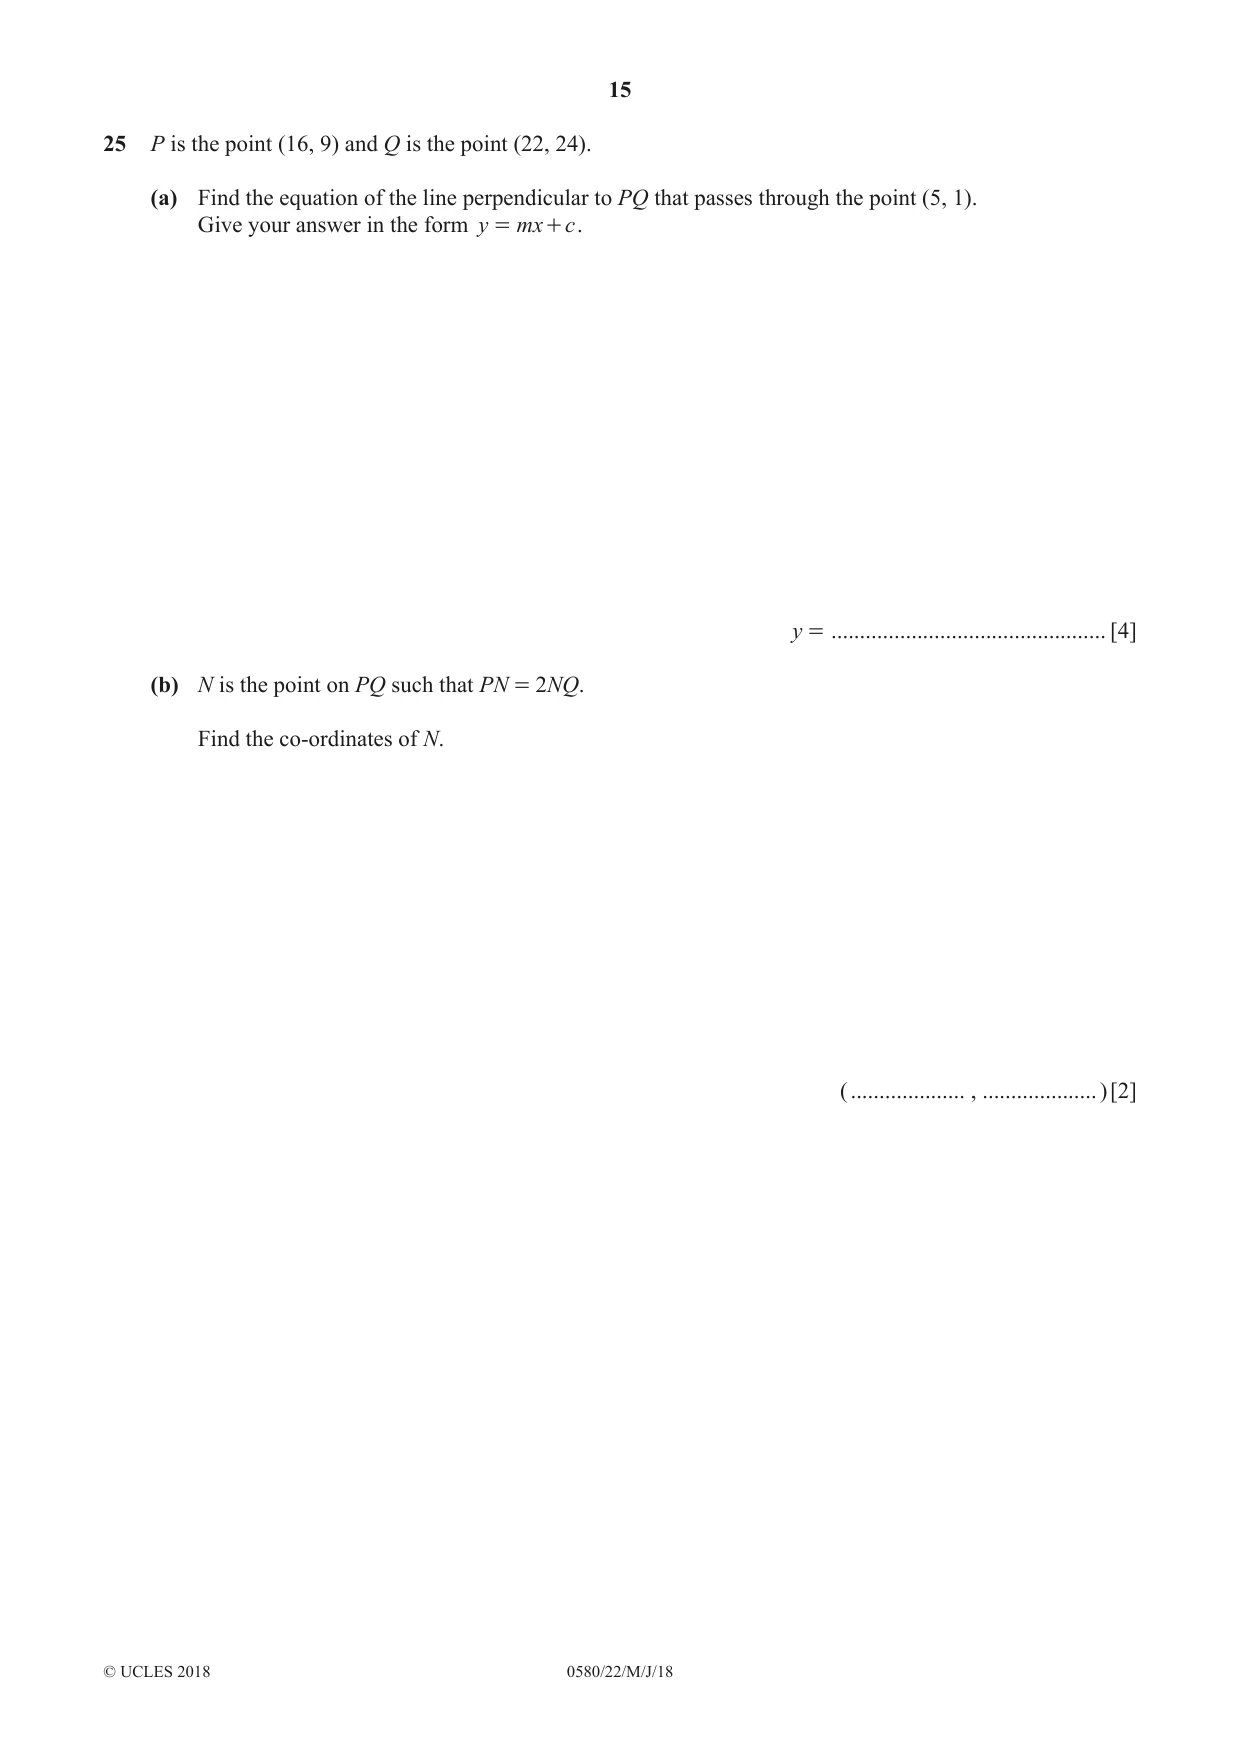
Q25 · P is the point (16, 9) and Q is the point (22, 24)
25 P is the point (16, 9) and Q is the point (22, 24). (a) Find the equation of the line perpendicular to PQ that passes through the point (5, 1). Give your answer in the form y = mx + c . y = ................................................ [4] (b) N is the point on PQ such that PN = 2NQ. Find the co-ordinates of N. ( .................... , .................... ) [2]
Mark scheme: 25(a) 2 4 2 [y =] – x + 3 or [y =] –0.4x + 3 B2 for [gradient of perpendicular =] − oe 5 5 final answer 24 − 9 22 − 16 or M1 for [gradient = ] or − 22 − 16 24 − 9 M1 for substituting (5, 1) into y = their mx + c 25(b) (20, 19) 2 2 2 M1 for ( 22 − 16 ) + 16 or ( 24 − 9 ) + 9 oe 3 3 or SC1 for answer (18, 14)
What was in this paper
The subtopics covered by these 25 questions, and how many questions each got. Open one in a new tab to see every Cambridge question on it.
2Introduction to algebra2Surface area and volume2Angles1Equations of linear graphs1Fractions, decimals and percentages1Geometrical constructions1Inequalities1Limits of accuracy1Probability of combined events1Pythagoras’ theorem1Rates1Ratio and proportion1Scatter diagrams1Sequences1Sets1Similarity1Standard form1Statistical charts and diagrams1Time1Types of number1Vectors in two dimensions1What you needed in this session
Cambridge’s own grade thresholds for 2018 May/June, Paper 2 · Variant 2. A higher threshold means an easier paper — the bar moves with how the cohort did.