Cambridge IGCSE Mathematics 0580 — 2012 Oct/Nov Paper 2 · Variant 2
0580/22/O/N/12 · 8 questions · 39 marks · ≈44 min
The question paper and its mark scheme, free to read here and free to download. This is Cambridge’s own paper, exactly as it was sat.
Question paper12 pages
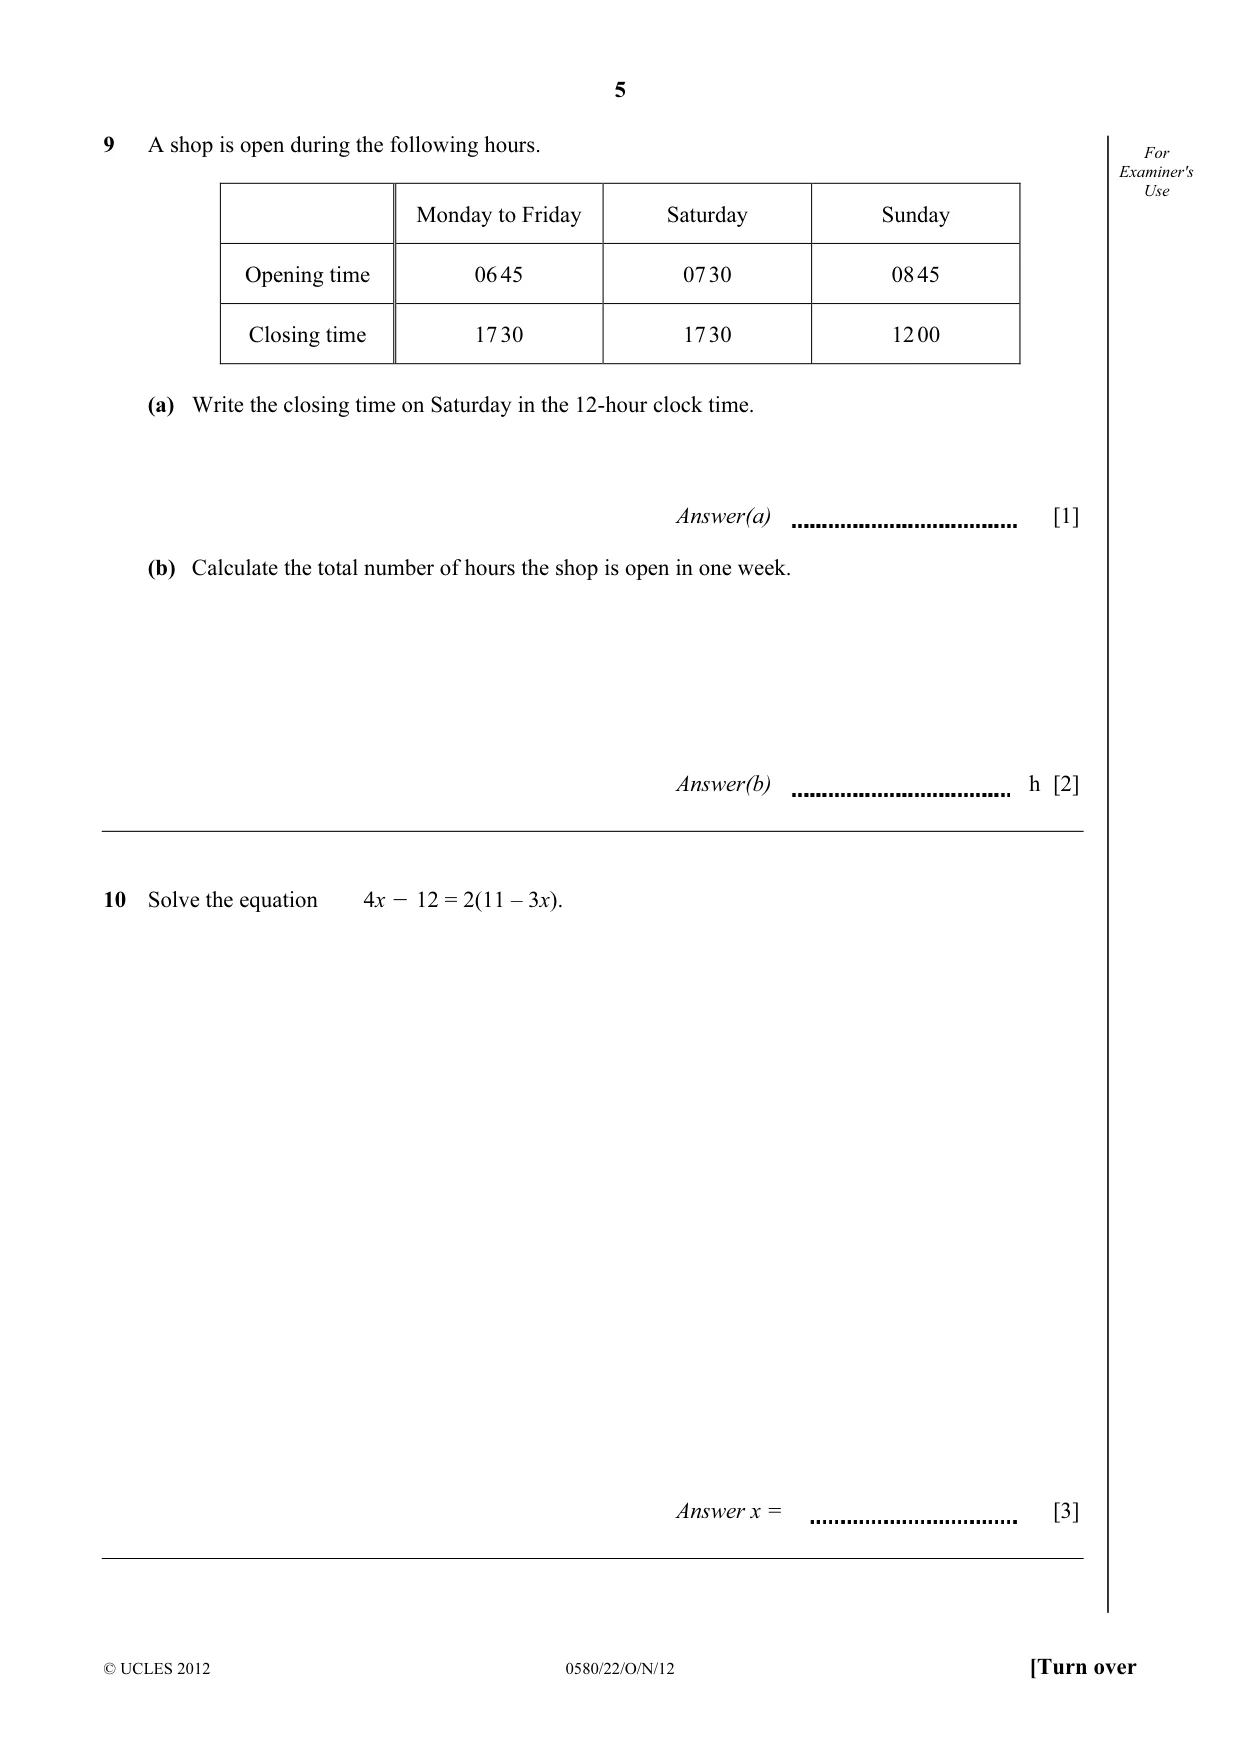
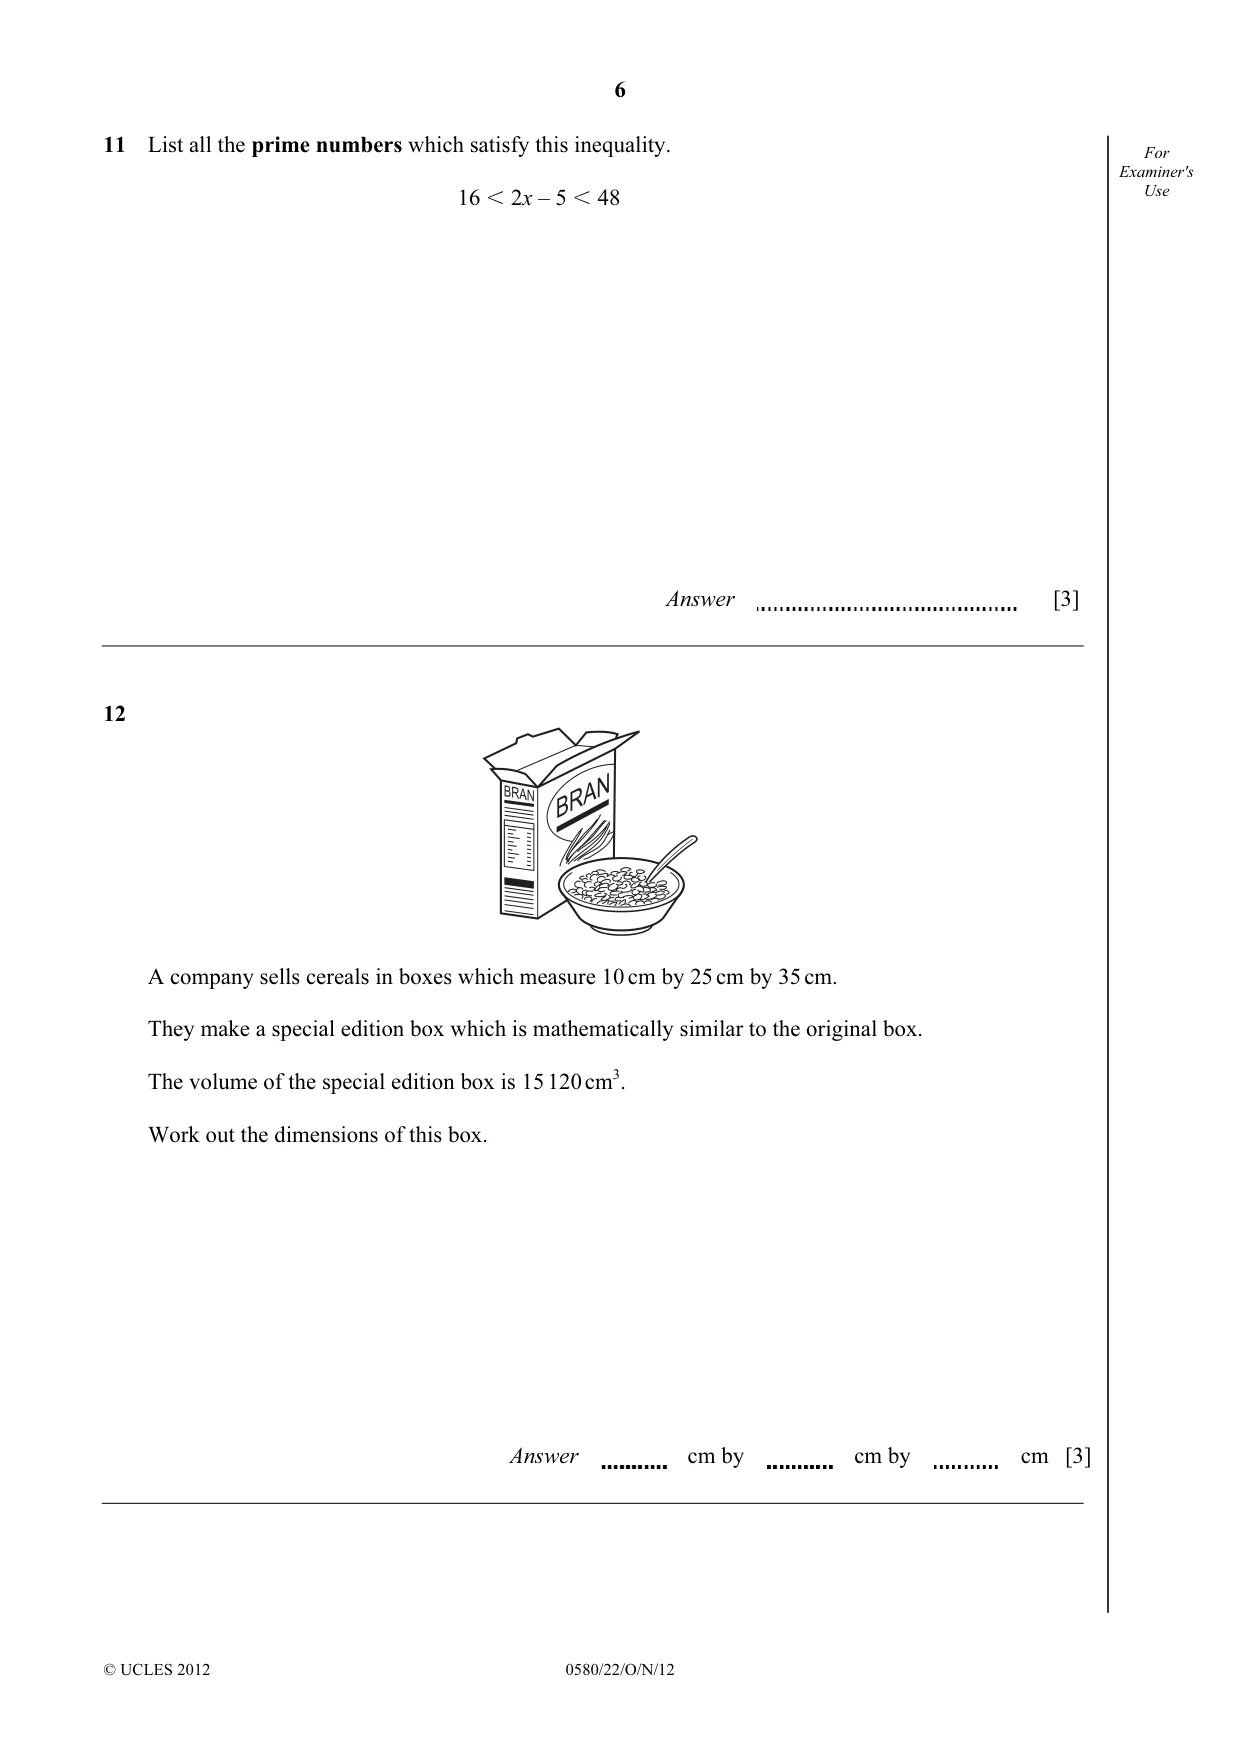
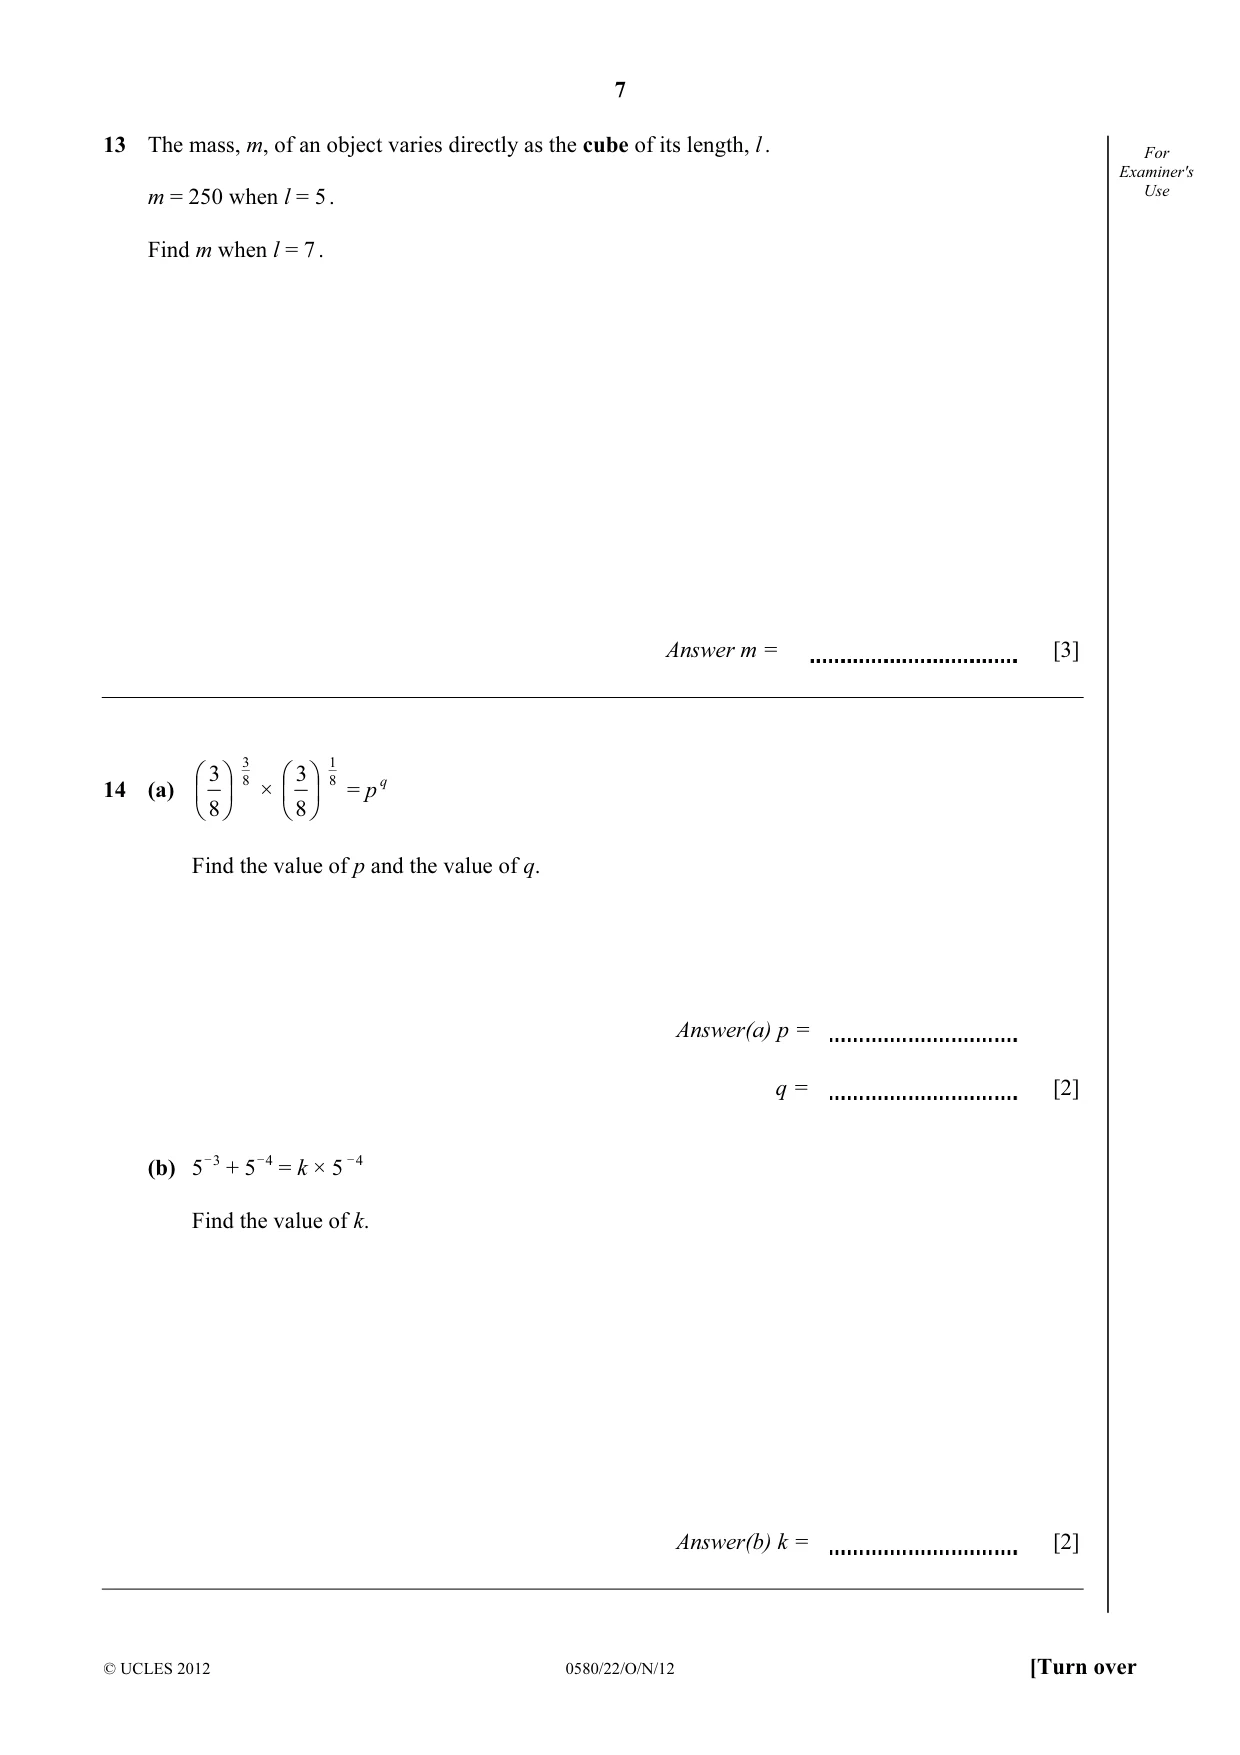
Mark scheme3 pages
Answers below. Sit the paper first if you are practising.
Questions as text
Q13 · The mass, m, of an object varies directly as the cube of its length, l
13 The mass, m, of an object varies directly as the cube of its length, l . For Examiner's Use m = 250 when l = 5 . Find m when l = 7 . Answer m = [3]
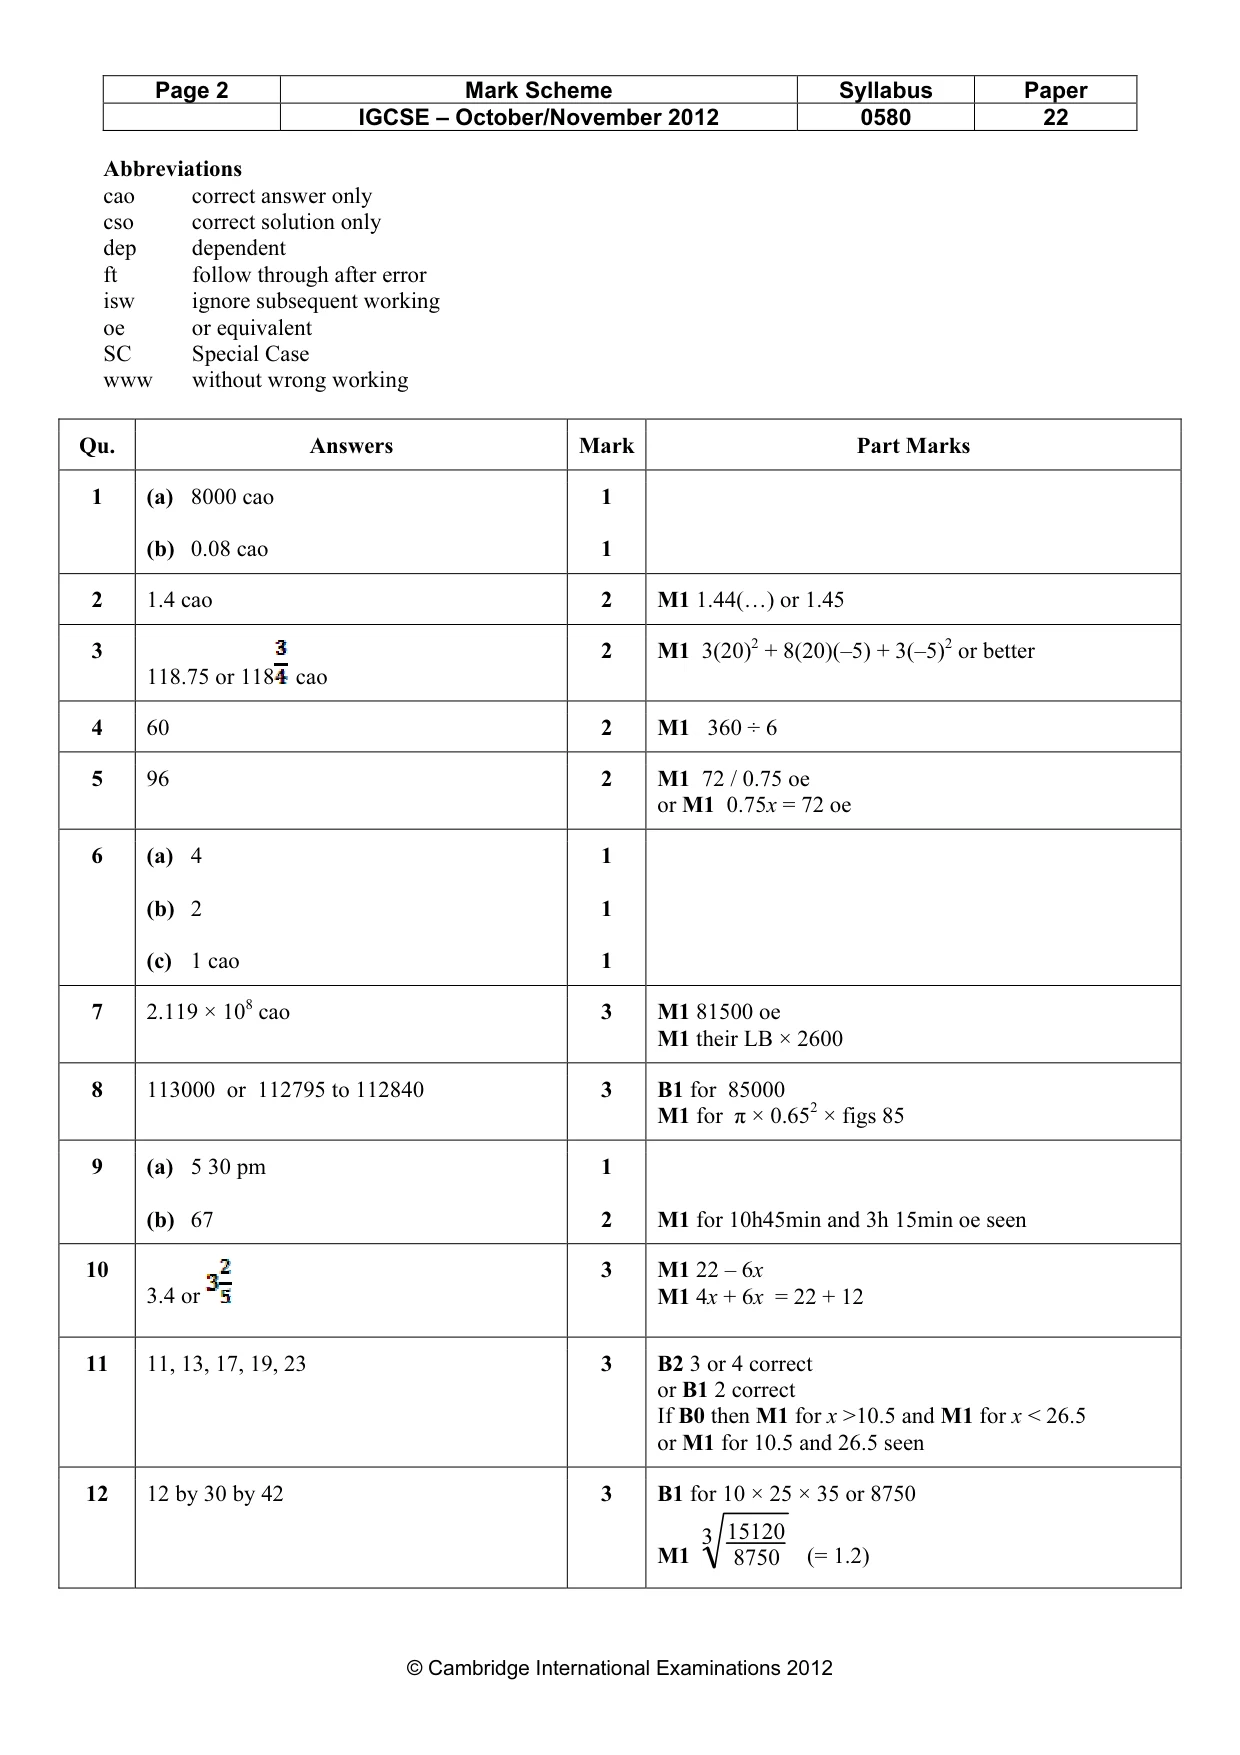
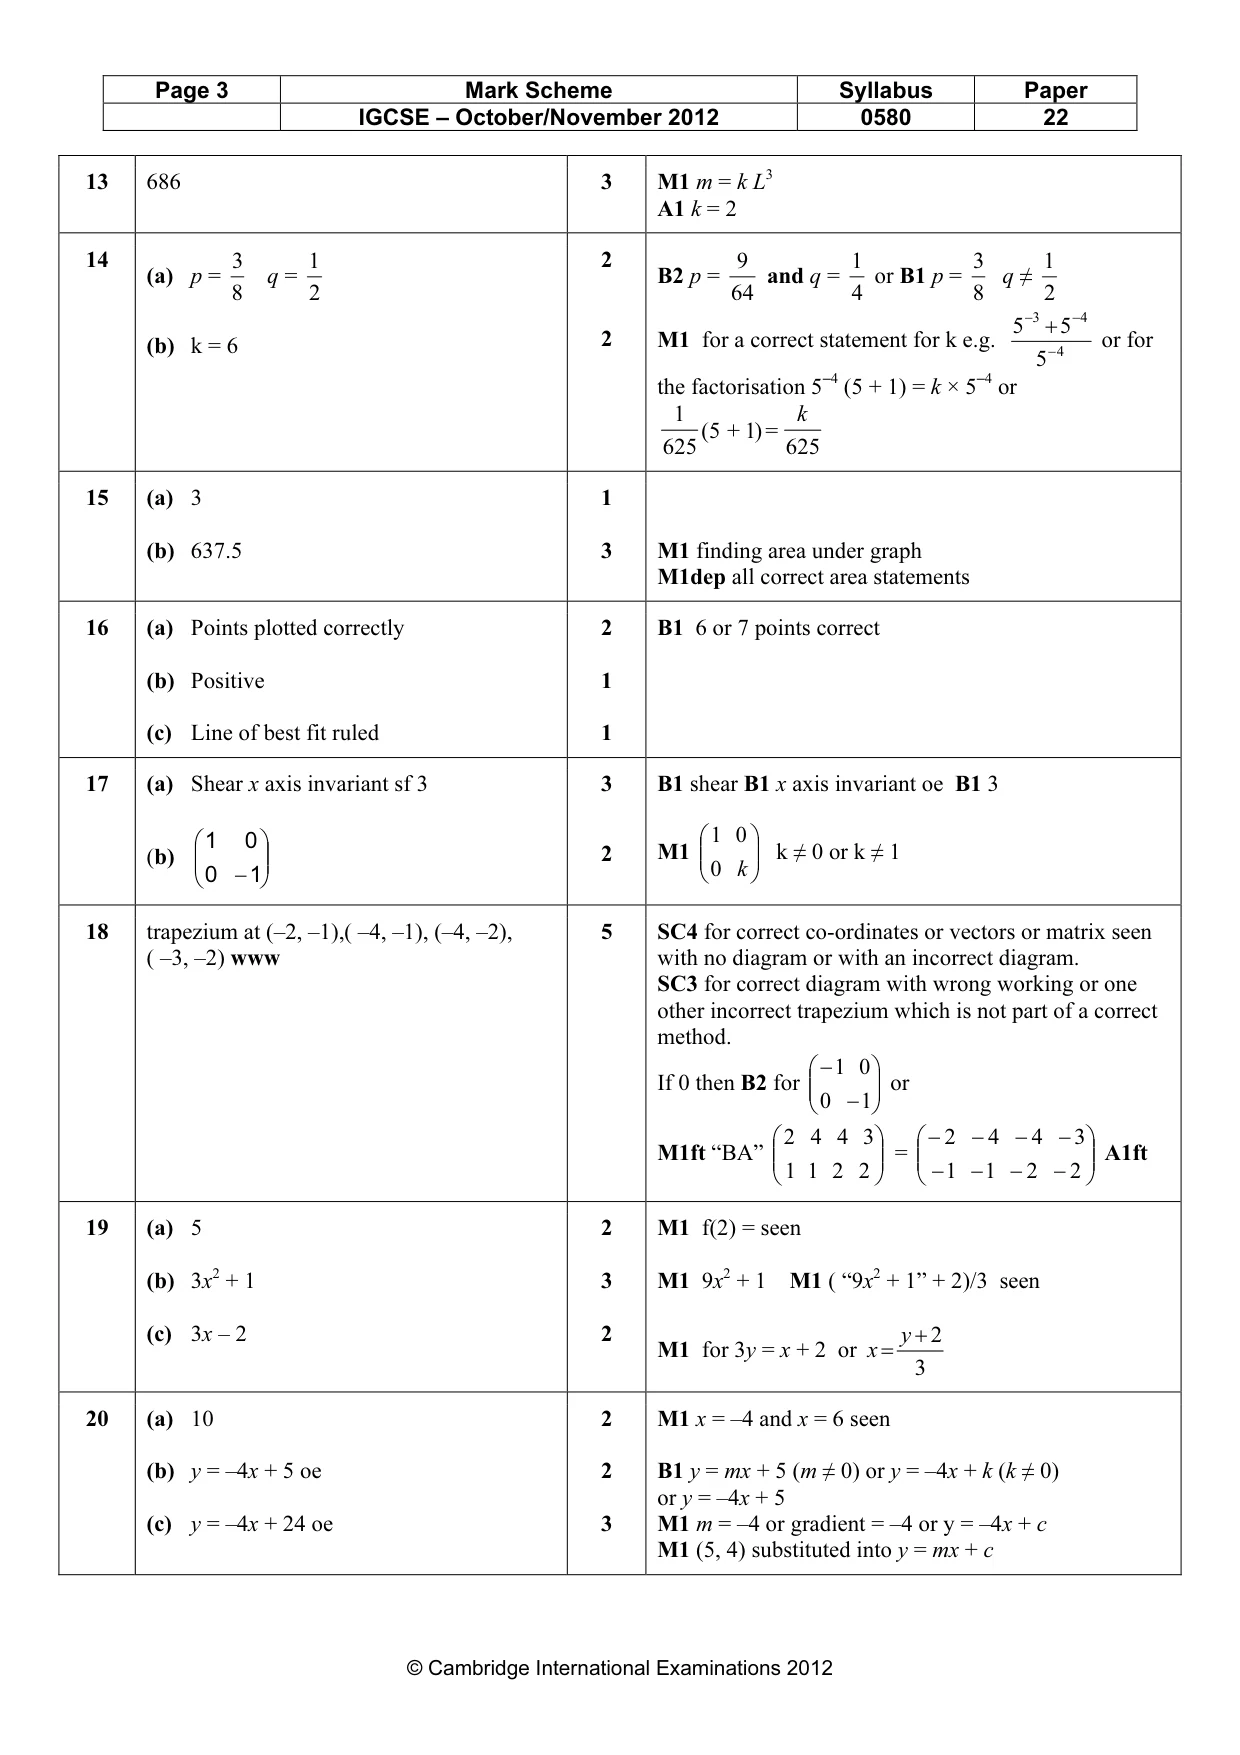
Mark scheme: 13 686 3 M1 m = k L3 A1 k = 2
Q14 · 3 83 3 18 q14 (a) × = p 8 8 Find the value of p and the value of q
3 83 3 18 q14 (a) × = p 8 8 Find the value of p and the value of q. Answer(a) p = q = [2] O3 O4 O4 (b) 5 + 5 = k × 5 Find the value of k. Answer(b) k = [2]
Mark scheme: 14 3 1 2 9 1 3 1 (a) p = q = B2 p = and q = or B1 p = q ≠ 8 2 64 4 8 2 5 −+3 5 −4 2 M1 for a correct statement for k e.g. − 4 or for (b) k = 6 5 the factorisation 5–4 (5 + 1) = k × 5–4 or 1 k (5 + )1 = 625 625
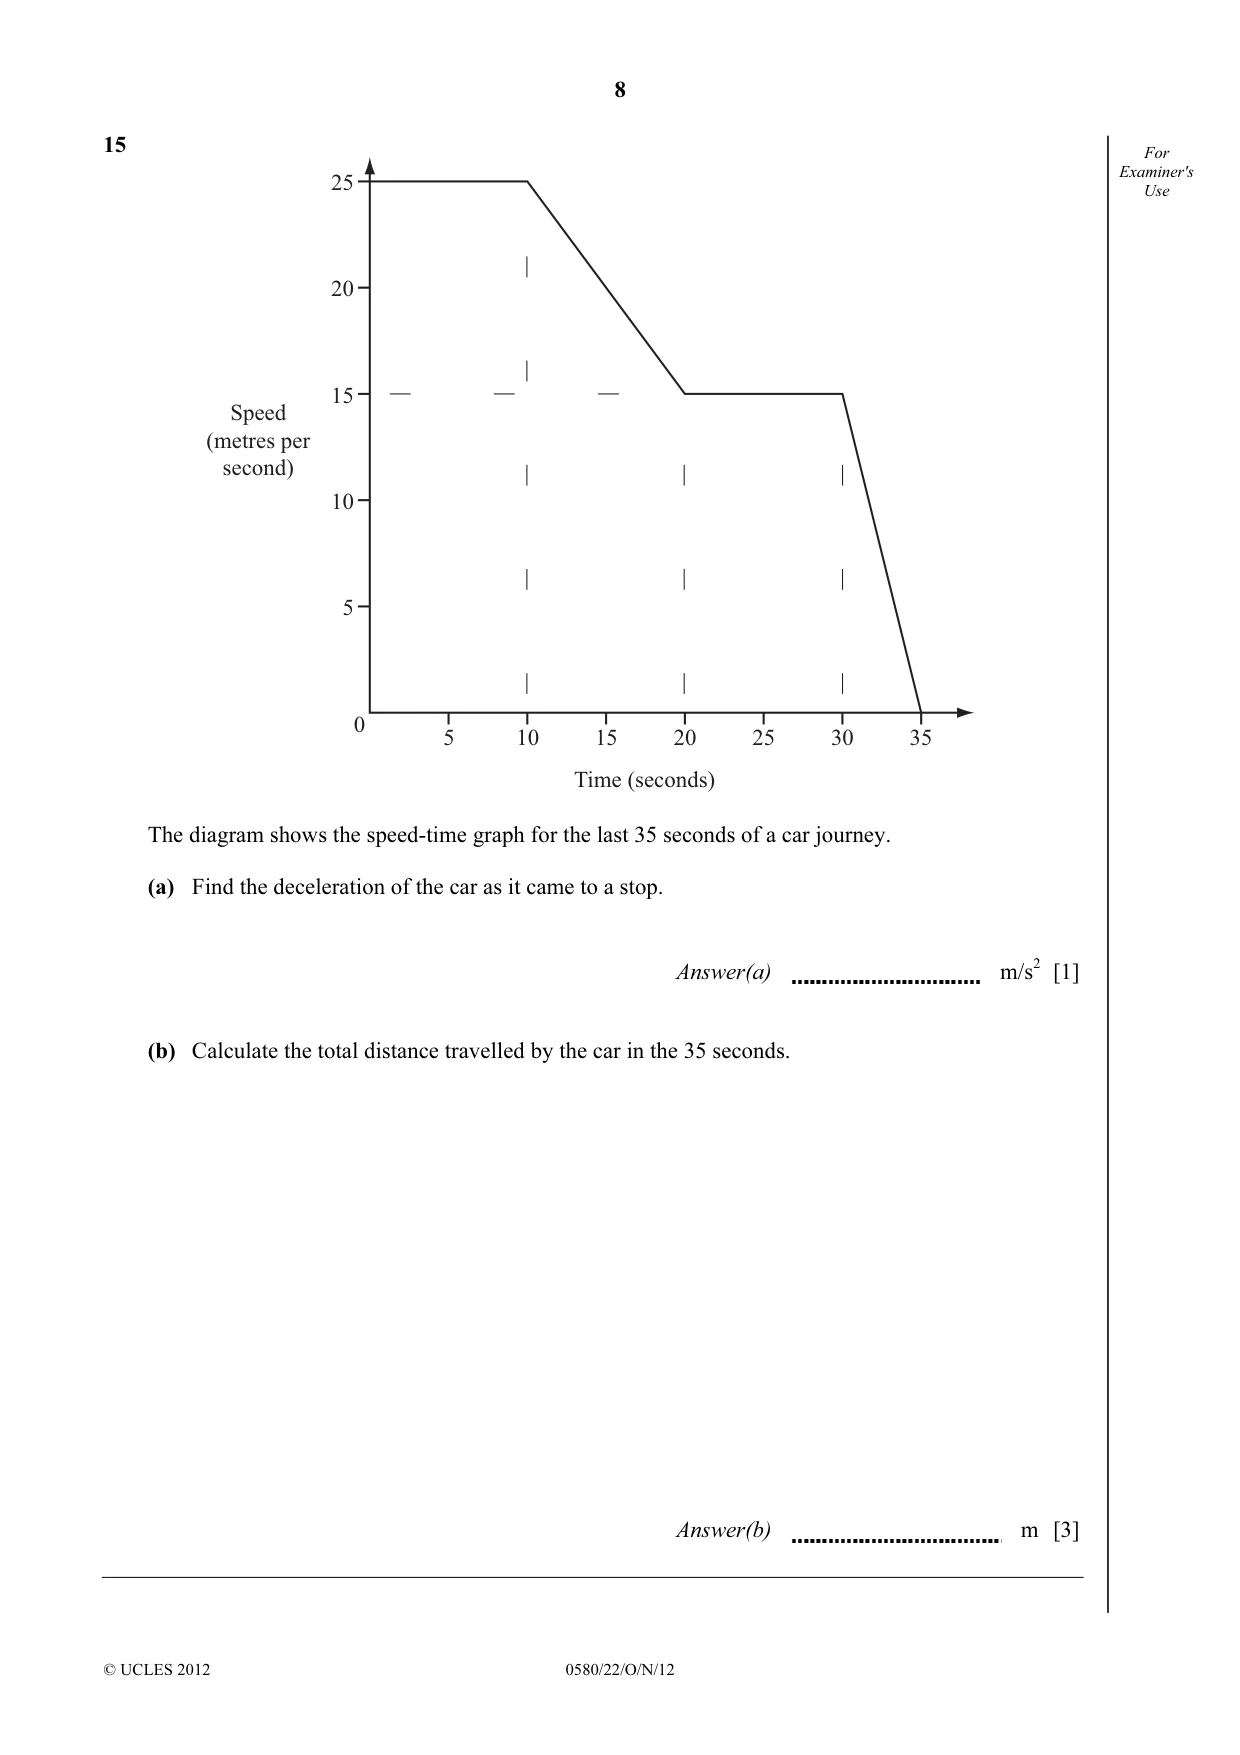
Q15 · For Examiner's 25 Use 20 15 Speed (metres per second) 10 5 0 5 10 15 20 25 30 35 Time…
15 For Examiner's 25 Use 20 15 Speed (metres per second) 10 5 0 5 10 15 20 25 30 35 Time (seconds) The diagram shows the speed-time graph for the last 35 seconds of a car journey. (a) Find the deceleration of the car as it came to a stop. Answer(a) m/s2 [1] (b) Calculate the total distance travelled by the car in the 35 seconds. Answer(b) m [3]
Mark scheme: 15 (a) 3 1 (b) 637.5 3 M1 finding area under graph M1dep all correct area statements
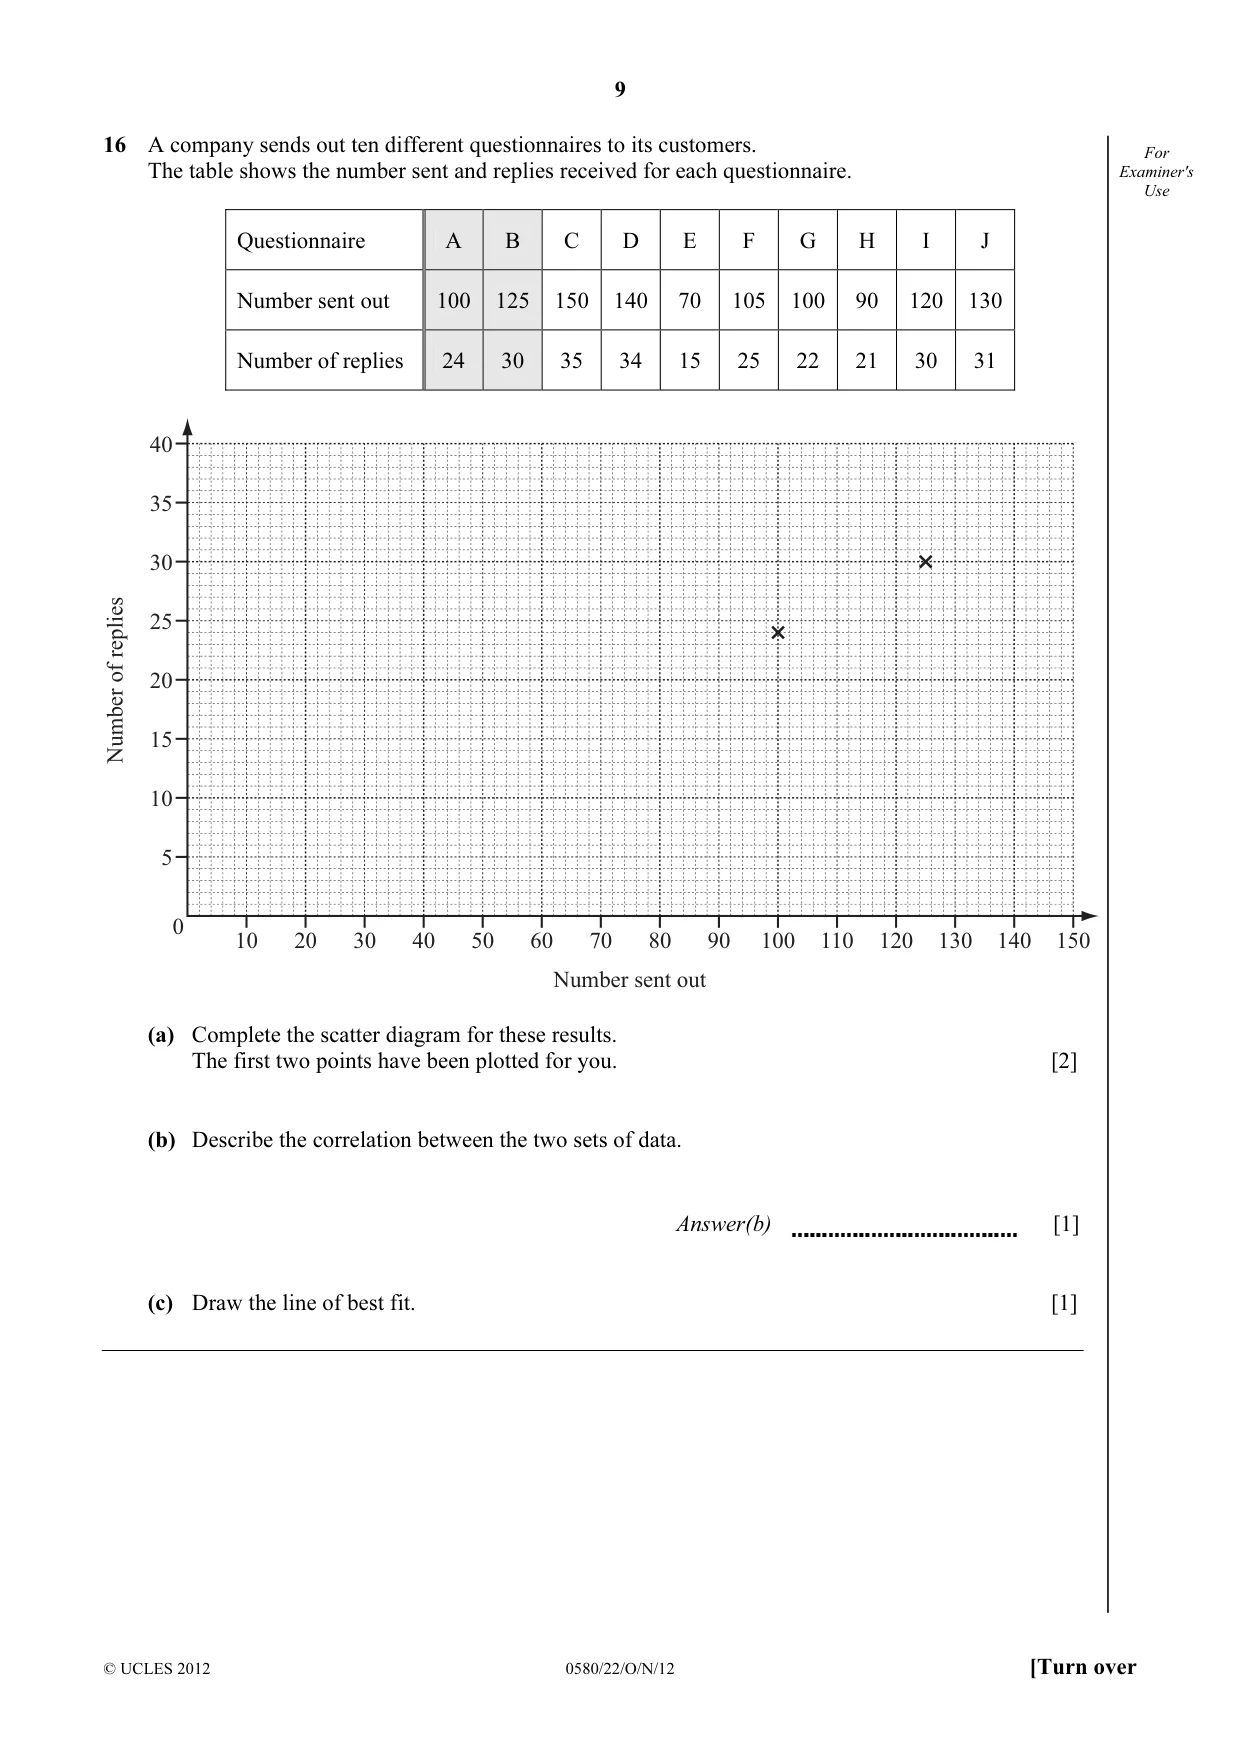
Q16 · A company sends out ten different questionnaires to its customers
16 A company sends out ten different questionnaires to its customers. For The table shows the number sent and replies received for each questionnaire. Examiner's Use Questionnaire A B C D E F G H I J Number sent out 100 125 150 140 70 105 100 90 120 130 Number of replies 24 30 35 34 15 25 22 21 30 31 40 35 30 25replies of 20 15Number 10 5 0 10 20 30 40 50 60 70 80 90 100 110 120 130 140 150 Number sent out (a) Complete the scatter diagram for these results. The first two points have been plotted for you. [2] (b) Describe the correlation between the two sets of data. Answer(b) [1] (c) Draw the line of best fit. [1]
Mark scheme: 16 (a) Points plotted correctly 2 B1 6 or 7 points correct (b) Positive 1 (c) Line of best fit ruled 1
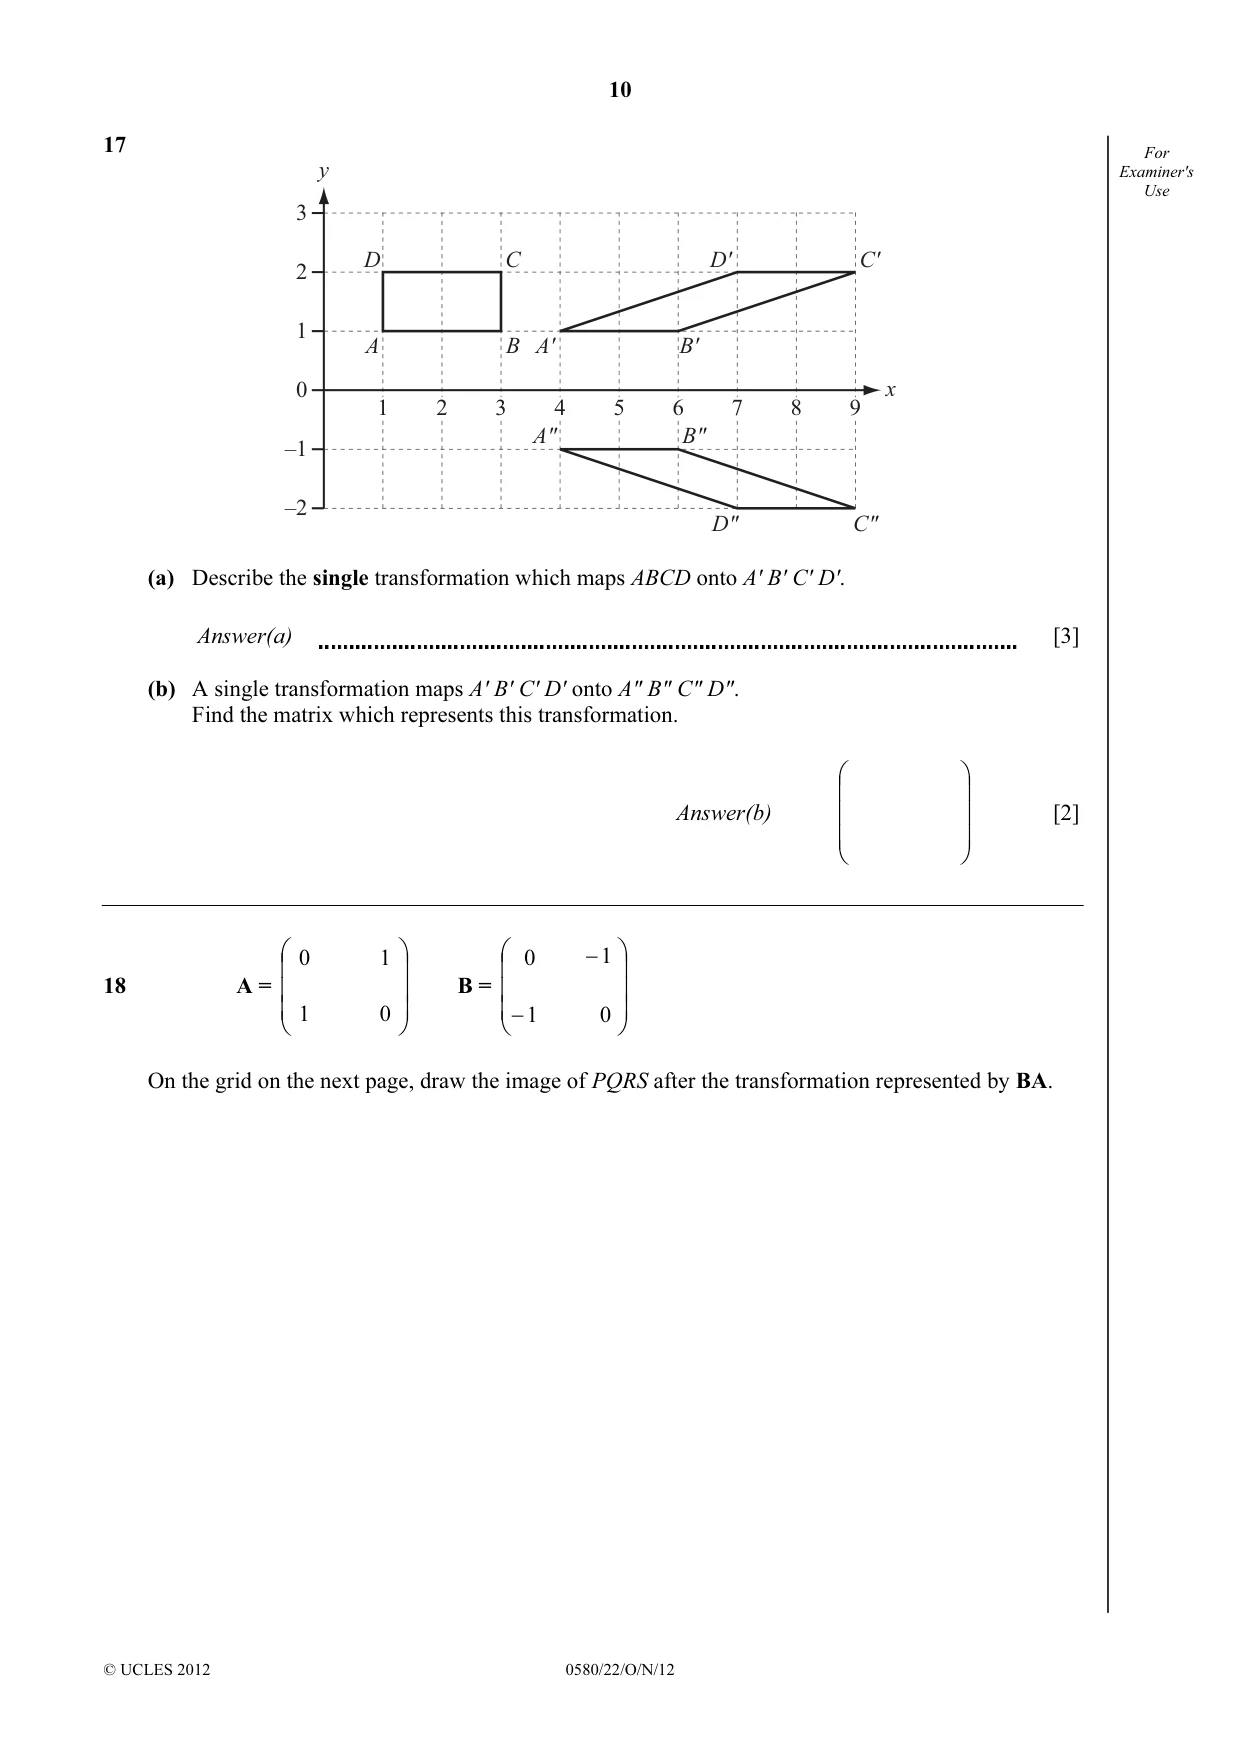
Q17 · For y Examiner's Use 3 D C D' C' 2 1 A B A' B' 0 x 1 2 3 4 5 6 7 8 9 A″ B″ –1 –2 D″ C″…
17 For y Examiner's Use 3 D C D' C' 2 1 A B A' B' 0 x 1 2 3 4 5 6 7 8 9 A″ B″ –1 –2 D″ C″ (a) Describe the single transformation which maps ABCD onto A' B' C' D'. Answer(a) [3] (b) A single transformation maps A' B' C' D' onto A" B" C" D". Find the matrix which represents this transformation. Answer(b) [2] 0 1 0 −1
Mark scheme: 17 (a) Shear x axis invariant sf 3 3 B1 shear B1 x axis invariant oe B1 3 1 0 1 0 k ≠ 0 or k ≠ 1 2 M1 (b) 0 k 0 −1
Q18 · A = 1 0 B = 1 0 − On the grid on the next page, draw the image of PQRS…
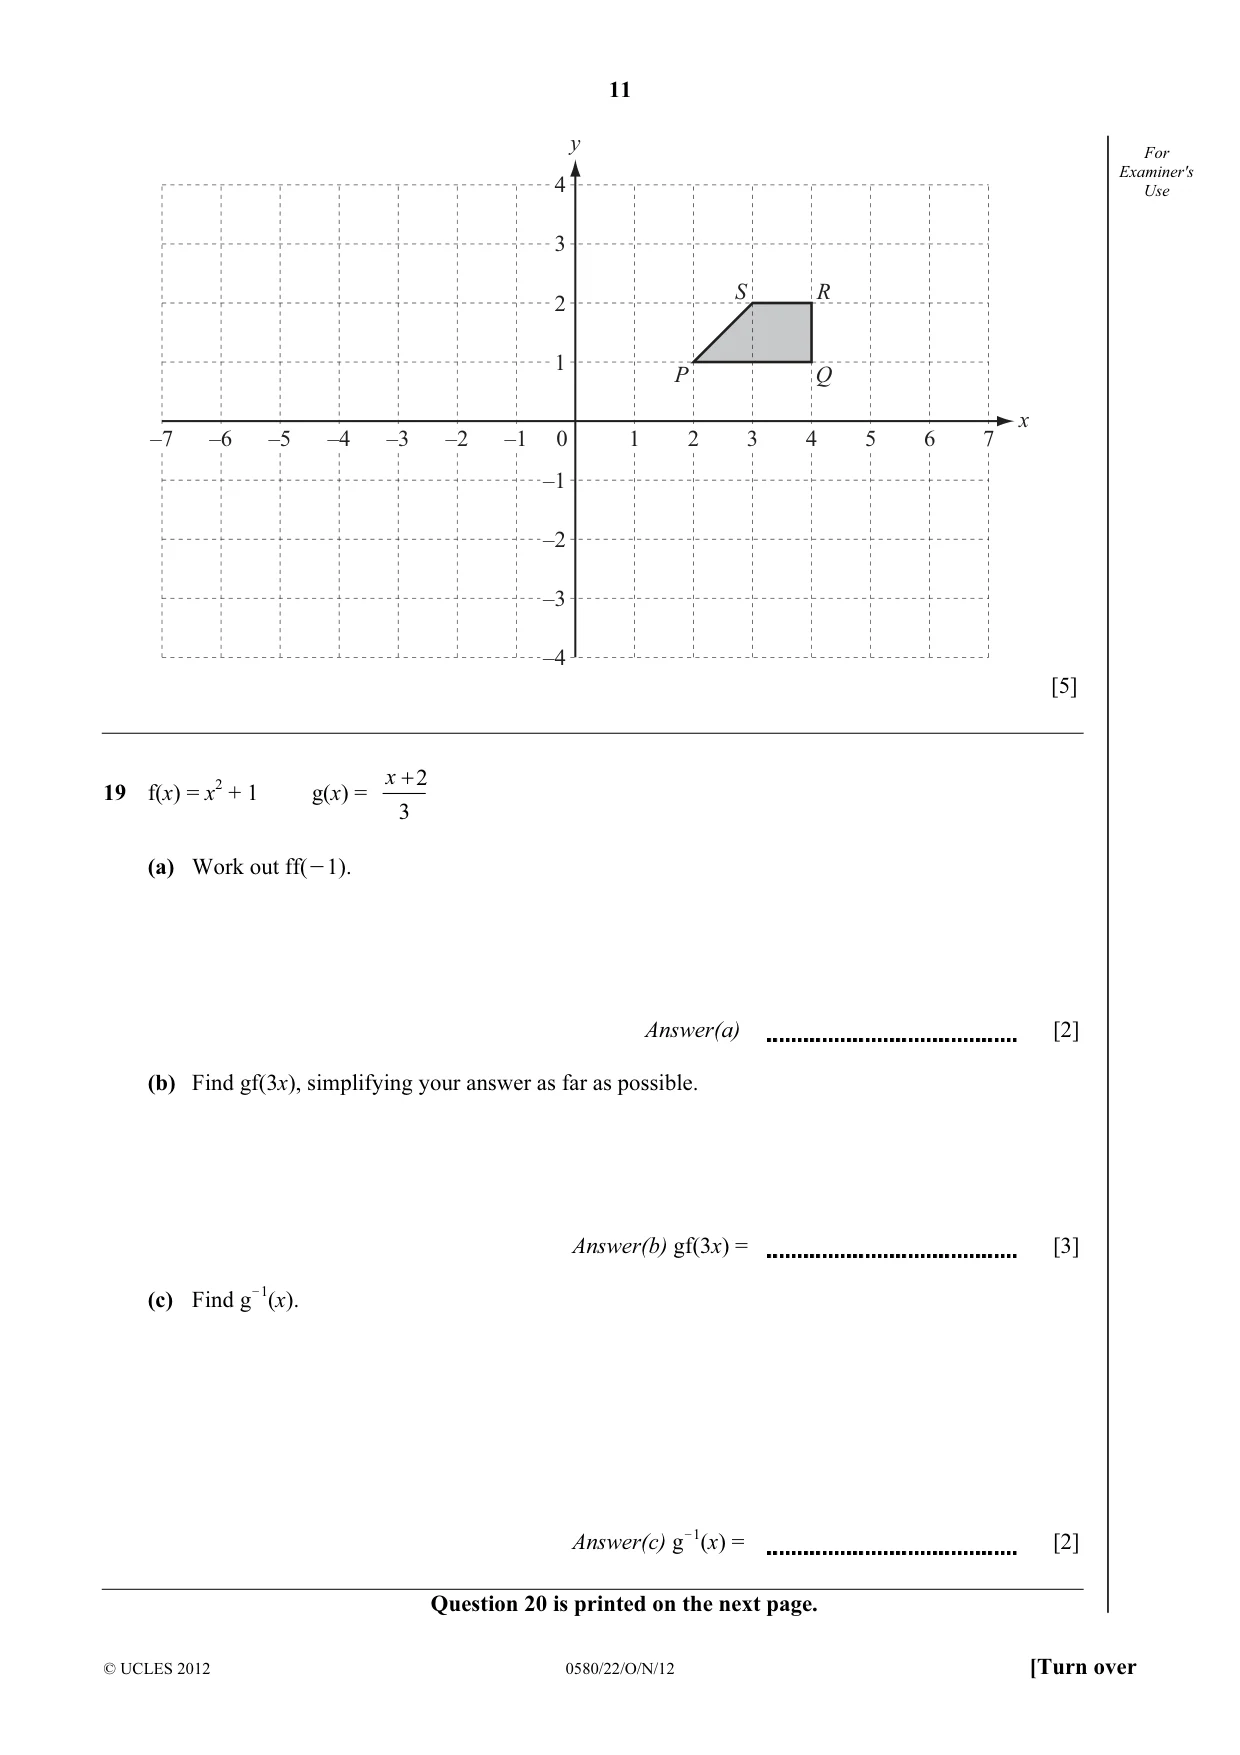
18 A = 1 0 B = 1 0 − On the grid on the next page, draw the image of PQRS after the transformation represented by BA. y For Examiner's 4 Use 3 S R 2 1 P Q x –7 –6 –5 –4 –3 –2 –1 0 1 2 3 4 5 6 7 –1 –2 –3 –4 [5]
Mark scheme: 18 trapezium at (–2, –1),( –4, –1), (–4, –2), 5 SC4 for correct co-ordinates or vectors or matrix seen ( –3, –2) www with no diagram or with an incorrect diagram. SC3 for correct diagram with wrong working or one other incorrect trapezium which is not part of a correct method. − 1 0 If 0 then B2 for or 0 − 1 2 4 4 3 − 2 − 4 − 4 − 3 M1ft “BA” = A1ft 1 1 2 2 − 1 − 1 − 2 − 2
Q19 · X + 2 19 f(x) = x2 + 1 g(x) = 3 (a) Work out ff(O1)
x + 2 19 f(x) = x2 + 1 g(x) = 3 (a) Work out ff(O1). Answer(a) [2] (b) Find gf(3x), simplifying your answer as far as possible. Answer(b) gf(3x) = [3] (c) Find gO1(x). Answer(c) g O1(x) = [2] Question 20 is printed on the next page.
Mark scheme: 19 (a) 5 2 M1 f(2) = seen (b) 3x2 + 1 3 M1 9x2 + 1 M1 ( “9x2 + 1” + 2)/3 seen (c) 3x – 2 2 y + 2 M1 for 3y = x + 2 or x = 3
Q20 · The two lines y = 2x + 8 and y = 2x – 12 intersect the x-axis at P and Q
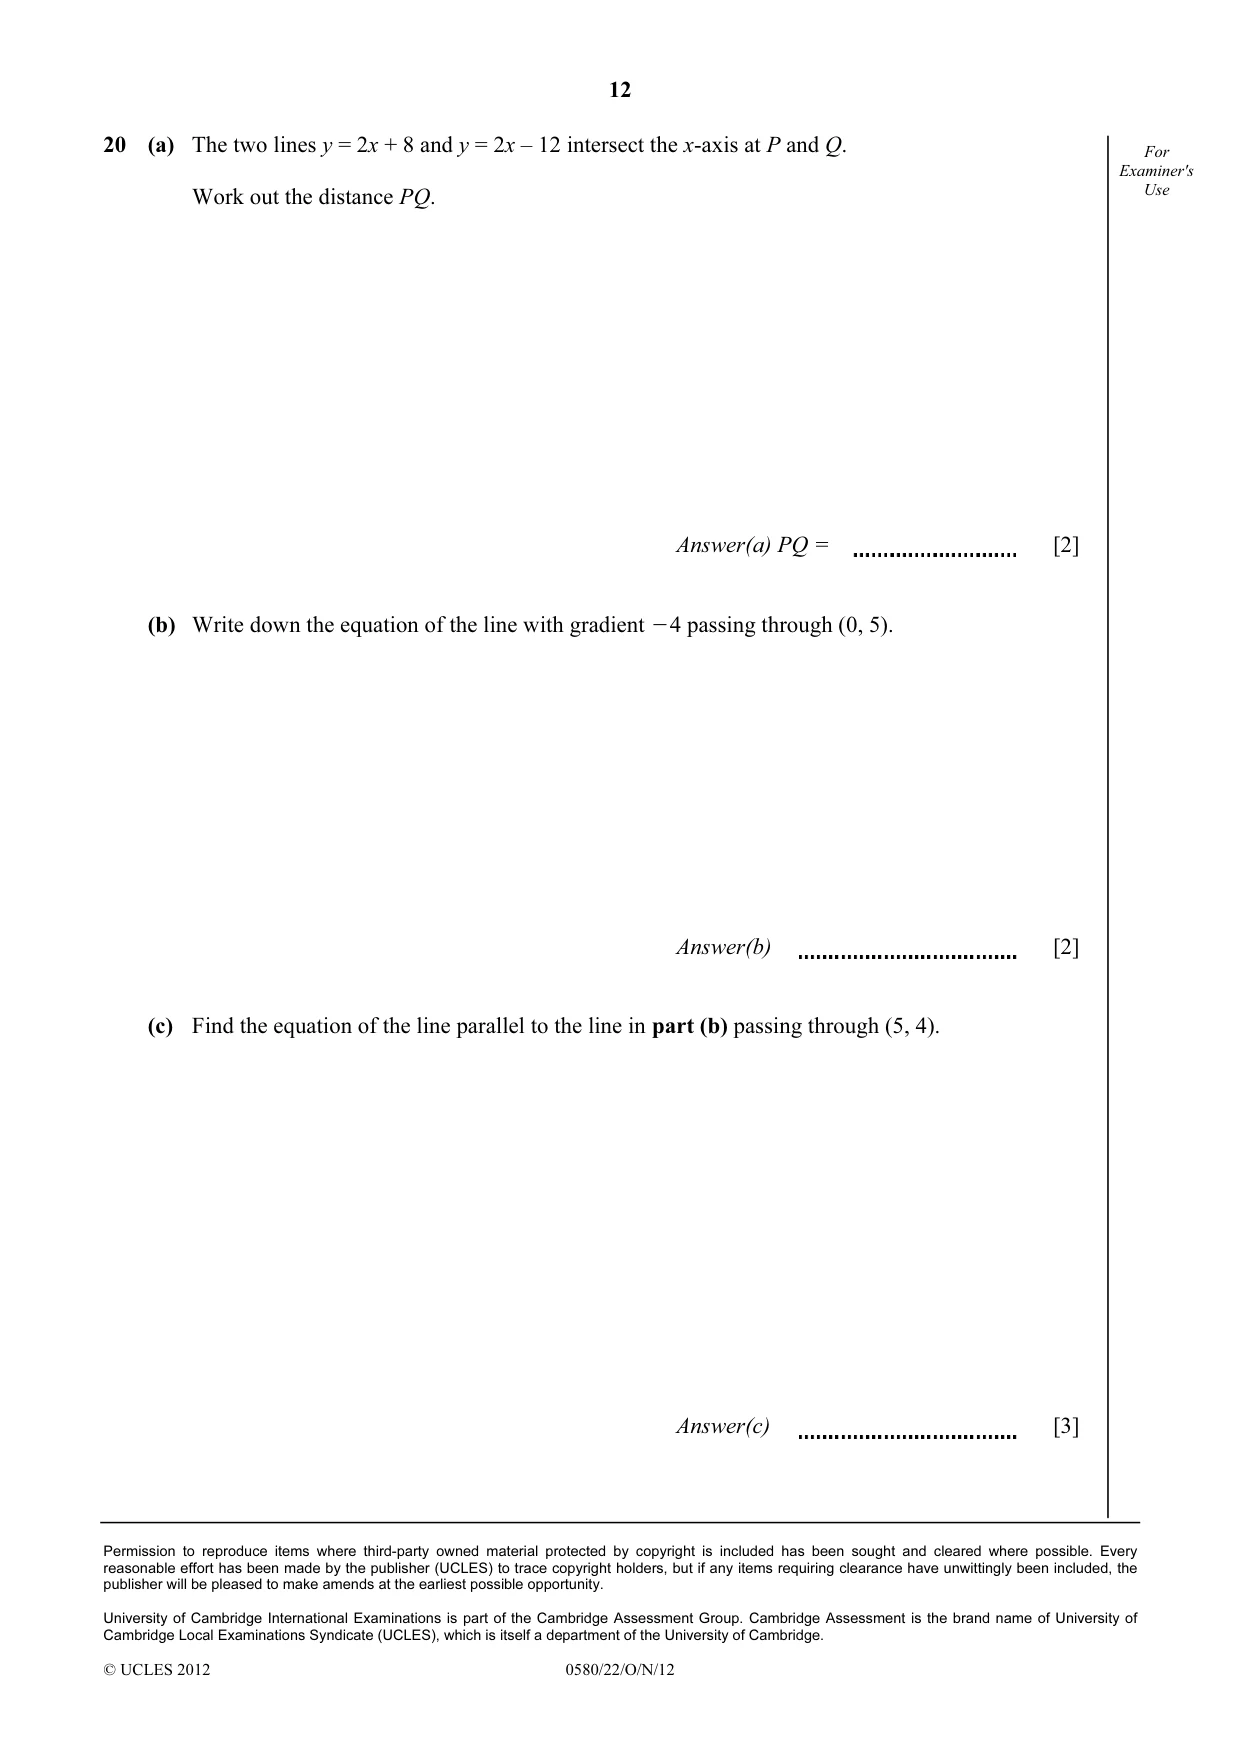
20 (a) The two lines y = 2x + 8 and y = 2x – 12 intersect the x-axis at P and Q. For Examiner's Use Work out the distance PQ. Answer(a) PQ = [2] (b) Write down the equation of the line with gradient O4 passing through (0, 5). Answer(b) [2] (c) Find the equation of the line parallel to the line in part (b) passing through (5, 4). Answer(c) [3]
Mark scheme: 20 (a) 10 2 M1 x = –4 and x = 6 seen (b) y = –4x + 5 oe 2 B1 y = mx + 5 (m ≠ 0) or y = –4x + k (k ≠ 0) or y = –4x + 5 (c) y = –4x + 24 oe 3 M1 m = –4 or gradient = –4 or y = –4x + c M1 (5, 4) substituted into y = mx + c
What was in this paper
The subtopics covered by these 8 questions, and how many questions each got. Open one in a new tab to see every Cambridge question on it.