Cambridge IGCSE Mathematics 0580 — 2019 Oct/Nov Paper 2 · Variant 3
0580/23/O/N/19 · 23 questions · 70 marks · ≈79 min
The question paper and its mark scheme, free to read here and free to download. This is Cambridge’s own paper, exactly as it was sat.
Question paper12 pages
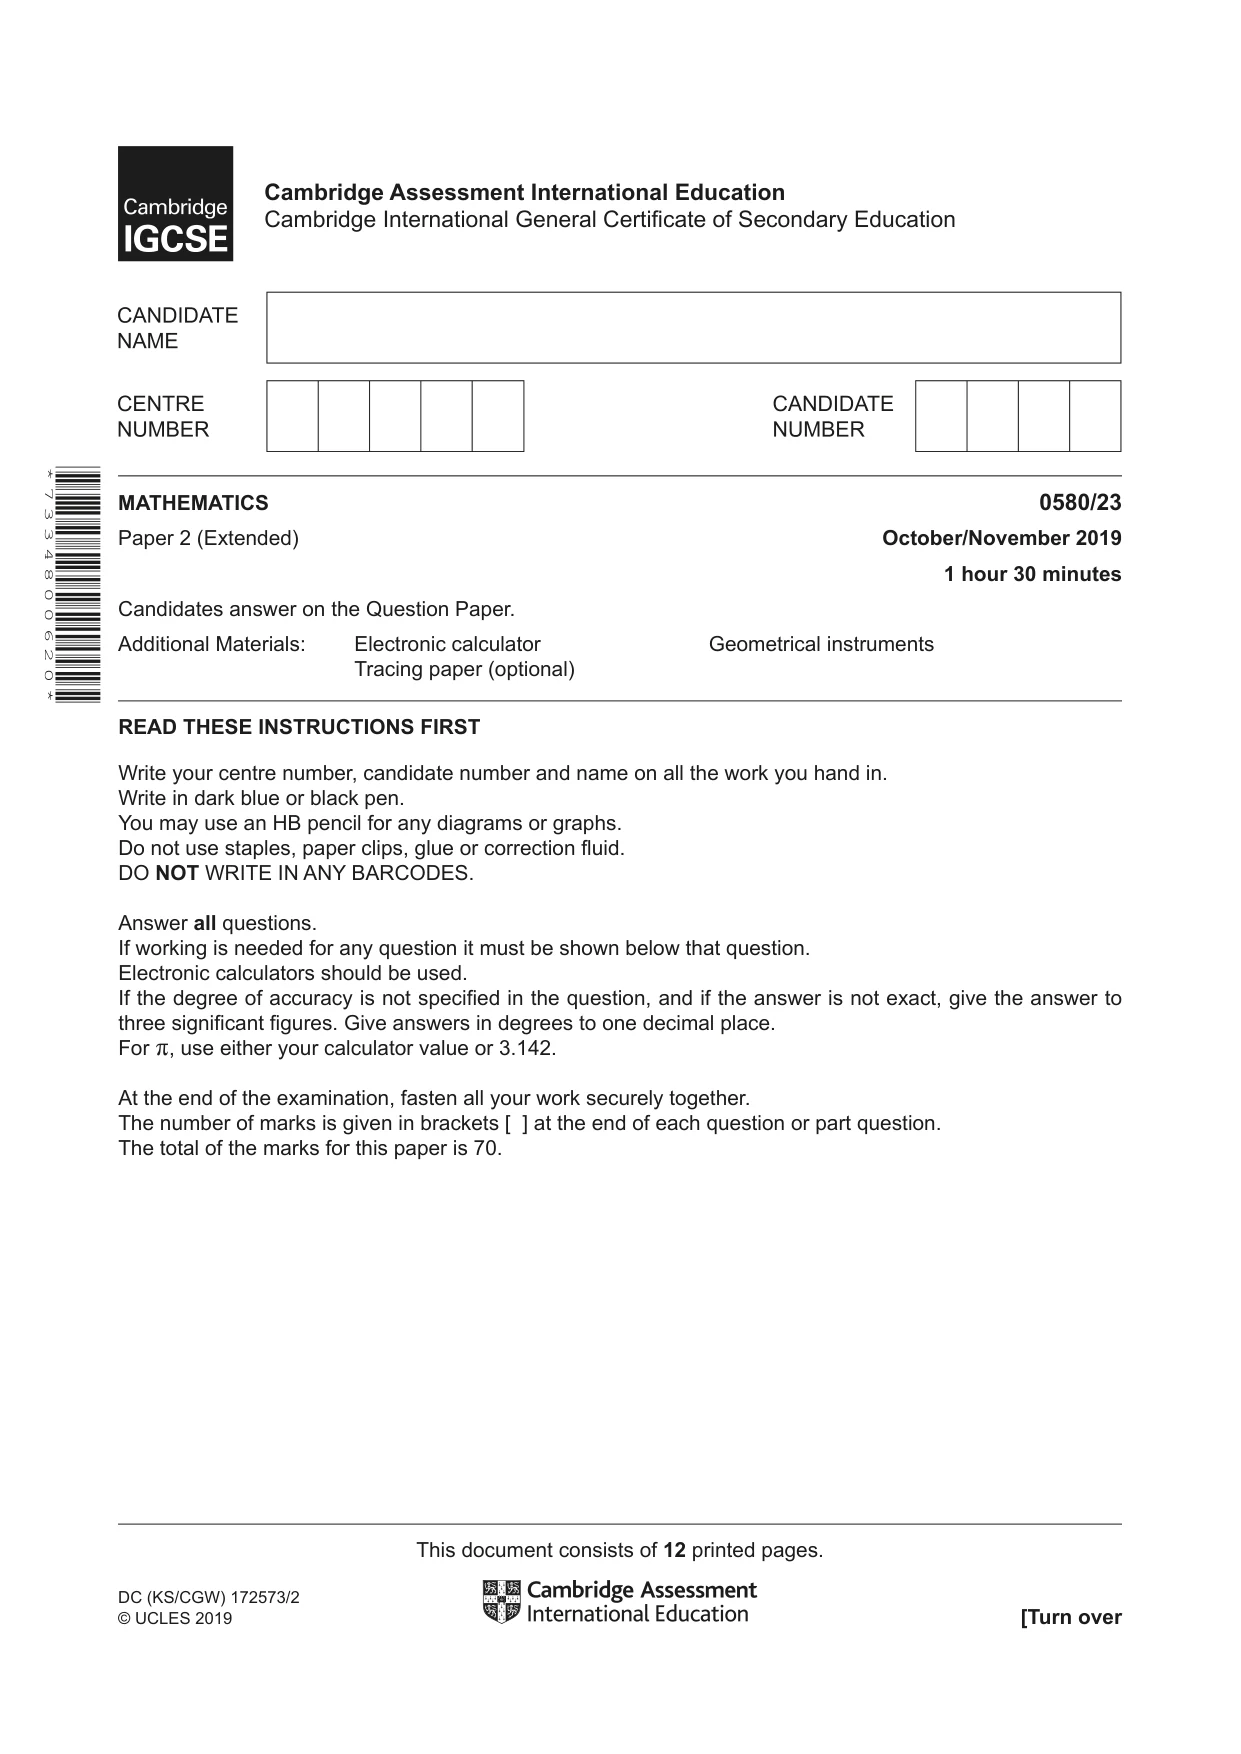
Mark scheme6 pages
Answers below. Sit the paper first if you are practising.
Questions as text
Q1 · Write down the temperature that is 7 °C below -3 °C
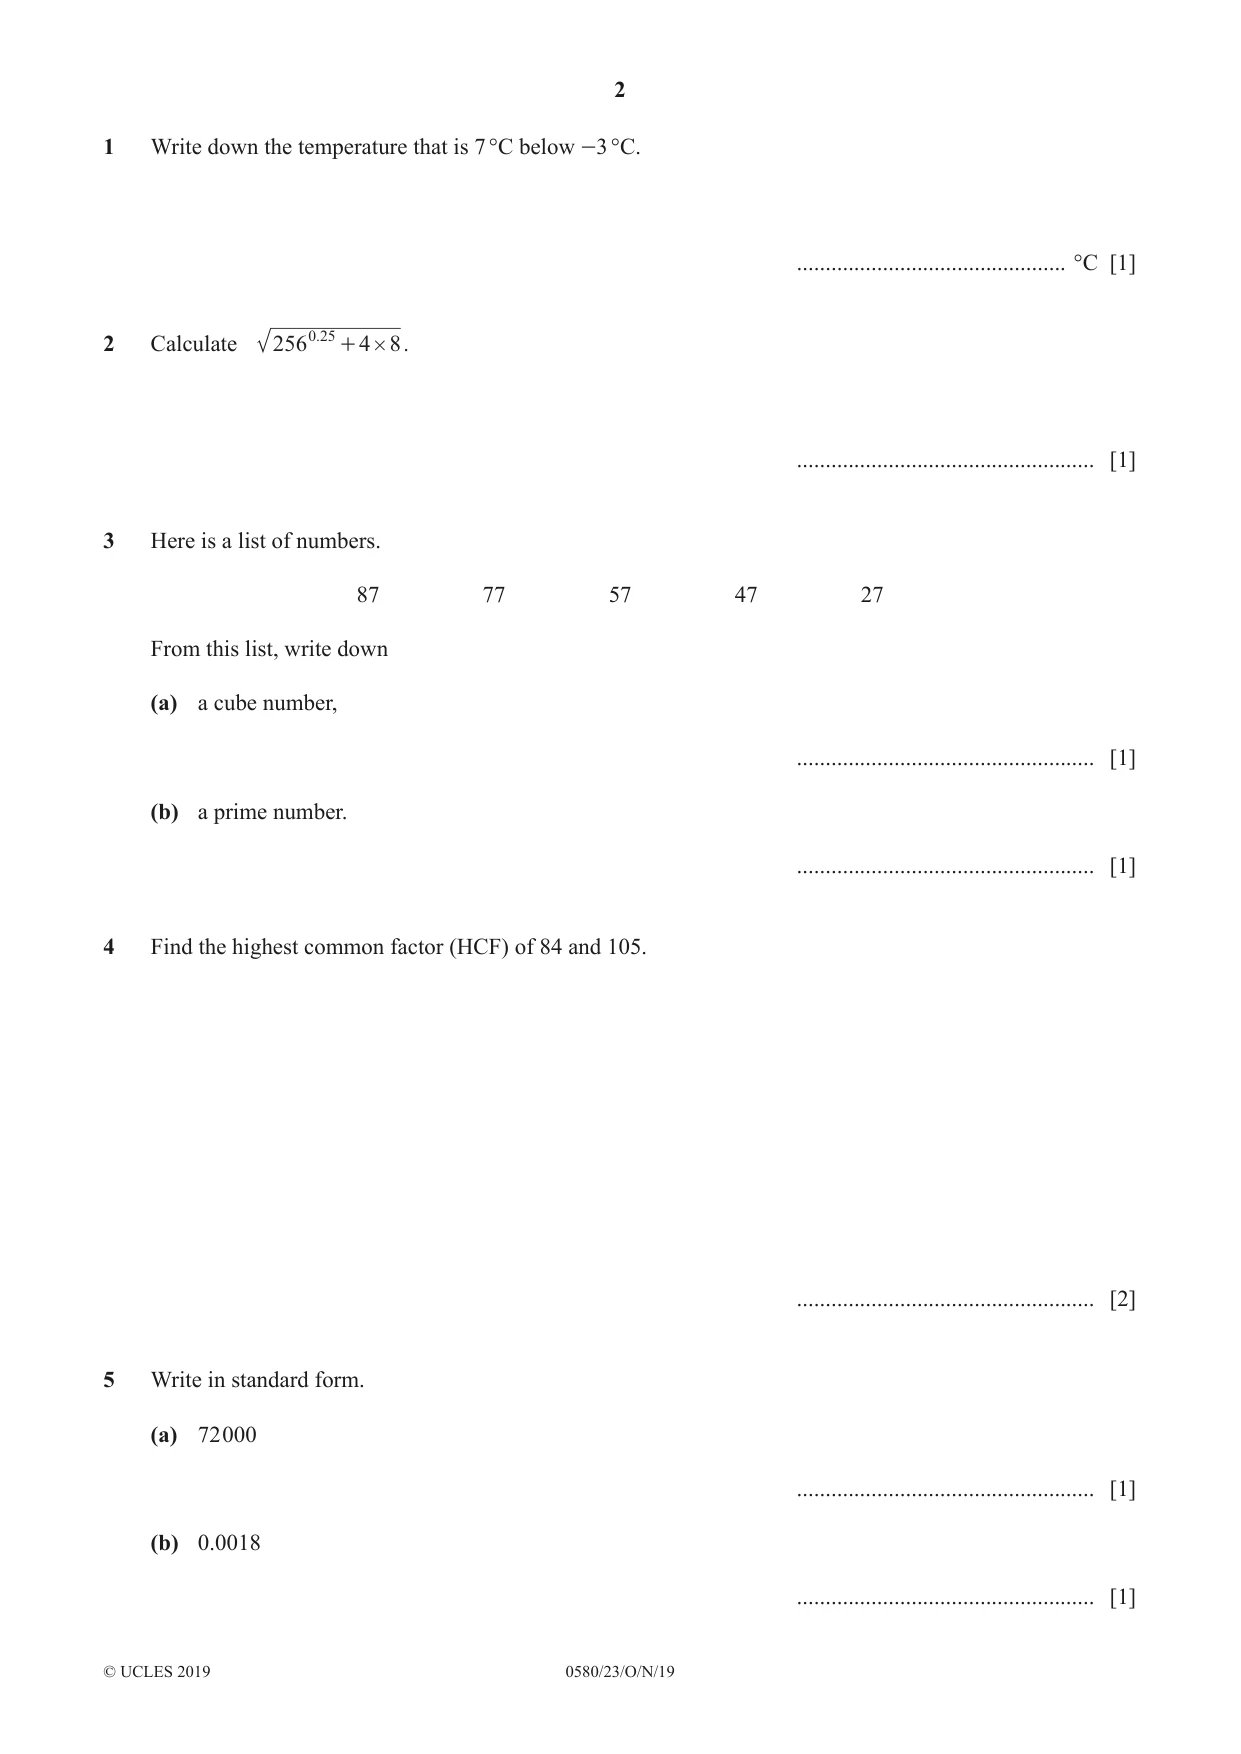
1 Write down the temperature that is 7 °C below -3 °C. ............................................... °C [1]
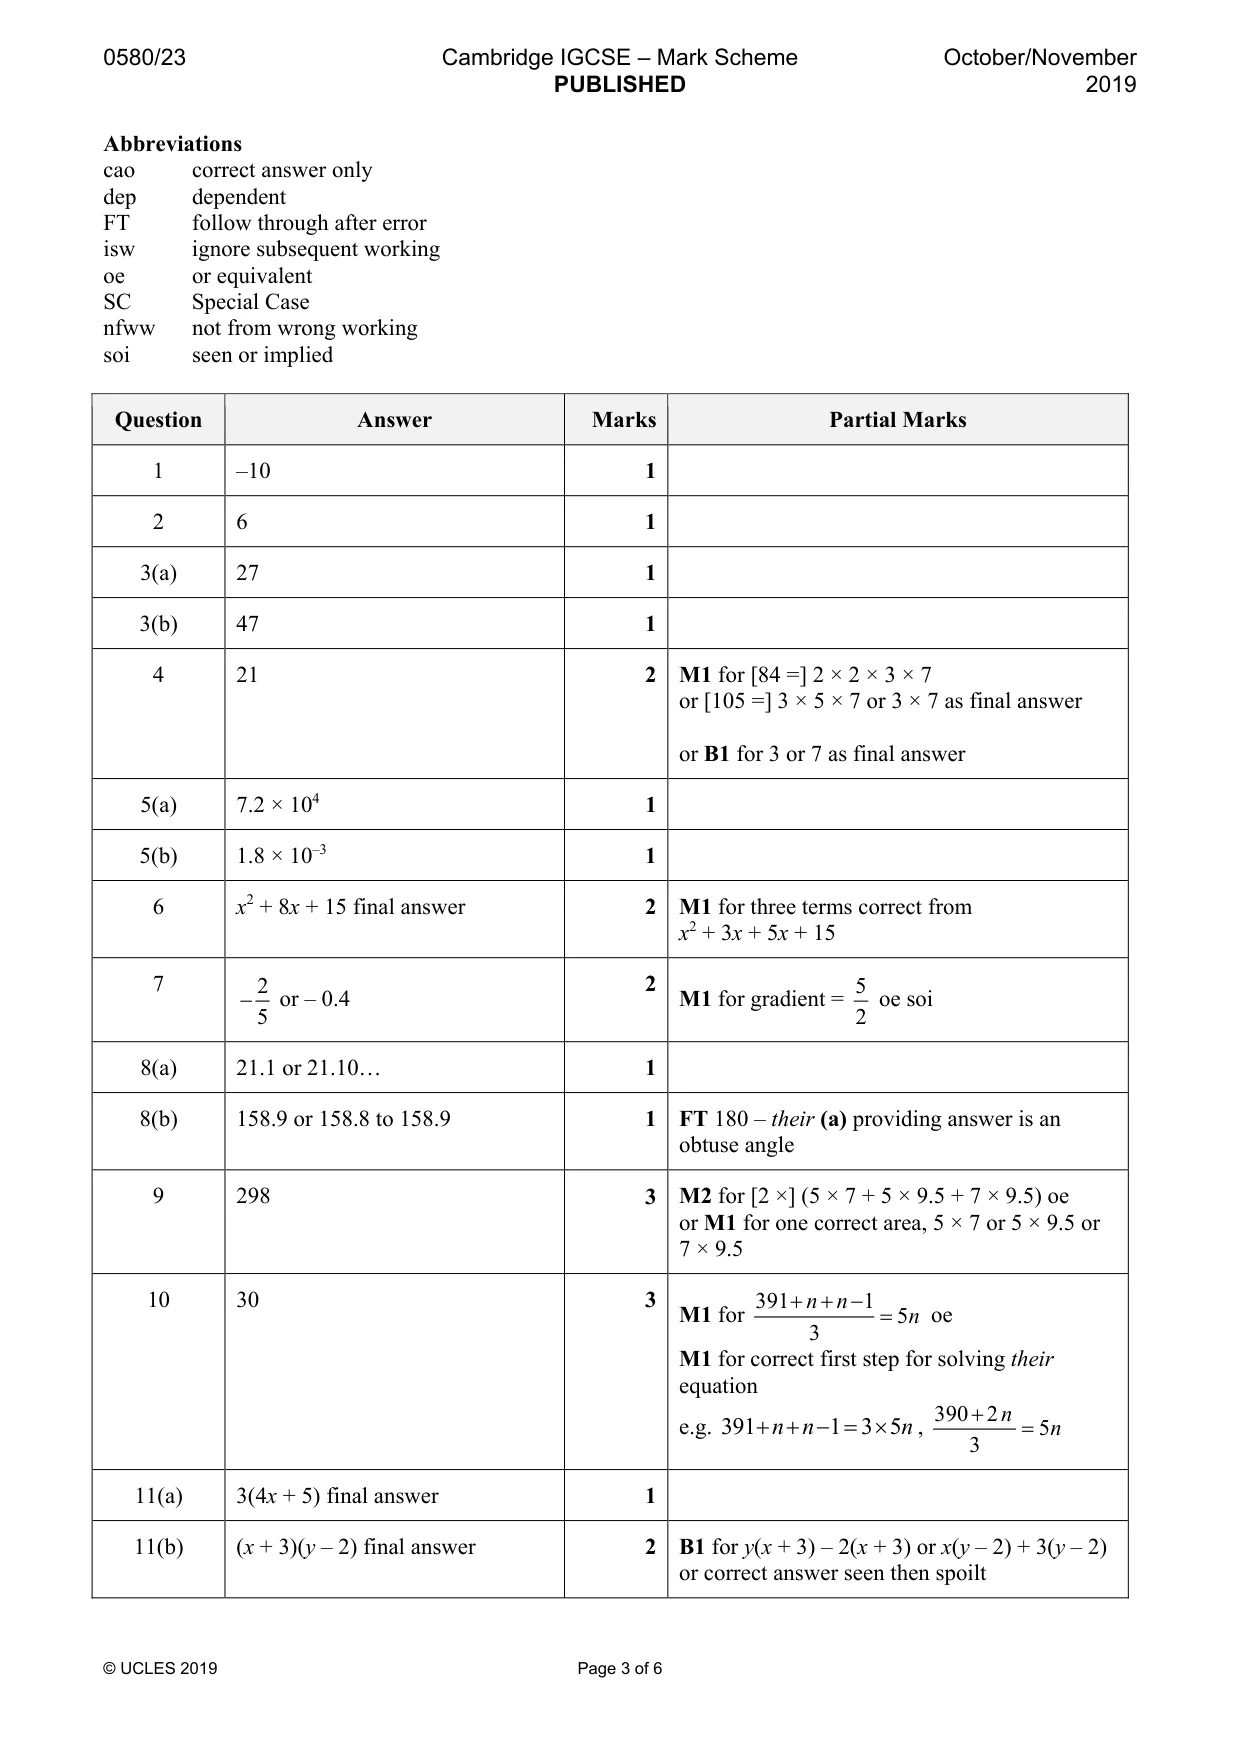
Mark scheme: Question Answer Marks Partial Marks 1 –10 1
Q2 · Calculate 256 .025 + 4 # 8
2 Calculate 256 .025 + 4 # 8 . .................................................... [1]
Mark scheme: 2 6 1
Q3 · Here is a list of numbers
3 Here is a list of numbers. 87 77 57 47 27 From this list, write down (a) a cube number, .................................................... [1] (b) a prime number. .................................................... [1]
Mark scheme: 3(a) 27 1 3(b) 47 1
Q4 · Find the highest common factor (HCF) of 84 and 105
4 Find the highest common factor (HCF) of 84 and 105. .................................................... [2]
Mark scheme: 4 21 2 M1 for [84 =] 2 × 2 × 3 × 7 or [105 =] 3 × 5 × 7 or 3 × 7 as final answer or B1 for 3 or 7 as final answer
Q5 · Write in standard form
5 Write in standard form. (a) 72 000 .................................................... [1] (b) 0.0018 .................................................... [1]
Mark scheme: 5(a) 7.2 × 10⁴ 1 5(b) 1.8 × 10⁻³ 1
Q6 · Expand and simplify (x + 3)(x + 5)
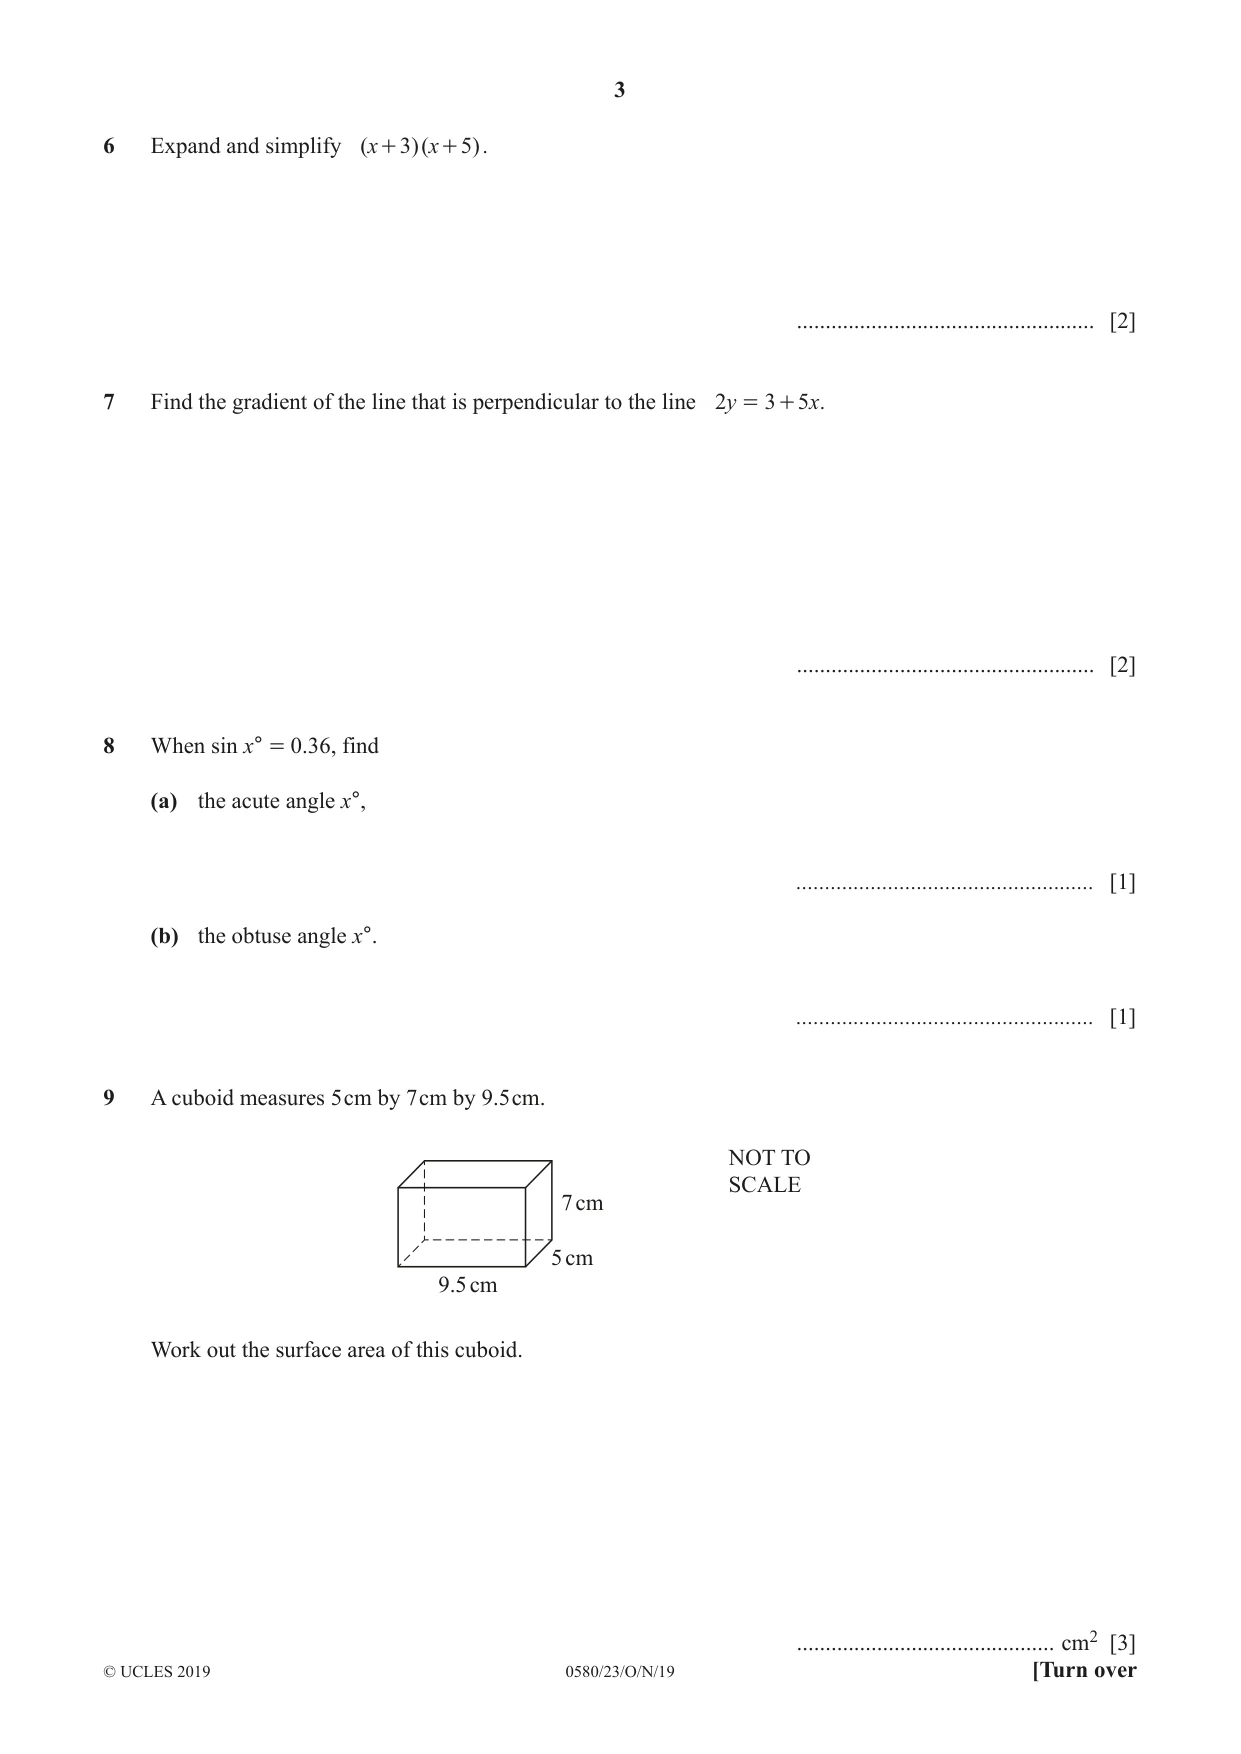
6 Expand and simplify (x + 3)(x + 5). .................................................... [2]
Mark scheme: 6 x2 + 8x + 15 final answer 2 M1 for three terms correct from x2 + 3x + 5x + 15
Q7 · Find the gradient of the line that is perpendicular to the line 2y = 3 + 5x
7 Find the gradient of the line that is perpendicular to the line 2y = 3 + 5x. .................................................... [2]
Mark scheme: 7 2 2 5 − or – 0.4 M1 for gradient = oe soi 5 2
Q8 · When sin x° = 0.36, find (a) the acute angle x°…
8 When sin x° = 0.36, find (a) the acute angle x°, .................................................... [1] (b) the obtuse angle x°. .................................................... [1]
Mark scheme: 8(a) 21.1 or 21.10… 1 8(b) 158.9 or 158.8 to 158.9 1 FT 180 – their (a) providing answer is an obtuse angle
Q9 · A cuboid measures 5 cm by 7 cm by 9.5 cm
9 A cuboid measures 5 cm by 7 cm by 9.5 cm. NOT TO SCALE 7 cm 5 cm 9.5 cm Work out the surface area of this cuboid. ............................................. cm2 [3]
Mark scheme: 9 298 3 M2 for [2 ×] (5 × 7 + 5 × 9.5 + 7 × 9.5) oe or M1 for one correct area, 5 × 7 or 5 × 9.5 or 7 × 9.5
Q10 · 5n is the mean of the three numbers 391, n and n - 1
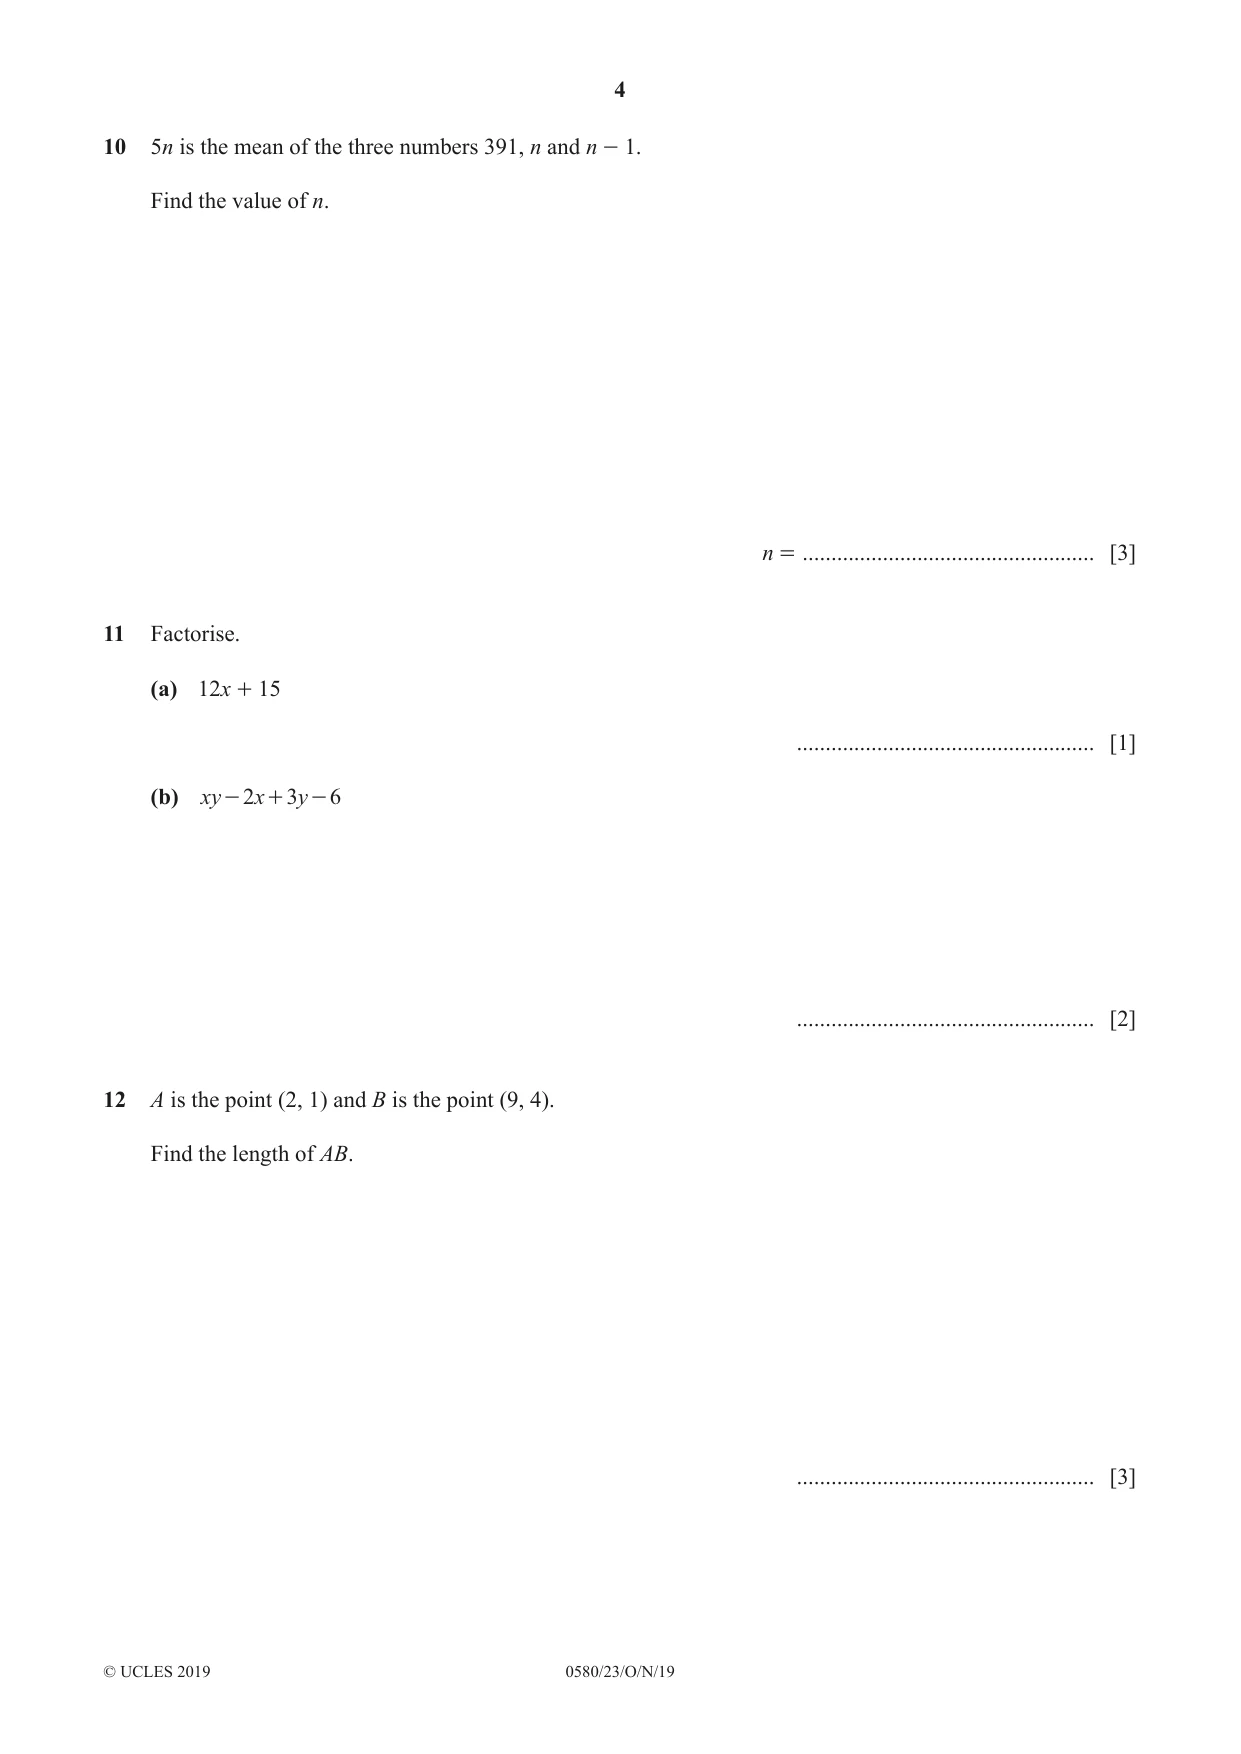
10 5n is the mean of the three numbers 391, n and n - 1. Find the value of n. n = ................................................... [3]
Mark scheme: 10 30 3 391 + n + n 1 M1 for −= 5 n oe 3 M1 for correct first step for solving their equation 390 + 2 n e.g. 391 + n + n −=1 3 × 5n , = 5 n 3
Question 11
11 Factorise. (a) 12x + 15 .................................................... [1] (b) xy - 2x + 3y - 6 .................................................... [2]
Mark scheme: 11(a) 3(4x + 5) final answer 1 11(b) (x + 3)(y – 2) final answer 2 B1 for y(x + 3) – 2(x + 3) or x(y – 2) + 3(y – 2) or correct answer seen then spoilt
Q12 · A is the point (2, 1) and B is the point (9, 4)
12 A is the point (2, 1) and B is the point (9, 4). Find the length of AB. .................................................... [3]
Mark scheme: 12 7.62 or 7.615 to 7.616 3 2 2 M2 for ( 9 − 2 ) + ( 4 − 1) oe or M1 for ( 9 − 2 ) 2 + ( 4 − 1) 2 oe or 58
Q13 · A straight line joins the points (3k, 6) and (k, -5)
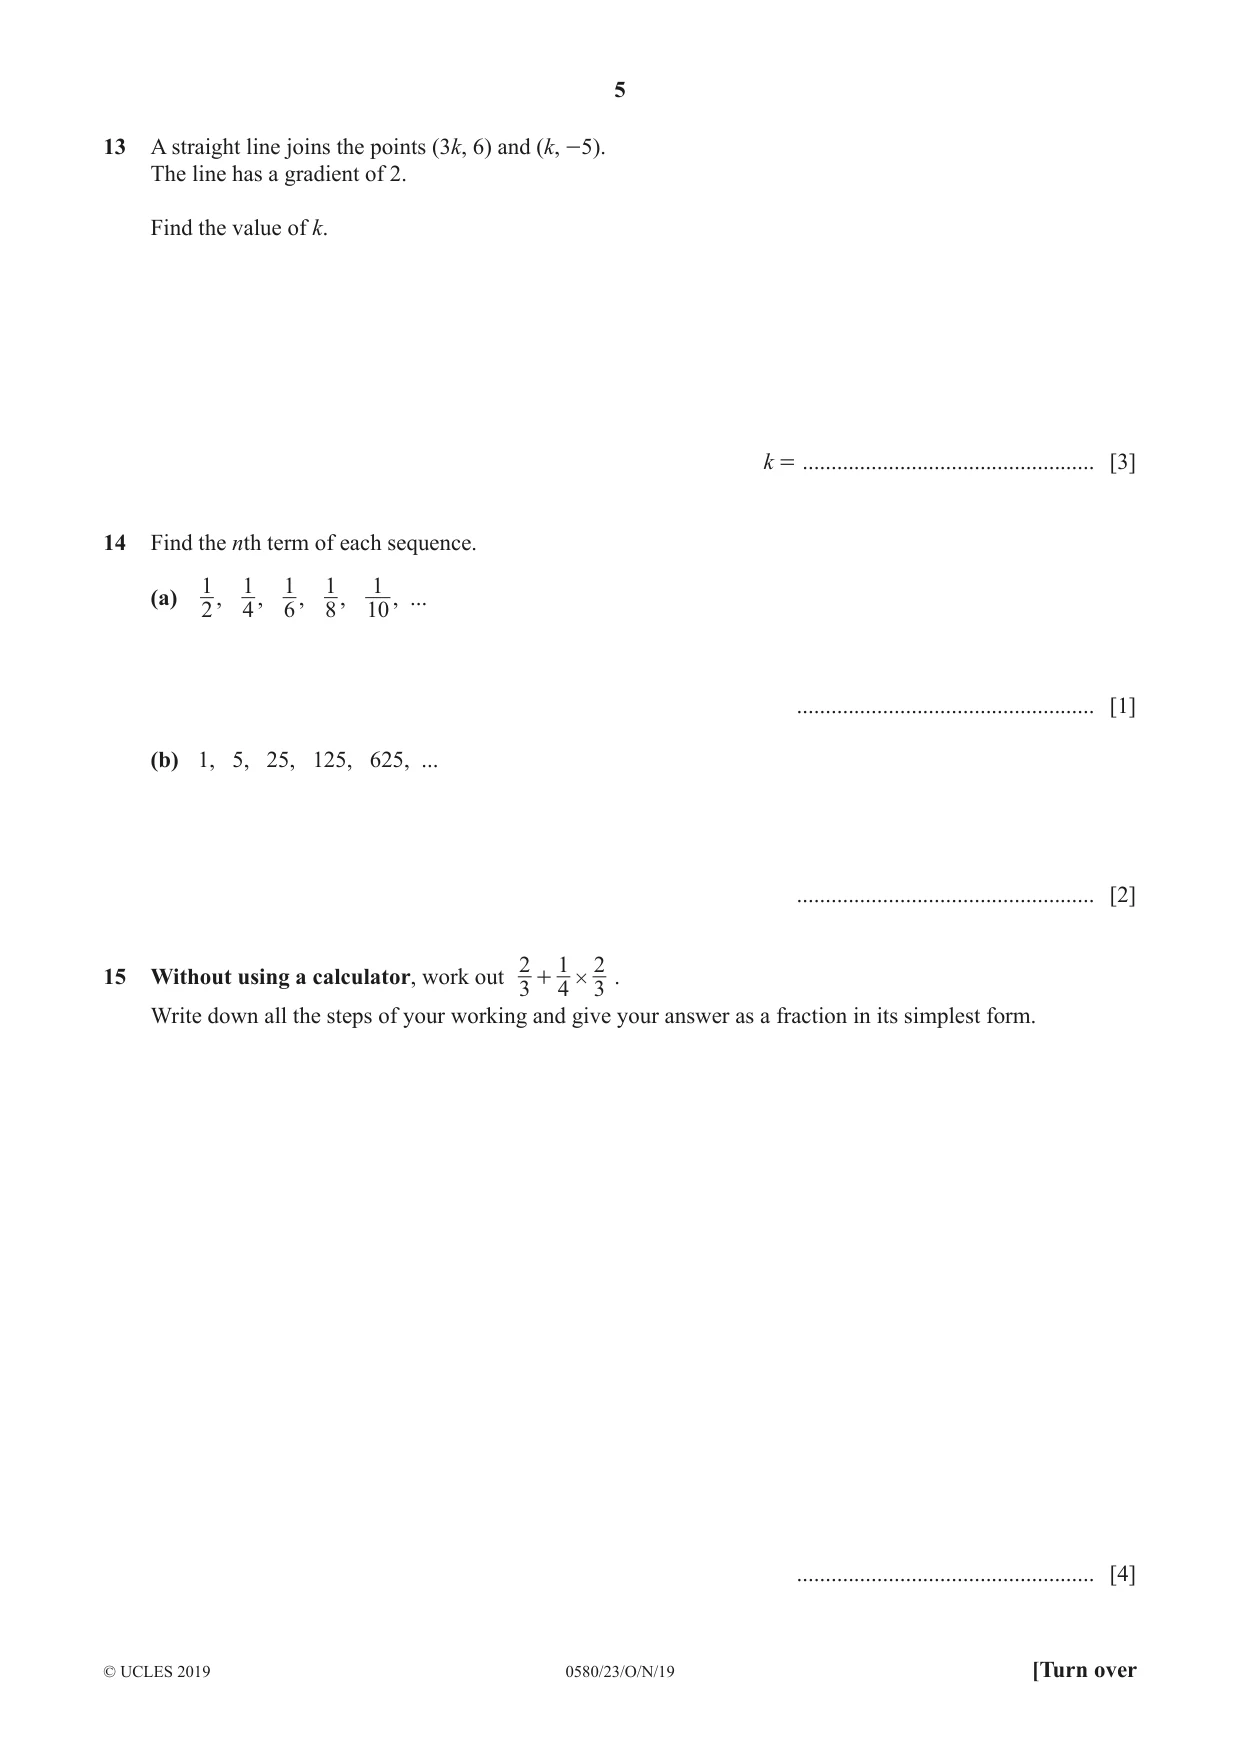
13 A straight line joins the points (3k, 6) and (k, -5). The line has a gradient of 2. Find the value of k. k = ................................................... [3]
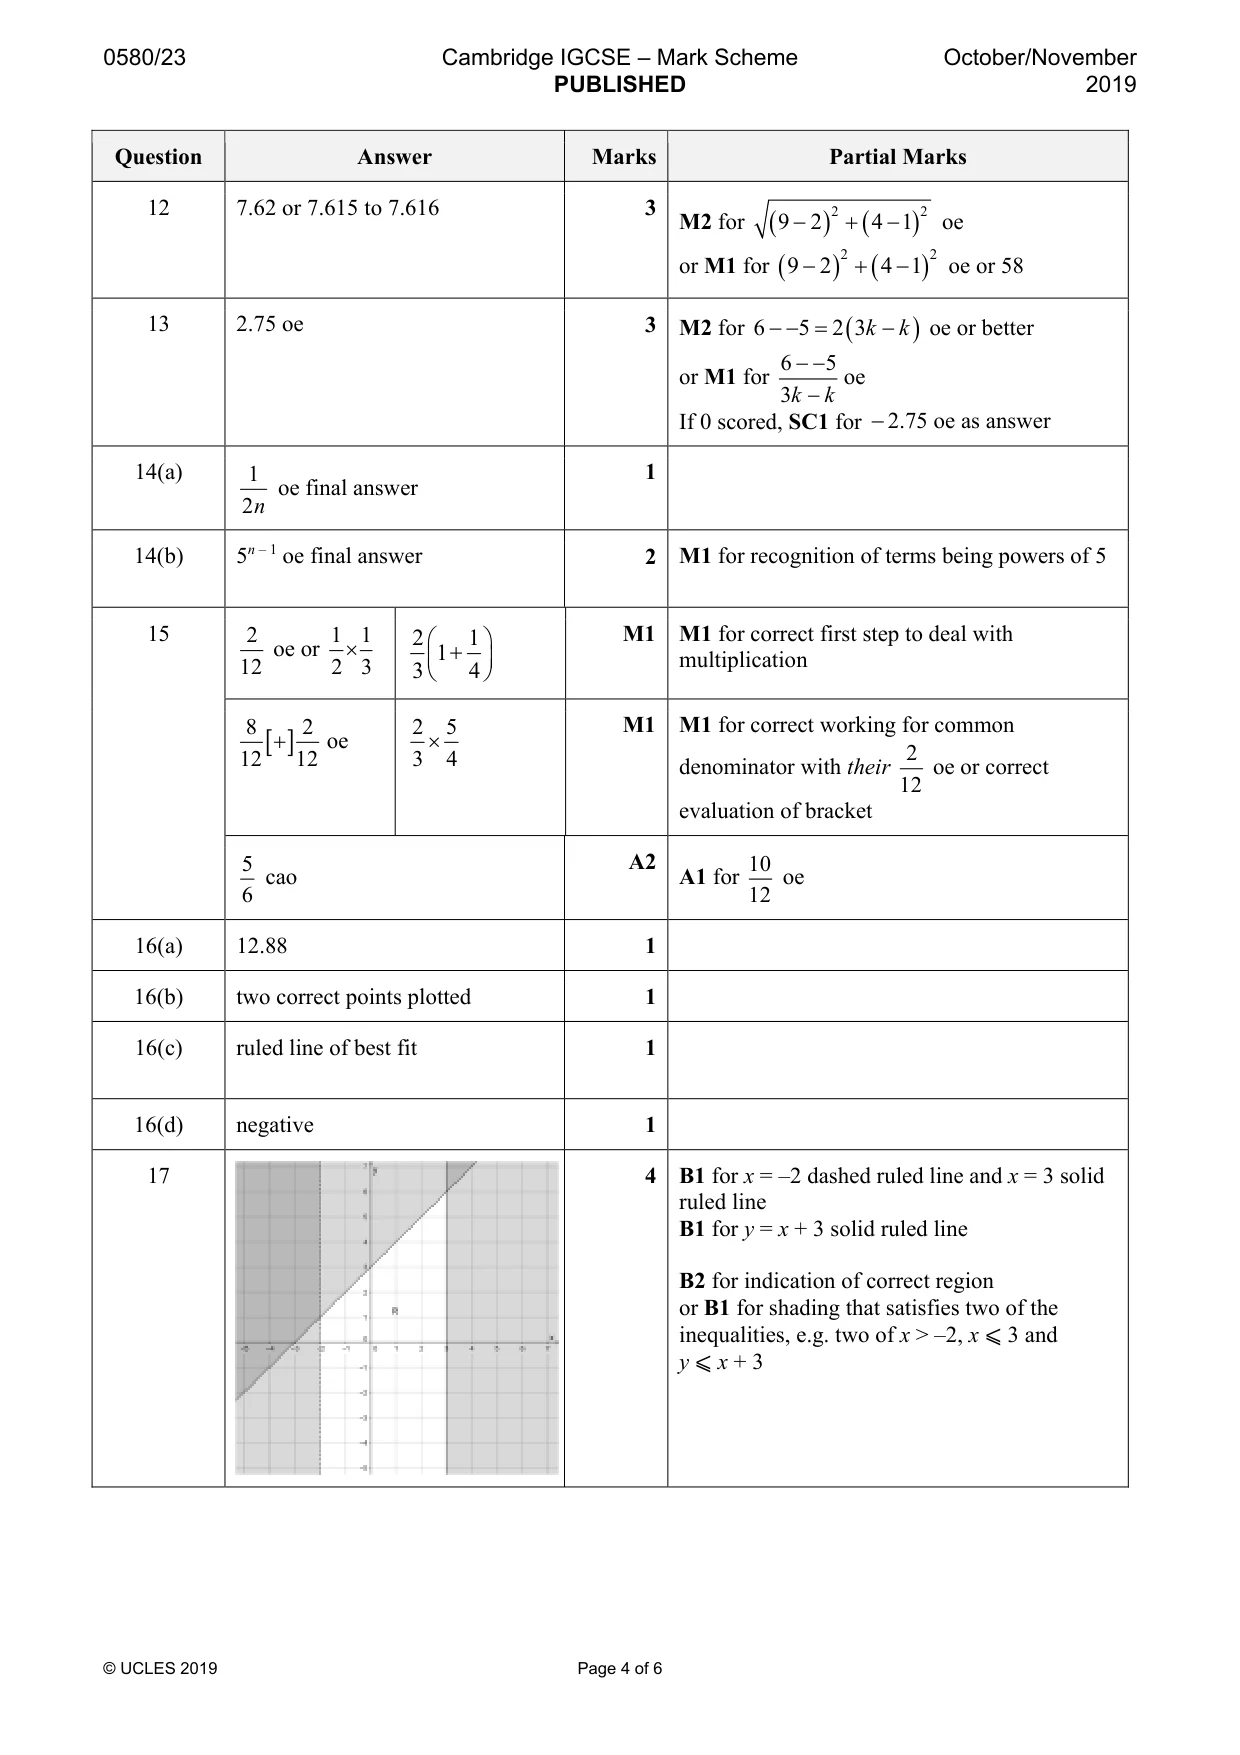
Mark scheme: 13 2.75 oe 3 M2 for 6 −−=5 2 ( 3k − k ) oe or better 6 −− 5 or M1 for oe 3k − k If 0 scored, SC1 for −2.75 oe as answer
Q14 · Find the nth term of each sequence
14 Find the nth term of each sequence. 1 1 1 1 1 (a) , , , , , ... 2 4 6 8 10 .................................................... [1] (b) 1, 5, 25, 125, 625, ... .................................................... [2]
Mark scheme: 14(a) 1 1 oe final answer 2n 14(b) 5n – 1 oe final answer 2 M1 for recognition of terms being powers of 5
Q15 · 1 215 Without using a calculator, work out + #
2 1 215 Without using a calculator, work out + # . 3 4 3 Write down all the steps of your working and give your answer as a fraction in its simplest form. .................................................... [4]
Mark scheme: 15 2 1 1 2 1 M1 M1 for correct first step to deal with oe or × 1 + multiplication 12 2 3 3 4 8 2 2 5 M1 M1 for correct working for common [ + ] oe × 12 12 3 4 2 denominator with their oe or correct 12 evaluation of bracket 5 A2 10 cao A1 for oe 6 12
Q16 · Ten athletes compete in both the 100 metre race and the triple jump
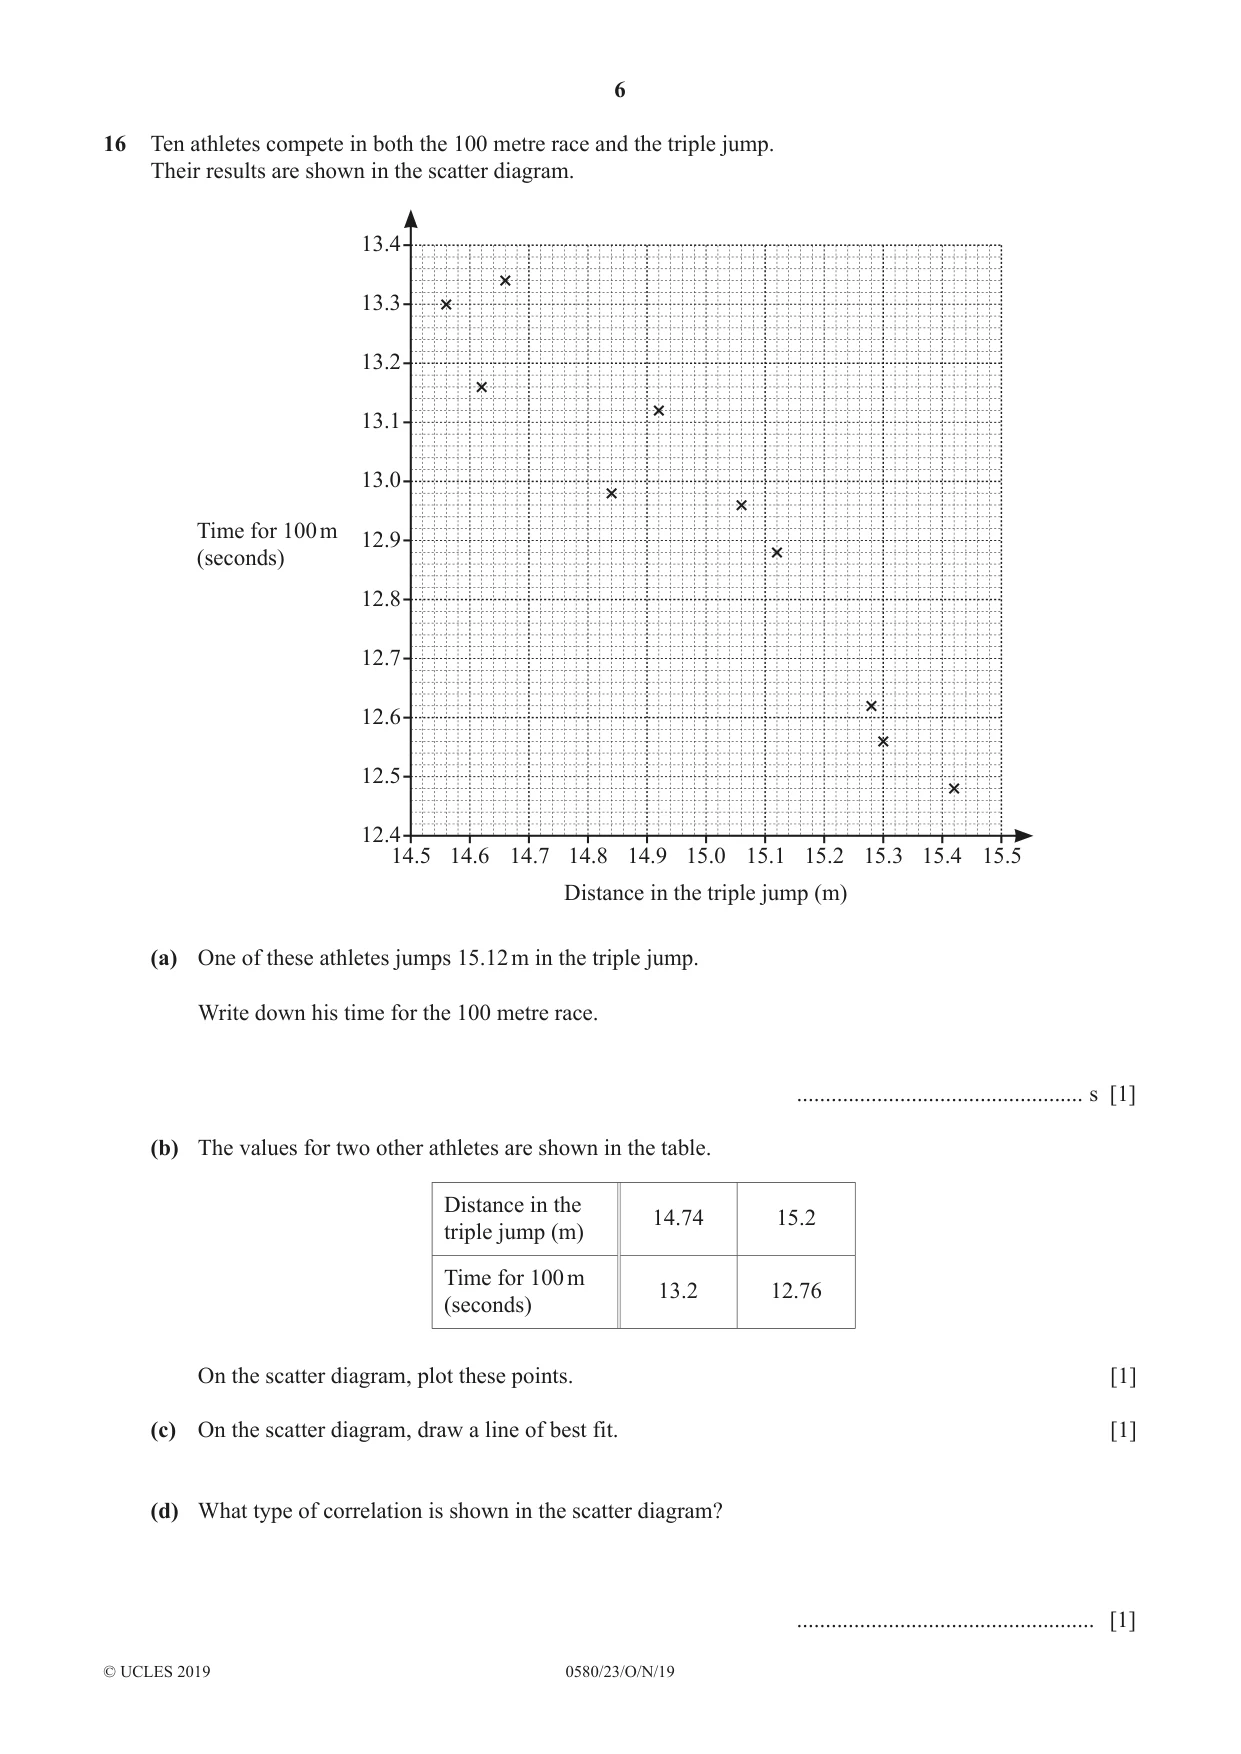
16 Ten athletes compete in both the 100 metre race and the triple jump. Their results are shown in the scatter diagram. 13.4 13.3 13.2 13.1 13.0 Time for 100 m 12.9 (seconds) 12.8 12.7 12.6 12.5 12.4 14.5 14.6 14.7 14.8 14.9 15.0 15.1 15.2 15.3 15.4 15.5 Distance in the triple jump (m) (a) One of these athletes jumps 15.12 m in the triple jump. Write down his time for the 100 metre race. .................................................. s [1] (b) The values for two other athletes are shown in the table. Distance in the 14.74 15.2 triple jump (m) Time for 100 m 13.2 12.76 (seconds) On the scatter diagram, plot these points. [1] (c) On the scatter diagram, draw a line of best fit. [1] (d) What type of correlation is shown in the scatter diagram? .................................................... [1]
Mark scheme: 16(a) 12.88 1 16(b) two correct points plotted 1 16(c) ruled line of best fit 1 16(d) negative 1
Q17 · Y 7 6 5 4 3 2 1 – 5 – 4 – 3 – 2 – 1 0 1 2 3 4 5 x – 1 – 2 – 3 – 4 – 5 By shading the…
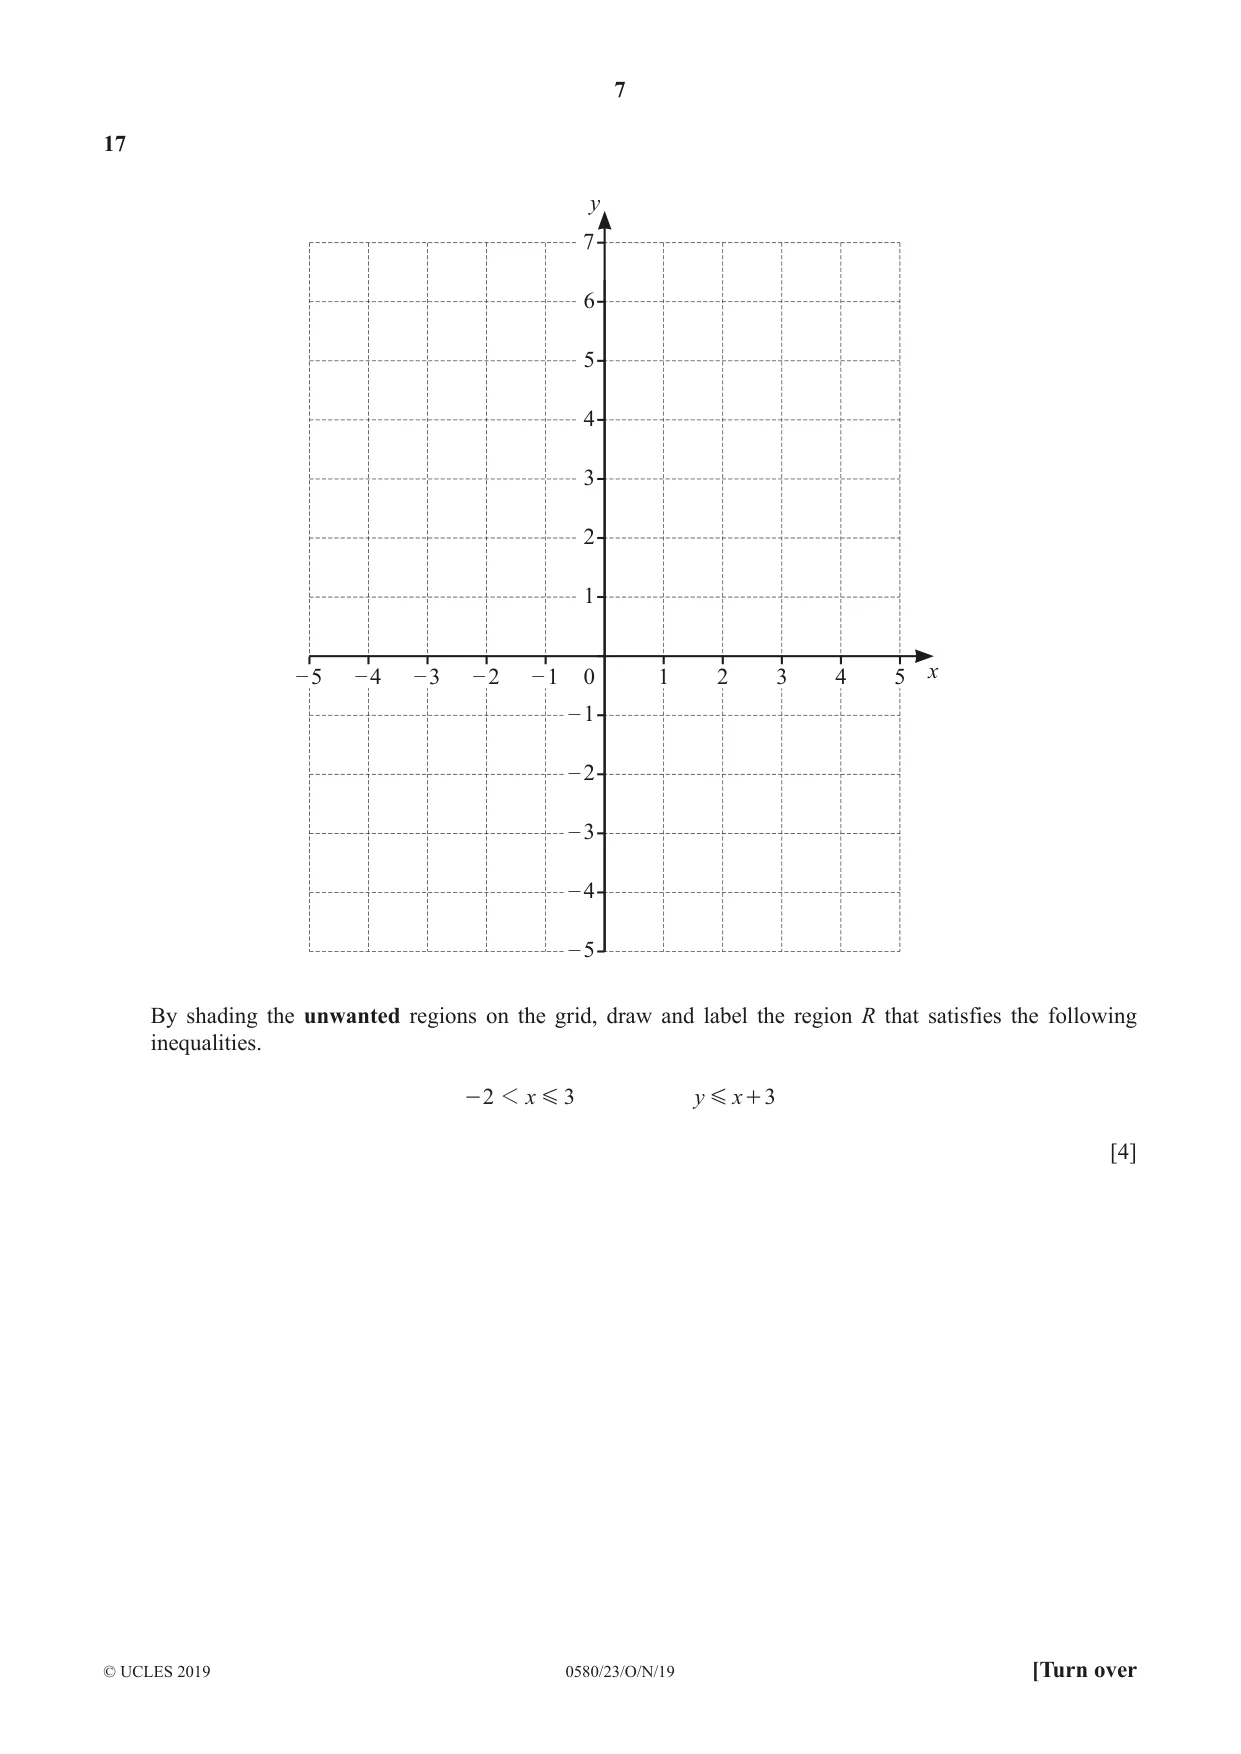
17 y 7 6 5 4 3 2 1 – 5 – 4 – 3 – 2 – 1 0 1 2 3 4 5 x – 1 – 2 – 3 – 4 – 5 By shading the unwanted regions on the grid, draw and label the region R that satisfies the following inequalities. - 2 1 x G 3 y G x + 3 [4]
Mark scheme: 17 4 B1 for x = –2 dashed ruled line and x = 3 solid ruled line B1 for y = x + 3 solid ruled line B2 for indication of correct region or B1 for shading that satisfies two of the inequalities, e.g. two of x > –2, x ⩽ 3 and y ⩽ x + 3
Q18 · M = {x | x is an integer and 2 G x 1 6} (i) Find n(M)
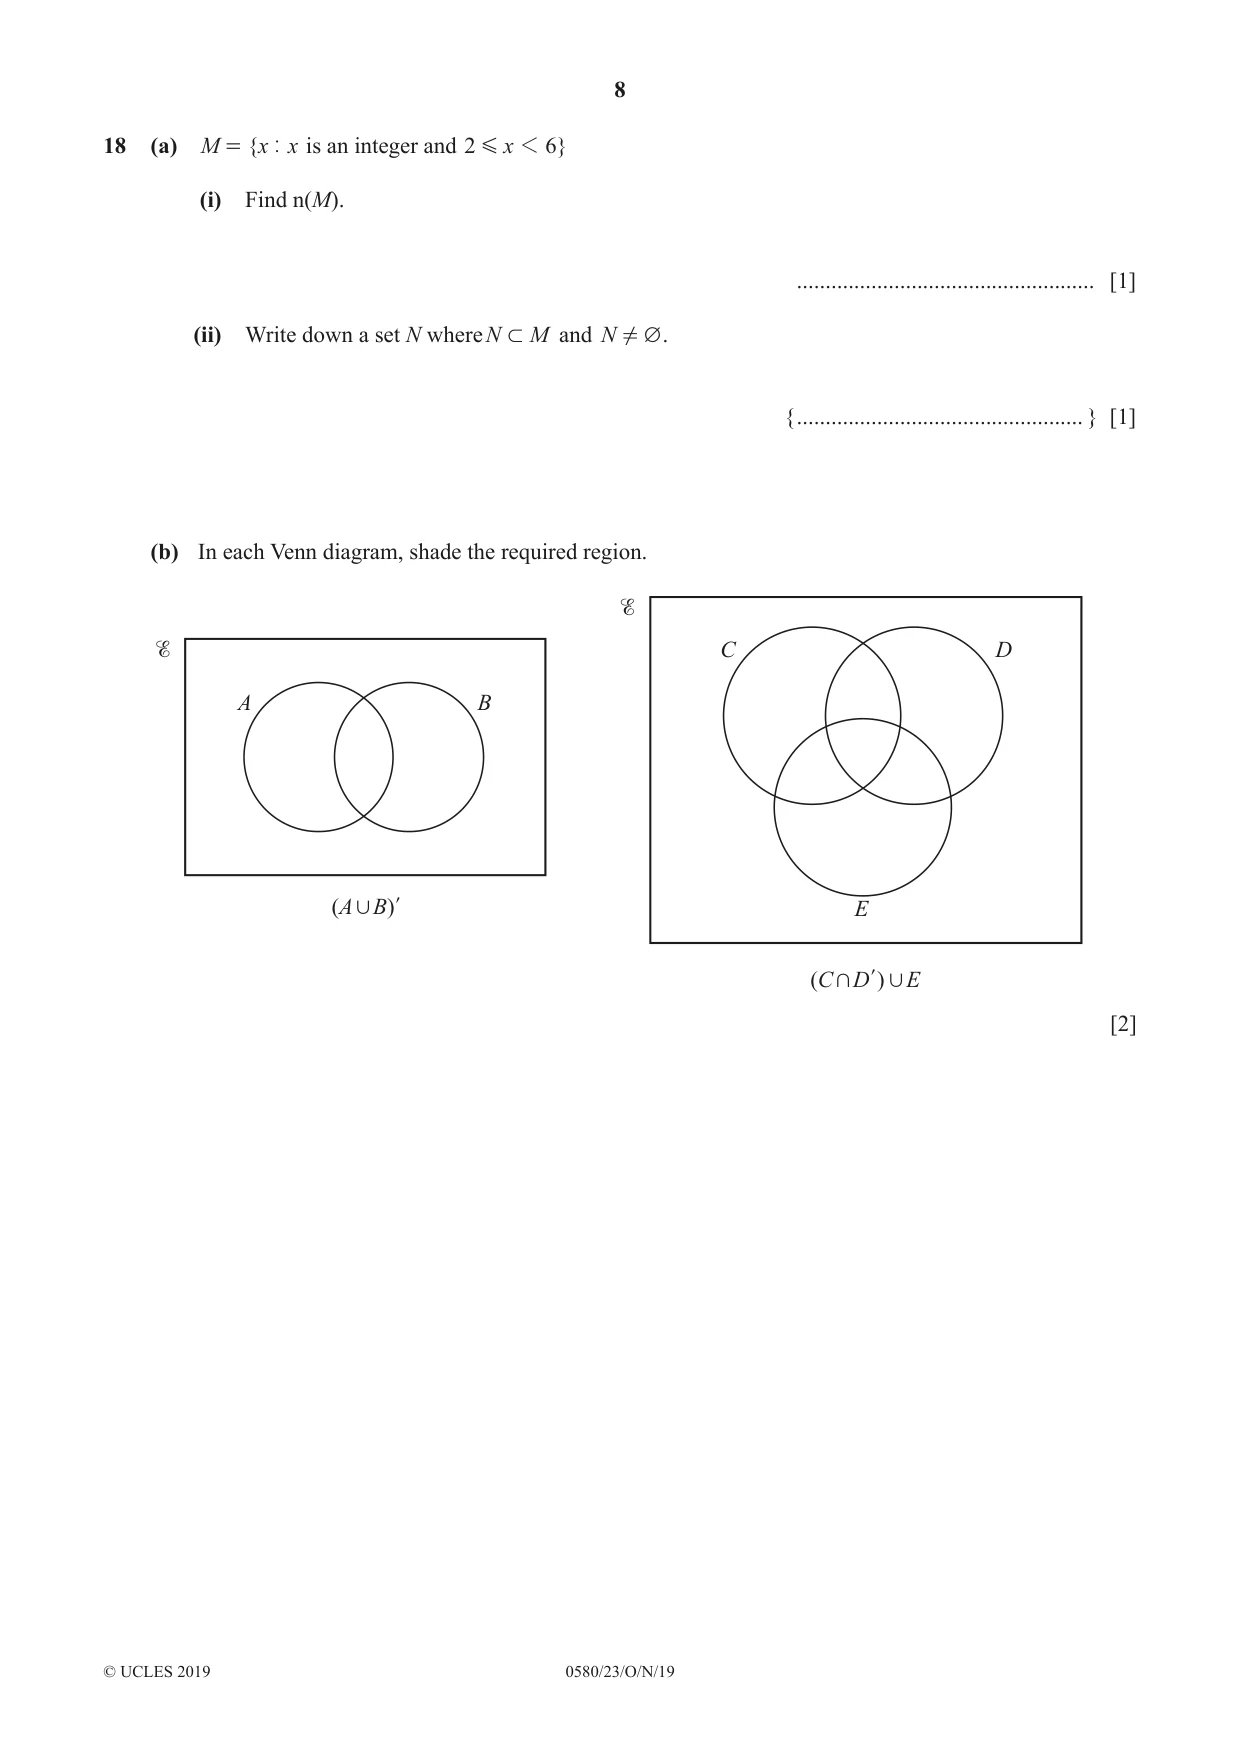
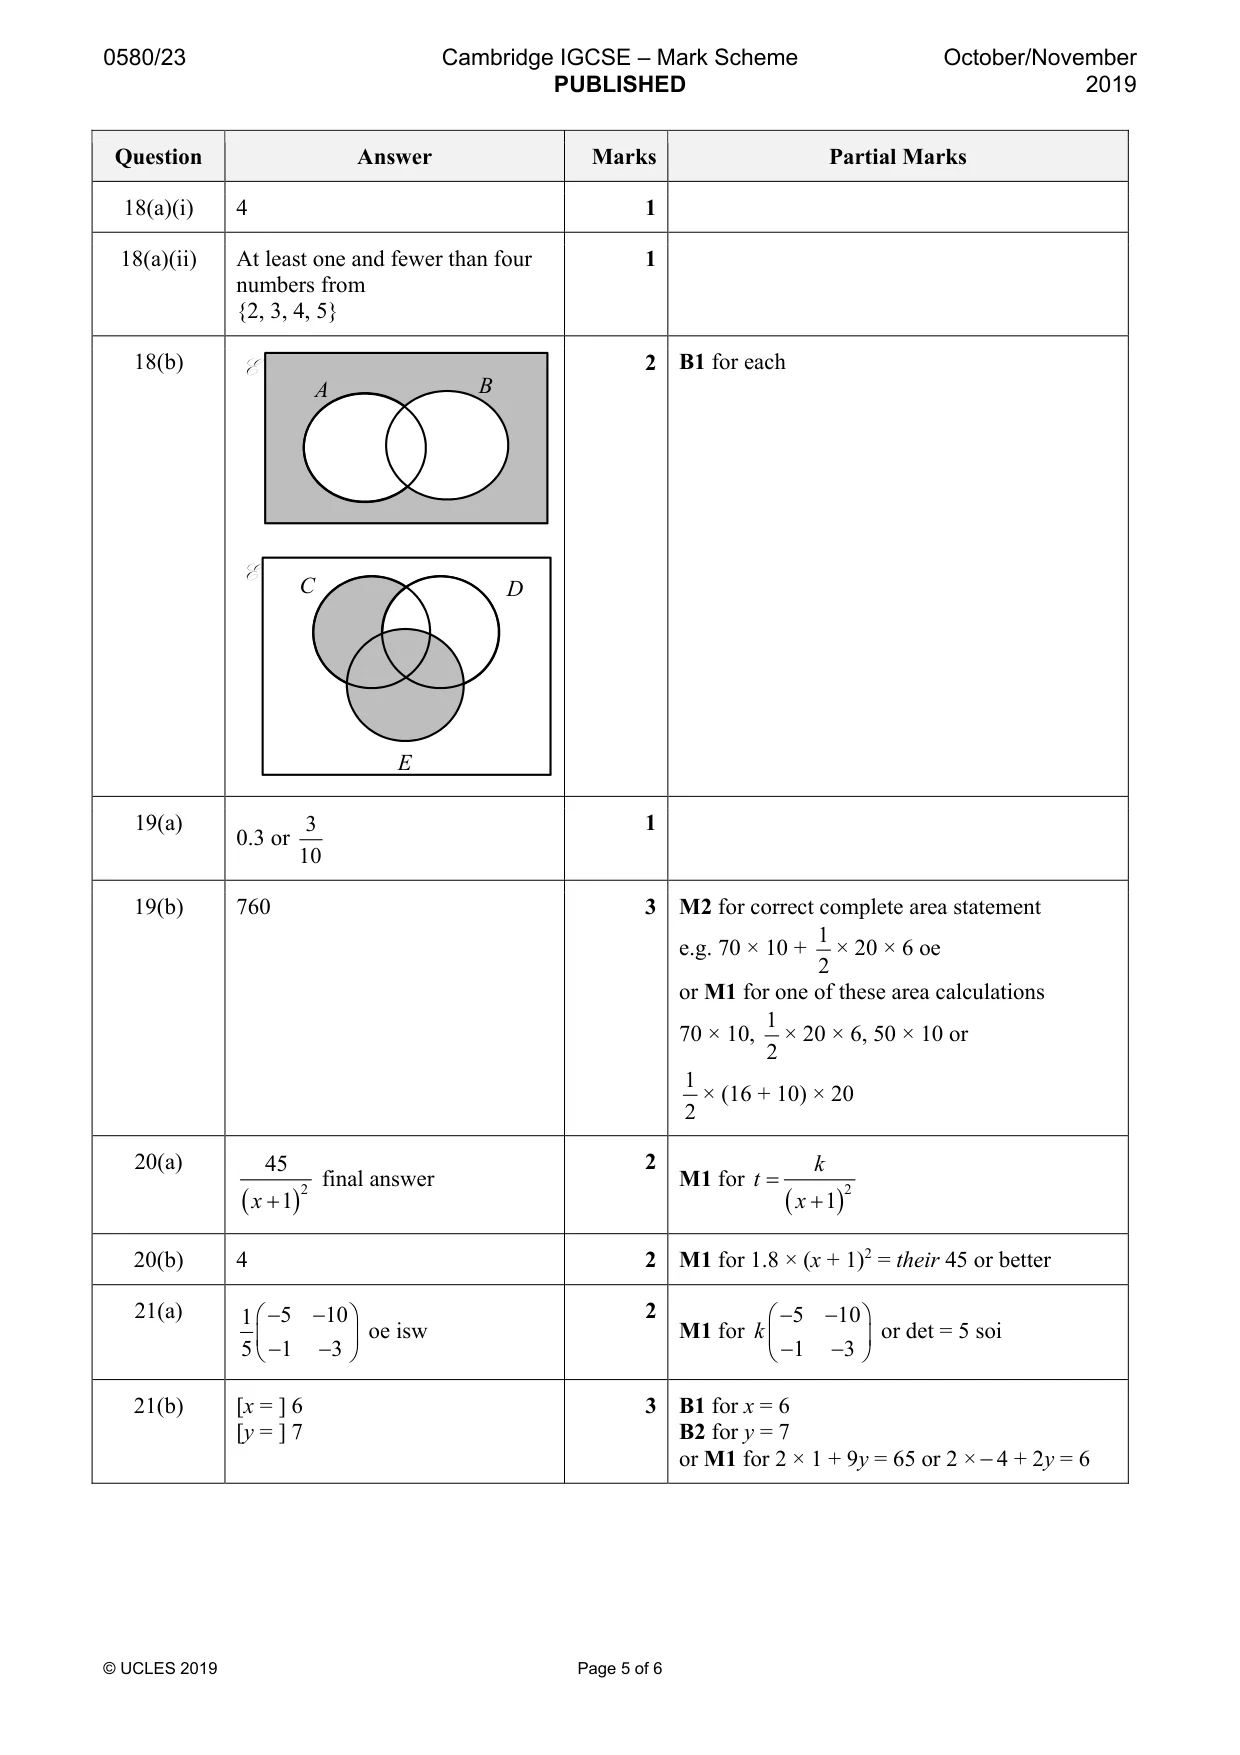
18 (a) M = {x | x is an integer and 2 G x 1 6} (i) Find n(M). .................................................... [1] (ii) Write down a set N whereN 1 M and N ! Q . { .................................................. } [1] (b) In each Venn diagram, shade the required region. C D A B (A , B ) l E (C + D l ) , E [2]
Mark scheme: 18(a)(i) 4 1 18(a)(ii) At least one and fewer than four 1 numbers from {2, 3, 4, 5} 18(b) 2 B1 for each E A B E C D E
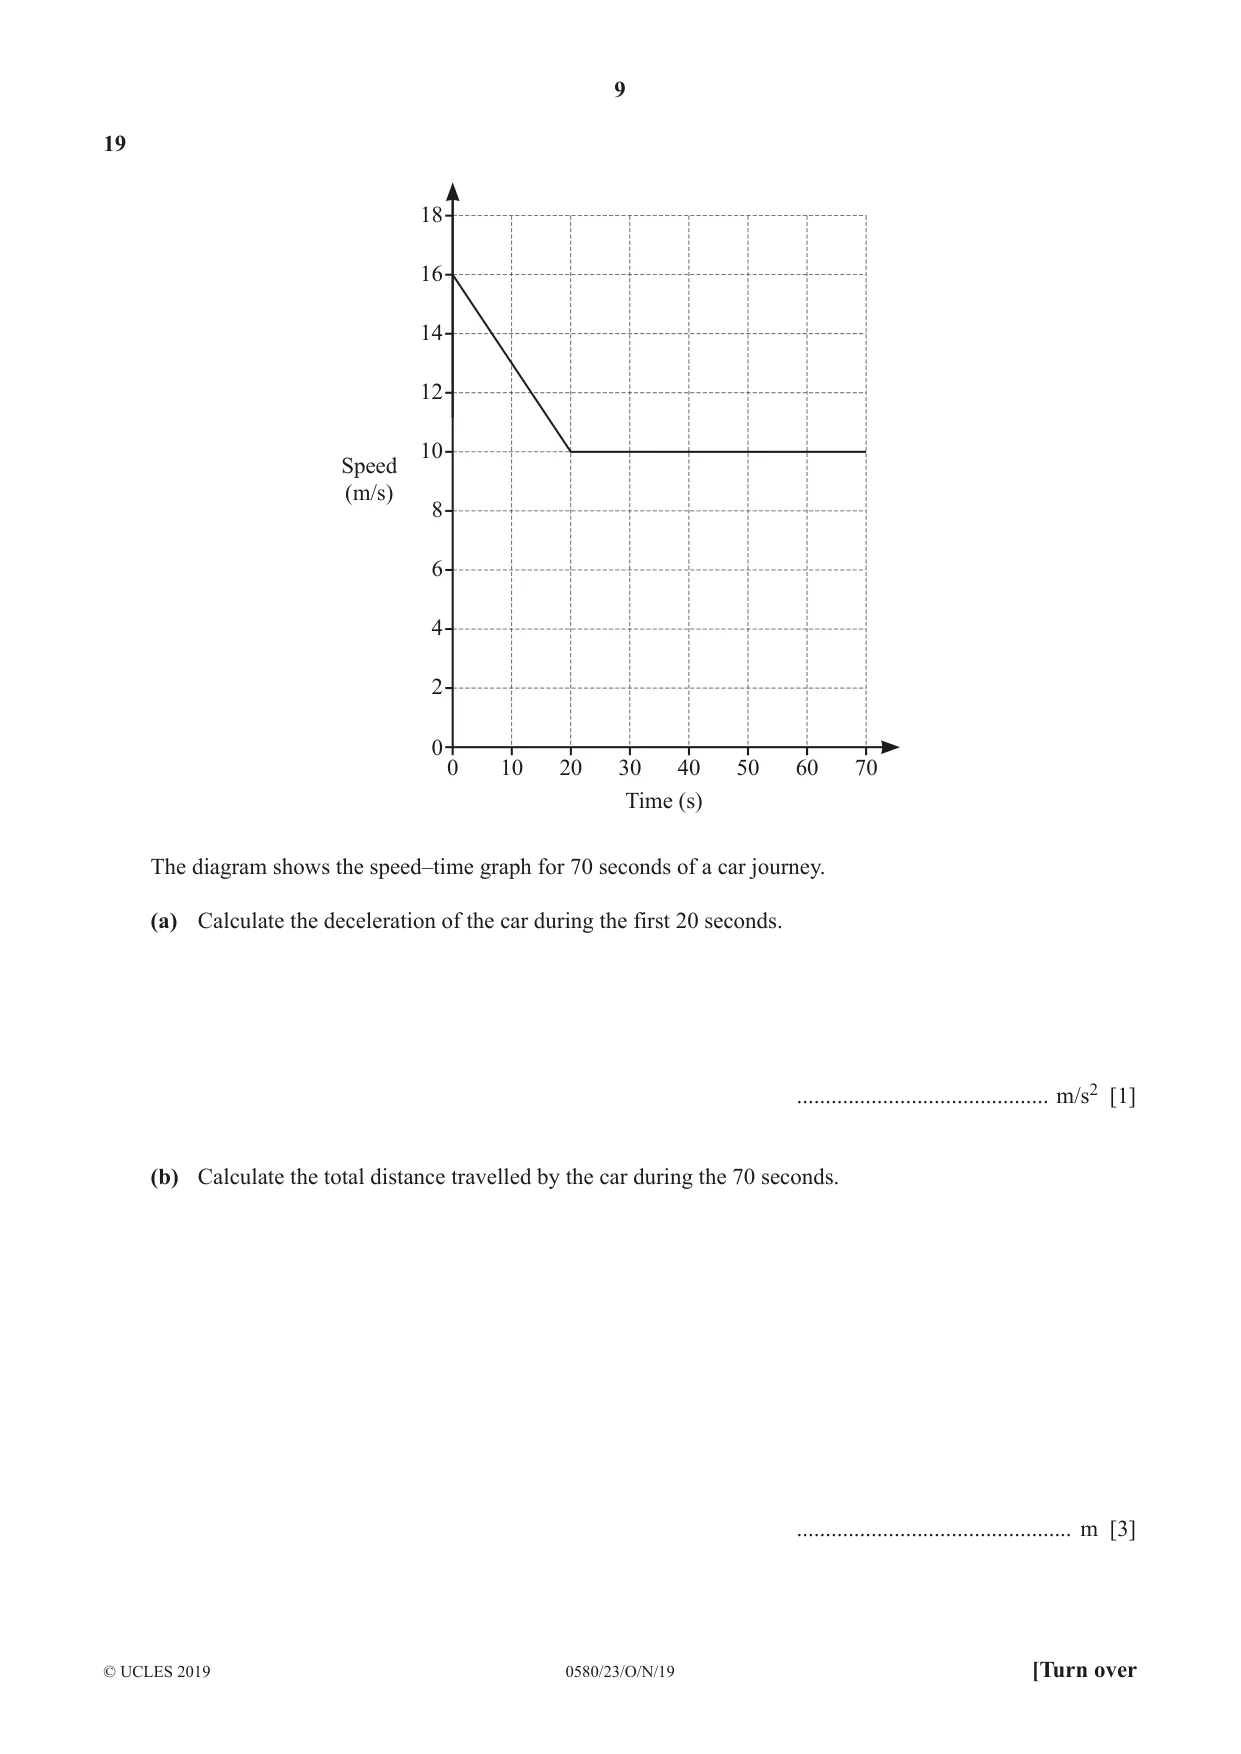
Q19 · 18 16 14 12 10 Speed (m/s) 8 6 4 2 0 0 10 20 30 40 50 60 70 Time (s) The diagram shows…
19 18 16 14 12 10 Speed (m/s) 8 6 4 2 0 0 10 20 30 40 50 60 70 Time (s) The diagram shows the speed–time graph for 70 seconds of a car journey. (a) Calculate the deceleration of the car during the first 20 seconds. ............................................ m/s2 [1] (b) Calculate the total distance travelled by the car during the 70 seconds. ................................................ m [3]
Mark scheme: 19(a) 3 1 0.3 or 10 19(b) 760 3 M2 for correct complete area statement 1 e.g. 70 × 10 + × 20 × 6 oe 2 or M1 for one of these area calculations 1 70 × 10, × 20 × 6, 50 × 10 or 2 1 × (16 + 10) × 20 2
Q20 · T is inversely proportional to the square of (x + 1)
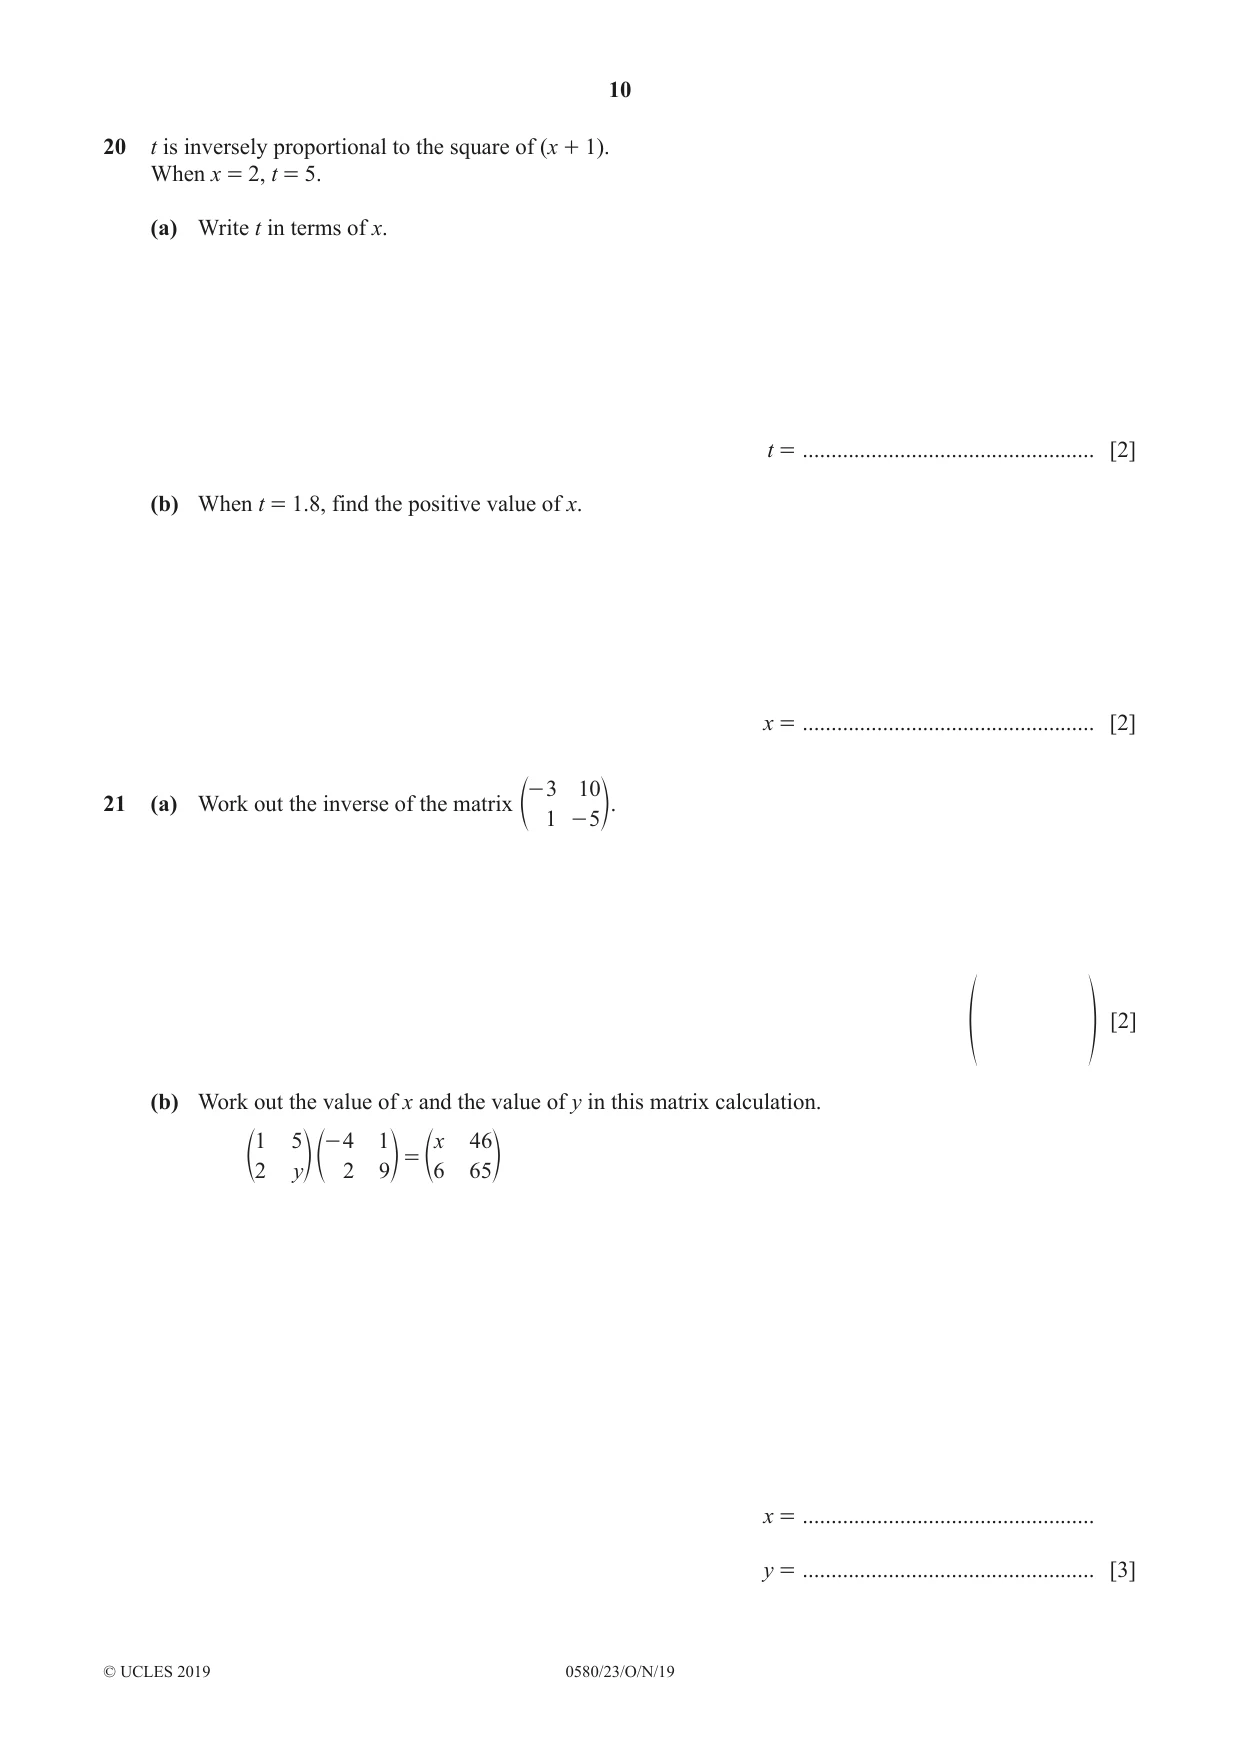
20 t is inversely proportional to the square of (x + 1). When x = 2, t = 5. (a) Write t in terms of x. t = ................................................... [2] (b) When t = 1.8, find the positive value of x. x = ................................................... [2]
Mark scheme: 20(a) 45 2 k final answer M1 for t = ( x + 1) 2 ( x + 1) 2 20(b) 4 2 M1 for 1.8 × (x + 1)2 = their 45 or better
Q21 · - 3 10 21 (a) Work out the inverse of the matrix e 1 - 5 o
- 3 10 21 (a) Work out the inverse of the matrix e 1 - 5 o. [2] f p (b) Work out the value of x and the value of y in this matrix calculation. 1 5 - 4 1 x 46 = e2 yo e 2 9o e6 65 o x = ................................................... y = ................................................... [3]
Mark scheme: 21(a) 1 − 5 − 10 2 − 5 − 10 oe isw M1 for k or det = 5 soi 5 − 1 −3 − 1 − 3 21(b) [x = ] 6 3 B1 for x = 6 [y = ] 7 B2 for y = 7 or M1 for 2 × 1 + 9y = 65 or 2 × −4 + 2y = 6
Q22 · A container is made from a cylinder and a cone, each of radius 5 cm
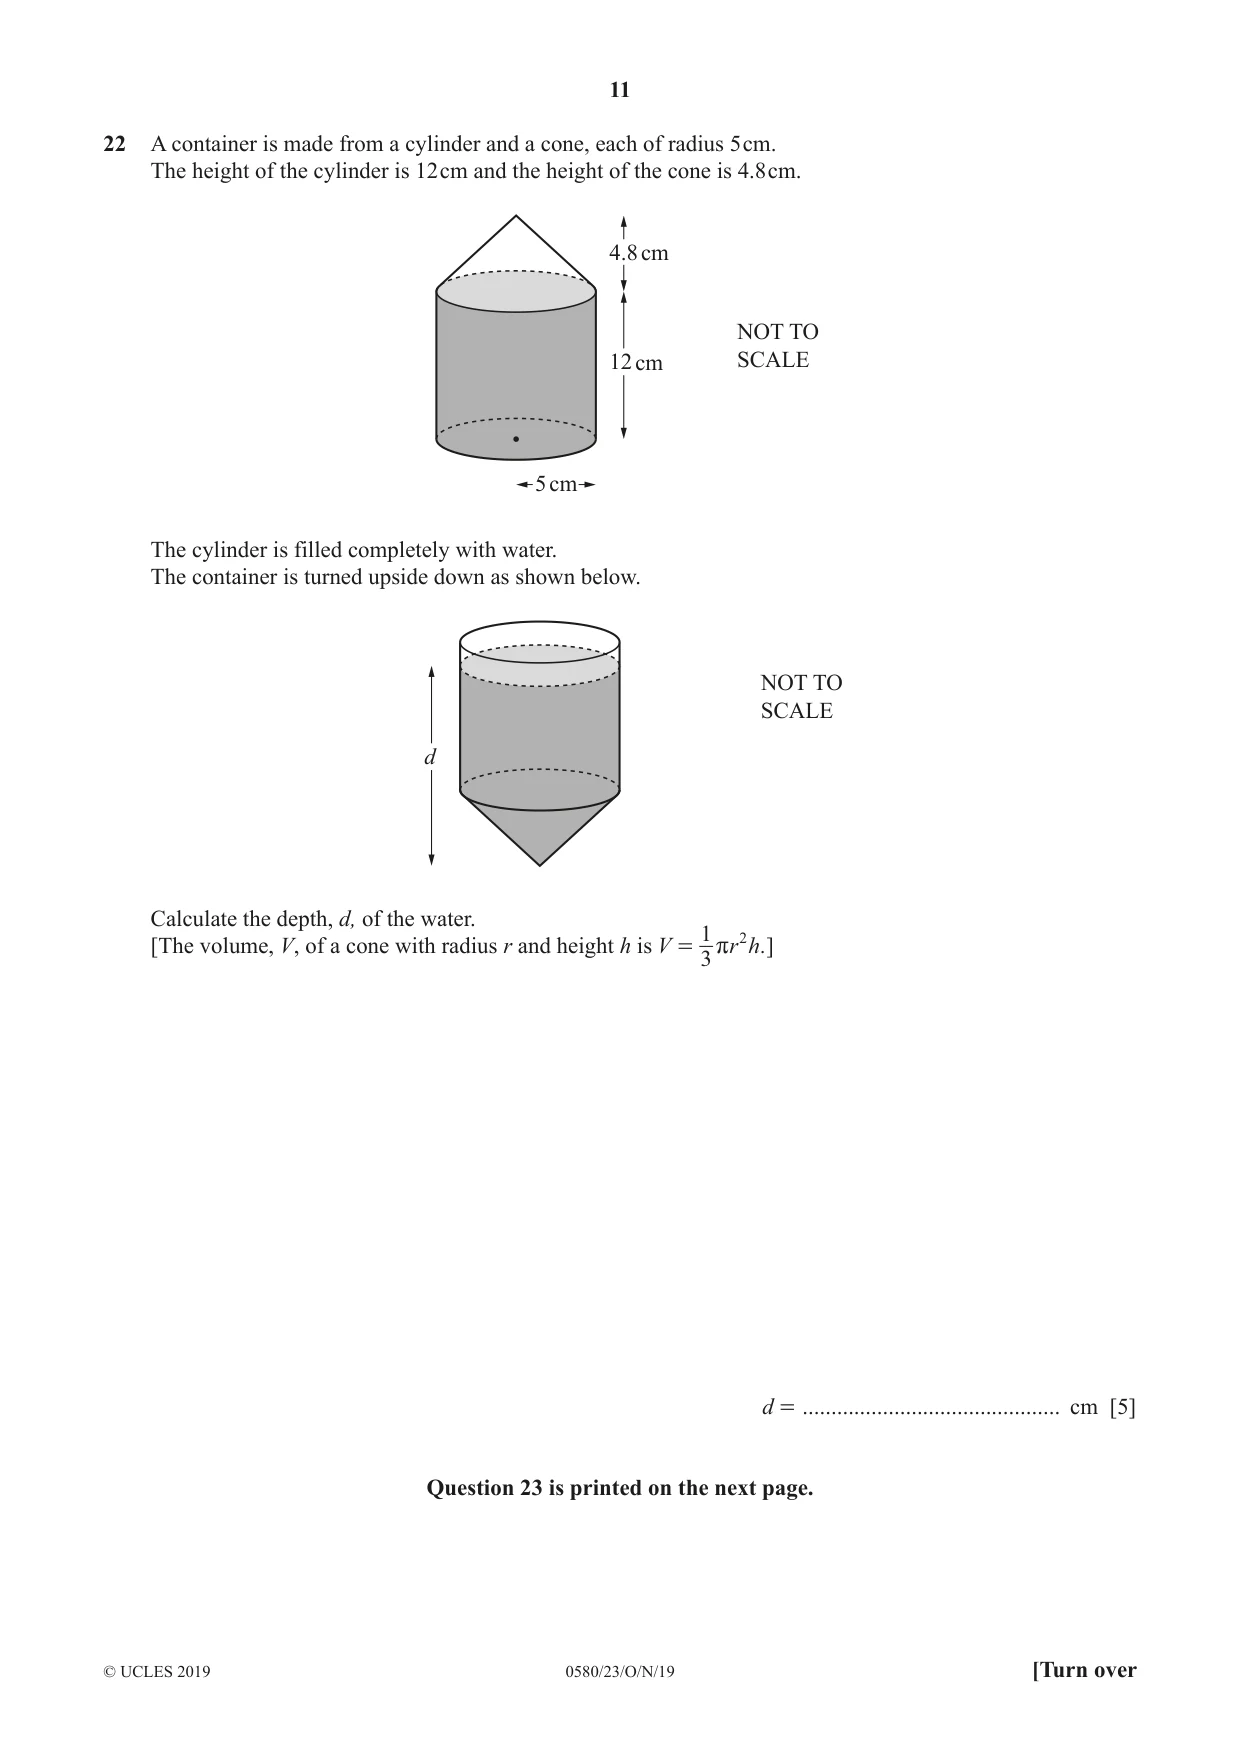
22 A container is made from a cylinder and a cone, each of radius 5 cm. The height of the cylinder is 12 cm and the height of the cone is 4.8 cm. 4.8 cm NOT TO 12 cm SCALE 5 cm The cylinder is filled completely with water. The container is turned upside down as shown below. NOT TO SCALE d Calculate the depth, d, of the water. 1 2 [The volume, V, of a cone with radius r and height h is V = r r h. ] 3 d = ............................................. cm [5] Question 23 is printed on the next page.
Mark scheme: 22 15.2 5 M4 for 2 1 2 2 π × 5 × 12 − × π × 5 × 4.8 ÷ π × 5 ( ) 3 2 1 2 or M3 for π × 5 × 12 − × π × 5 × 4.8 3 or M1 for π × 52 × 12 1 2 M1 for × π × 5 × 4.8 3
Q23 · The time, t minutes, it takes each of 50 students to travel to school is recorded
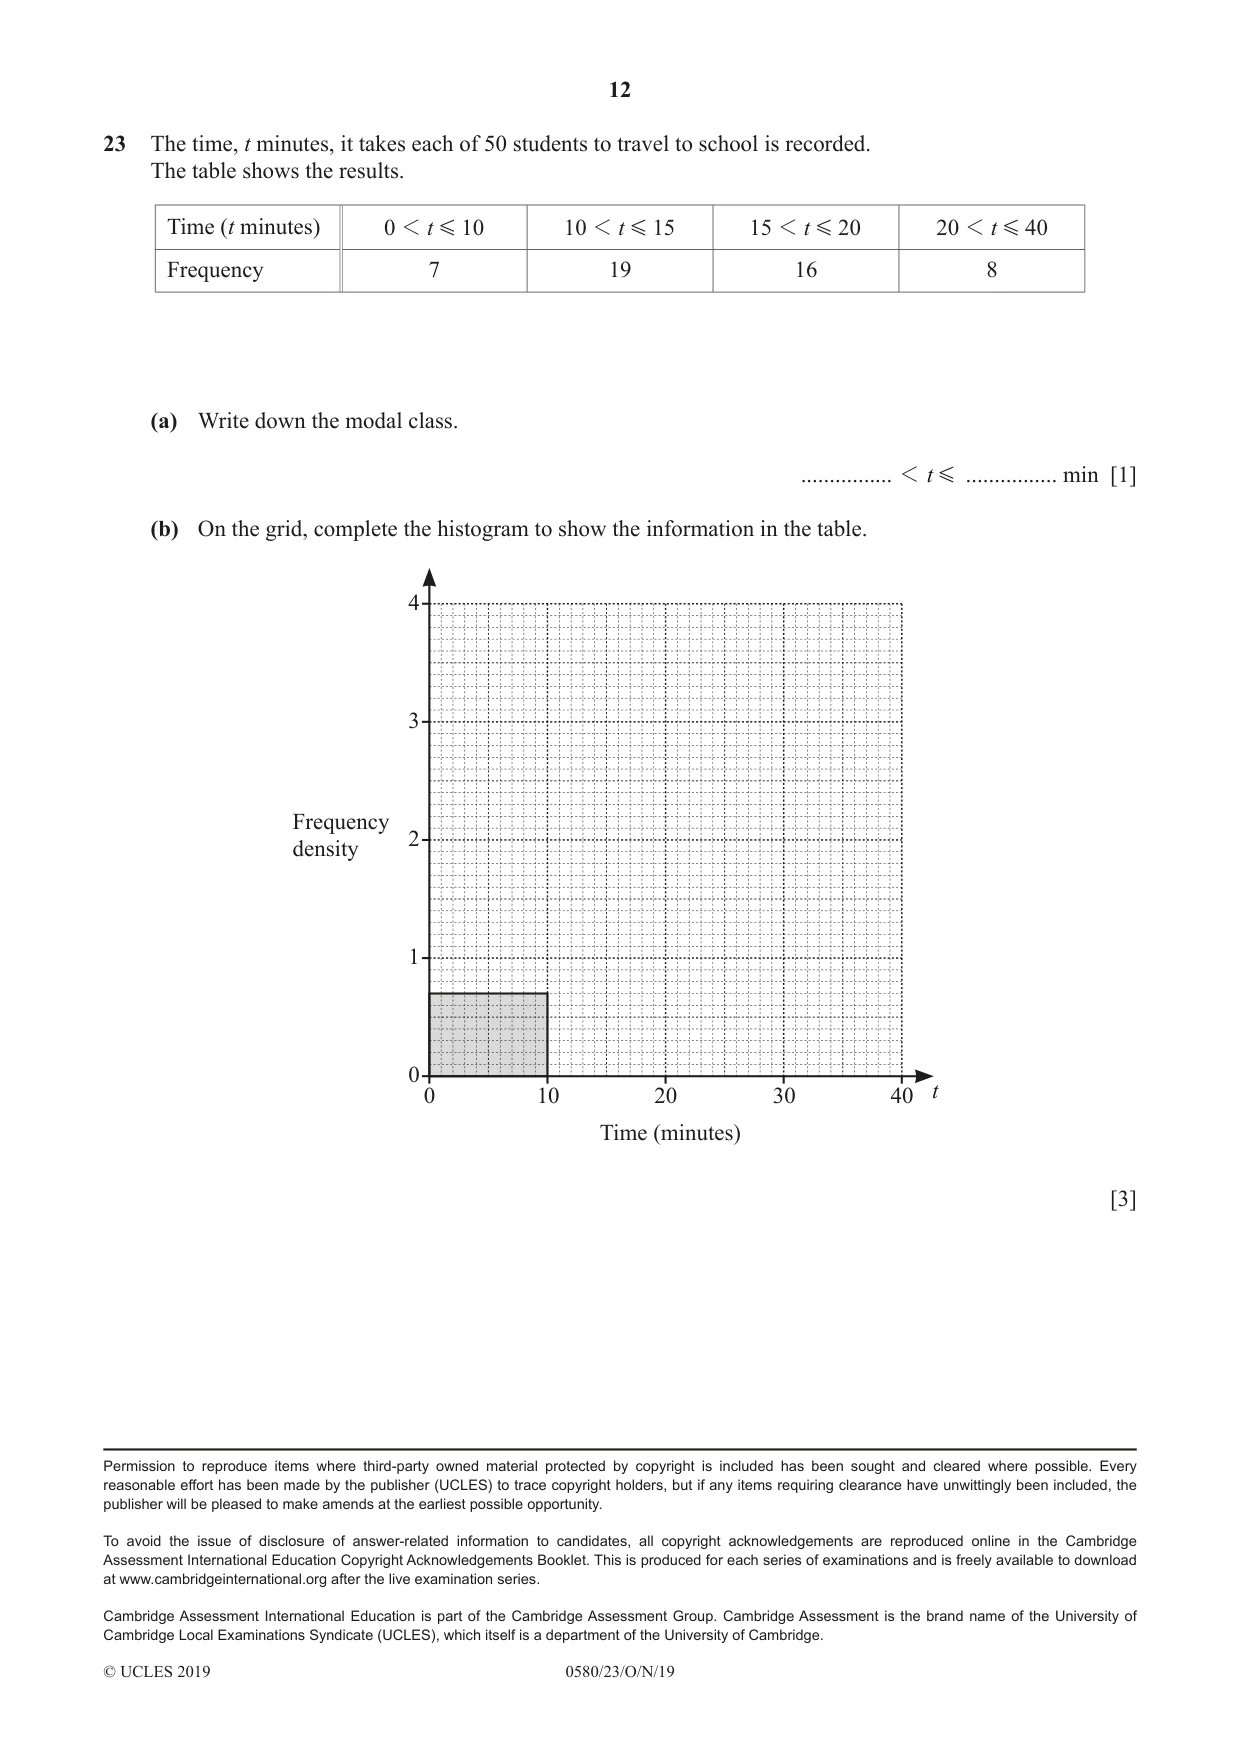
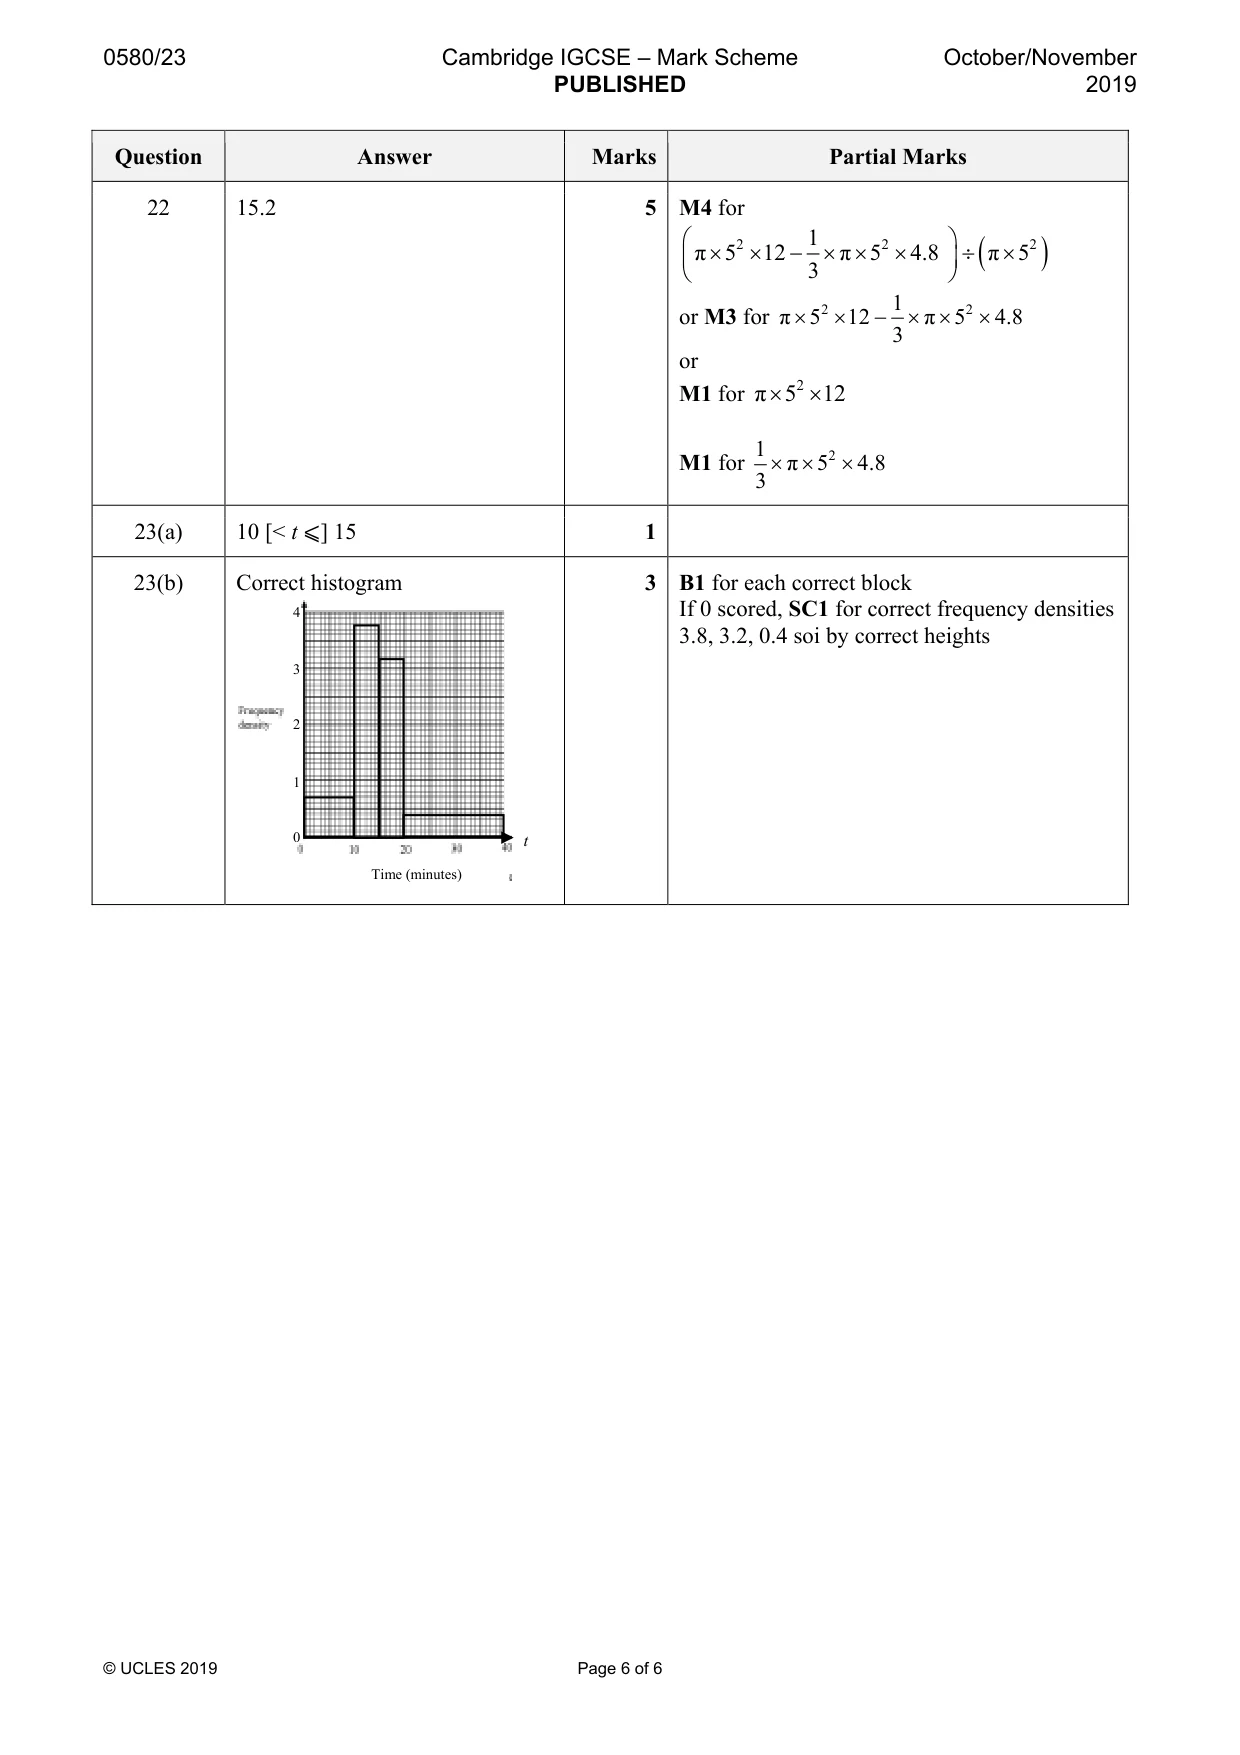
23 The time, t minutes, it takes each of 50 students to travel to school is recorded. The table shows the results. Time (t minutes) 0 1 t G 10 10 1 t G 15 15 1 t G 20 20 1 t G 40 Frequency 7 19 16 8 (a) Write down the modal class. ................ 1 t G ................ min [1] (b) On the grid, complete the histogram to show the information in the table. 4 3 Frequency 2 density 1 0 0 10 20 30 40 t Time (minutes) [3]
Mark scheme: 23(a) 10 [< t ⩽] 15 1 23(b) Correct histogram 3 B1 for each correct block 4 If 0 scored, SC1 for correct frequency densities 3.8, 3.2, 0.4 soi by correct heights 3 2 1 0 t Time (minutes)
What was in this paper
The subtopics covered by these 23 questions, and how many questions each got. Open one in a new tab to see every Cambridge question on it.
2Gradient of linear graphs2Surface area and volume2Types of number2Area and perimeter1Averages and measures of spread1Coordinates1Equations1Fractions, decimals and percentages1Inequalities1Powers and roots1Ratio and proportion1Scatter diagrams1Sequences1Sets1Standard form1Statistical charts and diagrams1The four operations1Trigonometric functions1What you needed in this session
Cambridge’s own grade thresholds for 2019 Oct/Nov, Paper 2 · Variant 3. A higher threshold means an easier paper — the bar moves with how the cohort did.