Questions as text
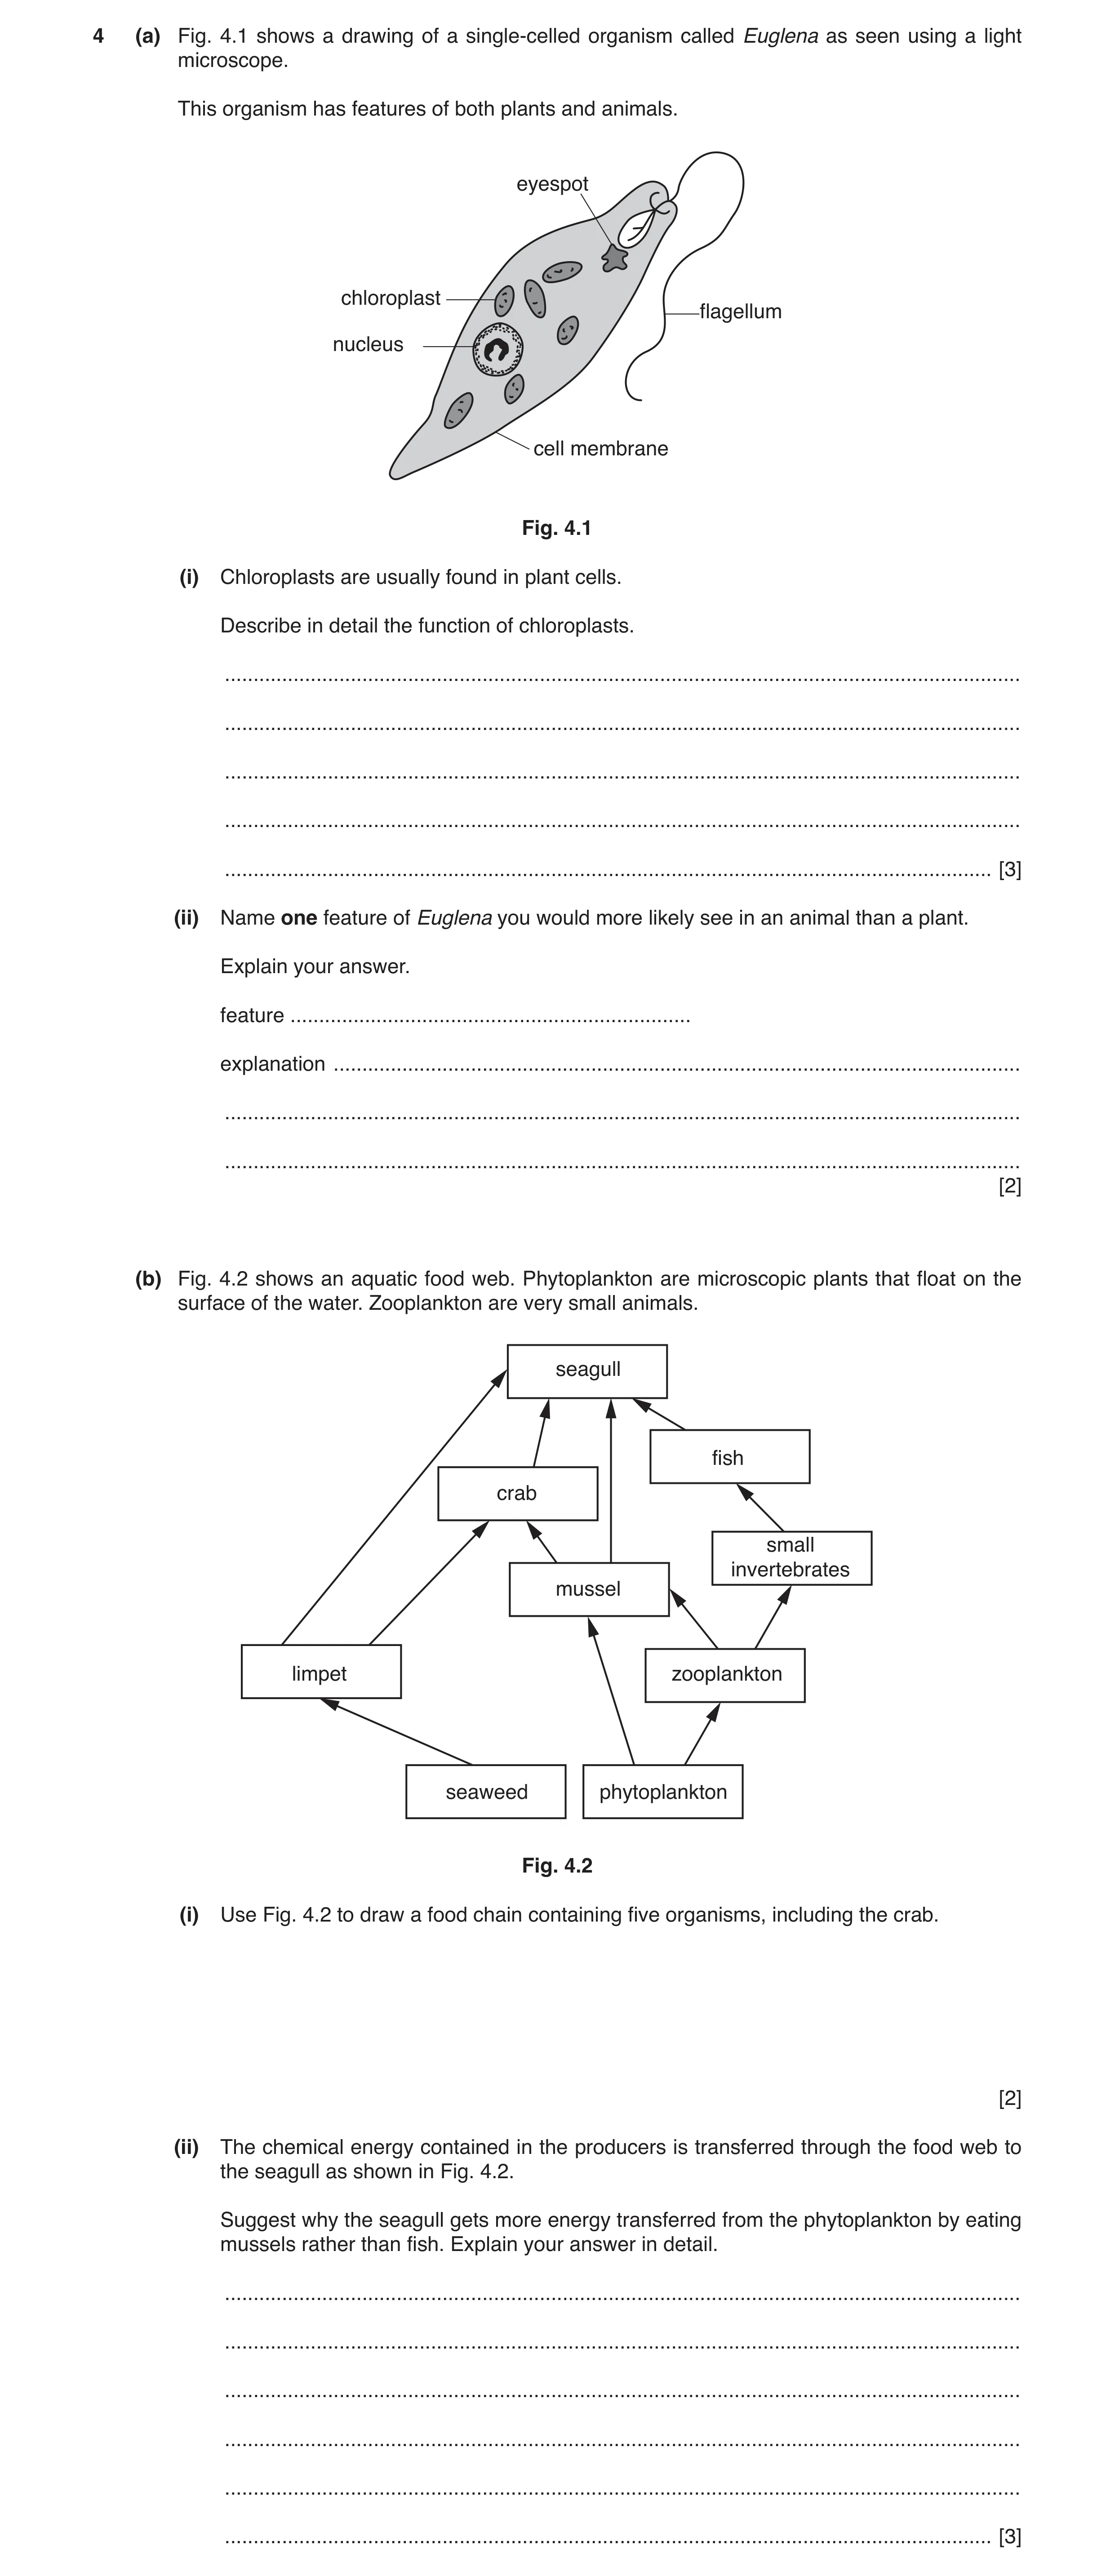
Q1 · A drawing of a single-celled organism called Euglena as seen using a light microscope 0653/41 May/June 2017
4 (a) Fig. 4.1 shows a drawing of a single-celled organism called Euglena as seen using a light microscope. This organism has features of both plants and animals. eyespot chloroplast flagellum nucleus cell membrane Fig. 4.1 (i) Chloroplasts are usually found in plant cells. Describe in detail the function of chloroplasts. … … … … … [3] (ii) Name one feature of Euglena you would more likely see in an animal than a plant. Explain your answer. feature … explanation … … … [2] (b) Fig. 4.2 shows an aquatic food web. Phytoplankton are microscopic plants that float on the surface of the water. Zooplankton are very small animals. seagull fish crab small invertebrates mussel limpet zooplankton seaweed phytoplankton Fig. 4.2 (i) Use Fig. 4.2 to draw a food chain containing five organisms, including the crab. [2] (ii) The chemical energy contained in the producers is transferred through the food web to the seagull as shown in Fig. 4.2. Suggest why the seagull gets more energy transferred from the phytoplankton by eating mussels rather than fish. Explain your answer in detail. … … … … … … [3]
10 marks
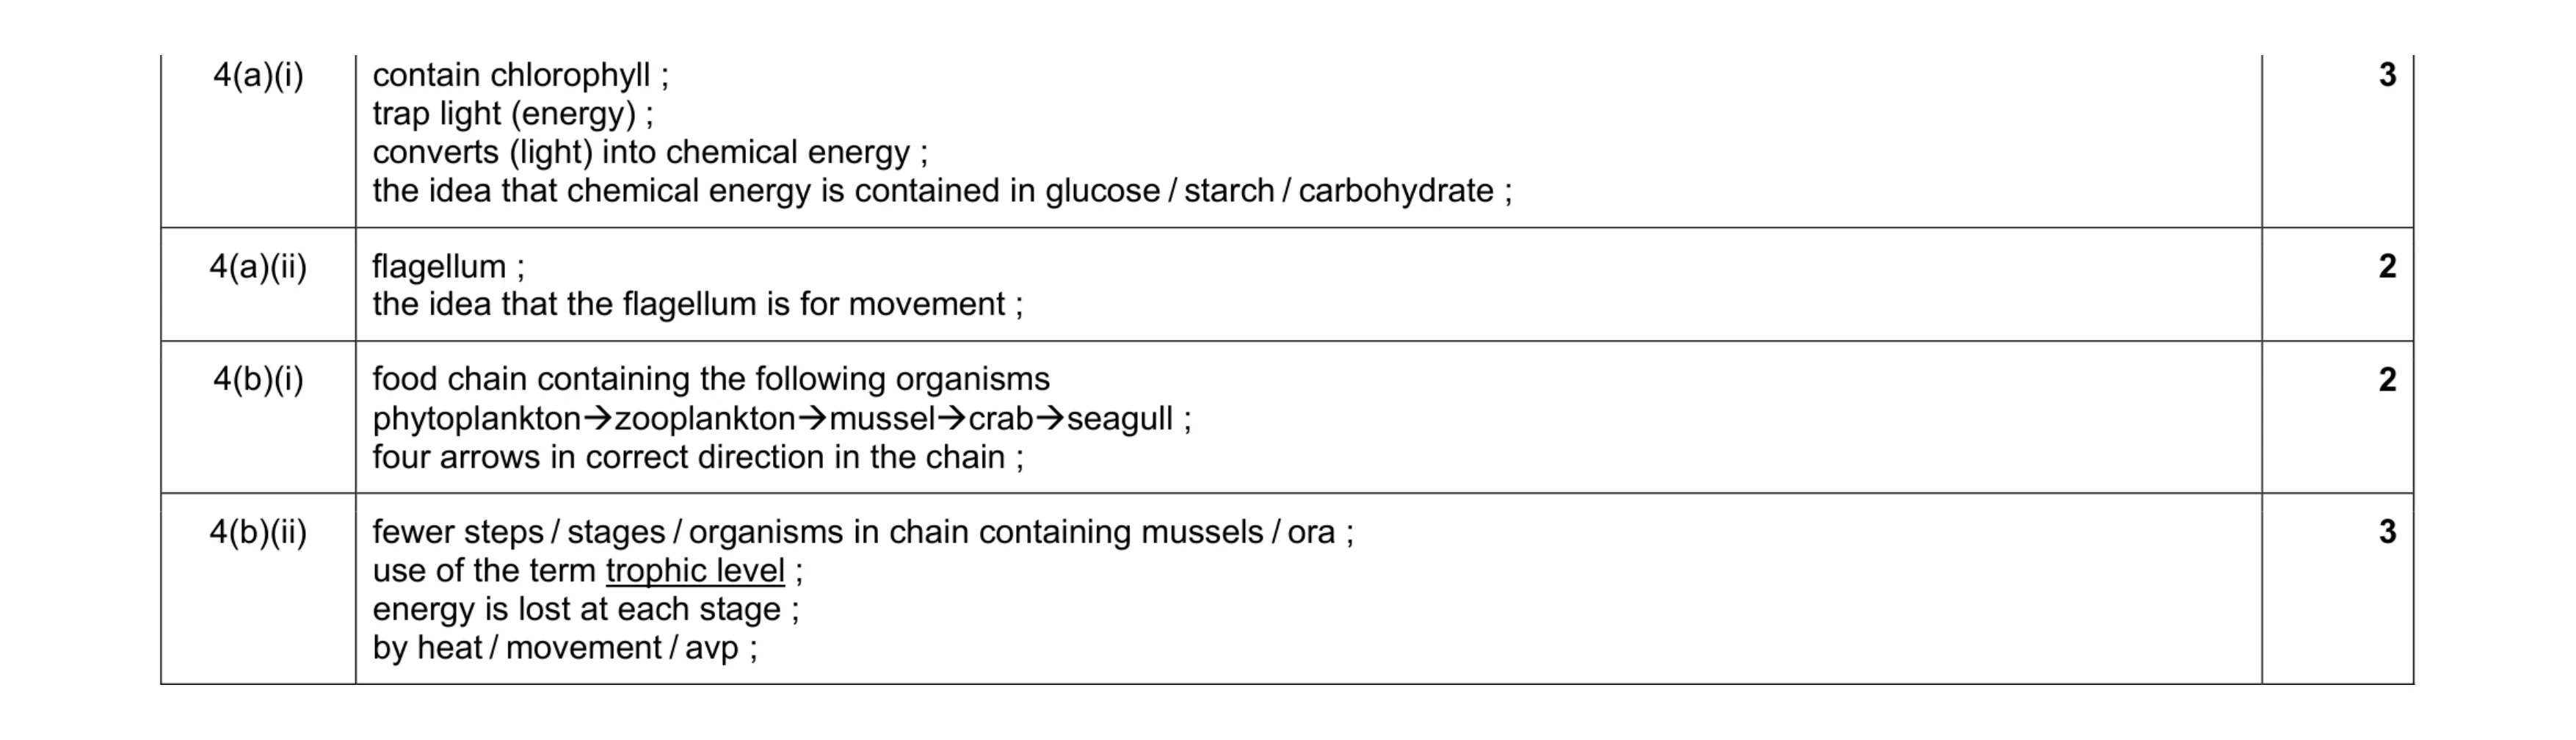
Mark scheme: 4(a)(i) contain chlorophyll ; trap light (energy) ; converts (light) into chemical energy ; the idea that chemical energy is contained in glucose / starch / carbohydrate ; 3 4(a)(ii) flagellum ; the idea that the flagellum is for movement ; 2 4(b)(i) food chain containing the following organisms phytoplanktonÆzooplanktonÆmusselÆcrabÆseagull ; four arrows in correct direction in the chain ; 2 4(b)(ii) fewer steps / stages / organisms in chain containing mussels / ora ; use of the term trophic level ; energy is lost at each stage ; by heat / movement / avp ; 3
This question in 0653/41 May/June 2017
Q2 · A food web in a garden 0653/41 May/June 2018
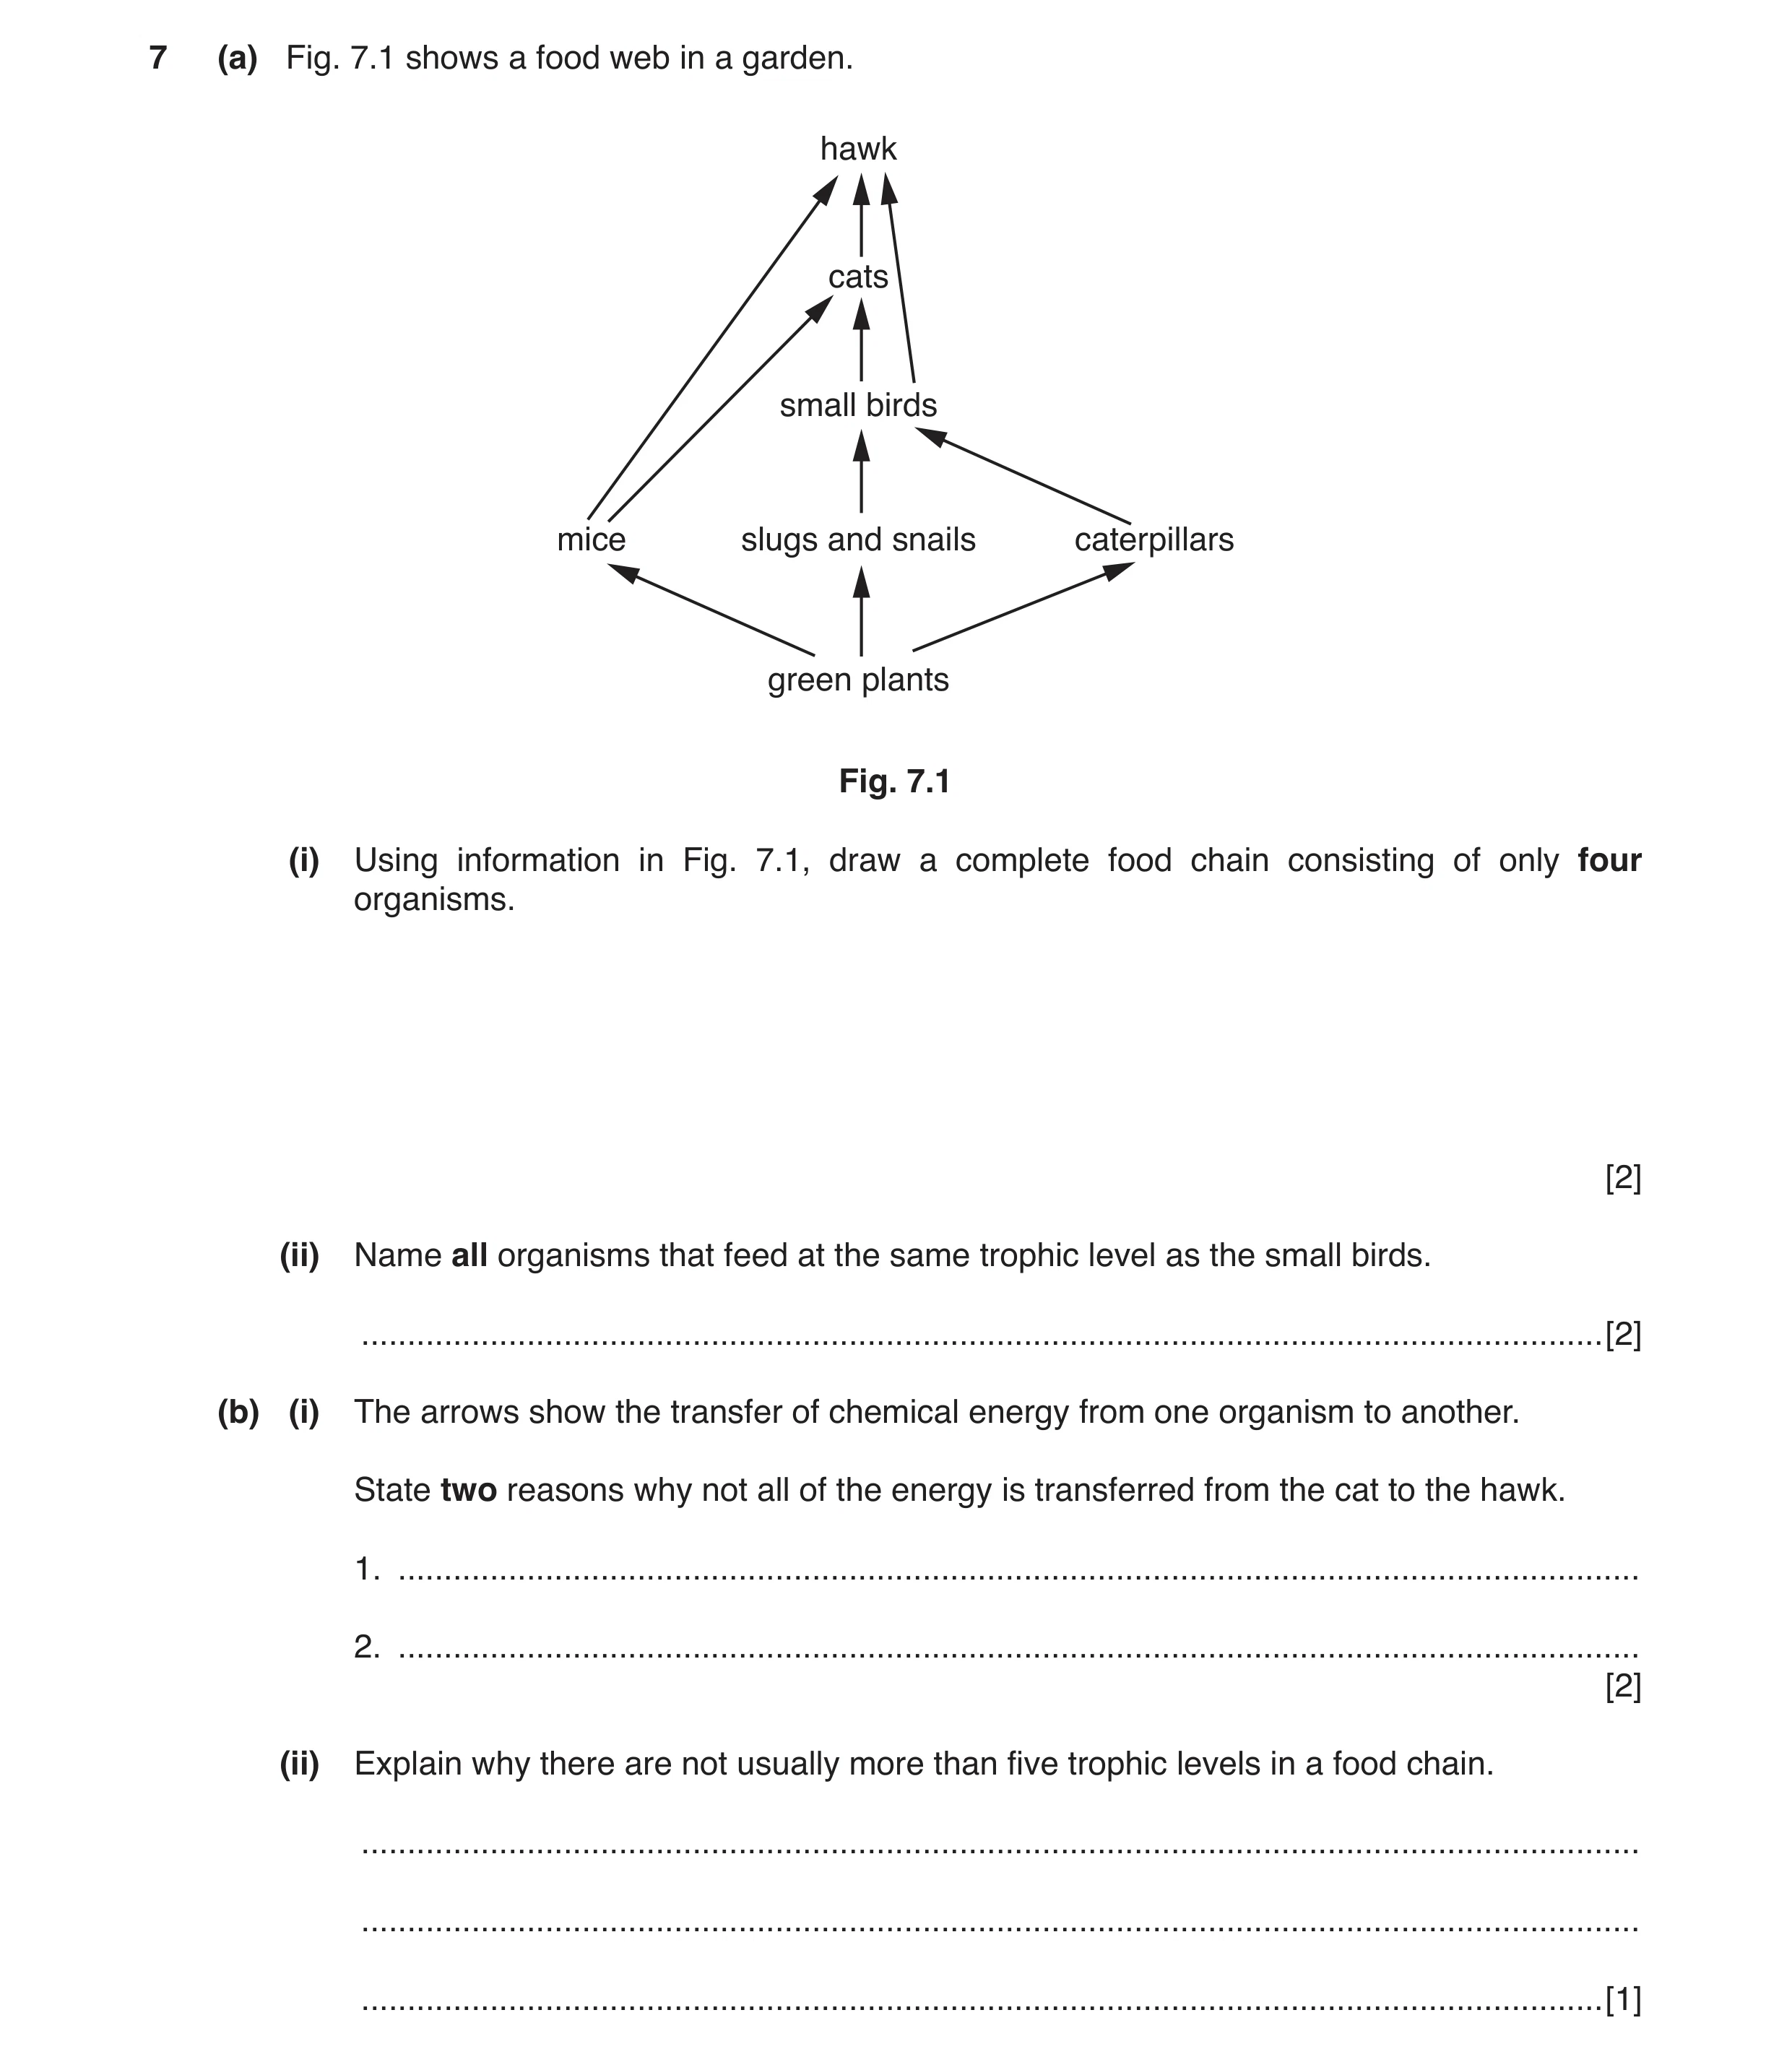
7 (a) Fig. 7.1 shows a food web in a garden. hawk cats small birds mice slugs and snails caterpillars green plants Fig. 7.1 (i) Using information in Fig. 7.1, draw a complete food chain consisting of only four organisms. [2] (ii) Name all organisms that feed at the same trophic level as the small birds. … [2] (b) (i) The arrows show the transfer of chemical energy from one organism to another. State two reasons why not all of the energy is transferred from the cat to the hawk. 1. … 2. … [2] (ii) Explain why there are not usually more than five trophic levels in a food chain. … … … [1]
7 marks
Mark scheme: 7(a)(i) green plants → caterpillars → small birds → hawk or green plants → mice → cats → hawk correct organisms from the diagram in order ; arrows in correct sense ; 2 7(a)(ii) cat ; hawk ; 2 7(b)(i) (the hawk’s) energy lost in respiration / heat / movement / growth ; (the hawk’s) energy lost in waste products e.g. faeces, urine ; not all of the cat eaten by the hawk ; max 2 7(b)(ii) very little energy remains after 4 transfers / the idea that there is insufficient energy to sustain further levels ; 1
This question in 0653/41 May/June 2018
Q3 · An aquatic food web 0653/41 Oct/Nov 2018
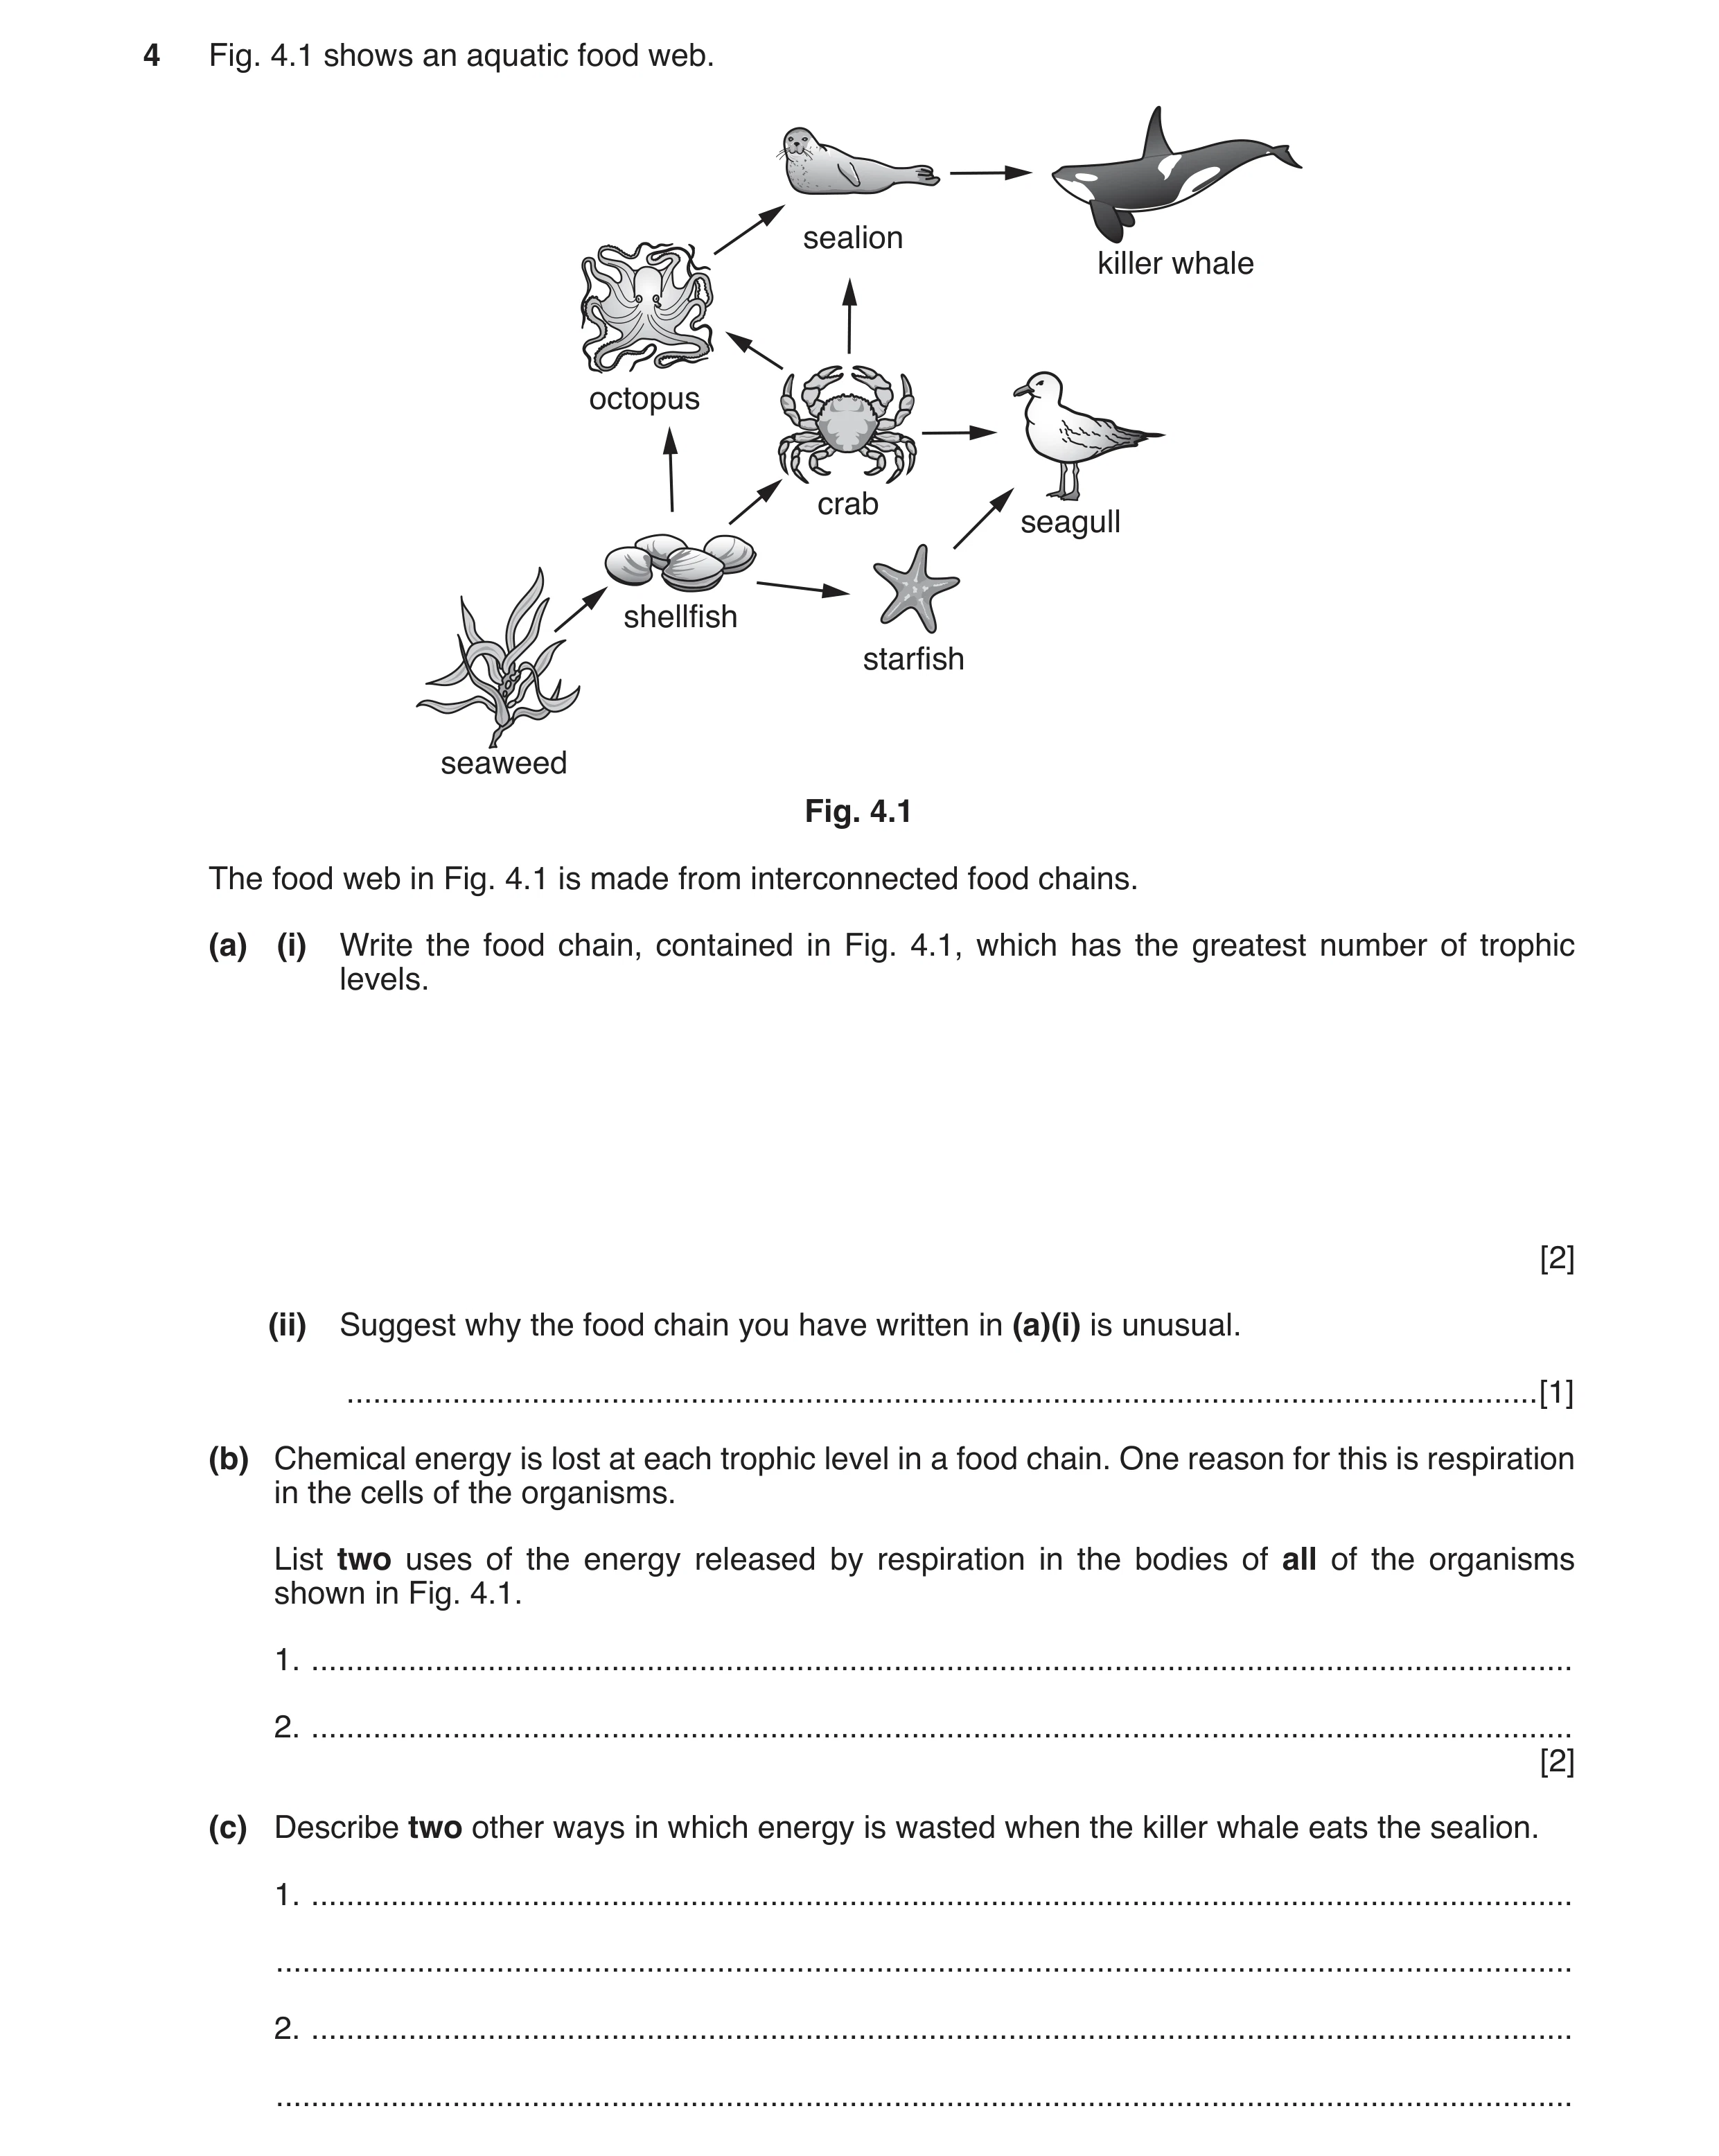
4 Fig. 4.1 shows an aquatic food web. sealion killer whale octopus crab seagull shellfish starfish seaweed Fig. 4.1 The food web in Fig. 4.1 is made from interconnected food chains. (a) (i) Write the food chain, contained in Fig. 4.1, which has the greatest number of trophic levels. [2] (ii) Suggest why the food chain you have written in (a)(i) is unusual. … [1] (b) Chemical energy is lost at each trophic level in a food chain. One reason for this is respiration in the cells of the organisms. List two uses of the energy released by respiration in the bodies of all of the organisms shown in Fig. 4.1. 1. … 2. … [2] (c) Describe two other ways in which energy is wasted when the killer whale eats the sealion. 1. … … 2. … …
7 marks
Mark scheme: 4(a)(i) 2 4(a)(ii) consists of more than 4 trophic levels ; 1 4(b) protein synthesis / building up molecules ; cell division ; growth ; Max 2 2 4(c) not all eaten ; not all digested / absorbed / egestion / lost in faeces ; excretion / lost in urine ; Max 2 2
This question in 0653/41 Oct/Nov 2018
Q4 · A food chain of some organisms in a garden 0653/42 Feb/March 2019
1 (a) (i) Fig. 1.1 shows a food chain of some organisms in a garden. cabbage slug hedgehog fox Fig. 1.1 The list shows the trophic levels of the organisms. primary consumer producer secondary consumer tertiary consumer In Fig. 1.1 write the correct trophic level in the box below each organism. [1] (ii) Fig. 1.2 shows a second food chain in the same garden. sunflower slug mouse fox Fig. 1.2 Complete the food web below by combining the organisms in the two food chains shown in Fig. 1.1 and Fig. 1.2. You do not need to include the pictures. cabbage sunflower [2] (iii) State two ways in which energy is wasted during transfer between trophic levels. 1. … … 2. … … [2] (b) Humans must eat a variety of foods for a balanced diet. (i) Use words from the list to complete the essential components of a human’s diet. bile carbohydrates chlorophyll enzymes haemoglobin hormones proteins A balanced diet contains mineral salts, fibre, … , fats, water, … and vitamins. [1] (ii) Describe the importance of fibre in the diet. … … [1] (iii) The list shows some foods. One of them is rich in fibre. apple cheese fish meat milk State the food rich in fibre. … [1] (c) If a person’s diet does not contain all the nutrients needed they can develop deficiency diseases. Scurvy is an example of a deficiency disease. State the cause of the disease scurvy. … [1] (d) The amount of each nutrient in a balanced diet varies according to a person’s need. The list describes four people A, B, C and D. person A is an adult male office worker person B is an adult male gardener person C is a teenage boy person D is a teenage girl (i) Suggest which person, A or B, needs more energy supplied by their diet. Give a reason for your answer. person … reason … … [1] (ii) Suggest which person, C or D, needs more energy supplied by their diet. Give a reason for your answer. person … reason … … [1] [Total: 11]
11 marks
Mark scheme: 1(a)(i) trophic levels in boxes in the order producer, primary consumer, secondary consumer, tertiary consumer ; 1 1(a)(ii) food web drawn as follows all organisms correct ; arrows pointing in the correct direction ; 2 1(a)(iii) any two from respiration / heat ; not all (prey) eaten ; not all (prey) digested / ref. to egestion (of faeces) ; excretion of waste products / urine ; max 2 1(b)(i) carbohydrates, proteins ; 1 1(b)(ii) prevents constipation / owtte ; 1 1(b)(iii) apple ; 1 1(c) lack of vitamin C ; 1 fox slug cabbage sunflower hedgehog mouse Question Answer Marks 1(d)(i) (person B) reference to a more active occupation ; 1 1(d)(ii) (person C) males need more energy than females ; 1
This question in 0653/42 Feb/March 2019
Q5 · The flow of energy through a forest ecosystem 0653/41 Oct/Nov 2019
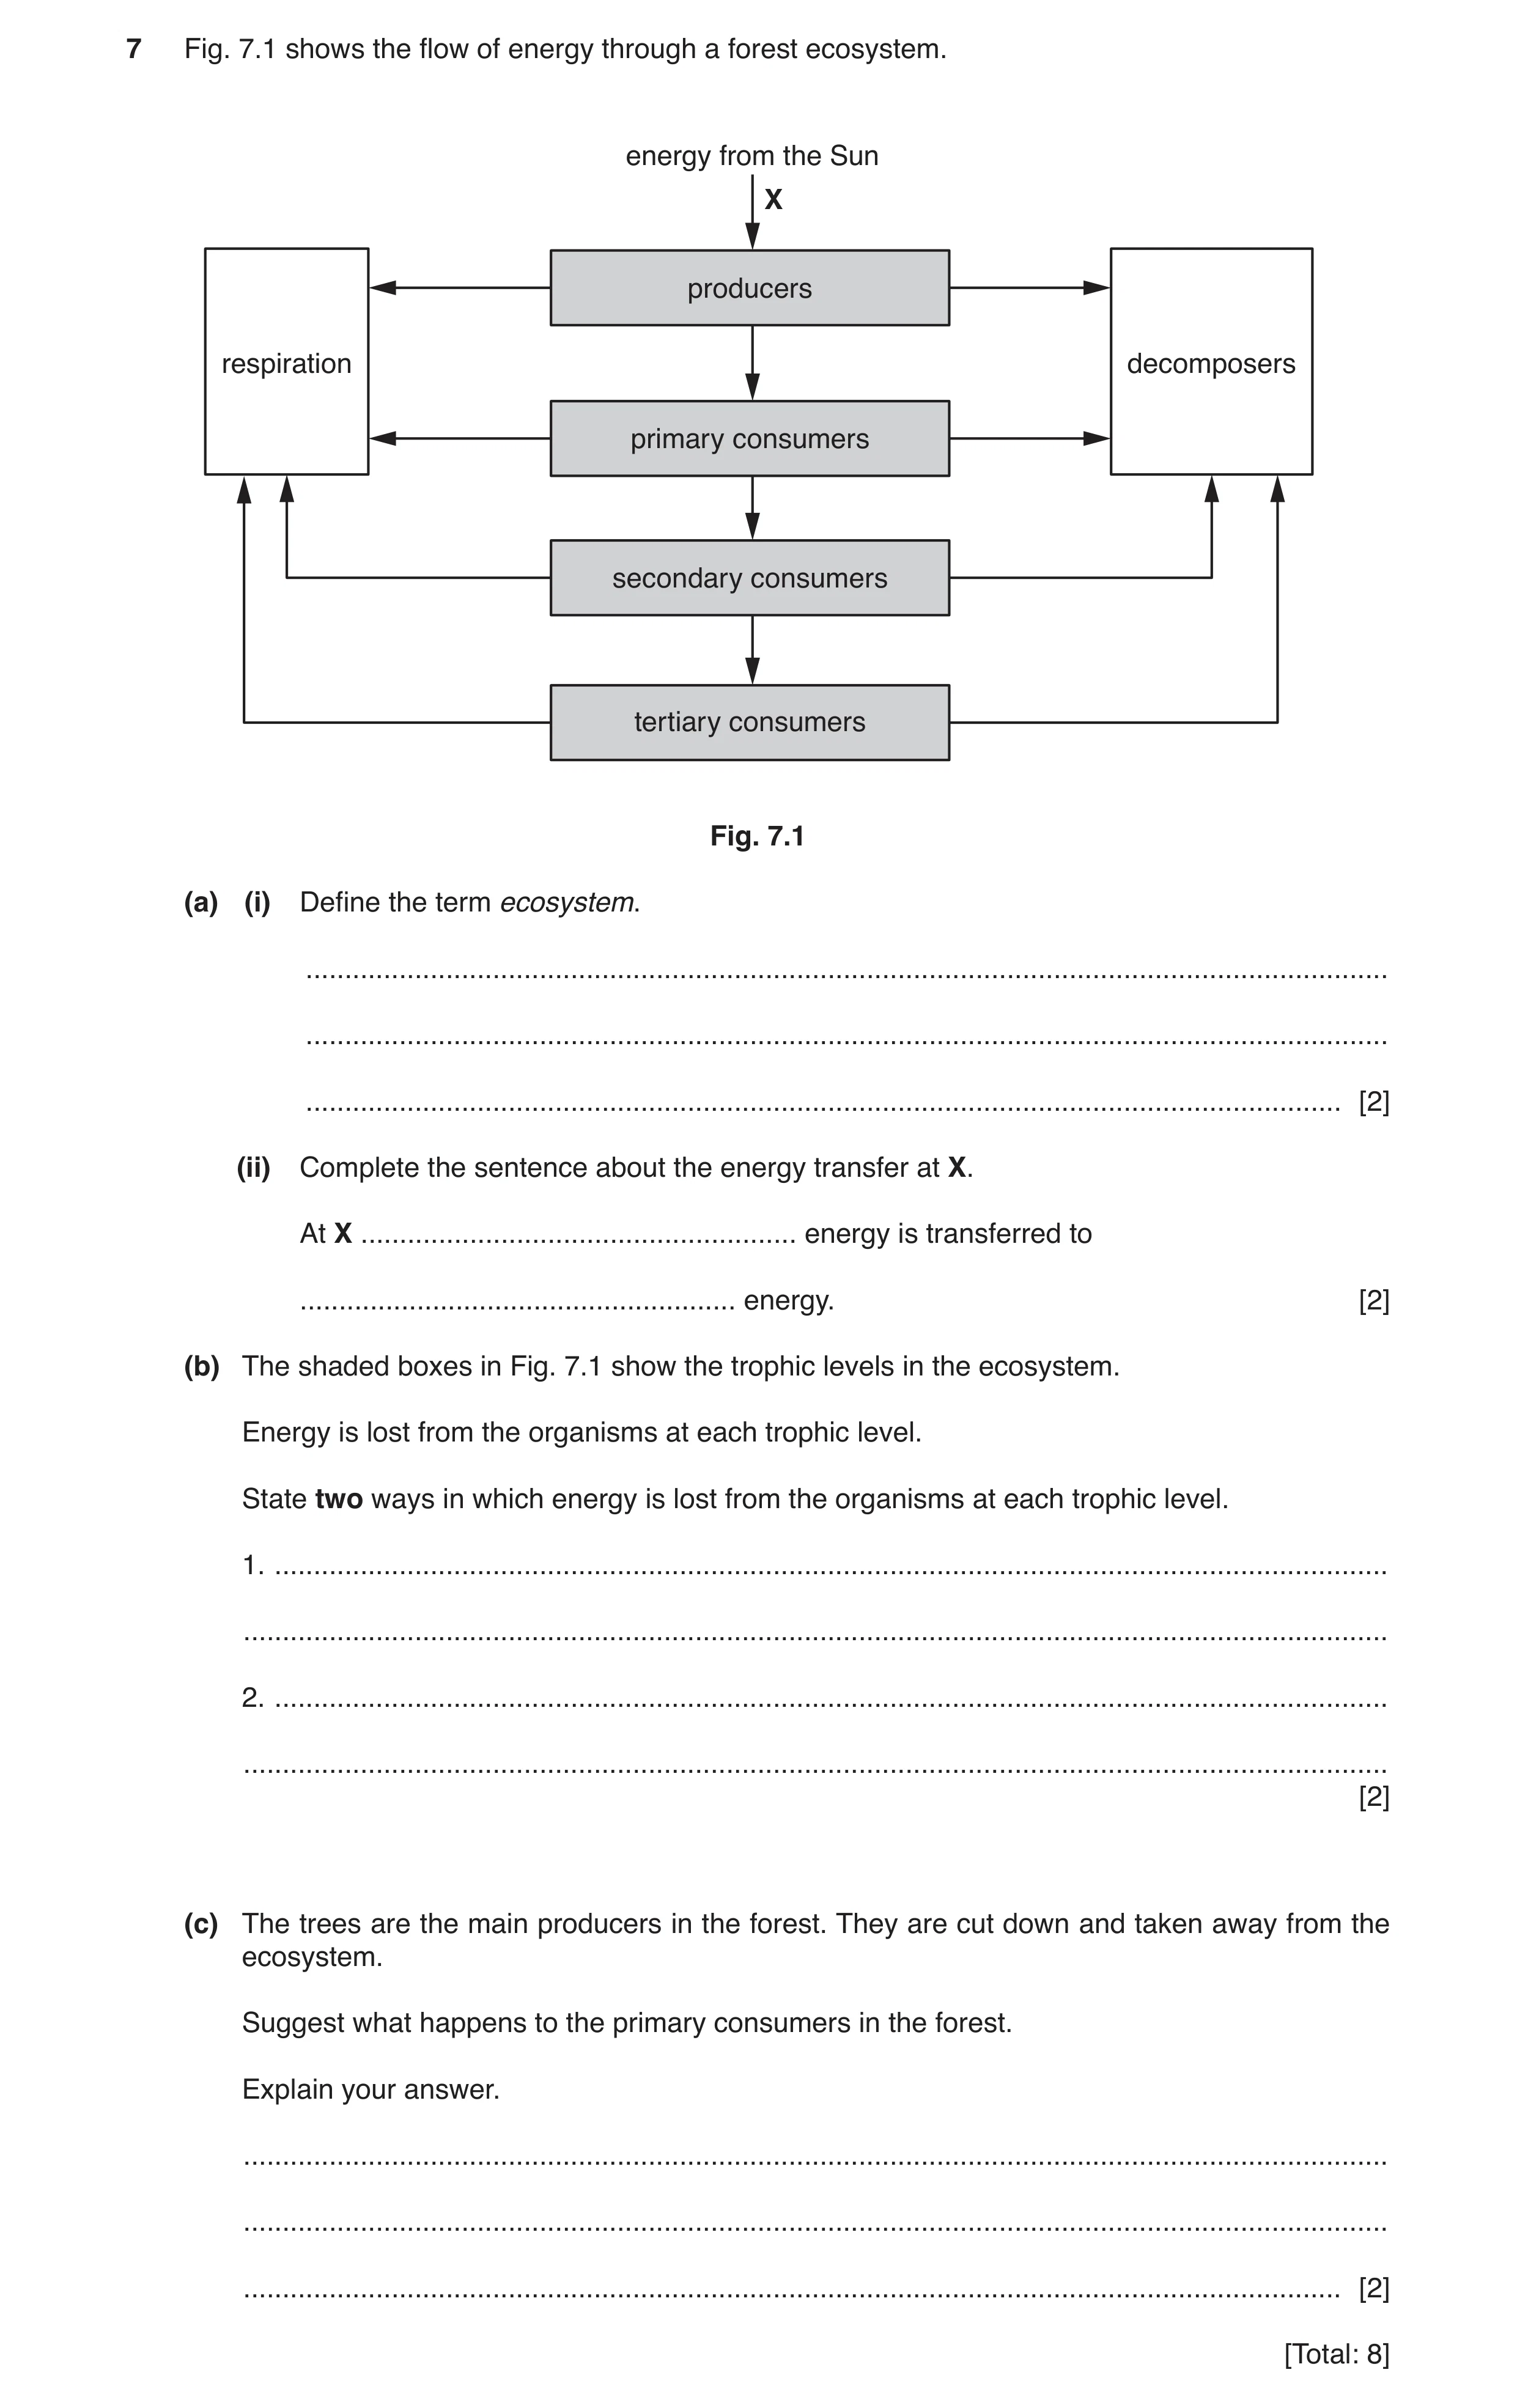
7 Fig. 7.1 shows the flow of energy through a forest ecosystem. energy from the Sun X producers respiration decomposers primary consumers secondary consumers tertiary consumers Fig. 7.1 (a) (i) Define the term ecosystem. … … … [2] (ii) Complete the sentence about the energy transfer at X. At X … energy is transferred to … energy. [2] (b) The shaded boxes in Fig. 7.1 show the trophic levels in the ecosystem. Energy is lost from the organisms at each trophic level. State two ways in which energy is lost from the organisms at each trophic level. 1. … … 2. … … [2] (c) The trees are the main producers in the forest. They are cut down and taken away from the ecosystem. Suggest what happens to the primary consumers in the forest. Explain your answer. … … … [2] [Total: 8]
8 marks
Mark scheme: 7(a)(i) (a unit containing) all the organisms and their environment ; interacting together ; 2 7(a)(ii) light ; chemical (potential) energy ; 2 7(b) any two from: death of organisms ; (excretion of) waste products from organisms ; respiration ; heat ; 2 7(c) die / become extinct ; source of food/energy has gone / loss of habitat ; 2
This question in 0653/41 Oct/Nov 2019
Q6 · An incomplete food web of some organisms in a field 0653/42 Feb/March 2020
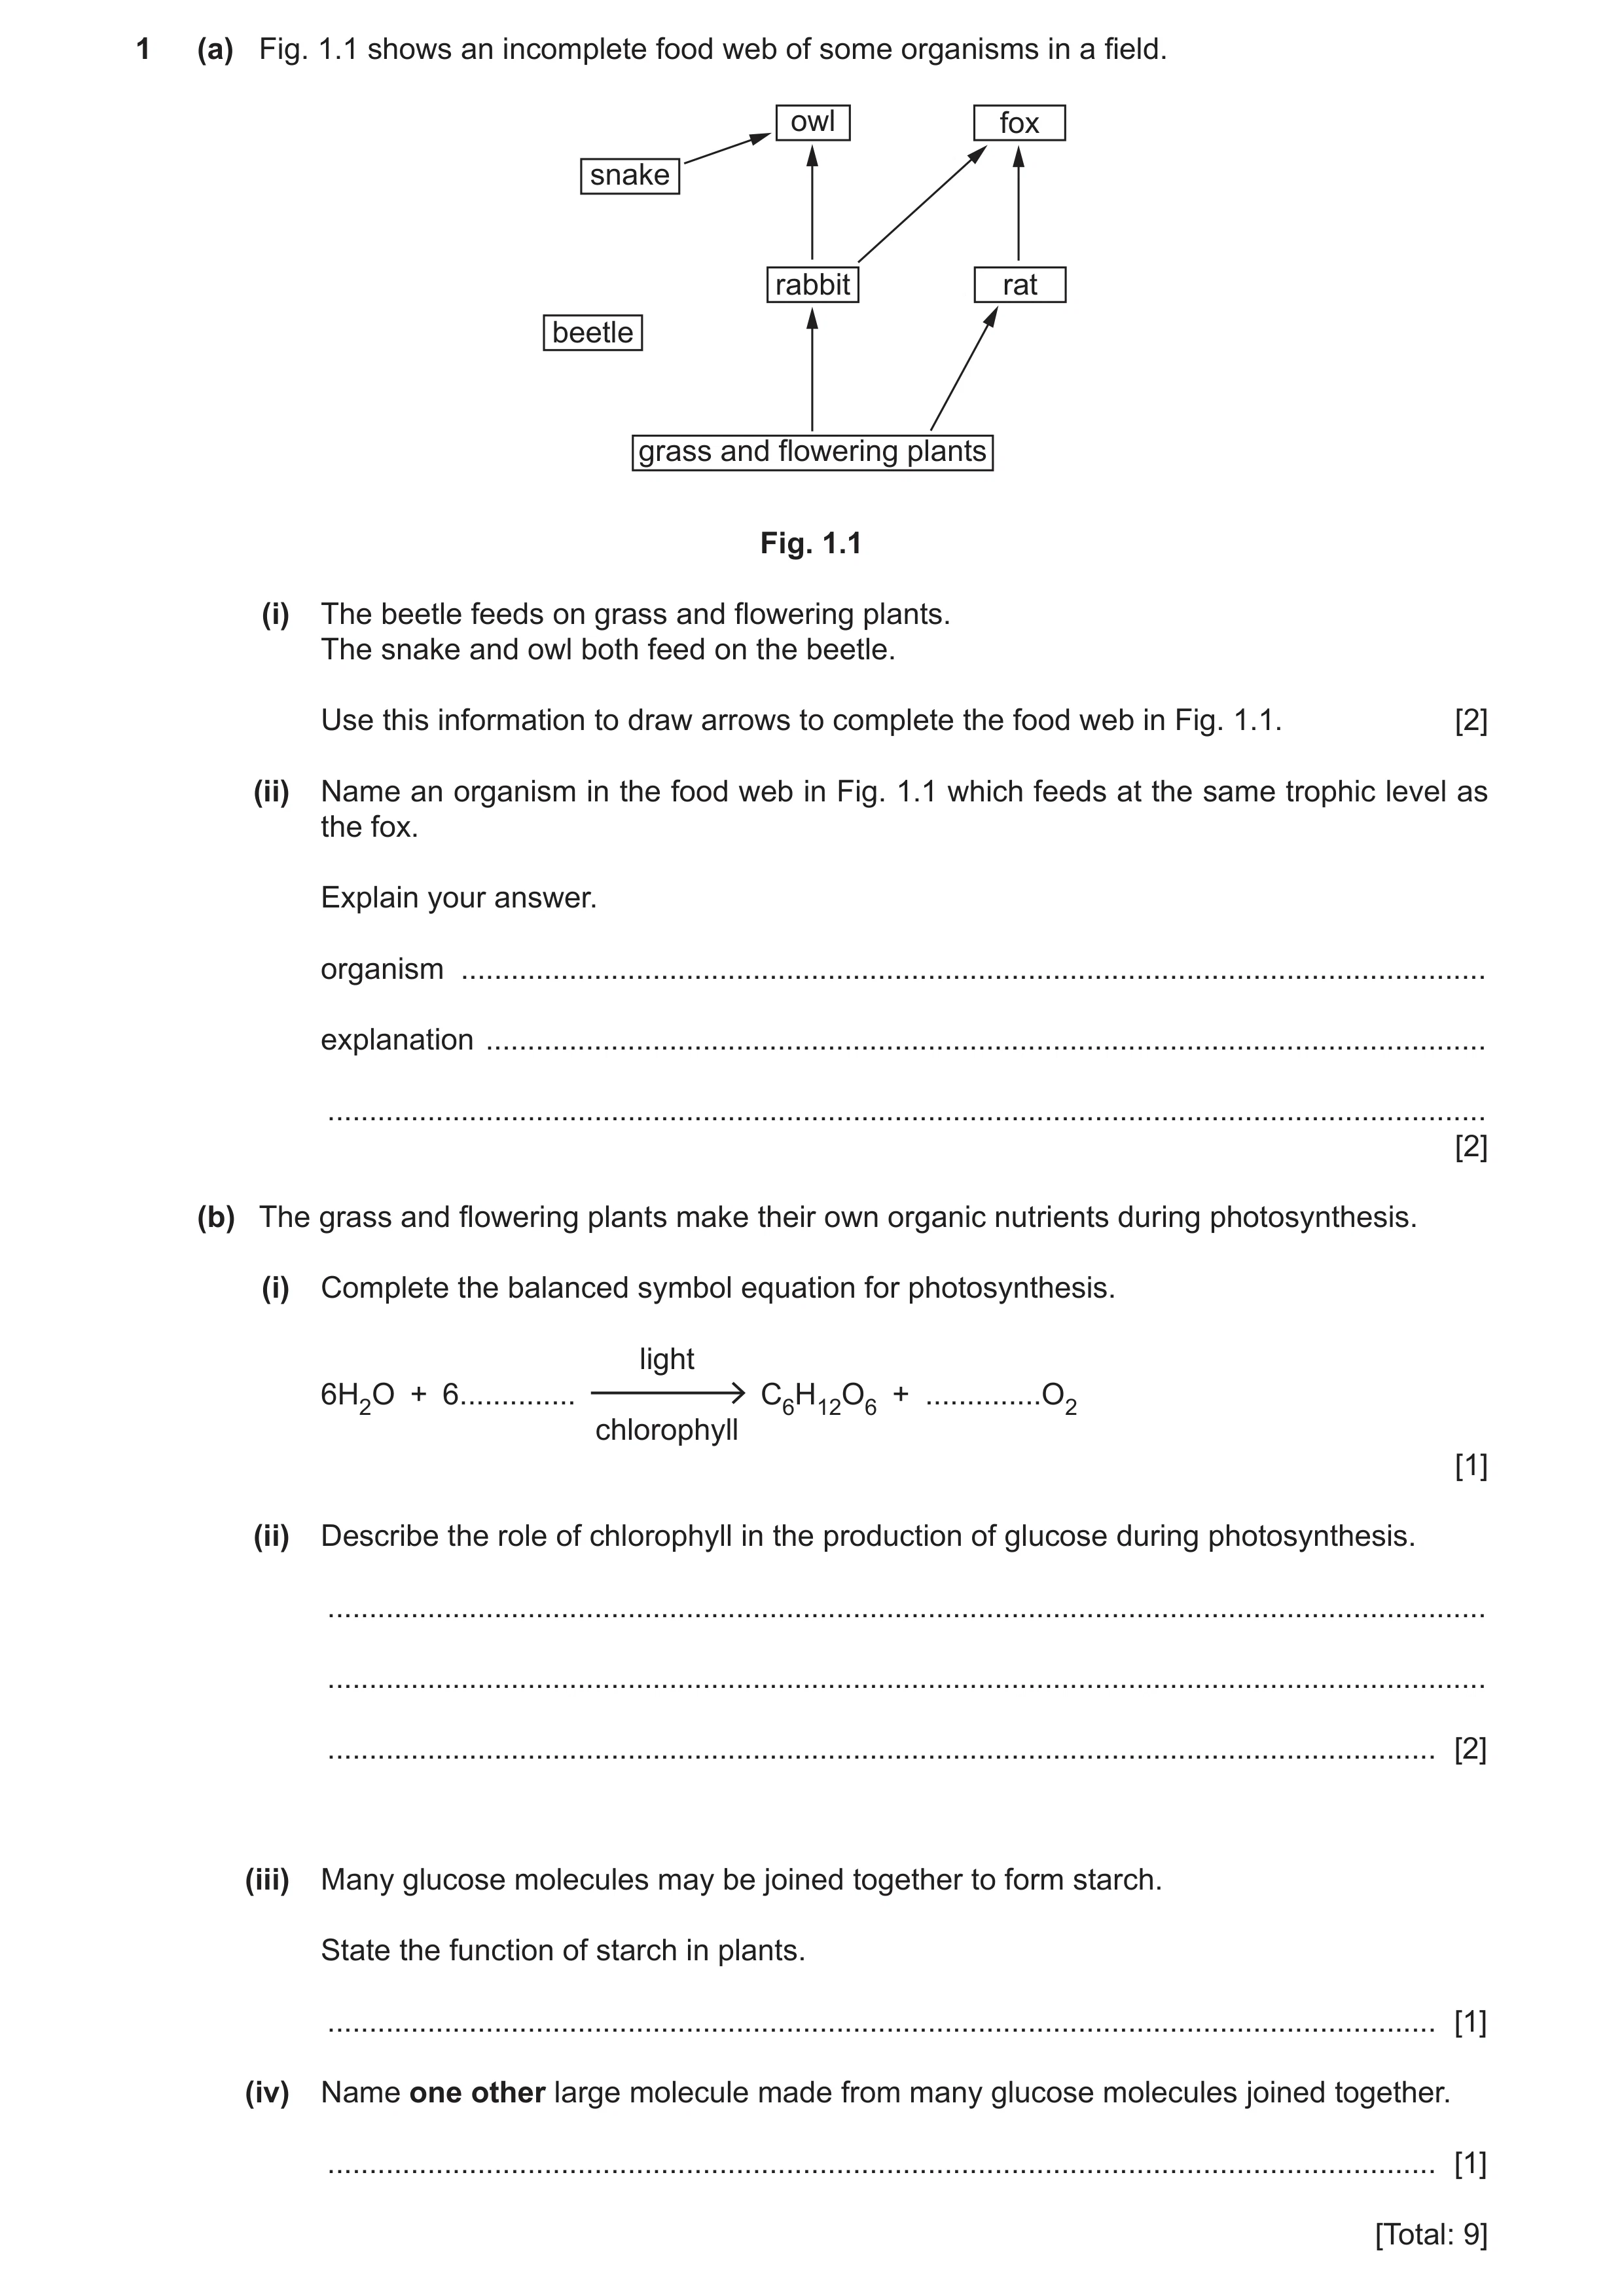
1 (a) Fig. 1.1 shows an incomplete food web of some organisms in a field. owl fox snake rabbit rat beetle grass and flowering plants Fig. 1.1 (i) The beetle feeds on grass and flowering plants. The snake and owl both feed on the beetle. Use this information to draw arrows to complete the food web in Fig. 1.1. [2] (ii) Name an organism in the food web in Fig. 1.1 which feeds at the same trophic level as the fox. Explain your answer. organism … explanation … … [2] (b) The grass and flowering plants make their own organic nutrients during photosynthesis. (i) Complete the balanced symbol equation for photosynthesis. light 6H2O + 6 … C6H12O6 + … O2 chlorophyll [1] (ii) Describe the role of chlorophyll in the production of glucose during photosynthesis. … … … [2] (iii) Many glucose molecules may be joined together to form starch. State the function of starch in plants. … [1] (iv) Name one other large molecule made from many glucose molecules joined together. … [1] [Total: 9]
9 marks
Mark scheme: 1(a)(i) arrow drawn correctly from grass and flowering plants to beetle ; arrows drawn from beetle to snake and from beetle to owl ; 2 1(a)(ii) owl / snake ; they are at the third trophic level / they are secondary consumers ; 2 1(b)(i) (6H2O + 6) CO2 → (C6H12O6 +) 6 (O2) CO2 and 6 both correct ; 1 1(b)(ii) absorbs / traps, (sun)light (energy) ; transfers / converts, light energy into chemical energy ; 2 1(b)(iii) storage (of energy) ; 1 1(b)(iv) glycogen ; 1
This question in 0653/42 Feb/March 2020
Question 7 0653/42 May/June 2020
1 (a) Fig. 1.1 represents a plant cell. Fig. 1.1 Add labels to Fig. 1.1 to name two structures that are only present in plant cells. [2] (b) Fig. 1.2 represents an animal cell from the trachea. Fig. 1.2 Describe how the structure of this cell is adapted to its function. … … … [2] (c) Fig. 1.3 shows part of a food web. foxes frogs owls stoats spiders rabbits voles insects grass Fig. 1.3 (i) Define the term consumer. … … [1] (ii) List all of the tertiary consumers shown in the food web in Fig. 1.3. Explain how you identified these consumers using the term trophic level. tertiary consumers … … explanation … … [2] (iii) Complete the food chain containing five organisms from the food web in Fig. 1.3. grass [1] (iv) Describe what the arrows in the food chain represent. … [1] (d) Use words from the list to complete the sentences about photosynthesis. chemical chlorophyll cytoplasm glucose light oxygen starch thermal Each word may be used once, more than once or not at all. During photosynthesis … energy is transferred into … energy by … molecules. [2] [Total: 11]
11 marks
Mark scheme: 1(a) any two of the following correctly labelled: chloroplast ; (large) vacuole ; cell wall ; 2 1(b) (presence of) cilia ; move mucus ; 2 1(c)(i) an organism that gets its energy by feeding on other organisms ; 1 1(c)(ii) (tertiary consumers) foxes and frogs and owls ; (explanation) organisms are at the fourth trophic level ; 2 1(c)(iii) (grass) insects spiders frogs foxes ; 1 1(c)(iv) transfer of energy ; 1 1(d) light (energy is transferred into) chemical (energy) ; chlorophyll ; 2
This question in 0653/42 May/June 2020
Q8 · A mistletoe plant growing on a tree branch 0653/43 Oct/Nov 2020
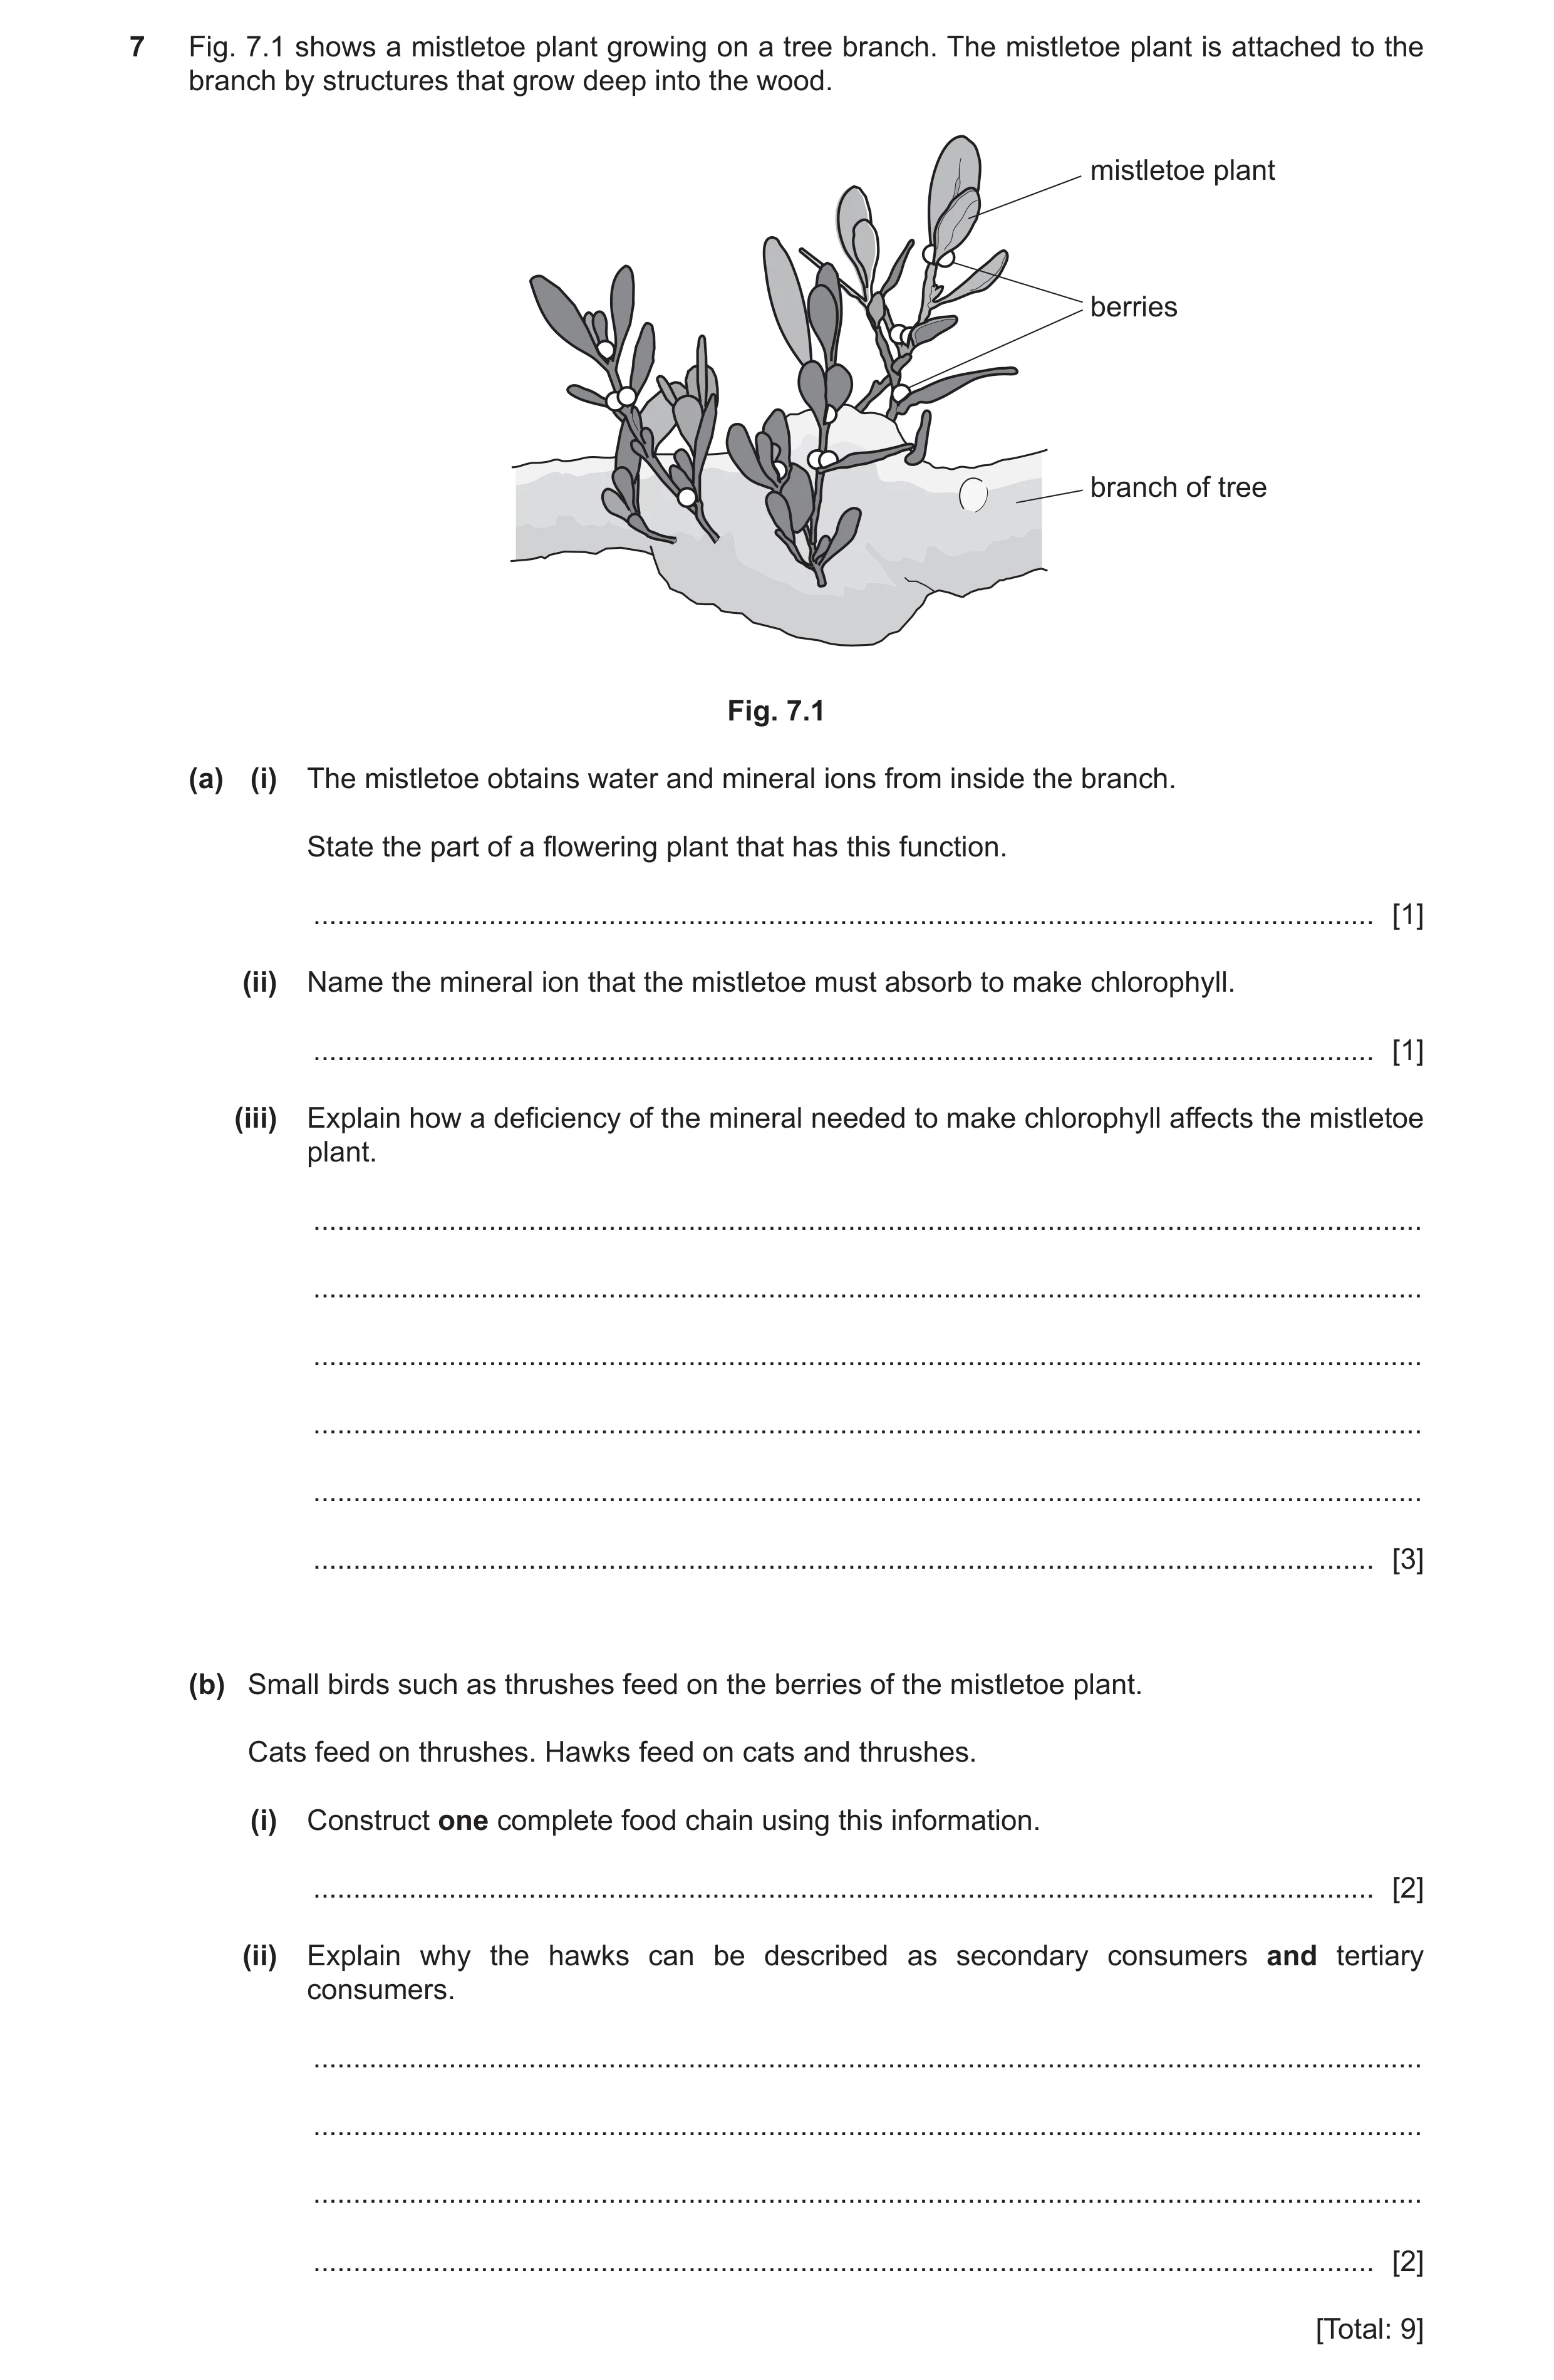
7 Fig. 7.1 shows a mistletoe plant growing on a tree branch. The mistletoe plant is attached to the branch by structures that grow deep into the wood. mistletoe plant berries branch of tree Fig. 7.1 (a) (i) The mistletoe obtains water and mineral ions from inside the branch. State the part of a flowering plant that has this function. … [1] (ii) Name the mineral ion that the mistletoe must absorb to make chlorophyll. … [1] (iii) Explain how a deficiency of the mineral needed to make chlorophyll affects the mistletoe plant. … … … … … … [3] (b) Small birds such as thrushes feed on the berries of the mistletoe plant. Cats feed on thrushes. Hawks feed on cats and thrushes. (i) Construct one complete food chain using this information. … [2] (ii) Explain why the hawks can be described as secondary consumers and tertiary consumers. … … … … [2] [Total: 9]
9 marks
Mark scheme: 7(a)(i) root(s) ; 1 7(a)(ii) magnesium ; 1 7(a)(iii) any three from: yellow leaves ; reference to chlorophyll transfers light energy to chemical energy ; chlorophyll is needed for photosynthesis / (lack of chlorophyll) reduces rate of photosynthesis reduced, carbohydrate / glucose / starch production ; 3 7(b)(i) mistletoe / berries → thrush / (small)bird → cat → hawk OR mistletoe / berries → thrush / (small) bird → hawk organisms in correct order in food chain ; arrows pointing in the correct direction ; 2 Question Answer Marks 7(b)(ii) hawks feed on thrushes which are primary consumers / at the second trophic level (so they are secondary consumers) ; hawks feed on cats which are secondary consumers / at the third trophic level (so they are tertiary consumers) ; 2
This question in 0653/43 Oct/Nov 2020
Q9 · Part of a forest food web 0653/42 Feb/March 2021
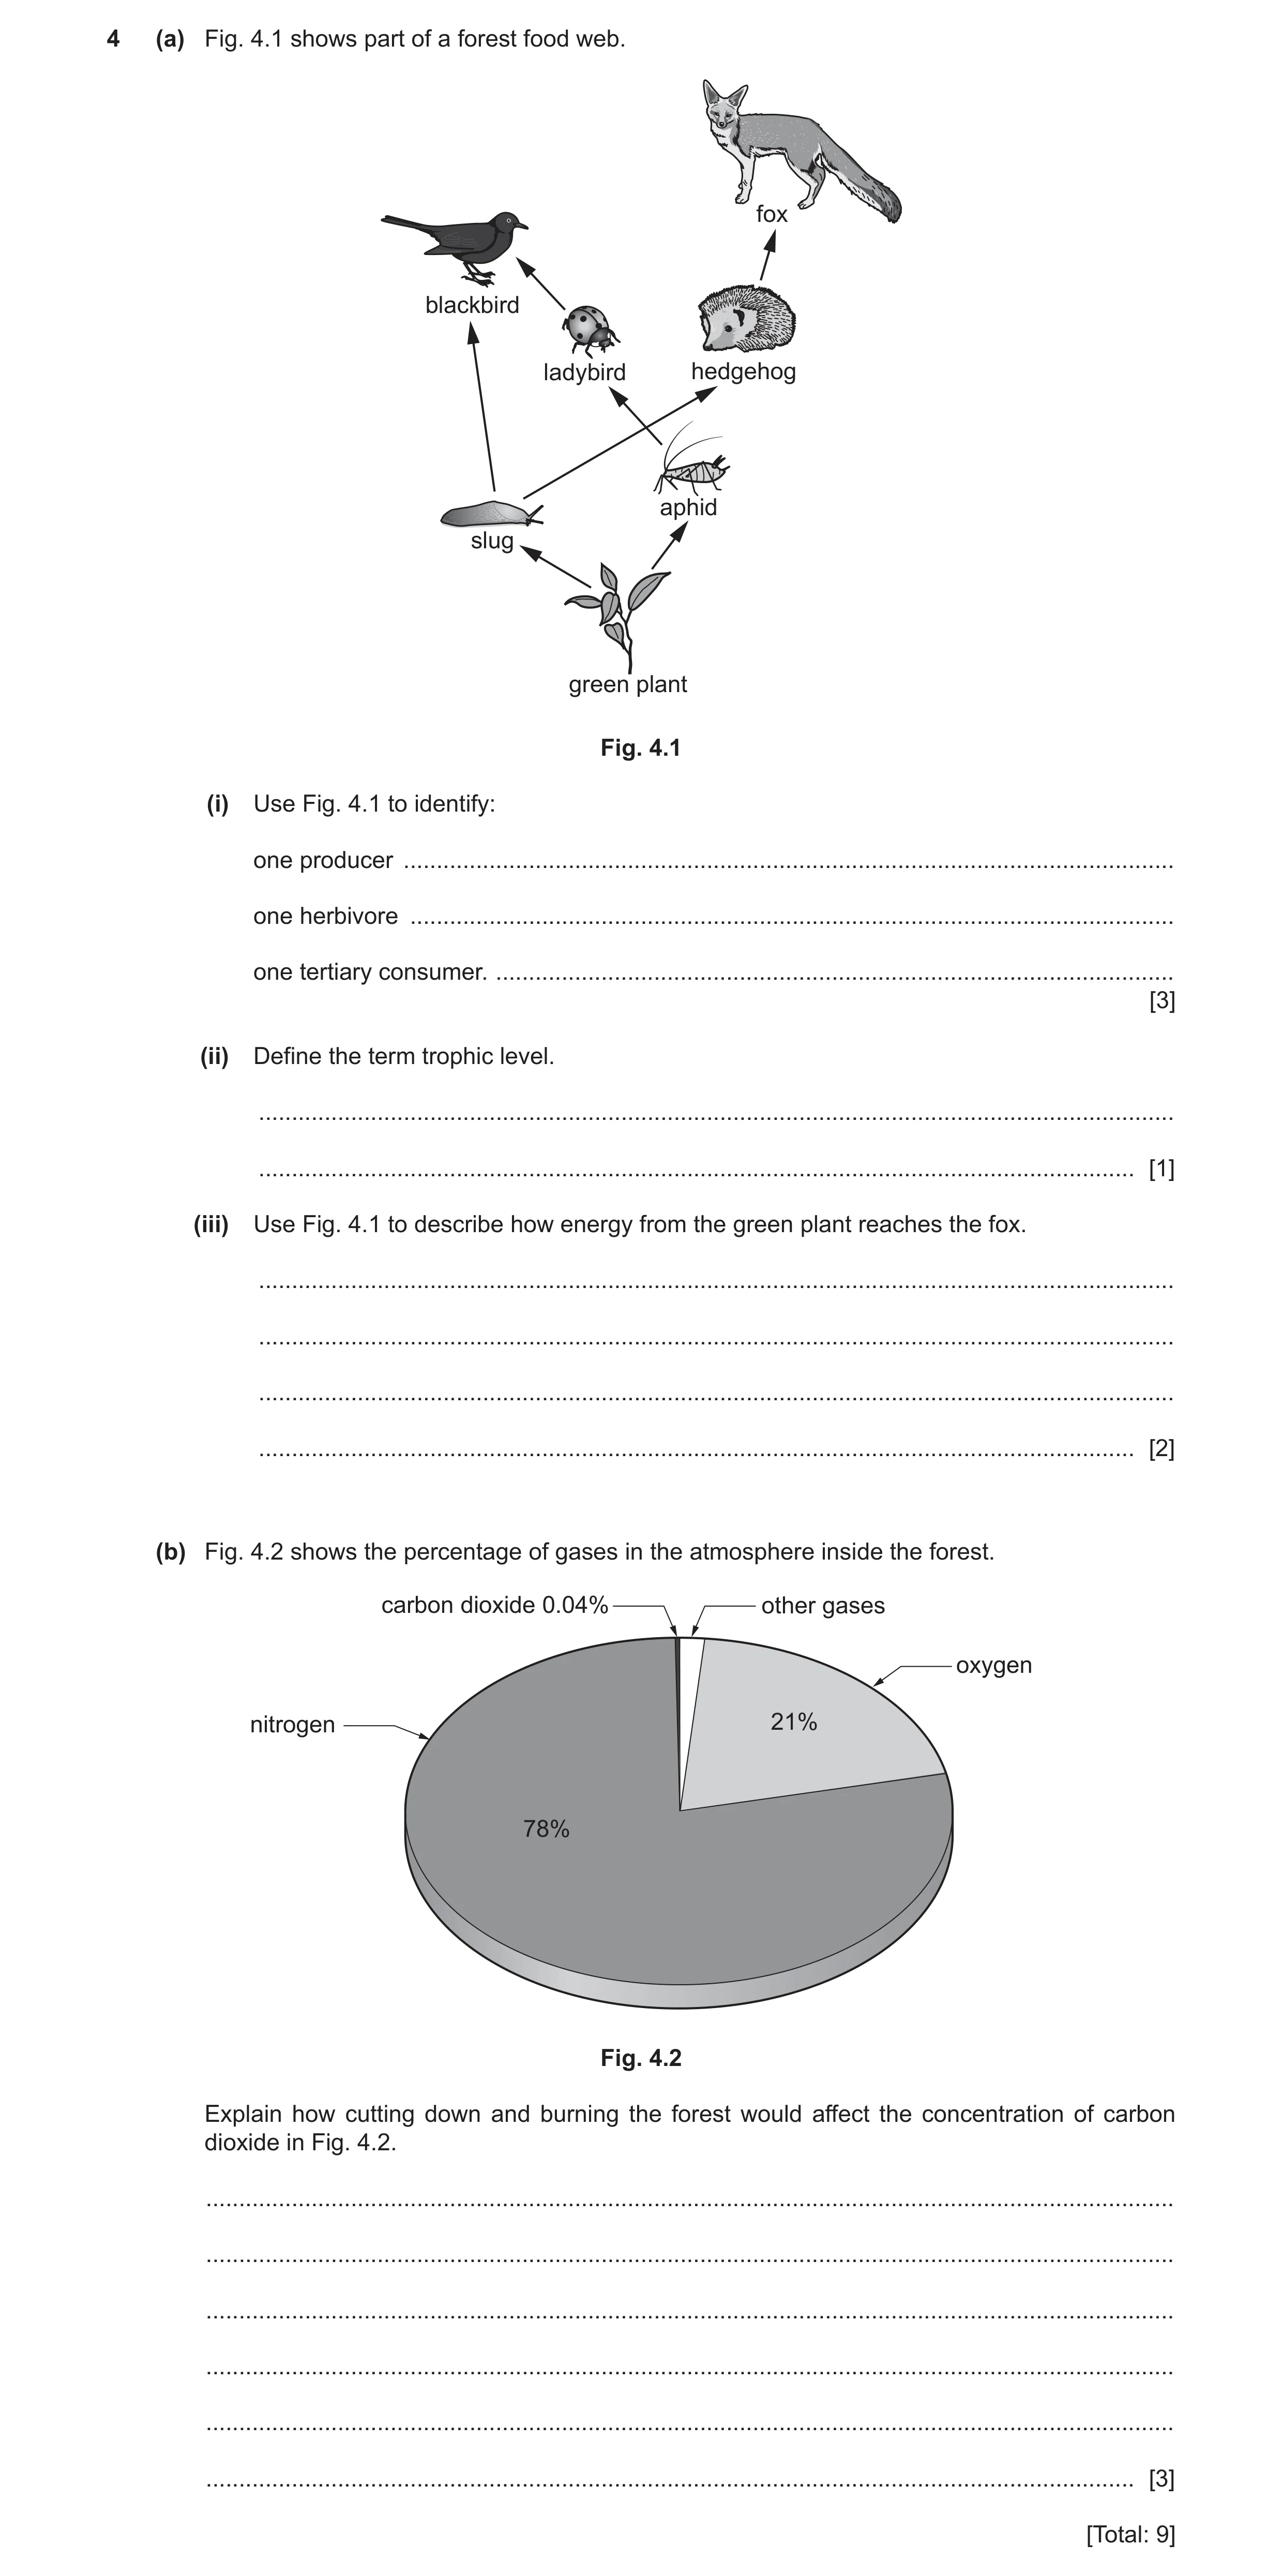
4 (a) Fig. 4.1 shows part of a forest food web. fox blackbird ladybird hedgehog aphid slug green plant Fig. 4.1 (i) Use Fig. 4.1 to identify: one producer … one herbivore … one tertiary consumer. … [3] (ii) Define the term trophic level. … … [1] (iii) Use Fig. 4.1 to describe how energy from the green plant reaches the fox. … … … … [2] (b) Fig. 4.2 shows the percentage of gases in the atmosphere inside the forest. carbon dioxide 0.04% other gases oxygen nitrogen 21% 78% Fig. 4.2 Explain how cutting down and burning the forest would affect the concentration of carbon dioxide in Fig. 4.2. … … … … … … [3] [Total: 9]
9 marks
Mark scheme: 4(a)(i) (green) plant ; slug / aphid ; fox / blackbird ; 3 4(a)(ii) the position of an organism in a food chain or food web ; 1 4(a)(iii) passes to slug when slug eats (green) plant passes to hedgehog when hedgehog eats slug passes to fox when fox eats hedgehog ;; all three = 2 marks one or two = 1 mark 2 4(b) concentration of carbon dioxide increases ; because, carbon dioxide is produced by burning (the forest) ; less carbon dioxide removed (from the air) by photosynthesis ; 3
This question in 0653/42 Feb/March 2021
Q10 · Define the term ecosystem 0653/42 May/June 2021
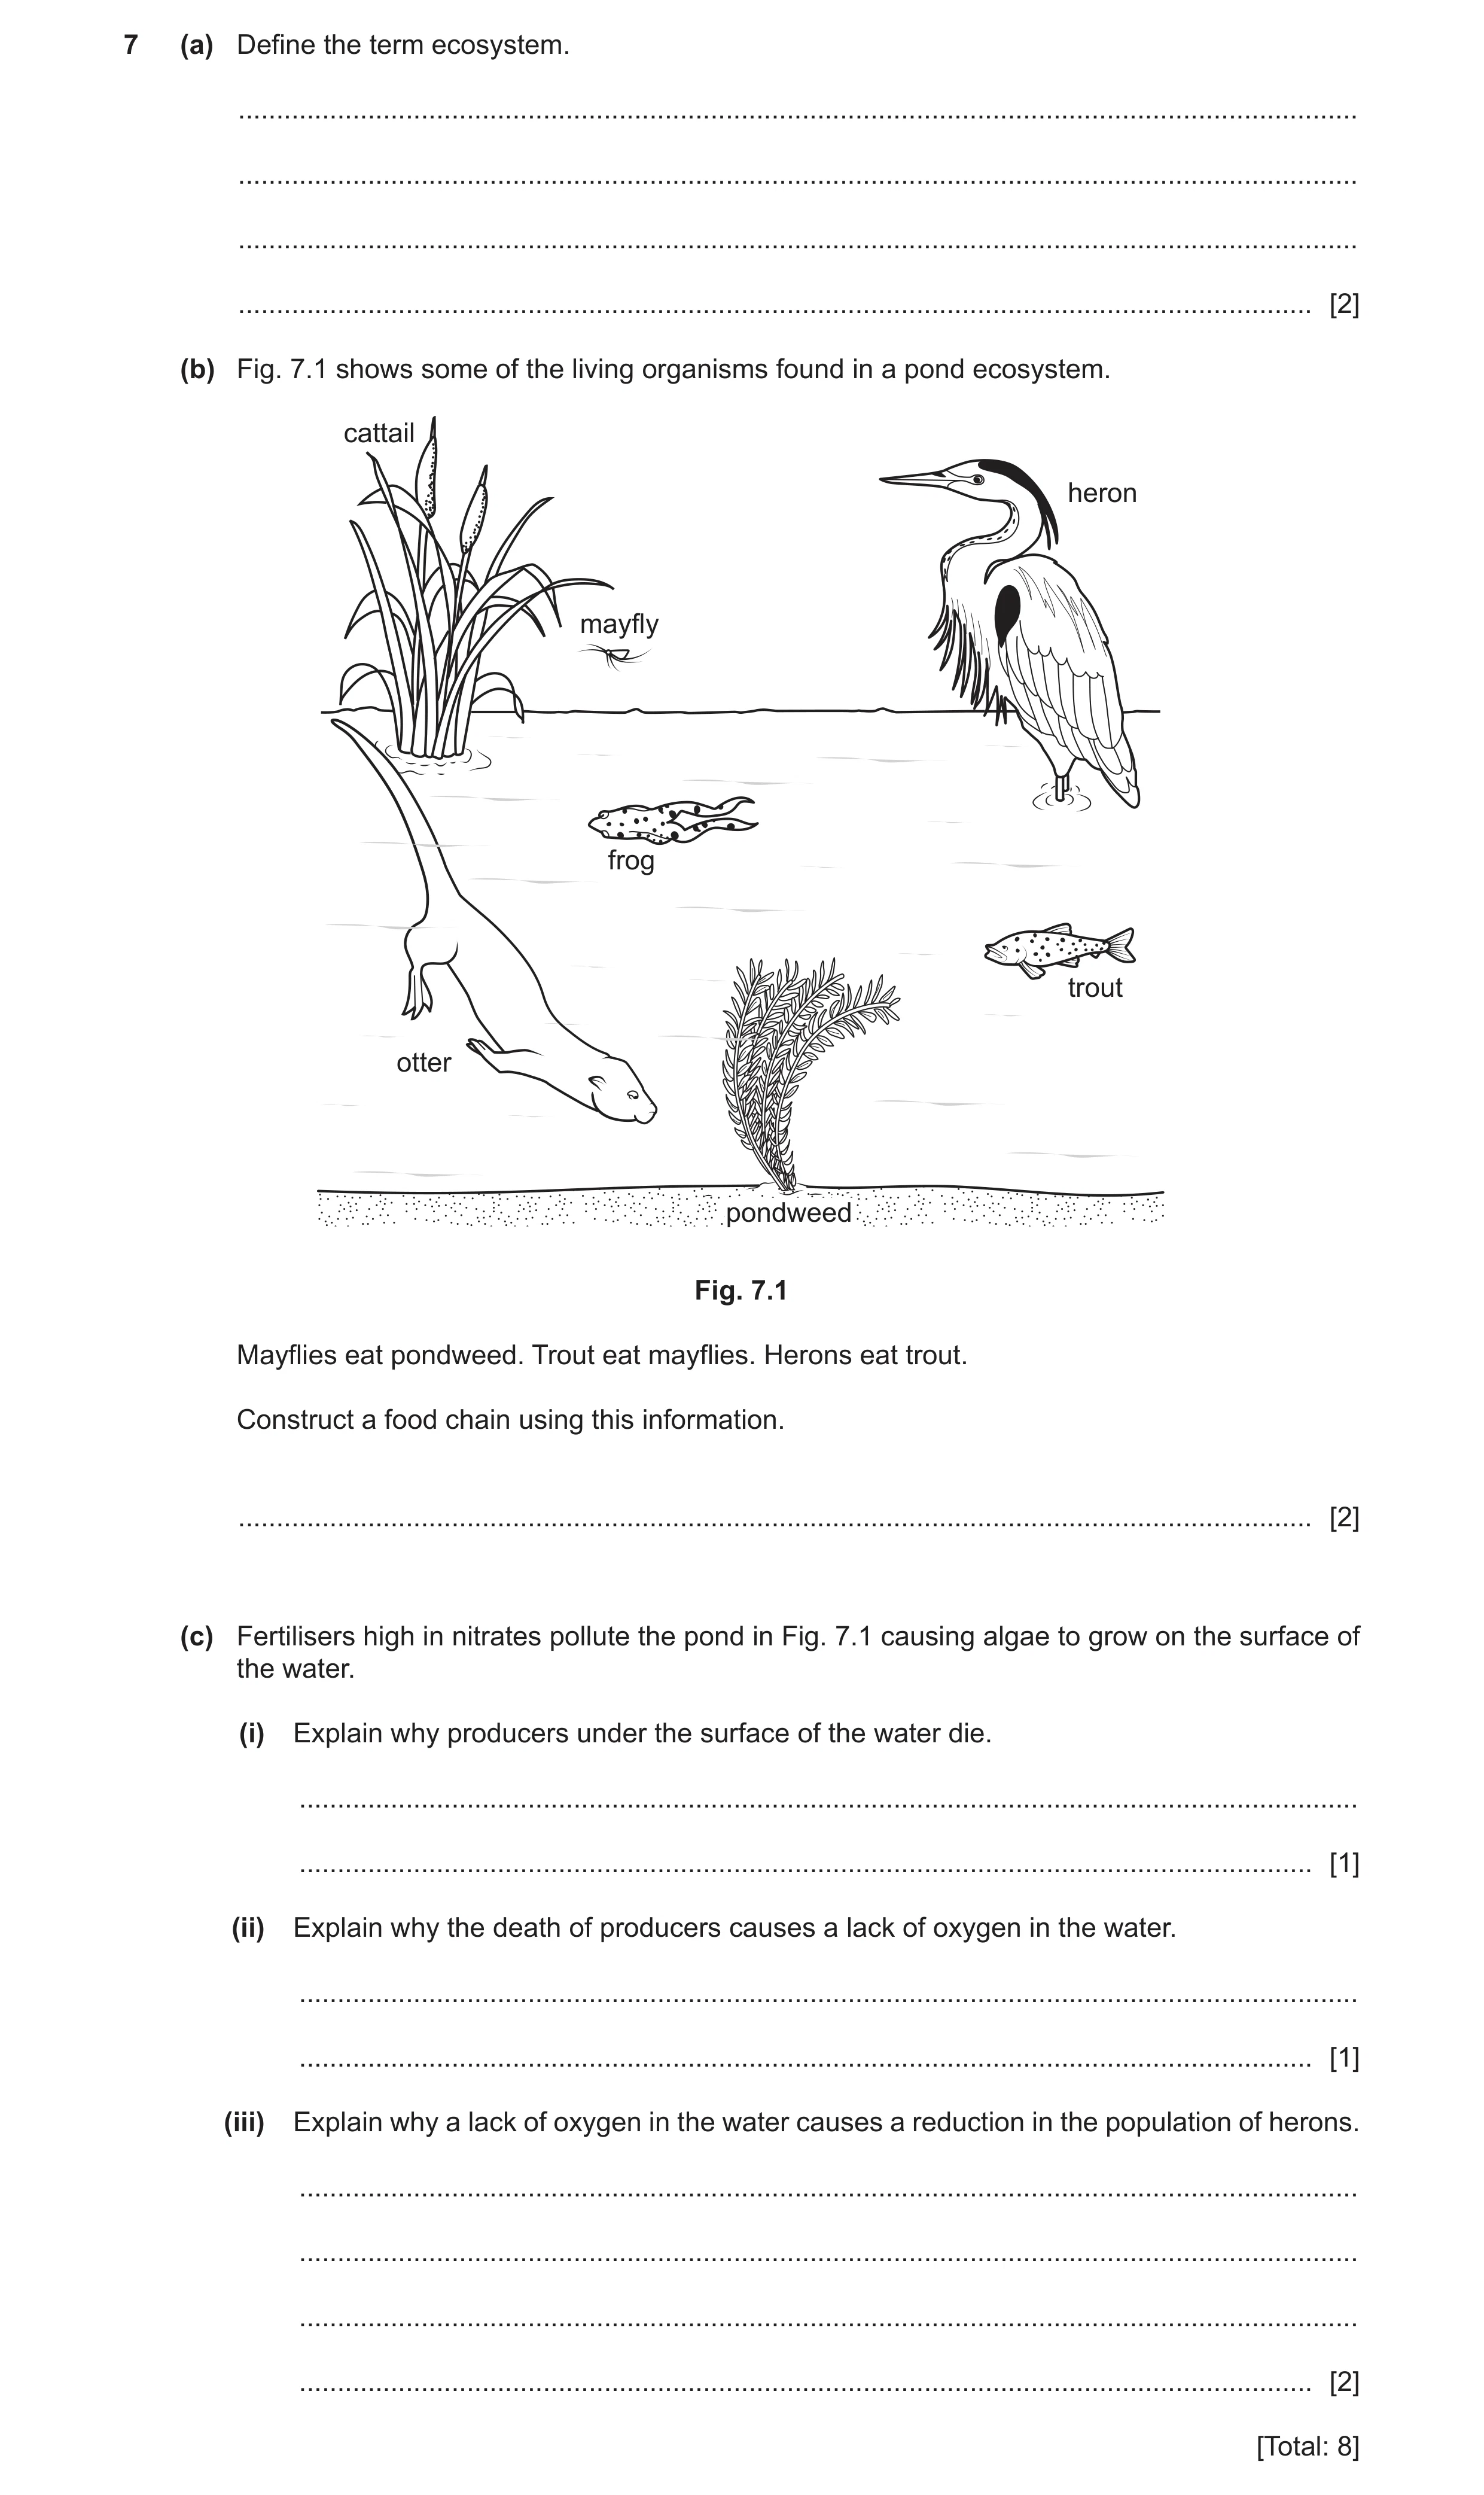
7 (a) Define the term ecosystem. … … … … [2] (b) Fig. 7.1 shows some of the living organisms found in a pond ecosystem. cattail heron mayfly frog trout otter pondweed Fig. 7.1 Mayflies eat pondweed. Trout eat mayflies. Herons eat trout. Construct a food chain using this information. … [2] (c) Fertilisers high in nitrates pollute the pond in Fig. 7.1 causing algae to grow on the surface of the water. (i) Explain why producers under the surface of the water die. … … [1] (ii) Explain why the death of producers causes a lack of oxygen in the water. … … [1] (iii) Explain why a lack of oxygen in the water causes a reduction in the population of herons. … … … … [2] [Total: 8]
8 marks
Mark scheme: 7(a) unit containing all organisms and their environment ; interacting together ; 2 7(b) pondweed → mayfly → trout → heron ;; one mark for organisms in correct order one mark for arrows 2 7(c)(i) light blocked so no photosynthesis / no light available for photosynthesis ; 1 7(c)(ii) reference to decomposition / respiration / decomposers, uses up oxygen ; 1 7(c)(iii) trout / fish, die ; heron has lost food source ; 2
This question in 0653/42 May/June 2021
Q11 · Complete the sentence to define an ecosystem 0653/41 Oct/Nov 2021
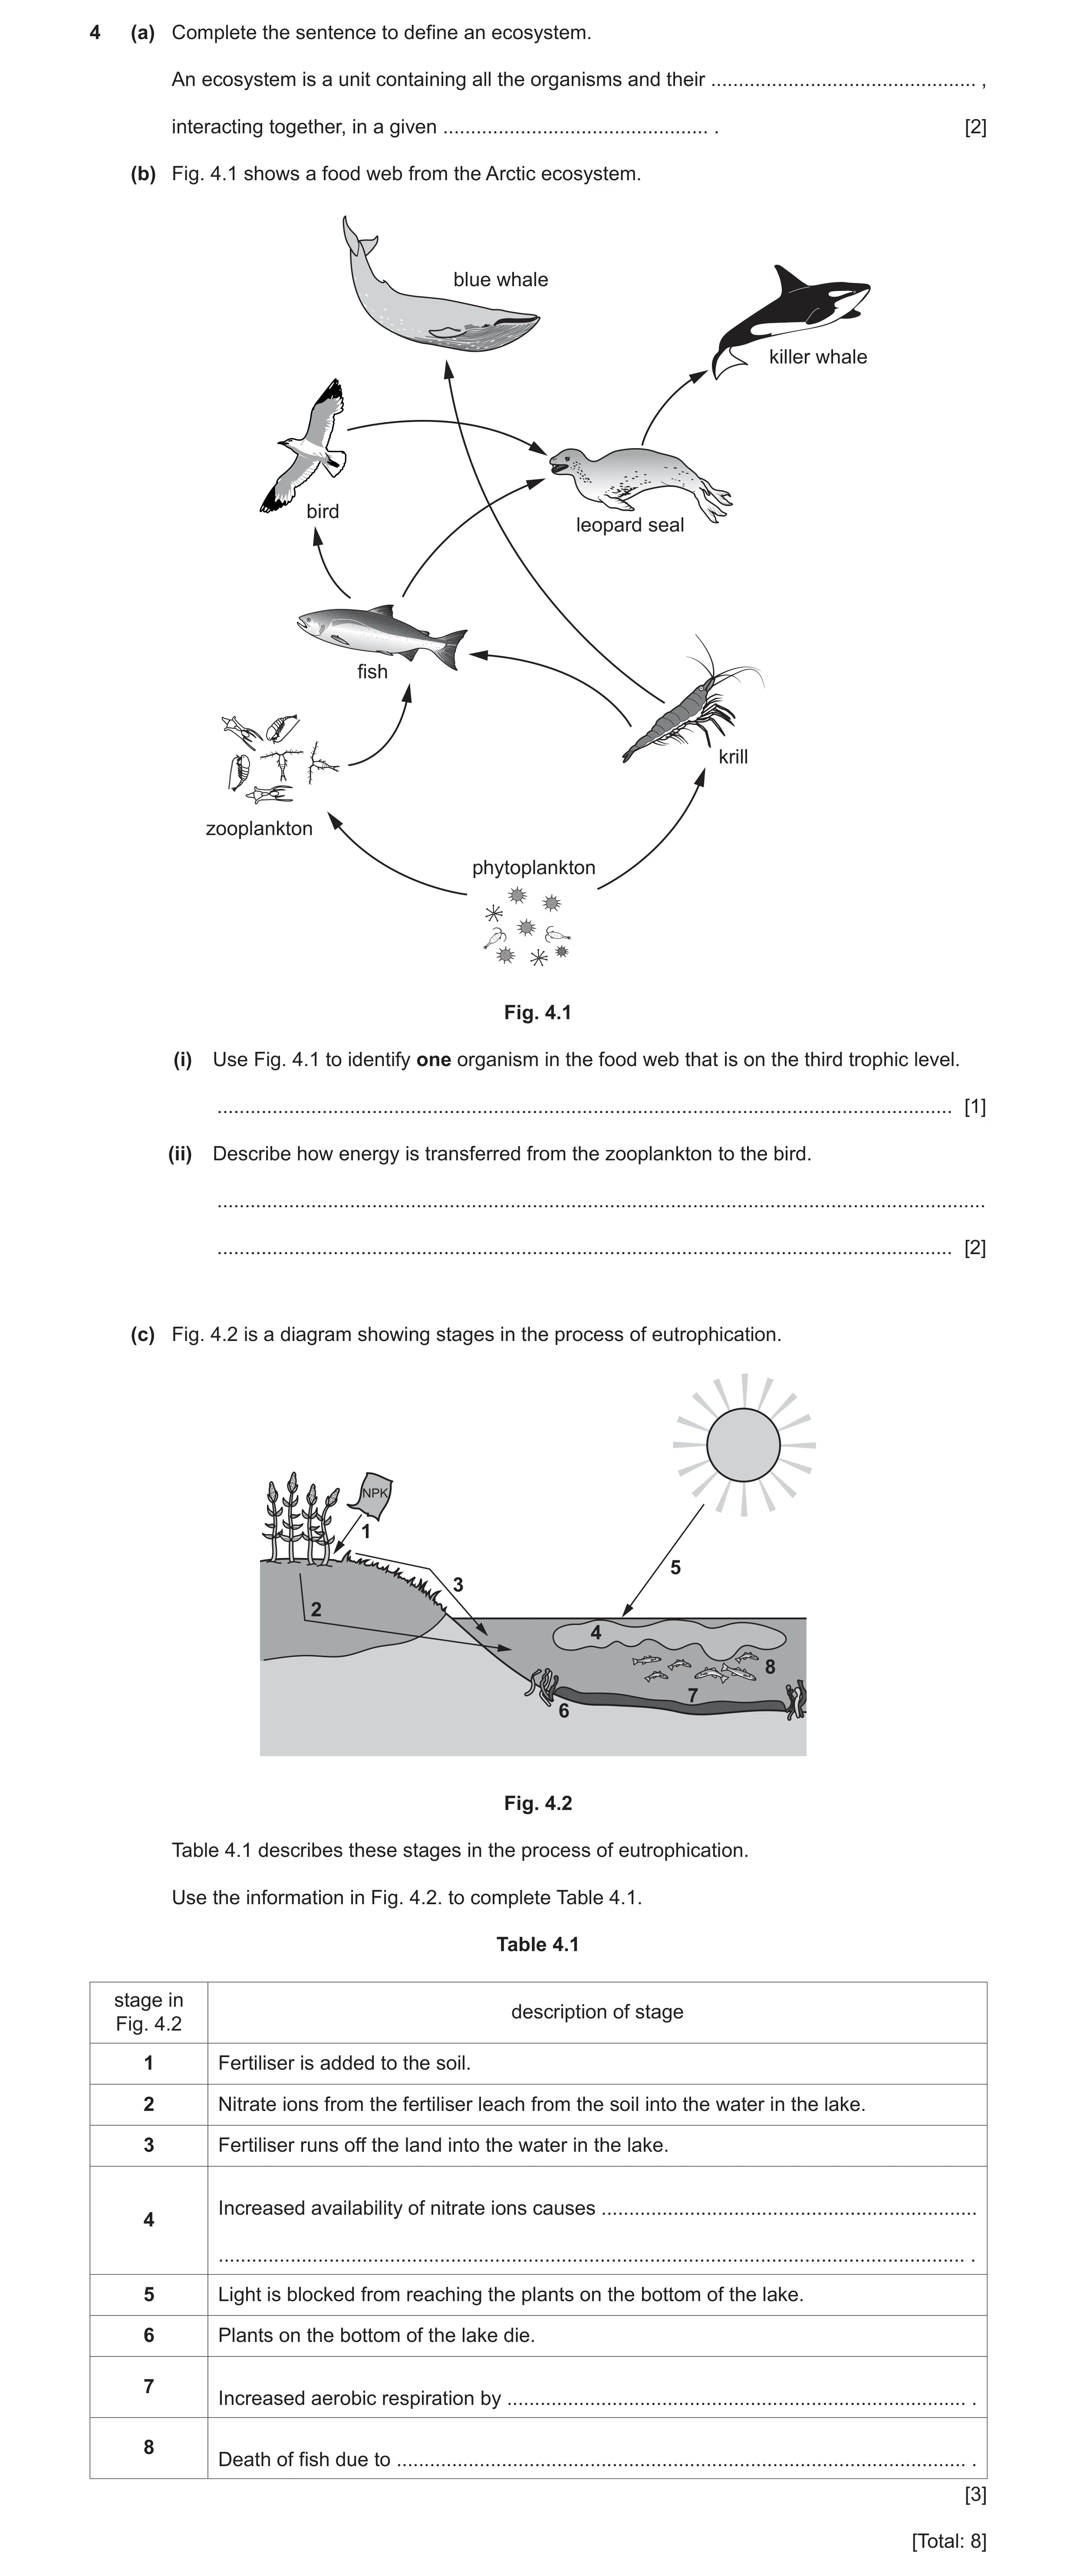
4 (a) Complete the sentence to define an ecosystem. An ecosystem is a unit containing all the organisms and their … , interacting together, in a given … . [2] (b) Fig. 4.1 shows a food web from the Arctic ecosystem. blue whale killer whale bird leopard seal fish krill zooplankton phytoplankton Fig. 4.1 (i) Use Fig. 4.1 to identify one organism in the food web that is on the third trophic level. … [1] (ii) Describe how energy is transferred from the zooplankton to the bird. … … [2] (c) Fig. 4.2 is a diagram showing stages in the process of eutrophication. 1 5 3 2 4 8 7 6 Fig. 4.2 Table 4.1 describes these stages in the process of eutrophication. Use the information in Fig. 4.2. to complete Table 4.1. Table 4.1 stage in description of stageFig. 4.2 1 Fertiliser is added to the soil. 2 Nitrate ions from the fertiliser leach from the soil into the water in the lake. 3 Fertiliser runs off the land into the water in the lake. Increased availability of nitrate ions causes … 4 … . 5 Light is blocked from reaching the plants on the bottom of the lake. 6 Plants on the bottom of the lake die. 7 Increased aerobic respiration by … . 8 Death of fish due to … . [3] [Total: 8]
8 marks
Mark scheme: 4(a) environment ; area ; 2 4(b)(i) fish / blue whale ; 1 4(b)(ii) transferred to fish when fish feeds on zooplankton ; transferred to bird when bird feeds on fish ; 2 4(c) (increased availability of nitrate ions causes) (increased) growth of producers ; (increased aerobic respiration by) decomposers / bacteria ; (death of fish due to) lack of oxygen ; 3
This question in 0653/41 Oct/Nov 2021
Q12 · Part of a food web 0653/43 Oct/Nov 2021
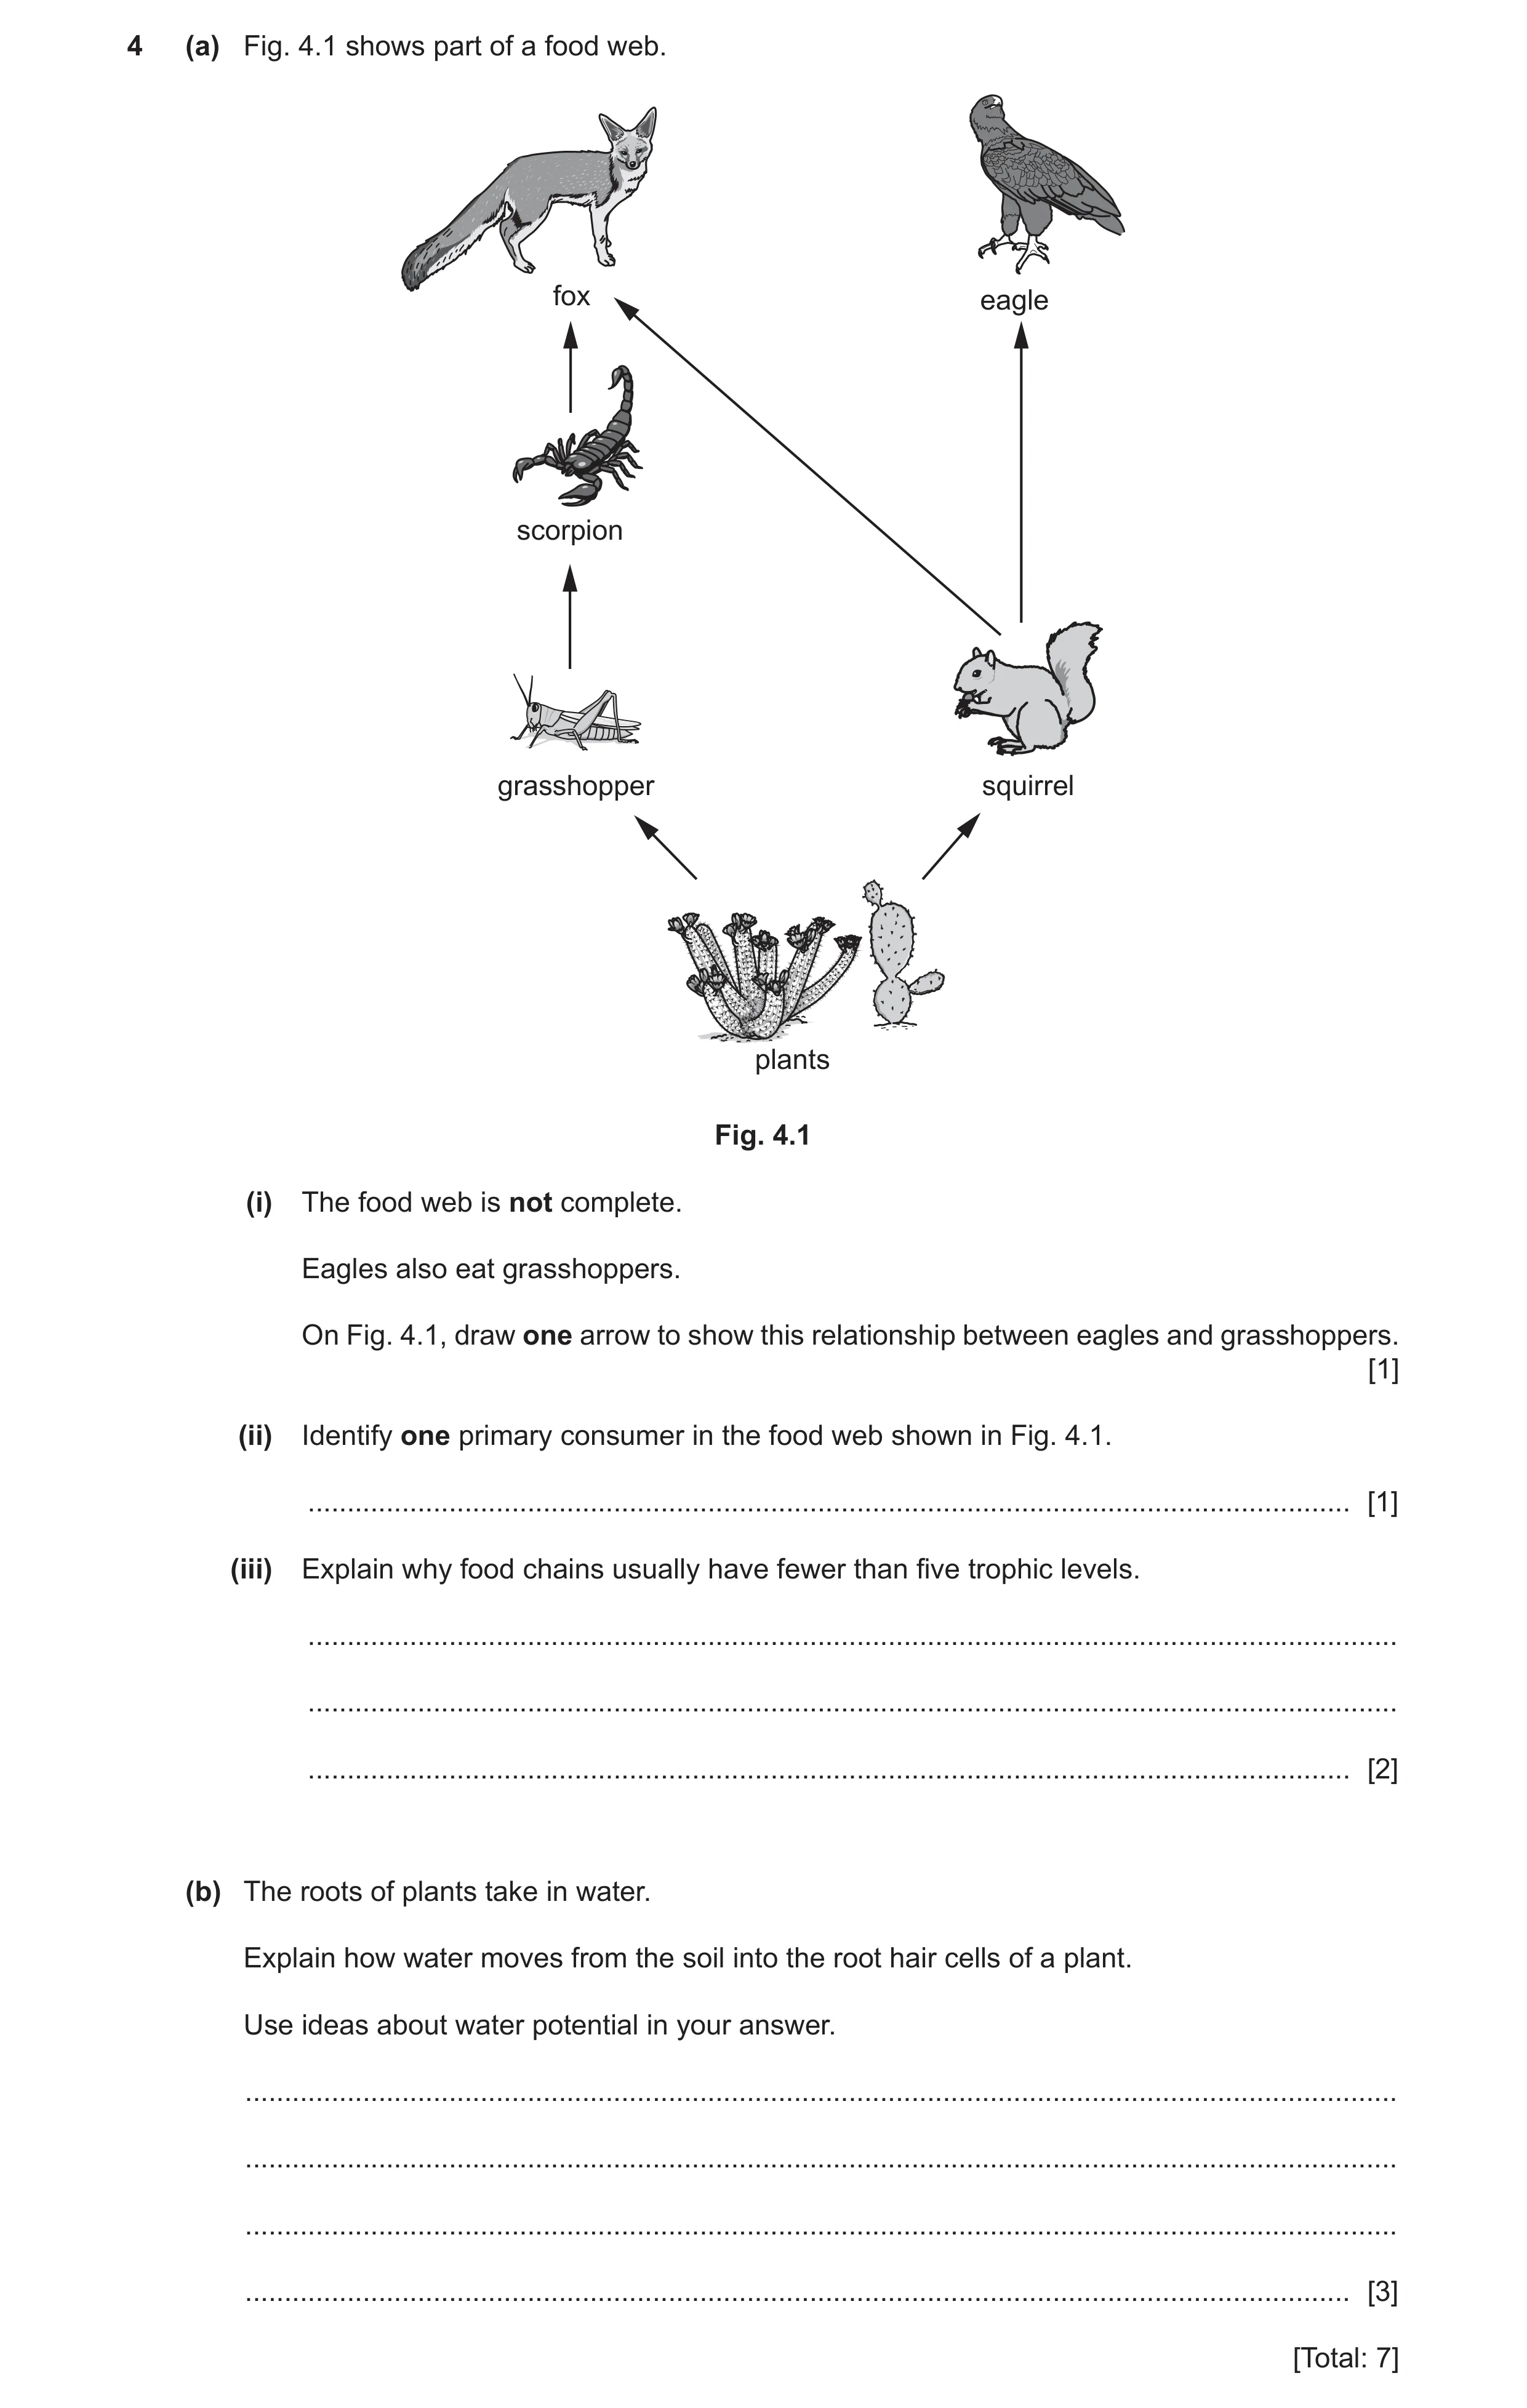
4 (a) Fig. 4.1 shows part of a food web. fox eagle scorpion grasshopper squirrel plants Fig. 4.1 (i) The food web is not complete. Eagles also eat grasshoppers. On Fig. 4.1, draw one arrow to show this relationship between eagles and grasshoppers. [1] (ii) Identify one primary consumer in the food web shown in Fig. 4.1. … [1] (iii) Explain why food chains usually have fewer than five trophic levels. … … … [2] (b) The roots of plants take in water. Explain how water moves from the soil into the root hair cells of a plant. Use ideas about water potential in your answer. … … … … [3] [Total: 7]
7 marks
Mark scheme: 4(a)(i) arrow drawn pointing from grasshopper to eagle ; 1 4(a)(ii) grasshopper / squirrel ; 1 4(a)(iii) any two from: energy is lost between trophic levels ; named example of energy loss ; the longer the chain the less energy is available ; 2 4(b) soil has a higher water potential / water moves from area of high water potential to low water potential ; reference to osmosis ; across a partially permeable membrane ; 3
This question in 0653/43 Oct/Nov 2021
Q13 · Part of a food web 0653/42 Feb/March 2022
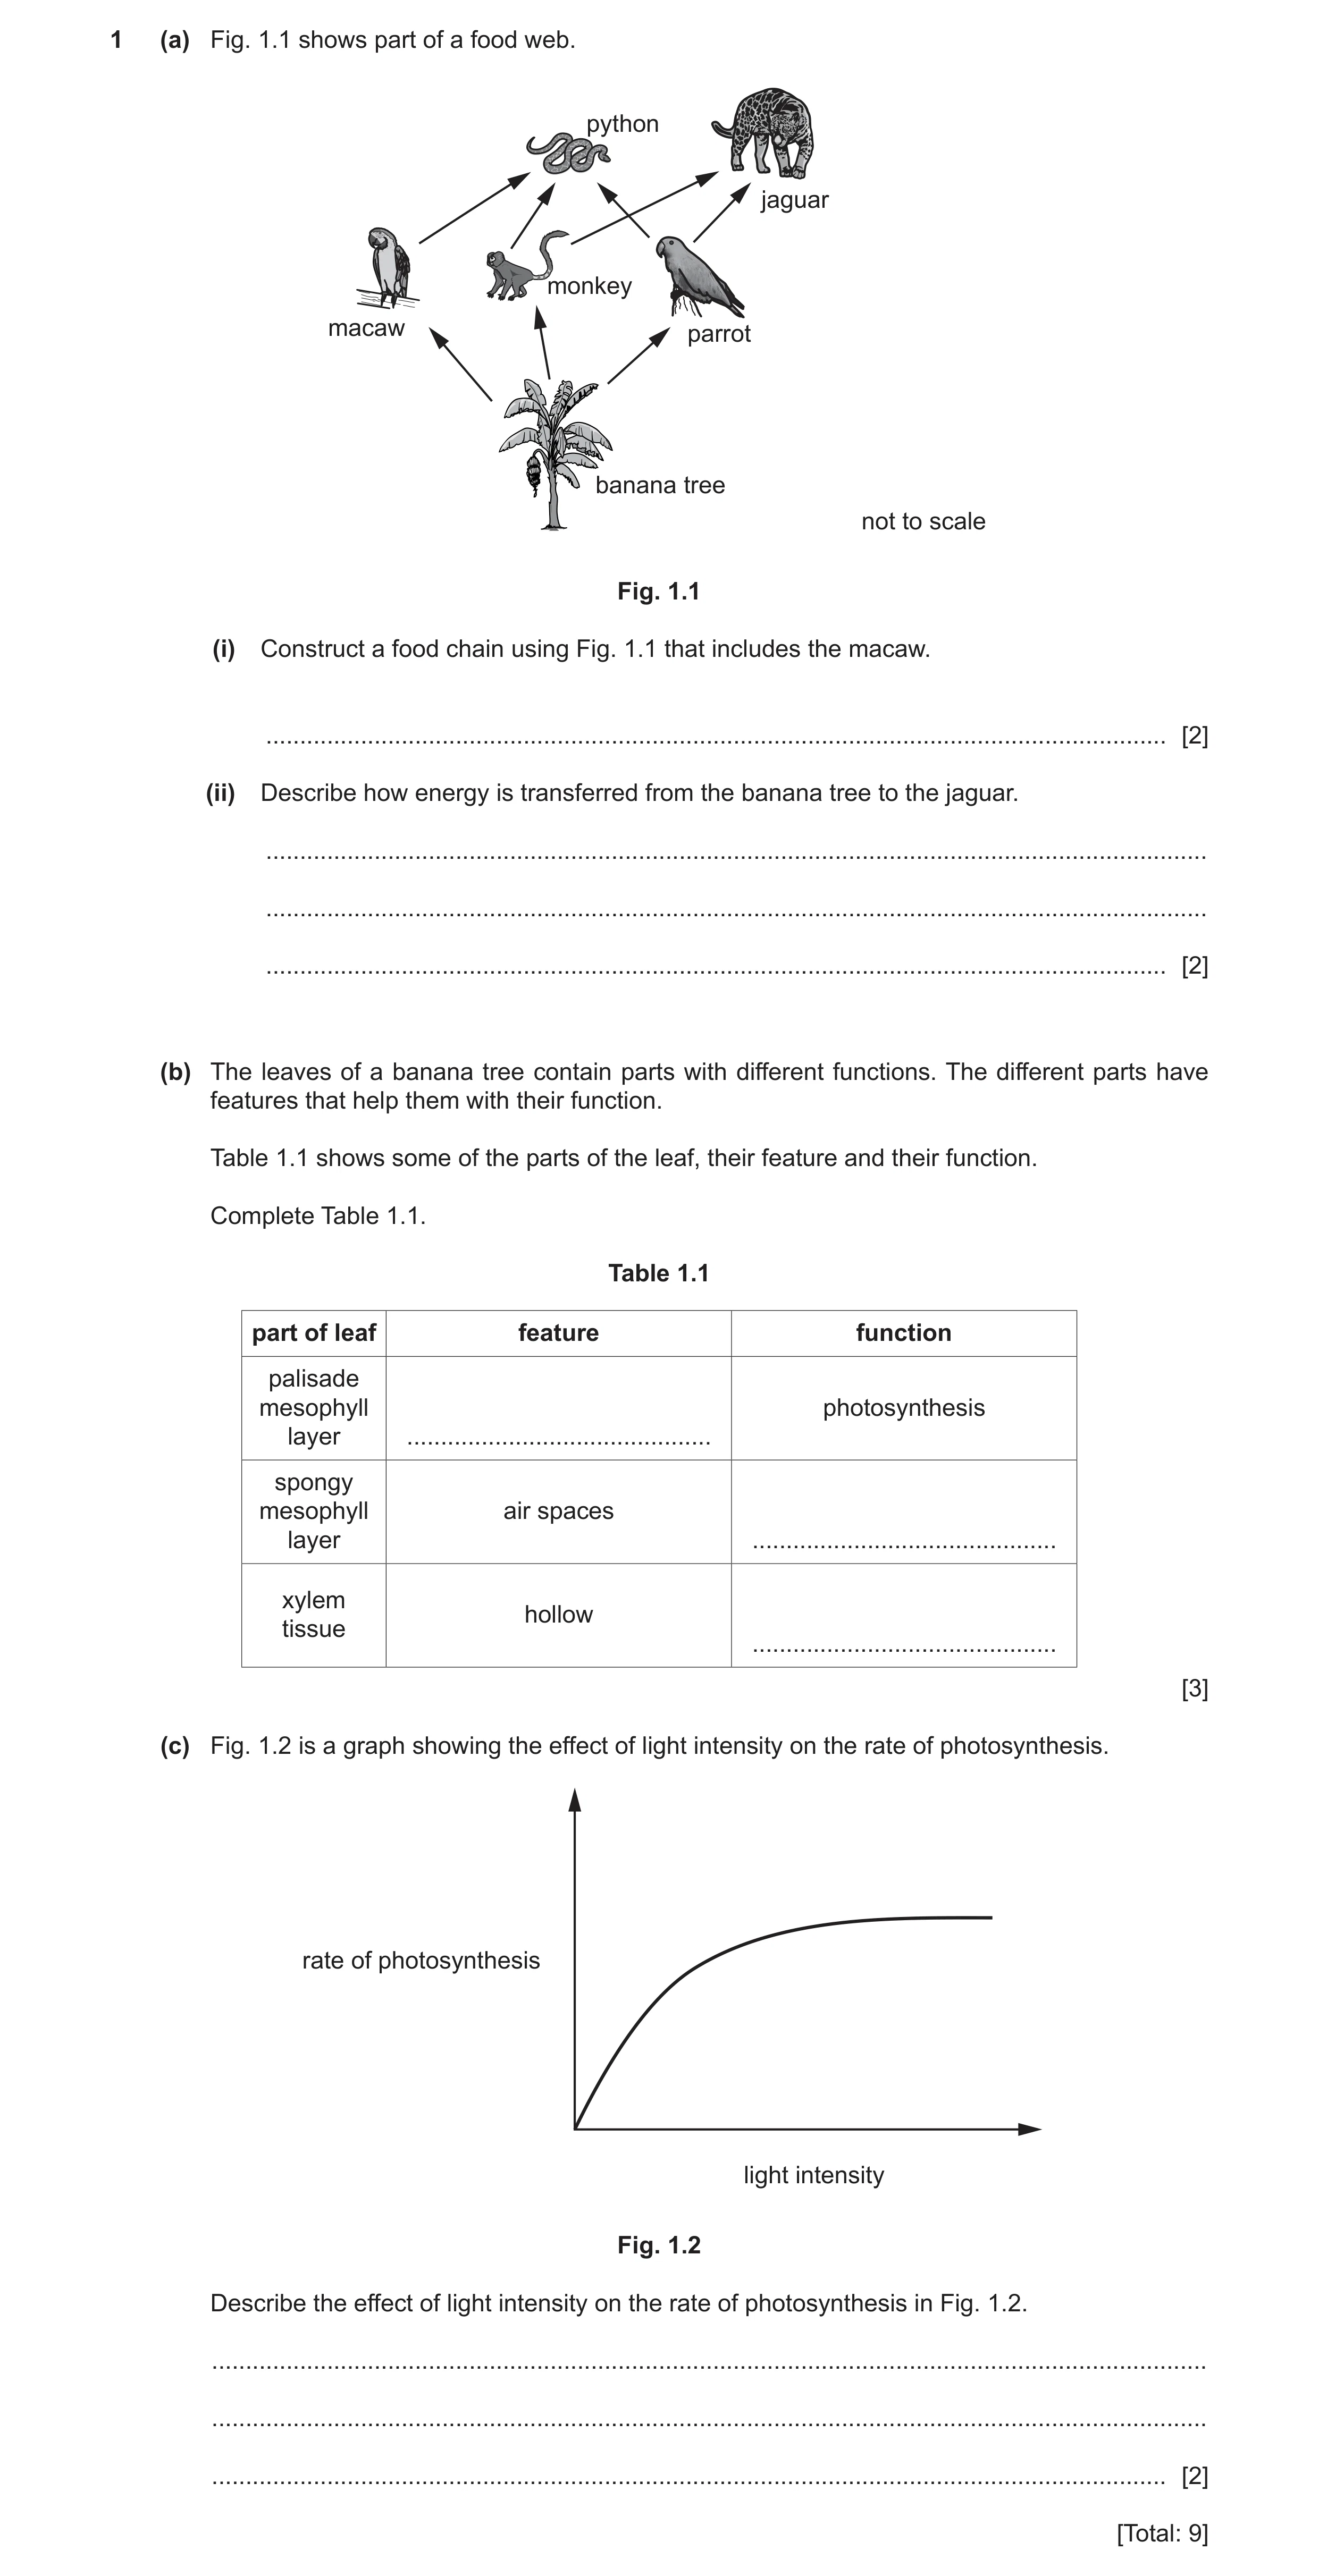
1 (a) Fig. 1.1 shows part of a food web. python jaguar monkey macaw parrot banana tree not to scale Fig. 1.1 (i) Construct a food chain using Fig. 1.1 that includes the macaw. … [2] (ii) Describe how energy is transferred from the banana tree to the jaguar. … … … [2] (b) The leaves of a banana tree contain parts with different functions. The different parts have features that help them with their function. Table 1.1 shows some of the parts of the leaf, their feature and their function. Complete Table 1.1. Table 1.1 part of leaf feature function palisade mesophyll photosynthesis layer … spongy mesophyll air spaces layer … xylem hollow tissue … [3] (c) Fig. 1.2 is a graph showing the effect of light intensity on the rate of photosynthesis. rate of photosynthesis light intensity Fig. 1.2 Describe the effect of light intensity on the rate of photosynthesis in Fig. 1.2. … … … [2] [Total: 9]
9 marks
Mark scheme: 1(a)(i) banana tree → macaw → python ;; one mark for correct order one mark for arrows in correct direction 1(a)(ii) banana eaten by monkey and/or parrot ; monkey and/or parrot eaten by jaguar ; 2 1(b) part of leaf feature function palisade mesophyll layer (many) chloroplasts (photosynthesis) spongy mesophyll layer (air spaces) gas exchange xylem tissue (hollow) transport of water / support ;;; 3 1(c) as light intensity increases the rate of photosynthesis increases ; then levels off / owtte ; 2
This question in 0653/42 Feb/March 2022
Question 14 0653/42 May/June 2022
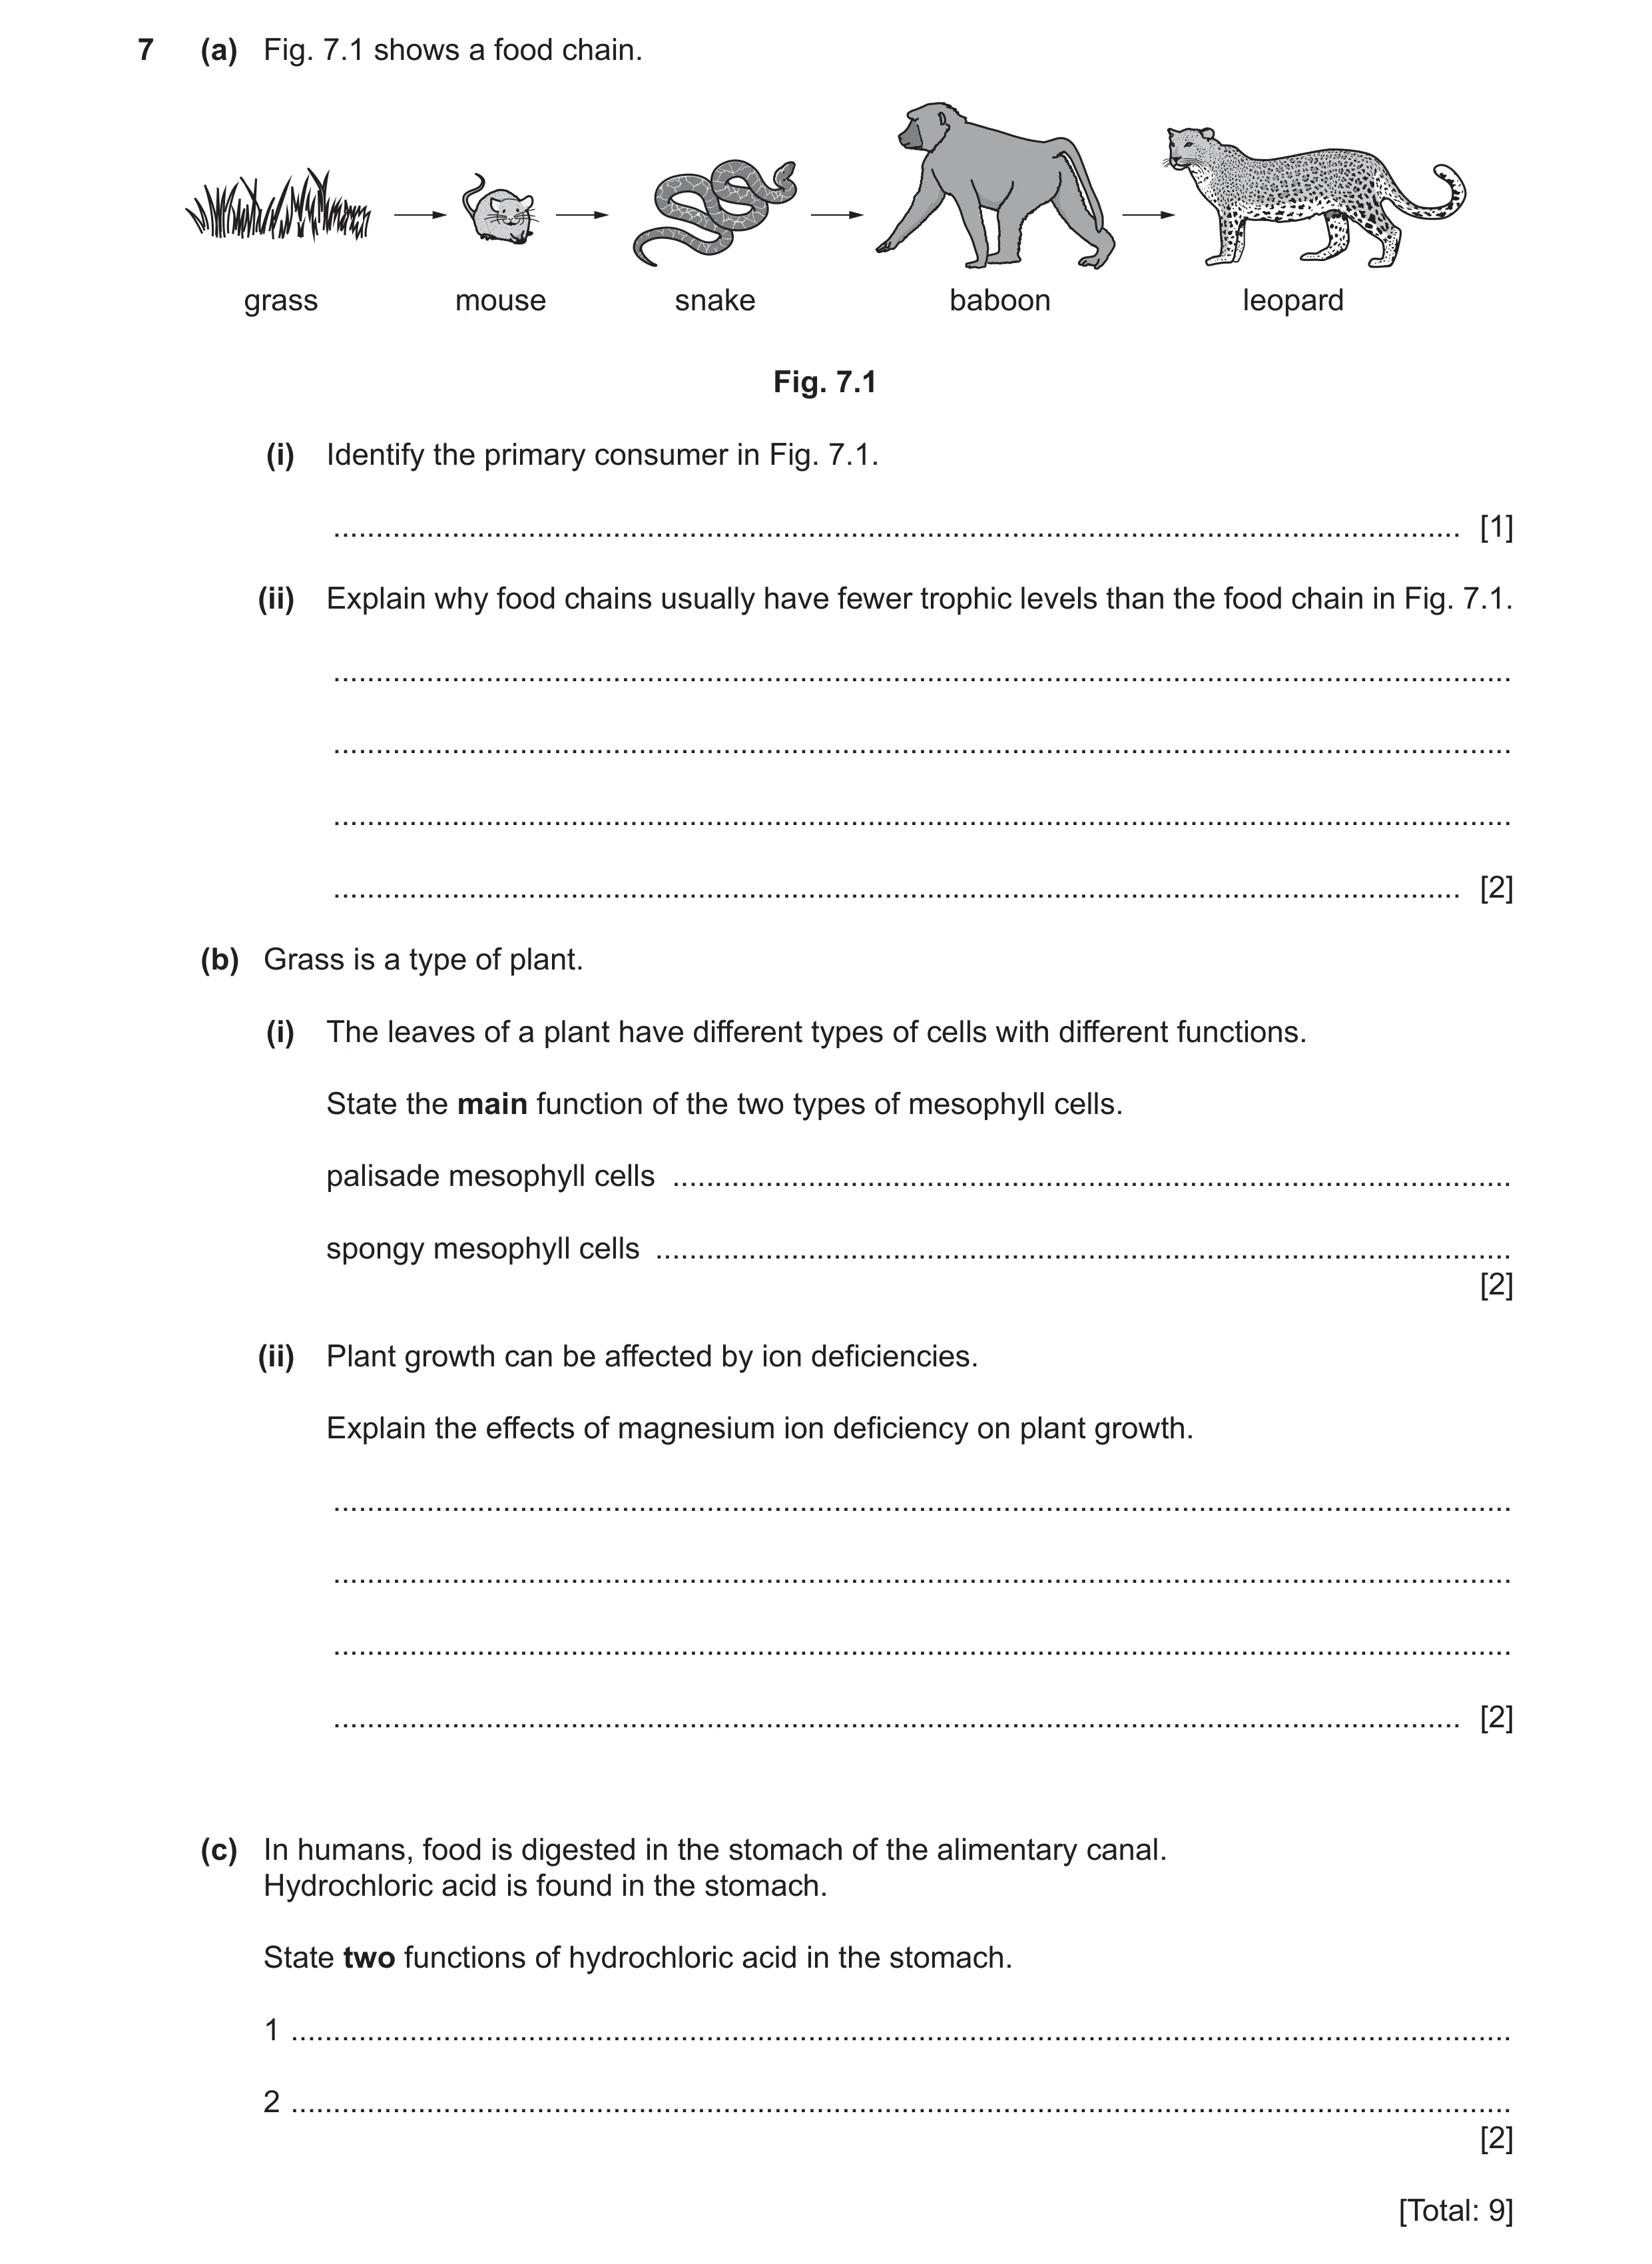
7 (a) Fig. 7.1 shows a food chain. grass mouse snake baboon leopard Fig. 7.1 (i) Identify the primary consumer in Fig. 7.1. … [1] (ii) Explain why food chains usually have fewer trophic levels than the food chain in Fig. 7.1. … … … … [2] (b) Grass is a type of plant. (i) The leaves of a plant have different types of cells with different functions. State the main function of the two types of mesophyll cells. palisade mesophyll cells … spongy mesophyll cells … [2] (ii) Plant growth can be affected by ion deficiencies. Explain the effects of magnesium ion deficiency on plant growth. … … … … [2] (c) In humans, food is digested in the stomach of the alimentary canal. Hydrochloric acid is found in the stomach. State two functions of hydrochloric acid in the stomach. 1 … 2 … [2] [Total: 9]
9 marks
Mark scheme: 7(a)(i) mouse ; 1 7(a)(ii) any two from: energy lost between trophic levels ; named example of energy loss ; so not enough energy to sustain more levels ; 2 7(b)(i) palisade mesophyll cells – photosynthesis ; spongy mesophyll cells – gas exchange ; 2 7(b)(ii) magnesium needed to synthesise chlorophyll / (less Mg means) plant becomes pale / yellow or less growth ; chlorophyll is needed for photosynthesis ; 2 7(c) kill bacteria ; provide (acidic) pH for enzymes ; 2
This question in 0653/42 May/June 2022
Q15 · A food chain from a pond 0653/43 May/June 2022
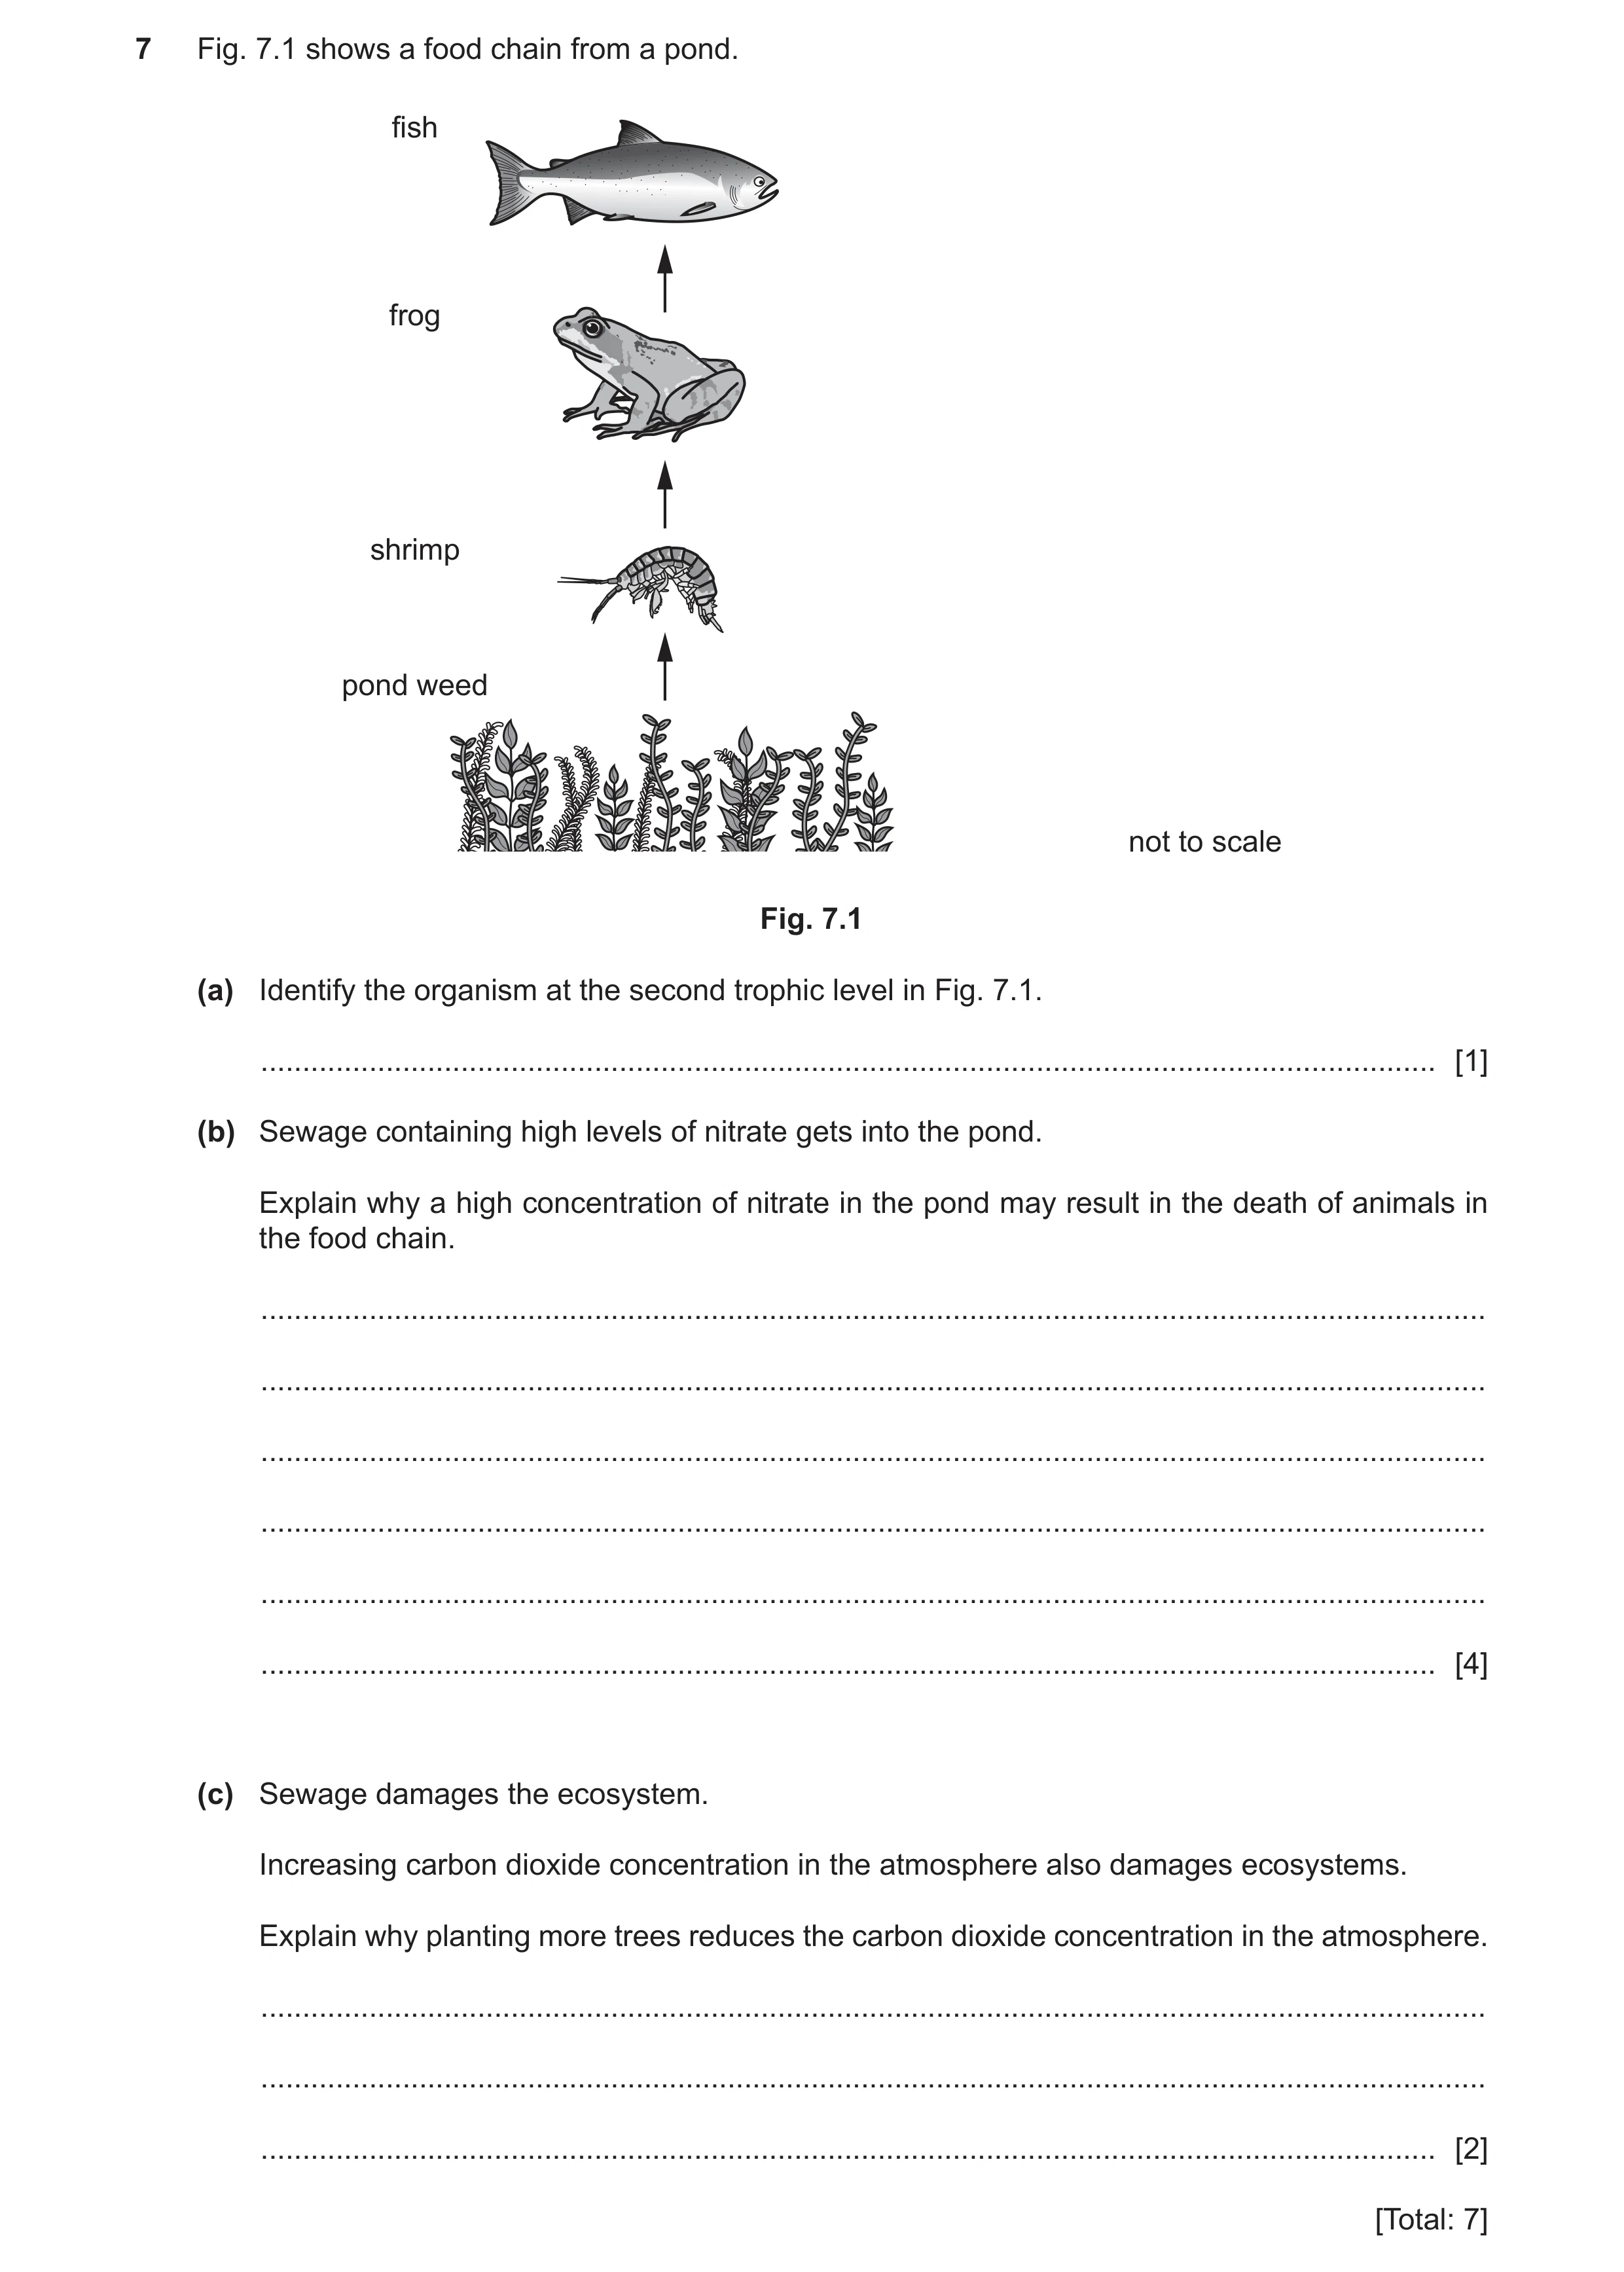
7 Fig. 7.1 shows a food chain from a pond. fish frog shrimp pond weed not to scale Fig. 7.1 (a) Identify the organism at the second trophic level in Fig. 7.1. … [1] (b) Sewage containing high levels of nitrate gets into the pond. Explain why a high concentration of nitrate in the pond may result in the death of animals in the food chain. … … … … … … [4] (c) Sewage damages the ecosystem. Increasing carbon dioxide concentration in the atmosphere also damages ecosystems. Explain why planting more trees reduces the carbon dioxide concentration in the atmosphere. … … … [2] [Total: 7]
7 marks
Mark scheme: 7(a) shrimp ; 1 7(b) any four from: increased growth of, producers / pond weed / plants ; blocks light / reduced photosynthesis (of plants below surface) ; death of, producers / pond weed / plants ; decomposition of, producers / pond weed / plants ; increased (aerobic) respiration by decomposers / bacteria / microorganisms ; reduction in oxygen levels ; AVP ; 4 7(c) plants take in carbon dioxide ; reference to photosynthesis ; 2
This question in 0653/43 May/June 2022
Q16 · Starch is broken down by amylase into smaller molecules 0653/41 Oct/Nov 2022
4 (a) Starch is broken down by amylase into smaller molecules. (i) State the type of carbohydrate molecules produced when amylase breaks down starch. … [1] (ii) Fig. 4.1 shows the effect of temperature on amylase activity. 600 500 time taken 400 for amylase to break down starch 300 / s 200 100 0 20 25 30 35 40 45 temperature / °C Fig. 4.1 Explain the effect of temperature on amylase activity between 25 °C and 35 °C. … … … … … [3] (iii) Explain why amylase does not break down protein molecules. … … … [2] (b) Starch is used for storage in plants. Carbon in starch is returned to the atmosphere as part of the carbon cycle. (i) State two processes in the carbon cycle that return carbon to the atmosphere. 1 … 2 … [2] (ii) State the process in the carbon cycle that traps carbon for millions of years. … [1] (c) Plants are the producers in a food web. Fig. 4.2 shows a food web. owl bird snake spider toad insect grass Fig. 4.2 Use Fig. 4.2 to explain why the snake is both a secondary and a tertiary consumer. … … … [2] [Total: 11]
11 marks
Mark scheme: 4(a)(i) (simple) sugar ; 1 4(a)(ii) starch is broken down more quickly as temperature increases / activity of amylase increases as temperature increases ; 3 increase in kinetic energy (of particles) / (particles) move faster ; increased frequency of collisions / increased number of successful collisions ; 4(a)(iii) idea that, amylase is specific (to starch) ; 2 protein molecules will not fit into active site / (shape of) active site not complementary to protein (shape) / (shape of) active site is complementary to starch (shape) ; 4(b)(i) any two from: 2 combustion ; respiration ; decomposition ; AVP ; 4(b)(ii) fossilisation ; 1 4(c) (snake is a) 2 secondary consumer when it eats the insect ; tertiary consumer when it eats the toad ;
This question in 0653/41 Oct/Nov 2022
Q17 · A diagram of a wind-pollinated flower 0653/43 Oct/Nov 2022
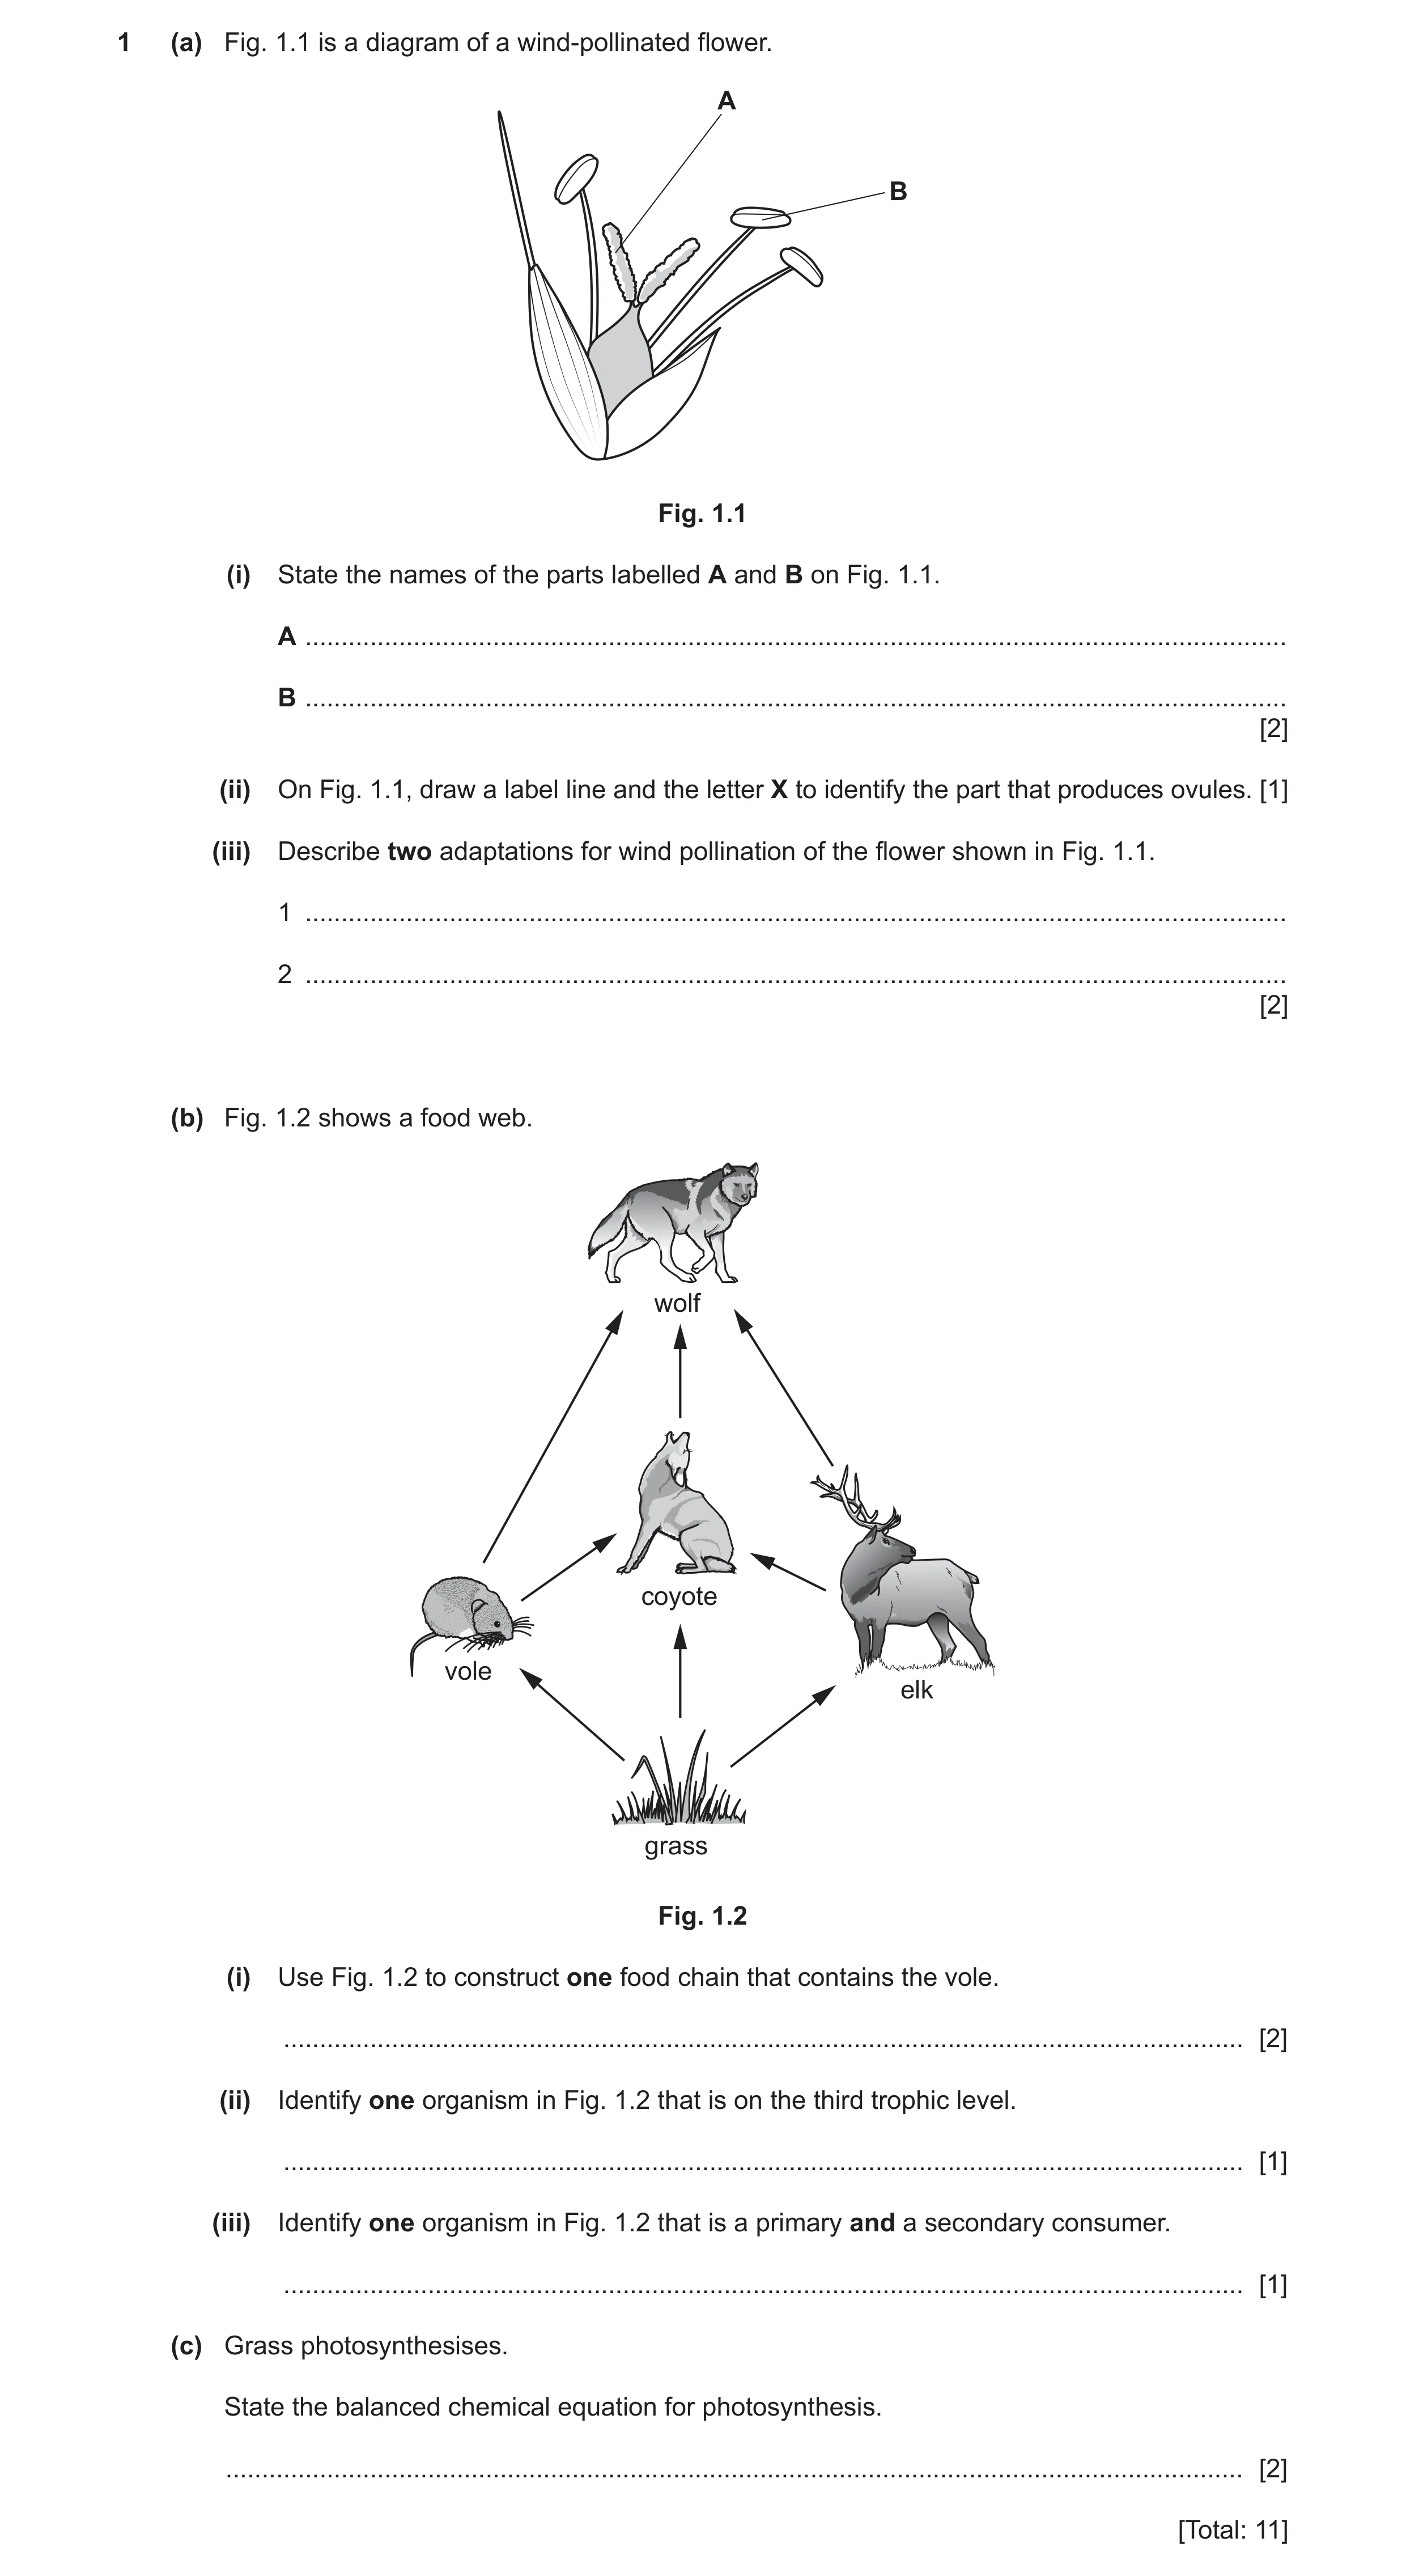
1 (a) Fig. 1.1 is a diagram of a wind-pollinated flower. A B Fig. 1.1 (i) State the names of the parts labelled A and B on Fig. 1.1. A … B … [2] (ii) On Fig. 1.1, draw a label line and the letter X to identify the part that produces ovules. [1] (iii) Describe two adaptations for wind pollination of the flower shown in Fig. 1.1. 1 … 2 … [2] (b) Fig. 1.2 shows a food web. wolf coyote vole elk grass Fig. 1.2 (i) Use Fig. 1.2 to construct one food chain that contains the vole. … [2] (ii) Identify one organism in Fig. 1.2 that is on the third trophic level. … [1] (iii) Identify one organism in Fig. 1.2 that is a primary and a secondary consumer. … [1] (c) Grass photosynthesises. State the balanced chemical equation for photosynthesis. … [2] [Total: 11]
11 marks
Mark scheme: Question Answer Marks 1(a)(i) A stigma ; 2 B anther ; 1(a)(ii) ovary labelled ; 1 1(a)(iii) any two from: 2 stigma feathery ; anther outside (flower) ; no petals ; 1(b)(i) grass → vole (→ coyote) → wolf 2 correct order of organisms ; arrows in correct direction ; 1(b)(ii) coyote / wolf ; 1 1(b)(iii) coyote ; 1 1(c) 6H2O + 6CO2 → C6H12O6 + 6O2 2 correct substrates (in either order) ; correct products (in either order) ;
This question in 0653/43 Oct/Nov 2022
Q18 · Part of a food web 0653/41 May/June 2023
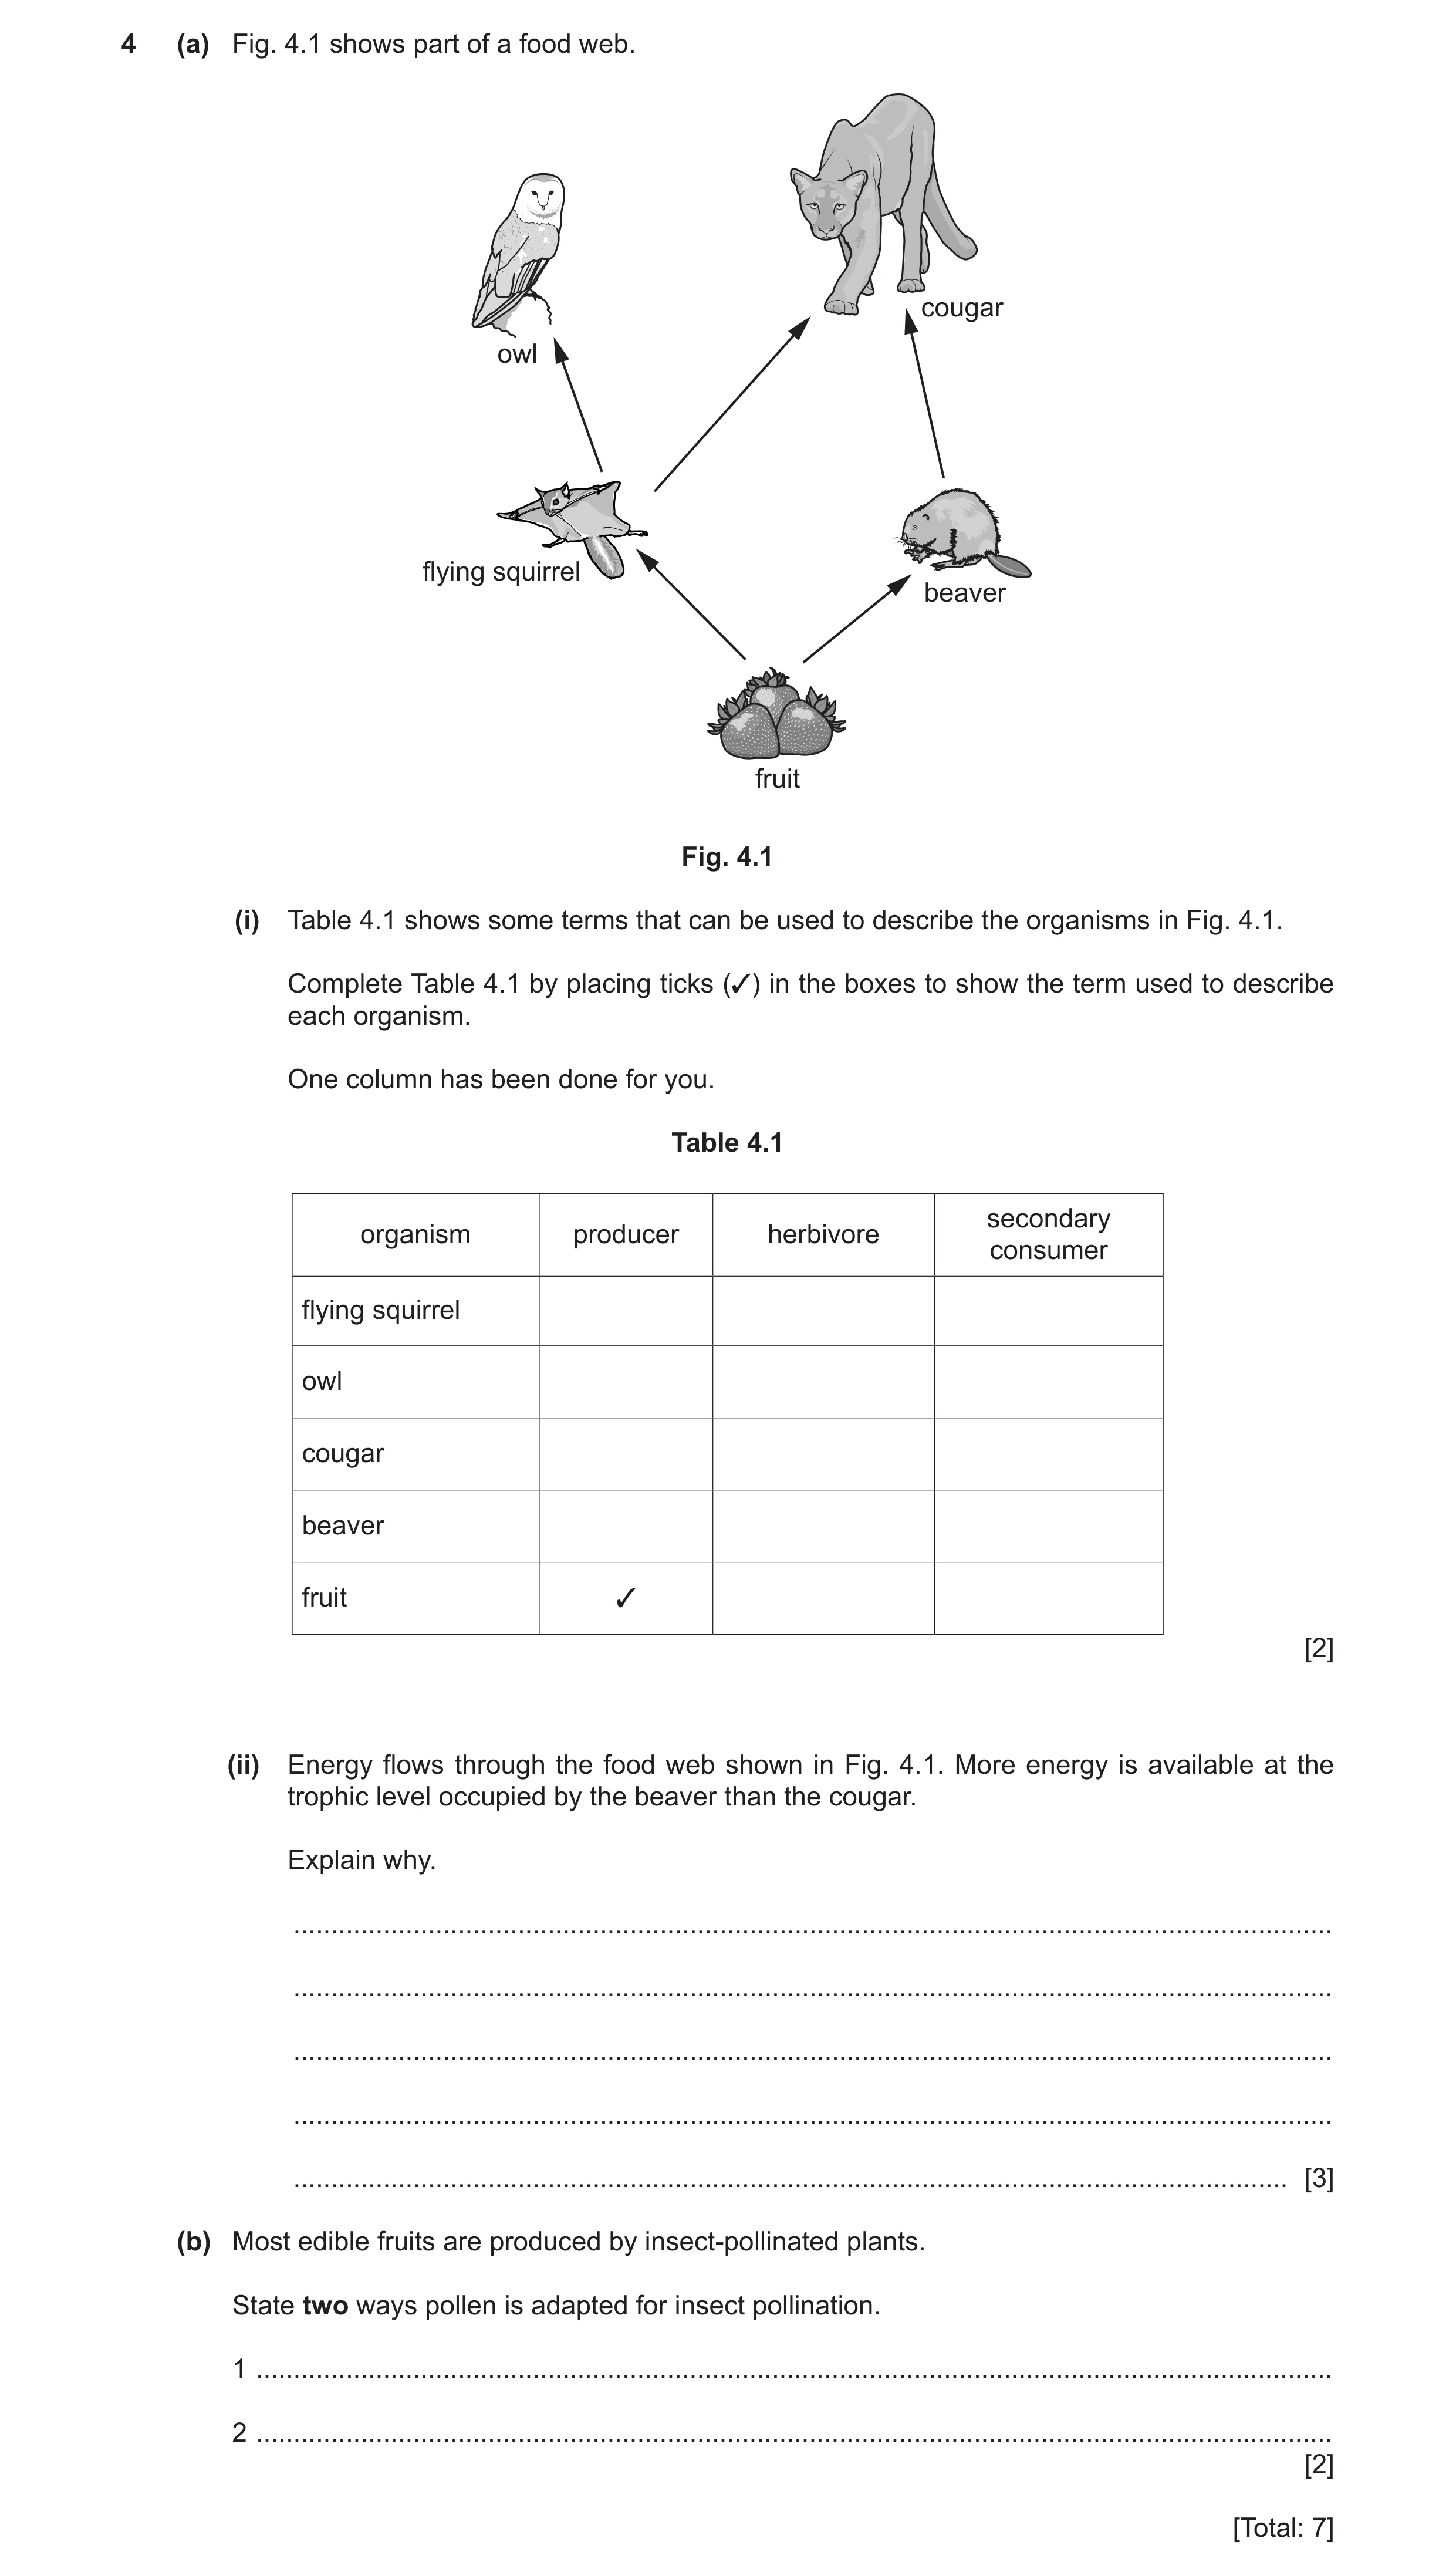
4 (a) Fig. 4.1 shows part of a food web. cougar owl flying squirrel beaver fruit Fig. 4.1 (i) Table 4.1 shows some terms that can be used to describe the organisms in Fig. 4.1. Complete Table 4.1 by placing ticks (3) in the boxes to show the term used to describe each organism. One column has been done for you. Table 4.1 secondary organism producer herbivore consumer flying squirrel owl cougar beaver fruit 3 [2] (ii) Energy flows through the food web shown in Fig. 4.1. More energy is available at the trophic level occupied by the beaver than the cougar. Explain why. … … … … … [3] (b) Most edible fruits are produced by insect-pollinated plants. State two ways pollen is adapted for insect pollination. 1 … 2 … [2] [Total: 7]
7 marks
Mark scheme: 4(a)(i) organism producer herbivore secondary consumer flying squirrel owl cougar beaver fruit () ;; one mark for each correct column 4(a)(ii) cougar is in a higher trophic level / beaver is in lower trophic level ; energy lost (between levels) ; example of energy loss, e.g. respiration / heat / waste / incomplete digestion ; 3 4(b) any two from : large / heavy (compared to wind pollinated) ; has spikes ; sticky ; 2
This question in 0653/41 May/June 2023
Q19 · Two young potted plants are left to grow in a room with no light 0653/41 May/June 2023
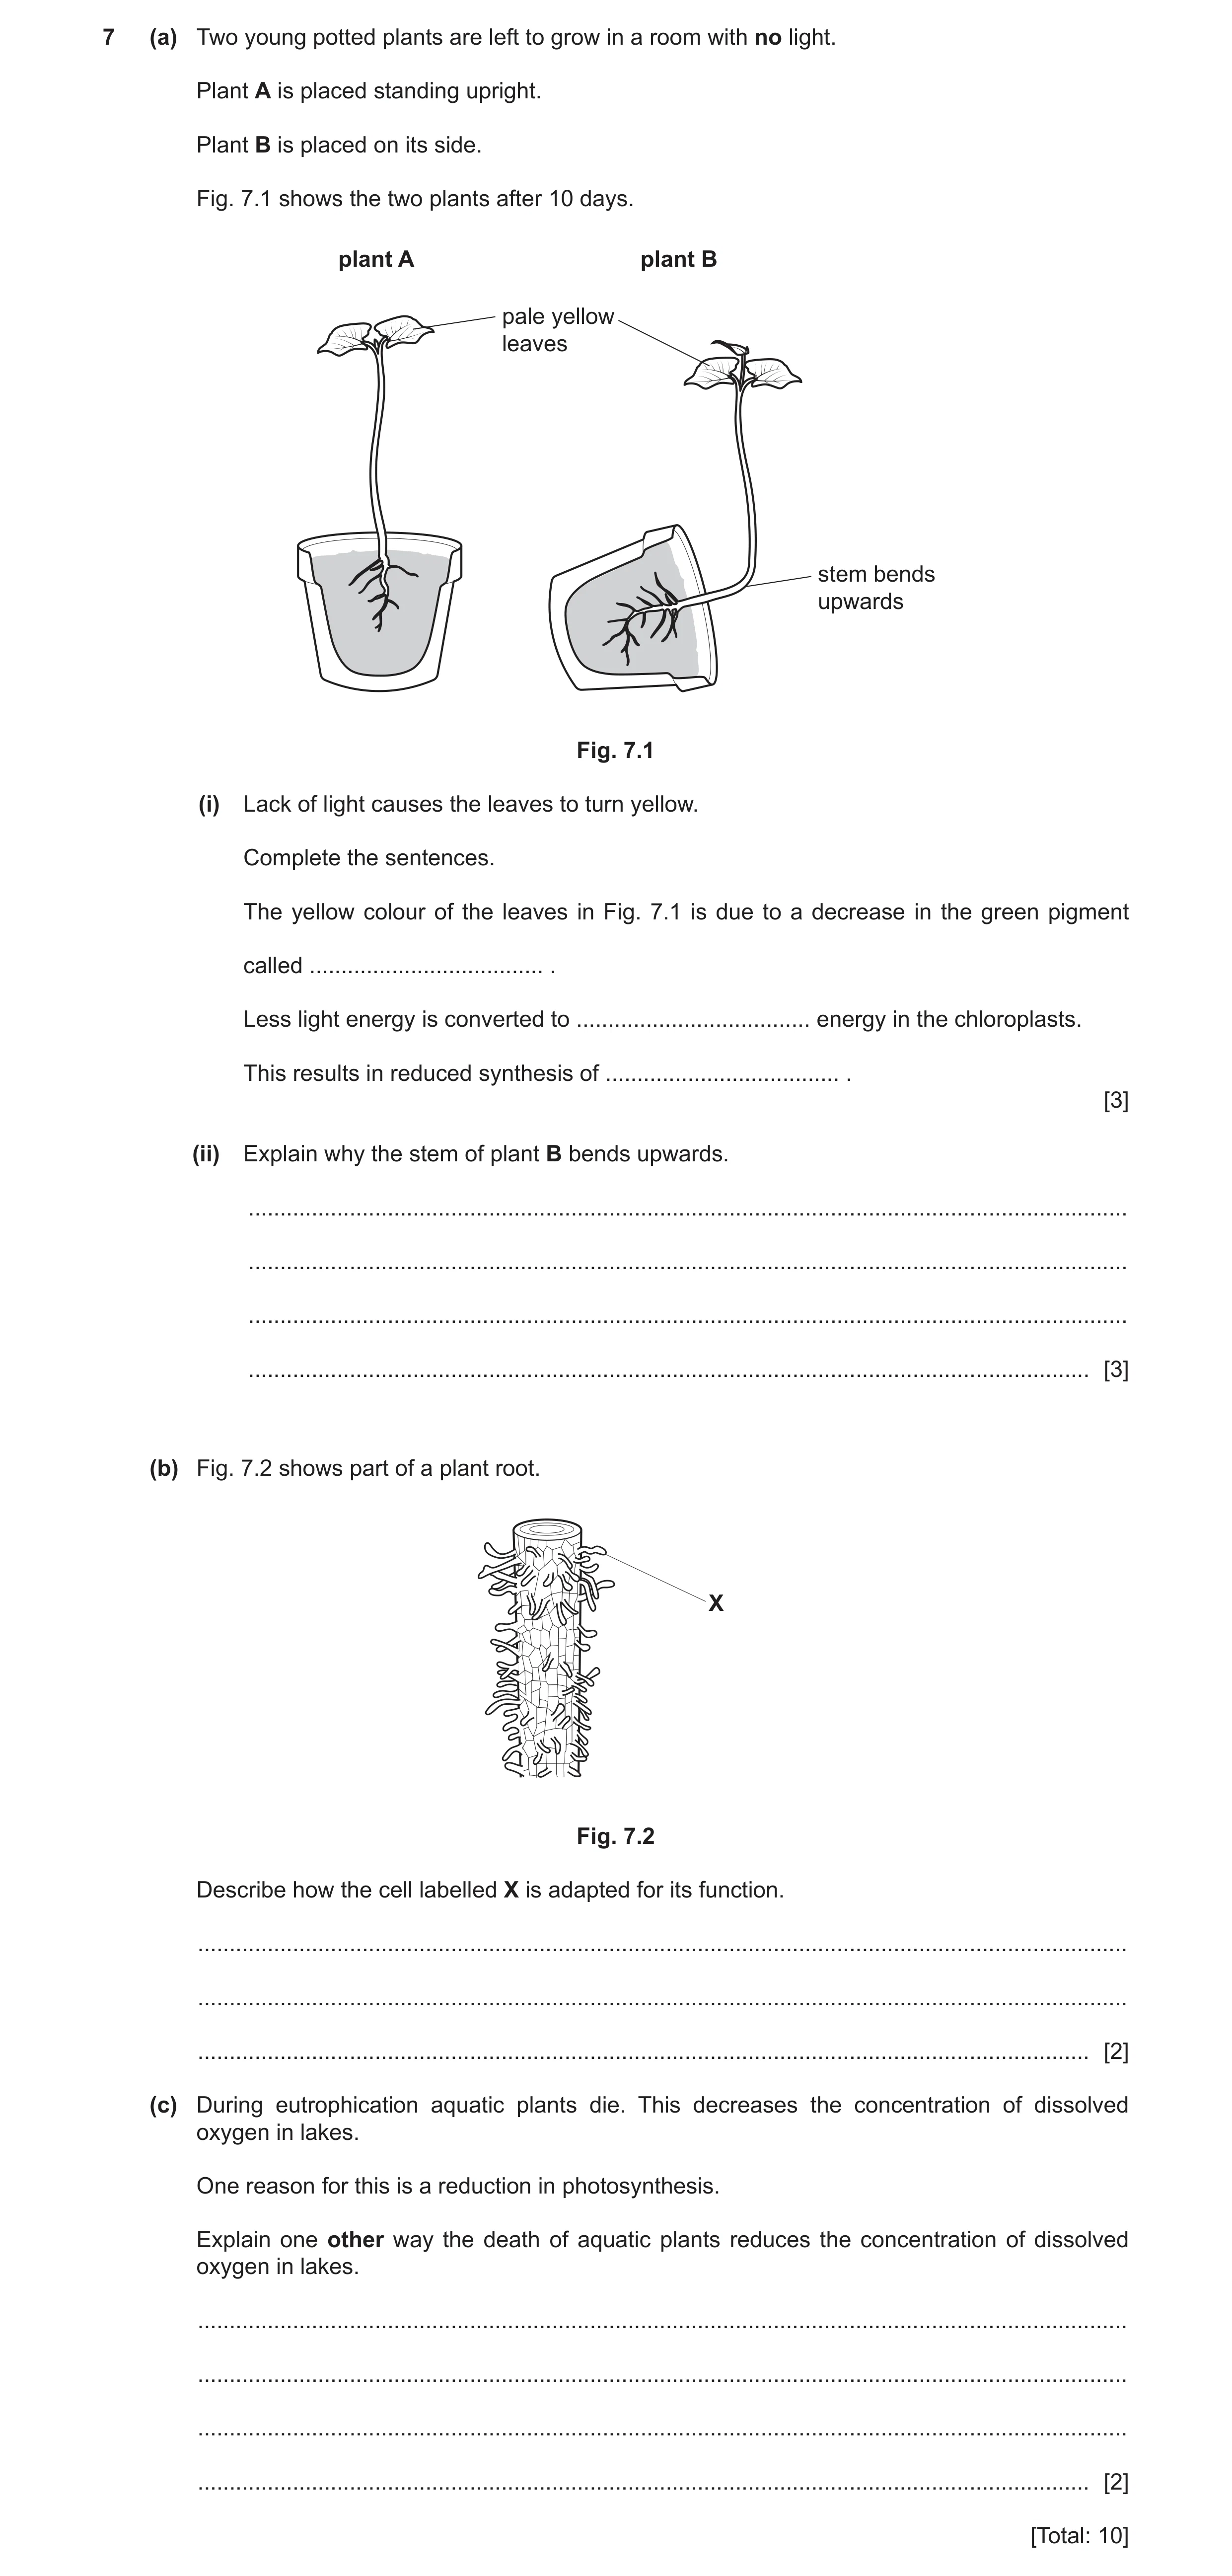
7 (a) Two young potted plants are left to grow in a room with no light. Plant A is placed standing upright. Plant B is placed on its side. Fig. 7.1 shows the two plants after 10 days. plant A plant B pale yellow leaves stem bends upwards Fig. 7.1 (i) Lack of light causes the leaves to turn yellow. Complete the sentences. The yellow colour of the leaves in Fig. 7.1 is due to a decrease in the green pigment called … . Less light energy is converted to … energy in the chloroplasts. This results in reduced synthesis of … . [3] (ii) Explain why the stem of plant B bends upwards. … … … … [3] (b) Fig. 7.2 shows part of a plant root. X Fig. 7.2 Describe how the cell labelled X is adapted for its function. … … … [2] (c) During eutrophication aquatic plants die. This decreases the concentration of dissolved oxygen in lakes. One reason for this is a reduction in photosynthesis. Explain one other way the death of aquatic plants reduces the concentration of dissolved oxygen in lakes. … … … … [2] [Total: 10]
10 marks
Mark scheme: 7(a)(i) chlorophyll ; chemical ; carbohydrates ; 7(a)(ii) any three from: responds to gravity / gravitropism ; auxin is produced at the shoot tip ; increased (concentration of) auxin on underside (of stem) ; auxin causes cell elongation ; 3 7(b) large surface area ; increased absorption of, water / mineral (ions) ; 2 7(c) decomposers feed on / break down, (aquatic) plants ; (aerobic) respiration of decomposers (uses oxygen) ; 2
This question in 0653/41 May/June 2023
Question 20 0653/42 May/June 2023
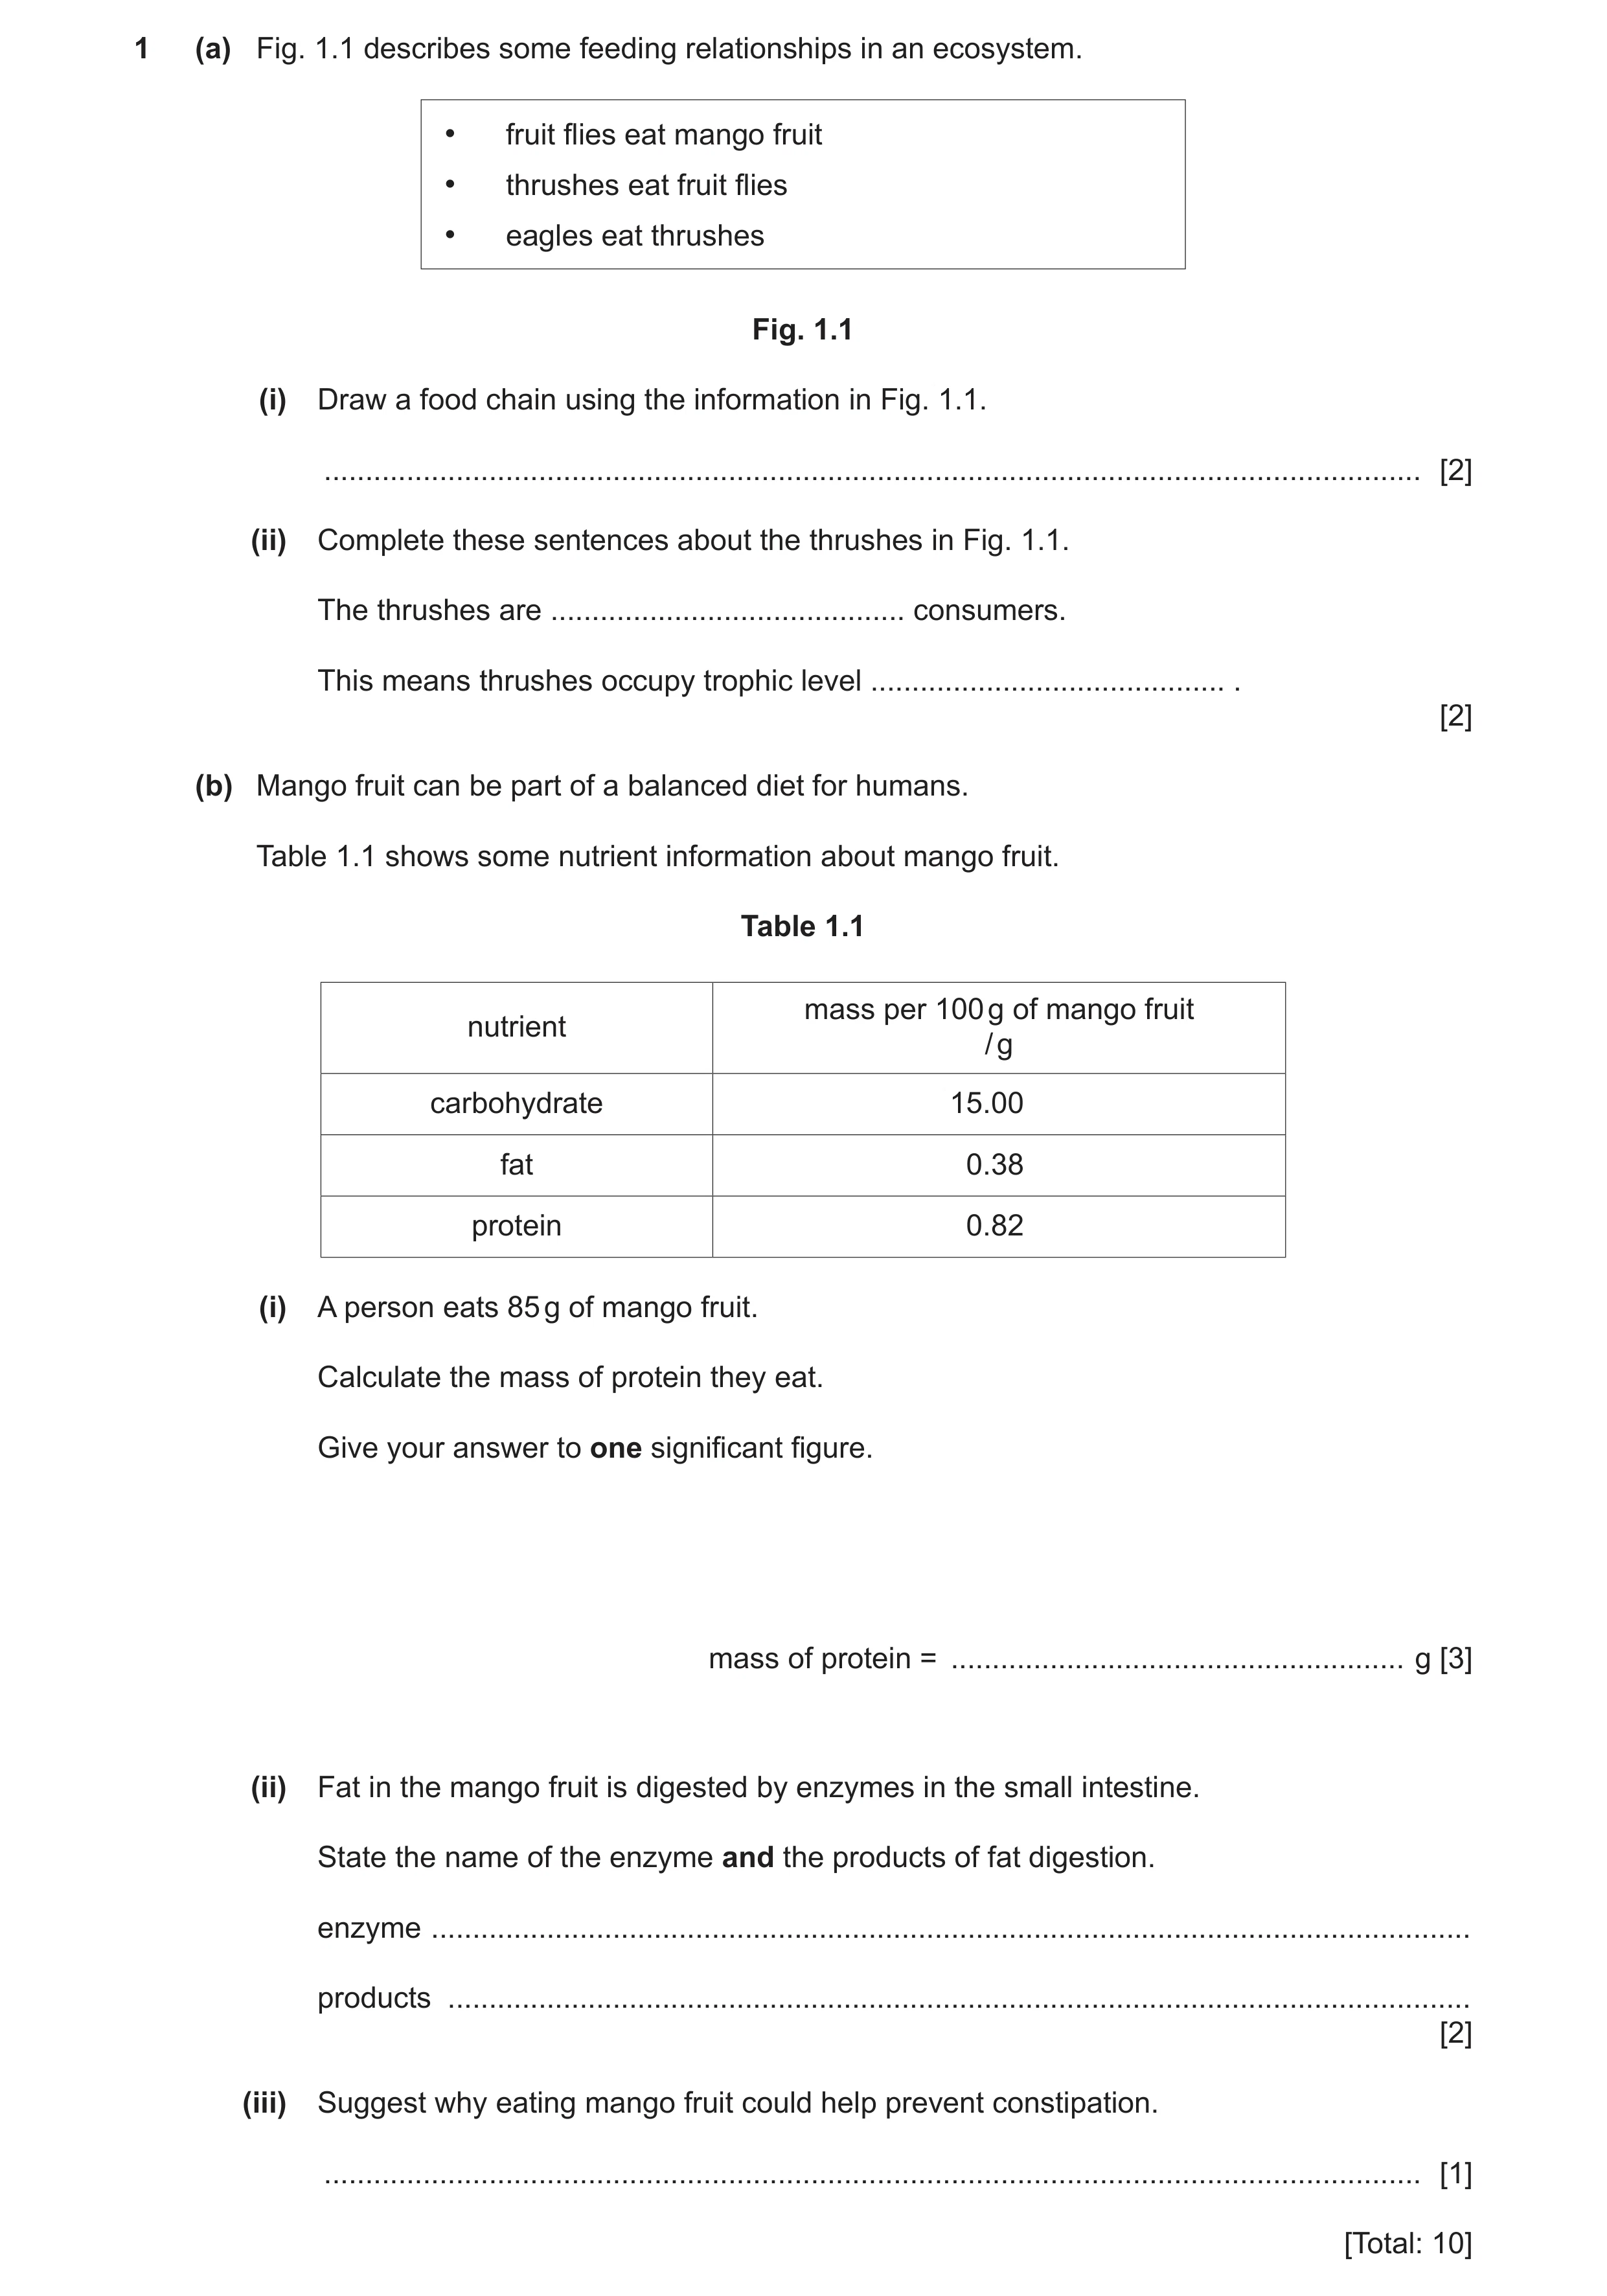
1 (a) Fig. 1.1 describes some feeding relationships in an ecosystem. • fruit flies eat mango fruit • thrushes eat fruit flies • eagles eat thrushes Fig. 1.1 (i) Draw a food chain using the information in Fig. 1.1. … [2] (ii) Complete these sentences about the thrushes in Fig. 1.1. The thrushes are … consumers. This means thrushes occupy trophic level … . [2] (b) Mango fruit can be part of a balanced diet for humans. Table 1.1 shows some nutrient information about mango fruit. Table 1.1 mass per 100 g of mango fruit nutrient / g carbohydrate 15.00 fat 0.38 protein 0.82 (i) A person eats 85 g of mango fruit. Calculate the mass of protein they eat. Give your answer to one significant figure. mass of protein = … g [3] (ii) Fat in the mango fruit is digested by enzymes in the small intestine. State the name of the enzyme and the products of fat digestion. enzyme … products … [2] (iii) Suggest why eating mango fruit could help prevent constipation. … [1] [Total: 10]
10 marks
Mark scheme: 1(a)(i) mango (fruit) (fruit) flies thrushes eagle ;; correct order = one mark arrows in correct direction = one mark 2 1(a)(ii) secondary ; three ; 2 1(b)(i) 0.82 85 ; 100 0.697 ; 0.7 ; 3 1(b)(ii) lipase ; fatty acids and glycerol ; 2 1(b)(iii) contains fibre ; 1
This question in 0653/42 May/June 2023
Question 21 0653/42 Oct/Nov 2023
4 (a) Fig. 4.1 shows a food web. hawk blackbird thrush caterpillar beetle tree Fig. 4.1 (i) Table 4.1 shows some terms that can be used to describe some of the organisms in Fig. 4.1. Complete Table 4.1 by placing ticks (3) in the boxes to show all the terms used to describe each organism. Table 4.1 primary occupies organism carnivore consumer trophic level 3 blackbird caterpillar hawk thrush [3] (ii) Explain why there are no trophic levels above the hawk. Use ideas about energy in your answer. … … … … [3] (b) Older trees store more carbon than younger trees. Scientists record the total number of trees of different species in two forest ecosystems: • a young forest area where all the trees are less than 20 years old • a mature forest area where all the trees are over 50 years old. Fig. 4.2 shows a bar chart of the results. 70 Key: young forest 60 mature forest 50 40 number of trees 30 20 10 0 red yellow red witch chestnut maple birch oak hazel oak tree species Fig. 4.2 (i) The scientists discover that there is more carbon stored in the young forest area. Use Fig. 4.2 to explain why. … … [1] (ii) Identify the tree species in Fig. 4.2 that is not found in the mature forest area. … [1] (c) Describe how light energy is used in the production of starch in trees. … … … … … [4] [Total: 12]
12 marks
Mark scheme: 4(a)(i) 3 organism carnivore primary consumer occupies trophic level 3 blackbird ✓ ✓ caterpillar ✓ hawk ✓ thrush ✓ ✓ carnivore column ; primary consumer column ; trophic level 3 column ; 4(a)(ii) any three from: 3 hawk is trophic level 4 / idea that next level is trophic level 5 ; not enough energy (to support another level) ; energy lost between each trophic level OR only a percentage of energy is transferred between trophic levels ; example of energy loss ; 4(b)(i) greater number of trees in the young forest area ; 1 4(b)(ii) red oak ; 1 4(c) glucose converted to starch / glucose is stored as starch ; 4 plus any three from: (light energy is) transferred to chemical energy ; by chlorophyll ; (takes place in) chloroplasts ; used in photosynthesis ; used to synthesise carbohydrates / glucose ; AVP ;
This question in 0653/42 Oct/Nov 2023
Q22 · The drawing of a cross‑section through a root 0653/43 Oct/Nov 2023
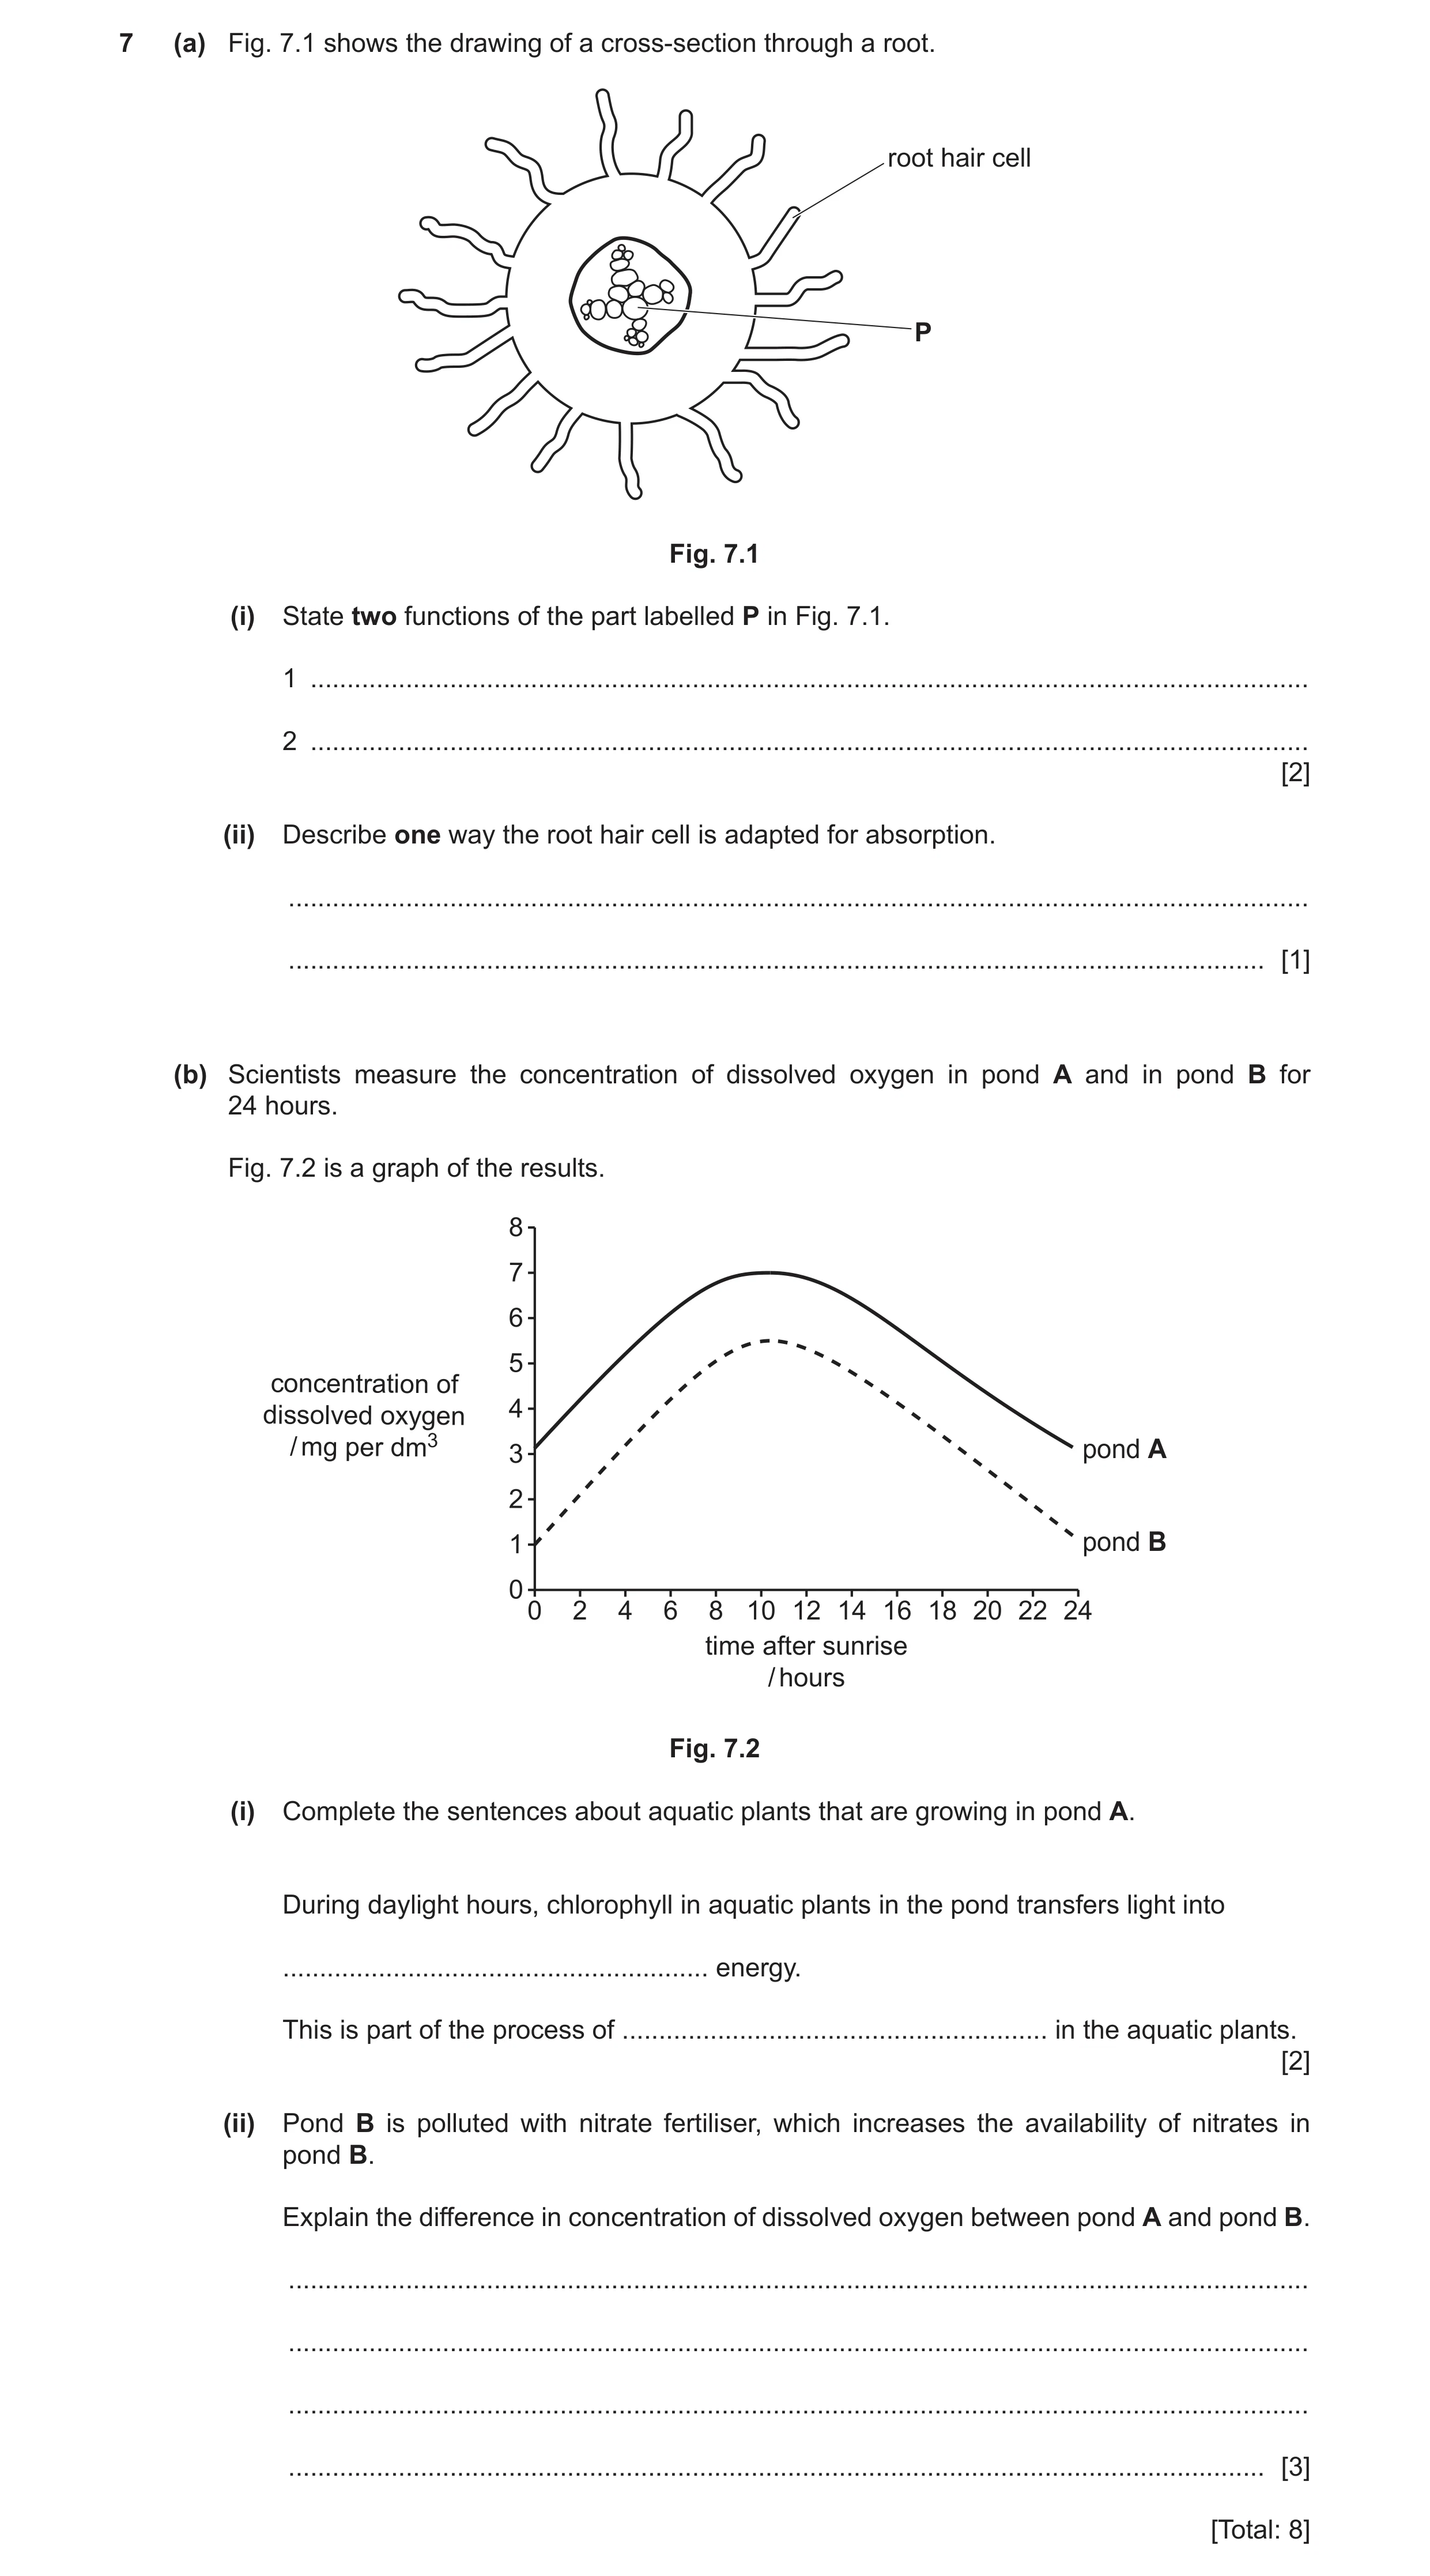
7 (a) Fig. 7.1 shows the drawing of a cross‑section through a root. root hair cell P Fig. 7.1 (i) State two functions of the part labelled P in Fig. 7.1. 1 … 2 … [2] (ii) Describe one way the root hair cell is adapted for absorption. … … [1] (b) Scientists measure the concentration of dissolved oxygen in pond A and in pond B for 24 hours. Fig. 7.2 is a graph of the results. 8 7 6 5 concentration of dissolved oxygen 4 / mg per dm3 3 pond A 2 1 pond B 0 0 2 4 6 8 10 12 14 16 18 20 22 24 time after sunrise / hours Fig. 7.2 (i) Complete the sentences about aquatic plants that are growing in pond A. During daylight hours, chlorophyll in aquatic plants in the pond transfers light into … energy. This is part of the process of … in the aquatic plants. [2] (ii) Pond B is polluted with nitrate fertiliser, which increases the availability of nitrates in pond B. Explain the difference in concentration of dissolved oxygen between pond A and pond B. … … … … [3] [Total: 8]
8 marks
Mark scheme: 7(a)(i) support ; 2 transport (of, water / minerals) ; 7(a)(ii) large surface (area) ; 1 7(b)(i) chemical ; 2 photosynthesis ; 7(b)(ii) any three from: 3 due to eutrophication ; increase in growth of producers / plants on surface (of pond B) ; (increased) decomposition of producers (after death) ; (increased aerobic) respiration by decomposers ; (aerobic respiration/decomposers) uses up the oxygen (in pond B) ; AVP ;
This question in 0653/43 Oct/Nov 2023
Q23 · A student draws diagrams to show the position of xylem in different parts of a plant 0653/42 Feb/March 2024
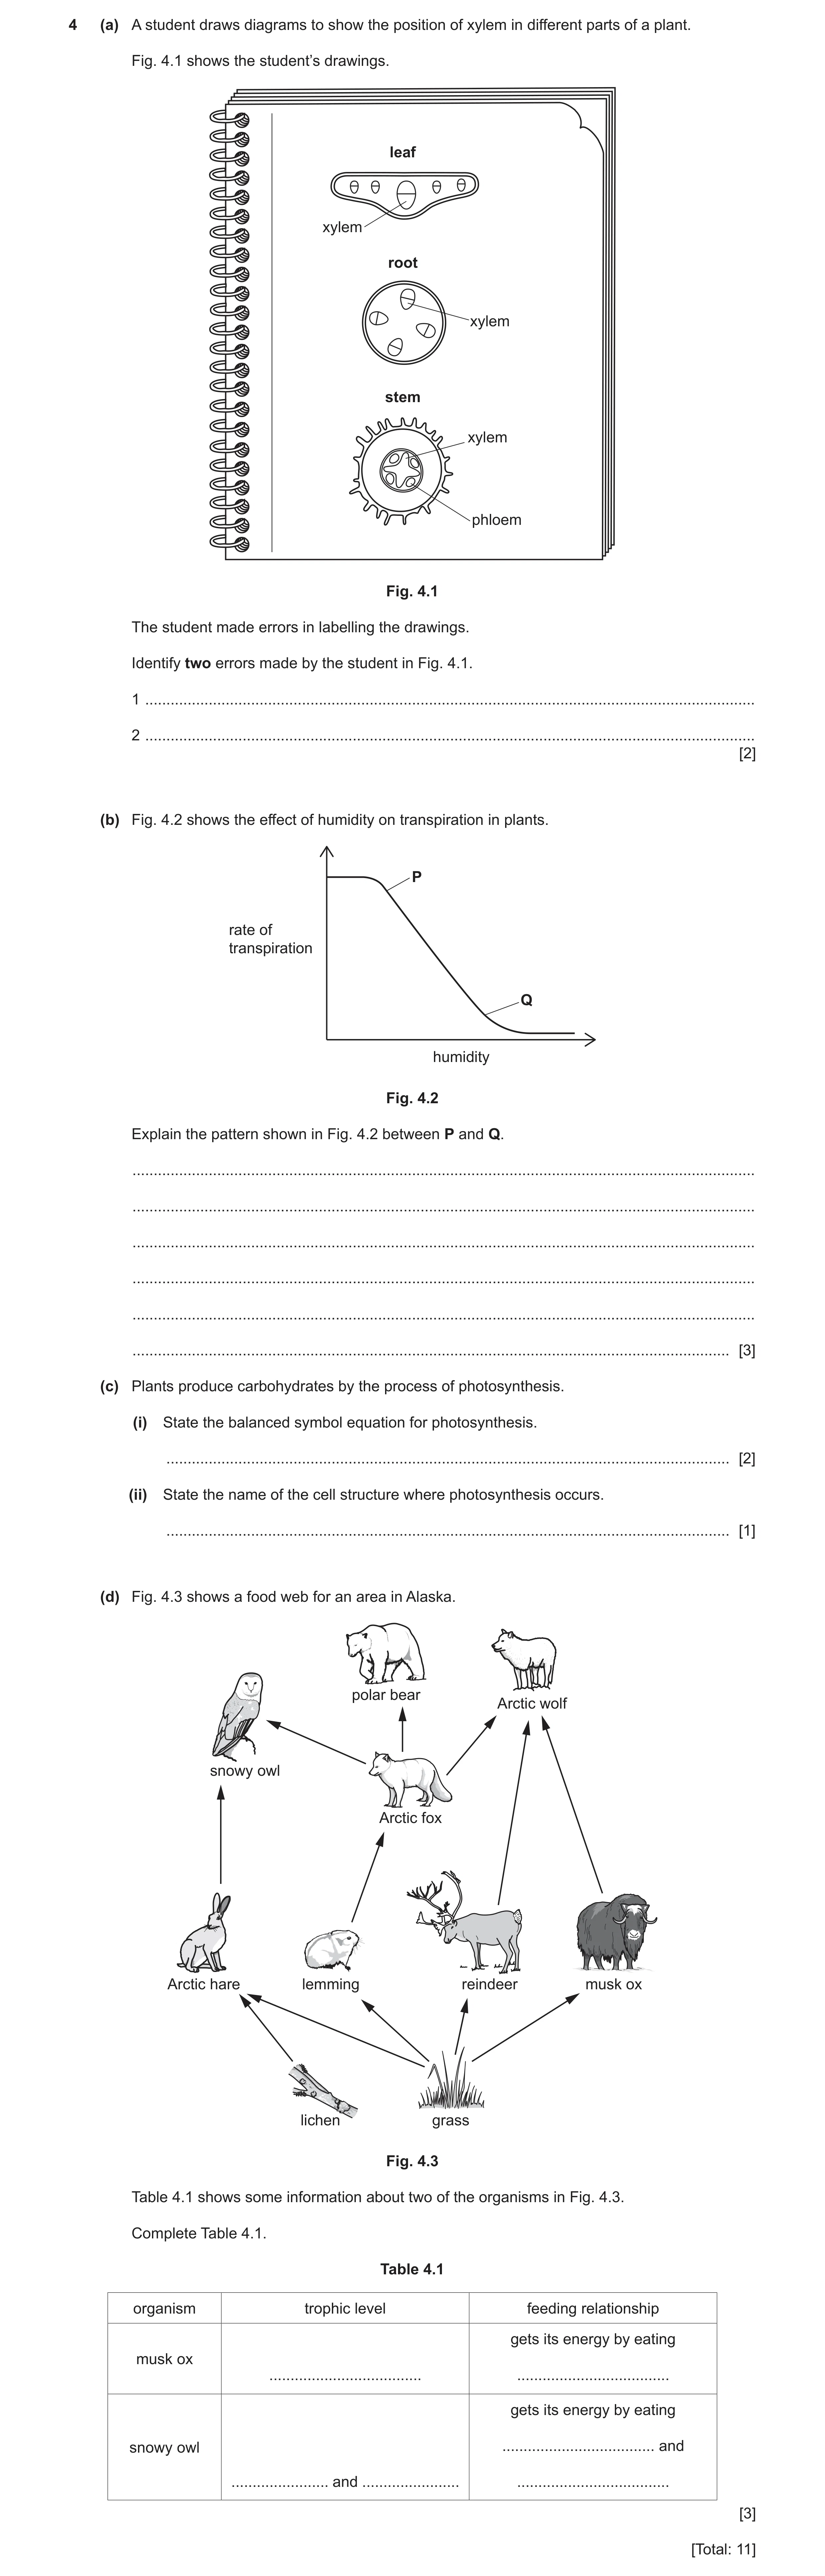
4 (a) A student draws diagrams to show the position of xylem in different parts of a plant. Fig. 4.1 shows the student’s drawings. leaf xylem root xylem stem xylem phloem Fig. 4.1 The student made errors in labelling the drawings. Identify two errors made by the student in Fig. 4.1. 1 … 2 … [2] (b) Fig. 4.2 shows the effect of humidity on transpiration in plants. P rate of transpiration Q humidity Fig. 4.2 Explain the pattern shown in Fig. 4.2 between P and Q. … … … … … … [3] (c) Plants produce carbohydrates by the process of photosynthesis. (i) State the balanced symbol equation for photosynthesis. … [2] (ii) State the name of the cell structure where photosynthesis occurs. … [1] (d) Fig. 4.3 shows a food web for an area in Alaska. polar bear Arctic wolf snowy owl Arctic fox Arctic hare lemming reindeer musk ox lichen grass Fig. 4.3 Table 4.1 shows some information about two of the organisms in Fig. 4.3. Complete Table 4.1. Table 4.1 organism trophic level feeding relationship gets its energy by eating musk ox … … gets its energy by eating snowy owl … and … and … … [3] [Total: 11]
11 marks
Mark scheme: 4(a) root and stem labels are the wrong way around ; 2 xylem label incorrect in leaf ; 4(b) any three from: 3 (description of trend) increased humidity causes decrease in rate of transpiration / ref to inverse relationship between humidity and transpiration rate ; higher humidity means higher water (vapour) concentration in air (surrounding the leaf) ; the idea that at higher humidity the concentration gradient between the leaf and the air is reduced ; reference to reduced, evaporation / diffusion (from leaf at higher humidity) ; 4(c)(i) 6CO2 + 6 H2O ; 2 C6H12O6 + 6O2 ; 4(c)(ii) chloroplast ; 1 4(d) 3 trophic organism feeding relationship level musk ox 2 (gets its energy by eating) grass (gets its energy by eating) snowy owl 3 and 4 (Arctic) fox and (Arctic) hare ;;; correct trophic levels = [1] grass = [1] (Arctic) fox and (Arctic) hare = [1]
This question in 0653/42 Feb/March 2024
Q24 · A diagram of a cross‑section through a leaf 0653/43 May/June 2024
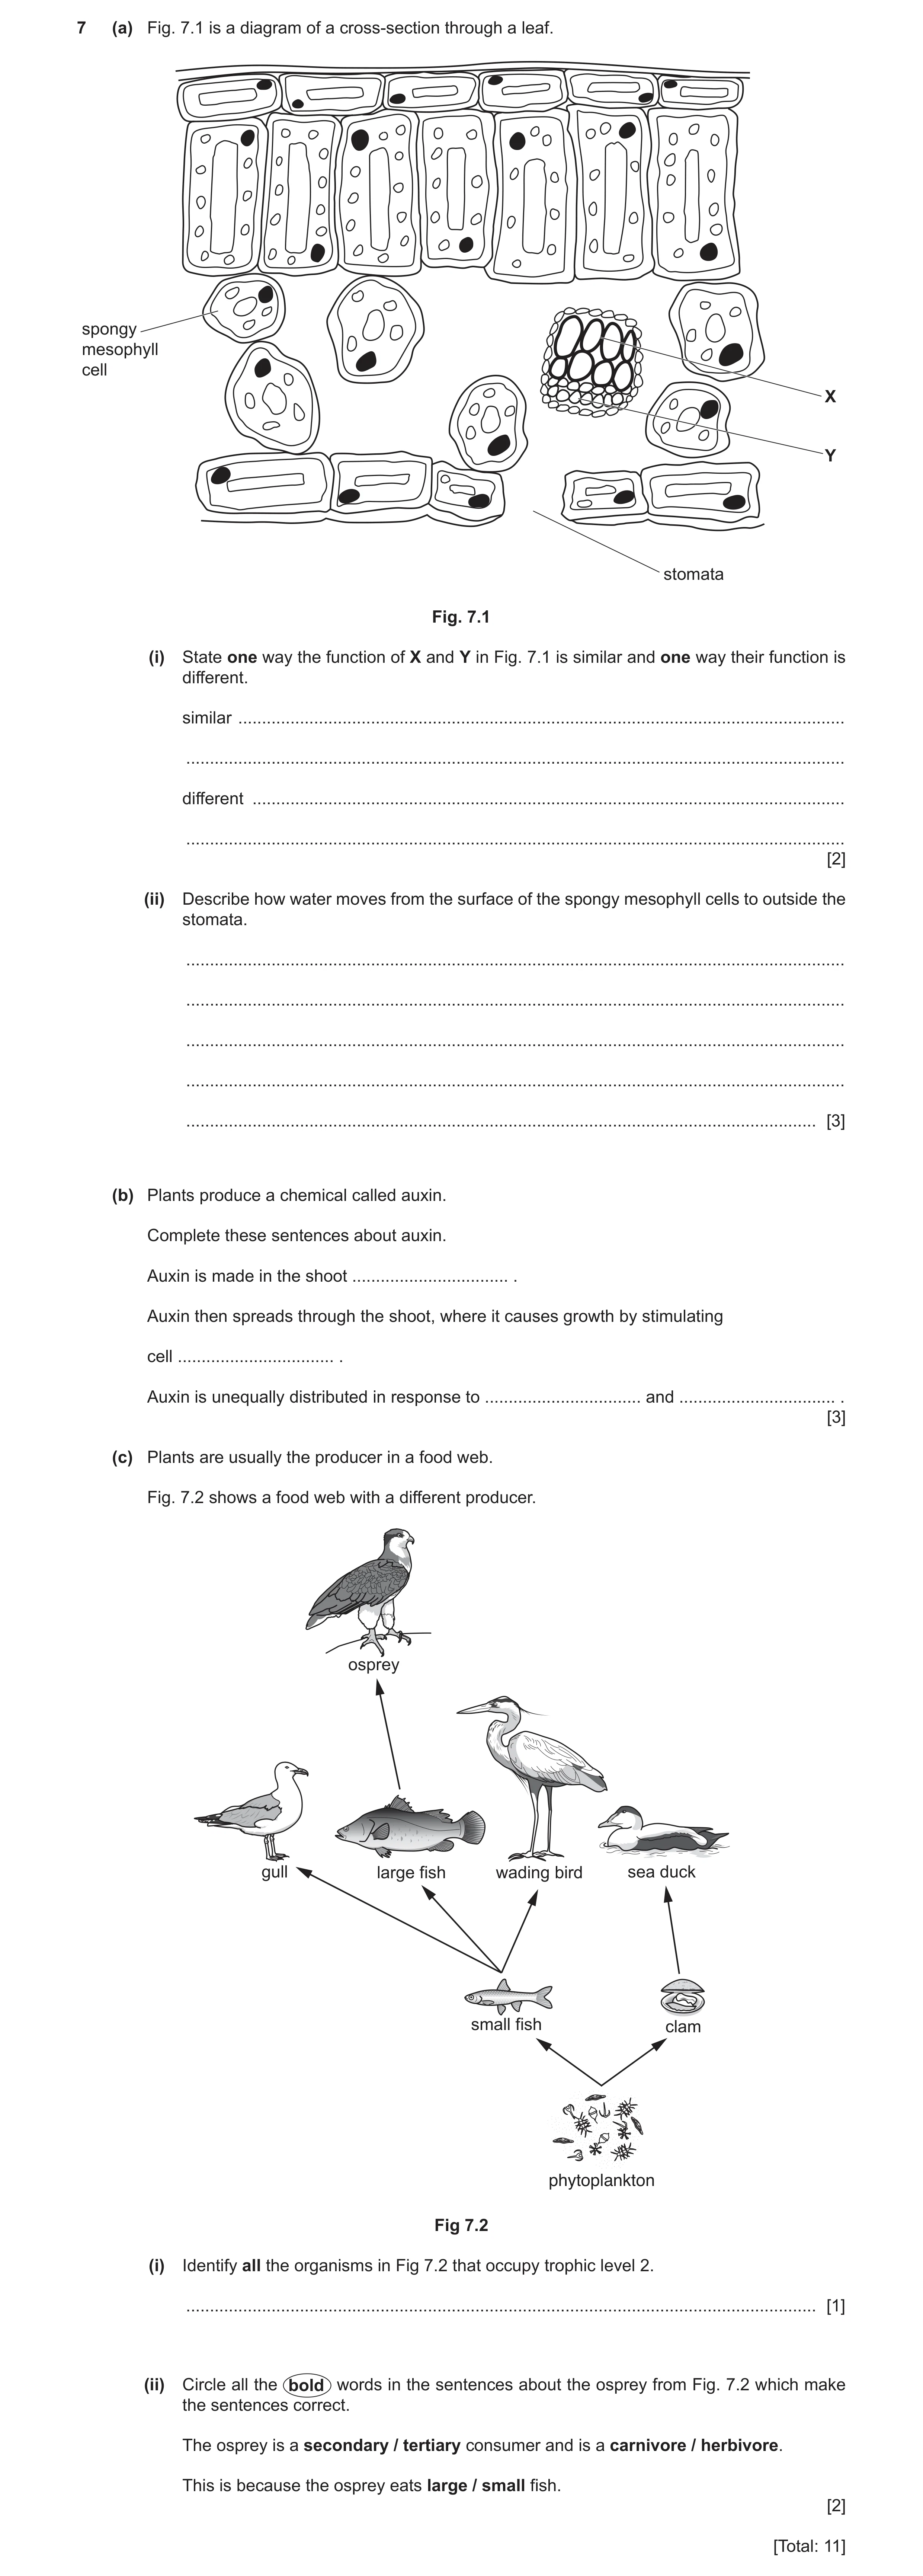
7 (a) Fig. 7.1 is a diagram of a cross‑section through a leaf. spongy mesophyll cell X Y stomata Fig. 7.1 (i) State one way the function of X and Y in Fig. 7.1 is similar and one way their function is different. similar … … different … … [2] (ii) Describe how water moves from the surface of the spongy mesophyll cells to outside the stomata. … … … … … [3] (b) Plants produce a chemical called auxin. Complete these sentences about auxin. Auxin is made in the shoot … . Auxin then spreads through the shoot, where it causes growth by stimulating cell … . Auxin is unequally distributed in response to … and … . [3] (c) Plants are usually the producer in a food web. Fig. 7.2 shows a food web with a different producer. osprey gull large fish wading bird sea duck small fish clam phytoplankton Fig 7.2 (i) Identify all the organisms in Fig 7.2 that occupy trophic level 2. … [1] (ii) Circle all the bold words in the sentences about the osprey from Fig. 7.2 which make the sentences correct. The osprey is a secondary / tertiary consumer and is a carnivore / herbivore. This is because the osprey eats large / small fish. [2] [Total: 11]
11 marks
Mark scheme: 7(a)(i) both / they, transport (substances) ; and either xylem / X, also provides support / transports mineral ions / transports up the stem ; or phloem / Y, transports sugars / amino acids / transports up and down the stem ; Question Answer Marks 7(a)(ii) by evaporation (from the surface) ; water vapour moves to / out of, stomata ; (water vapour passes through stomata) by diffusion ; 3 7(b) tip ; elongation ; gravity and light ; 3 7(c)(i) small fish and clam ; 1 7(c)(ii) tertiary carnivore large ;; all correct = 2 marks two correct = 1 mark 2
This question in 0653/43 May/June 2024
Question 25 0653/41 Oct/Nov 2024
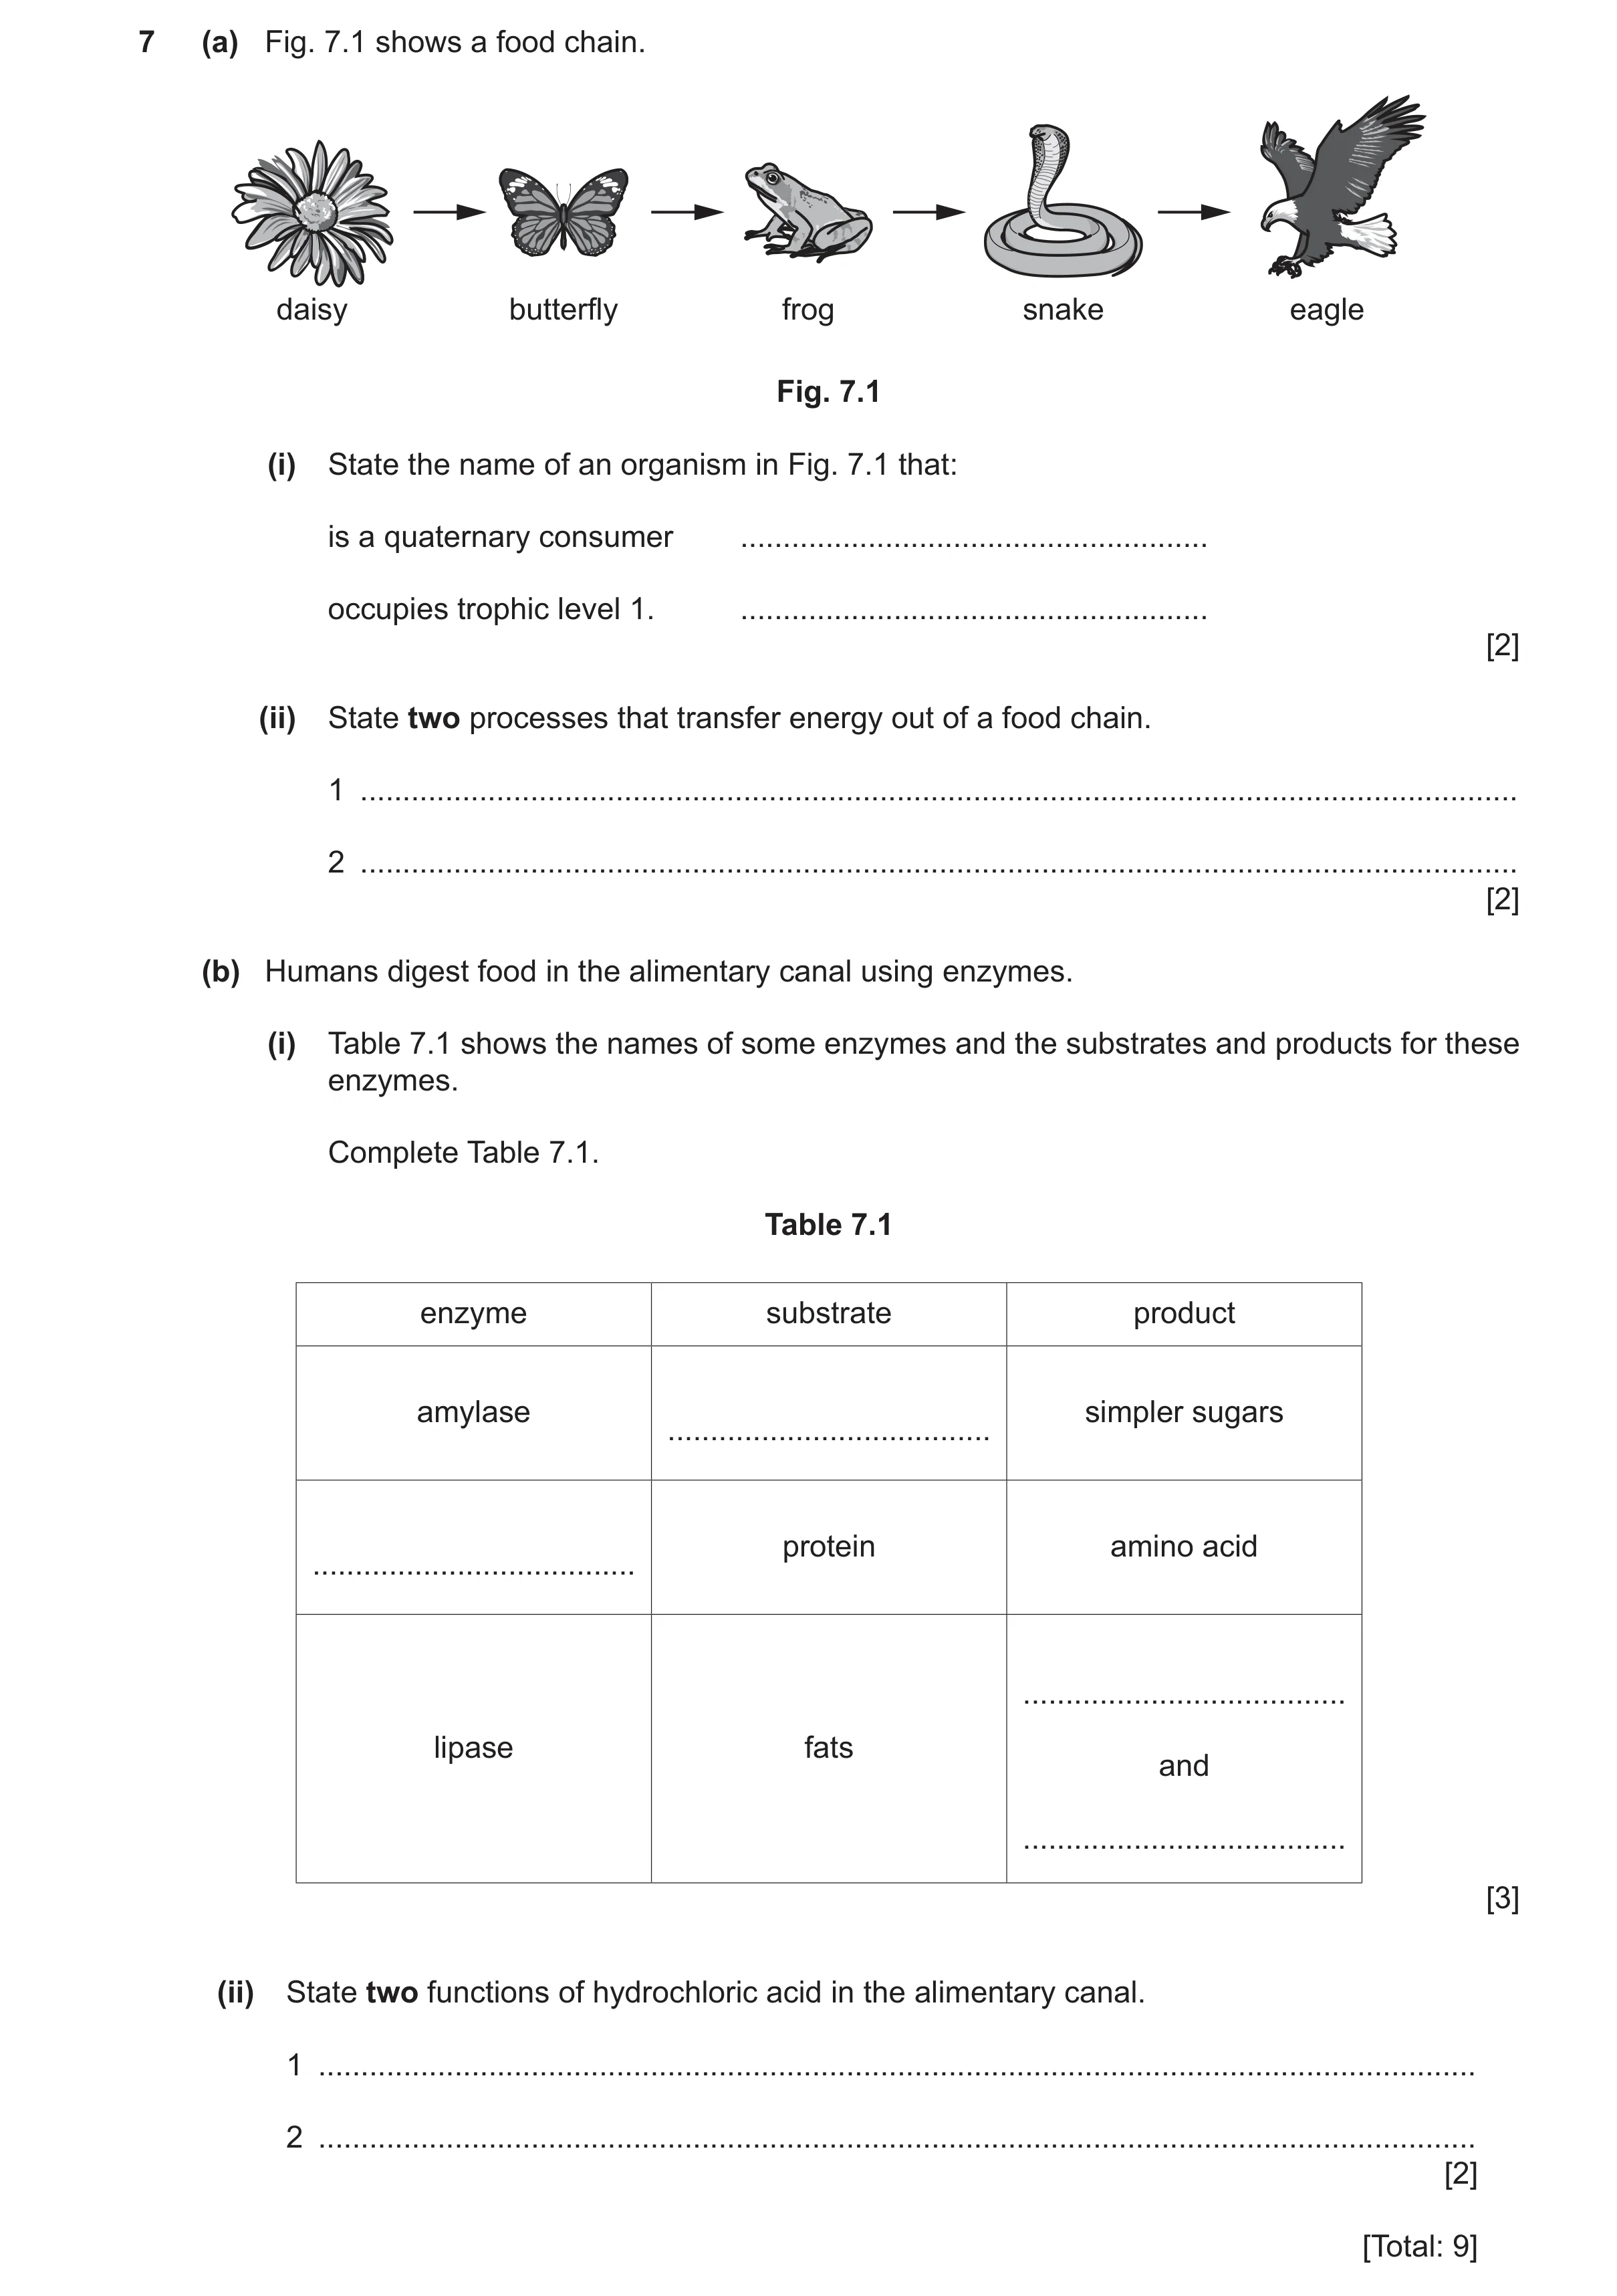
7 (a) Fig. 7.1 shows a food chain. daisy butterfly frog snake eagle Fig. 7.1 (i) State the name of an organism in Fig. 7.1 that: is a quaternary consumer … occupies trophic level 1. … [2] (ii) State two processes that transfer energy out of a food chain. 1 … 2 … [2] (b) Humans digest food in the alimentary canal using enzymes. (i) Table 7.1 shows the names of some enzymes and the substrates and products for these enzymes. Complete Table 7.1. Table 7.1 enzyme substrate product amylase simpler sugars … protein amino acid … … lipase fats and … [3] (ii) State two functions of hydrochloric acid in the alimentary canal. 1 … 2 … [2] [Total: 9]
9 marks
Mark scheme: 7(a)(i) eagle ; 2 daisy ; 7(a)(ii) any two from: 2 respiration ; movement ; excretion ; egestion ; decomposition ; 7(b)(i) substrate starch ; 3 enzyme protease ; product fatty acids AND glycerol ; 7(b)(ii) to kill bacteria ; 2 to provide, acid pH / low pH, for enzymes ;
This question in 0653/41 Oct/Nov 2024
Q26 · Sections through two different flowers, X and Y 0653/42 Oct/Nov 2024
1 (a) Fig. 1.1 shows sections through two different flowers, X and Y. flower X flower Y Fig. 1.1 (i) Draw a label line with the letter A to identify the anther on flower X in Fig. 1.1. [1] (ii) The flowers have structural adaptations for pollination by different types of agent. Identify the type of pollination agent for flower Y. Give one reason for your answer using evidence from Fig. 1.1. pollination agent … reason … … [2] (b) The leaves of plants have different types of cell with different functions. Complete the sentences about leaves. • Between the upper epidermis and the spongy mesophyll layers, there is a layer of cells called the … mesophyll. • The mesophyll cells in this layer are adapted for photosynthesis because they contain large numbers of … . • Sugars produced in the leaf are transported to other parts of the plant in … vessels. [3] (c) Plants are producers in food chains. (i) Circle two of the words in bold to give the correct definition of producers. Producers are organisms that make their own organic / trophic nutrients, usually using energy / food from sunlight, through the process of photosynthesis. [1] (ii) Circle the type of consumer that feeds on a producer in a food chain. primary quaternary secondary tertiary [1] (d) Plants growing in lakes and ponds are sometimes affected by eutrophication. Tick (✓) two boxes to identify correct descriptions of two parts of the process of eutrophication. increased aerobic respiration by decomposers in the water decreased availability of nitrates in the water increased decomposition of dead producers in the water increased aerobic respiration by plants increased concentration of dissolved oxygen in the water [2] [Total: 10]
10 marks
Mark scheme: Question Answer Marks 1(a)(i) anther labelled A on flower X ; 1 1(a)(ii) insect / bird / animal ; 2 anthers inside flower / stigma inside flower ; 1(b) palisade ; 3 chloroplasts ; phloem ; 1(c)(i) organic AND energy ; 1 1(c)(ii) primary ; 1 1(d) increased aerobic respiration by decomposers in the water ; 2 increased decomposition of dead producers in the water ;
This question in 0653/42 Oct/Nov 2024
Question 27 0653/43 Oct/Nov 2024
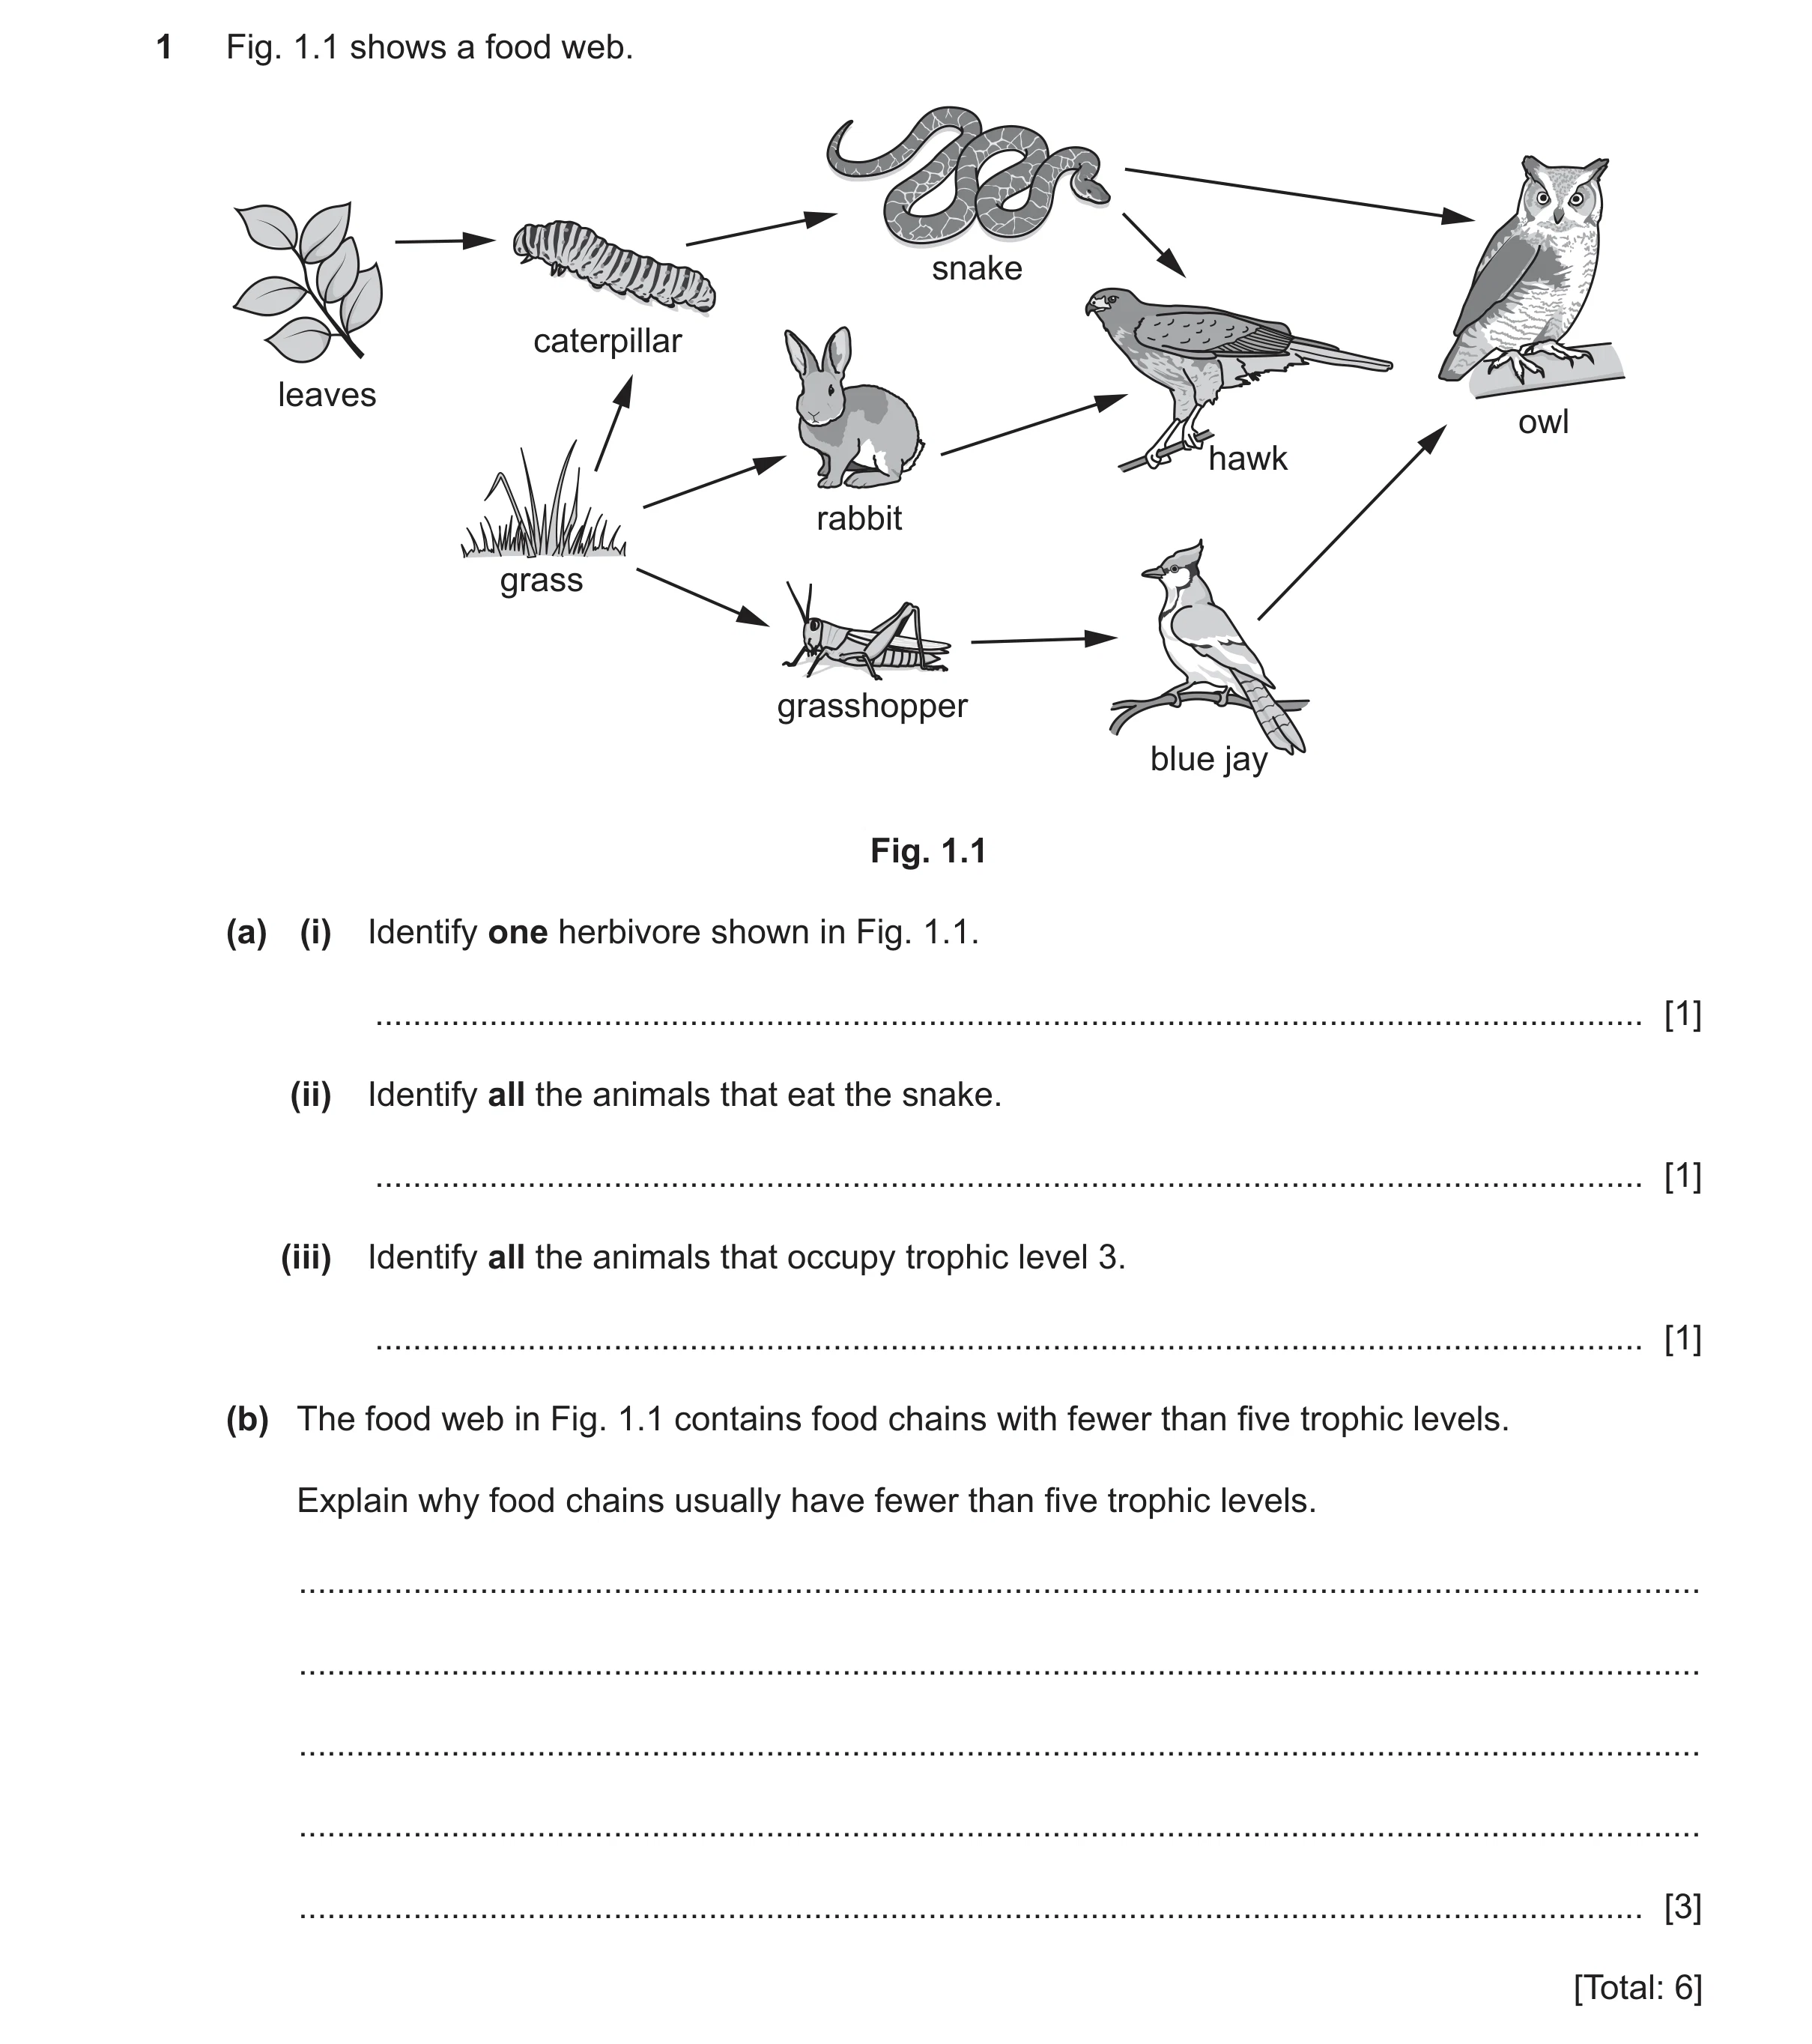
1 Fig. 1.1 shows a food web. snake caterpillar leaves owl hawk rabbit grass grasshopper blue jay Fig. 1.1 (a) (i) Identify one herbivore shown in Fig. 1.1. … [1] (ii) Identify all the animals that eat the snake. … [1] (iii) Identify all the animals that occupy trophic level 3. … [1] (b) The food web in Fig. 1.1 contains food chains with fewer than five trophic levels. Explain why food chains usually have fewer than five trophic levels. … … … … … [3] [Total: 6]
6 marks
Mark scheme: Question Answer Marks 1(a)(i) grasshopper / rabbit / caterpillar ; 1 1(a)(ii) hawk AND owl ; 1 1(a)(iii) snake AND hawk AND (blue) jay ; 1 1(b) energy is lost at each trophic level ; 3 named example of energy loss, e.g. heat / respiration / excretion / protein synthesis / metabolism / not all organism is eaten ; not enough energy left (to support trophic level five) ;
This question in 0653/43 Oct/Nov 2024
Q28 · A food web from land owned by one farmer 0653/42 Feb/March 2025
1 (a) Fig. 1.1 shows a food web from land owned by one farmer. hawk snake grasshopper mouse rabbit grass corn Fig. 1.1 (i) Identify one secondary consumer in Fig. 1.1. … [1] (ii) One year, the farmer grows only corn on the land and no grass. Use Fig. 1.1 to describe impacts on two different consumers in the food web. 1 … … 2 … … [2] (b) Hawks are an endangered species in some countries. Describe two ways to conserve endangered species. 1 … … 2 … … [2] (c) Corn is a principal dietary source of the carbohydrate starch. (i) Complete these sentences about the chemical digestion of starch. Starch is broken down by the enzyme … . The products of starch digestion are simple … sugars. [2] (ii) Explain why starch needs to be digested before it is absorbed. … … [1] [Total: 8]
8 marks
Mark scheme: Question Answer Marks 1(a)(i) hawk / snake ; 1 1(a)(ii) any two from: 2 rabbits would have no food / rabbits would decrease in number ; mice would have more food / mice would increase in number ; grasshoppers would eat more corn (rather than grass) ; hawks would eat more mice ; mice would decrease in number because more eaten by hawks ; AVP ; 1(b) any two from: 2 monitoring species ; protecting habitat ; education (qualified) ; (captive) breeding programs ; AVP ; 1(c)(i) amylase ; 2 reducing ; 1(c)(ii) any one from: 1 molecules are too large to pass through ileum wall or capillary wall / molecules are too large to pass into blood ; (starch)molecules are too, large / complex to be absorbed / only small / simple, molecules can be absorbed ; (starch) molecules cannot be absorbed because they are insoluble / only soluble molecules can be absorbed ;
This question in 0653/42 Feb/March 2025
Q29 · A plant cell before and after being immersed in a concentrated salt solution 0653/41 Oct/Nov 2025
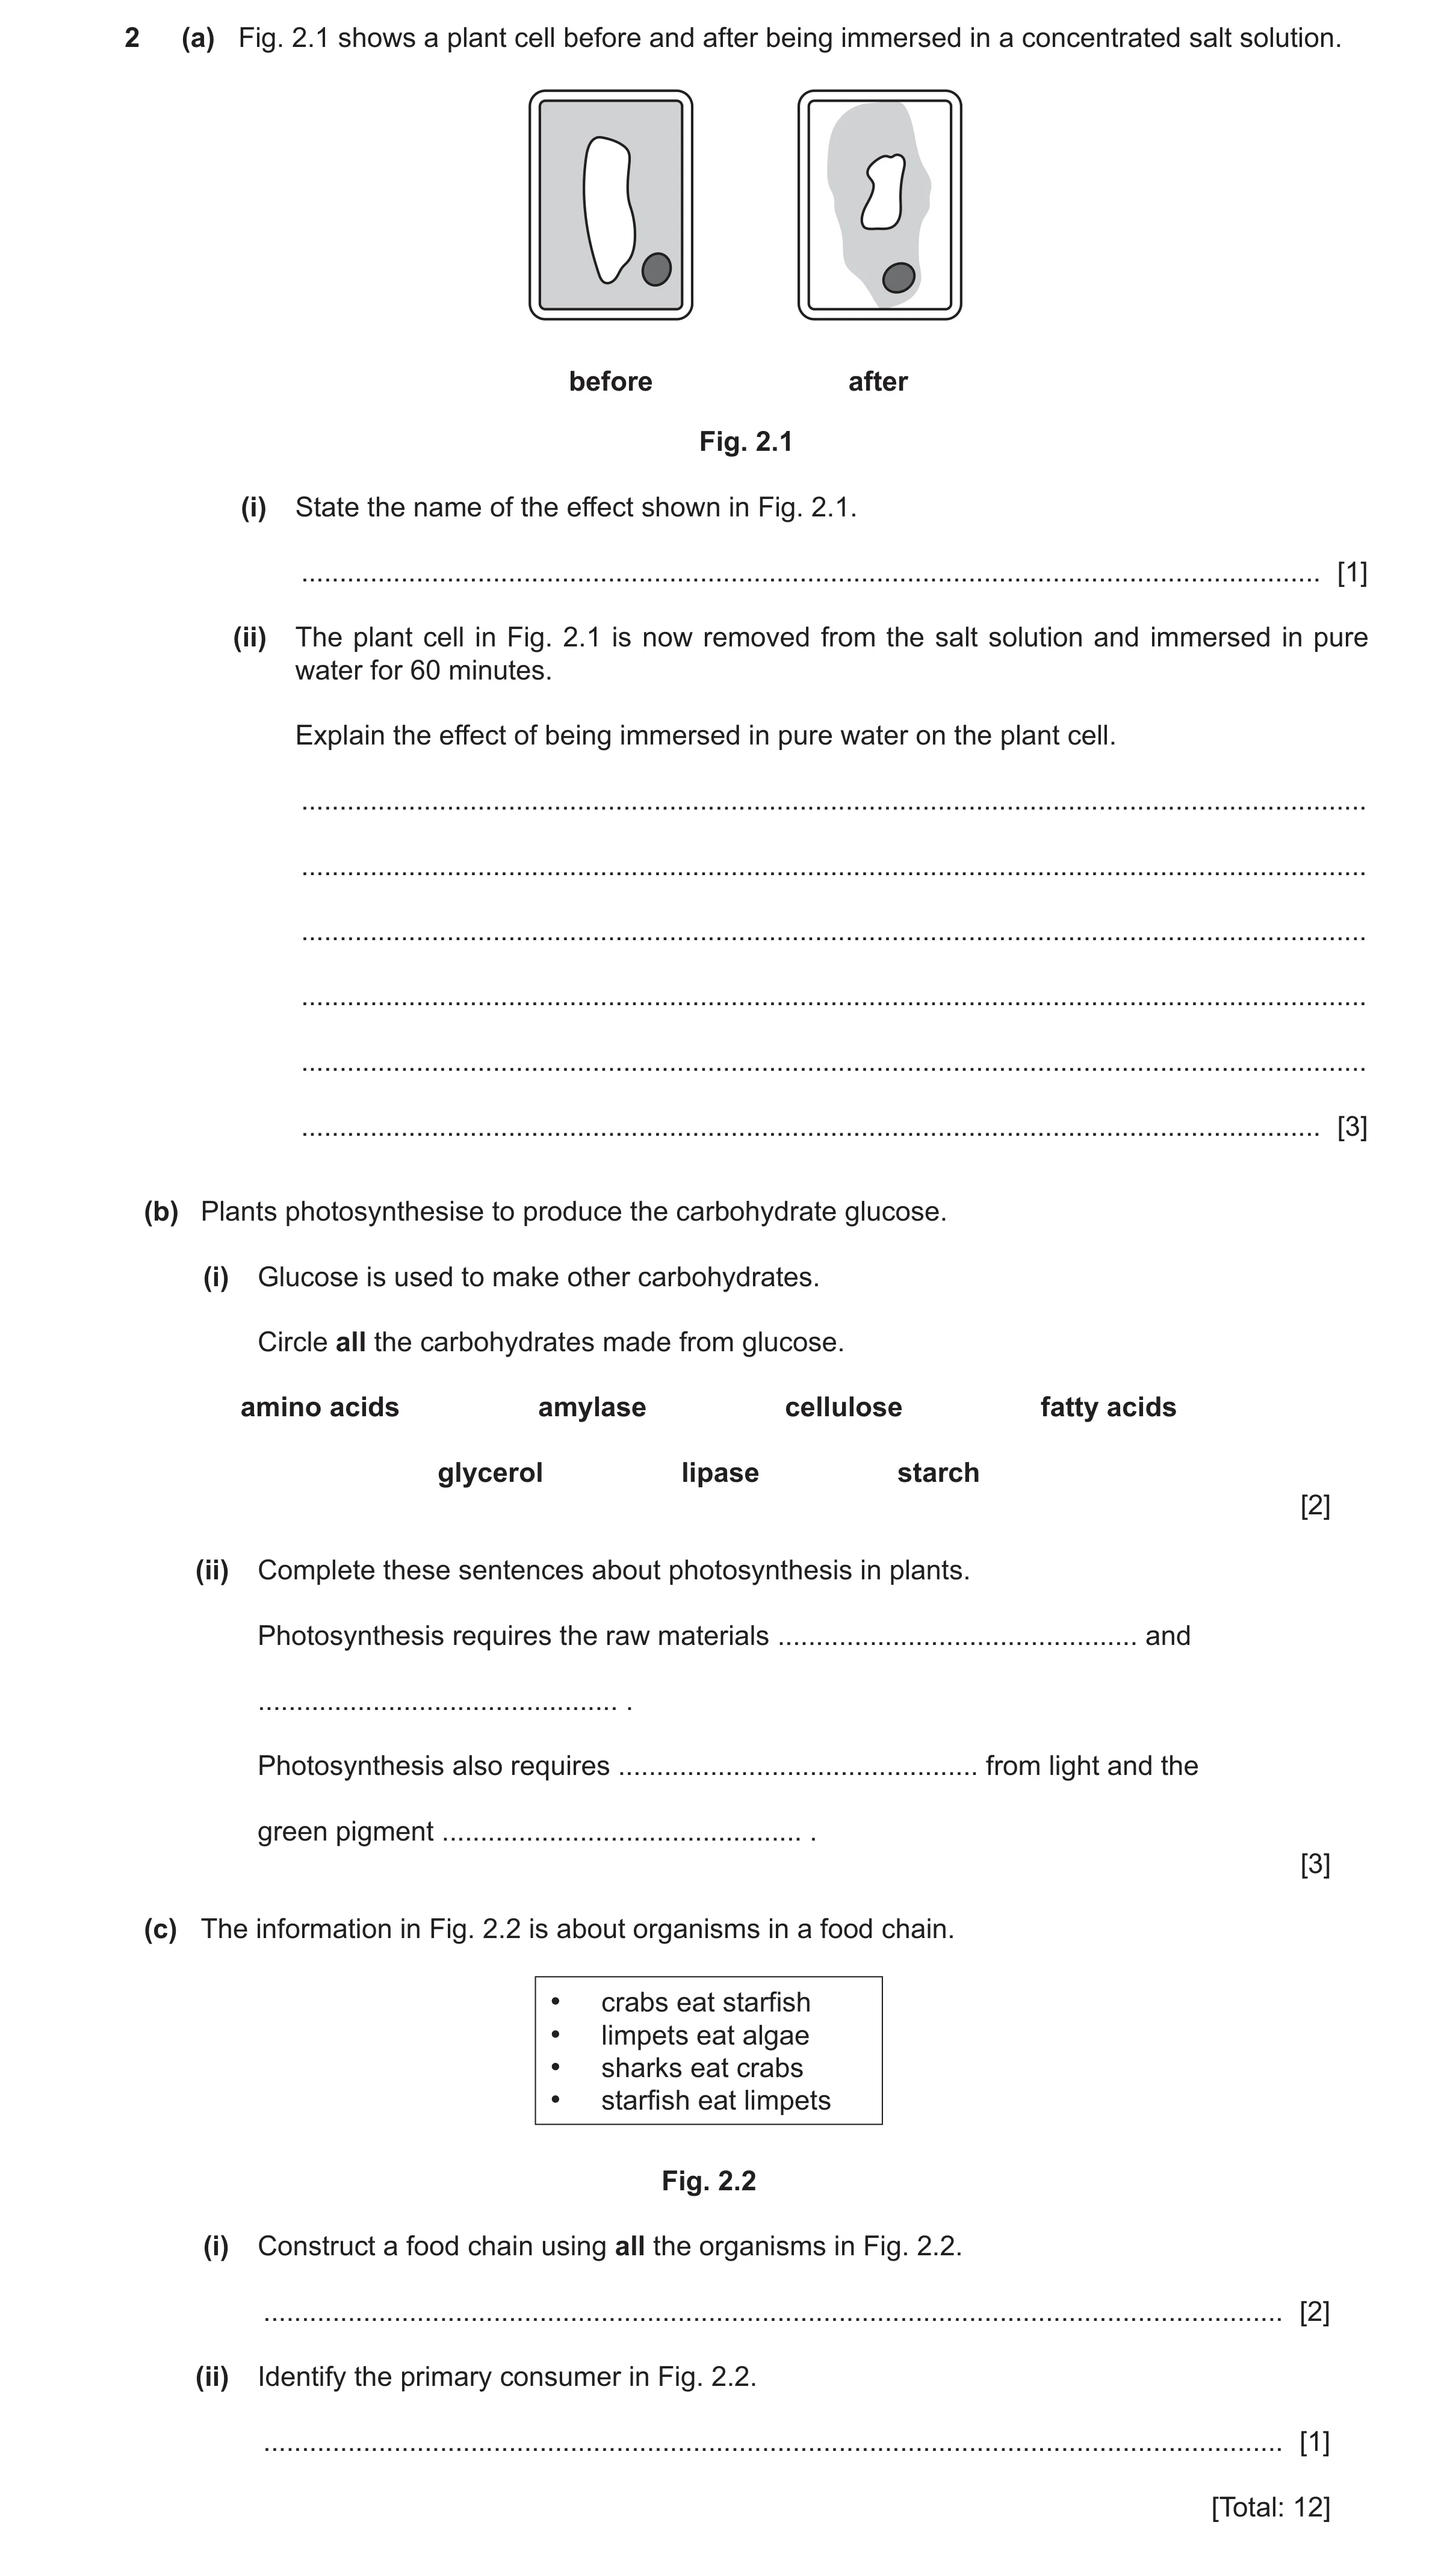
2 (a) Fig. 2.1 shows a plant cell before and after being immersed in a concentrated salt solution. before after Fig. 2.1 (i) State the name of the effect shown in Fig. 2.1. … [1] (ii) The plant cell in Fig. 2.1 is now removed from the salt solution and immersed in pure water for 60 minutes. Explain the effect of being immersed in pure water on the plant cell. … … … … … … [3] (b) Plants photosynthesise to produce the carbohydrate glucose. (i) Glucose is used to make other carbohydrates. Circle all the carbohydrates made from glucose. amino acids amylase cellulose fatty acids glycerol lipase starch [2] (ii) Complete these sentences about photosynthesis in plants. Photosynthesis requires the raw materials … and … . Photosynthesis also requires … from light and the green pigment … . [3] (c) The information in Fig. 2.2 is about organisms in a food chain. • crabs eat starfish • limpets eat algae • sharks eat crabs • starfish eat limpets Fig. 2.2 (i) Construct a food chain using all the organisms in Fig. 2.2. … [2] (ii) Identify the primary consumer in Fig. 2.2. … [1] [Total: 12]
12 marks
Mark scheme: 2(a)(i) plasmolysis ; 1 2(a)(ii) any three from: 3 M1 water enters the cell ; (Direction of water movement) M2 by osmosis ; M3 pure water has a high(er) water potential / low(er) water potential inside cell ; (Reason why water moves as it does) M4 increase in turgor pressure / cell becomes turgid ; 2(b)(i) cellulose ; 2 starch ; 2(b)(ii) carbon dioxide AND water ; 3 energy ; chlorophyll ; 2(c)(i) algae → limpets → starfish → crabs → sharks ;; 2 organisms in correct order arrows in correct direction 2(c)(ii) limpets ; 1
This question in 0653/41 Oct/Nov 2025
Q30 · A food web from a grassland habitat 0653/42 Oct/Nov 2025
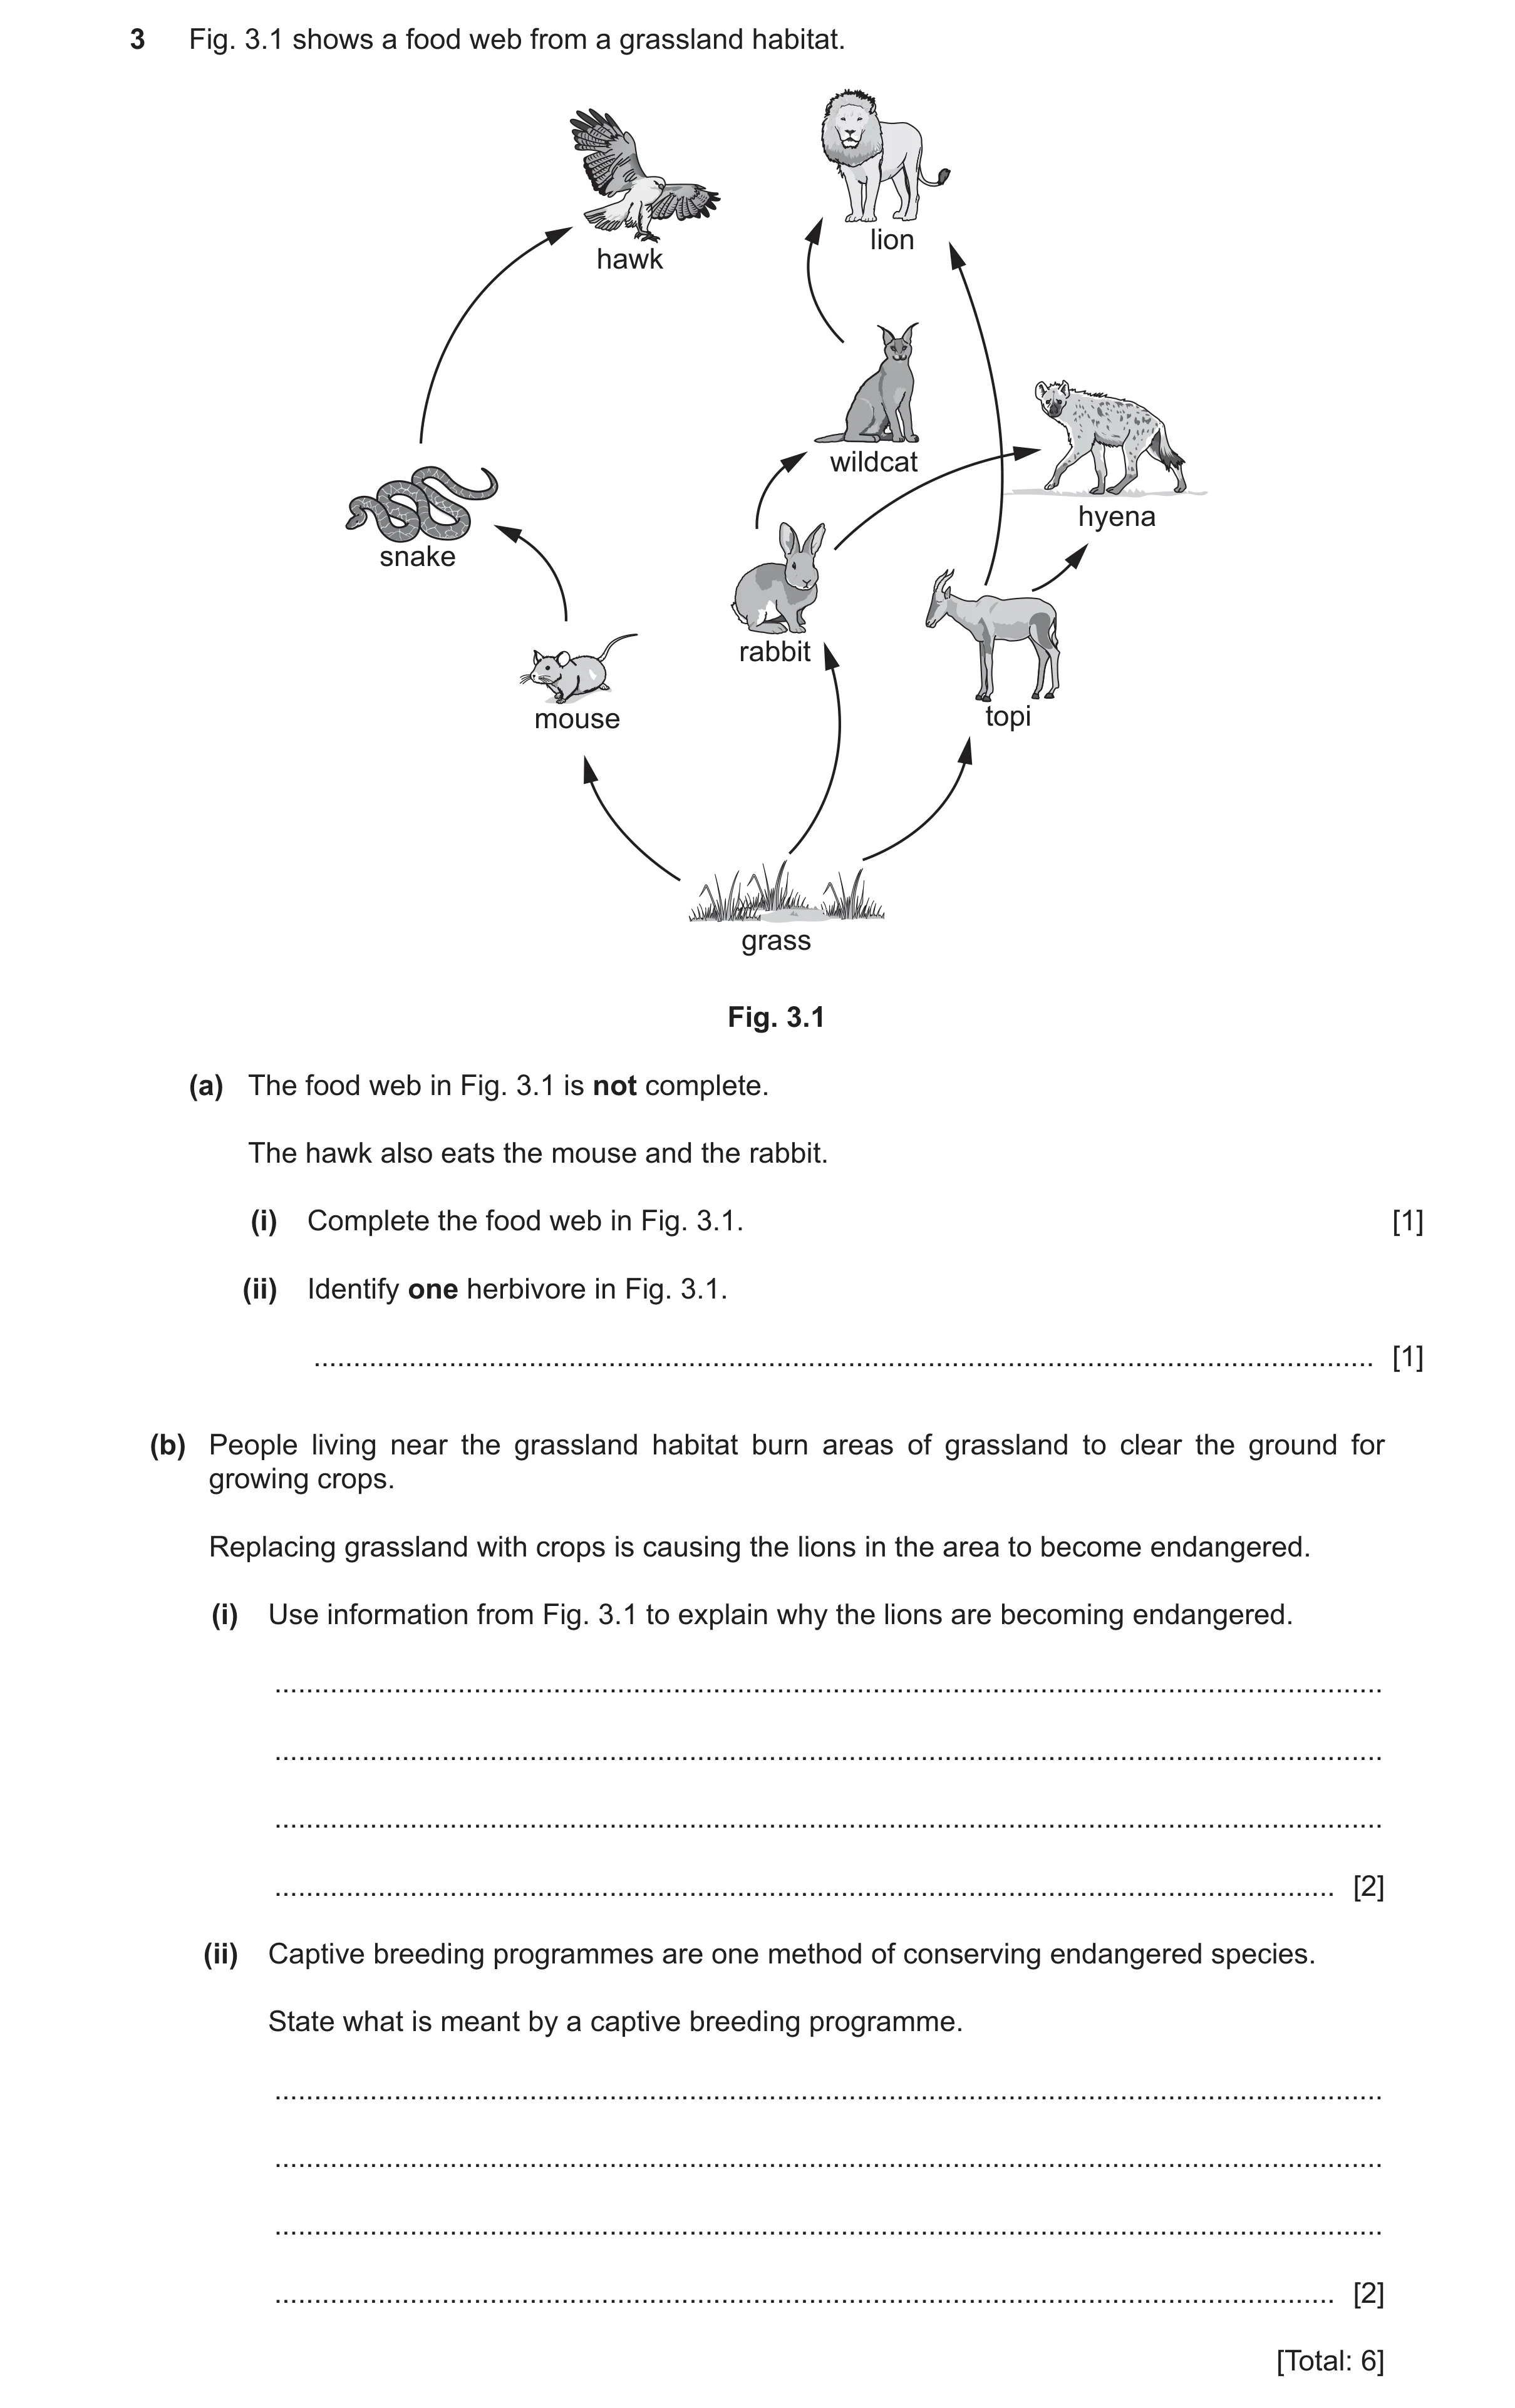
3 Fig. 3.1 shows a food web from a grassland habitat. lion hawk wildcat hyena snake rabbit mouse topi grass Fig. 3.1 (a) The food web in Fig. 3.1 is not complete. The hawk also eats the mouse and the rabbit. (i) Complete the food web in Fig. 3.1. [1] (ii) Identify one herbivore in Fig. 3.1. … [1] (b) People living near the grassland habitat burn areas of grassland to clear the ground for growing crops. Replacing grassland with crops is causing the lions in the area to become endangered. (i) Use information from Fig. 3.1 to explain why the lions are becoming endangered. … … … … [2] (ii) Captive breeding programmes are one method of conserving endangered species. State what is meant by a captive breeding programme. … … … … [2] [Total: 6]
6 marks
Mark scheme: 3(a)(i) arrow from mouse to hawk AND arrow from rabbit to hawk ; 1 3(a)(ii) mouse / rabbit / topi ; 1 3(b)(i) lion’s prey have less food / move to new habitats ; 2 (so) reduced number of prey / less food for lions ; 3(b)(ii) idea of keeping biological species in a controlled environment such as a zoo, wildlife reserve, sanctuary, botanic garden, 2 OR isolated from their natural habitat OR away from predators etc. ; for the purposes of reproduction / increasing populations ;
This question in 0653/42 Oct/Nov 2025
Question 31 0653/43 Oct/Nov 2025
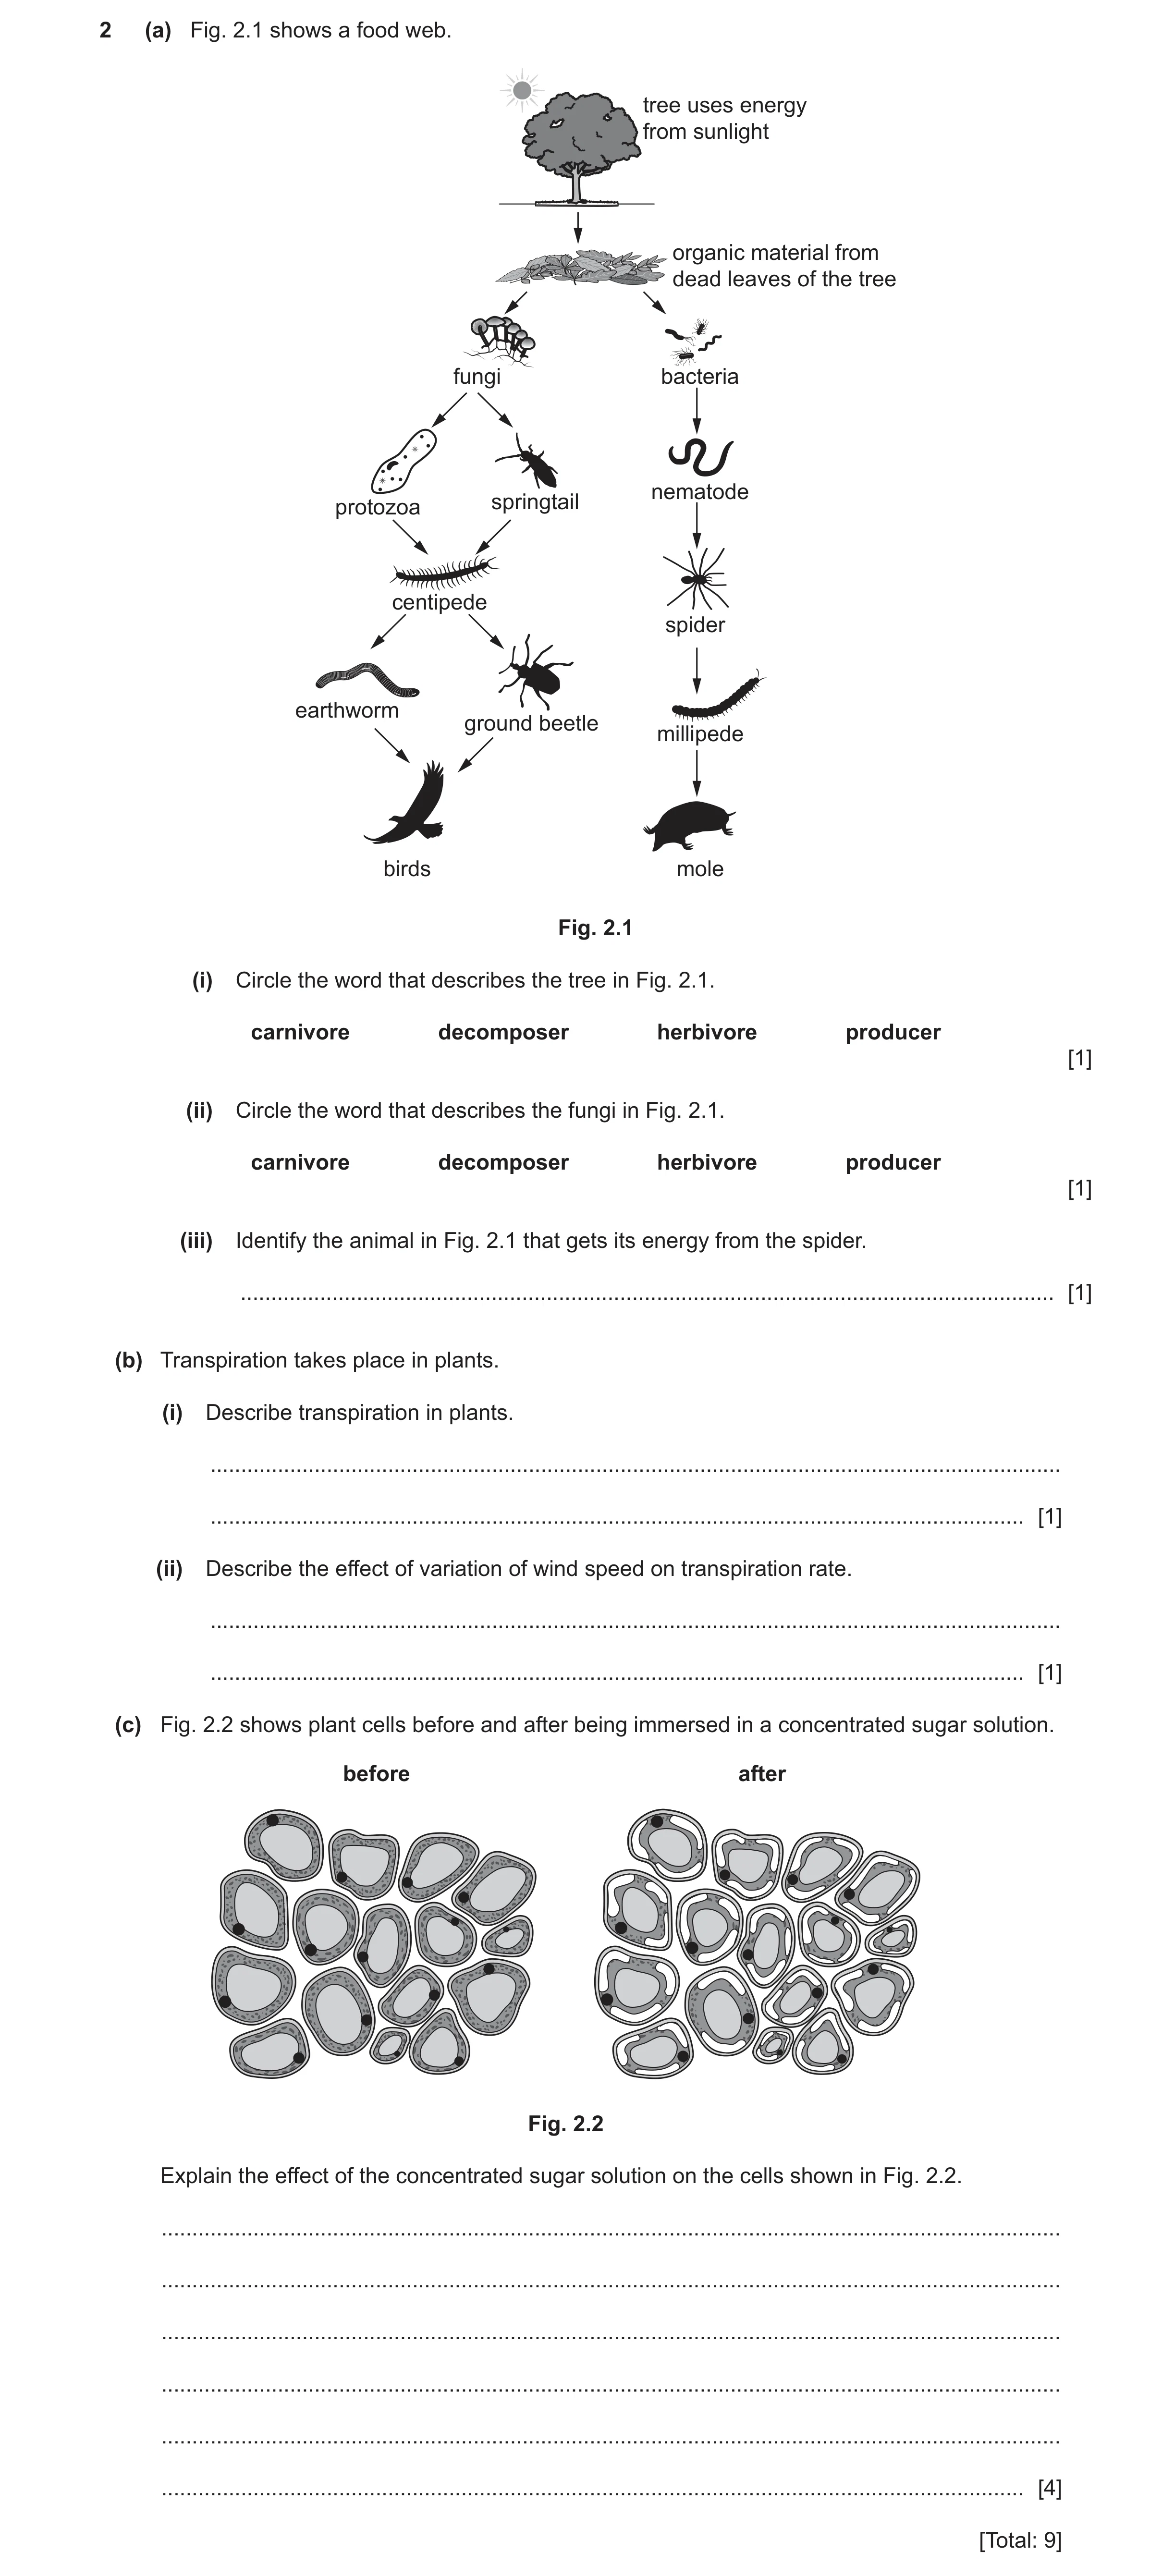
2 (a) Fig. 2.1 shows a food web. tree uses energy from sunlight organic material from dead leaves of the tree fungi bacteria nematode protozoa springtail centipede spider earthworm ground beetle millipede birds mole Fig. 2.1 (i) Circle the word that describes the tree in Fig. 2.1. carnivore decomposer herbivore producer [1] (ii) Circle the word that describes the fungi in Fig. 2.1. carnivore decomposer herbivore producer [1] (iii) Identify the animal in Fig. 2.1 that gets its energy from the spider. … [1] (b) Transpiration takes place in plants. (i) Describe transpiration in plants. … … [1] (ii) Describe the effect of variation of wind speed on transpiration rate. … … [1] (c) Fig. 2.2 shows plant cells before and after being immersed in a concentrated sugar solution. before after Fig. 2.2 Explain the effect of the concentrated sugar solution on the cells shown in Fig. 2.2. … … … … … … [4] [Total: 9]
9 marks
Mark scheme: 2(a)(i) producer ; 1 2(a)(ii) decomposer ; 1 2(a)(iii) millipede ; 1 2(b)(i) loss of water vapour from leaves ; 1 2(b)(ii) increasing wind speed increases transpiration/rate / ora ; 1 2(c) any four from: 4 water leaves the cells ; references to osmosis ; cytoplasm/vacuole shrinks or cell membrane pulled away from the cell wall or cytoplasm pulled away from cell wall ; turgor pressure decreases ; cells are plasmolysed ; cells have a high(er) water potential or (external/sugar) solution has low(er) water potential ;
This question in 0653/43 Oct/Nov 2025
 3 / 47
 4 / 47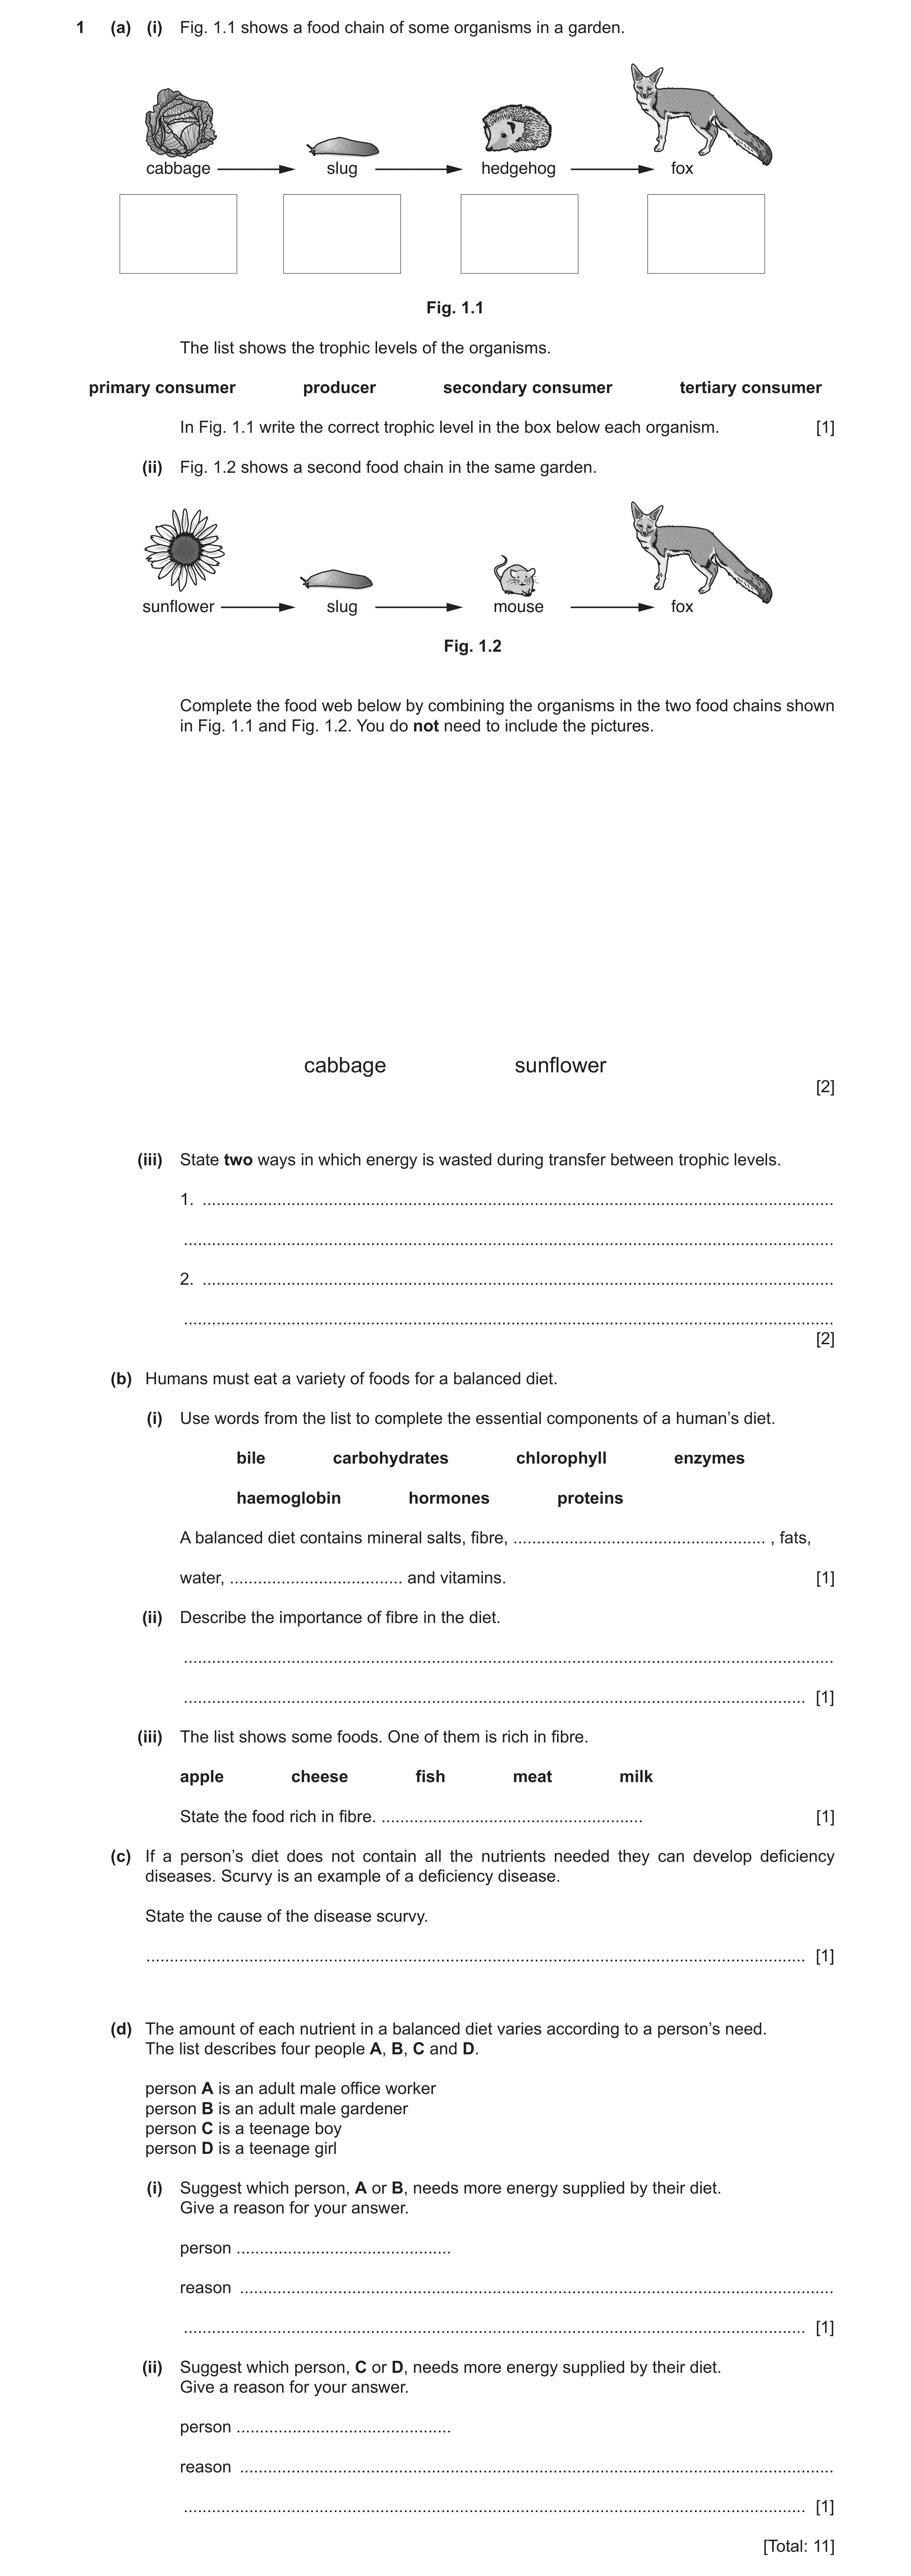
 9 / 47
![Question 7: (a) Fig. 1.1 represents a plant cell. Fig. 1.1 Add labels to Fig. 1.1 to name two structures that are only present in plant cells. [2] (b) …](https://img.pastlit.com/crops/1f783e97-1b33-4816-ae7a-e40f7ac4b774/q1.webp)
 21 / 47
 22 / 47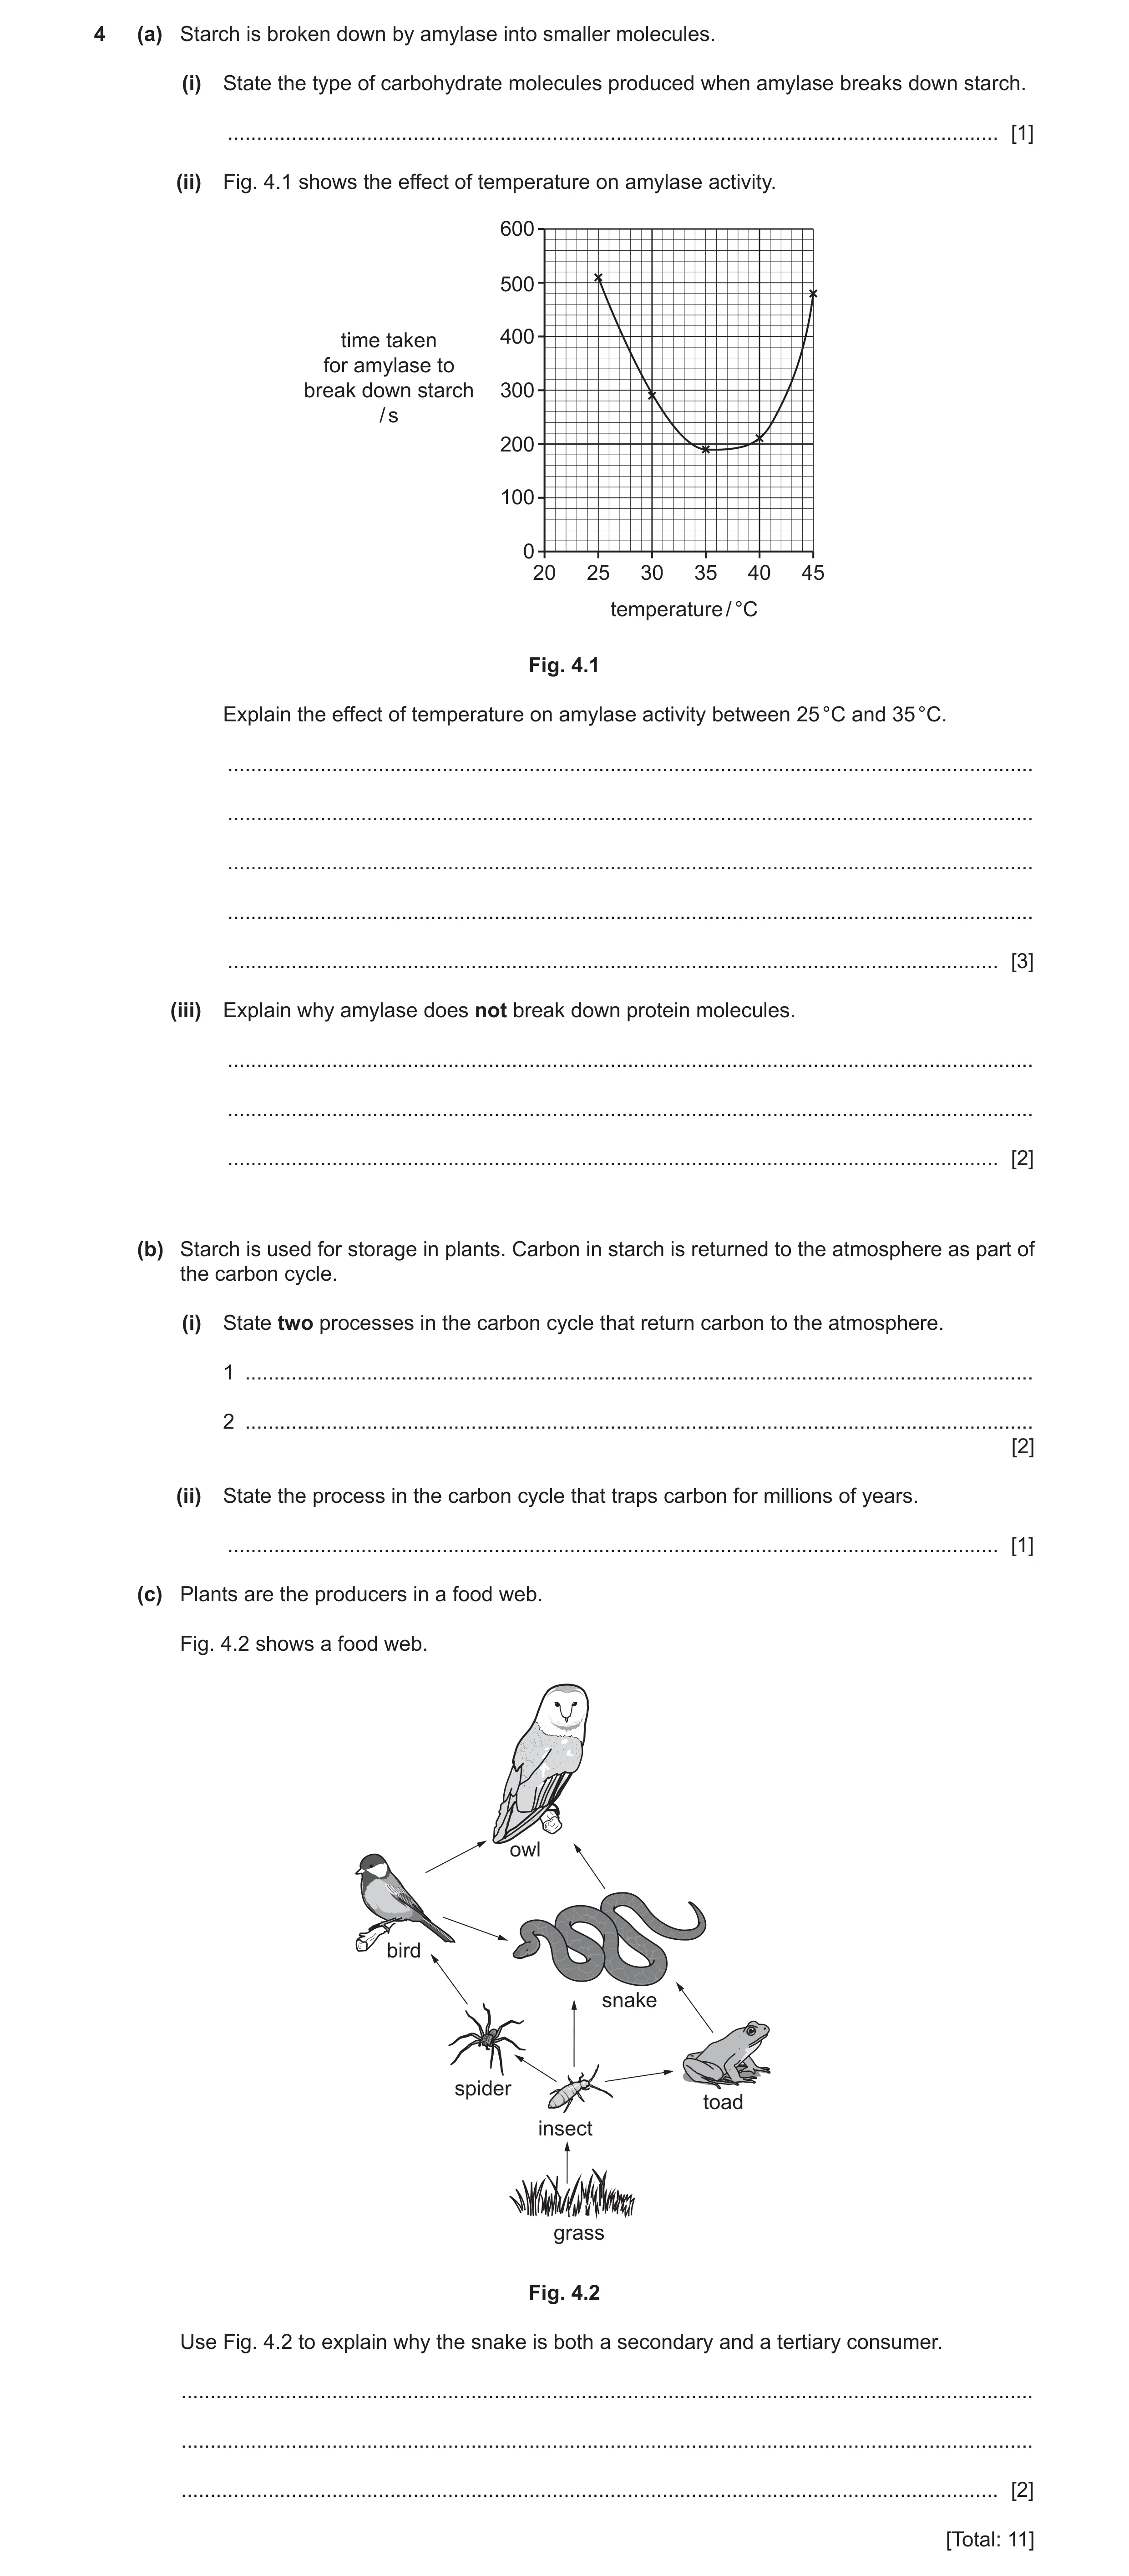
 29 / 47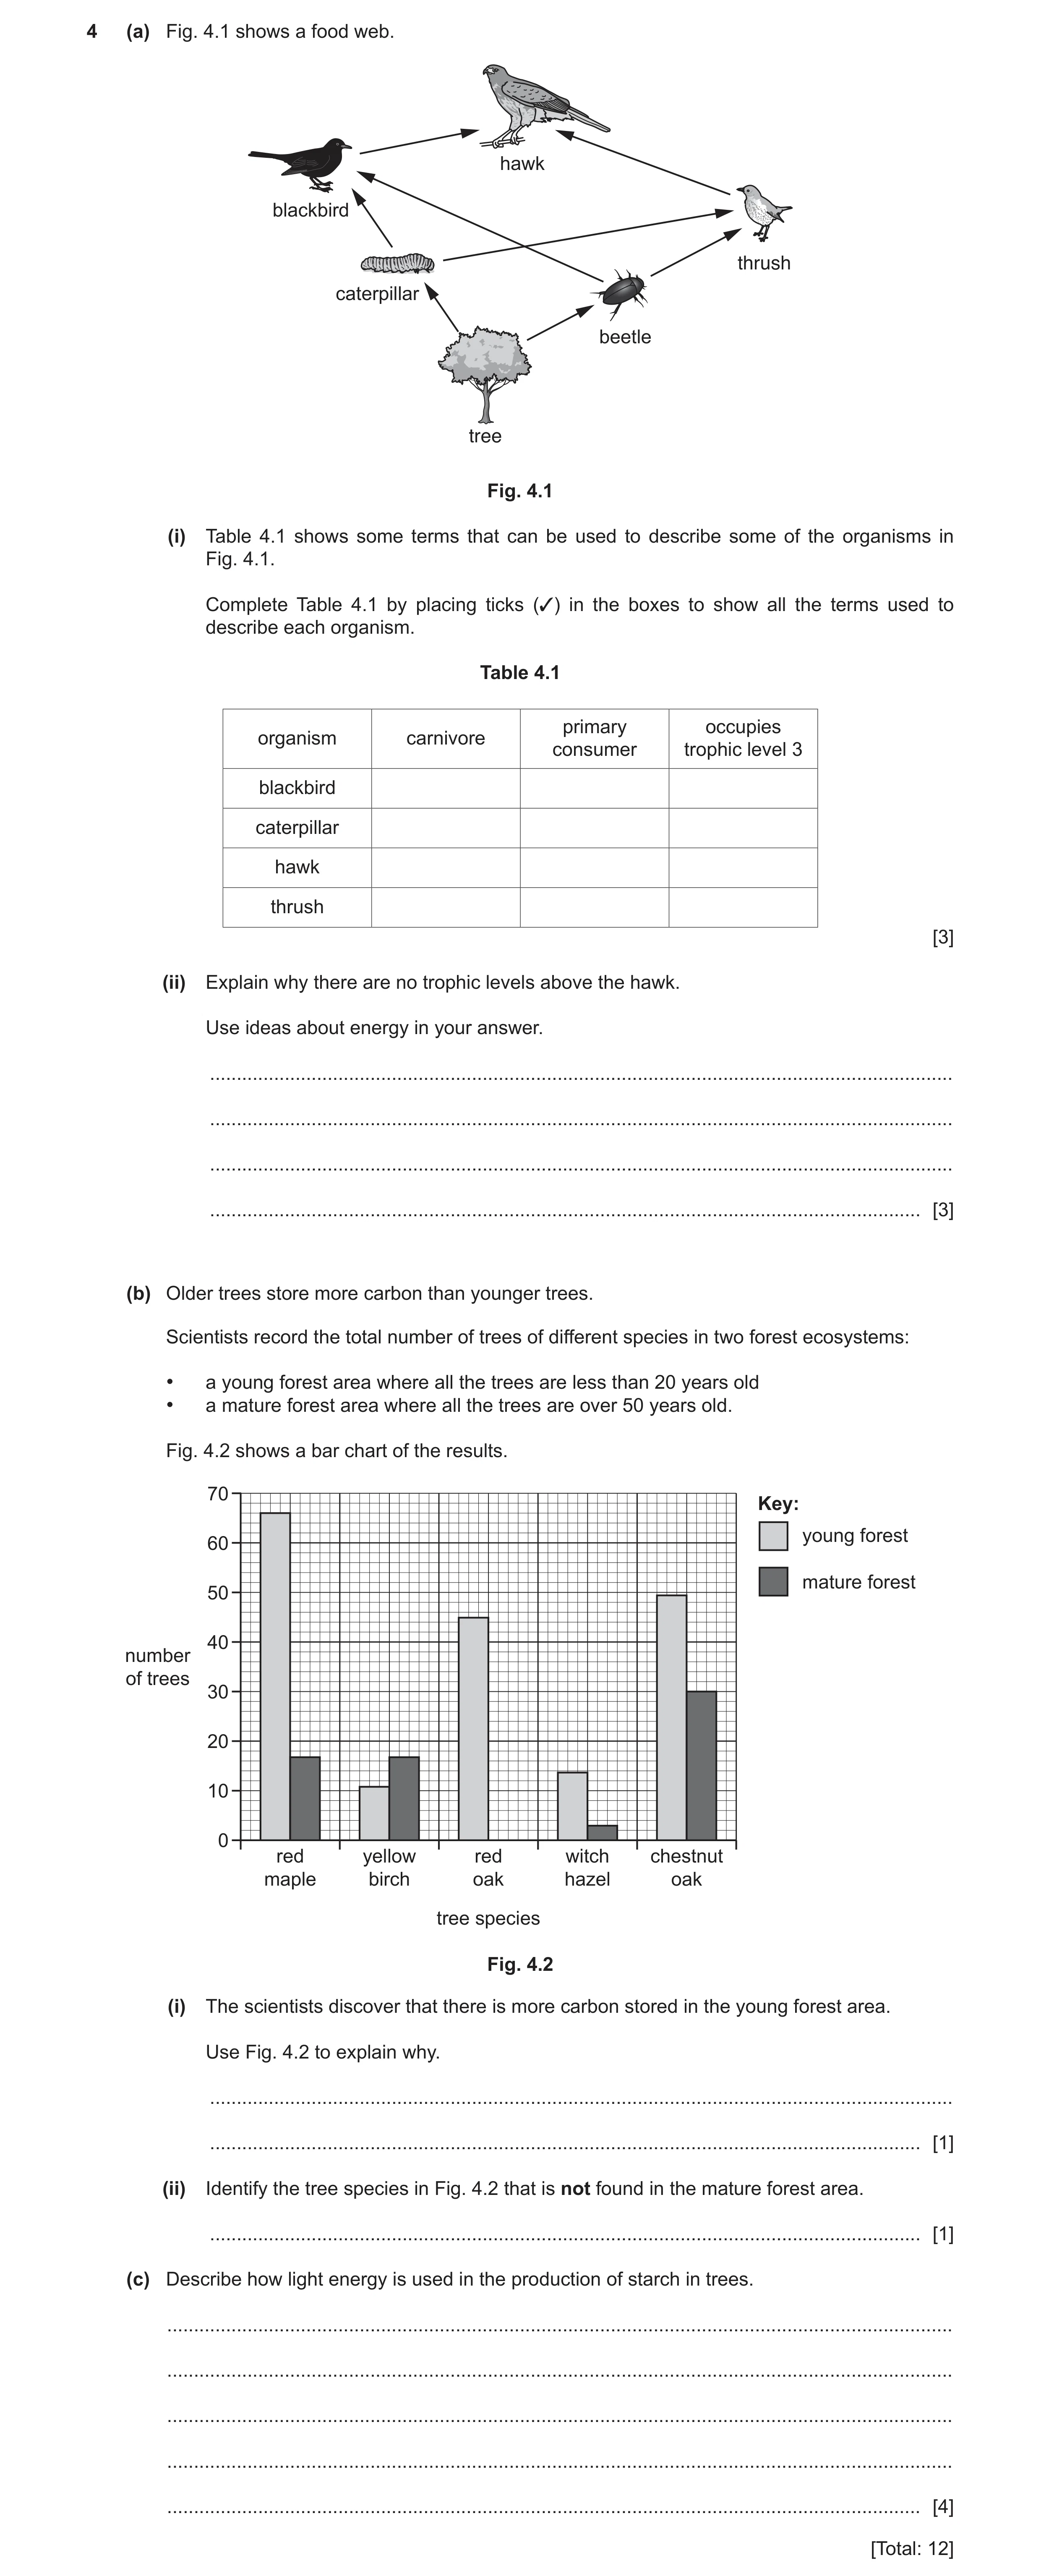
 38 / 47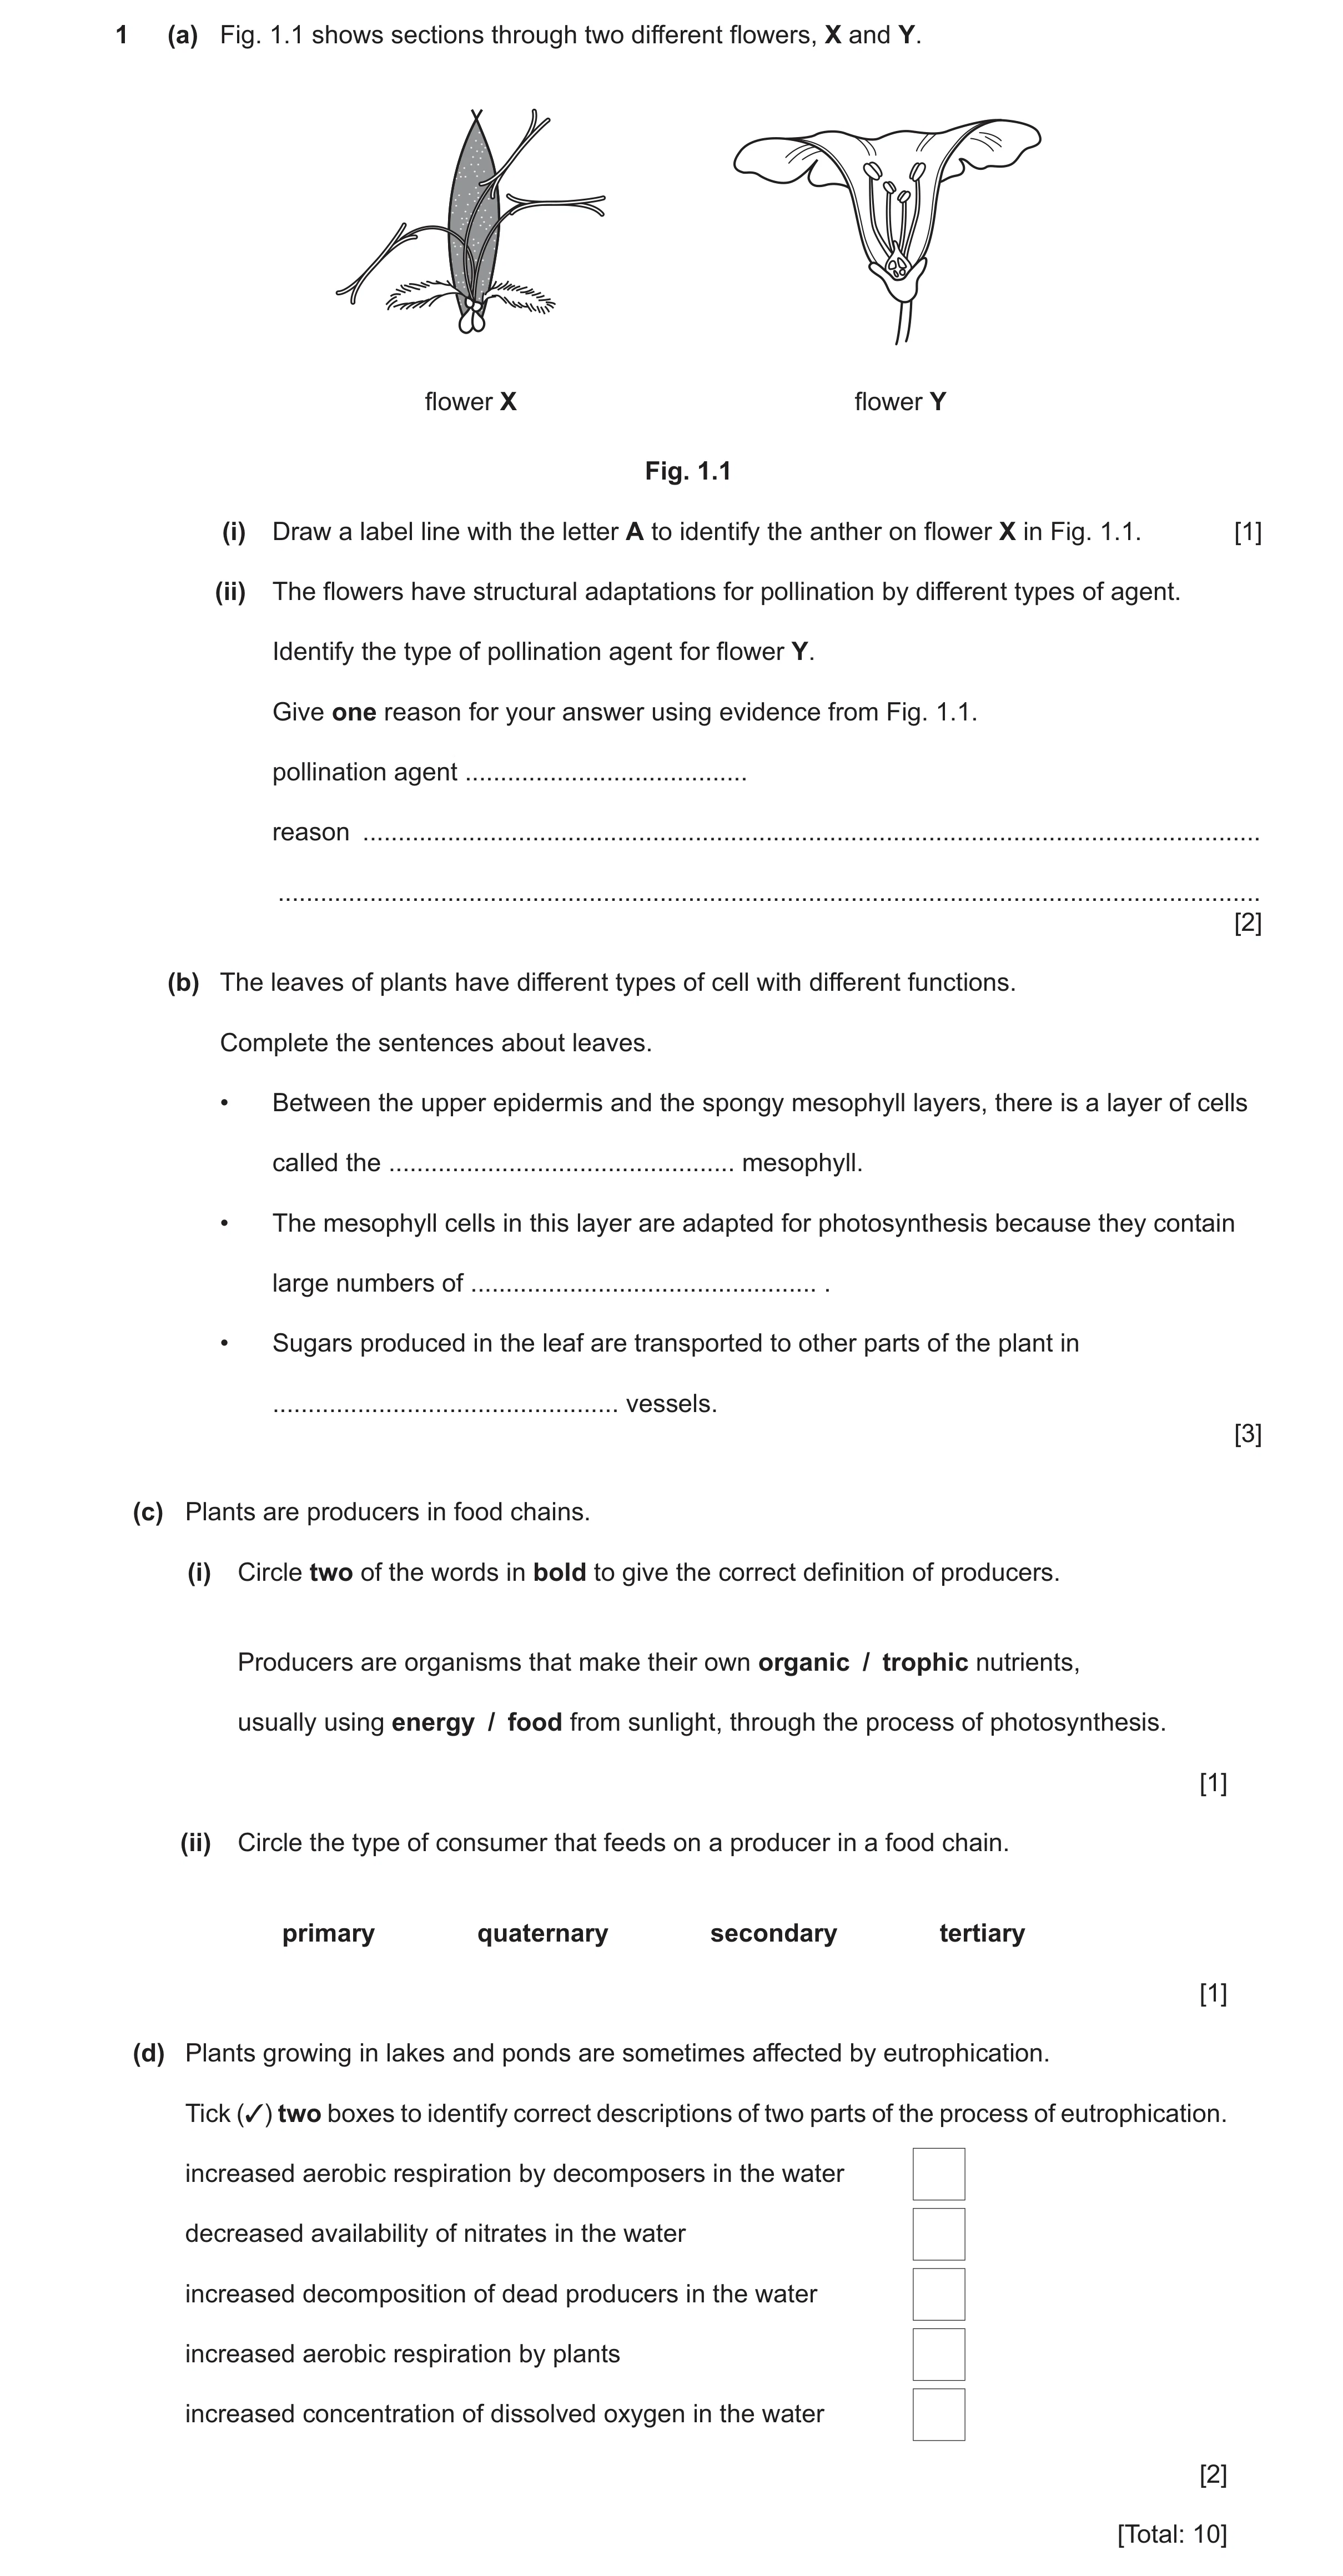
 41 / 47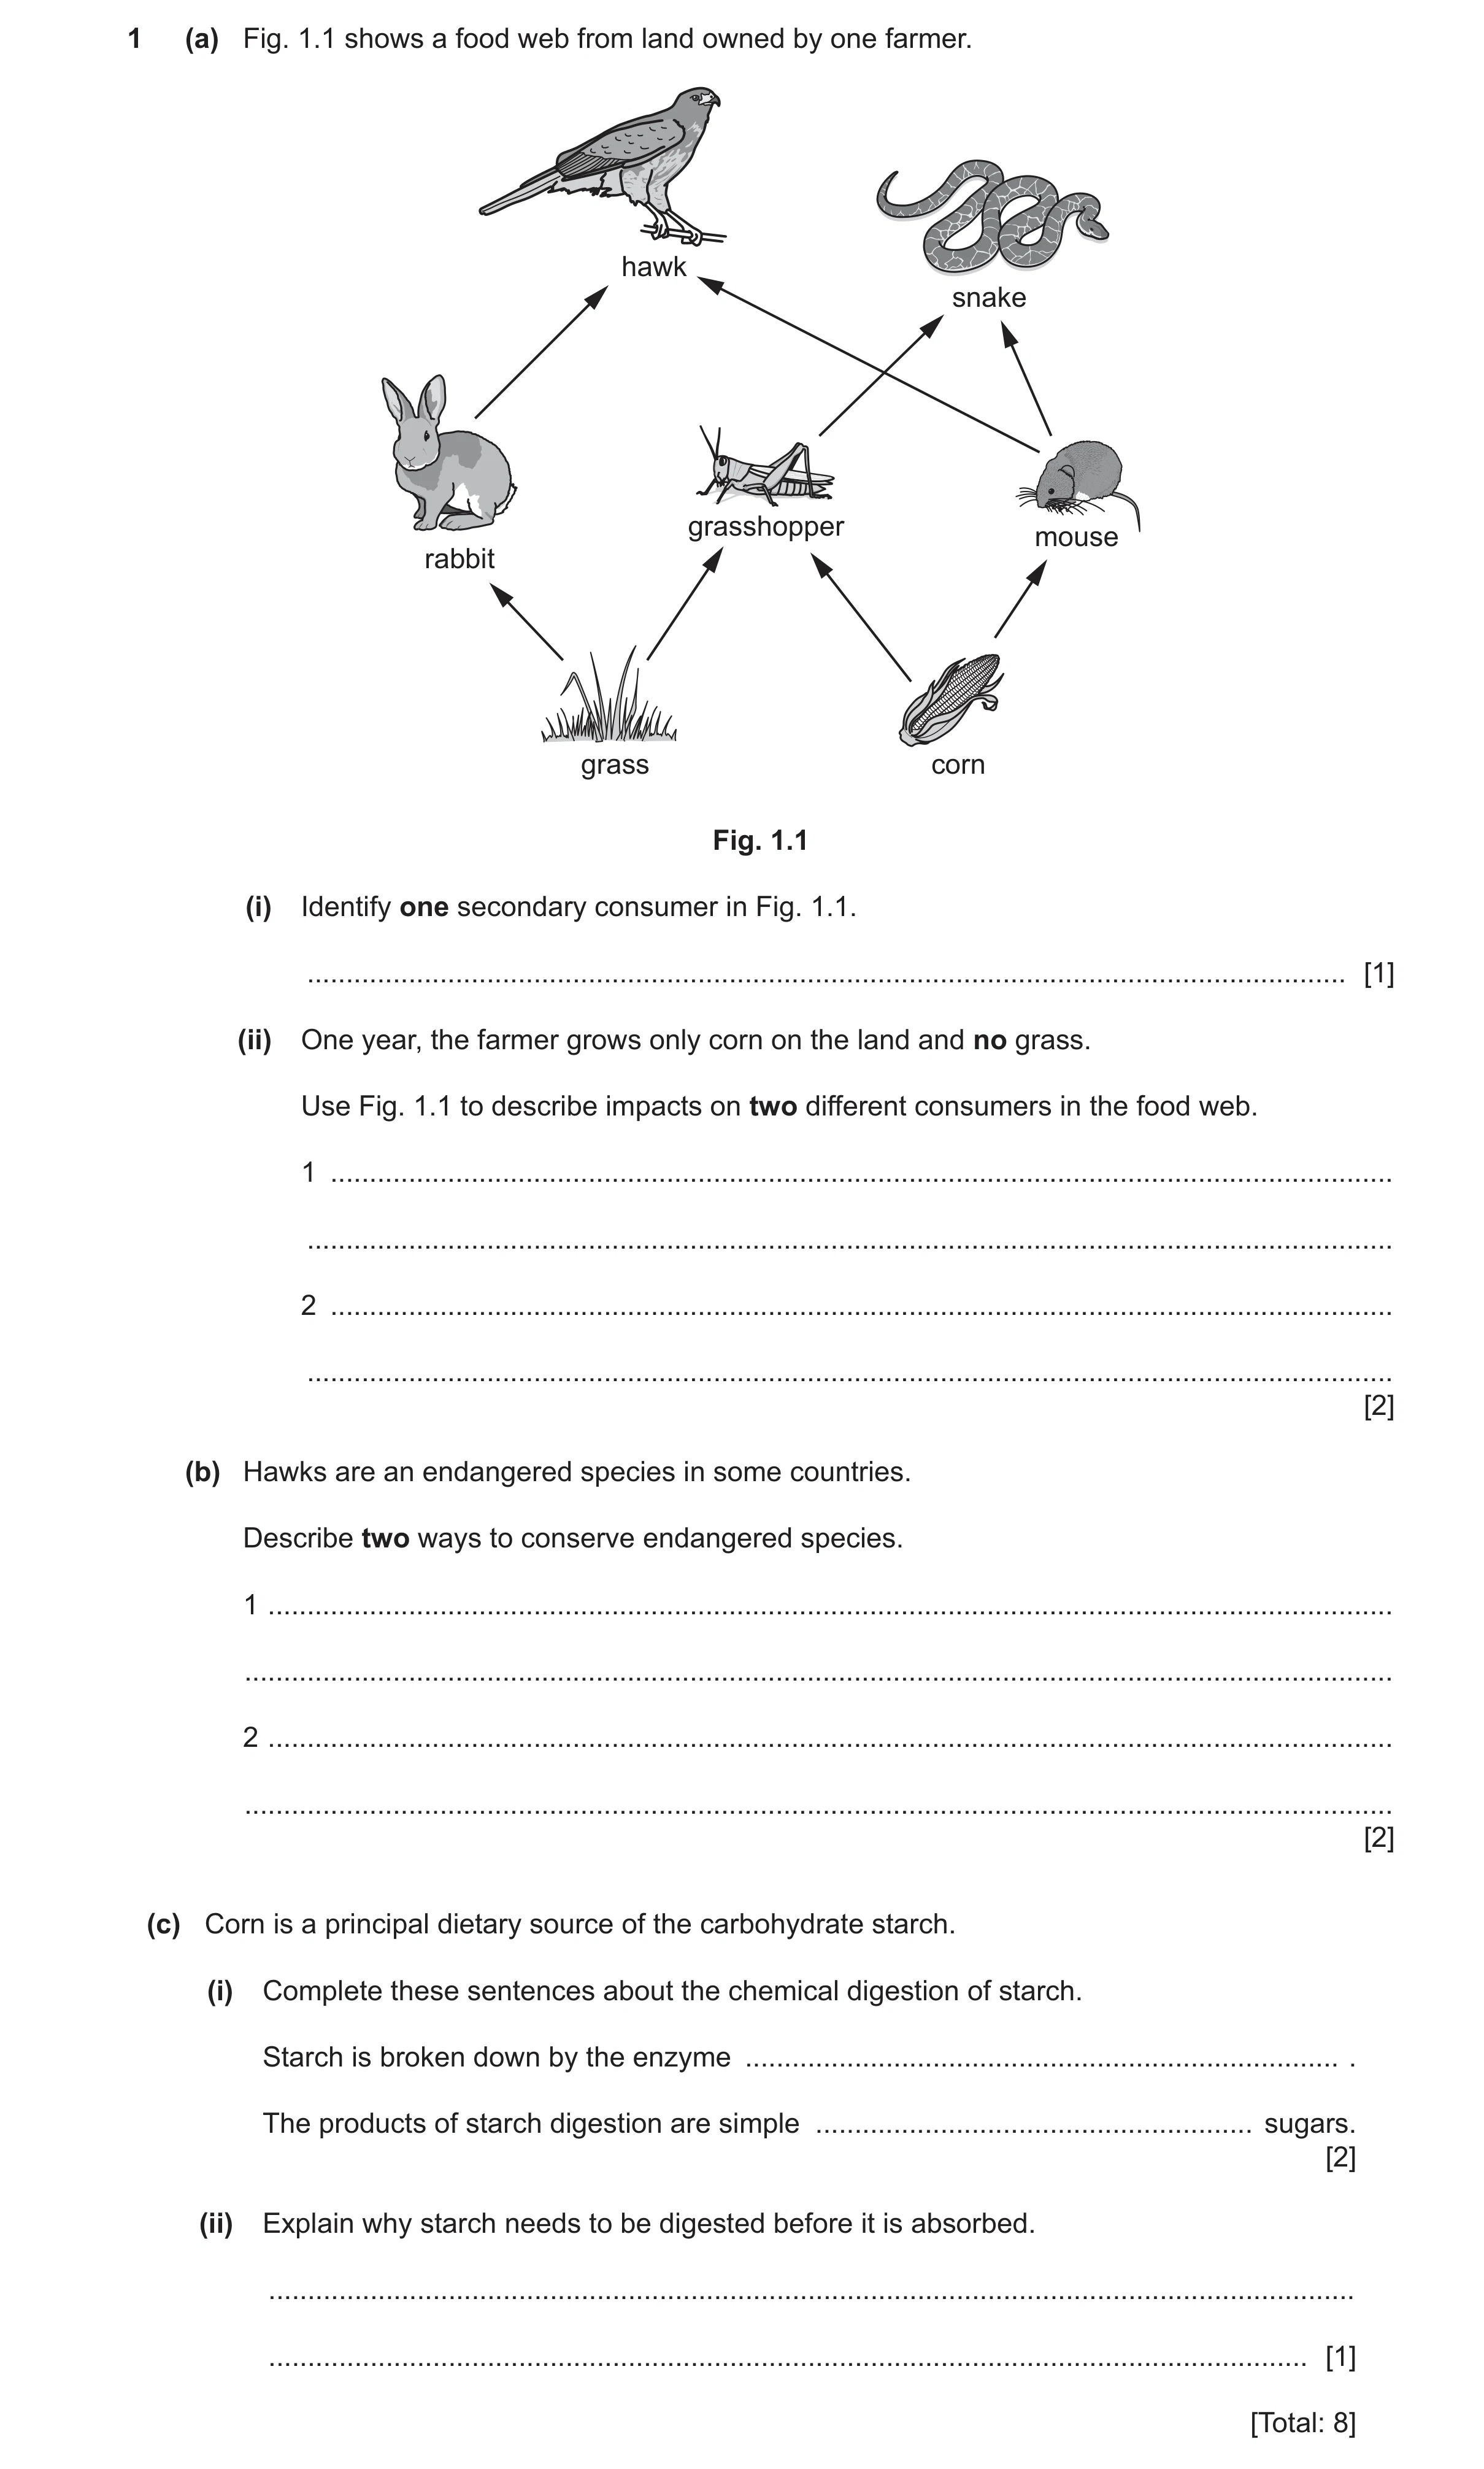
 10
10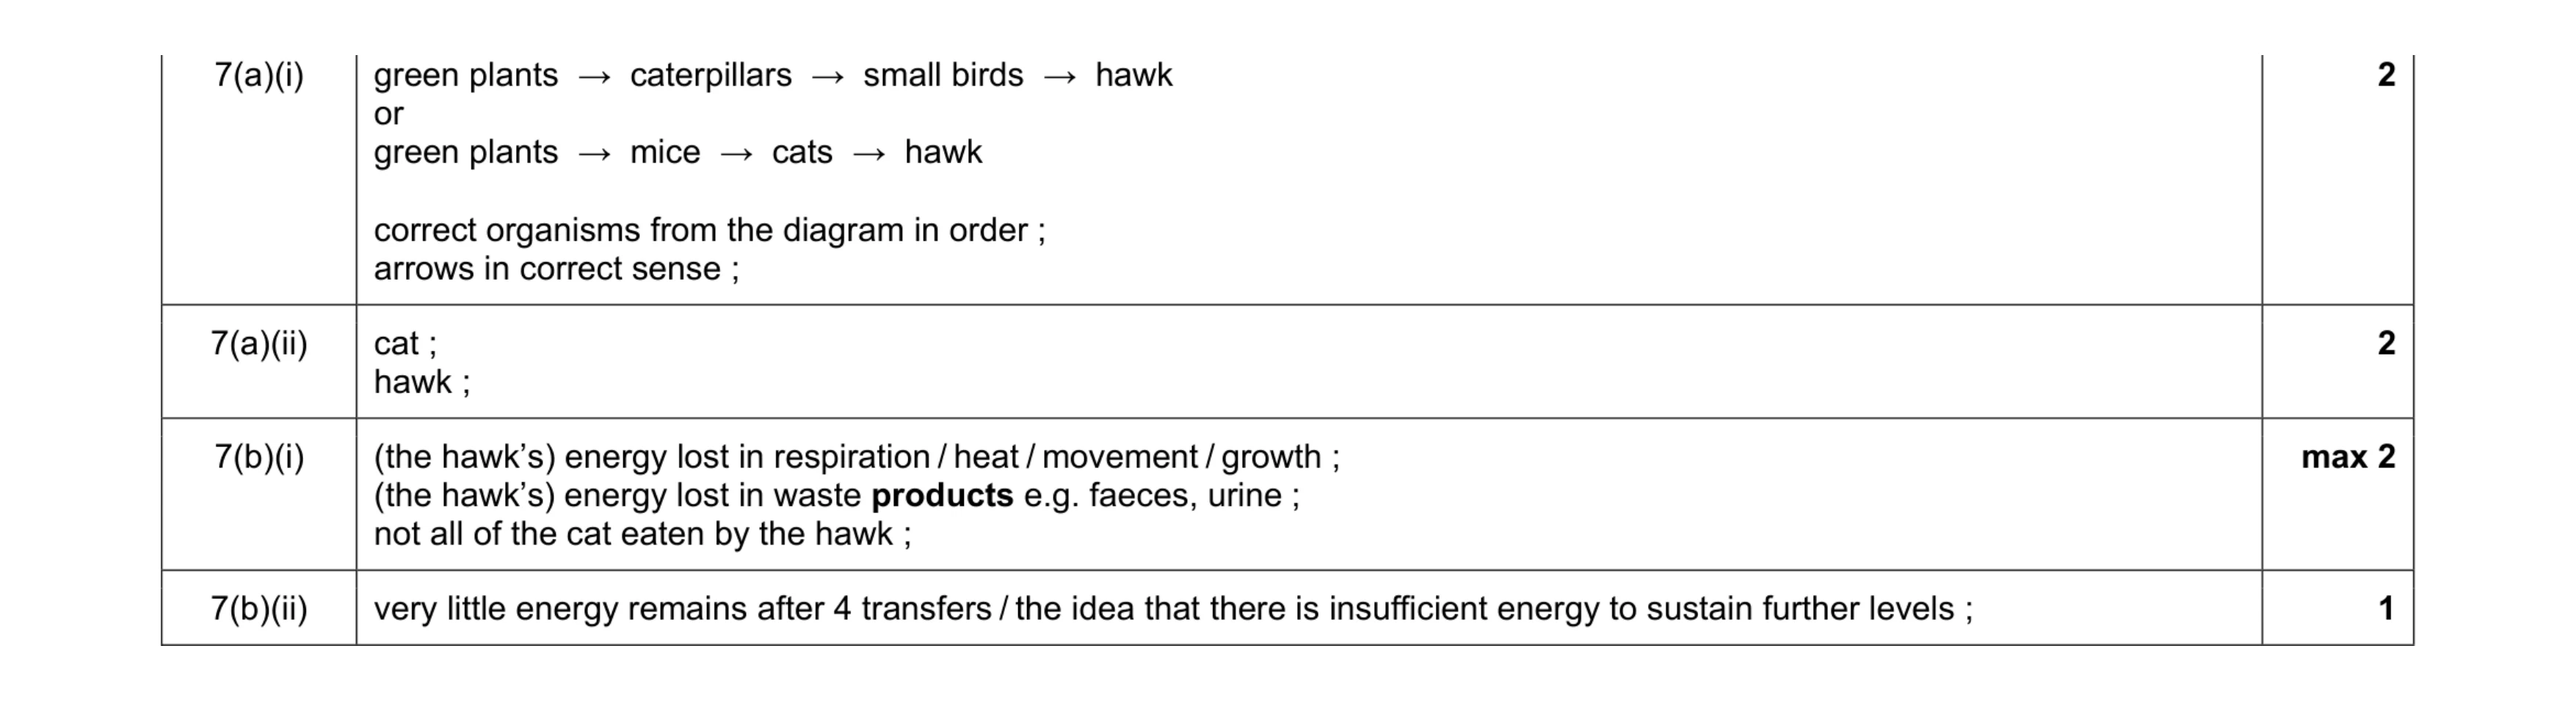 7
7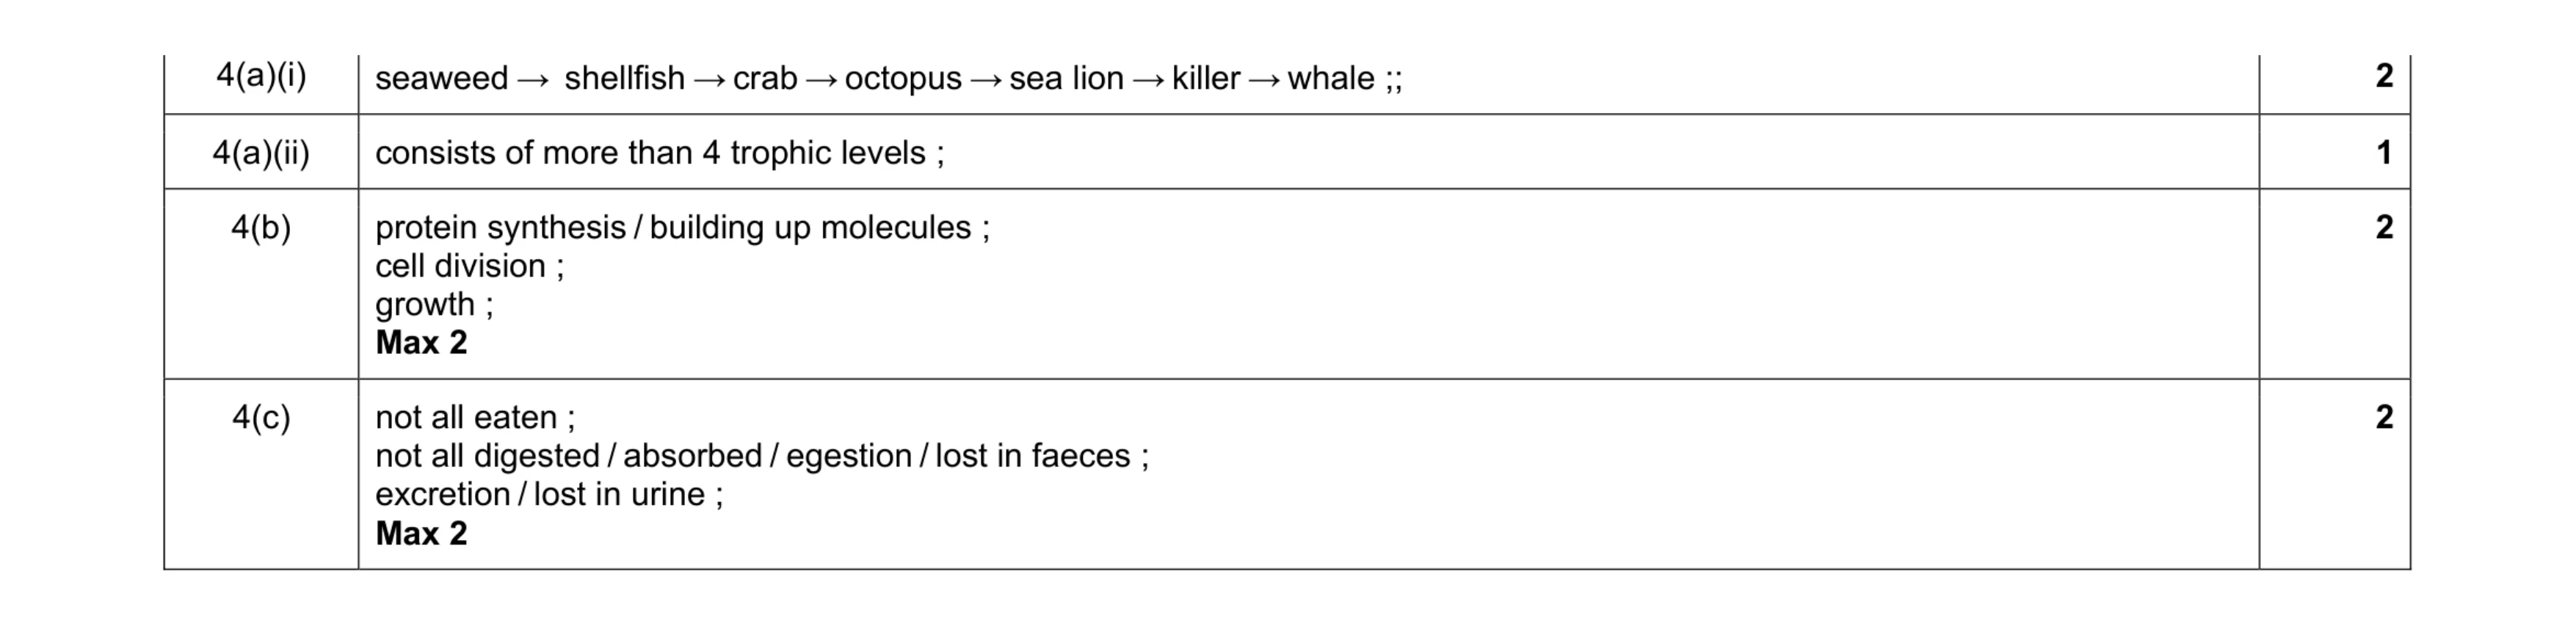 7
7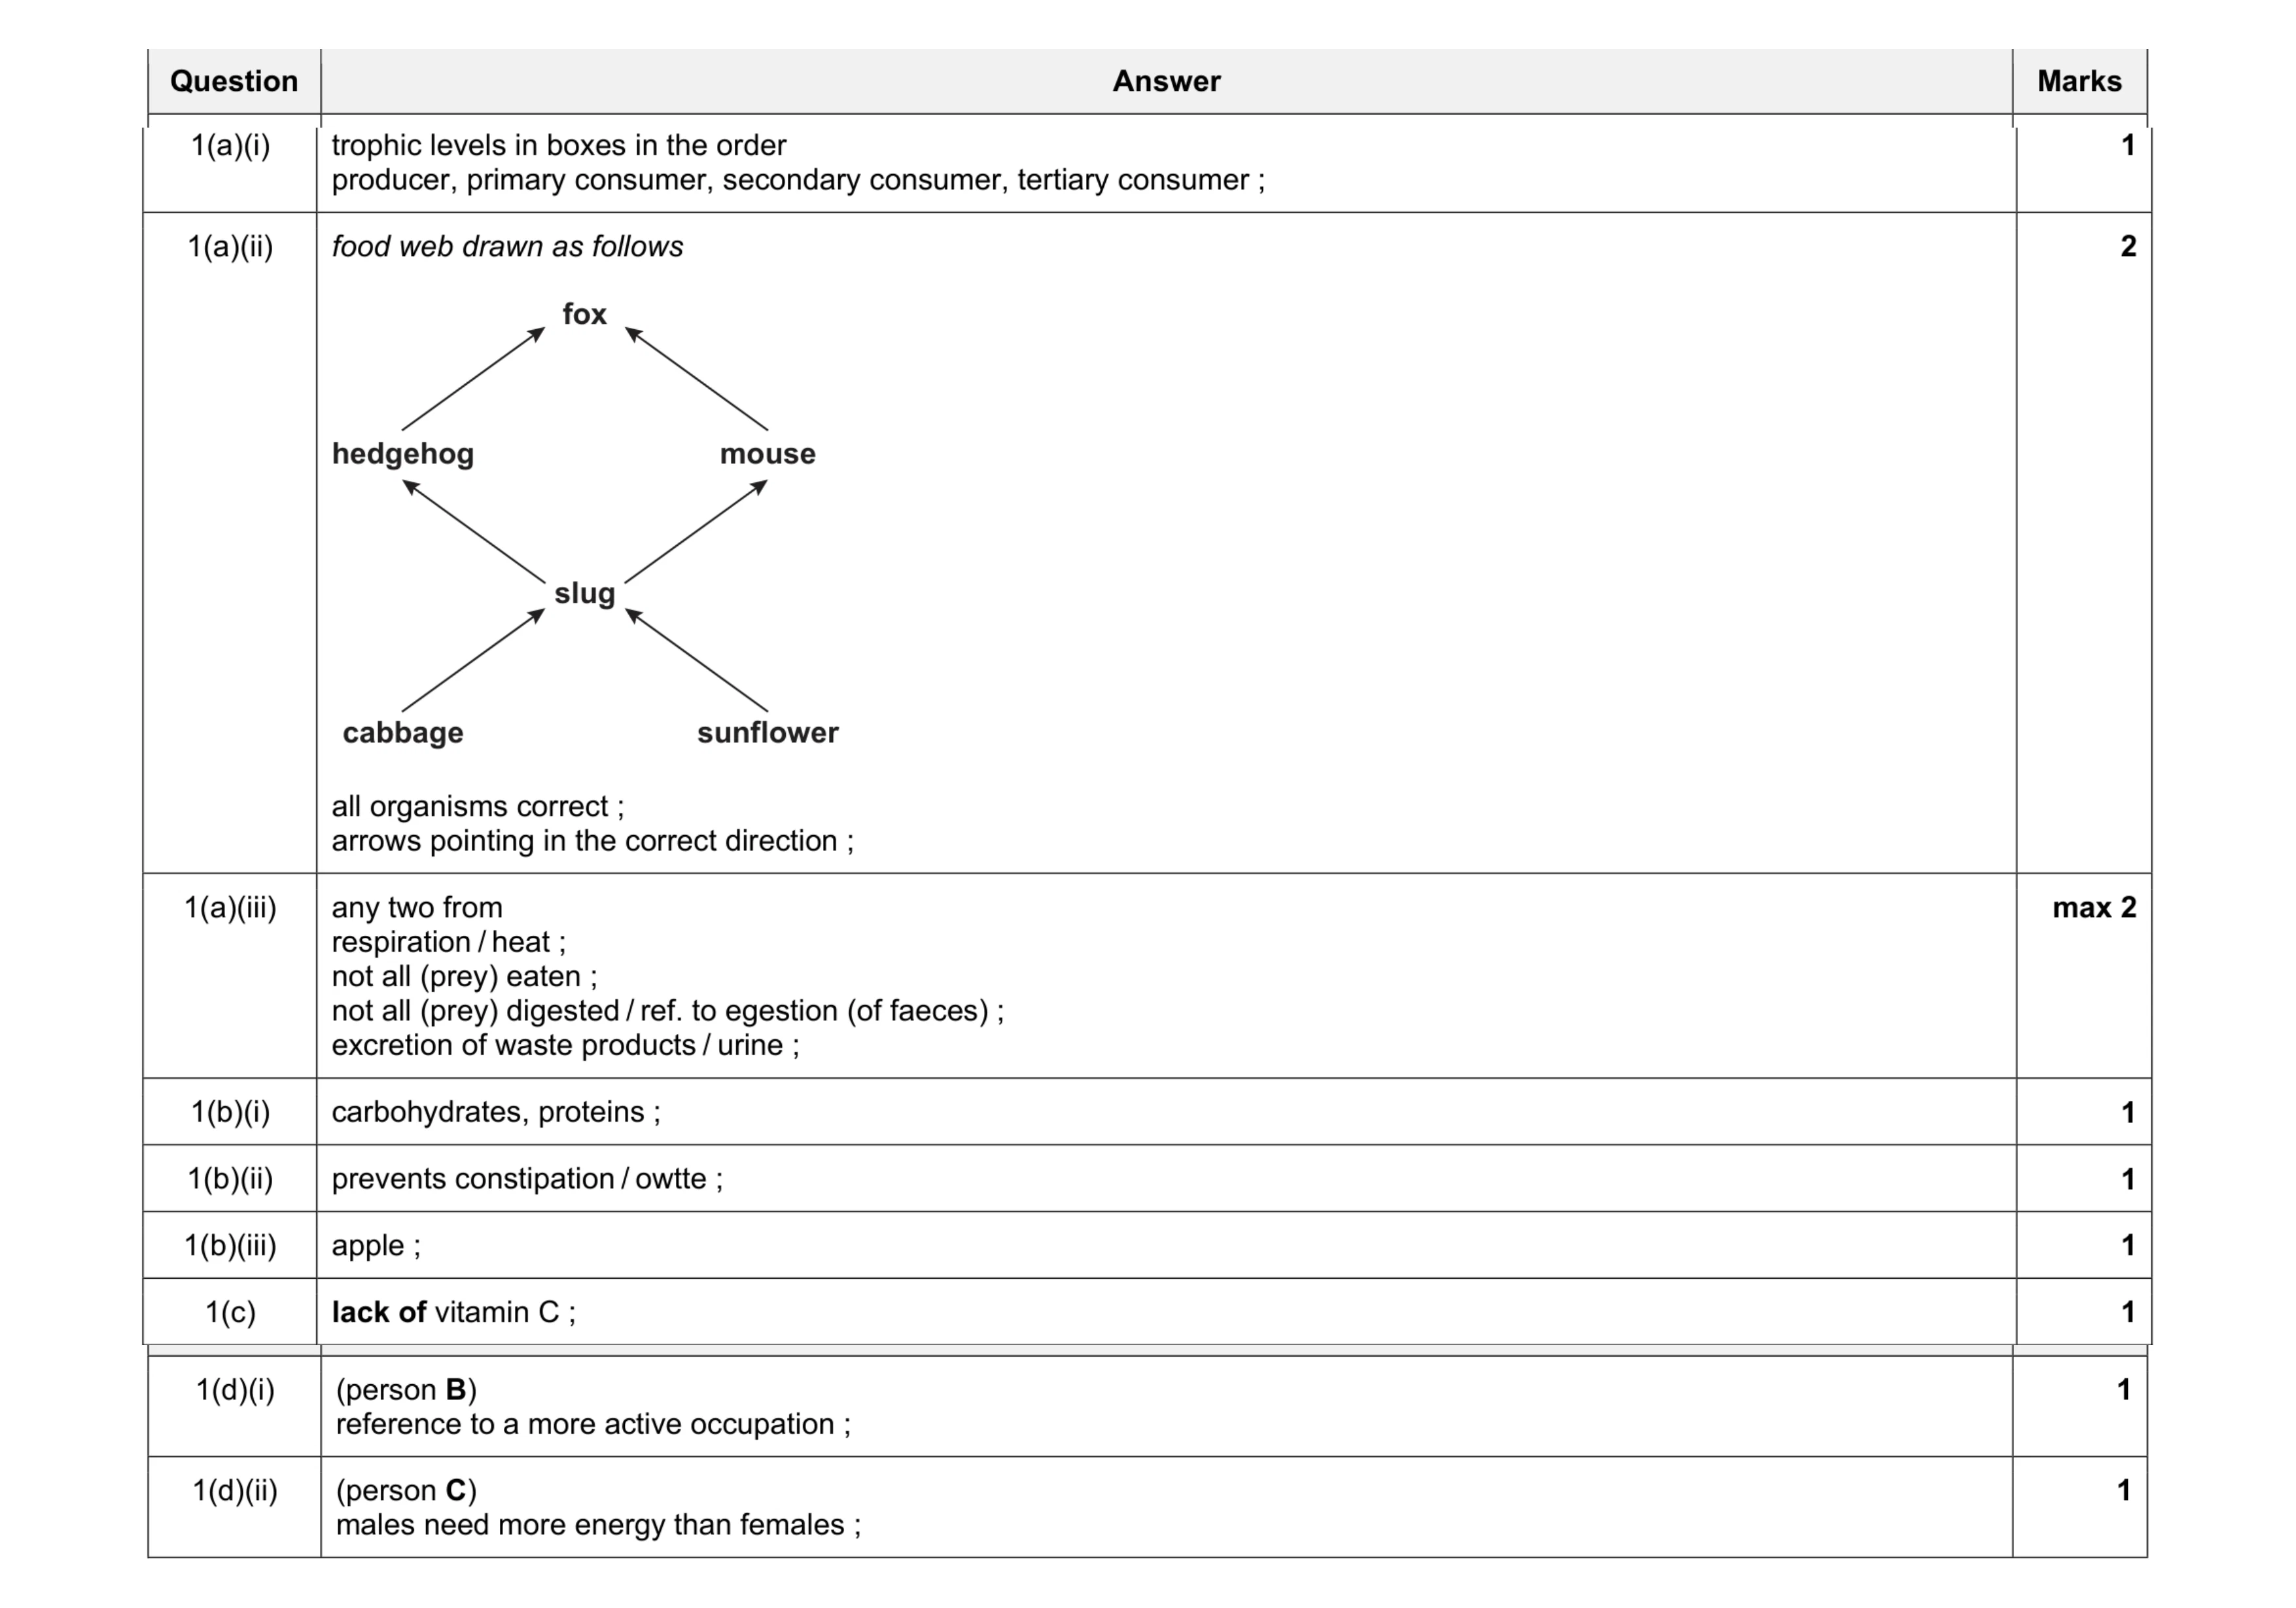 11
11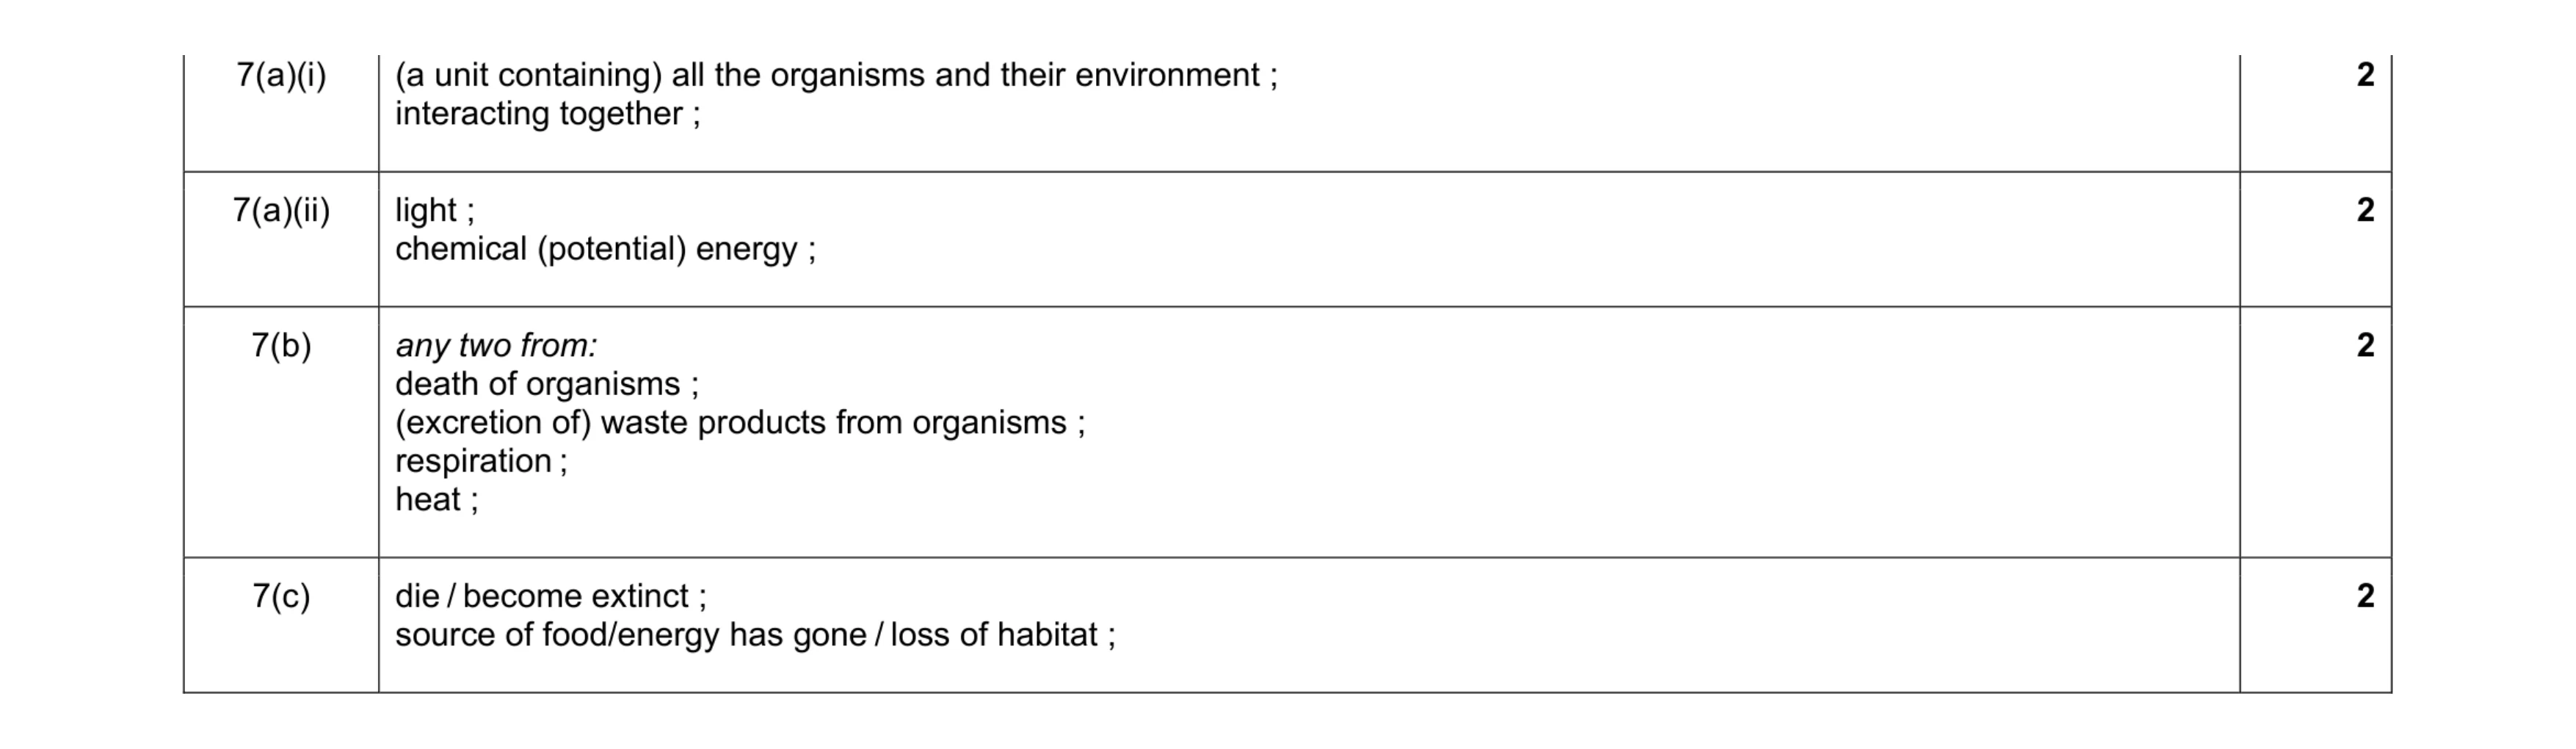 8
8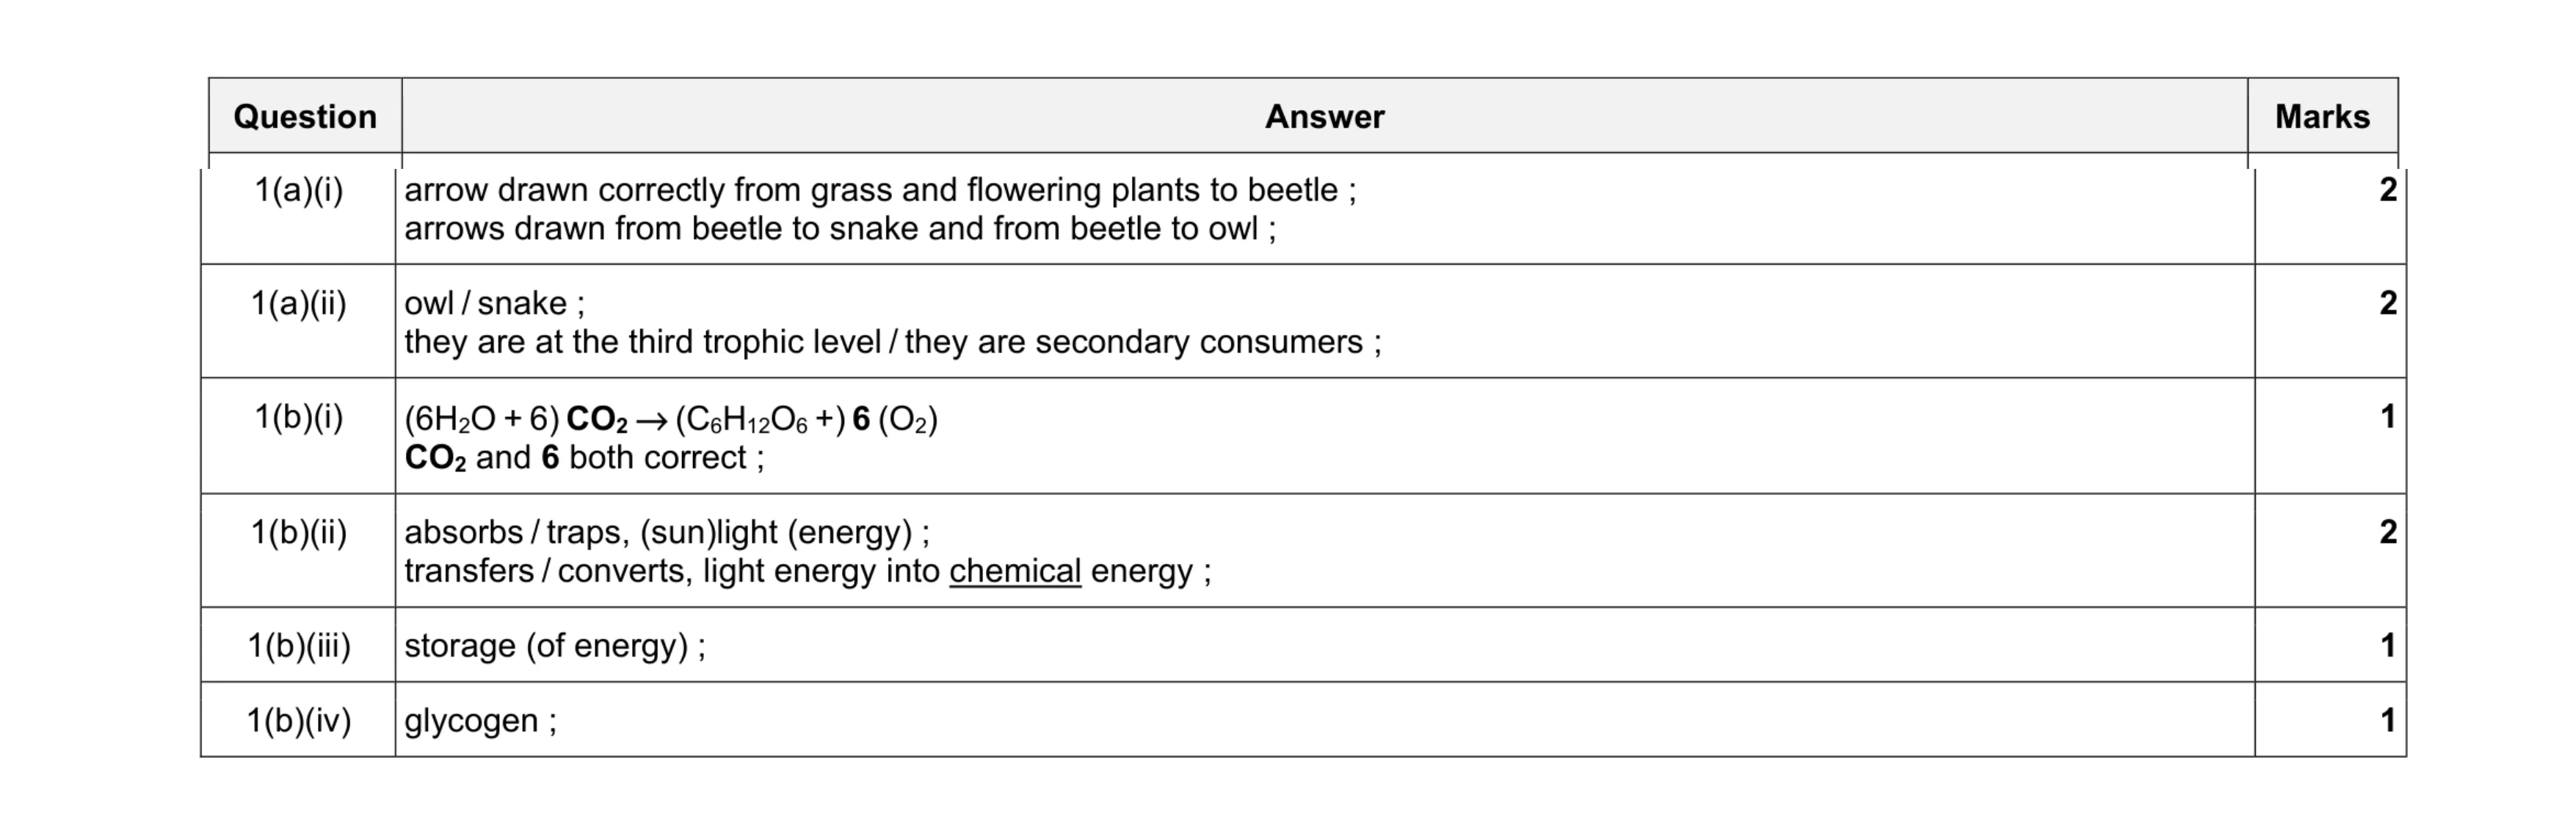 9
9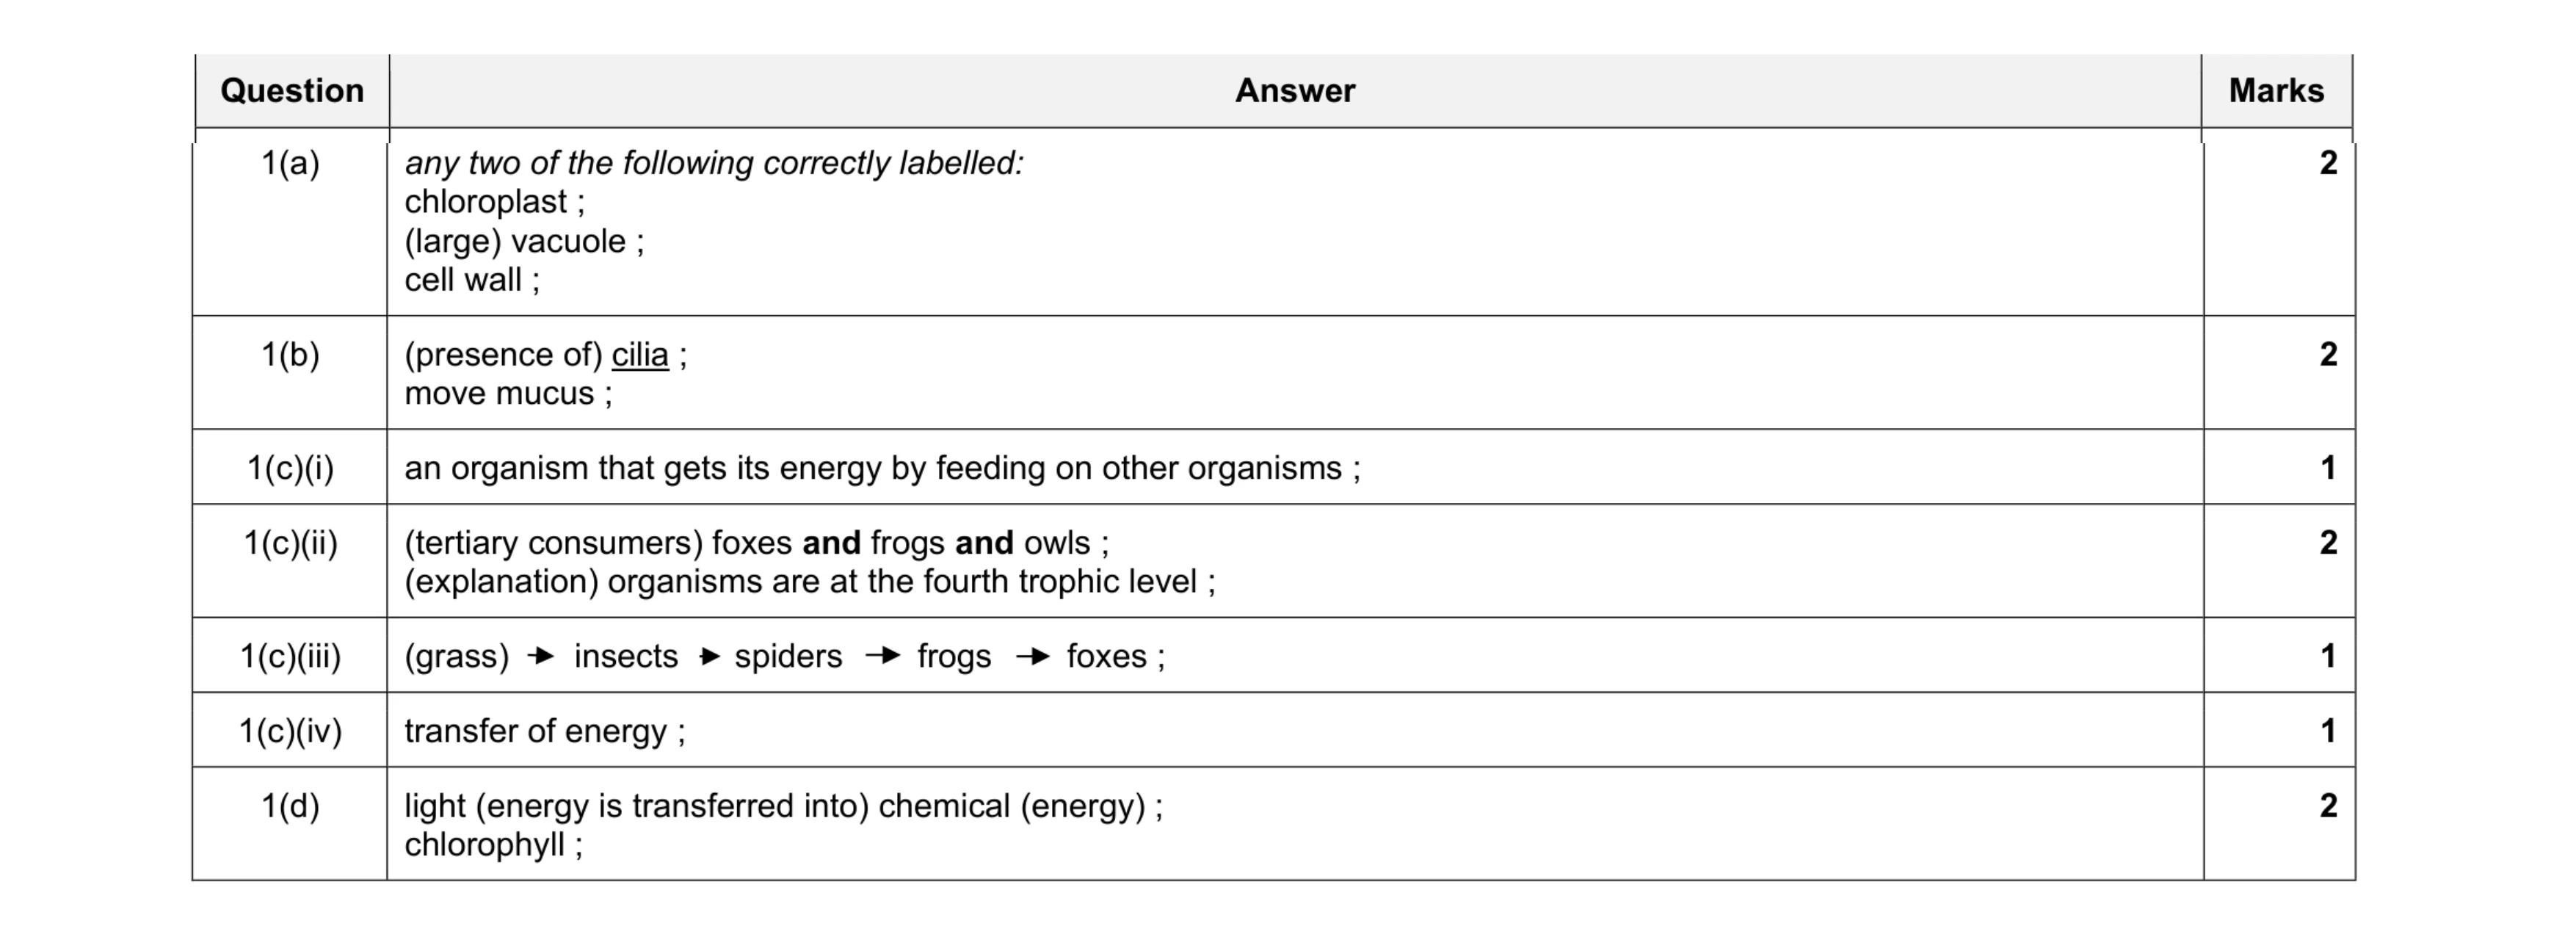 11
11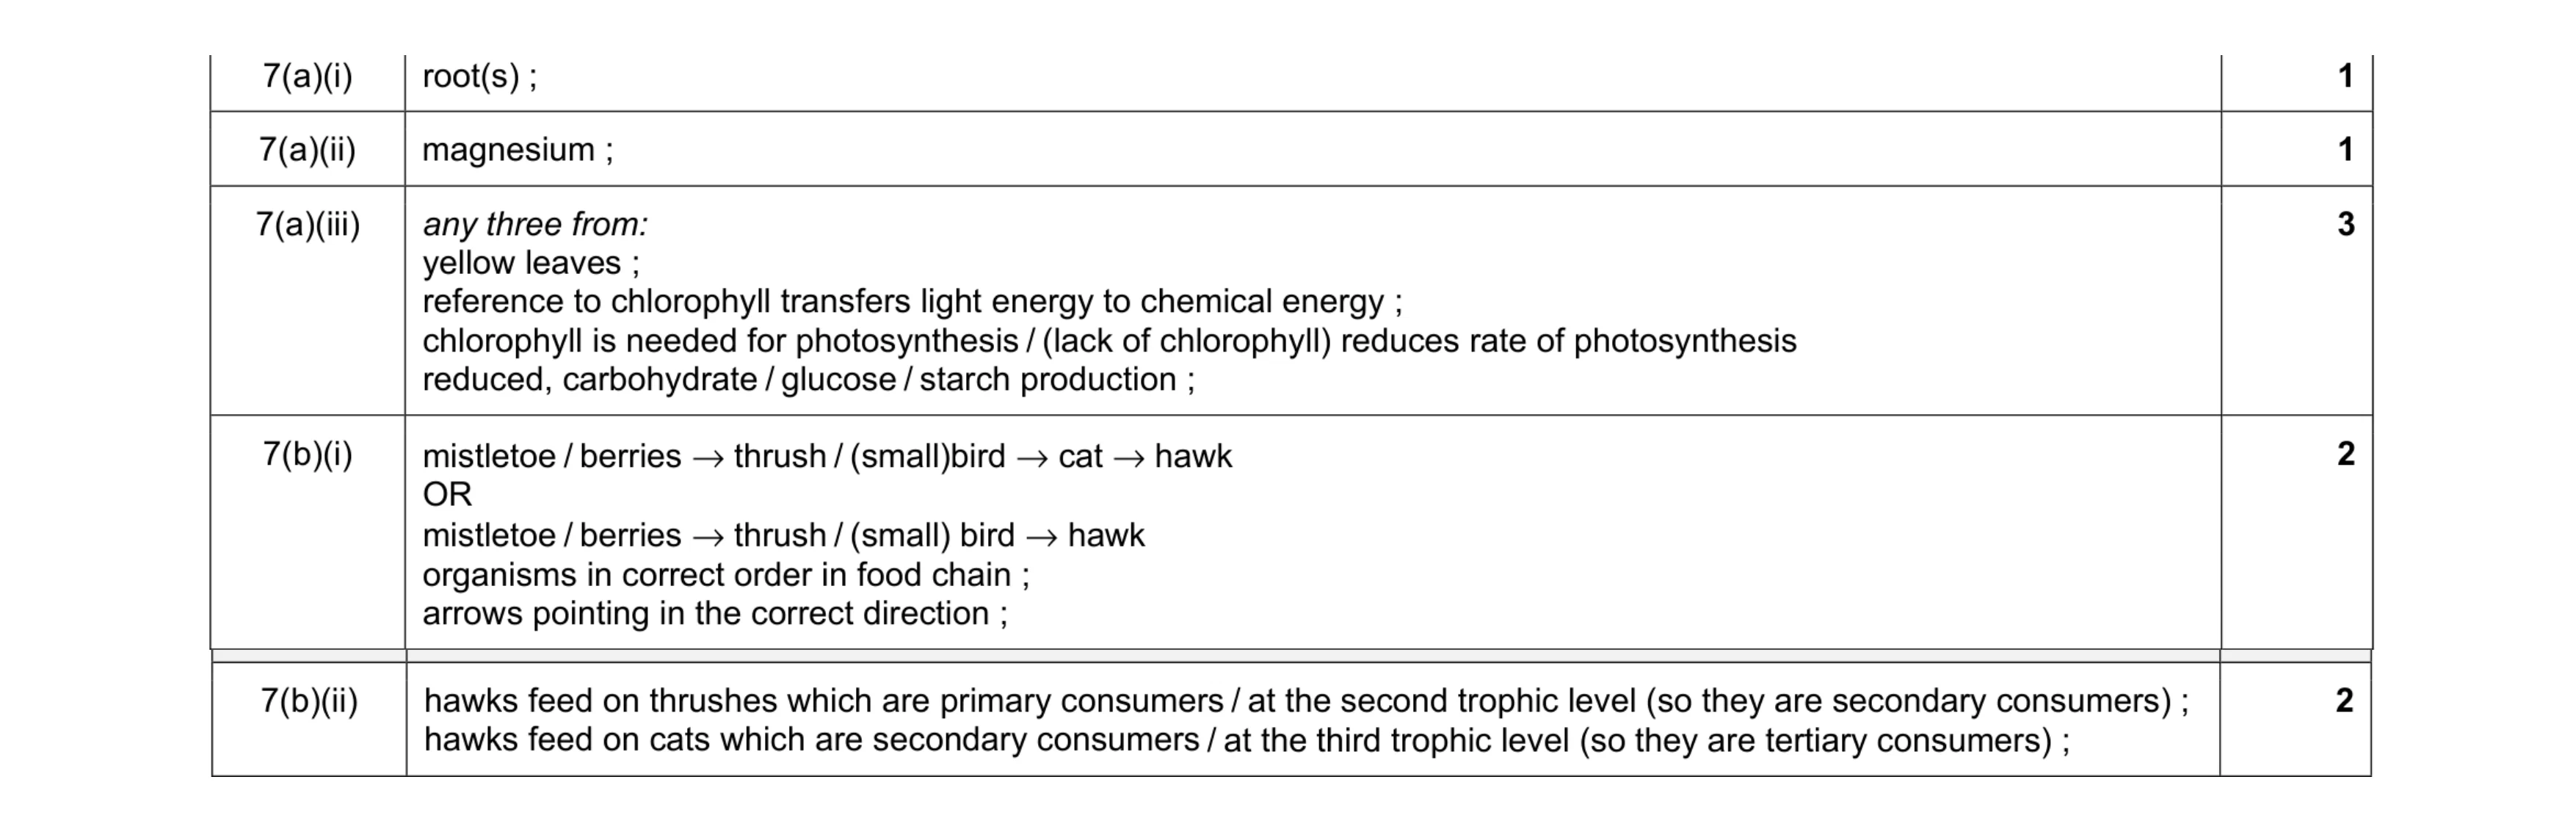 9
9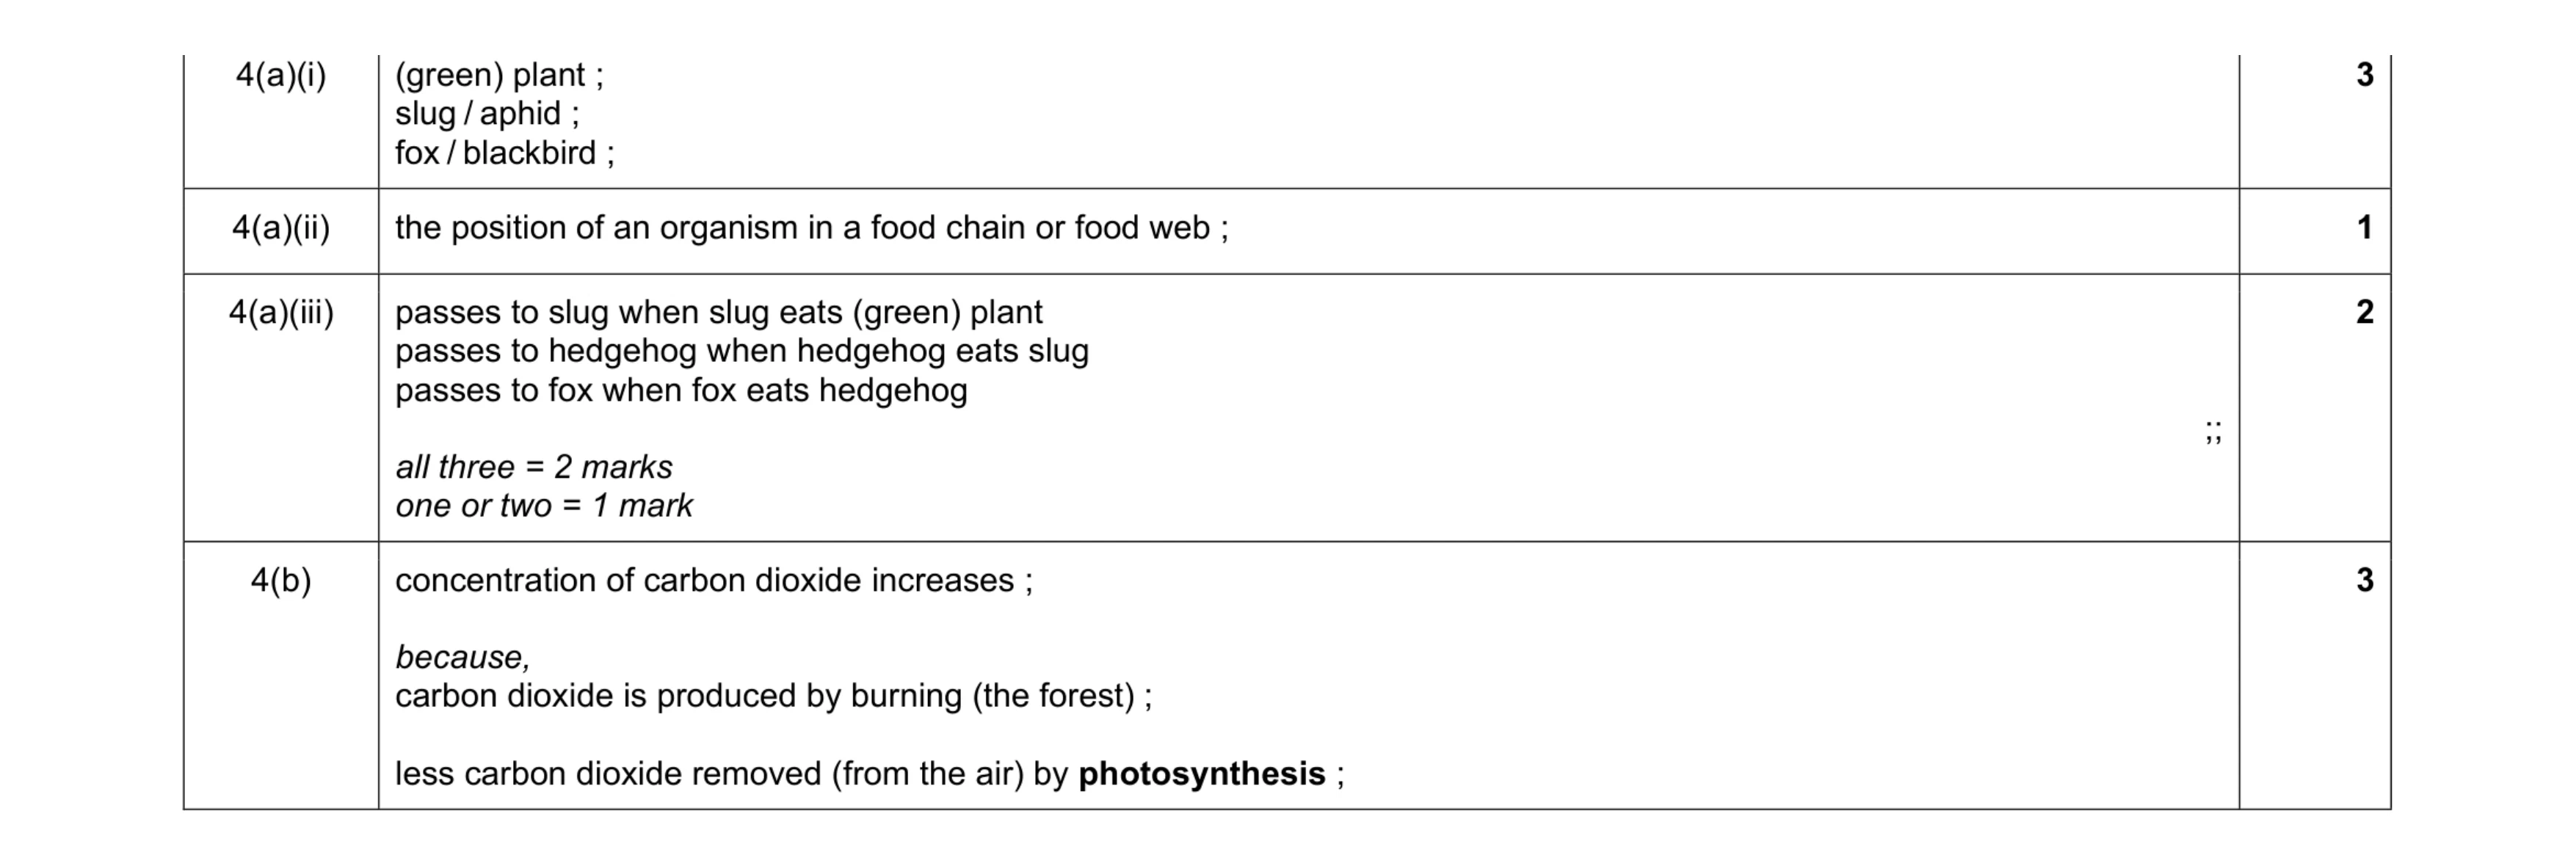 9
9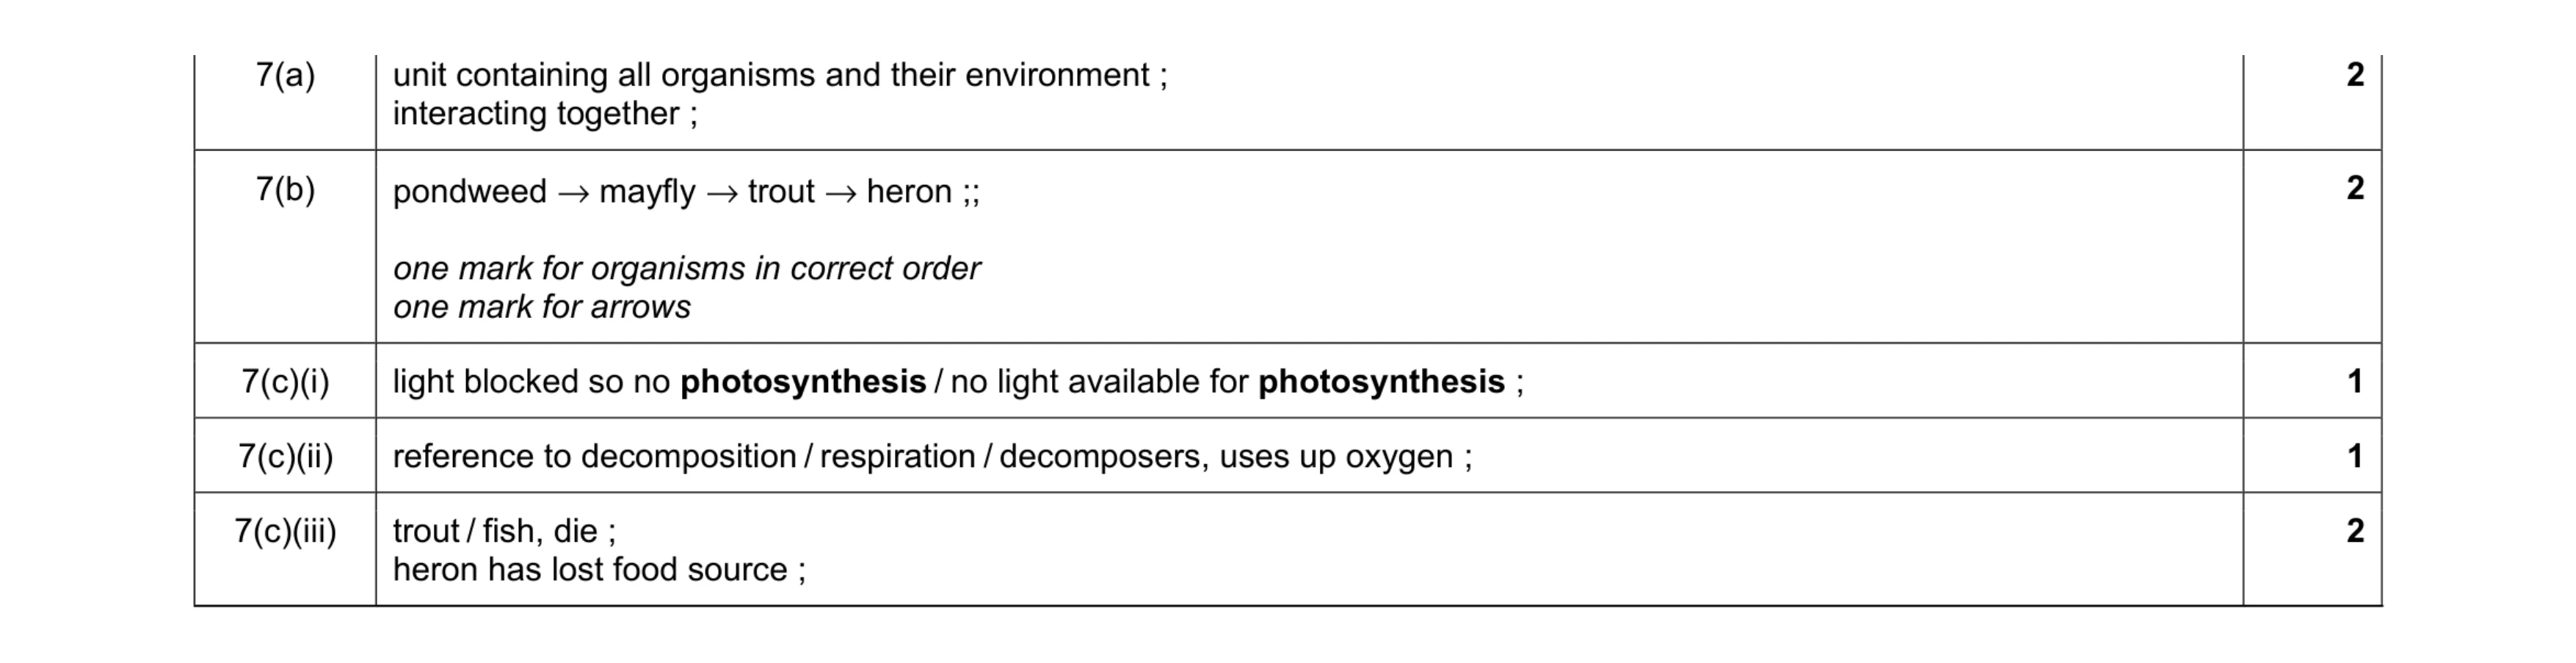 8
8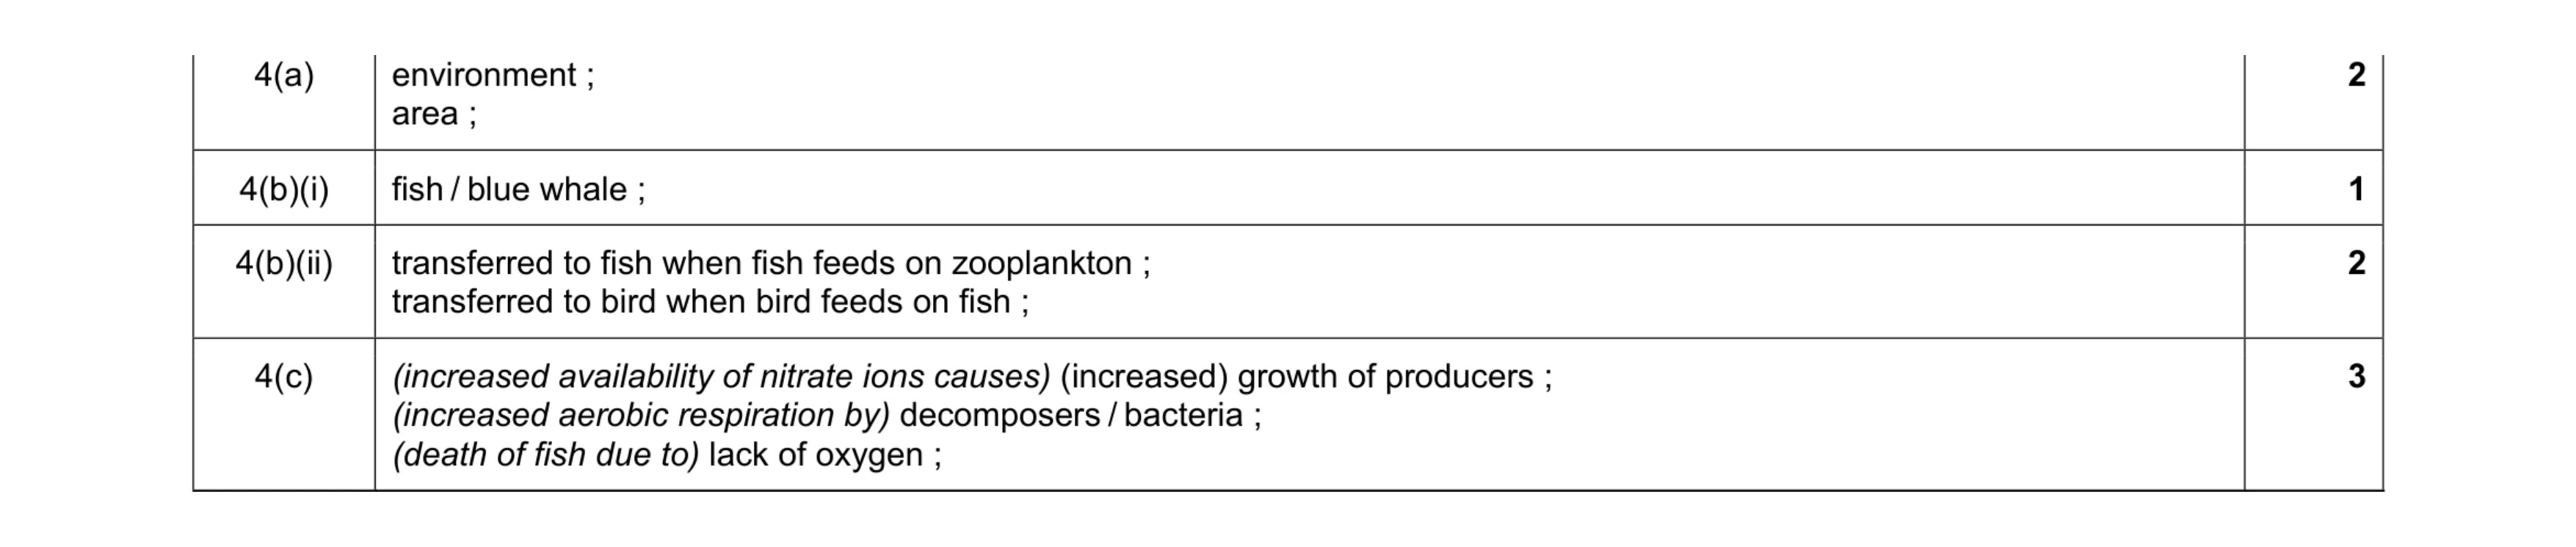 8
8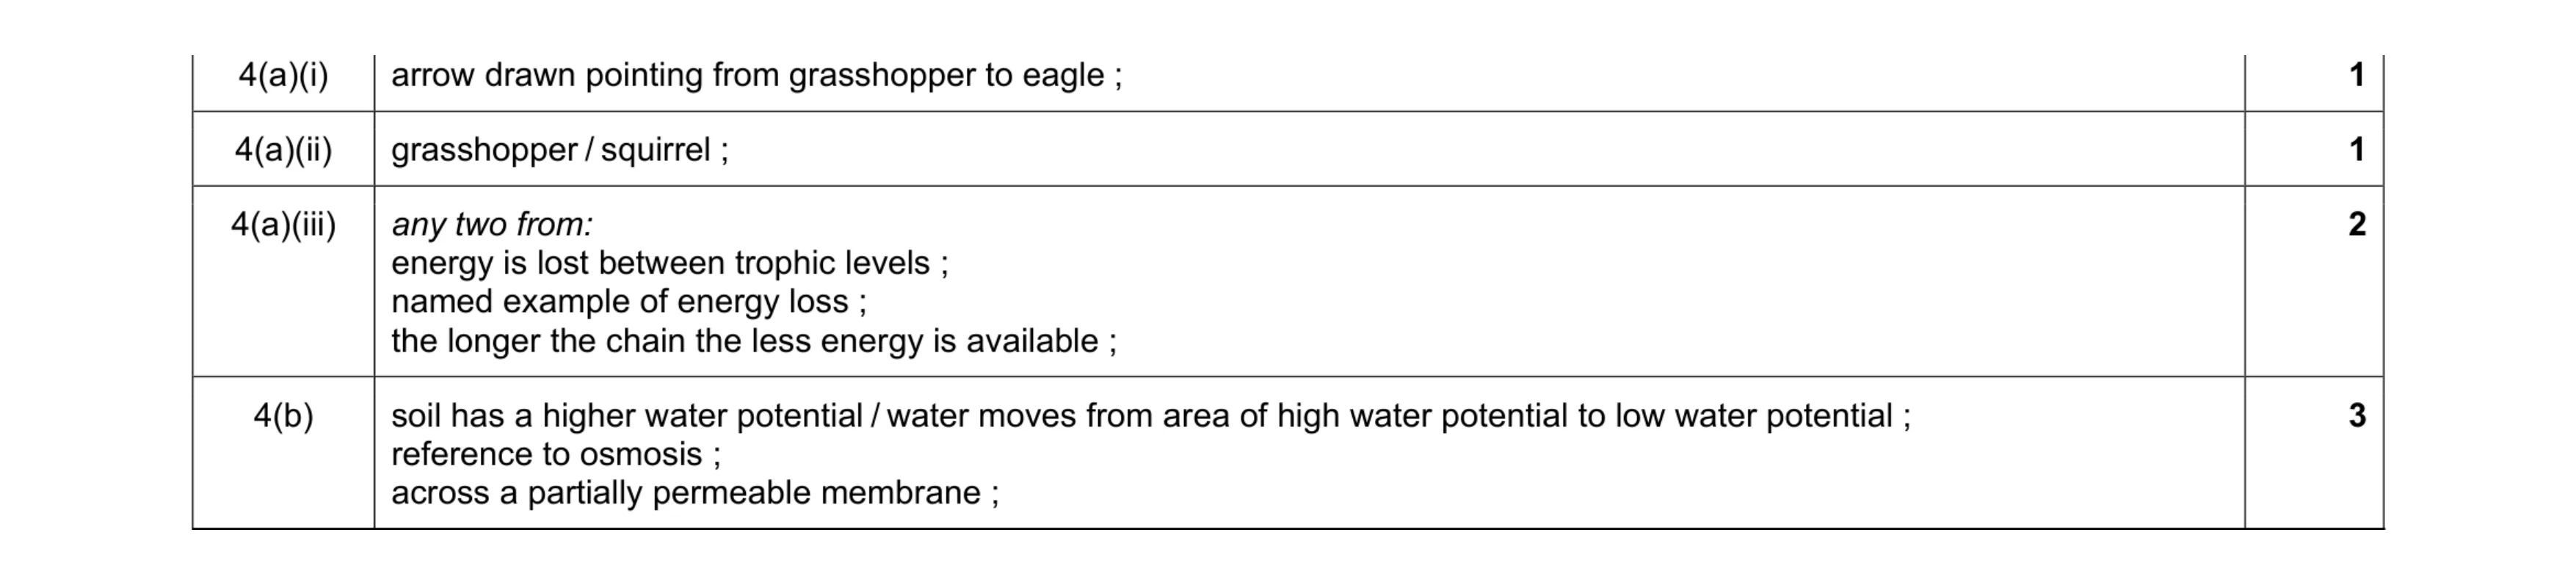 7
7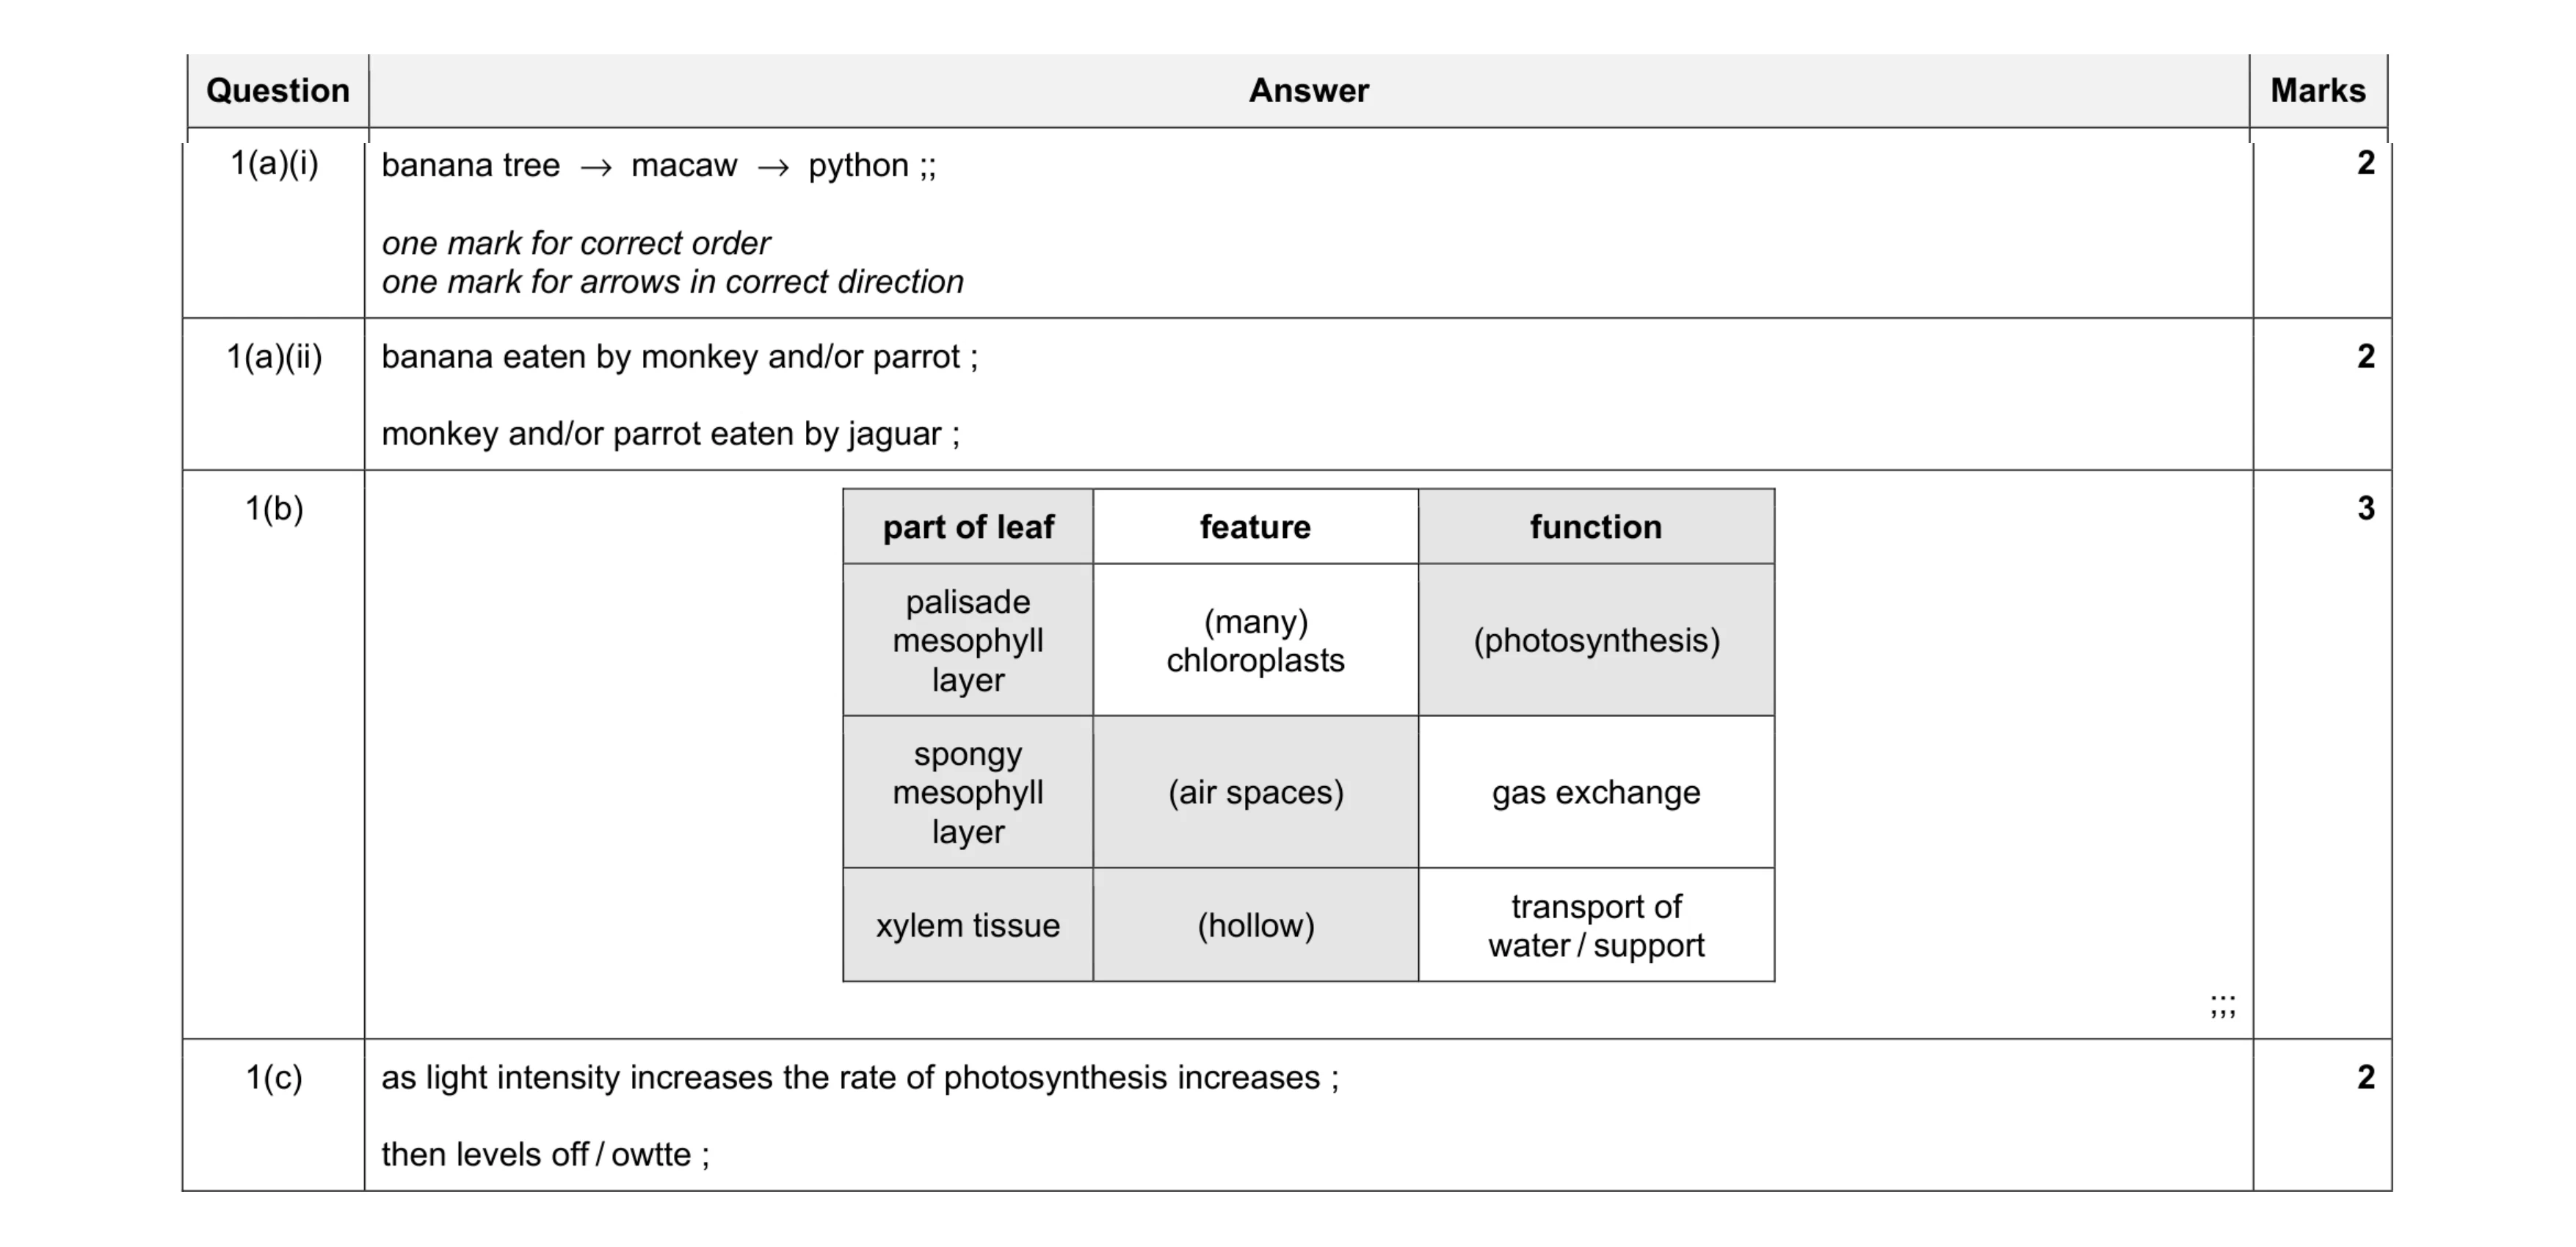 9
9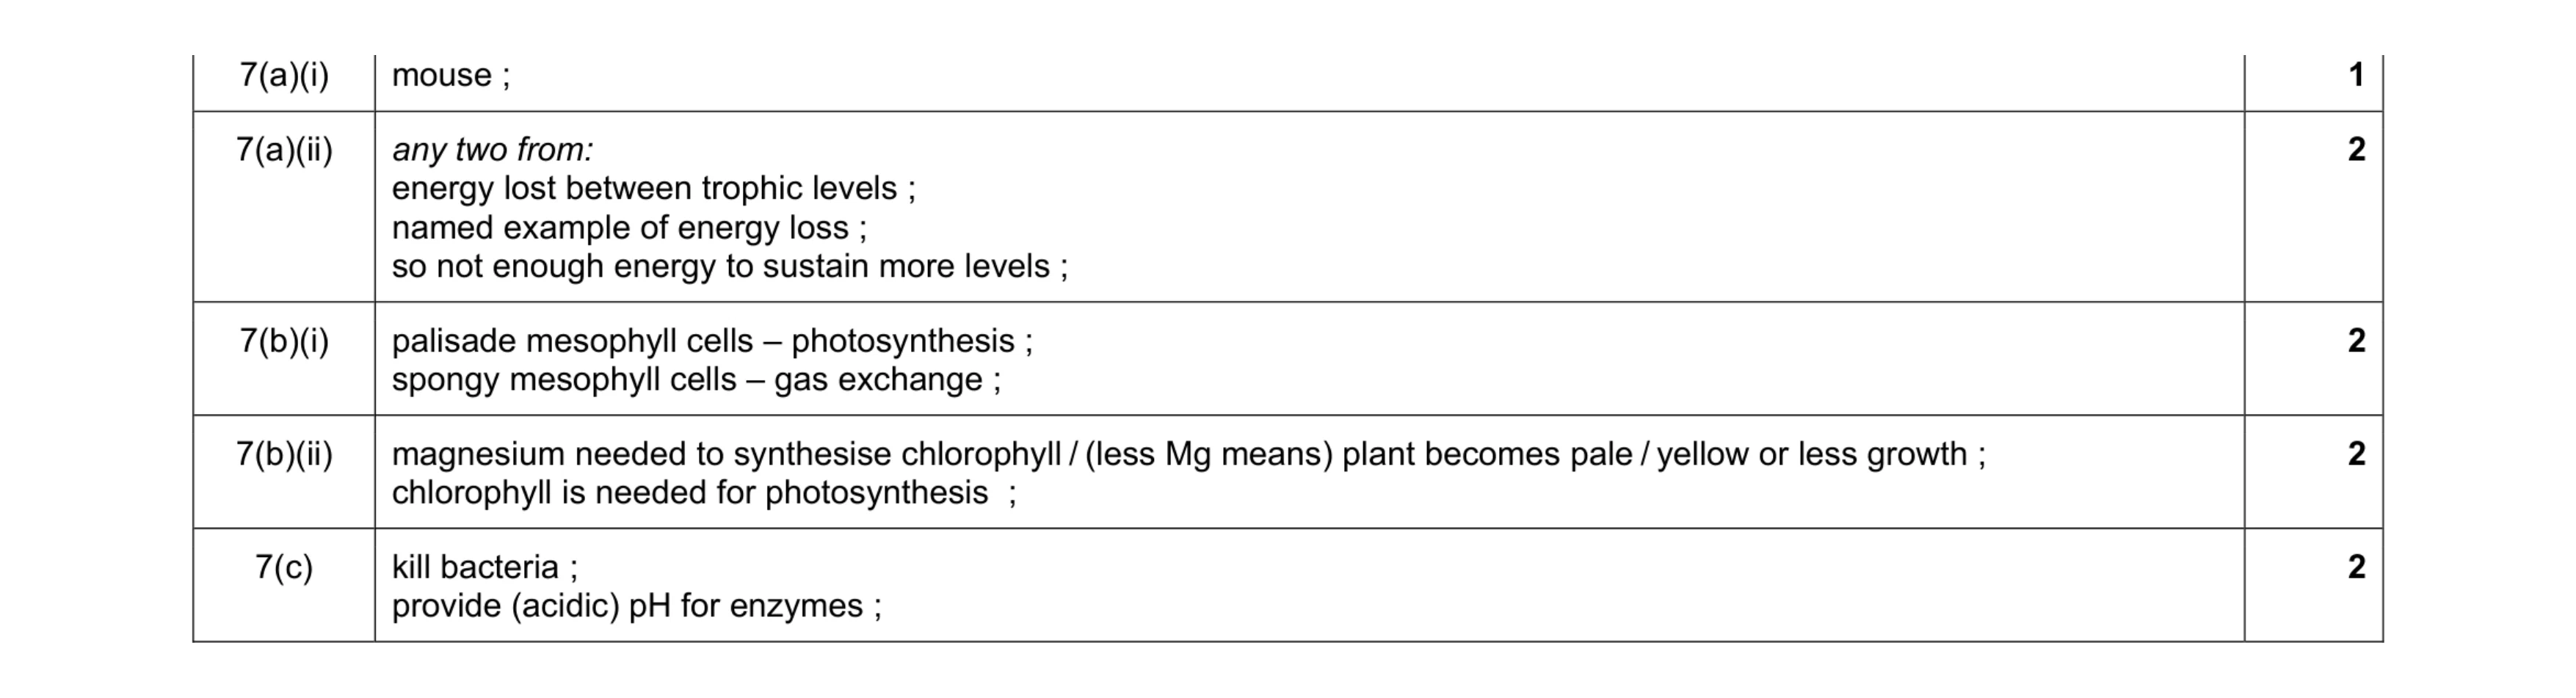 9
9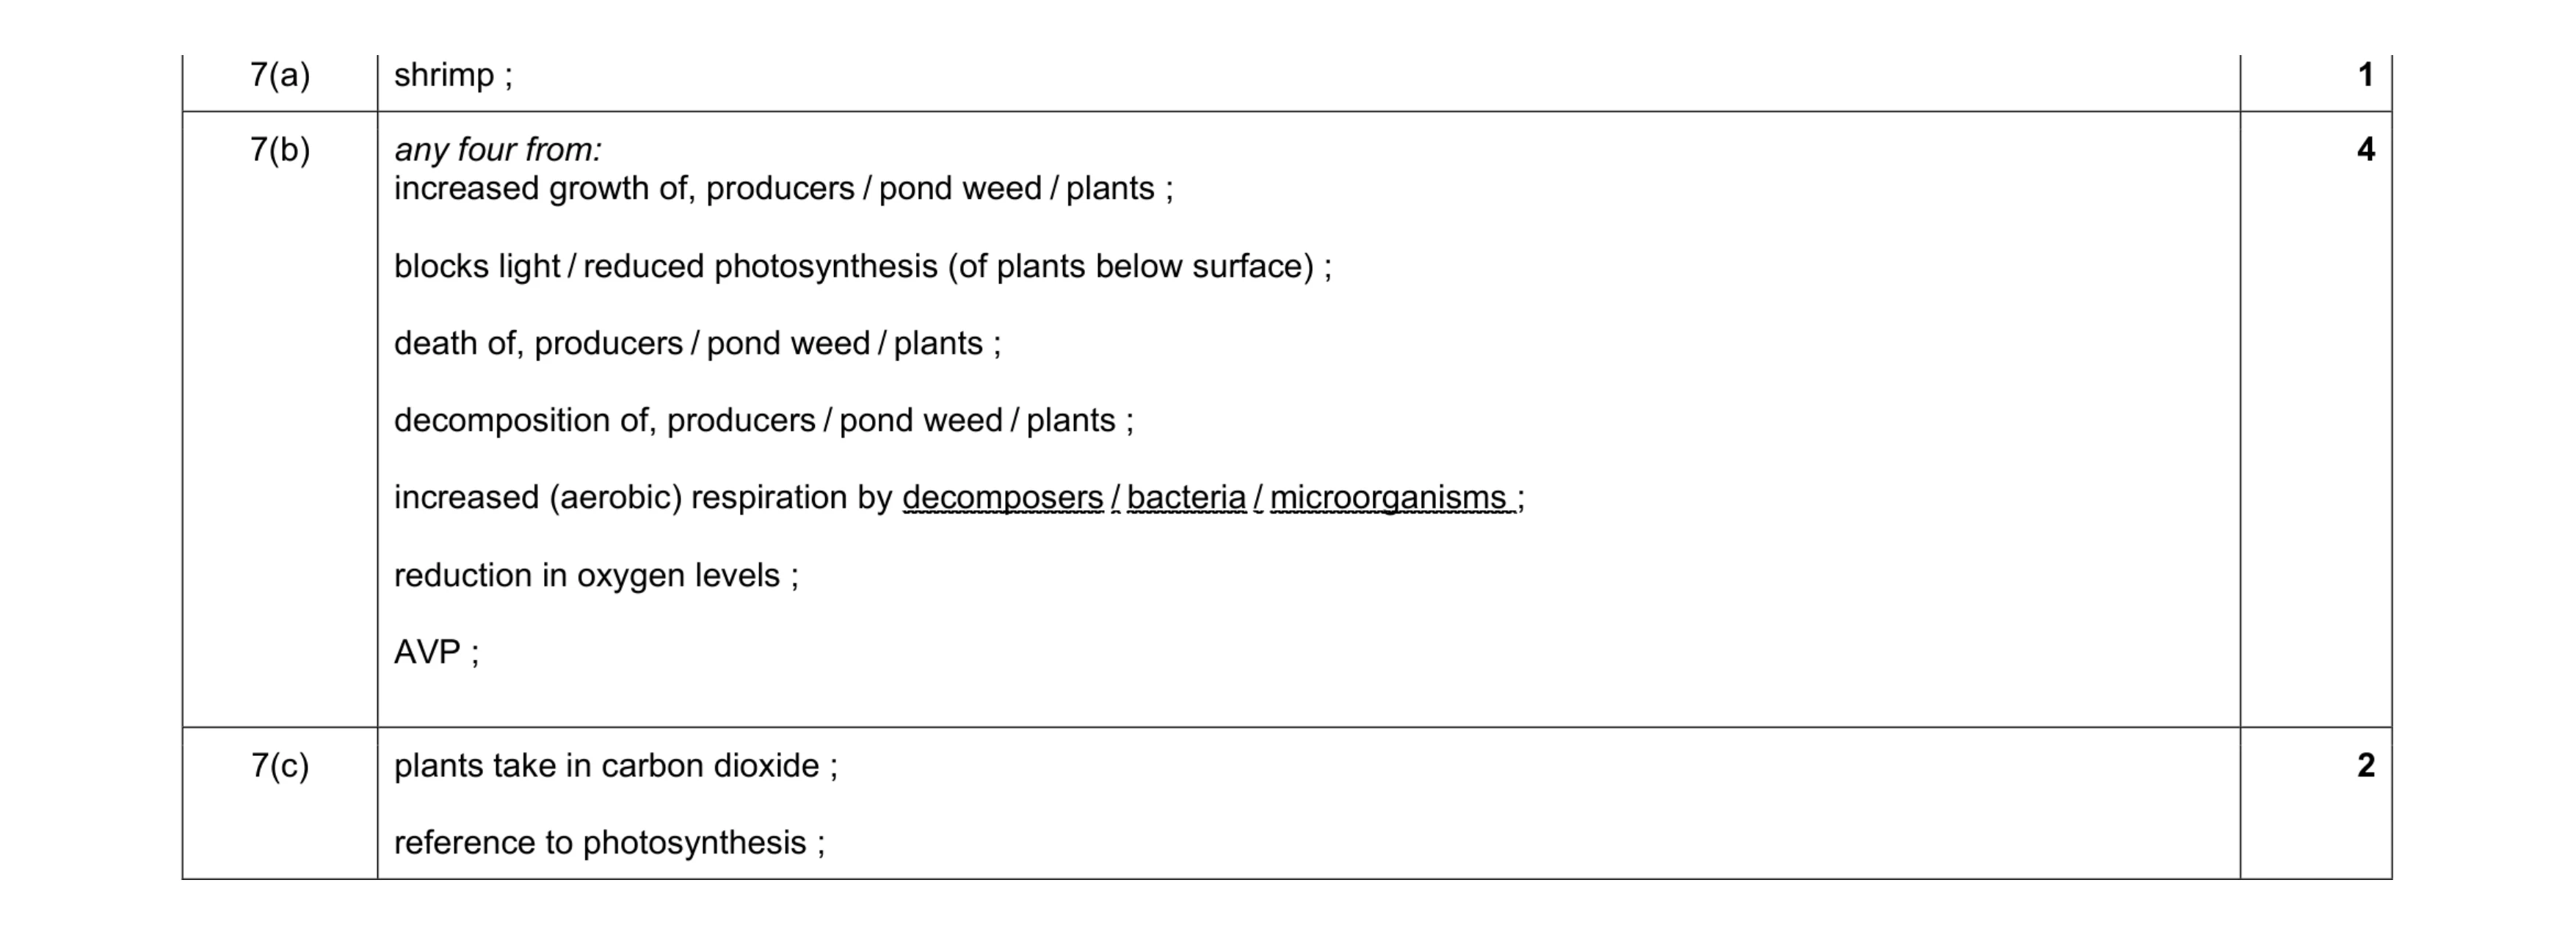 7
7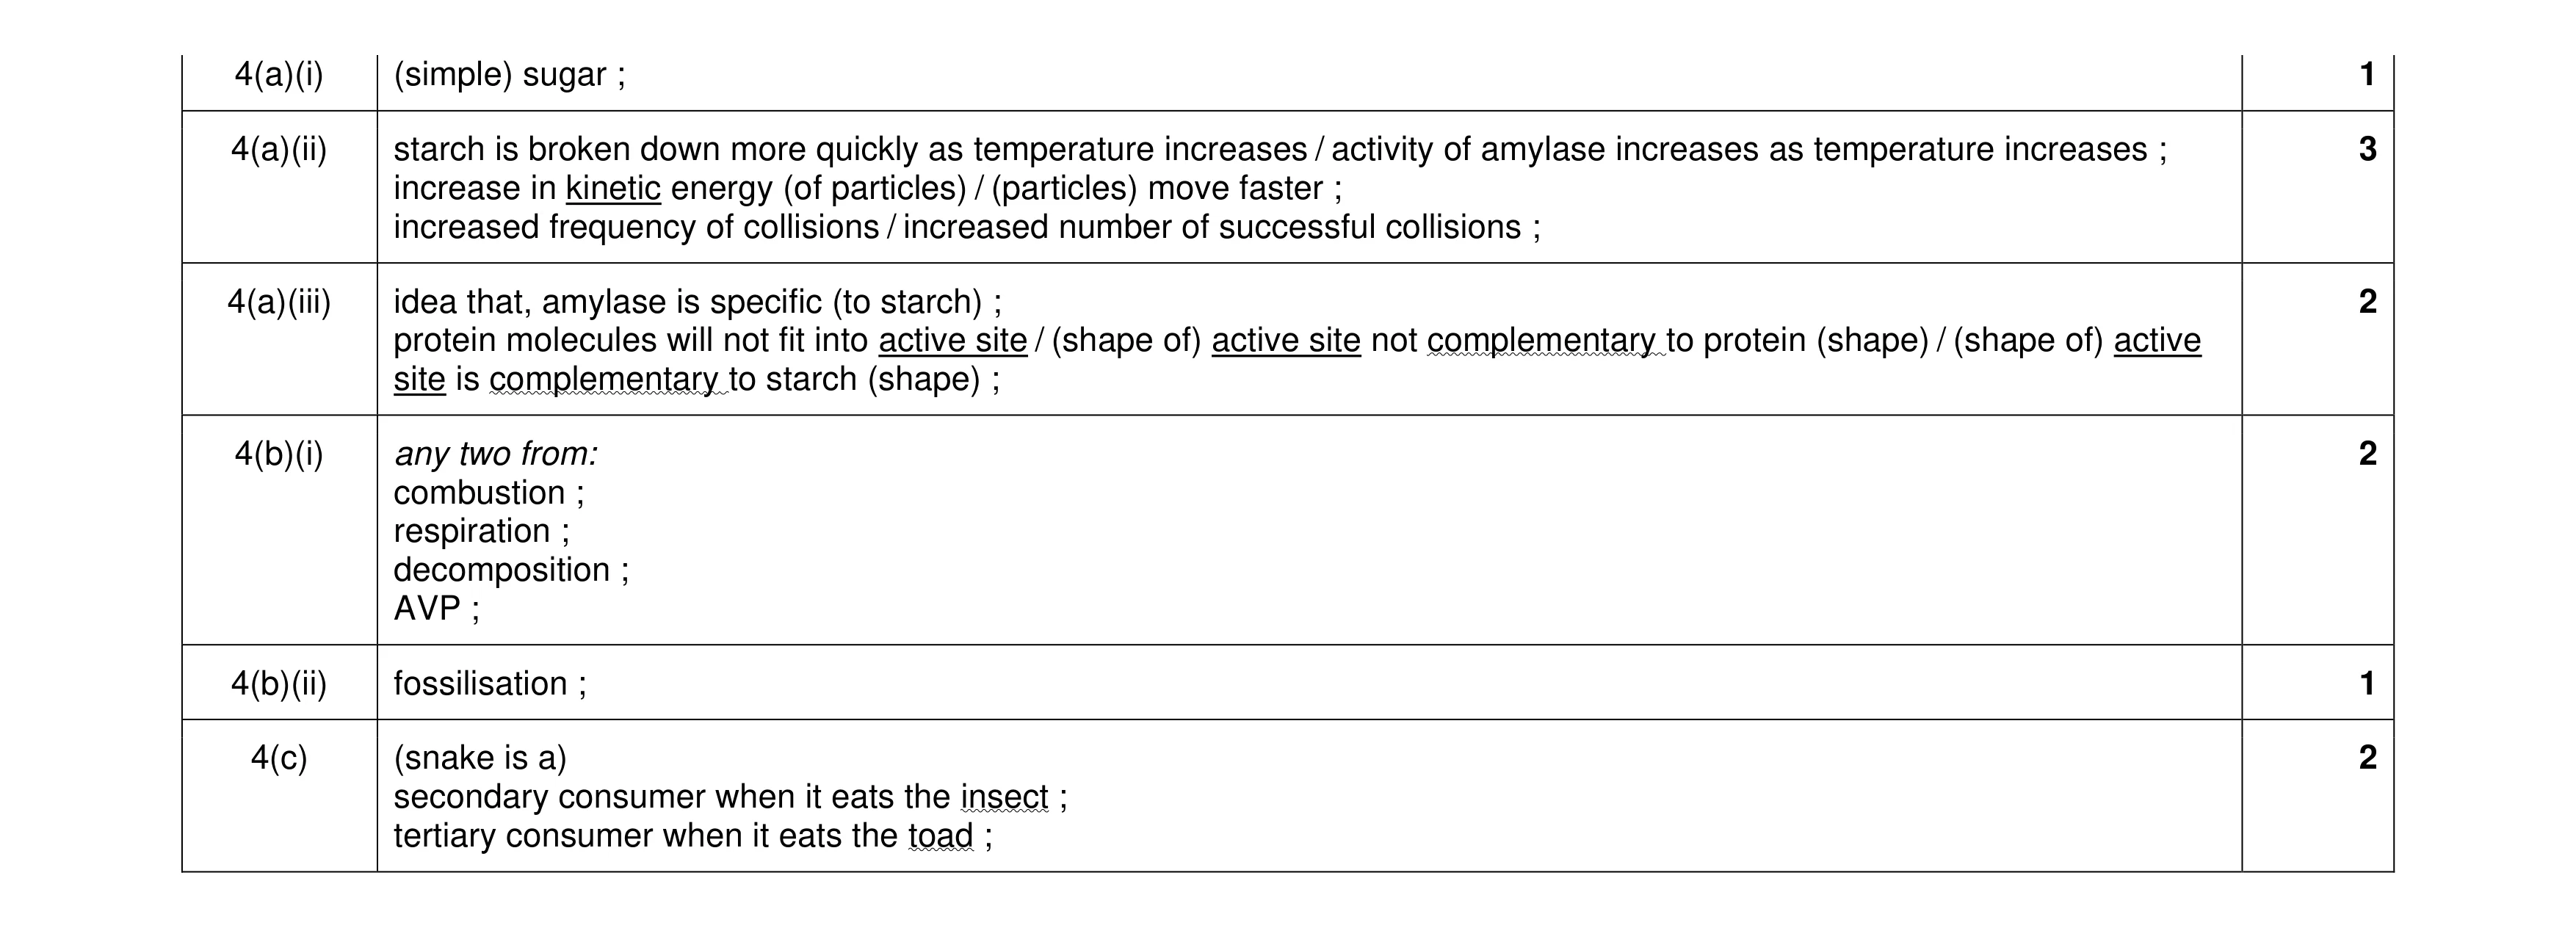 11
11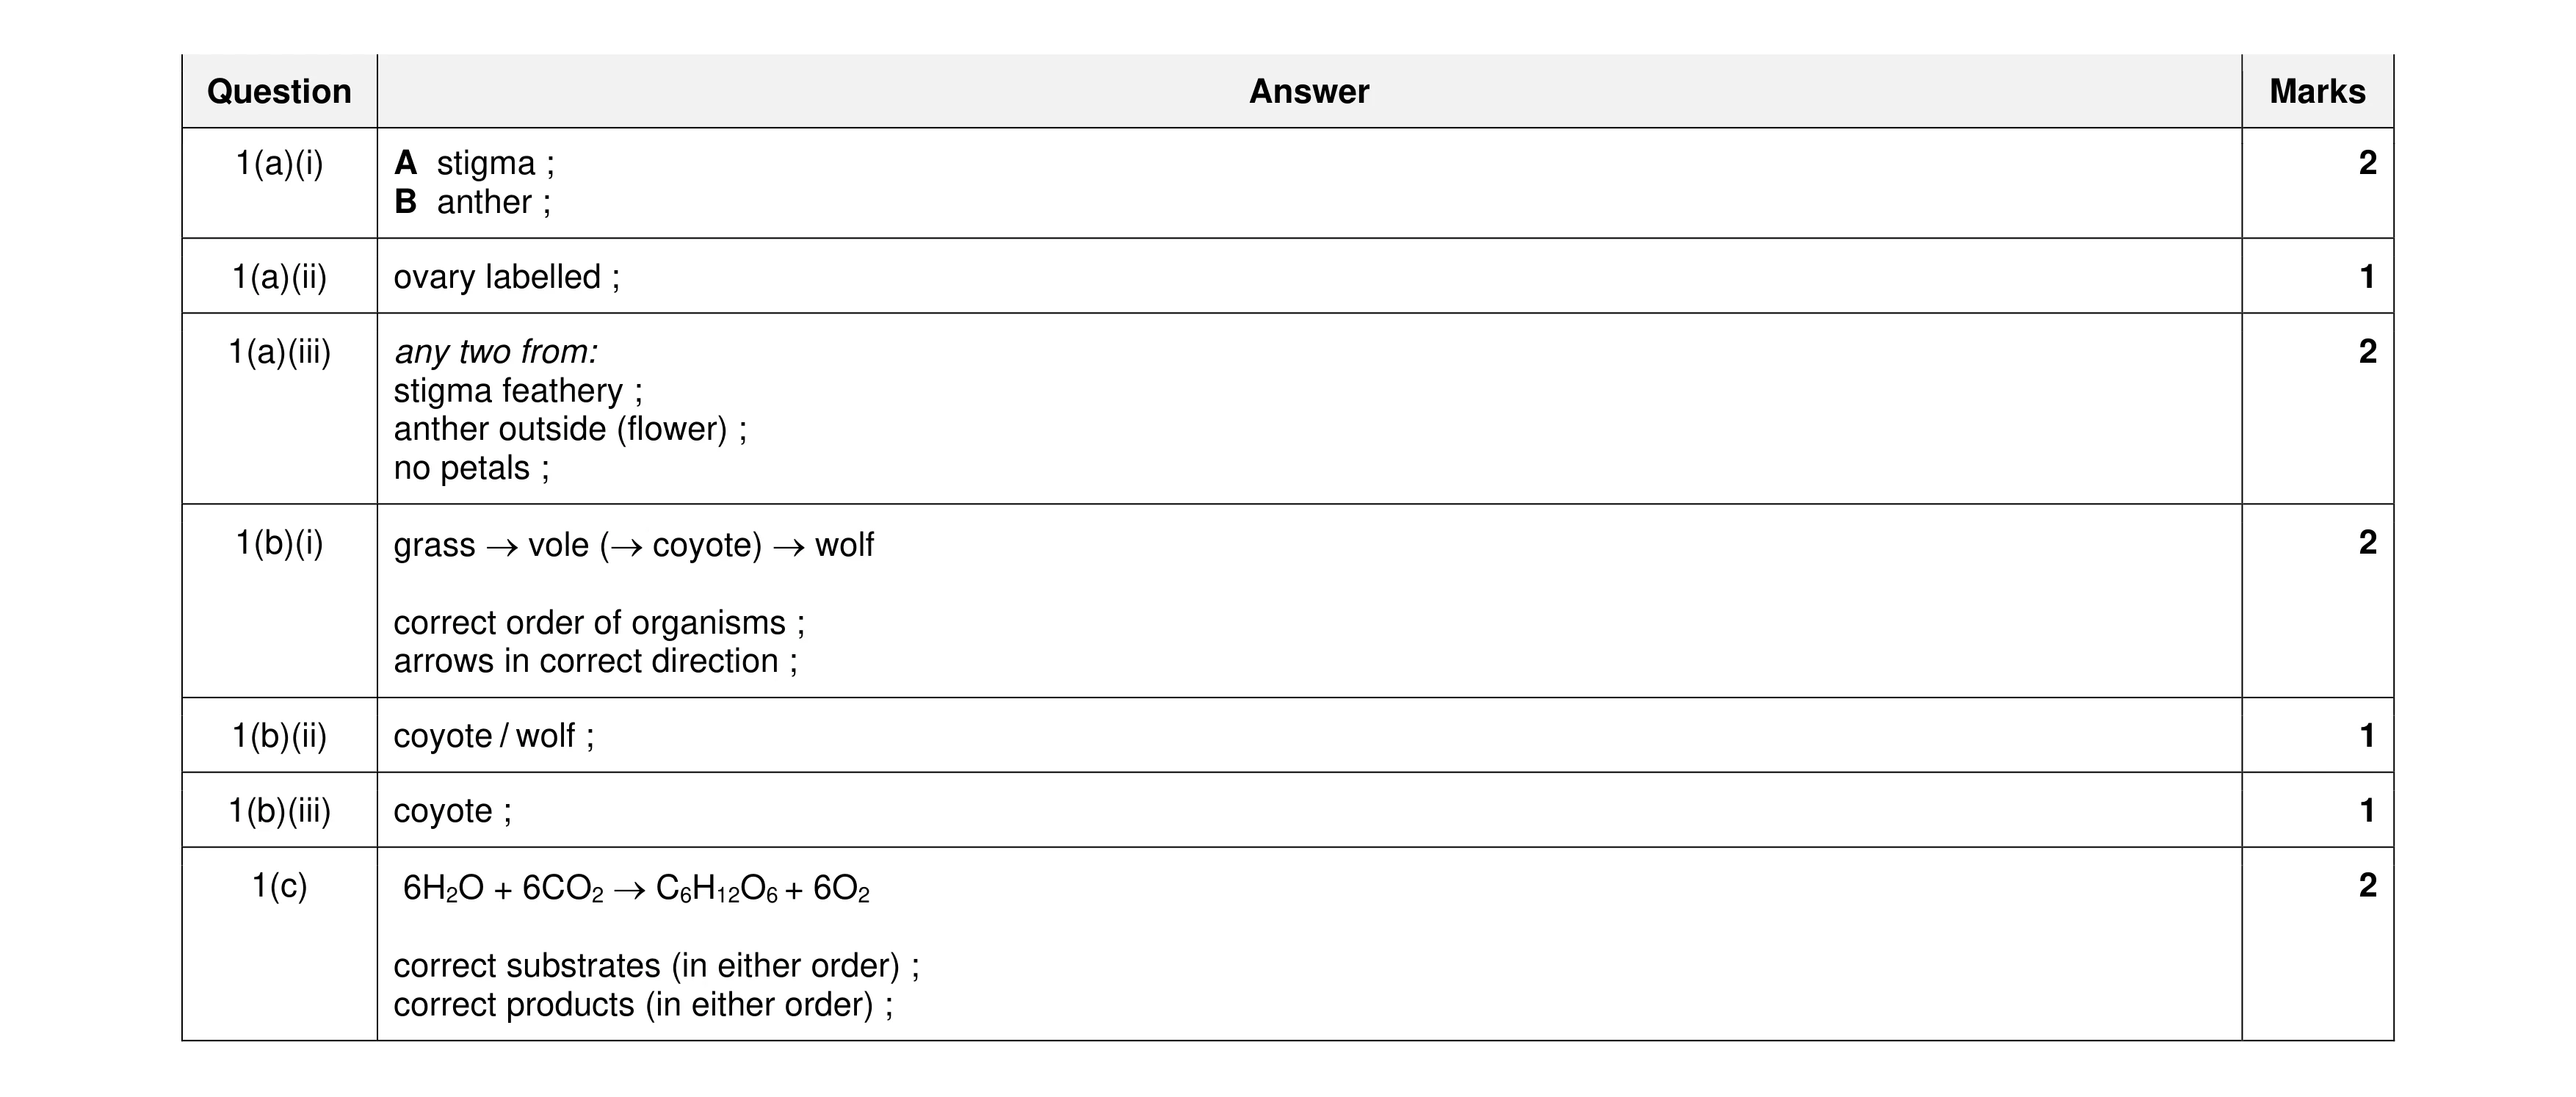 11
11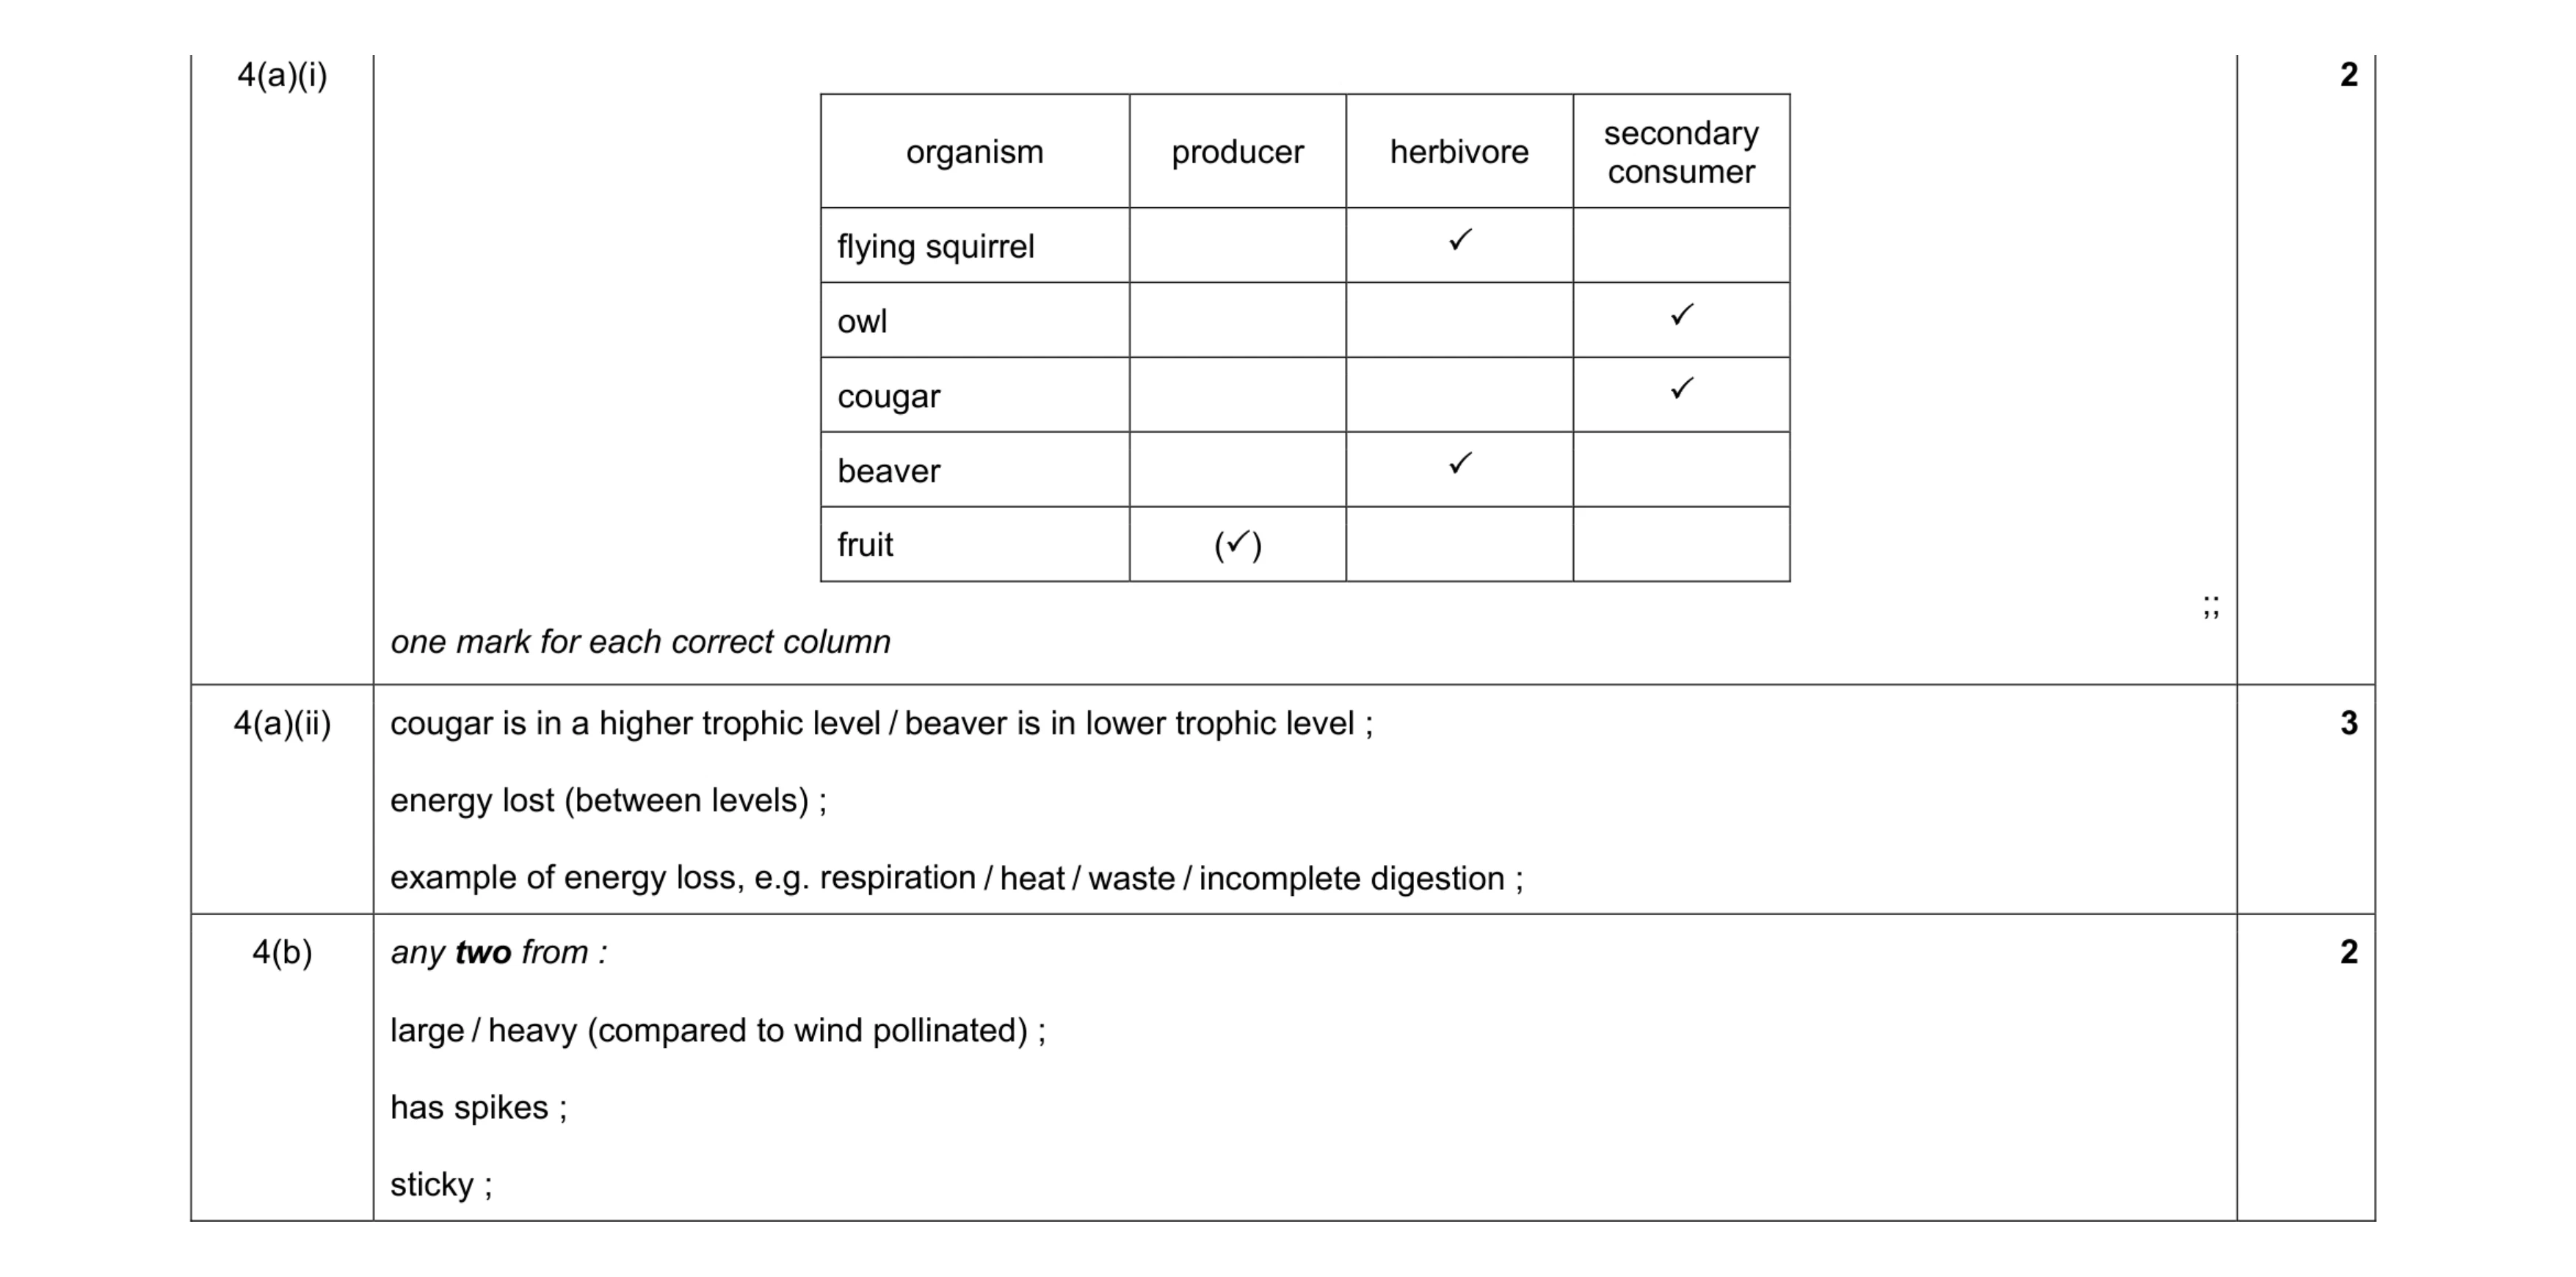 7
7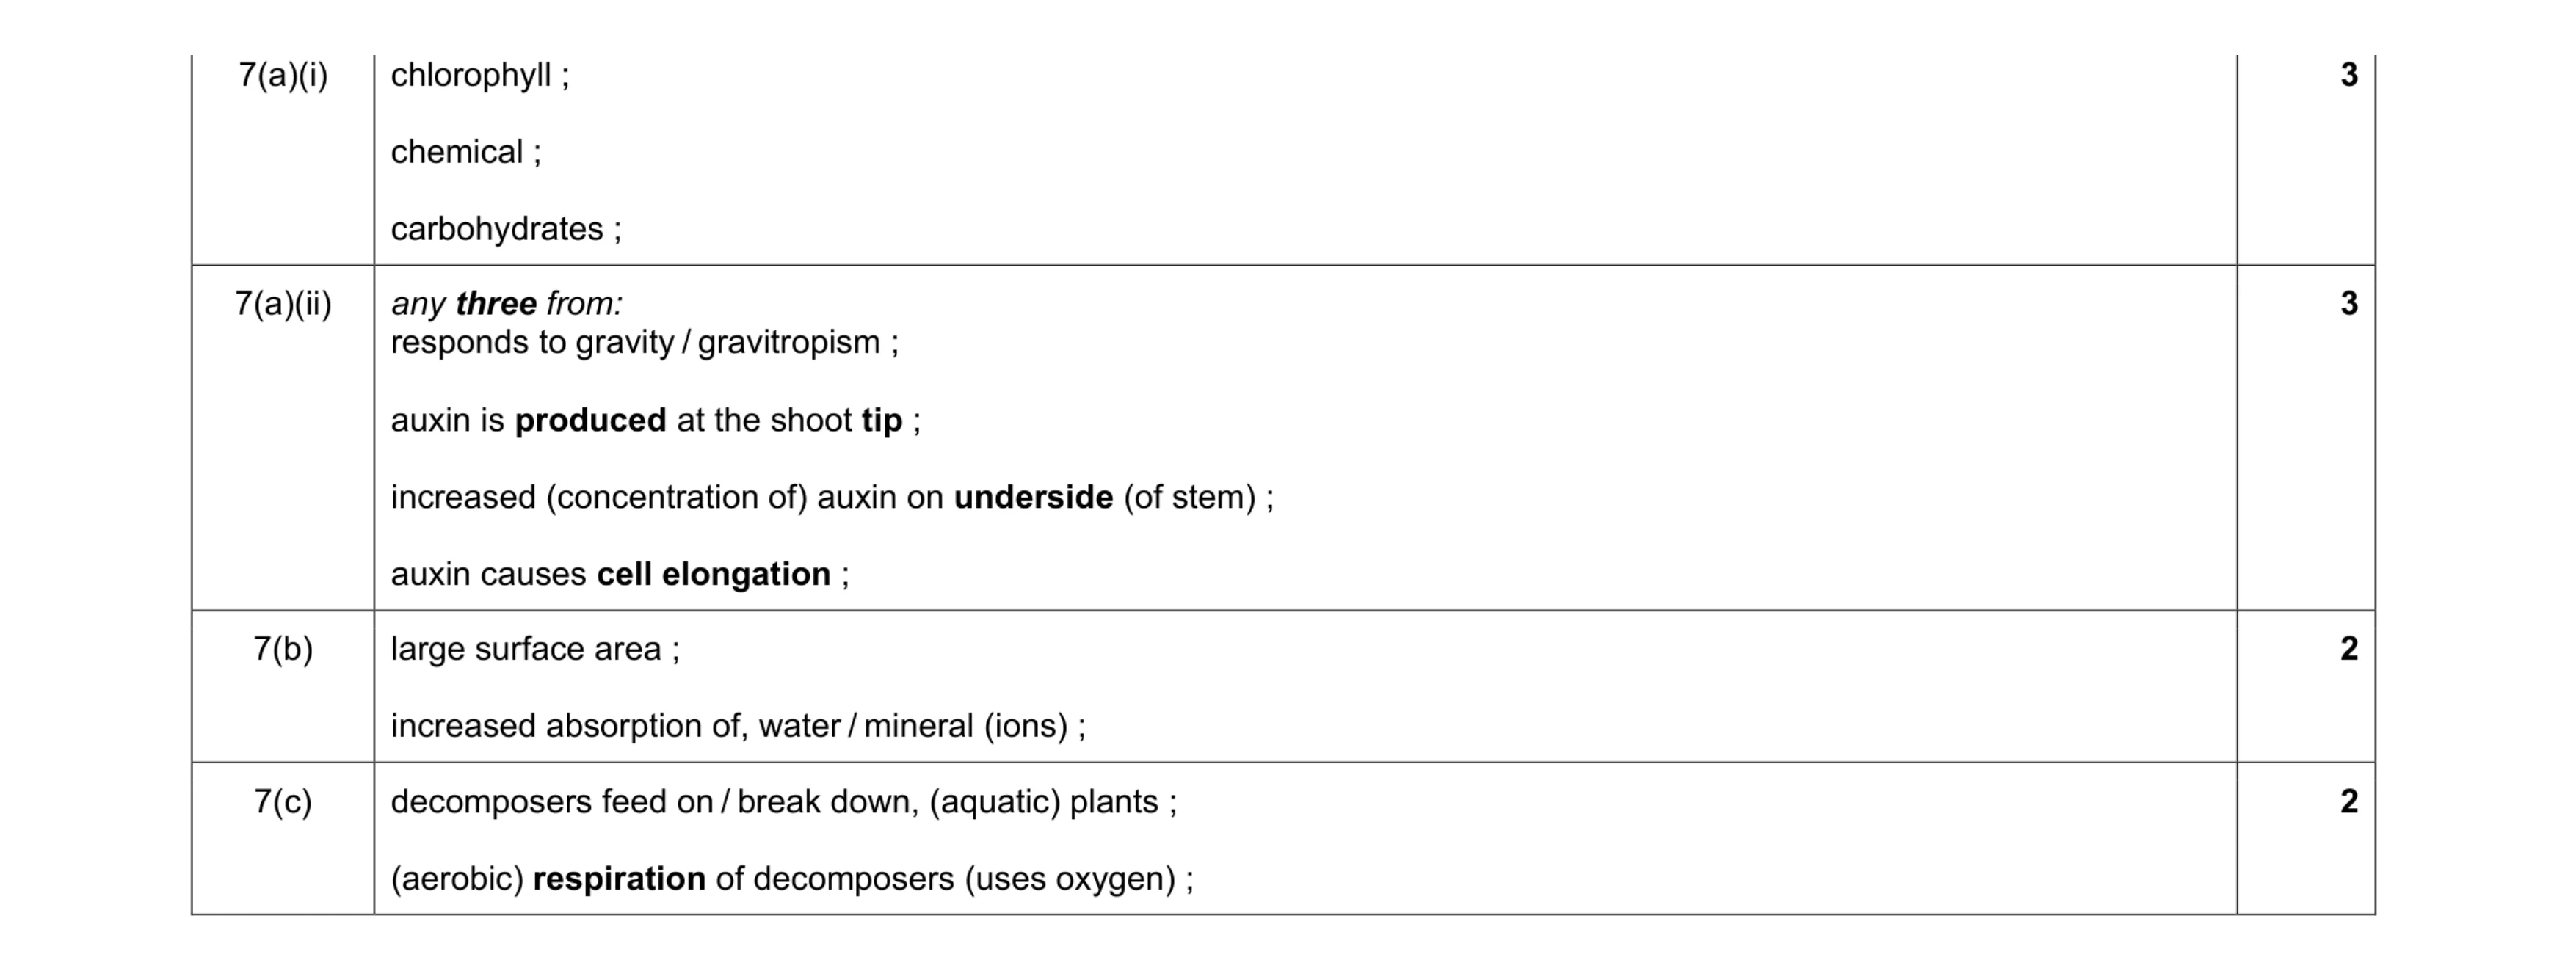 10
10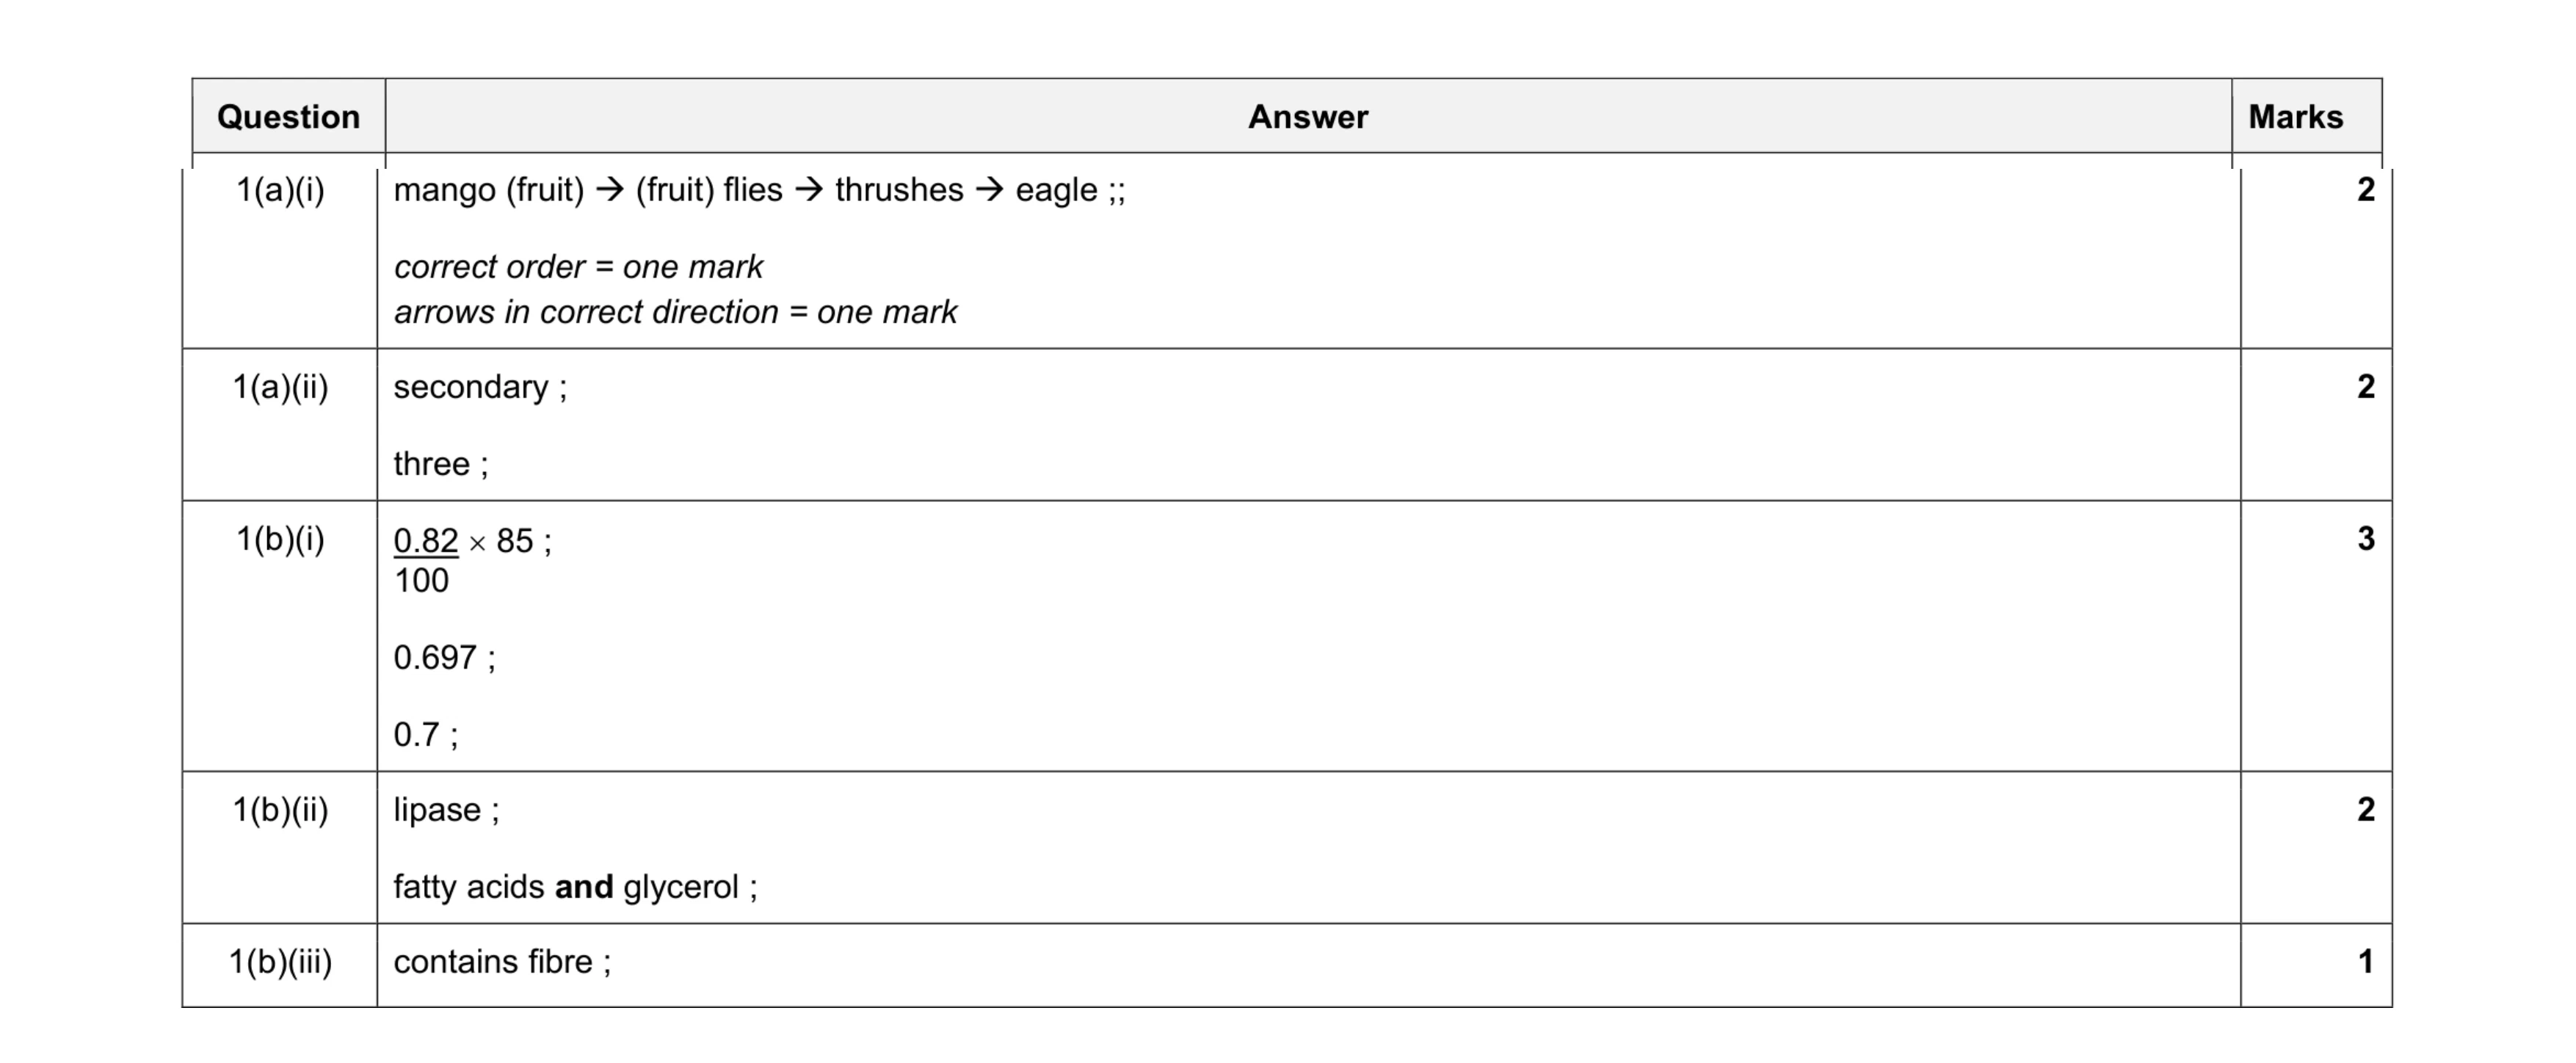 10
10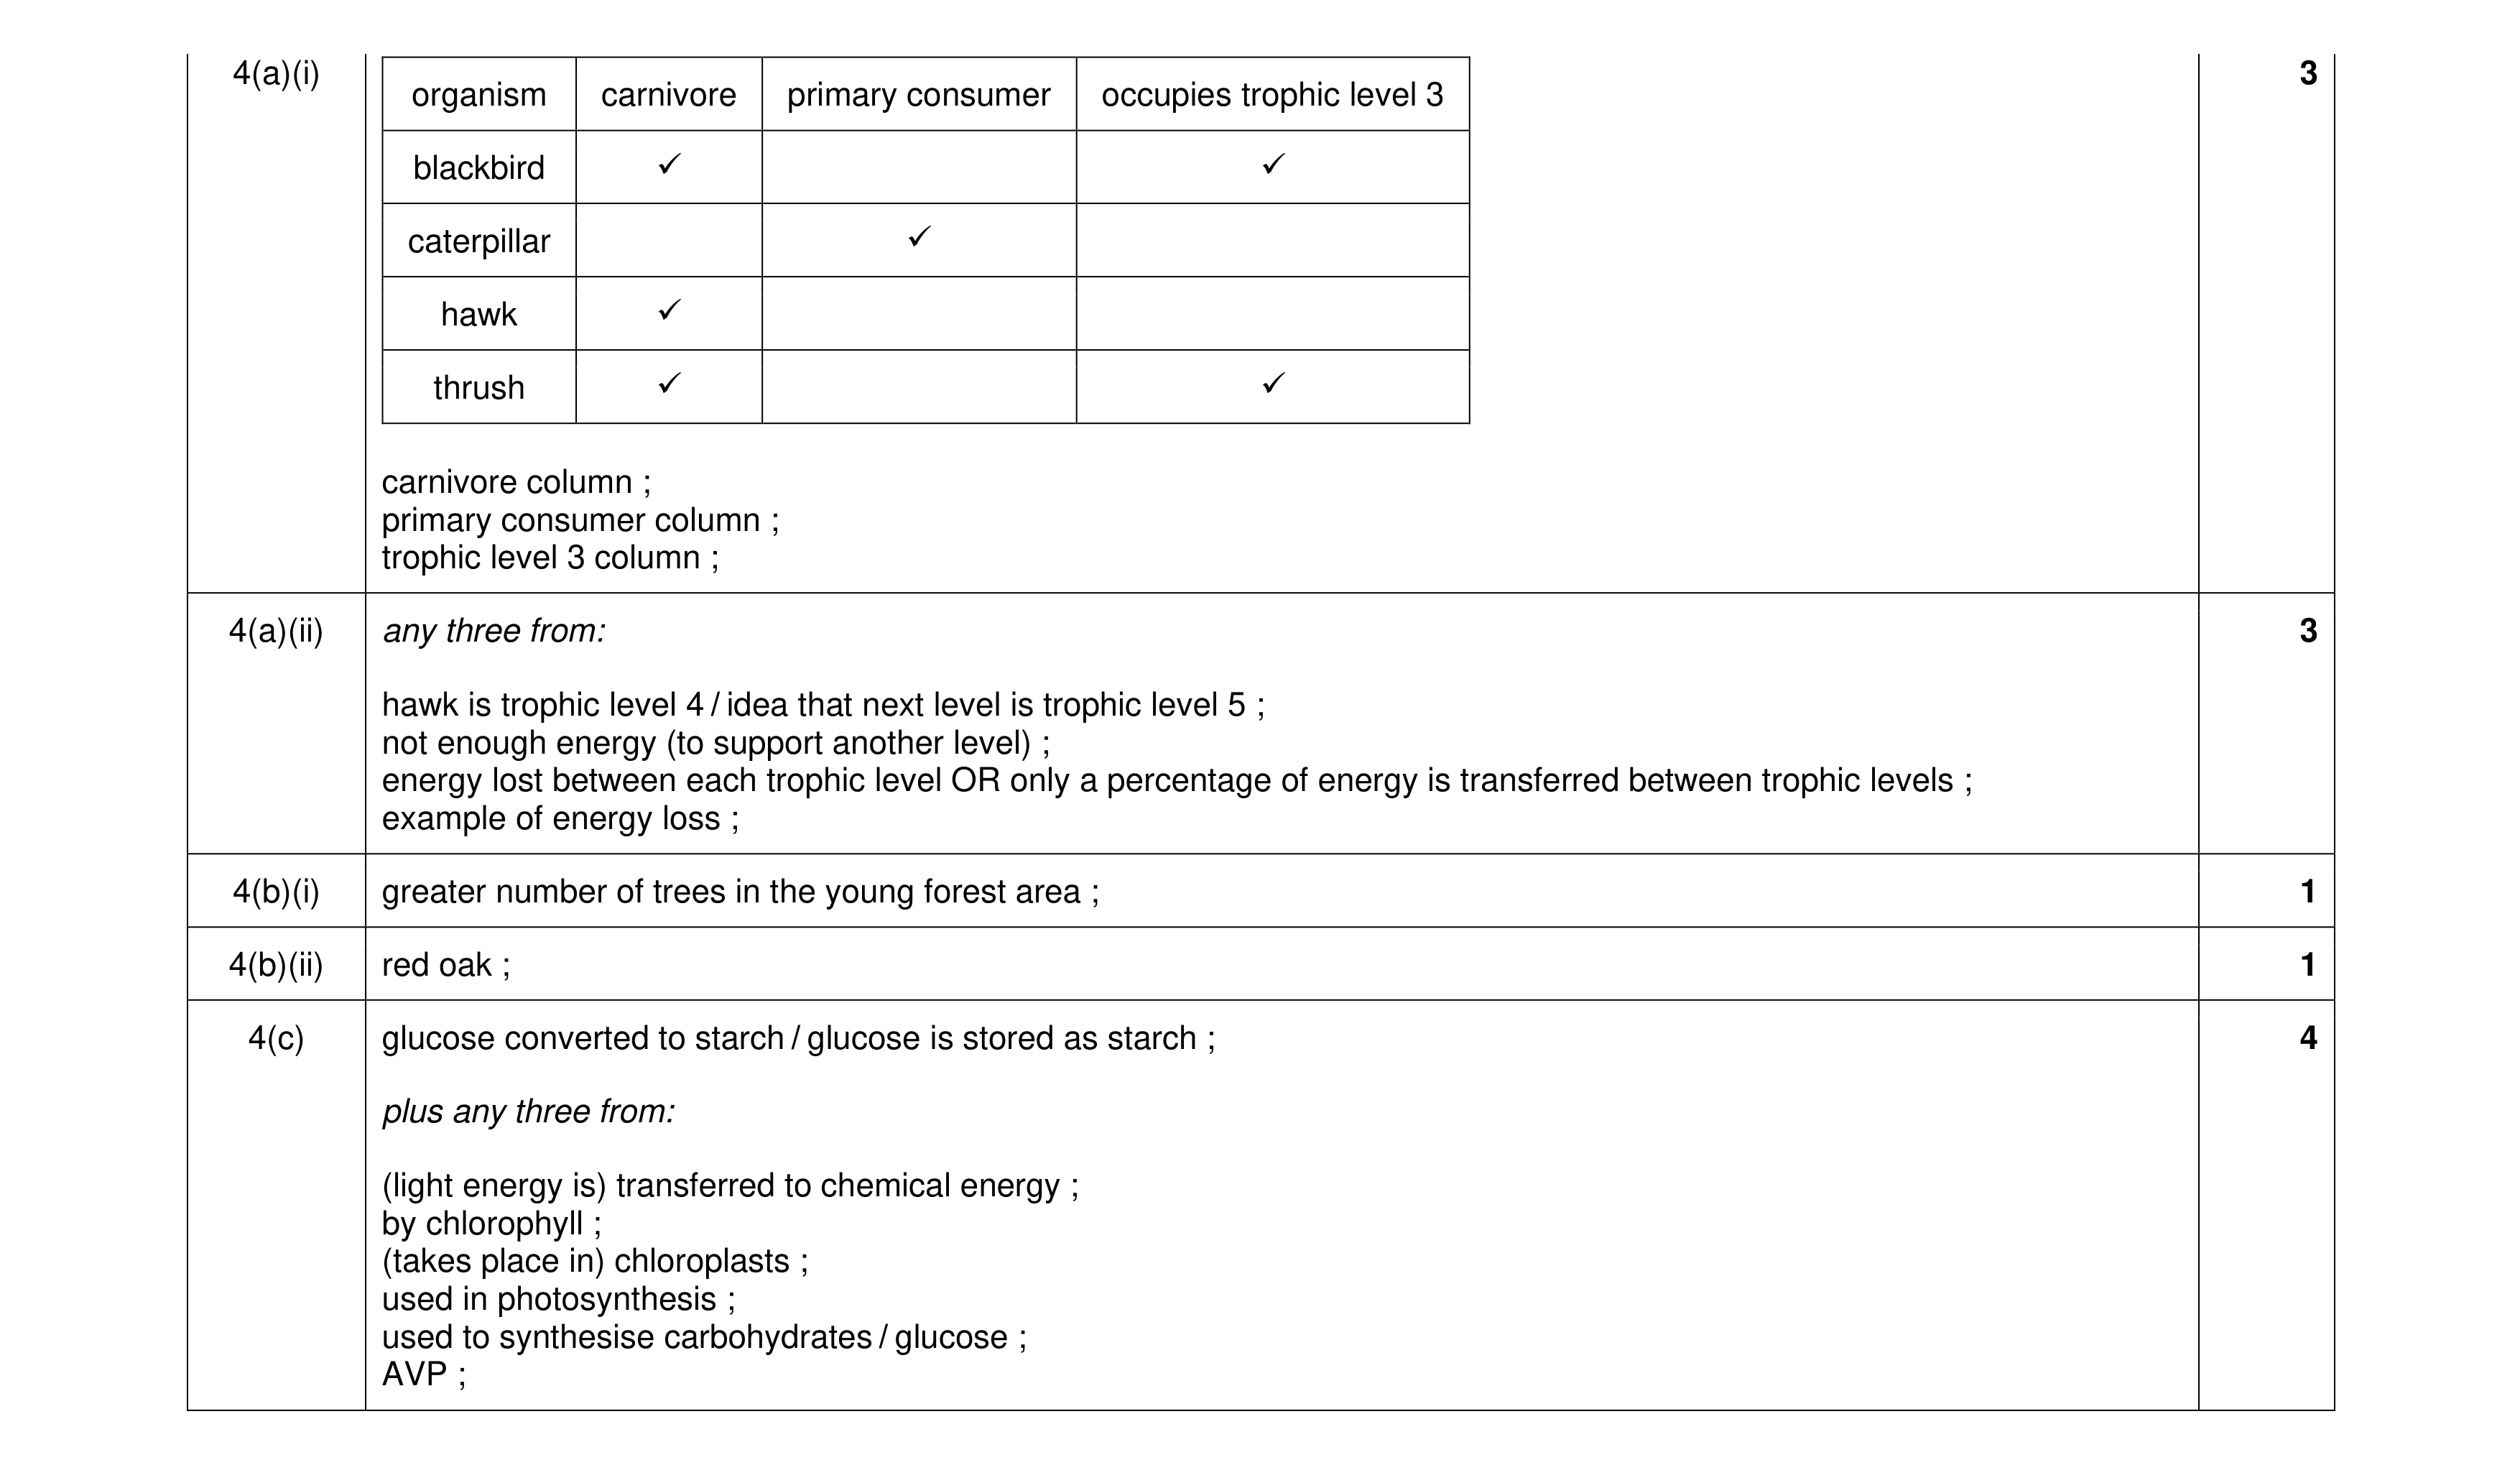 12
12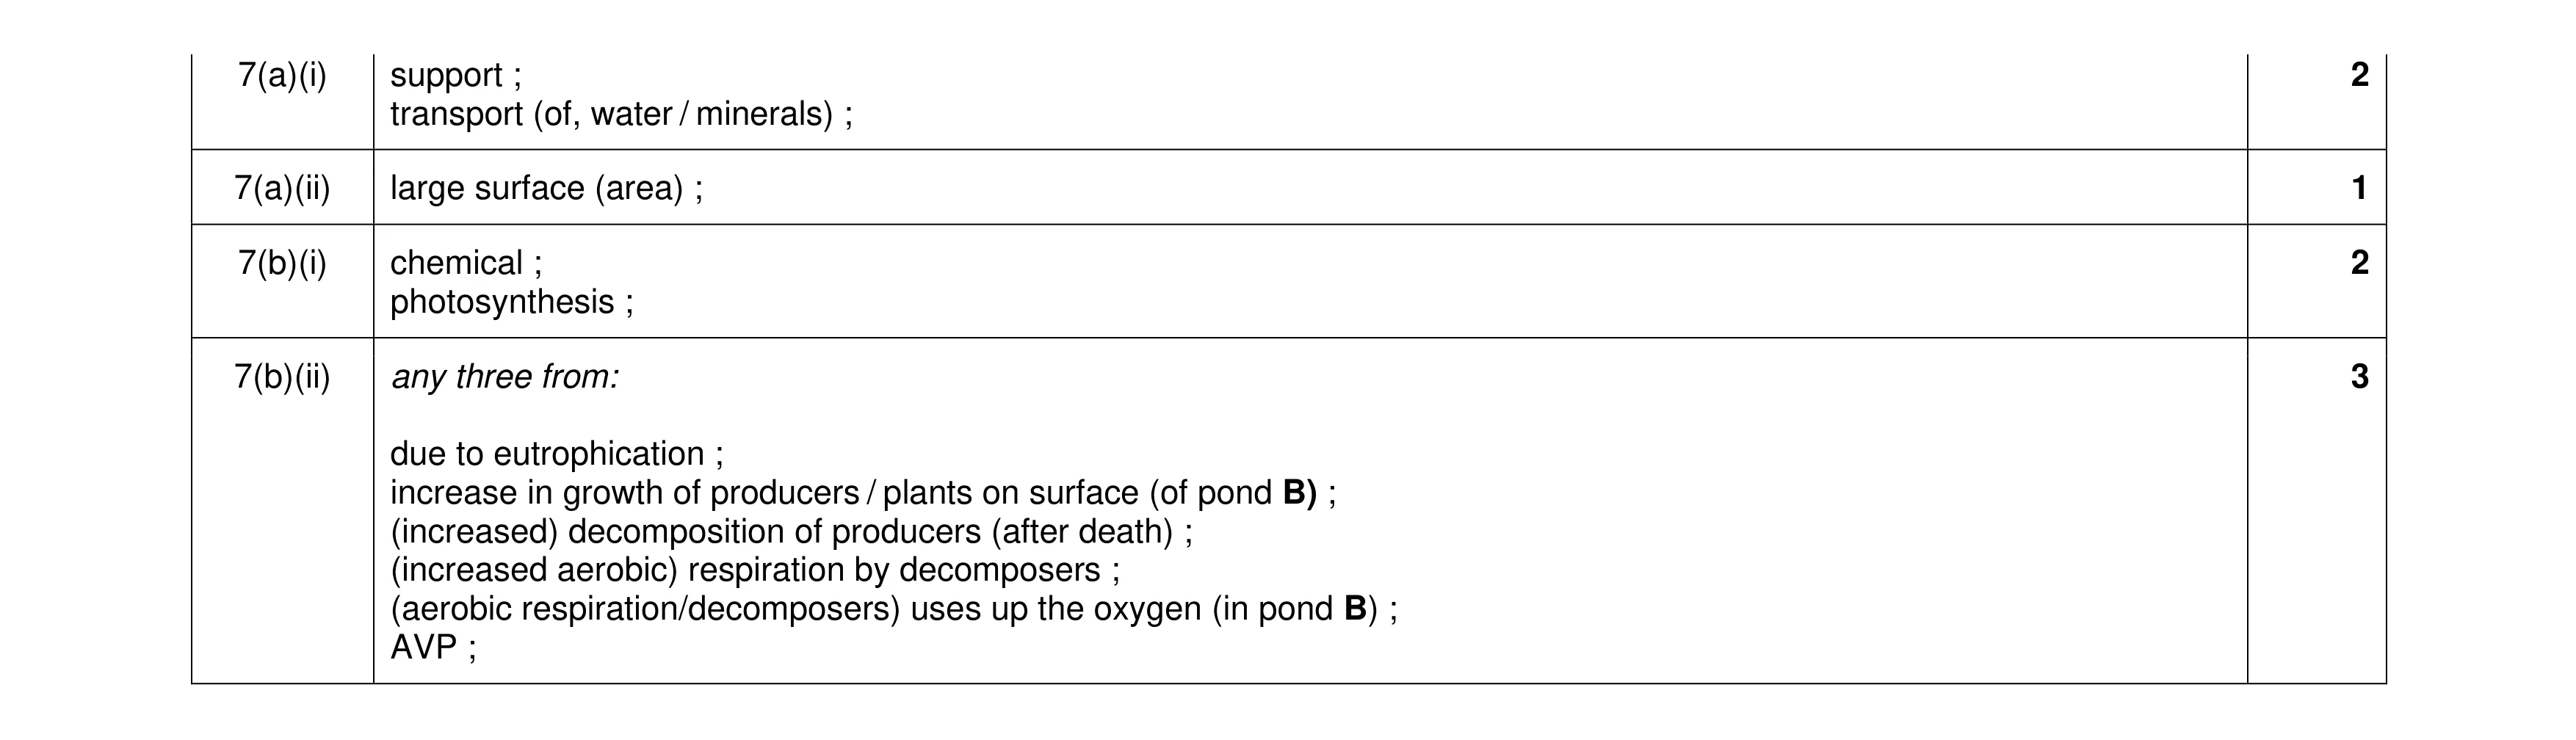 8
8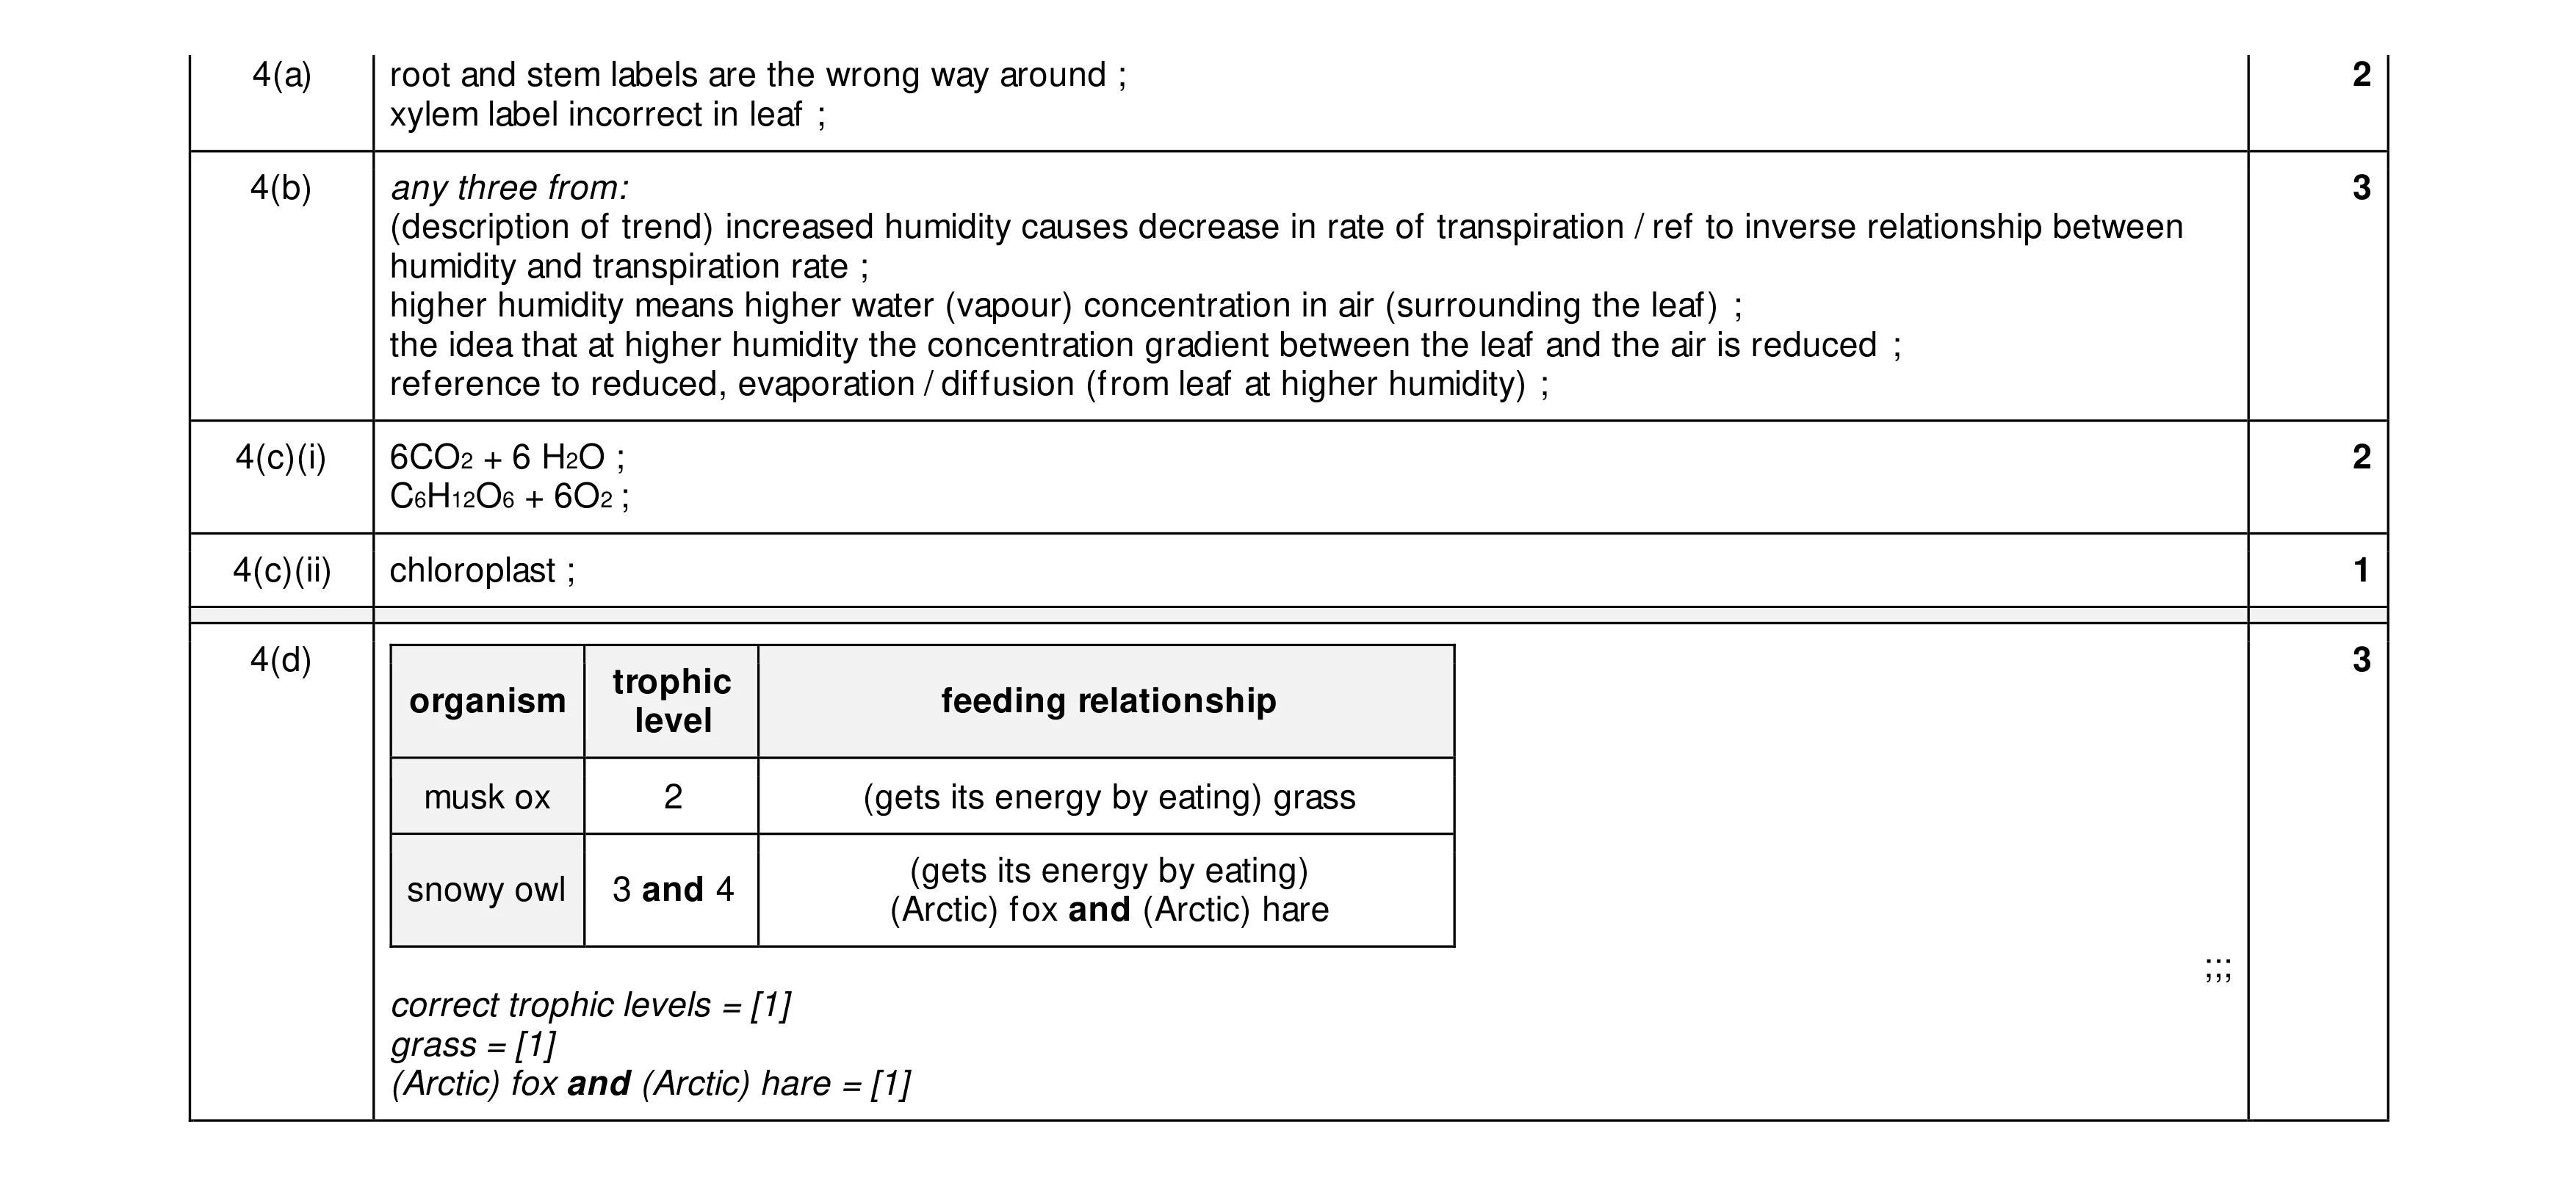 11
11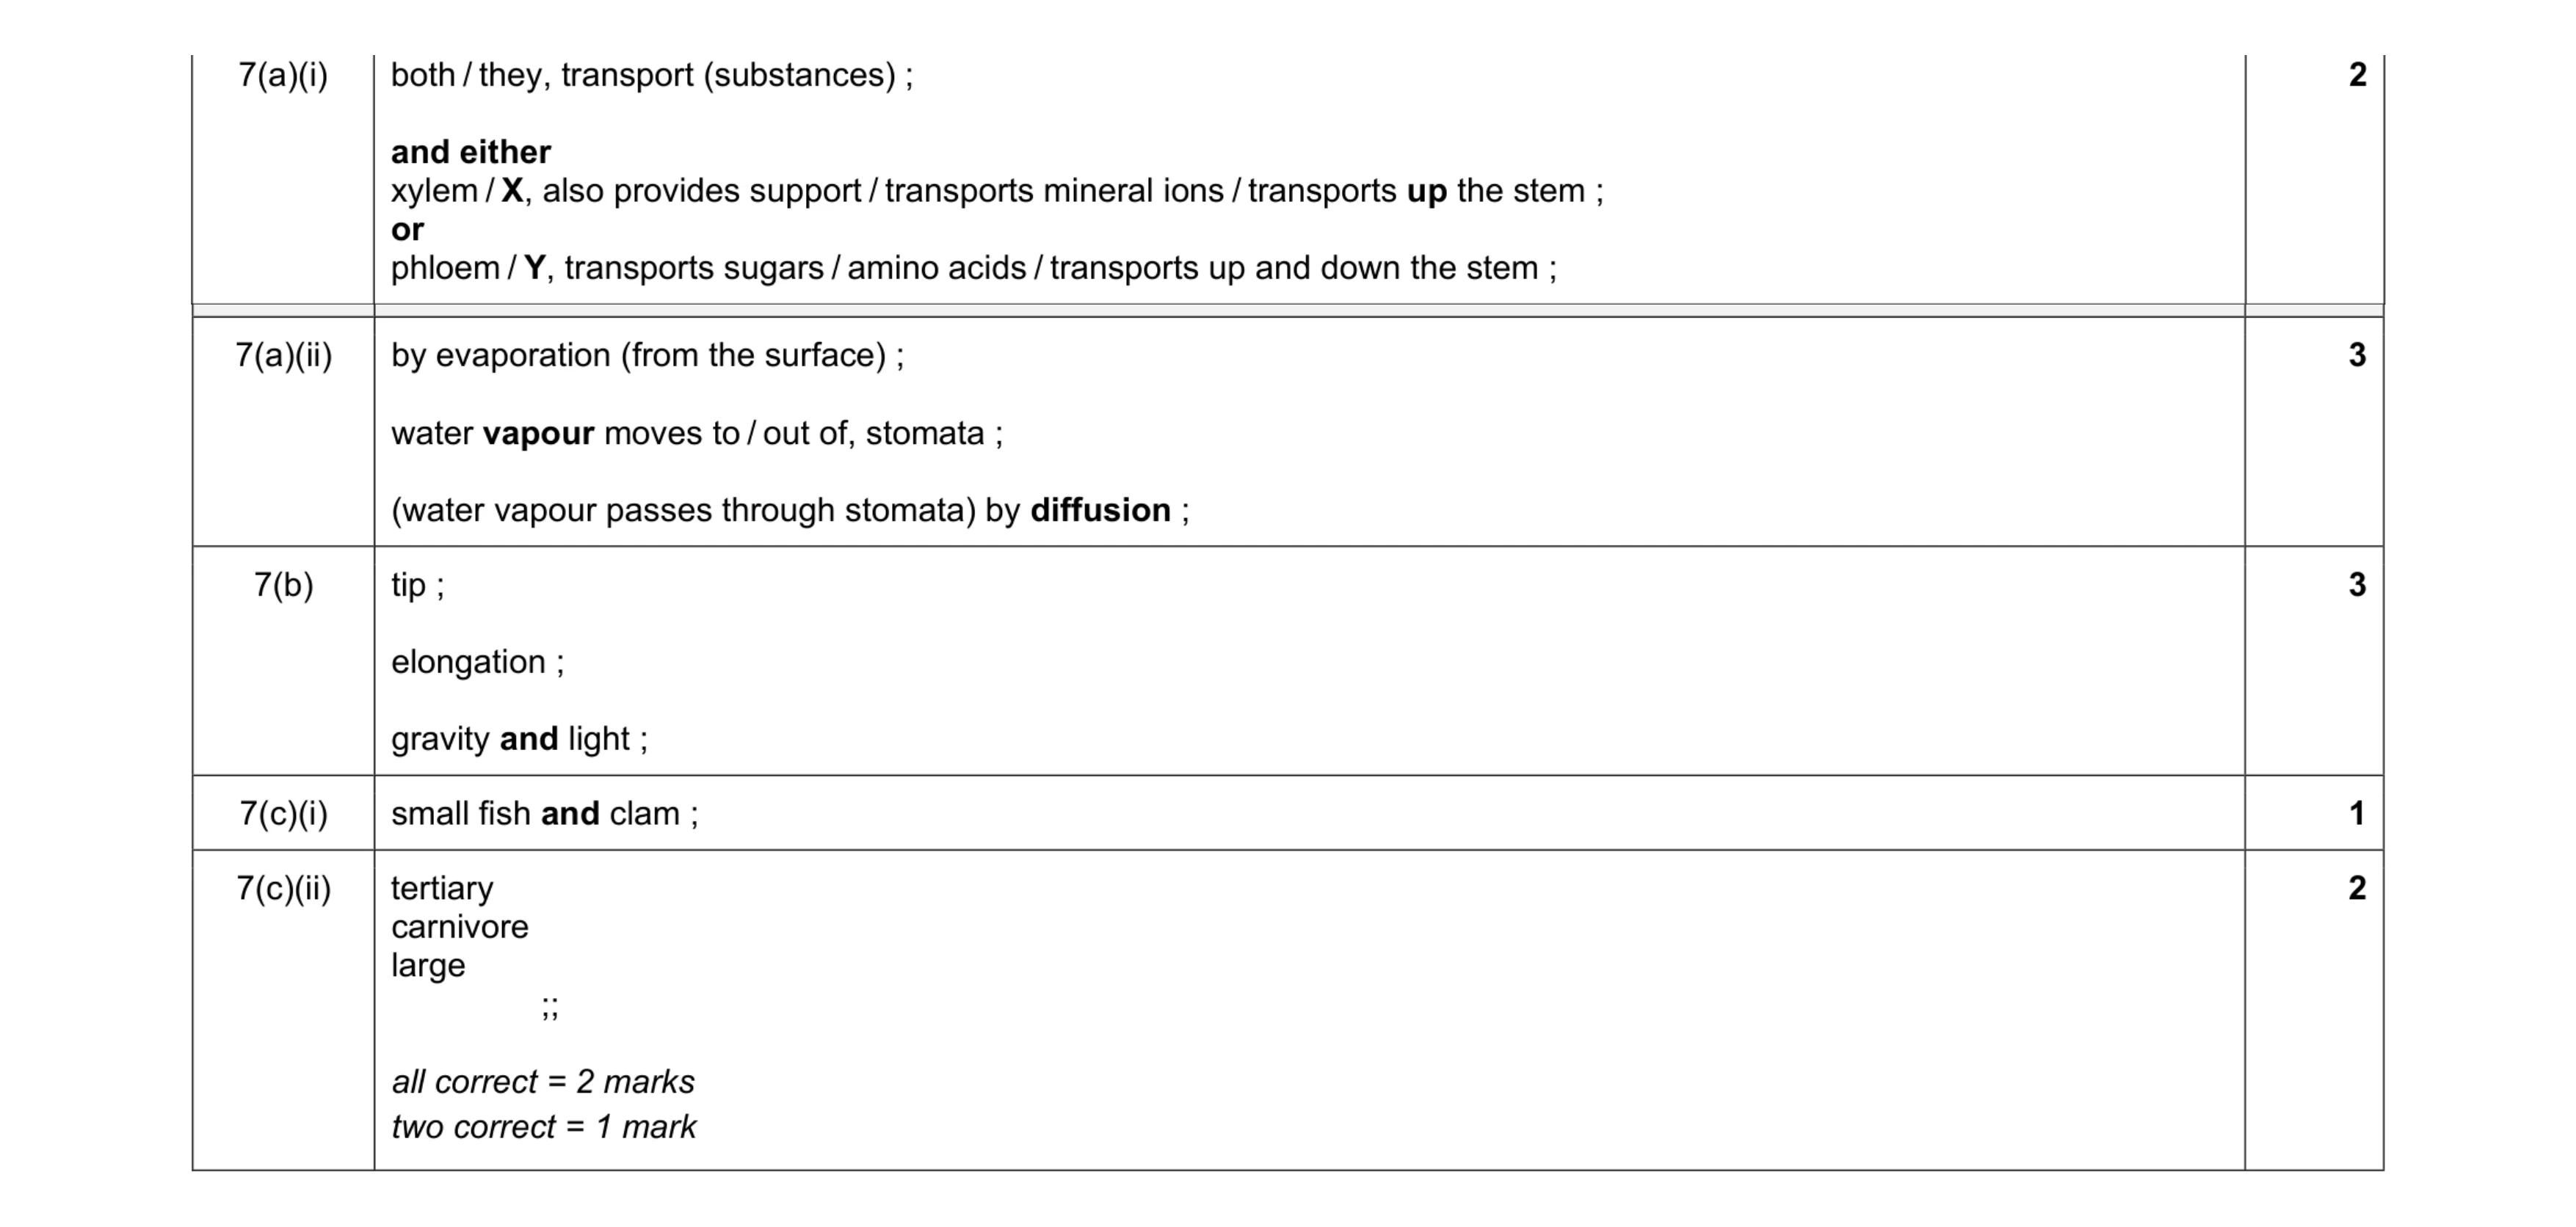 11
11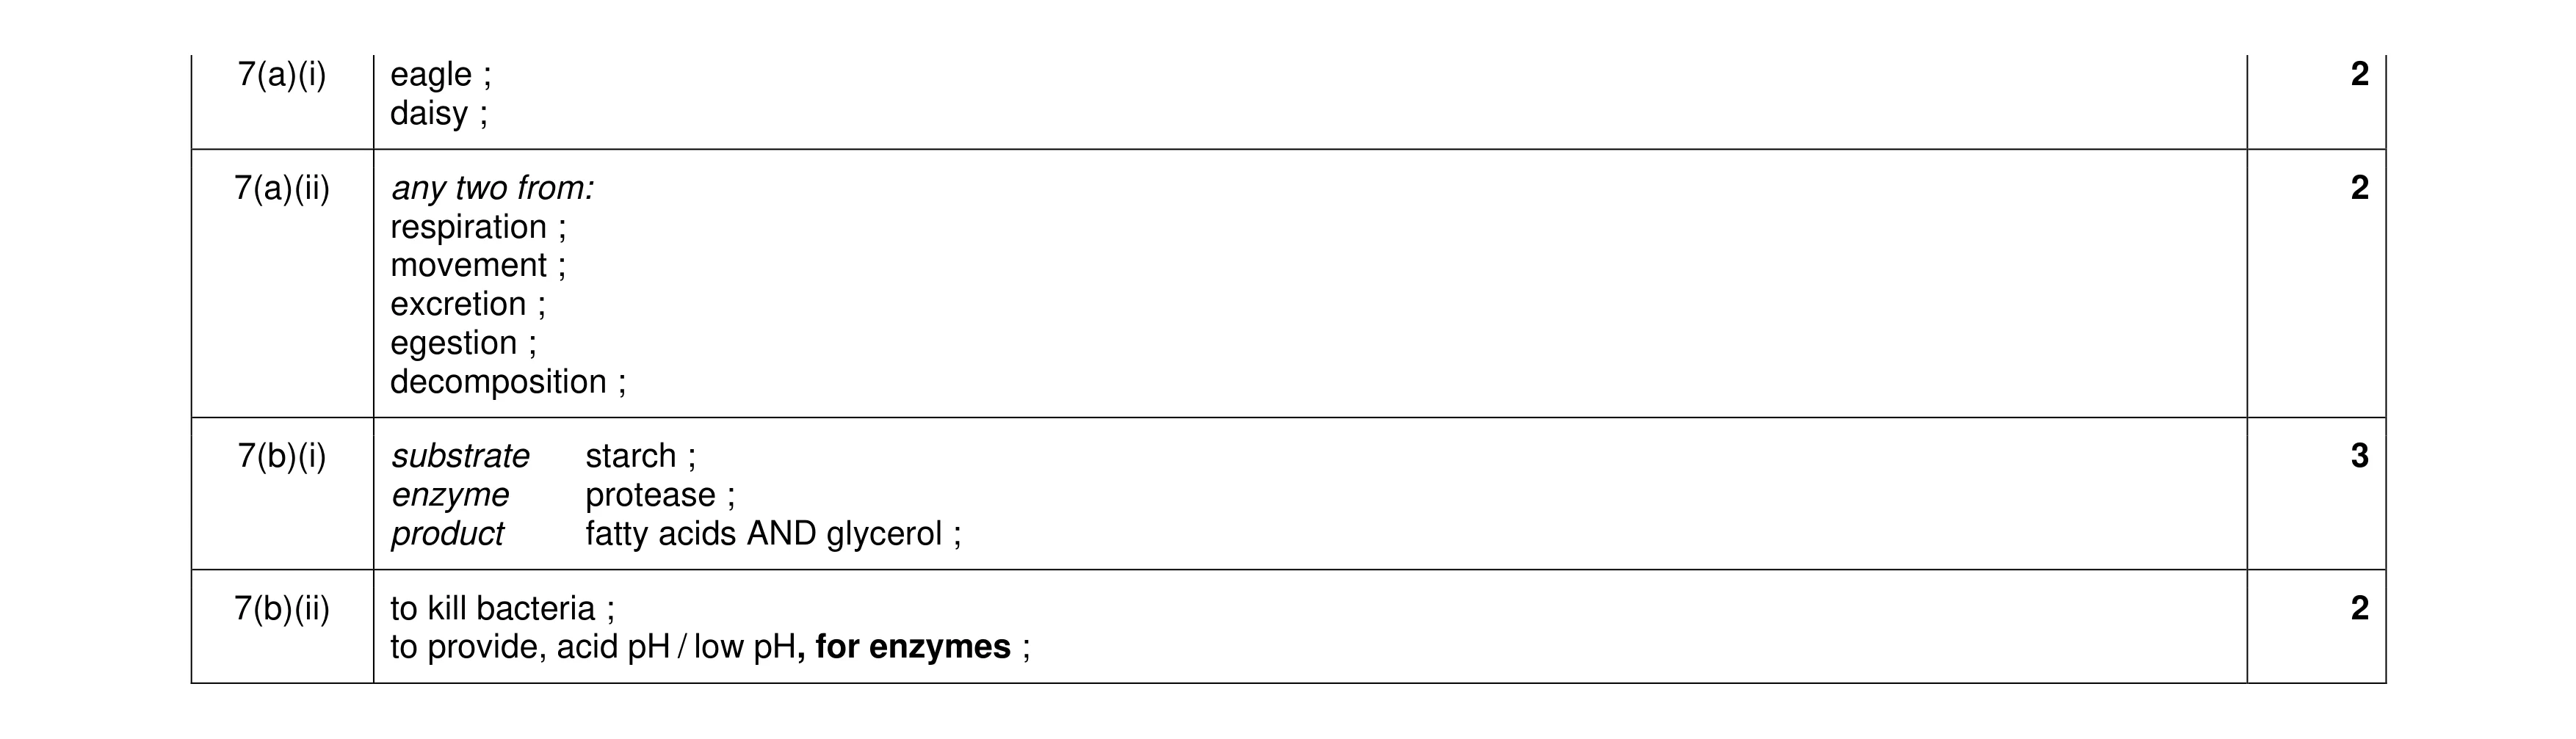 9
9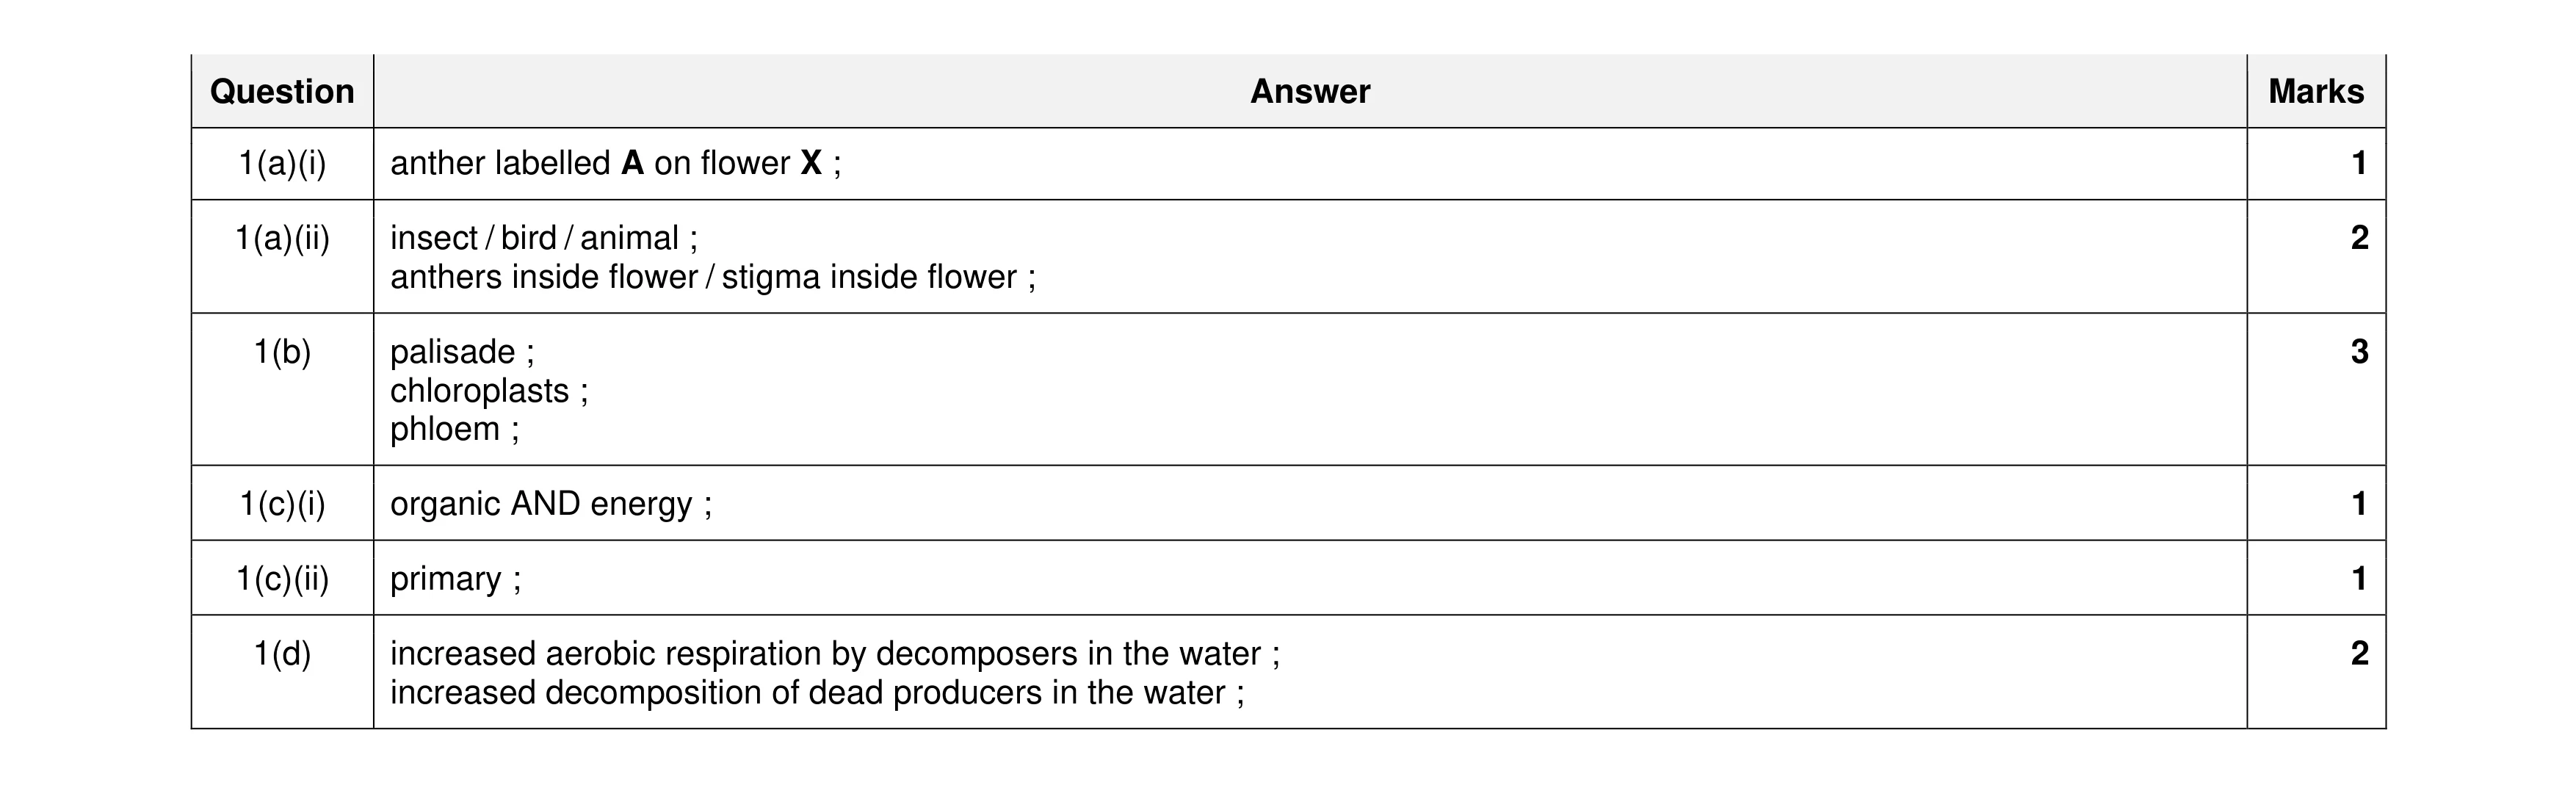 10
10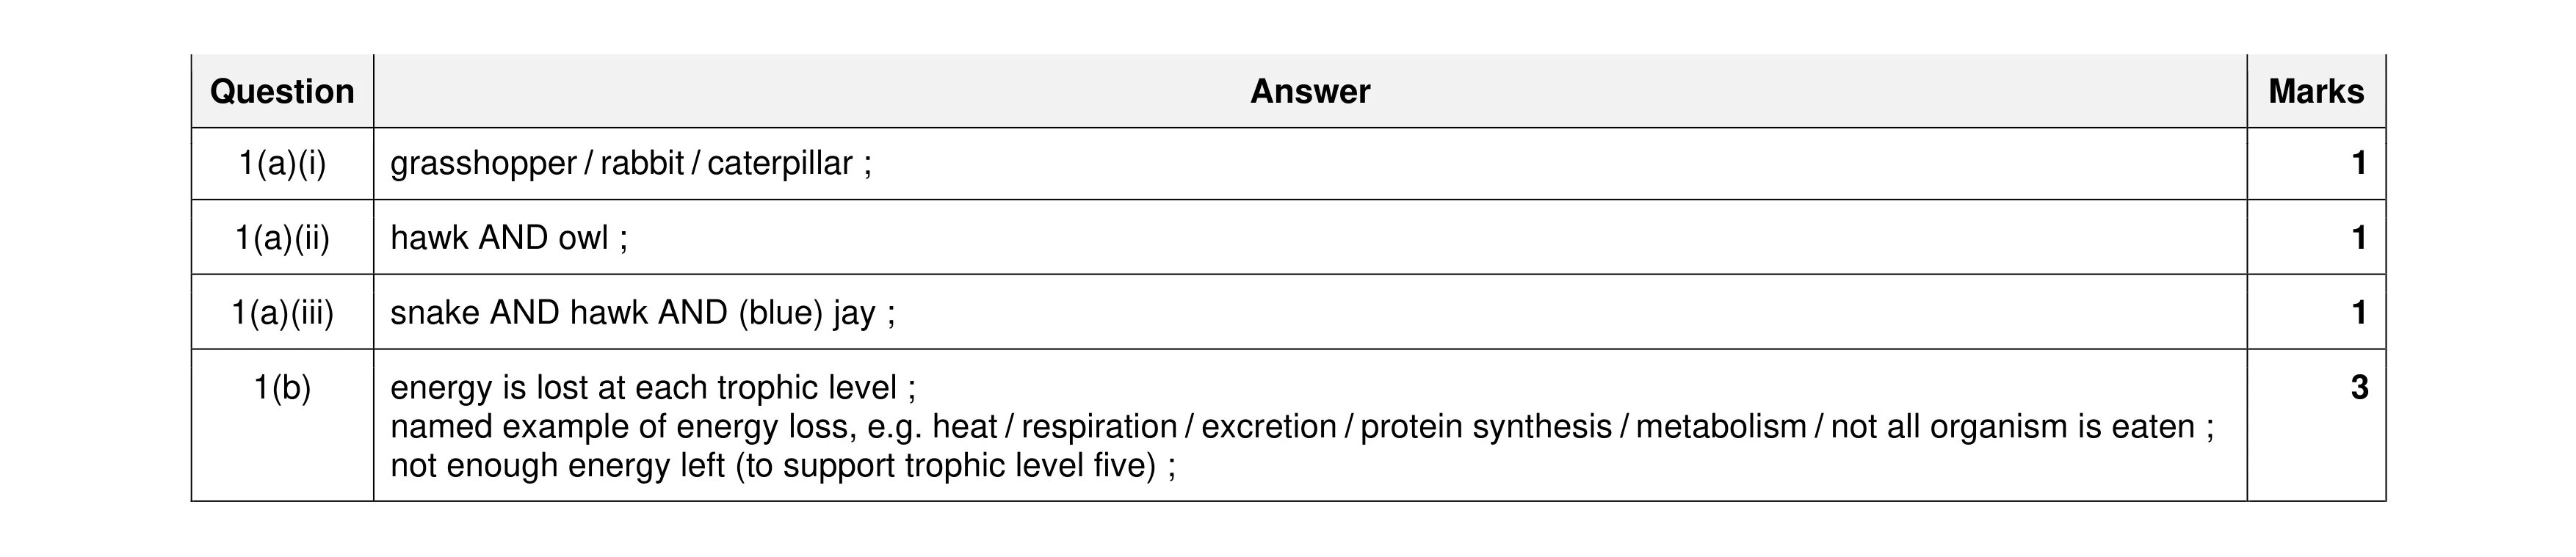 6
6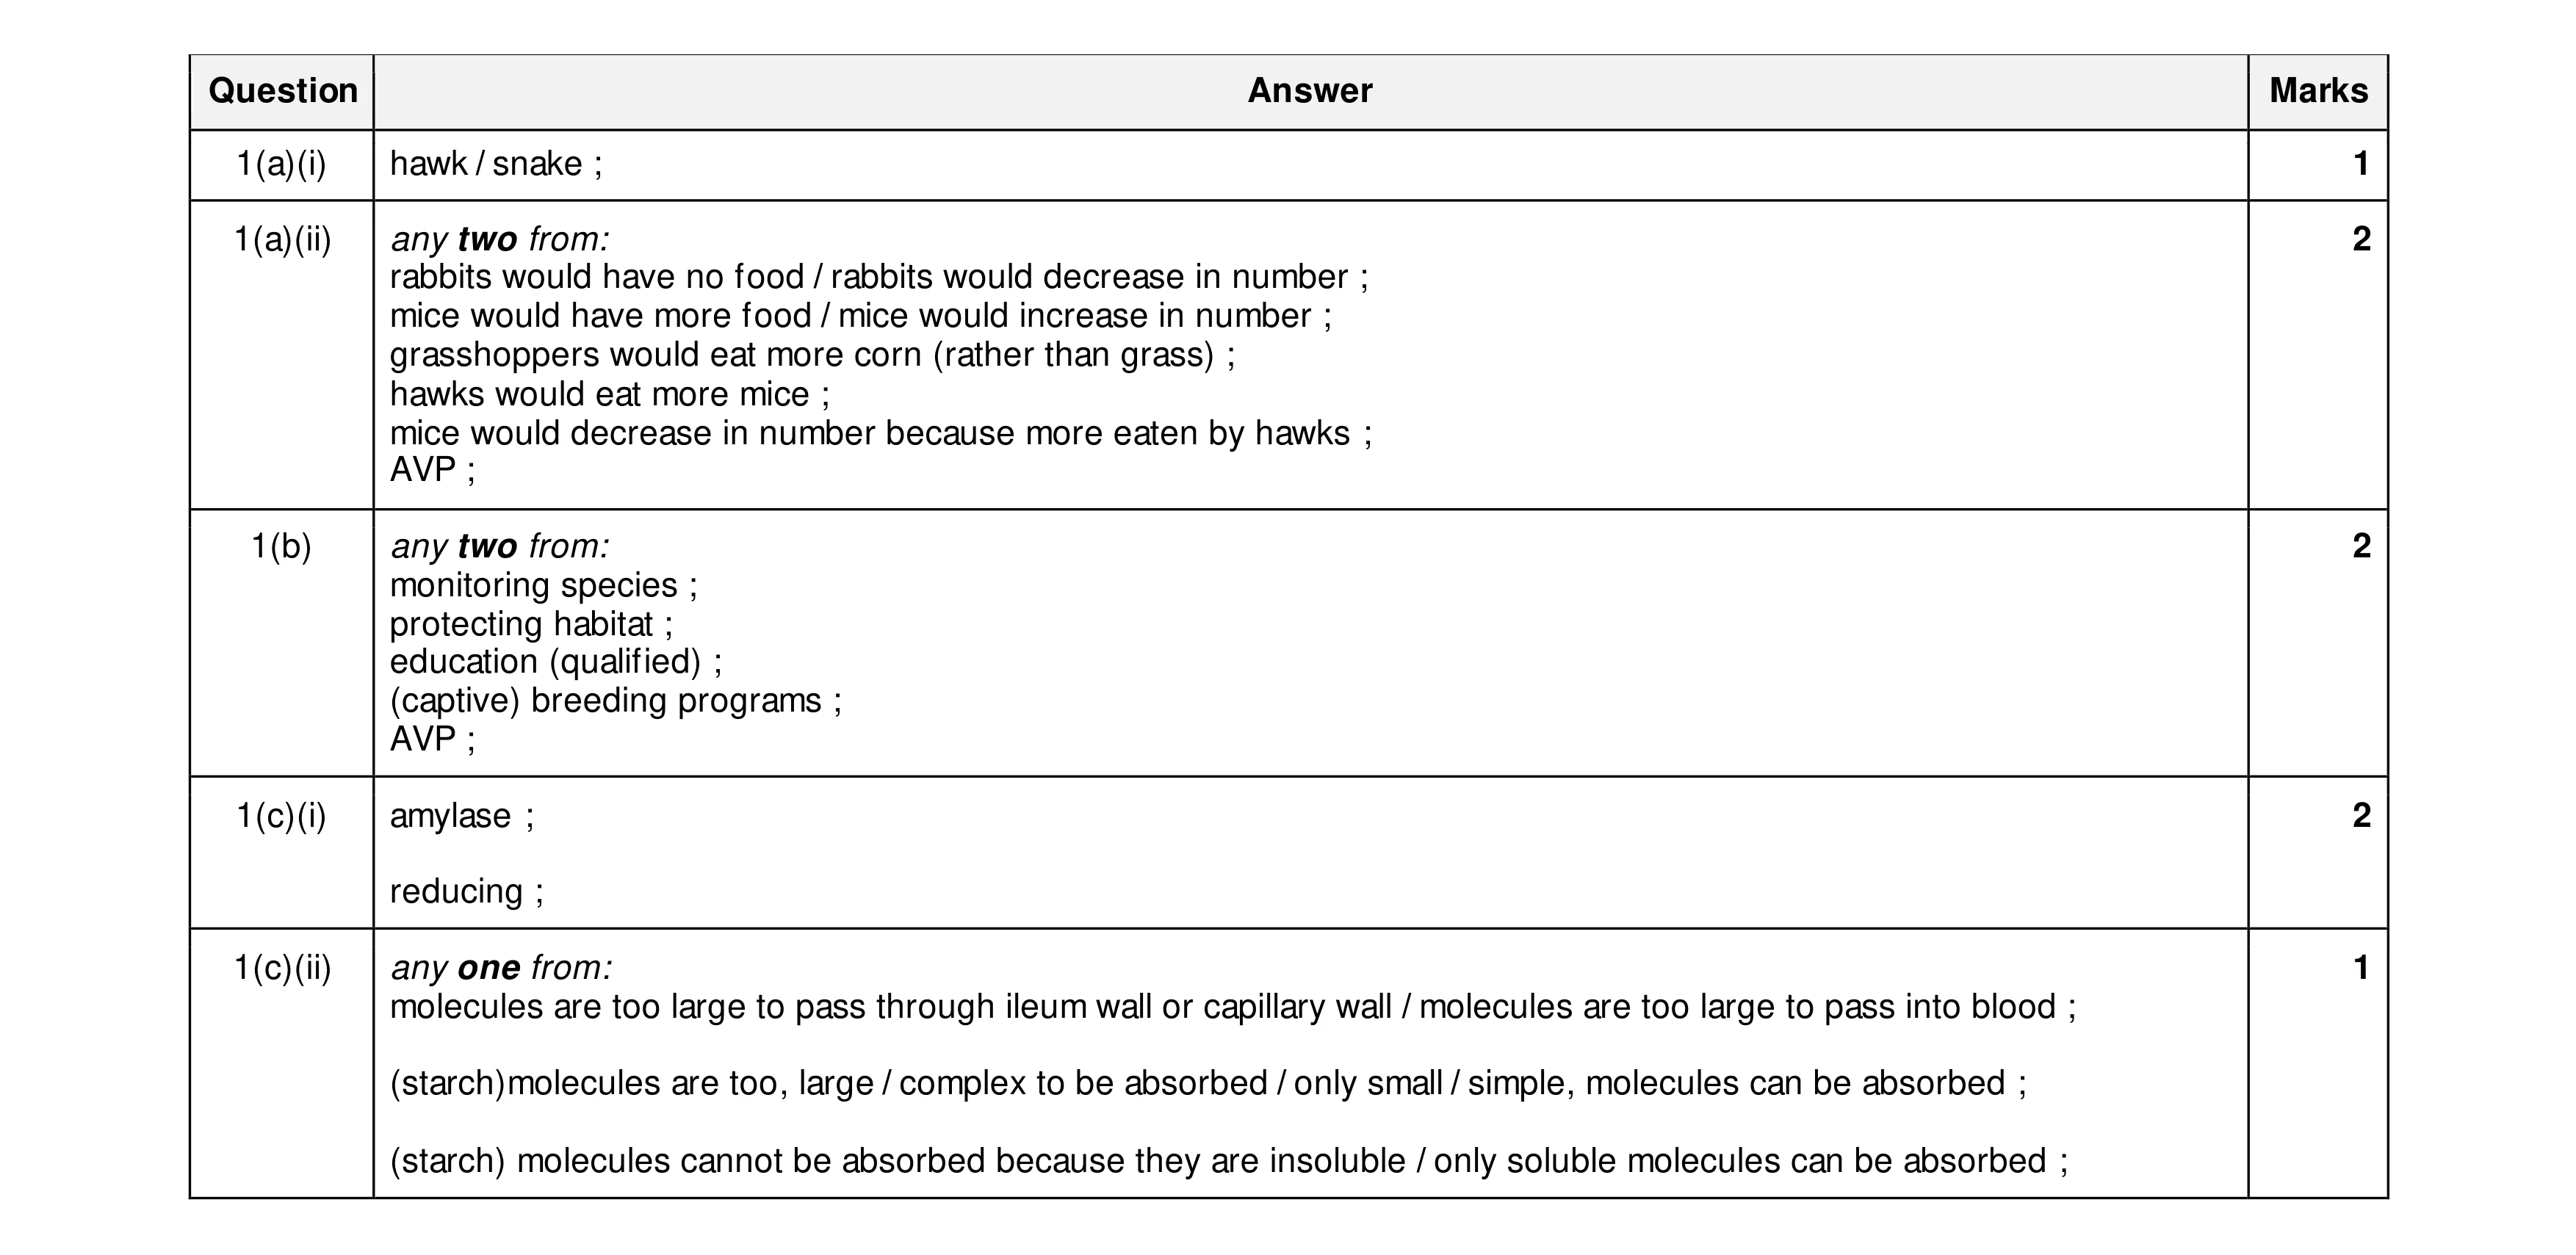 8
8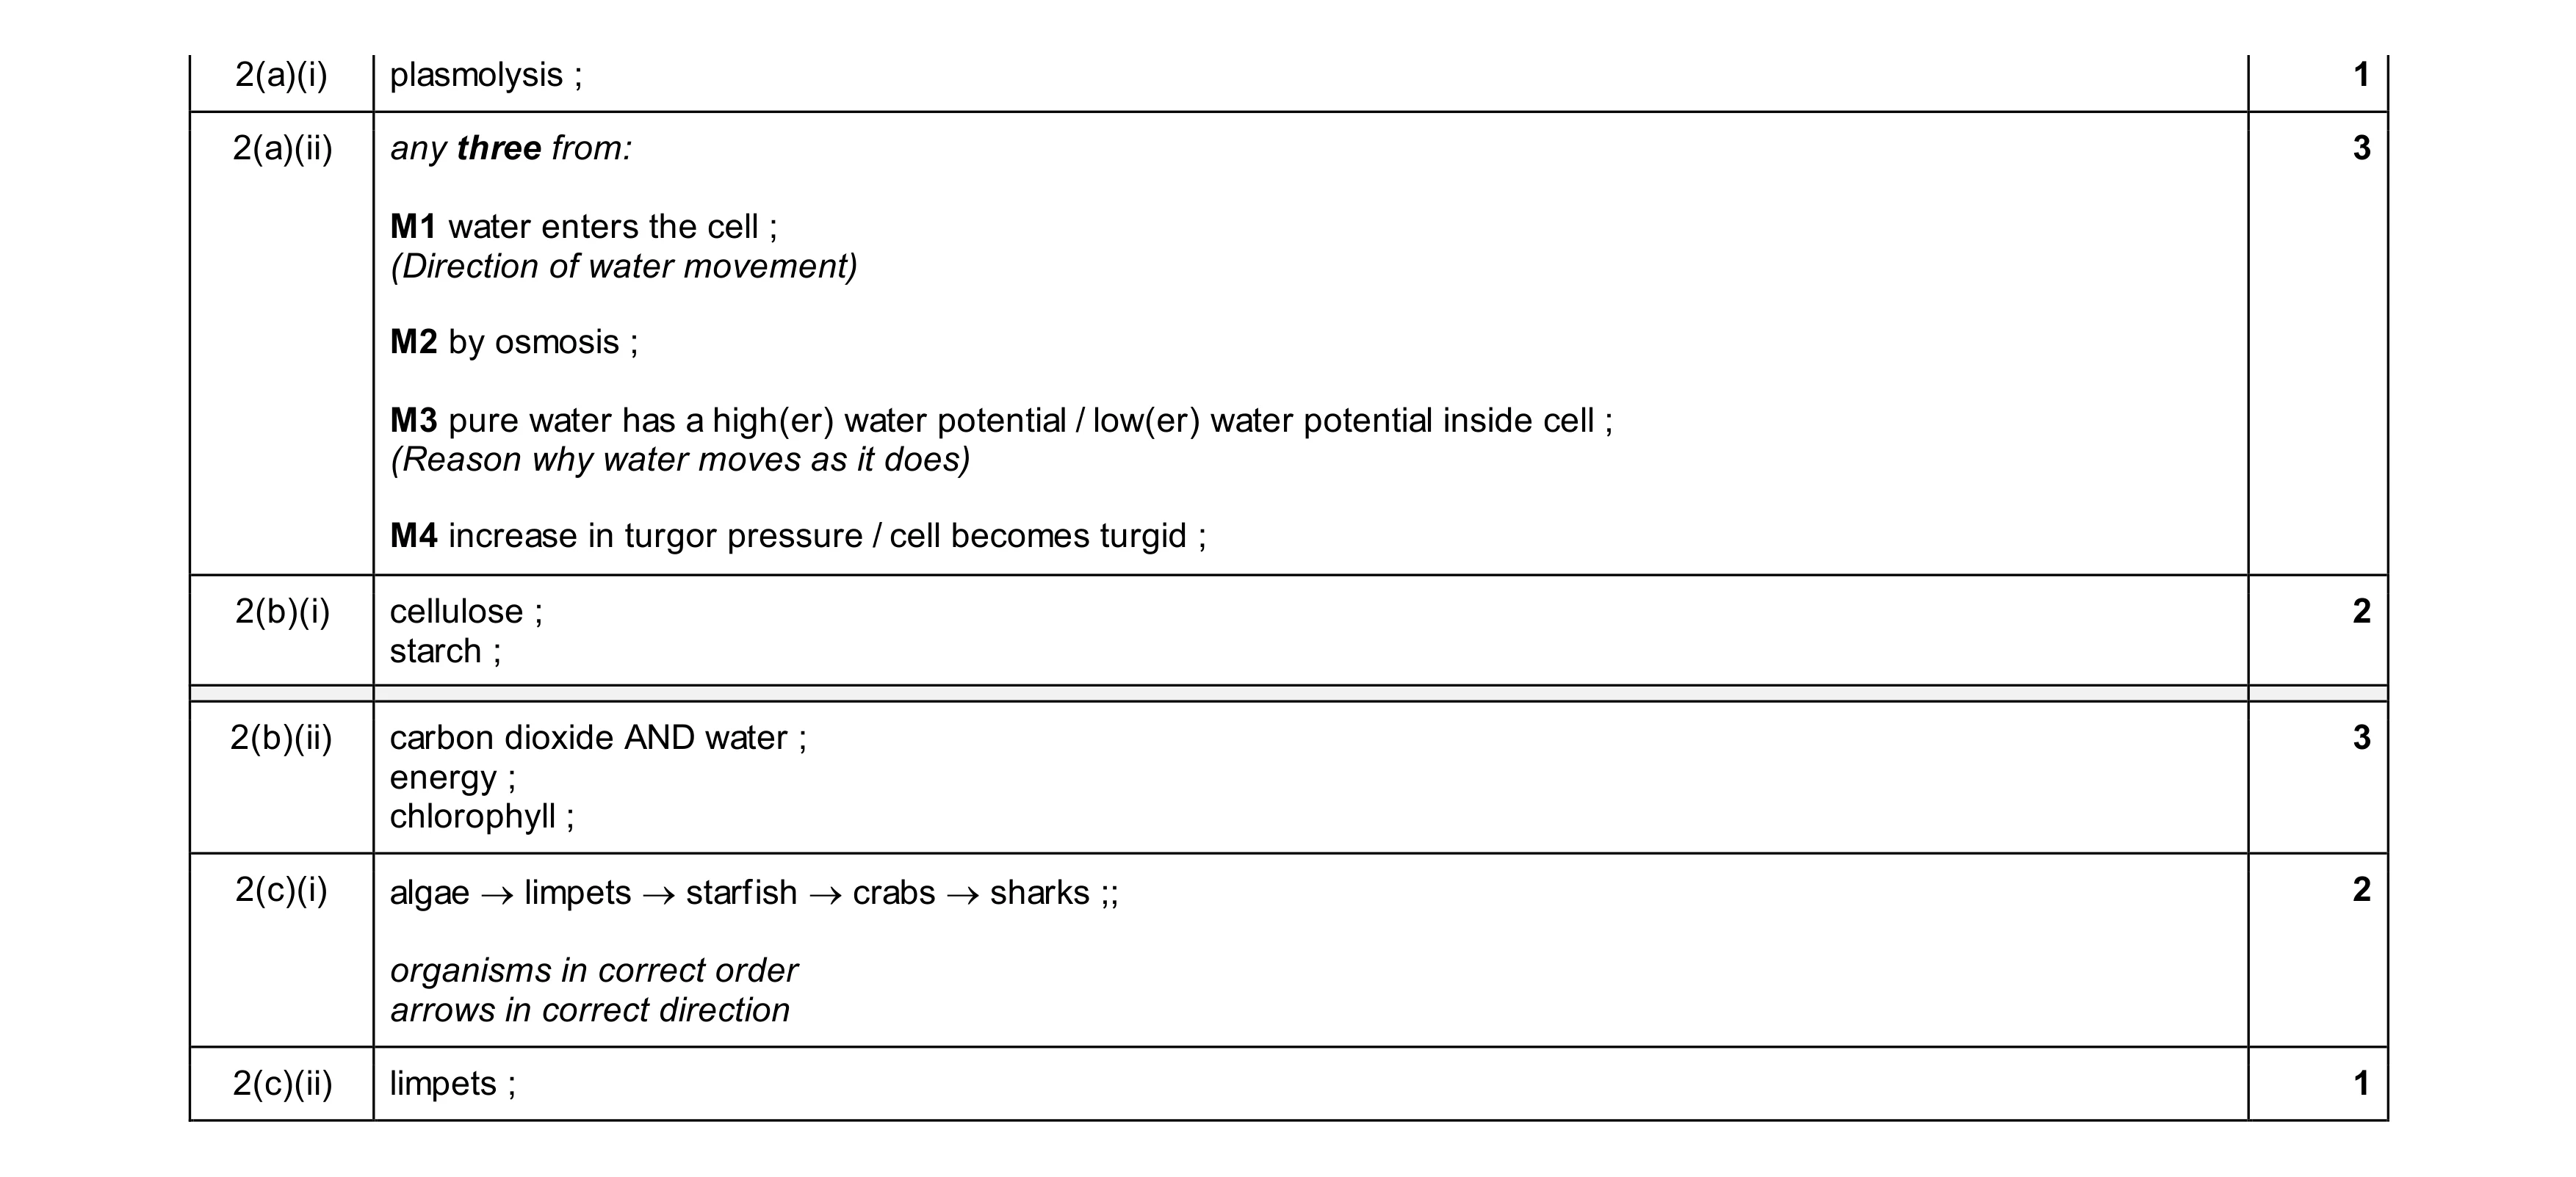 12
12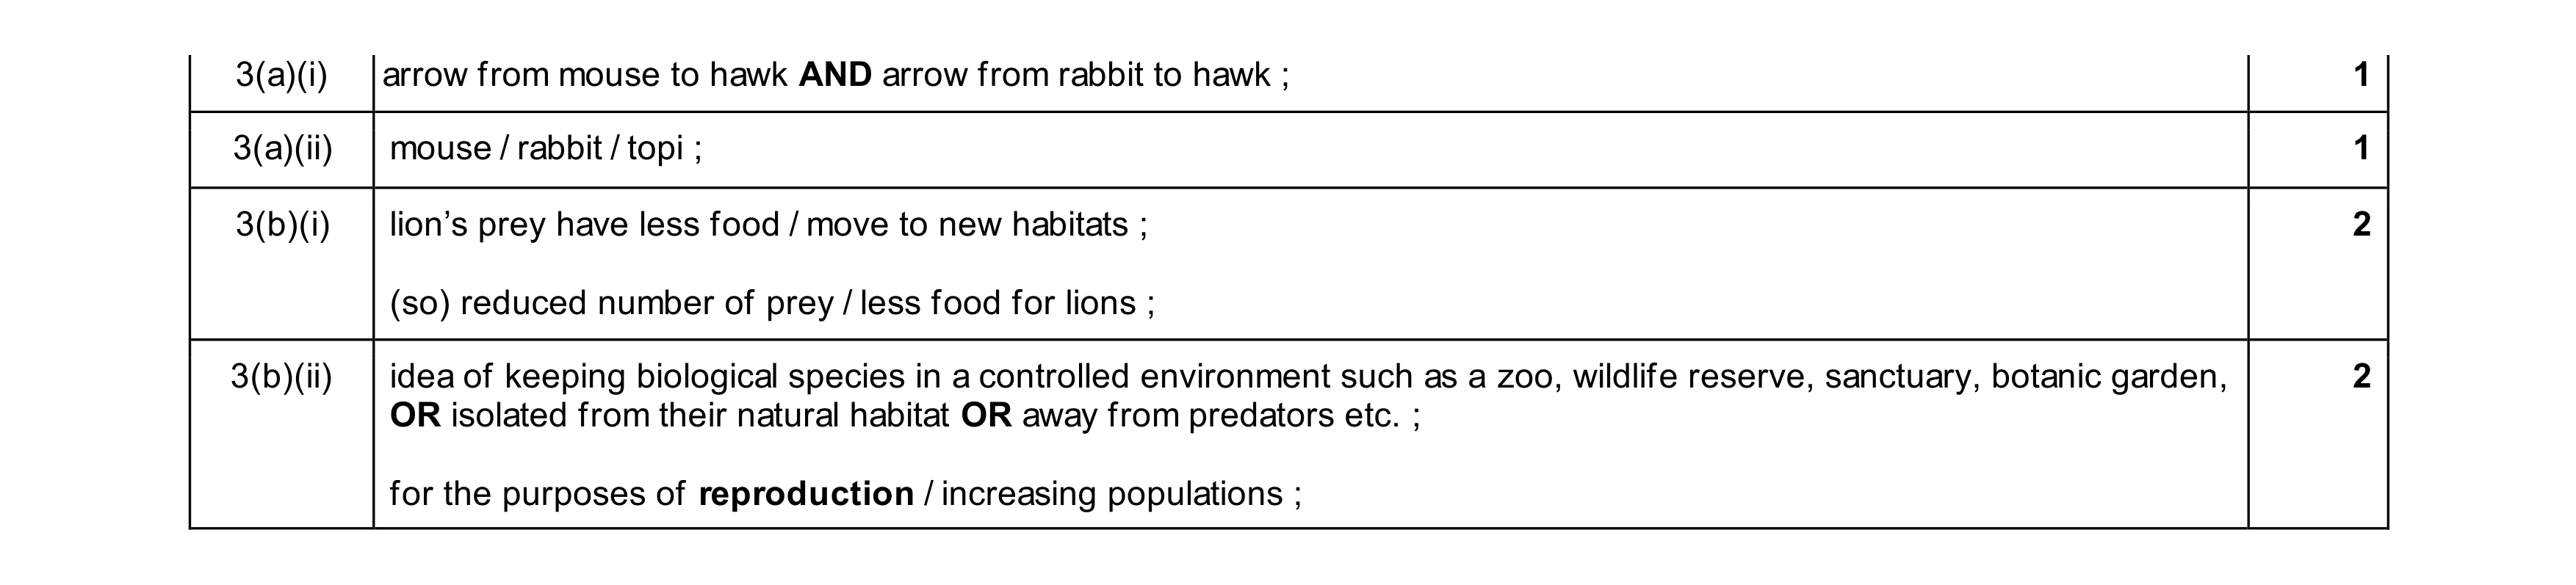 6
6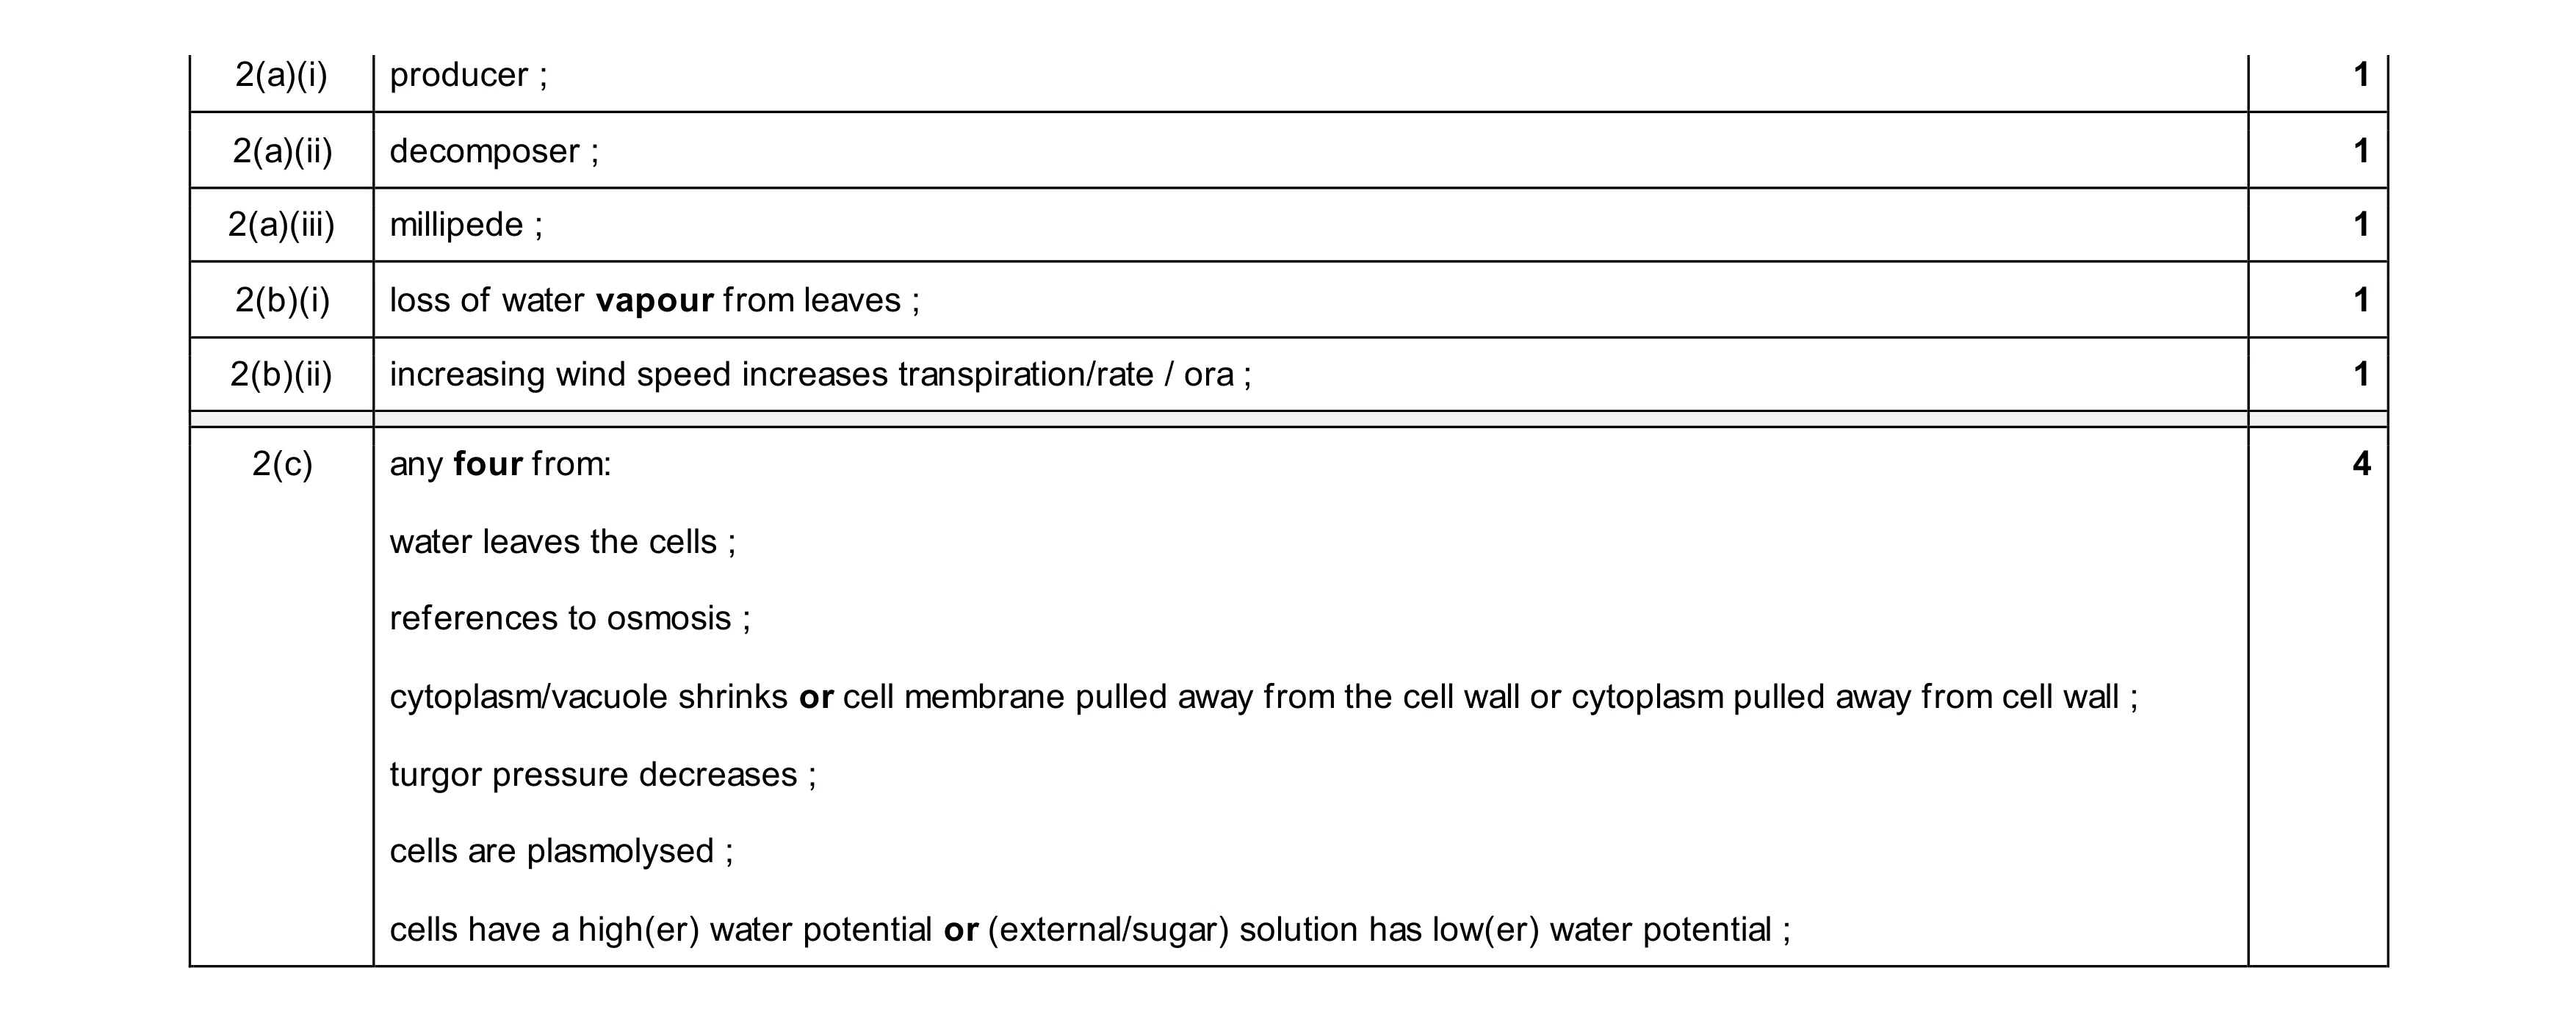 9
9