Questions as text
Q1 · The diagram is a speed-time graph for a moving object 0654/21 May/June 2017
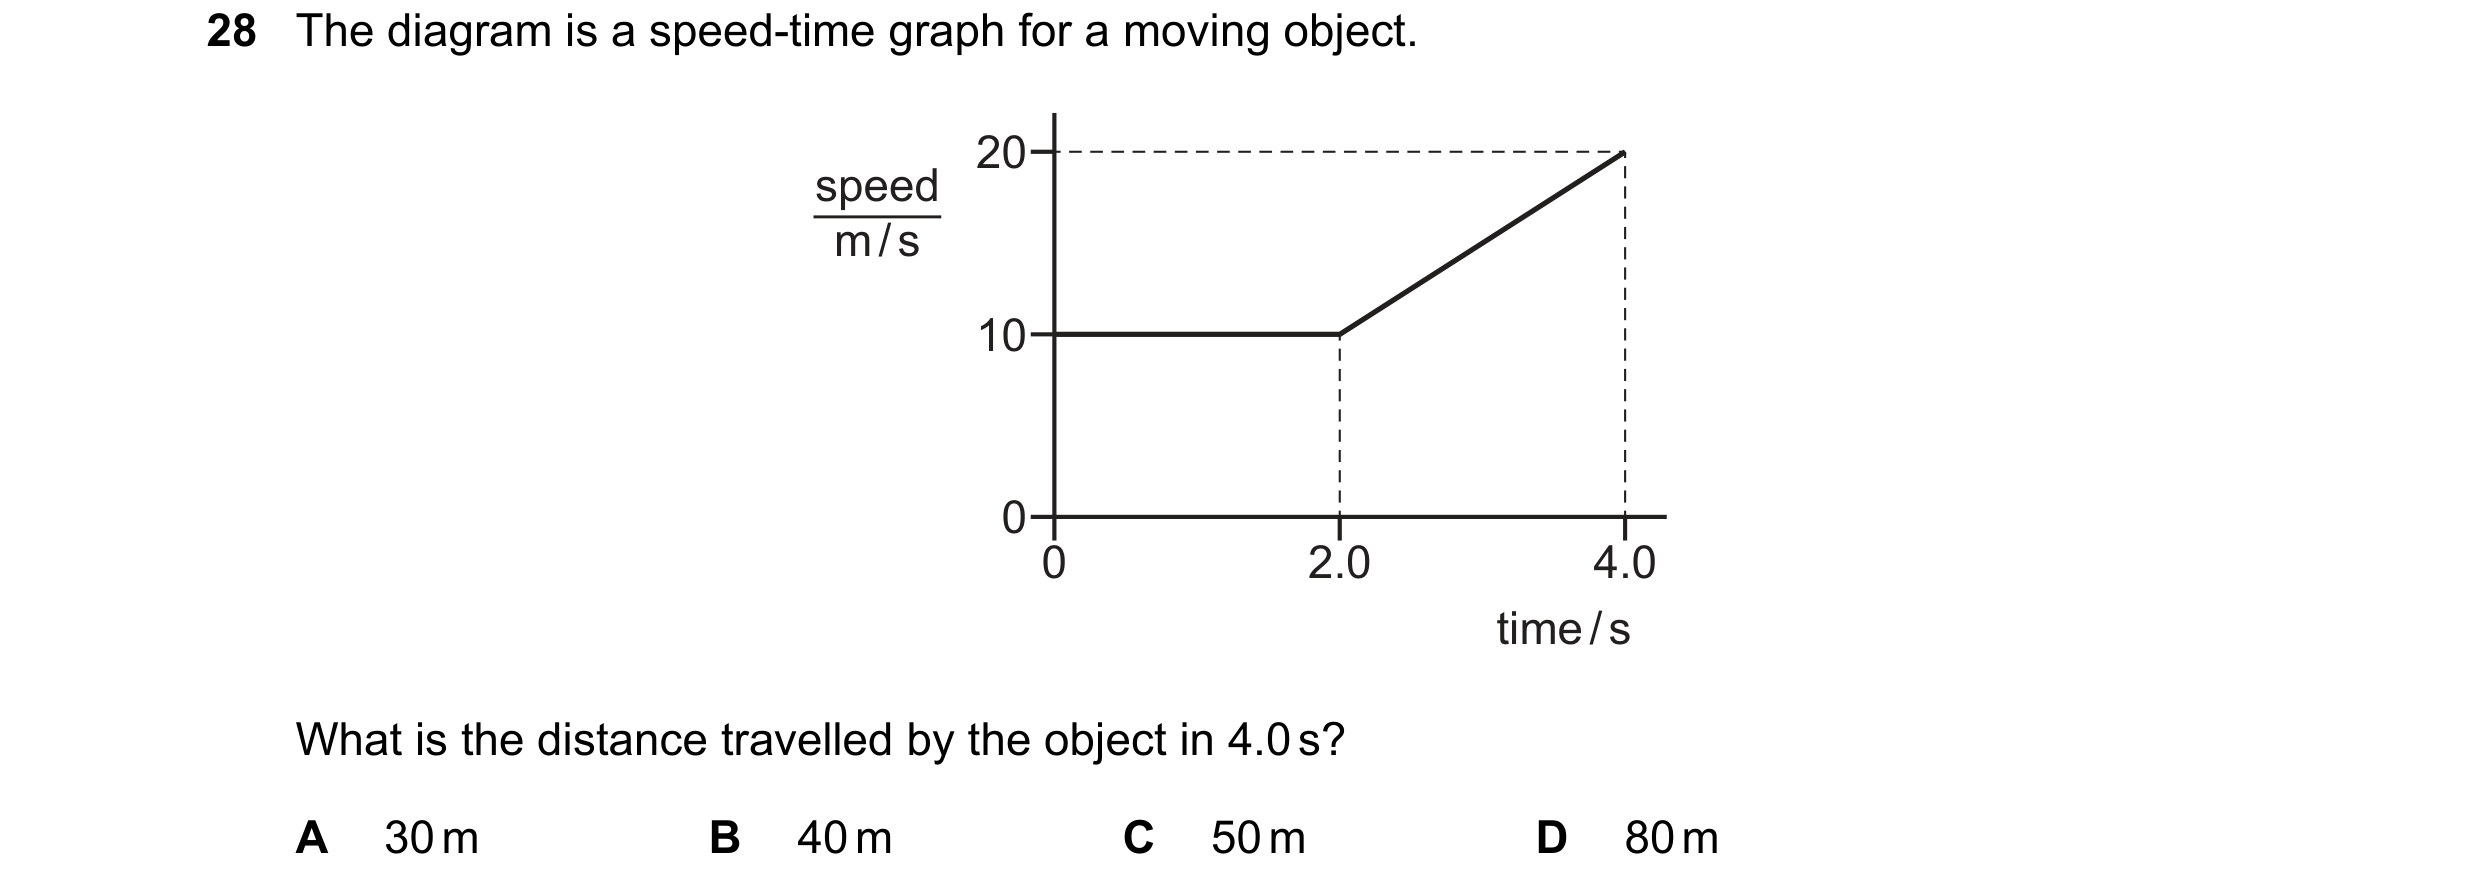
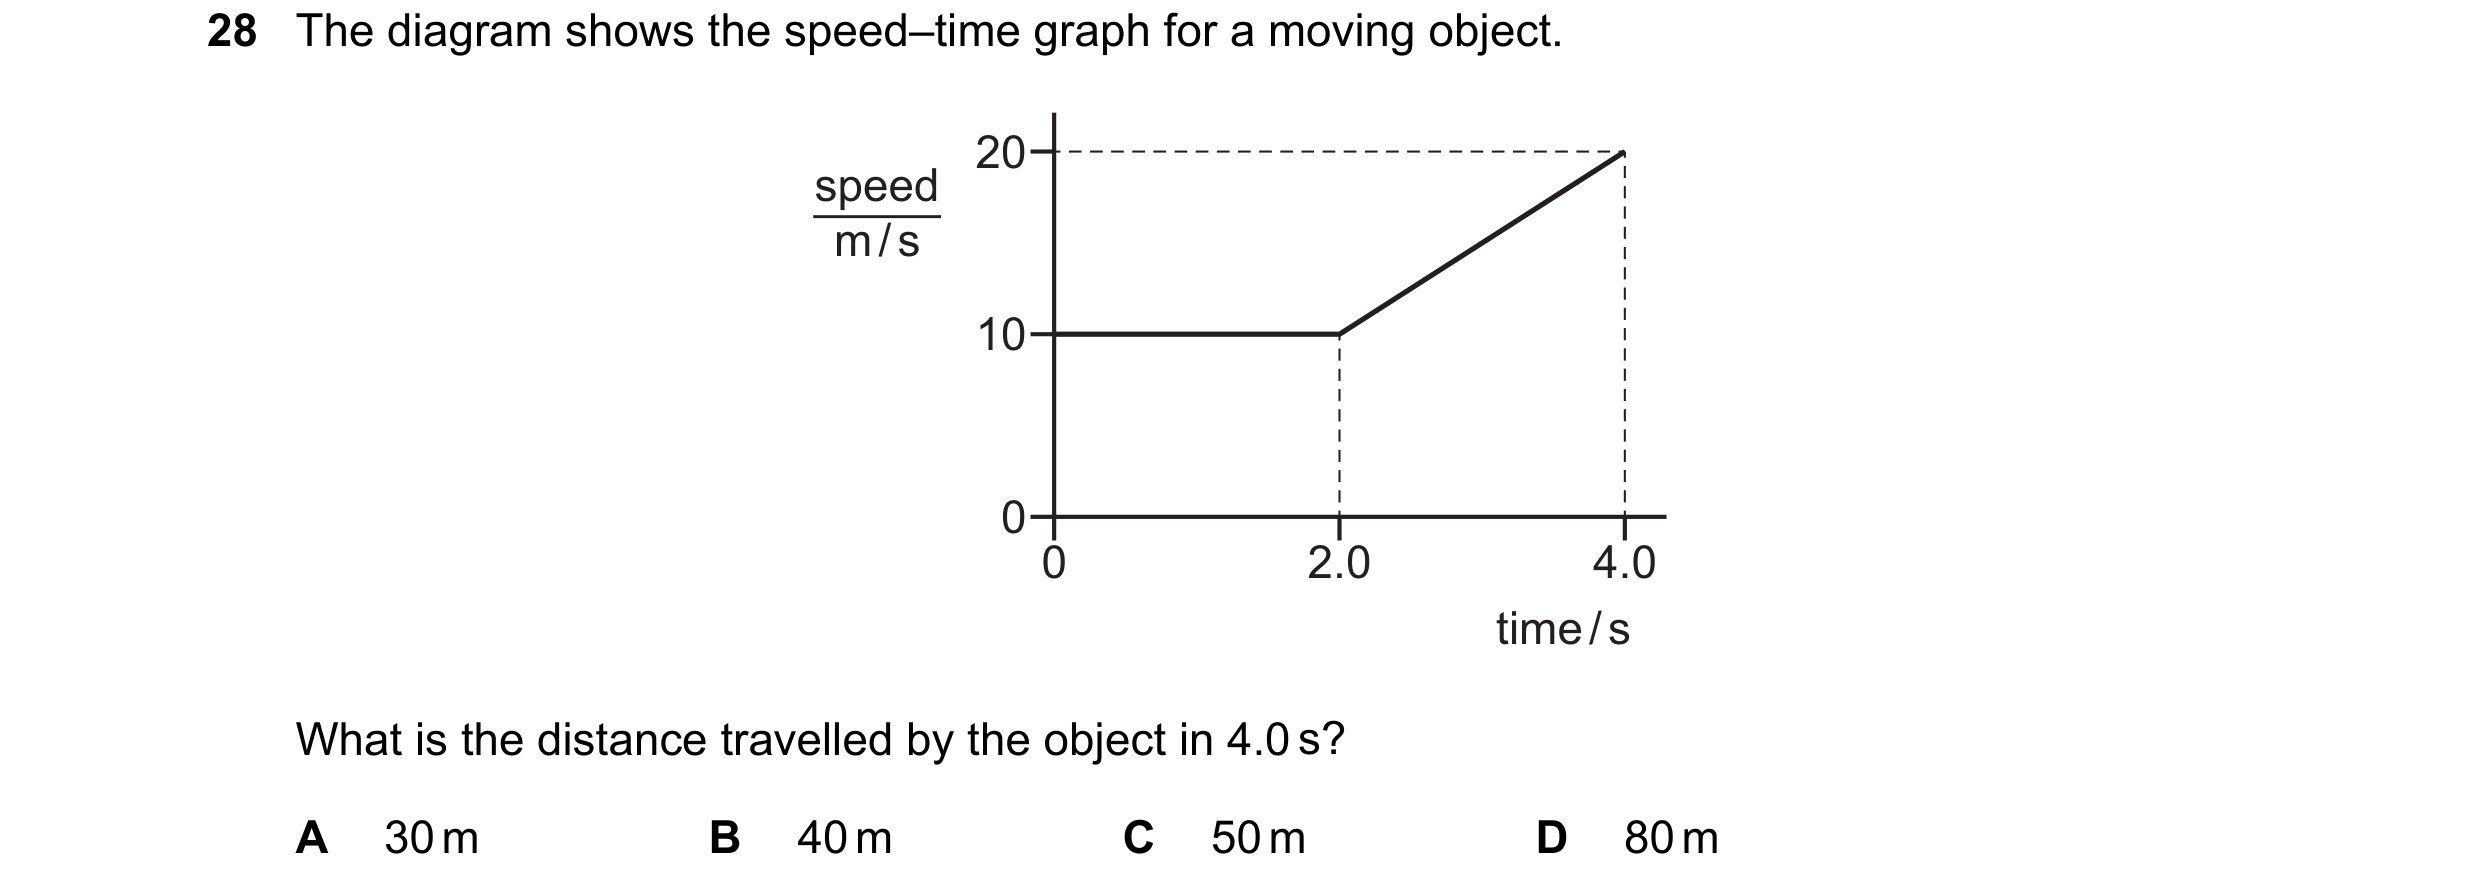
28 The diagram is a speed-time graph for a moving object. 20 speed m / s 10 0 0 2.0 4.0 time / s What is the distance travelled by the object in 4.0 s? A 30 m B 40 m C 50 m D 80 m
1 marks
Answer: C
This question in 0654/21 May/June 2017
Q2 · The diagram is a speed-time graph for a moving object 0654/22 May/June 2017
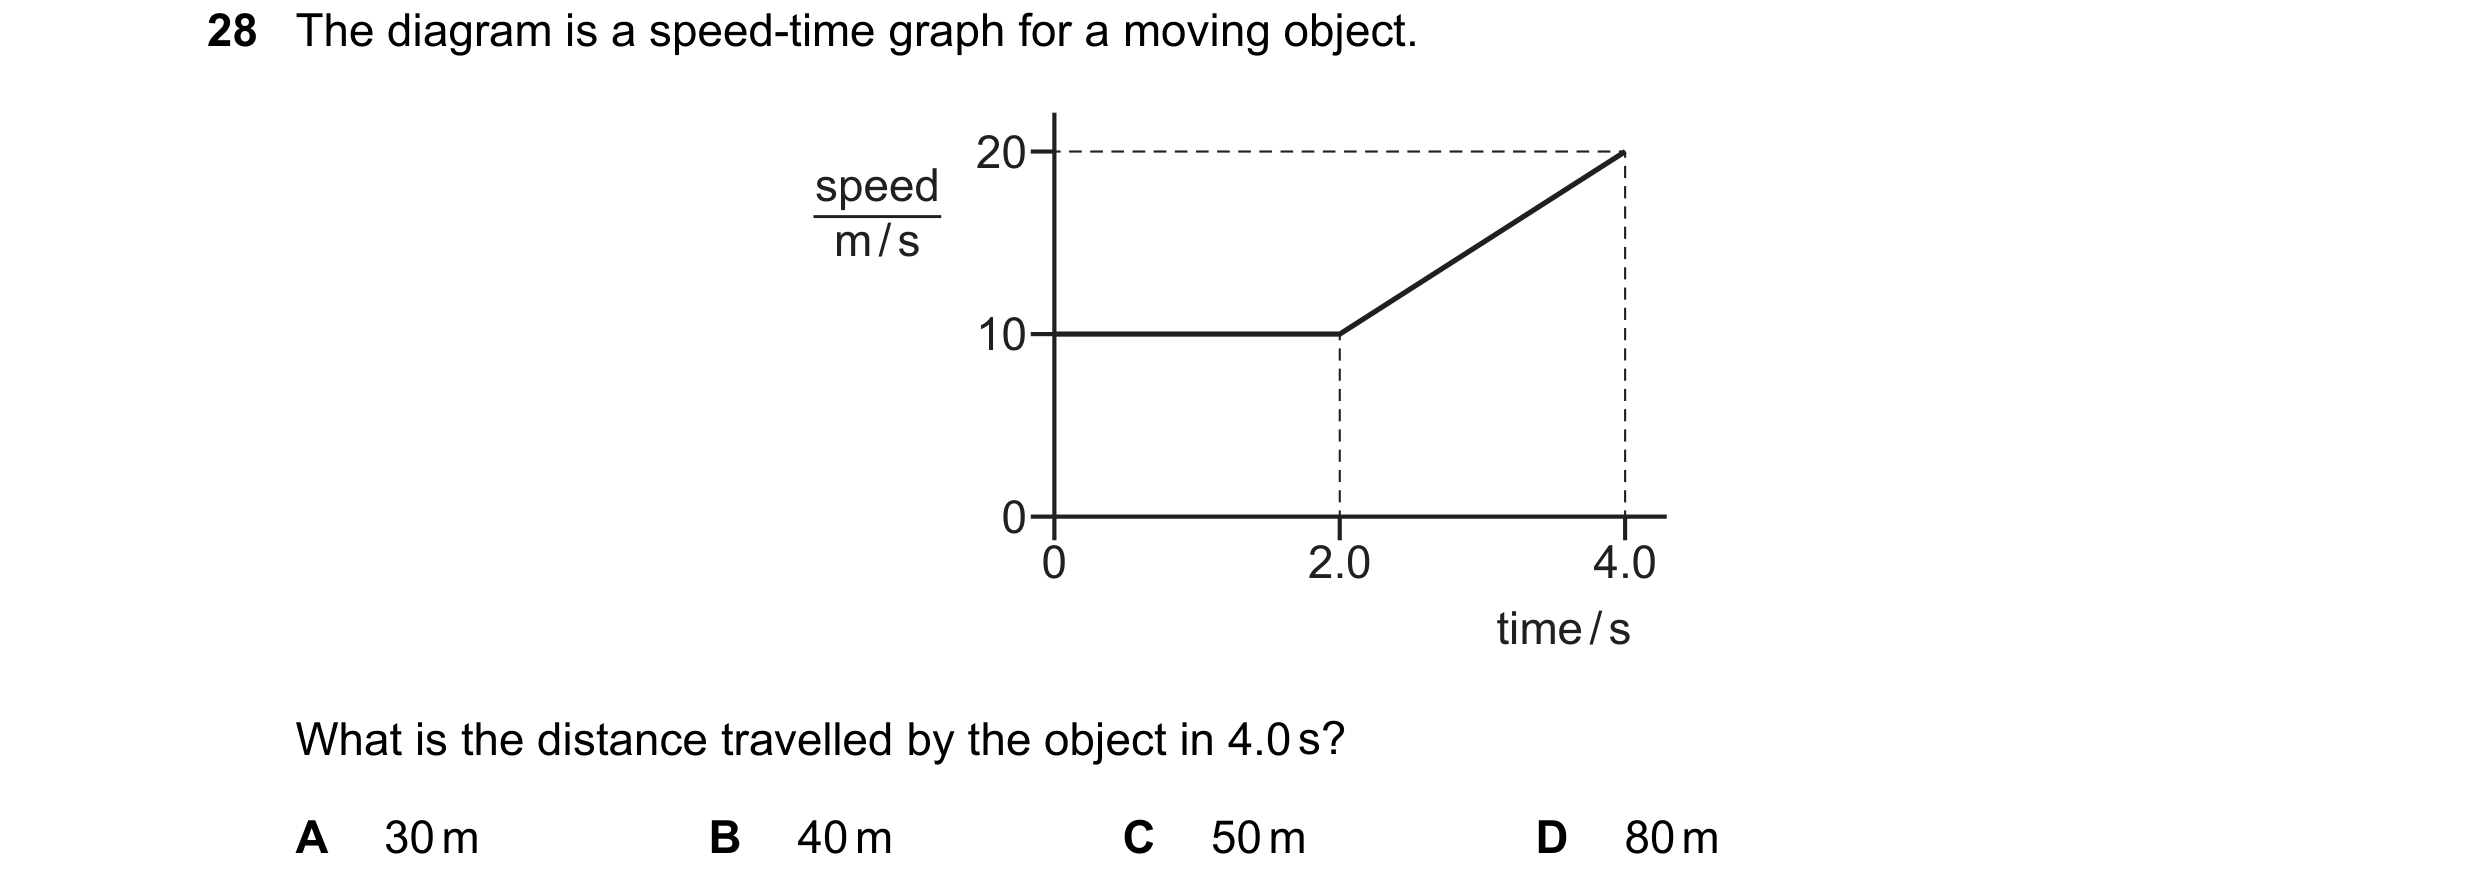
28 The diagram is a speed-time graph for a moving object. 20 speed m / s 10 0 0 2.0 4.0 time / s What is the distance travelled by the object in 4.0 s? A 30 m B 40 m C 50 m D 80 m
1 marks
Answer: C
This question in 0654/22 May/June 2017
Q3 · The diagram is a speed-time graph for a moving object 0654/23 May/June 2017
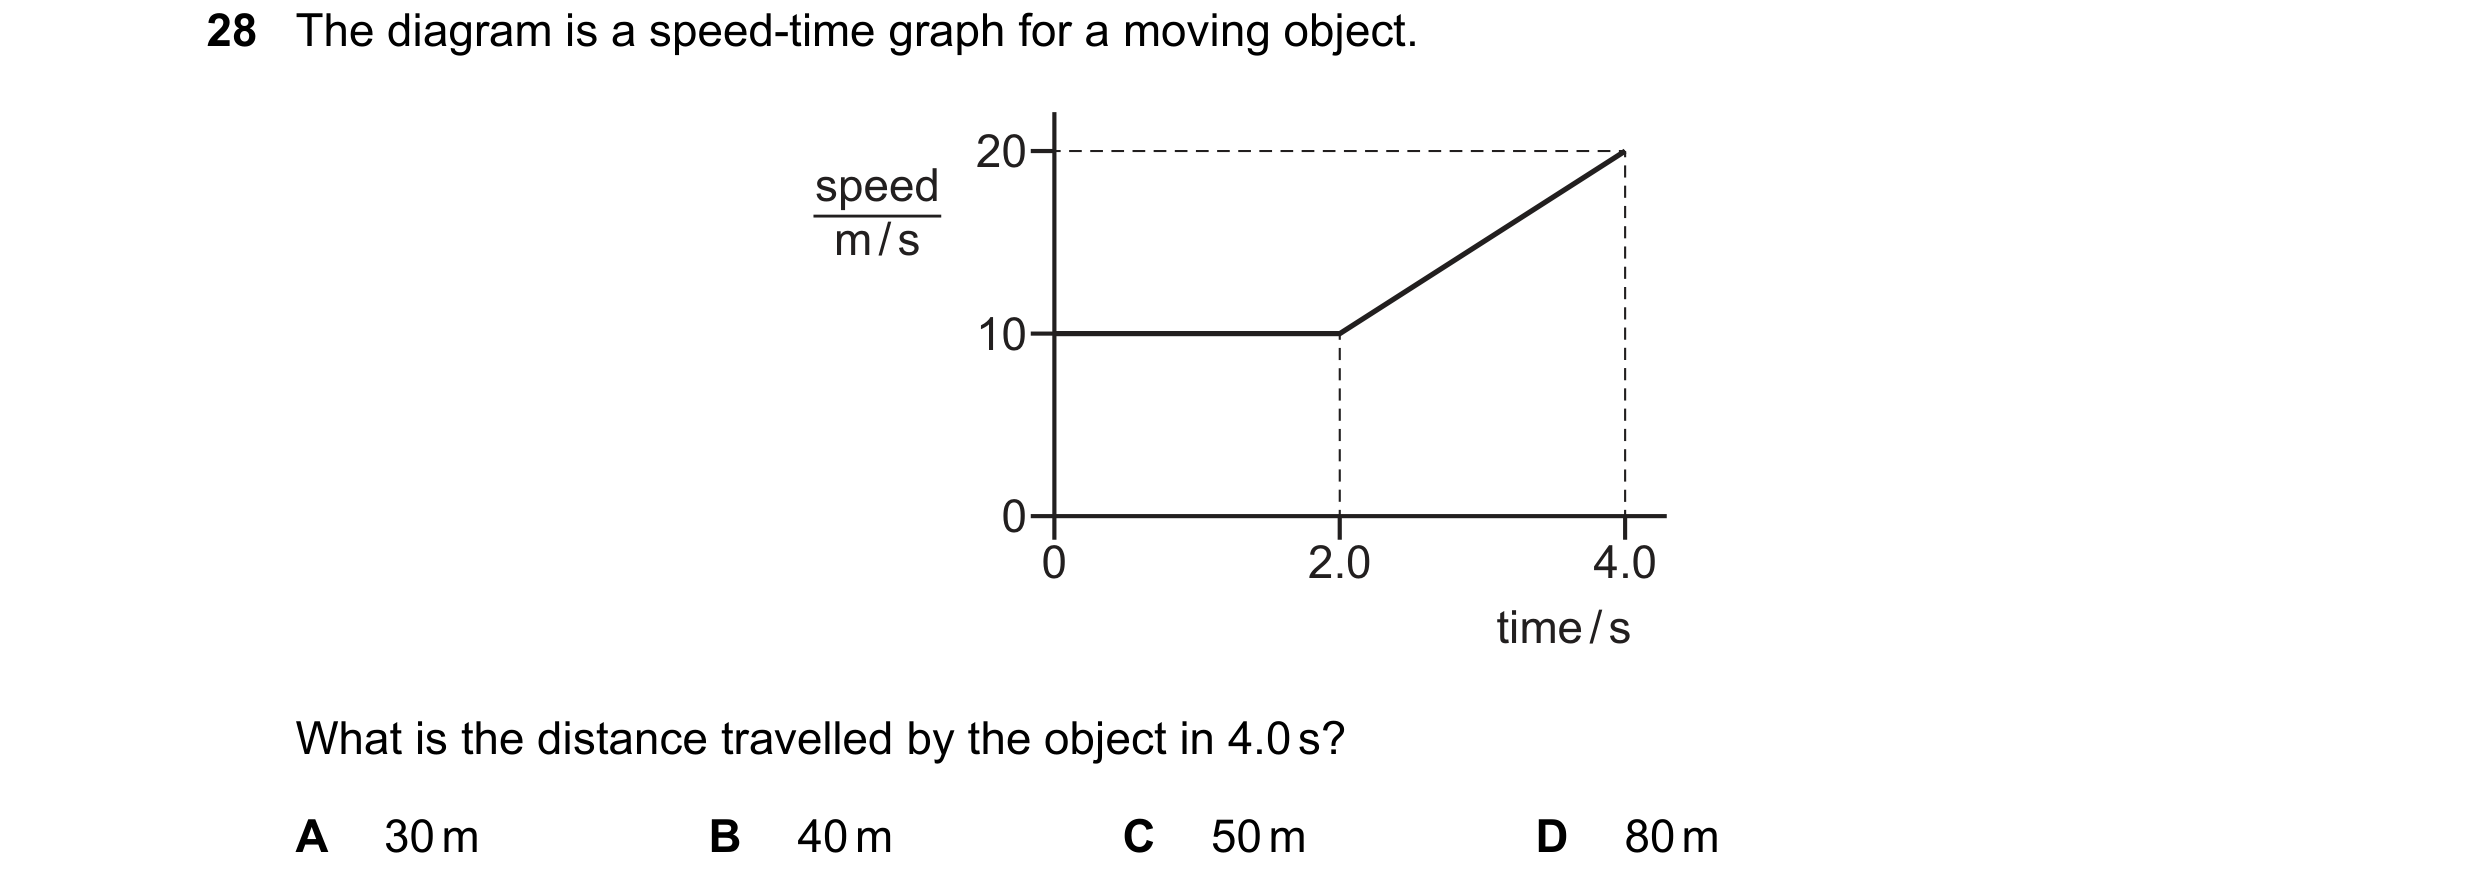
28 The diagram is a speed-time graph for a moving object. 20 speed m / s 10 0 0 2.0 4.0 time / s What is the distance travelled by the object in 4.0 s? A 30 m B 40 m C 50 m D 80 m
1 marks
Answer: C
This question in 0654/23 May/June 2017
Q4 · A car moves with a constant speed of 15 m / s along a road for 20 s 0654/21 Oct/Nov 2017
28 A car moves with a constant speed of 15 m / s along a road for 20 s. After this, the car is 100 m from where it started, measured in a straight line. Which statement about the car is correct? A It has travelled a distance of 100 m along the road. B It has travelled a distance of 300 m along the road. C Its direction was constant. D Its velocity was constant.
1 marks
Answer: B
This question in 0654/21 Oct/Nov 2017
Q5 · A car moves with a constant speed of 15 m / s along a road for 20 s 0654/22 Oct/Nov 2017
28 A car moves with a constant speed of 15 m / s along a road for 20 s. After this, the car is 100 m from where it started, measured in a straight line. Which statement about the car is correct? A It has travelled a distance of 100 m along the road. B It has travelled a distance of 300 m along the road. C Its direction was constant. D Its velocity was constant.
1 marks
Answer: B
This question in 0654/22 Oct/Nov 2017
Q6 · A car moves with a constant speed of 15 m / s along a road for 20 s 0654/23 Oct/Nov 2017
28 A car moves with a constant speed of 15 m / s along a road for 20 s. After this, the car is 100 m from where it started, measured in a straight line. Which statement about the car is correct? A It has travelled a distance of 100 m along the road. B It has travelled a distance of 300 m along the road. C Its direction was constant. D Its velocity was constant.
1 marks
Answer: B
This question in 0654/23 Oct/Nov 2017
Q7 · The diagram shows the speed-time graph for a car 0654/21 Oct/Nov 2018
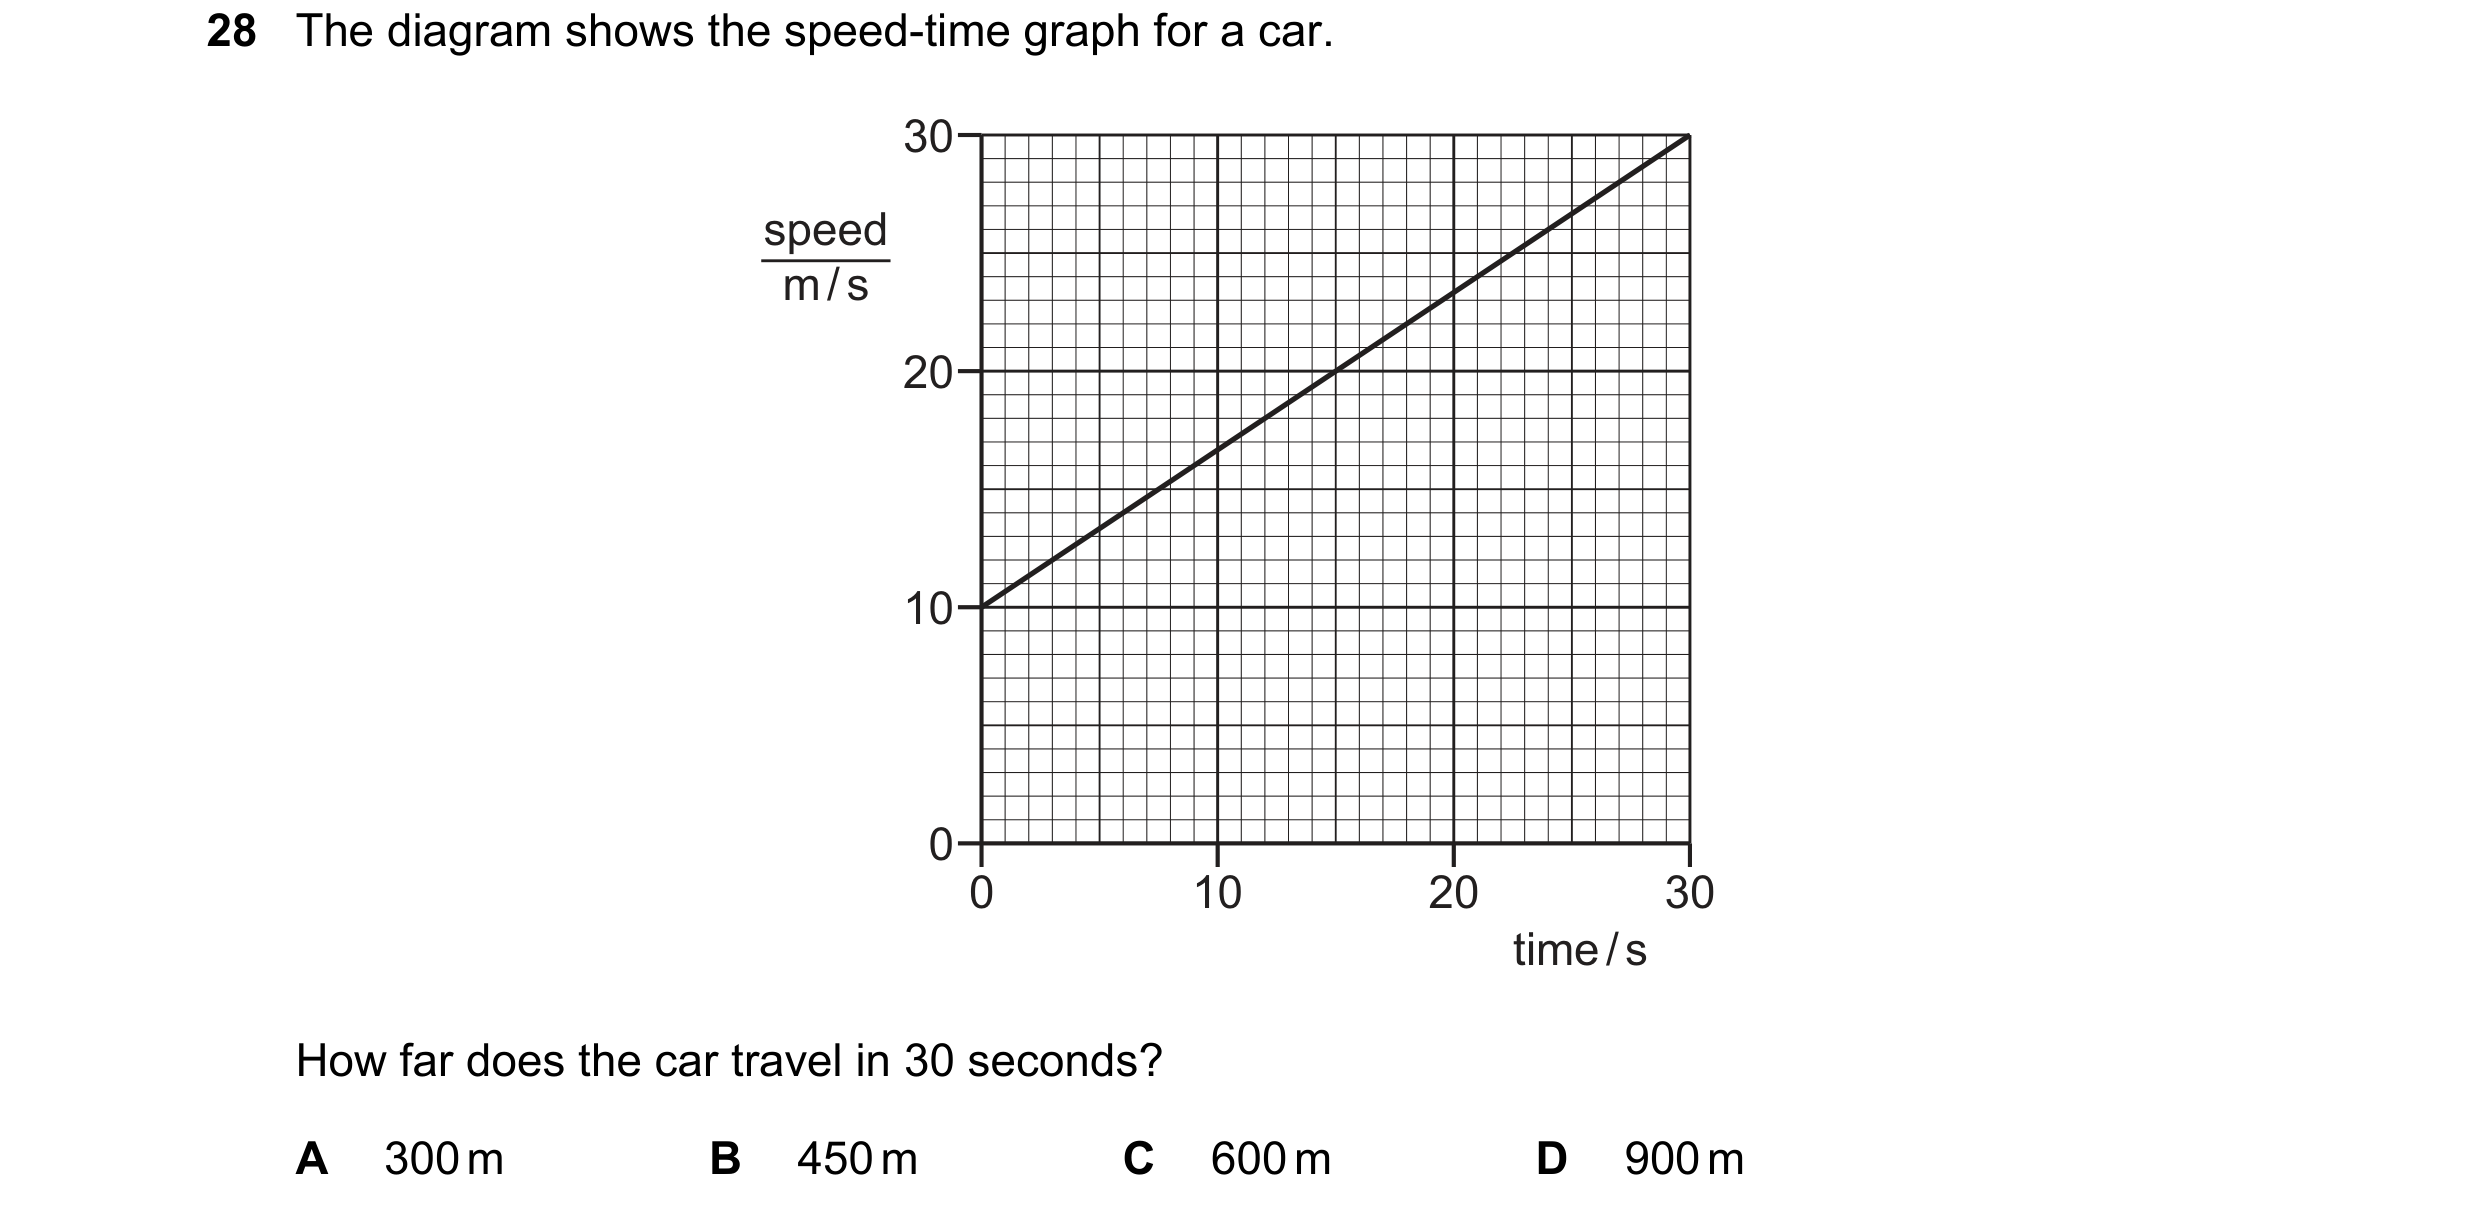
28 The diagram shows the speed-time graph for a car. 30 speed m / s 20 10 0 0 10 20 30 time / s How far does the car travel in 30 seconds? A 300 m B 450 m C 600 m D 900 m
1 marks
Answer: C
This question in 0654/21 Oct/Nov 2018
Q8 · A brick of mass 2.0 kg is at rest 0654/21 Oct/Nov 2018
30 A brick of mass 2.0 kg is at rest. It falls to the ground through a distance of 5.0 m. The acceleration of free fall g is 10 m / s2. Air resistance can be ignored. At what speed does the brick hit the ground? A 3.2 m / s B 7.1 m / s C 10 m / s D 50 m / s
1 marks
Answer: C
This question in 0654/21 Oct/Nov 2018
Q9 · A model aircraft starts to move 0654/22 Oct/Nov 2018
28 A model aircraft starts to move. It takes 16 seconds to reach its take-off speed of 32 m / s. What is the average acceleration of the aircraft during this time? A 0.25 m / s2 B 0.50 m / s2 C 1.0 m / s2 D 2.0 m / s2
1 marks
Answer: D
This question in 0654/22 Oct/Nov 2018
Q10 · A ball is thrown vertically upwards at a speed of 4.0 m / s 0654/22 Oct/Nov 2018
30 A ball is thrown vertically upwards at a speed of 4.0 m / s. The acceleration of free fall g is 10 m / s2. Air resistance can be ignored. What is the maximum height the ball reaches? A 0.20 m B 0.40 m C 0.80 m D 40 m
1 marks
Answer: C
This question in 0654/22 Oct/Nov 2018
Q11 · The diagrams show the speed-time graphs for four objects 0654/23 Oct/Nov 2018
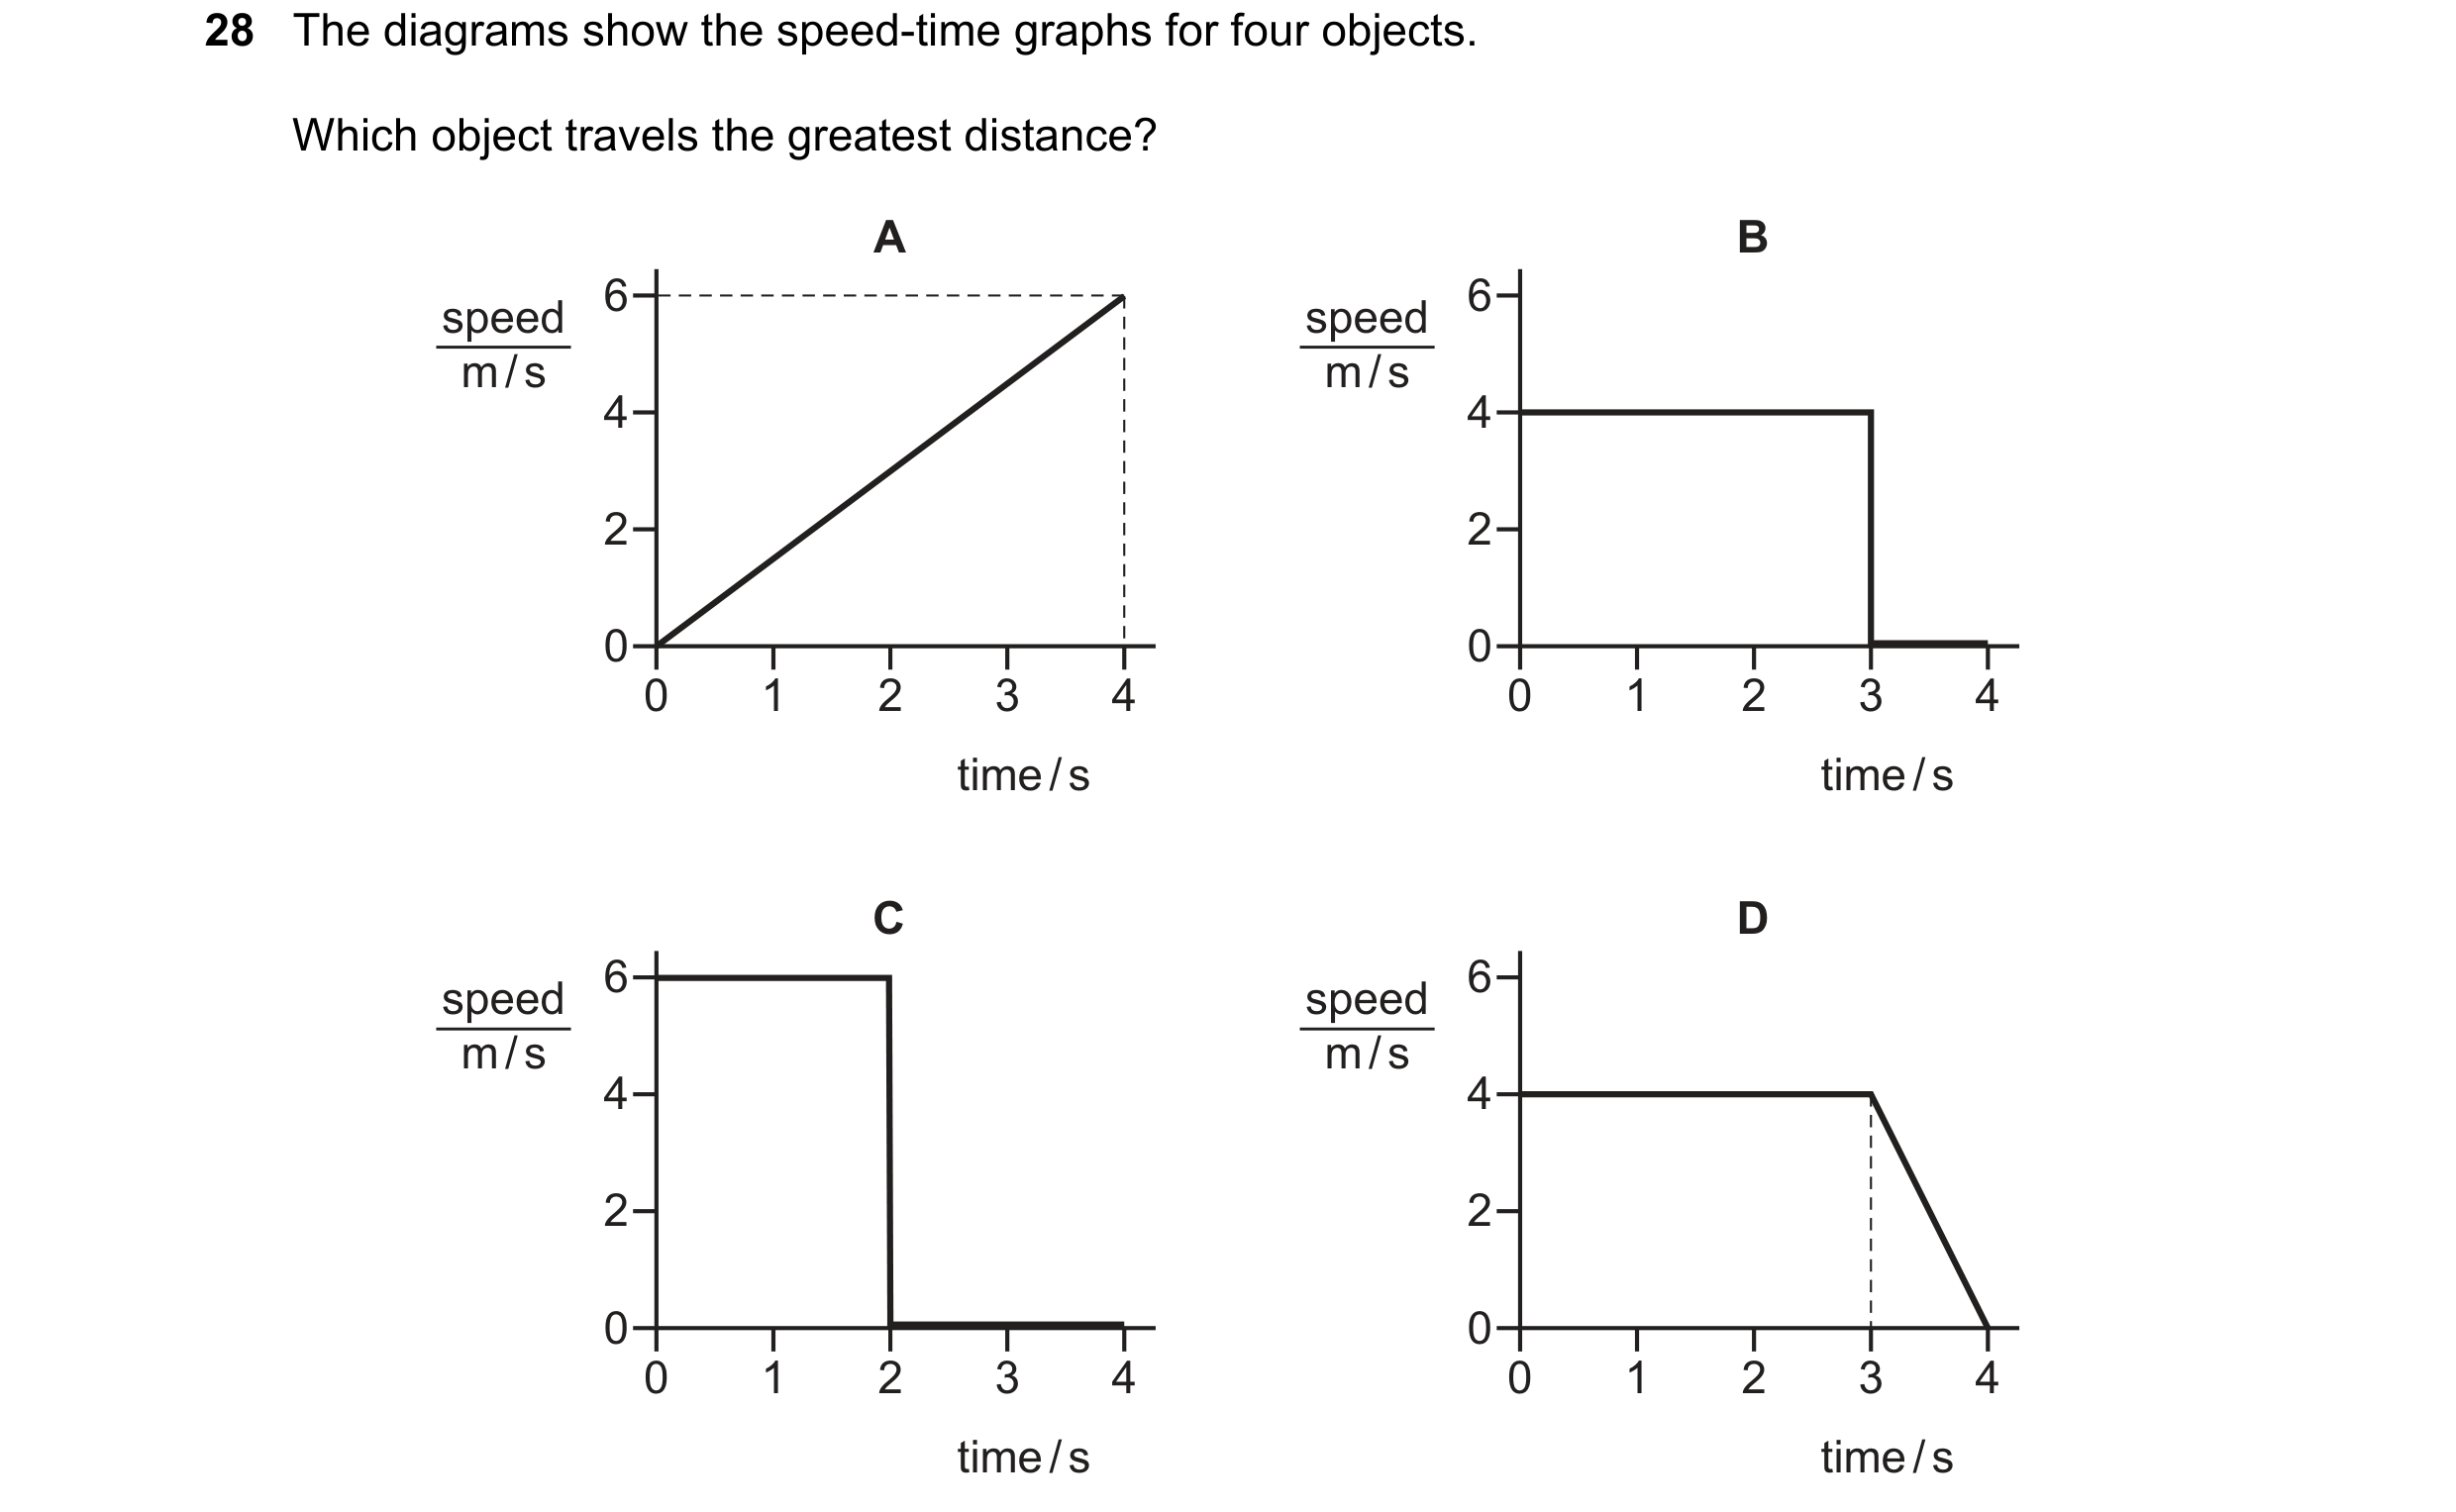
28 The diagrams show the speed-time graphs for four objects. Which object travels the greatest distance? A B 6 6 speed speed m / s m / s 4 4 2 2 0 0 0 1 2 3 4 0 1 2 3 4 time / s time / s C D 6 6 speed speed m / s m / s 4 4 2 2 0 0 0 1 2 3 4 0 1 2 3 4 time / s time / s
1 marks
Answer: D
This question in 0654/23 Oct/Nov 2018
Q12 · What is the difference, if any, between the terms speed and velocity? 0654/23 Oct/Nov 2018
29 What is the difference, if any, between the terms speed and velocity? A None. They have the same meaning. B Speed is velocity with a direction. C Velocity is rate of change of speed. D Velocity is speed with a direction.
1 marks
Answer: D
This question in 0654/23 Oct/Nov 2018
Q13 · A pole-vaulter of mass 60 kg rises to a maximum height of 5.0 m and then falls to the… 0654/23 Oct/Nov 2018
30 A pole-vaulter of mass 60 kg rises to a maximum height of 5.0 m and then falls to the ground. The acceleration of free fall g is 10 m / s2. Air resistance can be ignored. At what speed does the pole-vaulter hit the ground when she falls? A 5.0 m / s B 10 m / s C 25 m / s D 100 m / s
1 marks
Answer: B
This question in 0654/23 Oct/Nov 2018
Q14 · The diagram shows the two horizontal forces acting on a toy car of mass 2.0 kg that is… 0654/21 Oct/Nov 2019
28 The diagram shows the two horizontal forces acting on a toy car of mass 2.0 kg that is moving along a horizontal floor. resistive force forward force 2.0 N 6.0 N floor What are the resultant force on the car and its acceleration? acceleration resultant force / N m / s2 A 4.0 0.50 B 4.0 2.0 C 8.0 0.25 D 8.0 4.0
1 marks
Answer: B
This question in 0654/21 Oct/Nov 2019
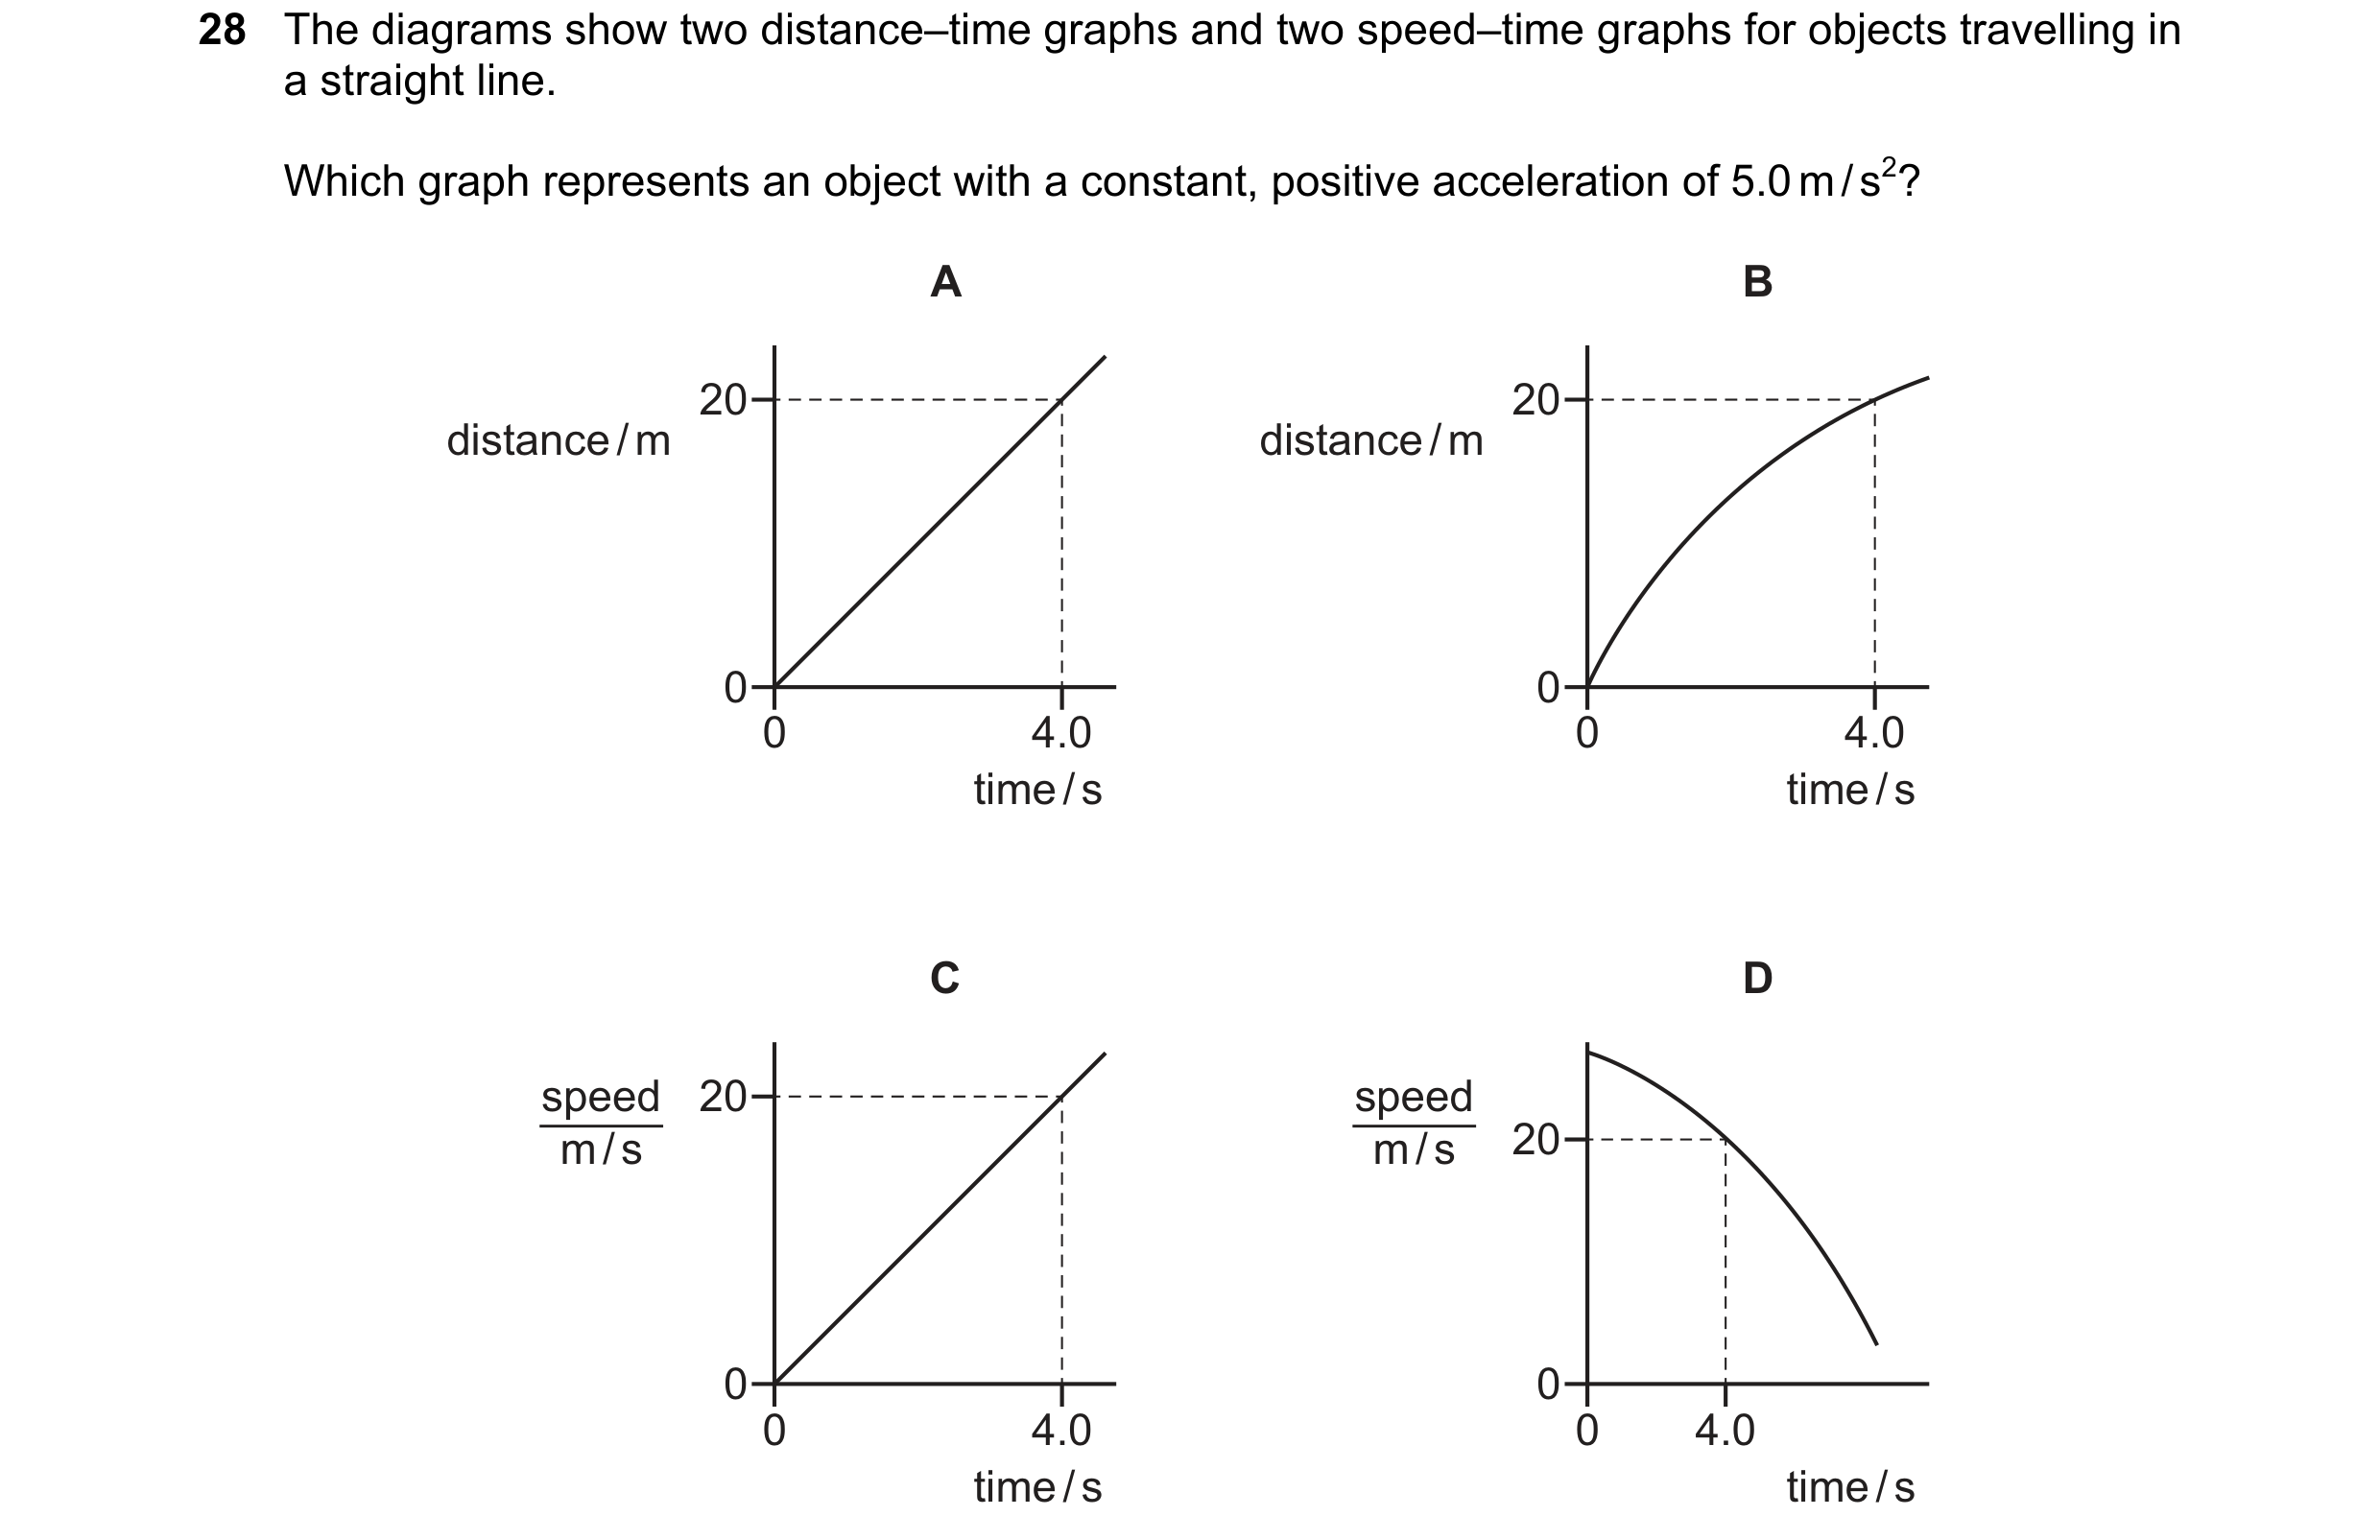
Q15 · The diagrams show two distance–time graphs and two speed–time graphs for objects… 0654/21 May/June 2020
28 The diagrams show two distance–time graphs and two speed–time graphs for objects travelling in a straight line. Which graph represents an object with a constant, positive acceleration of 5.0 m / s2? A B 20 20 distance / m distance / m 0 0 0 4.0 0 4.0 time / s time / s C D speed 20 speed m / s m / s 20 0 0 0 4.0 0 4.0 time / s time / s
1 marks
Answer: C
This question in 0654/21 May/June 2020
Q16 · Which speed–time graph represents an object moving with an acceleration of 2.0 m / s2? 0654/21 Oct/Nov 2020
28 Which speed–time graph represents an object moving with an acceleration of 2.0 m / s2? A B 4 4 speed speed m / s 3 m / s 3 2 2 1 1 0 0 0 1 2 3 4 0 1 2 3 4 time / s time / s C D 4 4 speed speed m / s 3 m / s 3 2 2 1 1 0 0 0 1 2 3 4 0 1 2 3 4 time / s time / s
1 marks
Answer: B
This question in 0654/21 Oct/Nov 2020
Q17 · An object travelling in a straight line accelerates from a speed of 6.0 m / s to a speed… 0654/22 Oct/Nov 2020
28 An object travelling in a straight line accelerates from a speed of 6.0 m / s to a speed of 15 m / s in 6.0 s. What is the acceleration of the object? A 1.0 m / s2 B 1.5 m / s2 C 2.5 m / s2 D 3.5 m / s2
1 marks
Answer: B
This question in 0654/22 Oct/Nov 2020
Q18 · A car accelerates with constant acceleration from a speed of 3.0 m / s to a speed of 9.0… 0654/21 May/June 2021
28 A car accelerates with constant acceleration from a speed of 3.0 m / s to a speed of 9.0 m / s in 3.0 s. What is the acceleration of the car? A 1.0 m / s2 B 2.0 m / s2 C 3.0 m / s2 D 4.0 m / s2
1 marks
Answer: B
This question in 0654/21 May/June 2021
Q19 · A girl runs 5000 m in 1200 seconds and then walks a further 3000 m in 1800 seconds 0654/22 May/June 2021
29 A girl runs 5000 m in 1200 seconds and then walks a further 3000 m in 1800 seconds. What is her average speed for this journey? A 1.7 m / s B 2.7 m / s C 2.9 m / s D 5.8 m / s
1 marks
Answer: B
This question in 0654/22 May/June 2021
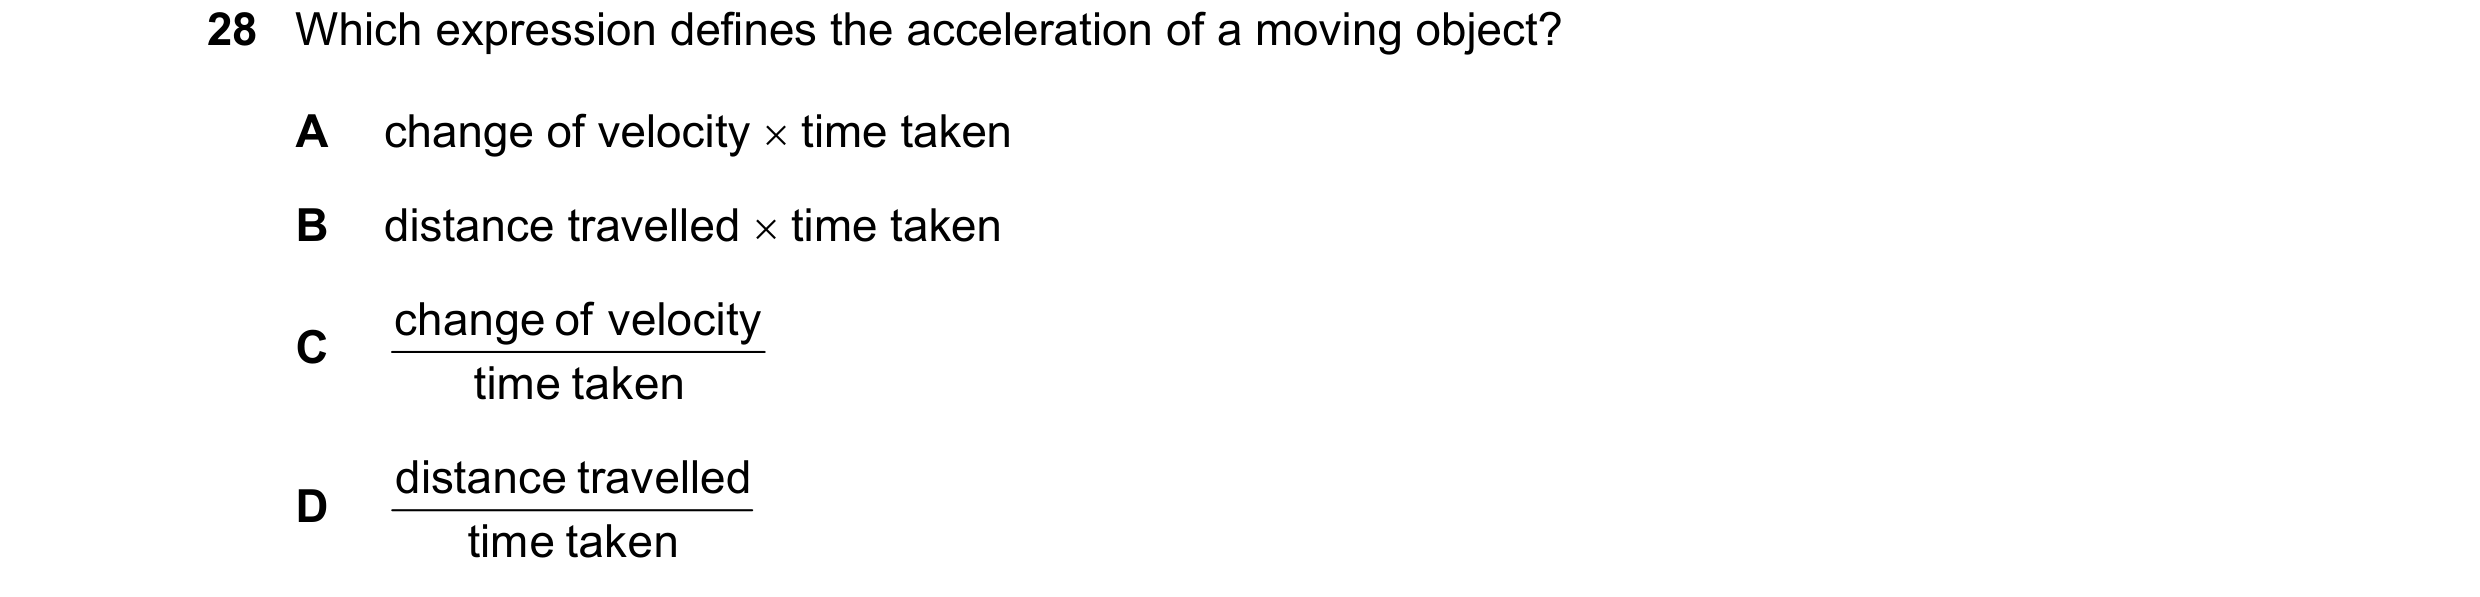
Q20 · Which expression defines the acceleration of a moving object? 0654/23 May/June 2021
28 Which expression defines the acceleration of a moving object? A change of velocity time taken B distance travelled time taken change of veloci t y C time take n distance travell e d D time take n
1 marks
Answer: C
This question in 0654/23 May/June 2021
Q21 · An object falls freely in a vacuum 0654/22 Feb/March 2022
28 An object falls freely in a vacuum. Which speed–time graph represents the motion of the object? A B speed speed 0 0 0 time 0 time C D speed speed 0 0 0 time 0 time
1 marks
Answer: D
This question in 0654/22 Feb/March 2022
Q22 · What is the difference between speed and velocity? 0654/21 May/June 2022
28 What is the difference between speed and velocity? A Speed has magnitude and direction; velocity has magnitude only. B Speed has magnitude and direction; velocity has direction only. C Speed has magnitude only; velocity has magnitude and direction. D Speed has magnitude only; velocity has direction only.
1 marks
Answer: C
This question in 0654/21 May/June 2022
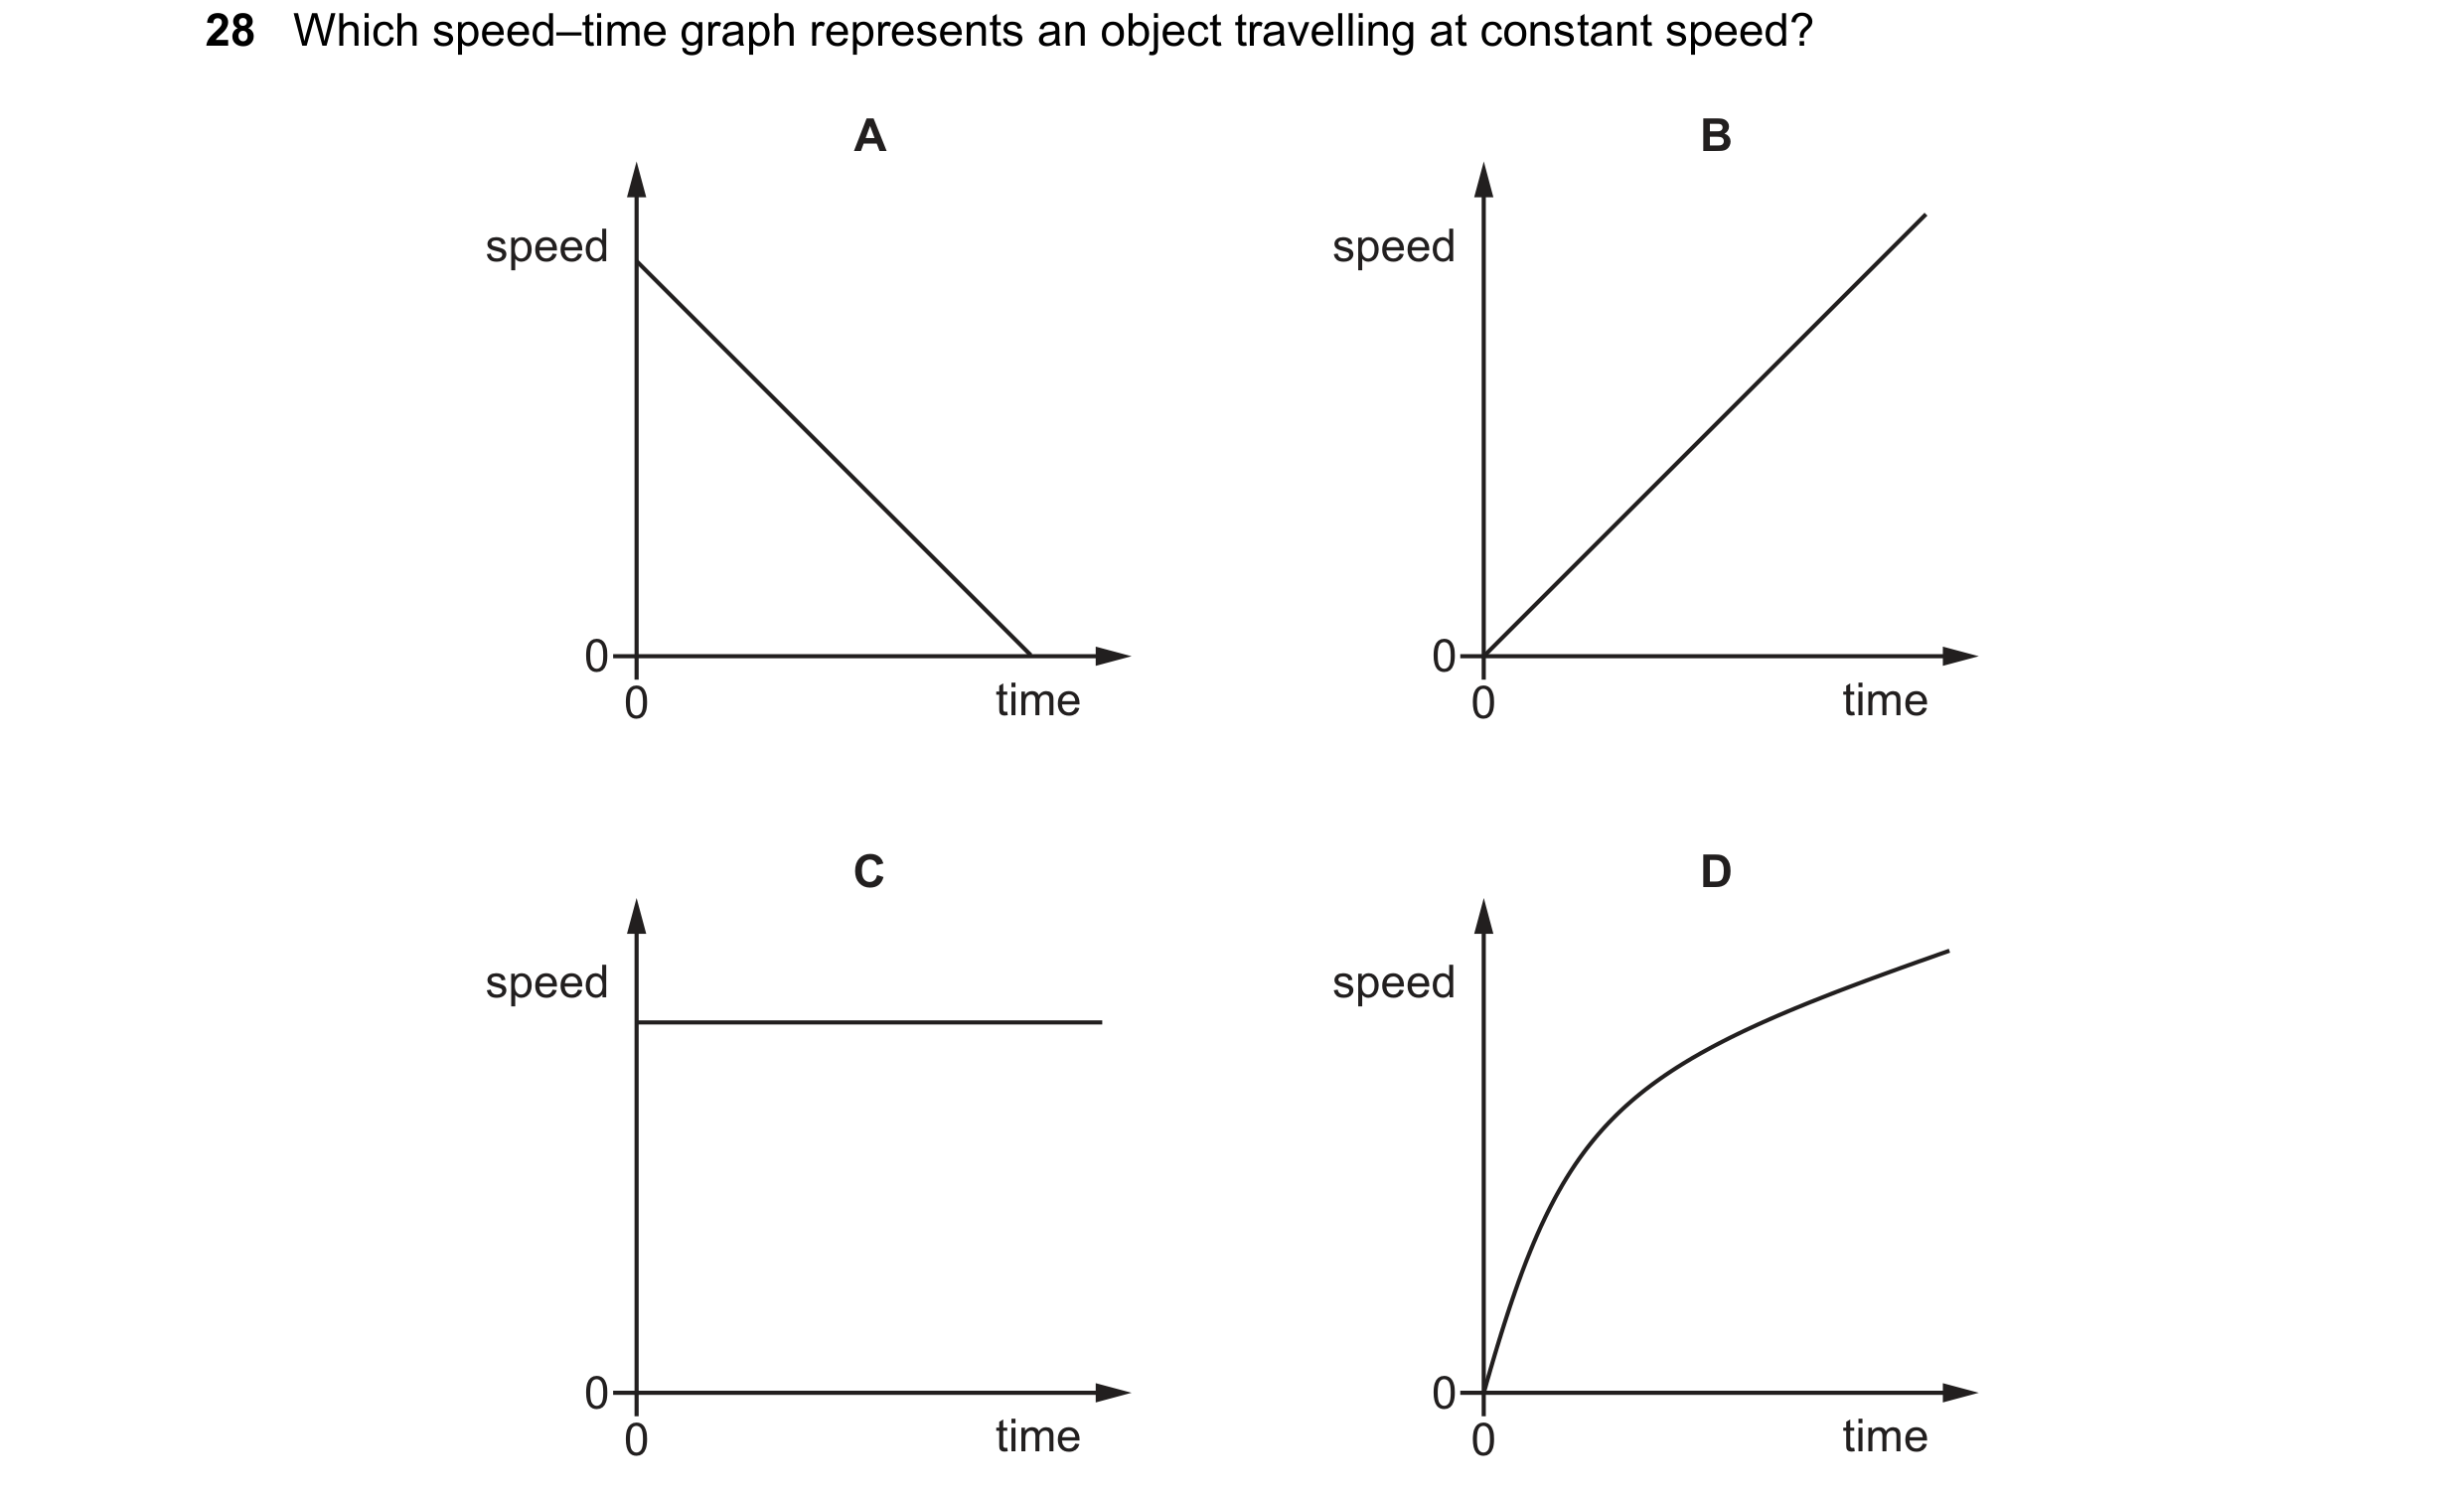
Q23 · Which speed–time graph represents an object travelling at constant speed? 0654/23 May/June 2022
28 Which speed–time graph represents an object travelling at constant speed? A B speed speed 0 0 0 time 0 time C D speed speed 0 0 0 time 0 time
1 marks
Answer: C
This question in 0654/23 May/June 2022
Q24 · A motorcycle accelerates uniformly from a velocity of 20 m / s to a velocity of 35 m / s… 0654/21 Oct/Nov 2022
28 A motorcycle accelerates uniformly from a velocity of 20 m / s to a velocity of 35 m / s in 5.0 s. What is its acceleration? A 3.0 m / s2 B 5.5 m / s2 C 7.0 m / s2 D 11 m / s2
1 marks
Answer: A
This question in 0654/21 Oct/Nov 2022
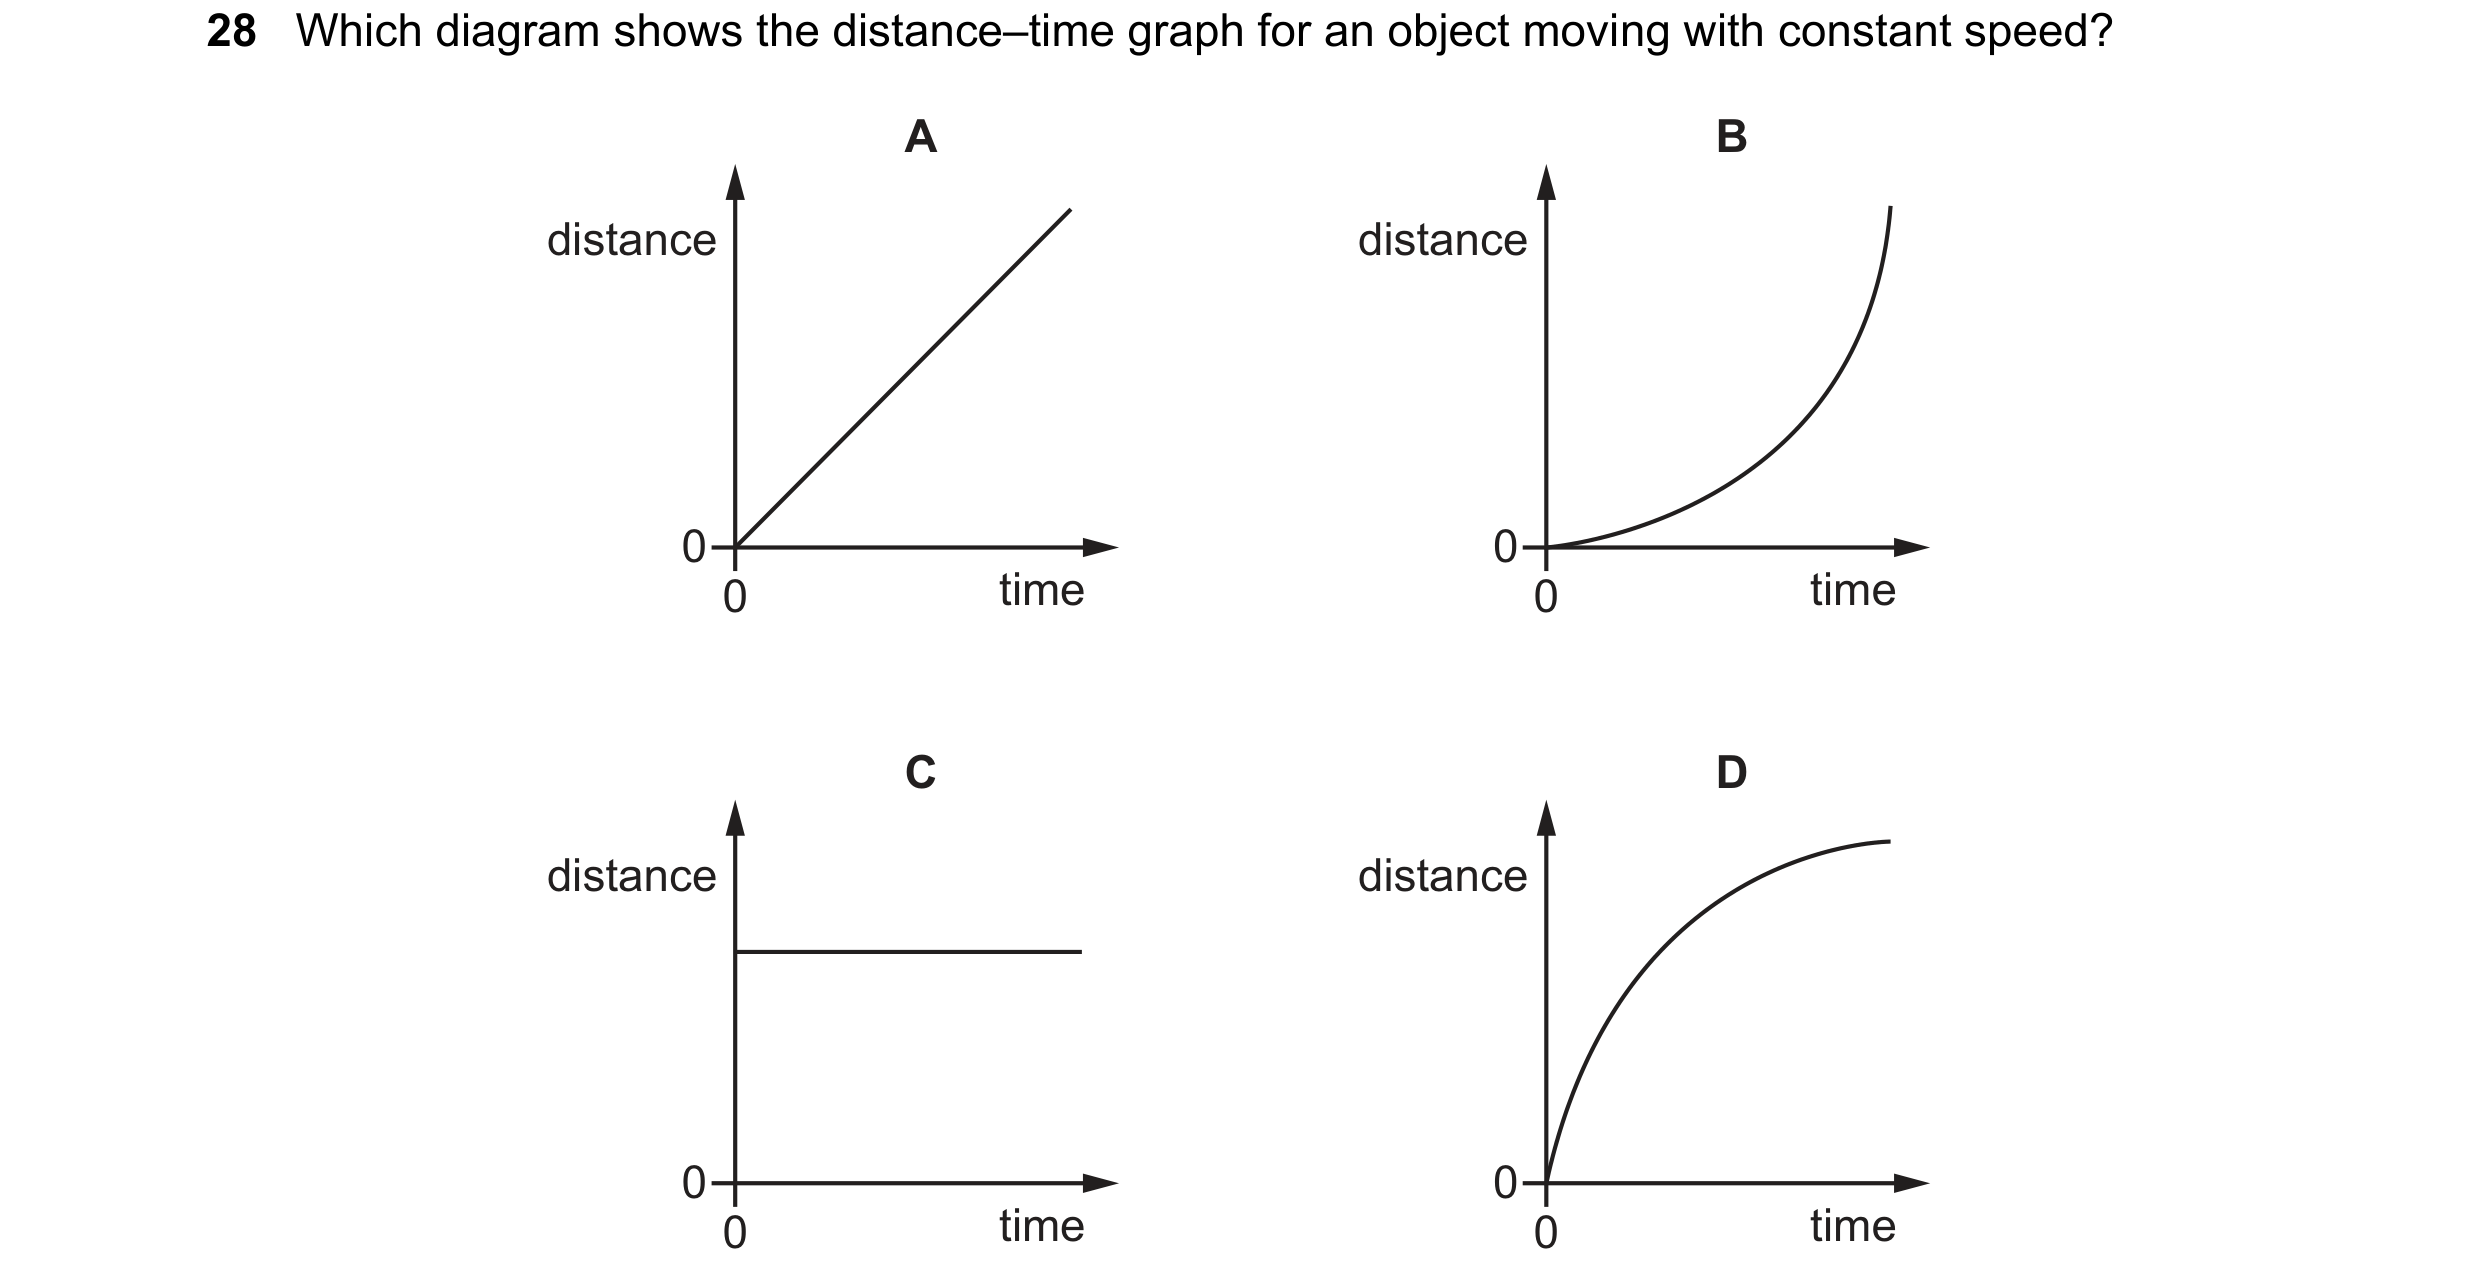
Q25 · Which diagram shows the distance–time graph for an object moving with constant speed? 0654/22 Feb/March 2023
28 Which diagram shows the distance–time graph for an object moving with constant speed? A B distance distance 0 0 0 time 0 time C D distance distance 0 0 0 time 0 time
1 marks
Answer: A
This question in 0654/22 Feb/March 2023
Q26 · The diagram shows the speed–time graph for a moving object 0654/21 May/June 2023
28 The diagram shows the speed–time graph for a moving object. 20 speed m / s 10 0 0 2.0 4.0 time / s What is the distance travelled by the object in 4.0 s? A 30 m B 40 m C 50 m D 80 m
1 marks
Answer: C
This question in 0654/21 May/June 2023
Q27 · The diagram shows the speed–time graph for an object moving in a straight line 0654/22 May/June 2023
28 The diagram shows the speed–time graph for an object moving in a straight line. speed 0 0 10 time / s Which statement about the motion of the object is not correct? A The acceleration is constant during the first 10 s. B The acceleration steadily increases and then becomes constant. C The rate of change of speed is constant during the first 10 s. D The speed steadily increases and then becomes constant.
1 marks
Answer: B
This question in 0654/22 May/June 2023
Q28 · The speed–time graph represents the journey of a bicycle 0654/23 May/June 2023
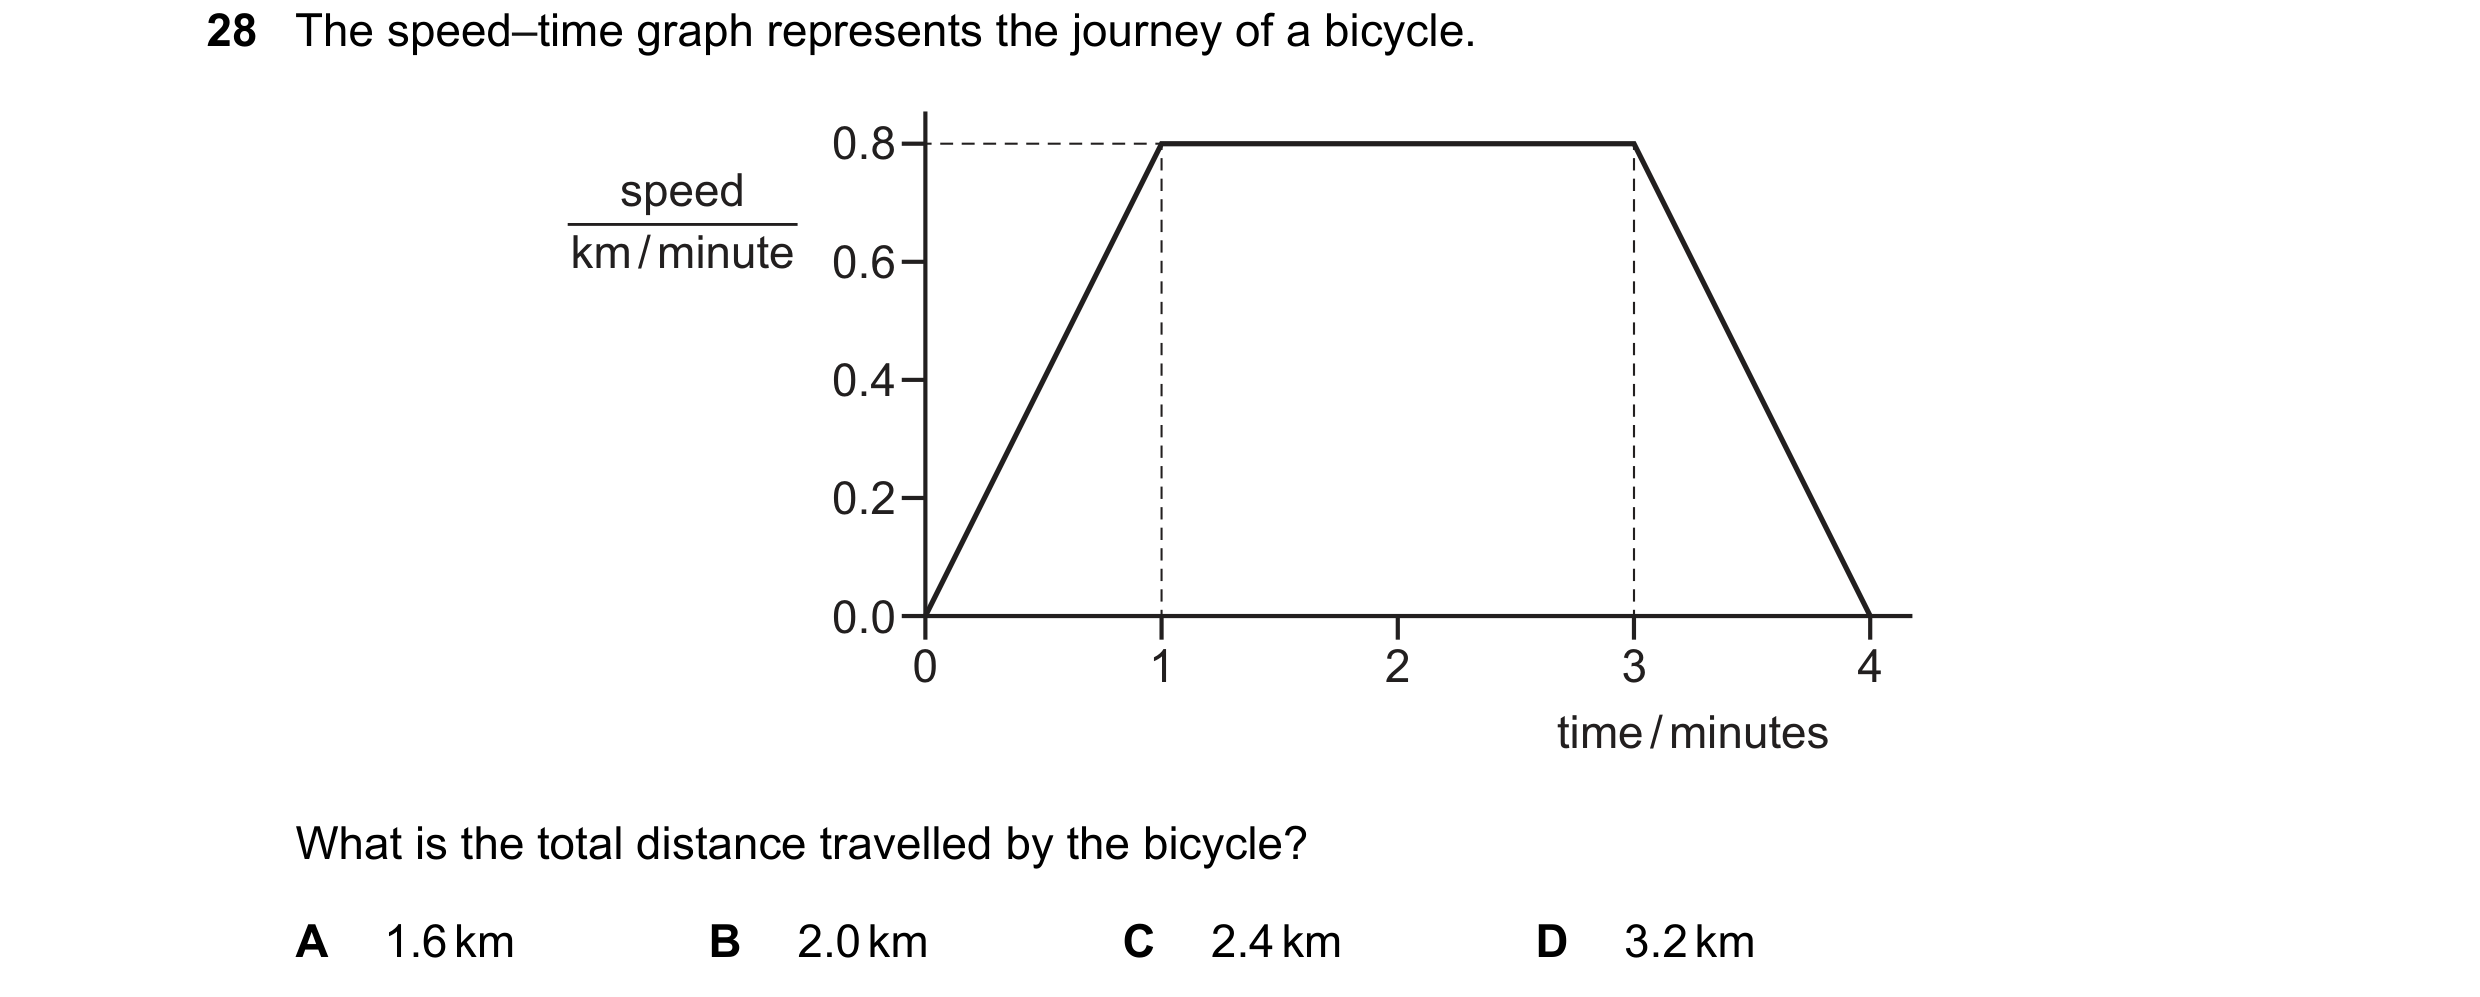
28 The speed–time graph represents the journey of a bicycle. 0.8 speed km / minute 0.6 0.4 0.2 0.0 0 1 2 3 4 time / minutes What is the total distance travelled by the bicycle? A 1.6 km B 2.0 km C 2.4 km D 3.2 km
1 marks
Answer: C
This question in 0654/23 May/June 2023
Q29 · The speed–time graph represents part of a car journey 0654/21 Oct/Nov 2023
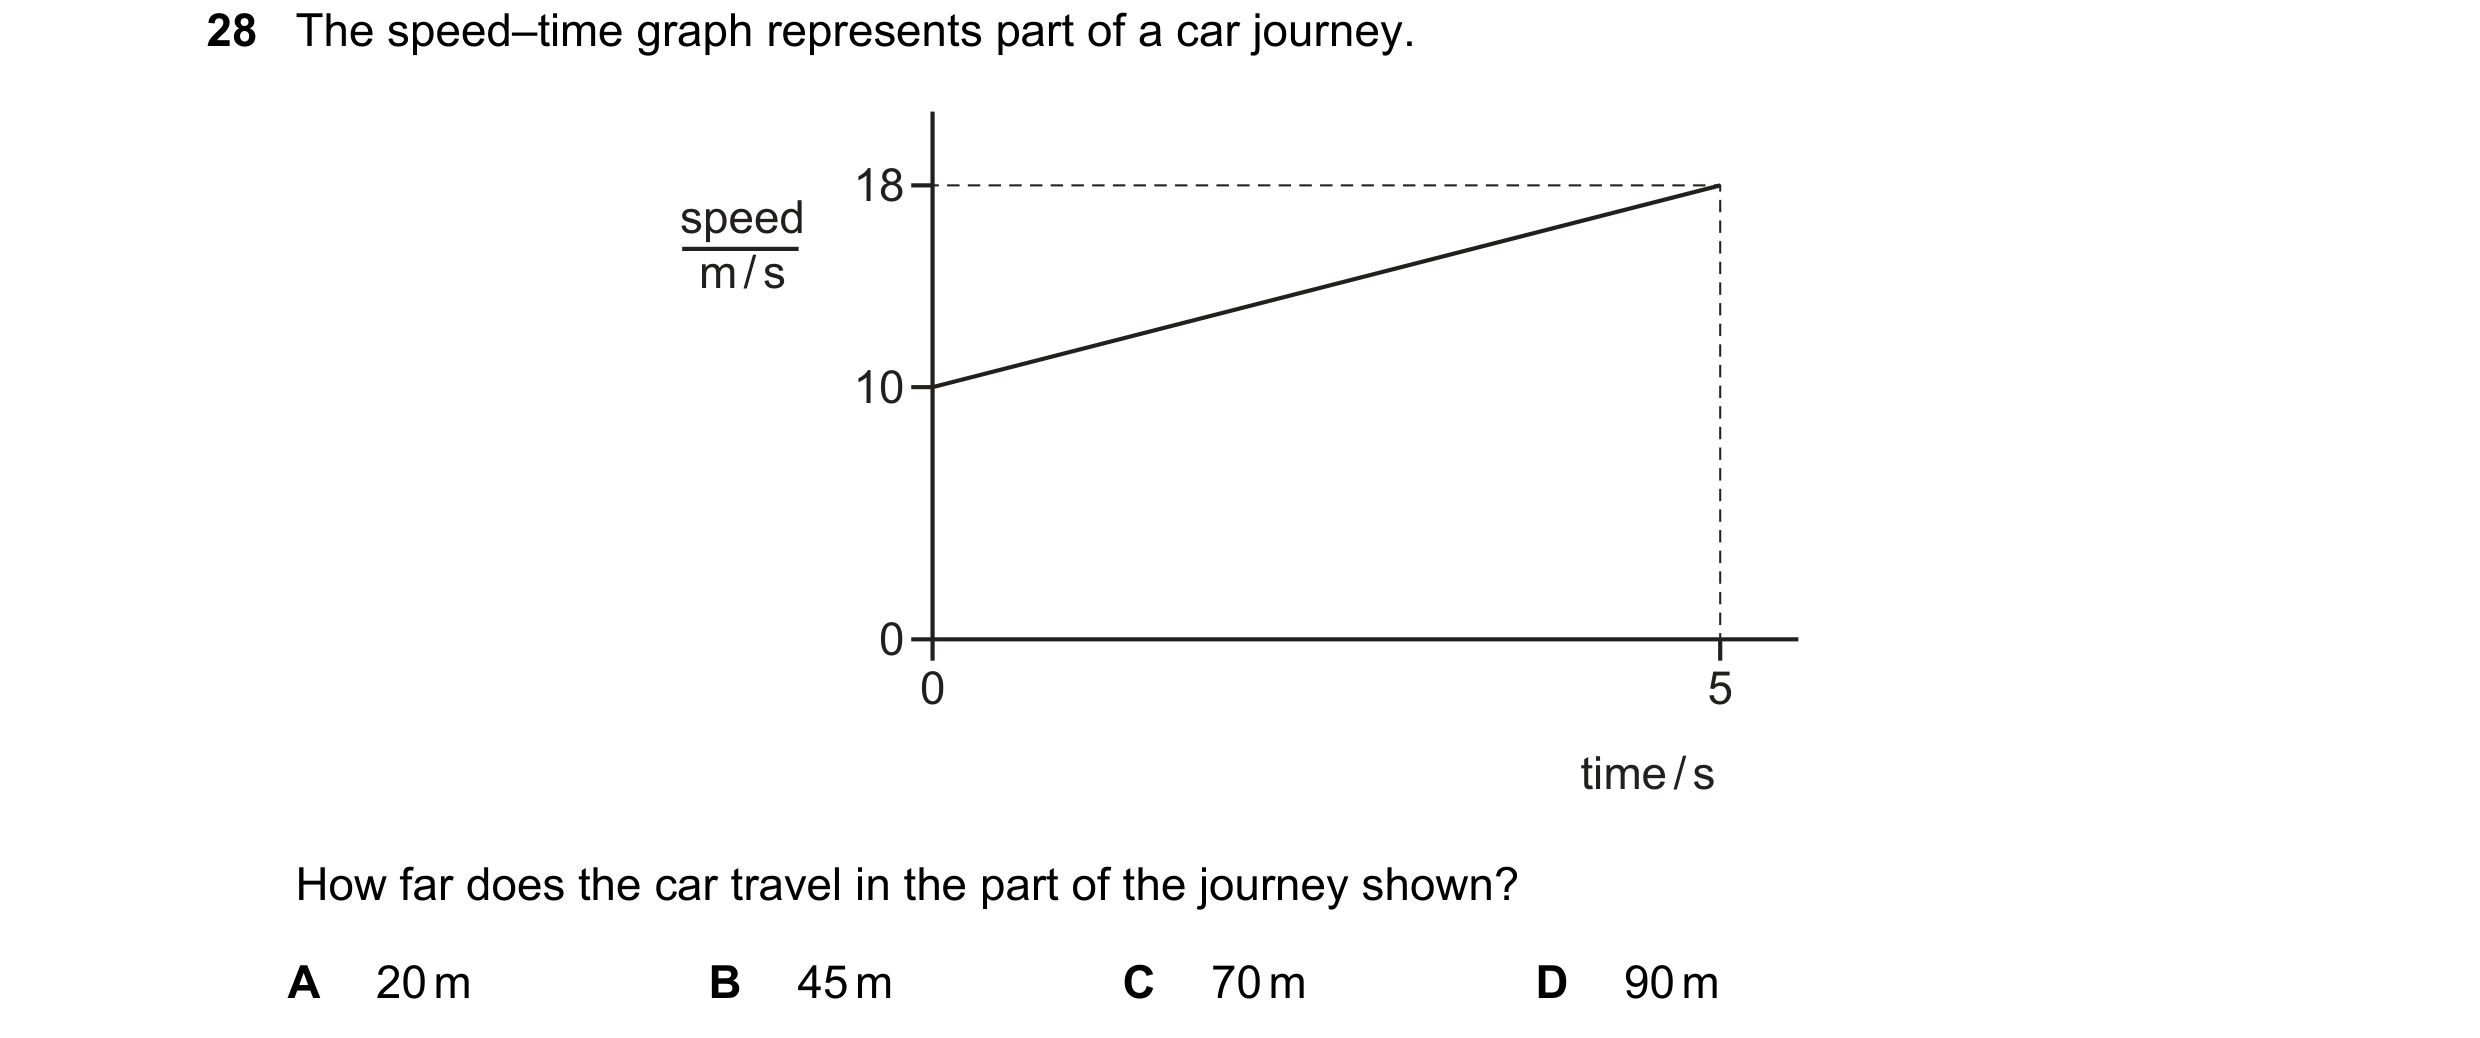
28 The speed–time graph represents part of a car journey. 18 speed m / s 10 0 0 5 time / s How far does the car travel in the part of the journey shown? A 20 m B 45 m C 70 m D 90 m
1 marks
Answer: C
This question in 0654/21 Oct/Nov 2023
Q30 · A brick falls from rest at a height of 45 m above the ground 0654/22 Oct/Nov 2023
31 A brick falls from rest at a height of 45 m above the ground. The acceleration of free fall g is 10 m / s2. There is no air resistance. What is the speed of the brick as it hits the ground? A 9.5 m / s B 21 m / s C 30 m / s D 450 m / s
1 marks
Answer: C
This question in 0654/22 Oct/Nov 2023
Q31 · The graph shows the variation of speed with time for an object moving in a straight line 0654/23 Oct/Nov 2023
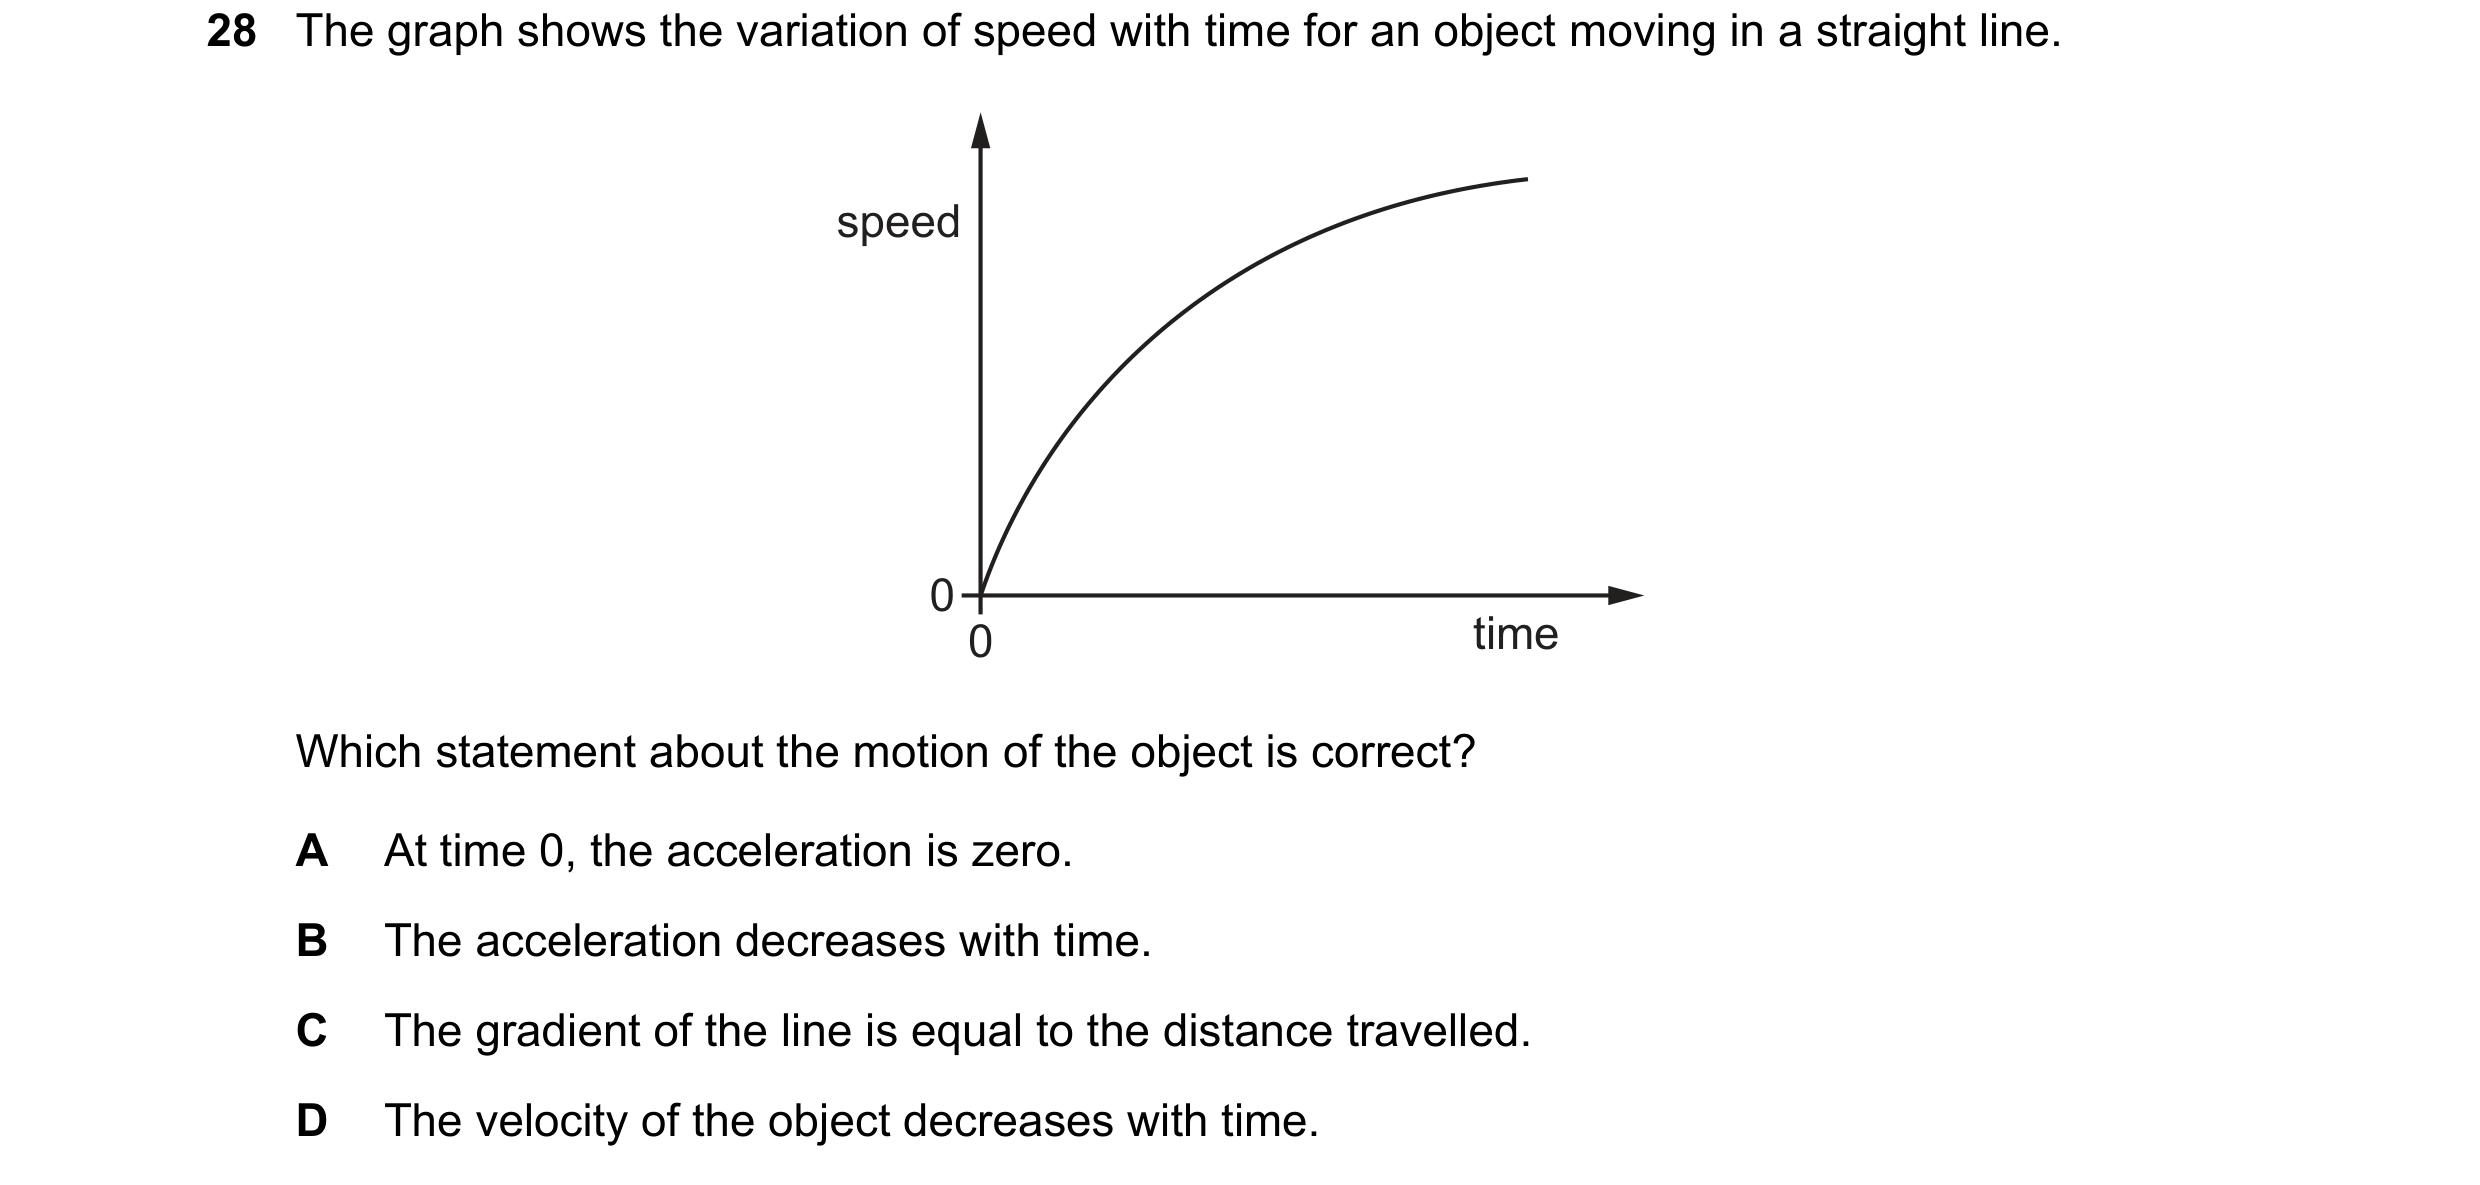
28 The graph shows the variation of speed with time for an object moving in a straight line. speed 0 0 time Which statement about the motion of the object is correct? A At time 0, the acceleration is zero. B The acceleration decreases with time. C The gradient of the line is equal to the distance travelled. D The velocity of the object decreases with time.
1 marks
Answer: B
This question in 0654/23 Oct/Nov 2023
Q32 · A ball is moving at a speed of 3.0 m / s 0654/22 May/June 2024
28 A ball is moving at a speed of 3.0 m / s. The ball now accelerates with a constant acceleration of 2.0 m / s2 in the direction that it is moving. What is the speed of the ball 5.0 s after it begins to accelerate? A 10 m / s B 13 m / s C 17 m / s D 30 m / s
1 marks
Answer: B
This question in 0654/22 May/June 2024
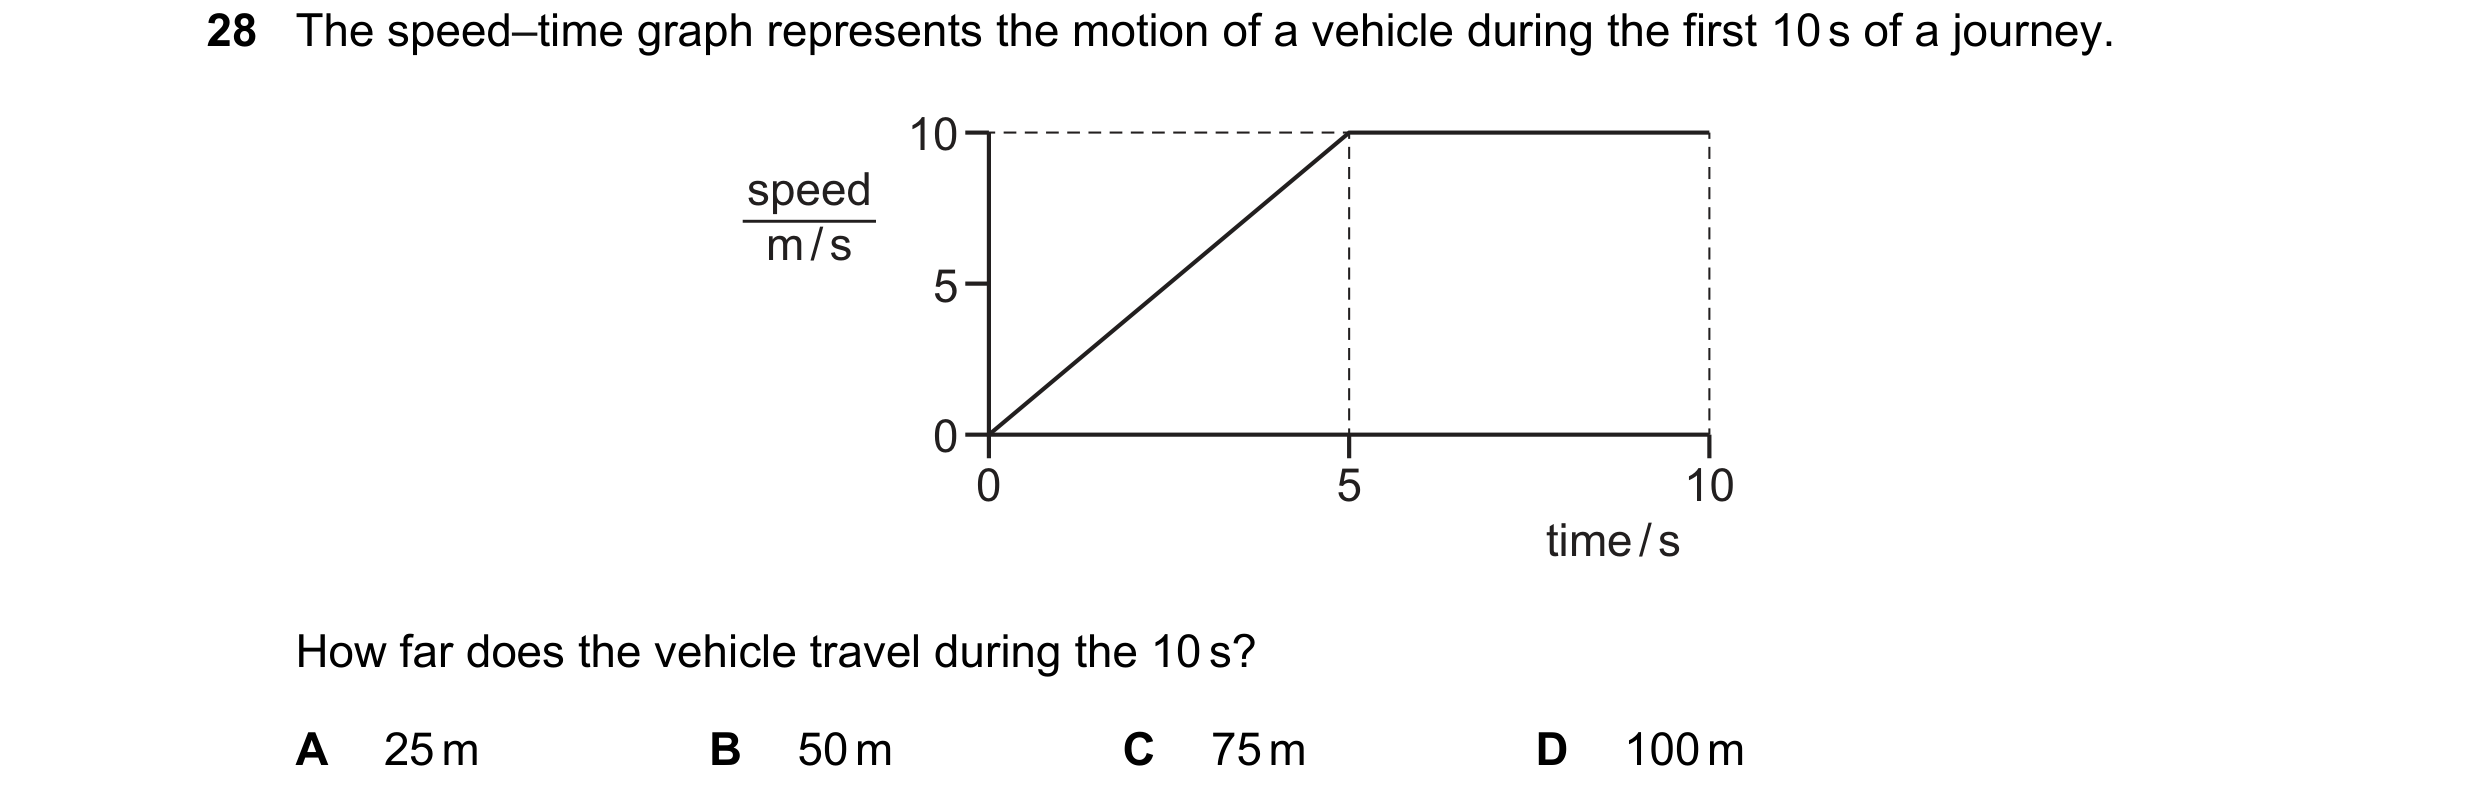
Q33 · The speed–time graph represents the motion of a vehicle during the first 10 s of a journey 0654/23 May/June 2024
28 The speed–time graph represents the motion of a vehicle during the first 10 s of a journey. 10 speed m / s 5 0 0 5 10 time / s How far does the vehicle travel during the 10 s? A 25 m B 50 m C 75 m D 100 m
1 marks
Answer: C
This question in 0654/23 May/June 2024
Q34 · In which speed–time graph is acceleration not constant or 0? 0654/22 May/June 2025
28 In which speed–time graph is acceleration not constant or 0? A B speed speed 0 0 0 time 0 time C D speed speed 0 0 0 time 0 time
1 marks
Answer: A
This question in 0654/22 May/June 2025
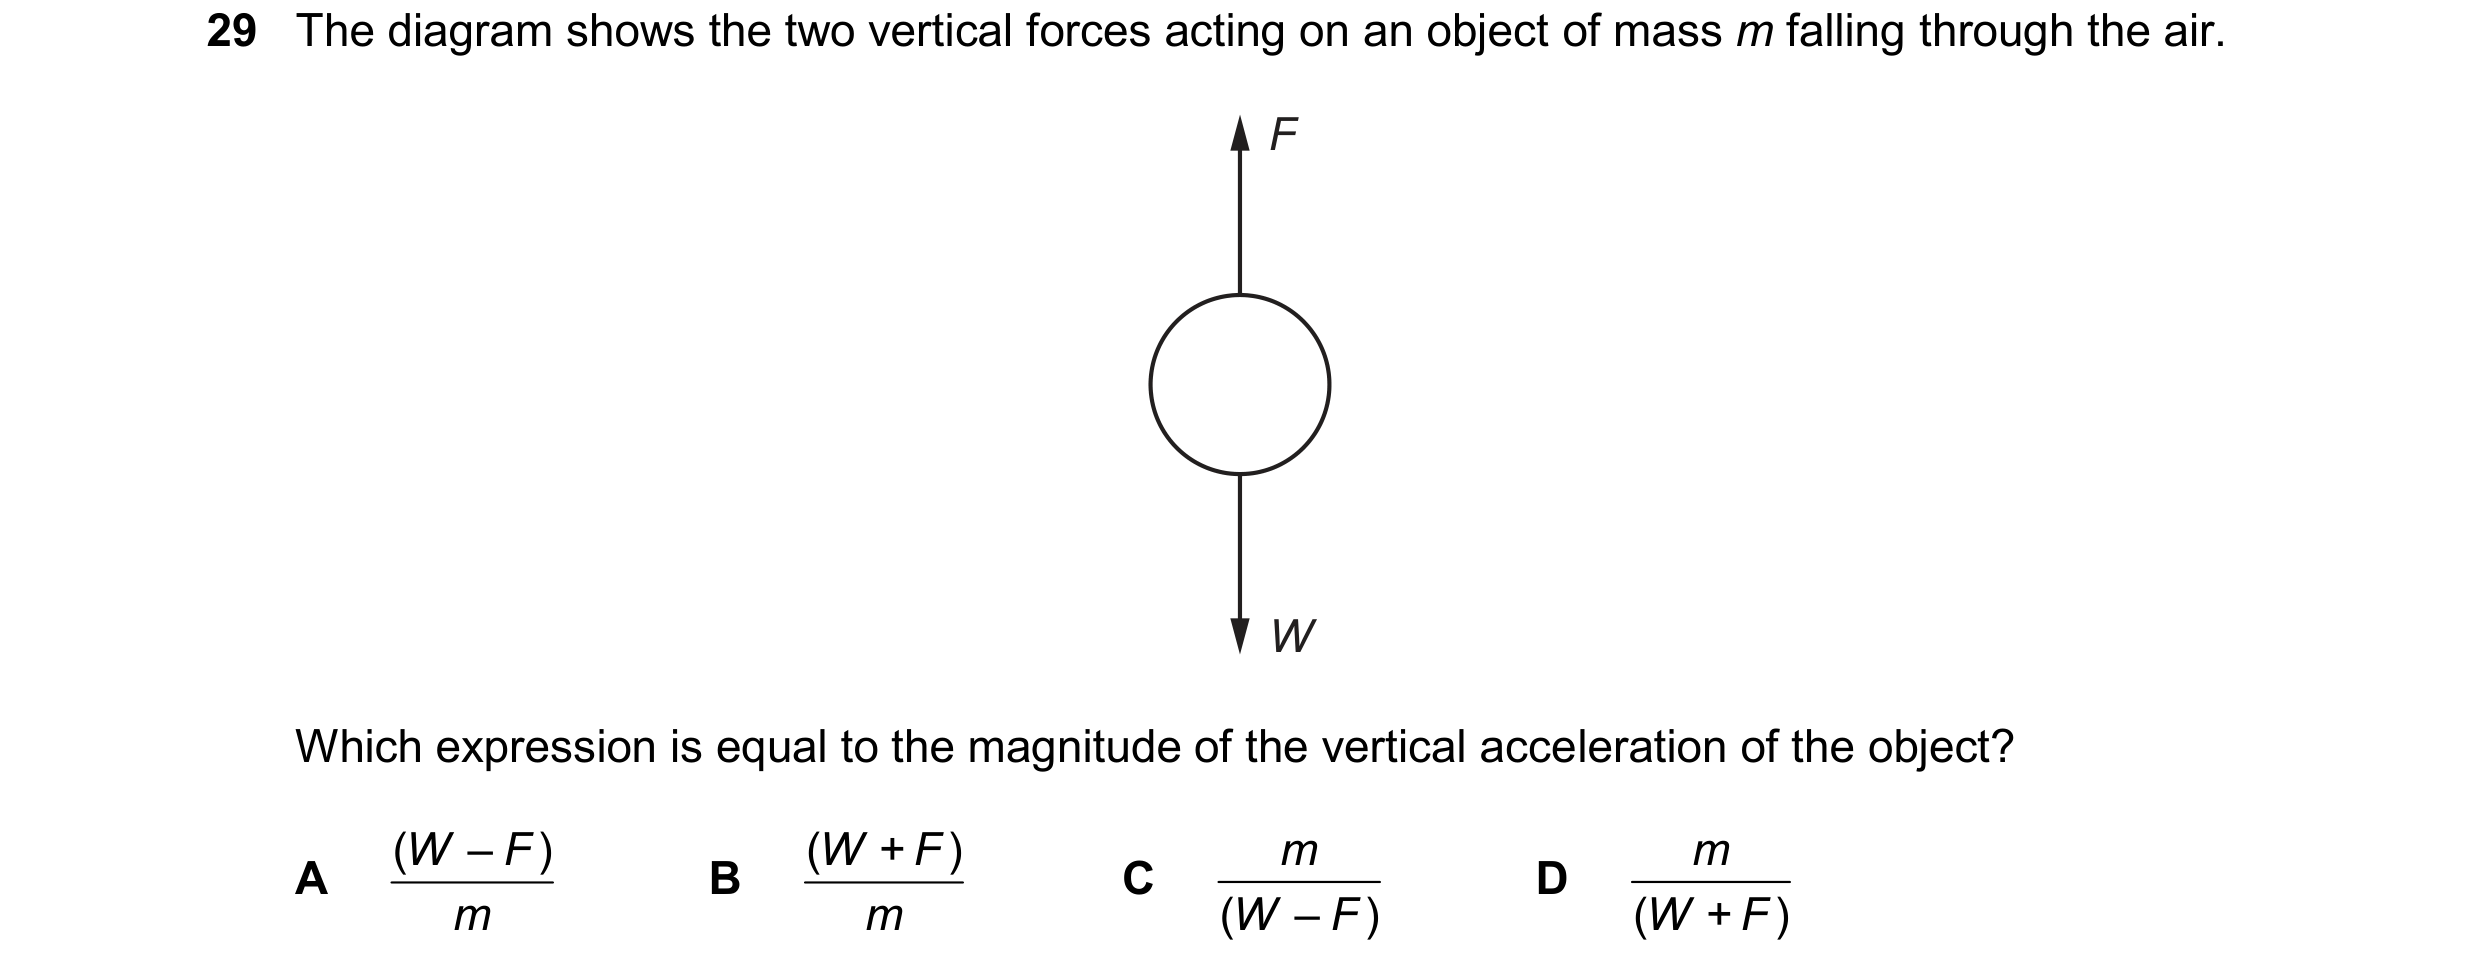
Q35 · The diagram shows the two vertical forces acting on an object of mass m falling through… 0654/21 Oct/Nov 2025
29 The diagram shows the two vertical forces acting on an object of mass m falling through the air. F W Which expression is equal to the magnitude of the vertical acceleration of the object? ( W – F ) ( W + F ) m m A B C F D F m m ( W – ) ( W + )
1 marks
Answer: A
This question in 0654/21 Oct/Nov 2025
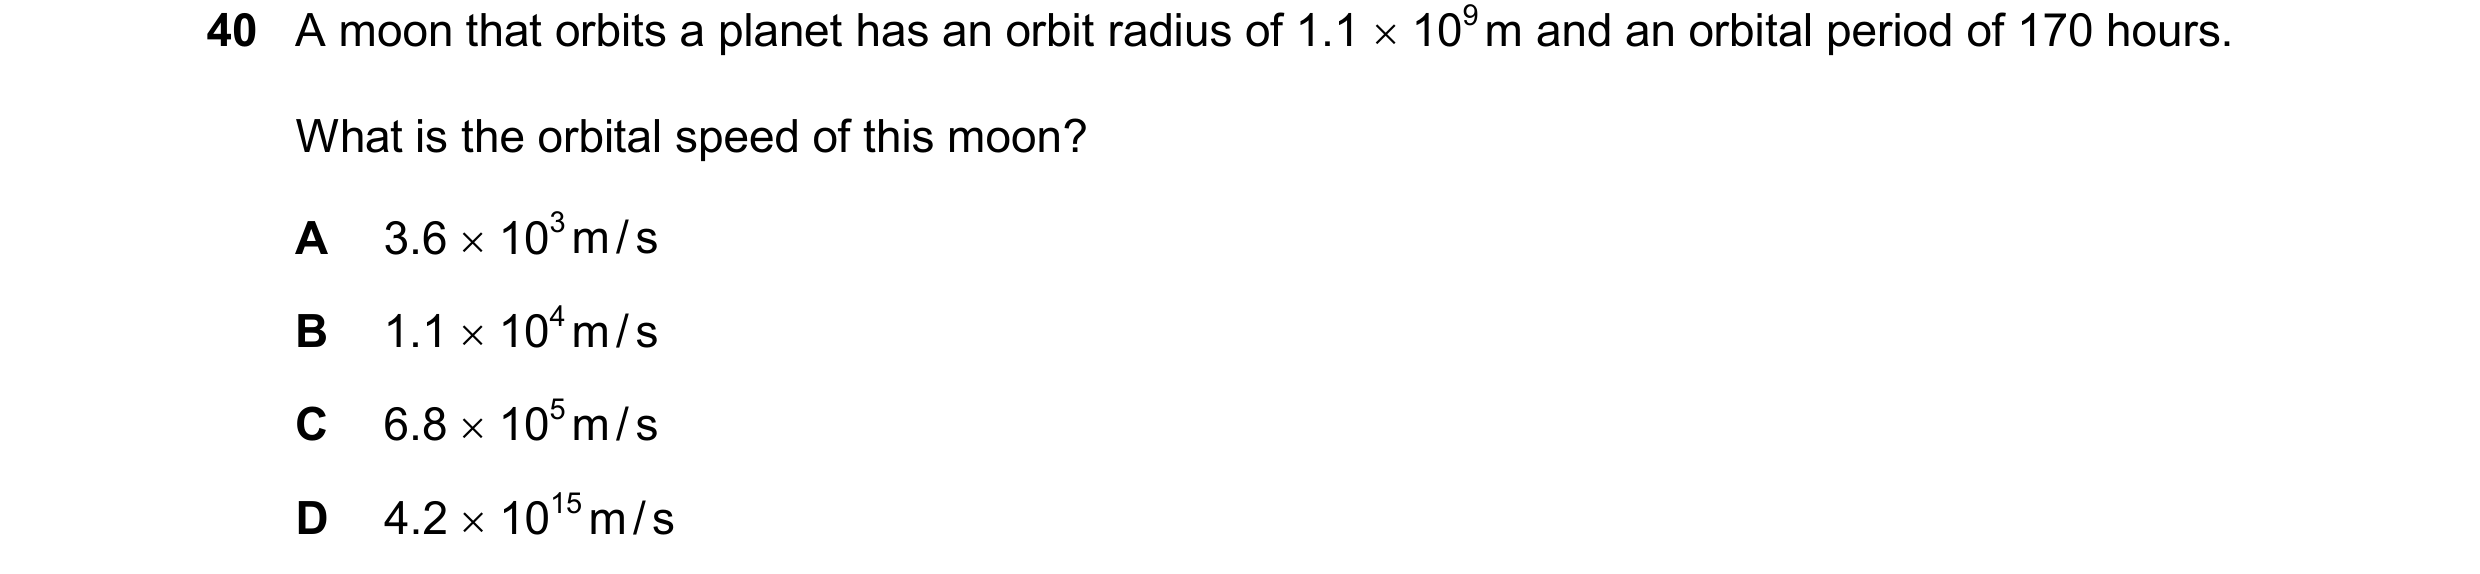
Q36 · A moon that orbits a planet has an orbit radius of 1.1 109 m and an orbital period of… 0654/21 Oct/Nov 2025
40 A moon that orbits a planet has an orbit radius of 1.1 109 m and an orbital period of 170 hours. What is the orbital speed of this moon? A 3.6 103 m / s B 1.1 104 m / s C 6.8 105 m / s D 4.2 1015 m / s
1 marks
Answer: B
This question in 0654/21 Oct/Nov 2025
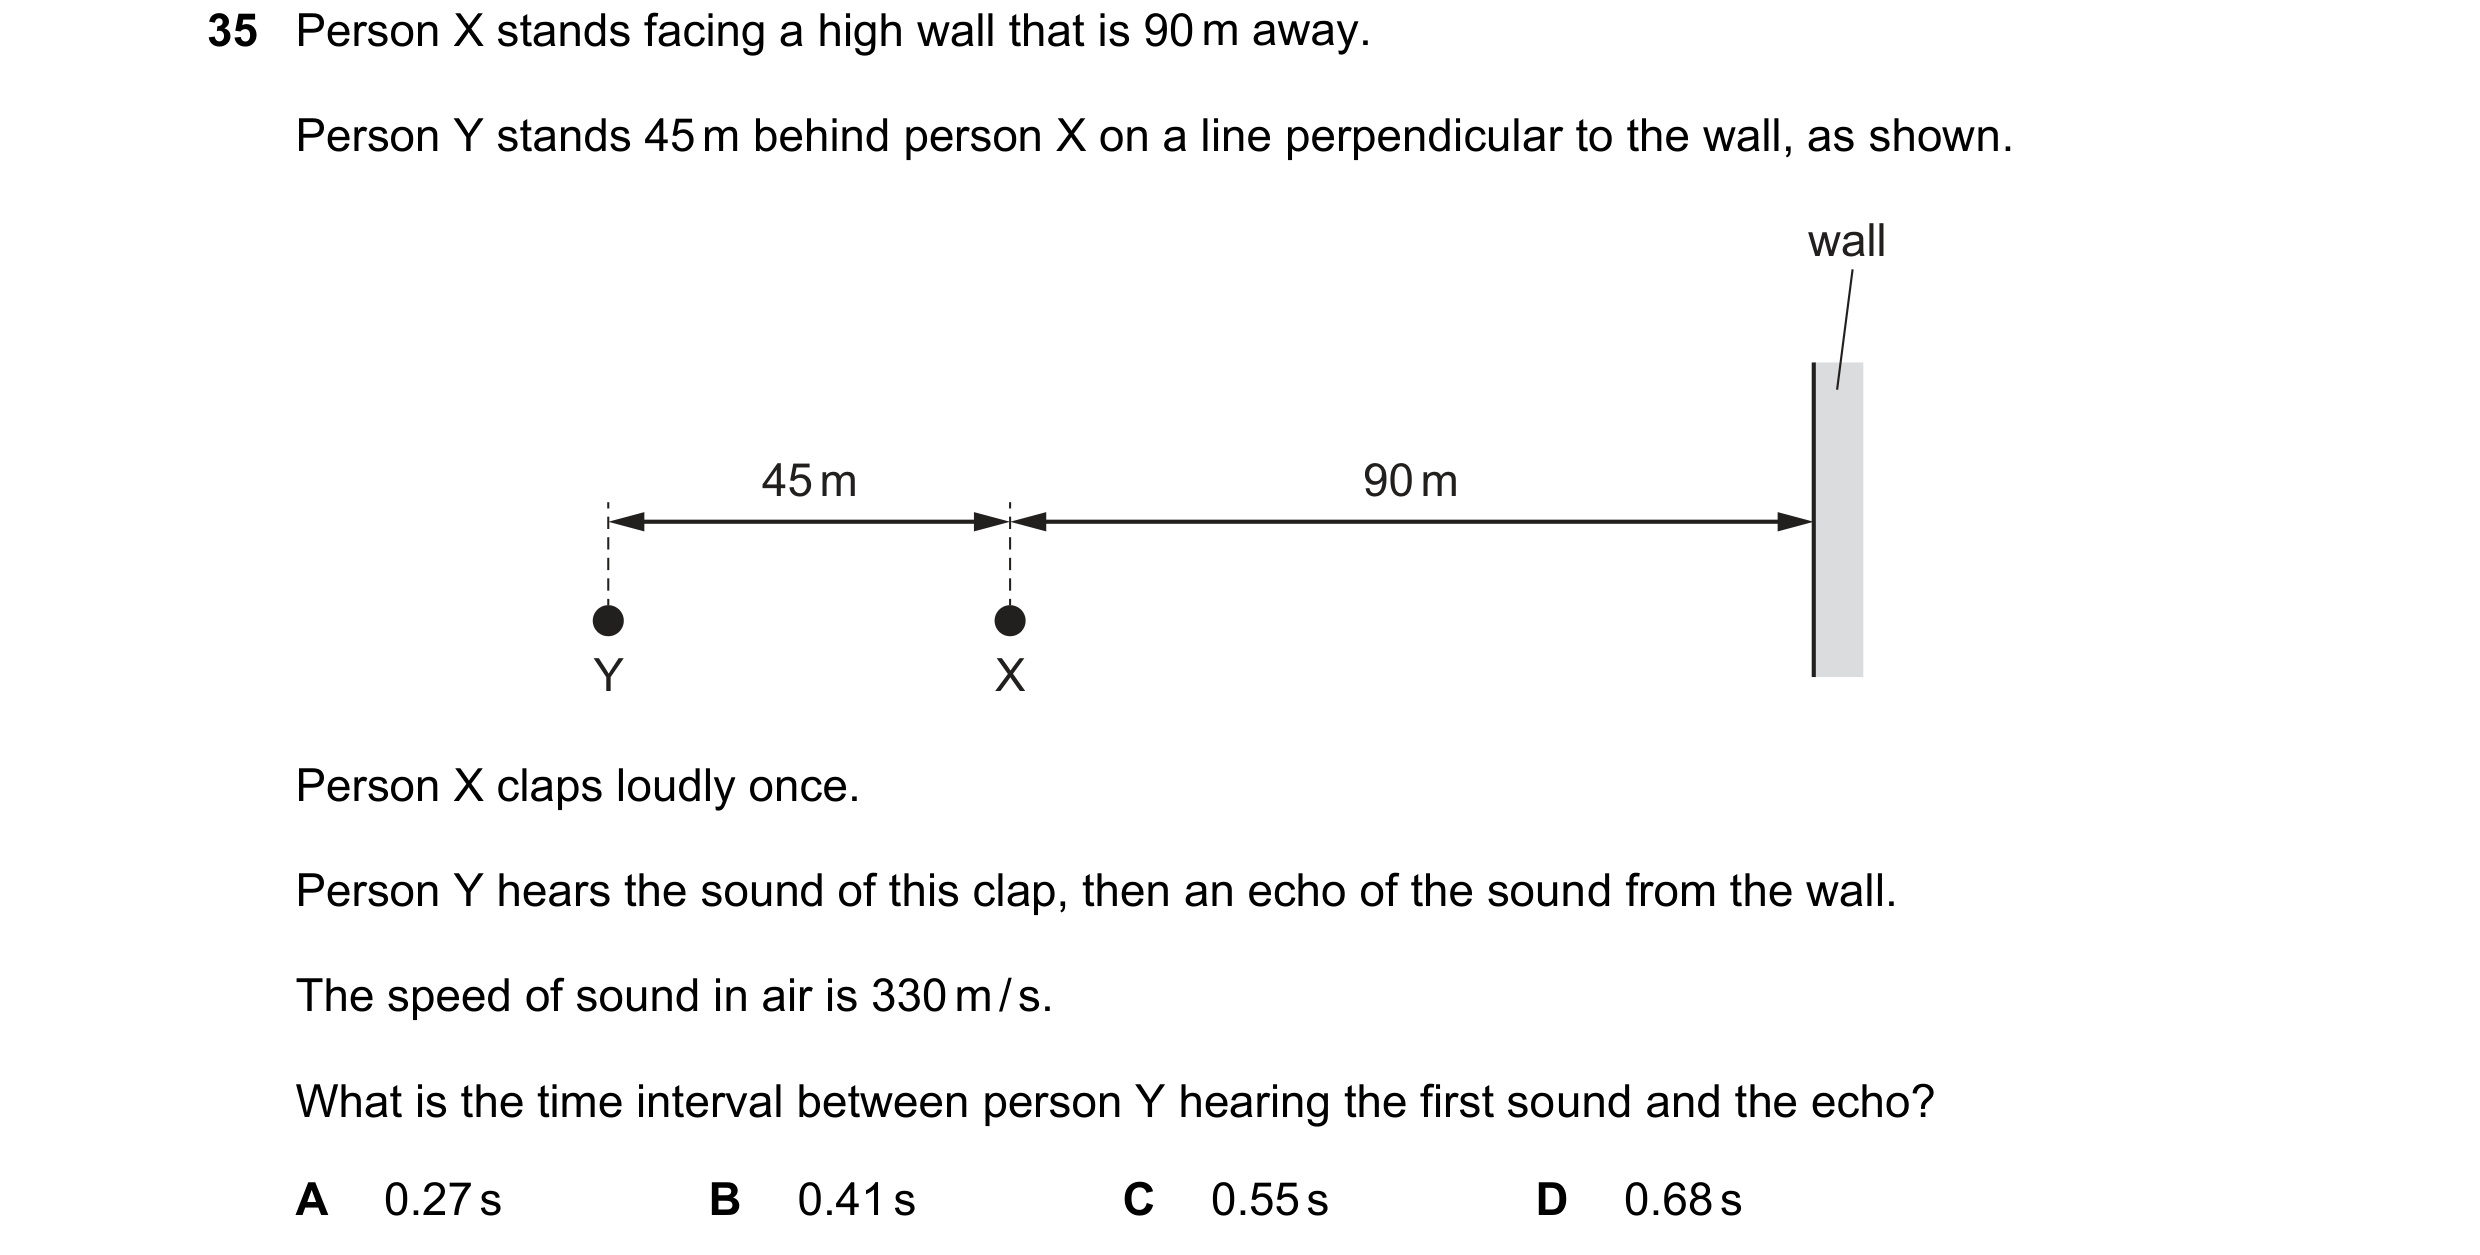
Q37 · Person X stands facing a high wall that is 90 m away 0654/23 Oct/Nov 2025
35 Person X stands facing a high wall that is 90 m away. Person Y stands 45 m behind person X on a line perpendicular to the wall, as shown. wall 45 m 90 m Y X Person X claps loudly once. Person Y hears the sound of this clap, then an echo of the sound from the wall. The speed of sound in air is 330 m / s. What is the time interval between person Y hearing the first sound and the echo? A 0.27 s B 0.41 s C 0.55 s D 0.68 s
1 marks
Answer: C
This question in 0654/23 Oct/Nov 2025
 1 / 11

 2 / 11

 3 / 11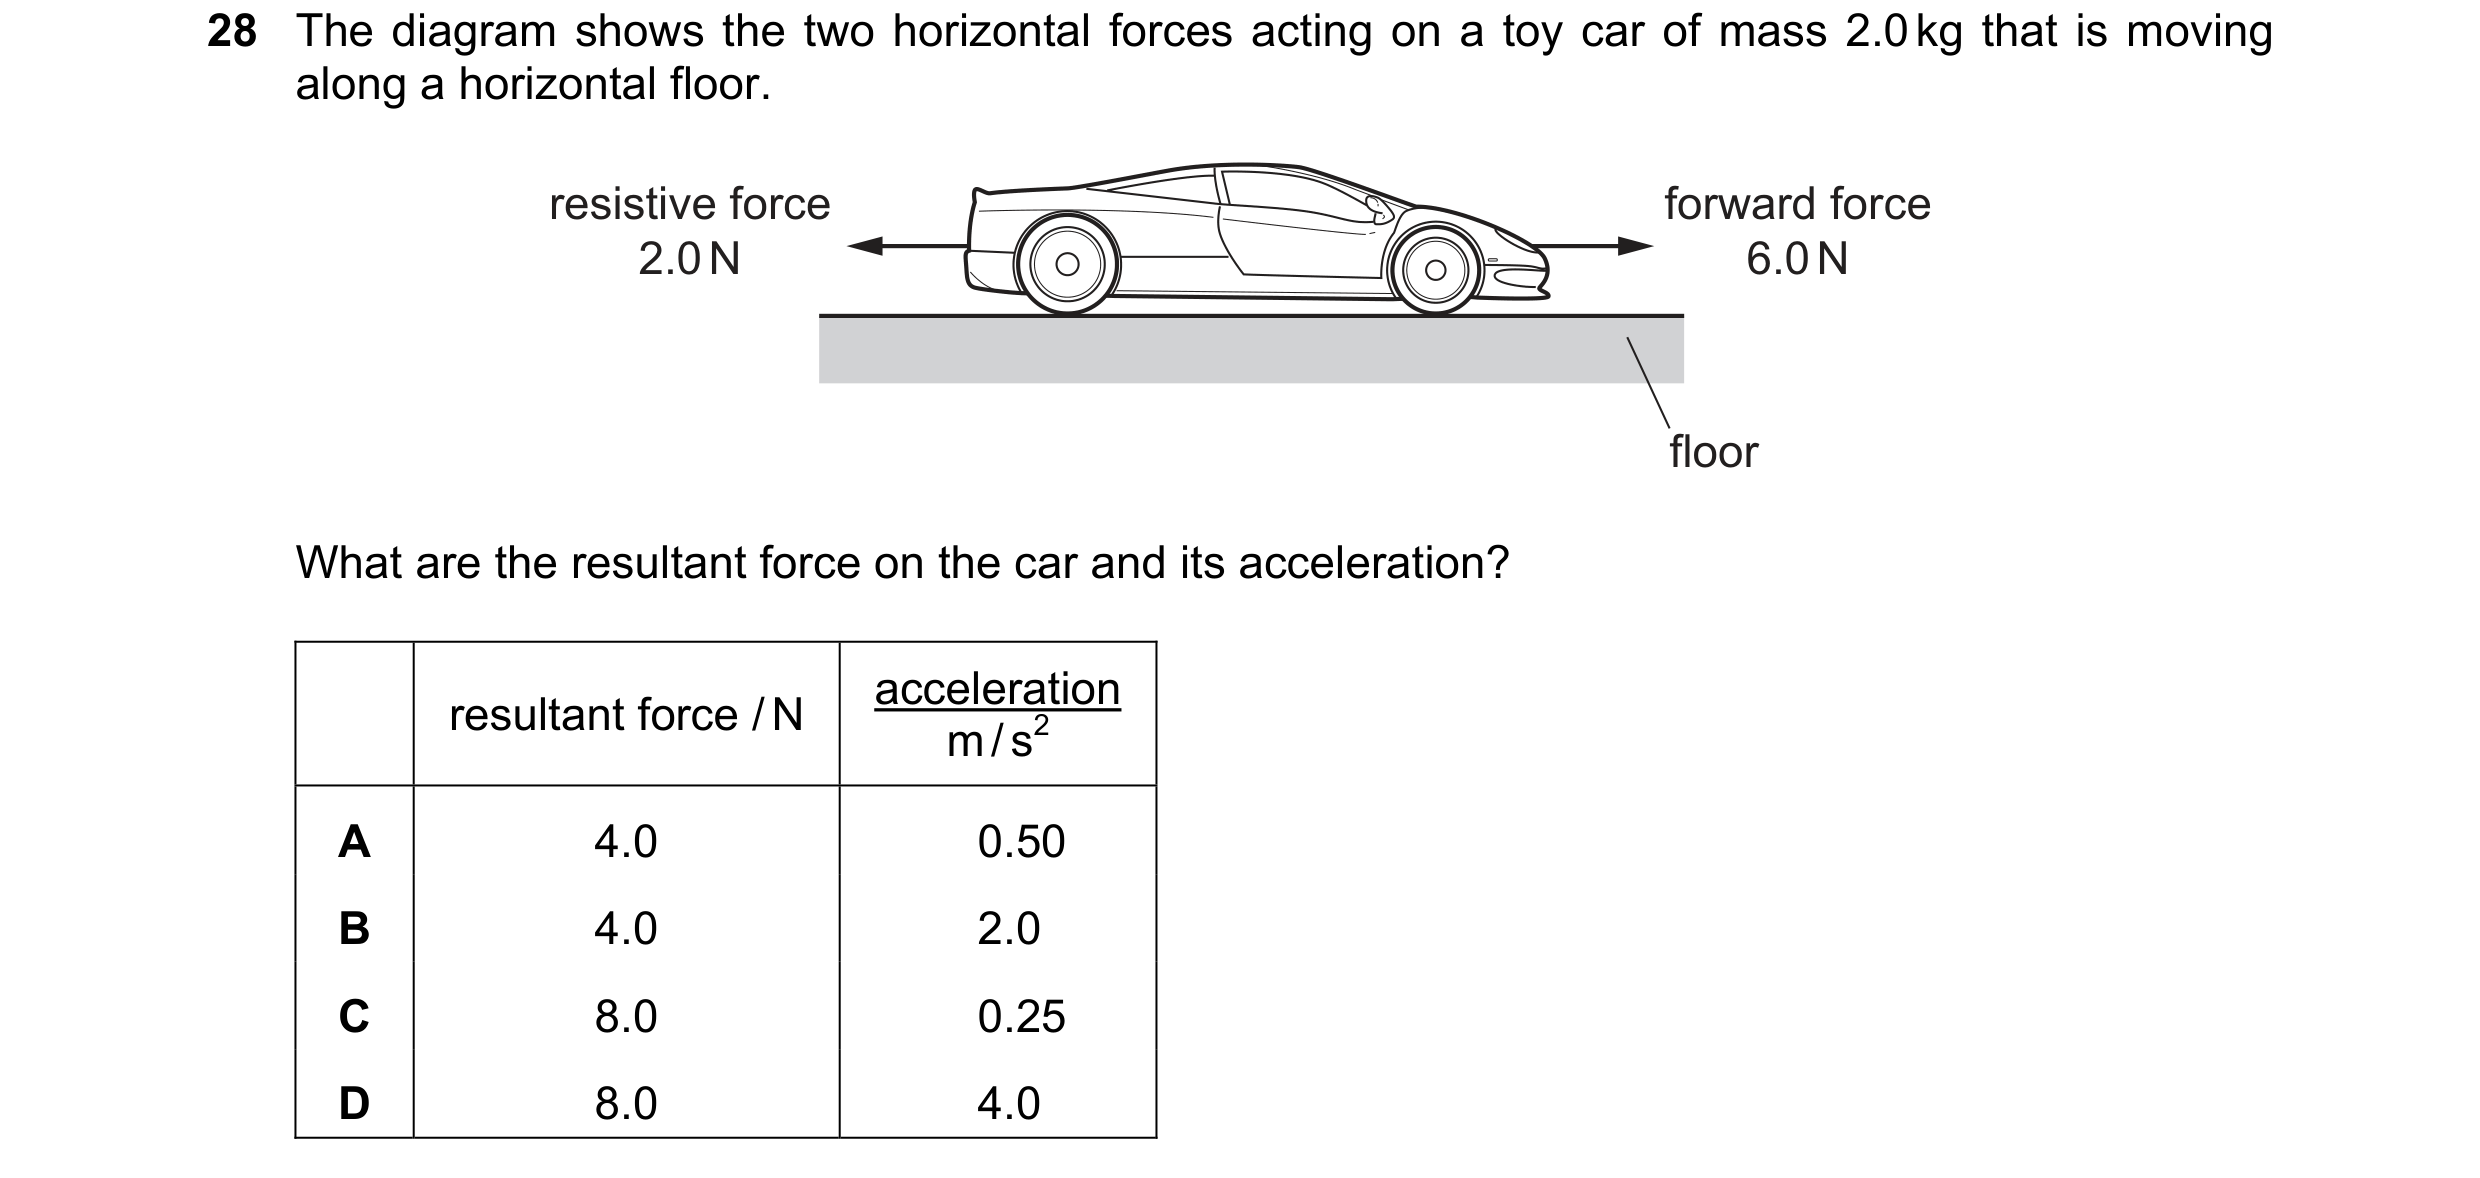
 4 / 11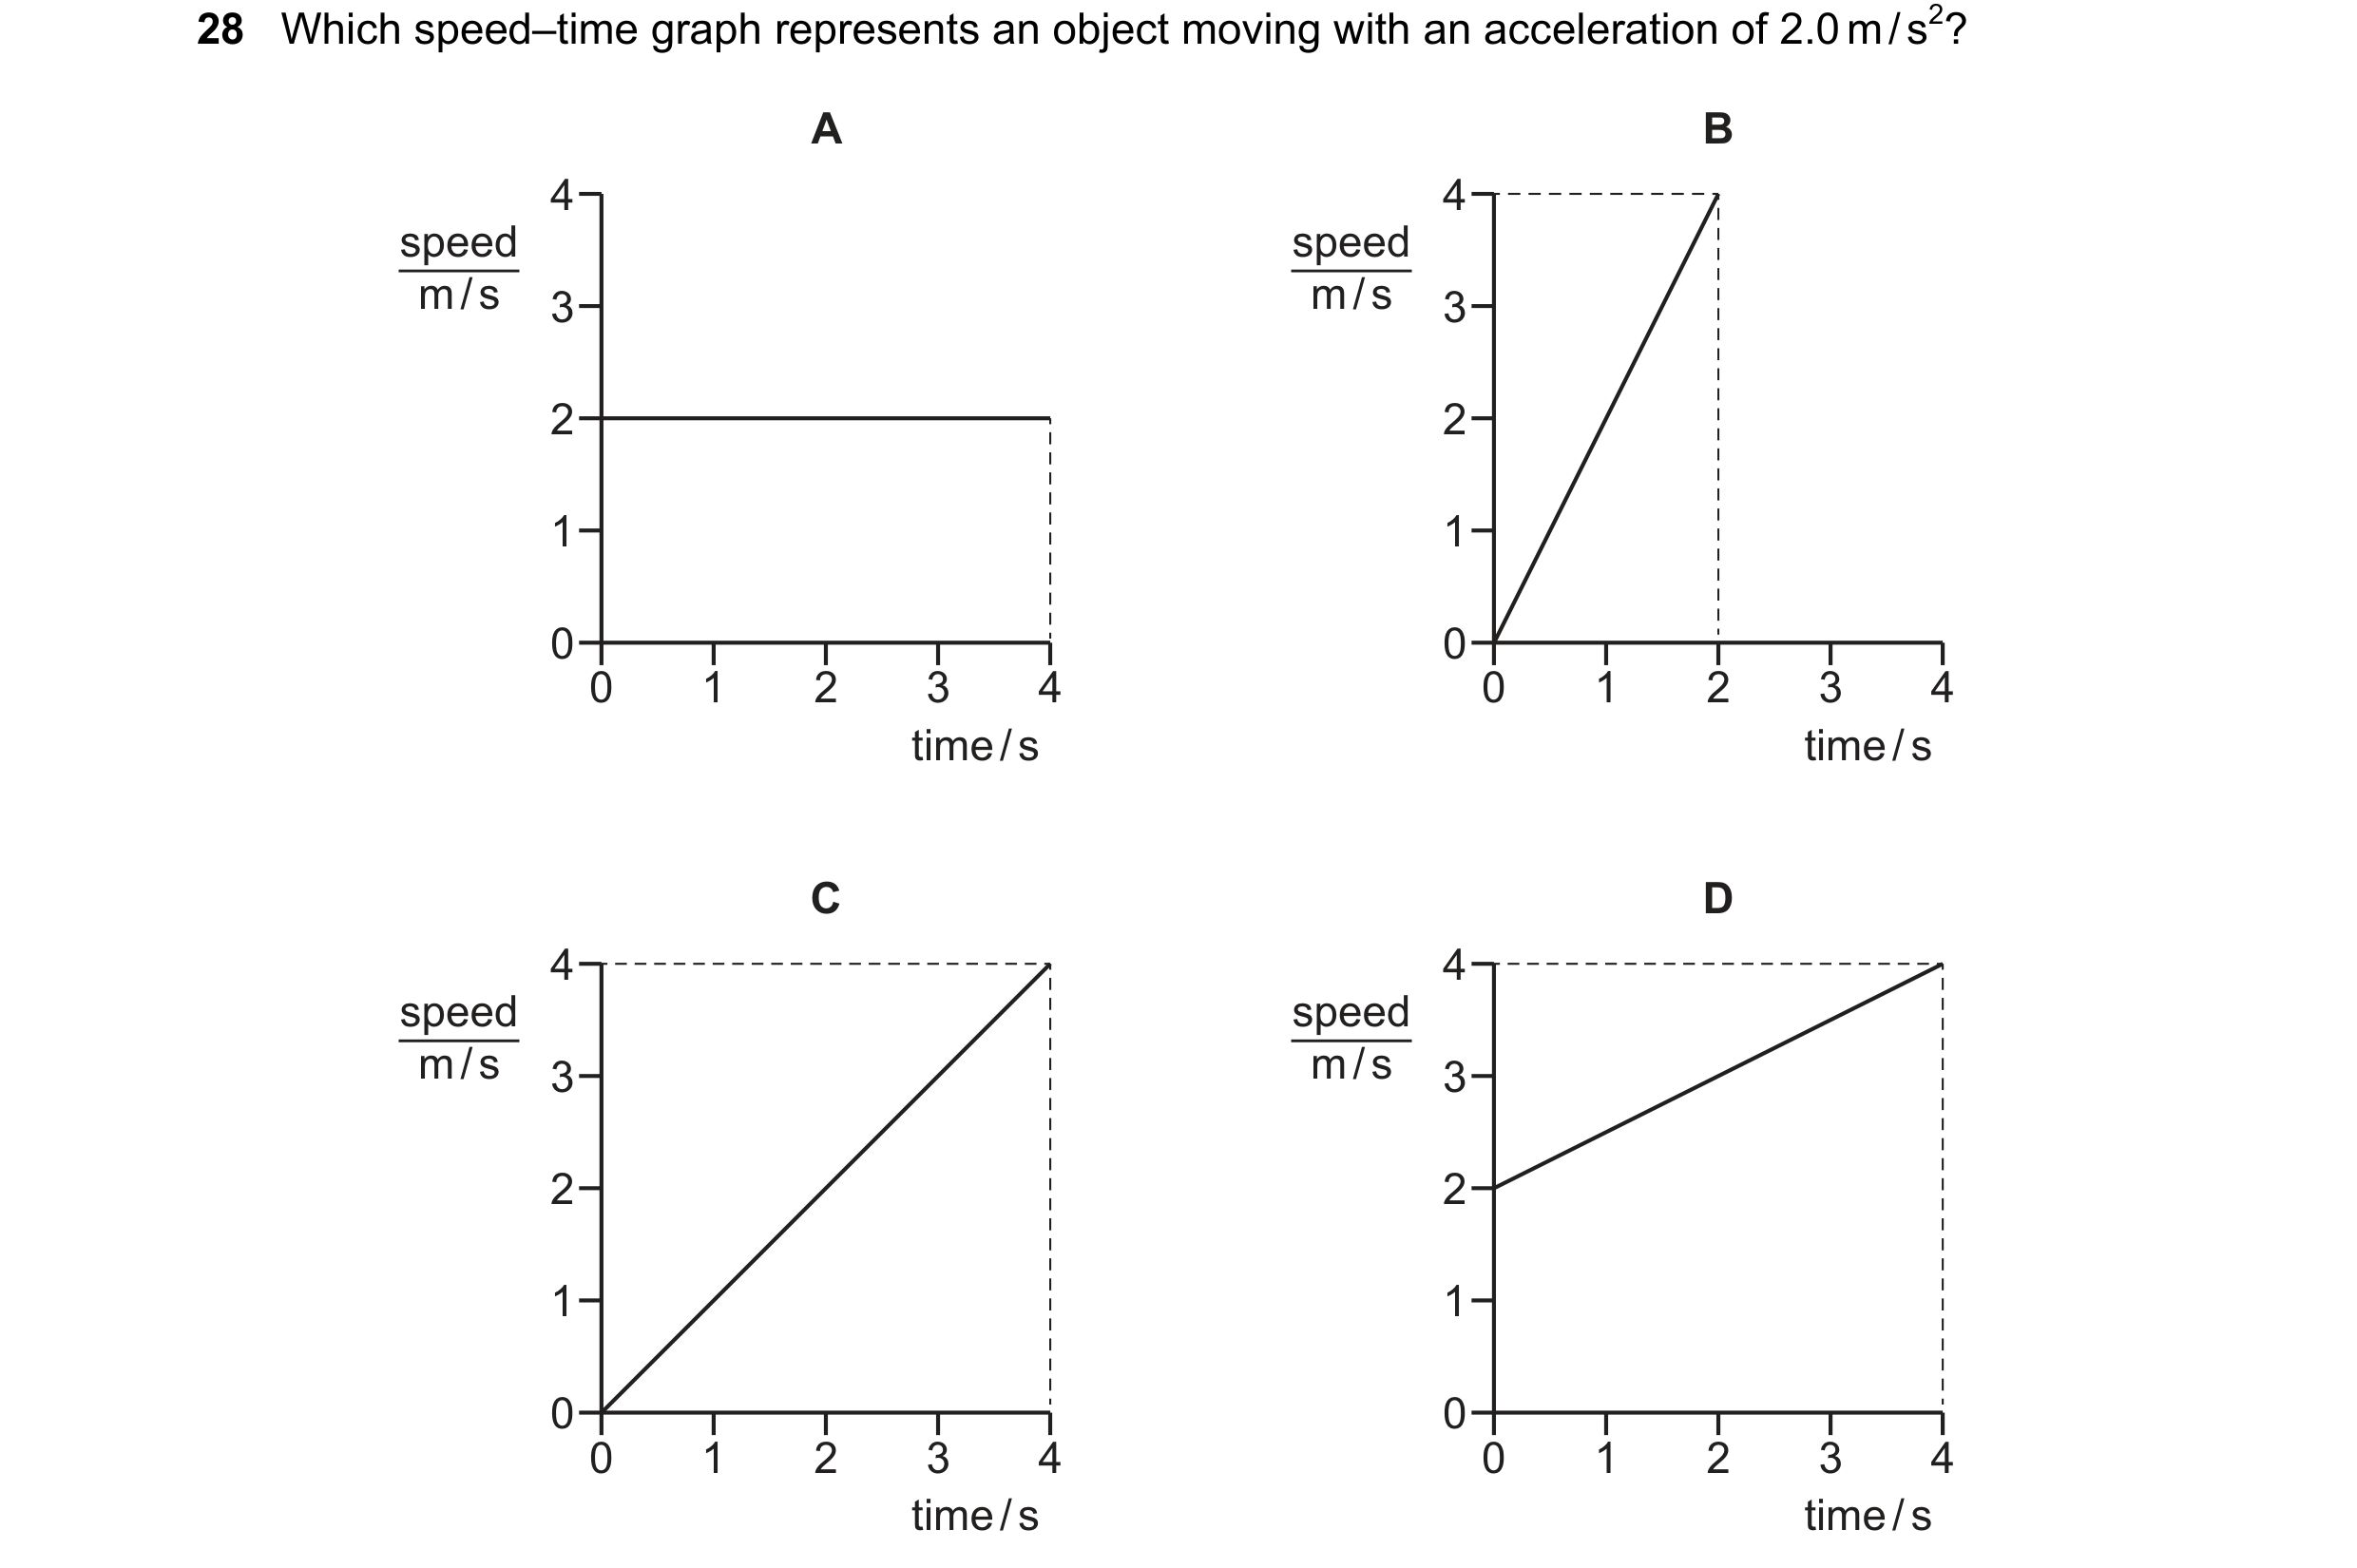



 5 / 11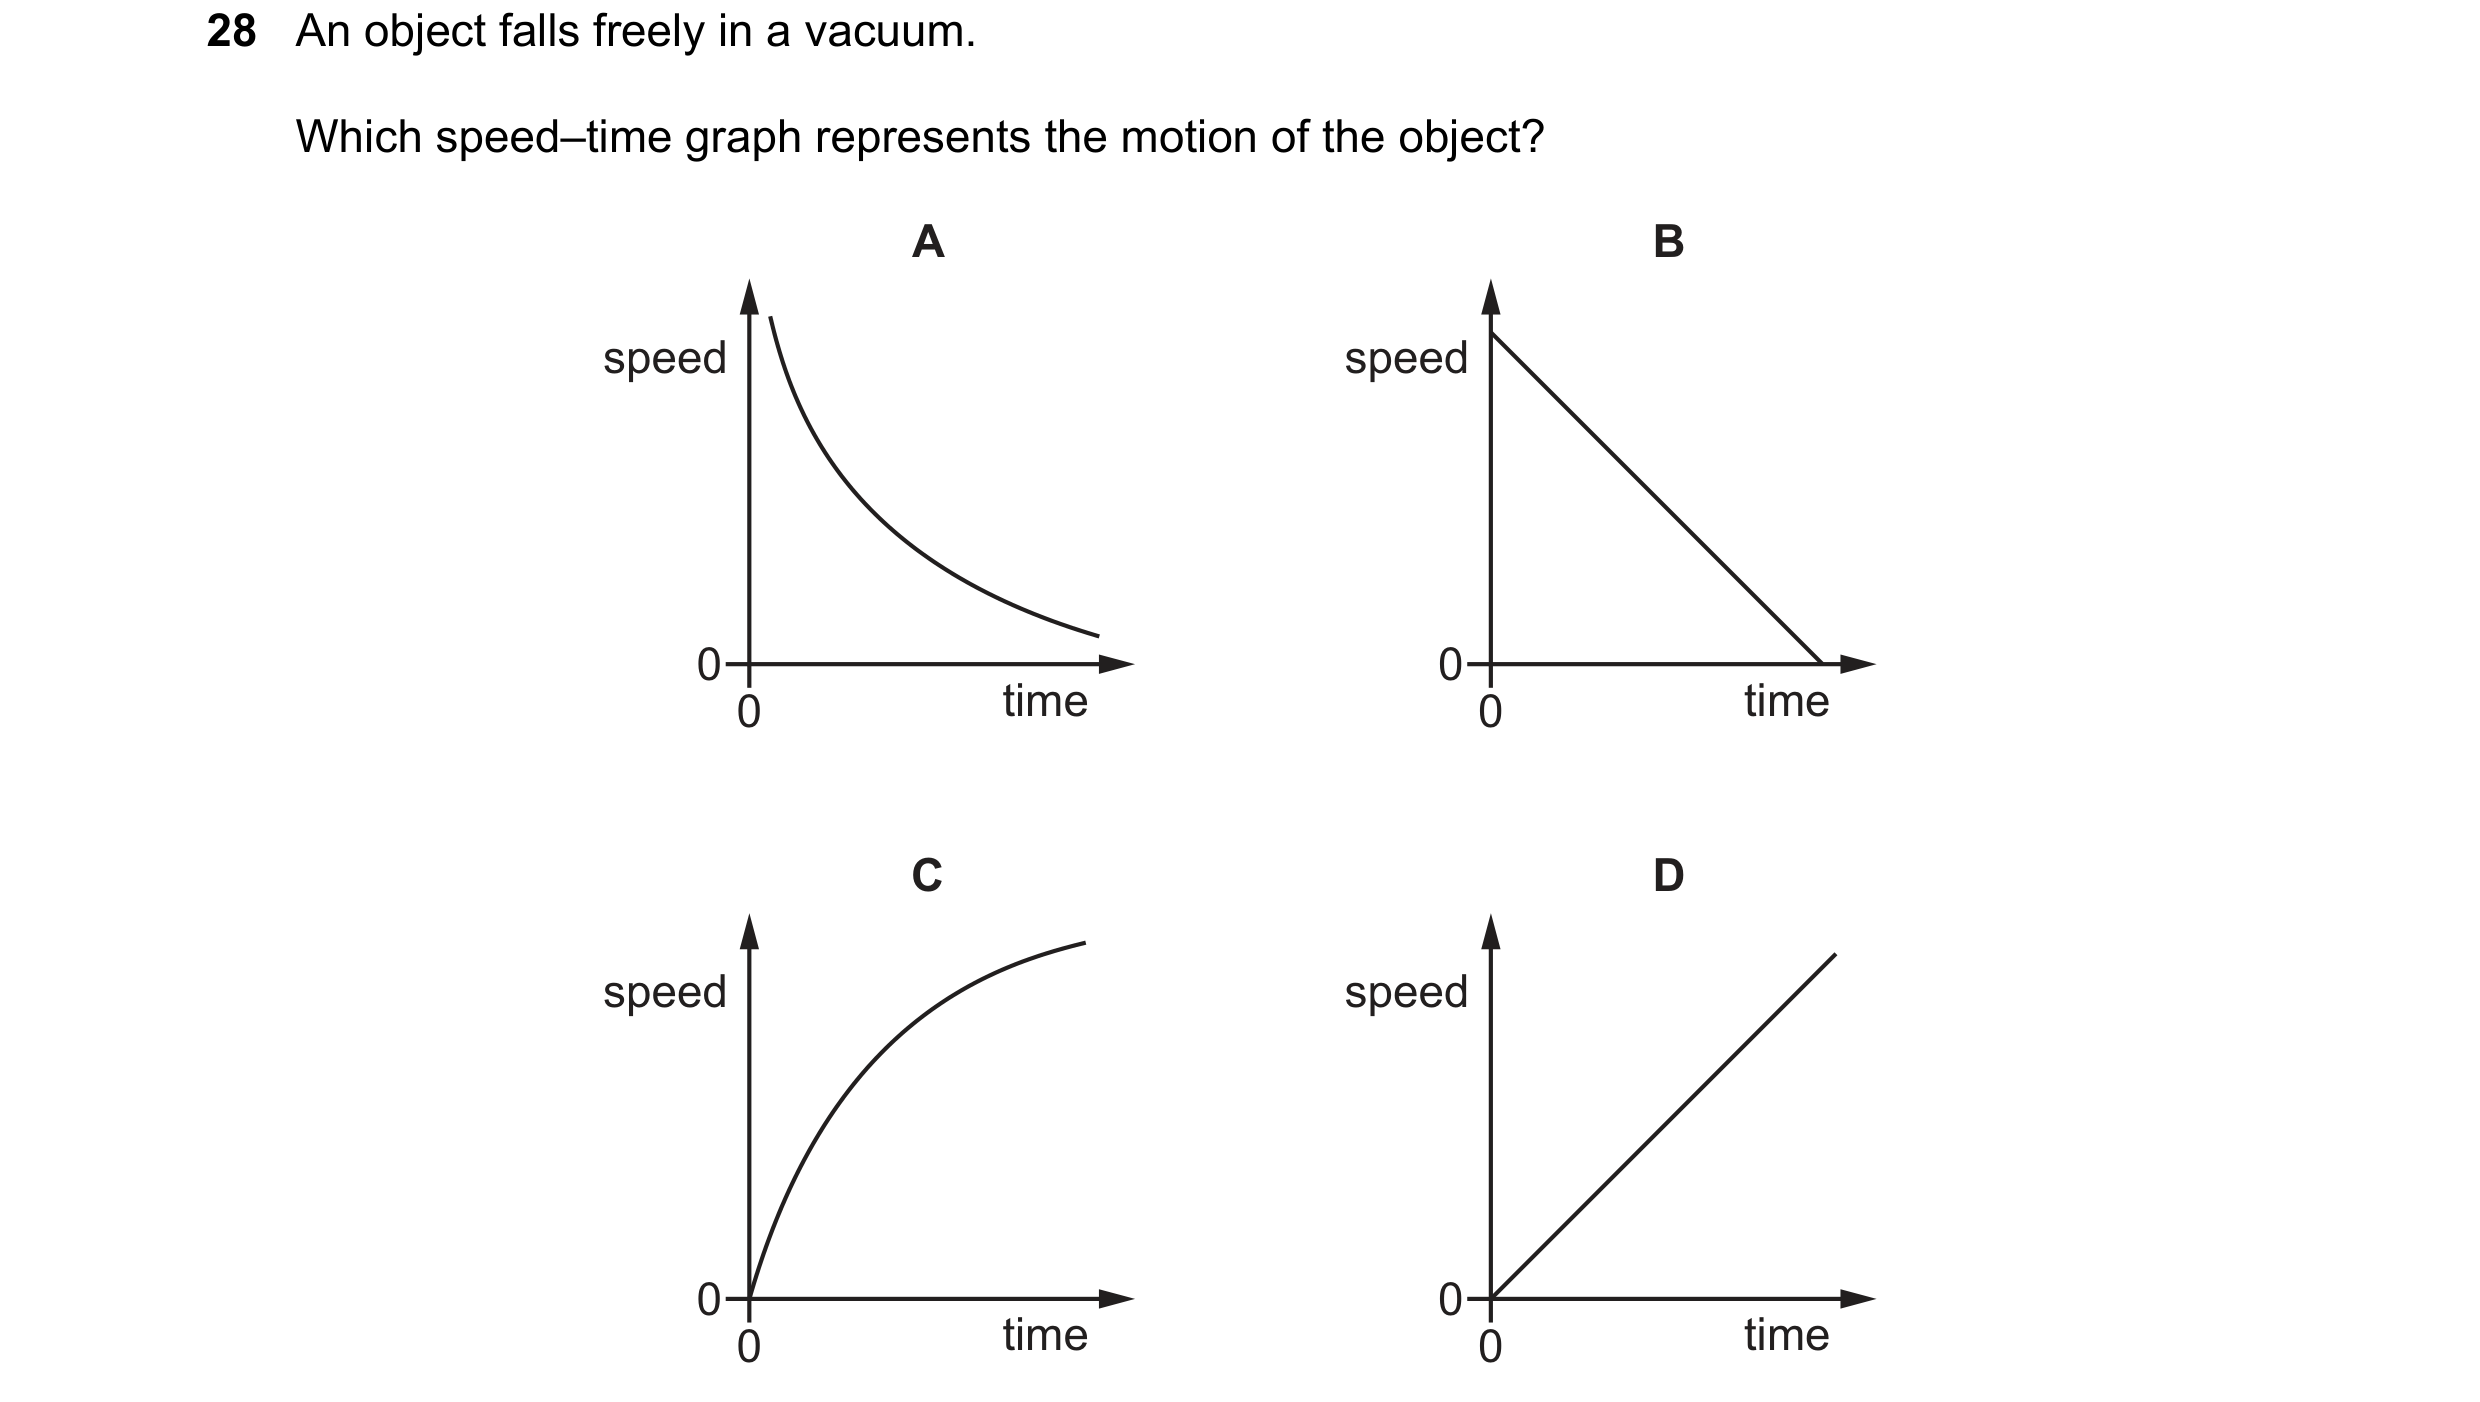

 6 / 11
 7 / 11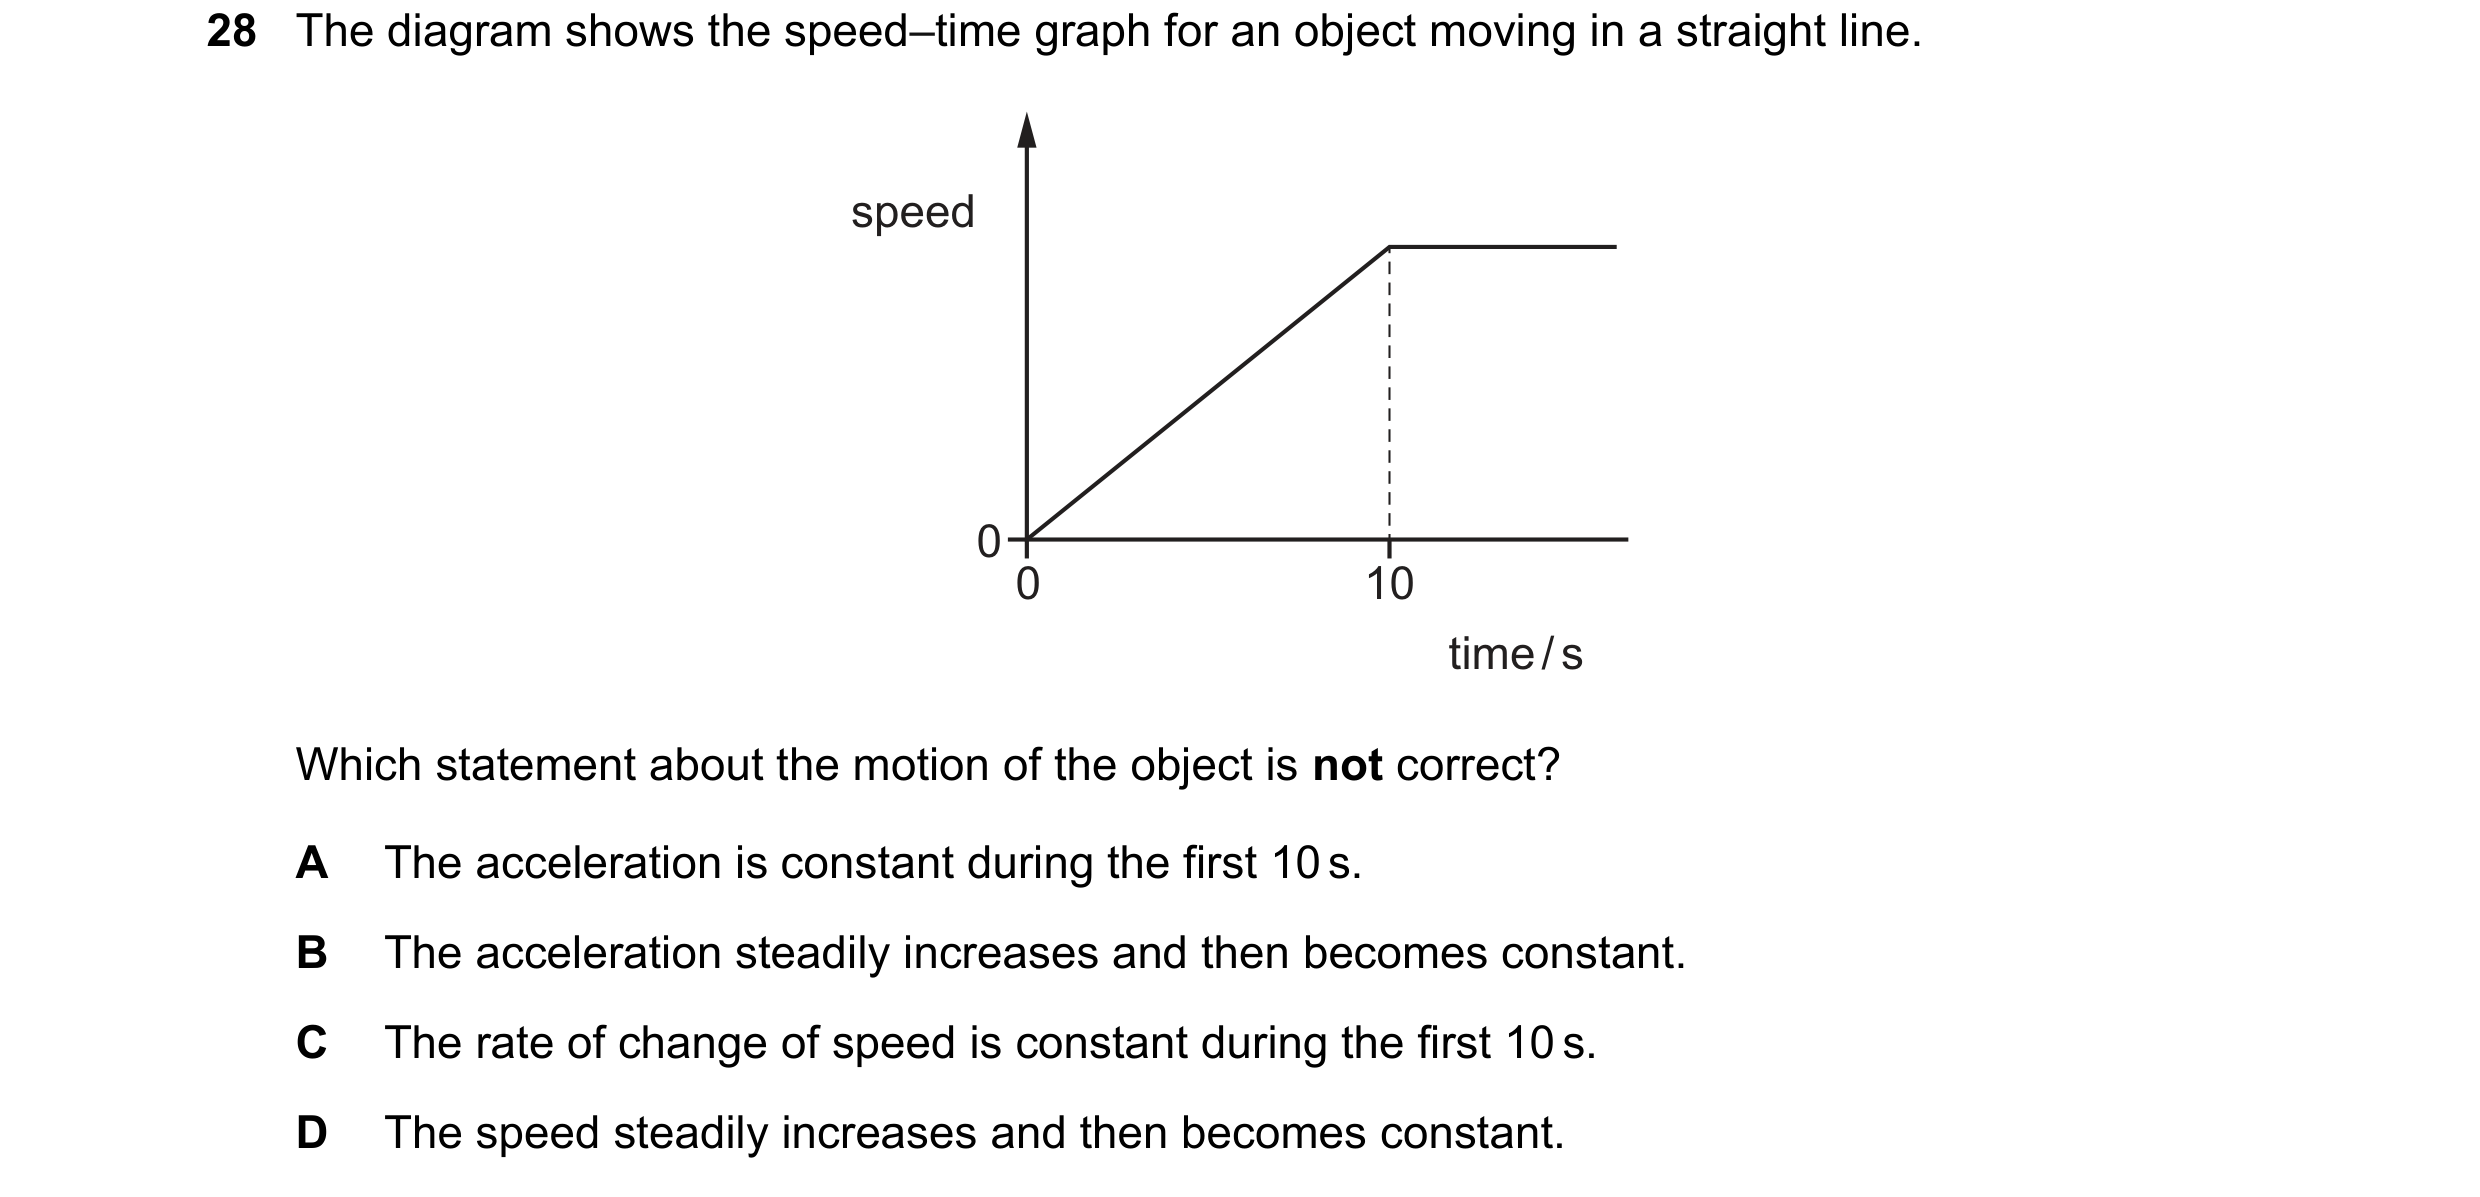
 8 / 11

 9 / 11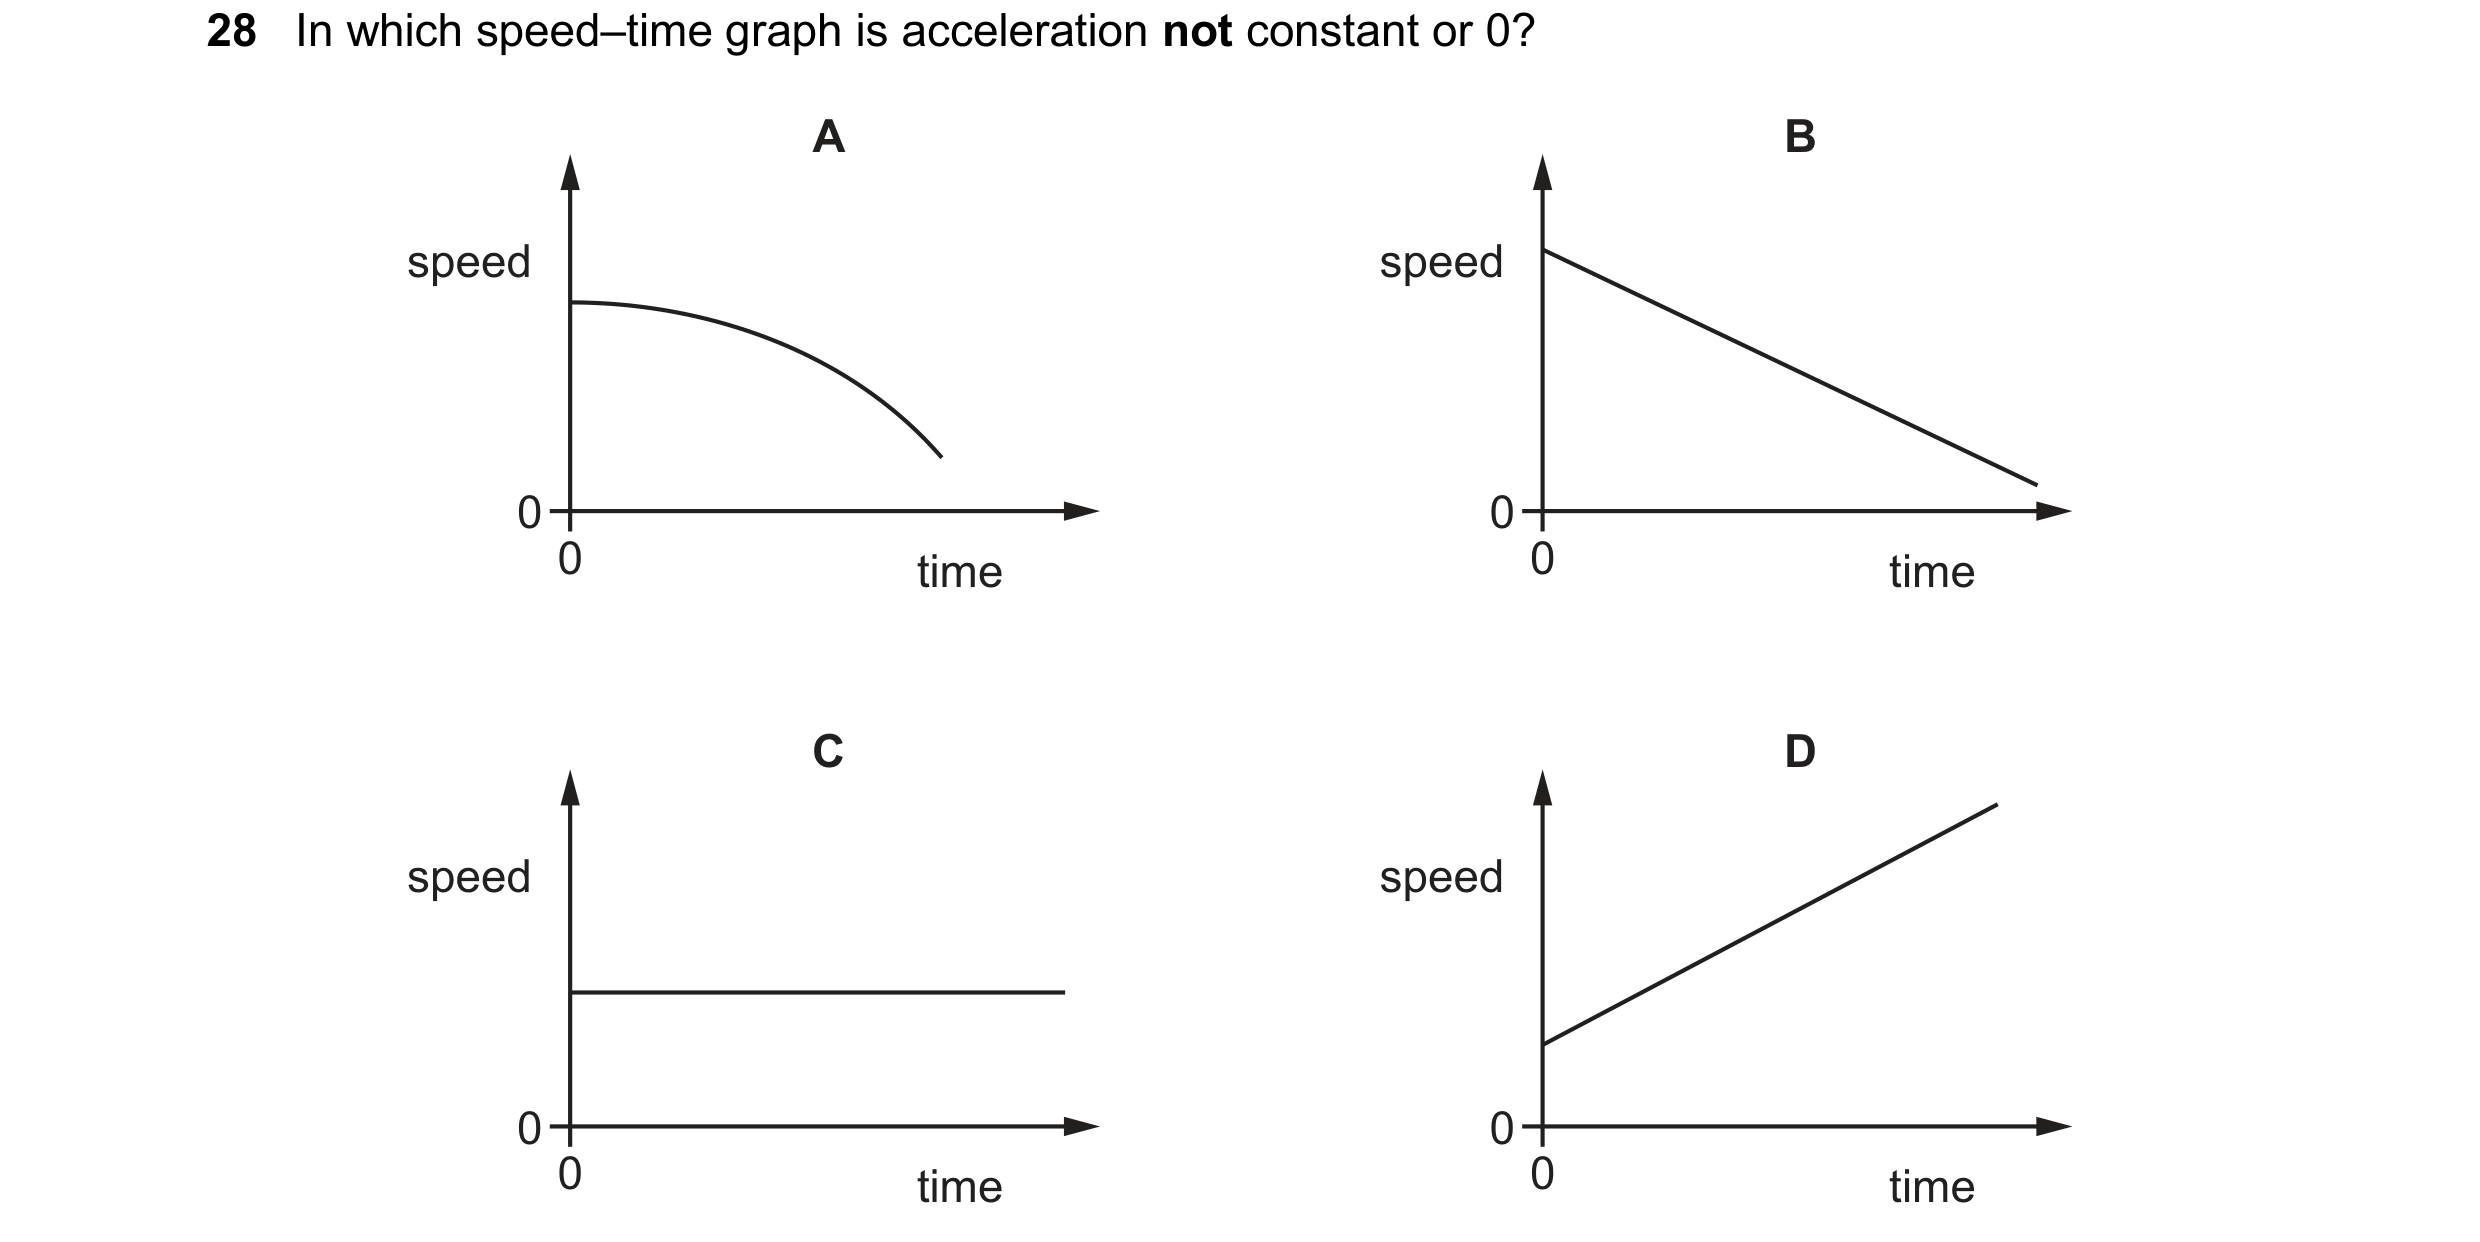
 10 / 11
 11 / 11