Questions as text
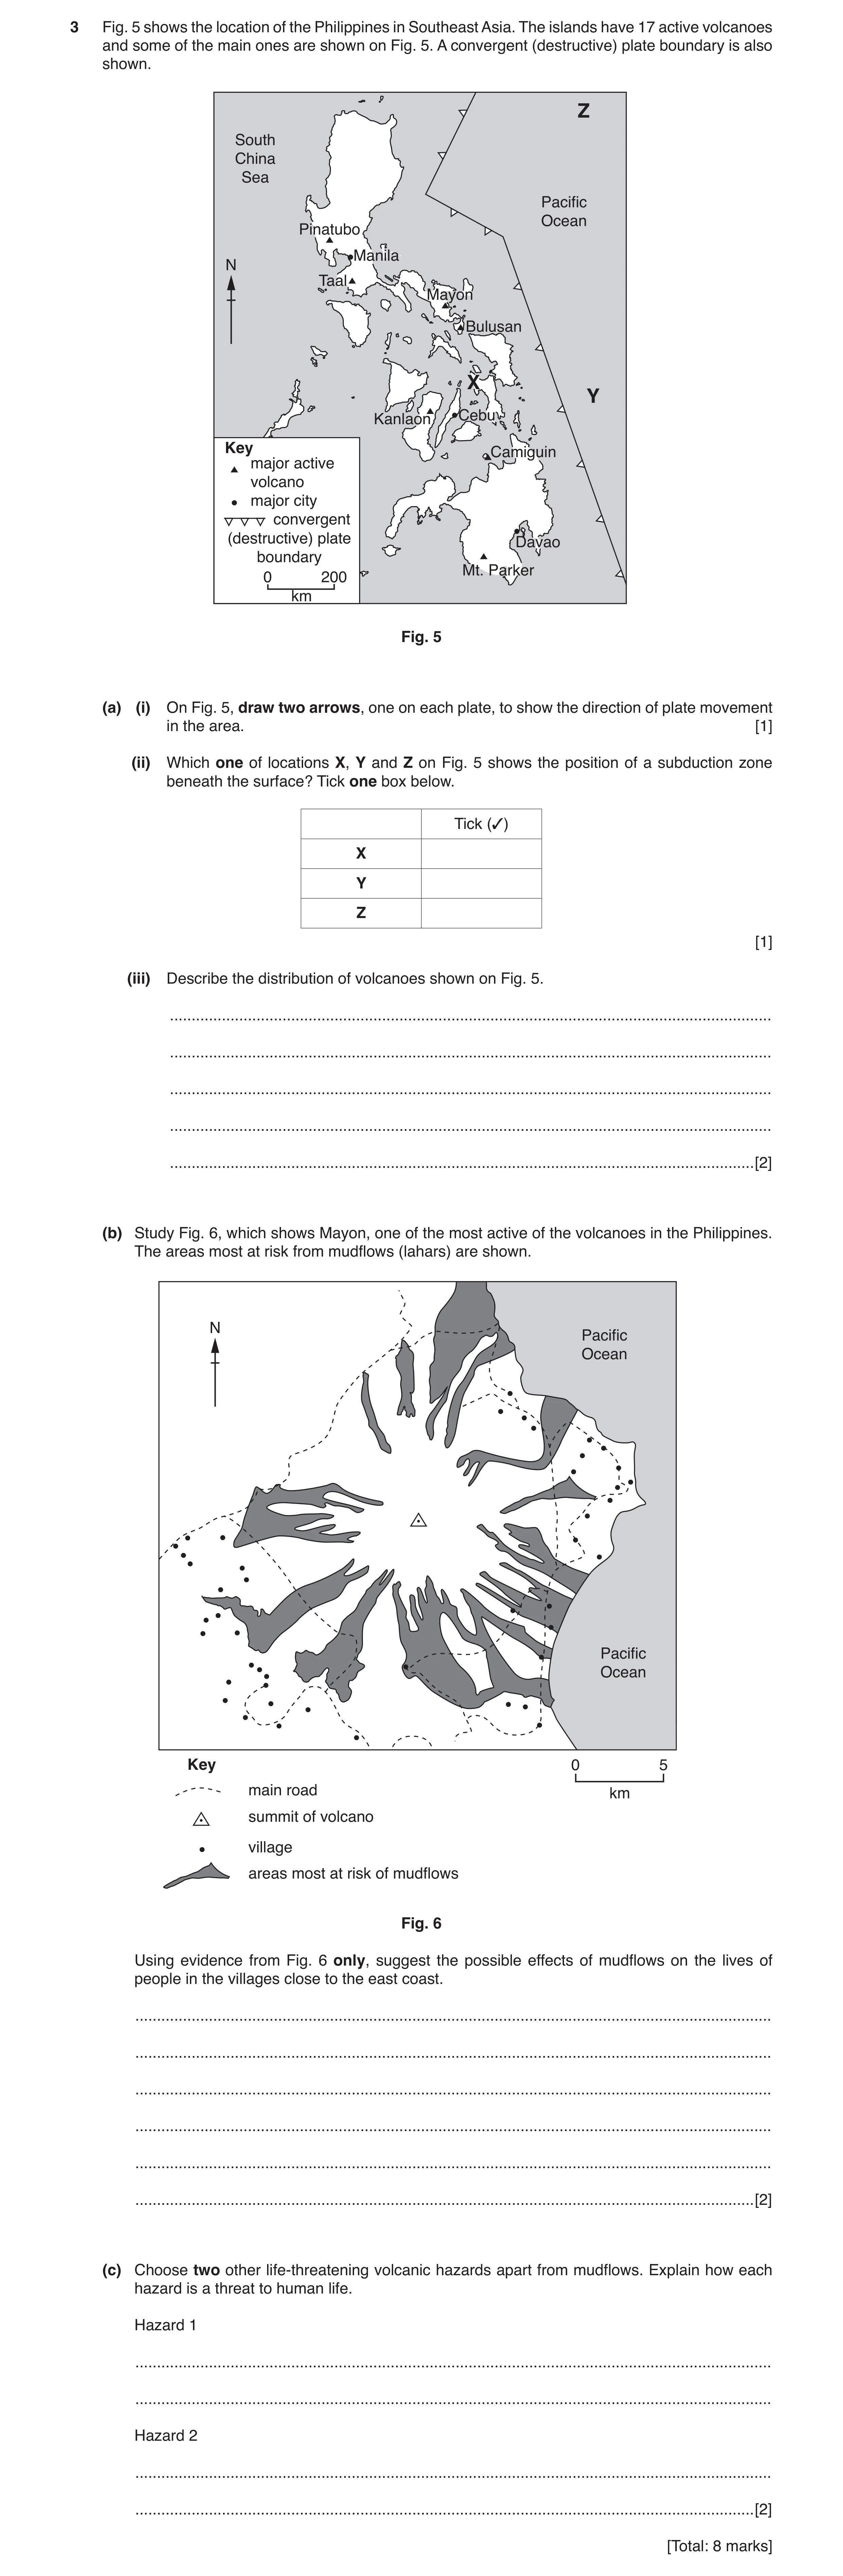
Q1 · The location of the Philippines in Southeast Asia 0460/21 May/June 2017
3 Fig. 5 shows the location of the Philippines in Southeast Asia. The islands have 17 active volcanoes and some of the main ones are shown on Fig. 5. A convergent (destructive) plate boundary is also shown. Z South China Sea Pacific Ocean Pinatubo Manila N Taal Mayon Bulusan X Y Kanlaon Cebu Key Camiguin major active volcano major city convergent (destructive) plate Davao boundary Mt. Parker 0 200 km Fig. 5 (a) (i) On Fig. 5, draw two arrows, one on each plate, to show the direction of plate movement in the area. [1] (ii) Which one of locations X, Y and Z on Fig. 5 shows the position of a subduction zone beneath the surface? Tick one box below. Tick (3) X Y Z [1] (iii) Describe the distribution of volcanoes shown on Fig. 5. … … … … … [2] (b) Study Fig. 6, which shows Mayon, one of the most active of the volcanoes in the Philippines. The areas most at risk from mudflows (lahars) are shown. N Pacific Ocean Pacific Ocean Key 0 5 main road km summit of volcano village areas most at risk of mudflows Fig. 6 Using evidence from Fig. 6 only, suggest the possible effects of mudflows on the lives of people in the villages close to the east coast. … … … … … … [2] (c) Choose two other life-threatening volcanic hazards apart from mudflows. Explain how each hazard is a threat to human life. Hazard 1 … … Hazard 2 … … [2] [Total: 8 marks]
8 marks
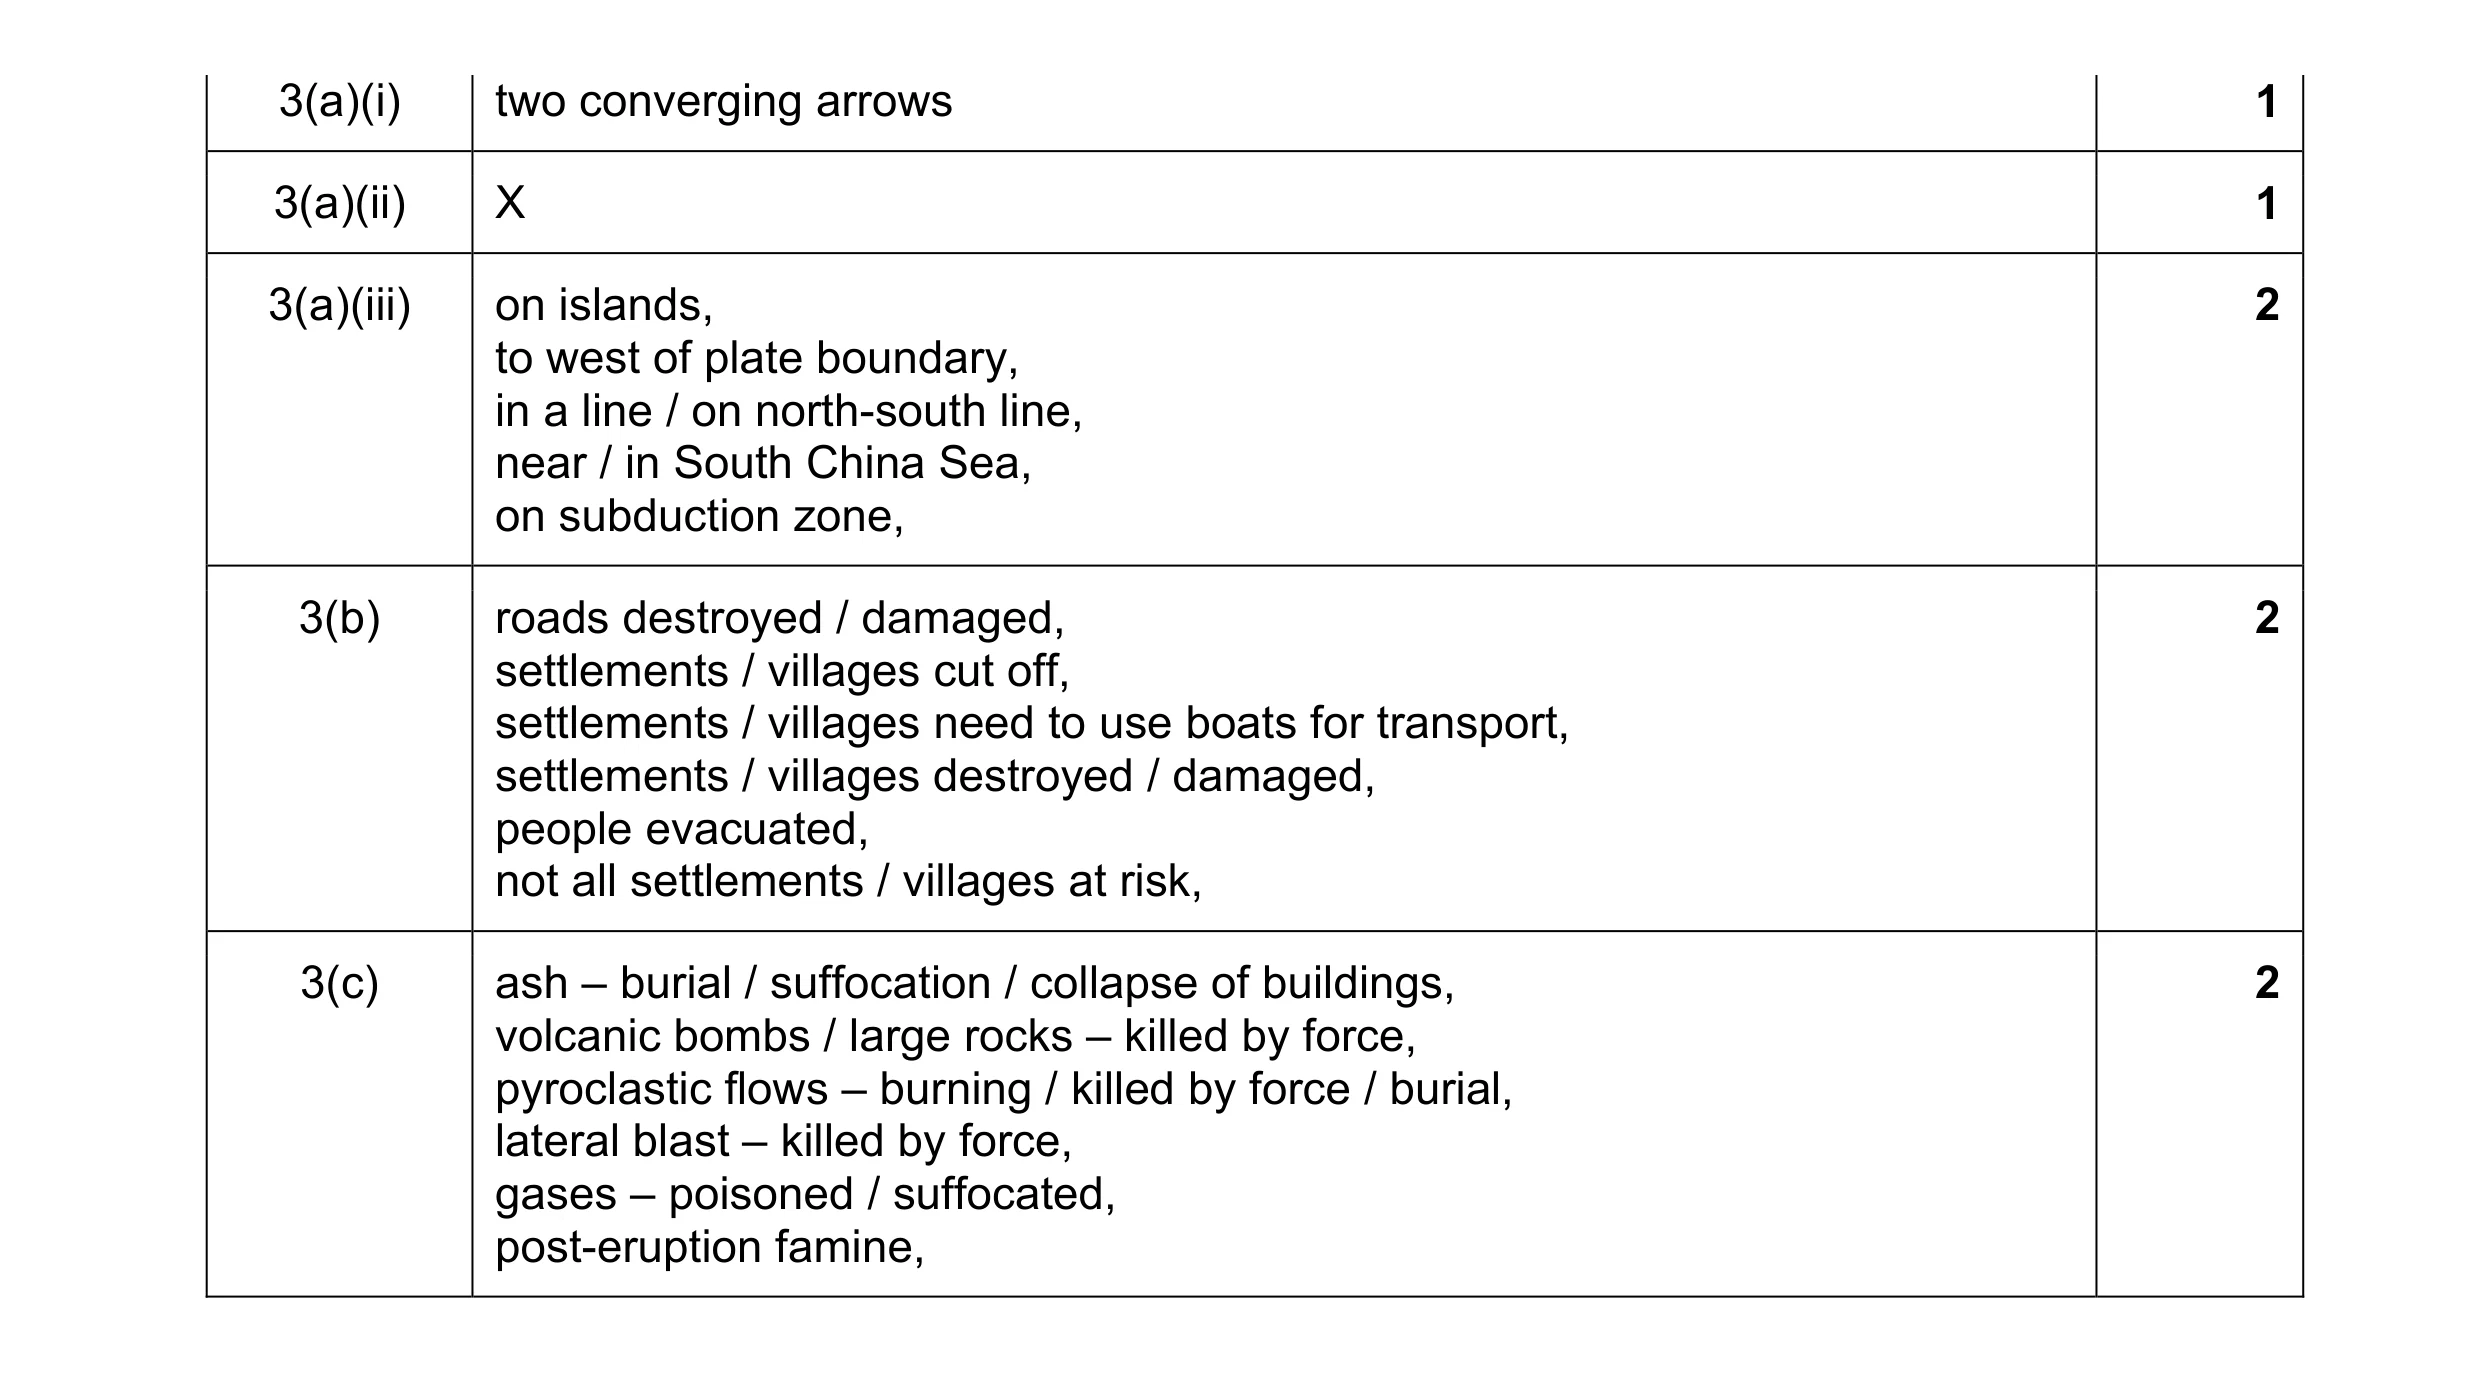
Mark scheme: 3(a)(i) two converging arrows 1 3(a)(ii) X 1 3(a)(iii) on islands, 2 to west of plate boundary, in a line / on north-south line, near / in South China Sea, on subduction zone, 3(b) roads destroyed / damaged, 2 settlements / villages cut off, settlements / villages need to use boats for transport, settlements / villages destroyed / damaged, people evacuated, not all settlements / villages at risk, 3(c) ash – burial / suffocation / collapse of buildings, 2 volcanic bombs / large rocks – killed by force, pyroclastic flows – burning / killed by force / burial, lateral blast – killed by force, gases – poisoned / suffocated, post-eruption famine,
This question in 0460/21 May/June 2017
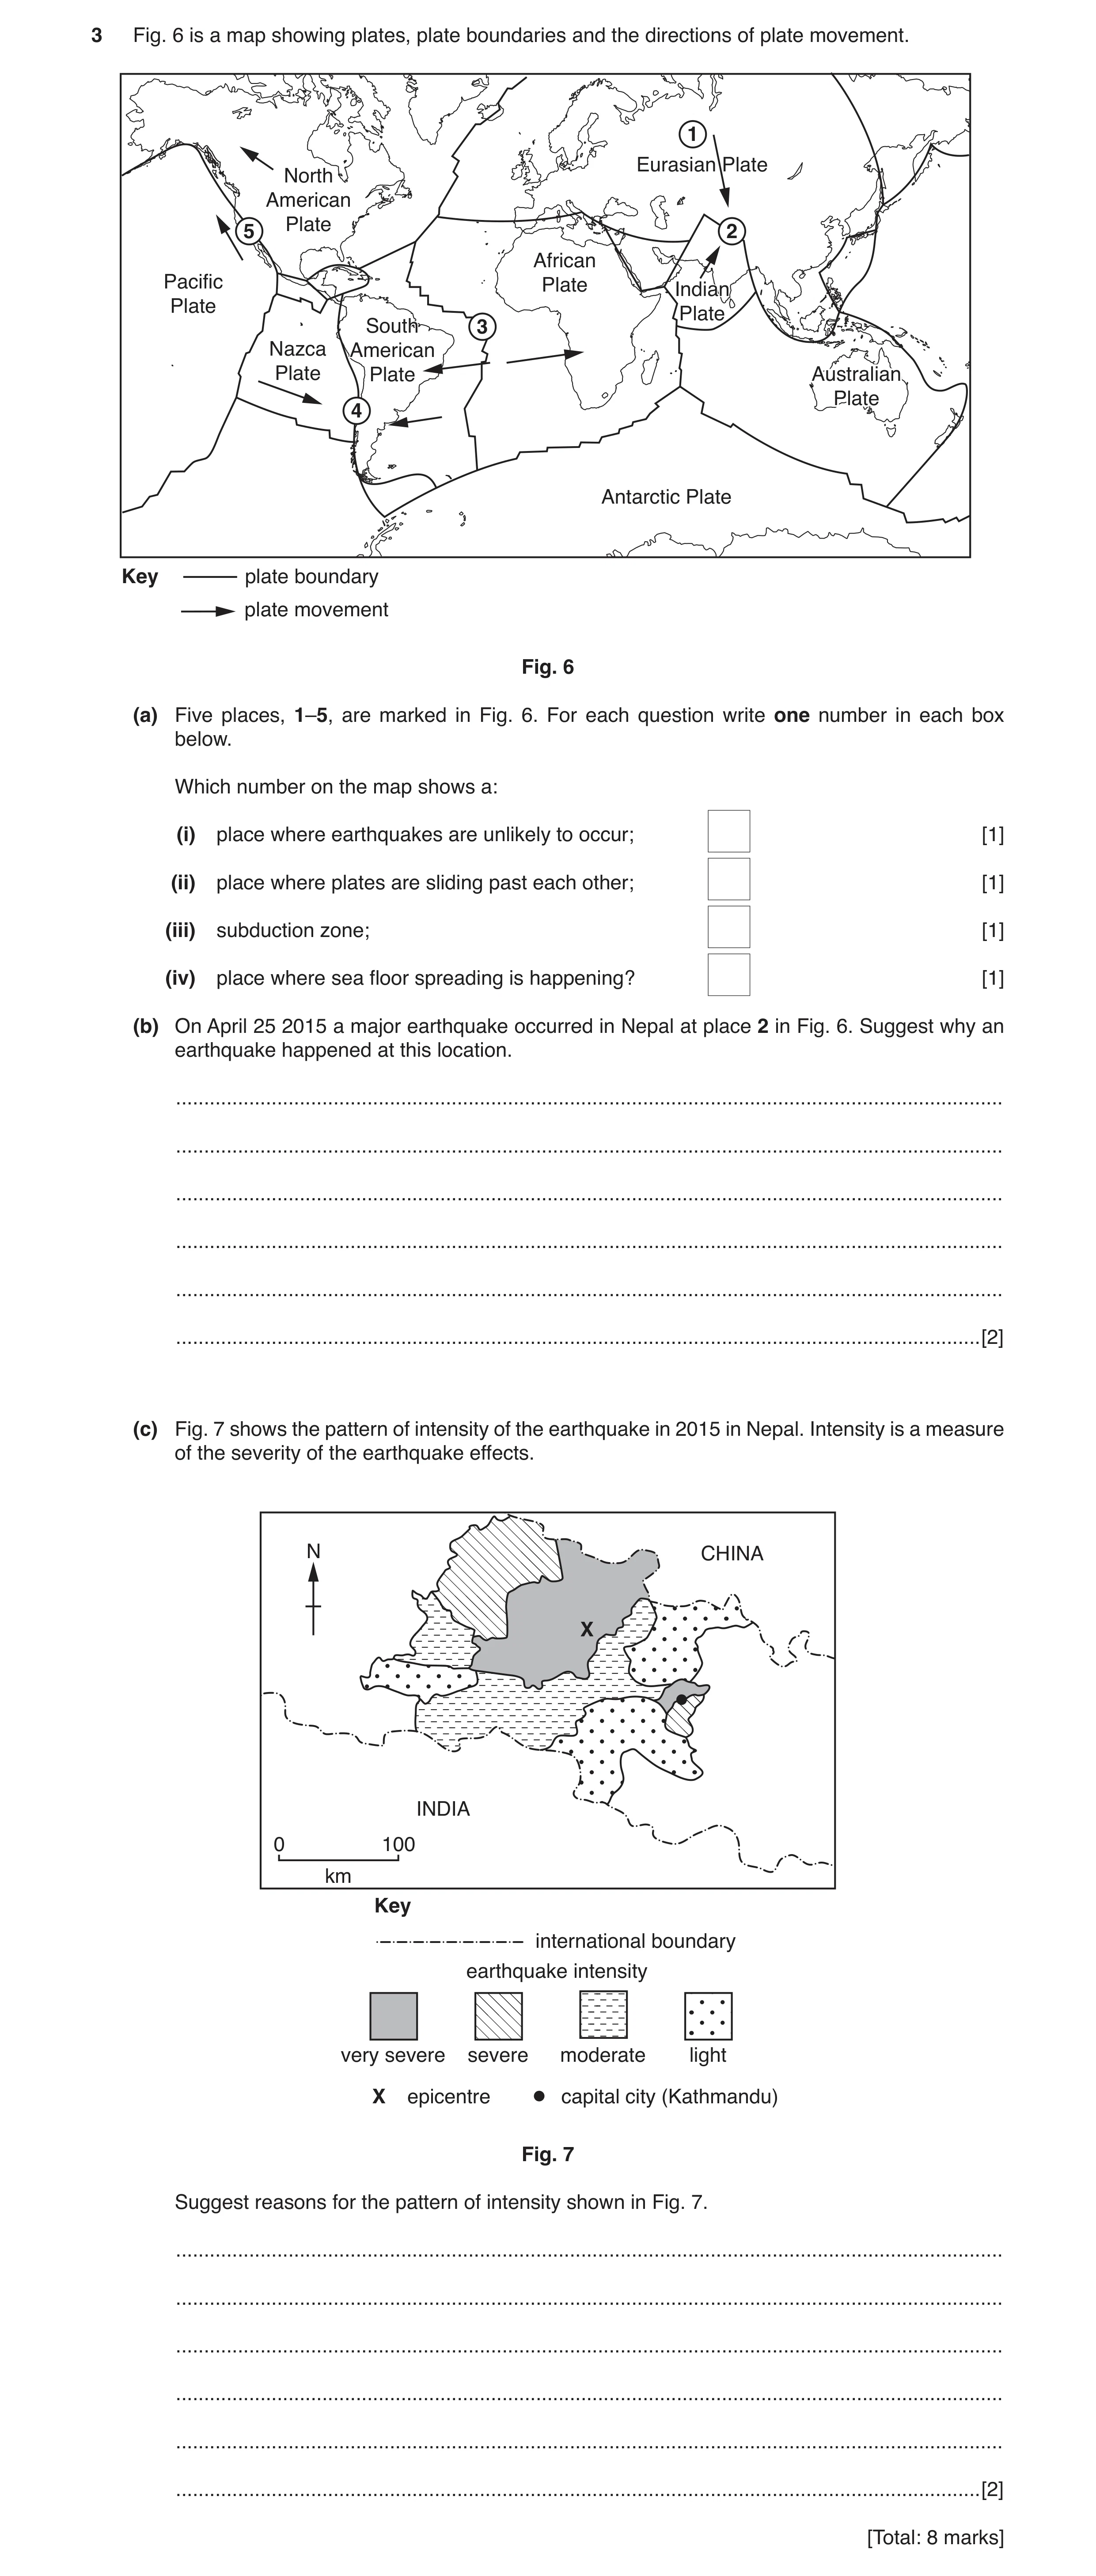
Q2 · A map showing plates, plate boundaries and the directions of plate movement 0460/21 Oct/Nov 2017
3 Fig. 6 is a map showing plates, plate boundaries and the directions of plate movement. 1 Eurasian Plate North American Plate 5 2 African Pacific Plate Indian Plate Plate South 3 Nazca American Plate Plate Australian Plate 4 Antarctic Plate Key plate boundary plate movement Fig. 6 (a) Five places, 1–5, are marked in Fig. 6. For each question write one number in each box below. Which number on the map shows a: (i) place where earthquakes are unlikely to occur; [1] (ii) place where plates are sliding past each other; [1] (iii) subduction zone; [1] (iv) place where sea floor spreading is happening? [1] (b) On April 25 2015 a major earthquake occurred in Nepal at place 2 in Fig. 6. Suggest why an earthquake happened at this location. … … … … … … [2] (c) Fig. 7 shows the pattern of intensity of the earthquake in 2015 in Nepal. Intensity is a measure of the severity of the earthquake effects. N CHINA X INDIA 0 100 km Key international boundary earthquake intensity very severe severe moderate light X epicentre capital city (Kathmandu) Fig. 7 Suggest reasons for the pattern of intensity shown in Fig. 7. … … … … … … [2] [Total: 8 marks]
8 marks
Mark scheme: 3(a)(i) 1, 1 3(a)(ii) 5, 1 3(a)(iii) 4, 1 3(a)(iv) 3, 1 3(b) *compulsory point: plates collide/converge/destructive margin, 2 stress/pressure/compression, friction, fracturing/faulting, 3(c) great(est) close to epicentre/less further away, 2 high around Kathmandu may relate to buildings type/density, possible effects of geology, possible effects of relief,
This question in 0460/21 Oct/Nov 2017
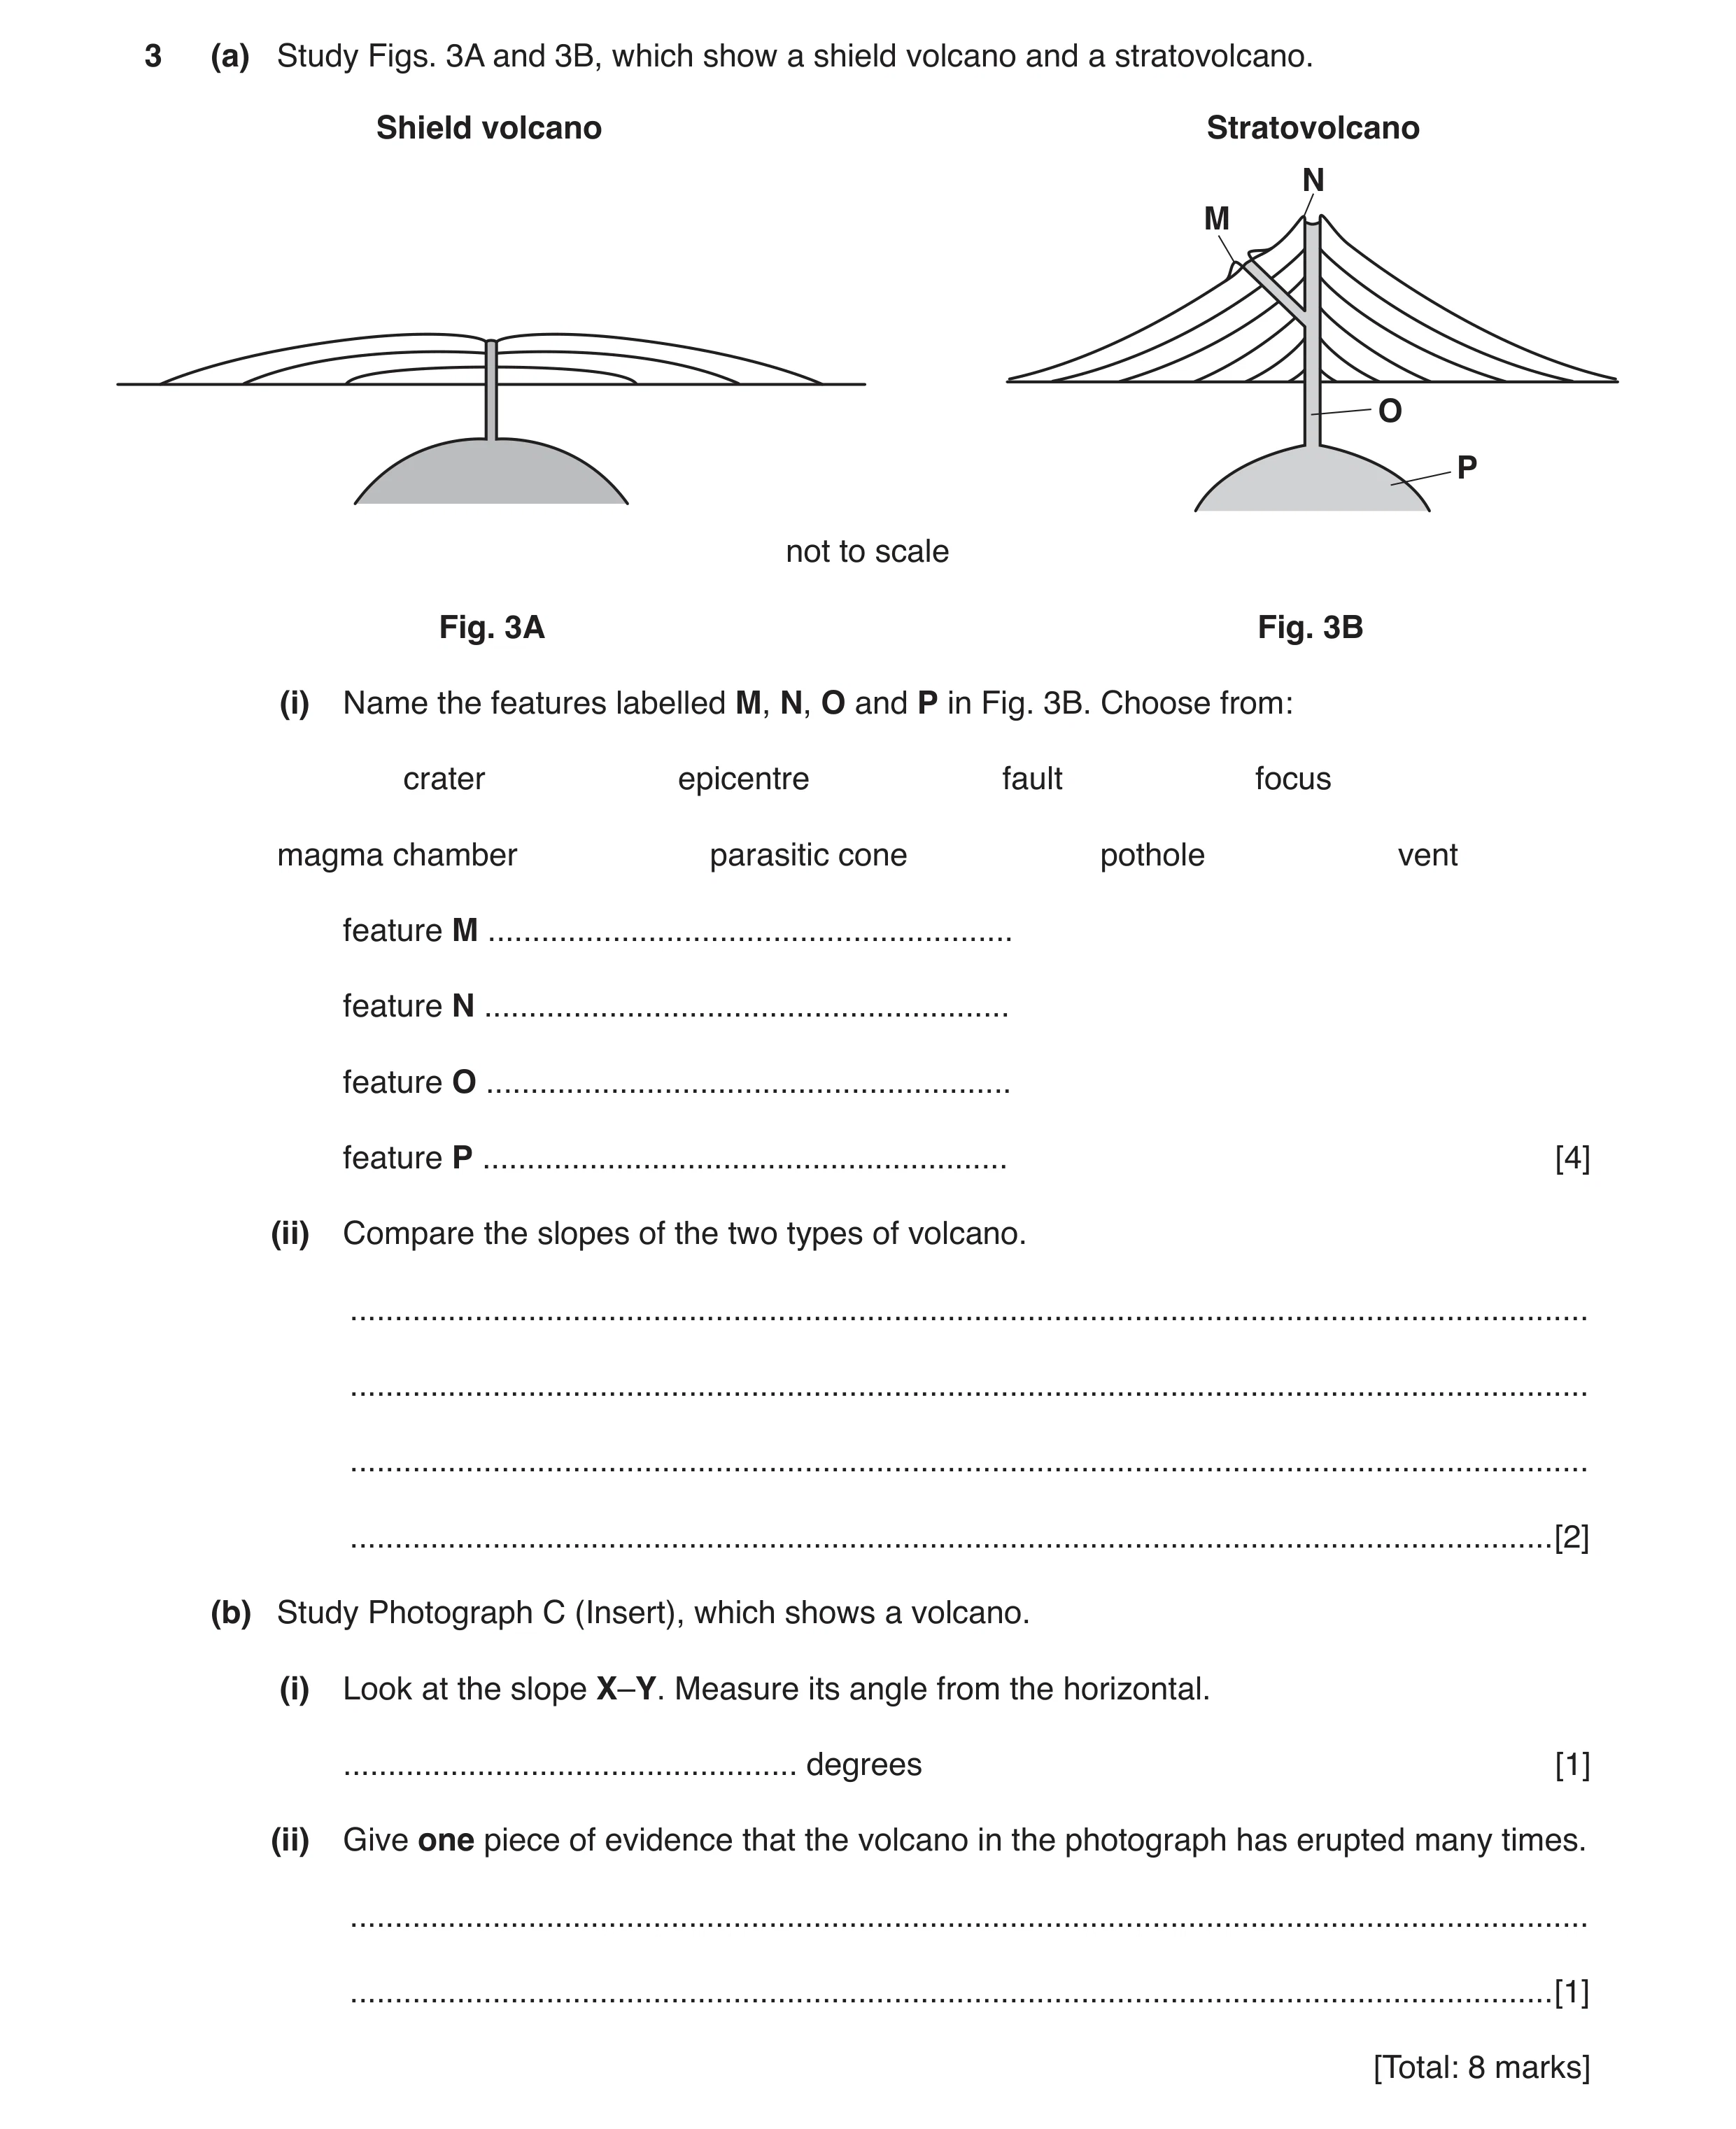
Question 3 0460/23 Oct/Nov 2017
3 (a) Study Figs. 3A and 3B, which show a shield volcano and a stratovolcano. Shield volcano Stratovolcano N M O P not to scale Fig. 3A Fig. 3B (i) Name the features labelled M, N, O and P in Fig. 3B. Choose from: crater epicentre fault focus magma chamber parasitic cone pothole vent feature M … feature N … feature O … feature P … [4] (ii) Compare the slopes of the two types of volcano. … … … … [2] (b) Study Photograph C (Insert), which shows a volcano. (i) Look at the slope X–Y. Measure its angle from the horizontal. … degrees [1] (ii) Give one piece of evidence that the volcano in the photograph has erupted many times. … … [1] [Total: 8 marks]
8 marks
Mark scheme: 3(a)(i) M parasitic cone, 4 N crater, O vent, P magma chamber, 3(a)(ii) shield gentler/stratovolcano steeper, 2 shield straight/convex + stratovolcano is concave OR shield steepens towards the base + stratovolcano steepens towards the summit, 3(b)(i) 23–30 (degrees), 1 3(b)(ii) layers, 1 it rises from the sea bed/high above sea level,
This question in 0460/23 Oct/Nov 2017
Q4 · A cross section through an area affected by an earthquake 0460/22 May/June 2018
4 (a) Fig. 4.1 shows a cross section through an area affected by an earthquake. ground surface A Y ground surface X B Key seismic waves ground movement Not to scale Fig. 4.1 (i) Identify points X and Y shown on Fig. 4.1. X … Y … [2] (ii) Describe what happened along line A – B to cause an earthquake. … … … [1] (b) Fig. 4.2 gives information about an earthquake at Bam in Iran. An earthquake occurred at Bam in south east Iran on December 26, 2003 at 05:26. More than 40 000 people were killed, 50 000 were injured and 100 000 became homeless. The Arg-e-Bam, the largest mud-brick building in the world, which was about 2000 years old, was almost totally destroyed in the earthquake. Fig. 4.2 Using Fig. 4.2, suggest the importance of the following on the effects of the earthquake: (i) the time of day … … [1] (ii) the building materials of the Arg-e-Bam. … … [1] (c) Using Fig. 4.2, suggest when the last major earthquake occurred at Bam before 2003. … … [1] (d) Fig. 4.3 is a map showing the intensity of the Bam earthquake. Fig. 4.4 describes the different intensity values. 5 5 5 6 6 5 Key 6 6 7 5 6 7 6 6 6 intensity 8 7 values 8 7 N 9 Arg-e-Bam line dividing areas of equal intensity 9 Airport 8 7 6 0 40 5 km Fig. 4.3 Intensity value Description of effects 5 Felt by nearly everyone. Sleepers wake up. Some windows broken. Unstable objects overturned. Clocks may stop. 6 Felt by everyone, many people frightened. Some plaster falls from walls. Damage slight. 7 Difficult to stand up. People run outdoors. Walls crack. 8 Partial collapse of buildings. Chimneys fall. Damage great in poorly constructed buildings. 9 Damage considerable in well-designed structures, with partial collapse. Buildings shifted off foundations. Fig. 4.4 (i) Complete the line of equal intensity in the north of Fig. 4.3. [1] (ii) Using Figs. 4.3 and 4.4, describe the effects of the earthquake on the buildings at the airport. … … [1] [Total: 8]
8 marks
Mark scheme: 4(a)(i) X focus, 2 Y epicentre. 4(a)(ii) fault, 1 fracture/break, displacement/movement/slipped, build up/release of pressure/tension/stress/energy, 4(b)(i) people in bed/at home/asleep (therefore affected by building collapse), 1 darkness (therefore rescue difficult). 4(b)(ii) mud-bricks weak (therefore easily destroyed), 1 allow a variety of expressions for ‘weak.’ 4(c) more than 2000 years ago, 1 before 3CE/AD, 4(d)(i) line drawn between the 5 and 6 values. 1 4(d)(ii) plaster fell from walls, 1 damage slight, Building points from intensity 8 and 9 spoil. Non-building points, points from intensity 5 and ‘walls crack’ don’t spoil.
This question in 0460/22 May/June 2018
Q5 · Plate boundaries and the direction of movement of some plates 0460/23 May/June 2018
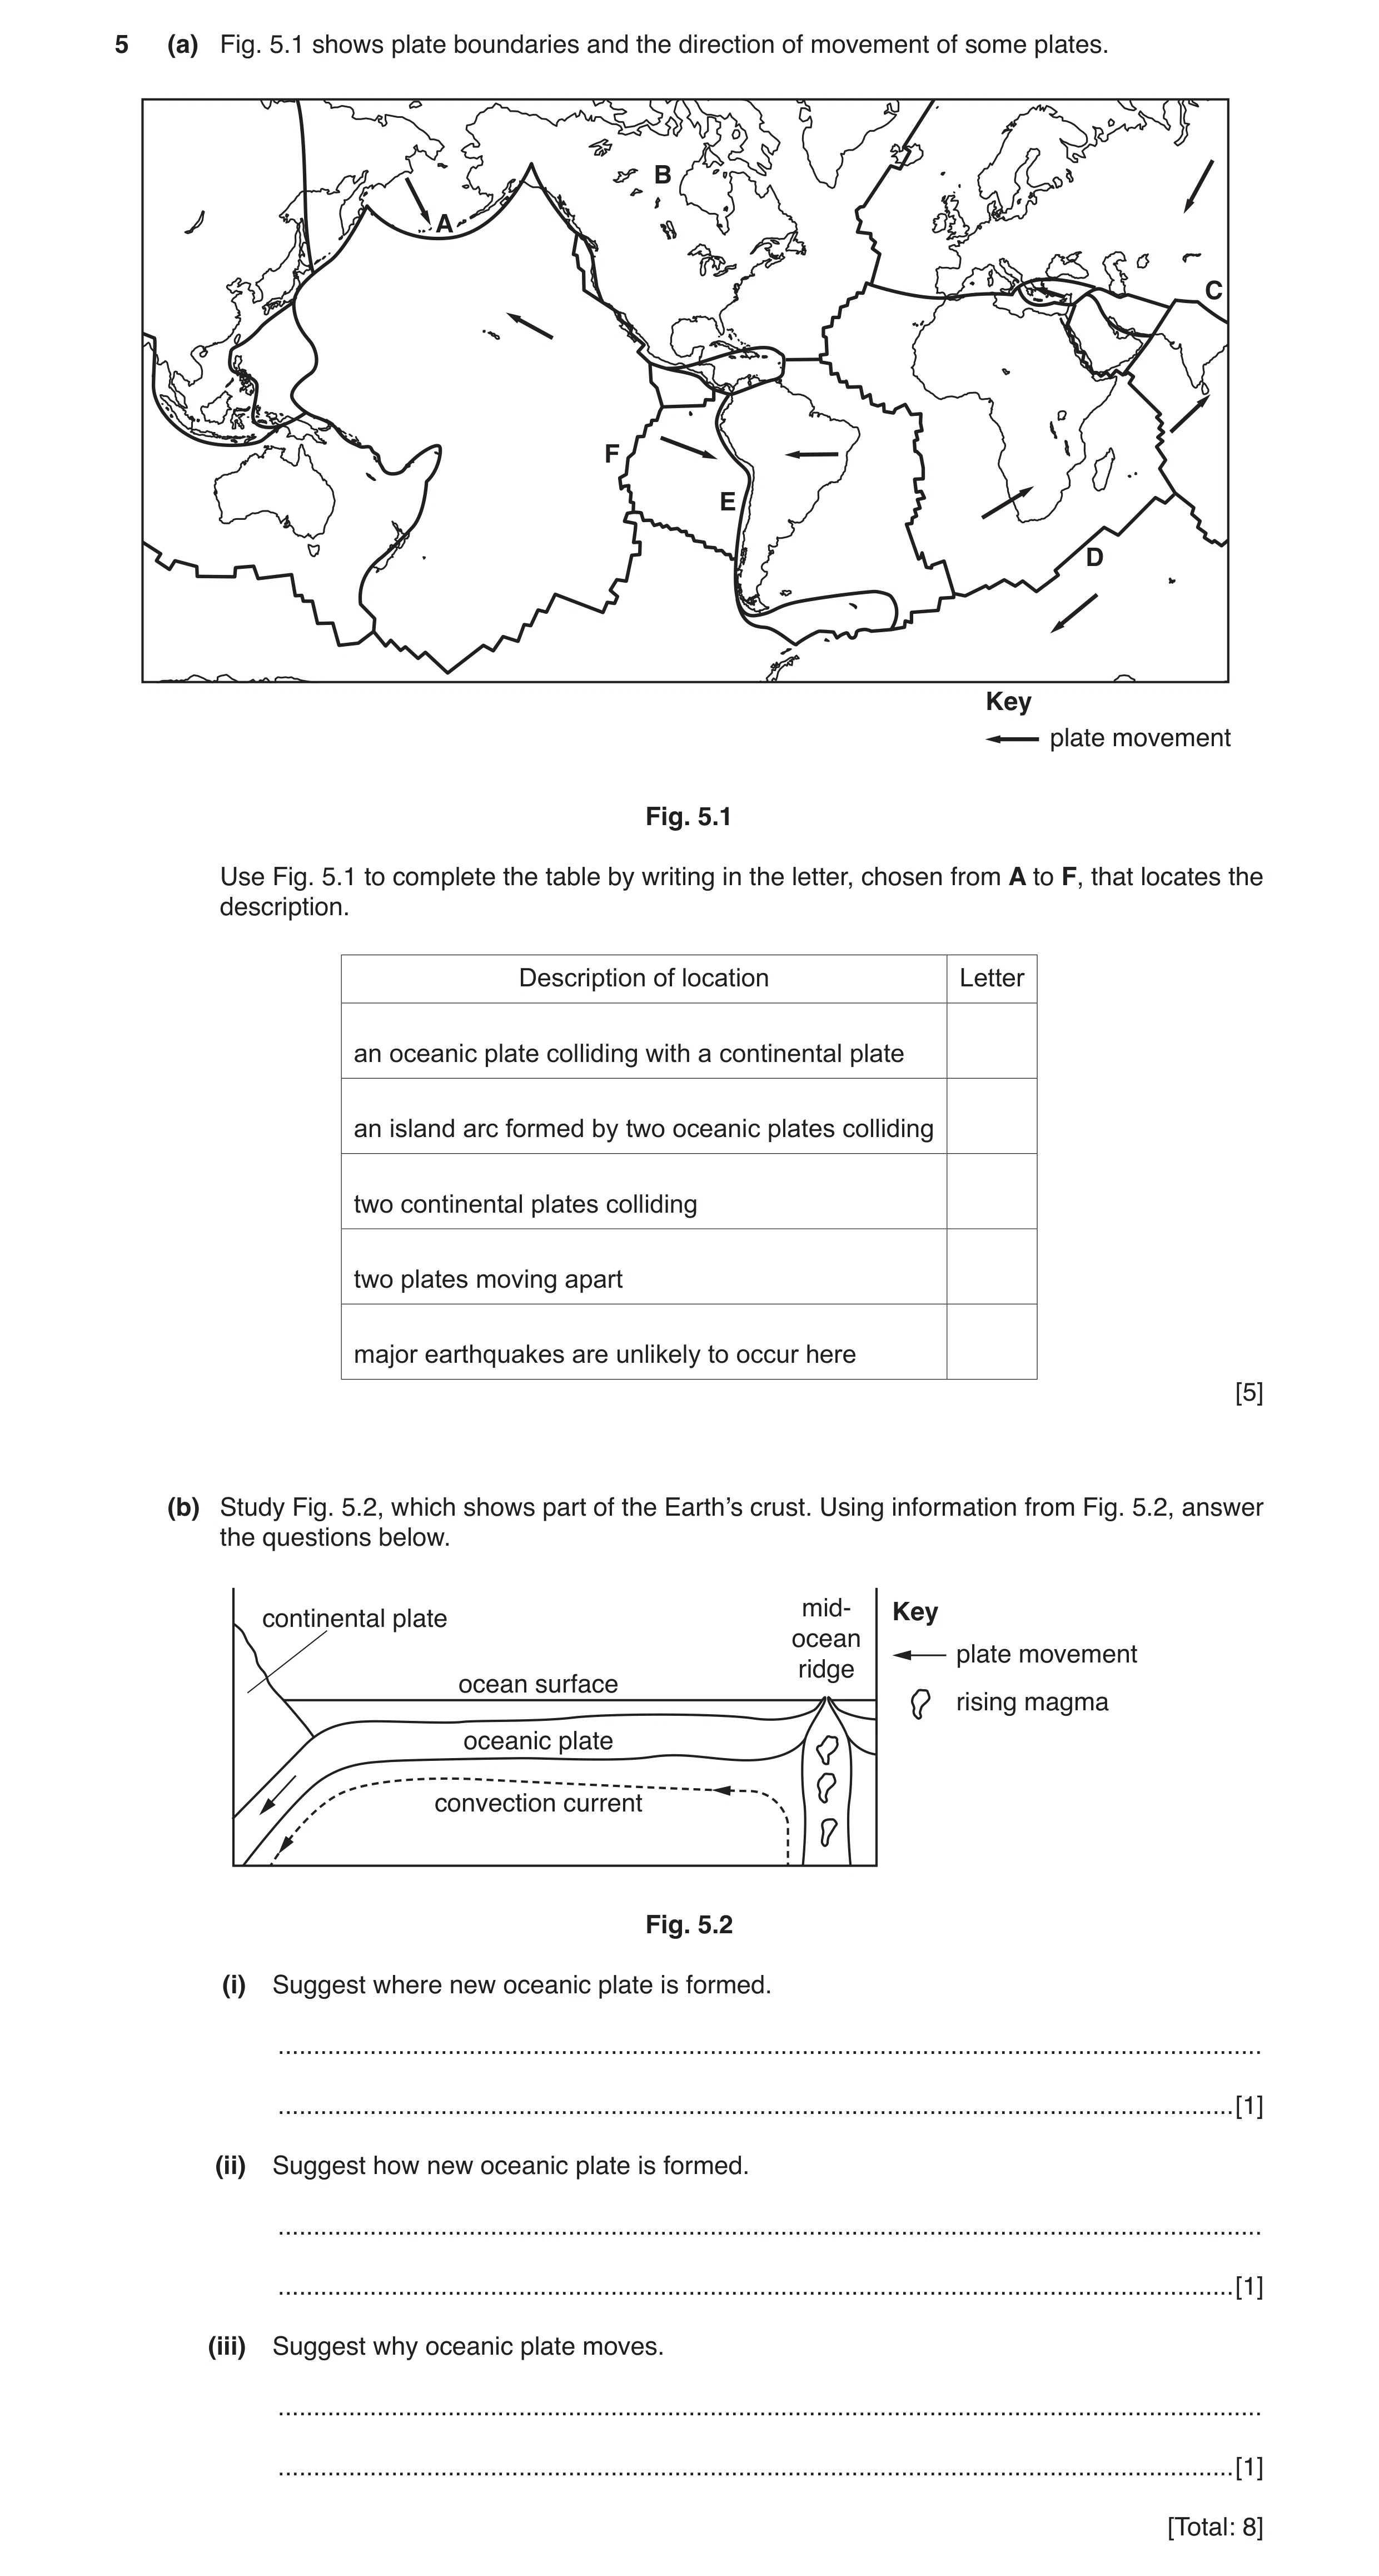
5 (a) Fig. 5.1 shows plate boundaries and the direction of movement of some plates. B A C F E D Key plate movement Fig. 5.1 Use Fig. 5.1 to complete the table by writing in the letter, chosen from A to F, that locates the description. Description of location Letter an oceanic plate colliding with a continental plate an island arc formed by two oceanic plates colliding two continental plates colliding two plates moving apart major earthquakes are unlikely to occur here [5] (b) Study Fig. 5.2, which shows part of the Earth’s crust. Using information from Fig. 5.2, answer the questions below. mid- Key continental plate ocean plate movement ridge ocean surface rising magma oceanic plate convection current Fig. 5.2 (i) Suggest where new oceanic plate is formed. … … [1] (ii) Suggest how new oceanic plate is formed. … … [1] (iii) Suggest why oceanic plate moves. … … [1] [Total: 8]
8 marks
Mark scheme: 5(a) E, 5 A, C, F, B, 5(b)(i) at ridge/constructive plate margin/divergent plate margin/where magma 1 rises, 5(b)(ii) magma rises to surface/magma cools/magma solidifies/volcano erupts, 1 (subduction spoils) 5(b)(iii) dragged by convection current, 1
This question in 0460/23 May/June 2018
Q6 · The tectonic plates, plate movements and plate margins around the Atlantic Ocean 0460/22 Oct/Nov 2018
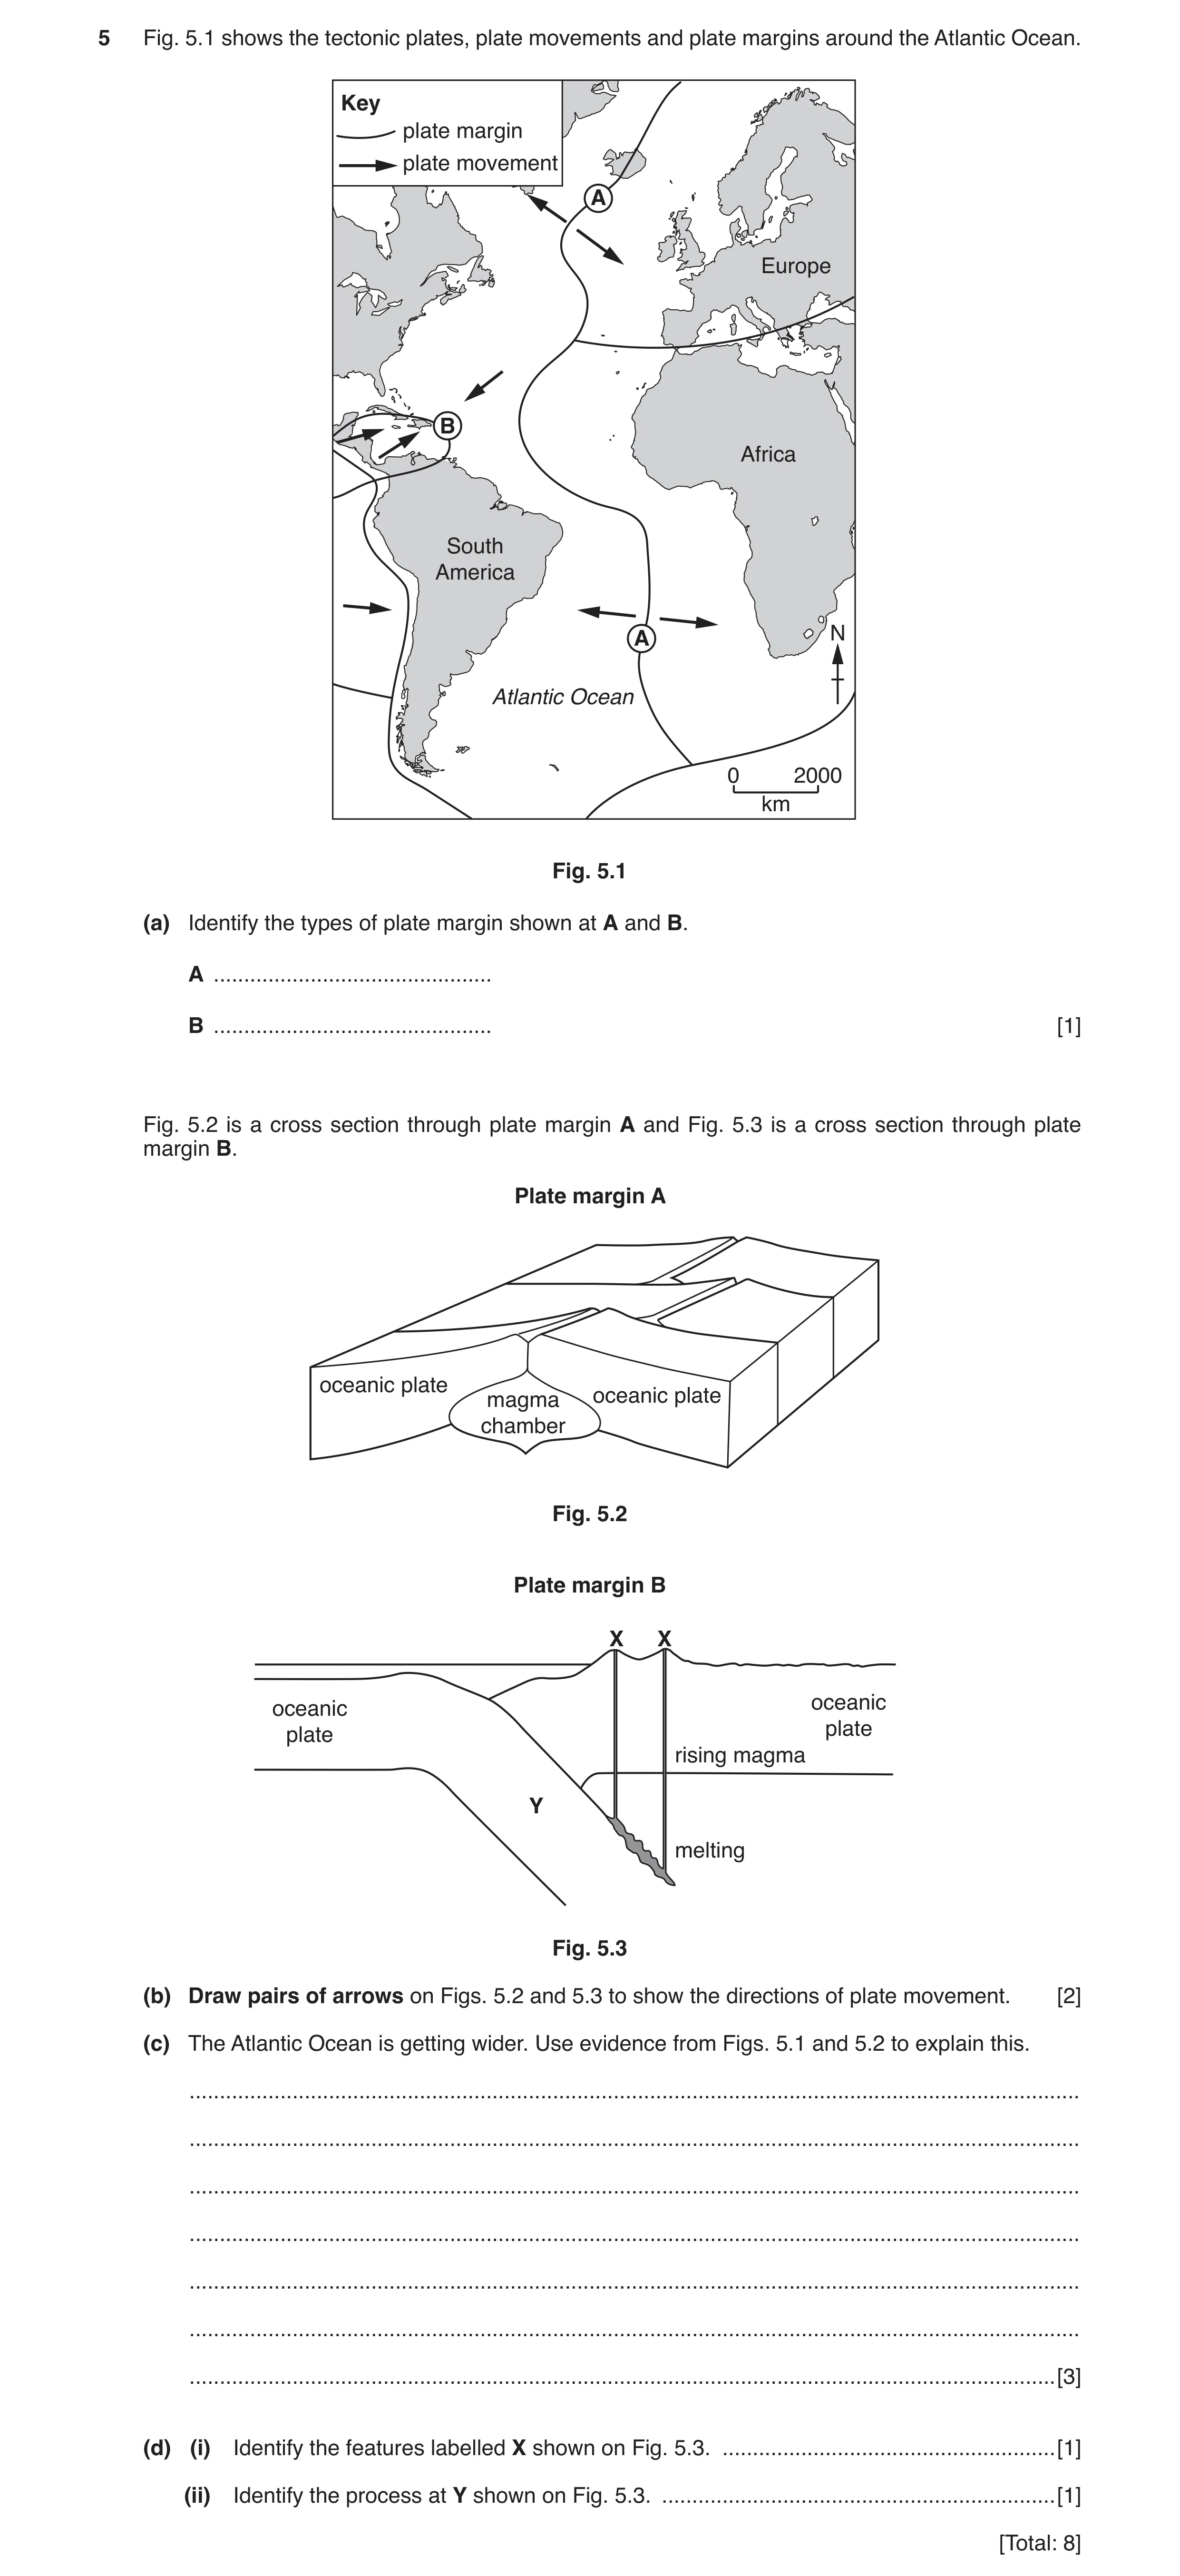
5 Fig. 5.1 shows the tectonic plates, plate movements and plate margins around the Atlantic Ocean. Key plate margin plate movement A Europe B Africa South America A N Atlantic Ocean 0 2000 km Fig. 5.1 (a) Identify the types of plate margin shown at A and B. A … B … [1] Fig. 5.2 is a cross section through plate margin A and Fig. 5.3 is a cross section through plate margin B. Plate margin A oceanic plate magma oceanic plate chamber Fig. 5.2 Plate margin B X X oceanic oceanic plate plate rising magma Y melting Fig. 5.3 (b) Draw pairs of arrows on Figs. 5.2 and 5.3 to show the directions of plate movement. [2] (c) The Atlantic Ocean is getting wider. Use evidence from Figs. 5.1 and 5.2 to explain this. … … … … … … … [3] (d) (i) Identify the features labelled X shown on Fig. 5.3. … [1] (ii) Identify the process at Y shown on Fig. 5.3. … [1] [Total: 8]
8 marks
Mark scheme: 5(a) A divergent/constructive 1 B convergent/destructive 5(b) diverging arrows on Fig. 5.2 2 converging arrows on Fig. 5.3 Allow if one arrow shows subduction. 5(c) constructive/divergent boundary/plates diverge (in ocean/at A) 3 lava at surface/magma rises/volcanoes form (in ocean/at A) new plate created/new land created/ (in ocean/at A) convection currents sea floor spreading few/no destructive boundaries plate not being destroyed 5(d)(i) volcanoes/volcanic islands/island arc 1 5(d)(ii) subduction 1
This question in 0460/22 Oct/Nov 2018
Question 7 0460/23 Oct/Nov 2018
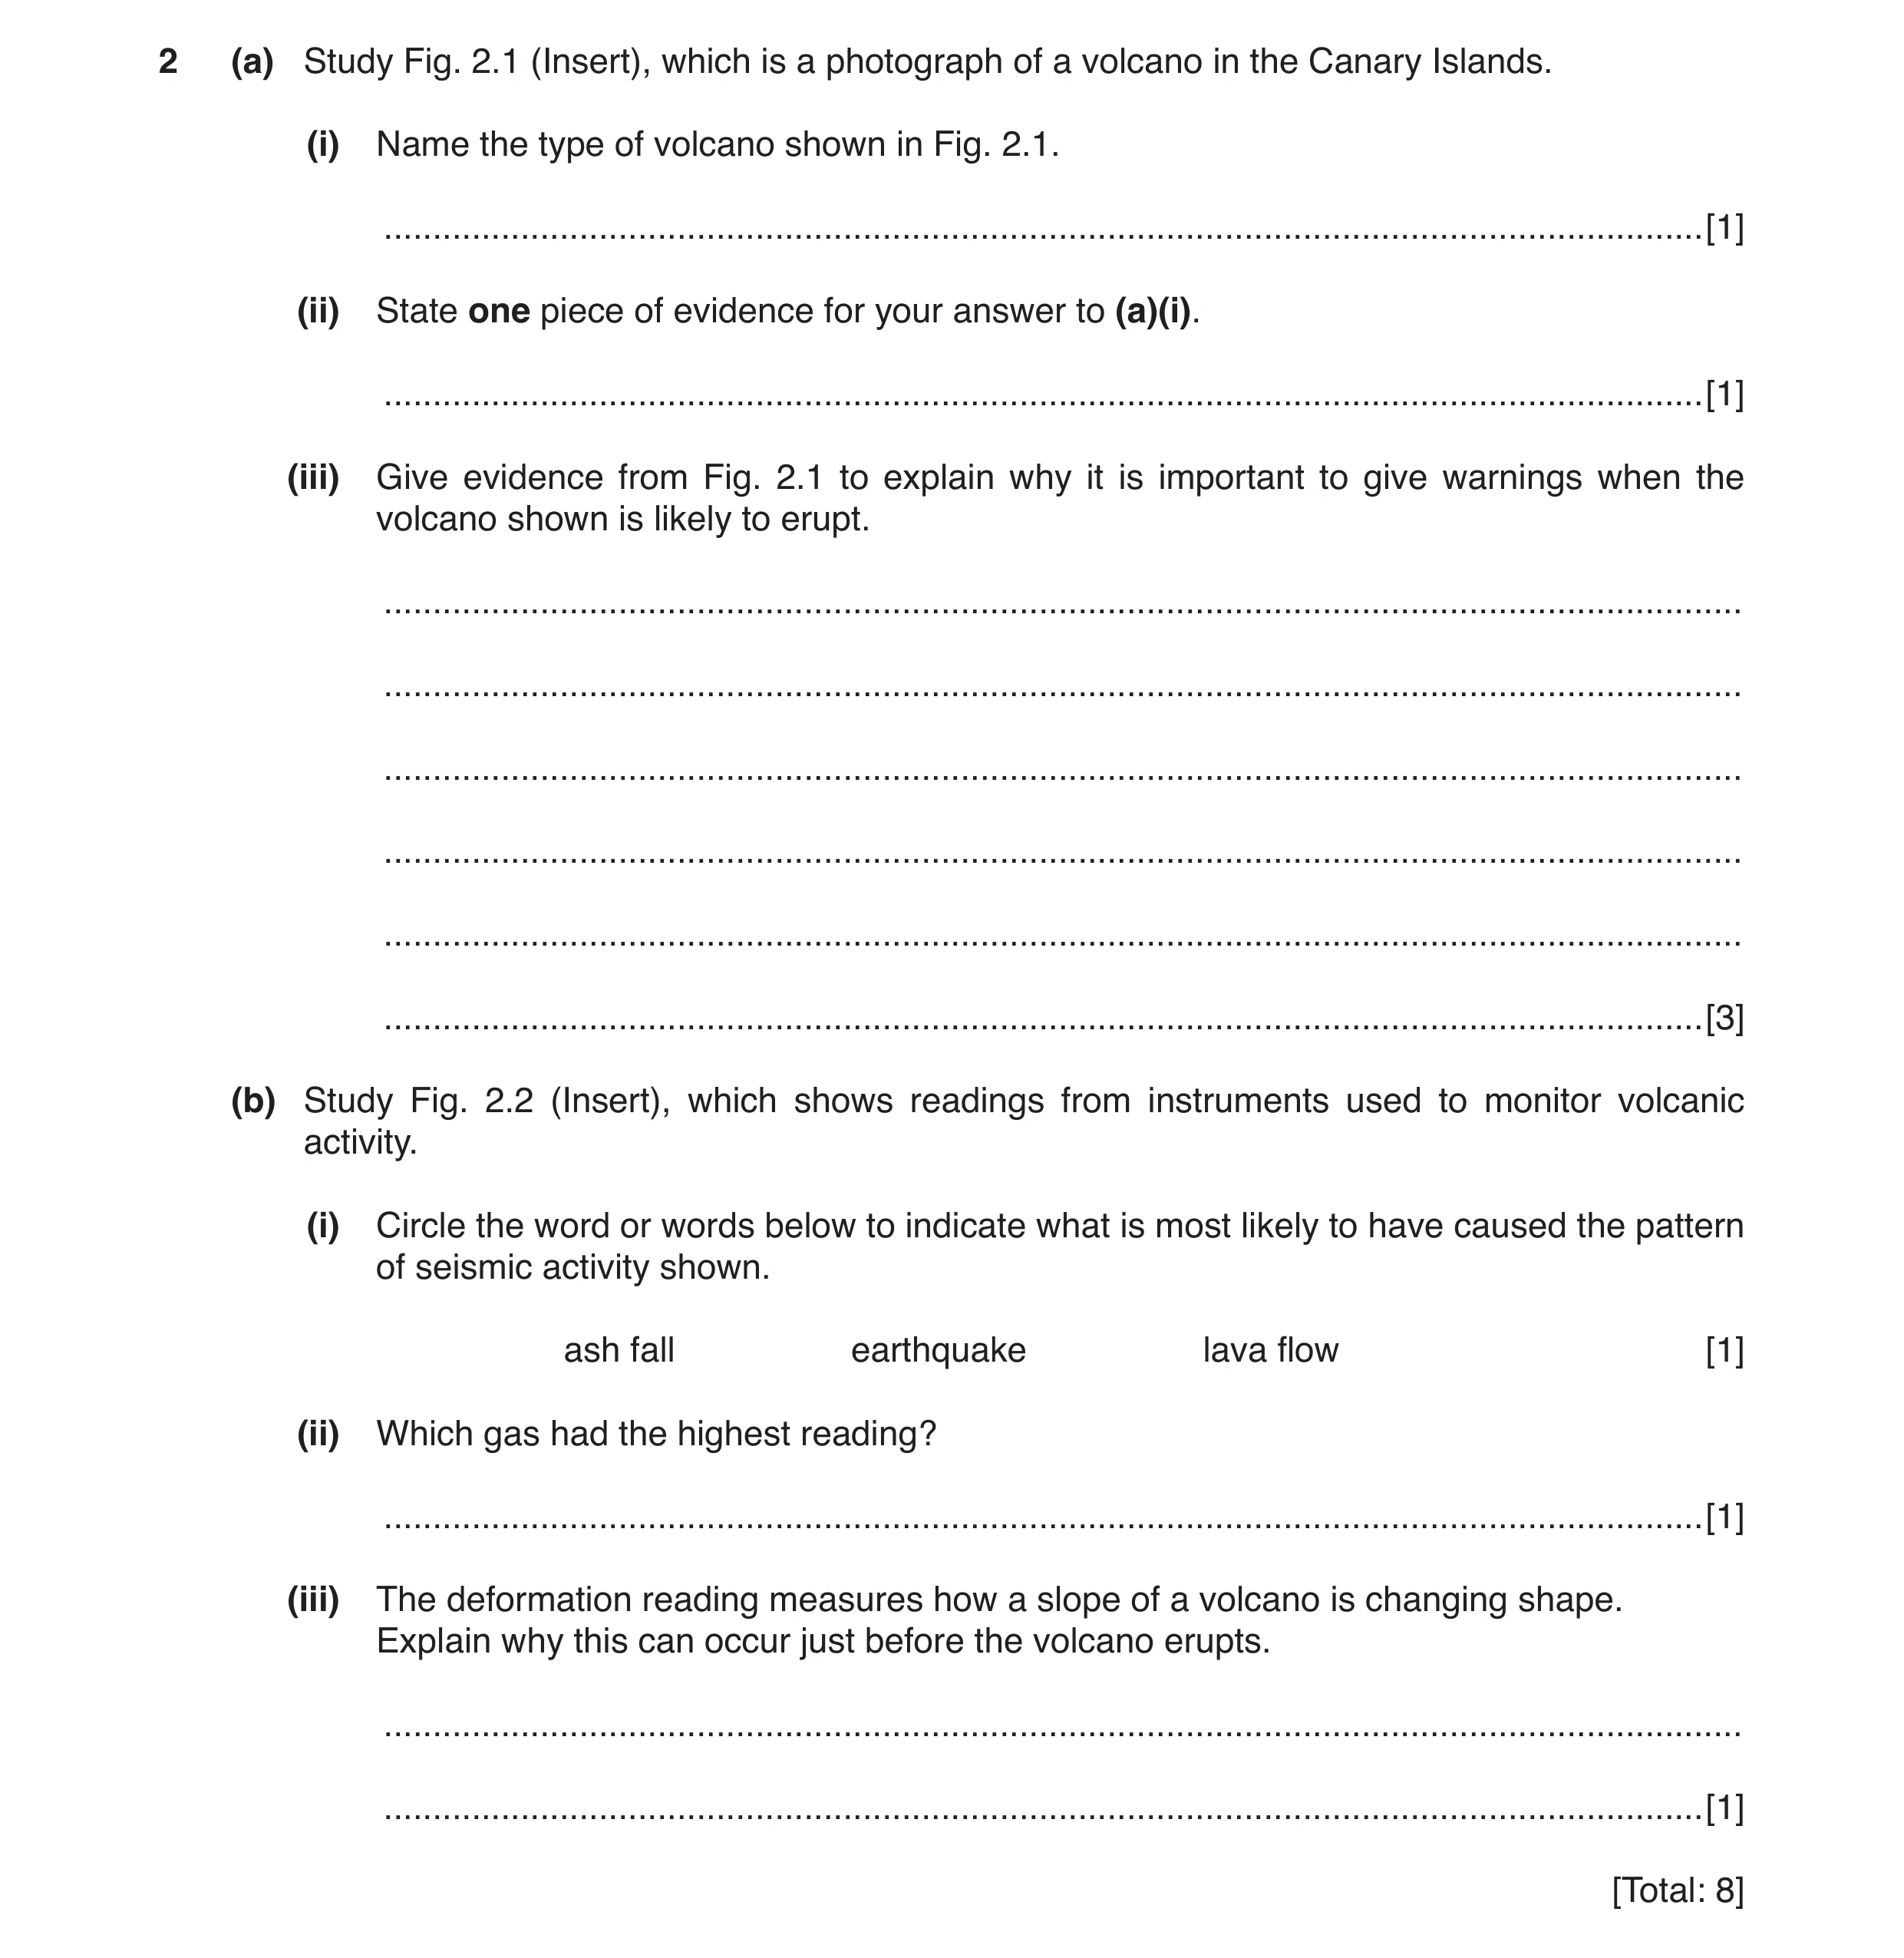
2 (a) Study Fig. 2.1 (Insert), which is a photograph of a volcano in the Canary Islands. (i) Name the type of volcano shown in Fig. 2.1. … [1] (ii) State one piece of evidence for your answer to (a)(i). … [1] (iii) Give evidence from Fig. 2.1 to explain why it is important to give warnings when the volcano shown is likely to erupt. … … … … … … [3] (b) Study Fig. 2.2 (Insert), which shows readings from instruments used to monitor volcanic activity. (i) Circle the word or words below to indicate what is most likely to have caused the pattern of seismic activity shown. ash fall earthquake lava flow [1] (ii) Which gas had the highest reading? … [1] (iii) The deformation reading measures how a slope of a volcano is changing shape. Explain why this can occur just before the volcano erupts. … … [1] [Total: 8]
8 marks
Mark scheme: 2(a)(i) stratovolcano/composite cone 1 2(a)(ii) steep sides 1 missing part of crater wall parasitic/secondary cone 2(a)(iii) settlement/people live nearby/buildings/houses 3 danger to life/injury to people/specific volcanic hazard need to evacuate/prevent entry to area road cut/blocked/transport disrupted explosive eruptions/blast towards town 2(b)(i) earthquake 1 2(b)(ii) SO2 1 2(b)(iii) magma/gas movement/pressure/build-up 1
This question in 0460/23 Oct/Nov 2018
Q8 · The locations of the epicentres of the largest earthquakes that occurred on January 3 2017 0460/21 May/June 2019
4 Fig. 4.1 shows the locations of the epicentres of the largest earthquakes that occurred on January 3 2017. North Eurasian Plate American Plate African Pacific Plate IndianIndian Plate PlatePlate South Nazca American Plate Plate AustralianAustralian PlatePlate Key plate boundary Antarctic Plate epicentre of earthquake Fig. 4.1 (a) (i) What is meant by the term epicentre? … … [1] (ii) Describe the relationship between earthquakes and plate boundaries shown on Fig. 4.1. … … … … … [2] (b) Table 4.1 shows the depth of focus and magnitude (strength) of the earthquakes shown on Fig. 4.1. Table 4.1 Depth of focus Magnitude (km) (Richter value) 206 3.9 36 5.5 121 4.5 68 5.2 36 4.6 54 4.5 44 2.7 8 3.4 35 2.6 5 2.6 1 2.6 7 2.6 6 3.5 110 3.2 35 3.3 108 5.9 216 4.2 11 4.8 Table 4.2 describes the depth of earthquake foci. Table 4.2 Depth of focus (km) Description 0–50 shallow 51–300 medium 301–670 deep Using Table 4.2, what is the depth of most of the earthquakes shown on Fig. 4.1 and Table 4.1? Tick one box in the table below. [1] Tick (3) shallow medium deep (c) (i) Table 4.3 describes the magnitude (strength) of earthquakes. Table 4.3 Magnitude Description Average frequency (Richter value) per year 2–3.9 minor More than 1 million 4–4.9 light 10 000–150 000 5–5.9 moderate 1000–1500 6–6.9 strong 100–150 7–7.9 major 10–20 8 and over great 1 What term describes most of the earthquakes shown on Fig. 4.1 and Table 4.1? Tick one box below. Tick (3) minor light moderate strong major great [1] (ii) Describe the relationship between the magnitude and frequency of earthquakes shown in Table 4.3. … … … [1] (d) Give two earthquake hazards which cause death or injury to people. 1 … 2 … [2] [Total: 8]
8 marks
Mark scheme: 4(a)(i) point on Earth’s surface above focus / origin 1 4(a)(ii) on plate boundaries, 2 some / 1 / 2 / 3 away from boundaries, mostly destructive / convergent boundaries 4(b) shallow 1 4(c)(i) minor 1 4(c)(ii) inverse relationship / negative correlation, 1 as one increases the other decreases (allow other expressions) 4(d) falling buildings, 2 collapse of other named structure (e.g. bridge, power line, road, trees, furniture), fire, breaking glass, named post-earthquake hazard (e.g. famine, disease), tsunami, slope failure / mass movement
This question in 0460/21 May/June 2019
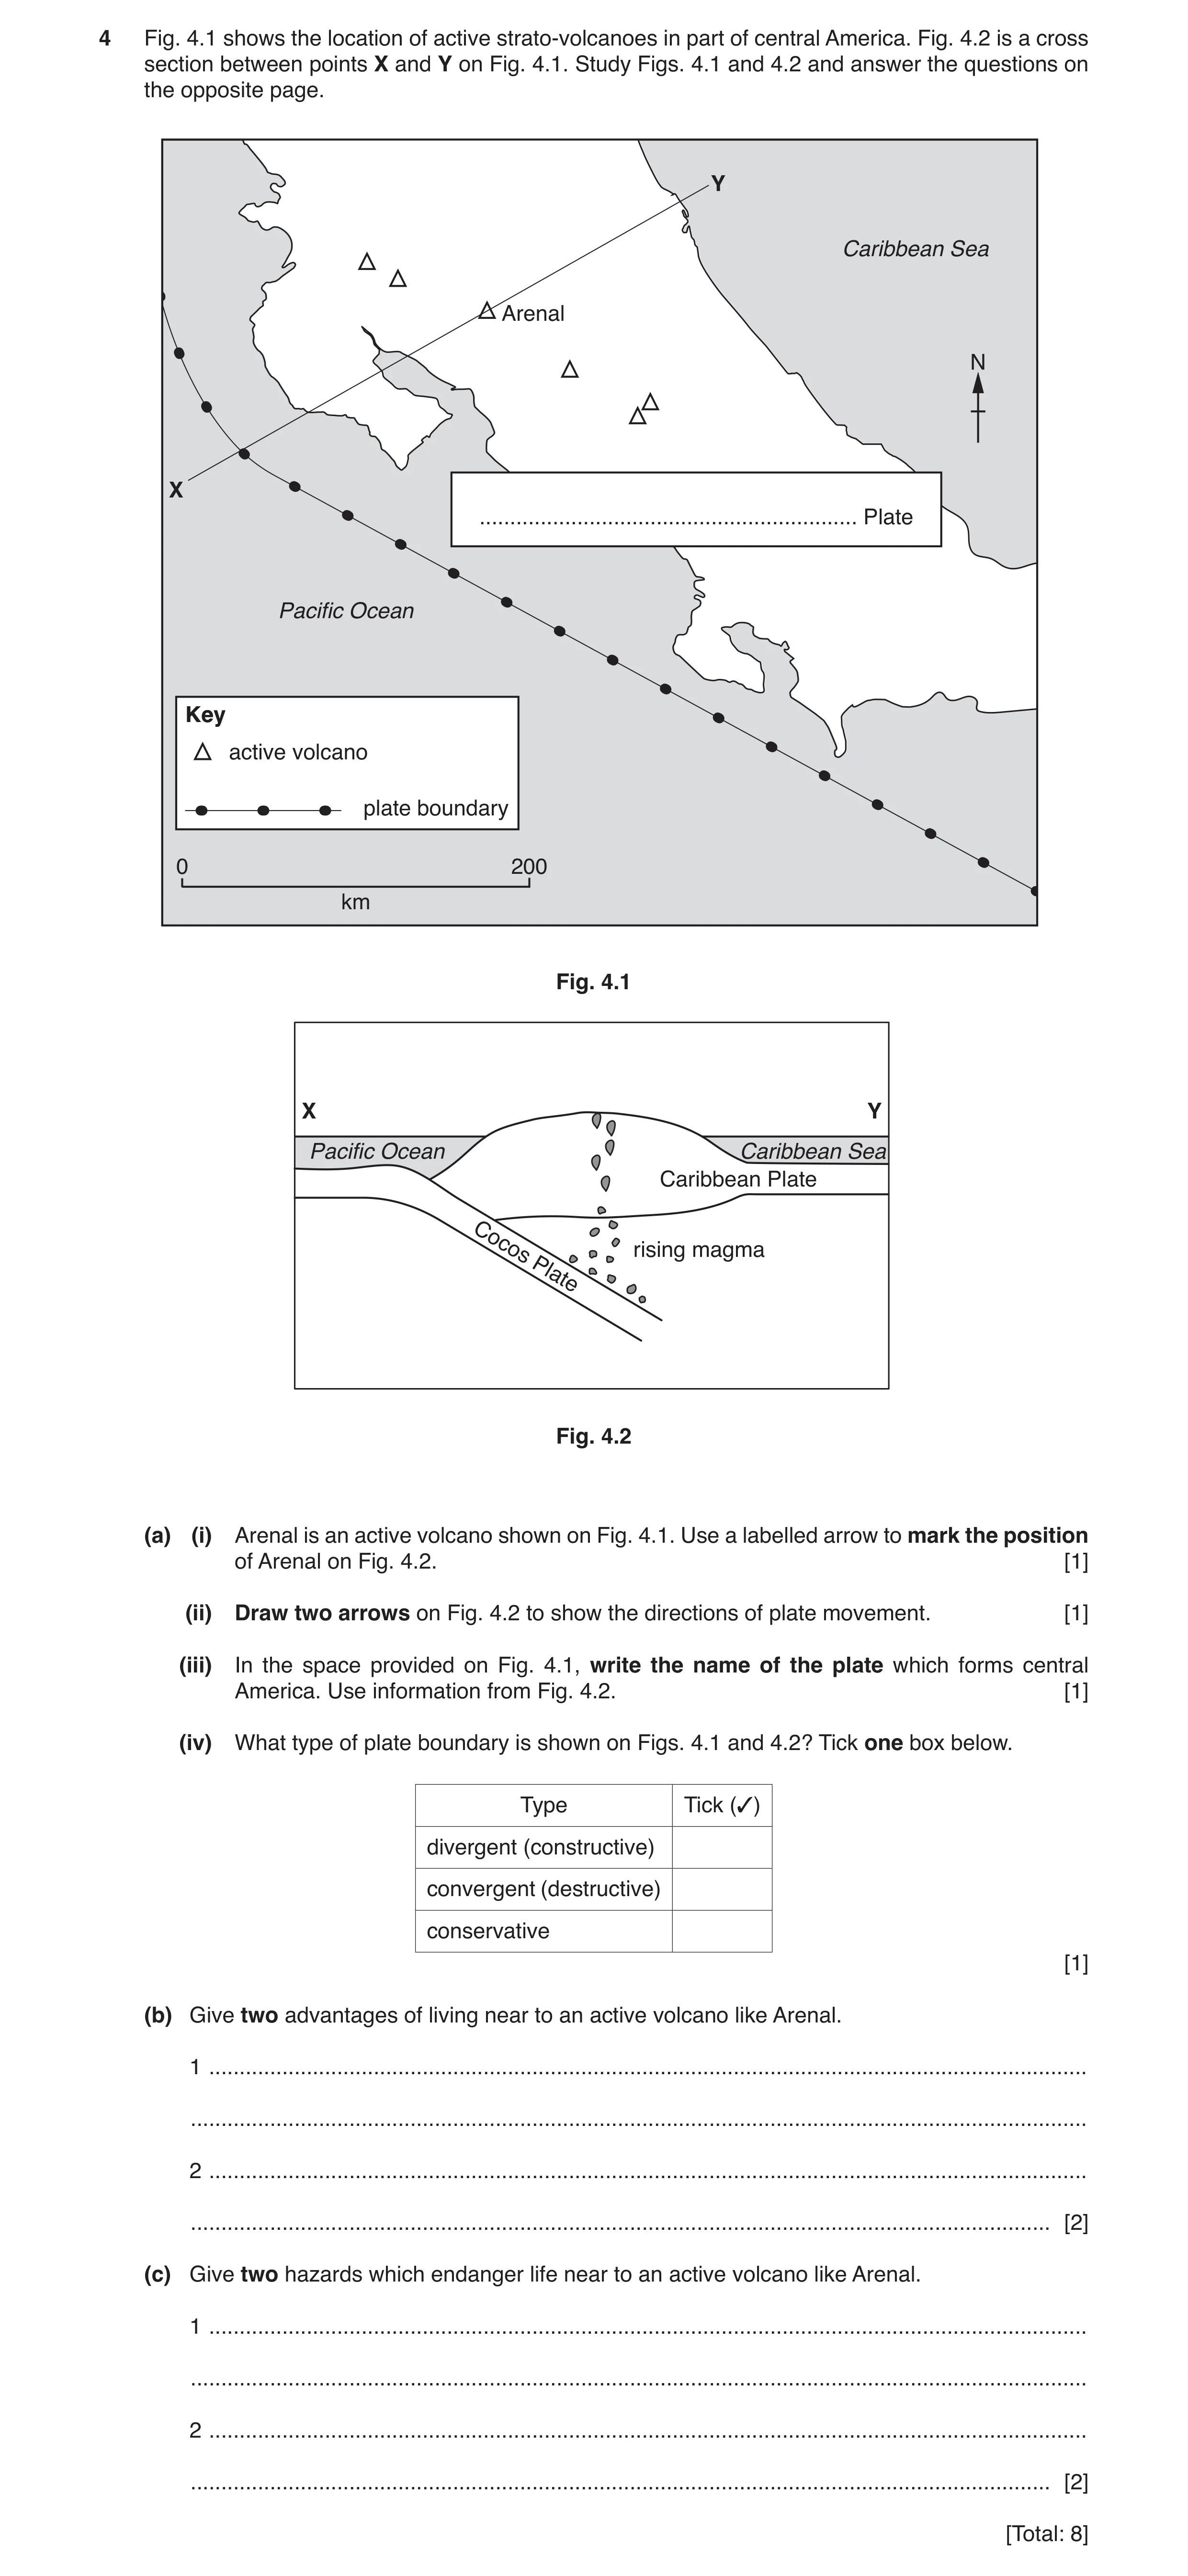
Q9 · The location of active strato-volcanoes in part of central America 0460/21 Oct/Nov 2019
4 Fig. 4.1 shows the location of active strato-volcanoes in part of central America. Fig. 4.2 is a cross section between points X and Y on Fig. 4.1. Study Figs. 4.1 and 4.2 and answer the questions on the opposite page. Y Caribbean Sea Arenal N X … Plate Pacific Ocean KeyKey active volcano plate boundary 0 200 km Fig. 4.1 X Y Pacific Ocean Caribbean Sea Caribbean Plate rising magma Cocos Plate Fig. 4.2 (a) (i) Arenal is an active volcano shown on Fig. 4.1. Use a labelled arrow to mark the position of Arenal on Fig. 4.2. [1] (ii) Draw two arrows on Fig. 4.2 to show the directions of plate movement. [1] (iii) In the space provided on Fig. 4.1, write the name of the plate which forms central America. Use information from Fig. 4.2. [1] (iv) What type of plate boundary is shown on Figs. 4.1 and 4.2? Tick one box below. Type Tick (3) divergent (constructive) convergent (destructive) conservative [1] (b) Give two advantages of living near to an active volcano like Arenal. 1 … … 2 … … [2] (c) Give two hazards which endanger life near to an active volcano like Arenal. 1 … … 2 … … [2] [Total: 8]
8 marks
Mark scheme: 4(a)(i) position of Arenal above rising magma, Label needed. 1 4(a)(ii) two converging arrows (or one subducting), 1 4(a)(iii) Caribbean, 1 4(a)(iv) convergent, 1 4(b) fertile soils, 2 geothermal power / hot water, tourism, mineral wealth / deposits, 4(c) ash falls / ash clouds / burial in ash, (specific comment needed) 2 pyroclastic flows, lateral blasts, mudflows/lahars, poisonous gases / smoke, post eruption famine, lava flow, (specific comment needed) volcanic bombs, toxic lakes,
This question in 0460/21 Oct/Nov 2019
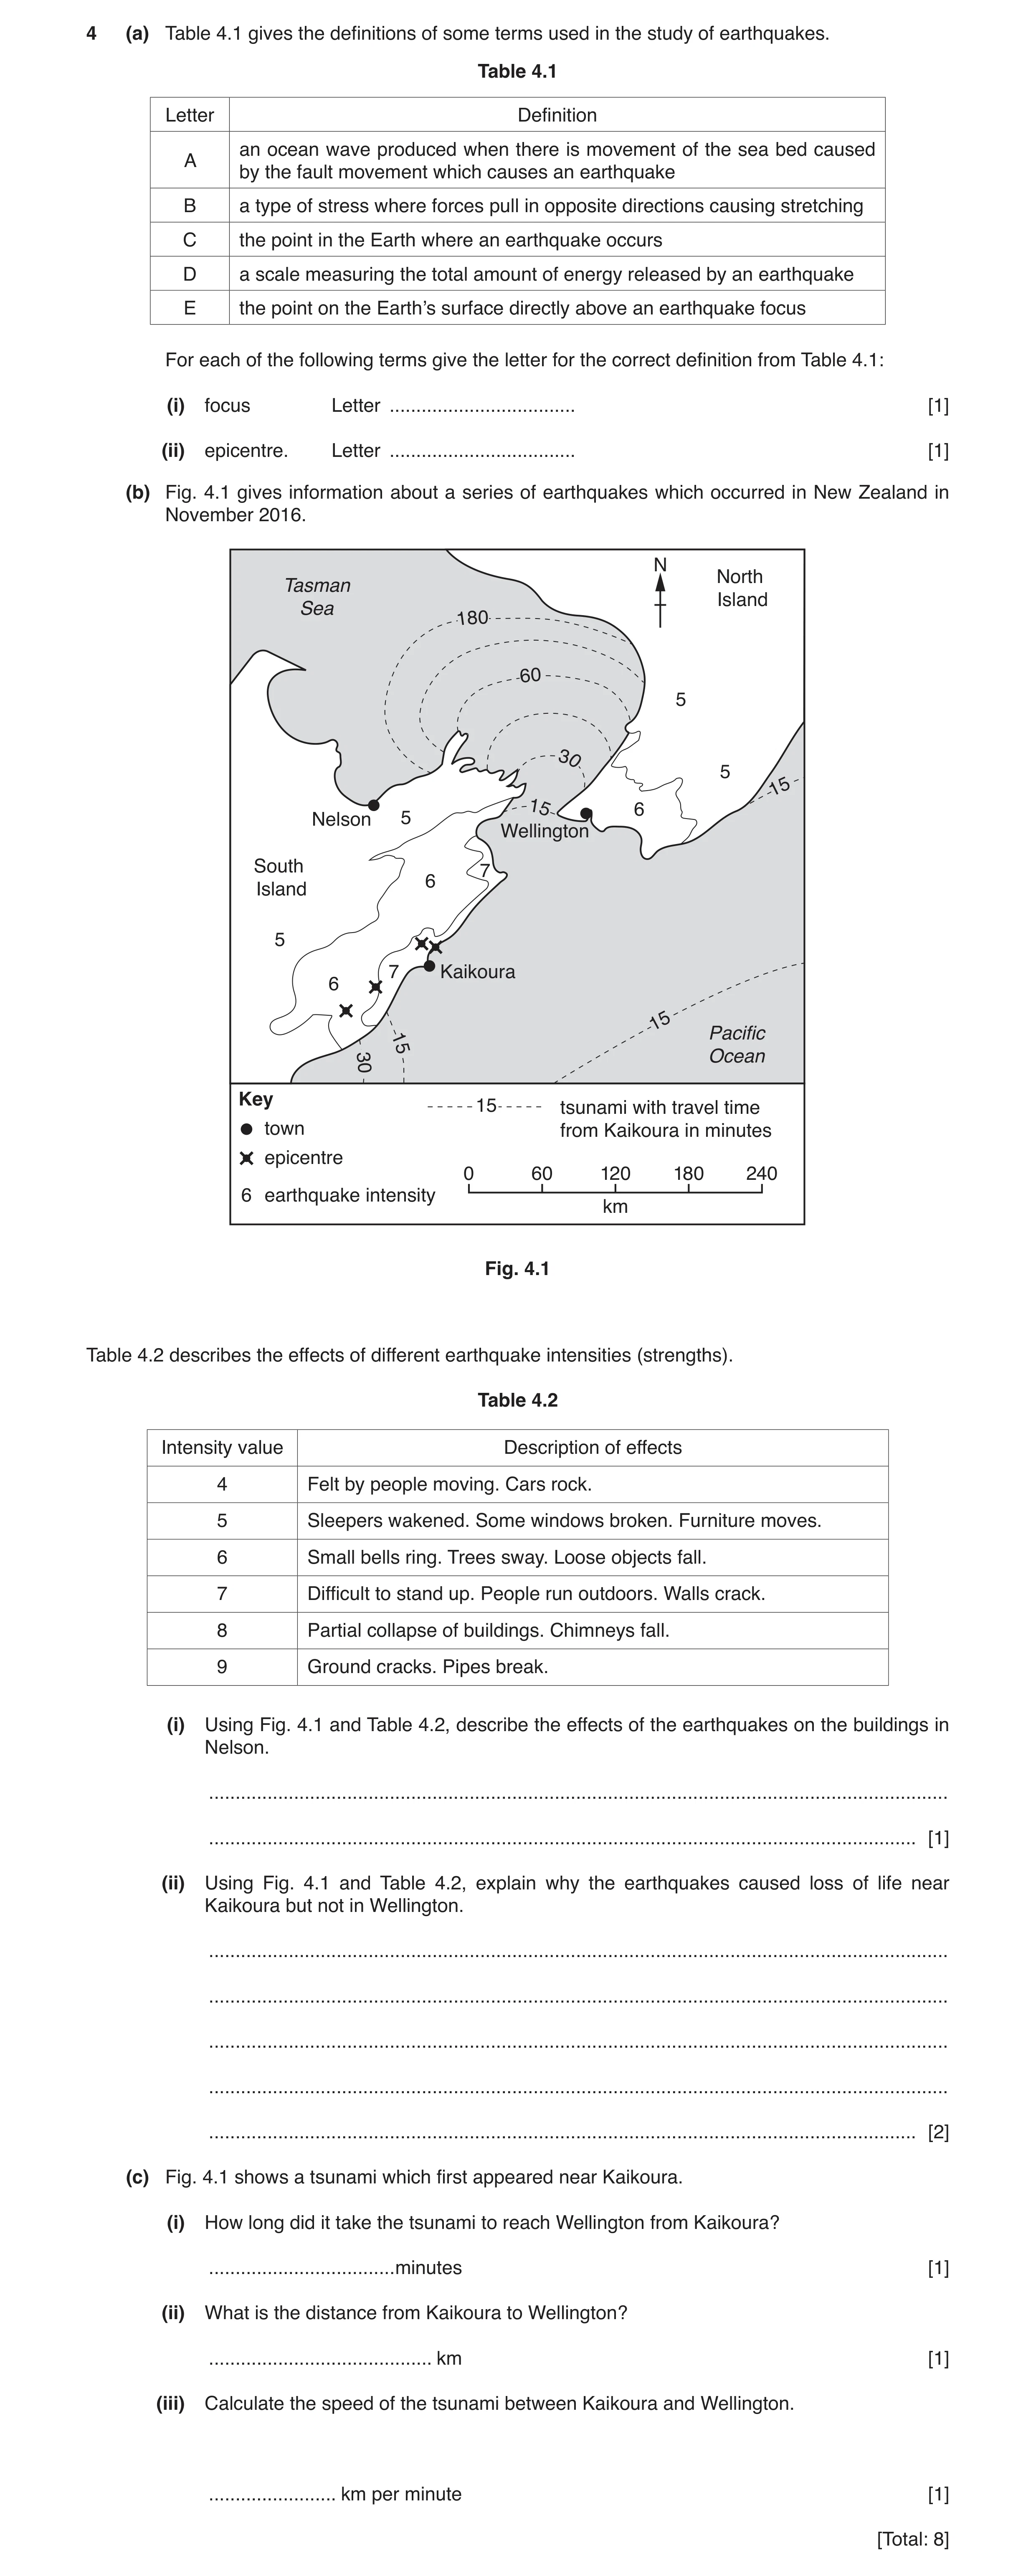
Q10 · The definitions of some terms used in the study of earthquakes 0460/22 Oct/Nov 2019
4 (a) Table 4.1 gives the definitions of some terms used in the study of earthquakes. Table 4.1 Letter Definition an ocean wave produced when there is movement of the sea bed caused A by the fault movement which causes an earthquake B a type of stress where forces pull in opposite directions causing stretching C the point in the Earth where an earthquake occurs D a scale measuring the total amount of energy released by an earthquake E the point on the Earth’s surface directly above an earthquake focus For each of the following terms give the letter for the correct definition from Table 4.1: (i) focus Letter … [1] (ii) epicentre. Letter … [1] (b) Fig. 4.1 gives information about a series of earthquakes which occurred in New Zealand in November 2016. N North Tasman Island Sea 180 60 5 30 5 15 15 6 Nelson 5 Wellington South 7 6 Island 5 7 Kaikoura 6 15 1 Pacific 5 3 0 Ocean Key 15 tsunami with travel time town from Kaikoura in minutes epicentre 0 60 120 180 240 6 earthquake intensity km Fig. 4.1 Table 4.2 describes the effects of different earthquake intensities (strengths). Table 4.2 Intensity value Description of effects 4 Felt by people moving. Cars rock. 5 Sleepers wakened. Some windows broken. Furniture moves. 6 Small bells ring. Trees sway. Loose objects fall. 7 Difficult to stand up. People run outdoors. Walls crack. 8 Partial collapse of buildings. Chimneys fall. 9 Ground cracks. Pipes break. (i) Using Fig. 4.1 and Table 4.2, describe the effects of the earthquakes on the buildings in Nelson. … … [1] (ii) Using Fig. 4.1 and Table 4.2, explain why the earthquakes caused loss of life near Kaikoura but not in Wellington. … … … … … [2] (c) Fig. 4.1 shows a tsunami which first appeared near Kaikoura. (i) How long did it take the tsunami to reach Wellington from Kaikoura? … minutes [1] (ii) What is the distance from Kaikoura to Wellington? … km [1] (iii) Calculate the speed of the tsunami between Kaikoura and Wellington. … km per minute [1] [Total: 8]
8 marks
Mark scheme: 4(a)(i) C 1 4(a)(ii) E 1 4(b)(i) windows broken 1 4(b)(ii) Kaikoura 7 and Wellington 6/Kaikoura greater intensity/strength/Wellington 2 less intensity/strength, Kaikoura nearer epicentre(s)/Wellington further away, Note: Comparison needed for the above two points. Kaikoura people fall, Kaikoura people run outside and hit by glass/falling objects, etc. 4(c)(i) 14–16 (minutes), 1 4(c)(ii) 179–182 (km), 1 4(c)(iii) 11.3–13.0 (km per minute), 1
This question in 0460/22 Oct/Nov 2019
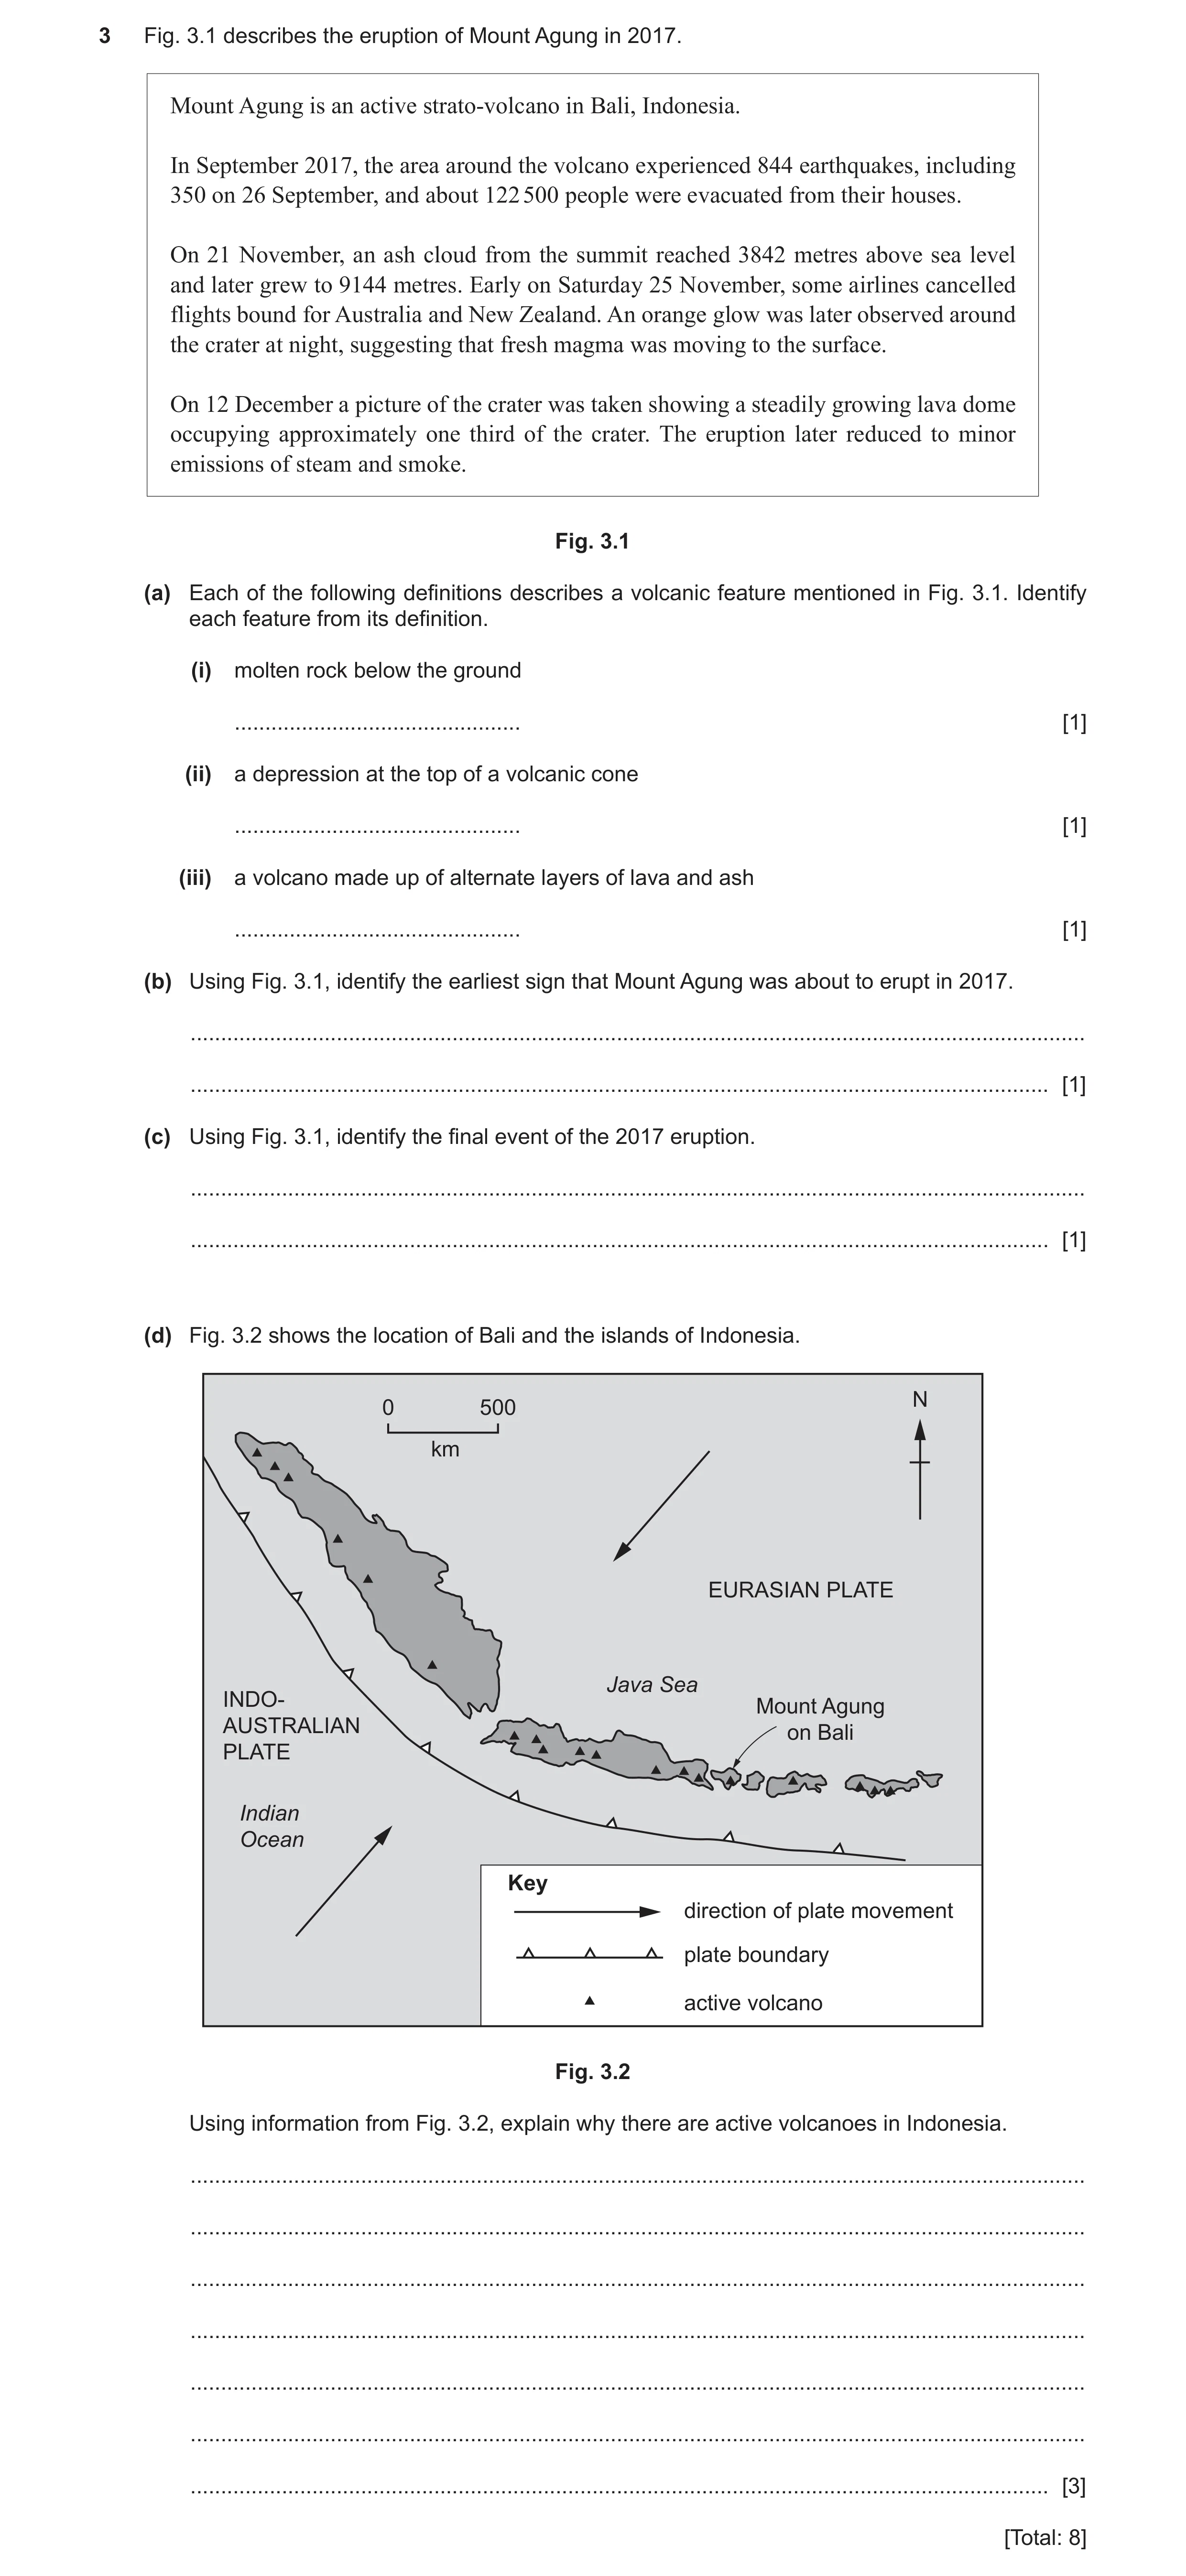
Question 11 0460/22 Feb/March 2020
3 Fig. 3.1 describes the eruption of Mount Agung in 2017. Mount Agung is an active strato-volcano in Bali, Indonesia. In September 2017, the area around the volcano experienced 844 earthquakes, including 350 on 26 September, and about 122 500 people were evacuated from their houses. On 21 November, an ash cloud from the summit reached 3842 metres above sea level and later grew to 9144 metres. Early on Saturday 25 November, some airlines cancelled flights bound for Australia and New Zealand. An orange glow was later observed around the crater at night, suggesting that fresh magma was moving to the surface. On 12 December a picture of the crater was taken showing a steadily growing lava dome occupying approximately one third of the crater. The eruption later reduced to minor emissions of steam and smoke. Fig. 3.1 (a) Each of the following definitions describes a volcanic feature mentioned in Fig. 3.1. Identify each feature from its definition. (i) molten rock below the ground … [1] (ii) a depression at the top of a volcanic cone … [1] (iii) a volcano made up of alternate layers of lava and ash … [1] (b) Using Fig. 3.1, identify the earliest sign that Mount Agung was about to erupt in 2017. … … [1] (c) Using Fig. 3.1, identify the final event of the 2017 eruption. … … [1] (d) Fig. 3.2 shows the location of Bali and the islands of Indonesia. N 0 500 km EURASIAN PLATE Java Sea INDO- Mount Agung AUSTRALIAN on Bali PLATE Indian Ocean Key direction of plate movement plate boundary active volcano Fig. 3.2 Using information from Fig. 3.2, explain why there are active volcanoes in Indonesia. … … … … … … … [3] [Total: 8]
8 marks
Mark scheme: 3(a)(i) magma, 1 3(a)(ii) crater, 1 3(a)(iii) stratovolcano/composite cone, 1 3(b) earthquakes, 1 3(c) minor emissions/steam/smoke, 1 3(d) subduction, 3 melting, rising magma, convergence/collision of plates/destructive plate margin, Reserve one mark for the last point, linking to the resource.
This question in 0460/22 Feb/March 2020
Question 12 0460/23 May/June 2020
5 Fig. 5.1 (Insert) shows Teide, an active volcano in the Canary Islands. (a) Describe the features of Teide shown in Fig. 5.1. … … … … … … … … … … … … … … … [5] (b) Give three opportunities that volcanoes like Teide offer to people. 1 … … 2 … … 3 … … [3] [Total: 8]
8 marks
Mark scheme: 5(a) high, 5 steep, conical, crater, parasitic cone, gullies/valleys, bare, lower slopes gentle, lower slopes vegetated/populated, snow (on upper slopes), 5(b) fertile soils, 3 tourism, geothermal power, minerals, relief rainfall in dry areas, creating new land area,
This question in 0460/23 May/June 2020
Q13 · The strongest earthquake in history was at Bio-Bio in Chile, in 1960, with a magnitude of… 0460/21 Oct/Nov 2020
3 The strongest earthquake in history was at Bio-Bio in Chile, in 1960, with a magnitude of 9.5. The location of Bio-Bio is shown in Fig. 3.1. N South America South American Nazca Plate Plate Bio-BioBio-Bio Key plate boundary plate movement sea 0 1000 km Fig. 3.1 (a) What type of plate margin is close to Bio-Bio? Tick one box below. Tick (3) Constructive (divergent) Destructive (convergent) Conservative [1] (b) Using evidence from Fig. 3.1, explain the cause of the Bio-Bio earthquake. … … … … … … … … [4] (c) Explain what can be done to reduce the impacts of earthquakes. … … … … … … … [3] [Total: 8]
8 marks
Mark scheme: 3(a) destructive, 1 3(b) Bio-Bio close to/on plate boundary, 4 plates converge/collide, subduction (or description of subduction), of oceanic plate, oceanic denser/continental less dense, friction, compression/pressure, fracturing/faulting, release of energy, 3(c) monitoring systems/example, e.g. lasers, 3 tsunami warnings, warnings sent to cell phones, evacuation, earthquake drills/education/public services prepared, hazard mapping/areas not built on, strong foundations, (allow deeper) strengthening, e.g. diagonal bracing, flexible structures, ground isolation systems, build low rise, building design (if examples not given),
This question in 0460/21 Oct/Nov 2020
Q14 · Information about the eruption of Mount Tambora 0460/23 Oct/Nov 2020
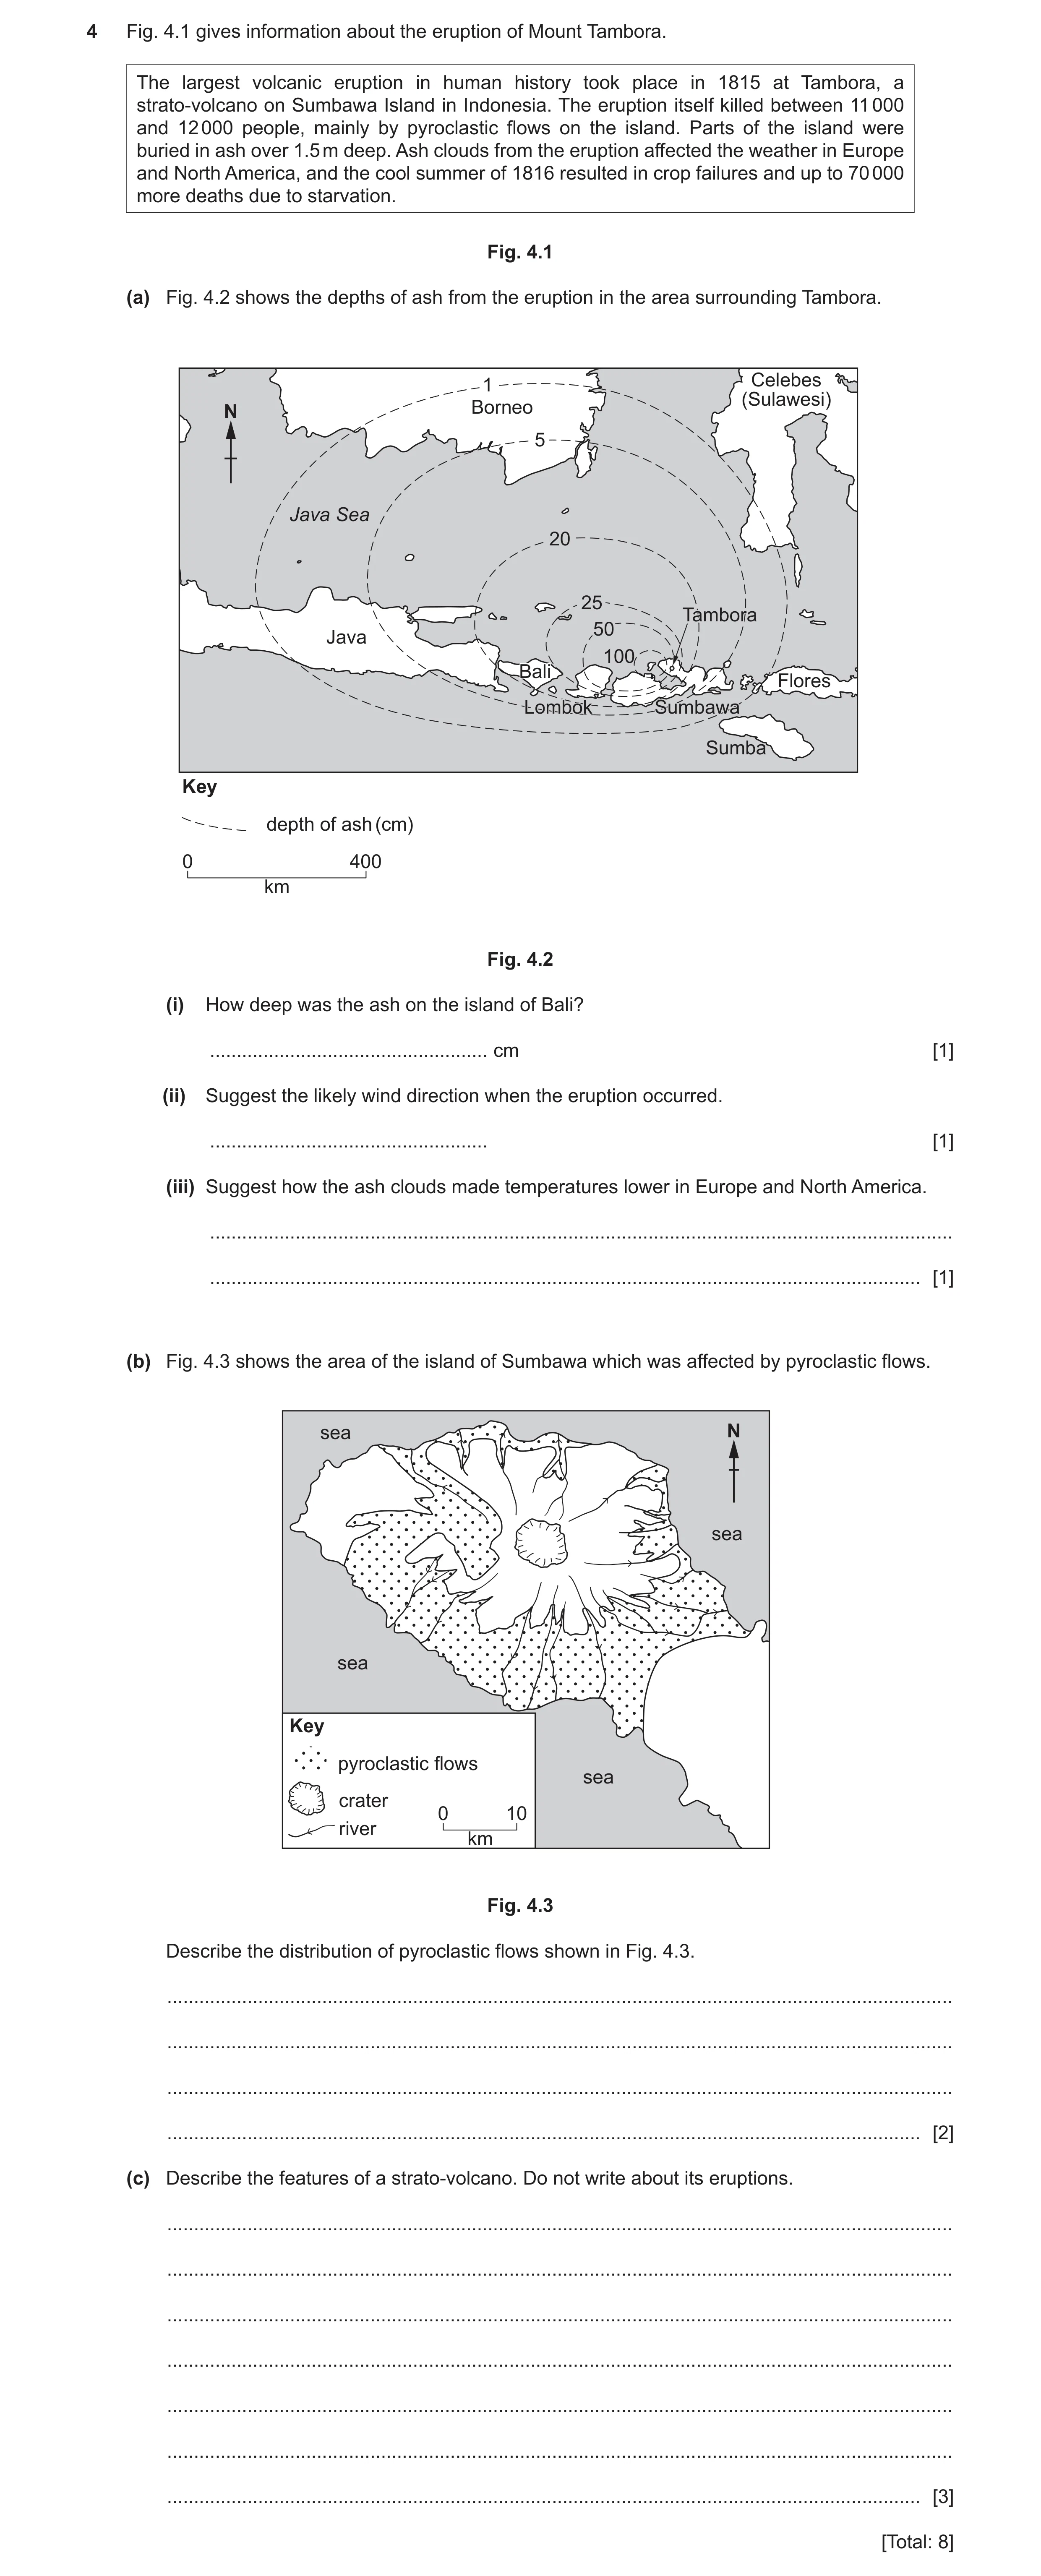
4 Fig. 4.1 gives information about the eruption of Mount Tambora. The largest volcanic eruption in human history took place in 1815 at Tambora, a strato-volcano on Sumbawa Island in Indonesia. The eruption itself killed between 11 000 and 12 000 people, mainly by pyroclastic flows on the island. Parts of the island were buried in ash over 1.5 m deep. Ash clouds from the eruption affected the weather in Europe and North America, and the cool summer of 1816 resulted in crop failures and up to 70 000 more deaths due to starvation. Fig. 4.1 (a) Fig. 4.2 shows the depths of ash from the eruption in the area surrounding Tambora. 1 Celebes (Sulawesi) N Borneo 5 Java Sea 20 25 TamboraTambora 50 Java 100 BaliBali Flores LombokLombok SumbawaSumbawa Sumba Key depth of ash (cm) 0 400 km Fig. 4.2 (i) How deep was the ash on the island of Bali? … cm [1] (ii) Suggest the likely wind direction when the eruption occurred. … [1] (iii) Suggest how the ash clouds made temperatures lower in Europe and North America. … … [1] (b) Fig. 4.3 shows the area of the island of Sumbawa which was affected by pyroclastic flows. sea N sea sea Key pyroclastic flows sea crater 0 10 river km Fig. 4.3 Describe the distribution of pyroclastic flows shown in Fig. 4.3. … … … … [2] (c) Describe the features of a strato-volcano. Do not write about its eruptions. … … … … … … … [3] [Total: 8]
8 marks
Mark scheme: 4(a)(i) 20–25 (cm), 1 4(a)(ii) SE/ESE, 1
This question in 0460/23 Oct/Nov 2020
Question 15 0460/21 May/June 2021
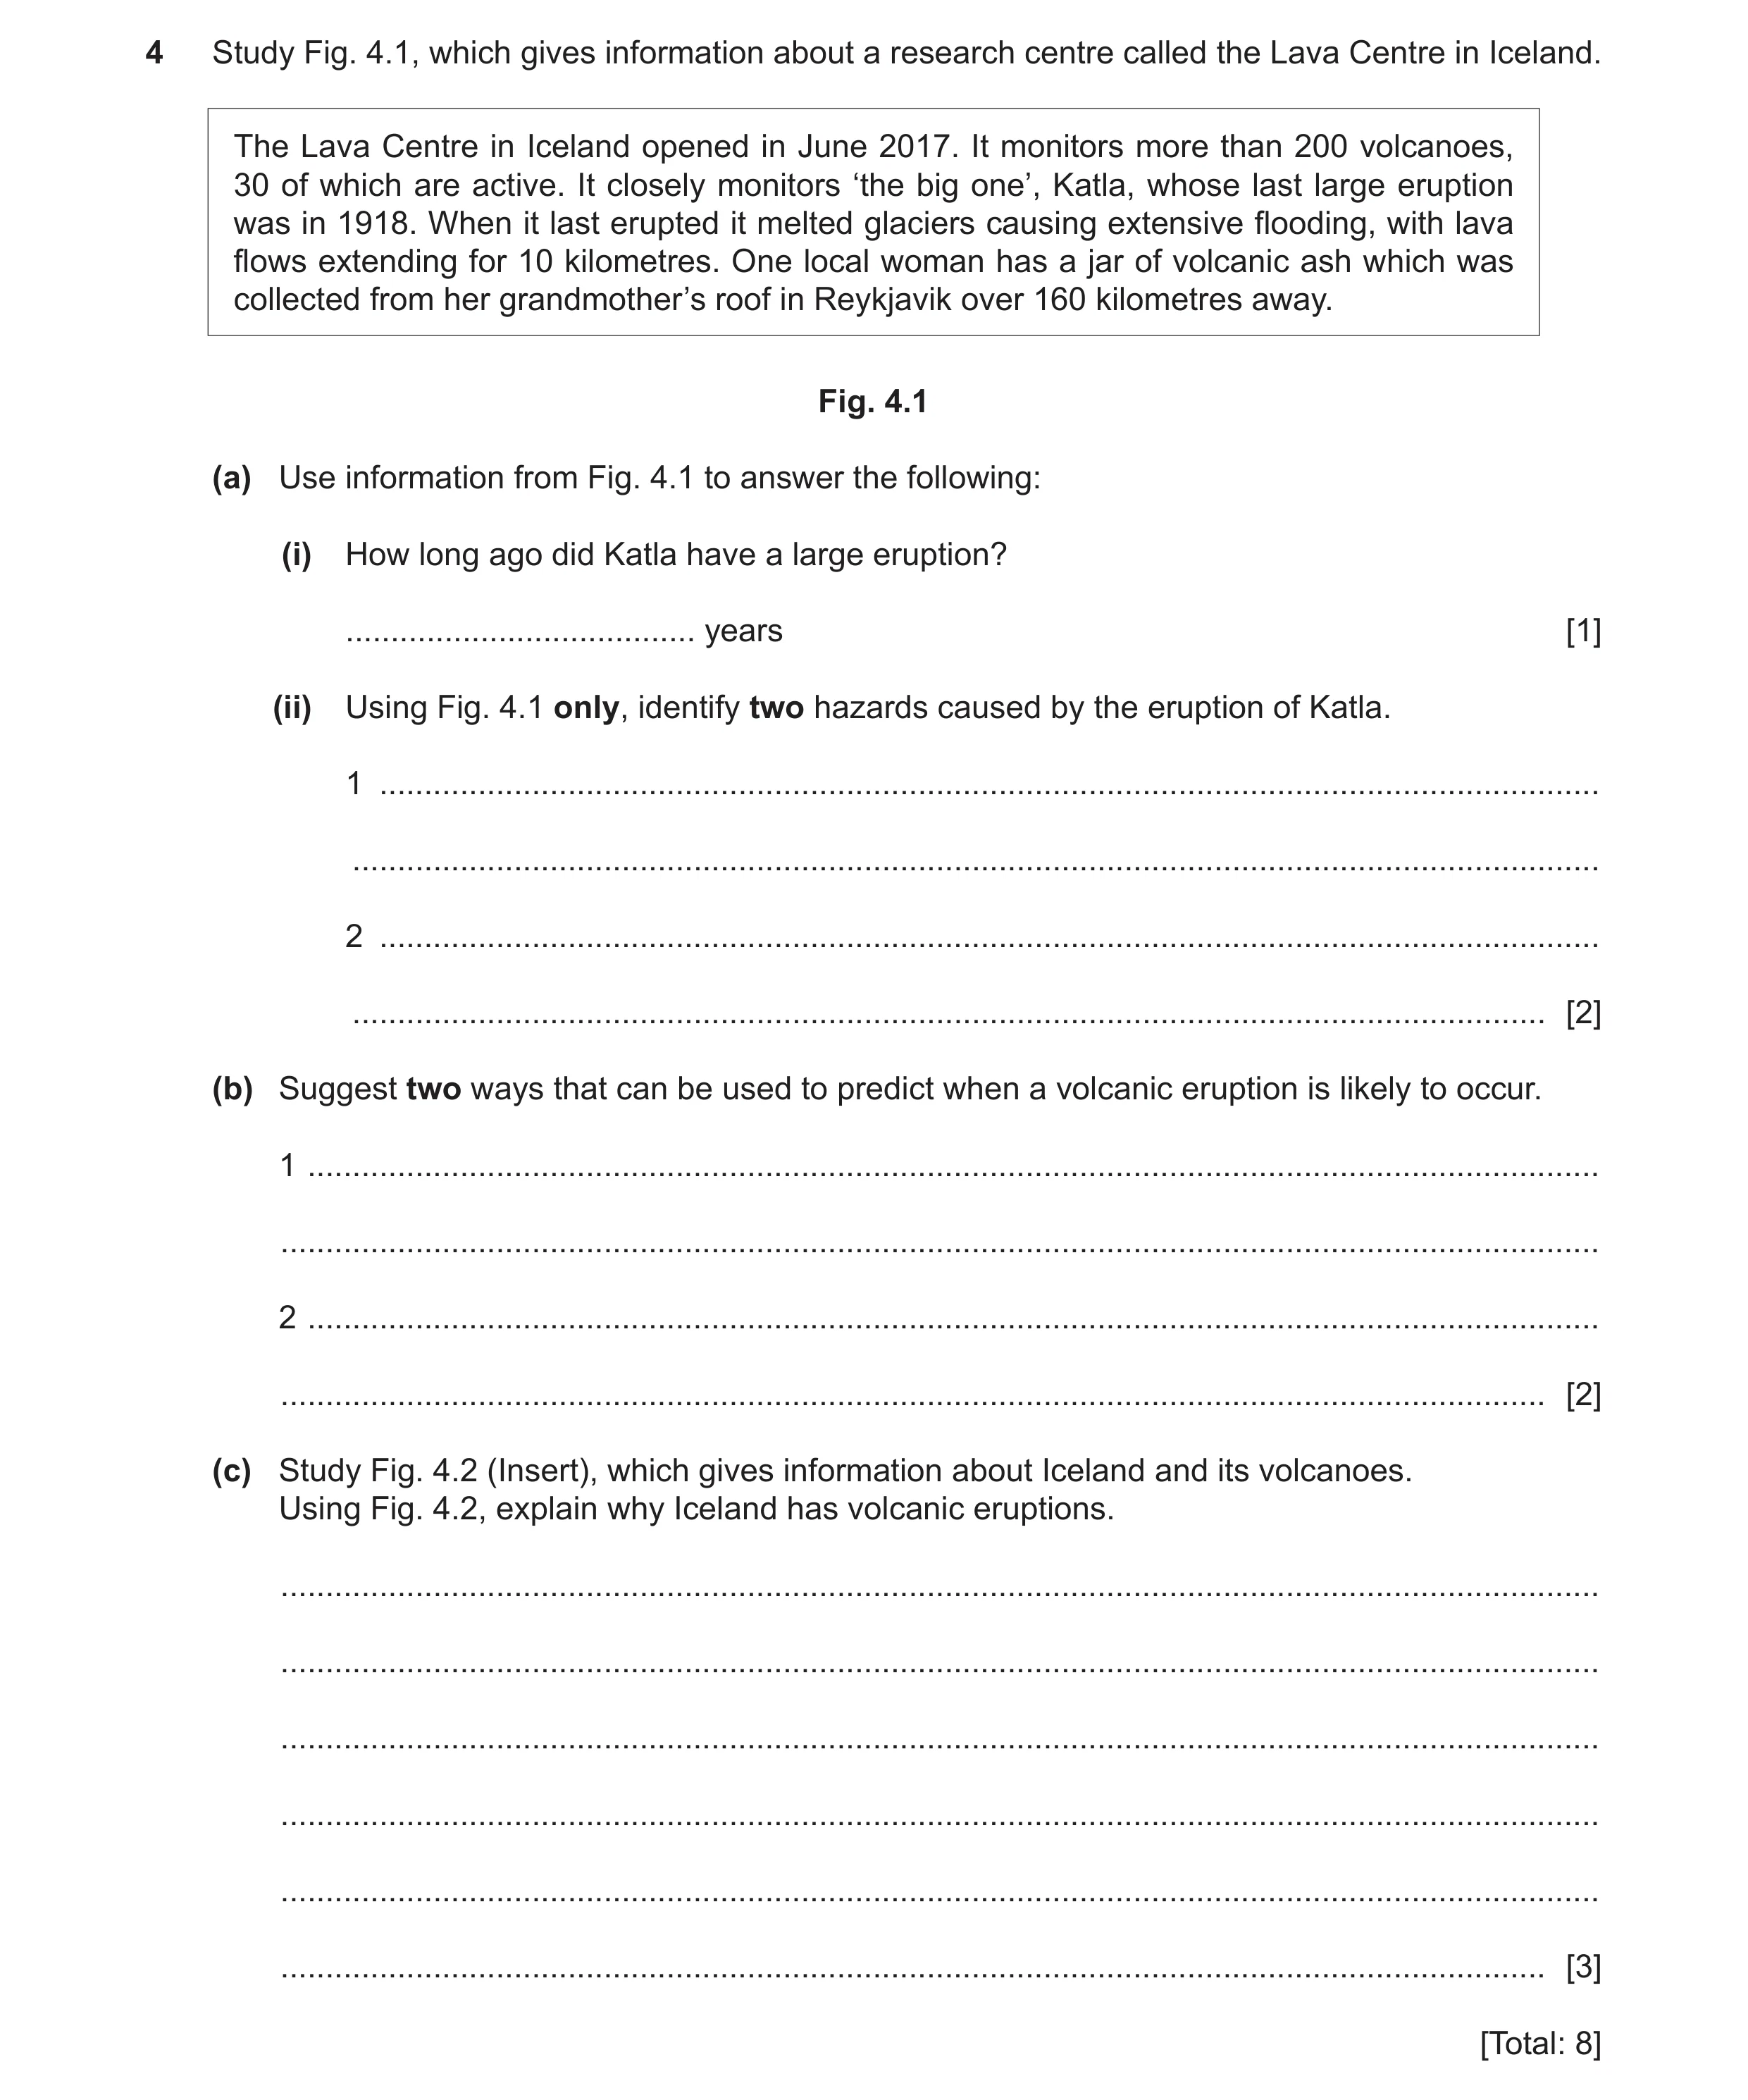
4 Study Fig. 4.1, which gives information about a research centre called the Lava Centre in Iceland. The Lava Centre in Iceland opened in June 2017. It monitors more than 200 volcanoes, 30 of which are active. It closely monitors ‘the big one’, Katla, whose last large eruption was in 1918. When it last erupted it melted glaciers causing extensive flooding, with lava flows extending for 10 kilometres. One local woman has a jar of volcanic ash which was collected from her grandmother’s roof in Reykjavik over 160 kilometres away. Fig. 4.1 (a) Use information from Fig. 4.1 to answer the following: (i) How long ago did Katla have a large eruption? … years [1] (ii) Using Fig. 4.1 only, identify two hazards caused by the eruption of Katla. 1 … … 2 … … [2] (b) Suggest two ways that can be used to predict when a volcanic eruption is likely to occur. 1 … … 2 … … [2] (c) Study Fig. 4.2 (Insert), which gives information about Iceland and its volcanoes. Using Fig. 4.2, explain why Iceland has volcanic eruptions. … … … … … … [3] [Total: 8]
8 marks
Mark scheme: 4(a)(i) 103 (years), 1 4(a)(ii) flooding, 2 lava (flows), ash (clouds), 4(b) seismometers/earthquakes, 2 thermal imaging/increase in heat, laser survey/bulge in ground, steam/gas emissions, animal behaviour, 4(c) divergent/constructive margin/plates move apart, 3 Mid Atlantic Ridge, melting (in mantle), magma rises,
This question in 0460/21 May/June 2021
Q16 · Australia’s biggest earthquake was at the city of Newcastle in 1989 0460/22 Oct/Nov 2021
4 Australia’s biggest earthquake was at the city of Newcastle in 1989. It measured 5.6 on the Richter scale and killed 13 people. (a) Fig. 4.1 and Table 4.1 give information about the intensity (strength) of the earthquake and its effects. N 2 3 4 3 4 4 2 3 3 5 8 4 4 7 Newcastle 6 4 5 Sydney 3 4 4 3 3 2 Tasman Sea 3 2 Key 2, 3, 4, 5, 6, 7, 8 earthquake intensities line of equal intensity 0 250 km Fig. 4.1 Table 4.1 intensity value description of effects 1 Not normally felt. Birds and animals uneasy. 2 Felt only by a few people at rest. 3 Vibrations like a large truck passing. Felt by people at rest. 4 Felt indoors by many. Cars rock. 5 Sleepers wakened. Some windows broken. 6 Small bells ring. Trees sway. Loose objects fall. 7 Difficult to stand up. People run outdoors. Walls crack. 8 Partial collapse of buildings. Chimneys fall. (i) On Fig. 4.1, label the position of the epicentre with the letter E. [1] (ii) On Fig. 4.1, draw the missing line of equal intensity. [1] (iii) Using Fig. 4.1 and Table 4.1, describe the effects of the earthquake in Australia’s largest city, Sydney. … … … … [2] (b) Fig. 4.2 shows the world distribution of earthquakes. Fig. 4.3 shows plate boundaries and the location of Newcastle. Using Figs. 4.2 and 4.3, what is unusual about the position of the Newcastle earthquake? … … [1] Key earthquake epicentre Fig. 4.2 NewcastleNewcastle Key plate boundary Fig. 4.3 (c) Explain why many earthquakes occur at destructive (convergent) plate boundaries. … … … … … … … … [3] [Total: 8]
8 marks
Mark scheme: 4(a)(i) letter E in intensity 8 area, 1 4(a)(ii) line between 3 and 4 values, 1 4(a) (iii) bells ring, 2 trees sway, objects fall, windows broken, sleepers awakened, cars rock, felt by many, 4(b) it is not on a plate boundary, 1 4(c) compression, 3 subduction/description of subduction, of oceanic plate/denser plate (development point), friction, fracturing/faulting, build up/release of energy/pressure/stress,
This question in 0460/22 Oct/Nov 2021
Q17 · The predicted impact of future earthquakes along the San Andreas fault in the USA 0460/22 Feb/March 2022
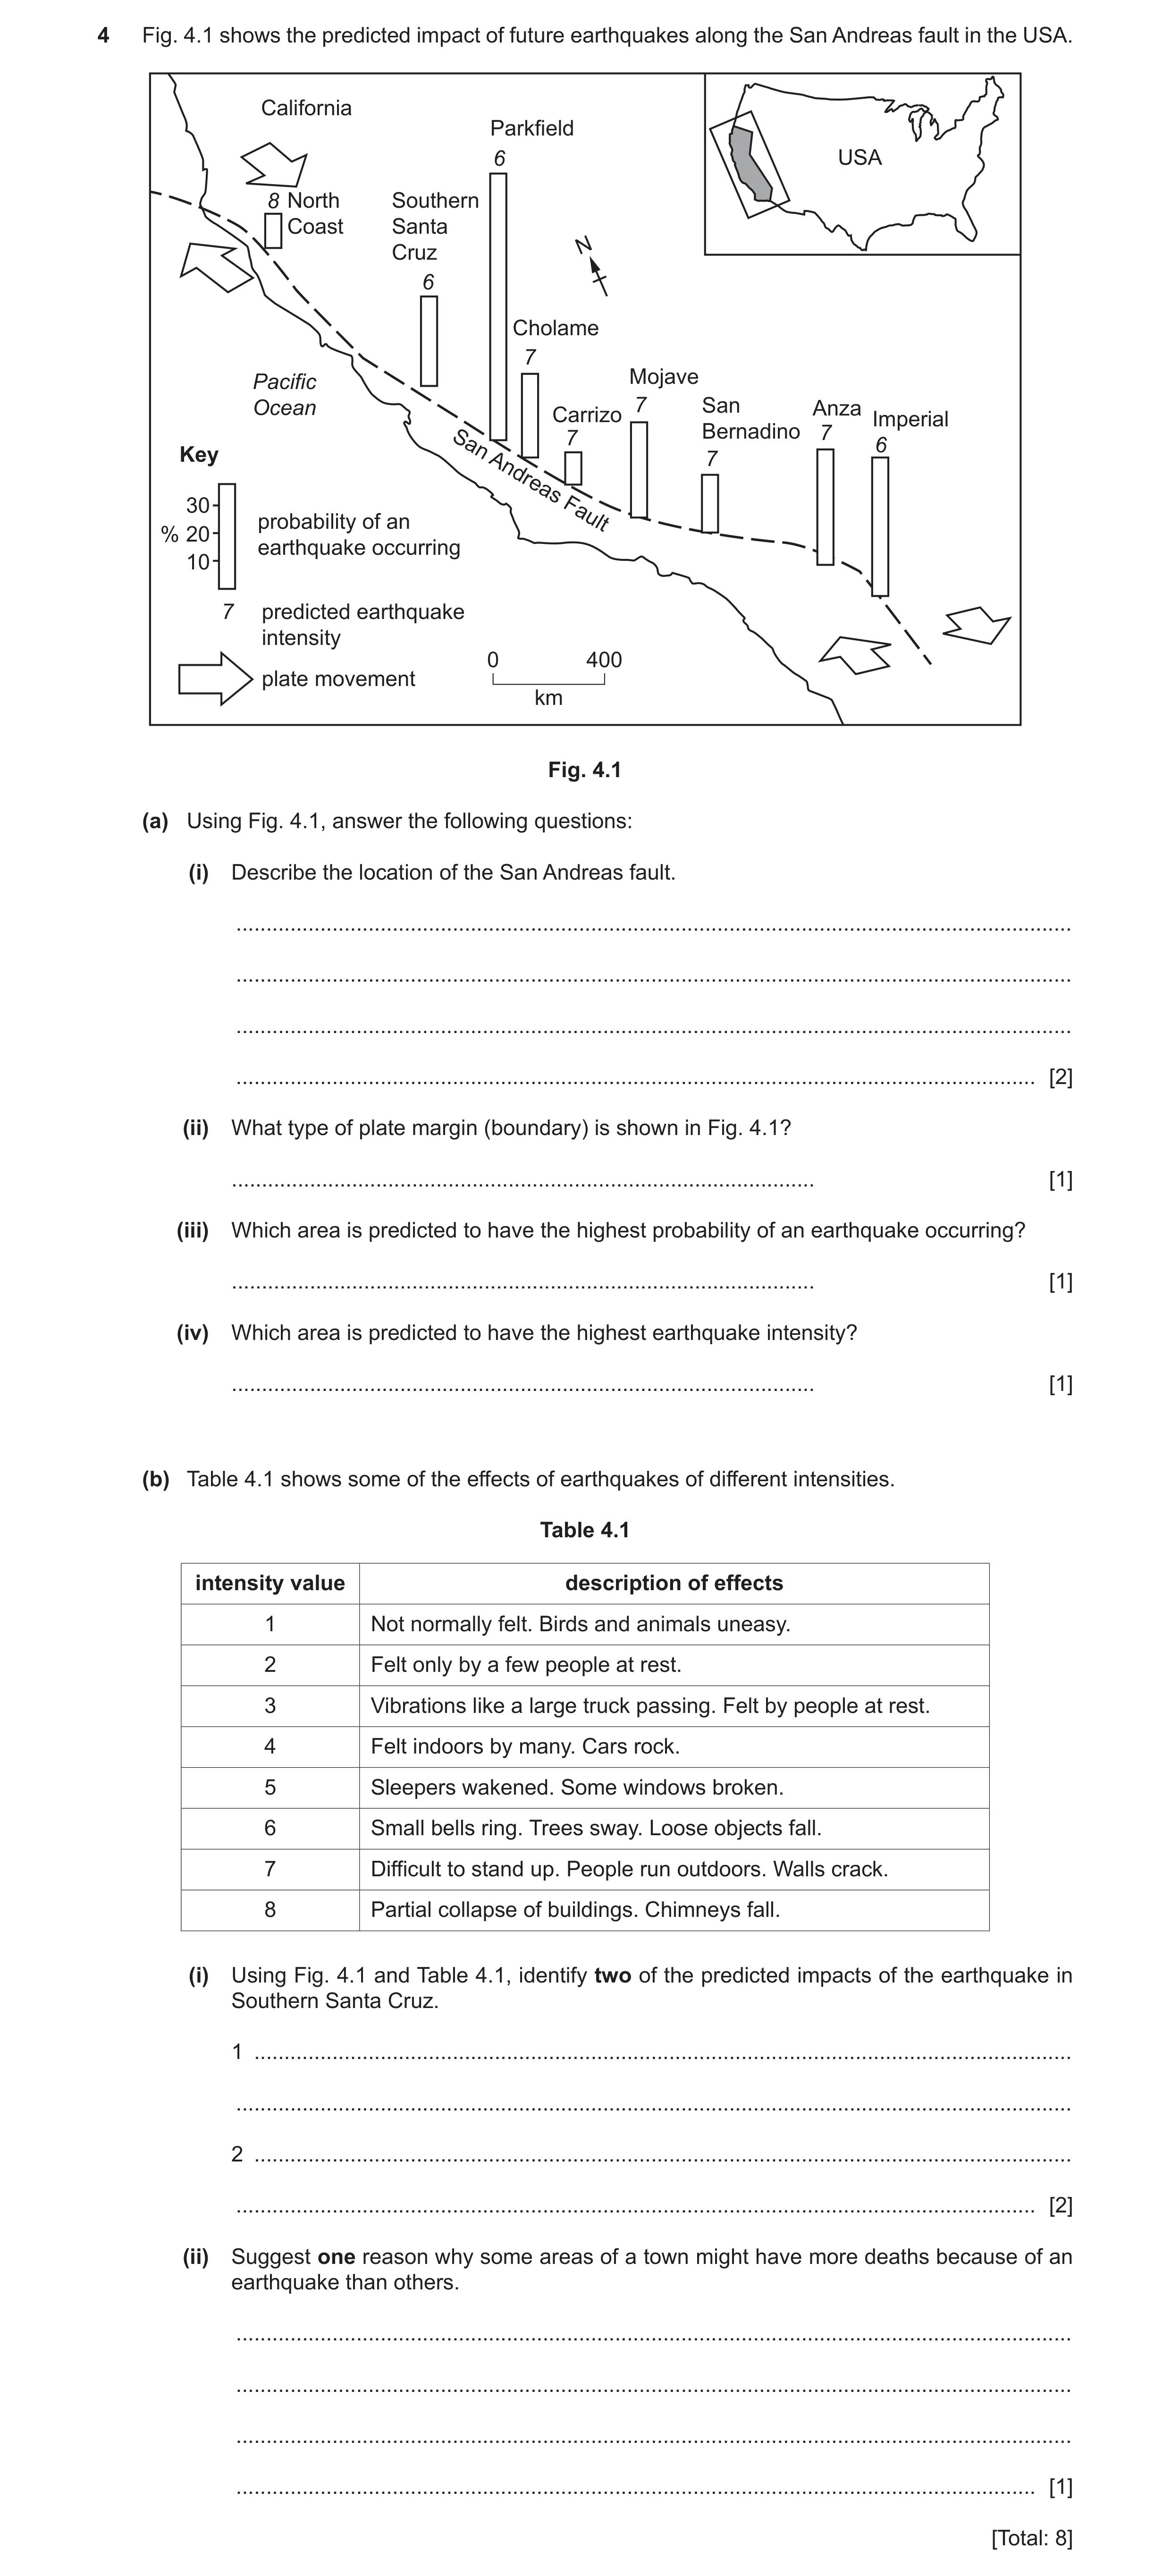
4 Fig. 4.1 shows the predicted impact of future earthquakes along the San Andreas fault in the USA. California Parkfield 6 USA 8 North Southern Coast Santa Cruz N 6 Cholame 7 Pacific Mojave Ocean 7 San Anza Carrizo Imperial Bernadino 7 7 6 Key San 7 Andreas 30 probability of an Fault % 20 earthquake occurring 10 7 predicted earthquake intensity 0 400 plate movement km Fig. 4.1 (a) Using Fig. 4.1, answer the following questions: (i) Describe the location of the San Andreas fault. … … … … [2] (ii) What type of plate margin (boundary) is shown in Fig. 4.1? … [1] (iii) Which area is predicted to have the highest probability of an earthquake occurring? … [1] (iv) Which area is predicted to have the highest earthquake intensity? … [1] (b) Table 4.1 shows some of the effects of earthquakes of different intensities. Table 4.1 intensity value description of effects 1 Not normally felt. Birds and animals uneasy. 2 Felt only by a few people at rest. 3 Vibrations like a large truck passing. Felt by people at rest. 4 Felt indoors by many. Cars rock. 5 Sleepers wakened. Some windows broken. 6 Small bells ring. Trees sway. Loose objects fall. 7 Difficult to stand up. People run outdoors. Walls crack. 8 Partial collapse of buildings. Chimneys fall. (i) Using Fig. 4.1 and Table 4.1, identify two of the predicted impacts of the earthquake in Southern Santa Cruz. 1 … … 2 … … [2] (ii) Suggest one reason why some areas of a town might have more deaths because of an earthquake than others. … … … … [1] [Total: 8]
8 marks
Mark scheme: 4(a)(i) W/SW of USA/California, 2 coastal, parallel to coast/NW–SE, further from coast in south, 4(a)(ii) conservative, (allow transverse and transform) 1 4(a)(iii) Parkfield, 1 4(a)(iv) North Coast, 1 4(b)(i) bells ring, 2 trees sway, loose objects fall, felt indoors by many, cars rock, windows broken, sleepers awakened, 2@1 mark each 4(b)(ii) building construction/design, 1 population density, gradient, geological factors,
This question in 0460/22 Feb/March 2022
Question 18 0460/22 May/June 2022
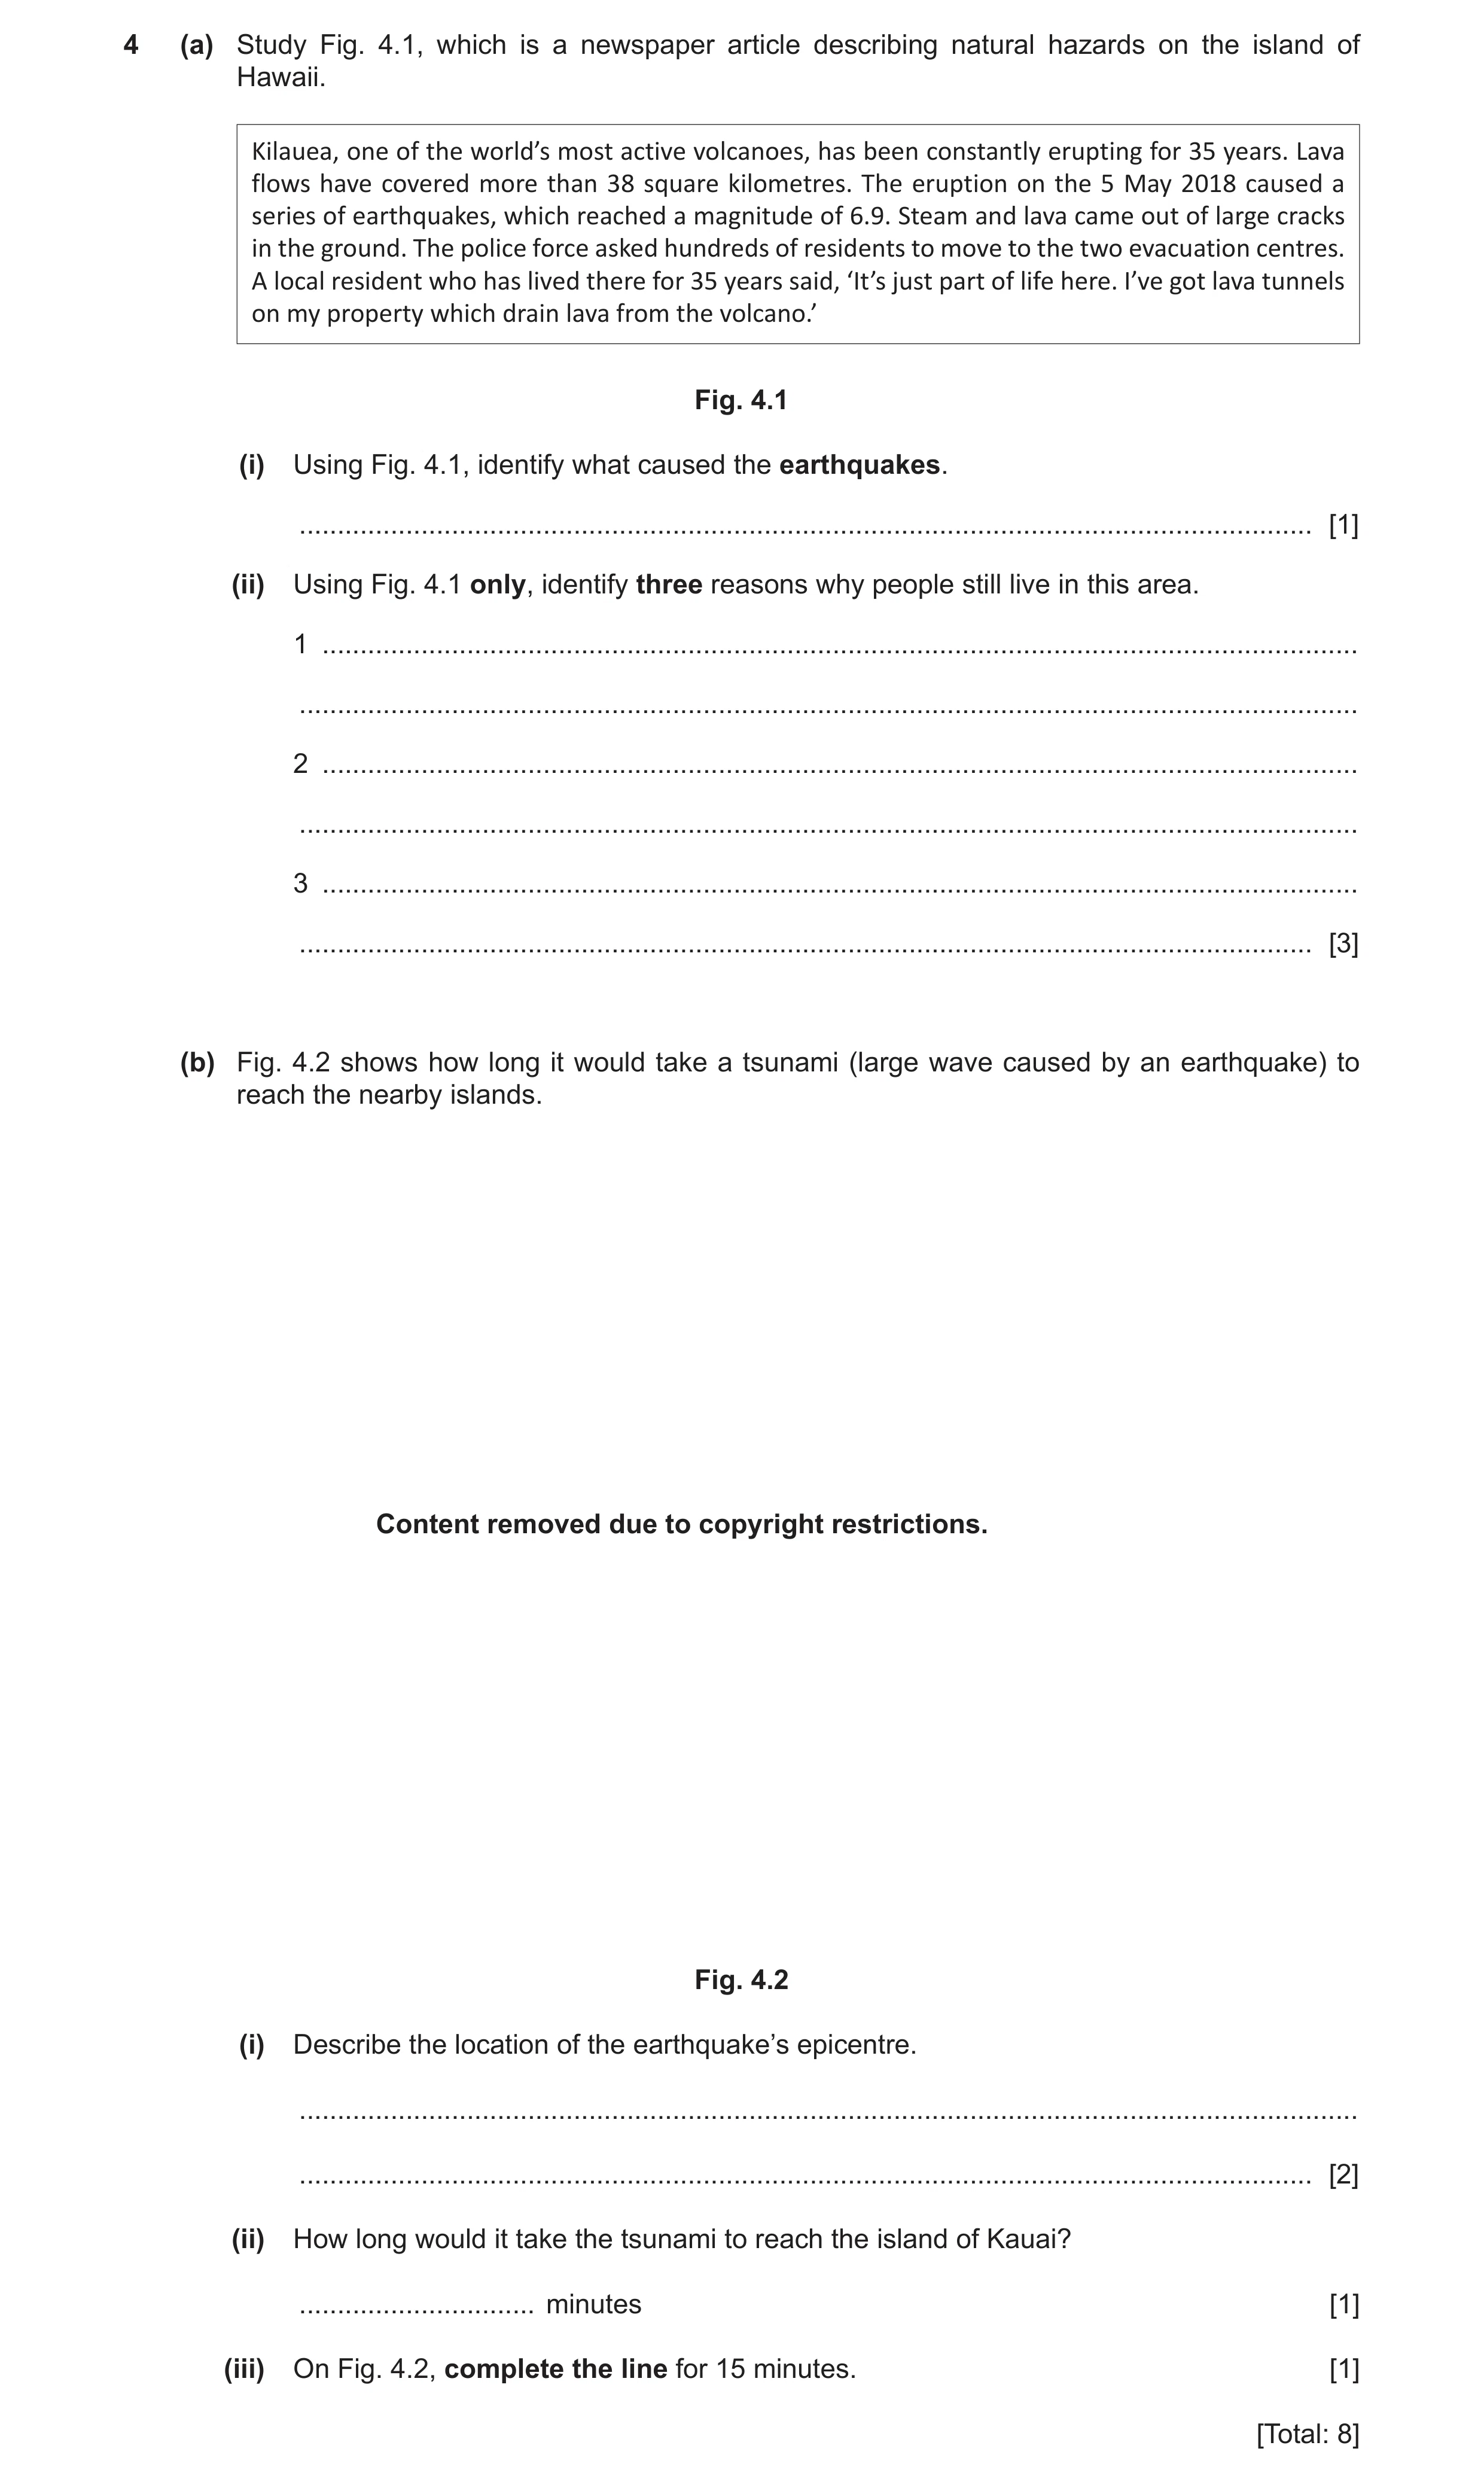
4 (a) Study Fig. 4.1, which is a newspaper article describing natural hazards on the island of Hawaii. Kilauea, one of the world’s most active volcanoes, has been constantly erupting for 35 years. Lava flows have covered more than 38 square kilometres. The eruption on the 5 May 2018 caused a series of earthquakes, which reached a magnitude of 6.9. Steam and lava came out of large cracks in the ground. The police force asked hundreds of residents to move to the two evacuation centres. A local resident who has lived there for 35 years said, ‘It’s just part of life here. I’ve got lava tunnels on my property which drain lava from the volcano.’ Fig. 4.1 (i) Using Fig. 4.1, identify what caused the earthquakes. … [1] (ii) Using Fig. 4.1 only, identify three reasons why people still live in this area. 1 … … 2 … … 3 … … [3] (b) Fig. 4.2 shows how long it would take a tsunami (large wave caused by an earthquake) to reach the nearby islands. Content removed due to copyright restrictions. Fig. 4.2 (i) Describe the location of the earthquake’s epicentre. … … [2] (ii) How long would it take the tsunami to reach the island of Kauai? … minutes [1] (iii) On Fig. 4.2, complete the line for 15 minutes. [1] [Total: 8]
8 marks
Mark scheme: 4(a)(i) Kilauea/volcano/eruption 1 4(a)(ii) evacuation (centres)/prepared; 3 police force to alert; lived there for (35) years/long time/all life/don’t want to leave/attachment to the place/their homes; know how to survive/part of life/adapt to it/used to it (eruptions)/frequent occurrence; lava tunnels (on their property) (so feel safe); Answers should refer to or be directly implied by Fig. 4.1. 4(b)(i) in the sea/Pacific Ocean/off the coast/offshore/underwater/on ocean floor; 2 (off the coast of Hawaii = 1) close to/near/next to Hawaii; 10-15 km from Hawaii; West/SW/WSW/SSW of Hawaii; 4(c)(ii) 37–43 (minutes) 1 4(c)(iii) completion of line between 10 and 20 (not touching) and hitting the bottom 1 edge of Fig. 4.2/map, clearly away from the 20 isoline;
This question in 0460/22 May/June 2022
Q19 · A cross-section through an area affected by an earthquake 0460/23 May/June 2022
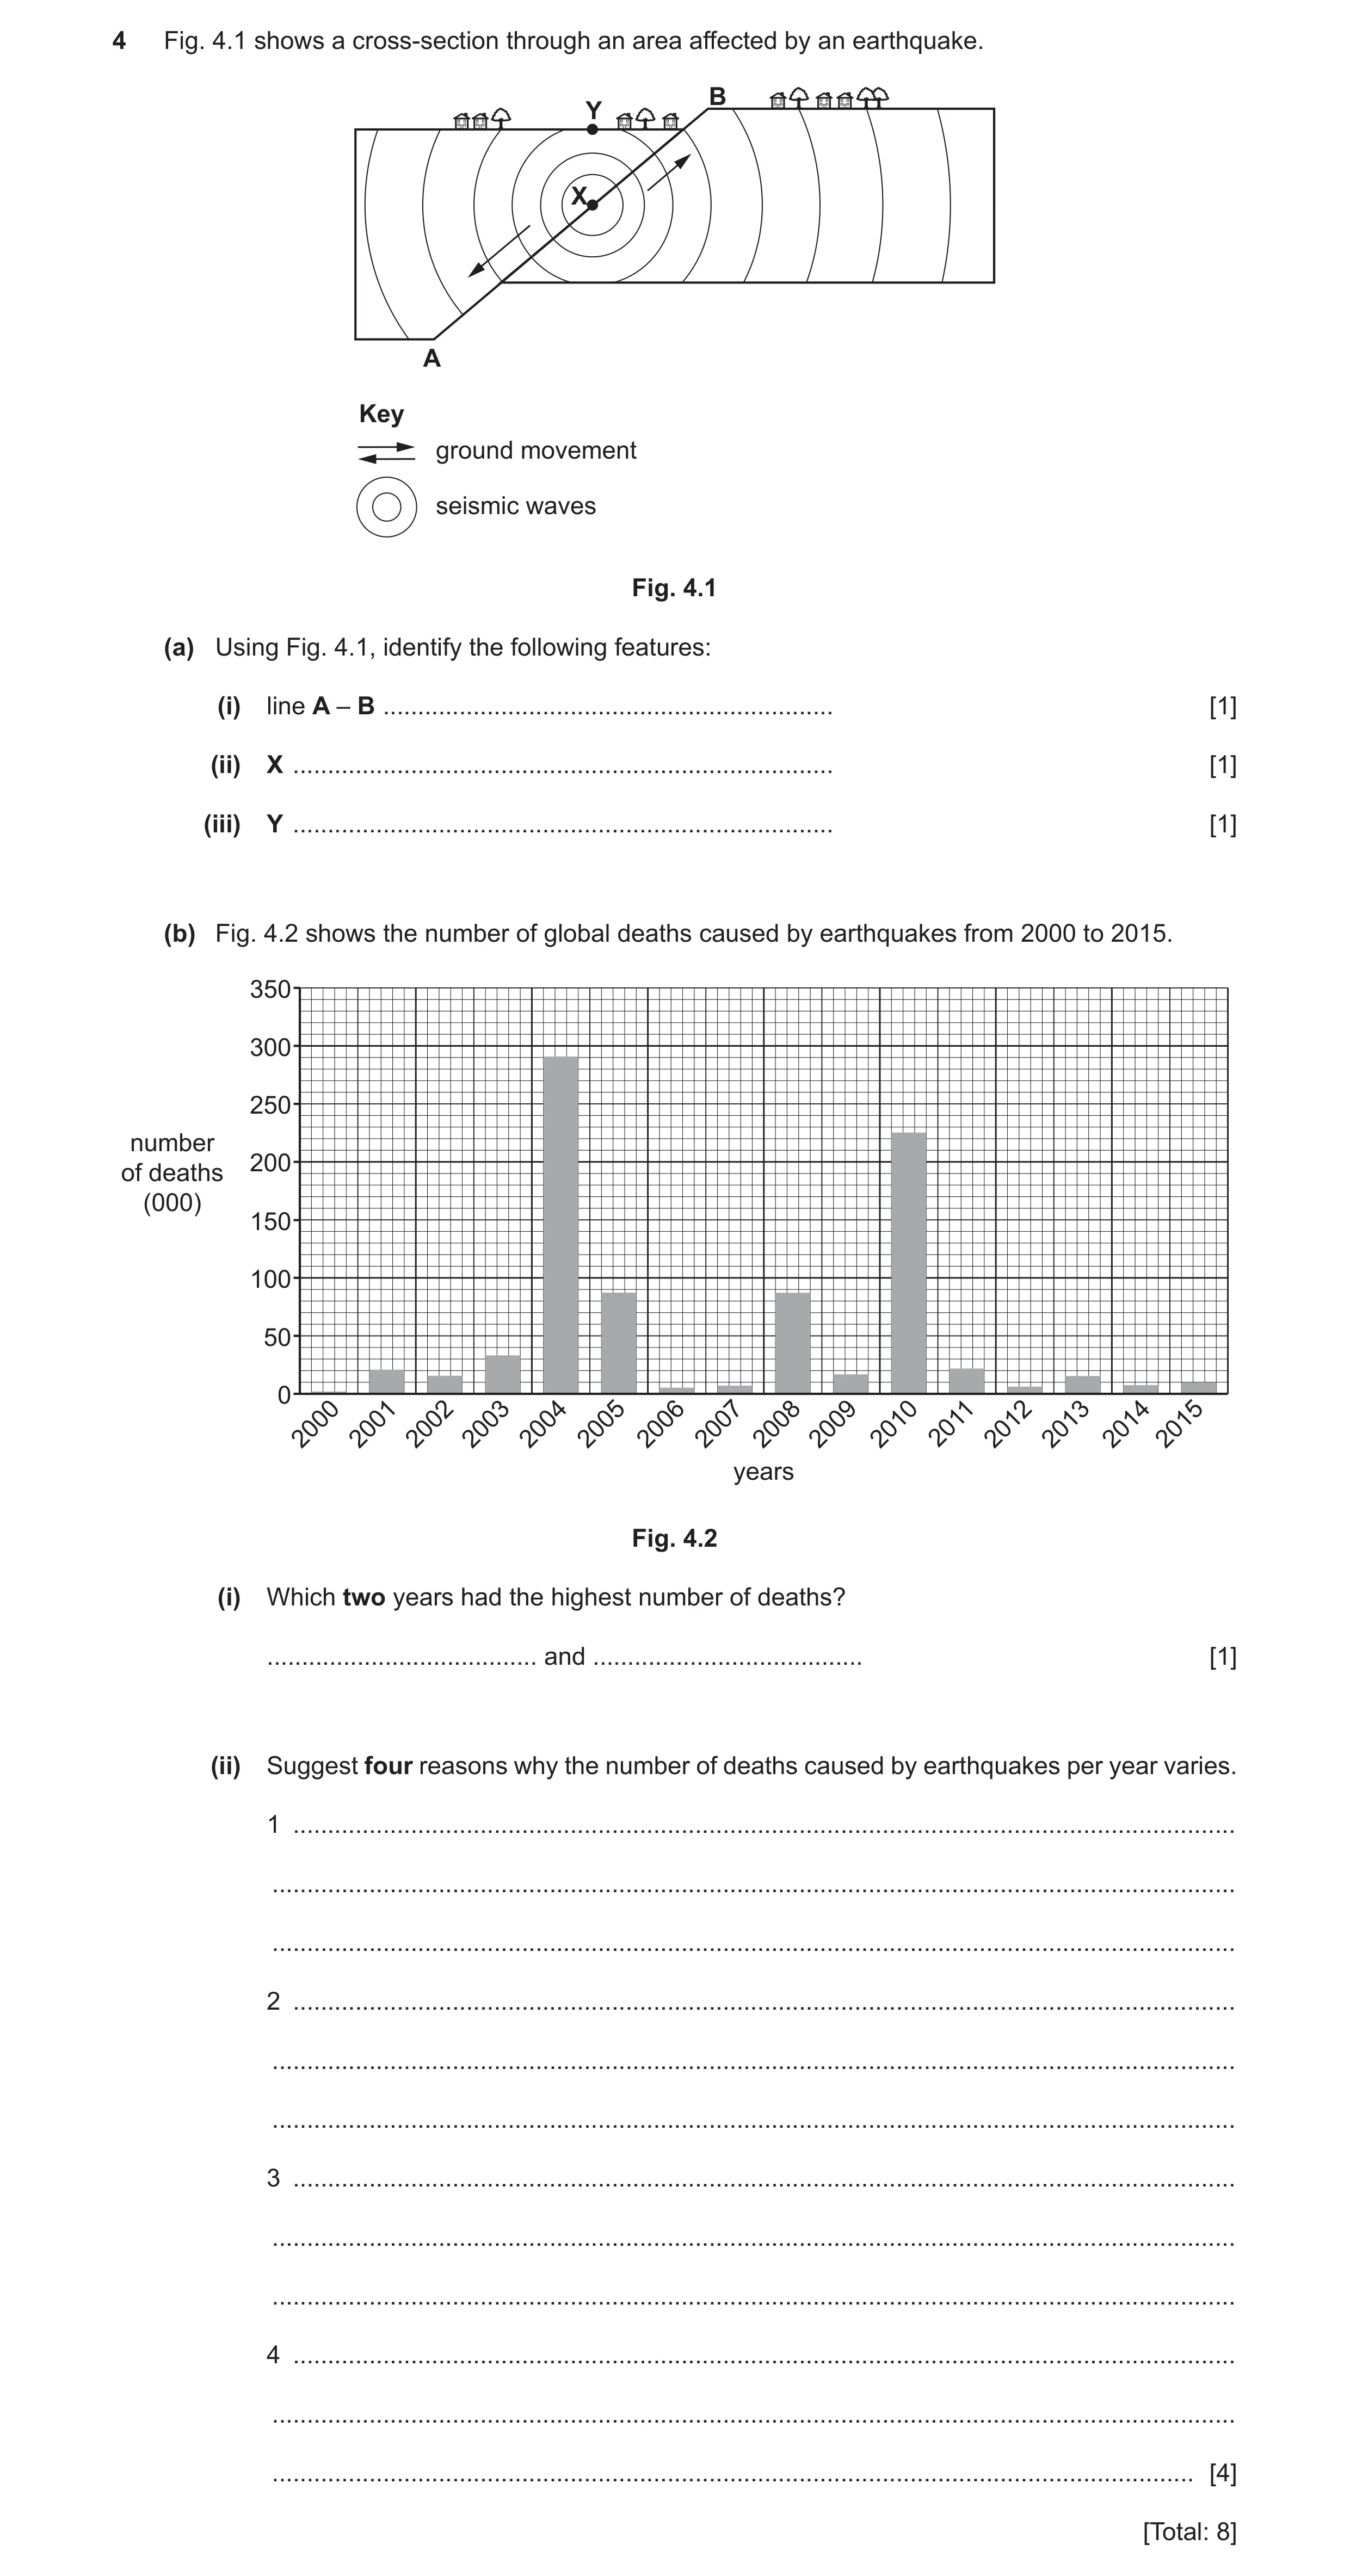
4 Fig. 4.1 shows a cross-section through an area affected by an earthquake. B Y X A Key ground movement seismic waves Fig. 4.1 (a) Using Fig. 4.1, identify the following features: (i) line A – B … [1] (ii) X … [1] (iii) Y … [1] (b) Fig. 4.2 shows the number of global deaths caused by earthquakes from 2000 to 2015. 350 300 250 number 200of deaths (000) 150 100 50 0 2000200120022003200420052006200720082009201020112012201320142015 years Fig. 4.2 (i) Which two years had the highest number of deaths? … and … [1] (ii) Suggest four reasons why the number of deaths caused by earthquakes per year varies. 1 … … … 2 … … … 3 … … … 4 … … … [4] [Total: 8]
8 marks
Mark scheme: 4(a)(i) Fault/slip line 1 4(a)(ii) Focus 1 4(a)(iii) Epicentre 1 4(b)(i) 2004 and 2010 1 4(b)(ii) size/intensity/magnitude of earthquakes; 4 depth/focus of earthquake; number/frequency of earthquakes/number of aftershocks; building condition/earthquake proofing; land-use planning/zoning; level of economic development/LEDC’s V MEDC’s; level of preparedness of the population/drills/education/awareness; speed of response/availability of medical teams/rescue; population density/rural v urban; less emergency relief provided; post-earthquake provision and planning (shelter/food/medical aid); areas of unstable soils/geology; time of the day; tsunamis; Max. 1 mark for secondary effects e.g., tsunami, spread of disease
This question in 0460/23 May/June 2022
Q20 · The average annual number of volcanic eruptions reported in the world between 1890 and… 0460/21 Oct/Nov 2022
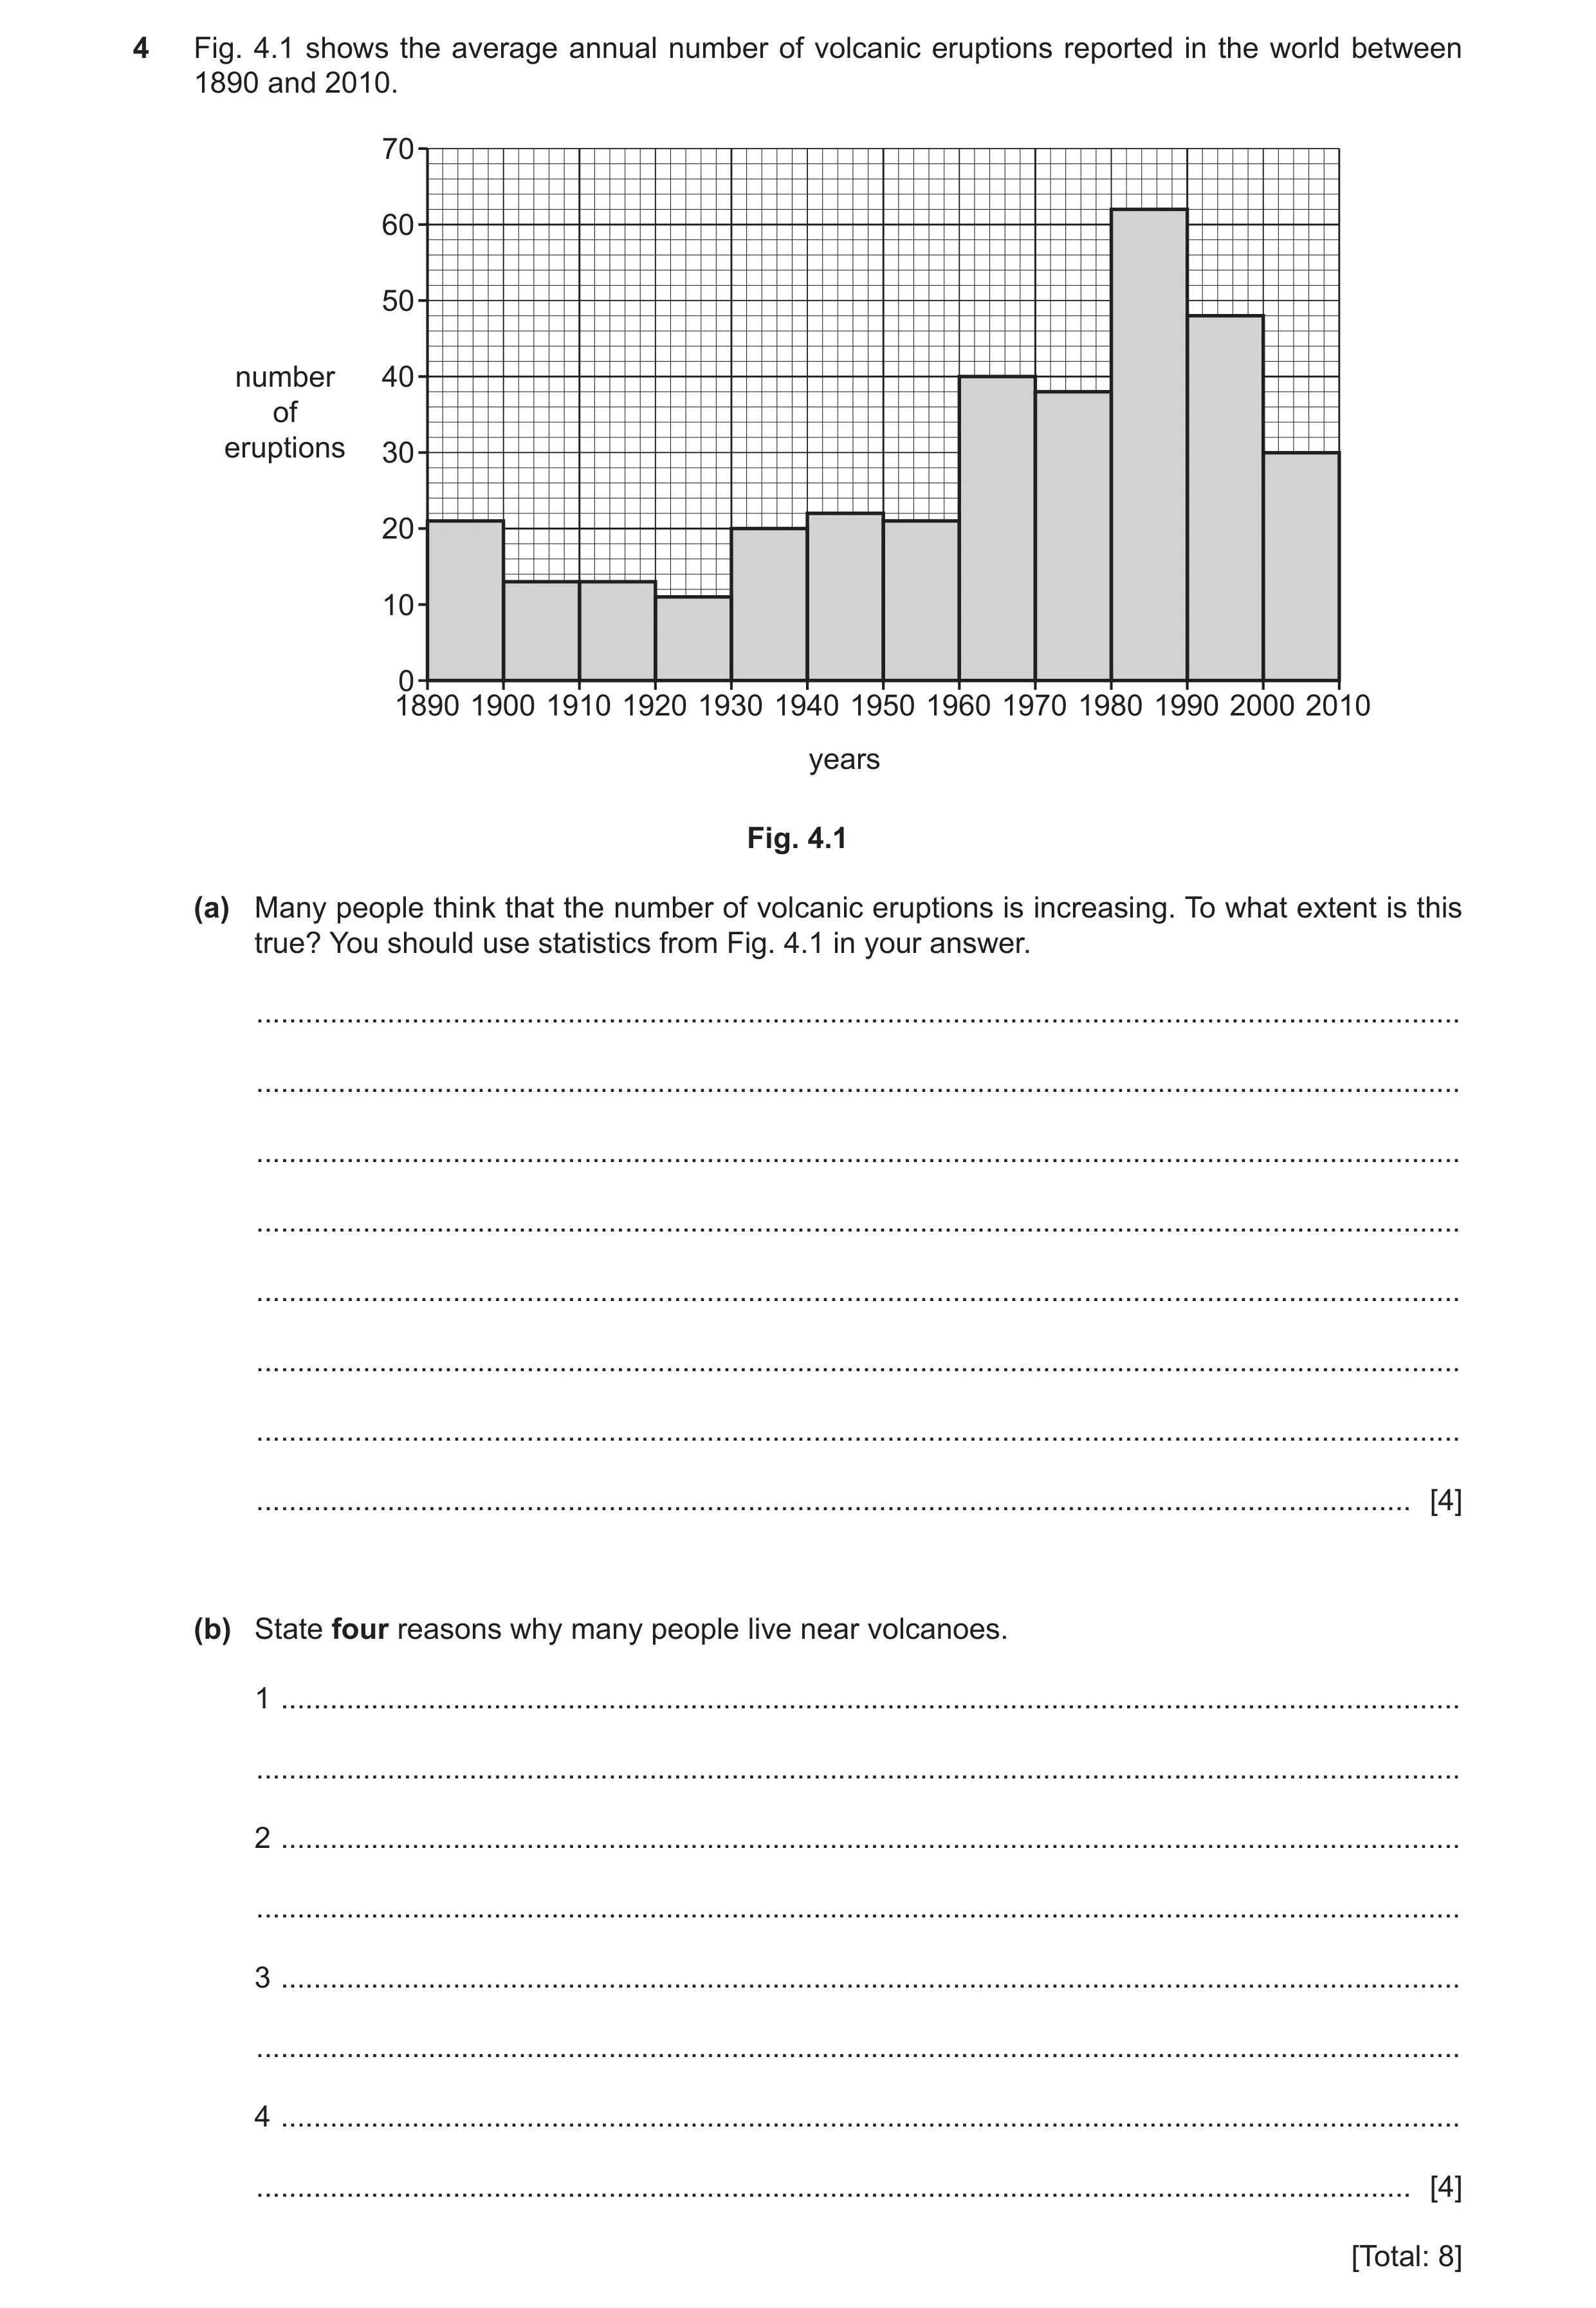
4 Fig. 4.1 shows the average annual number of volcanic eruptions reported in the world between 1890 and 2010. 70 60 50 number 40 of eruptions 30 20 10 0 1890 1900 1910 1920 1930 1940 1950 1960 1970 1980 1990 2000 2010 years Fig. 4.1 (a) Many people think that the number of volcanic eruptions is increasing. To what extent is this true? You should use statistics from Fig. 4.1 in your answer. … … … … … … … … [4] (b) State four reasons why many people live near volcanoes. 1 … … 2 … … 3 … … 4 … … [4] [Total: 8]
8 marks
Mark scheme: 4(a) True/partially true/true to some extent (or converse); 4 Overall increase over time; Large increase since 1960/increase up to 1990; Largest increase 1970–1980; Largest decrease 2000–2010; Higher from 1960/lower before 1960; The numbers fluctuate over time; Only shows data since 1890; Numbers reducing recently/since 1990; 1890–1900–1950–1960 constant. 1 mark reserve for statistics exemplifying a point. 4(b) Fertile land/good for agriculture; 4 Family and friends live there/always lived there; Rely on warning systems/think the eruption won’t happen again; Income/jobs from tourism/e.g., of job; Religious reasons; Cannot afford to move away; Volcanoes are dormant/think eruption won’t happen/used to it/unaware of dangers; Geothermal power/electricity for heating; Hot water/springs; Minerals/mining/source of building materials; Gentle slopes for building/farming.
This question in 0460/21 Oct/Nov 2022
Question 21 0460/23 Oct/Nov 2022
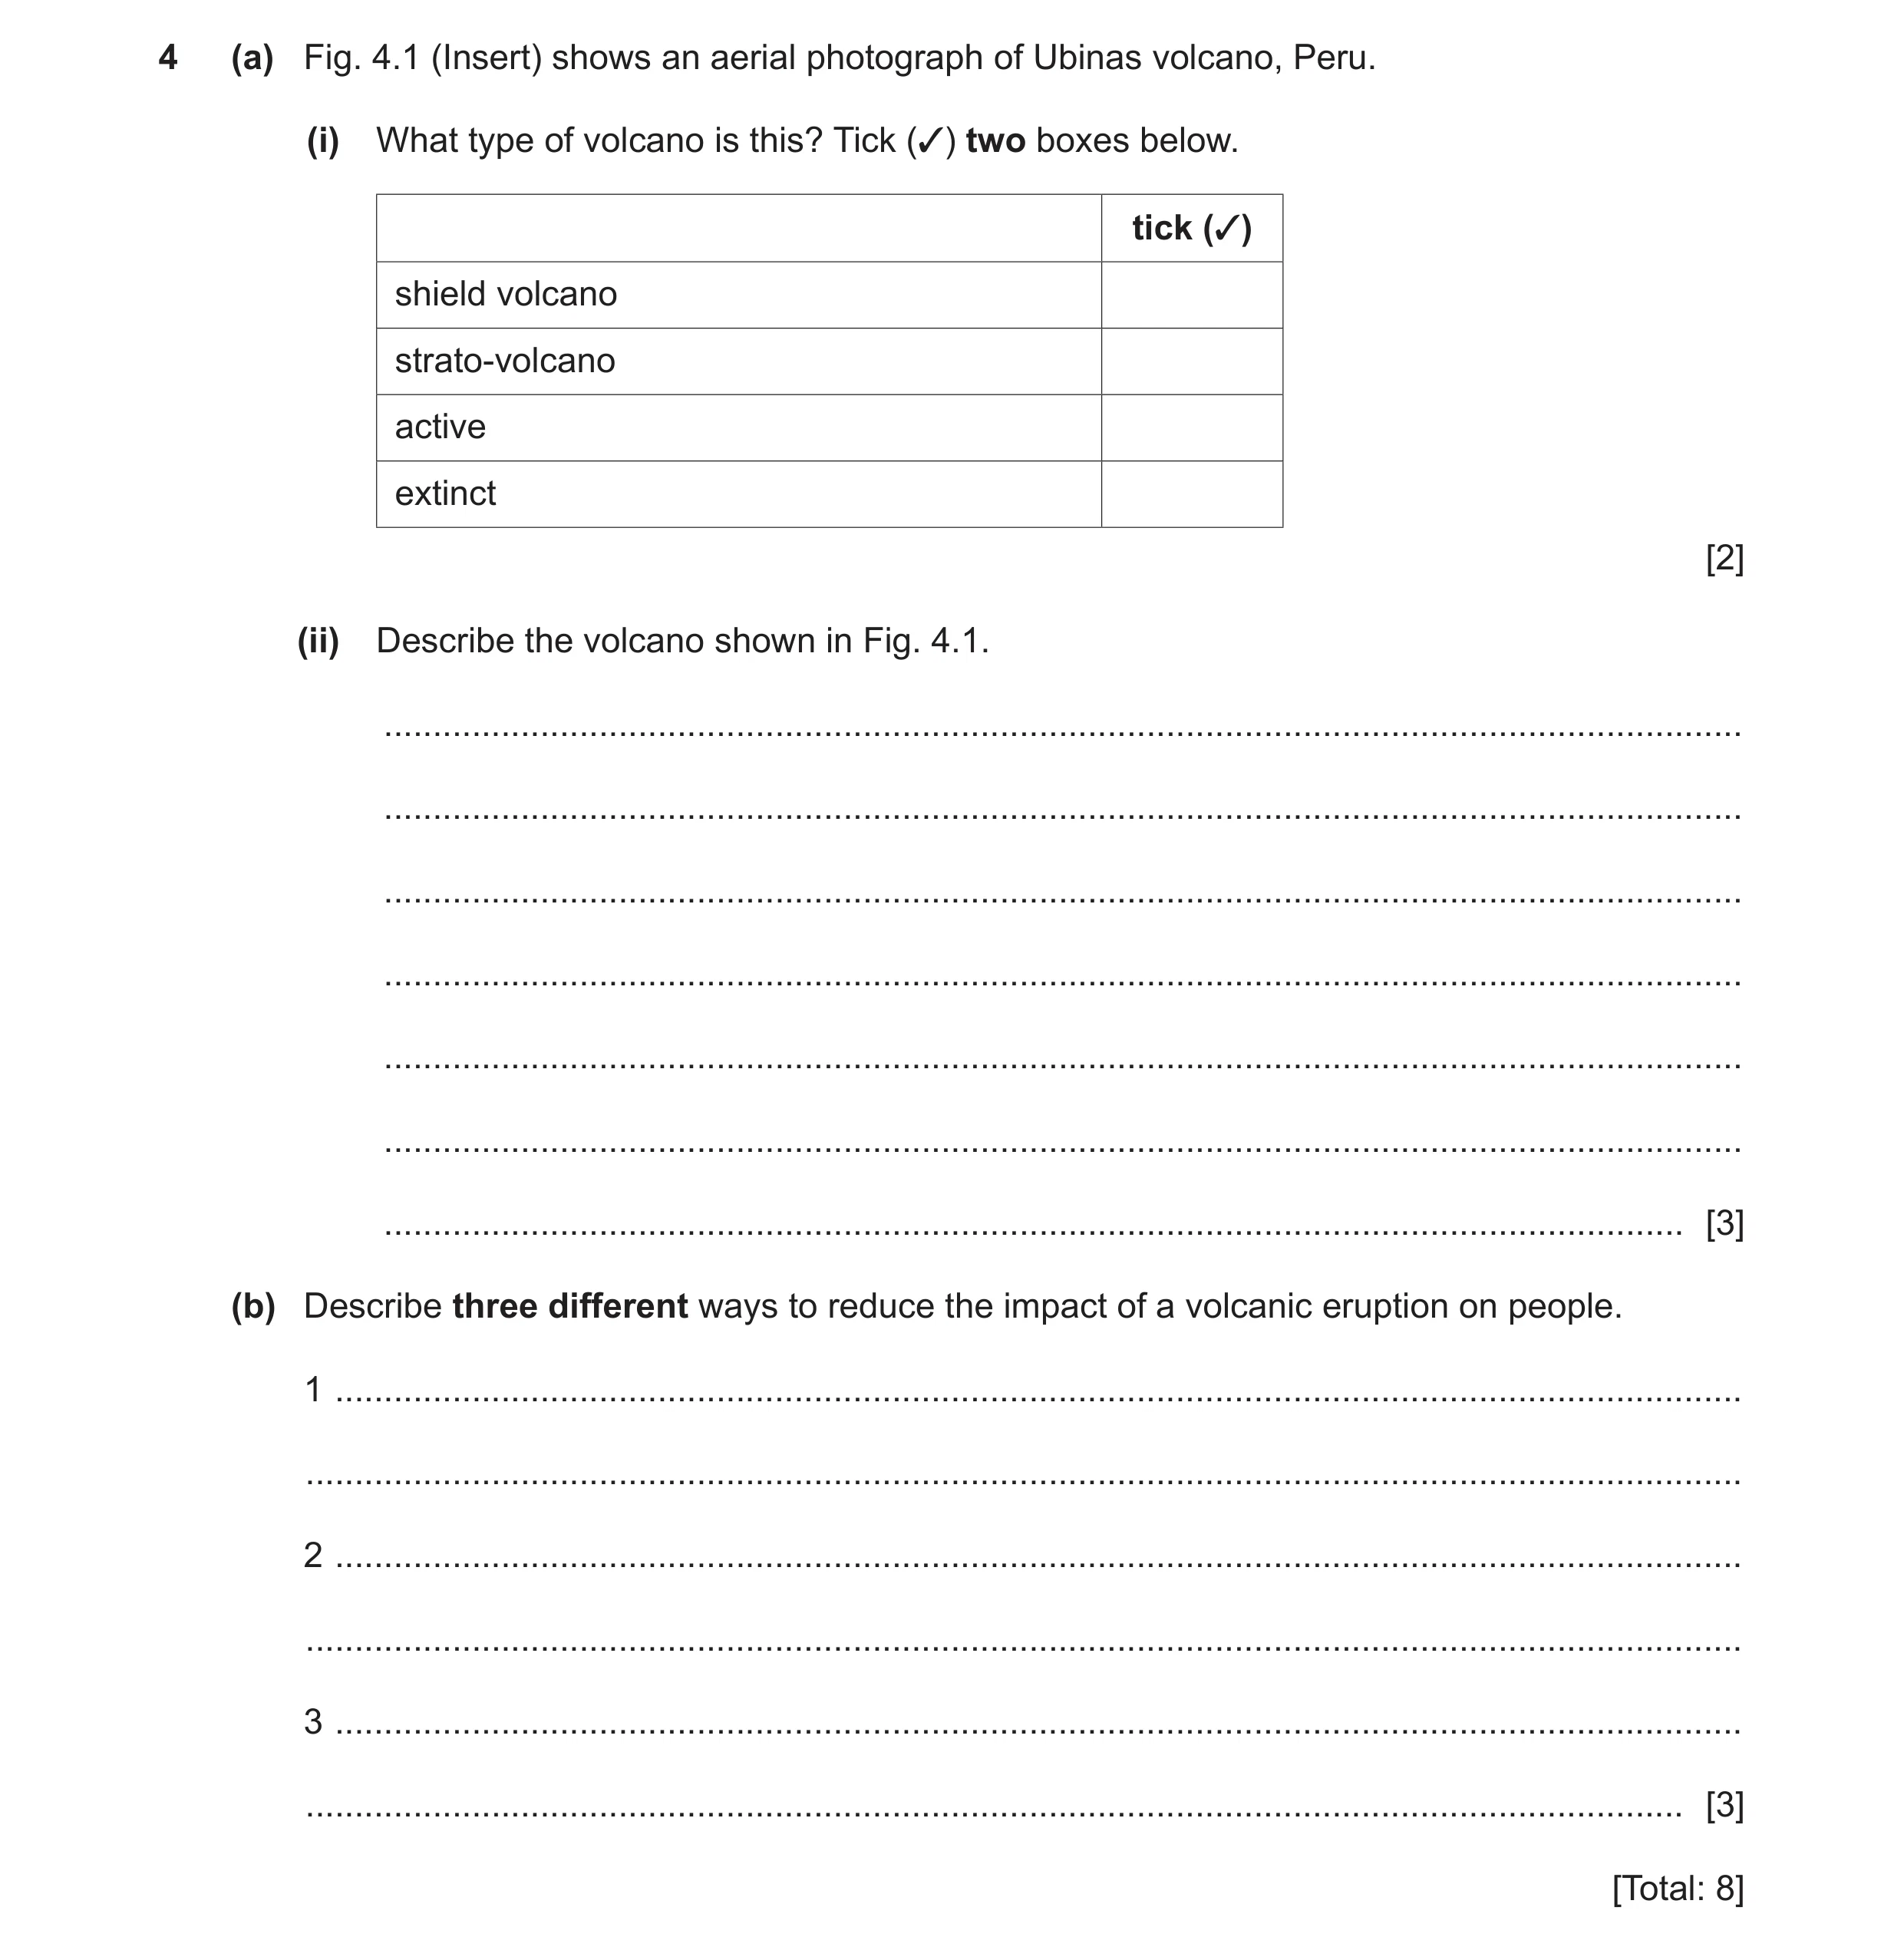
4 (a) Fig. 4.1 (Insert) shows an aerial photograph of Ubinas volcano, Peru. (i) What type of volcano is this? Tick (3) two boxes below. tick (3) shield volcano strato-volcano active extinct [2] (ii) Describe the volcano shown in Fig. 4.1. … … … … … … … [3] (b) Describe three different ways to reduce the impact of a volcanic eruption on people. 1 … … 2 … … 3 … … [3] [Total: 8]
8 marks
Mark scheme: 4(a)(i) Strato-volcano; 2 Active. 4(a)(ii) Steep sided; 3 Concave/steeper top, gentle(r) base; Conical; Crater/caldera; Vent; Ash/lava/magma; Smoke/steam/gases; Dissected slopes/gullies/ridges. 4(b) Monitoring/warning/prediction; 3 Evacuation; Land-use zoning/exclusion zones/building codes; Emergency shelters (protection from ash); Spraying lava flows with sea water/lava channels/tunnels; Reroute aircraft; Emergency response planning/drills/education; Aid/medical resources/rescue equipment/food supplies.
This question in 0460/23 Oct/Nov 2022
Question 22 0460/22 Feb/March 2023
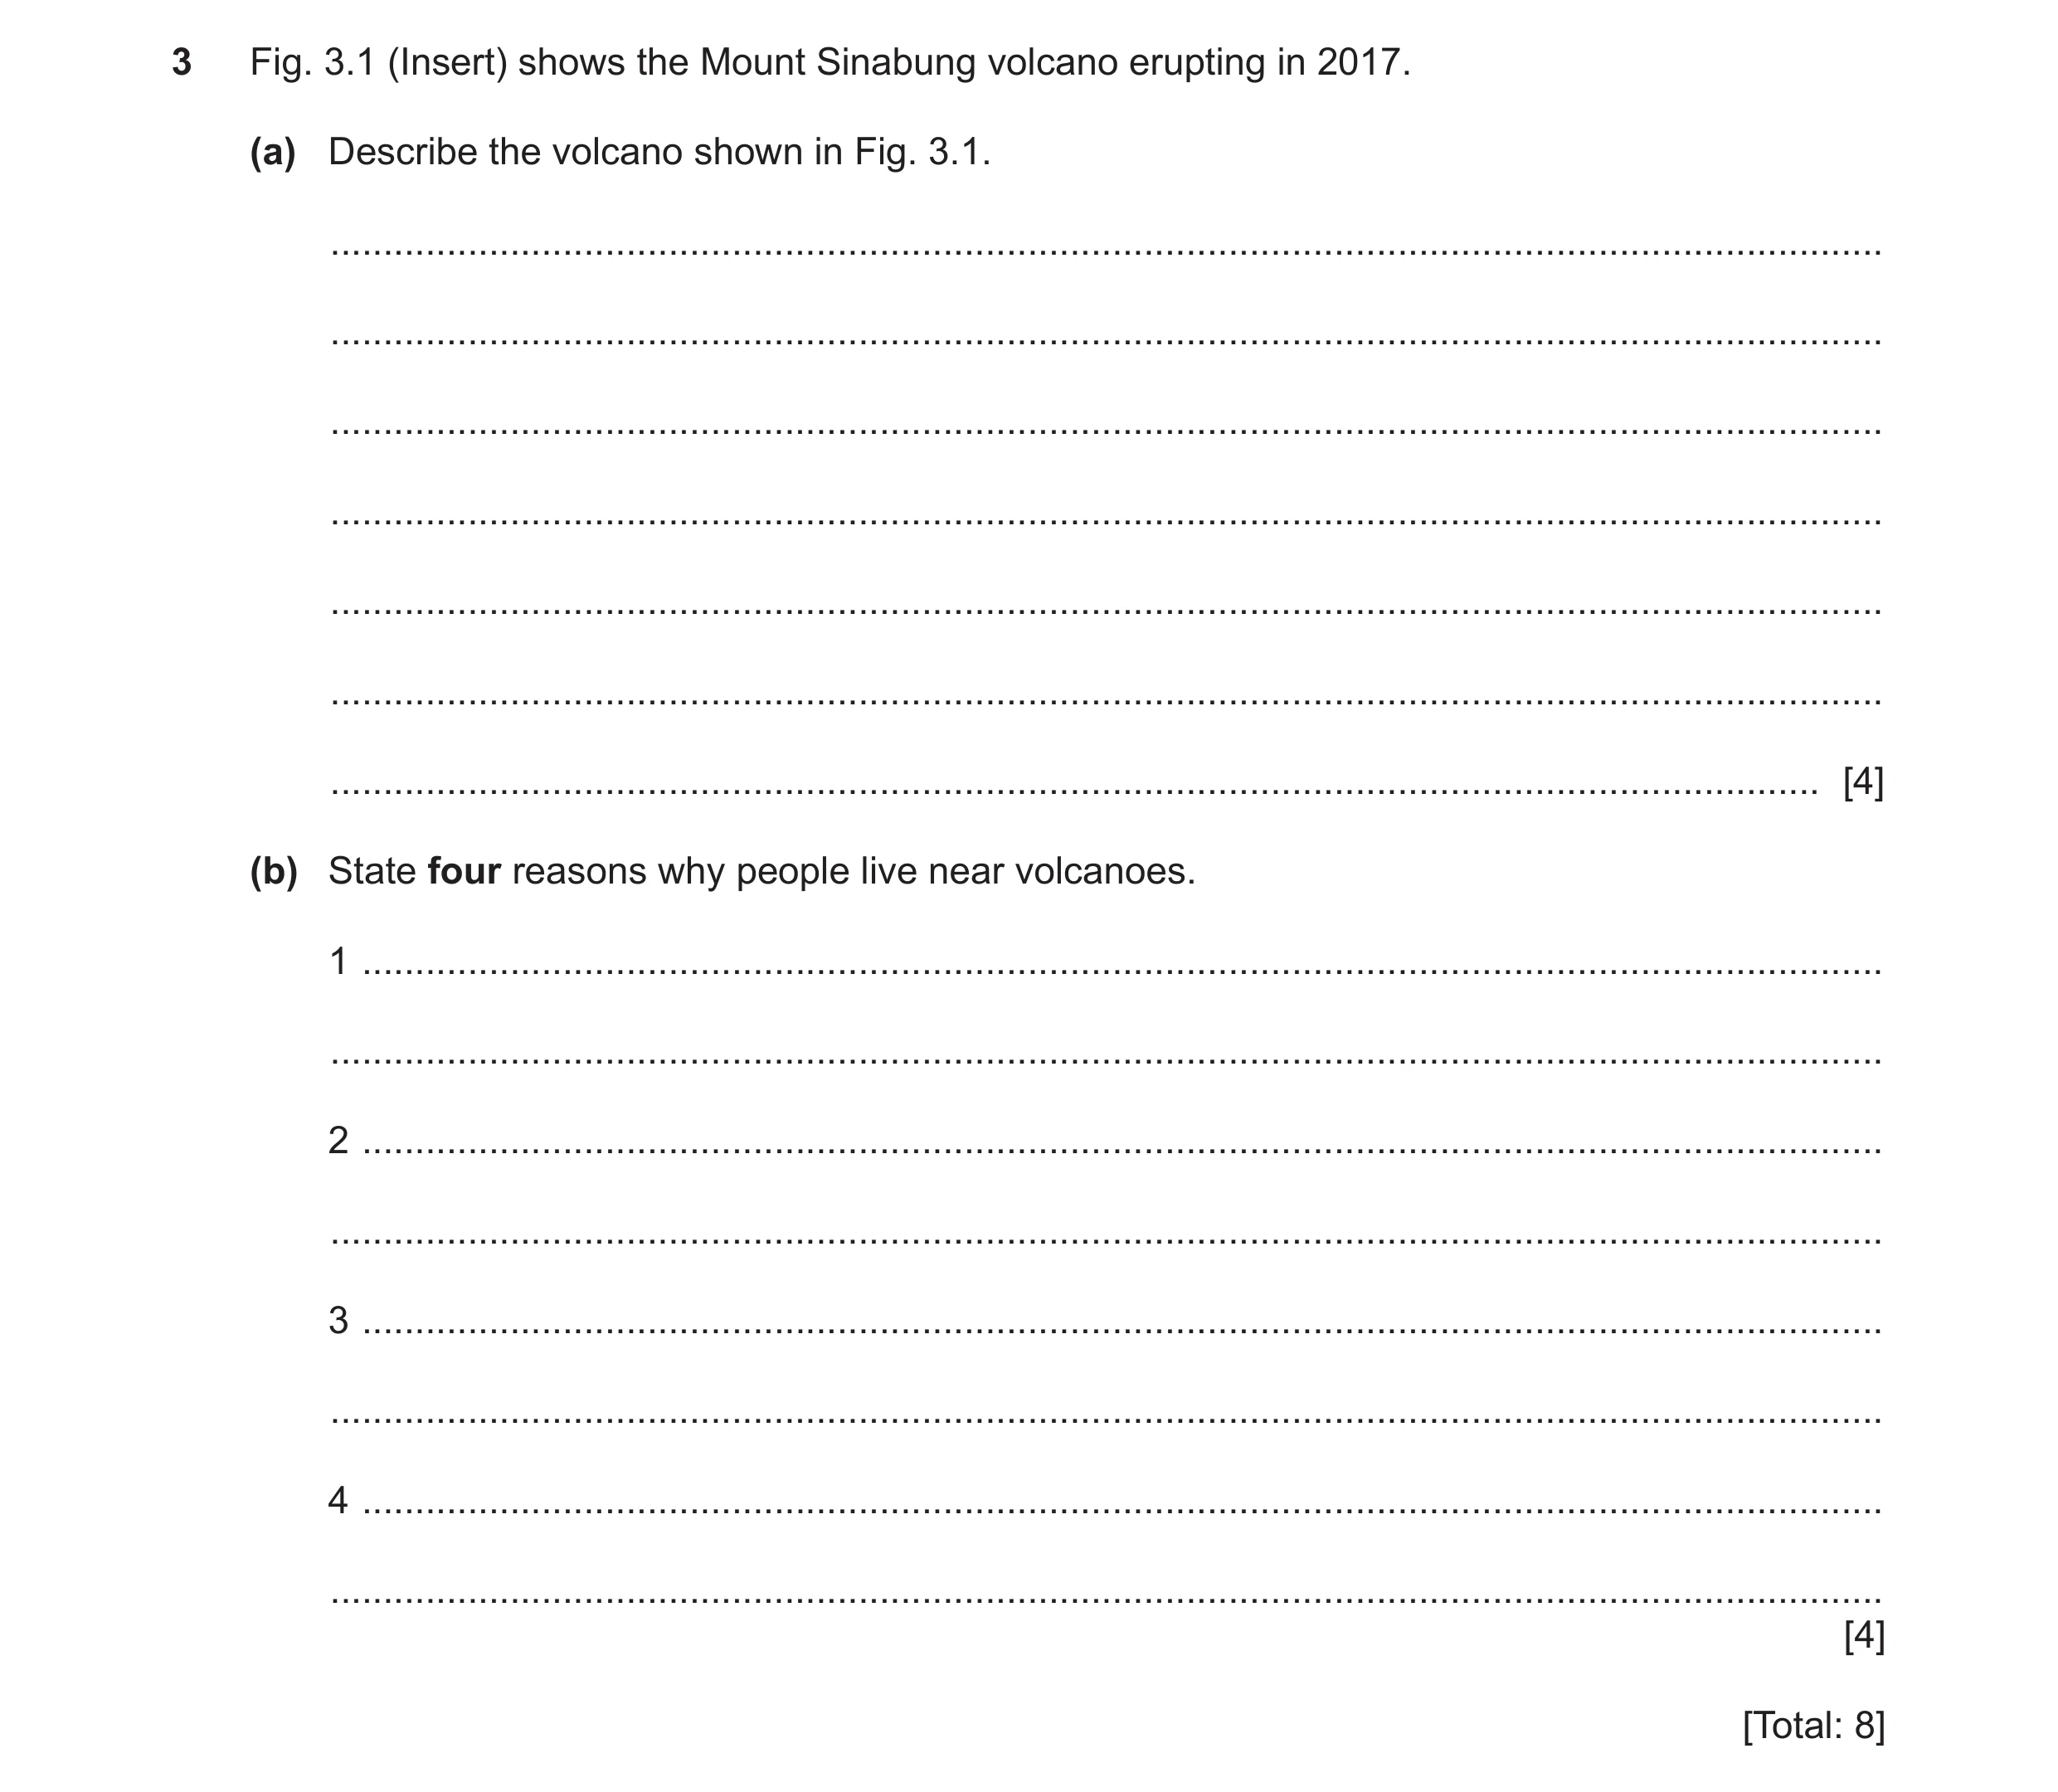
3 Fig. 3.1 (Insert) shows the Mount Sinabung volcano erupting in 2017. (a) Describe the volcano shown in Fig. 3.1. … … … … … … … [4] (b) State four reasons why people live near volcanoes. 1 … … 2 … … 3 … … 4 … … [4] [Total: 8]
8 marks
Mark scheme: 3(a) Cone/conical; 4 Steep sided/tall/high; Concave slopes/steeper at top than at the bottom; (Vertical) ash/gas cloud/smoke/steam; (smoke containing ash = 1) (From) crater; Wide base; Covered in ash/ash layers/rivers of ash/grey slopes; Bare/barren slopes; Some vegetation on lower slopes; Stratovolcano/composite volcano; (composite cone = 2) Active/currently erupting. ‘Grey/ash’ on its own = 1; Max. 2 for ash overall (air borne ash and deposited ash). 3(b) Fertile soils; 4 Scientists/to study the volcano; Earn/jobs/economic benefits from tourism; (accept ‘jobs in hospitality’) Lived there all their lives/used to living there/family/friends there; Can’t afford to move; Spiritual connection to the volcano/sentimental attachment/religious beliefs; Trust predictions/warning systems; Familiar with evacuation procedures/know what to do in the event of an eruption; Shelters available; Not erupted for a long time/think it won’t erupt; Geothermal power/hot water supply, heating/hot springs; Mining minerals/extraction of raw materials/precious stones or example, such as diamonds; Sulphur used for fertilisers/matches; Volcanic rocks are used for building materials; Scenic; Cheaper houses/land. Too vague: Too far to move to somewhere safe; Difficult to move; Cultural attraction; Feel safe. ‘Tourist attraction’ on its own; Pull factors.
This question in 0460/22 Feb/March 2023
Q23 · Information about the total number of global deaths from natural hazards between 1900 and… 0460/22 Oct/Nov 2023
5 Fig. 5.1 shows information about the total number of global deaths from natural hazards between 1900 and 2019. 4 3.5 3 2.5 total deaths 2 (million) 1.5 1 0.5 0 1900 1920 1940 1960 1980 2000 2019 year Fig. 5.1 (a) Using evidence from Fig. 5.1 only, describe the pattern of global deaths from natural hazards between 1900 and 2019. Do not use statistics in your answer. … … … … … … … … [4] (b) Fig. 5.2 (Insert), shows the global distribution of deaths from natural hazards in 2017. Using Fig. 5.2, describe the global distribution of deaths from natural hazards. You may use statistics in your answer. … … … … … … … … [4] [Total: 8]
8 marks
Mark scheme: 5(a) • Vary / fluctuates / increase and decrease / uneven / not consistent / no 4 relationship between years and number of deaths; • 2 or 7 peaks; • Most / largest peaks / deaths 1920’s to 1960’s / highest between 1920 and 1965; • Most / largest peak in 1931; (allow 1930 or 1931) • Declining over time / less deaths in 2019 than 1900; • No major peaks / small peaks / stayed low / fewer deaths / declined / slowed down since 1966 / 1970’s; • Most years had few deaths; • Lowest 2011 / 12–2019. 5(b) • Uneven distribution; 4 • High / highest / higher / more number of deaths in the Northern hemisphere / low / lowest / lower / fewer in Southern Hemisphere; • High(est) number / concentration / 500 to 10 000 in Asia / Asia is the only continent with 1000–10 000 deaths; • Highest in S / SW Asia / 1000–10 000 deaths in S / SW Asia; • High rate / second highest concentration in N. America / 100–1000 in North America; • Most countries have a low number of deaths / higher deaths in a small number of countries / large areas with 0–50 / below 50; • Low(est) / lower / less / least / few deaths / 0–50 / below 50 in Europe / Africa / South America / Australasia; • High rates / 500–1000 in Central Africa / along the Equator in Africa.
This question in 0460/22 Oct/Nov 2023
Q24 · A map of part of South America, showing some of the main active volcanoes in Chile 0460/21 May/June 2024
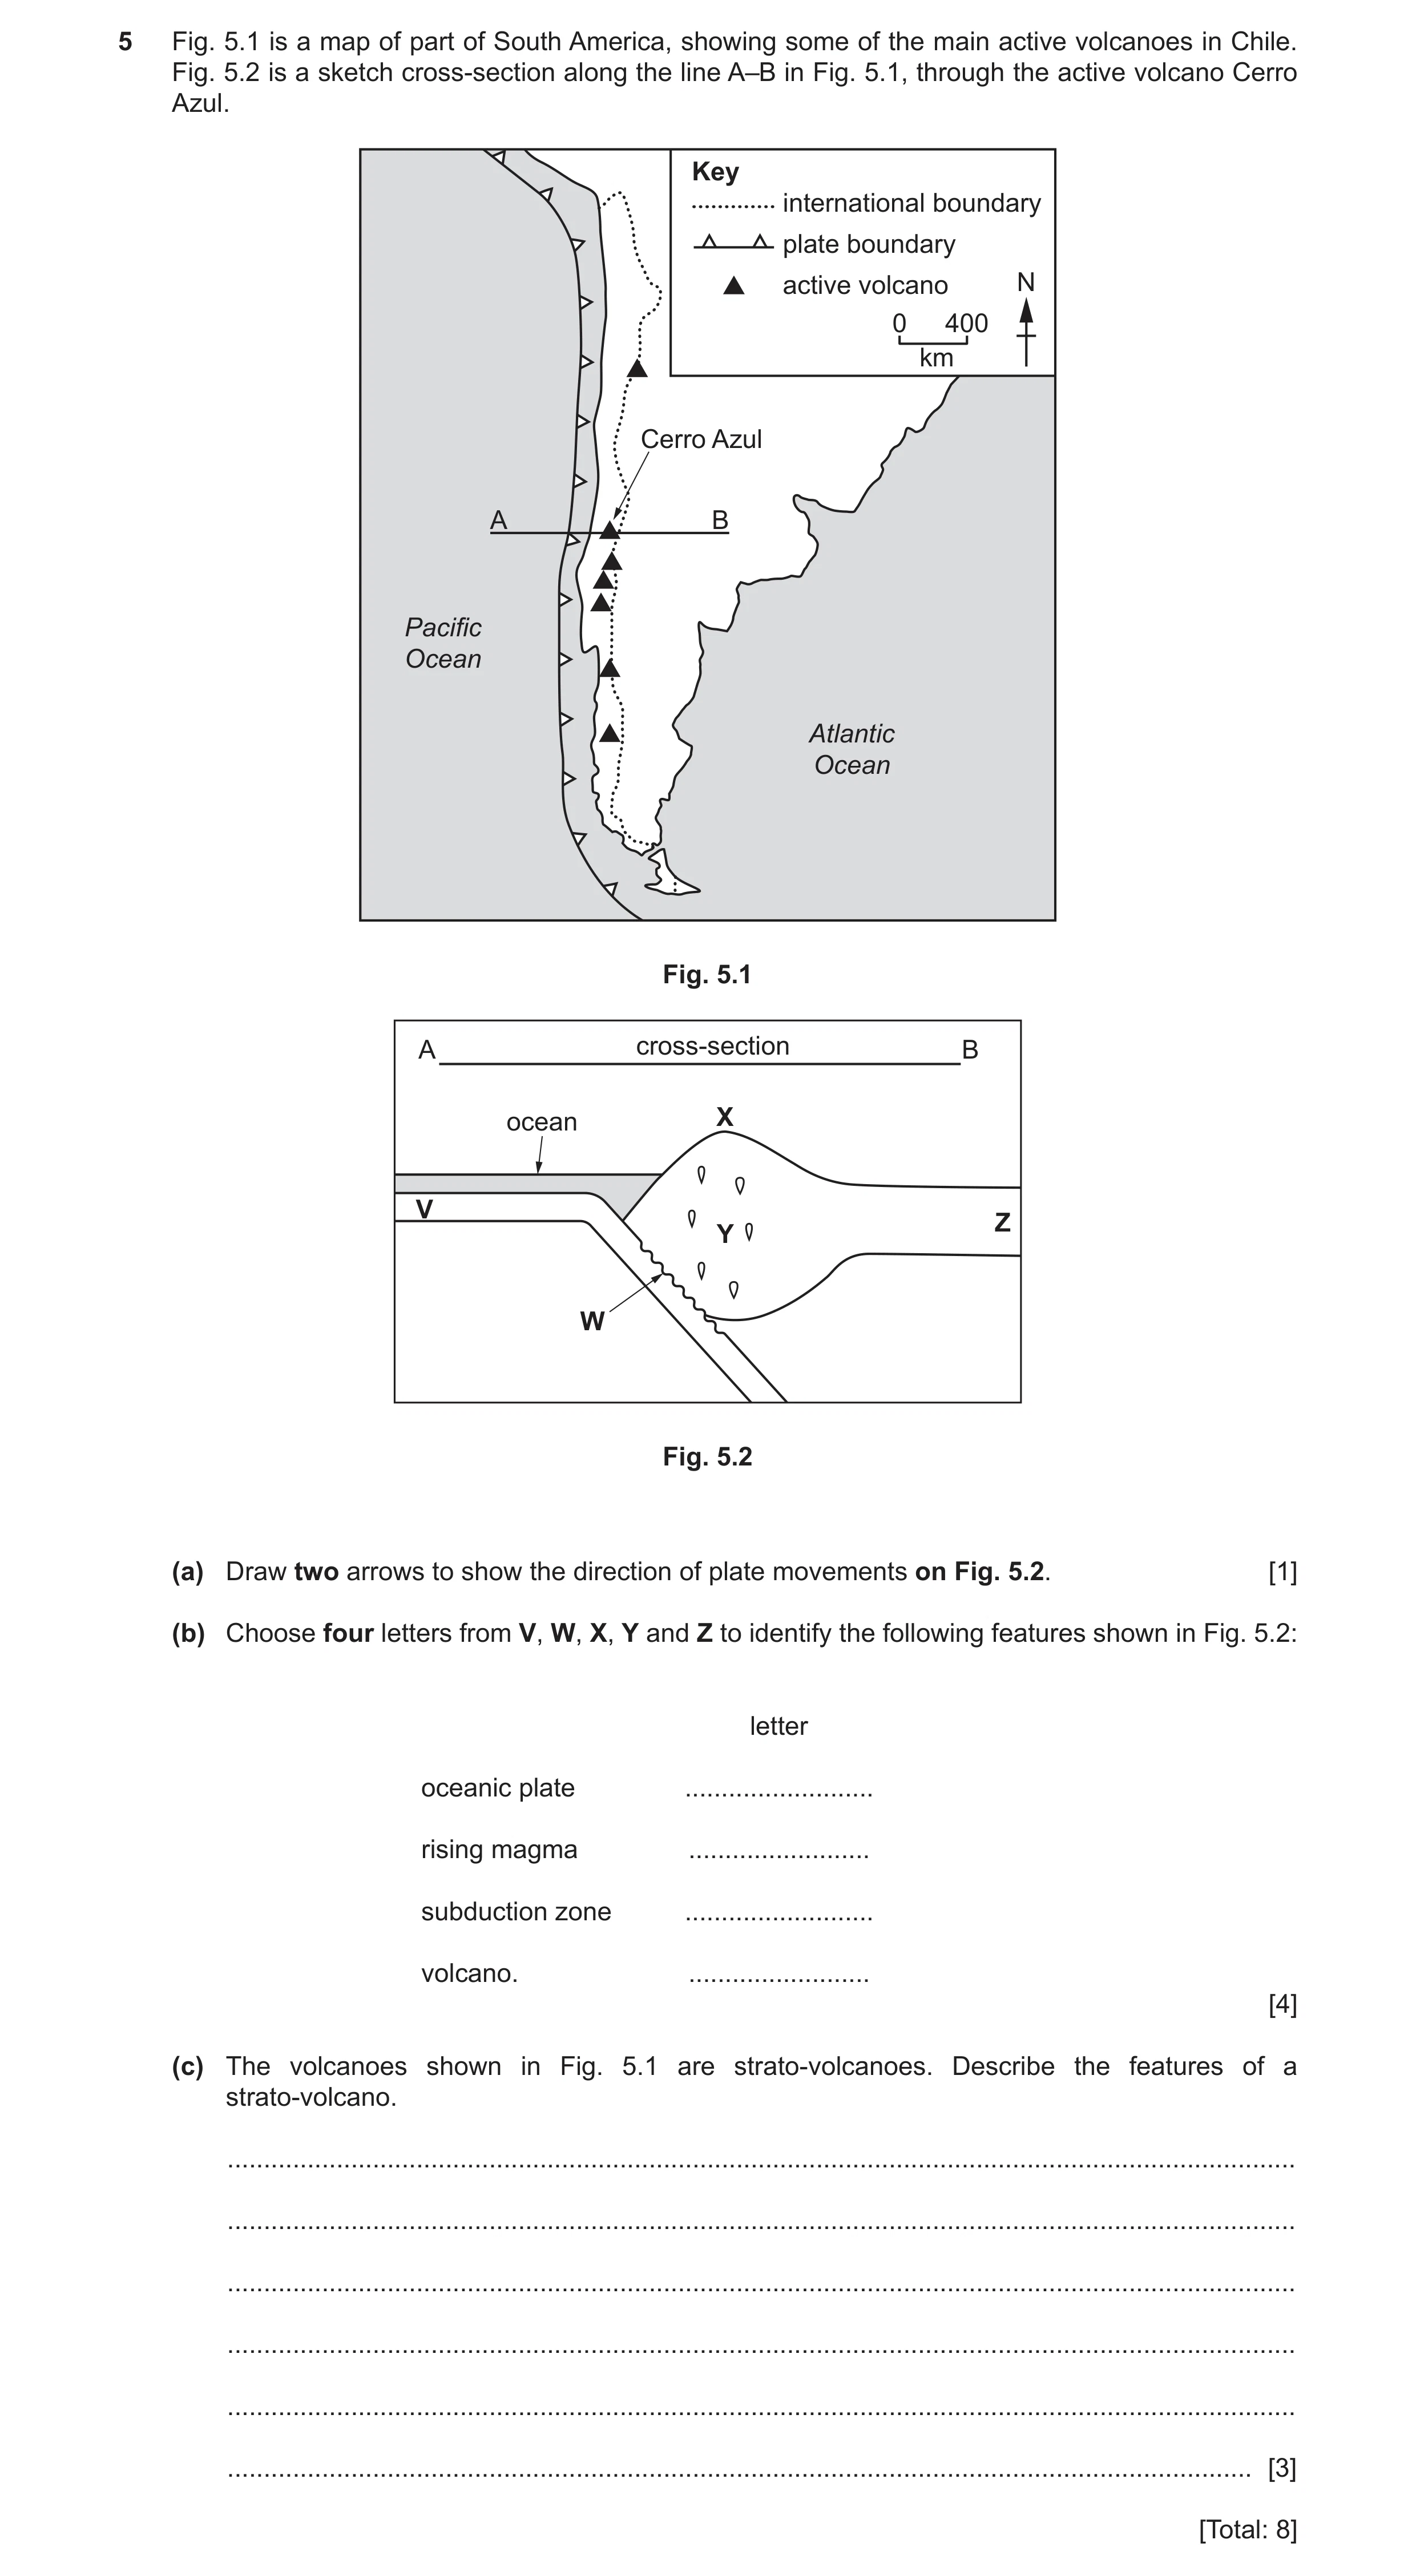
5 Fig. 5.1 is a map of part of South America, showing some of the main active volcanoes in Chile. Fig. 5.2 is a sketch cross-section along the line A–B in Fig. 5.1, through the active volcano Cerro Azul. Key international boundary plate boundary active volcano N 0 400 km Cerro Azul A B Pacific Ocean Atlantic Ocean Fig. 5.1 A cross-section B ocean X V Z Y W Fig. 5.2 (a) Draw two arrows to show the direction of plate movements on Fig. 5.2. [1] (b) Choose four letters from V, W, X, Y and Z to identify the following features shown in Fig. 5.2: letter oceanic plate … rising magma … subduction zone … volcano. … [4] (c) The volcanoes shown in Fig. 5.1 are strato-volcanoes. Describe the features of a strato-volcano. … … … … … … [3] [Total: 8]
8 marks
Mark scheme: 5(a) Two converging arrows. 1 Arrows can be drawn anywhere on Fig. 5.2 (allow on 5.1). Allow horizontal arrow on RH side and oblique arrow on LH side (following the line of subduction). 5(b) V – oceanic plate 4 Y – rising magma W – subduction zone X – volcano 5(c) Layers of lava and ash; 3 Conical/cone/concave; Steep (sides); Crater; Parasitic/secondary cones; Violent/high pressure eruptions/explosive/explosive lava; Dormant phases; Subject to landslides; Viscous/thick/slow-moving lava; Pyroclastics/ ash clouds/gas; Volcanic bombs; Lahars/mudflows/mudslides.
This question in 0460/21 May/June 2024
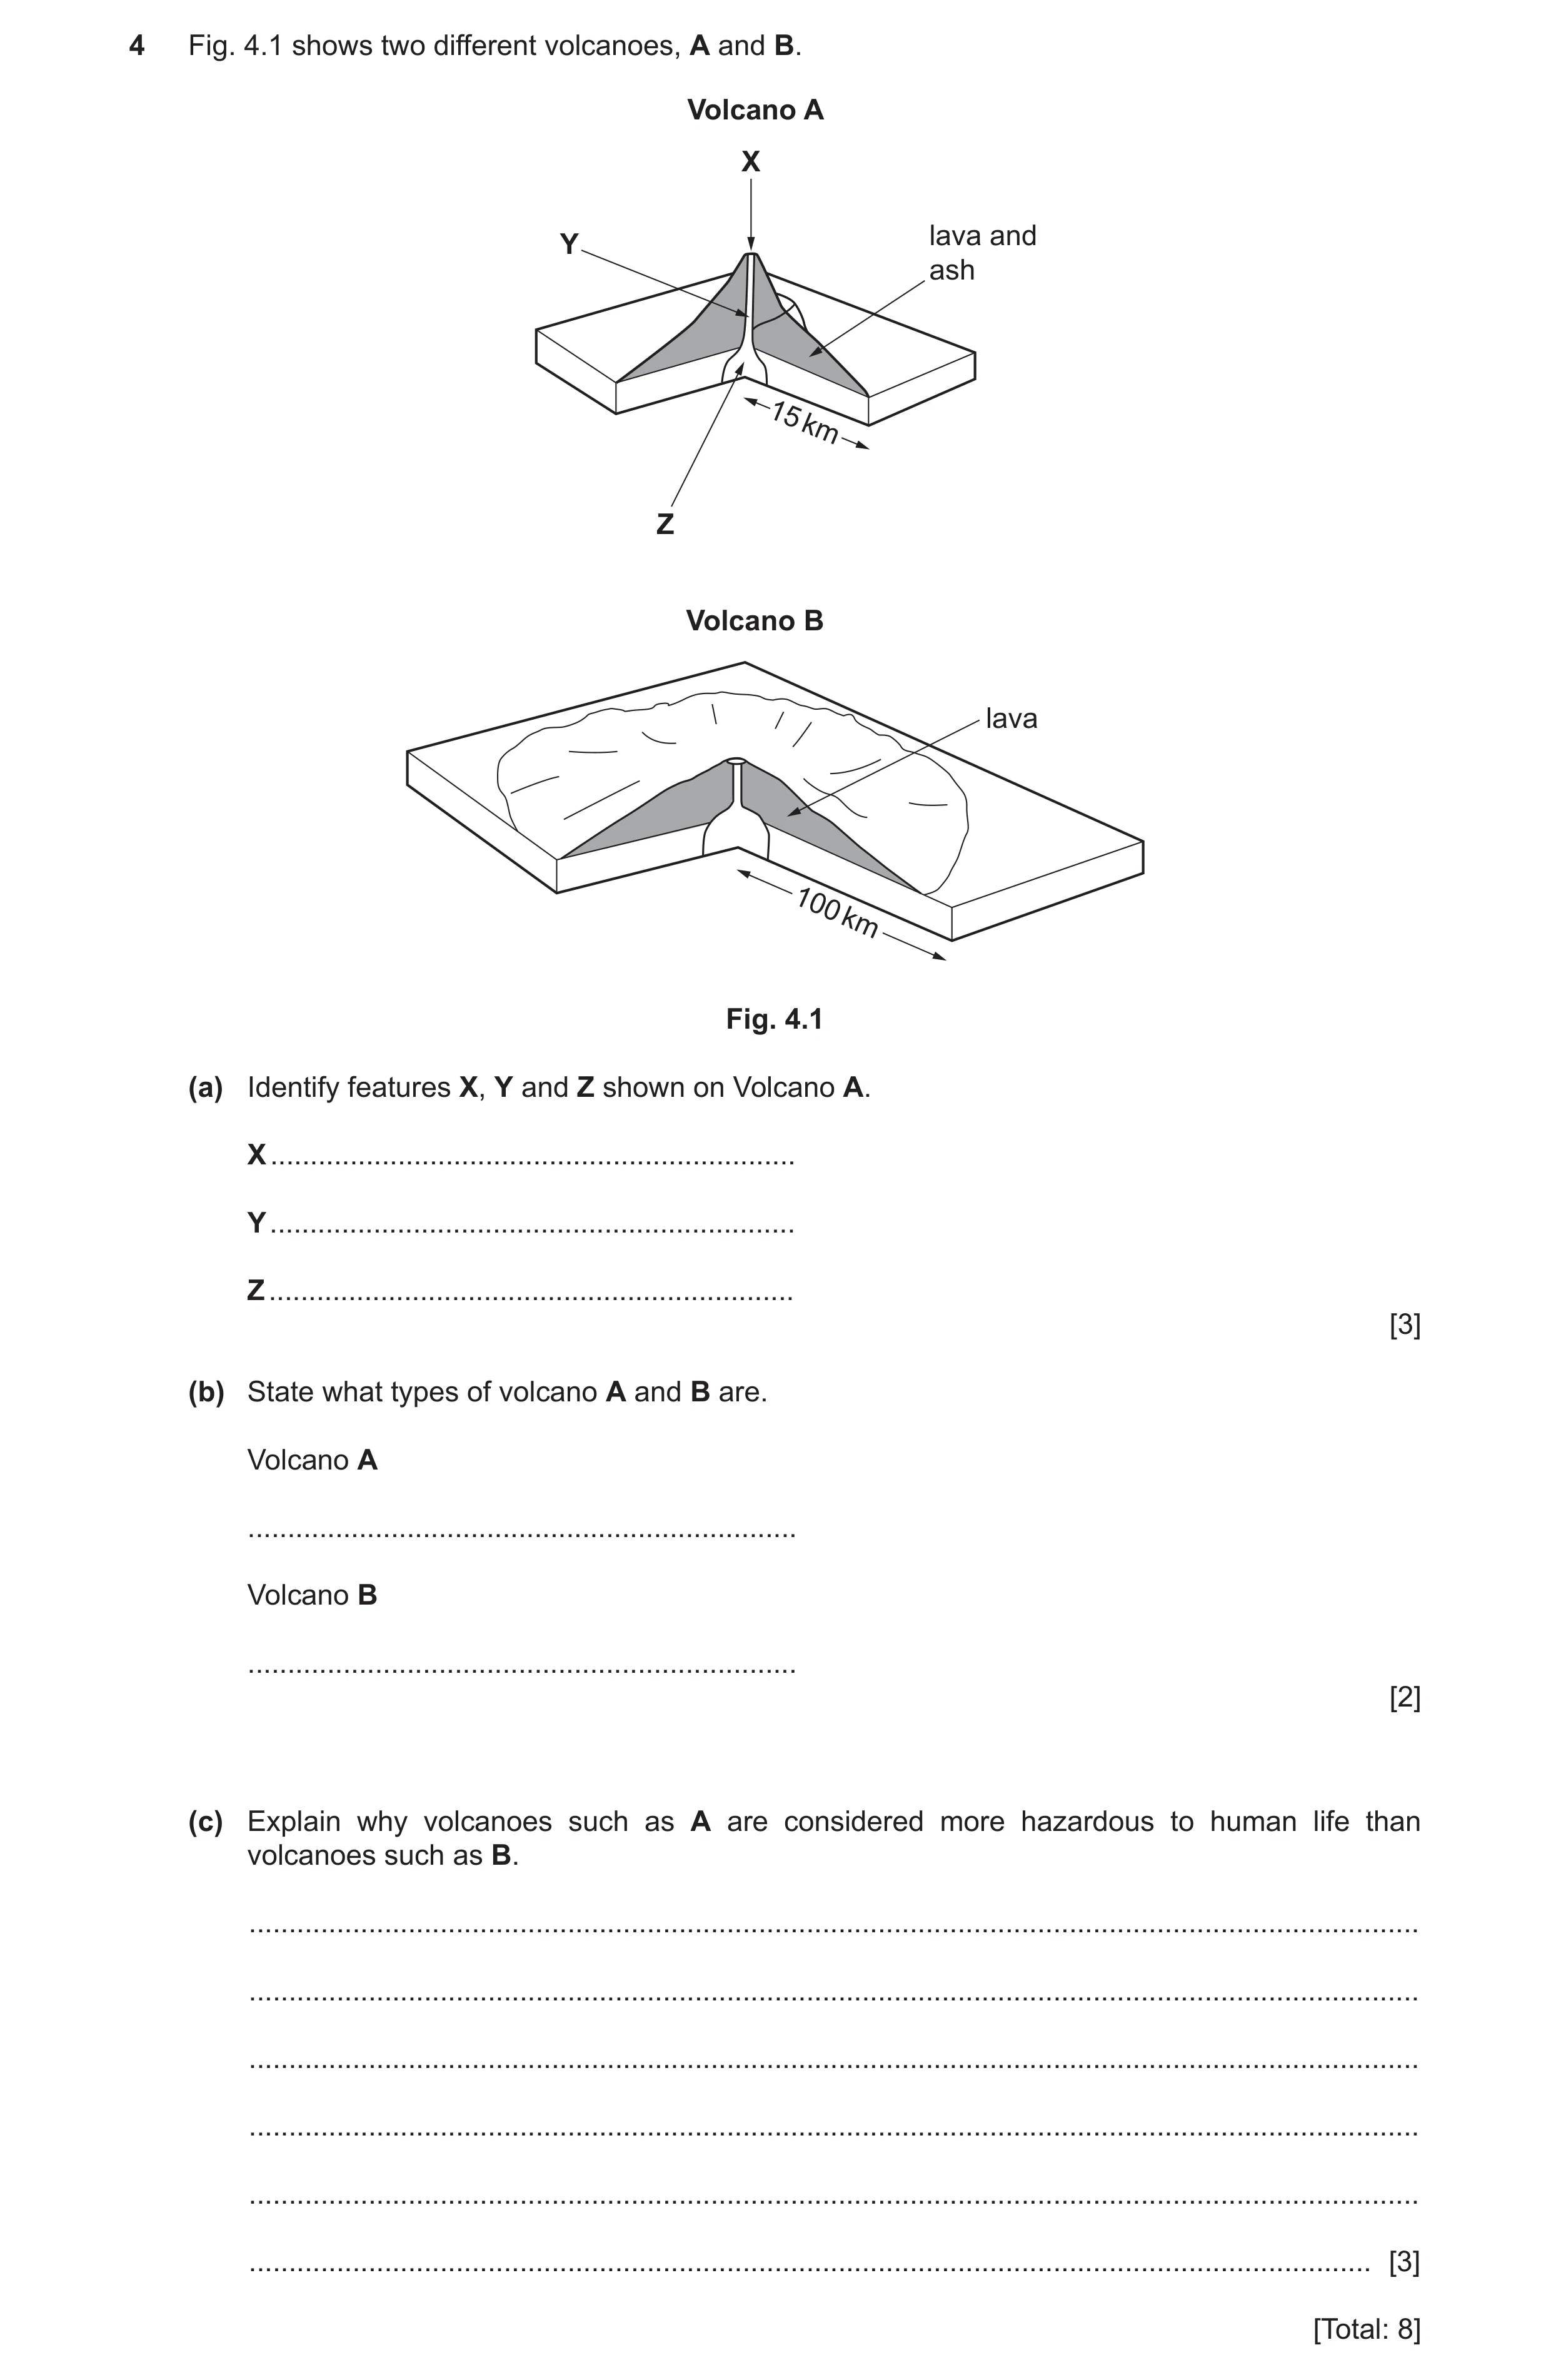
Q25 · Two different volcanoes, A and B 0460/22 May/June 2024
4 Fig. 4.1 shows two different volcanoes, A and B. Volcano A X lava and Y ash 15 km Z Volcano B lava 100 km Fig. 4.1 (a) Identify features X, Y and Z shown on Volcano A. X … Y … Z … [3] (b) State what types of volcano A and B are. Volcano A … Volcano B … [2] (c) Explain why volcanoes such as A are considered more hazardous to human life than volcanoes such as B. … … … … … … [3] [Total: 8]
8 marks
Mark scheme: 4(a) X = crater 3 Y = vent/pipe/conduit Z = magma chamber 4(b) A stratovolcano/composite/cinder cone 2 B shield volcano 4(c) A – unpredictable/B – continuous eruption; 3 A – violent/explosive (eruptions)/greater blast/materials ejected with greater pressure B – non-violent/gentle; A – ejects more/a lot of/heavy ash/or ejects ash which can cause respiratory problems/burial; A – lateral blasts; A – nuée ardente/cloud of gas and ash/incandescent clouds/poisonous or toxic or dangerous gases/pyroclastic flow/(difficult to outrun/escape); A – (the explosive nature melts snow and can) cause lahars or mudflows; A – ejects (volcanic/lava) bombs (which can kill people); A – steeper so landslides more likely; A – has parasitic or secondary cones which can erupt in different directions. Note: No need to compare both A and B. If not stated, assume candidate is talking about A.
This question in 0460/22 May/June 2024
Question 26 0460/21 Oct/Nov 2024
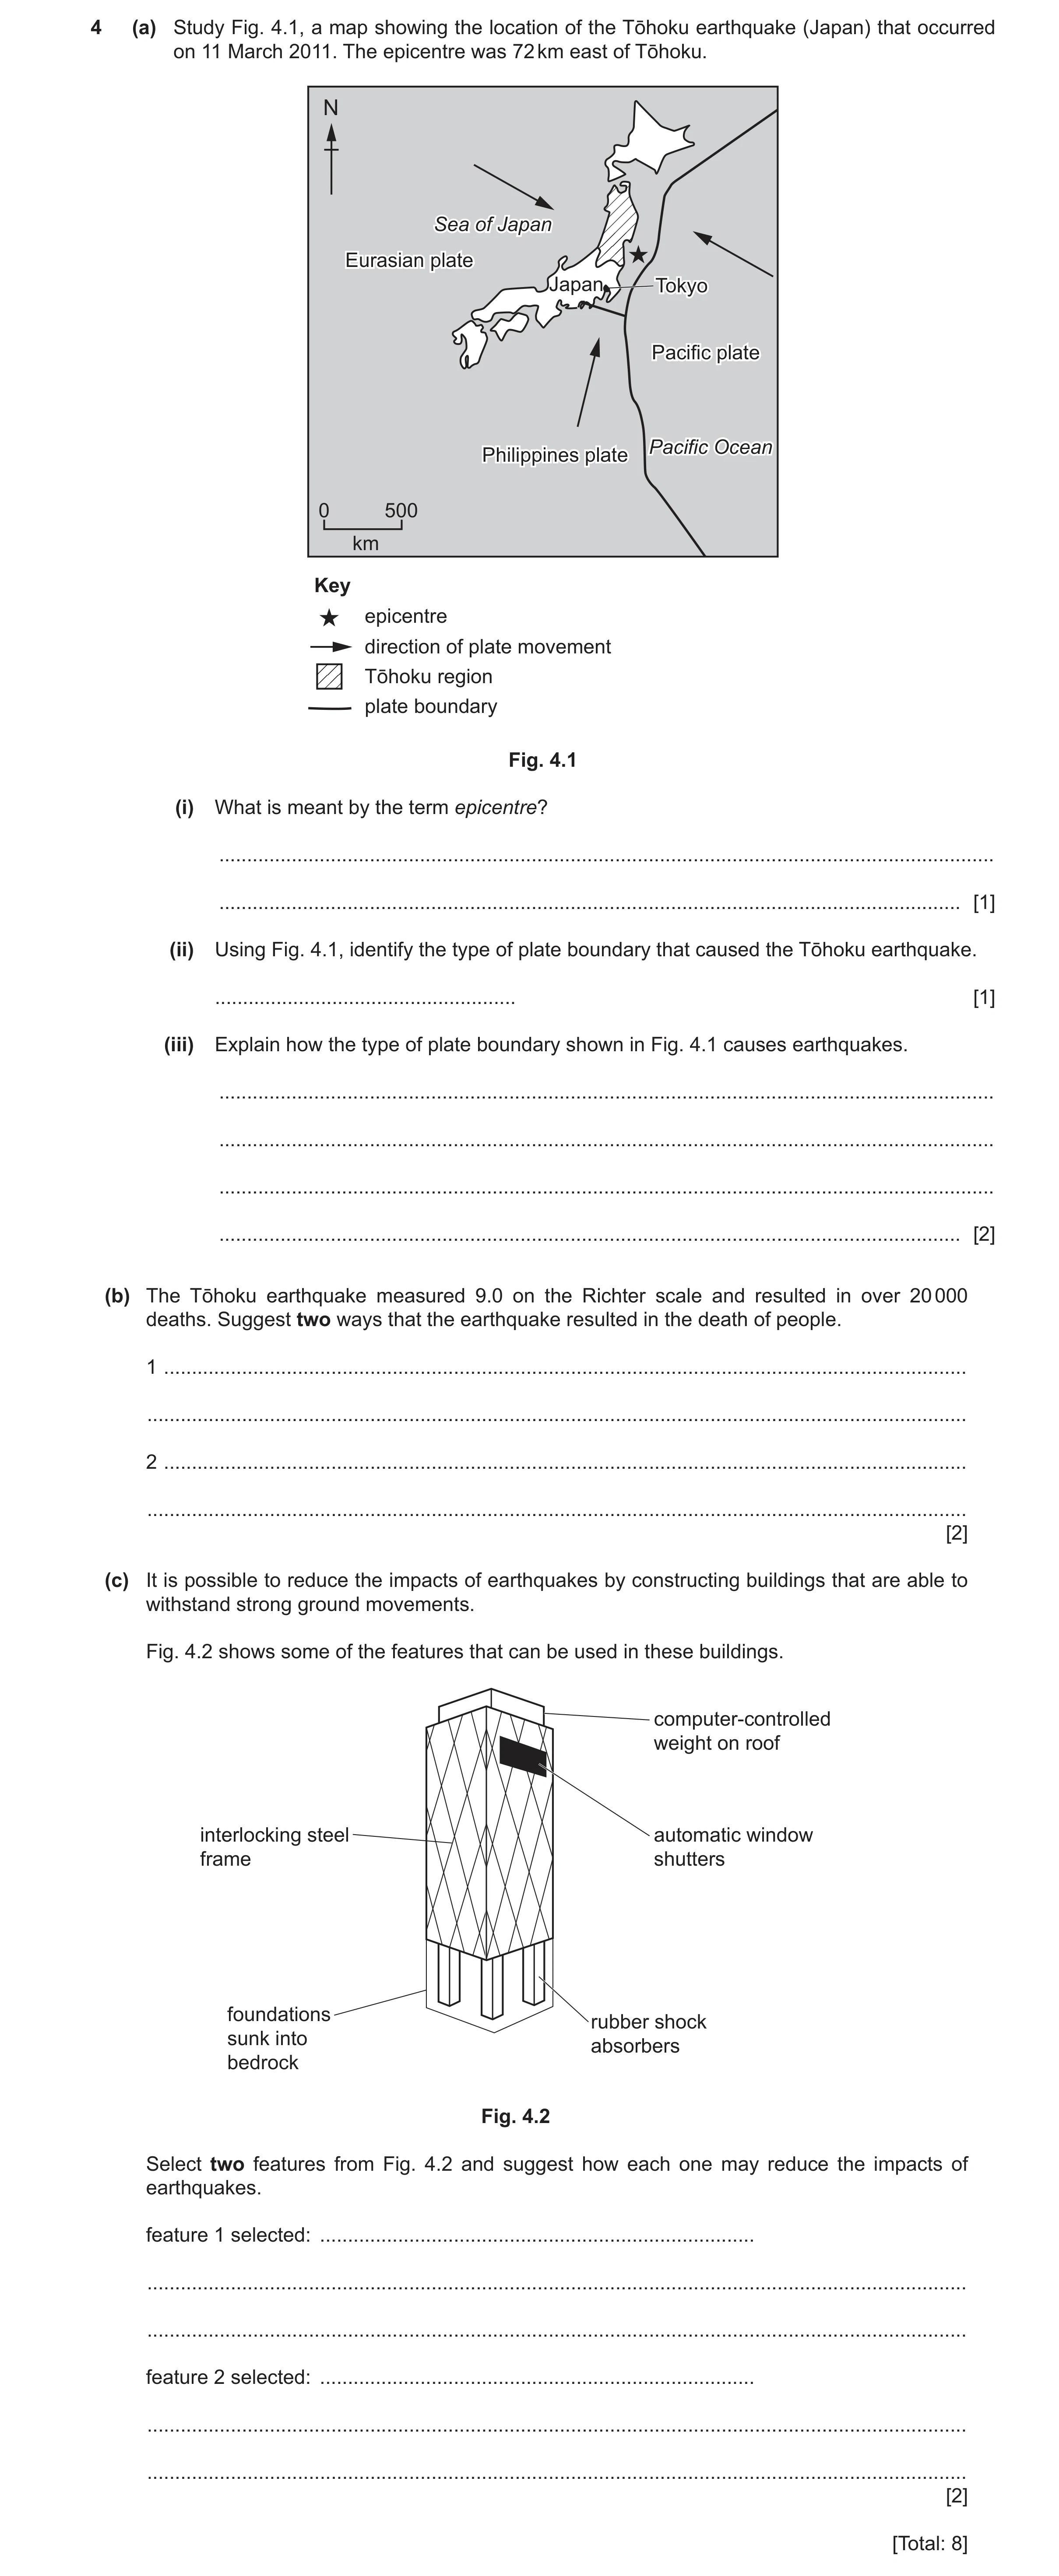
4 (a) Study Fig. 4.1, a map showing the location of the Tōhoku earthquake (Japan) that occurred on 11 March 2011. The epicentre was 72 km east of Tōhoku. N SeaSea ofof JapanJapan EurasianEurasian plateplate Japan TokyoTokyo PacificPacific plateplate PacificPacific OceanOcean PhilippinesPhilippines plateplate 0 500 km Key epicentre direction of plate movement Tōhoku region plate boundary Fig. 4.1 (i) What is meant by the term epicentre? … … [1] (ii) Using Fig. 4.1, identify the type of plate boundary that caused the Tōhoku earthquake. … [1] (iii) Explain how the type of plate boundary shown in Fig. 4.1 causes earthquakes. … … … … [2] (b) The Tōhoku earthquake measured 9.0 on the Richter scale and resulted in over 20 000 deaths. Suggest two ways that the earthquake resulted in the death of people. 1 … … 2 … … [2] (c) It is possible to reduce the impacts of earthquakes by constructing buildings that are able to withstand strong ground movements. Fig. 4.2 shows some of the features that can be used in these buildings. computer-controlled weight on roof interlocking steel automatic window frame shutters foundations rubber shock sunk into absorbers bedrock Fig. 4.2 Select two features from Fig. 4.2 and suggest how each one may reduce the impacts of earthquakes. feature 1 selected: … … … feature 2 selected: … … … [2] [Total: 8]
8 marks
Mark scheme: 4(a)(i) The location at the surface of the ground above the focus or origin of an 1 earthquake. NOTE Needs both parts of definition 4(a)(ii) Destructive/convergent 1 4(a)(iii) Plates move towards each other/collide; 2 Heavier oceanic plate forced under/subduction; Friction/plate becomes stuck/movement not smooth; Build-up of pressure/energy/stress; Release of pressure/energy/stress (causing seismic waves). 4(b) Falling/destroyed buildings/houses; 2 Collapse of other named structure e.g. bridge, power line, road, trees; Fire; Breaking glass; Tsunami; Landslides; Gas explosion; Unable to call for/reach medical help. 4(b)(iii) Plates move towards each other/collide; 2 Heavier oceanic plate forced under/subduction; Friction/plate becomes stuck/movement not smooth; Build-up of pressure/energy/stress; Release of pressure/energy/stress (causing seismic waves).
This question in 0460/21 Oct/Nov 2024
Question 27 0460/22 Feb/March 2025
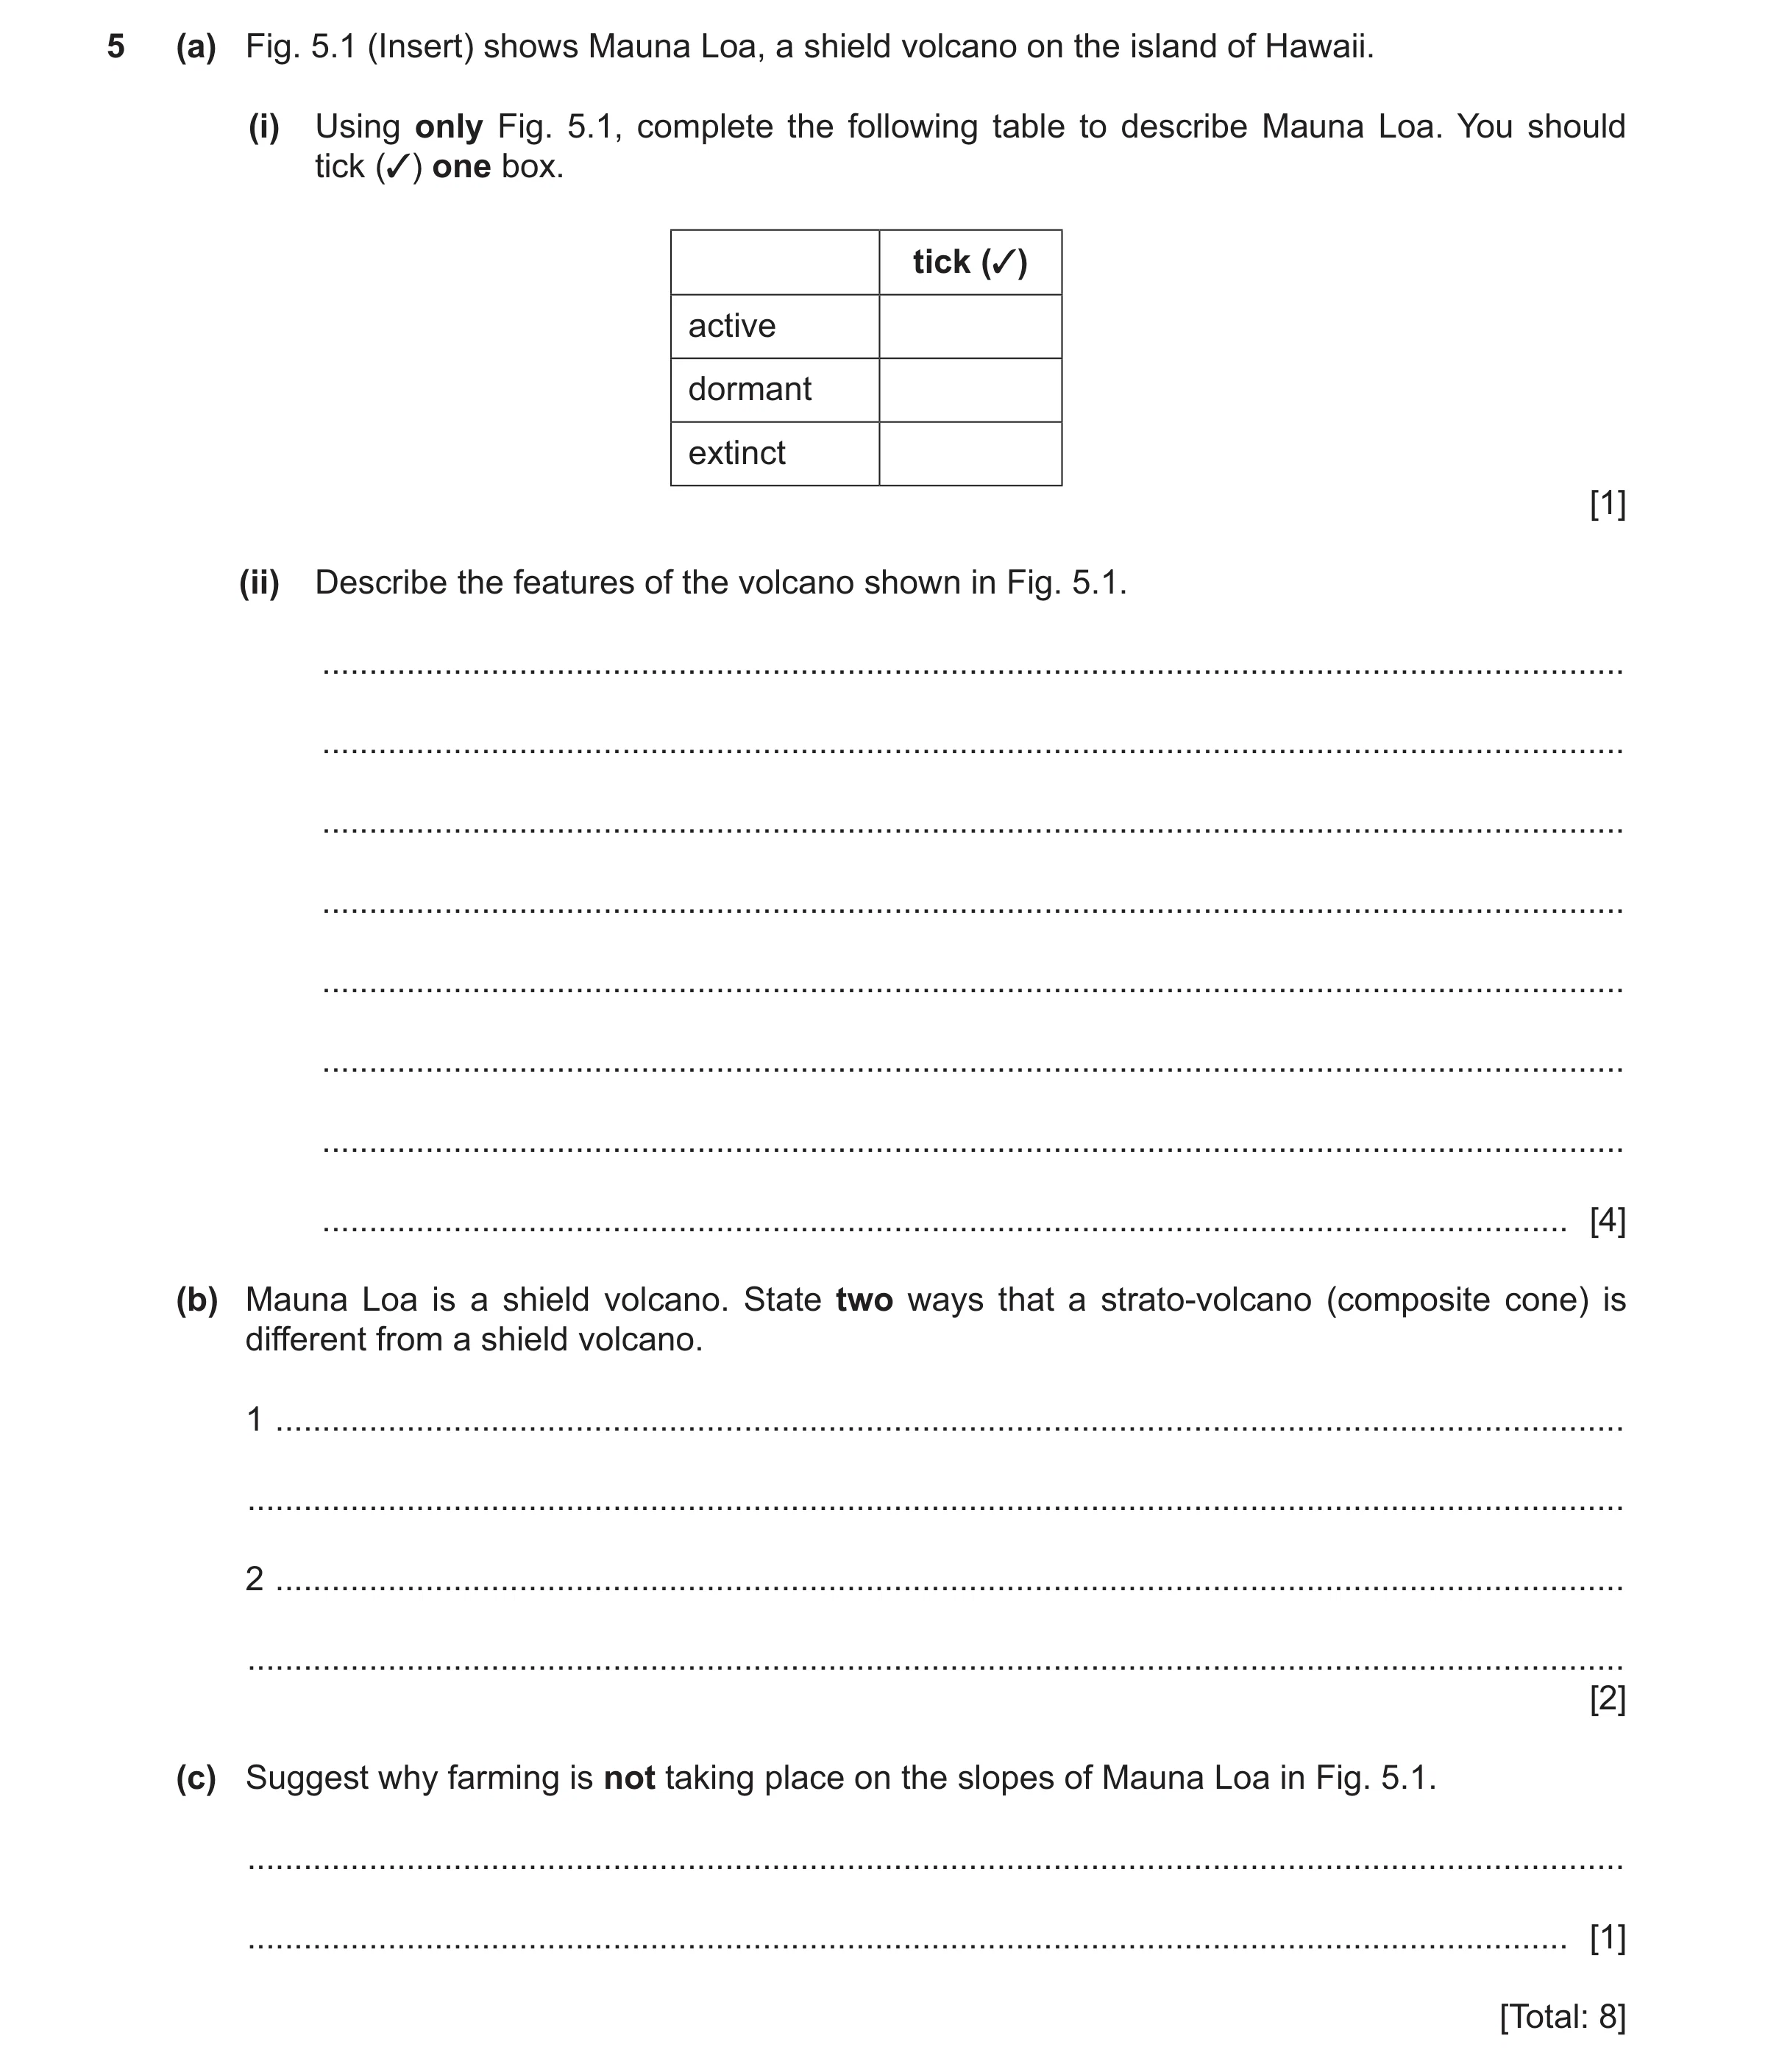
5 (a) Fig. 5.1 (Insert) shows Mauna Loa, a shield volcano on the island of Hawaii. (i) Using only Fig. 5.1, complete the following table to describe Mauna Loa. You should tick (3) one box. tick (3) active dormant extinct [1] (ii) Describe the features of the volcano shown in Fig. 5.1. … … … … … … … … [4] (b) Mauna Loa is a shield volcano. State two ways that a strato-volcano (composite cone) is different from a shield volcano. 1 … … 2 … … [2] (c) Suggest why farming is not taking place on the slopes of Mauna Loa in Fig. 5.1. … … [1] [Total: 8]
8 marks
Mark scheme: 5(a)(i) Active. 1 5(a)(ii) • gentle/gradual slopes; 4 • bare rock/rocky//bare slopes/no vegetation/soil/barren; unused land = 0 • crater/caldera/vents; • secondary/parasitic cone/secondary crater/secondary/side vents; (allow secondary only once) • fissure/cracks; • smoke/steam/gases/fumes; emissions = ^ • ash; (for ‘ash cloud’ allow 1 mark for ash) • lava; • dissected slopes/gullies/ridge; • wide/broad. (ignore ‘base’) = ^ flat. = 0 high, colours, holes, uneven, steep, flat(ter), not very tall, conical, pyroclastic flow, magma, dome. 5(b) Strato-volcano: 2 • is (more) explosive/violent eruption; • has steep(er) sides/gradient; • has a narrower base; • more conical; • unpredictable/less frequent (v continuous eruption); • more prone to landslides; • acidic lava v basaltic/basic lava/alkaline; (needs both sides for credit) • covers a smaller (area); • its lava has greater silica content; • its lava is slower/the viscosity of the lava is great(er)/lava is thick(er)/has viscous/lava; viscous/thick without term lava = ^ • the temperature of its lava is higher; • builds up from layers of ash and lava compared with mainly just lava (shield volcano); • prone to pyroclastic flows/lahars; • ejects lava bombs. Comparison can be from the shield volcano perspective, providing it is made clear. = ^ more dangerous (why?), taller, emits small clouds of gases, narrower top. = 0 lava moves faster, bigger magma chamber, less side vents, smaller crater, emits poisonous gases = 0 (both do!). 5(c) • lava is infertile/ not sufficiently weathered/barren/lacks soil; 1 • the volcano has recently erupted lava; • temperature is too hot; • it’s too dangerous/risky(for farming)/volcano is active/can erupt any time; • some slopes are too steep; • lack of water/slopes won’t hold water; • emissions of ash and smoke unhealthy for crops. = ^ uneven land, too much pollution, rugged.
This question in 0460/22 Feb/March 2025
Question 28 0460/22 May/June 2025
5 (a) Fig. 5.1 (Insert) shows the location of the largest magnitude earthquakes in 2022 together with their depth of focus. Using Fig. 5.1, tick (✓) the three correct statements. tick (✓) Most earthquakes occur on or near to the coast. The earthquakes are equally distributed around the world. The Atlantic and Indian Oceans each have one earthquake. The biggest concentration of earthquakes is in the South Pacific Ocean. The earthquakes with a deep depth of focus all occur on land. The earthquakes with a deep depth of focus have the highest magnitudes. [3] (b) (i) Study Fig. 5.2 (Insert), which shows a weak relationship between magnitude and number of deaths. Use evidence from Fig. 5.2 to support this statement. … … … … [2] (ii) Suggest two reasons why some major earthquakes cause no deaths. 1 … … 2 … … [2] (c) Earthquakes are caused by tectonic plate movement. Tick one box (✓) to show the cause of this movement. cause tick (✓) conduction convection radiation [1] [Total: 8]
8 marks
Mark scheme: 5(a) • (1st) most earthquakes occur on or near to the coast; 3 • (3rd) the Atlantic and Indian Ocean each have one earthquake; • (4th) the biggest concentration of earthquakes is in the South Pacific Ocean. 5(b)(i) Credit any valid statement and/or data that supports a weak relationship; 2 assume that one would expect a strong positive relationship: • number of deaths and magnitude fluctuate; • a positive relationship/correlation in some years but negative in other years; • two peaks for number of deaths but varying magnitude/one shows a high magnitude and the other shows a low magnitude; • two magnitude peaks, one has a high number of deaths and the other has a low number of deaths; • many years have no deaths, but the magnitude varies; • magnitudes have a similar/narrow range, but death rates have a wide variation; • Use of data that shows variation in deaths and/or magnitude. Examples An earthquake with a high magnitude had no deaths = 1 A magnitude of 8 had 0 deaths but a magnitude of 6.2 had 10000 deaths = 1 A magnitude 7 earthquake (in 2010) caused 225 000 deaths whilst one of 9.1 magnitude only caused 25 500 deaths (in 2011). Check data is correct using the following table: allow tolerance of +/-0.1 for magnitude and +/– 5000 for deaths. DATE MAGNITUDE DEATHS 1990 7.4 50000 1991 6.8 0 1992 7.8 0 1993 6.2 10000 1994 6.8 0 1995 6.9 5000 5(b)(i) 2 DATE MAGNITUDE DEATHS 1996 6.6 0 1997 7.2 0 1998 6.6 4000 1999 7.6 15000 2000 7.9 0 2001 7.7 20000 2002 6.1 0 2003 6.6 30000 2004 9.0 230000 2005 7.6 80000 2006 6.3 5000 2007 8.0 0 2008 7.9 85000 2009 7.5 0 2010 7.0 225000 2011 9.1 25500 2012 6.4 0 2013 7.7 0 2014 6.1 0 2015 7.8 7500 2016 7.8 0 2017 7.3 0 2018 7.5 4000 2019 6.4 0 2020 7.0 0 2020 7.0 0 5(b)(ii) • in the sea/away from the land; 2 • earthquake/epicentre away from large areas of population/in unpopulated areas/rural areas/low population density; • earthquakes at deeper depths/deeper focus (so the seismic energy dissipates before reaching the surface); • solid rock can absorb the intensity of shaking; • strong construction methods/earthquake proofing of buildings or examples 1 mark max. 5(c) Convection 1
This question in 0460/22 May/June 2025
Q29 · Two volcanoes, Mount Fuji in Japan and Mauna Loa, in Hawaii, USA 0460/23 May/June 2025
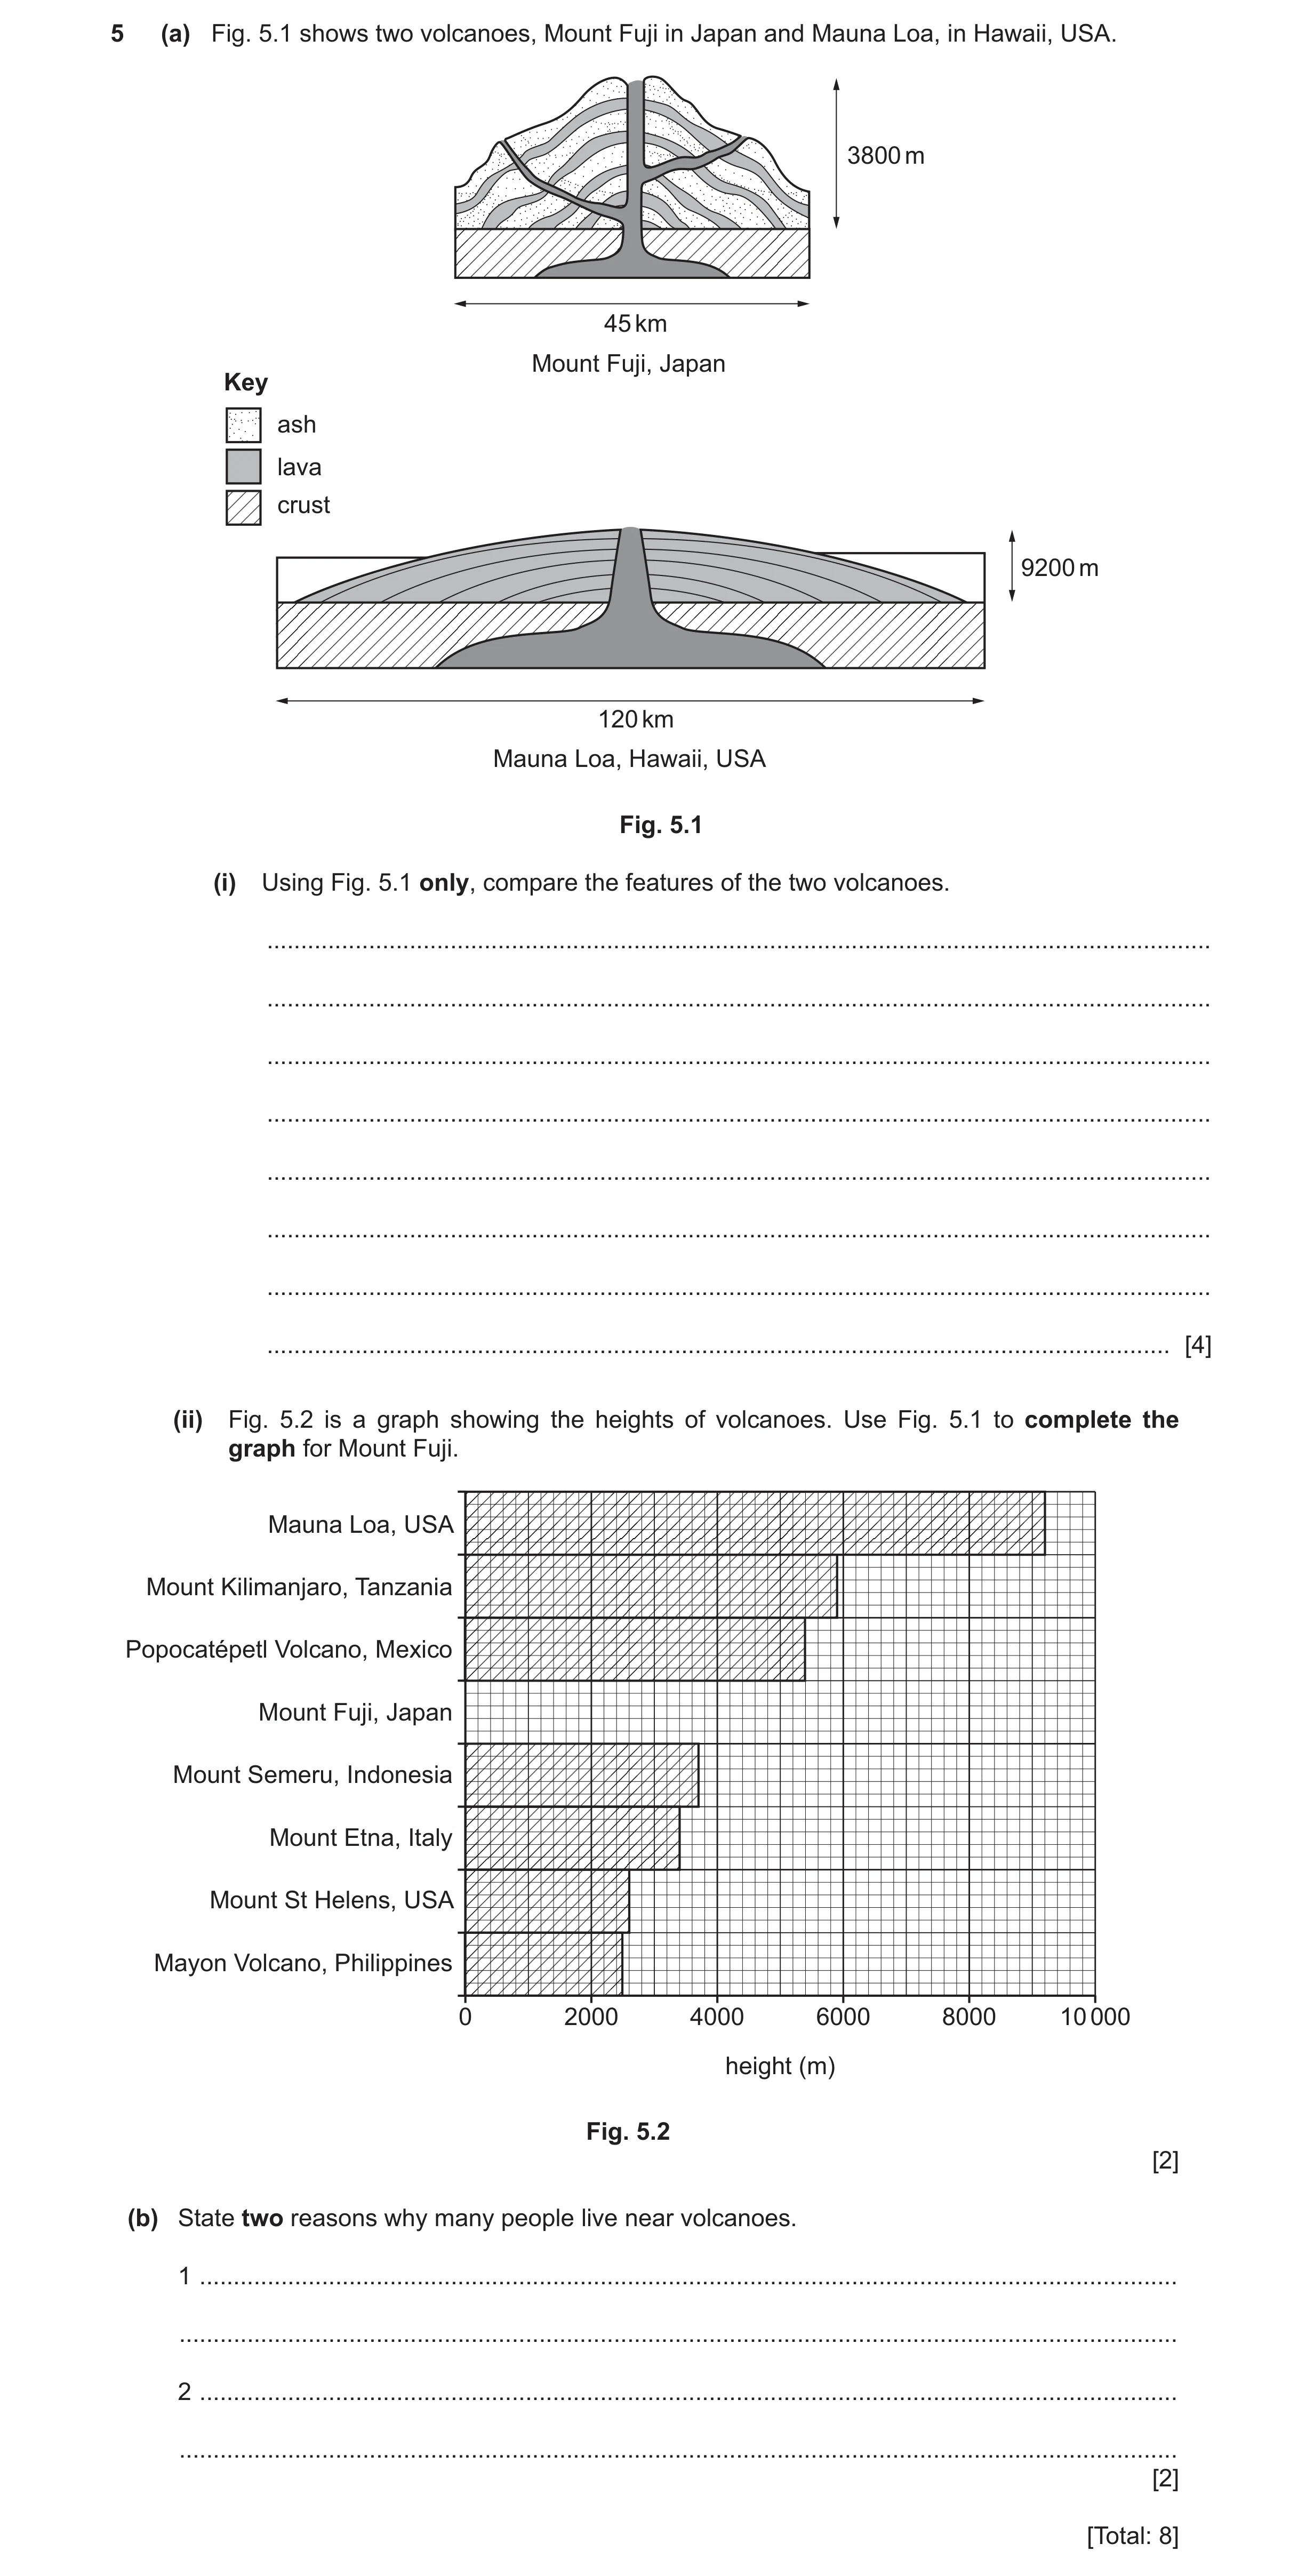
5 (a) Fig. 5.1 shows two volcanoes, Mount Fuji in Japan and Mauna Loa, in Hawaii, USA. 3800 m 45 km Mount Fuji, Japan Key ash lava crust 9200 m 120 km Mauna Loa, Hawaii, USA Fig. 5.1 (i) Using Fig. 5.1 only, compare the features of the two volcanoes. … … … … … … … … [4] (ii) Fig. 5.2 is a graph showing the heights of volcanoes. Use Fig. 5.1 to complete the graph for Mount Fuji. Mauna Loa, USA Mount Kilimanjaro, Tanzania Popocatépetl Volcano, Mexico Mount Fuji, Japan Mount Semeru, Indonesia Mount Etna, Italy Mount St Helens, USA Mayon Volcano, Philippines 0 2000 4000 6000 8000 10 000 height (m) Fig. 5.2 [2] (b) State two reasons why many people live near volcanoes. 1 … … 2 … … [2] [Total: 8]
8 marks
Mark scheme: 5(a)(i) Mount Fuji strato/composite and Mauna Loa shield; 4 Mount Fuji is conical and Mauna Loa is dome-shaped; Mount Fuji steep sides and Mauna Loa gentle sides/Mount Fuji steeper; Mount Fuji narrower/smaller surface area/Mauna Loa wider/larger surface area; Mount Fuji shorter/Mauna Loa taller; Mount Fuji lava and ash and Mauna Loa just lava; Mount Fuji has more layers/Mount Fuji has 10 layers and Mauna Loa has 6 layers; Mount Fuji has more vents/pipes/craters /Mount Fuji has side vents/3 vents/pipes/craters and Mauna Loa no side vents/1 vent/pipe/crater; Mount Fuji smaller magma chamber/Mauna Loa larger magma chamber; Mount Fuji has narrower pipe/vent/Mauna Loa has wider pipe/vent. Note: Must be comparative. 5(a)(ii) Bar drawn at 3800 m 2 Diagonal lines drawn 5(b) Fertile land/good for agriculture; 2 Family and friends live there/always lived there; Rely on warning systems/think it won’t erupt/used to it/extinct; Income/jobs from tourism; Can’t afford to leave; Geothermal power; Hot springs; Minerals/mining; Building materials.
This question in 0460/23 May/June 2025
Question 30 0460/23 Oct/Nov 2025
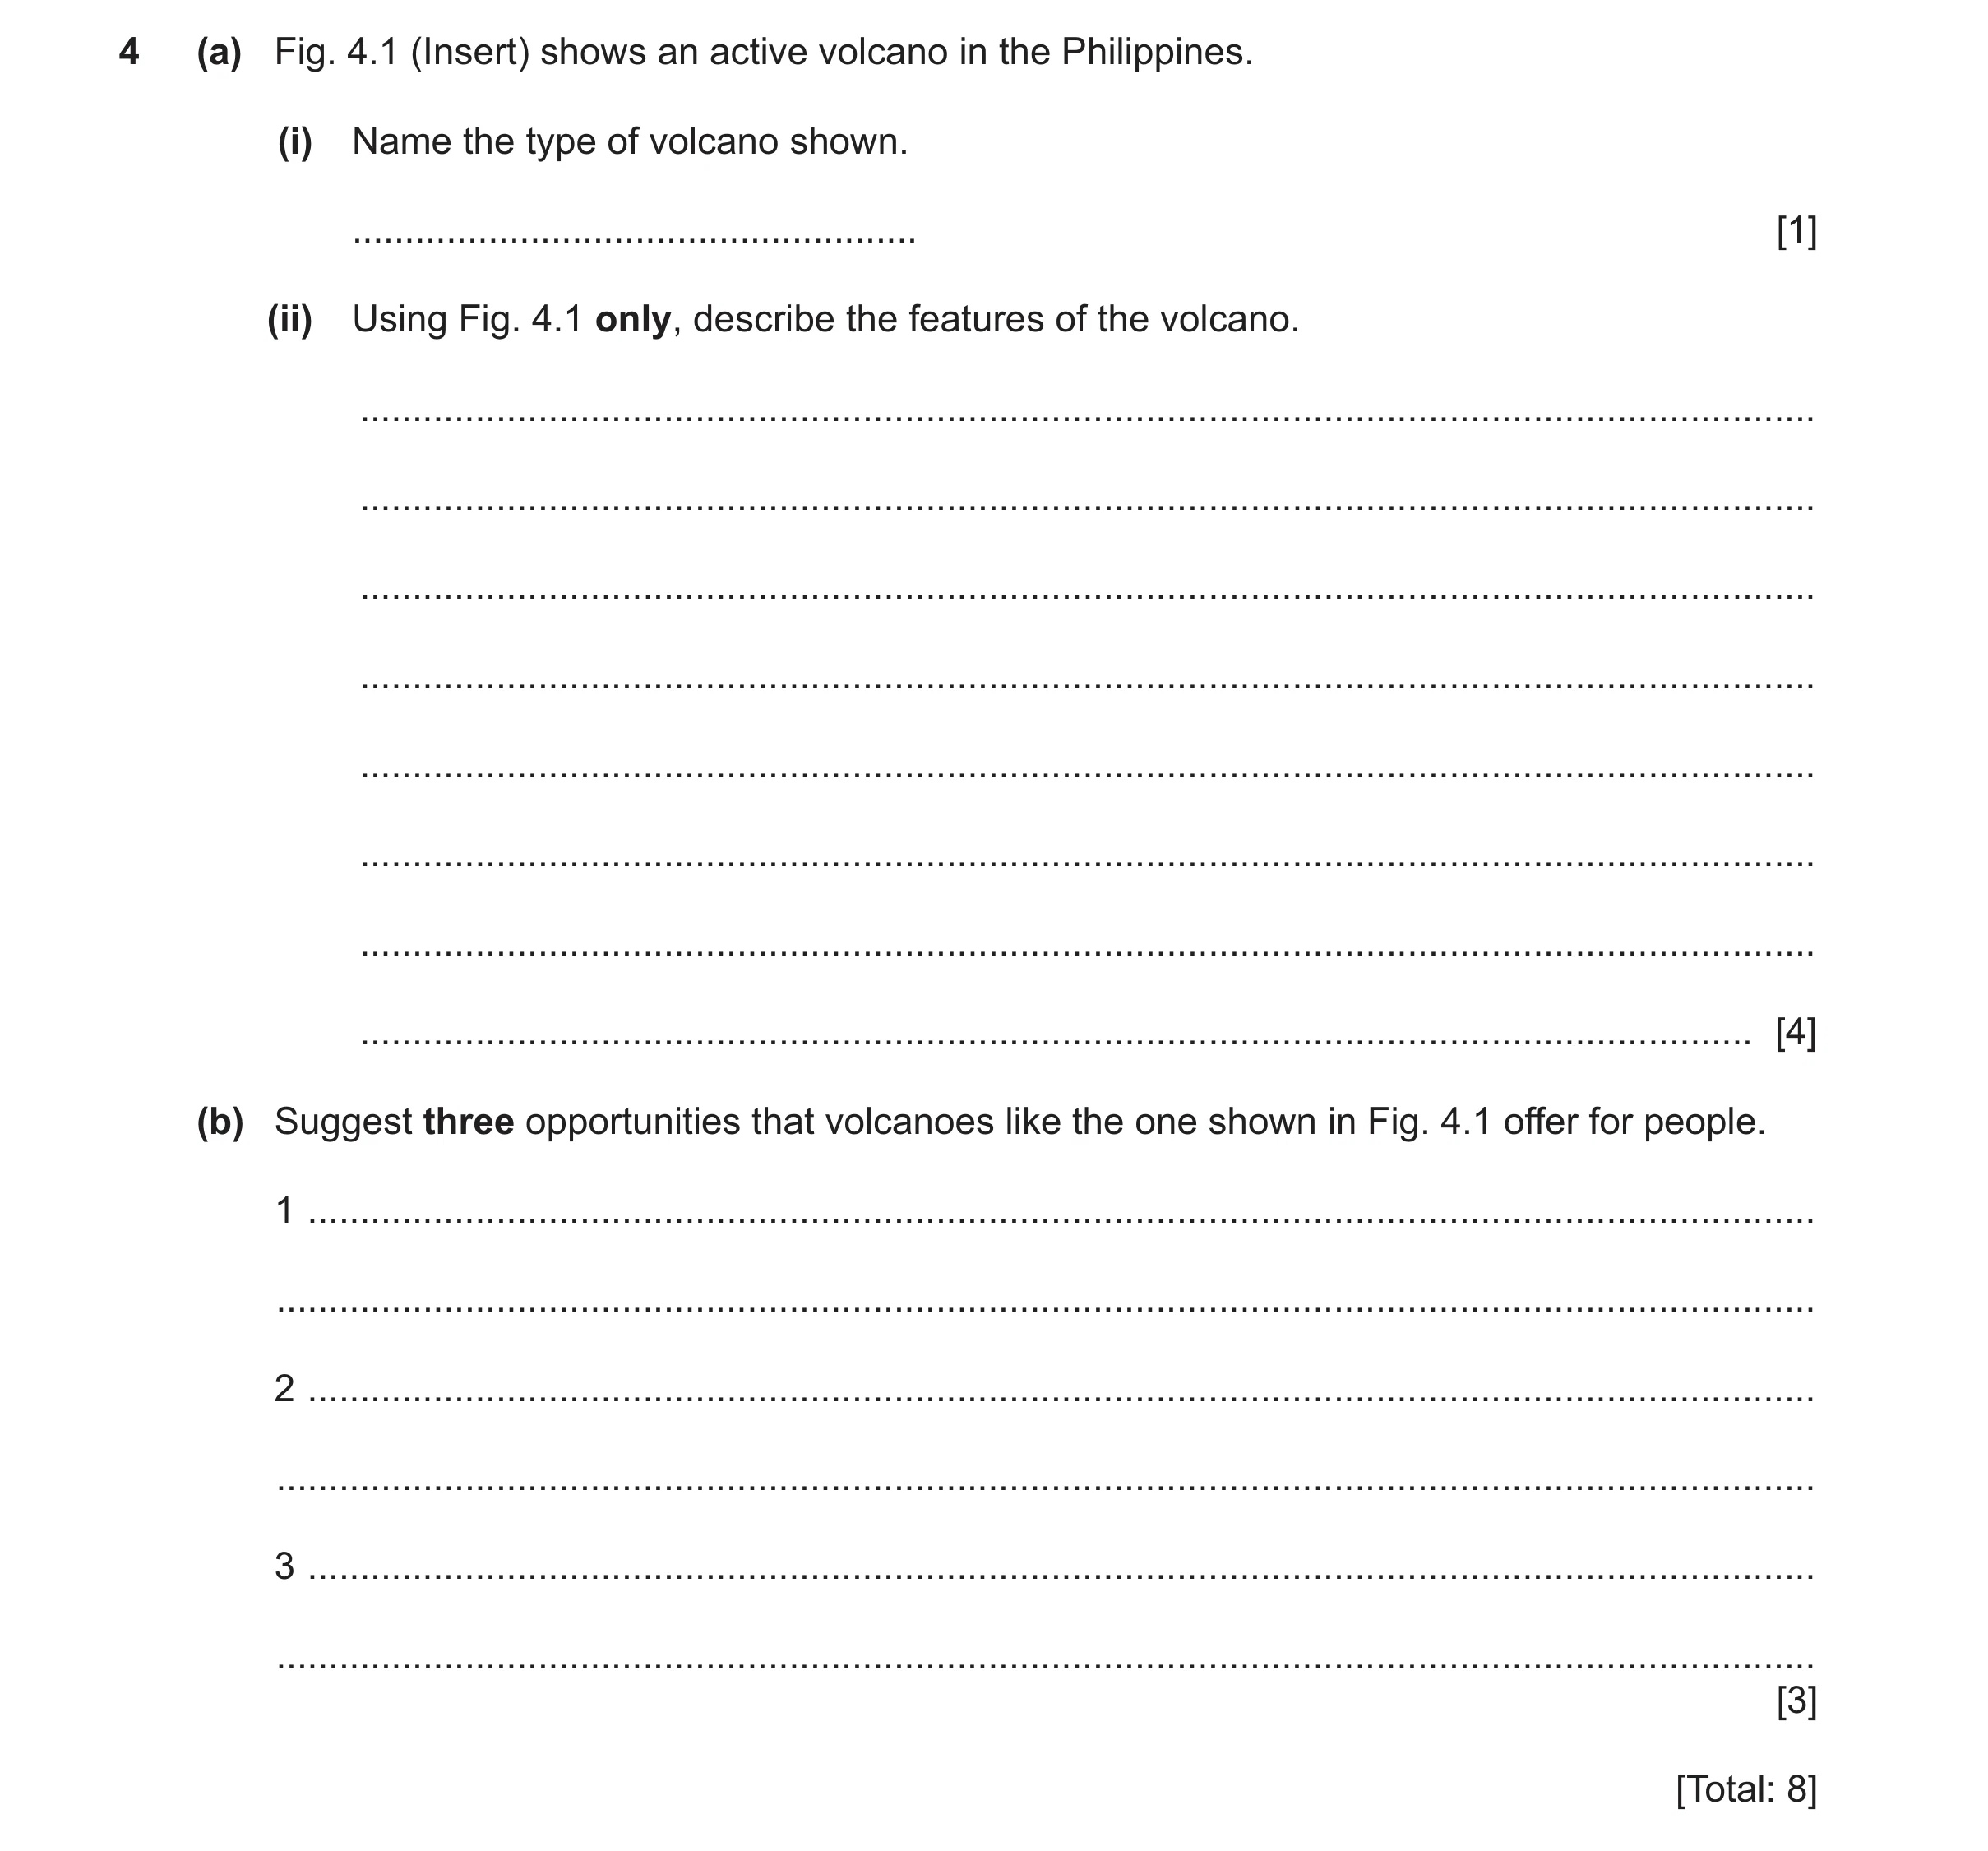
4 (a) Fig. 4.1 (Insert) shows an active volcano in the Philippines. (i) Name the type of volcano shown. … [1] (ii) Using Fig. 4.1 only, describe the features of the volcano. … … … … … … … … [4] (b) Suggest three opportunities that volcanoes like the one shown in Fig. 4.1 offer for people. 1 … … 2 … … 3 … … [3] [Total: 8]
8 marks
Mark scheme: 4(a)(i) strato/composite cone 1 4(a)(ii) high/tall 4 steep dissected/ gullies/ ridges / valleys black/grey/ash crater gas emission/vent cone/conical concave/steeper at the top/gentler at the base (bare) rock / rocky vegetation on lower / gentler slopes 4(b) fertile soil 3 jobs/income from tourism not economy geothermal power hot springs minerals/mining or named mineral (e.g. sulphur, gold, silver, diamonds) building materials/sand fertiliser (production) relief rainfall in dry areas leisure opportunities / climbing / hiking cheap house prices research/study opportunity
This question in 0460/23 Oct/Nov 2025
 5 / 45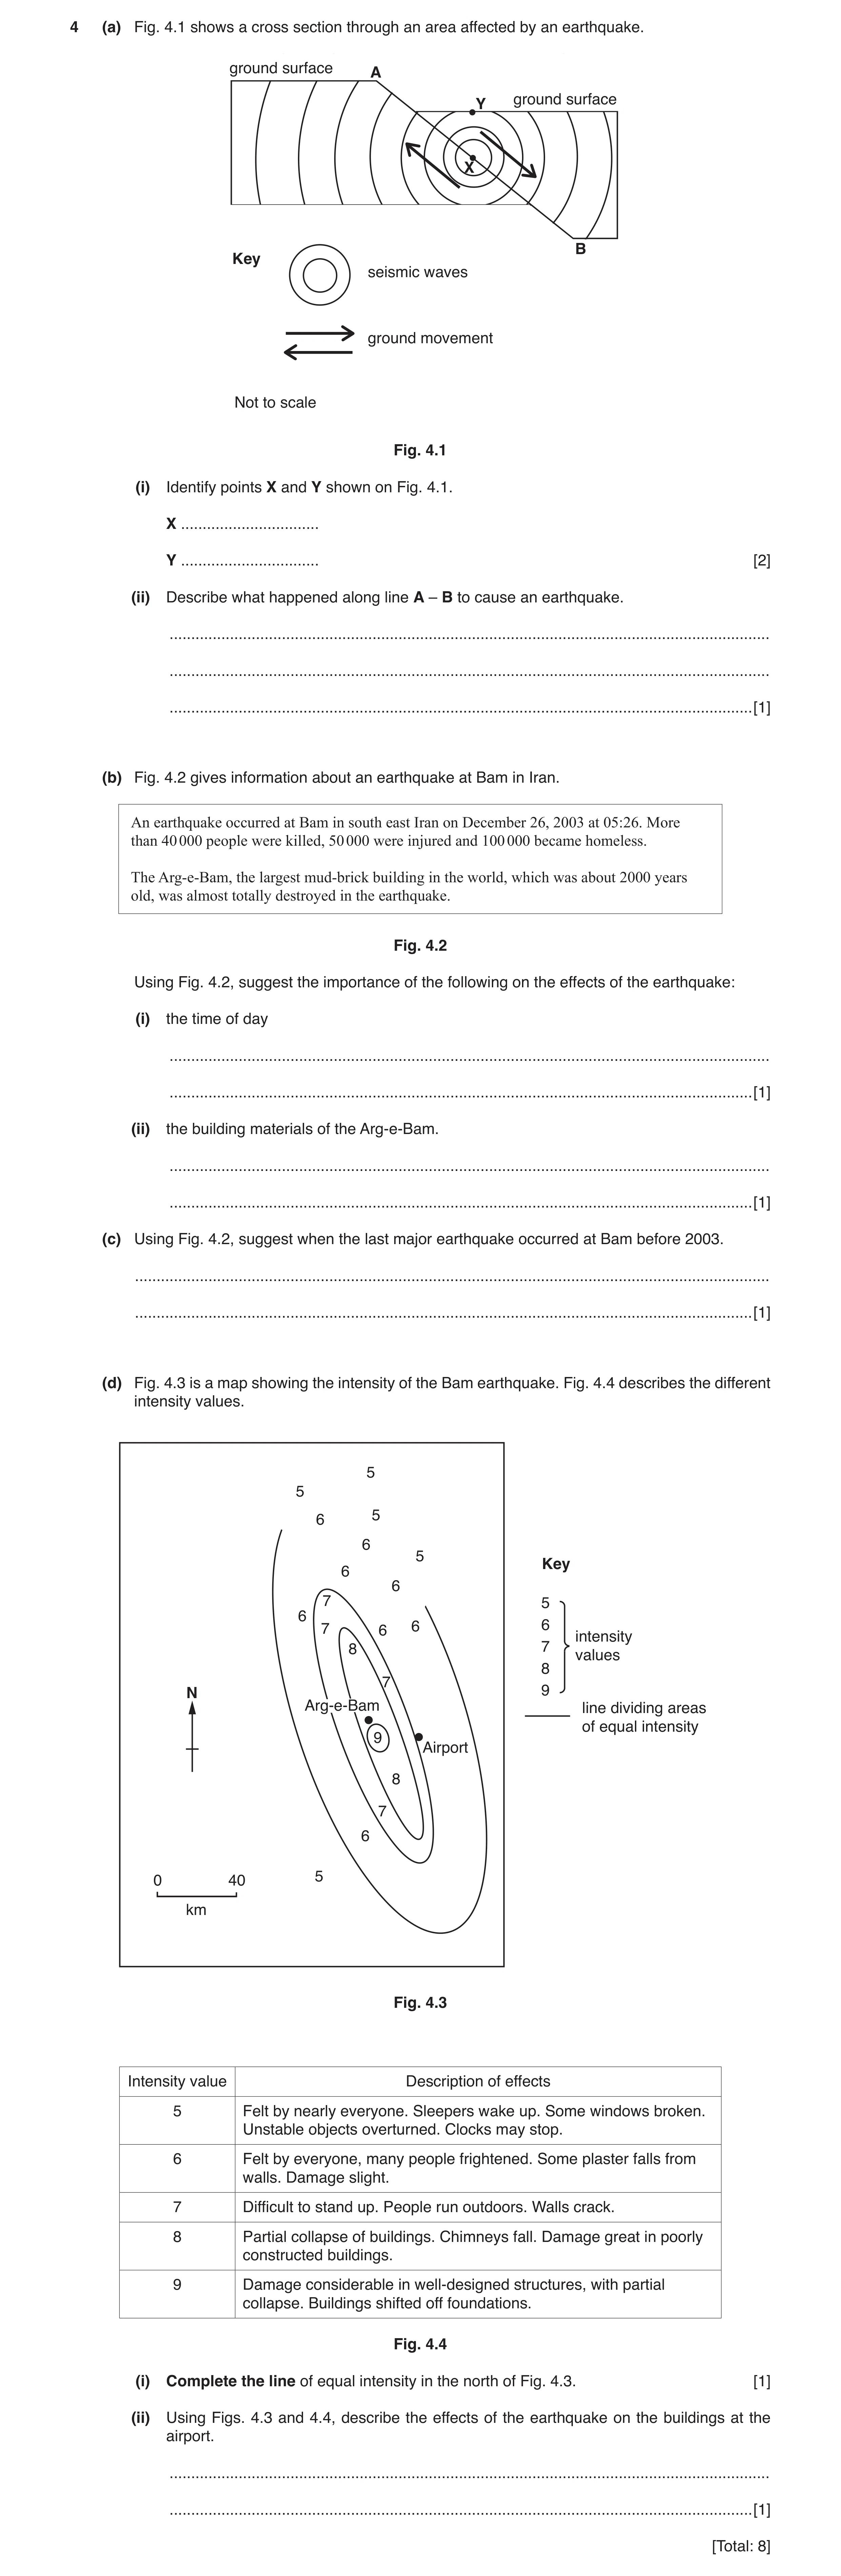
 12 / 45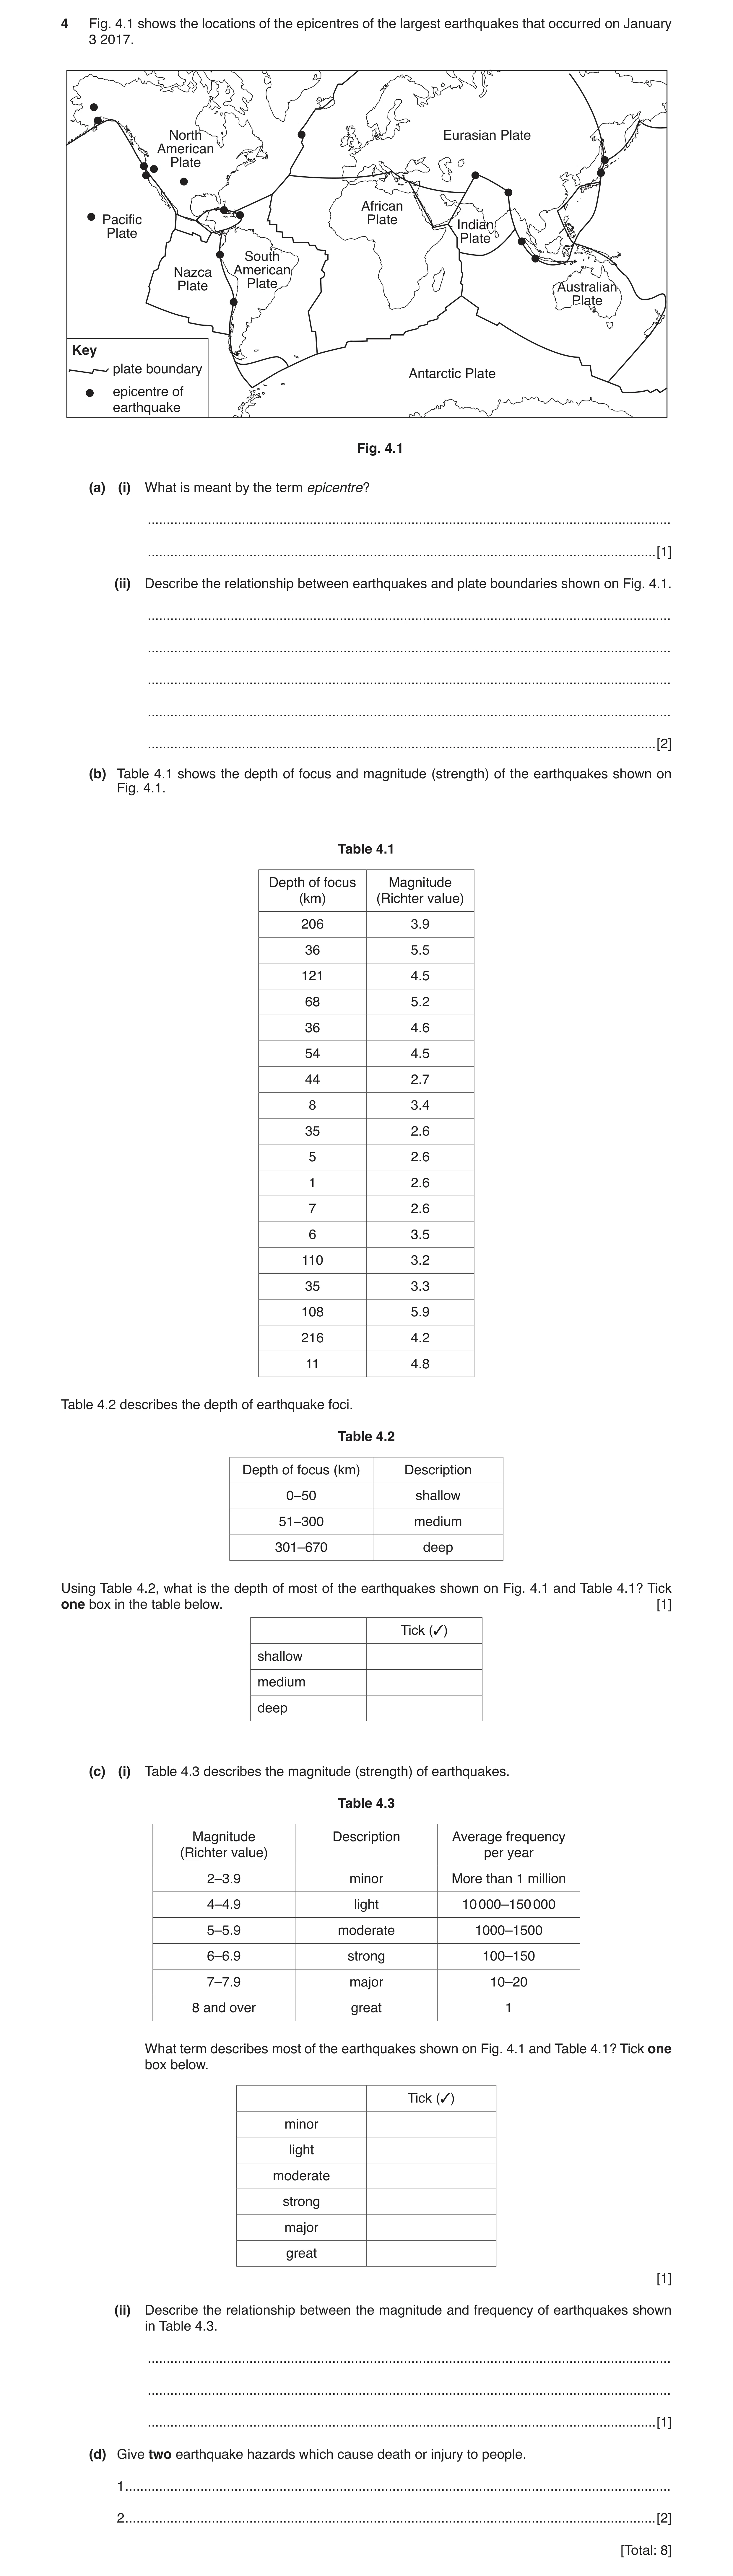
 21 / 45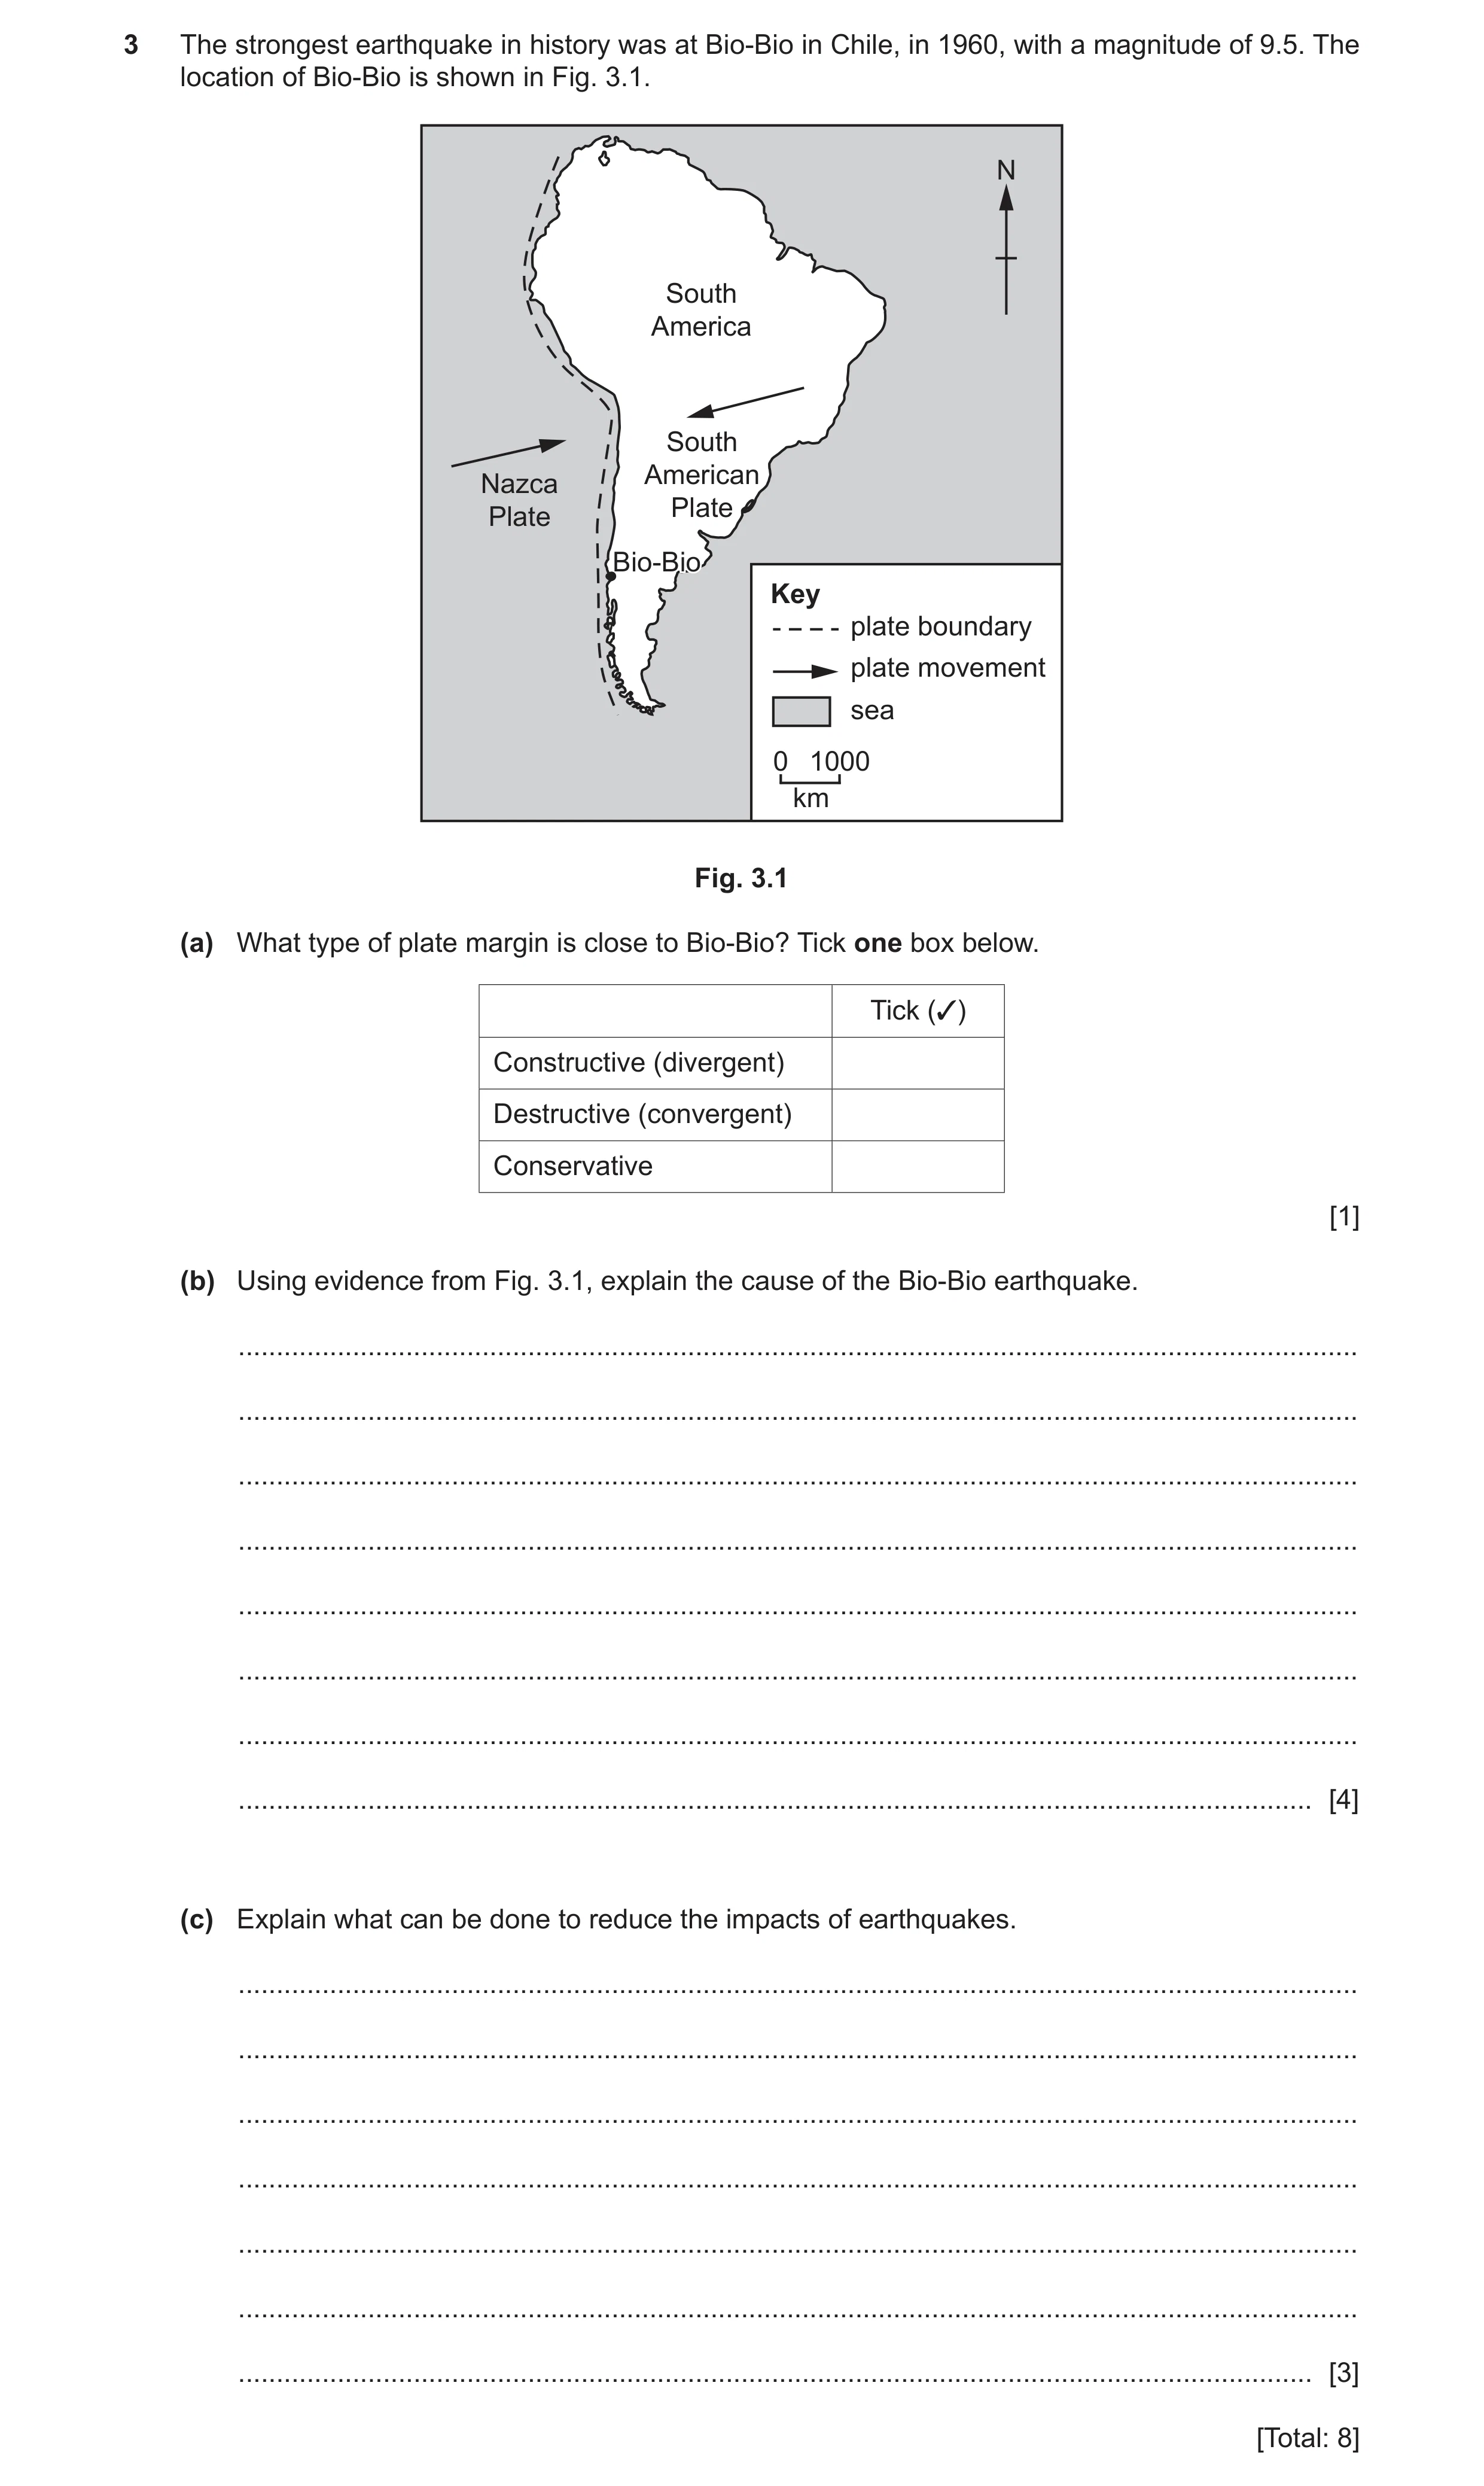
 25 / 45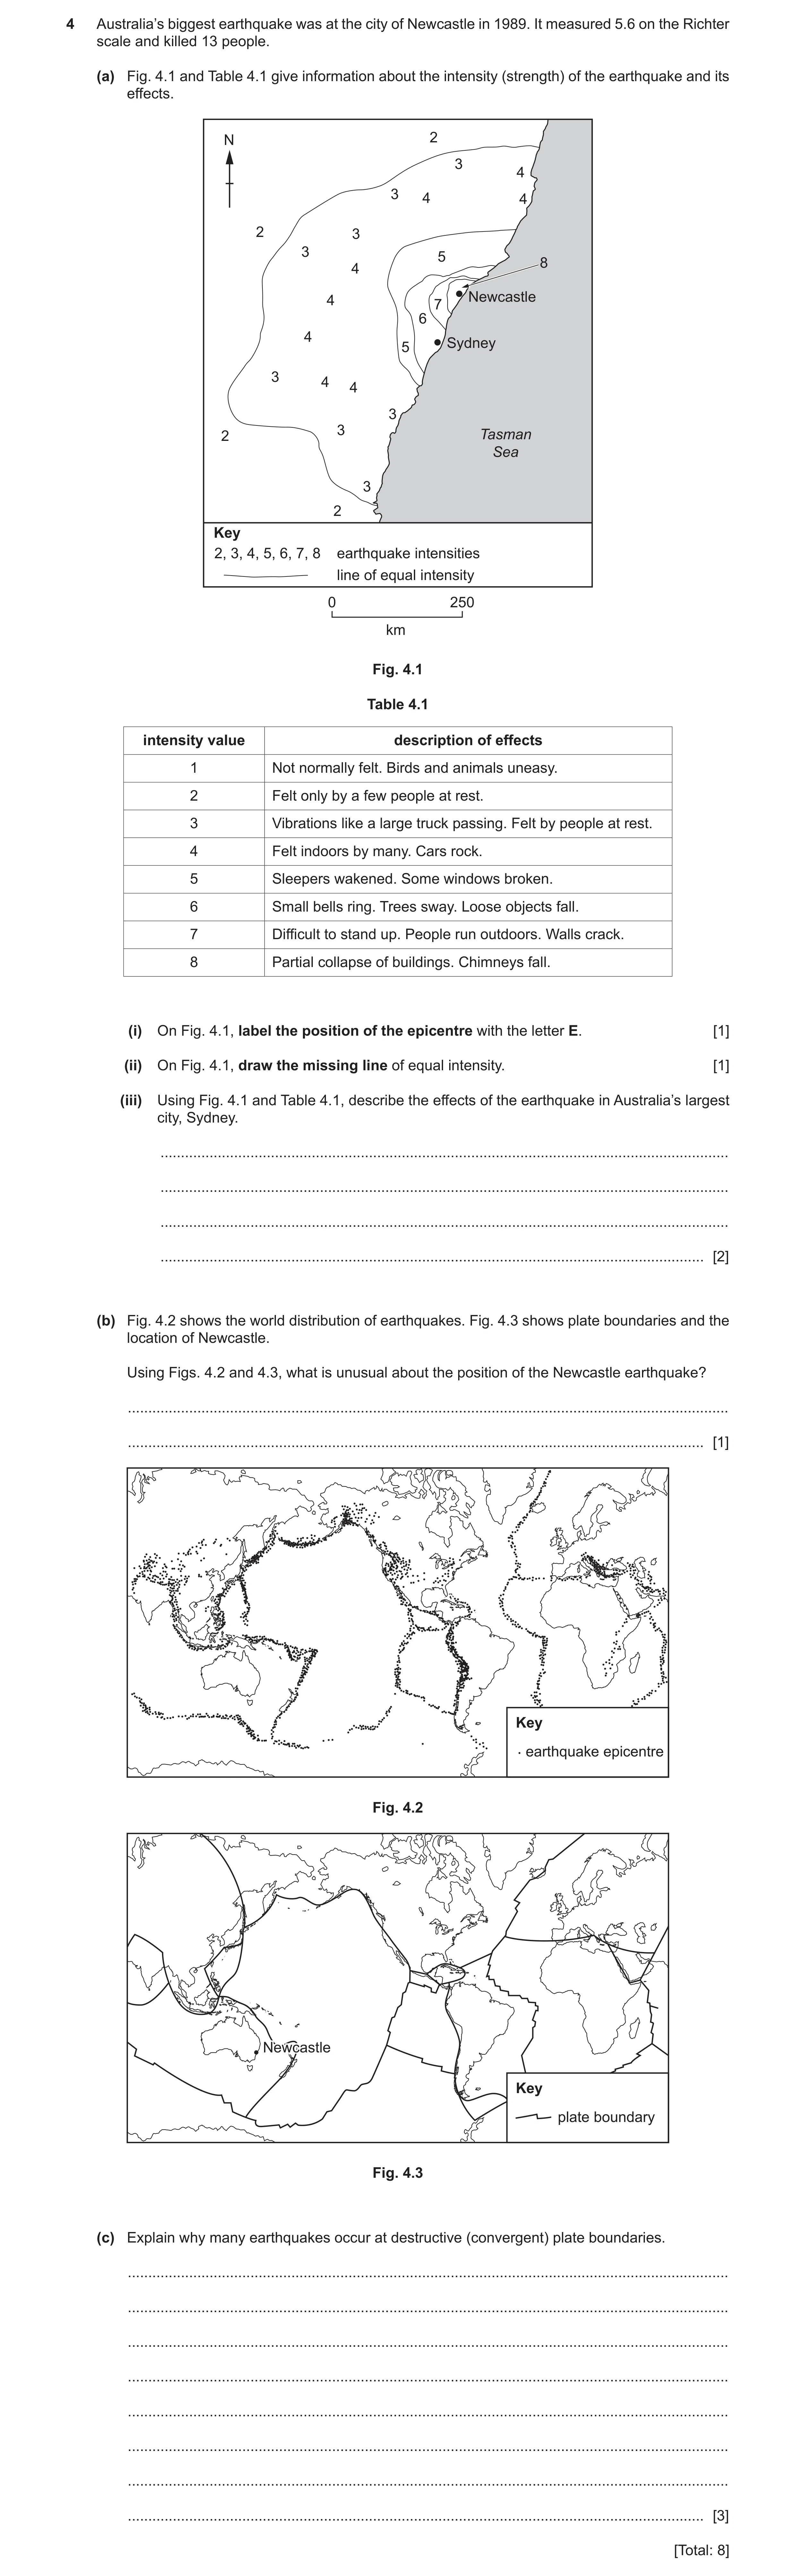
 33 / 45
 34 / 45
 35 / 45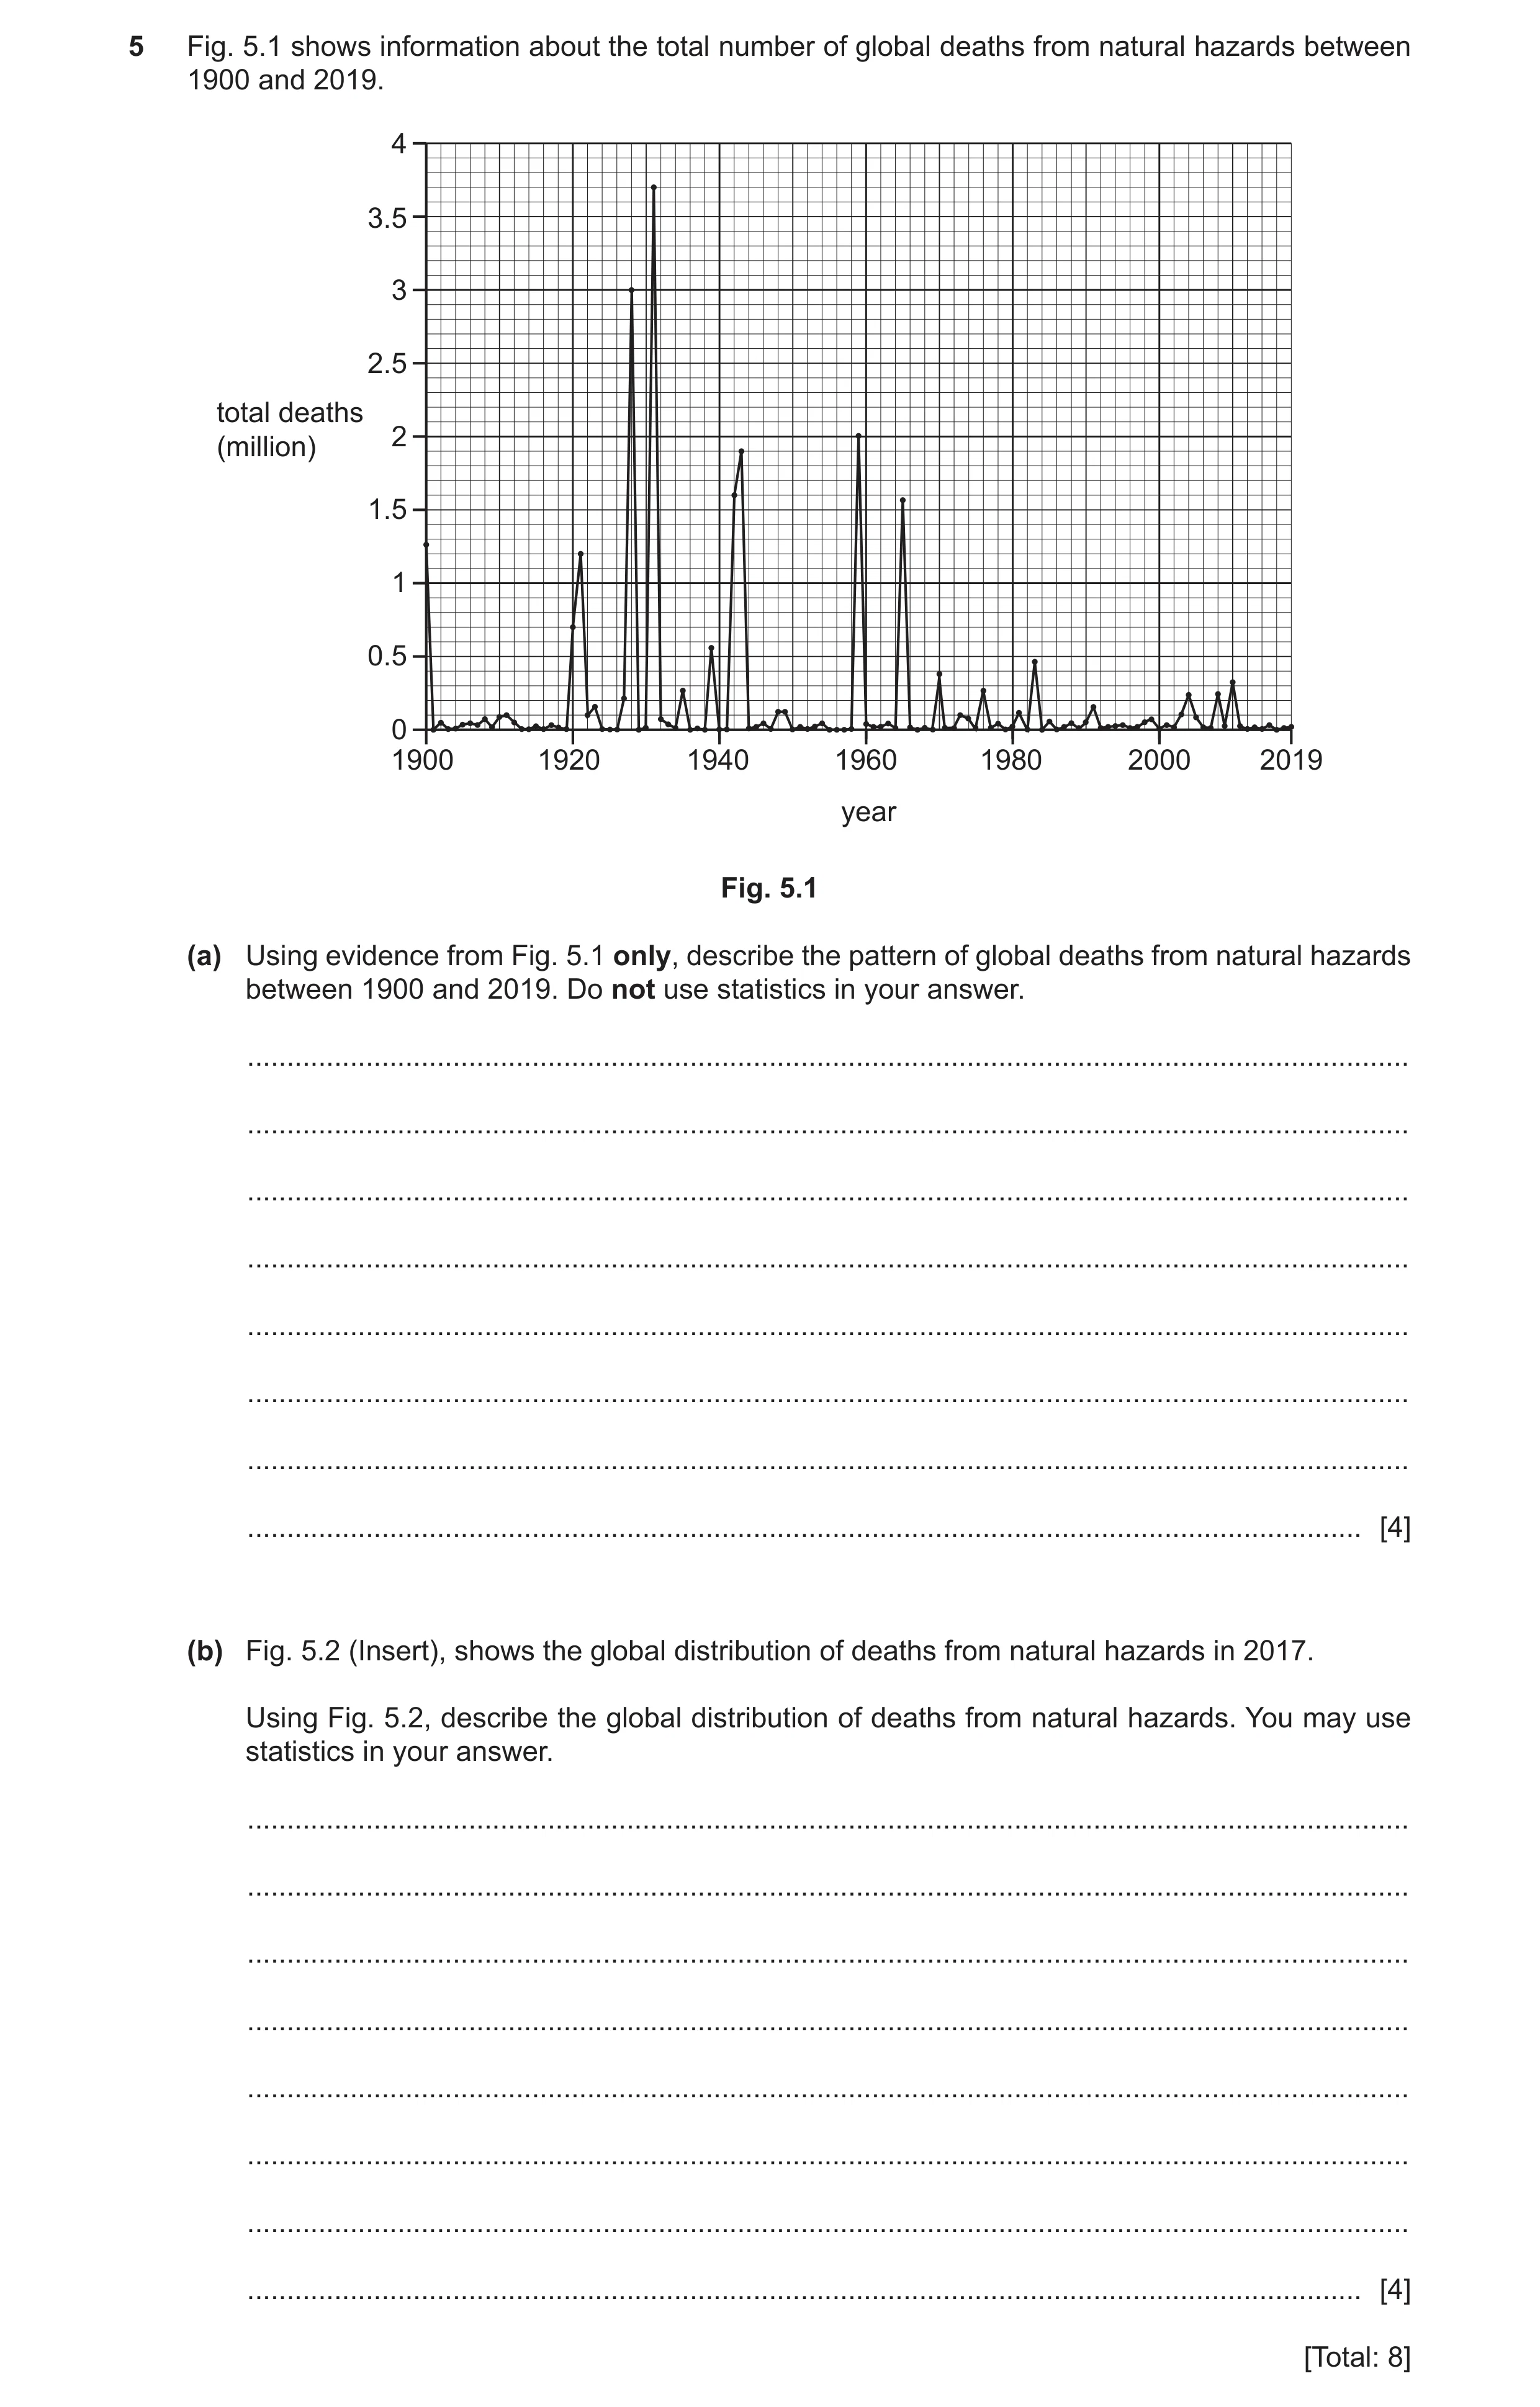
 41 / 45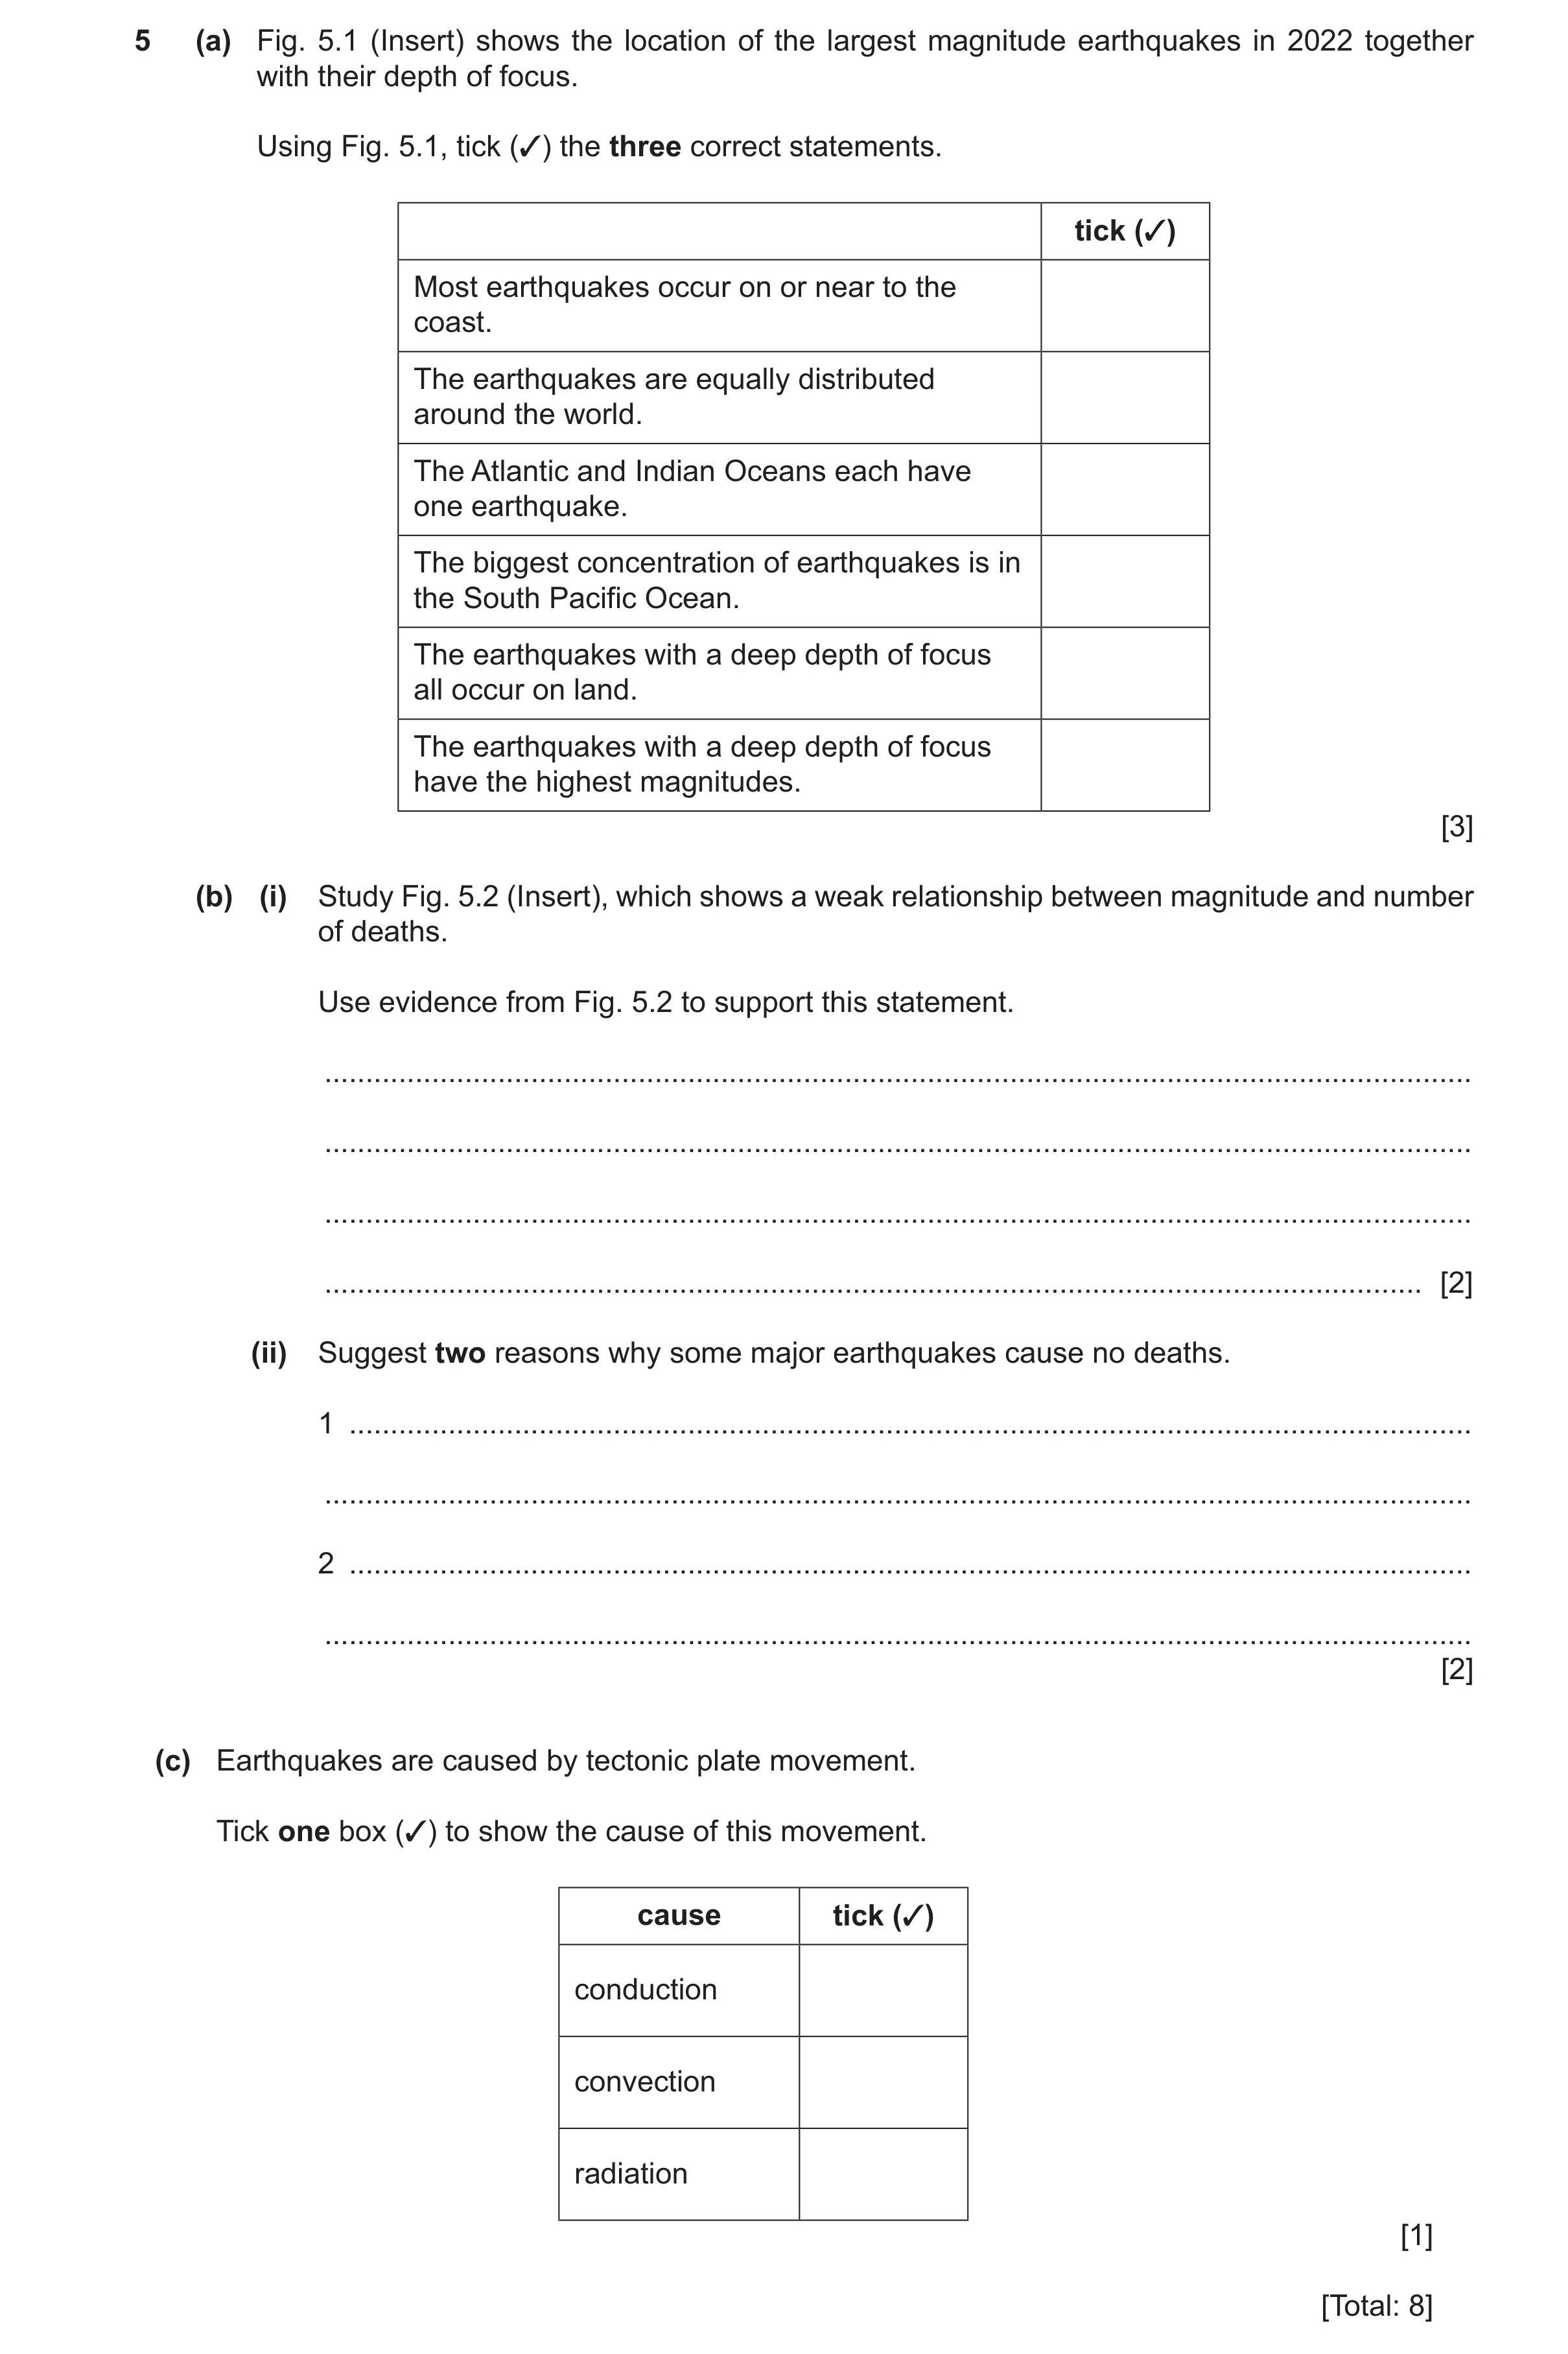
 45 / 45
 8
8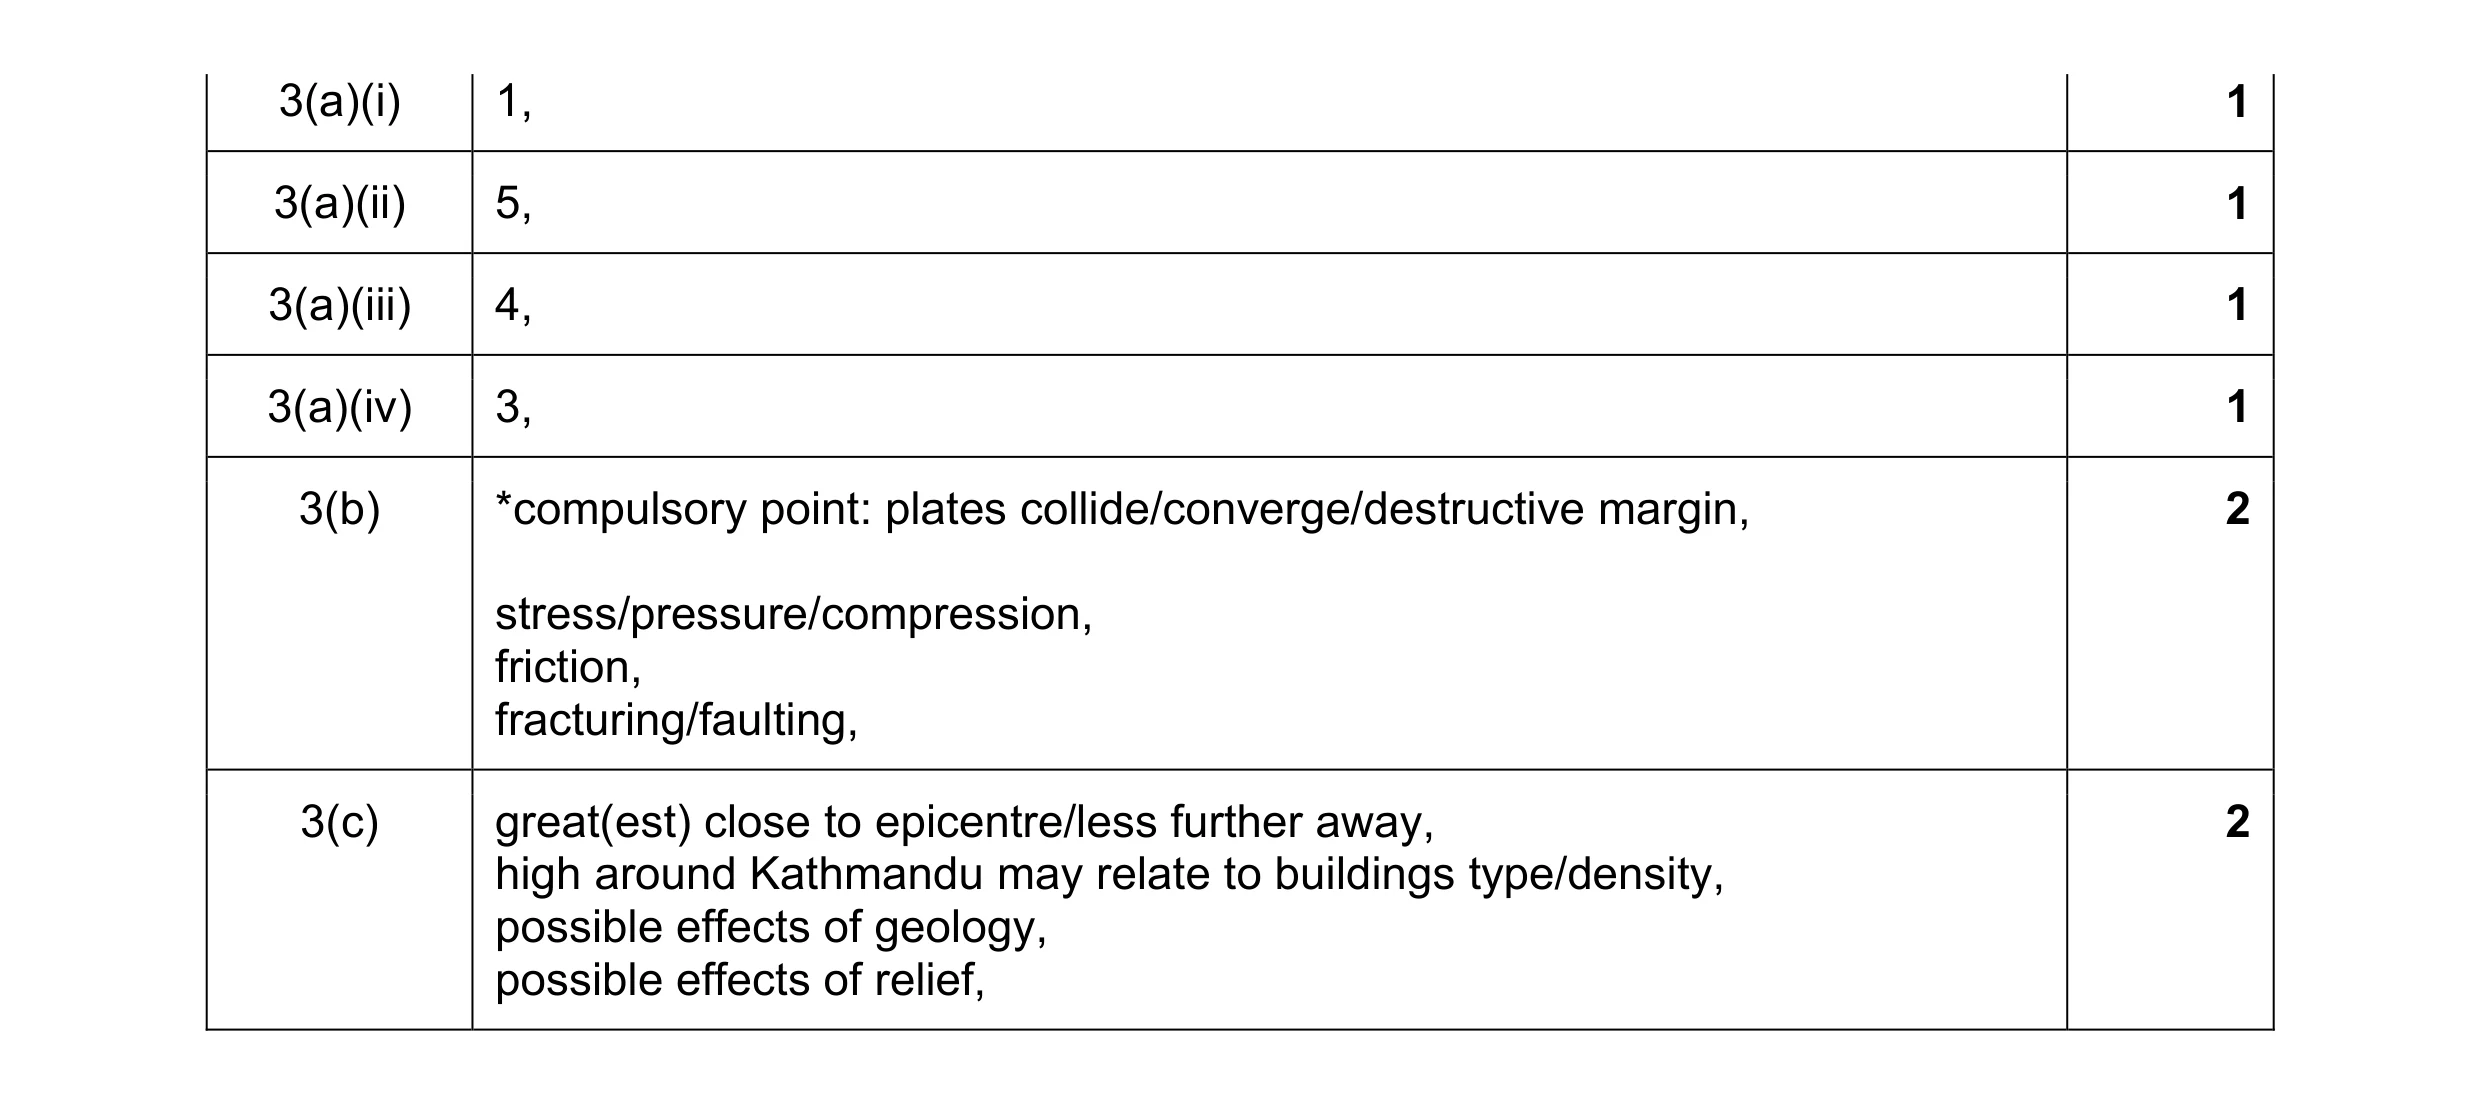 8
8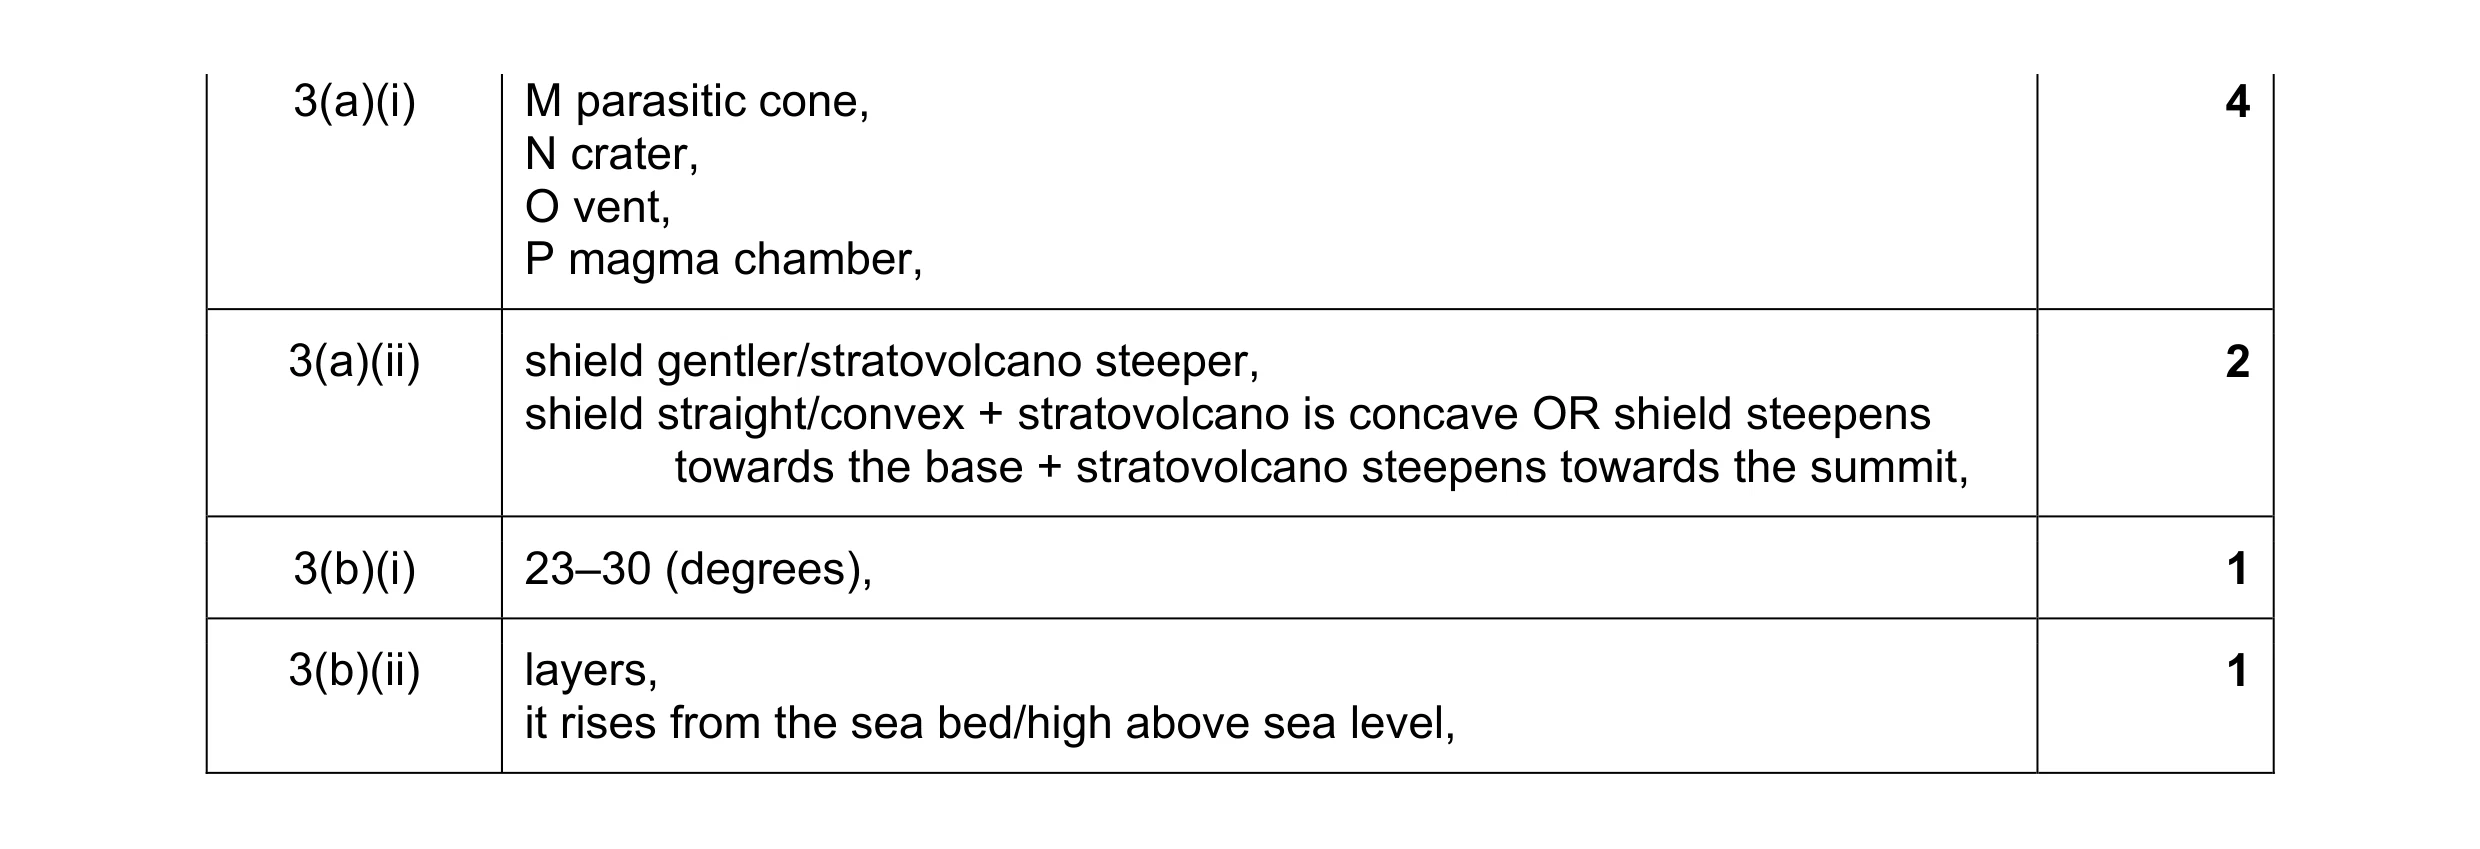 8
8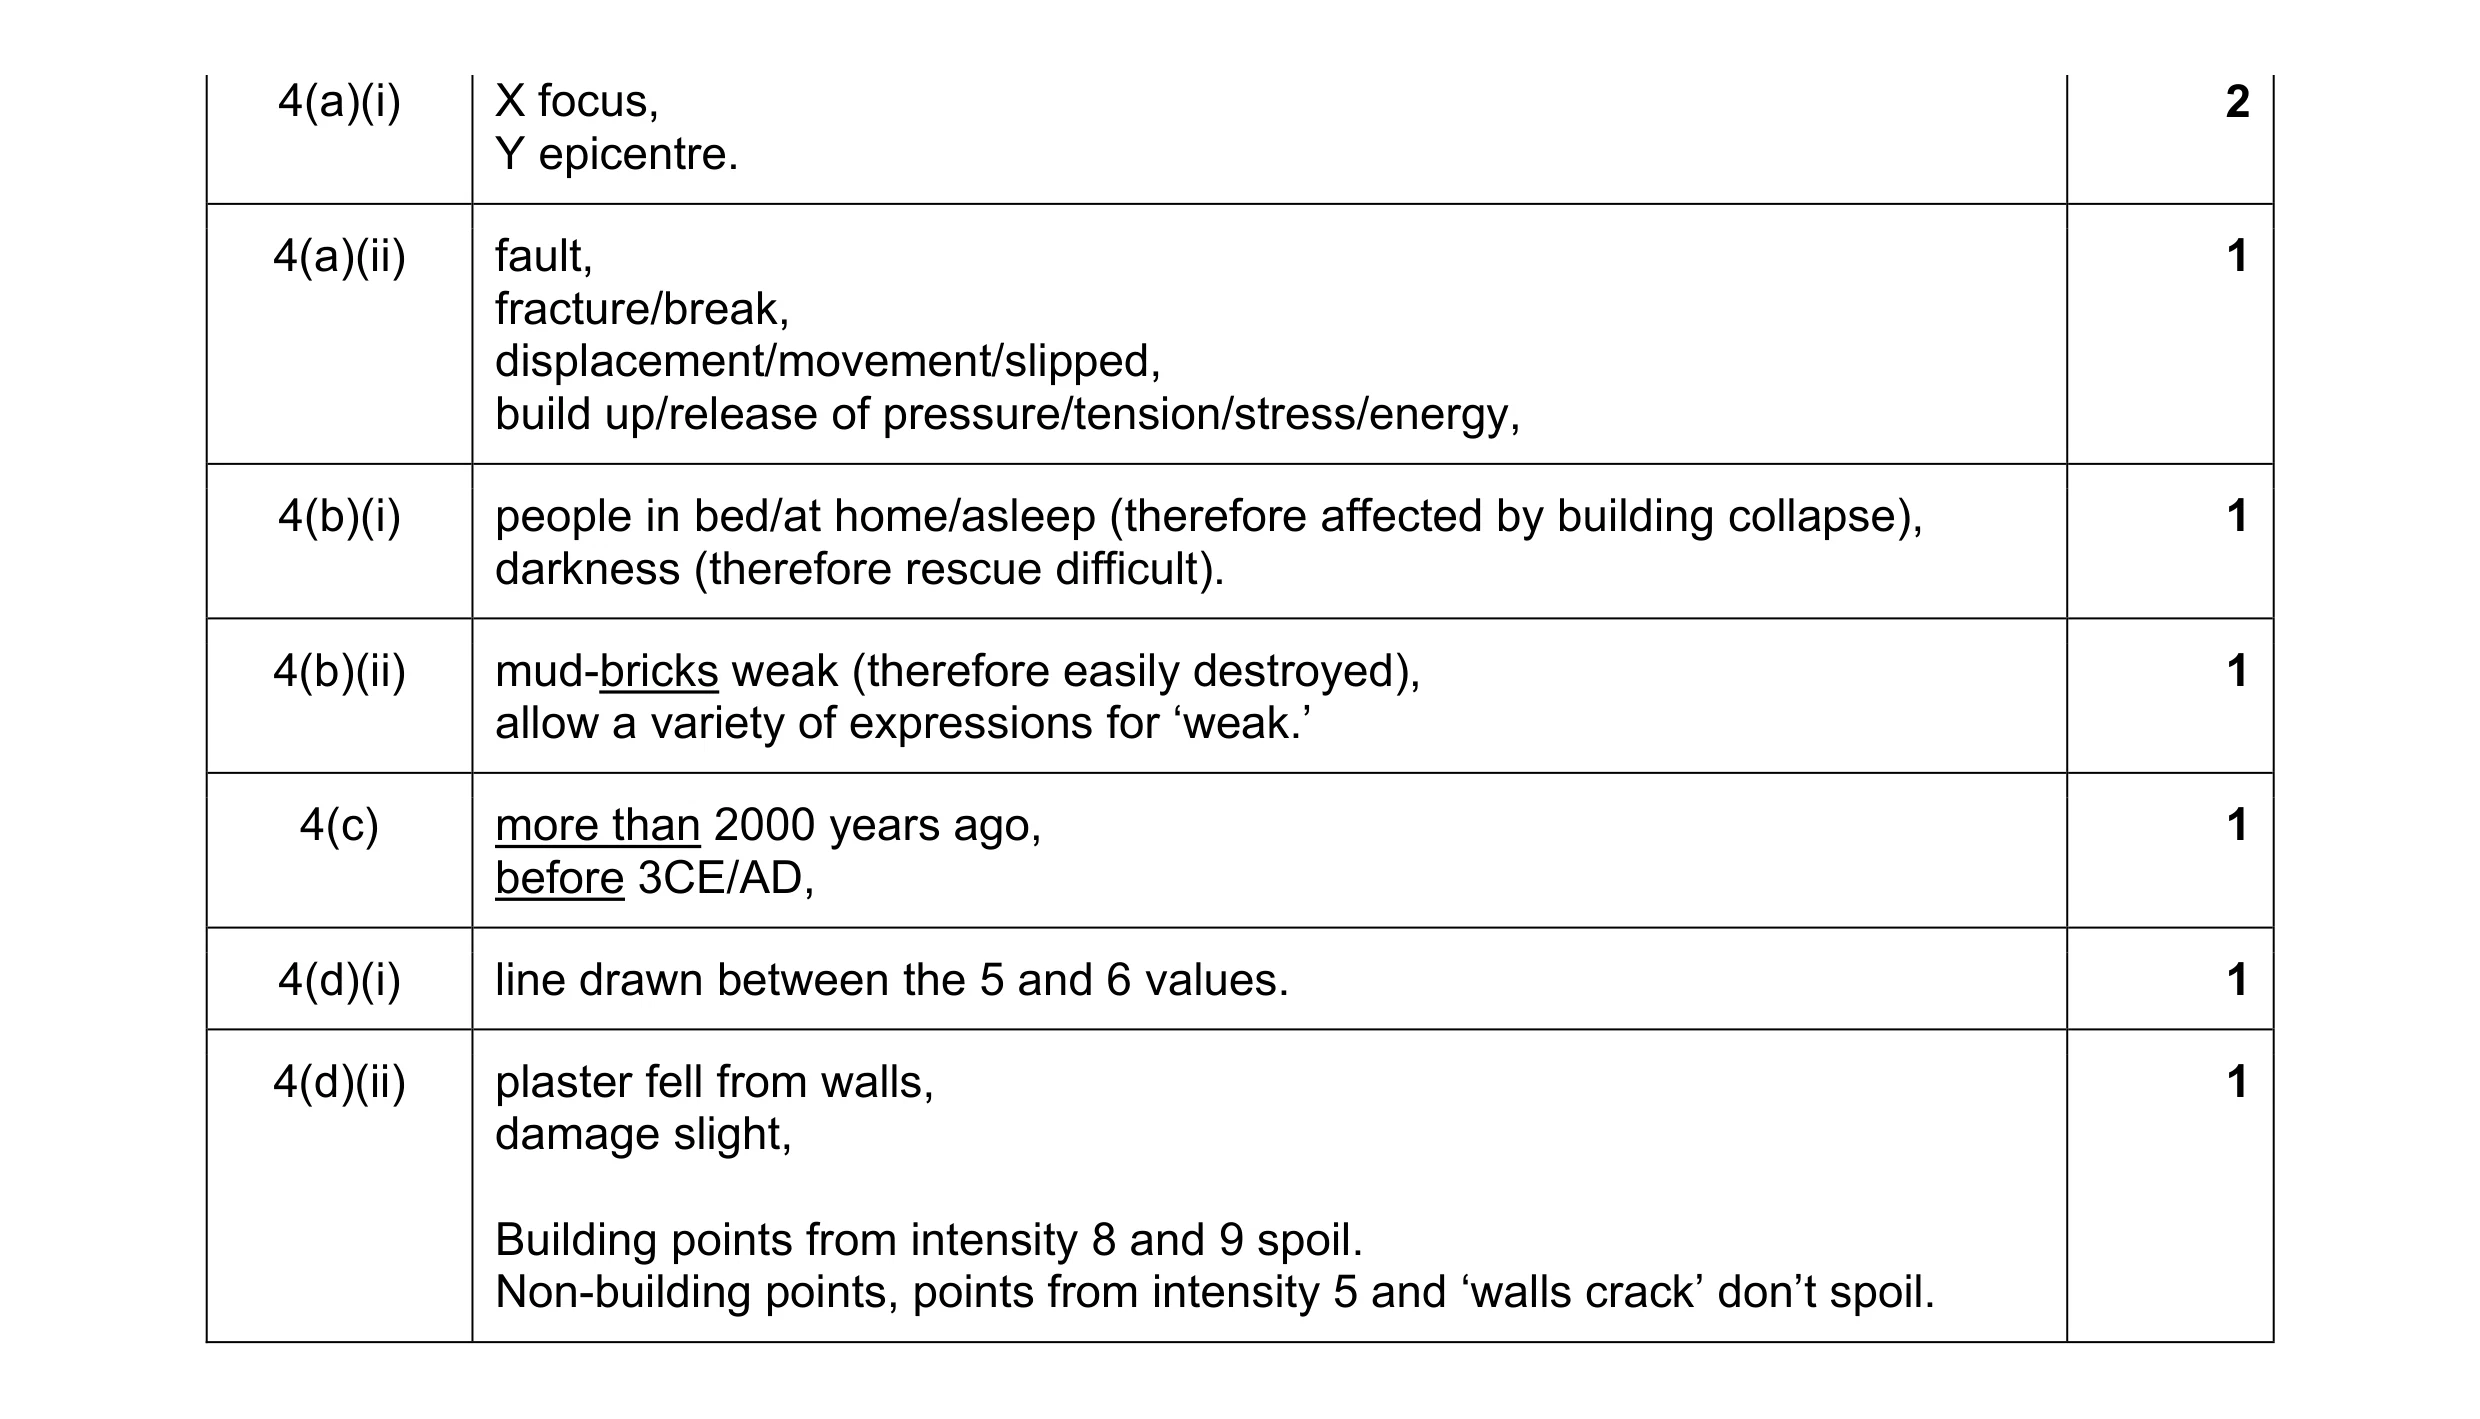 8
8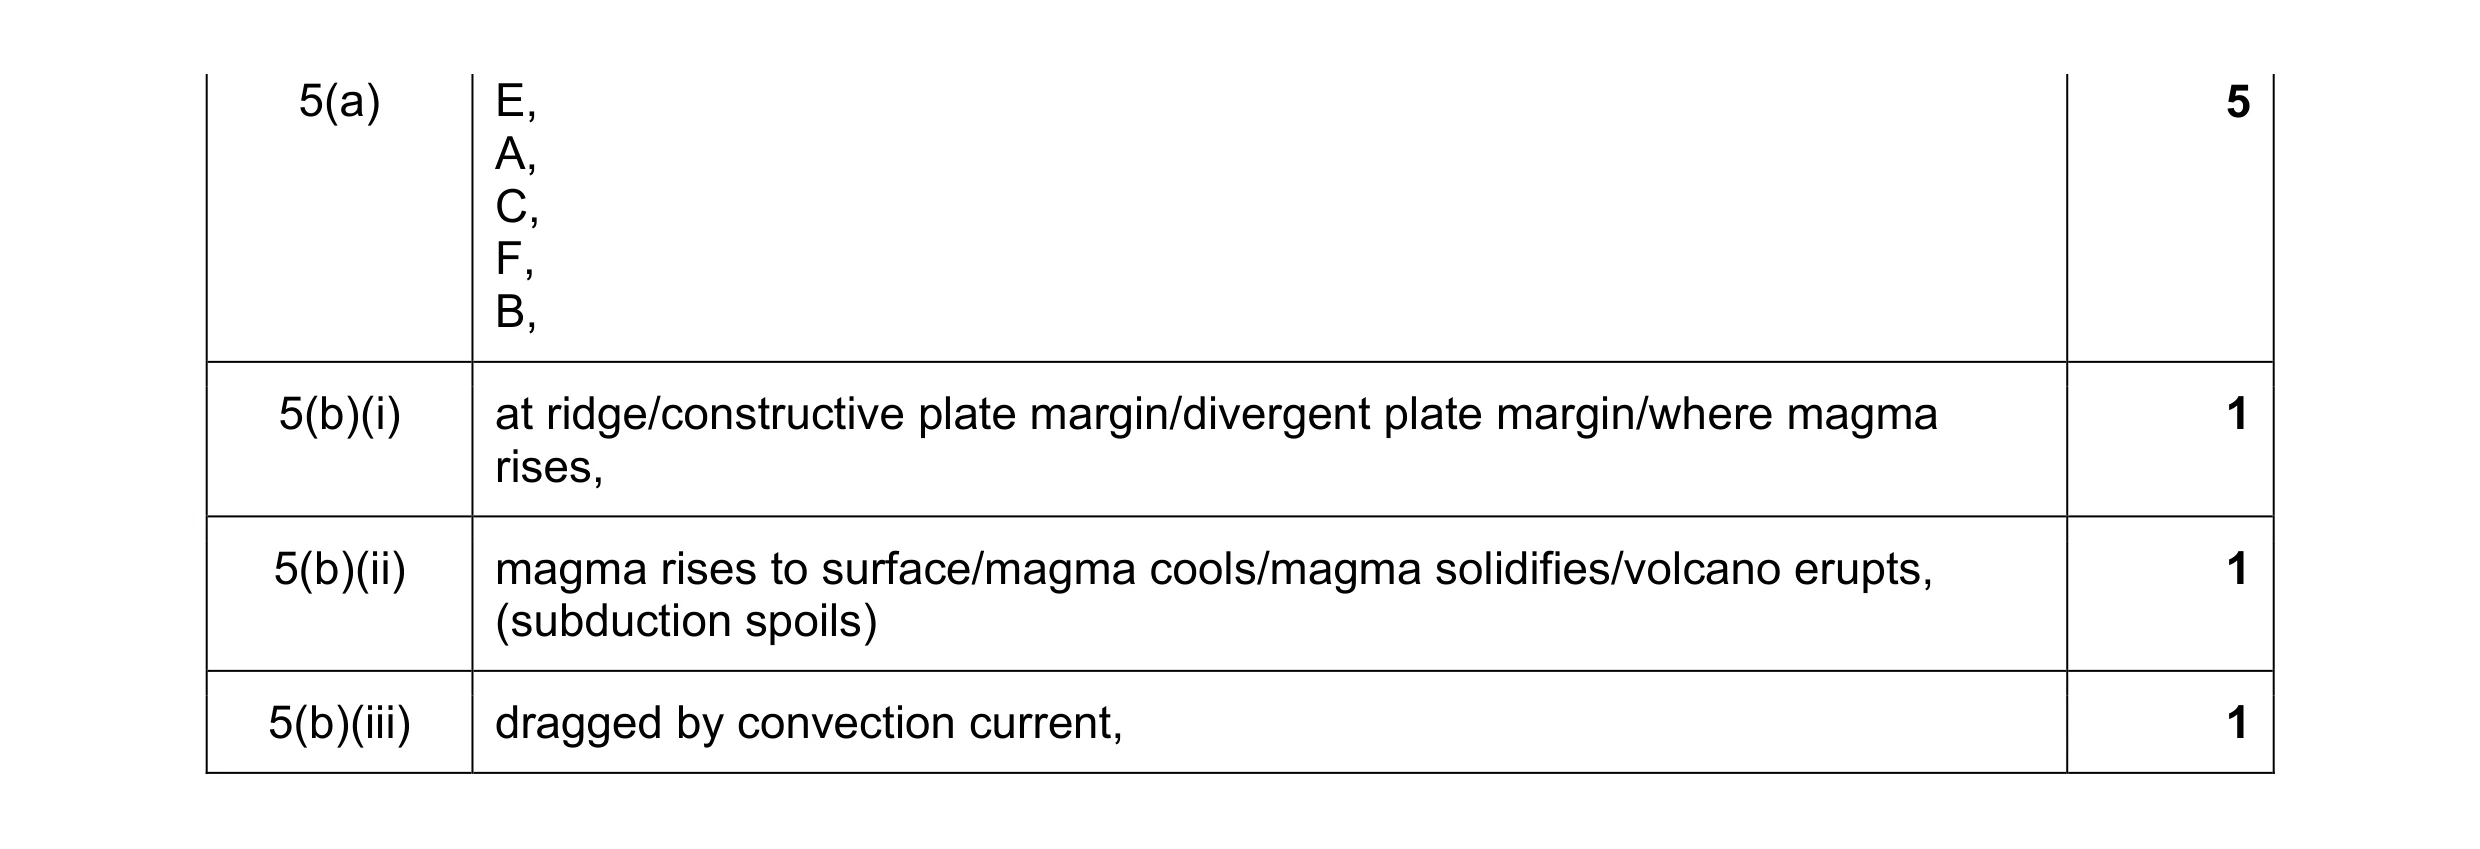 8
8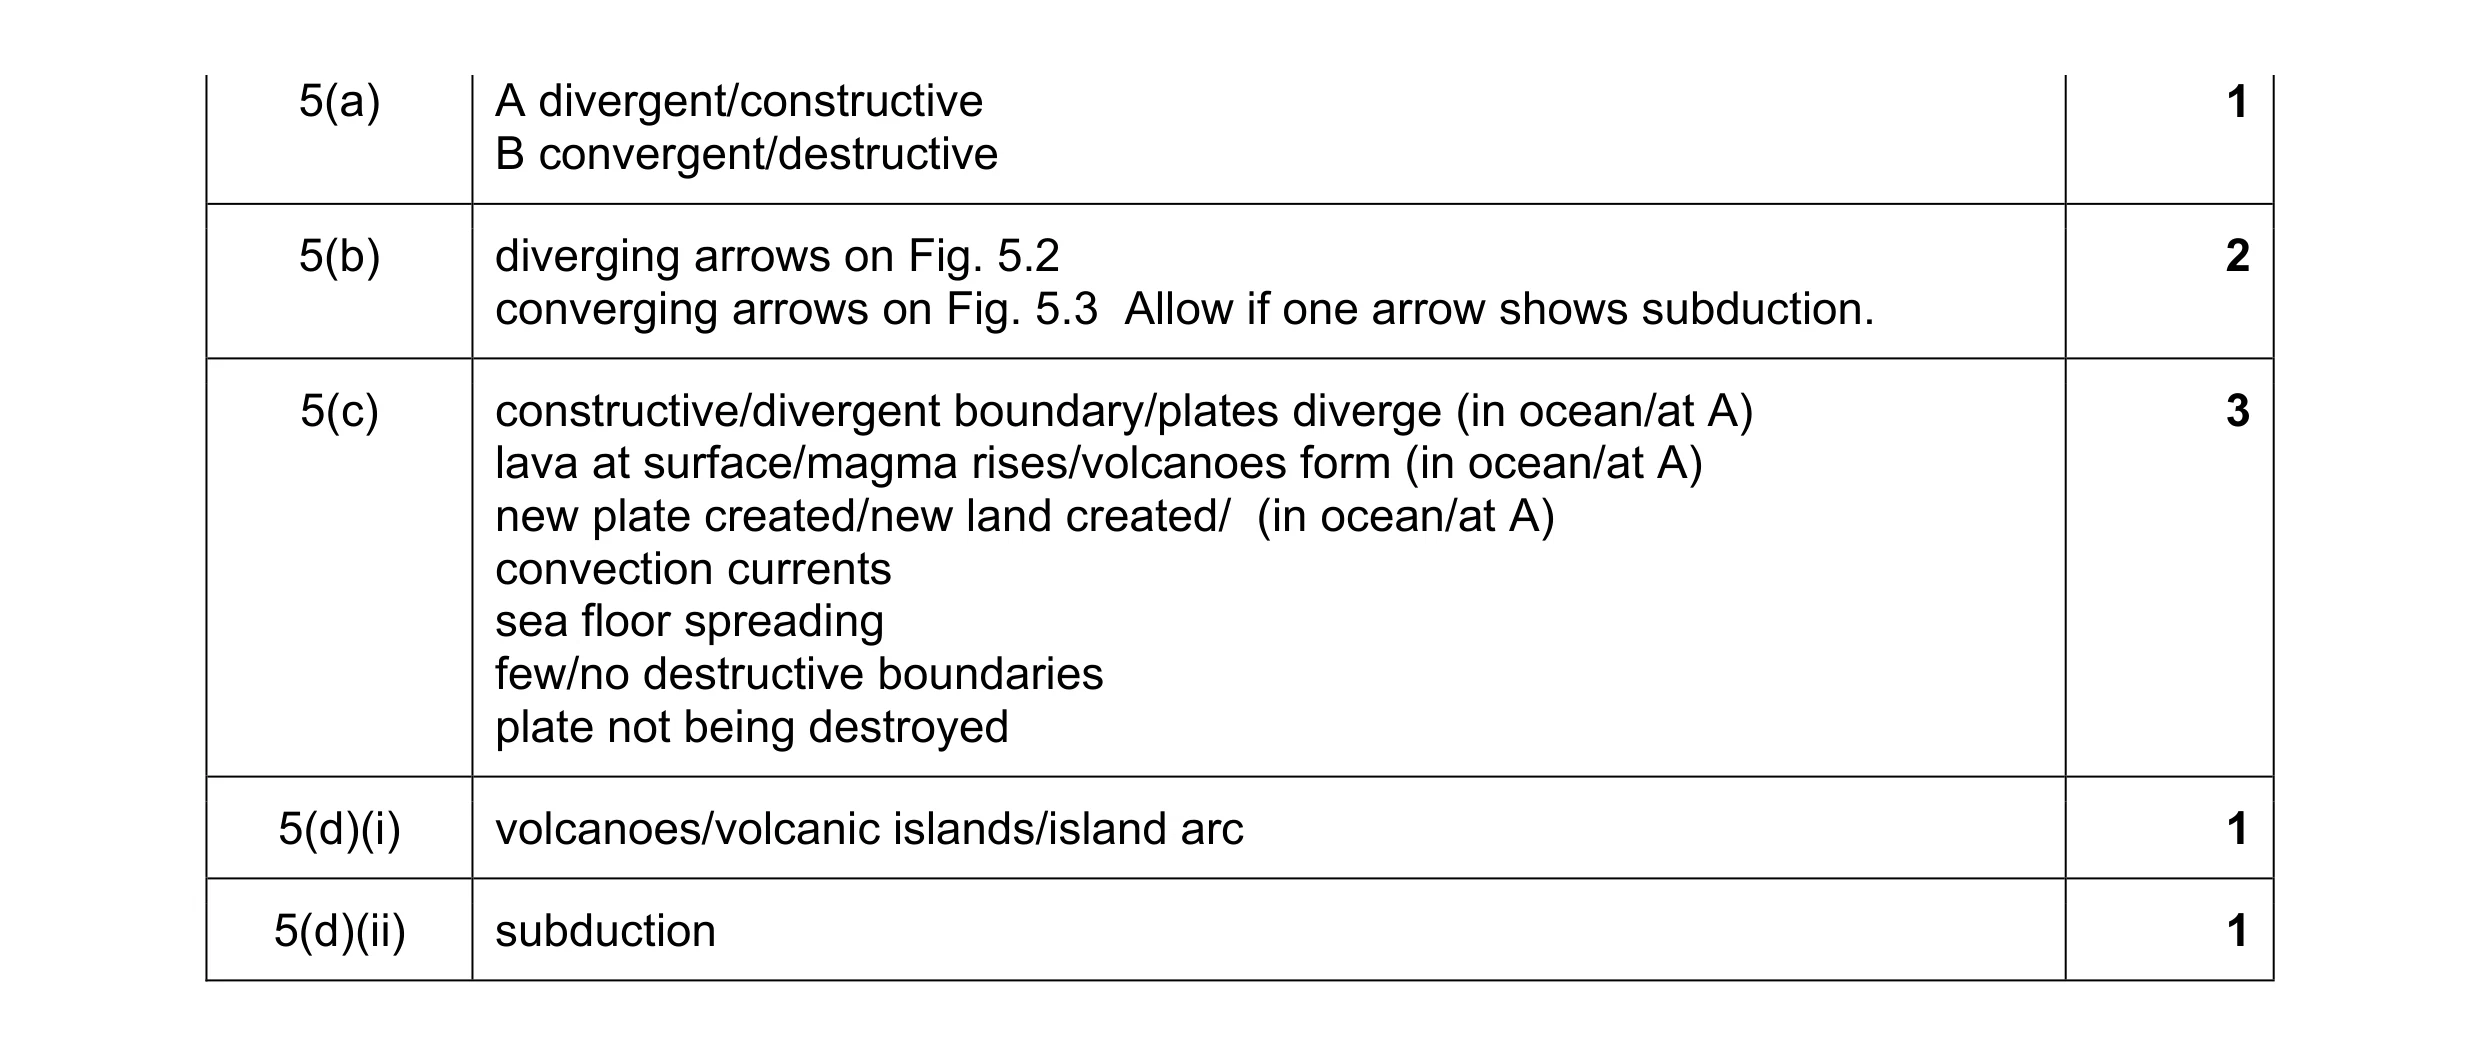 8
8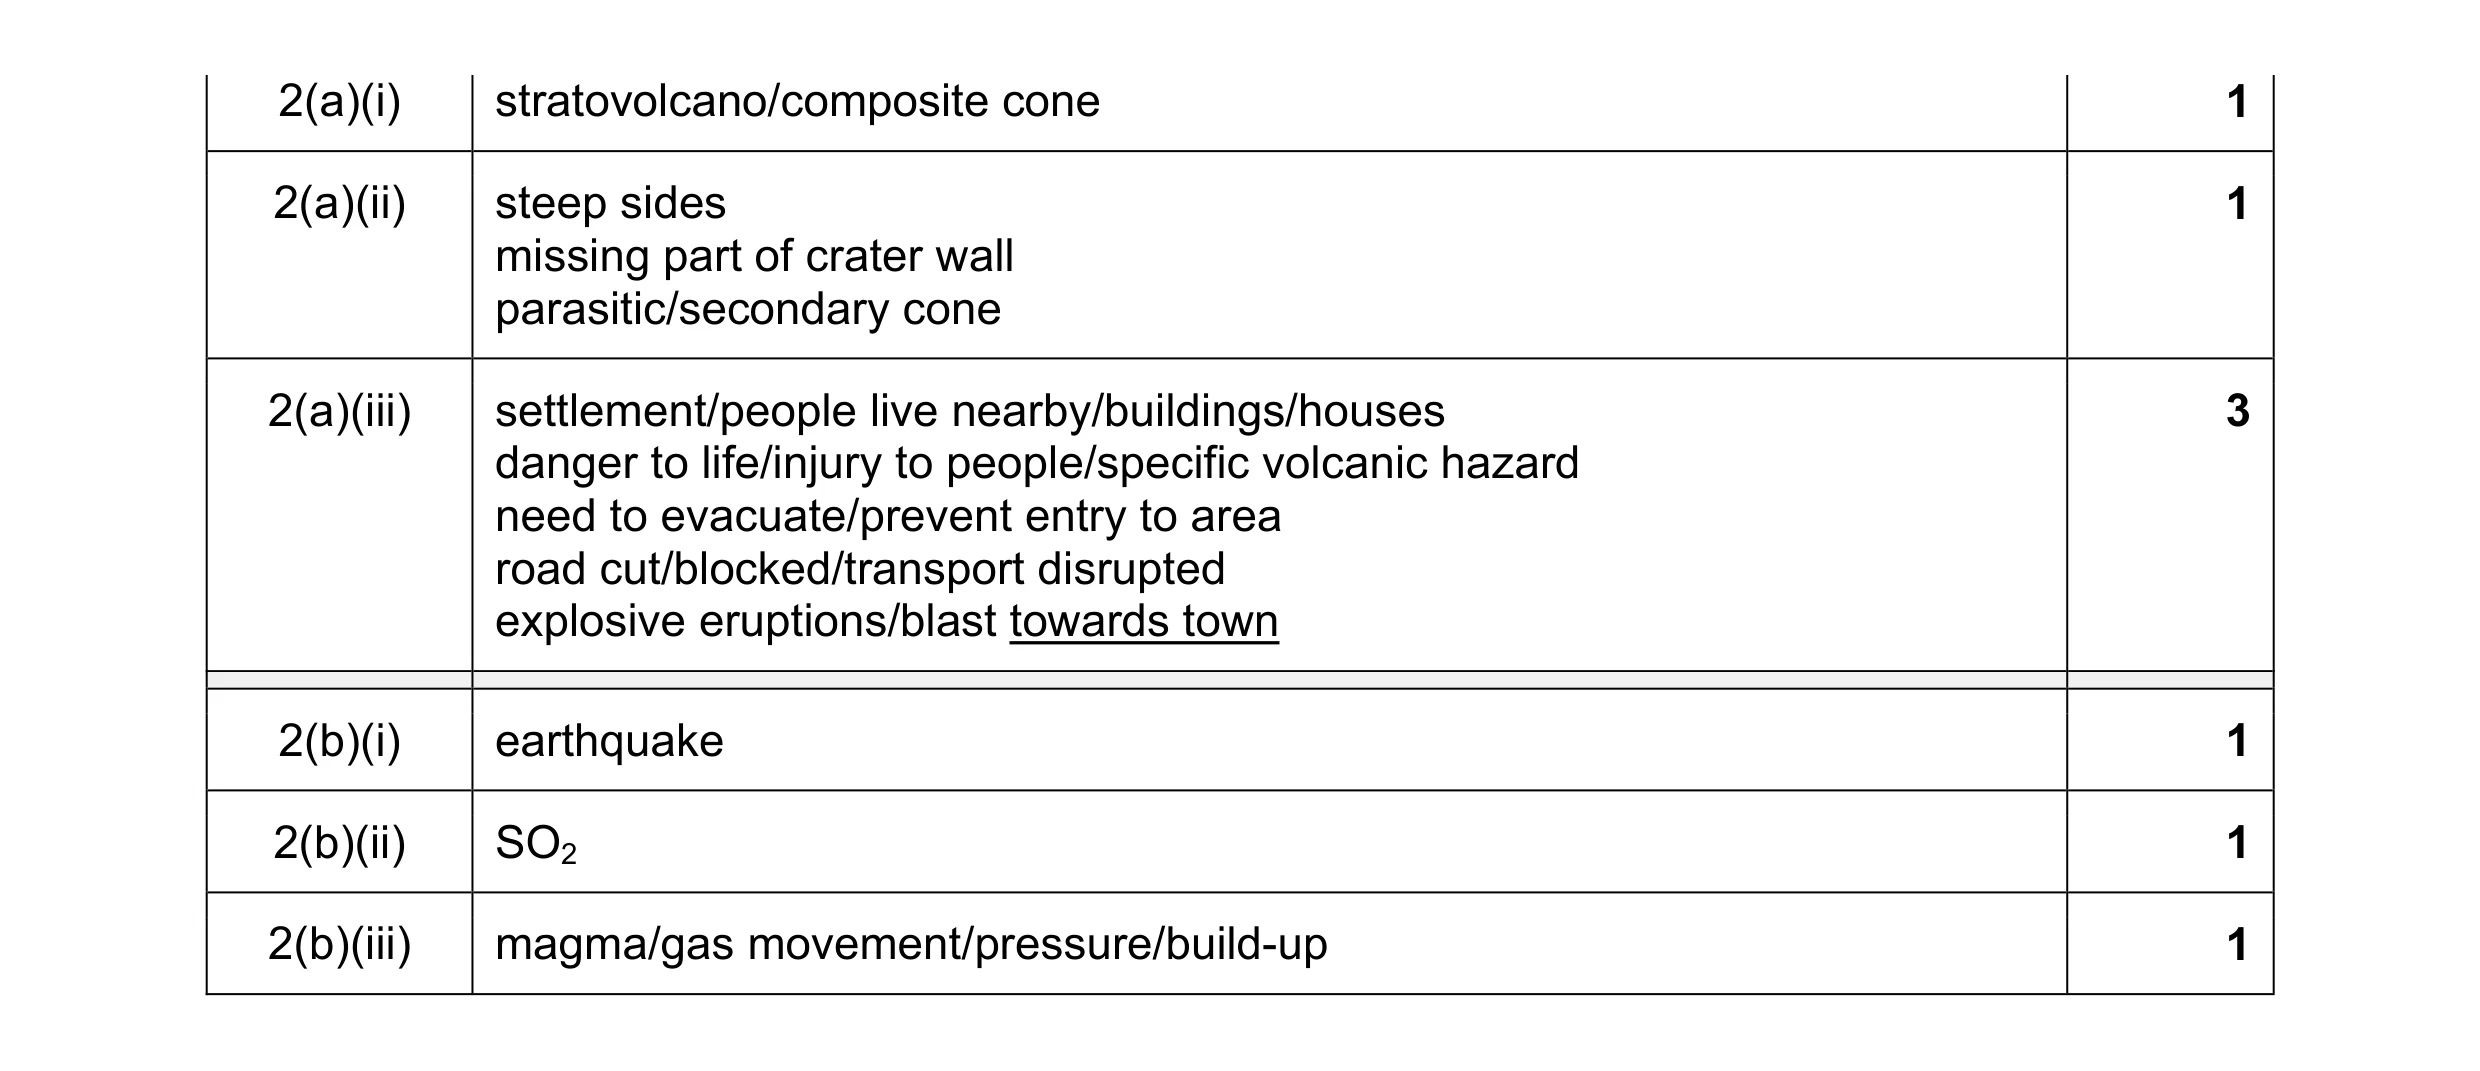 8
8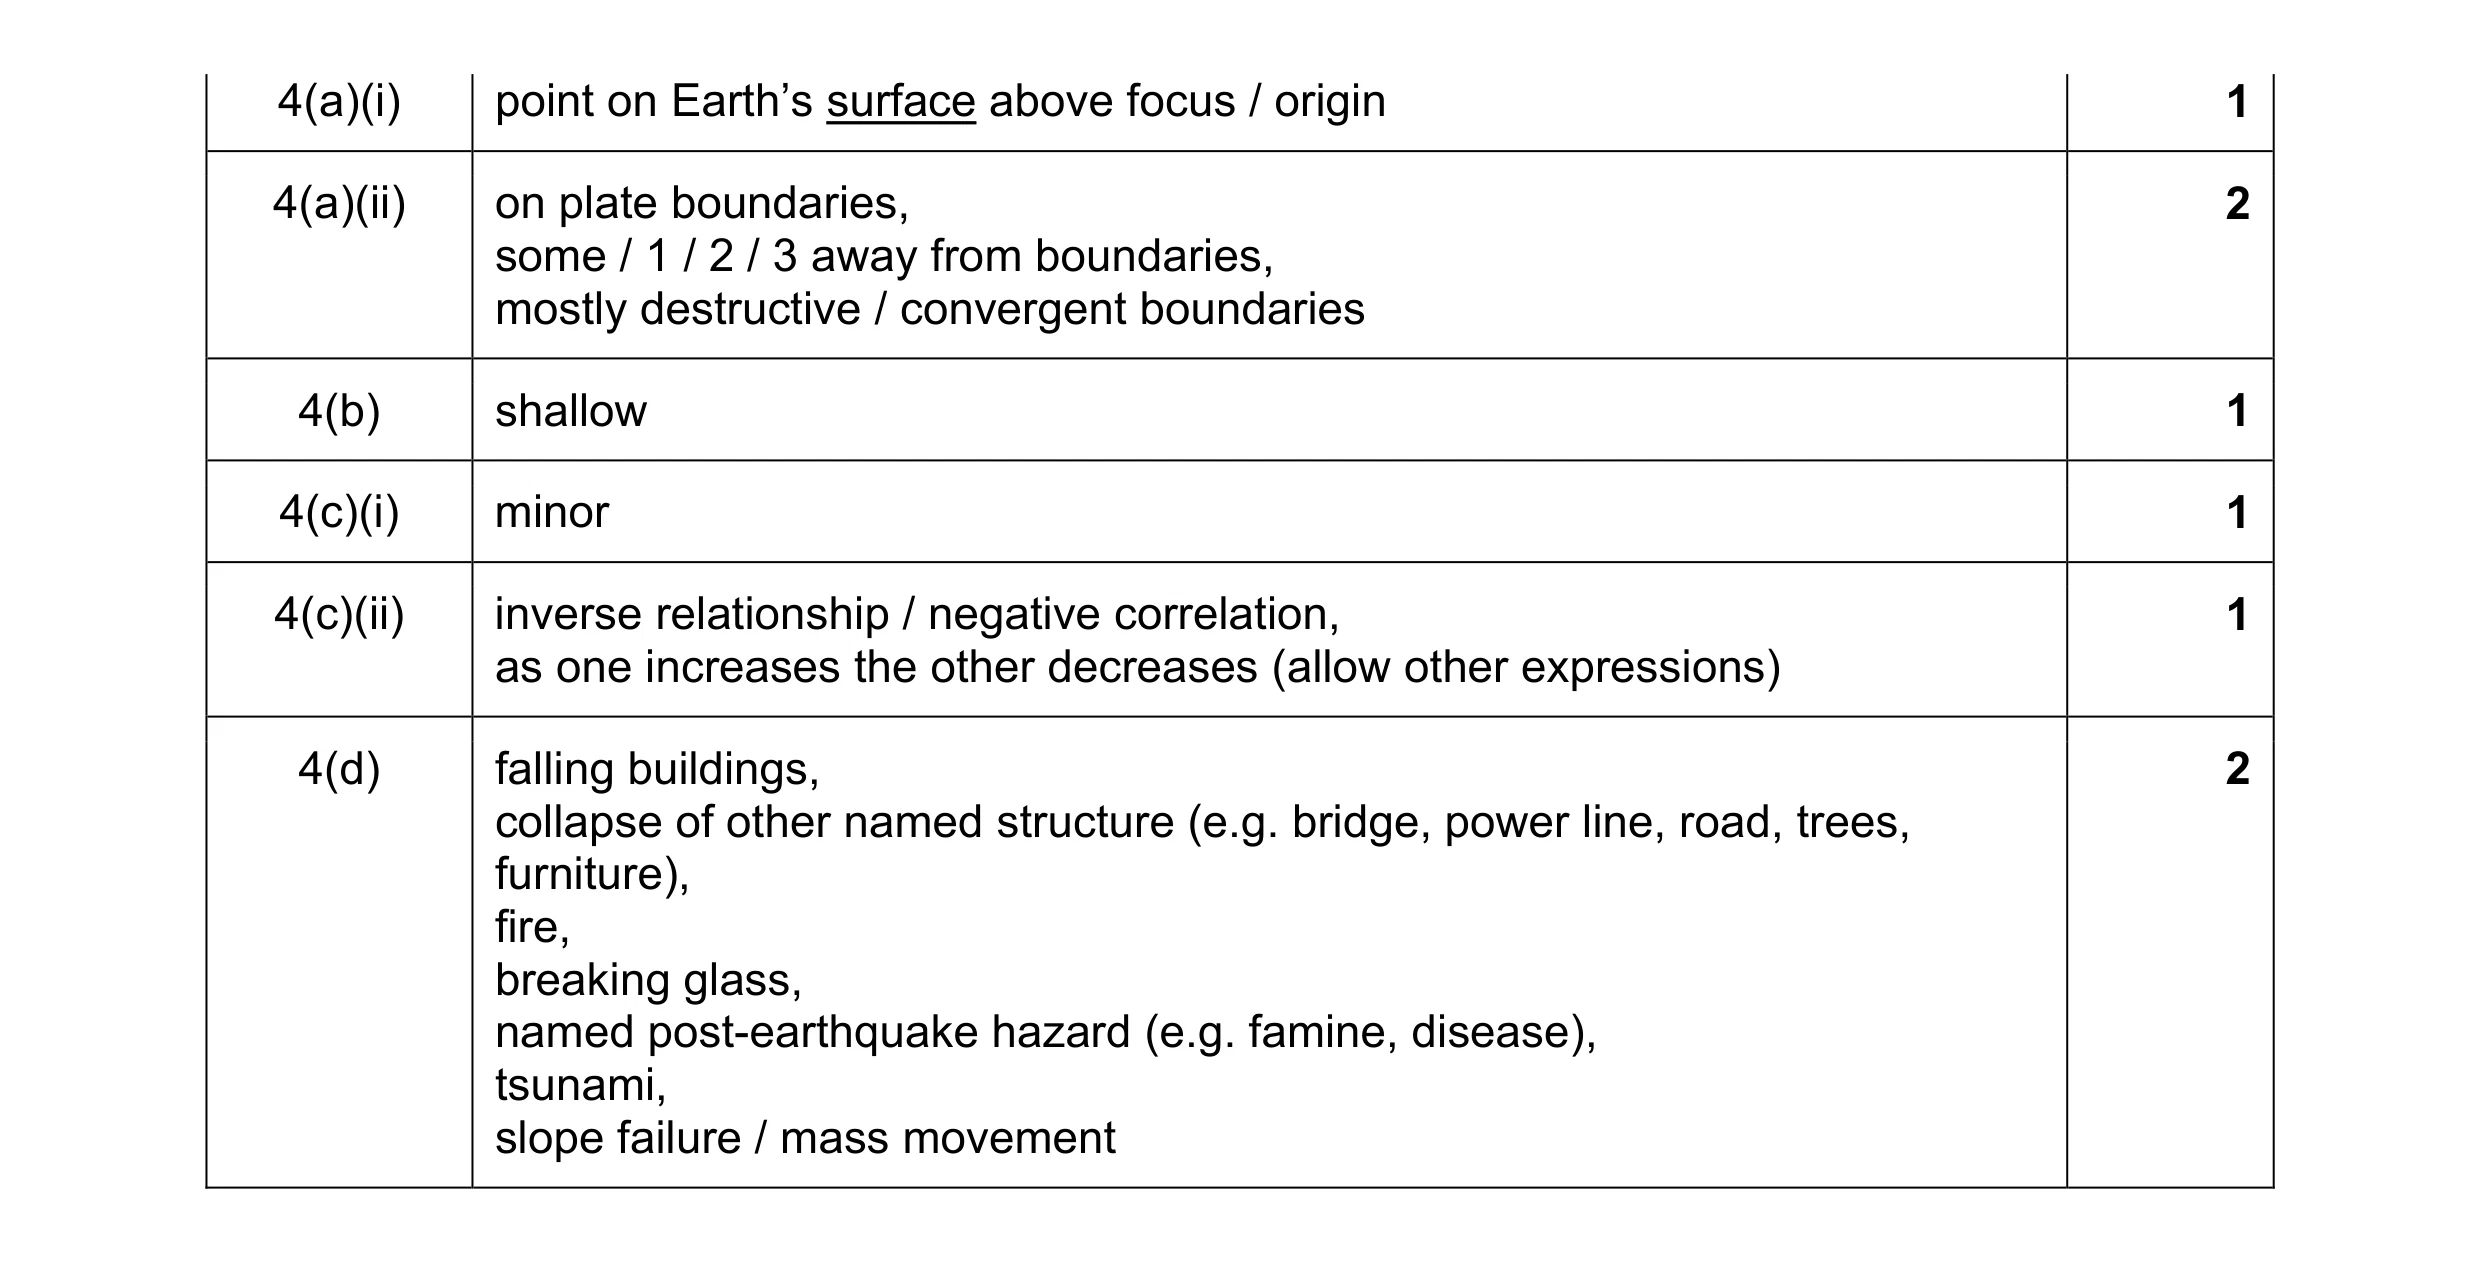 8
8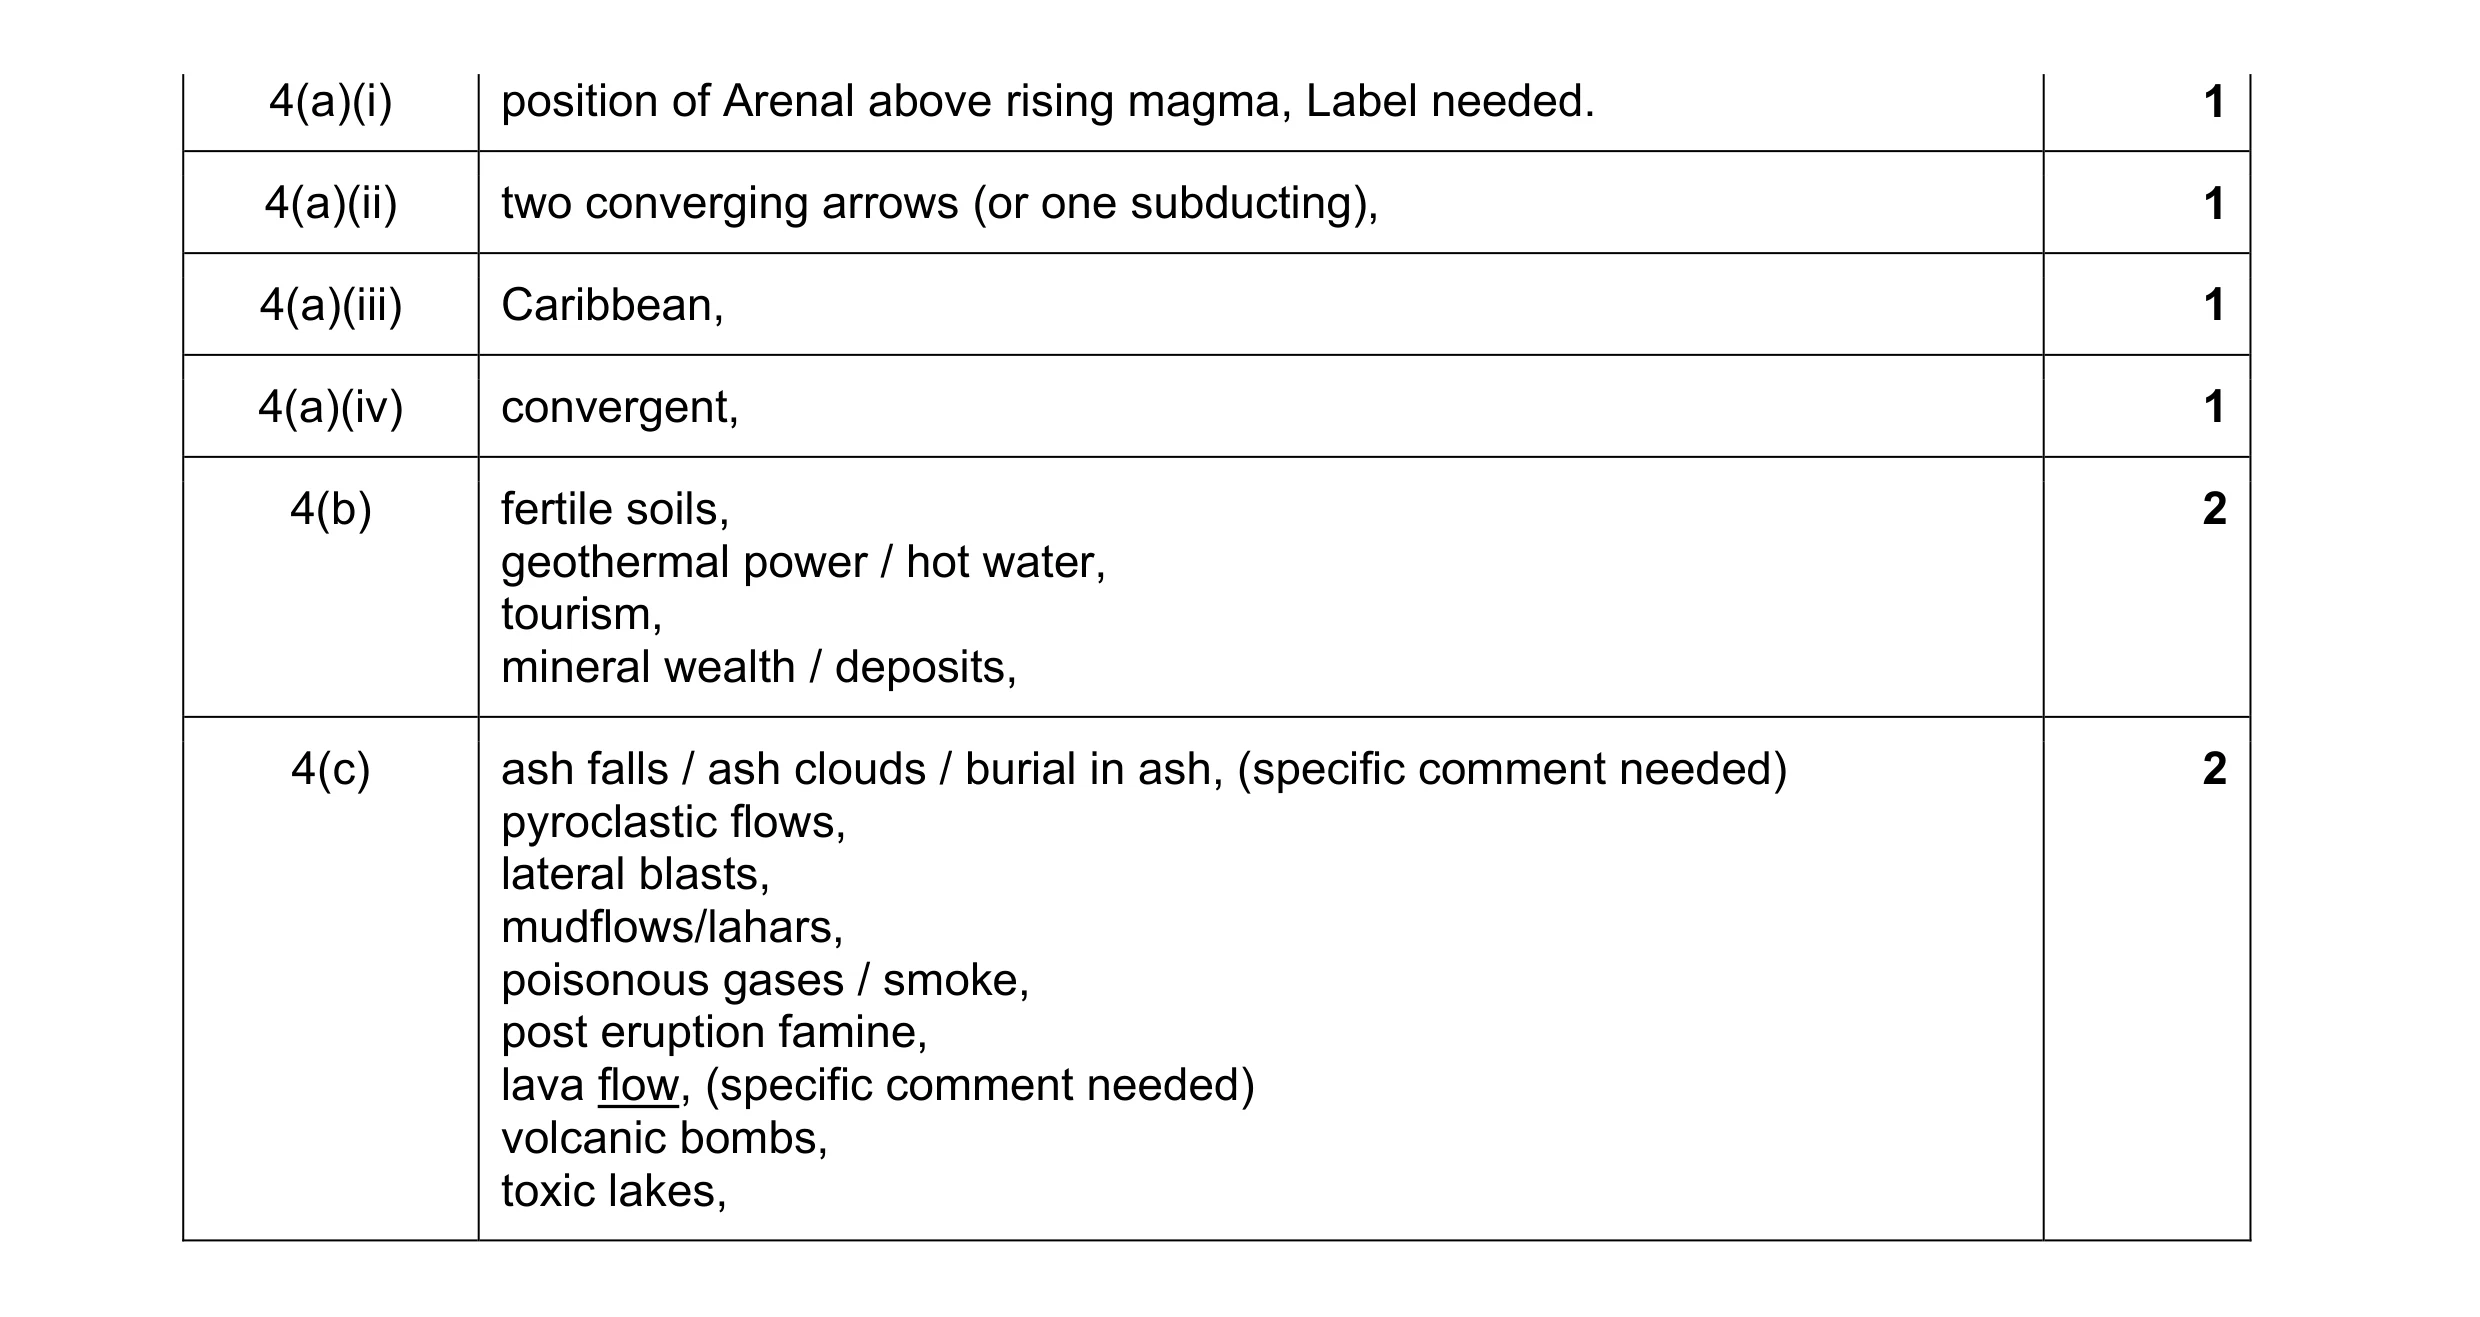 8
8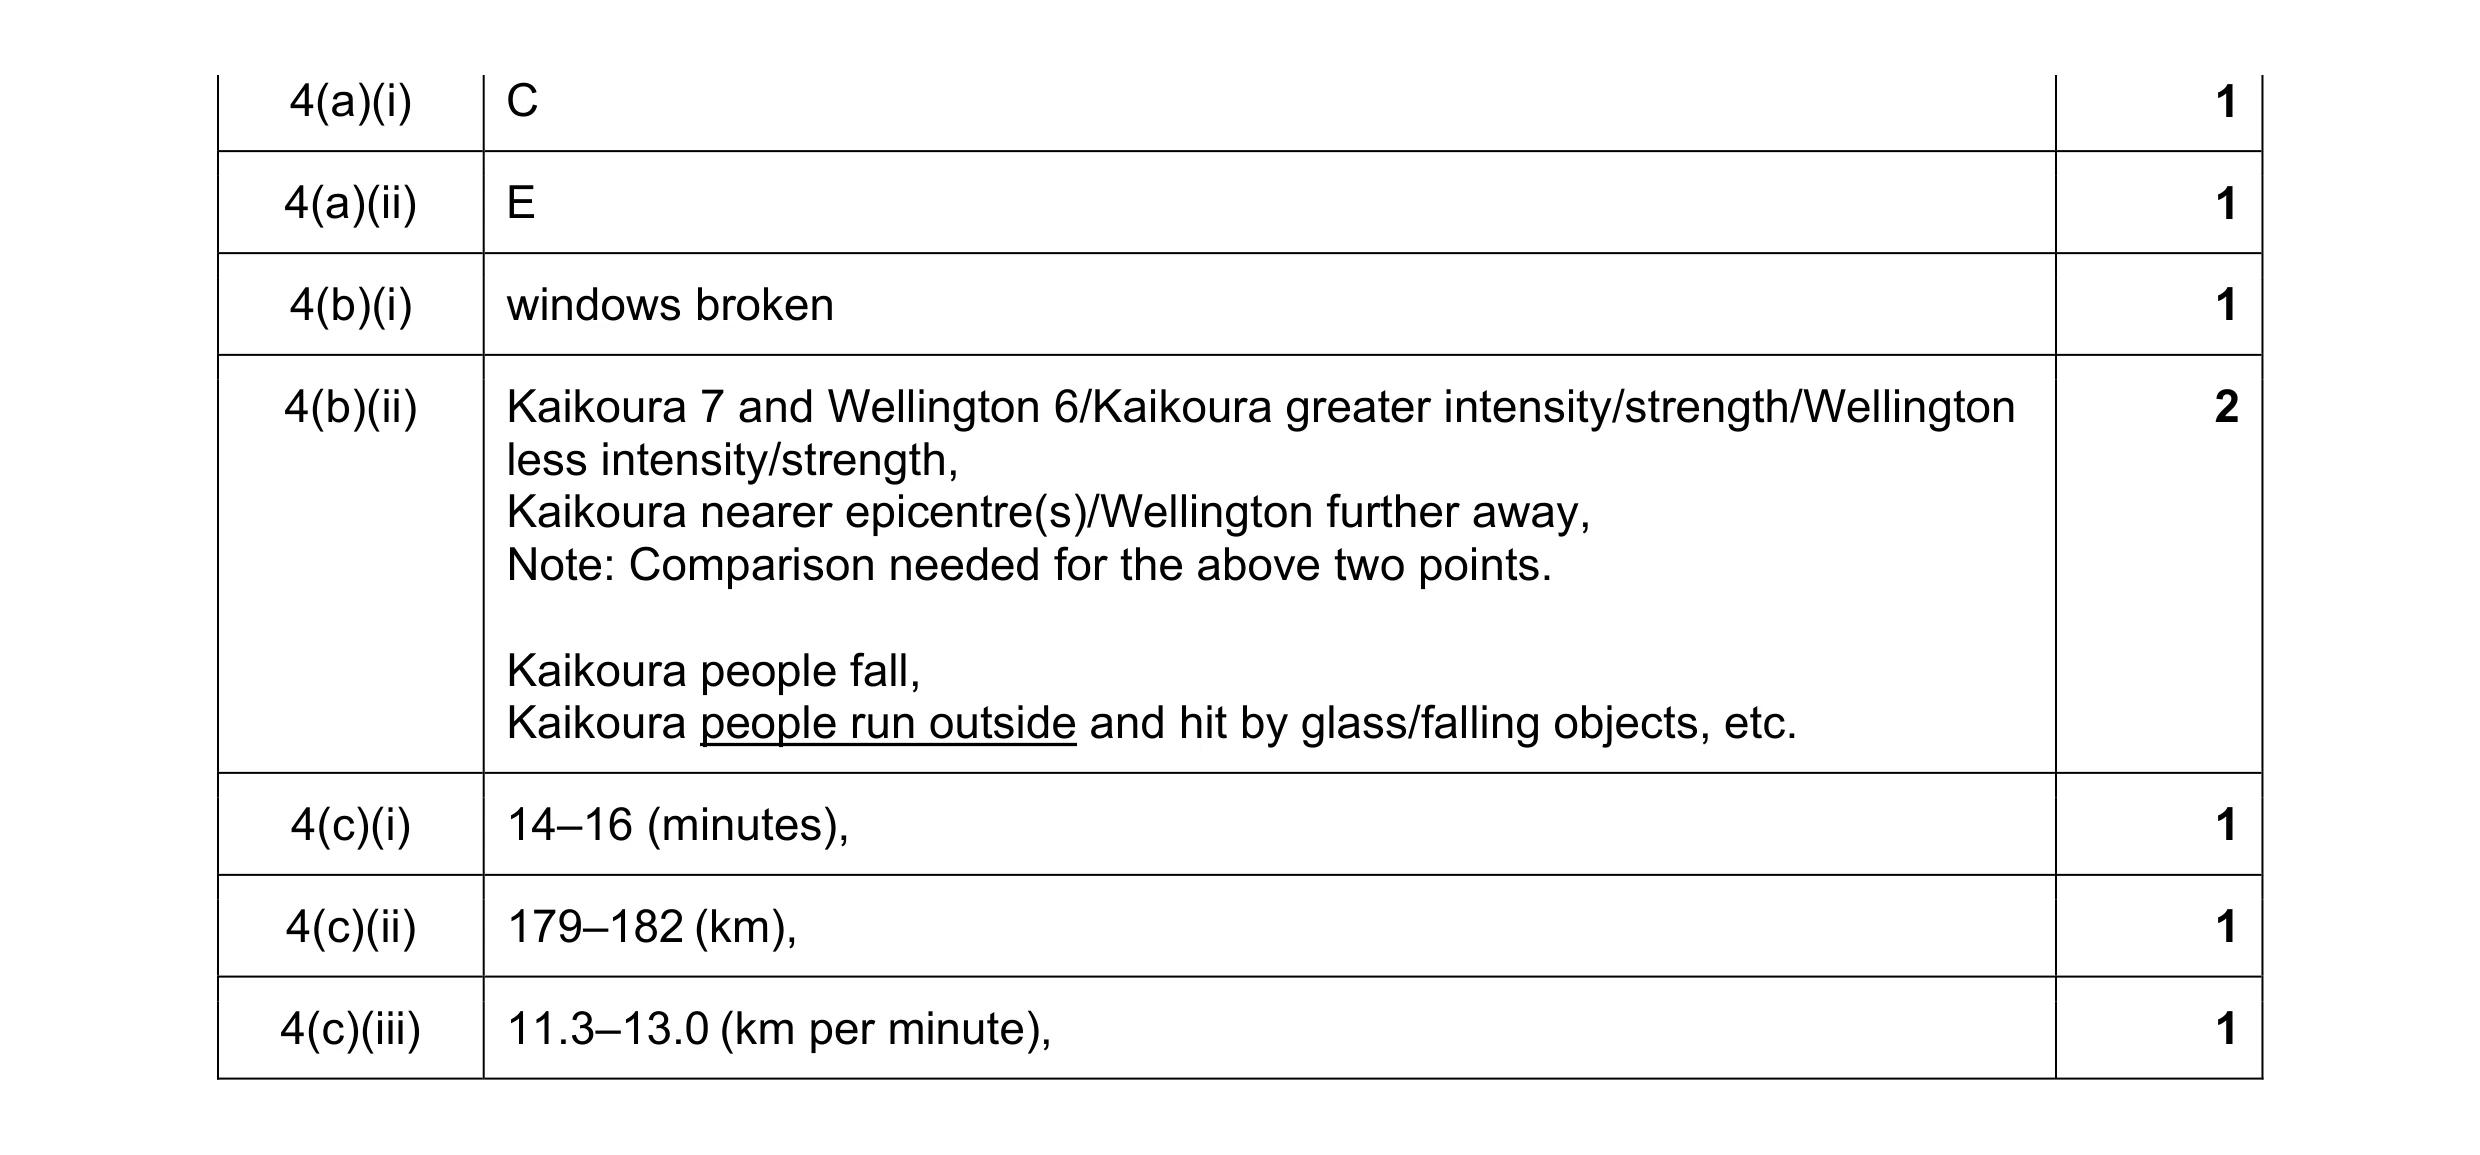 8
8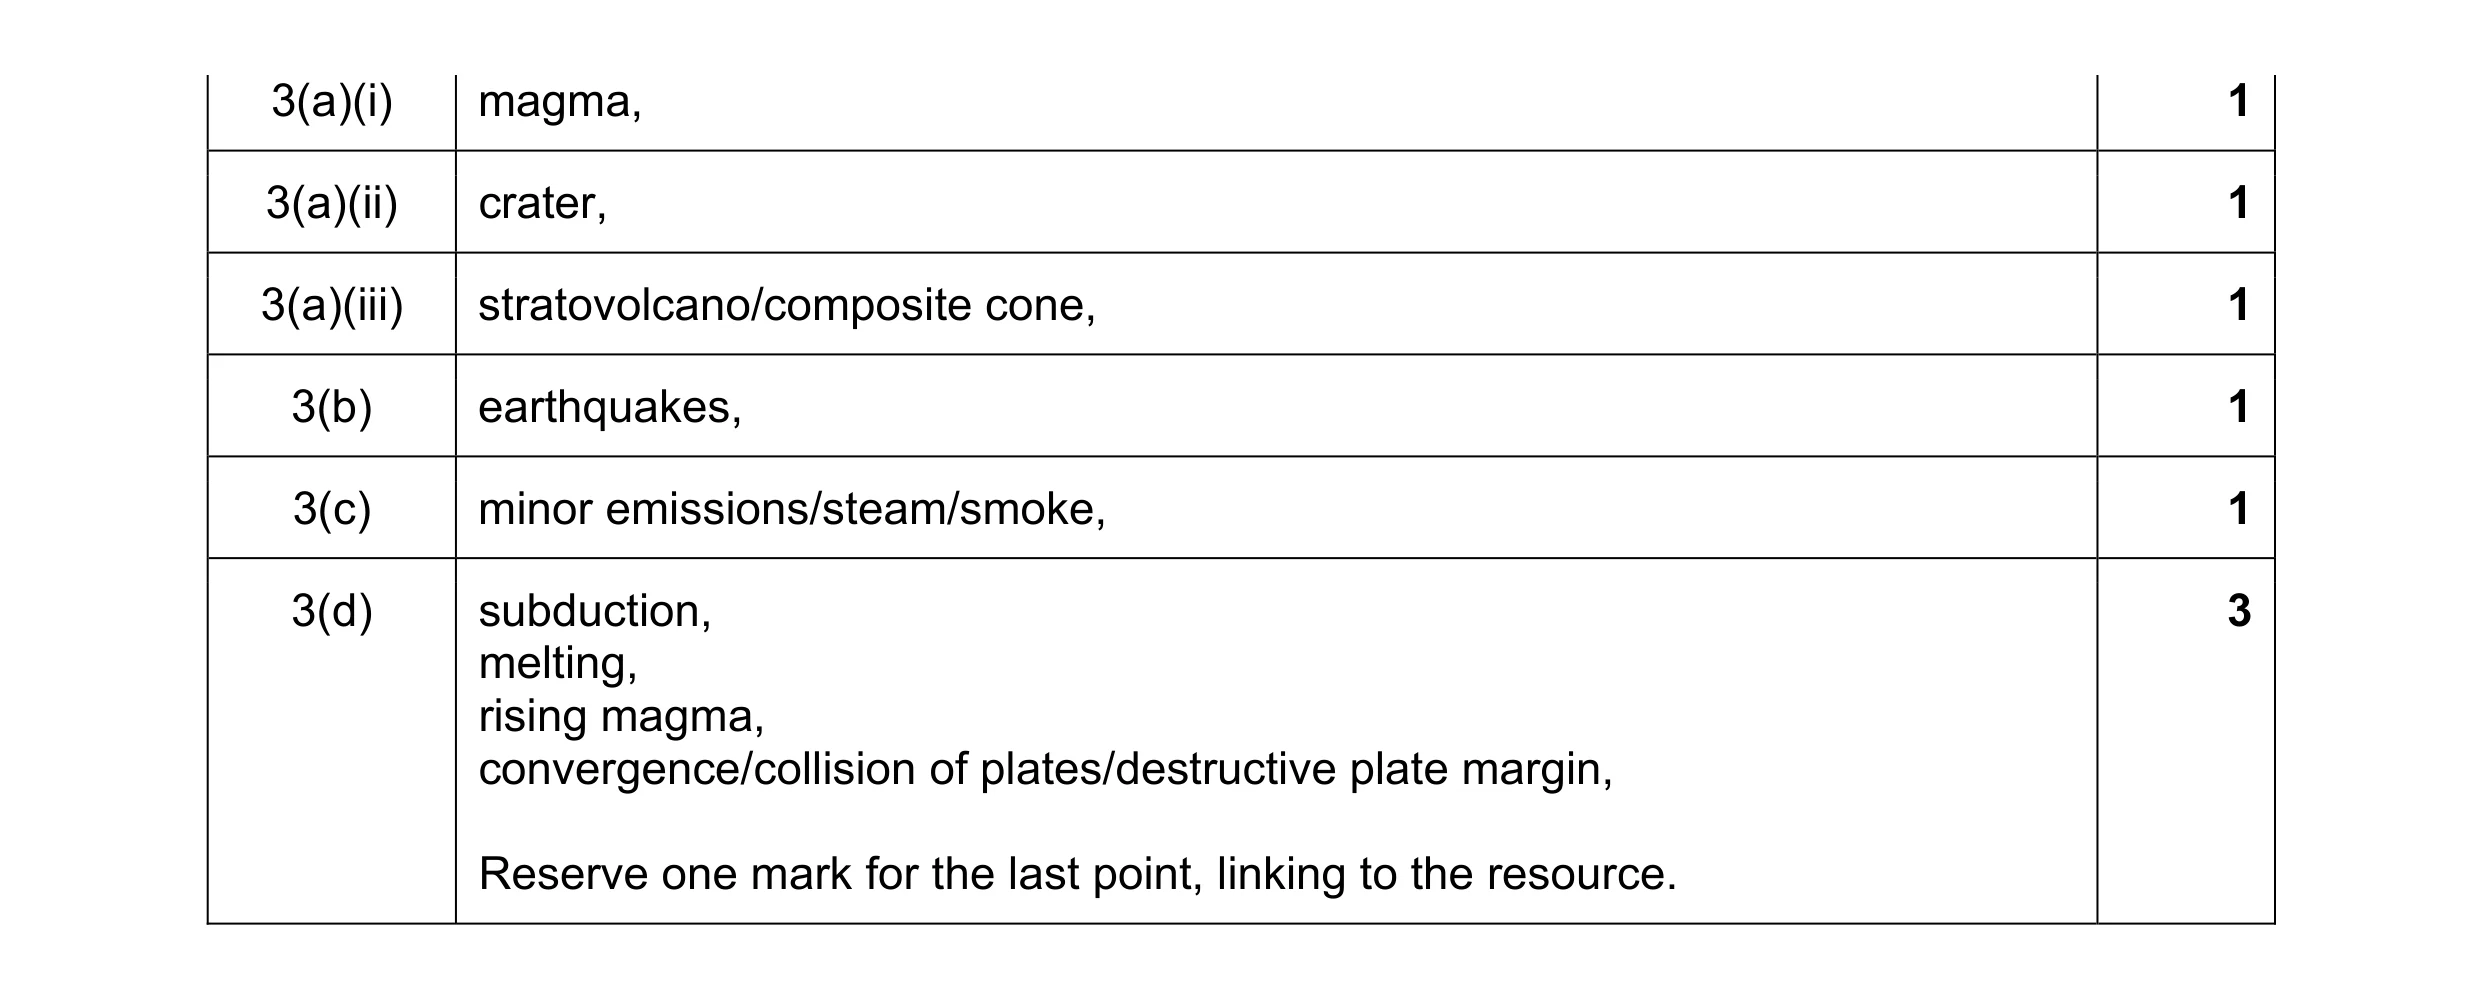 8
8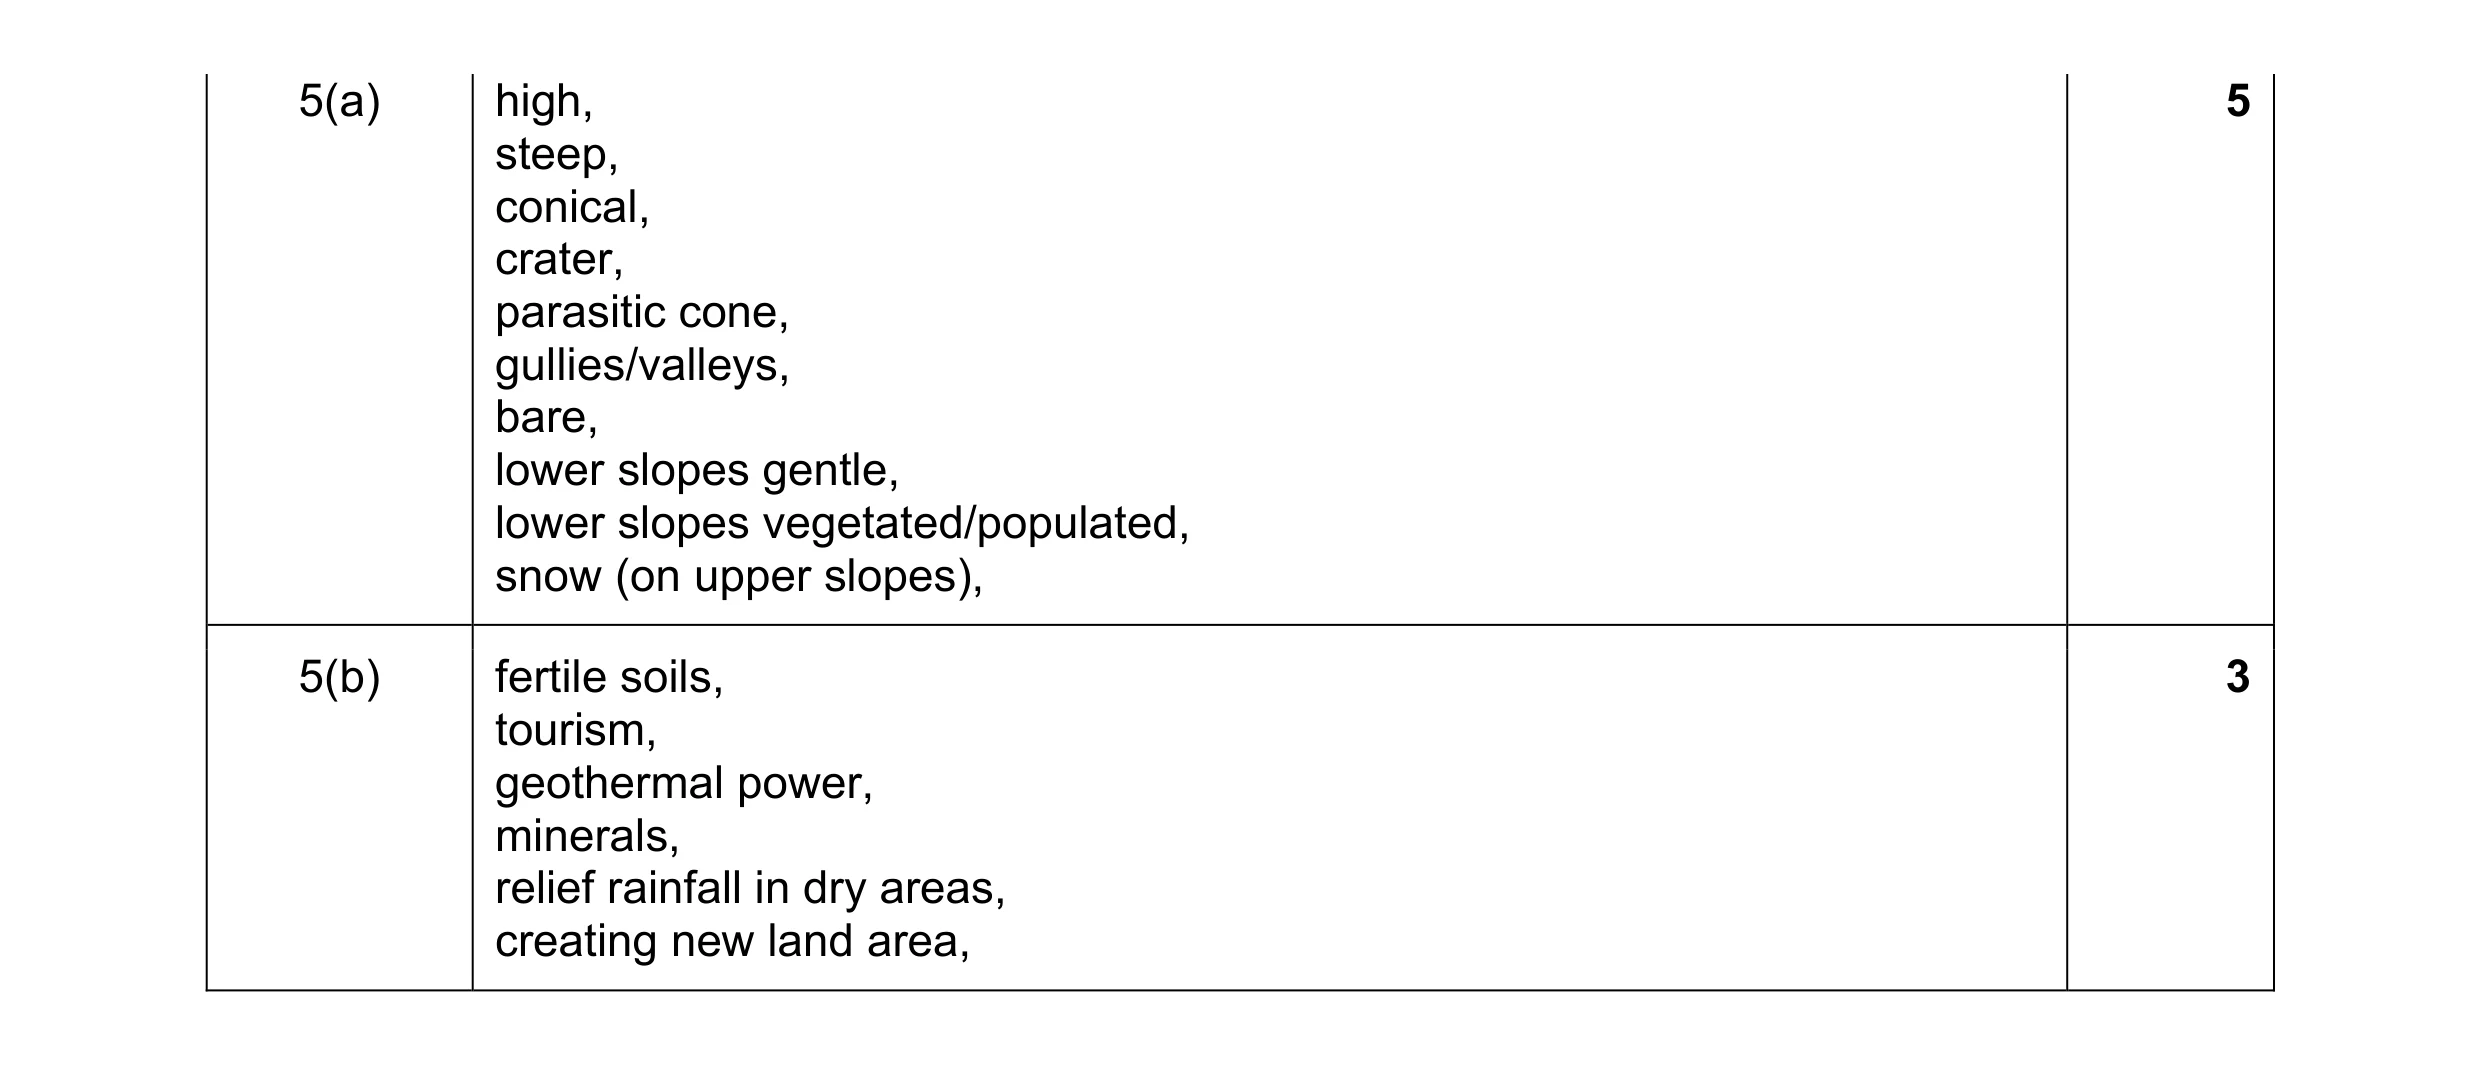 8
8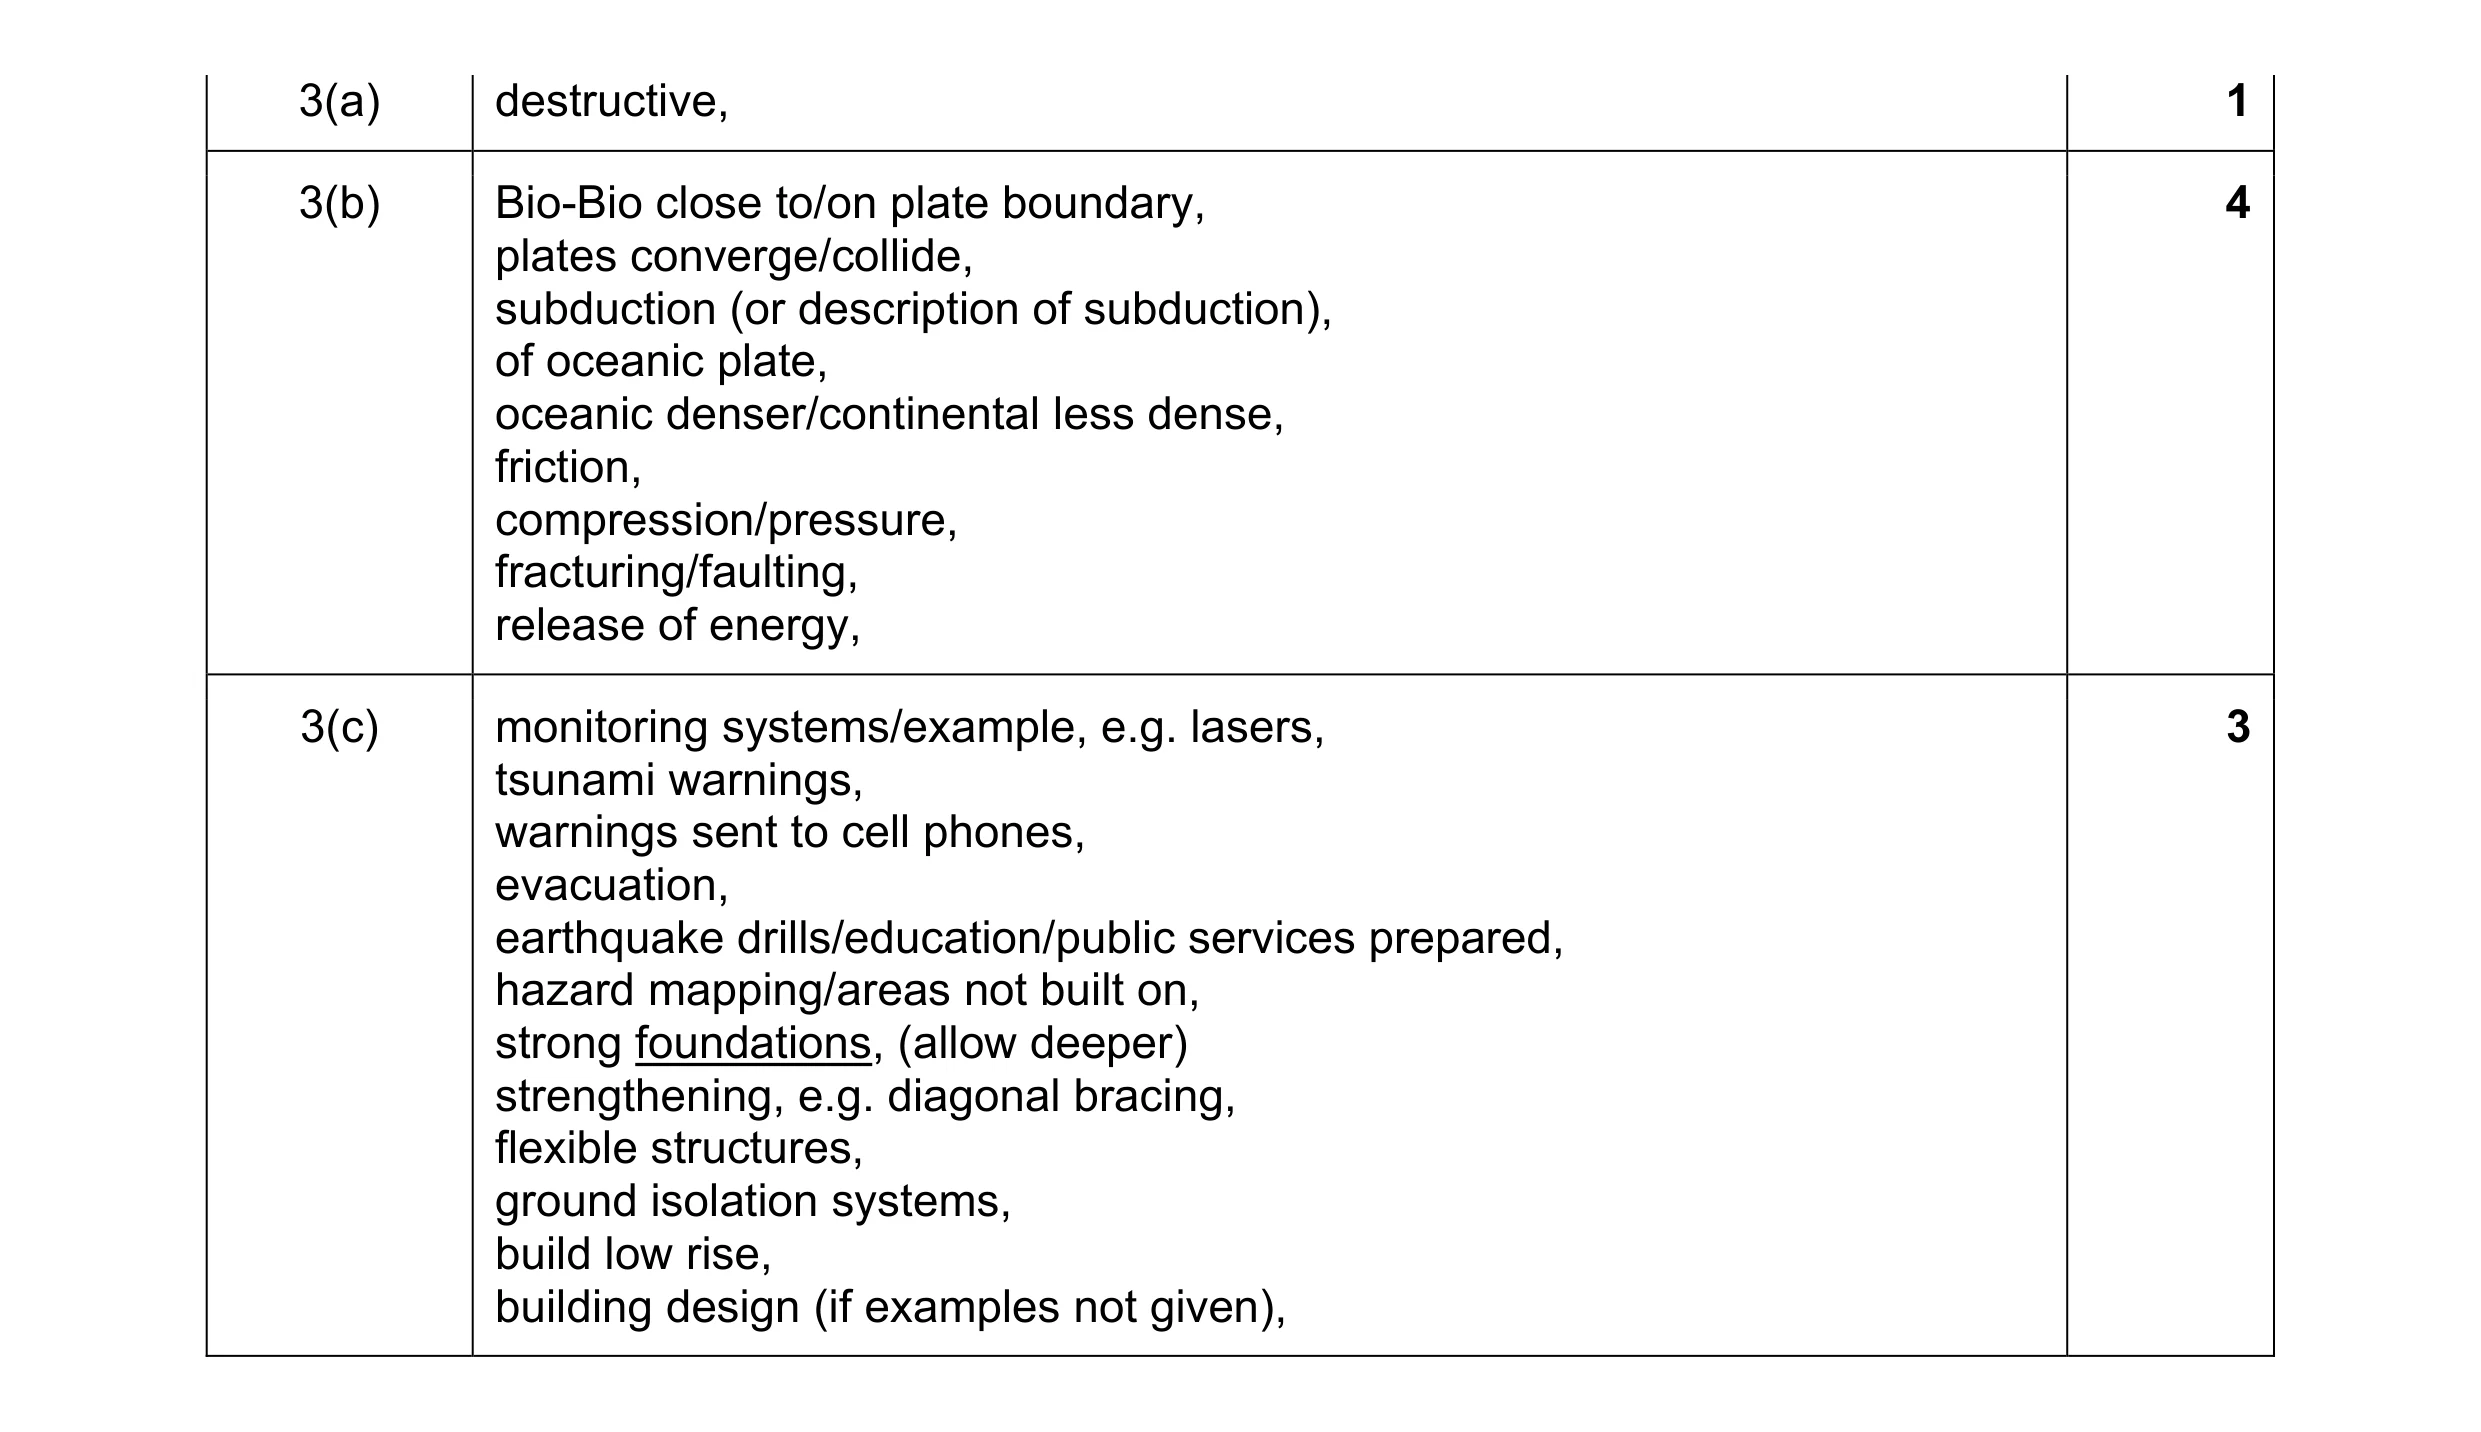 8
8 8
8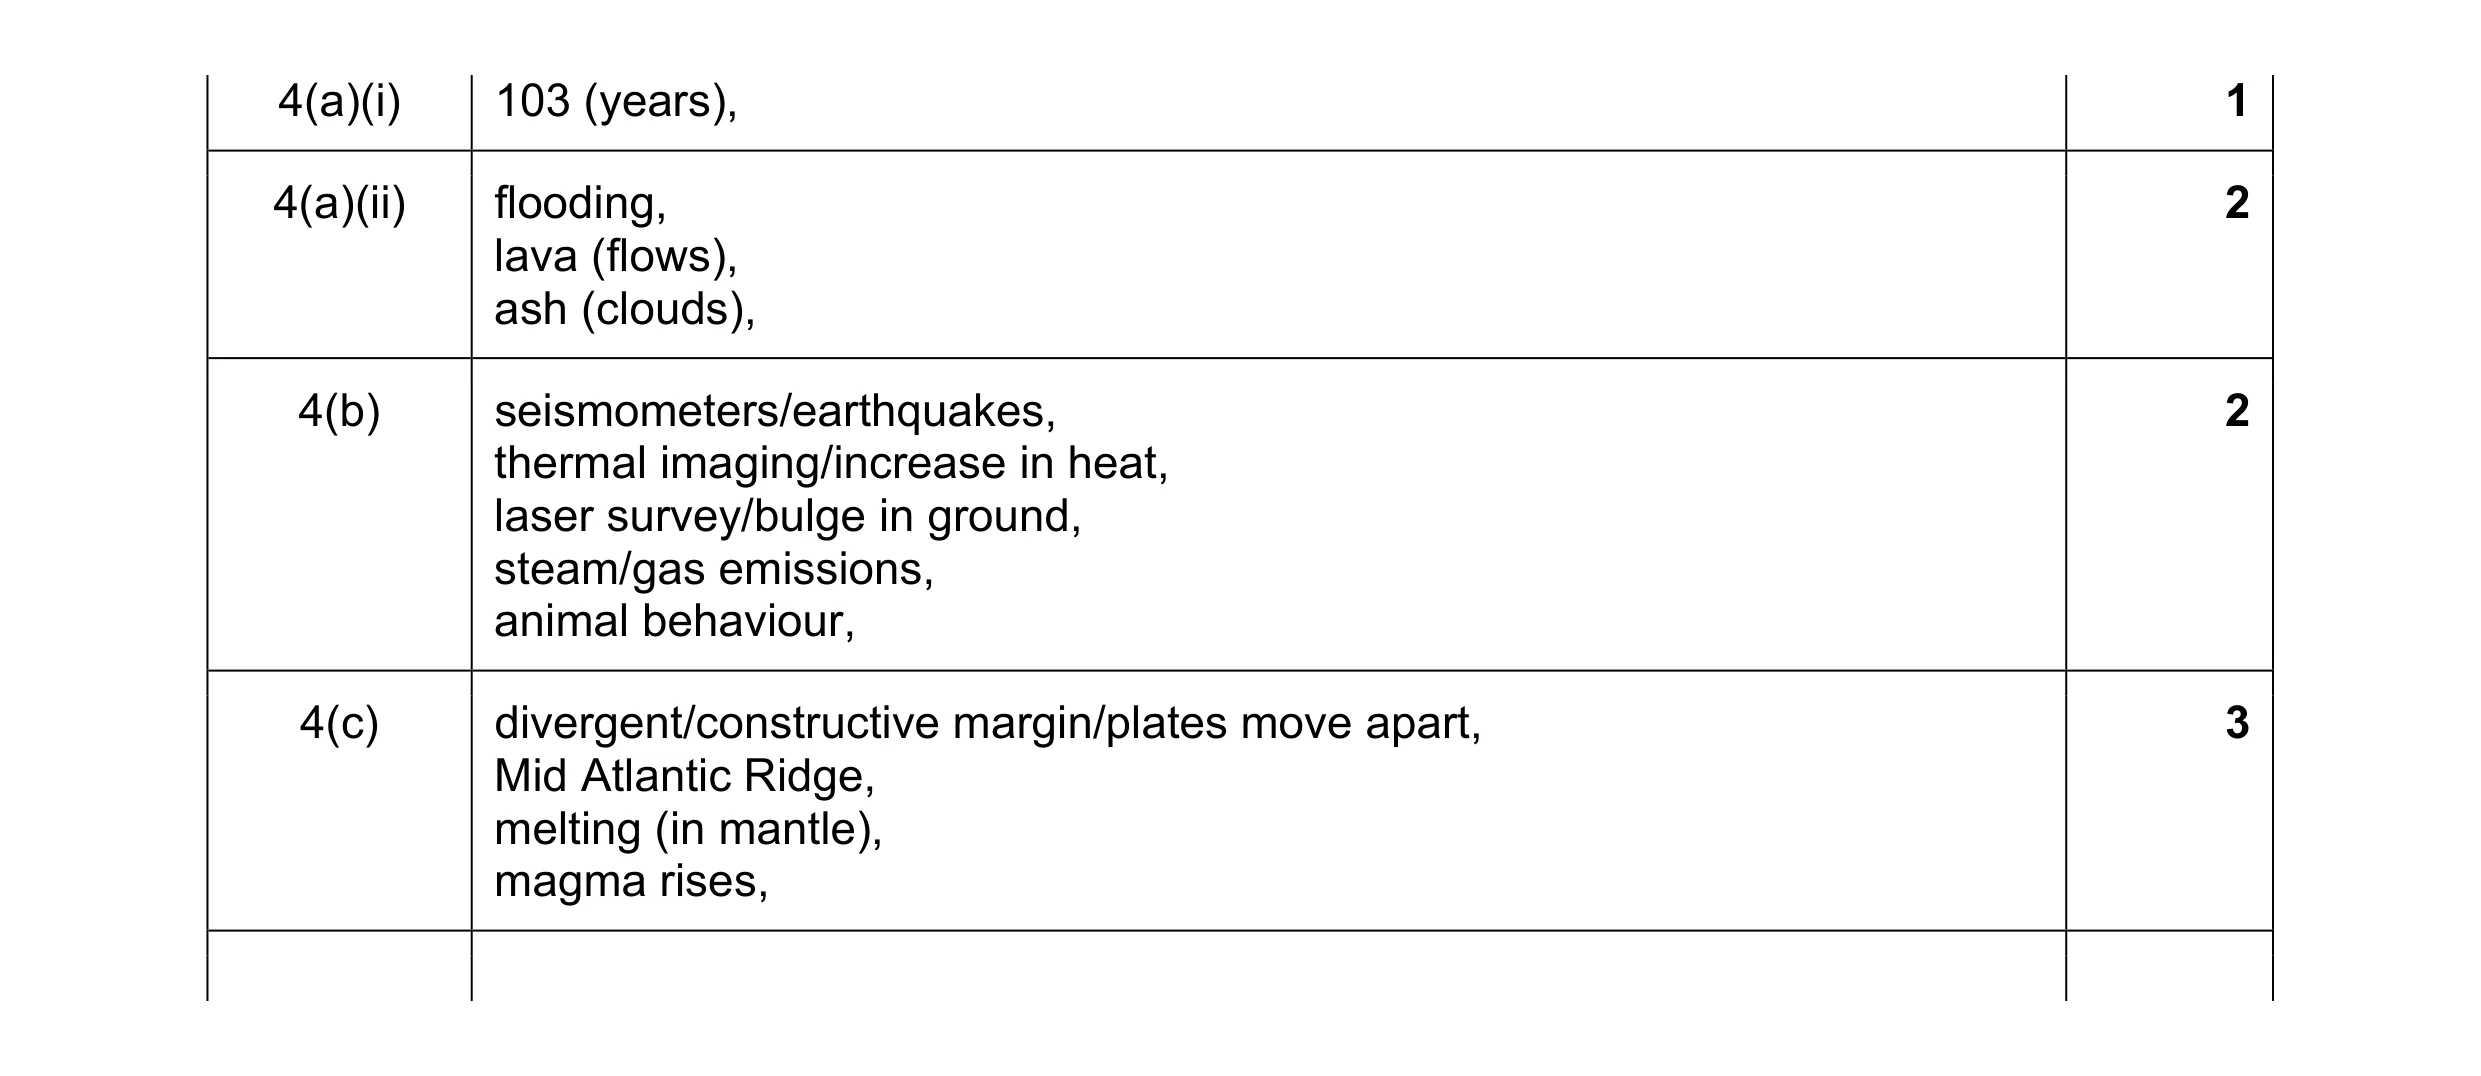 8
8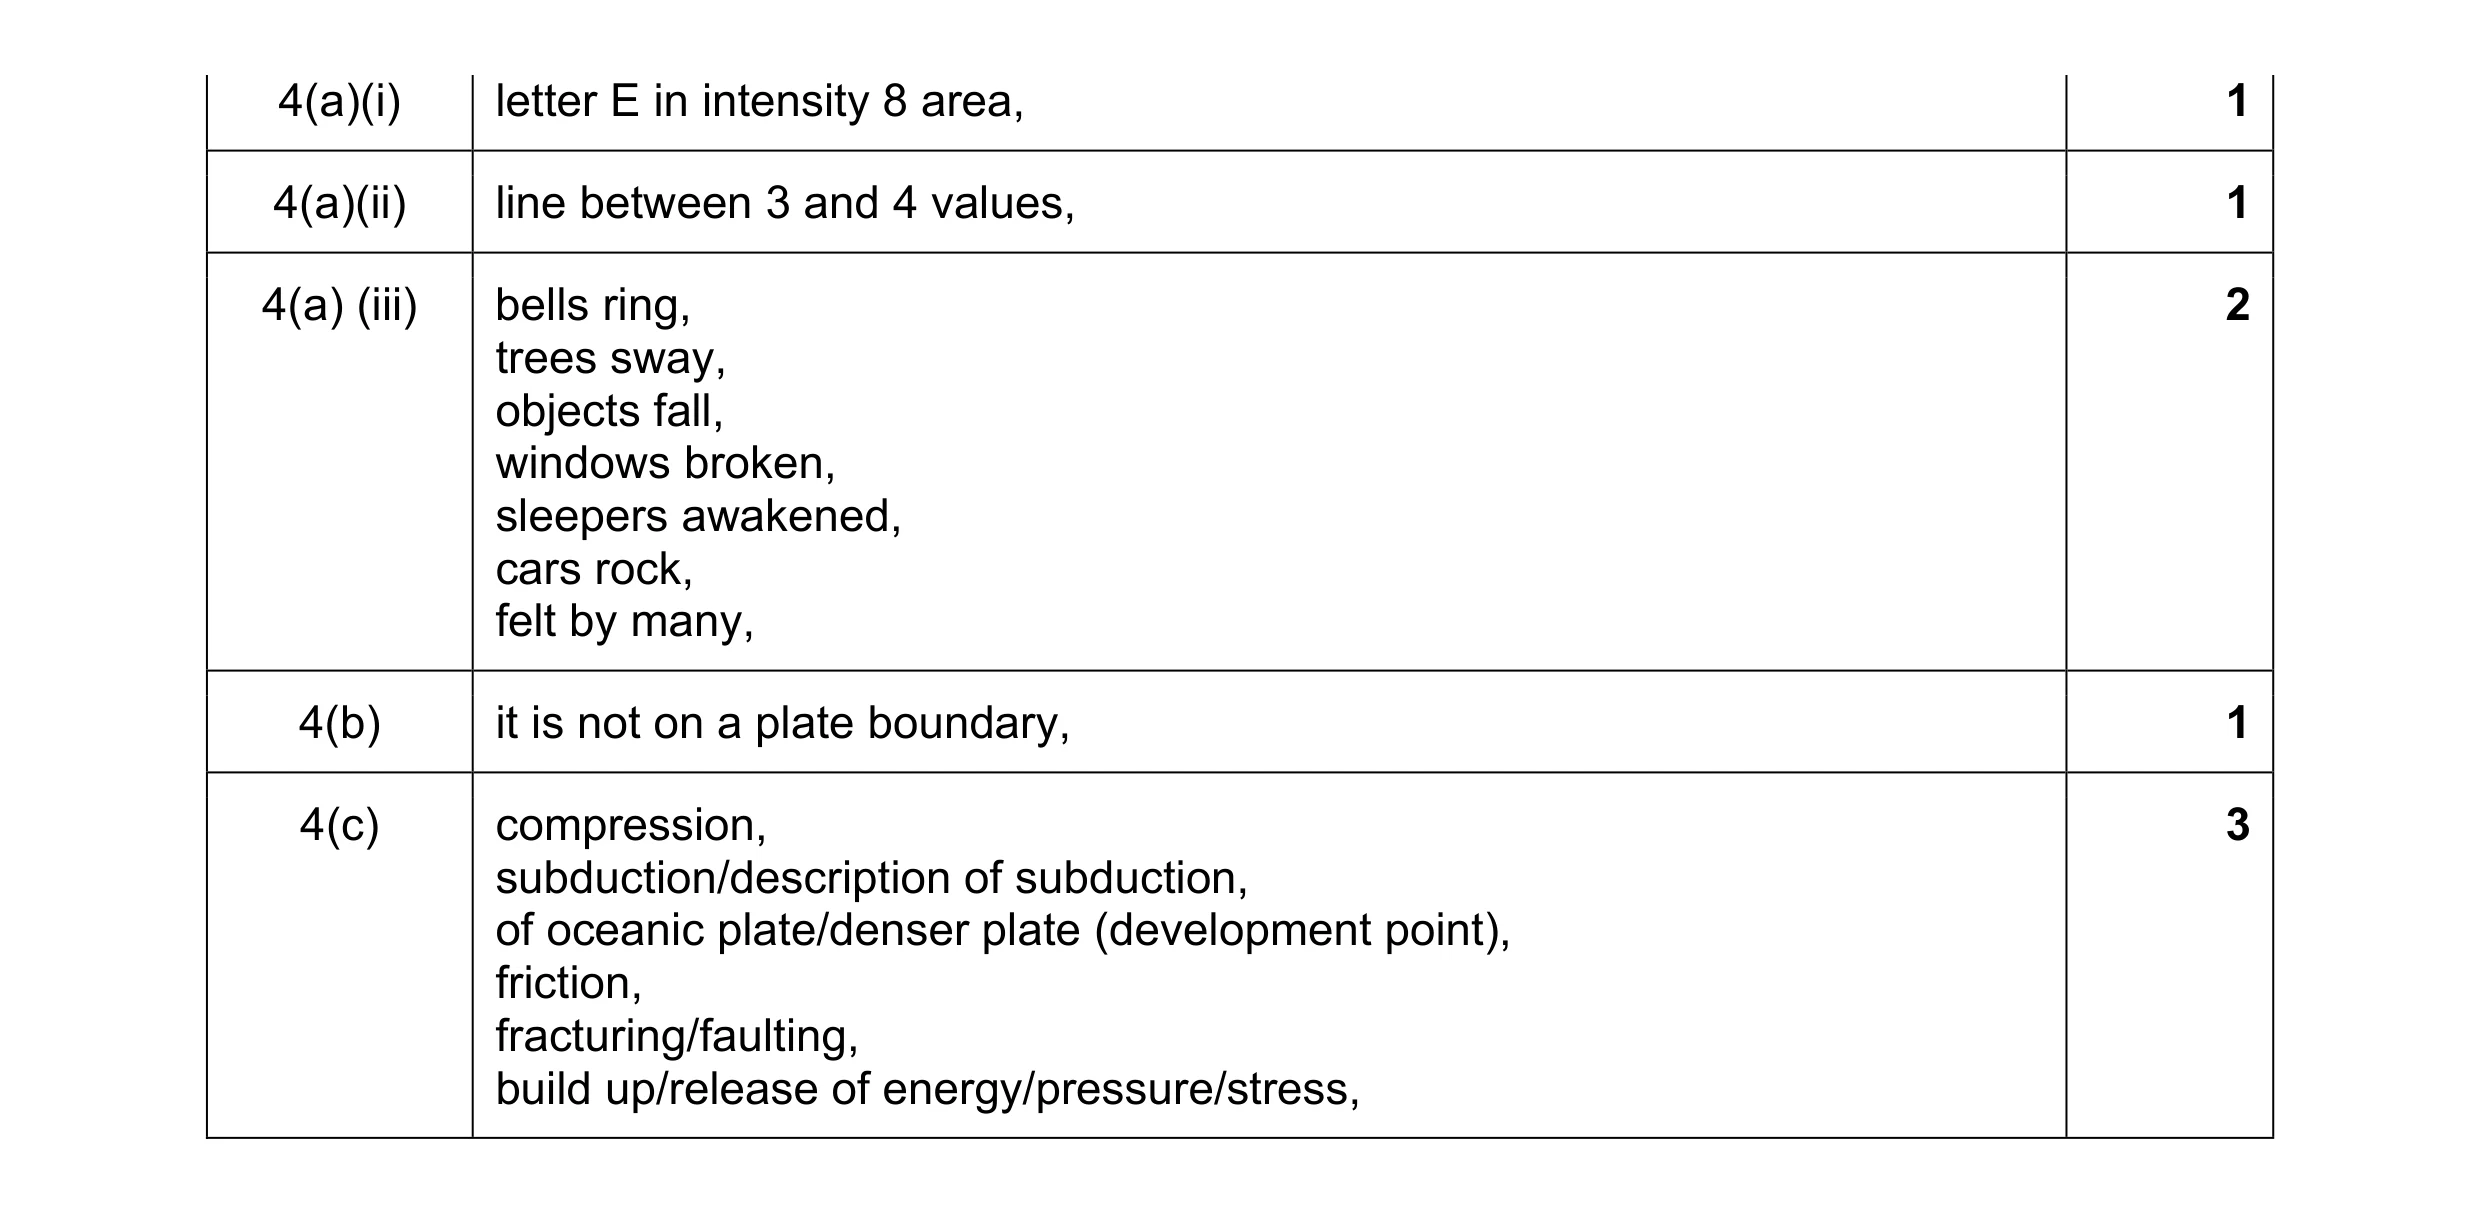 8
8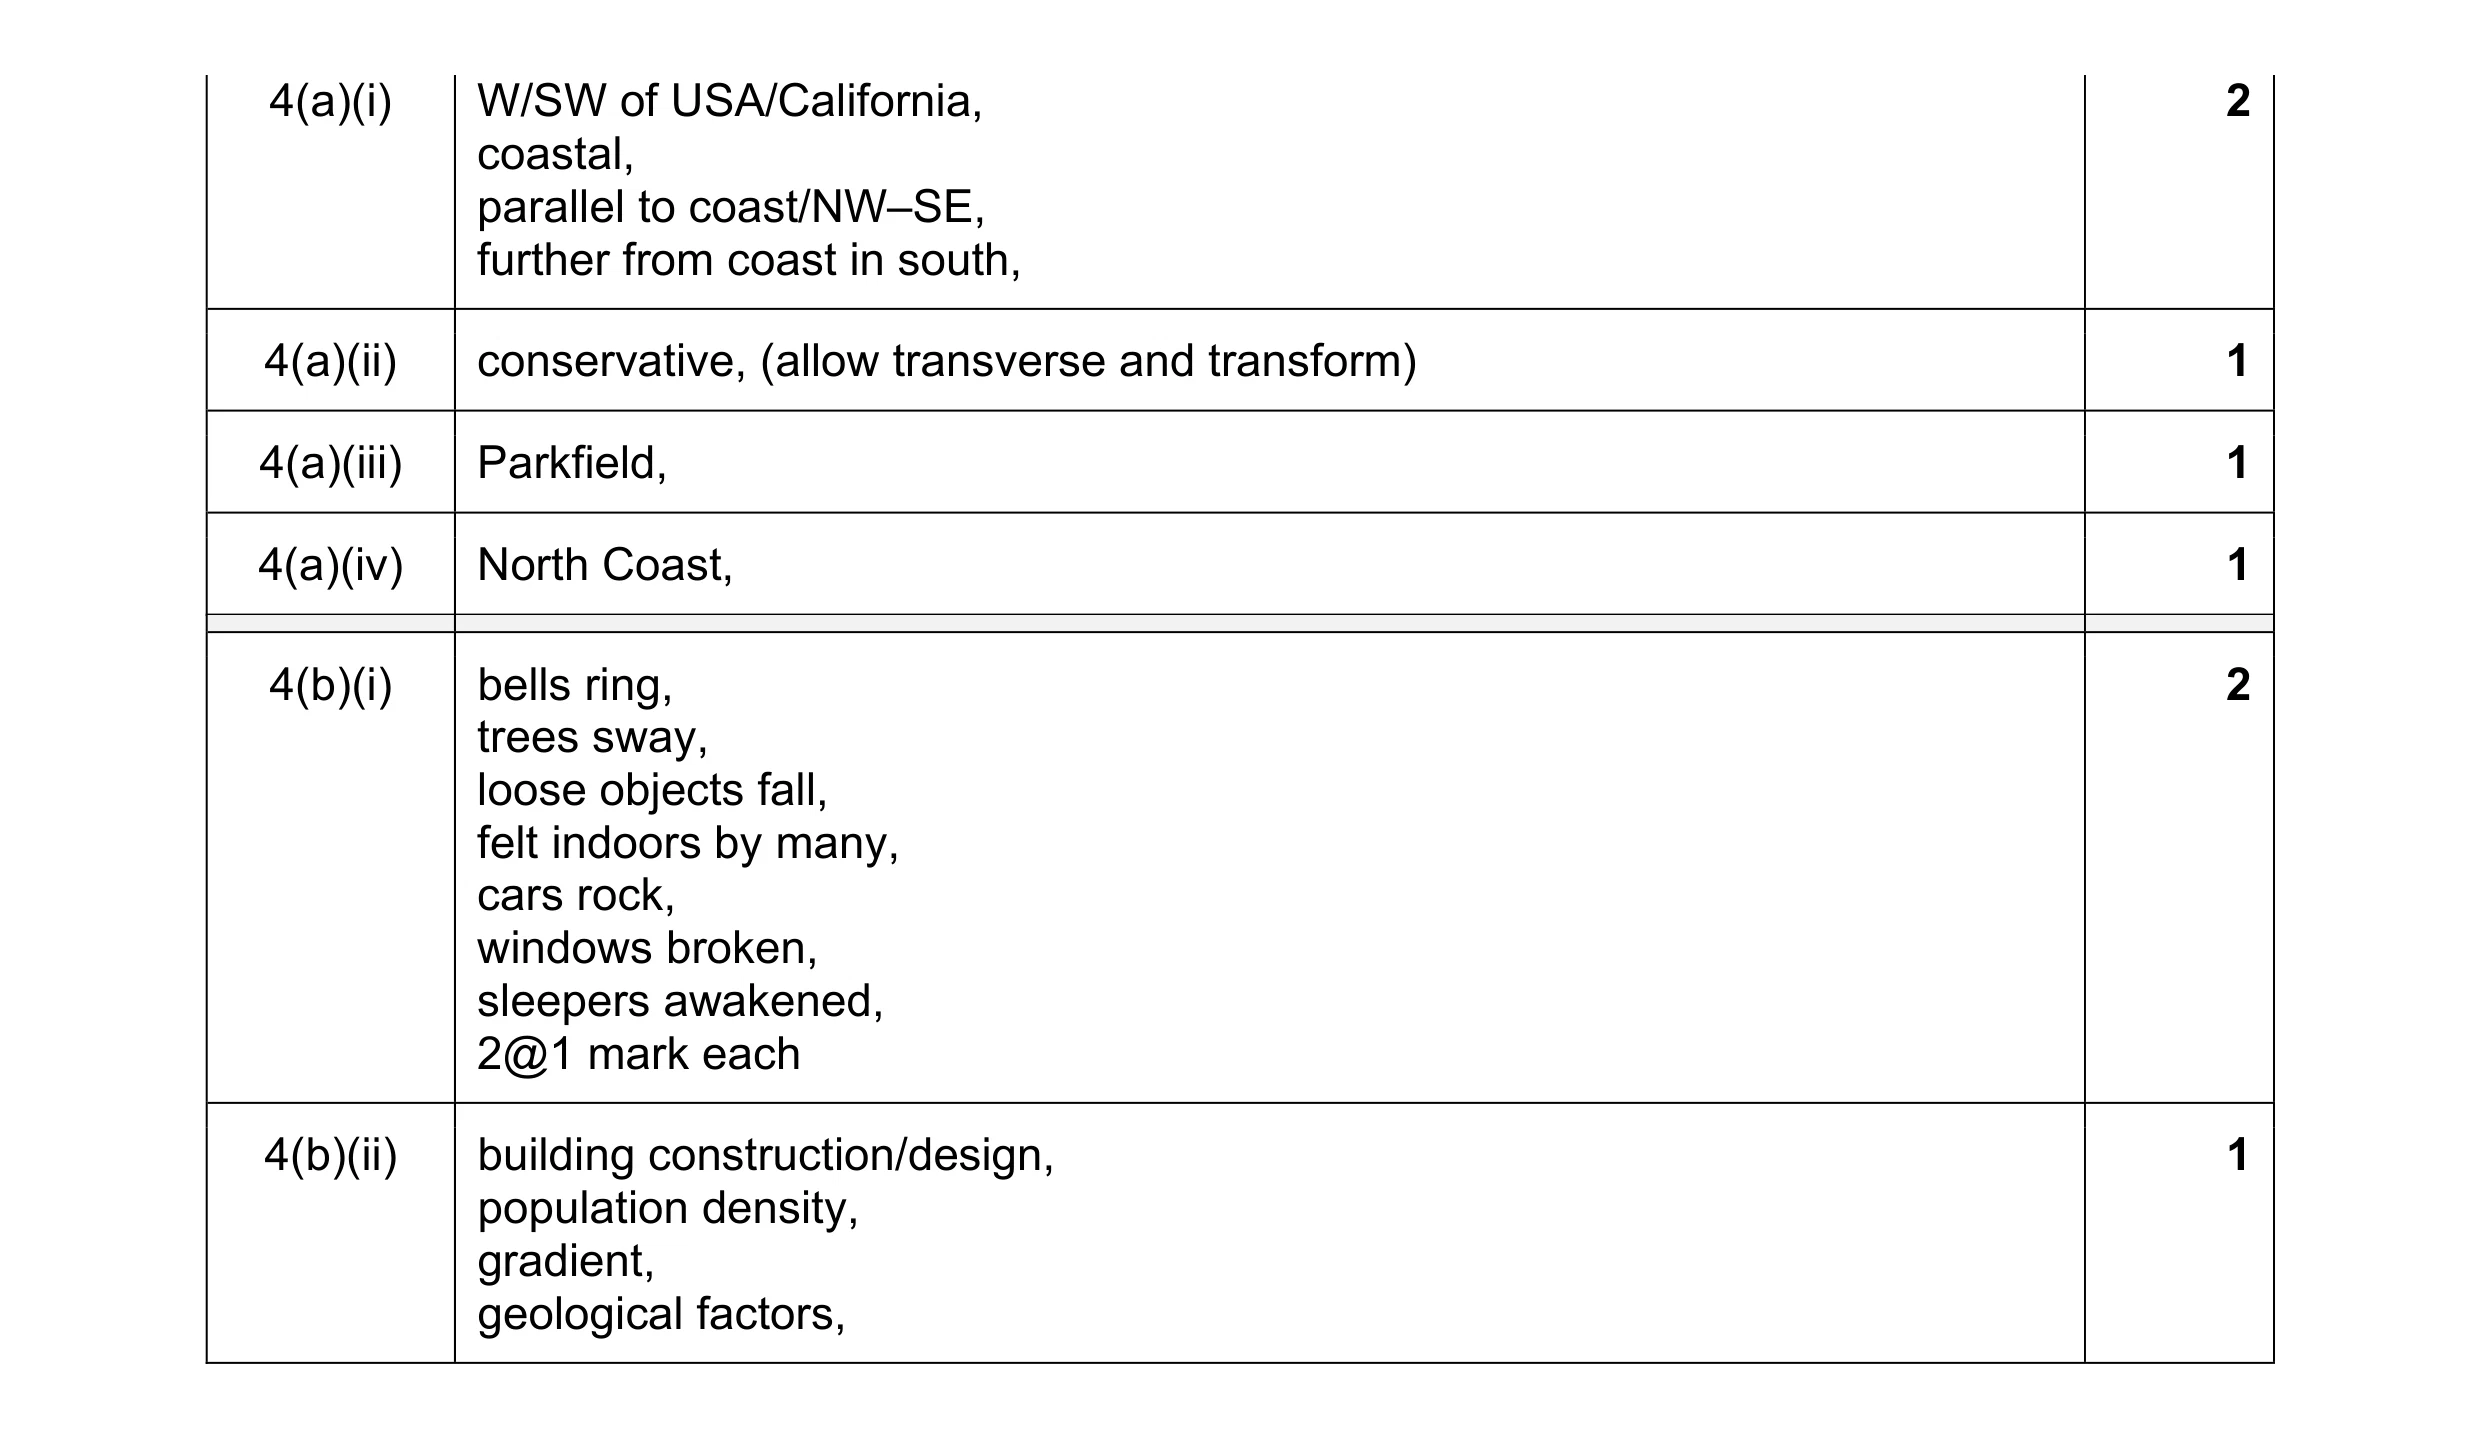 8
8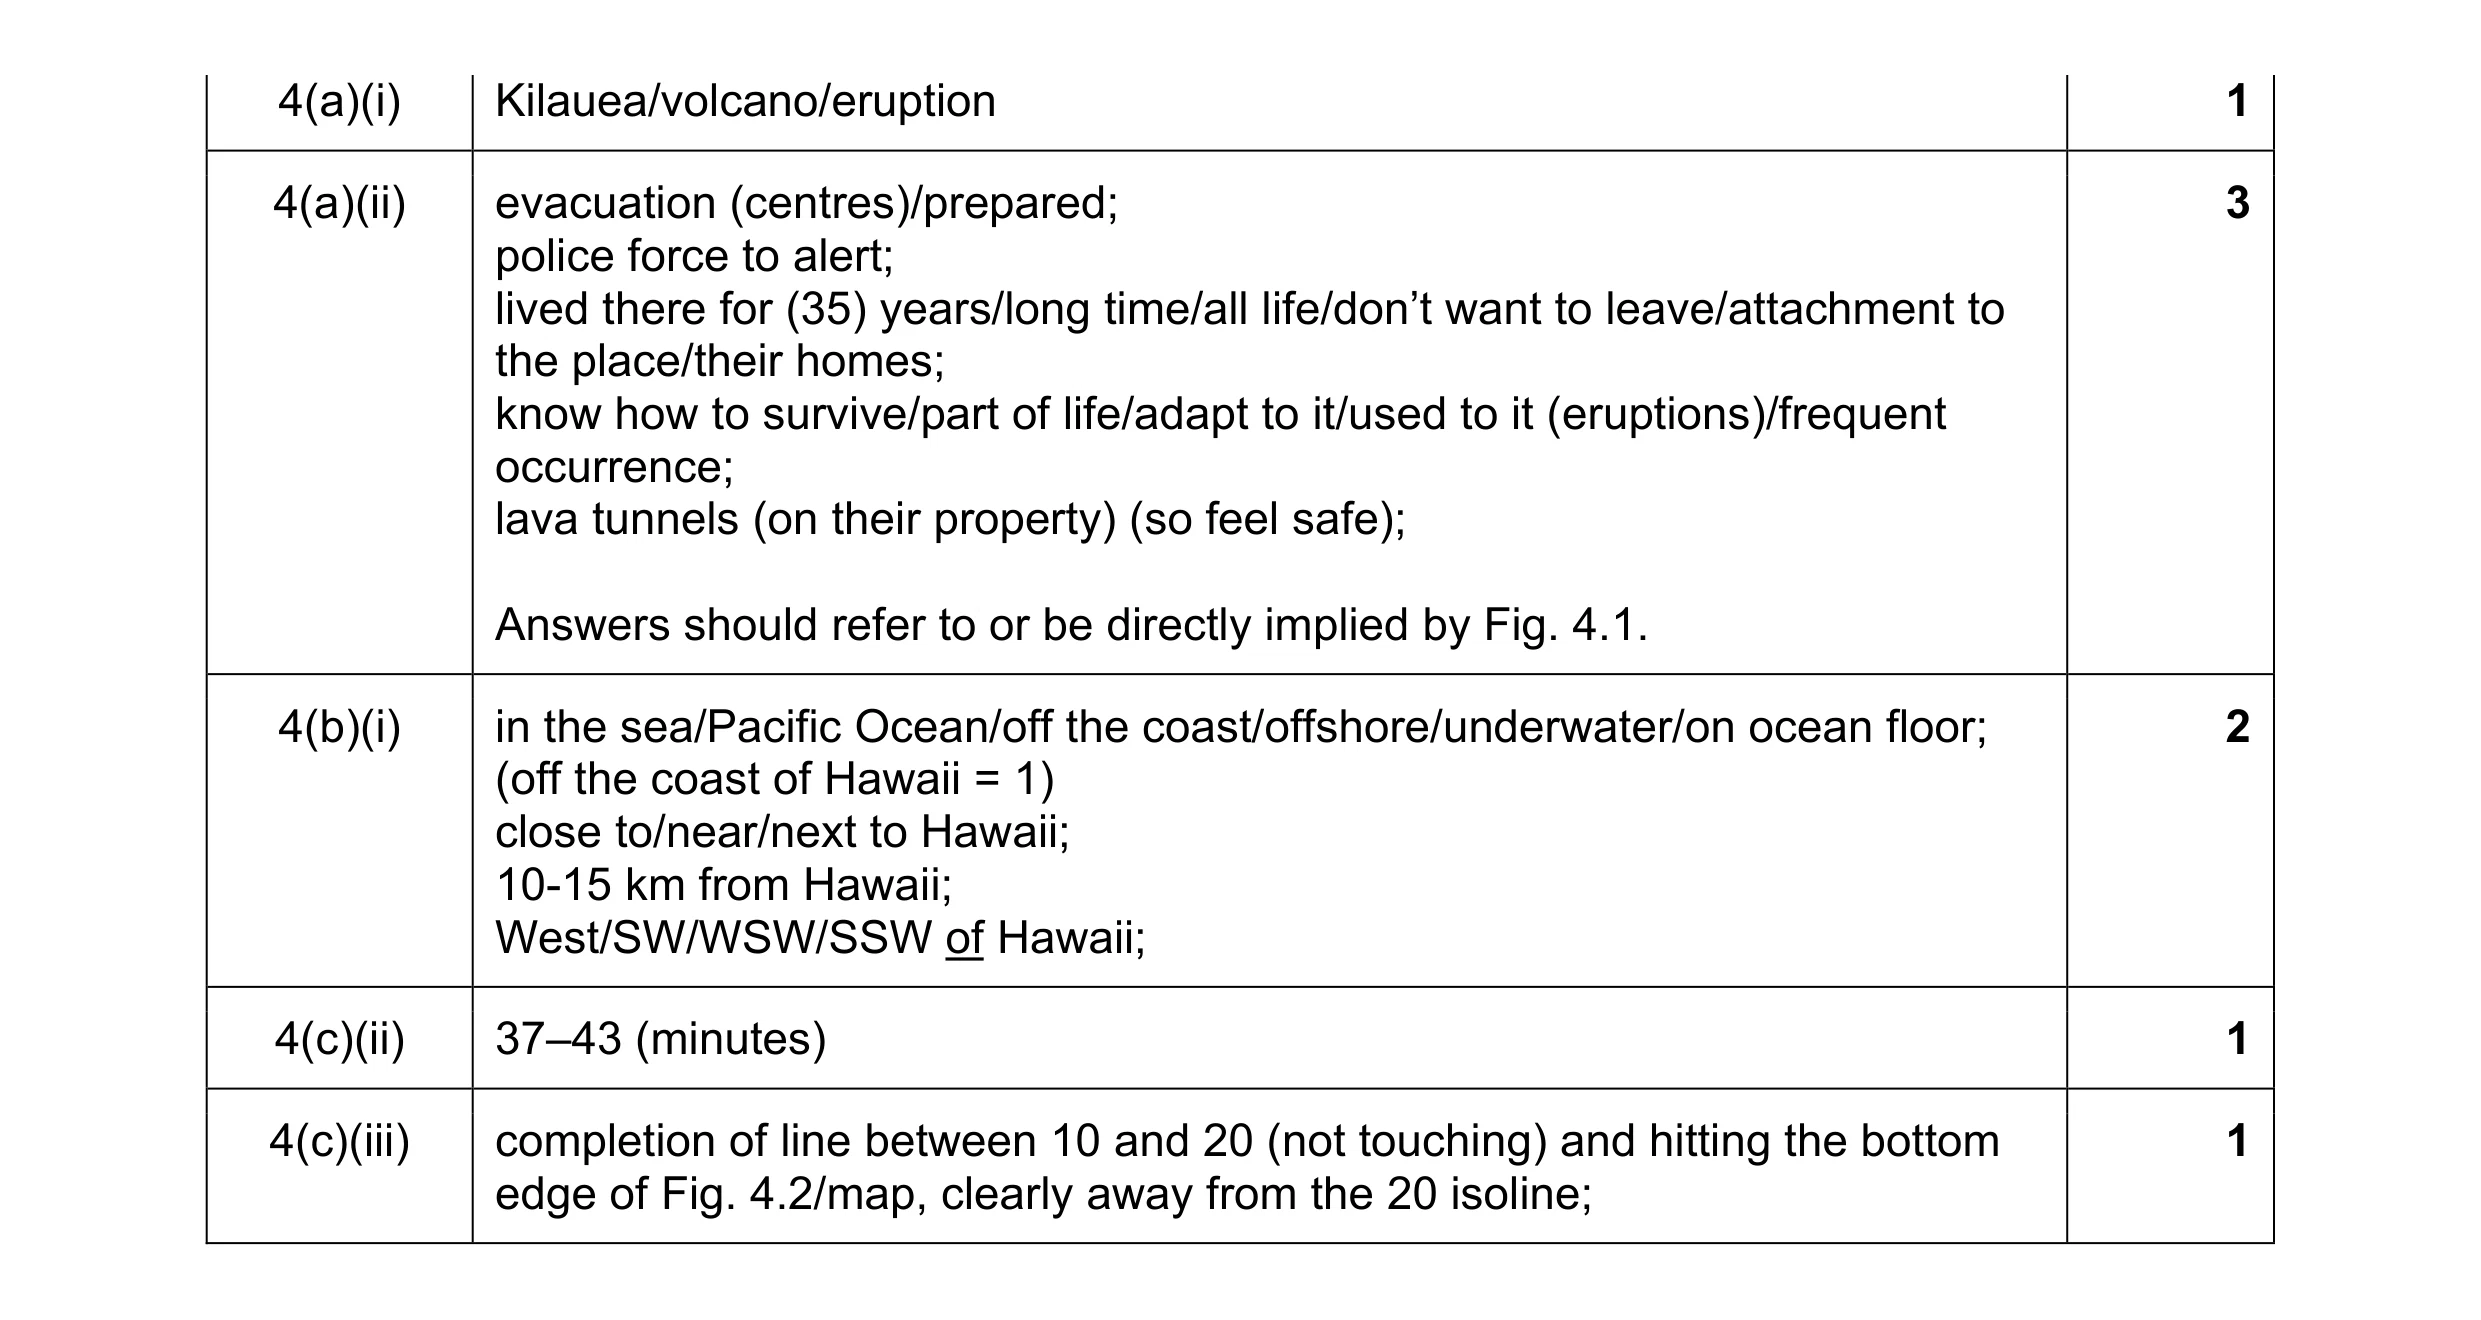 8
8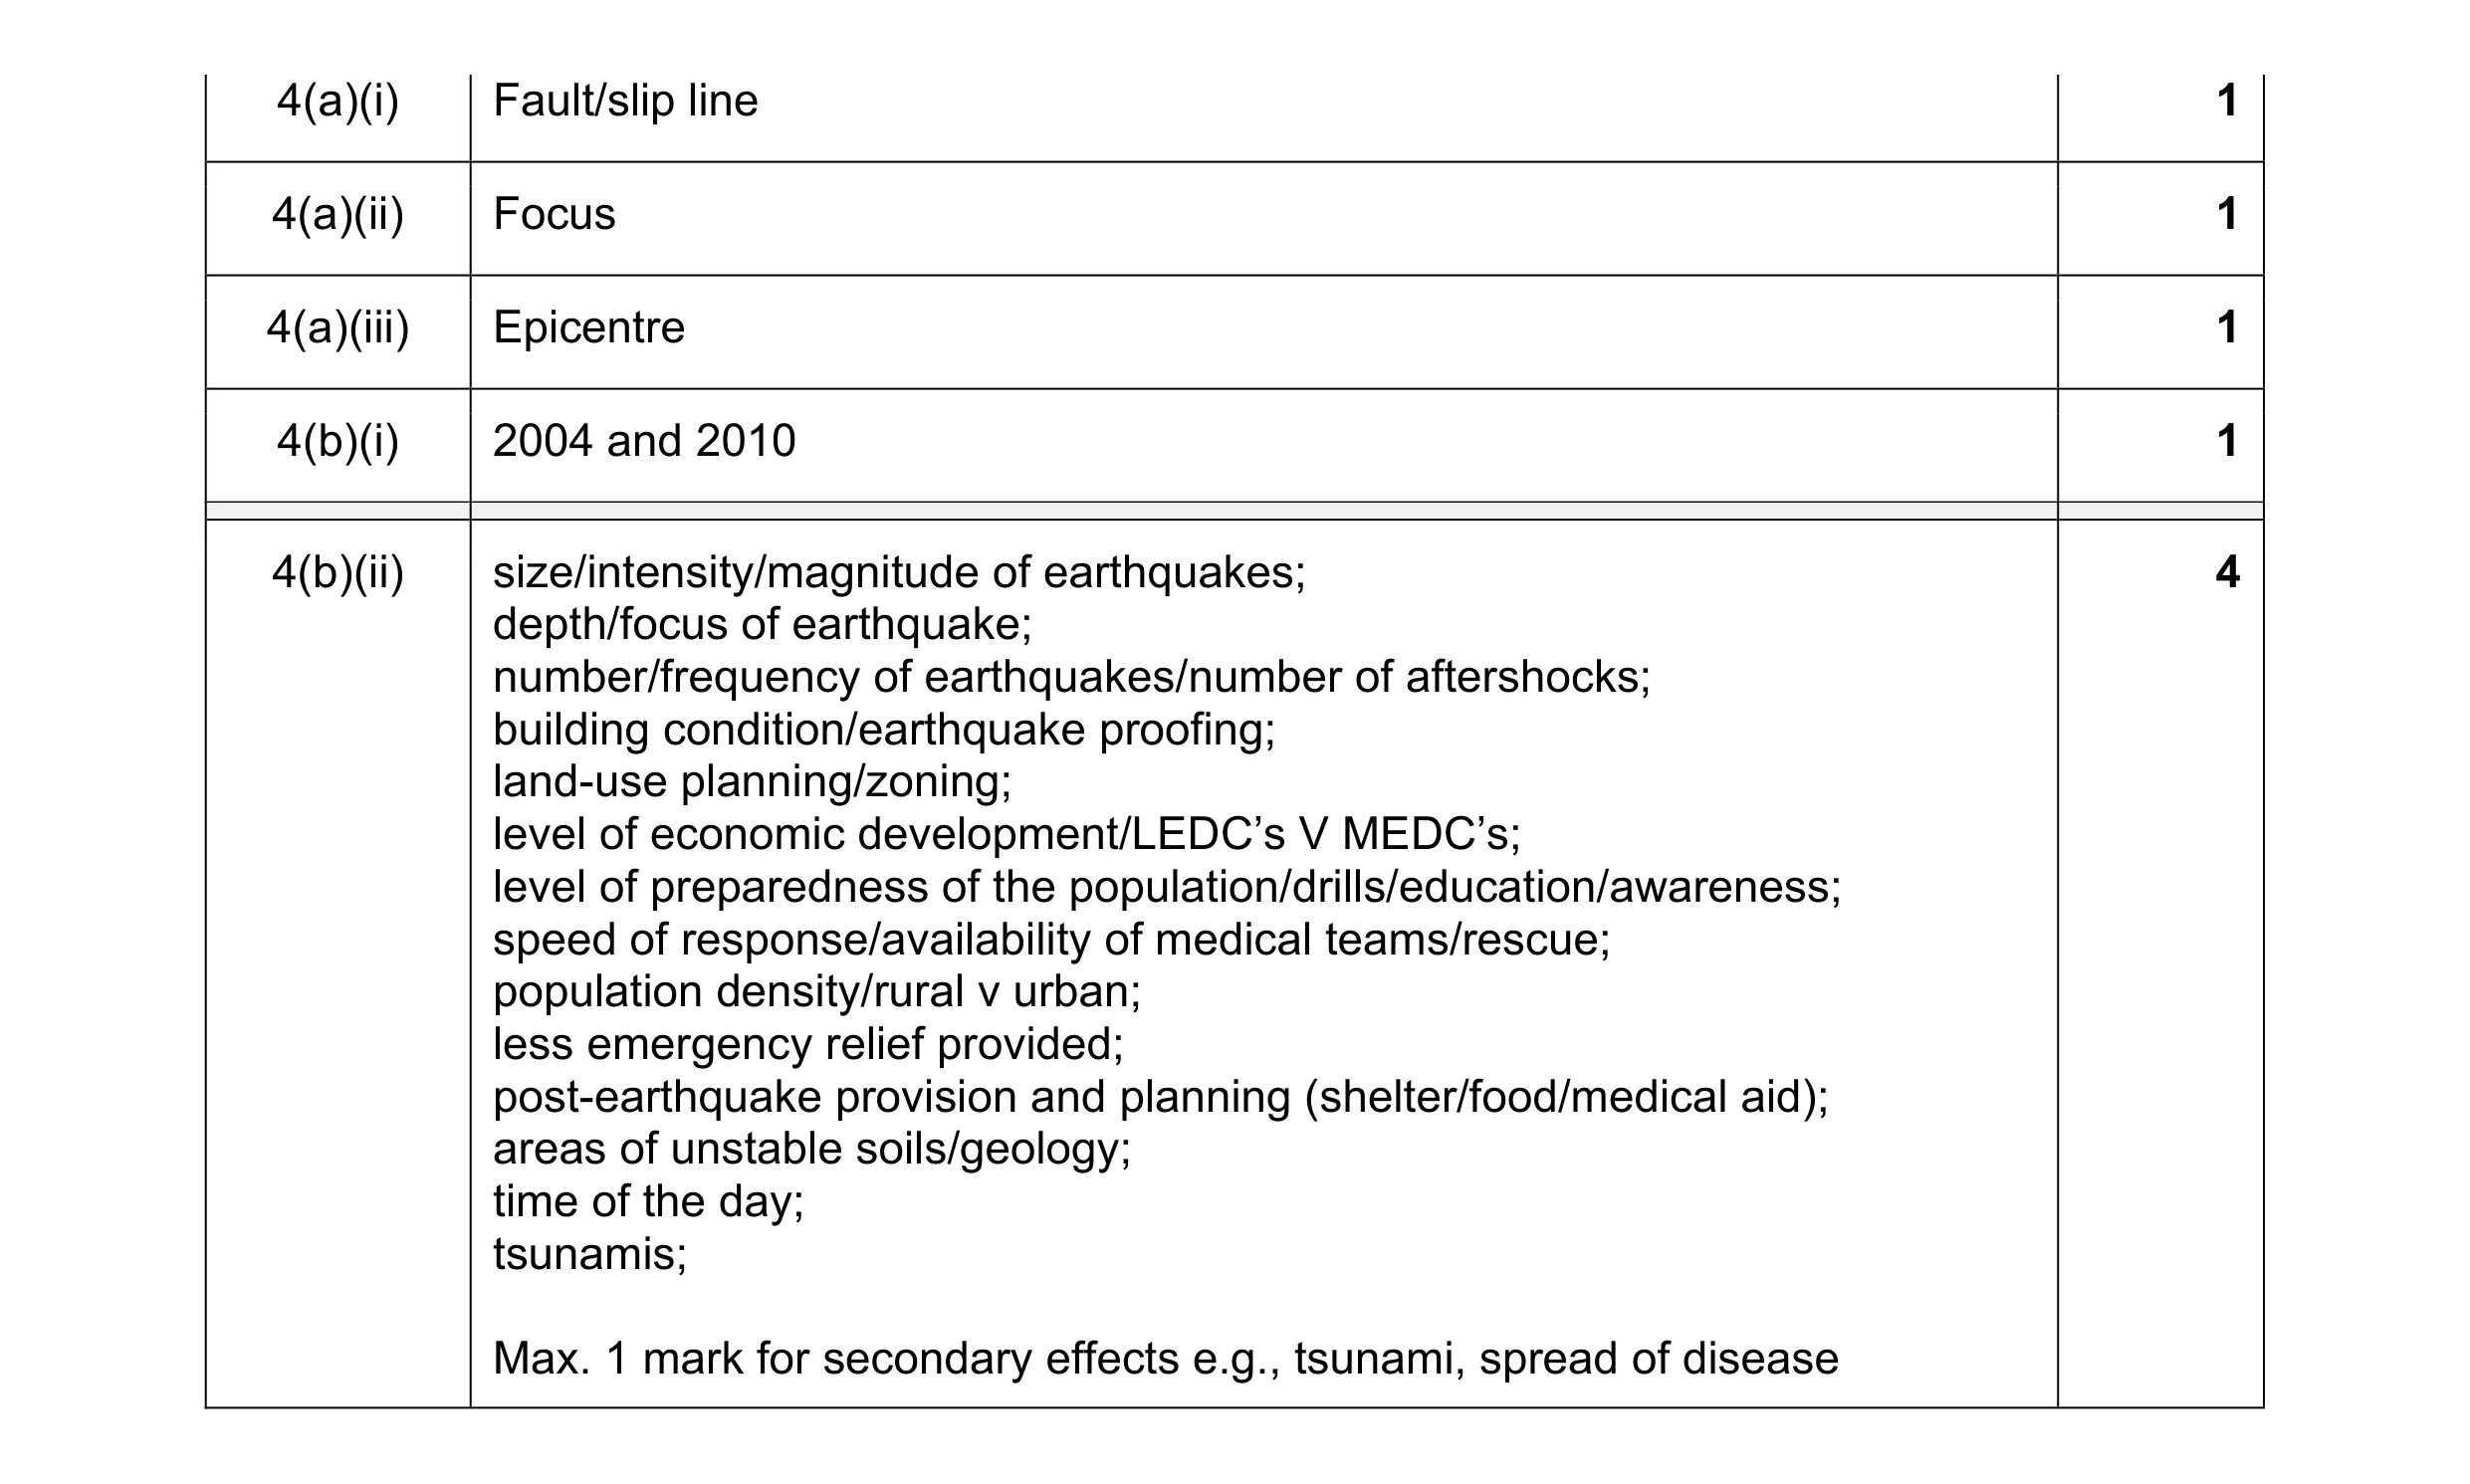 8
8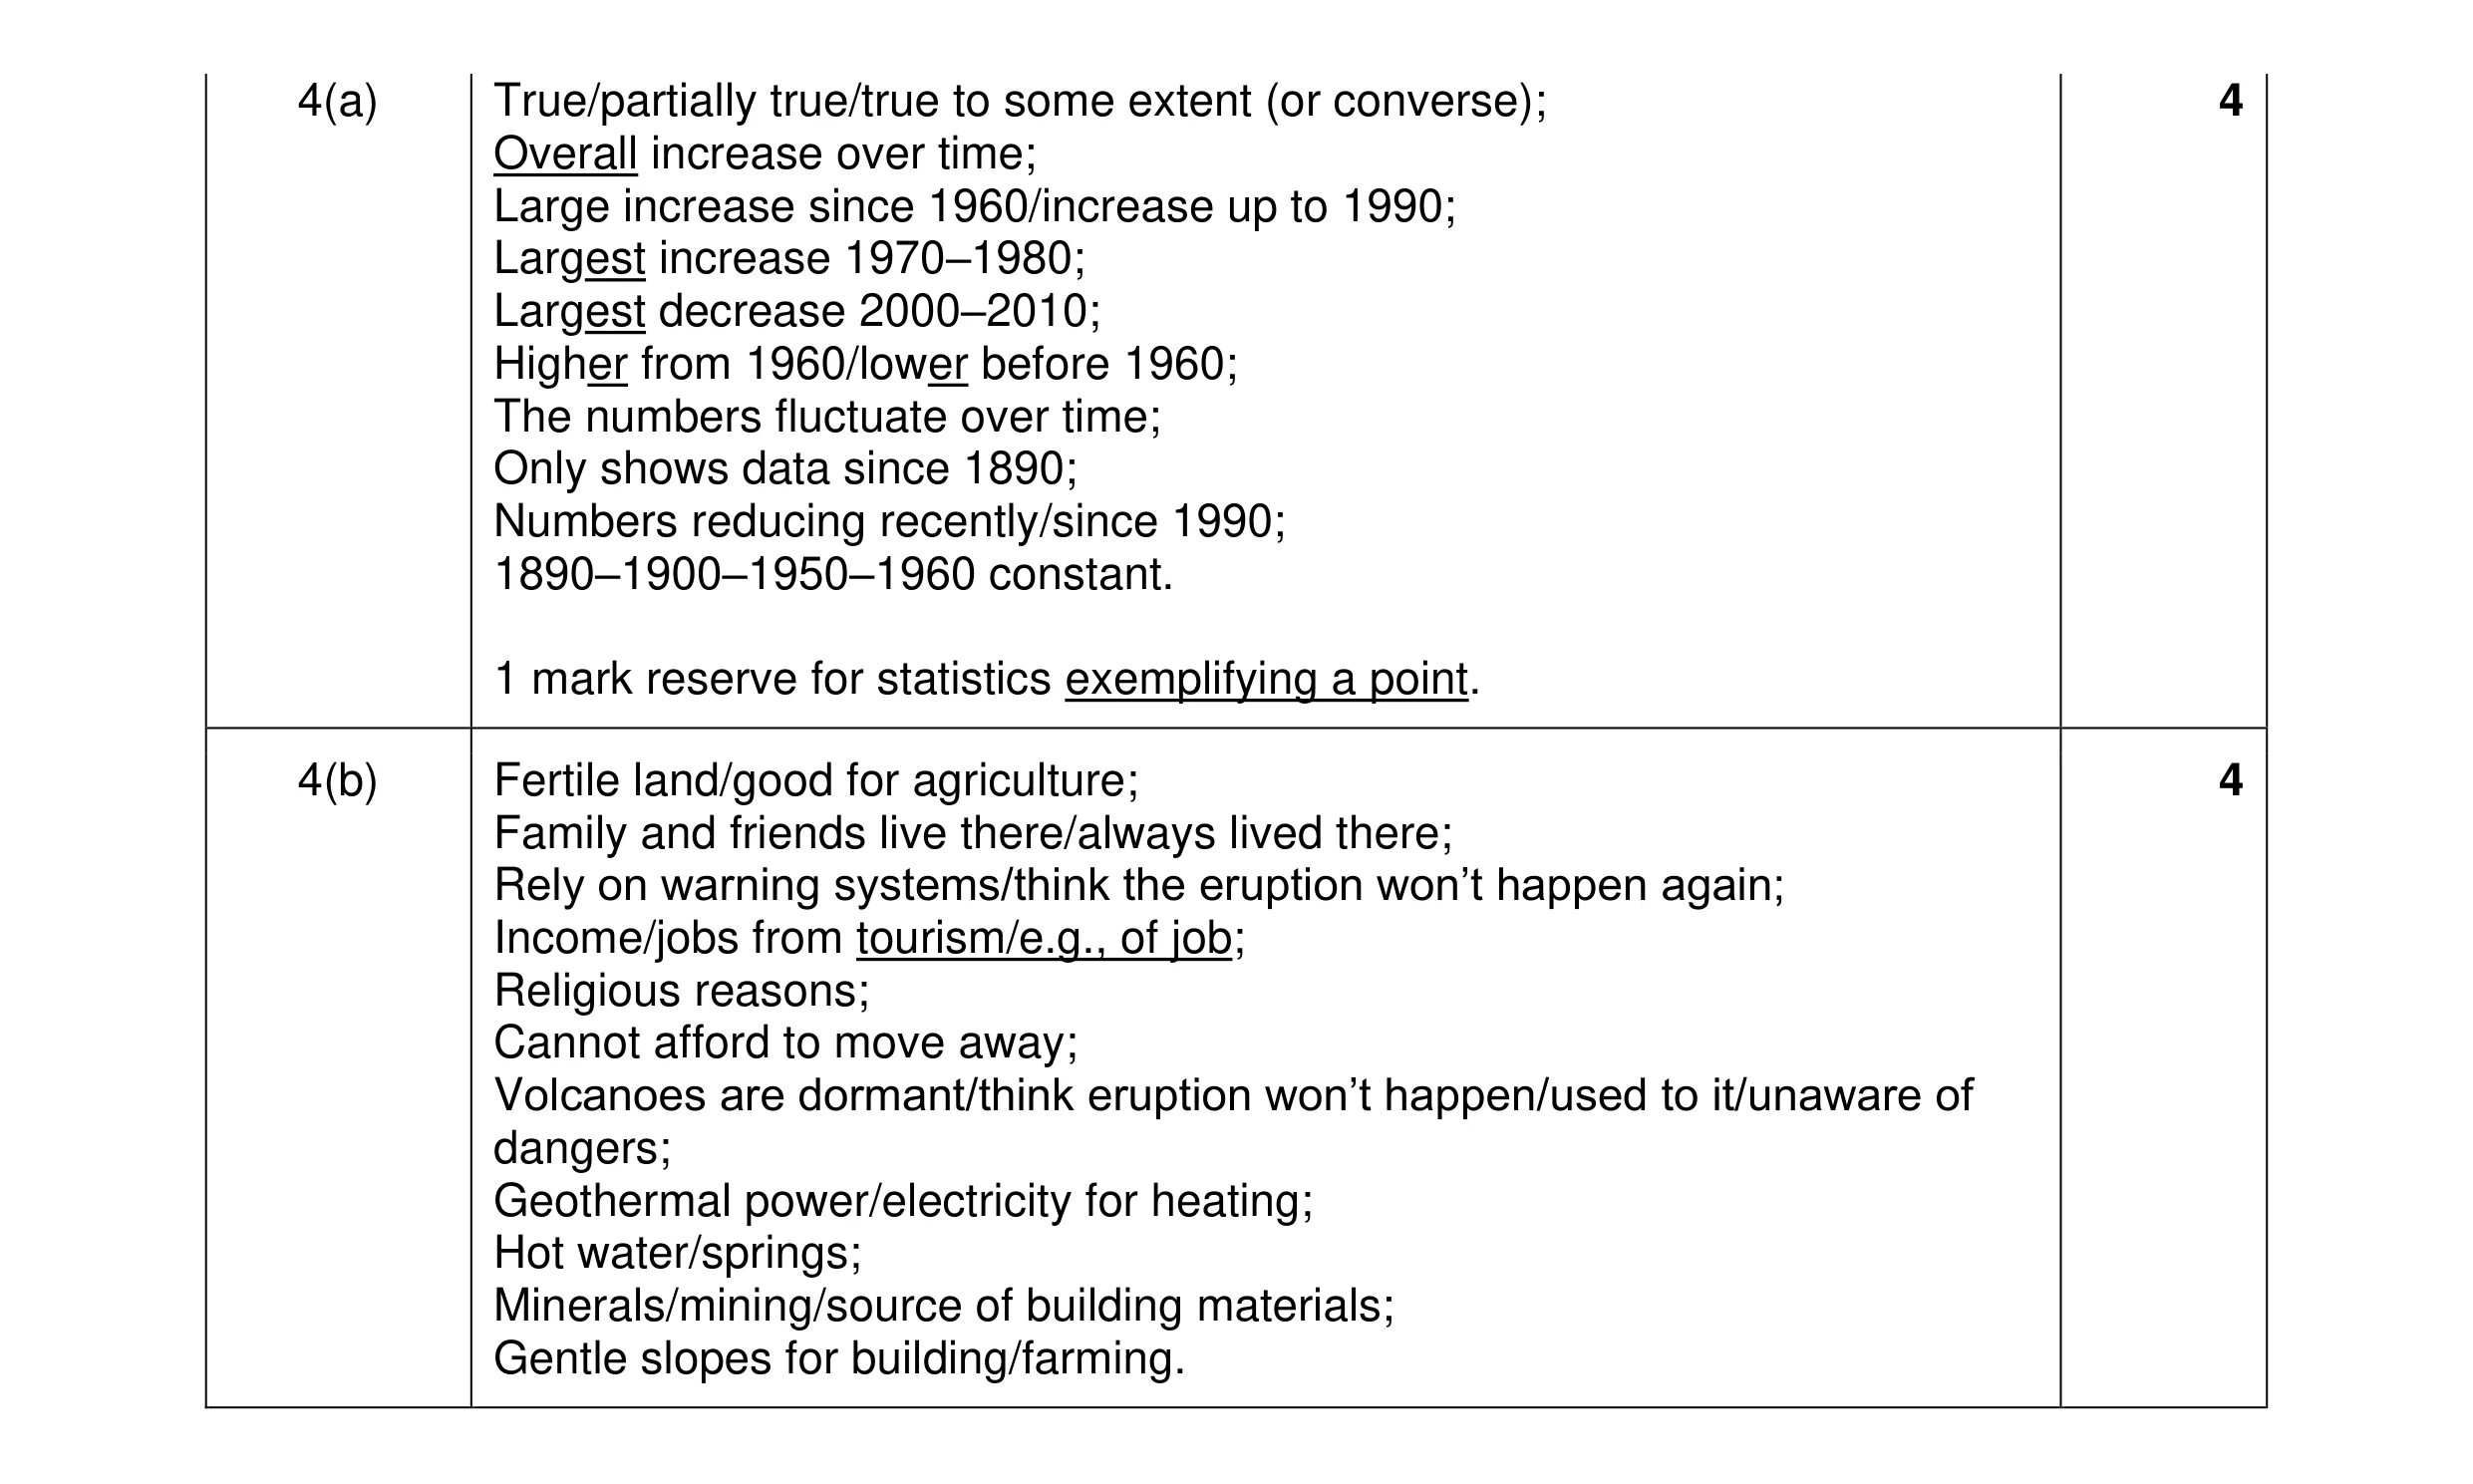 8
8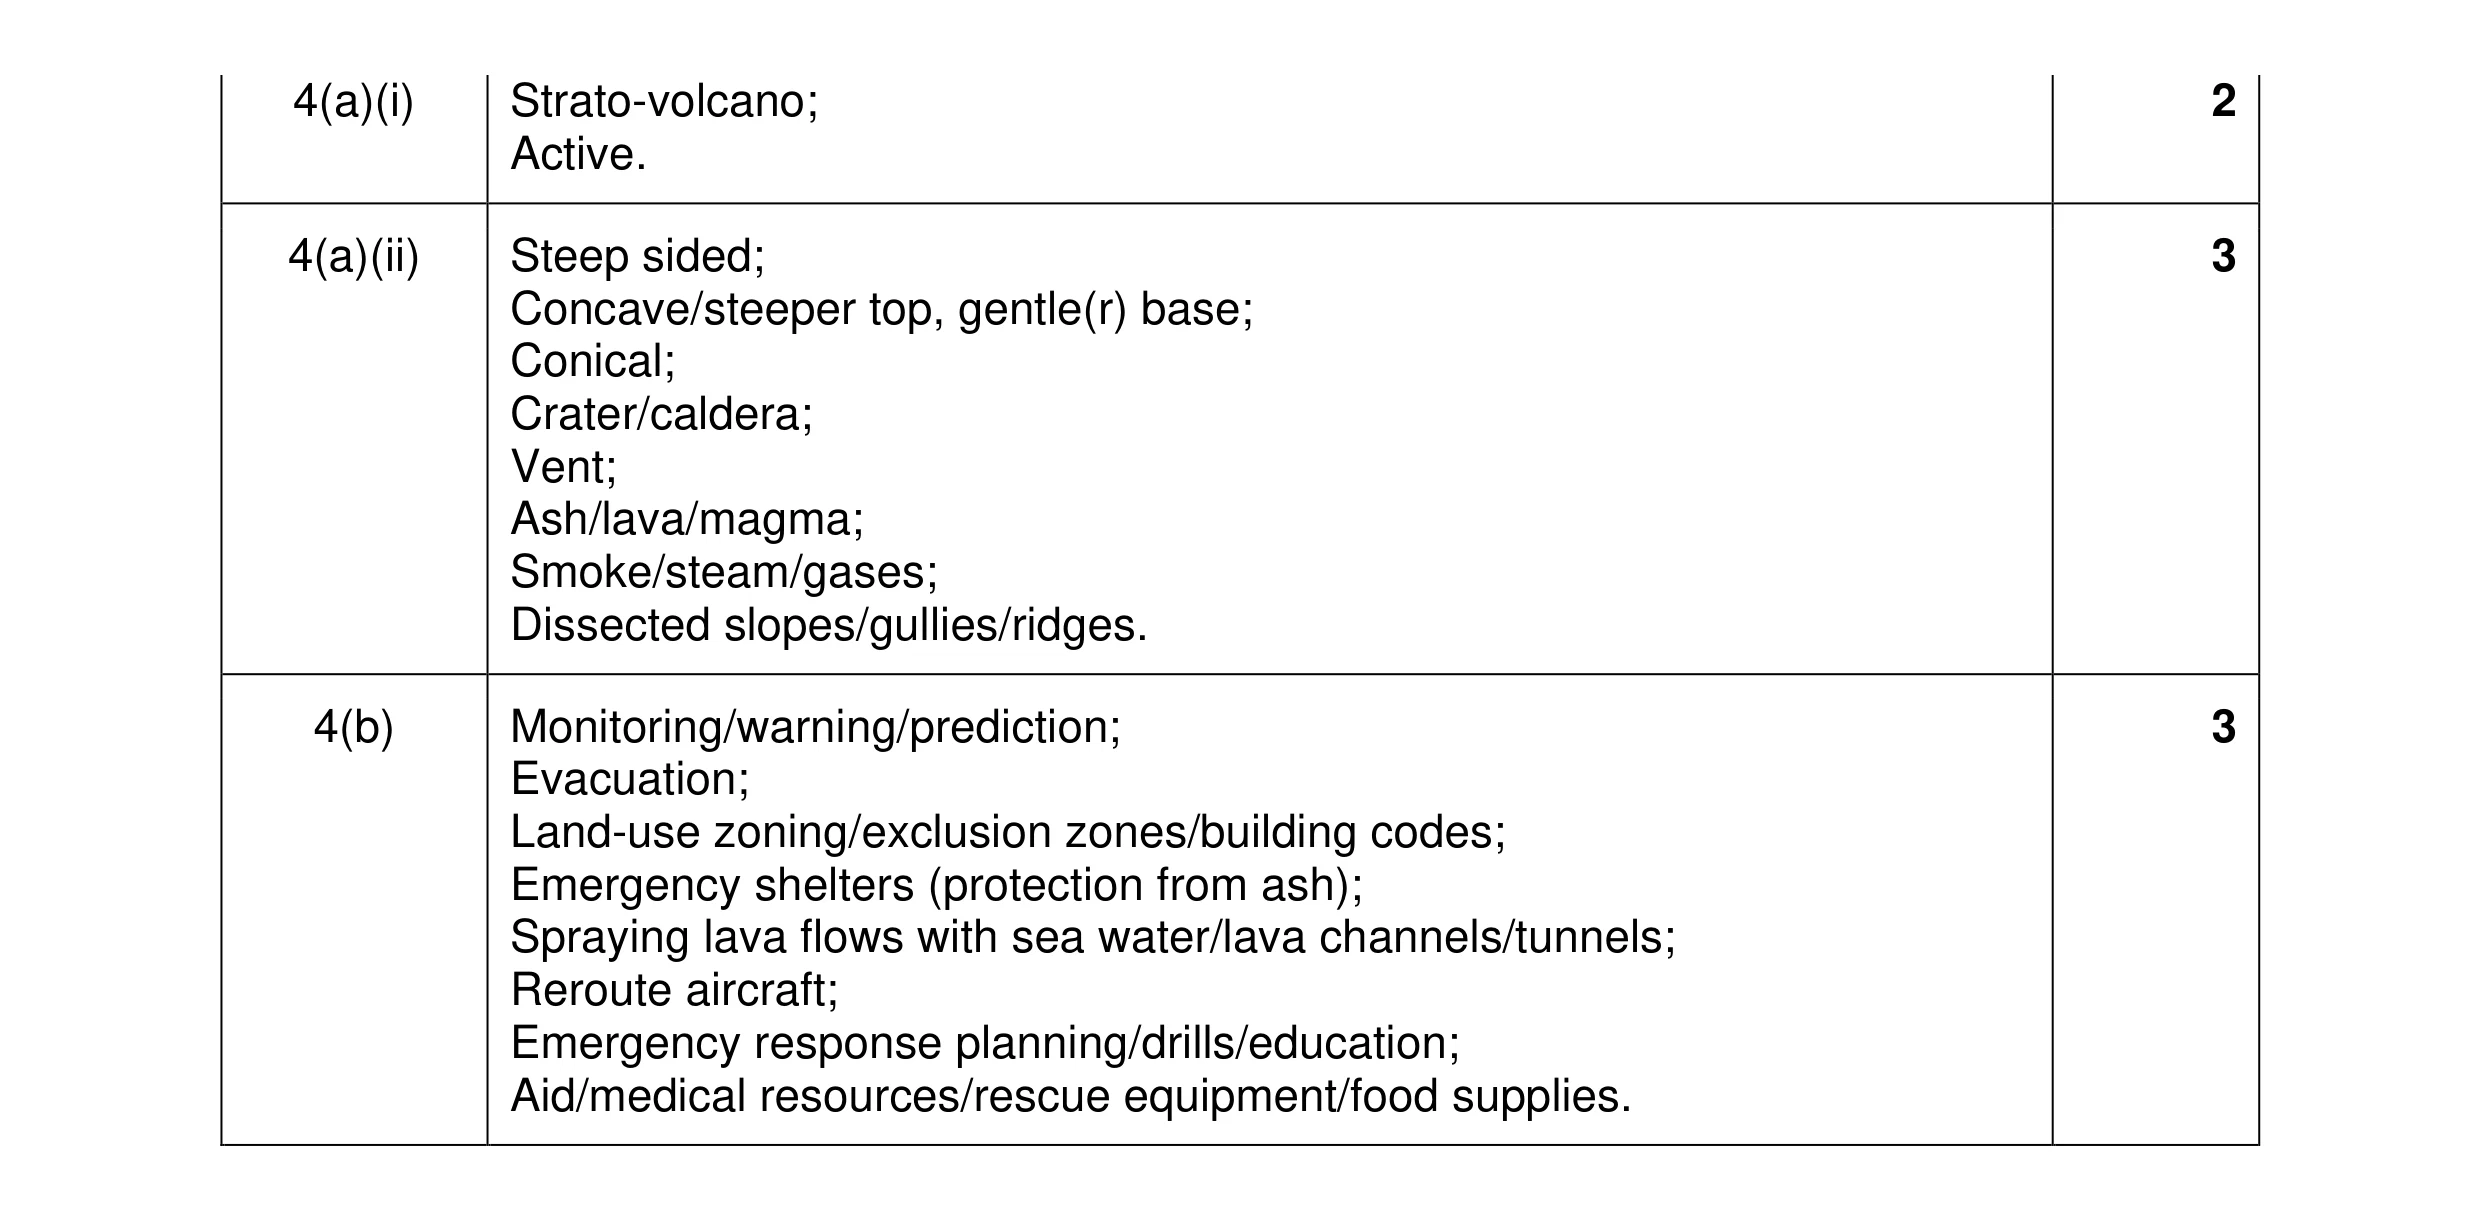 8
8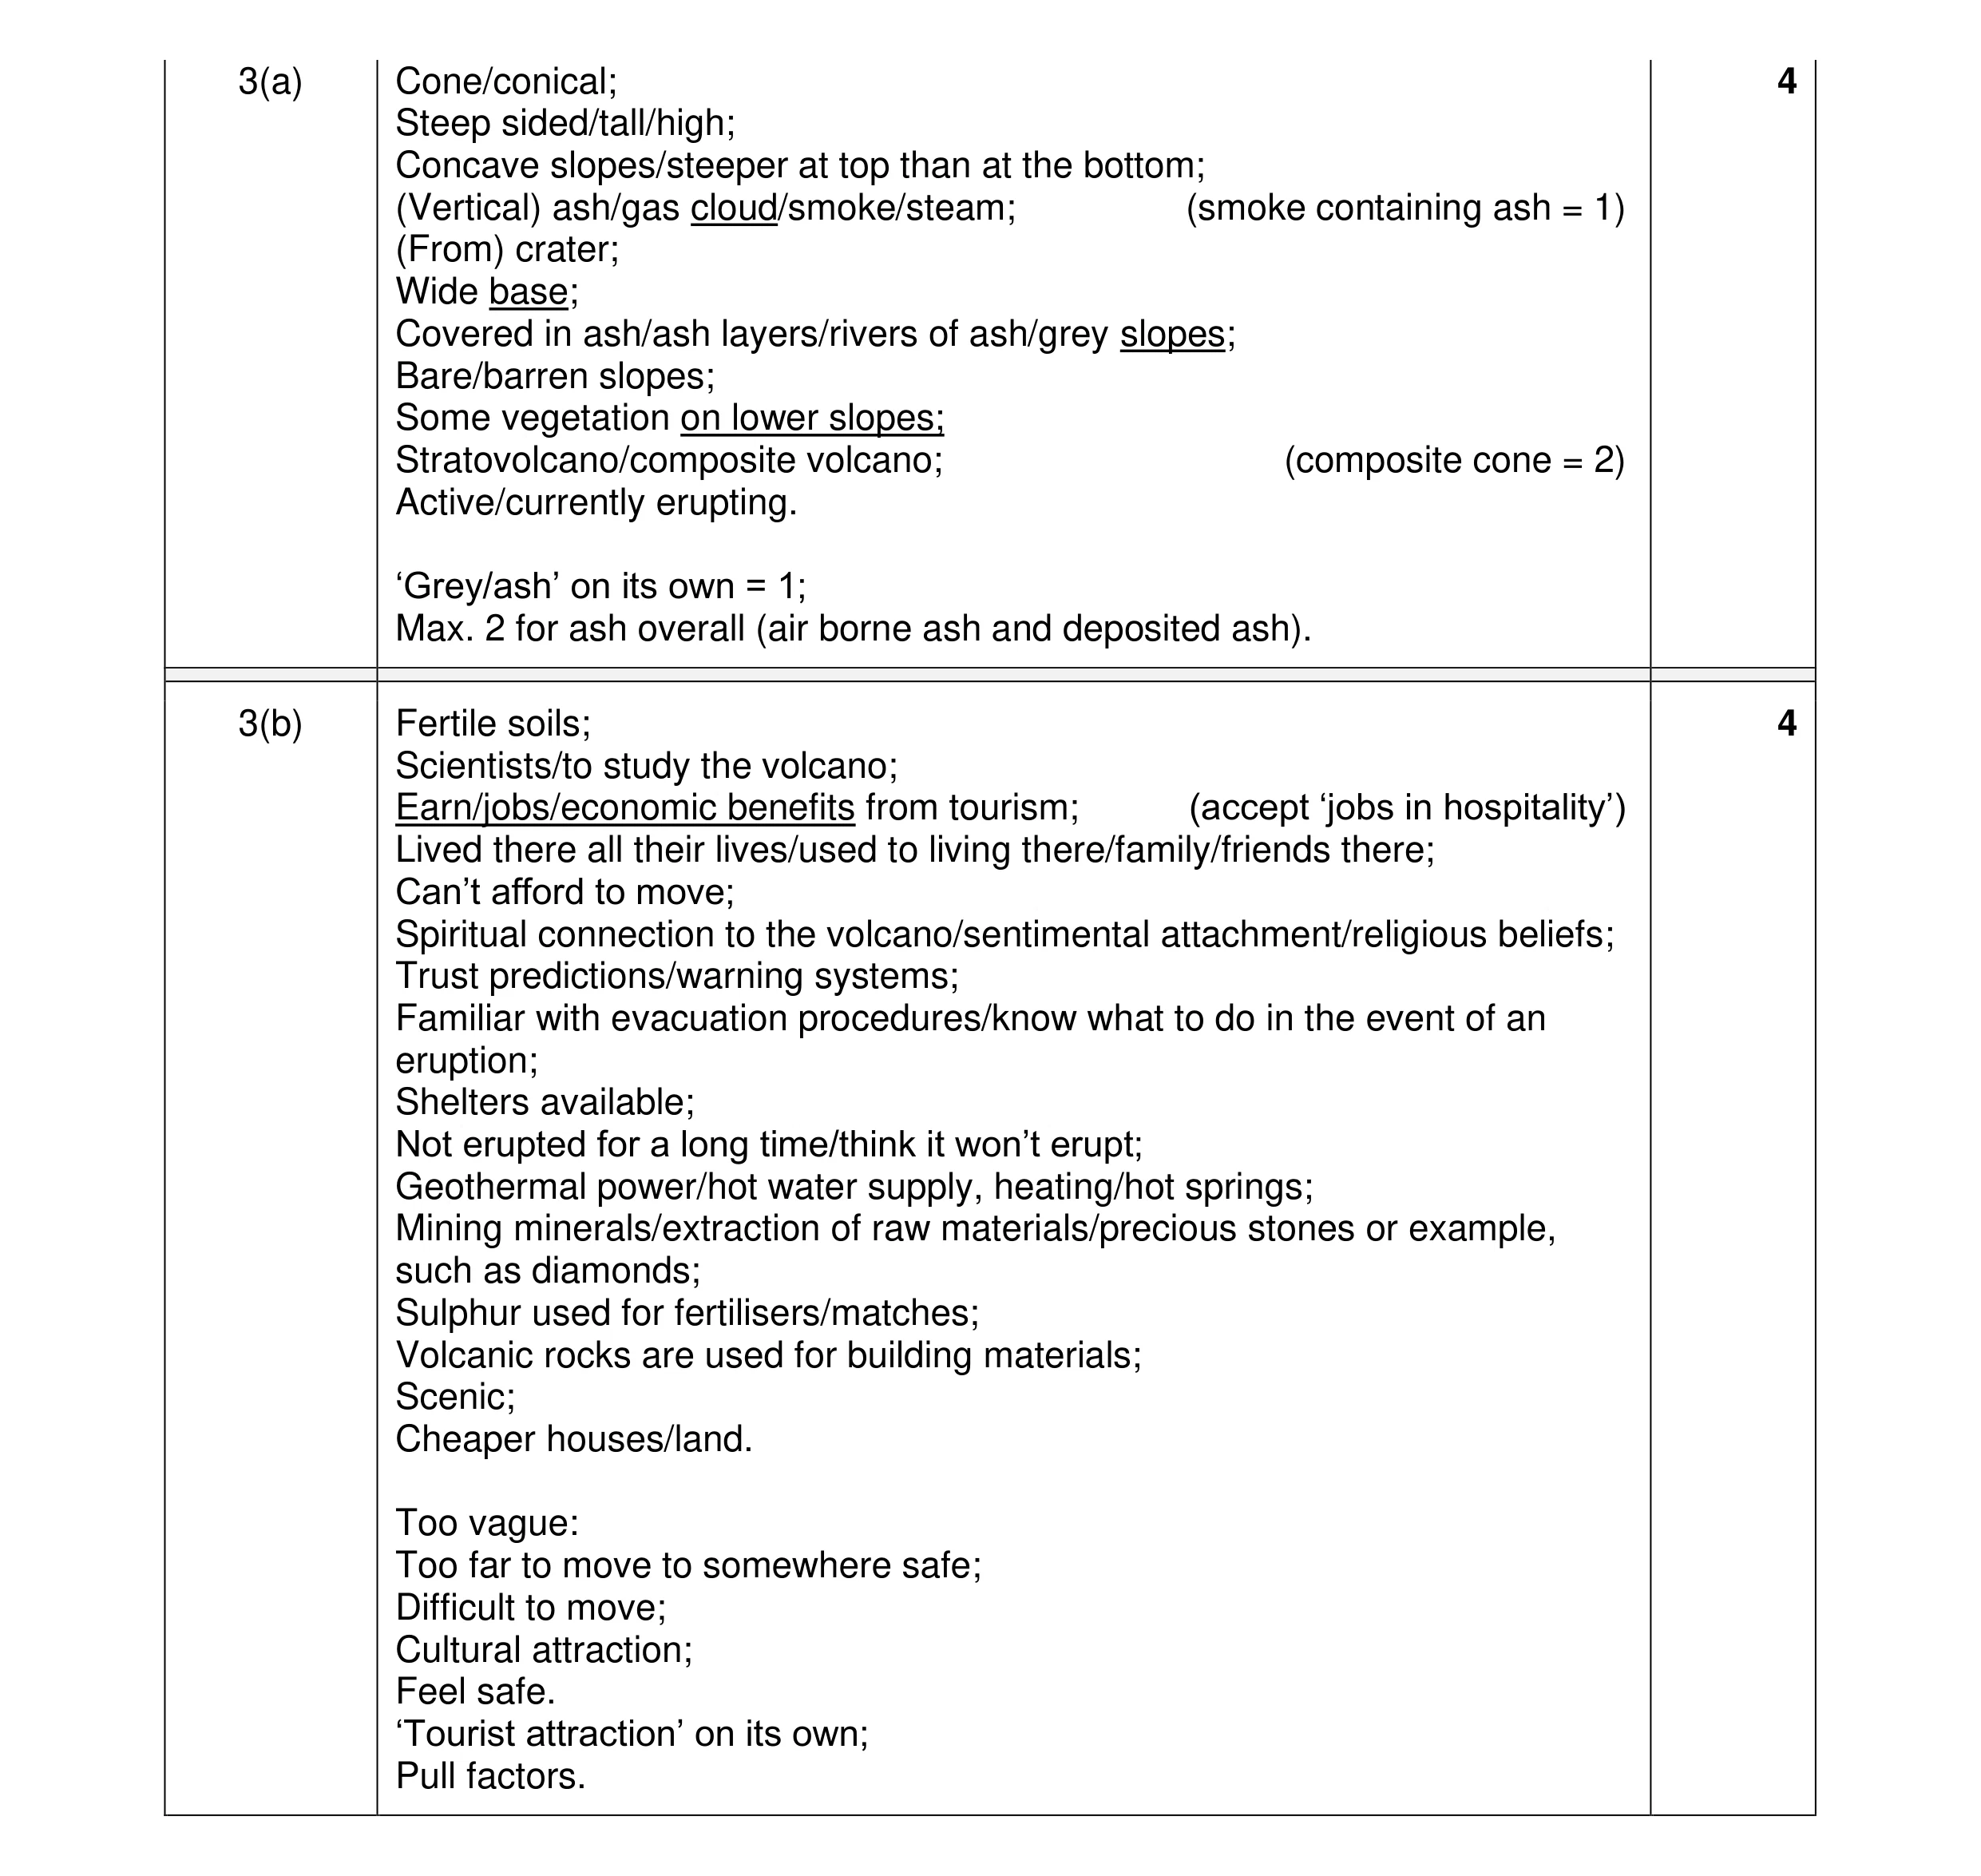 8
8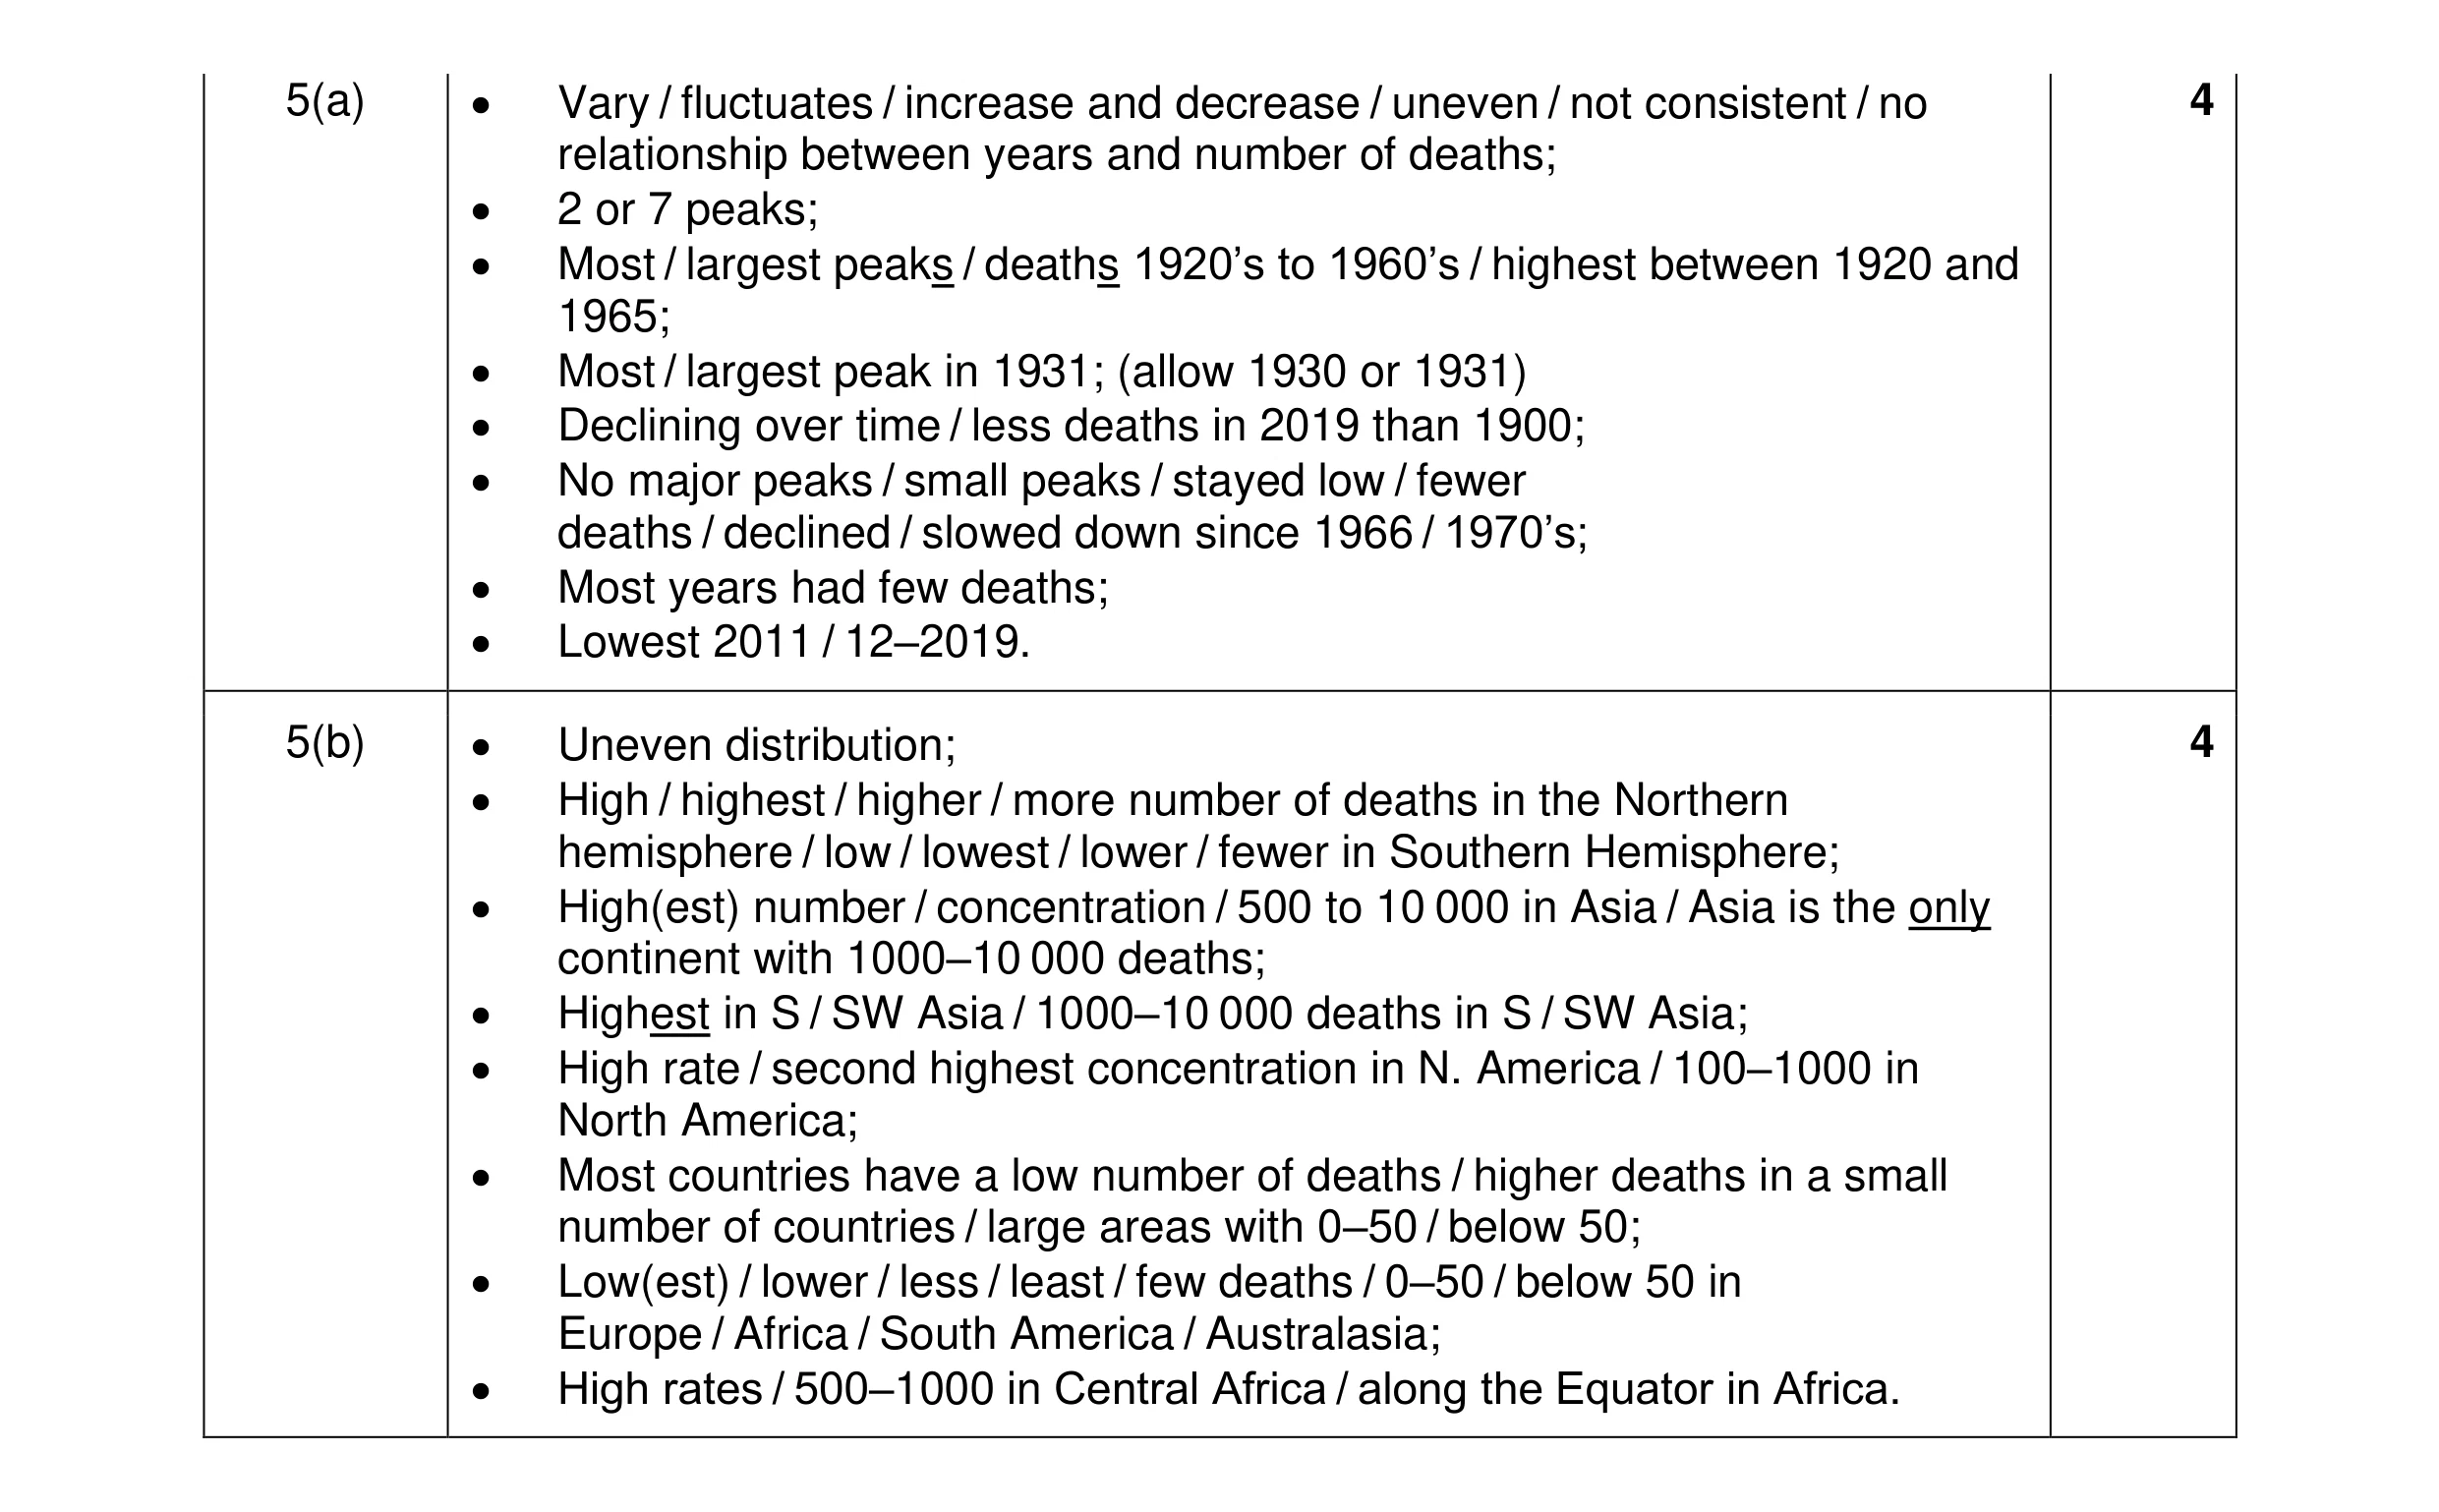 8
8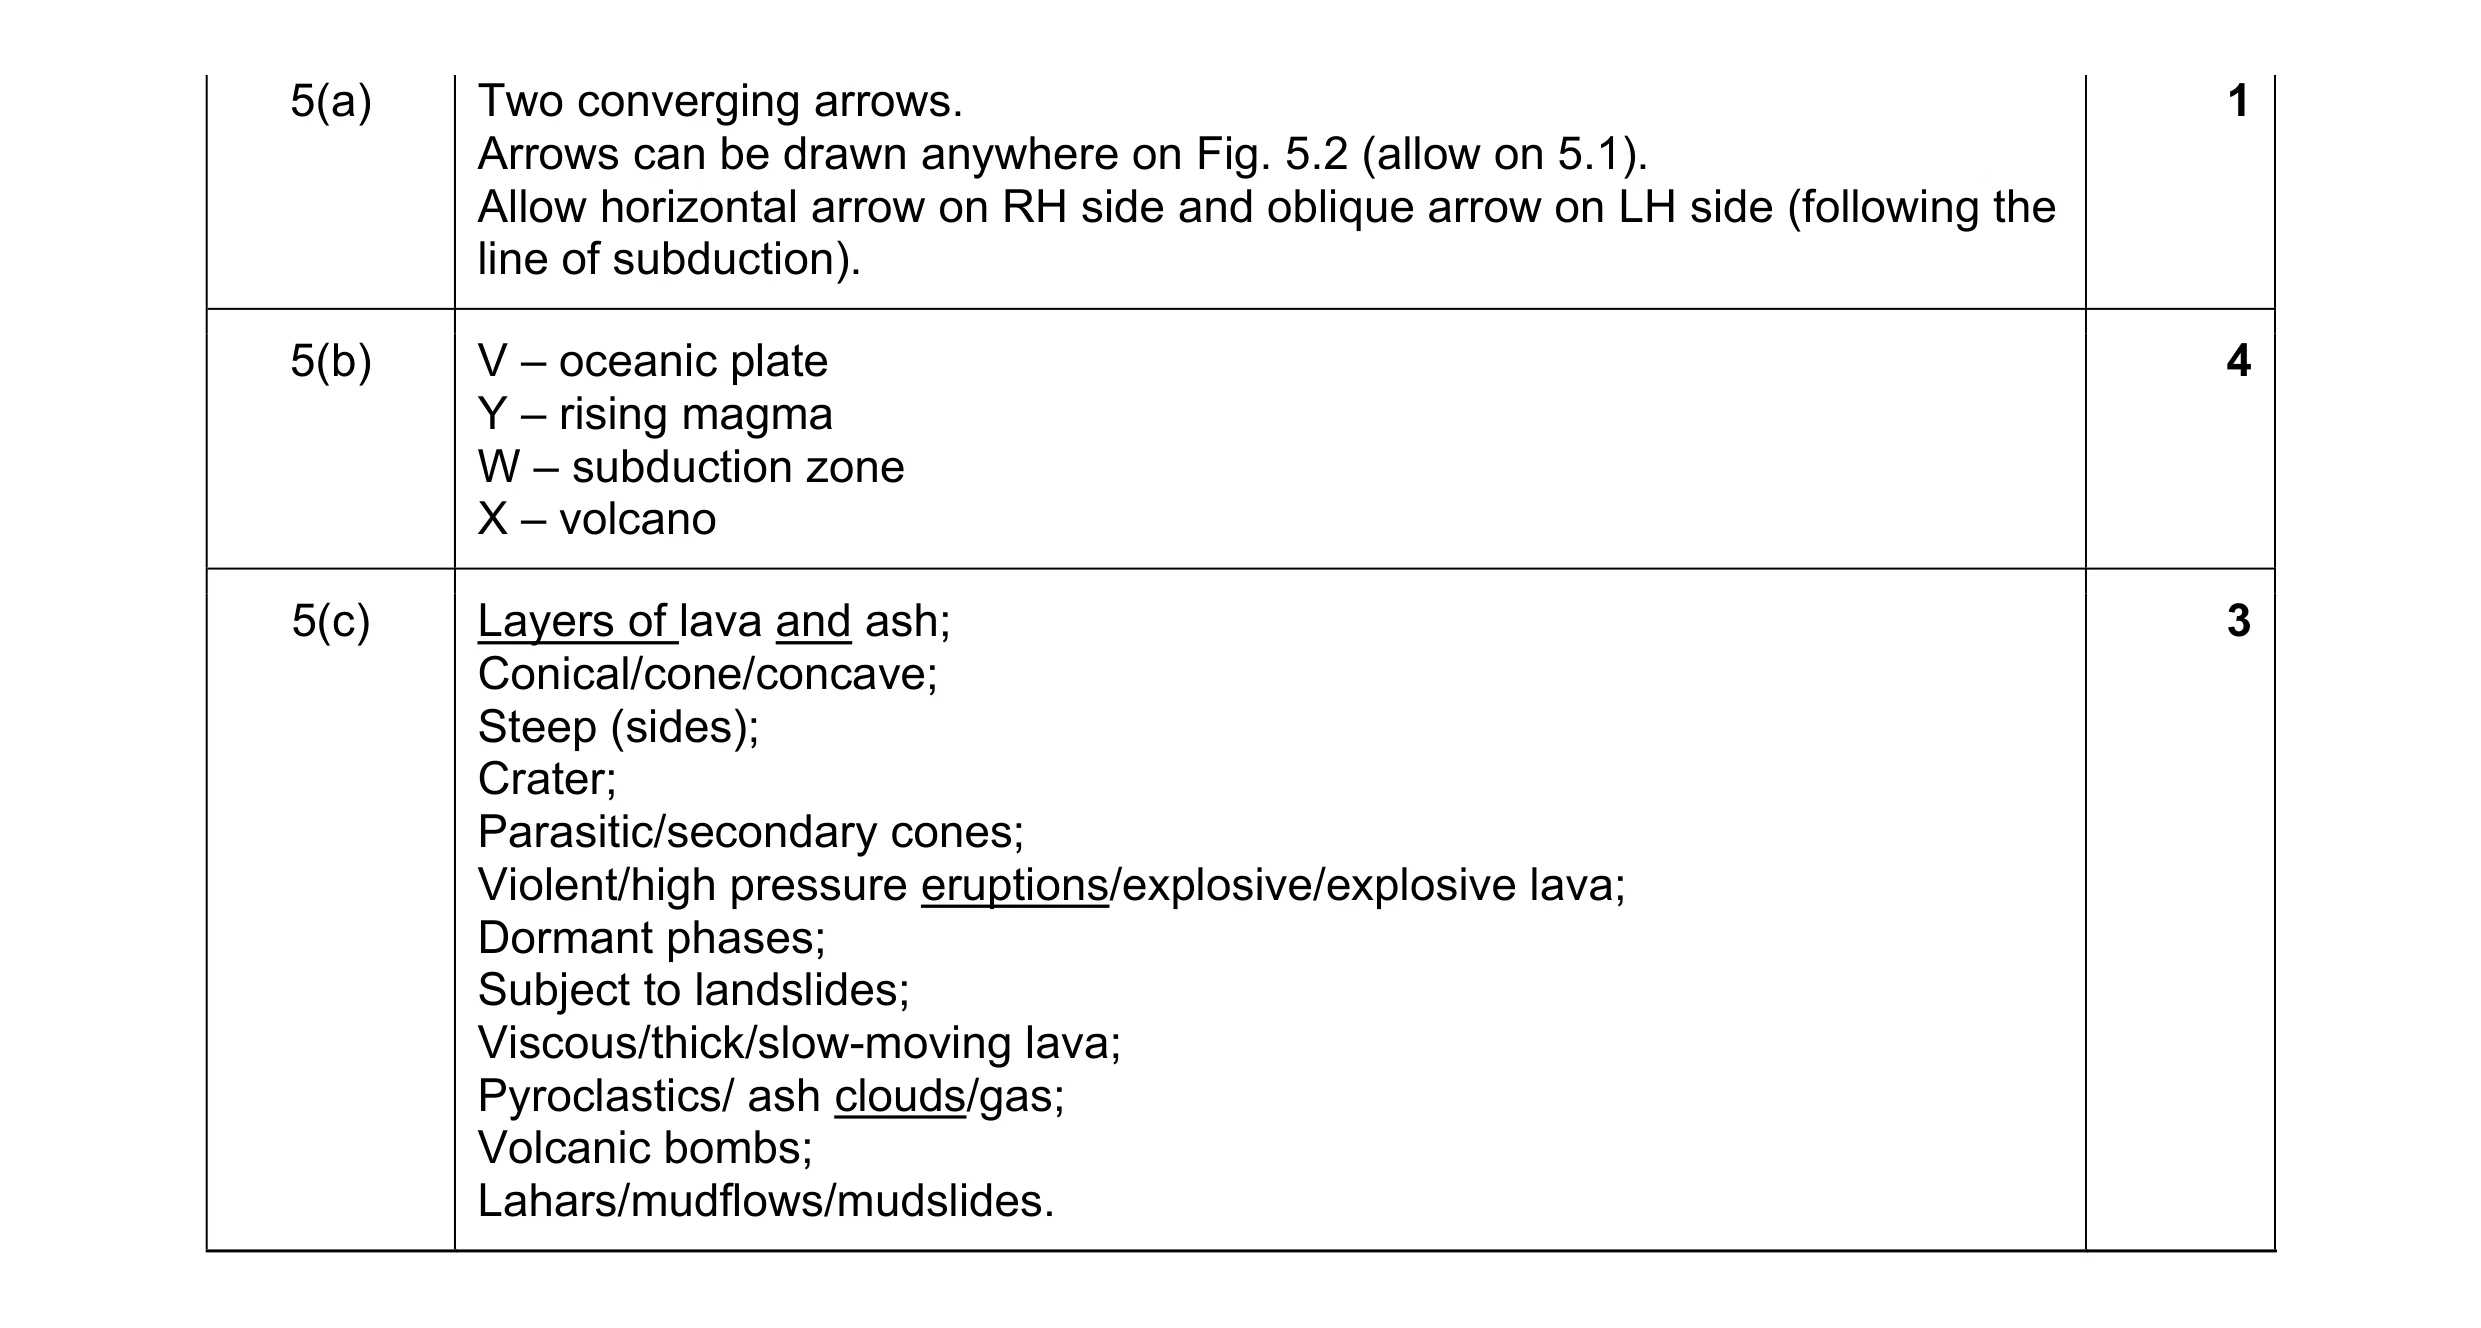 8
8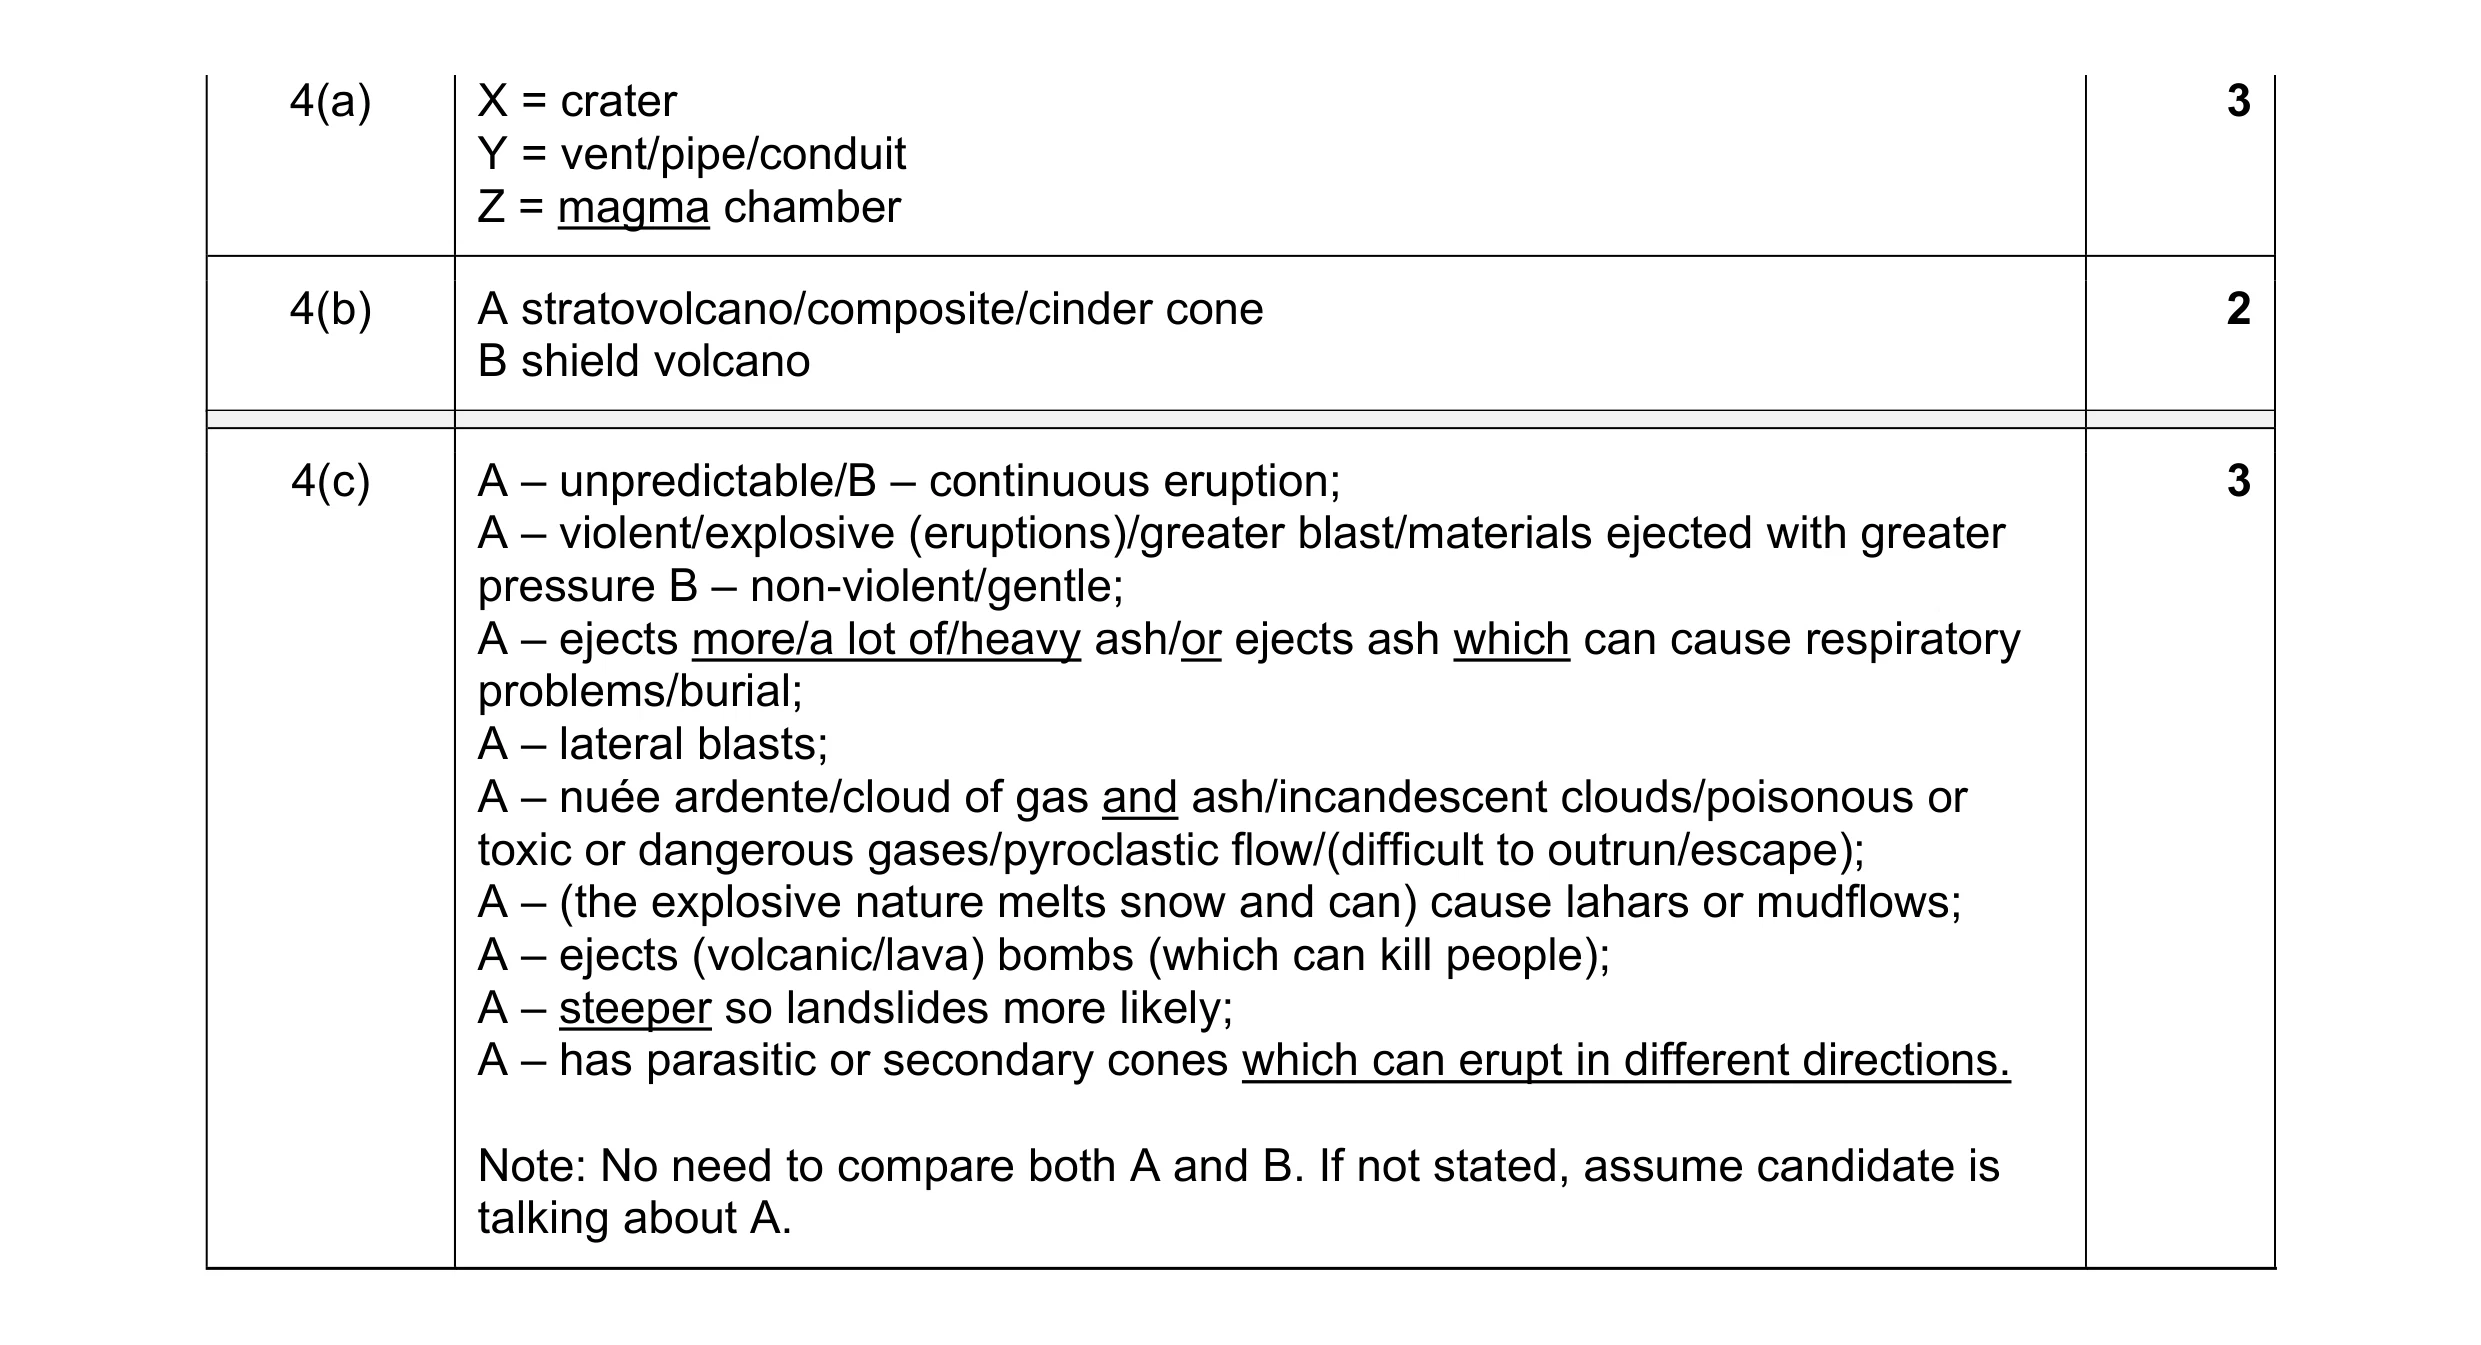 8
8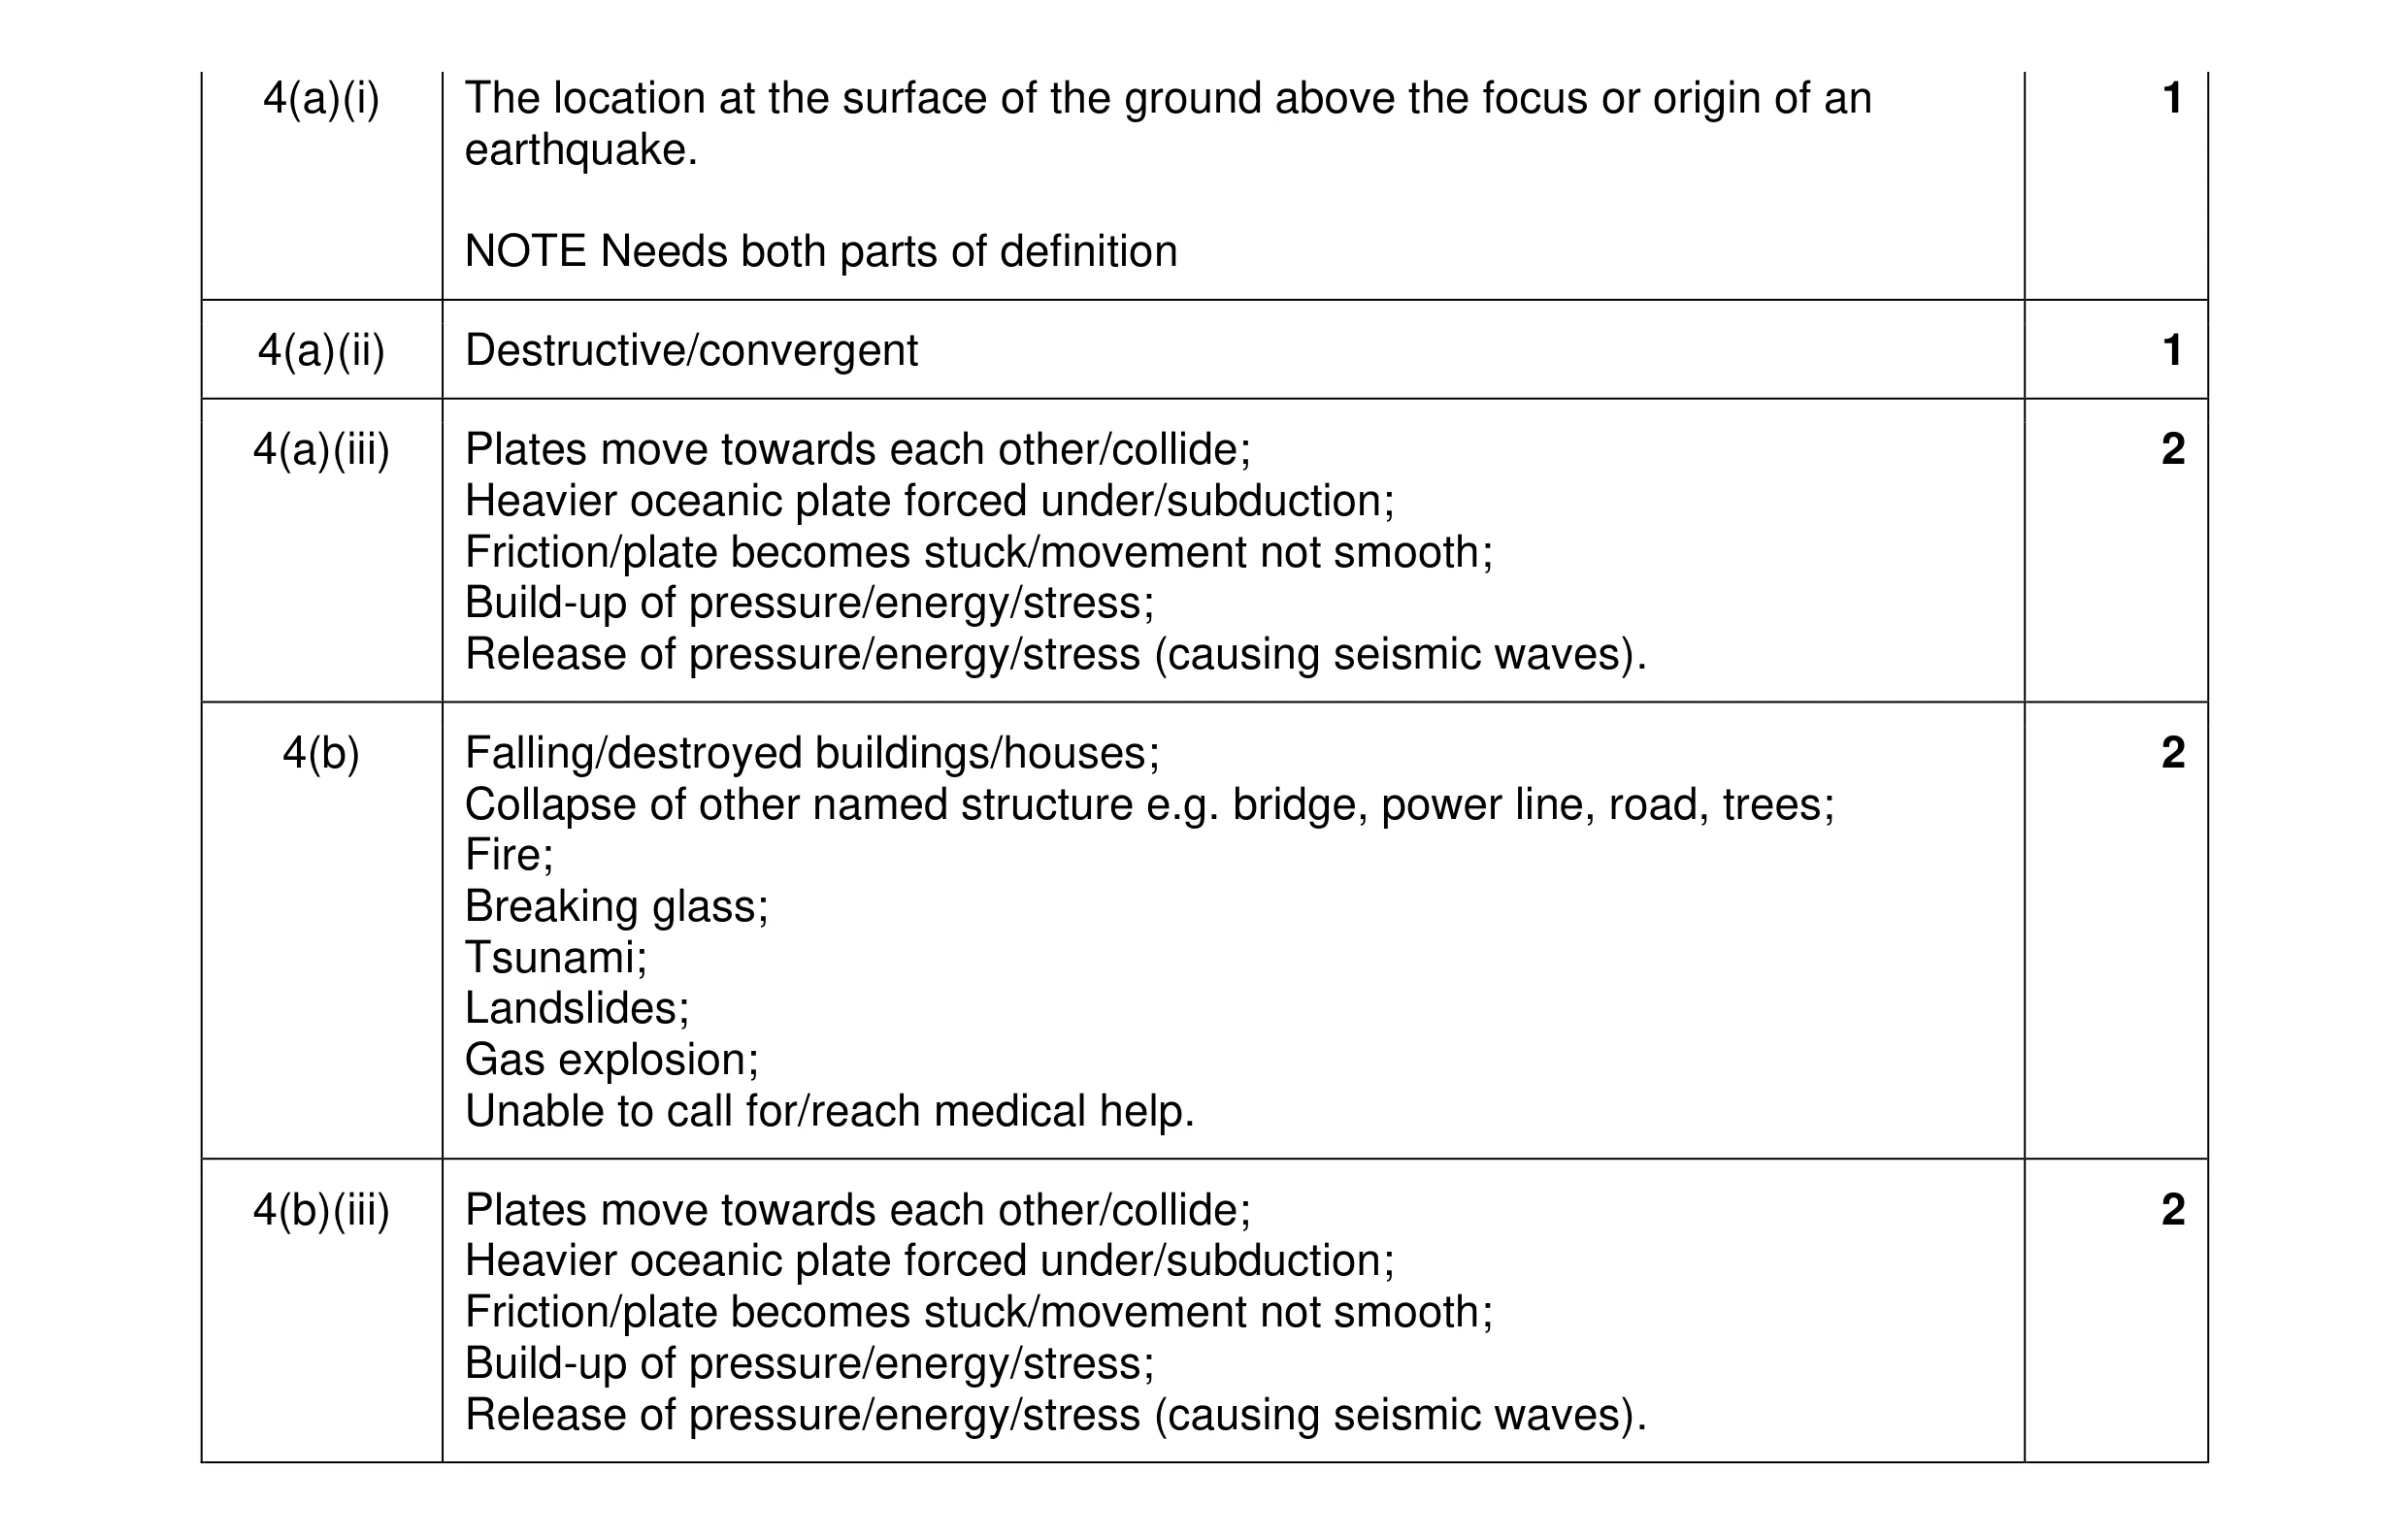 8
8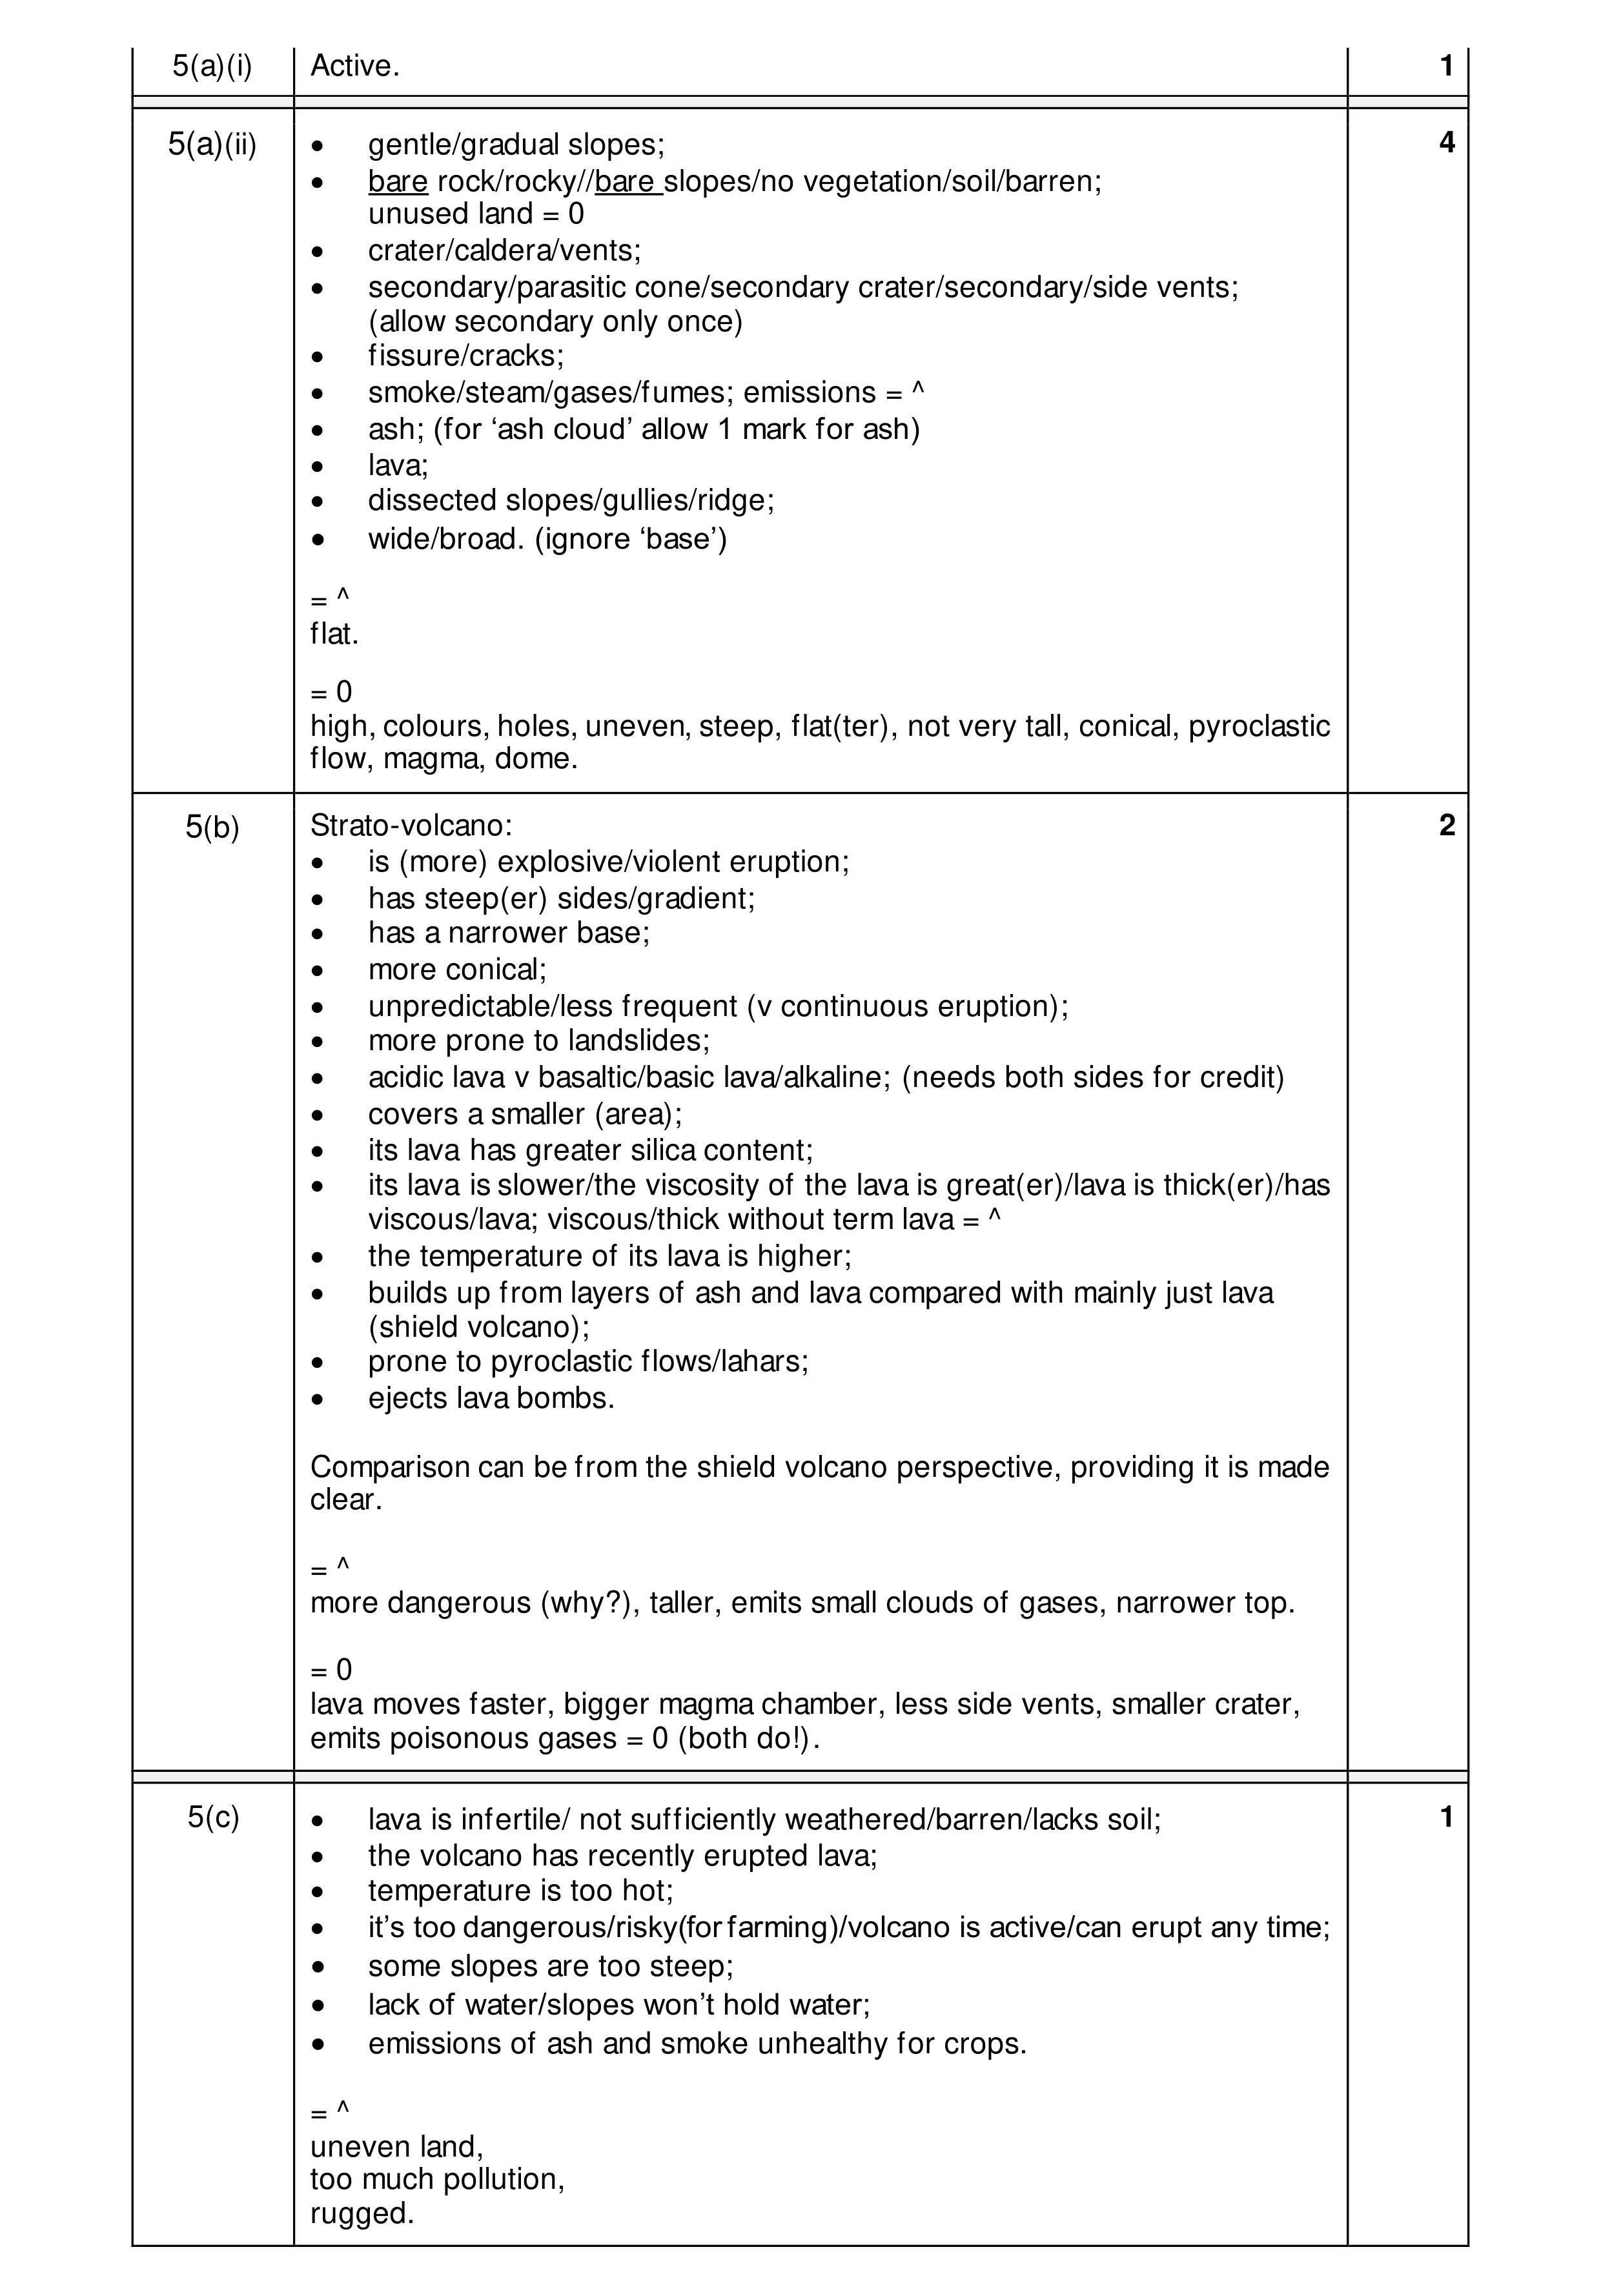 8
8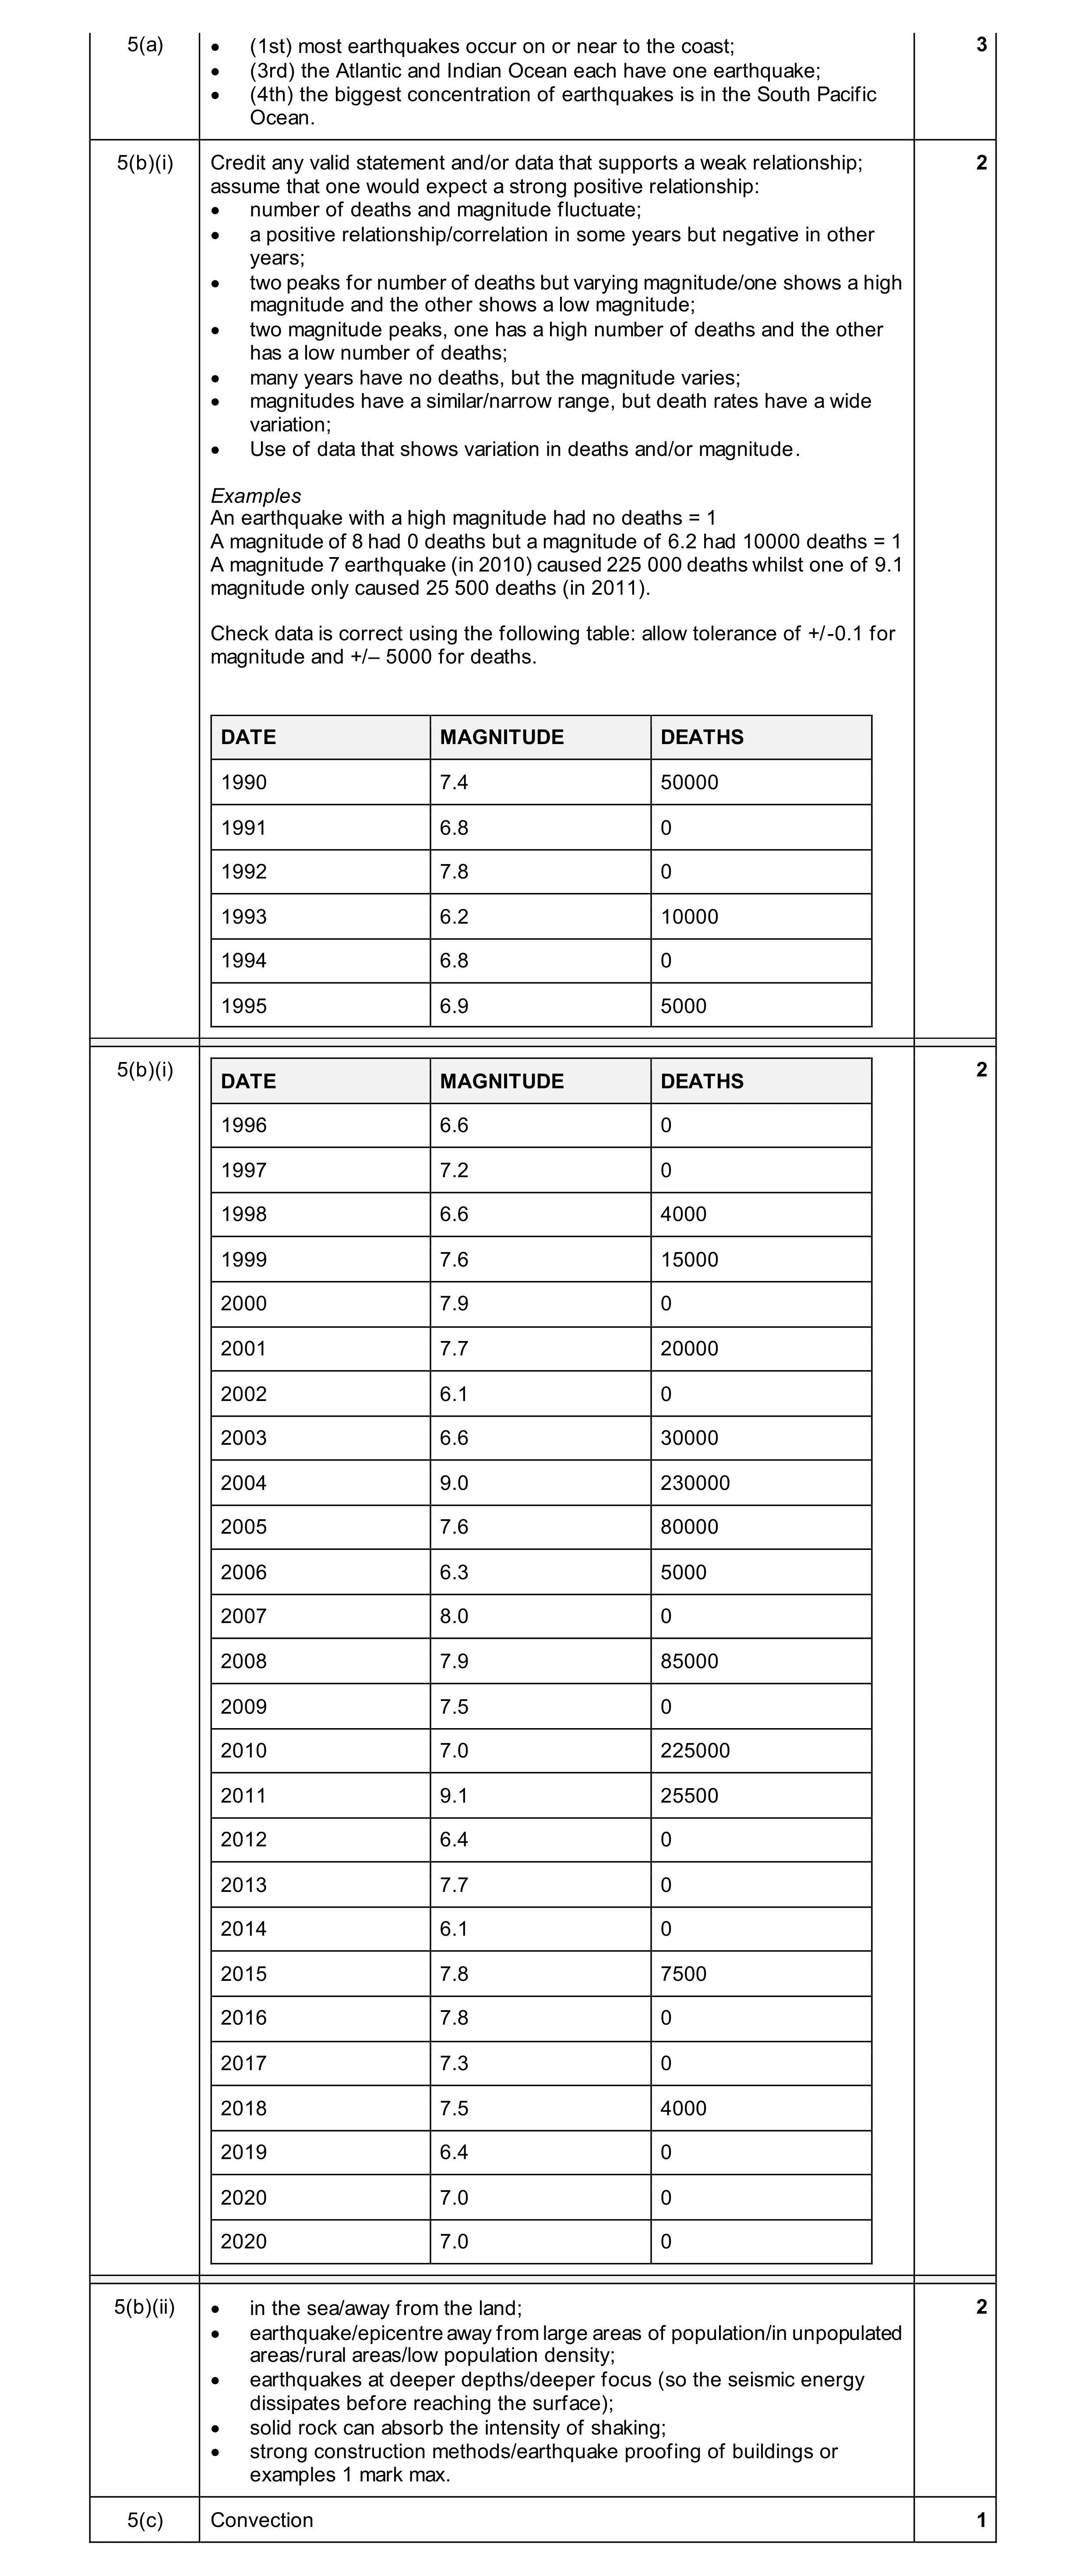 8
8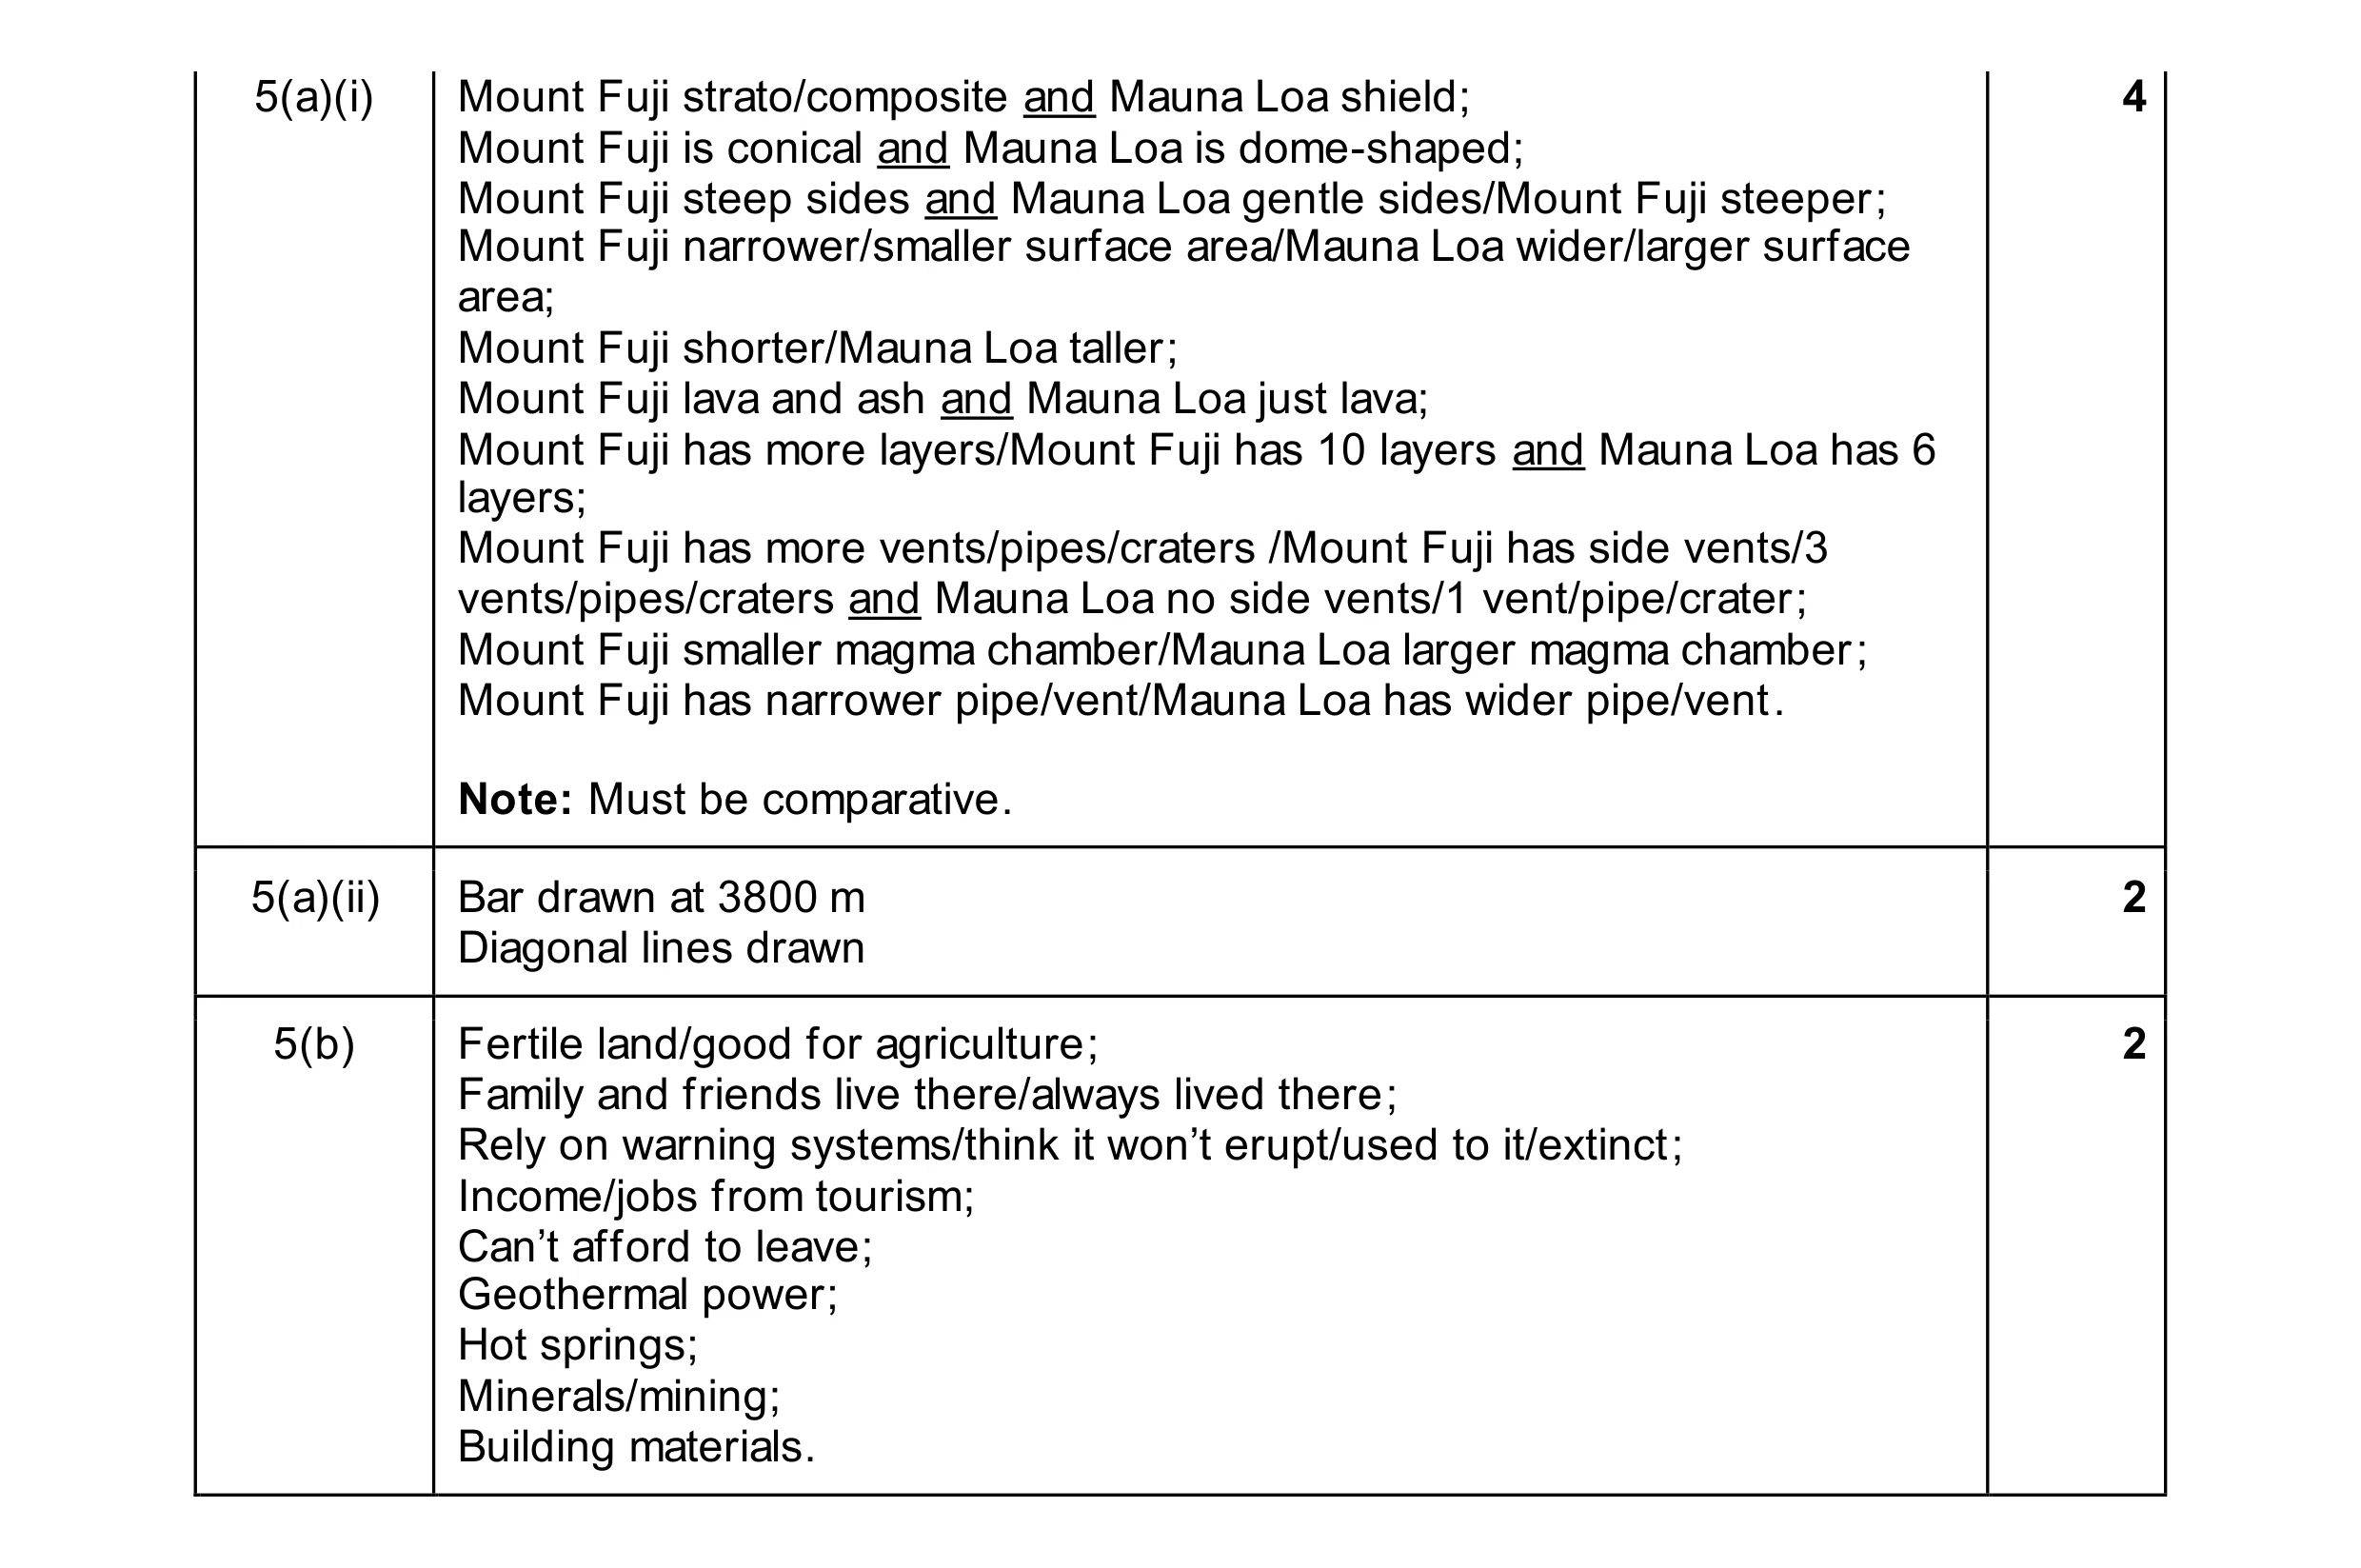 8
8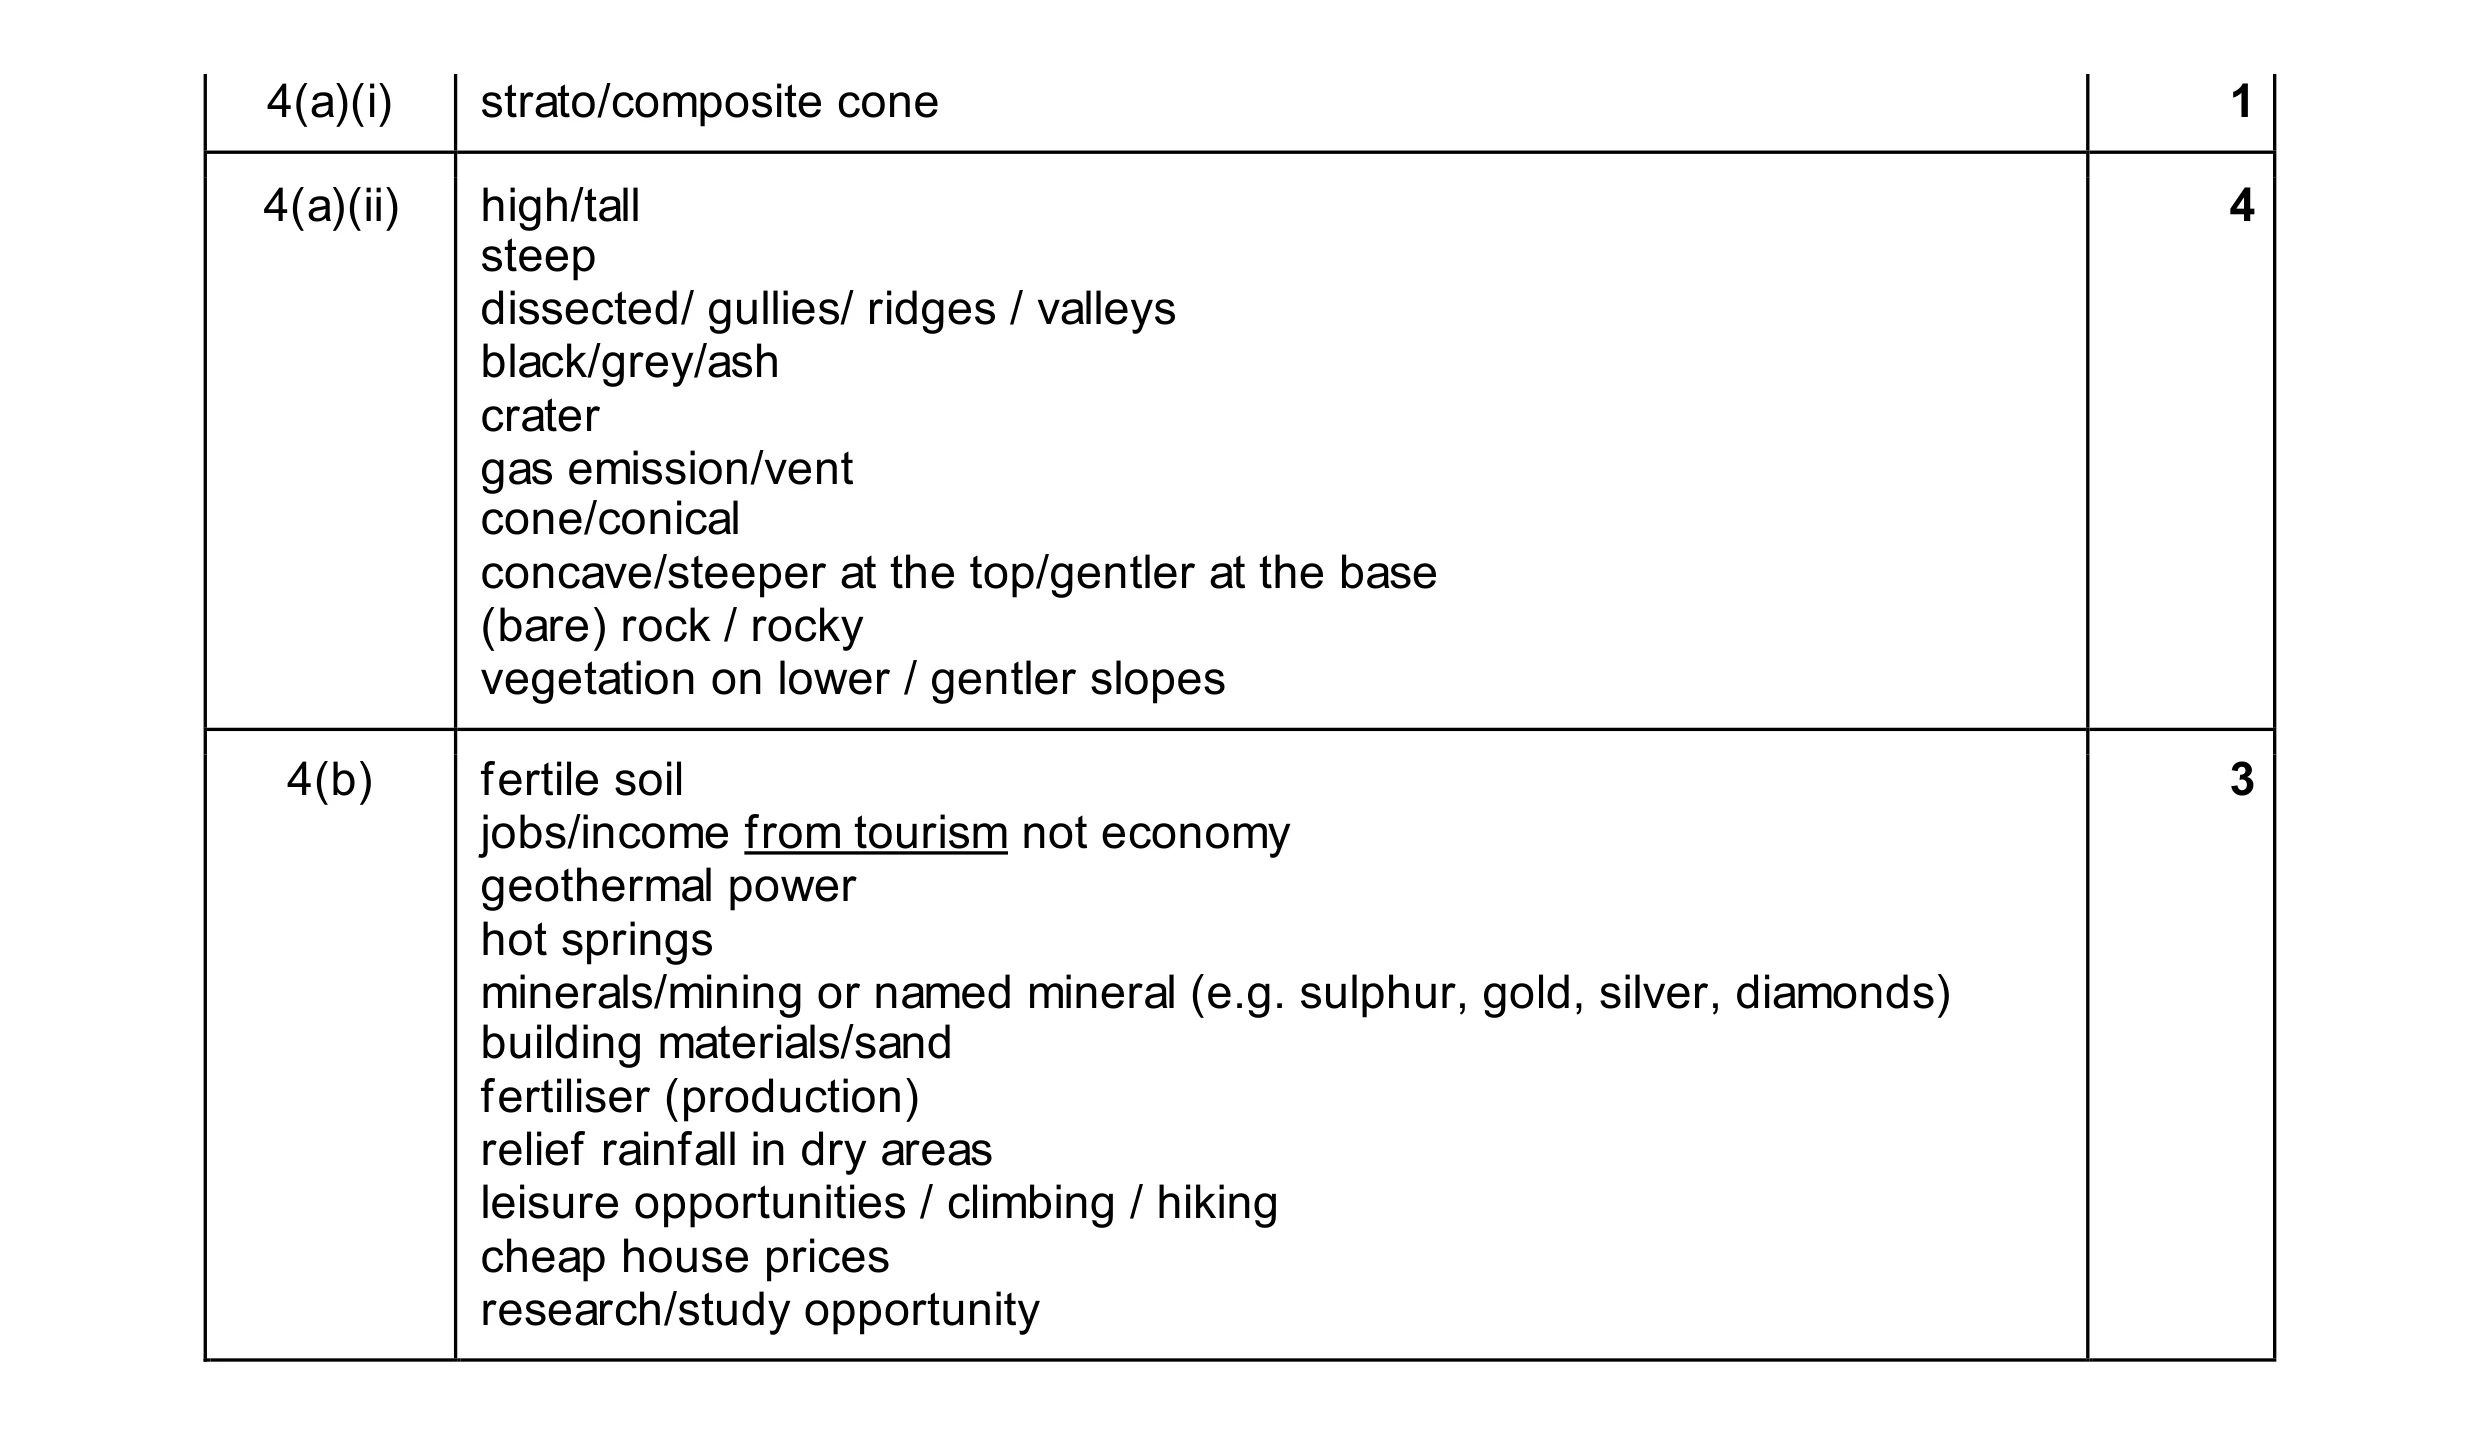 8
8