Cambridge IGCSE Geography 0460 — 2018 Oct/Nov Paper 2 · Variant 3
0460/23/O/N/18 · 6 questions · 60 marks · ≈68 min
The question paper and its mark scheme, free to read here and free to download. This is Cambridge’s own paper, exactly as it was sat.
Question paper16 pages




Mark scheme5 pages
Answers below. Sit the paper first if you are practising.
Questions as text
Q1 · Study the map extract, which is for Mjølkeråen, Norway
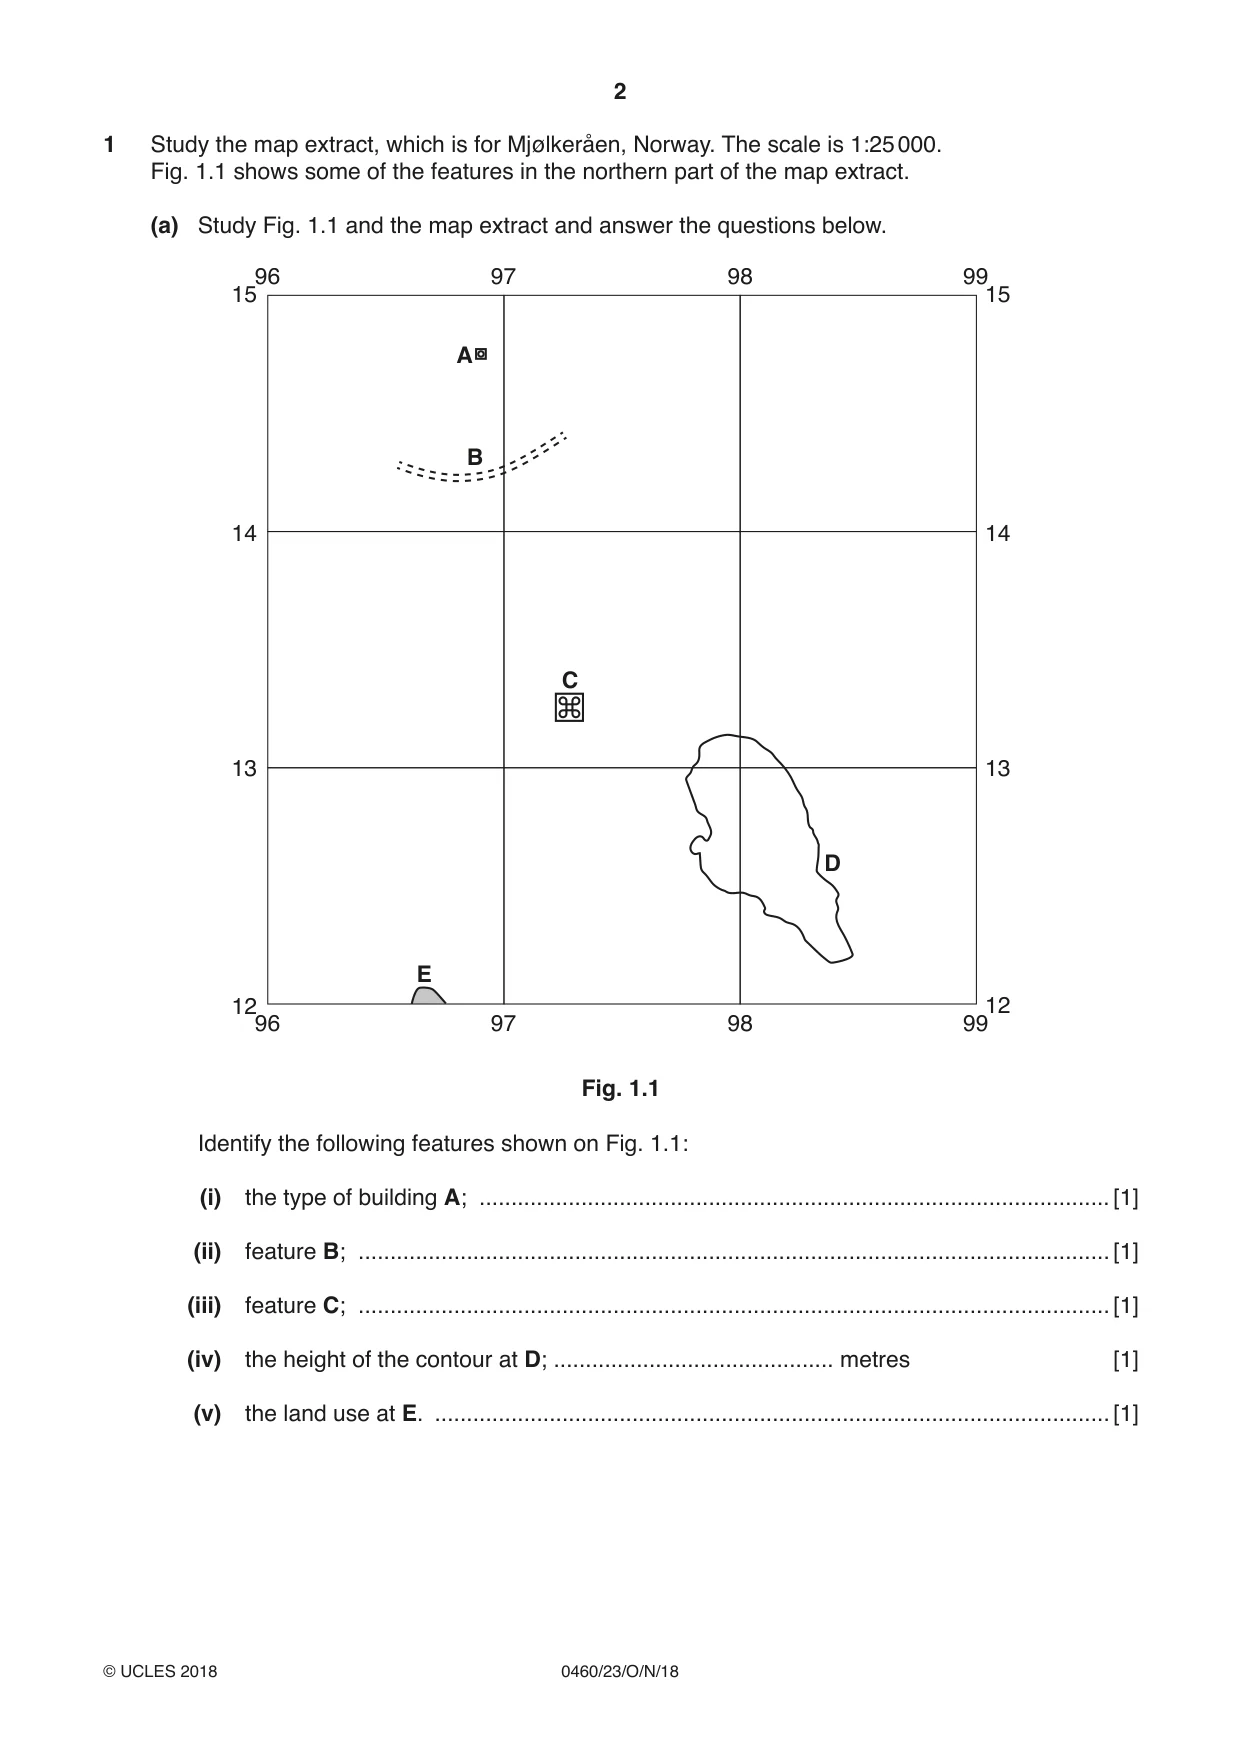
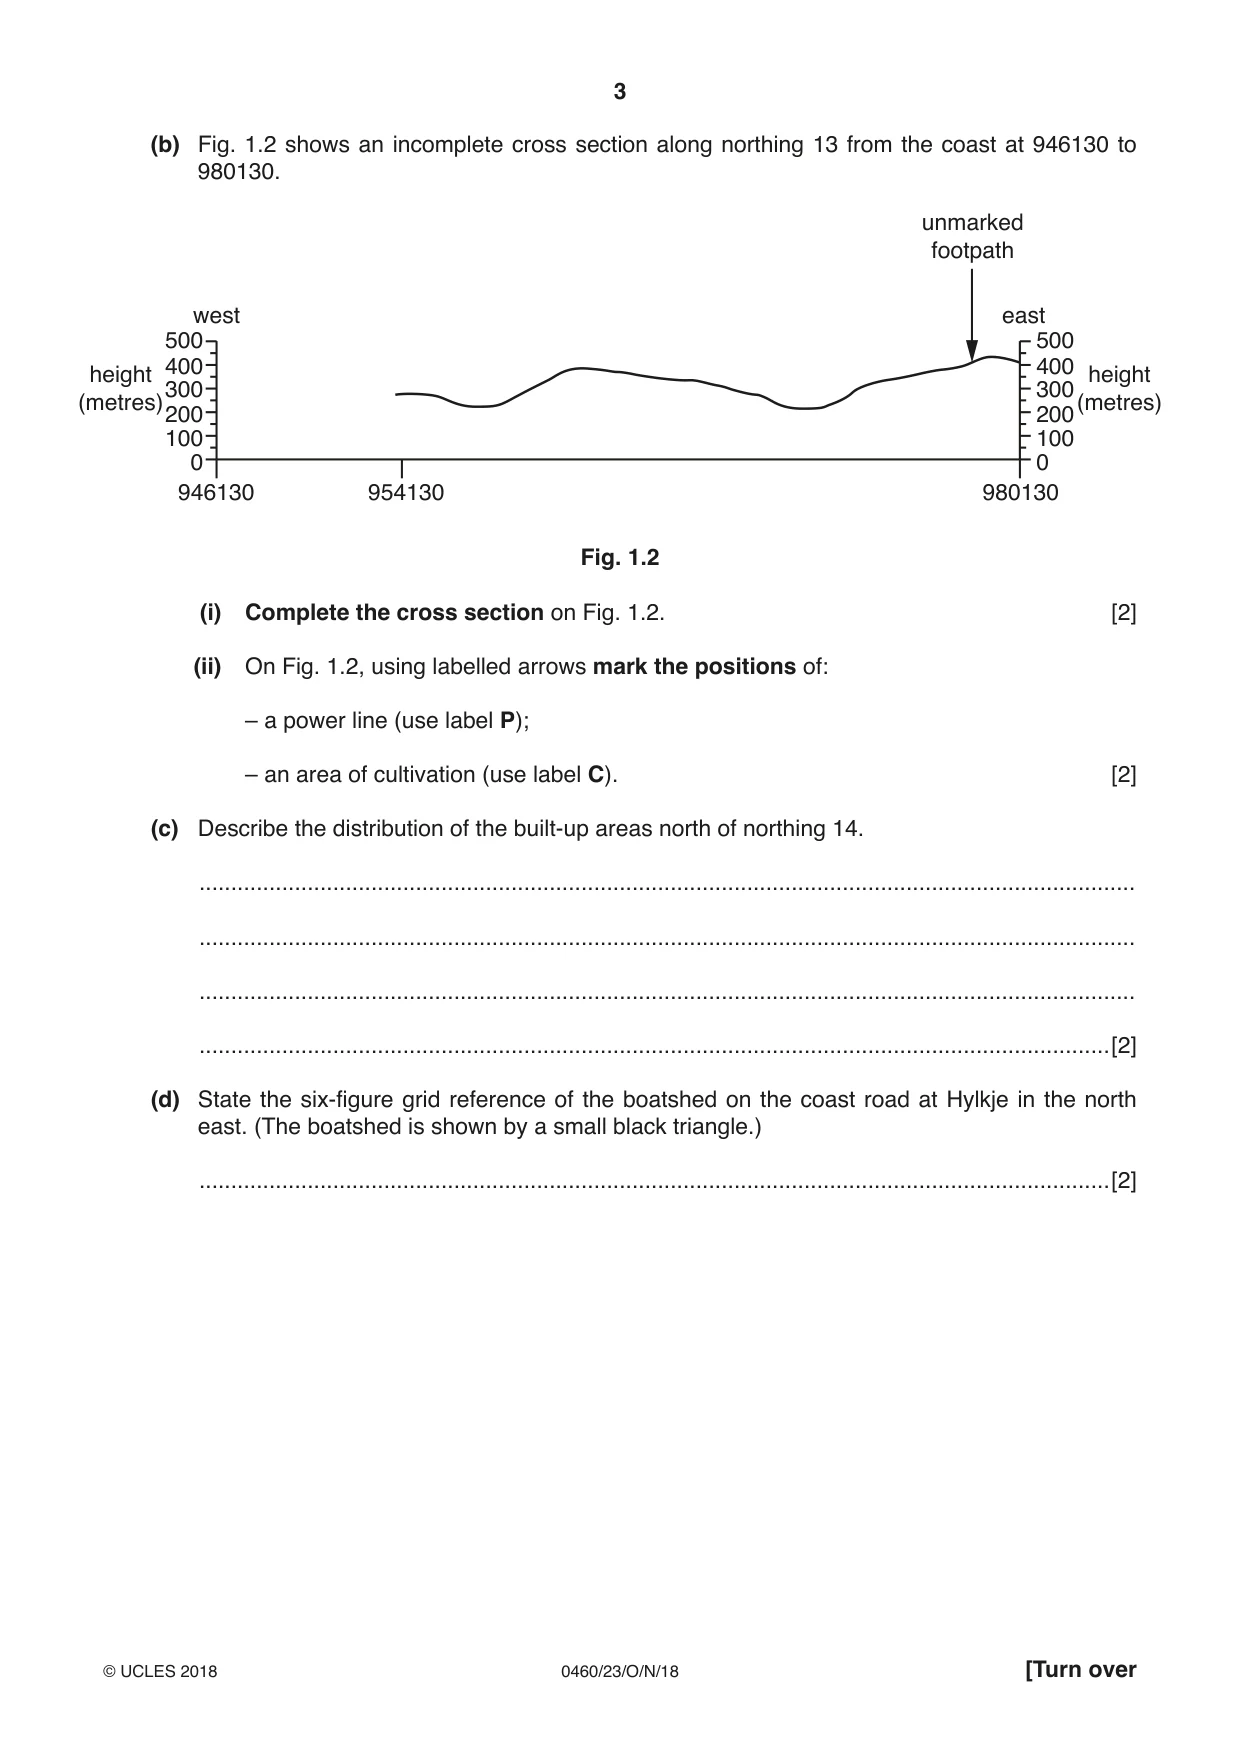
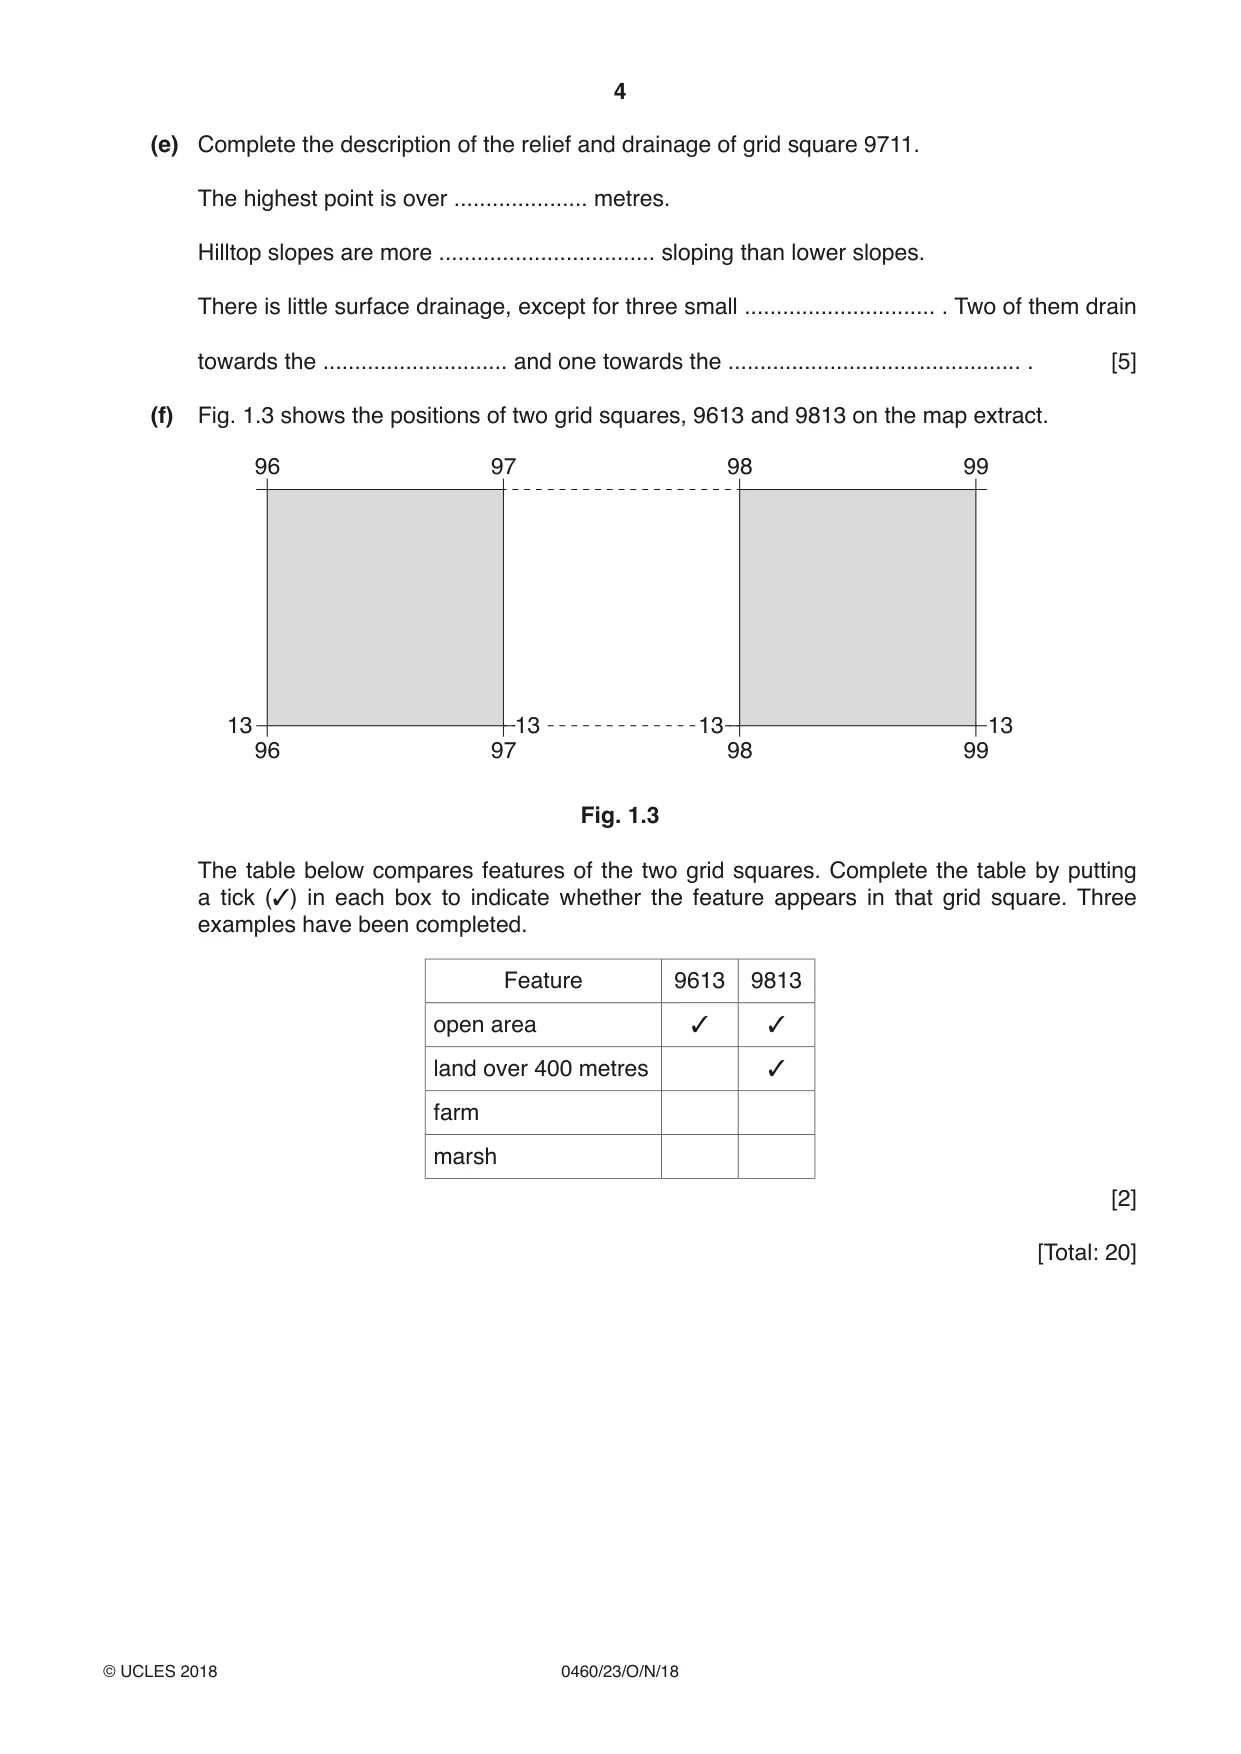
1 Study the map extract, which is for Mjølkeråen, Norway. The scale is 1:25 000. Fig. 1.1 shows some of the features in the northern part of the map extract. (a) Study Fig. 1.1 and the map extract and answer the questions below. 96 97 98 99 15 15 A B 14 14 C 13 13 D E 12 12 96 97 98 99 Fig. 1.1 Identify the following features shown on Fig. 1.1: (i) the type of building A; ................................................................................................... [1] (ii) feature B; ......................................................................................................................[1] (iii) feature C; ......................................................................................................................[1] (iv) the height of the contour at D; ............................................ metres [1] (v) the land use at E. .......................................................................................................... [1] (b) Fig. 1.2 shows an incomplete cross section along northing 13 from the coast at 946130 to 980130. unmarked footpath west east 500 500 400 400 height height 300 300(metres) (metres) 200 200 100 100 0 0 946130 954130 980130 Fig. 1.2 (i) Complete the cross section on Fig. 1.2. [2] (ii) On Fig. 1.2, using labelled arrows mark the positions of: – a power line (use label P); – an area of cultivation (use label C). [2] (c) Describe the distribution of the built-up areas north of northing 14. ................................................................................................................................................... ................................................................................................................................................... ................................................................................................................................................... ...............................................................................................................................................[2] (d) State the six-figure grid reference of the boatshed on the coast road at Hylkje in the north east. (The boatshed is shown by a small black triangle.) ...............................................................................................................................................[2] (e) Complete the description of the relief and drainage of grid square 9711. The highest point is over ..................... metres. Hilltop slopes are more .................................. sloping than lower slopes. There is little surface drainage, except for three small .............................. . Two of them drain towards the ............................. and one towards the .............................................. . [5] (f) Fig. 1.3 shows the positions of two grid squares, 9613 and 9813 on the map extract. 96 97 98 99 13 13 13 13 96 97 98 99 Fig. 1.3 The table below compares features of the two grid squares. Complete the table by putting a tick (3) in each box to indicate whether the feature appears in that grid square. Three examples have been completed. Feature 9613 9813 3 3 open area 3 land over 400 metres farm marsh [2] [Total: 20]
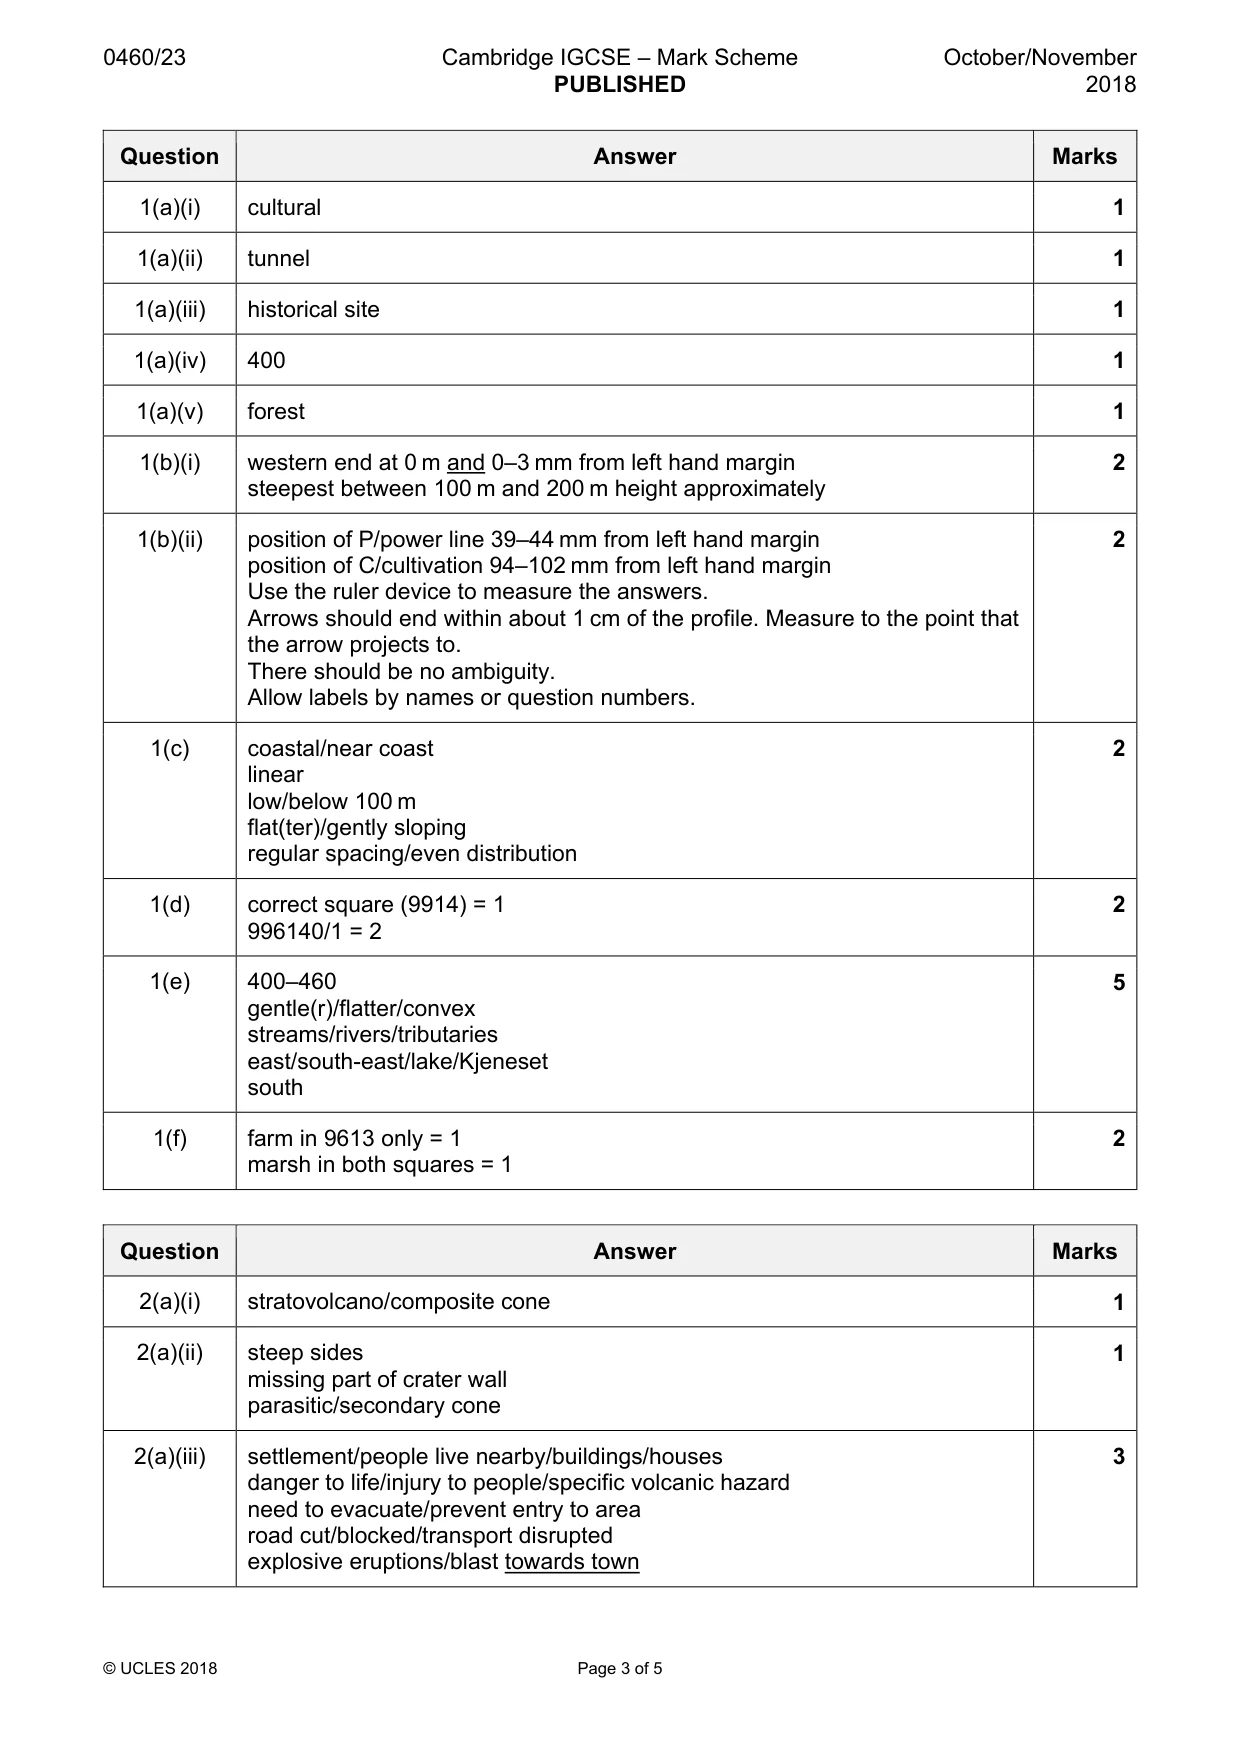
Mark scheme: Question Answer Marks 1(a)(i) cultural 1 1(a)(ii) tunnel 1 1(a)(iii) historical site 1 1(a)(iv) 400 1 1(a)(v) forest 1 1(b)(i) western end at 0 m and 0–3 mm from left hand margin 2 steepest between 100 m and 200 m height approximately 1(b)(ii) position of P/power line 39–44 mm from left hand margin 2 position of C/cultivation 94–102 mm from left hand margin Use the ruler device to measure the answers. Arrows should end within about 1 cm of the profile. Measure to the point that the arrow projects to. There should be no ambiguity. Allow labels by names or question numbers. 1(c) coastal/near coast 2 linear low/below 100 m flat(ter)/gently sloping regular spacing/even distribution 1(d) correct square (9914) = 1 2 996140/1 = 2 1(e) 400–460 5 gentle(r)/flatter/convex streams/rivers/tributaries east/south-east/lake/Kjeneset south 1(f) farm in 9613 only = 1 2 marsh in both squares = 1
More questions on Settlements (rural and urban) and service provision
Question 2
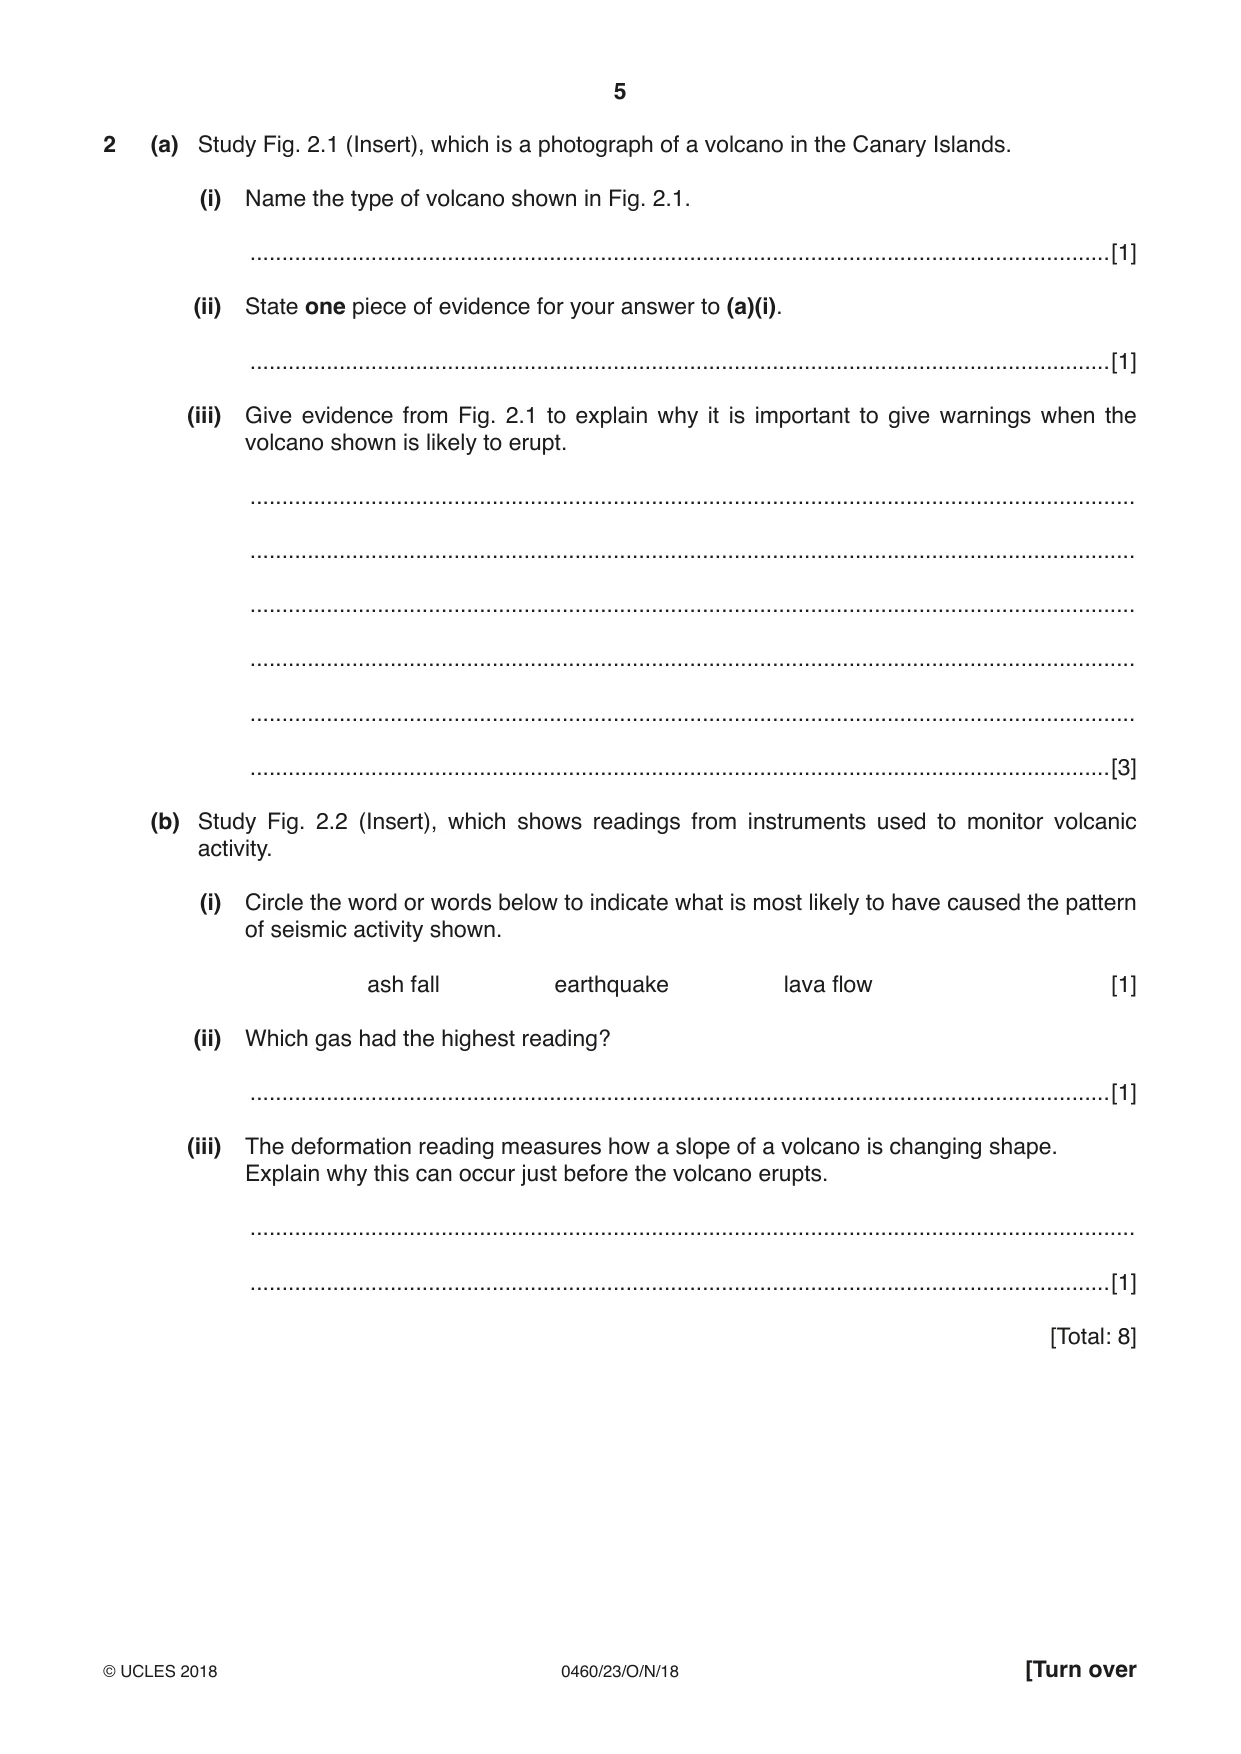
2 (a) Study Fig. 2.1 (Insert), which is a photograph of a volcano in the Canary Islands. (i) Name the type of volcano shown in Fig. 2.1. .......................................................................................................................................[1] (ii) State one piece of evidence for your answer to (a)(i). .......................................................................................................................................[1] (iii) Give evidence from Fig. 2.1 to explain why it is important to give warnings when the volcano shown is likely to erupt. ........................................................................................................................................... ........................................................................................................................................... ........................................................................................................................................... ........................................................................................................................................... ........................................................................................................................................... .......................................................................................................................................[3] (b) Study Fig. 2.2 (Insert), which shows readings from instruments used to monitor volcanic activity. (i) Circle the word or words below to indicate what is most likely to have caused the pattern of seismic activity shown. ash fall earthquake lava flow [1] (ii) Which gas had the highest reading? .......................................................................................................................................[1] (iii) The deformation reading measures how a slope of a volcano is changing shape. Explain why this can occur just before the volcano erupts. ........................................................................................................................................... .......................................................................................................................................[1] [Total: 8]
Mark scheme: 2(a)(i) stratovolcano/composite cone 1 2(a)(ii) steep sides 1 missing part of crater wall parasitic/secondary cone 2(a)(iii) settlement/people live nearby/buildings/houses 3 danger to life/injury to people/specific volcanic hazard need to evacuate/prevent entry to area road cut/blocked/transport disrupted explosive eruptions/blast towards town 2(b)(i) earthquake 1 2(b)(ii) SO2 1 2(b)(iii) magma/gas movement/pressure/build-up 1
Question 3
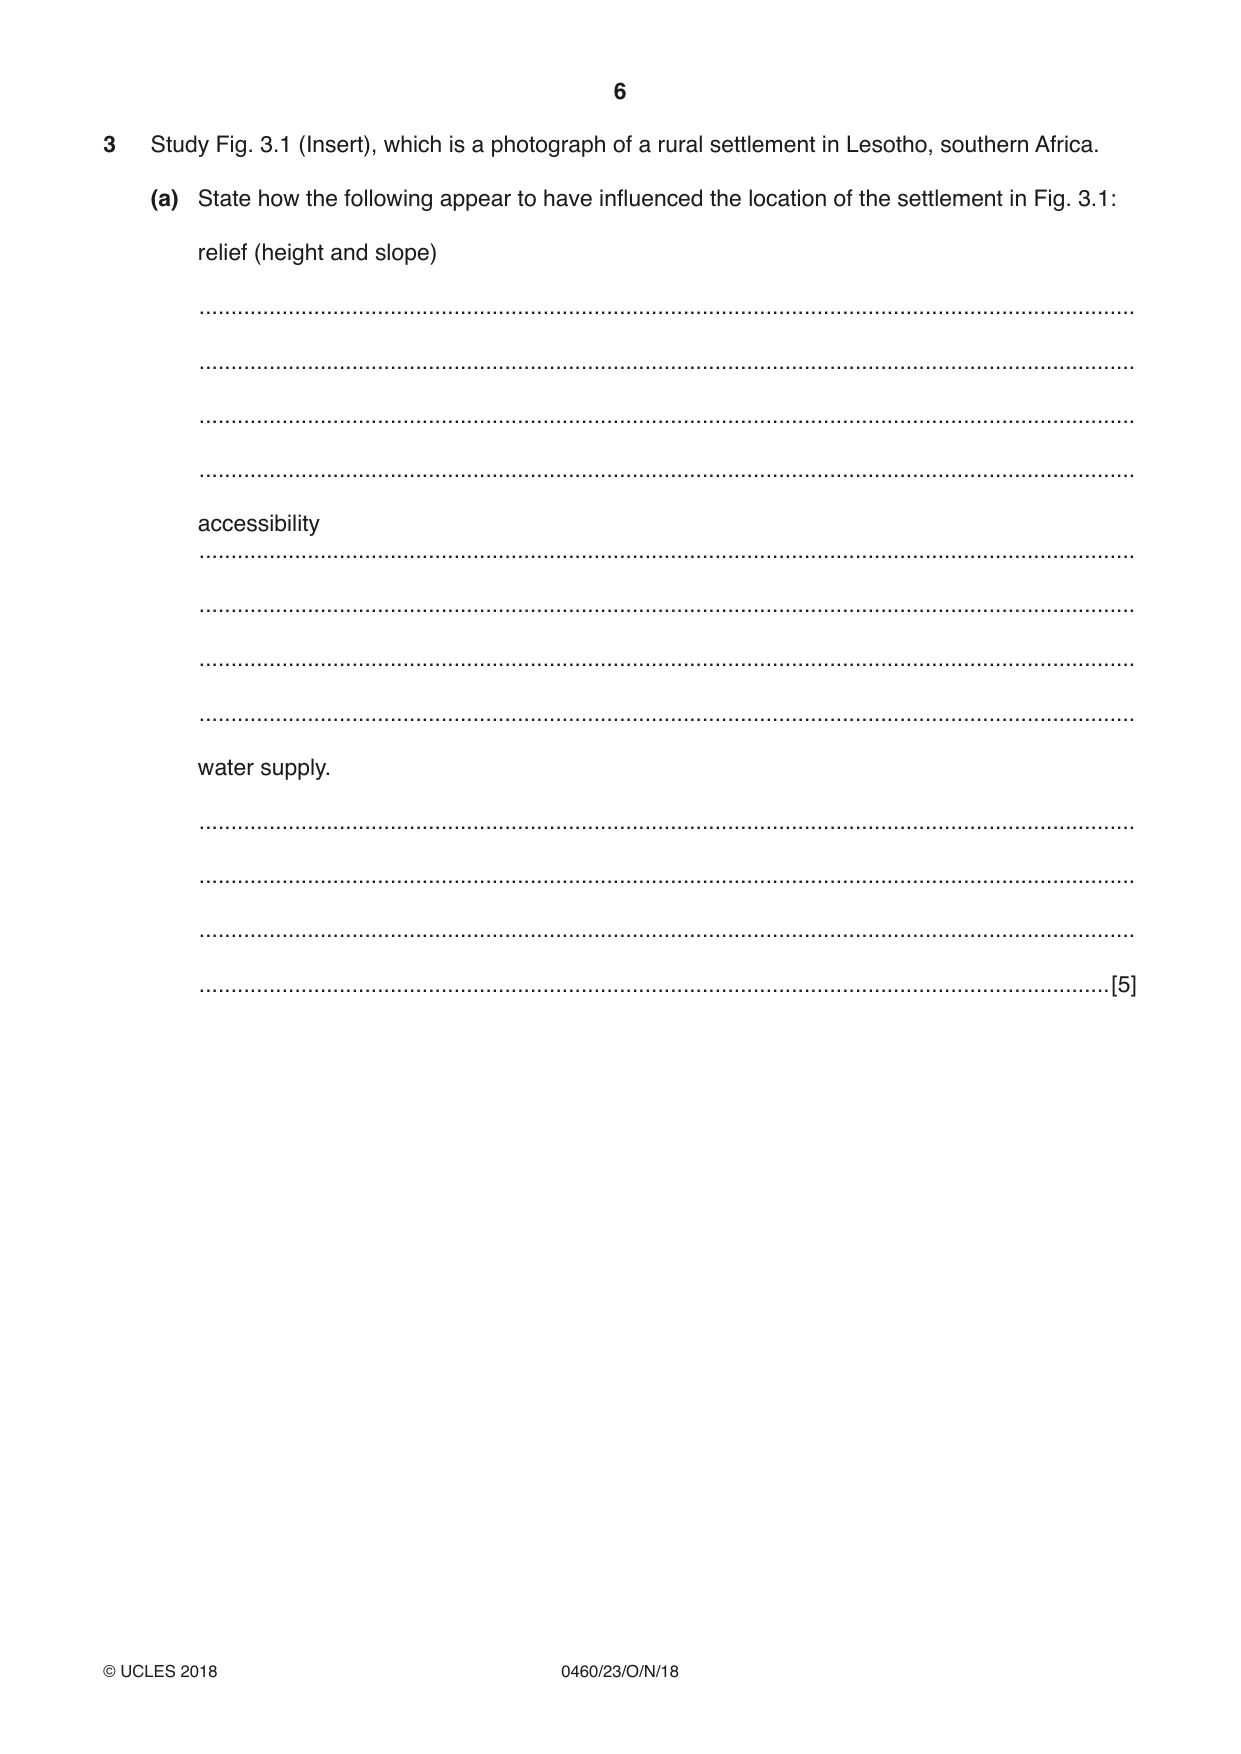
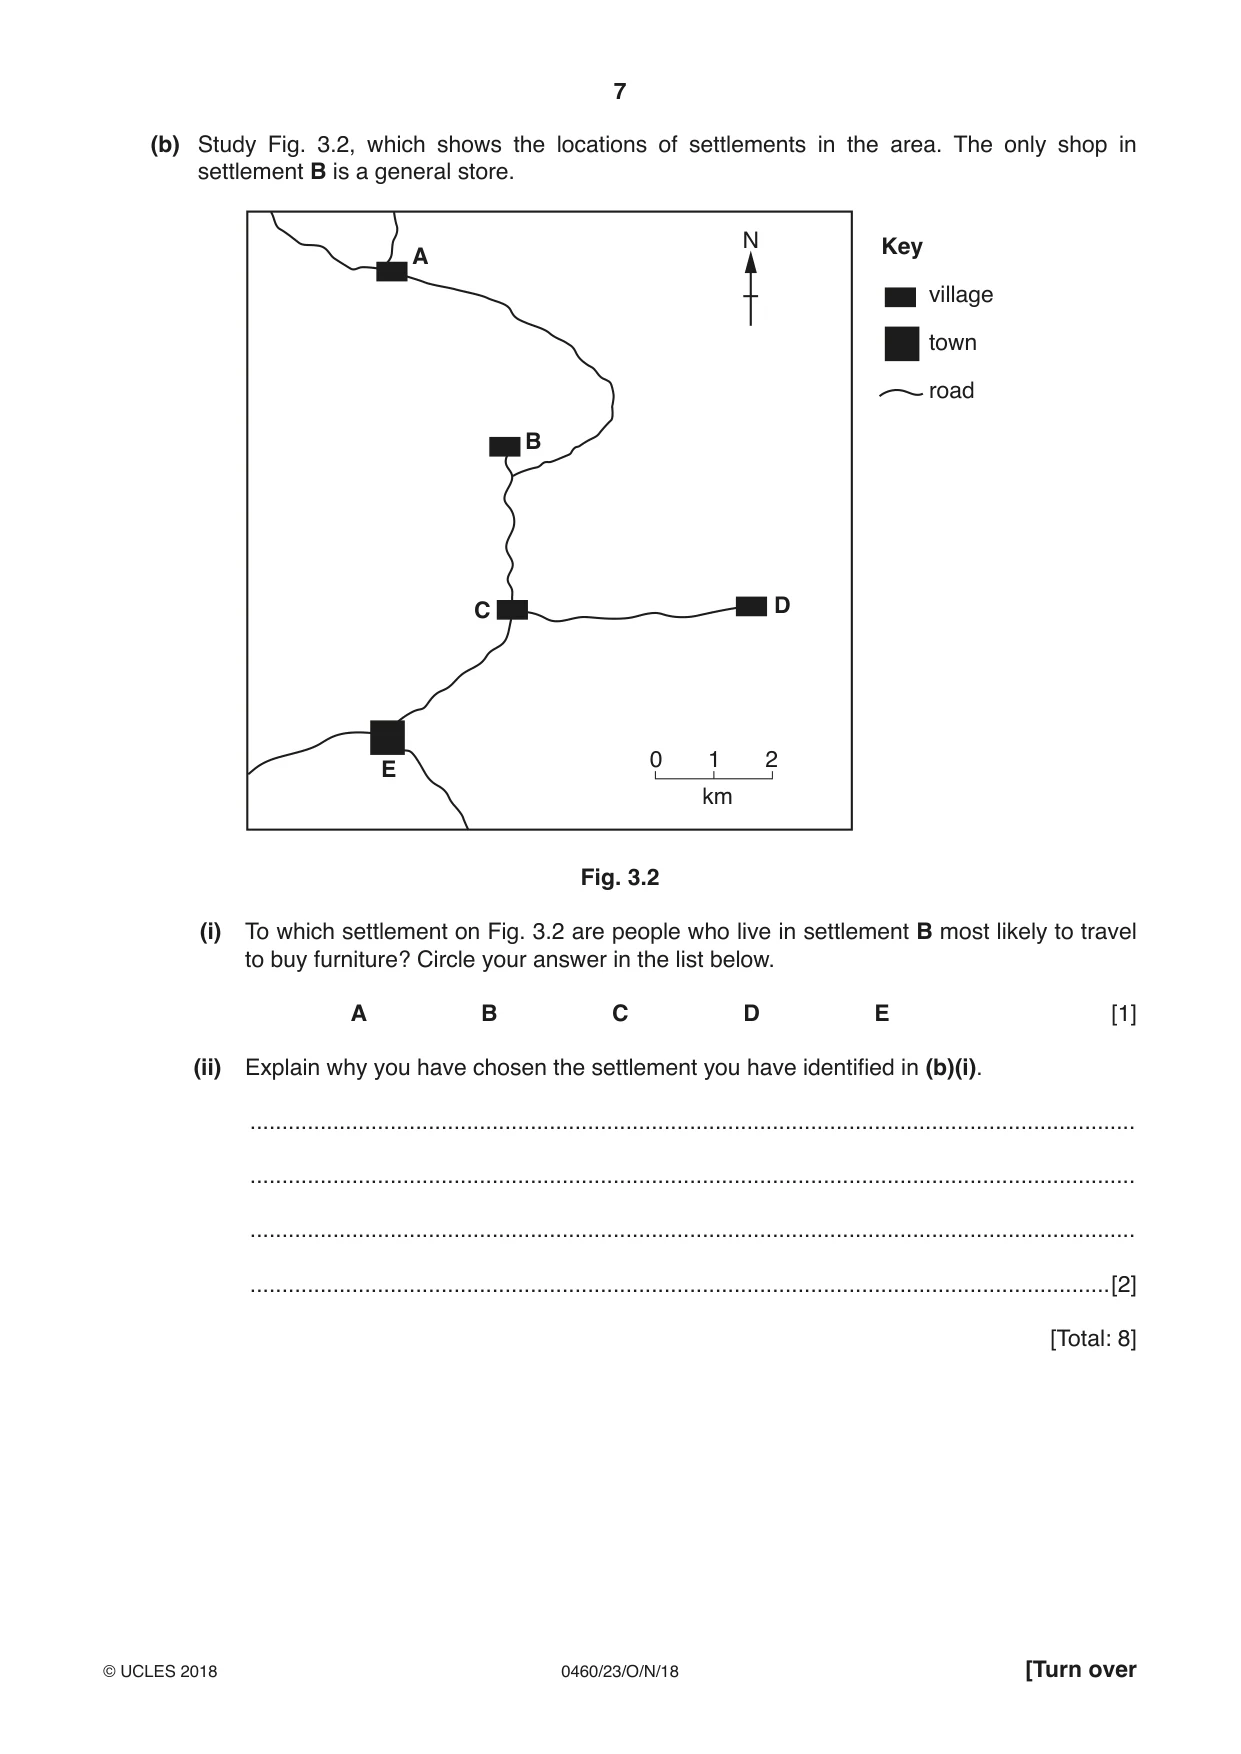
3 Study Fig. 3.1 (Insert), which is a photograph of a rural settlement in Lesotho, southern Africa. (a) State how the following appear to have influenced the location of the settlement in Fig. 3.1: relief (height and slope) ................................................................................................................................................... ................................................................................................................................................... ................................................................................................................................................... ................................................................................................................................................... accessibility ................................................................................................................................................... ................................................................................................................................................... ................................................................................................................................................... ................................................................................................................................................... water supply. ................................................................................................................................................... ................................................................................................................................................... ................................................................................................................................................... ...............................................................................................................................................[5] (b) Study Fig. 3.2, which shows the locations of settlements in the area. The only shop in settlement B is a general store. N Key A village town road B C D 0 1 2 E km Fig. 3.2 (i) To which settlement on Fig. 3.2 are people who live in settlement B most likely to travel to buy furniture? Circle your answer in the list below. A B C D E [1] (ii) Explain why you have chosen the settlement you have identified in (b)(i). ........................................................................................................................................... ........................................................................................................................................... ........................................................................................................................................... .......................................................................................................................................[2] [Total: 8]
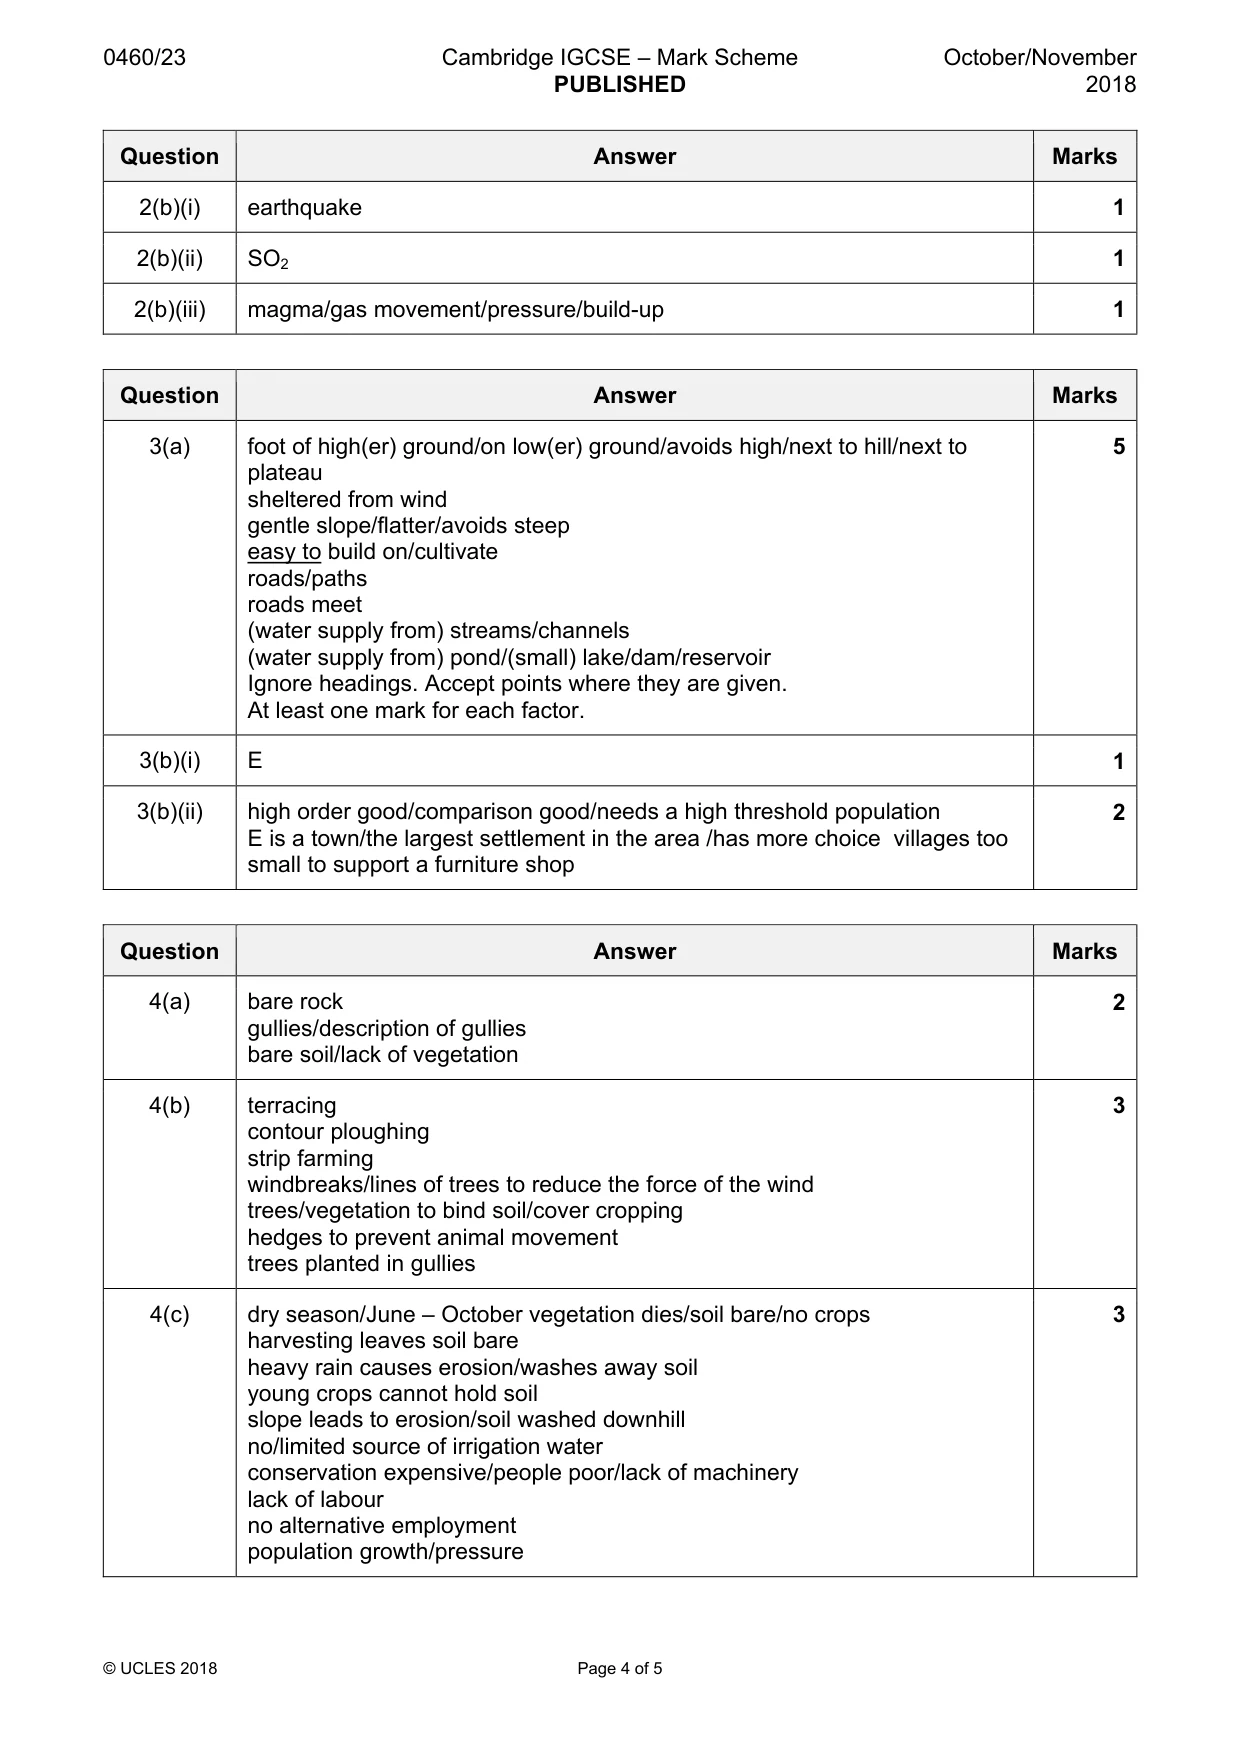
Mark scheme: 3(a) foot of high(er) ground/on low(er) ground/avoids high/next to hill/next to 5 plateau sheltered from wind gentle slope/flatter/avoids steep easy to build on/cultivate roads/paths roads meet (water supply from) streams/channels (water supply from) pond/(small) lake/dam/reservoir Ignore headings. Accept points where they are given. At least one mark for each factor. 3(b)(i) E 1 3(b)(ii) high order good/comparison good/needs a high threshold population 2 E is a town/the largest settlement in the area /has more choice villages too small to support a furniture shop
More questions on Settlements (rural and urban) and service provision
Question 4
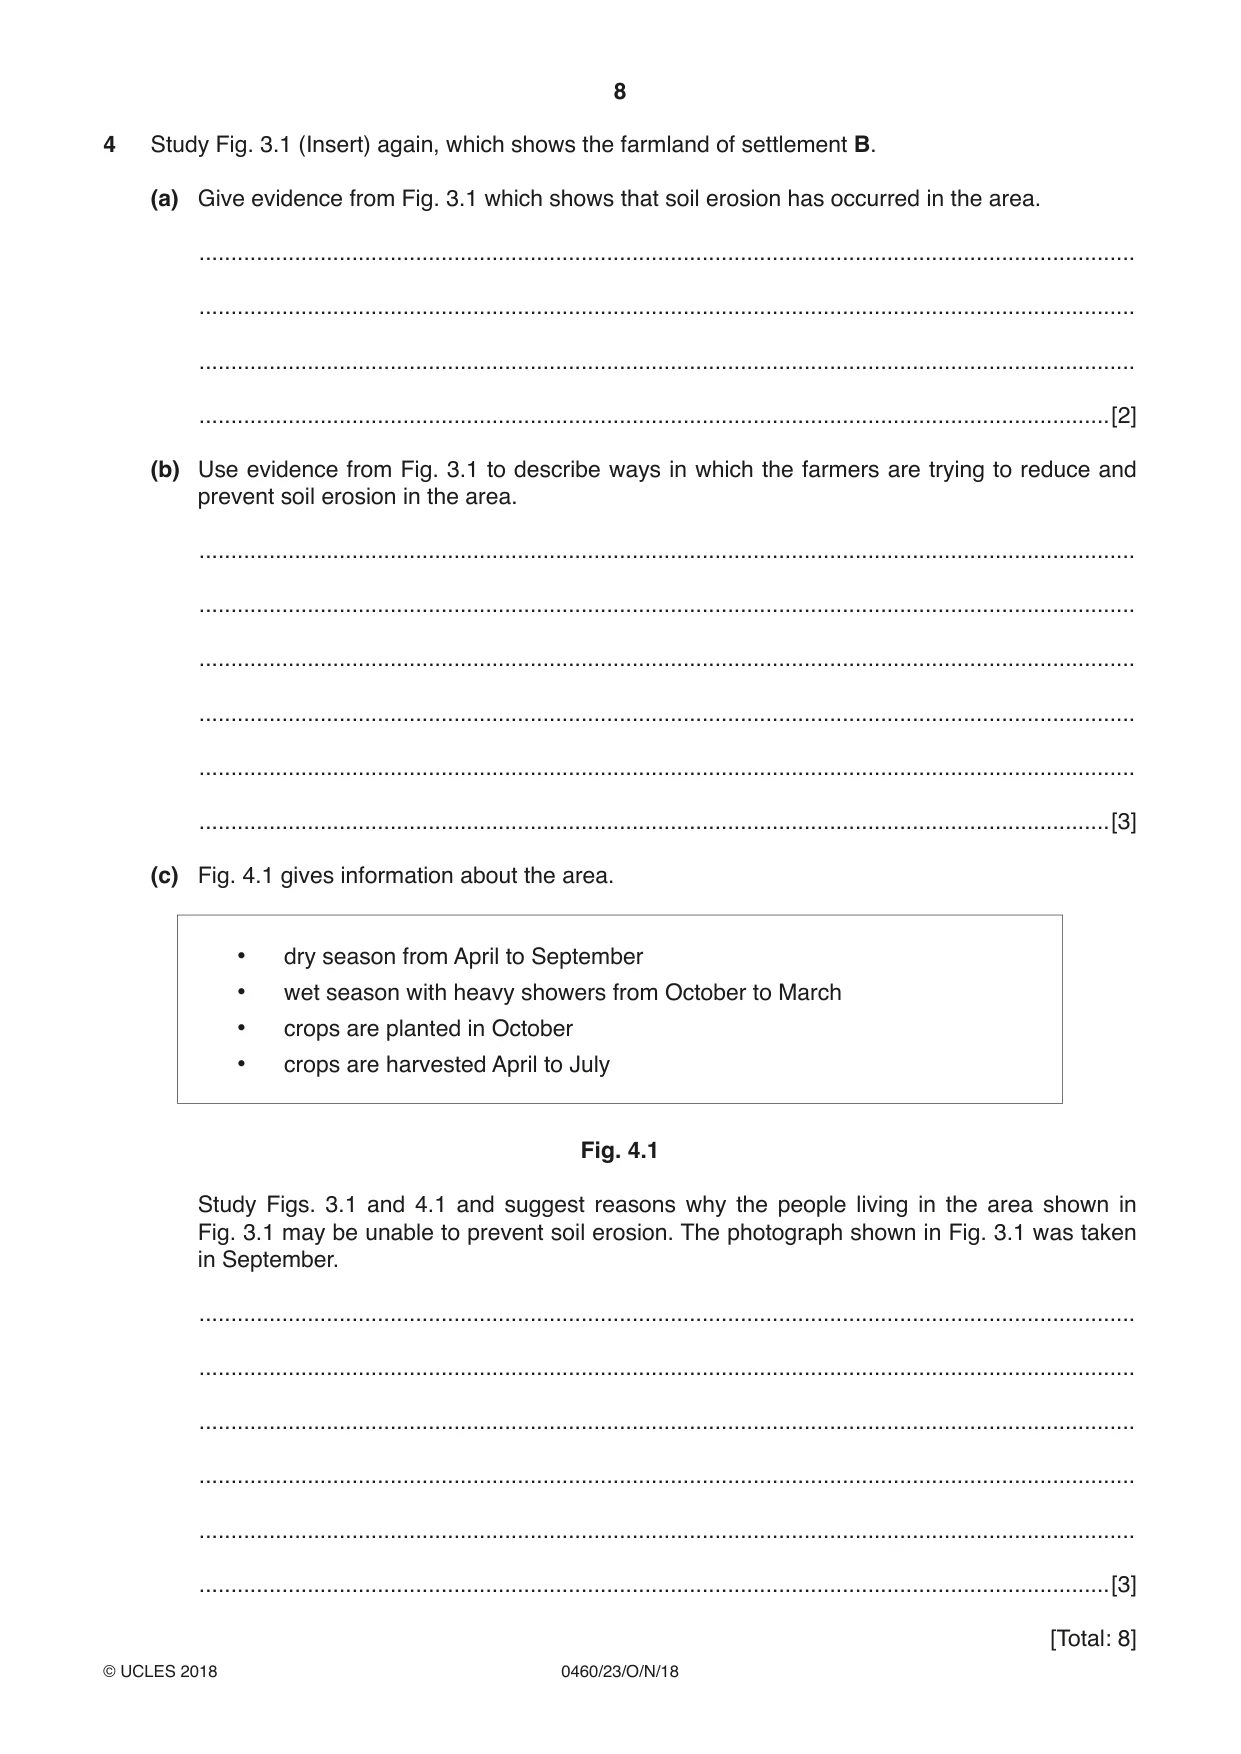
4 Study Fig. 3.1 (Insert) again, which shows the farmland of settlement B. (a) Give evidence from Fig. 3.1 which shows that soil erosion has occurred in the area. ................................................................................................................................................... ................................................................................................................................................... ................................................................................................................................................... ...............................................................................................................................................[2] (b) Use evidence from Fig. 3.1 to describe ways in which the farmers are trying to reduce and prevent soil erosion in the area. ................................................................................................................................................... ................................................................................................................................................... ................................................................................................................................................... ................................................................................................................................................... ................................................................................................................................................... ...............................................................................................................................................[3] (c) Fig. 4.1 gives information about the area. • dry season from April to September • wet season with heavy showers from October to March • crops are planted in October • crops are harvested April to July Fig. 4.1 Study Figs. 3.1 and 4.1 and suggest reasons why the people living in the area shown in Fig. 3.1 may be unable to prevent soil erosion. The photograph shown in Fig. 3.1 was taken in September. ................................................................................................................................................... ................................................................................................................................................... ................................................................................................................................................... ................................................................................................................................................... ................................................................................................................................................... ...............................................................................................................................................[3] [Total: 8] TURN PAGE FOR QUESTION 5
Mark scheme: 4(a) bare rock 2 gullies/description of gullies bare soil/lack of vegetation 4(b) terracing 3 contour ploughing strip farming windbreaks/lines of trees to reduce the force of the wind trees/vegetation to bind soil/cover cropping hedges to prevent animal movement trees planted in gullies 4(c) dry season/June – October vegetation dies/soil bare/no crops 3 harvesting leaves soil bare heavy rain causes erosion/washes away soil young crops cannot hold soil slope leads to erosion/soil washed downhill no/limited source of irrigation water conservation expensive/people poor/lack of machinery lack of labour no alternative employment population growth/pressure
Question 5
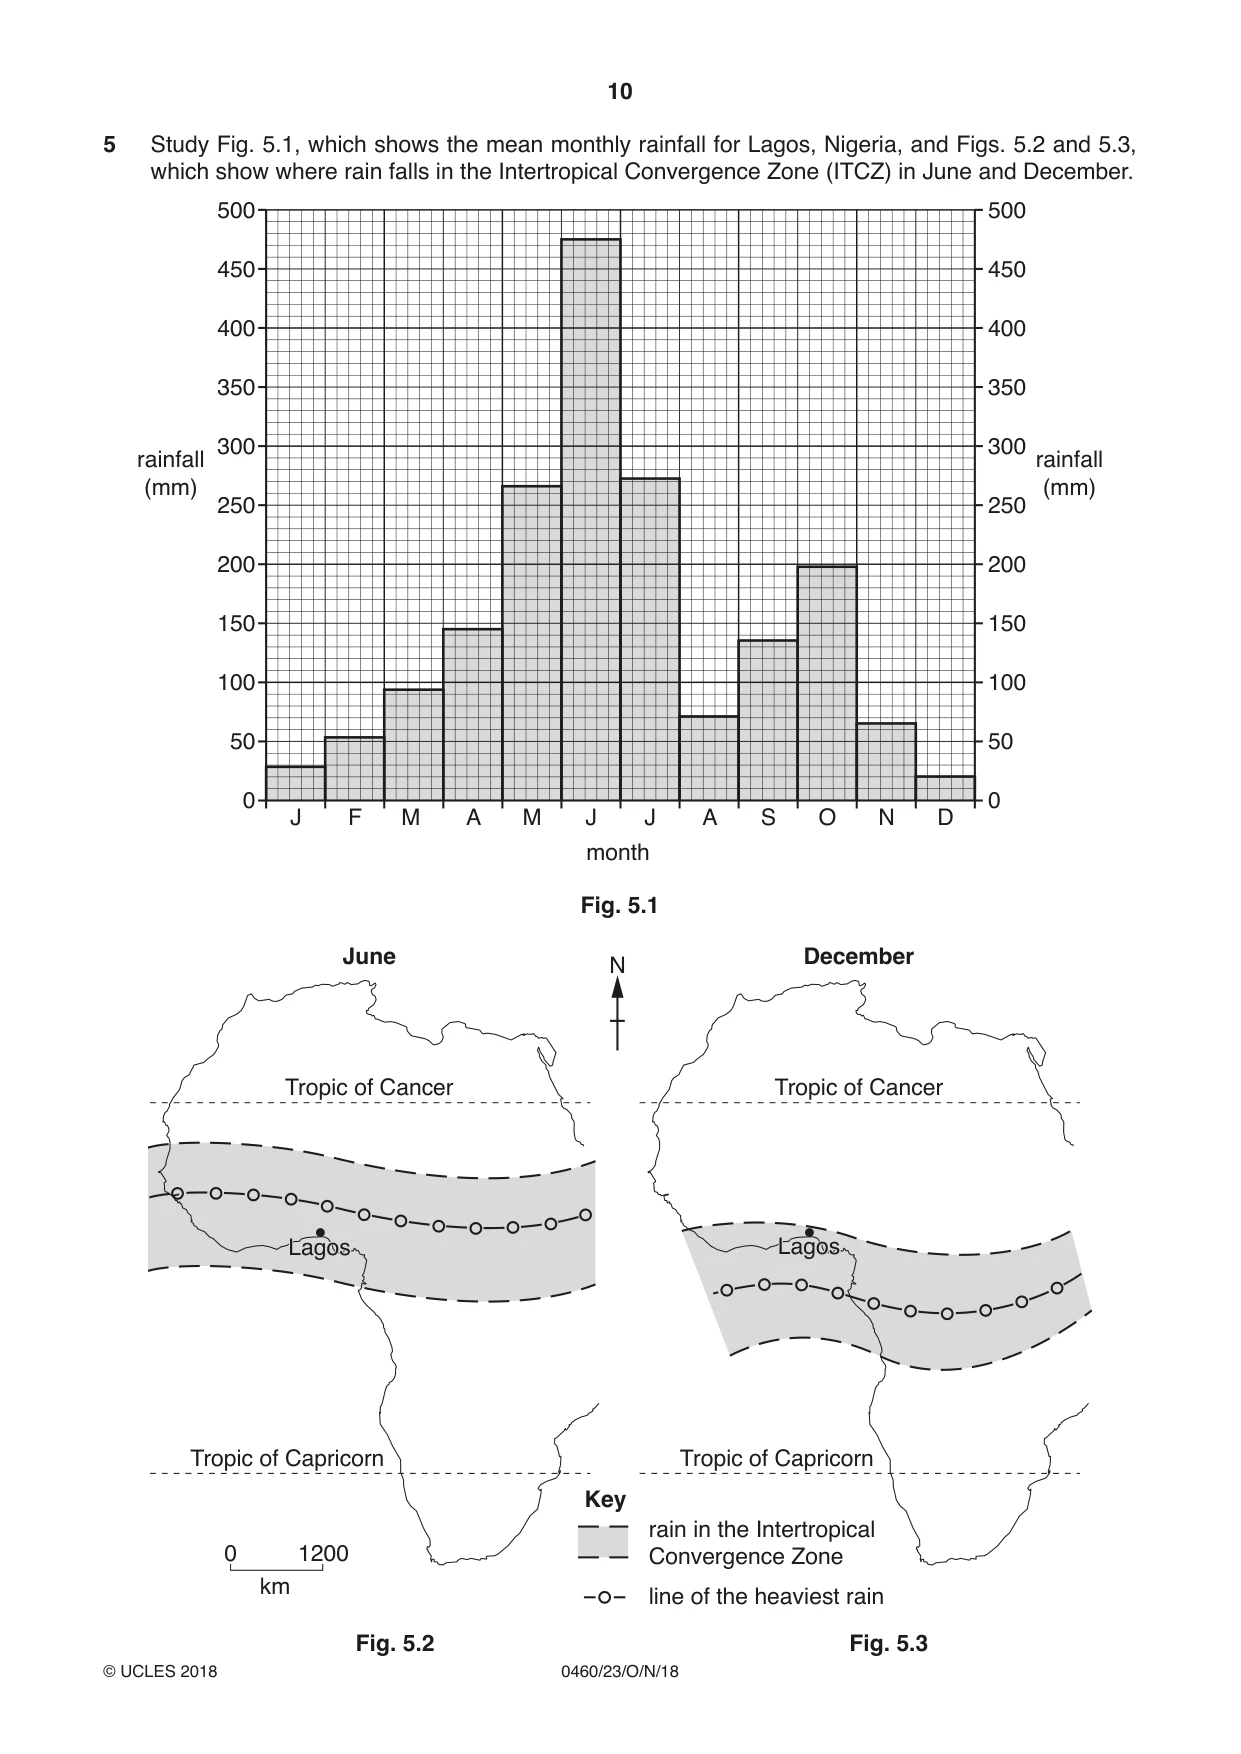
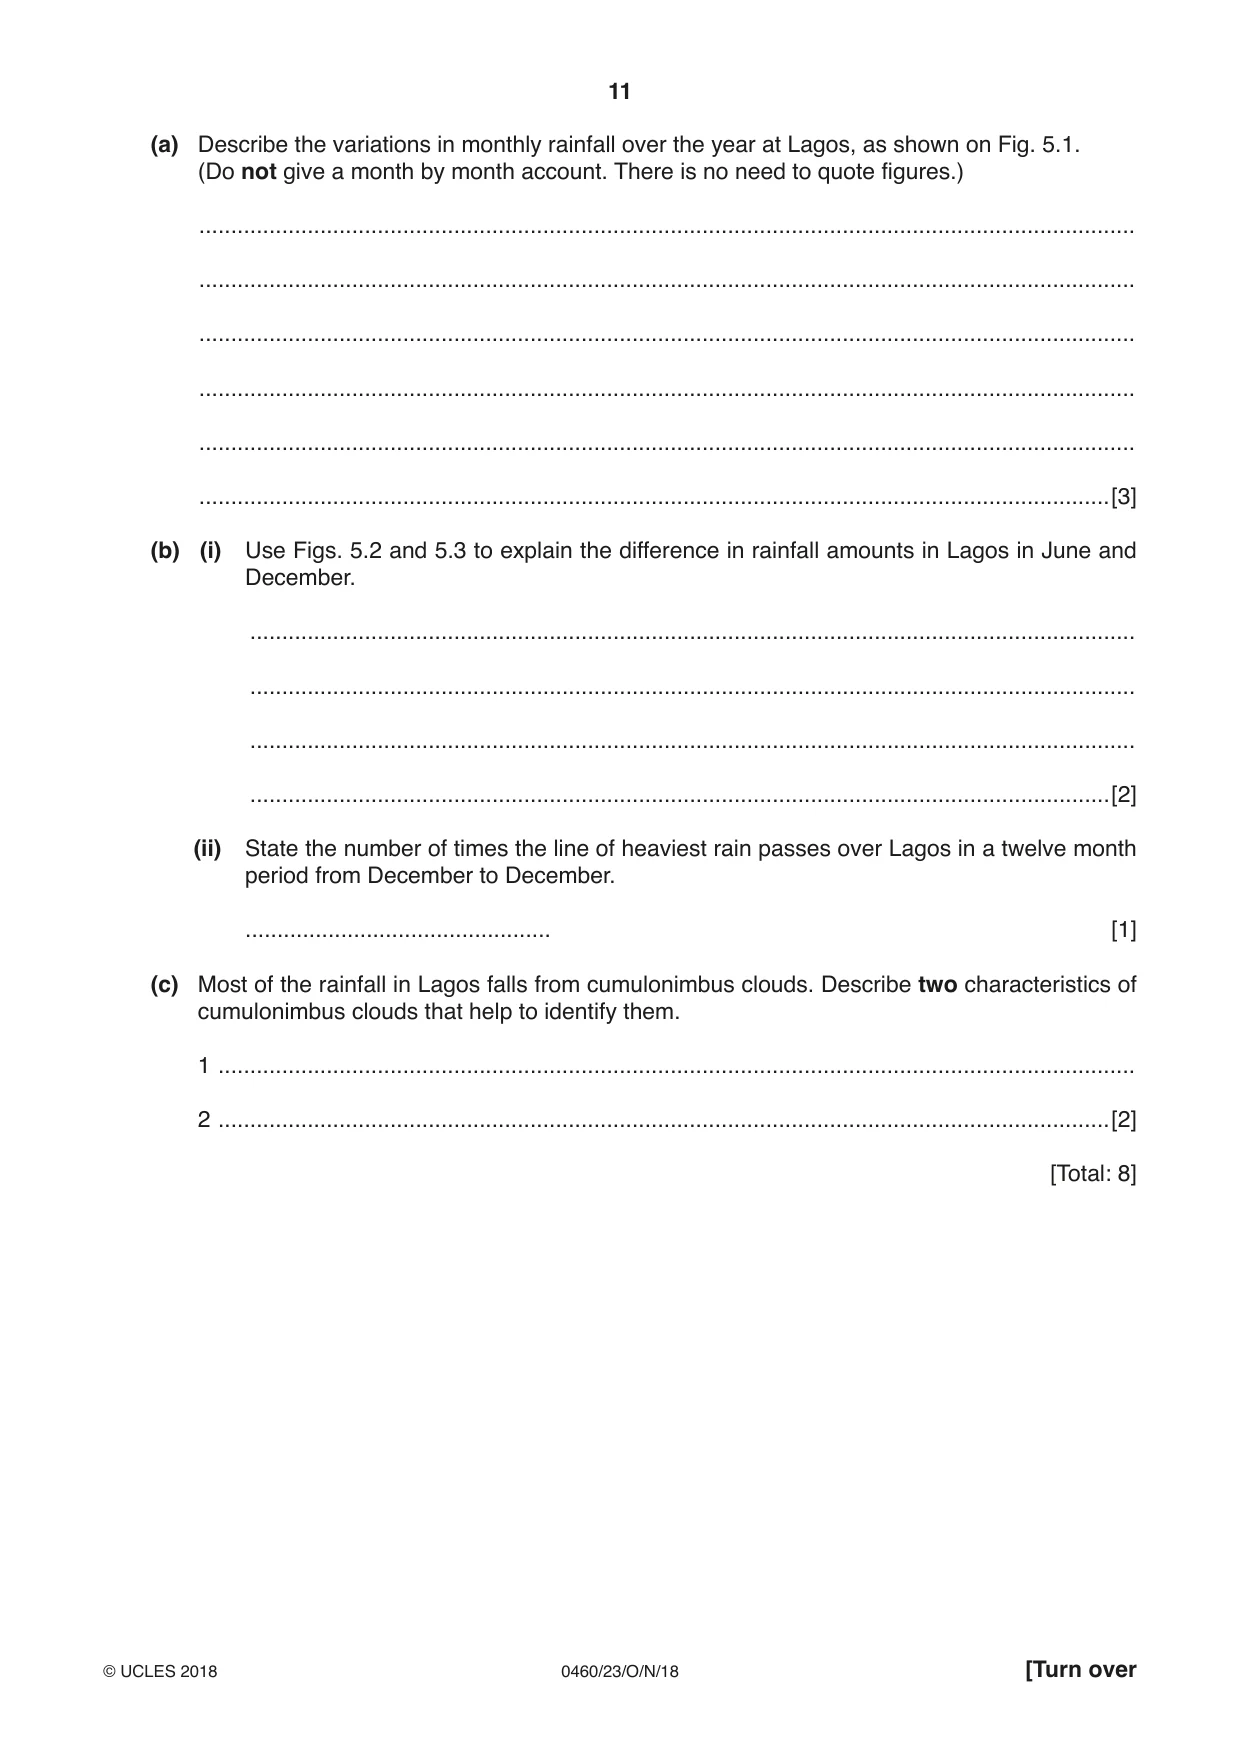
5 Study Fig. 5.1, which shows the mean monthly rainfall for Lagos, Nigeria, and Figs. 5.2 and 5.3, which show where rain falls in the Intertropical Convergence Zone (ITCZ) in June and December. 500 500 450 450 400 400 350 350 300 300 rainfall rainfall (mm) (mm) 250 250 200 200 150 150 100 100 50 50 0 0 J F M A M J J A S O N D month Fig. 5.1 June December N Tropic of Cancer Tropic of Cancer Lagos Lagos Tropic of Capricorn Tropic of Capricorn Key rain in the Intertropical 0 1200 Convergence Zone km line of the heaviest rain Fig. 5.2 Fig. 5.3 (a) Describe the variations in monthly rainfall over the year at Lagos, as shown on Fig. 5.1. (Do not give a month by month account. There is no need to quote figures.) ................................................................................................................................................... ................................................................................................................................................... ................................................................................................................................................... ................................................................................................................................................... ................................................................................................................................................... ...............................................................................................................................................[3] (b) (i) Use Figs. 5.2 and 5.3 to explain the difference in rainfall amounts in Lagos in June and December. ........................................................................................................................................... ........................................................................................................................................... ........................................................................................................................................... .......................................................................................................................................[2] (ii) State the number of times the line of heaviest rain passes over Lagos in a twelve month period from December to December. ................................................ [1] (c) Most of the rainfall in Lagos falls from cumulonimbus clouds. Describe two characteristics of cumulonimbus clouds that help to identify them. 1 ................................................................................................................................................ 2 ............................................................................................................................................[2] [Total: 8]
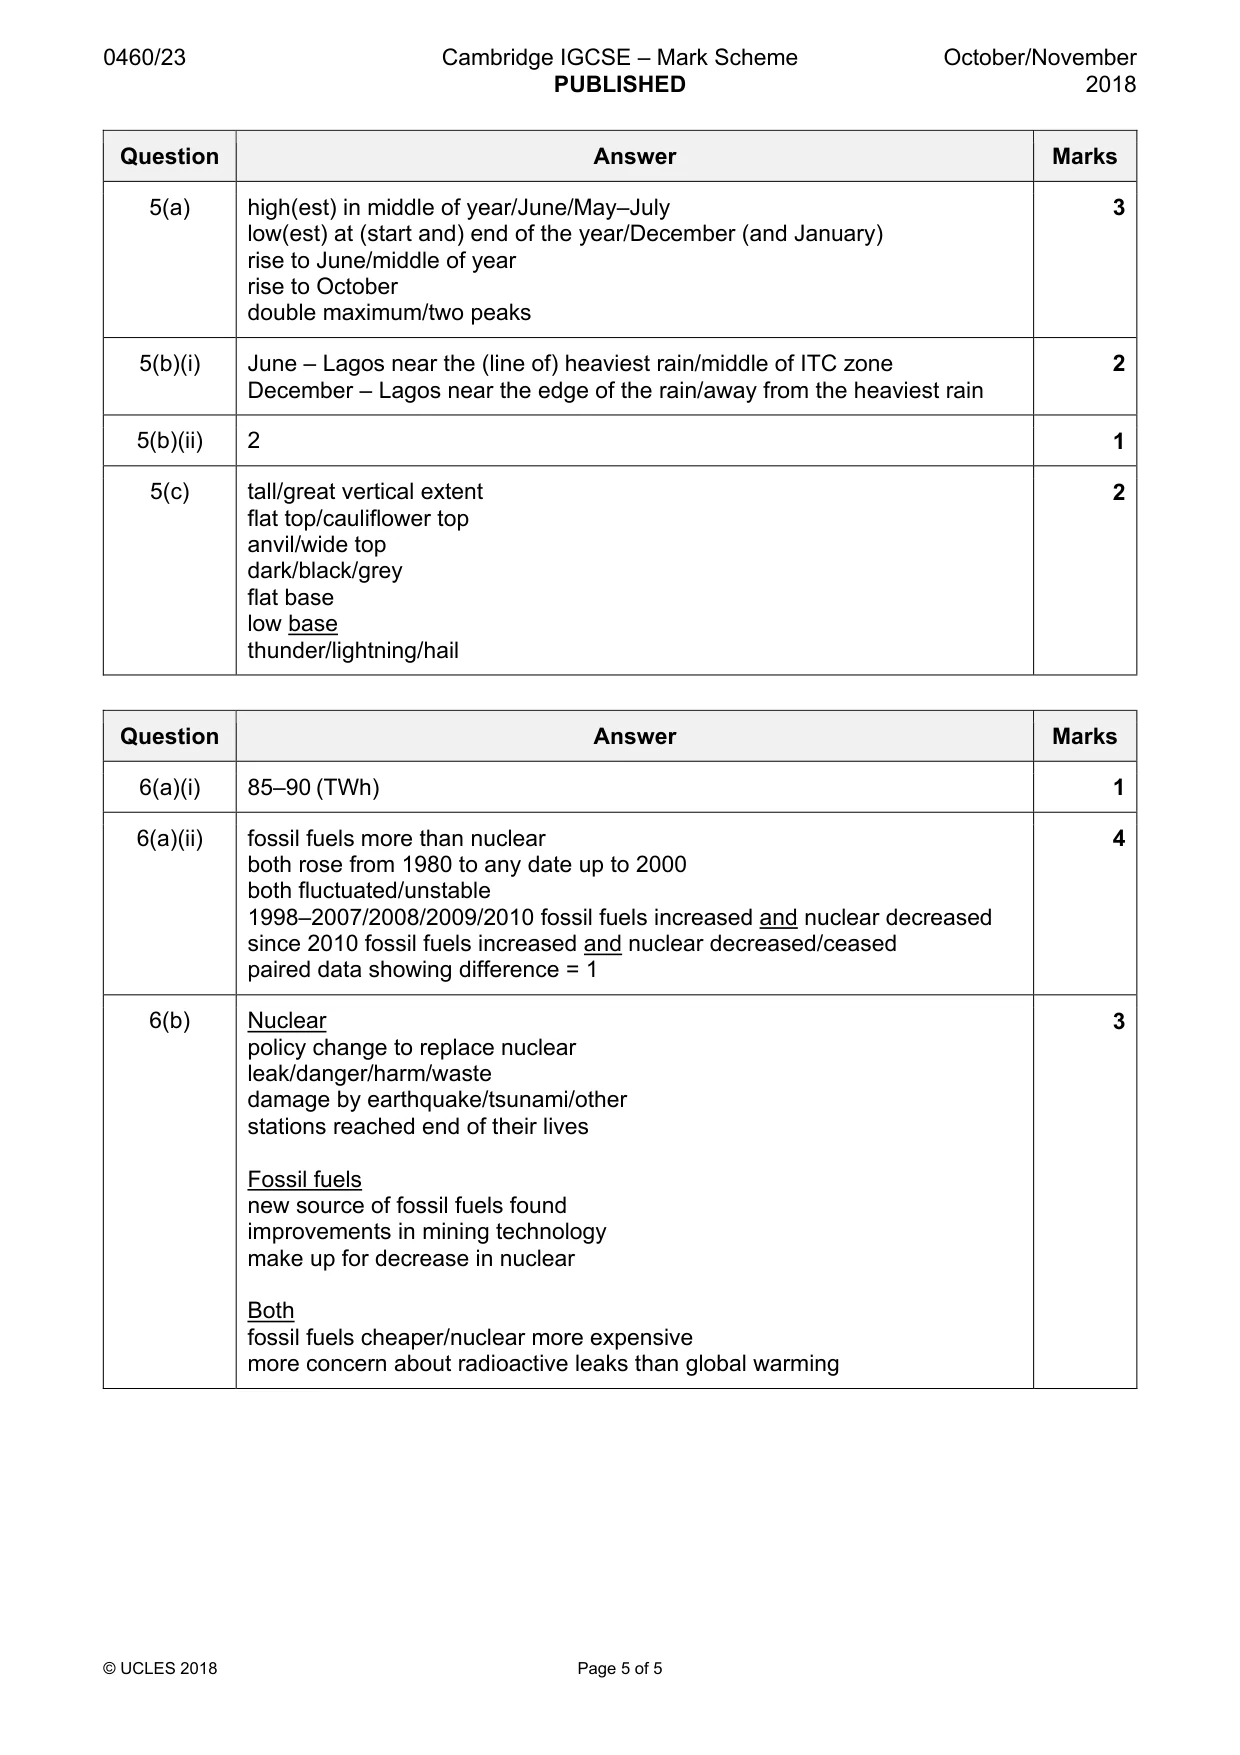
Mark scheme: 5(a) high(est) in middle of year/June/May–July 3 low(est) at (start and) end of the year/December (and January) rise to June/middle of year rise to October double maximum/two peaks 5(b)(i) June – Lagos near the (line of) heaviest rain/middle of ITC zone 2 December – Lagos near the edge of the rain/away from the heaviest rain 5(b)(ii) 2 1 5(c) tall/great vertical extent 2 flat top/cauliflower top anvil/wide top dark/black/grey flat base low base thunder/lightning/hail
Question 6
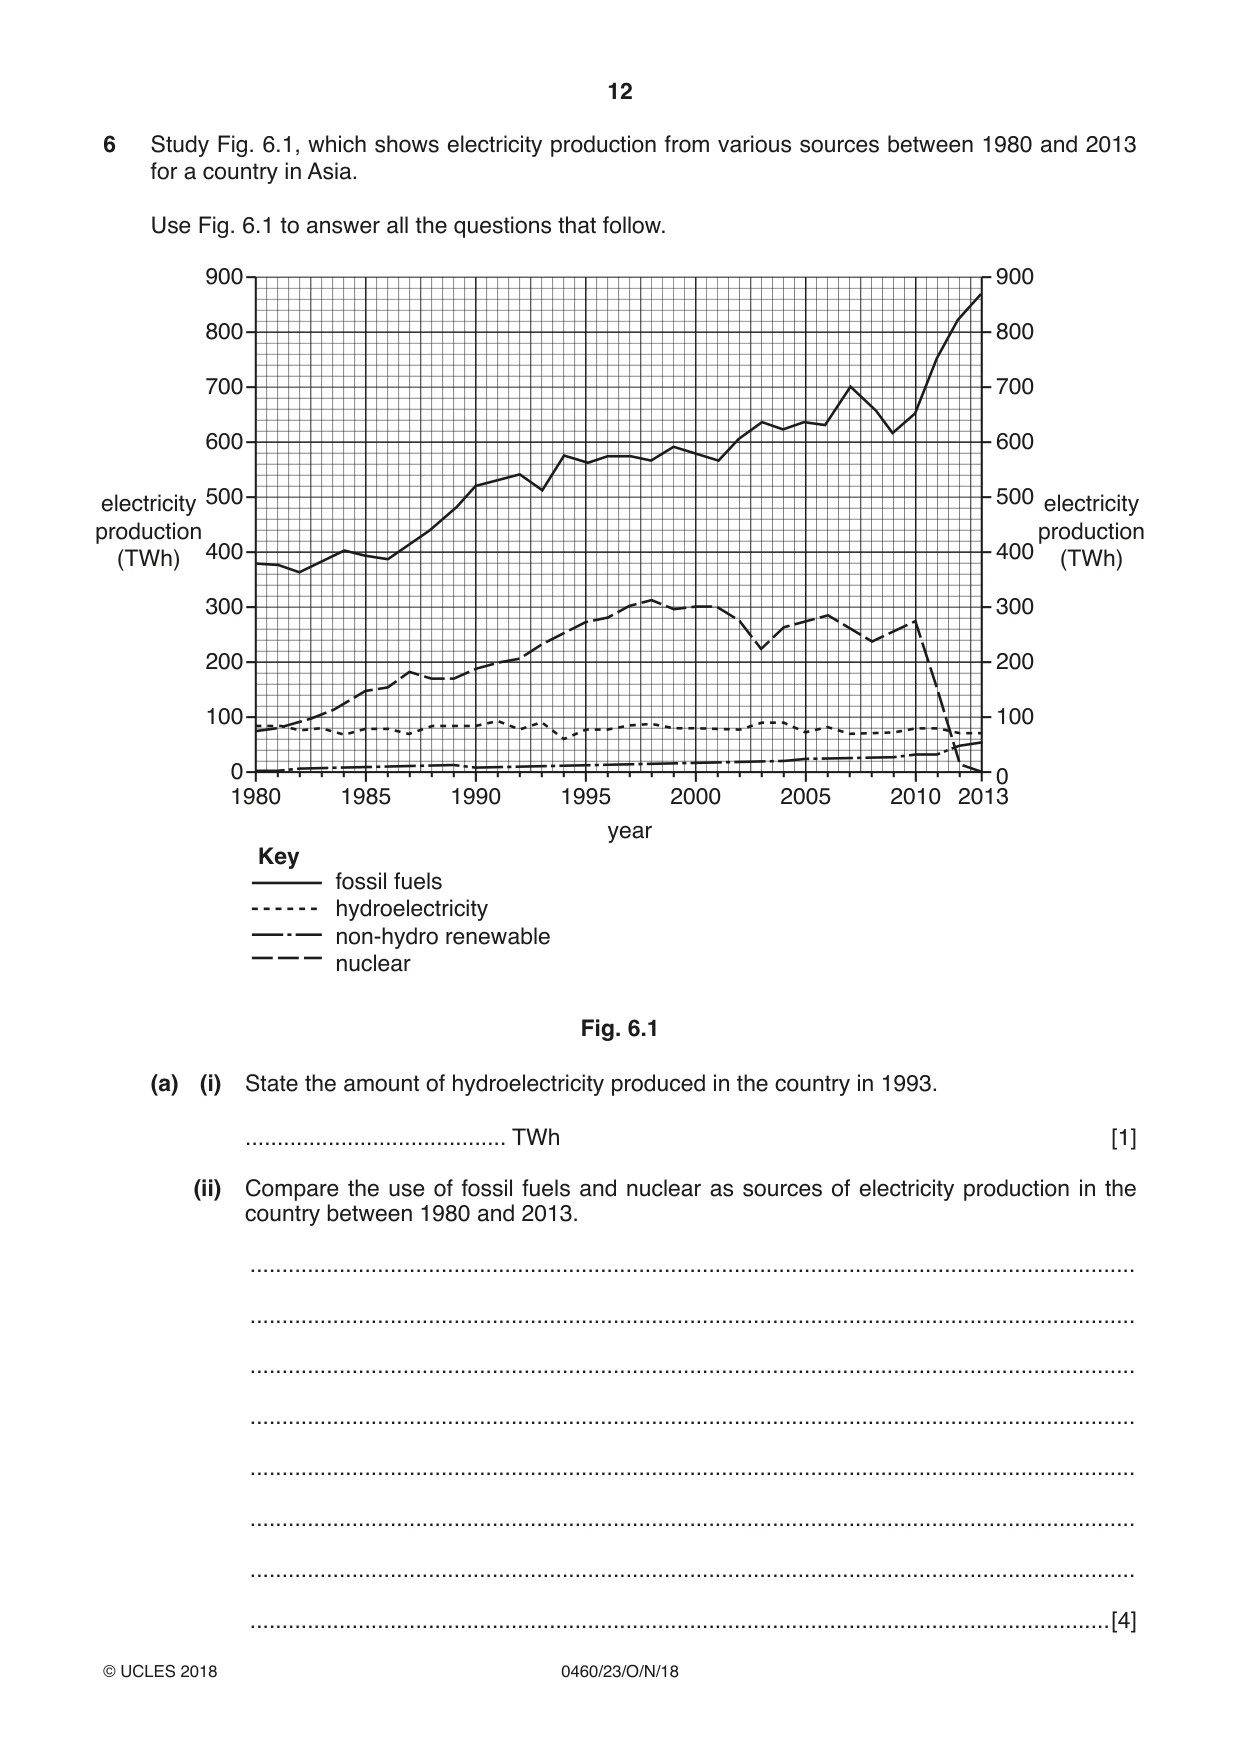
6 Study Fig. 6.1, which shows electricity production from various sources between 1980 and 2013 for a country in Asia. Use Fig. 6.1 to answer all the questions that follow. 900 900 800 800 700 700 600 600 500 500 electricity electricity production production 400 400 (TWh) (TWh) 300 300 200 200 100 100 0 0 1980 1985 1990 1995 2000 2005 2010 2013 year Key fossil fuels hydroelectricity non-hydro renewable nuclear Fig. 6.1 (a) (i) State the amount of hydroelectricity produced in the country in 1993. ......................................... TWh [1] (ii) Compare the use of fossil fuels and nuclear as sources of electricity production in the country between 1980 and 2013. ........................................................................................................................................... ........................................................................................................................................... ........................................................................................................................................... ........................................................................................................................................... ........................................................................................................................................... ........................................................................................................................................... ........................................................................................................................................... .......................................................................................................................................[4] (b) Suggest possible reasons for the difference in the use of fossil fuels and nuclear as sources of electricity in the country since 2010. ................................................................................................................................................... ................................................................................................................................................... ................................................................................................................................................... ................................................................................................................................................... ................................................................................................................................................... ...............................................................................................................................................[3] [Total: 8] Additional Pages If you use the following lined pages to complete the answer(s) to any question(s), the question number(s) must be clearly shown. .................................................................................................................................................................. .................................................................................................................................................................. .................................................................................................................................................................. .................................................................................................................................................................. .................................................................................................................................................................. .................................................................................................................................................................. .................................................................................................................................................................. .................................................................................................................................................................. .................................................................................................................................................................. .................................................................................................................................................................. .................................................................................................................................................................. .................................................................................................................................................................. .................................................................................................................................................................. .................................................................................................................................................................. .................................................................................................................................................................. .................................................................................................................................................................. .................................................................................................................................................................. .................................................................................................................................................................. .................................................................................................................................................................. .................................................................................................................................................................. .................................................................................................................................................................. .................................................................................................................................................................. .................................................................................................................................................................. .................................................................................................................................................................. .................................................................................................................................................................. ..................................................................................................................................................................
Mark scheme: 6(a)(i) 85–90 (TWh) 1 6(a)(ii) fossil fuels more than nuclear 4 both rose from 1980 to any date up to 2000 both fluctuated/unstable 1998–2007/2008/2009/2010 fossil fuels increased and nuclear decreased since 2010 fossil fuels increased and nuclear decreased/ceased paired data showing difference = 1 6(b) Nuclear 3 policy change to replace nuclear leak/danger/harm/waste damage by earthquake/tsunami/other stations reached end of their lives Fossil fuels new source of fossil fuels found improvements in mining technology make up for decrease in nuclear Both fossil fuels cheaper/nuclear more expensive more concern about radioactive leaks than global warming
What was in this paper
The subtopics covered by these 6 questions, and how many questions each got. Open one in a new tab to see every Cambridge question on it.
What you needed in this session
Cambridge’s own grade thresholds for 2018 Oct/Nov, Paper 2 · Variant 3. A higher threshold means an easier paper — the bar moves with how the cohort did.