Cambridge IGCSE Geography 0460 — 2018 May/June Paper 2 · Variant 3
0460/23/M/J/18 · 6 questions · 60 marks · ≈68 min
The question paper and its mark scheme, free to read here and free to download. This is Cambridge’s own paper, exactly as it was sat.
Question paper20 pages






Mark scheme6 pages
Answers below. Sit the paper first if you are practising.
Questions as text
Q1 · Study the map extract, which is for Valestrandsfossen, Norway
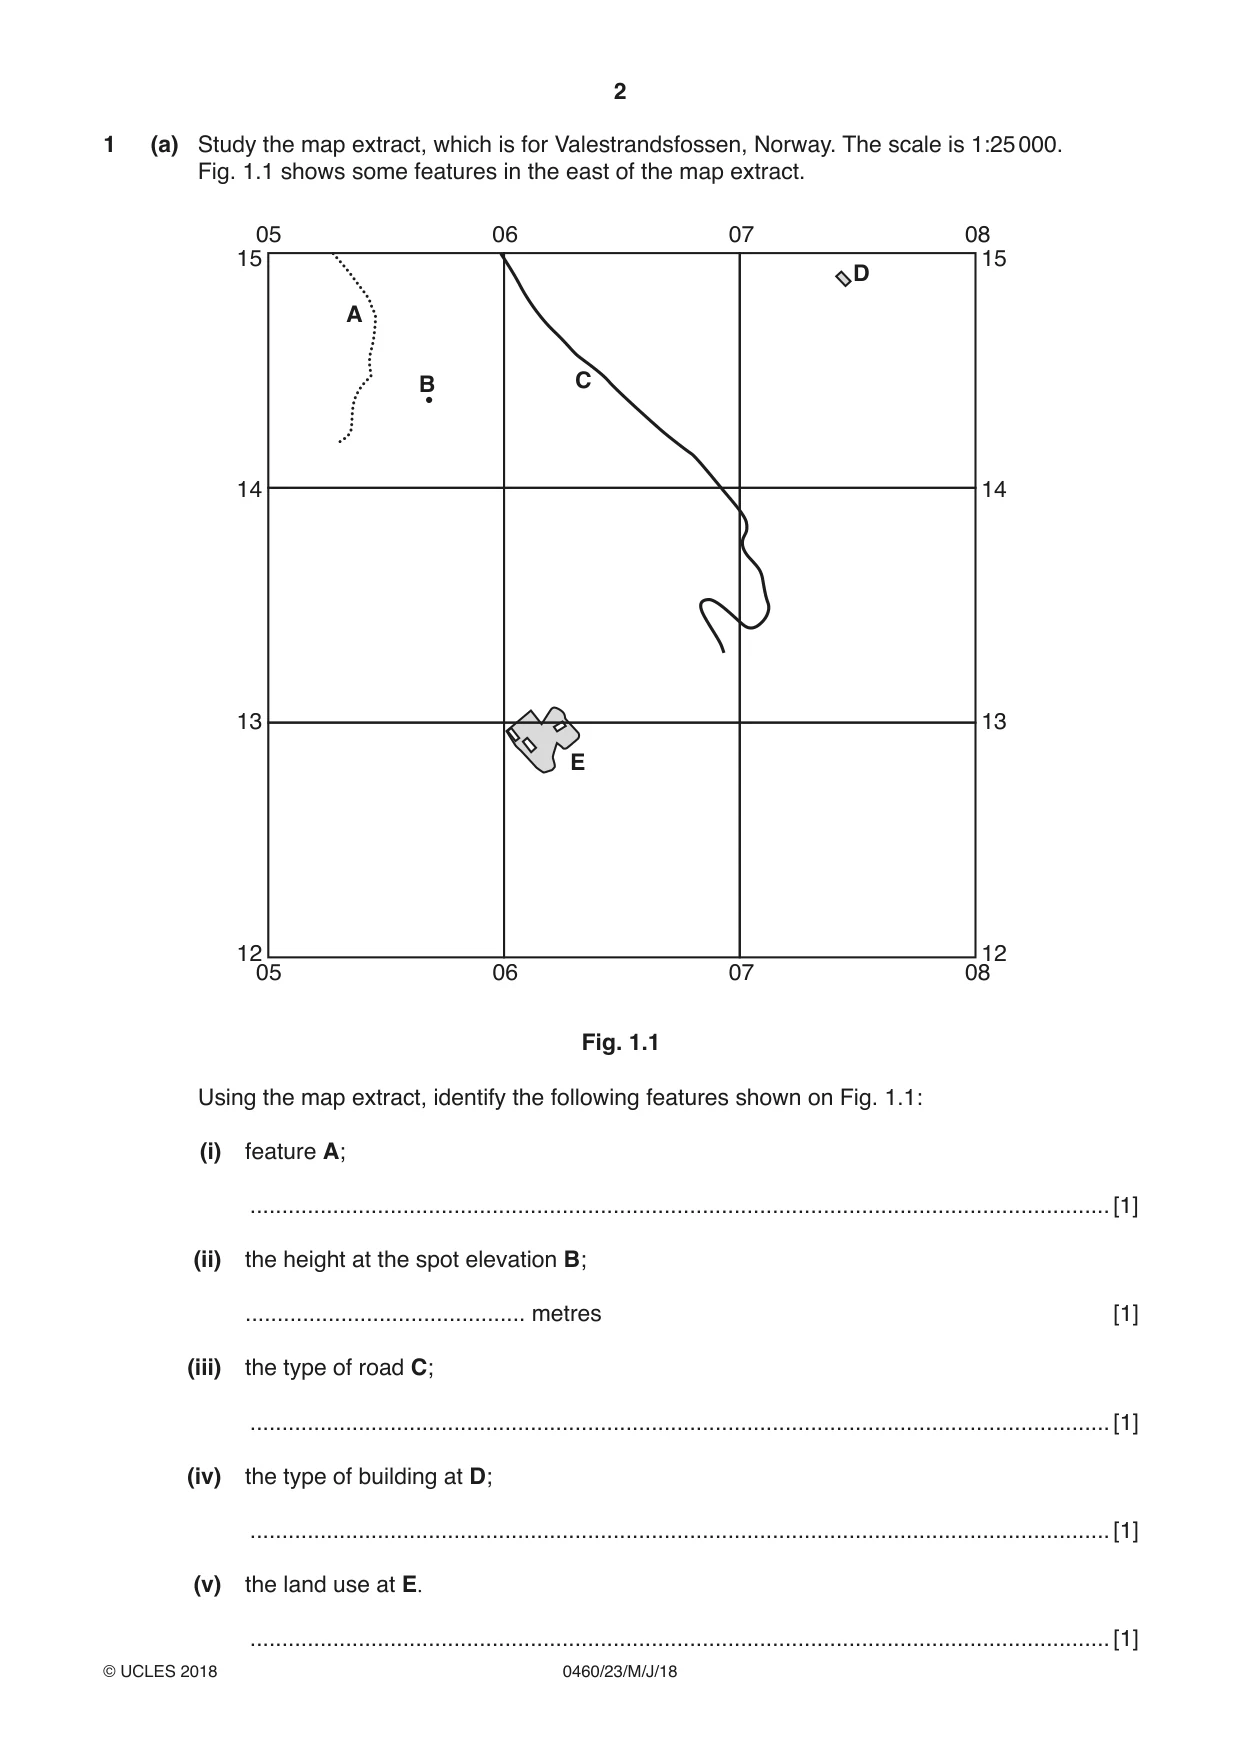
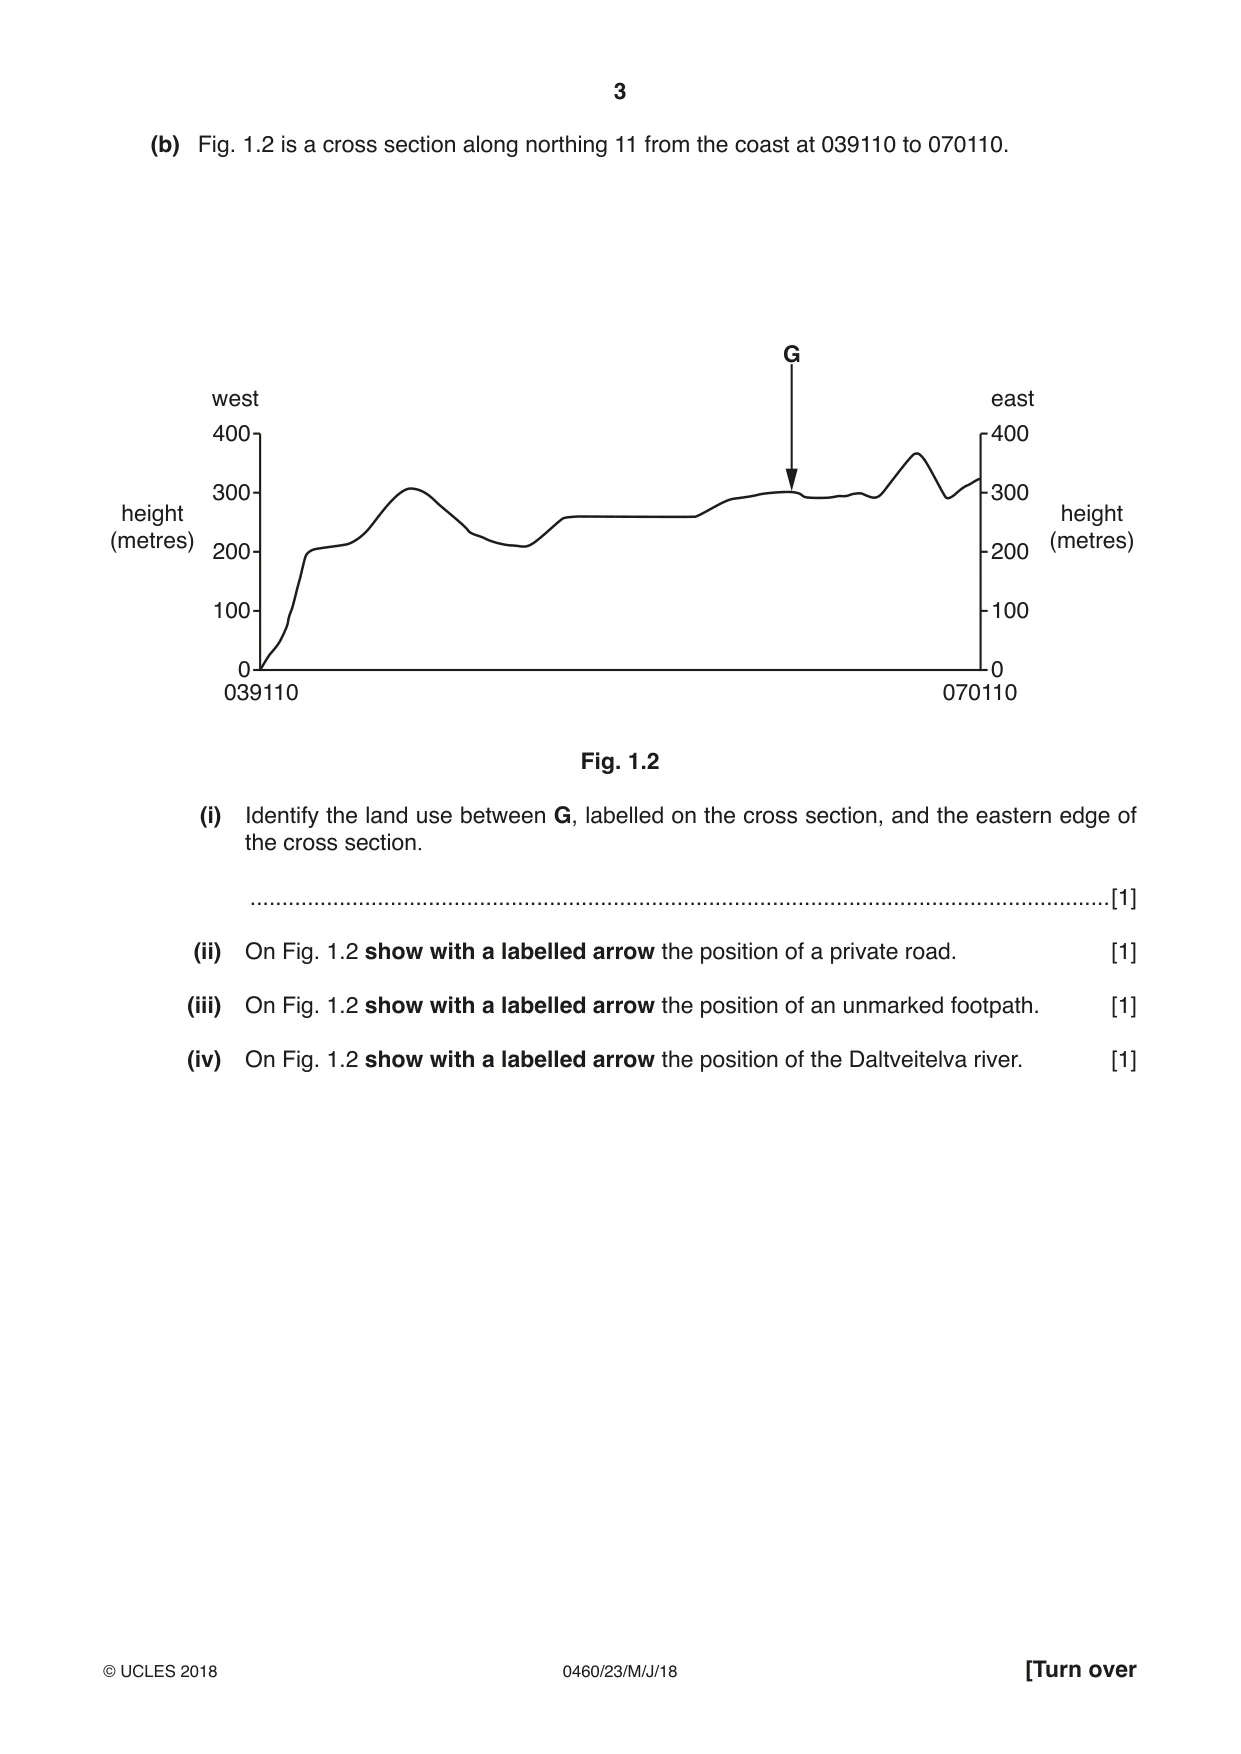
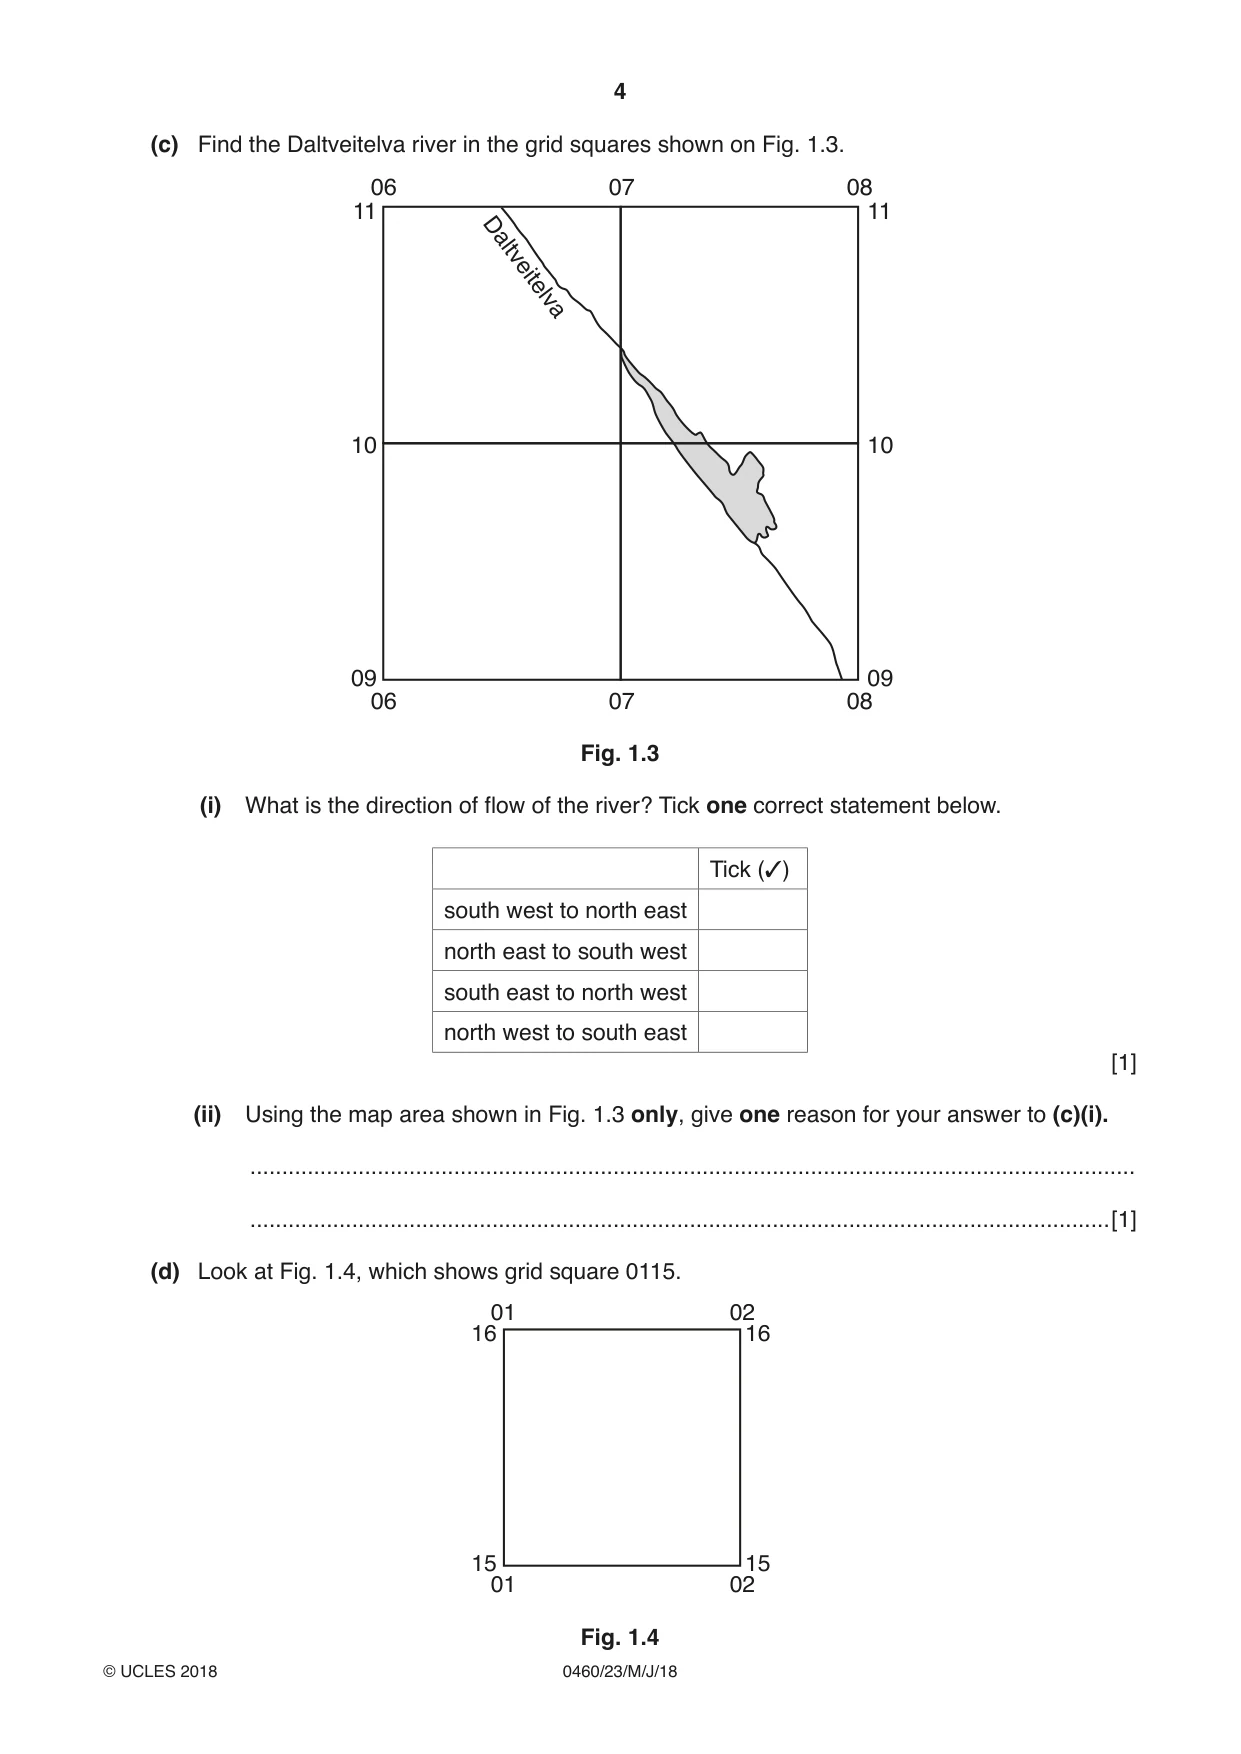
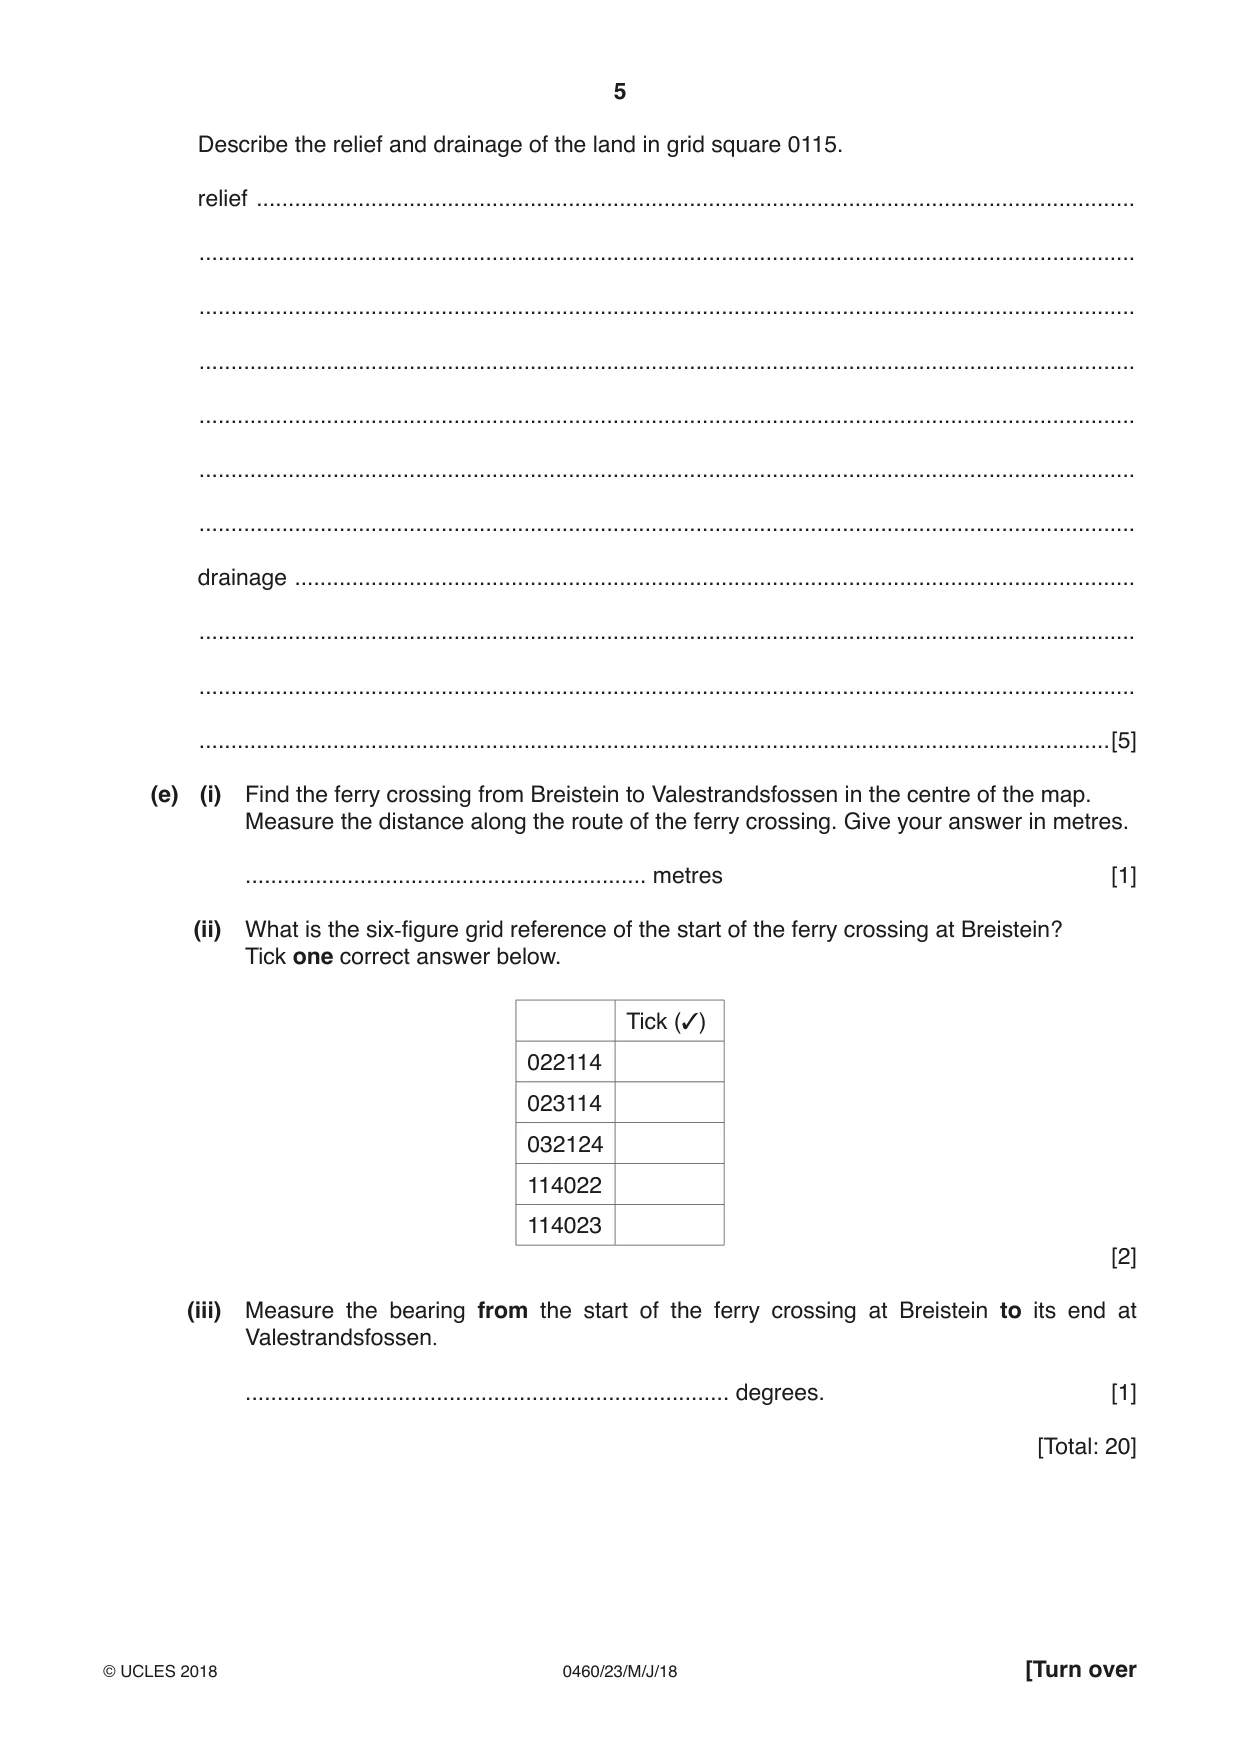
1 (a) Study the map extract, which is for Valestrandsfossen, Norway. The scale is 1:25 000. Fig. 1.1 shows some features in the east of the map extract. 05 06 07 08 15 15 D A B C 14 14 13 13 E 12 12 05 06 07 08 Fig. 1.1 Using the map extract, identify the following features shown on Fig. 1.1: (i) feature A; .......................................................................................................................................[1] (ii) the height at the spot elevation B; ............................................ metres [1] (iii) the type of road C; .......................................................................................................................................[1] (iv) the type of building at D; .......................................................................................................................................[1] (v) the land use at E. .......................................................................................................................................[1] (b) Fig. 1.2 is a cross section along northing 11 from the coast at 039110 to 070110. G west east 400 400 300 300 height height (metres) (metres) 200 200 100 100 0 0 039110 070110 Fig. 1.2 (i) Identify the land use between G, labelled on the cross section, and the eastern edge of the cross section. .......................................................................................................................................[1] (ii) On Fig. 1.2 show with a labelled arrow the position of a private road. [1] (iii) On Fig. 1.2 show with a labelled arrow the position of an unmarked footpath. [1] (iv) On Fig. 1.2 show with a labelled arrow the position of the Daltveitelva river. [1] (c) Find the Daltveitelva river in the grid squares shown on Fig. 1.3. 06 07 08 11 11 Daltveitelva 10 10 09 09 06 07 08 Fig. 1.3 (i) What is the direction of flow of the river? Tick one correct statement below. Tick (3) south west to north east north east to south west south east to north west north west to south east [1] (ii) Using the map area shown in Fig. 1.3 only, give one reason for your answer to (c)(i). ........................................................................................................................................... .......................................................................................................................................[1] (d) Look at Fig. 1.4, which shows grid square 0115. 01 02 16 16 15 15 01 02 Fig. 1.4 Describe the relief and drainage of the land in grid square 0115. relief .......................................................................................................................................... ................................................................................................................................................... ................................................................................................................................................... ................................................................................................................................................... ................................................................................................................................................... ................................................................................................................................................... ................................................................................................................................................... drainage .................................................................................................................................... ................................................................................................................................................... ................................................................................................................................................... ...............................................................................................................................................[5] (e) (i) Find the ferry crossing from Breistein to Valestrandsfossen in the centre of the map. Measure the distance along the route of the ferry crossing. Give your answer in metres. ............................................................... metres [1] (ii) What is the six-figure grid reference of the start of the ferry crossing at Breistein? Tick one correct answer below. Tick (3) 022114 023114 032124 114022 114023 [2] (iii) Measure the bearing from the start of the ferry crossing at Breistein to its end at Valestrandsfossen. ............................................................................ degrees. [1] [Total: 20]
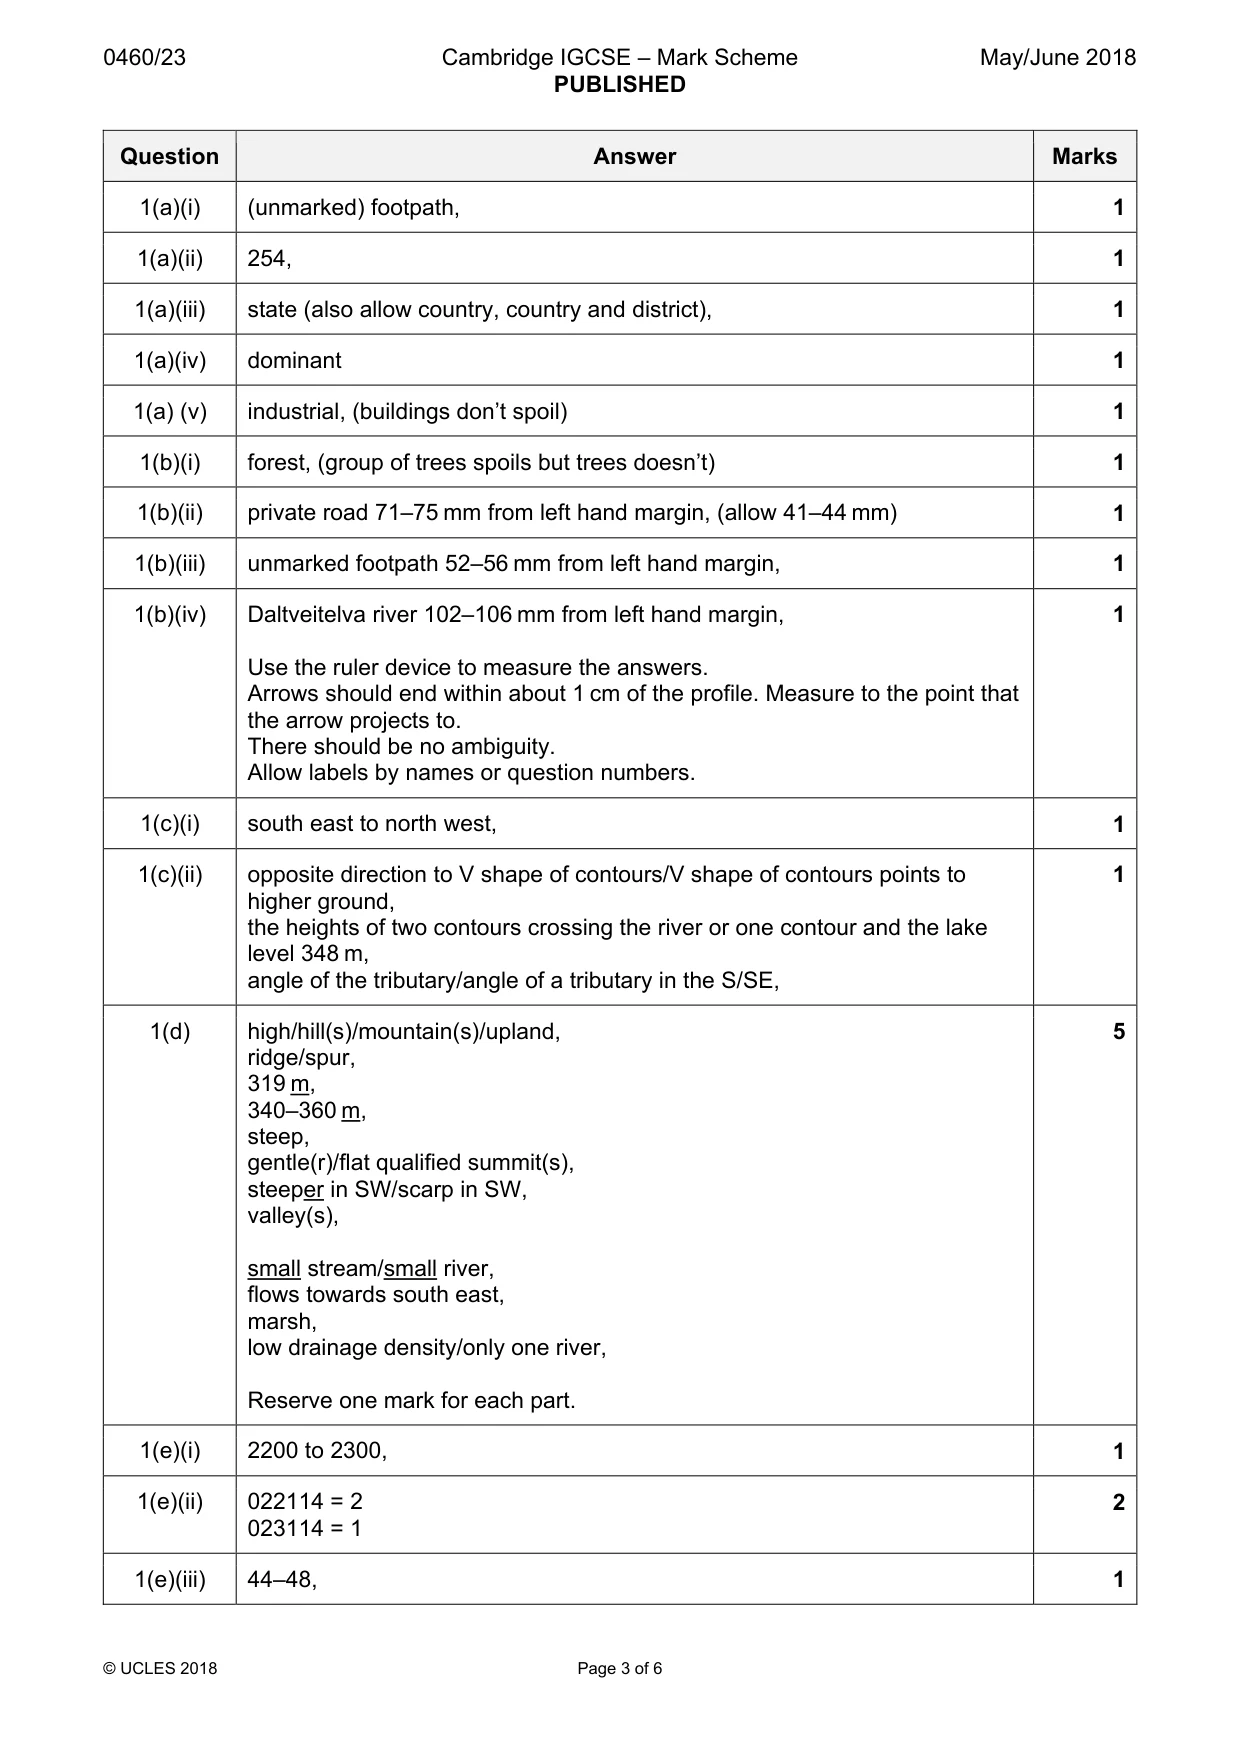
Mark scheme: Question Answer Marks 1(a)(i) (unmarked) footpath, 1 1(a)(ii) 254, 1 1(a)(iii) state (also allow country, country and district), 1 1(a)(iv) dominant 1 1(a) (v) industrial, (buildings don’t spoil) 1 1(b)(i) forest, (group of trees spoils but trees doesn’t) 1 1(b)(ii) private road 71–75 mm from left hand margin, (allow 41–44 mm) 1 1(b)(iii) unmarked footpath 52–56 mm from left hand margin, 1 1(b)(iv) Daltveitelva river 102–106 mm from left hand margin, 1 Use the ruler device to measure the answers. Arrows should end within about 1 cm of the profile. Measure to the point that the arrow projects to. There should be no ambiguity. Allow labels by names or question numbers. 1(c)(i) south east to north west, 1 1(c)(ii) opposite direction to V shape of contours/V shape of contours points to 1 higher ground, the heights of two contours crossing the river or one contour and the lake level 348 m, angle of the tributary/angle of a tributary in the S/SE, 1(d) high/hill(s)/mountain(s)/upland, 5 ridge/spur, 319 m, 340–360 m, steep, gentle(r)/flat qualified summit(s), steeper in SW/scarp in SW, valley(s), small stream/small river, flows towards south east, marsh, low drainage density/only one river, Reserve one mark for each part. 1(e)(i) 2200 to 2300, 1 1(e)(ii) 022114 = 2 2 023114 = 1 1(e)(iii) 44–48, 1
Question 2
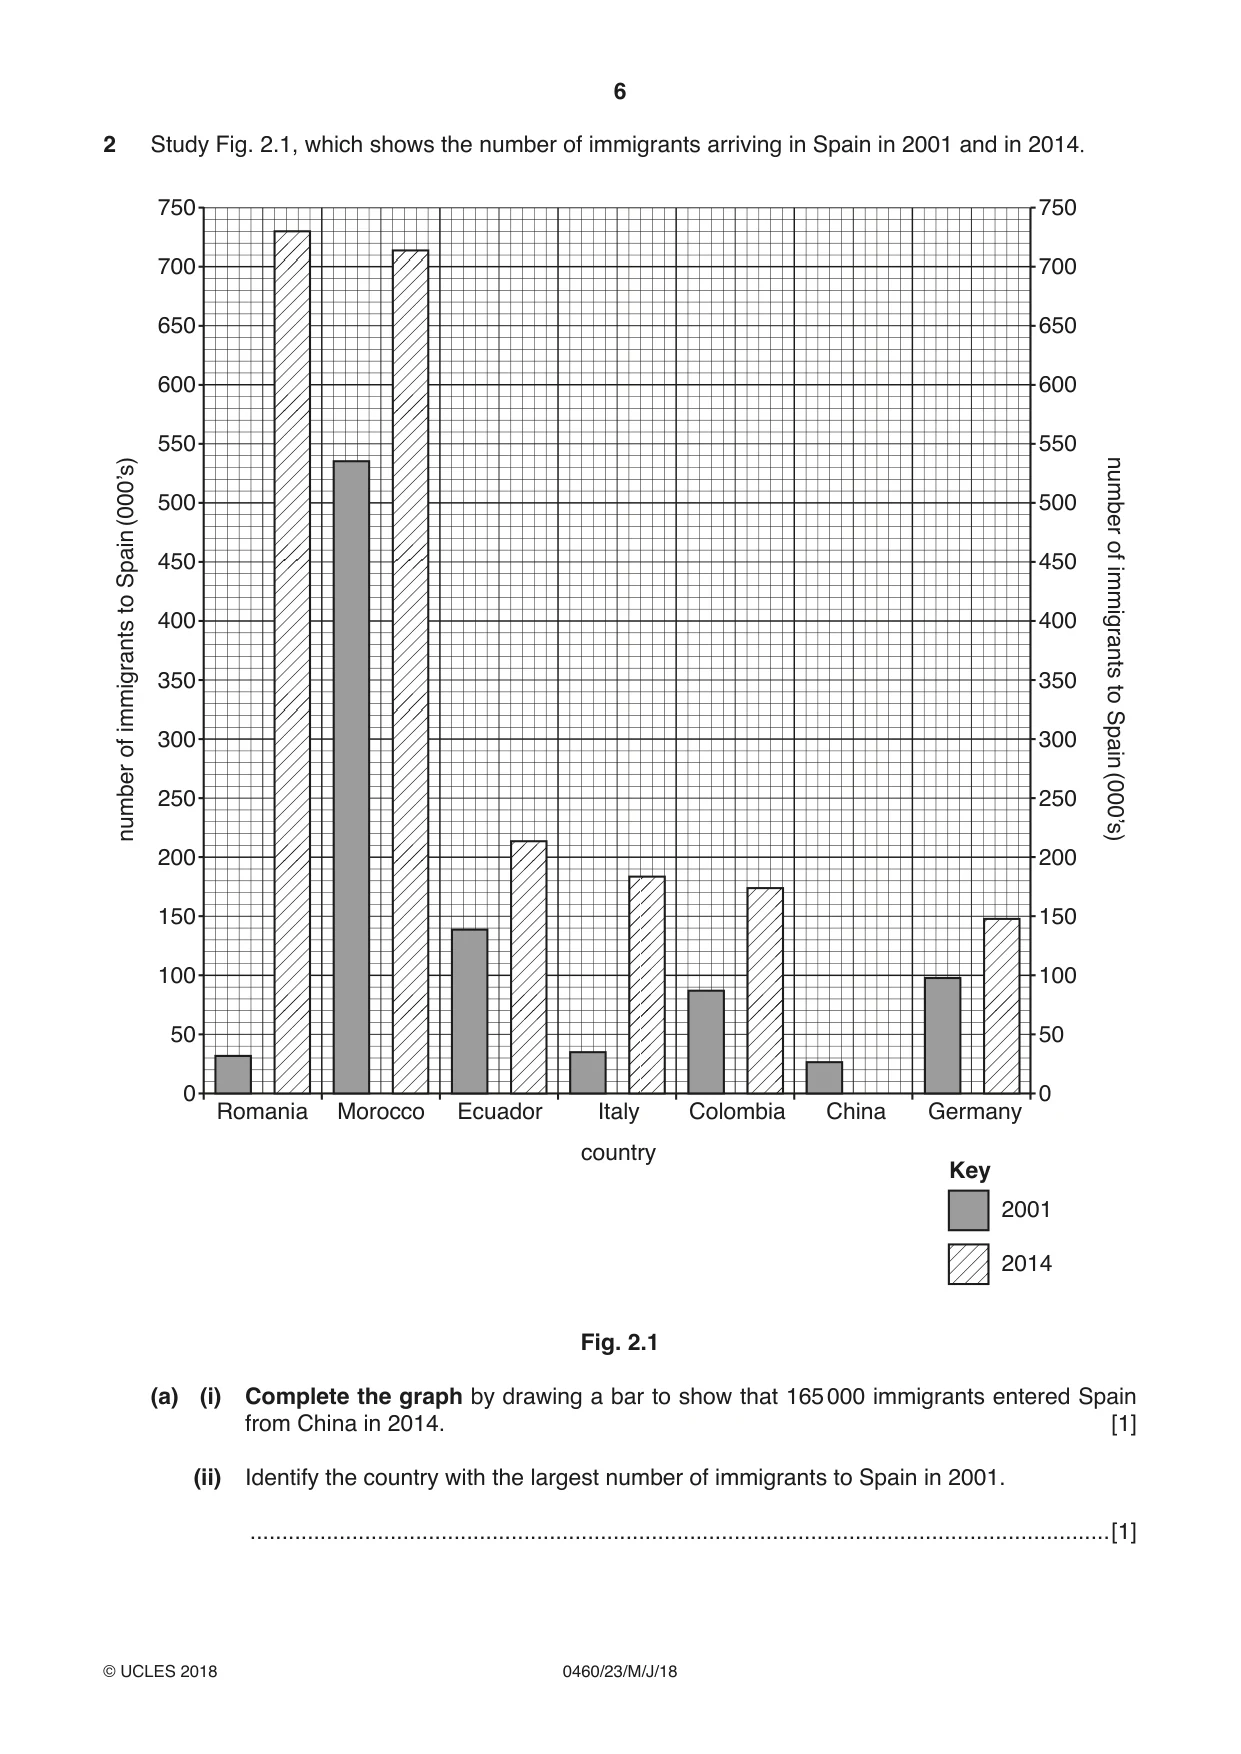
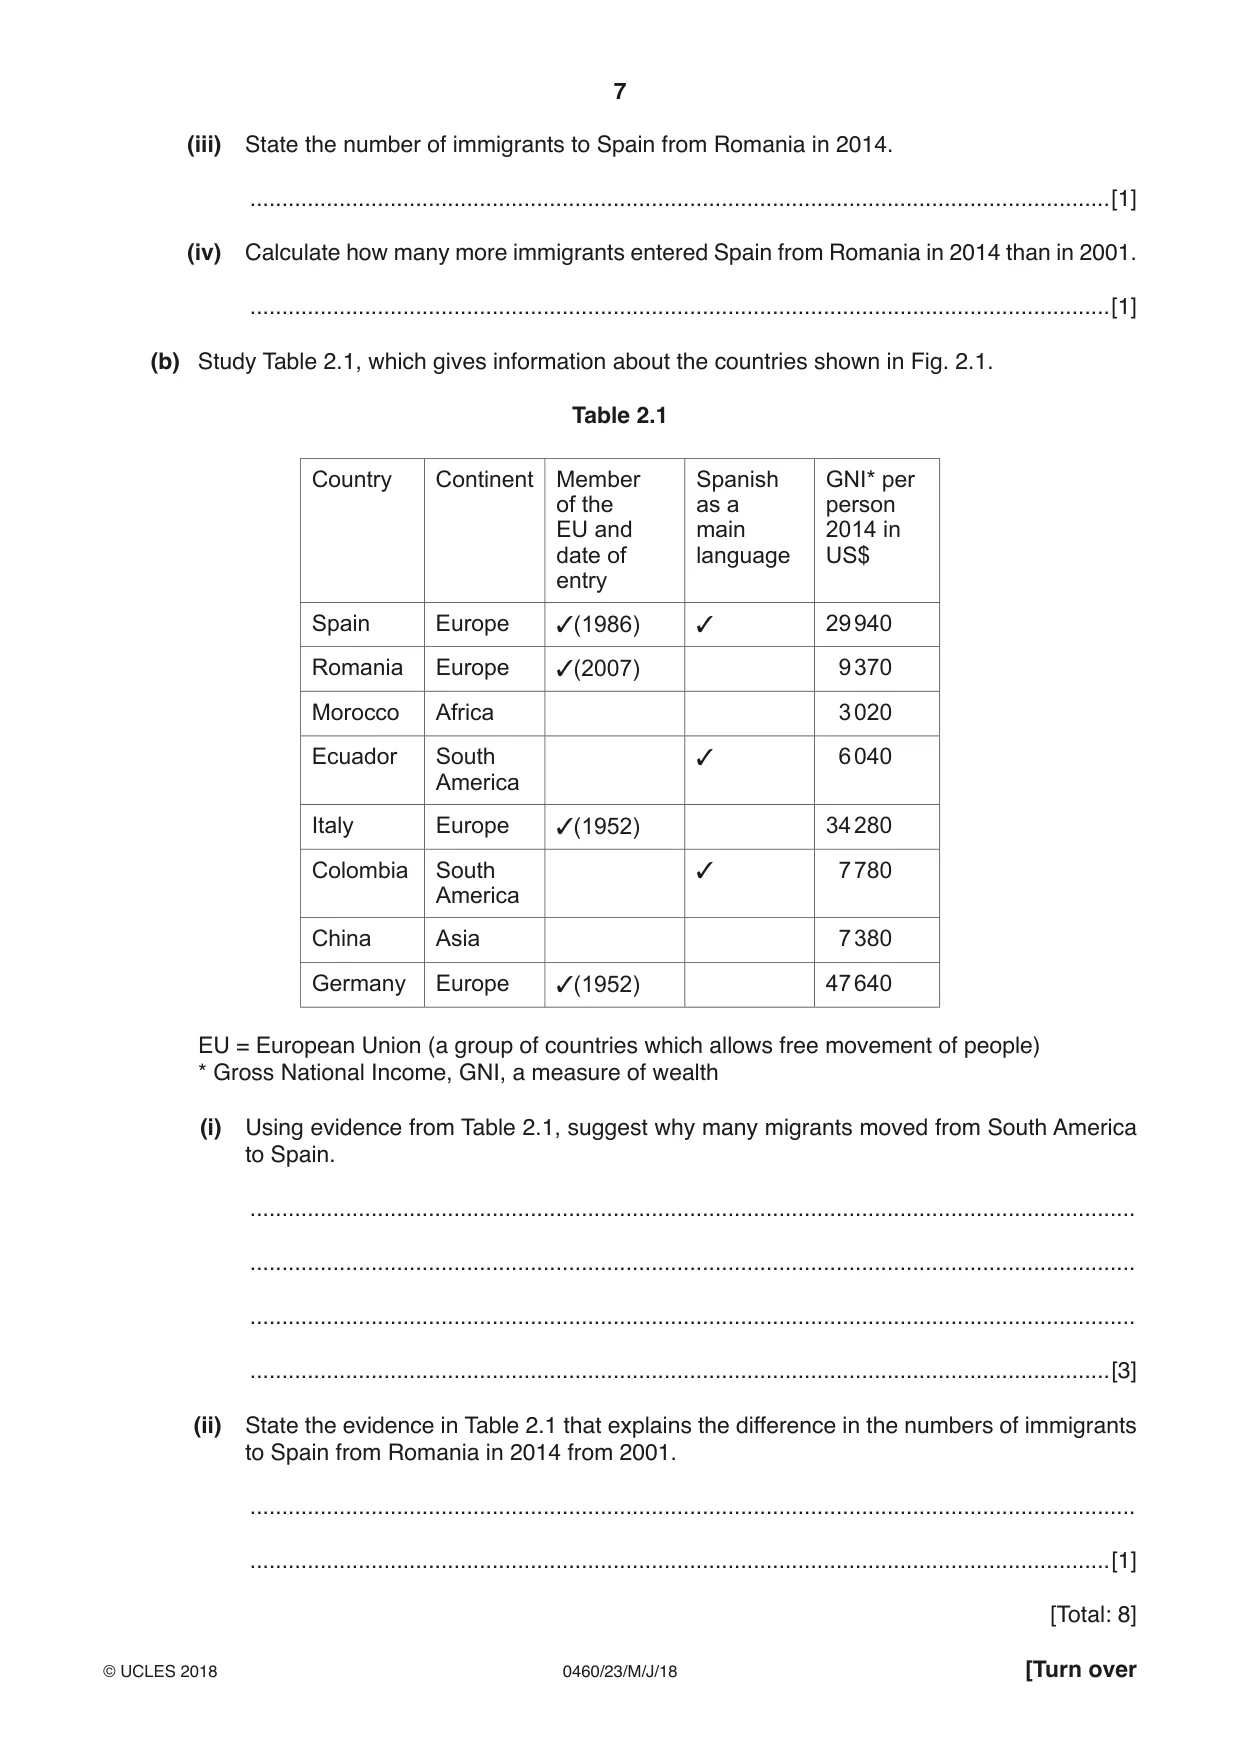
2 Study Fig. 2.1, which shows the number of immigrants arriving in Spain in 2001 and in 2014. 750 750 700 700 650 650 600 600 550 550 (000’s) 500 500 number 450 450 ofSpain to 400 400 immigrants 350 350 to immigrants of 300 300 Spain 250 250 number (000’s) 200 200 150 150 100 100 50 50 0 0 Romania Morocco Ecuador Italy Colombia China Germany country Key 2001 2014 Fig. 2.1 (a) (i) Complete the graph by drawing a bar to show that 165 000 immigrants entered Spain from China in 2014. [1] (ii) Identify the country with the largest number of immigrants to Spain in 2001. .......................................................................................................................................[1] (iii) State the number of immigrants to Spain from Romania in 2014. .......................................................................................................................................[1] (iv) Calculate how many more immigrants entered Spain from Romania in 2014 than in 2001. .......................................................................................................................................[1] (b) Study Table 2.1, which gives information about the countries shown in Fig. 2.1. Table 2.1 Country Continent Member Spanish GNI* per of the as a person EU and main 2014 in date of language US$ entry Spain Europe 3(1986) 3 29 940 Romania Europe 3(2007) 9 370 Morocco Africa 3 020 Ecuador South 3 6 040 America Italy Europe 3(1952) 34 280 Colombia South 3 7 780 America China Asia 7 380 Germany Europe 3(1952) 47 640 EU = European Union (a group of countries which allows free movement of people) * Gross National Income, GNI, a measure of wealth (i) Using evidence from Table 2.1, suggest why many migrants moved from South America to Spain. ........................................................................................................................................... ........................................................................................................................................... ........................................................................................................................................... .......................................................................................................................................[3] (ii) State the evidence in Table 2.1 that explains the difference in the numbers of immigrants to Spain from Romania in 2014 from 2001. ........................................................................................................................................... .......................................................................................................................................[1] [Total: 8]
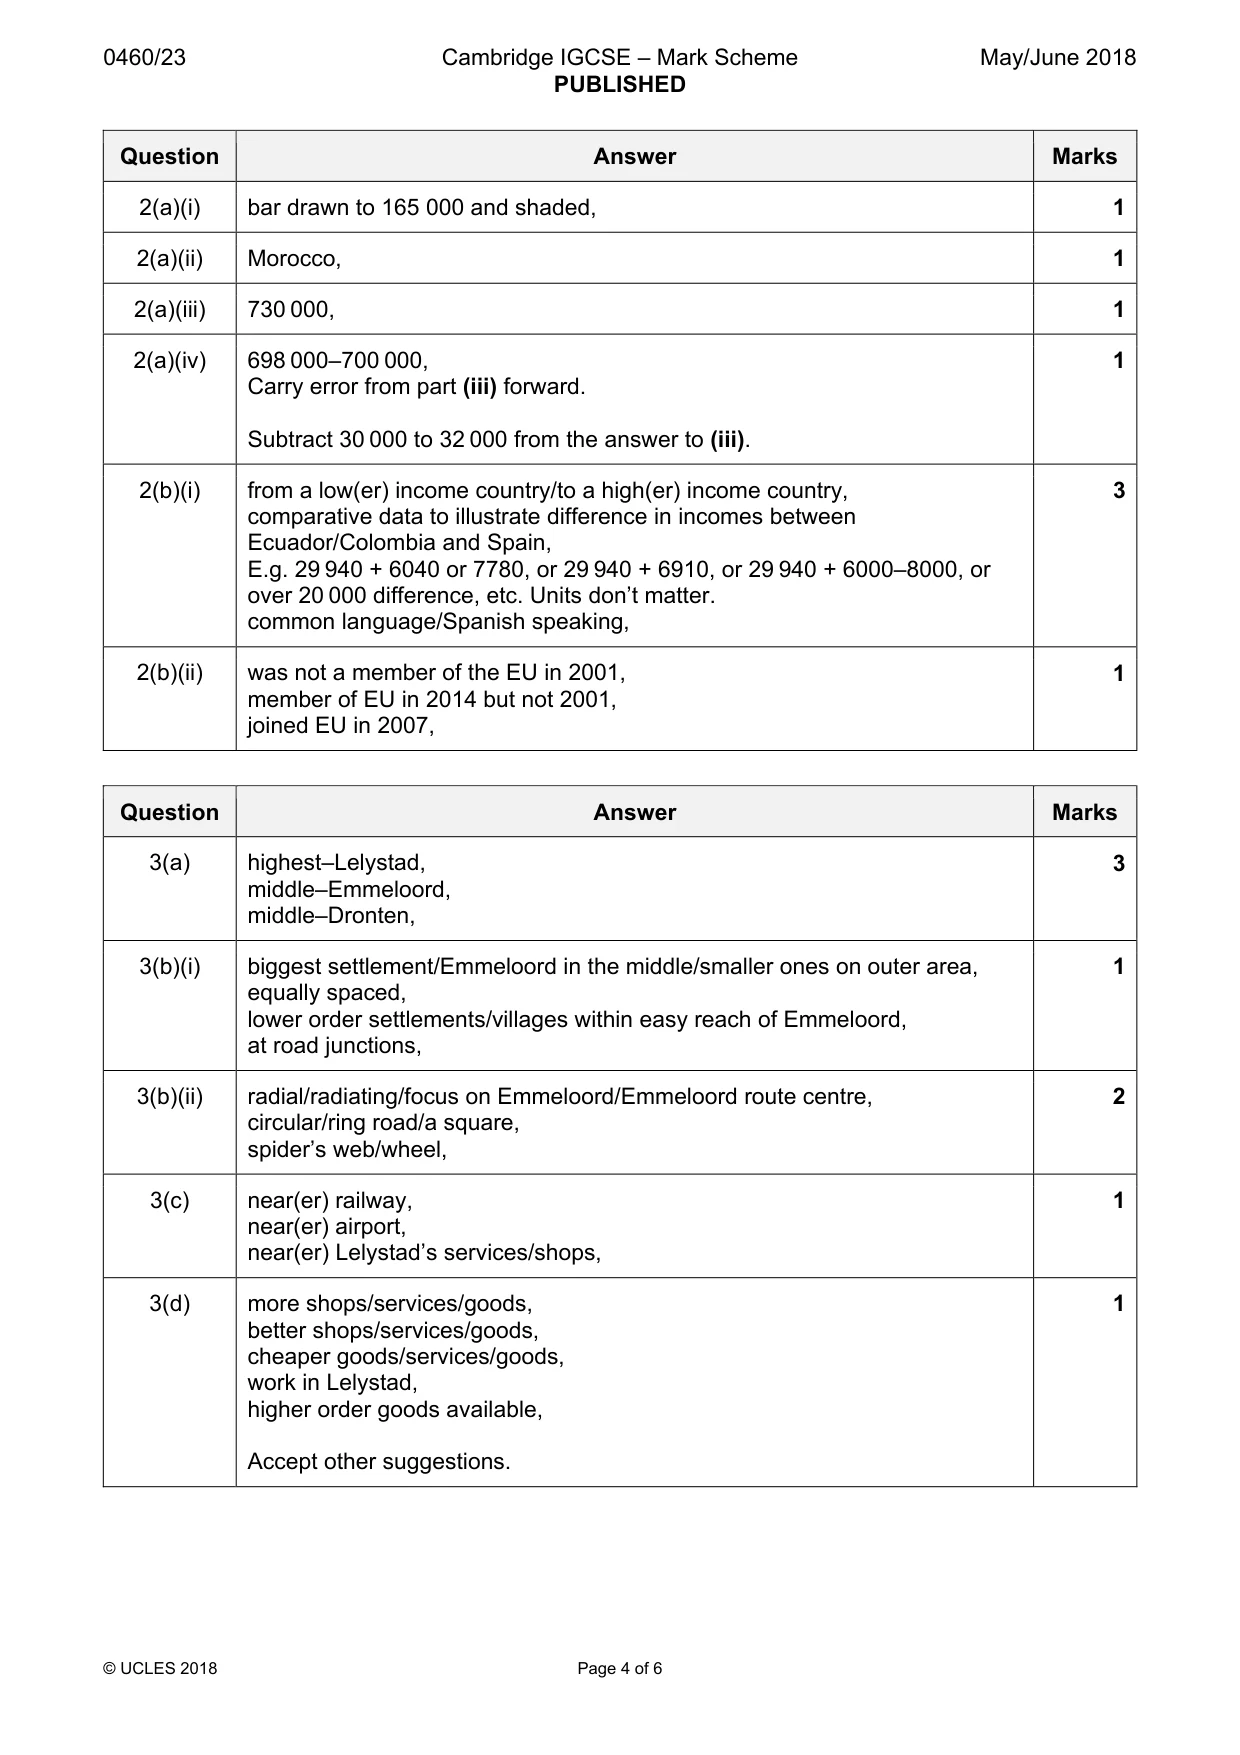
Mark scheme: 2(a)(i) bar drawn to 165 000 and shaded, 1 2(a)(ii) Morocco, 1 2(a)(iii) 730 000, 1 2(a)(iv) 698 000–700 000, 1 Carry error from part (iii) forward. Subtract 30 000 to 32 000 from the answer to (iii). 2(b)(i) from a low(er) income country/to a high(er) income country, 3 comparative data to illustrate difference in incomes between Ecuador/Colombia and Spain, E.g. 29 940 + 6040 or 7780, or 29 940 + 6910, or 29 940 + 6000–8000, or over 20 000 difference, etc. Units don’t matter. common language/Spanish speaking, 2(b)(ii) was not a member of the EU in 2001, 1 member of EU in 2014 but not 2001, joined EU in 2007,
Question 3
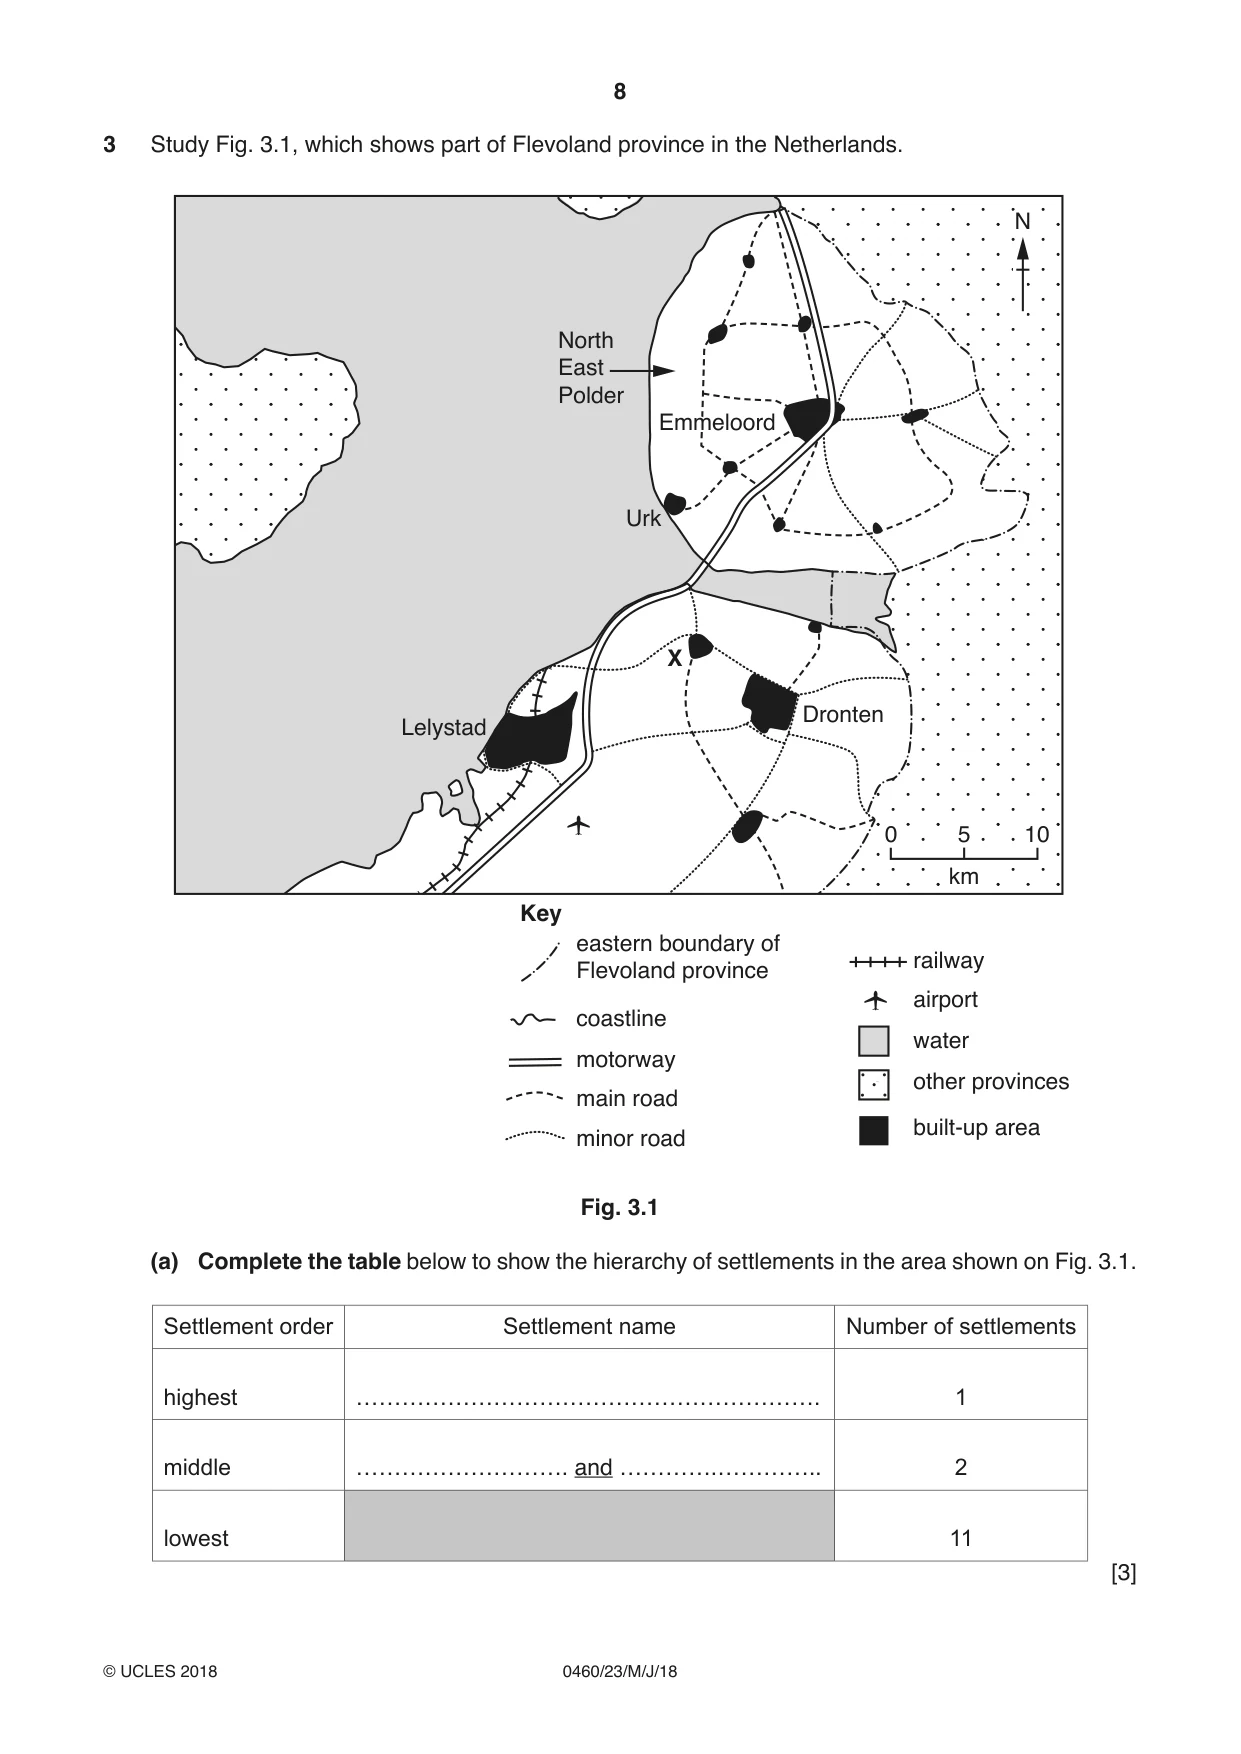
3 Study Fig. 3.1, which shows part of Flevoland province in the Netherlands. N North East Polder EmmeloordEmmeloord Urk X Dronten Lelystad 0 5 10 km Key eastern boundary of railway Flevoland province airport coastline water motorway other provinces main road built-up area minor road Fig. 3.1 (a) Complete the table below to show the hierarchy of settlements in the area shown on Fig. 3.1. Settlement order Settlement name Number of settlements highest 1 middle ………………………. and ………….………….. 2 lowest 11 [3] (b) All land uses on the North East Polder were planned. (i) Describe how the planners arranged the settlements on the North East Polder. ........................................................................................................................................... .......................................................................................................................................[1] (ii) Describe the road pattern on the North East Polder. ........................................................................................................................................... ........................................................................................................................................... ........................................................................................................................................... .......................................................................................................................................[2] (c) Use Fig. 3.1 to explain why Dronten has grown more rapidly than Emmeloord. ................................................................................................................................................... ...............................................................................................................................................[1] (d) Suggest why residents in village X use shops and services in Lelystad even though Dronten is closer. ................................................................................................................................................... ...............................................................................................................................................[1] [Total: 8]
Mark scheme: 3(a) highest–Lelystad, 3 middle–Emmeloord, middle–Dronten, 3(b)(i) biggest settlement/Emmeloord in the middle/smaller ones on outer area, 1 equally spaced, lower order settlements/villages within easy reach of Emmeloord, at road junctions, 3(b)(ii) radial/radiating/focus on Emmeloord/Emmeloord route centre, 2 circular/ring road/a square, spider’s web/wheel, 3(c) near(er) railway, 1 near(er) airport, near(er) Lelystad’s services/shops, 3(d) more shops/services/goods, 1 better shops/services/goods, cheaper goods/services/goods, work in Lelystad, higher order goods available, Accept other suggestions.
More questions on Settlements (rural and urban) and service provision
Question 4
4 (a) (i) Study Fig. 4.1 (Insert), which is a photograph showing part of a coastline. Name the features of coastal erosion shown in Fig. 4.1. ........................................................................................................................................... ........................................................................................................................................... ........................................................................................................................................... .......................................................................................................................................[3] (ii) Give one characteristic of the rock shown in Fig. 4.1 that causes it to be eroded. ........................................................................................................................................... .......................................................................................................................................[1] (b) (i) Study Fig. 4.2 (Insert), which is a photograph showing part of a different type of coastline. Describe the beach shown in Fig. 4.2. Do not include the seaweed. ........................................................................................................................................... ........................................................................................................................................... ........................................................................................................................................... .......................................................................................................................................[2] (ii) Explain why the coastline in Fig. 4.2 has more deposition than the coastline in Fig. 4.1. ........................................................................................................................................... ........................................................................................................................................... ........................................................................................................................................... .......................................................................................................................................[2] [Total: 8] TURN PAGE FOR QUESTION 5
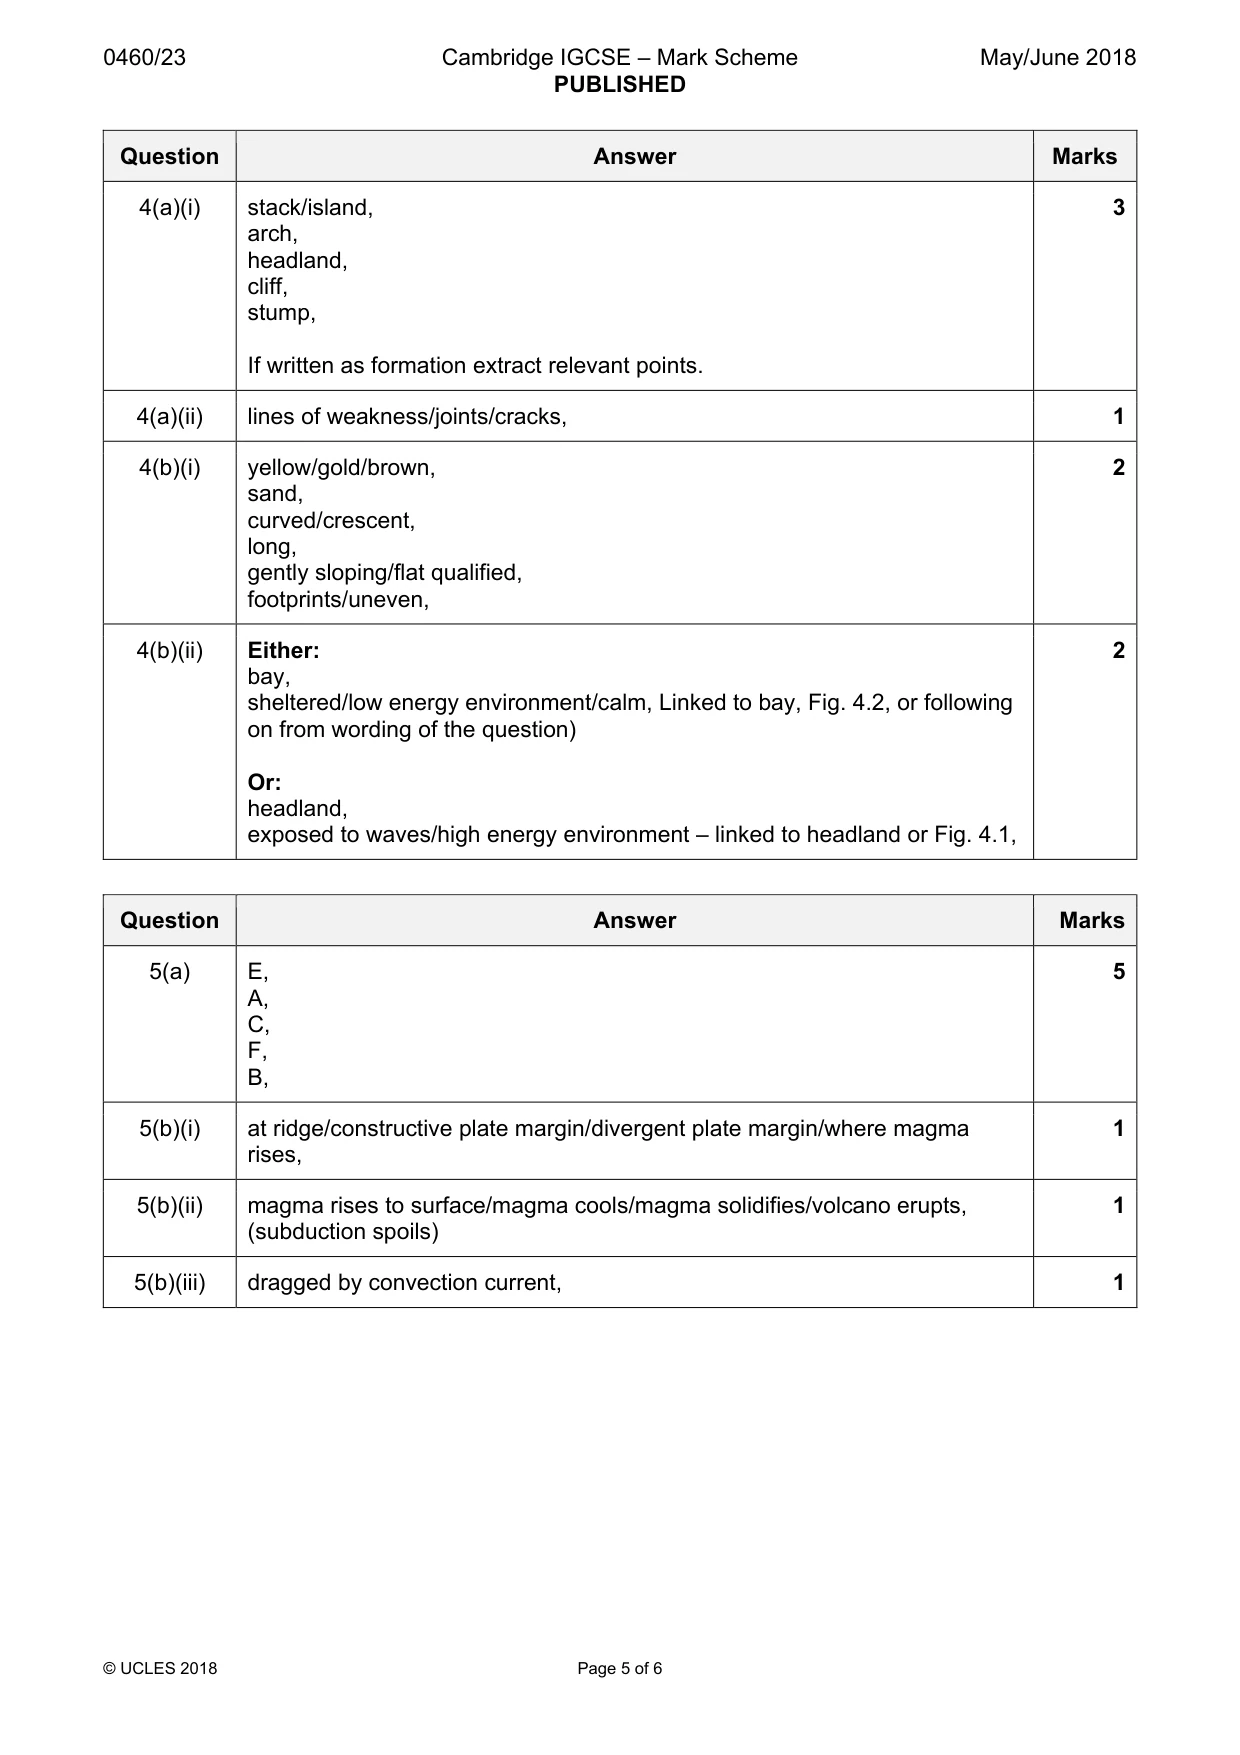
Mark scheme: 4(a)(i) stack/island, 3 arch, headland, cliff, stump, If written as formation extract relevant points. 4(a)(ii) lines of weakness/joints/cracks, 1 4(b)(i) yellow/gold/brown, 2 sand, curved/crescent, long, gently sloping/flat qualified, footprints/uneven, 4(b)(ii) Either: 2 bay, sheltered/low energy environment/calm, Linked to bay, Fig. 4.2, or following on from wording of the question) Or: headland, exposed to waves/high energy environment – linked to headland or Fig. 4.1,
Q5 · Plate boundaries and the direction of movement of some plates
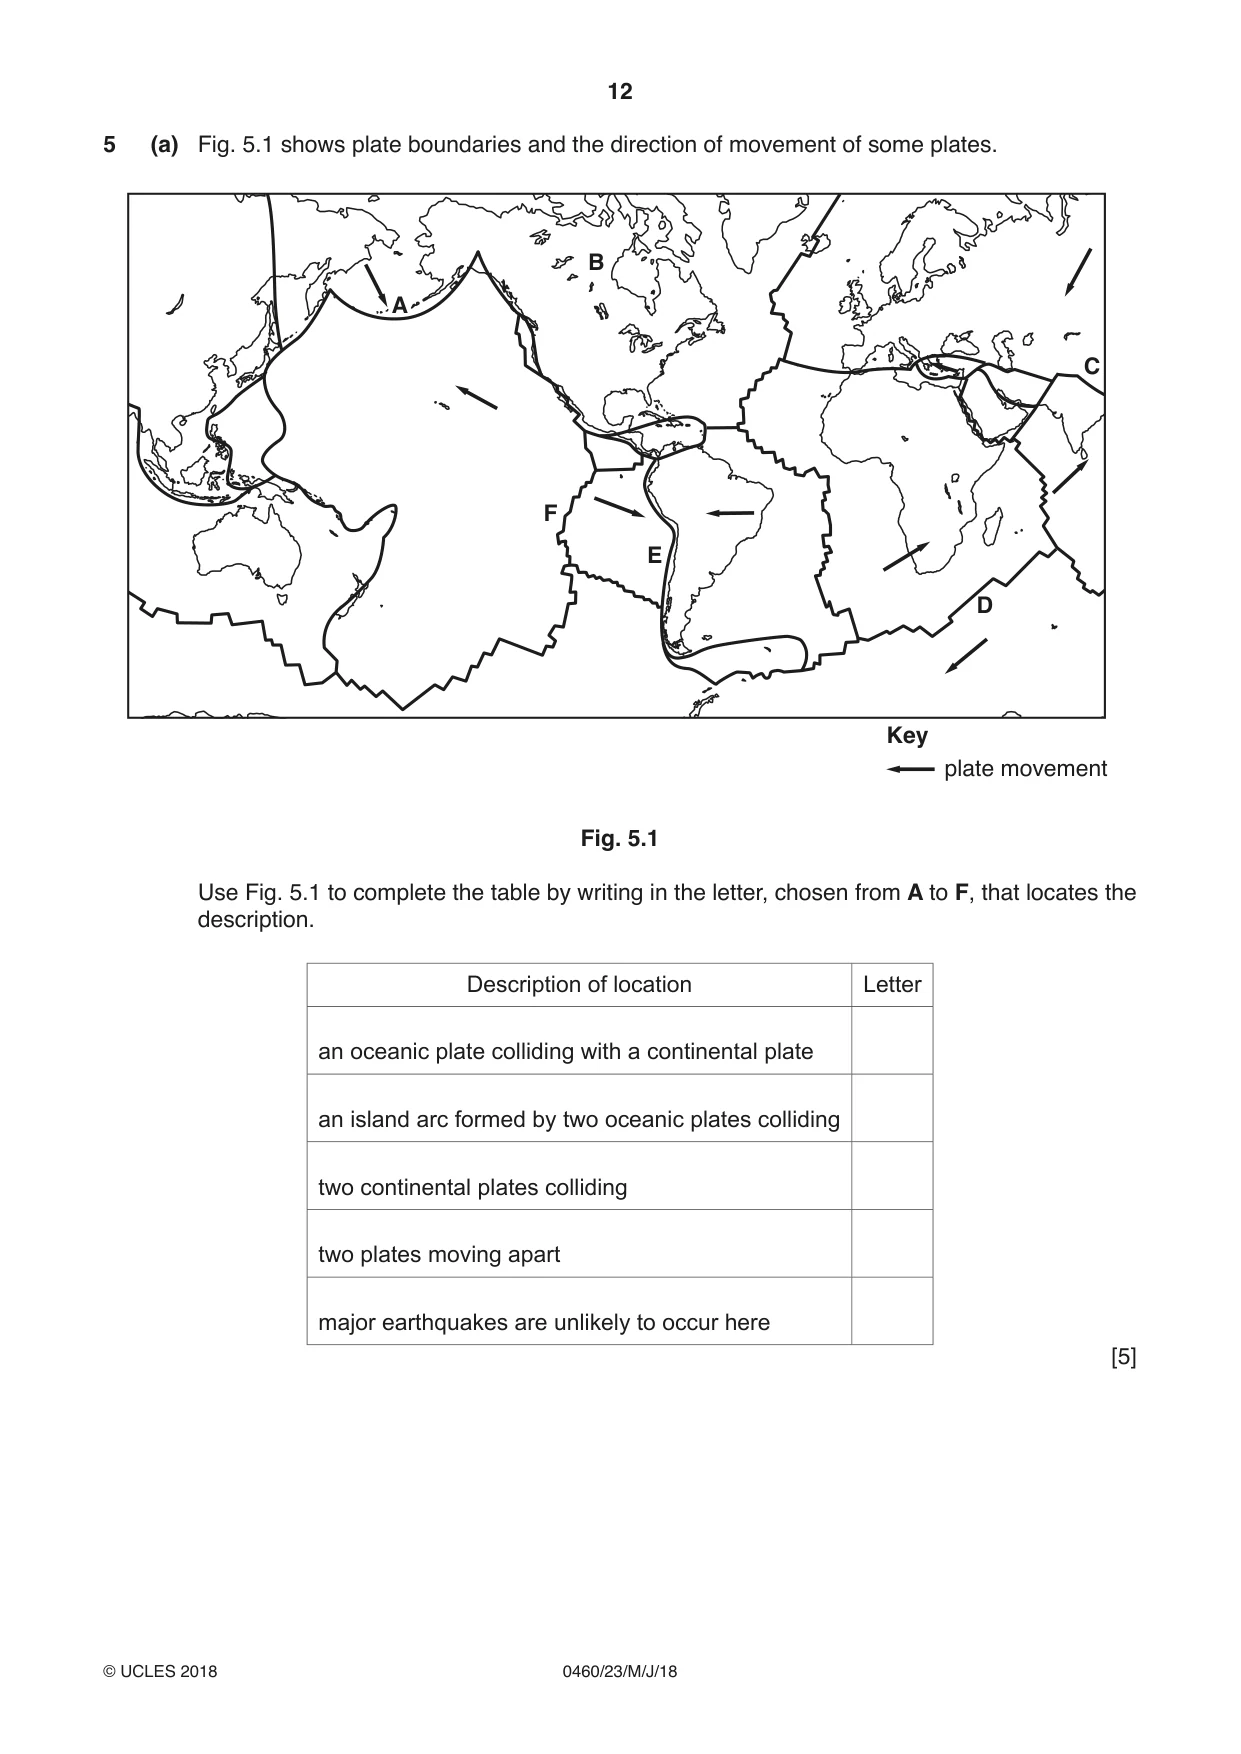
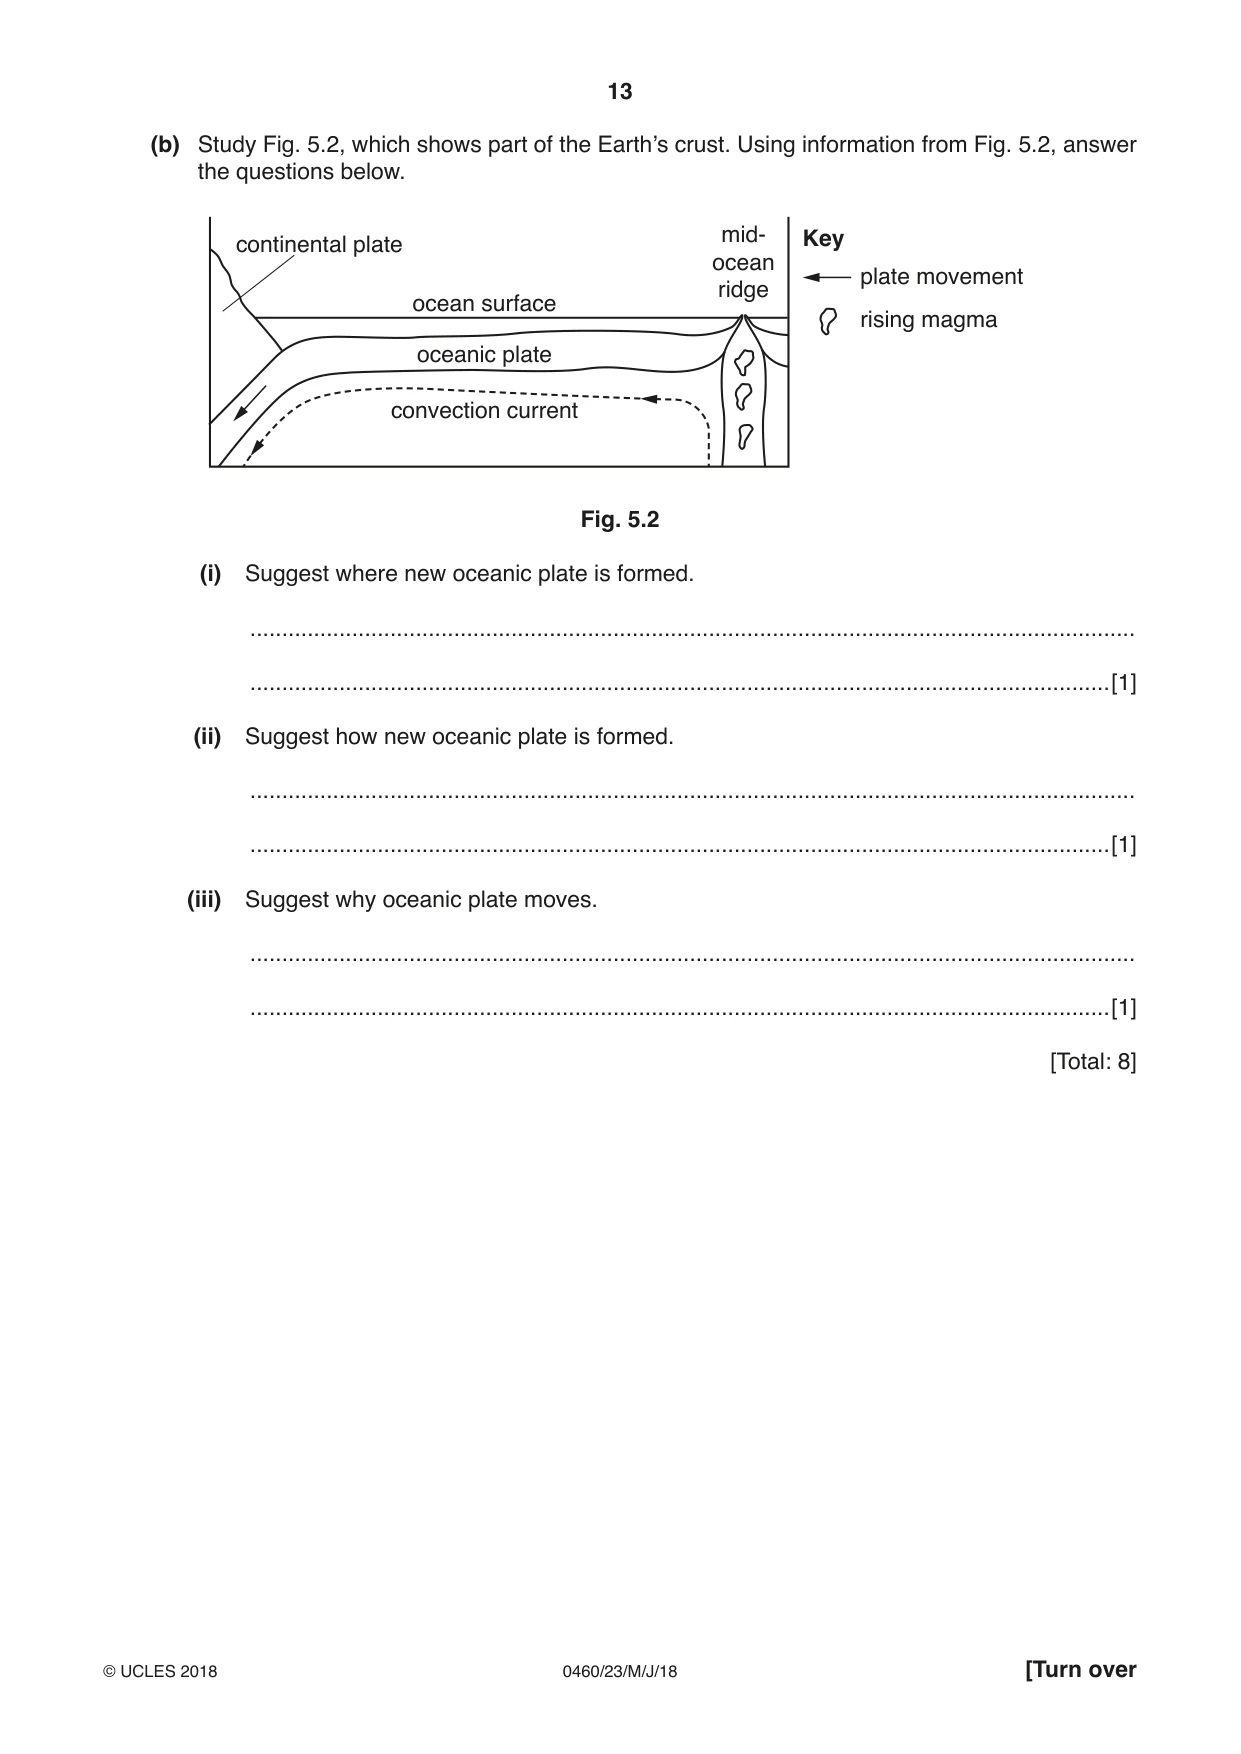
5 (a) Fig. 5.1 shows plate boundaries and the direction of movement of some plates. B A C F E D Key plate movement Fig. 5.1 Use Fig. 5.1 to complete the table by writing in the letter, chosen from A to F, that locates the description. Description of location Letter an oceanic plate colliding with a continental plate an island arc formed by two oceanic plates colliding two continental plates colliding two plates moving apart major earthquakes are unlikely to occur here [5] (b) Study Fig. 5.2, which shows part of the Earth’s crust. Using information from Fig. 5.2, answer the questions below. mid- Key continental plate ocean plate movement ridge ocean surface rising magma oceanic plate convection current Fig. 5.2 (i) Suggest where new oceanic plate is formed. ........................................................................................................................................... .......................................................................................................................................[1] (ii) Suggest how new oceanic plate is formed. ........................................................................................................................................... .......................................................................................................................................[1] (iii) Suggest why oceanic plate moves. ........................................................................................................................................... .......................................................................................................................................[1] [Total: 8]
Mark scheme: 5(a) E, 5 A, C, F, B, 5(b)(i) at ridge/constructive plate margin/divergent plate margin/where magma 1 rises, 5(b)(ii) magma rises to surface/magma cools/magma solidifies/volcano erupts, 1 (subduction spoils) 5(b)(iii) dragged by convection current, 1
Question 6
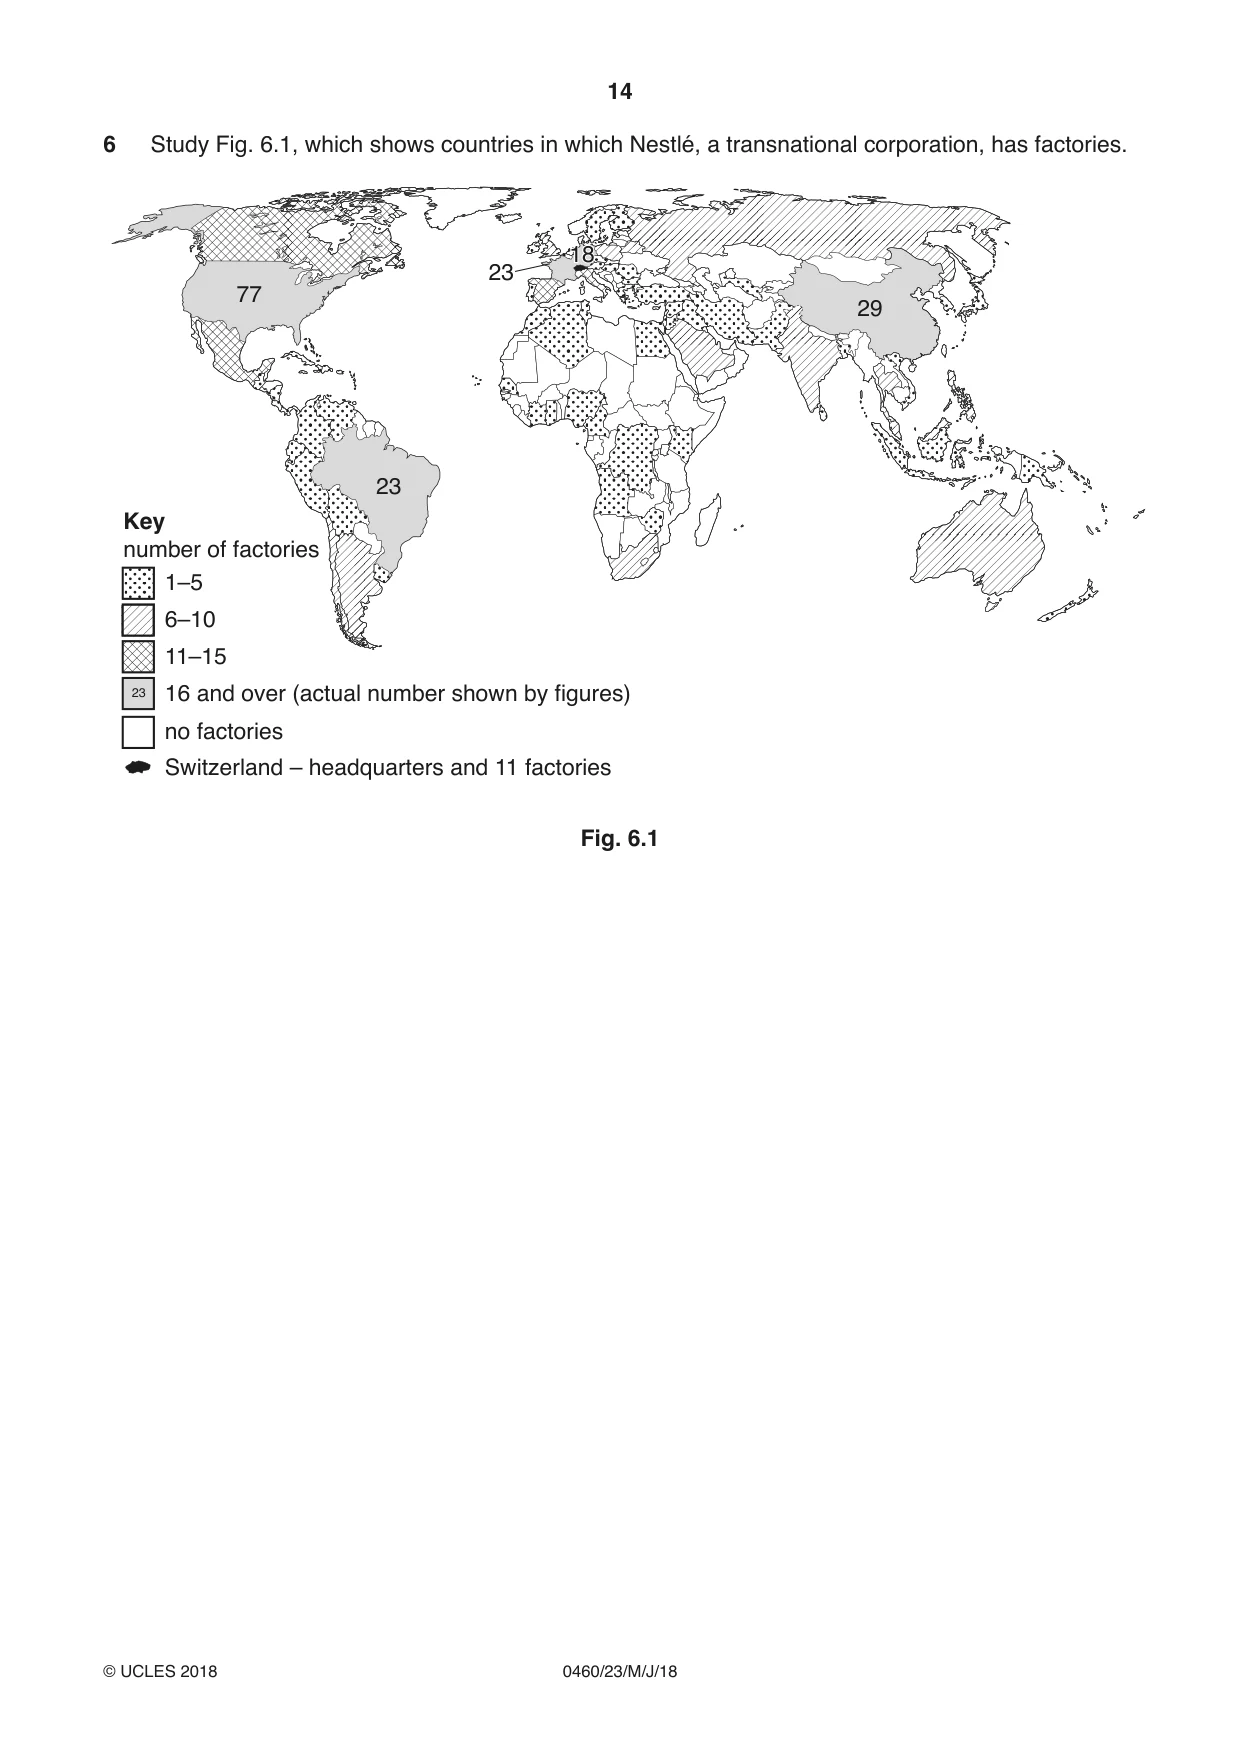
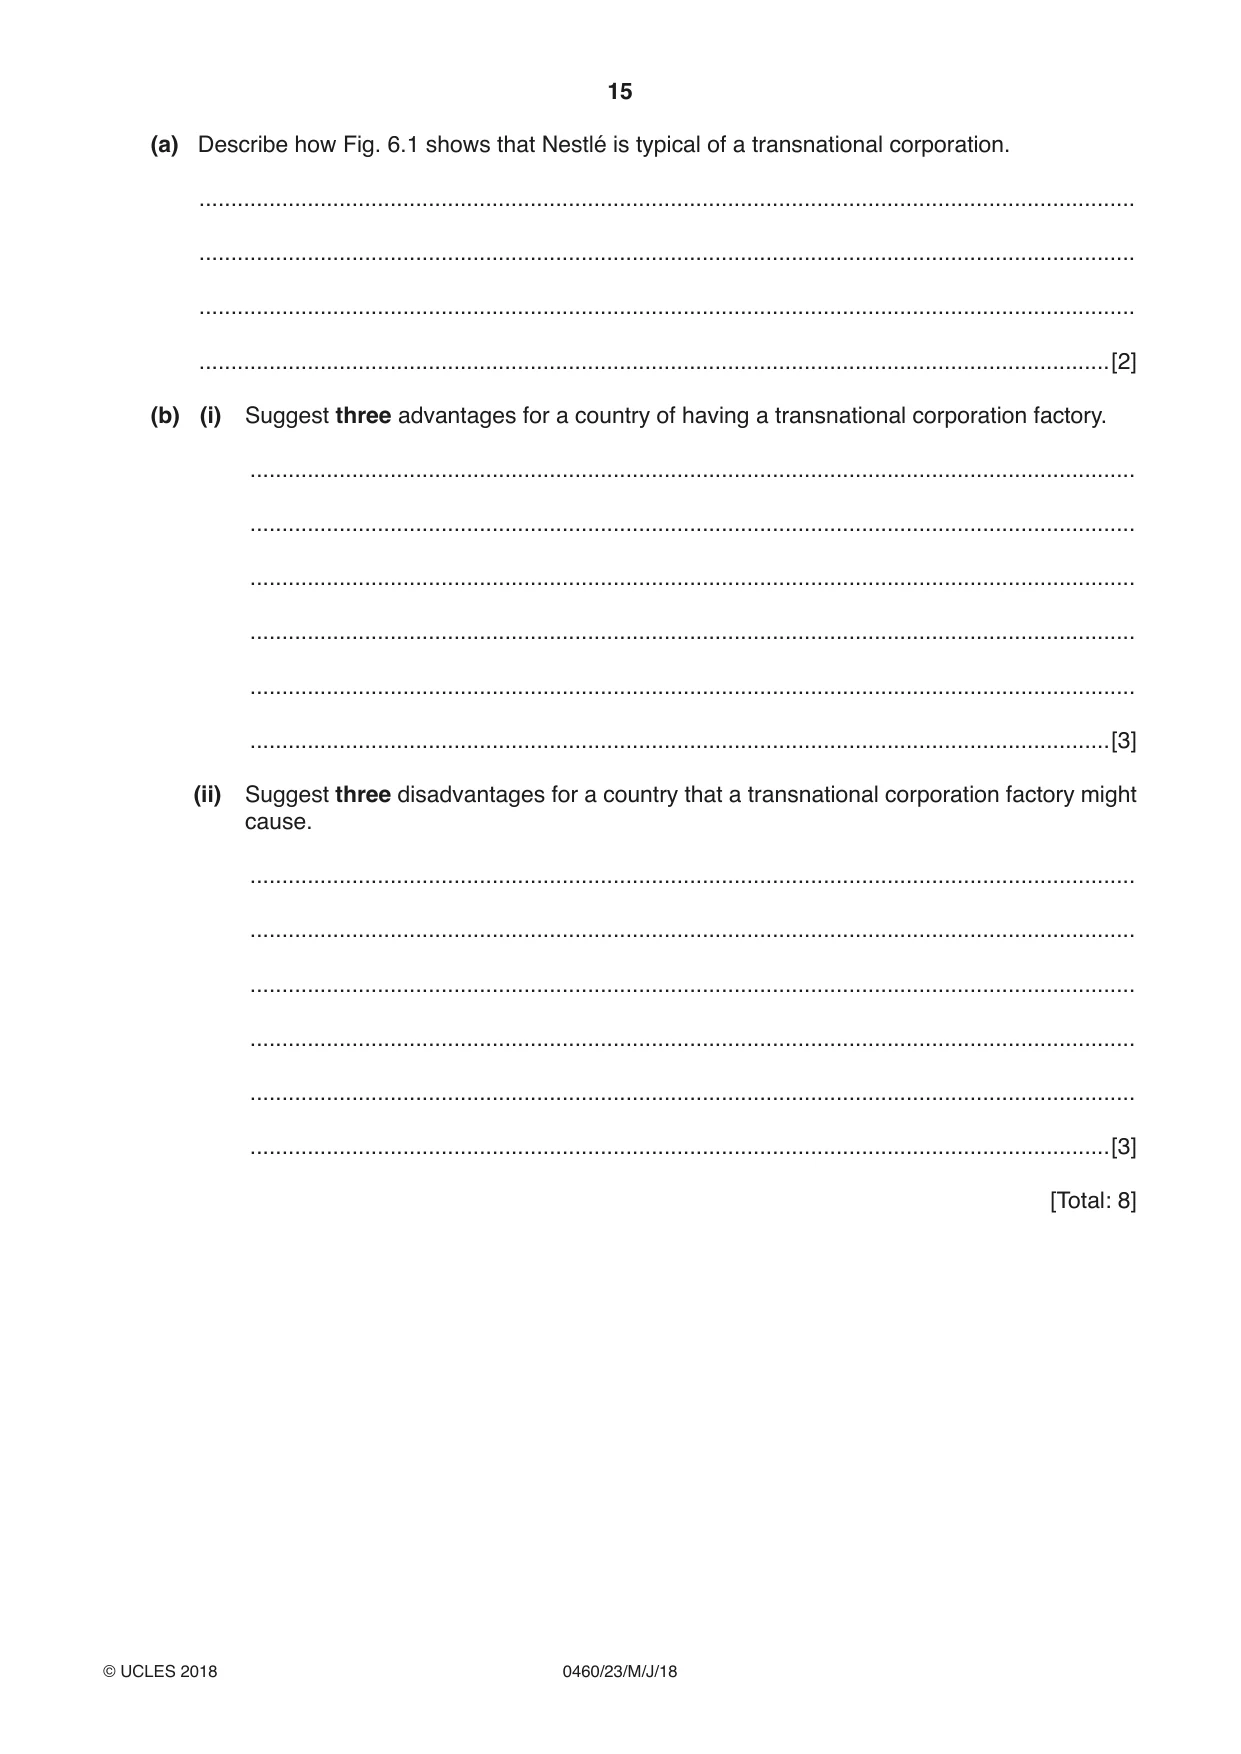
6 Study Fig. 6.1, which shows countries in which Nestlé, a transnational corporation, has factories. 1818 23 77 29 23 Key number of factories 1–5 6–10 11–15 23 16 and over (actual number shown by figures) no factories Switzerland – headquarters and 11 factories Fig. 6.1 (a) Describe how Fig. 6.1 shows that Nestlé is typical of a transnational corporation. ................................................................................................................................................... ................................................................................................................................................... ................................................................................................................................................... ...............................................................................................................................................[2] (b) (i) Suggest three advantages for a country of having a transnational corporation factory. ........................................................................................................................................... ........................................................................................................................................... ........................................................................................................................................... ........................................................................................................................................... ........................................................................................................................................... .......................................................................................................................................[3] (ii) Suggest three disadvantages for a country that a transnational corporation factory might cause. ........................................................................................................................................... ........................................................................................................................................... ........................................................................................................................................... ........................................................................................................................................... ........................................................................................................................................... .......................................................................................................................................[3] [Total: 8] Additional Pages If you use the following lined pages to complete the answer(s) to any question(s), the question number(s) must be clearly shown. .................................................................................................................................................................. .................................................................................................................................................................. .................................................................................................................................................................. .................................................................................................................................................................. .................................................................................................................................................................. .................................................................................................................................................................. .................................................................................................................................................................. .................................................................................................................................................................. .................................................................................................................................................................. .................................................................................................................................................................. .................................................................................................................................................................. .................................................................................................................................................................. .................................................................................................................................................................. .................................................................................................................................................................. .................................................................................................................................................................. .................................................................................................................................................................. .................................................................................................................................................................. .................................................................................................................................................................. .................................................................................................................................................................. .................................................................................................................................................................. .................................................................................................................................................................. .................................................................................................................................................................. .................................................................................................................................................................. .................................................................................................................................................................. ..................................................................................................................................................................
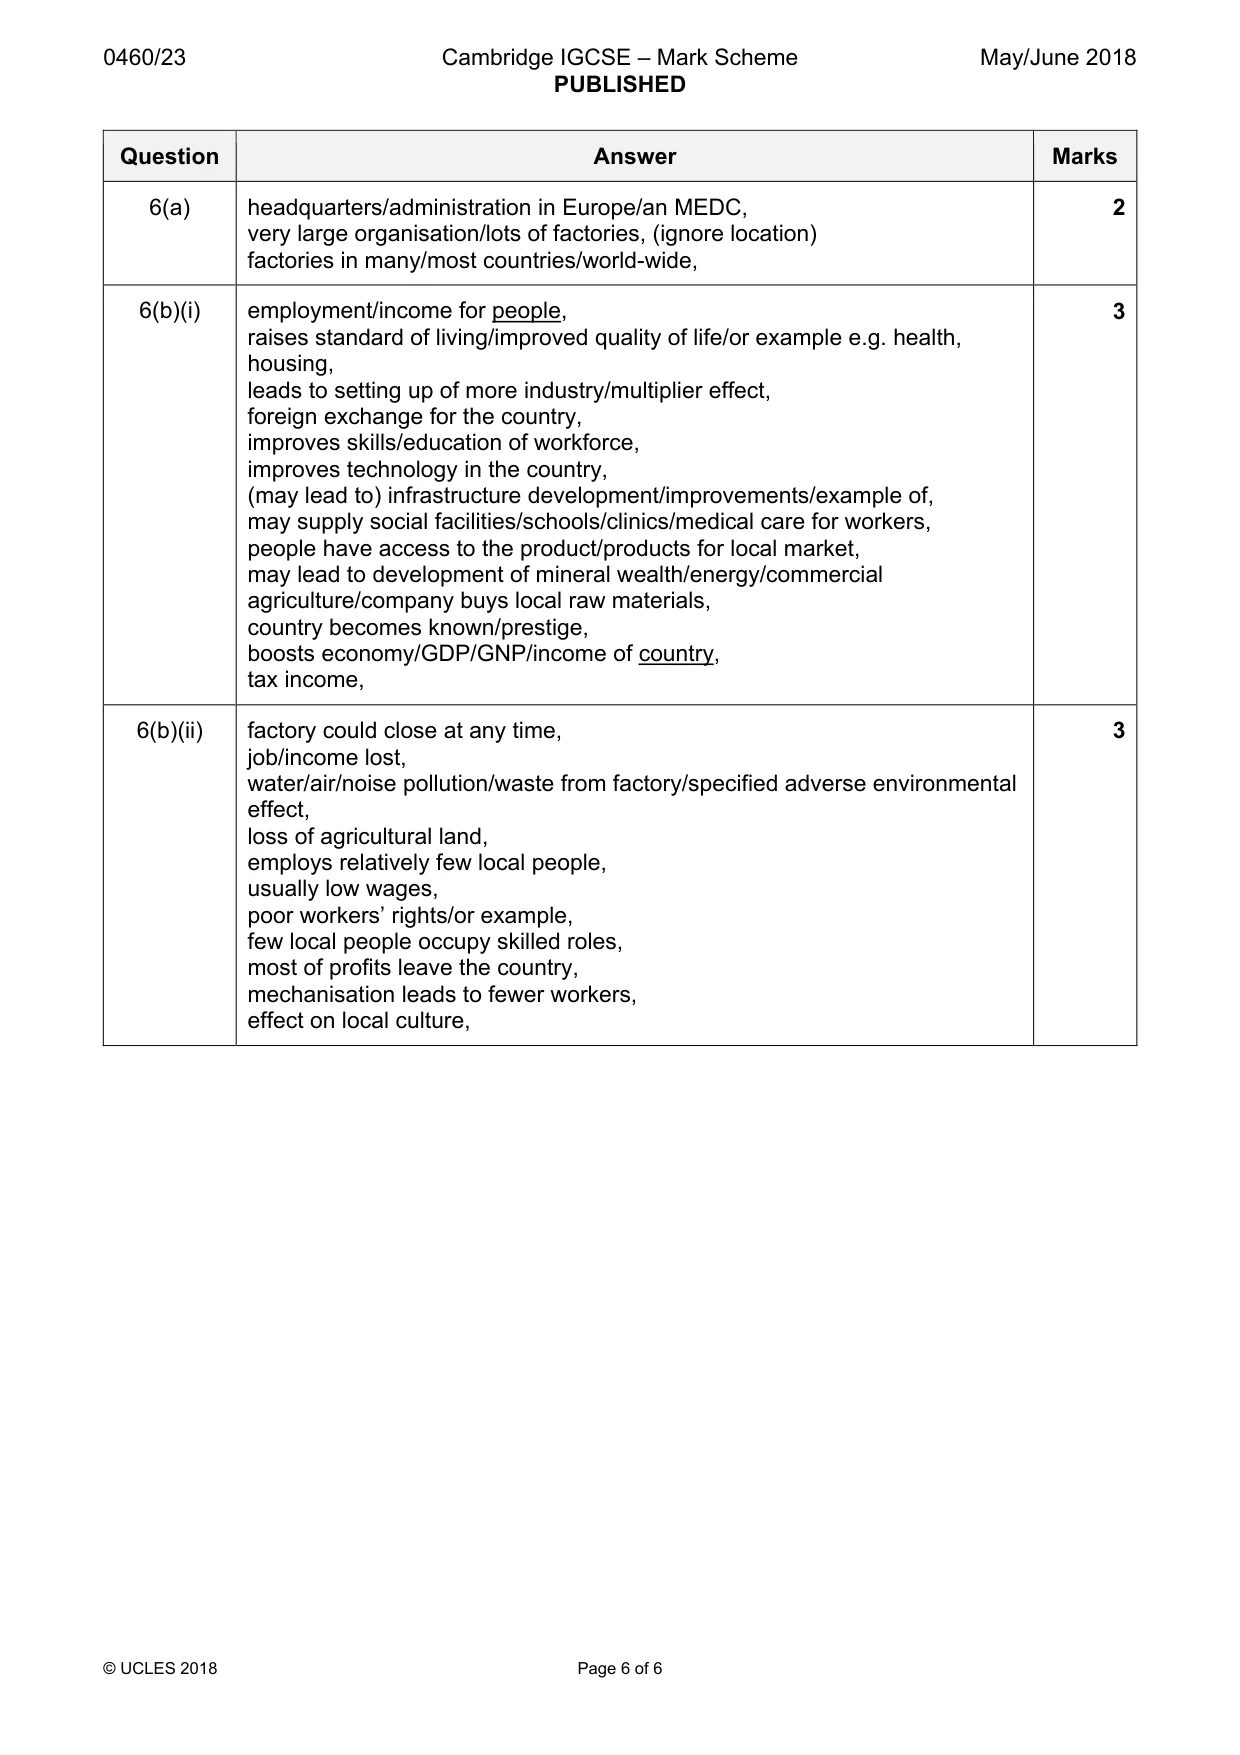
Mark scheme: 6(a) headquarters/administration in Europe/an MEDC, 2 very large organisation/lots of factories, (ignore location) factories in many/most countries/world-wide, 6(b)(i) employment/income for people, 3 raises standard of living/improved quality of life/or example e.g. health, housing, leads to setting up of more industry/multiplier effect, foreign exchange for the country, improves skills/education of workforce, improves technology in the country, (may lead to) infrastructure development/improvements/example of, may supply social facilities/schools/clinics/medical care for workers, people have access to the product/products for local market, may lead to development of mineral wealth/energy/commercial agriculture/company buys local raw materials, country becomes known/prestige, boosts economy/GDP/GNP/income of country, tax income, 6(b)(ii) factory could close at any time, 3 job/income lost, water/air/noise pollution/waste from factory/specified adverse environmental effect, loss of agricultural land, employs relatively few local people, usually low wages, poor workers’ rights/or example, few local people occupy skilled roles, most of profits leave the country, mechanisation leads to fewer workers, effect on local culture,
What was in this paper
The subtopics covered by these 6 questions, and how many questions each got. Open one in a new tab to see every Cambridge question on it.
What you needed in this session
Cambridge’s own grade thresholds for 2018 May/June, Paper 2 · Variant 3. A higher threshold means an easier paper — the bar moves with how the cohort did.