Cambridge IGCSE Geography 0460 — 2025 Feb/March Paper 2 · Variant 2
0460/22/F/M/25 · 6 questions · 60 marks · 90 min
The question paper and its mark scheme, free to read here and free to download. This is Cambridge’s own paper, exactly as it was sat.
Question paper16 pages
Mark scheme13 pages
Answers below. Sit the paper first if you are practising.
Questions as text
Q1 · Study the map extract for Lysefjorden, Norway
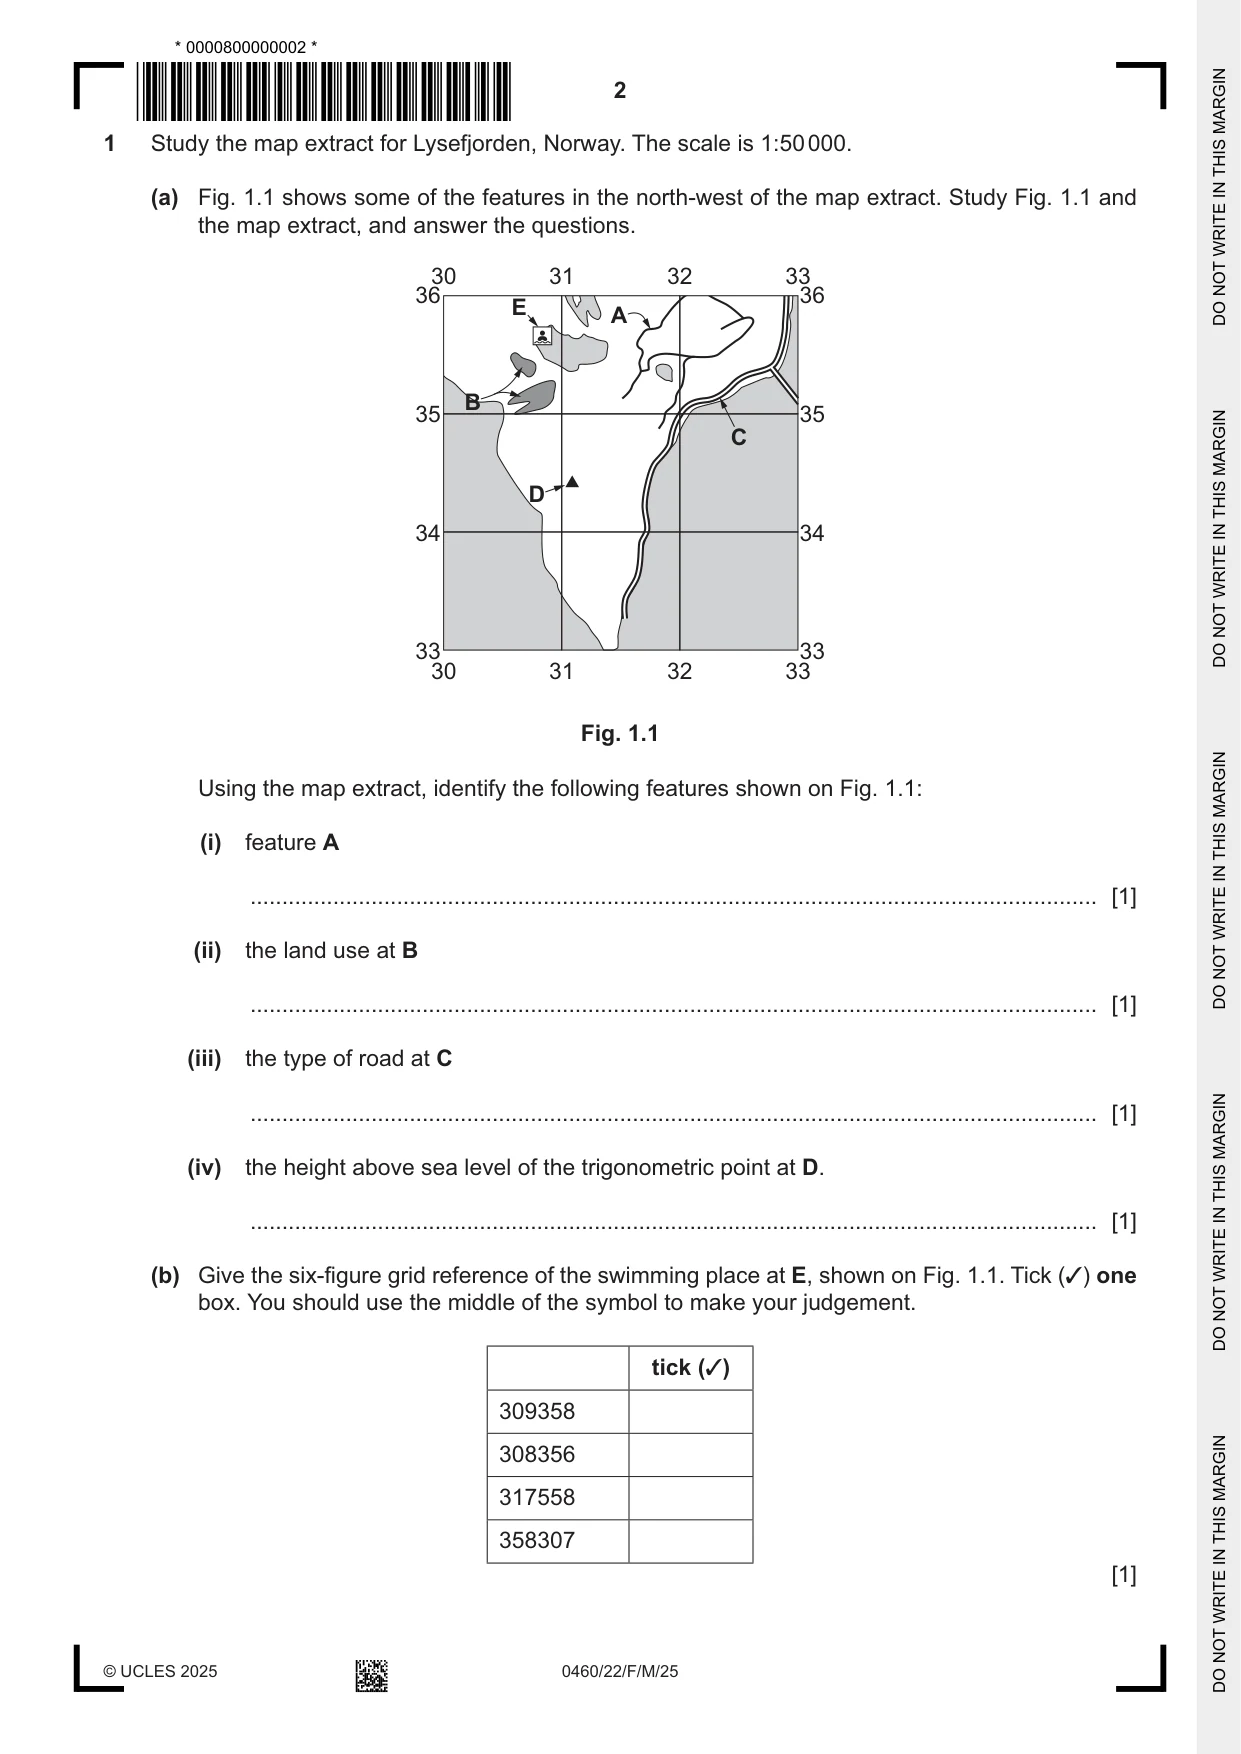
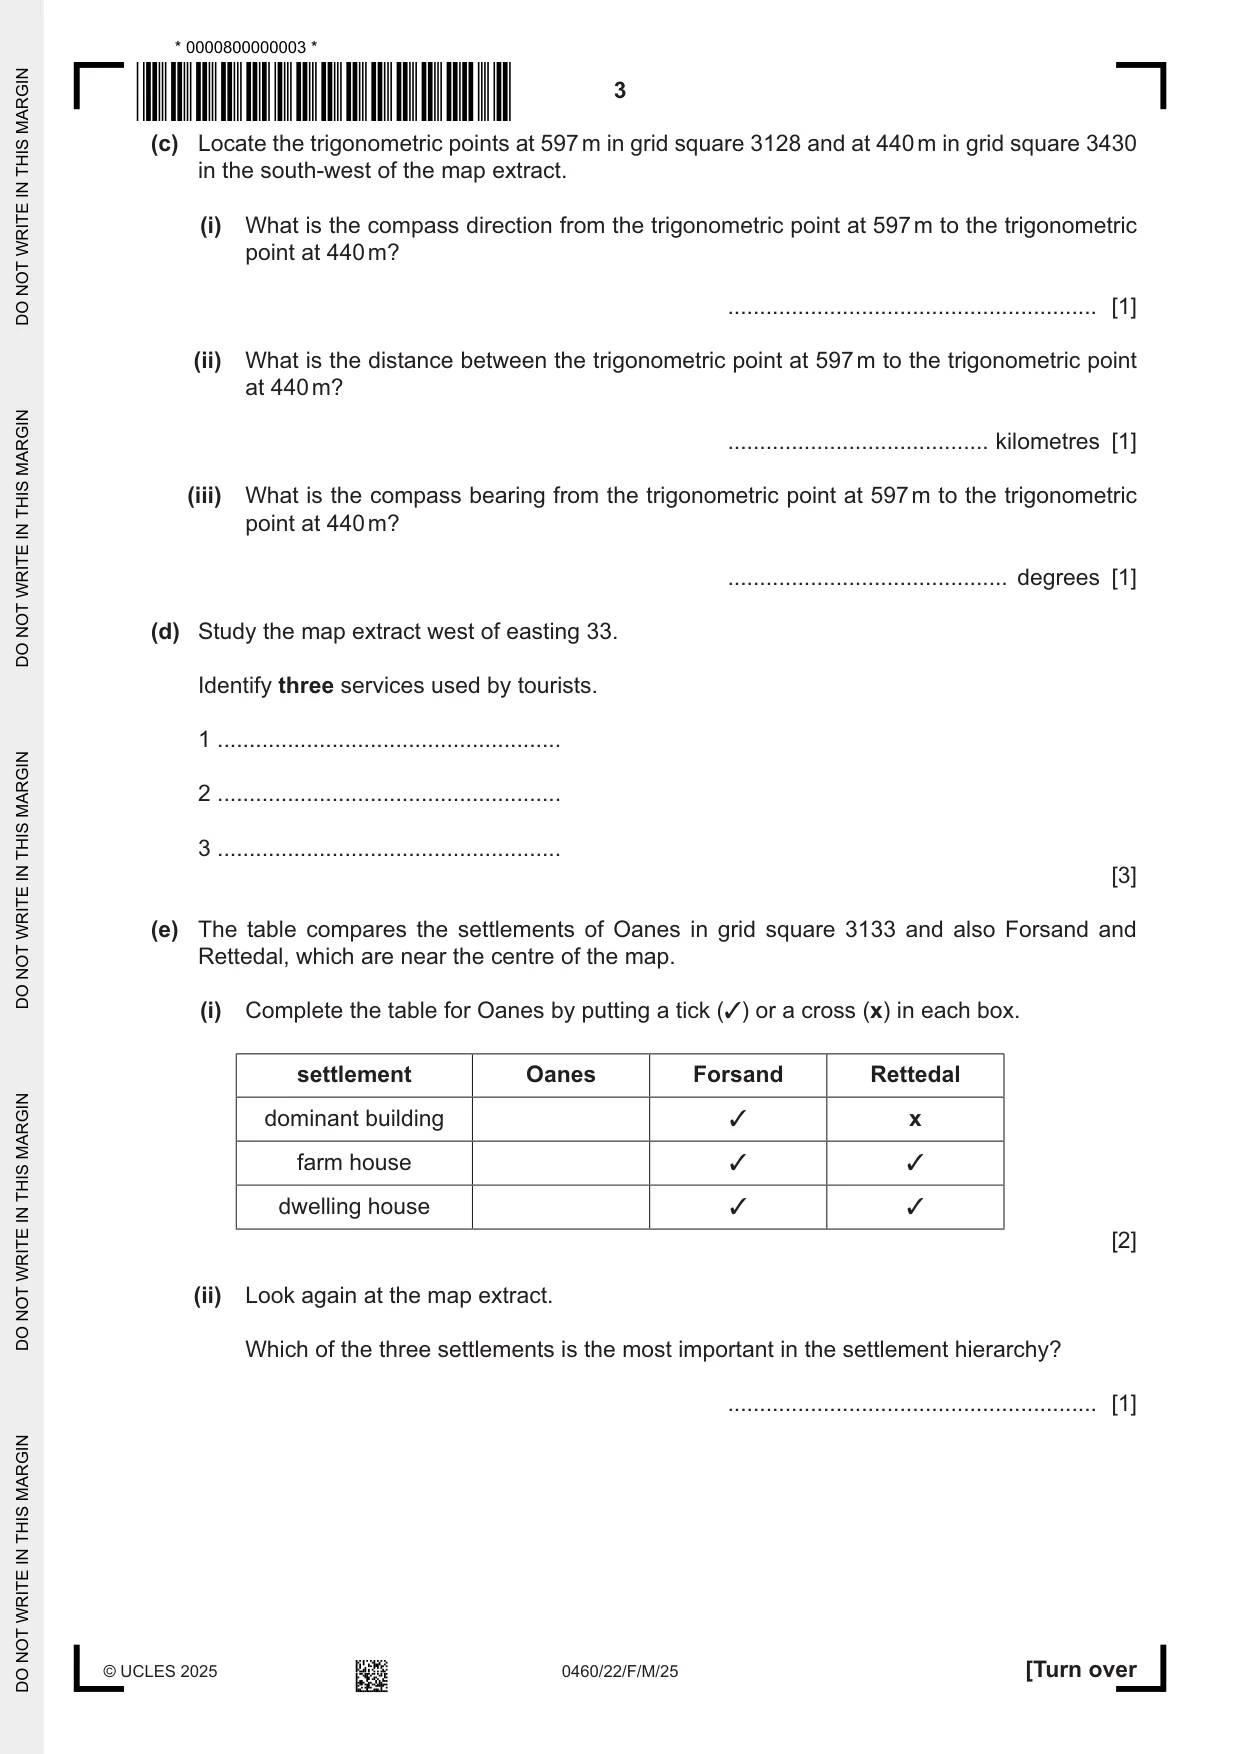
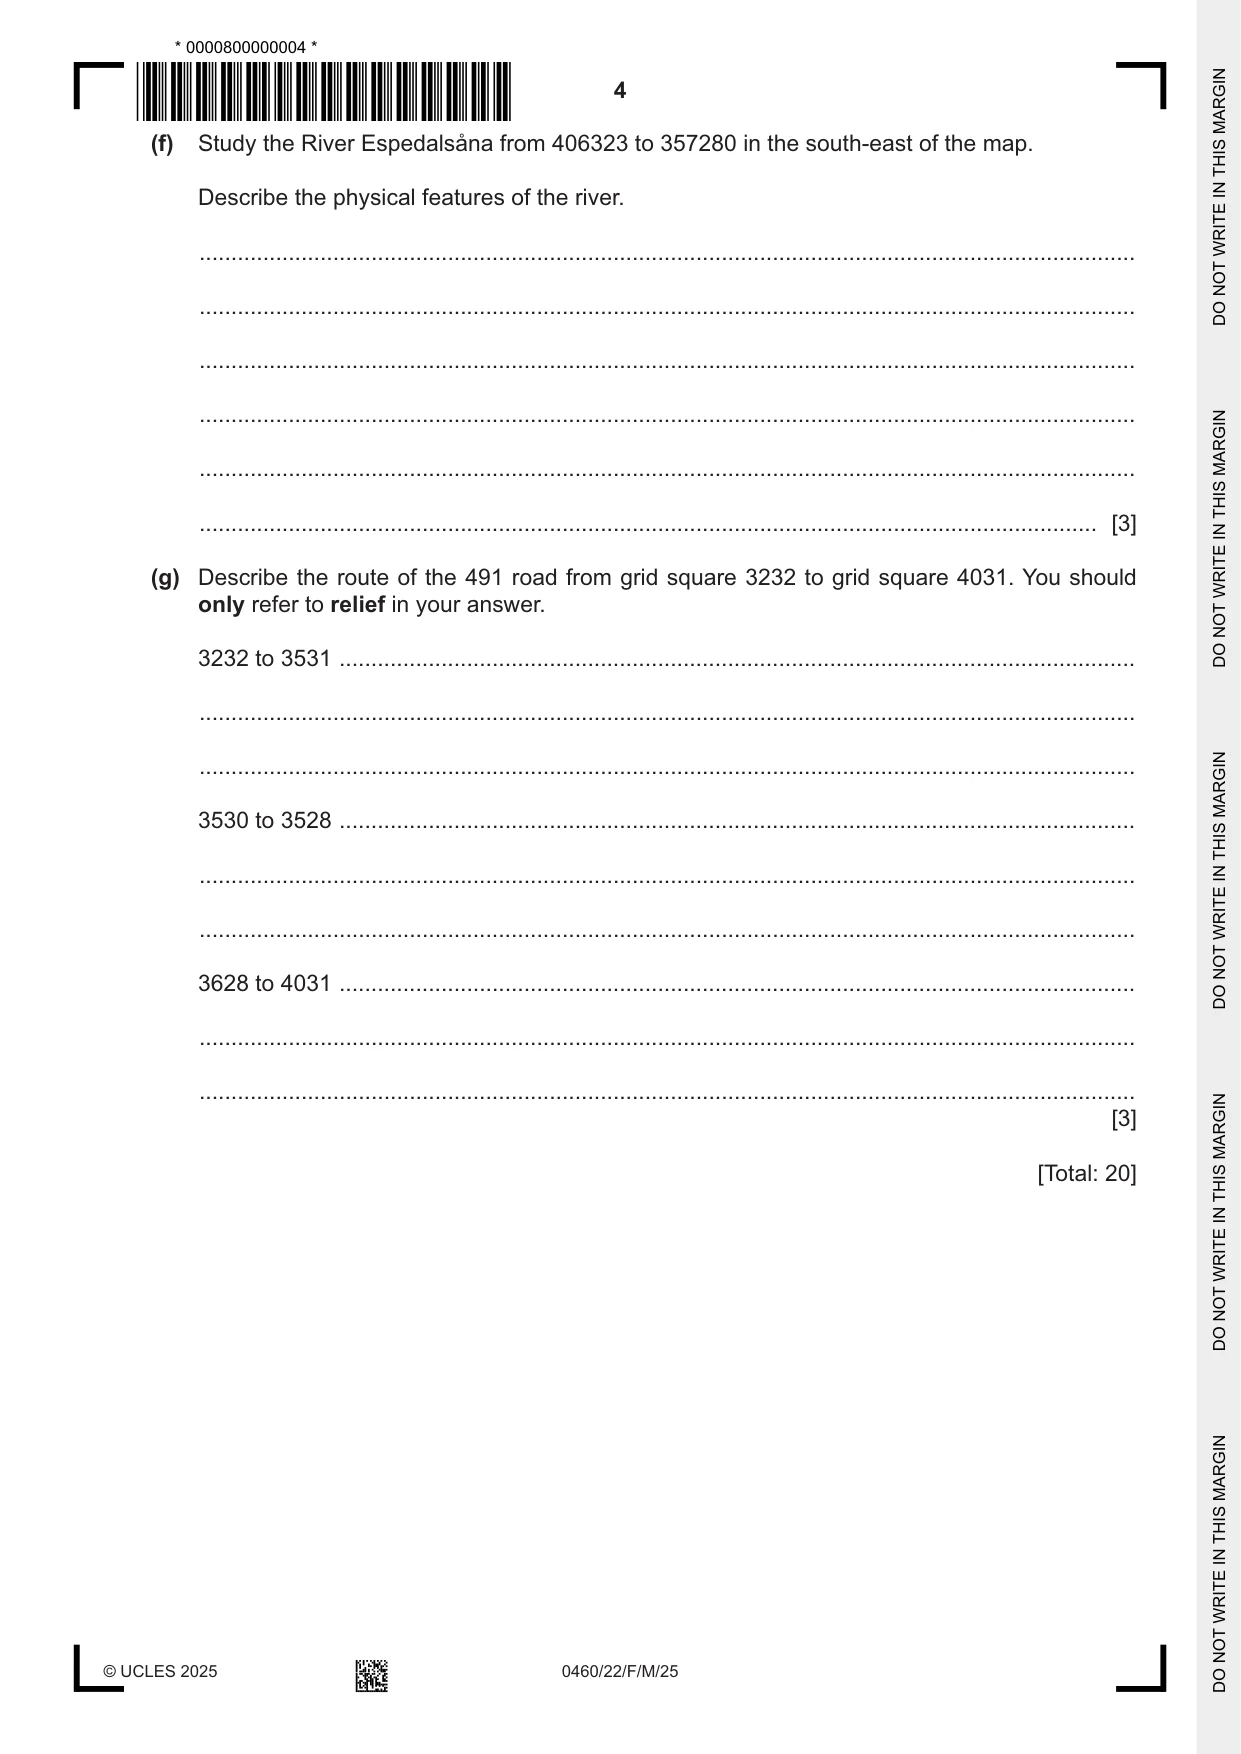
1 Study the map extract for Lysefjorden, Norway. The scale is 1:50 000. (a) Fig. 1.1 shows some of the features in the north-west of the map extract. Study Fig. 1.1 and the map extract, and answer the questions. 30 31 32 33 36 36 E A B 35 35 C D 34 34 33 33 30 31 32 33 Fig. 1.1 Using the map extract, identify the following features shown on Fig. 1.1: (i) feature A ..................................................................................................................................... [1] (ii) the land use at B ..................................................................................................................................... [1] (iii) the type of road at C ..................................................................................................................................... [1] (iv) the height above sea level of the trigonometric point at D. ..................................................................................................................................... [1] (b) Give the six-figure grid reference of the swimming place at E, shown on Fig. 1.1. Tick (3) one box. You should use the middle of the symbol to make your judgement. tick (3) 309358 308356 317558 358307 [1] (c) Locate the trigonometric points at 597 m in grid square 3128 and at 440 m in grid square 3430 in the south-west of the map extract. (i) What is the compass direction from the trigonometric point at 597 m to the trigonometric point at 440 m? .......................................................... [1] (ii) What is the distance between the trigonometric point at 597 m to the trigonometric point at 440 m? ......................................... kilometres [1] (iii) What is the compass bearing from the trigonometric point at 597 m to the trigonometric point at 440 m? ............................................ degrees [1] (d) Study the map extract west of easting 33. Identify three services used by tourists. 1 ...................................................... 2 ...................................................... 3 ...................................................... [3] (e) The table compares the settlements of Oanes in grid square 3133 and also Forsand and Rettedal, which are near the centre of the map. (i) Complete the table for Oanes by putting a tick (3) or a cross (x) in each box. settlement Oanes Forsand Rettedal dominant building 3 x farm house 3 3 dwelling house 3 3 [2] (ii) Look again at the map extract. Which of the three settlements is the most important in the settlement hierarchy? .......................................................... [1] (f) Study the River Espedalsåna from 406323 to 357280 in the south-east of the map. Describe the physical features of the river. ................................................................................................................................................... ................................................................................................................................................... ................................................................................................................................................... ................................................................................................................................................... ................................................................................................................................................... ............................................................................................................................................. [3] (g) Describe the route of the 491 road from grid square 3232 to grid square 4031. You should only refer to relief in your answer. 3232 to 3531 ............................................................................................................................. ................................................................................................................................................... ................................................................................................................................................... 3530 to 3528 ............................................................................................................................. ................................................................................................................................................... ................................................................................................................................................... 3628 to 4031 ............................................................................................................................. ................................................................................................................................................... ................................................................................................................................................... [3] [Total: 20]
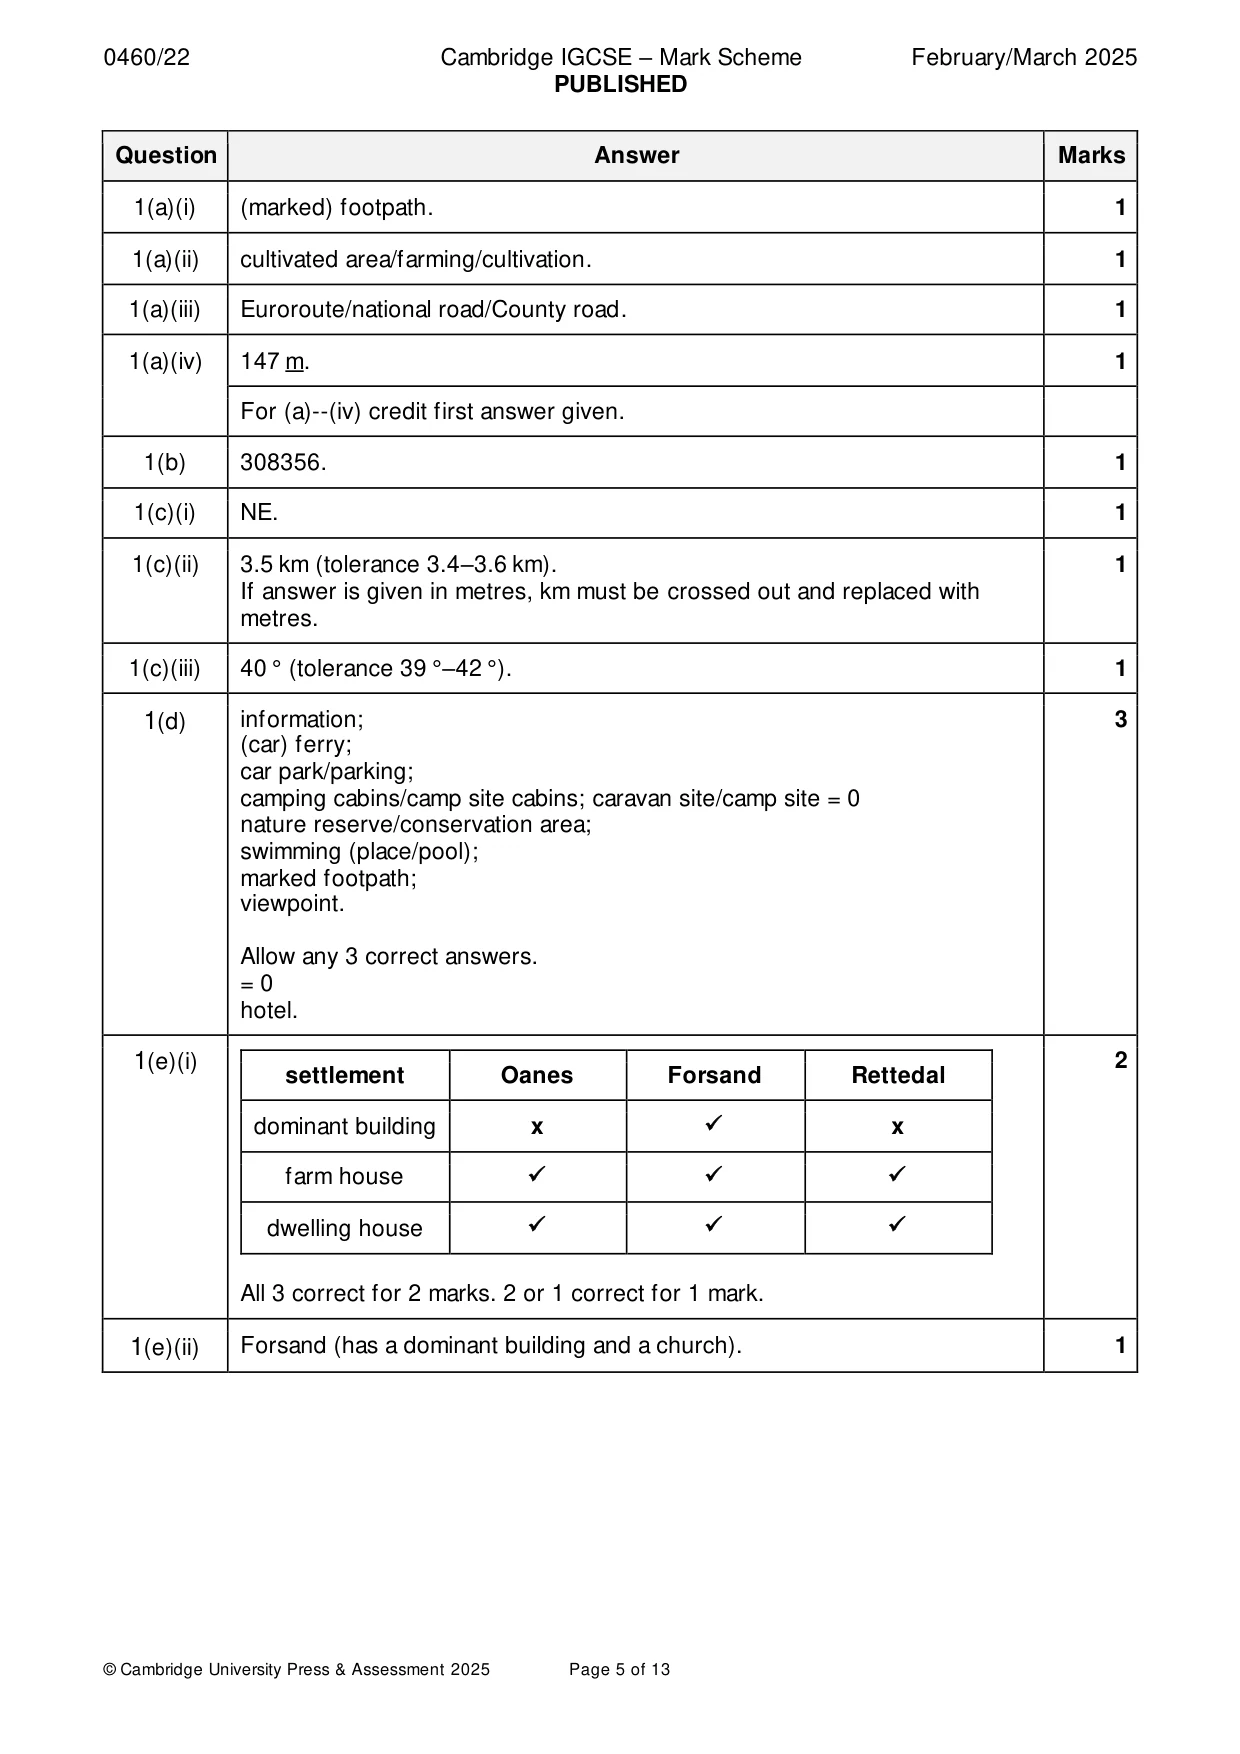
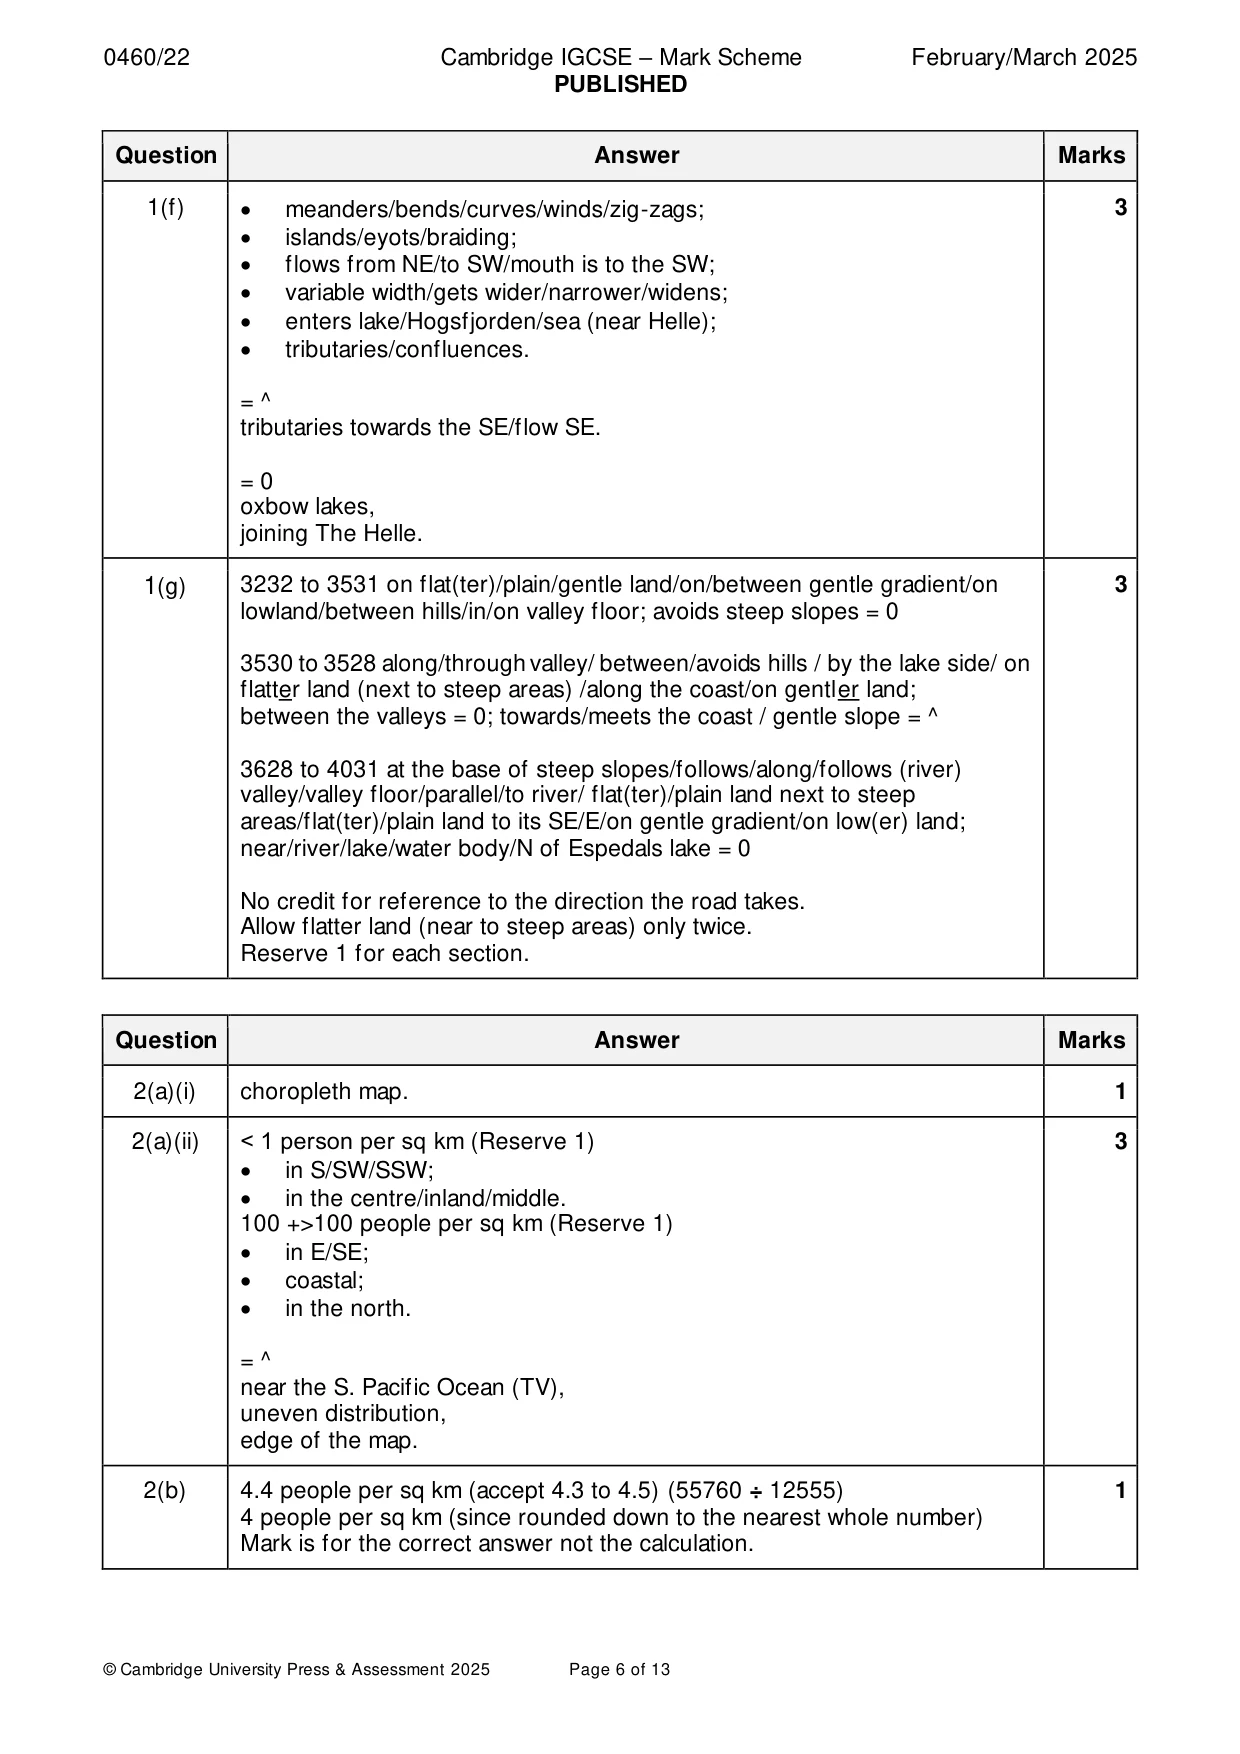
Mark scheme: Question Answer Marks 1(a)(i) (marked) footpath. 1 1(a)(ii) cultivated area/farming/cultivation. 1 1(a)(iii) Euroroute/national road/County road. 1 1(a)(iv) 147 m. 1 For (a)--(iv) credit first answer given. 1(b) 308356. 1 1(c)(i) NE. 1 1(c)(ii) 3.5 km (tolerance 3.4–3.6 km). 1 If answer is given in metres, km must be crossed out and replaced with metres. 1(c)(iii) 40 ° (tolerance 39 °–42 °). 1 1(d) information; 3 (car) ferry; car park/parking; camping cabins/camp site cabins; caravan site/camp site = 0 nature reserve/conservation area; swimming (place/pool); marked footpath; viewpoint. Allow any 3 correct answers. = 0 hotel. 1(e)(i) 2 settlement Oanes Forsand Rettedal dominant building x ✓ x farm house ✓ ✓ ✓ dwelling house ✓ ✓ ✓ All 3 correct for 2 marks. 2 or 1 correct for 1 mark. 1(e)(ii) Forsand (has a dominant building and a church). 1 1(f) • meanders/bends/curves/winds/zig-zags; 3 • islands/eyots/braiding; • flows from NE/to SW/mouth is to the SW; • variable width/gets wider/narrower/widens; • enters lake/Hogsfjorden/sea (near Helle); • tributaries/confluences. = ^ tributaries towards the SE/flow SE. = 0 oxbow lakes, joining The Helle. 1(g) 3232 to 3531 on flat(ter)/plain/gentle land/on/between gentle gradient/on 3 lowland/between hills/in/on valley floor; avoids steep slopes = 0 3530 to 3528 along/through valley/ between/avoids hills / by the lake side/ on flatter land (next to steep areas) /along the coast/on gentler land; between the valleys = 0; towards/meets the coast / gentle slope = ^ 3628 to 4031 at the base of steep slopes/follows/along/follows (river) valley/valley floor/parallel/to river/ flat(ter)/plain land next to steep areas/flat(ter)/plain land to its SE/E/on gentle gradient/on low(er) land; near/river/lake/water body/N of Espedals lake = 0 No credit for reference to the direction the road takes. Allow flatter land (near to steep areas) only twice. Reserve 1 for each section.
More questions on Settlements (rural and urban) and service provision
Question 2
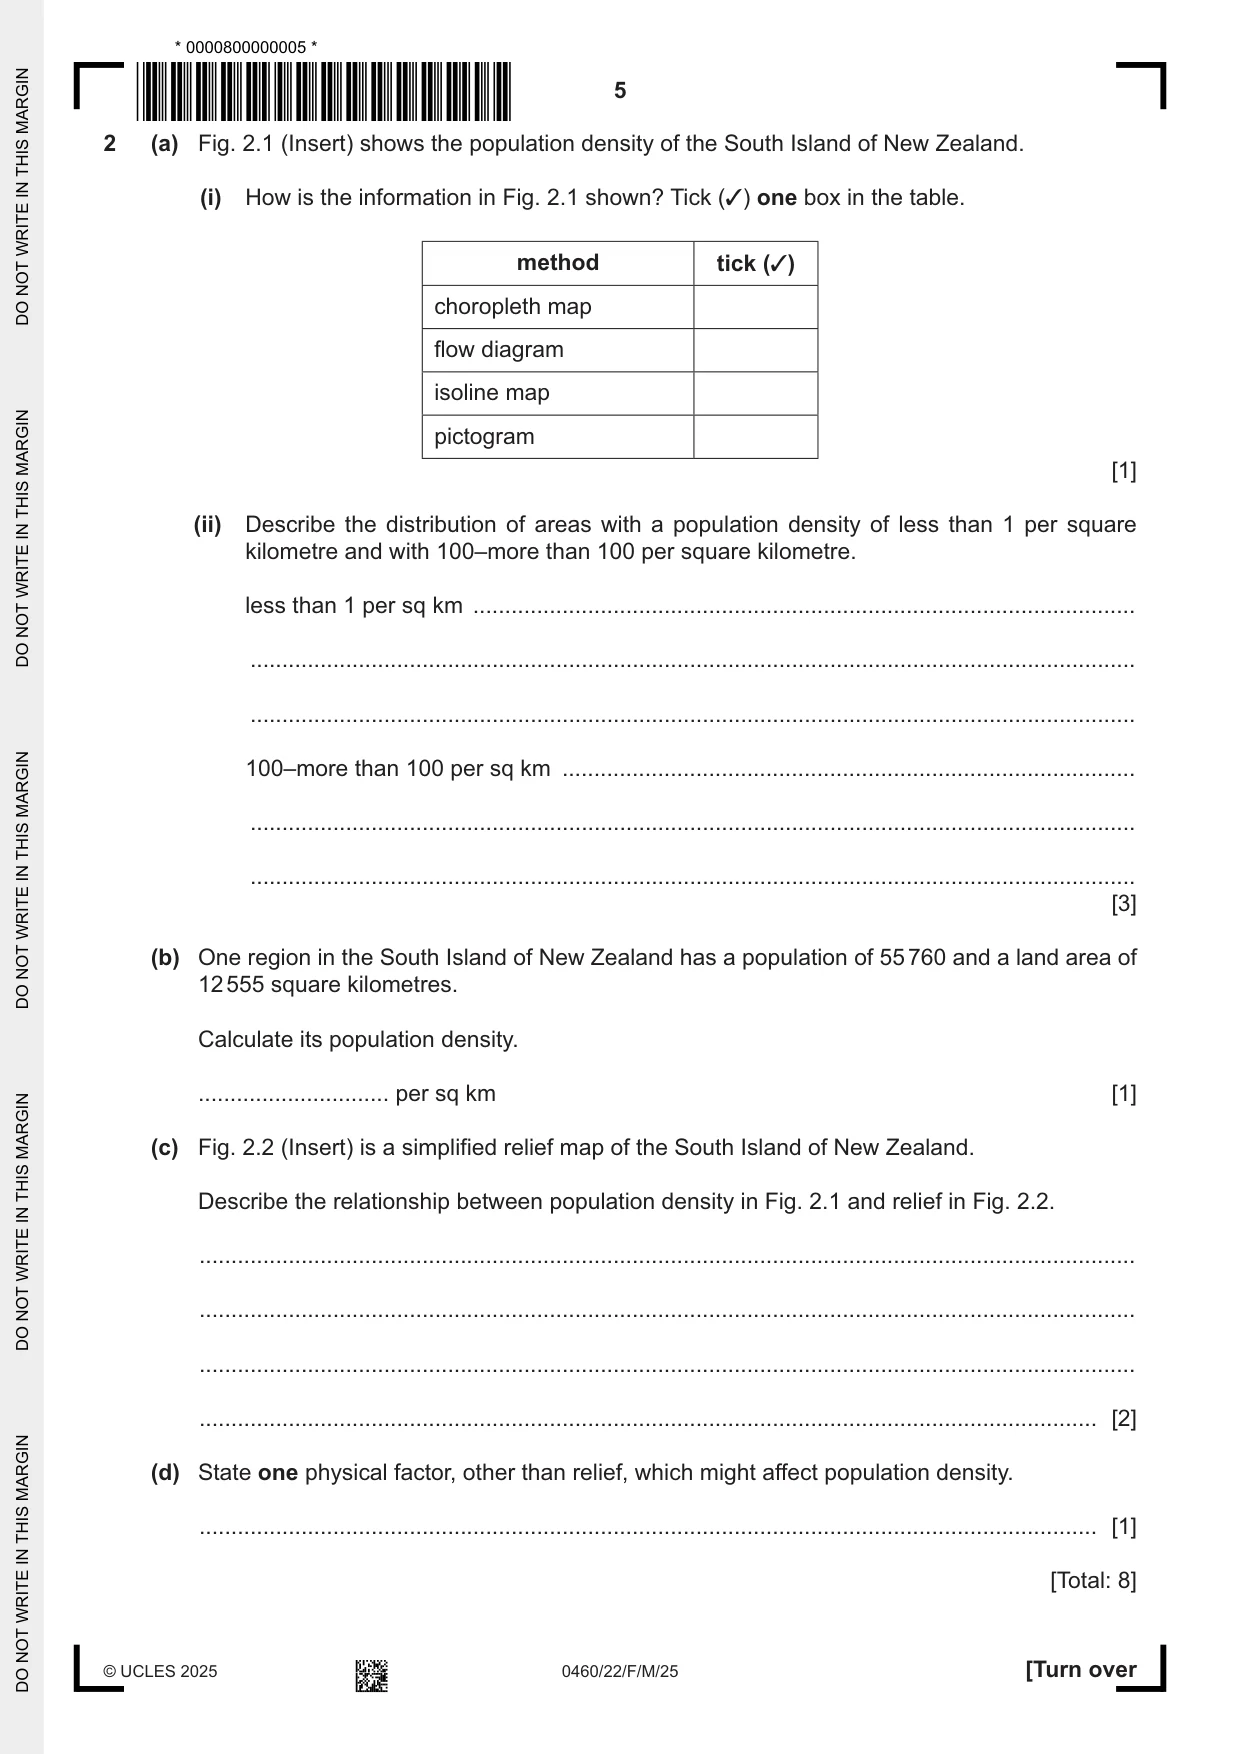
2 (a) Fig. 2.1 (Insert) shows the population density of the South Island of New Zealand. (i) How is the information in Fig. 2.1 shown? Tick (3) one box in the table. method tick (3) choropleth map flow diagram isoline map pictogram [1] (ii) Describe the distribution of areas with a population density of less than 1 per square kilometre and with 100–more than 100 per square kilometre. less than 1 per sq km ........................................................................................................ ........................................................................................................................................... ........................................................................................................................................... 100–more than 100 per sq km .......................................................................................... ........................................................................................................................................... ........................................................................................................................................... [3] (b) One region in the South Island of New Zealand has a population of 55 760 and a land area of 12 555 square kilometres. Calculate its population density. .............................. per sq km [1] (c) Fig. 2.2 (Insert) is a simplified relief map of the South Island of New Zealand. Describe the relationship between population density in Fig. 2.1 and relief in Fig. 2.2. ................................................................................................................................................... ................................................................................................................................................... ................................................................................................................................................... ............................................................................................................................................. [2] (d) State one physical factor, other than relief, which might affect population density. ............................................................................................................................................. [1] [Total: 8]
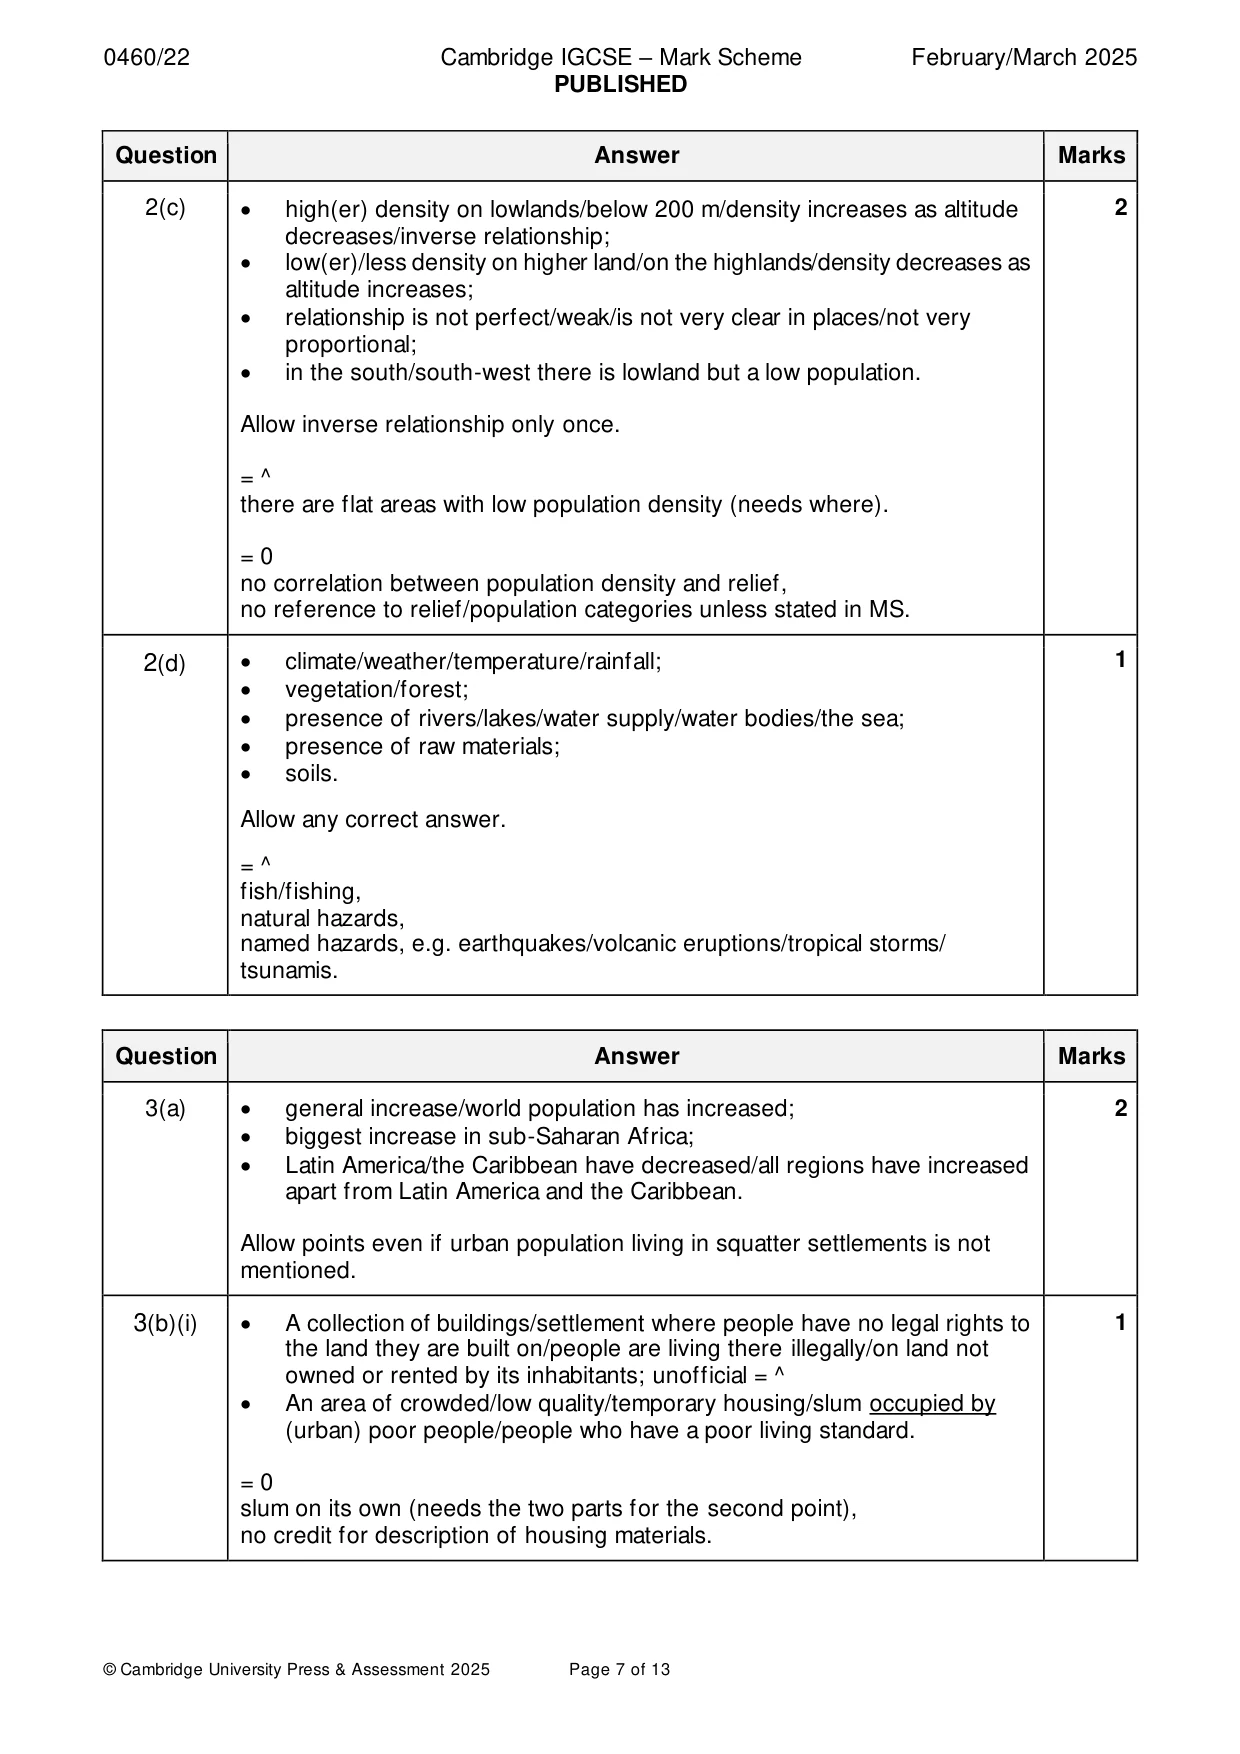
Mark scheme: 2(a)(i) choropleth map. 1 2(a)(ii) ˂ 1 person per sq km (Reserve 1) 3 • in S/SW/SSW; • in the centre/inland/middle. 100 +>100 people per sq km (Reserve 1) • in E/SE; • coastal; • in the north. = ^ near the S. Pacific Ocean (TV), uneven distribution, edge of the map. 2(b) 4.4 people per sq km (accept 4.3 to 4.5) (55760 ÷ 12555) 1 4 people per sq km (since rounded down to the nearest whole number) Mark is for the correct answer not the calculation. 2(c) • high(er) density on lowlands/below 200 m/density increases as altitude 2 decreases/inverse relationship; • low(er)/less density on higher land/on the highlands/density decreases as altitude increases; • relationship is not perfect/weak/is not very clear in places/not very proportional; • in the south/south-west there is lowland but a low population. Allow inverse relationship only once. = ^ there are flat areas with low population density (needs where). = 0 no correlation between population density and relief, no reference to relief/population categories unless stated in MS. 2(d) • climate/weather/temperature/rainfall; 1 • vegetation/forest; • presence of rivers/lakes/water supply/water bodies/the sea; • presence of raw materials; • soils. Allow any correct answer. = ^ fish/fishing, natural hazards, named hazards, e.g. earthquakes/volcanic eruptions/tropical storms/ tsunamis.
Q3 · The urban population living in squatter settlements in 2000 and 2018 in selected world…
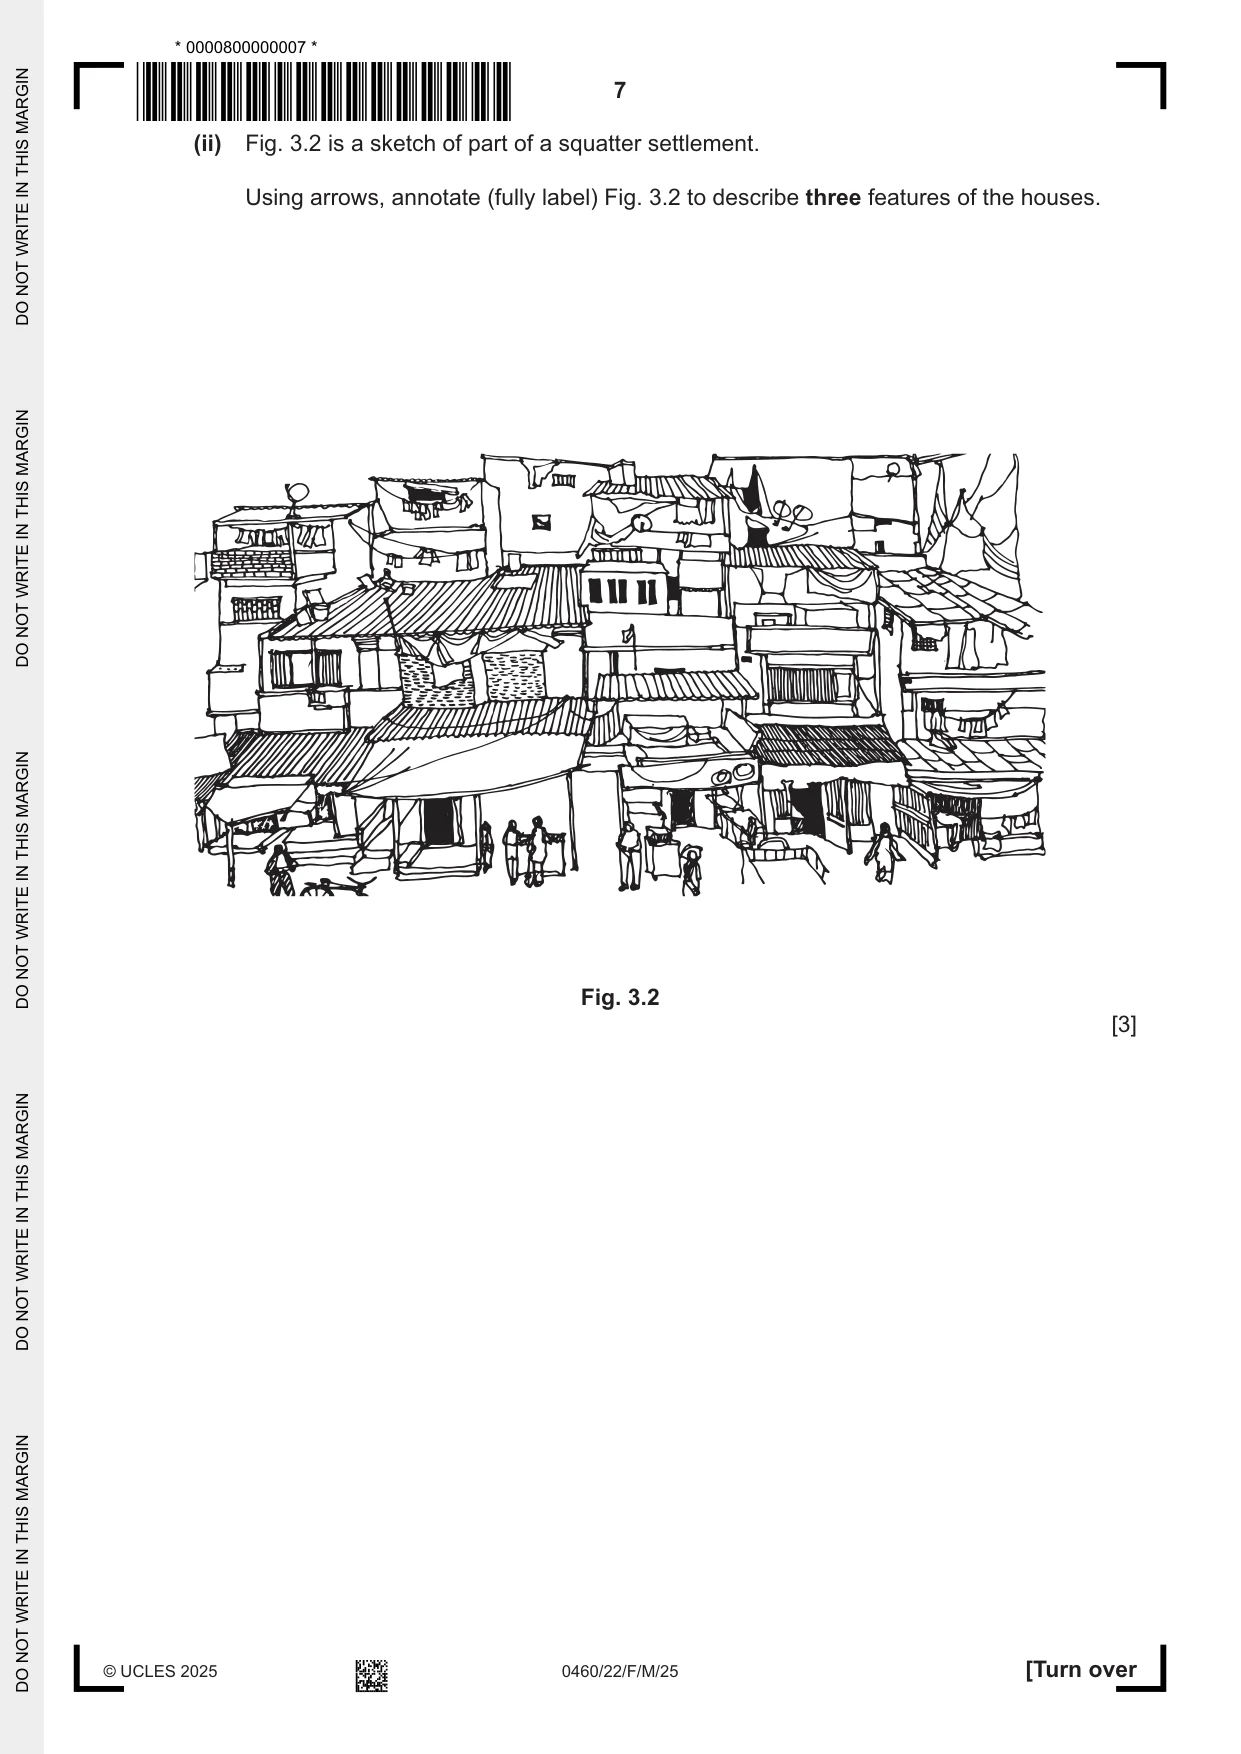
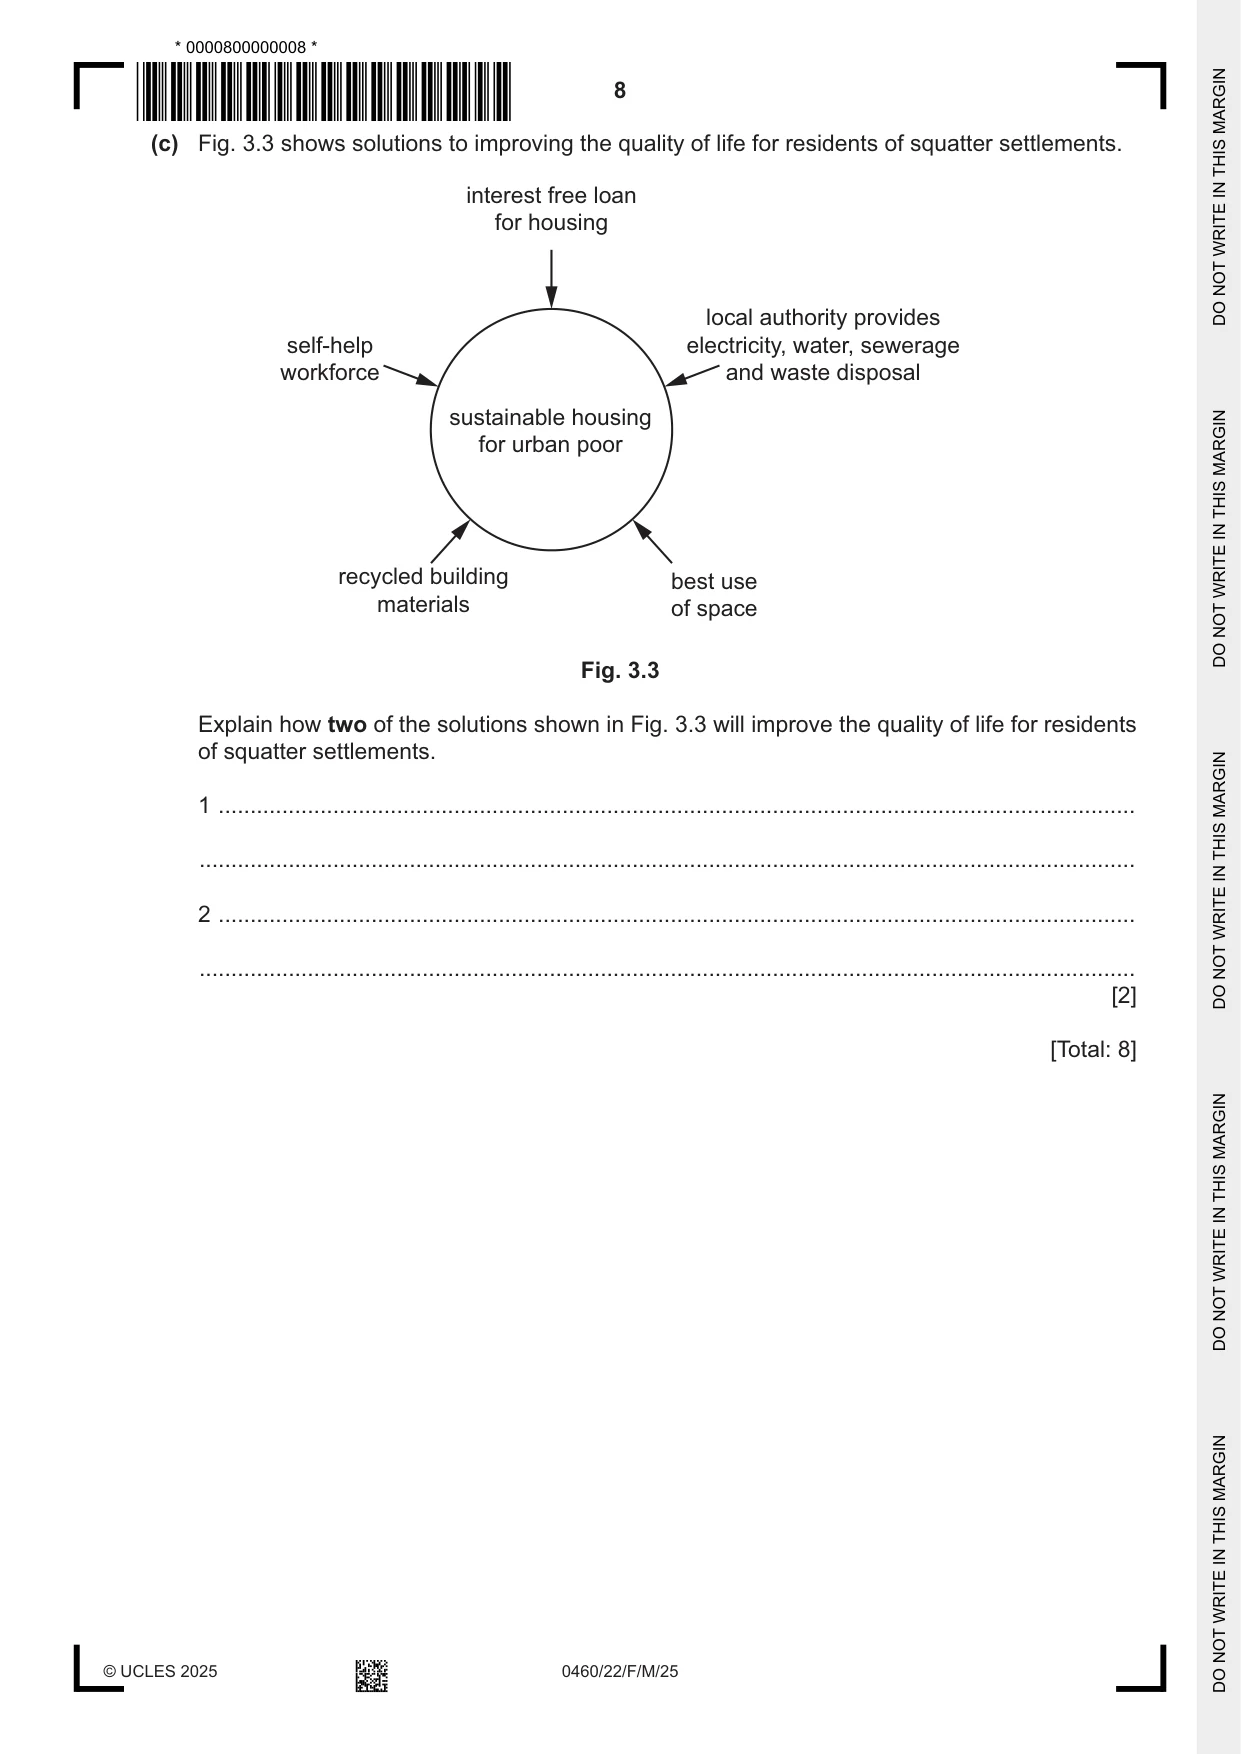
3 (a) Fig. 3.1 shows the urban population living in squatter settlements in 2000 and 2018 in selected world regions (millions). Content removed due to copyright restrictions. Fig. 3.1 Describe the main changes shown in Fig. 3.1. Do not use statistics in your answer. ................................................................................................................................................... ................................................................................................................................................... ................................................................................................................................................... ............................................................................................................................................. [2] (b) (i) What is a squatter settlement? ........................................................................................................................................... ..................................................................................................................................... [1] (ii) Fig. 3.2 is a sketch of part of a squatter settlement. Using arrows, annotate (fully label) Fig. 3.2 to describe three features of the houses. Fig. 3.2 [3] (c) Fig. 3.3 shows solutions to improving the quality of life for residents of squatter settlements. interest free loan for housing local authority provides self-help electricity, water, sewerage workforce and waste disposal sustainable housing for urban poor recycled building best use materials of space Fig. 3.3 Explain how two of the solutions shown in Fig. 3.3 will improve the quality of life for residents of squatter settlements. 1 ................................................................................................................................................ ................................................................................................................................................... 2 ................................................................................................................................................ ................................................................................................................................................... [2] [Total: 8]
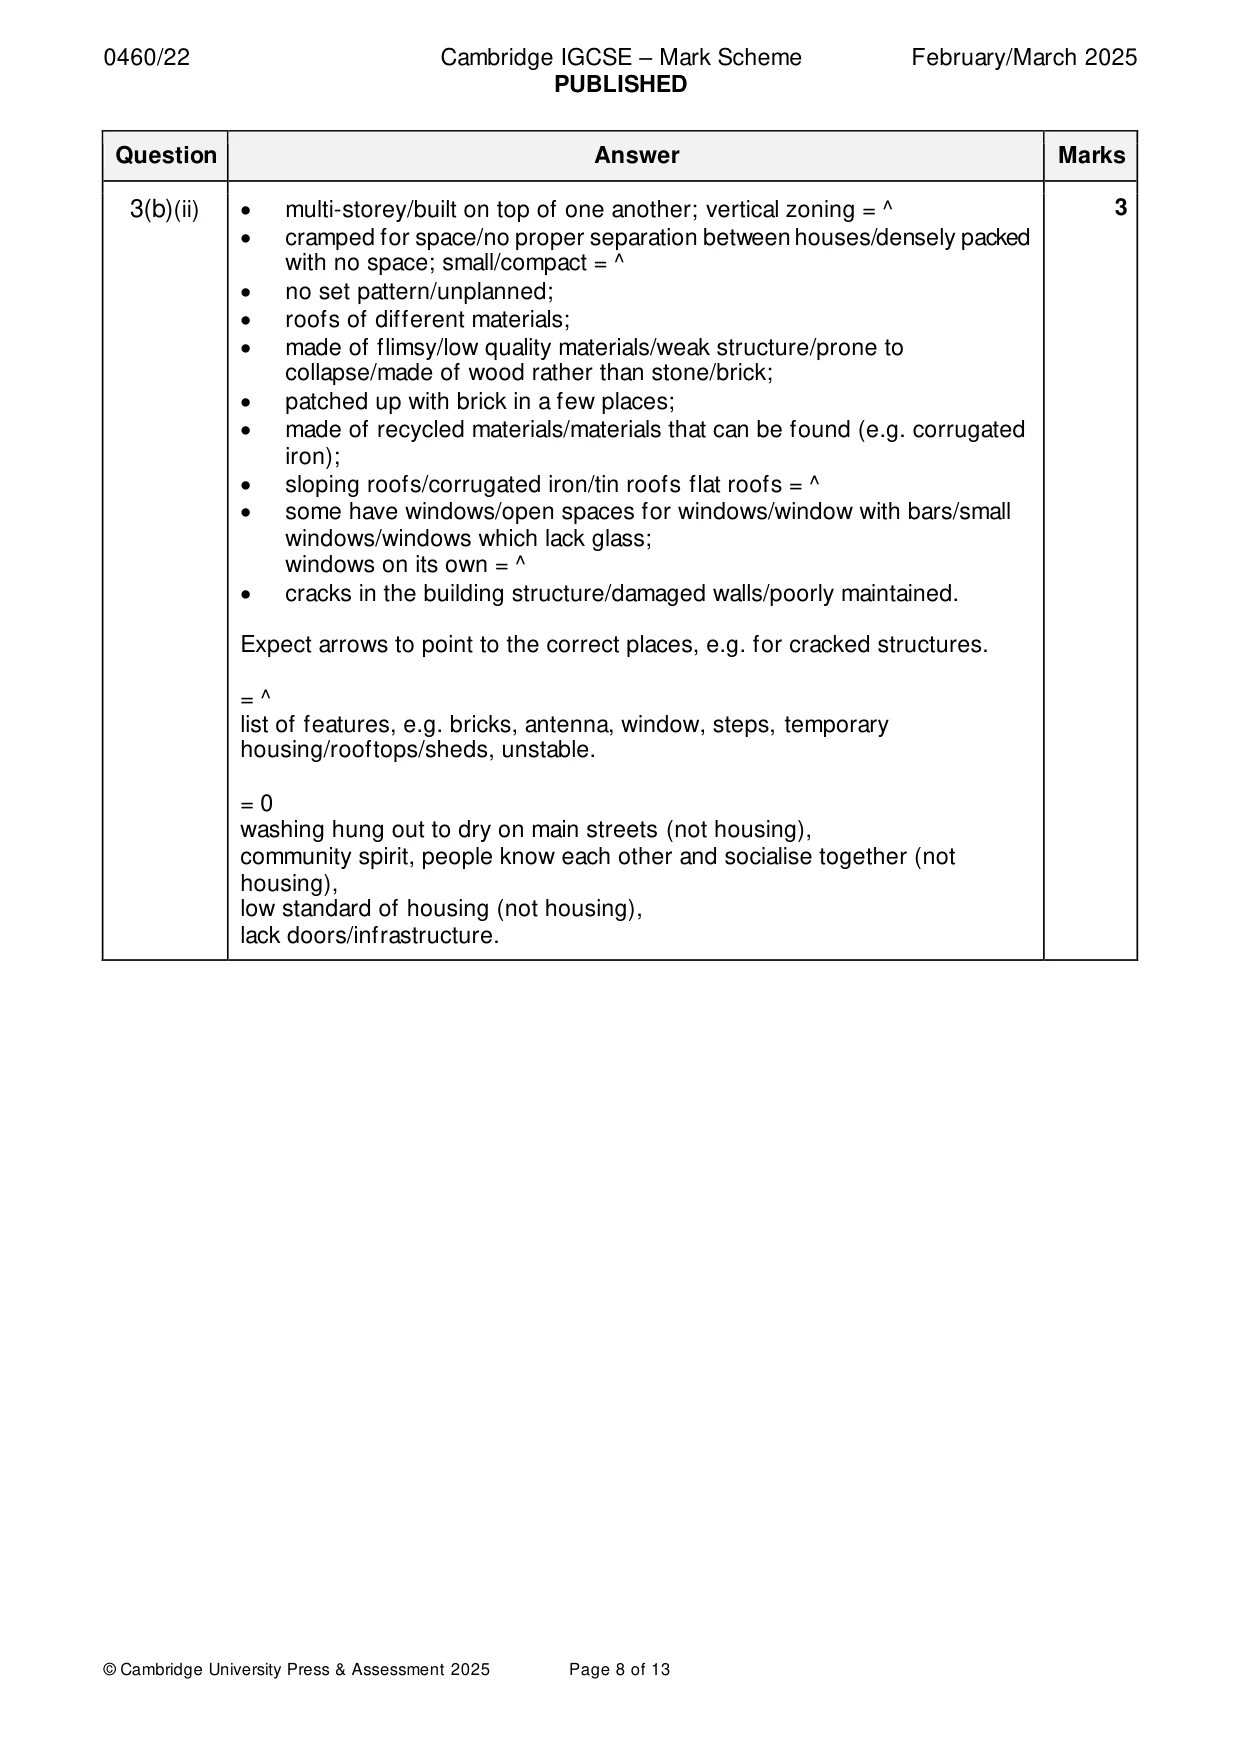
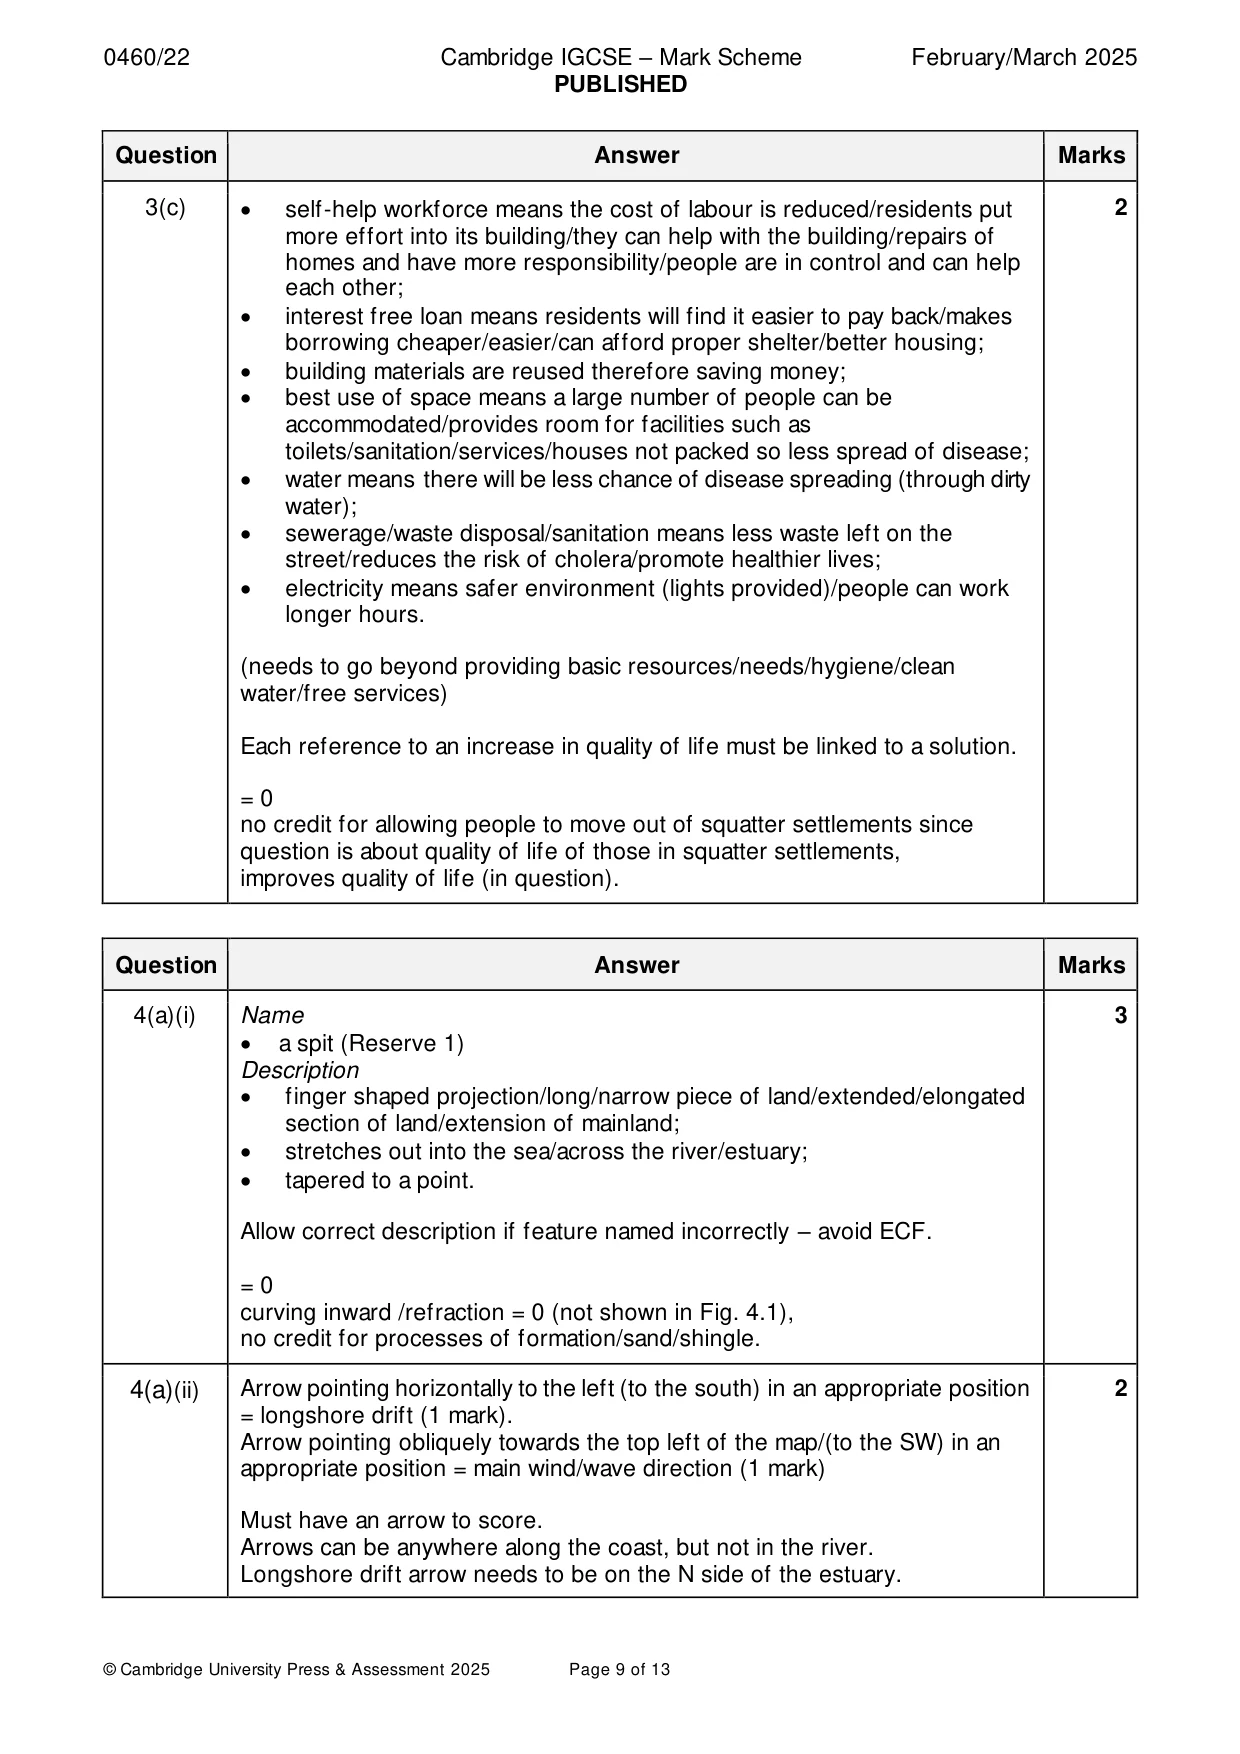
Mark scheme: 3(a) • general increase/world population has increased; 2 • biggest increase in sub-Saharan Africa; • Latin America/the Caribbean have decreased/all regions have increased apart from Latin America and the Caribbean. Allow points even if urban population living in squatter settlements is not mentioned. 3(b)(i) • A collection of buildings/settlement where people have no legal rights to 1 the land they are built on/people are living there illegally/on land not owned or rented by its inhabitants; unofficial = ^ • An area of crowded/low quality/temporary housing/slum occupied by (urban) poor people/people who have a poor living standard. = 0 slum on its own (needs the two parts for the second point), no credit for description of housing materials. 3(b)(ii) • multi-storey/built on top of one another; vertical zoning = ^ 3 • cramped for space/no proper separation between houses/densely packed with no space; small/compact = ^ • no set pattern/unplanned; • roofs of different materials; • made of flimsy/low quality materials/weak structure/prone to collapse/made of wood rather than stone/brick; • patched up with brick in a few places; • made of recycled materials/materials that can be found (e.g. corrugated iron); • sloping roofs/corrugated iron/tin roofs flat roofs = ^ • some have windows/open spaces for windows/window with bars/small windows/windows which lack glass; windows on its own = ^ • cracks in the building structure/damaged walls/poorly maintained. Expect arrows to point to the correct places, e.g. for cracked structures. = ^ list of features, e.g. bricks, antenna, window, steps, temporary housing/rooftops/sheds, unstable. = 0 washing hung out to dry on main streets (not housing), community spirit, people know each other and socialise together (not housing), low standard of housing (not housing), lack doors/infrastructure. 3(c) • self-help workforce means the cost of labour is reduced/residents put 2 more effort into its building/they can help with the building/repairs of homes and have more responsibility/people are in control and can help each other; • interest free loan means residents will find it easier to pay back/makes borrowing cheaper/easier/can afford proper shelter/better housing; • building materials are reused therefore saving money; • best use of space means a large number of people can be accommodated/provides room for facilities such as toilets/sanitation/services/houses not packed so less spread of disease; • water means there will be less chance of disease spreading (through dirty water); • sewerage/waste disposal/sanitation means less waste left on the street/reduces the risk of cholera/promote healthier lives; • electricity means safer environment (lights provided)/people can work longer hours. (needs to go beyond providing basic resources/needs/hygiene/clean water/free services) Each reference to an increase in quality of life must be linked to a solution. = 0 no credit for allowing people to move out of squatter settlements since question is about quality of life of those in squatter settlements, improves quality of life (in question).
Q4 · A sketch of a section of coast at Teignmouth in the UK
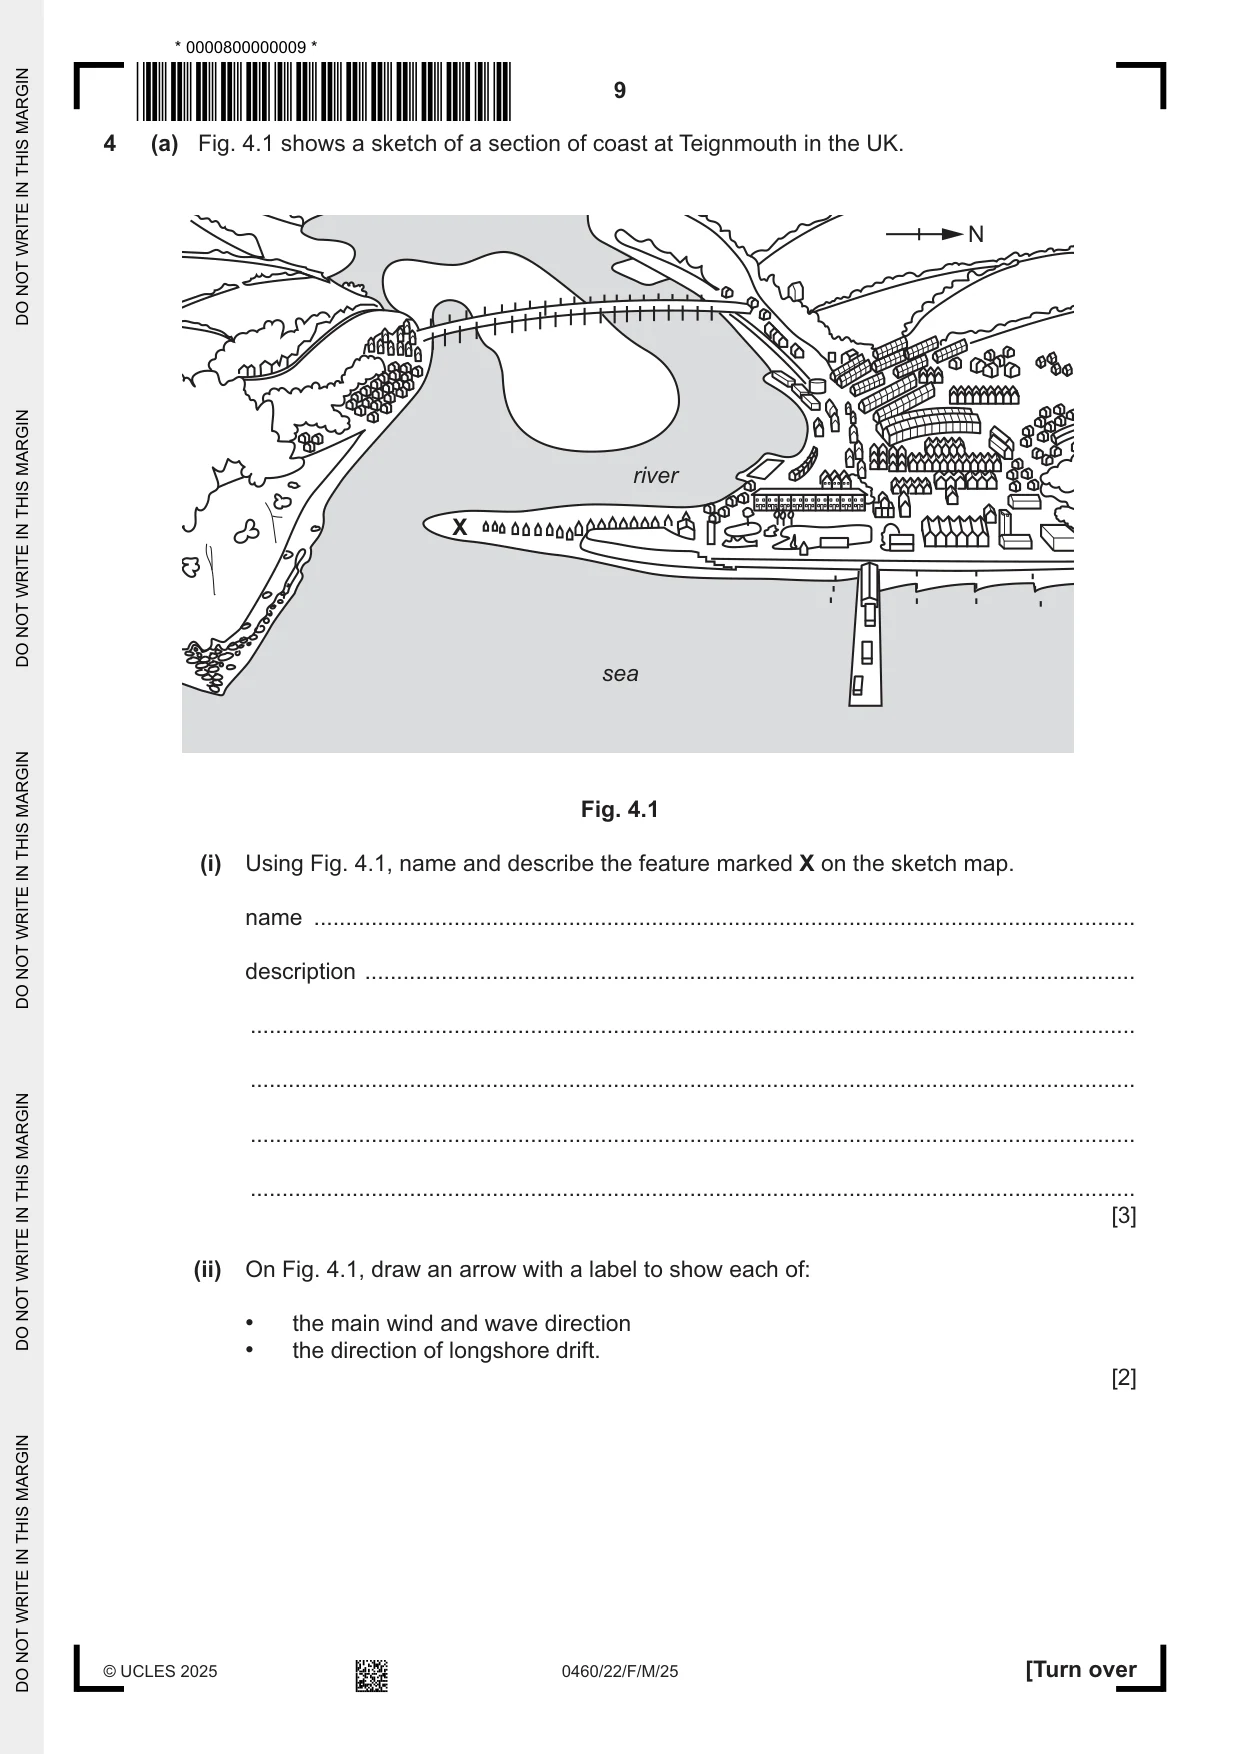
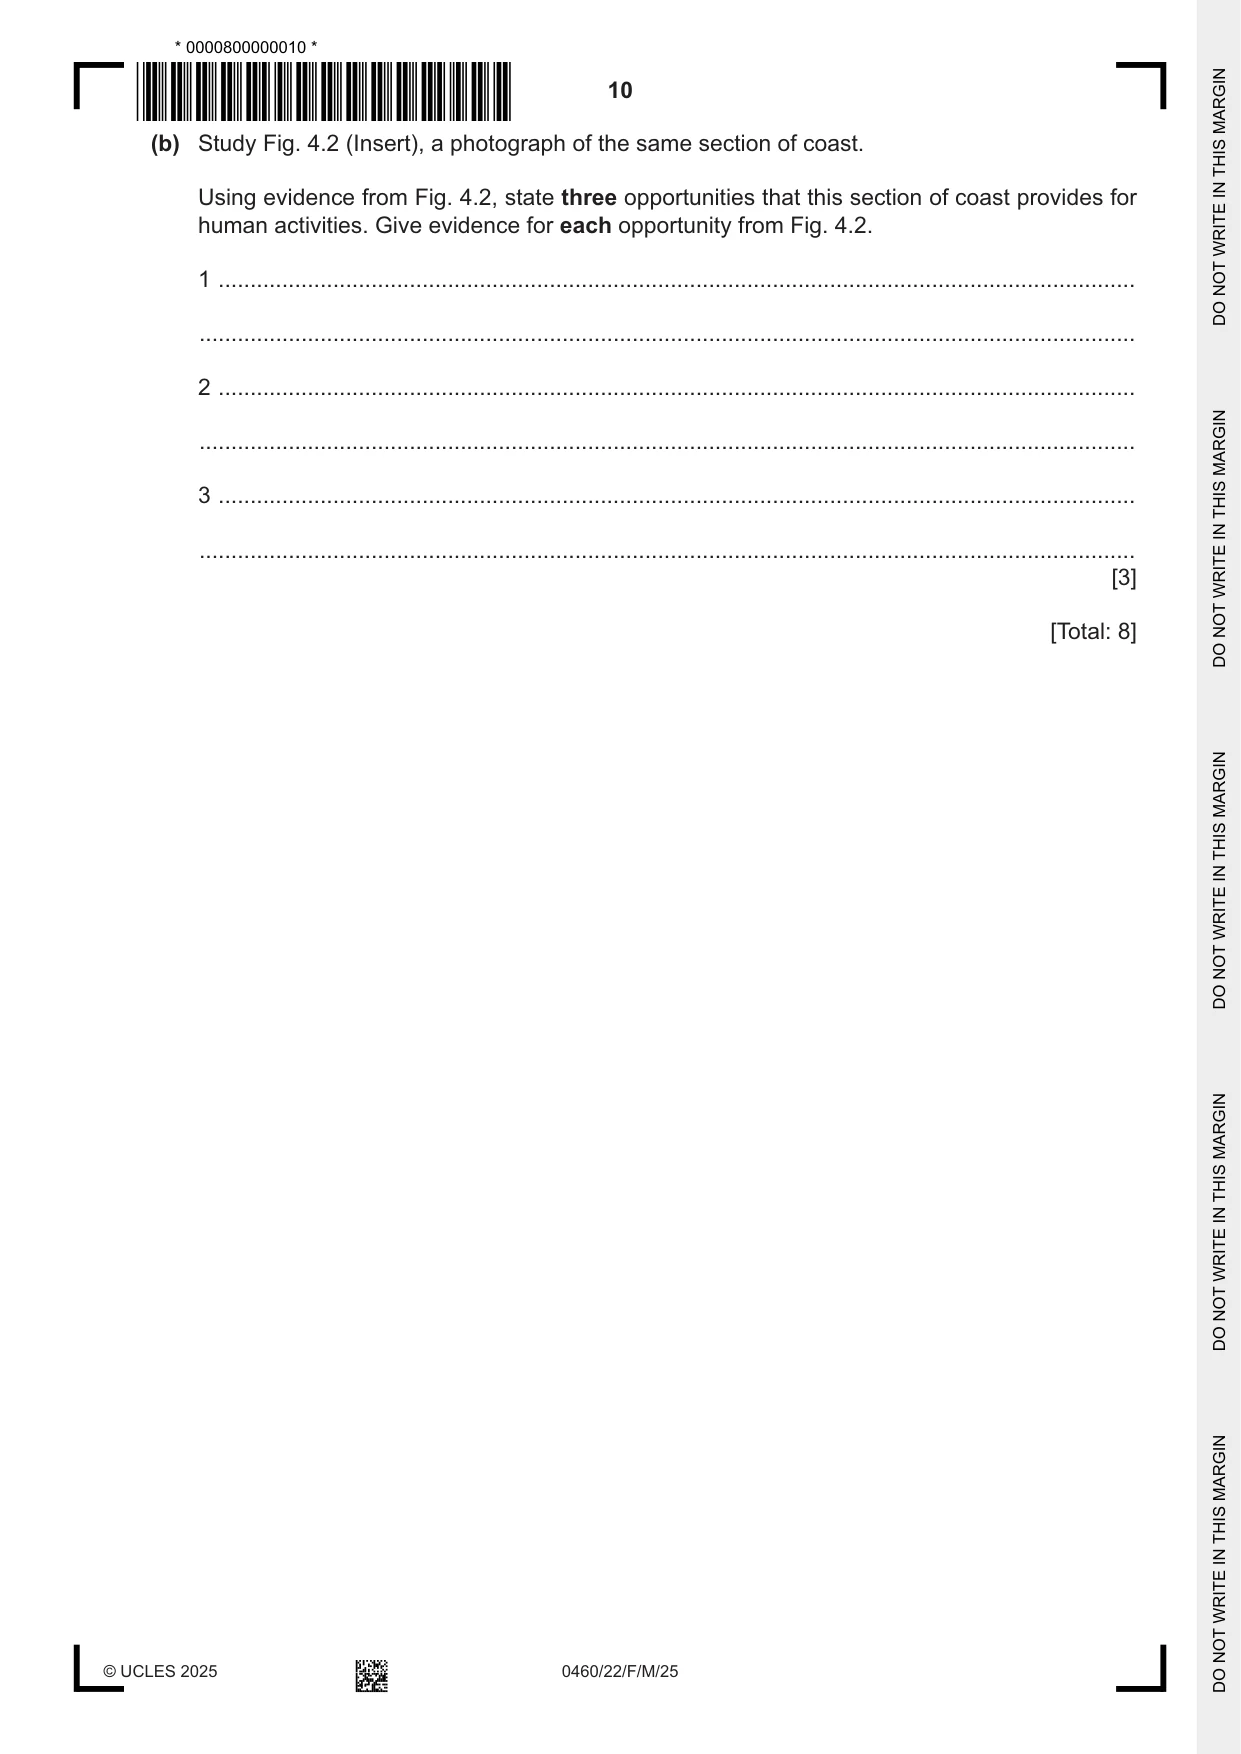
4 (a) Fig. 4.1 shows a sketch of a section of coast at Teignmouth in the UK. N river X sea Fig. 4.1 (i) Using Fig. 4.1, name and describe the feature marked X on the sketch map. name ................................................................................................................................. description ......................................................................................................................... ........................................................................................................................................... ........................................................................................................................................... ........................................................................................................................................... ........................................................................................................................................... [3] (ii) On Fig. 4.1, draw an arrow with a label to show each of: • the main wind and wave direction • the direction of longshore drift. [2] (b) Study Fig. 4.2 (Insert), a photograph of the same section of coast. Using evidence from Fig. 4.2, state three opportunities that this section of coast provides for human activities. Give evidence for each opportunity from Fig. 4.2. 1 ................................................................................................................................................ ................................................................................................................................................... 2 ................................................................................................................................................ ................................................................................................................................................... 3 ................................................................................................................................................ ................................................................................................................................................... [3] [Total: 8]
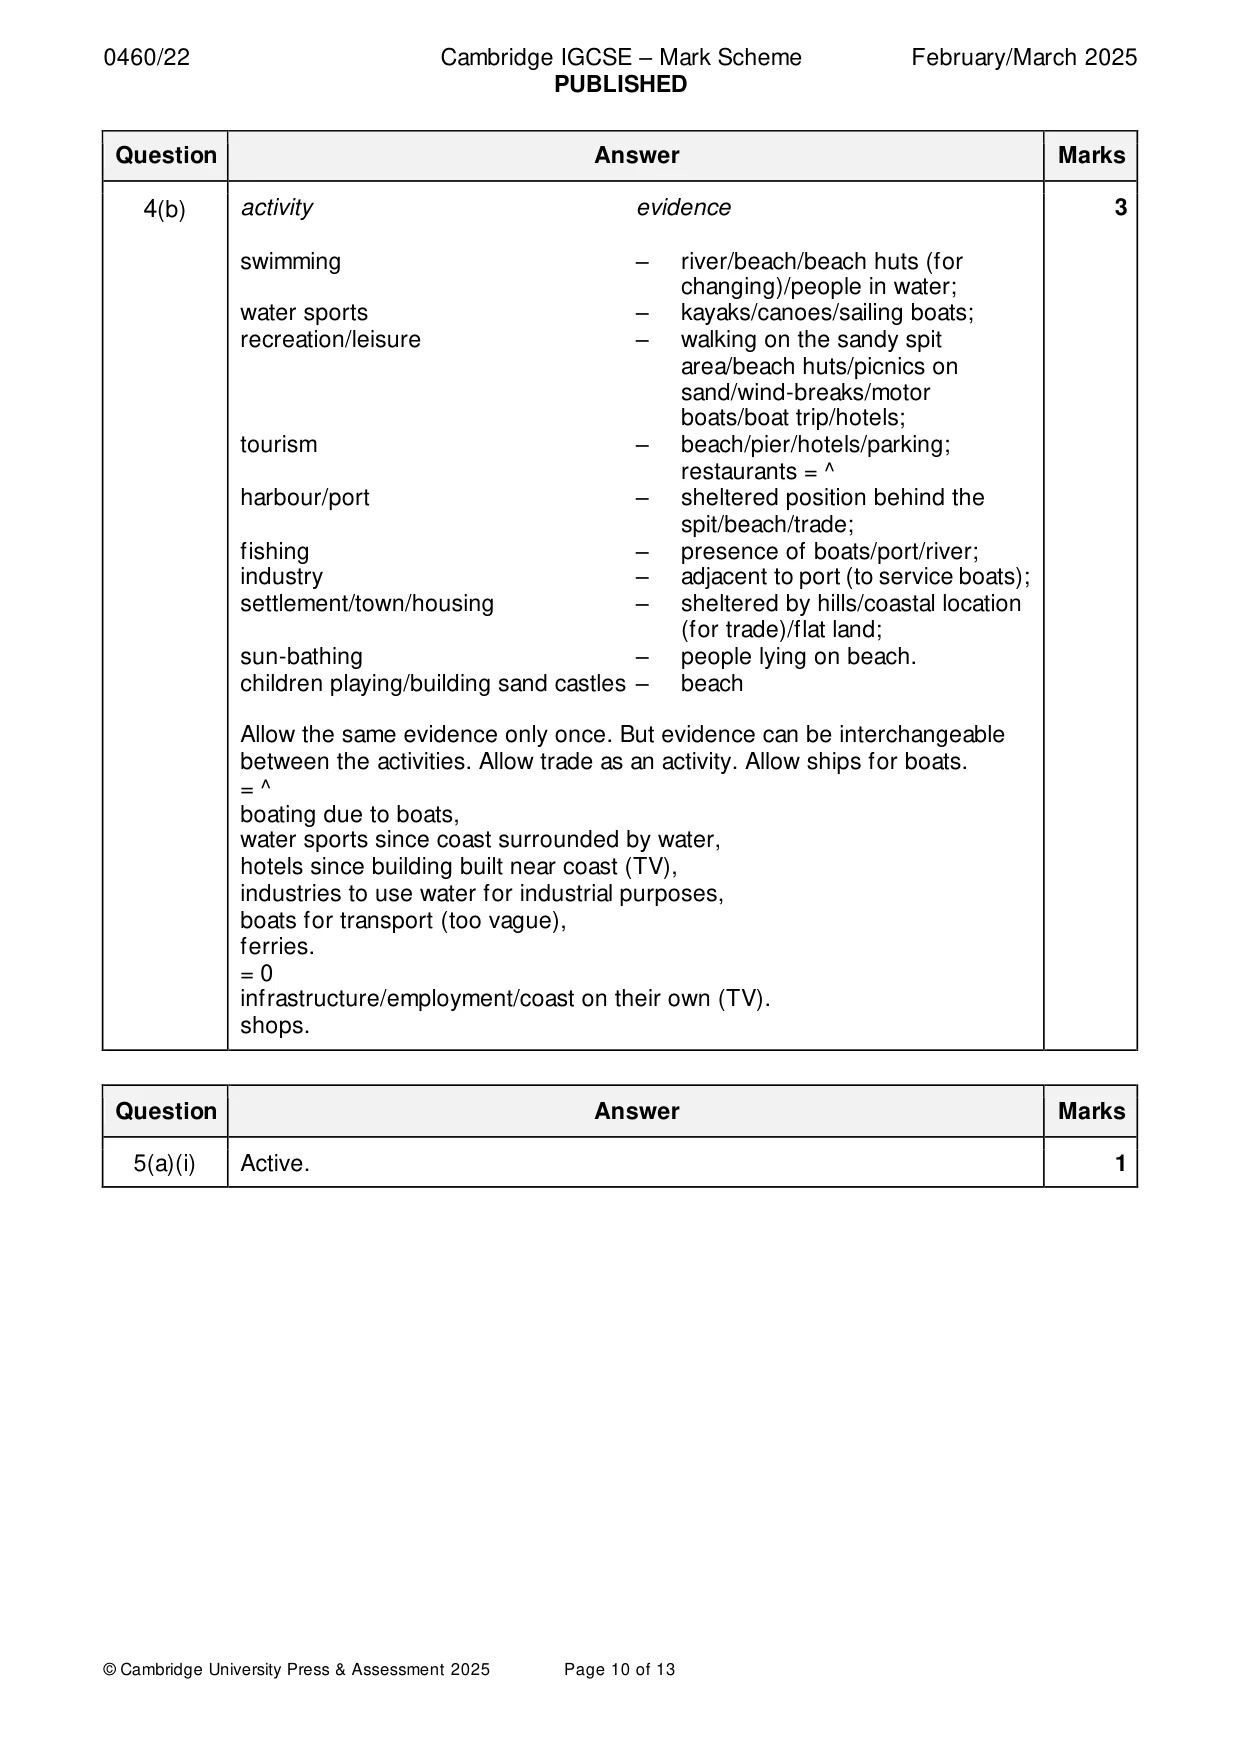
Mark scheme: 4(a)(i) Name 3 • a spit (Reserve 1) Description • finger shaped projection/long/narrow piece of land/extended/elongated section of land/extension of mainland; • stretches out into the sea/across the river/estuary; • tapered to a point. Allow correct description if feature named incorrectly – avoid ECF. = 0 curving inward /refraction = 0 (not shown in Fig. 4.1), no credit for processes of formation/sand/shingle. 4(a)(ii) Arrow pointing horizontally to the left (to the south) in an appropriate position 2 = longshore drift (1 mark). Arrow pointing obliquely towards the top left of the map/(to the SW) in an appropriate position = main wind/wave direction (1 mark) Must have an arrow to score. Arrows can be anywhere along the coast, but not in the river. Longshore drift arrow needs to be on the N side of the estuary. 4(b) activity evidence 3 swimming – river/beach/beach huts (for changing)/people in water; water sports – kayaks/canoes/sailing boats; recreation/leisure – walking on the sandy spit area/beach huts/picnics on sand/wind-breaks/motor boats/boat trip/hotels; tourism – beach/pier/hotels/parking; restaurants = ^ harbour/port – sheltered position behind the spit/beach/trade; fishing – presence of boats/port/river; industry – adjacent to port (to service boats); settlement/town/housing – sheltered by hills/coastal location (for trade)/flat land; sun-bathing – people lying on beach. children playing/building sand castles – beach Allow the same evidence only once. But evidence can be interchangeable between the activities. Allow trade as an activity. Allow ships for boats. = ^ boating due to boats, water sports since coast surrounded by water, hotels since building built near coast (TV), industries to use water for industrial purposes, boats for transport (too vague), ferries. = 0 infrastructure/employment/coast on their own (TV). shops.
Question 5
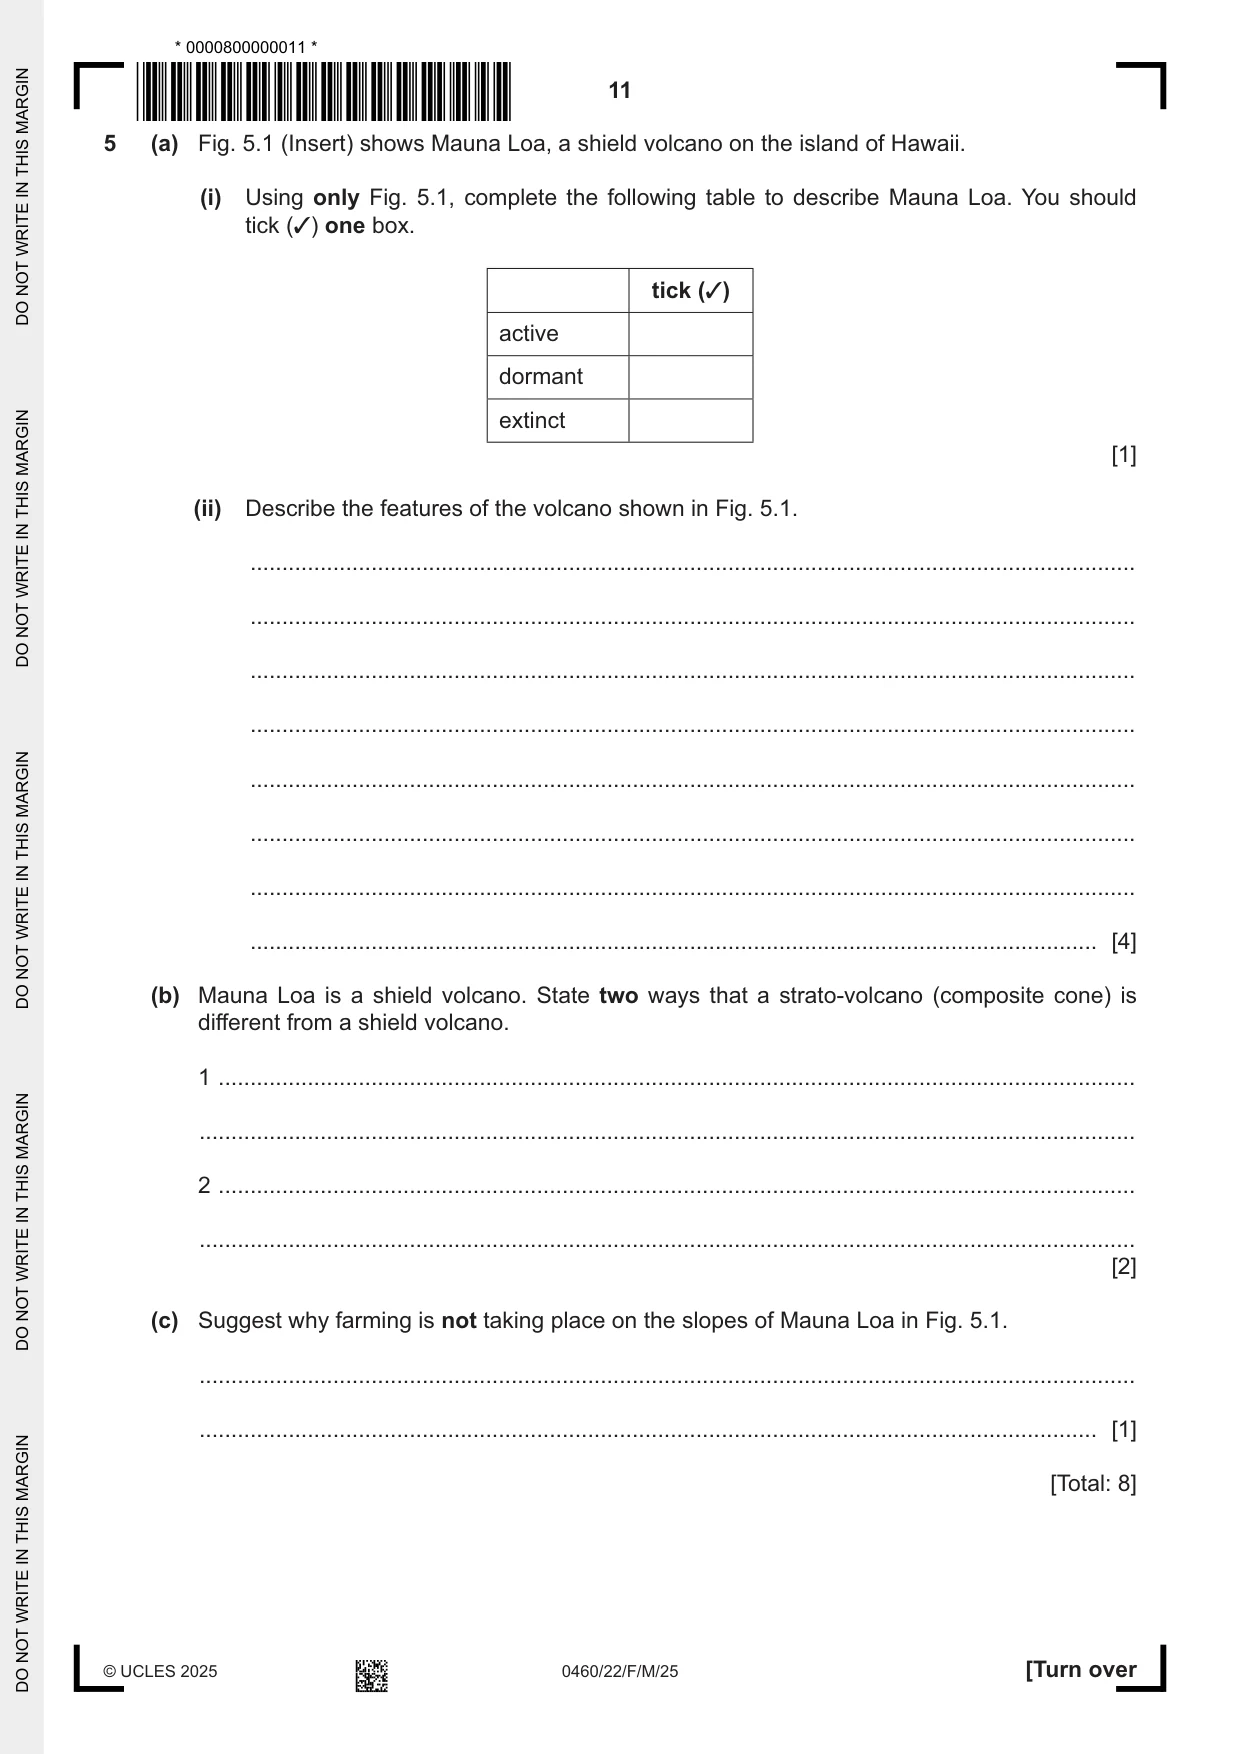
5 (a) Fig. 5.1 (Insert) shows Mauna Loa, a shield volcano on the island of Hawaii. (i) Using only Fig. 5.1, complete the following table to describe Mauna Loa. You should tick (3) one box. tick (3) active dormant extinct [1] (ii) Describe the features of the volcano shown in Fig. 5.1. ........................................................................................................................................... ........................................................................................................................................... ........................................................................................................................................... ........................................................................................................................................... ........................................................................................................................................... ........................................................................................................................................... ........................................................................................................................................... ..................................................................................................................................... [4] (b) Mauna Loa is a shield volcano. State two ways that a strato-volcano (composite cone) is different from a shield volcano. 1 ................................................................................................................................................ ................................................................................................................................................... 2 ................................................................................................................................................ ................................................................................................................................................... [2] (c) Suggest why farming is not taking place on the slopes of Mauna Loa in Fig. 5.1. ................................................................................................................................................... ............................................................................................................................................. [1] [Total: 8]
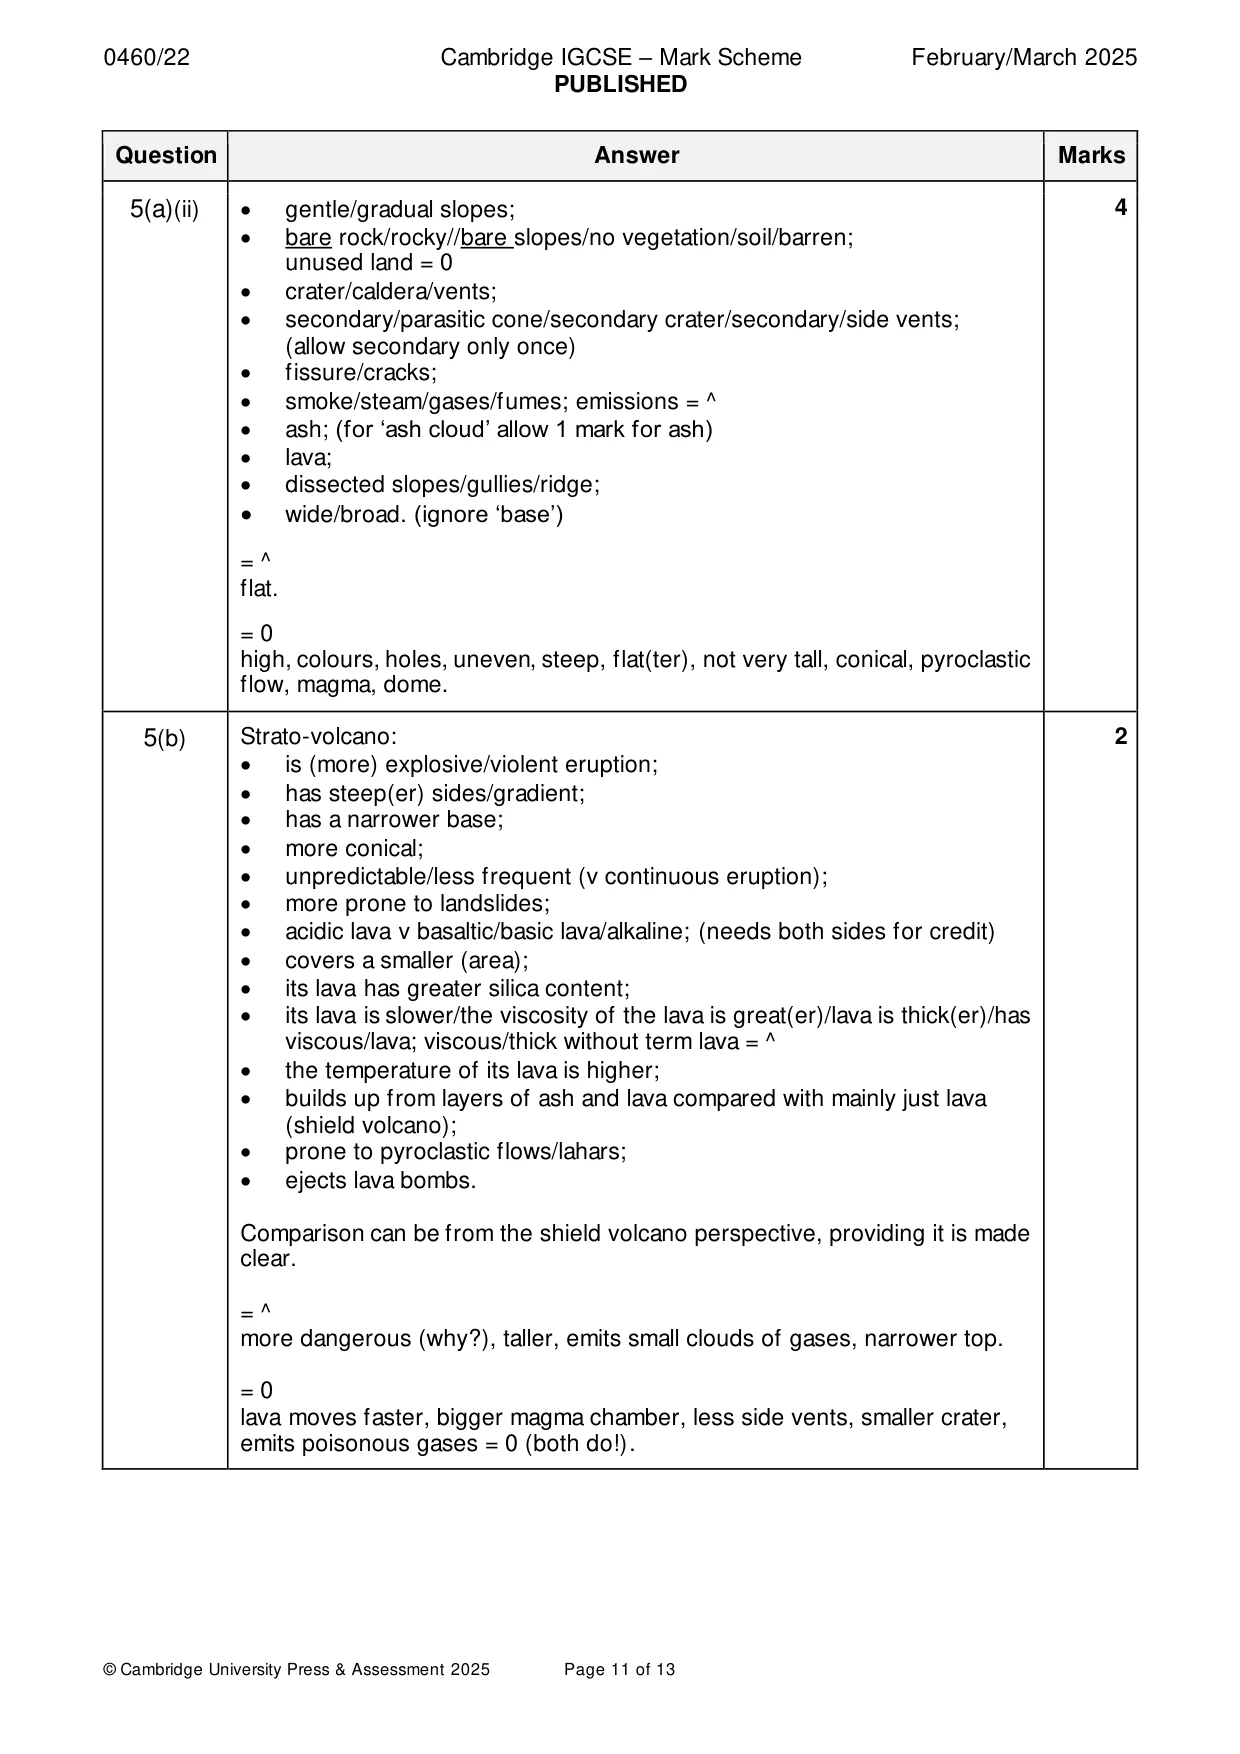
Mark scheme: 5(a)(i) Active. 1 5(a)(ii) • gentle/gradual slopes; 4 • bare rock/rocky//bare slopes/no vegetation/soil/barren; unused land = 0 • crater/caldera/vents; • secondary/parasitic cone/secondary crater/secondary/side vents; (allow secondary only once) • fissure/cracks; • smoke/steam/gases/fumes; emissions = ^ • ash; (for ‘ash cloud’ allow 1 mark for ash) • lava; • dissected slopes/gullies/ridge; • wide/broad. (ignore ‘base’) = ^ flat. = 0 high, colours, holes, uneven, steep, flat(ter), not very tall, conical, pyroclastic flow, magma, dome. 5(b) Strato-volcano: 2 • is (more) explosive/violent eruption; • has steep(er) sides/gradient; • has a narrower base; • more conical; • unpredictable/less frequent (v continuous eruption); • more prone to landslides; • acidic lava v basaltic/basic lava/alkaline; (needs both sides for credit) • covers a smaller (area); • its lava has greater silica content; • its lava is slower/the viscosity of the lava is great(er)/lava is thick(er)/has viscous/lava; viscous/thick without term lava = ^ • the temperature of its lava is higher; • builds up from layers of ash and lava compared with mainly just lava (shield volcano); • prone to pyroclastic flows/lahars; • ejects lava bombs. Comparison can be from the shield volcano perspective, providing it is made clear. = ^ more dangerous (why?), taller, emits small clouds of gases, narrower top. = 0 lava moves faster, bigger magma chamber, less side vents, smaller crater, emits poisonous gases = 0 (both do!). 5(c) • lava is infertile/ not sufficiently weathered/barren/lacks soil; 1 • the volcano has recently erupted lava; • temperature is too hot; • it’s too dangerous/risky(for farming)/volcano is active/can erupt any time; • some slopes are too steep; • lack of water/slopes won’t hold water; • emissions of ash and smoke unhealthy for crops. = ^ uneven land, too much pollution, rugged.
Q6 · Information about India’s water shortage
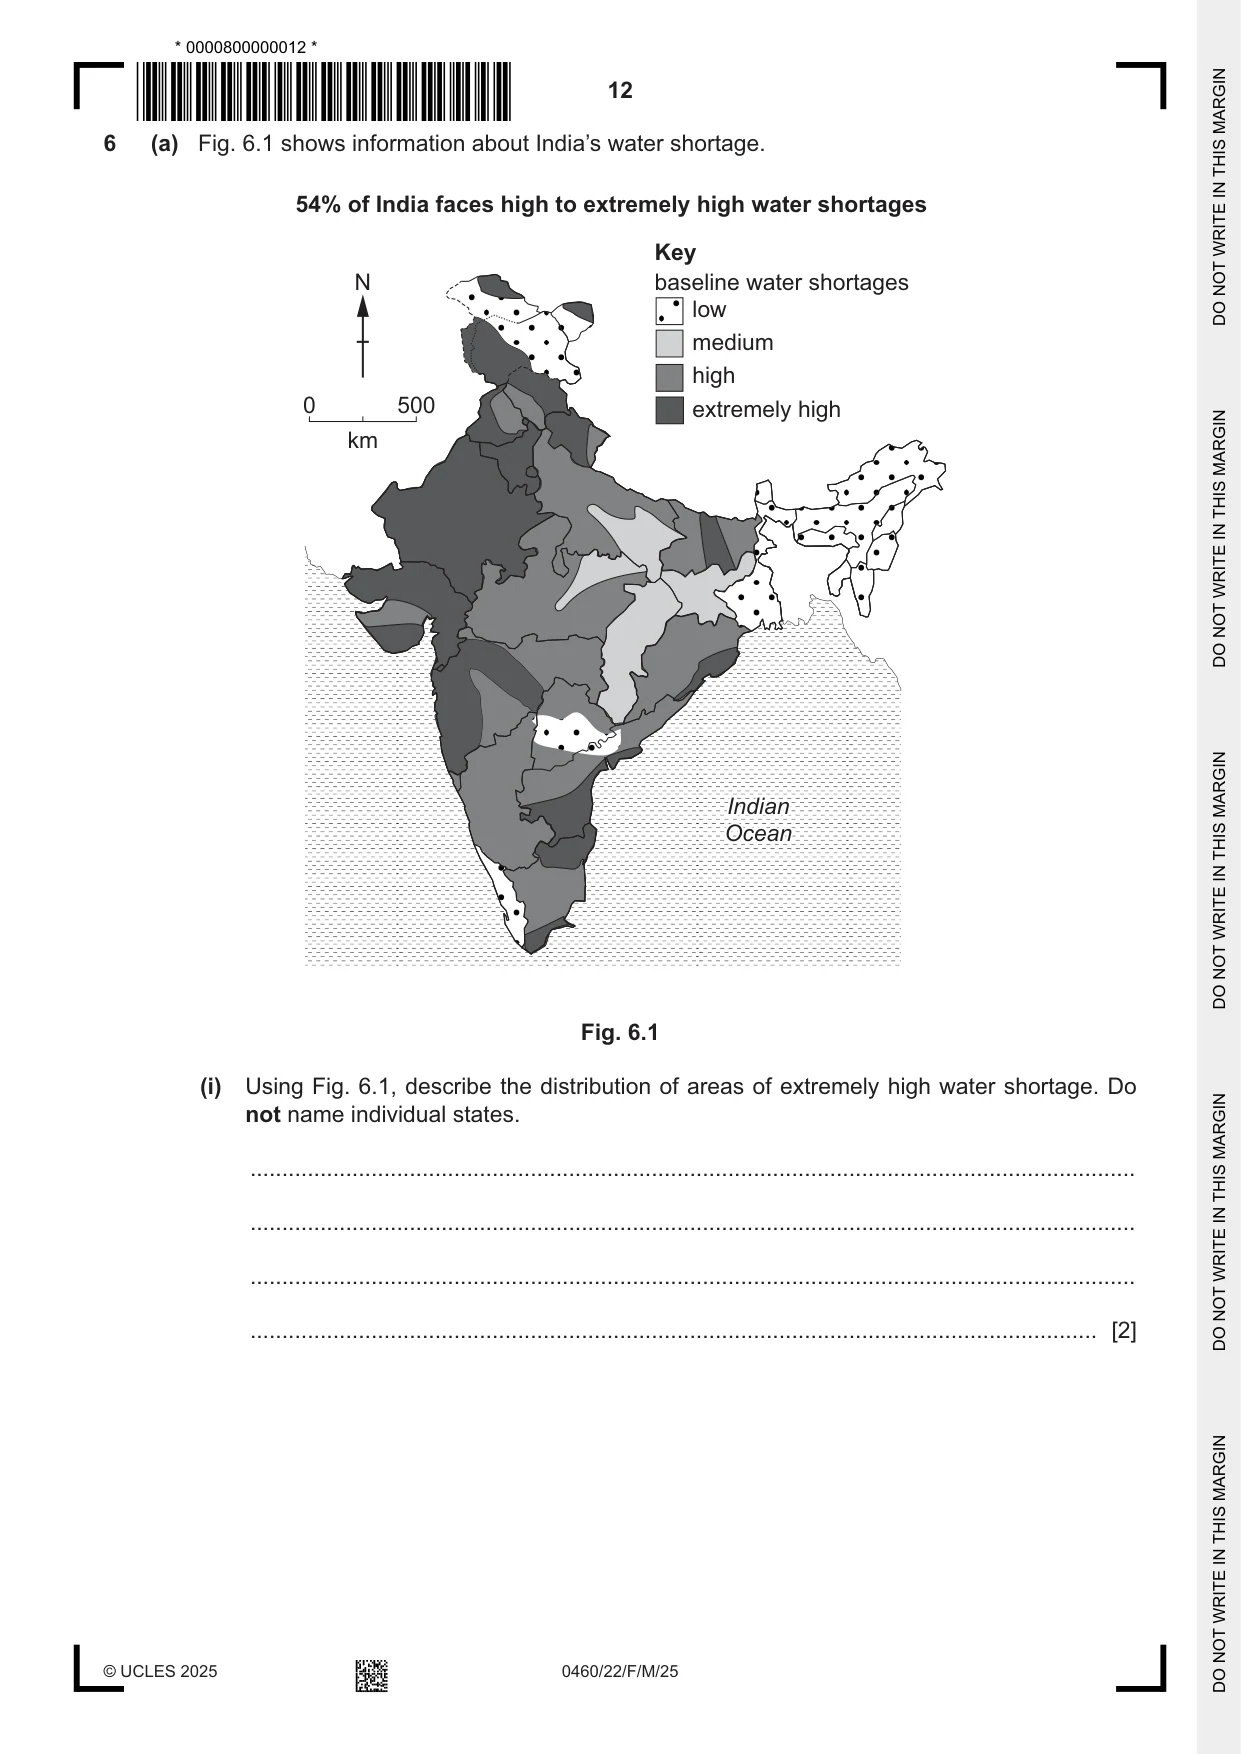
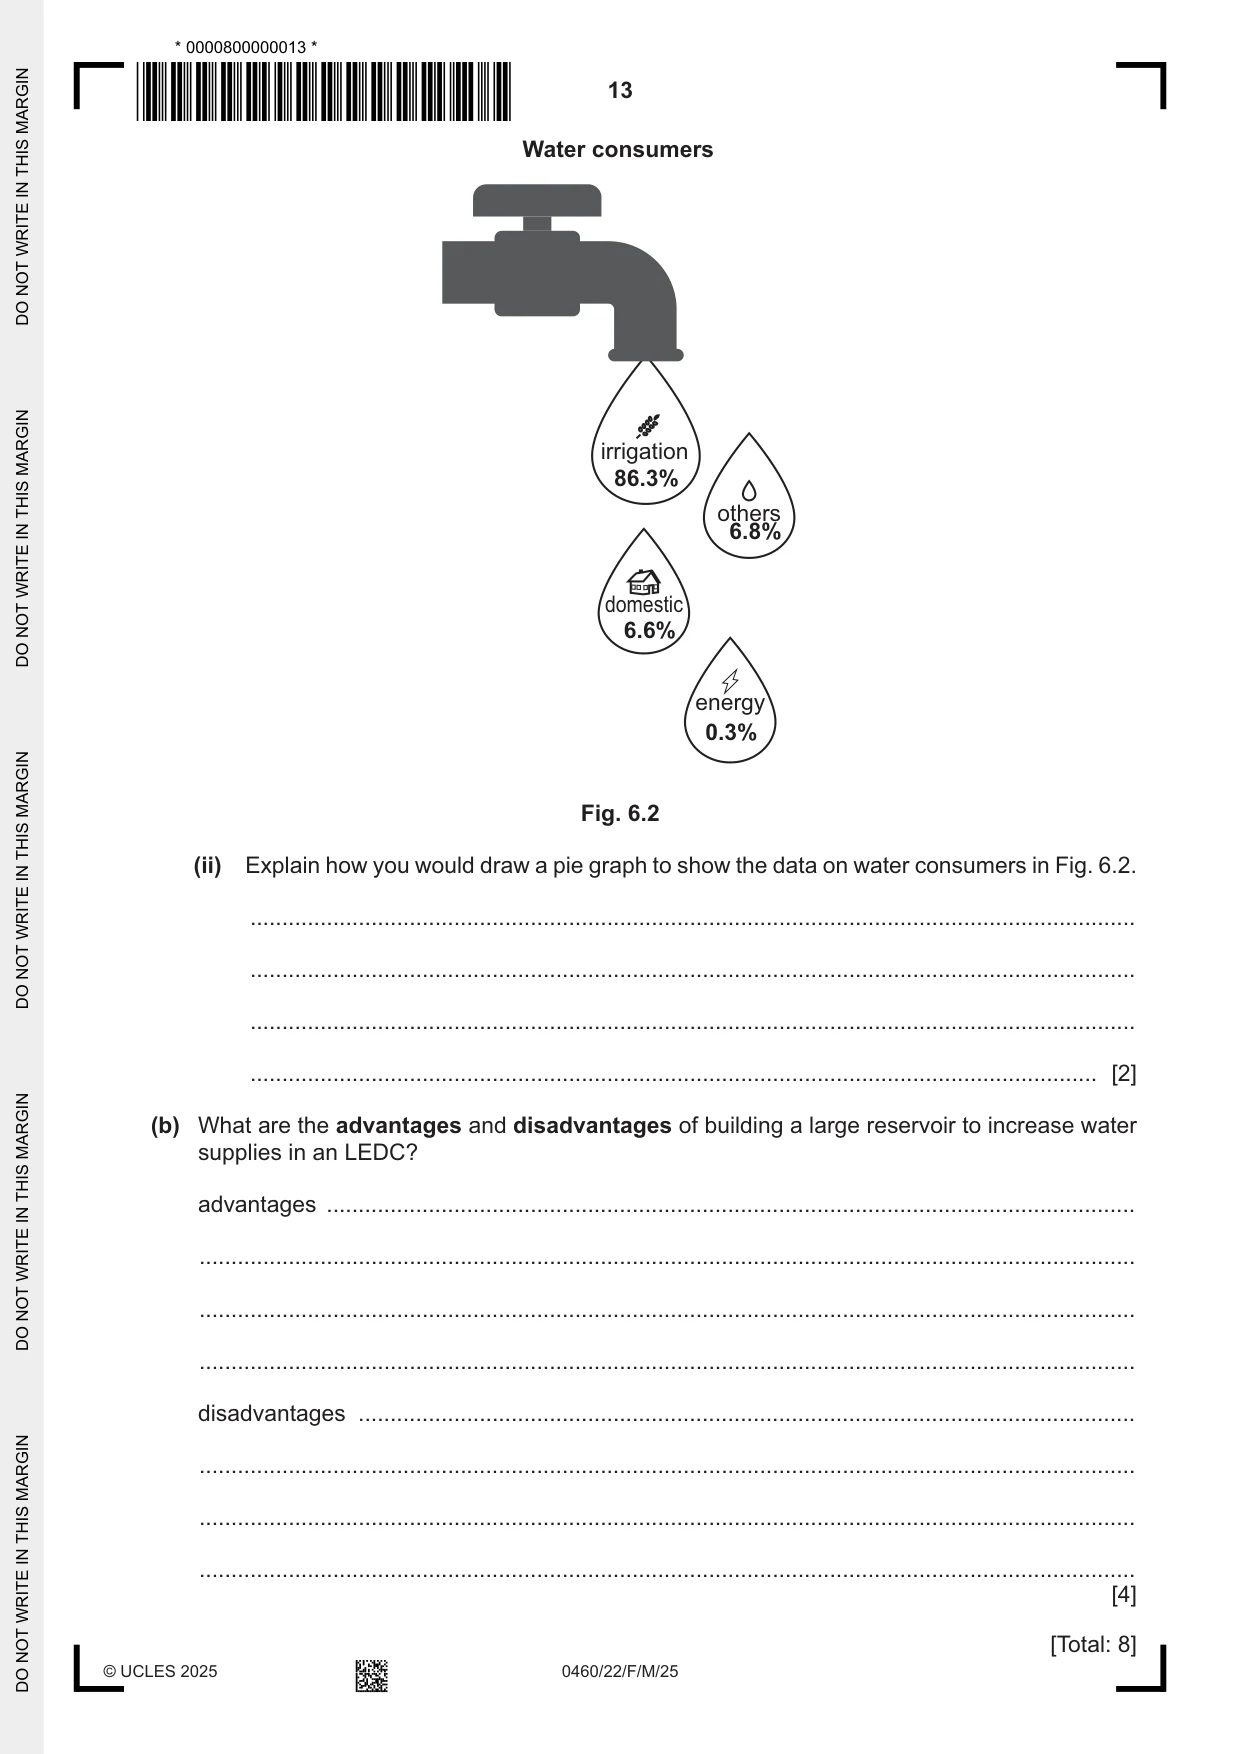
6 (a) Fig. 6.1 shows information about India’s water shortage. 54% of India faces high to extremely high water shortages Key N baseline water shortages low medium high 0 500500 extremely high kmkm IndianIndian OceanOcean Fig. 6.1 (i) Using Fig. 6.1, describe the distribution of areas of extremely high water shortage. Do not name individual states. ........................................................................................................................................... ........................................................................................................................................... ........................................................................................................................................... ..................................................................................................................................... [2] Water consumers irrigation 86.3% others 6.8% domestic 6.6% energy 0.3% Fig. 6.2 (ii) Explain how you would draw a pie graph to show the data on water consumers in Fig. 6.2. ........................................................................................................................................... ........................................................................................................................................... ........................................................................................................................................... ..................................................................................................................................... [2] (b) What are the advantages and disadvantages of building a large reservoir to increase water supplies in an LEDC? advantages ............................................................................................................................... ................................................................................................................................................... ................................................................................................................................................... ................................................................................................................................................... disadvantages .......................................................................................................................... ................................................................................................................................................... ................................................................................................................................................... ................................................................................................................................................... [4] [Total: 8] Additional page If you use the following page to complete the answer to any question, the question number must be clearly shown. .................................................................................................................................................................. .................................................................................................................................................................. .................................................................................................................................................................. .................................................................................................................................................................. .................................................................................................................................................................. .................................................................................................................................................................. .................................................................................................................................................................. .................................................................................................................................................................. .................................................................................................................................................................. .................................................................................................................................................................. .................................................................................................................................................................. .................................................................................................................................................................. .................................................................................................................................................................. .................................................................................................................................................................. .................................................................................................................................................................. .................................................................................................................................................................. .................................................................................................................................................................. .................................................................................................................................................................. .................................................................................................................................................................. .................................................................................................................................................................. .................................................................................................................................................................. .................................................................................................................................................................. .................................................................................................................................................................. .................................................................................................................................................................. .................................................................................................................................................................. .................................................................................................................................................................. © UCLES 2025 0460/22/F/M/25
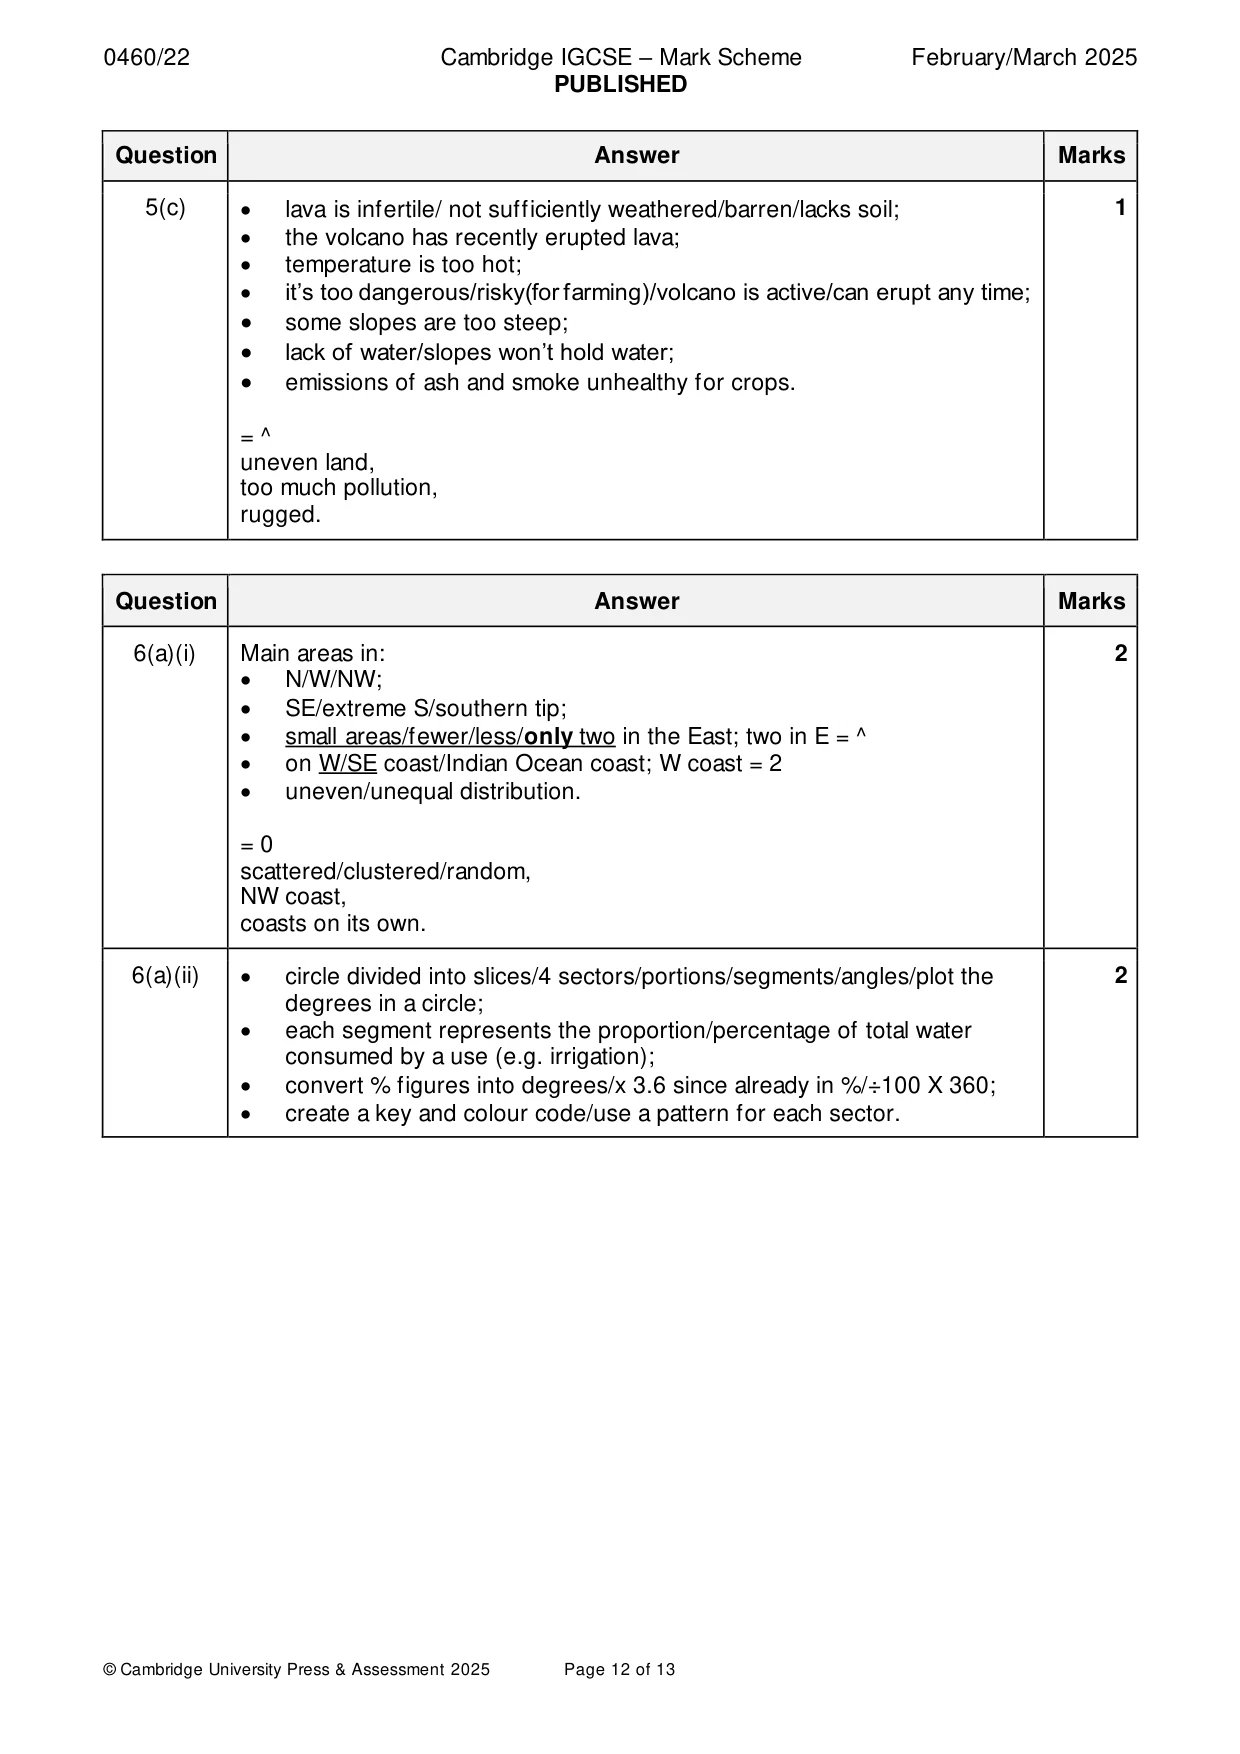
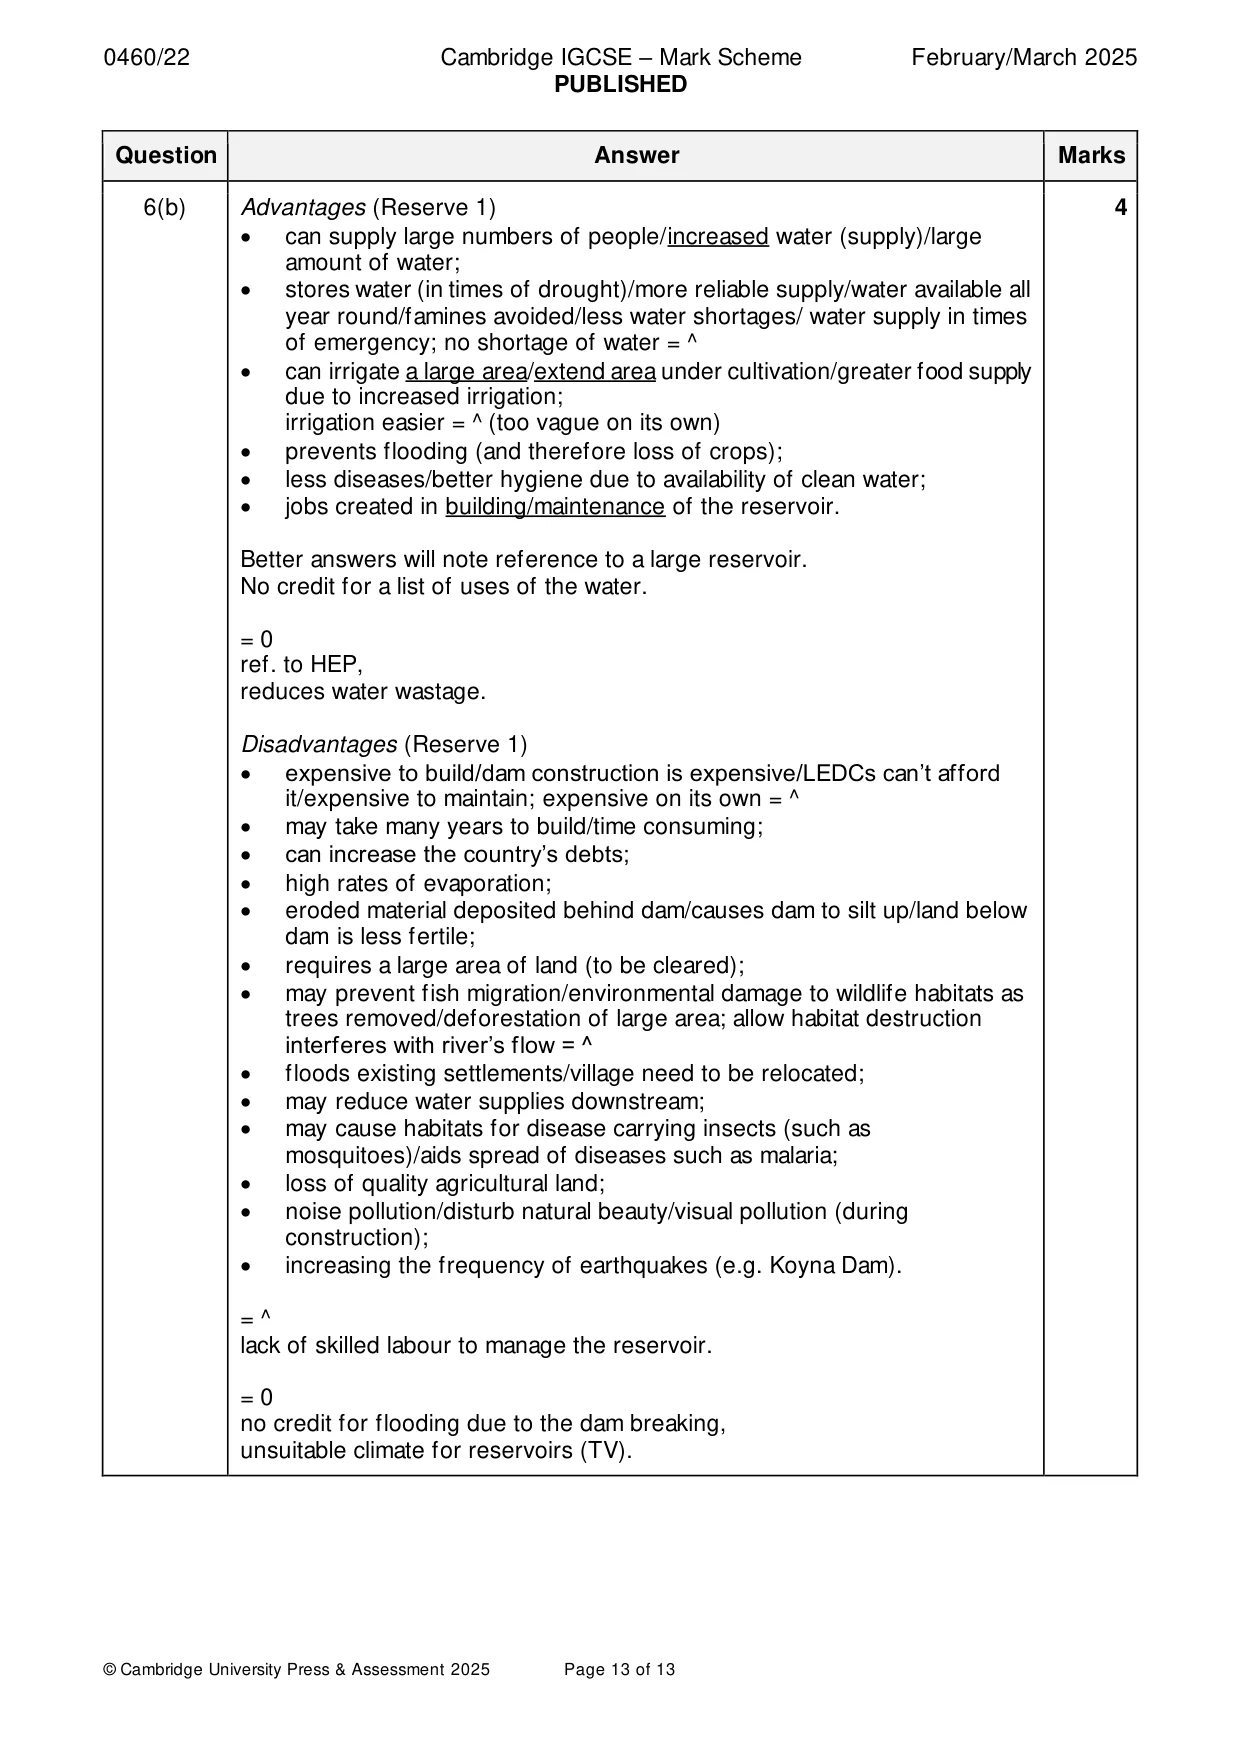
Mark scheme: 6(a)(i) Main areas in: 2 • N/W/NW; • SE/extreme S/southern tip; • small areas/fewer/less/only two in the East; two in E = ^ • on W/SE coast/Indian Ocean coast; W coast = 2 • uneven/unequal distribution. = 0 scattered/clustered/random, NW coast, coasts on its own. 6(a)(ii) • circle divided into slices/4 sectors/portions/segments/angles/plot the 2 degrees in a circle; • each segment represents the proportion/percentage of total water consumed by a use (e.g. irrigation); • convert % figures into degrees/x 3.6 since already in %/÷100 X 360; • create a key and colour code/use a pattern for each sector. 6(b) Advantages (Reserve 1) 4 • can supply large numbers of people/increased water (supply)/large amount of water; • stores water (in times of drought)/more reliable supply/water available all year round/famines avoided/less water shortages/ water supply in times of emergency; no shortage of water = ^ • can irrigate a large area/extend area under cultivation/greater food supply due to increased irrigation; irrigation easier = ^ (too vague on its own) • prevents flooding (and therefore loss of crops); • less diseases/better hygiene due to availability of clean water; • jobs created in building/maintenance of the reservoir. Better answers will note reference to a large reservoir. No credit for a list of uses of the water. = 0 ref. to HEP, reduces water wastage. Disadvantages (Reserve 1) • expensive to build/dam construction is expensive/LEDCs can’t afford it/expensive to maintain; expensive on its own = ^ • may take many years to build/time consuming; • can increase the country’s debts; • high rates of evaporation; • eroded material deposited behind dam/causes dam to silt up/land below dam is less fertile; • requires a large area of land (to be cleared); • may prevent fish migration/environmental damage to wildlife habitats as trees removed/deforestation of large area; allow habitat destruction interferes with river’s flow = ^ • floods existing settlements/village need to be relocated; • may reduce water supplies downstream; • may cause habitats for disease carrying insects (such as mosquitoes)/aids spread of diseases such as malaria; • loss of quality agricultural land; • noise pollution/disturb natural beauty/visual pollution (during construction); • increasing the frequency of earthquakes (e.g. Koyna Dam). = ^ lack of skilled labour to manage the reservoir. = 0 no credit for flooding due to the dam breaking, unsuitable climate for reservoirs (TV).
What was in this paper
The subtopics covered by these 6 questions, and how many questions each got. Open one in a new tab to see every Cambridge question on it.
What you needed in this session
Cambridge’s own grade thresholds for 2025 Feb/March, Paper 2 · Variant 2. A higher threshold means an easier paper — the bar moves with how the cohort did.