Cambridge IGCSE Geography 0460 — 2023 Feb/March Paper 2 · Variant 2
0460/22/F/M/23 · 6 questions · 60 marks · ≈68 min
The question paper and its mark scheme, free to read here and free to download. This is Cambridge’s own paper, exactly as it was sat.
Question paper20 pages




Mark scheme9 pages
Answers below. Sit the paper first if you are practising.
Questions as text
Q1 · Study the map extract for Southannan Sands, Scotland
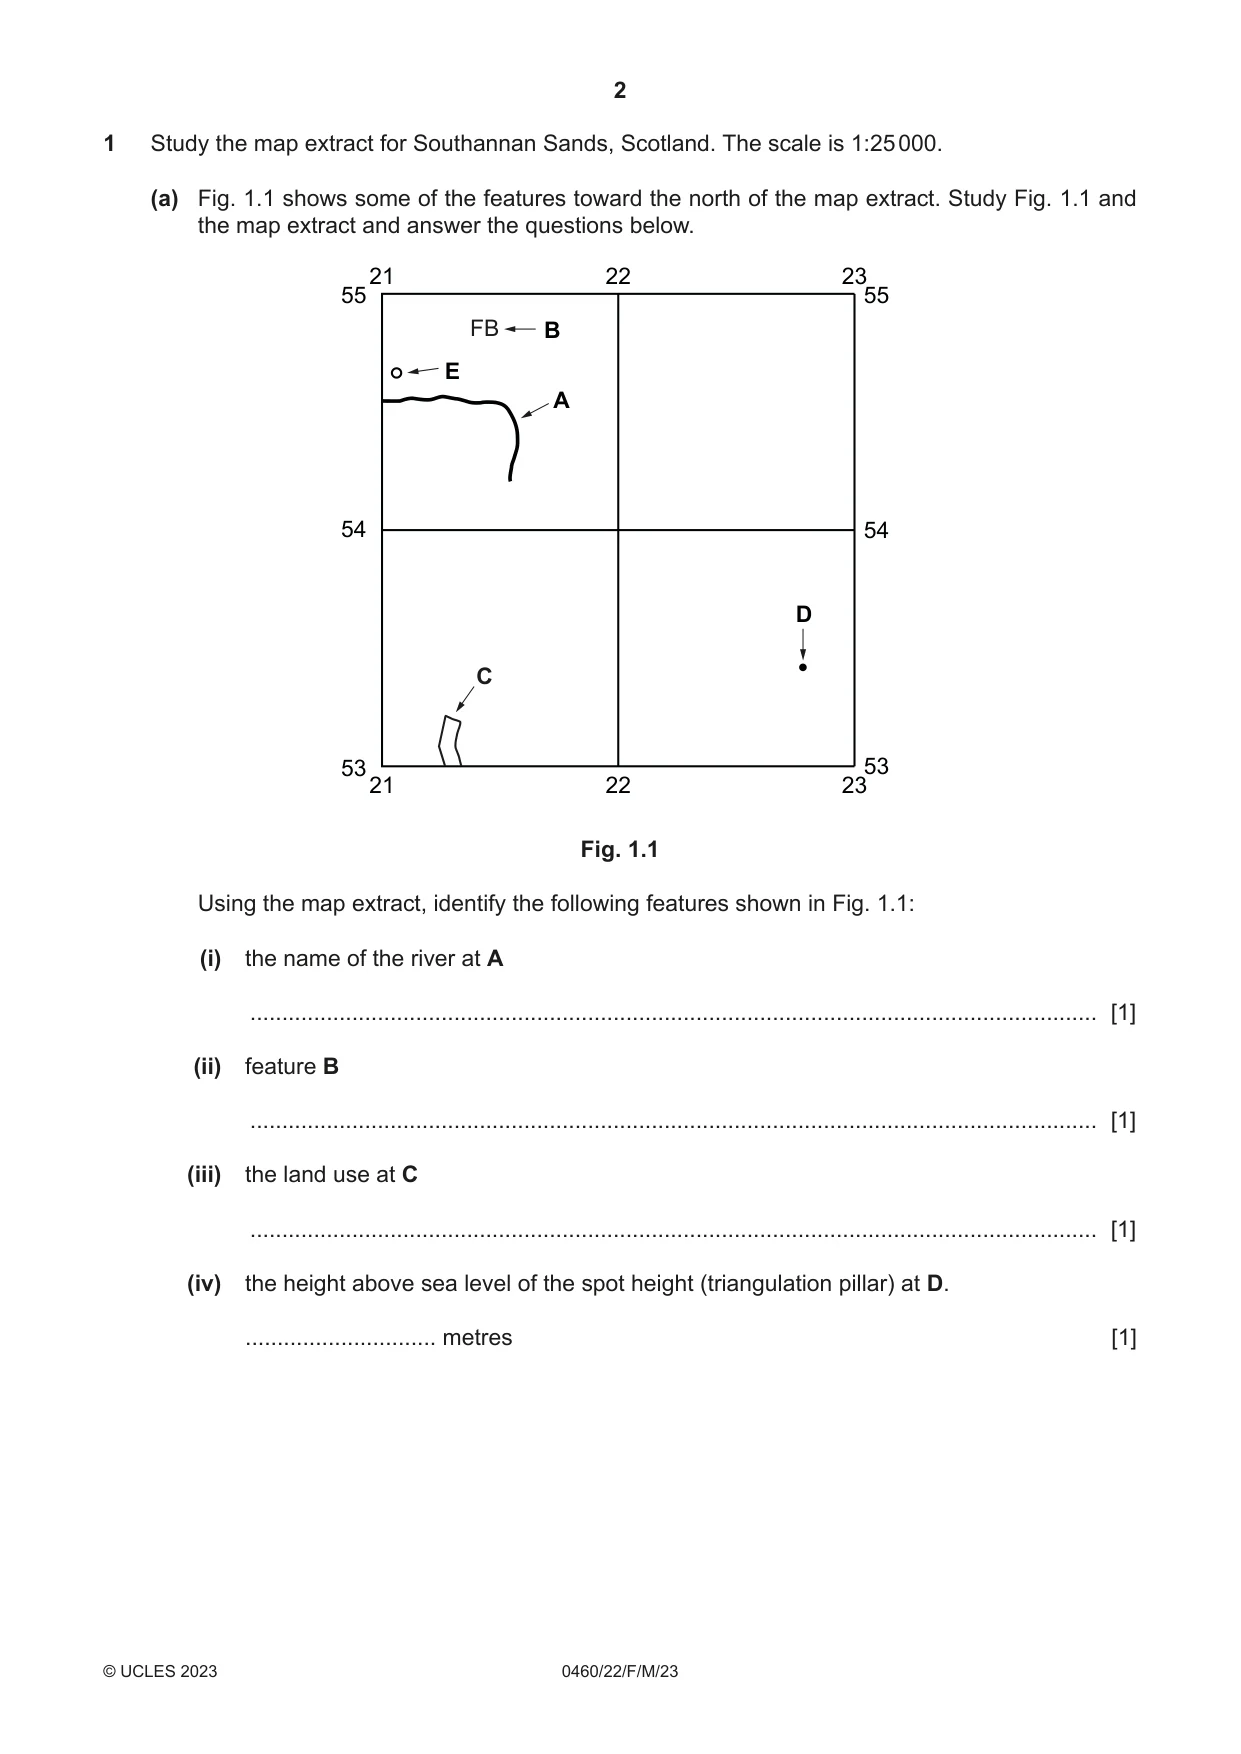
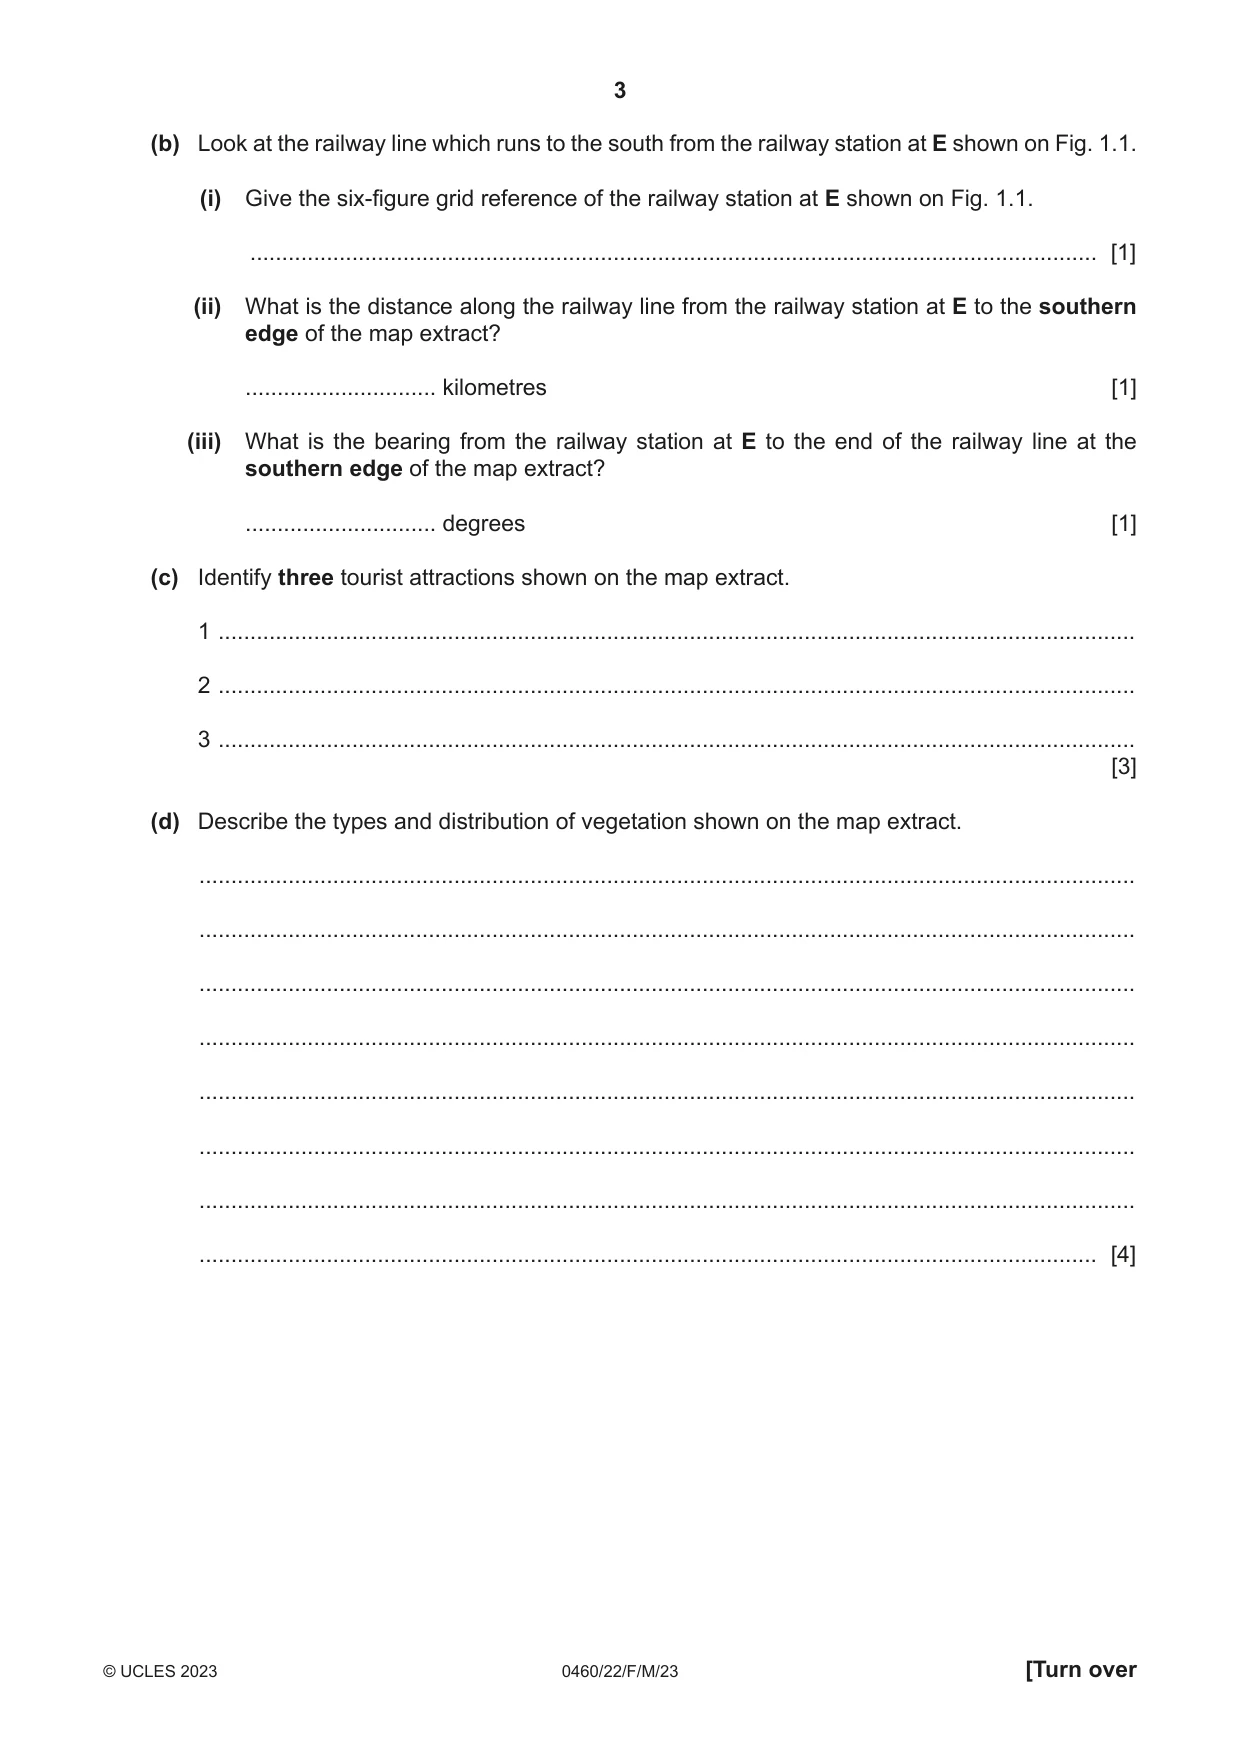
1 Study the map extract for Southannan Sands, Scotland. The scale is 1:25 000. (a) Fig. 1.1 shows some of the features toward the north of the map extract. Study Fig. 1.1 and the map extract and answer the questions below. 21 22 23 55 55 FB B E A 54 54 D C 53 53 21 22 23 Fig. 1.1 Using the map extract, identify the following features shown in Fig. 1.1: (i) the name of the river at A ..................................................................................................................................... [1] (ii) feature B ..................................................................................................................................... [1] (iii) the land use at C ..................................................................................................................................... [1] (iv) the height above sea level of the spot height (triangulation pillar) at D. .............................. metres [1] (b) Look at the railway line which runs to the south from the railway station at E shown on Fig. 1.1. (i) Give the six-figure grid reference of the railway station at E shown on Fig. 1.1. ..................................................................................................................................... [1] (ii) What is the distance along the railway line from the railway station at E to the southern edge of the map extract? .............................. kilometres [1] (iii) What is the bearing from the railway station at E to the end of the railway line at the southern edge of the map extract? .............................. degrees [1] (c) Identify three tourist attractions shown on the map extract. 1 ................................................................................................................................................ 2 ................................................................................................................................................ 3 ................................................................................................................................................ [3] (d) Describe the types and distribution of vegetation shown on the map extract. ................................................................................................................................................... ................................................................................................................................................... ................................................................................................................................................... ................................................................................................................................................... ................................................................................................................................................... ................................................................................................................................................... ................................................................................................................................................... ............................................................................................................................................. [4] (e) Describe the drainage pattern east of easting 21 shown on the map extract. ................................................................................................................................................... ................................................................................................................................................... ................................................................................................................................................... ................................................................................................................................................... ................................................................................................................................................... ................................................................................................................................................... ................................................................................................................................................... ................................................................................................................................................... ................................................................................................................................................... ................................................................................................................................................... ................................................................................................................................................... ............................................................................................................................................. [6] [Total: 20] TURN PAGE FOR QUESTION 2
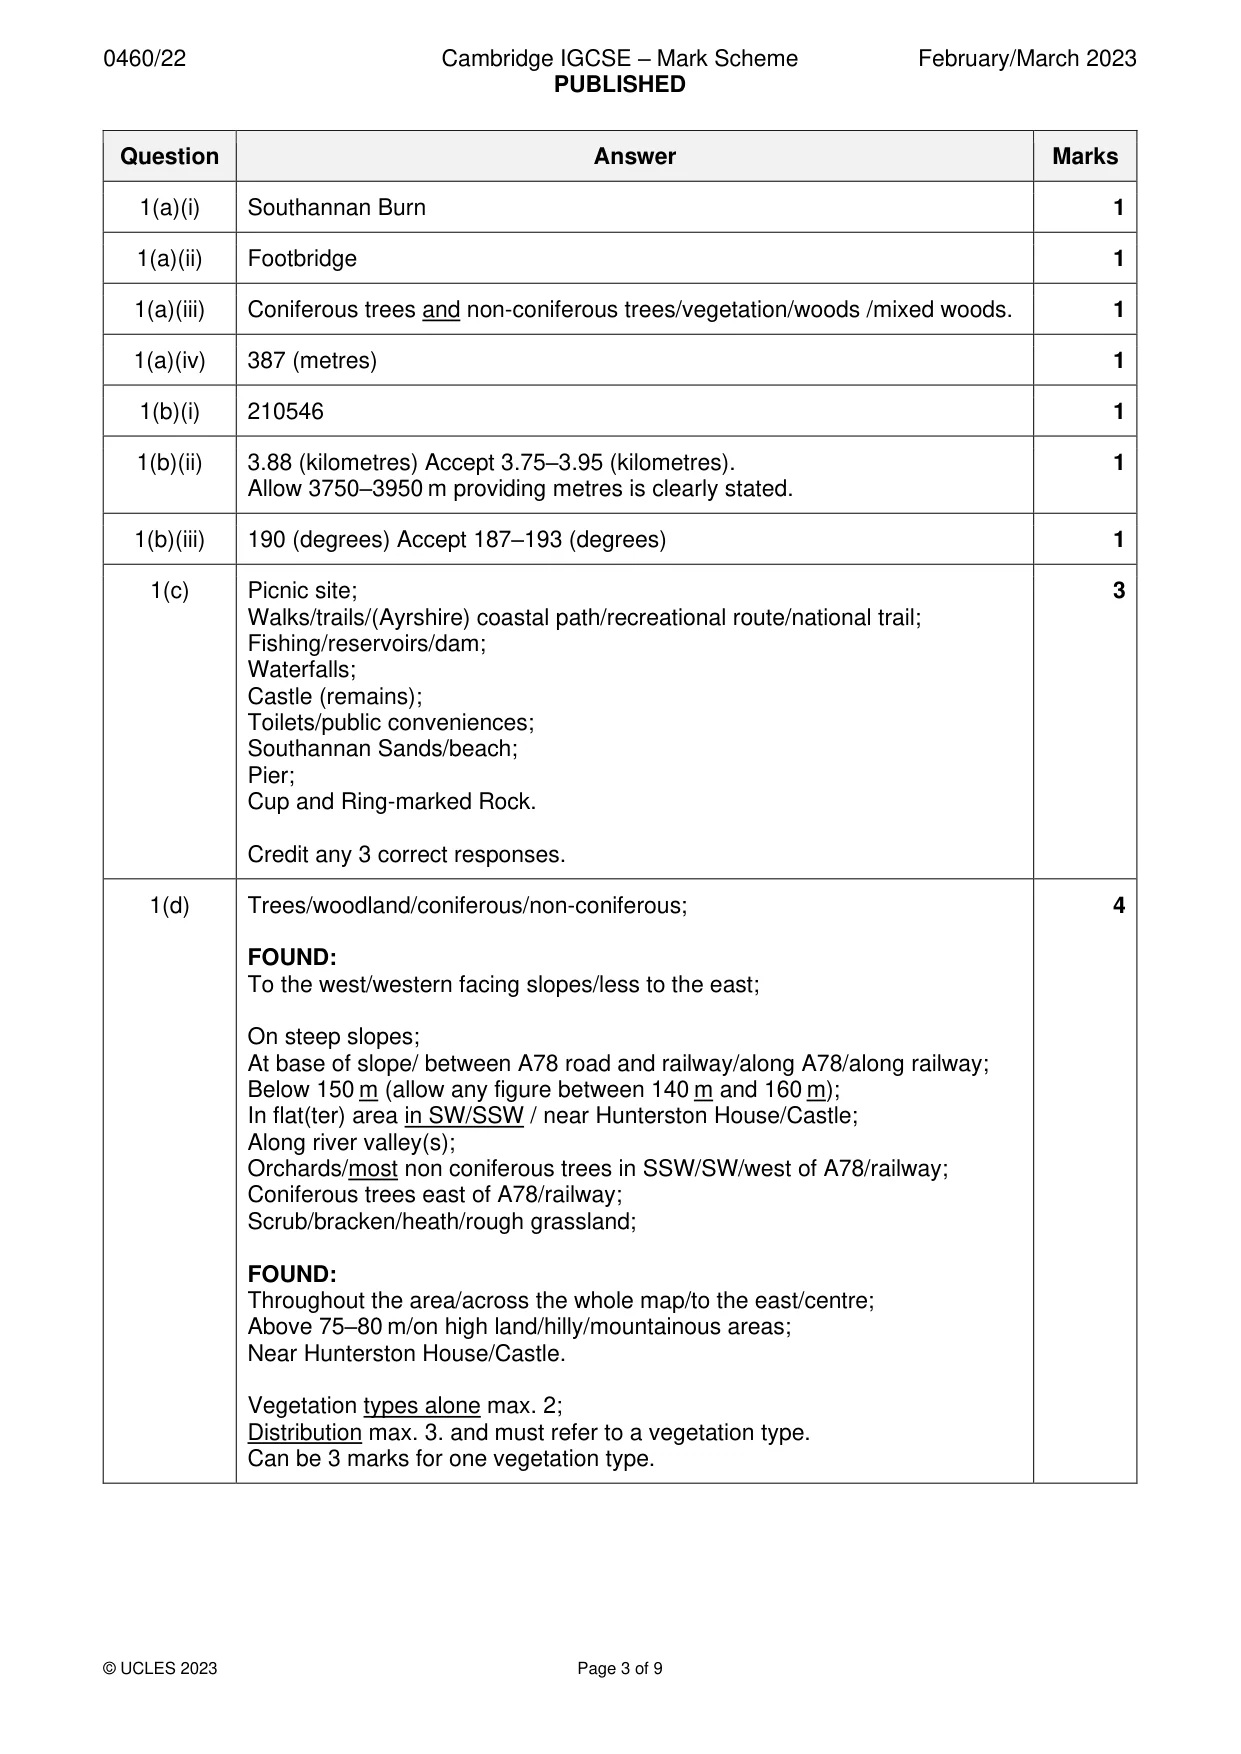
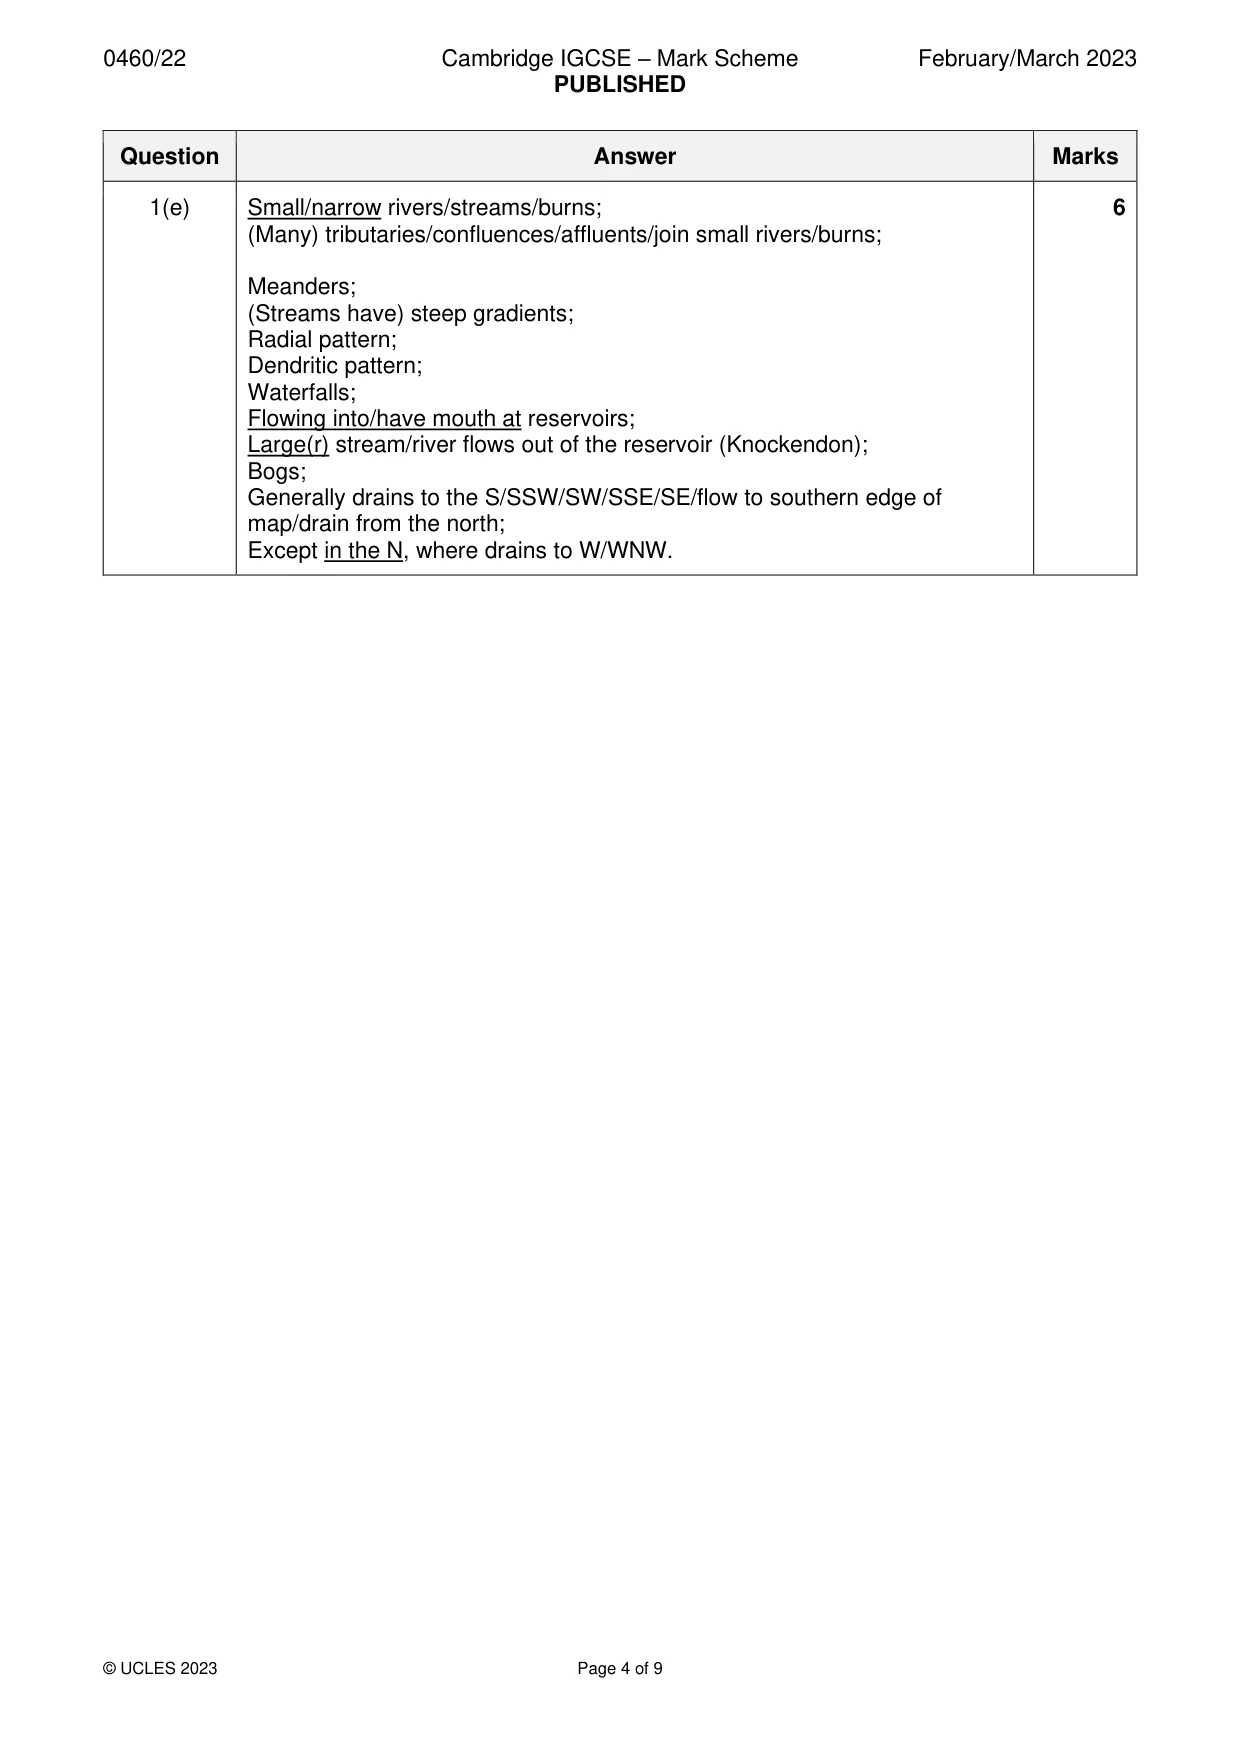
Mark scheme: Question Answer Marks 1(a)(i) Southannan Burn 1 1(a)(ii) Footbridge 1 1(a)(iii) Coniferous trees and non-coniferous trees/vegetation/woods /mixed woods. 1 1(a)(iv) 387 (metres) 1 1(b)(i) 210546 1 1(b)(ii) 3.88 (kilometres) Accept 3.75–3.95 (kilometres). 1 Allow 3750–3950 m providing metres is clearly stated. 1(b)(iii) 190 (degrees) Accept 187–193 (degrees) 1 1(c) Picnic site; 3 Walks/trails/(Ayrshire) coastal path/recreational route/national trail; Fishing/reservoirs/dam; Waterfalls; Castle (remains); Toilets/public conveniences; Southannan Sands/beach; Pier; Cup and Ring-marked Rock. Credit any 3 correct responses. 1(d) Trees/woodland/coniferous/non-coniferous; 4 FOUND: To the west/western facing slopes/less to the east; On steep slopes; At base of slope/ between A78 road and railway/along A78/along railway; Below 150 m (allow any figure between 140 m and 160 m); In flat(ter) area in SW/SSW / near Hunterston House/Castle; Along river valley(s); Orchards/most non coniferous trees in SSW/SW/west of A78/railway; Coniferous trees east of A78/railway; Scrub/bracken/heath/rough grassland; FOUND: Throughout the area/across the whole map/to the east/centre; Above 75–80 m/on high land/hilly/mountainous areas; Near Hunterston House/Castle. Vegetation types alone max. 2; Distribution max. 3. and must refer to a vegetation type. Can be 3 marks for one vegetation type. 1(e) Small/narrow rivers/streams/burns; 6 (Many) tributaries/confluences/affluents/join small rivers/burns; Meanders; (Streams have) steep gradients; Radial pattern; Dendritic pattern; Waterfalls; Flowing into/have mouth at reservoirs; Large(r) stream/river flows out of the reservoir (Knockendon); Bogs; Generally drains to the S/SSW/SW/SSE/SE/flow to southern edge of map/drain from the north; Except in the N, where drains to W/WNW.
Question 2
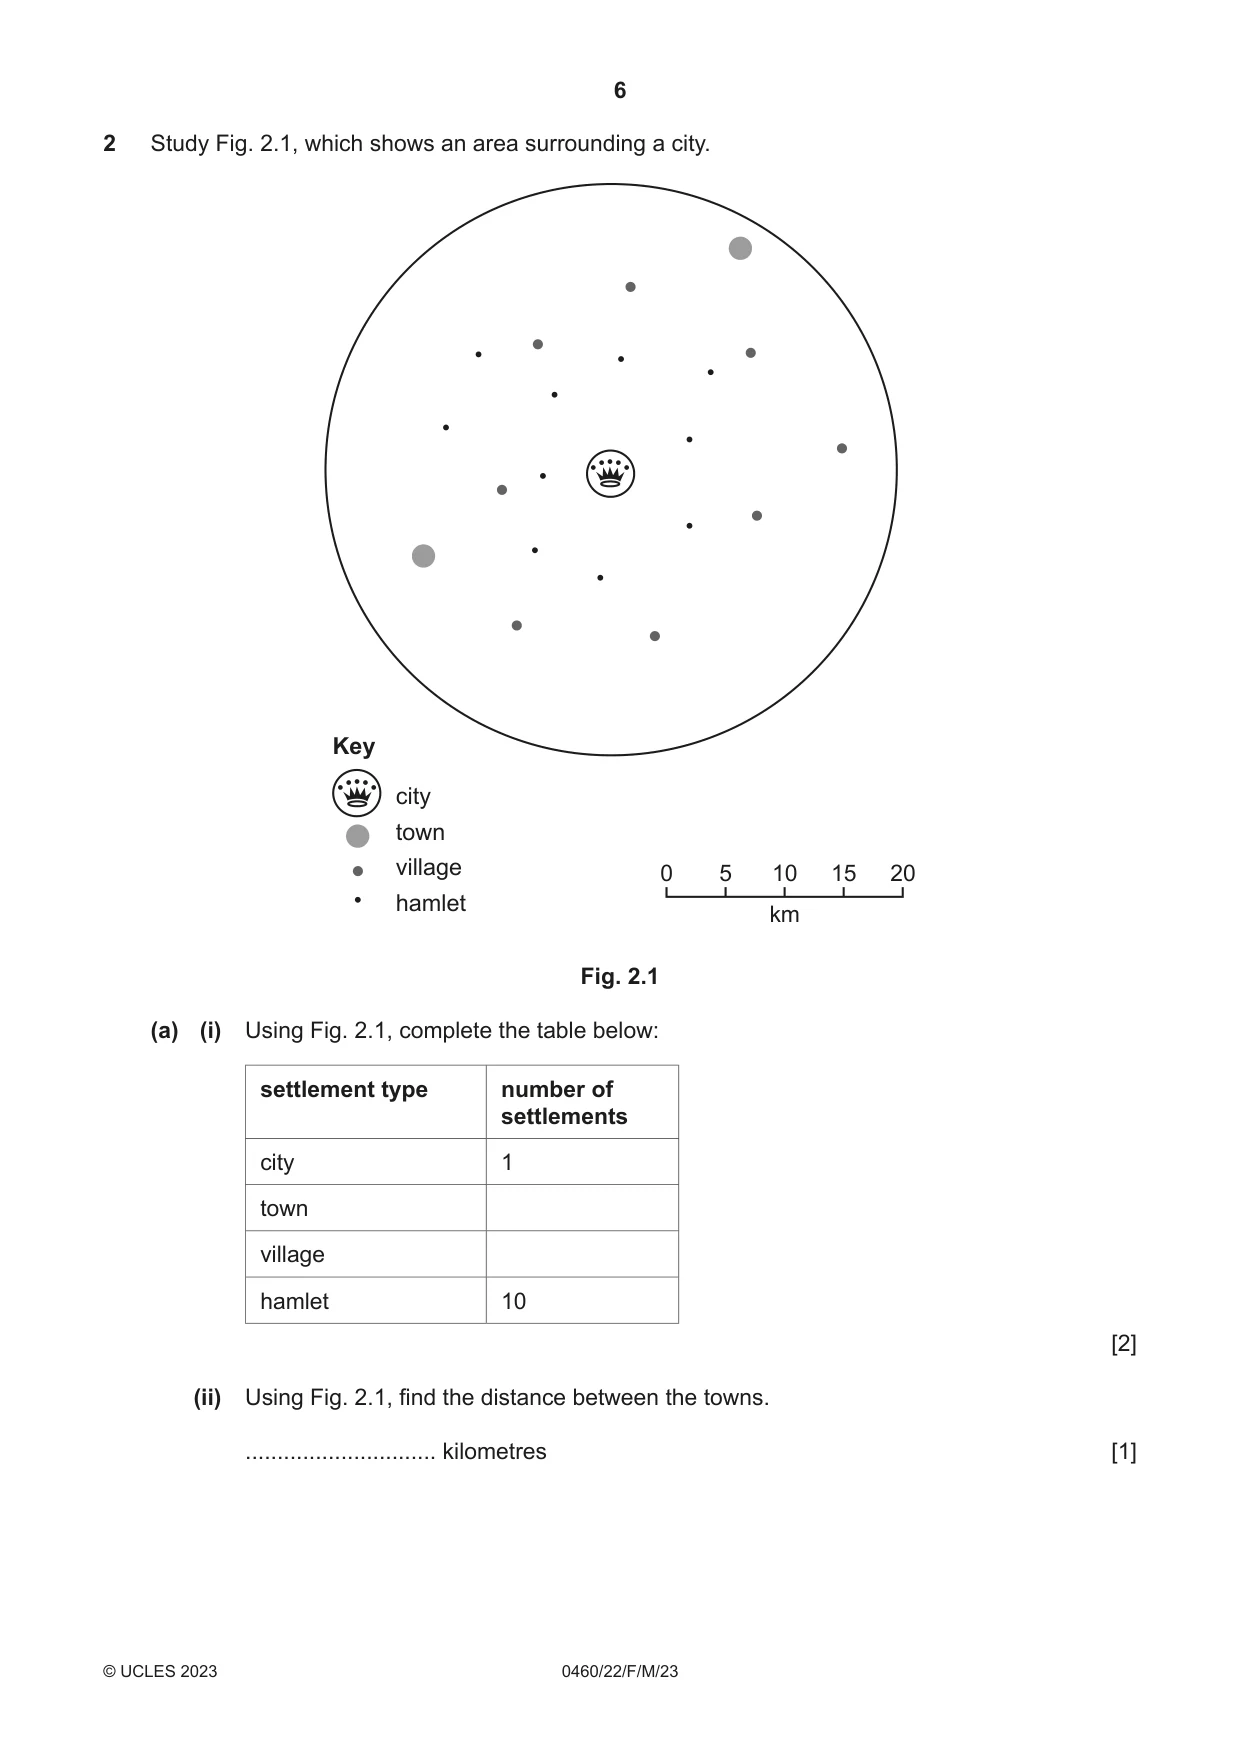
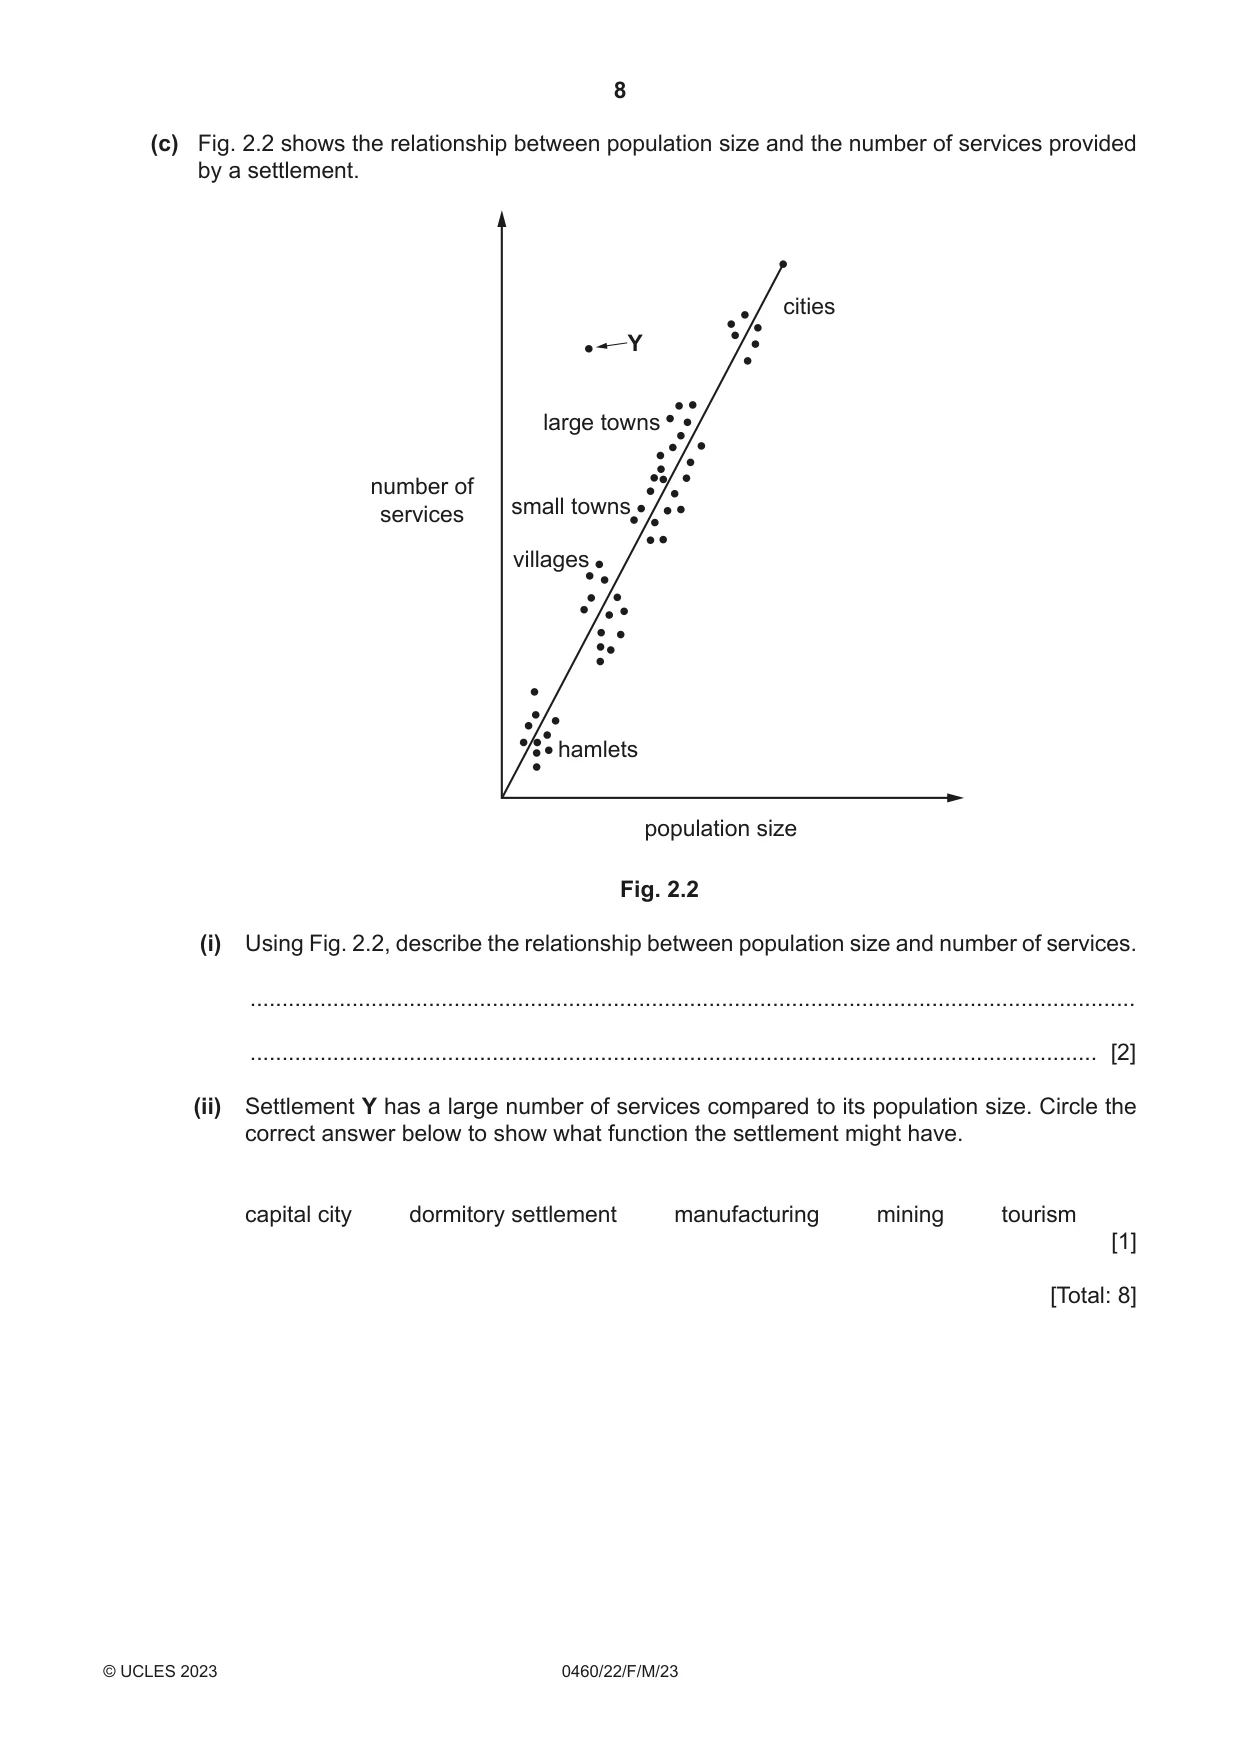
2 Study Fig. 2.1, which shows an area surrounding a city. Key city town village 0 5 10 15 20 hamlet km Fig. 2.1 (a) (i) Using Fig. 2.1, complete the table below: settlement type number of settlements city 1 town village hamlet 10 [2] (ii) Using Fig. 2.1, find the distance between the towns. .............................. kilometres [1] (b) What is meant by the following terms? (i) sphere of influence ........................................................................................................................................... ..................................................................................................................................... [1] (ii) threshold population ........................................................................................................................................... ..................................................................................................................................... [1] (c) Fig. 2.2 shows the relationship between population size and the number of services provided by a settlement. cities Y large towns number of small towns services villages hamlets population size Fig. 2.2 (i) Using Fig. 2.2, describe the relationship between population size and number of services. ........................................................................................................................................... ..................................................................................................................................... [2] (ii) Settlement Y has a large number of services compared to its population size. Circle the correct answer below to show what function the settlement might have. capital city dormitory settlement manufacturing mining tourism [1] [Total: 8]
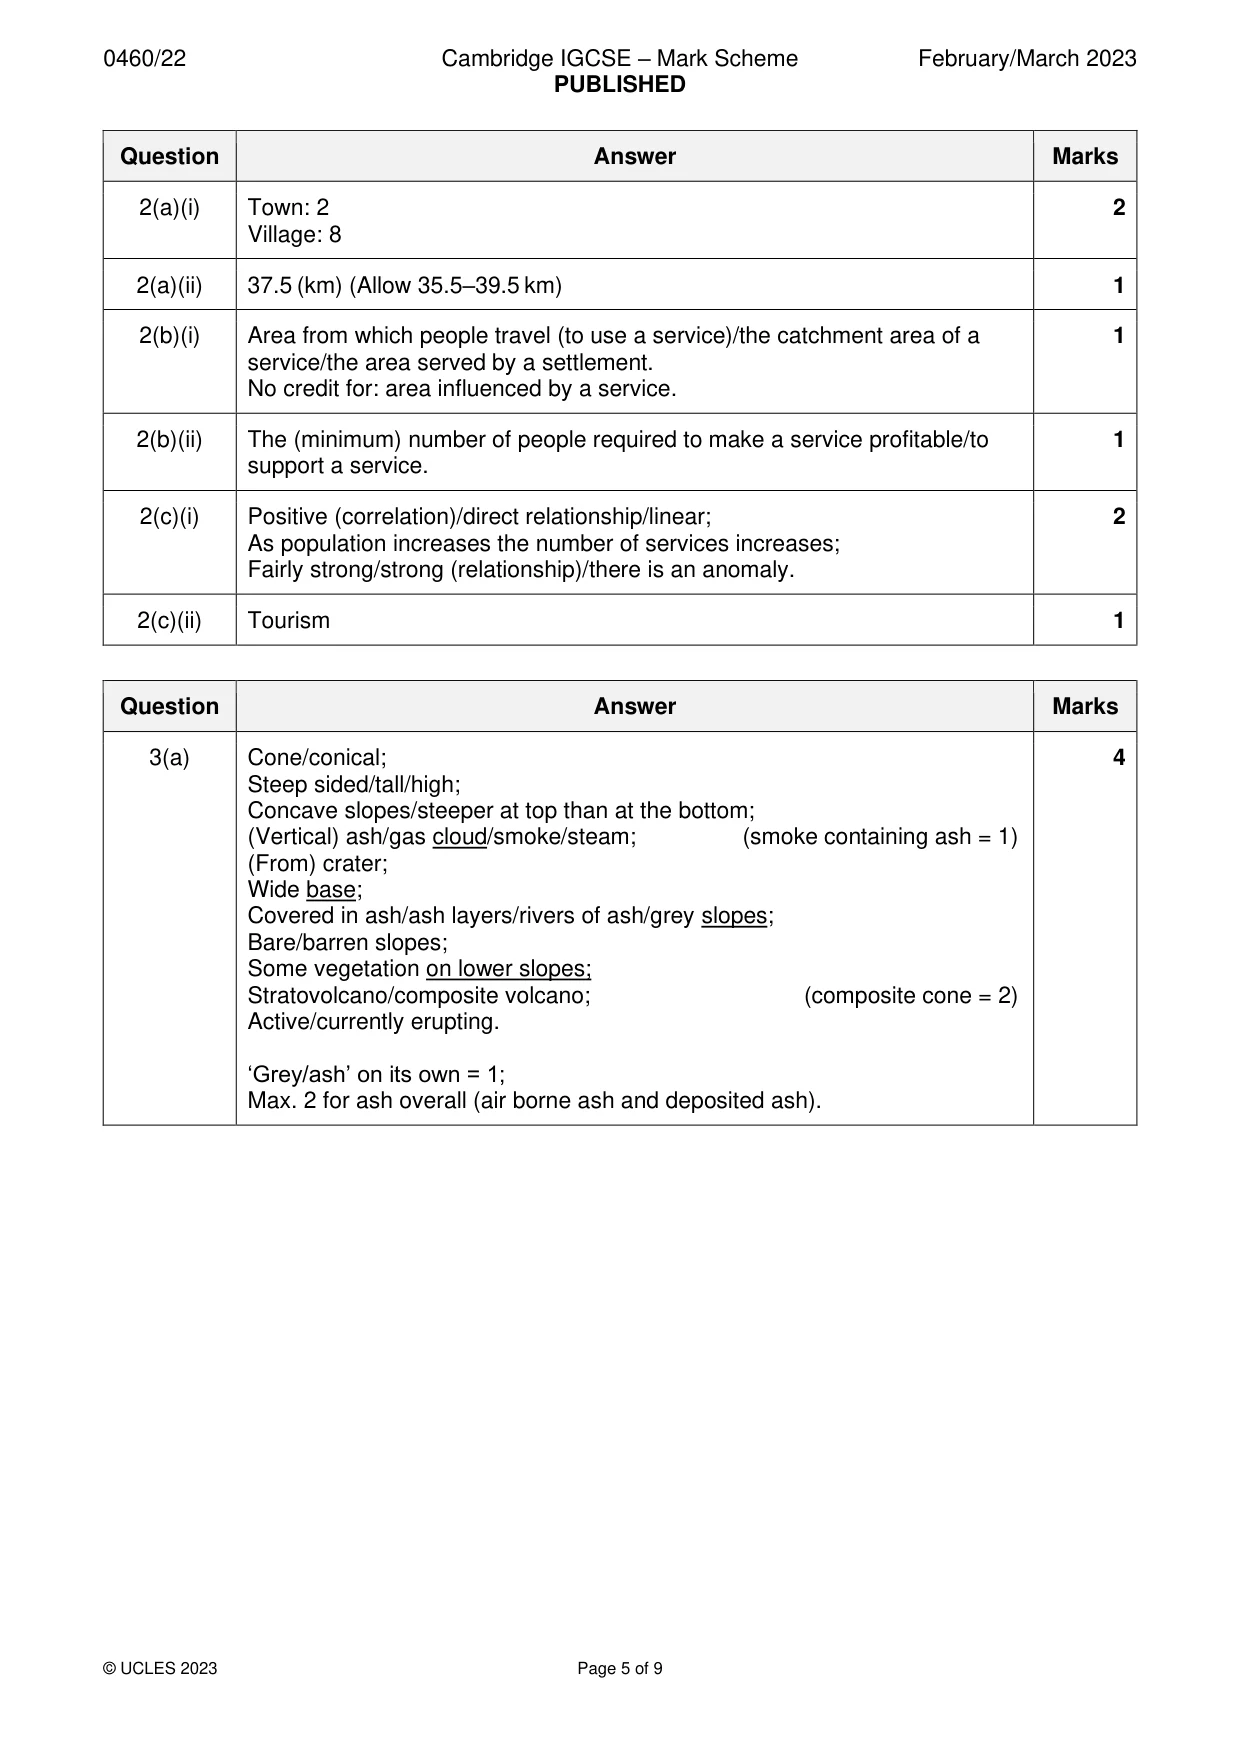
Mark scheme: 2(a)(i) Town: 2 2 Village: 8 2(a)(ii) 37.5 (km) (Allow 35.5–39.5 km) 1 2(b)(i) Area from which people travel (to use a service)/the catchment area of a 1 service/the area served by a settlement. No credit for: area influenced by a service. 2(b)(ii) The (minimum) number of people required to make a service profitable/to 1 support a service. 2(c)(i) Positive (correlation)/direct relationship/linear; 2 As population increases the number of services increases; Fairly strong/strong (relationship)/there is an anomaly. 2(c)(ii) Tourism 1
More questions on Settlements (rural and urban) and service provision
Question 3
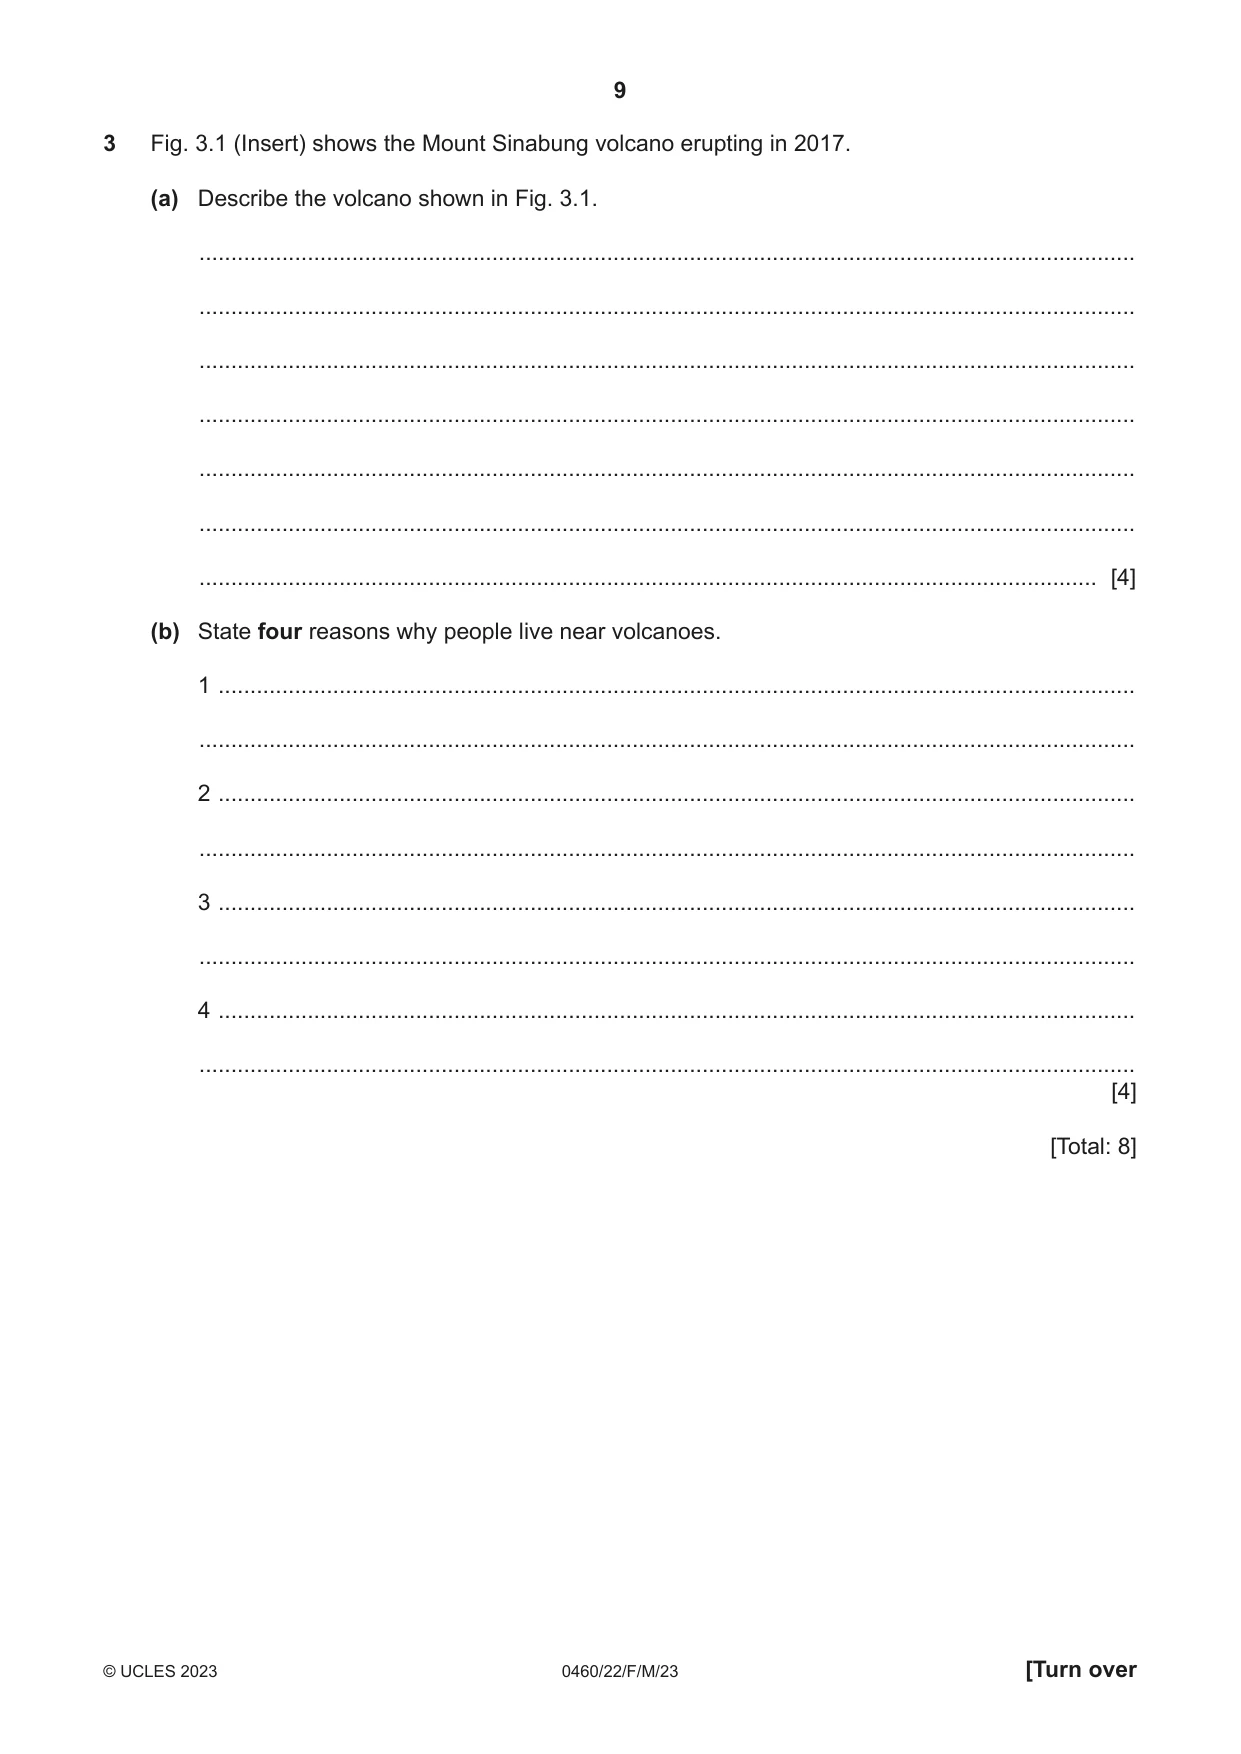
3 Fig. 3.1 (Insert) shows the Mount Sinabung volcano erupting in 2017. (a) Describe the volcano shown in Fig. 3.1. ................................................................................................................................................... ................................................................................................................................................... ................................................................................................................................................... ................................................................................................................................................... ................................................................................................................................................... ................................................................................................................................................... ............................................................................................................................................. [4] (b) State four reasons why people live near volcanoes. 1 ................................................................................................................................................ ................................................................................................................................................... 2 ................................................................................................................................................ ................................................................................................................................................... 3 ................................................................................................................................................ ................................................................................................................................................... 4 ................................................................................................................................................ ................................................................................................................................................... [4] [Total: 8]
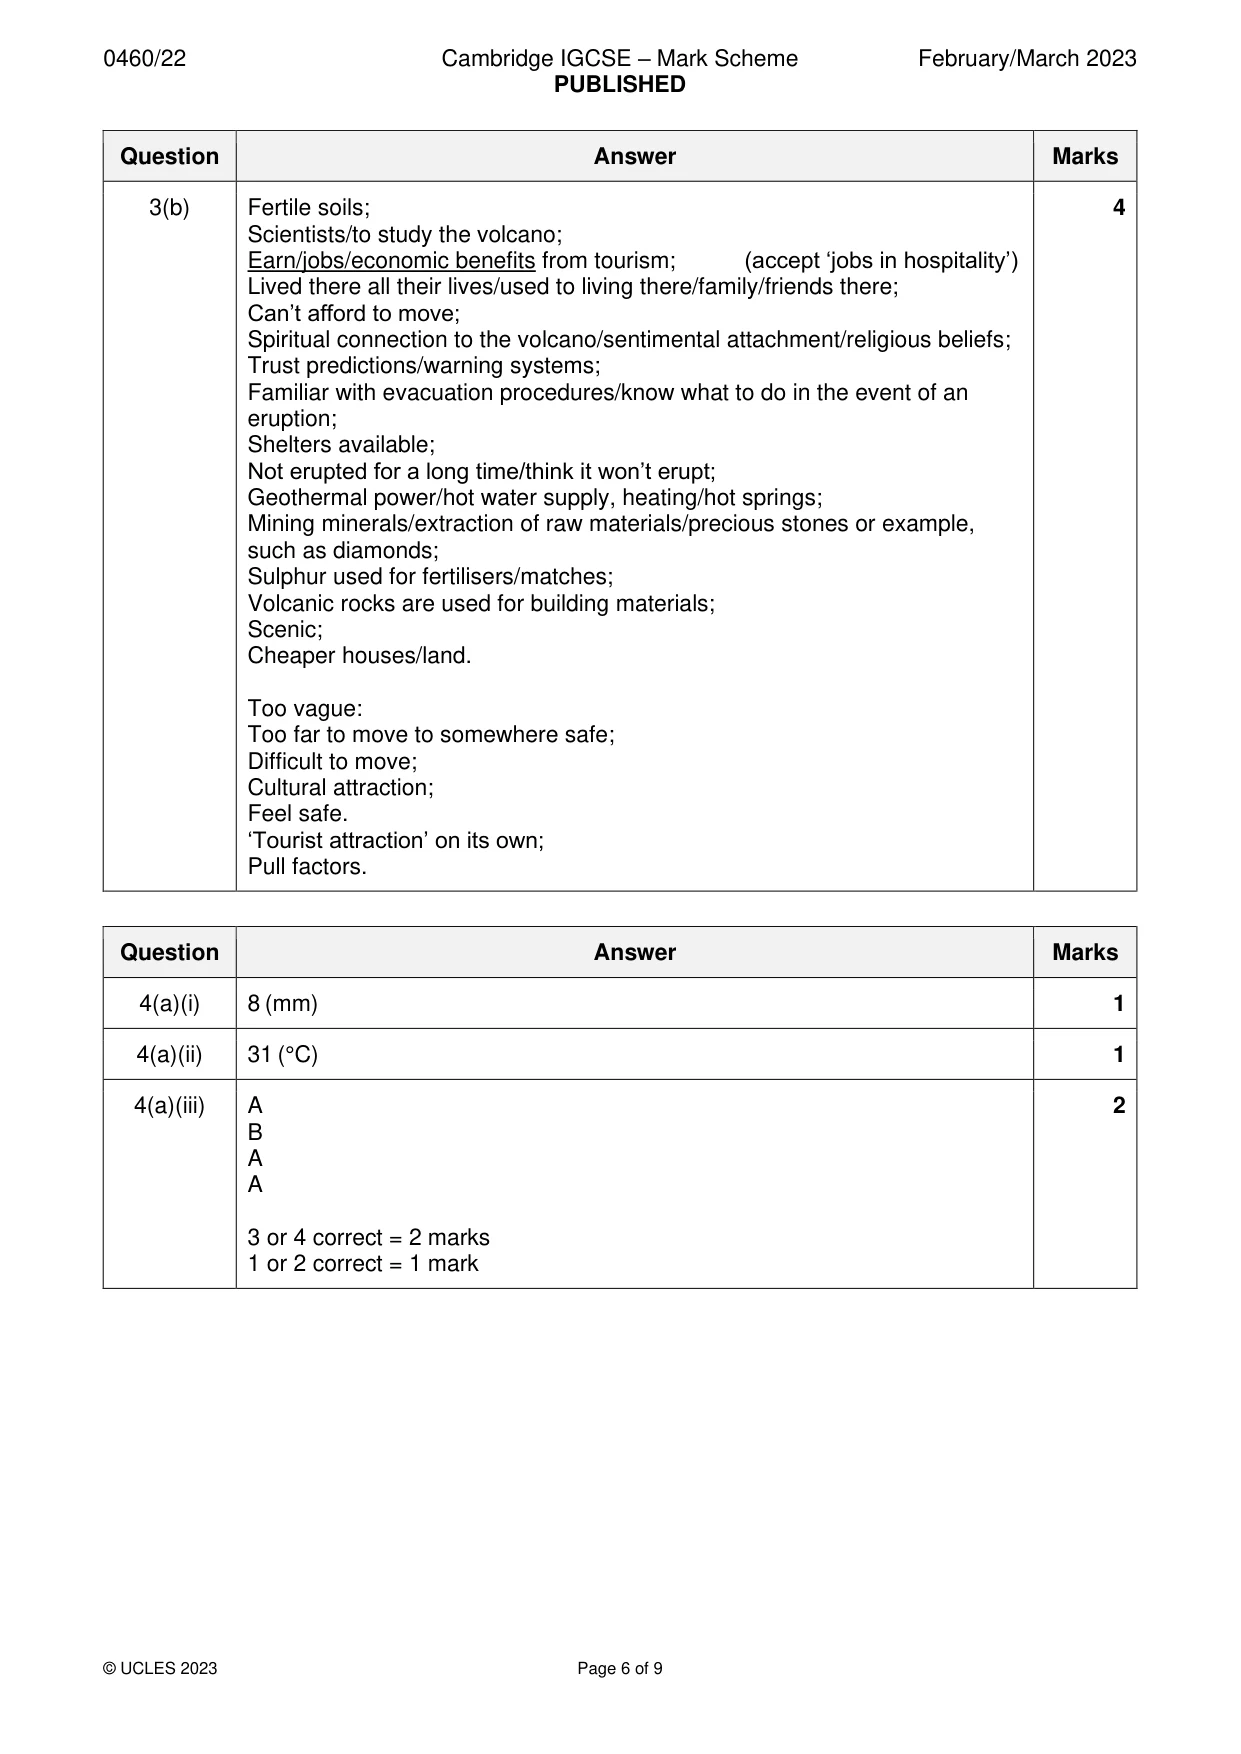
Mark scheme: 3(a) Cone/conical; 4 Steep sided/tall/high; Concave slopes/steeper at top than at the bottom; (Vertical) ash/gas cloud/smoke/steam; (smoke containing ash = 1) (From) crater; Wide base; Covered in ash/ash layers/rivers of ash/grey slopes; Bare/barren slopes; Some vegetation on lower slopes; Stratovolcano/composite volcano; (composite cone = 2) Active/currently erupting. ‘Grey/ash’ on its own = 1; Max. 2 for ash overall (air borne ash and deposited ash). 3(b) Fertile soils; 4 Scientists/to study the volcano; Earn/jobs/economic benefits from tourism; (accept ‘jobs in hospitality’) Lived there all their lives/used to living there/family/friends there; Can’t afford to move; Spiritual connection to the volcano/sentimental attachment/religious beliefs; Trust predictions/warning systems; Familiar with evacuation procedures/know what to do in the event of an eruption; Shelters available; Not erupted for a long time/think it won’t erupt; Geothermal power/hot water supply, heating/hot springs; Mining minerals/extraction of raw materials/precious stones or example, such as diamonds; Sulphur used for fertilisers/matches; Volcanic rocks are used for building materials; Scenic; Cheaper houses/land. Too vague: Too far to move to somewhere safe; Difficult to move; Cultural attraction; Feel safe. ‘Tourist attraction’ on its own; Pull factors.
Q4 · Graphs A and B in Fig
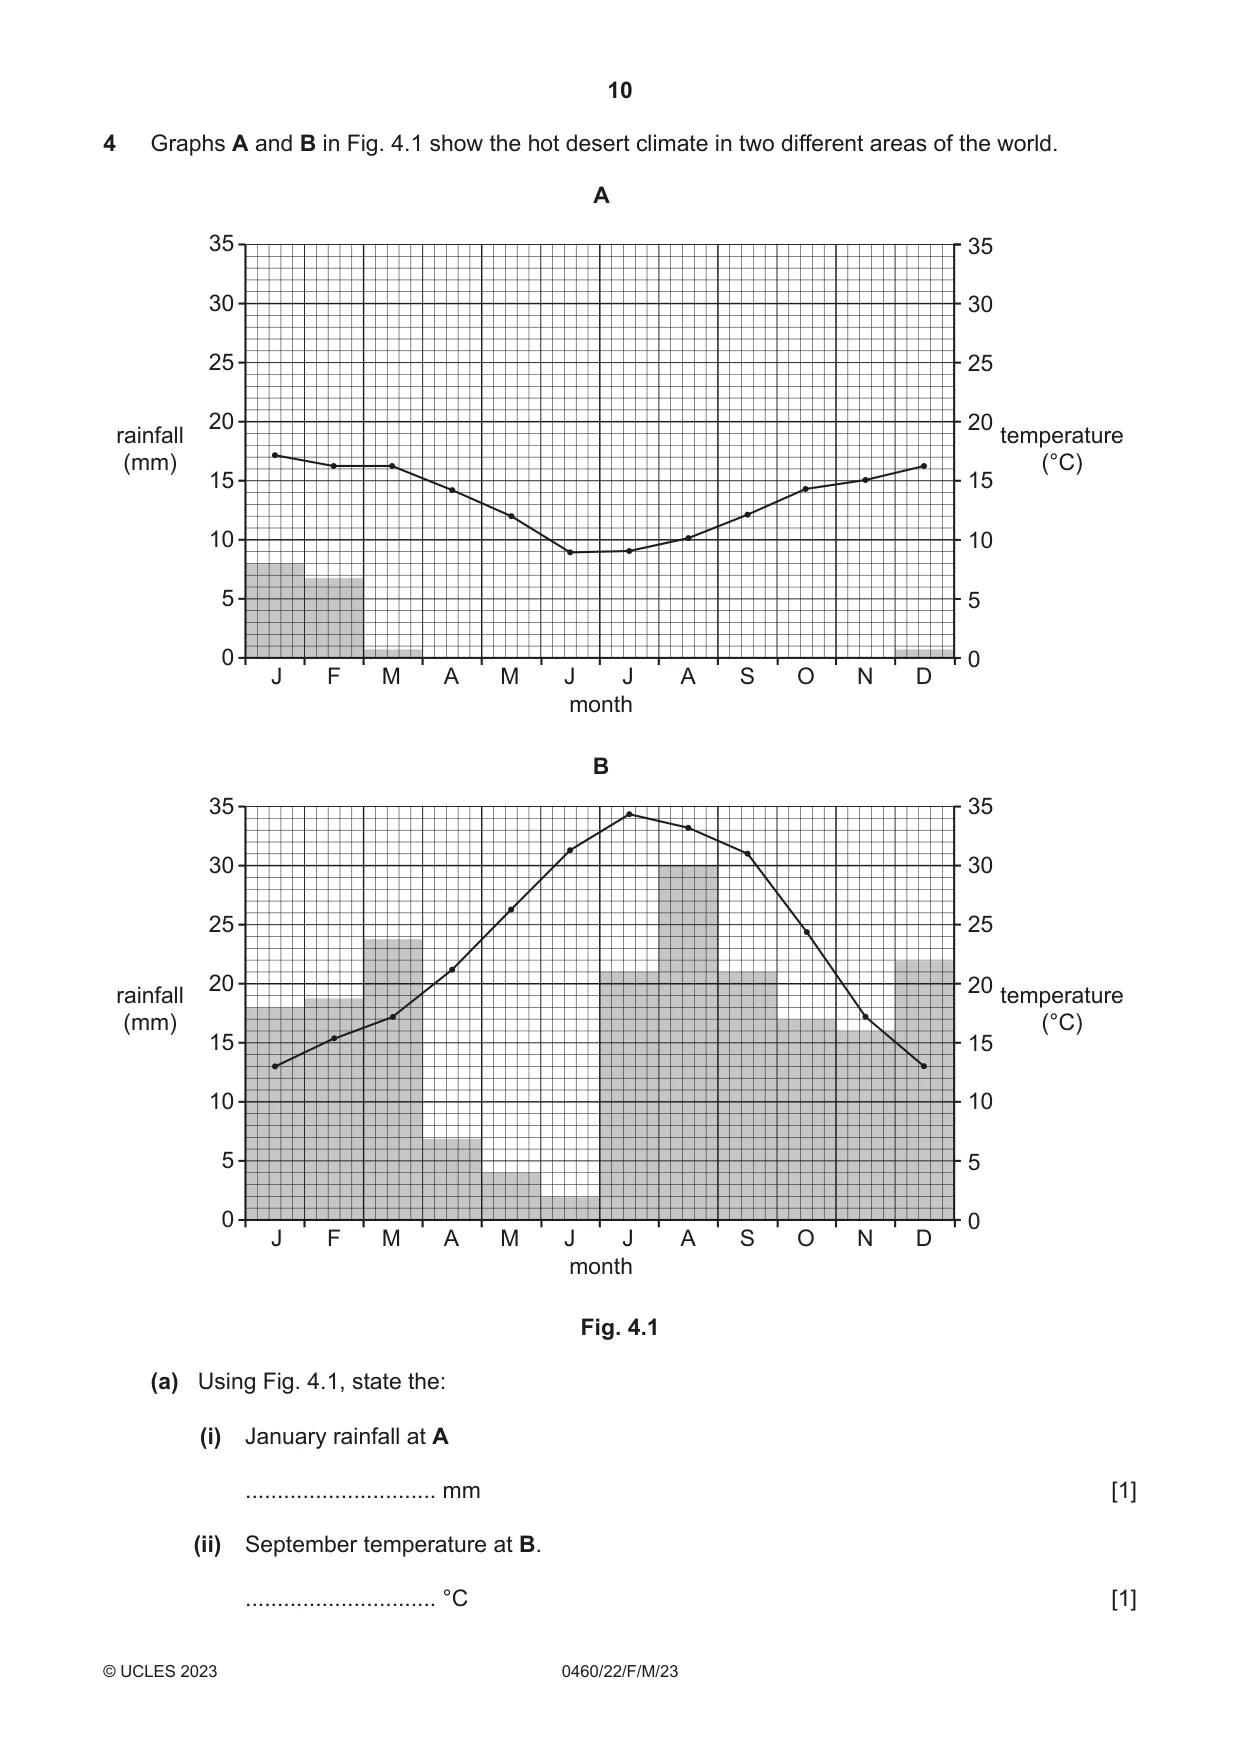
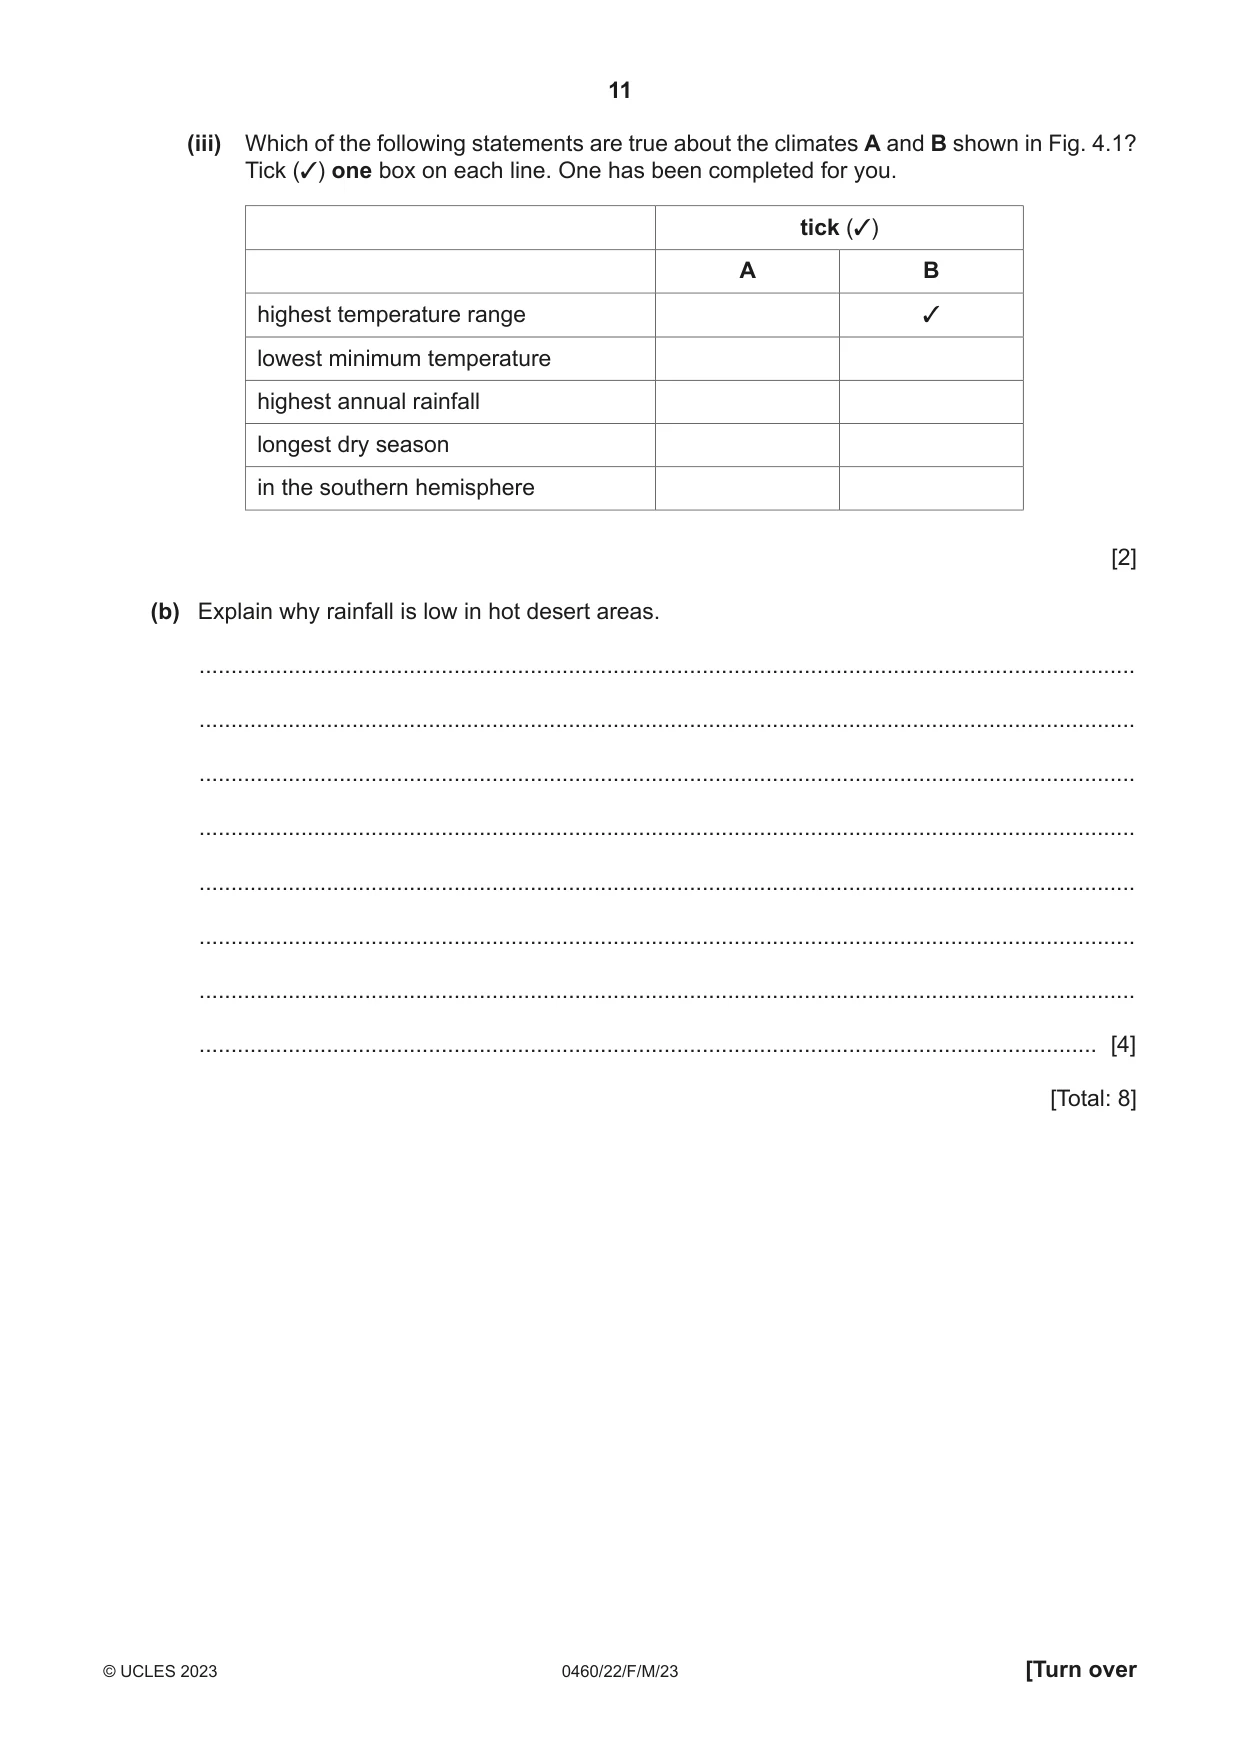
4 Graphs A and B in Fig. 4.1 show the hot desert climate in two different areas of the world. A 35 35 30 30 25 25 20 20 rainfall temperature (mm) (°C) 15 15 10 10 5 5 0 0 J F M A M J J A S O N D month B 35 35 30 30 25 25 20 20 rainfall temperature (mm) (°C) 15 15 10 10 5 5 0 0 J F M A M J J A S O N D month Fig. 4.1 (a) Using Fig. 4.1, state the: (i) January rainfall at A .............................. mm [1] (ii) September temperature at B. .............................. °C [1] (iii) Which of the following statements are true about the climates A and B shown in Fig. 4.1? Tick (✓) one box on each line. One has been completed for you. tick (✓) A B highest temperature range ✓ lowest minimum temperature highest annual rainfall longest dry season in the southern hemisphere [2] (b) Explain why rainfall is low in hot desert areas. ................................................................................................................................................... ................................................................................................................................................... ................................................................................................................................................... ................................................................................................................................................... ................................................................................................................................................... ................................................................................................................................................... ................................................................................................................................................... ............................................................................................................................................. [4] [Total: 8]
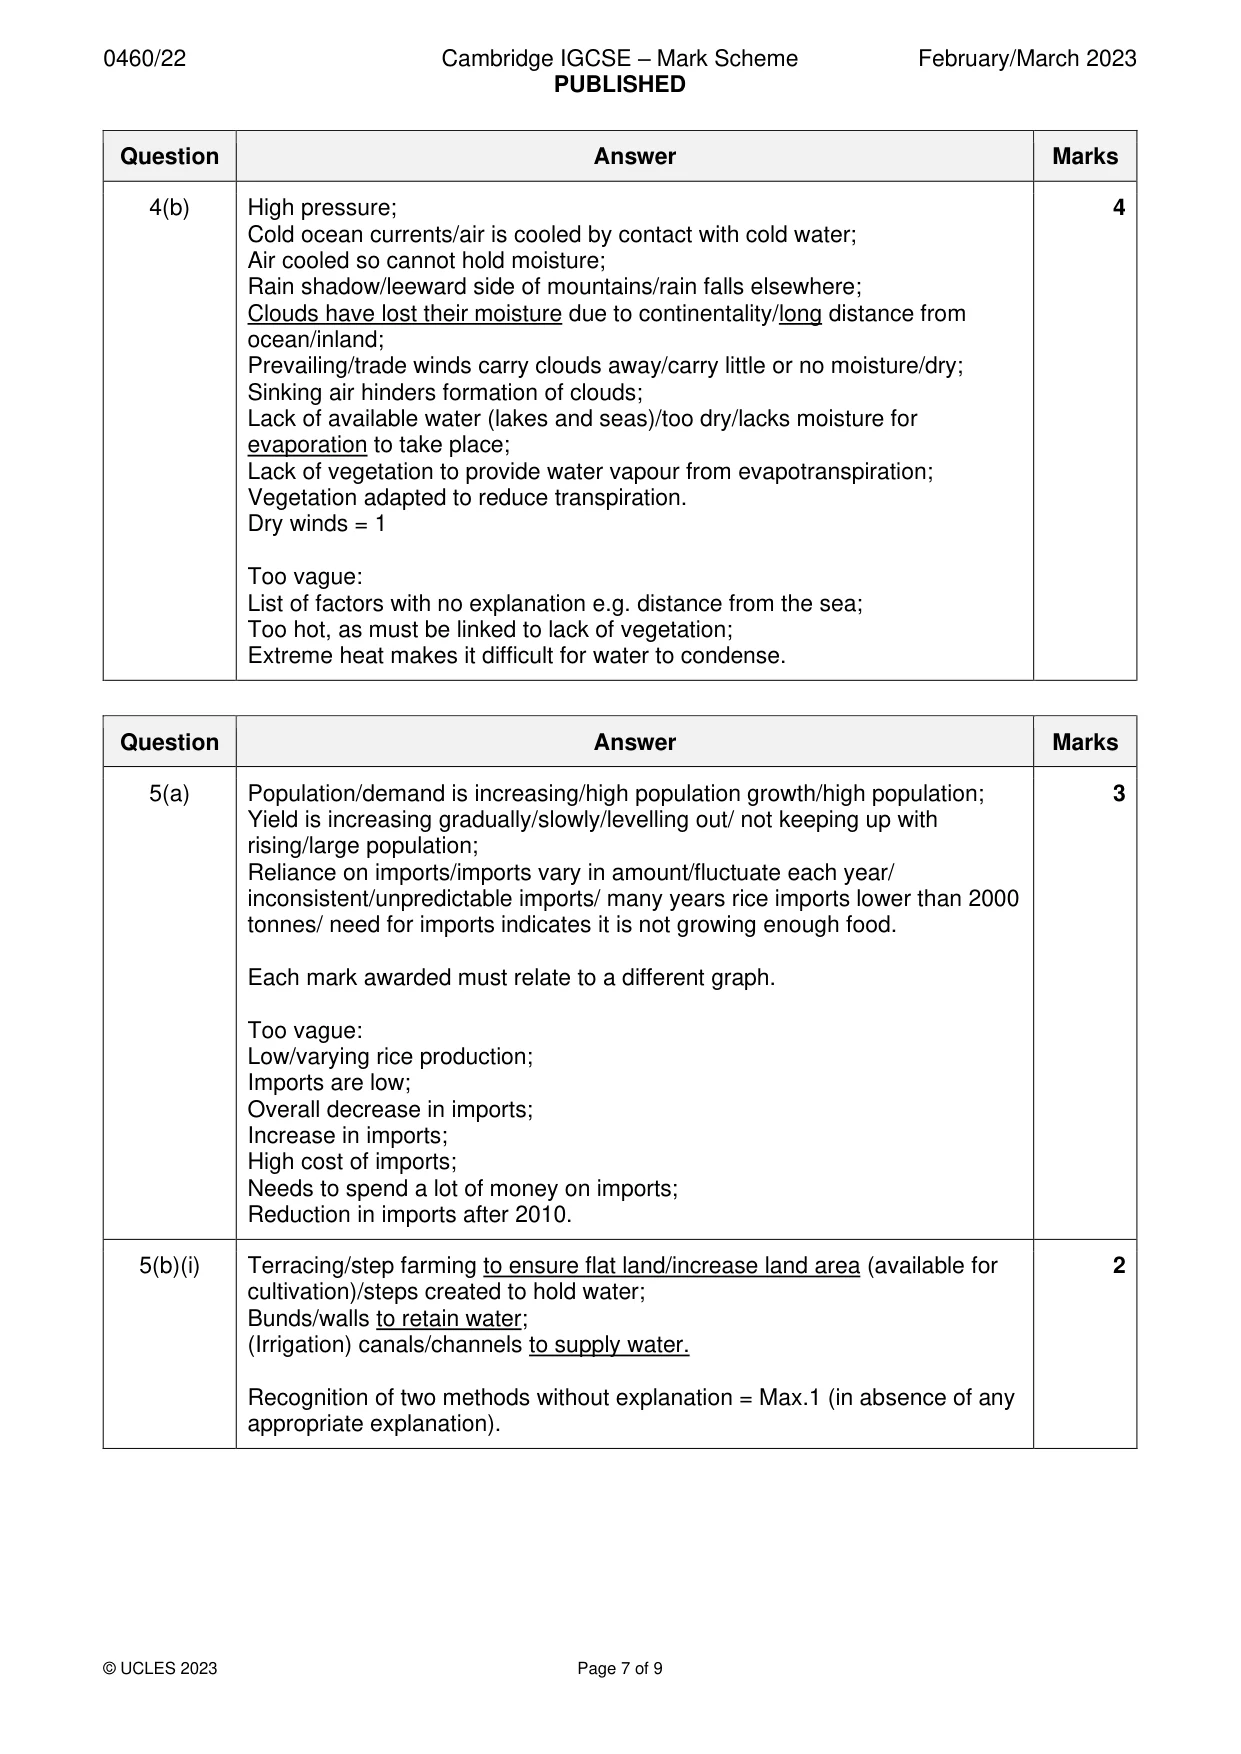
Mark scheme: 4(a)(i) 8 (mm) 1 4(a)(ii) 31 (°C) 1 4(a)(iii) A 2 B A A 3 or 4 correct = 2 marks 1 or 2 correct = 1 mark 4(b) High pressure; 4 Cold ocean currents/air is cooled by contact with cold water; Air cooled so cannot hold moisture; Rain shadow/leeward side of mountains/rain falls elsewhere; Clouds have lost their moisture due to continentality/long distance from ocean/inland; Prevailing/trade winds carry clouds away/carry little or no moisture/dry; Sinking air hinders formation of clouds; Lack of available water (lakes and seas)/too dry/lacks moisture for evaporation to take place; Lack of vegetation to provide water vapour from evapotranspiration; Vegetation adapted to reduce transpiration. Dry winds = 1 Too vague: List of factors with no explanation e.g. distance from the sea; Too hot, as must be linked to lack of vegetation; Extreme heat makes it difficult for water to condense.
Question 5
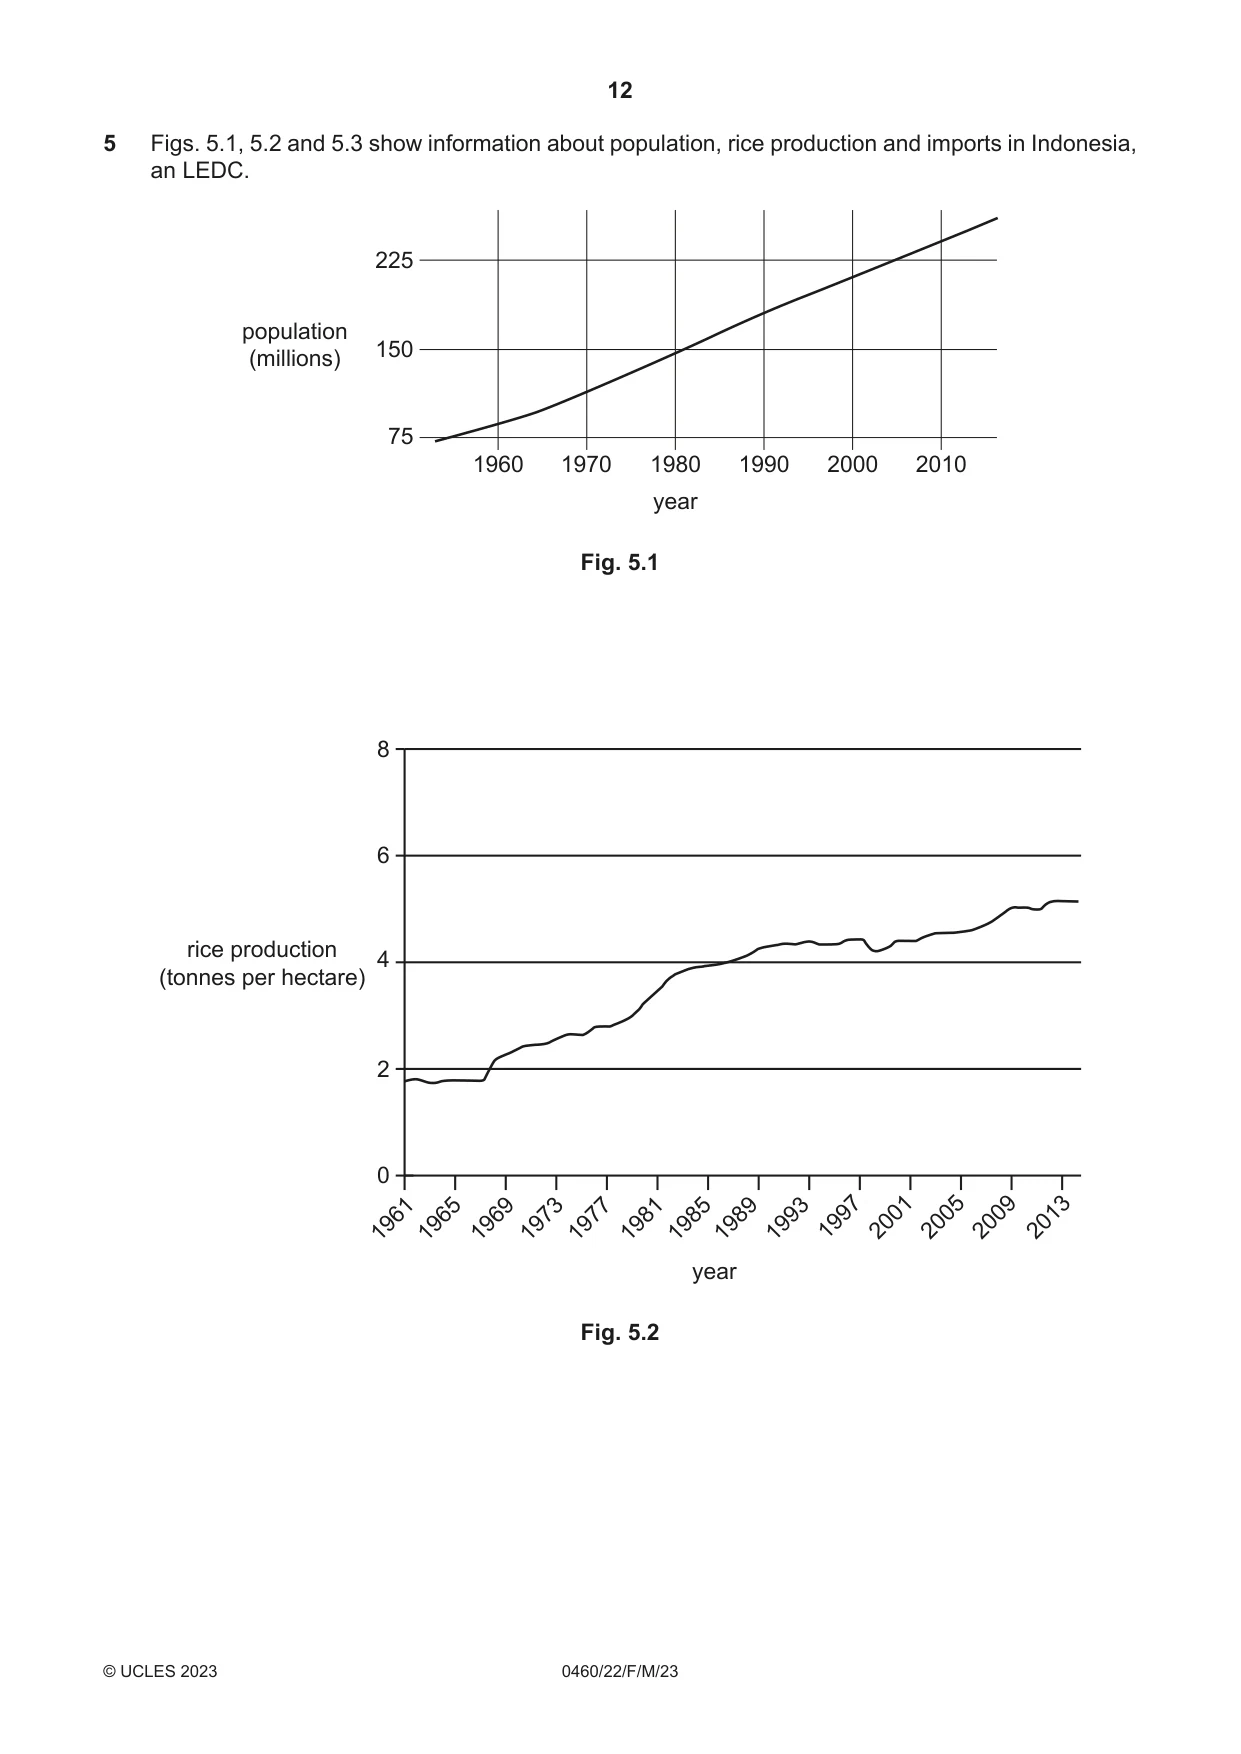
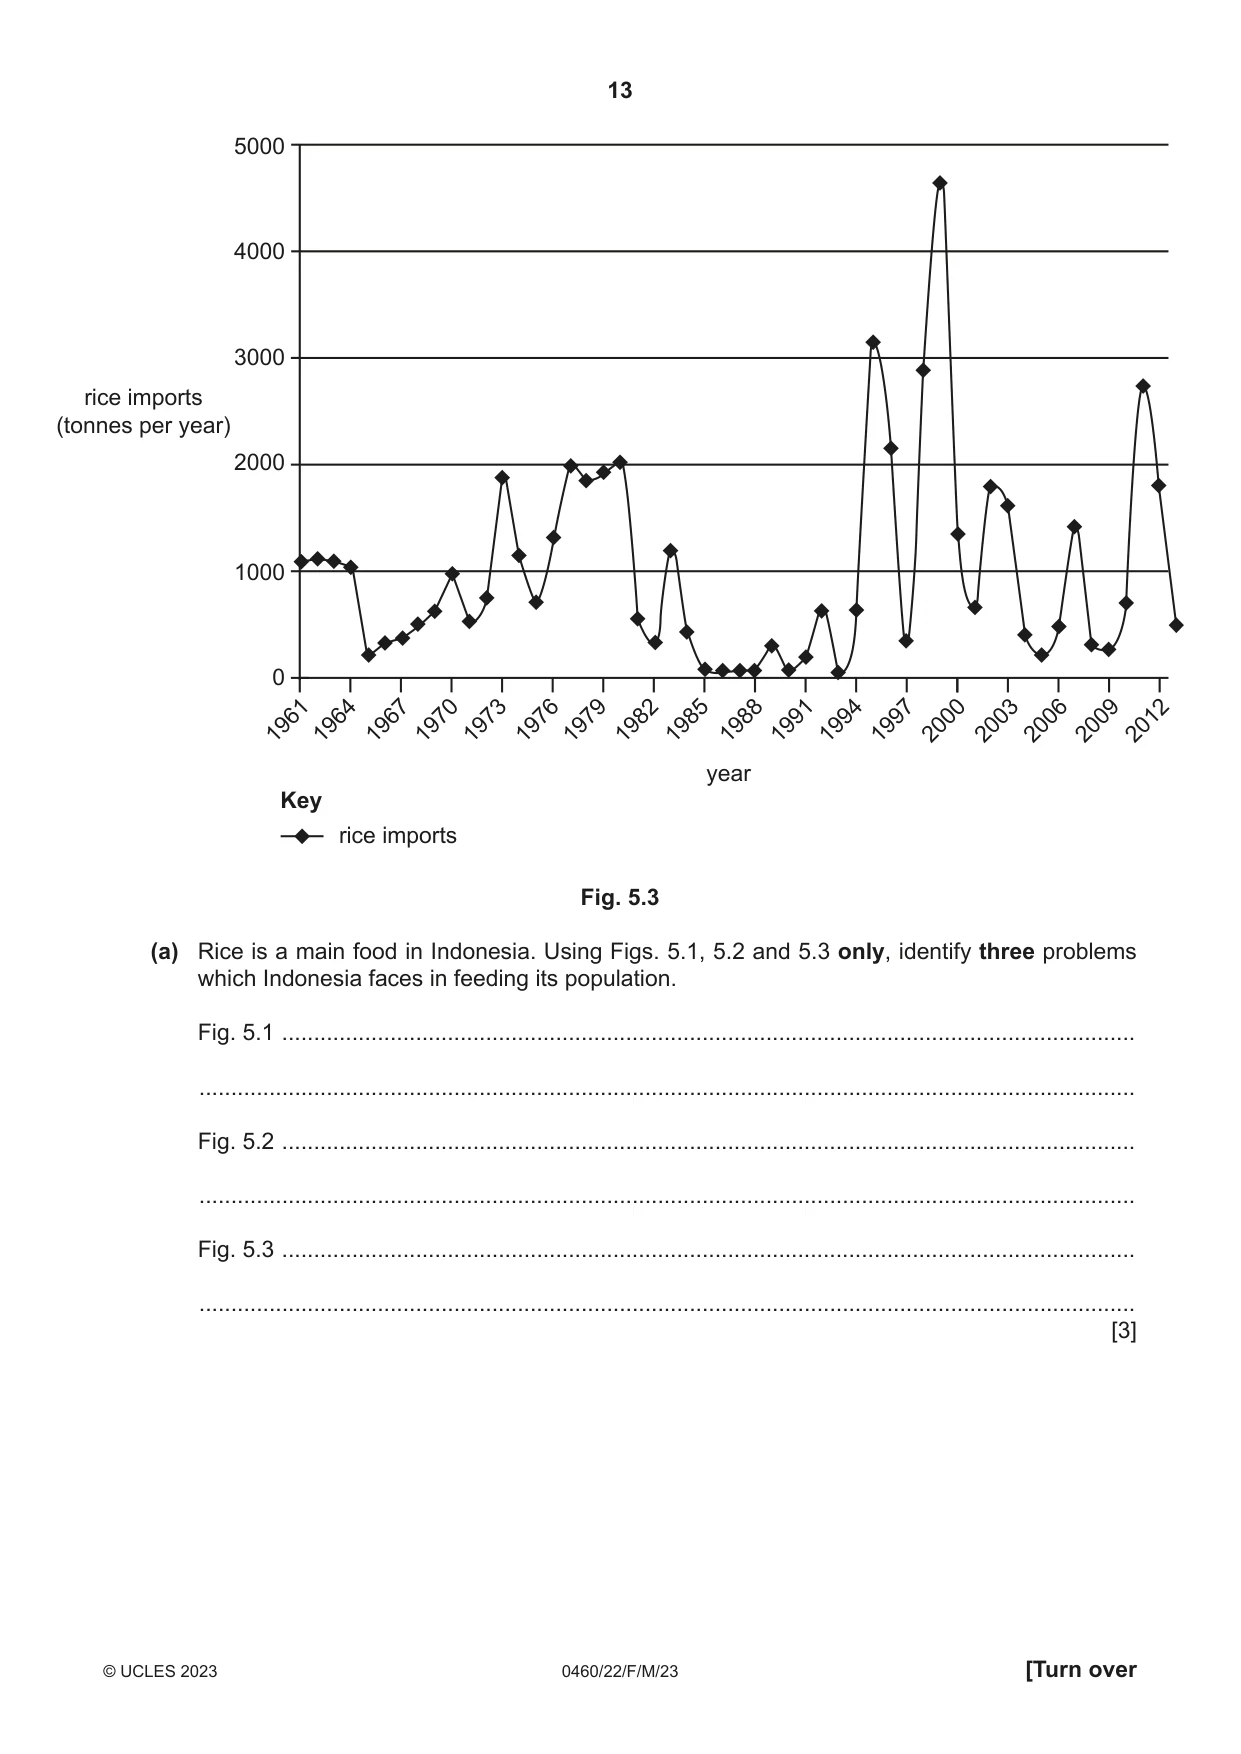
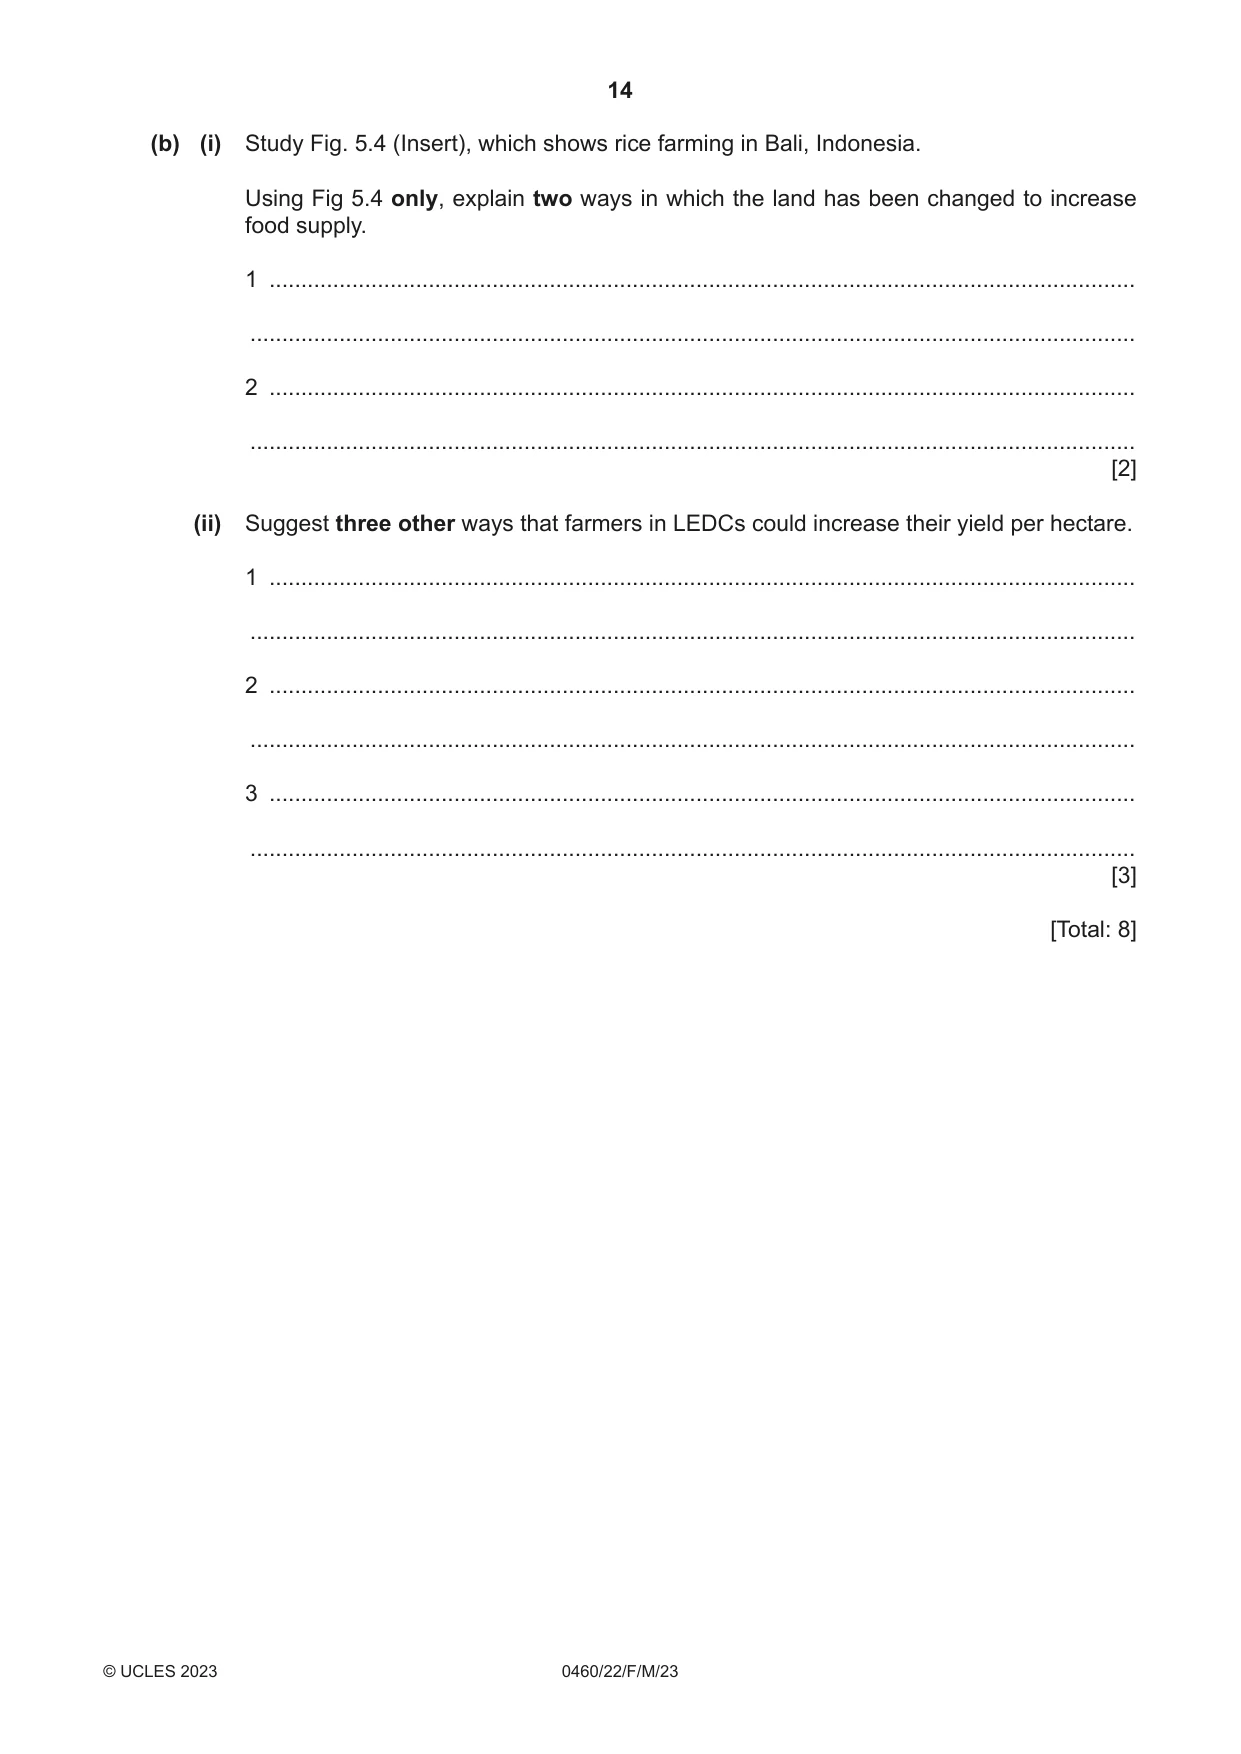
5 Figs. 5.1, 5.2 and 5.3 show information about population, rice production and imports in Indonesia, an LEDC. 225 population 150 (millions) 75 1960 1970 1980 1990 2000 2010 year Fig. 5.1 8 6 rice production 4 (tonnes per hectare) 2 0 19611965196919731977198119851989199319972001200520092013 year Fig. 5.2 5000 4000 3000 rice imports (tonnes per year) 2000 1000 0 196119641967197019731976197919821985198819911994199720002003200620092012 year Key rice imports Fig. 5.3 (a) Rice is a main food in Indonesia. Using Figs. 5.1, 5.2 and 5.3 only, identify three problems which Indonesia faces in feeding its population. Fig. 5.1 ...................................................................................................................................... ................................................................................................................................................... Fig. 5.2 ...................................................................................................................................... ................................................................................................................................................... Fig. 5.3 ...................................................................................................................................... ................................................................................................................................................... [3] (b) (i) Study Fig. 5.4 (Insert), which shows rice farming in Bali, Indonesia. Using Fig 5.4 only, explain two ways in which the land has been changed to increase food supply. 1 ........................................................................................................................................ ........................................................................................................................................... 2 ........................................................................................................................................ ........................................................................................................................................... [2] (ii) Suggest three other ways that farmers in LEDCs could increase their yield per hectare. 1 ........................................................................................................................................ ........................................................................................................................................... 2 ........................................................................................................................................ ........................................................................................................................................... 3 ........................................................................................................................................ ........................................................................................................................................... [3] [Total: 8] TURN PAGE FOR QUESTION 6
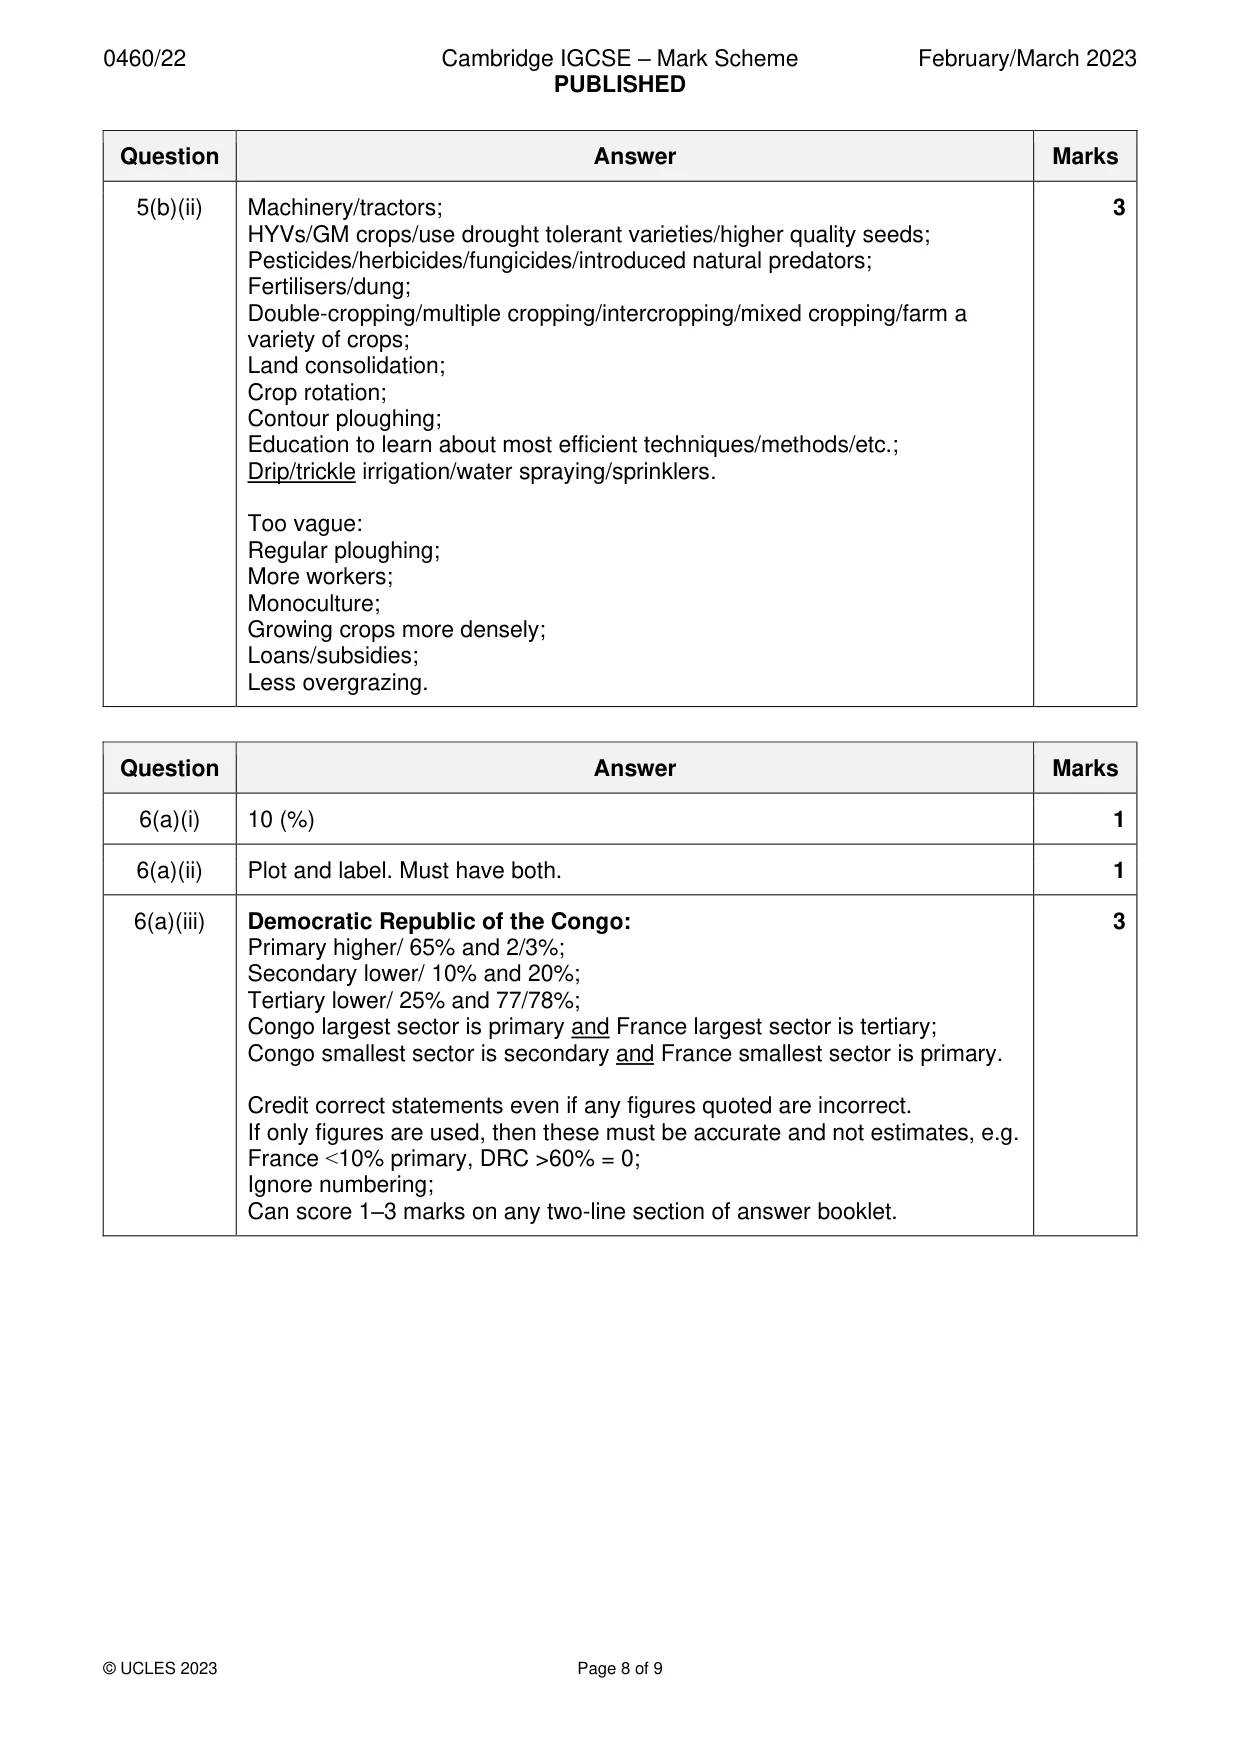
Mark scheme: 5(a) Population/demand is increasing/high population growth/high population; 3 Yield is increasing gradually/slowly/levelling out/ not keeping up with rising/large population; Reliance on imports/imports vary in amount/fluctuate each year/ inconsistent/unpredictable imports/ many years rice imports lower than 2000 tonnes/ need for imports indicates it is not growing enough food. Each mark awarded must relate to a different graph. Too vague: Low/varying rice production; Imports are low; Overall decrease in imports; Increase in imports; High cost of imports; Needs to spend a lot of money on imports; Reduction in imports after 2010. 5(b)(i) Terracing/step farming to ensure flat land/increase land area (available for 2 cultivation)/steps created to hold water; Bunds/walls to retain water; (Irrigation) canals/channels to supply water. Recognition of two methods without explanation = Max.1 (in absence of any appropriate explanation). 5(b)(ii) Machinery/tractors; 3 HYVs/GM crops/use drought tolerant varieties/higher quality seeds; Pesticides/herbicides/fungicides/introduced natural predators; Fertilisers/dung; Double-cropping/multiple cropping/intercropping/mixed cropping/farm a variety of crops; Land consolidation; Crop rotation; Contour ploughing; Education to learn about most efficient techniques/methods/etc.; Drip/trickle irrigation/water spraying/sprinklers. Too vague: Regular ploughing; More workers; Monoculture; Growing crops more densely; Loans/subsidies; Less overgrazing.
Question 6
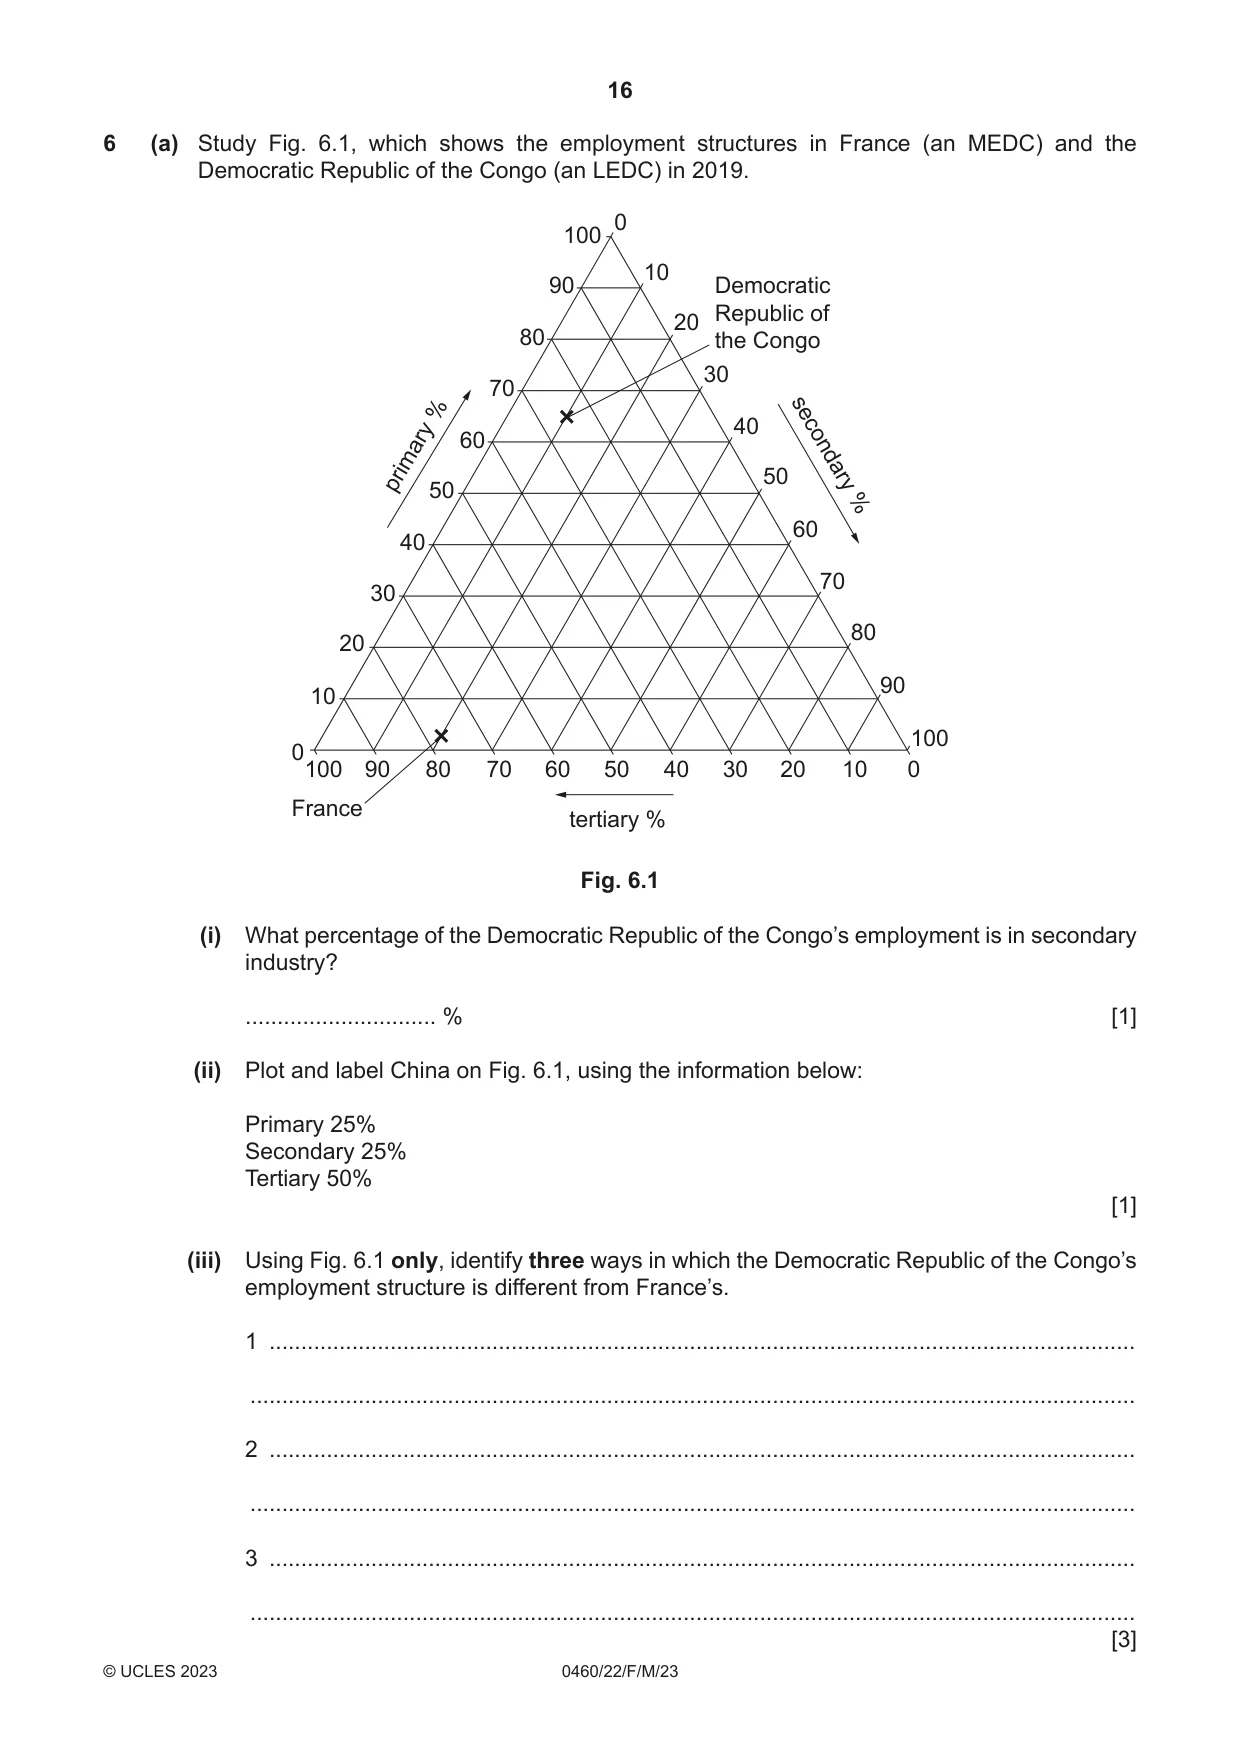
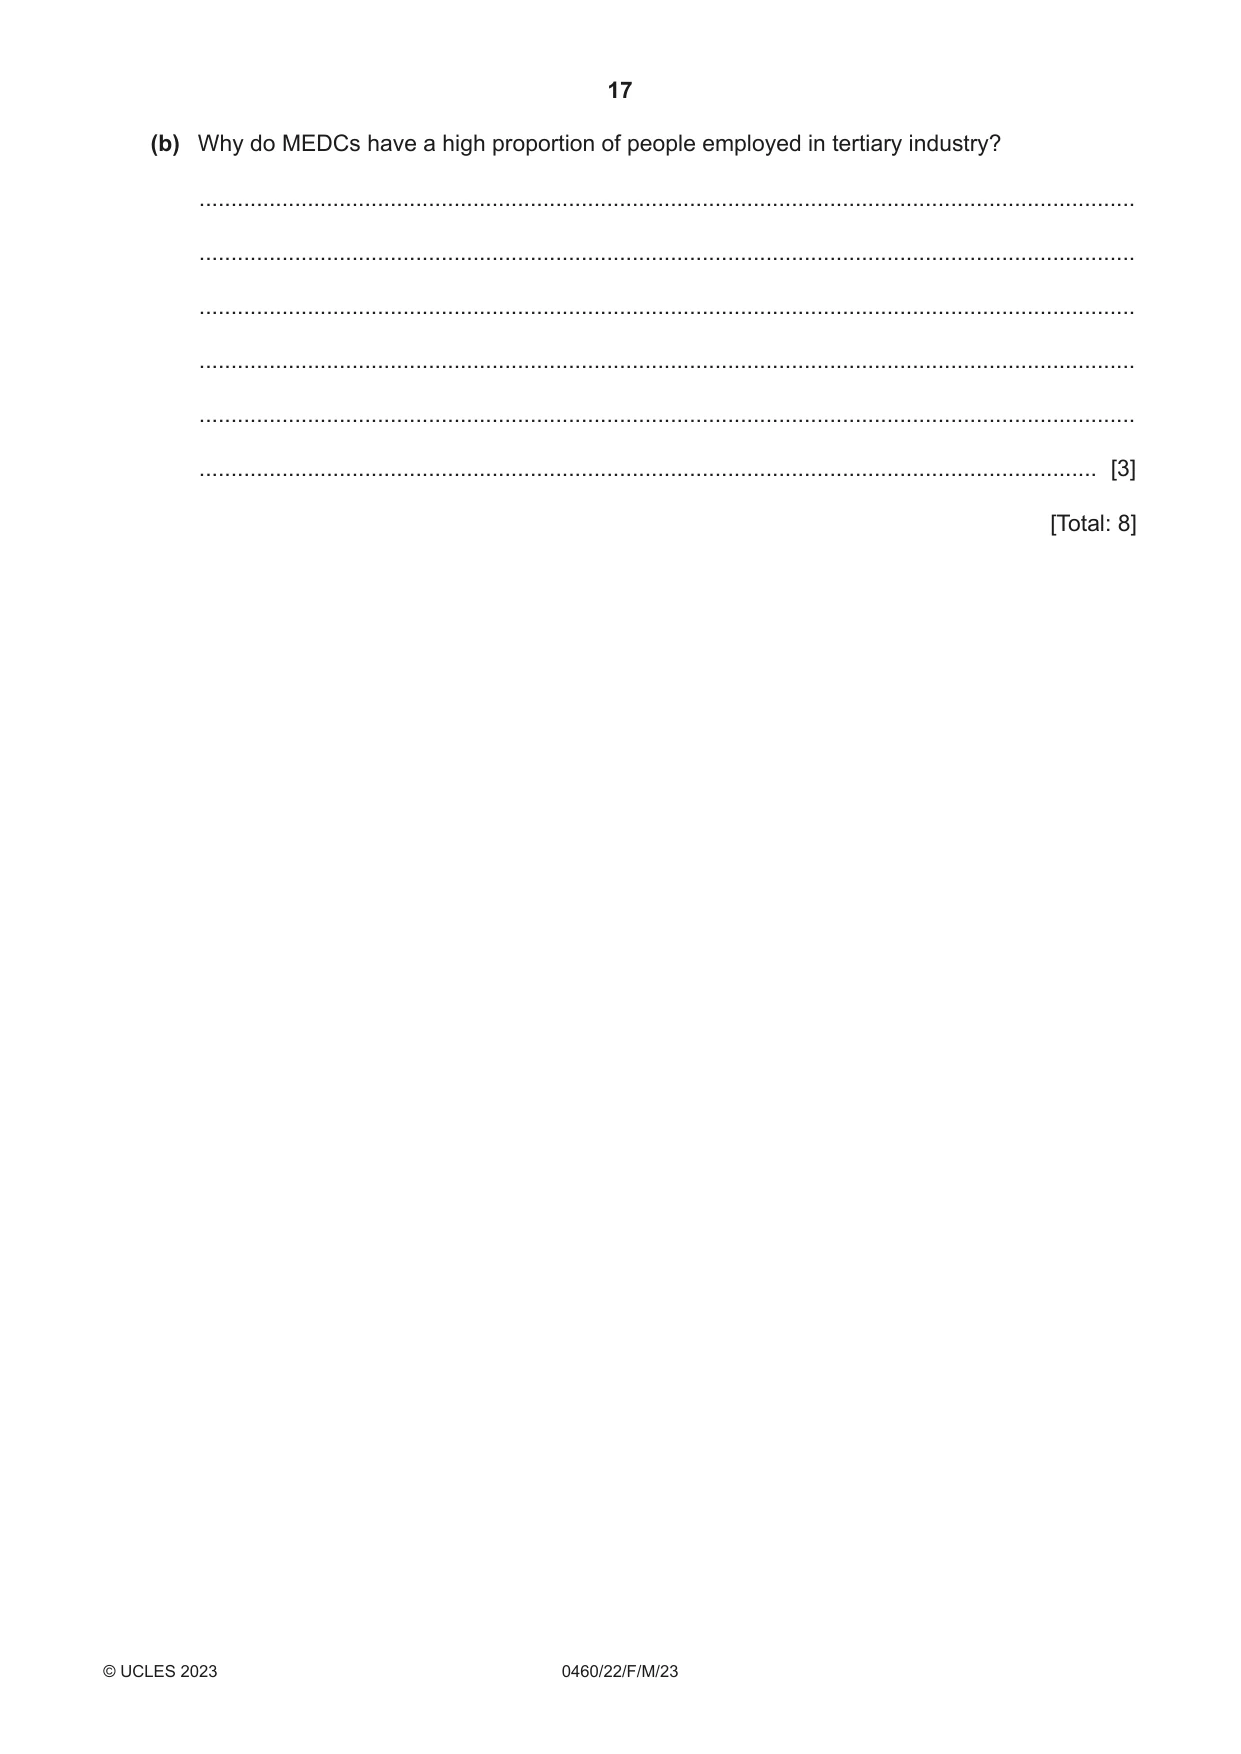
6 (a) Study Fig. 6.1, which shows the employment structures in France (an MEDC) and the Democratic Republic of the Congo (an LEDC) in 2019. 0 100 10 90 Democratic Republic of 20 80 the Congo 30 70 % 40 60 primary 50secondary 50 % 60 40 70 30 80 20 90 10 100 0 100 90 80 70 60 50 40 30 20 10 0 France tertiary % Fig. 6.1 (i) What percentage of the Democratic Republic of the Congo’s employment is in secondary industry? .............................. % [1] (ii) Plot and label China on Fig. 6.1, using the information below: Primary 25% Secondary 25% Tertiary 50% [1] (iii) Using Fig. 6.1 only, identify three ways in which the Democratic Republic of the Congo’s employment structure is different from France’s. 1 ........................................................................................................................................ ........................................................................................................................................... 2 ........................................................................................................................................ ........................................................................................................................................... 3 ........................................................................................................................................ ........................................................................................................................................... [3] (b) Why do MEDCs have a high proportion of people employed in tertiary industry? ................................................................................................................................................... ................................................................................................................................................... ................................................................................................................................................... ................................................................................................................................................... ................................................................................................................................................... ............................................................................................................................................. [3] [Total: 8] Additional pages If you use the following pages to complete the answer to any question, the question number must be clearly shown. .................................................................................................................................................................. .................................................................................................................................................................. .................................................................................................................................................................. .................................................................................................................................................................. .................................................................................................................................................................. .................................................................................................................................................................. .................................................................................................................................................................. .................................................................................................................................................................. .................................................................................................................................................................. .................................................................................................................................................................. .................................................................................................................................................................. .................................................................................................................................................................. .................................................................................................................................................................. .................................................................................................................................................................. .................................................................................................................................................................. .................................................................................................................................................................. .................................................................................................................................................................. .................................................................................................................................................................. .................................................................................................................................................................. .................................................................................................................................................................. .................................................................................................................................................................. .................................................................................................................................................................. .................................................................................................................................................................. .................................................................................................................................................................. ..................................................................................................................................................................
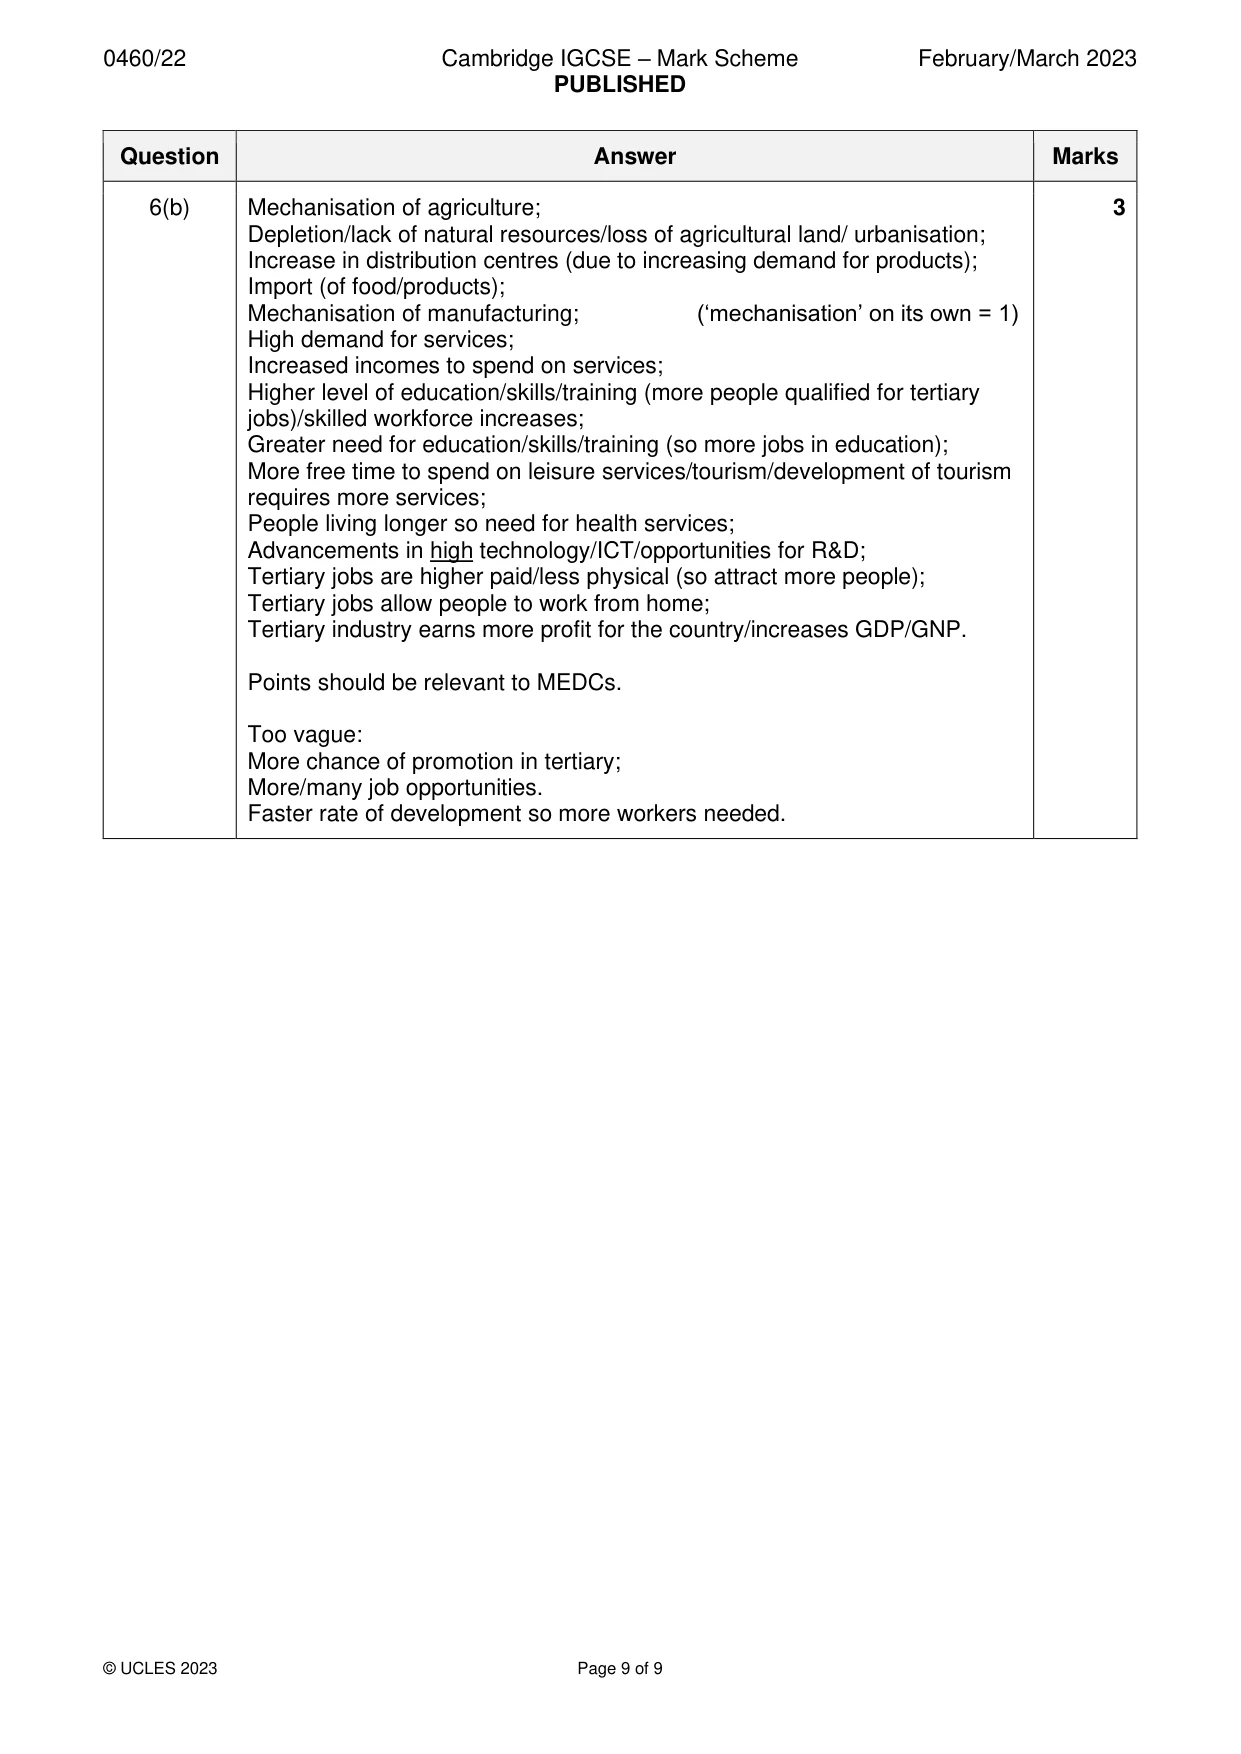
Mark scheme: 6(a)(i) 10 (%) 1 6(a)(ii) Plot and label. Must have both. 1 6(a)(iii) Democratic Republic of the Congo: 3 Primary higher/ 65% and 2/3%; Secondary lower/ 10% and 20%; Tertiary lower/ 25% and 77/78%; Congo largest sector is primary and France largest sector is tertiary; Congo smallest sector is secondary and France smallest sector is primary. Credit correct statements even if any figures quoted are incorrect. If only figures are used, then these must be accurate and not estimates, e.g. France ˂10% primary, DRC >60% = 0; Ignore numbering; Can score 1–3 marks on any two-line section of answer booklet. 6(b) Mechanisation of agriculture; 3 Depletion/lack of natural resources/loss of agricultural land/ urbanisation; Increase in distribution centres (due to increasing demand for products); Import (of food/products); Mechanisation of manufacturing; (‘mechanisation’ on its own = 1) High demand for services; Increased incomes to spend on services; Higher level of education/skills/training (more people qualified for tertiary jobs)/skilled workforce increases; Greater need for education/skills/training (so more jobs in education); More free time to spend on leisure services/tourism/development of tourism requires more services; People living longer so need for health services; Advancements in high technology/ICT/opportunities for R&D; Tertiary jobs are higher paid/less physical (so attract more people); Tertiary jobs allow people to work from home; Tertiary industry earns more profit for the country/increases GDP/GNP. Points should be relevant to MEDCs. Too vague: More chance of promotion in tertiary; More/many job opportunities. Faster rate of development so more workers needed.
What was in this paper
The subtopics covered by these 6 questions, and how many questions each got. Open one in a new tab to see every Cambridge question on it.
What you needed in this session
Cambridge’s own grade thresholds for 2023 Feb/March, Paper 2 · Variant 2. A higher threshold means an easier paper — the bar moves with how the cohort did.