Cambridge IGCSE Geography 0460 — 2017 May/June Paper 2 · Variant 1
0460/21/M/J/17 · 6 questions · 60 marks · ≈68 min
The question paper and its mark scheme, free to read here and free to download. This is Cambridge’s own paper, exactly as it was sat.
Question paper20 pages
Mark scheme5 pages
Answers below. Sit the paper first if you are practising.
Questions as text
Q1 · Study the map extract for Voss, Norway
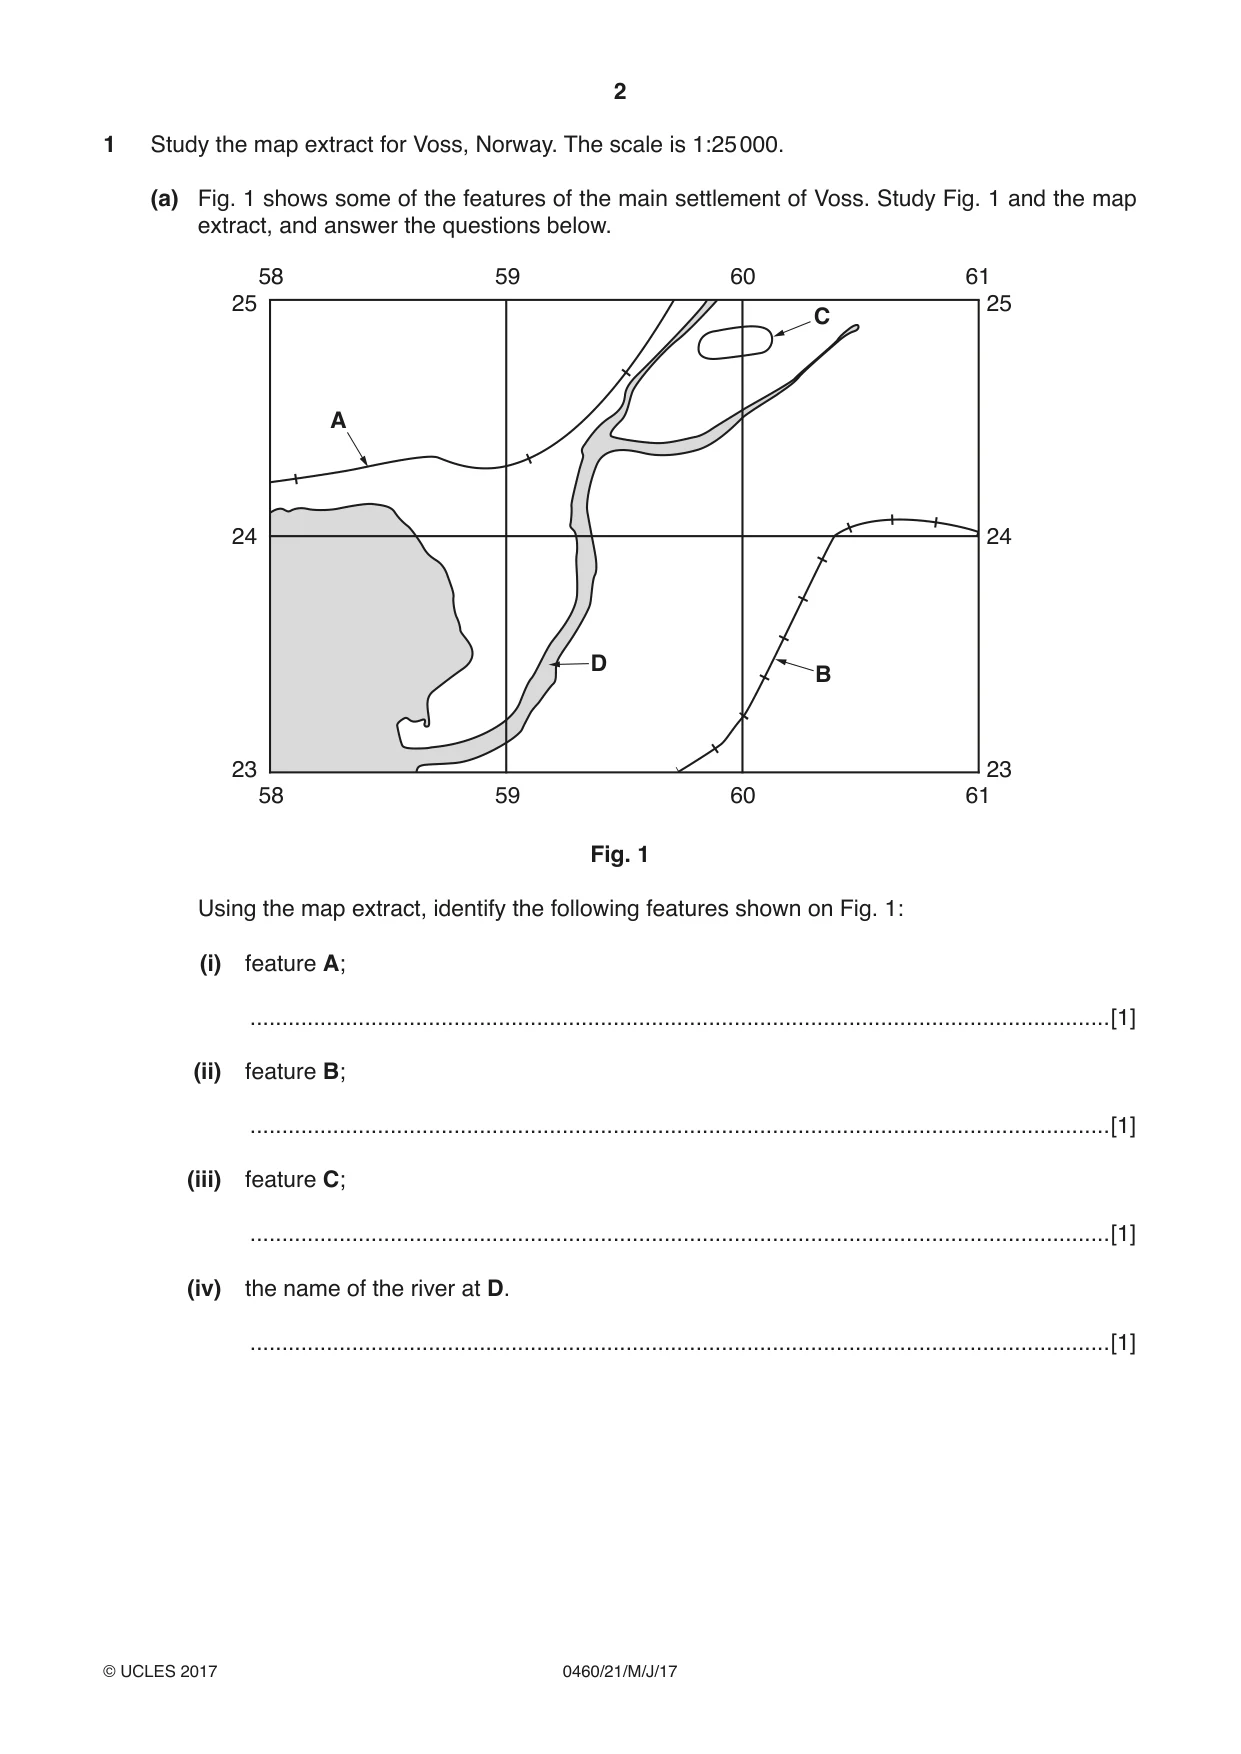
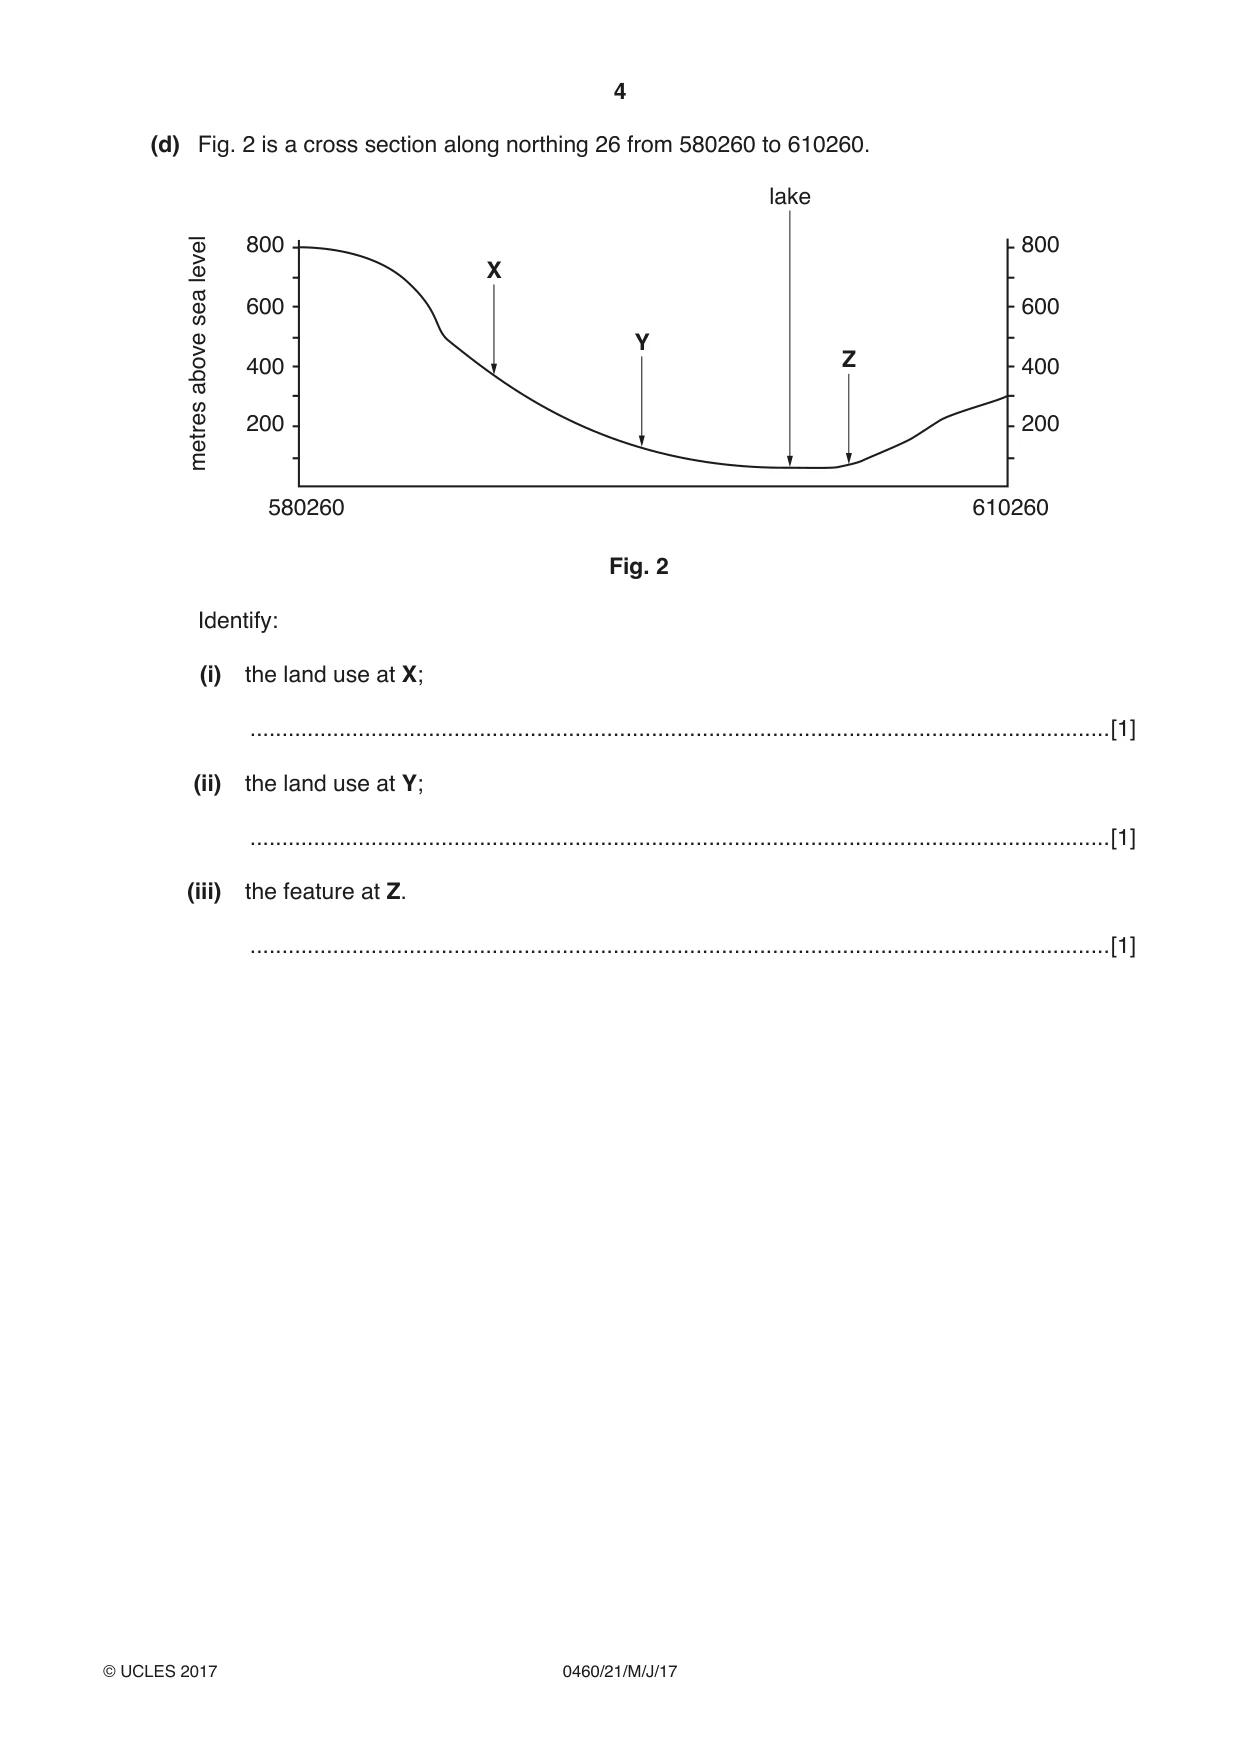
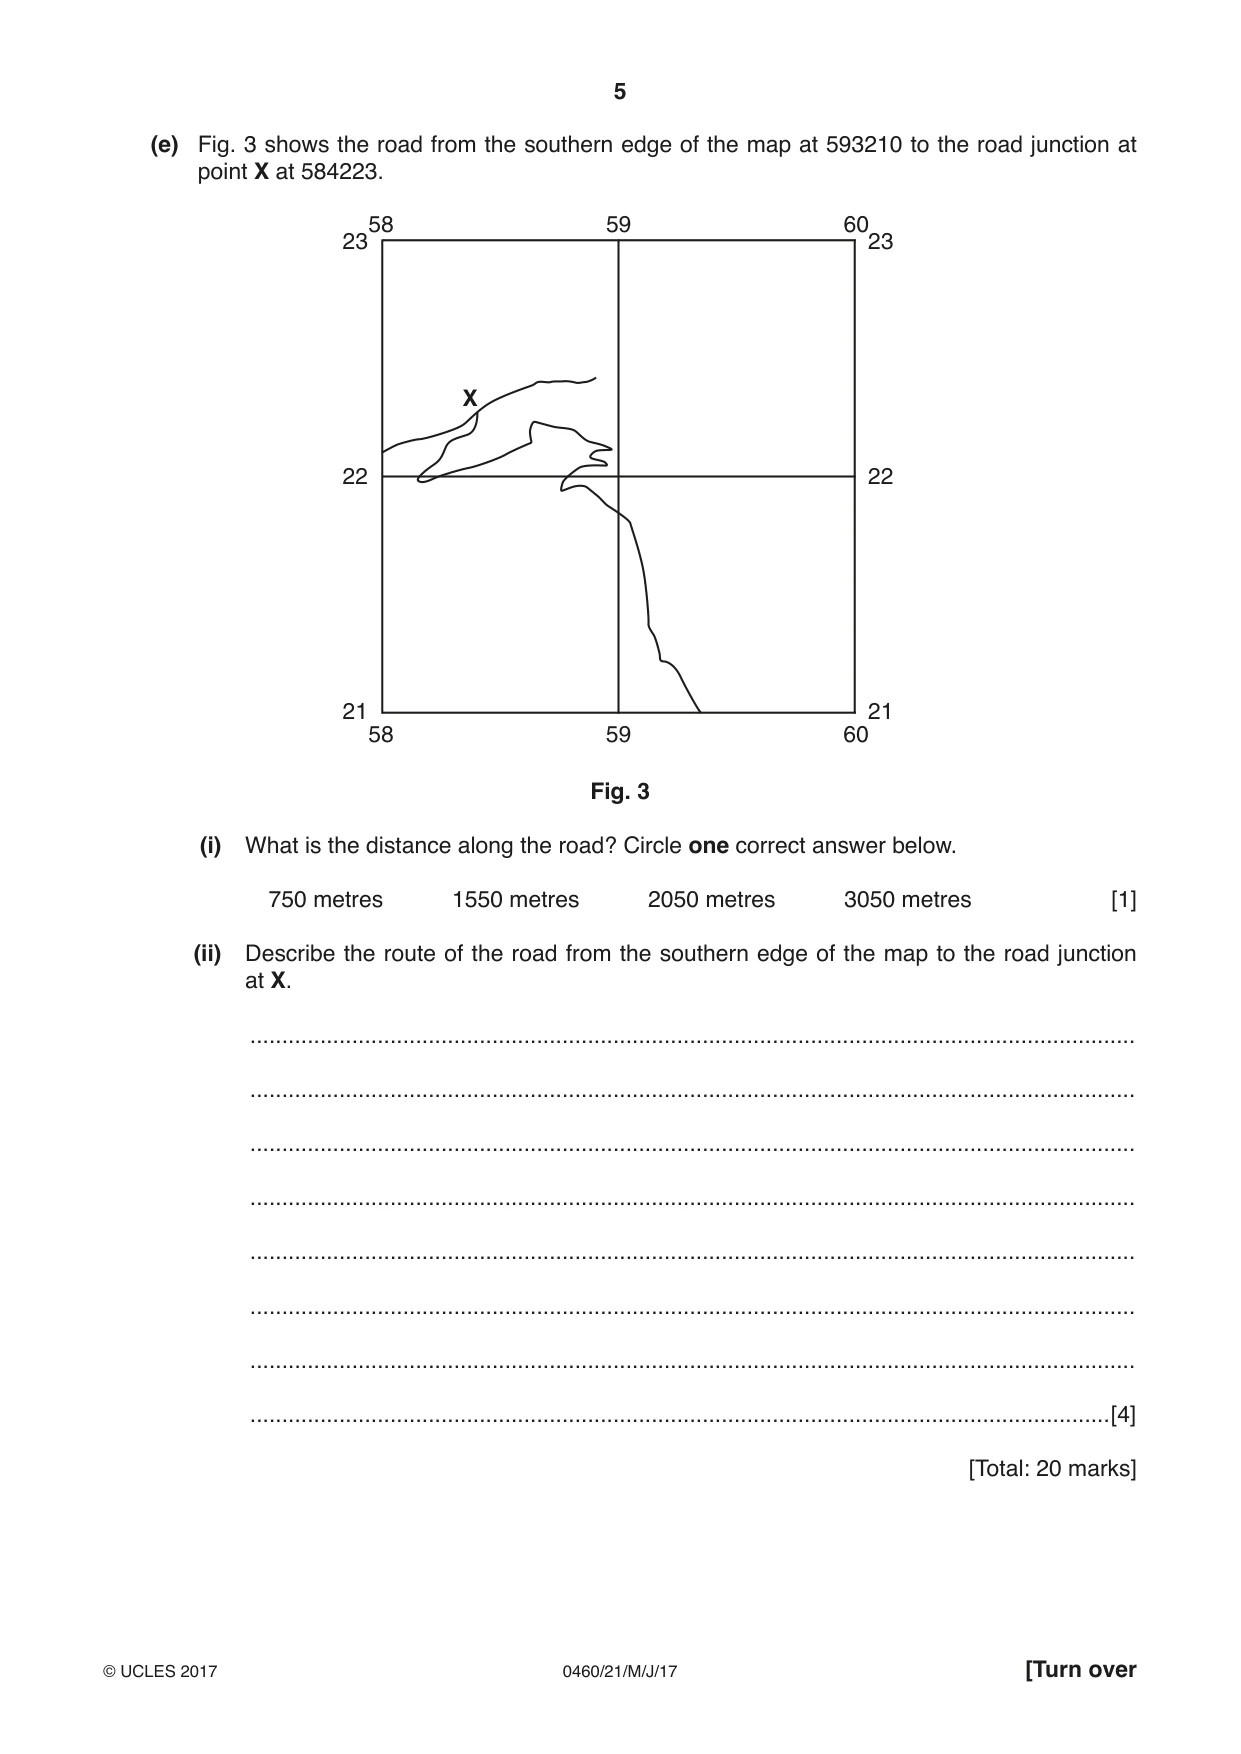
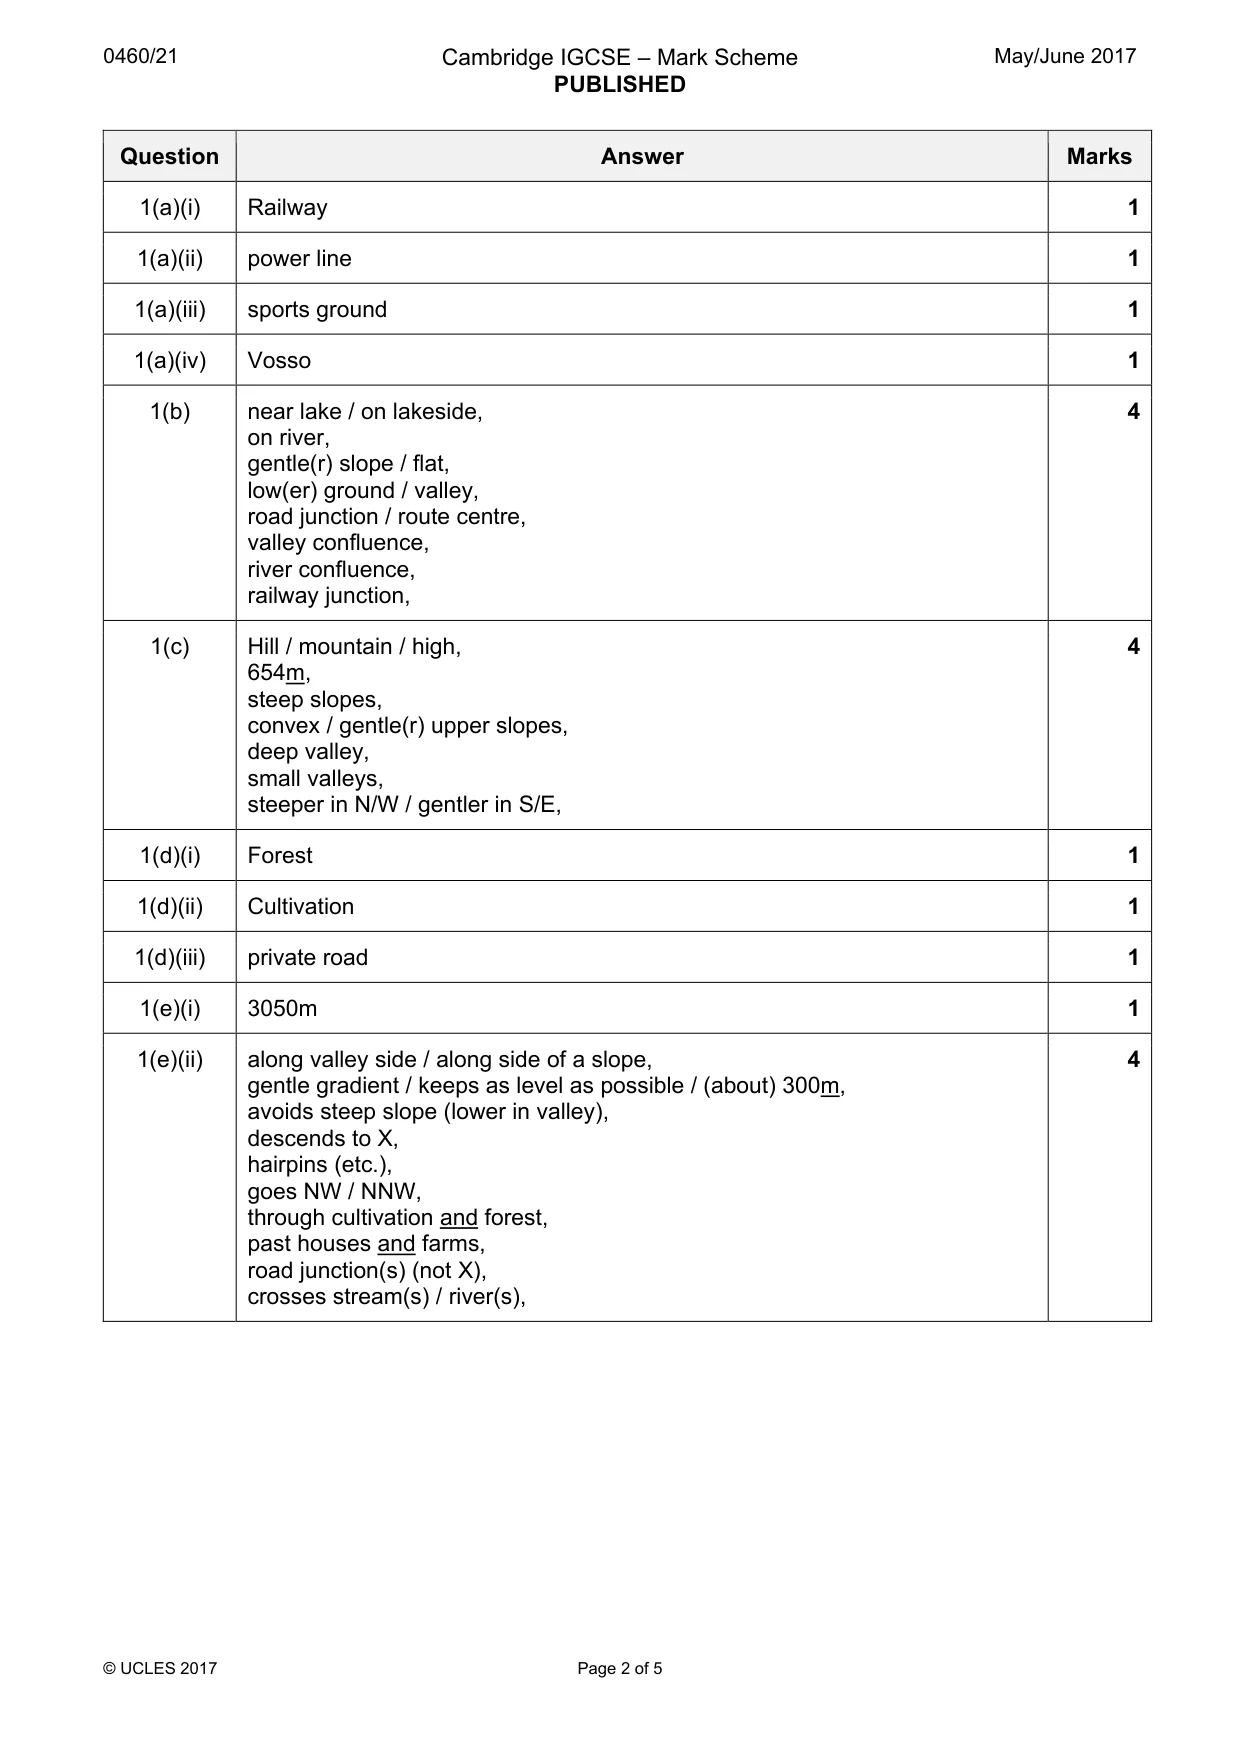
1 Study the map extract for Voss, Norway. The scale is 1:25 000. (a) Fig. 1 shows some of the features of the main settlement of Voss. Study Fig. 1 and the map extract, and answer the questions below. 58 59 60 61 25 25 C A 24 24 D B 23 23 58 59 60 61 Fig. 1 Using the map extract, identify the following features shown on Fig. 1: (i) feature A; .......................................................................................................................................[1] (ii) feature B; .......................................................................................................................................[1] (iii) feature C; .......................................................................................................................................[1] (iv) the name of the river at D. .......................................................................................................................................[1] (b) Describe the site of the settlement at Voss. ................................................................................................................................................... ................................................................................................................................................... ................................................................................................................................................... ................................................................................................................................................... ................................................................................................................................................... ................................................................................................................................................... ................................................................................................................................................... ...............................................................................................................................................[4] (c) Describe the relief of the area around Sonvesåsen in the south east of the map extract. ................................................................................................................................................... ................................................................................................................................................... ................................................................................................................................................... ................................................................................................................................................... ................................................................................................................................................... ................................................................................................................................................... ................................................................................................................................................... ...............................................................................................................................................[4] (d) Fig. 2 is a cross section along northing 26 from 580260 to 610260. lake 800 800 level X sea 600 600 Y Z 400 400 above metres 200 200 580260 610260 Fig. 2 Identify: (i) the land use at X; .......................................................................................................................................[1] (ii) the land use at Y; .......................................................................................................................................[1] (iii) the feature at Z. .......................................................................................................................................[1] (e) Fig. 3 shows the road from the southern edge of the map at 593210 to the road junction at point X at 584223. 58 59 60 23 23 X 22 22 21 21 58 59 60 Fig. 3 (i) What is the distance along the road? Circle one correct answer below. 750 metres 1550 metres 2050 metres 3050 metres [1] (ii) Describe the route of the road from the southern edge of the map to the road junction at X. ........................................................................................................................................... ........................................................................................................................................... ........................................................................................................................................... ........................................................................................................................................... ........................................................................................................................................... ........................................................................................................................................... ........................................................................................................................................... .......................................................................................................................................[4] [Total: 20 marks]
Mark scheme: Question Answer Marks 1(a)(i) Railway 1 1(a)(ii) power line 1 1(a)(iii) sports ground 1 1(a)(iv) Vosso 1 1(b) near lake / on lakeside, 4 on river, gentle(r) slope / flat, low(er) ground / valley, road junction / route centre, valley confluence, river confluence, railway junction, 1(c) Hill / mountain / high, 4 654m, steep slopes, convex / gentle(r) upper slopes, deep valley, small valleys, steeper in N/W / gentler in S/E, 1(d)(i) Forest 1 1(d)(ii) Cultivation 1 1(d)(iii) private road 1 1(e)(i) 3050m 1 1(e)(ii) along valley side / along side of a slope, 4 gentle gradient / keeps as level as possible / (about) 300m, avoids steep slope (lower in valley), descends to X, hairpins (etc.), goes NW / NNW, through cultivation and forest, past houses and farms, road junction(s) (not X), crosses stream(s) / river(s),
More questions on Settlements (rural and urban) and service provision
Q2 · The local council in North Devon, UK, made a map of the settlement hierarchy in the area
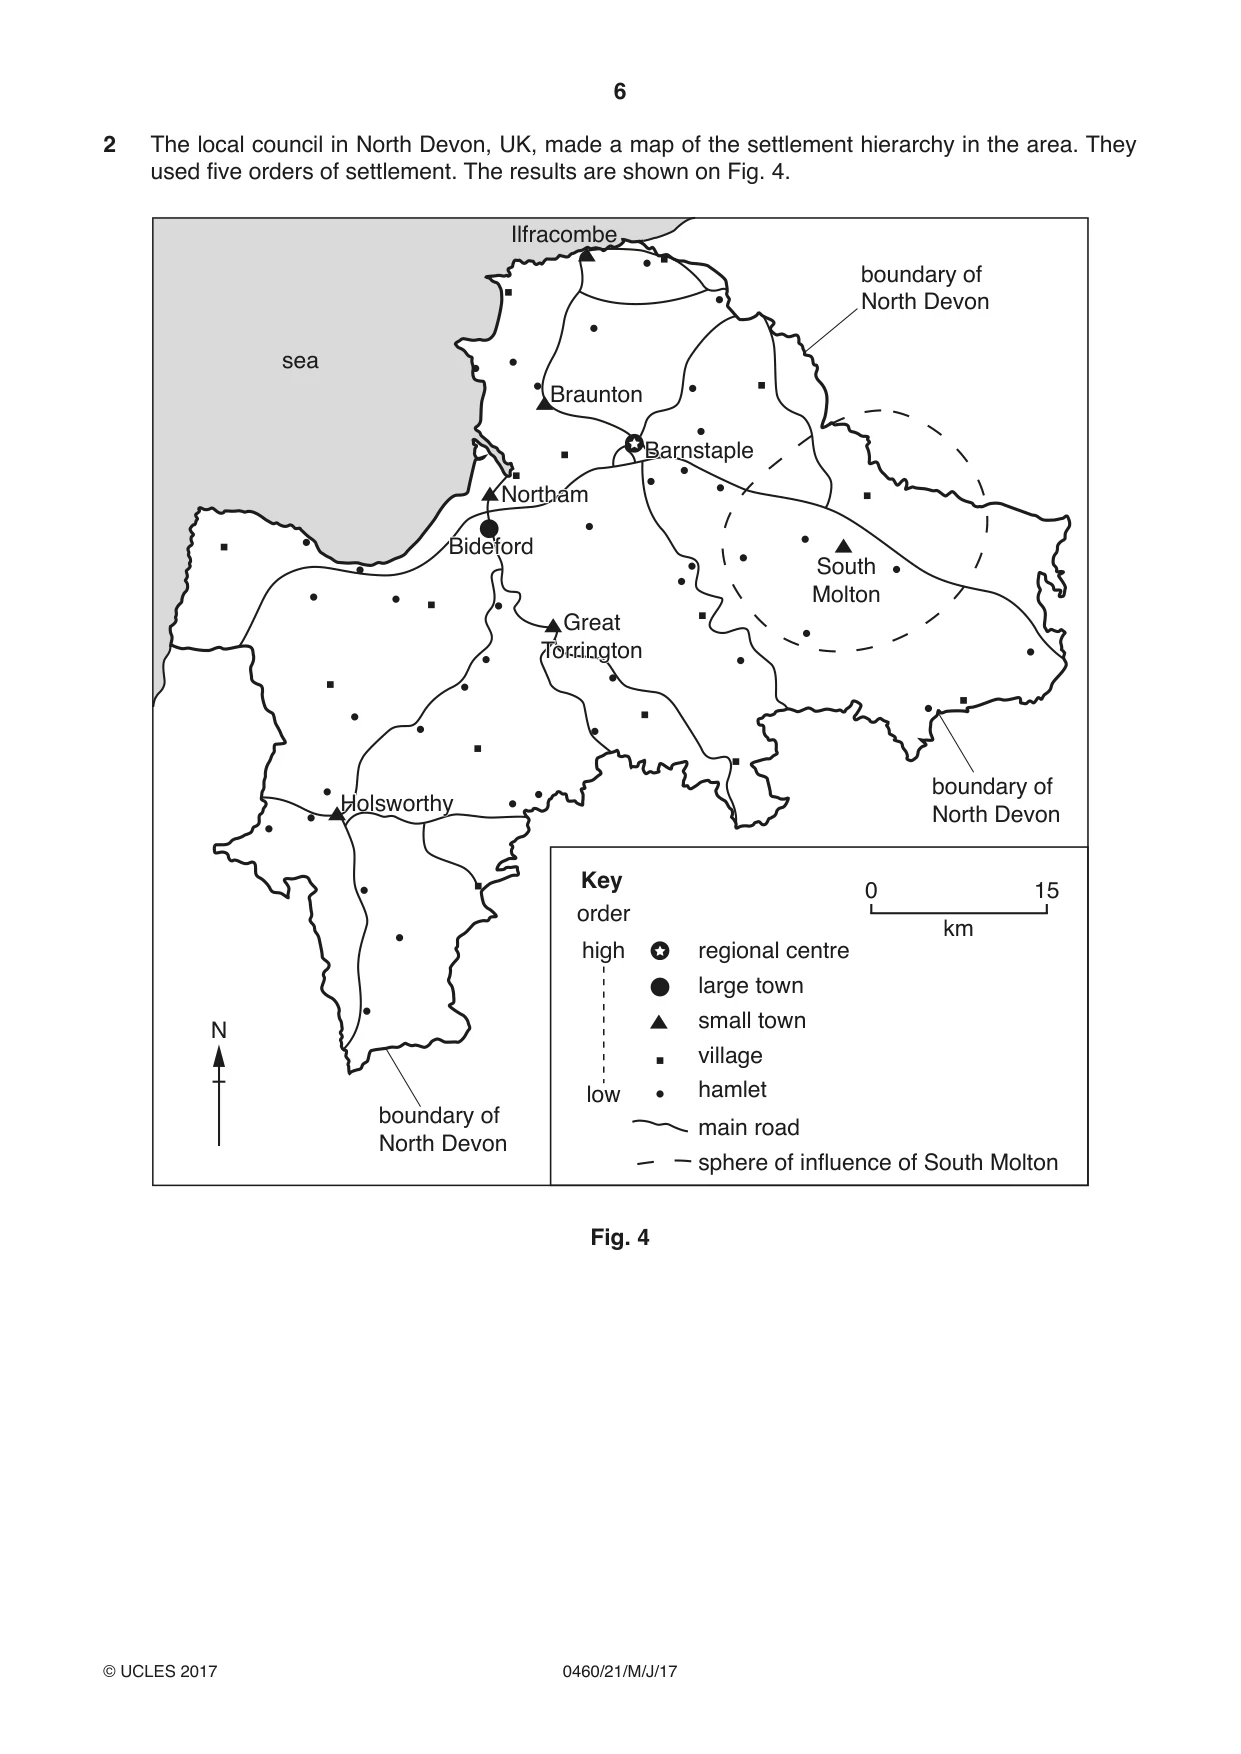
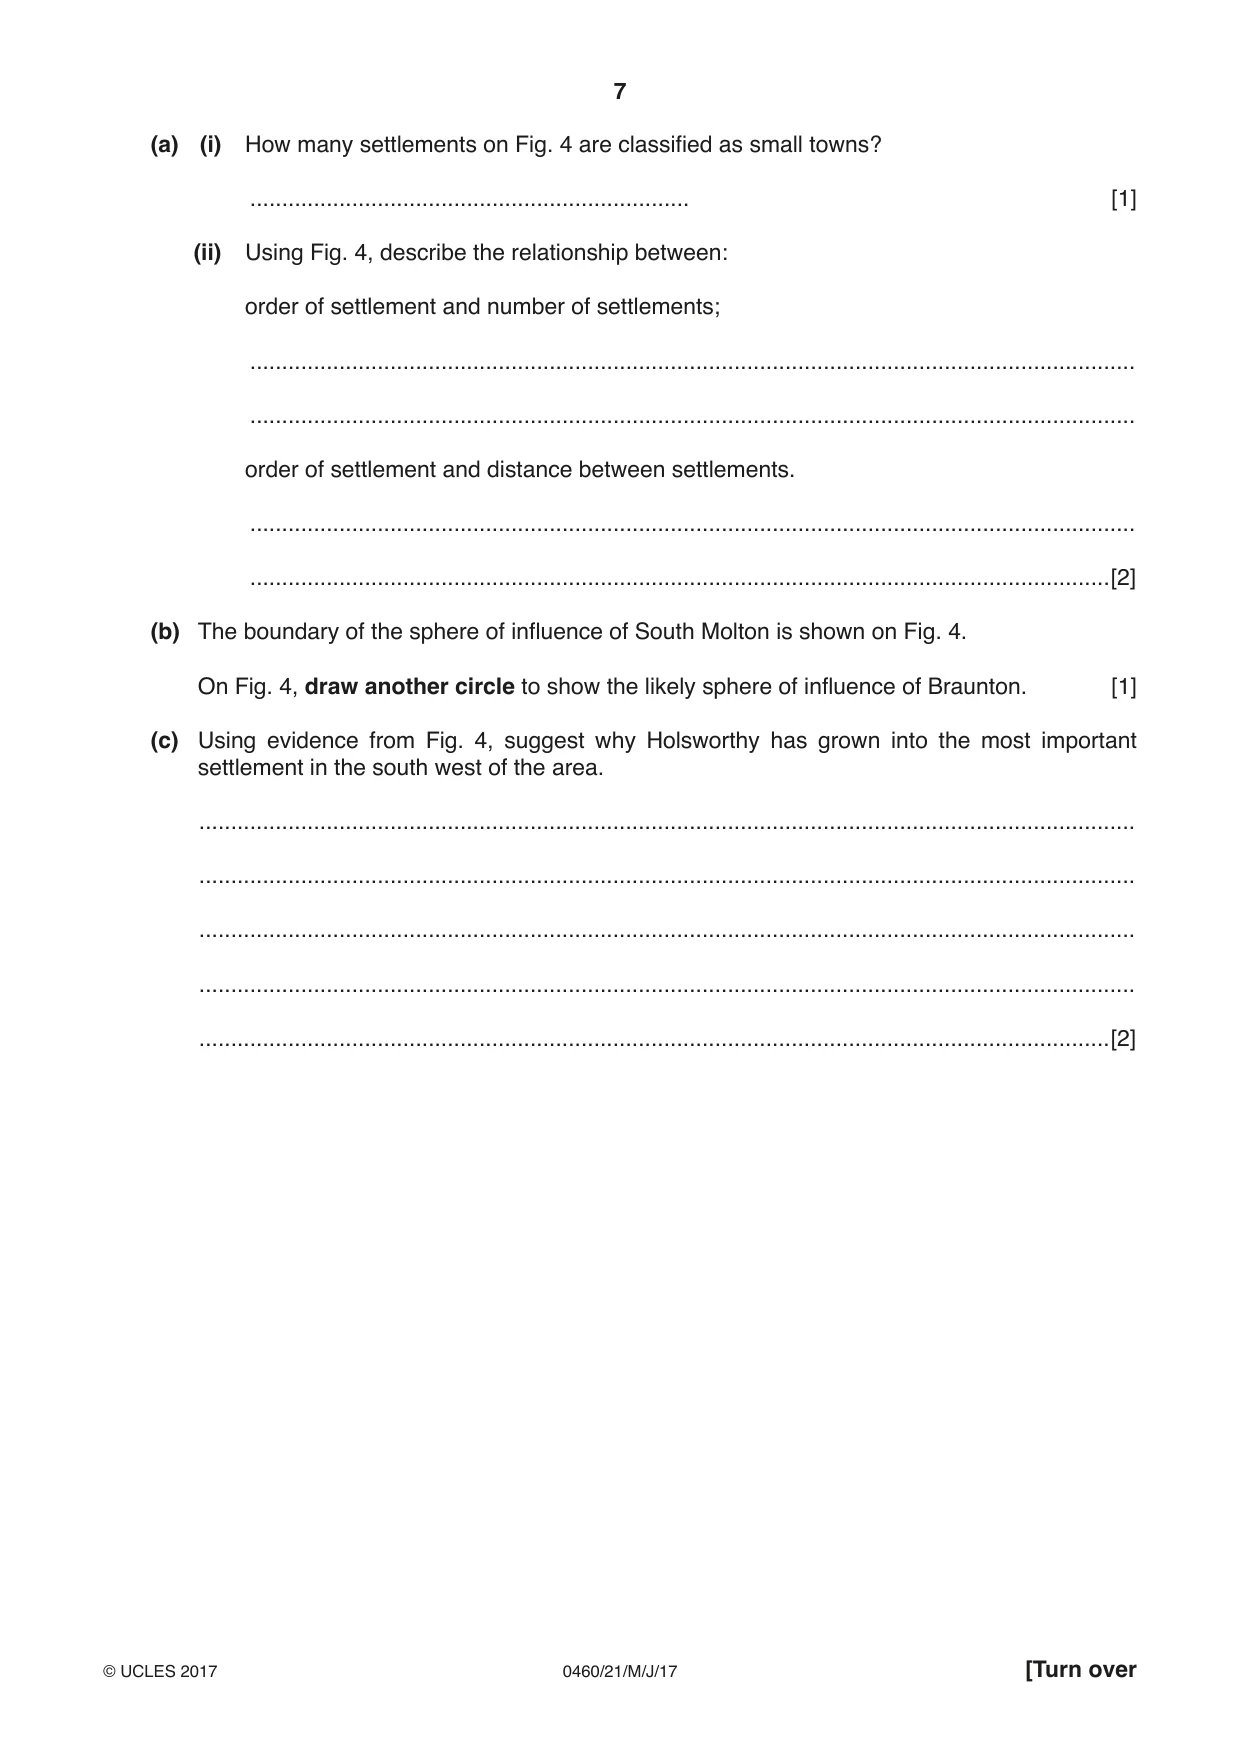
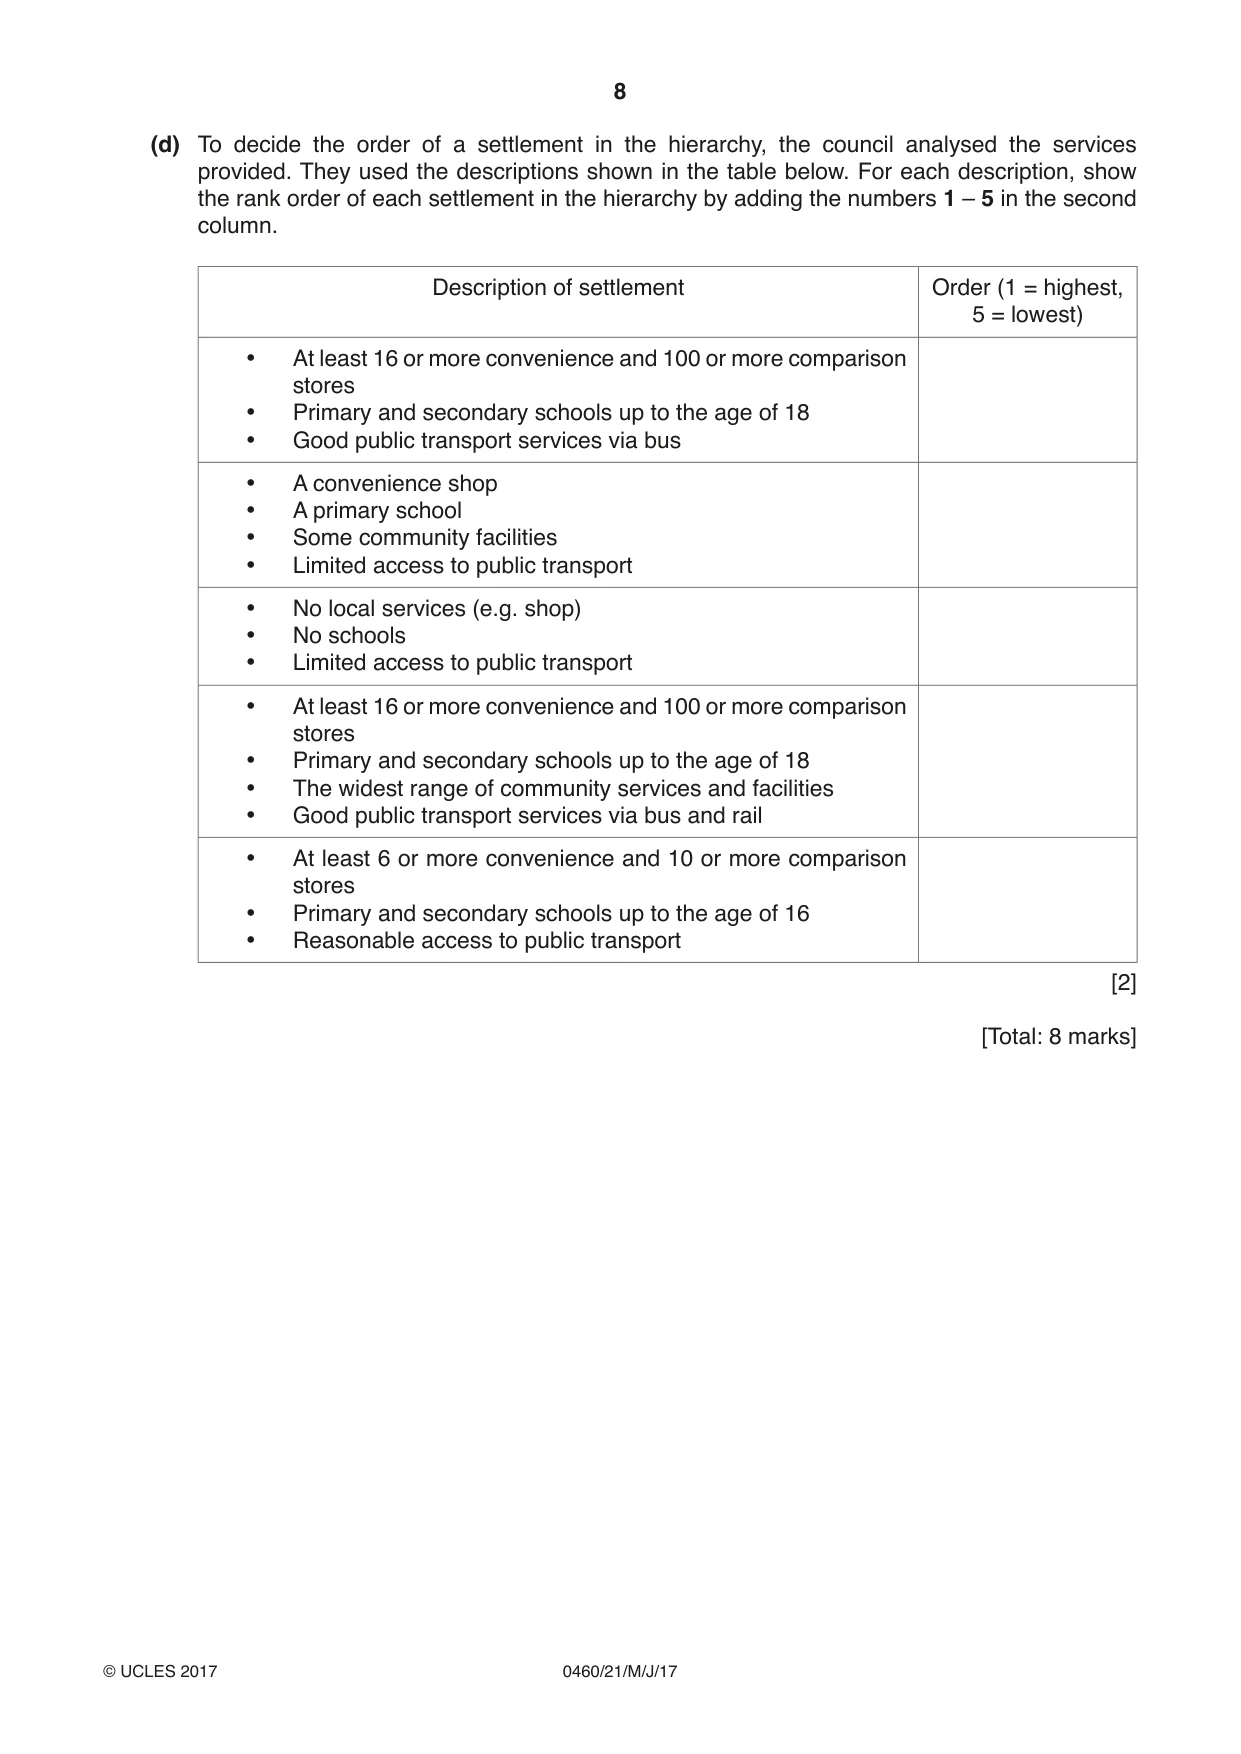
2 The local council in North Devon, UK, made a map of the settlement hierarchy in the area. They used five orders of settlement. The results are shown on Fig. 4. Ilfracombe boundary of North Devon sea Braunton BarnstapleBarnstaple NorthamNortham BidefordBideford South Molton GreatGreat TorringtonTorrington boundary of HolsworthyHolsworthy North Devon Key 0 15 order km high regional centre large town small town N village low hamlet boundary of main road North Devon sphere of influence of South Molton Fig. 4 (a) (i) How many settlements on Fig. 4 are classified as small towns? ..................................................................... [1] (ii) Using Fig. 4, describe the relationship between: order of settlement and number of settlements; ........................................................................................................................................... ........................................................................................................................................... order of settlement and distance between settlements. ........................................................................................................................................... .......................................................................................................................................[2] (b) The boundary of the sphere of influence of South Molton is shown on Fig. 4. On Fig. 4, draw another circle to show the likely sphere of influence of Braunton. [1] (c) Using evidence from Fig. 4, suggest why Holsworthy has grown into the most important settlement in the south west of the area. ................................................................................................................................................... ................................................................................................................................................... ................................................................................................................................................... ................................................................................................................................................... ...............................................................................................................................................[2] (d) To decide the order of a settlement in the hierarchy, the council analysed the services provided. They used the descriptions shown in the table below. For each description, show the rank order of each settlement in the hierarchy by adding the numbers 1 – 5 in the second column. Description of settlement Order (1 = highest, 5 = lowest) • At least 16 or more convenience and 100 or more comparison stores • Primary and secondary schools up to the age of 18 • Good public transport services via bus • A convenience shop • A primary school • Some community facilities • Limited access to public transport • No local services (e.g. shop) • No schools • Limited access to public transport • At least 16 or more convenience and 100 or more comparison stores • Primary and secondary schools up to the age of 18 • The widest range of community services and facilities • Good public transport services via bus and rail • At least 6 or more convenience and 10 or more comparison stores • Primary and secondary schools up to the age of 16 • Reasonable access to public transport [2] [Total: 8 marks] TURN PAGE FOR QUESTION 3
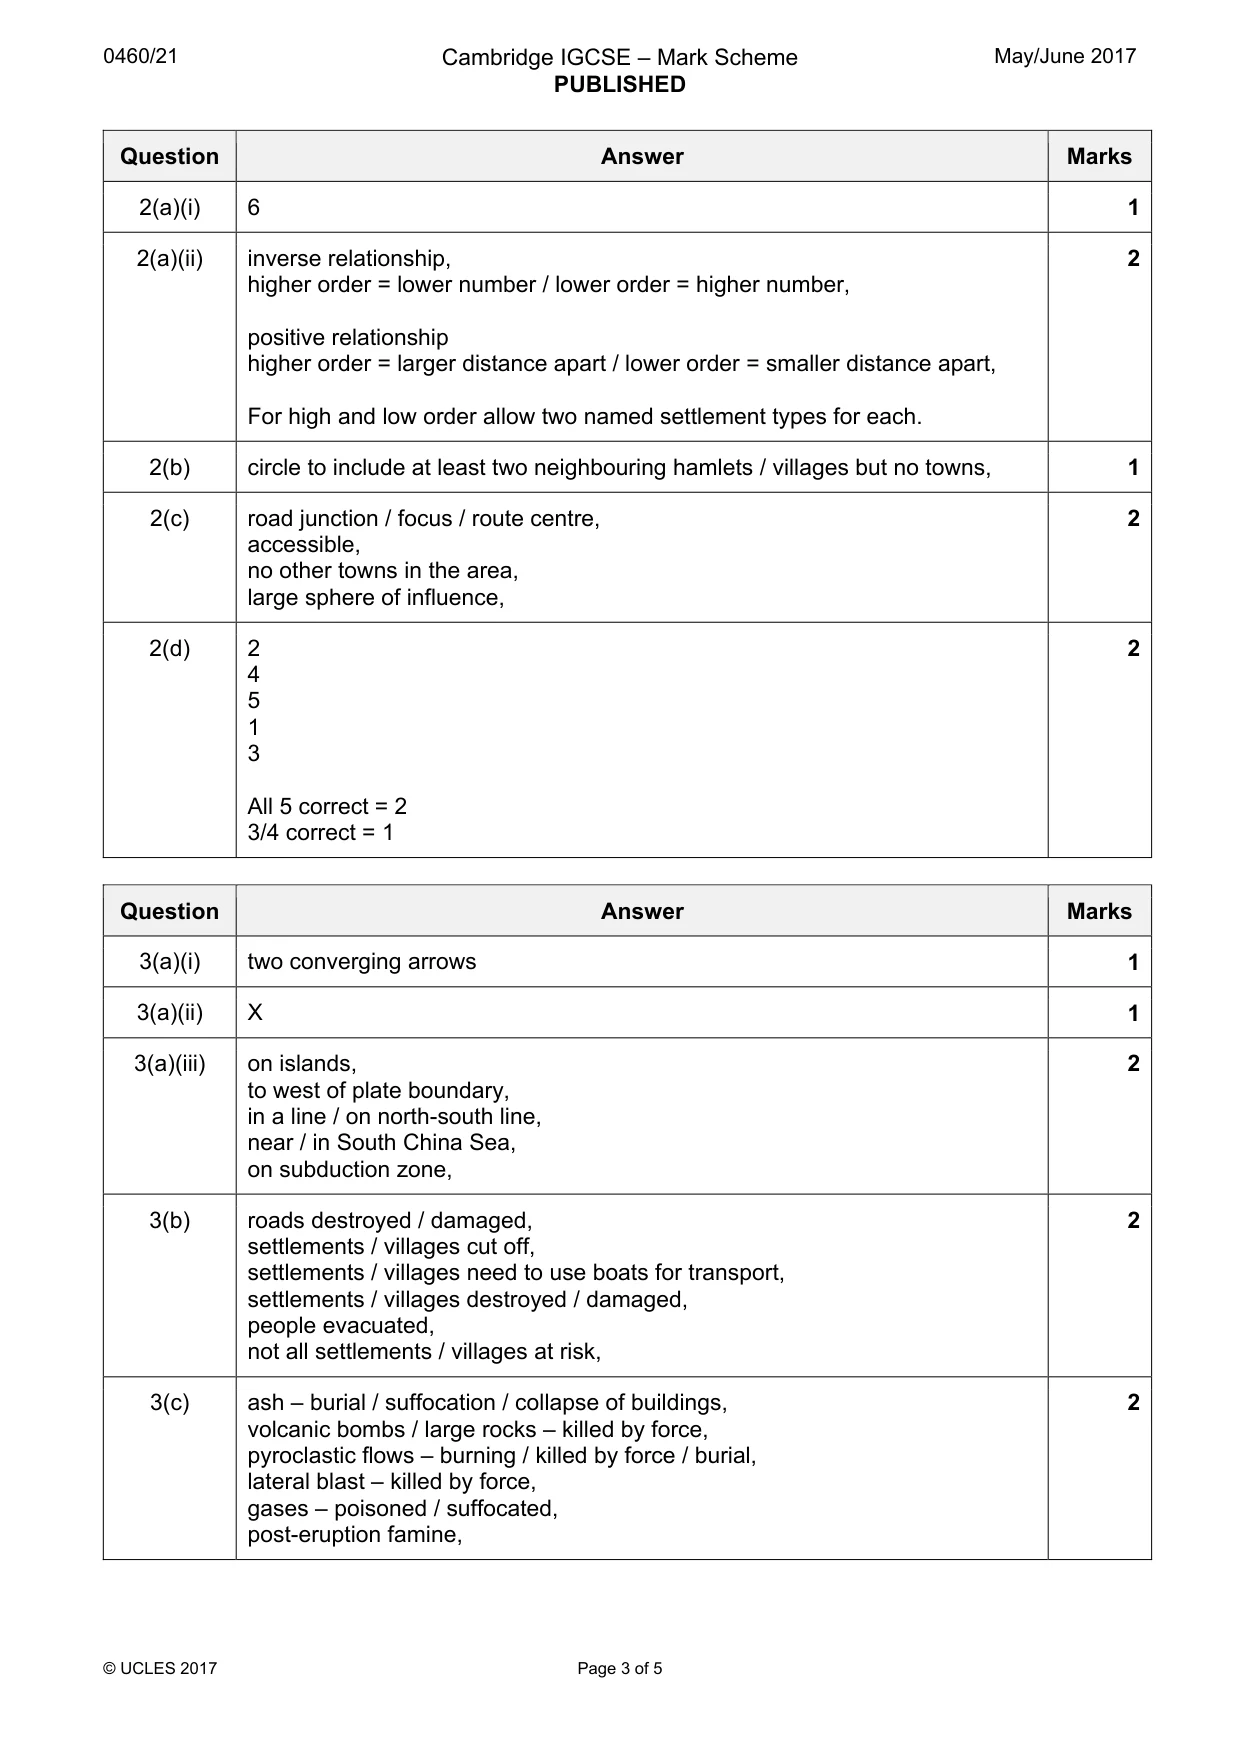
Mark scheme: 2(a)(i) 6 1 2(a)(ii) inverse relationship, 2 higher order = lower number / lower order = higher number, positive relationship higher order = larger distance apart / lower order = smaller distance apart, For high and low order allow two named settlement types for each. 2(b) circle to include at least two neighbouring hamlets / villages but no towns, 1 2(c) road junction / focus / route centre, 2 accessible, no other towns in the area, large sphere of influence, 2(d) 2 2 4 5 1 3 All 5 correct = 2 3/4 correct = 1
More questions on Settlements (rural and urban) and service provision
Q3 · The location of the Philippines in Southeast Asia
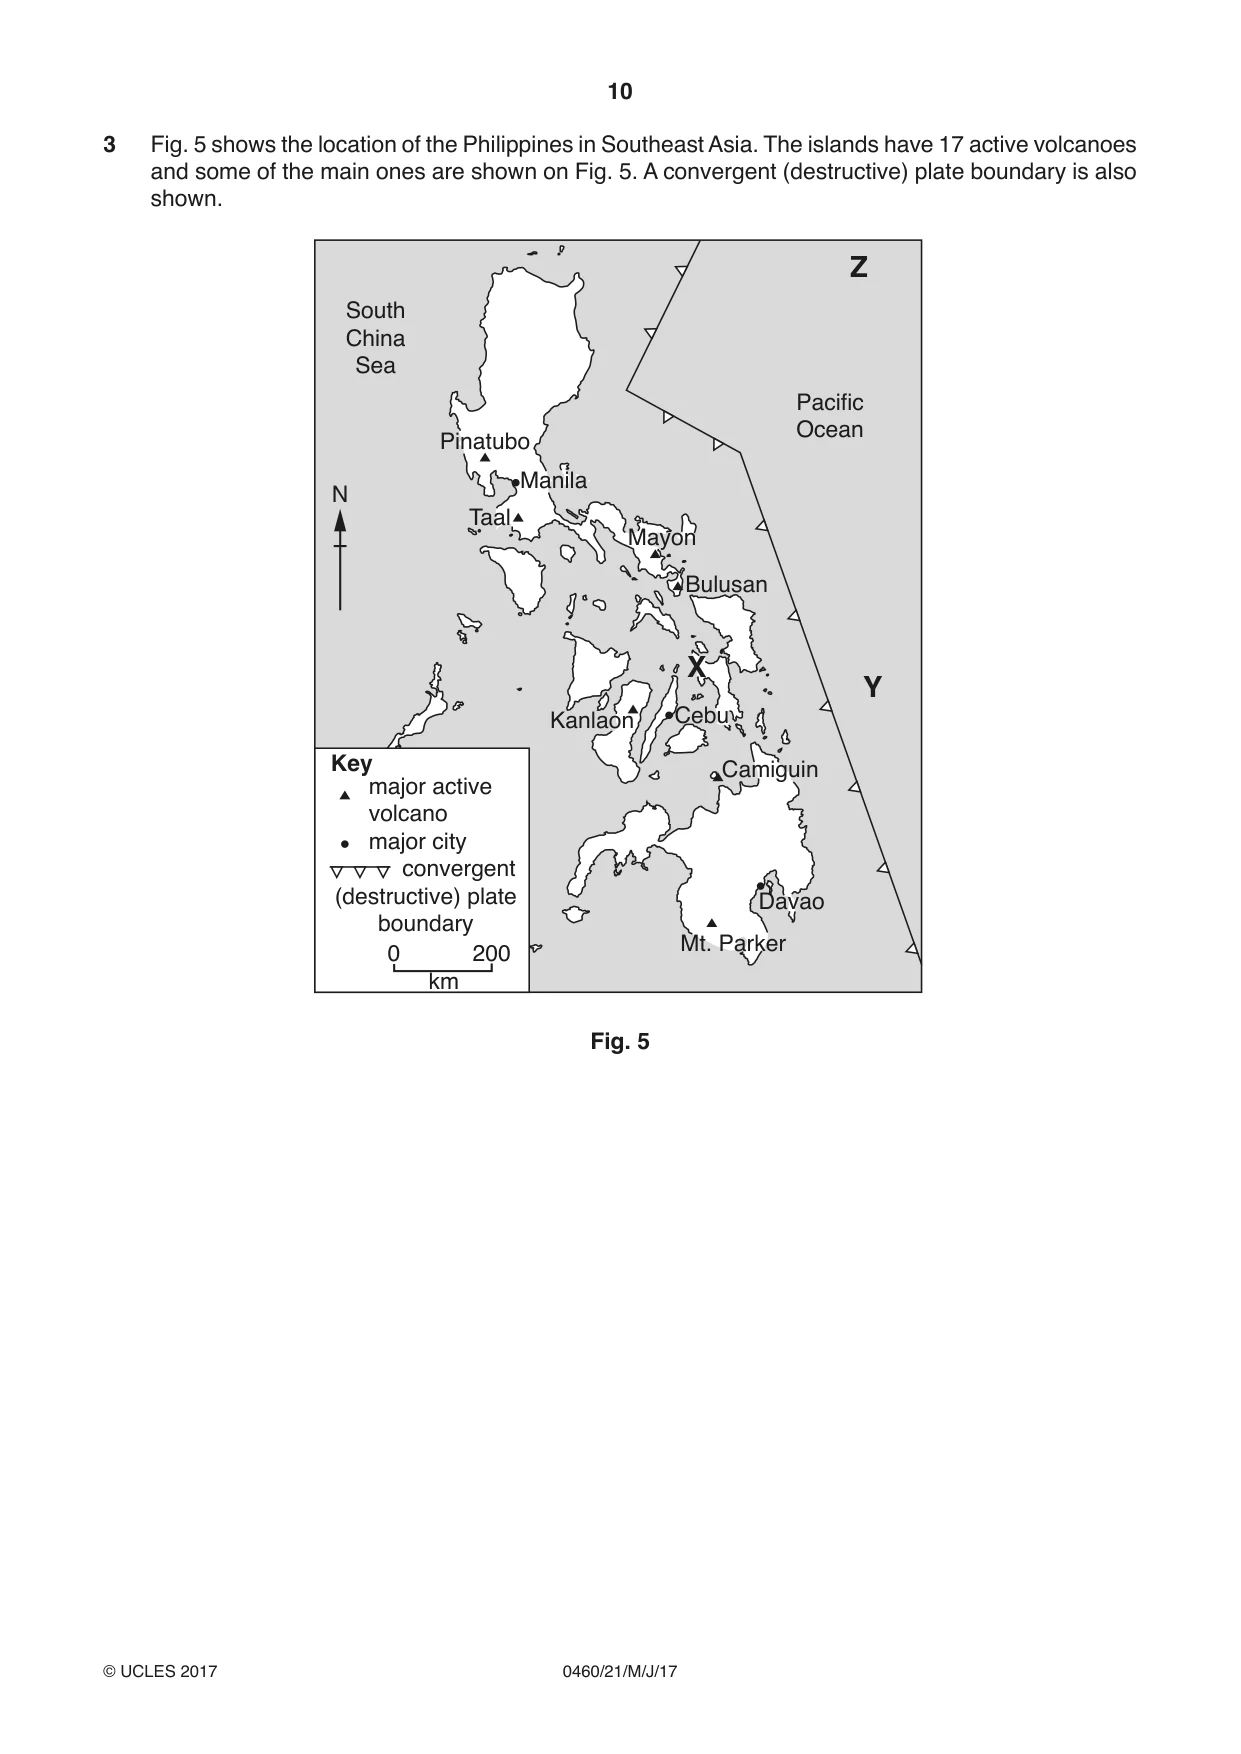
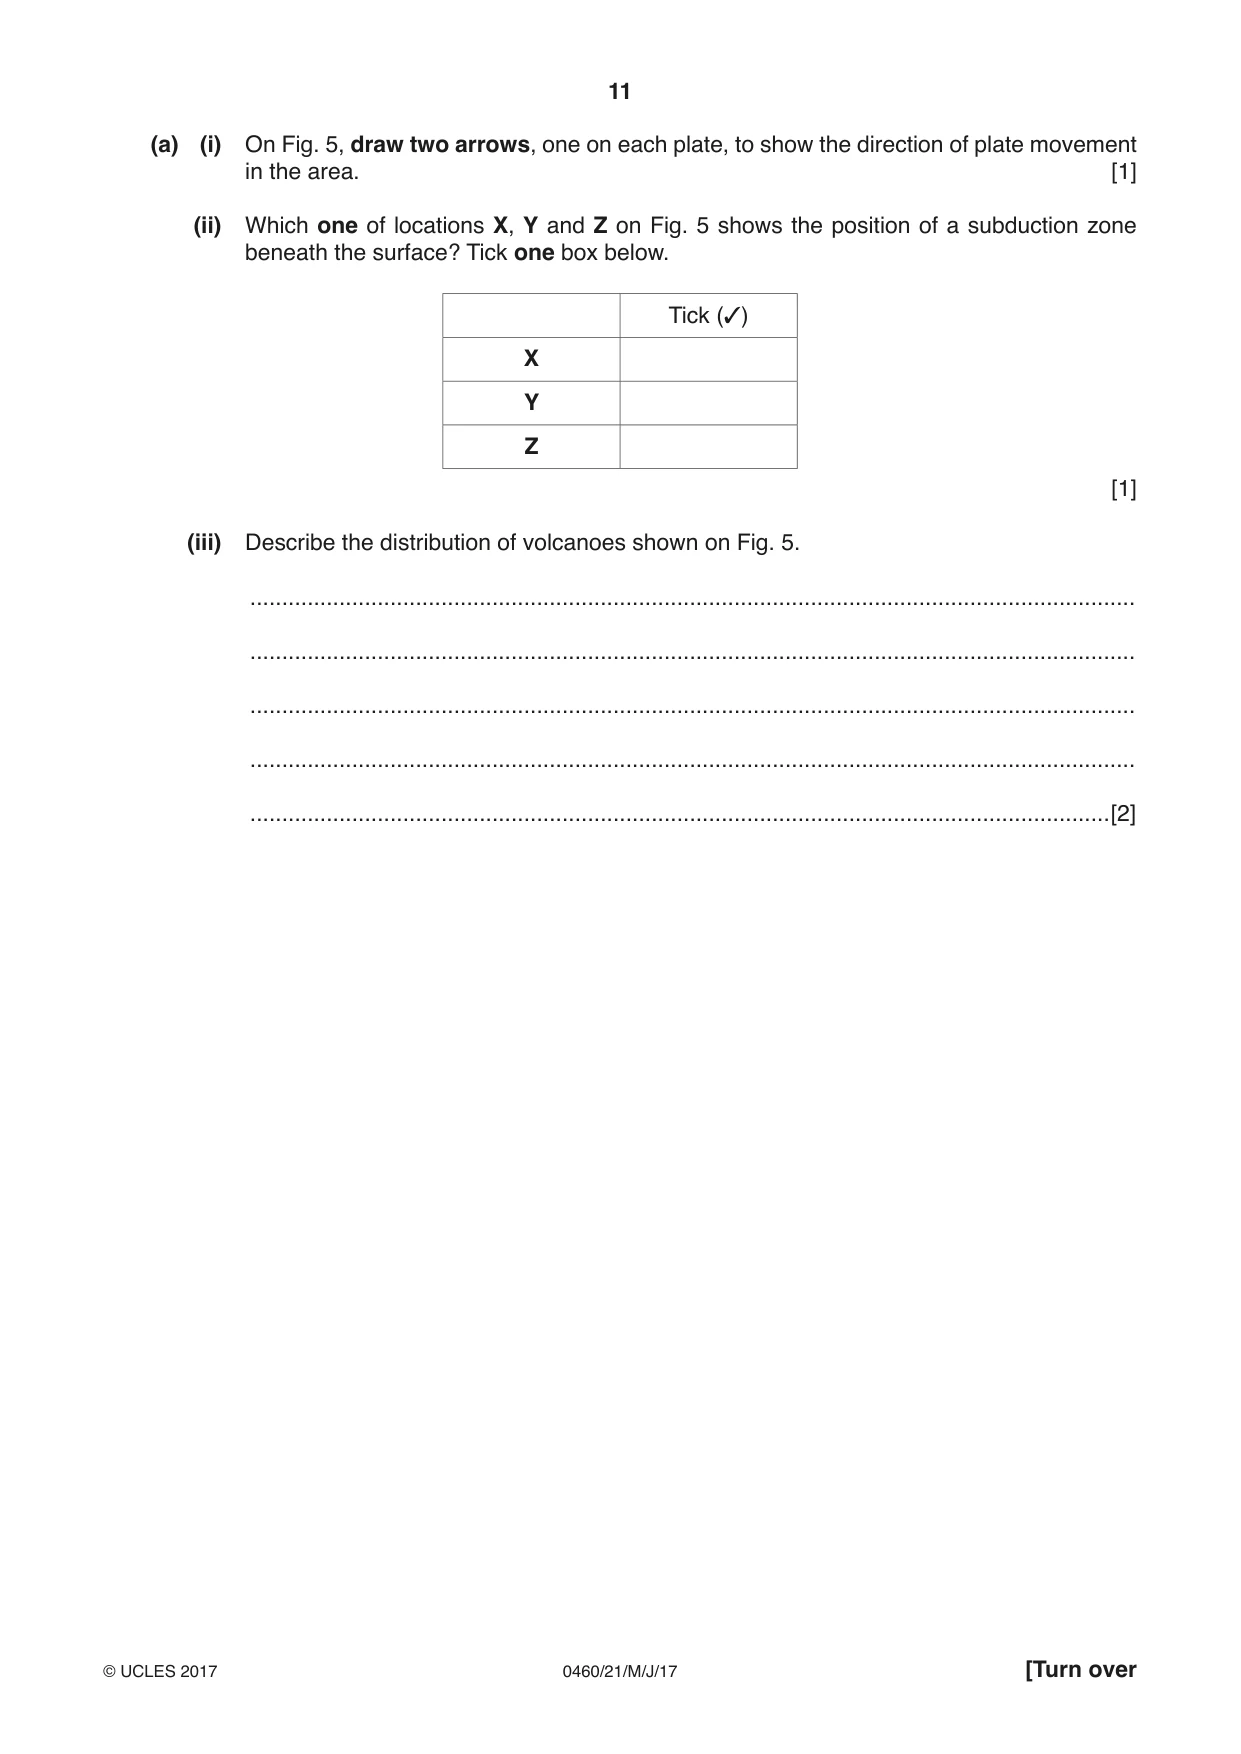
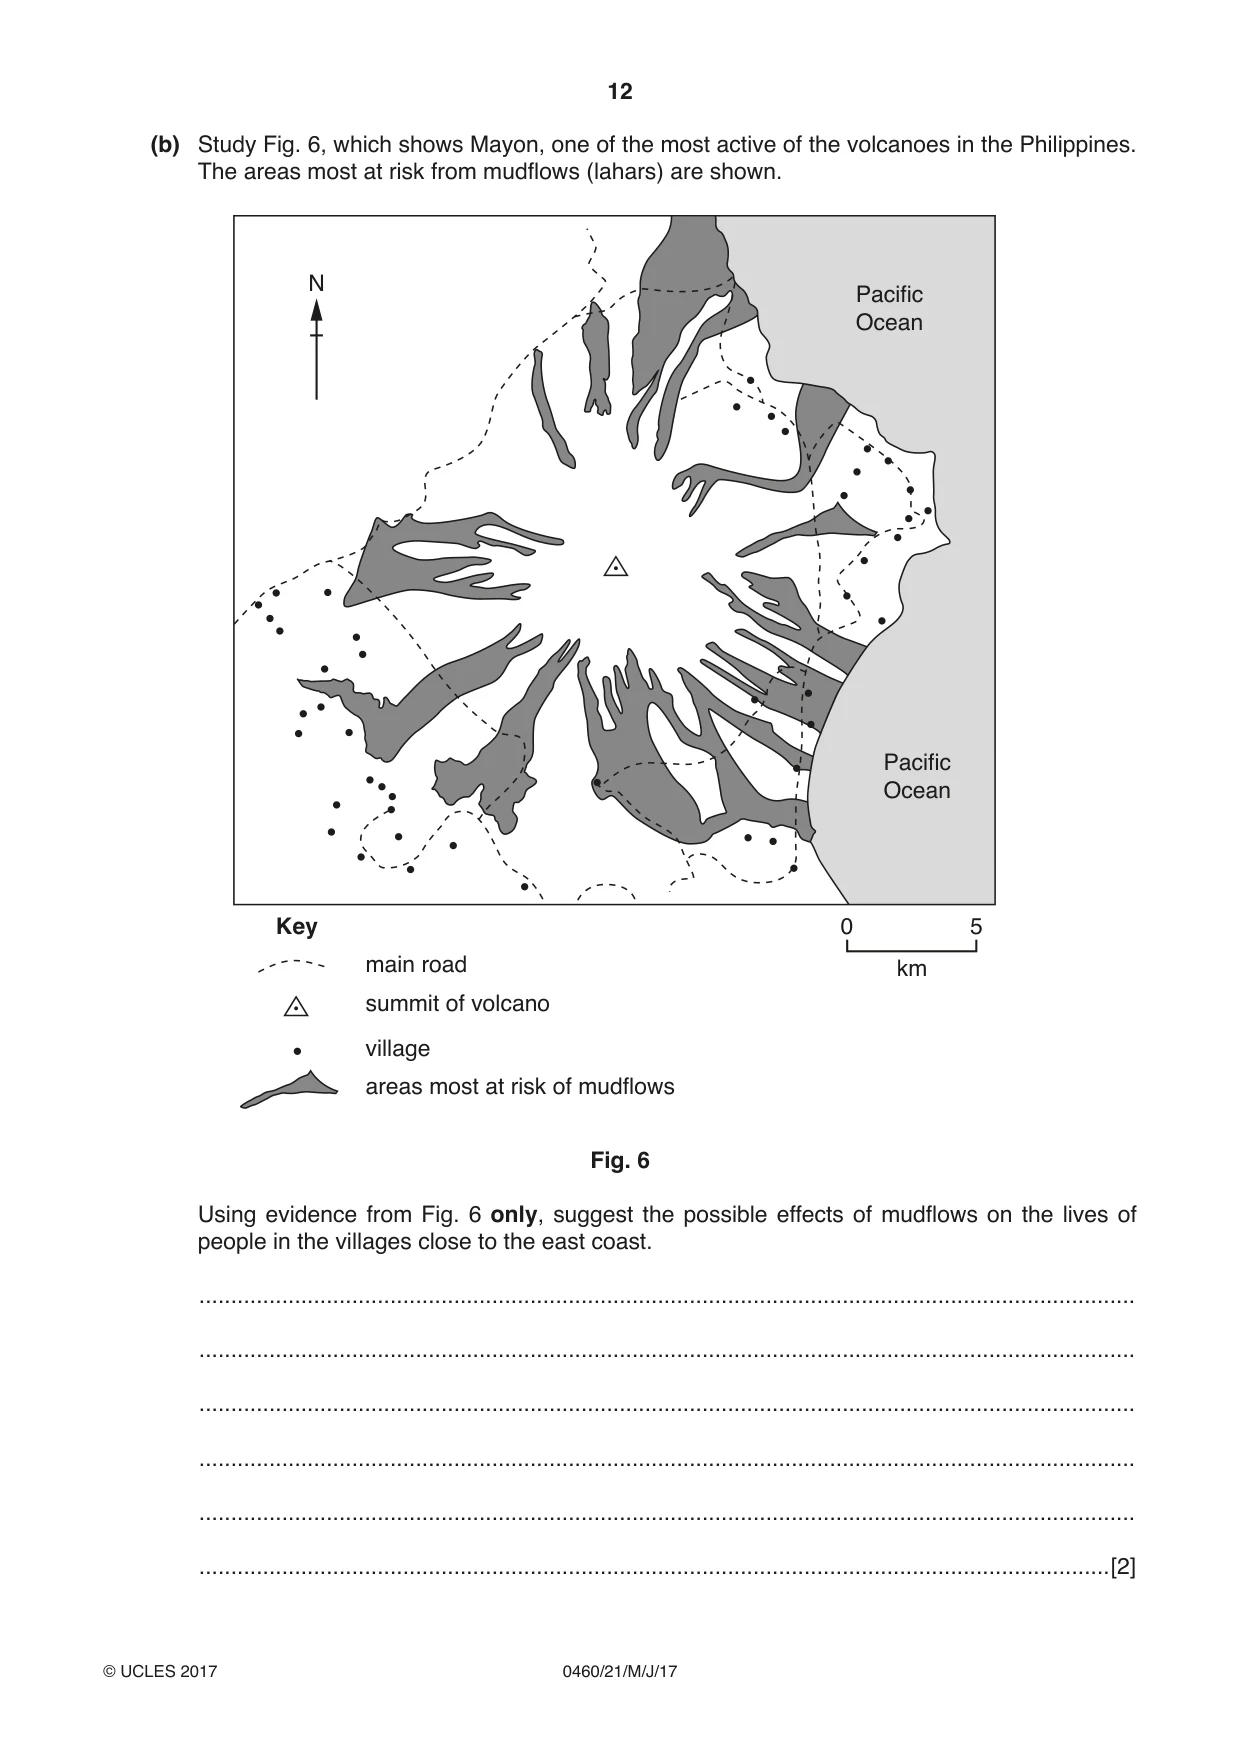
3 Fig. 5 shows the location of the Philippines in Southeast Asia. The islands have 17 active volcanoes and some of the main ones are shown on Fig. 5. A convergent (destructive) plate boundary is also shown. Z South China Sea Pacific Ocean Pinatubo Manila N Taal Mayon Bulusan X Y Kanlaon Cebu Key Camiguin major active volcano major city convergent (destructive) plate Davao boundary Mt. Parker 0 200 km Fig. 5 (a) (i) On Fig. 5, draw two arrows, one on each plate, to show the direction of plate movement in the area. [1] (ii) Which one of locations X, Y and Z on Fig. 5 shows the position of a subduction zone beneath the surface? Tick one box below. Tick (3) X Y Z [1] (iii) Describe the distribution of volcanoes shown on Fig. 5. ........................................................................................................................................... ........................................................................................................................................... ........................................................................................................................................... ........................................................................................................................................... .......................................................................................................................................[2] (b) Study Fig. 6, which shows Mayon, one of the most active of the volcanoes in the Philippines. The areas most at risk from mudflows (lahars) are shown. N Pacific Ocean Pacific Ocean Key 0 5 main road km summit of volcano village areas most at risk of mudflows Fig. 6 Using evidence from Fig. 6 only, suggest the possible effects of mudflows on the lives of people in the villages close to the east coast. ................................................................................................................................................... ................................................................................................................................................... ................................................................................................................................................... ................................................................................................................................................... ................................................................................................................................................... ...............................................................................................................................................[2] (c) Choose two other life-threatening volcanic hazards apart from mudflows. Explain how each hazard is a threat to human life. Hazard 1 ................................................................................................................................................... ................................................................................................................................................... Hazard 2 ................................................................................................................................................... ...............................................................................................................................................[2] [Total: 8 marks]
Mark scheme: 3(a)(i) two converging arrows 1 3(a)(ii) X 1 3(a)(iii) on islands, 2 to west of plate boundary, in a line / on north-south line, near / in South China Sea, on subduction zone, 3(b) roads destroyed / damaged, 2 settlements / villages cut off, settlements / villages need to use boats for transport, settlements / villages destroyed / damaged, people evacuated, not all settlements / villages at risk, 3(c) ash – burial / suffocation / collapse of buildings, 2 volcanic bombs / large rocks – killed by force, pyroclastic flows – burning / killed by force / burial, lateral blast – killed by force, gases – poisoned / suffocated, post-eruption famine,
Q4 · Photograph A (Insert) shows an area in Africa
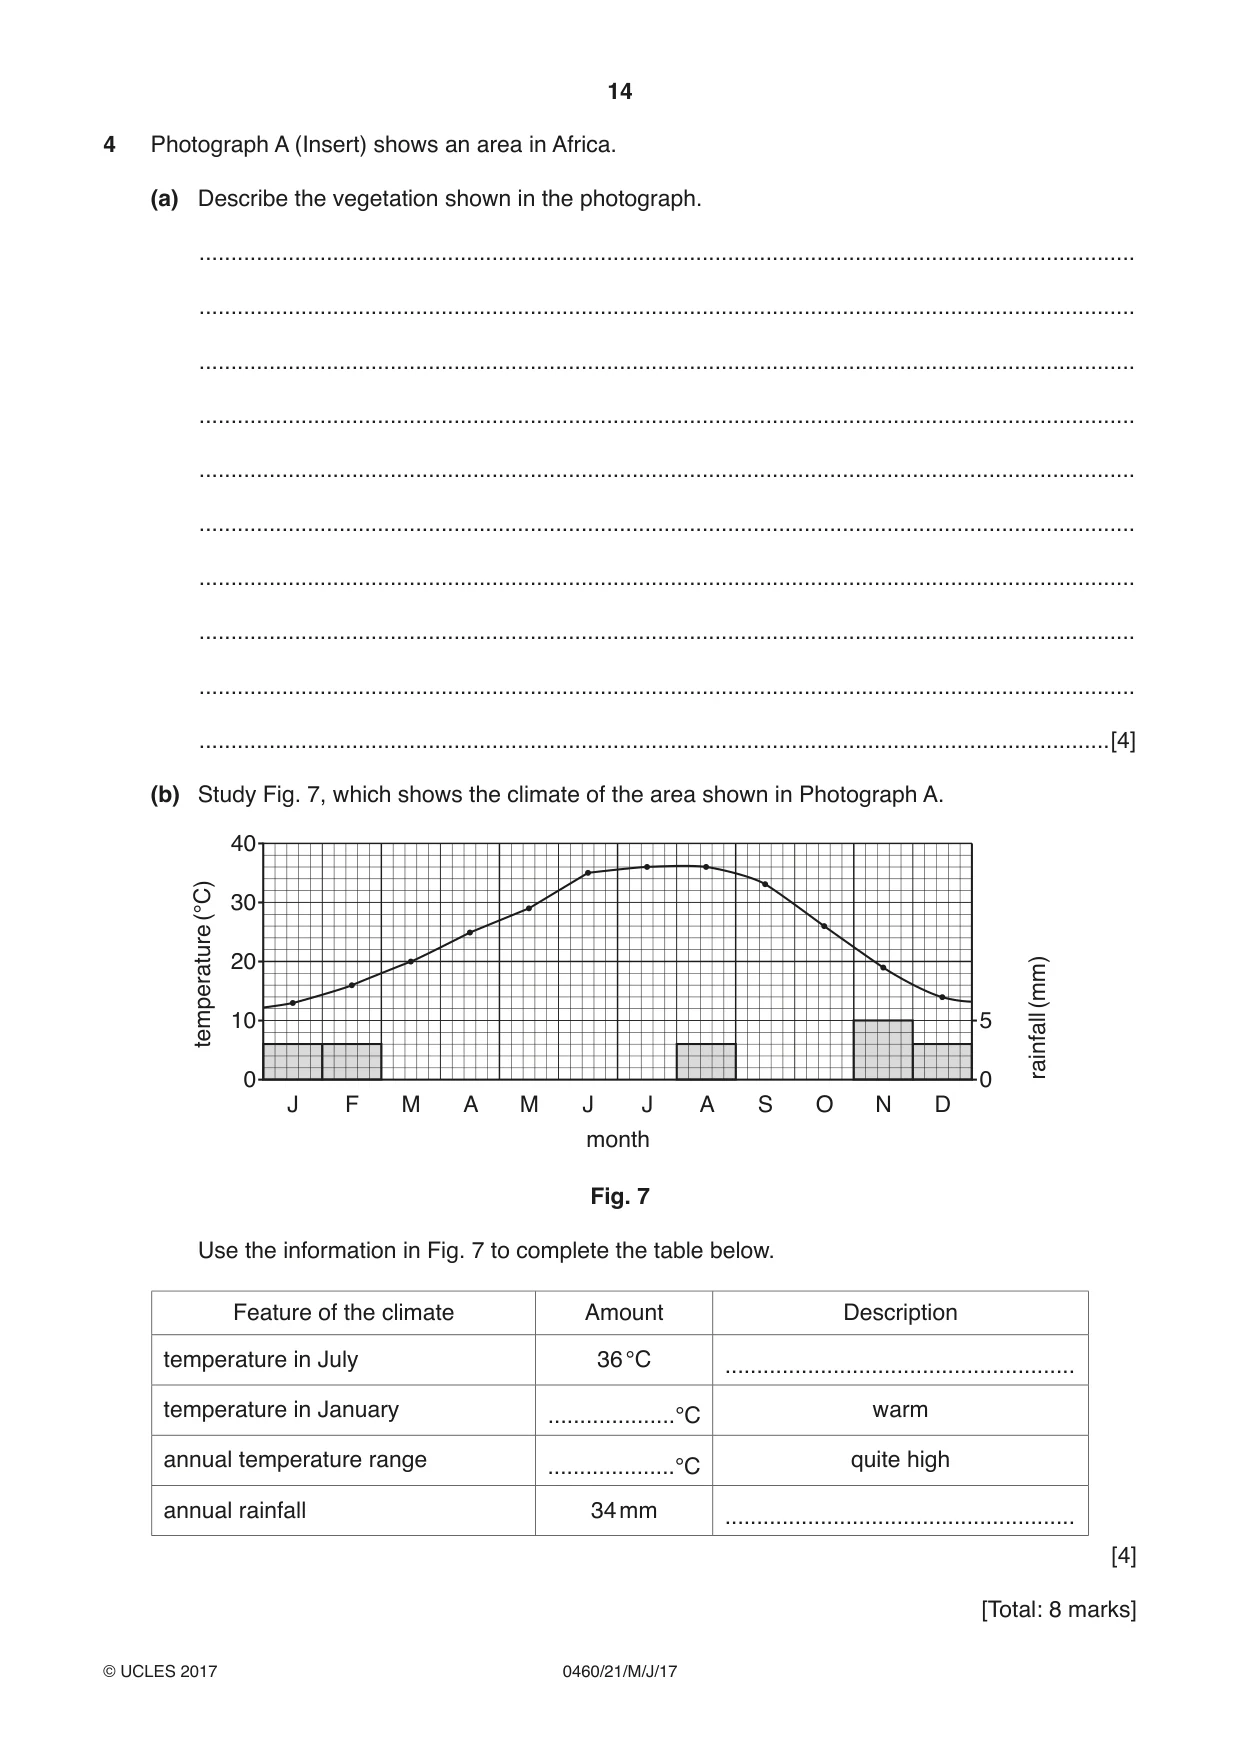
4 Photograph A (Insert) shows an area in Africa. (a) Describe the vegetation shown in the photograph. ................................................................................................................................................... ................................................................................................................................................... ................................................................................................................................................... ................................................................................................................................................... ................................................................................................................................................... ................................................................................................................................................... ................................................................................................................................................... ................................................................................................................................................... ................................................................................................................................................... ...............................................................................................................................................[4] (b) Study Fig. 7, which shows the climate of the area shown in Photograph A. 40 (°C) 30 20 (mm) 10 5 temperature rainfall 0 0 J F M A M J J A S O N D month Fig. 7 Use the information in Fig. 7 to complete the table below. Feature of the climate Amount Description temperature in July 36 °C ....................................................... temperature in January ....................°C warm annual temperature range ....................°C quite high annual rainfall 34 mm ....................................................... [4] [Total: 8 marks]
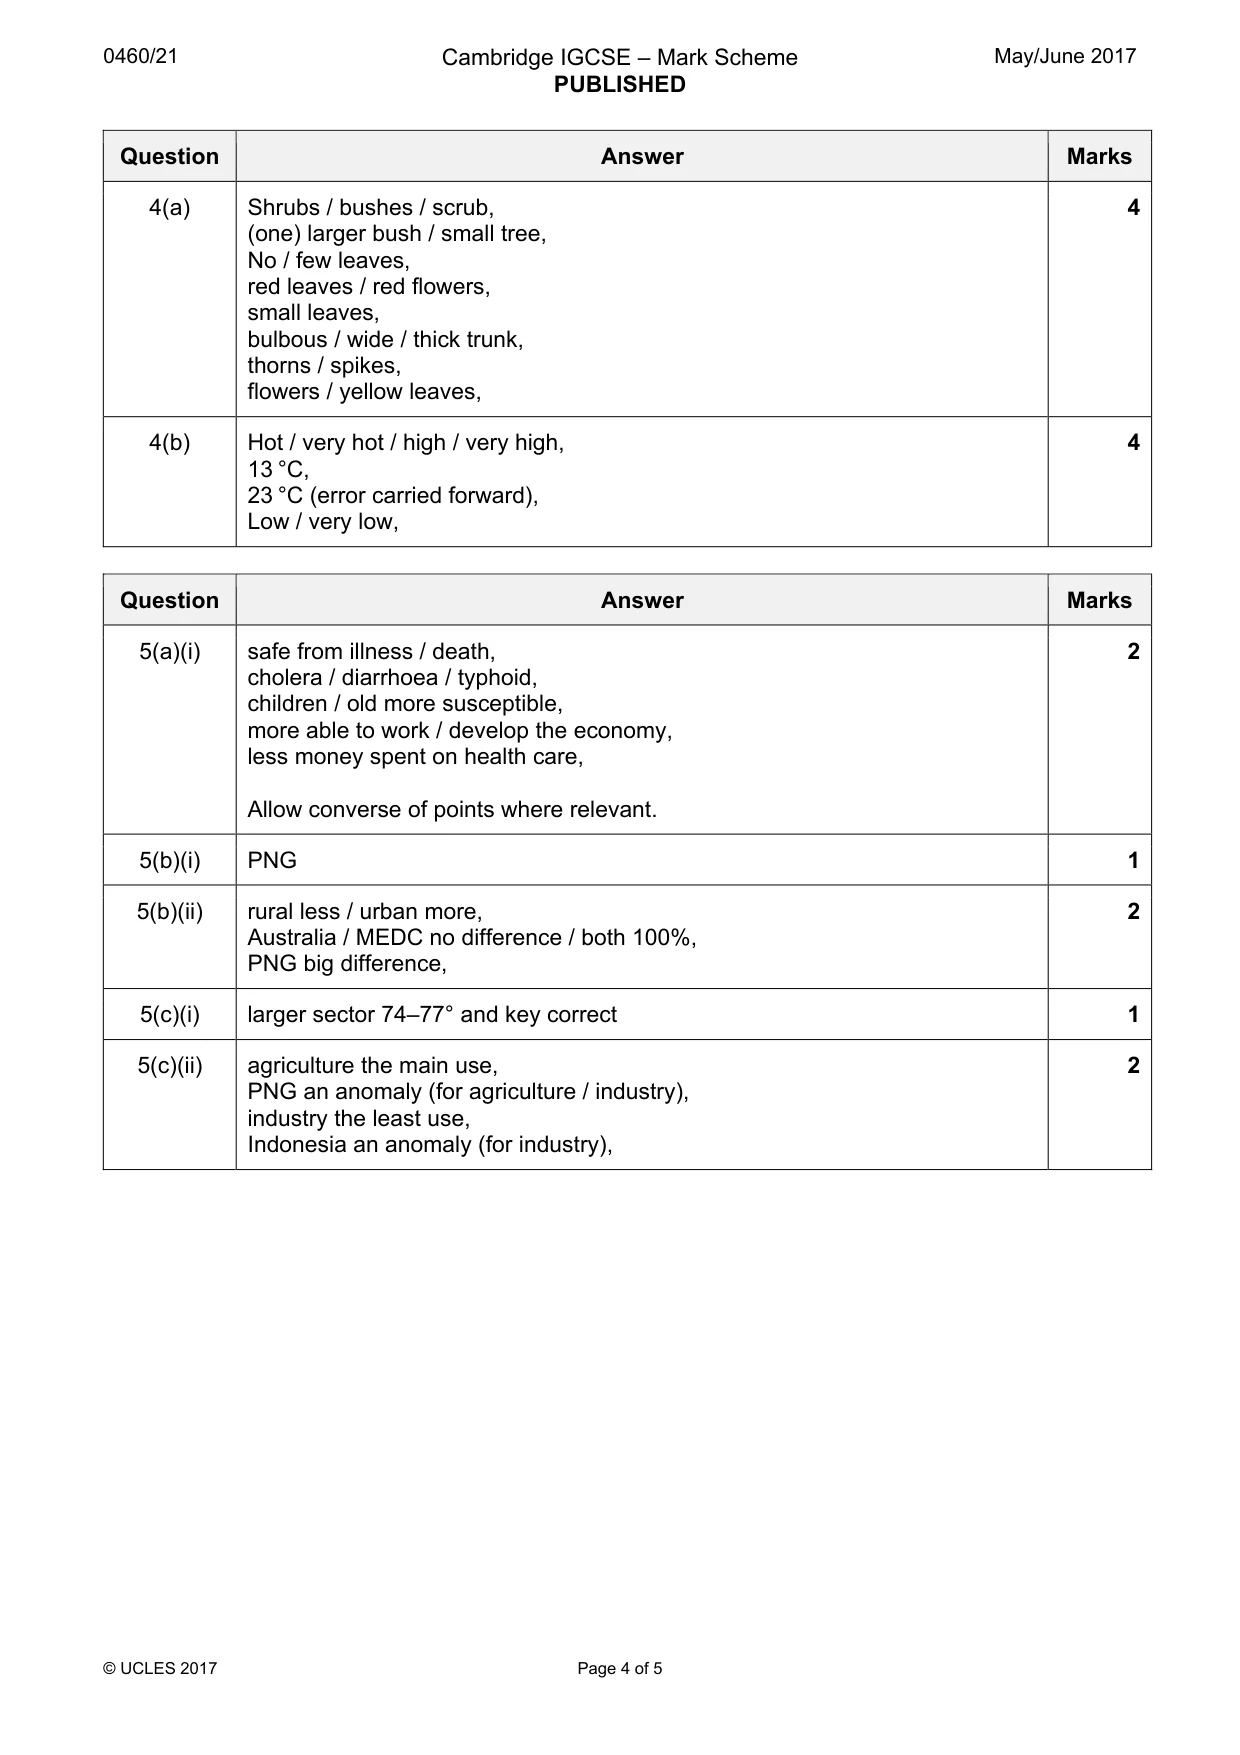
Mark scheme: 4(a) Shrubs / bushes / scrub, 4 (one) larger bush / small tree, No / few leaves, red leaves / red flowers, small leaves, bulbous / wide / thick trunk, thorns / spikes, flowers / yellow leaves, 4(b) Hot / very hot / high / very high, 4 13 °C, 23 °C (error carried forward), Low / very low,
Q5 · Why is safe drinking water important to the people of a country?
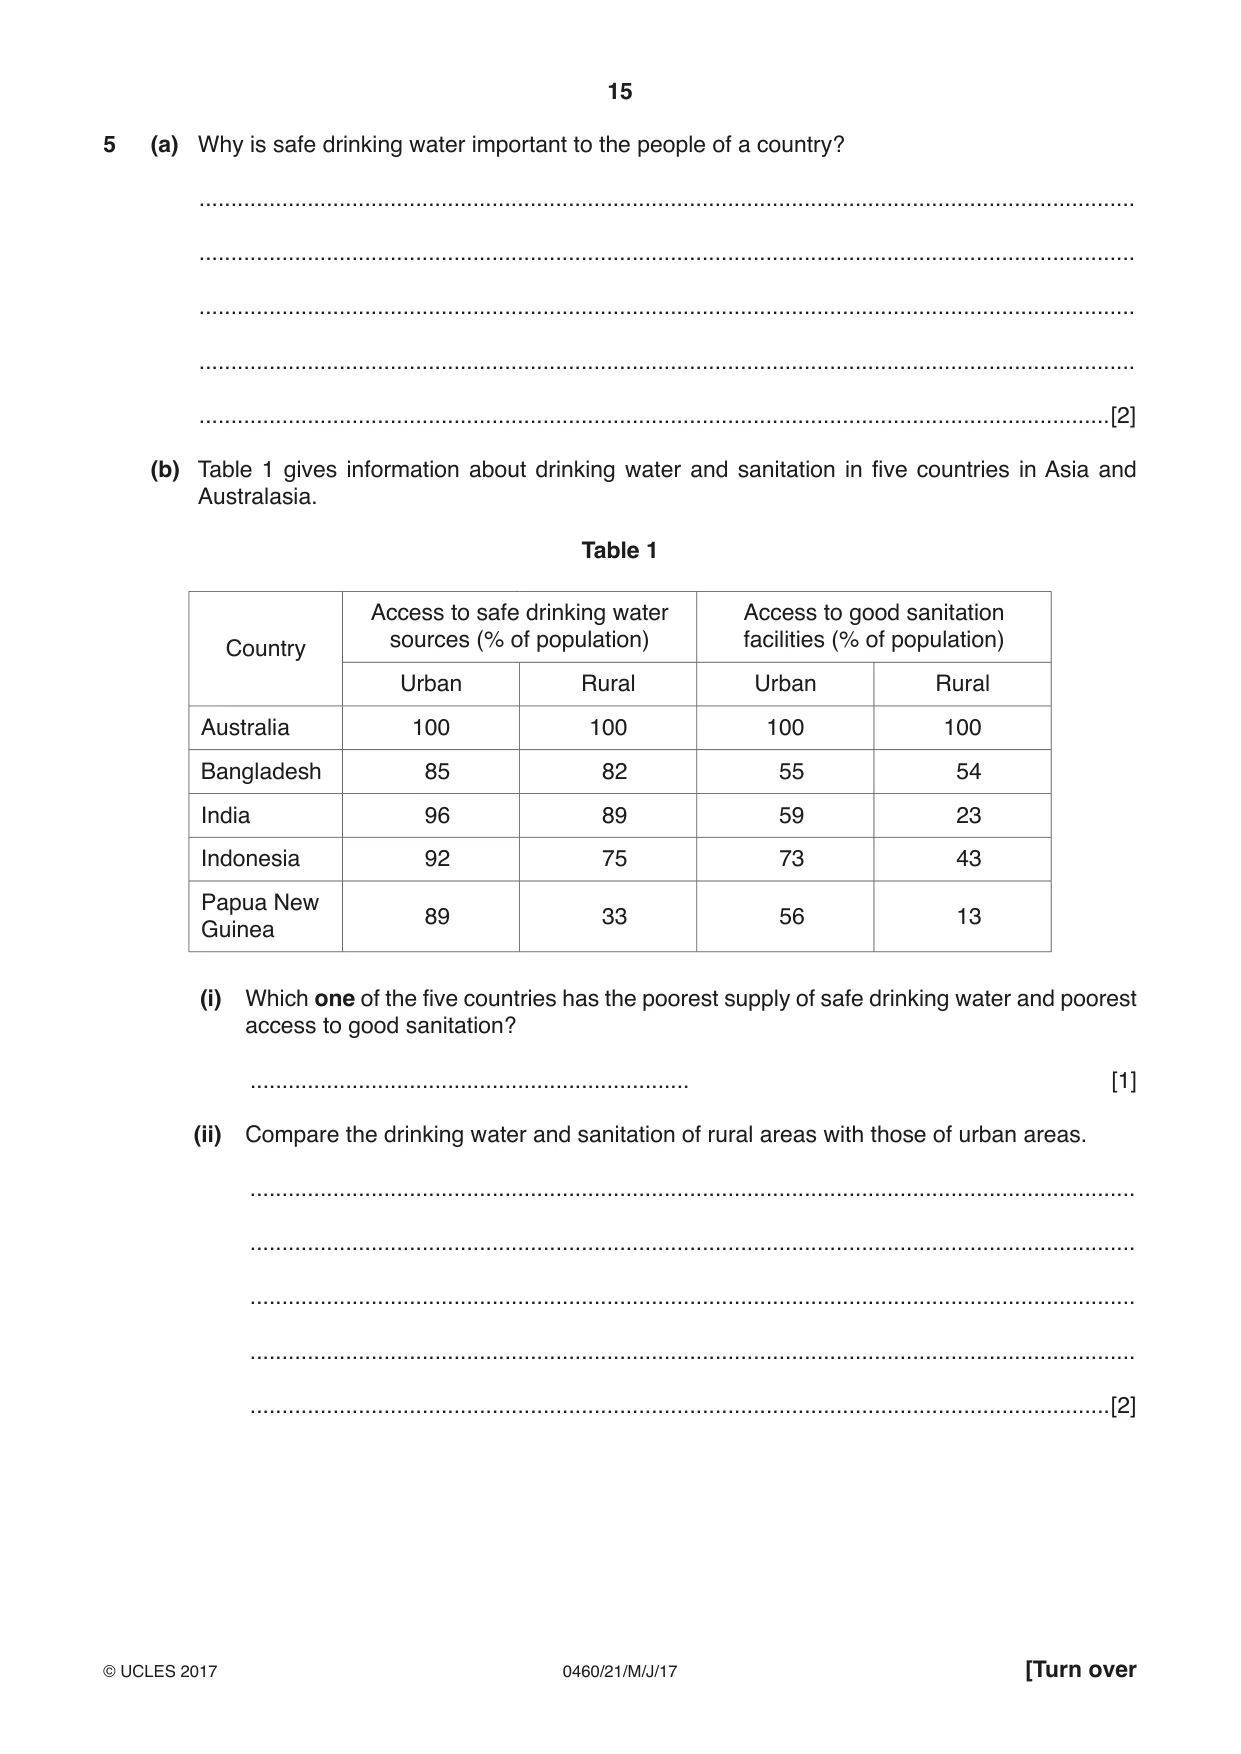
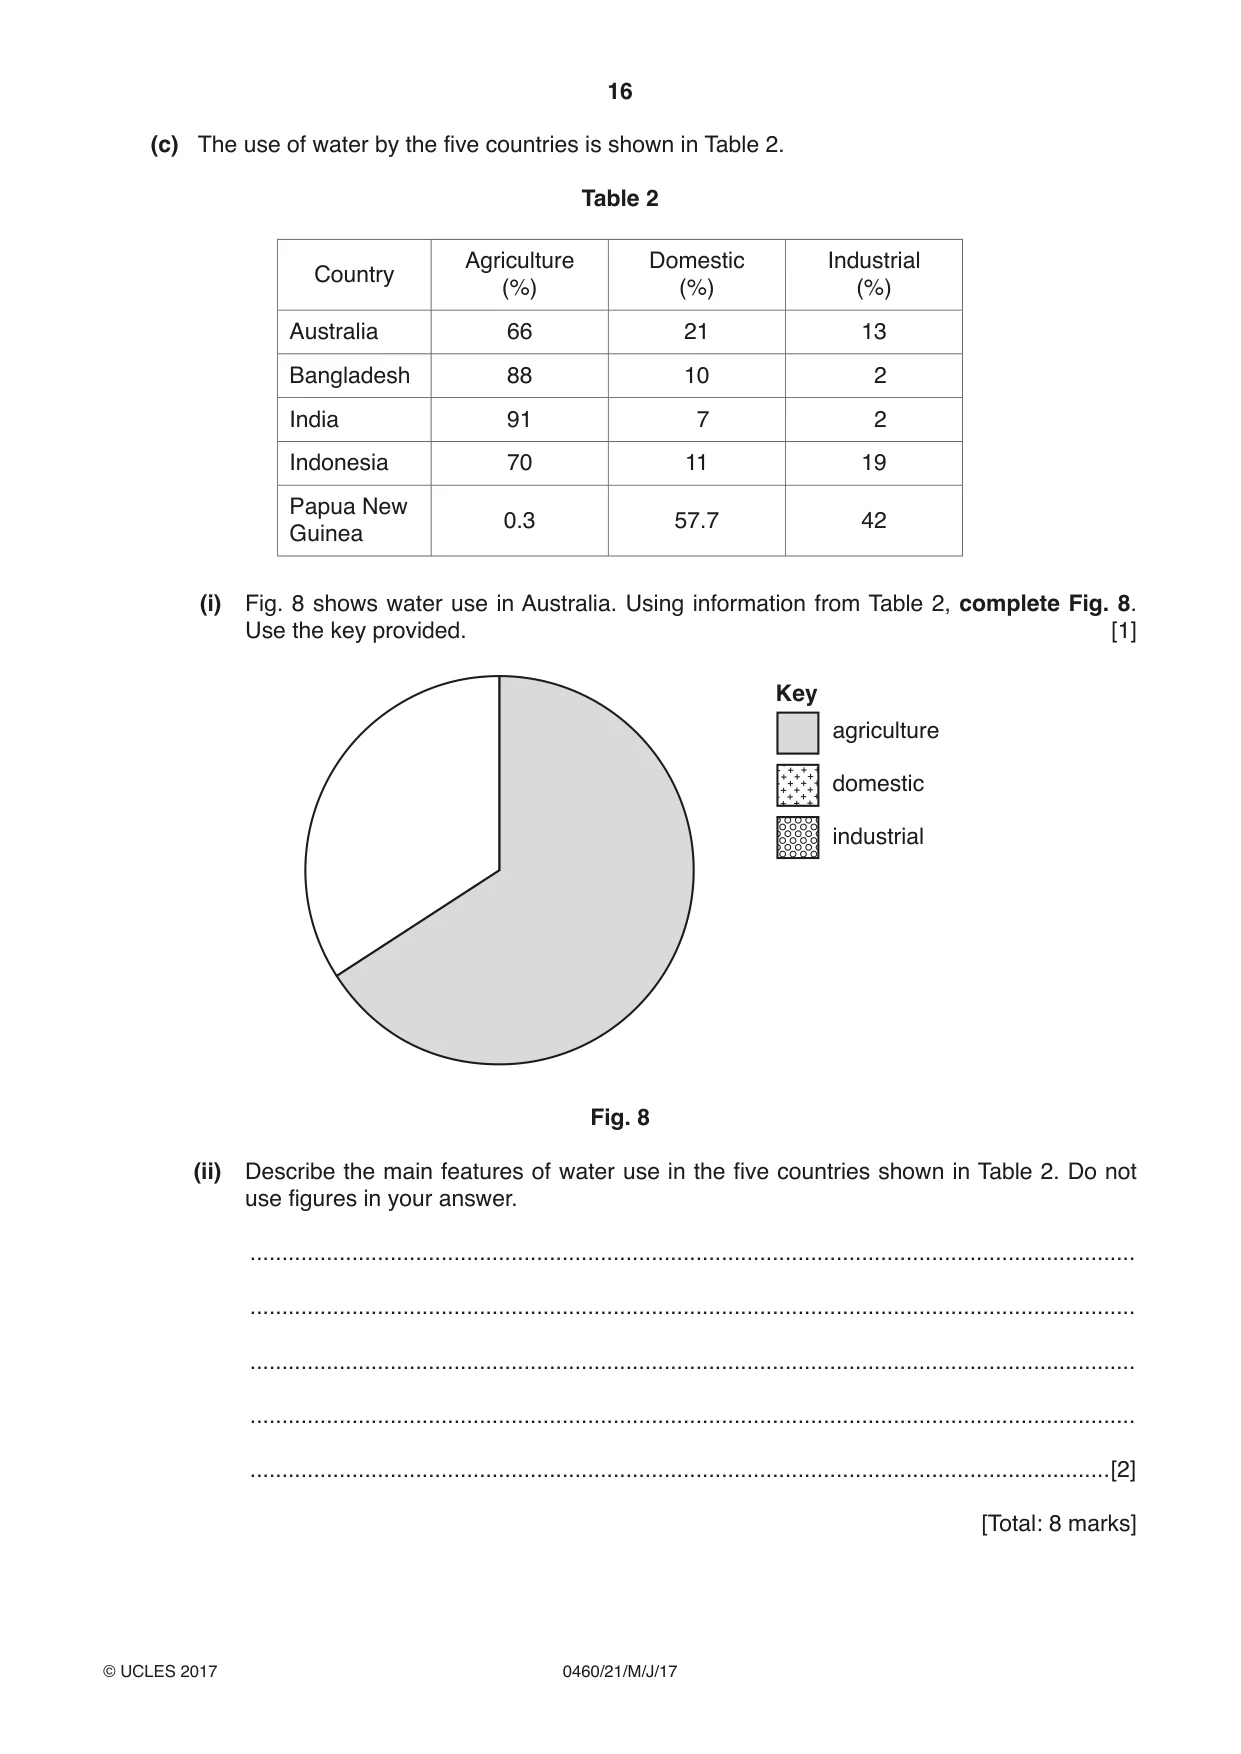
5 (a) Why is safe drinking water important to the people of a country? ................................................................................................................................................... ................................................................................................................................................... ................................................................................................................................................... ................................................................................................................................................... ...............................................................................................................................................[2] (b) Table 1 gives information about drinking water and sanitation in five countries in Asia and Australasia. Table 1 Access to safe drinking water Access to good sanitation sources (% of population) facilities (% of population) Country Urban Rural Urban Rural Australia 100 100 100 100 Bangladesh 85 82 55 54 India 96 89 59 23 Indonesia 92 75 73 43 Papua New 89 33 56 13 Guinea (i) Which one of the five countries has the poorest supply of safe drinking water and poorest access to good sanitation? ..................................................................... [1] (ii) Compare the drinking water and sanitation of rural areas with those of urban areas. ........................................................................................................................................... ........................................................................................................................................... ........................................................................................................................................... ........................................................................................................................................... .......................................................................................................................................[2] (c) The use of water by the five countries is shown in Table 2. Table 2 Agriculture Domestic Industrial Country (%) (%) (%) Australia 66 21 13 Bangladesh 88 10 2 India 91 7 2 Indonesia 70 11 19 Papua New 0.3 57.7 42 Guinea (i) Fig. 8 shows water use in Australia. Using information from Table 2, complete Fig. 8. Use the key provided. [1] Key agriculture domestic industrial Fig. 8 (ii) Describe the main features of water use in the five countries shown in Table 2. Do not use figures in your answer. ........................................................................................................................................... ........................................................................................................................................... ........................................................................................................................................... ........................................................................................................................................... .......................................................................................................................................[2] [Total: 8 marks]
Mark scheme: 5(a)(i) safe from illness / death, 2 cholera / diarrhoea / typhoid, children / old more susceptible, more able to work / develop the economy, less money spent on health care, Allow converse of points where relevant. 5(b)(i) PNG 1 5(b)(ii) rural less / urban more, 2 Australia / MEDC no difference / both 100%, PNG big difference, 5(c)(i) larger sector 74–77° and key correct 1 5(c)(ii) agriculture the main use, 2 PNG an anomaly (for agriculture / industry), industry the least use, Indonesia an anomaly (for industry),
Q6 · Photograph B (Insert) shows an area of commercial farming
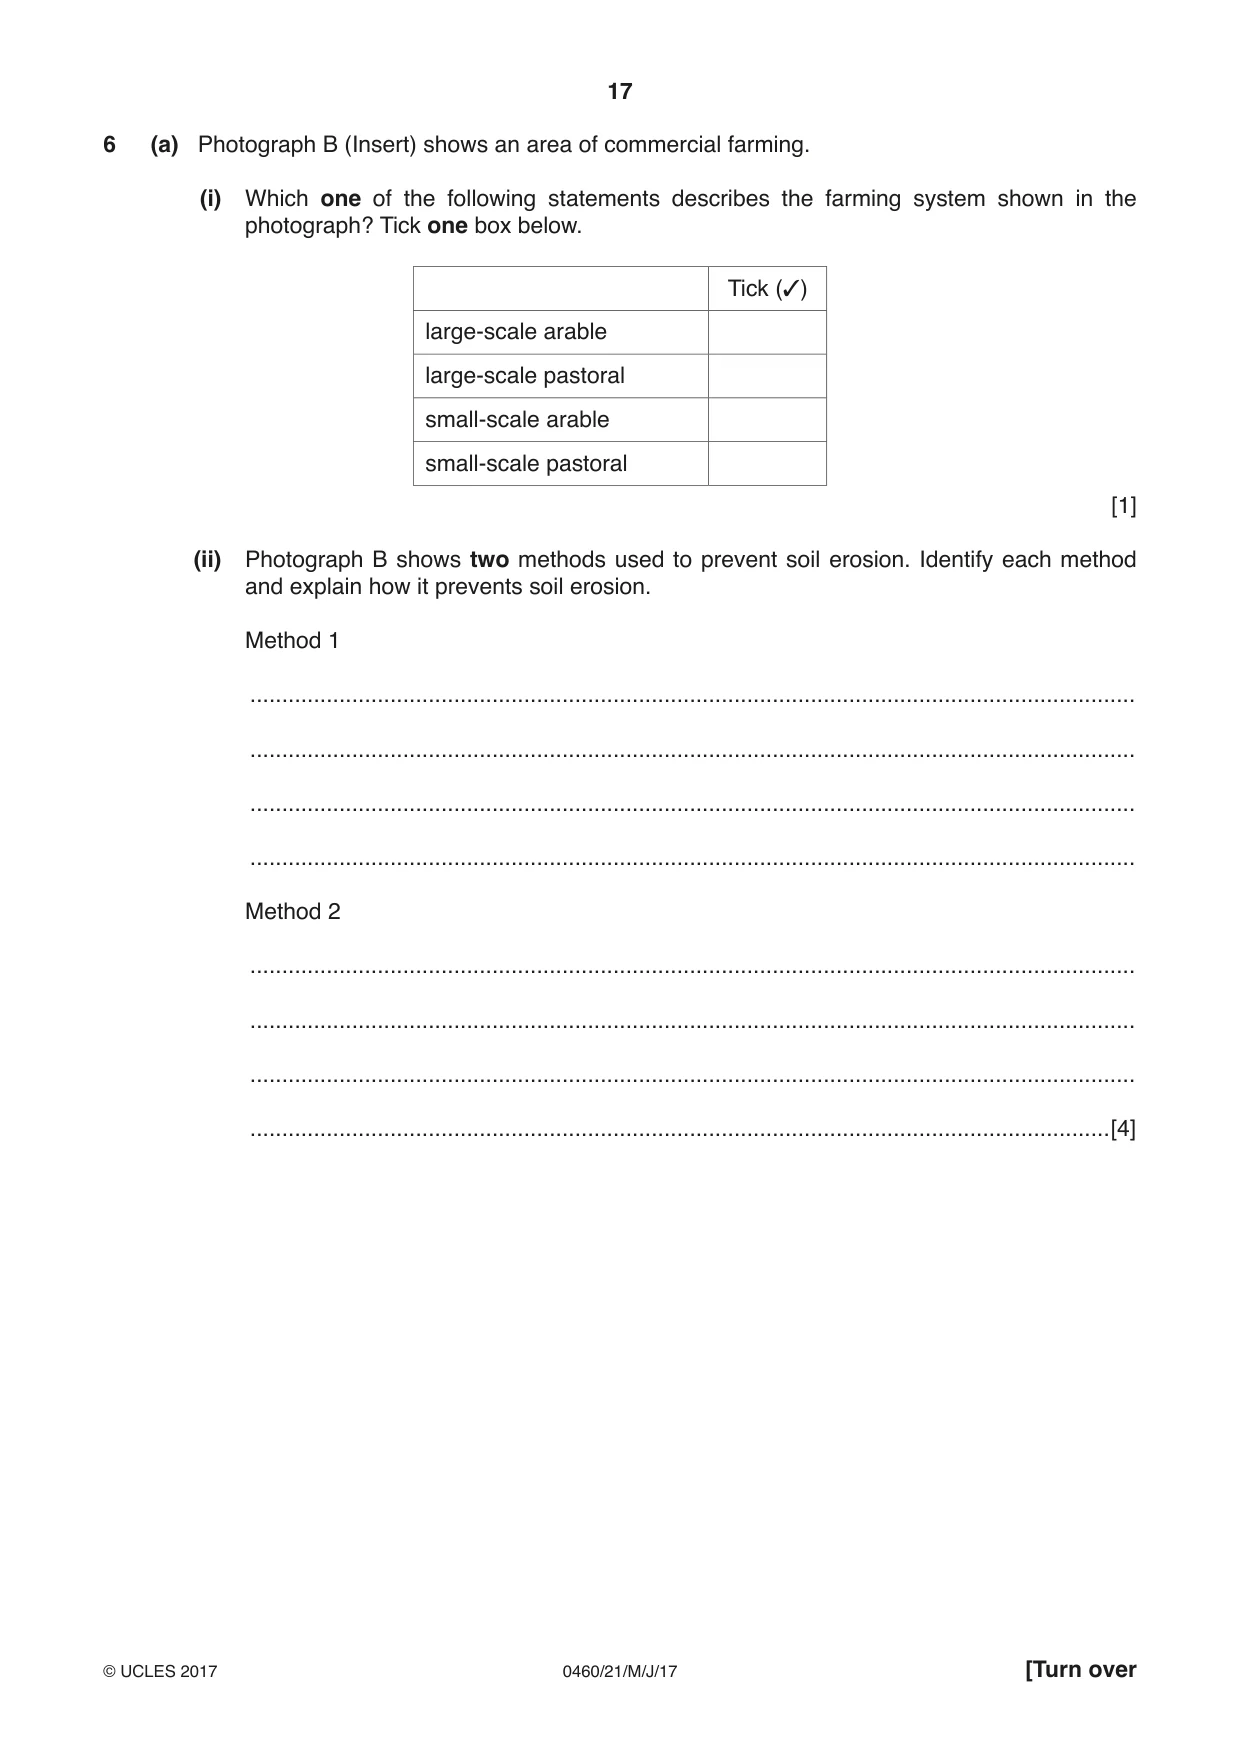
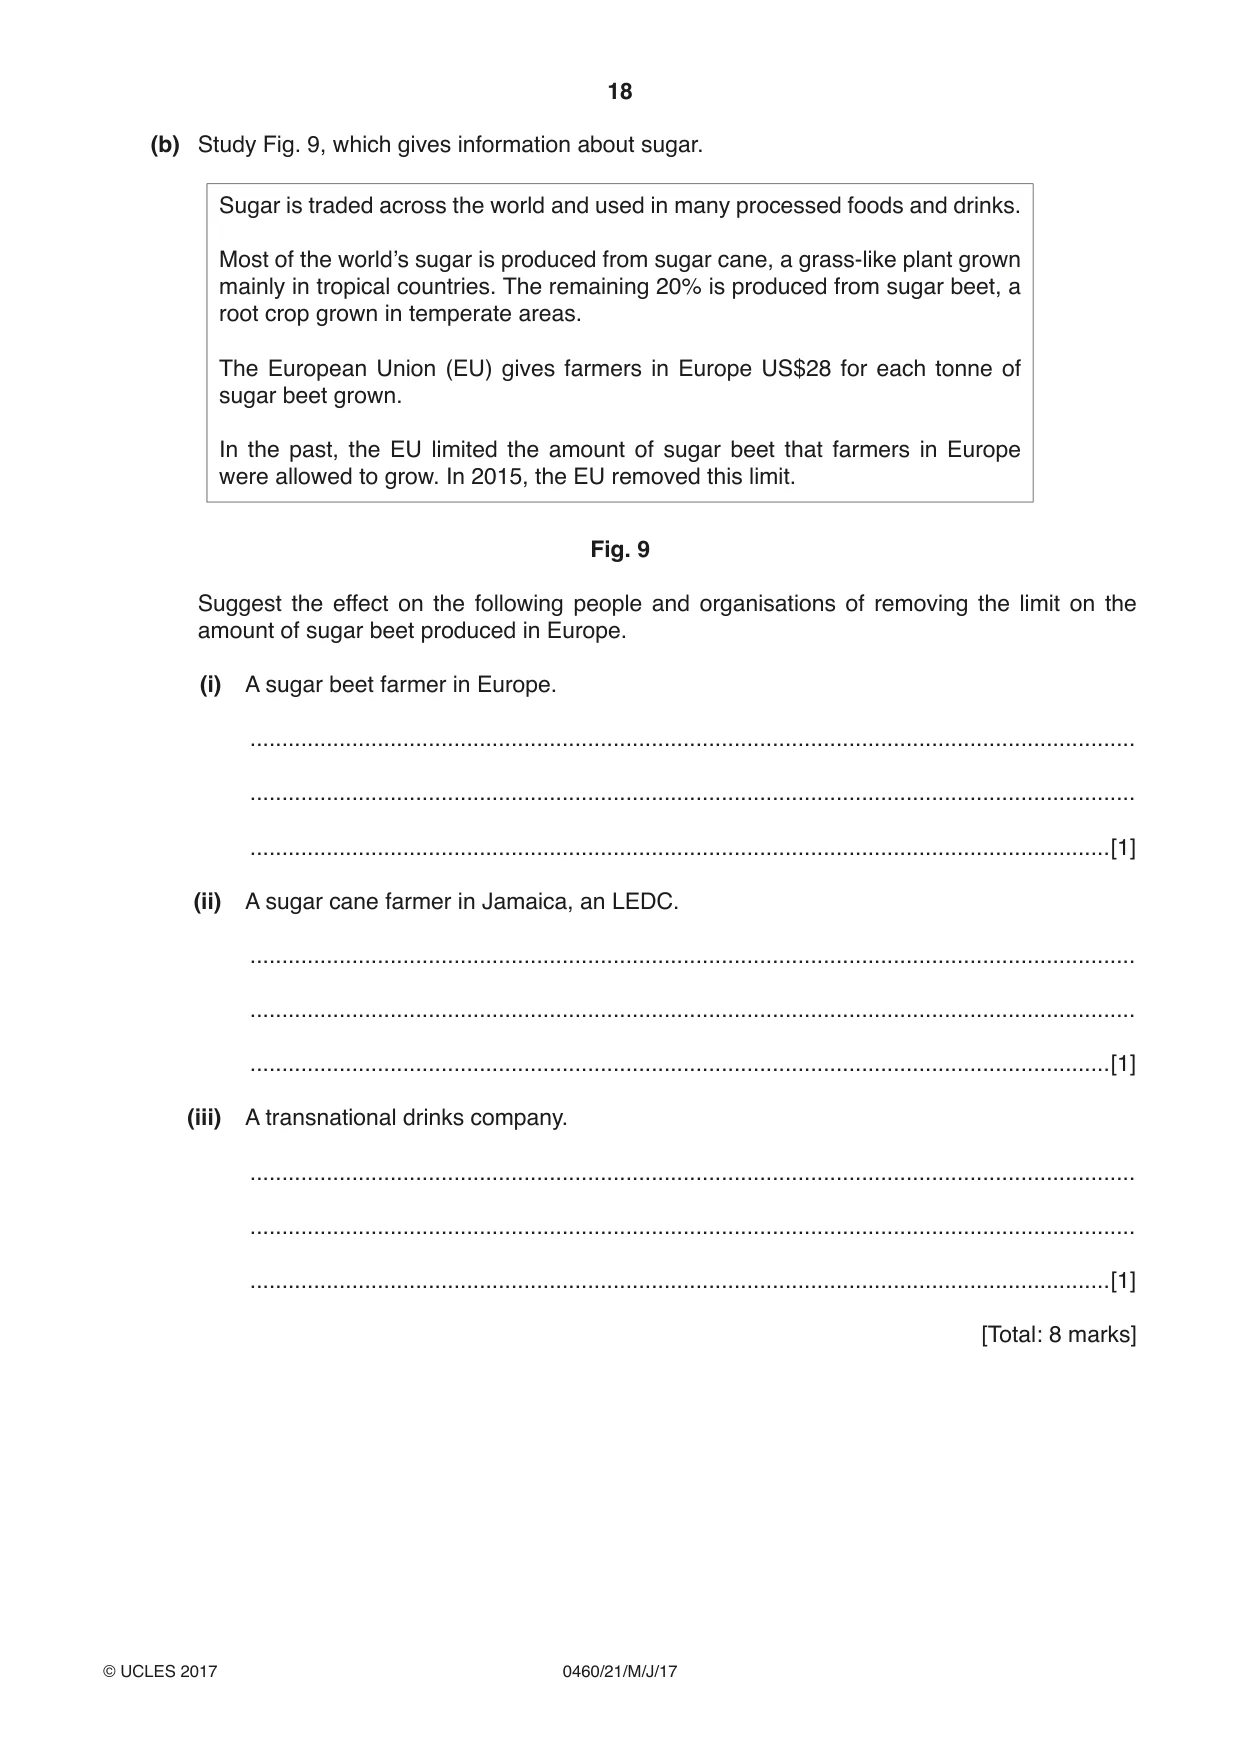
6 (a) Photograph B (Insert) shows an area of commercial farming. (i) Which one of the following statements describes the farming system shown in the photograph? Tick one box below. Tick (3) large-scale arable large-scale pastoral small-scale arable small-scale pastoral [1] (ii) Photograph B shows two methods used to prevent soil erosion. Identify each method and explain how it prevents soil erosion. Method 1 ........................................................................................................................................... ........................................................................................................................................... ........................................................................................................................................... ........................................................................................................................................... Method 2 ........................................................................................................................................... ........................................................................................................................................... ........................................................................................................................................... .......................................................................................................................................[4] (b) Study Fig. 9, which gives information about sugar. Sugar is traded across the world and used in many processed foods and drinks. Most of the world’s sugar is produced from sugar cane, a grass-like plant grown mainly in tropical countries. The remaining 20% is produced from sugar beet, a root crop grown in temperate areas. The European Union (EU) gives farmers in Europe US$28 for each tonne of sugar beet grown. In the past, the EU limited the amount of sugar beet that farmers in Europe were allowed to grow. In 2015, the EU removed this limit. Fig. 9 Suggest the effect on the following people and organisations of removing the limit on the amount of sugar beet produced in Europe. (i) A sugar beet farmer in Europe. ........................................................................................................................................... ........................................................................................................................................... .......................................................................................................................................[1] (ii) A sugar cane farmer in Jamaica, an LEDC. ........................................................................................................................................... ........................................................................................................................................... .......................................................................................................................................[1] (iii) A transnational drinks company. ........................................................................................................................................... ........................................................................................................................................... .......................................................................................................................................[1] [Total: 8 marks] Additional Pages If you use the following lined pages to complete the answer(s) to any question(s), the question number(s) must be clearly shown. .................................................................................................................................................................. .................................................................................................................................................................. .................................................................................................................................................................. .................................................................................................................................................................. .................................................................................................................................................................. .................................................................................................................................................................. .................................................................................................................................................................. .................................................................................................................................................................. .................................................................................................................................................................. .................................................................................................................................................................. .................................................................................................................................................................. .................................................................................................................................................................. .................................................................................................................................................................. .................................................................................................................................................................. .................................................................................................................................................................. .................................................................................................................................................................. .................................................................................................................................................................. .................................................................................................................................................................. .................................................................................................................................................................. .................................................................................................................................................................. .................................................................................................................................................................. .................................................................................................................................................................. .................................................................................................................................................................. .................................................................................................................................................................. ..................................................................................................................................................................
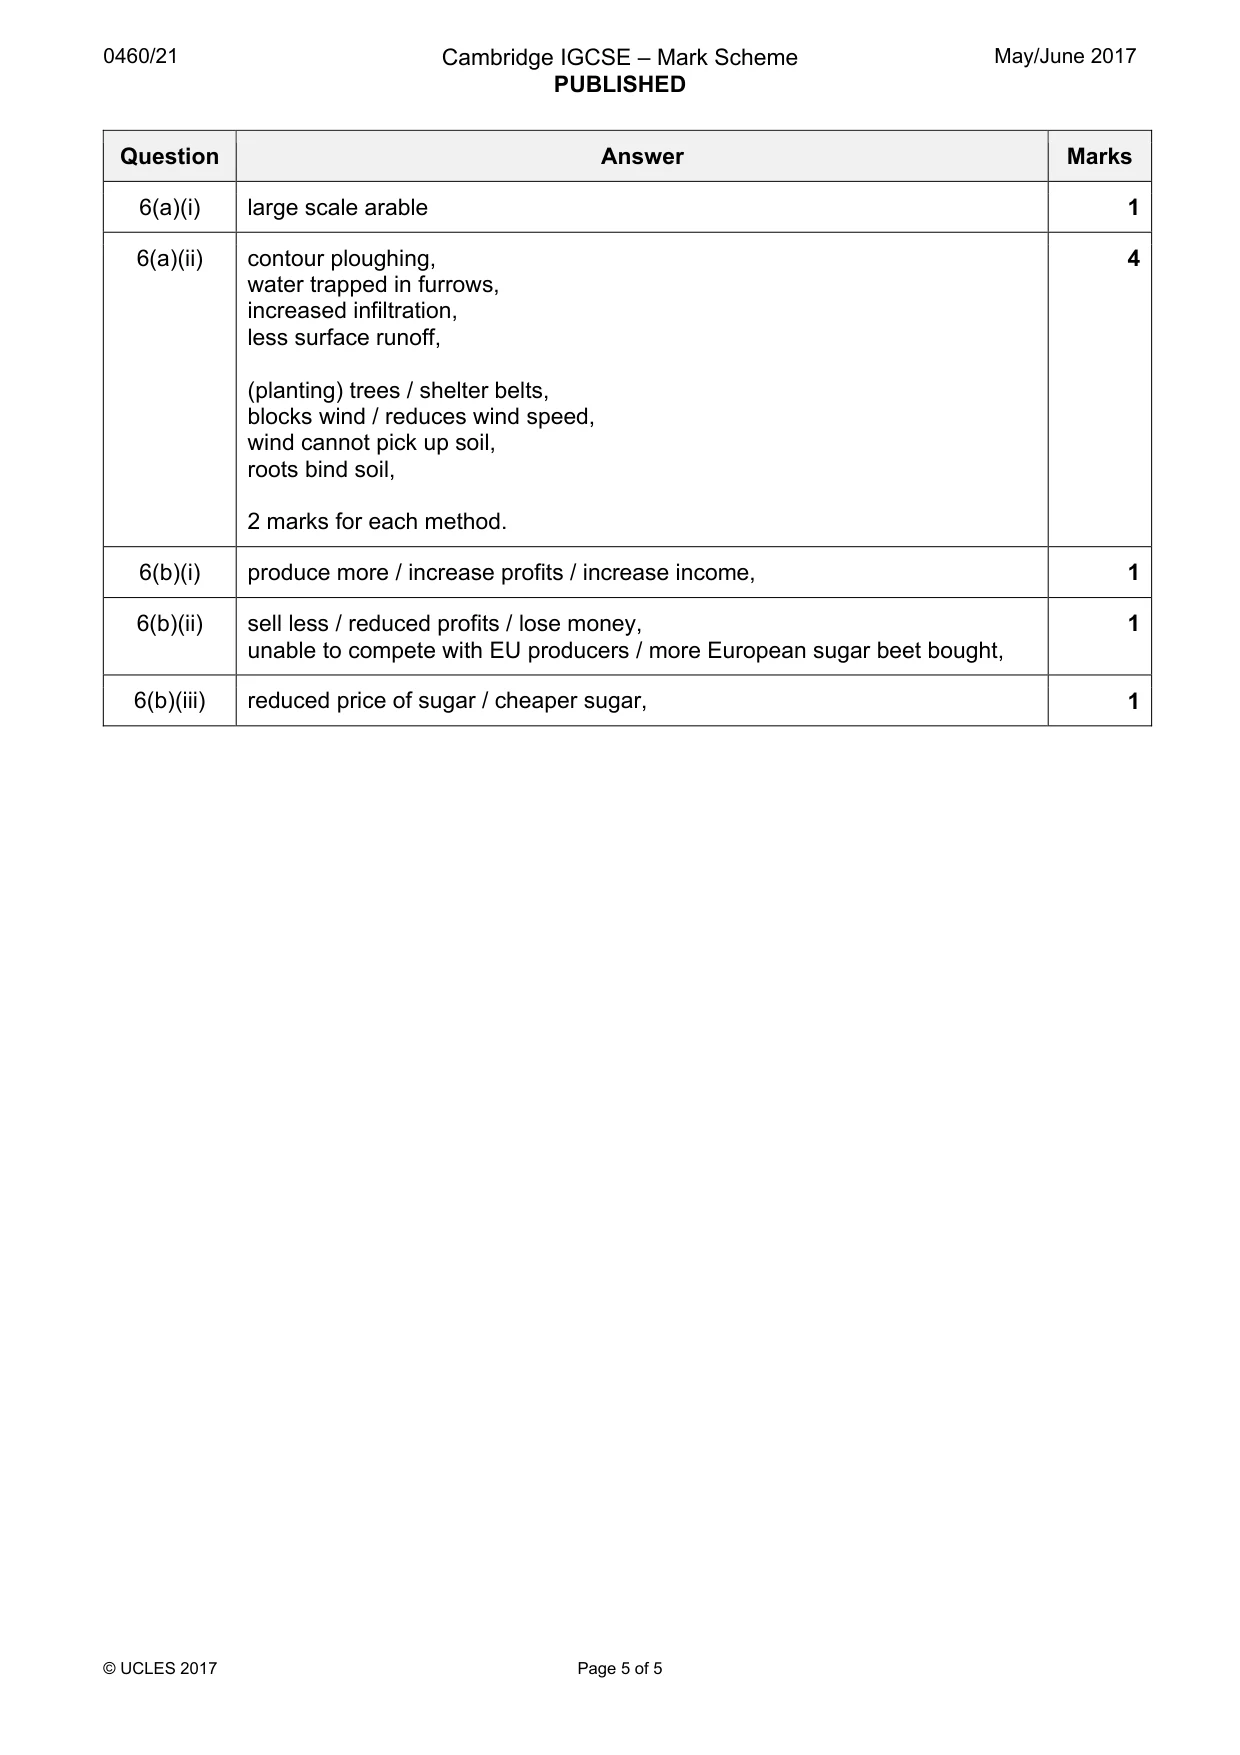
Mark scheme: 6(a)(i) large scale arable 1 6(a)(ii) contour ploughing, 4 water trapped in furrows, increased infiltration, less surface runoff, (planting) trees / shelter belts, blocks wind / reduces wind speed, wind cannot pick up soil, roots bind soil, 2 marks for each method. 6(b)(i) produce more / increase profits / increase income, 1 6(b)(ii) sell less / reduced profits / lose money, 1 unable to compete with EU producers / more European sugar beet bought, 6(b)(iii) reduced price of sugar / cheaper sugar, 1
What was in this paper
The subtopics covered by these 6 questions, and how many questions each got. Open one in a new tab to see every Cambridge question on it.
What you needed in this session
Cambridge’s own grade thresholds for 2017 May/June, Paper 2 · Variant 1. A higher threshold means an easier paper — the bar moves with how the cohort did.