Cambridge IGCSE Geography 0460 — 2024 May/June Paper 2 · Variant 1
0460/21/M/J/24 · 6 questions · 60 marks · ≈68 min
The question paper and its mark scheme, free to read here and free to download. This is Cambridge’s own paper, exactly as it was sat.
Question paper16 pages
Mark scheme8 pages
Answers below. Sit the paper first if you are practising.
Questions as text
Q1 · Study the map extract for Panzendorf, in the Tyrol region of Europe
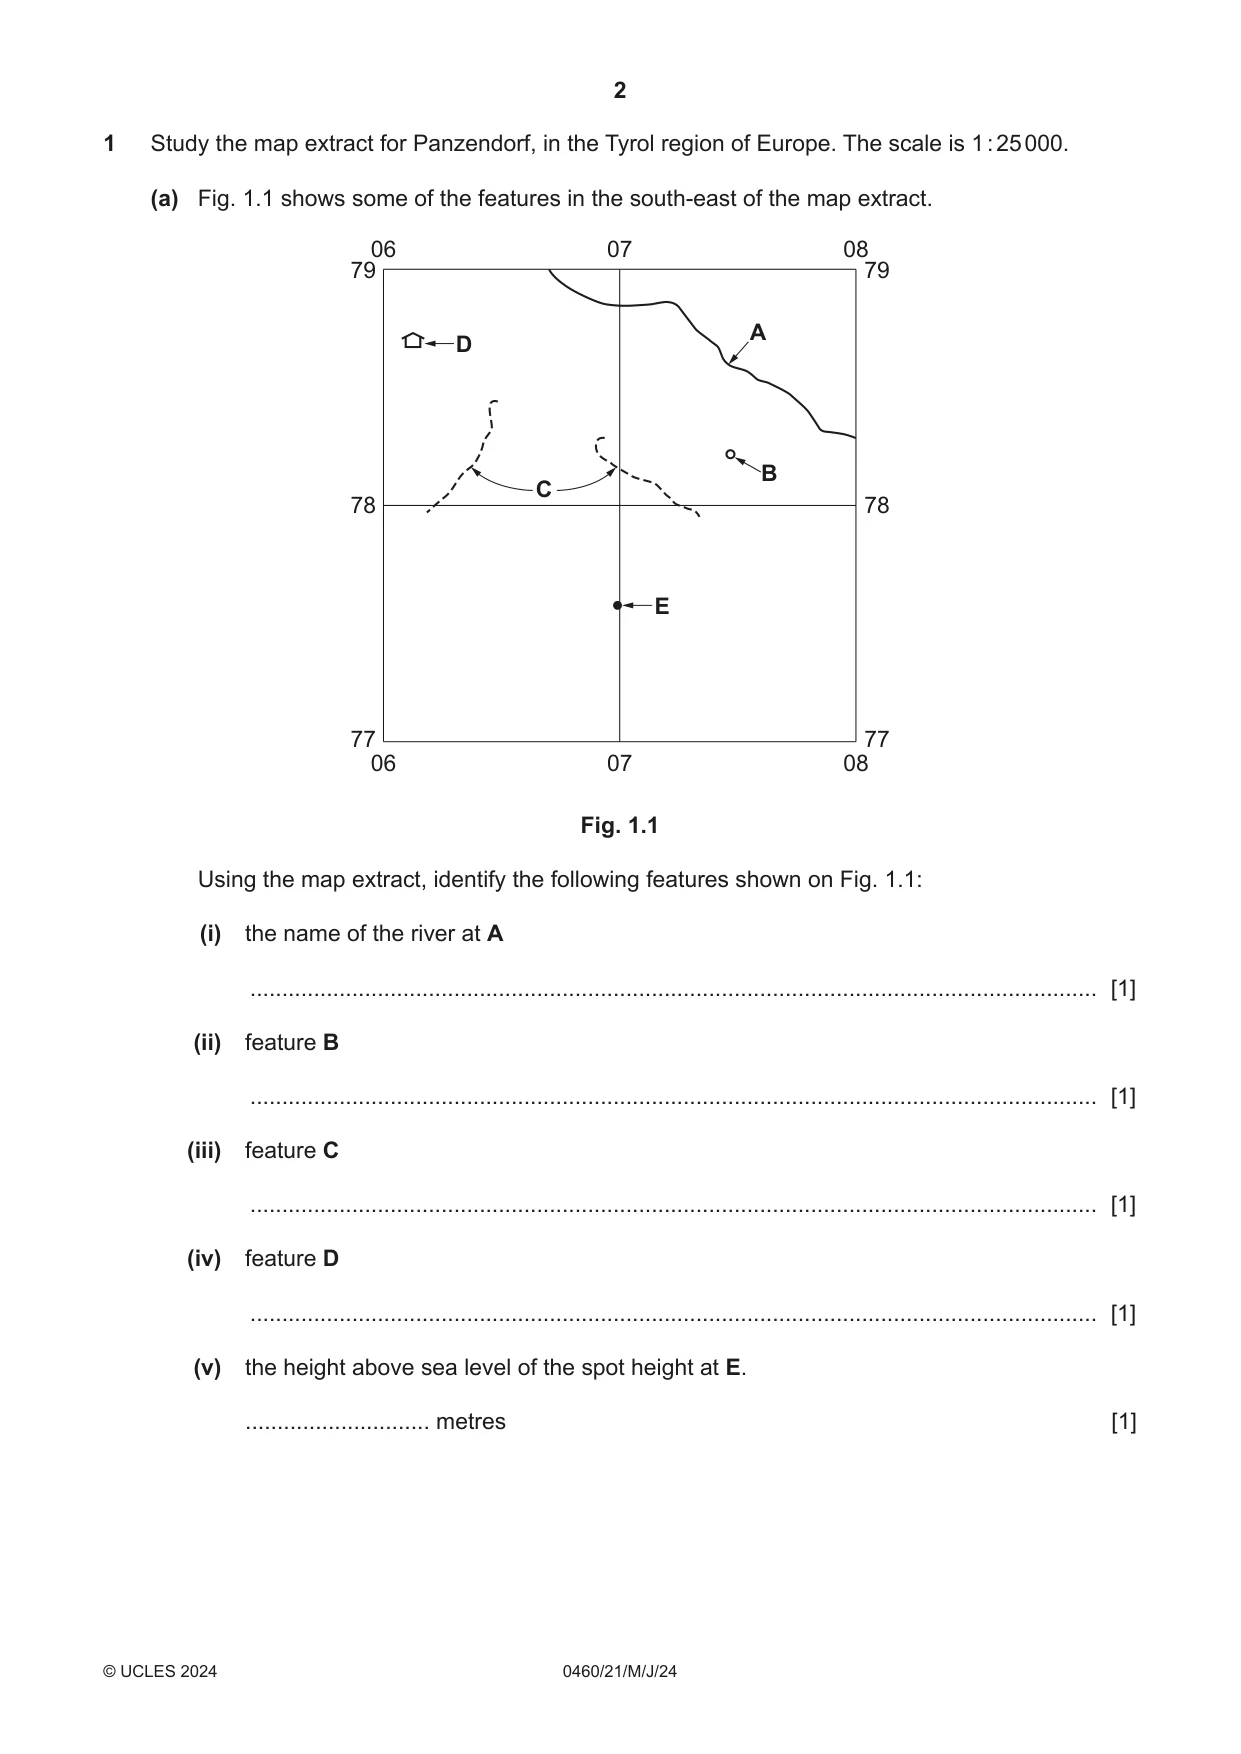
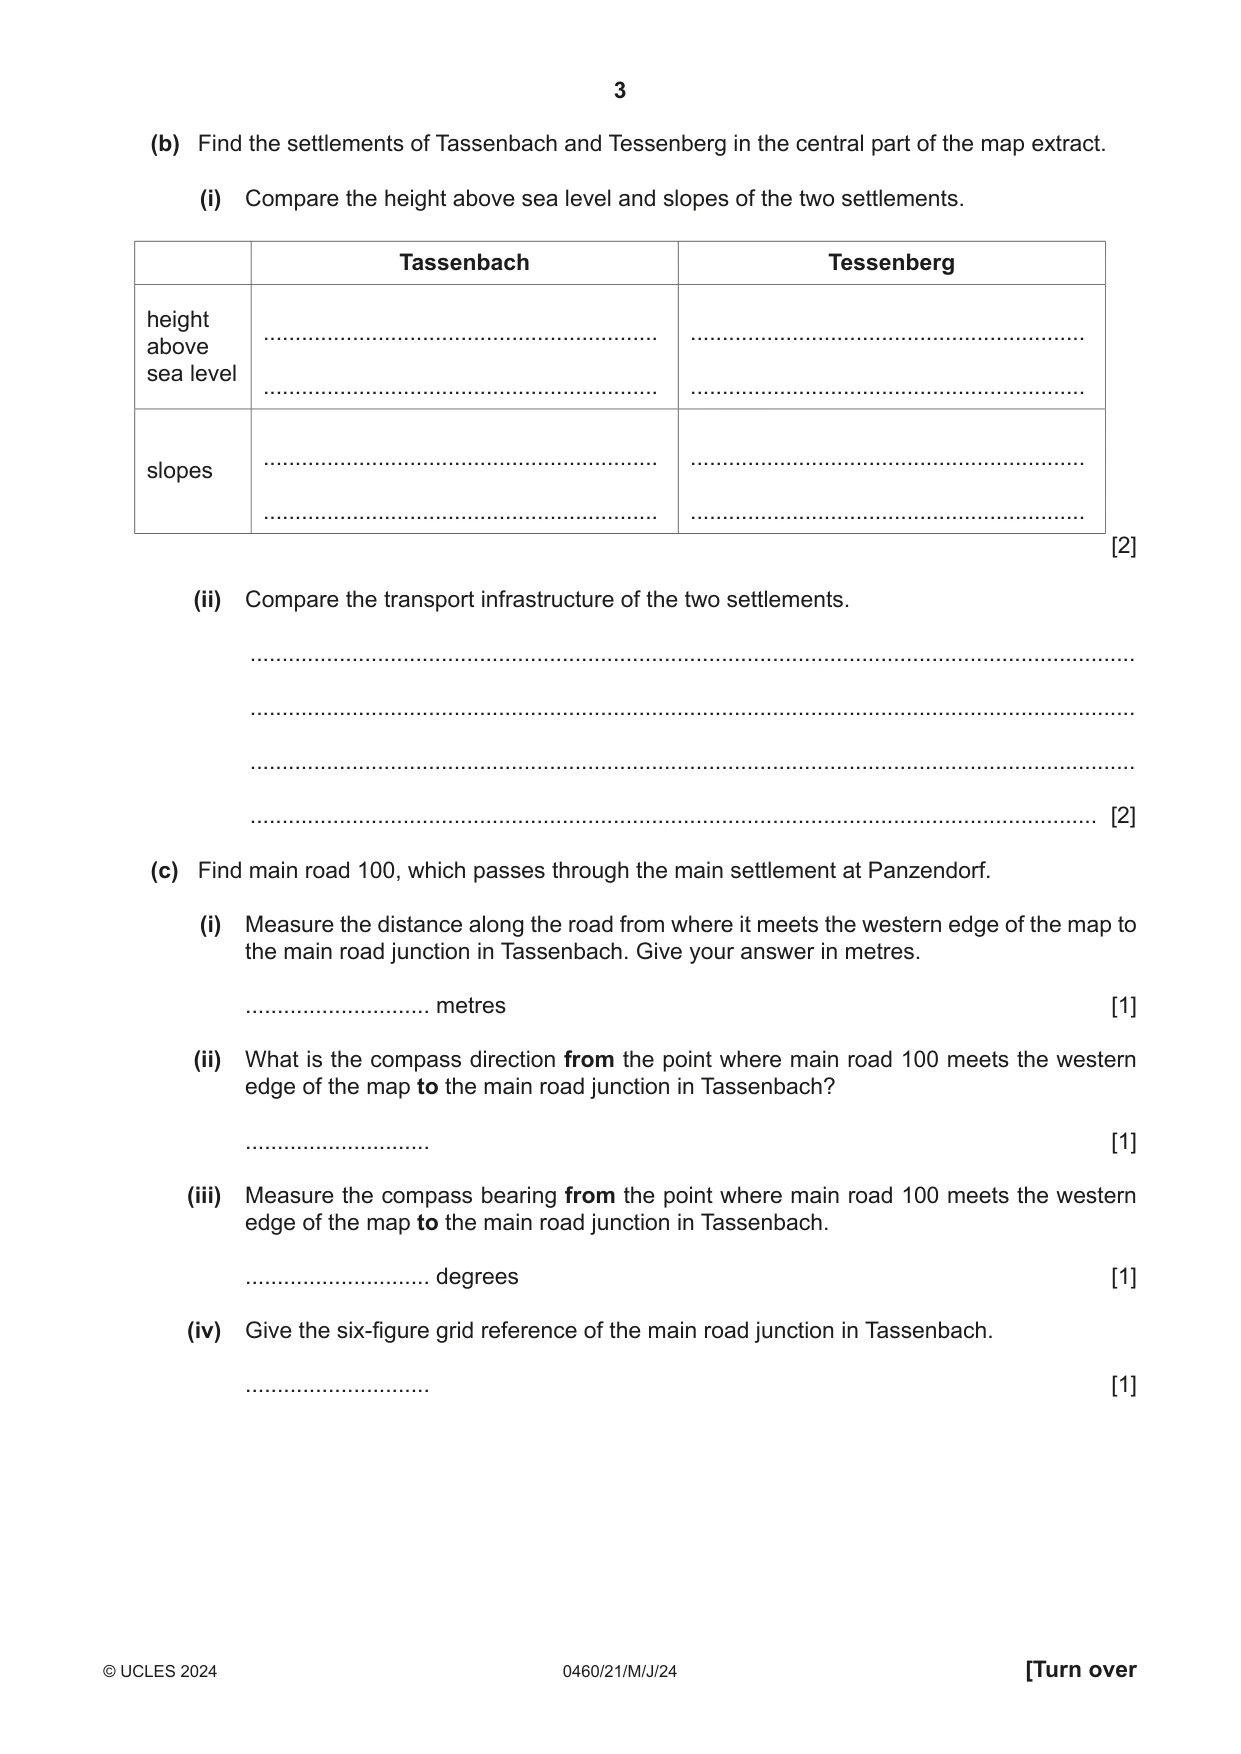
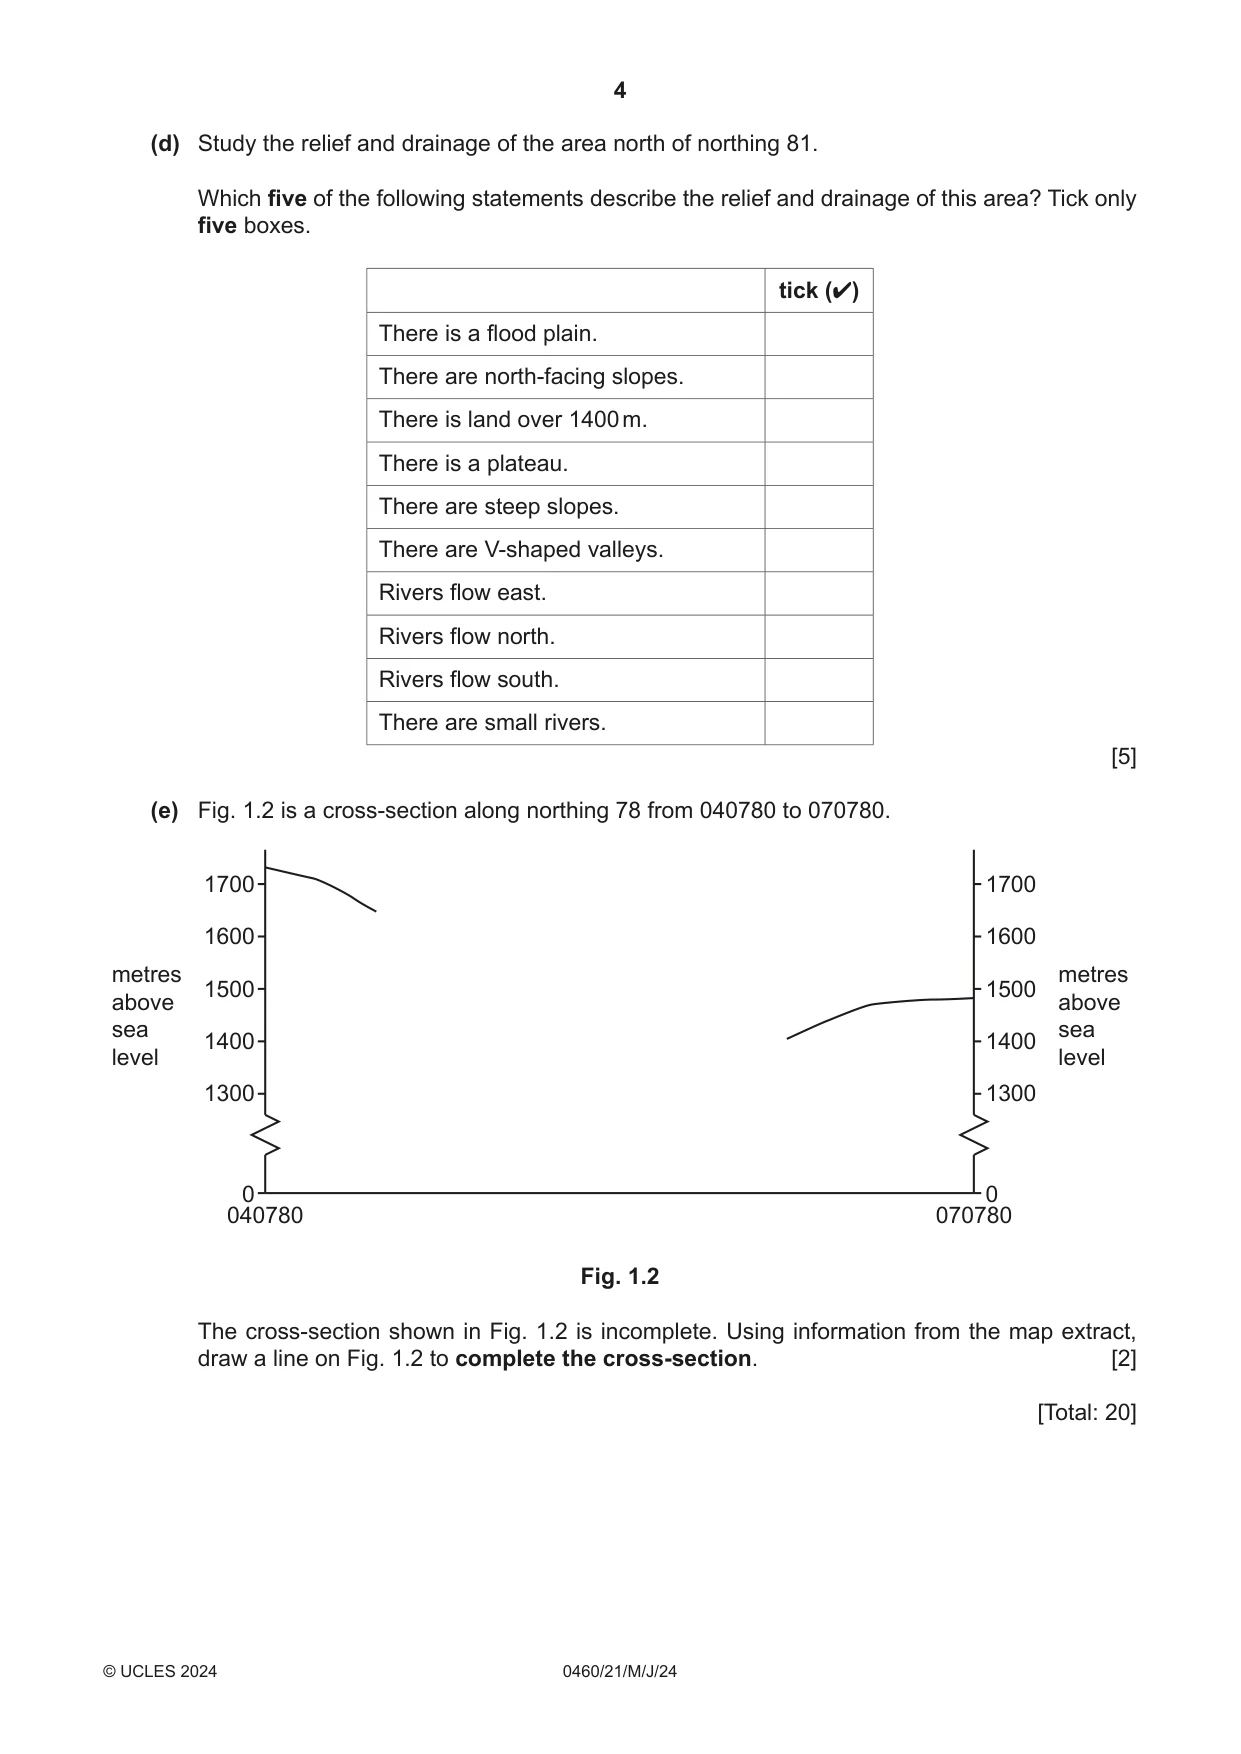
1 Study the map extract for Panzendorf, in the Tyrol region of Europe. The scale is 1 : 25 000. (a) Fig. 1.1 shows some of the features in the south-east of the map extract. 06 07 08 79 79 A D B C 78 78 E 77 77 06 07 08 Fig. 1.1 Using the map extract, identify the following features shown on Fig. 1.1: (i) the name of the river at A ..................................................................................................................................... [1] (ii) feature B ..................................................................................................................................... [1] (iii) feature C ..................................................................................................................................... [1] (iv) feature D ..................................................................................................................................... [1] (v) the height above sea level of the spot height at E. ............................. metres [1] (b) Find the settlements of Tassenbach and Tessenberg in the central part of the map extract. (i) Compare the height above sea level and slopes of the two settlements. Tassenbach Tessenberg height .............................................................. ..............................................................above sea level .............................................................. .............................................................. .............................................................. ..............................................................slopes .............................................................. .............................................................. [2] (ii) Compare the transport infrastructure of the two settlements. ........................................................................................................................................... ........................................................................................................................................... ........................................................................................................................................... ..................................................................................................................................... [2] (c) Find main road 100, which passes through the main settlement at Panzendorf. (i) Measure the distance along the road from where it meets the western edge of the map to the main road junction in Tassenbach. Give your answer in metres. ............................. metres [1] (ii) What is the compass direction from the point where main road 100 meets the western edge of the map to the main road junction in Tassenbach? ............................. [1] (iii) Measure the compass bearing from the point where main road 100 meets the western edge of the map to the main road junction in Tassenbach. ............................. degrees [1] (iv) Give the six-figure grid reference of the main road junction in Tassenbach. ............................. [1] (d) Study the relief and drainage of the area north of northing 81. Which five of the following statements describe the relief and drainage of this area? Tick only five boxes. tick (✔) There is a flood plain. There are north-facing slopes. There is land over 1400 m. There is a plateau. There are steep slopes. There are V-shaped valleys. Rivers flow east. Rivers flow north. Rivers flow south. There are small rivers. [5] (e) Fig. 1.2 is a cross-section along northing 78 from 040780 to 070780. 1700 1700 1600 1600 metres metres 1500 1500above above sea sea 1400 1400 level level 1300 1300 0 0 040780 070780 Fig. 1.2 The cross-section shown in Fig. 1.2 is incomplete. Using information from the map extract, draw a line on Fig. 1.2 to complete the cross-section. [2] [Total: 20]
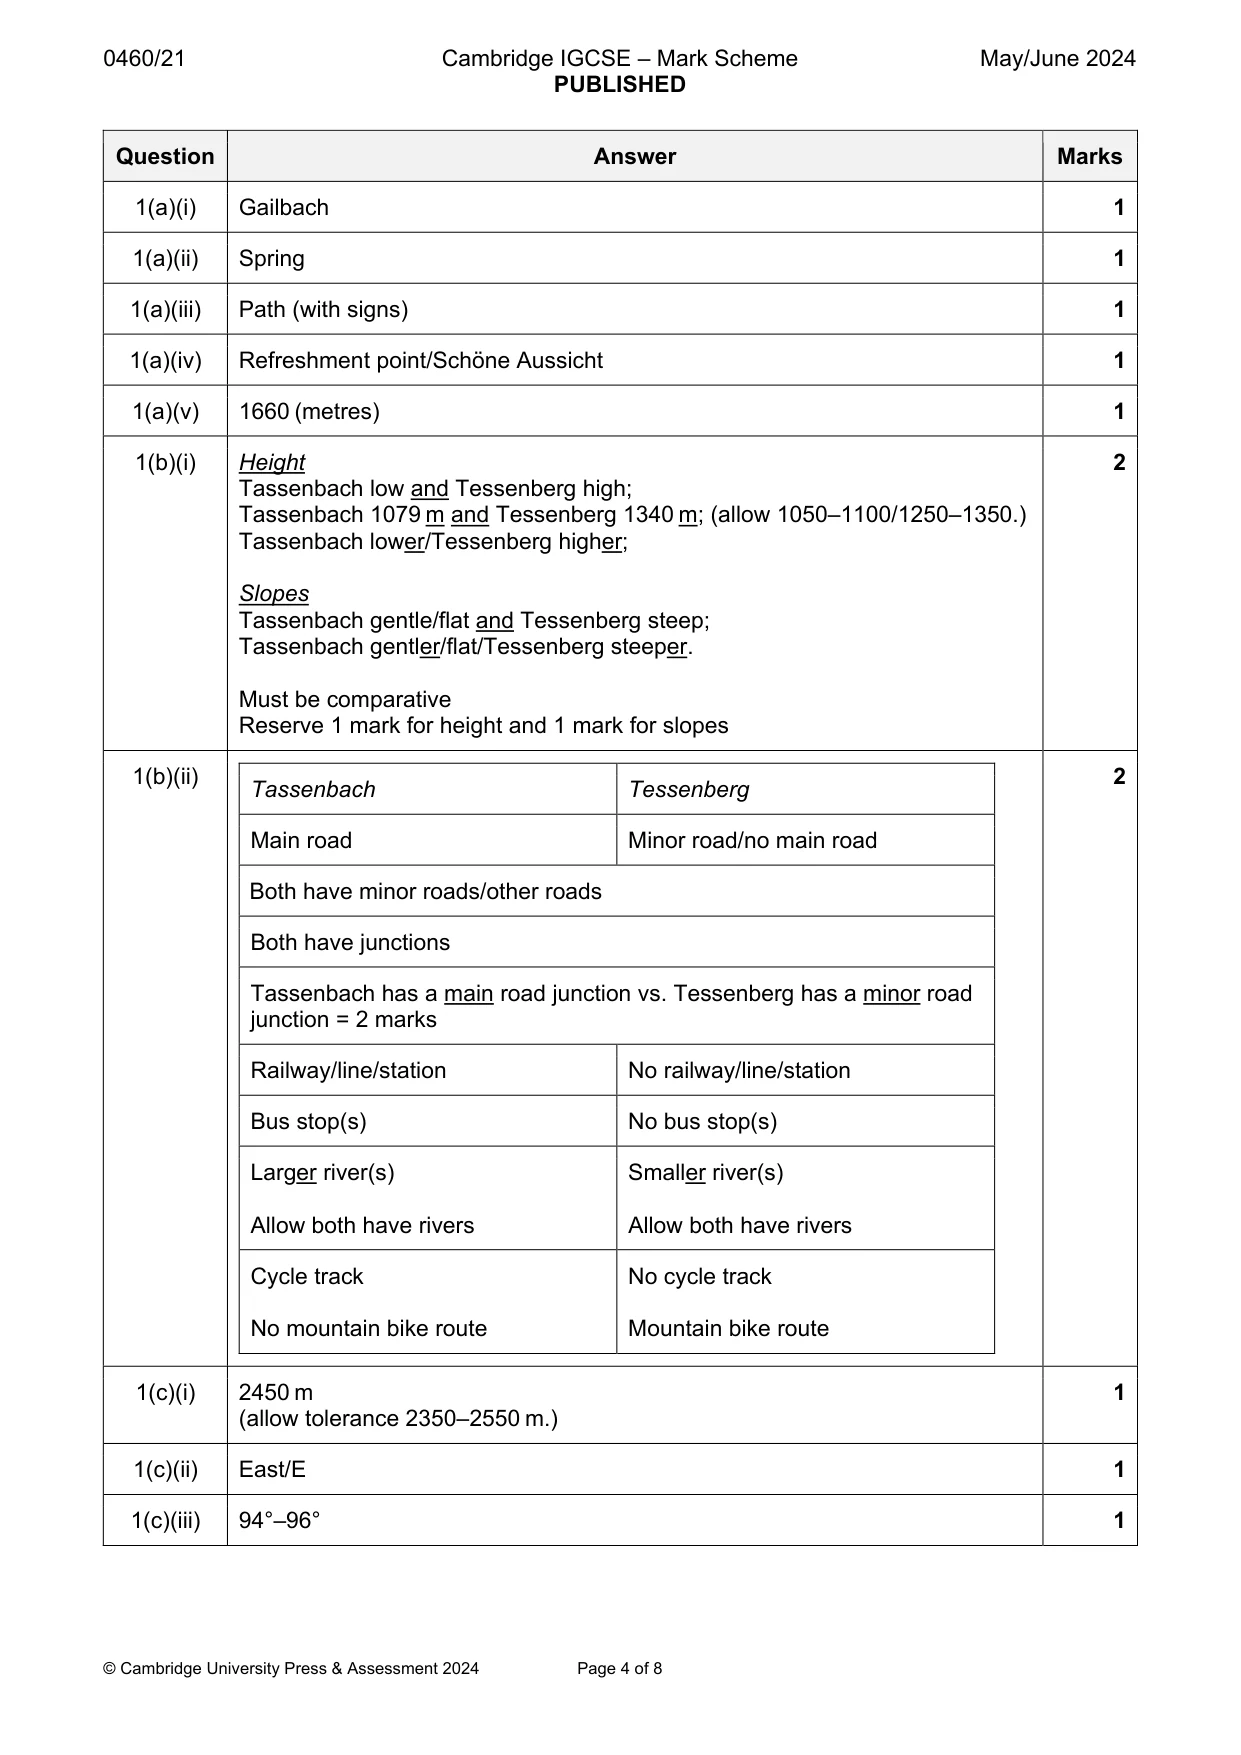
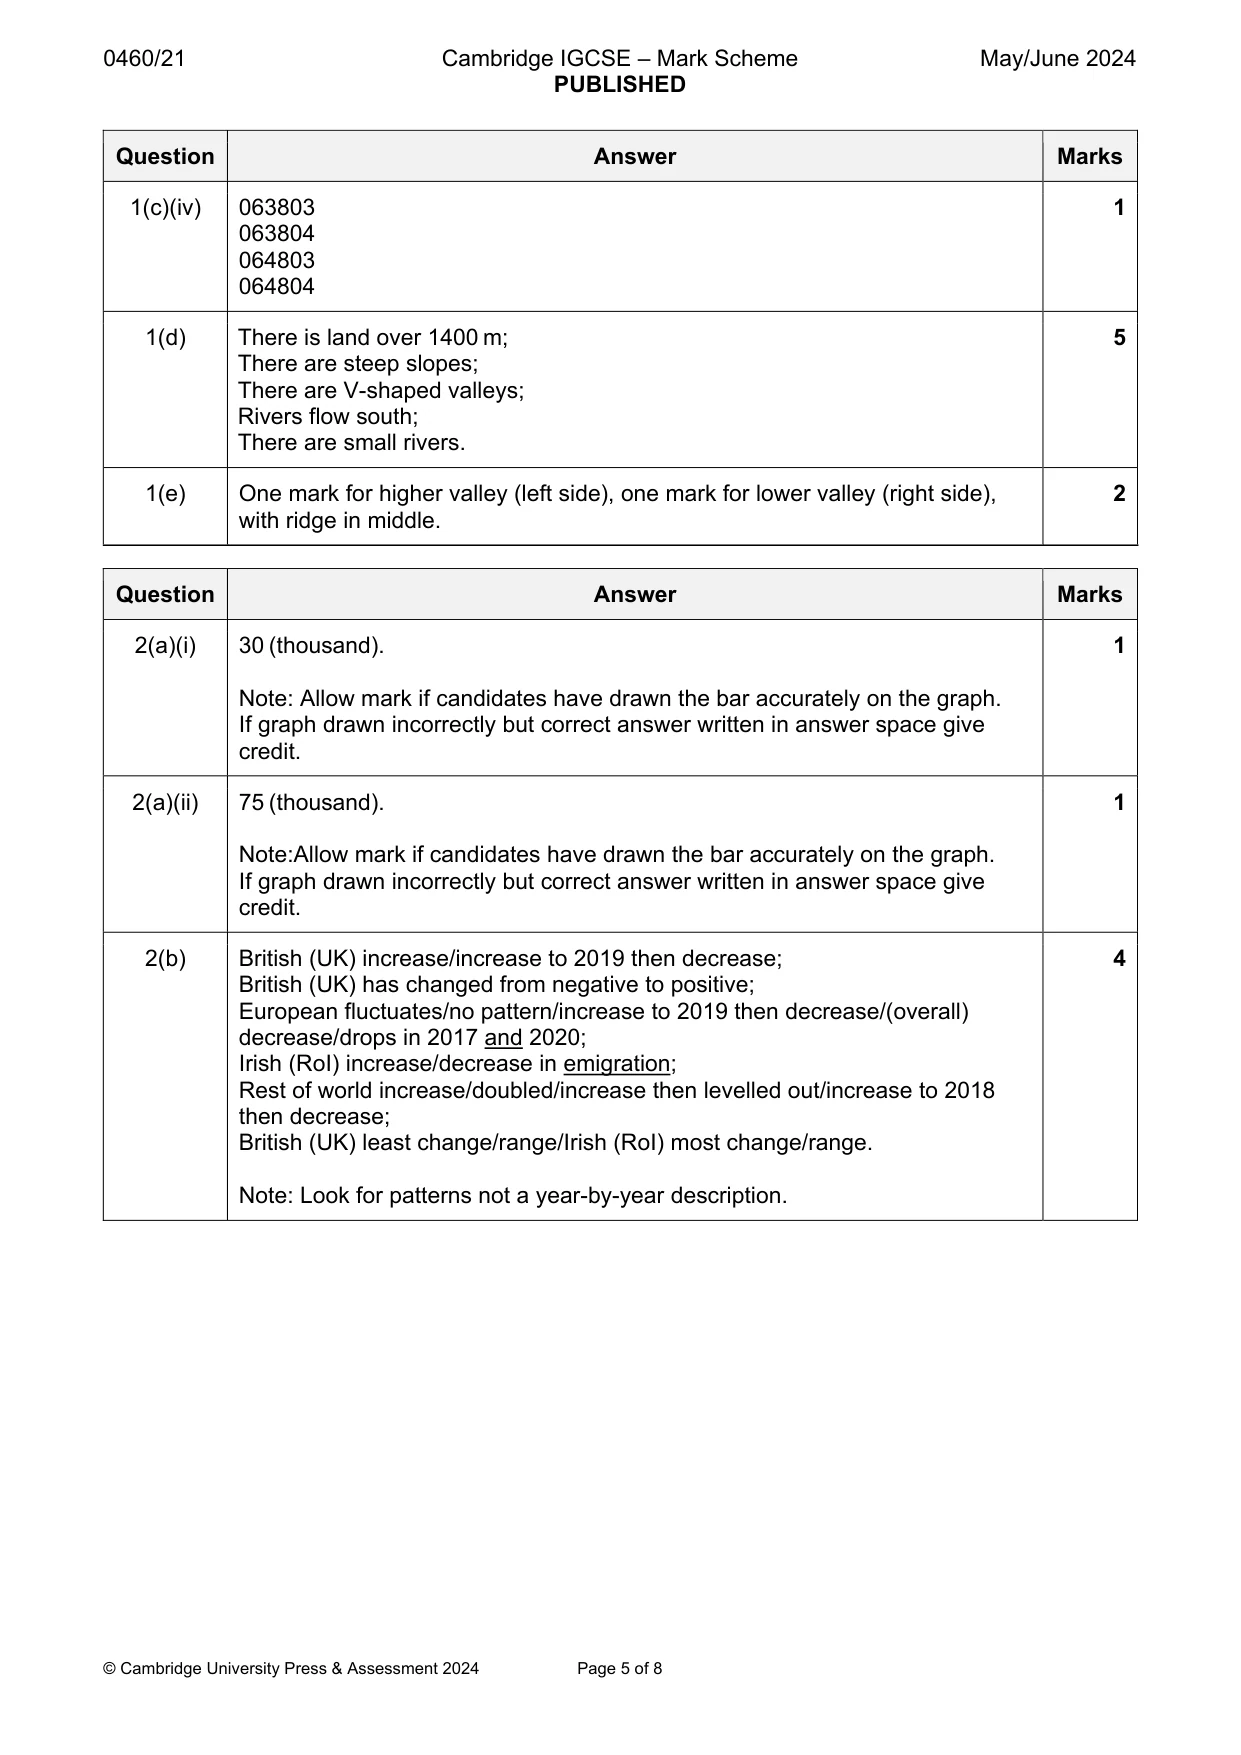
Mark scheme: Question Answer Marks 1(a)(i) Gailbach 1 1(a)(ii) Spring 1 1(a)(iii) Path (with signs) 1 1(a)(iv) Refreshment point/Schöne Aussicht 1 1(a)(v) 1660 (metres) 1 1(b)(i) Height 2 Tassenbach low and Tessenberg high; Tassenbach 1079 m and Tessenberg 1340 m; (allow 1050–1100/1250–1350.) Tassenbach lower/Tessenberg higher; Slopes Tassenbach gentle/flat and Tessenberg steep; Tassenbach gentler/flat/Tessenberg steeper. Must be comparative Reserve 1 mark for height and 1 mark for slopes 1(b)(ii) 2 Tassenbach Tessenberg Main road Minor road/no main road Both have minor roads/other roads Both have junctions Tassenbach has a main road junction vs. Tessenberg has a minor road junction = 2 marks Railway/line/station No railway/line/station Bus stop(s) No bus stop(s) Larger river(s) Smaller river(s) Allow both have rivers Allow both have rivers Cycle track No cycle track No mountain bike route Mountain bike route 1(c)(i) 2450 m 1 (allow tolerance 2350–2550 m.) 1(c)(ii) East/E 1 1(c)(iii) 94°–96° 1 1(c)(iv) 063803 1 063804 064803 064804 1(d) There is land over 1400 m; 5 There are steep slopes; There are V-shaped valleys; Rivers flow south; There are small rivers. 1(e) One mark for higher valley (left side), one mark for lower valley (right side), 2 with ridge in middle.
Q2 · International population migration data to and from the Republic of Ireland for selected…
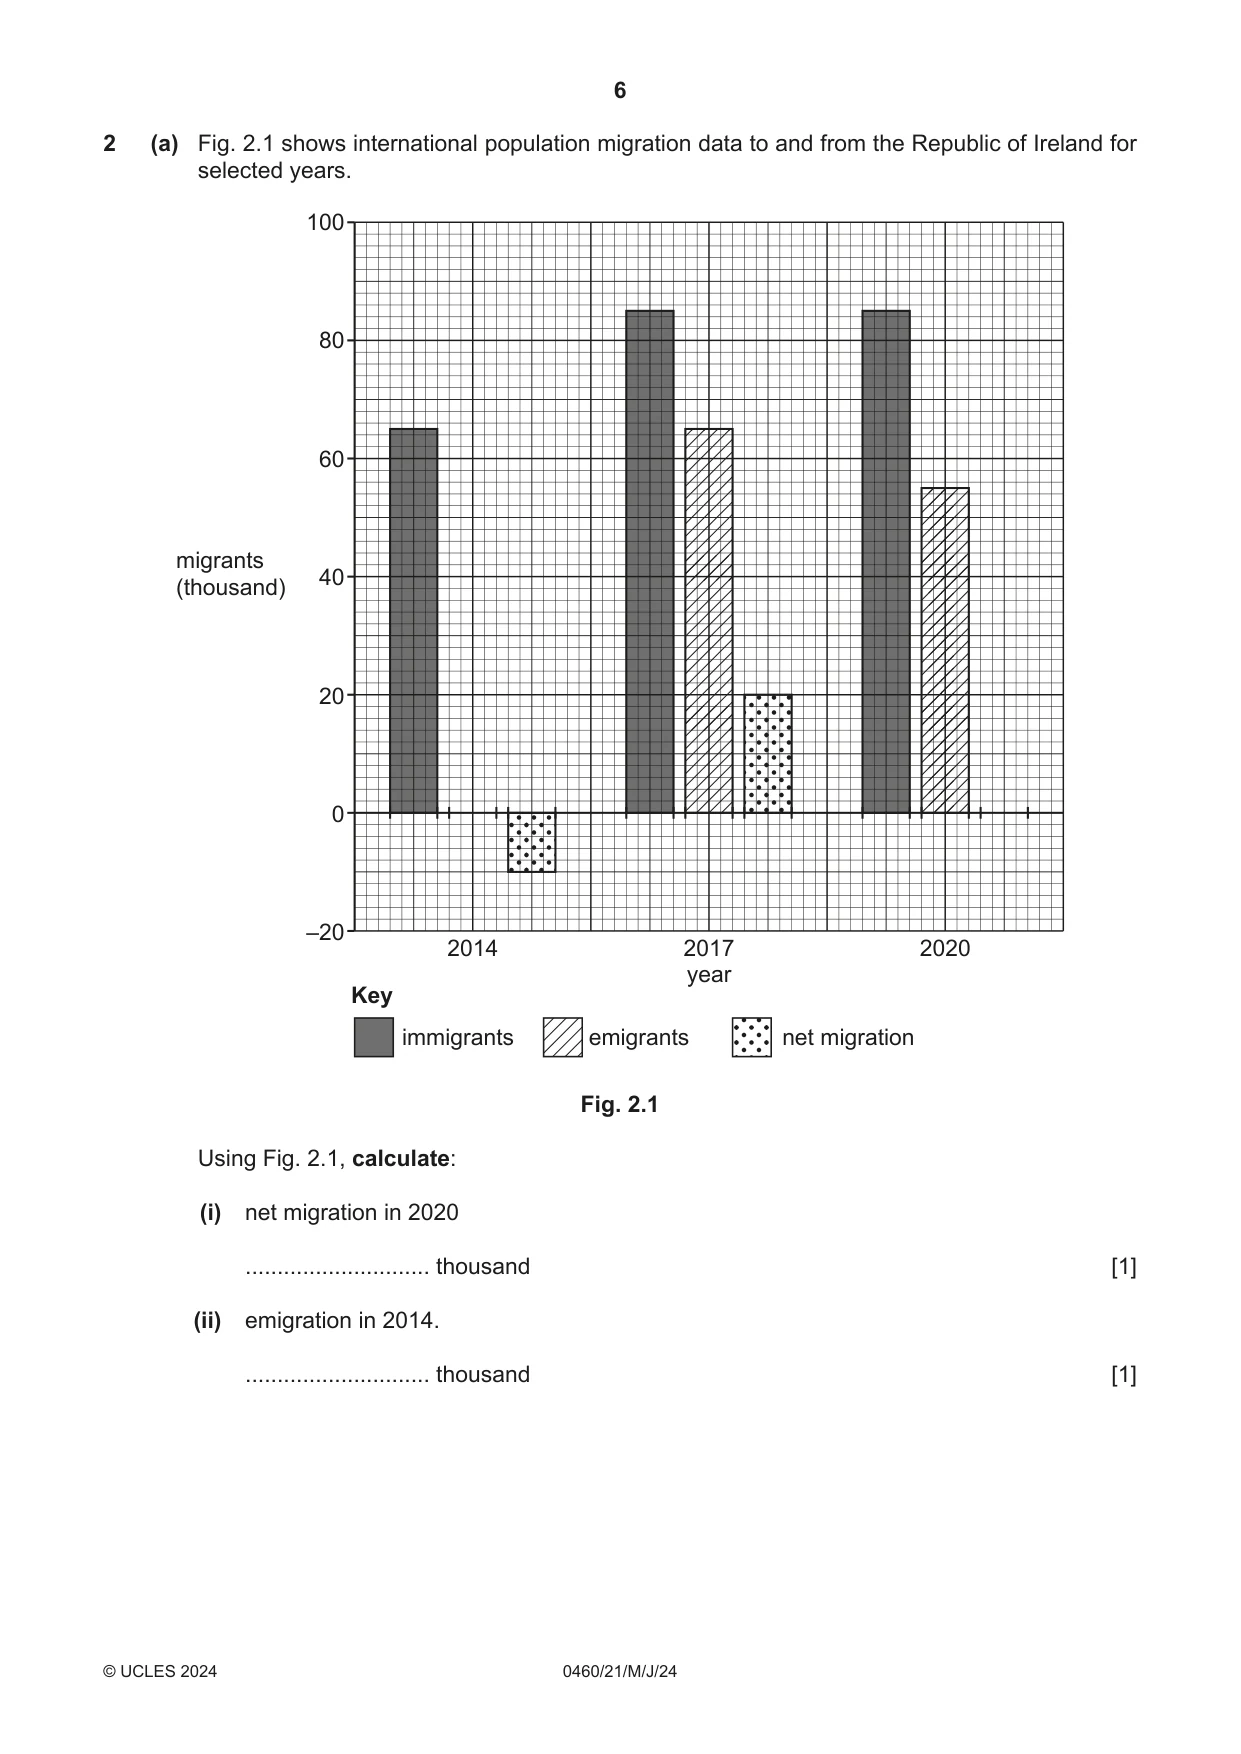
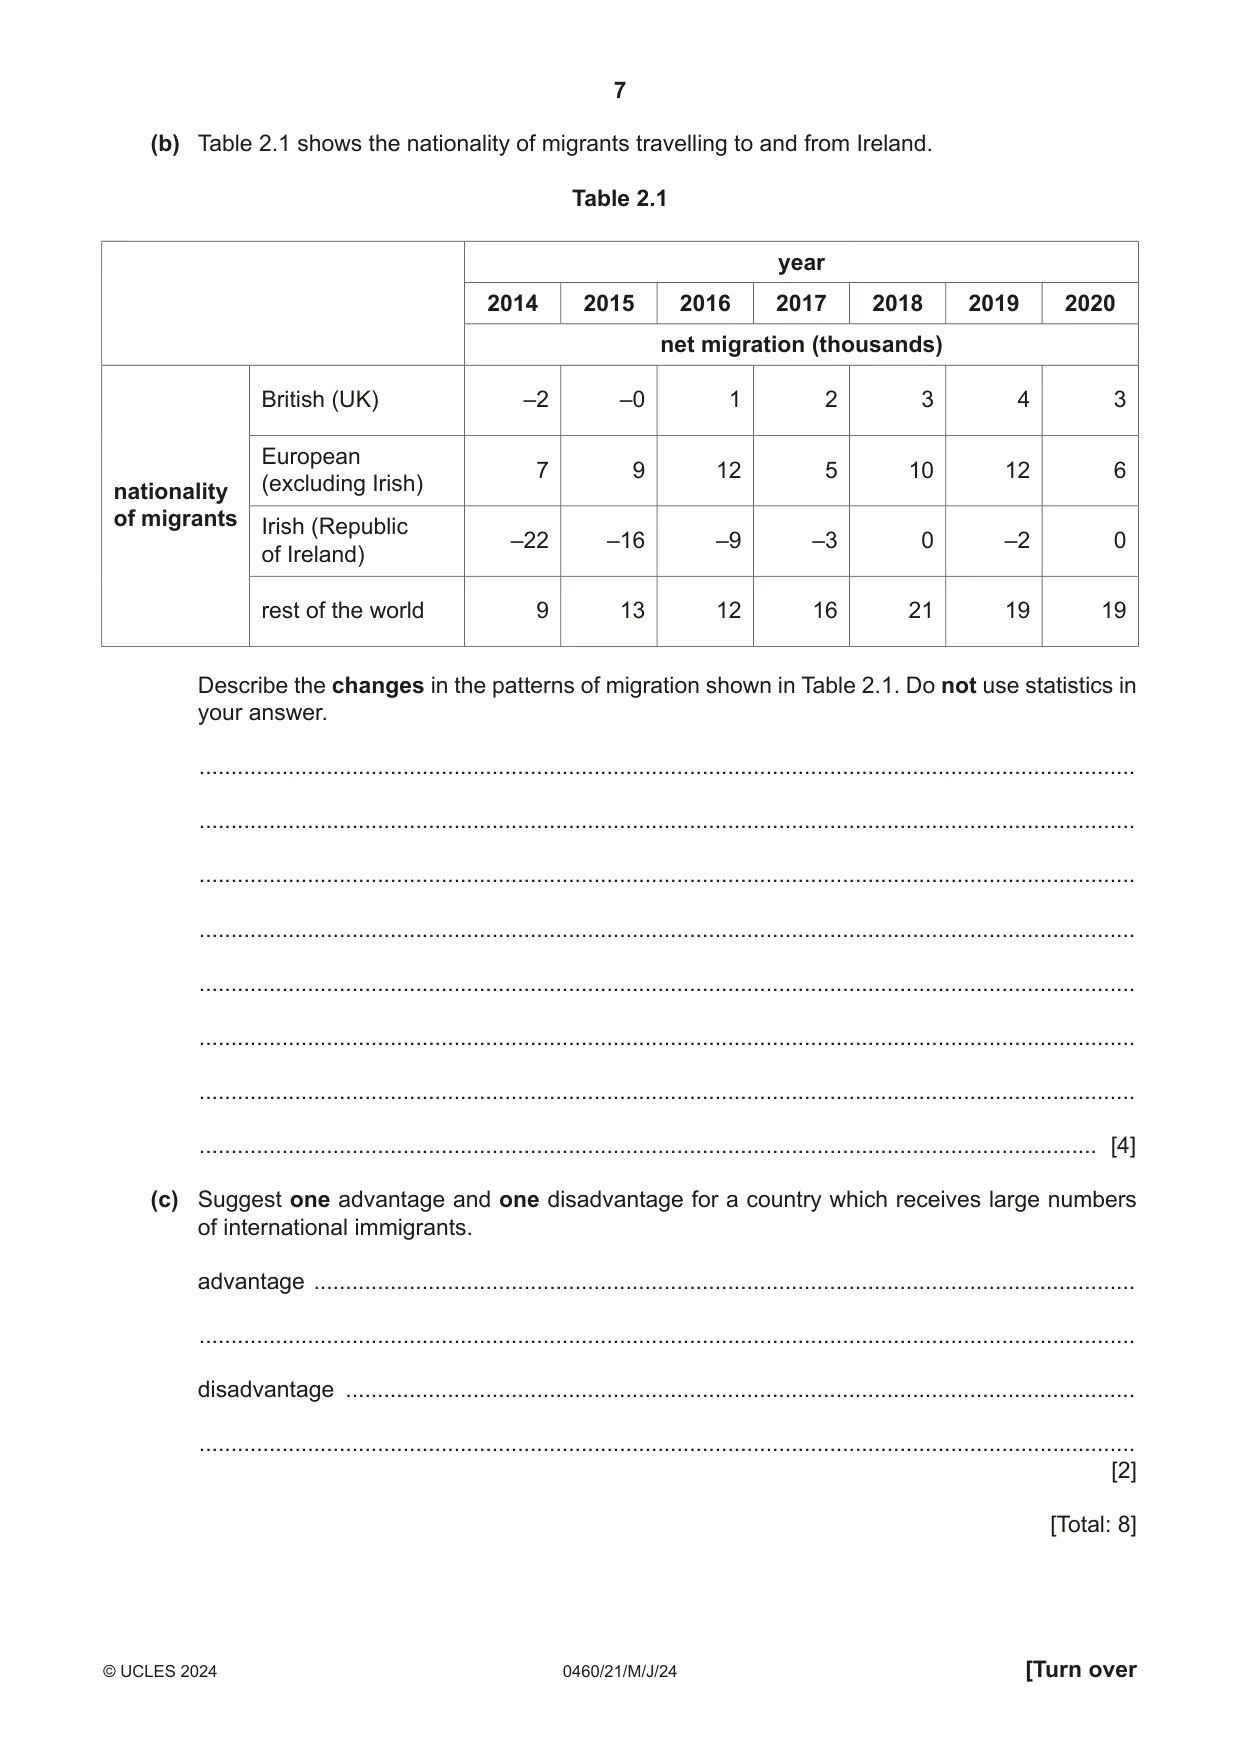
2 (a) Fig. 2.1 shows international population migration data to and from the Republic of Ireland for selected years. 100 80 60 migrants 40 (thousand) 20 0 –20 2014 2017 2020 year Key immigrants emigrants net migration Fig. 2.1 Using Fig. 2.1, calculate: (i) net migration in 2020 ............................. thousand [1] (ii) emigration in 2014. ............................. thousand [1] (b) Table 2.1 shows the nationality of migrants travelling to and from Ireland. Table 2.1 year 2014 2015 2016 2017 2018 2019 2020 net migration (thousands) British (UK) –2 –0 1 2 3 4 3 European 7 9 12 5 10 12 6 (excluding Irish)nationality of migrants Irish (Republic –22 –16 –9 –3 0 –2 0 of Ireland) rest of the world 9 13 12 16 21 19 19 Describe the changes in the patterns of migration shown in Table 2.1. Do not use statistics in your answer. ................................................................................................................................................... ................................................................................................................................................... ................................................................................................................................................... ................................................................................................................................................... ................................................................................................................................................... ................................................................................................................................................... ................................................................................................................................................... ............................................................................................................................................. [4] (c) Suggest one advantage and one disadvantage for a country which receives large numbers of international immigrants. advantage ................................................................................................................................. ................................................................................................................................................... disadvantage ............................................................................................................................ ................................................................................................................................................... [2] [Total: 8]
Mark scheme: 2(a)(i) 30 (thousand). 1 Note: Allow mark if candidates have drawn the bar accurately on the graph. If graph drawn incorrectly but correct answer written in answer space give credit. 2(a)(ii) 75 (thousand). 1 Note:Allow mark if candidates have drawn the bar accurately on the graph. If graph drawn incorrectly but correct answer written in answer space give credit. 2(b) British (UK) increase/increase to 2019 then decrease; 4 British (UK) has changed from negative to positive; European fluctuates/no pattern/increase to 2019 then decrease/(overall) decrease/drops in 2017 and 2020; Irish (RoI) increase/decrease in emigration; Rest of world increase/doubled/increase then levelled out/increase to 2018 then decrease; British (UK) least change/range/Irish (RoI) most change/range. Note: Look for patterns not a year-by-year description. 2(c) Advantage 2 More/many (skilled) workers/boost workforce/more taxpayers/younger population; Can fill shortfalls in particular types of jobs or named example e.g. more doctors or nurses; Cultural diversity e.g. food, music, religion/new language; Disadvantage Increased competition for jobs; Wages sent to home country; Racial tensions; Increased pressure on housing/healthcare/schools; Increased pressure on food/water/energy. Note: Reserve 1 mark for advantage and 1 mark for disadvantage Must be in correct section.
Q3 · The settlement hierarchy of a district in Antrim, Northern Ireland
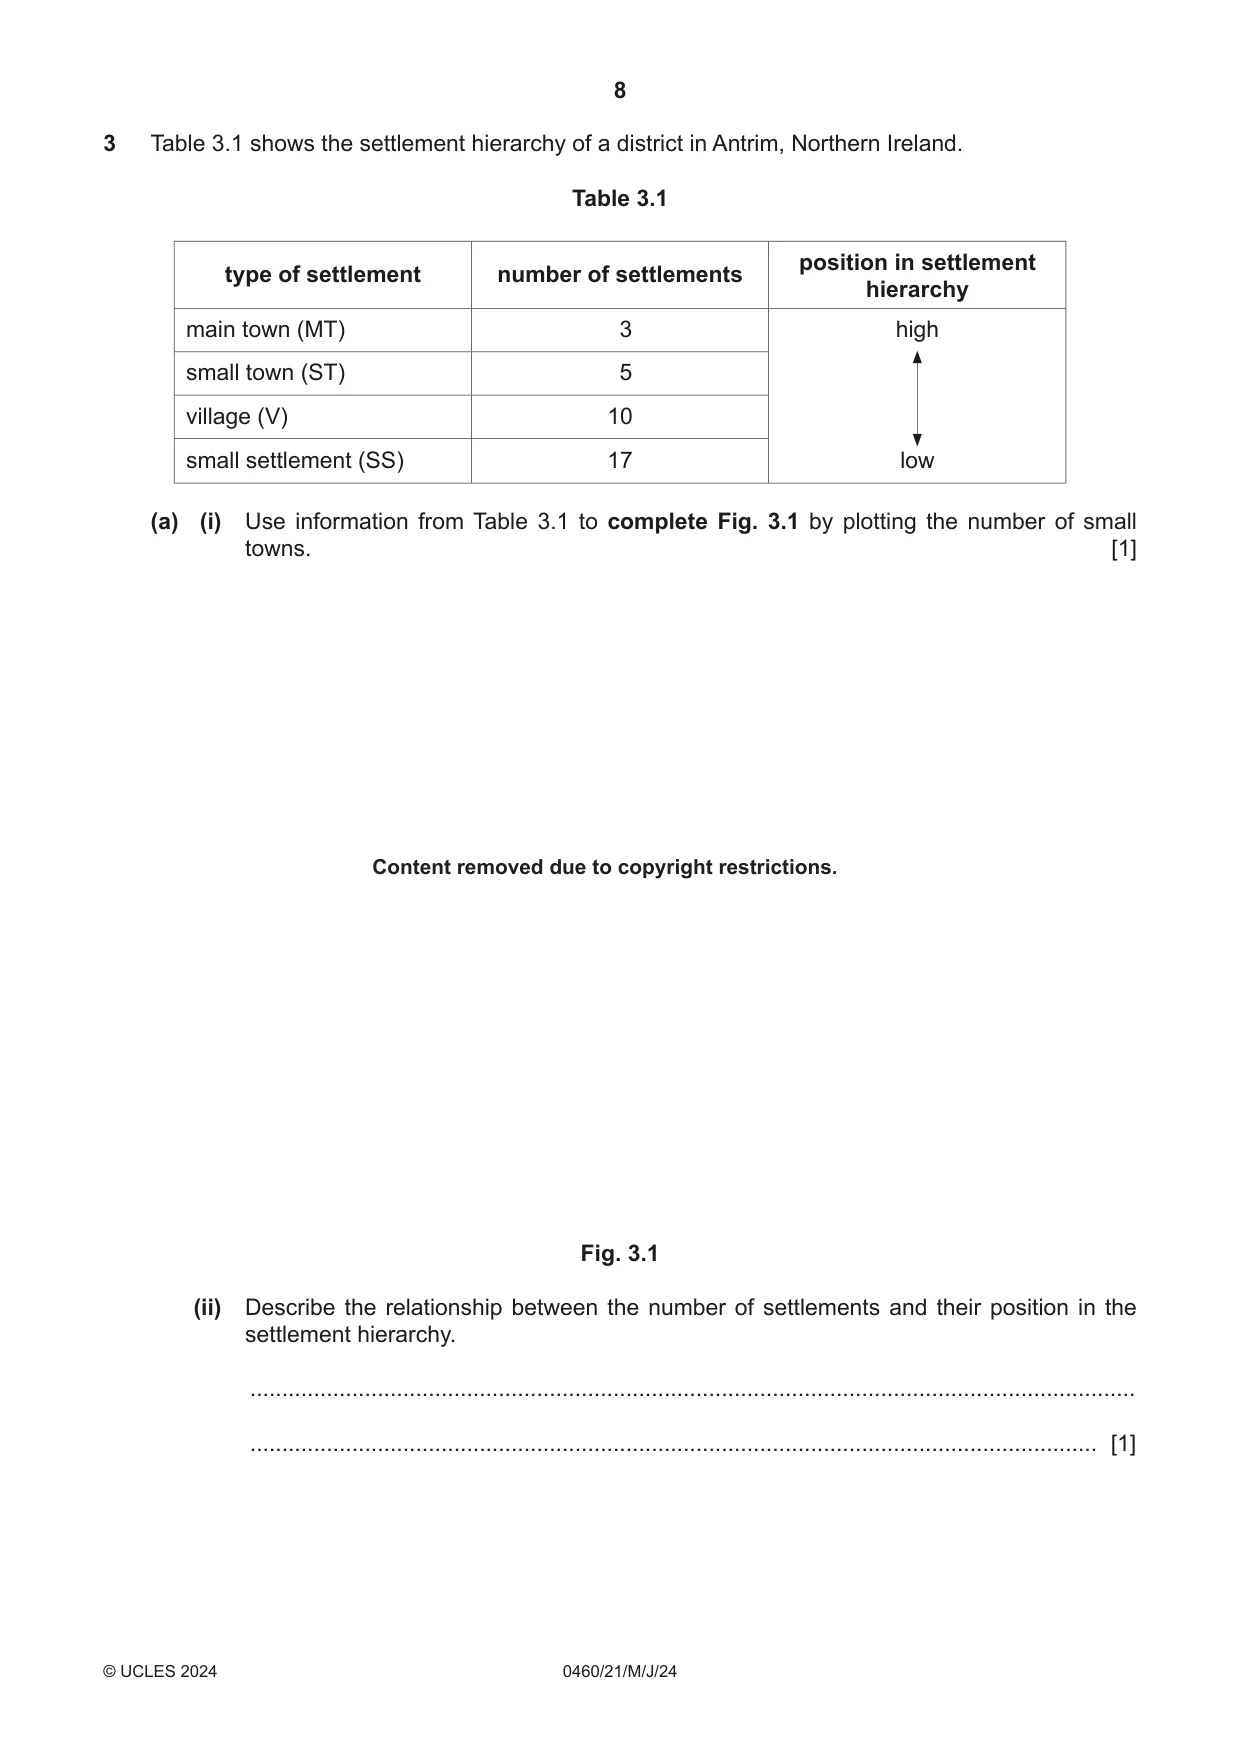
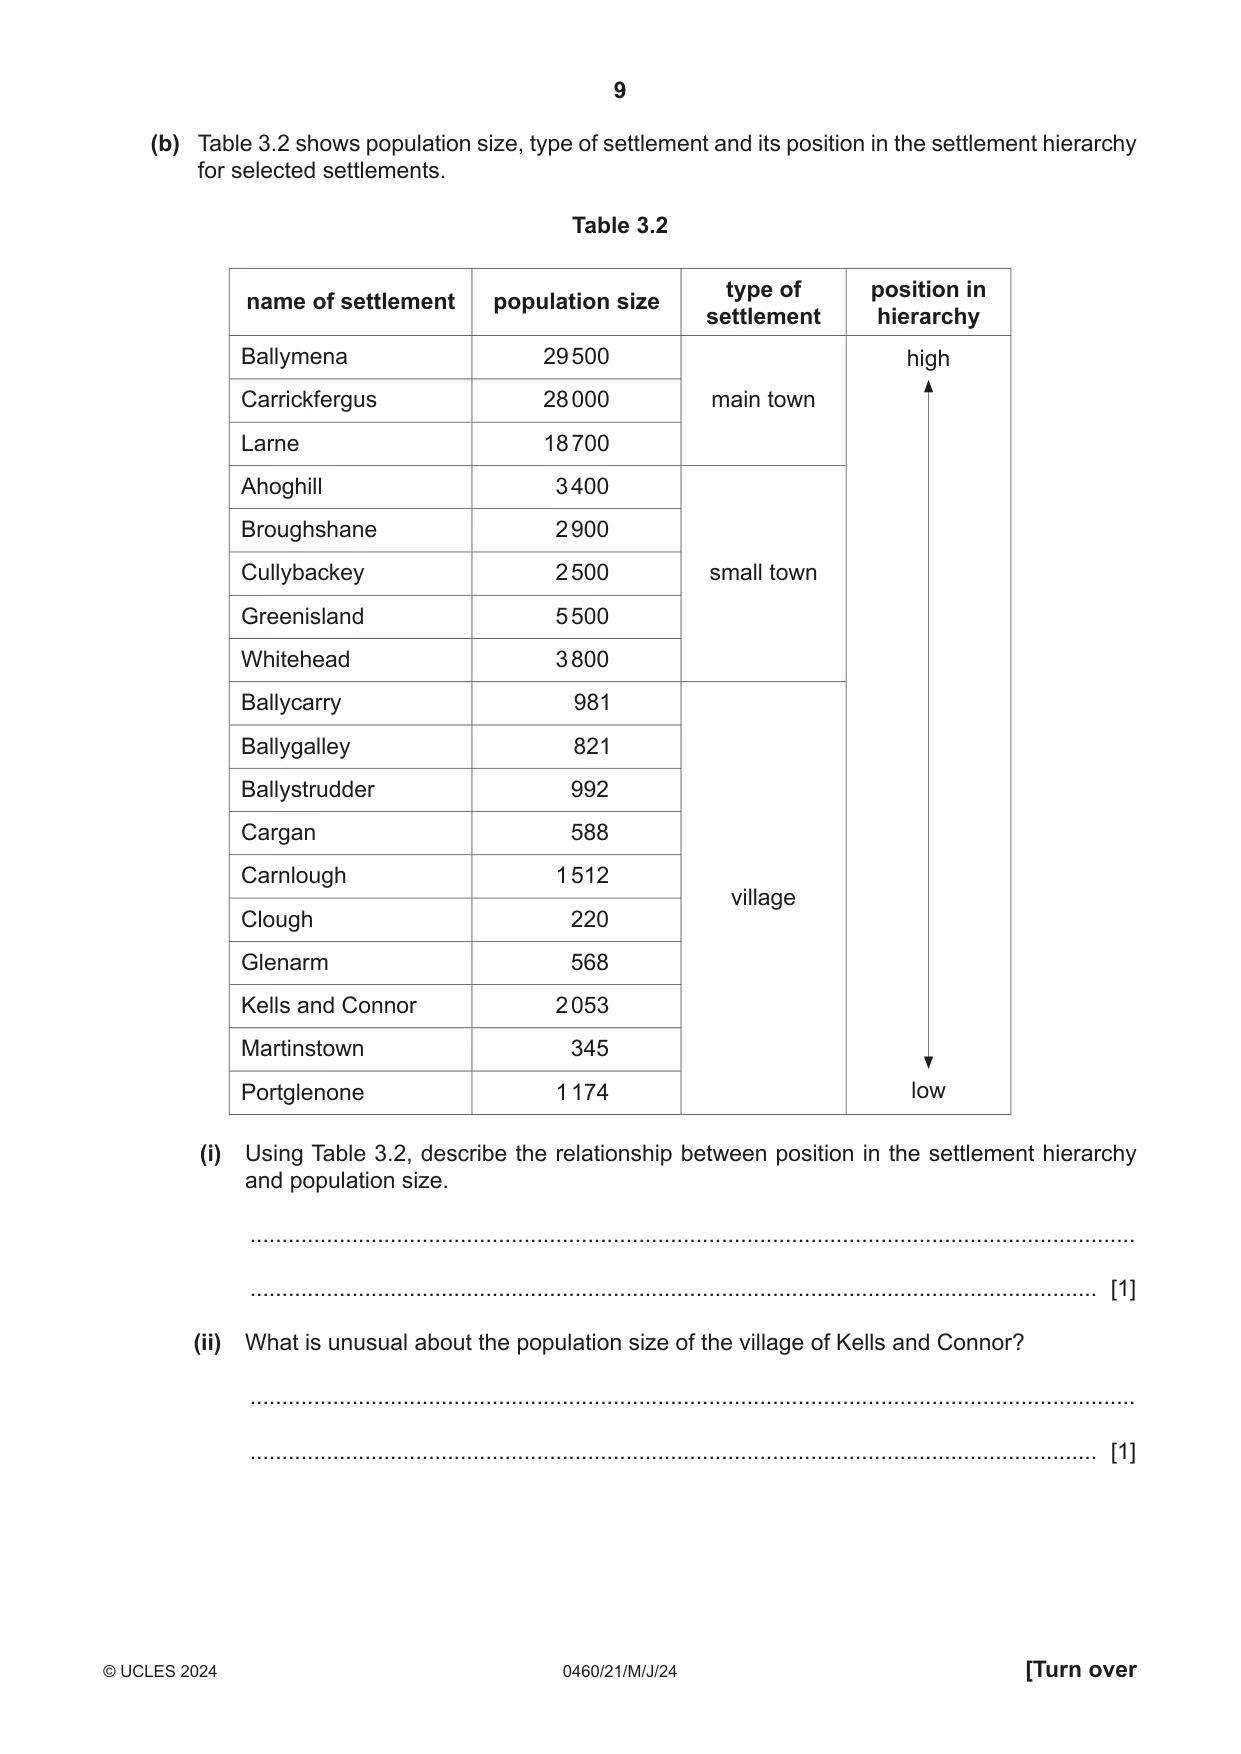
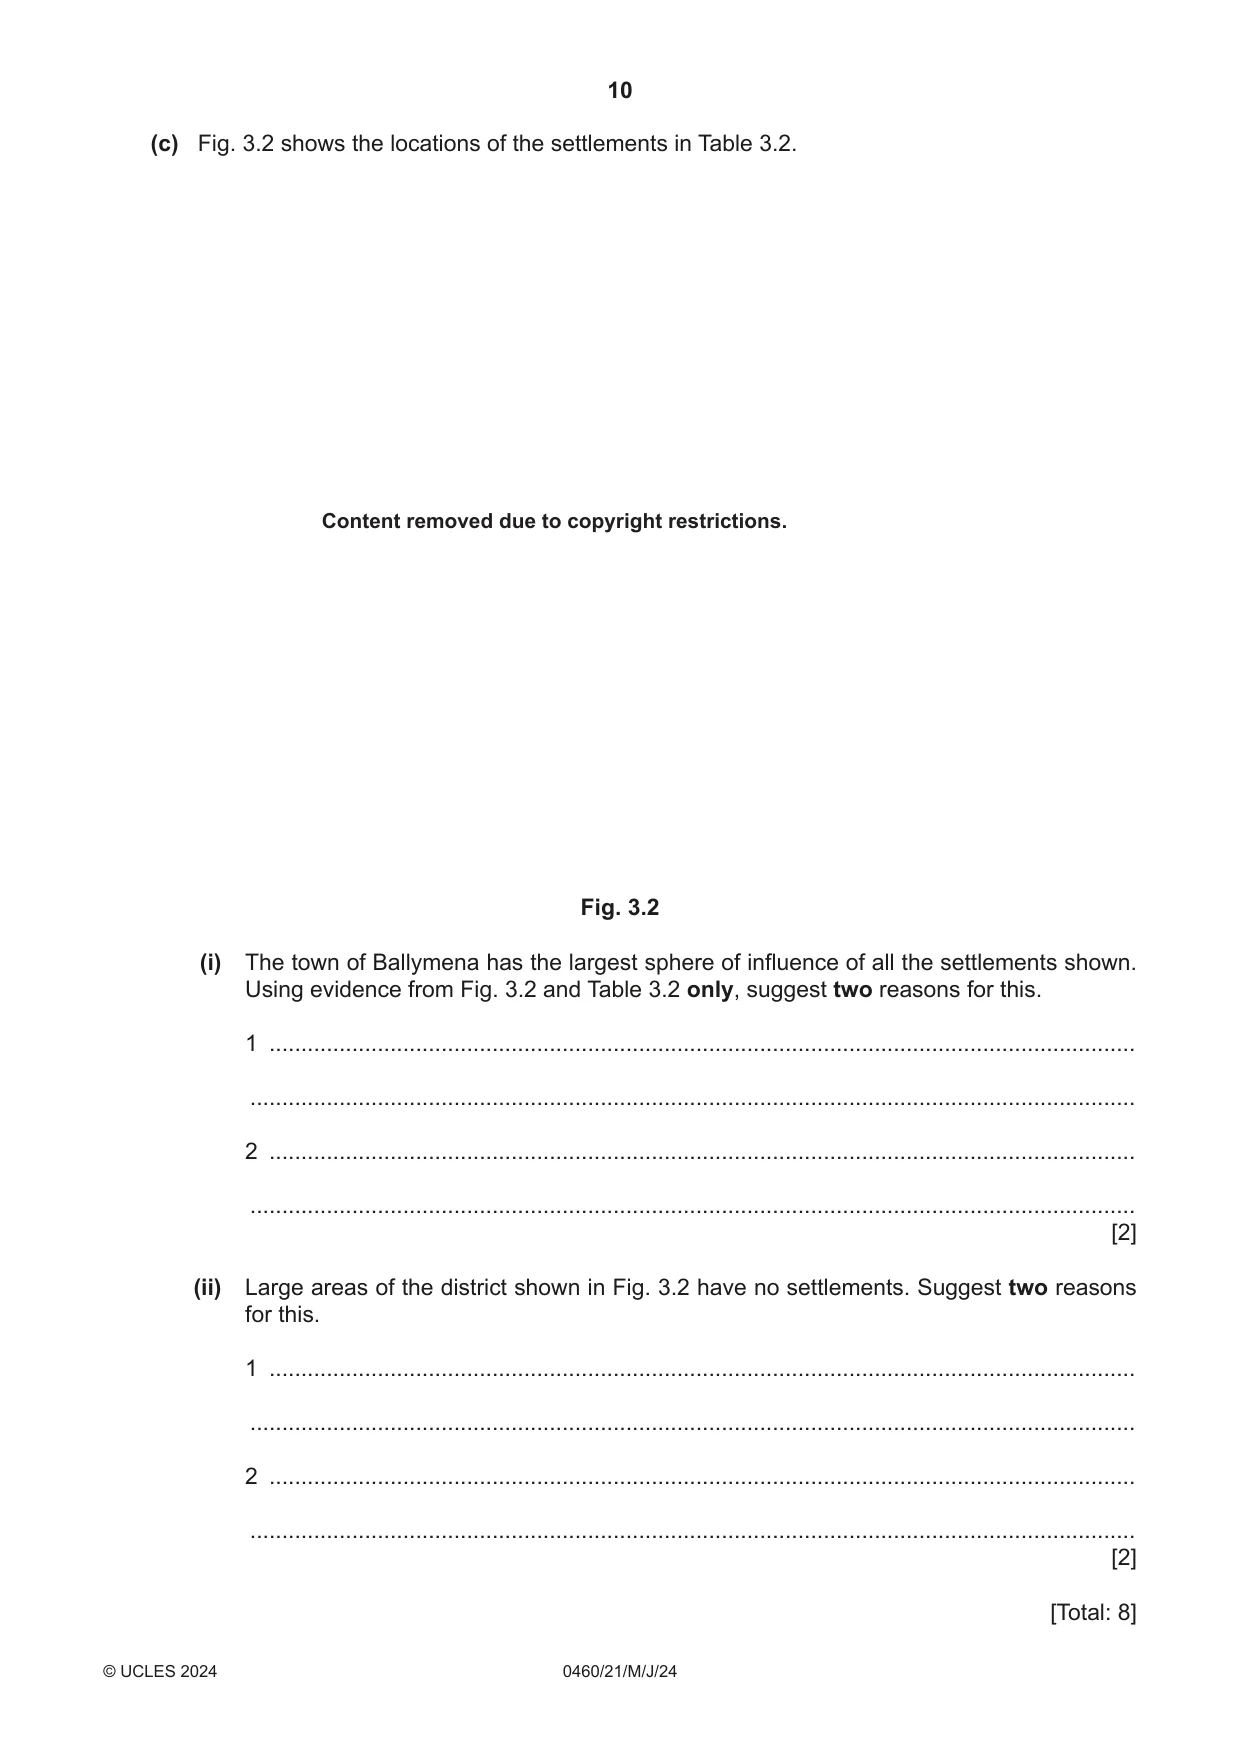
3 Table 3.1 shows the settlement hierarchy of a district in Antrim, Northern Ireland. Table 3.1 position in settlement type of settlement number of settlements hierarchy main town (MT) 3 high small town (ST) 5 village (V) 10 small settlement (SS) 17 low (a) (i) Use information from Table 3.1 to complete Fig. 3.1 by plotting the number of small towns. [1] Content removed due to copyright restrictions. Fig. 3.1 (ii) Describe the relationship between the number of settlements and their position in the settlement hierarchy. ........................................................................................................................................... ..................................................................................................................................... [1] (b) Table 3.2 shows population size, type of settlement and its position in the settlement hierarchy for selected settlements. Table 3.2 type of position in name of settlement population size settlement hierarchy Ballymena 29 500 high Carrickfergus 28 000 main town Larne 18 700 Ahoghill 3 400 Broughshane 2 900 Cullybackey 2 500 small town Greenisland 5 500 Whitehead 3 800 Ballycarry 981 Ballygalley 821 Ballystrudder 992 Cargan 588 Carnlough 1 512 village Clough 220 Glenarm 568 Kells and Connor 2 053 Martinstown 345 Portglenone 1 174 low (i) Using Table 3.2, describe the relationship between position in the settlement hierarchy and population size. ........................................................................................................................................... ..................................................................................................................................... [1] (ii) What is unusual about the population size of the village of Kells and Connor? ........................................................................................................................................... ..................................................................................................................................... [1] (c) Fig. 3.2 shows the locations of the settlements in Table 3.2. Content removed due to copyright restrictions. Fig. 3.2 (i) The town of Ballymena has the largest sphere of influence of all the settlements shown. Using evidence from Fig. 3.2 and Table 3.2 only, suggest two reasons for this. 1 ........................................................................................................................................ ........................................................................................................................................... 2 ........................................................................................................................................ ........................................................................................................................................... [2] (ii) Large areas of the district shown in Fig. 3.2 have no settlements. Suggest two reasons for this. 1 ........................................................................................................................................ ........................................................................................................................................... 2 ........................................................................................................................................ ........................................................................................................................................... [2] [Total: 8]
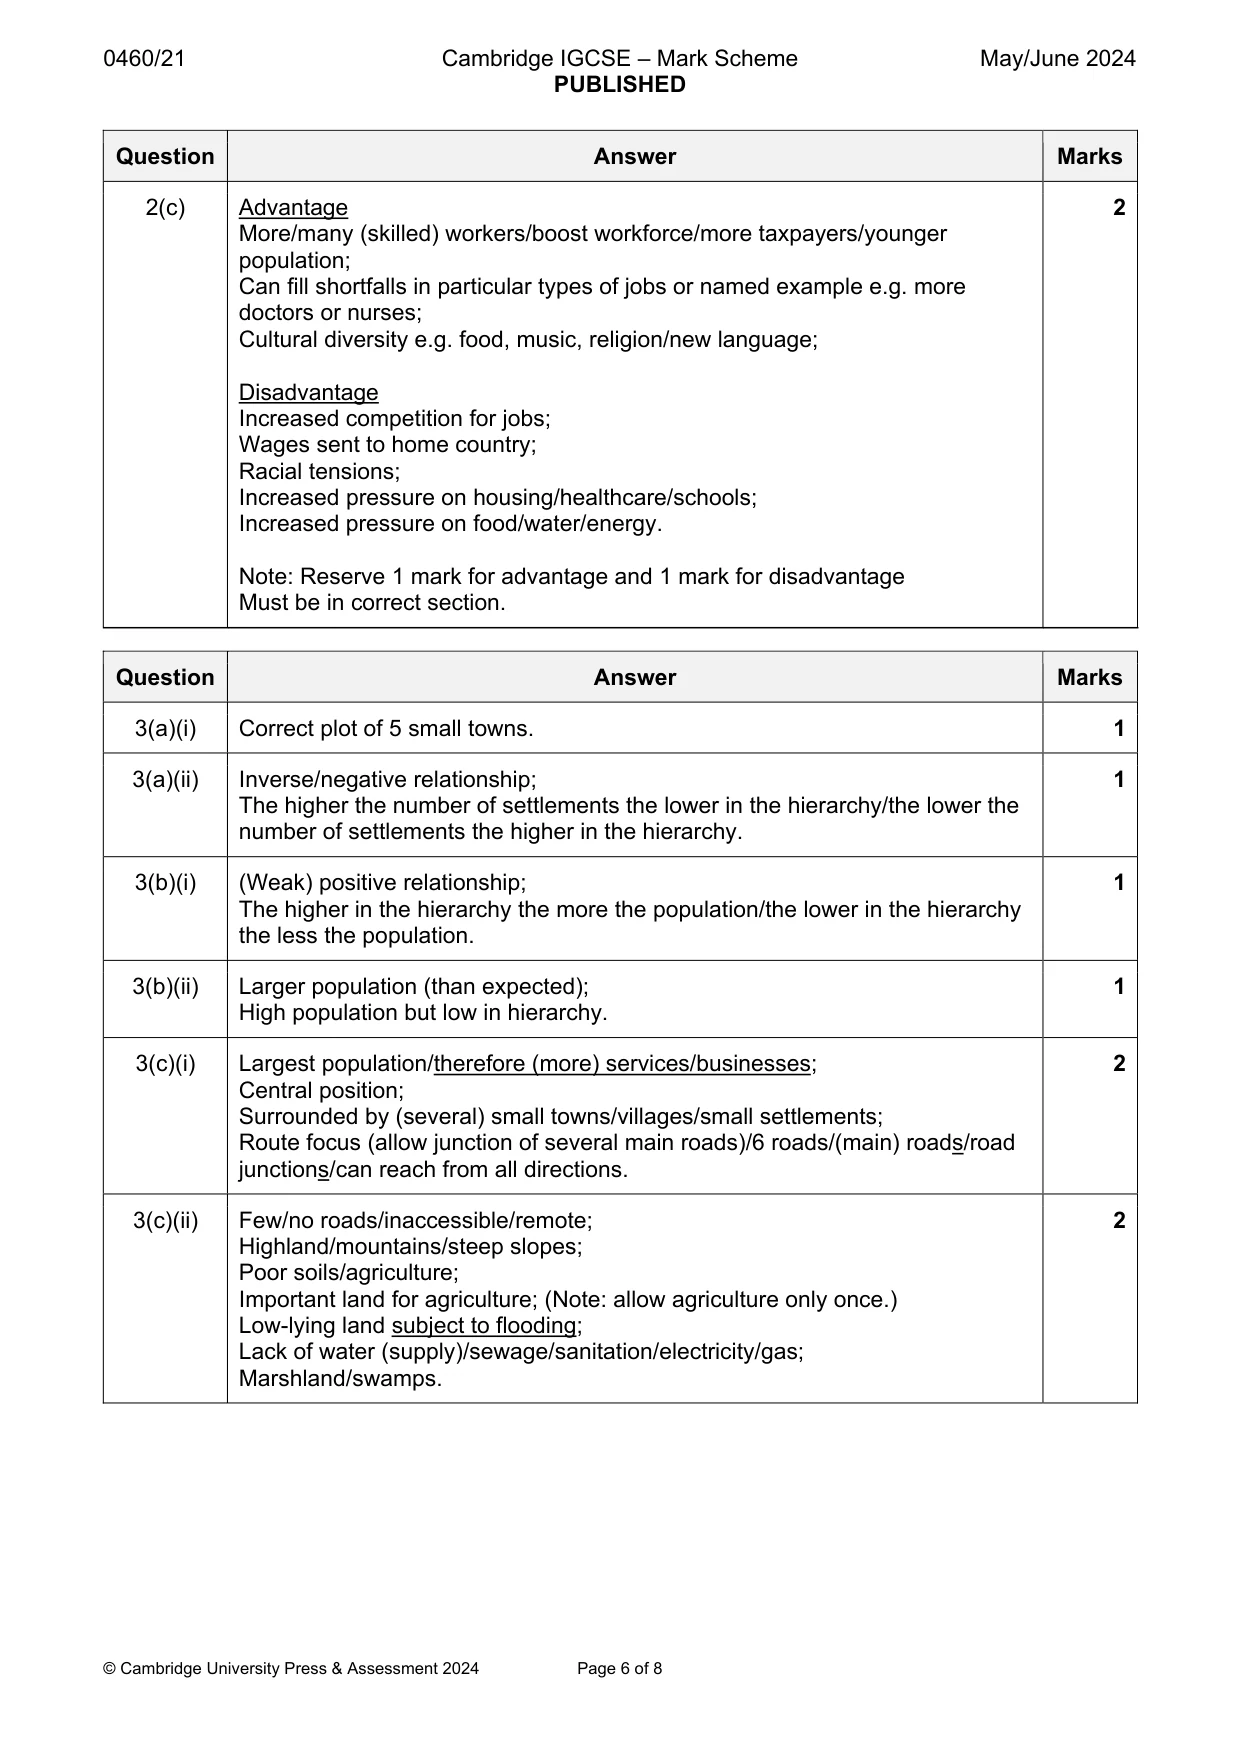
Mark scheme: 3(a)(i) Correct plot of 5 small towns. 1 3(a)(ii) Inverse/negative relationship; 1 The higher the number of settlements the lower in the hierarchy/the lower the number of settlements the higher in the hierarchy. 3(b)(i) (Weak) positive relationship; 1 The higher in the hierarchy the more the population/the lower in the hierarchy the less the population. 3(b)(ii) Larger population (than expected); 1 High population but low in hierarchy. 3(c)(i) Largest population/therefore (more) services/businesses; 2 Central position; Surrounded by (several) small towns/villages/small settlements; Route focus (allow junction of several main roads)/6 roads/(main) roads/road junctions/can reach from all directions. 3(c)(ii) Few/no roads/inaccessible/remote; 2 Highland/mountains/steep slopes; Poor soils/agriculture; Important land for agriculture; (Note: allow agriculture only once.) Low-lying land subject to flooding; Lack of water (supply)/sewage/sanitation/electricity/gas; Marshland/swamps.
More questions on Settlements (rural and urban) and service provision
Question 4
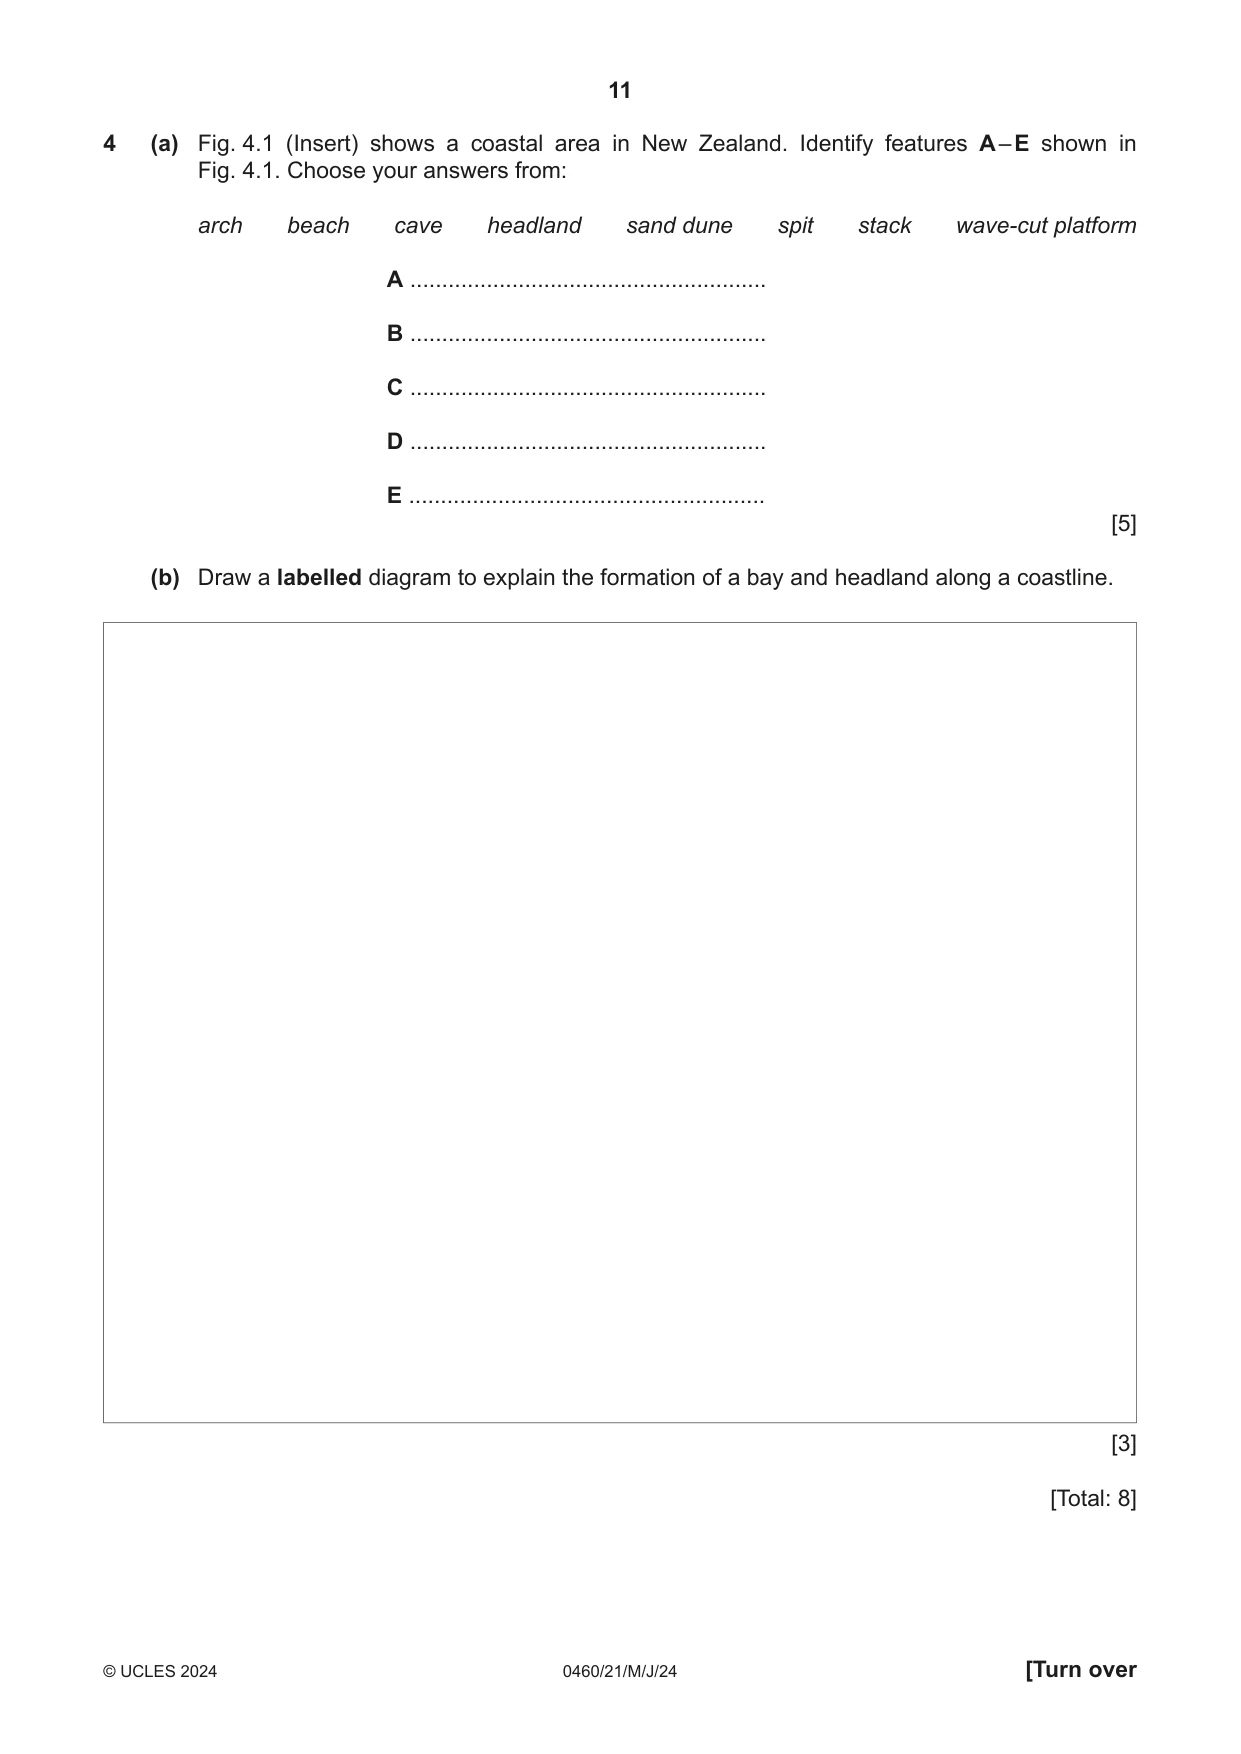
4 (a) Fig. 4.1 (Insert) shows a coastal area in New Zealand. Identify features A – E shown in Fig. 4.1. Choose your answers from: arch beach cave headland sand dune spit stack wave-cut platform A ........................................................ B ........................................................ C ........................................................ D ........................................................ E ........................................................ [5] (b) Draw a labelled diagram to explain the formation of a bay and headland along a coastline. [3] [Total: 8]
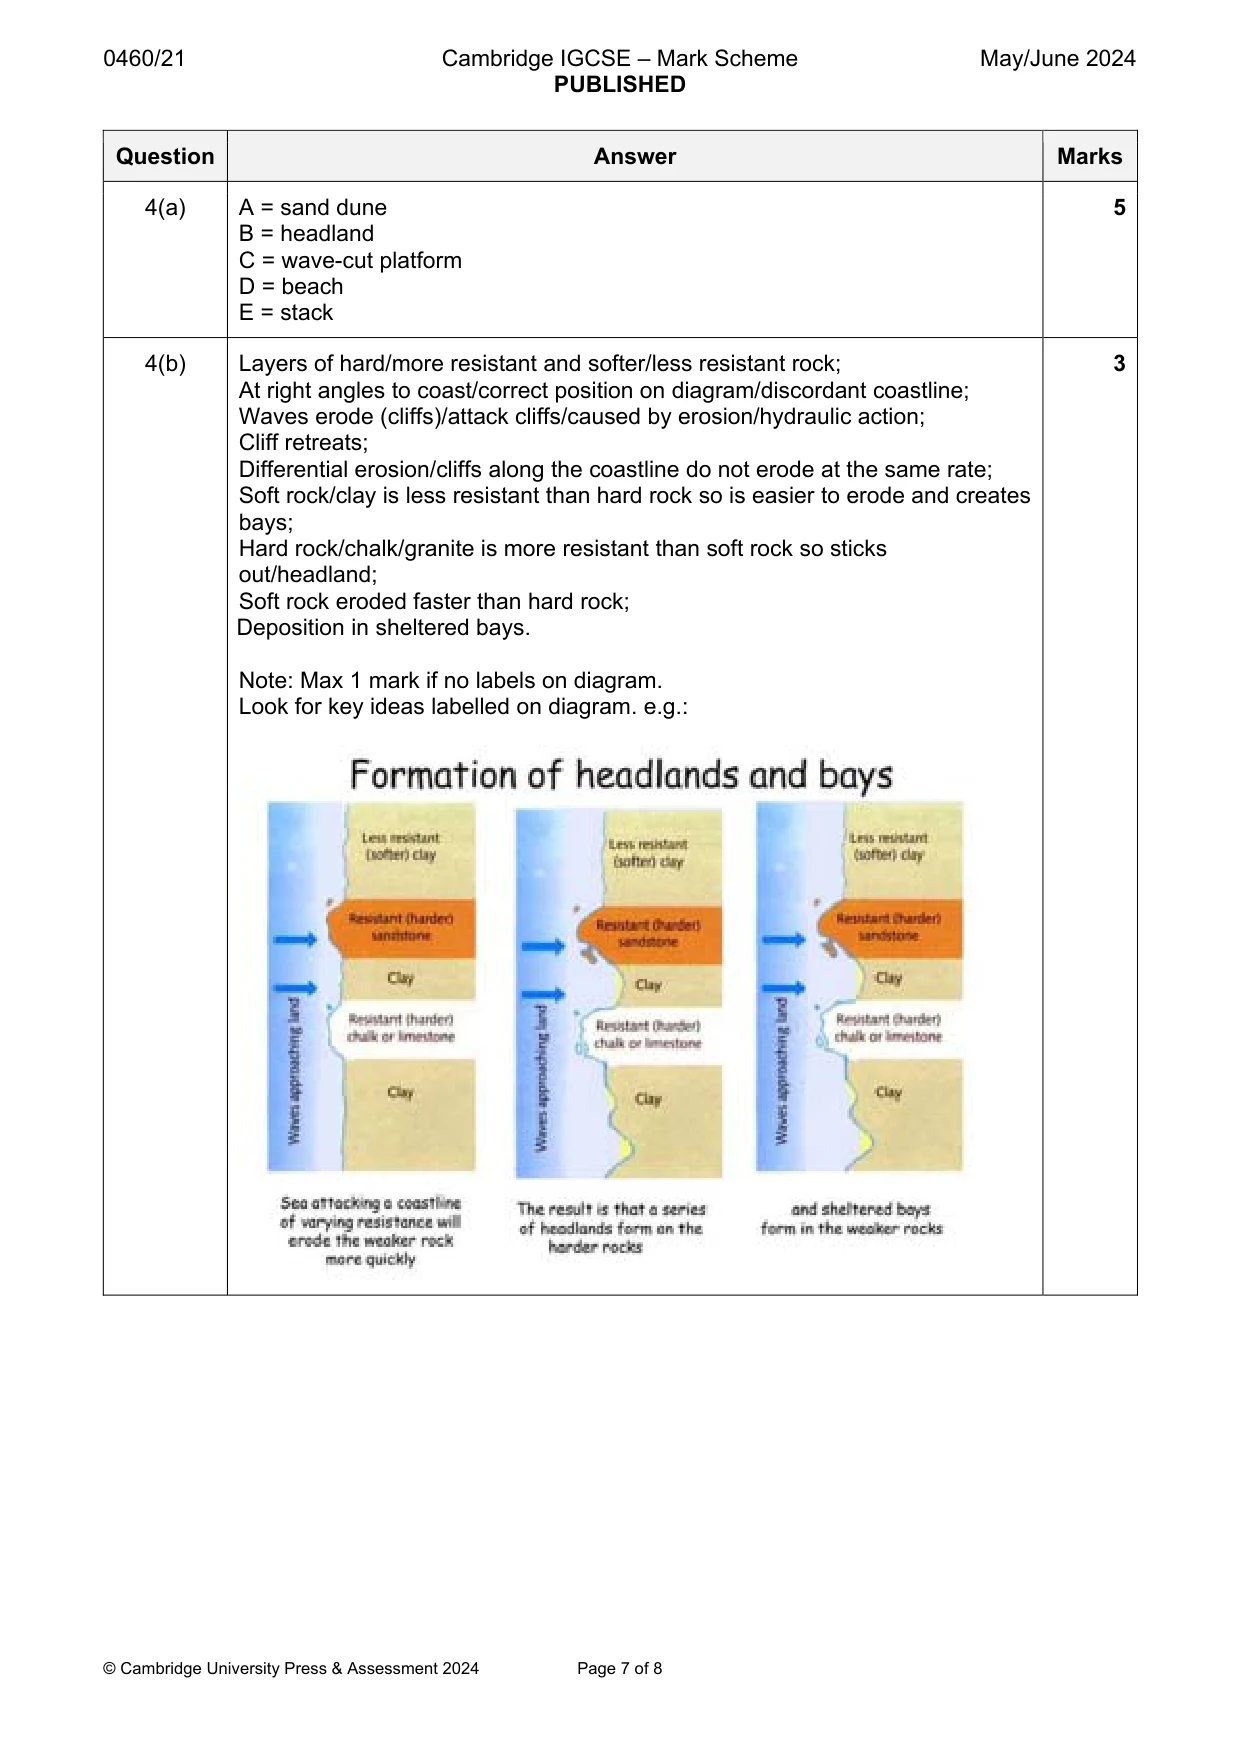
Mark scheme: 4(a) A = sand dune 5 B = headland C = wave-cut platform D = beach E = stack 4(b) Layers of hard/more resistant and softer/less resistant rock; 3 At right angles to coast/correct position on diagram/discordant coastline; Waves erode (cliffs)/attack cliffs/caused by erosion/hydraulic action; Cliff retreats; Differential erosion/cliffs along the coastline do not erode at the same rate; Soft rock/clay is less resistant than hard rock so is easier to erode and creates bays; Hard rock/chalk/granite is more resistant than soft rock so sticks out/headland; Soft rock eroded faster than hard rock; Deposition in sheltered bays. Note: Max 1 mark if no labels on diagram. Look for key ideas labelled on diagram. e.g.:
Q5 · A map of part of South America, showing some of the main active volcanoes in Chile
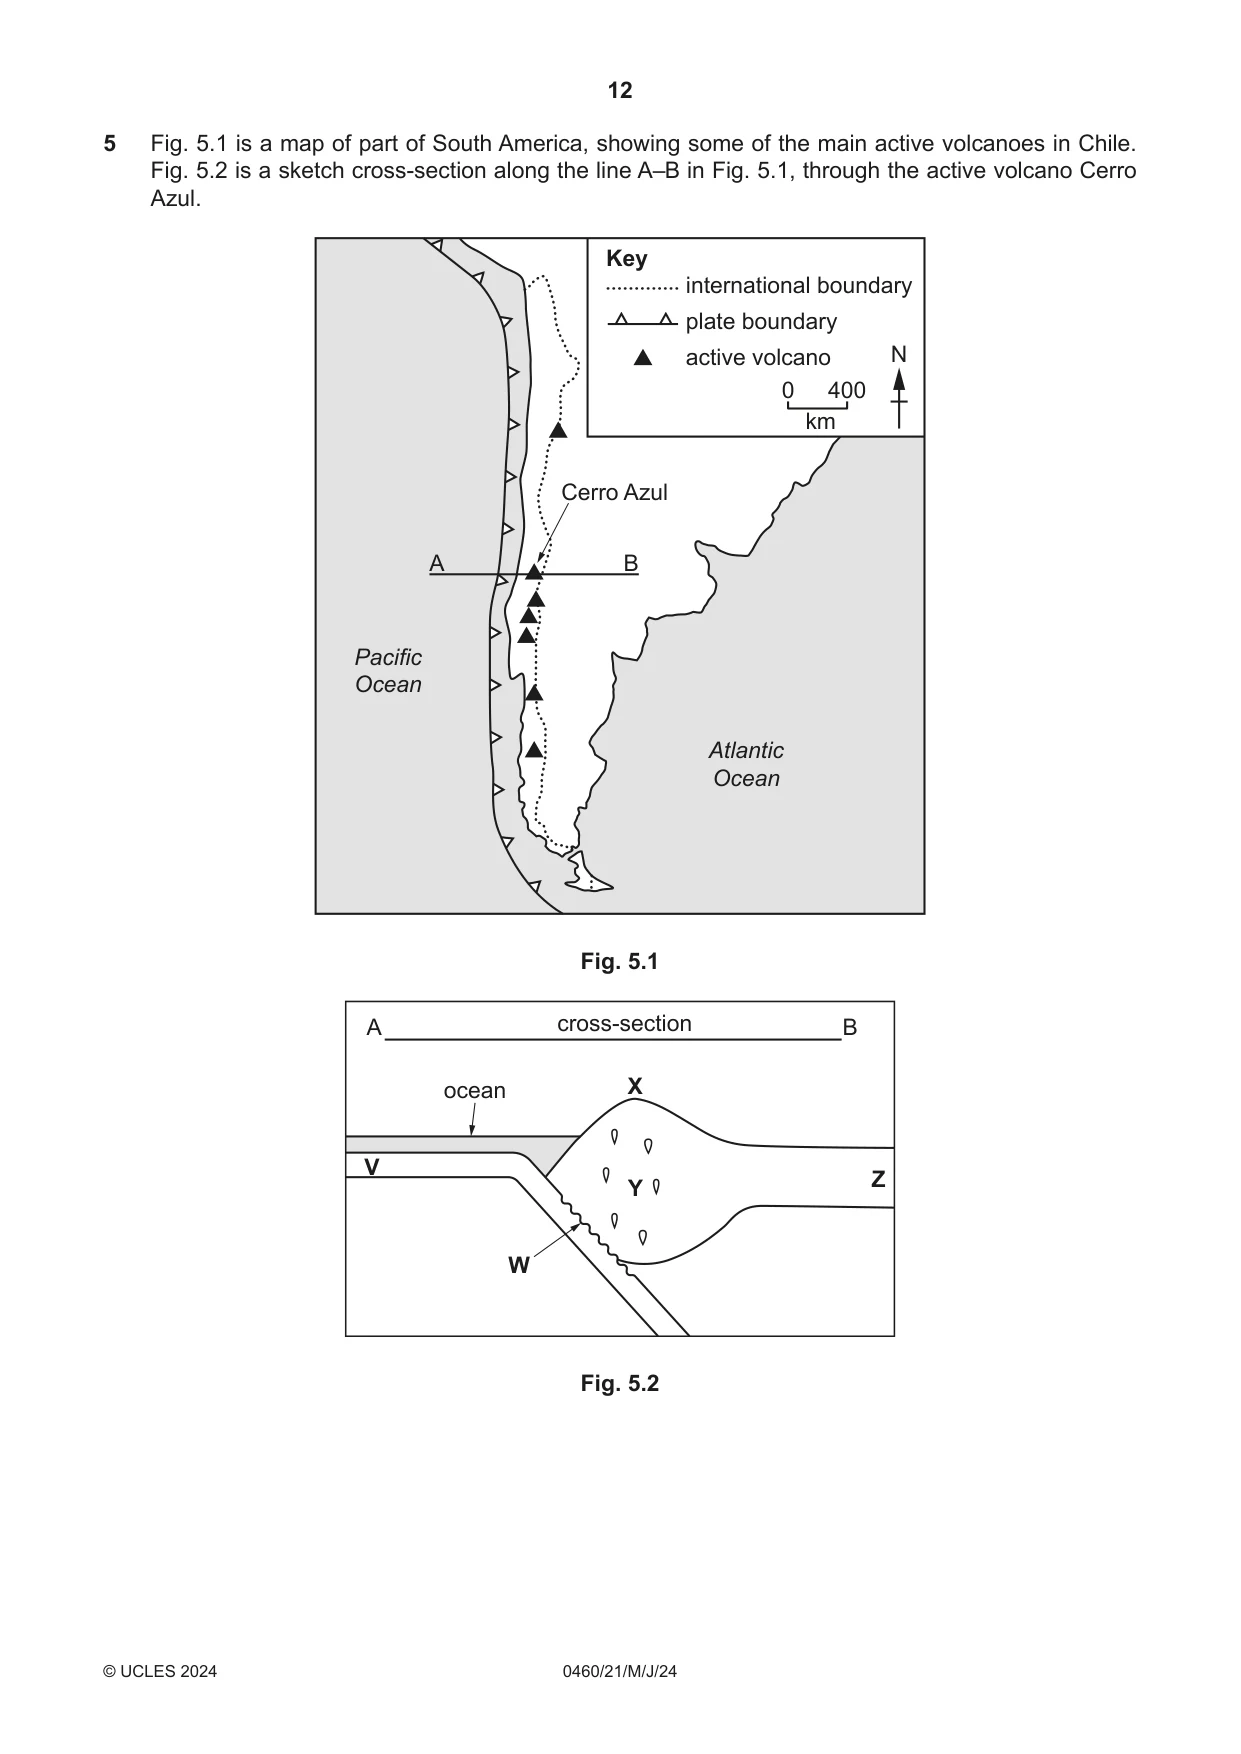
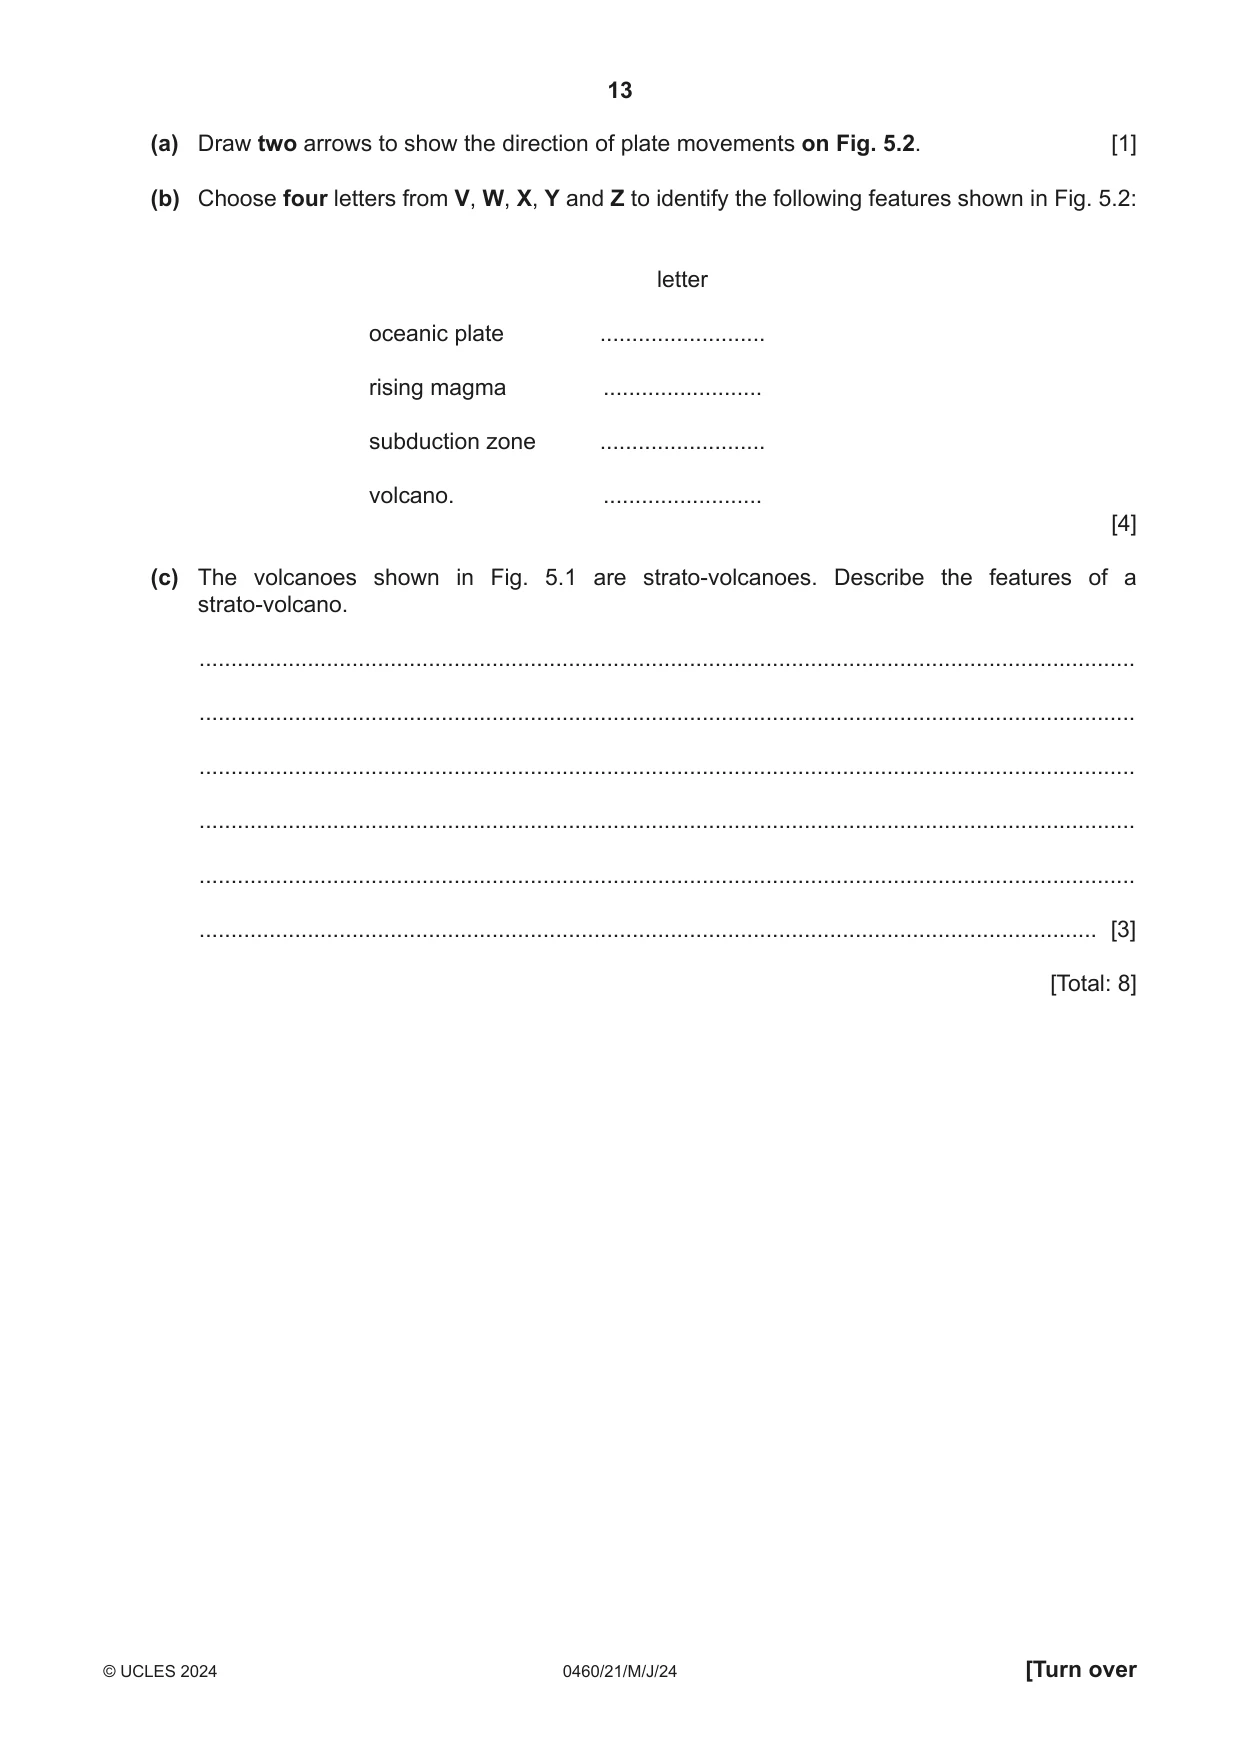
5 Fig. 5.1 is a map of part of South America, showing some of the main active volcanoes in Chile. Fig. 5.2 is a sketch cross-section along the line A–B in Fig. 5.1, through the active volcano Cerro Azul. Key international boundary plate boundary active volcano N 0 400 km Cerro Azul A B Pacific Ocean Atlantic Ocean Fig. 5.1 A cross-section B ocean X V Z Y W Fig. 5.2 (a) Draw two arrows to show the direction of plate movements on Fig. 5.2. [1] (b) Choose four letters from V, W, X, Y and Z to identify the following features shown in Fig. 5.2: letter oceanic plate .......................... rising magma ......................... subduction zone .......................... volcano. ......................... [4] (c) The volcanoes shown in Fig. 5.1 are strato-volcanoes. Describe the features of a strato-volcano. ................................................................................................................................................... ................................................................................................................................................... ................................................................................................................................................... ................................................................................................................................................... ................................................................................................................................................... ............................................................................................................................................. [3] [Total: 8]
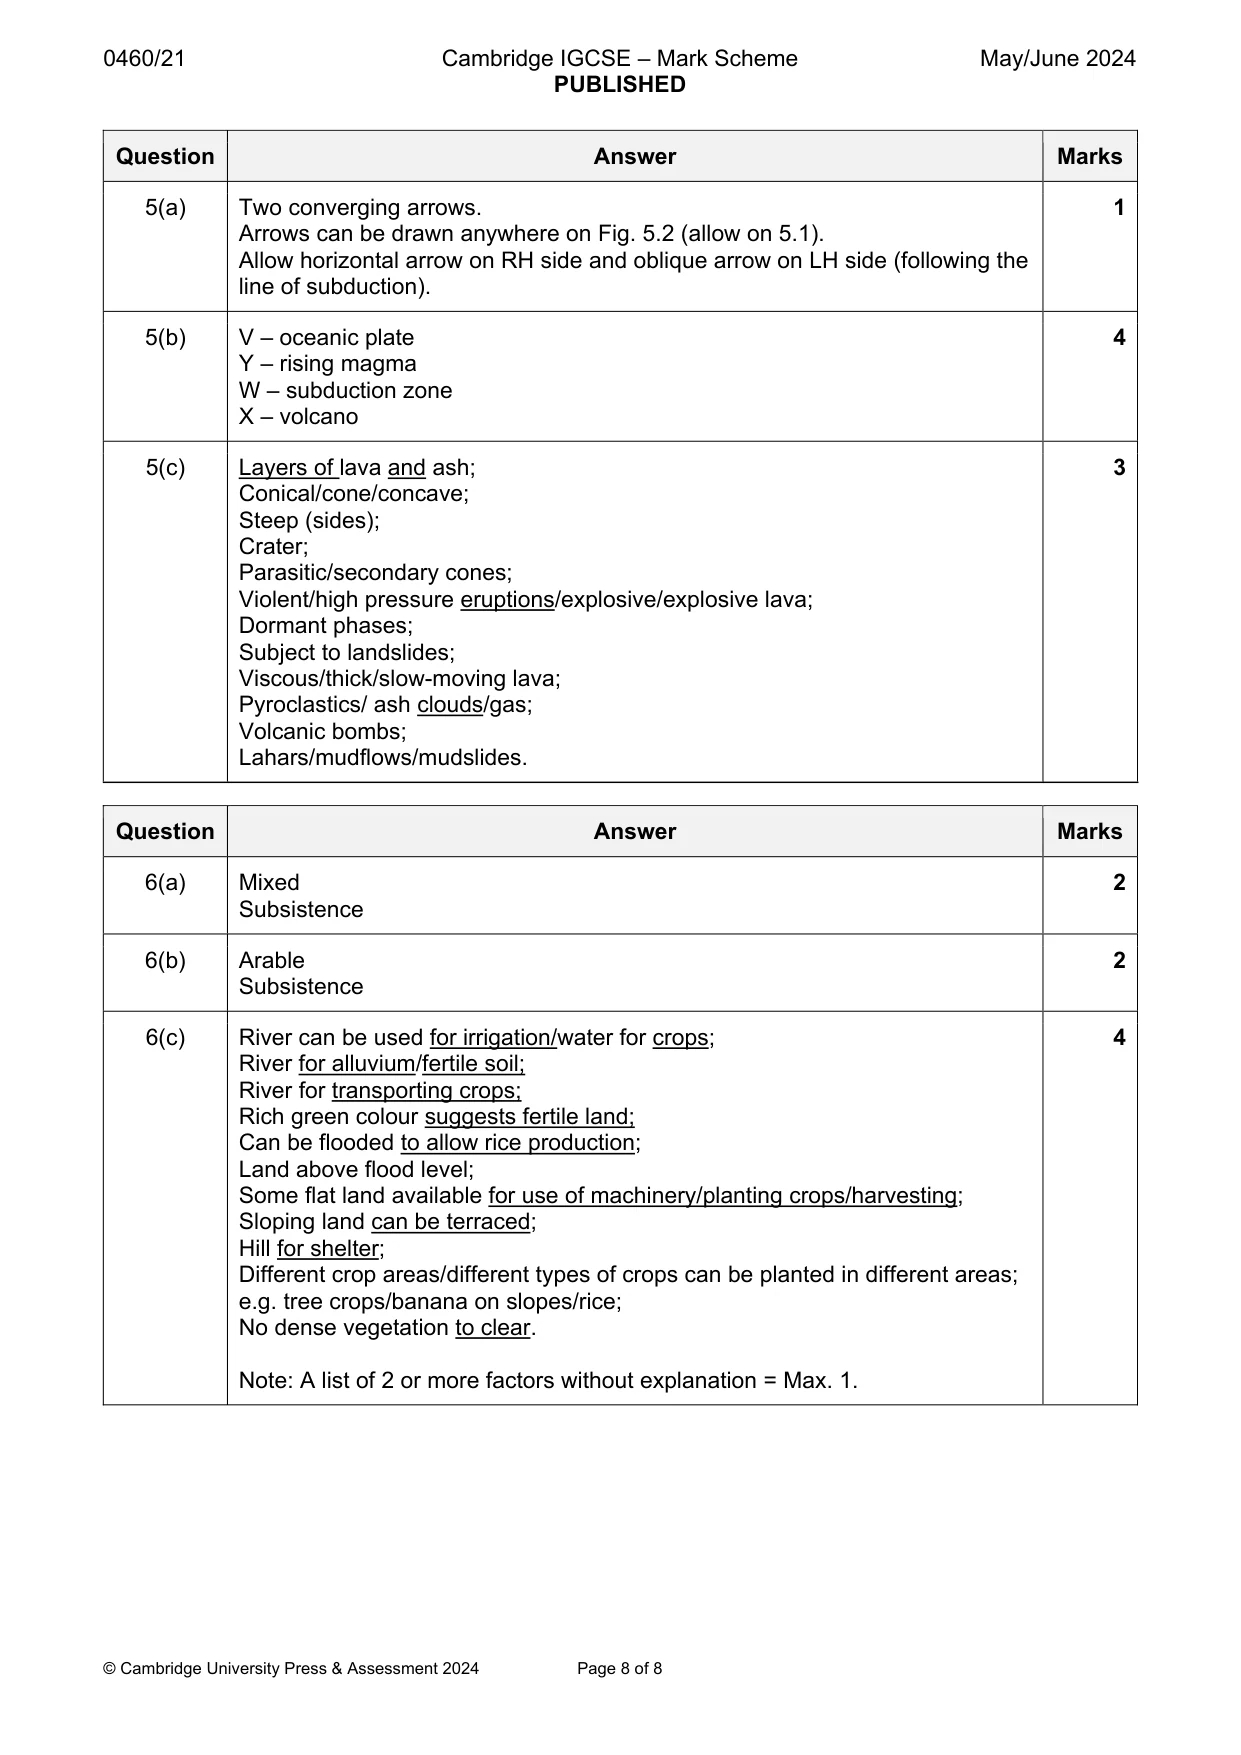
Mark scheme: 5(a) Two converging arrows. 1 Arrows can be drawn anywhere on Fig. 5.2 (allow on 5.1). Allow horizontal arrow on RH side and oblique arrow on LH side (following the line of subduction). 5(b) V – oceanic plate 4 Y – rising magma W – subduction zone X – volcano 5(c) Layers of lava and ash; 3 Conical/cone/concave; Steep (sides); Crater; Parasitic/secondary cones; Violent/high pressure eruptions/explosive/explosive lava; Dormant phases; Subject to landslides; Viscous/thick/slow-moving lava; Pyroclastics/ ash clouds/gas; Volcanic bombs; Lahars/mudflows/mudslides.
Question 6
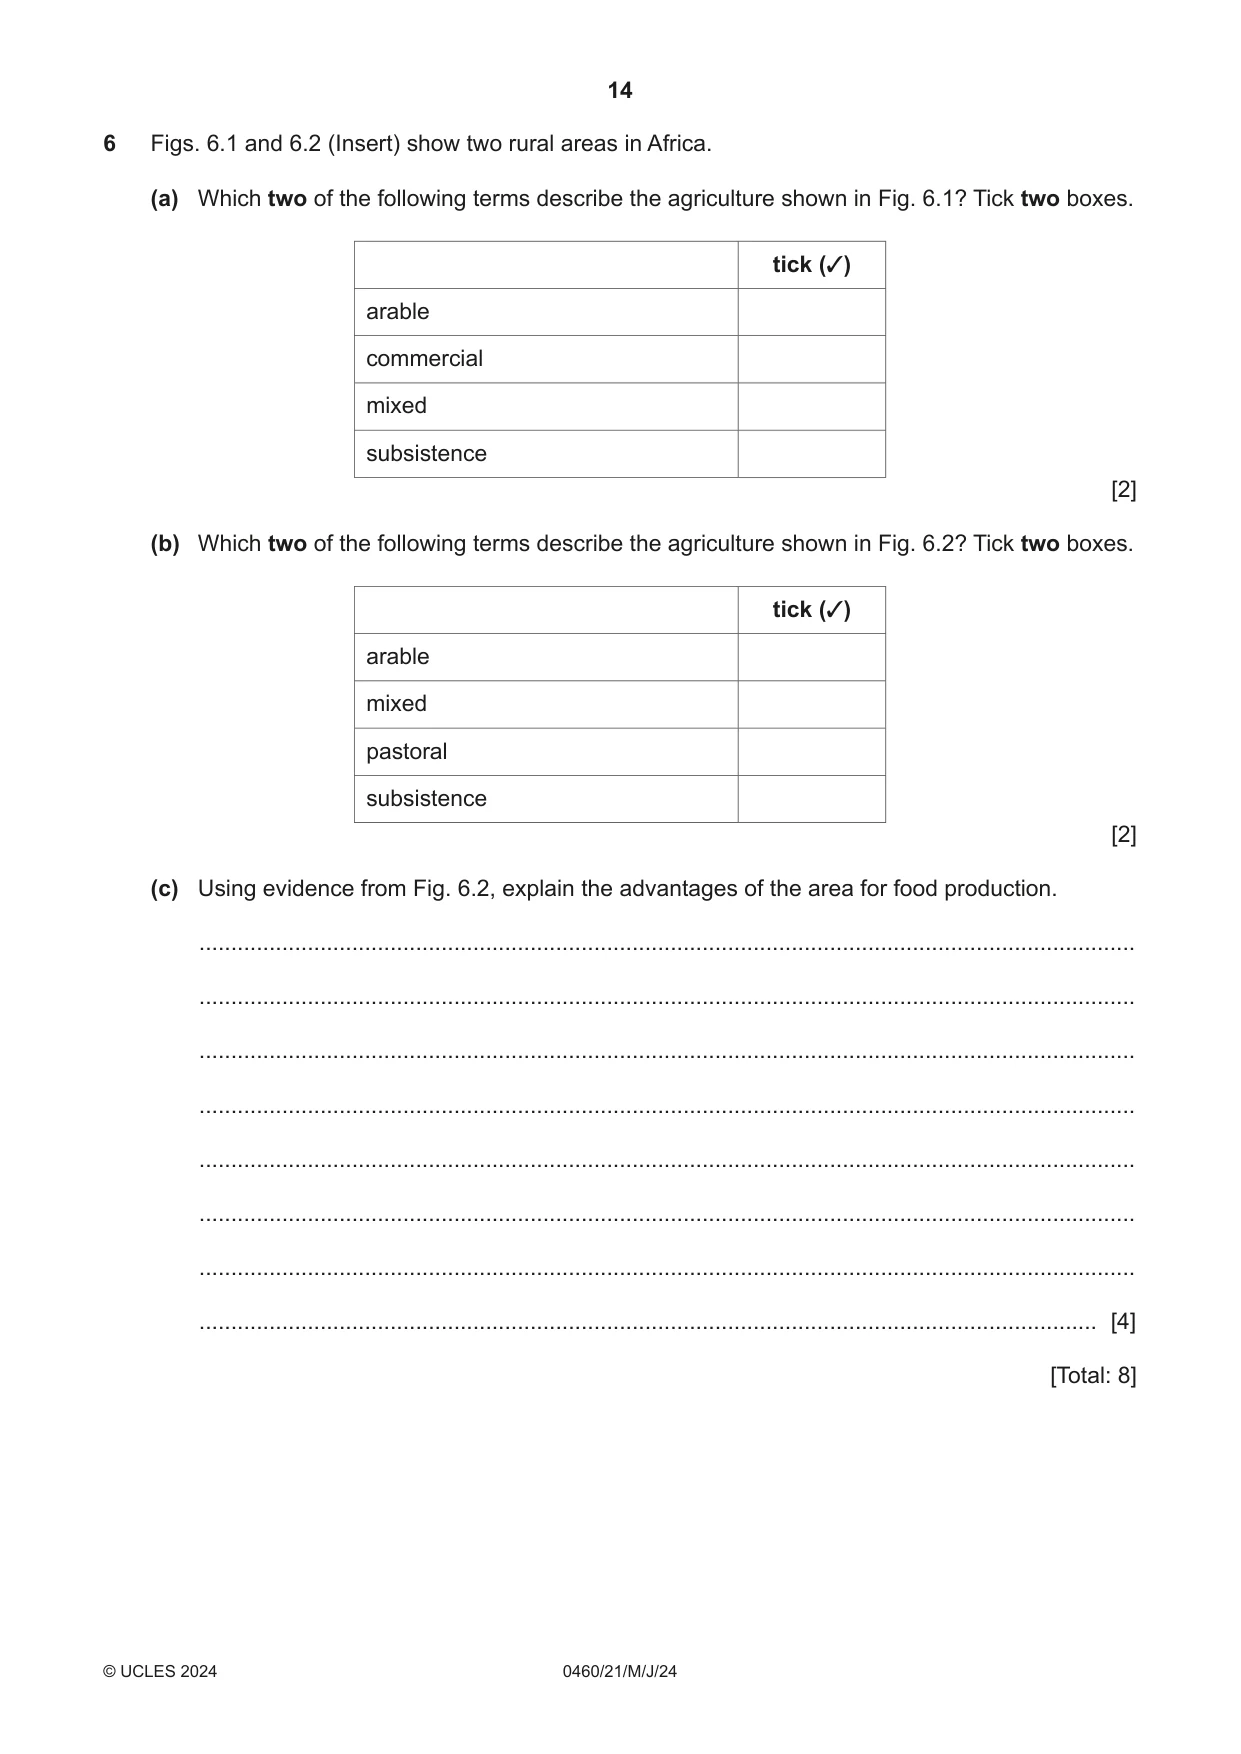
6 Figs. 6.1 and 6.2 (Insert) show two rural areas in Africa. (a) Which two of the following terms describe the agriculture shown in Fig. 6.1? Tick two boxes. tick (3) arable commercial mixed subsistence [2] (b) Which two of the following terms describe the agriculture shown in Fig. 6.2? Tick two boxes. tick (3) arable mixed pastoral subsistence [2] (c) Using evidence from Fig. 6.2, explain the advantages of the area for food production. ................................................................................................................................................... ................................................................................................................................................... ................................................................................................................................................... ................................................................................................................................................... ................................................................................................................................................... ................................................................................................................................................... ................................................................................................................................................... ............................................................................................................................................. [4] [Total: 8] Additional pages If you use the following pages to complete the answer to any question, the question number must be clearly shown. .................................................................................................................................................................. .................................................................................................................................................................. .................................................................................................................................................................. .................................................................................................................................................................. .................................................................................................................................................................. .................................................................................................................................................................. .................................................................................................................................................................. .................................................................................................................................................................. .................................................................................................................................................................. .................................................................................................................................................................. .................................................................................................................................................................. .................................................................................................................................................................. .................................................................................................................................................................. .................................................................................................................................................................. .................................................................................................................................................................. .................................................................................................................................................................. .................................................................................................................................................................. .................................................................................................................................................................. .................................................................................................................................................................. .................................................................................................................................................................. .................................................................................................................................................................. .................................................................................................................................................................. .................................................................................................................................................................. .................................................................................................................................................................. .................................................................................................................................................................. .................................................................................................................................................................. .................................................................................................................................................................. .................................................................................................................................................................. .................................................................................................................................................................. .................................................................................................................................................................. .................................................................................................................................................................. .................................................................................................................................................................. .................................................................................................................................................................. .................................................................................................................................................................. .................................................................................................................................................................. .................................................................................................................................................................. .................................................................................................................................................................. .................................................................................................................................................................. .................................................................................................................................................................. .................................................................................................................................................................. .................................................................................................................................................................. .................................................................................................................................................................. .................................................................................................................................................................. .................................................................................................................................................................. .................................................................................................................................................................. .................................................................................................................................................................. .................................................................................................................................................................. .................................................................................................................................................................. The boundaries and names shown, the designations used and the presentation of material on any maps contained in this question paper/insert do not imply official endorsement or acceptance by Cambridge Assessment International Education concerning the legal status of any country, territory, or area or any of its authorities, or of the delimitation of its frontiers or boundaries.
Mark scheme: 6(a) Mixed 2 Subsistence 6(b) Arable 2 Subsistence 6(c) River can be used for irrigation/water for crops; 4 River for alluvium/fertile soil; River for transporting crops; Rich green colour suggests fertile land; Can be flooded to allow rice production; Land above flood level; Some flat land available for use of machinery/planting crops/harvesting; Sloping land can be terraced; Hill for shelter; Different crop areas/different types of crops can be planted in different areas; e.g. tree crops/banana on slopes/rice; No dense vegetation to clear. Note: A list of 2 or more factors without explanation = Max. 1.
What was in this paper
The subtopics covered by these 6 questions, and how many questions each got. Open one in a new tab to see every Cambridge question on it.
What you needed in this session
Cambridge’s own grade thresholds for 2024 May/June, Paper 2 · Variant 1. A higher threshold means an easier paper — the bar moves with how the cohort did.