Cambridge IGCSE Geography 0460 — 2024 May/June Paper 2 · Variant 2
0460/22/M/J/24 · 6 questions · 60 marks · ≈68 min
The question paper and its mark scheme, free to read here and free to download. This is Cambridge’s own paper, exactly as it was sat.
Question paper20 pages
Mark scheme8 pages
Answers below. Sit the paper first if you are practising.
Questions as text
Q1 · Study the map extract for Toblach Dobbiaco, Italy
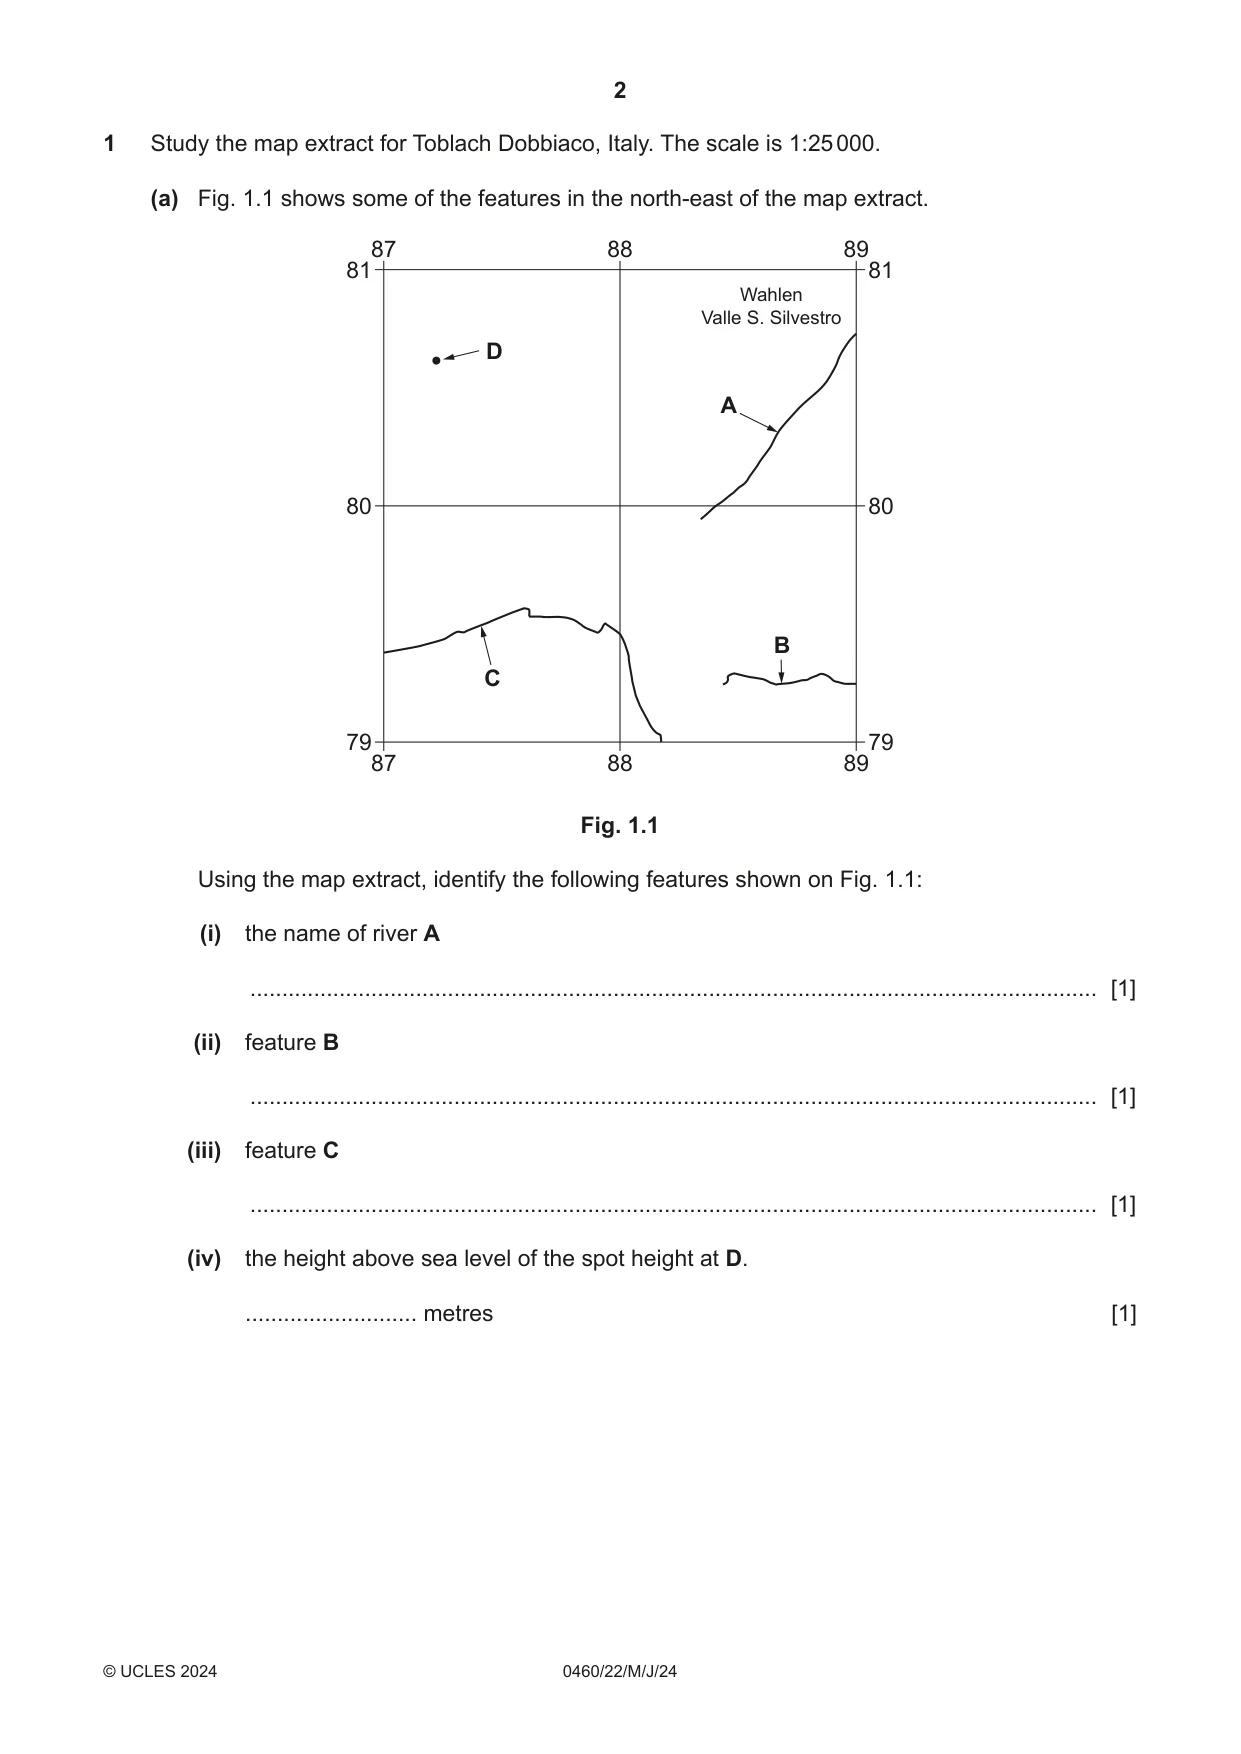
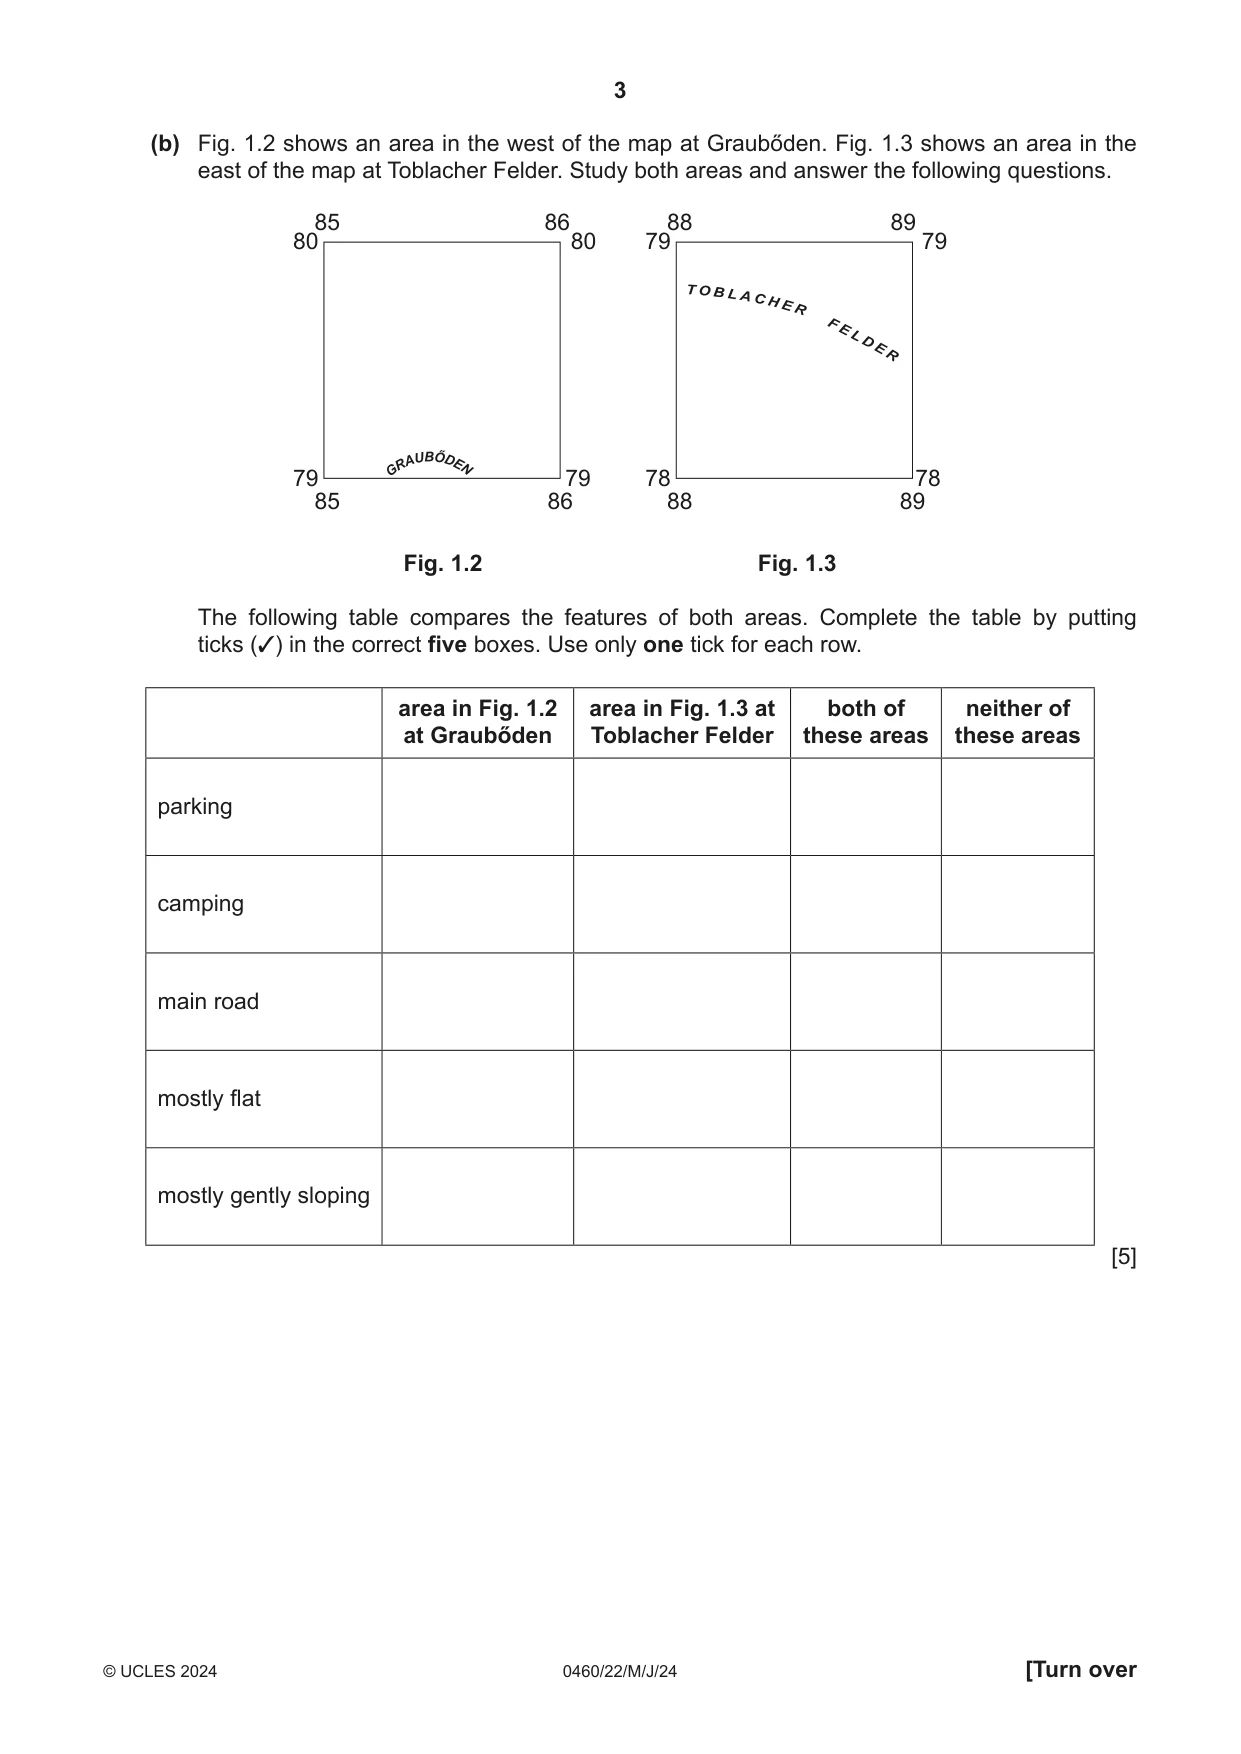
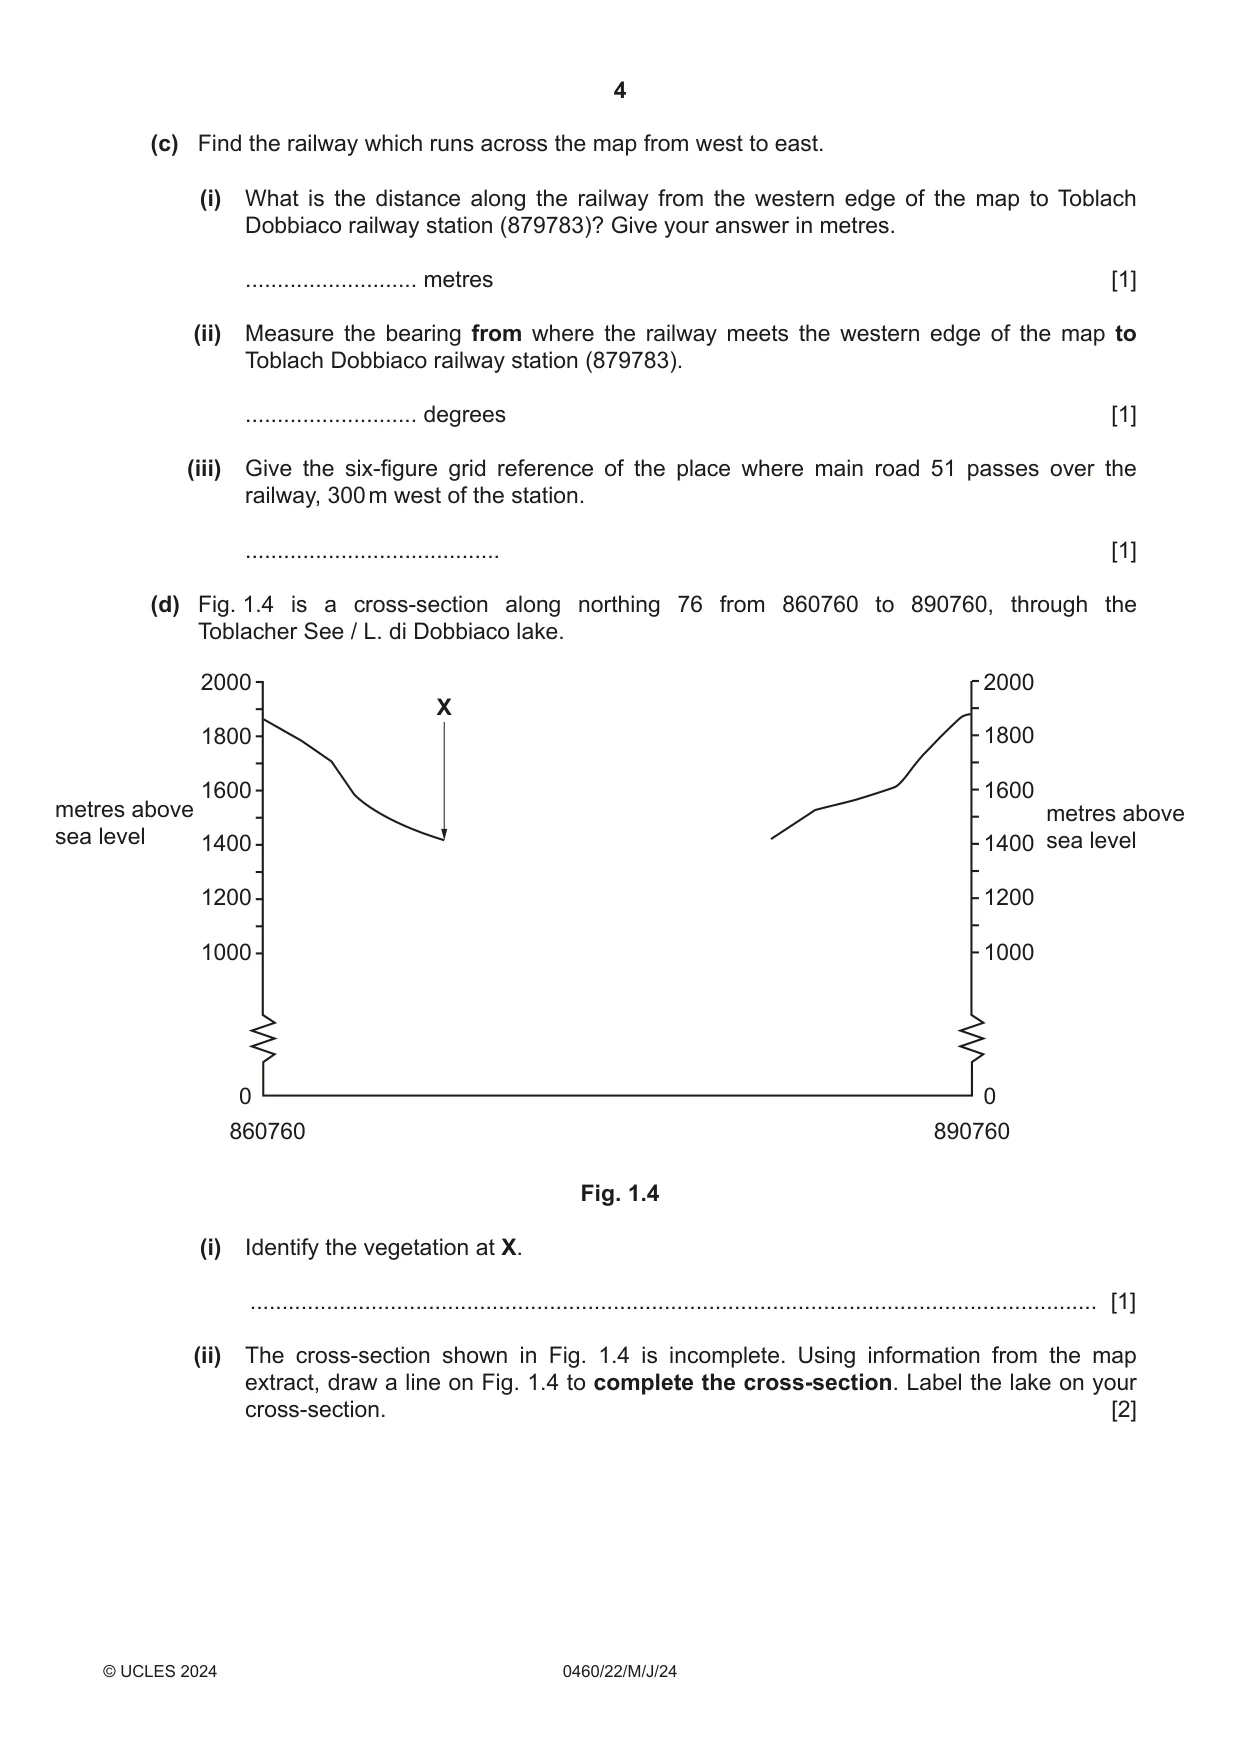
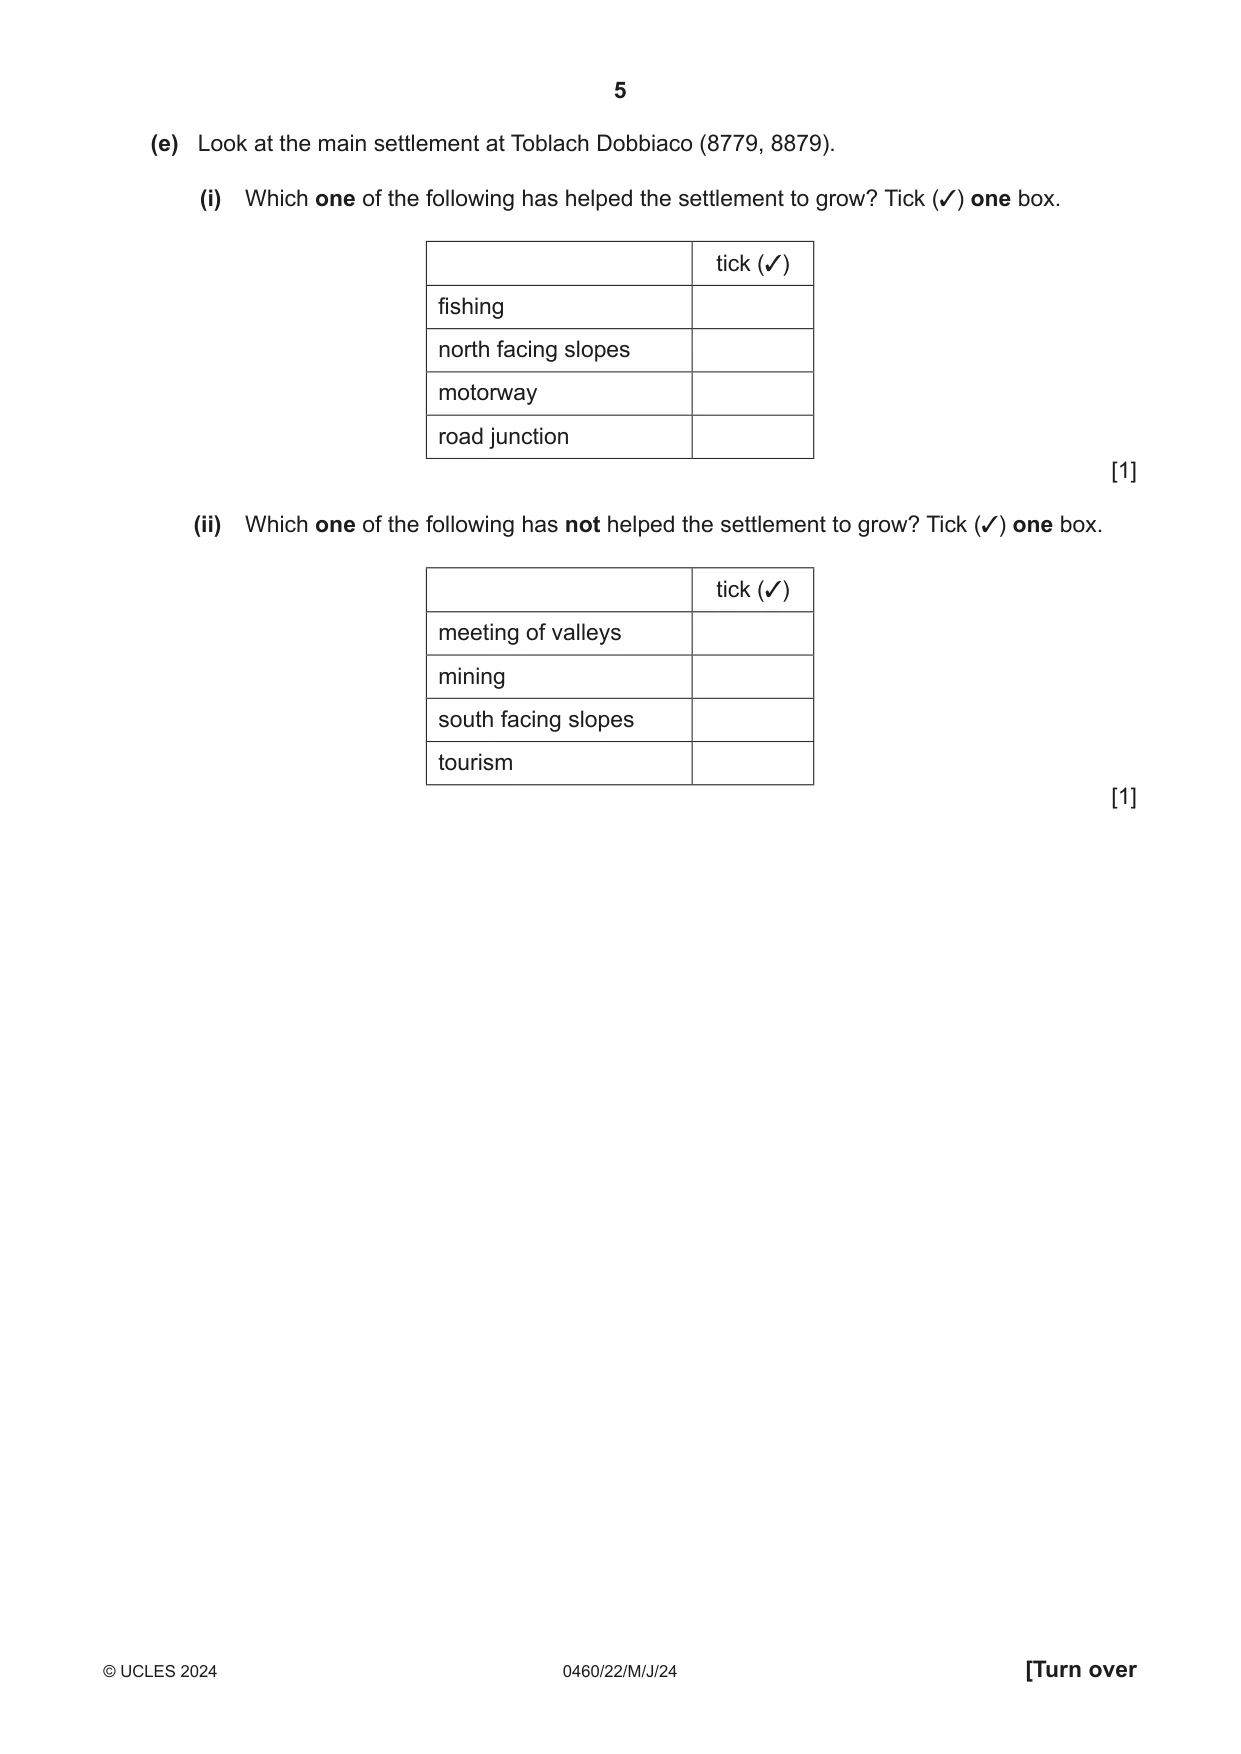
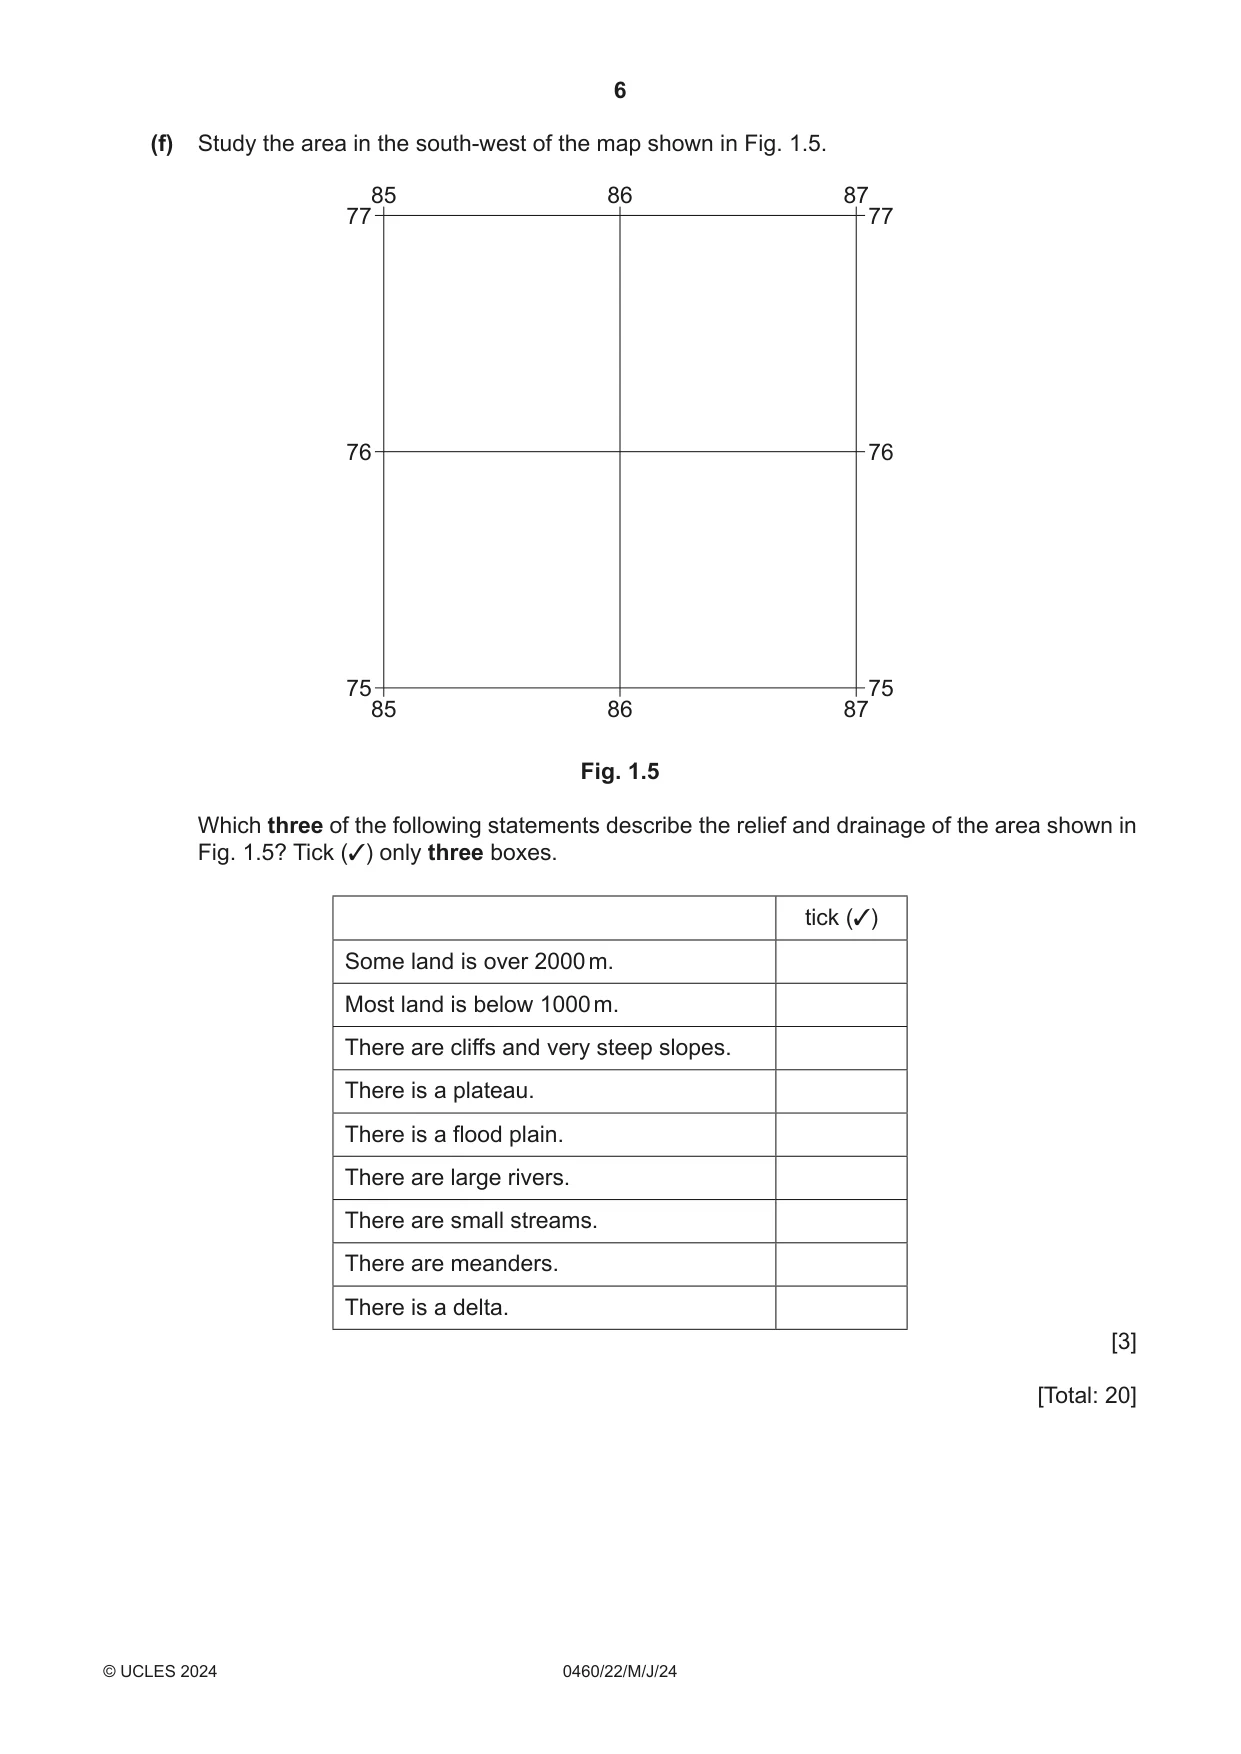
1 Study the map extract for Toblach Dobbiaco, Italy. The scale is 1:25 000. (a) Fig. 1.1 shows some of the features in the north‑east of the map extract. 87 88 89 81 81 Wahlen Valle S. Silvestro D A 80 80 B C 79 79 87 88 89 Fig. 1.1 Using the map extract, identify the following features shown on Fig. 1.1: (i) the name of river A ..................................................................................................................................... [1] (ii) feature B ..................................................................................................................................... [1] (iii) feature C ..................................................................................................................................... [1] (iv) the height above sea level of the spot height at D. ........................... metres [1] (b) Fig. 1.2 shows an area in the west of the map at Graubőden. Fig. 1.3 shows an area in the east of the map at Toblacher Felder. Study both areas and answer the following questions. 85 86 88 89 80 80 79 79 T O B L ACHER FEL D E R EN GRAUBŐD 79 79 78 78 85 86 88 89 Fig. 1.2 Fig. 1.3 The following table compares the features of both areas. Complete the table by putting ticks (3) in the correct five boxes. Use only one tick for each row. area in Fig. 1.2 area in Fig. 1.3 at both of neither of at Graubőden Toblacher Felder these areas these areas parking camping main road mostly flat mostly gently sloping [5] (c) Find the railway which runs across the map from west to east. (i) What is the distance along the railway from the western edge of the map to Toblach Dobbiaco railway station (879783)? Give your answer in metres. ........................... metres [1] (ii) Measure the bearing from where the railway meets the western edge of the map to Toblach Dobbiaco railway station (879783). ........................... degrees [1] (iii) Give the six‑figure grid reference of the place where main road 51 passes over the railway, 300 m west of the station. ........................................ [1] (d) Fig. 1.4 is a cross‑section along northing 76 from 860760 to 890760, through the Toblacher See / L. di Dobbiaco lake. 2000 2000 X 1800 1800 1600 1600 metres above metres above sea level 1400 1400 sea level 1200 1200 1000 1000 0 0 860760 890760 Fig. 1.4 (i) Identify the vegetation at X. ..................................................................................................................................... [1] (ii) The cross‑section shown in Fig. 1.4 is incomplete. Using information from the map extract, draw a line on Fig. 1.4 to complete the cross-section. Label the lake on your cross‑section. [2] (e) Look at the main settlement at Toblach Dobbiaco (8779, 8879). (i) Which one of the following has helped the settlement to grow? Tick (3) one box. tick (3) fishing north facing slopes motorway road junction [1] (ii) Which one of the following has not helped the settlement to grow? Tick (3) one box. tick (3) meeting of valleys mining south facing slopes tourism [1] (f) Study the area in the south‑west of the map shown in Fig. 1.5. 85 86 87 77 77 76 76 75 75 85 86 87 Fig. 1.5 Which three of the following statements describe the relief and drainage of the area shown in Fig. 1.5? Tick (3) only three boxes. tick (3) Some land is over 2000 m. Most land is below 1000 m. There are cliffs and very steep slopes. There is a plateau. There is a flood plain. There are large rivers. There are small streams. There are meanders. There is a delta. [3] [Total: 20]
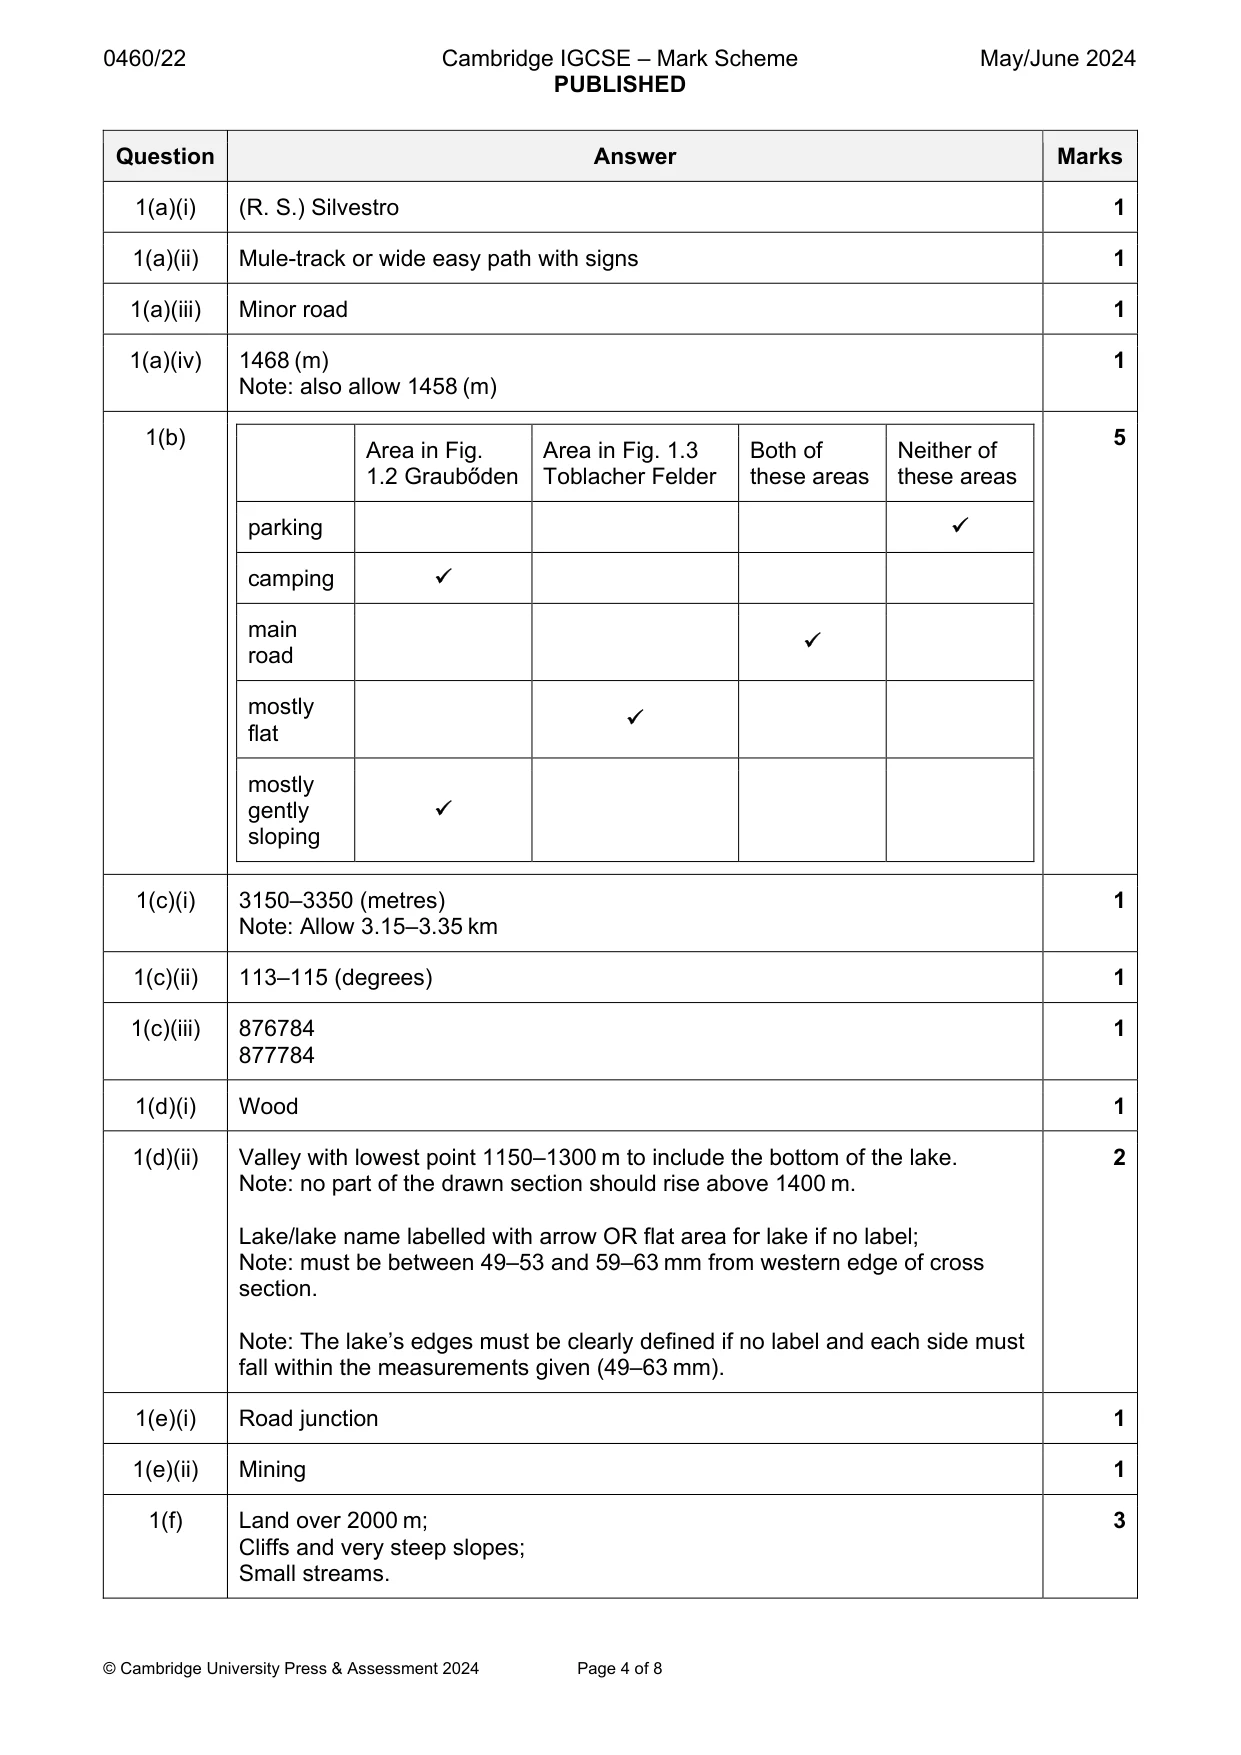
Mark scheme: Question Answer Marks 1(a)(i) (R. S.) Silvestro 1 1(a)(ii) Mule-track or wide easy path with signs 1 1(a)(iii) Minor road 1 1(a)(iv) 1468 (m) 1 Note: also allow 1458 (m) 1(b) 5 Area in Fig. Area in Fig. 1.3 Both of Neither of 1.2 Graubőden Toblacher Felder these areas these areas parking camping main road mostly flat mostly gently sloping 1(c)(i) 3150–3350 (metres) 1 Note: Allow 3.15–3.35 km 1(c)(ii) 113–115 (degrees) 1 1(c)(iii) 876784 1 877784 1(d)(i) Wood 1 1(d)(ii) Valley with lowest point 1150–1300 m to include the bottom of the lake. 2 Note: no part of the drawn section should rise above 1400 m. Lake/lake name labelled with arrow OR flat area for lake if no label; Note: must be between 49–53 and 59–63 mm from western edge of cross section. Note: The lake’s edges must be clearly defined if no label and each side must fall within the measurements given (49–63 mm). 1(e)(i) Road junction 1 1(e)(ii) Mining 1 1(f) Land over 2000 m; 3 Cliffs and very steep slopes; Small streams.
More questions on Settlements (rural and urban) and service provision
Q2 · The population density of provinces in The Netherlands, a country in Europe
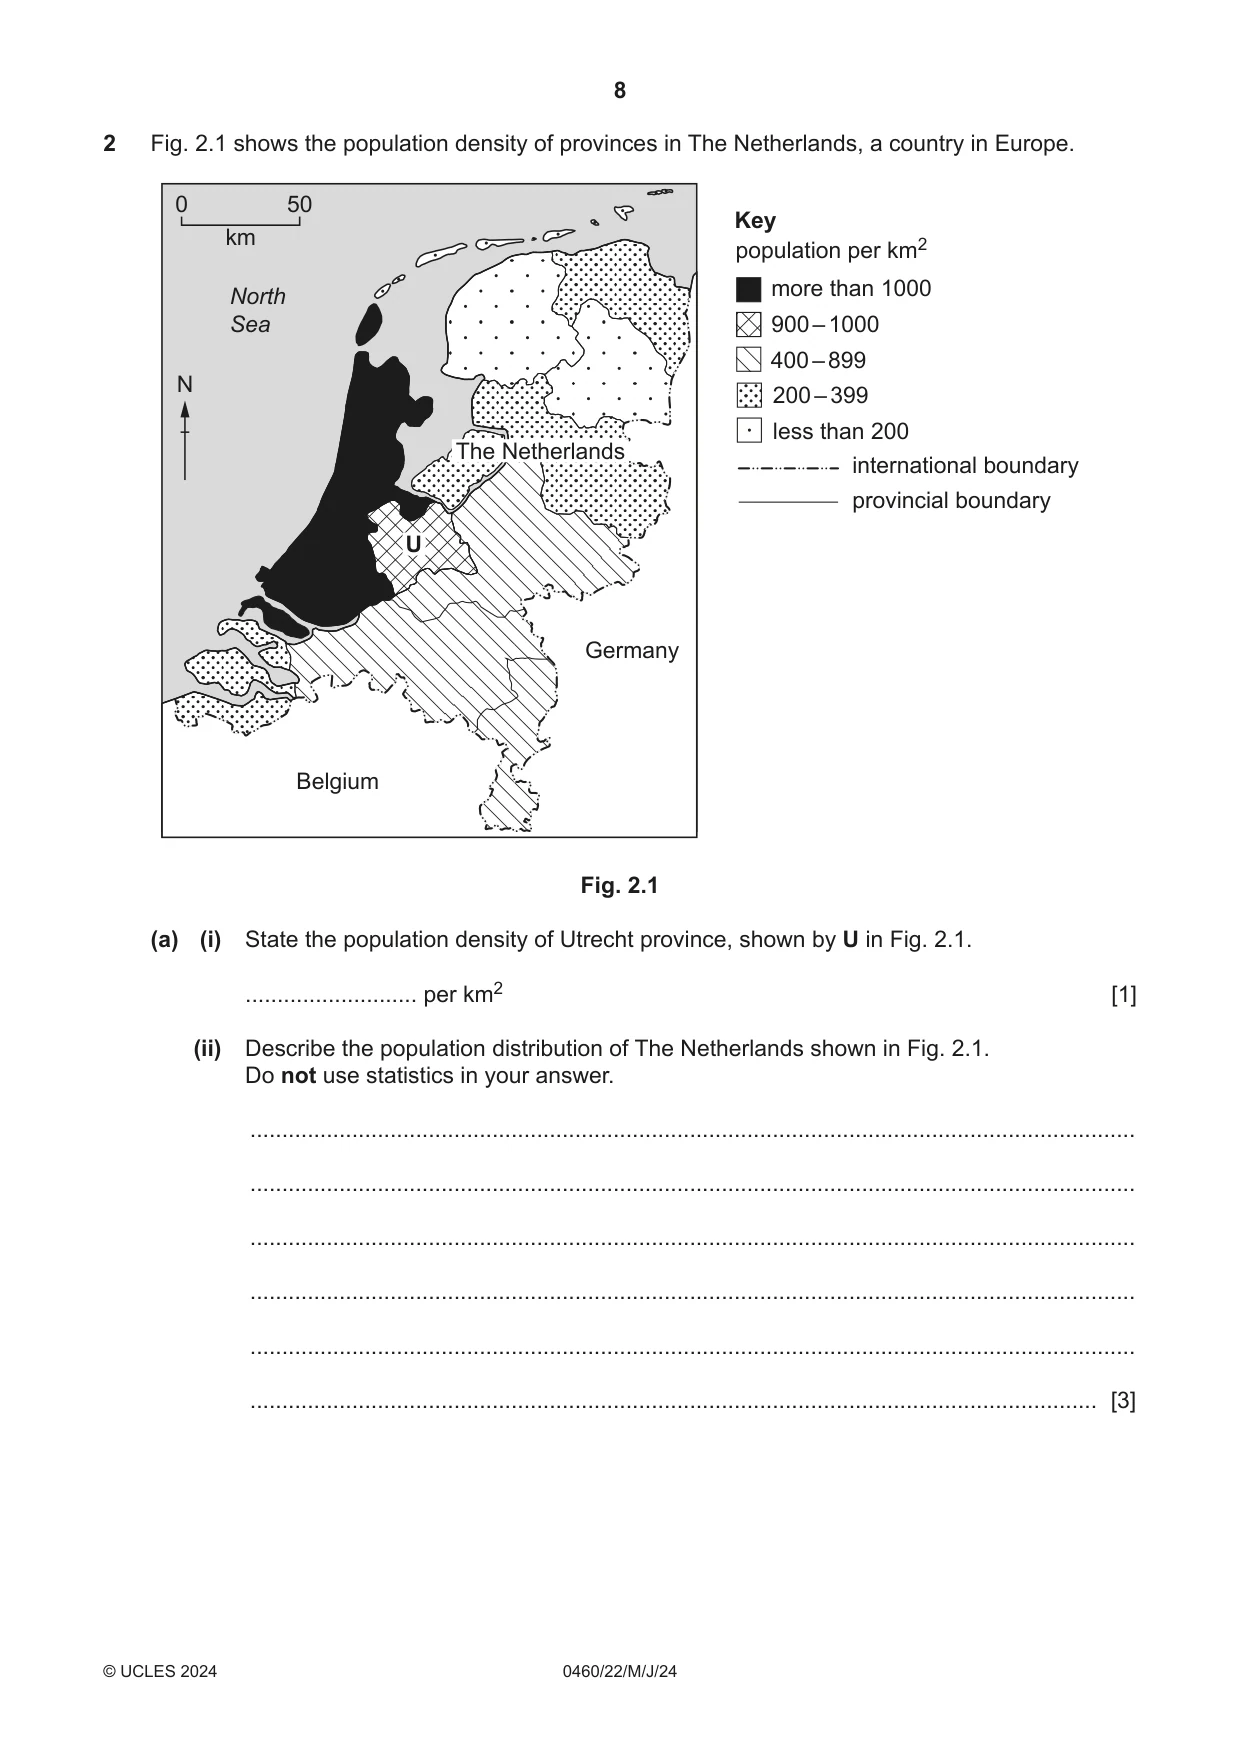
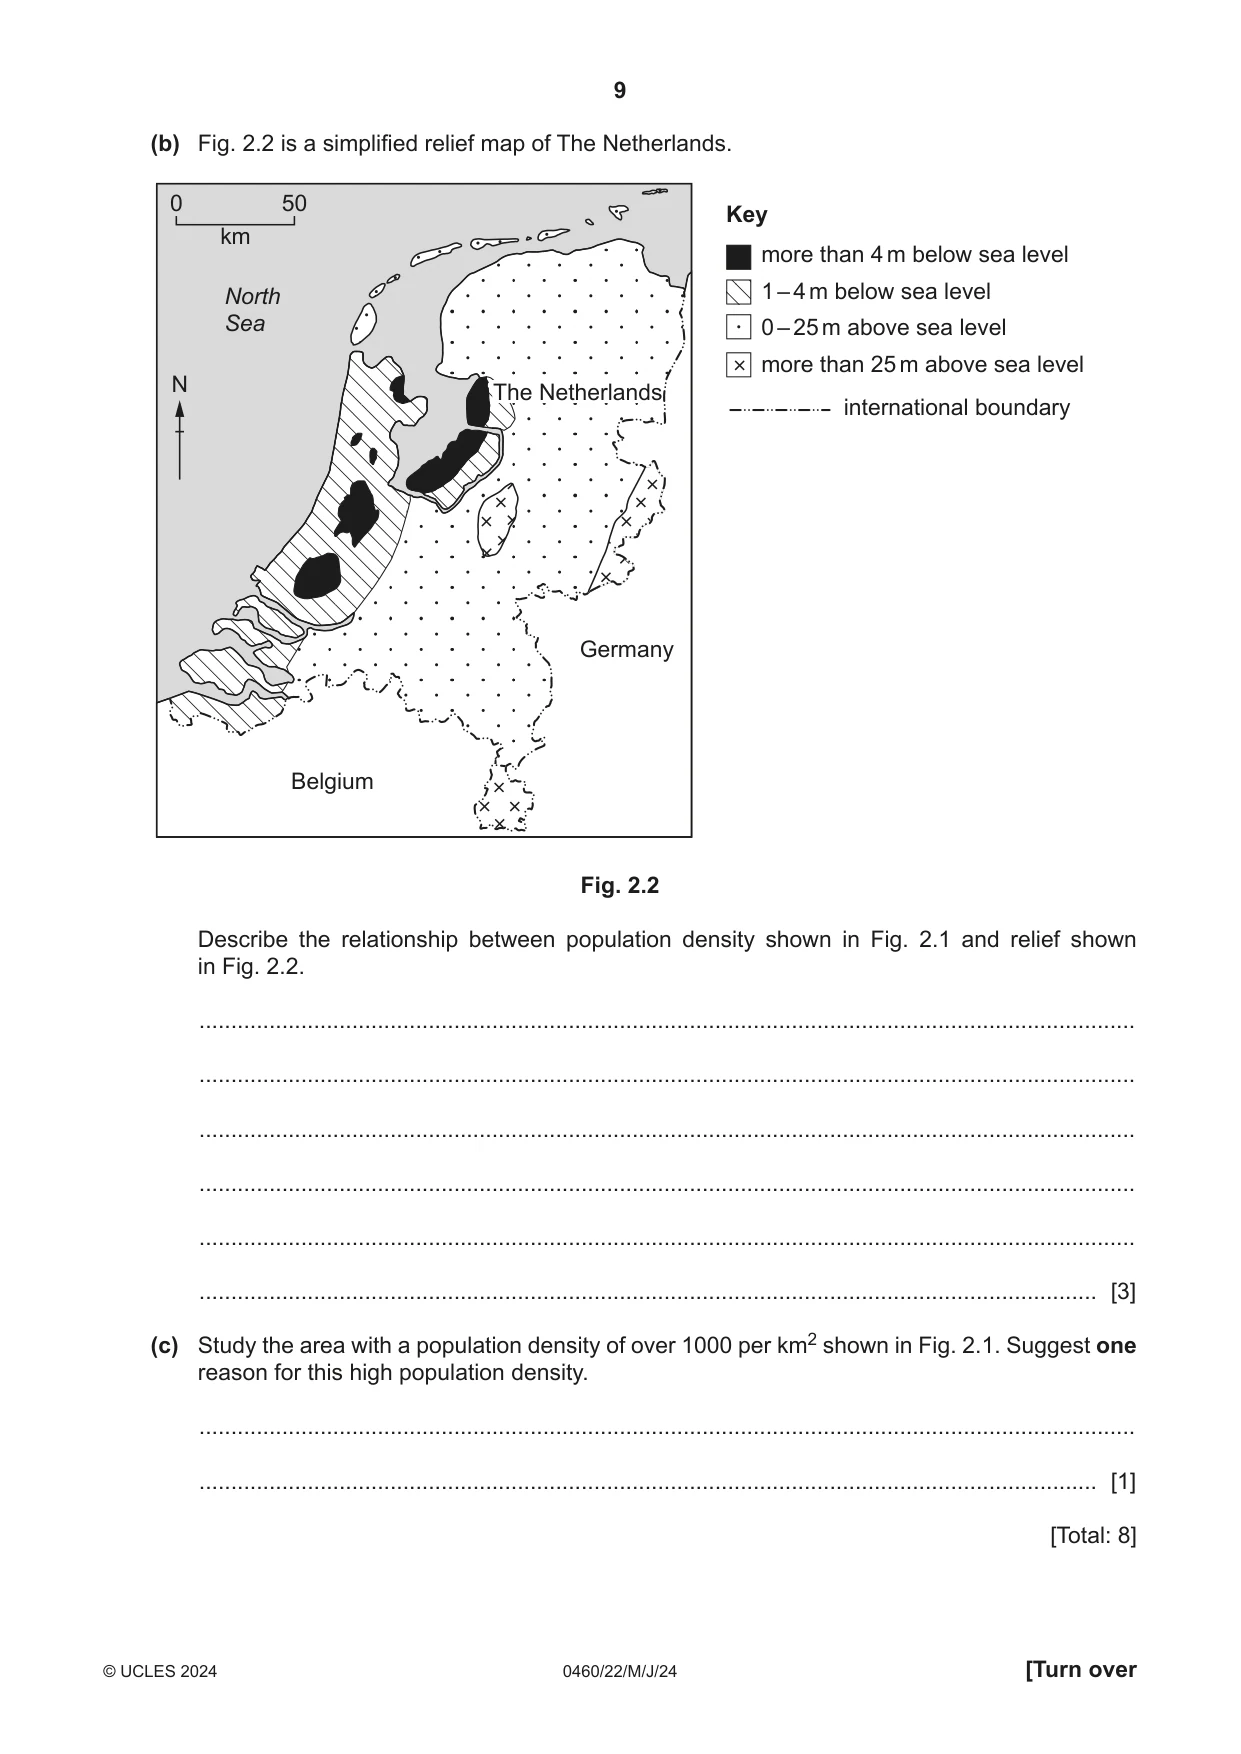
2 Fig. 2.1 shows the population density of provinces in The Netherlands, a country in Europe. 0 50 Key km population per km2 more than 1000 North Sea 900 – 1000 400 – 899 N 200 – 399 less than 200 The Netherlands international boundary provincial boundary U Germany Belgium Fig. 2.1 (a) (i) State the population density of Utrecht province, shown by U in Fig. 2.1. ........................... per km2 [1] (ii) Describe the population distribution of The Netherlands shown in Fig. 2.1. Do not use statistics in your answer. ........................................................................................................................................... ........................................................................................................................................... ........................................................................................................................................... ........................................................................................................................................... ........................................................................................................................................... ..................................................................................................................................... [3] (b) Fig. 2.2 is a simplified relief map of The Netherlands. 0 50 Key km more than 4 m below sea level North 1 – 4 m below sea level Sea 0 – 25 m above sea level more than 25 m above sea level N The Netherlands international boundary Germany Belgium Fig. 2.2 Describe the relationship between population density shown in Fig. 2.1 and relief shown in Fig. 2.2. ................................................................................................................................................... ................................................................................................................................................... ................................................................................................................................................... ................................................................................................................................................... ................................................................................................................................................... ............................................................................................................................................. [3] (c) Study the area with a population density of over 1000 per km2 shown in Fig. 2.1. Suggest one reason for this high population density. ................................................................................................................................................... ............................................................................................................................................. [1] [Total: 8]
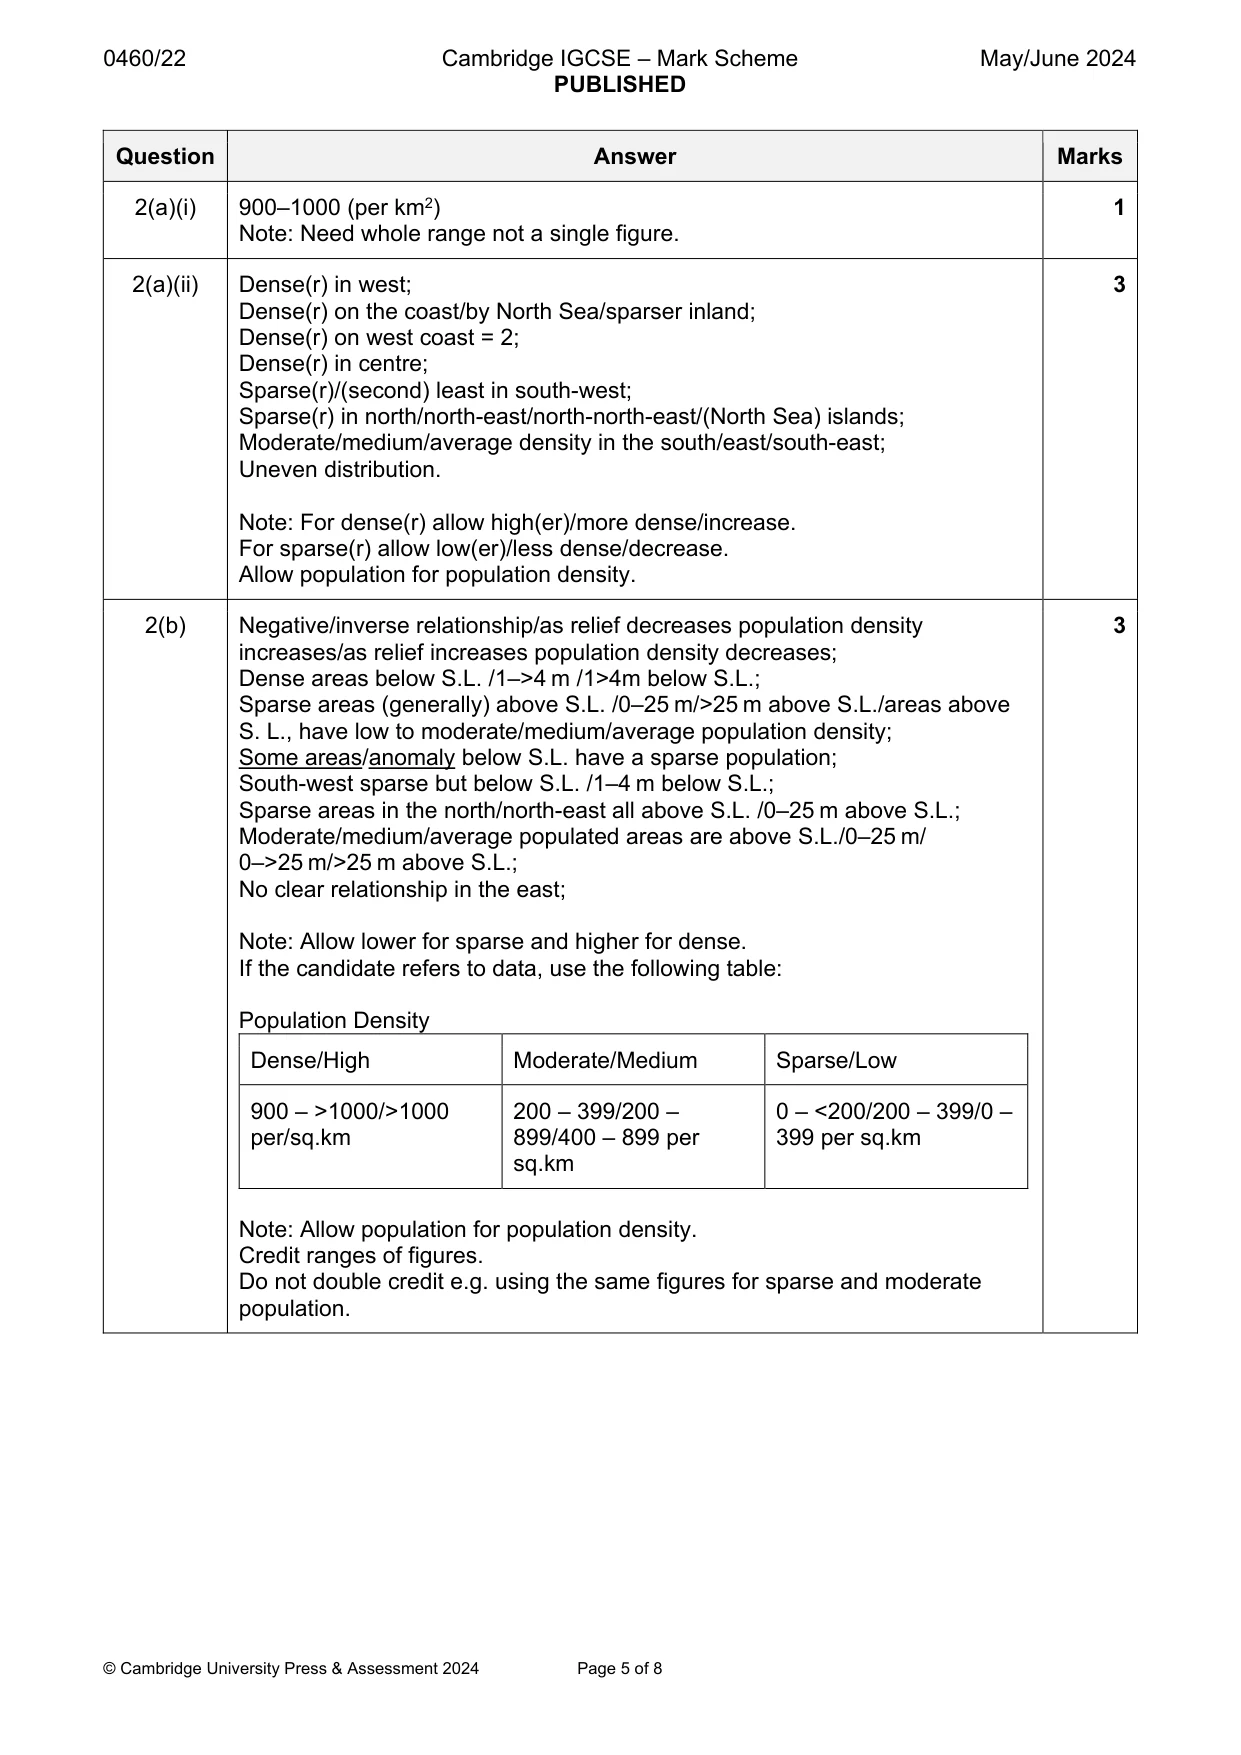
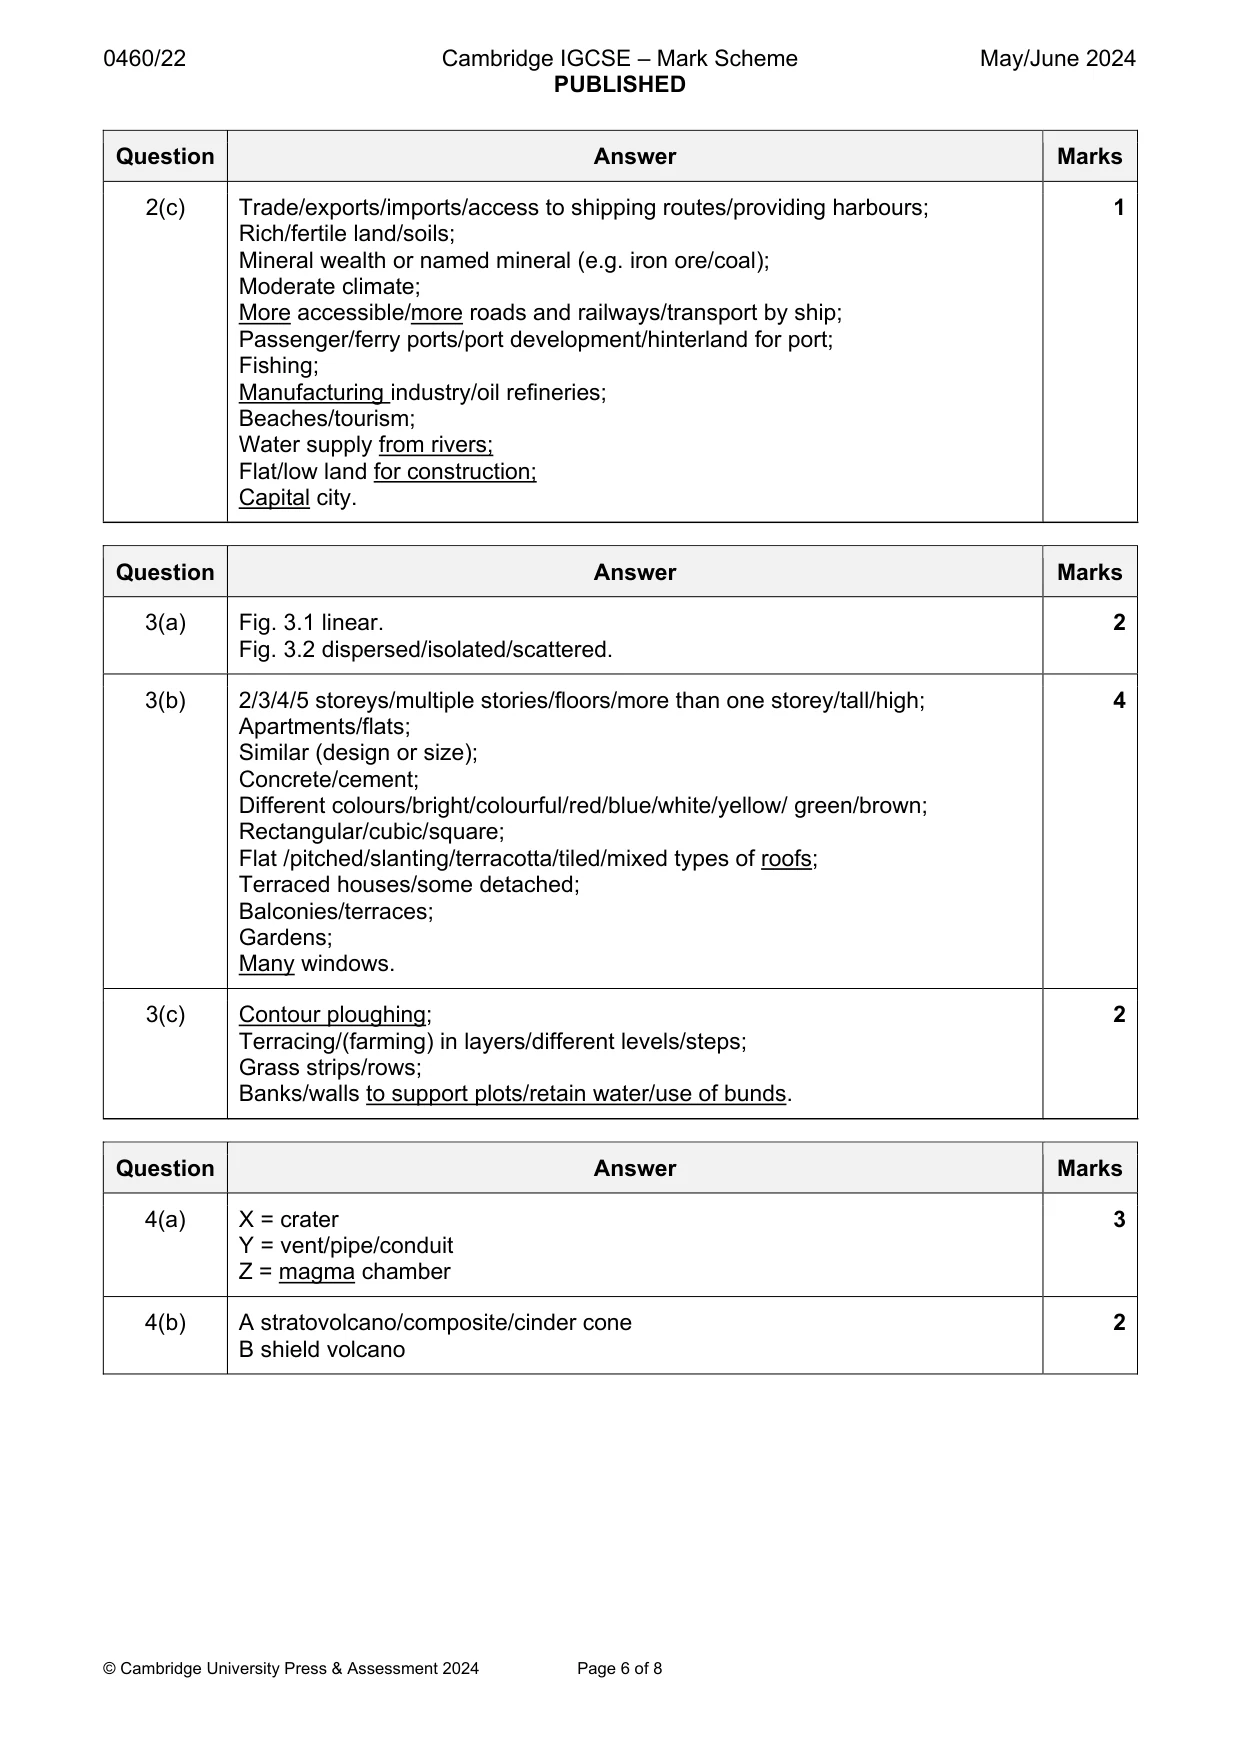
Mark scheme: 2(a)(i) 900–1000 (per km2) 1 Note: Need whole range not a single figure. 2(a)(ii) Dense(r) in west; 3 Dense(r) on the coast/by North Sea/sparser inland; Dense(r) on west coast = 2; Dense(r) in centre; Sparse(r)/(second) least in south-west; Sparse(r) in north/north-east/north-north-east/(North Sea) islands; Moderate/medium/average density in the south/east/south-east; Uneven distribution. Note: For dense(r) allow high(er)/more dense/increase. For sparse(r) allow low(er)/less dense/decrease. Allow population for population density. 2(b) Negative/inverse relationship/as relief decreases population density 3 increases/as relief increases population density decreases; Dense areas below S.L. /1–>4 m /1>4m below S.L.; Sparse areas (generally) above S.L. /0–25 m/>25 m above S.L./areas above S. L., have low to moderate/medium/average population density; Some areas/anomaly below S.L. have a sparse population; South-west sparse but below S.L. /1–4 m below S.L.; Sparse areas in the north/north-east all above S.L. /0–25 m above S.L.; Moderate/medium/average populated areas are above S.L./0–25 m/ 0–>25 m/>25 m above S.L.; No clear relationship in the east; Note: Allow lower for sparse and higher for dense. If the candidate refers to data, use the following table: Population Density Dense/High Moderate/Medium Sparse/Low 900 – >1000/>1000 200 – 399/200 – 0 – <200/200 – 399/0 – per/sq.km 899/400 – 899 per 399 per sq.km sq.km Note: Allow population for population density. Credit ranges of figures. Do not double credit e.g. using the same figures for sparse and moderate population. 2(c) Trade/exports/imports/access to shipping routes/providing harbours; 1 Rich/fertile land/soils; Mineral wealth or named mineral (e.g. iron ore/coal); Moderate climate; More accessible/more roads and railways/transport by ship; Passenger/ferry ports/port development/hinterland for port; Fishing; Manufacturing industry/oil refineries; Beaches/tourism; Water supply from rivers; Flat/low land for construction; Capital city.
Question 3
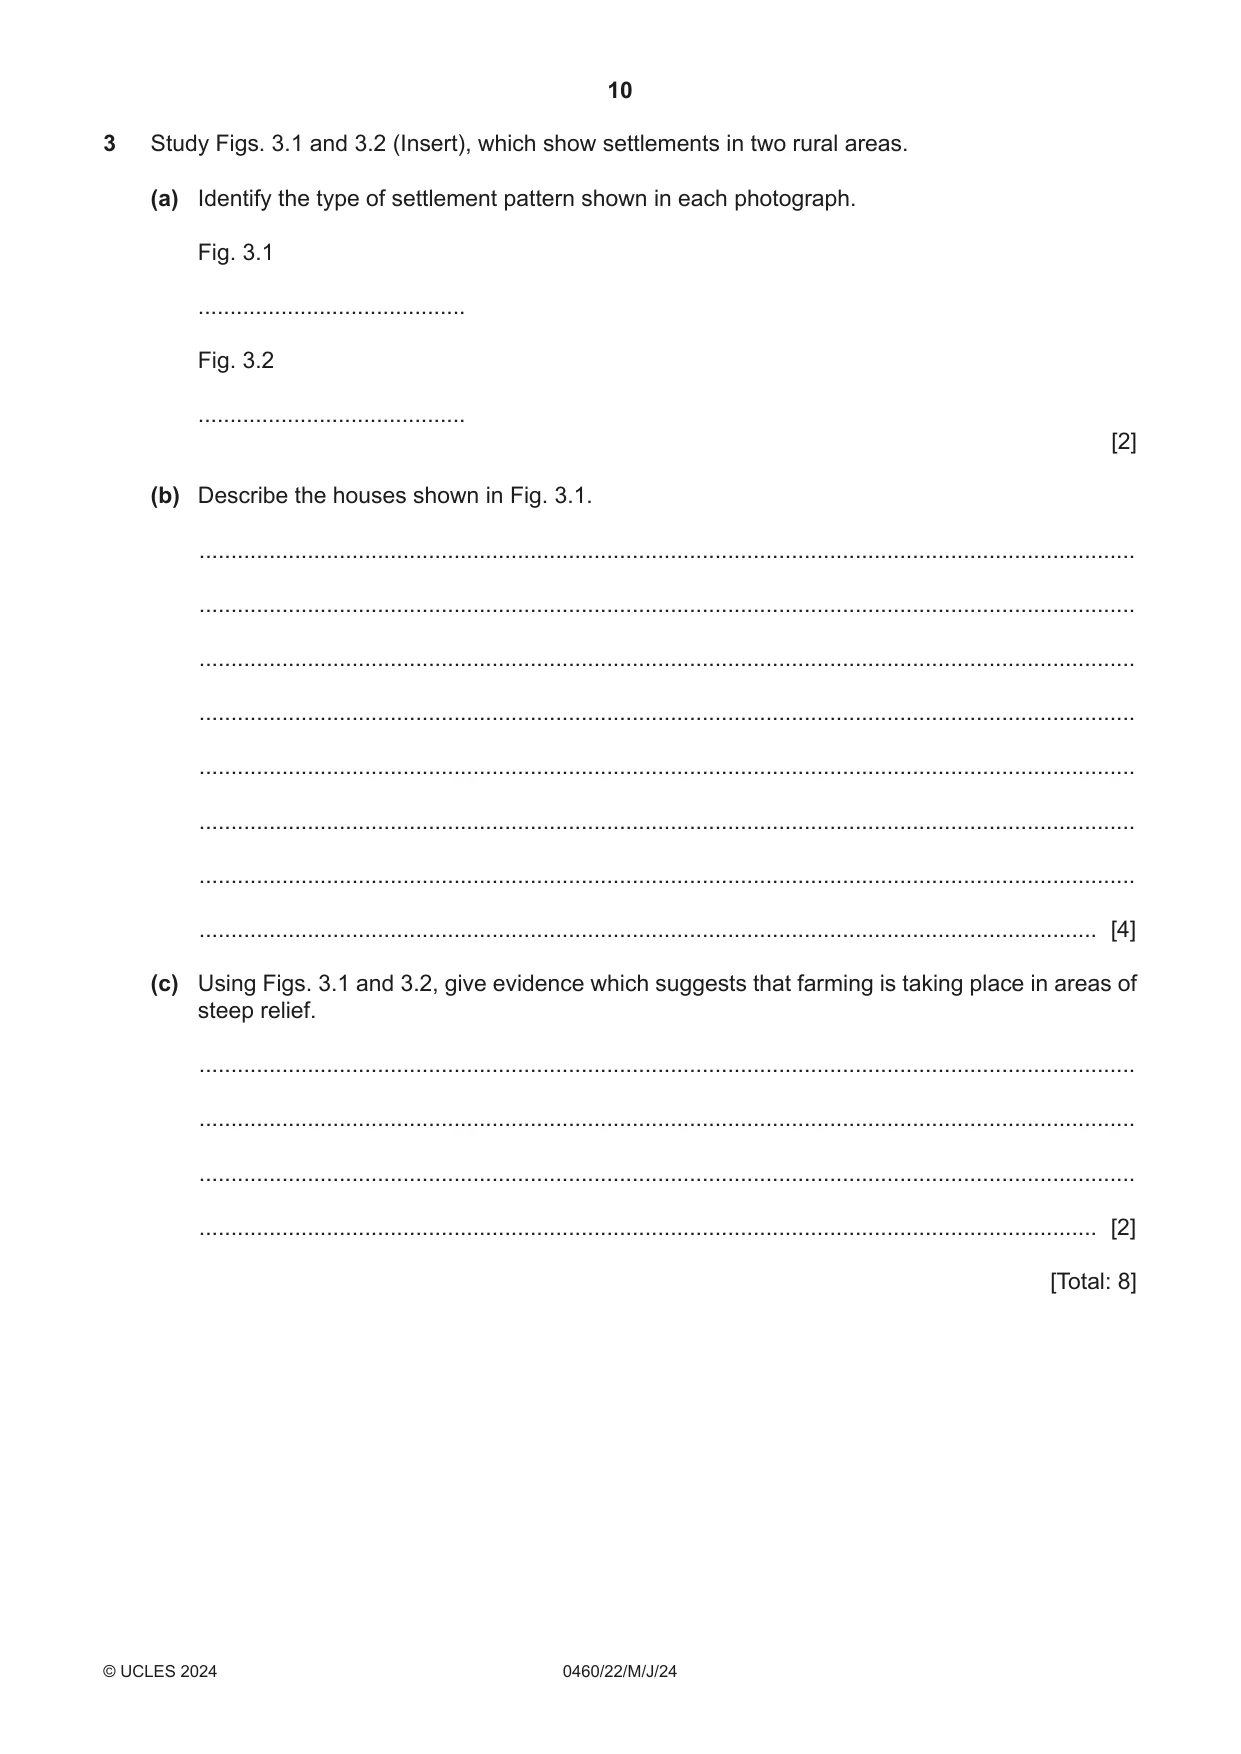
3 Study Figs. 3.1 and 3.2 (Insert), which show settlements in two rural areas. (a) Identify the type of settlement pattern shown in each photograph. Fig. 3.1 .......................................... Fig. 3.2 .......................................... [2] (b) Describe the houses shown in Fig. 3.1. ................................................................................................................................................... ................................................................................................................................................... ................................................................................................................................................... ................................................................................................................................................... ................................................................................................................................................... ................................................................................................................................................... ................................................................................................................................................... ............................................................................................................................................. [4] (c) Using Figs. 3.1 and 3.2, give evidence which suggests that farming is taking place in areas of steep relief. ................................................................................................................................................... ................................................................................................................................................... ................................................................................................................................................... ............................................................................................................................................. [2] [Total: 8]
Mark scheme: 3(a) Fig. 3.1 linear. 2 Fig. 3.2 dispersed/isolated/scattered. 3(b) 2/3/4/5 storeys/multiple stories/floors/more than one storey/tall/high; 4 Apartments/flats; Similar (design or size); Concrete/cement; Different colours/bright/colourful/red/blue/white/yellow/ green/brown; Rectangular/cubic/square; Flat /pitched/slanting/terracotta/tiled/mixed types of roofs; Terraced houses/some detached; Balconies/terraces; Gardens; Many windows. 3(c) Contour ploughing; 2 Terracing/(farming) in layers/different levels/steps; Grass strips/rows; Banks/walls to support plots/retain water/use of bunds.
More questions on Settlements (rural and urban) and service provision
Q4 · Two different volcanoes, A and B
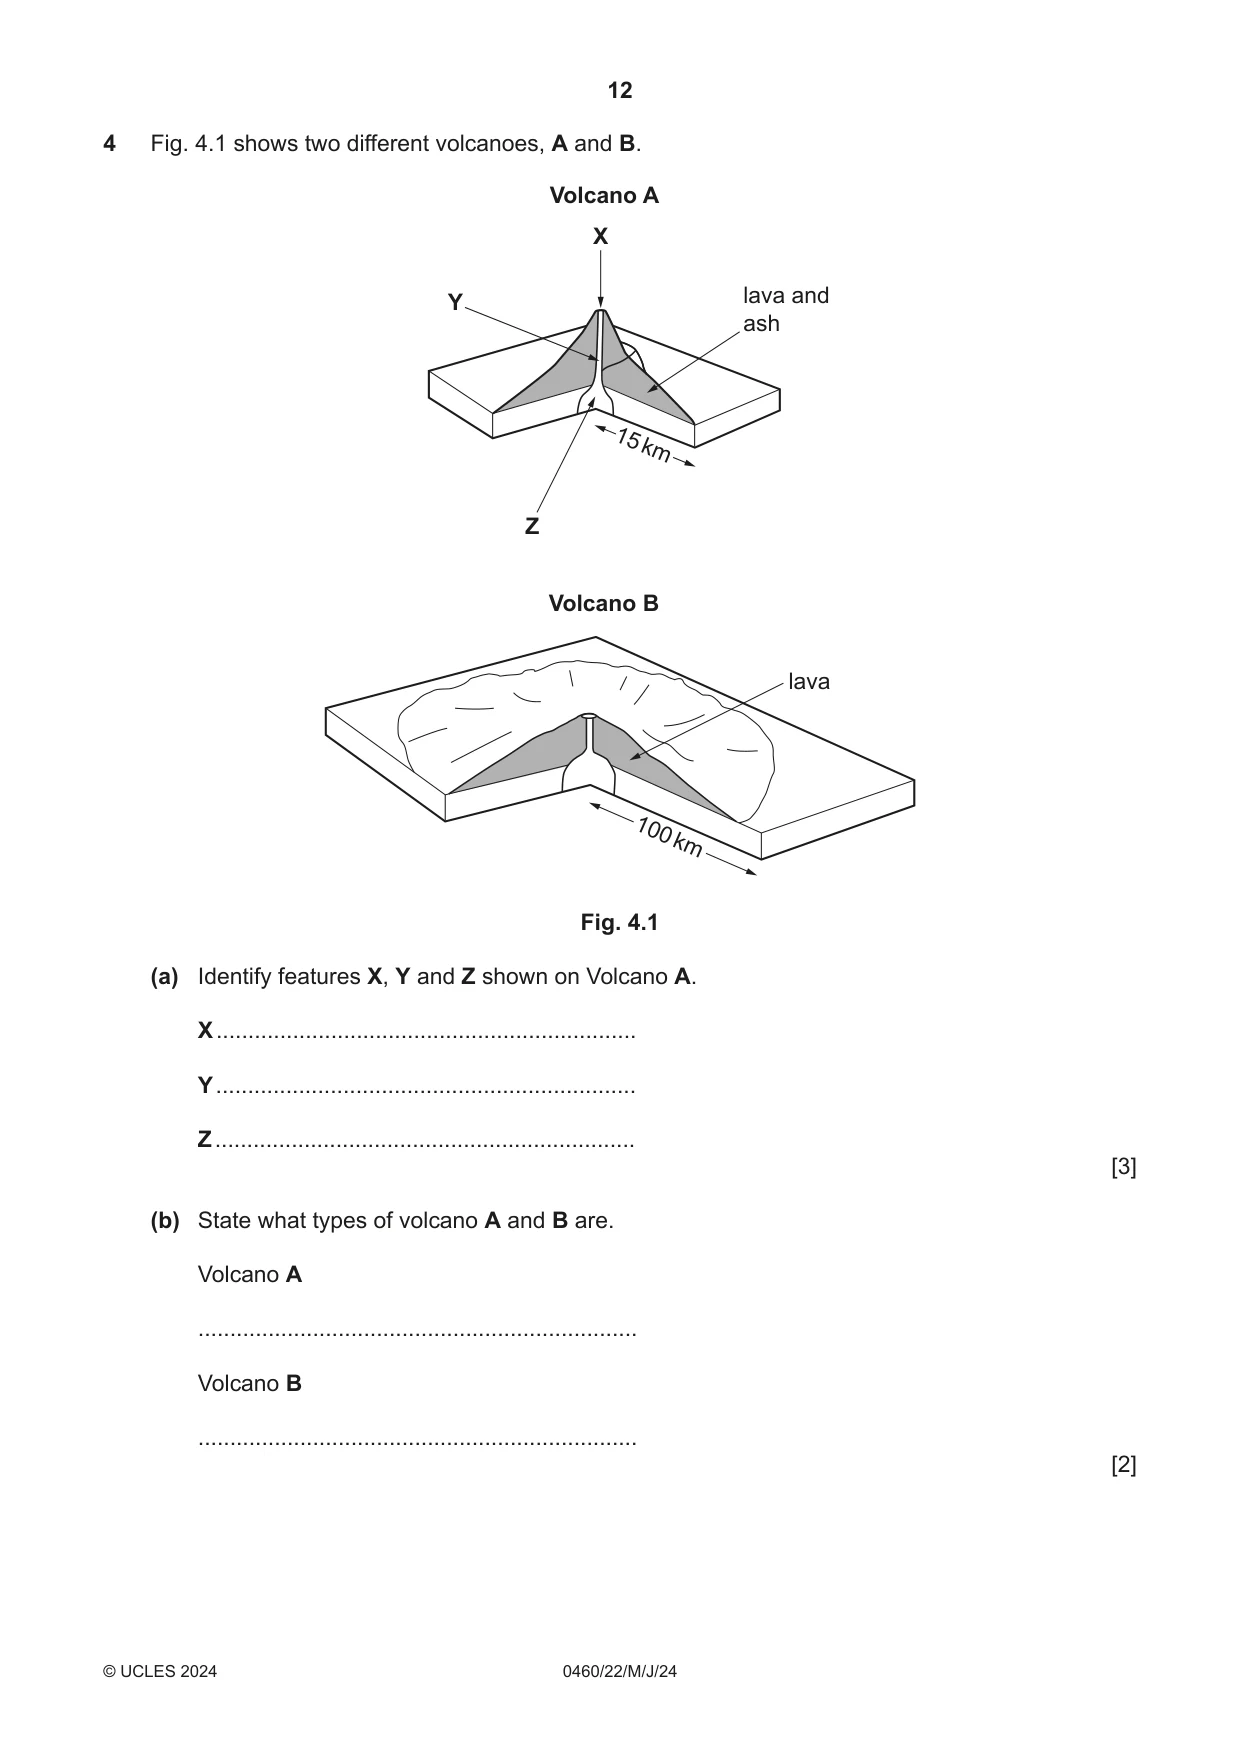
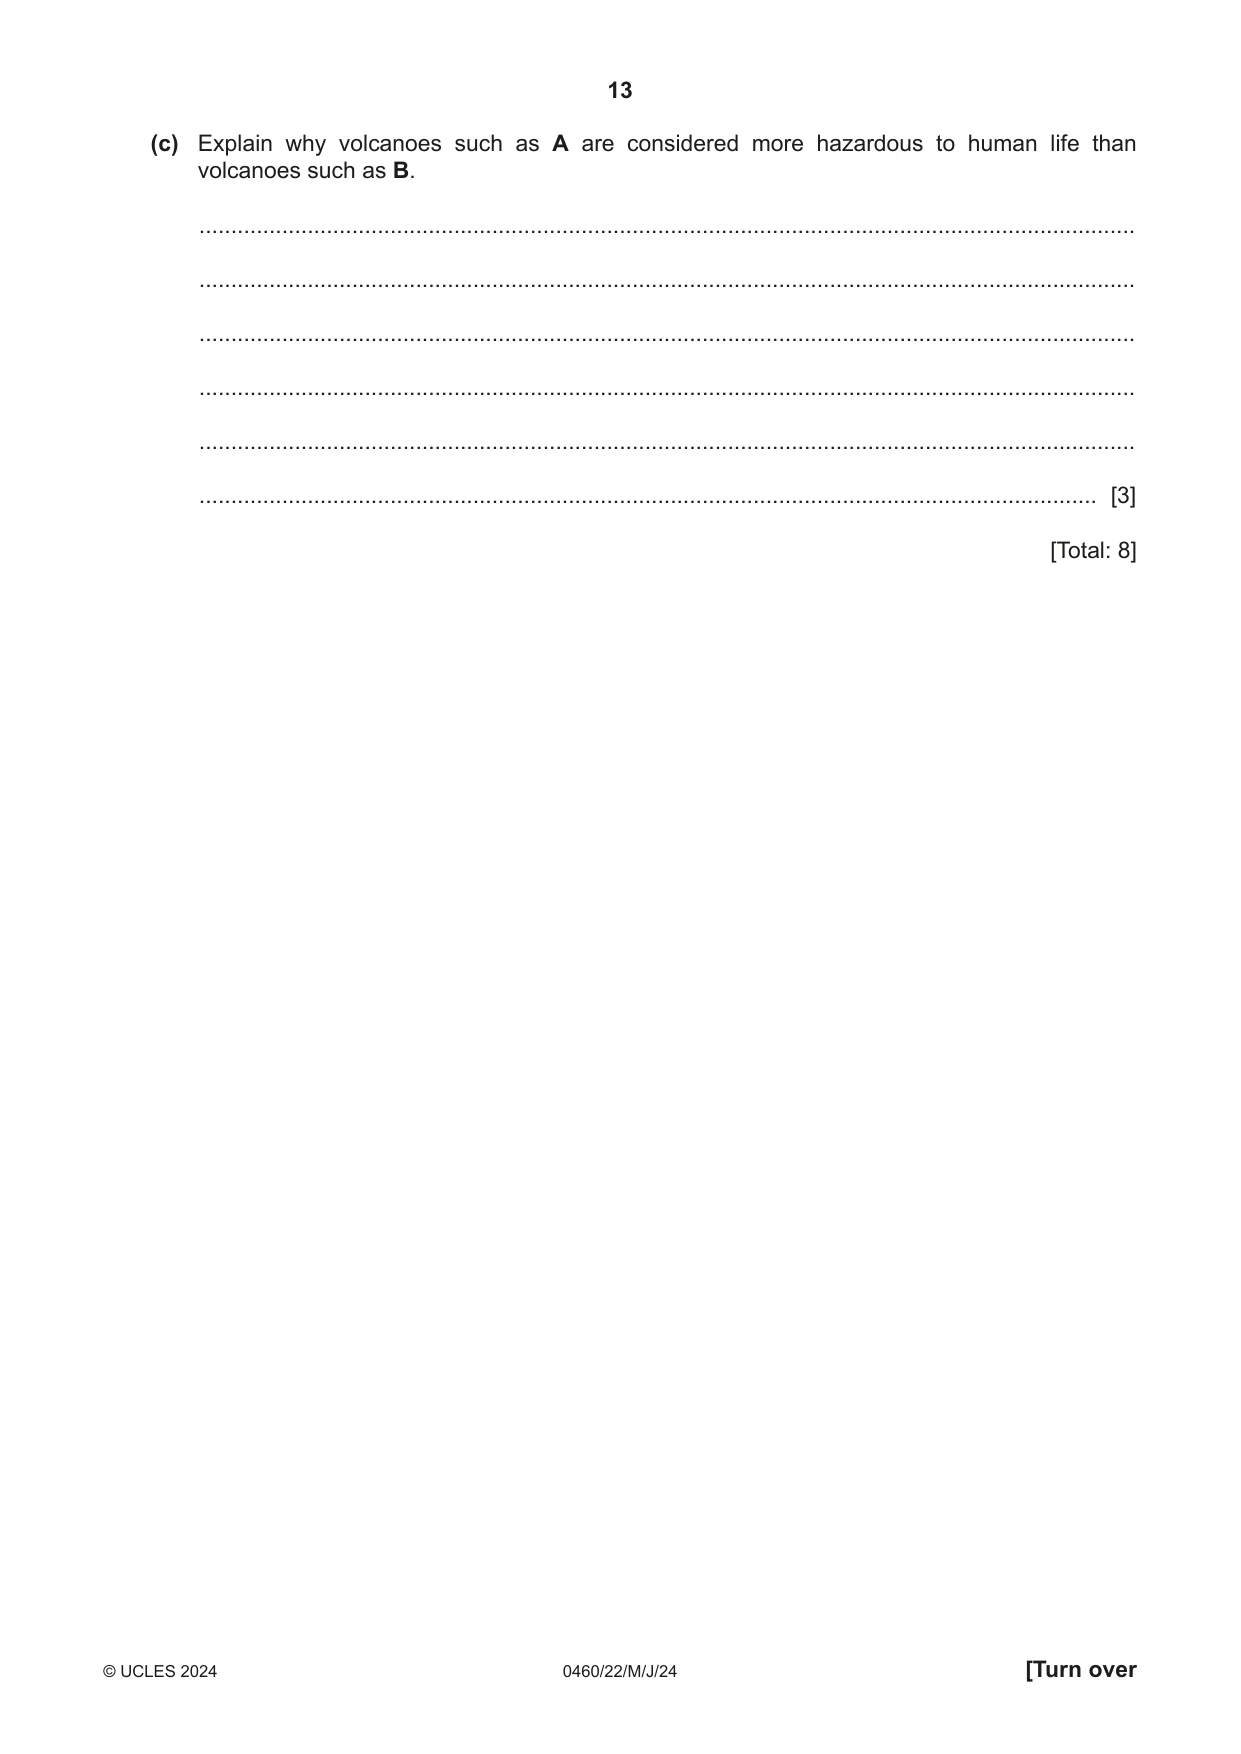
4 Fig. 4.1 shows two different volcanoes, A and B. Volcano A X lava and Y ash 15 km Z Volcano B lava 100 km Fig. 4.1 (a) Identify features X, Y and Z shown on Volcano A. X .................................................................. Y .................................................................. Z .................................................................. [3] (b) State what types of volcano A and B are. Volcano A ..................................................................... Volcano B ..................................................................... [2] (c) Explain why volcanoes such as A are considered more hazardous to human life than volcanoes such as B. ................................................................................................................................................... ................................................................................................................................................... ................................................................................................................................................... ................................................................................................................................................... ................................................................................................................................................... ............................................................................................................................................. [3] [Total: 8]
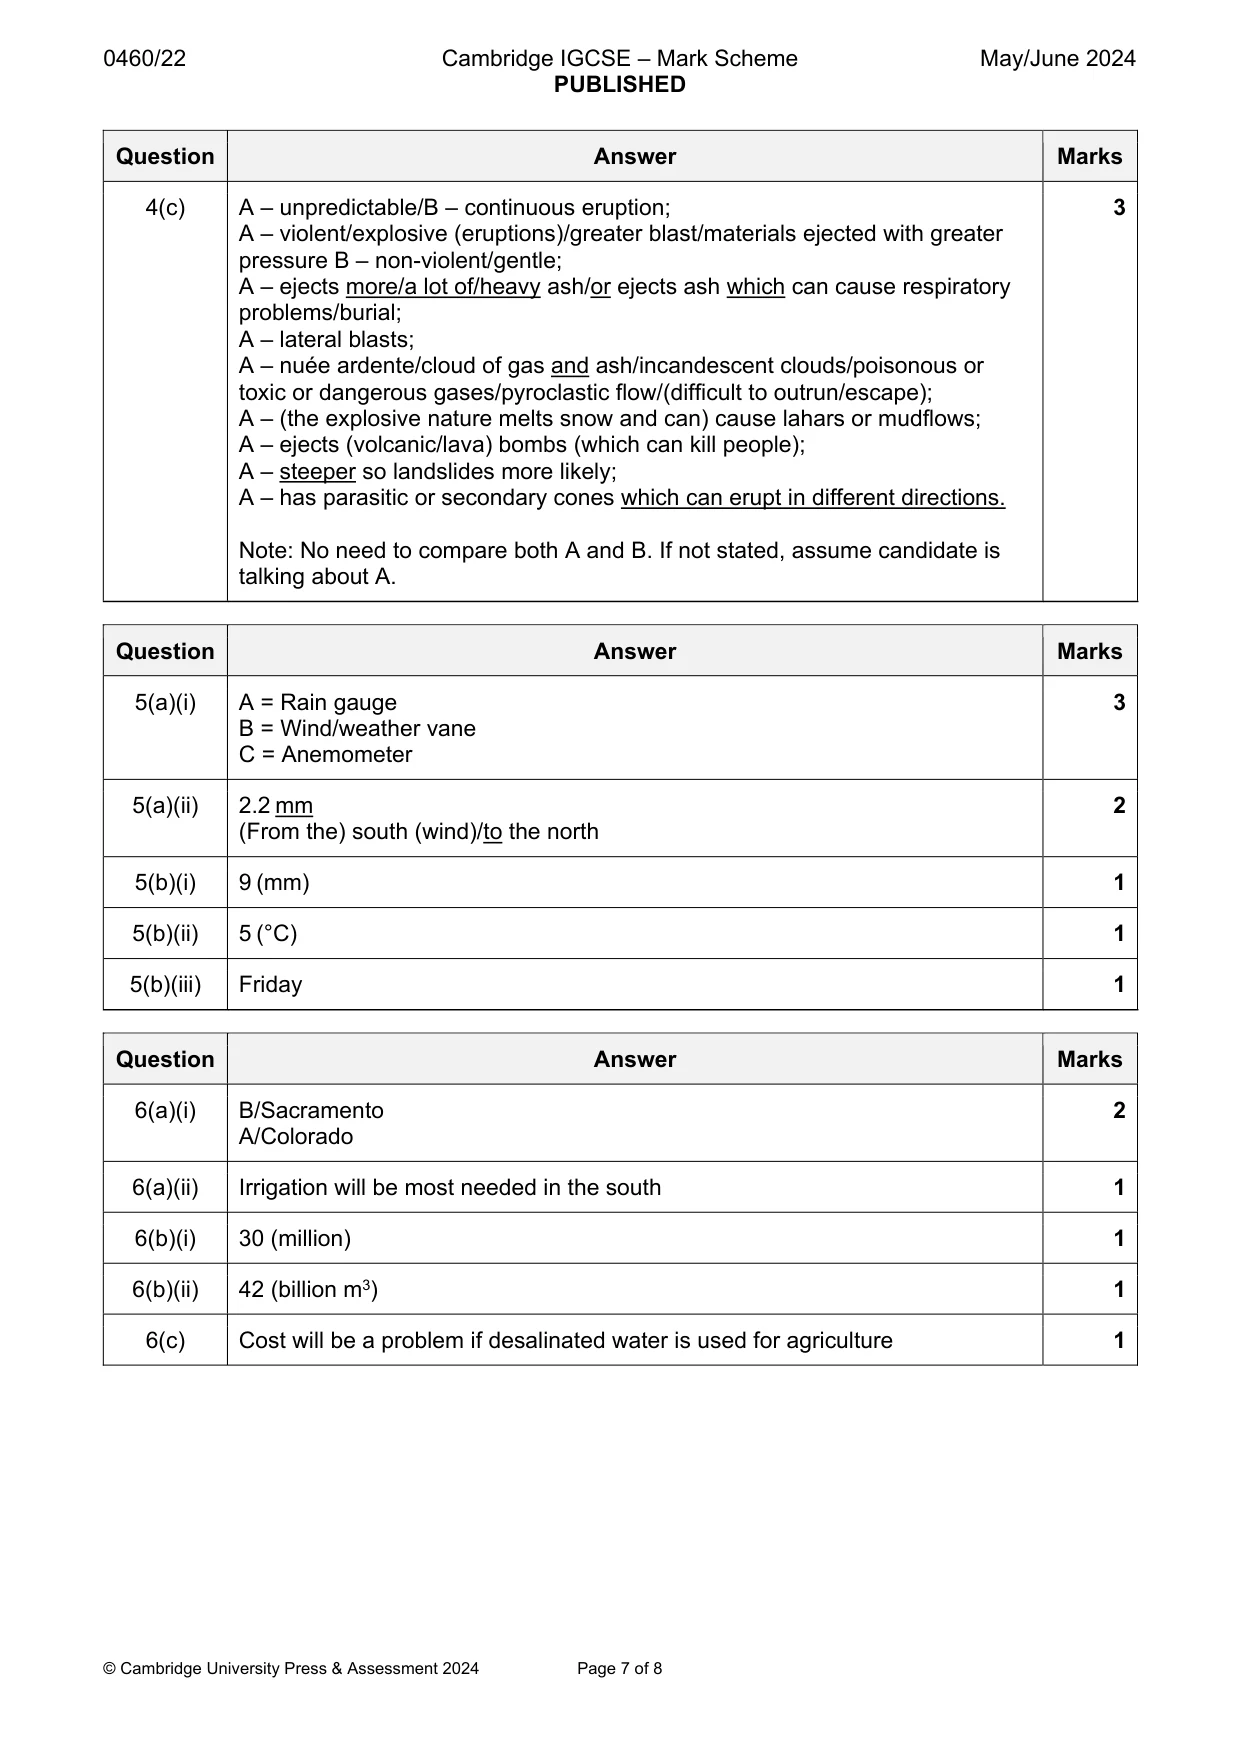
Mark scheme: 4(a) X = crater 3 Y = vent/pipe/conduit Z = magma chamber 4(b) A stratovolcano/composite/cinder cone 2 B shield volcano 4(c) A – unpredictable/B – continuous eruption; 3 A – violent/explosive (eruptions)/greater blast/materials ejected with greater pressure B – non-violent/gentle; A – ejects more/a lot of/heavy ash/or ejects ash which can cause respiratory problems/burial; A – lateral blasts; A – nuée ardente/cloud of gas and ash/incandescent clouds/poisonous or toxic or dangerous gases/pyroclastic flow/(difficult to outrun/escape); A – (the explosive nature melts snow and can) cause lahars or mudflows; A – ejects (volcanic/lava) bombs (which can kill people); A – steeper so landslides more likely; A – has parasitic or secondary cones which can erupt in different directions. Note: No need to compare both A and B. If not stated, assume candidate is talking about A.
Q5 · Three instruments, A, B and C, kept at a weather station
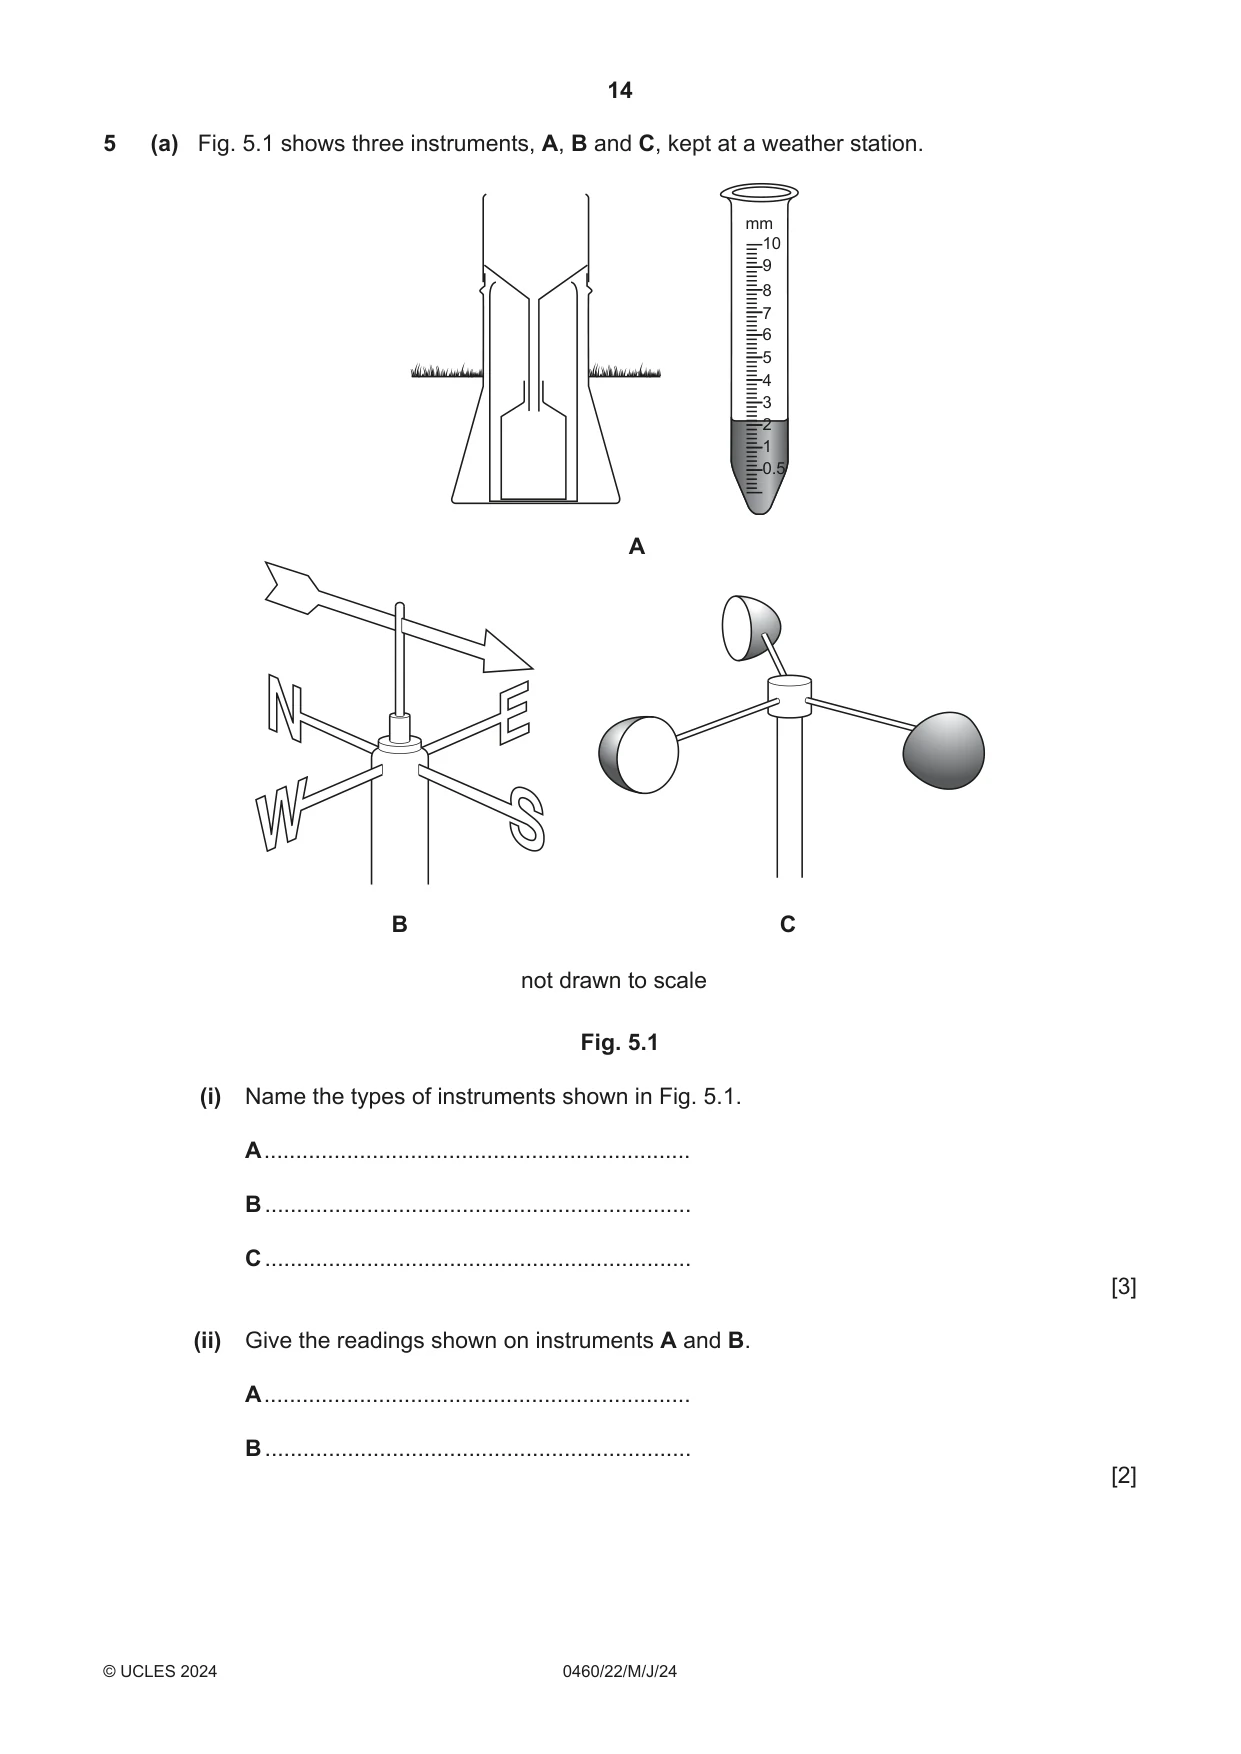
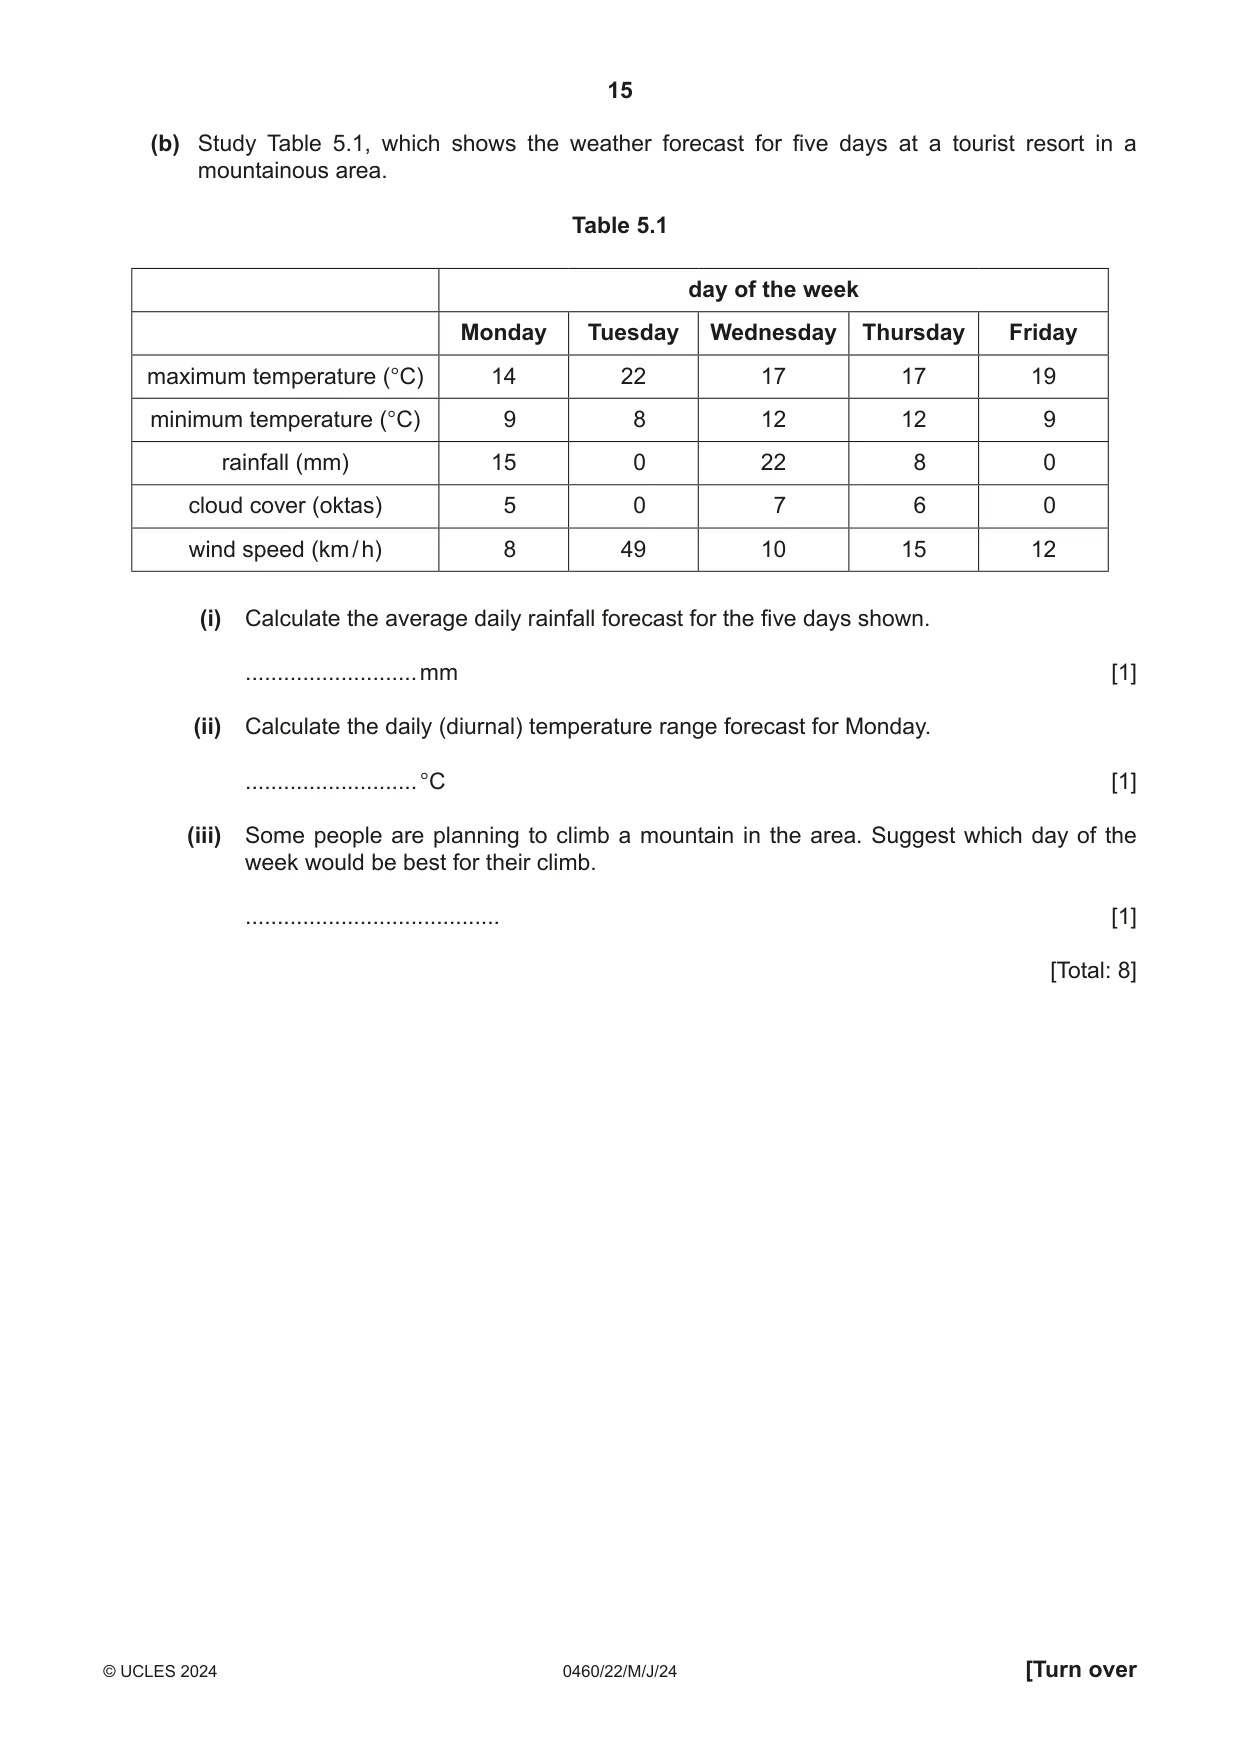
5 (a) Fig. 5.1 shows three instruments, A, B and C, kept at a weather station. mm 10 9 8 7 6 5 4 3 2 1 0.5 A B C not drawn to scale Fig. 5.1 (i) Name the types of instruments shown in Fig. 5.1. A ................................................................... B ................................................................... C ................................................................... [3] (ii) Give the readings shown on instruments A and B. A ................................................................... B ................................................................... [2] (b) Study Table 5.1, which shows the weather forecast for five days at a tourist resort in a mountainous area. Table 5.1 day of the week Monday Tuesday Wednesday Thursday Friday maximum temperature (°C) 14 22 17 17 19 minimum temperature (°C) 9 8 12 12 9 rainfall (mm) 15 0 22 8 0 cloud cover (oktas) 5 0 7 6 0 wind speed (km / h) 8 49 10 15 12 (i) Calculate the average daily rainfall forecast for the five days shown. ........................... mm [1] (ii) Calculate the daily (diurnal) temperature range forecast for Monday. ........................... °C [1] (iii) Some people are planning to climb a mountain in the area. Suggest which day of the week would be best for their climb. ........................................ [1] [Total: 8]
Mark scheme: 5(a)(i) A = Rain gauge 3 B = Wind/weather vane C = Anemometer 5(a)(ii) 2.2 mm 2 (From the) south (wind)/to the north 5(b)(i) 9 (mm) 1 5(b)(ii) 5 (°C) 1 5(b)(iii) Friday 1
Q6 · Information about four drainage basins which provide most of the water supply for the…
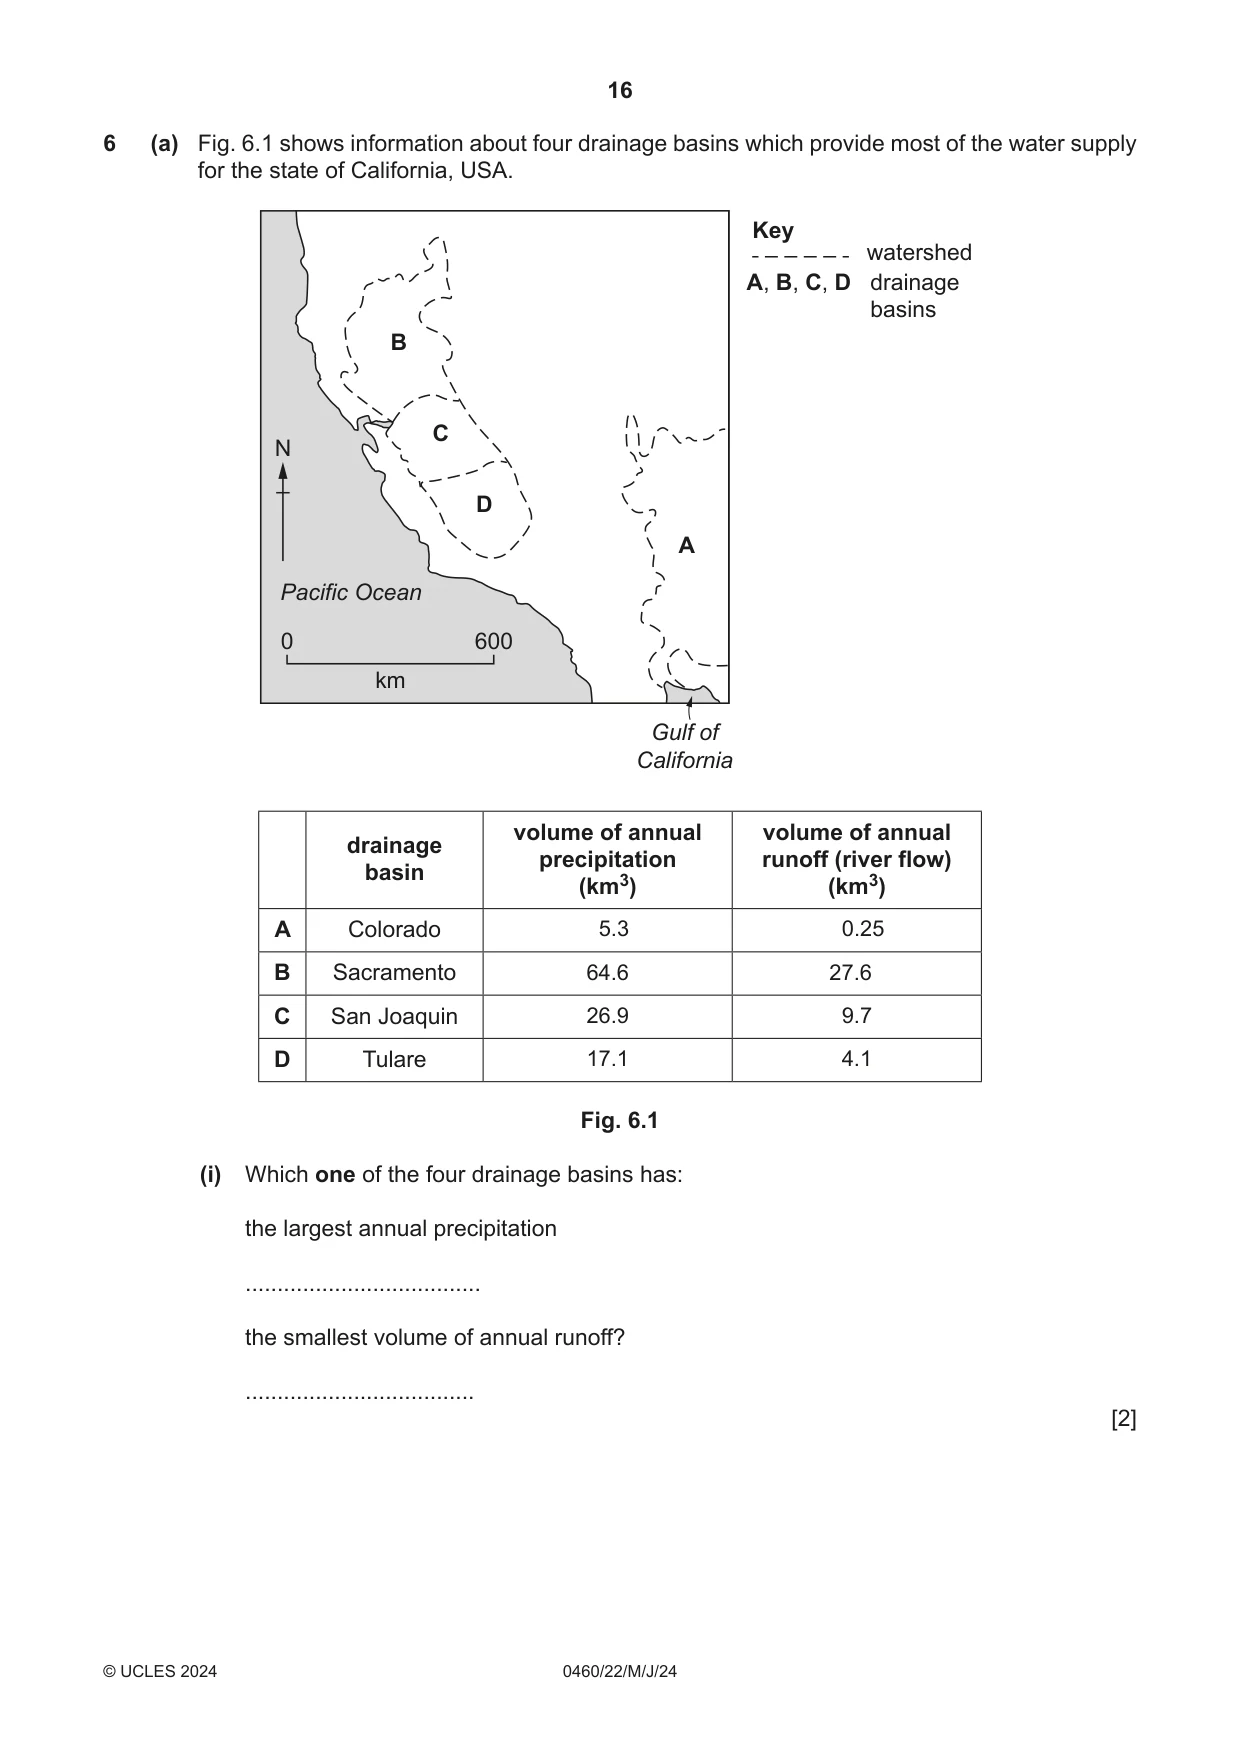
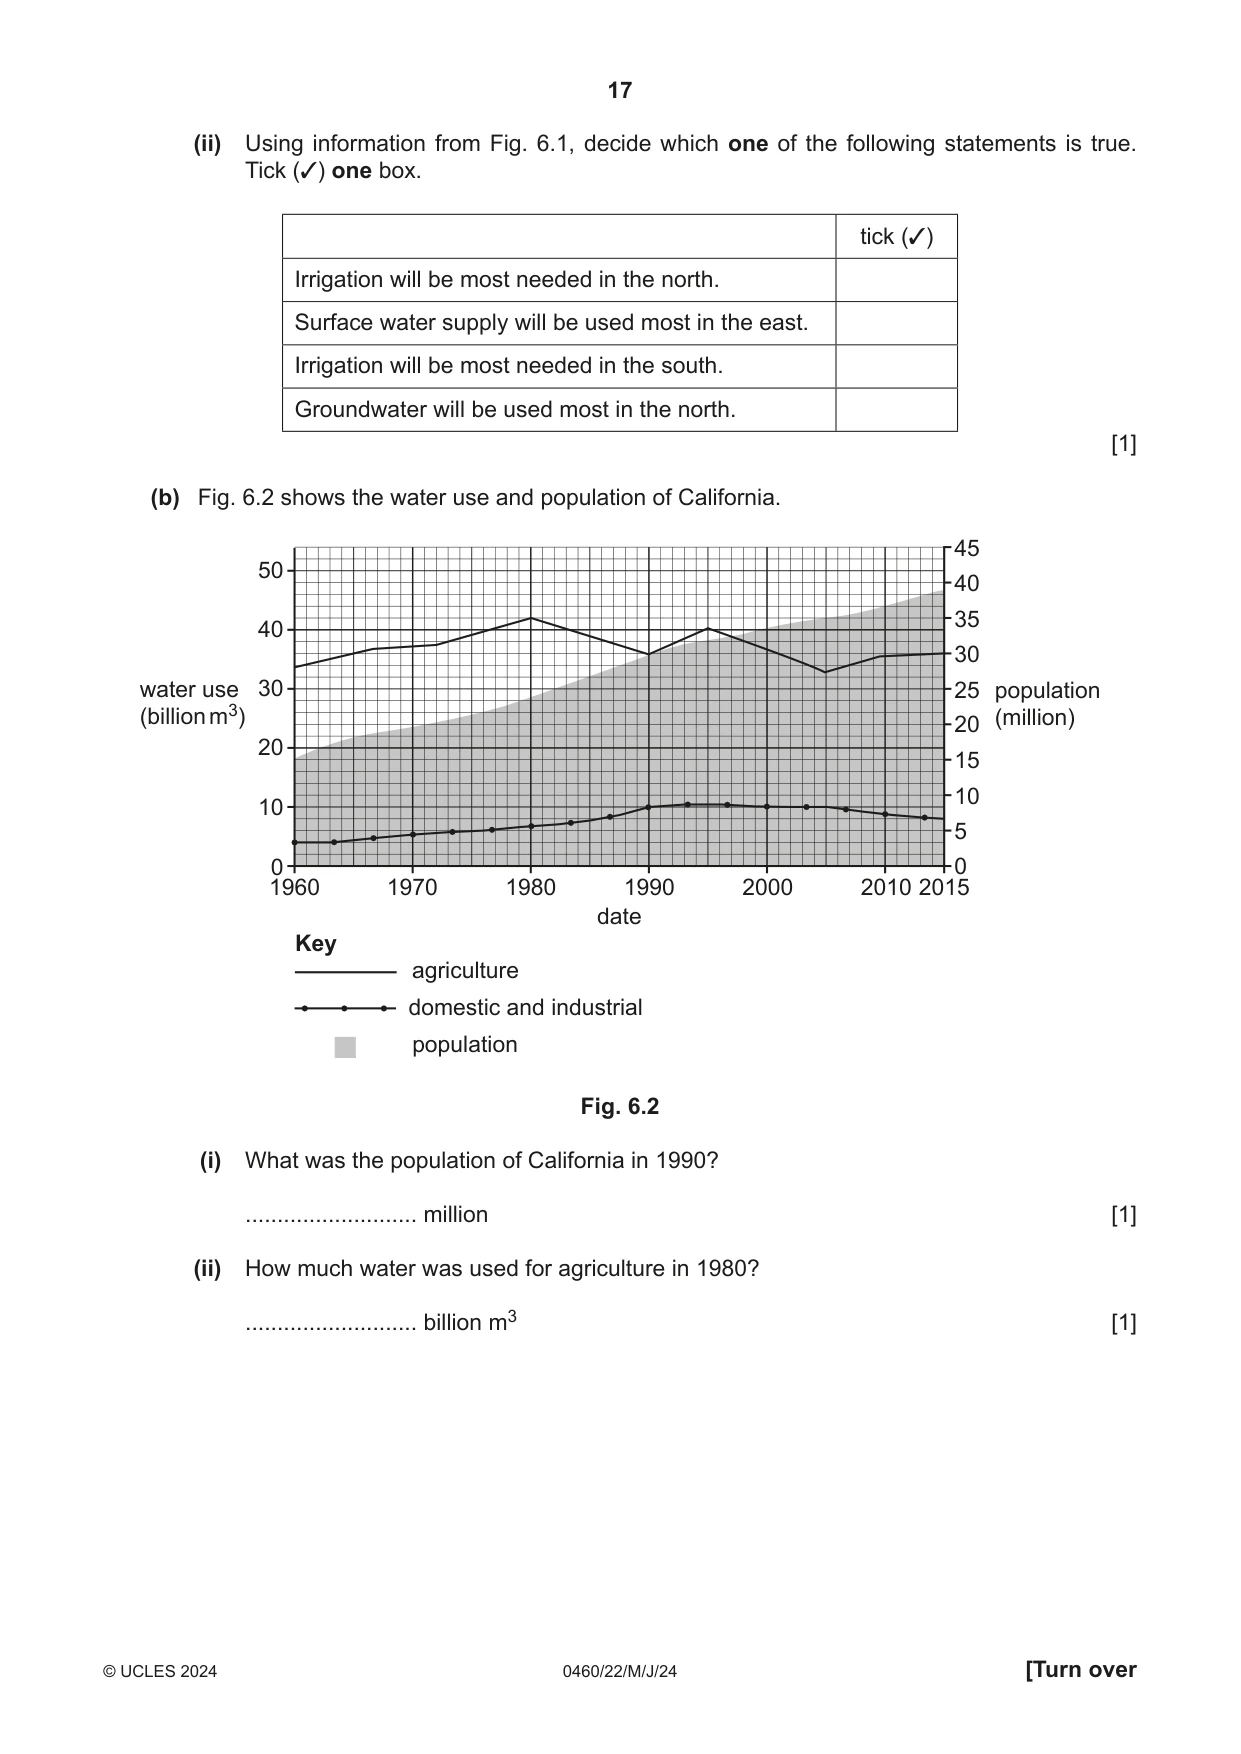
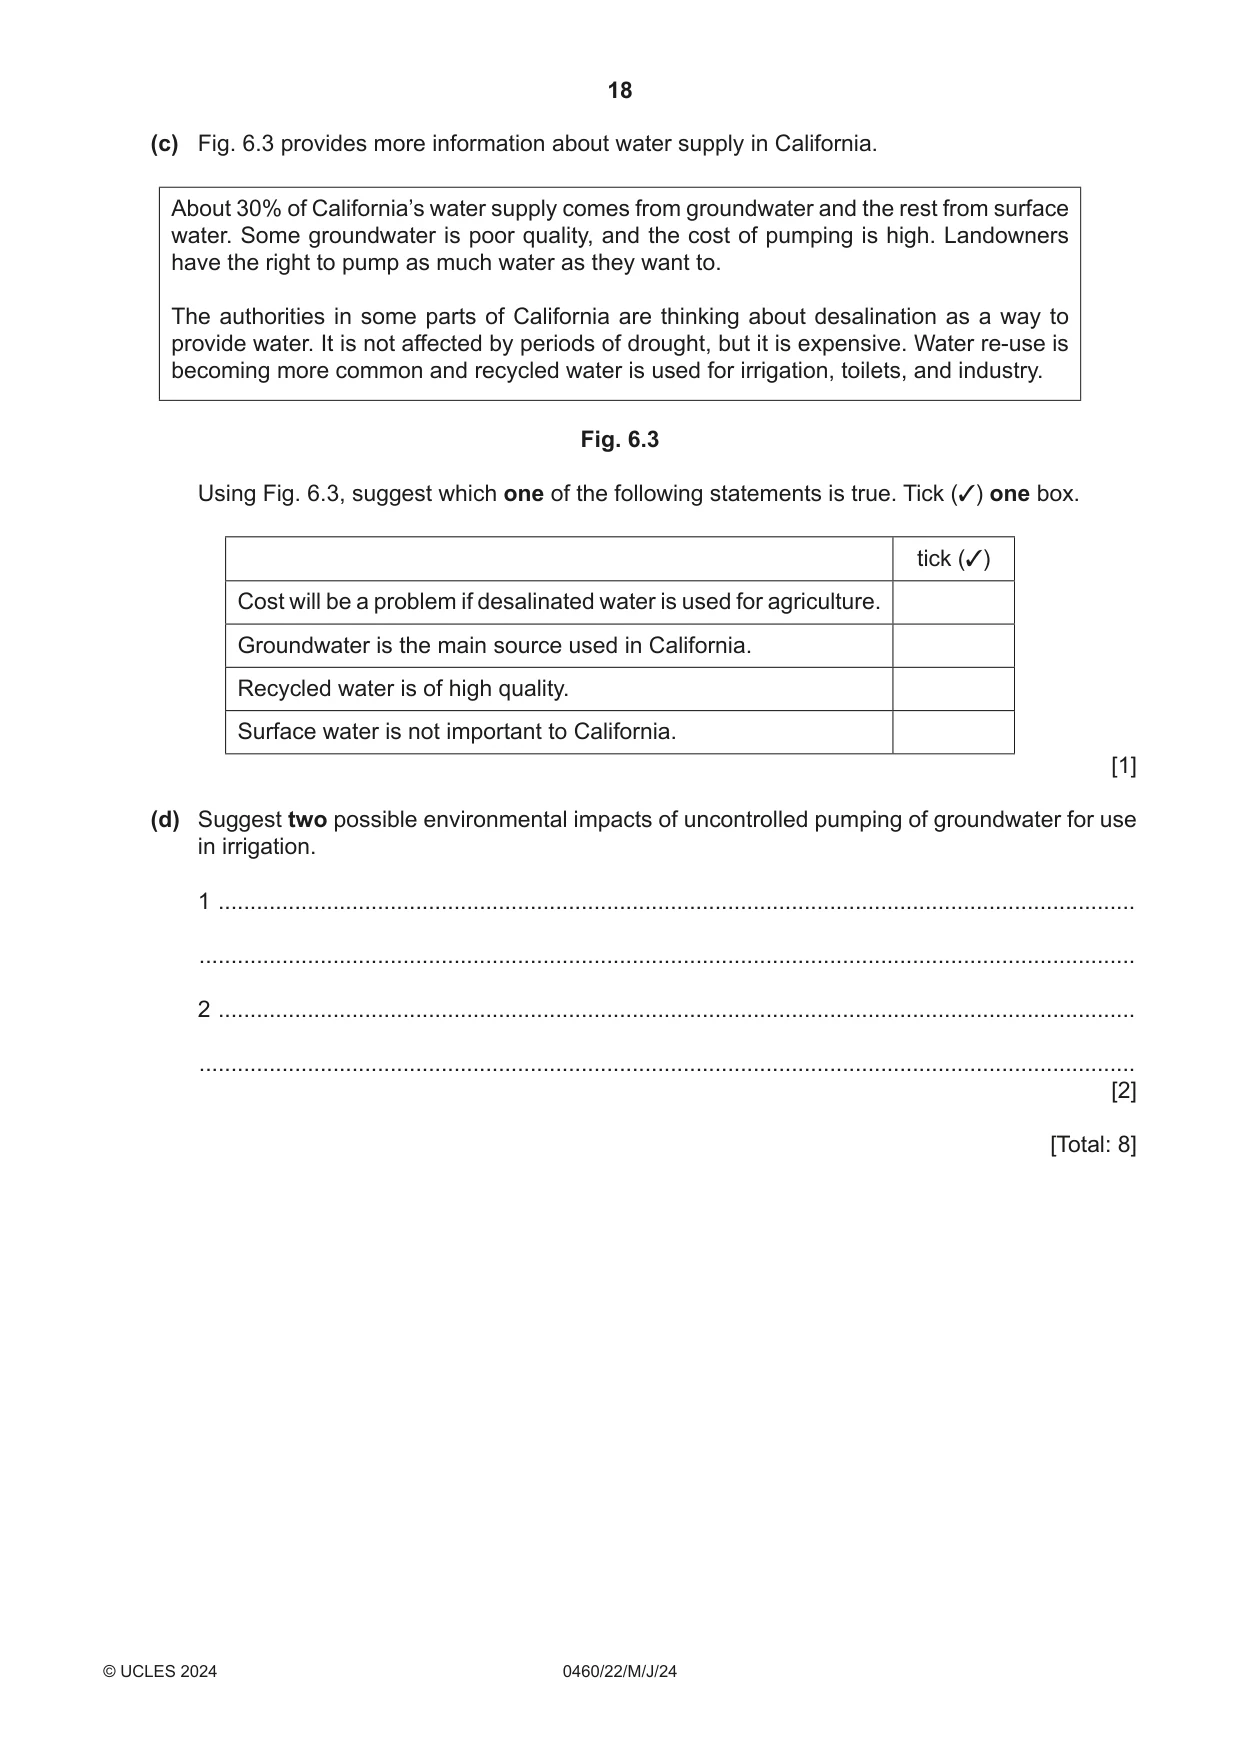
6 (a) Fig. 6.1 shows information about four drainage basins which provide most of the water supply for the state of California, USA. Key watershed A, B, C, D drainage basins B C N D A Pacific Ocean 0 600 km Gulf of California volume of annual volume of annual drainage precipitation runoff (river flow) basin (km3) (km3) A Colorado 5.3 0.25 B Sacramento 64.6 27.6 C San Joaquin 26.9 9.7 D Tulare 17.1 4.1 Fig. 6.1 (i) Which one of the four drainage basins has: the largest annual precipitation ..................................... the smallest volume of annual runoff? .................................... [2] (ii) Using information from Fig. 6.1, decide which one of the following statements is true. Tick (3) one box. tick (3) Irrigation will be most needed in the north. Surface water supply will be used most in the east. Irrigation will be most needed in the south. Groundwater will be used most in the north. [1] (b) Fig. 6.2 shows the water use and population of California. 45 50 40 35 40 30 water use 30 25 population (billion m3) (million) 20 20 15 10 10 5 0 0 1960 1970 1980 1990 2000 2010 2015 date Key agriculture domestic and industrial population Fig. 6.2 (i) What was the population of California in 1990? ........................... million [1] (ii) How much water was used for agriculture in 1980? ........................... billion m3 [1] (c) Fig. 6.3 provides more information about water supply in California. About 30% of California’s water supply comes from groundwater and the rest from surface water. Some groundwater is poor quality, and the cost of pumping is high. Landowners have the right to pump as much water as they want to. The authorities in some parts of California are thinking about desalination as a way to provide water. It is not affected by periods of drought, but it is expensive. Water re‑use is becoming more common and recycled water is used for irrigation, toilets, and industry. Fig. 6.3 Using Fig. 6.3, suggest which one of the following statements is true. Tick (3) one box. tick (3) Cost will be a problem if desalinated water is used for agriculture. Groundwater is the main source used in California. Recycled water is of high quality. Surface water is not important to California. [1] (d) Suggest two possible environmental impacts of uncontrolled pumping of groundwater for use in irrigation. 1 ................................................................................................................................................ ................................................................................................................................................... 2 ................................................................................................................................................ ................................................................................................................................................... [2] [Total: 8]
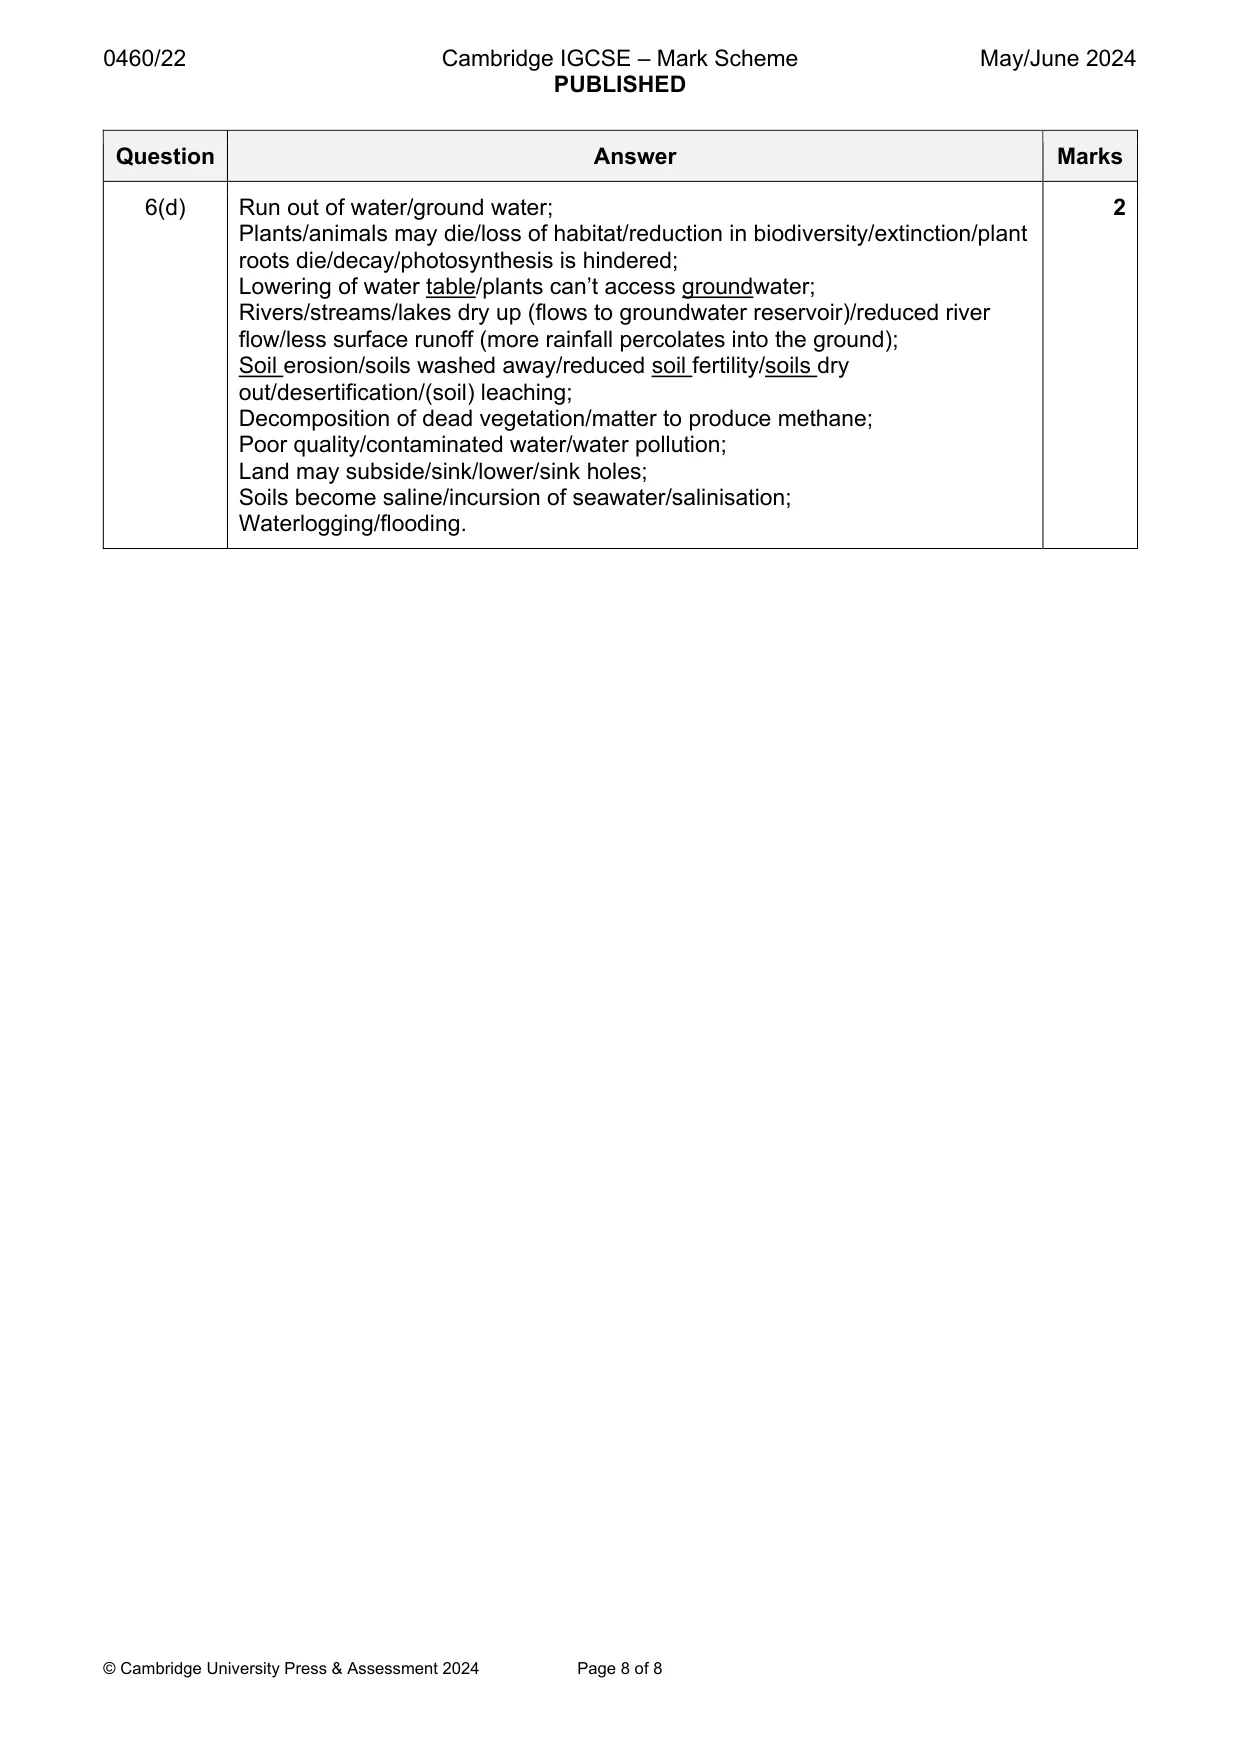
Mark scheme: 6(a)(i) B/Sacramento 2 A/Colorado 6(a)(ii) Irrigation will be most needed in the south 1 6(b)(i) 30 (million) 1 6(b)(ii) 42 (billion m3) 1 6(c) Cost will be a problem if desalinated water is used for agriculture 1 6(d) Run out of water/ground water; 2 Plants/animals may die/loss of habitat/reduction in biodiversity/extinction/plant roots die/decay/photosynthesis is hindered; Lowering of water table/plants can’t access groundwater; Rivers/streams/lakes dry up (flows to groundwater reservoir)/reduced river flow/less surface runoff (more rainfall percolates into the ground); Soil erosion/soils washed away/reduced soil fertility/soils dry out/desertification/(soil) leaching; Decomposition of dead vegetation/matter to produce methane; Poor quality/contaminated water/water pollution; Land may subside/sink/lower/sink holes; Soils become saline/incursion of seawater/salinisation; Waterlogging/flooding.
What was in this paper
The subtopics covered by these 6 questions, and how many questions each got. Open one in a new tab to see every Cambridge question on it.
What you needed in this session
Cambridge’s own grade thresholds for 2024 May/June, Paper 2 · Variant 2. A higher threshold means an easier paper — the bar moves with how the cohort did.