Cambridge IGCSE Geography 0460 — 2022 Oct/Nov Paper 2 · Variant 3
0460/23/O/N/22 · 6 questions · 60 marks · ≈68 min
The question paper and its mark scheme, free to read here and free to download. This is Cambridge’s own paper, exactly as it was sat.
Question paper16 pages
Mark scheme8 pages
Answers below. Sit the paper first if you are practising.
Questions as text
Q1 · Study the map extract for Saltcoats, Scotland
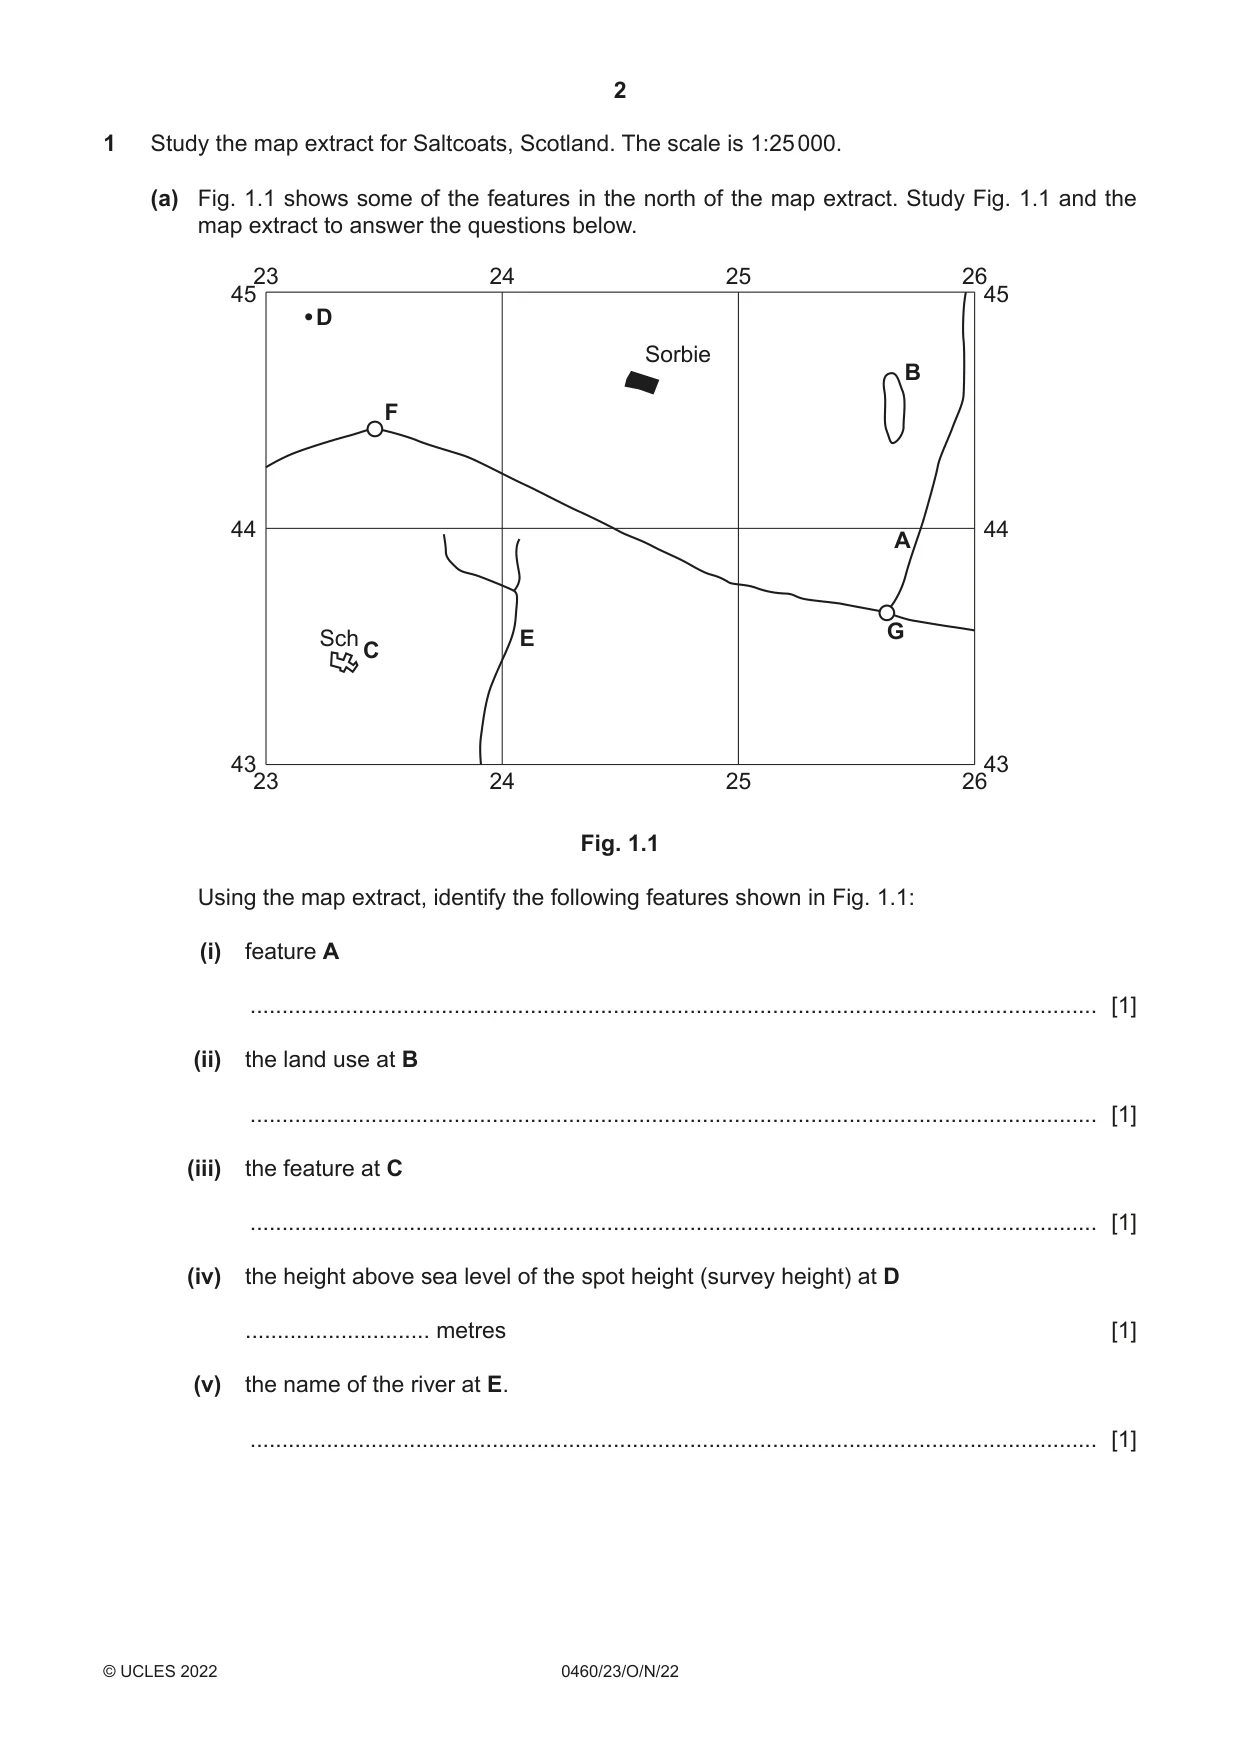
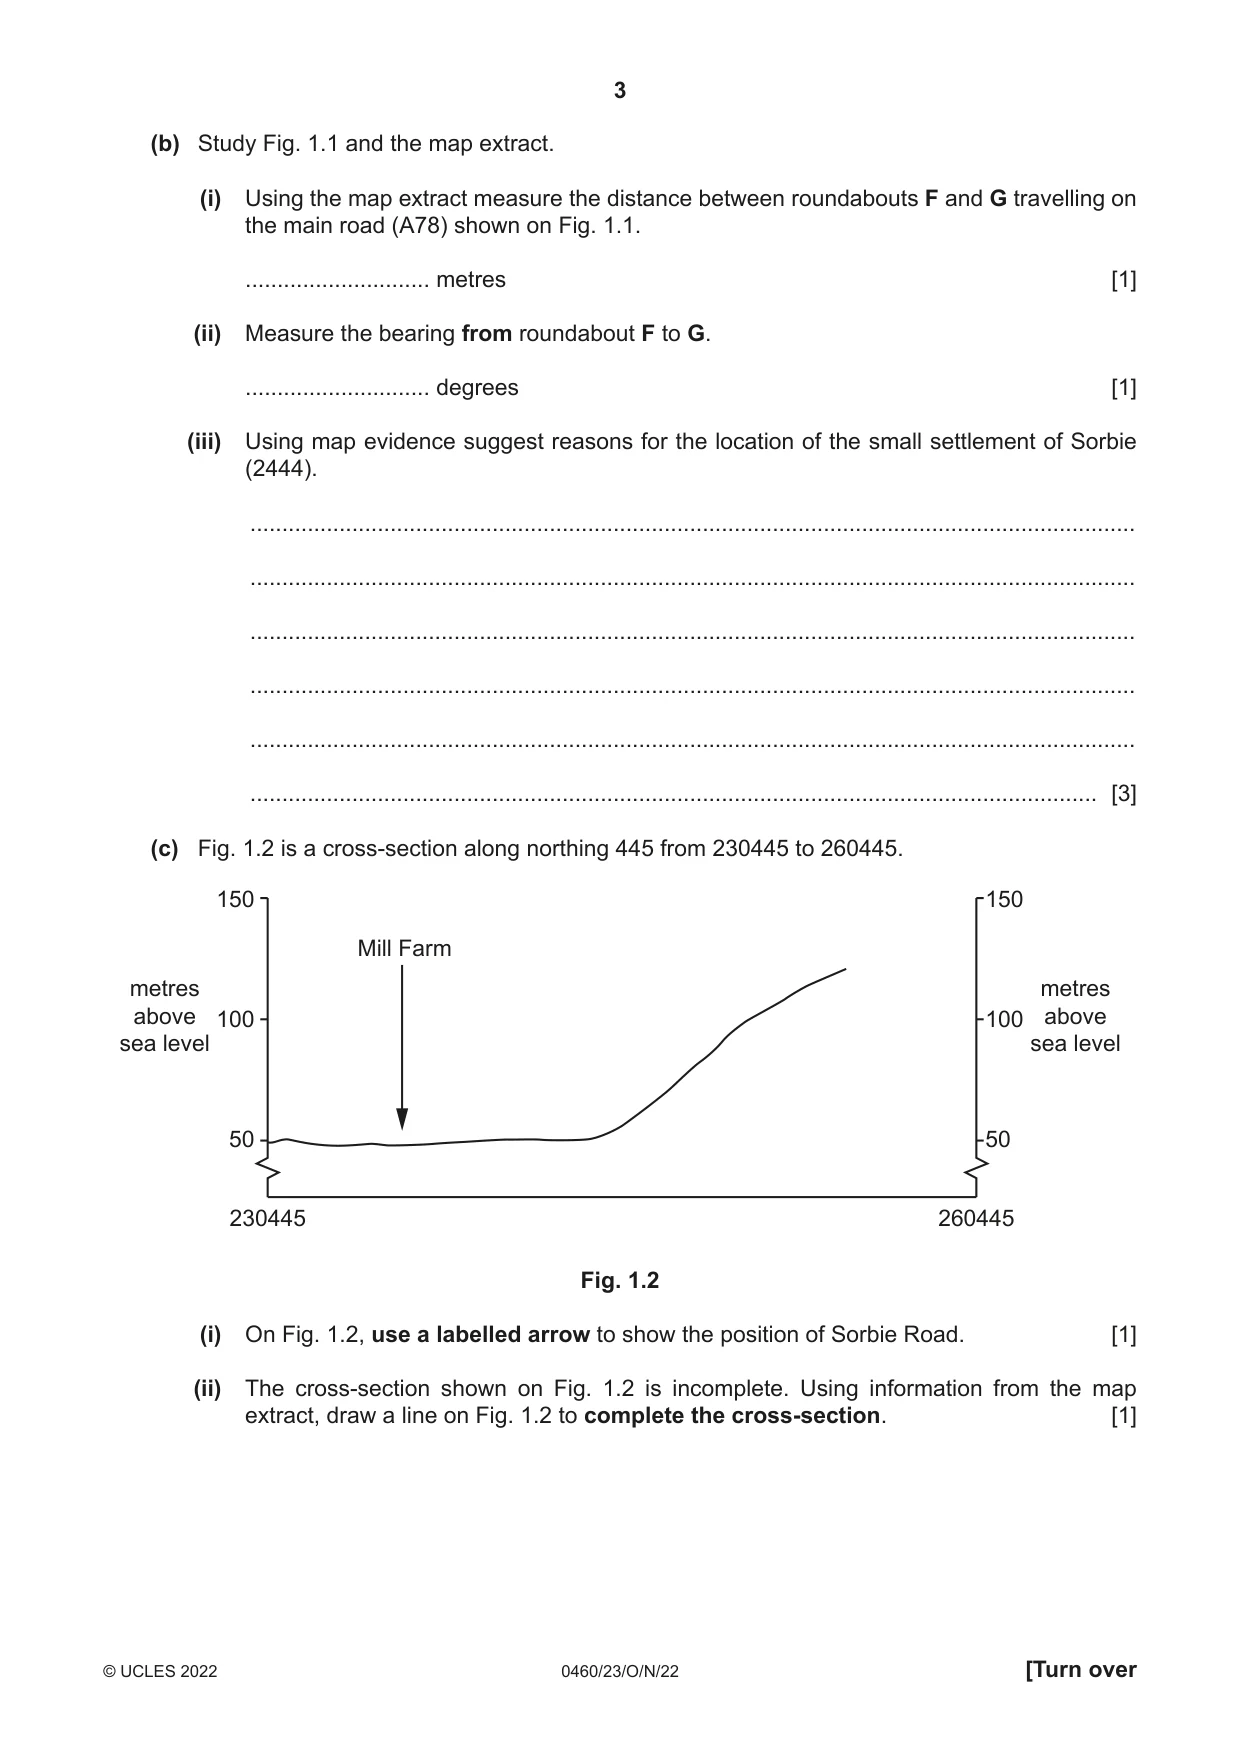
1 Study the map extract for Saltcoats, Scotland. The scale is 1:25 000. (a) Fig. 1.1 shows some of the features in the north of the map extract. Study Fig. 1.1 and the map extract to answer the questions below. 23 24 25 26 45 45 D Sorbie B F 44 44 A G Sch E C 43 43 23 24 25 26 Fig. 1.1 Using the map extract, identify the following features shown in Fig. 1.1: (i) feature A ..................................................................................................................................... [1] (ii) the land use at B ..................................................................................................................................... [1] (iii) the feature at C ..................................................................................................................................... [1] (iv) the height above sea level of the spot height (survey height) at D ............................. metres [1] (v) the name of the river at E. ..................................................................................................................................... [1] (b) Study Fig. 1.1 and the map extract. (i) Using the map extract measure the distance between roundabouts F and G travelling on the main road (A78) shown on Fig. 1.1. ............................. metres [1] (ii) Measure the bearing from roundabout F to G. ............................. degrees [1] (iii) Using map evidence suggest reasons for the location of the small settlement of Sorbie (2444). ........................................................................................................................................... ........................................................................................................................................... ........................................................................................................................................... ........................................................................................................................................... ........................................................................................................................................... ..................................................................................................................................... [3] (c) Fig. 1.2 is a cross-section along northing 445 from 230445 to 260445. 150 150 Mill Farm metres metres above 100 100 above sea level sea level 50 50 230445 260445 Fig. 1.2 (i) On Fig. 1.2, use a labelled arrow to show the position of Sorbie Road. [1] (ii) The cross-section shown on Fig. 1.2 is incomplete. Using information from the map extract, draw a line on Fig. 1.2 to complete the cross-section. [1] (d) (i) Identify three human features of the coastline shown on the map extract. 1 ........................................................................................................................................ 2 ........................................................................................................................................ 3 ................................................................................................................................... [3] (ii) Describe the physical features of the coastline shown on the map extract. ........................................................................................................................................... ........................................................................................................................................... ........................................................................................................................................... ........................................................................................................................................... ........................................................................................................................................... ........................................................................................................................................... ........................................................................................................................................... ........................................................................................................................................... ........................................................................................................................................... ..................................................................................................................................... [5] [Total: 20]
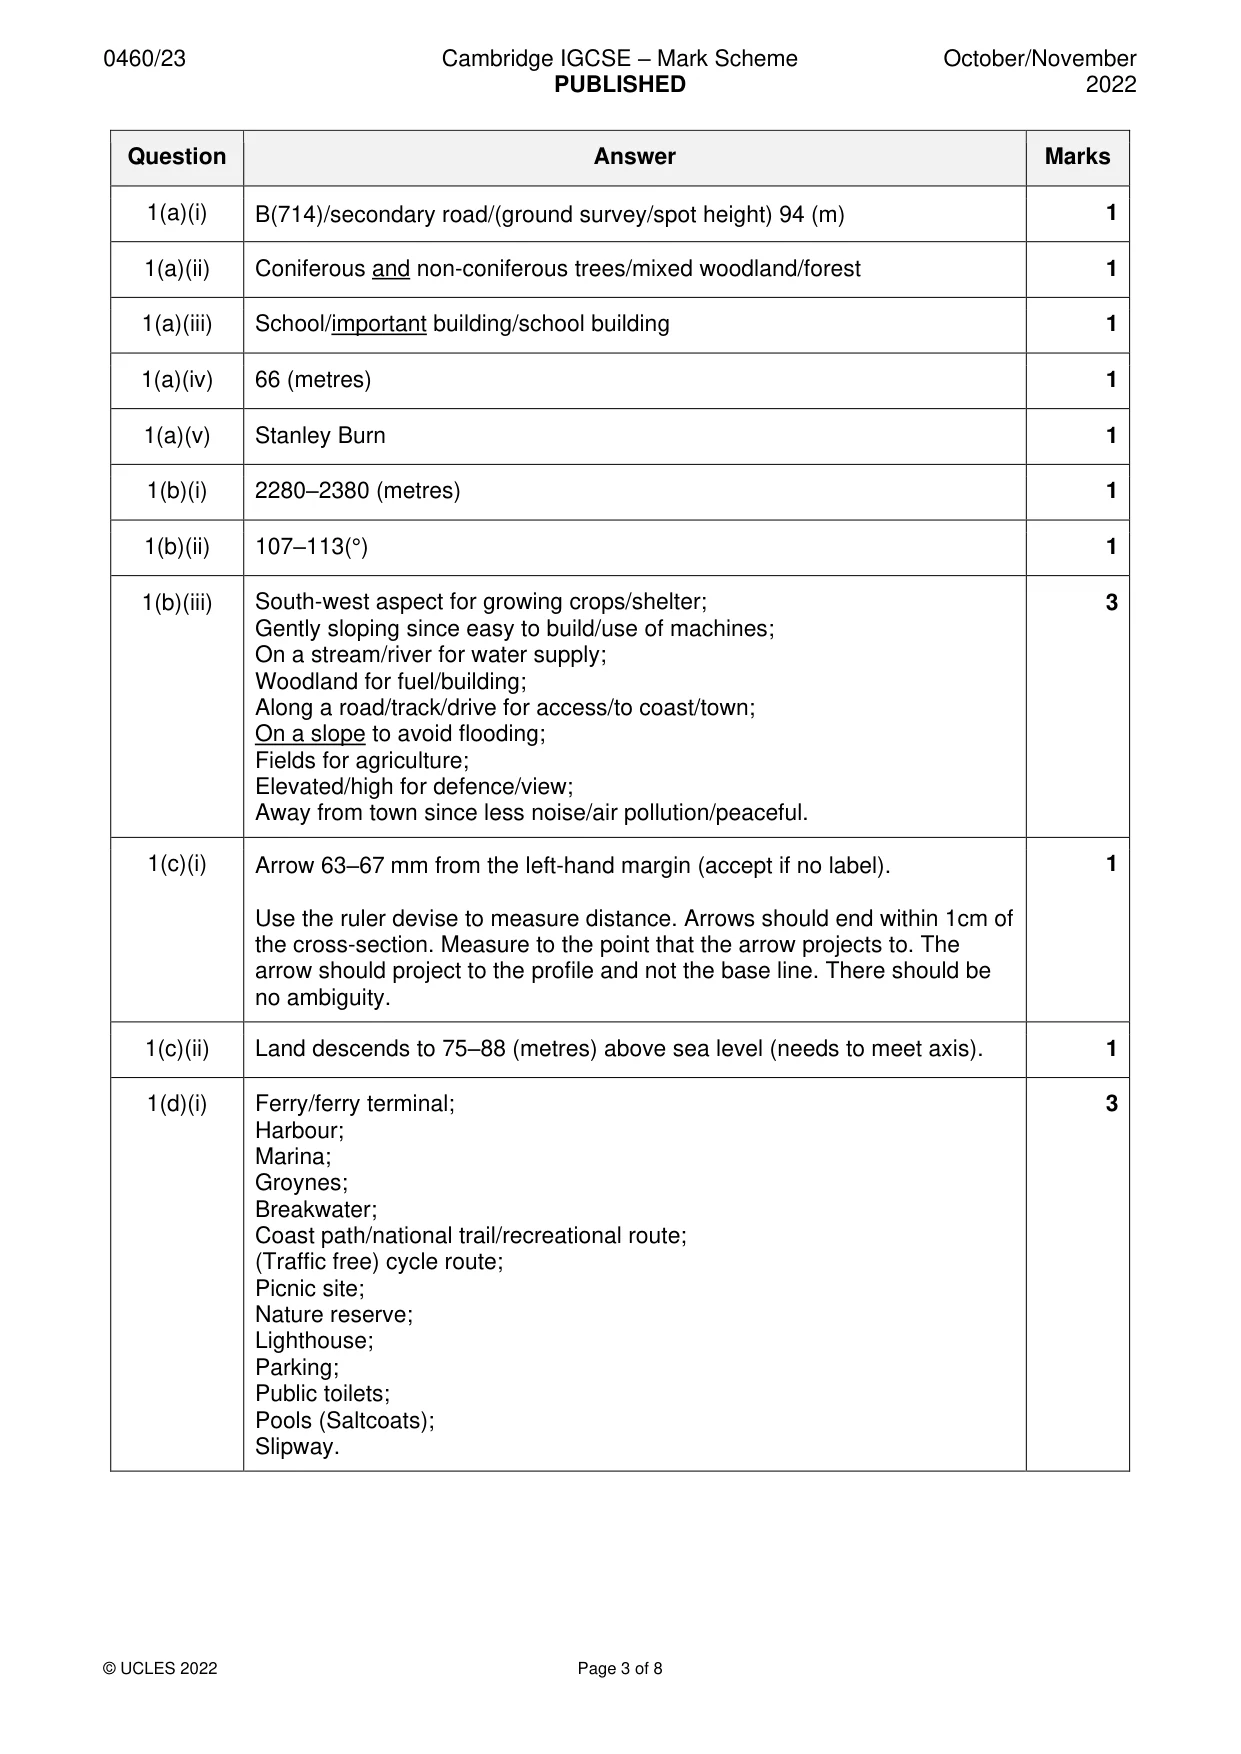
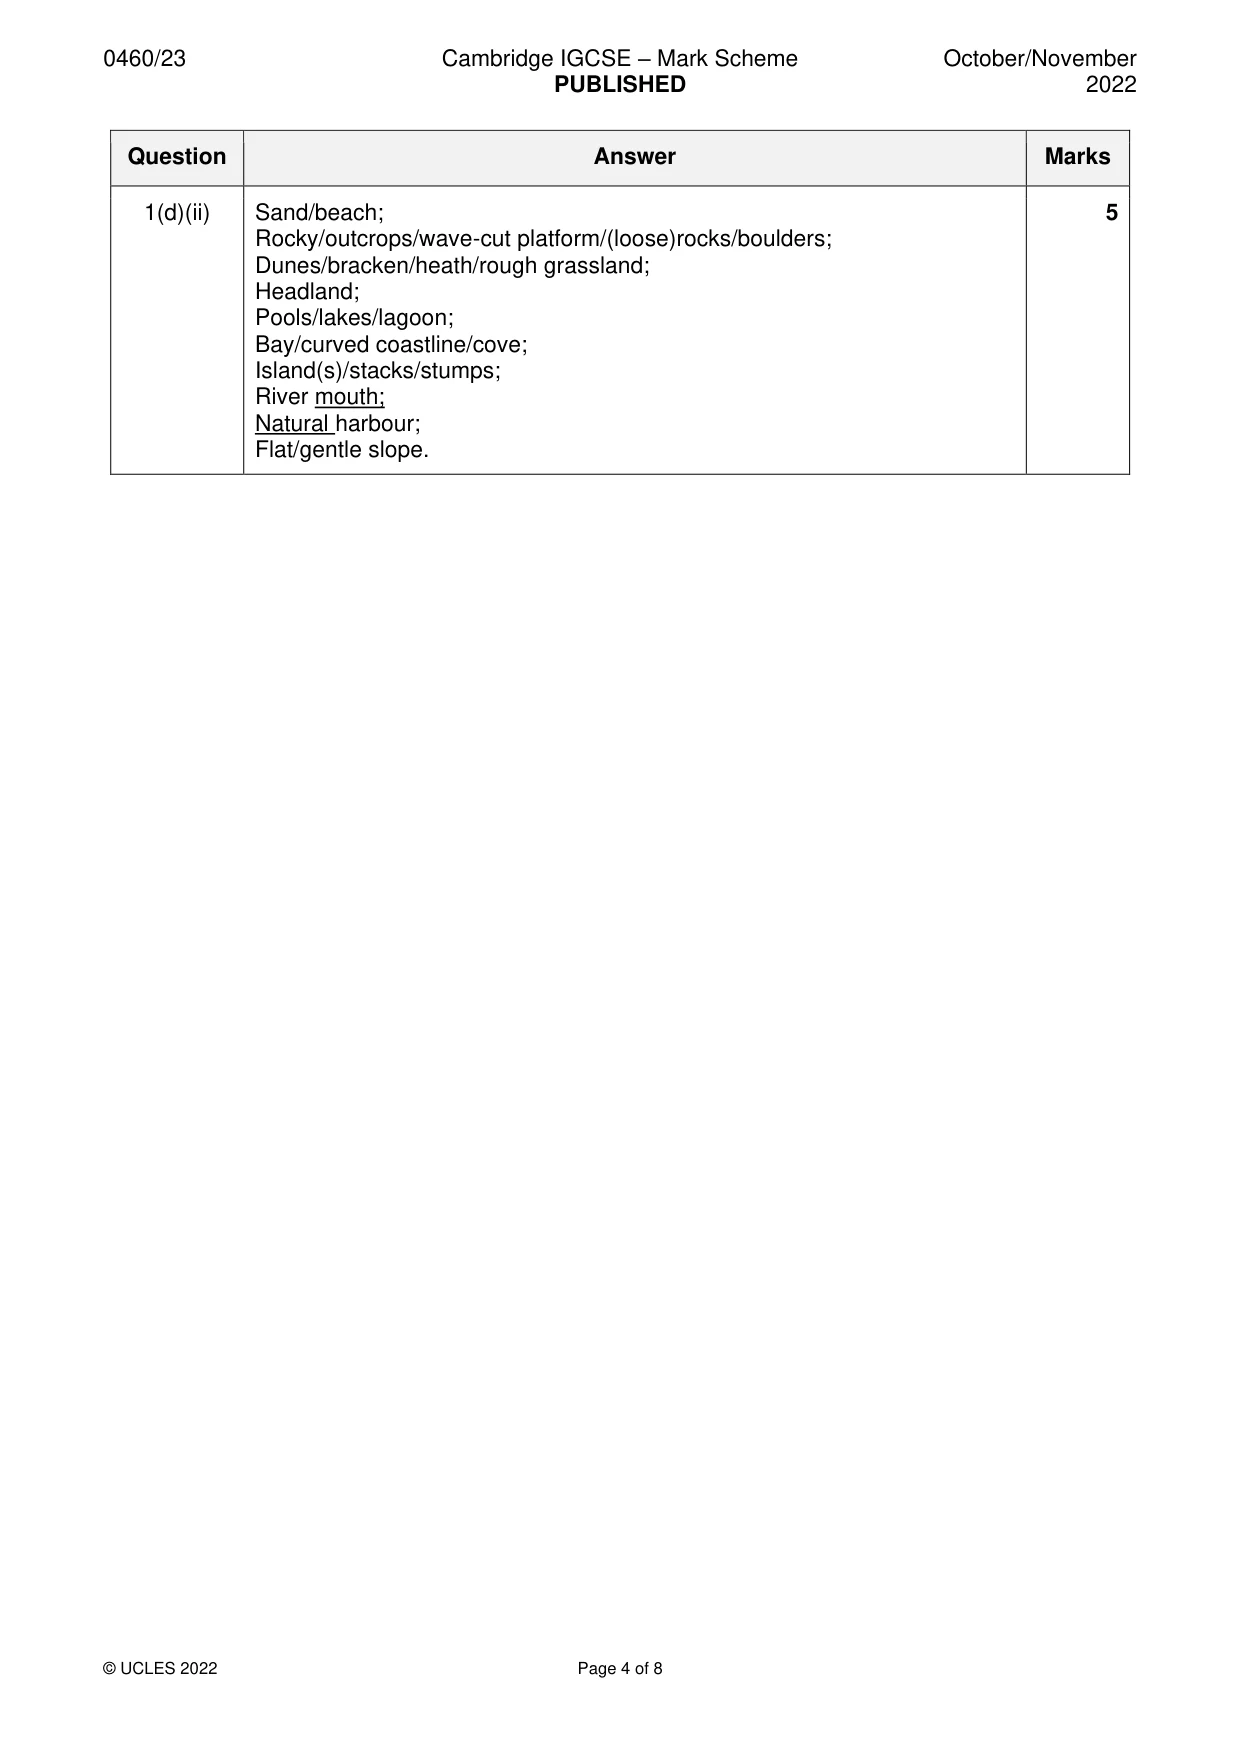
Mark scheme: Question Answer Marks 1(a)(i) B(714)/secondary road/(ground survey/spot height) 94 (m) 1 1(a)(ii) Coniferous and non-coniferous trees/mixed woodland/forest 1 1(a)(iii) School/important building/school building 1 1(a)(iv) 66 (metres) 1 1(a)(v) Stanley Burn 1 1(b)(i) 2280–2380 (metres) 1 1(b)(ii) 107–113(°) 1 1(b)(iii) South-west aspect for growing crops/shelter; 3 Gently sloping since easy to build/use of machines; On a stream/river for water supply; Woodland for fuel/building; Along a road/track/drive for access/to coast/town; On a slope to avoid flooding; Fields for agriculture; Elevated/high for defence/view; Away from town since less noise/air pollution/peaceful. 1(c)(i) Arrow 63–67 mm from the left-hand margin (accept if no label). 1 Use the ruler devise to measure distance. Arrows should end within 1cm of the cross-section. Measure to the point that the arrow projects to. The arrow should project to the profile and not the base line. There should be no ambiguity. 1(c)(ii) Land descends to 75–88 (metres) above sea level (needs to meet axis). 1 1(d)(i) Ferry/ferry terminal; 3 Harbour; Marina; Groynes; Breakwater; Coast path/national trail/recreational route; (Traffic free) cycle route; Picnic site; Nature reserve; Lighthouse; Parking; Public toilets; Pools (Saltcoats); Slipway. 1(d)(ii) Sand/beach; 5 Rocky/outcrops/wave-cut platform/(loose)rocks/boulders; Dunes/bracken/heath/rough grassland; Headland; Pools/lakes/lagoon; Bay/curved coastline/cove; Island(s)/stacks/stumps; River mouth; Natural harbour; Flat/gentle slope.
More questions on Settlements (rural and urban) and service provision
Question 2
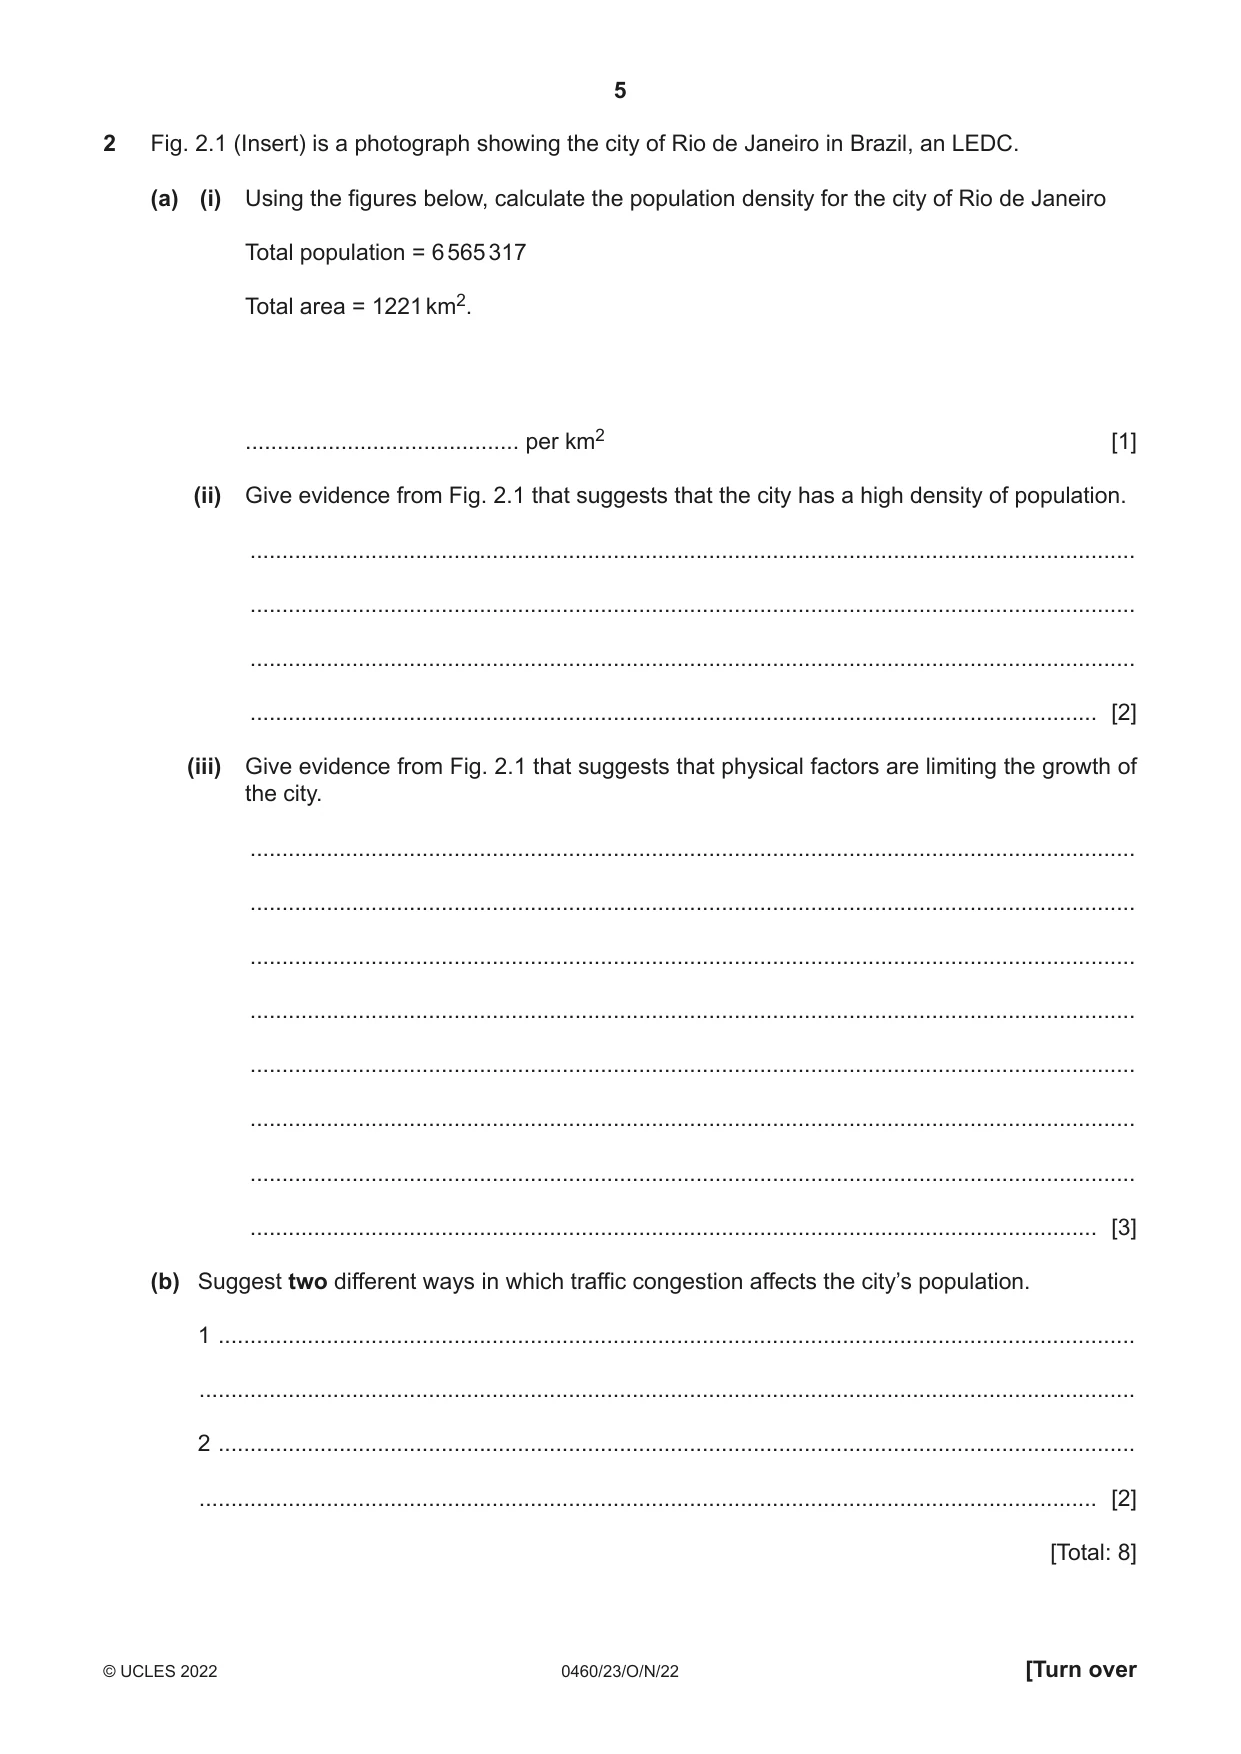
2 Fig. 2.1 (Insert) is a photograph showing the city of Rio de Janeiro in Brazil, an LEDC. (a) (i) Using the figures below, calculate the population density for the city of Rio de Janeiro Total population = 6 565 317 Total area = 1221 km2. ........................................... per km2 [1] (ii) Give evidence from Fig. 2.1 that suggests that the city has a high density of population. ........................................................................................................................................... ........................................................................................................................................... ........................................................................................................................................... ..................................................................................................................................... [2] (iii) Give evidence from Fig. 2.1 that suggests that physical factors are limiting the growth of the city. ........................................................................................................................................... ........................................................................................................................................... ........................................................................................................................................... ........................................................................................................................................... ........................................................................................................................................... ........................................................................................................................................... ........................................................................................................................................... ..................................................................................................................................... [3] (b) Suggest two different ways in which traffic congestion affects the city’s population. 1 ................................................................................................................................................ ................................................................................................................................................... 2 ................................................................................................................................................ ............................................................................................................................................. [2] [Total: 8]
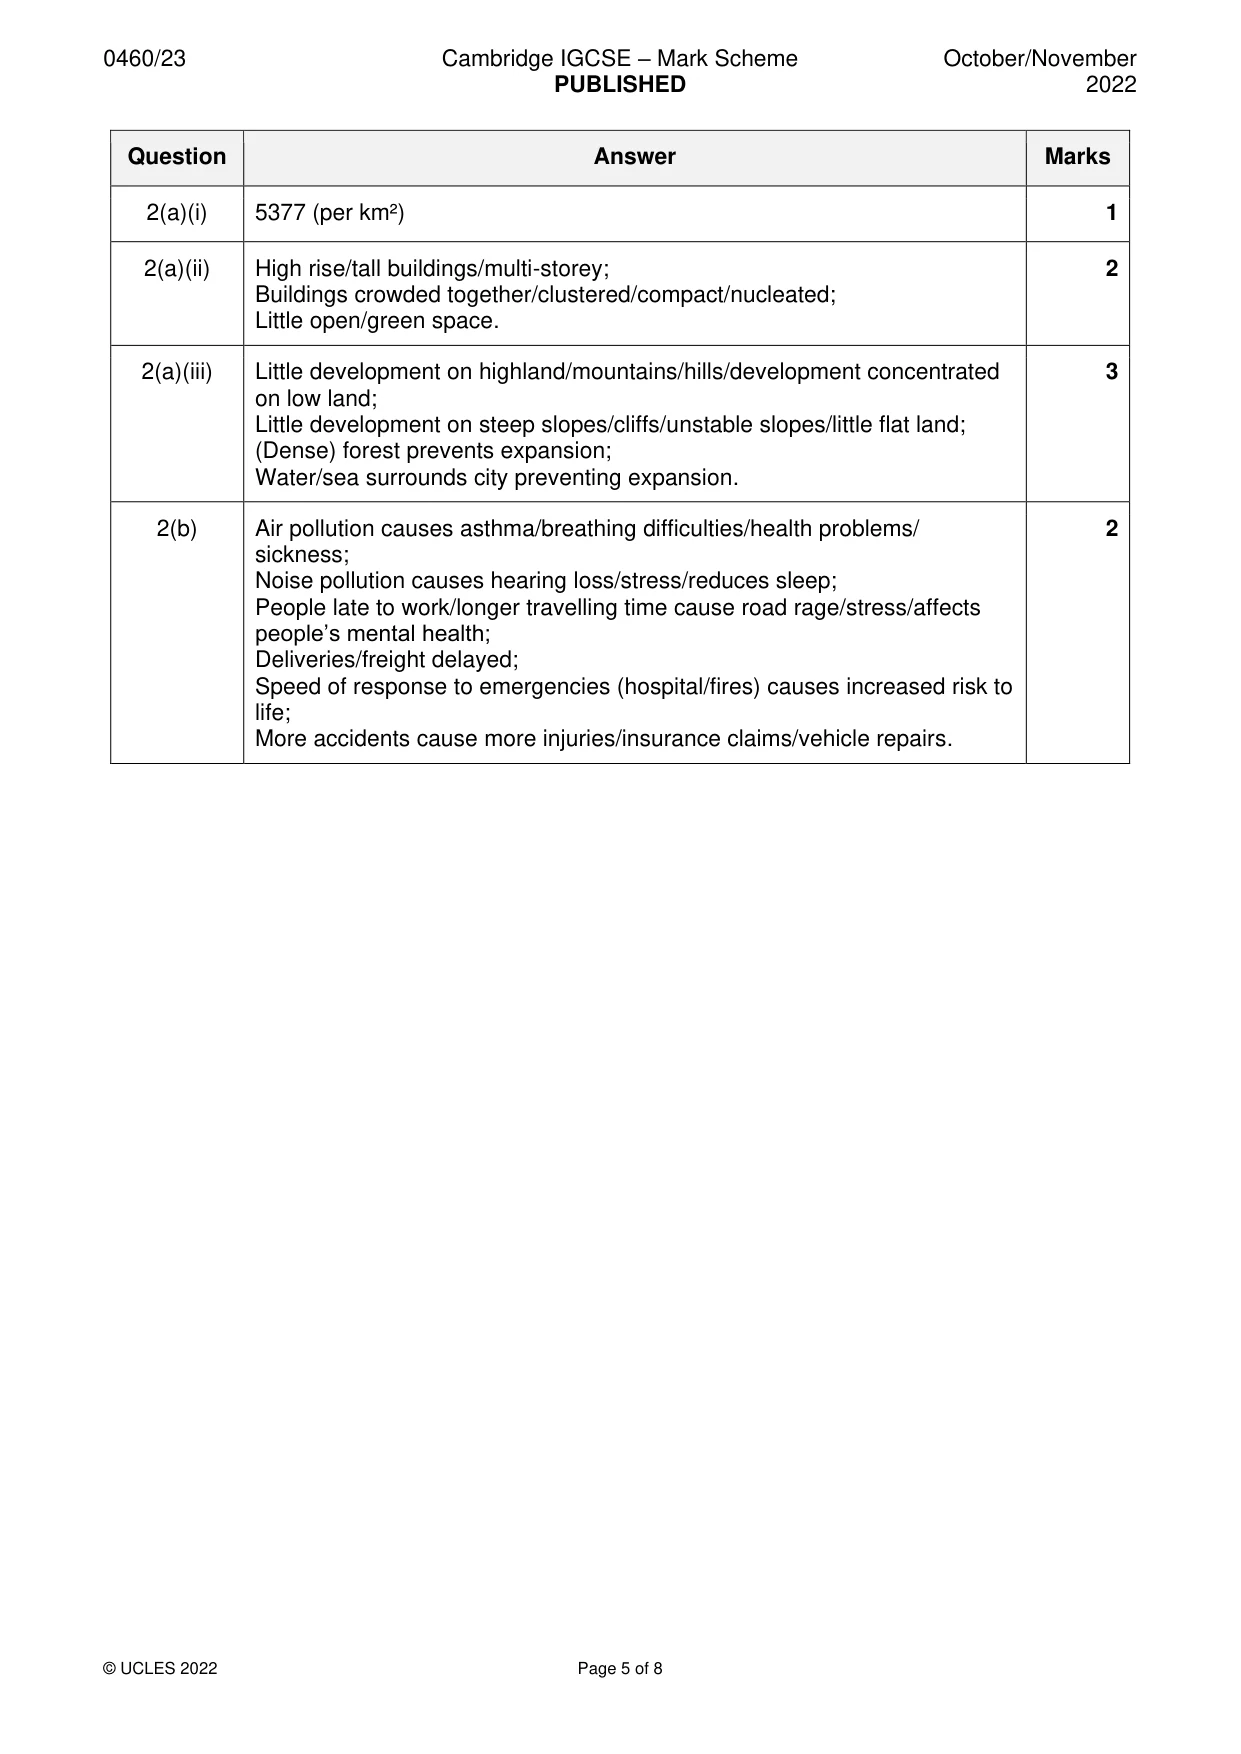
Mark scheme: 2(a)(i) 5377 (per km²) 1 2(a)(ii) High rise/tall buildings/multi-storey; 2 Buildings crowded together/clustered/compact/nucleated; Little open/green space. 2(a)(iii) Little development on highland/mountains/hills/development concentrated 3 on low land; Little development on steep slopes/cliffs/unstable slopes/little flat land; (Dense) forest prevents expansion; Water/sea surrounds city preventing expansion. 2(b) Air pollution causes asthma/breathing difficulties/health problems/ 2 sickness; Noise pollution causes hearing loss/stress/reduces sleep; People late to work/longer travelling time cause road rage/stress/affects people’s mental health; Deliveries/freight delayed; Speed of response to emergencies (hospital/fires) causes increased risk to life; More accidents cause more injuries/insurance claims/vehicle repairs.
Q3 · Information about migration in the nine provinces of South Africa
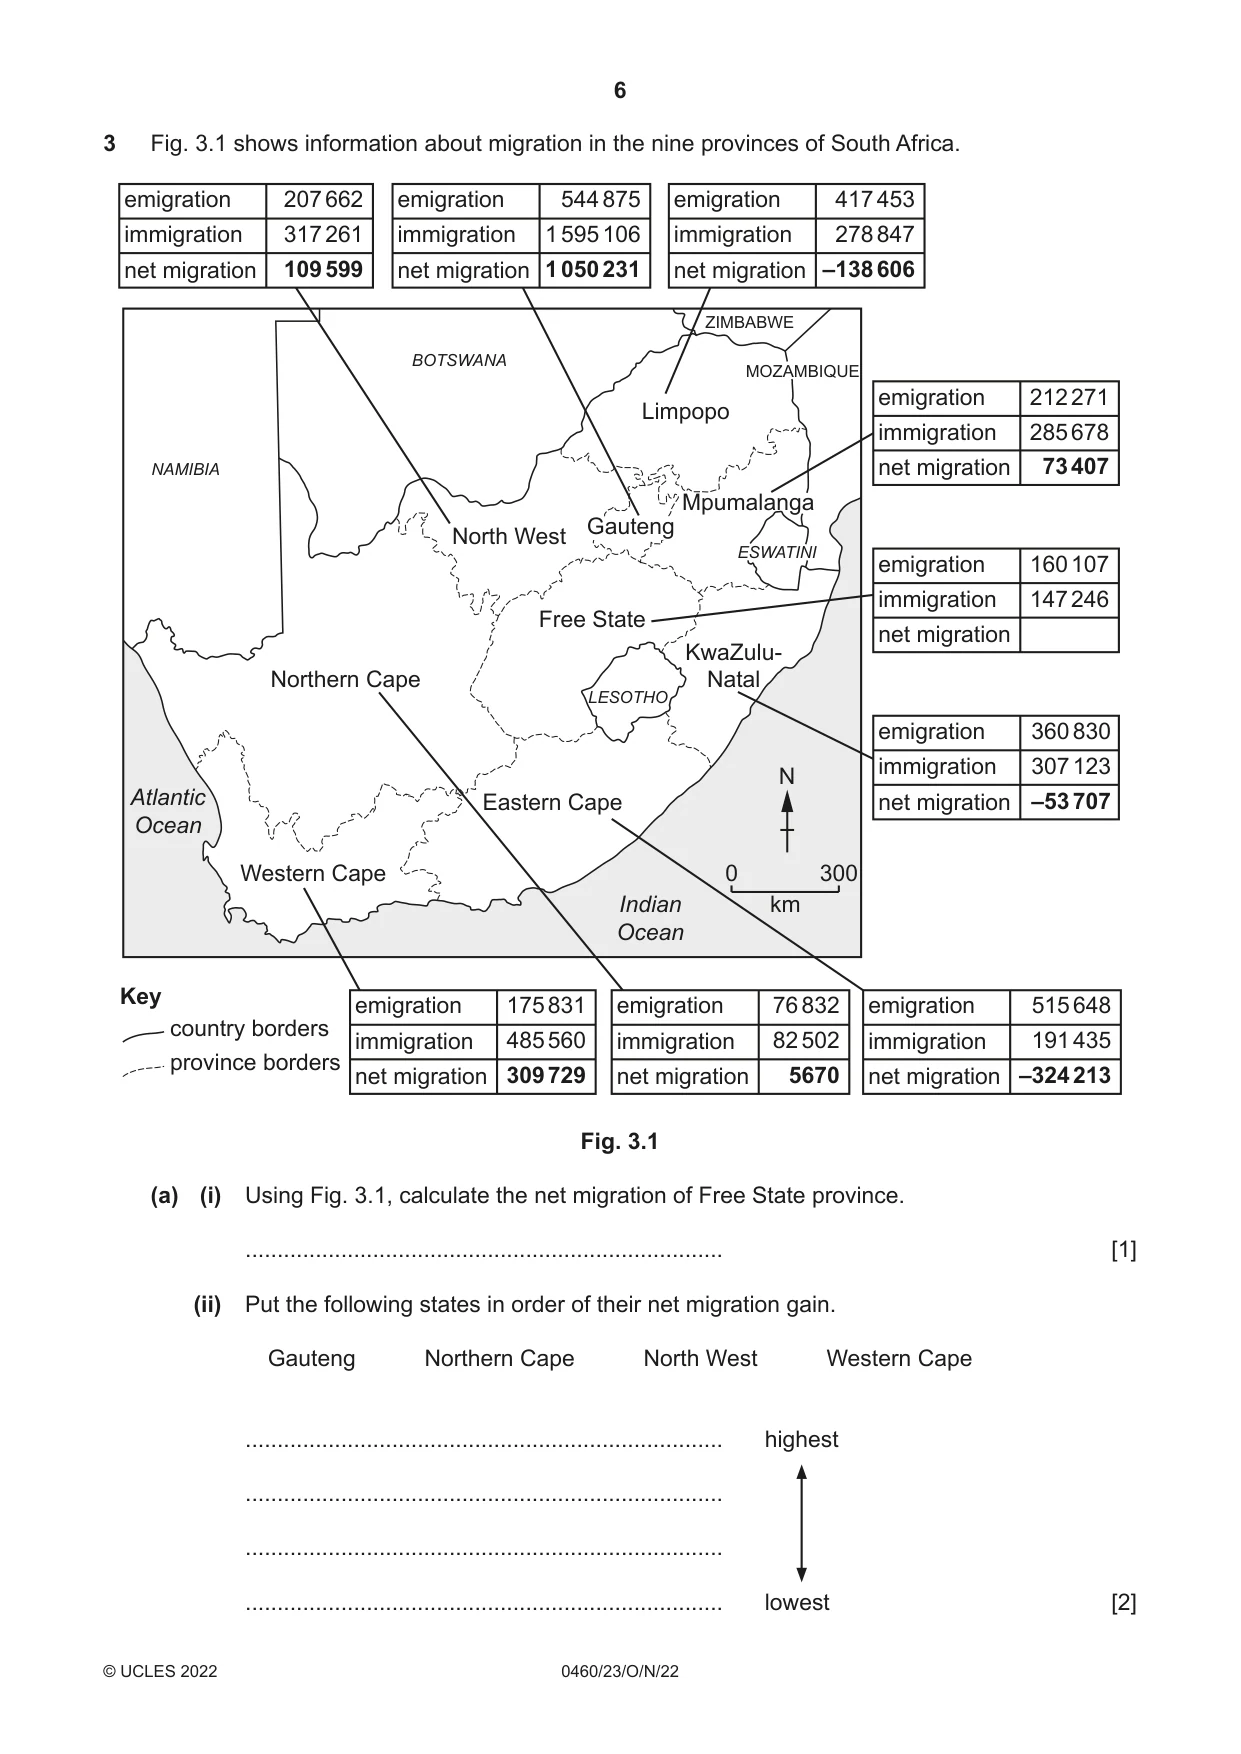
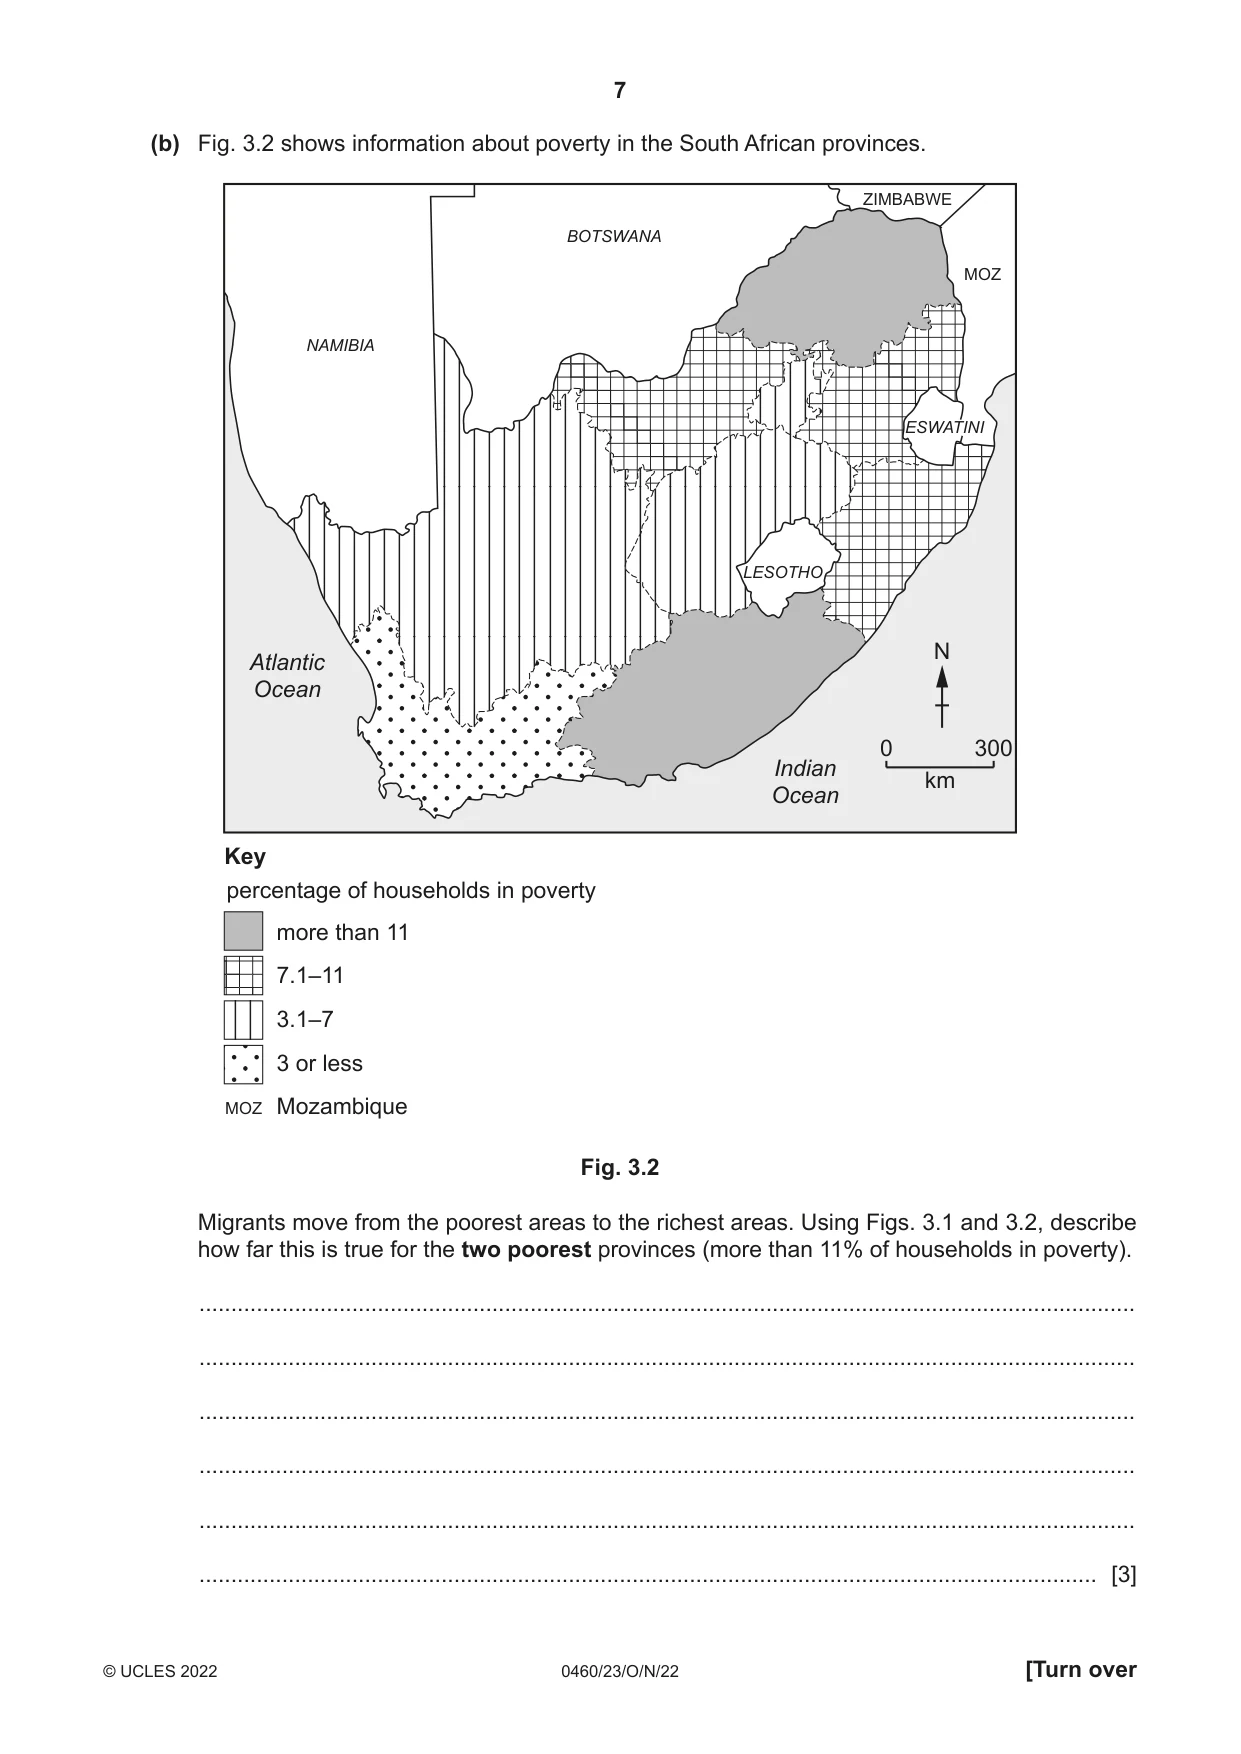
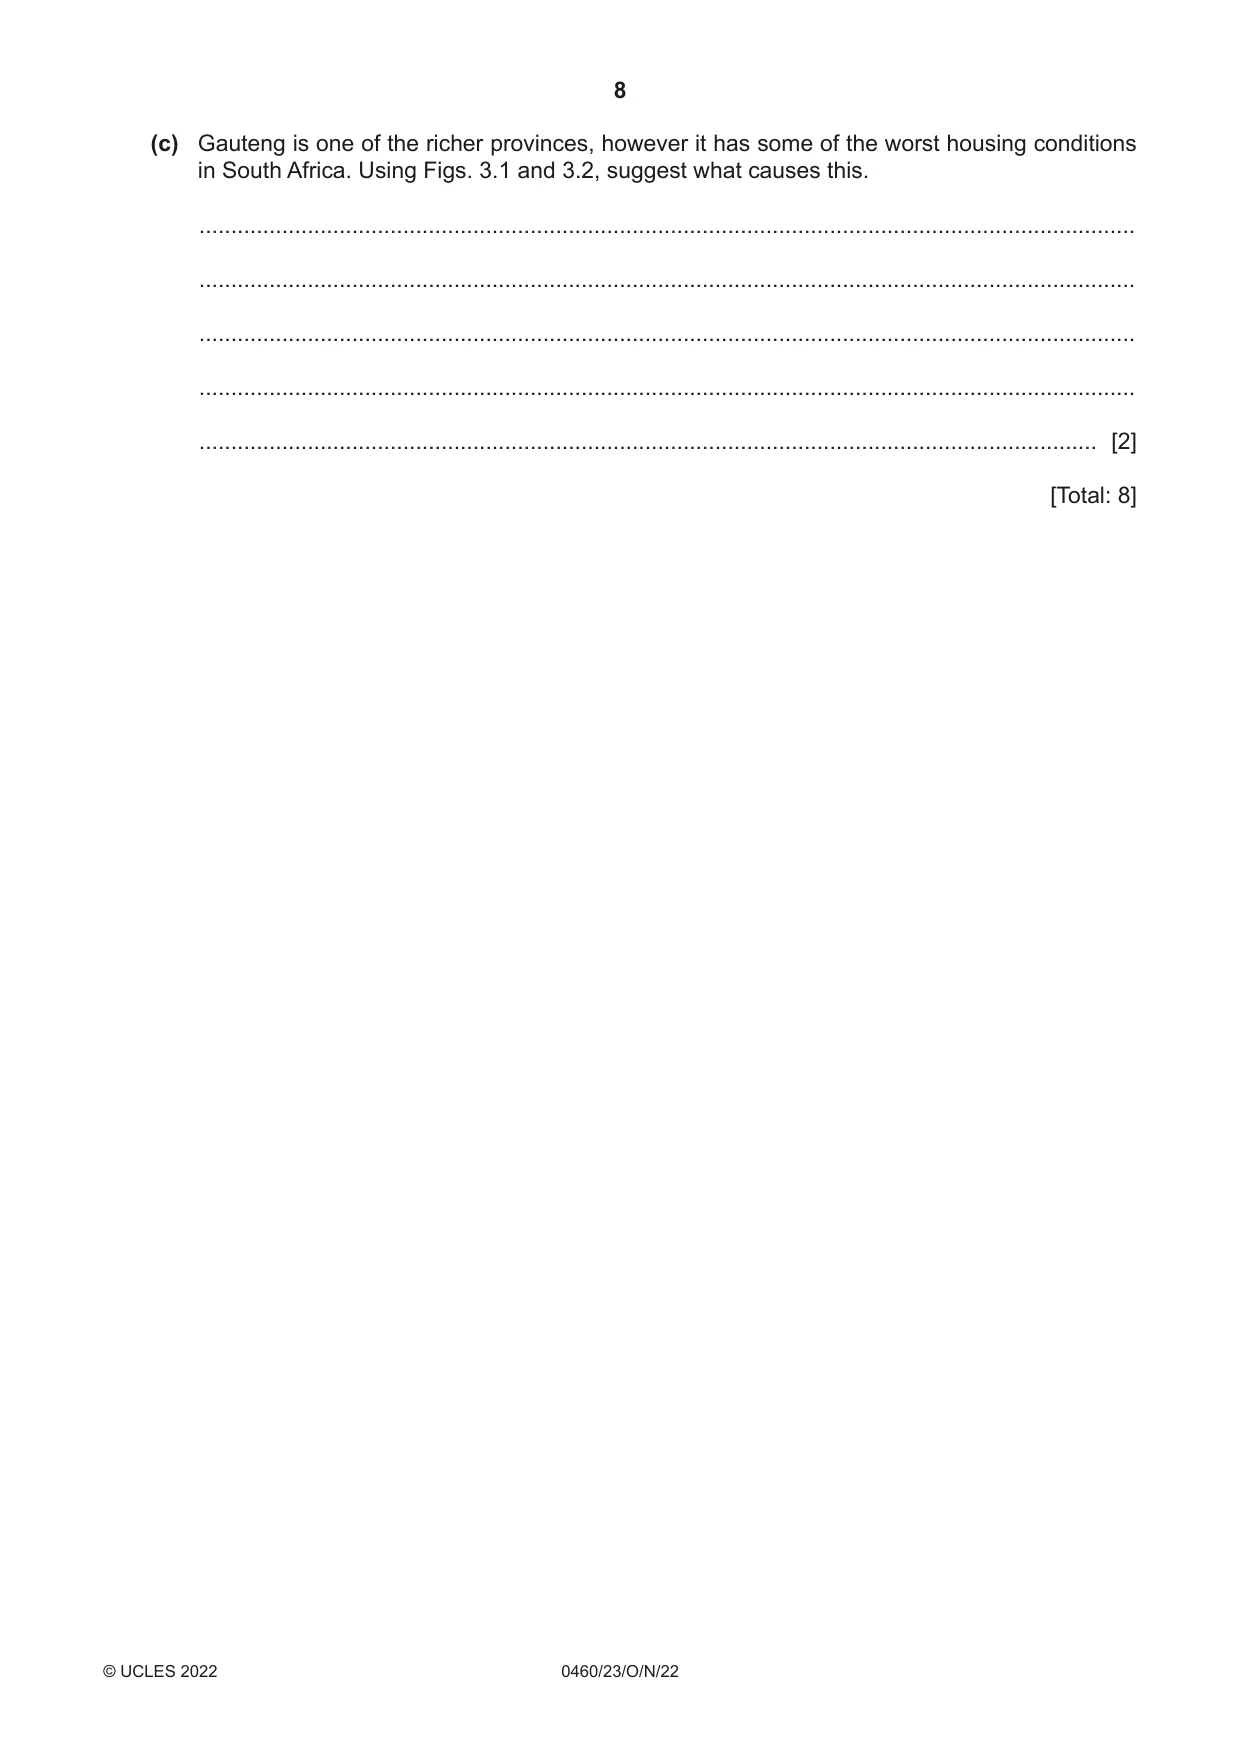
3 Fig. 3.1 shows information about migration in the nine provinces of South Africa. emigration 207 662 emigration 544 875 emigration 417 453 immigration 317 261 immigration 1 595 106 immigration 278 847 net migration 109 599 net migration 1 050 231 net migration –138 606 ZIMBABWE BOTSWANA MOZAMBIQUE emigration 212 271 Limpopo immigration 285 678 NAMIBIA net migration 73 407 Mpumalanga Gauteng North West ESWATINI emigration 160 107 immigration 147 246 Free State net migration KwaZulu- Northern Cape Natal LESOTHO emigration 360 830 immigration 307 123 N Atlantic Eastern Cape net migration –53 707 Ocean Western Cape 0 300 Indian km Ocean Key emigration 175 831 emigration 76 832 emigration 515 648 country borders immigration 485 560 immigration 82 502 immigration 191 435 province borders net migration 309 729 net migration 5670 net migration –324 213 Fig. 3.1 (a) (i) Using Fig. 3.1, calculate the net migration of Free State province. ........................................................................... [1] (ii) Put the following states in order of their net migration gain. Gauteng Northern Cape North West Western Cape ........................................................................... highest ........................................................................... ........................................................................... ........................................................................... lowest [2] (b) Fig. 3.2 shows information about poverty in the South African provinces. ZIMBABWE BOTSWANA MOZ NAMIBIA ESWATINI LESOTHO N Atlantic Ocean 0 300 Indian km Ocean Key percentage of households in poverty more than 11 7.1–11 3.1–7 3 or less MOZ Mozambique Fig. 3.2 Migrants move from the poorest areas to the richest areas. Using Figs. 3.1 and 3.2, describe how far this is true for the two poorest provinces (more than 11% of households in poverty). ................................................................................................................................................... ................................................................................................................................................... ................................................................................................................................................... ................................................................................................................................................... ................................................................................................................................................... ............................................................................................................................................. [3] (c) Gauteng is one of the richer provinces, however it has some of the worst housing conditions in South Africa. Using Figs. 3.1 and 3.2, suggest what causes this. ................................................................................................................................................... ................................................................................................................................................... ................................................................................................................................................... ................................................................................................................................................... ............................................................................................................................................. [2] [Total: 8]
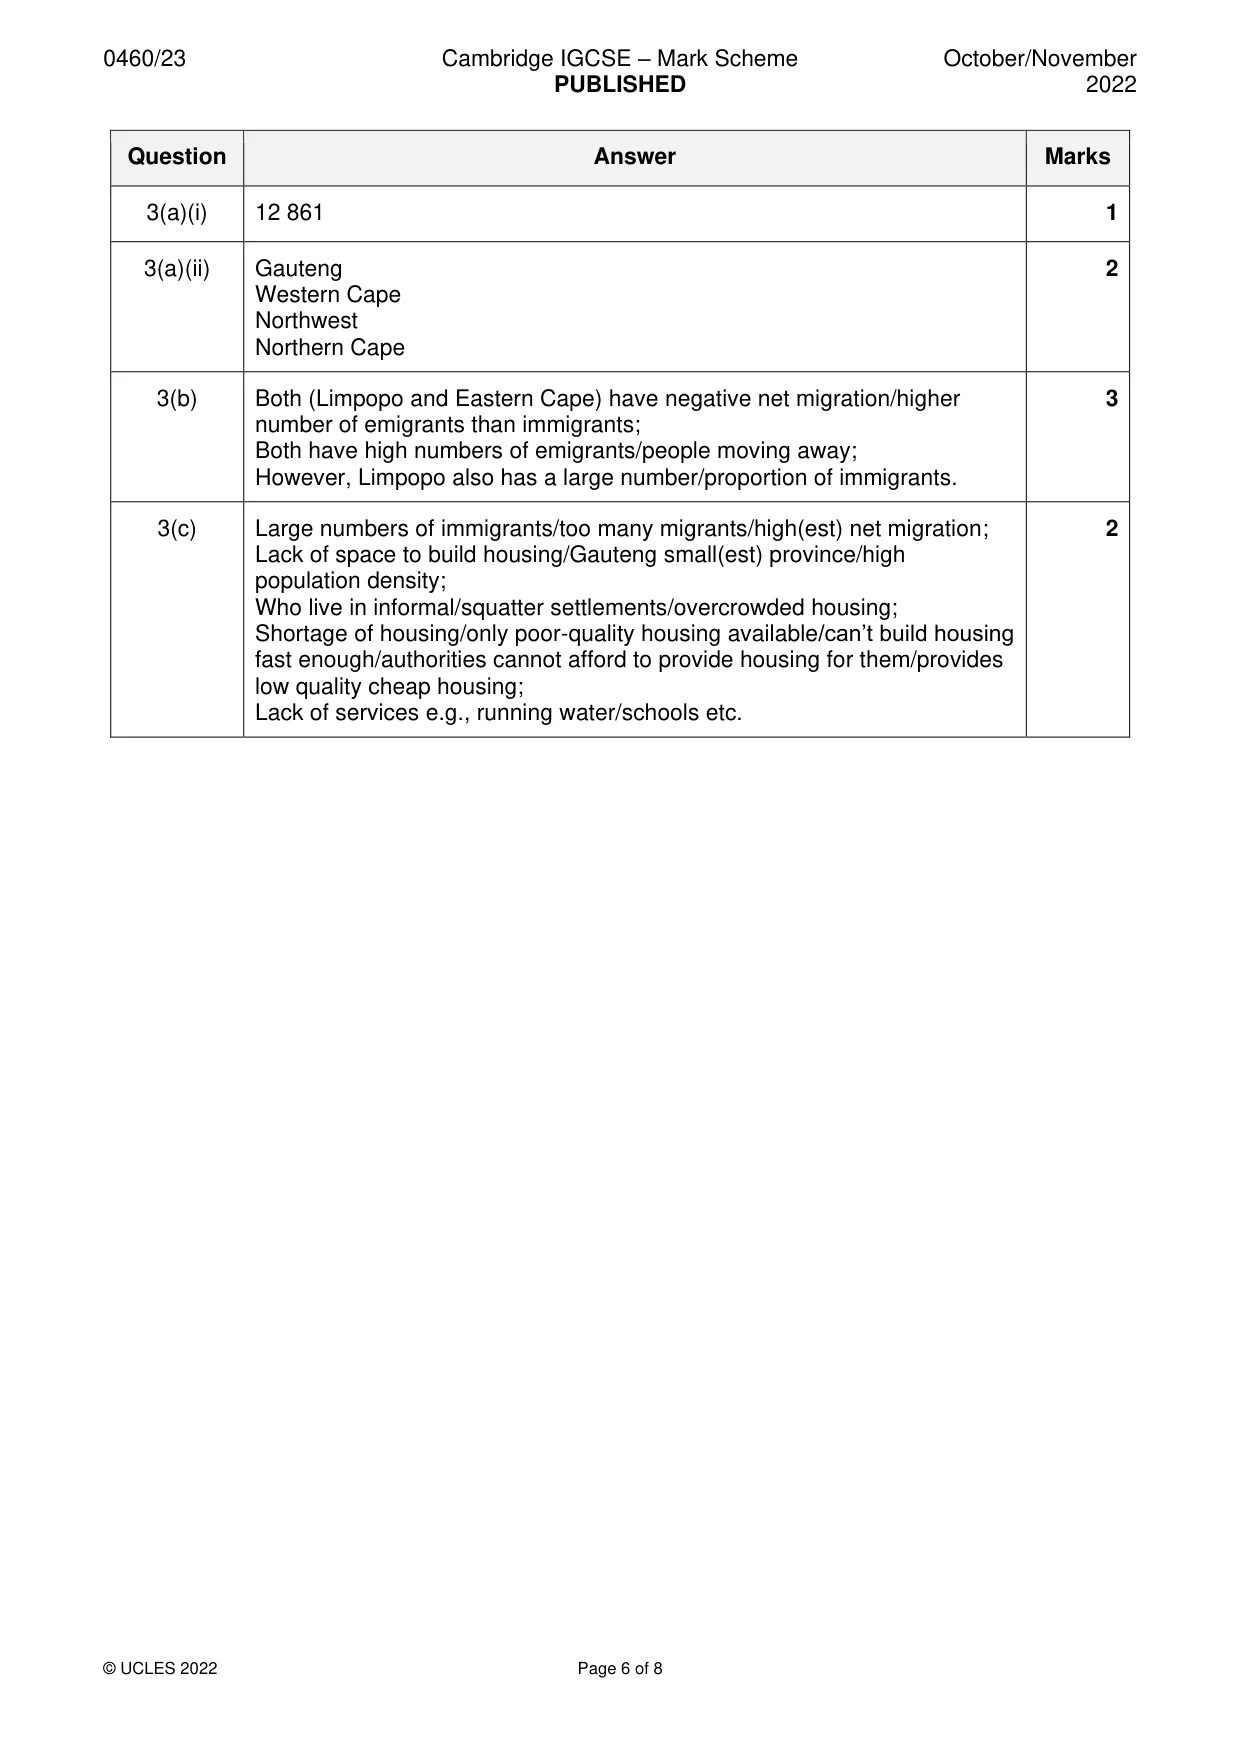
Mark scheme: 3(a)(i) 12 861 1 3(a)(ii) Gauteng 2 Western Cape Northwest Northern Cape 3(b) Both (Limpopo and Eastern Cape) have negative net migration/higher 3 number of emigrants than immigrants; Both have high numbers of emigrants/people moving away; However, Limpopo also has a large number/proportion of immigrants. 3(c) Large numbers of immigrants/too many migrants/high(est) net migration; 2 Lack of space to build housing/Gauteng small(est) province/high population density; Who live in informal/squatter settlements/overcrowded housing; Shortage of housing/only poor-quality housing available/can’t build housing fast enough/authorities cannot afford to provide housing for them/provides low quality cheap housing; Lack of services e.g., running water/schools etc.
Question 4
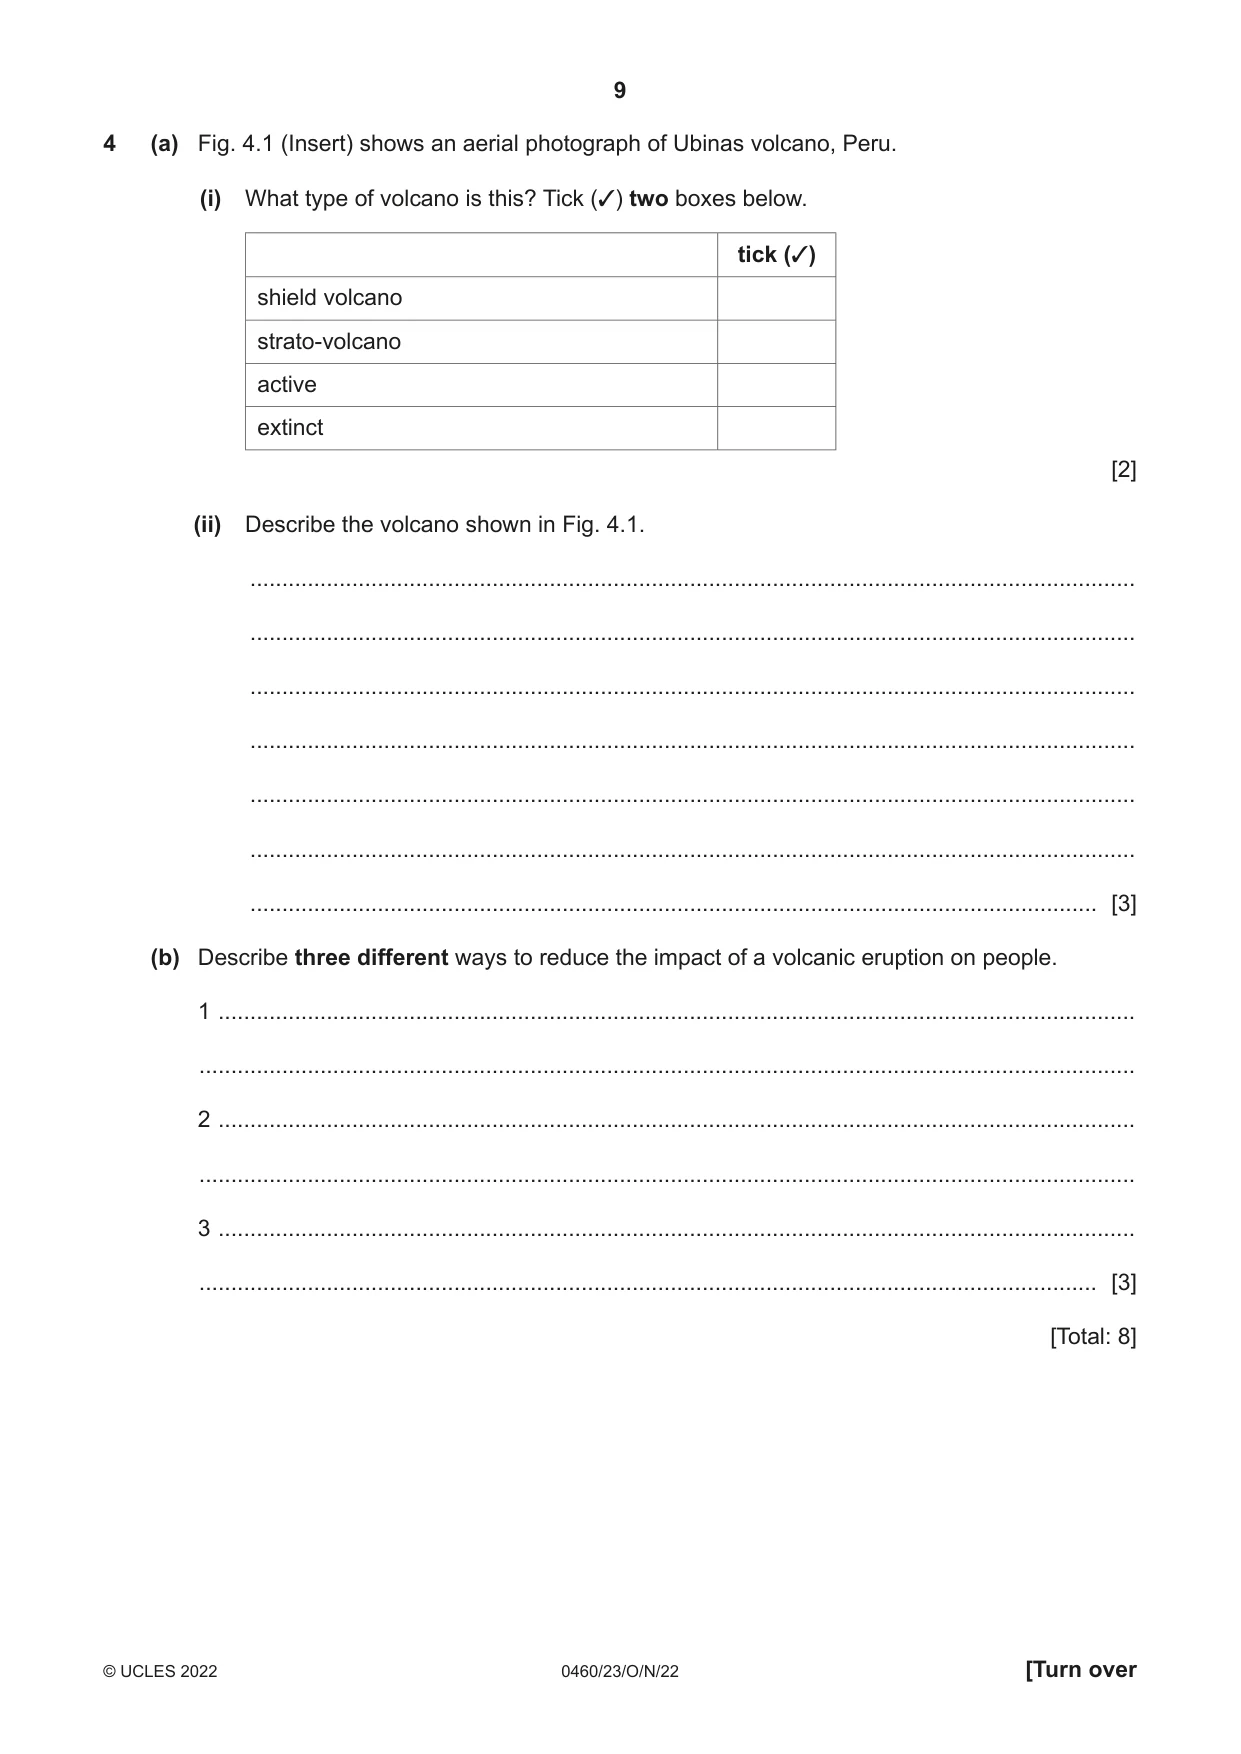
4 (a) Fig. 4.1 (Insert) shows an aerial photograph of Ubinas volcano, Peru. (i) What type of volcano is this? Tick (3) two boxes below. tick (3) shield volcano strato-volcano active extinct [2] (ii) Describe the volcano shown in Fig. 4.1. ........................................................................................................................................... ........................................................................................................................................... ........................................................................................................................................... ........................................................................................................................................... ........................................................................................................................................... ........................................................................................................................................... ..................................................................................................................................... [3] (b) Describe three different ways to reduce the impact of a volcanic eruption on people. 1 ................................................................................................................................................ ................................................................................................................................................... 2 ................................................................................................................................................ ................................................................................................................................................... 3 ................................................................................................................................................ ............................................................................................................................................. [3] [Total: 8]
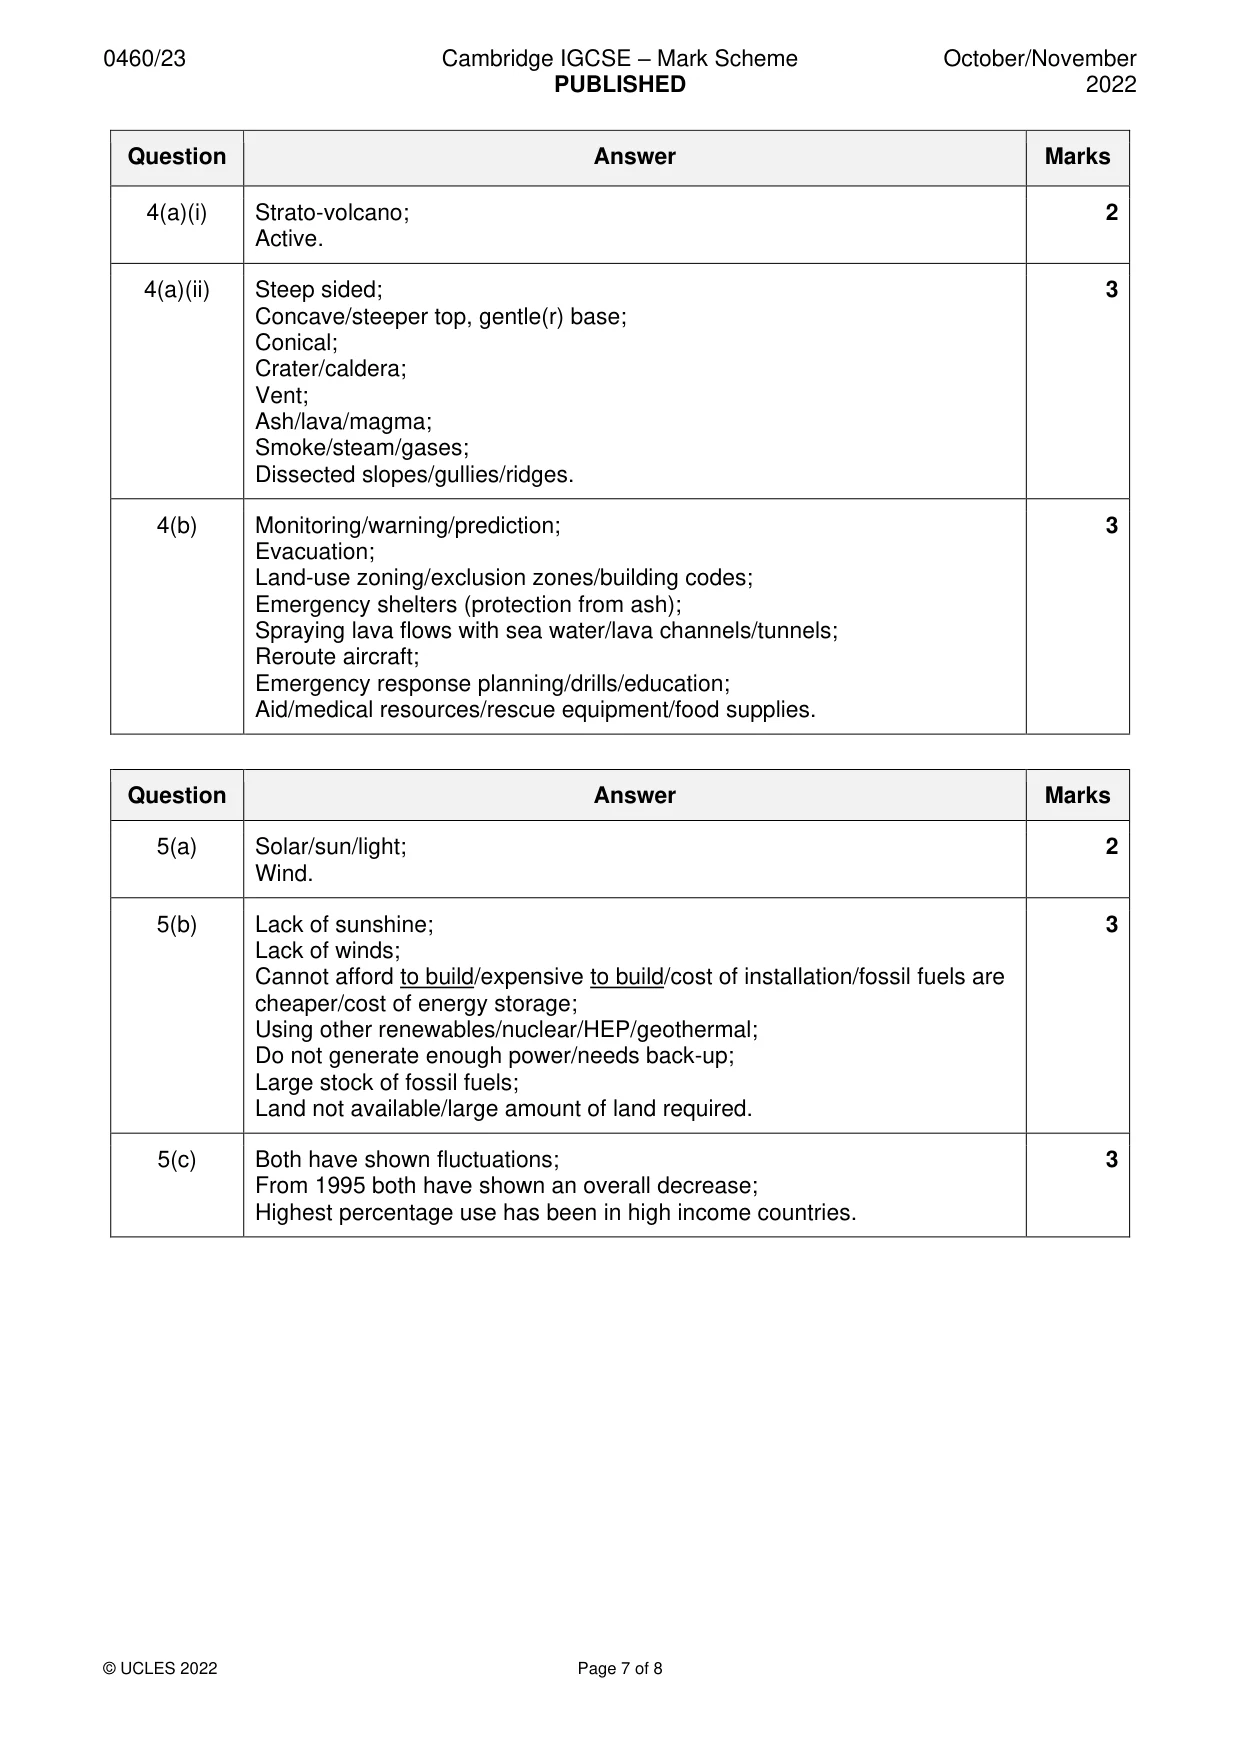
Mark scheme: 4(a)(i) Strato-volcano; 2 Active. 4(a)(ii) Steep sided; 3 Concave/steeper top, gentle(r) base; Conical; Crater/caldera; Vent; Ash/lava/magma; Smoke/steam/gases; Dissected slopes/gullies/ridges. 4(b) Monitoring/warning/prediction; 3 Evacuation; Land-use zoning/exclusion zones/building codes; Emergency shelters (protection from ash); Spraying lava flows with sea water/lava channels/tunnels; Reroute aircraft; Emergency response planning/drills/education; Aid/medical resources/rescue equipment/food supplies.
Question 5
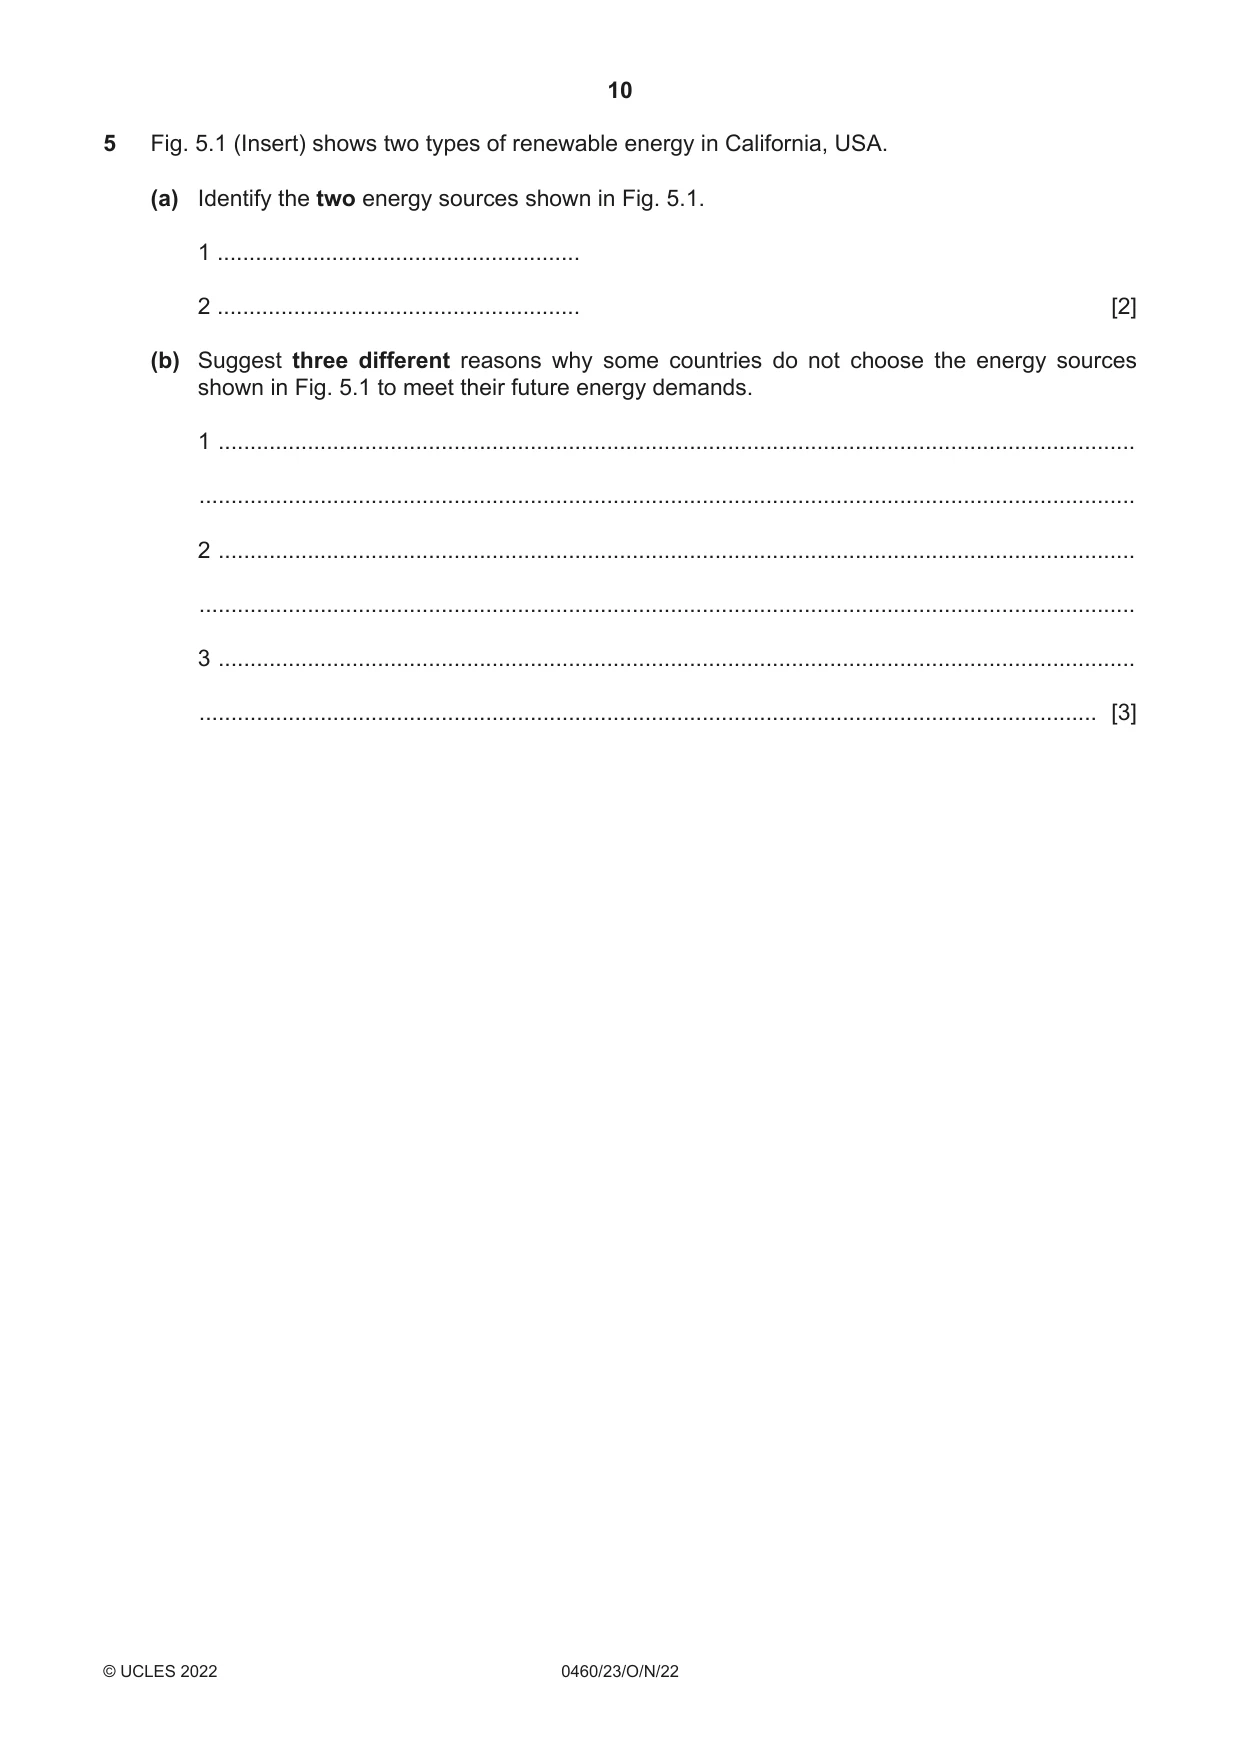
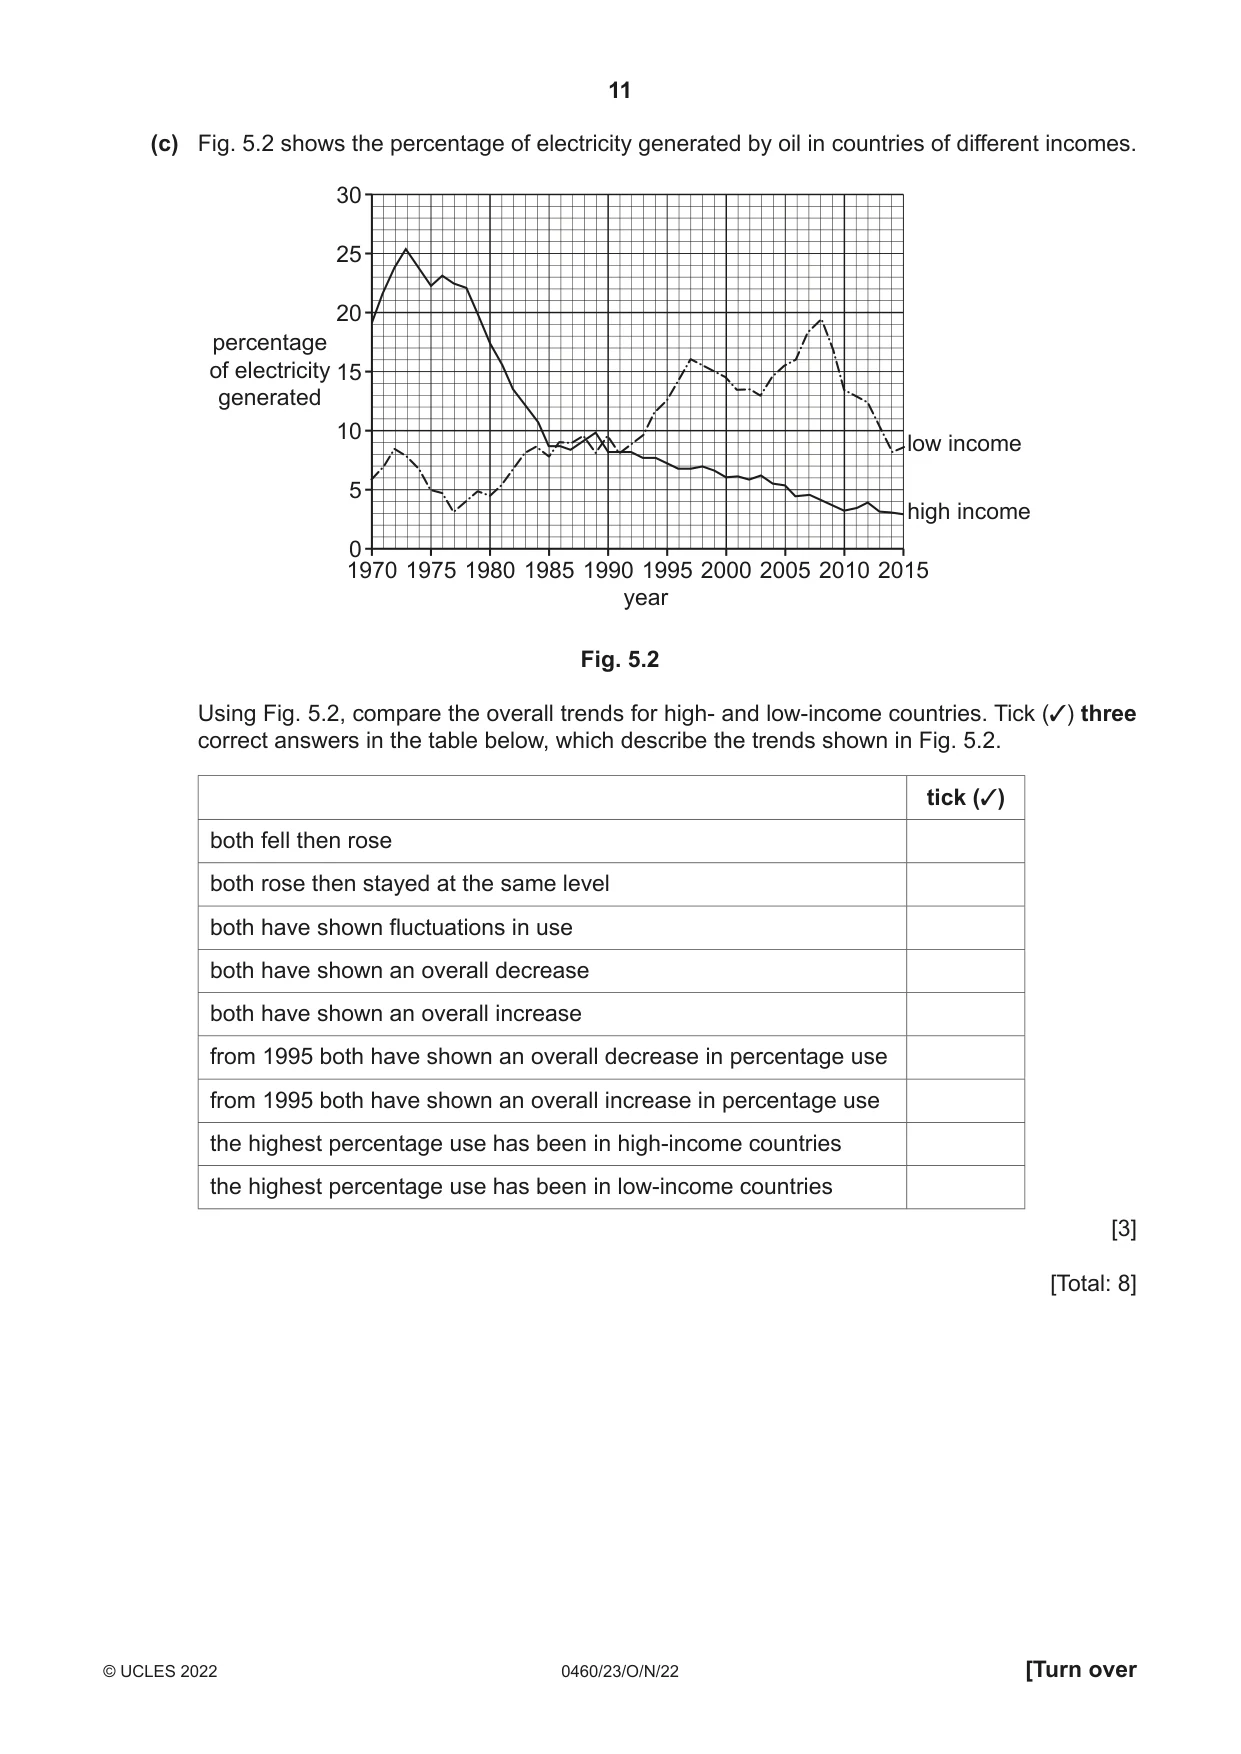
5 Fig. 5.1 (Insert) shows two types of renewable energy in California, USA. (a) Identify the two energy sources shown in Fig. 5.1. 1 ......................................................... 2 ......................................................... [2] (b) Suggest three different reasons why some countries do not choose the energy sources shown in Fig. 5.1 to meet their future energy demands. 1 ................................................................................................................................................ ................................................................................................................................................... 2 ................................................................................................................................................ ................................................................................................................................................... 3 ................................................................................................................................................ ............................................................................................................................................. [3] (c) Fig. 5.2 shows the percentage of electricity generated by oil in countries of different incomes. 30 25 20 percentage of electricity 15 generated 10 low income 5 high income 0 1970 1975 1980 1985 1990 1995 2000 2005 2010 2015 year Fig. 5.2 Using Fig. 5.2, compare the overall trends for high- and low-income countries. Tick (3) three correct answers in the table below, which describe the trends shown in Fig. 5.2. tick (3) both fell then rose both rose then stayed at the same level both have shown fluctuations in use both have shown an overall decrease both have shown an overall increase from 1995 both have shown an overall decrease in percentage use from 1995 both have shown an overall increase in percentage use the highest percentage use has been in high-income countries the highest percentage use has been in low-income countries [3] [Total: 8]
Mark scheme: 5(a) Solar/sun/light; 2 Wind. 5(b) Lack of sunshine; 3 Lack of winds; Cannot afford to build/expensive to build/cost of installation/fossil fuels are cheaper/cost of energy storage; Using other renewables/nuclear/HEP/geothermal; Do not generate enough power/needs back-up; Large stock of fossil fuels; Land not available/large amount of land required. 5(c) Both have shown fluctuations; 3 From 1995 both have shown an overall decrease; Highest percentage use has been in high income countries.
Question 6
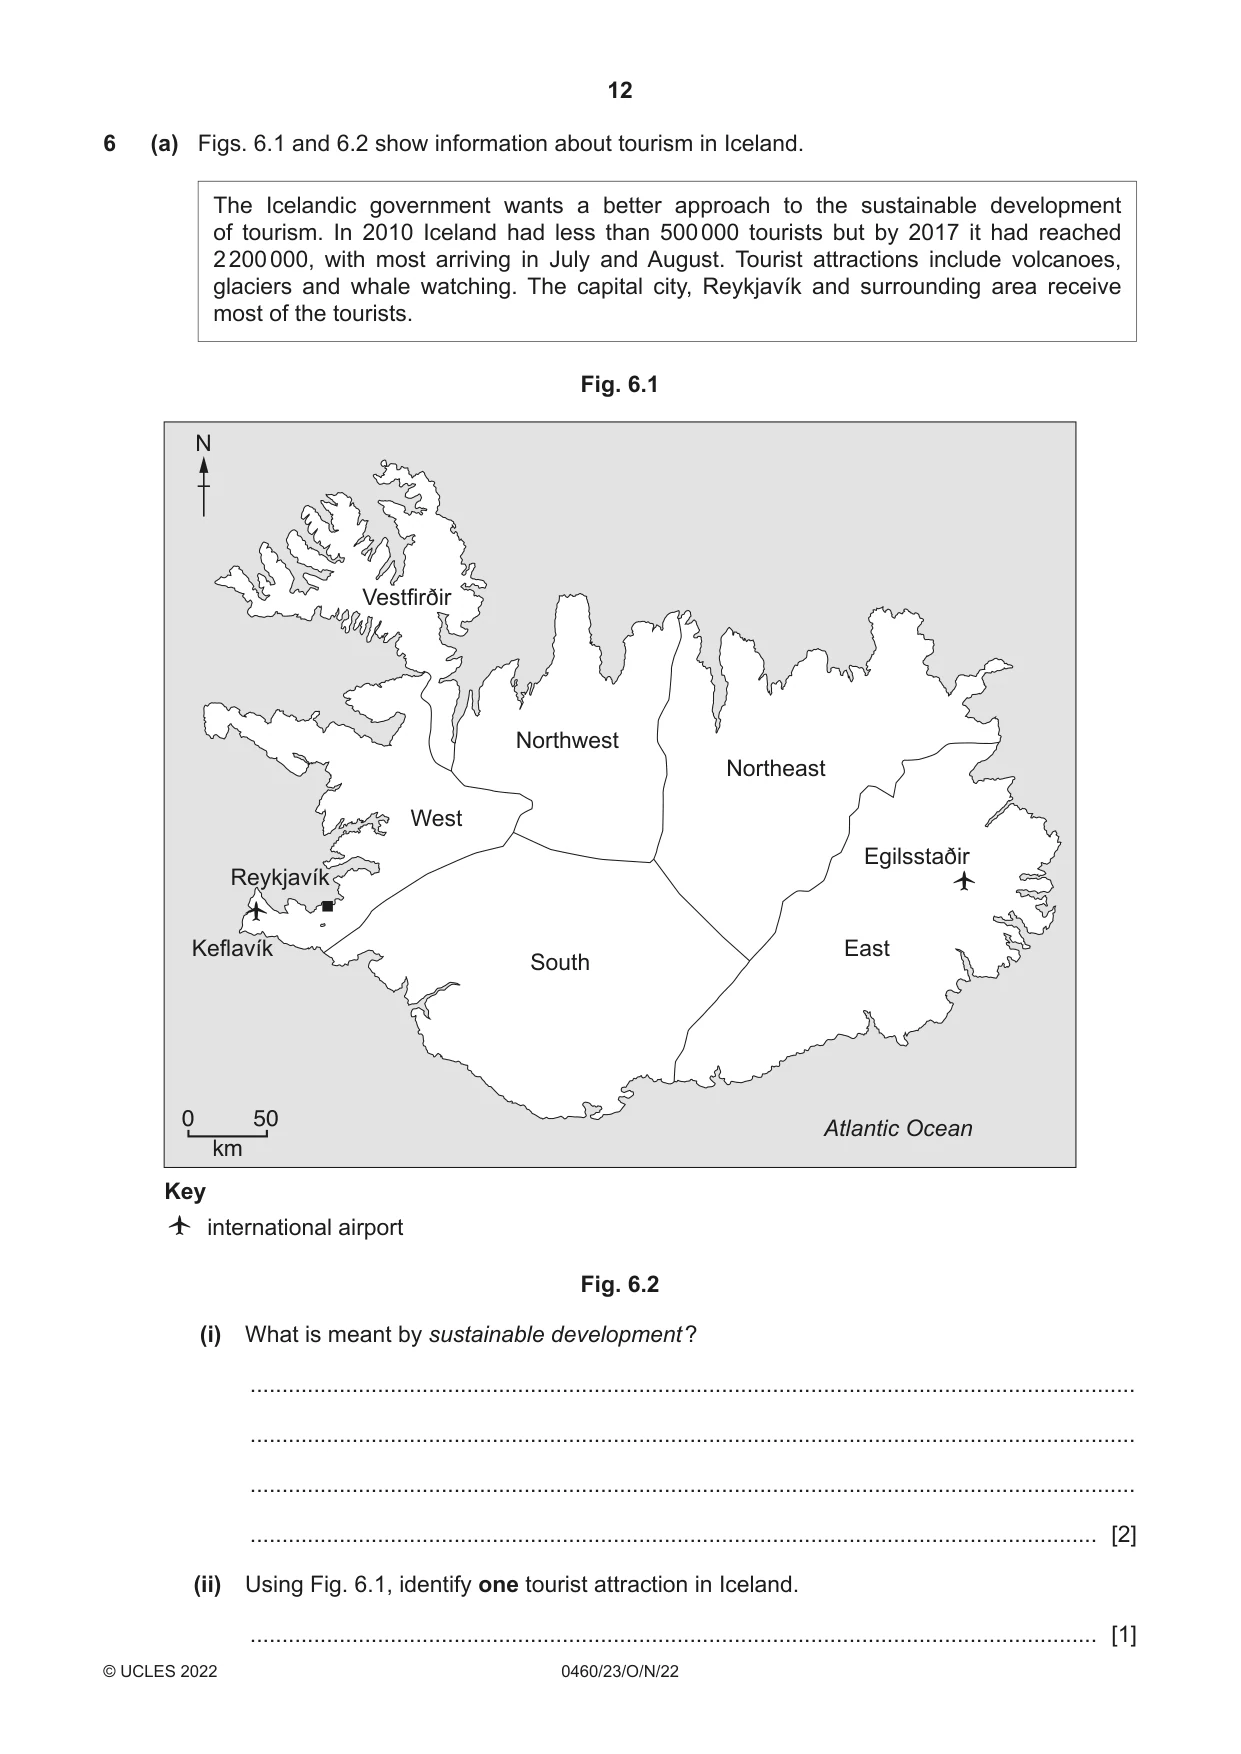
6 (a) Figs. 6.1 and 6.2 show information about tourism in Iceland. The Icelandic government wants a better approach to the sustainable development of tourism. In 2010 Iceland had less than 500 000 tourists but by 2017 it had reached 2 200 000, with most arriving in July and August. Tourist attractions include volcanoes, glaciers and whale watching. The capital city, Reykjavík and surrounding area receive most of the tourists. Fig. 6.1 N Vestfirðir Northwest Northeast West Egilsstaðir Reykjavík Keflavík East South 0 50 Atlantic Ocean km Key international airport Fig. 6.2 (i) What is meant by sustainable development ? ........................................................................................................................................... ........................................................................................................................................... ........................................................................................................................................... ..................................................................................................................................... [2] (ii) Using Fig. 6.1, identify one tourist attraction in Iceland. ..................................................................................................................................... [1] (iii) Describe the change in the number of tourists between 2010 and 2017. ........................................................................................................................................... ..................................................................................................................................... [2] (b) Suggest three solutions that Iceland’s government could use to reduce the number of tourists in the area around Reykjavík. 1 ................................................................................................................................................ ................................................................................................................................................... 2 ................................................................................................................................................ ................................................................................................................................................... 3 ................................................................................................................................................ ............................................................................................................................................. [3] [Total: 8] Additional pages If you use the following pages to complete the answer to any question, the question number must be clearly shown. .................................................................................................................................................................. .................................................................................................................................................................. .................................................................................................................................................................. .................................................................................................................................................................. .................................................................................................................................................................. .................................................................................................................................................................. .................................................................................................................................................................. .................................................................................................................................................................. .................................................................................................................................................................. .................................................................................................................................................................. .................................................................................................................................................................. .................................................................................................................................................................. .................................................................................................................................................................. .................................................................................................................................................................. .................................................................................................................................................................. .................................................................................................................................................................. .................................................................................................................................................................. .................................................................................................................................................................. .................................................................................................................................................................. .................................................................................................................................................................. .................................................................................................................................................................. .................................................................................................................................................................. .................................................................................................................................................................. .................................................................................................................................................................. ..................................................................................................................................................................
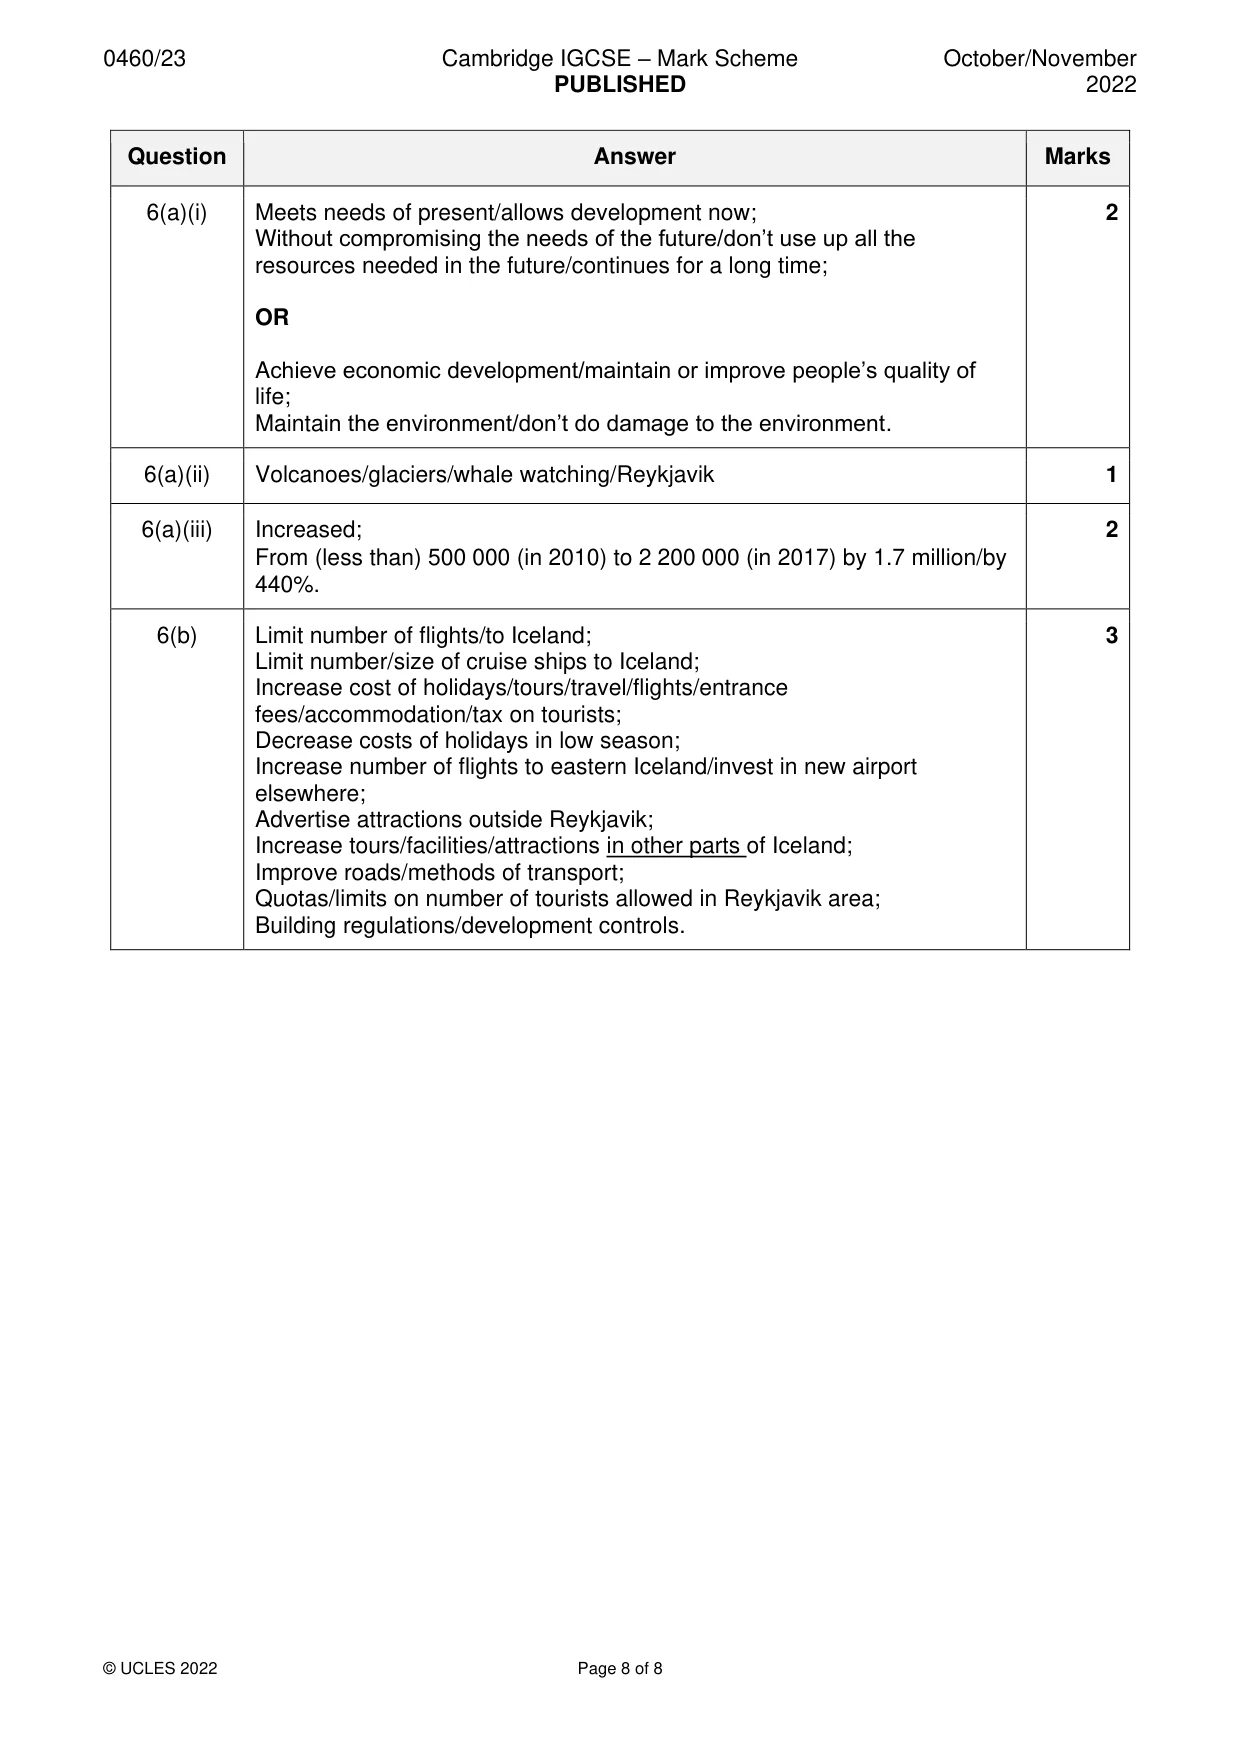
Mark scheme: 6(a)(i) Meets needs of present/allows development now; 2 Without compromising the needs of the future/don’t use up all the resources needed in the future/continues for a long time; OR Achieve economic development/maintain or improve people’s quality of life; Maintain the environment/don’t do damage to the environment. 6(a)(ii) Volcanoes/glaciers/whale watching/Reykjavik 1 6(a)(iii) Increased; 2 From (less than) 500 000 (in 2010) to 2 200 000 (in 2017) by 1.7 million/by 440%. 6(b) Limit number of flights/to Iceland; 3 Limit number/size of cruise ships to Iceland; Increase cost of holidays/tours/travel/flights/entrance fees/accommodation/tax on tourists; Decrease costs of holidays in low season; Increase number of flights to eastern Iceland/invest in new airport elsewhere; Advertise attractions outside Reykjavik; Increase tours/facilities/attractions in other parts of Iceland; Improve roads/methods of transport; Quotas/limits on number of tourists allowed in Reykjavik area; Building regulations/development controls.
What was in this paper
The subtopics covered by these 6 questions, and how many questions each got. Open one in a new tab to see every Cambridge question on it.
What you needed in this session
Cambridge’s own grade thresholds for 2022 Oct/Nov, Paper 2 · Variant 3. A higher threshold means an easier paper — the bar moves with how the cohort did.