Cambridge IGCSE Geography 0460 — 2022 Oct/Nov Paper 2 · Variant 1
0460/21/O/N/22 · 6 questions · 60 marks · ≈68 min
The question paper and its mark scheme, free to read here and free to download. This is Cambridge’s own paper, exactly as it was sat.
Question paper16 pages


Mark scheme7 pages
Answers below. Sit the paper first if you are practising.
Questions as text
Q1 · Study the map extract for Beith, Scotland
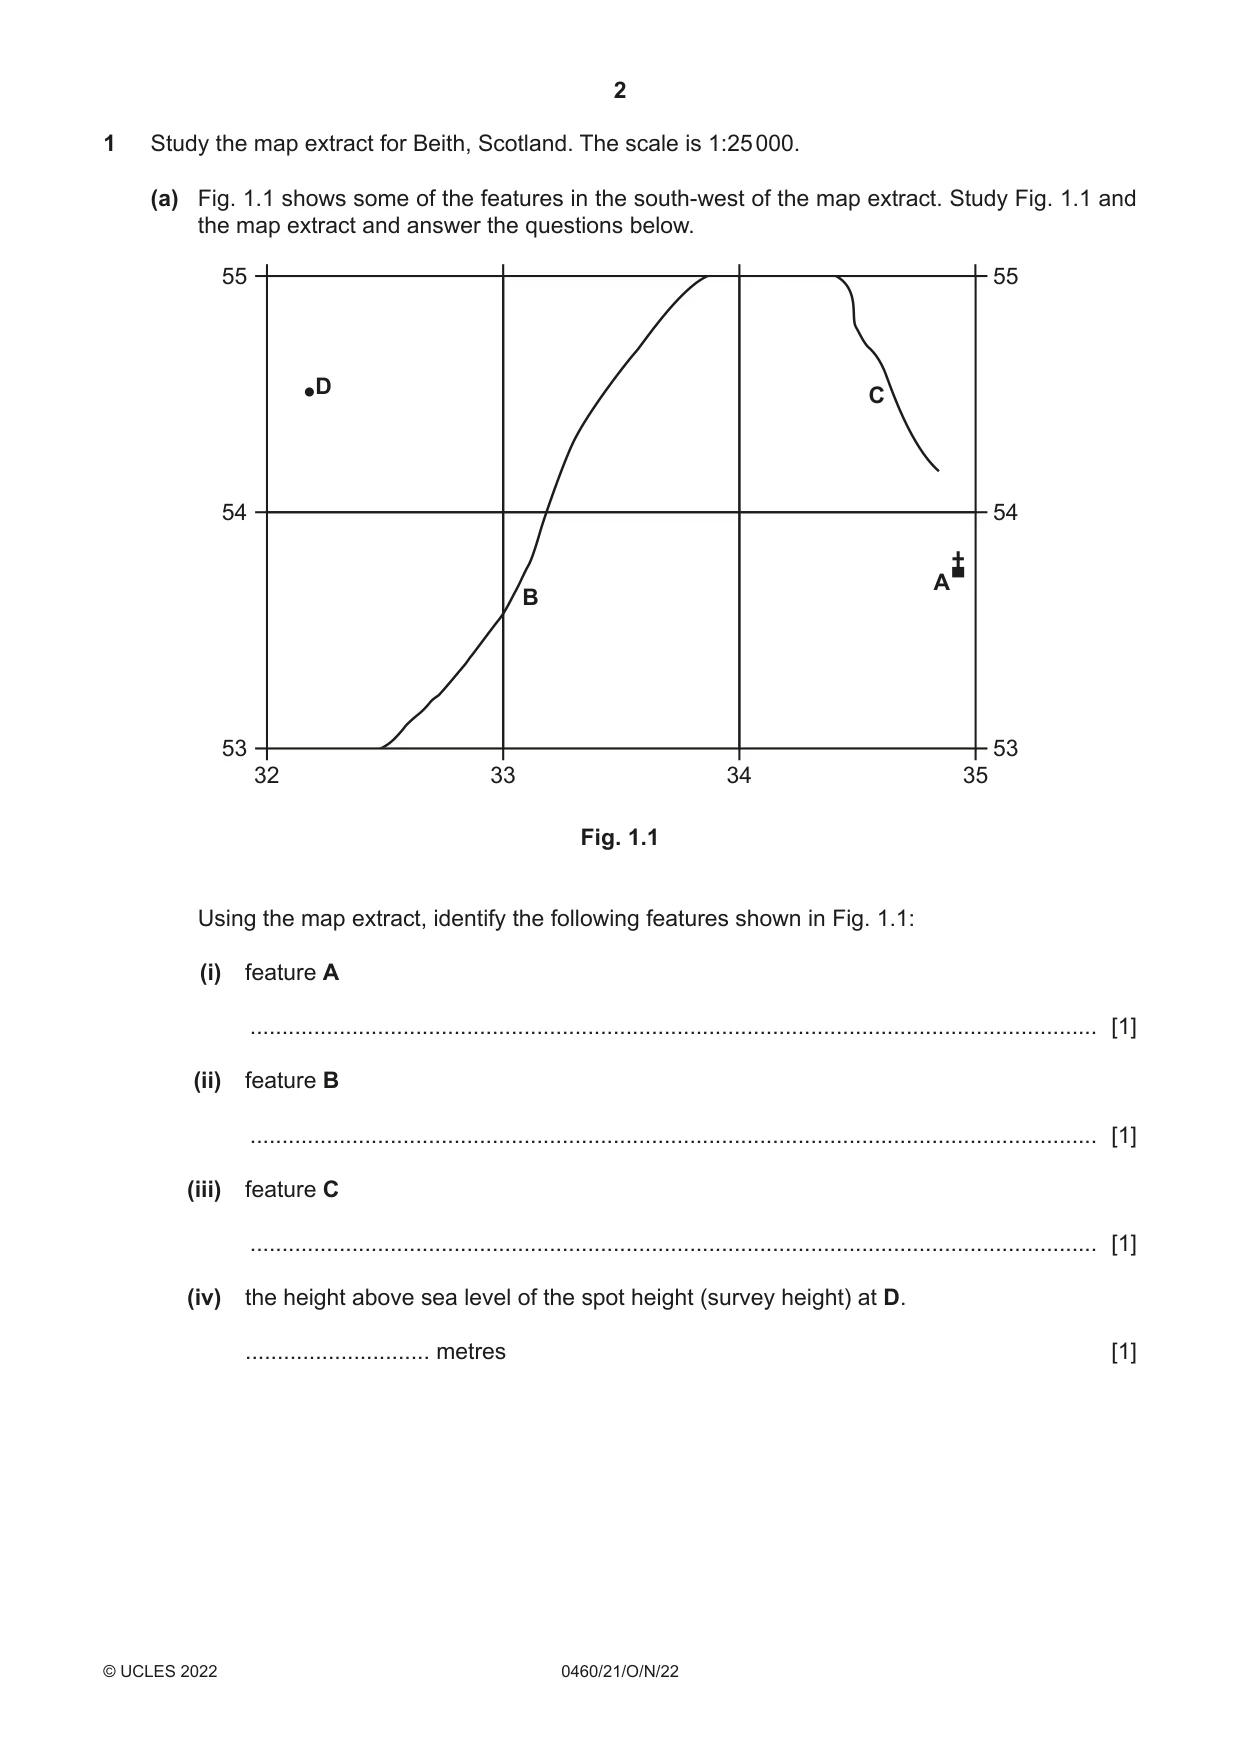
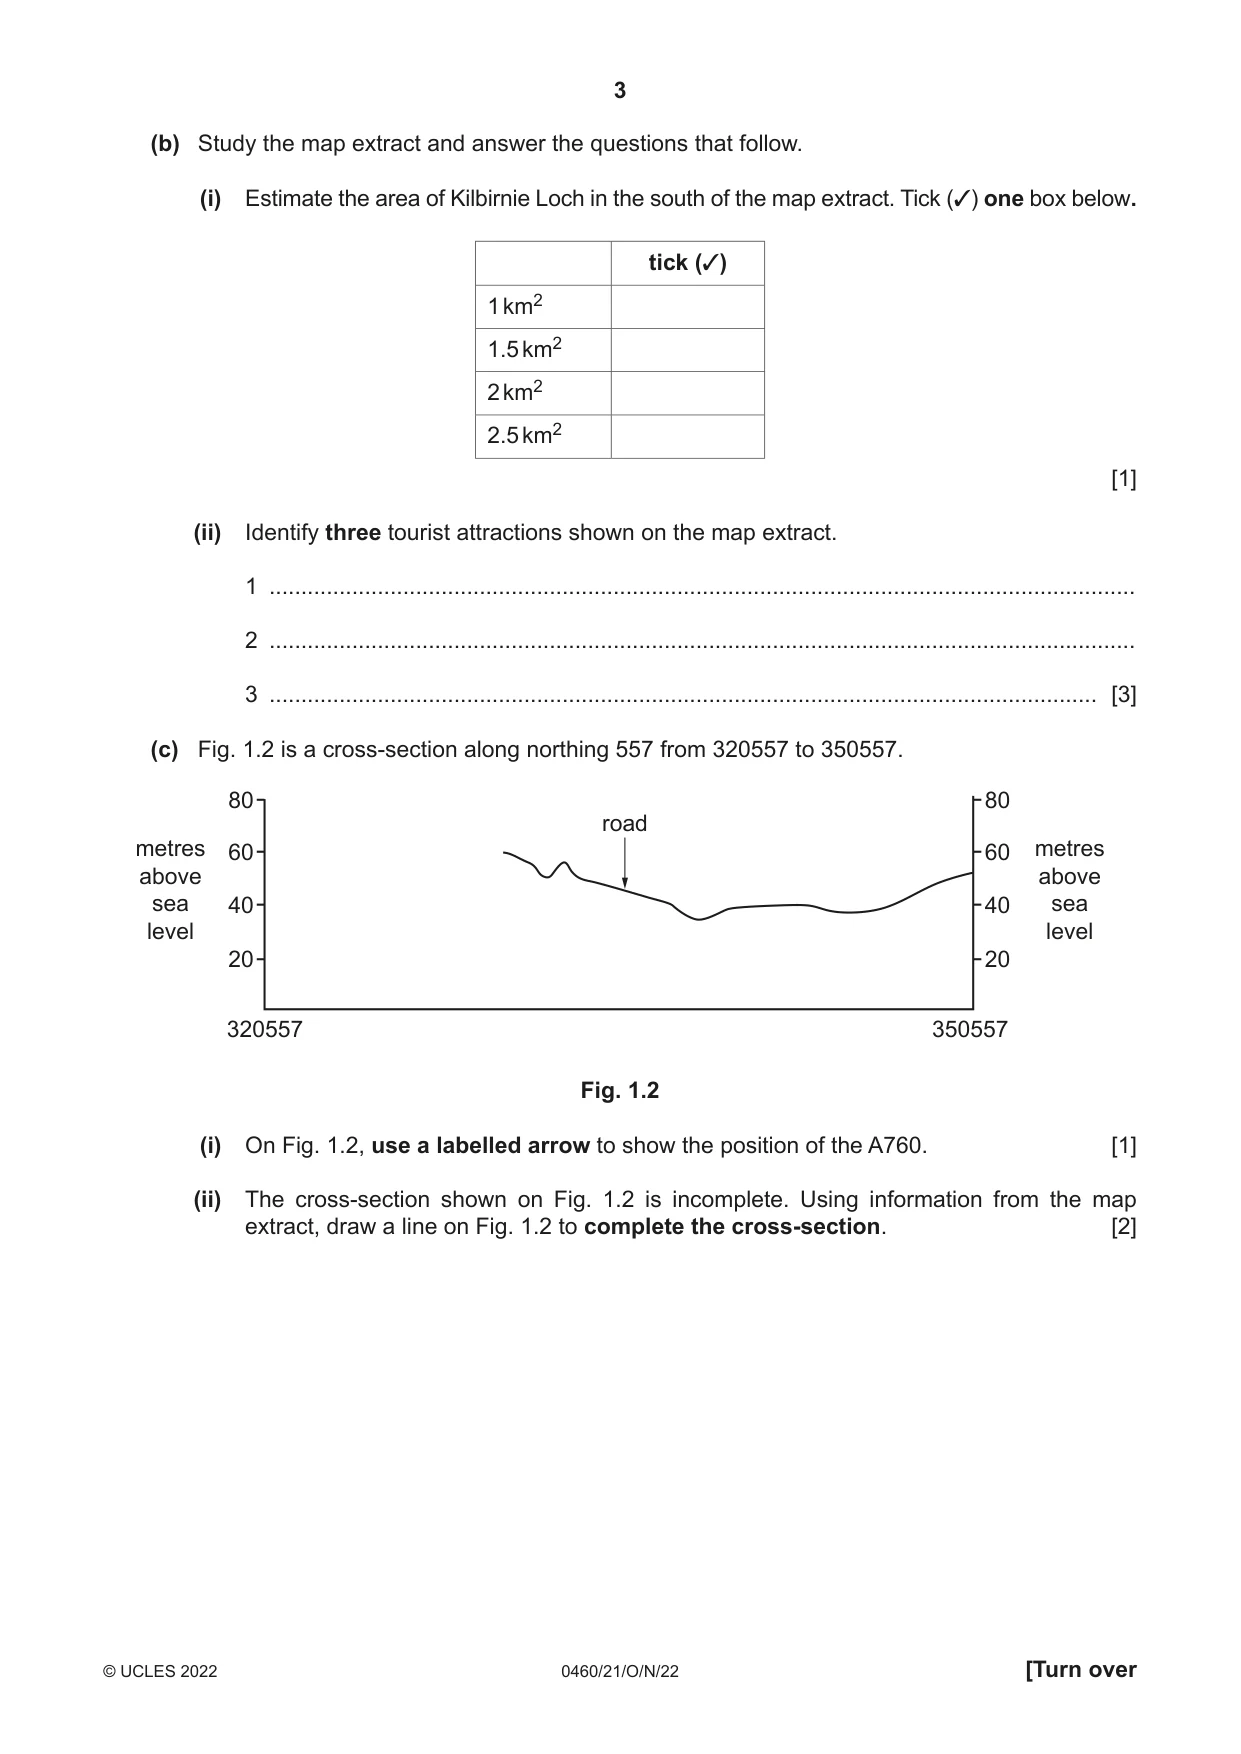
1 Study the map extract for Beith, Scotland. The scale is 1:25 000. (a) Fig. 1.1 shows some of the features in the south-west of the map extract. Study Fig. 1.1 and the map extract and answer the questions below. 55 55 D C 54 54 A B 53 53 32 33 34 35 Fig. 1.1 Using the map extract, identify the following features shown in Fig. 1.1: (i) feature A ..................................................................................................................................... [1] (ii) feature B ..................................................................................................................................... [1] (iii) feature C ..................................................................................................................................... [1] (iv) the height above sea level of the spot height (survey height) at D. ............................. metres [1] (b) Study the map extract and answer the questions that follow. (i) Estimate the area of Kilbirnie Loch in the south of the map extract. Tick (✓) one box below. tick (✓) 1 km2 1.5 km2 2 km2 2.5 km2 [1] (ii) Identify three tourist attractions shown on the map extract. 1 ........................................................................................................................................ 2 ........................................................................................................................................ 3 .................................................................................................................................. [3] (c) Fig. 1.2 is a cross-section along northing 557 from 320557 to 350557. 80 80 road metres 60 60 metres above above sea 40 40 sea level level 20 20 320557 350557 Fig. 1.2 (i) On Fig. 1.2, use a labelled arrow to show the position of the A760. [1] (ii) The cross-section shown on Fig. 1.2 is incomplete. Using information from the map extract, draw a line on Fig. 1.2 to complete the cross-section. [2] (d) Describe the distribution of settlement to the west of the A760 main road. ................................................................................................................................................... ................................................................................................................................................... ................................................................................................................................................... ................................................................................................................................................... ................................................................................................................................................... ................................................................................................................................................... ................................................................................................................................................... ................................................................................................................................................... ................................................................................................................................................... ............................................................................................................................................. [5] (e) Describe the site of the settlement of Beith. ................................................................................................................................................... ................................................................................................................................................... ................................................................................................................................................... ................................................................................................................................................... ................................................................................................................................................... ................................................................................................................................................... ................................................................................................................................................... ............................................................................................................................................. [4] [Total: 20] TURN PAGE FOR QUESTION 2
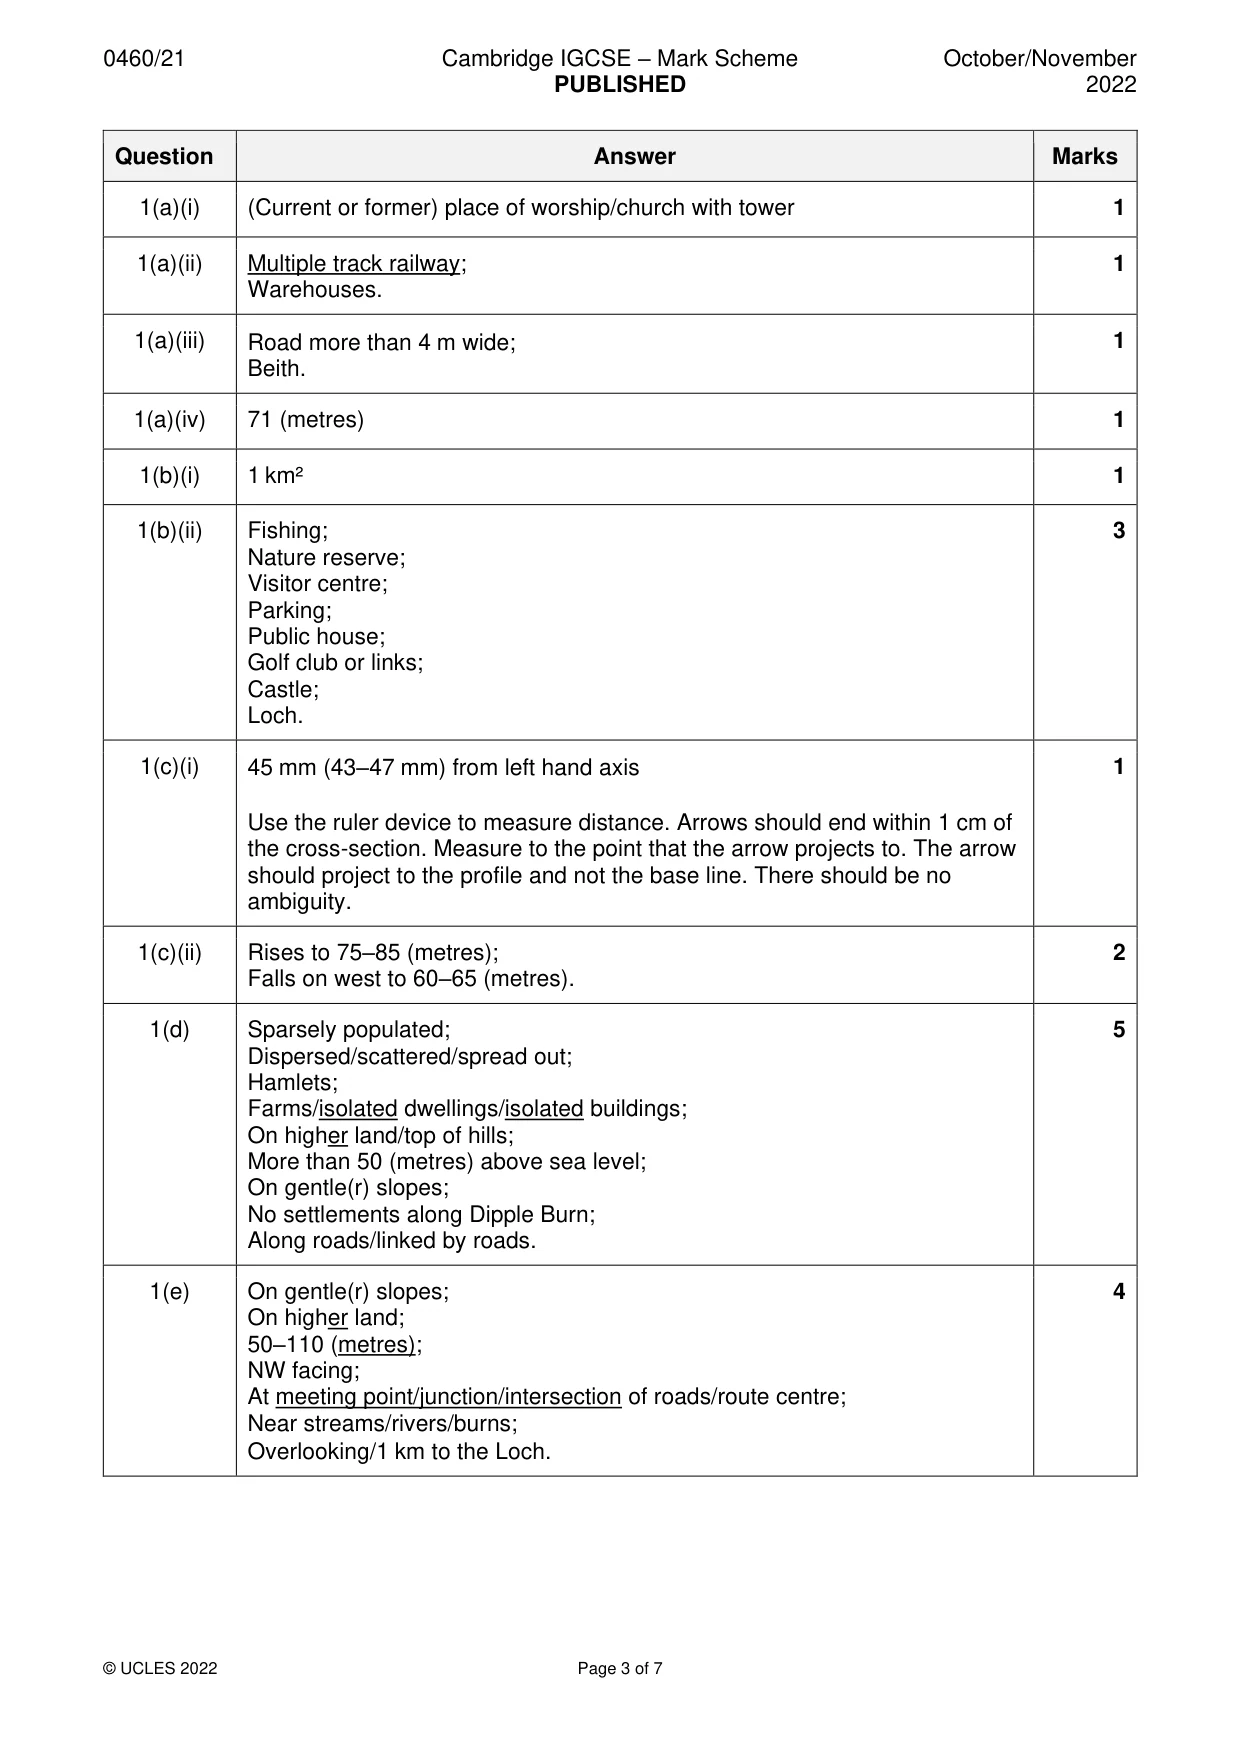
Mark scheme: Question Answer Marks 1(a)(i) (Current or former) place of worship/church with tower 1 1(a)(ii) Multiple track railway; 1 Warehouses. 1(a)(iii) Road more than 4 m wide; 1 Beith. 1(a)(iv) 71 (metres) 1 1(b)(i) 1 km² 1 1(b)(ii) Fishing; 3 Nature reserve; Visitor centre; Parking; Public house; Golf club or links; Castle; Loch. 1(c)(i) 45 mm (43–47 mm) from left hand axis 1 Use the ruler device to measure distance. Arrows should end within 1 cm of the cross-section. Measure to the point that the arrow projects to. The arrow should project to the profile and not the base line. There should be no ambiguity. 1(c)(ii) Rises to 75–85 (metres); 2 Falls on west to 60–65 (metres). 1(d) Sparsely populated; 5 Dispersed/scattered/spread out; Hamlets; Farms/isolated dwellings/isolated buildings; On higher land/top of hills; More than 50 (metres) above sea level; On gentle(r) slopes; No settlements along Dipple Burn; Along roads/linked by roads. 1(e) On gentle(r) slopes; 4 On higher land; 50–110 (metres); NW facing; At meeting point/junction/intersection of roads/route centre; Near streams/rivers/burns; Overlooking/1 km to the Loch.
More questions on Settlements (rural and urban) and service provision
Question 2
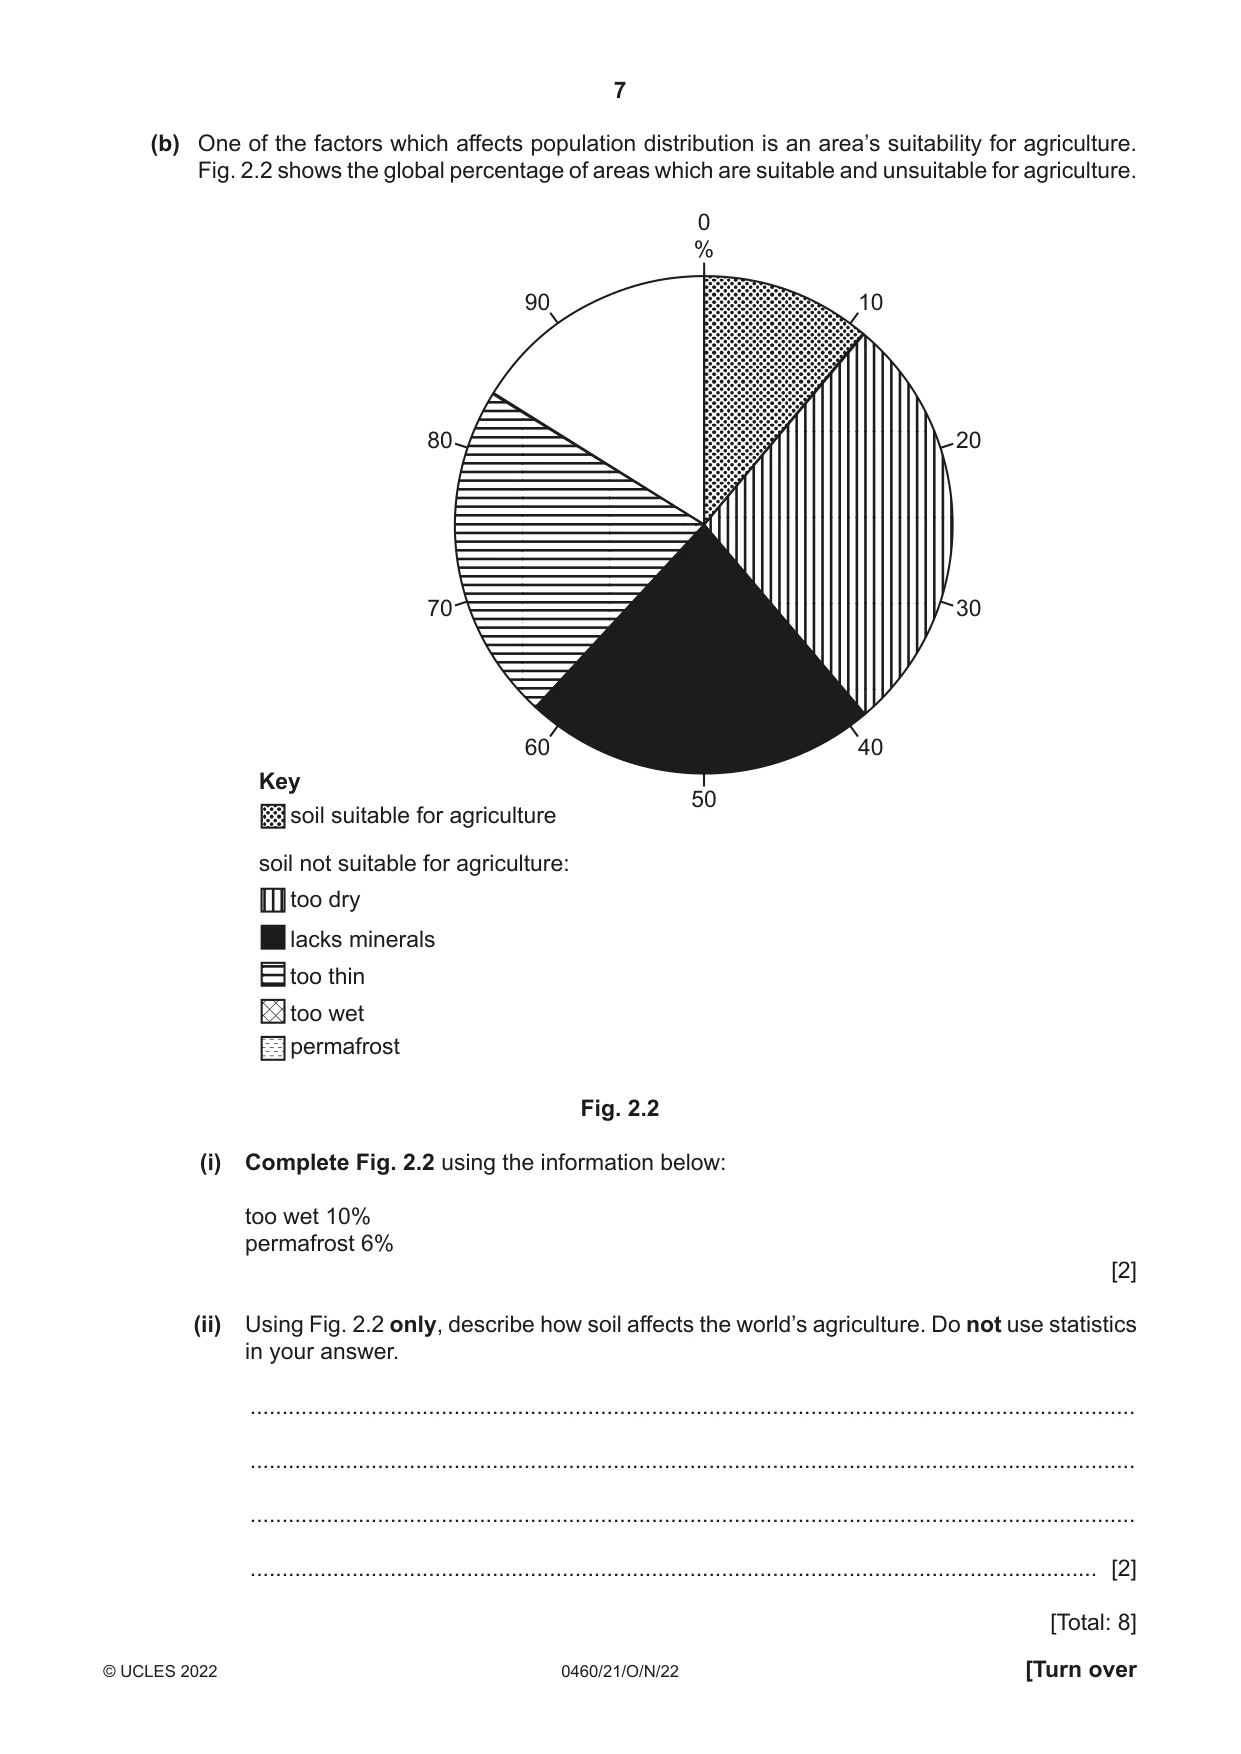
2 Fig. 2.1 (Insert) shows global population density. (a) Describe the distribution of densely populated areas and sparsely populated areas. Densely populated areas ................................................................................................................................................... ................................................................................................................................................... ................................................................................................................................................... ................................................................................................................................................... Sparsely populated areas ................................................................................................................................................... ................................................................................................................................................... ................................................................................................................................................... ............................................................................................................................................. [4] (b) One of the factors which affects population distribution is an area’s suitability for agriculture. Fig. 2.2 shows the global percentage of areas which are suitable and unsuitable for agriculture. 0 % 90 10 80 20 70 30 60 40 Key 50 soil suitable for agriculture soil not suitable for agriculture: too dry lacks minerals too thin too wet permafrost Fig. 2.2 (i) Complete Fig. 2.2 using the information below: too wet 10% permafrost 6% [2] (ii) Using Fig. 2.2 only, describe how soil affects the world’s agriculture. Do not use statistics in your answer. ........................................................................................................................................... ........................................................................................................................................... ........................................................................................................................................... ..................................................................................................................................... [2] [Total: 8]
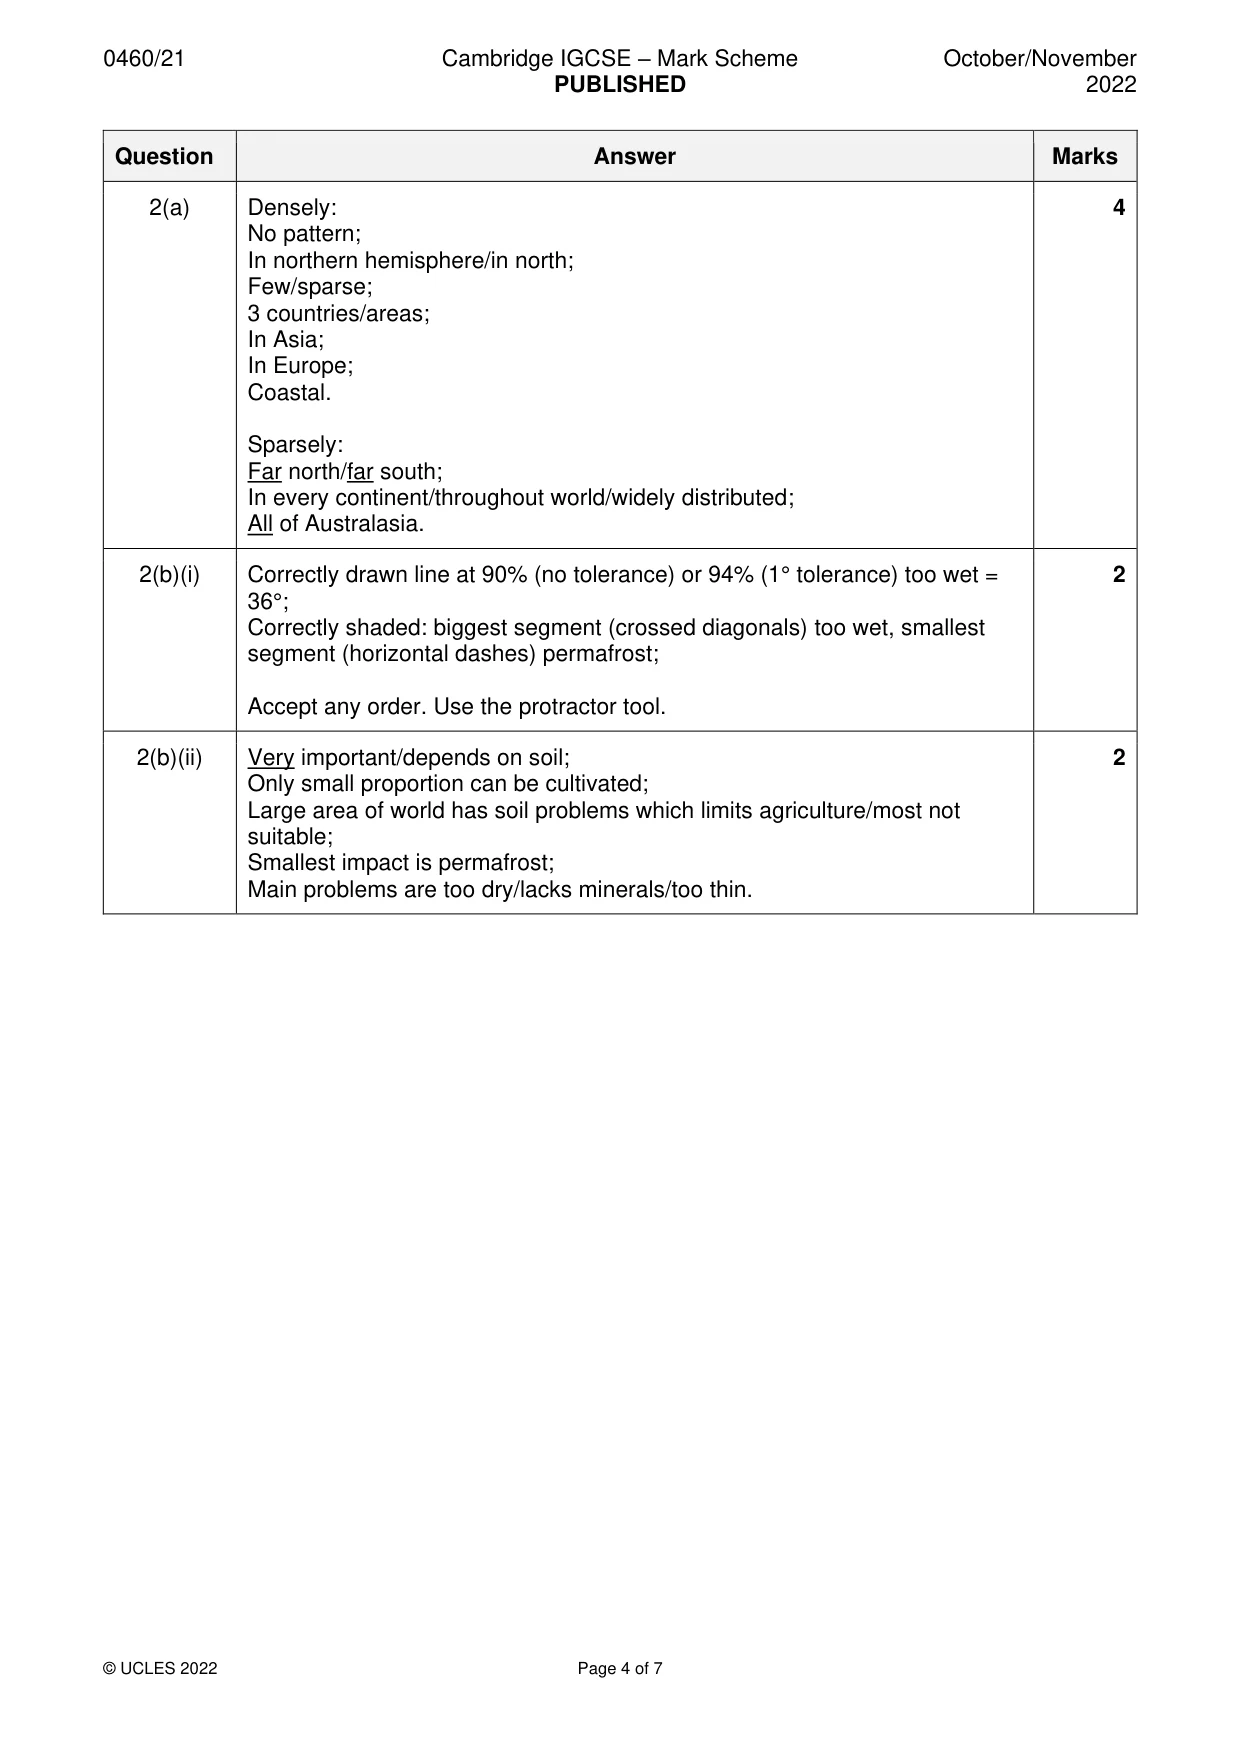
Mark scheme: 2(a) Densely: 4 No pattern; In northern hemisphere/in north; Few/sparse; 3 countries/areas; In Asia; In Europe; Coastal. Sparsely: Far north/far south; In every continent/throughout world/widely distributed; All of Australasia. 2(b)(i) Correctly drawn line at 90% (no tolerance) or 94% (1° tolerance) too wet = 2 36°; Correctly shaded: biggest segment (crossed diagonals) too wet, smallest segment (horizontal dashes) permafrost; Accept any order. Use the protractor tool. 2(b)(ii) Very important/depends on soil; 2 Only small proportion can be cultivated; Large area of world has soil problems which limits agriculture/most not suitable; Smallest impact is permafrost; Main problems are too dry/lacks minerals/too thin.
Q3 · The main sources of two air pollutants, carbon monoxide and nitrogen oxides, in Hong Kong…
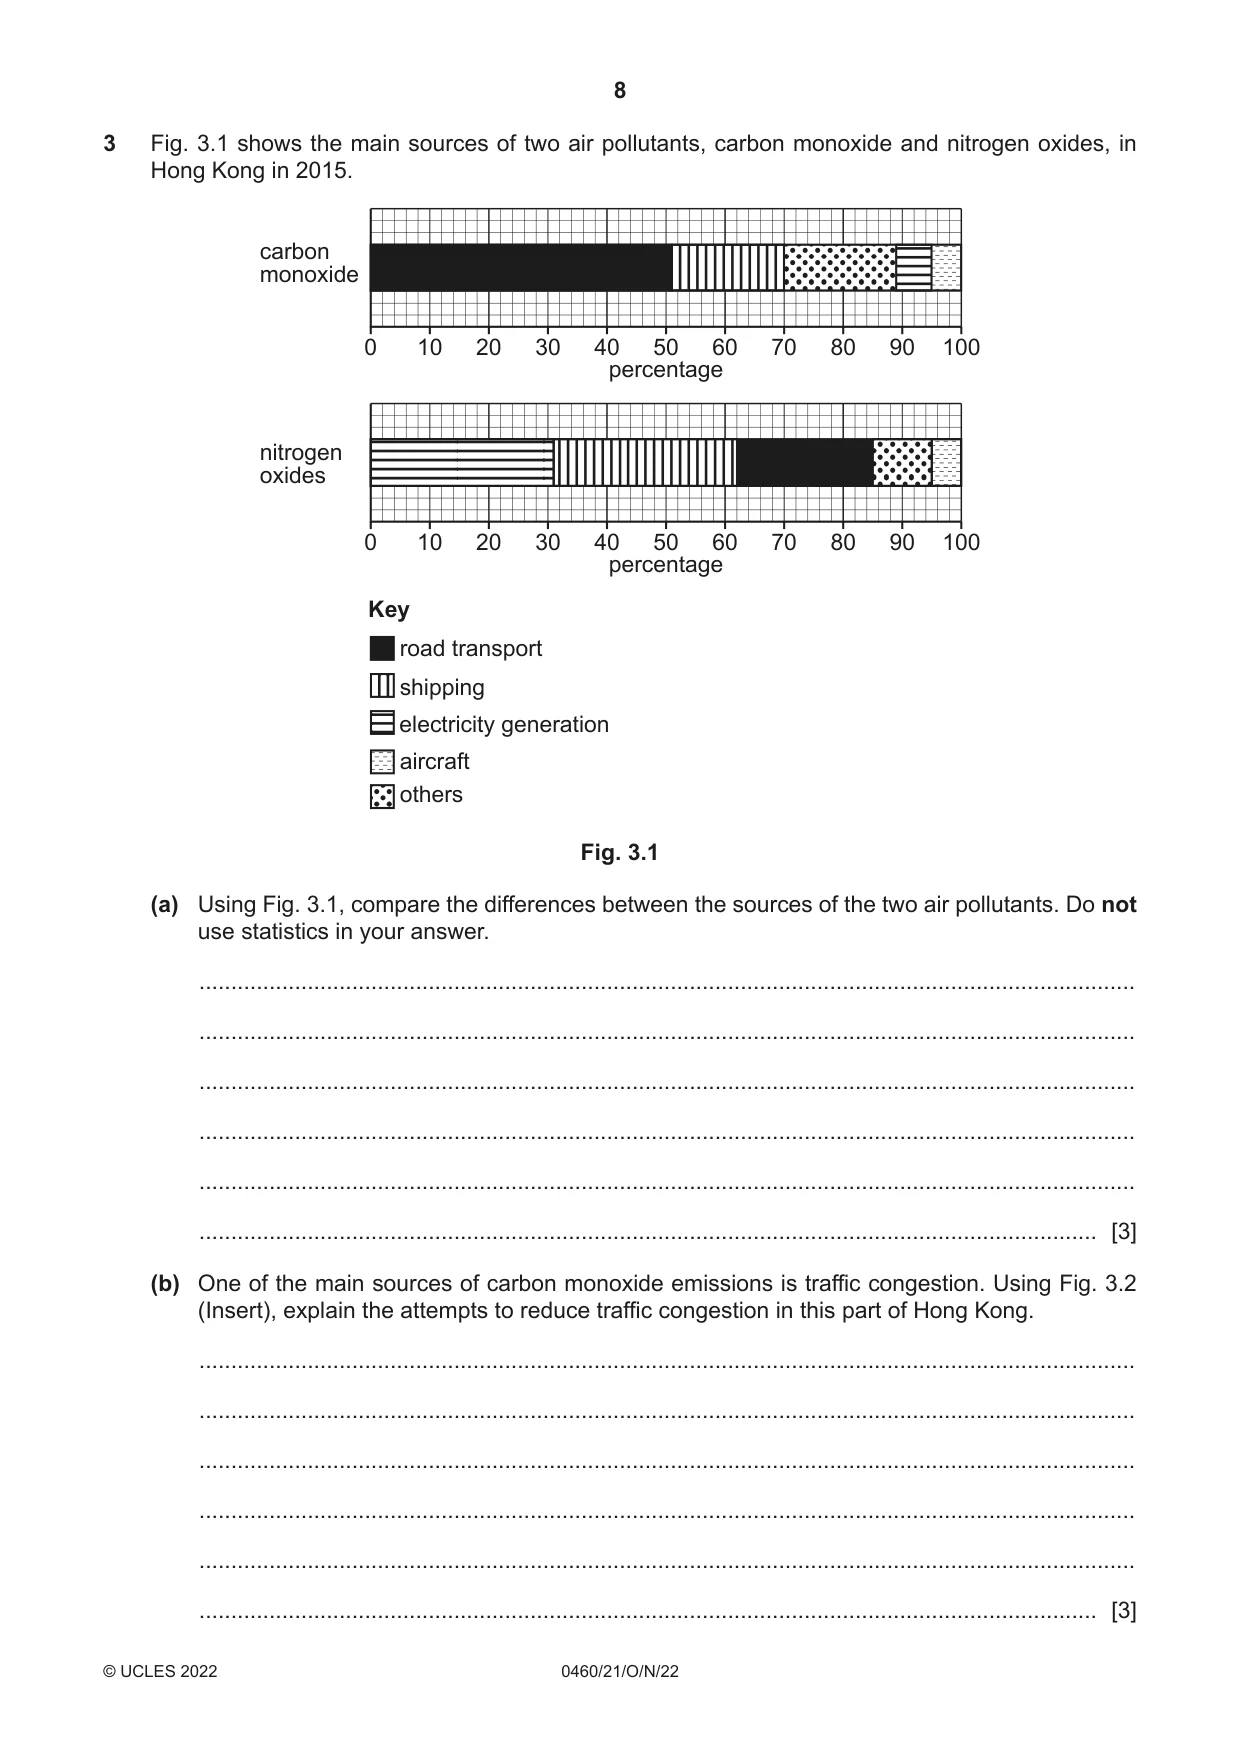
3 Fig. 3.1 shows the main sources of two air pollutants, carbon monoxide and nitrogen oxides, in Hong Kong in 2015. carbon monoxide 0 10 20 30 40 50 60 70 80 90 100 percentage nitrogen oxides 0 10 20 30 40 50 60 70 80 90 100 percentage Key road transport shipping electricity generation aircraft others Fig. 3.1 (a) Using Fig. 3.1, compare the differences between the sources of the two air pollutants. Do not use statistics in your answer. ................................................................................................................................................... ................................................................................................................................................... ................................................................................................................................................... ................................................................................................................................................... ................................................................................................................................................... ............................................................................................................................................. [3] (b) One of the main sources of carbon monoxide emissions is traffic congestion. Using Fig. 3.2 (Insert), explain the attempts to reduce traffic congestion in this part of Hong Kong. ................................................................................................................................................... ................................................................................................................................................... ................................................................................................................................................... ................................................................................................................................................... ................................................................................................................................................... ............................................................................................................................................. [3] (c) Suggest two reasons why it is difficult to reduce the number of people using cars on the road. 1 ................................................................................................................................................ ................................................................................................................................................... 2 ................................................................................................................................................ ............................................................................................................................................. [2] [Total: 8]
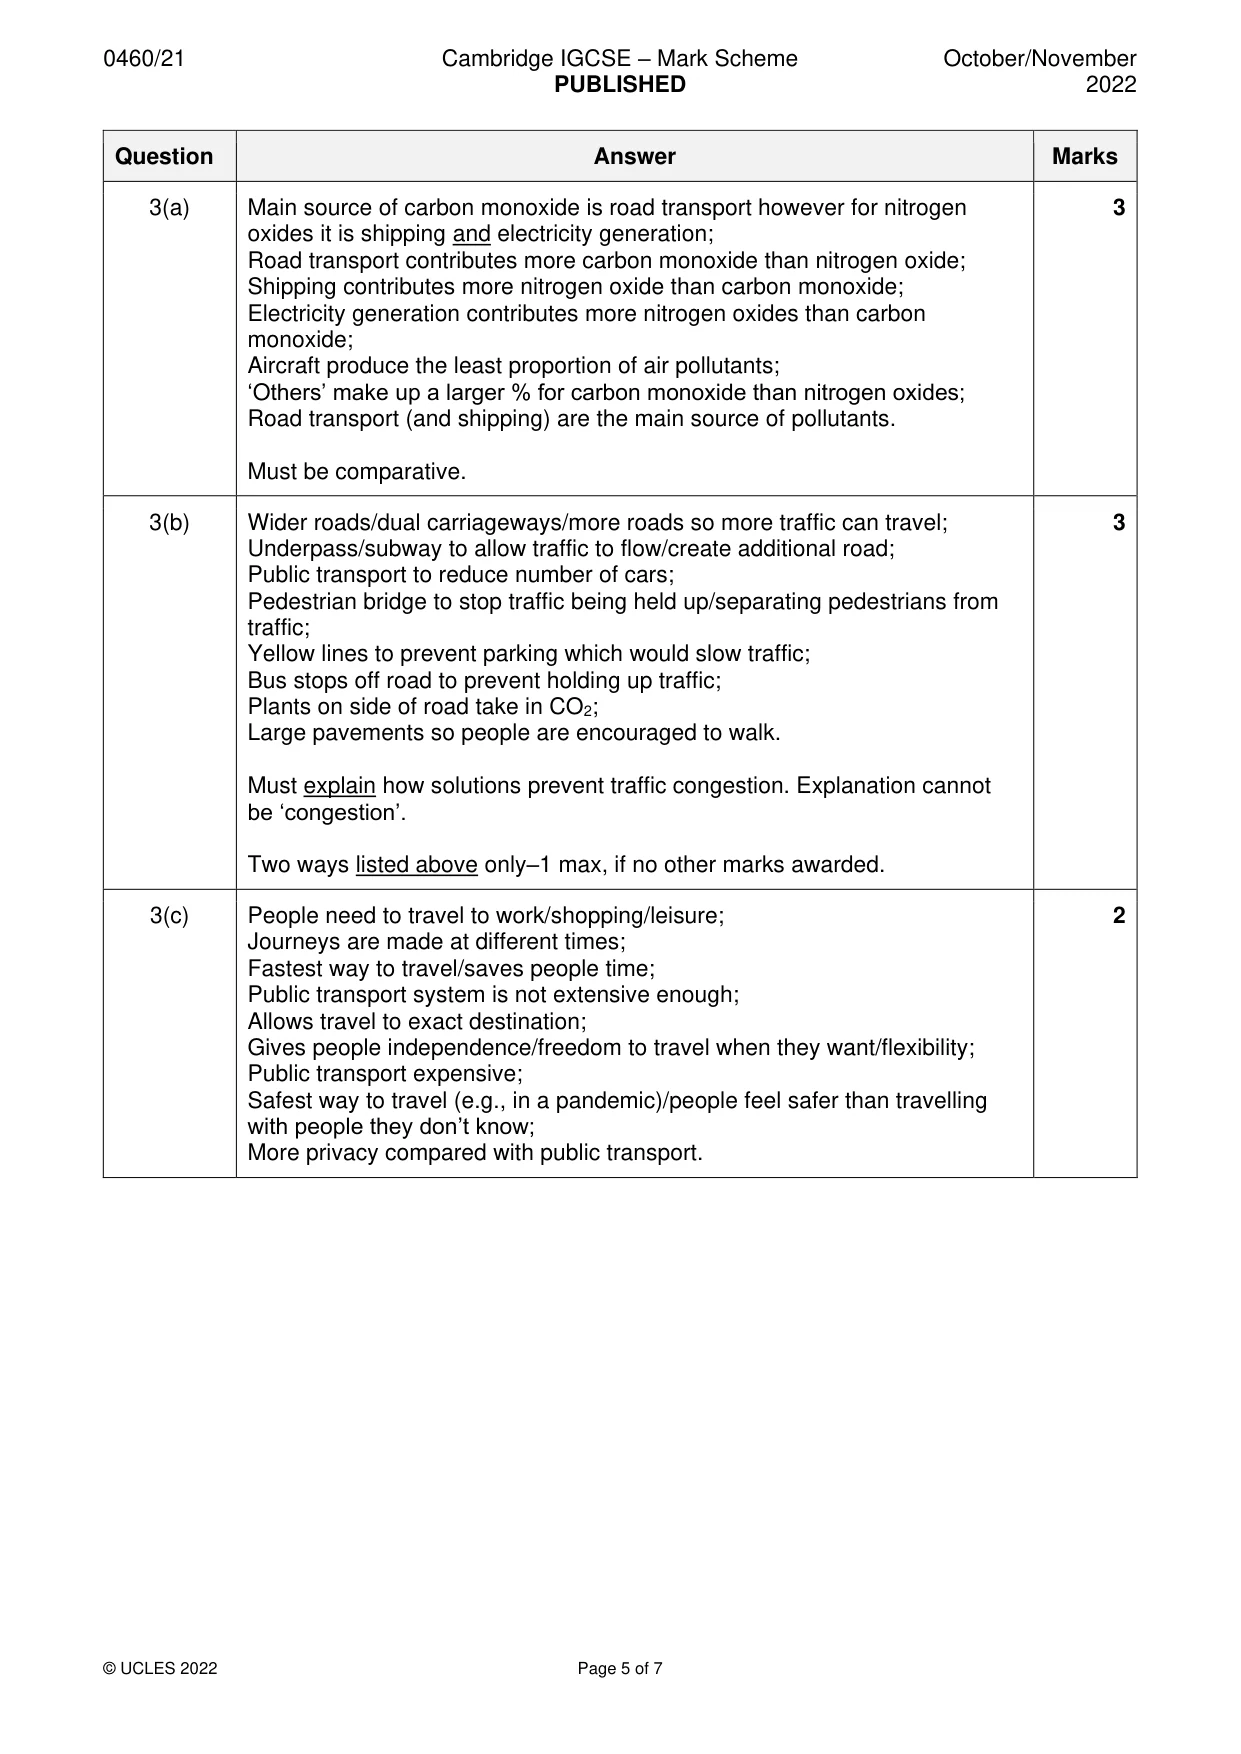
Mark scheme: 3(a) Main source of carbon monoxide is road transport however for nitrogen 3 oxides it is shipping and electricity generation; Road transport contributes more carbon monoxide than nitrogen oxide; Shipping contributes more nitrogen oxide than carbon monoxide; Electricity generation contributes more nitrogen oxides than carbon monoxide; Aircraft produce the least proportion of air pollutants; ‘Others’ make up a larger % for carbon monoxide than nitrogen oxides; Road transport (and shipping) are the main source of pollutants. Must be comparative. 3(b) Wider roads/dual carriageways/more roads so more traffic can travel; 3 Underpass/subway to allow traffic to flow/create additional road; Public transport to reduce number of cars; Pedestrian bridge to stop traffic being held up/separating pedestrians from traffic; Yellow lines to prevent parking which would slow traffic; Bus stops off road to prevent holding up traffic; Plants on side of road take in CO2; Large pavements so people are encouraged to walk. Must explain how solutions prevent traffic congestion. Explanation cannot be ‘congestion’. Two ways listed above only–1 max, if no other marks awarded. 3(c) People need to travel to work/shopping/leisure; 2 Journeys are made at different times; Fastest way to travel/saves people time; Public transport system is not extensive enough; Allows travel to exact destination; Gives people independence/freedom to travel when they want/flexibility; Public transport expensive; Safest way to travel (e.g., in a pandemic)/people feel safer than travelling with people they don’t know; More privacy compared with public transport.
More questions on Environmental risks of economic development
Q4 · The average annual number of volcanic eruptions reported in the world between 1890 and…
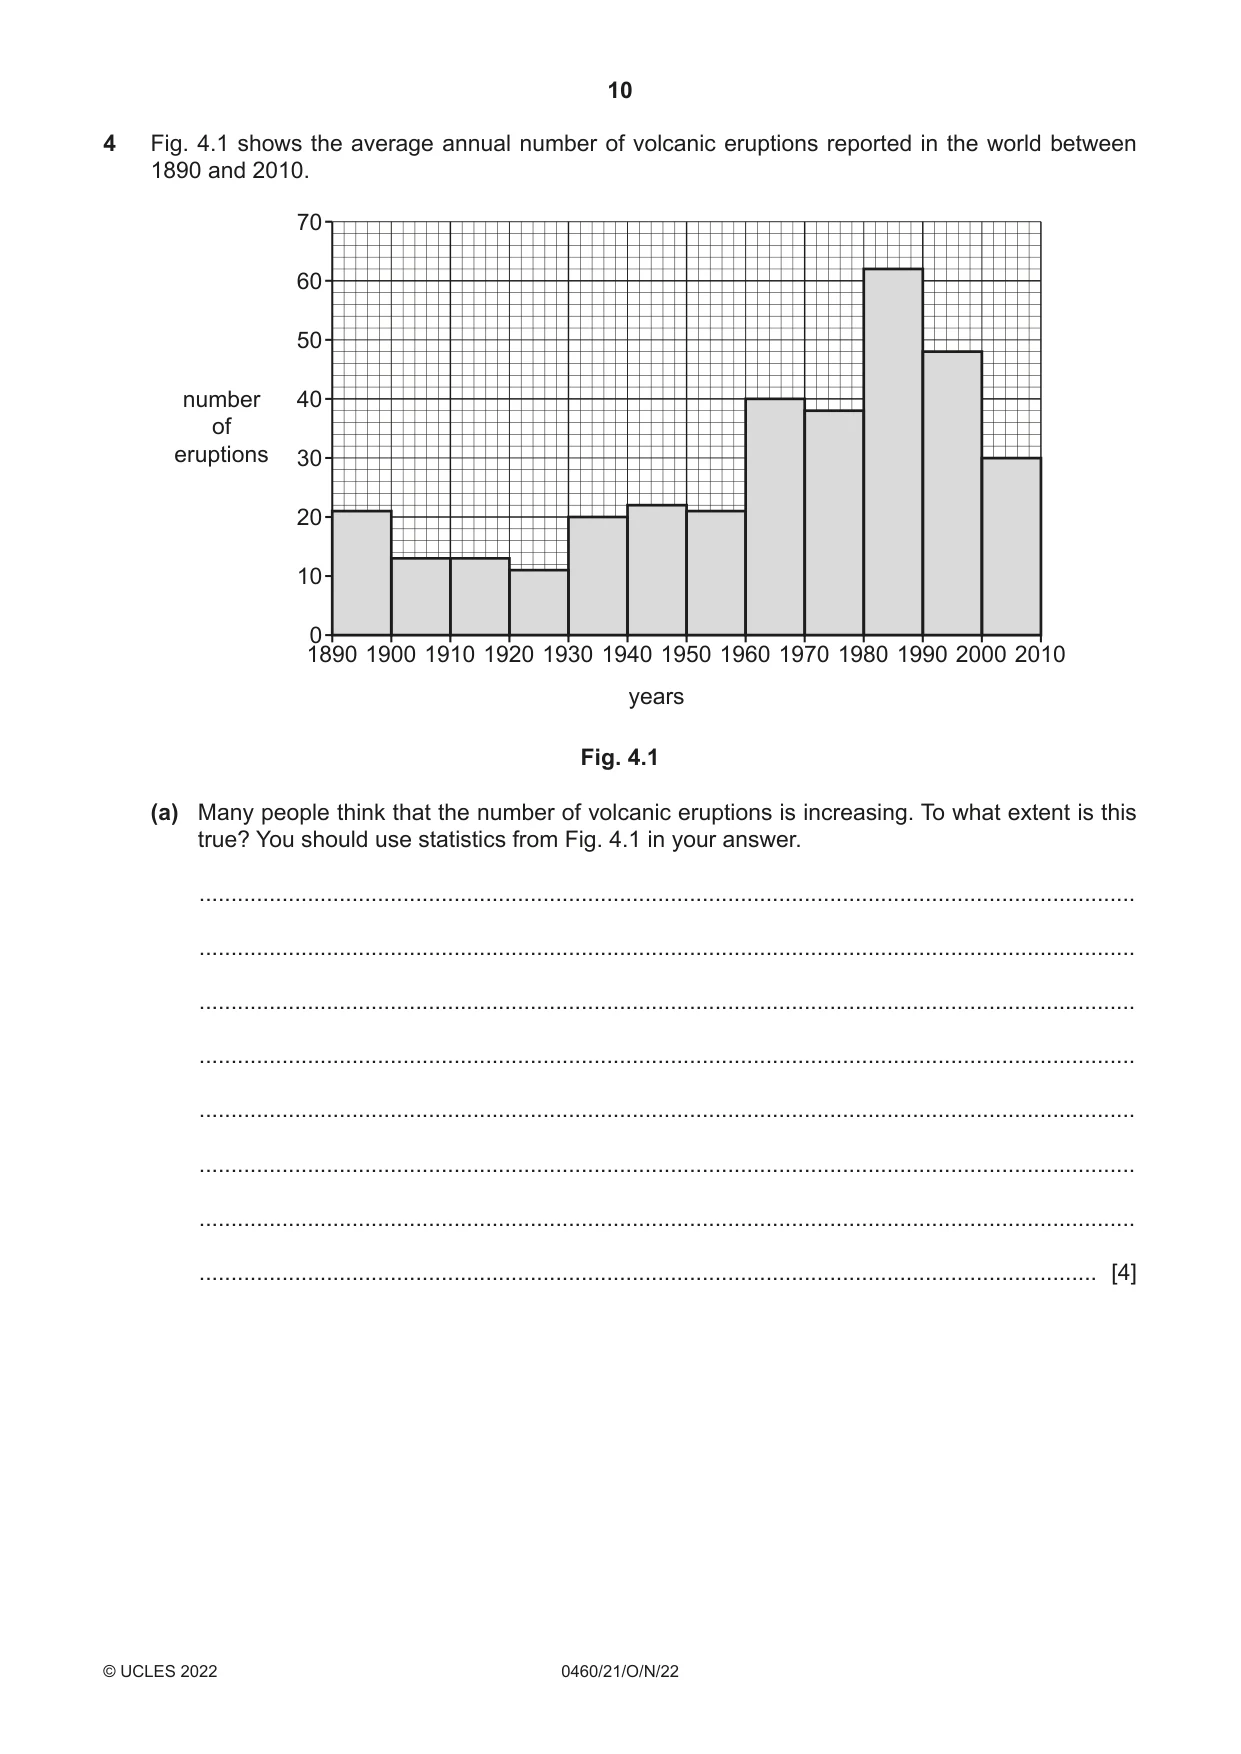
4 Fig. 4.1 shows the average annual number of volcanic eruptions reported in the world between 1890 and 2010. 70 60 50 number 40 of eruptions 30 20 10 0 1890 1900 1910 1920 1930 1940 1950 1960 1970 1980 1990 2000 2010 years Fig. 4.1 (a) Many people think that the number of volcanic eruptions is increasing. To what extent is this true? You should use statistics from Fig. 4.1 in your answer. ................................................................................................................................................... ................................................................................................................................................... ................................................................................................................................................... ................................................................................................................................................... ................................................................................................................................................... ................................................................................................................................................... ................................................................................................................................................... ............................................................................................................................................. [4] (b) State four reasons why many people live near volcanoes. 1 ................................................................................................................................................ ................................................................................................................................................... 2 ................................................................................................................................................ ................................................................................................................................................... 3 ................................................................................................................................................ ................................................................................................................................................... 4 ................................................................................................................................................ ............................................................................................................................................. [4] [Total: 8]
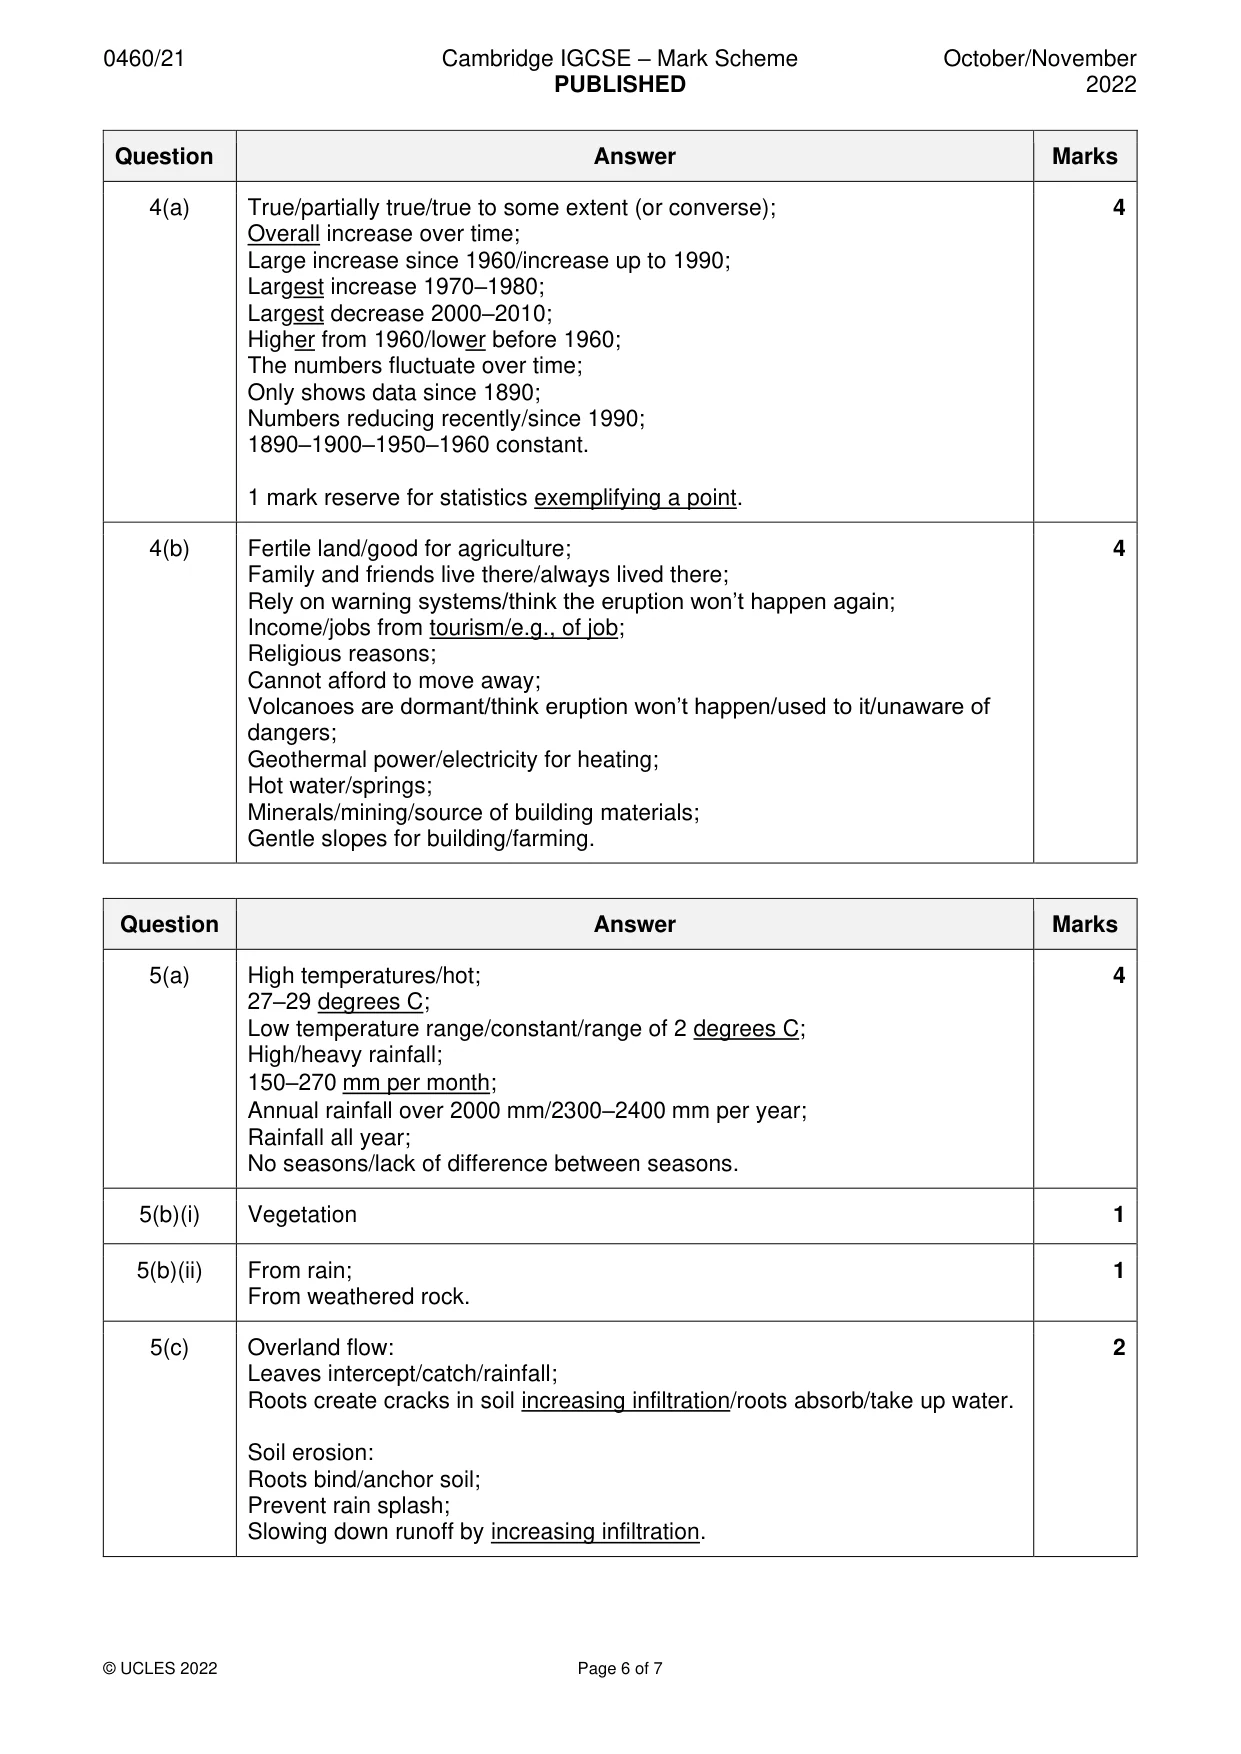
Mark scheme: 4(a) True/partially true/true to some extent (or converse); 4 Overall increase over time; Large increase since 1960/increase up to 1990; Largest increase 1970–1980; Largest decrease 2000–2010; Higher from 1960/lower before 1960; The numbers fluctuate over time; Only shows data since 1890; Numbers reducing recently/since 1990; 1890–1900–1950–1960 constant. 1 mark reserve for statistics exemplifying a point. 4(b) Fertile land/good for agriculture; 4 Family and friends live there/always lived there; Rely on warning systems/think the eruption won’t happen again; Income/jobs from tourism/e.g., of job; Religious reasons; Cannot afford to move away; Volcanoes are dormant/think eruption won’t happen/used to it/unaware of dangers; Geothermal power/electricity for heating; Hot water/springs; Minerals/mining/source of building materials; Gentle slopes for building/farming.
Q5 · A climate graph for an equatorial area
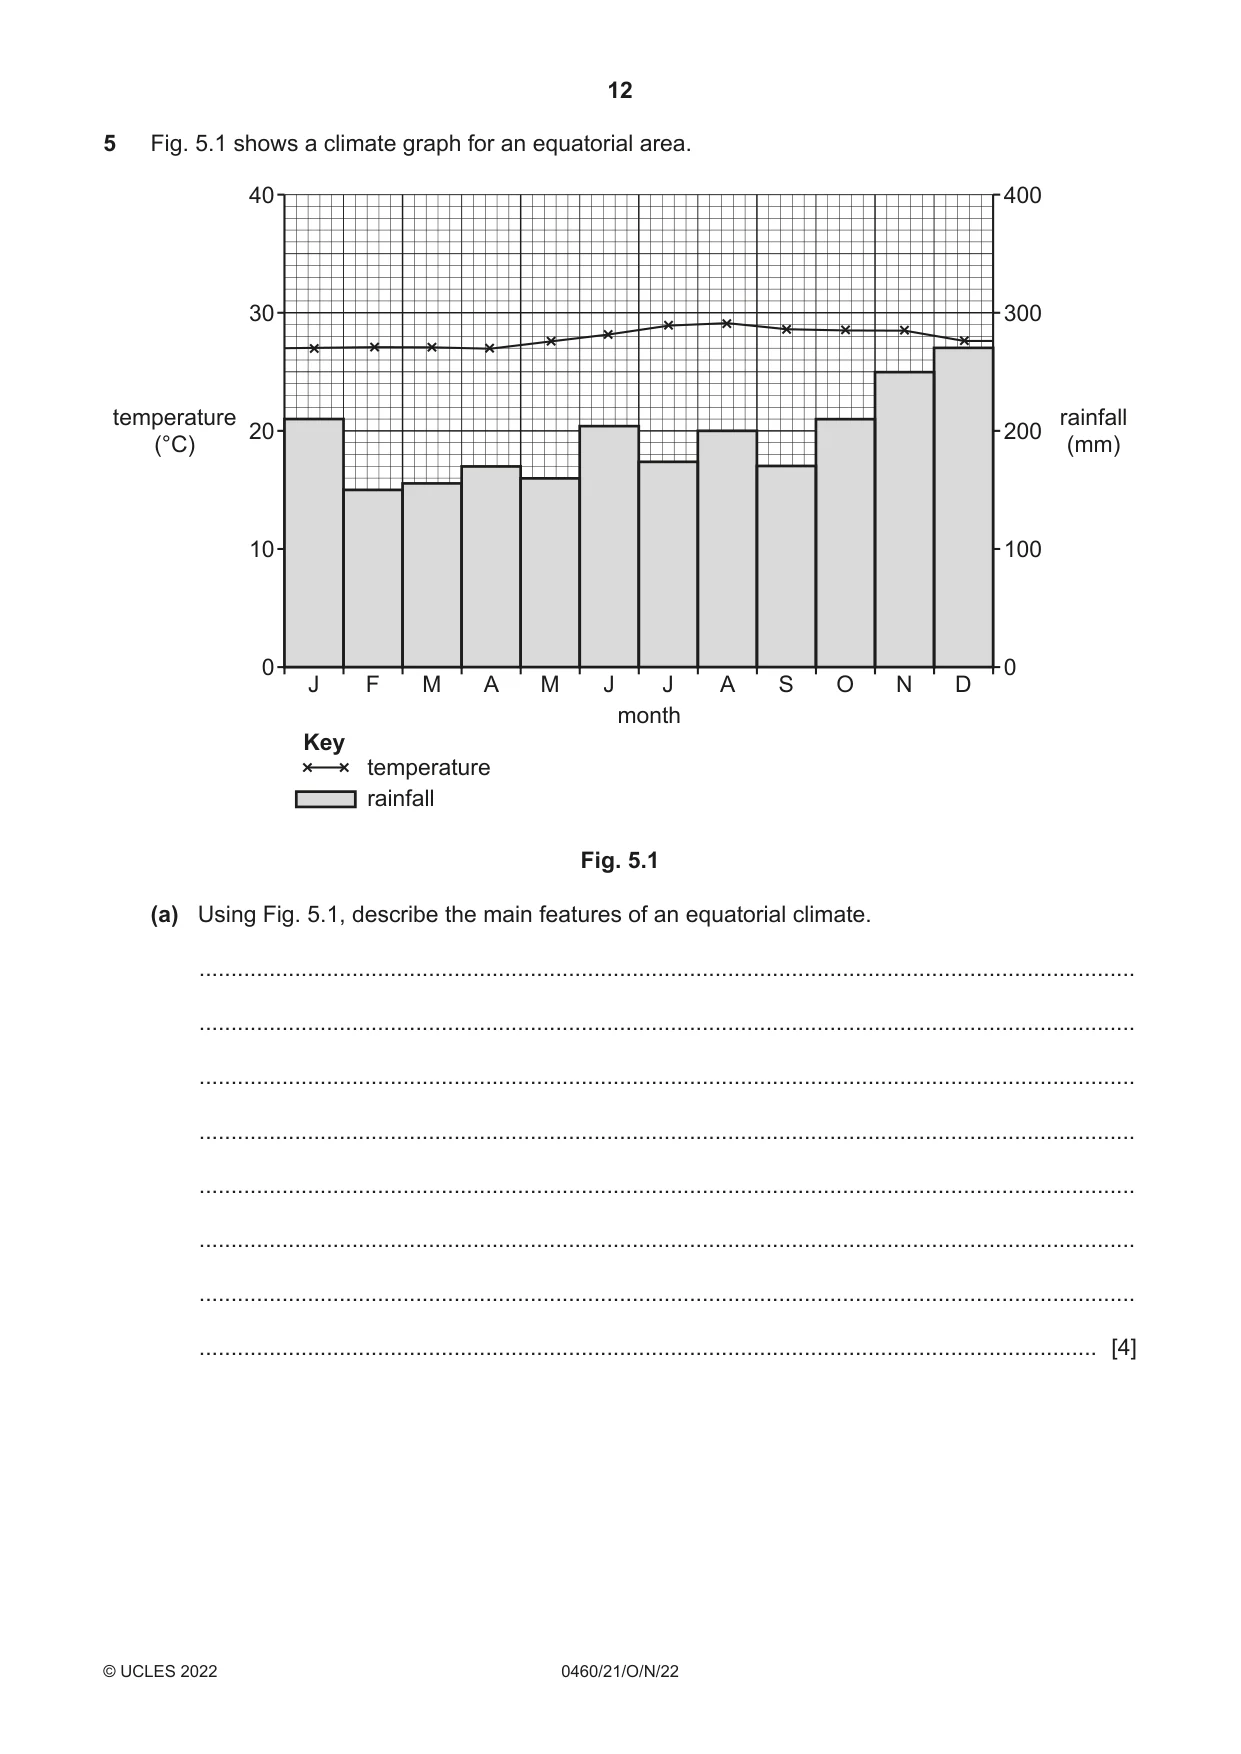
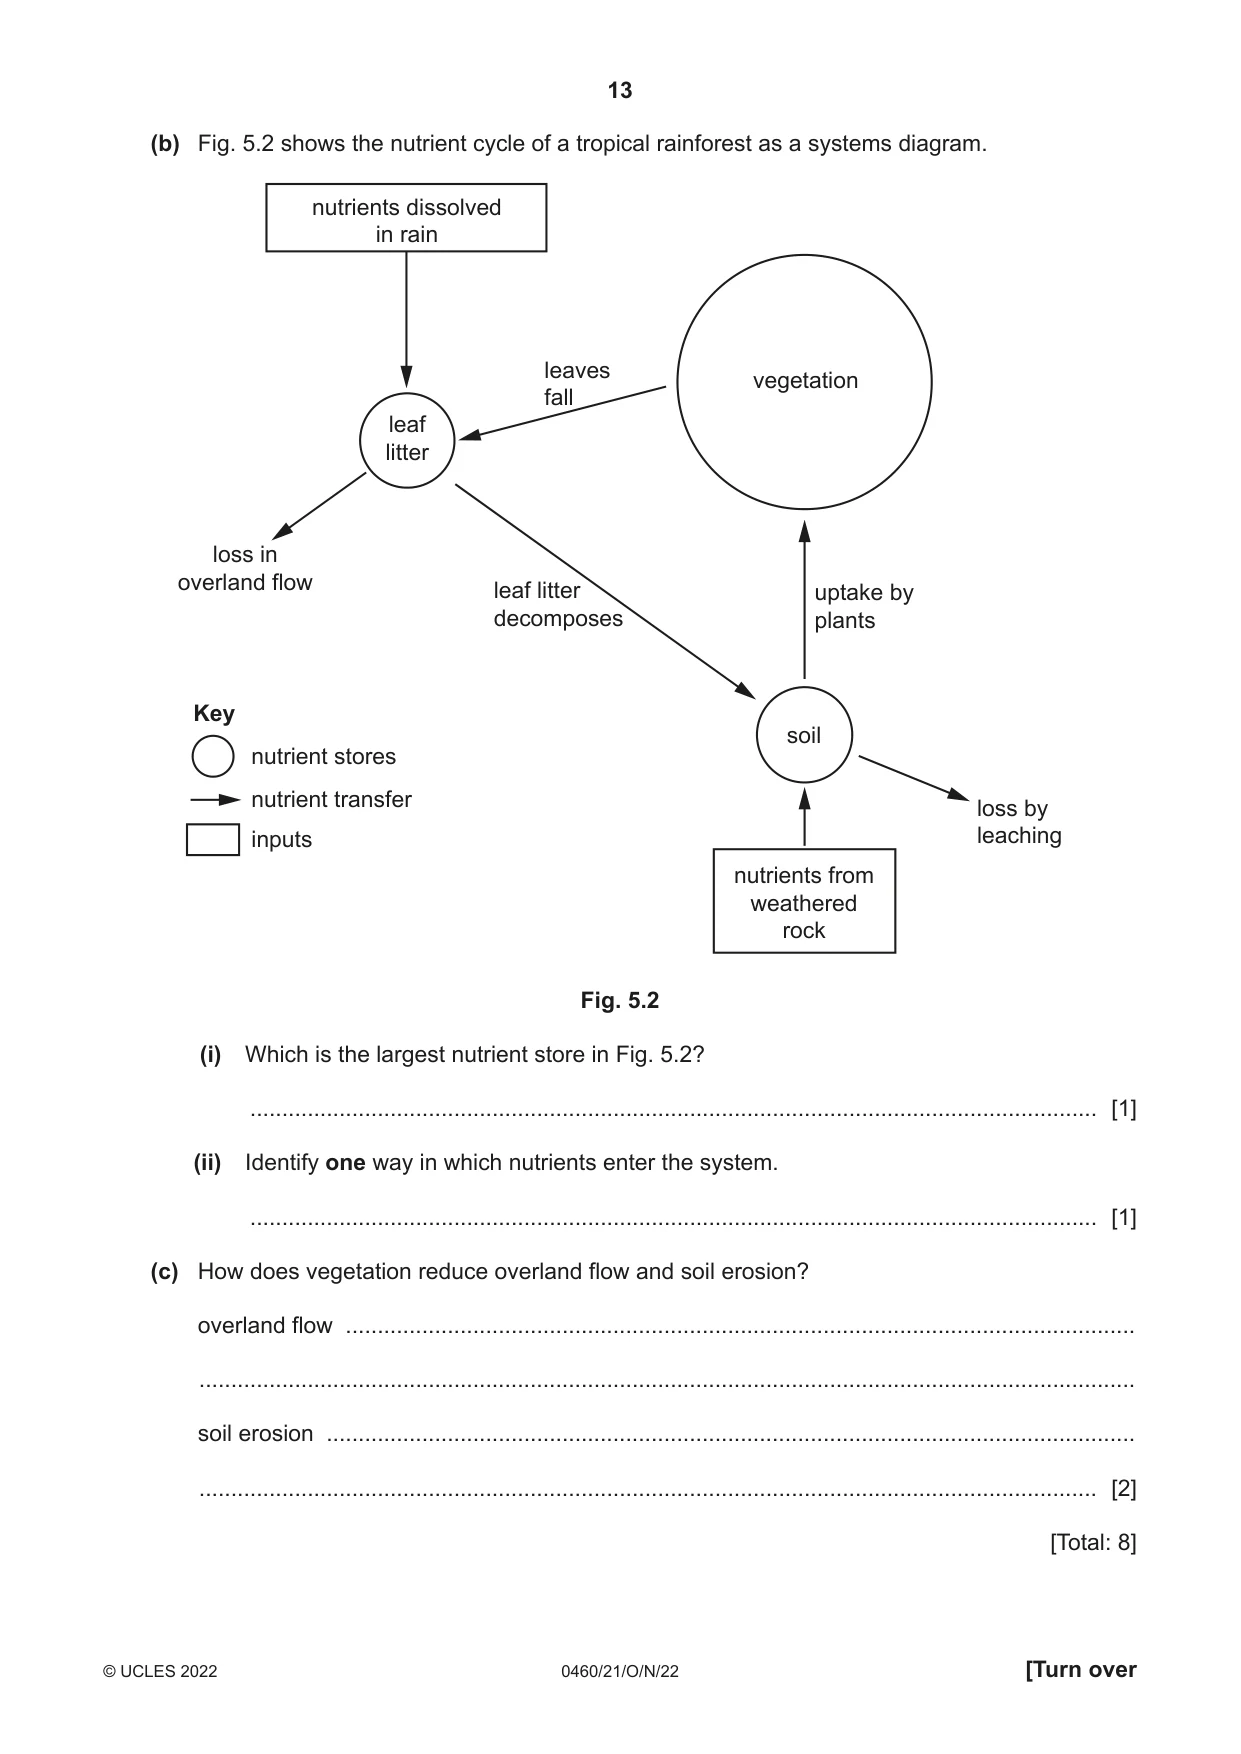
5 Fig. 5.1 shows a climate graph for an equatorial area. 40 400 30 300 temperature rainfall 20 200 (°C) (mm) 10 100 0 0 J F M A M J J A S O N D month Key temperature rainfall Fig. 5.1 (a) Using Fig. 5.1, describe the main features of an equatorial climate. ................................................................................................................................................... ................................................................................................................................................... ................................................................................................................................................... ................................................................................................................................................... ................................................................................................................................................... ................................................................................................................................................... ................................................................................................................................................... ............................................................................................................................................. [4] (b) Fig. 5.2 shows the nutrient cycle of a tropical rainforest as a systems diagram. nutrients dissolved in rain leaves vegetation fall leaf litter loss in overland flow leaf litter uptake by decomposes plants Key soil nutrient stores nutrient transfer loss by inputs leaching nutrients from weathered rock Fig. 5.2 (i) Which is the largest nutrient store in Fig. 5.2? ..................................................................................................................................... [1] (ii) Identify one way in which nutrients enter the system. ..................................................................................................................................... [1] (c) How does vegetation reduce overland flow and soil erosion? overland flow ............................................................................................................................ ................................................................................................................................................... soil erosion ............................................................................................................................... ............................................................................................................................................. [2] [Total: 8]
Mark scheme: 5(a) High temperatures/hot; 4 27–29 degrees C; Low temperature range/constant/range of 2 degrees C; High/heavy rainfall; 150–270 mm per month; Annual rainfall over 2000 mm/2300–2400 mm per year; Rainfall all year; No seasons/lack of difference between seasons. 5(b)(i) Vegetation 1 5(b)(ii) From rain; 1 From weathered rock. 5(c) Overland flow: 2 Leaves intercept/catch/rainfall; Roots create cracks in soil increasing infiltration/roots absorb/take up water. Soil erosion: Roots bind/anchor soil; Prevent rain splash; Slowing down runoff by increasing infiltration.
Question 6
6 Fig. 6.1 (Insert) shows a farm in Indonesia. (a) Which one of the following terms describes the farm in Fig. 6.1? Tick (✓) one box below. tick (✓) extensive pastoral mechanised intensive [1] (b) Describe the features of the agriculture shown in Fig. 6.1 (Insert). ................................................................................................................................................... ................................................................................................................................................... ................................................................................................................................................... ................................................................................................................................................... ................................................................................................................................................... ................................................................................................................................................... ................................................................................................................................................... ............................................................................................................................................. [4] (c) Describe the economic and political problems which cause food shortages. ................................................................................................................................................... ................................................................................................................................................... ................................................................................................................................................... ................................................................................................................................................... ................................................................................................................................................... ................................................................................................................................................... ................................................................................................................................................... ............................................................................................................................................. [3] [Total: 8] Additional pages If you use the following pages to complete the answer to any question, the question number must be clearly shown. .................................................................................................................................................................. .................................................................................................................................................................. .................................................................................................................................................................. .................................................................................................................................................................. .................................................................................................................................................................. .................................................................................................................................................................. .................................................................................................................................................................. .................................................................................................................................................................. .................................................................................................................................................................. .................................................................................................................................................................. .................................................................................................................................................................. .................................................................................................................................................................. .................................................................................................................................................................. .................................................................................................................................................................. .................................................................................................................................................................. .................................................................................................................................................................. .................................................................................................................................................................. .................................................................................................................................................................. .................................................................................................................................................................. .................................................................................................................................................................. .................................................................................................................................................................. .................................................................................................................................................................. .................................................................................................................................................................. .................................................................................................................................................................. .................................................................................................................................................................. .................................................................................................................................................................. .................................................................................................................................................................. .................................................................................................................................................................. .................................................................................................................................................................. .................................................................................................................................................................. .................................................................................................................................................................. .................................................................................................................................................................. .................................................................................................................................................................. .................................................................................................................................................................. .................................................................................................................................................................. .................................................................................................................................................................. .................................................................................................................................................................. .................................................................................................................................................................. .................................................................................................................................................................. .................................................................................................................................................................. .................................................................................................................................................................. .................................................................................................................................................................. .................................................................................................................................................................. .................................................................................................................................................................. .................................................................................................................................................................. .................................................................................................................................................................. .................................................................................................................................................................. .................................................................................................................................................................. The boundaries and names shown, the designations used and the presentation of material on any maps contained in this question paper/insert do not imply official endorsement or acceptance by Cambridge Assessment International Education concerning the legal status of any country, territory, or area or any of its authorities, or of the delimitation of its frontiers or boundaries.
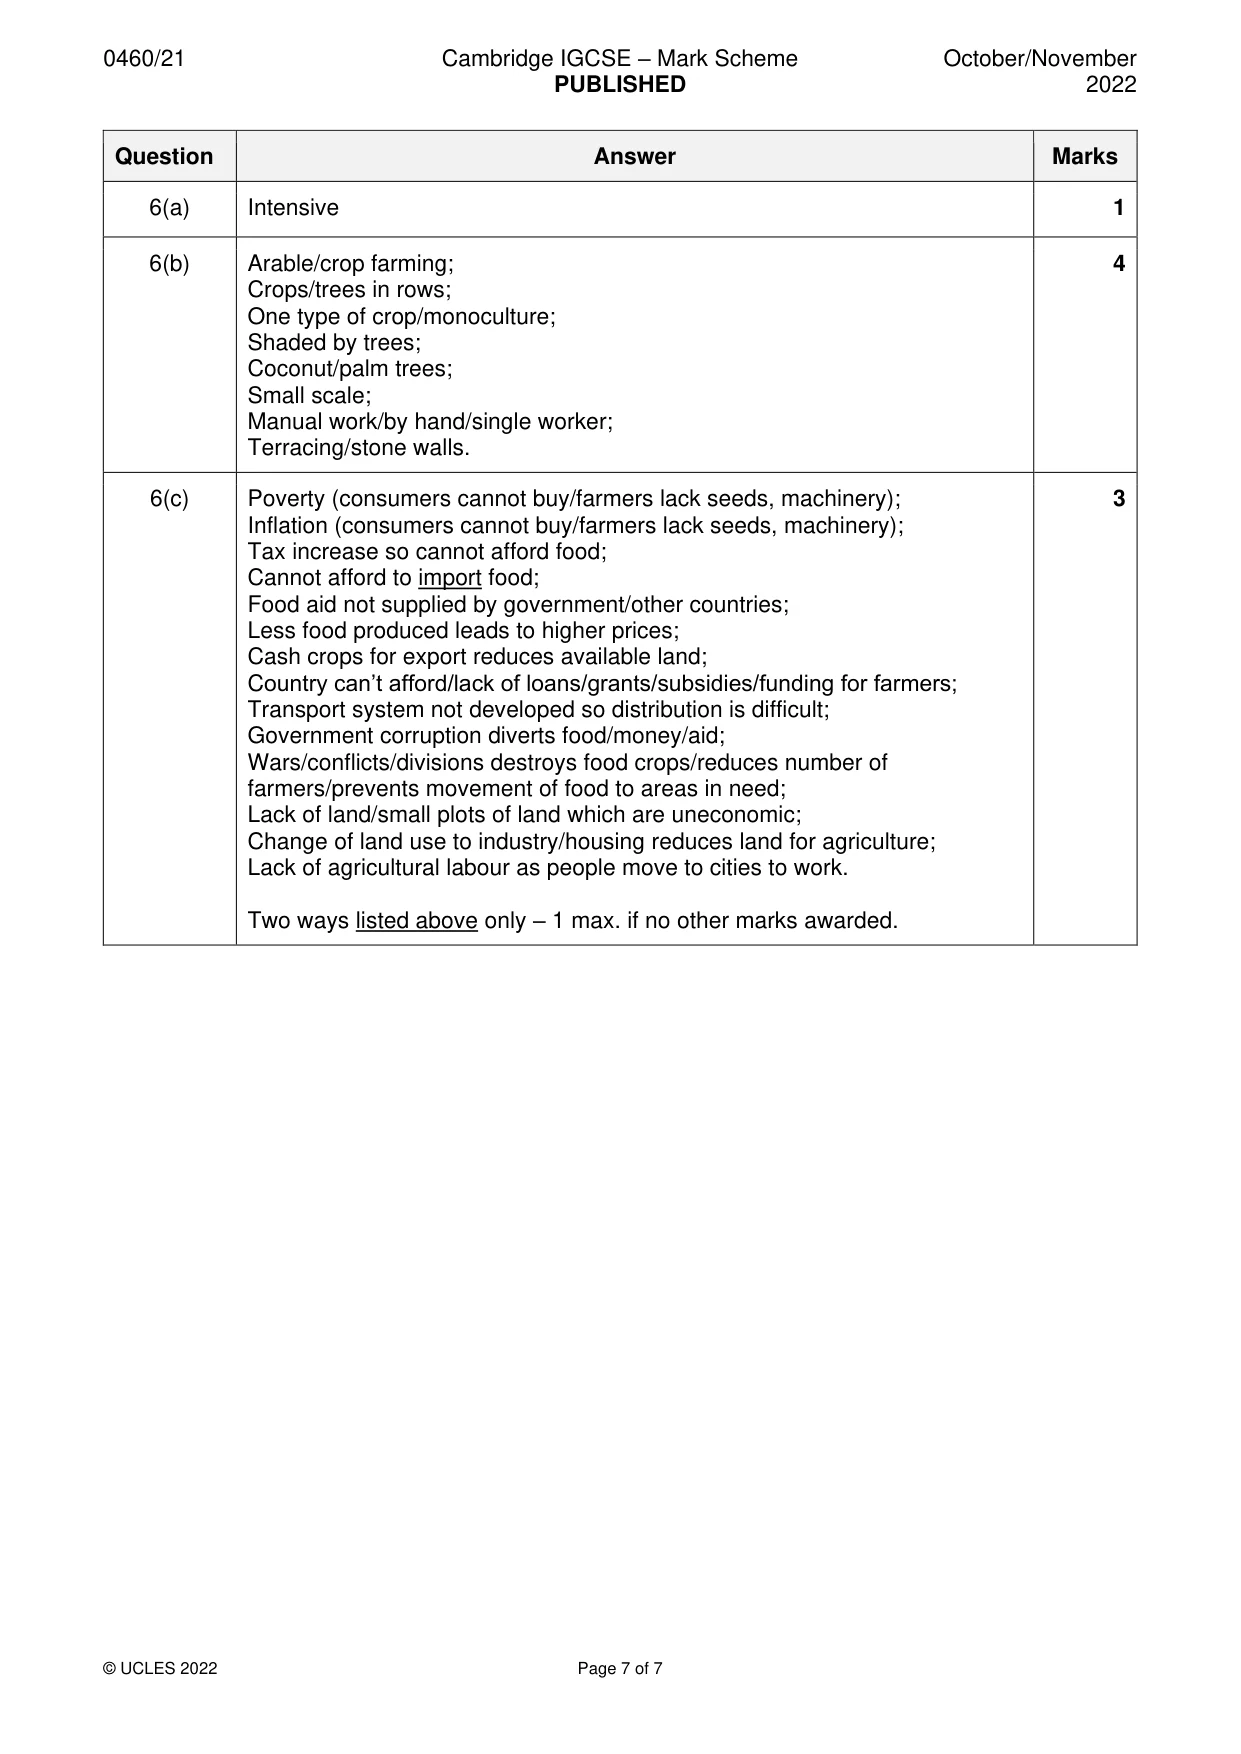
Mark scheme: 6(a) Intensive 1 6(b) Arable/crop farming; 4 Crops/trees in rows; One type of crop/monoculture; Shaded by trees; Coconut/palm trees; Small scale; Manual work/by hand/single worker; Terracing/stone walls. 6(c) Poverty (consumers cannot buy/farmers lack seeds, machinery); 3 Inflation (consumers cannot buy/farmers lack seeds, machinery); Tax increase so cannot afford food; Cannot afford to import food; Food aid not supplied by government/other countries; Less food produced leads to higher prices; Cash crops for export reduces available land; Country can’t afford/lack of loans/grants/subsidies/funding for farmers; Transport system not developed so distribution is difficult; Government corruption diverts food/money/aid; Wars/conflicts/divisions destroys food crops/reduces number of farmers/prevents movement of food to areas in need; Lack of land/small plots of land which are uneconomic; Change of land use to industry/housing reduces land for agriculture; Lack of agricultural labour as people move to cities to work. Two ways listed above only – 1 max. if no other marks awarded.
What was in this paper
The subtopics covered by these 6 questions, and how many questions each got. Open one in a new tab to see every Cambridge question on it.
What you needed in this session
Cambridge’s own grade thresholds for 2022 Oct/Nov, Paper 2 · Variant 1. A higher threshold means an easier paper — the bar moves with how the cohort did.