Cambridge IGCSE Geography 0460 — 2020 Oct/Nov Paper 2 · Variant 3
0460/23/O/N/20 · 6 questions · 60 marks · ≈68 min
The question paper and its mark scheme, free to read here and free to download. This is Cambridge’s own paper, exactly as it was sat.
Question paper20 pages


Mark scheme7 pages
Answers below. Sit the paper first if you are practising.
Questions as text
Q1 · Study the map extract for Taormina, Italy
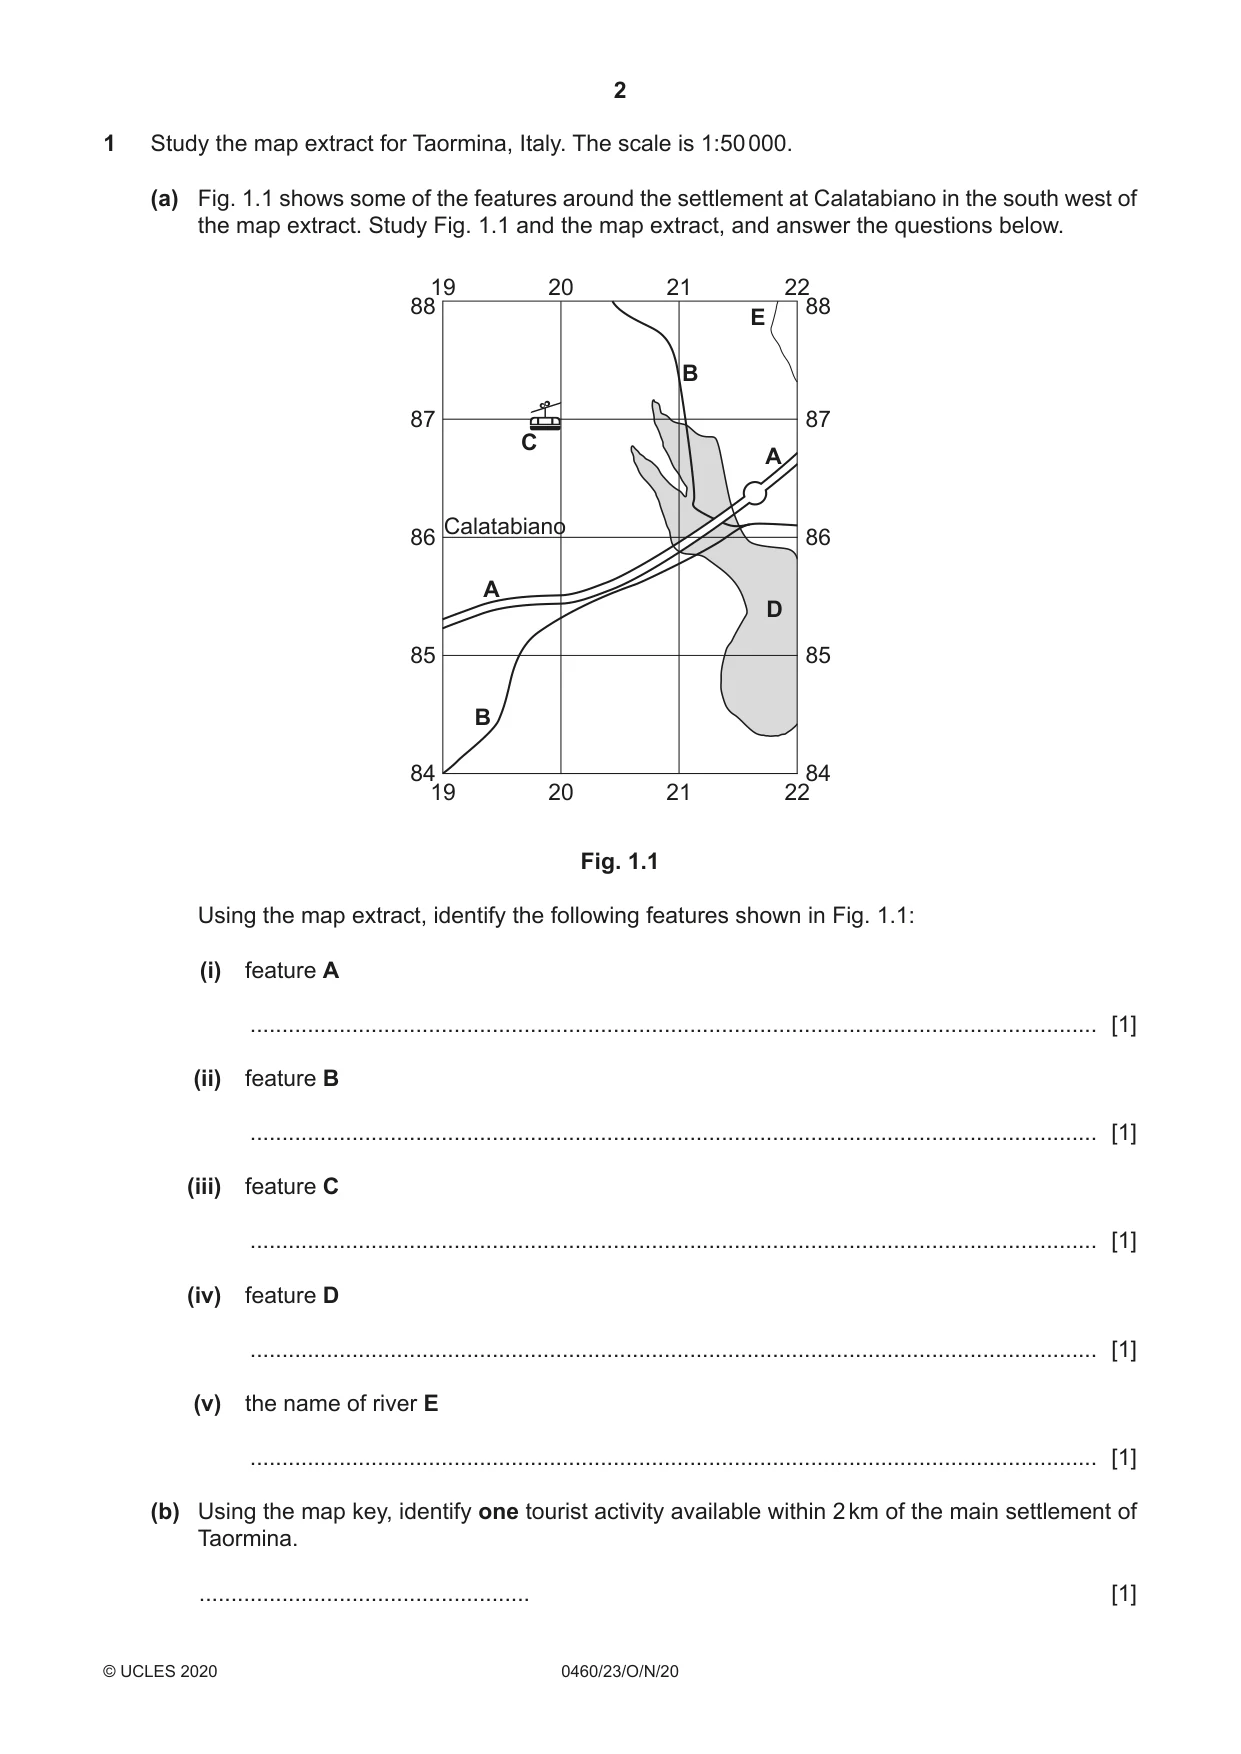
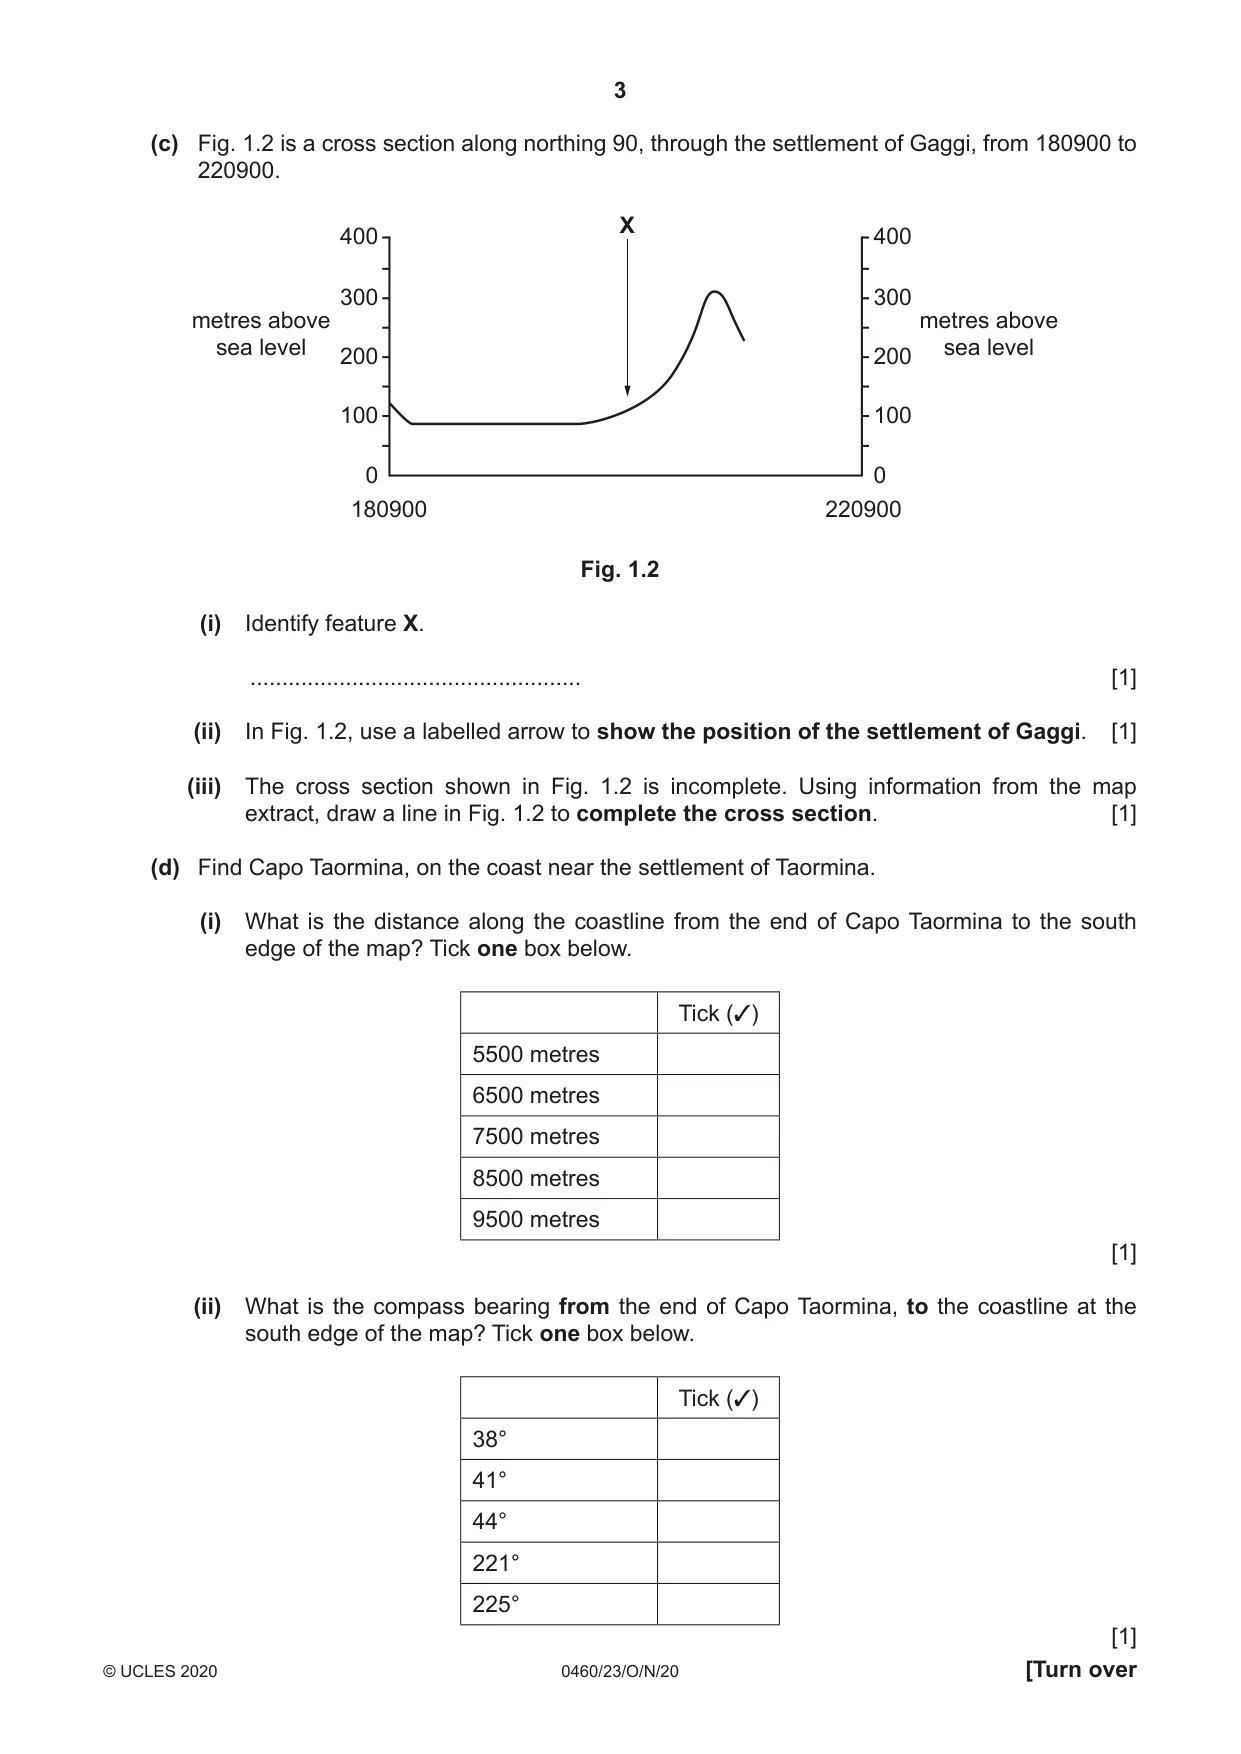
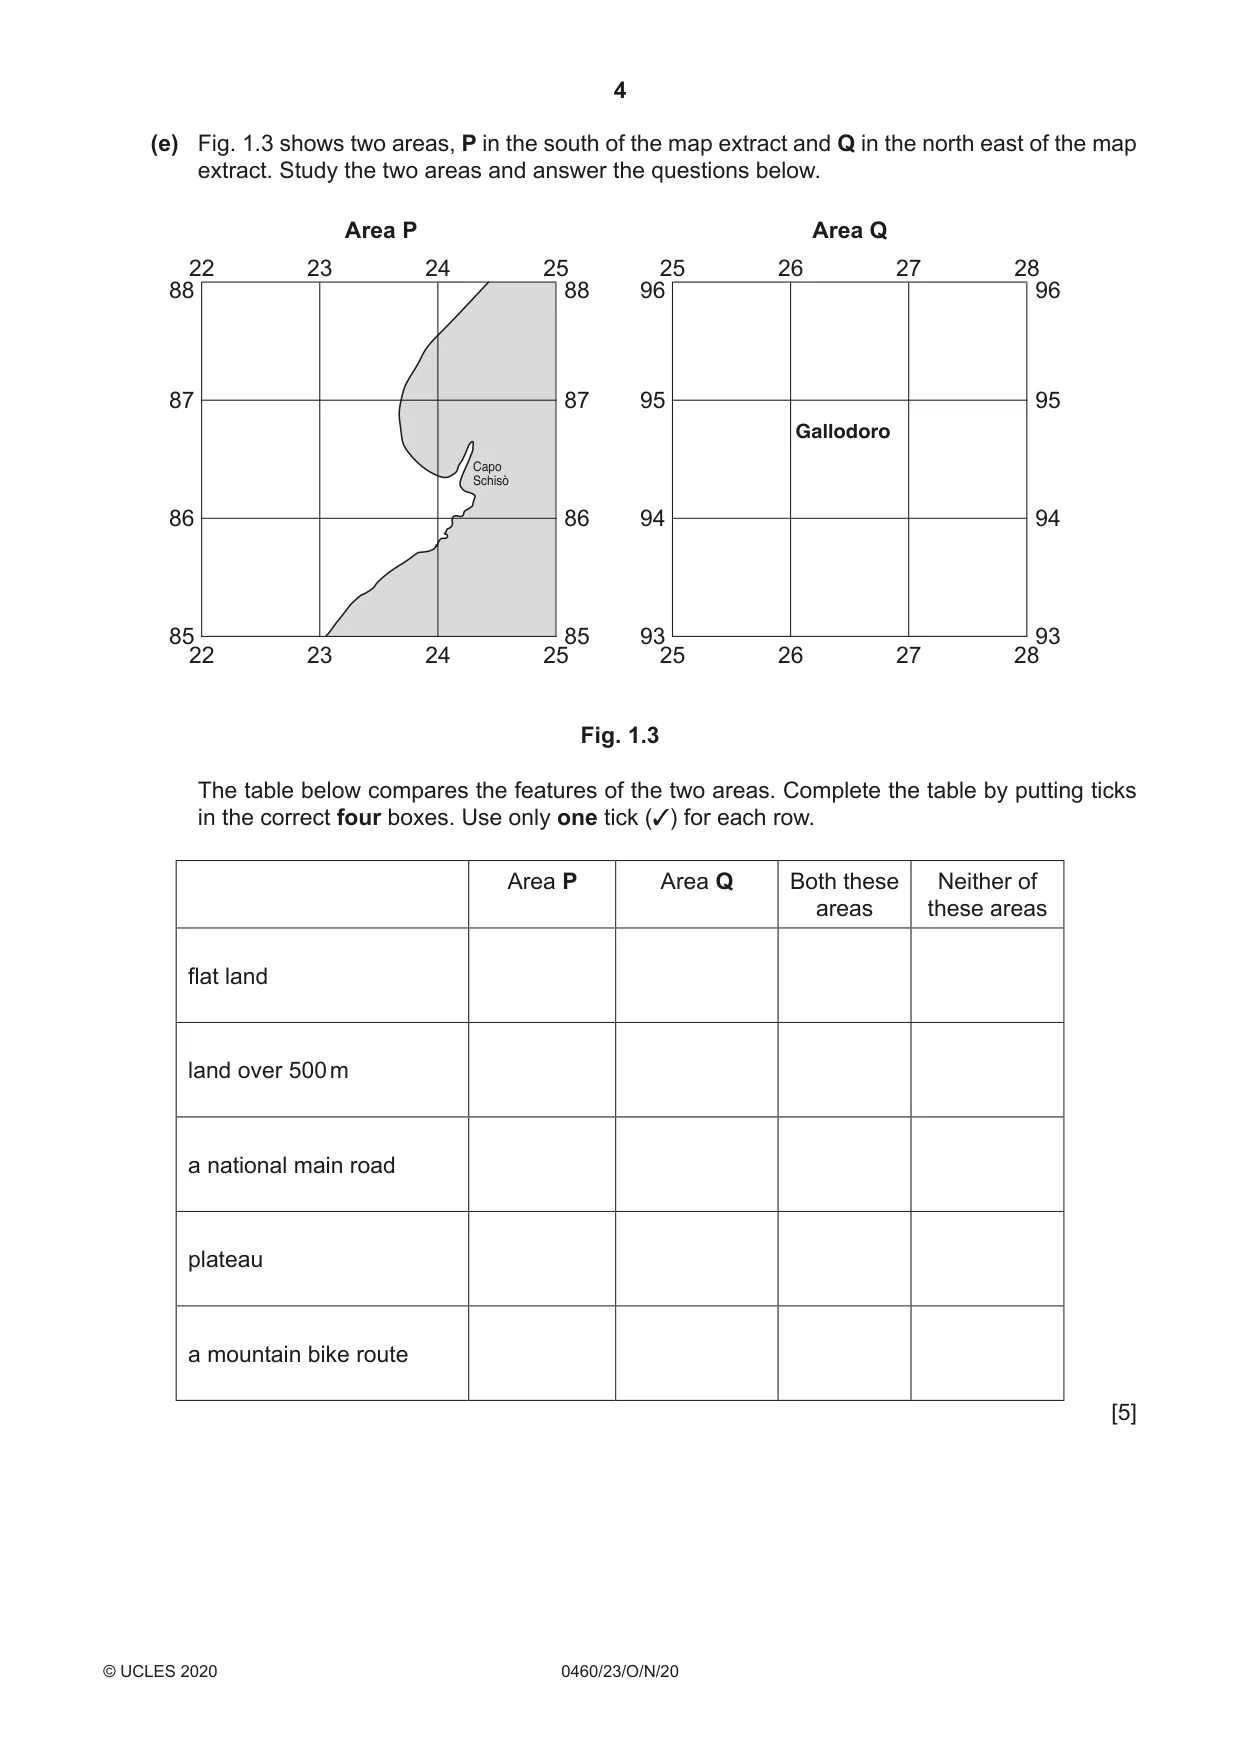
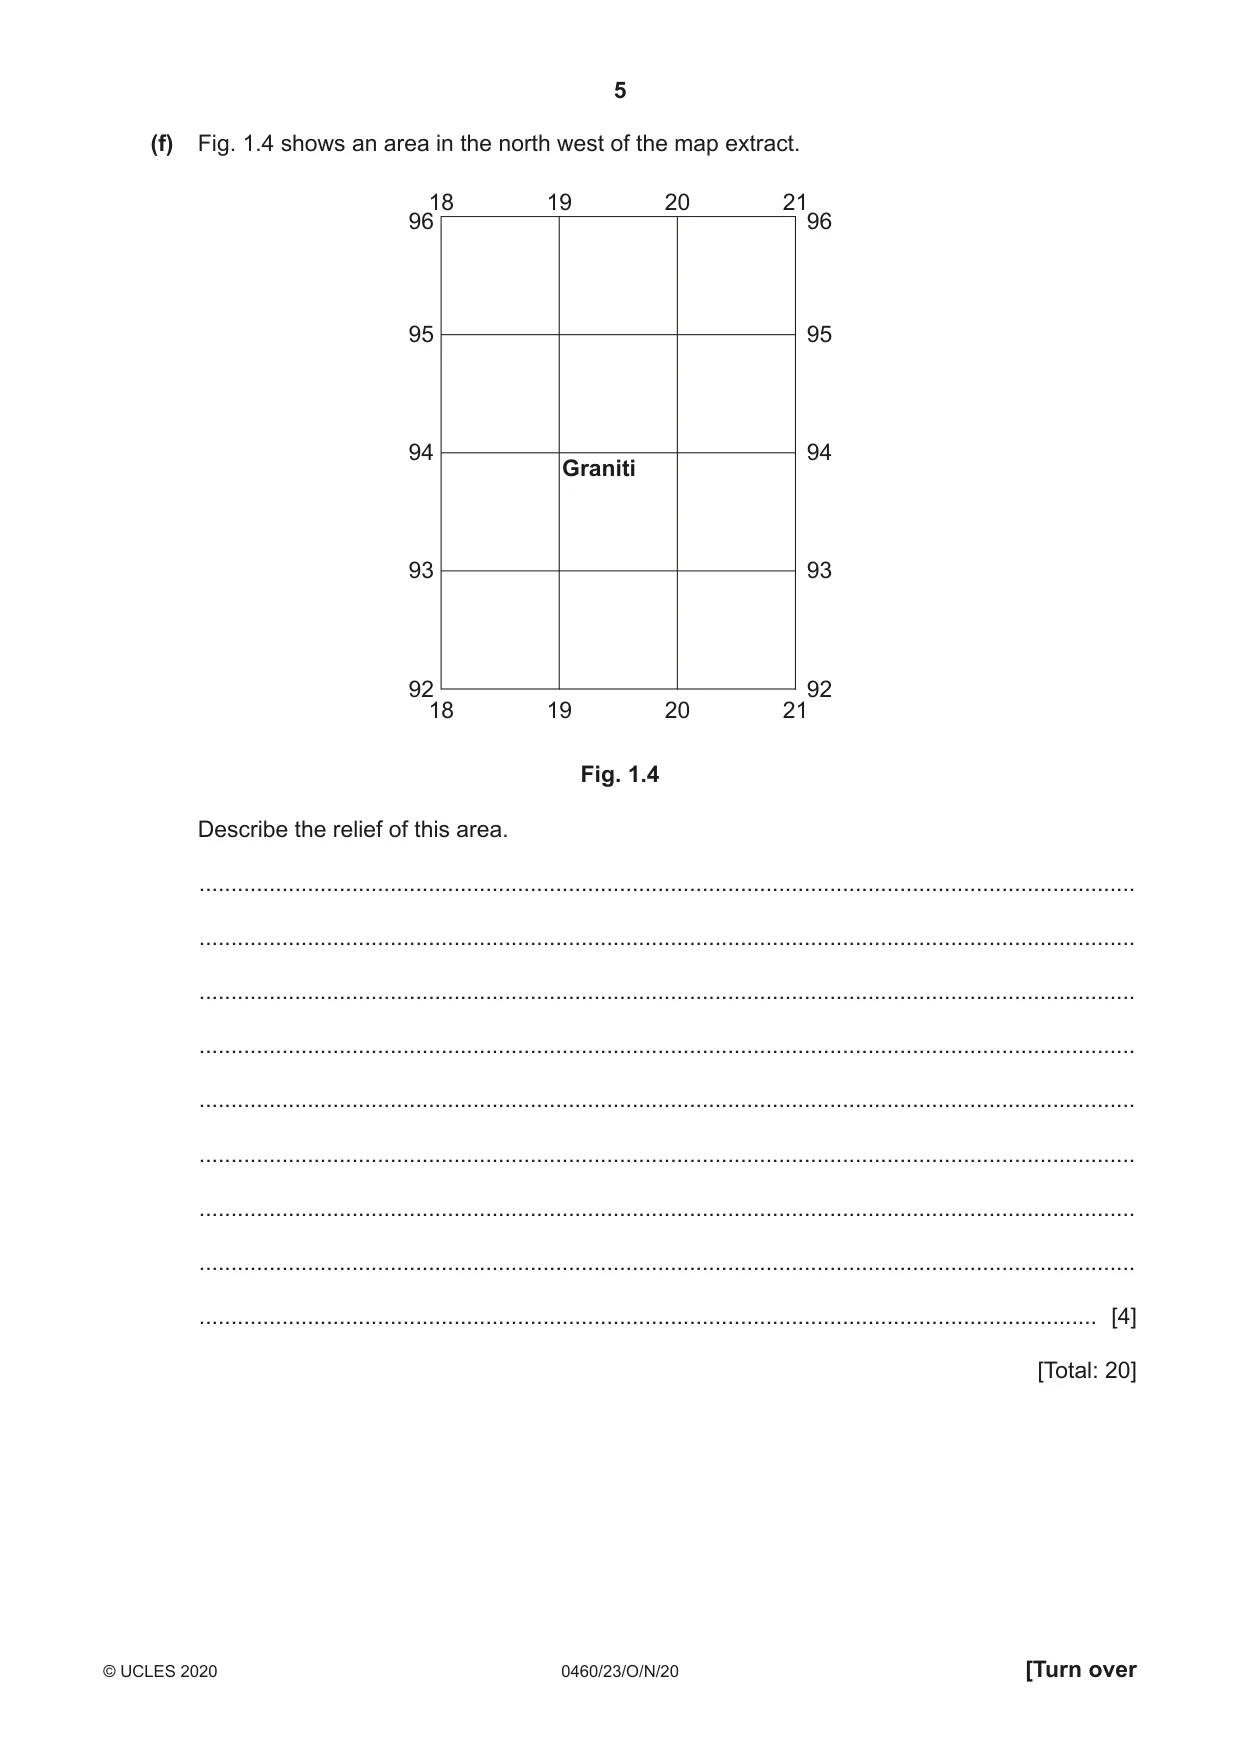
1 Study the map extract for Taormina, Italy. The scale is 1:50 000. (a) Fig. 1.1 shows some of the features around the settlement at Calatabiano in the south west of the map extract. Study Fig. 1.1 and the map extract, and answer the questions below. 19 20 21 22 88 88 E B 87 87 C A Calatabiano 86 86 A D 85 85 B 84 84 19 20 21 22 Fig. 1.1 Using the map extract, identify the following features shown in Fig. 1.1: (i) feature A ..................................................................................................................................... [1] (ii) feature B ..................................................................................................................................... [1] (iii) feature C ..................................................................................................................................... [1] (iv) feature D ..................................................................................................................................... [1] (v) the name of river E ..................................................................................................................................... [1] (b) Using the map key, identify one tourist activity available within 2 km of the main settlement of Taormina. .................................................... [1] (c) Fig. 1.2 is a cross section along northing 90, through the settlement of Gaggi, from 180900 to 220900. X 400 400 300 300 metres above metres above sea level sea level 200 200 100 100 0 0 180900 220900 Fig. 1.2 (i) Identify feature X. .................................................... [1] (ii) In Fig. 1.2, use a labelled arrow to show the position of the settlement of Gaggi. [1] (iii) The cross section shown in Fig. 1.2 is incomplete. Using information from the map extract, draw a line in Fig. 1.2 to complete the cross section. [1] (d) Find Capo Taormina, on the coast near the settlement of Taormina. (i) What is the distance along the coastline from the end of Capo Taormina to the south edge of the map? Tick one box below. Tick (✓) 5500 metres 6500 metres 7500 metres 8500 metres 9500 metres [1] (ii) What is the compass bearing from the end of Capo Taormina, to the coastline at the south edge of the map? Tick one box below. Tick (✓) 38° 41° 44° 221° 225° [1] (e) Fig. 1.3 shows two areas, P in the south of the map extract and Q in the north east of the map extract. Study the two areas and answer the questions below. Area P Area Q 22 23 24 25 25 26 27 28 88 88 96 96 87 87 95 95 Gallodoro Capo Schisò 86 86 94 94 85 85 93 93 22 23 24 25 25 26 27 28 Fig. 1.3 The table below compares the features of the two areas. Complete the table by putting ticks in the correct four boxes. Use only one tick (✓) for each row. Area P Area Q Both these Neither of areas these areas flat land land over 500 m a national main road plateau a mountain bike route [5] (f) Fig. 1.4 shows an area in the north west of the map extract. 18 19 20 21 96 96 95 95 94 94 Graniti 93 93 92 92 18 19 20 21 Fig. 1.4 Describe the relief of this area. ................................................................................................................................................... ................................................................................................................................................... ................................................................................................................................................... ................................................................................................................................................... ................................................................................................................................................... ................................................................................................................................................... ................................................................................................................................................... ................................................................................................................................................... ............................................................................................................................................. [4] [Total: 20]
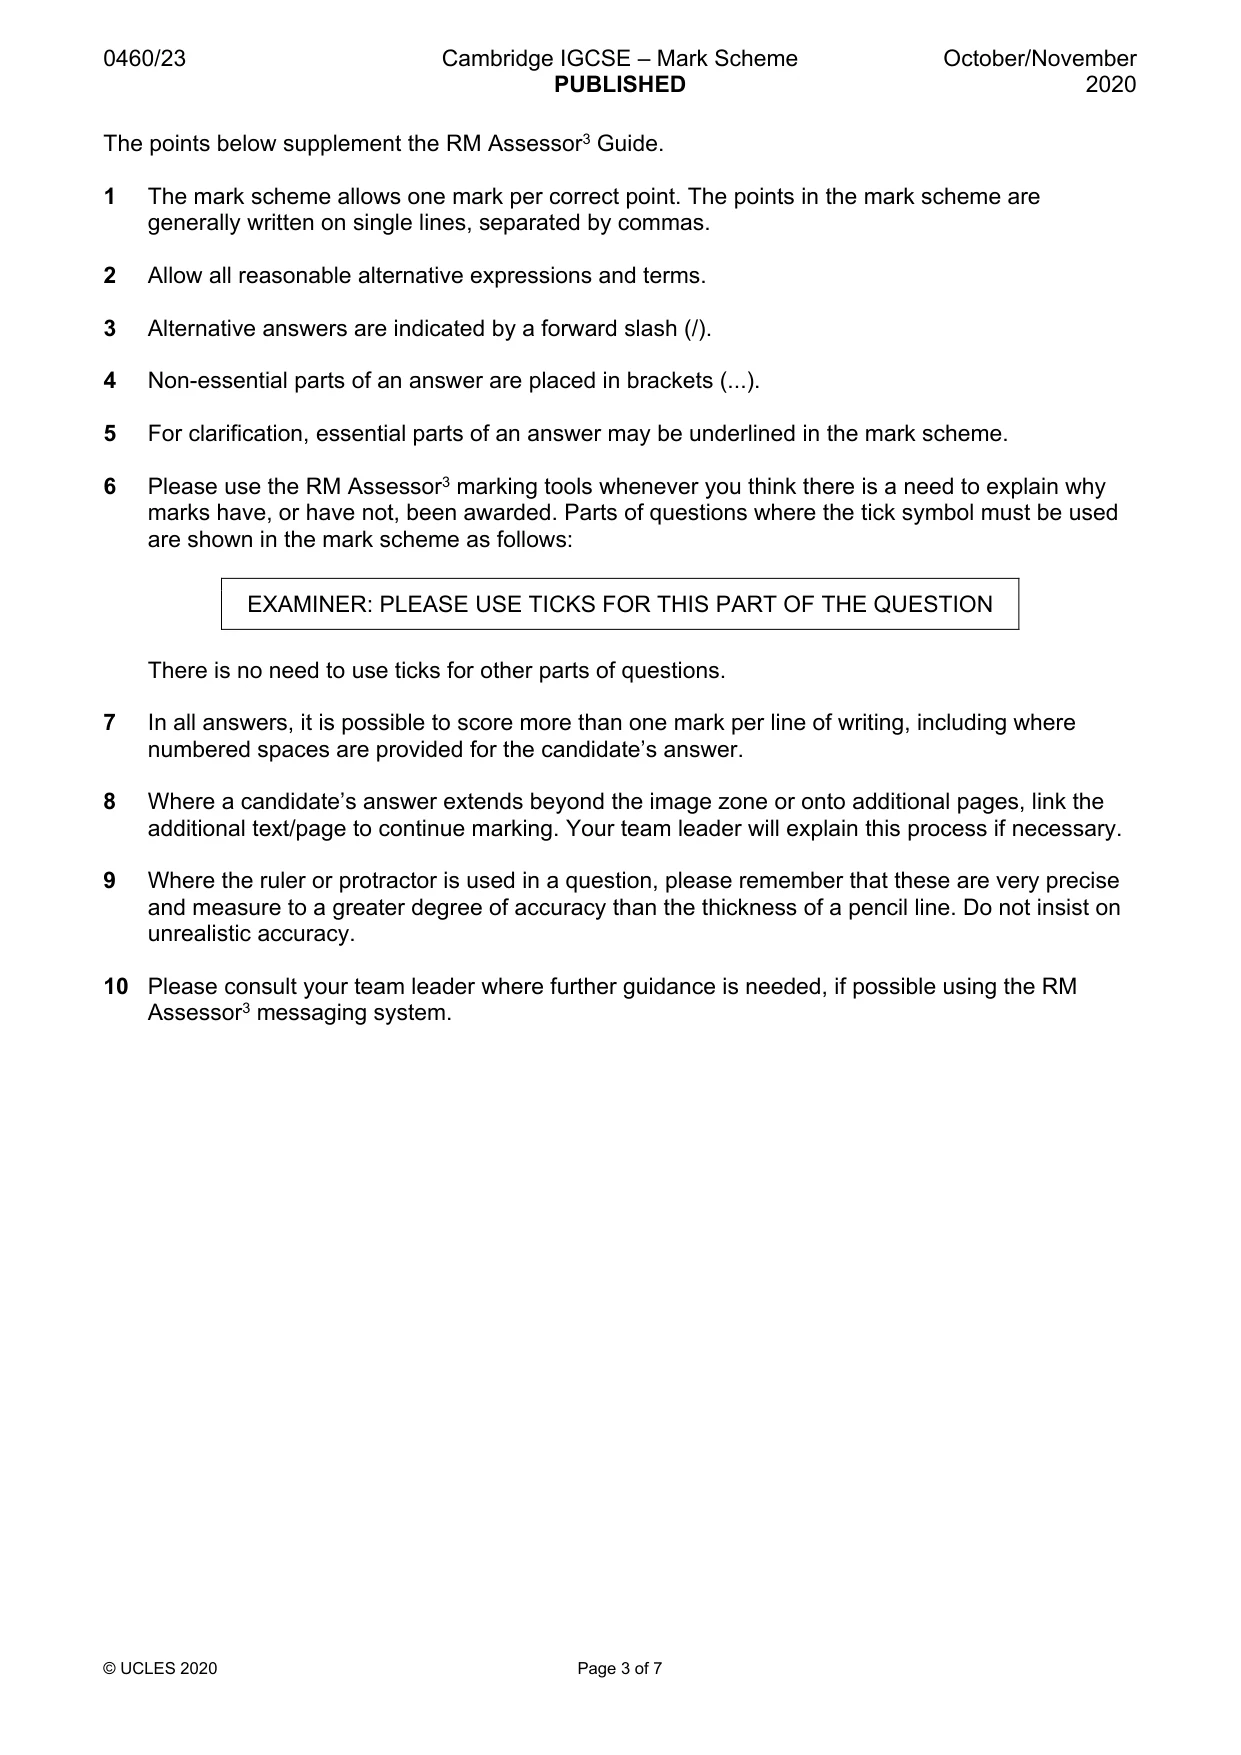
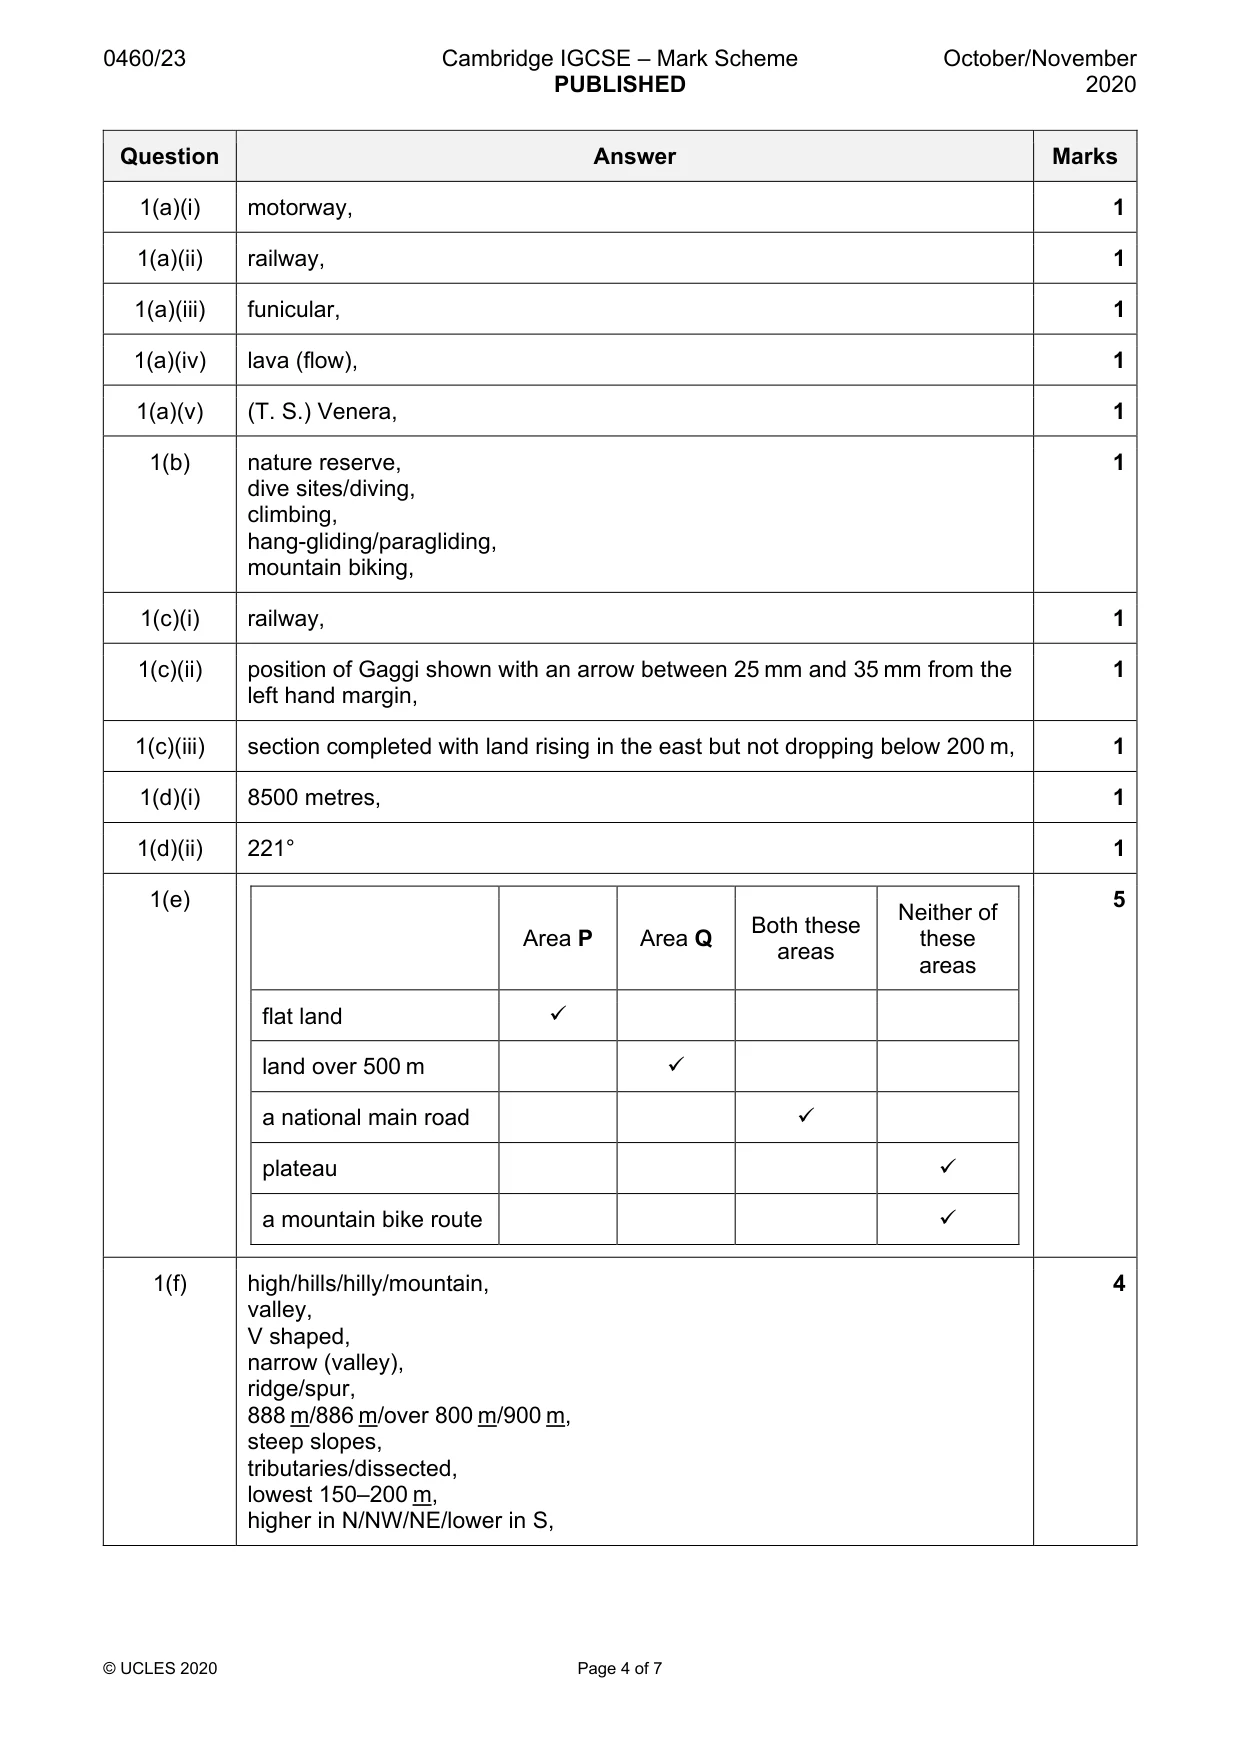
Mark scheme: Question Answer Marks 1(a)(i) motorway, 1 1(a)(ii) railway, 1 1(a)(iii) funicular, 1 1(a)(iv) lava (flow), 1 1(a)(v) (T. S.) Venera, 1 1(b) nature reserve, 1 dive sites/diving, climbing, hang-gliding/paragliding, mountain biking, 1(c)(i) railway, 1 1(c)(ii) position of Gaggi shown with an arrow between 25 mm and 35 mm from the 1 left hand margin, 1(c)(iii) section completed with land rising in the east but not dropping below 200 m, 1 1(d)(i) 8500 metres, 1 1(d)(ii) 221° 1 1(e) 5 Neither of Both these Area P Area Q these areas areas flat land land over 500 m a national main road plateau a mountain bike route 1(f) high/hills/hilly/mountain, 4 valley, V shaped, narrow (valley), ridge/spur, 888 m/886 m/over 800 m/900 m, steep slopes, tributaries/dissected, lowest 150–200 m, higher in N/NW/NE/lower in S,
More questions on Settlements (rural and urban) and service provision
Q2 · One estimate of the population growth rates of the countries in the world
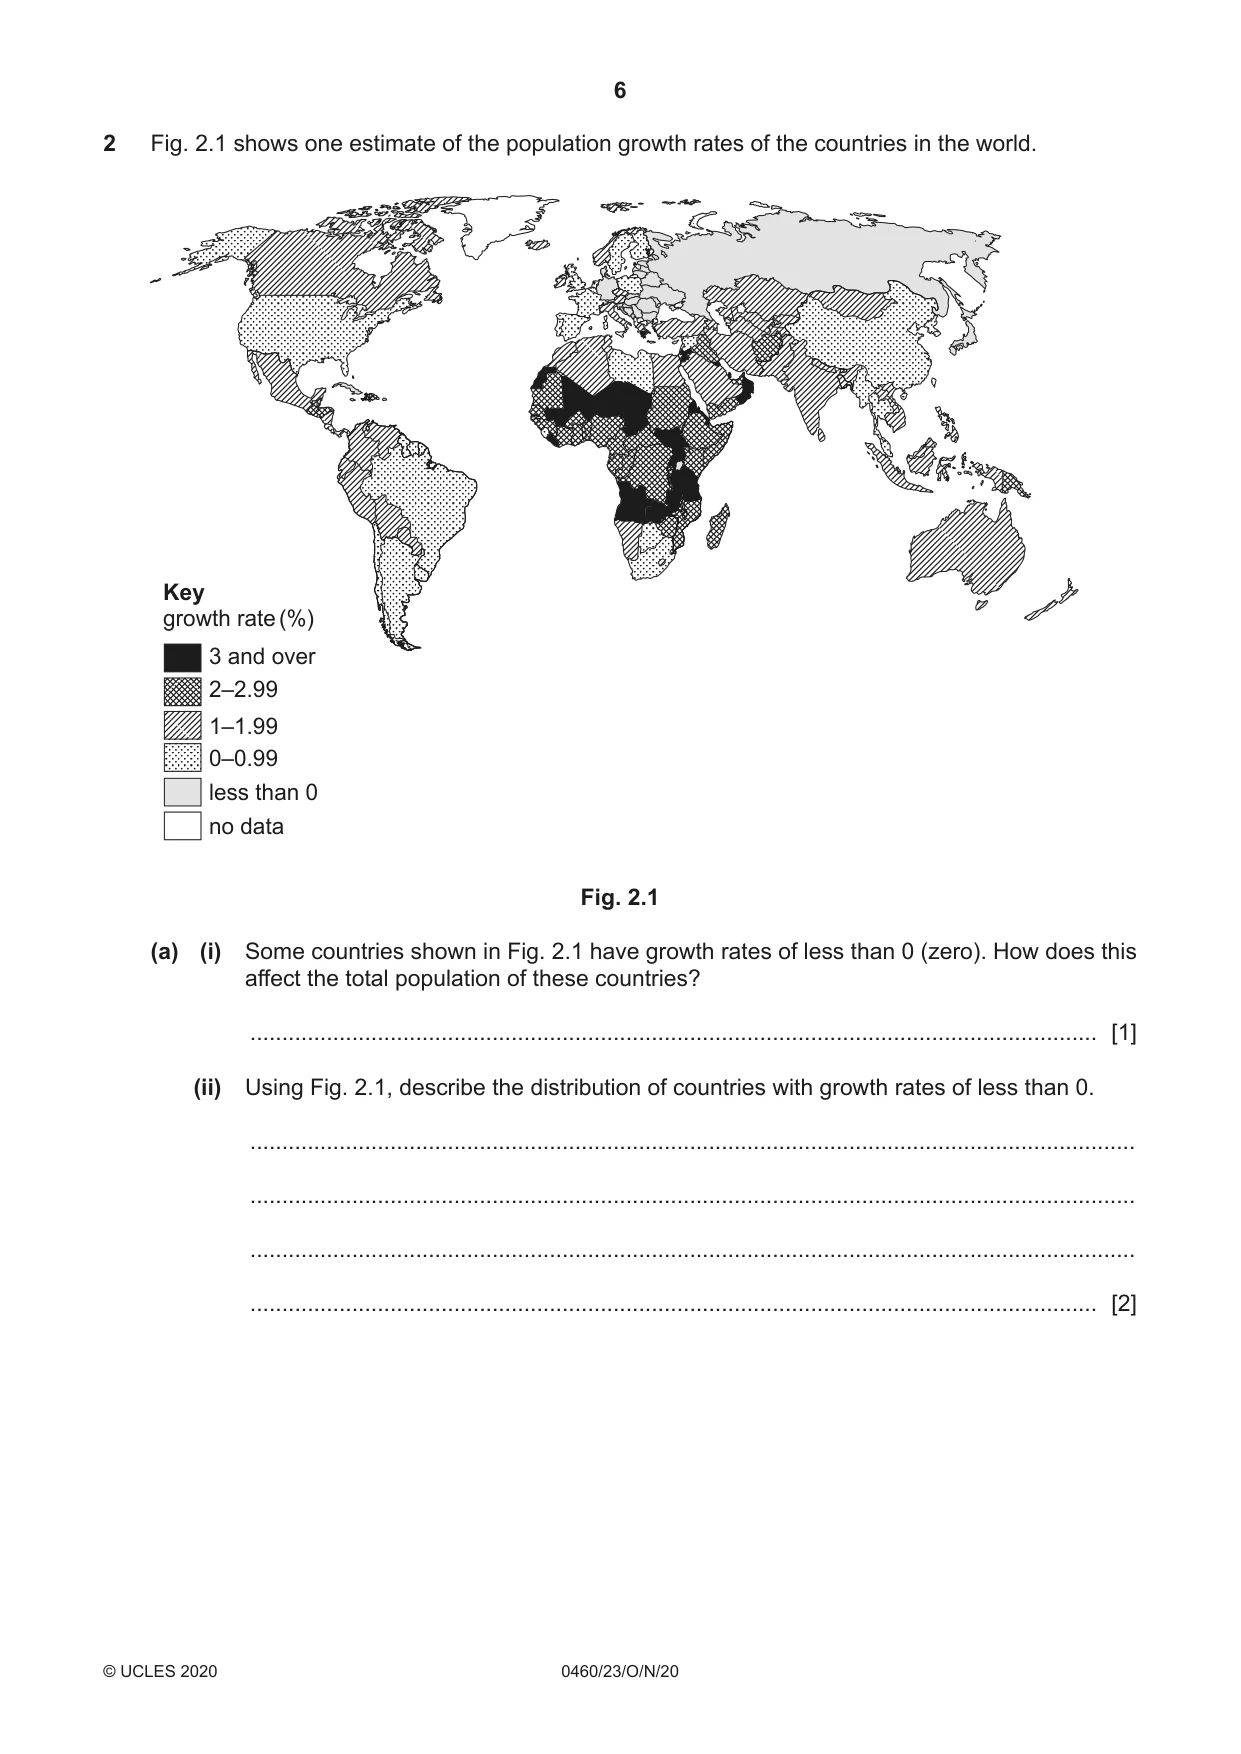
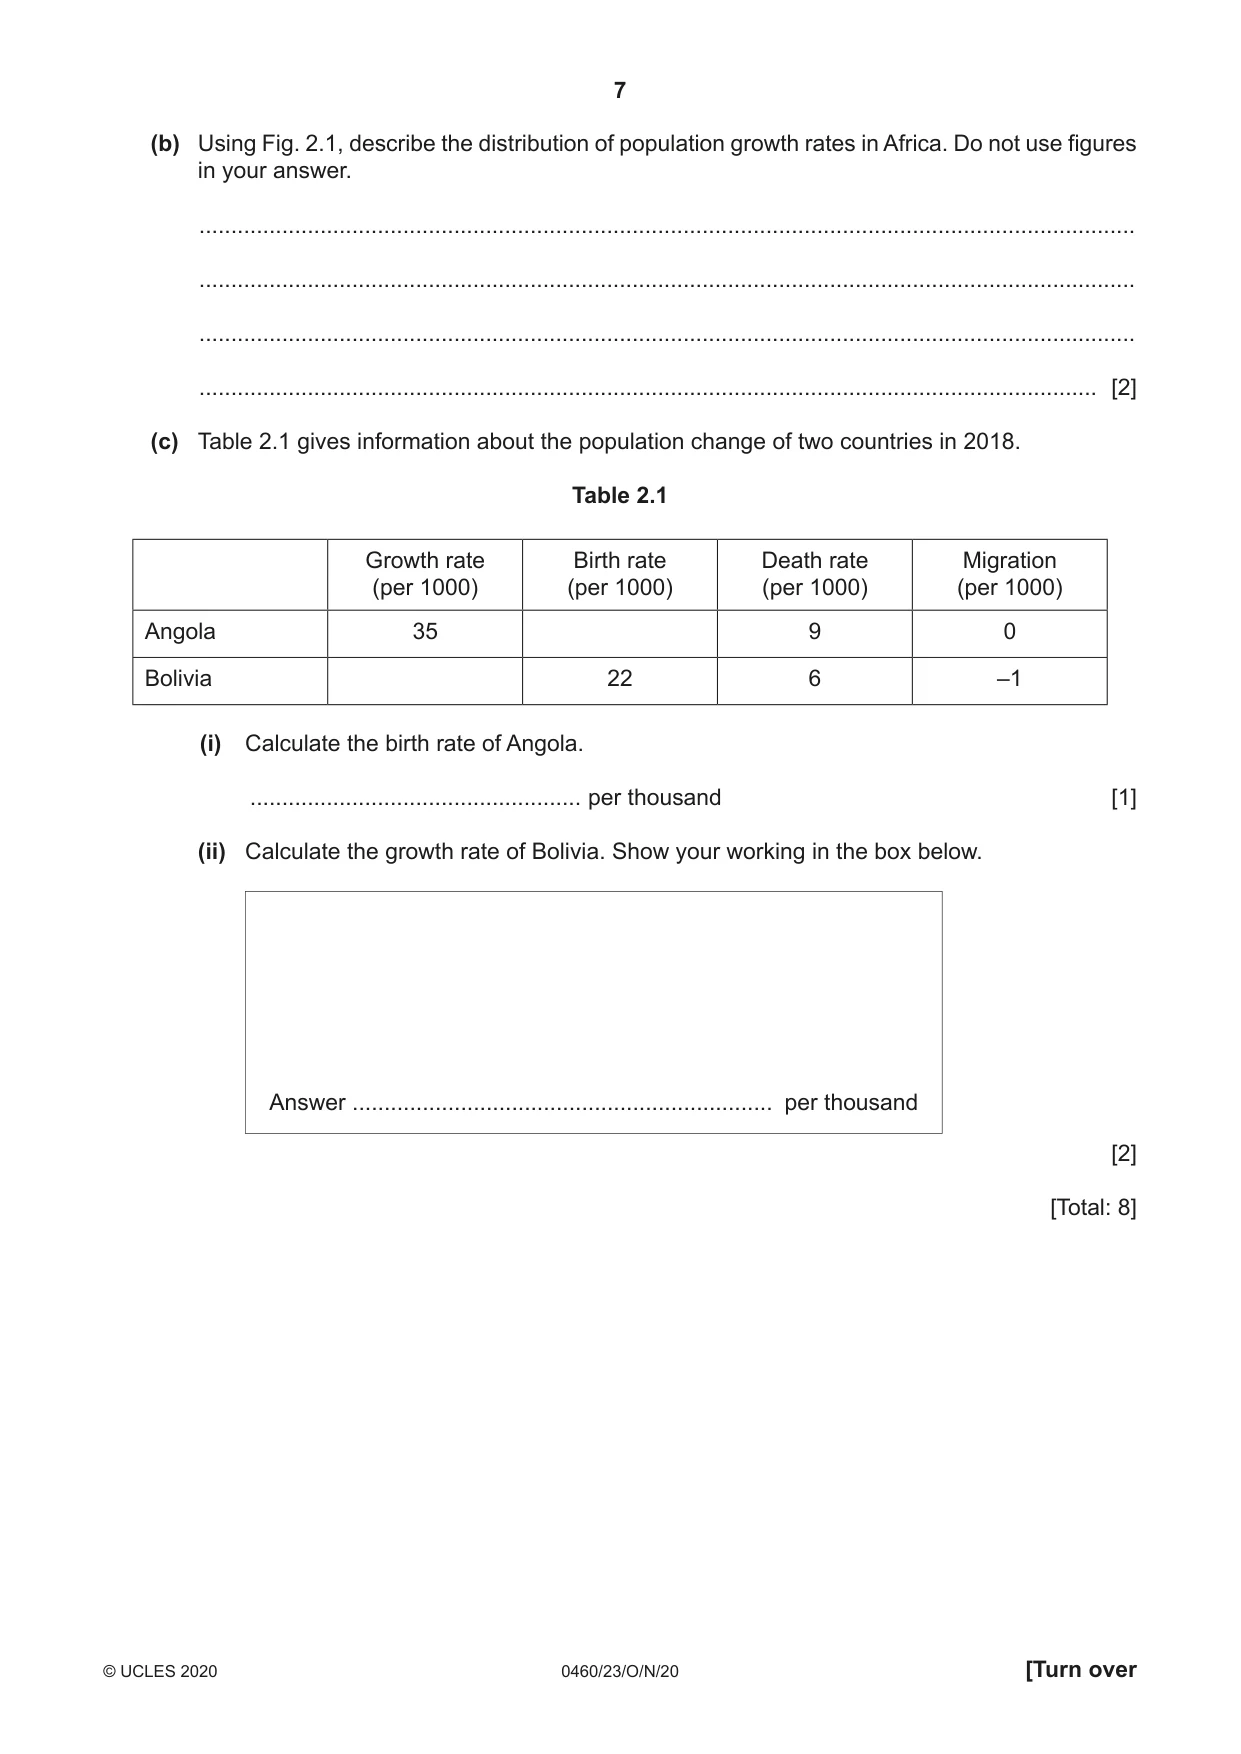
2 Fig. 2.1 shows one estimate of the population growth rates of the countries in the world. Key growth rate (%) 3 and over 2–2.99 1–1.99 0–0.99 less than 0 no data Fig. 2.1 (a) (i) Some countries shown in Fig. 2.1 have growth rates of less than 0 (zero). How does this affect the total population of these countries? ..................................................................................................................................... [1] (ii) Using Fig. 2.1, describe the distribution of countries with growth rates of less than 0. ........................................................................................................................................... ........................................................................................................................................... ........................................................................................................................................... ..................................................................................................................................... [2] (b) Using Fig. 2.1, describe the distribution of population growth rates in Africa. Do not use figures in your answer. ................................................................................................................................................... ................................................................................................................................................... ................................................................................................................................................... ............................................................................................................................................. [2] (c) Table 2.1 gives information about the population change of two countries in 2018. Table 2.1 Growth rate Birth rate Death rate Migration (per 1000) (per 1000) (per 1000) (per 1000) Angola 35 9 0 Bolivia 22 6 –1 (i) Calculate the birth rate of Angola. .................................................... per thousand [1] (ii) Calculate the growth rate of Bolivia. Show your working in the box below. Answer .................................................................. per thousand [2] [Total: 8]
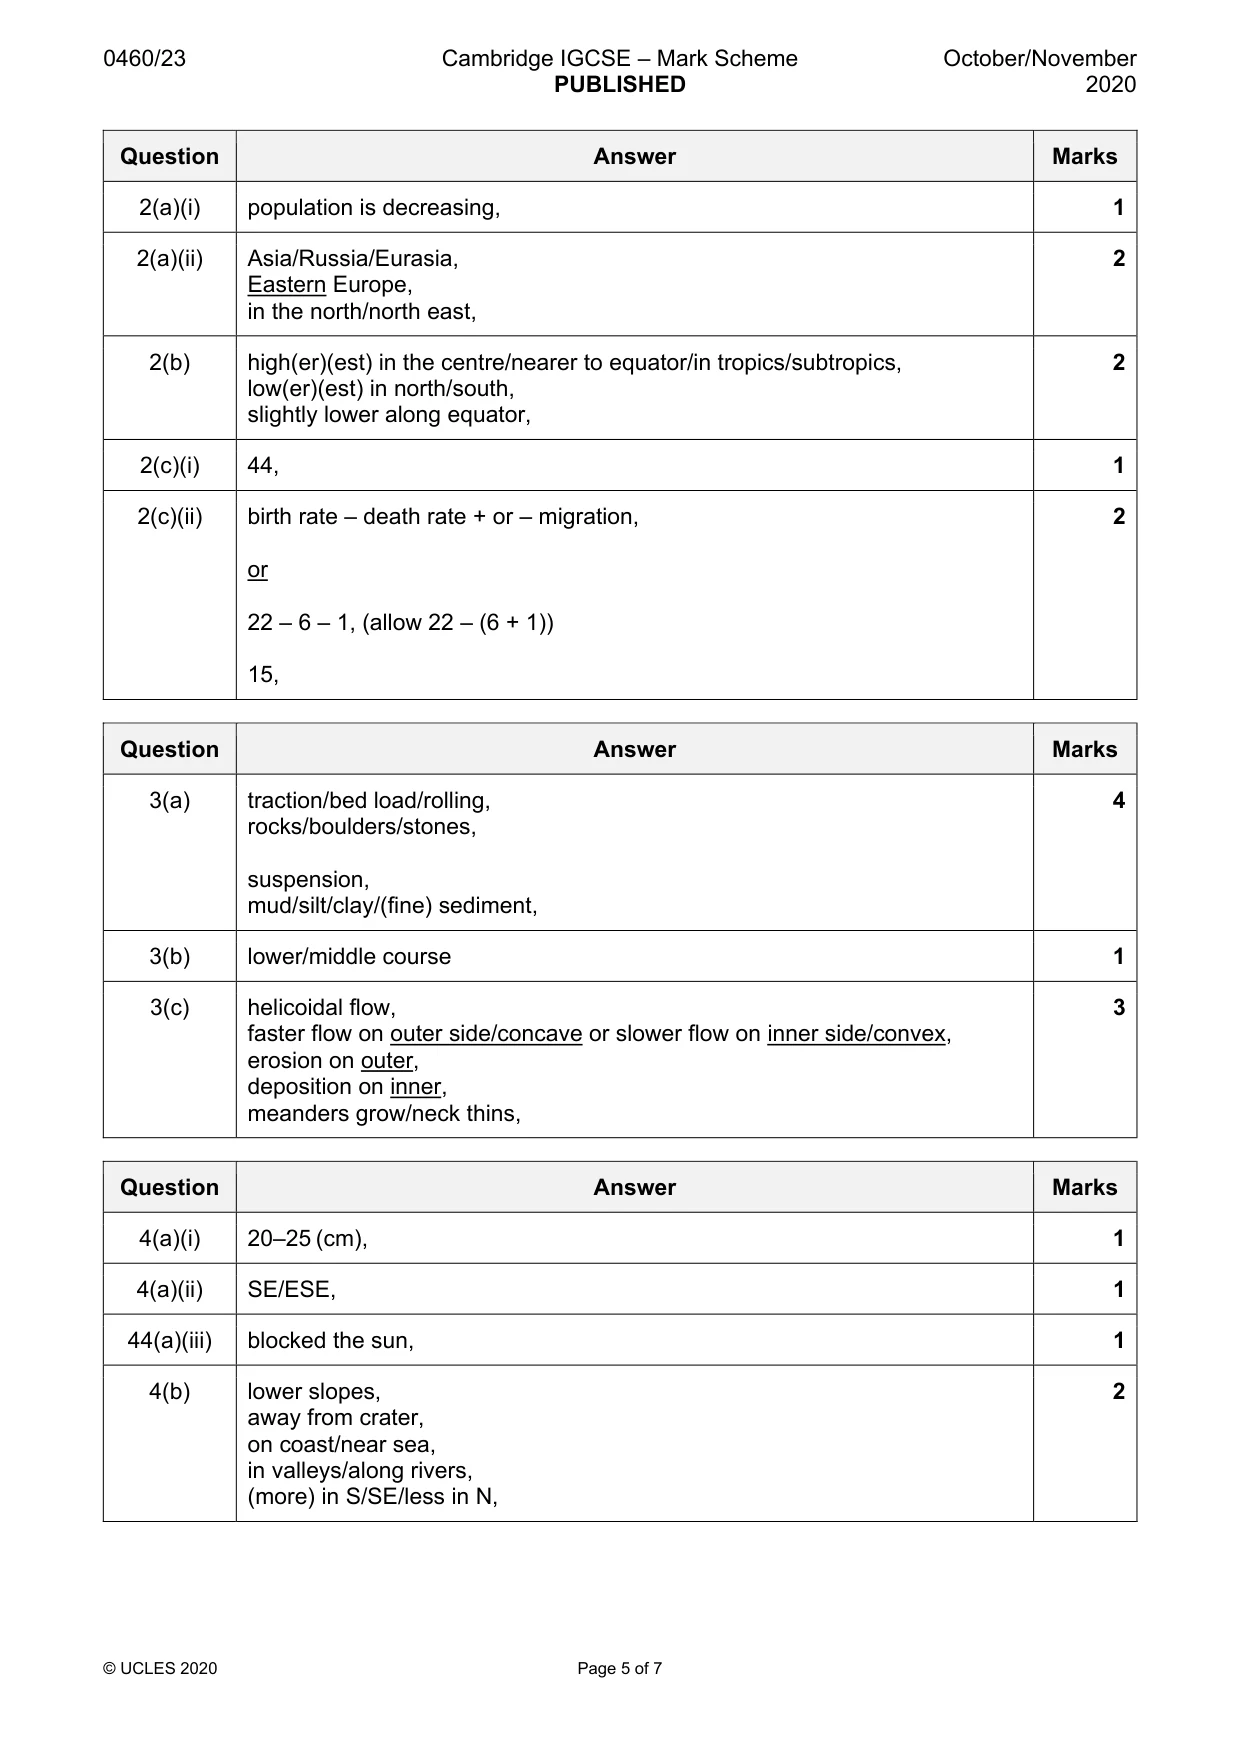
Mark scheme: 2(a)(i) population is decreasing, 1 2(a)(ii) Asia/Russia/Eurasia, 2 Eastern Europe, in the north/north east, 2(b) high(er)(est) in the centre/nearer to equator/in tropics/subtropics, 2 low(er)(est) in north/south, slightly lower along equator, 2(c)(i) 44, 1 2(c)(ii) birth rate – death rate + or – migration, 2 or 22 – 6 – 1, (allow 22 – (6 + 1)) 15,
Question 3
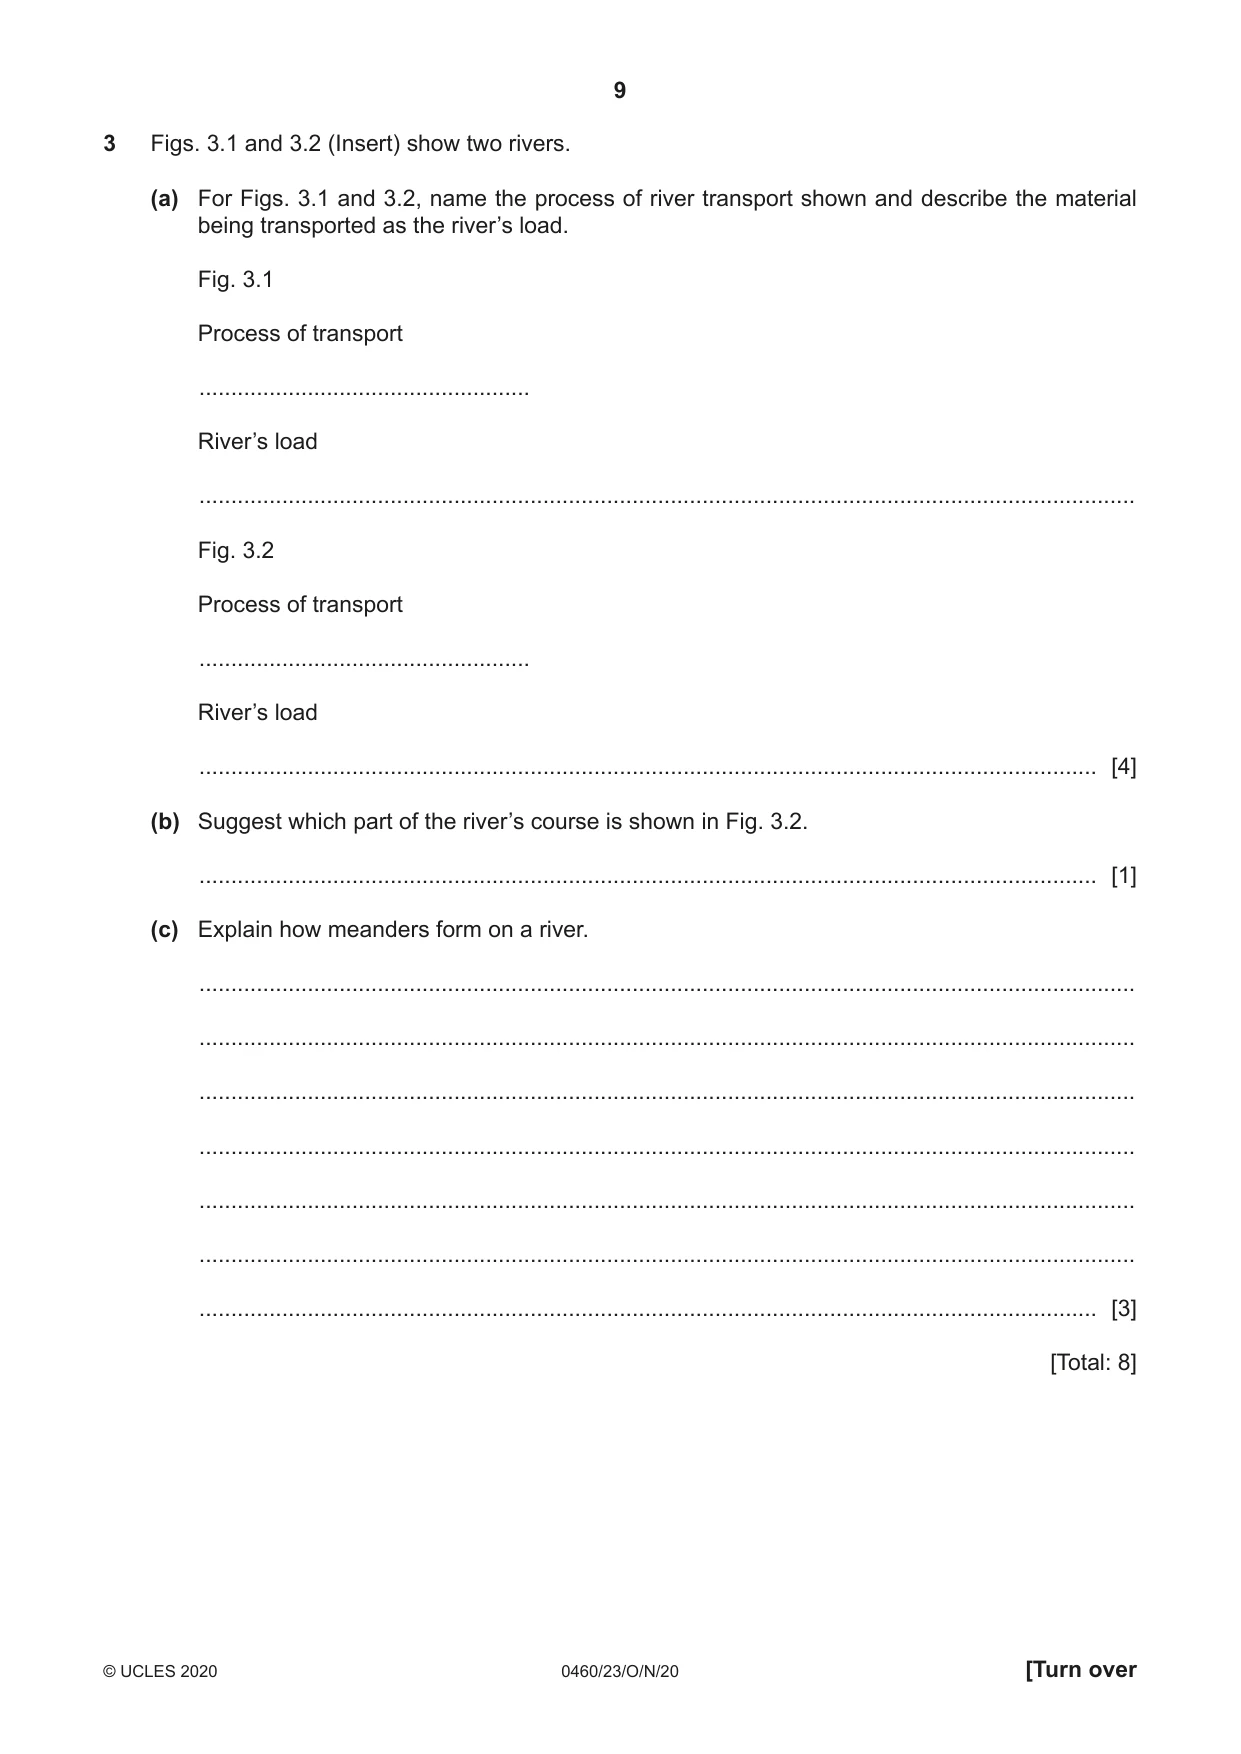
3 Figs. 3.1 and 3.2 (Insert) show two rivers. (a) For Figs. 3.1 and 3.2, name the process of river transport shown and describe the material being transported as the river’s load. Fig. 3.1 Process of transport .................................................... River’s load ................................................................................................................................................... Fig. 3.2 Process of transport .................................................... River’s load ............................................................................................................................................. [4] (b) Suggest which part of the river’s course is shown in Fig. 3.2. ............................................................................................................................................. [1] (c) Explain how meanders form on a river. ................................................................................................................................................... ................................................................................................................................................... ................................................................................................................................................... ................................................................................................................................................... ................................................................................................................................................... ................................................................................................................................................... ............................................................................................................................................. [3] [Total: 8]
Mark scheme: 3(a) traction/bed load/rolling, 4 rocks/boulders/stones, suspension, mud/silt/clay/(fine) sediment, 3(b) lower/middle course 1 3(c) helicoidal flow, 3 faster flow on outer side/concave or slower flow on inner side/convex, erosion on outer, deposition on inner, meanders grow/neck thins,
Q4 · Information about the eruption of Mount Tambora
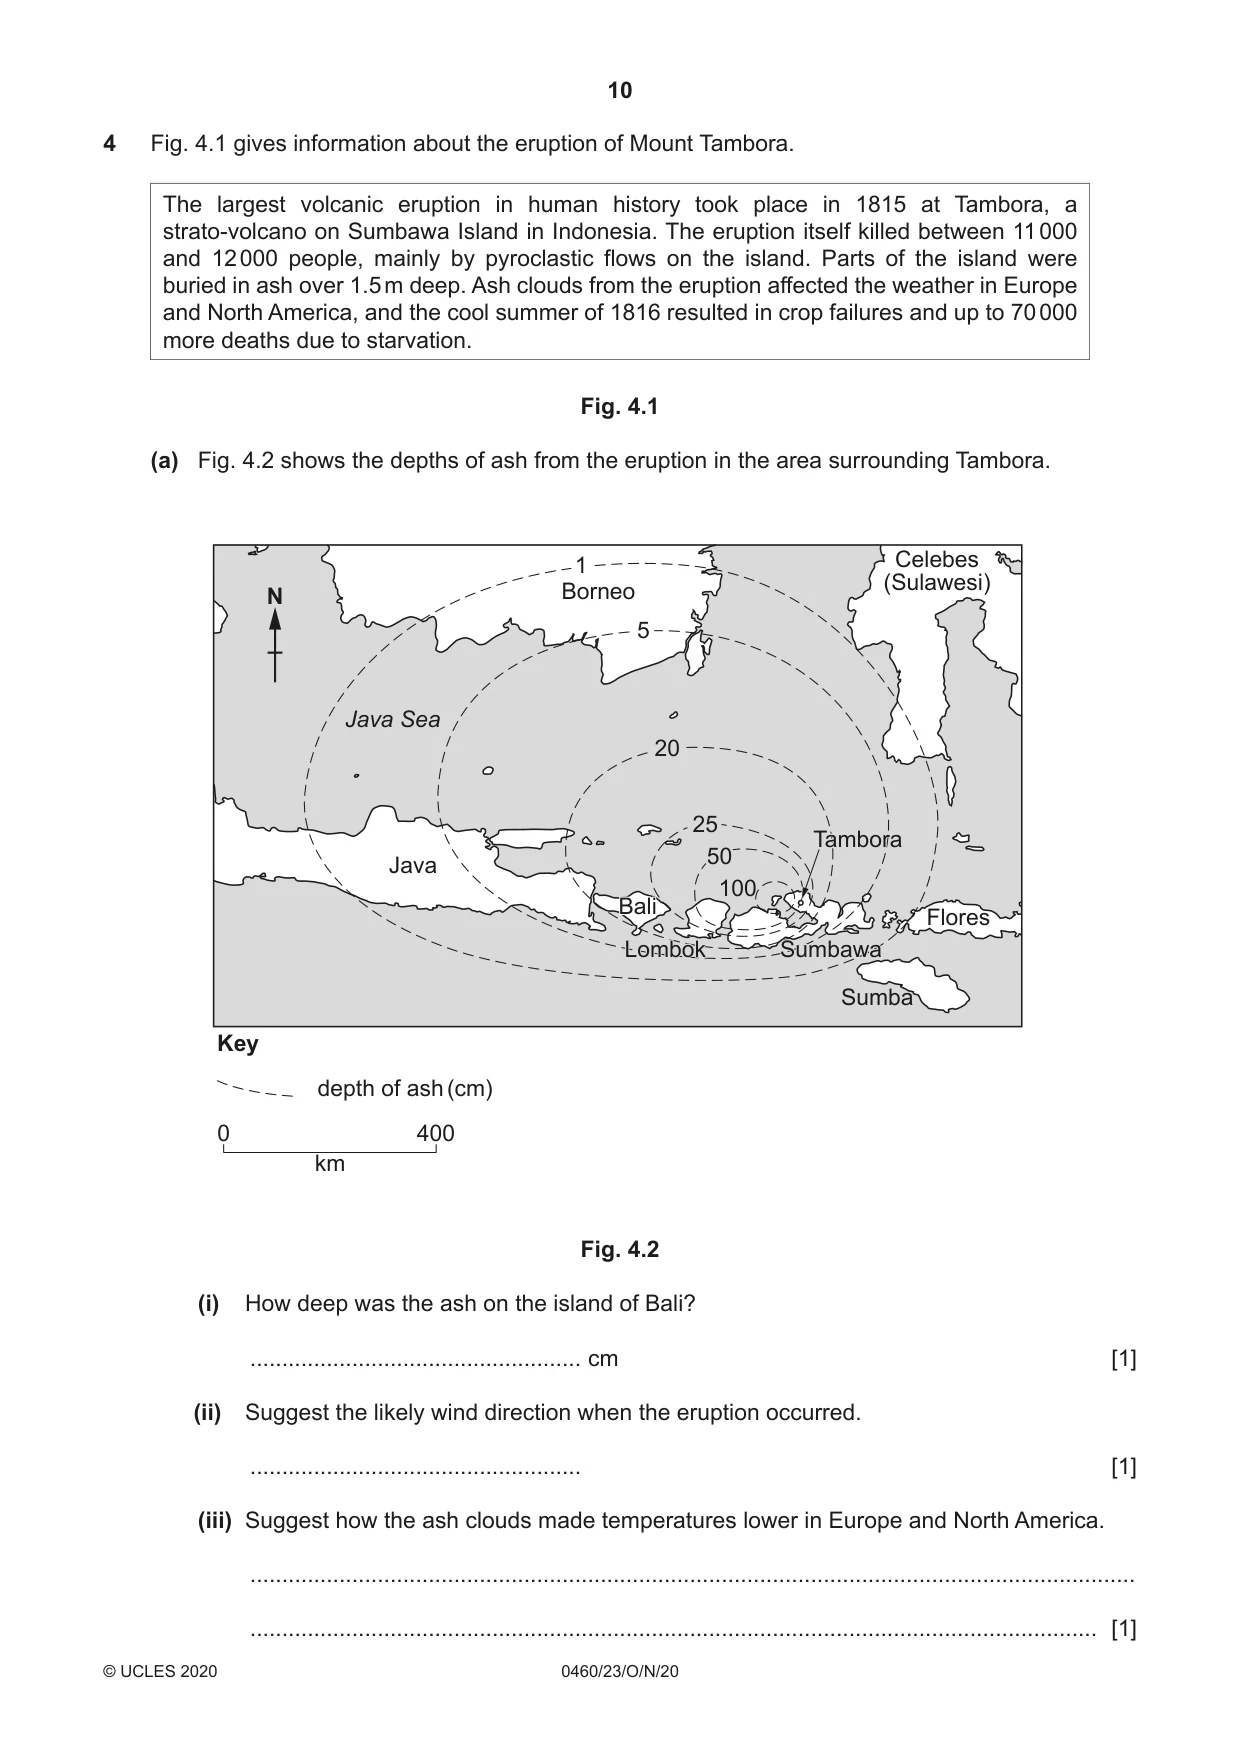
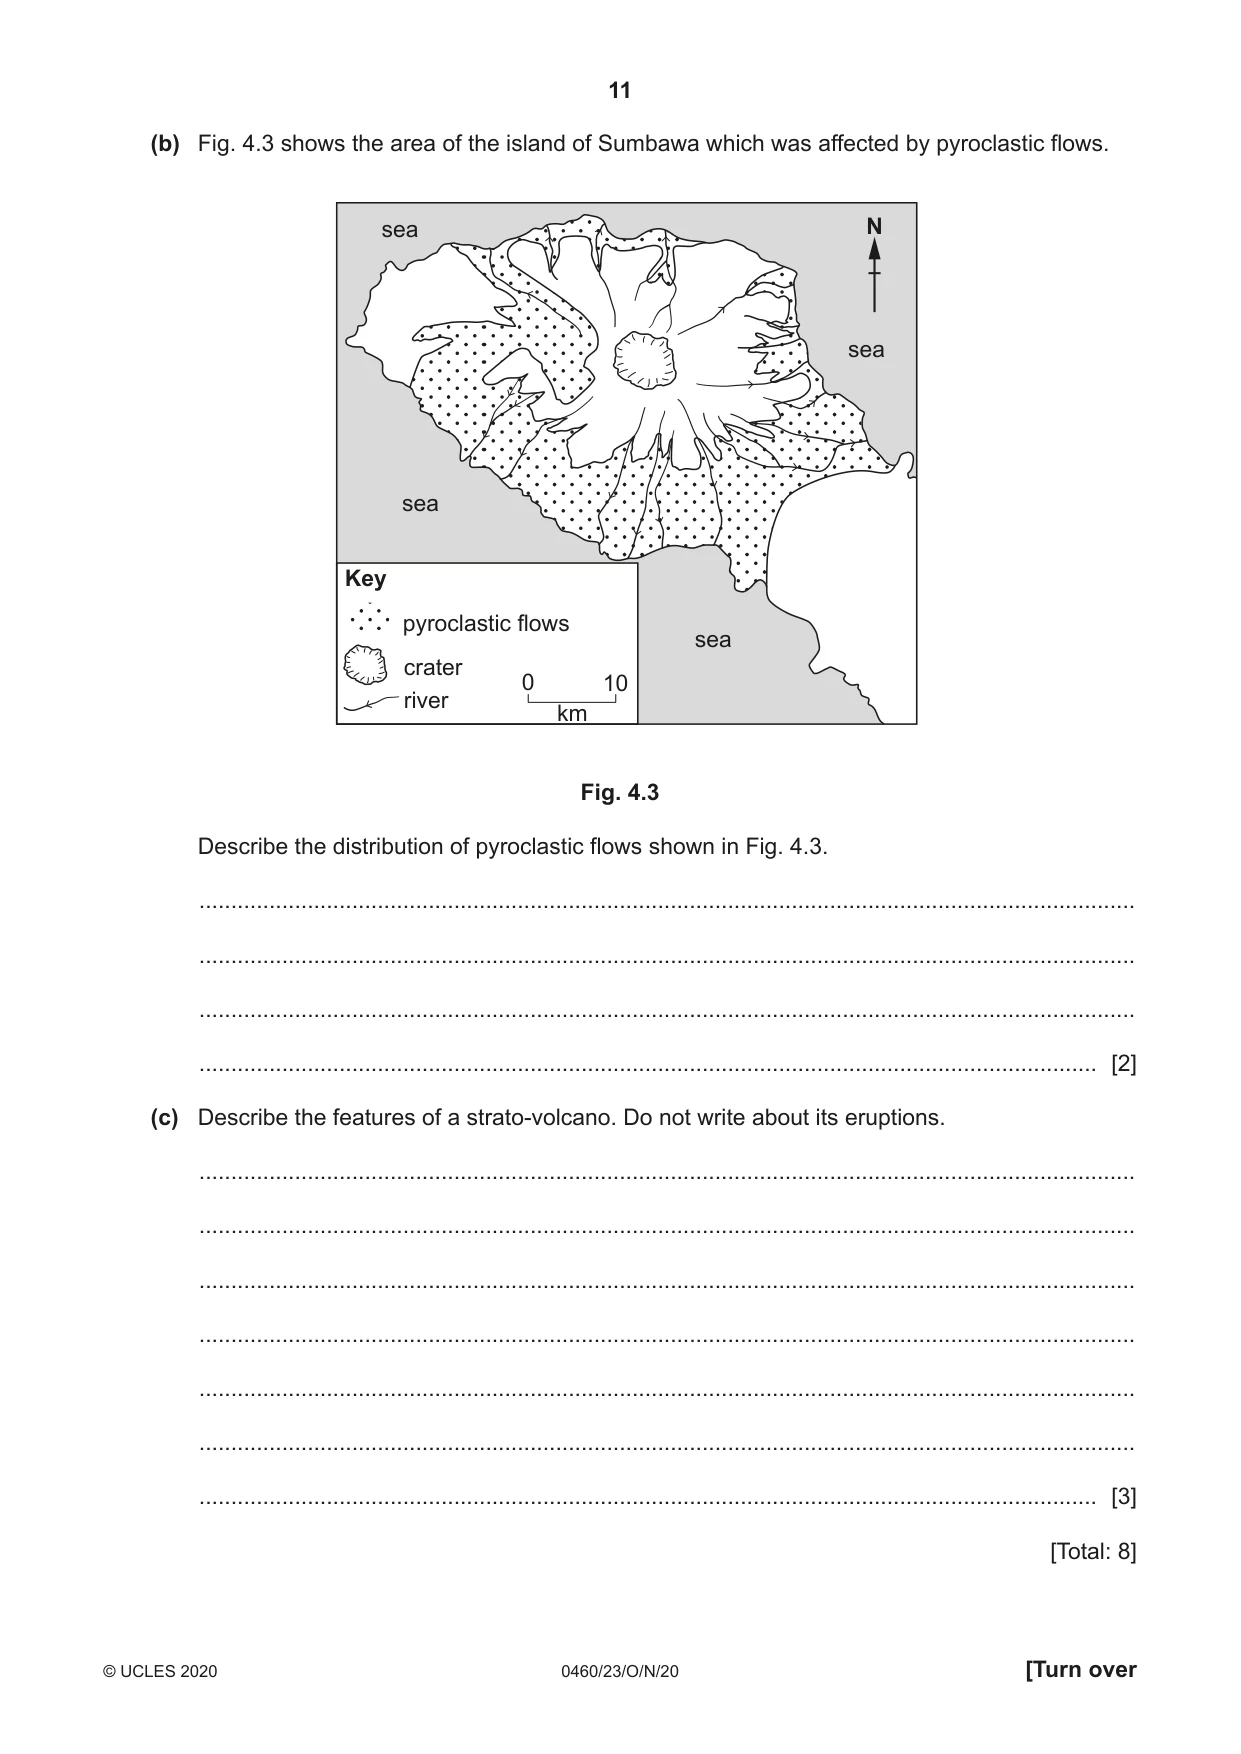
4 Fig. 4.1 gives information about the eruption of Mount Tambora. The largest volcanic eruption in human history took place in 1815 at Tambora, a strato-volcano on Sumbawa Island in Indonesia. The eruption itself killed between 11 000 and 12 000 people, mainly by pyroclastic flows on the island. Parts of the island were buried in ash over 1.5 m deep. Ash clouds from the eruption affected the weather in Europe and North America, and the cool summer of 1816 resulted in crop failures and up to 70 000 more deaths due to starvation. Fig. 4.1 (a) Fig. 4.2 shows the depths of ash from the eruption in the area surrounding Tambora. 1 Celebes (Sulawesi) N Borneo 5 Java Sea 20 25 TamboraTambora 50 Java 100 BaliBali Flores LombokLombok SumbawaSumbawa Sumba Key depth of ash (cm) 0 400 km Fig. 4.2 (i) How deep was the ash on the island of Bali? .................................................... cm [1] (ii) Suggest the likely wind direction when the eruption occurred. .................................................... [1] (iii) Suggest how the ash clouds made temperatures lower in Europe and North America. ........................................................................................................................................... ..................................................................................................................................... [1] (b) Fig. 4.3 shows the area of the island of Sumbawa which was affected by pyroclastic flows. sea N sea sea Key pyroclastic flows sea crater 0 10 river km Fig. 4.3 Describe the distribution of pyroclastic flows shown in Fig. 4.3. ................................................................................................................................................... ................................................................................................................................................... ................................................................................................................................................... ............................................................................................................................................. [2] (c) Describe the features of a strato-volcano. Do not write about its eruptions. ................................................................................................................................................... ................................................................................................................................................... ................................................................................................................................................... ................................................................................................................................................... ................................................................................................................................................... ................................................................................................................................................... ............................................................................................................................................. [3] [Total: 8]
Mark scheme: 4(a)(i) 20–25 (cm), 1 4(a)(ii) SE/ESE, 1
Question 5
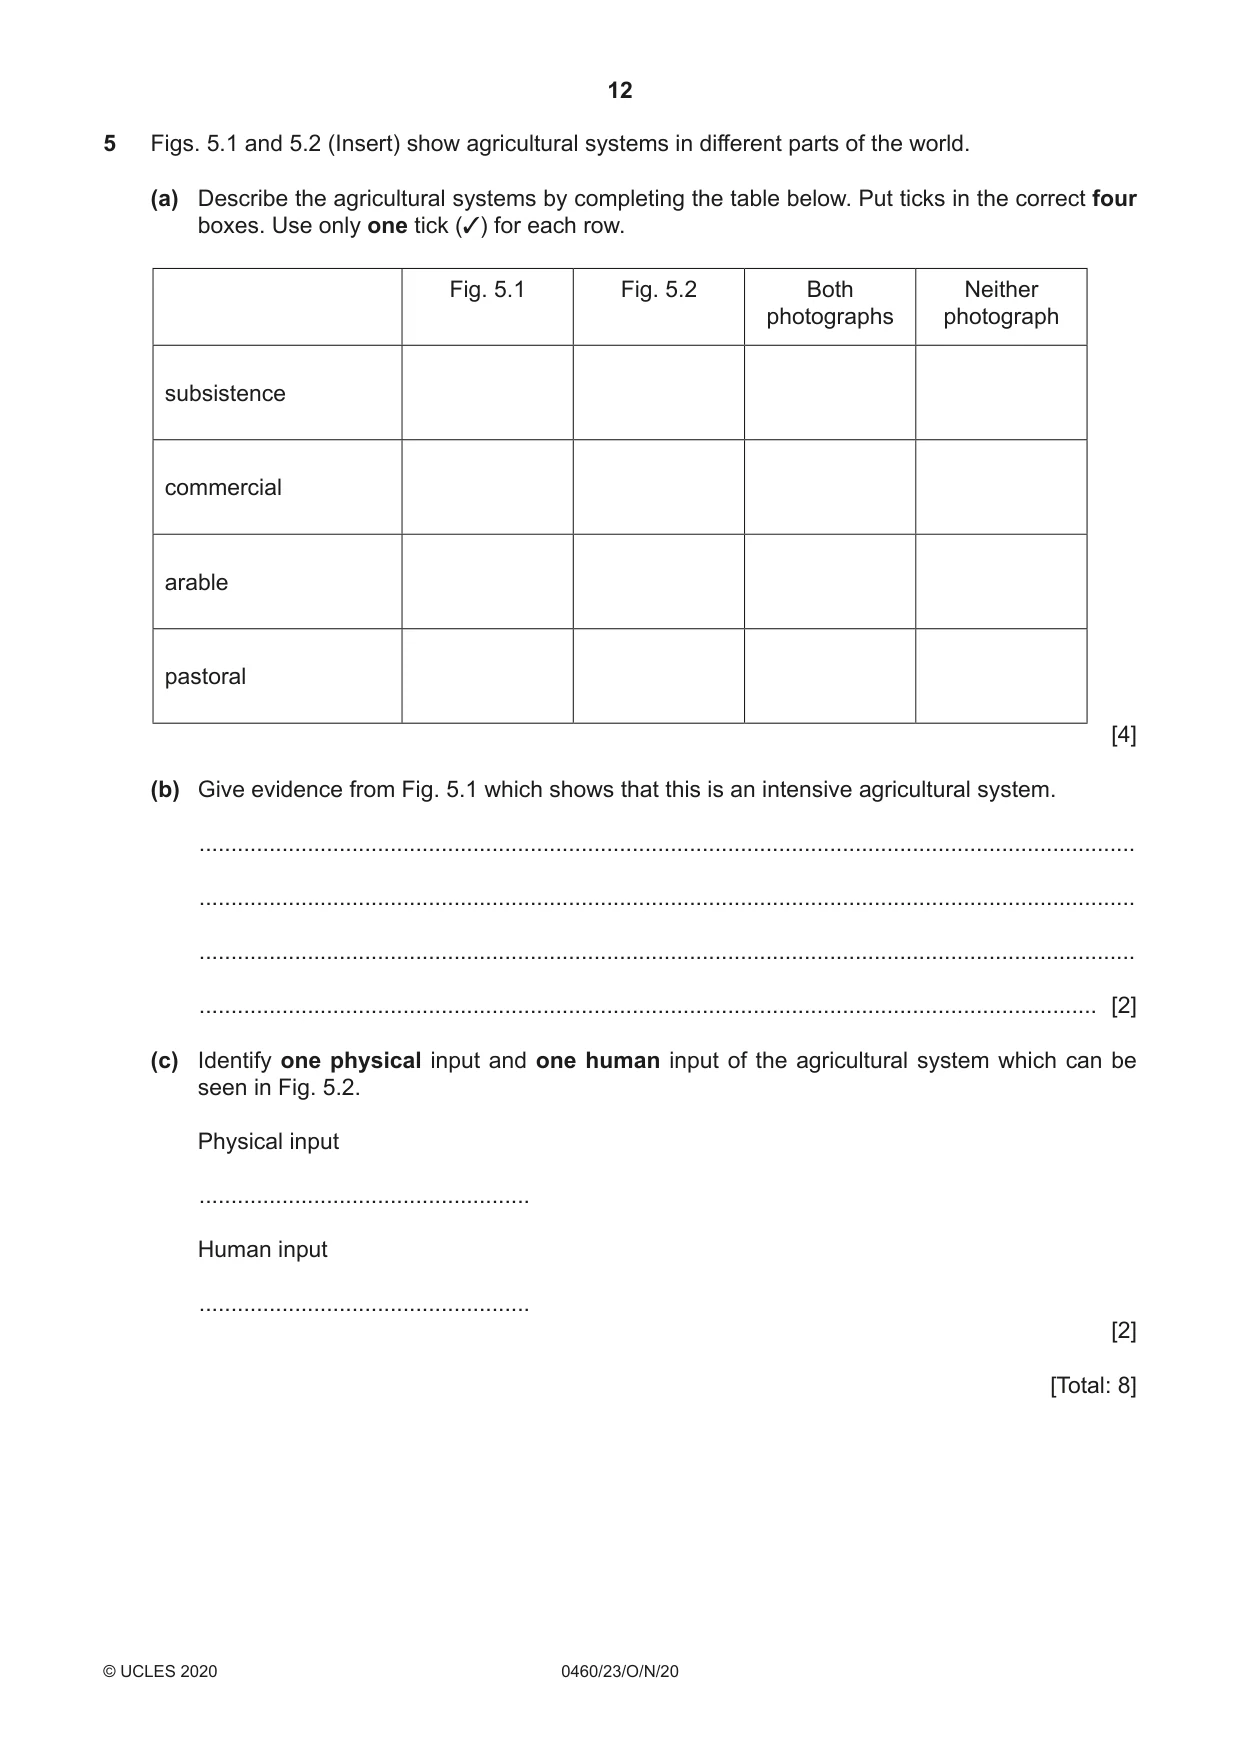
5 Figs. 5.1 and 5.2 (Insert) show agricultural systems in different parts of the world. (a) Describe the agricultural systems by completing the table below. Put ticks in the correct four boxes. Use only one tick (✓) for each row. Fig. 5.1 Fig. 5.2 Both Neither photographs photograph subsistence commercial arable pastoral [4] (b) Give evidence from Fig. 5.1 which shows that this is an intensive agricultural system. ................................................................................................................................................... ................................................................................................................................................... ................................................................................................................................................... ............................................................................................................................................. [2] (c) Identify one physical input and one human input of the agricultural system which can be seen in Fig. 5.2. Physical input .................................................... Human input .................................................... [2] [Total: 8] TURN PAGE FOR QUESTION 6
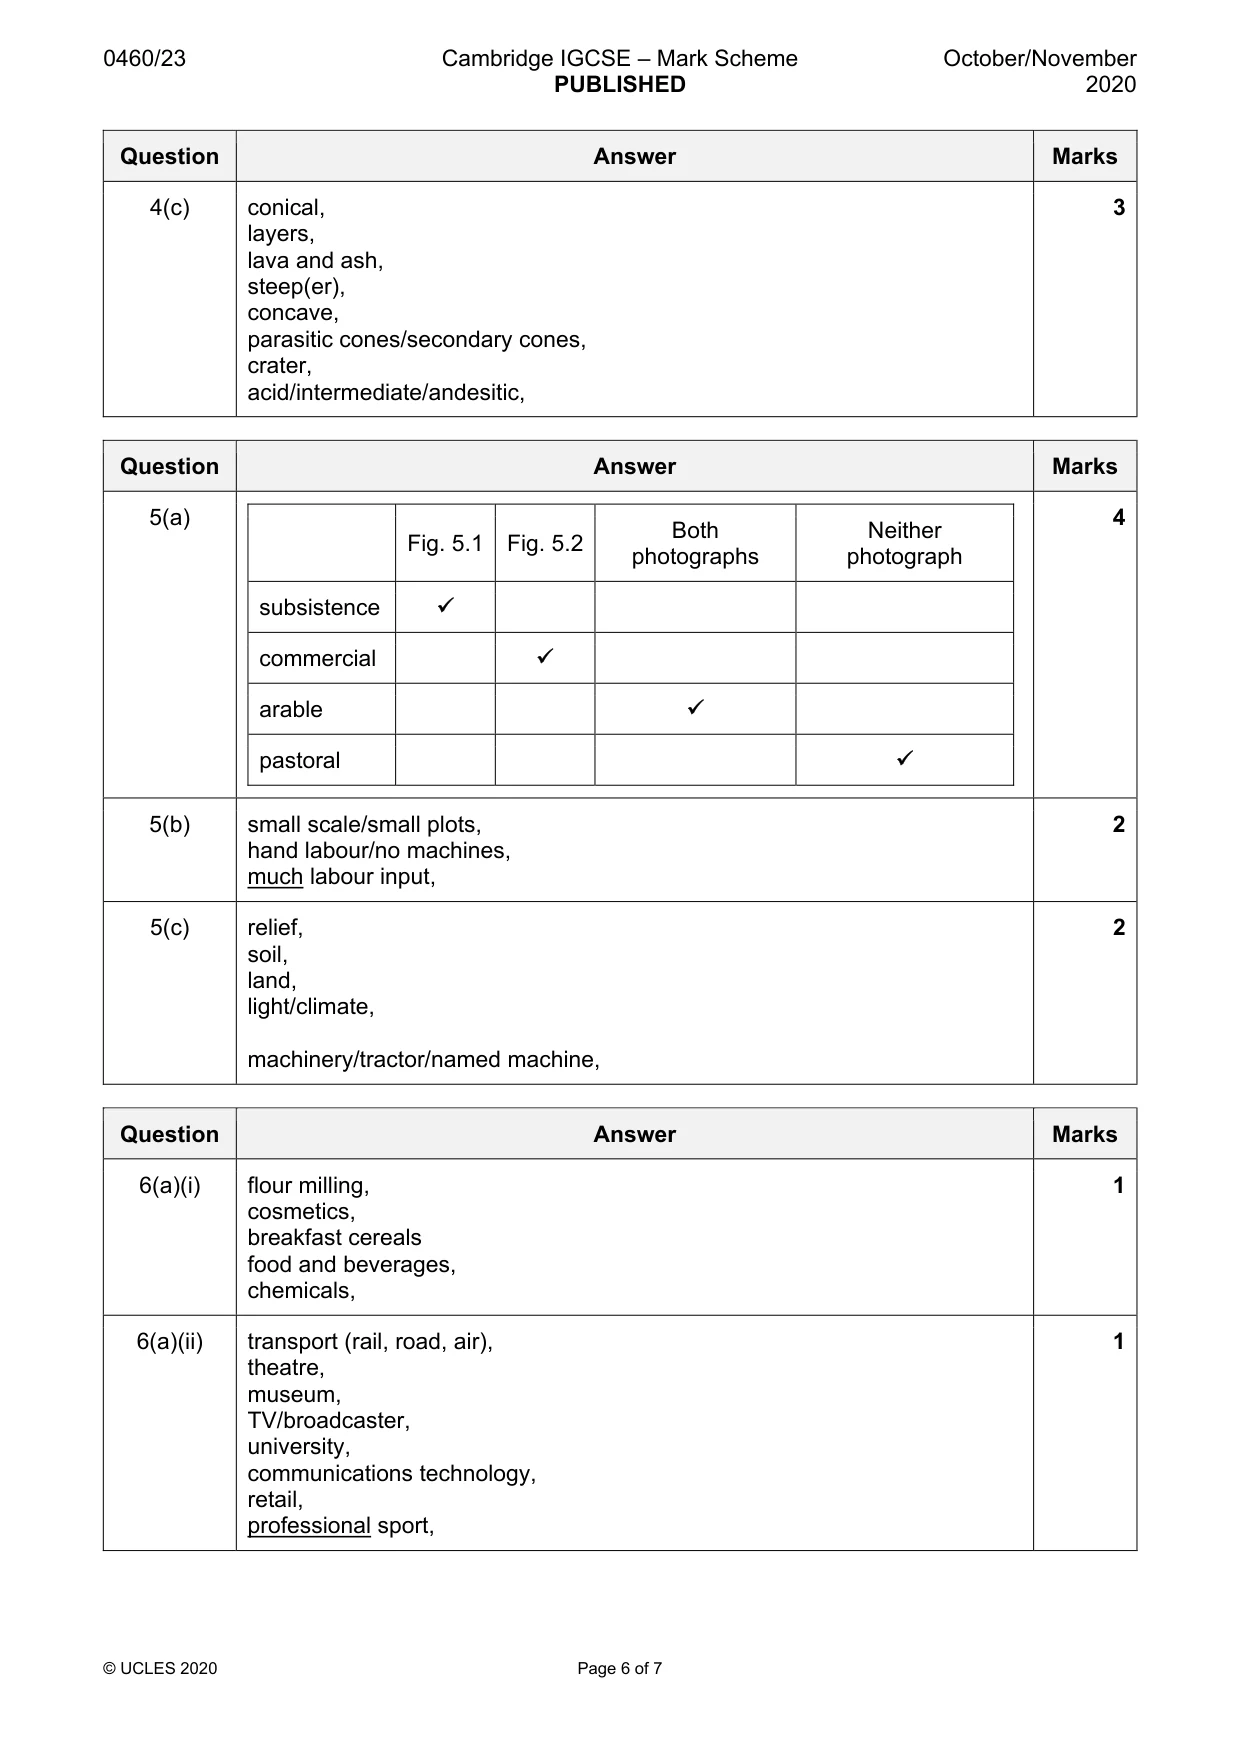
Mark scheme: 5(a) 4 Both Neither Fig. 5.1 Fig. 5.2 photographs photograph subsistence commercial arable pastoral 5(b) small scale/small plots, 2 hand labour/no machines, much labour input, 5(c) relief, 2 soil, land, light/climate, machinery/tractor/named machine,
Q6 · An industrial zone in the city of Manchester, UK
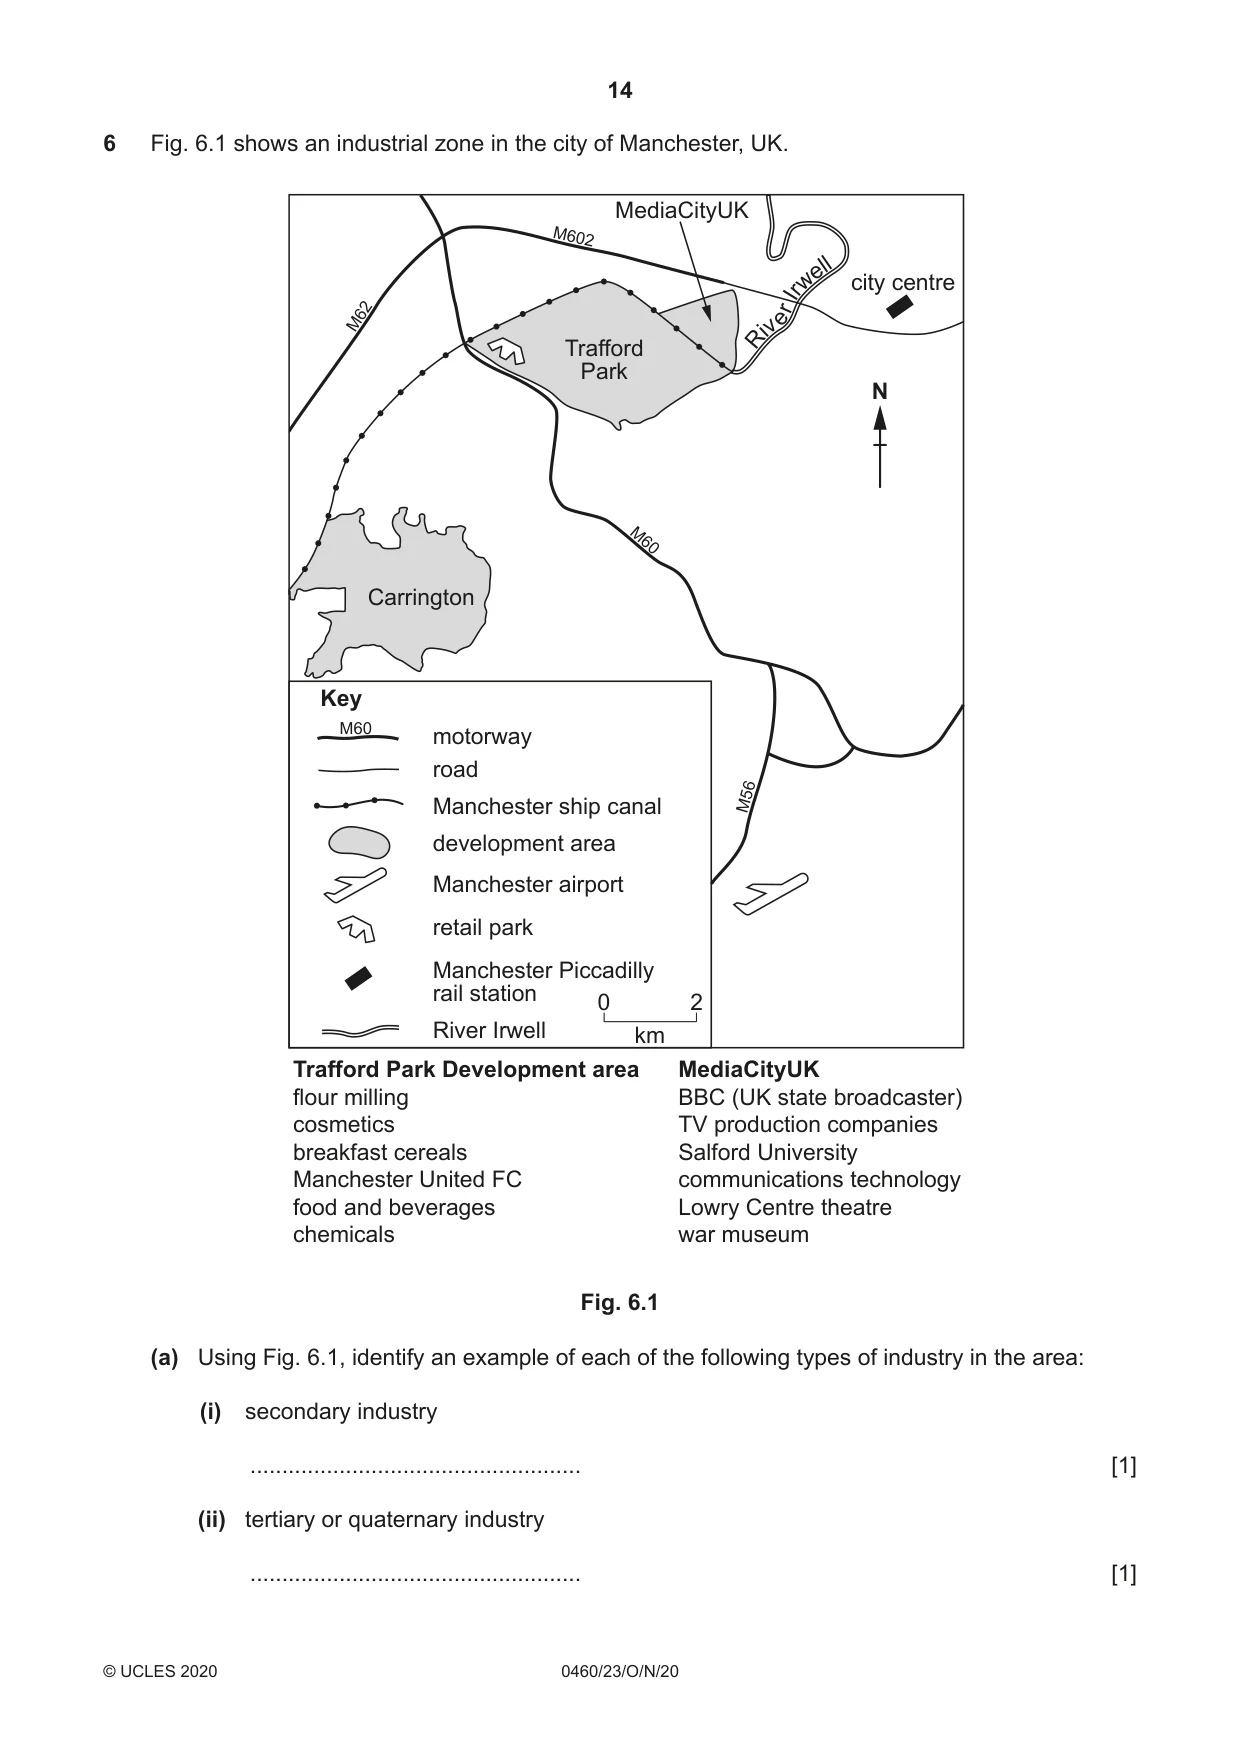
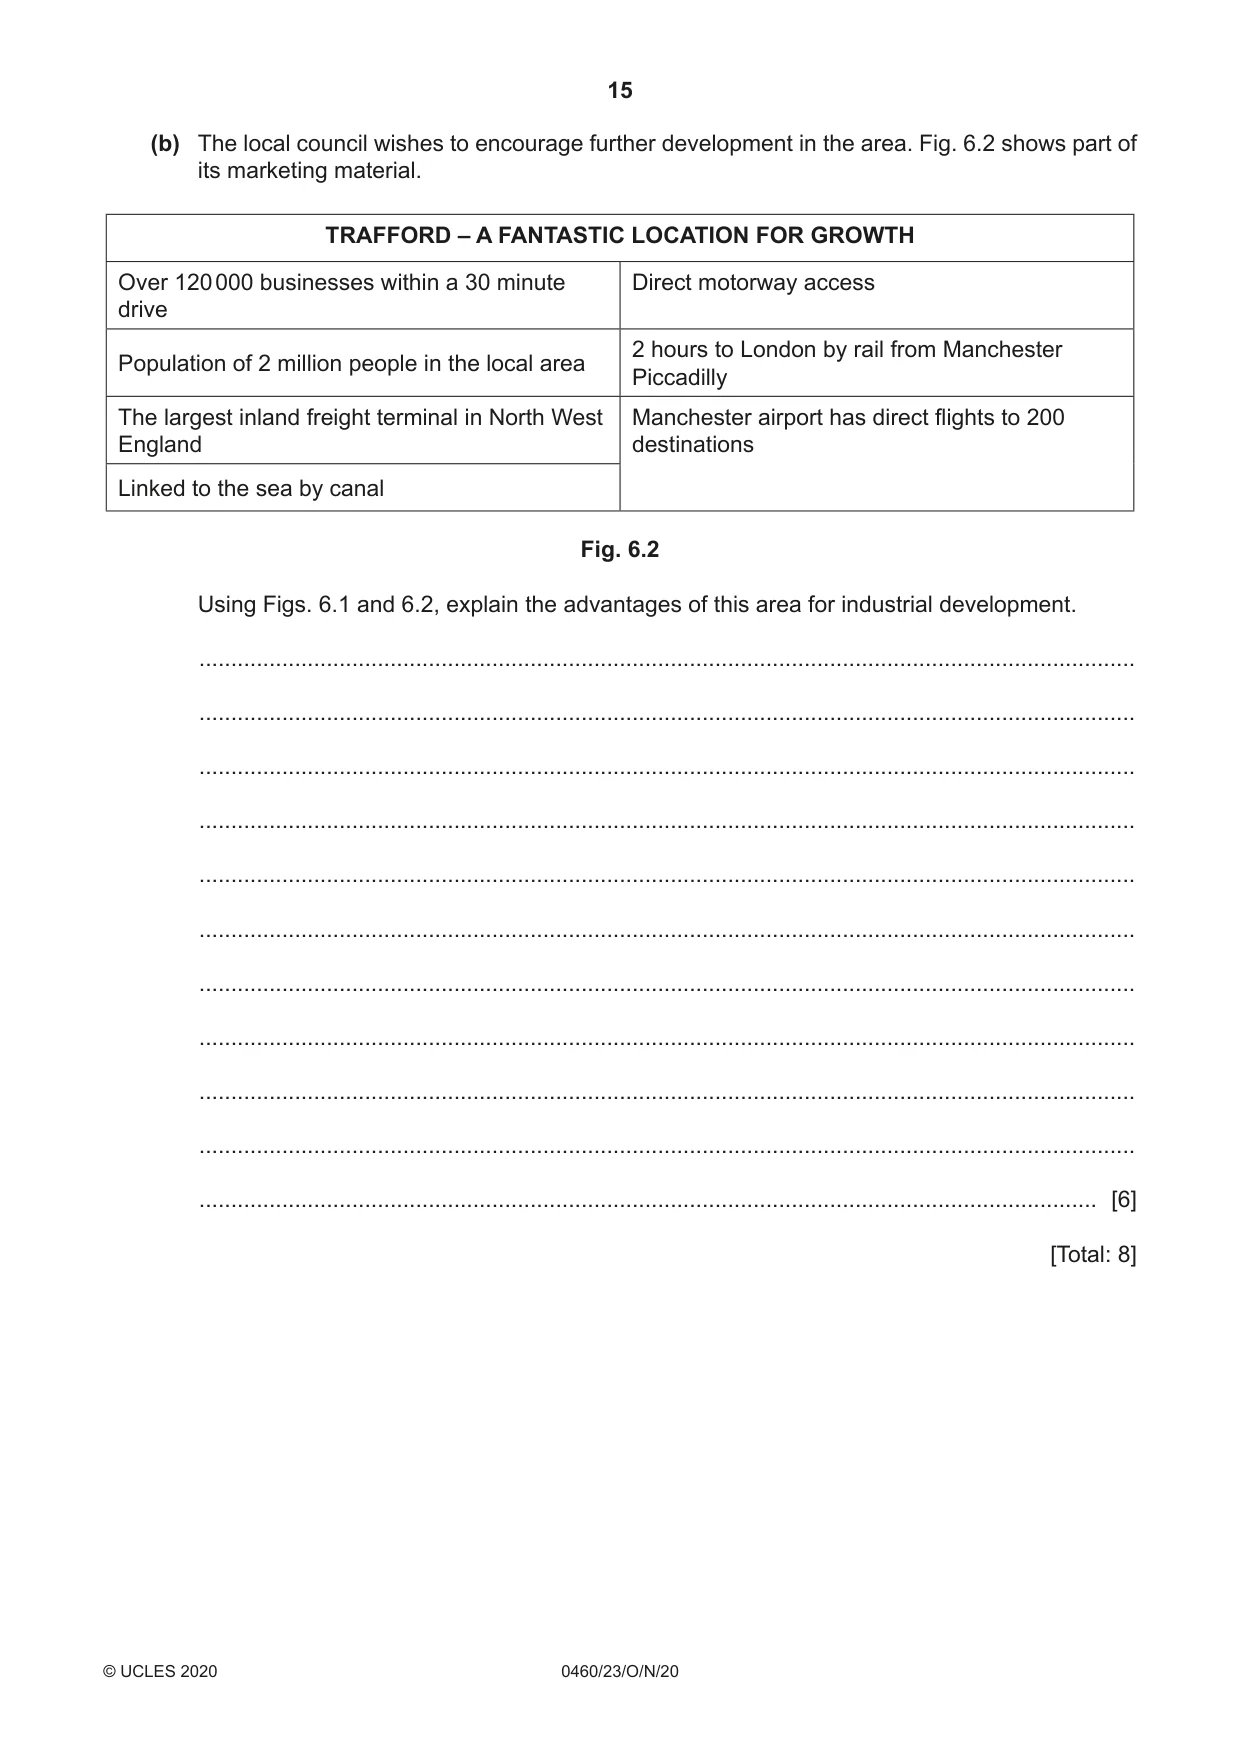
6 Fig. 6.1 shows an industrial zone in the city of Manchester, UK. MediaCityUK M602 ell w city centre Ir er M62 iv R Trafford Park N M60 Carrington Key M60 motorway road Manchester ship canal M56 development area Manchester airport retail park Manchester Piccadilly rail station 0 2 River Irwell km Trafford Park Development area MediaCityUK flour milling BBC (UK state broadcaster) cosmetics TV production companies breakfast cereals Salford University Manchester United FC communications technology food and beverages Lowry Centre theatre chemicals war museum Fig. 6.1 (a) Using Fig. 6.1, identify an example of each of the following types of industry in the area: (i) secondary industry .................................................... [1] (ii) tertiary or quaternary industry .................................................... [1] (b) The local council wishes to encourage further development in the area. Fig. 6.2 shows part of its marketing material. TRAFFORD – A FANTASTIC LOCATION FOR GROWTH Over 120 000 businesses within a 30 minute Direct motorway access drive 2 hours to London by rail from ManchesterPopulation of 2 million people in the local area Piccadilly The largest inland freight terminal in North West Manchester airport has direct flights to 200 England destinations Linked to the sea by canal Fig. 6.2 Using Figs. 6.1 and 6.2, explain the advantages of this area for industrial development. ................................................................................................................................................... ................................................................................................................................................... ................................................................................................................................................... ................................................................................................................................................... ................................................................................................................................................... ................................................................................................................................................... ................................................................................................................................................... ................................................................................................................................................... ................................................................................................................................................... ................................................................................................................................................... ............................................................................................................................................. [6] [Total: 8] Additional Pages If you use the following lined pages to complete the answer(s) to any question(s), the question number(s) must be clearly shown. .................................................................................................................................................................. .................................................................................................................................................................. .................................................................................................................................................................. .................................................................................................................................................................. .................................................................................................................................................................. .................................................................................................................................................................. .................................................................................................................................................................. .................................................................................................................................................................. .................................................................................................................................................................. .................................................................................................................................................................. .................................................................................................................................................................. .................................................................................................................................................................. .................................................................................................................................................................. .................................................................................................................................................................. .................................................................................................................................................................. .................................................................................................................................................................. .................................................................................................................................................................. .................................................................................................................................................................. .................................................................................................................................................................. .................................................................................................................................................................. .................................................................................................................................................................. .................................................................................................................................................................. .................................................................................................................................................................. .................................................................................................................................................................. ..................................................................................................................................................................
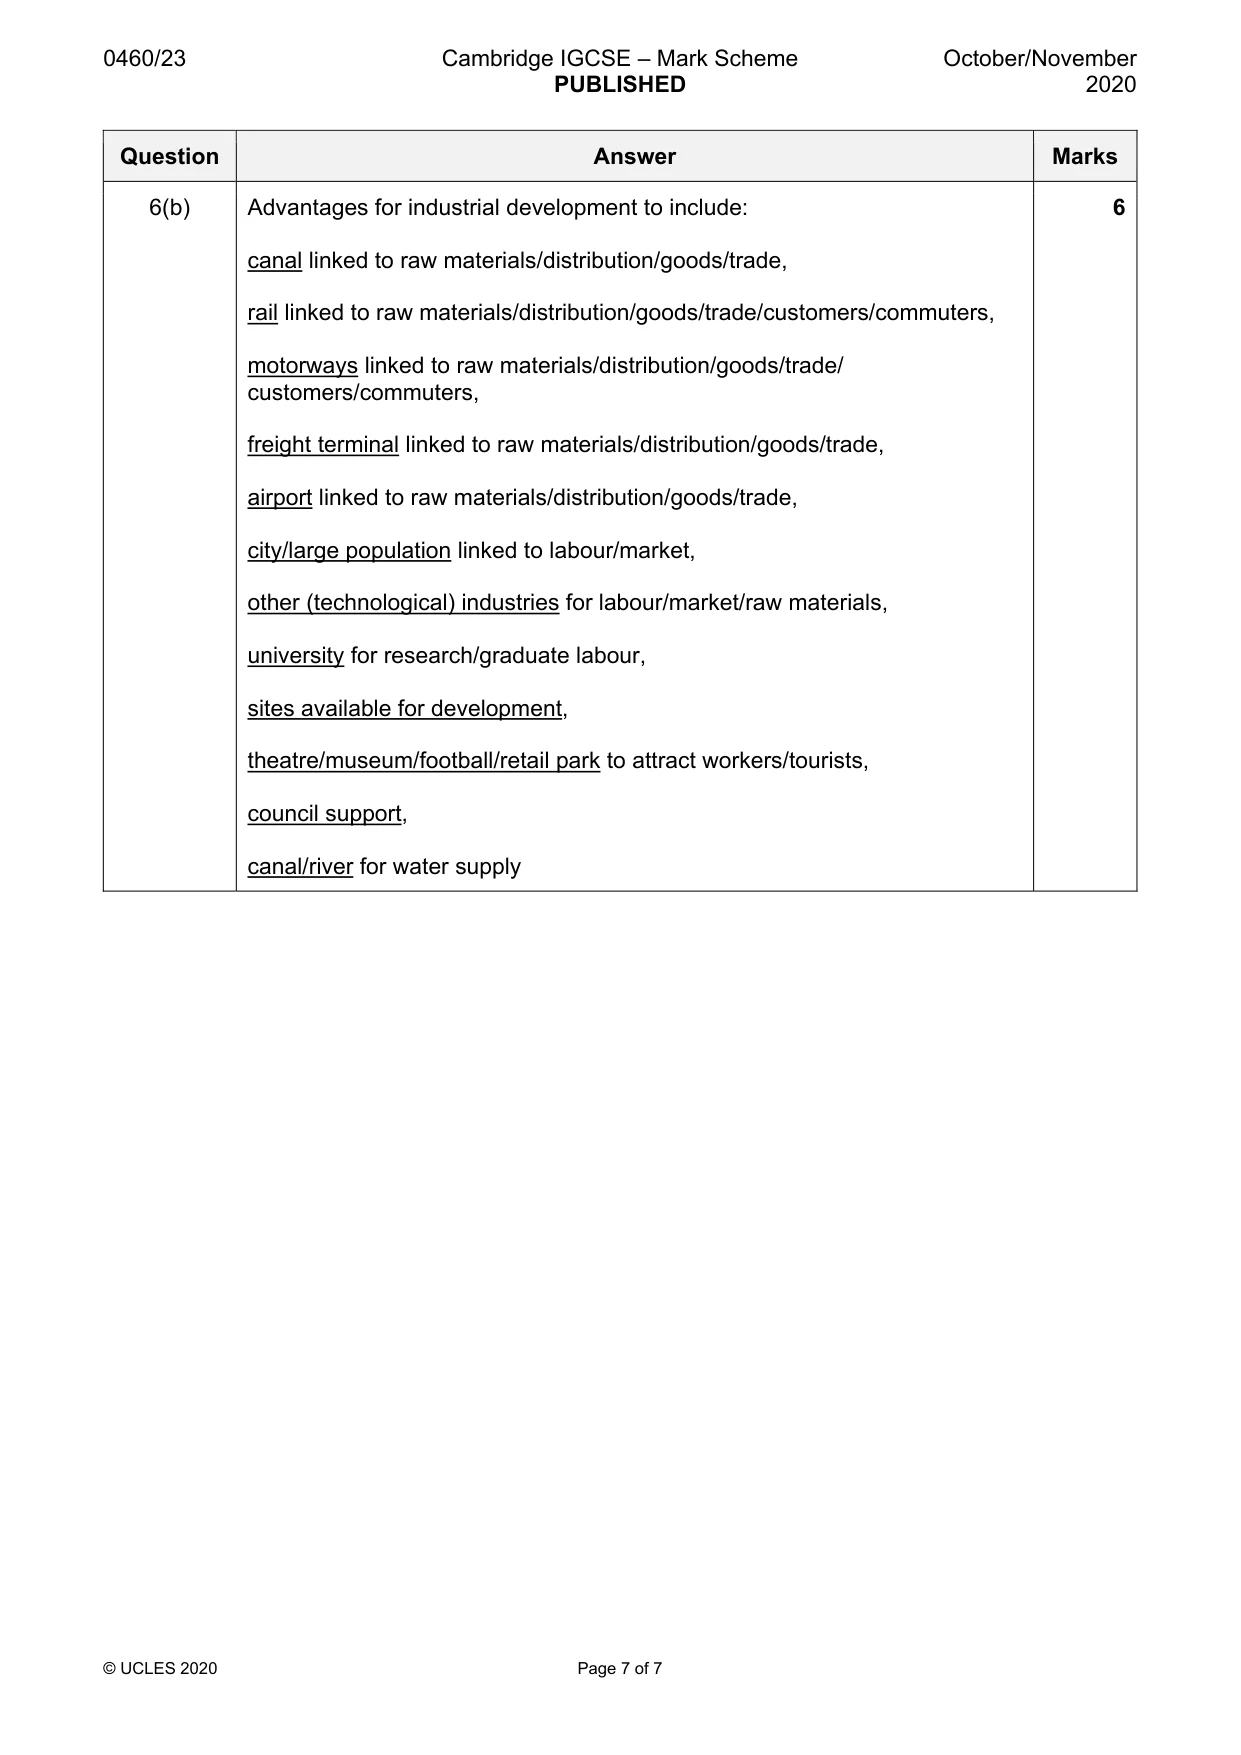
Mark scheme: 6(a)(i) flour milling, 1 cosmetics, breakfast cereals food and beverages, chemicals, 6(a)(ii) transport (rail, road, air), 1 theatre, museum, TV/broadcaster, university, communications technology, retail, professional sport, 6(b) Advantages for industrial development to include: 6 canal linked to raw materials/distribution/goods/trade, rail linked to raw materials/distribution/goods/trade/customers/commuters, motorways linked to raw materials/distribution/goods/trade/ customers/commuters, freight terminal linked to raw materials/distribution/goods/trade, airport linked to raw materials/distribution/goods/trade, city/large population linked to labour/market, other (technological) industries for labour/market/raw materials, university for research/graduate labour, sites available for development, theatre/museum/football/retail park to attract workers/tourists, council support, canal/river for water supply
What was in this paper
The subtopics covered by these 6 questions, and how many questions each got. Open one in a new tab to see every Cambridge question on it.
What you needed in this session
Cambridge’s own grade thresholds for 2020 Oct/Nov, Paper 2 · Variant 3. A higher threshold means an easier paper — the bar moves with how the cohort did.