Cambridge IGCSE Geography 0460 — 2024 Oct/Nov Paper 2 · Variant 1
0460/21/O/N/24 · 6 questions · 60 marks · ≈68 min
The question paper and its mark scheme, free to read here and free to download. This is Cambridge’s own paper, exactly as it was sat.
Question paper20 pages
Mark scheme8 pages
Answers below. Sit the paper first if you are practising.
Questions as text
Q1 · Study the map extract for Wimereux, France
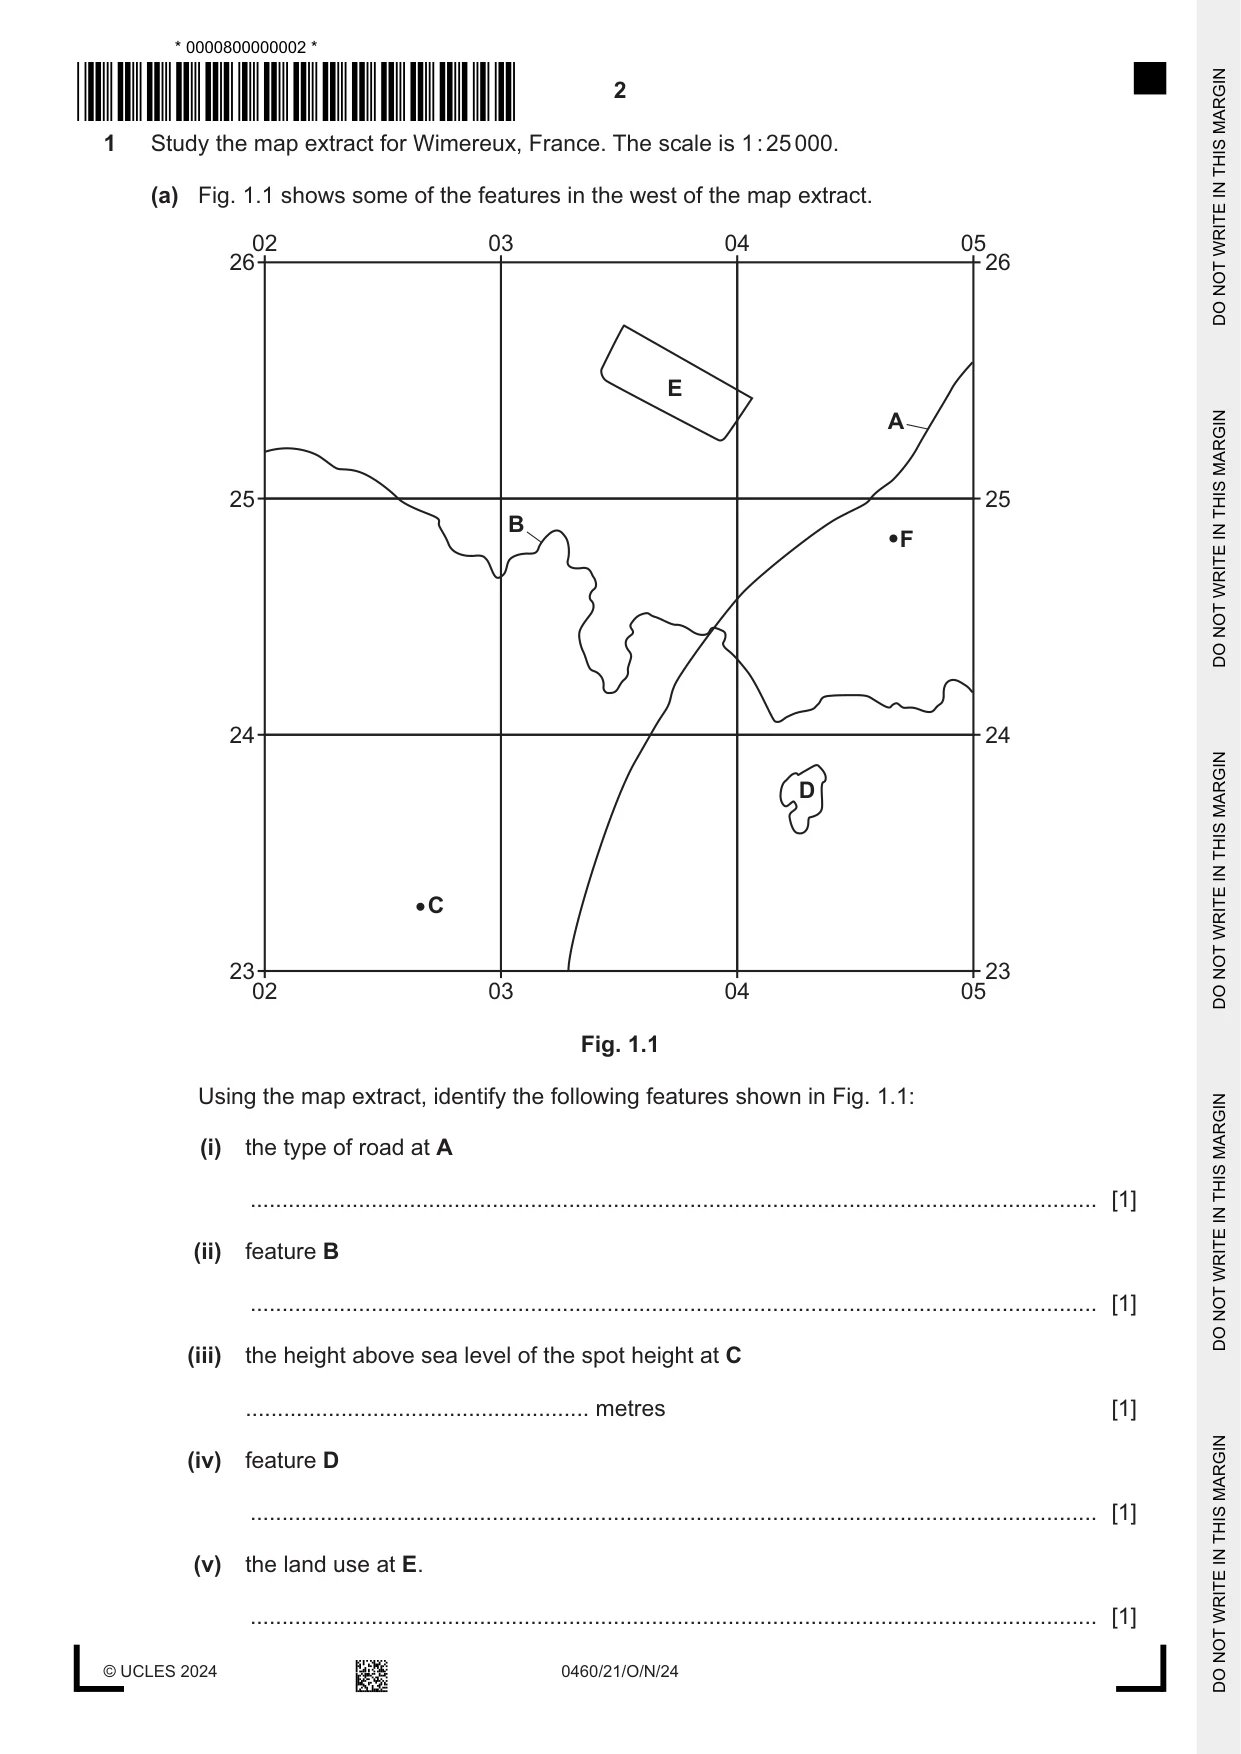
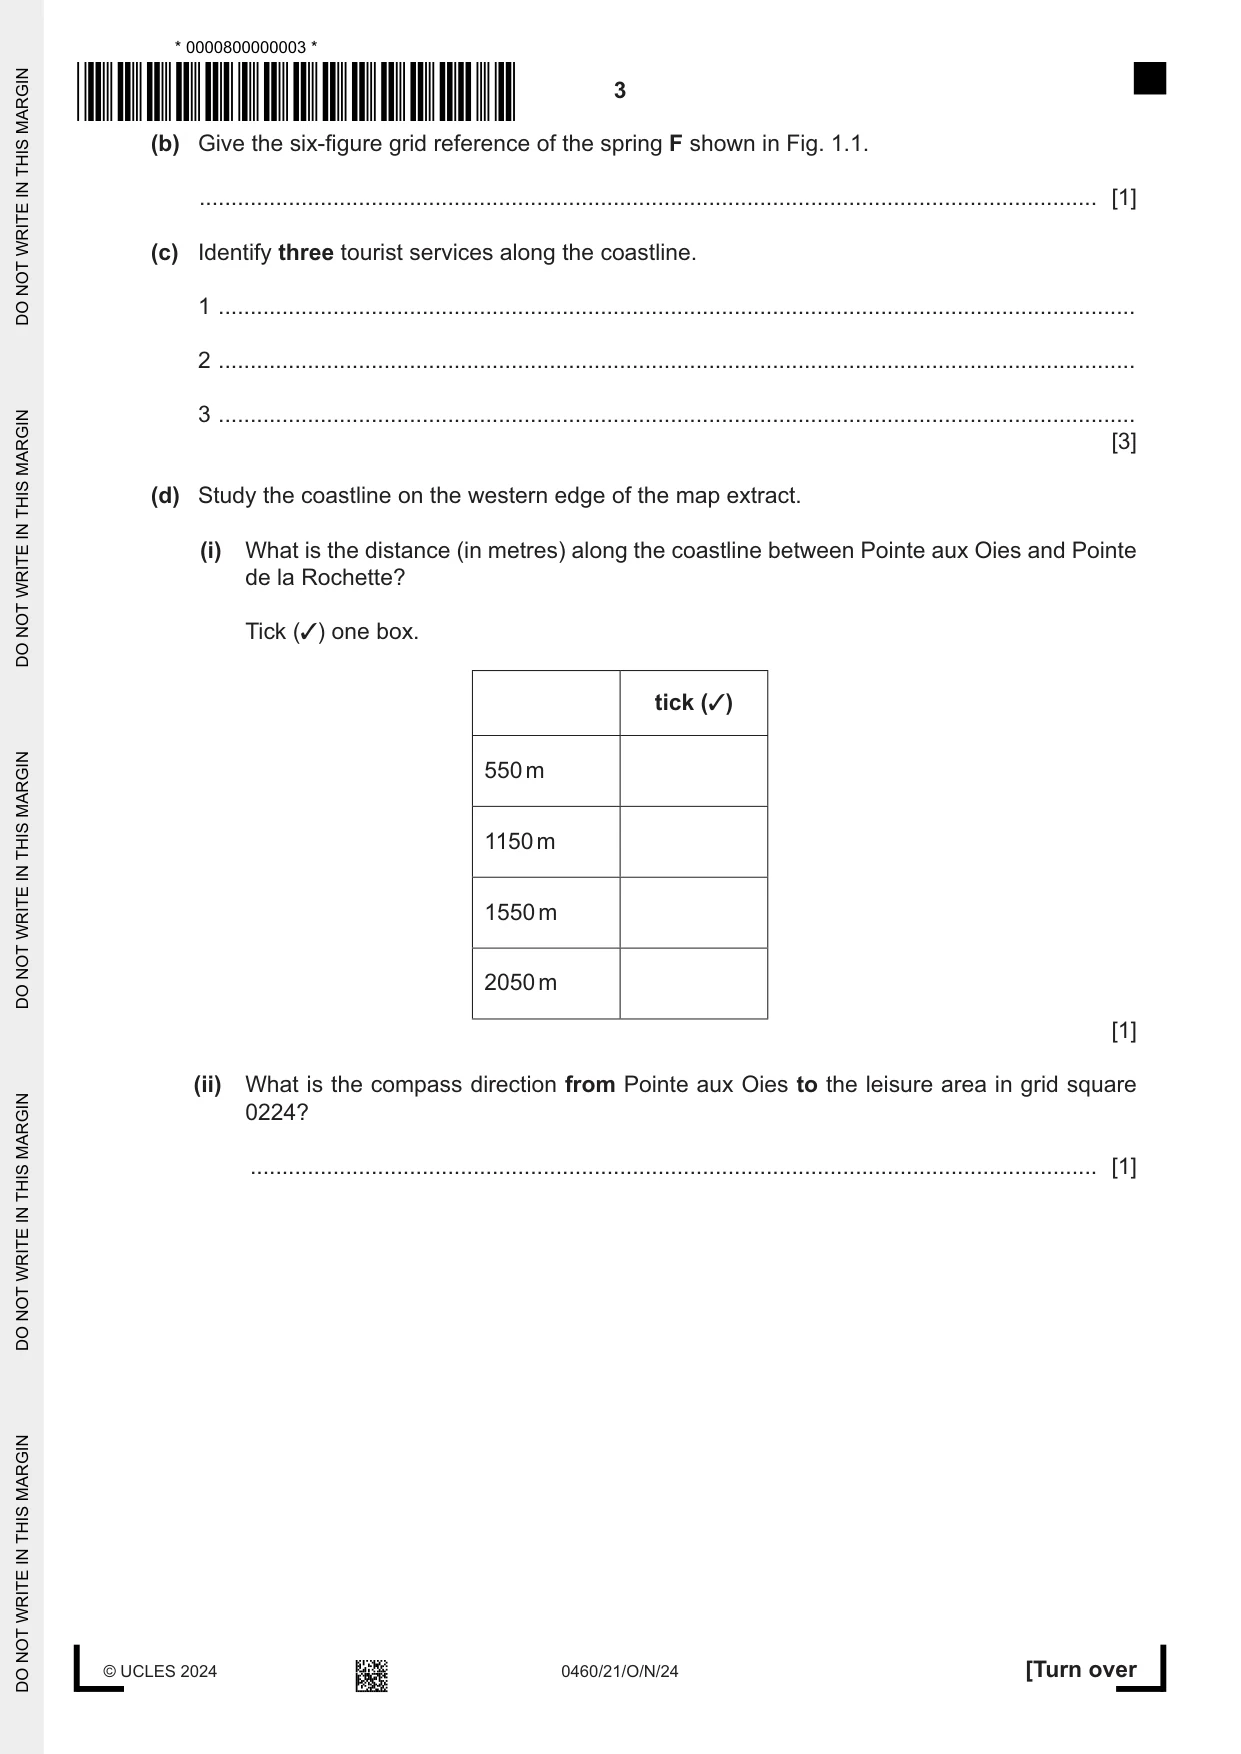
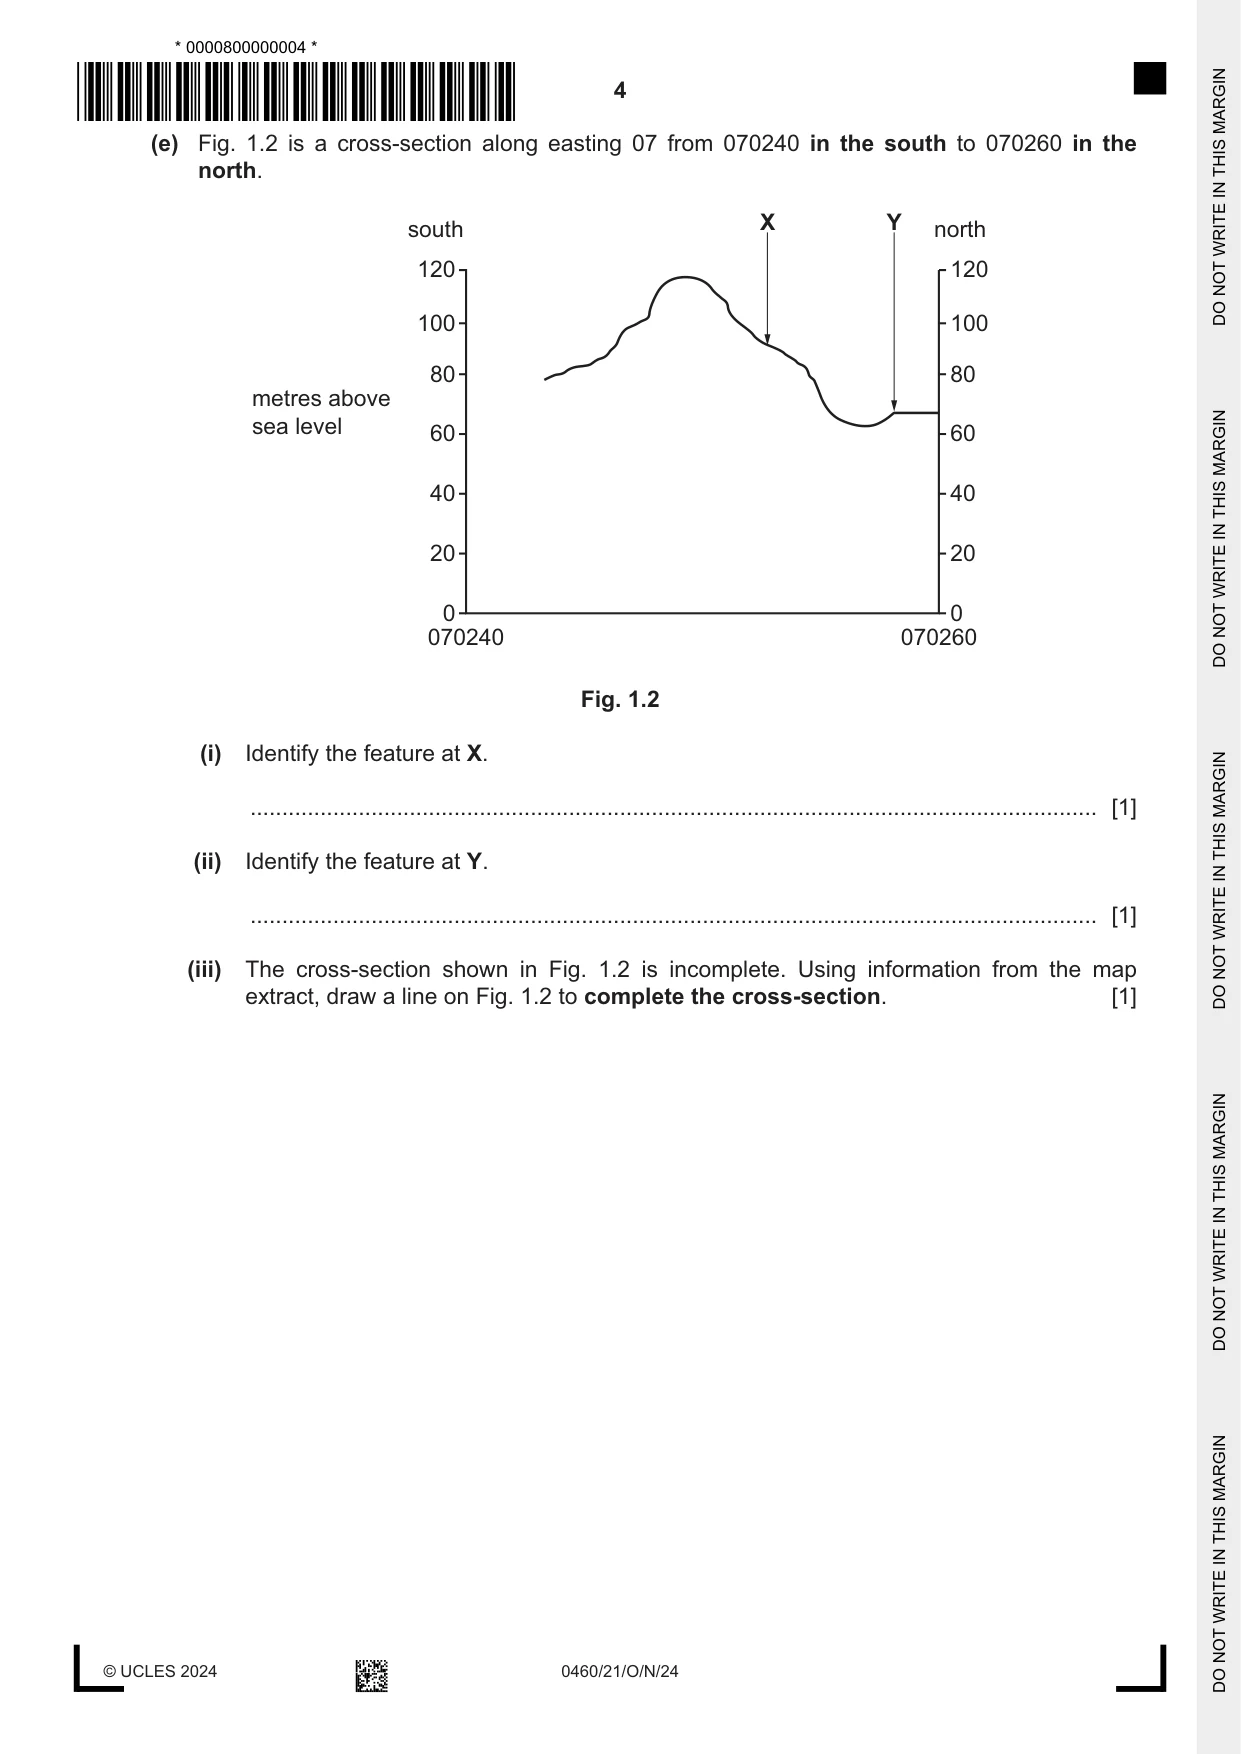
1 Study the map extract for Wimereux, France. The scale is 1 : 25 000. (a) Fig. 1.1 shows some of the features in the west of the map extract. 02 03 04 05 26 26 E A 25 25 B F 24 24 D C 23 23 02 03 04 05 Fig. 1.1 Using the map extract, identify the following features shown in Fig. 1.1: (i) the type of road at A ..................................................................................................................................... [1] (ii) feature B ..................................................................................................................................... [1] (iii) the height above sea level of the spot height at C ...................................................... metres [1] (iv) feature D ..................................................................................................................................... [1] (v) the land use at E. ..................................................................................................................................... [1] (b) Give the six‑figure grid reference of the spring F shown in Fig. 1.1. ............................................................................................................................................. [1] (c) Identify three tourist services along the coastline. 1 ................................................................................................................................................ 2 ................................................................................................................................................ 3 ................................................................................................................................................ [3] (d) Study the coastline on the western edge of the map extract. (i) What is the distance (in metres) along the coastline between Pointe aux Oies and Pointe de la Rochette? Tick (✓) one box. tick (✓) 550 m 1150 m 1550 m 2050 m [1] (ii) What is the compass direction from Pointe aux Oies to the leisure area in grid square 0224? ..................................................................................................................................... [1] (e) Fig. 1.2 is a cross‑section along easting 07 from 070240 in the south to 070260 in the north. X Y south north 120 120 100 100 80 80 metres above sea level 60 60 40 40 20 20 0 0 070240 070260 Fig. 1.2 (i) Identify the feature at X. ..................................................................................................................................... [1] (ii) Identify the feature at Y. ..................................................................................................................................... [1] (iii) The cross‑section shown in Fig. 1.2 is incomplete. Using information from the map extract, draw a line on Fig. 1.2 to complete the cross‑section. [1] (f) Study the settlement of Wimereux. Describe the site of the settlement and give reasons for its growth. ................................................................................................................................................... ................................................................................................................................................... ................................................................................................................................................... ................................................................................................................................................... ................................................................................................................................................... ................................................................................................................................................... ................................................................................................................................................... ................................................................................................................................................... ................................................................................................................................................... ................................................................................................................................................... ................................................................................................................................................... ............................................................................................................................................. [6] [Total: 20]
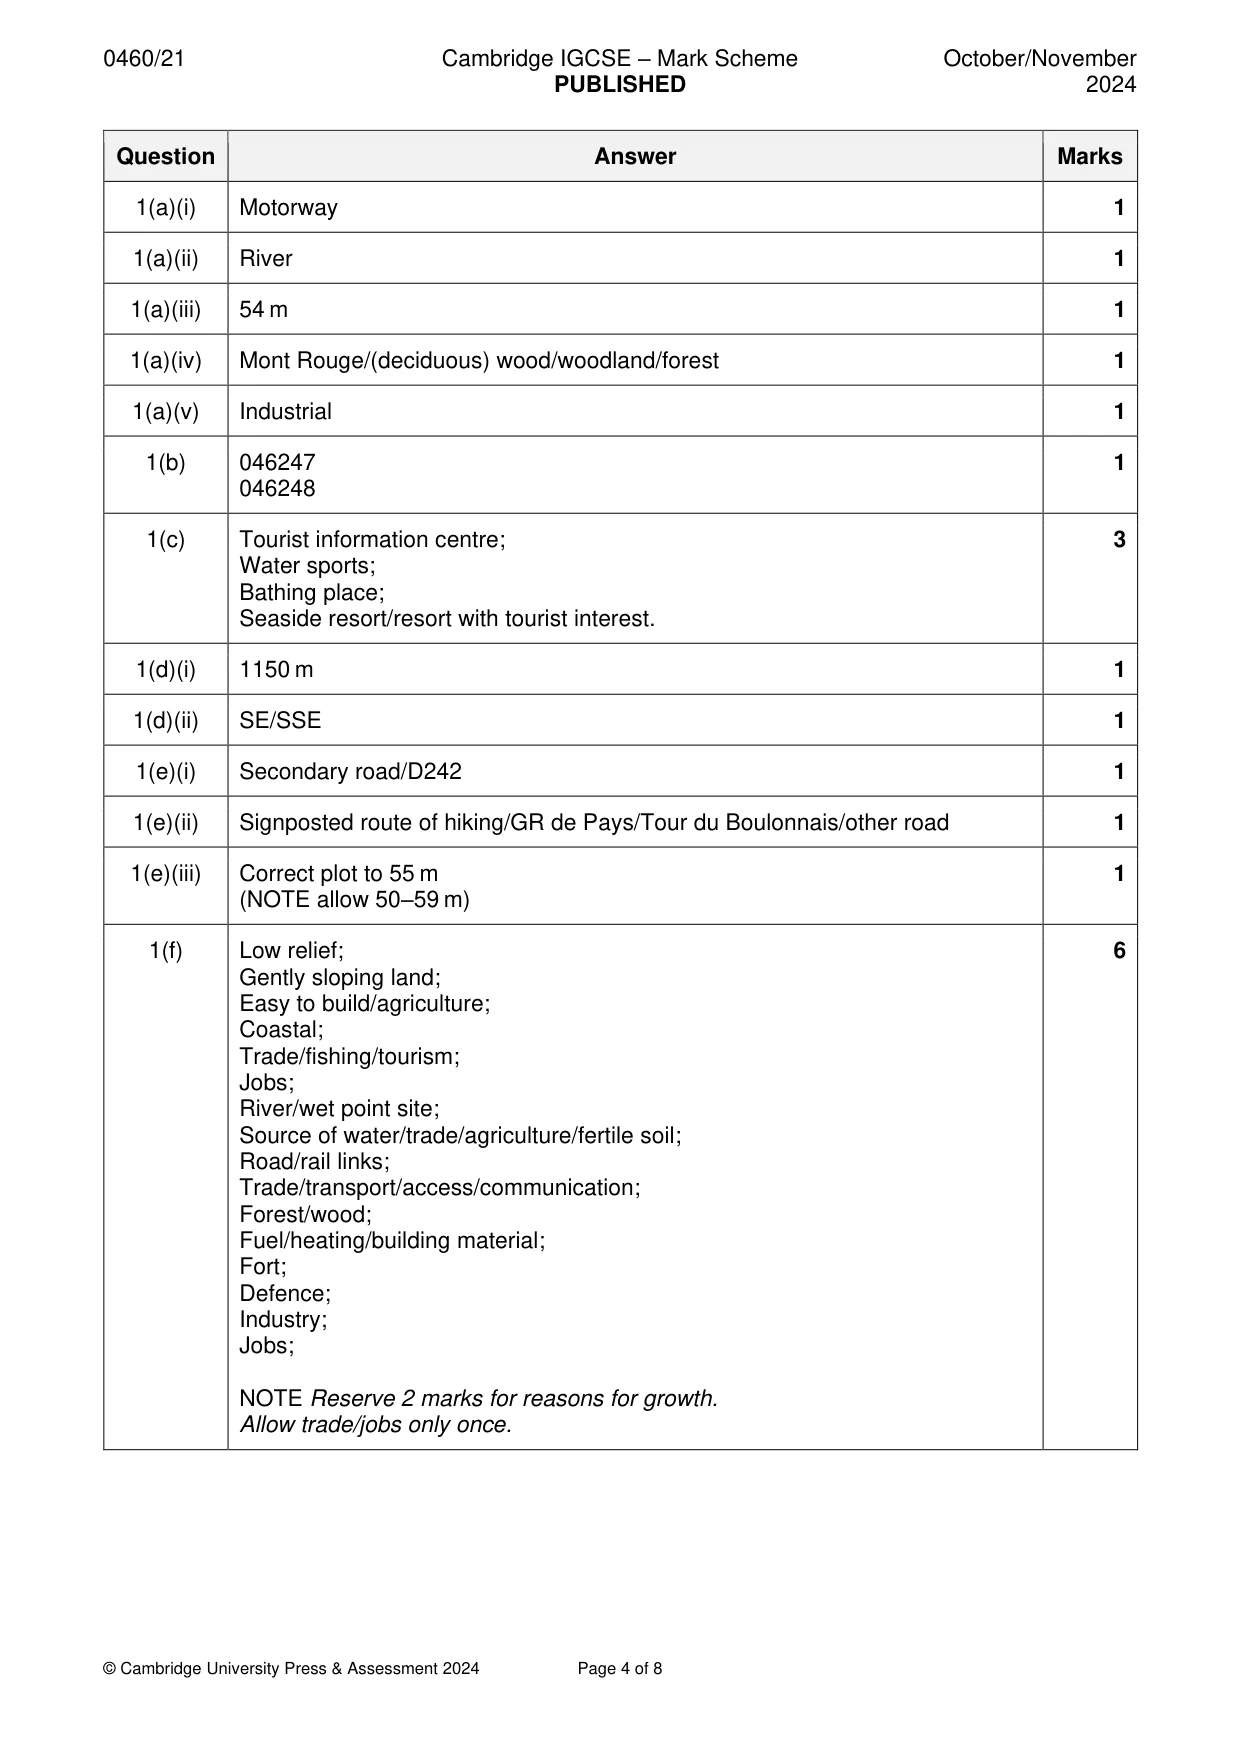
Mark scheme: Question Answer Marks 1(a)(i) Motorway 1 1(a)(ii) River 1 1(a)(iii) 54 m 1 1(a)(iv) Mont Rouge/(deciduous) wood/woodland/forest 1 1(a)(v) Industrial 1 1(b) 046247 1 046248 1(c) Tourist information centre; 3 Water sports; Bathing place; Seaside resort/resort with tourist interest. 1(d)(i) 1150 m 1 1(d)(ii) SE/SSE 1 1(e)(i) Secondary road/D242 1 1(e)(ii) Signposted route of hiking/GR de Pays/Tour du Boulonnais/other road 1 1(e)(iii) Correct plot to 55 m 1 (NOTE allow 50–59 m) 1(f) Low relief; 6 Gently sloping land; Easy to build/agriculture; Coastal; Trade/fishing/tourism; Jobs; River/wet point site; Source of water/trade/agriculture/fertile soil; Road/rail links; Trade/transport/access/communication; Forest/wood; Fuel/heating/building material; Fort; Defence; Industry; Jobs; NOTE Reserve 2 marks for reasons for growth. Allow trade/jobs only once.
More questions on Settlements (rural and urban) and service provision
Question 2
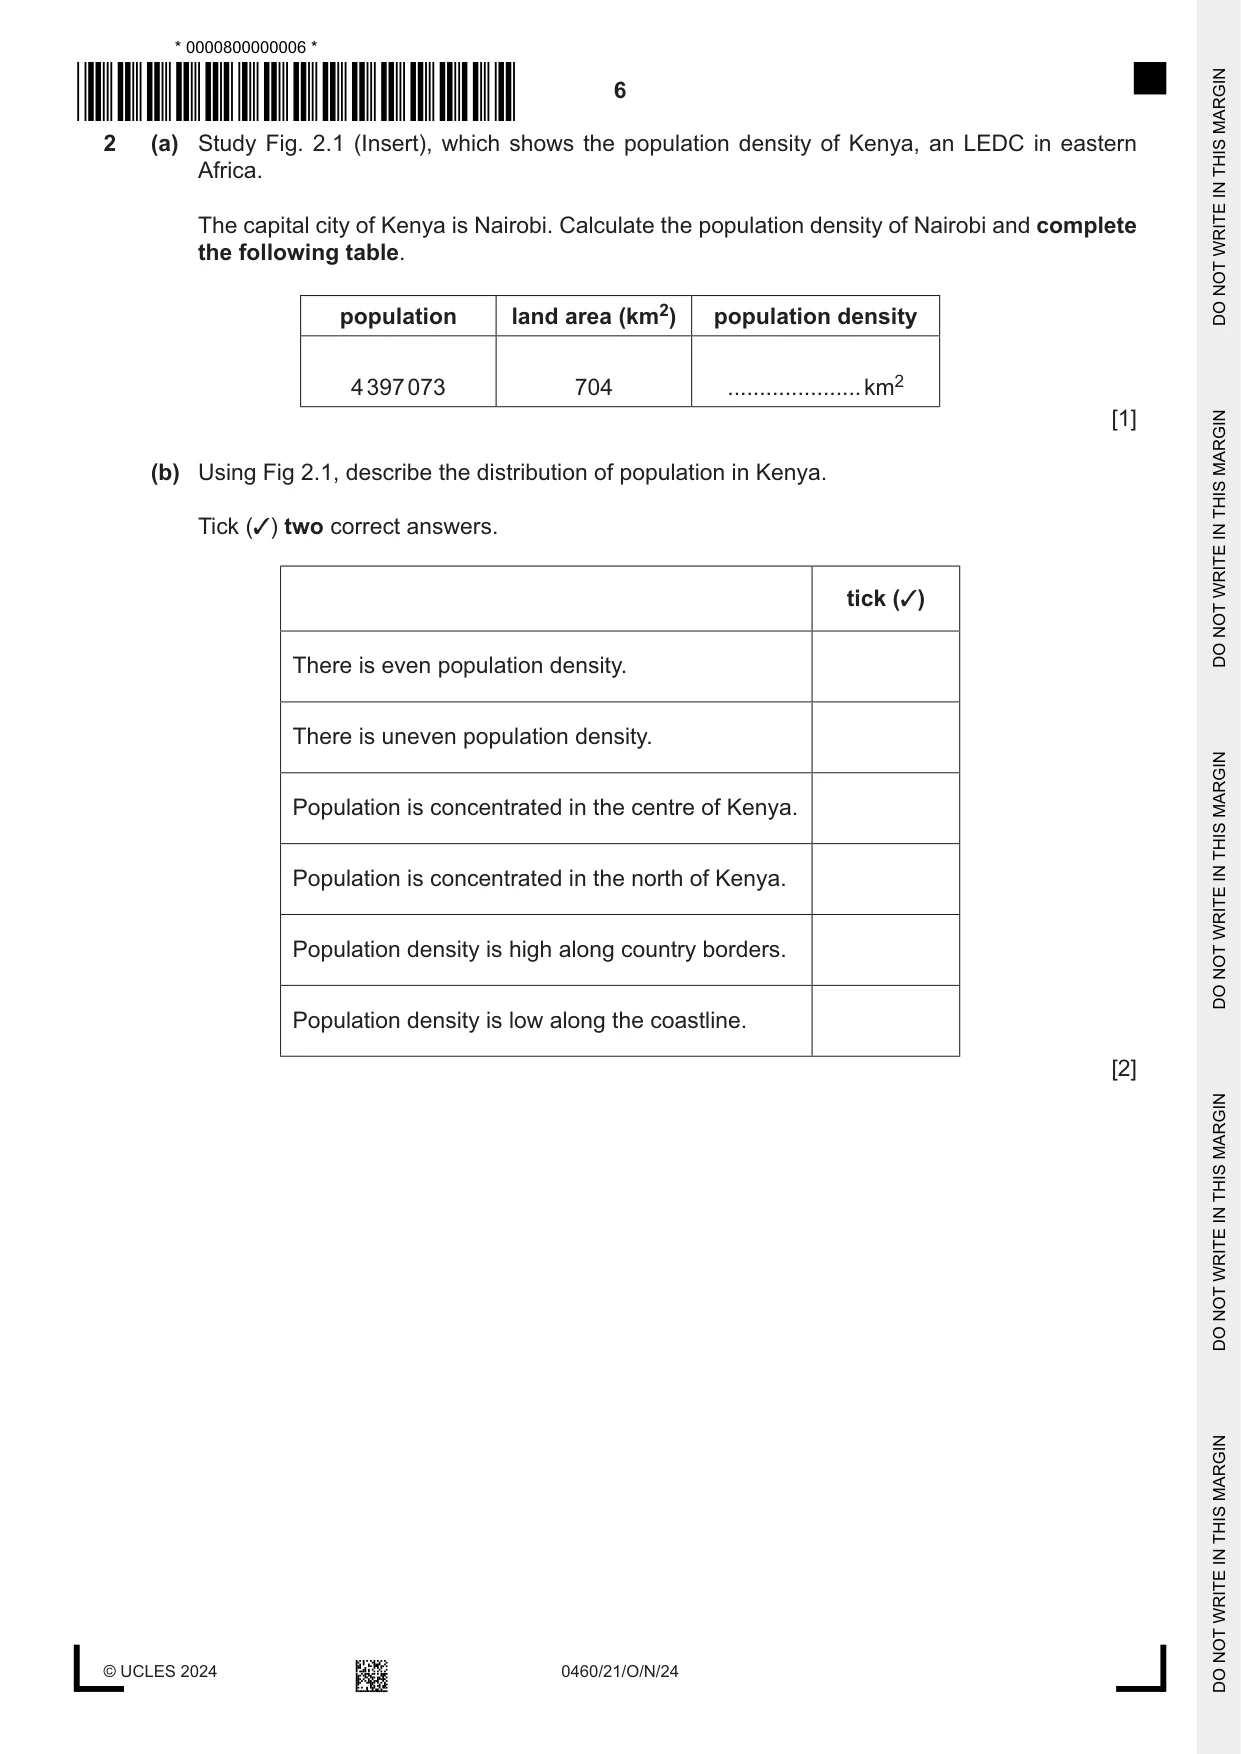
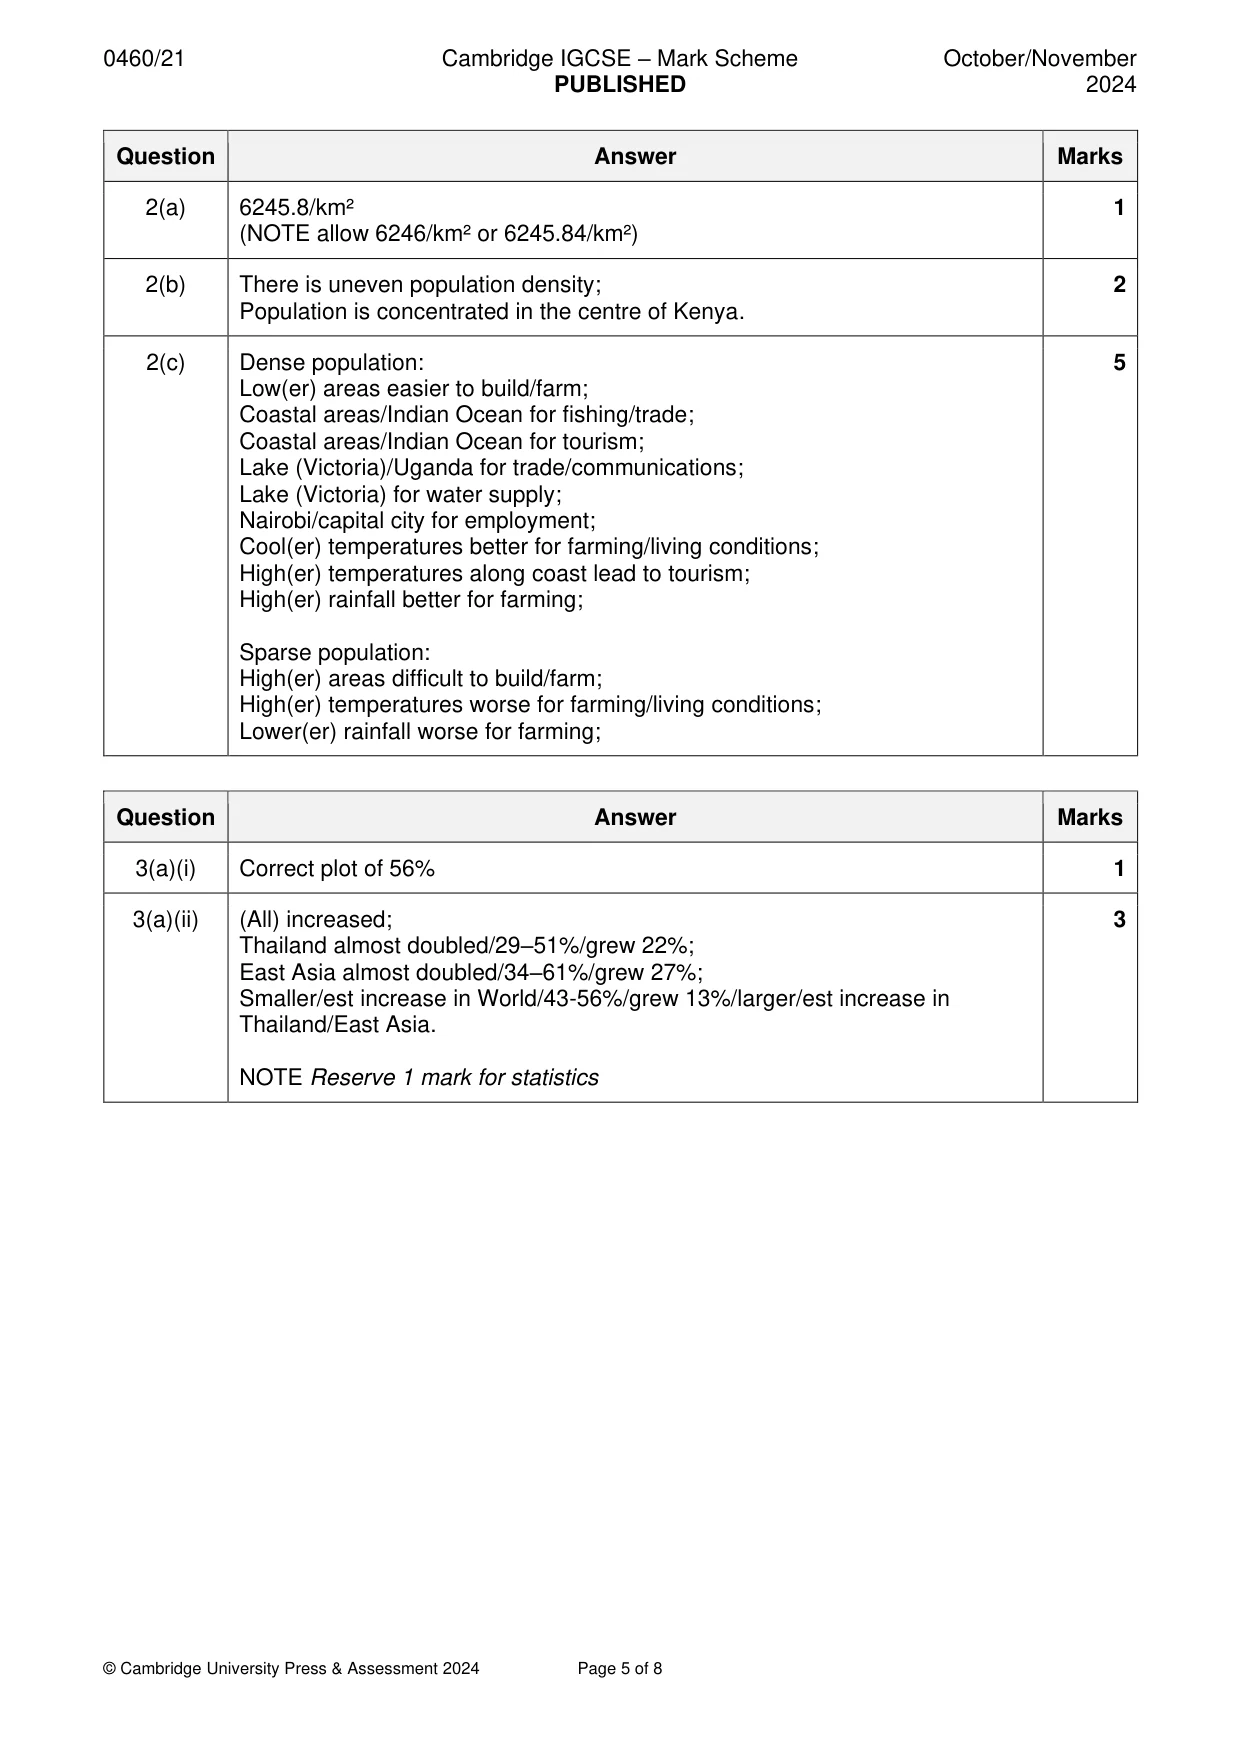
2 (a) Study Fig. 2.1 (Insert), which shows the population density of Kenya, an LEDC in eastern Africa. The capital city of Kenya is Nairobi. Calculate the population density of Nairobi and complete the following table. population land area (km2) population density 4 397 073 704 ..................... km2 [1] (b) Using Fig 2.1, describe the distribution of population in Kenya. Tick (✓) two correct answers. tick (✓) There is even population density. There is uneven population density. Population is concentrated in the centre of Kenya. Population is concentrated in the north of Kenya. Population density is high along country borders. Population density is low along the coastline. [2] (c) Study Figs. 2.2 and 2.3 (Insert). Fig. 2.2 shows the relief in Kenya, and Fig. 2.3 shows climatic zones in Kenya. Using Figs. 2.1, 2.2 and 2.3 (Insert), suggest reasons why some areas of Kenya are more densely populated than others. ................................................................................................................................................... ................................................................................................................................................... ................................................................................................................................................... ................................................................................................................................................... ................................................................................................................................................... ................................................................................................................................................... ................................................................................................................................................... ................................................................................................................................................... ................................................................................................................................................... ............................................................................................................................................. [5] [Total: 8]
Mark scheme: 2(a) 6245.8/km² 1 (NOTE allow 6246/km² or 6245.84/km²) 2(b) There is uneven population density; 2 Population is concentrated in the centre of Kenya. 2(c) Dense population: 5 Low(er) areas easier to build/farm; Coastal areas/Indian Ocean for fishing/trade; Coastal areas/Indian Ocean for tourism; Lake (Victoria)/Uganda for trade/communications; Lake (Victoria) for water supply; Nairobi/capital city for employment; Cool(er) temperatures better for farming/living conditions; High(er) temperatures along coast lead to tourism; High(er) rainfall better for farming; Sparse population: High(er) areas difficult to build/farm; High(er) temperatures worse for farming/living conditions; Lower(er) rainfall worse for farming;
Q3 · Information about urban population
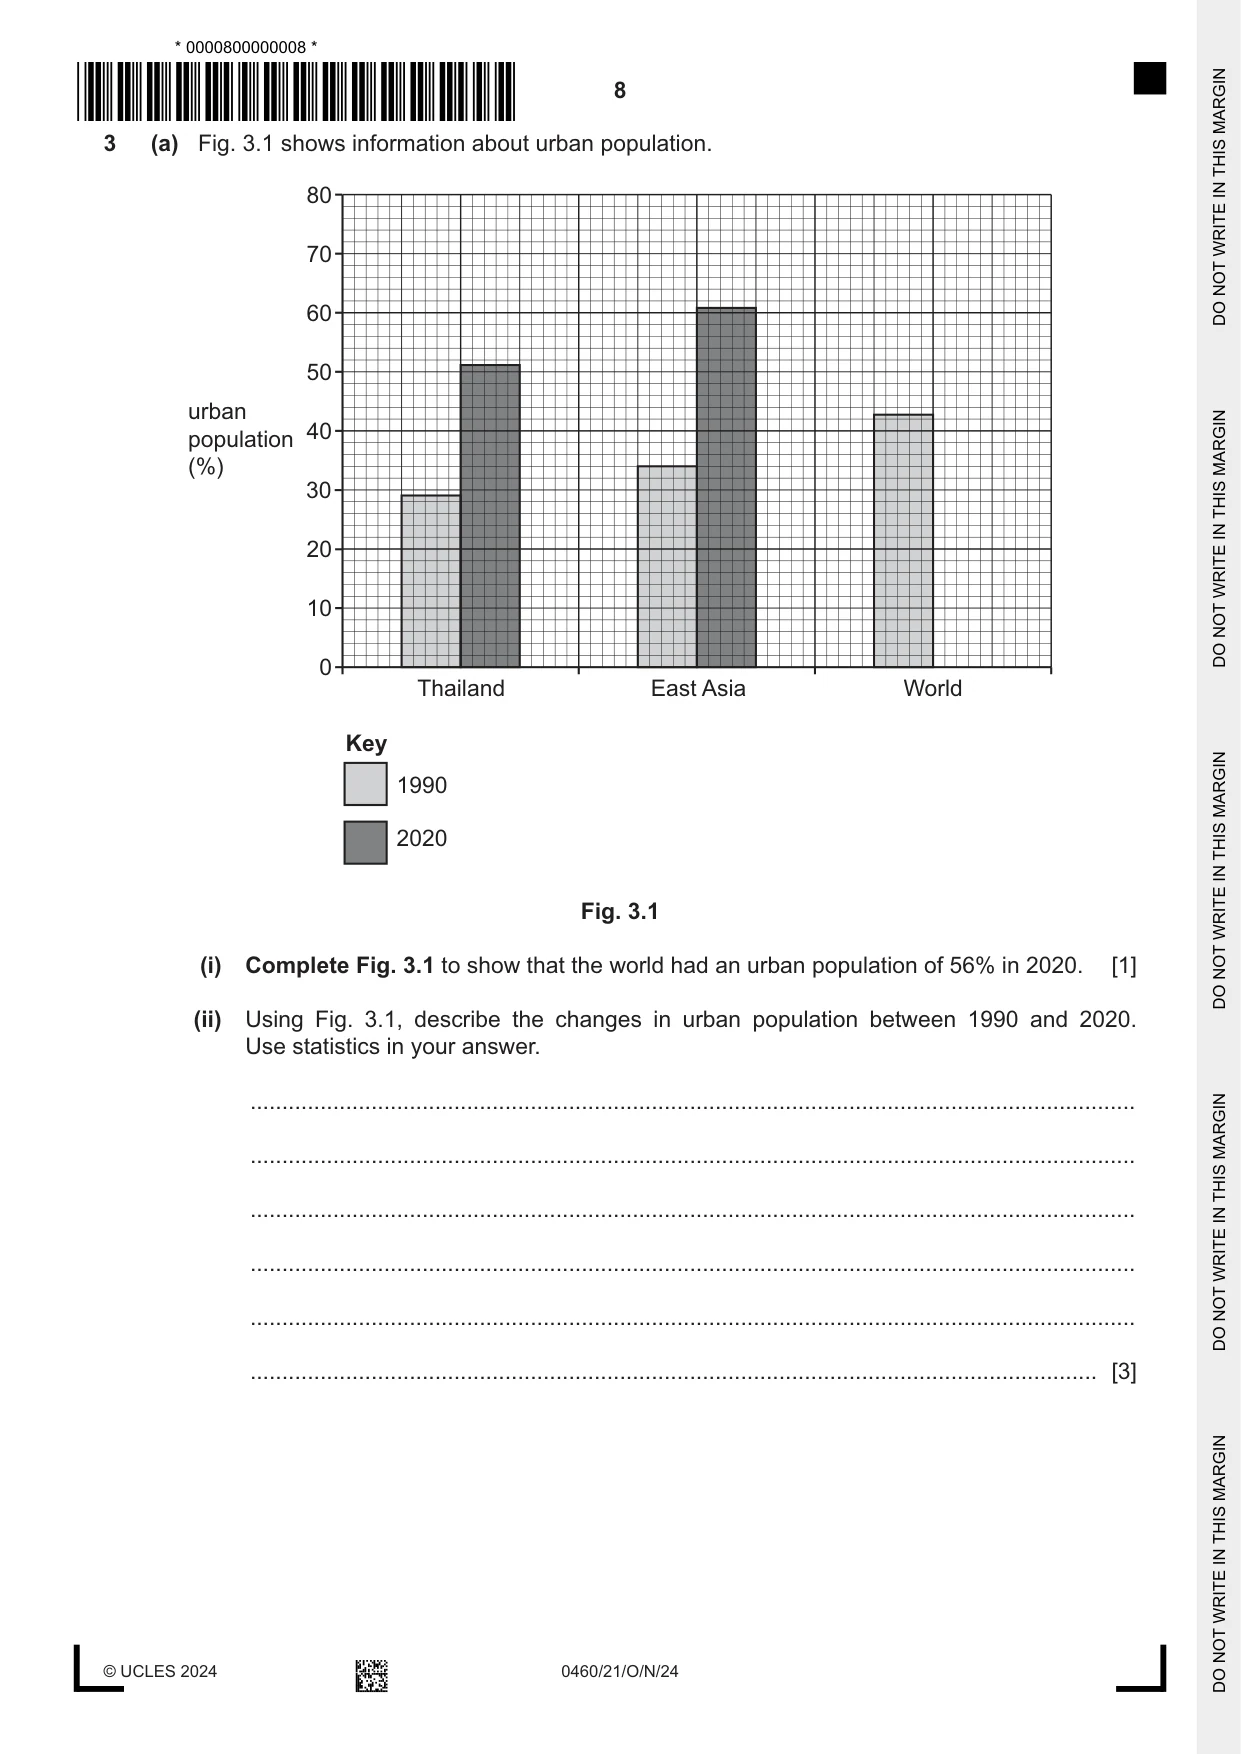
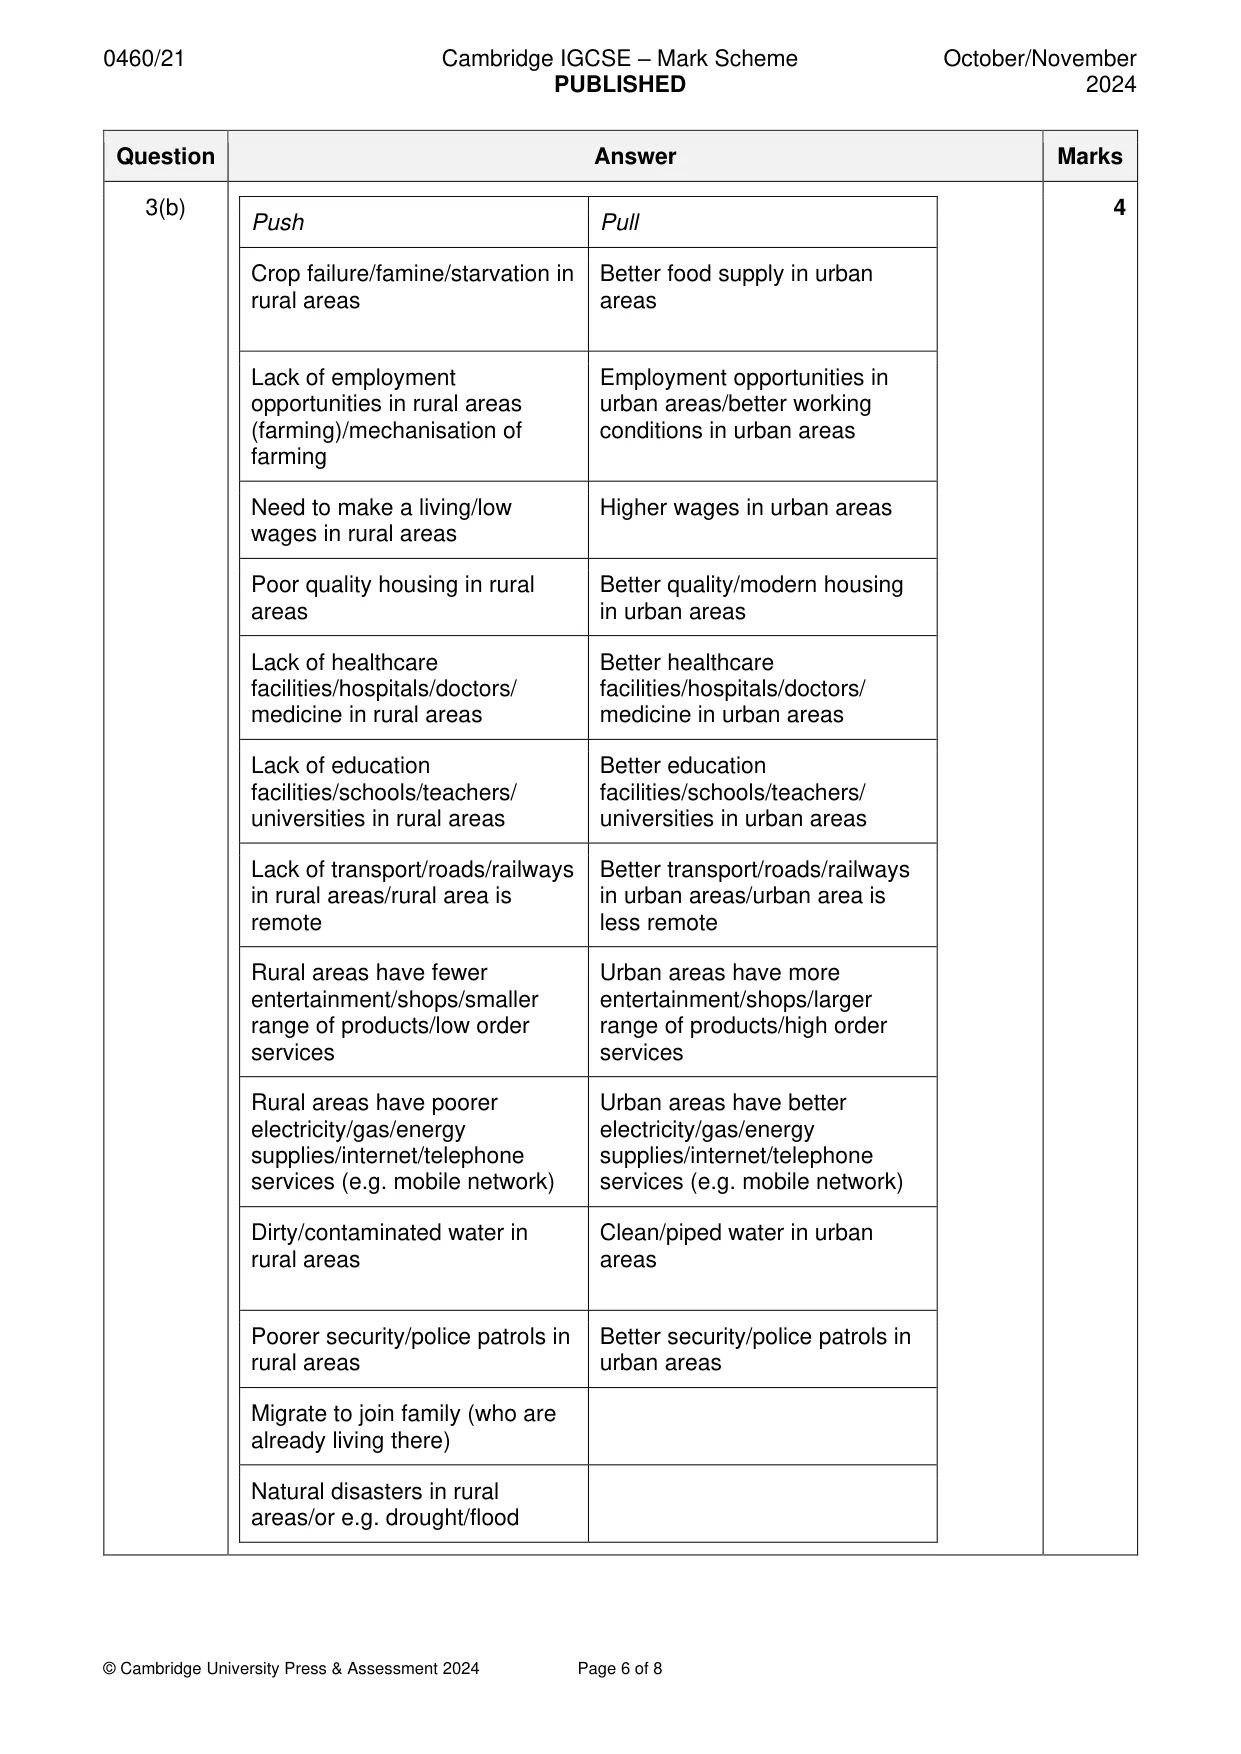
3 (a) Fig. 3.1 shows information about urban population. 80 70 60 50 urban 40 population (%) 30 20 10 0 Thailand East Asia World Key 1990 2020 Fig. 3.1 (i) Complete Fig. 3.1 to show that the world had an urban population of 56% in 2020. [1] (ii) Using Fig. 3.1, describe the changes in urban population between 1990 and 2020. Use statistics in your answer. ........................................................................................................................................... ........................................................................................................................................... ........................................................................................................................................... ........................................................................................................................................... ........................................................................................................................................... ..................................................................................................................................... [3] (b) Study Fig. 3.2 (Insert), which shows an urban settlement in Thailand, Asia. Suggest why people migrate to live in urban areas such as the one shown in Fig. 3.2. ................................................................................................................................................... ................................................................................................................................................... ................................................................................................................................................... ................................................................................................................................................... ................................................................................................................................................... ................................................................................................................................................... ................................................................................................................................................... ............................................................................................................................................. [4] [Total: 8]
Mark scheme: 3(a)(i) Correct plot of 56% 1 3(a)(ii) (All) increased; 3 Thailand almost doubled/29–51%/grew 22%; East Asia almost doubled/34–61%/grew 27%; Smaller/est increase in World/43-56%/grew 13%/larger/est increase in Thailand/East Asia. NOTE Reserve 1 mark for statistics 3(b) 4 Push Pull Crop failure/famine/starvation in Better food supply in urban rural areas areas Lack of employment Employment opportunities in opportunities in rural areas urban areas/better working (farming)/mechanisation of conditions in urban areas farming Need to make a living/low Higher wages in urban areas wages in rural areas Poor quality housing in rural Better quality/modern housing areas in urban areas Lack of healthcare Better healthcare facilities/hospitals/doctors/ facilities/hospitals/doctors/ medicine in rural areas medicine in urban areas Lack of education Better education facilities/schools/teachers/ facilities/schools/teachers/ universities in rural areas universities in urban areas Lack of transport/roads/railways Better transport/roads/railways in rural areas/rural area is in urban areas/urban area is remote less remote Rural areas have fewer Urban areas have more entertainment/shops/smaller entertainment/shops/larger range of products/low order range of products/high order services services Rural areas have poorer Urban areas have better electricity/gas/energy electricity/gas/energy supplies/internet/telephone supplies/internet/telephone services (e.g. mobile network) services (e.g. mobile network) Dirty/contaminated water in Clean/piped water in urban rural areas areas Poorer security/police patrols in Better security/police patrols in rural areas urban areas Migrate to join family (who are already living there) Natural disasters in rural areas/or e.g. drought/flood
Question 4
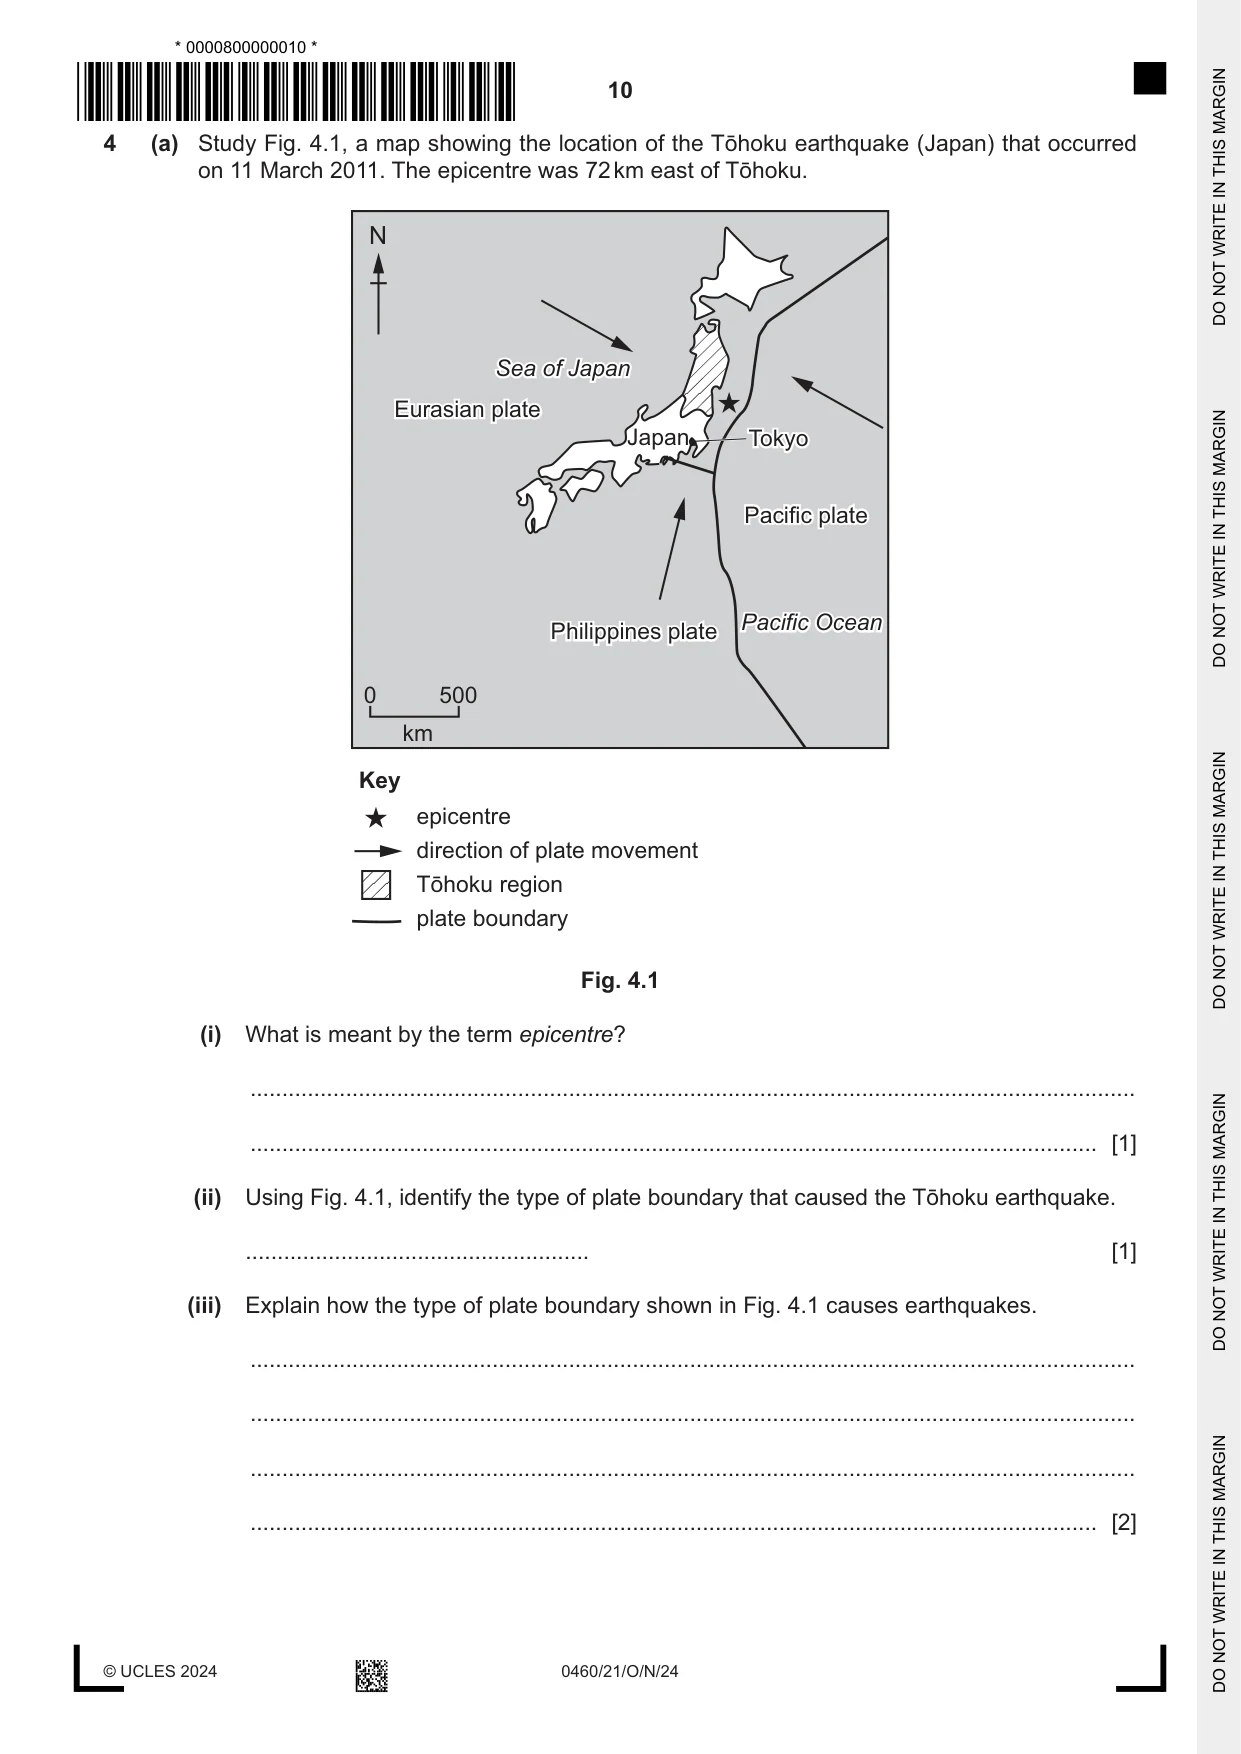
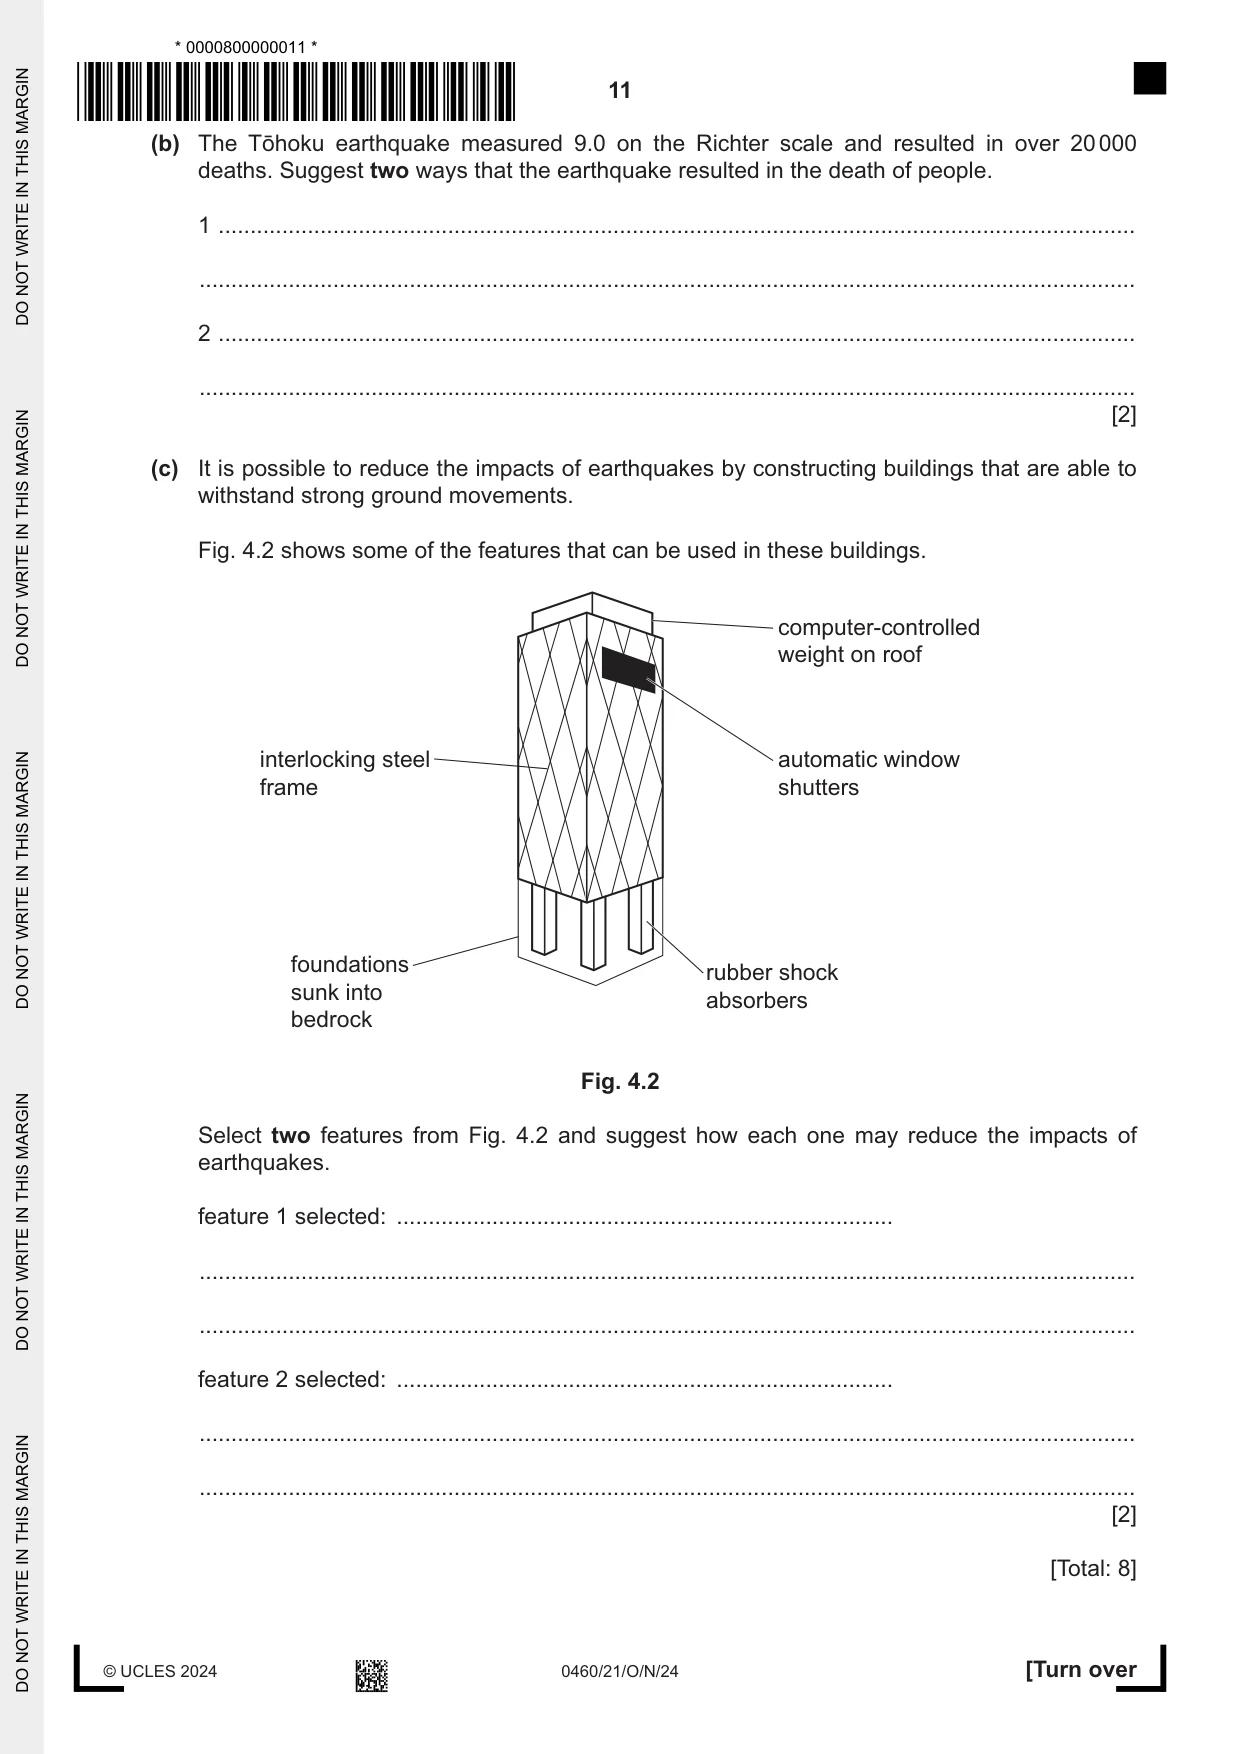
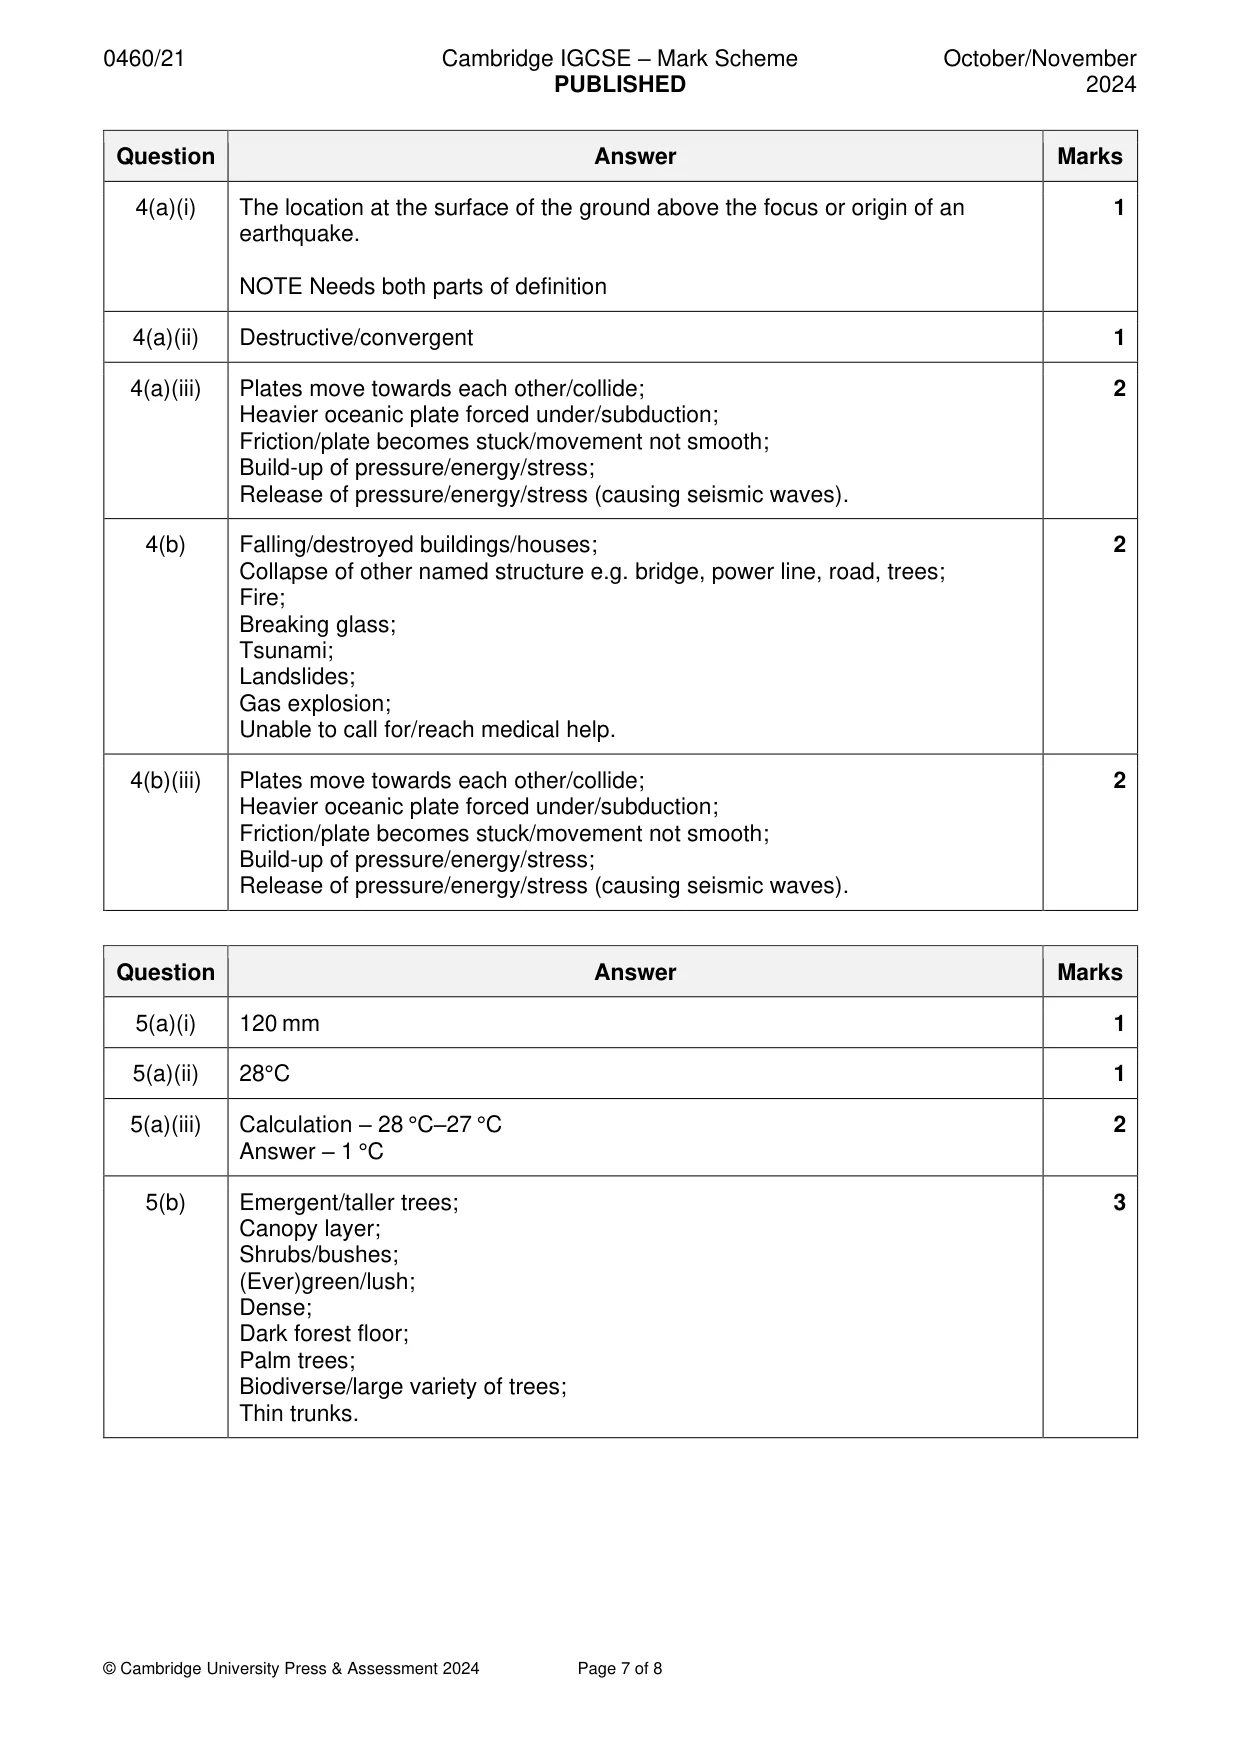
4 (a) Study Fig. 4.1, a map showing the location of the Tōhoku earthquake (Japan) that occurred on 11 March 2011. The epicentre was 72 km east of Tōhoku. N SeaSea ofof JapanJapan EurasianEurasian plateplate Japan TokyoTokyo PacificPacific plateplate PacificPacific OceanOcean PhilippinesPhilippines plateplate 0 500 km Key epicentre direction of plate movement Tōhoku region plate boundary Fig. 4.1 (i) What is meant by the term epicentre? ........................................................................................................................................... ..................................................................................................................................... [1] (ii) Using Fig. 4.1, identify the type of plate boundary that caused the Tōhoku earthquake. ...................................................... [1] (iii) Explain how the type of plate boundary shown in Fig. 4.1 causes earthquakes. ........................................................................................................................................... ........................................................................................................................................... ........................................................................................................................................... ..................................................................................................................................... [2] (b) The Tōhoku earthquake measured 9.0 on the Richter scale and resulted in over 20 000 deaths. Suggest two ways that the earthquake resulted in the death of people. 1 ................................................................................................................................................ ................................................................................................................................................... 2 ................................................................................................................................................ ................................................................................................................................................... [2] (c) It is possible to reduce the impacts of earthquakes by constructing buildings that are able to withstand strong ground movements. Fig. 4.2 shows some of the features that can be used in these buildings. computer-controlled weight on roof interlocking steel automatic window frame shutters foundations rubber shock sunk into absorbers bedrock Fig. 4.2 Select two features from Fig. 4.2 and suggest how each one may reduce the impacts of earthquakes. feature 1 selected: .............................................................................. ................................................................................................................................................... ................................................................................................................................................... feature 2 selected: .............................................................................. ................................................................................................................................................... ................................................................................................................................................... [2] [Total: 8]
Mark scheme: 4(a)(i) The location at the surface of the ground above the focus or origin of an 1 earthquake. NOTE Needs both parts of definition 4(a)(ii) Destructive/convergent 1 4(a)(iii) Plates move towards each other/collide; 2 Heavier oceanic plate forced under/subduction; Friction/plate becomes stuck/movement not smooth; Build-up of pressure/energy/stress; Release of pressure/energy/stress (causing seismic waves). 4(b) Falling/destroyed buildings/houses; 2 Collapse of other named structure e.g. bridge, power line, road, trees; Fire; Breaking glass; Tsunami; Landslides; Gas explosion; Unable to call for/reach medical help. 4(b)(iii) Plates move towards each other/collide; 2 Heavier oceanic plate forced under/subduction; Friction/plate becomes stuck/movement not smooth; Build-up of pressure/energy/stress; Release of pressure/energy/stress (causing seismic waves).
Question 5
5 (a) Study Fig. 5.1 (Insert), which shows information about the equatorial climate in Manaus, Brazil. (i) What is the average monthly rainfall in June? ...................................................... mm [1] (ii) What is the average monthly temperature in November? ...................................................... °C [1] (iii) Calculate the annual temperature range for Manaus, Brazil. You should show your calculations. ...................................................... °C [2] (b) Study Fig. 5.2 (Insert), which shows the tropical rainforest found in Manaus, Brazil. Using Fig. 5.2, identify three features which are typical of a tropical rainforest. 1 ................................................................................................................................................ 2 ................................................................................................................................................ 3 ................................................................................................................................................ [3] (c) Deforestation of the tropical rainforest has been happening for many years. State one reason for deforestation. ............................................................................................................................................. [1] [Total: 8]
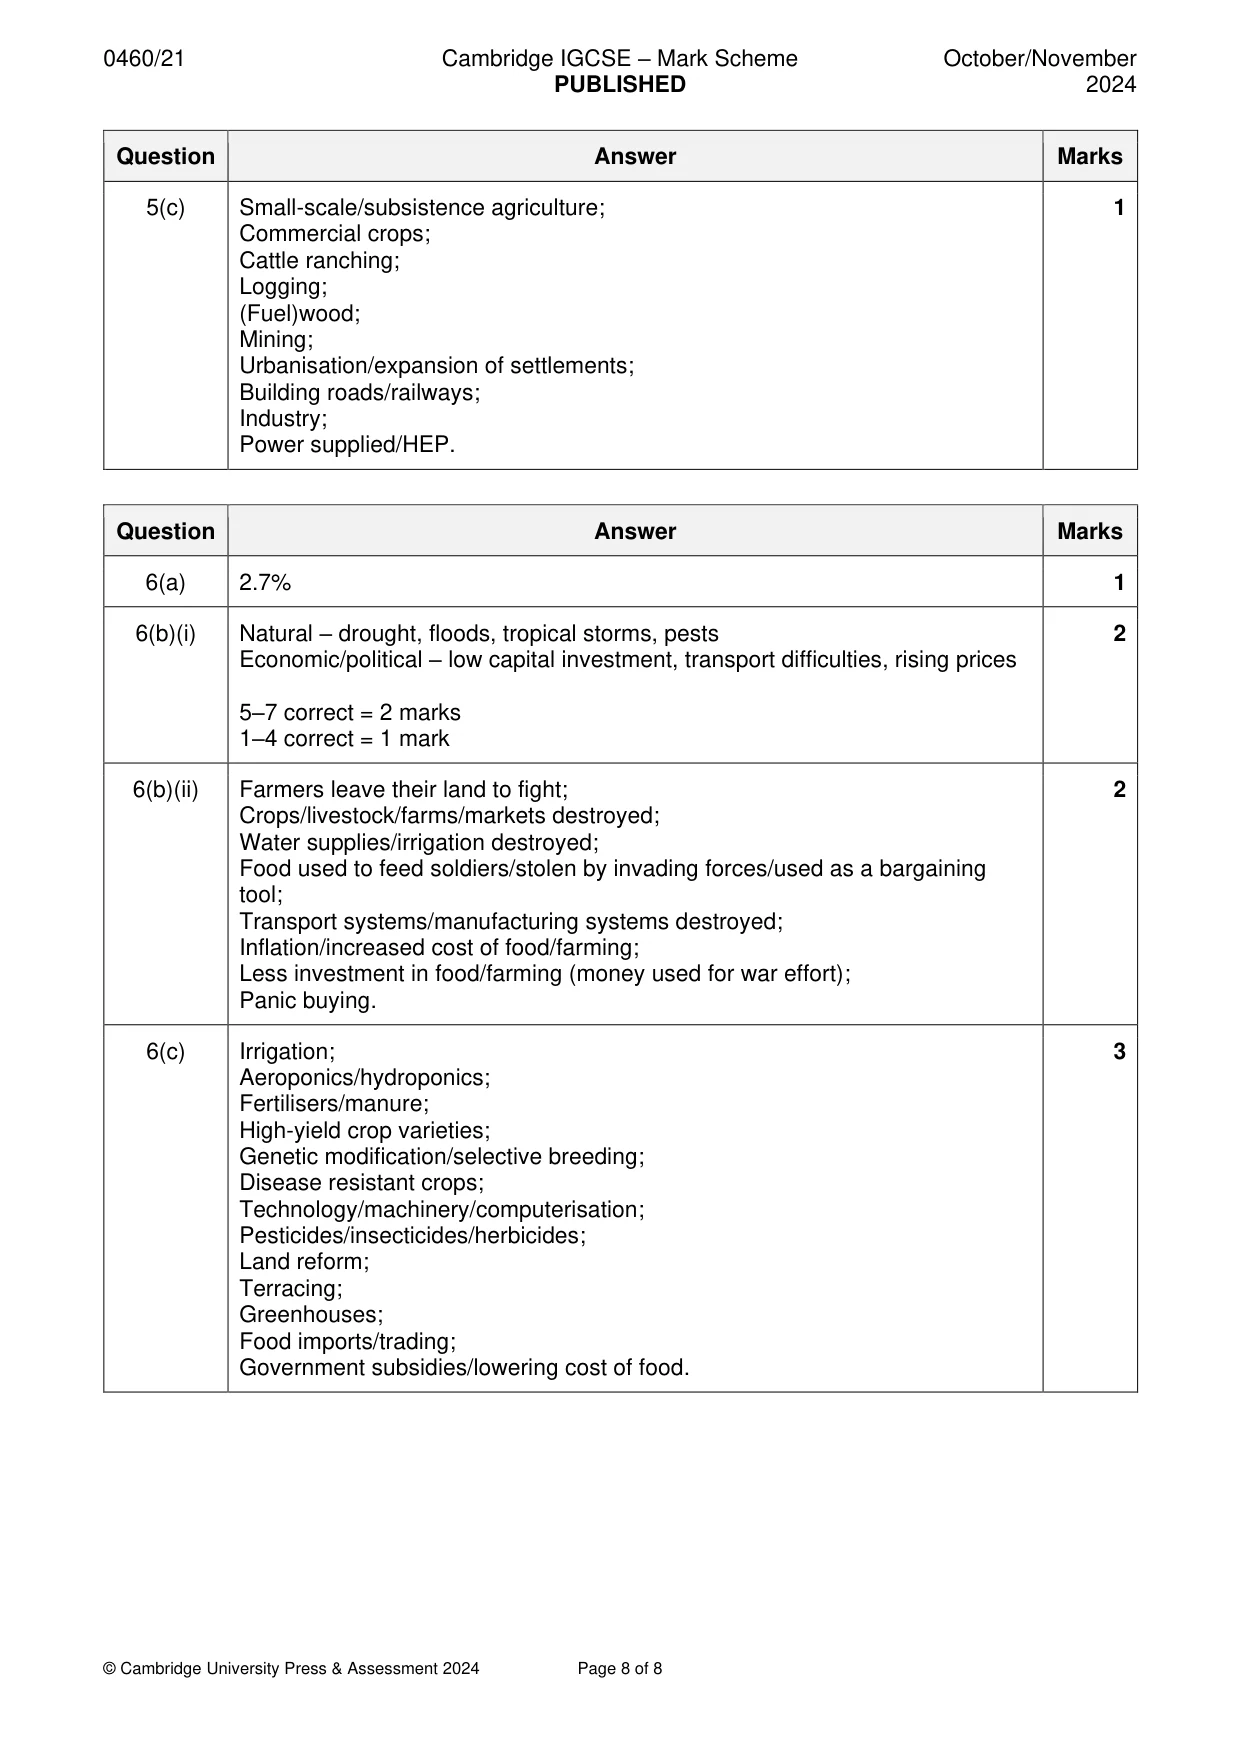
Mark scheme: 5(a)(i) 120 mm 1 5(a)(ii) 28°C 1 5(a)(iii) Calculation – 28 °C–27 °C 2 Answer – 1 °C 5(b) Emergent/taller trees; 3 Canopy layer; Shrubs/bushes; (Ever)green/lush; Dense; Dark forest floor; Palm trees; Biodiverse/large variety of trees; Thin trunks. 5(c) Small-scale/subsistence agriculture; 1 Commercial crops; Cattle ranching; Logging; (Fuel)wood; Mining; Urbanisation/expansion of settlements; Building roads/railways; Industry; Power supplied/HEP.
Q6 · Study Table 6.1, which shows the percentage of the total population of each continent who…
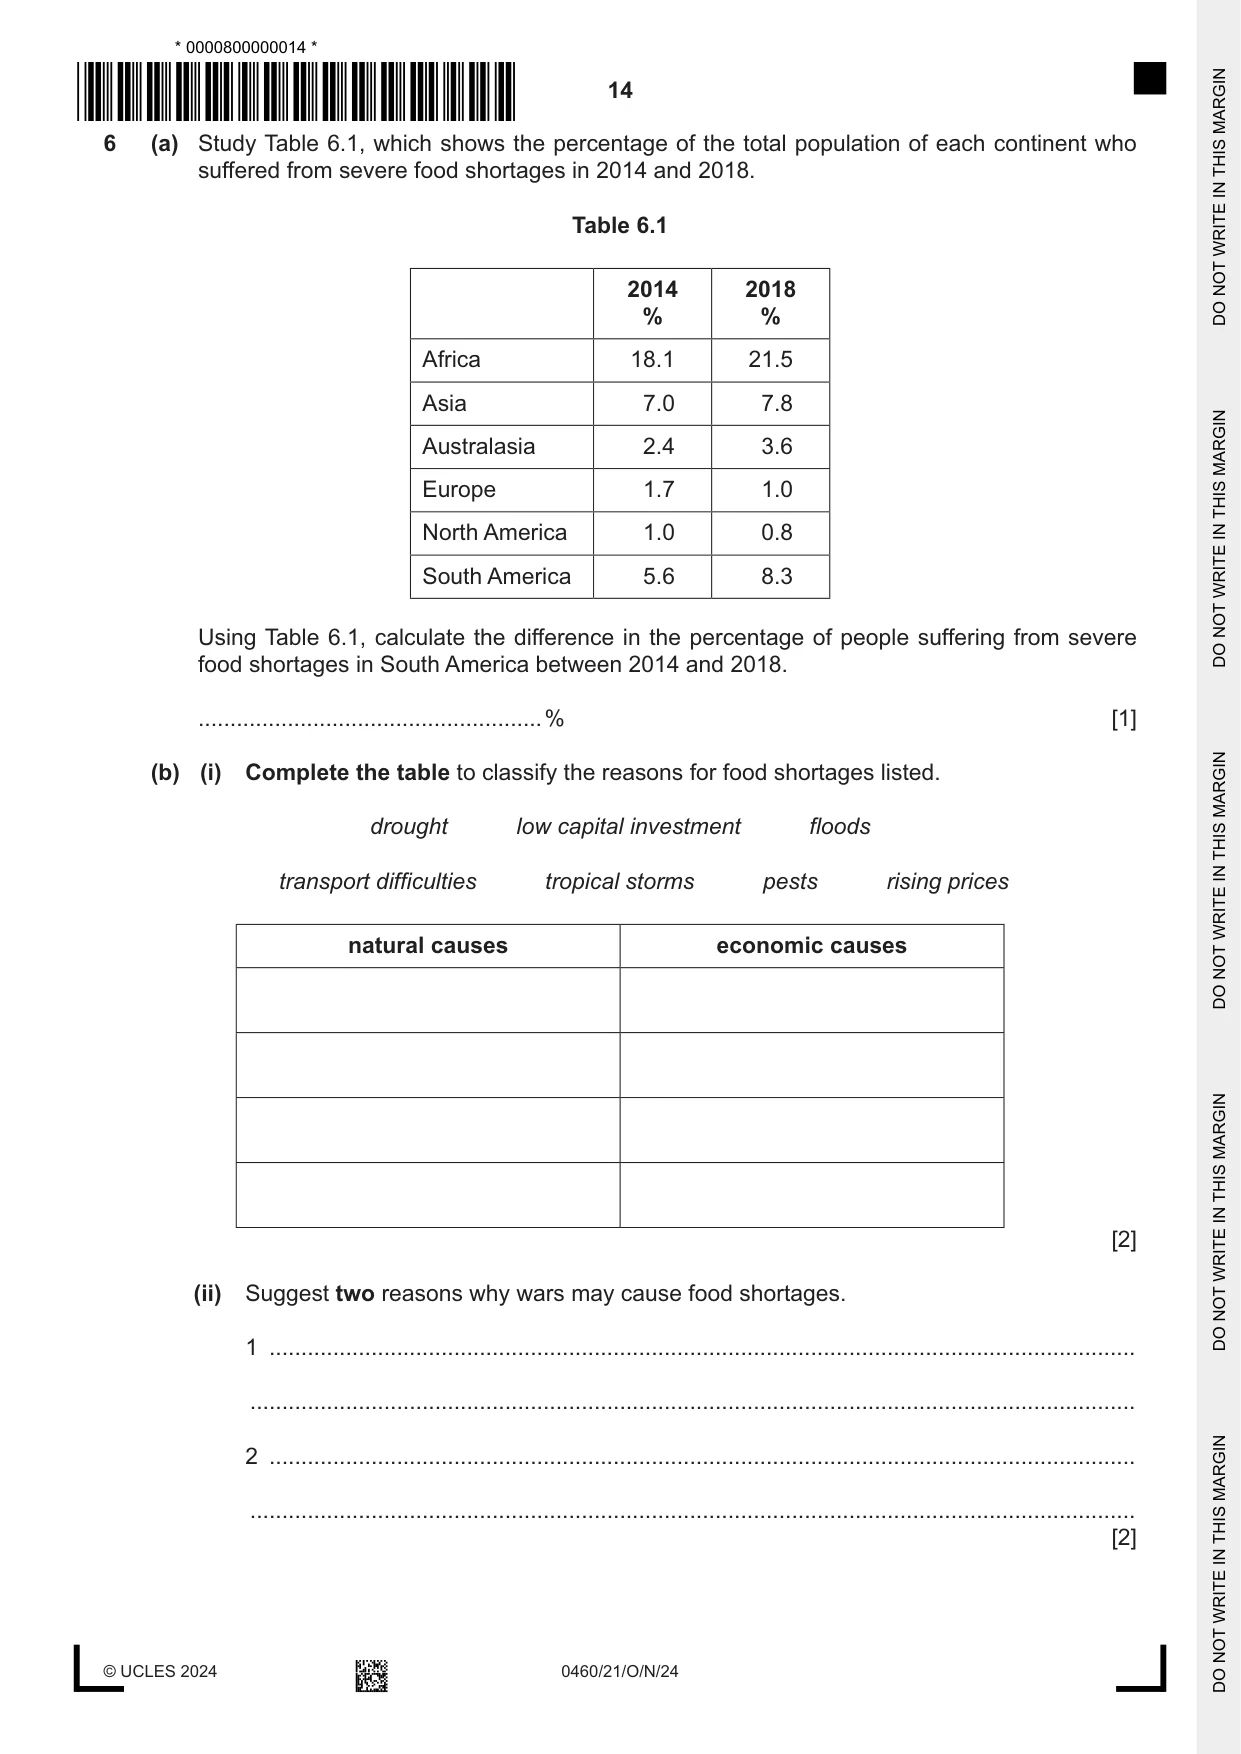
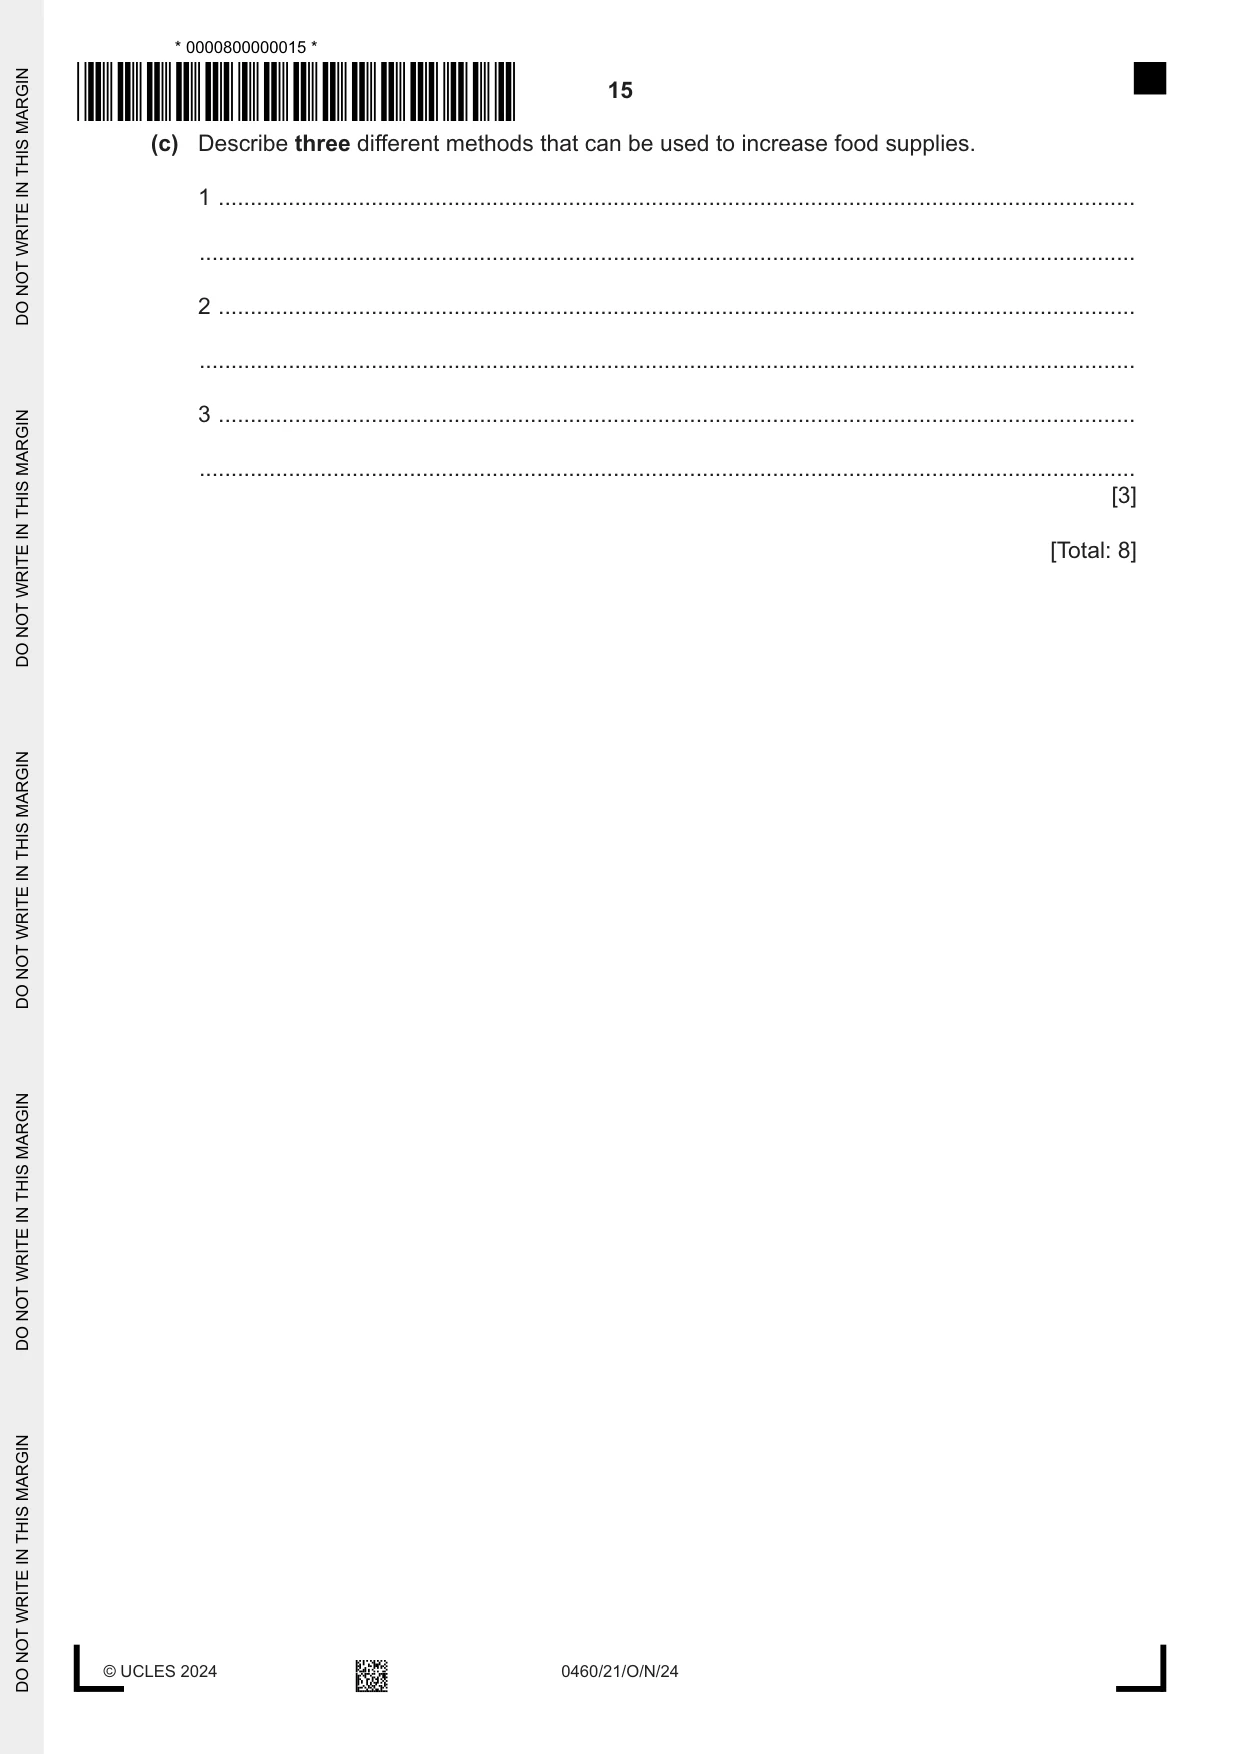
6 (a) Study Table 6.1, which shows the percentage of the total population of each continent who suffered from severe food shortages in 2014 and 2018. Table 6.1 2014 2018 % % Africa 18.1 21.5 Asia 7.0 7.8 Australasia 2.4 3.6 Europe 1.7 1.0 North America 1.0 0.8 South America 5.6 8.3 Using Table 6.1, calculate the difference in the percentage of people suffering from severe food shortages in South America between 2014 and 2018. ...................................................... % [1] (b) (i) Complete the table to classify the reasons for food shortages listed. drought low capital investment floods transport difficulties tropical storms pests rising prices natural causes economic causes [2] (ii) Suggest two reasons why wars may cause food shortages. 1 ........................................................................................................................................ ........................................................................................................................................... 2 ........................................................................................................................................ ........................................................................................................................................... [2] (c) Describe three different methods that can be used to increase food supplies. 1 ................................................................................................................................................ ................................................................................................................................................... 2 ................................................................................................................................................ ................................................................................................................................................... 3 ................................................................................................................................................ ................................................................................................................................................... [3] [Total: 8] Additional pages If you use the following pages to complete the answer to any question, the question number must be clearly shown. .................................................................................................................................................................. .................................................................................................................................................................. .................................................................................................................................................................. .................................................................................................................................................................. .................................................................................................................................................................. .................................................................................................................................................................. .................................................................................................................................................................. .................................................................................................................................................................. .................................................................................................................................................................. .................................................................................................................................................................. .................................................................................................................................................................. .................................................................................................................................................................. .................................................................................................................................................................. .................................................................................................................................................................. .................................................................................................................................................................. .................................................................................................................................................................. .................................................................................................................................................................. .................................................................................................................................................................. .................................................................................................................................................................. .................................................................................................................................................................. .................................................................................................................................................................. .................................................................................................................................................................. .................................................................................................................................................................. .................................................................................................................................................................. ..................................................................................................................................................................
Mark scheme: 6(a) 2.7% 1 6(b)(i) Natural – drought, floods, tropical storms, pests 2 Economic/political – low capital investment, transport difficulties, rising prices 5–7 correct = 2 marks 1–4 correct = 1 mark 6(b)(ii) Farmers leave their land to fight; 2 Crops/livestock/farms/markets destroyed; Water supplies/irrigation destroyed; Food used to feed soldiers/stolen by invading forces/used as a bargaining tool; Transport systems/manufacturing systems destroyed; Inflation/increased cost of food/farming; Less investment in food/farming (money used for war effort); Panic buying. 6(c) Irrigation; 3 Aeroponics/hydroponics; Fertilisers/manure; High-yield crop varieties; Genetic modification/selective breeding; Disease resistant crops; Technology/machinery/computerisation; Pesticides/insecticides/herbicides; Land reform; Terracing; Greenhouses; Food imports/trading; Government subsidies/lowering cost of food.
What was in this paper
The subtopics covered by these 6 questions, and how many questions each got. Open one in a new tab to see every Cambridge question on it.
What you needed in this session
Cambridge’s own grade thresholds for 2024 Oct/Nov, Paper 2 · Variant 1. A higher threshold means an easier paper — the bar moves with how the cohort did.