Cambridge IGCSE Geography 0460 — 2022 May/June Paper 2 · Variant 2
0460/22/M/J/22 · 6 questions · 60 marks · ≈68 min
The question paper and its mark scheme, free to read here and free to download. This is Cambridge’s own paper, exactly as it was sat.
Question paper20 pages






Mark scheme6 pages
Answers below. Sit the paper first if you are practising.
Questions as text
Q1 · Study the map extract for Uplawmoor, Scotland
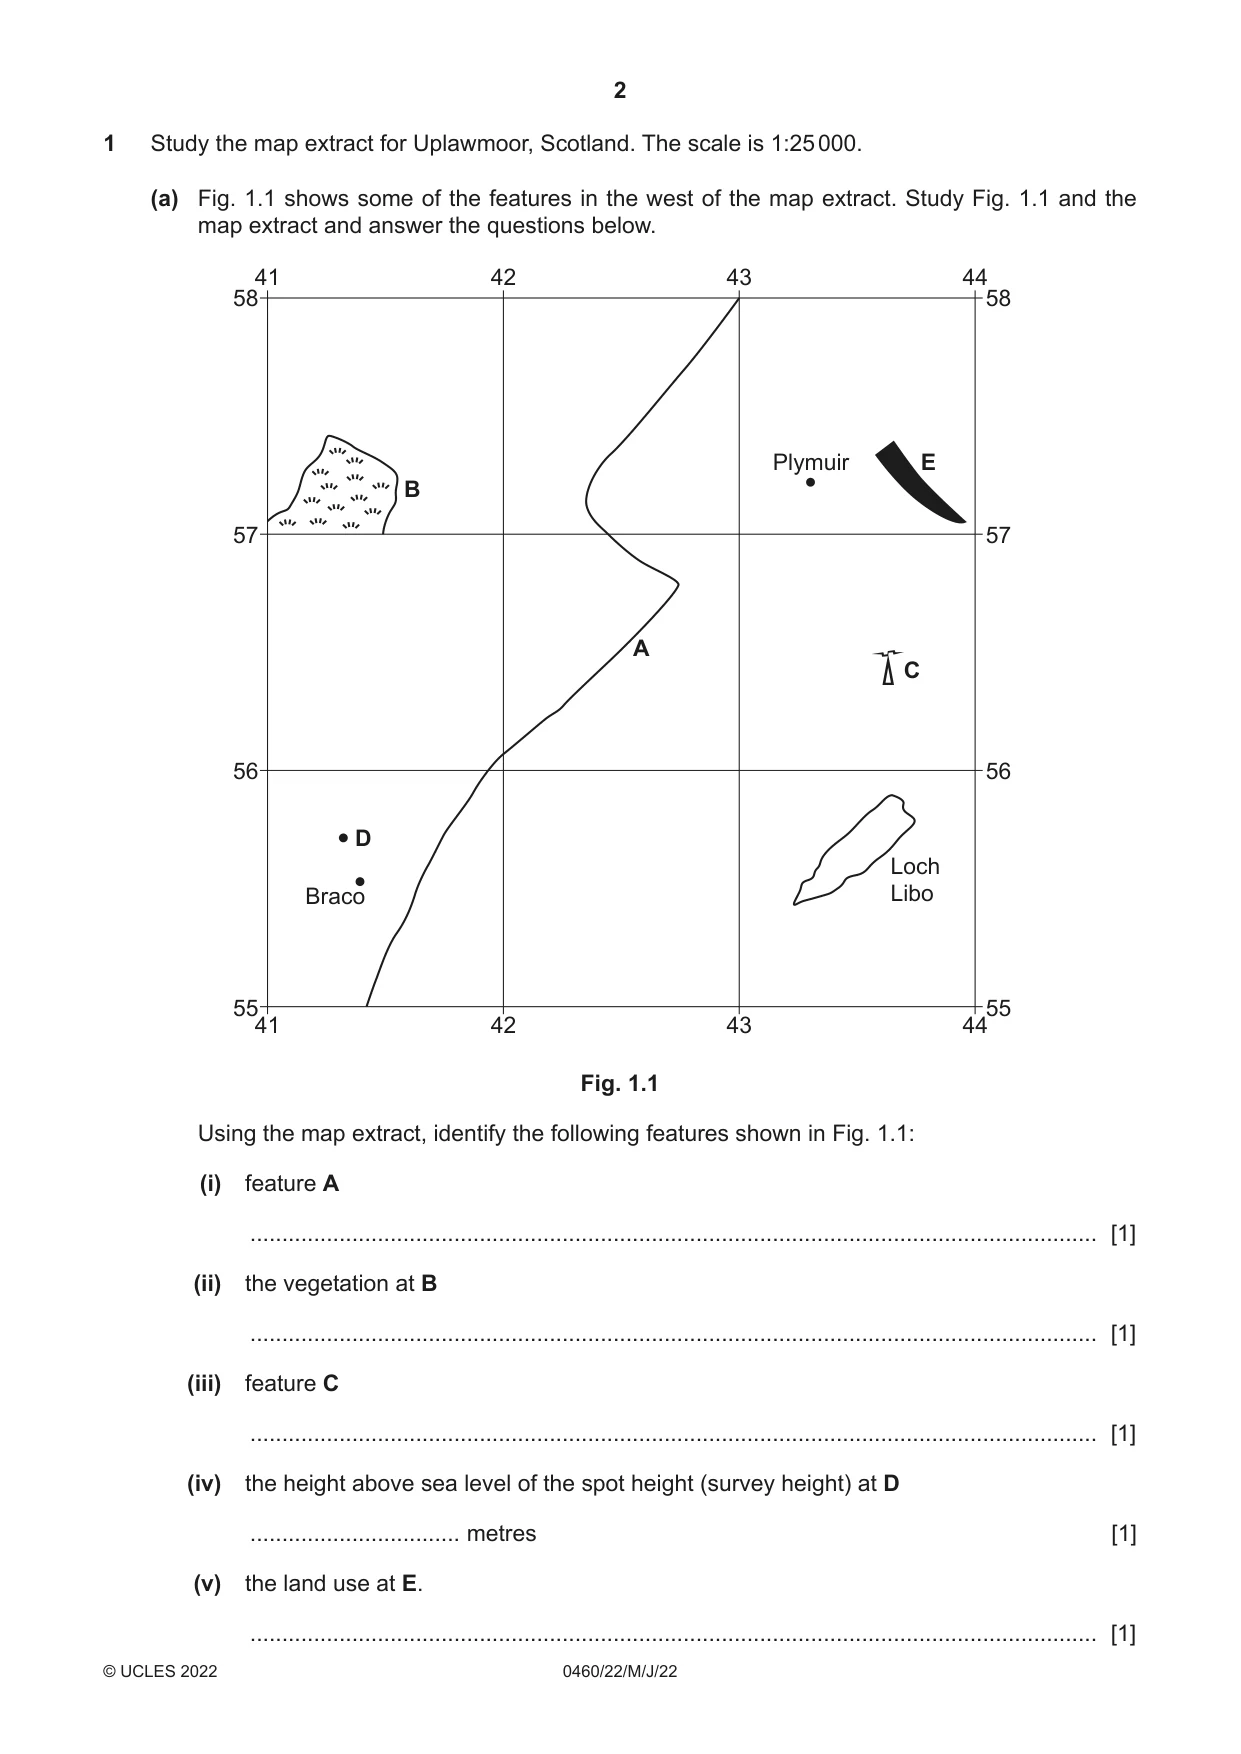
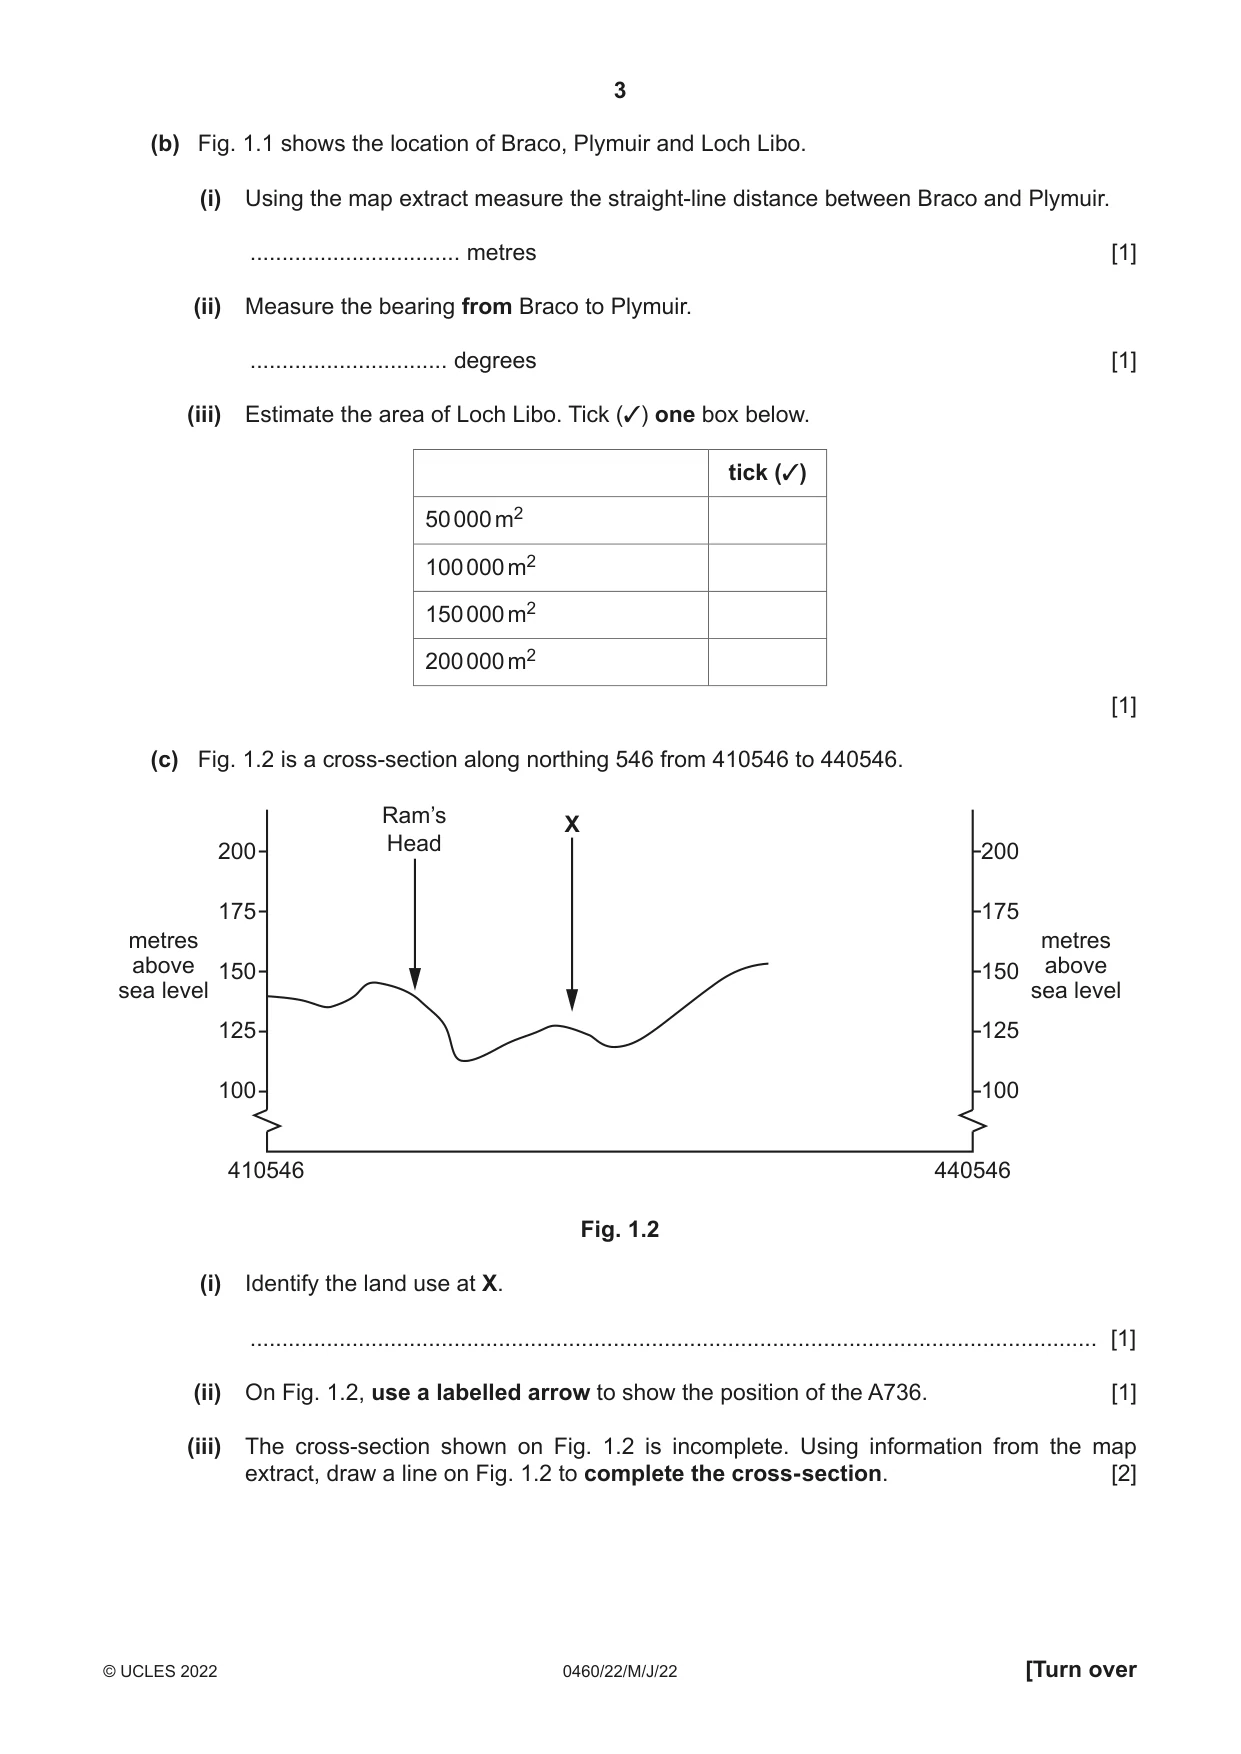
1 Study the map extract for Uplawmoor, Scotland. The scale is 1:25 000. (a) Fig. 1.1 shows some of the features in the west of the map extract. Study Fig. 1.1 and the map extract and answer the questions below. 41 42 43 44 58 58 Plymuir E B 57 57 A C 56 56 D Loch Braco Libo 55 55 41 42 43 44 Fig. 1.1 Using the map extract, identify the following features shown in Fig. 1.1: (i) feature A ..................................................................................................................................... [1] (ii) the vegetation at B ..................................................................................................................................... [1] (iii) feature C ..................................................................................................................................... [1] (iv) the height above sea level of the spot height (survey height) at D ................................. metres [1] (v) the land use at E. ..................................................................................................................................... [1] (b) Fig. 1.1 shows the location of Braco, Plymuir and Loch Libo. (i) Using the map extract measure the straight-line distance between Braco and Plymuir. ................................. metres [1] (ii) Measure the bearing from Braco to Plymuir. ............................... degrees [1] (iii) Estimate the area of Loch Libo. Tick (✓) one box below. tick (✓) 50 000 m2 100 000 m2 150 000 m2 200 000 m2 [1] (c) Fig. 1.2 is a cross-section along northing 546 from 410546 to 440546. Ram’s X Head 200 200 175 175 metres metres above 150 150 above sea level sea level 125 125 100 100 410546 440546 Fig. 1.2 (i) Identify the land use at X. ..................................................................................................................................... [1] (ii) On Fig. 1.2, use a labelled arrow to show the position of the A736. [1] (iii) The cross-section shown on Fig. 1.2 is incomplete. Using information from the map extract, draw a line on Fig. 1.2 to complete the cross-section. [2] (d) Describe the relief of the land to the north of the main road (A736) on the map extract. ................................................................................................................................................... ................................................................................................................................................... ................................................................................................................................................... ................................................................................................................................................... ................................................................................................................................................... ................................................................................................................................................... ................................................................................................................................................... ............................................................................................................................................. [4] (e) Describe the distribution of settlement to the south of the main road (A736) on the map extract. ................................................................................................................................................... ................................................................................................................................................... ................................................................................................................................................... ................................................................................................................................................... ................................................................................................................................................... ................................................................................................................................................... ................................................................................................................................................... ............................................................................................................................................. [4] [Total: 20] TURN PAGE FOR QUESTION 2
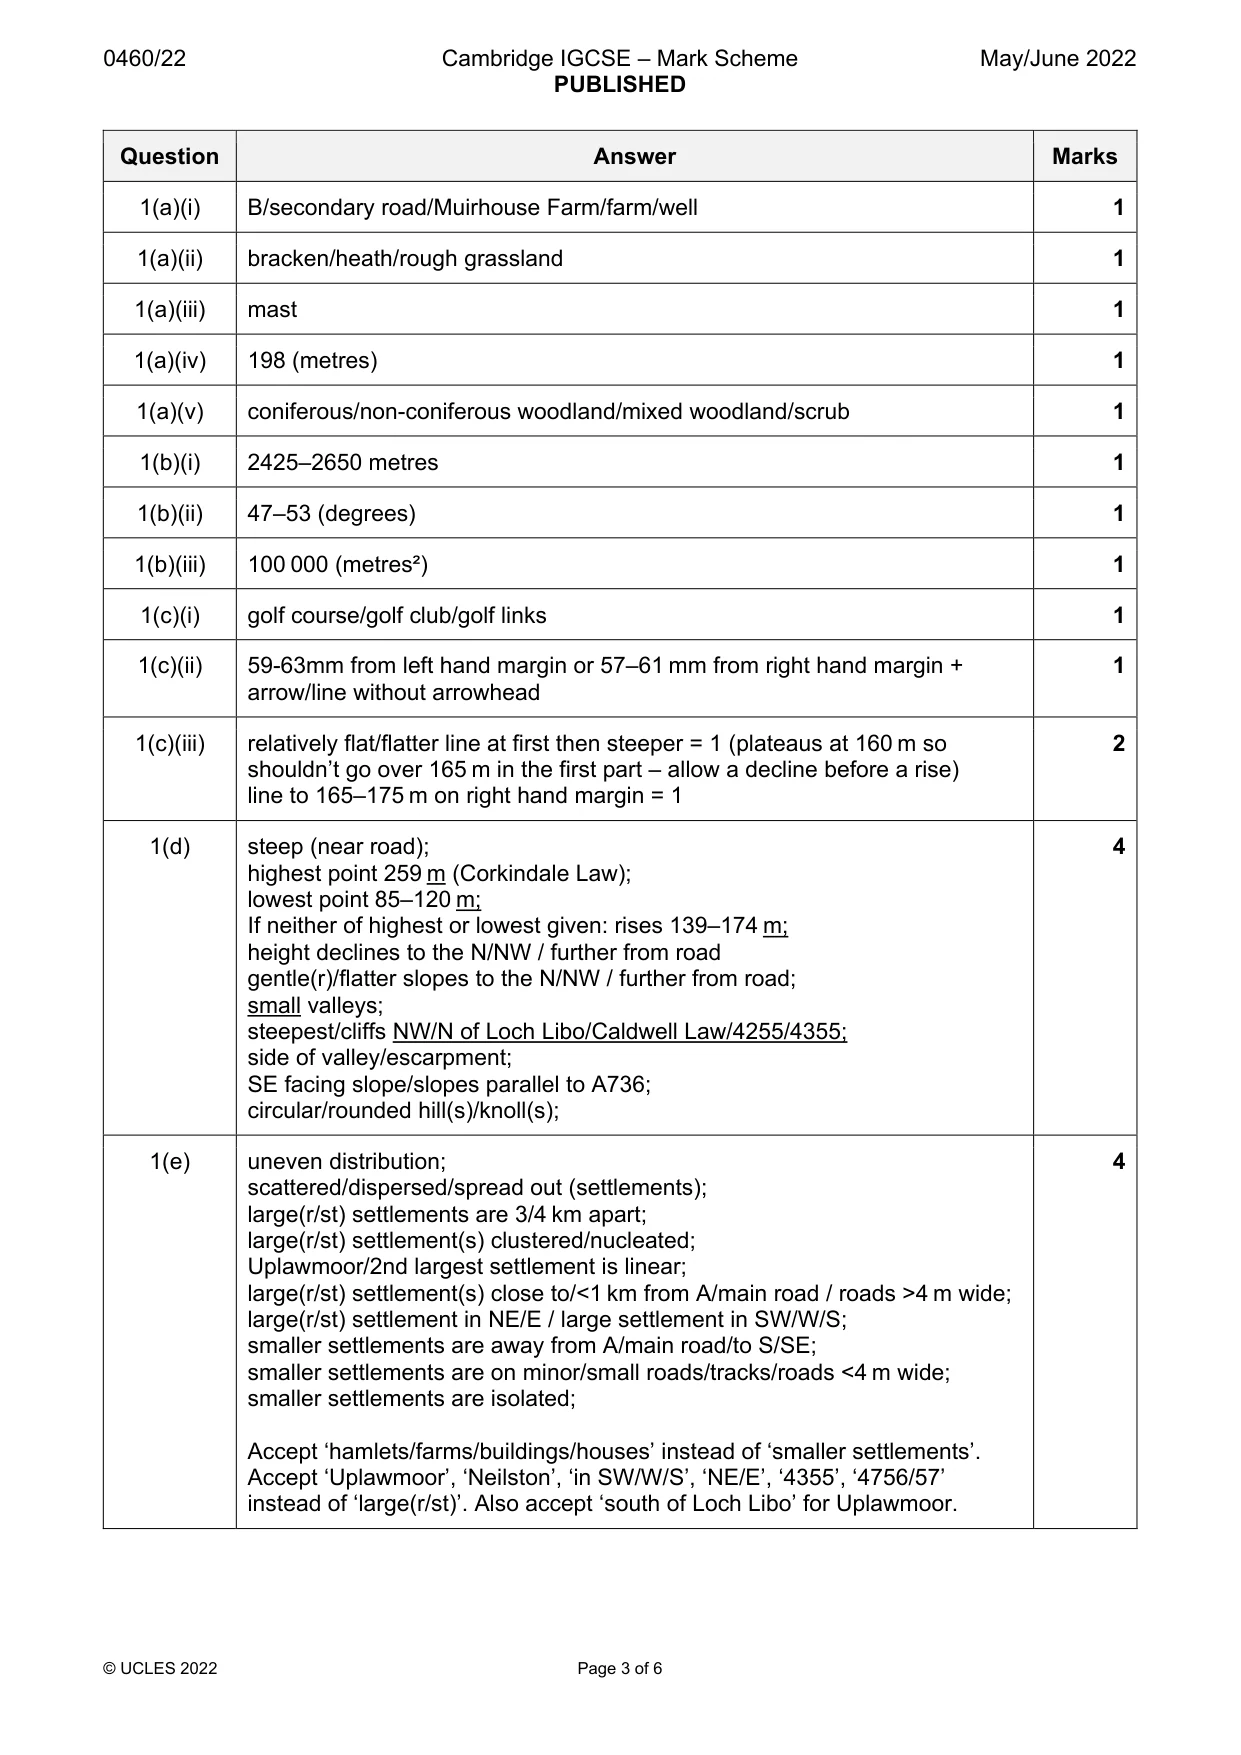
Mark scheme: Question Answer Marks 1(a)(i) B/secondary road/Muirhouse Farm/farm/well 1 1(a)(ii) bracken/heath/rough grassland 1 1(a)(iii) mast 1 1(a)(iv) 198 (metres) 1 1(a)(v) coniferous/non-coniferous woodland/mixed woodland/scrub 1 1(b)(i) 2425–2650 metres 1 1(b)(ii) 47–53 (degrees) 1 1(b)(iii) 100 000 (metres²) 1 1(c)(i) golf course/golf club/golf links 1 1(c)(ii) 59-63mm from left hand margin or 57–61 mm from right hand margin + 1 arrow/line without arrowhead 1(c)(iii) relatively flat/flatter line at first then steeper = 1 (plateaus at 160 m so 2 shouldn’t go over 165 m in the first part – allow a decline before a rise) line to 165–175 m on right hand margin = 1 1(d) steep (near road); 4 highest point 259 m (Corkindale Law); lowest point 85–120 m; If neither of highest or lowest given: rises 139–174 m; height declines to the N/NW / further from road gentle(r)/flatter slopes to the N/NW / further from road; small valleys; steepest/cliffs NW/N of Loch Libo/Caldwell Law/4255/4355; side of valley/escarpment; SE facing slope/slopes parallel to A736; circular/rounded hill(s)/knoll(s); 1(e) uneven distribution; 4 scattered/dispersed/spread out (settlements); large(r/st) settlements are 3/4 km apart; large(r/st) settlement(s) clustered/nucleated; Uplawmoor/2nd largest settlement is linear; large(r/st) settlement(s) close to/<1 km from A/main road / roads >4 m wide; large(r/st) settlement in NE/E / large settlement in SW/W/S; smaller settlements are away from A/main road/to S/SE; smaller settlements are on minor/small roads/tracks/roads <4 m wide; smaller settlements are isolated; Accept ‘hamlets/farms/buildings/houses’ instead of ‘smaller settlements’. Accept ‘Uplawmoor’, ‘Neilston’, ‘in SW/W/S’, ‘NE/E’, ‘4355’, ‘4756/57’ instead of ‘large(r/st)’. Also accept ‘south of Loch Libo’ for Uplawmoor.
More questions on Settlements (rural and urban) and service provision
Q2 · Many migrants travel to Shanghai, China each year
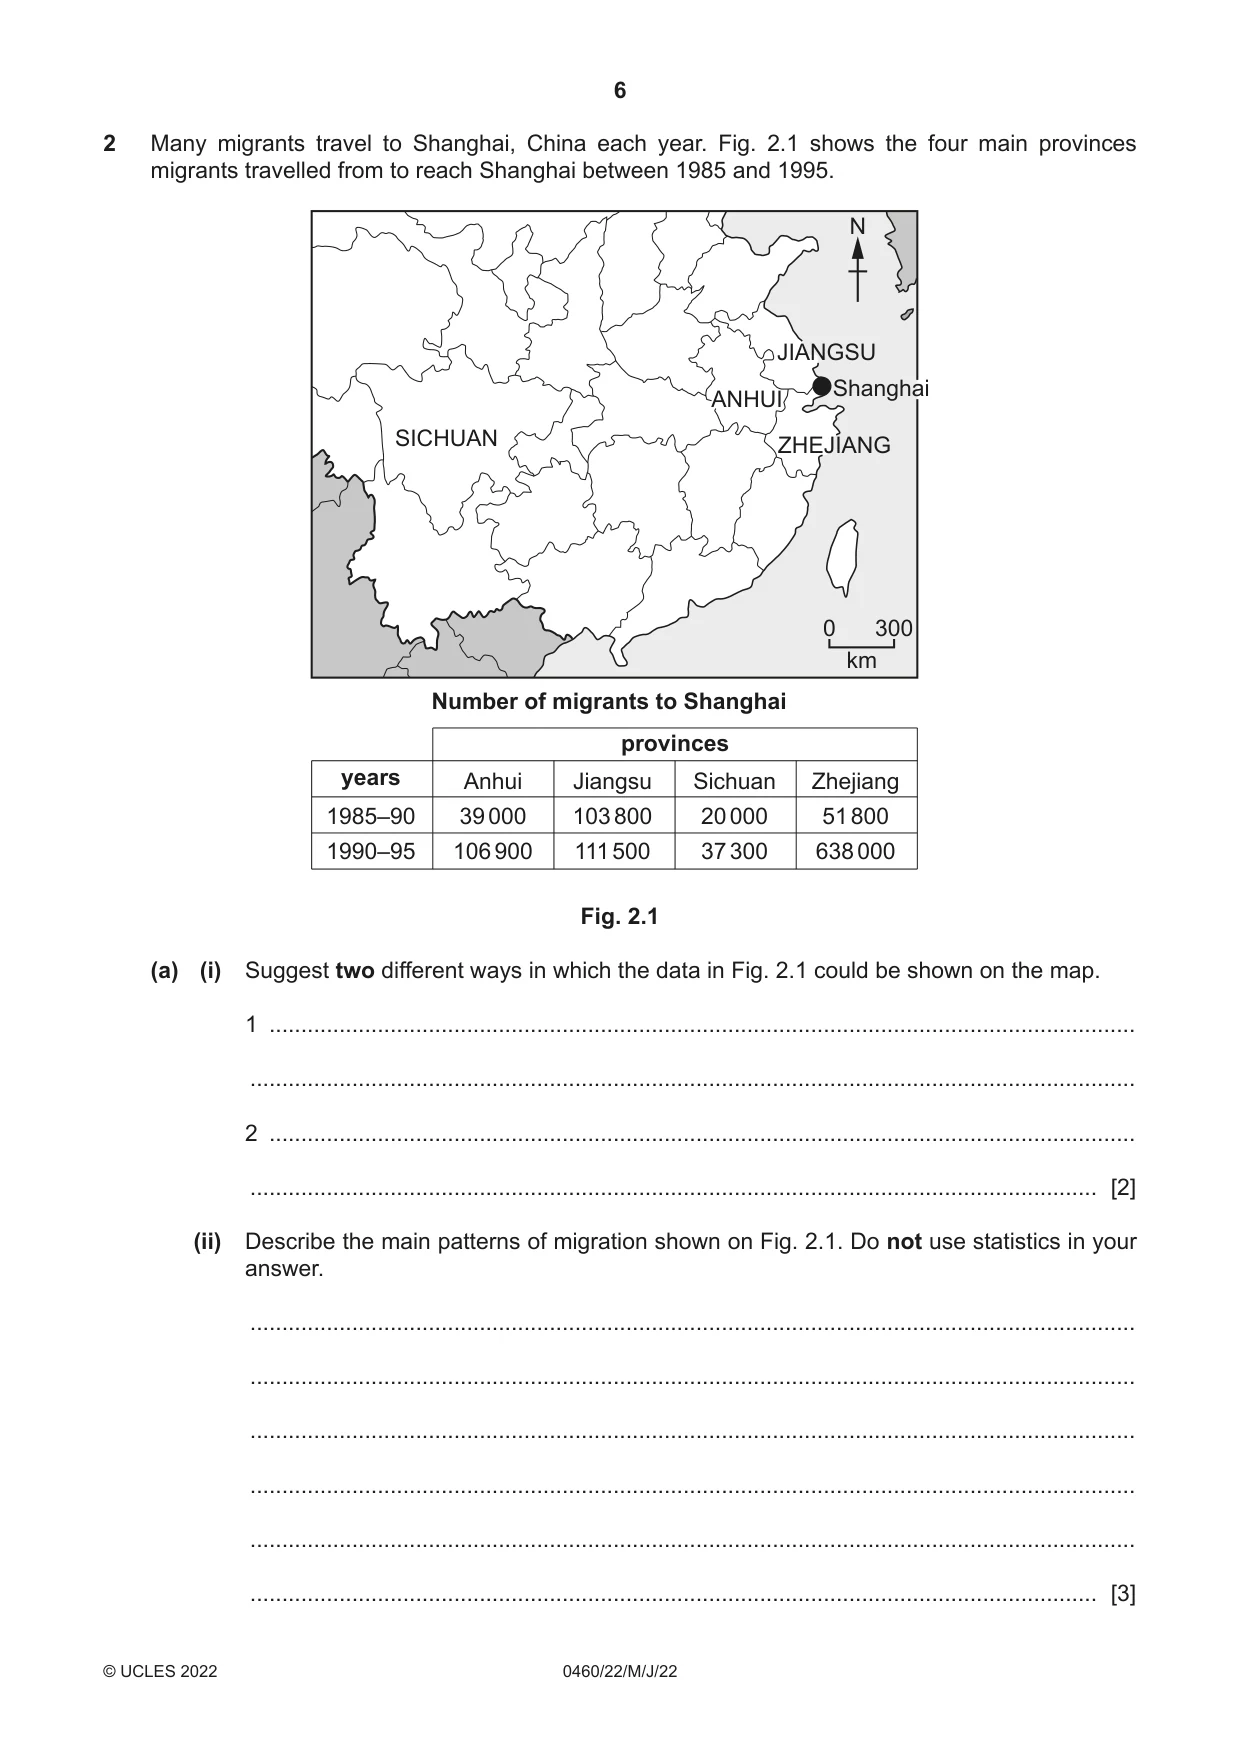
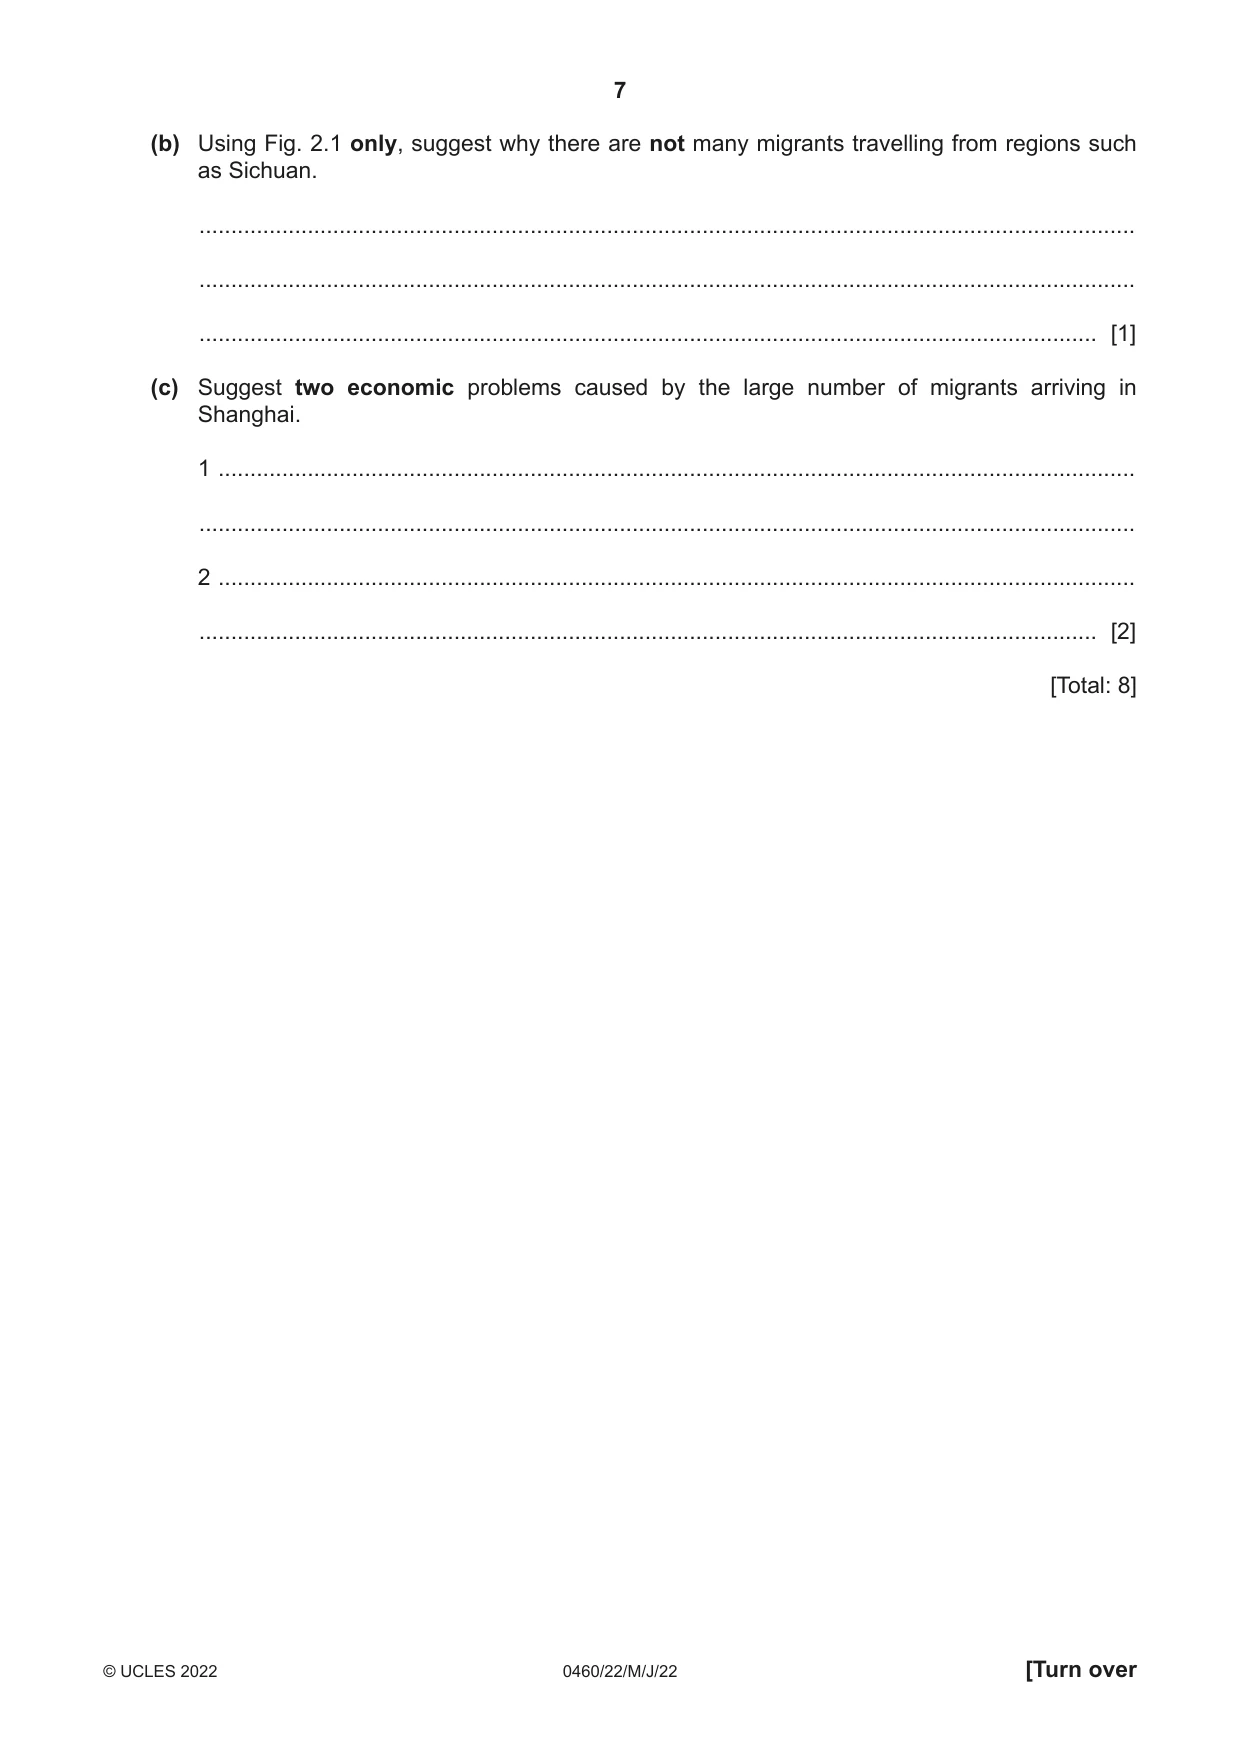
2 Many migrants travel to Shanghai, China each year. Fig. 2.1 shows the four main provinces migrants travelled from to reach Shanghai between 1985 and 1995. N JIANGSU Shanghai ANHUI SICHUAN ZHEJIANG 0 300 km Number of migrants to Shanghai provinces years Anhui Jiangsu Sichuan Zhejiang 1985–90 39 000 103 800 20 000 51 800 1990–95 106 900 111 500 37 300 638 000 Fig. 2.1 (a) (i) Suggest two different ways in which the data in Fig. 2.1 could be shown on the map. 1 ........................................................................................................................................ ........................................................................................................................................... 2 ........................................................................................................................................ ..................................................................................................................................... [2] (ii) Describe the main patterns of migration shown on Fig. 2.1. Do not use statistics in your answer. ........................................................................................................................................... ........................................................................................................................................... ........................................................................................................................................... ........................................................................................................................................... ........................................................................................................................................... ..................................................................................................................................... [3] (b) Using Fig. 2.1 only, suggest why there are not many migrants travelling from regions such as Sichuan. ................................................................................................................................................... ................................................................................................................................................... ............................................................................................................................................. [1] (c) Suggest two economic problems caused by the large number of migrants arriving in Shanghai. 1 ................................................................................................................................................ ................................................................................................................................................... 2 ................................................................................................................................................ ............................................................................................................................................. [2] [Total: 8]
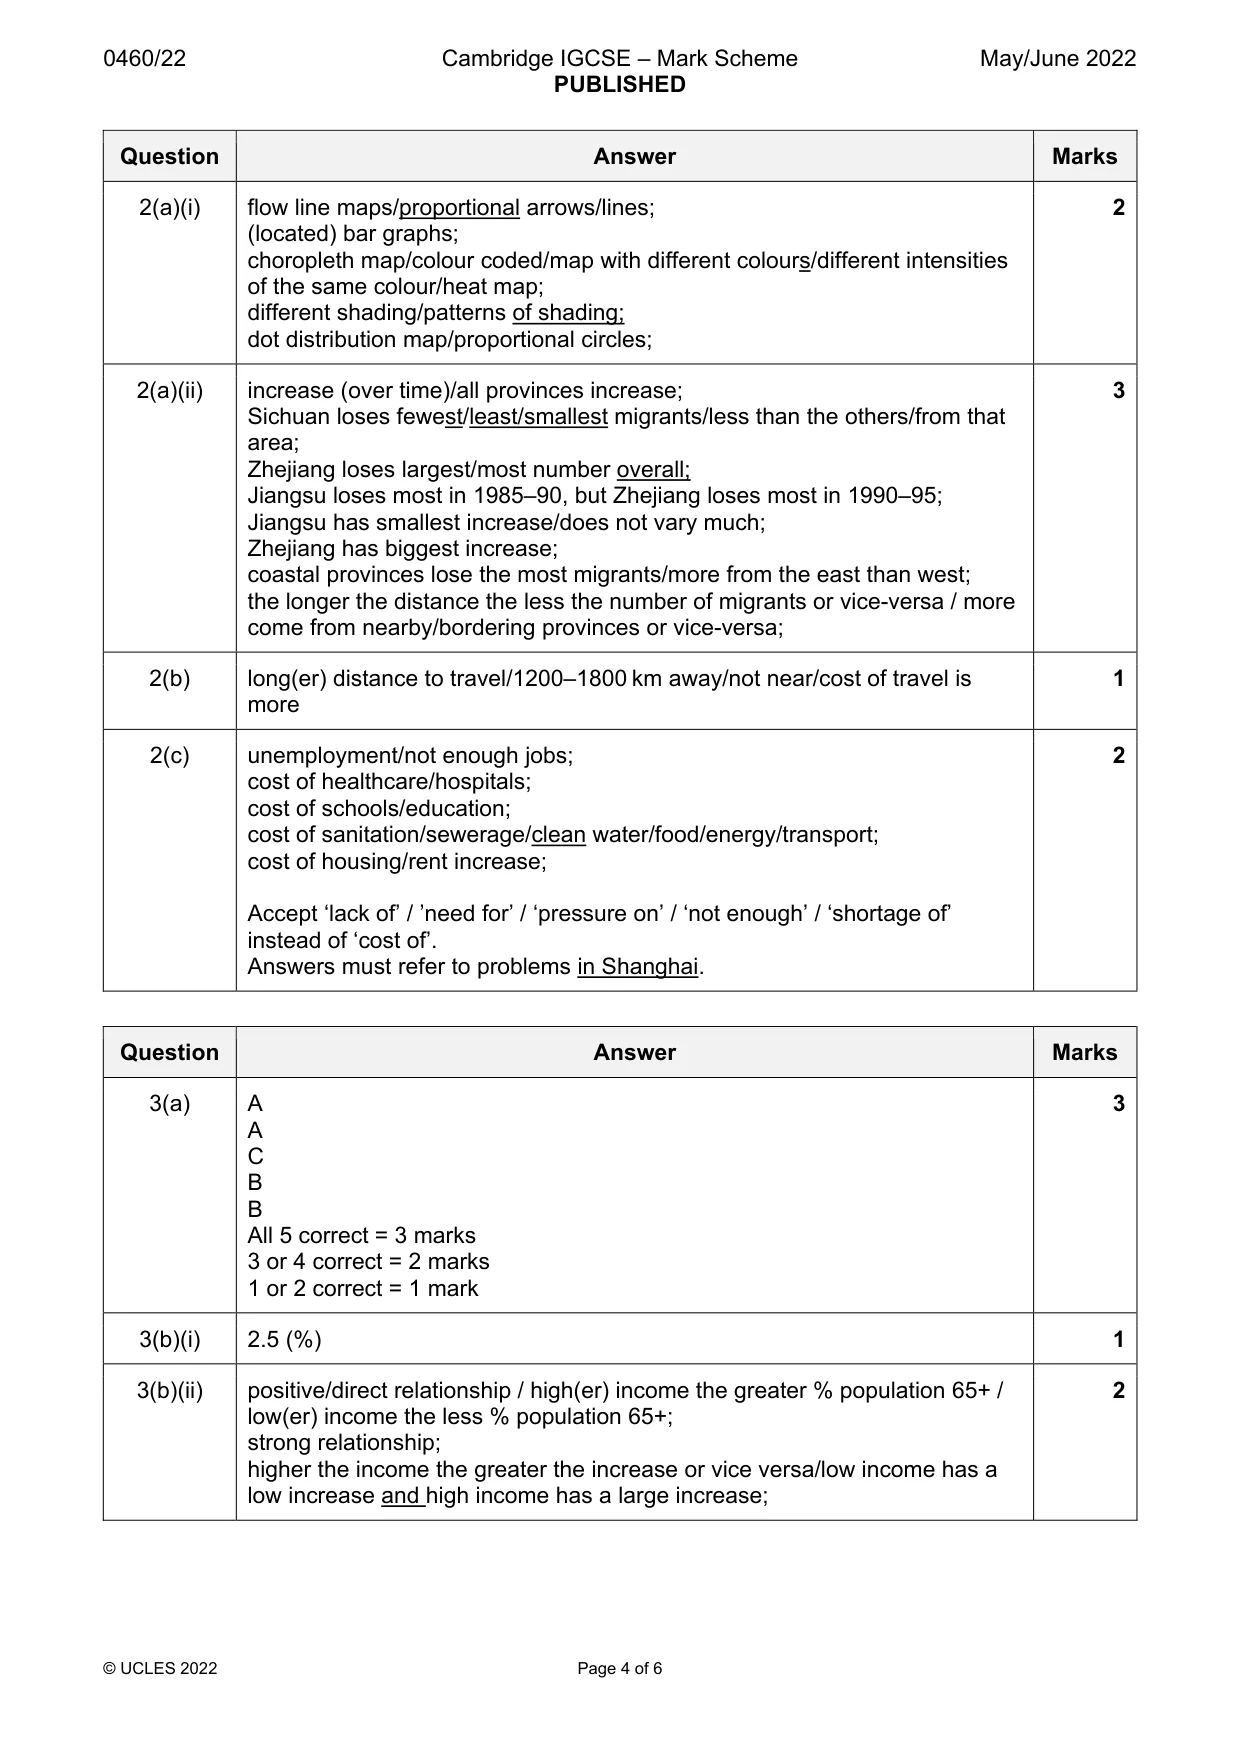
Mark scheme: 2(a)(i) flow line maps/proportional arrows/lines; 2 (located) bar graphs; choropleth map/colour coded/map with different colours/different intensities of the same colour/heat map; different shading/patterns of shading; dot distribution map/proportional circles; 2(a)(ii) increase (over time)/all provinces increase; 3 Sichuan loses fewest/least/smallest migrants/less than the others/from that area; Zhejiang loses largest/most number overall; Jiangsu loses most in 1985–90, but Zhejiang loses most in 1990–95; Jiangsu has smallest increase/does not vary much; Zhejiang has biggest increase; coastal provinces lose the most migrants/more from the east than west; the longer the distance the less the number of migrants or vice-versa / more come from nearby/bordering provinces or vice-versa; 2(b) long(er) distance to travel/1200–1800 km away/not near/cost of travel is 1 more 2(c) unemployment/not enough jobs; 2 cost of healthcare/hospitals; cost of schools/education; cost of sanitation/sewerage/clean water/food/energy/transport; cost of housing/rent increase; Accept ‘lack of’ / ’need for’ / ‘pressure on’ / ‘not enough’ / ‘shortage of’ instead of ‘cost of’. Answers must refer to problems in Shanghai.
Question 3
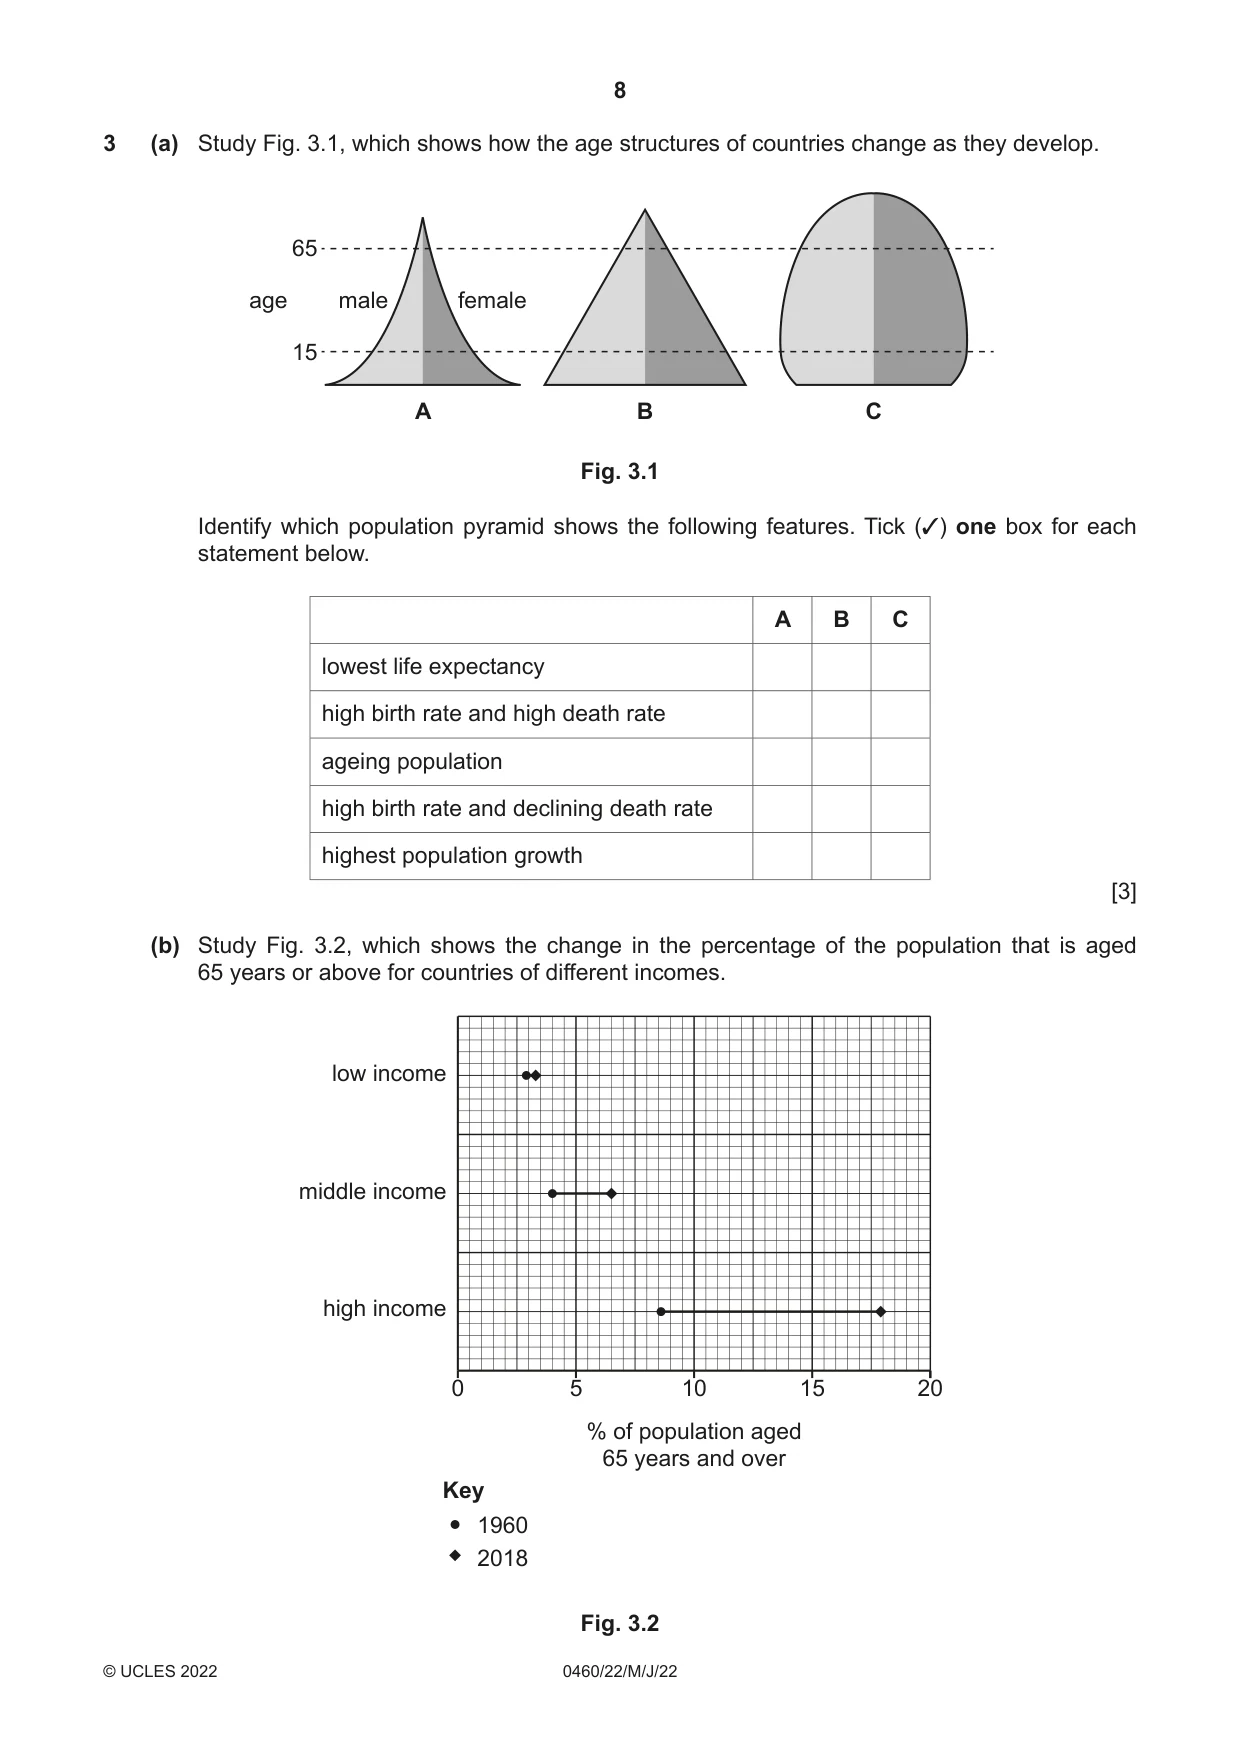
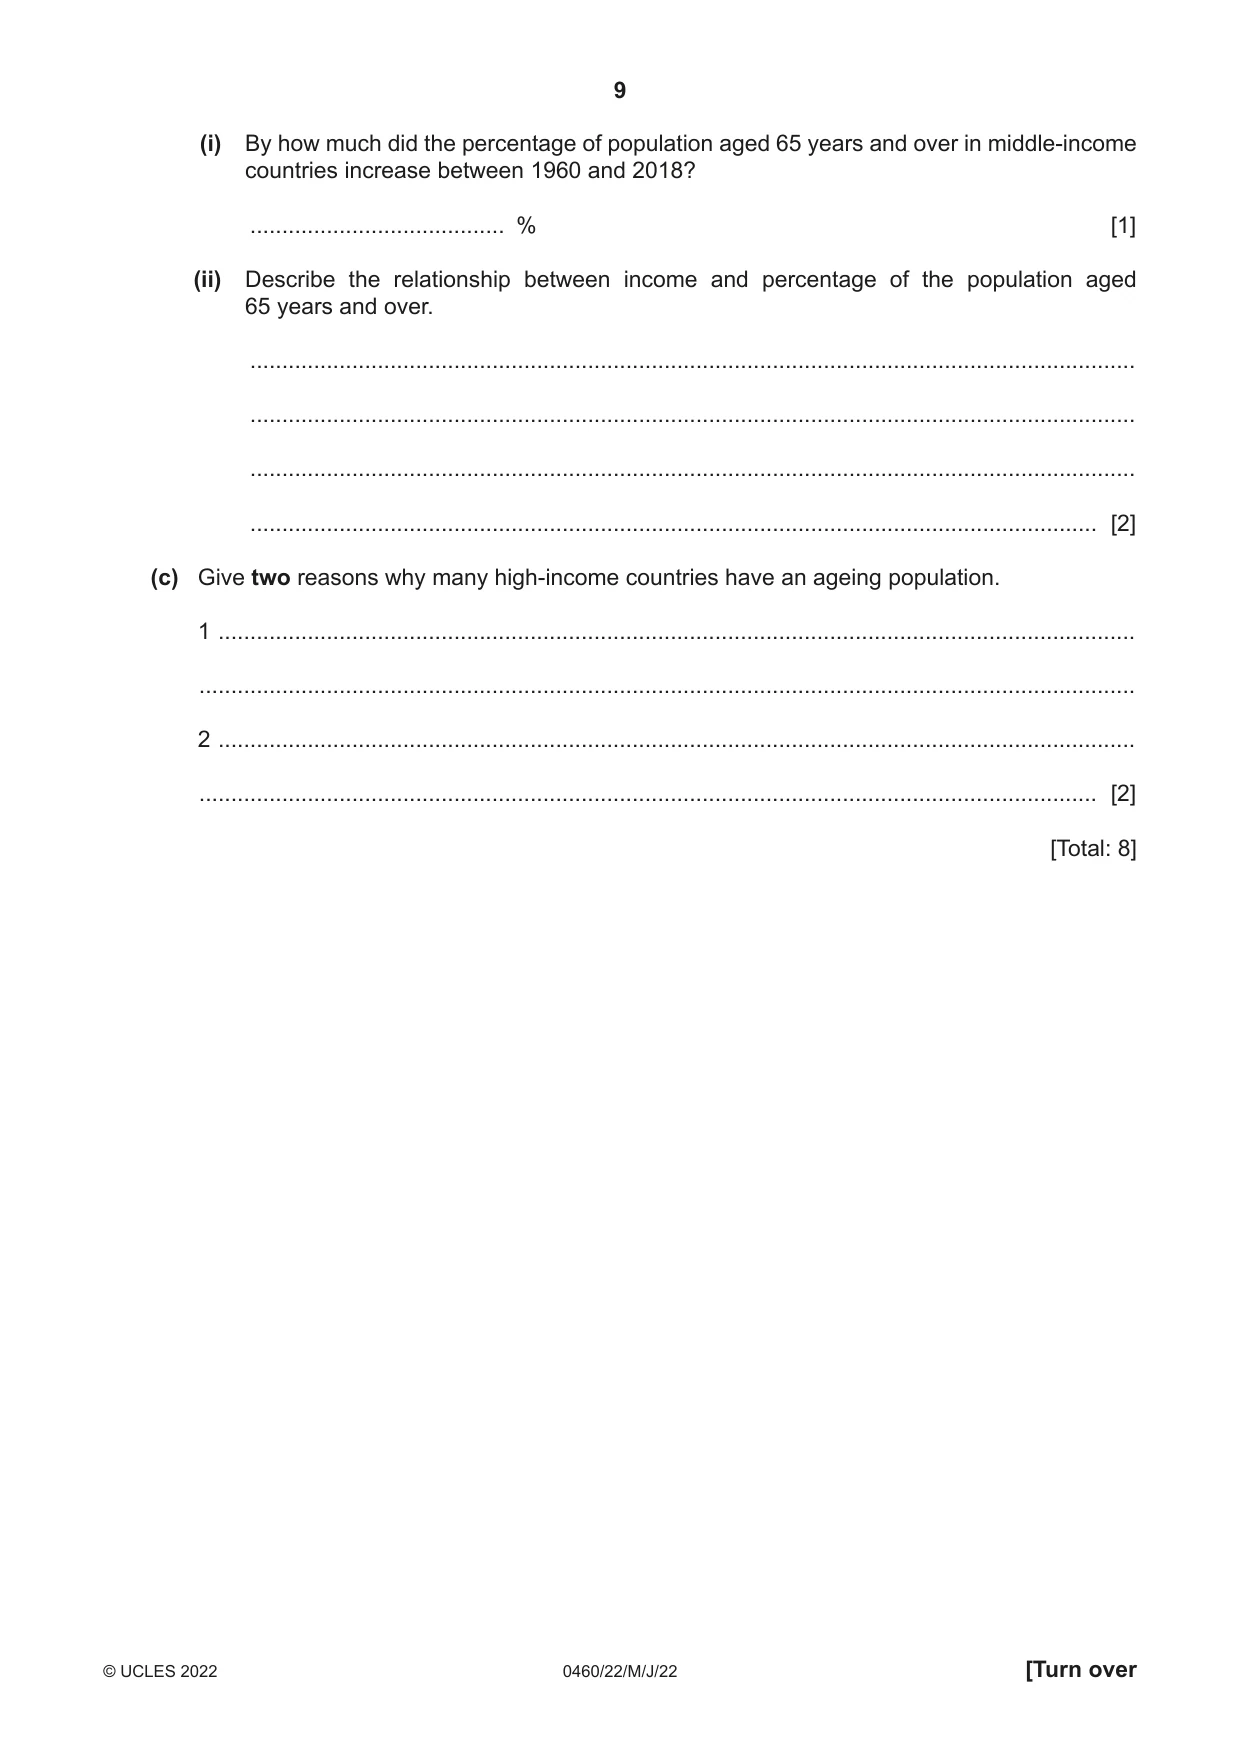
3 (a) Study Fig. 3.1, which shows how the age structures of countries change as they develop. 65 age male female 15 A B C Fig. 3.1 Identify which population pyramid shows the following features. Tick (✓) one box for each statement below. A B C lowest life expectancy high birth rate and high death rate ageing population high birth rate and declining death rate highest population growth [3] (b) Study Fig. 3.2, which shows the change in the percentage of the population that is aged 65 years or above for countries of different incomes. low income middle income high income 0 5 10 15 20 % of population aged 65 years and over Key 1960 2018 Fig. 3.2 (i) By how much did the percentage of population aged 65 years and over in middle-income countries increase between 1960 and 2018? ........................................ % [1] (ii) Describe the relationship between income and percentage of the population aged 65 years and over. ........................................................................................................................................... ........................................................................................................................................... ........................................................................................................................................... ..................................................................................................................................... [2] (c) Give two reasons why many high-income countries have an ageing population. 1 ................................................................................................................................................ ................................................................................................................................................... 2 ................................................................................................................................................ ............................................................................................................................................. [2] [Total: 8]
Mark scheme: 3(a) A 3 A C B B All 5 correct = 3 marks 3 or 4 correct = 2 marks 1 or 2 correct = 1 mark 3(b)(i) 2.5 (%) 1 3(b)(ii) positive/direct relationship / high(er) income the greater % population 65+ / 2 low(er) income the less % population 65+; strong relationship; higher the income the greater the increase or vice versa/low income has a low increase and high income has a large increase; 3(c) Pensions; 2 better/good healthcare/medicine/greater amount of money spent on disease prevention; better/good sanitation/clean water supply; old people’s homes; better/good diet/better knowledge of dietary requirements/balanced diet/better/good food supply; (education about) healthy lifestyle/exercise; low(er) birth rate/less children;
Question 4
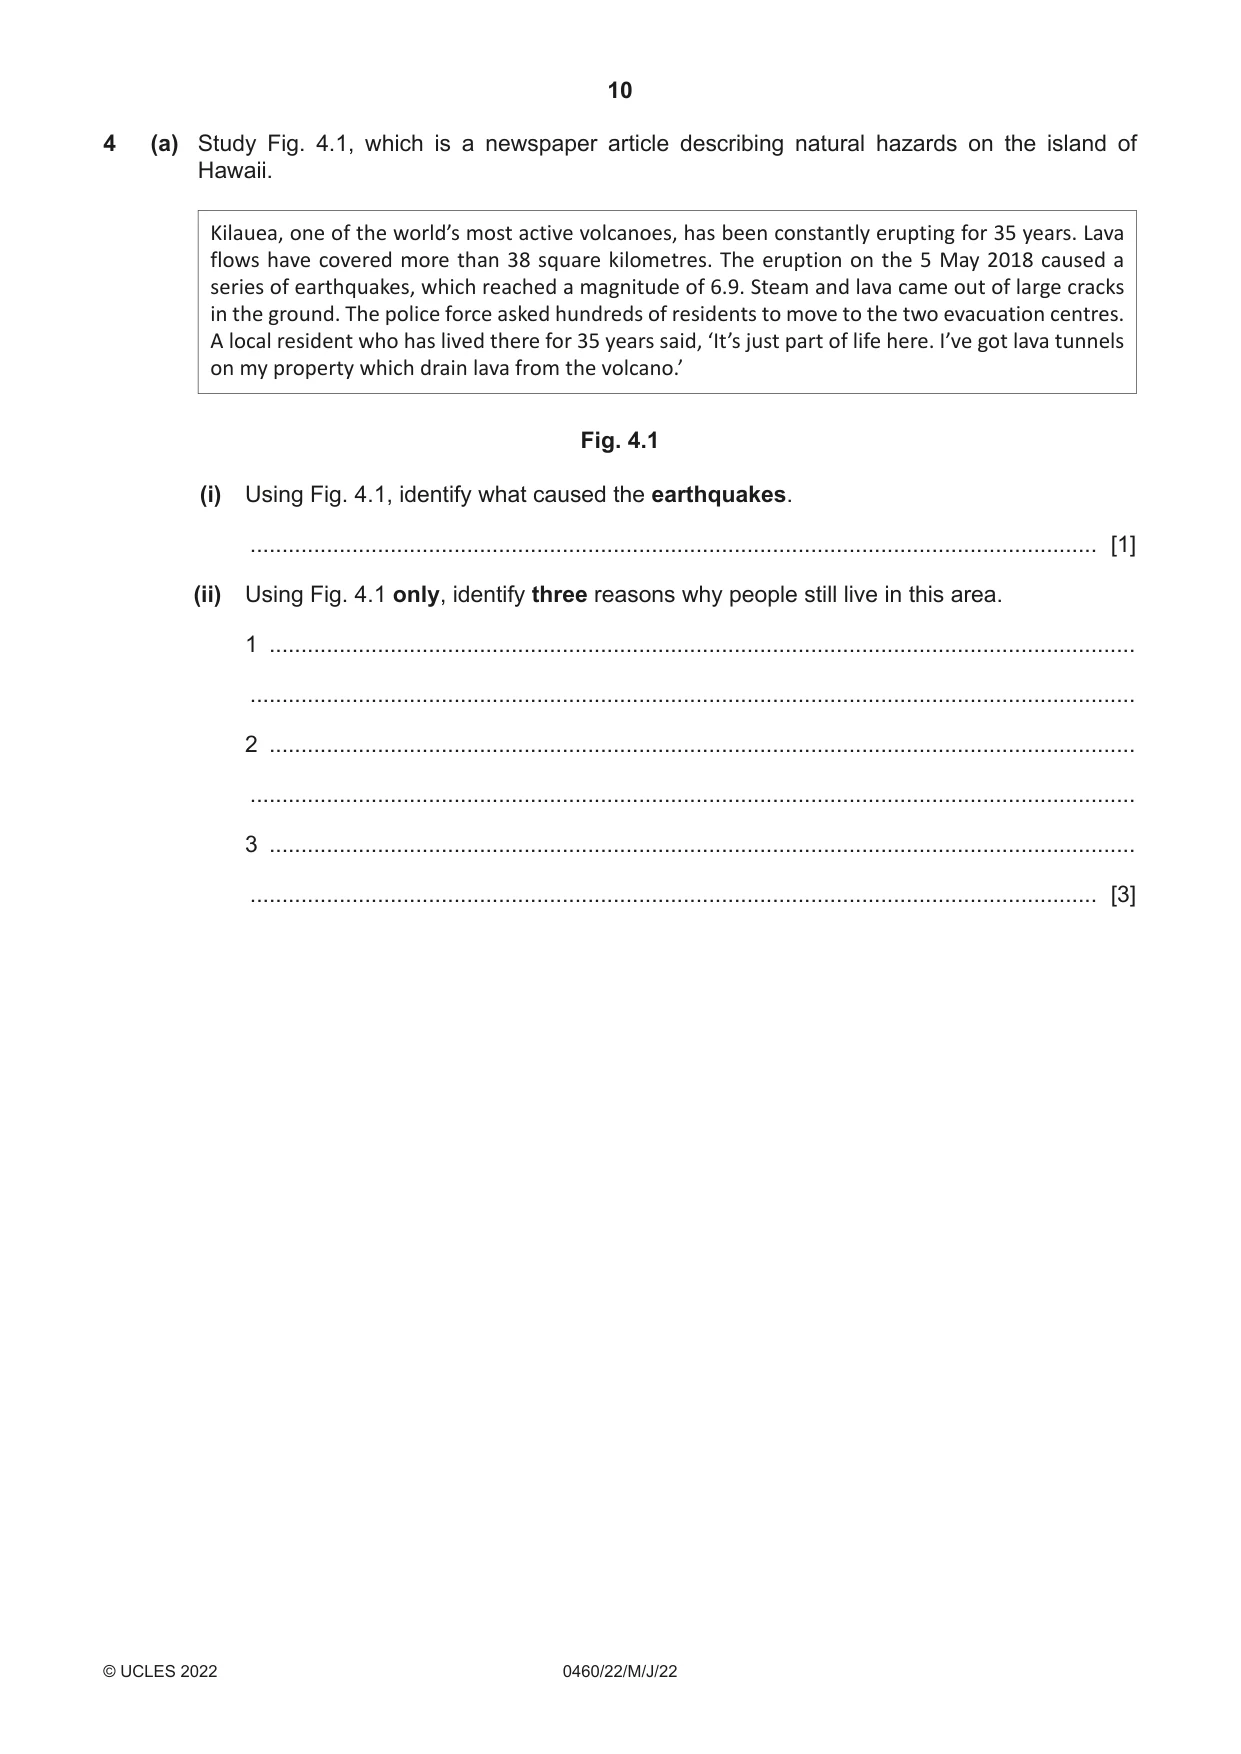
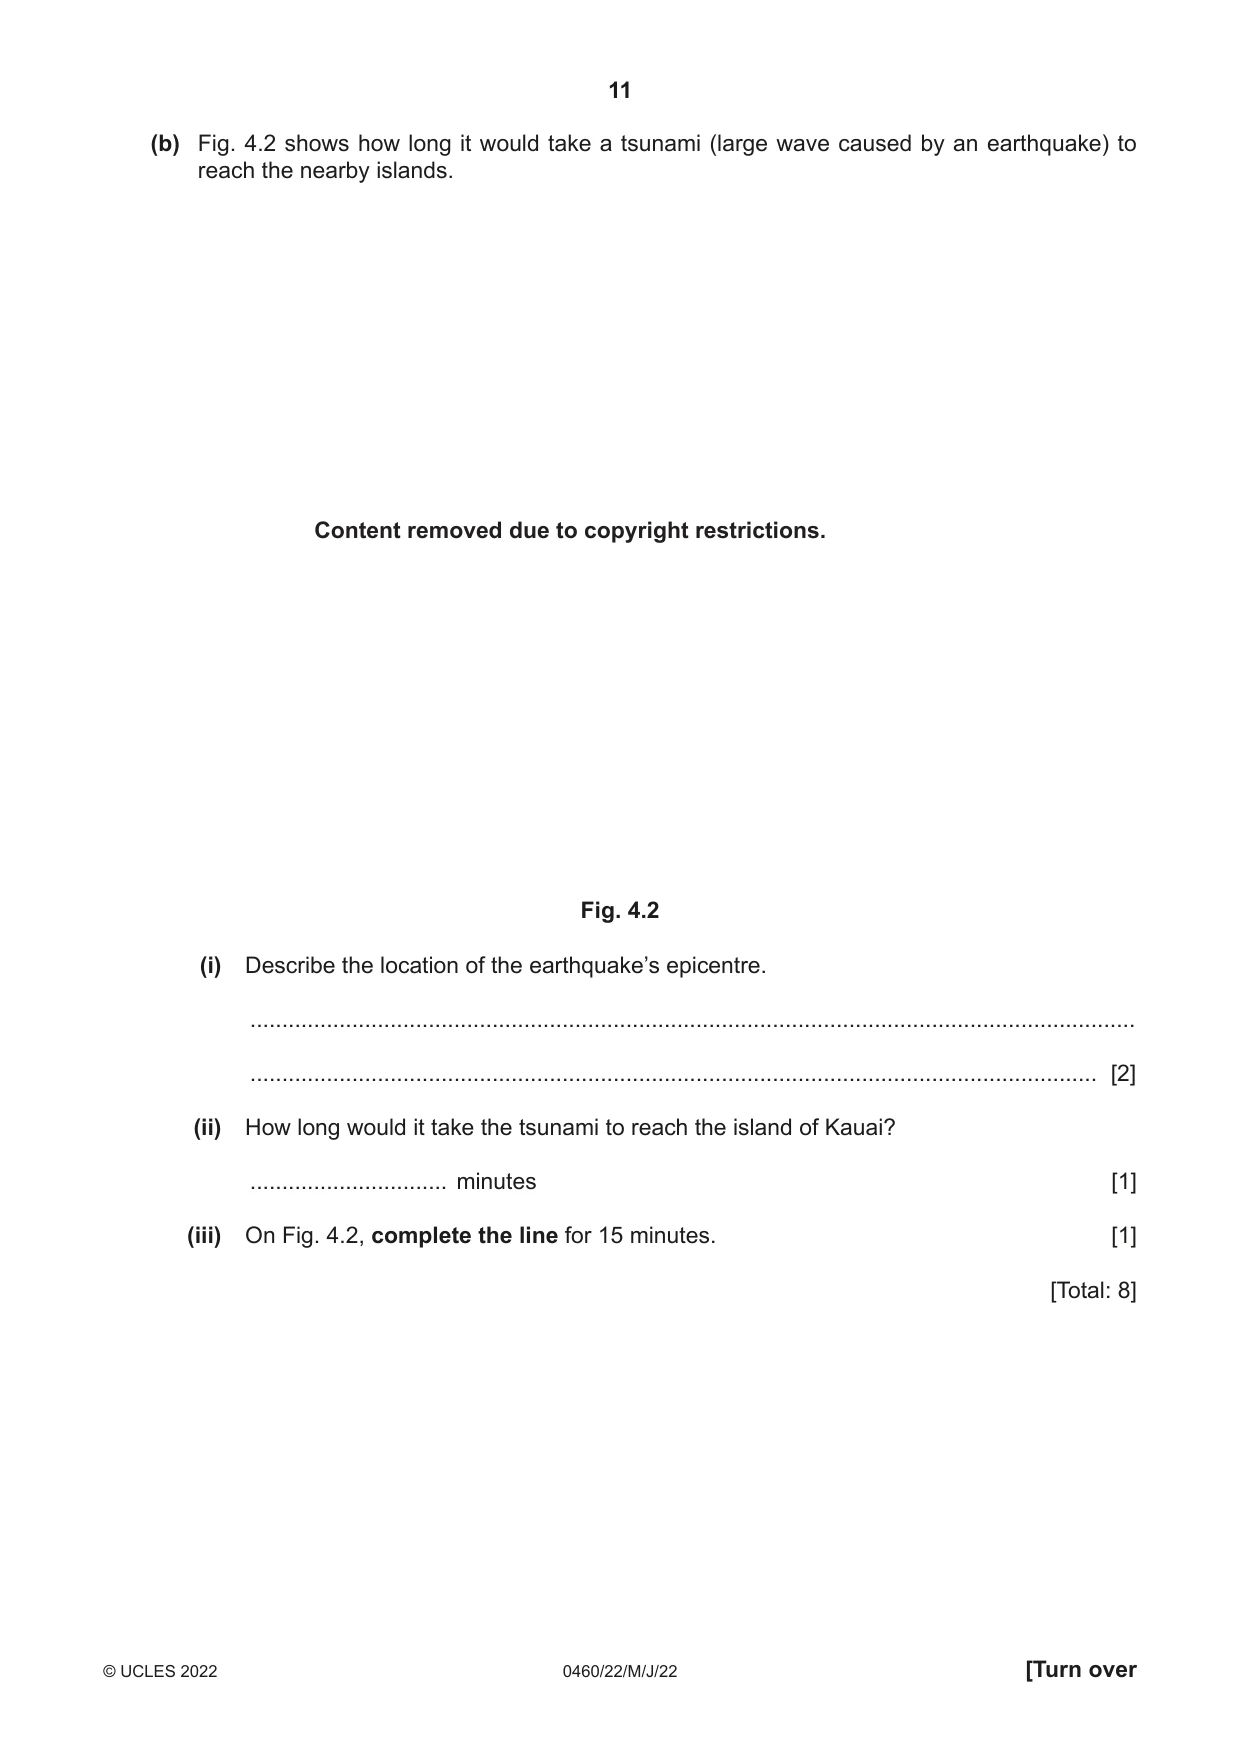
4 (a) Study Fig. 4.1, which is a newspaper article describing natural hazards on the island of Hawaii. Kilauea, one of the world’s most active volcanoes, has been constantly erupting for 35 years. Lava flows have covered more than 38 square kilometres. The eruption on the 5 May 2018 caused a series of earthquakes, which reached a magnitude of 6.9. Steam and lava came out of large cracks in the ground. The police force asked hundreds of residents to move to the two evacuation centres. A local resident who has lived there for 35 years said, ‘It’s just part of life here. I’ve got lava tunnels on my property which drain lava from the volcano.’ Fig. 4.1 (i) Using Fig. 4.1, identify what caused the earthquakes. ..................................................................................................................................... [1] (ii) Using Fig. 4.1 only, identify three reasons why people still live in this area. 1 ........................................................................................................................................ ........................................................................................................................................... 2 ........................................................................................................................................ ........................................................................................................................................... 3 ........................................................................................................................................ ..................................................................................................................................... [3] (b) Fig. 4.2 shows how long it would take a tsunami (large wave caused by an earthquake) to reach the nearby islands. Content removed due to copyright restrictions. Fig. 4.2 (i) Describe the location of the earthquake’s epicentre. ........................................................................................................................................... ..................................................................................................................................... [2] (ii) How long would it take the tsunami to reach the island of Kauai? ............................... minutes [1] (iii) On Fig. 4.2, complete the line for 15 minutes. [1] [Total: 8]
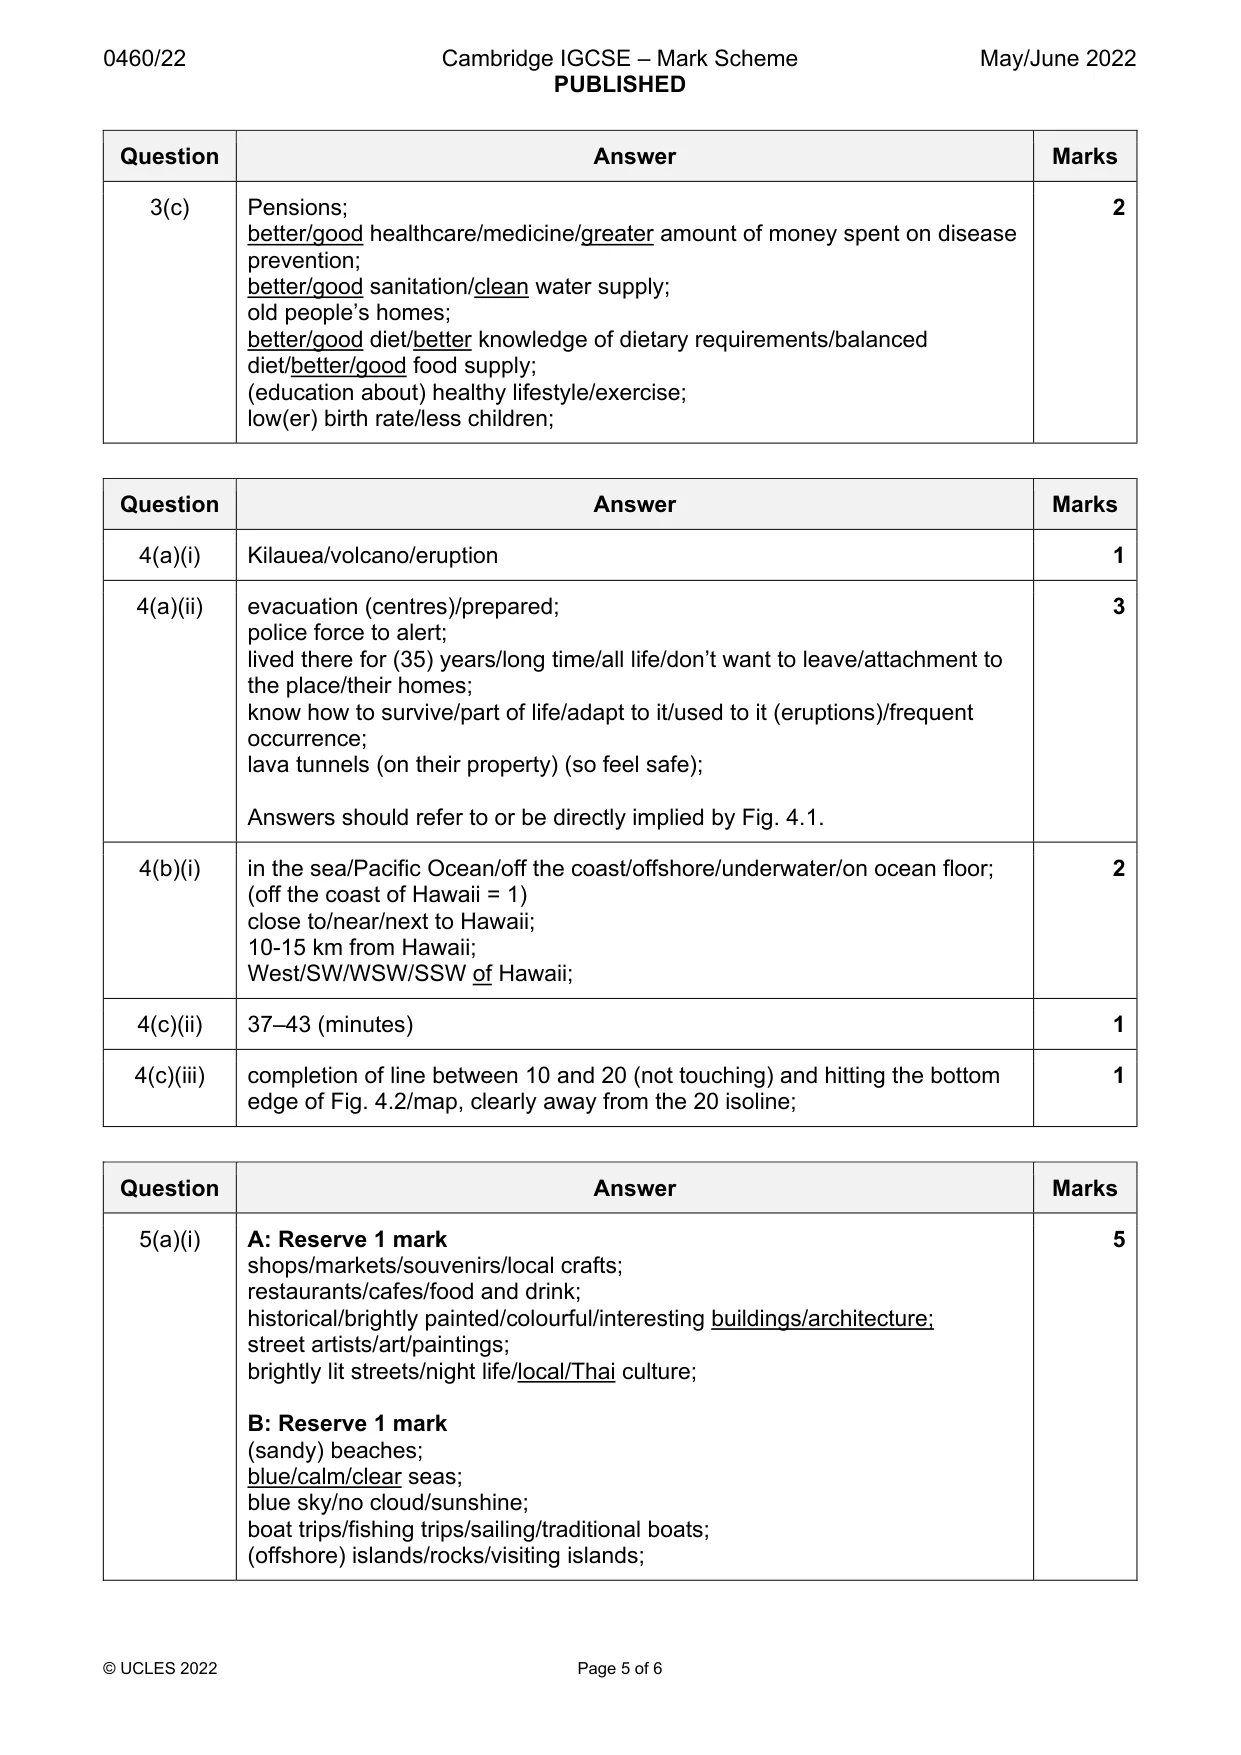
Mark scheme: 4(a)(i) Kilauea/volcano/eruption 1 4(a)(ii) evacuation (centres)/prepared; 3 police force to alert; lived there for (35) years/long time/all life/don’t want to leave/attachment to the place/their homes; know how to survive/part of life/adapt to it/used to it (eruptions)/frequent occurrence; lava tunnels (on their property) (so feel safe); Answers should refer to or be directly implied by Fig. 4.1. 4(b)(i) in the sea/Pacific Ocean/off the coast/offshore/underwater/on ocean floor; 2 (off the coast of Hawaii = 1) close to/near/next to Hawaii; 10-15 km from Hawaii; West/SW/WSW/SSW of Hawaii; 4(c)(ii) 37–43 (minutes) 1 4(c)(iii) completion of line between 10 and 20 (not touching) and hitting the bottom 1 edge of Fig. 4.2/map, clearly away from the 20 isoline;
Question 5
5 (a) Figs. 5.1 and 5.2 (Insert) are photographs which show two different tourist locations in Thailand. Describe the attractions for tourists shown in Figs. 5.1 and 5.2. Fig. 5.1 ...................................................................................................................................... ................................................................................................................................................... ................................................................................................................................................... ................................................................................................................................................... ................................................................................................................................................... Fig. 5.2 ...................................................................................................................................... ................................................................................................................................................... ................................................................................................................................................... ................................................................................................................................................... ............................................................................................................................................. [5] (b) Suggest two reasons why the local population would welcome tourists. 1 ................................................................................................................................................ ................................................................................................................................................... 2 ................................................................................................................................................ ............................................................................................................................................. [2] (c) Suggest one problem caused by tourists. ................................................................................................................................................... ............................................................................................................................................. [1] [Total: 8] TURN PAGE FOR QUESTION 6
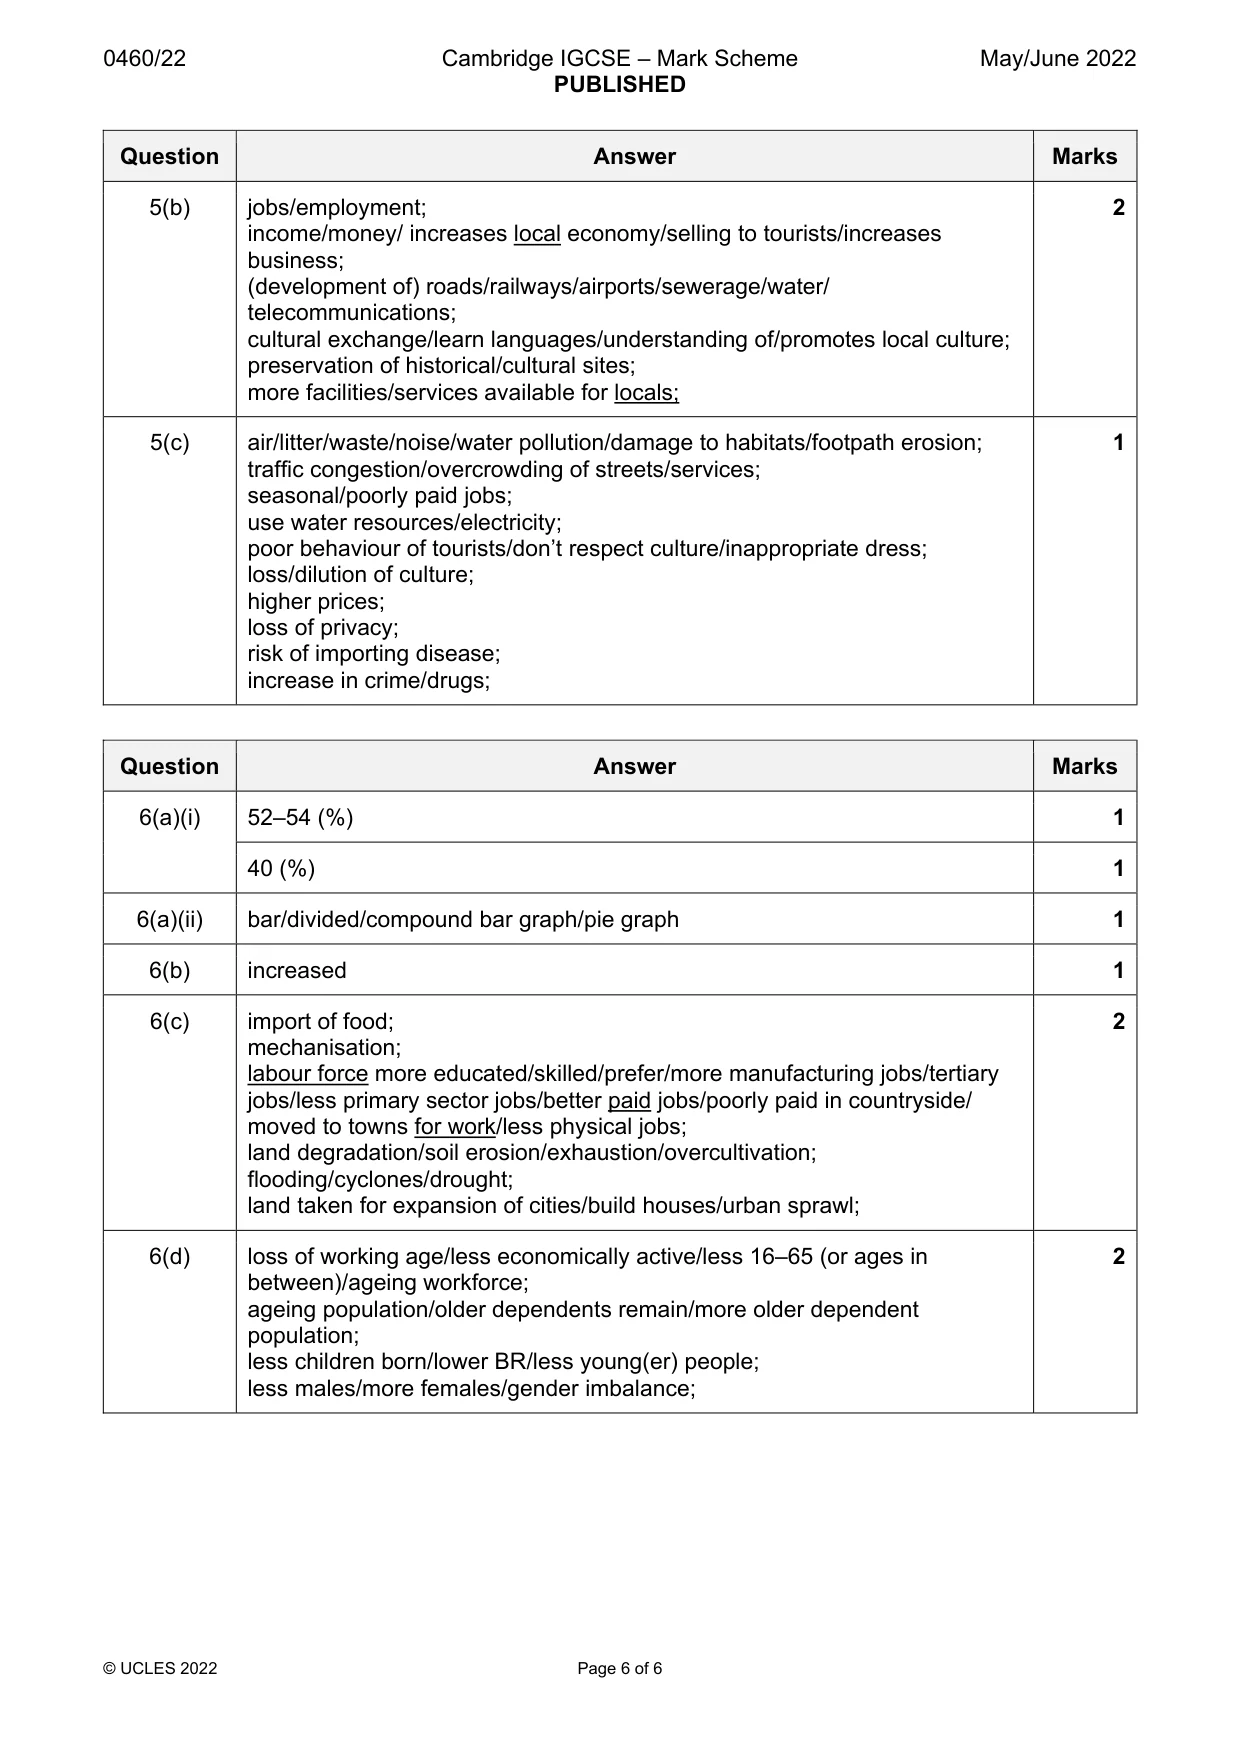
Mark scheme: 5(a)(i) A: Reserve 1 mark 5 shops/markets/souvenirs/local crafts; restaurants/cafes/food and drink; historical/brightly painted/colourful/interesting buildings/architecture; street artists/art/paintings; brightly lit streets/night life/local/Thai culture; B: Reserve 1 mark (sandy) beaches; blue/calm/clear seas; blue sky/no cloud/sunshine; boat trips/fishing trips/sailing/traditional boats; (offshore) islands/rocks/visiting islands; 5(b) jobs/employment; 2 income/money/ increases local economy/selling to tourists/increases business; (development of) roads/railways/airports/sewerage/water/ telecommunications; cultural exchange/learn languages/understanding of/promotes local culture; preservation of historical/cultural sites; more facilities/services available for locals; 5(c) air/litter/waste/noise/water pollution/damage to habitats/footpath erosion; 1 traffic congestion/overcrowding of streets/services; seasonal/poorly paid jobs; use water resources/electricity; poor behaviour of tourists/don’t respect culture/inappropriate dress; loss/dilution of culture; higher prices; loss of privacy; risk of importing disease; increase in crime/drugs;
Q6 · How the employment structure of Bangladesh (an LEDC) has changed over time
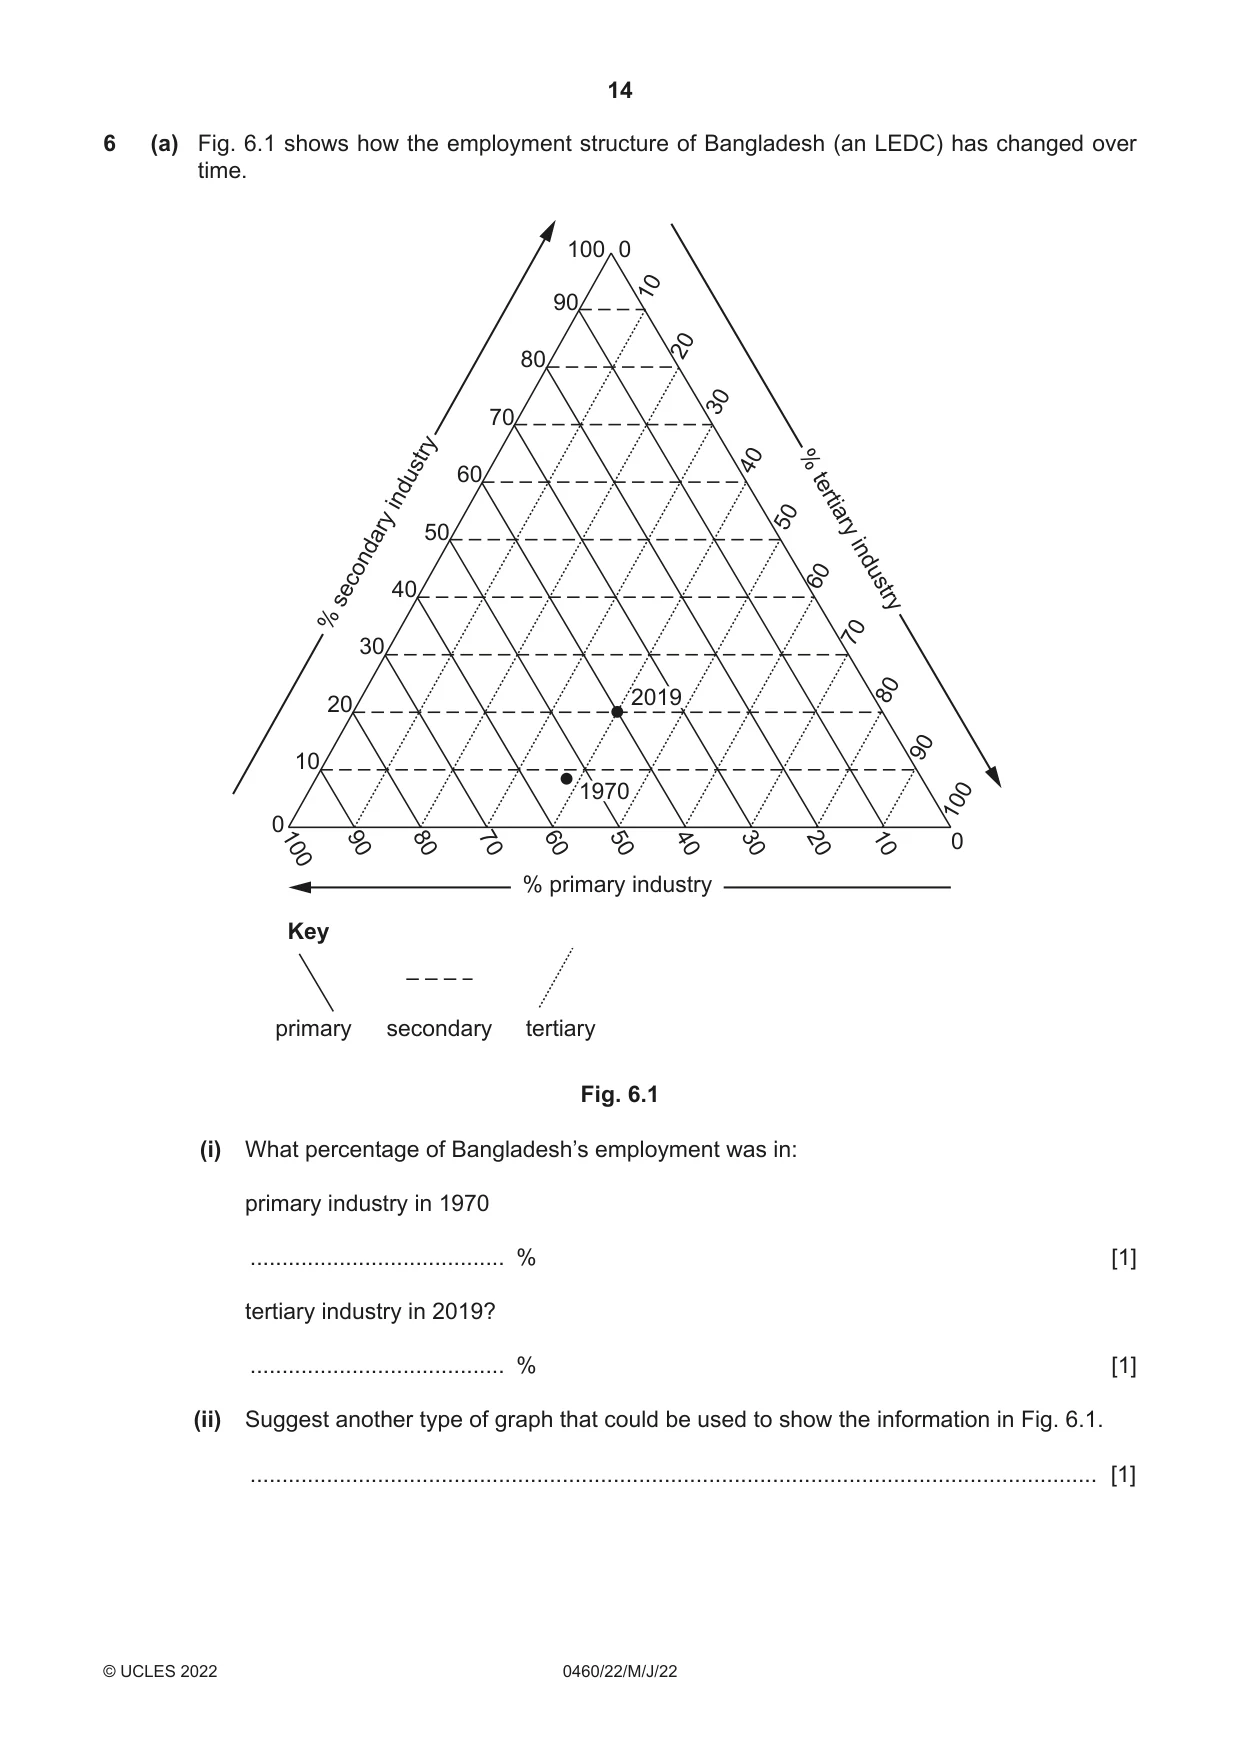
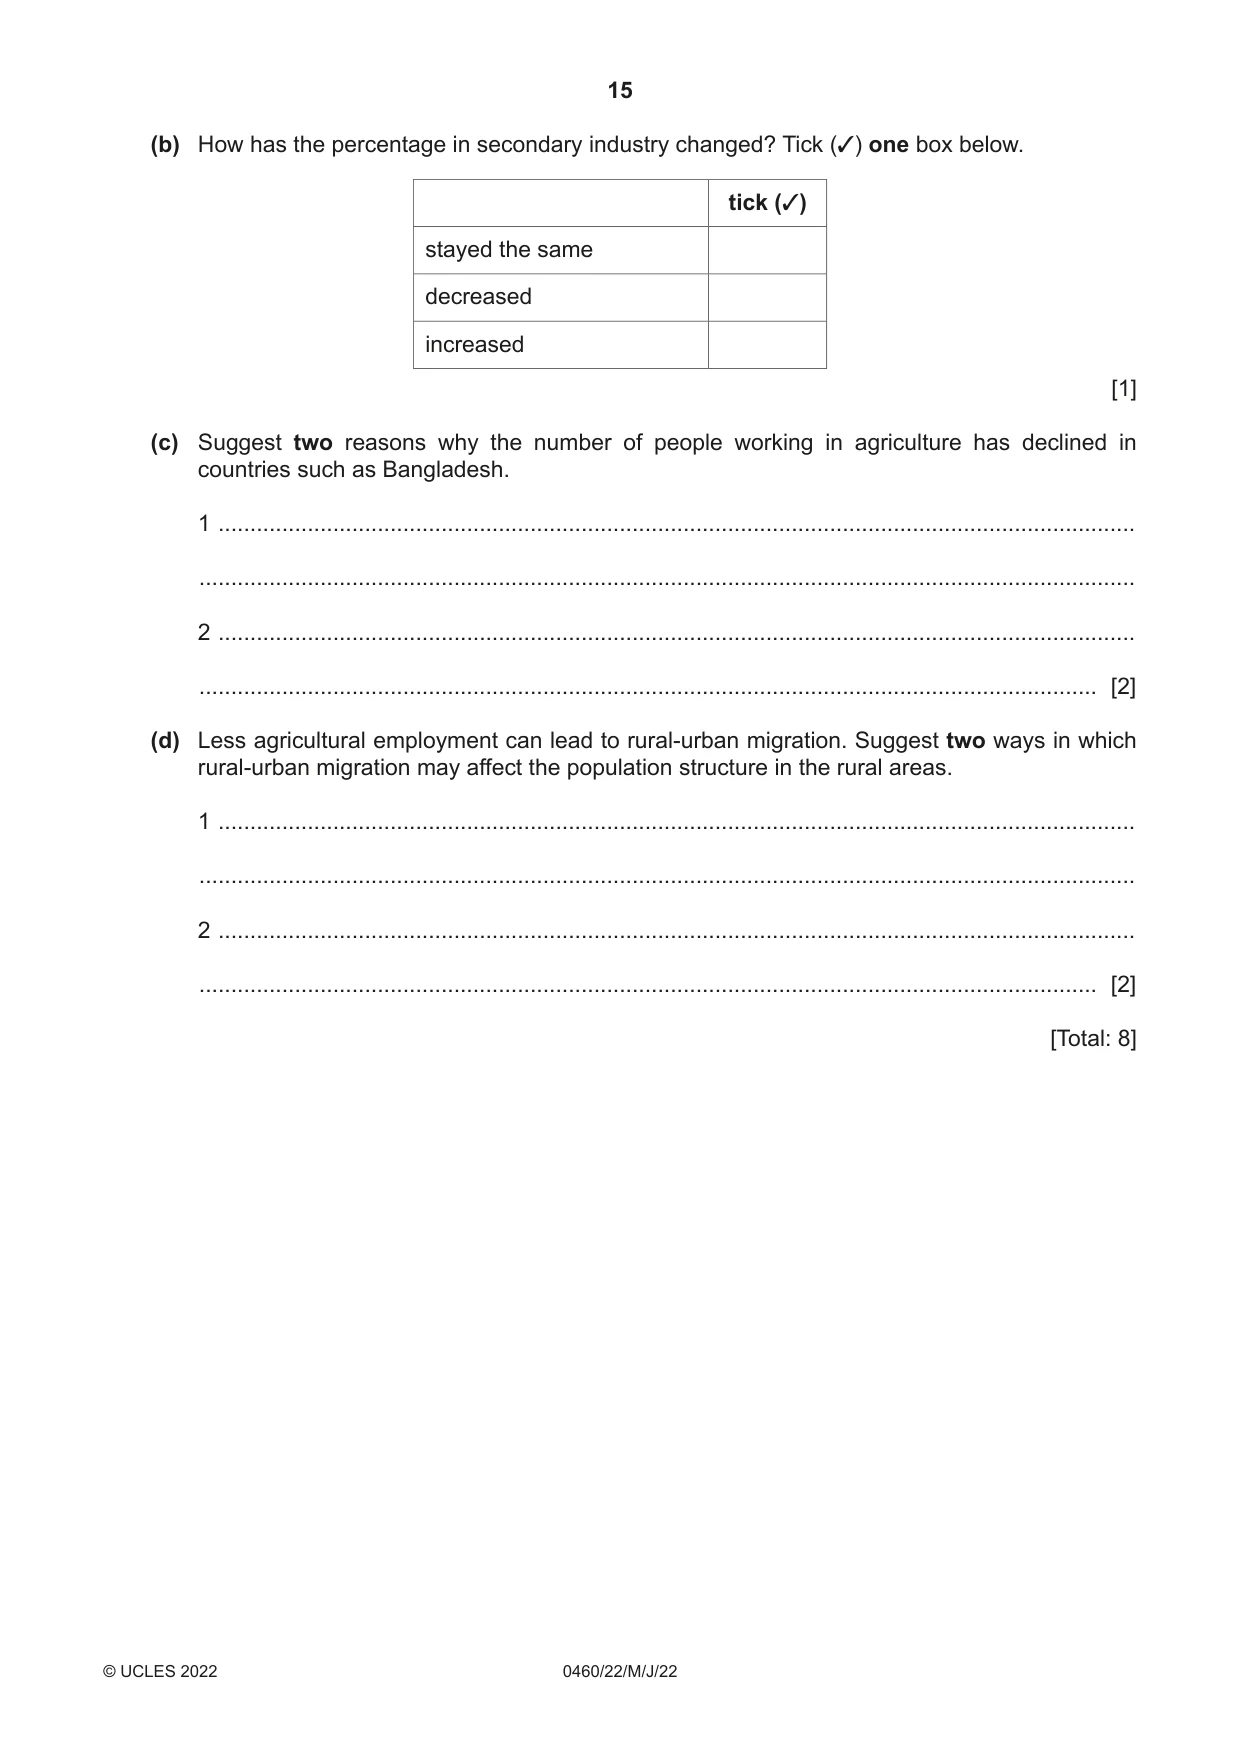
6 (a) Fig. 6.1 shows how the employment structure of Bangladesh (an LEDC) has changed over time. 100 0 10 90 20 80 30 70 40 % 60 industry 50 50 tertiary 60 40 secondary industry % 70 30 2019 80 20 90 10 1970 100 0 100 90 80 70 60 50 40 30 20 10 0 % primary industry Key primary secondary tertiary Fig. 6.1 (i) What percentage of Bangladesh’s employment was in: primary industry in 1970 ........................................ % [1] tertiary industry in 2019? ........................................ % [1] (ii) Suggest another type of graph that could be used to show the information in Fig. 6.1. ..................................................................................................................................... [1] (b) How has the percentage in secondary industry changed? Tick (✓) one box below. tick (✓) stayed the same decreased increased [1] (c) Suggest two reasons why the number of people working in agriculture has declined in countries such as Bangladesh. 1 ................................................................................................................................................ ................................................................................................................................................... 2 ................................................................................................................................................ ............................................................................................................................................. [2] (d) Less agricultural employment can lead to rural-urban migration. Suggest two ways in which rural-urban migration may affect the population structure in the rural areas. 1 ................................................................................................................................................ ................................................................................................................................................... 2 ................................................................................................................................................ ............................................................................................................................................. [2] [Total: 8] Additional pages If you use the following pages to complete the answer to any question, the question number must be clearly shown. .................................................................................................................................................................. .................................................................................................................................................................. .................................................................................................................................................................. .................................................................................................................................................................. .................................................................................................................................................................. .................................................................................................................................................................. .................................................................................................................................................................. .................................................................................................................................................................. .................................................................................................................................................................. .................................................................................................................................................................. .................................................................................................................................................................. .................................................................................................................................................................. .................................................................................................................................................................. .................................................................................................................................................................. .................................................................................................................................................................. .................................................................................................................................................................. .................................................................................................................................................................. .................................................................................................................................................................. .................................................................................................................................................................. .................................................................................................................................................................. .................................................................................................................................................................. .................................................................................................................................................................. .................................................................................................................................................................. .................................................................................................................................................................. ..................................................................................................................................................................
Mark scheme: 6(a)(i) 52–54 (%) 1 40 (%) 1 6(a)(ii) bar/divided/compound bar graph/pie graph 1 6(b) increased 1 6(c) import of food; 2 mechanisation; labour force more educated/skilled/prefer/more manufacturing jobs/tertiary jobs/less primary sector jobs/better paid jobs/poorly paid in countryside/ moved to towns for work/less physical jobs; land degradation/soil erosion/exhaustion/overcultivation; flooding/cyclones/drought; land taken for expansion of cities/build houses/urban sprawl; 6(d) loss of working age/less economically active/less 16–65 (or ages in 2 between)/ageing workforce; ageing population/older dependents remain/more older dependent population; less children born/lower BR/less young(er) people; less males/more females/gender imbalance;
What was in this paper
The subtopics covered by these 6 questions, and how many questions each got. Open one in a new tab to see every Cambridge question on it.
What you needed in this session
Cambridge’s own grade thresholds for 2022 May/June, Paper 2 · Variant 2. A higher threshold means an easier paper — the bar moves with how the cohort did.