Cambridge IGCSE Geography 0460 — 2021 Oct/Nov Paper 2 · Variant 2
0460/22/O/N/21 · 6 questions · 60 marks · ≈68 min
The question paper and its mark scheme, free to read here and free to download. This is Cambridge’s own paper, exactly as it was sat.
Question paper24 pages




Mark scheme6 pages
Answers below. Sit the paper first if you are practising.
Questions as text
Q1 · Study the map extract for Pluneret, France
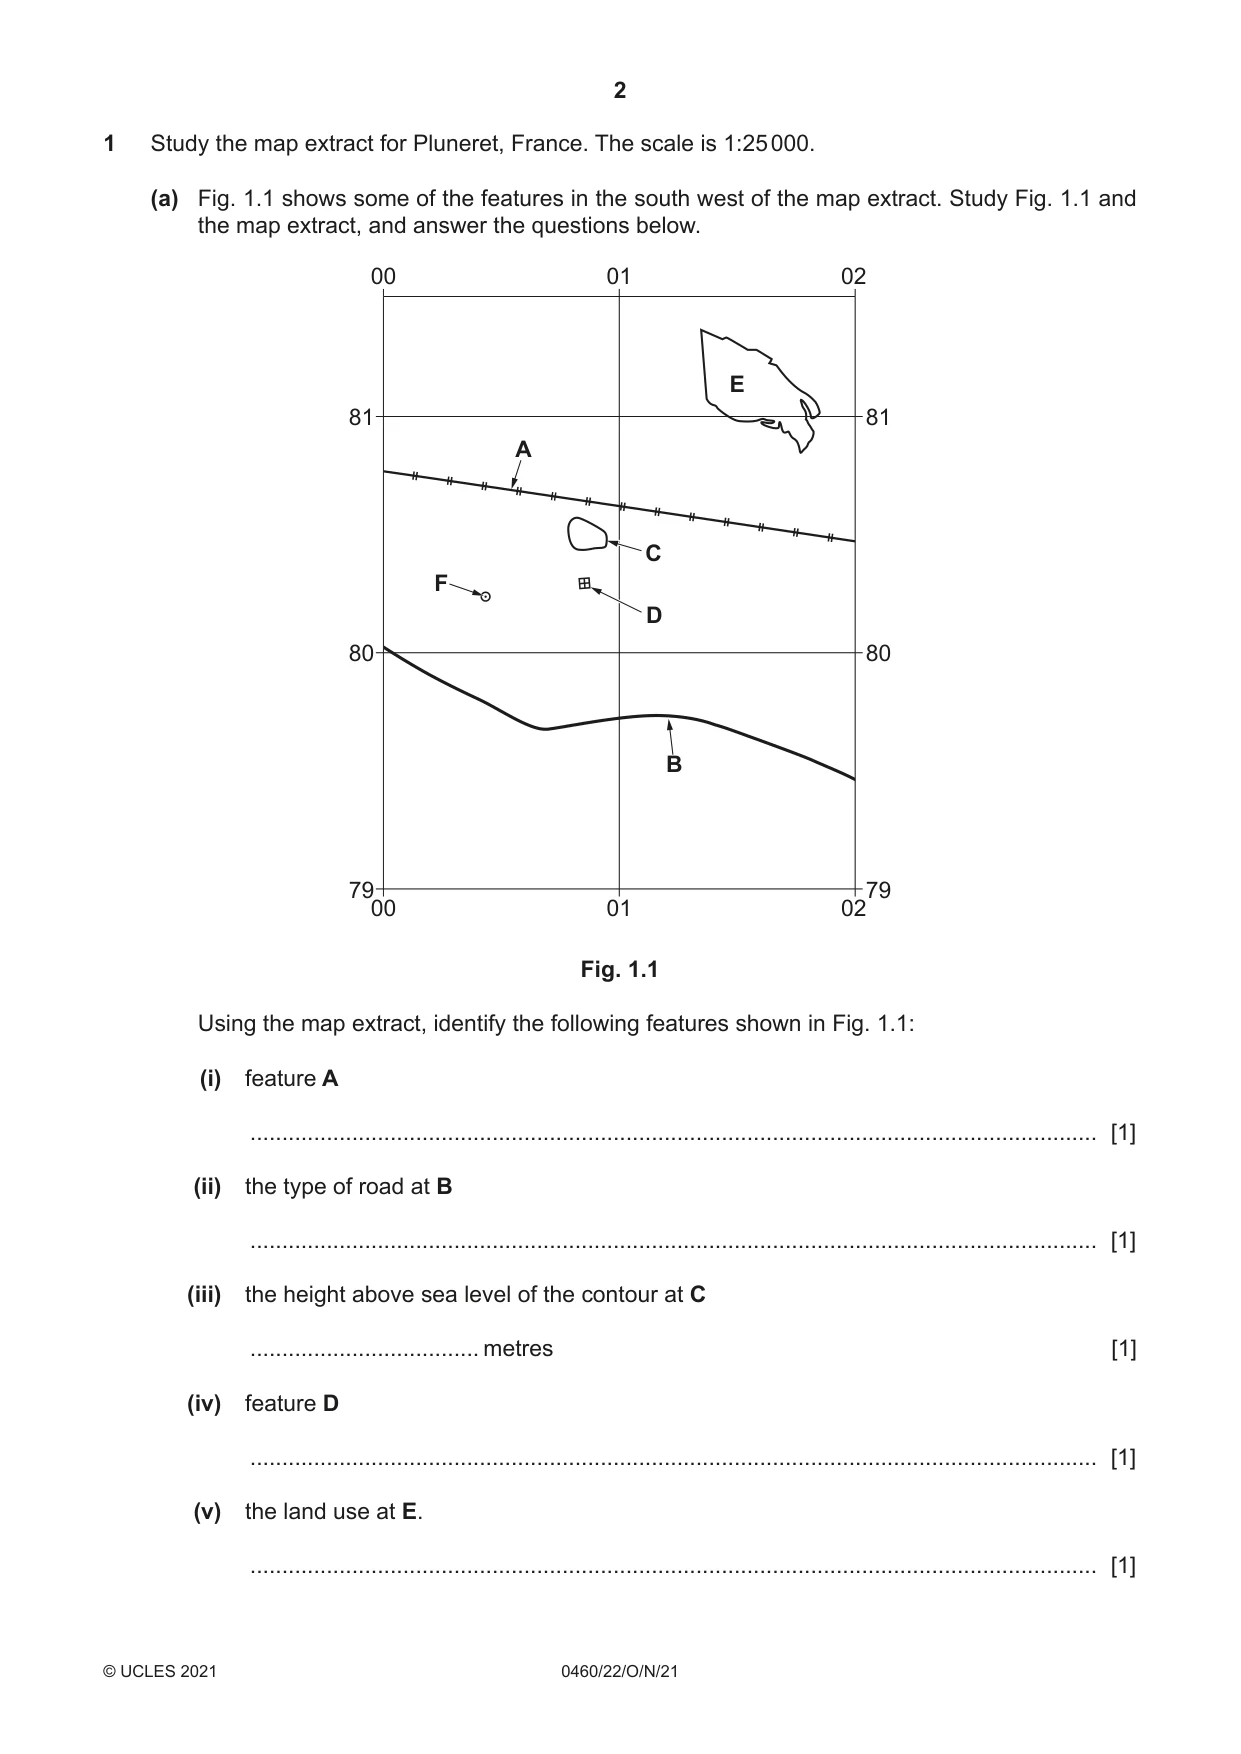
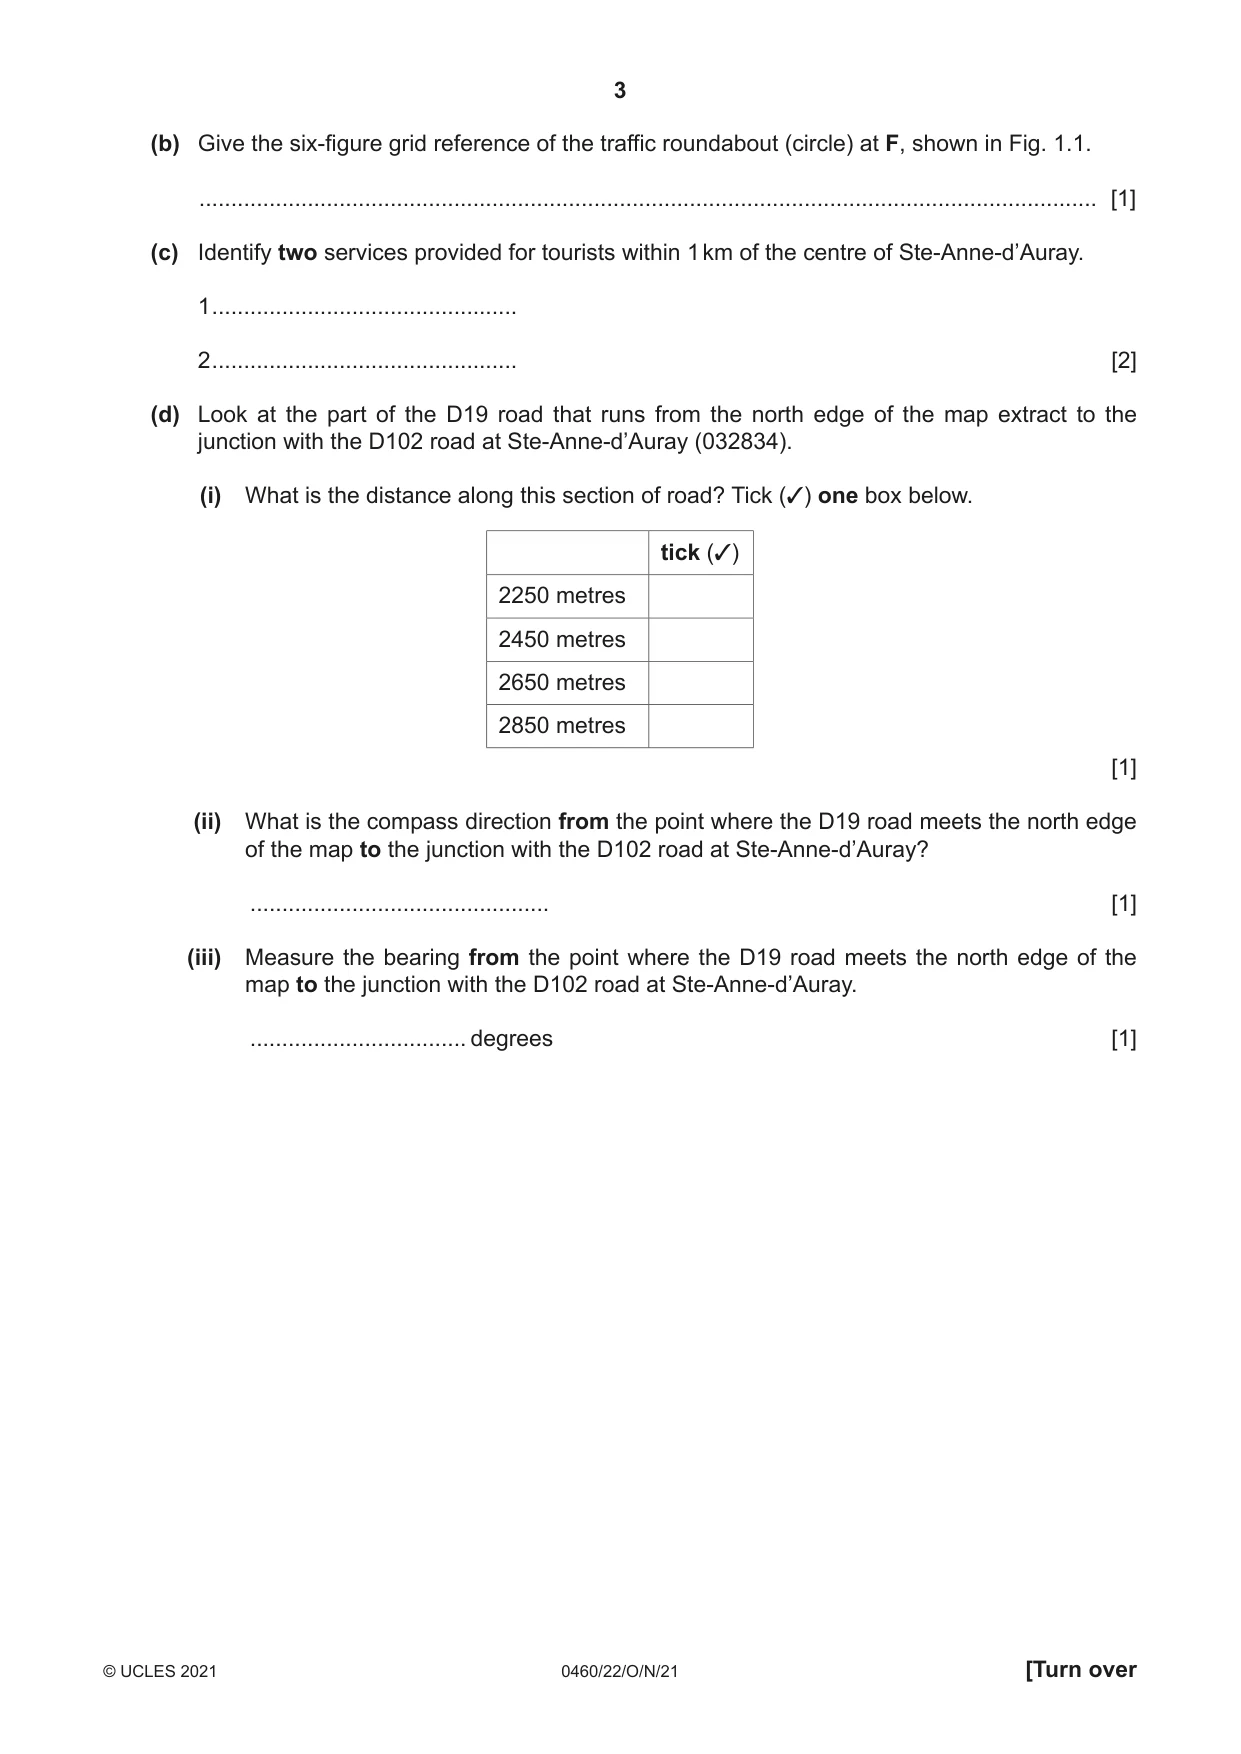
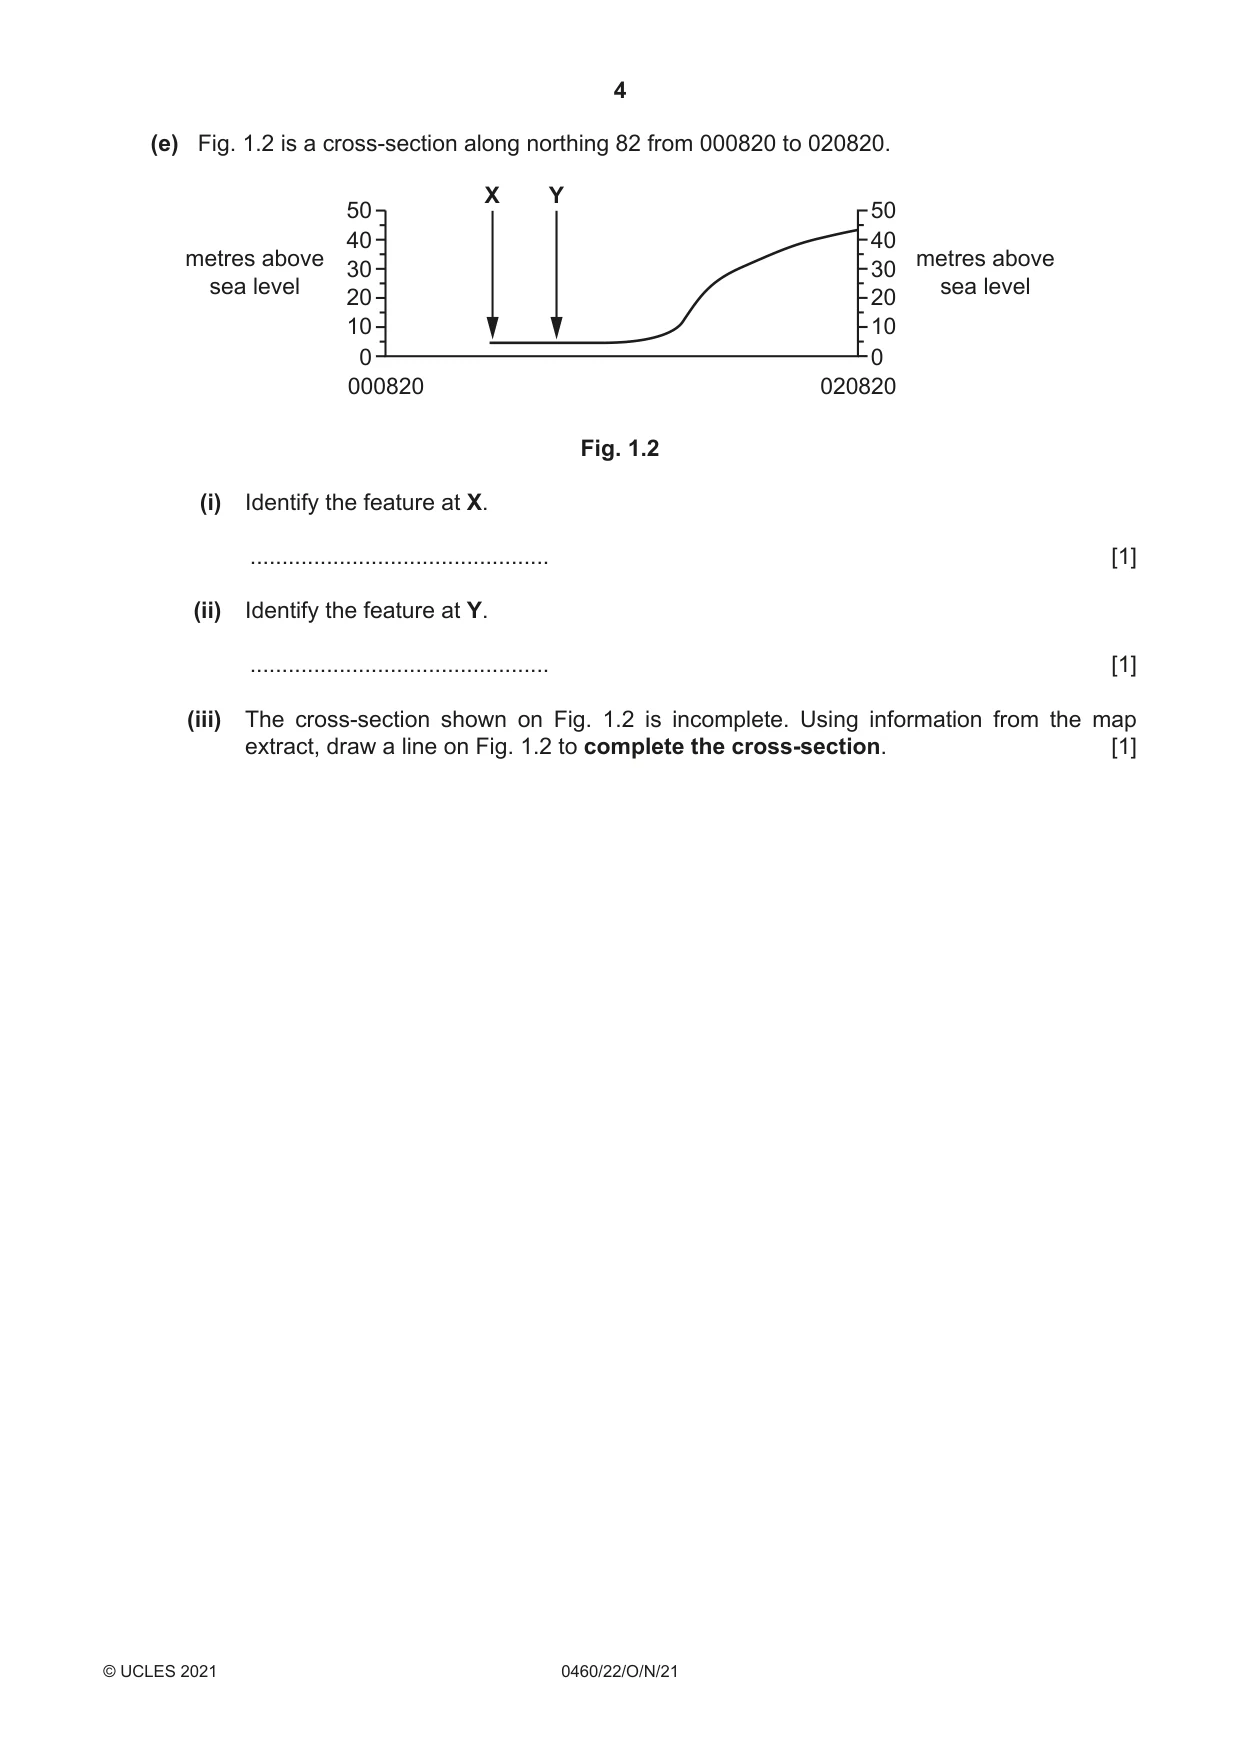
1 Study the map extract for Pluneret, France. The scale is 1:25 000. (a) Fig. 1.1 shows some of the features in the south west of the map extract. Study Fig. 1.1 and the map extract, and answer the questions below. 00 01 02 EE 81 81 AA CC FF DD 80 80 BB 7900 01 0279 Fig. 1.1 Using the map extract, identify the following features shown in Fig. 1.1: (i) feature A ..................................................................................................................................... [1] (ii) the type of road at B ..................................................................................................................................... [1] (iii) the height above sea level of the contour at C .................................... metres [1] (iv) feature D ..................................................................................................................................... [1] (v) the land use at E. ..................................................................................................................................... [1] (b) Give the six-figure grid reference of the traffic roundabout (circle) at F, shown in Fig. 1.1. ............................................................................................................................................. [1] (c) Identify two services provided for tourists within 1 km of the centre of Ste-Anne-d’Auray. 1 ................................................ 2 ................................................ [2] (d) Look at the part of the D19 road that runs from the north edge of the map extract to the junction with the D102 road at Ste-Anne-d’Auray (032834). (i) What is the distance along this section of road? Tick (3) one box below. tick (3) 2250 metres 2450 metres 2650 metres 2850 metres [1] (ii) What is the compass direction from the point where the D19 road meets the north edge of the map to the junction with the D102 road at Ste-Anne-d’Auray? ............................................... [1] (iii) Measure the bearing from the point where the D19 road meets the north edge of the map to the junction with the D102 road at Ste-Anne-d’Auray. .................................. degrees [1] (e) Fig. 1.2 is a cross-section along northing 82 from 000820 to 020820. X Y 50 50 40 40 metres above metres above 30 30 sea level sea level 20 20 10 10 0 0 000820 020820 Fig. 1.2 (i) Identify the feature at X. ............................................... [1] (ii) Identify the feature at Y. ............................................... [1] (iii) The cross-section shown on Fig. 1.2 is incomplete. Using information from the map extract, draw a line on Fig. 1.2 to complete the cross-section. [1] (f) Look at the main river which crosses the map extract and passes through the town of Pluneret. Describe the physical (natural) features of the river and its valley. Do not refer to land use beside the river. River ................................................................................................................................................... ................................................................................................................................................... ................................................................................................................................................... ................................................................................................................................................... ................................................................................................................................................... ................................................................................................................................................... ................................................................................................................................................... ................................................................................................................................................... ................................................................................................................................................... Valley ................................................................................................................................................... ................................................................................................................................................... ................................................................................................................................................... ................................................................................................................................................... ................................................................................................................................................... ............................................................................................................................................. [6] [Total: 20]
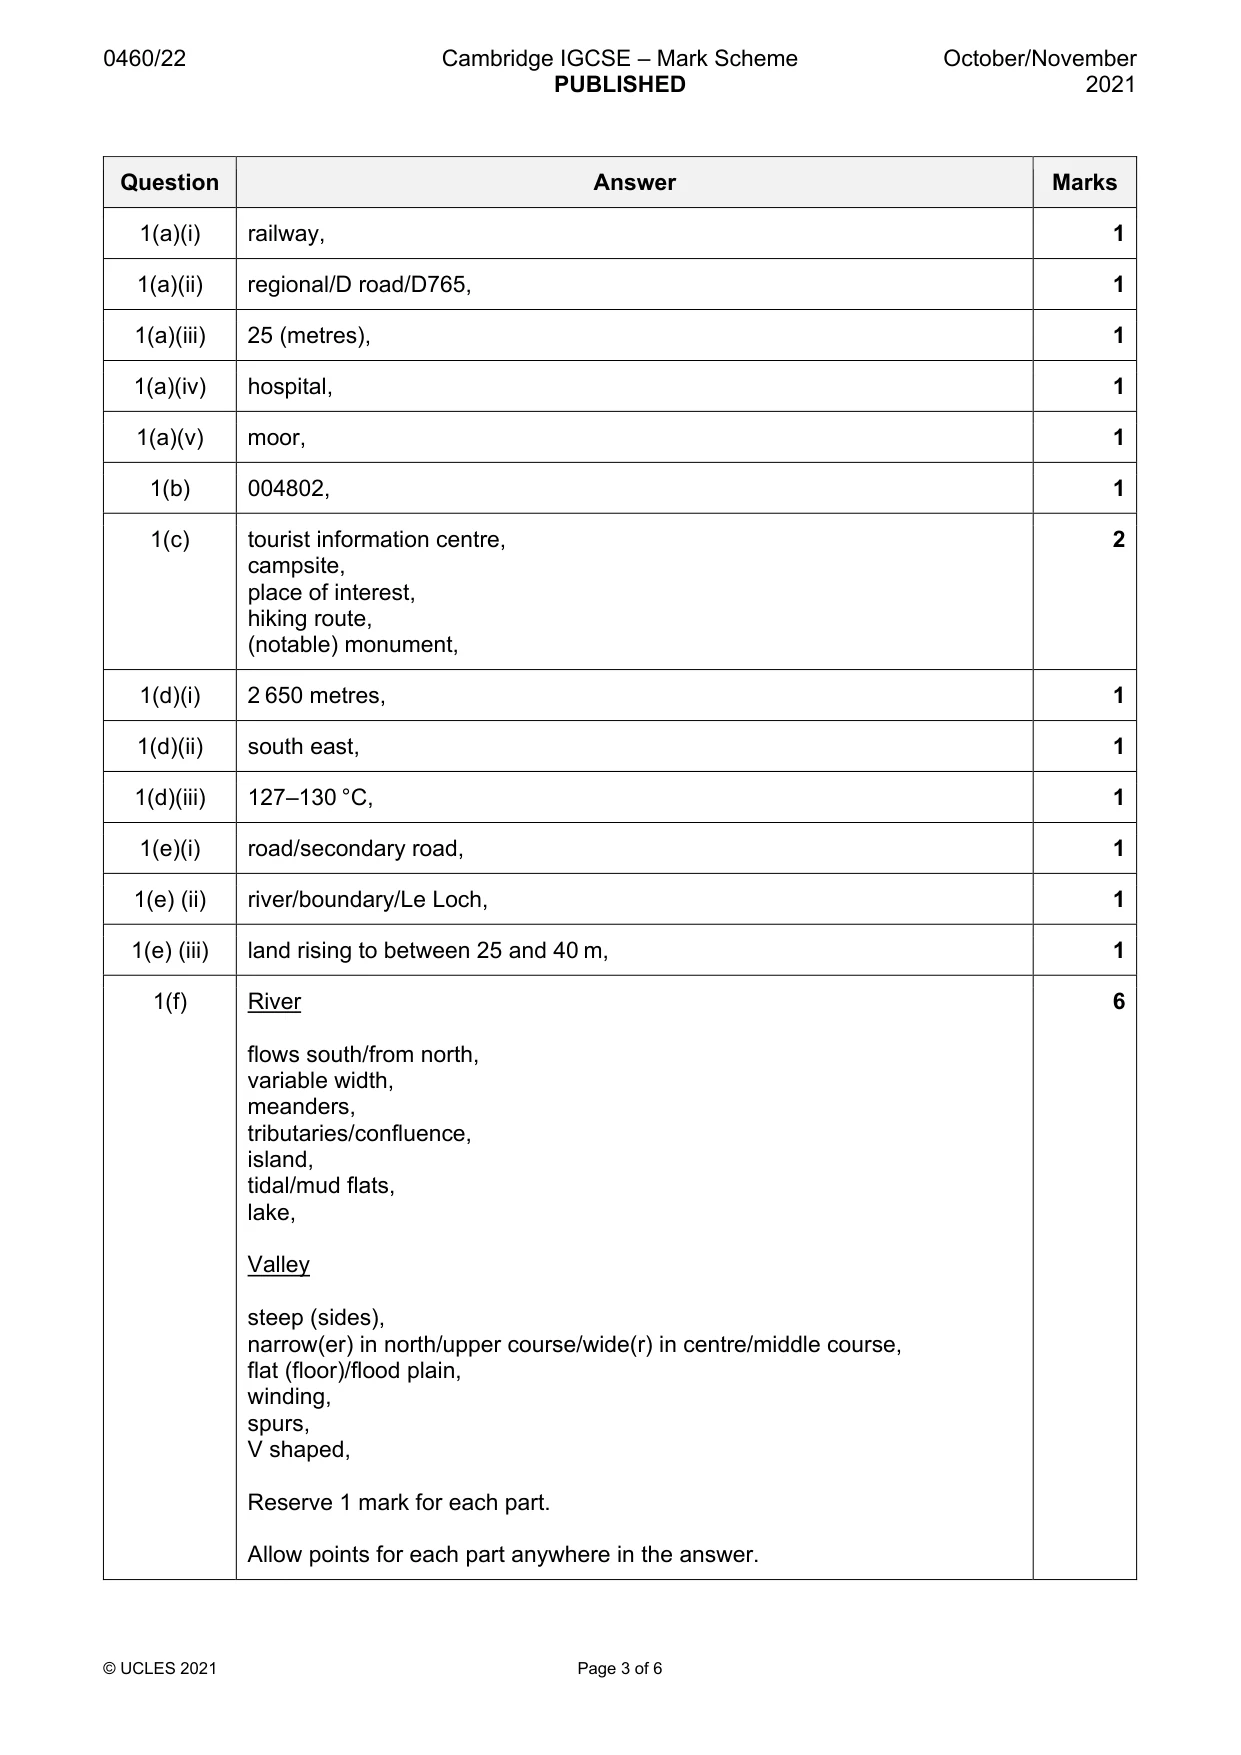
Mark scheme: Question Answer Marks 1(a)(i) railway, 1 1(a)(ii) regional/D road/D765, 1 1(a)(iii) 25 (metres), 1 1(a)(iv) hospital, 1 1(a)(v) moor, 1 1(b) 004802, 1 1(c) tourist information centre, 2 campsite, place of interest, hiking route, (notable) monument, 1(d)(i) 2 650 metres, 1 1(d)(ii) south east, 1 1(d)(iii) 127–130 °C, 1 1(e)(i) road/secondary road, 1 1(e) (ii) river/boundary/Le Loch, 1 1(e) (iii) land rising to between 25 and 40 m, 1 1(f) River 6 flows south/from north, variable width, meanders, tributaries/confluence, island, tidal/mud flats, lake, Valley steep (sides), narrow(er) in north/upper course/wide(r) in centre/middle course, flat (floor)/flood plain, winding, spurs, V shaped, Reserve 1 mark for each part. Allow points for each part anywhere in the answer.
More questions on Settlements (rural and urban) and service provision
Q2 · Information about the population of the nine provinces of South Africa
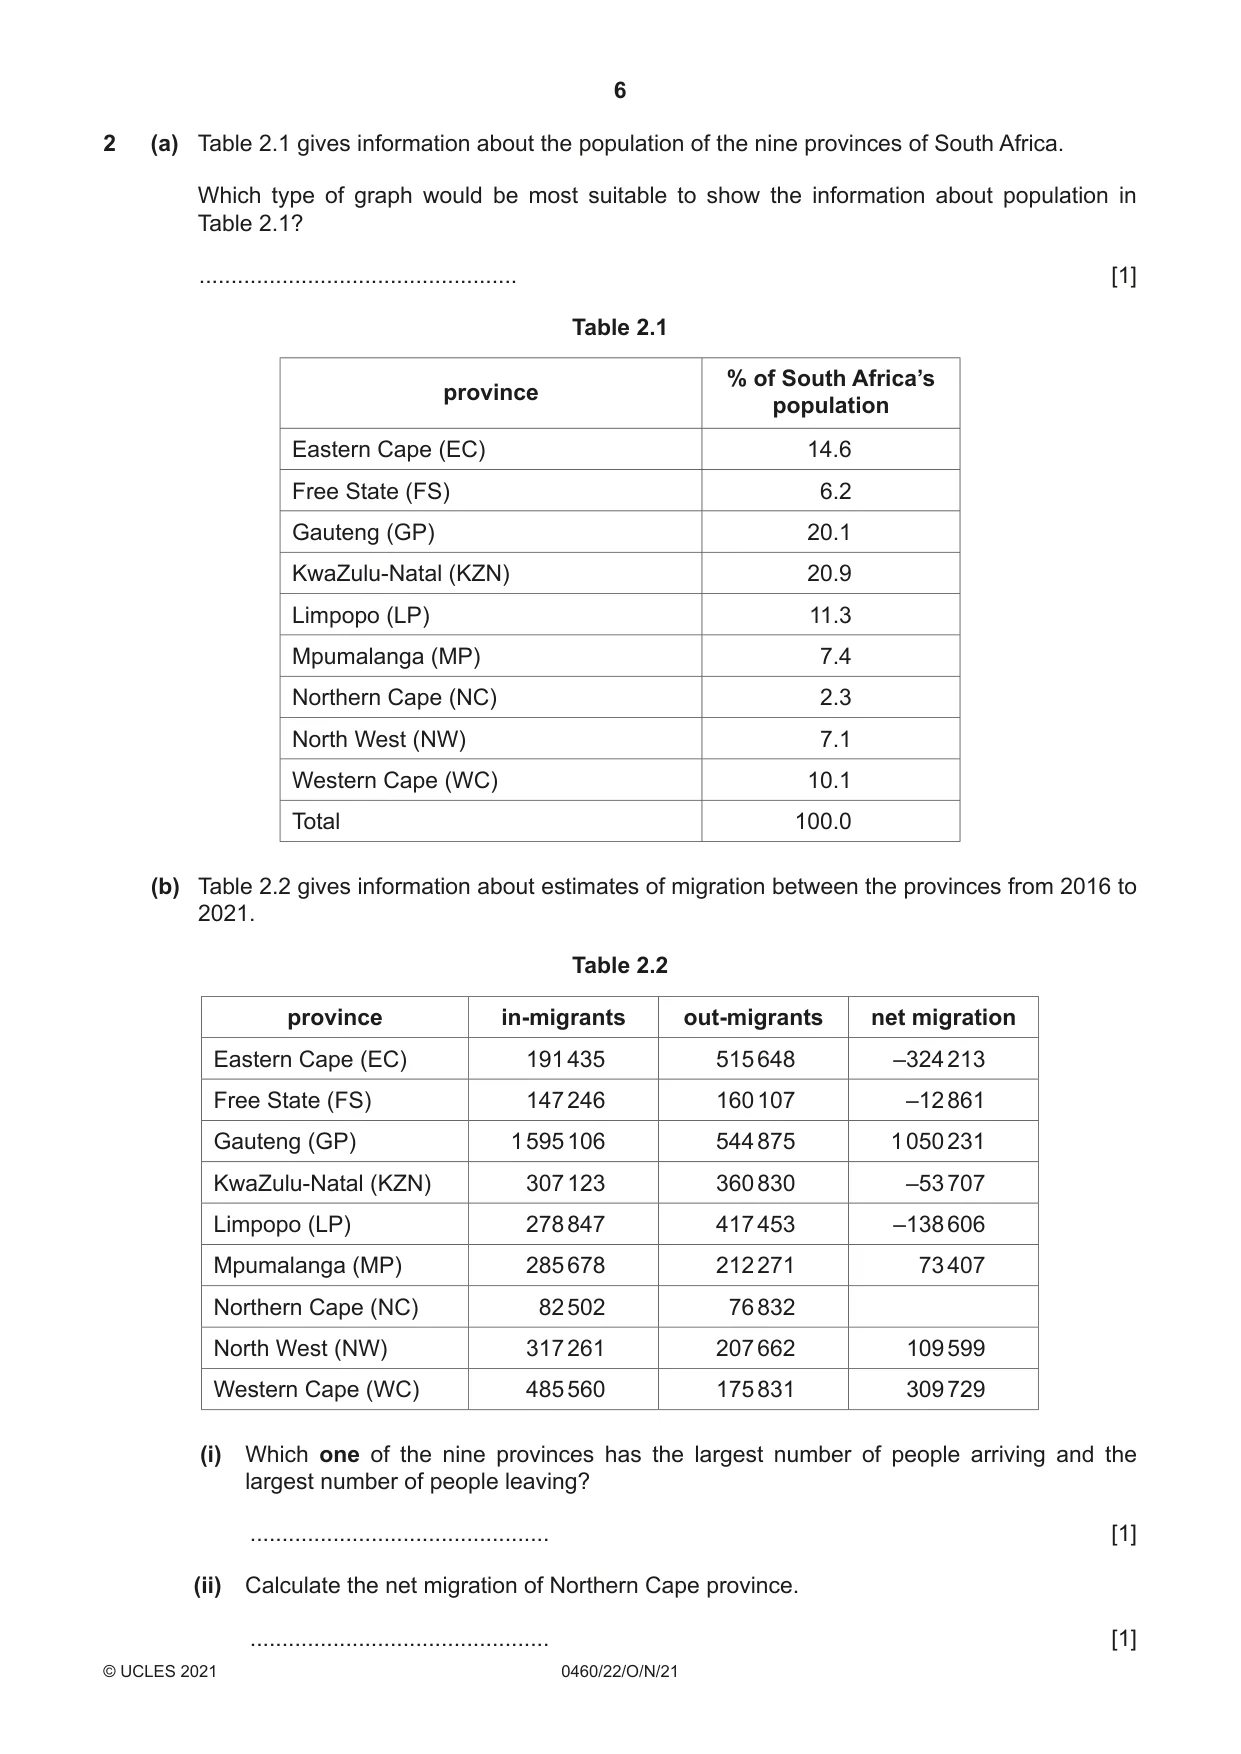
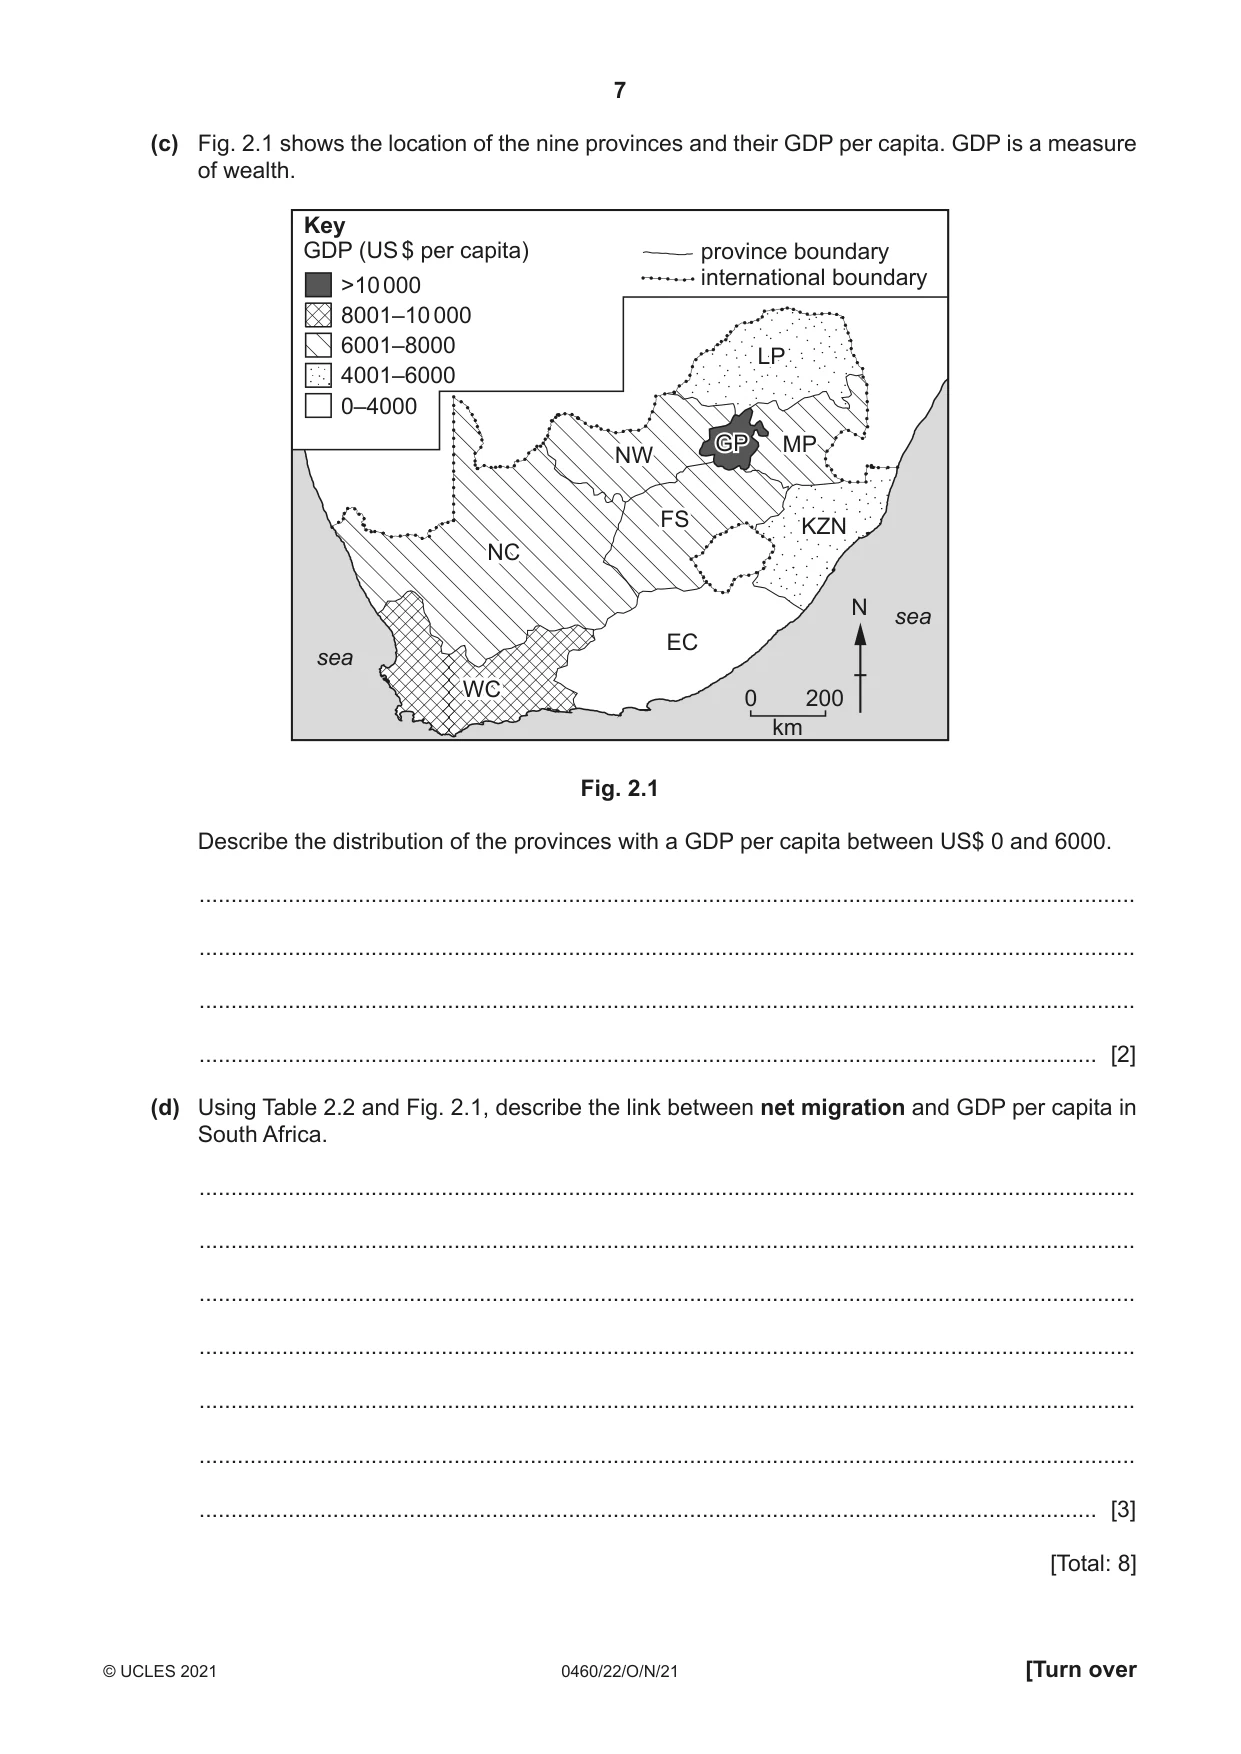
2 (a) Table 2.1 gives information about the population of the nine provinces of South Africa. Which type of graph would be most suitable to show the information about population in Table 2.1? .................................................. [1] Table 2.1 % of South Africa’s province population Eastern Cape (EC) 14.6 Free State (FS) 6.2 Gauteng (GP) 20.1 KwaZulu-Natal (KZN) 20.9 Limpopo (LP) 11.3 Mpumalanga (MP) 7.4 Northern Cape (NC) 2.3 North West (NW) 7.1 Western Cape (WC) 10.1 Total 100.0 (b) Table 2.2 gives information about estimates of migration between the provinces from 2016 to 2021. Table 2.2 province in-migrants out-migrants net migration Eastern Cape (EC) 191 435 515 648 –324 213 Free State (FS) 147 246 160 107 –12 861 Gauteng (GP) 1 595 106 544 875 1 050 231 KwaZulu-Natal (KZN) 307 123 360 830 –53 707 Limpopo (LP) 278 847 417 453 –138 606 Mpumalanga (MP) 285 678 212 271 73 407 Northern Cape (NC) 82 502 76 832 North West (NW) 317 261 207 662 109 599 Western Cape (WC) 485 560 175 831 309 729 (i) Which one of the nine provinces has the largest number of people arriving and the largest number of people leaving? ............................................... [1] (ii) Calculate the net migration of Northern Cape province. ............................................... [1] (c) Fig. 2.1 shows the location of the nine provinces and their GDP per capita. GDP is a measure of wealth. Key GDP (US $ per capita) province boundary international boundary >10 000 8001–10 000 6001–8000 LPLP 4001–6000 0–4000 GPGP MP NW FSFS KZN NC N sea EC sea WC 0 200 km Fig. 2.1 Describe the distribution of the provinces with a GDP per capita between US$ 0 and 6000. ................................................................................................................................................... ................................................................................................................................................... ................................................................................................................................................... ............................................................................................................................................. [2] (d) Using Table 2.2 and Fig. 2.1, describe the link between net migration and GDP per capita in South Africa. ................................................................................................................................................... ................................................................................................................................................... ................................................................................................................................................... ................................................................................................................................................... ................................................................................................................................................... ................................................................................................................................................... ............................................................................................................................................. [3] [Total: 8]
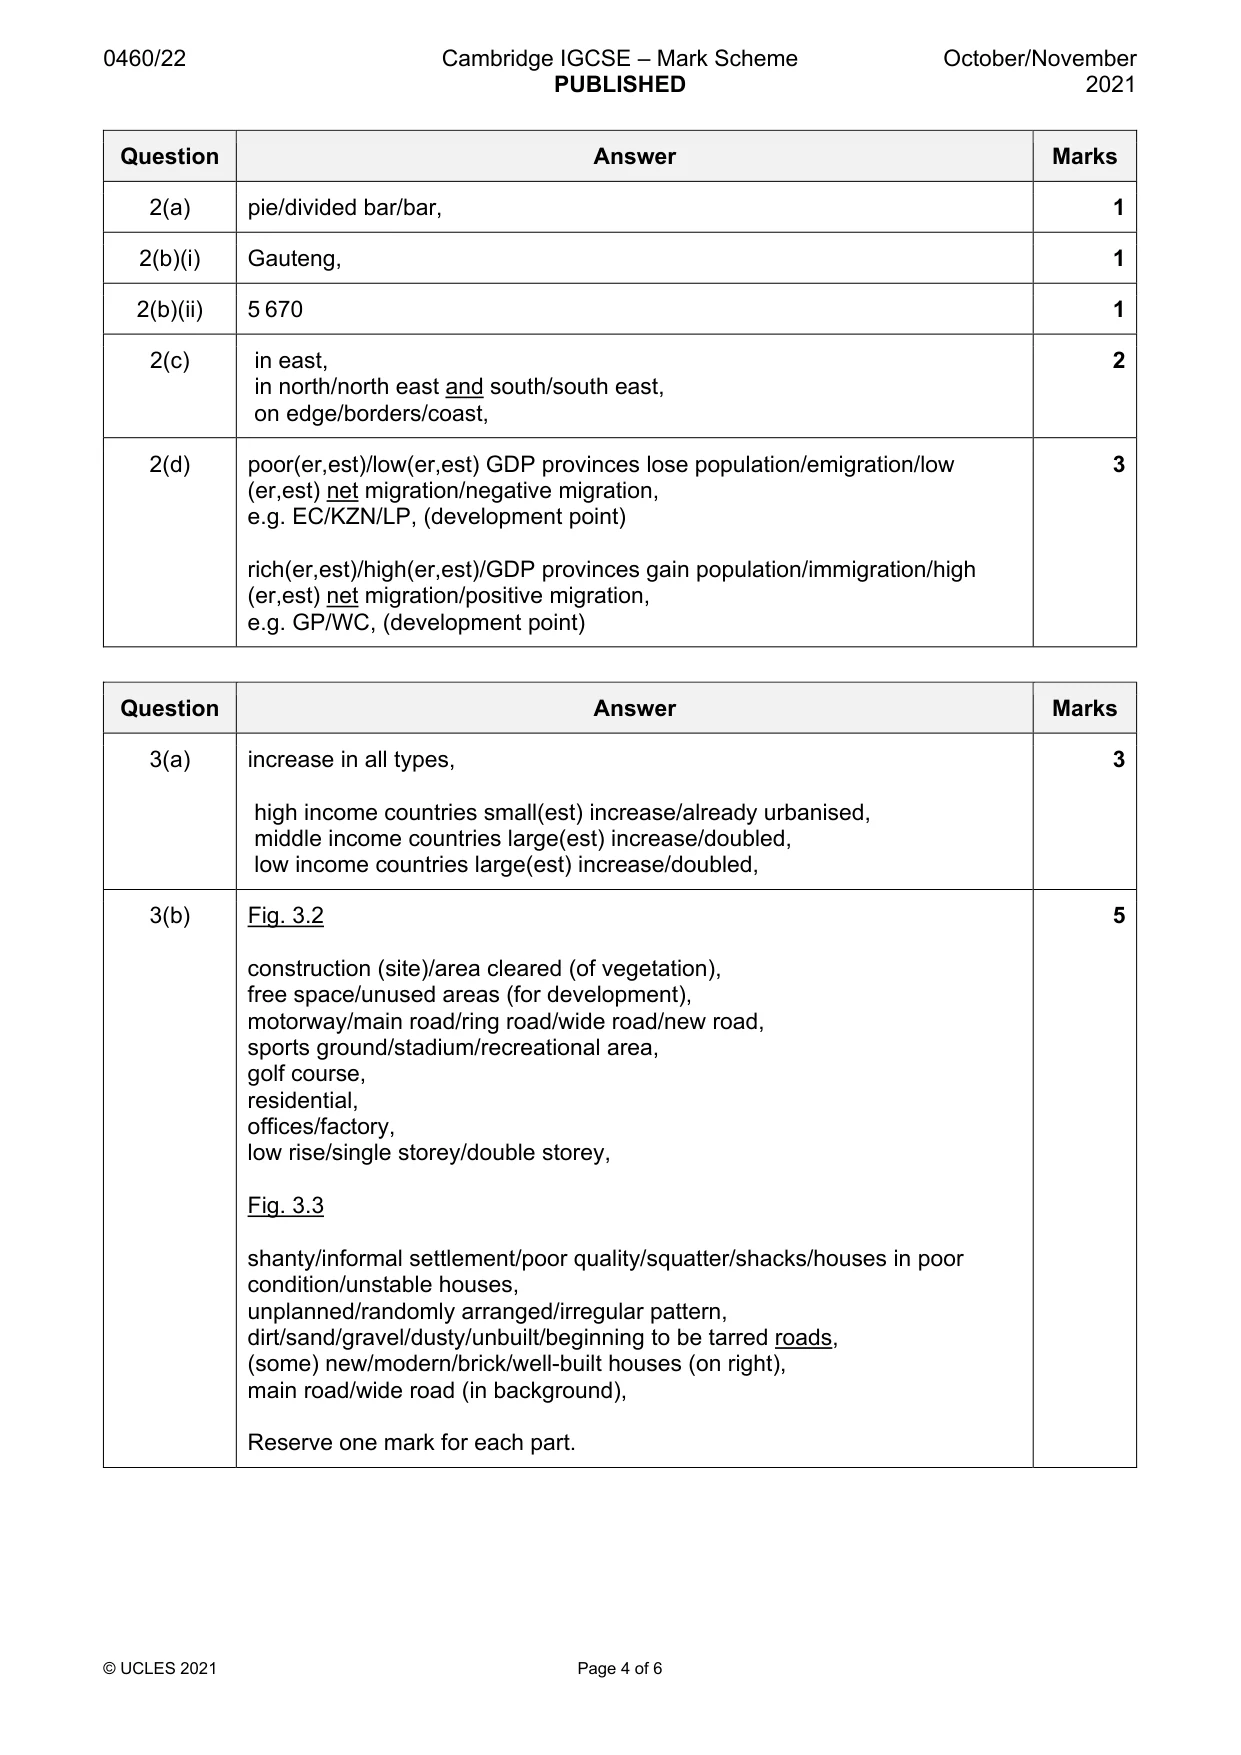
Mark scheme: 2(a) pie/divided bar/bar, 1 2(b)(i) Gauteng, 1 2(b)(ii) 5 670 1 2(c) in east, 2 in north/north east and south/south east, on edge/borders/coast, 2(d) poor(er,est)/low(er,est) GDP provinces lose population/emigration/low 3 (er,est) net migration/negative migration, e.g. EC/KZN/LP, (development point) rich(er,est)/high(er,est)/GDP provinces gain population/immigration/high (er,est) net migration/positive migration, e.g. GP/WC, (development point)
Q3 · Urbanisation is the increase in the percentage of the population living in towns and…
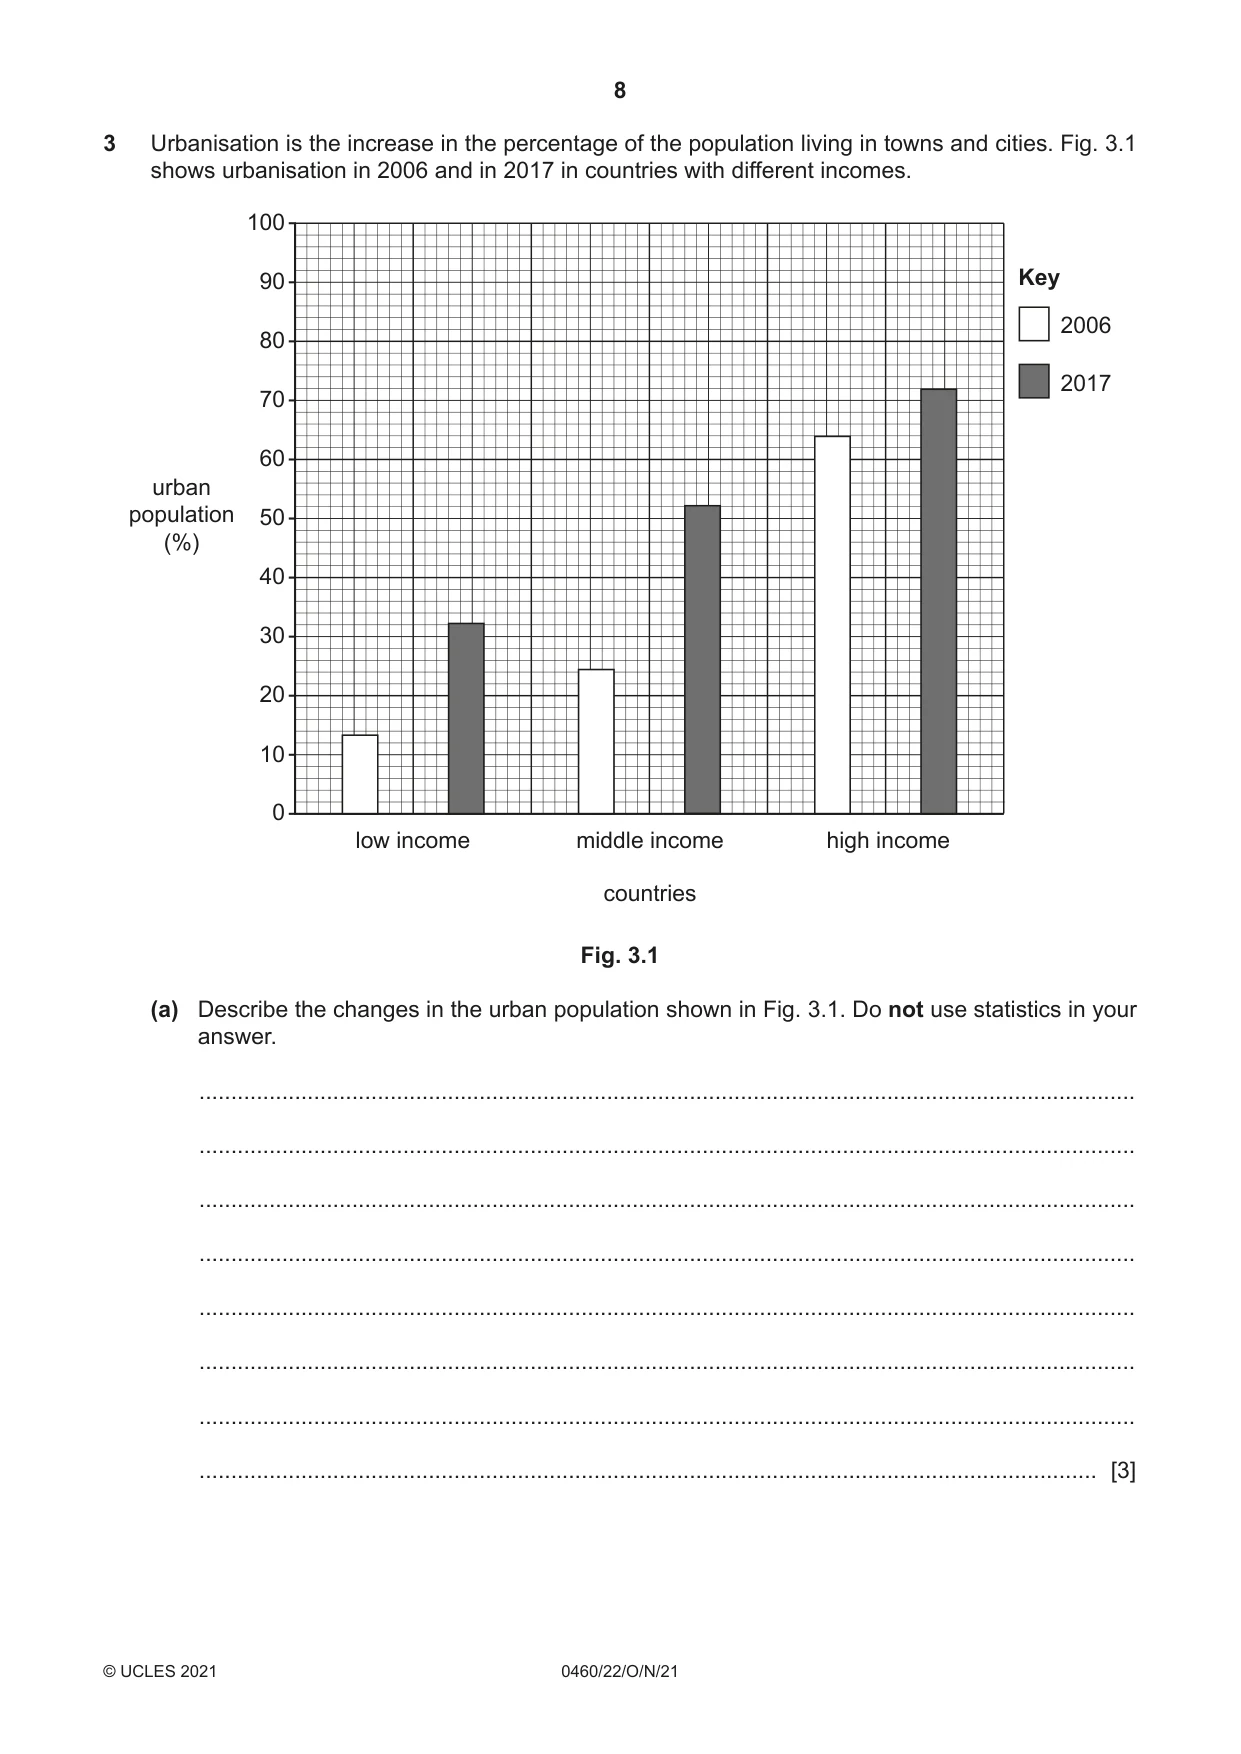
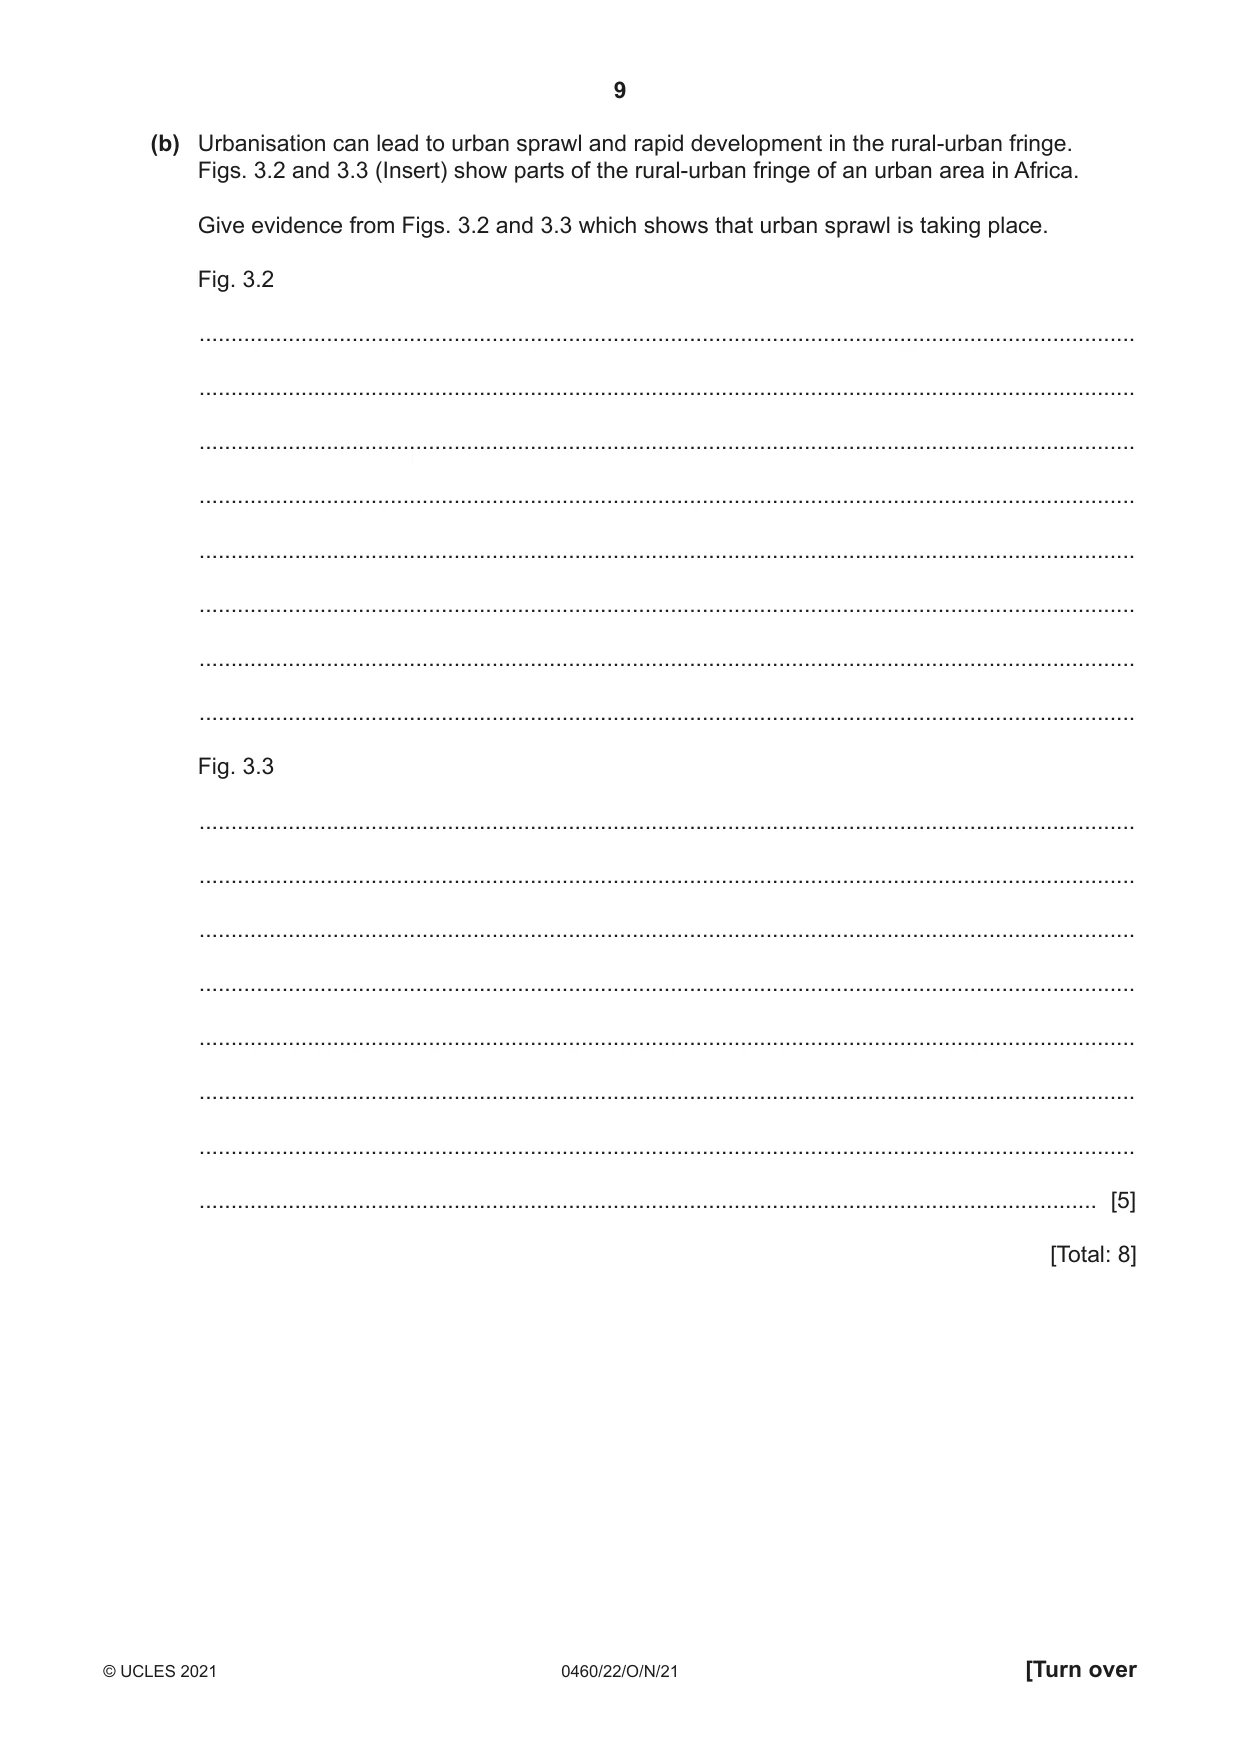
3 Urbanisation is the increase in the percentage of the population living in towns and cities. Fig. 3.1 shows urbanisation in 2006 and in 2017 in countries with different incomes. 100 90 Key 2006 80 2017 70 60 urban population 50 (%) 40 30 20 10 0 low income middle income high income countries Fig. 3.1 (a) Describe the changes in the urban population shown in Fig. 3.1. Do not use statistics in your answer. ................................................................................................................................................... ................................................................................................................................................... ................................................................................................................................................... ................................................................................................................................................... ................................................................................................................................................... ................................................................................................................................................... ................................................................................................................................................... ............................................................................................................................................. [3] (b) Urbanisation can lead to urban sprawl and rapid development in the rural-urban fringe. Figs. 3.2 and 3.3 (Insert) show parts of the rural-urban fringe of an urban area in Africa. Give evidence from Figs. 3.2 and 3.3 which shows that urban sprawl is taking place. Fig. 3.2 ................................................................................................................................................... ................................................................................................................................................... ................................................................................................................................................... ................................................................................................................................................... ................................................................................................................................................... ................................................................................................................................................... ................................................................................................................................................... ................................................................................................................................................... Fig. 3.3 ................................................................................................................................................... ................................................................................................................................................... ................................................................................................................................................... ................................................................................................................................................... ................................................................................................................................................... ................................................................................................................................................... ................................................................................................................................................... ............................................................................................................................................. [5] [Total: 8]
Mark scheme: 3(a) increase in all types, 3 high income countries small(est) increase/already urbanised, middle income countries large(est) increase/doubled, low income countries large(est) increase/doubled, 3(b) Fig. 3.2 5 construction (site)/area cleared (of vegetation), free space/unused areas (for development), motorway/main road/ring road/wide road/new road, sports ground/stadium/recreational area, golf course, residential, offices/factory, low rise/single storey/double storey, Fig. 3.3 shanty/informal settlement/poor quality/squatter/shacks/houses in poor condition/unstable houses, unplanned/randomly arranged/irregular pattern, dirt/sand/gravel/dusty/unbuilt/beginning to be tarred roads, (some) new/modern/brick/well-built houses (on right), main road/wide road (in background), Reserve one mark for each part.
Q4 · Australia’s biggest earthquake was at the city of Newcastle in 1989
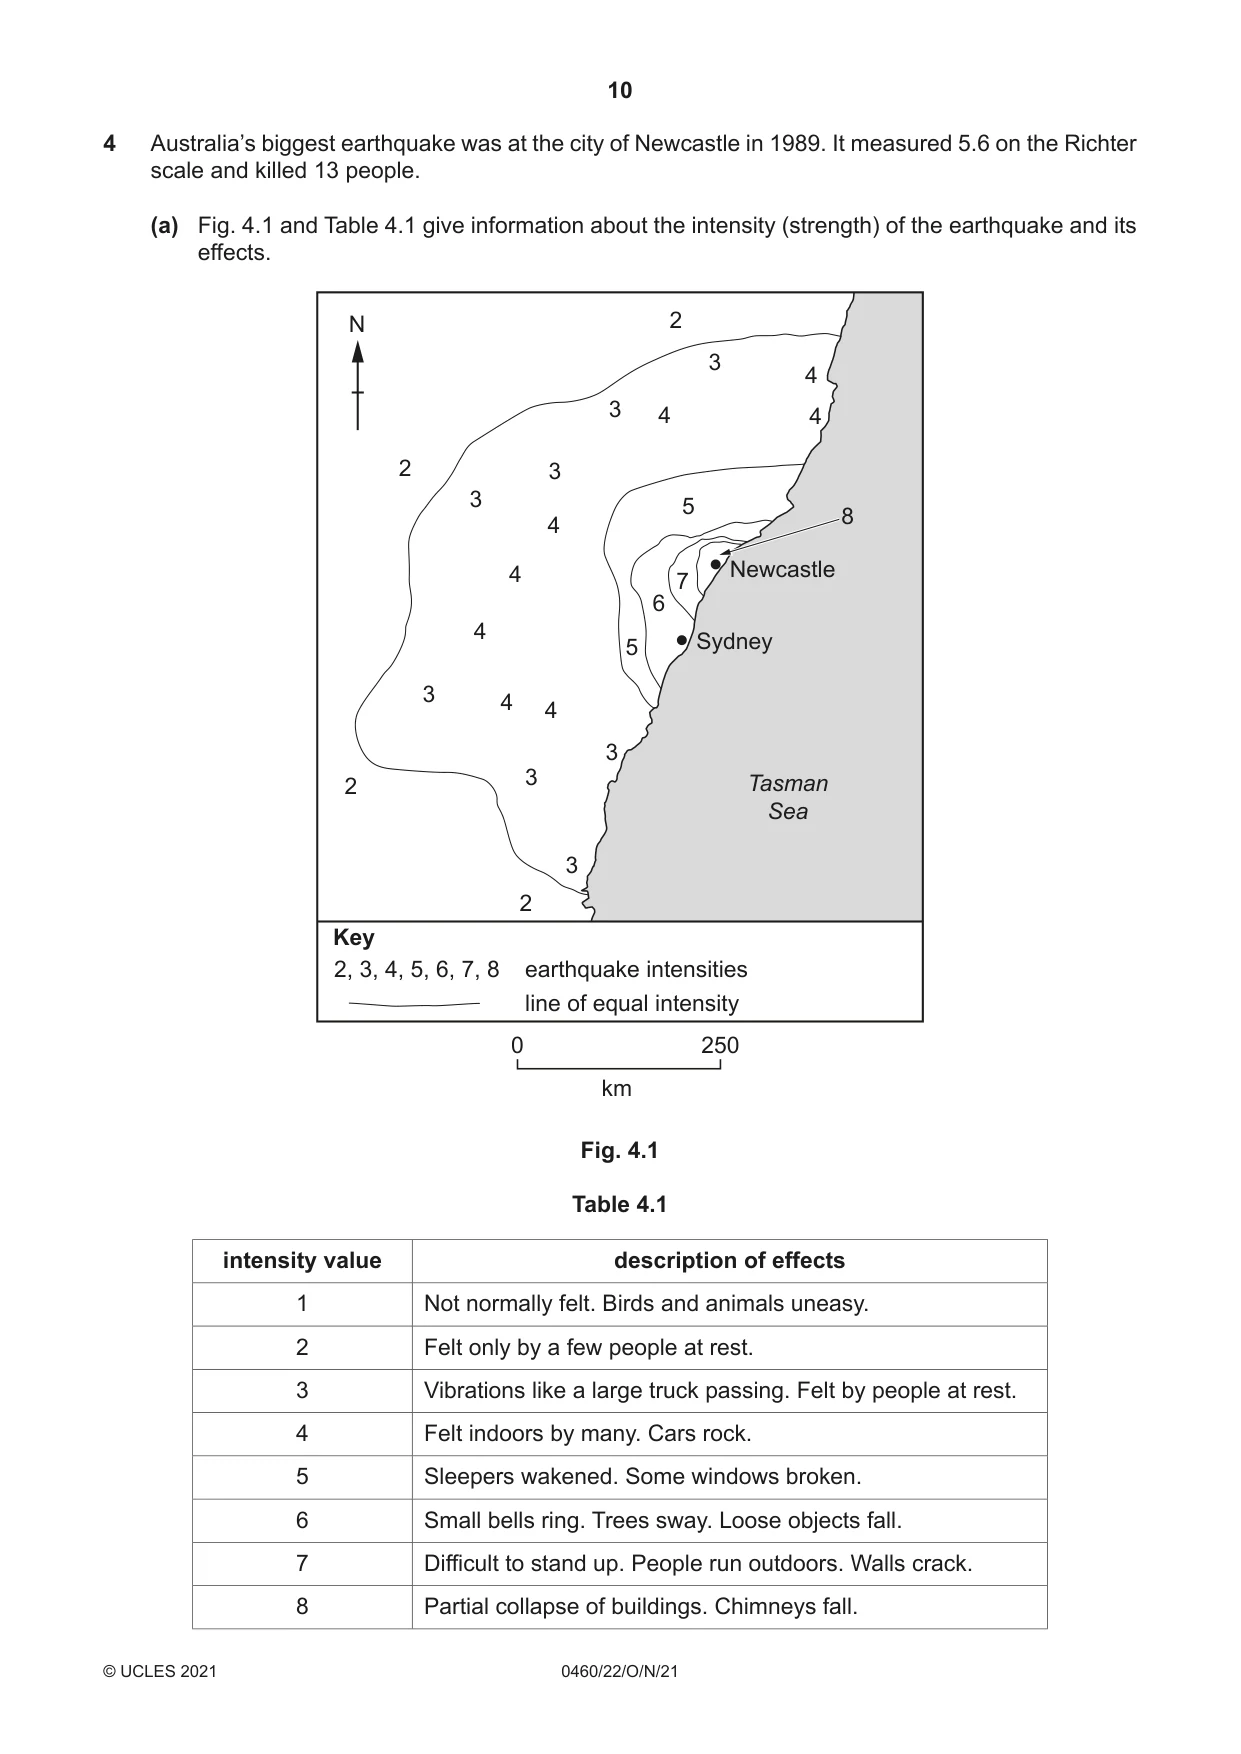
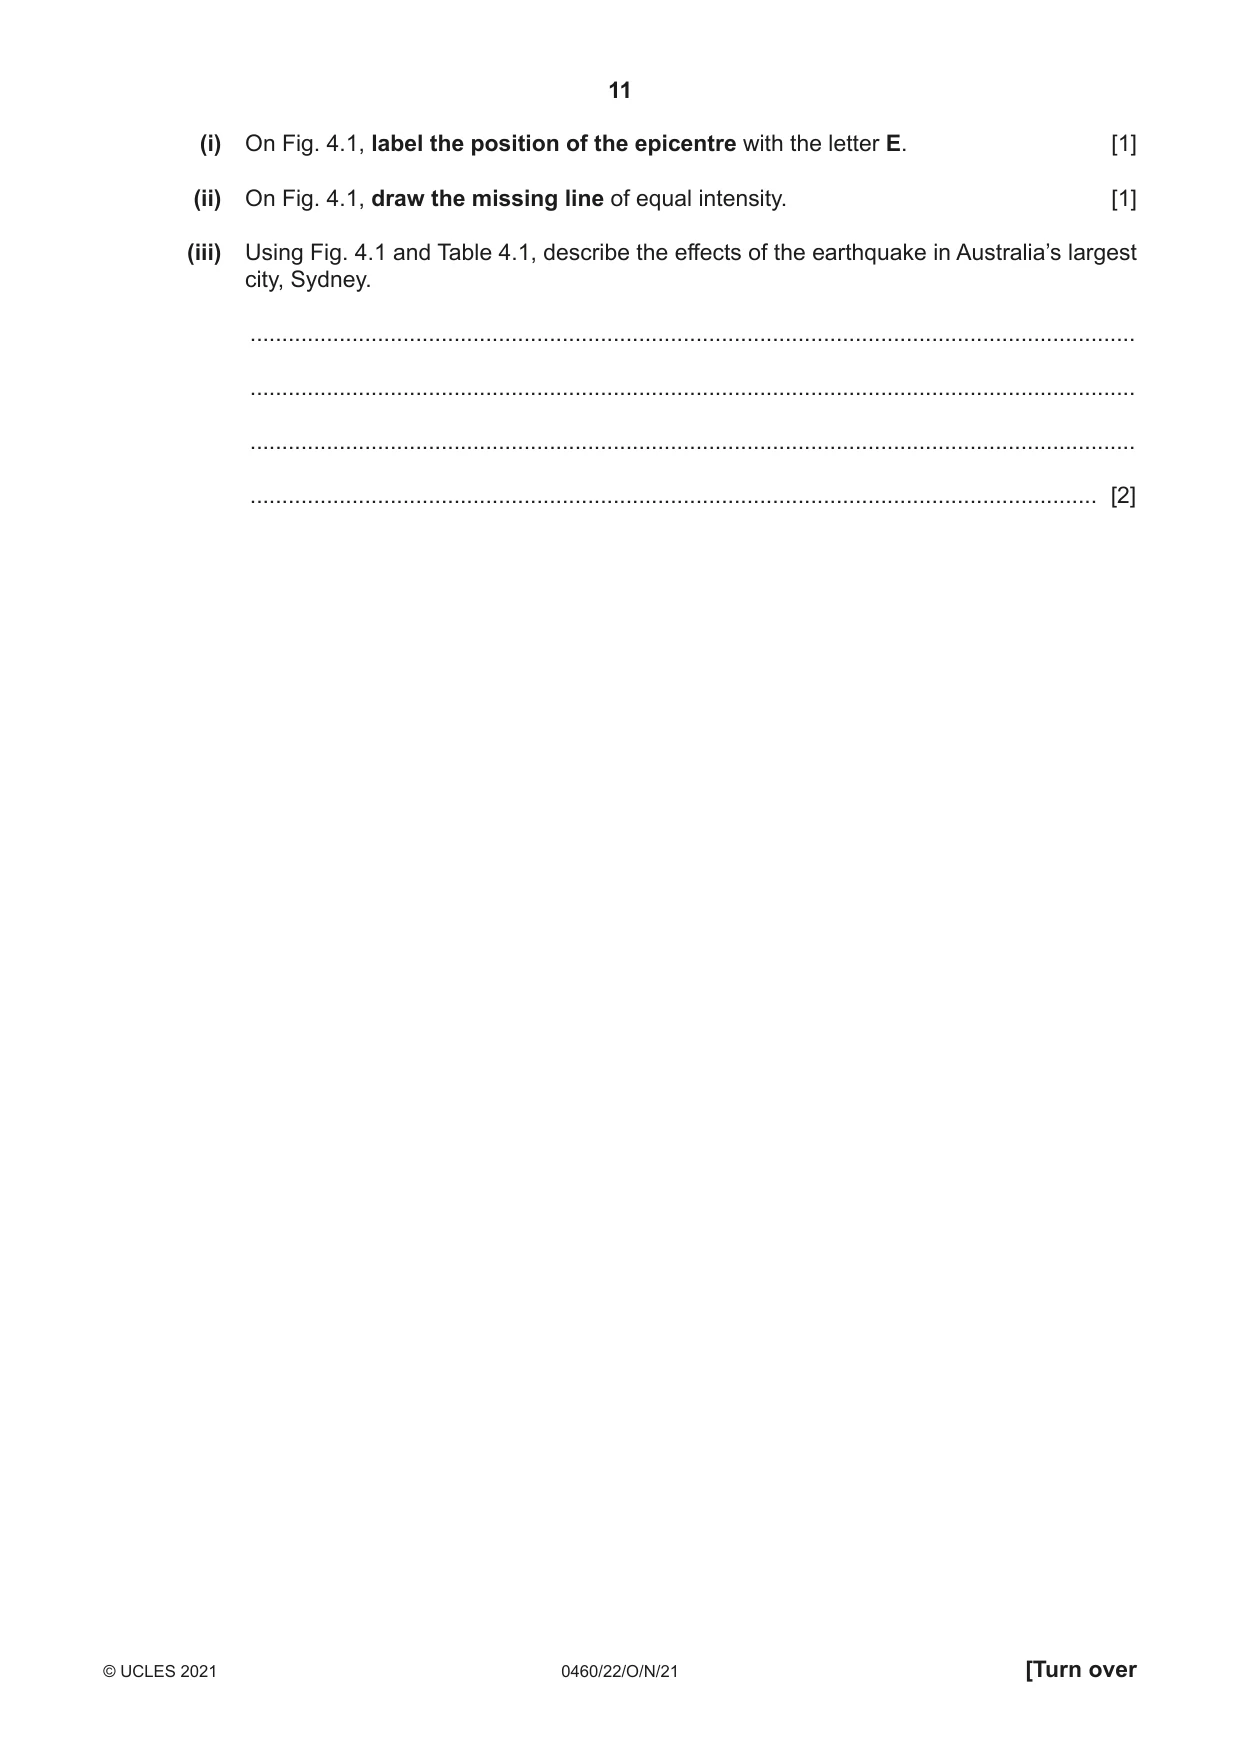
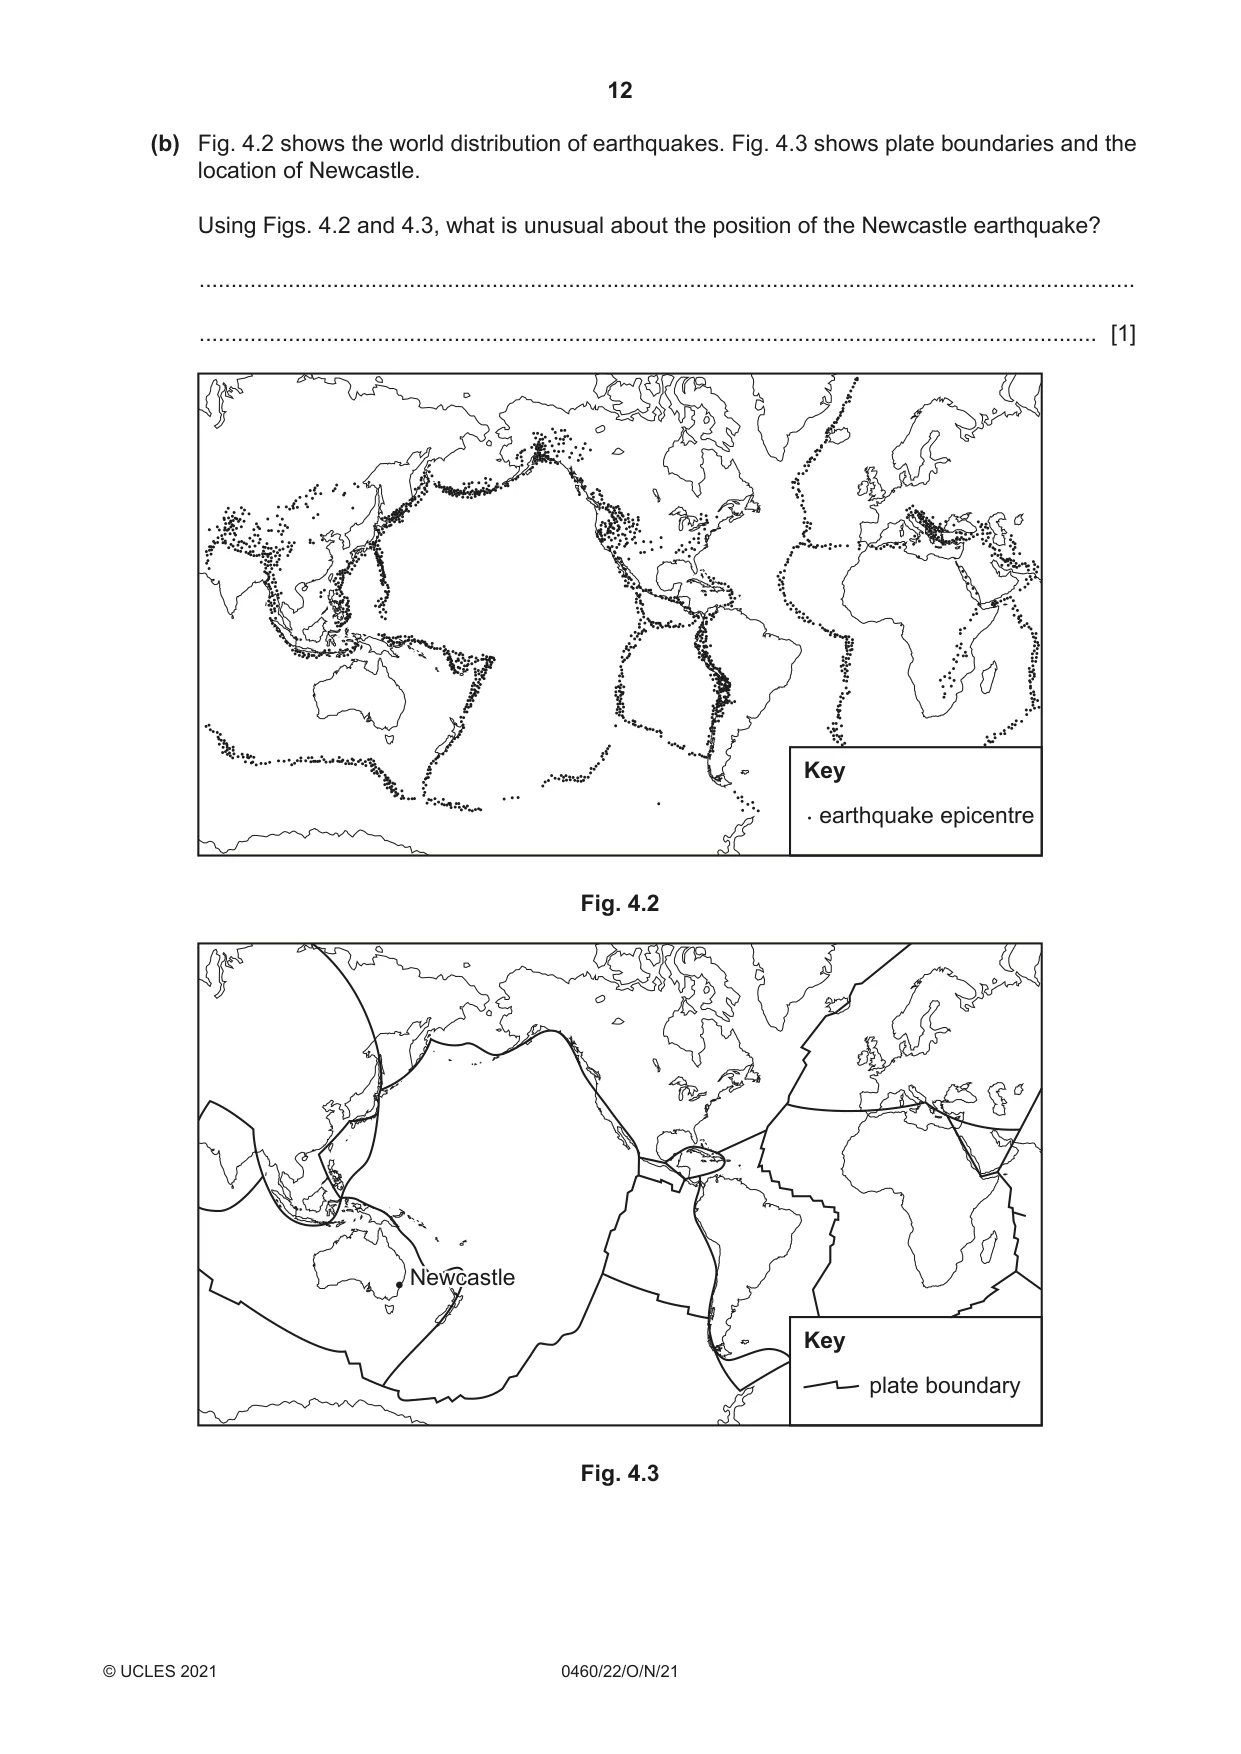
4 Australia’s biggest earthquake was at the city of Newcastle in 1989. It measured 5.6 on the Richter scale and killed 13 people. (a) Fig. 4.1 and Table 4.1 give information about the intensity (strength) of the earthquake and its effects. N 2 3 4 3 4 4 2 3 3 5 8 4 4 7 Newcastle 6 4 5 Sydney 3 4 4 3 3 2 Tasman Sea 3 2 Key 2, 3, 4, 5, 6, 7, 8 earthquake intensities line of equal intensity 0 250 km Fig. 4.1 Table 4.1 intensity value description of effects 1 Not normally felt. Birds and animals uneasy. 2 Felt only by a few people at rest. 3 Vibrations like a large truck passing. Felt by people at rest. 4 Felt indoors by many. Cars rock. 5 Sleepers wakened. Some windows broken. 6 Small bells ring. Trees sway. Loose objects fall. 7 Difficult to stand up. People run outdoors. Walls crack. 8 Partial collapse of buildings. Chimneys fall. (i) On Fig. 4.1, label the position of the epicentre with the letter E. [1] (ii) On Fig. 4.1, draw the missing line of equal intensity. [1] (iii) Using Fig. 4.1 and Table 4.1, describe the effects of the earthquake in Australia’s largest city, Sydney. ........................................................................................................................................... ........................................................................................................................................... ........................................................................................................................................... ..................................................................................................................................... [2] (b) Fig. 4.2 shows the world distribution of earthquakes. Fig. 4.3 shows plate boundaries and the location of Newcastle. Using Figs. 4.2 and 4.3, what is unusual about the position of the Newcastle earthquake? ................................................................................................................................................... ............................................................................................................................................. [1] Key earthquake epicentre Fig. 4.2 NewcastleNewcastle Key plate boundary Fig. 4.3 (c) Explain why many earthquakes occur at destructive (convergent) plate boundaries. ................................................................................................................................................... ................................................................................................................................................... ................................................................................................................................................... ................................................................................................................................................... ................................................................................................................................................... ................................................................................................................................................... ................................................................................................................................................... ............................................................................................................................................. [3] [Total: 8]
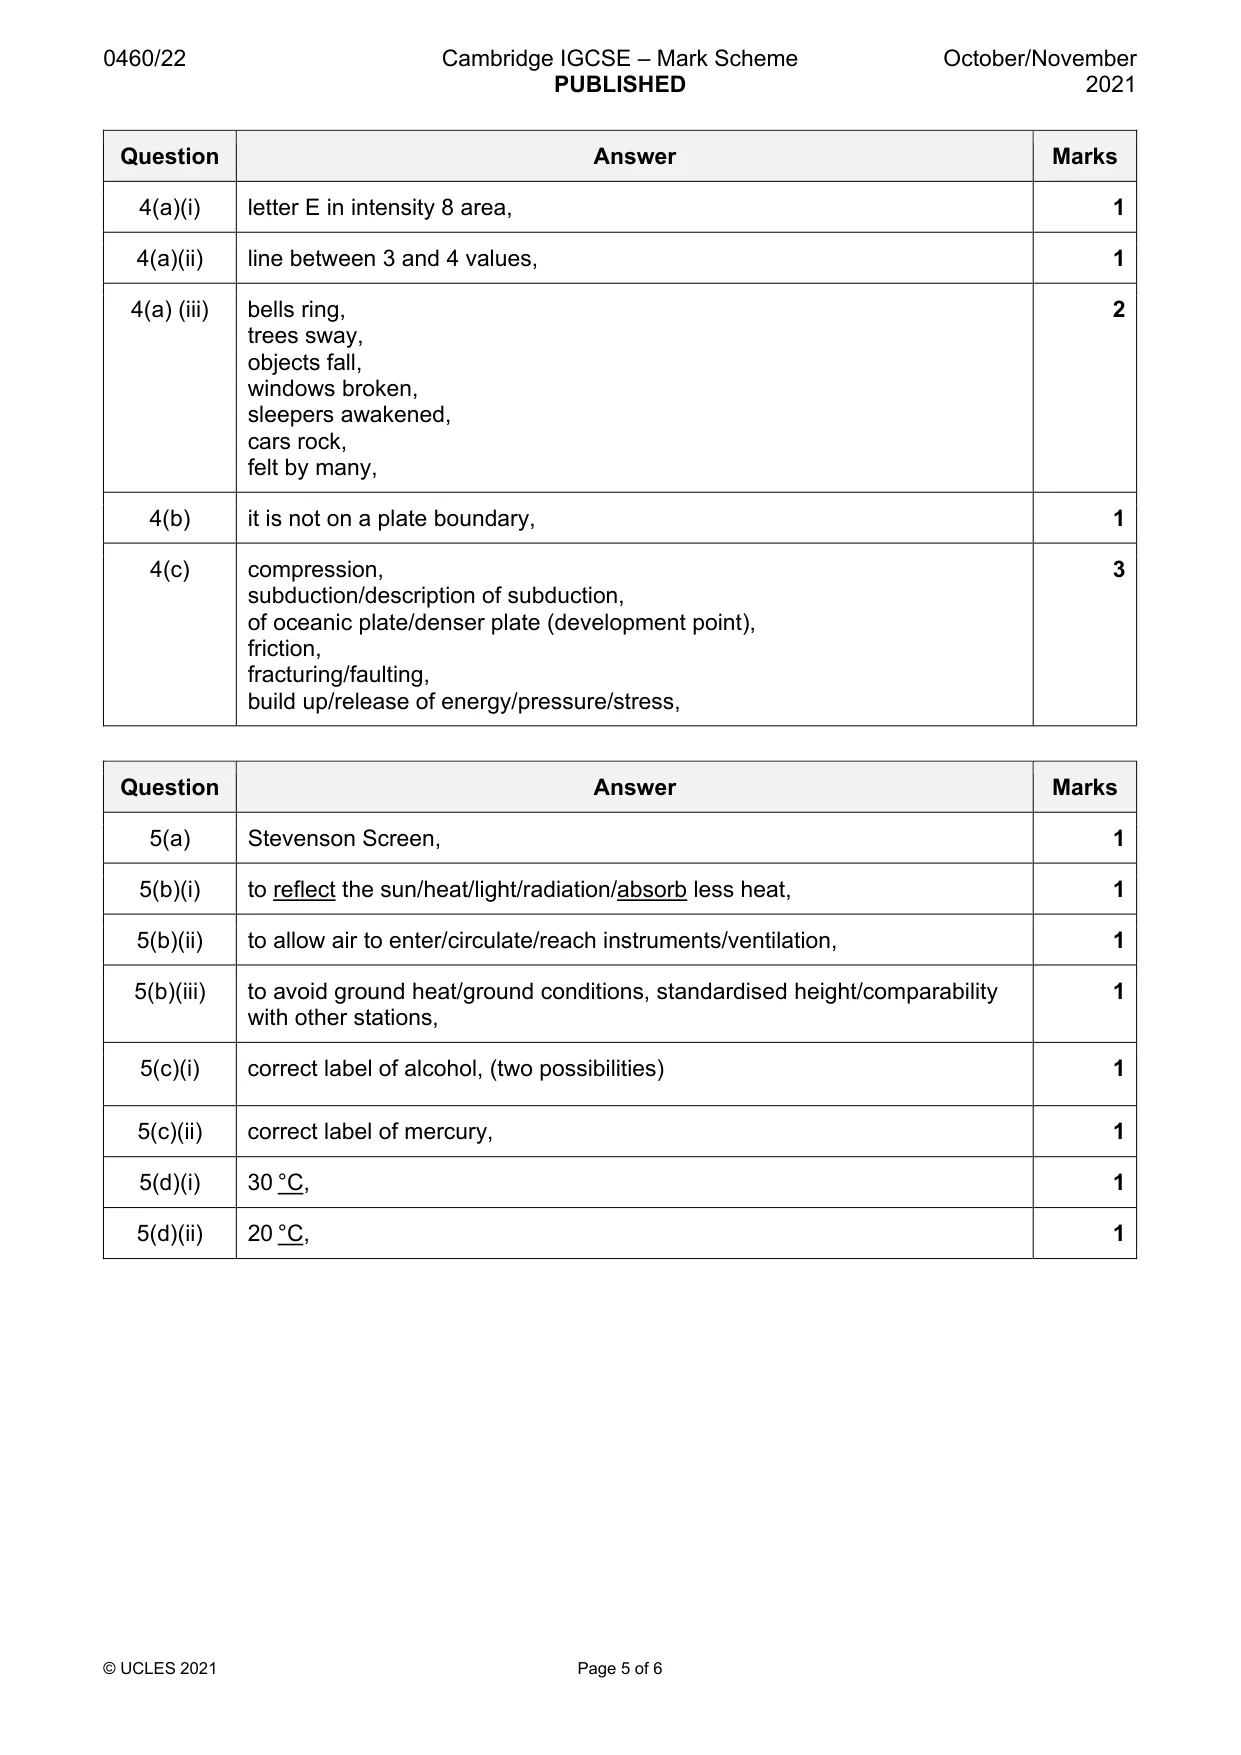
Mark scheme: 4(a)(i) letter E in intensity 8 area, 1 4(a)(ii) line between 3 and 4 values, 1 4(a) (iii) bells ring, 2 trees sway, objects fall, windows broken, sleepers awakened, cars rock, felt by many, 4(b) it is not on a plate boundary, 1 4(c) compression, 3 subduction/description of subduction, of oceanic plate/denser plate (development point), friction, fracturing/faulting, build up/release of energy/pressure/stress,
Q5 · Part of a weather station
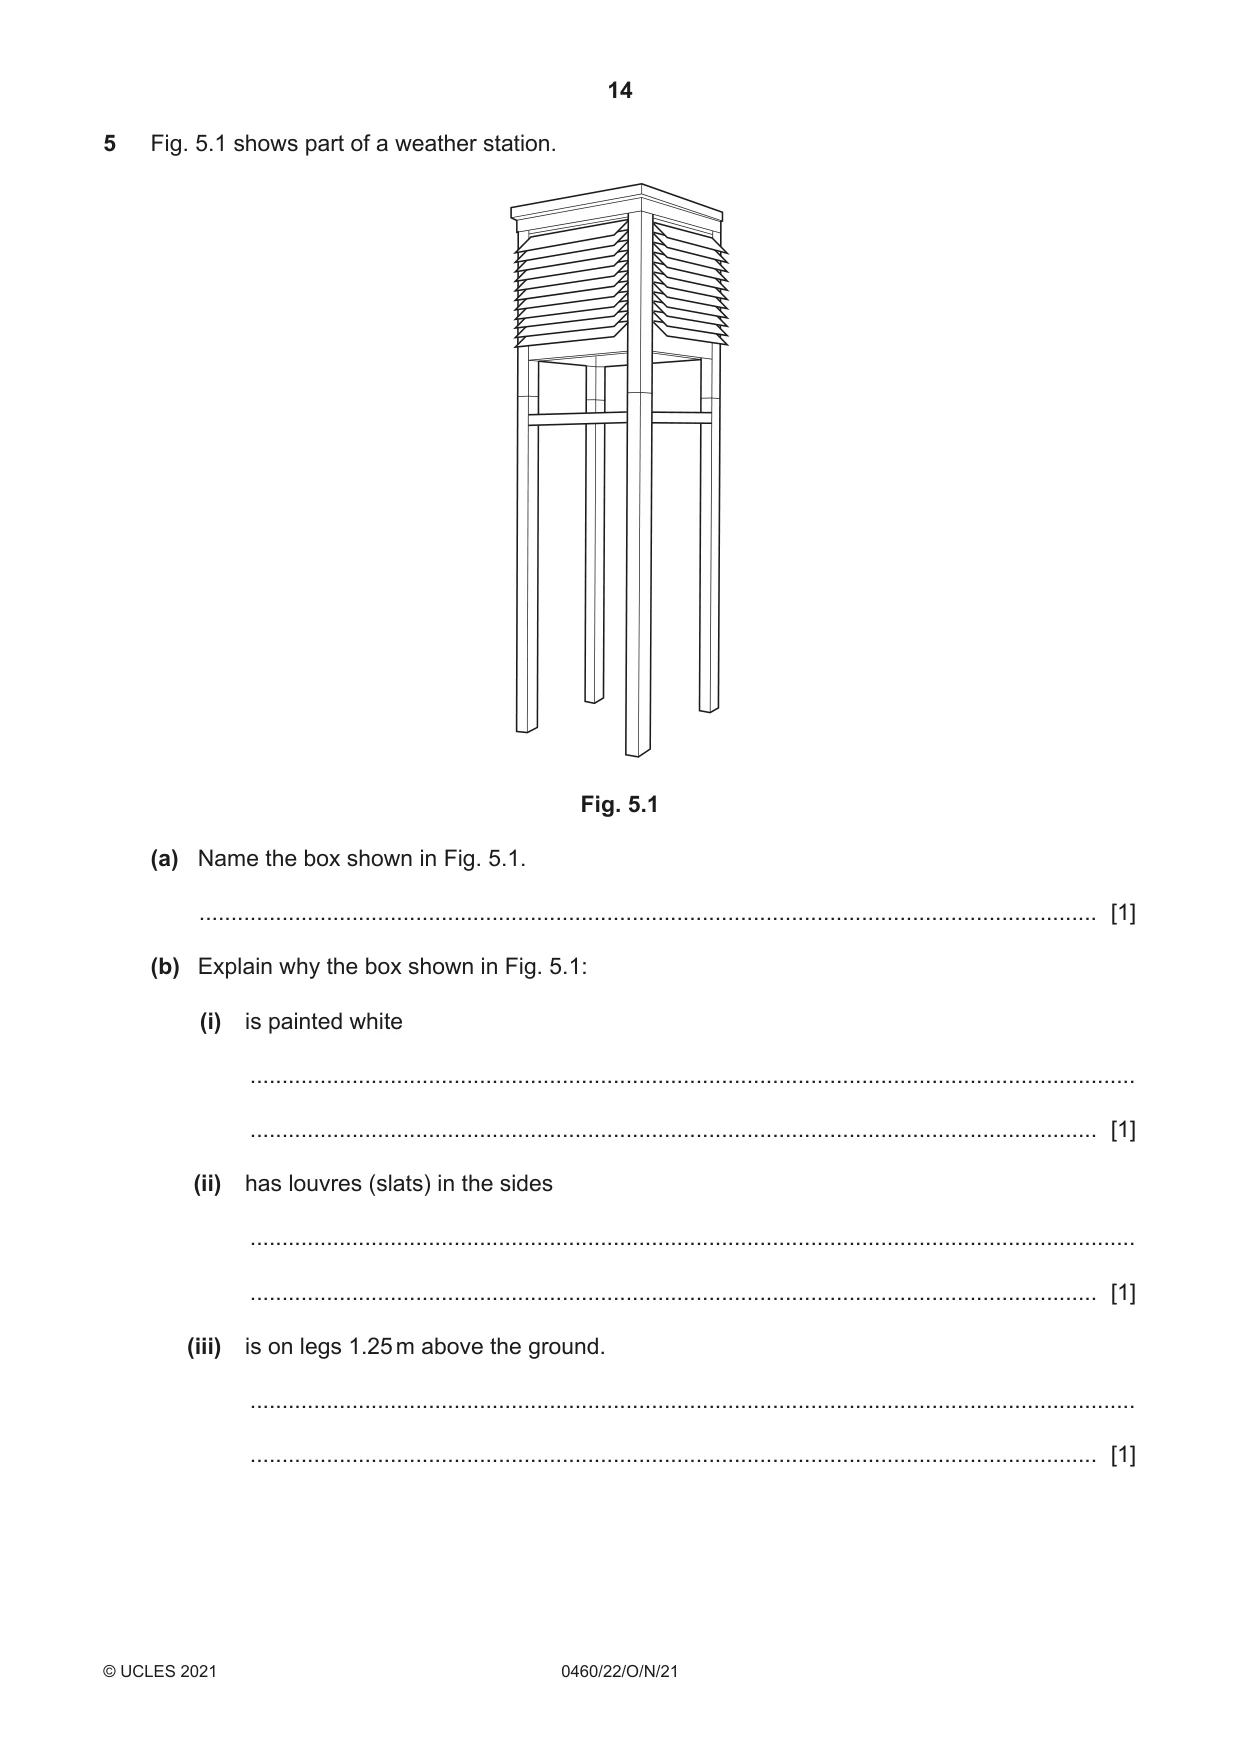
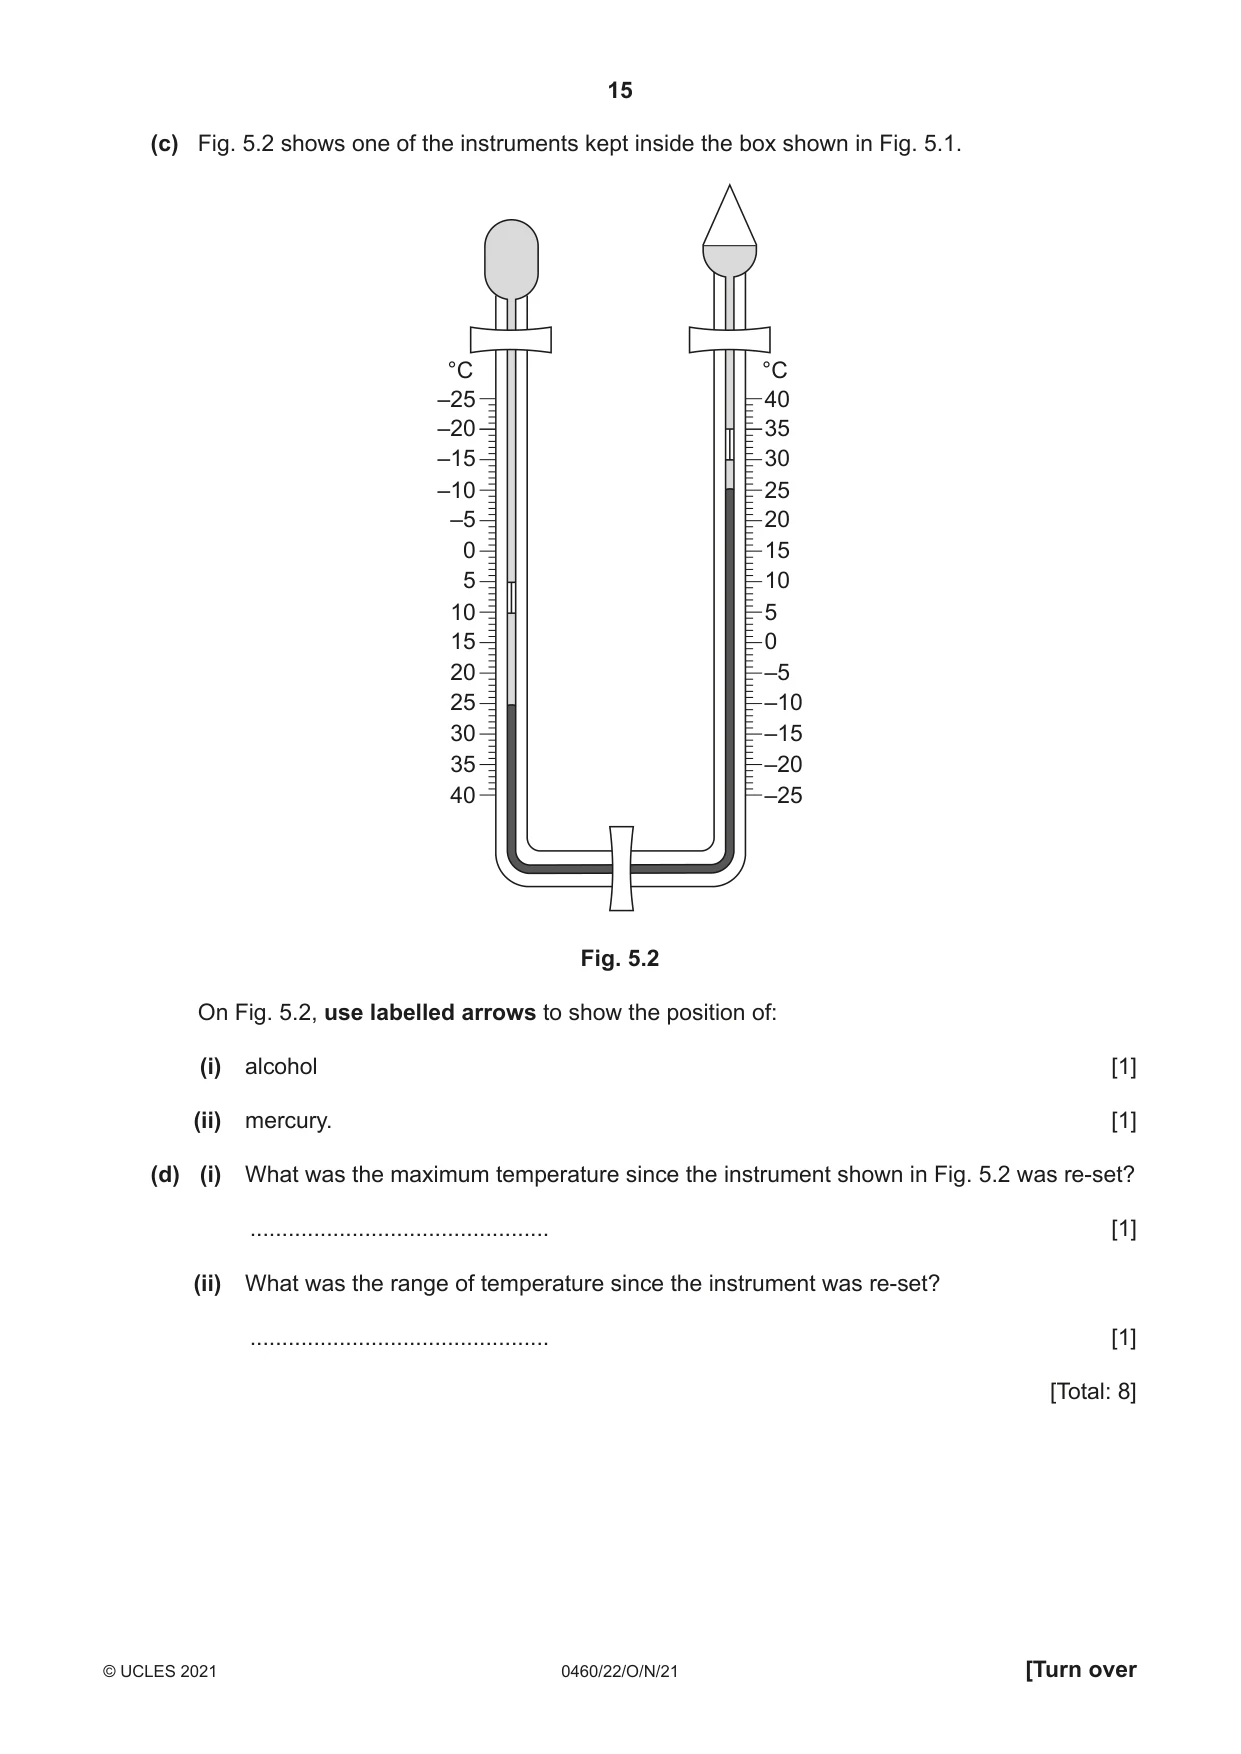
5 Fig. 5.1 shows part of a weather station. Fig. 5.1 (a) Name the box shown in Fig. 5.1. ............................................................................................................................................. [1] (b) Explain why the box shown in Fig. 5.1: (i) is painted white ........................................................................................................................................... ..................................................................................................................................... [1] (ii) has louvres (slats) in the sides ........................................................................................................................................... ..................................................................................................................................... [1] (iii) is on legs 1.25 m above the ground. ........................................................................................................................................... ..................................................................................................................................... [1] (c) Fig. 5.2 shows one of the instruments kept inside the box shown in Fig. 5.1. °C °C –25 40 –20 35 –15 30 –10 25 –5 20 0 15 5 10 10 5 15 0 20 –5 25 –10 30 –15 35 –20 40 –25 Fig. 5.2 On Fig. 5.2, use labelled arrows to show the position of: (i) alcohol [1] (ii) mercury. [1] (d) (i) What was the maximum temperature since the instrument shown in Fig. 5.2 was re-set? ............................................... [1] (ii) What was the range of temperature since the instrument was re-set? ............................................... [1] [Total: 8]
Mark scheme: 5(a) Stevenson Screen, 1 5(b)(i) to reflect the sun/heat/light/radiation/absorb less heat, 1 5(b)(ii) to allow air to enter/circulate/reach instruments/ventilation, 1 5(b)(iii) to avoid ground heat/ground conditions, standardised height/comparability 1 with other stations, 5(c)(i) correct label of alcohol, (two possibilities) 1 5(c)(ii) correct label of mercury, 1 5(d)(i) 30 °C, 1 5(d)(ii) 20 °C, 1
Question 6
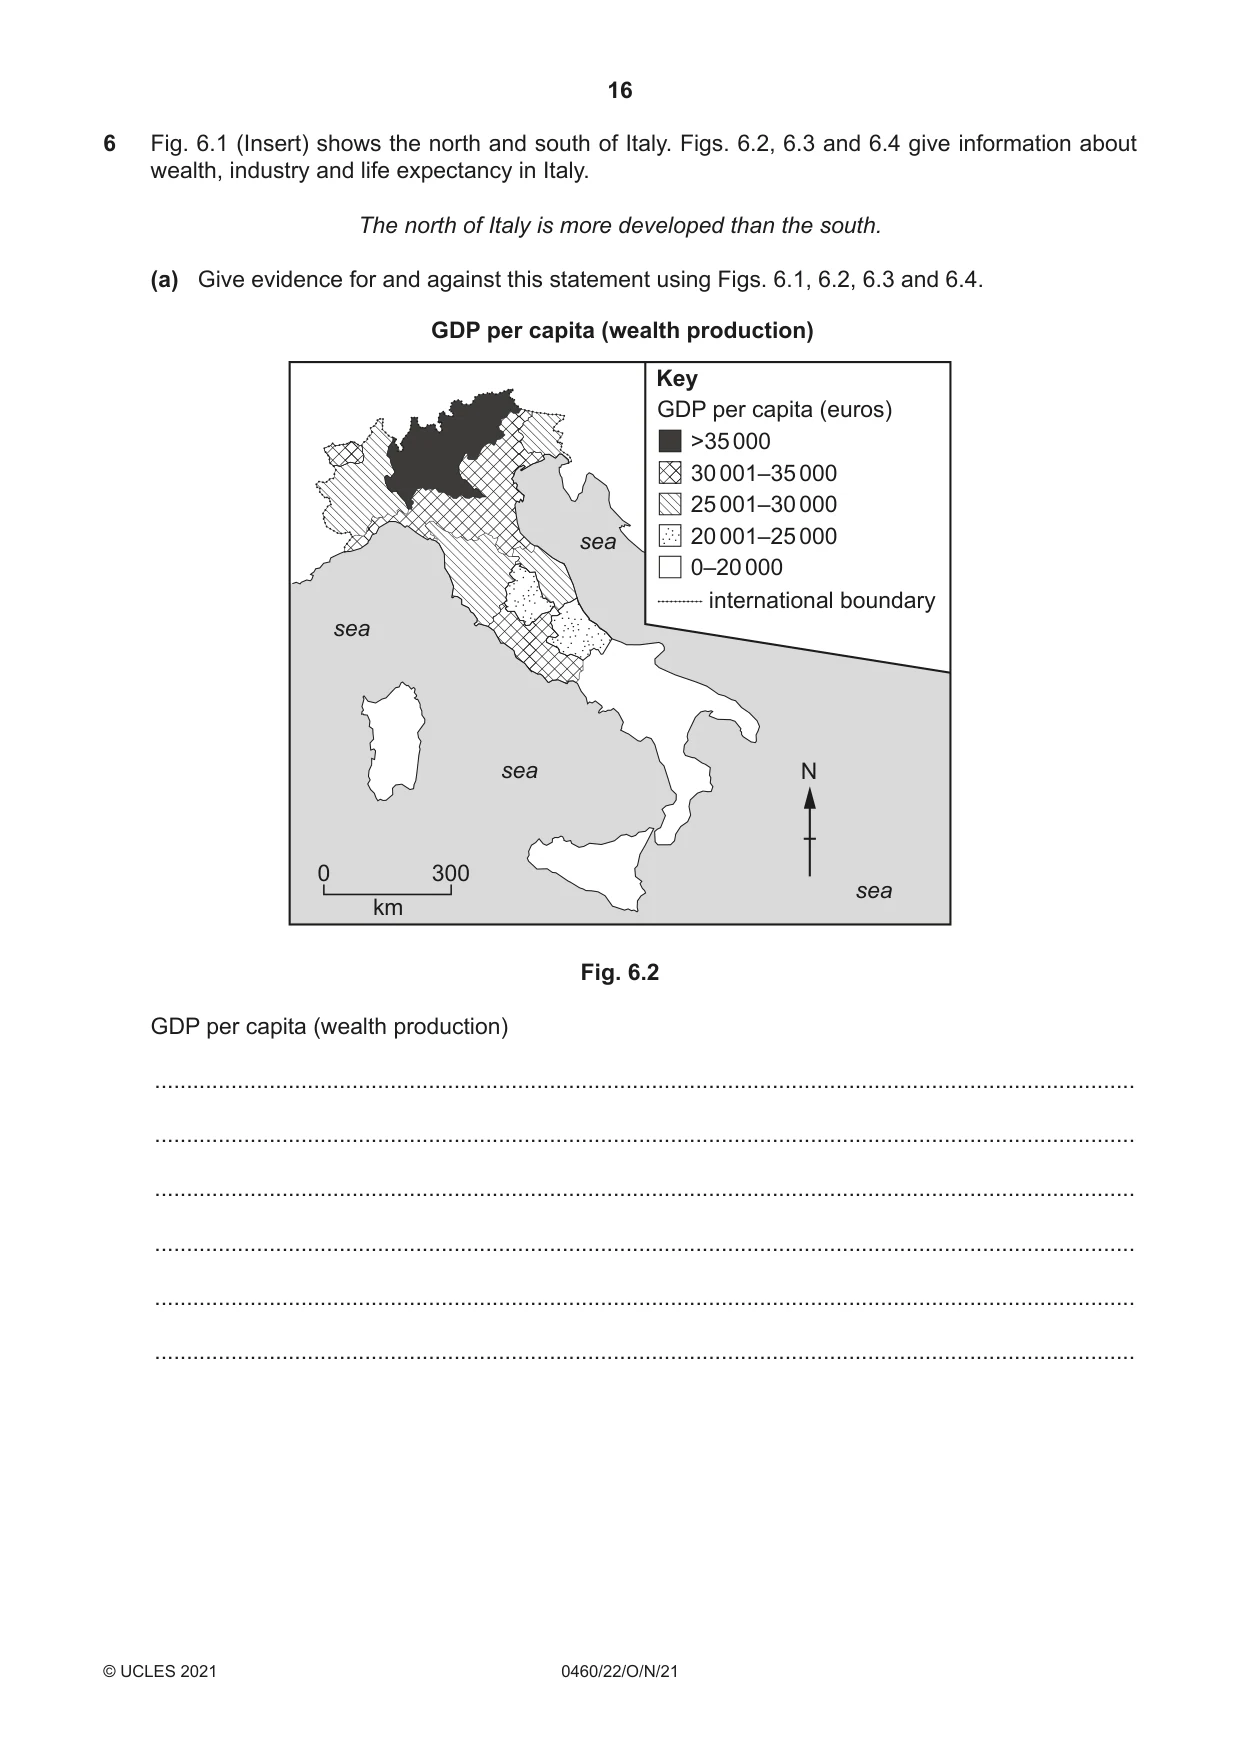
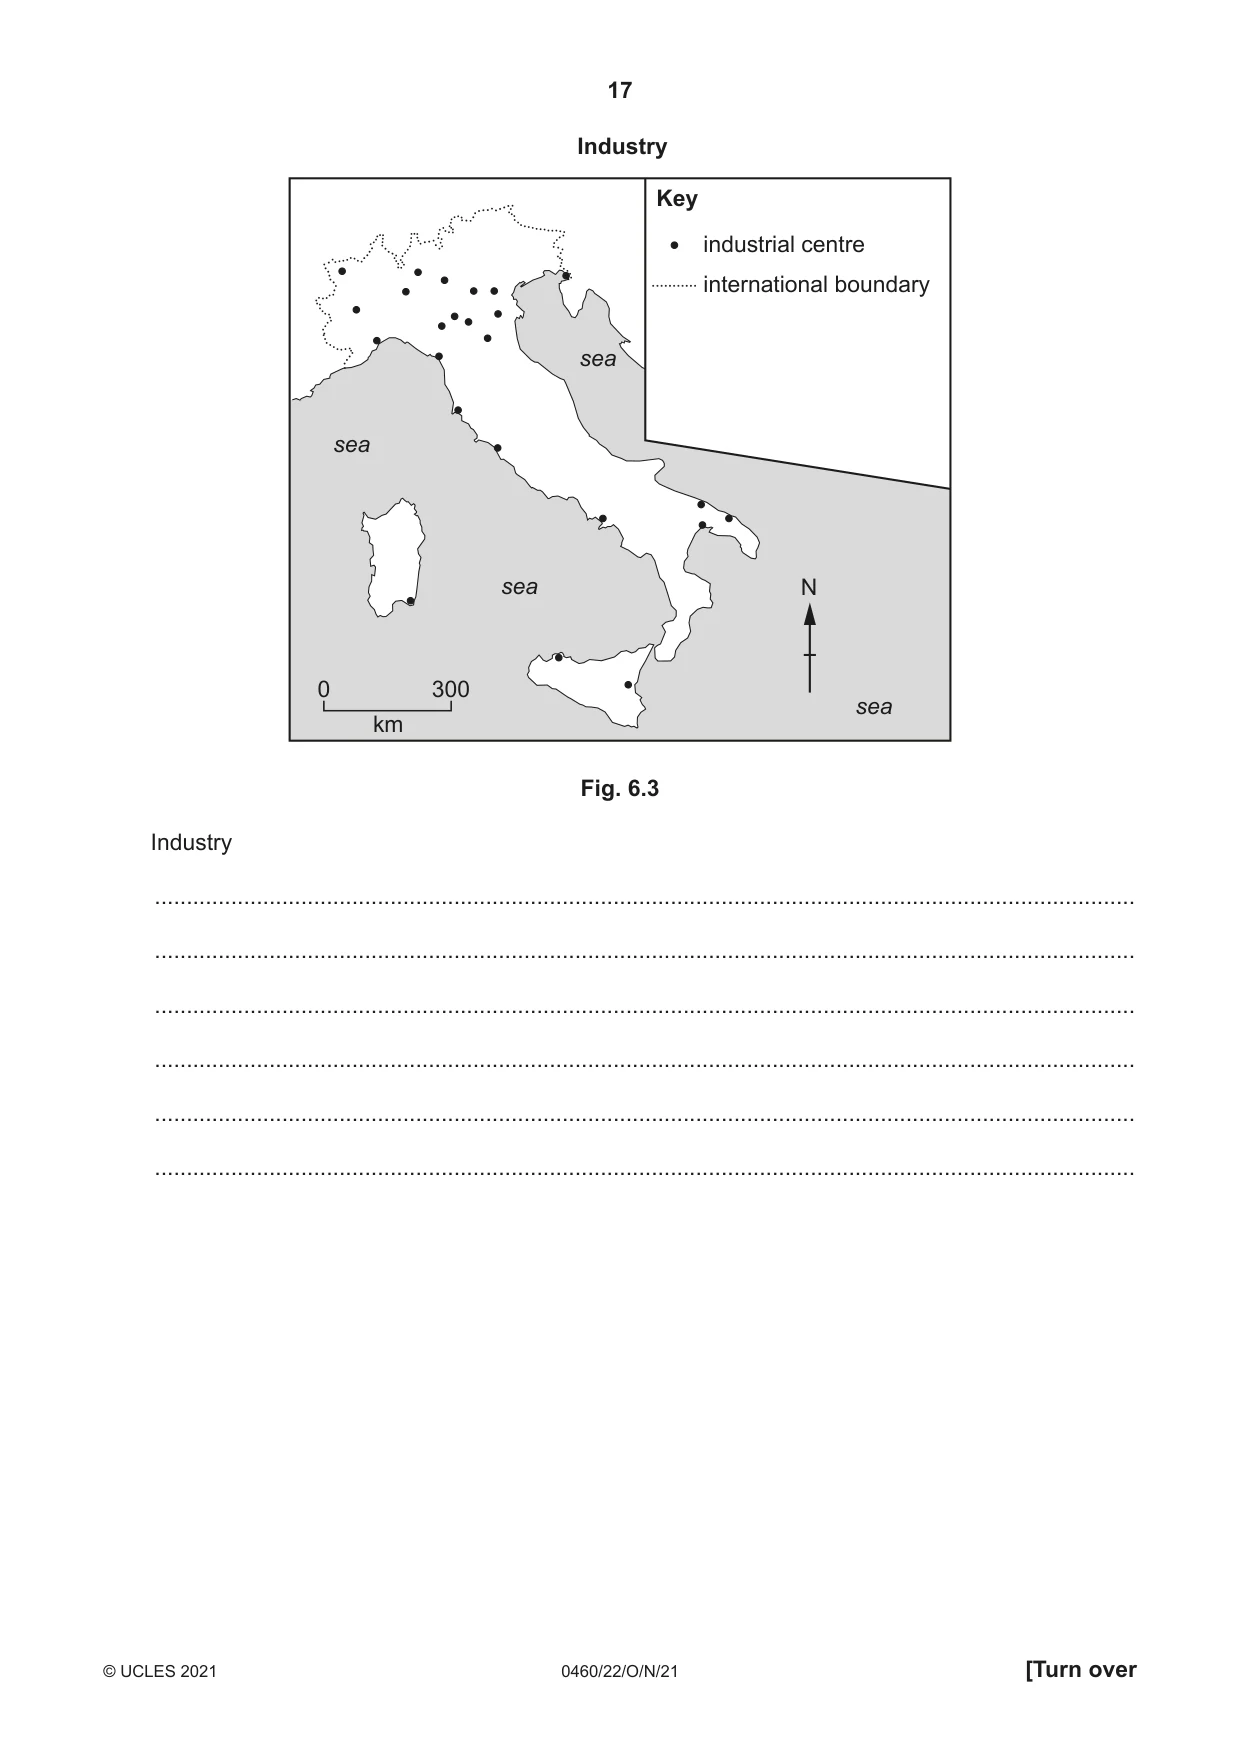
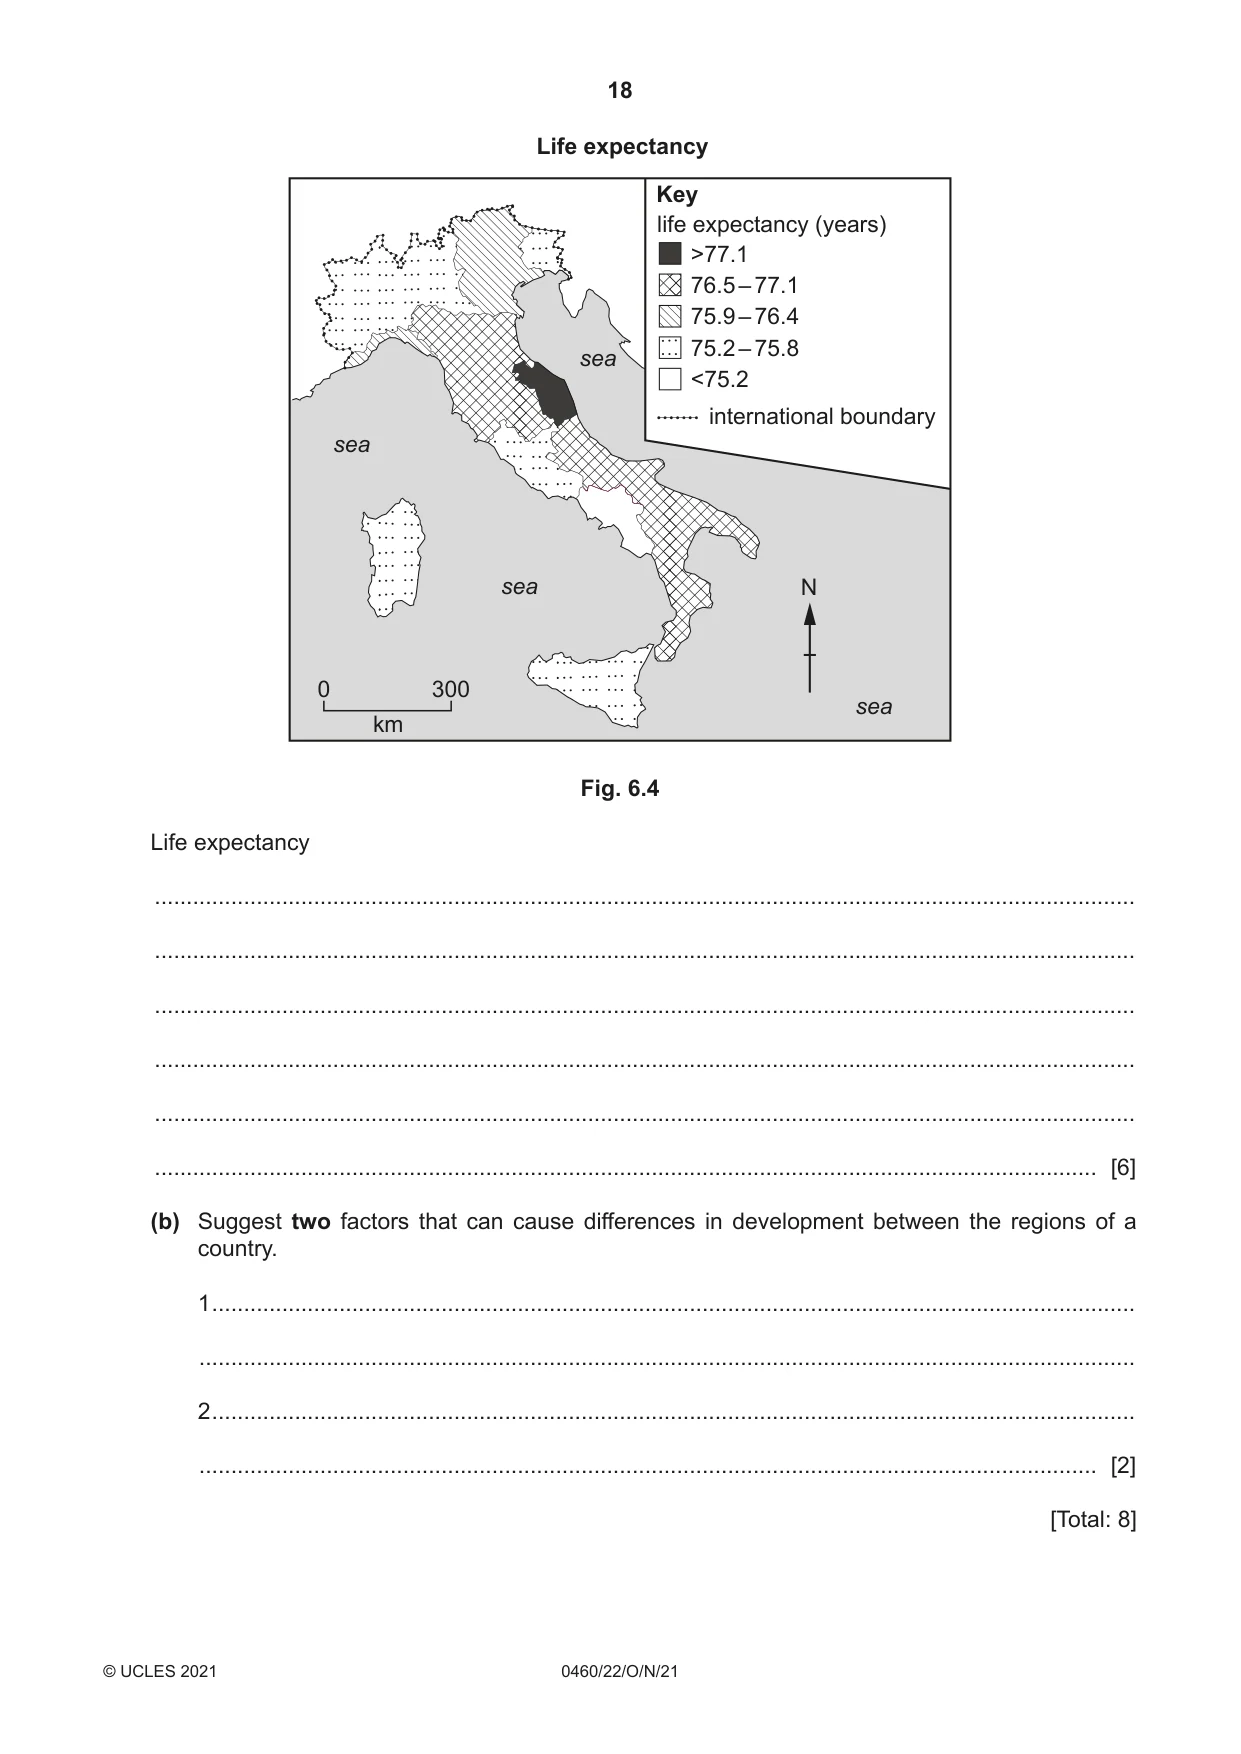
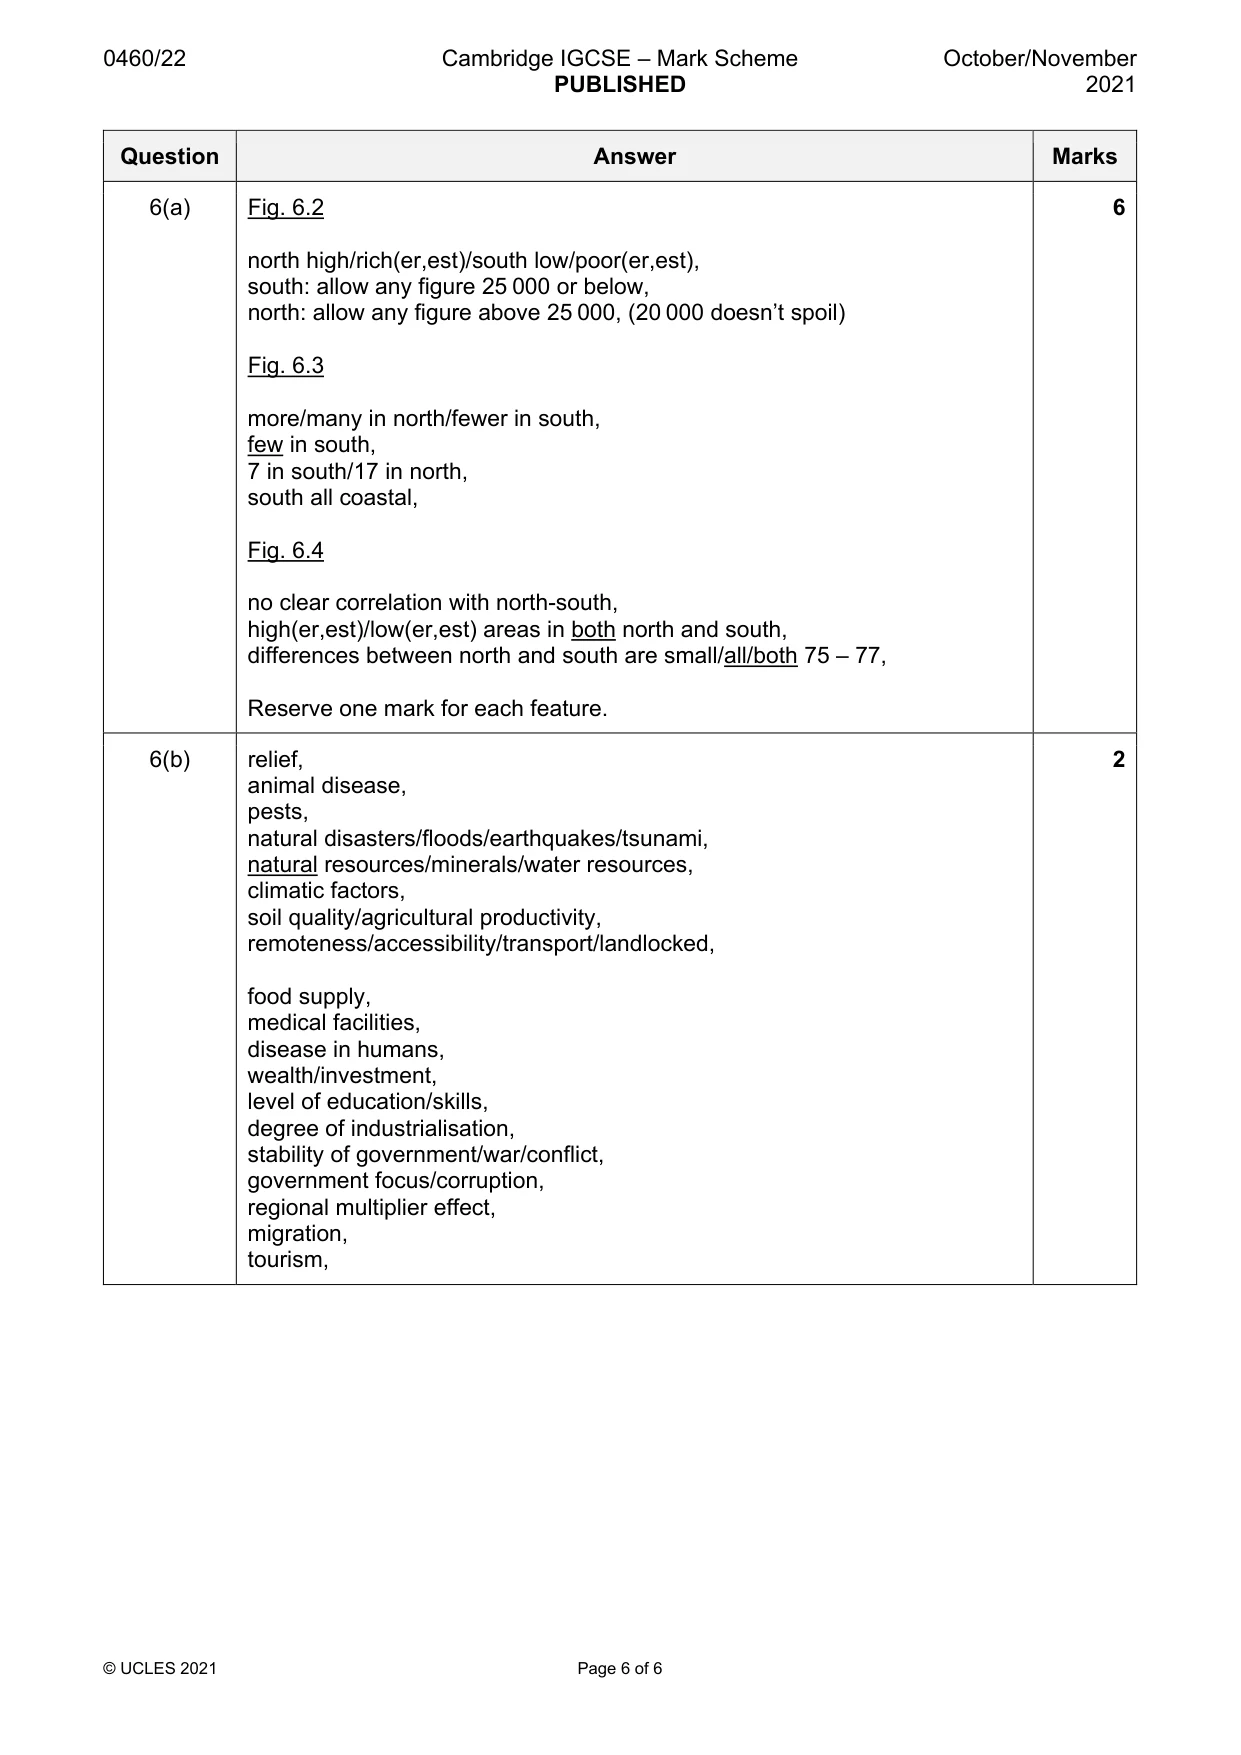
6 Fig. 6.1 (Insert) shows the north and south of Italy. Figs. 6.2, 6.3 and 6.4 give information about wealth, industry and life expectancy in Italy. The north of Italy is more developed than the south. (a) Give evidence for and against this statement using Figs. 6.1, 6.2, 6.3 and 6.4. GDP per capita (wealth production) Key GDP per capita (euros) >35 000 30 001–35 000 25 001–30 000 sea 20 001–25 000 0–20 000 international boundary sea sea N 0 300 sea km Fig. 6.2 GDP per capita (wealth production) .......................................................................................................................................................... .......................................................................................................................................................... .......................................................................................................................................................... .......................................................................................................................................................... .......................................................................................................................................................... .......................................................................................................................................................... Industry Key industrial centre international boundary sea sea sea N 0 300 sea km Fig. 6.3 Industry .......................................................................................................................................................... .......................................................................................................................................................... .......................................................................................................................................................... .......................................................................................................................................................... .......................................................................................................................................................... .......................................................................................................................................................... Life expectancy Key life expectancy (years) >77.1 76.5 – 77.1 75.9 – 76.4 75.2 – 75.8 sea <75.2 international boundary sea sea N 0 300 sea km Fig. 6.4 Life expectancy .......................................................................................................................................................... .......................................................................................................................................................... .......................................................................................................................................................... .......................................................................................................................................................... .......................................................................................................................................................... .................................................................................................................................................... [6] (b) Suggest two factors that can cause differences in development between the regions of a country. 1 ................................................................................................................................................. ................................................................................................................................................... 2 ................................................................................................................................................. ............................................................................................................................................. [2] [Total: 8]
Mark scheme: 6(a) Fig. 6.2 6 north high/rich(er,est)/south low/poor(er,est), south: allow any figure 25 000 or below, north: allow any figure above 25 000, (20 000 doesn’t spoil) Fig. 6.3 more/many in north/fewer in south, few in south, 7 in south/17 in north, south all coastal, Fig. 6.4 no clear correlation with north-south, high(er,est)/low(er,est) areas in both north and south, differences between north and south are small/all/both 75 – 77, Reserve one mark for each feature. 6(b) relief, 2 animal disease, pests, natural disasters/floods/earthquakes/tsunami, natural resources/minerals/water resources, climatic factors, soil quality/agricultural productivity, remoteness/accessibility/transport/landlocked, food supply, medical facilities, disease in humans, wealth/investment, level of education/skills, degree of industrialisation, stability of government/war/conflict, government focus/corruption, regional multiplier effect, migration, tourism,
What was in this paper
The subtopics covered by these 6 questions, and how many questions each got. Open one in a new tab to see every Cambridge question on it.
What you needed in this session
Cambridge’s own grade thresholds for 2021 Oct/Nov, Paper 2 · Variant 2. A higher threshold means an easier paper — the bar moves with how the cohort did.