Cambridge IGCSE Geography 0460 — 2019 Oct/Nov Paper 2 · Variant 1
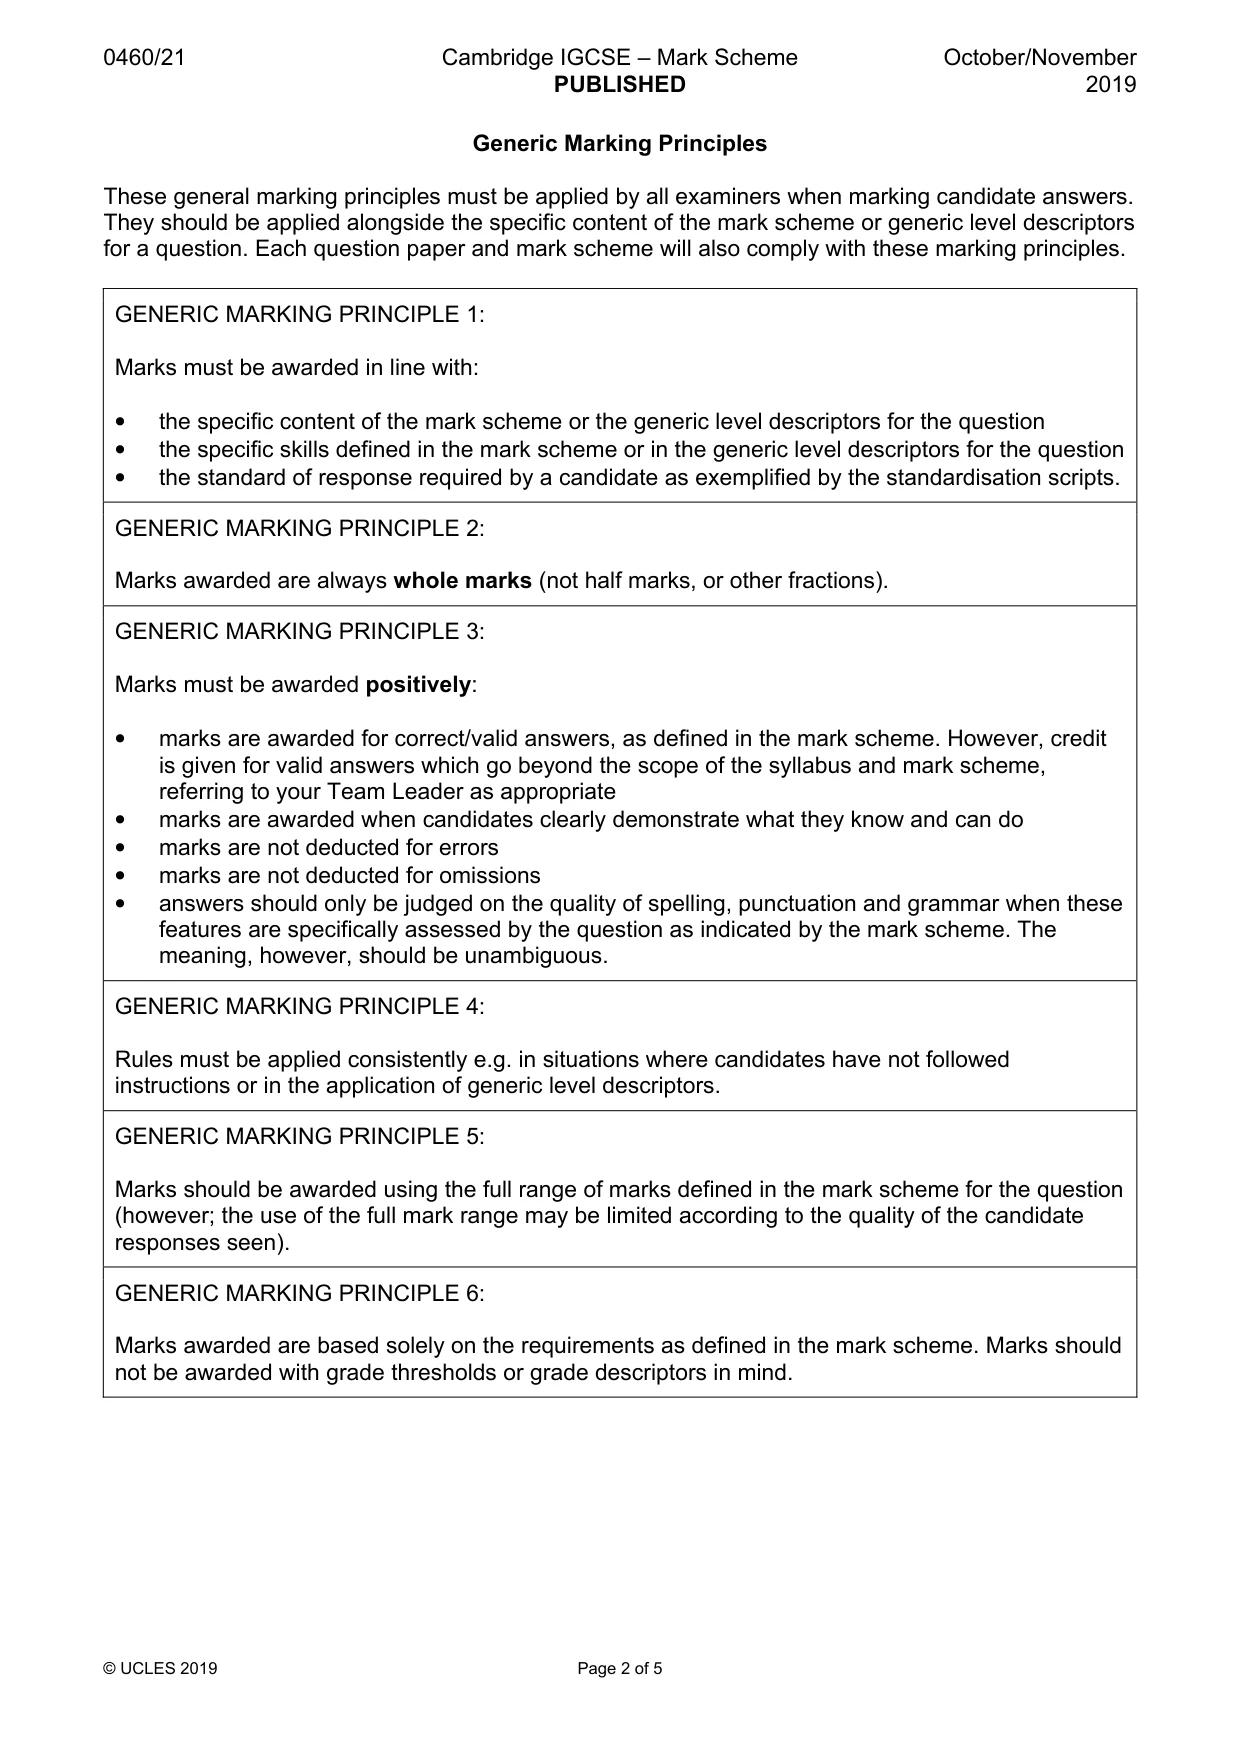
0460/21/O/N/19 · 6 questions · 60 marks · ≈68 min
The question paper and its mark scheme, free to read here and free to download. This is Cambridge’s own paper, exactly as it was sat.
Question paper20 pages

Mark scheme5 pages
Answers below. Sit the paper first if you are practising.
Questions as text
Q1 · Study the map extract for Hammarsjön, Sweden
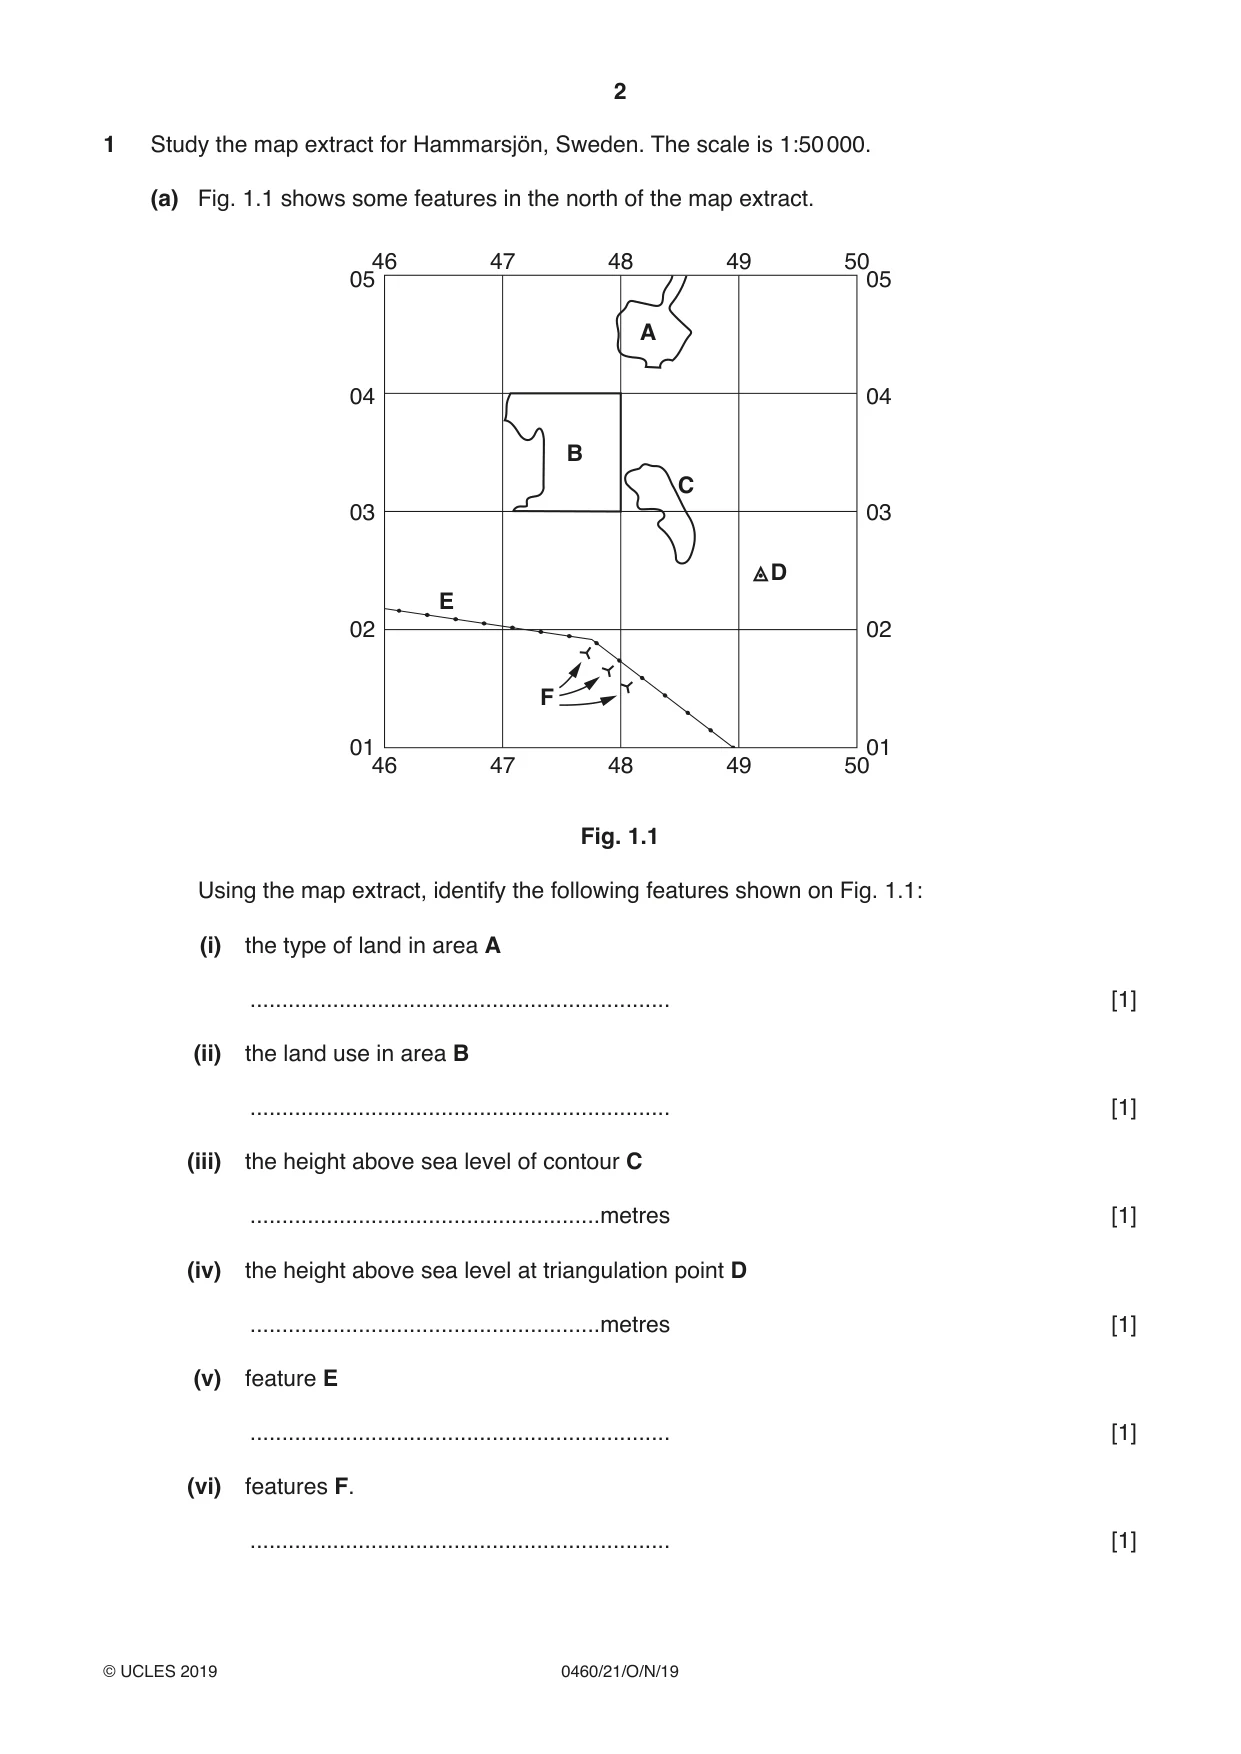
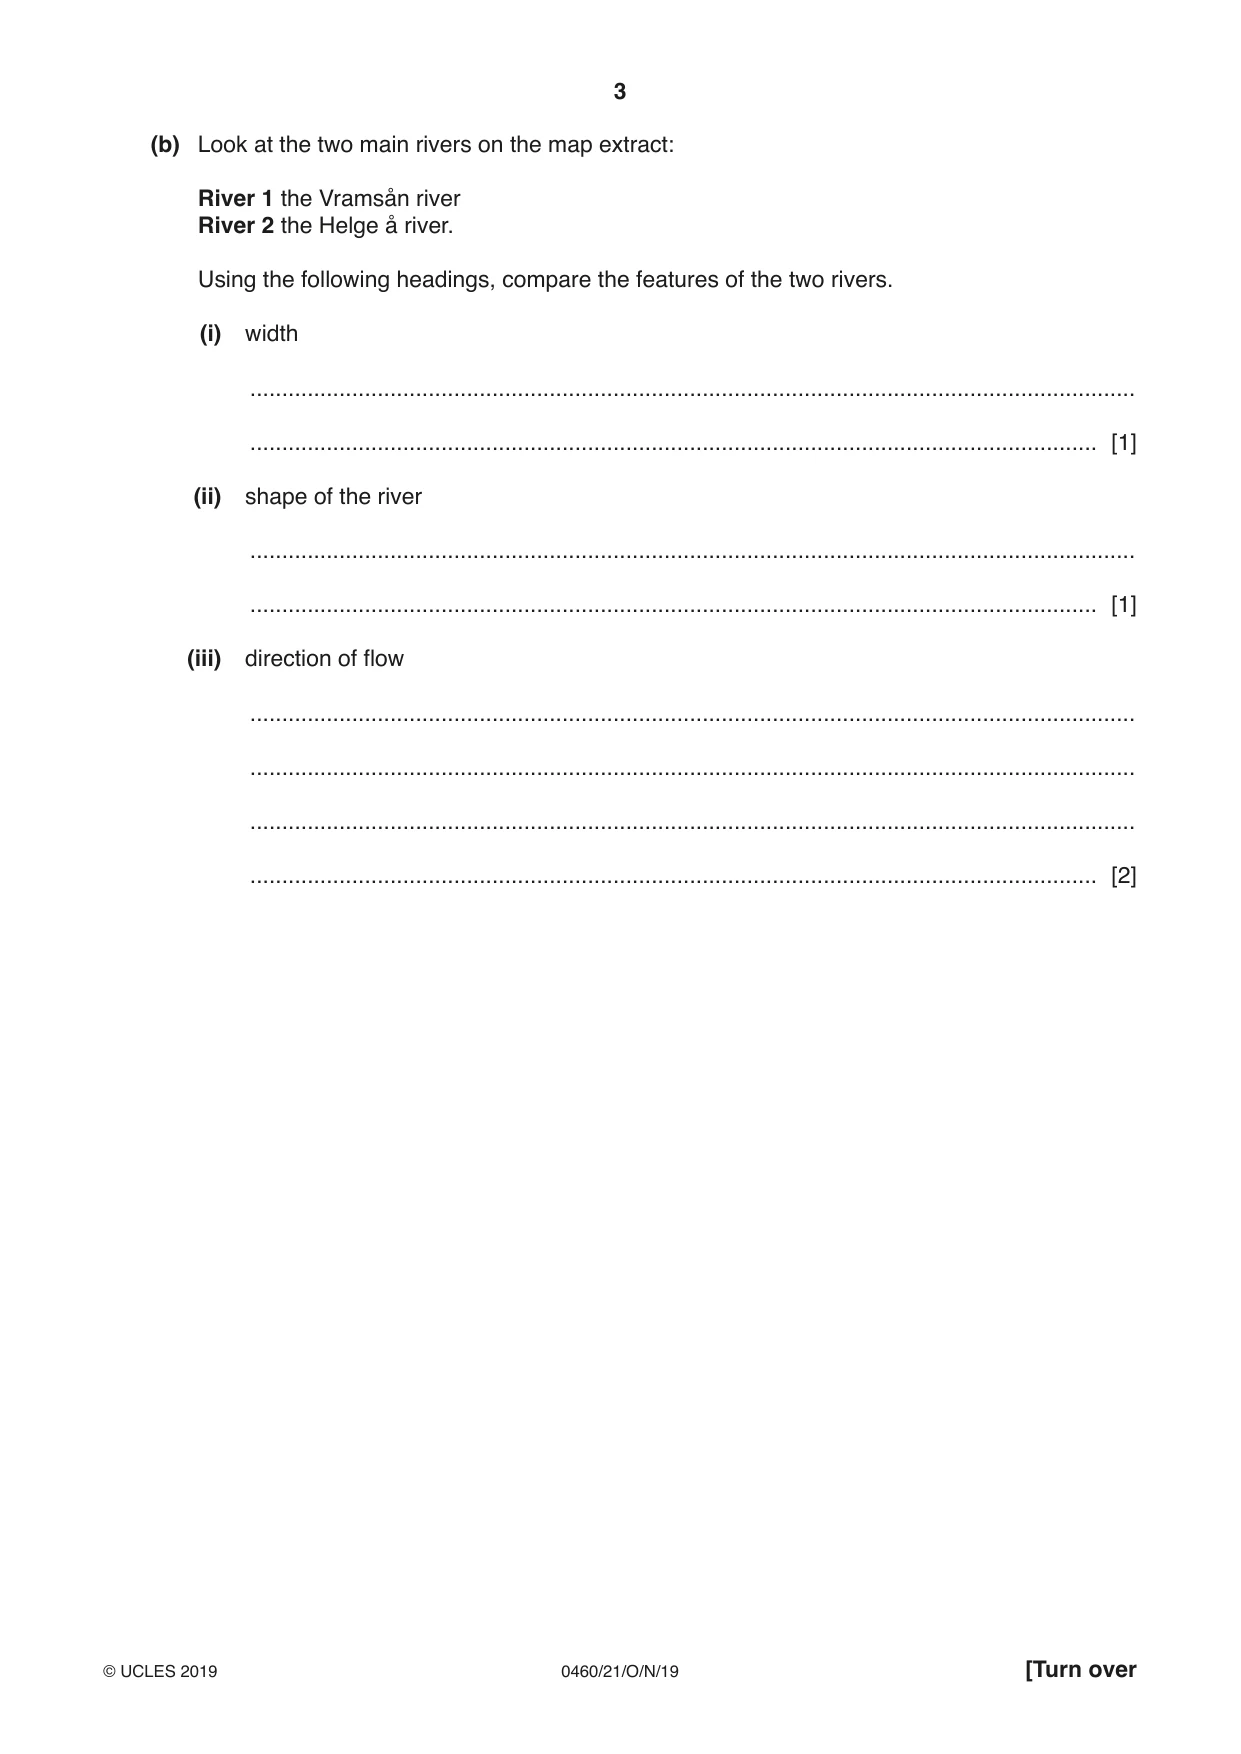
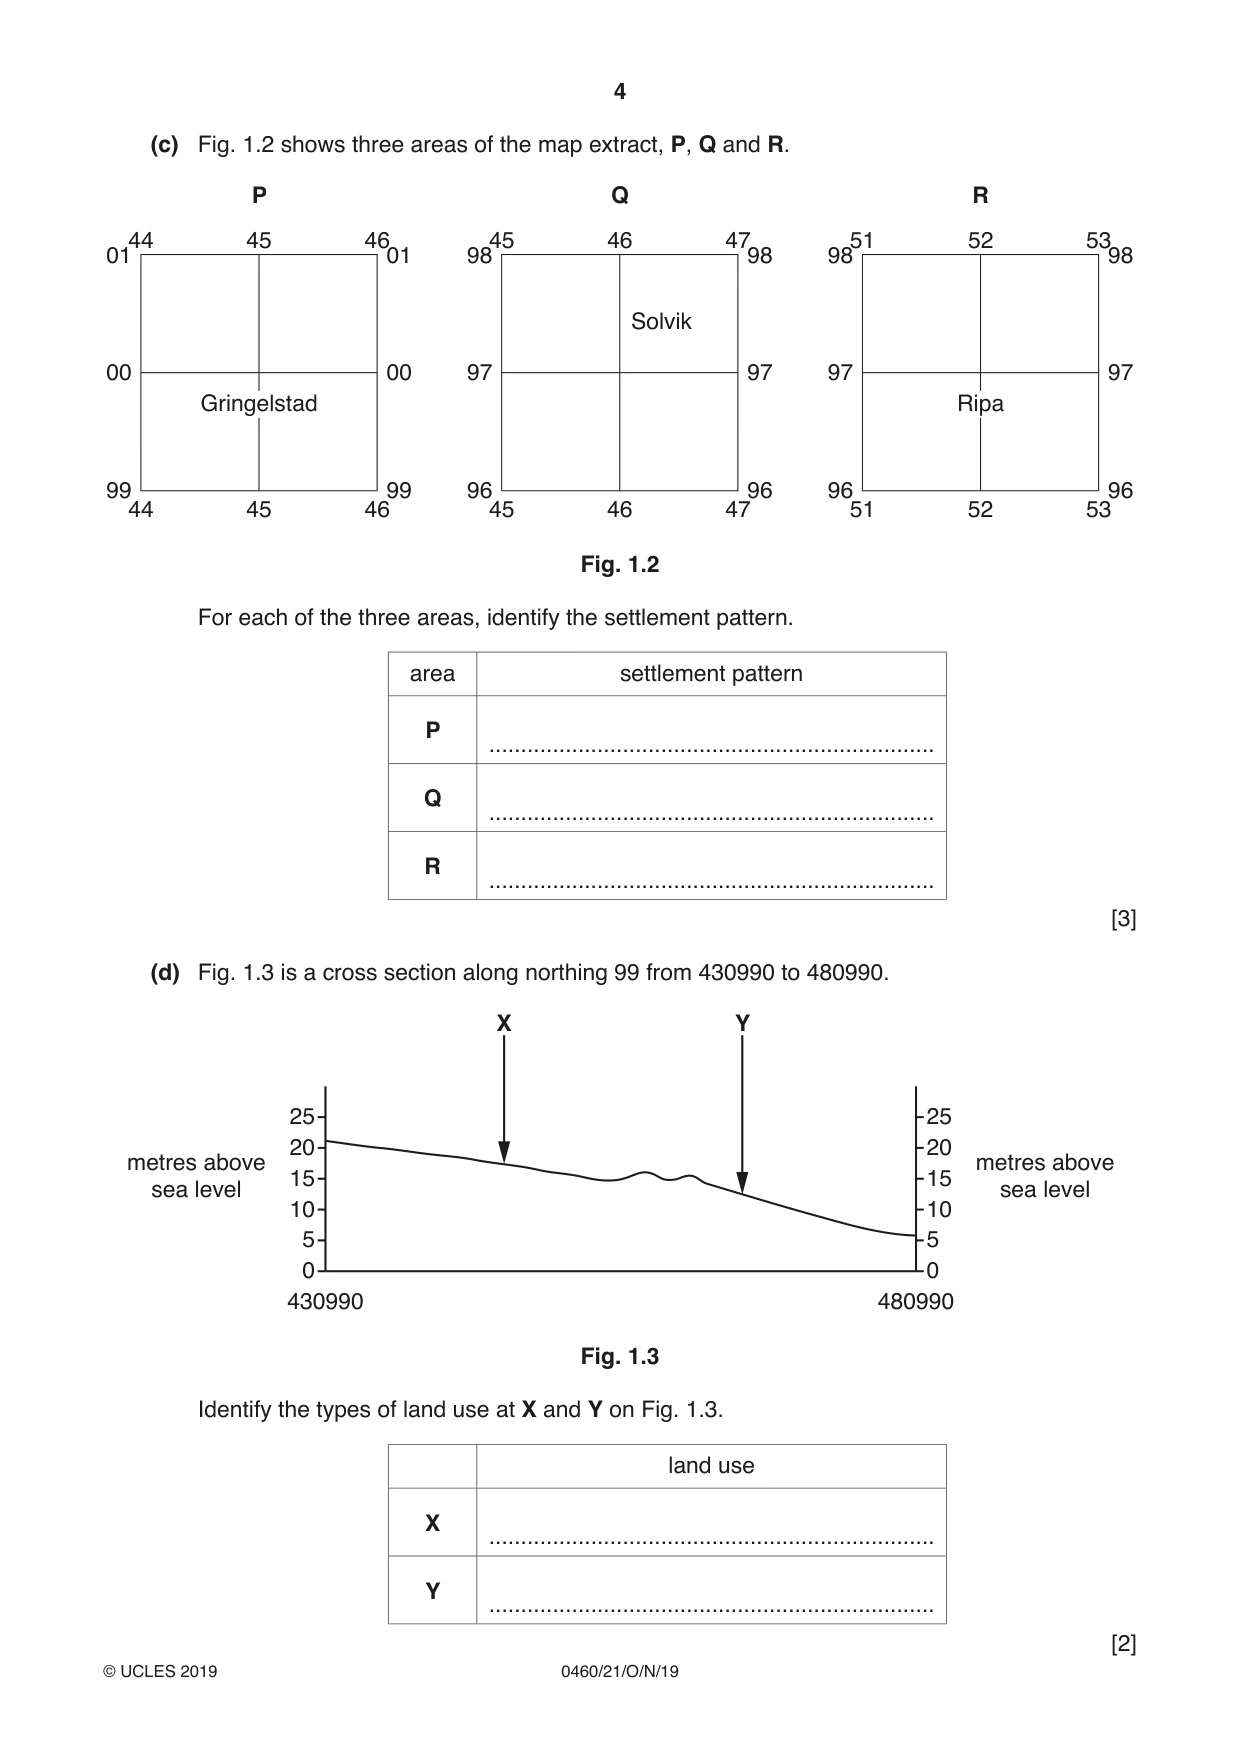
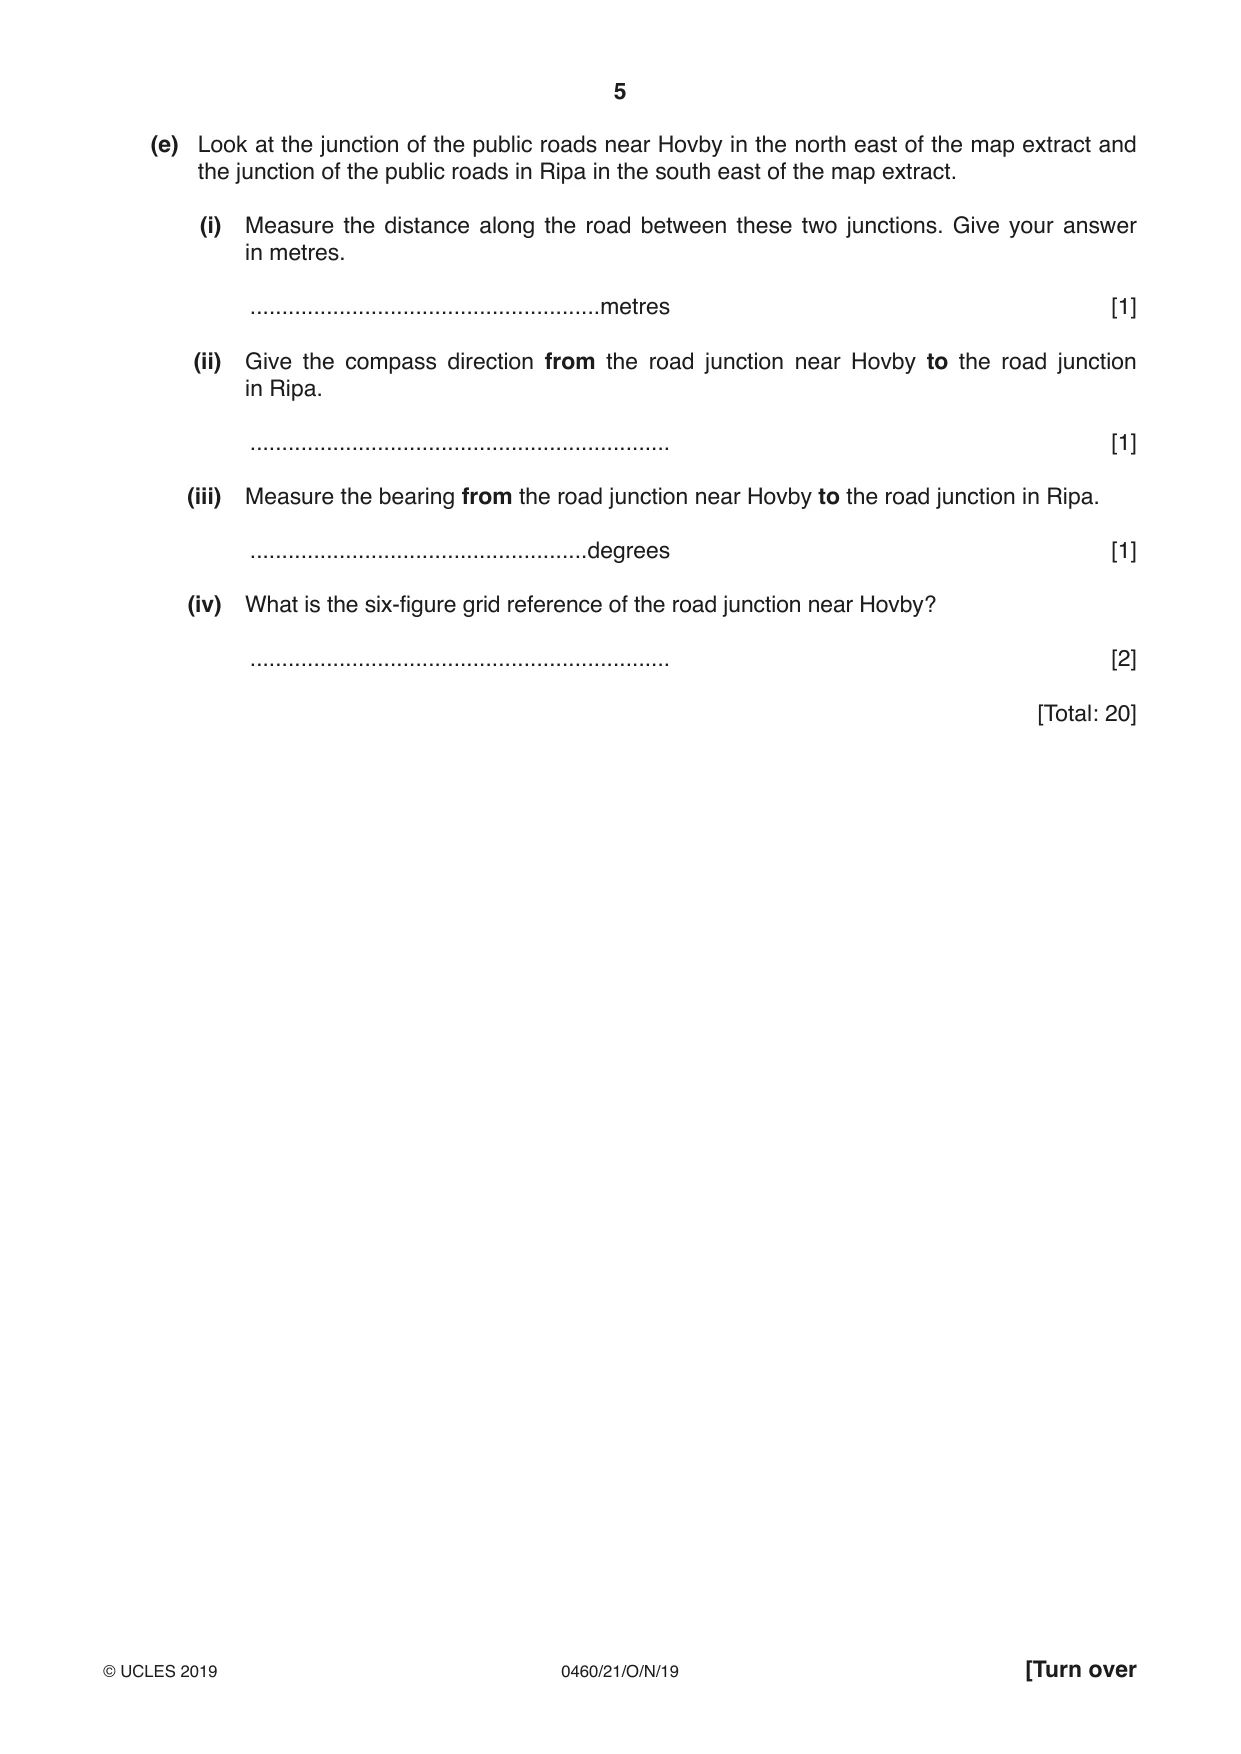
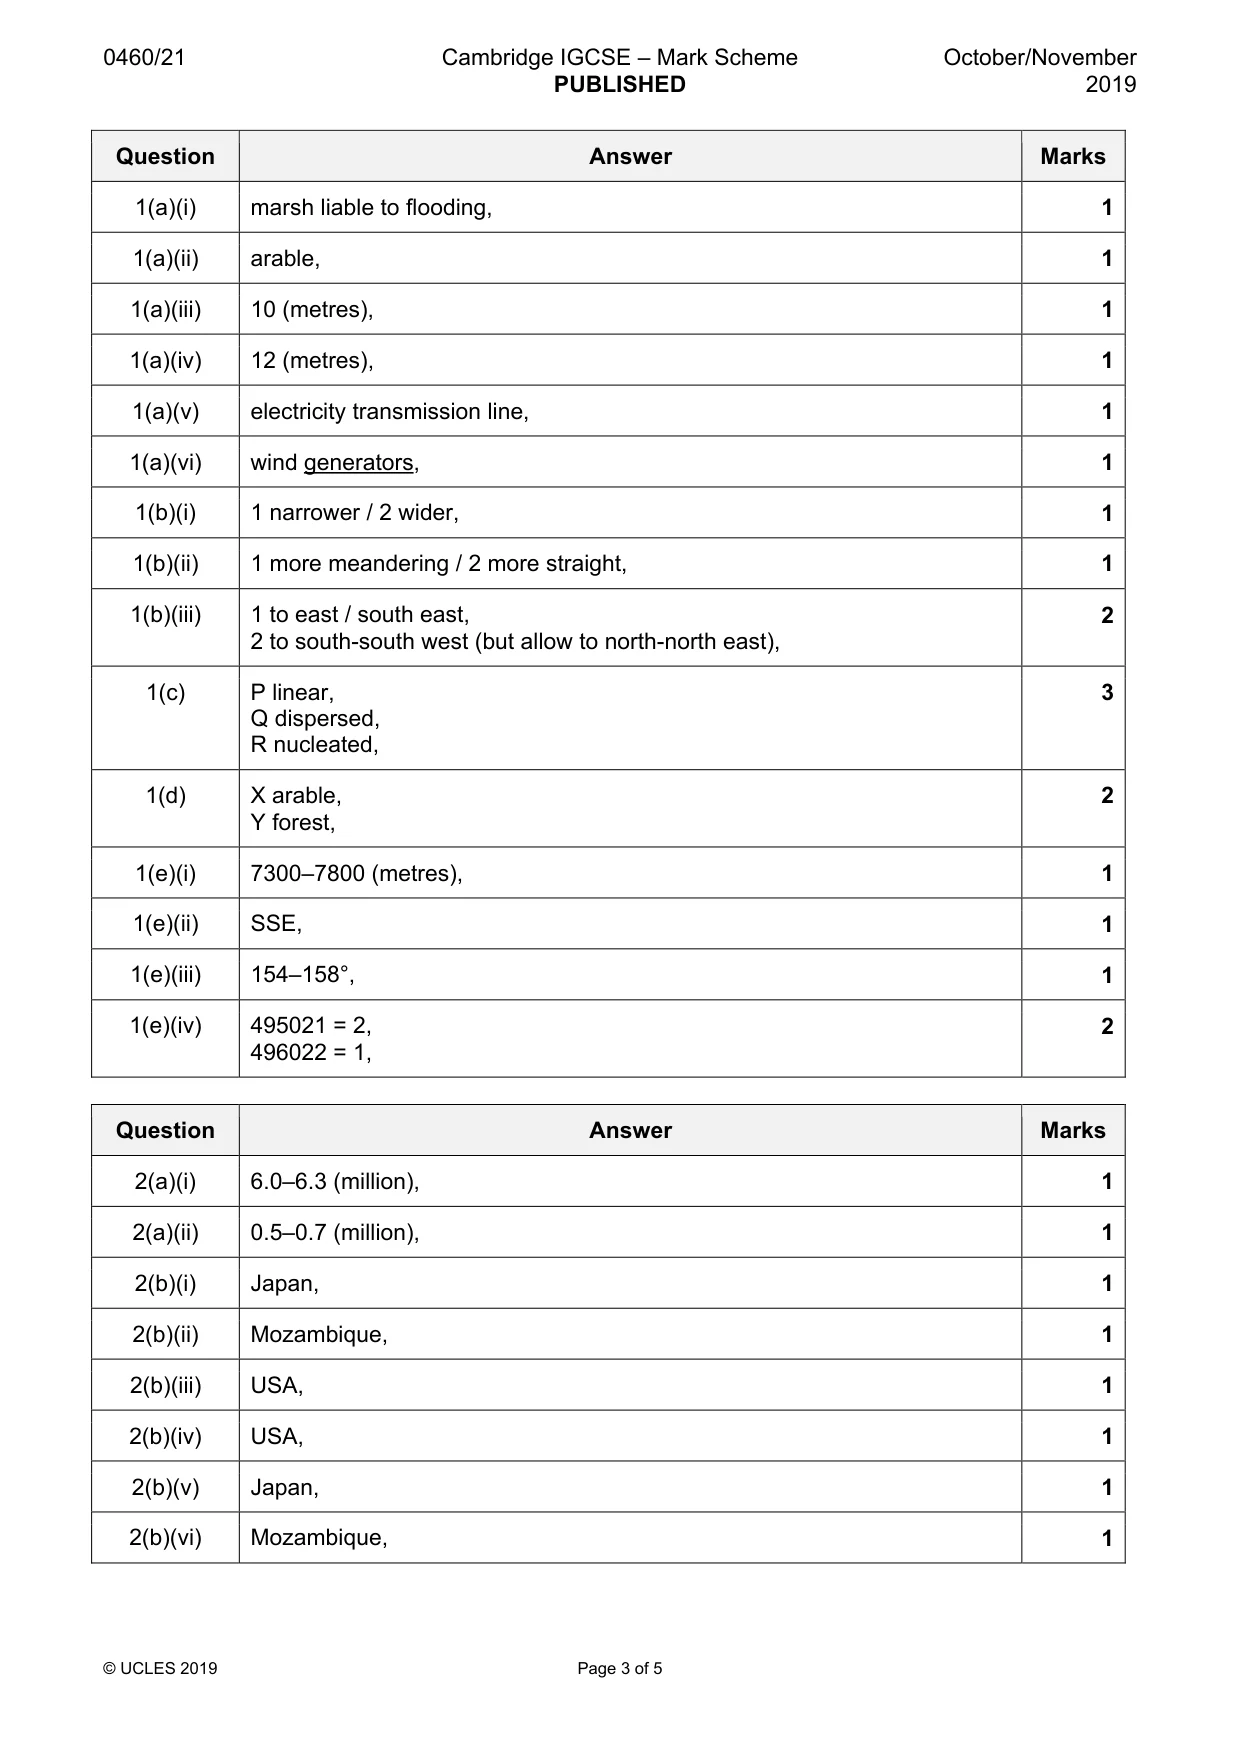
1 Study the map extract for Hammarsjön, Sweden. The scale is 1:50 000. (a) Fig. 1.1 shows some features in the north of the map extract. 46 47 48 49 50 05 05 A 04 04 B C 03 03 D E 02 02 F 01 01 46 47 48 49 50 Fig. 1.1 Using the map extract, identify the following features shown on Fig. 1.1: (i) the type of land in area A .................................................................. [1] (ii) the land use in area B .................................................................. [1] (iii) the height above sea level of contour C .......................................................metres [1] (iv) the height above sea level at triangulation point D .......................................................metres [1] (v) feature E .................................................................. [1] (vi) features F. .................................................................. [1] (b) Look at the two main rivers on the map extract: River 1 the Vramsån river River 2 the Helge å river. Using the following headings, compare the features of the two rivers. (i) width ........................................................................................................................................... ..................................................................................................................................... [1] (ii) shape of the river ........................................................................................................................................... ..................................................................................................................................... [1] (iii) direction of flow ........................................................................................................................................... ........................................................................................................................................... ........................................................................................................................................... ..................................................................................................................................... [2] (c) Fig. 1.2 shows three areas of the map extract, P, Q and R. P Q R 44 45 46 45 46 47 51 52 5301 01 98 98 98 98 Solvik 00 00 97 97 97 97 Gringelstad Ripa 99 99 96 96 96 96 44 45 46 45 46 47 51 52 53 Fig. 1.2 For each of the three areas, identify the settlement pattern. area settlement pattern P ...................................................................... Q ...................................................................... R ...................................................................... [3] (d) Fig. 1.3 is a cross section along northing 99 from 430990 to 480990. X Y 25 25 20 20 metres above metres above 15 15 sea level sea level 10 10 5 5 0 0 430990 480990 Fig. 1.3 Identify the types of land use at X and Y on Fig. 1.3. land use X ...................................................................... Y ...................................................................... [2] (e) Look at the junction of the public roads near Hovby in the north east of the map extract and the junction of the public roads in Ripa in the south east of the map extract. (i) Measure the distance along the road between these two junctions. Give your answer in metres. .......................................................metres [1] (ii) Give the compass direction from the road junction near Hovby to the road junction in Ripa. .................................................................. [1] (iii) Measure the bearing from the road junction near Hovby to the road junction in Ripa. .....................................................degrees [1] (iv) What is the six-figure grid reference of the road junction near Hovby? .................................................................. [2] [Total: 20]
Mark scheme: Question Answer Marks 1(a)(i) marsh liable to flooding, 1 1(a)(ii) arable, 1 1(a)(iii) 10 (metres), 1 1(a)(iv) 12 (metres), 1 1(a)(v) electricity transmission line, 1 1(a)(vi) wind generators, 1 1(b)(i) 1 narrower / 2 wider, 1 1(b)(ii) 1 more meandering / 2 more straight, 1 1(b)(iii) 1 to east / south east, 2 2 to south-south west (but allow to north-north east), 1(c) P linear, 3 Q dispersed, R nucleated, 1(d) X arable, 2 Y forest, 1(e)(i) 7300–7800 (metres), 1 1(e)(ii) SSE, 1 1(e)(iii) 154–158°, 1 1(e)(iv) 495021 = 2, 2 496022 = 1,
More questions on Settlements (rural and urban) and service provision
Question 2
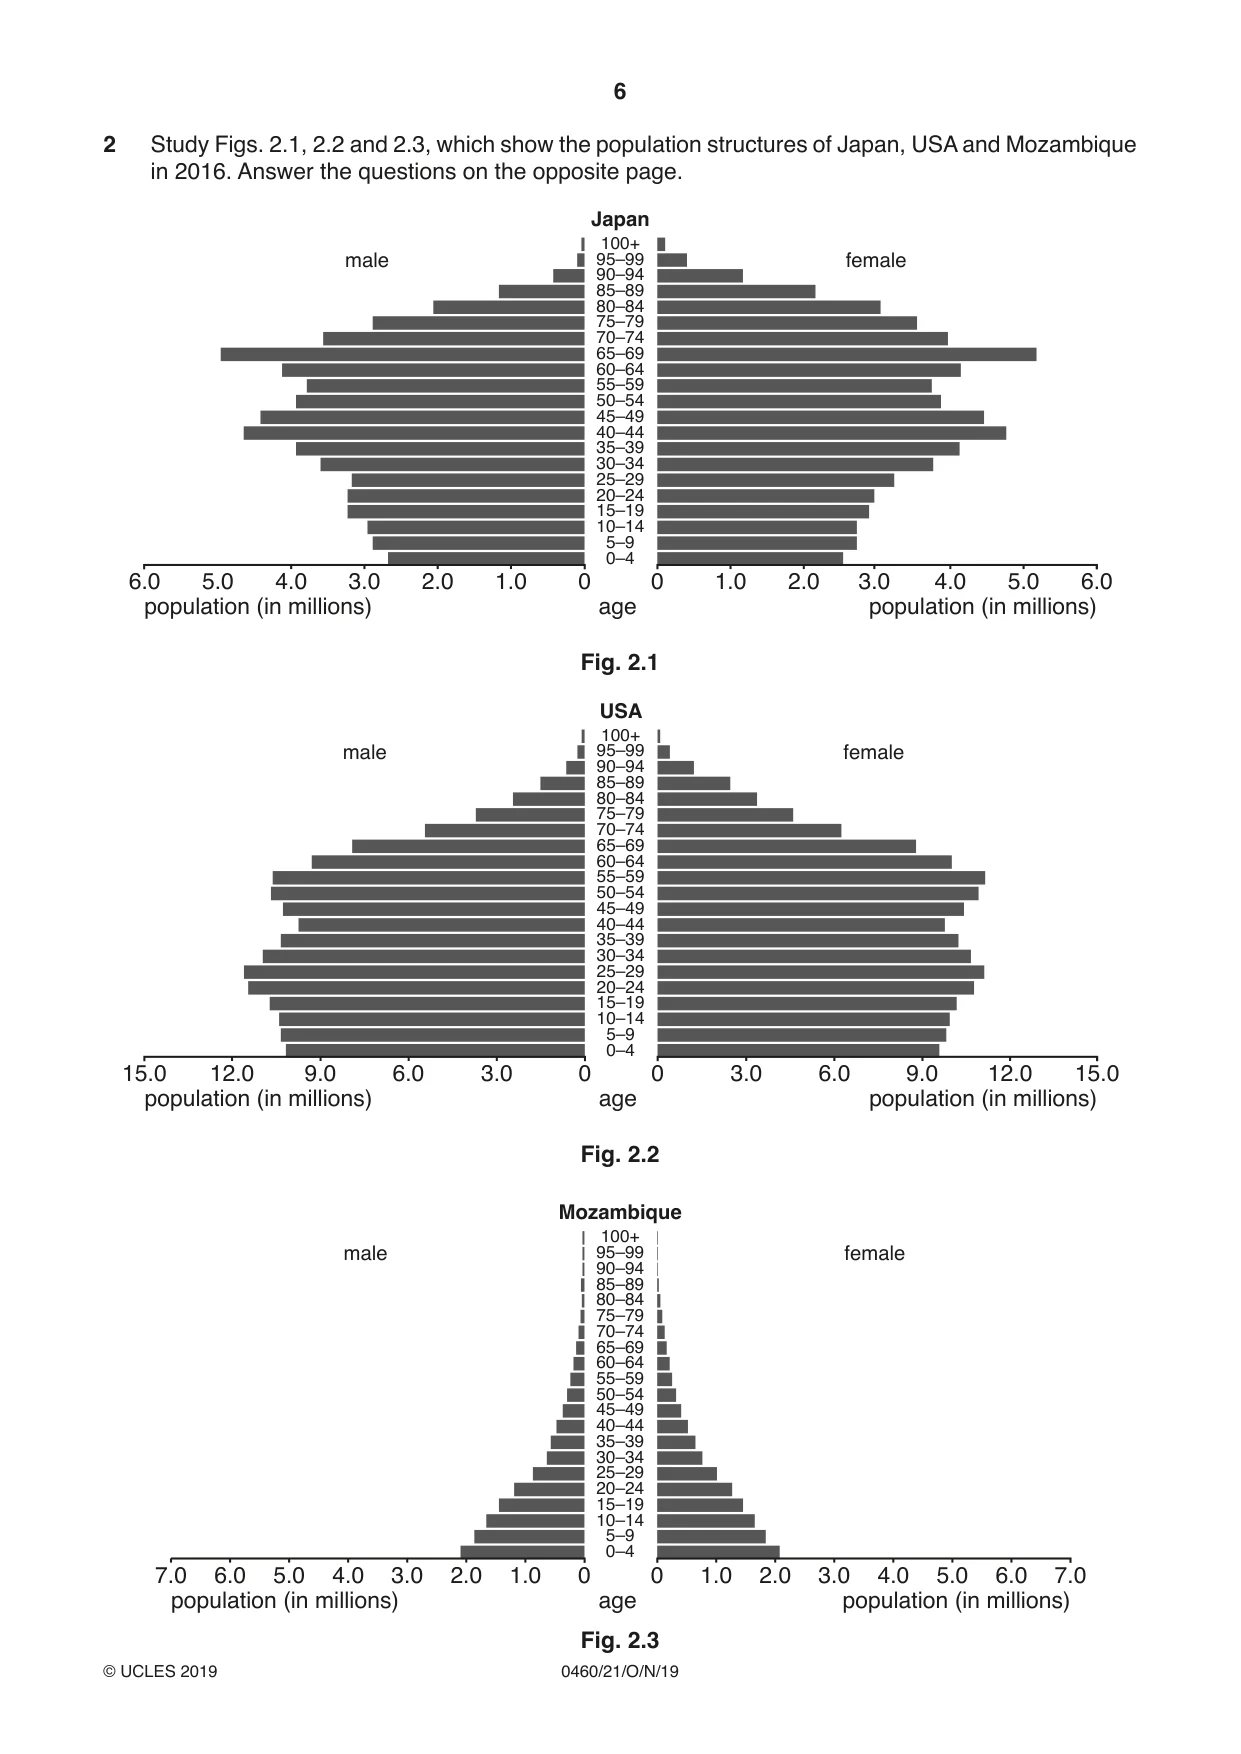
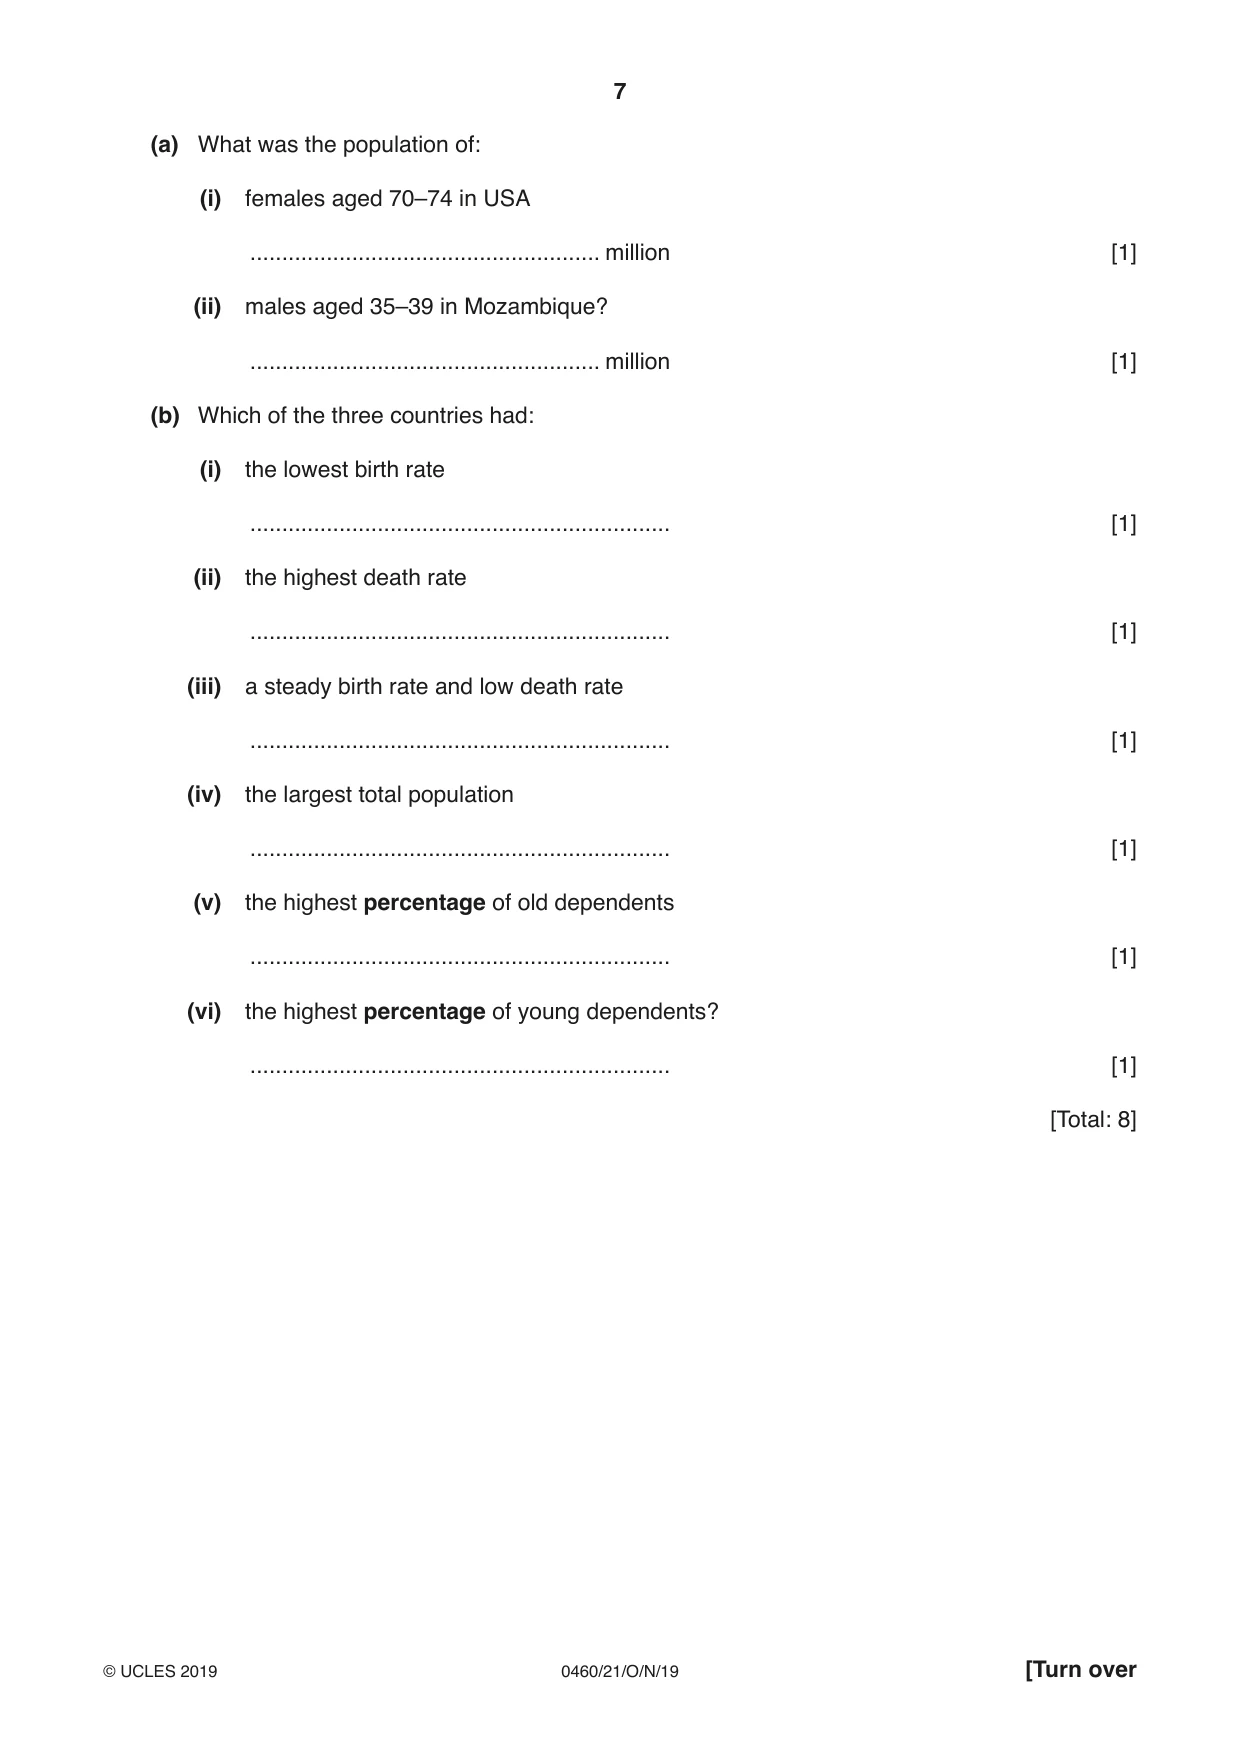
2 Study Figs. 2.1, 2.2 and 2.3, which show the population structures of Japan, USA and Mozambique in 2016. Answer the questions on the opposite page. Japan 100+ male 95–99 female 90–94 85–89 80–84 75–79 70–74 65–69 60–64 55–59 50–54 45–49 40–44 35–39 30–34 25–29 20–24 15–19 10–14 5–9 0–4 6.0 5.0 4.0 3.0 2.0 1.0 0 0 1.0 2.0 3.0 4.0 5.0 6.0 population (in millions) age population (in millions) Fig. 2.1 USA 100+ male 95–99 female 90–94 85–89 80–84 75–79 70–74 65–69 60–64 55–59 50–54 45–49 40–44 35–39 30–34 25–29 20–24 15–19 10–14 5–9 0–4 15.0 12.0 9.0 6.0 3.0 0 0 3.0 6.0 9.0 12.0 15.0 population (in millions) age population (in millions) Fig. 2.2 Mozambique 100+ male 95–99 female 90–94 85–89 80–84 75–79 70–74 65–69 60–64 55–59 50–54 45–49 40–44 35–39 30–34 25–29 20–24 15–19 10–14 5–9 0–4 7.0 6.0 5.0 4.0 3.0 2.0 1.0 0 0 1.0 2.0 3.0 4.0 5.0 6.0 7.0 population (in millions) age population (in millions) Fig. 2.3 (a) What was the population of: (i) females aged 70–74 in USA ....................................................... million [1] (ii) males aged 35–39 in Mozambique? ....................................................... million [1] (b) Which of the three countries had: (i) the lowest birth rate .................................................................. [1] (ii) the highest death rate .................................................................. [1] (iii) a steady birth rate and low death rate .................................................................. [1] (iv) the largest total population .................................................................. [1] (v) the highest percentage of old dependents .................................................................. [1] (vi) the highest percentage of young dependents? .................................................................. [1] [Total: 8]
Mark scheme: 2(a)(i) 6.0–6.3 (million), 1 2(a)(ii) 0.5–0.7 (million), 1 2(b)(i) Japan, 1 2(b)(ii) Mozambique, 1 2(b)(iii) USA, 1 2(b)(iv) USA, 1 2(b)(v) Japan, 1 2(b)(vi) Mozambique, 1
Question 3
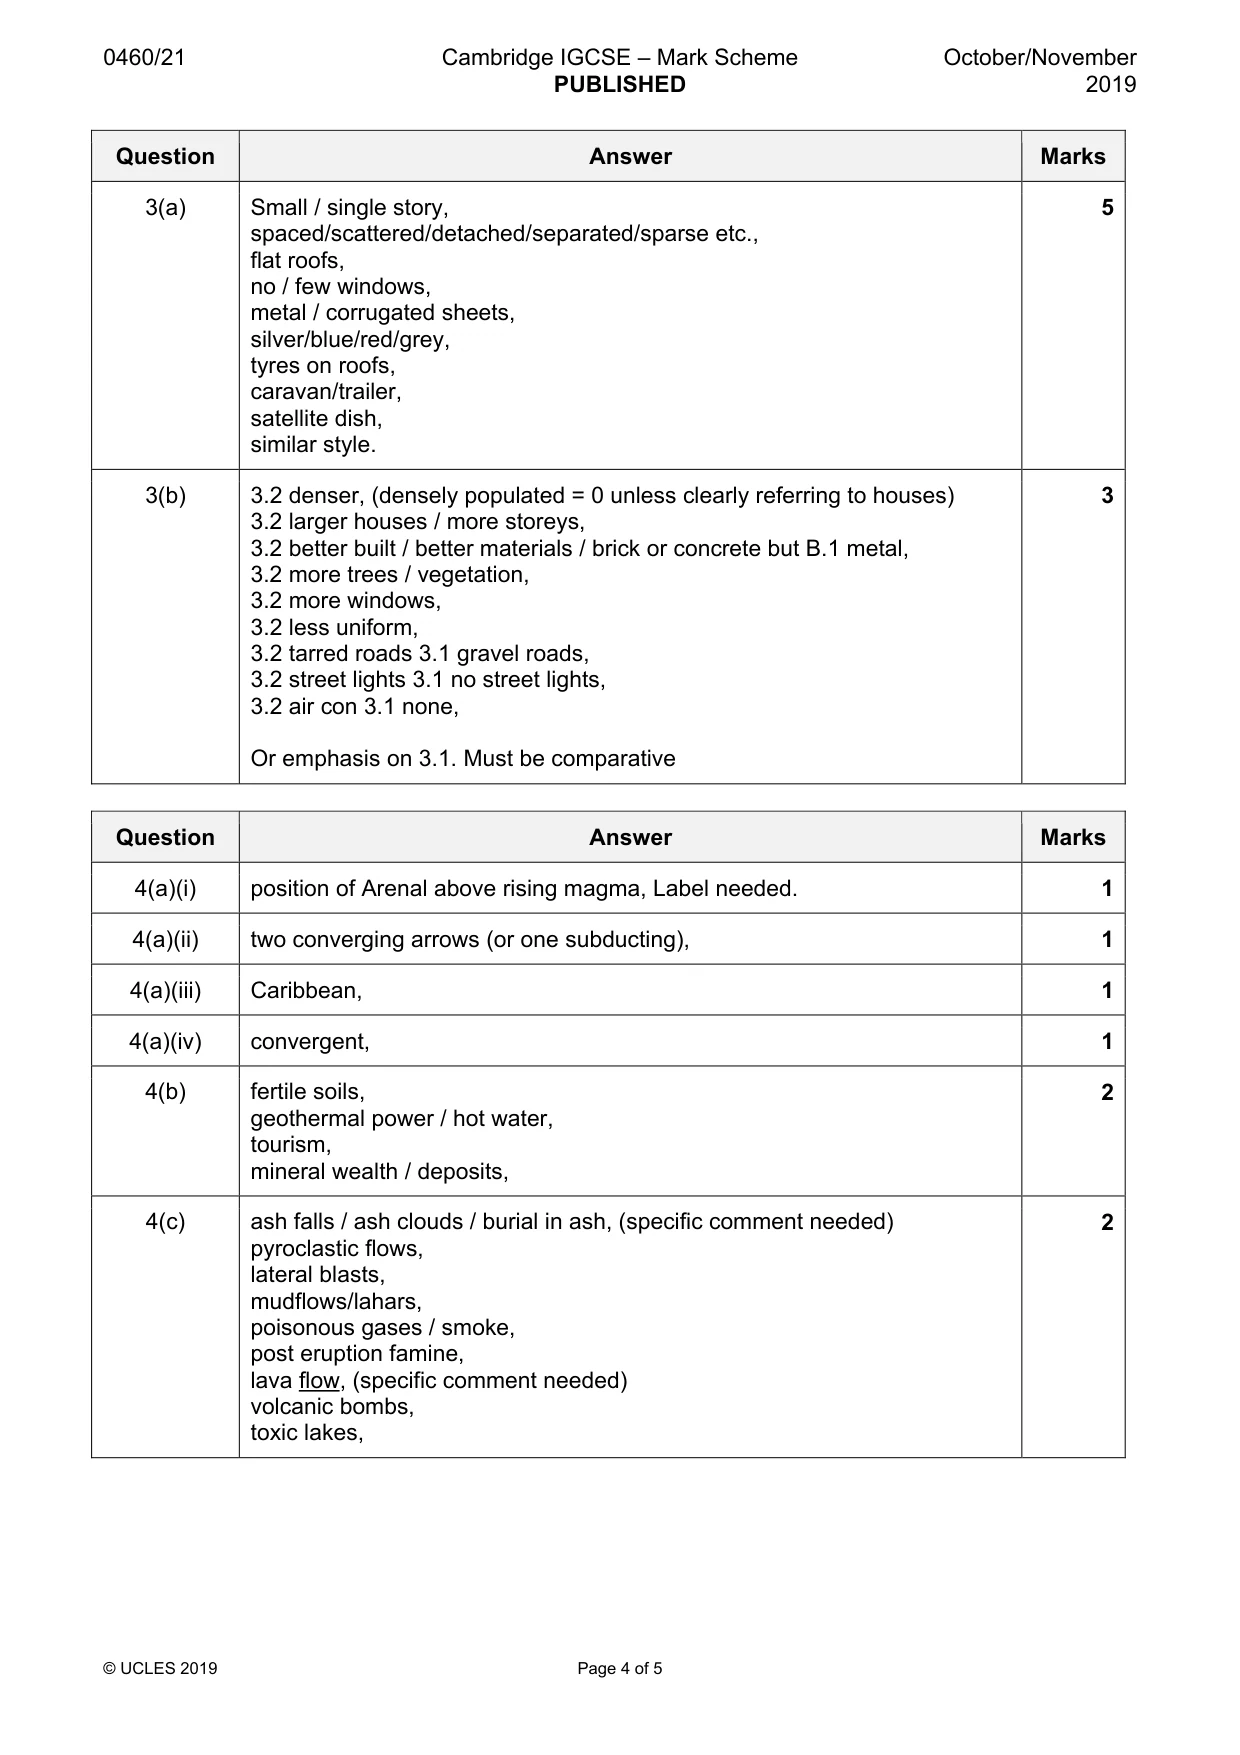
3 Figs. 3.1 and 3.2 (Insert) are photographs which show two residential areas of Windhoek, the capital city of Namibia. (a) Describe the housing shown in Fig. 3.1. ................................................................................................................................................... ................................................................................................................................................... ................................................................................................................................................... ................................................................................................................................................... ................................................................................................................................................... ................................................................................................................................................... ................................................................................................................................................... ................................................................................................................................................... ................................................................................................................................................... ................................................................................................................................................... ................................................................................................................................................... ............................................................................................................................................. [5] (b) Give three differences between the residential area shown in Fig. 3.1 and the residential area shown in Fig. 3.2. 1 ................................................................................................................................................ ................................................................................................................................................... 2 ................................................................................................................................................ ................................................................................................................................................... 3 ................................................................................................................................................ ............................................................................................................................................. [3] [Total: 8]
Mark scheme: 3(a) Small / single story, 5 spaced/scattered/detached/separated/sparse etc., flat roofs, no / few windows, metal / corrugated sheets, silver/blue/red/grey, tyres on roofs, caravan/trailer, satellite dish, similar style. 3(b) 3.2 denser, (densely populated = 0 unless clearly referring to houses) 3 3.2 larger houses / more storeys, 3.2 better built / better materials / brick or concrete but B.1 metal, 3.2 more trees / vegetation, 3.2 more windows, 3.2 less uniform, 3.2 tarred roads 3.1 gravel roads, 3.2 street lights 3.1 no street lights, 3.2 air con 3.1 none, Or emphasis on 3.1. Must be comparative
Q4 · The location of active strato-volcanoes in part of central America
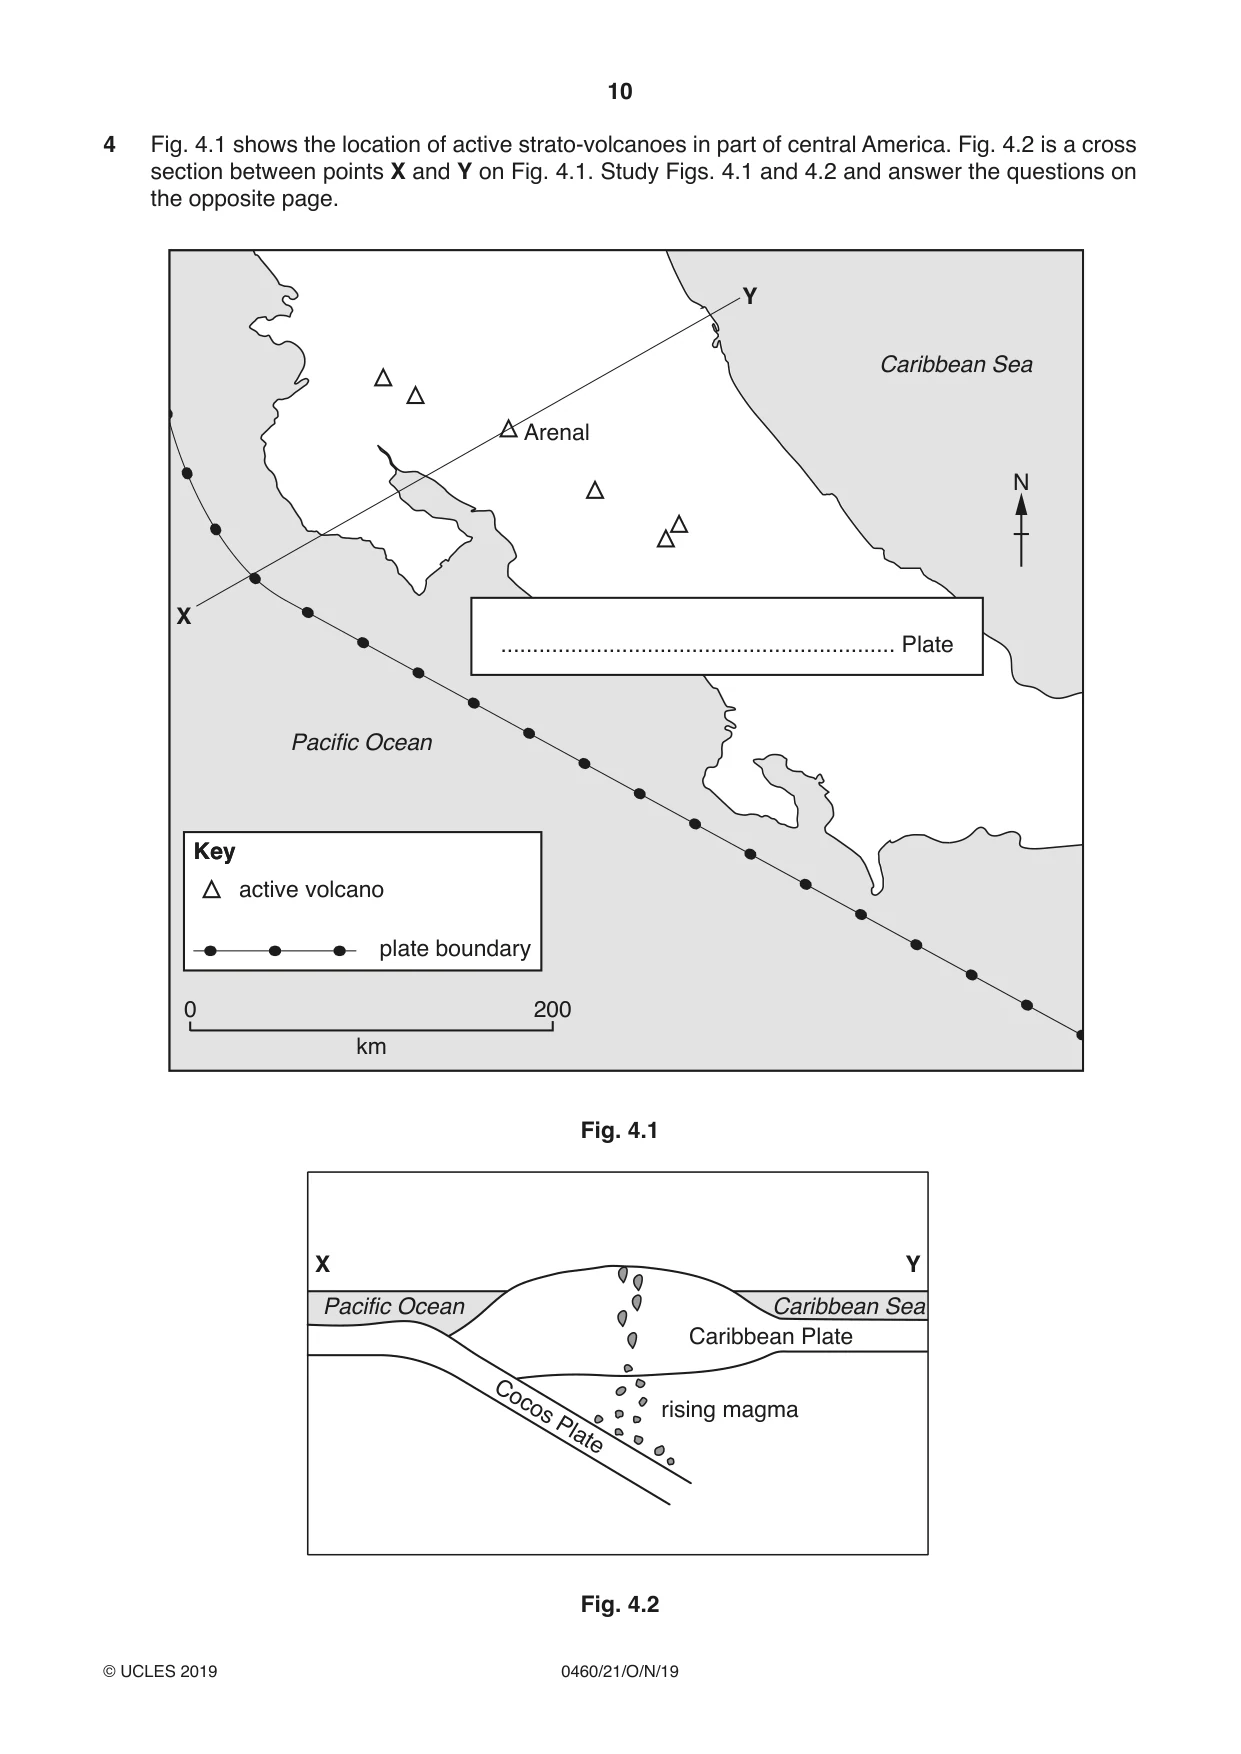
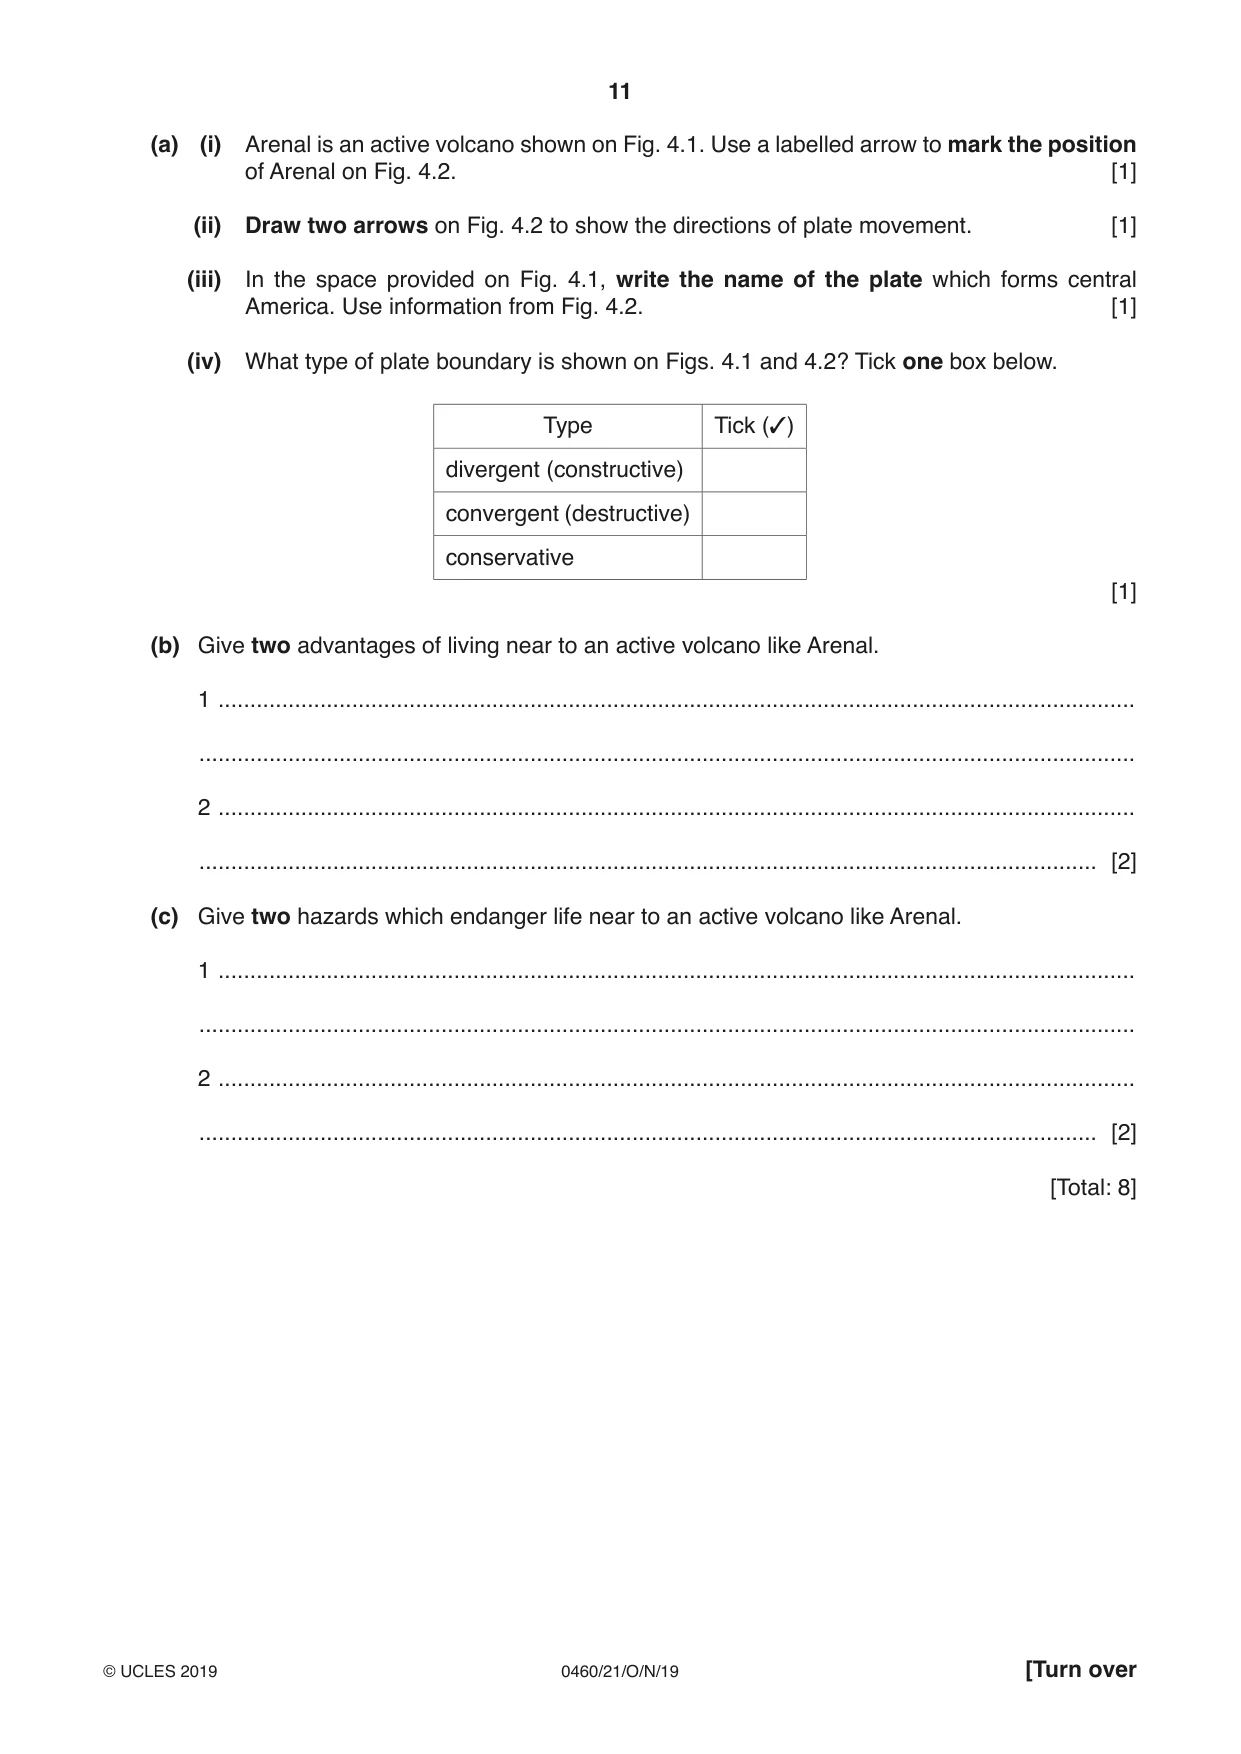
4 Fig. 4.1 shows the location of active strato-volcanoes in part of central America. Fig. 4.2 is a cross section between points X and Y on Fig. 4.1. Study Figs. 4.1 and 4.2 and answer the questions on the opposite page. Y Caribbean Sea Arenal N X .............................................................. Plate Pacific Ocean KeyKey active volcano plate boundary 0 200 km Fig. 4.1 X Y Pacific Ocean Caribbean Sea Caribbean Plate rising magma Cocos Plate Fig. 4.2 (a) (i) Arenal is an active volcano shown on Fig. 4.1. Use a labelled arrow to mark the position of Arenal on Fig. 4.2. [1] (ii) Draw two arrows on Fig. 4.2 to show the directions of plate movement. [1] (iii) In the space provided on Fig. 4.1, write the name of the plate which forms central America. Use information from Fig. 4.2. [1] (iv) What type of plate boundary is shown on Figs. 4.1 and 4.2? Tick one box below. Type Tick (3) divergent (constructive) convergent (destructive) conservative [1] (b) Give two advantages of living near to an active volcano like Arenal. 1 ................................................................................................................................................ ................................................................................................................................................... 2 ................................................................................................................................................ ............................................................................................................................................. [2] (c) Give two hazards which endanger life near to an active volcano like Arenal. 1 ................................................................................................................................................ ................................................................................................................................................... 2 ................................................................................................................................................ ............................................................................................................................................. [2] [Total: 8]
Mark scheme: 4(a)(i) position of Arenal above rising magma, Label needed. 1 4(a)(ii) two converging arrows (or one subducting), 1 4(a)(iii) Caribbean, 1 4(a)(iv) convergent, 1 4(b) fertile soils, 2 geothermal power / hot water, tourism, mineral wealth / deposits, 4(c) ash falls / ash clouds / burial in ash, (specific comment needed) 2 pyroclastic flows, lateral blasts, mudflows/lahars, poisonous gases / smoke, post eruption famine, lava flow, (specific comment needed) volcanic bombs, toxic lakes,
Question 5
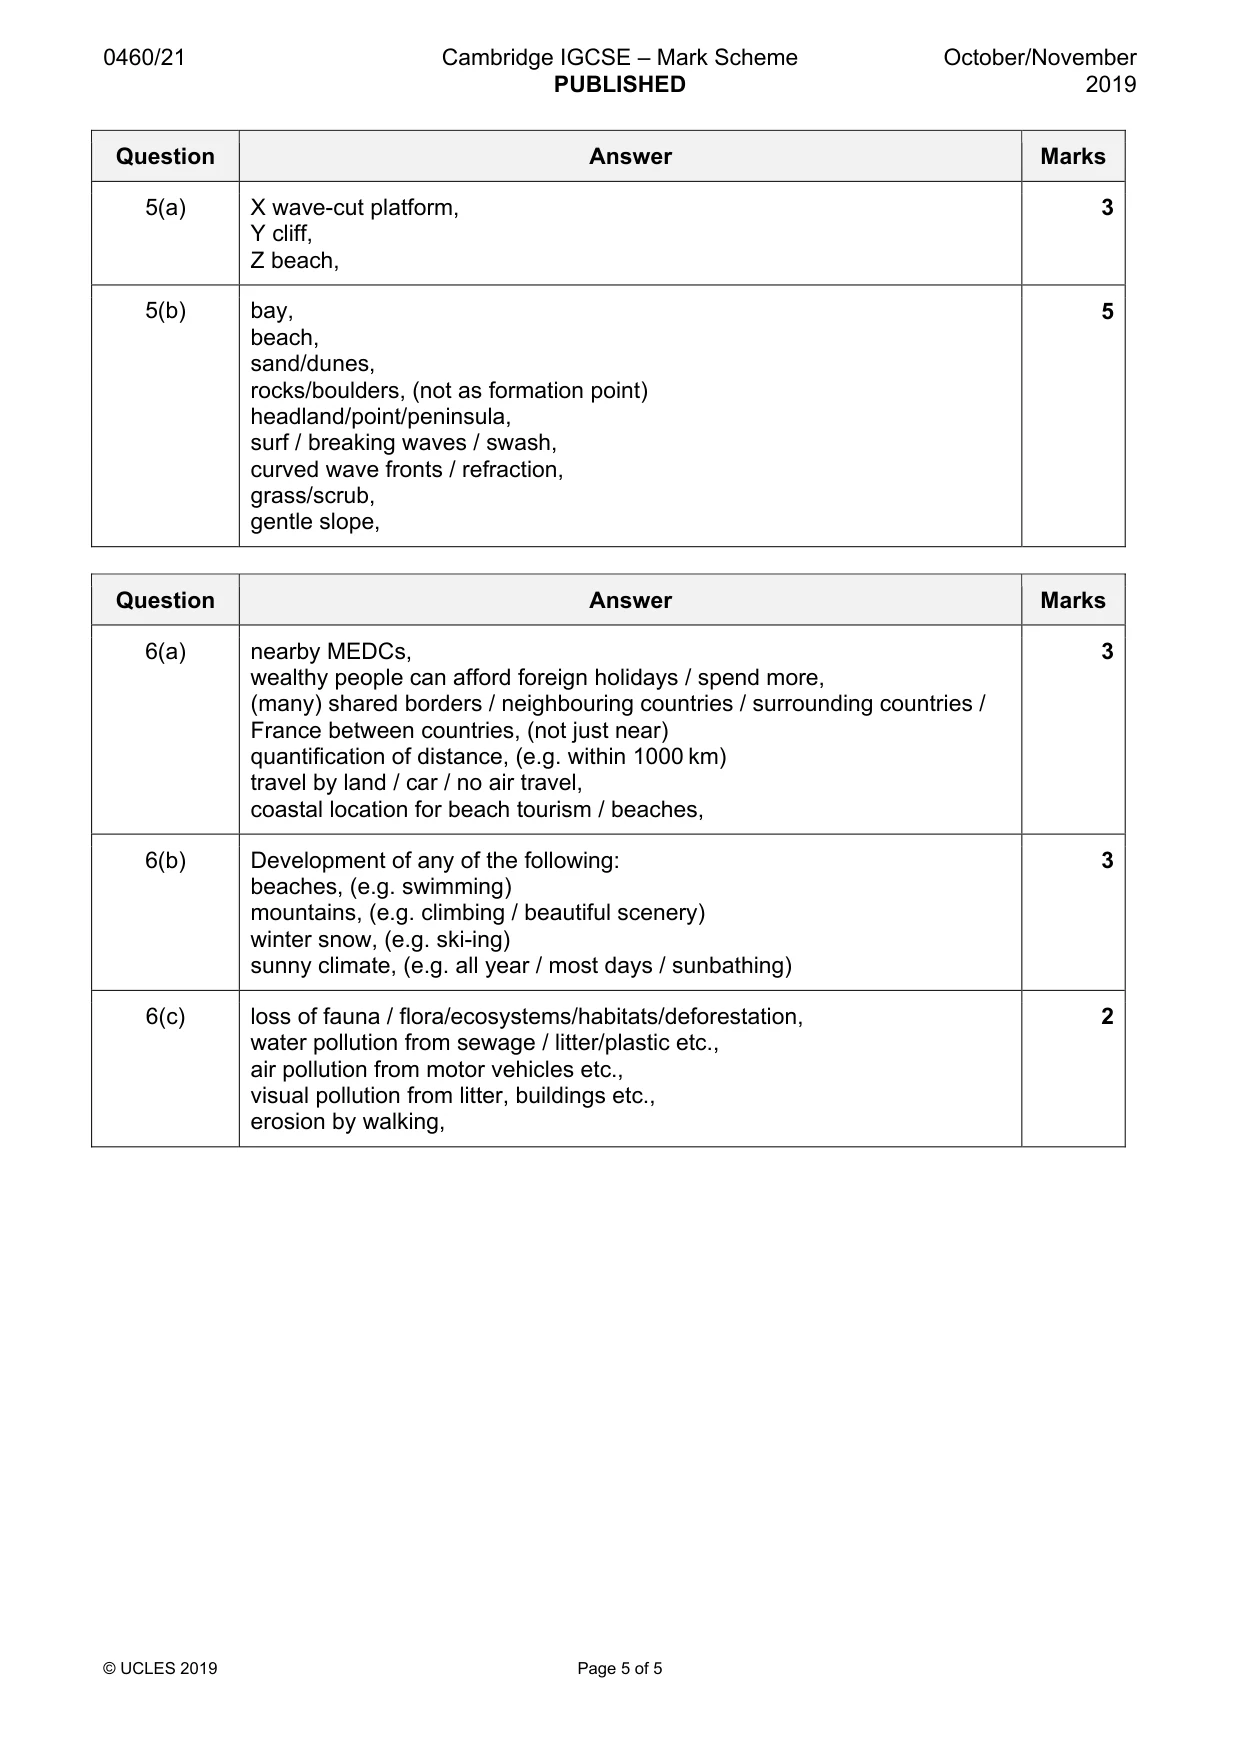
5 Study Figs. 5.1 and 5.2 (Insert), which are photographs showing coasts in South Africa. (a) Identify landforms X, Y and Z on Fig. 5.1. X ....................................................................... Y ....................................................................... Z ....................................................................... [3] (b) Describe the physical features of the coastline shown in Fig. 5.2. ................................................................................................................................................... ................................................................................................................................................... ................................................................................................................................................... ................................................................................................................................................... ................................................................................................................................................... ................................................................................................................................................... ................................................................................................................................................... ................................................................................................................................................... ................................................................................................................................................... ................................................................................................................................................... ................................................................................................................................................... ............................................................................................................................................. [5] [Total: 8]
Mark scheme: 5(a) X wave-cut platform, 3 Y cliff, Z beach, 5(b) bay, 5 beach, sand/dunes, rocks/boulders, (not as formation point) headland/point/peninsula, surf / breaking waves / swash, curved wave fronts / refraction, grass/scrub, gentle slope,
Q6 · France, in north west Europe, is the most popular international tourist destination in…
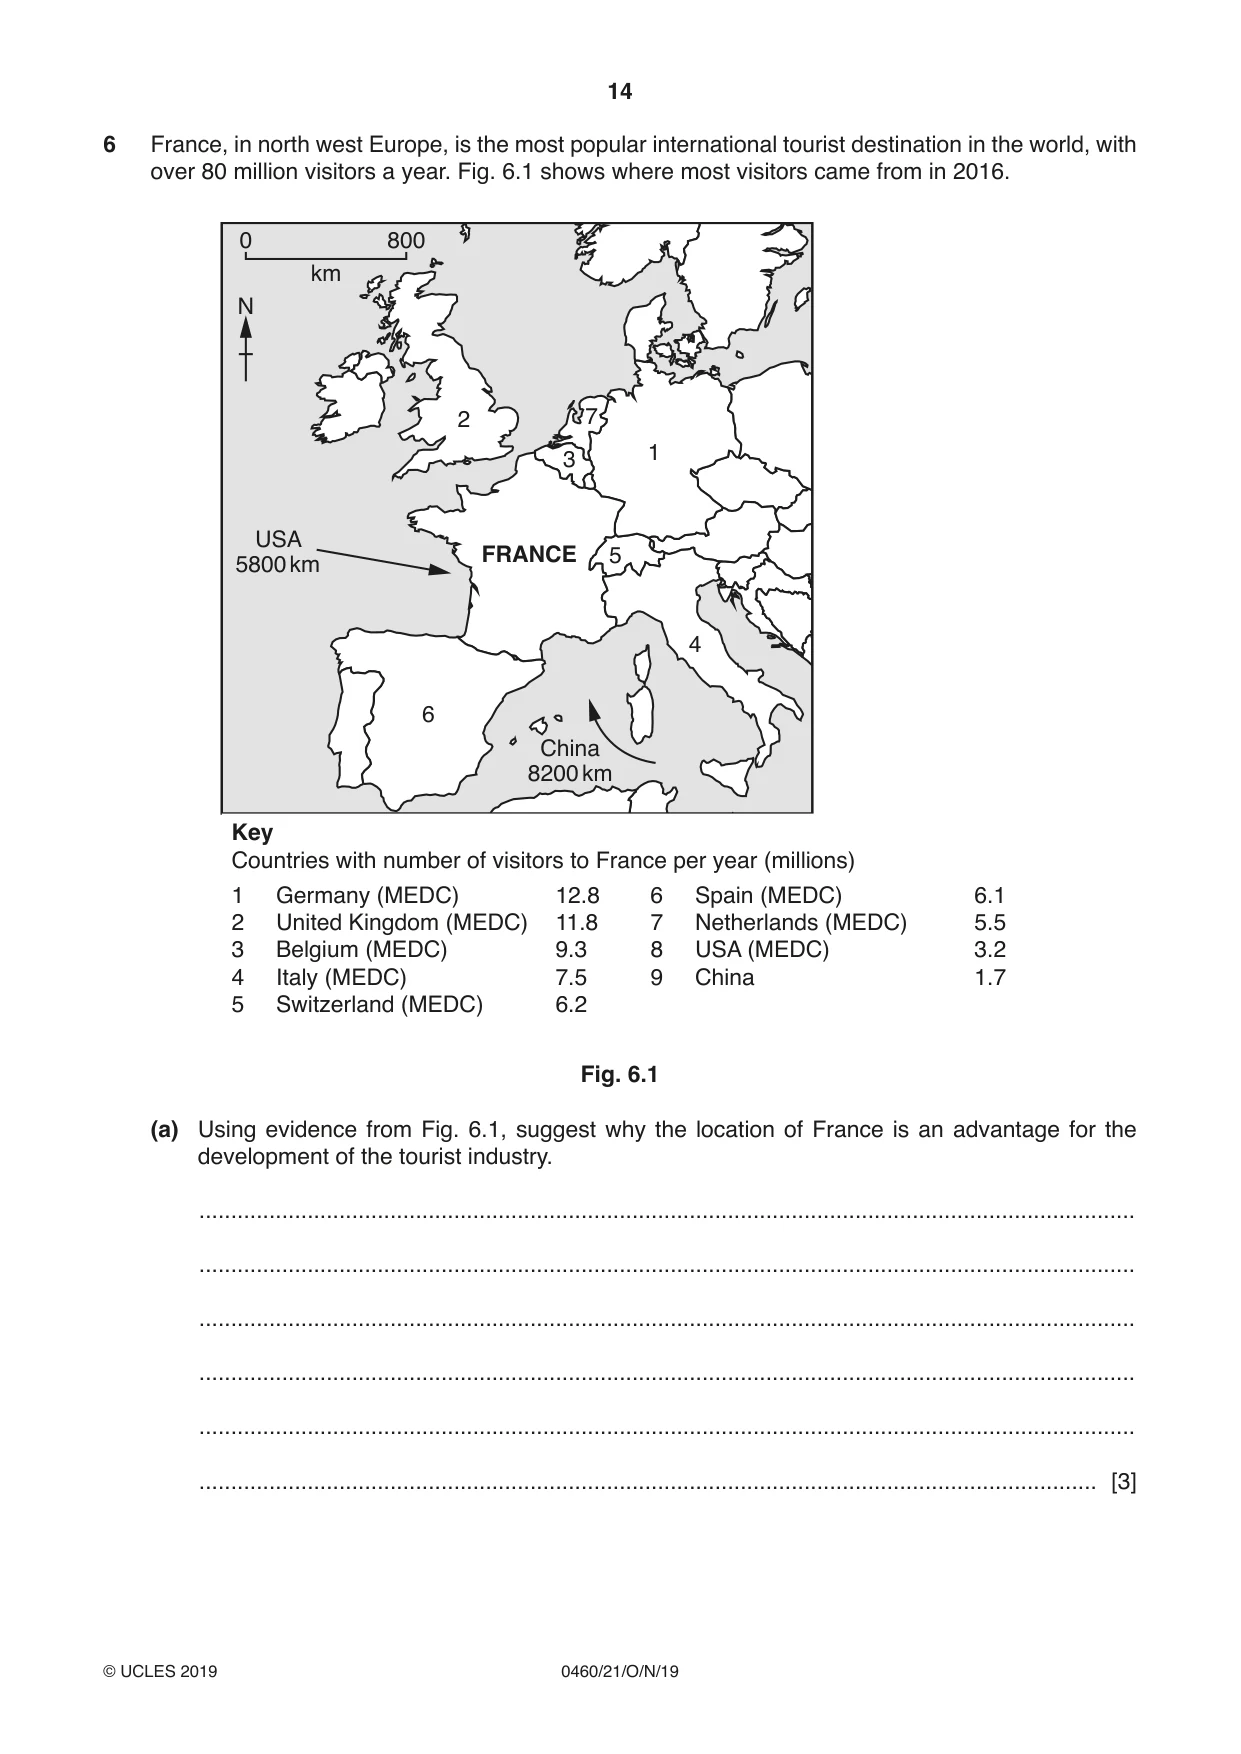
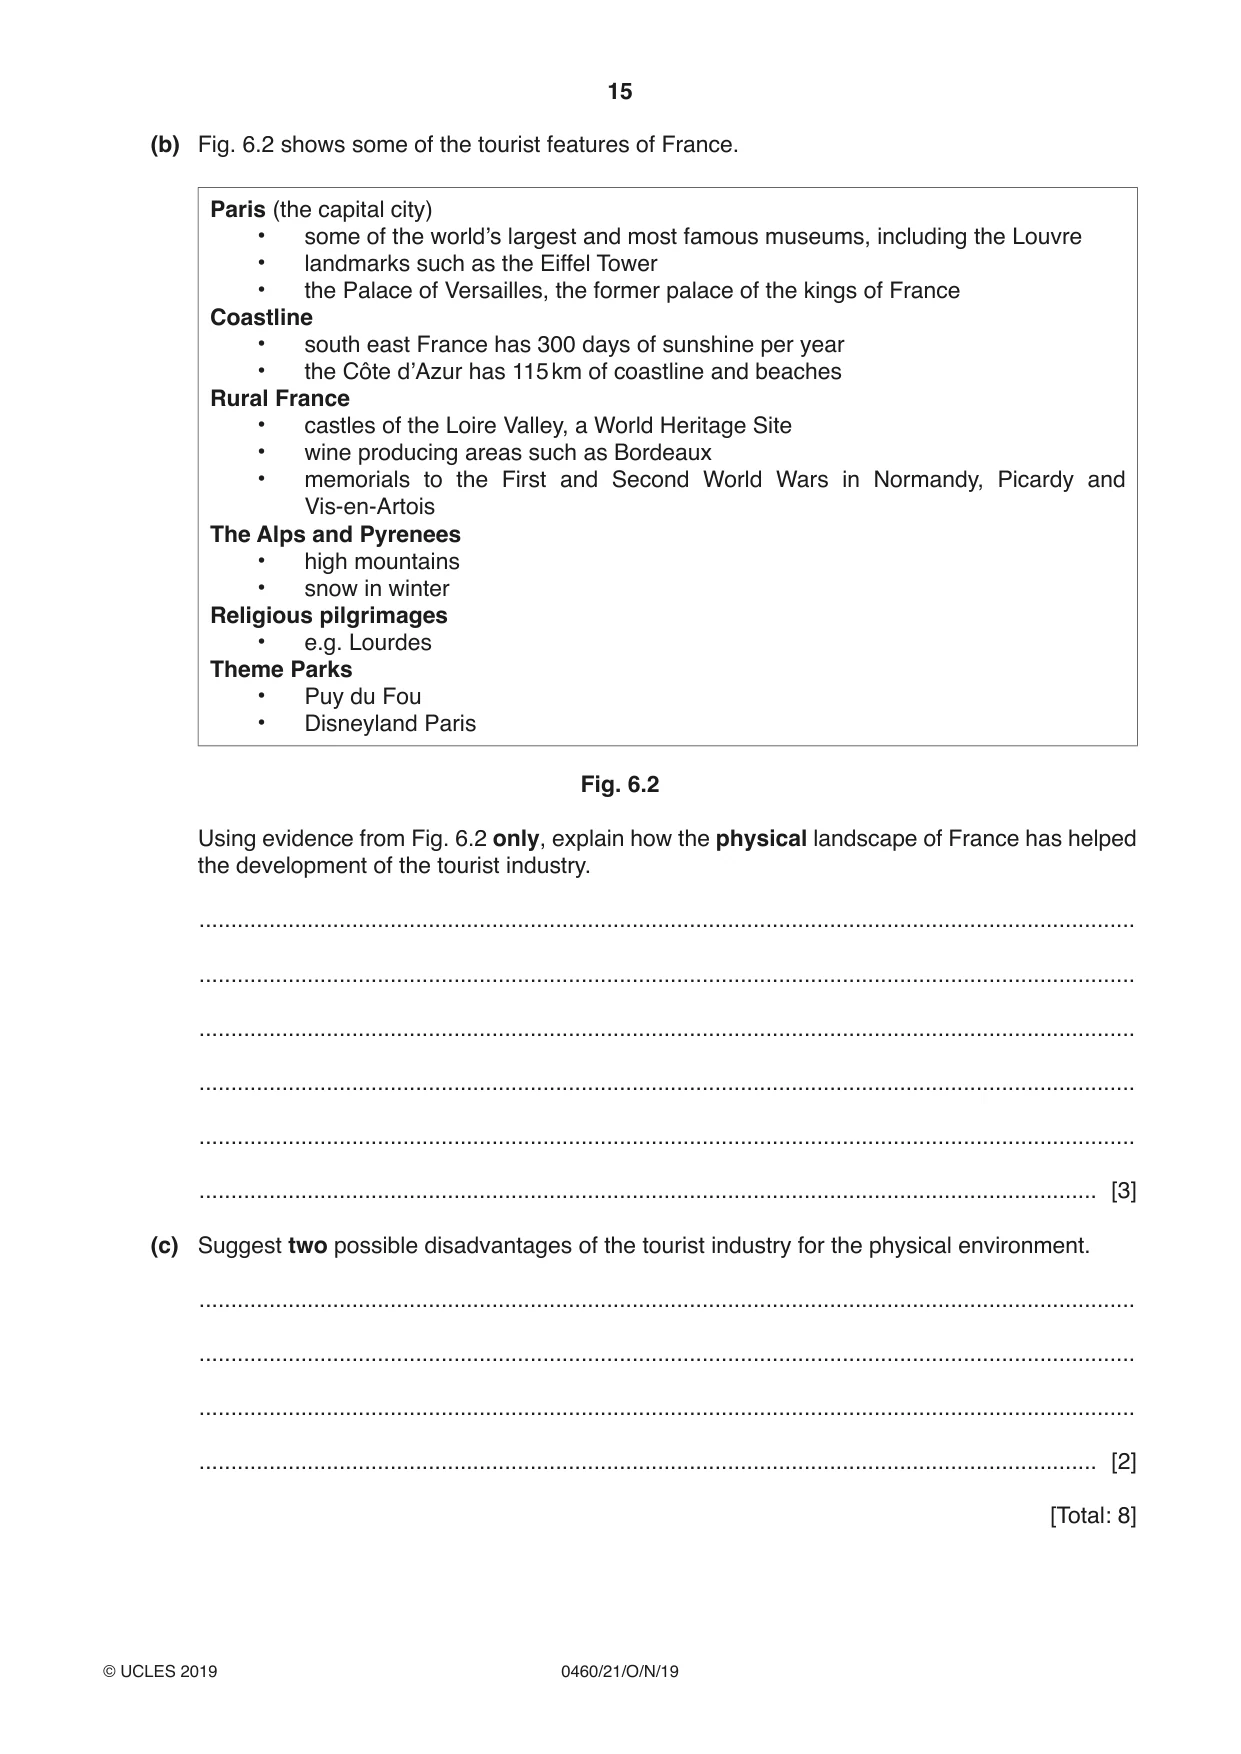
6 France, in north west Europe, is the most popular international tourist destination in the world, with over 80 million visitors a year. Fig. 6.1 shows where most visitors came from in 2016. 0 800 km N 2 7 1 3 USA FRANCE 5 5800 km 4 6 China 8200 km Key Countries with number of visitors to France per year (millions) 1 Germany (MEDC) 12.8 6 Spain (MEDC) 6.1 2 United Kingdom (MEDC) 11.8 7 Netherlands (MEDC) 5.5 3 Belgium (MEDC) 9.3 8 USA (MEDC) 3.2 4 Italy (MEDC) 7.5 9 China 1.7 5 Switzerland (MEDC) 6.2 Fig. 6.1 (a) Using evidence from Fig. 6.1, suggest why the location of France is an advantage for the development of the tourist industry. ................................................................................................................................................... ................................................................................................................................................... ................................................................................................................................................... ................................................................................................................................................... ................................................................................................................................................... ............................................................................................................................................. [3] (b) Fig. 6.2 shows some of the tourist features of France. Paris (the capital city) • some of the world’s largest and most famous museums, including the Louvre • landmarks such as the Eiffel Tower • the Palace of Versailles, the former palace of the kings of France Coastline • south east France has 300 days of sunshine per year • the Côte d’Azur has 115 km of coastline and beaches Rural France • castles of the Loire Valley, a World Heritage Site • wine producing areas such as Bordeaux • memorials to the First and Second World Wars in Normandy, Picardy and Vis-en-Artois The Alps and Pyrenees • high mountains • snow in winter Religious pilgrimages • e.g. Lourdes Theme Parks • Puy du Fou • Disneyland Paris Fig. 6.2 Using evidence from Fig. 6.2 only, explain how the physical landscape of France has helped the development of the tourist industry. ................................................................................................................................................... ................................................................................................................................................... ................................................................................................................................................... ................................................................................................................................................... ................................................................................................................................................... ............................................................................................................................................. [3] (c) Suggest two possible disadvantages of the tourist industry for the physical environment. ................................................................................................................................................... ................................................................................................................................................... ................................................................................................................................................... ............................................................................................................................................. [2] [Total: 8] Additional Pages If you use the following pages to complete the answer(s) to any question(s), the question number(s) must be clearly shown. .................................................................................................................................................................. .................................................................................................................................................................. .................................................................................................................................................................. .................................................................................................................................................................. .................................................................................................................................................................. .................................................................................................................................................................. .................................................................................................................................................................. .................................................................................................................................................................. .................................................................................................................................................................. .................................................................................................................................................................. .................................................................................................................................................................. .................................................................................................................................................................. .................................................................................................................................................................. .................................................................................................................................................................. .................................................................................................................................................................. .................................................................................................................................................................. .................................................................................................................................................................. .................................................................................................................................................................. .................................................................................................................................................................. .................................................................................................................................................................. .................................................................................................................................................................. .................................................................................................................................................................. .................................................................................................................................................................. .................................................................................................................................................................. ..................................................................................................................................................................
Mark scheme: 6(a) nearby MEDCs, 3 wealthy people can afford foreign holidays / spend more, (many) shared borders / neighbouring countries / surrounding countries / France between countries, (not just near) quantification of distance, (e.g. within 1000 km) travel by land / car / no air travel, coastal location for beach tourism / beaches, 6(b) Development of any of the following: 3 beaches, (e.g. swimming) mountains, (e.g. climbing / beautiful scenery) winter snow, (e.g. ski-ing) sunny climate, (e.g. all year / most days / sunbathing) 6(c) loss of fauna / flora/ecosystems/habitats/deforestation, 2 water pollution from sewage / litter/plastic etc., air pollution from motor vehicles etc., visual pollution from litter, buildings etc., erosion by walking,
What was in this paper
The subtopics covered by these 6 questions, and how many questions each got. Open one in a new tab to see every Cambridge question on it.
What you needed in this session
Cambridge’s own grade thresholds for 2019 Oct/Nov, Paper 2 · Variant 1. A higher threshold means an easier paper — the bar moves with how the cohort did.