Cambridge IGCSE Geography 0460 — 2017 Oct/Nov Paper 2 · Variant 1
0460/21/O/N/17 · 6 questions · 60 marks · ≈68 min
The question paper and its mark scheme, free to read here and free to download. This is Cambridge’s own paper, exactly as it was sat.
Question paper20 pages



Mark scheme5 pages
Answers below. Sit the paper first if you are practising.
Questions as text
Q1 · Study the map extract for Vangsvatnet, Norway
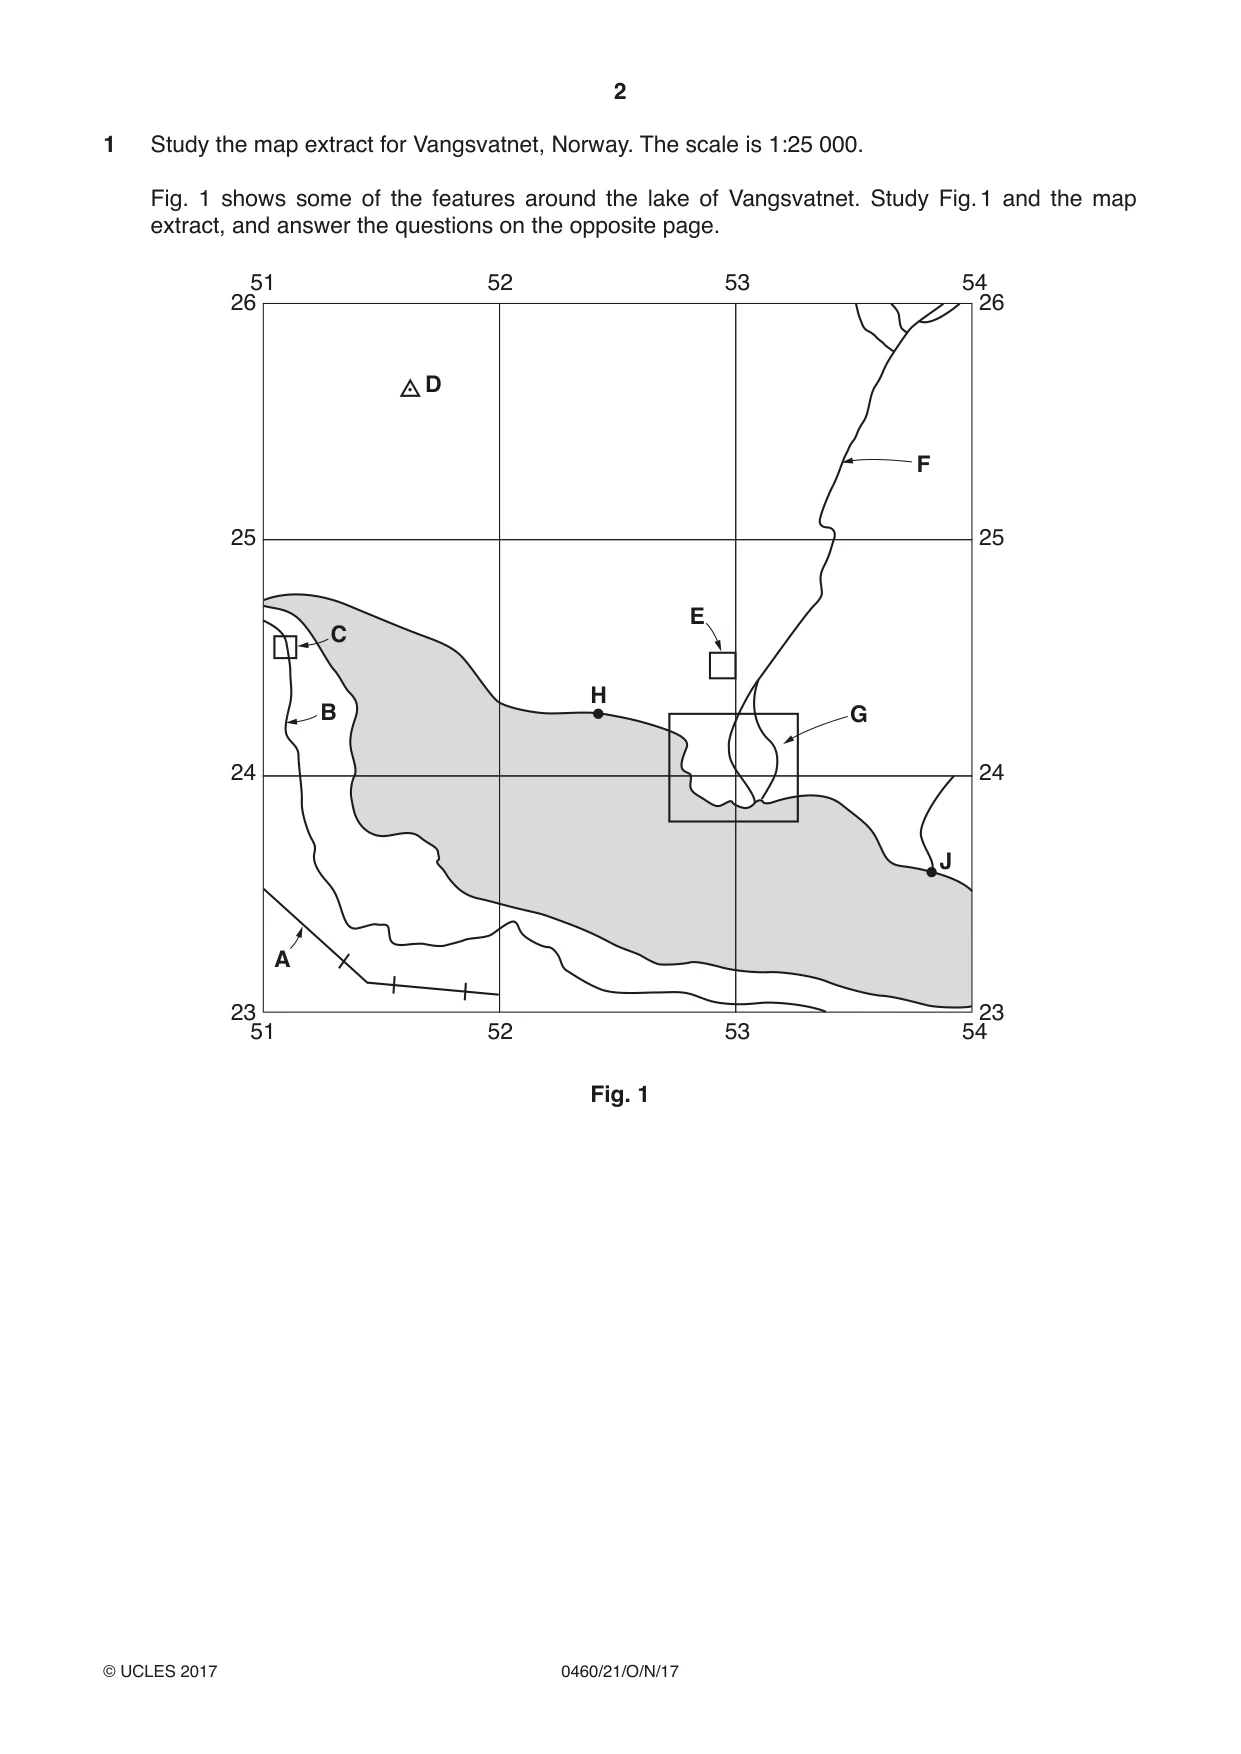
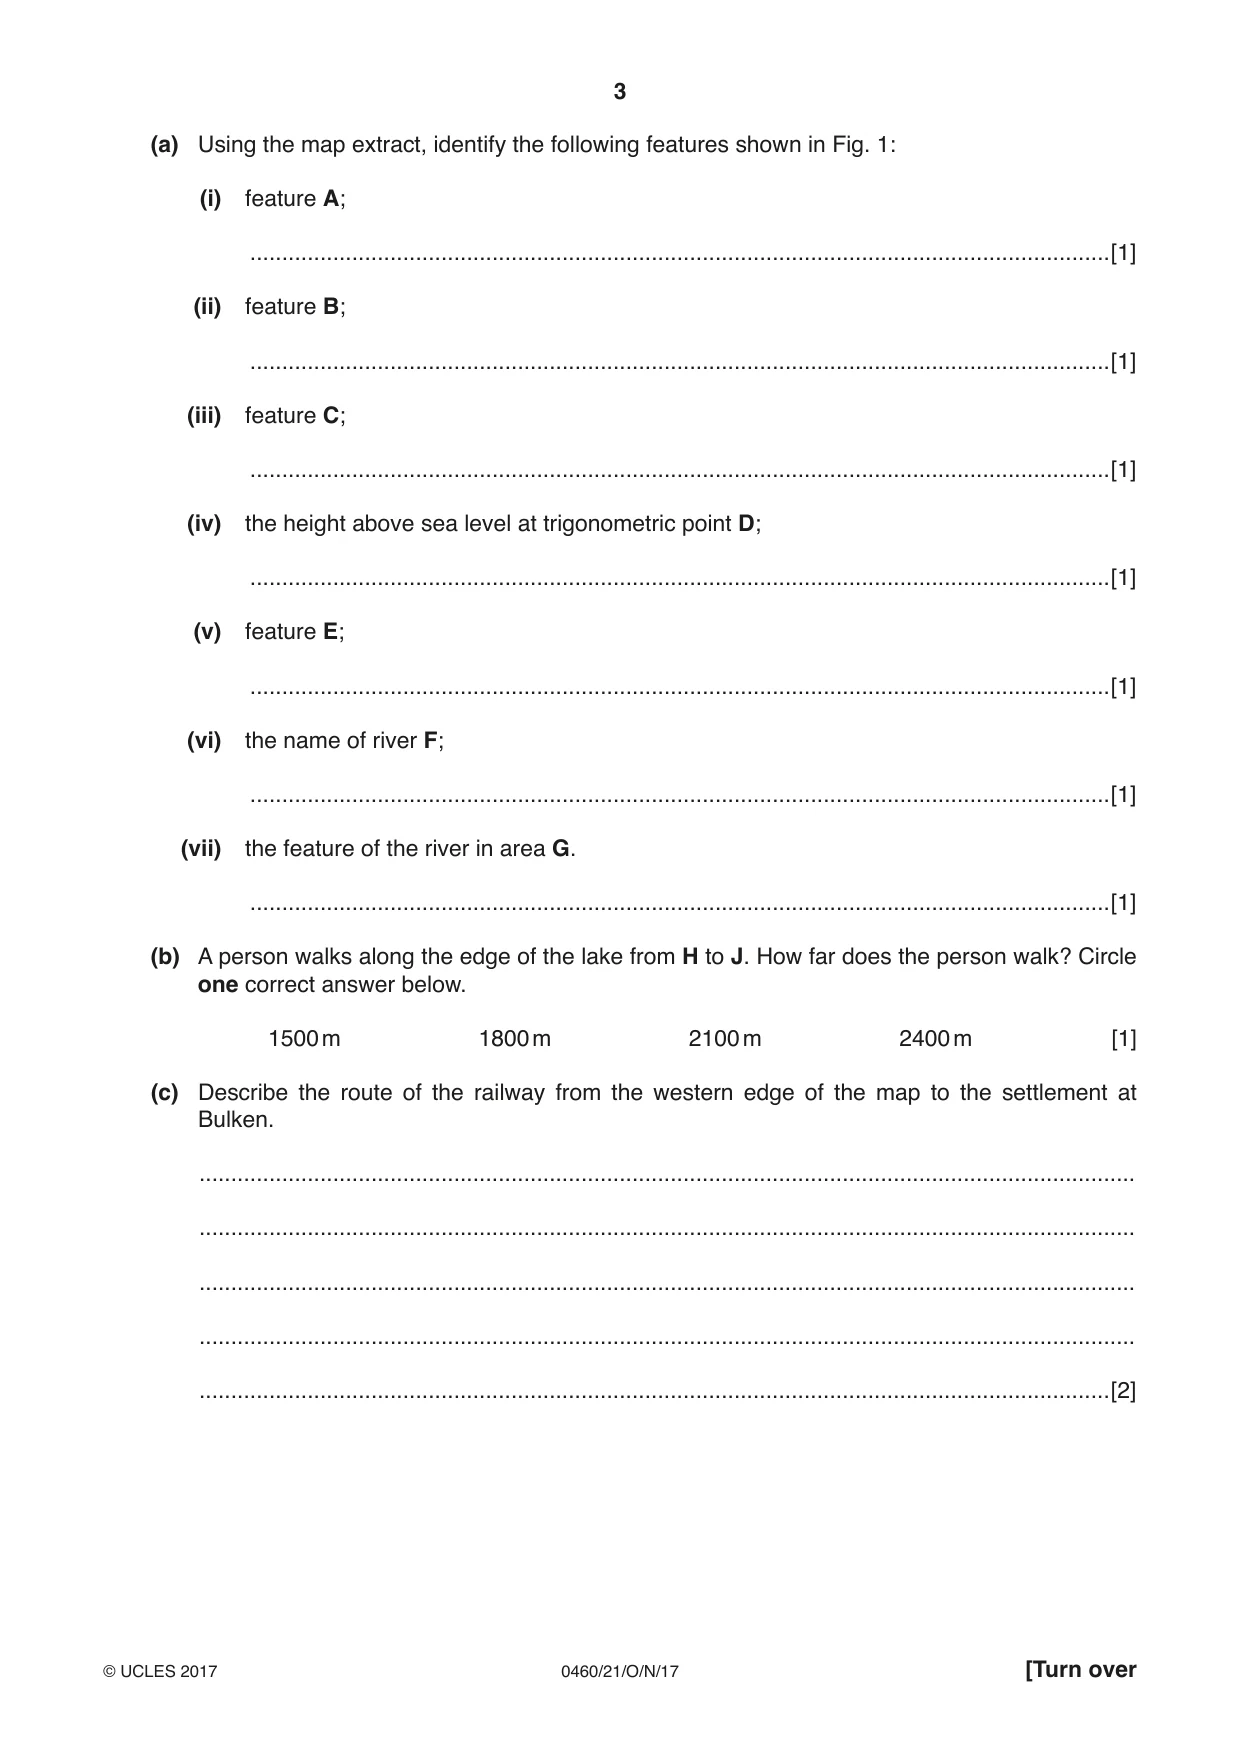
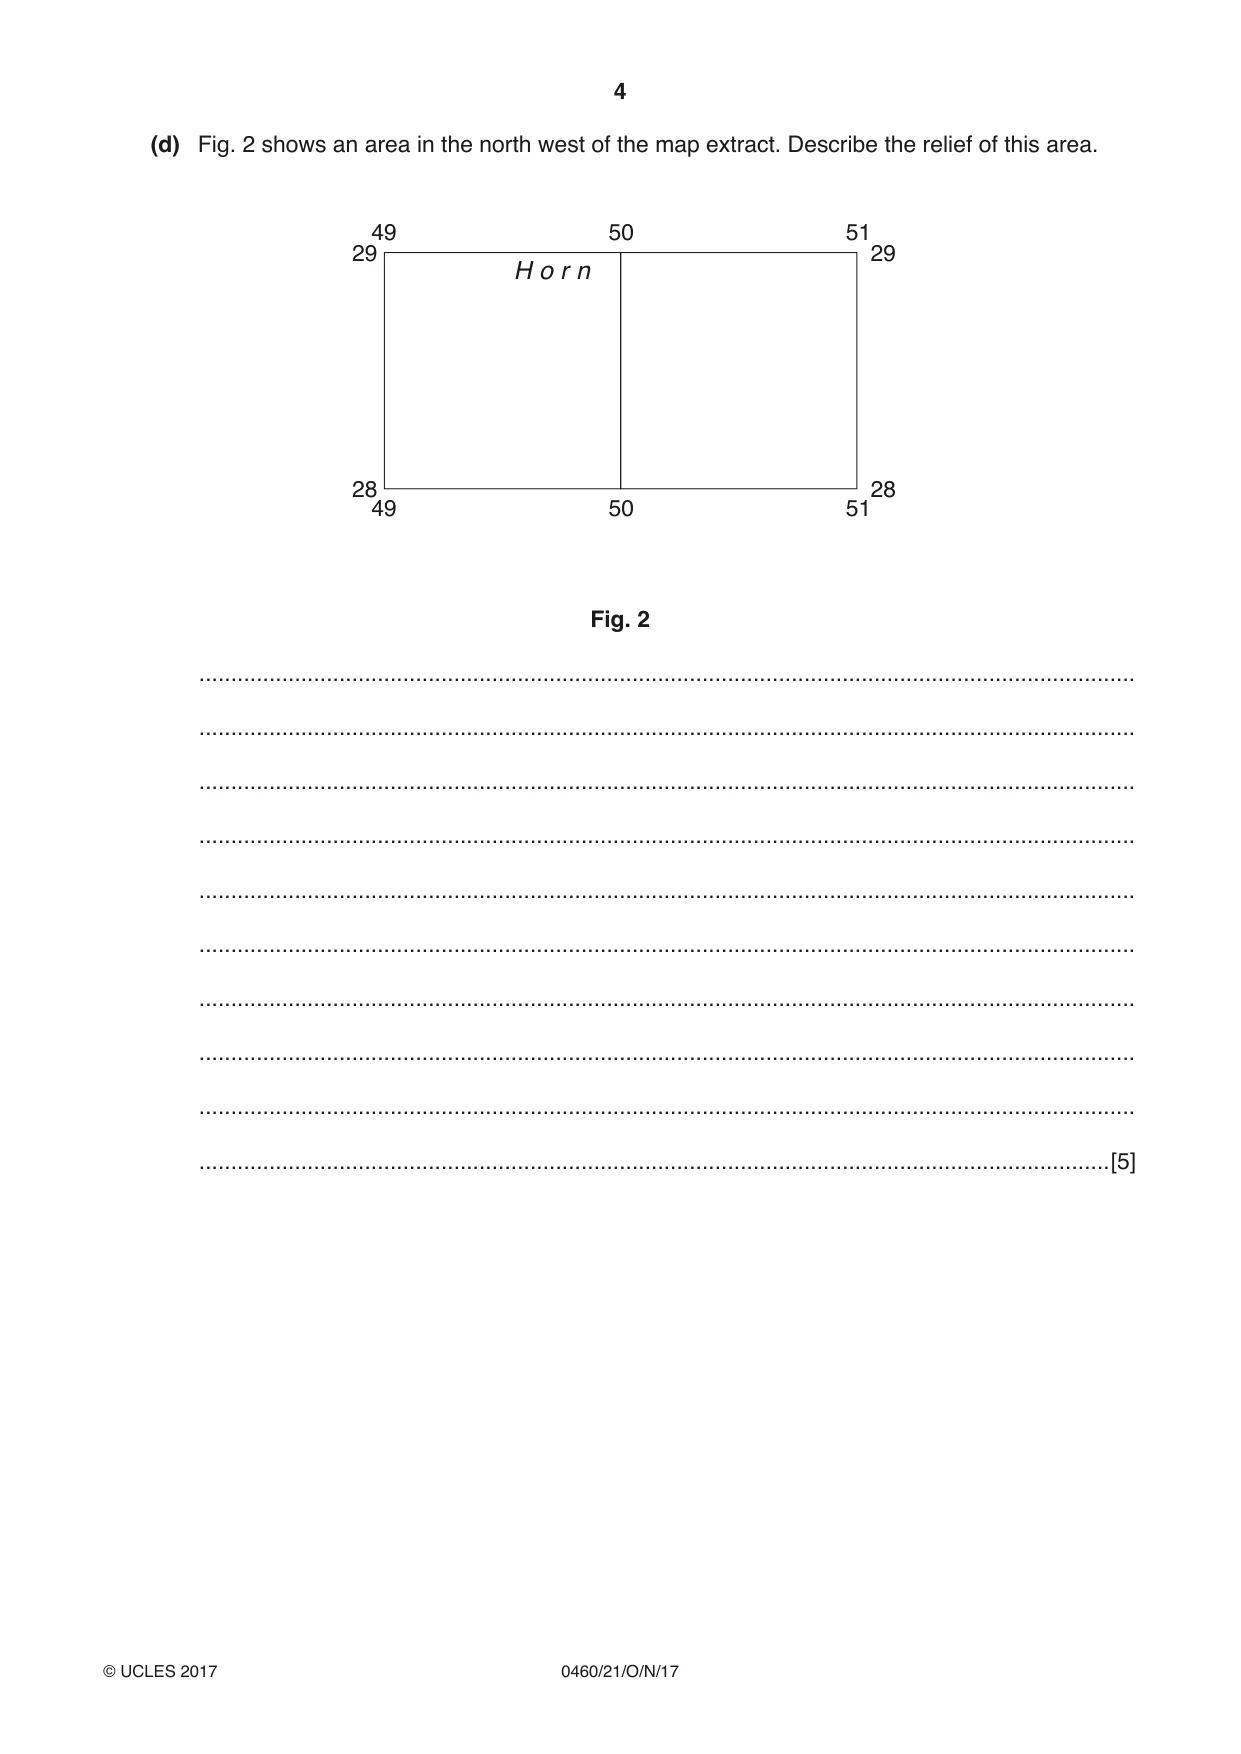
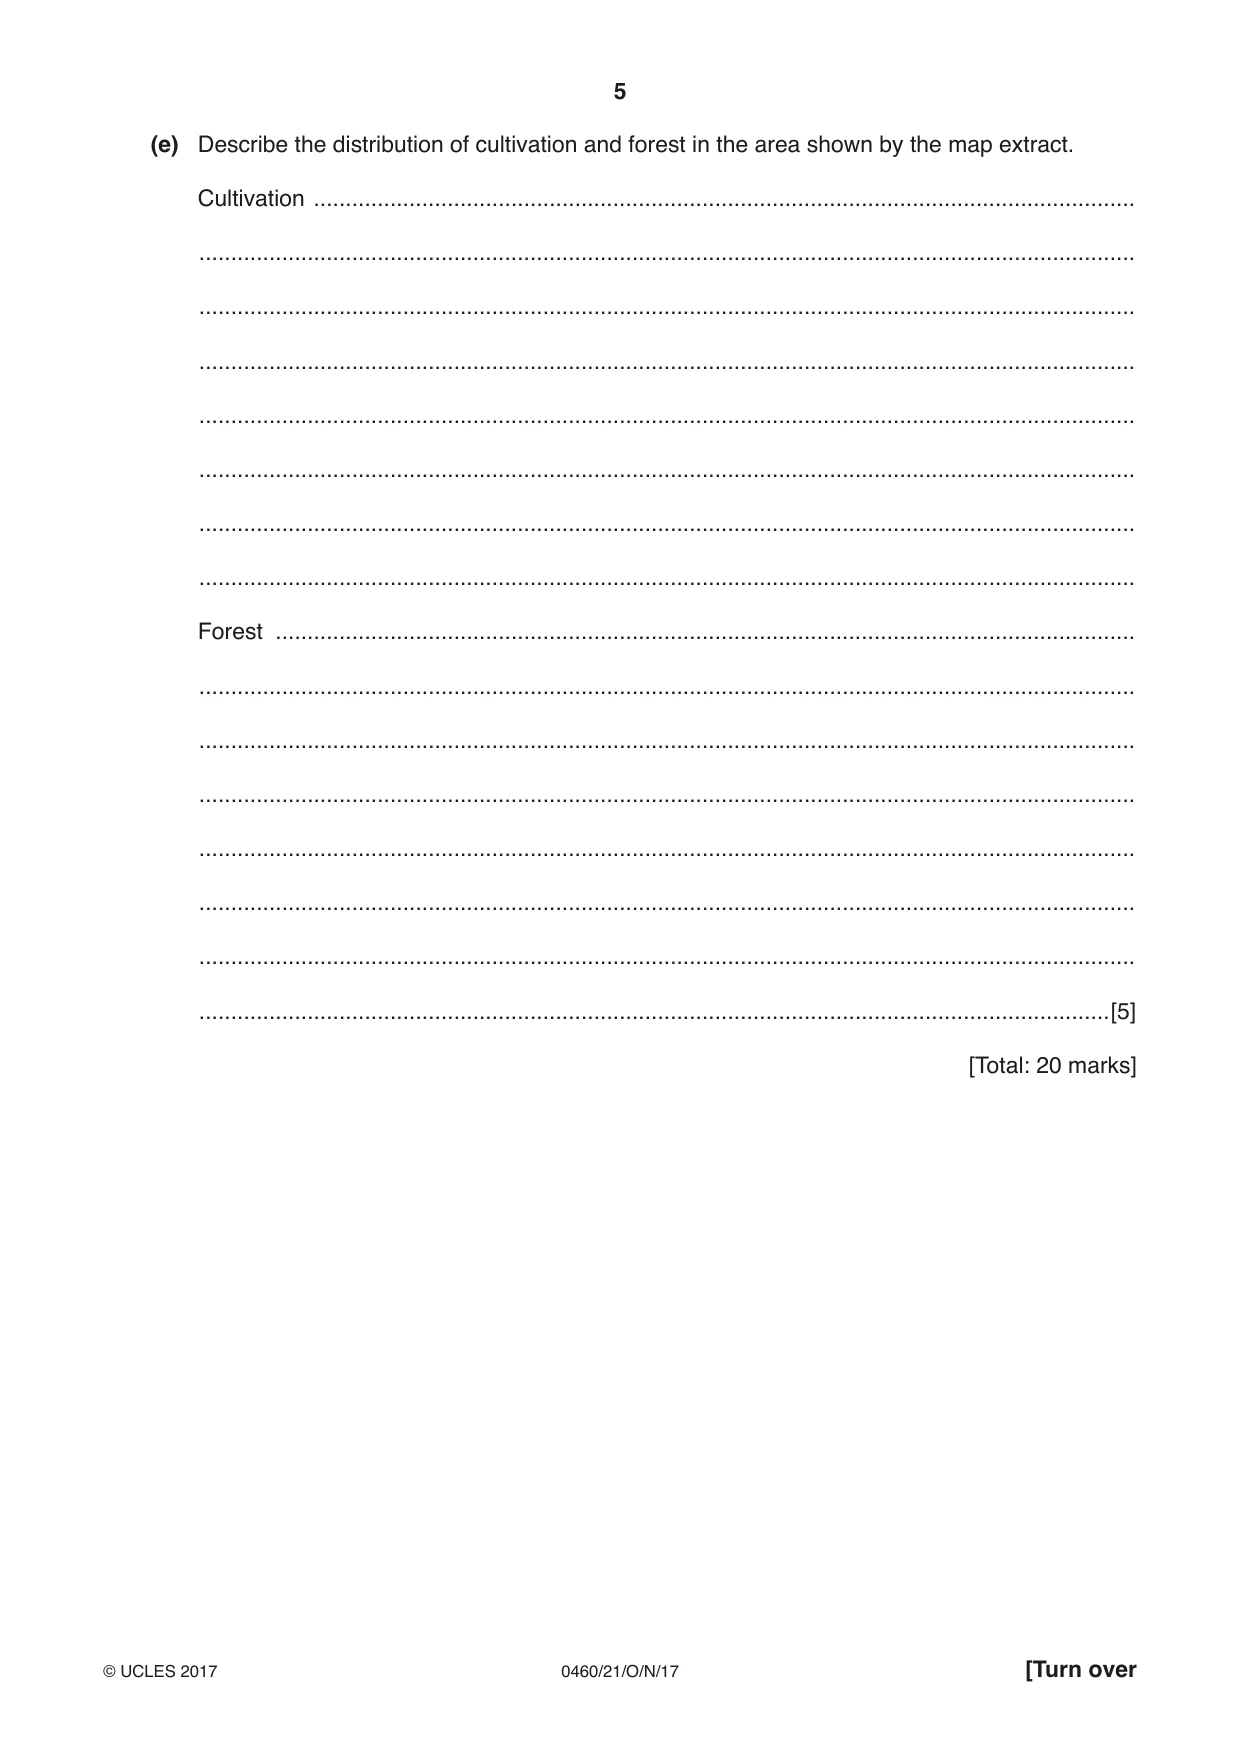
1 Study the map extract for Vangsvatnet, Norway. The scale is 1:25 000. Fig. 1 shows some of the features around the lake of Vangsvatnet. Study Fig. 1 and the map extract, and answer the questions on the opposite page. 51 52 53 54 26 26 D F 25 25 E C H B G 24 24 J A 23 23 51 52 53 54 Fig. 1 (a) Using the map extract, identify the following features shown in Fig. 1: (i) feature A; .......................................................................................................................................[1] (ii) feature B; .......................................................................................................................................[1] (iii) feature C; .......................................................................................................................................[1] (iv) the height above sea level at trigonometric point D; .......................................................................................................................................[1] (v) feature E; .......................................................................................................................................[1] (vi) the name of river F; .......................................................................................................................................[1] (vii) the feature of the river in area G. .......................................................................................................................................[1] (b) A person walks along the edge of the lake from H to J. How far does the person walk? Circle one correct answer below. 1500 m 1800 m 2100 m 2400 m [1] (c) Describe the route of the railway from the western edge of the map to the settlement at Bulken. ................................................................................................................................................... ................................................................................................................................................... ................................................................................................................................................... ................................................................................................................................................... ...............................................................................................................................................[2] (d) Fig. 2 shows an area in the north west of the map extract. Describe the relief of this area. 49 50 51 29 29 H o r n 28 28 49 50 51 Fig. 2 ................................................................................................................................................... ................................................................................................................................................... ................................................................................................................................................... ................................................................................................................................................... ................................................................................................................................................... ................................................................................................................................................... ................................................................................................................................................... ................................................................................................................................................... ................................................................................................................................................... ...............................................................................................................................................[5] (e) Describe the distribution of cultivation and forest in the area shown by the map extract. Cultivation ................................................................................................................................. ................................................................................................................................................... ................................................................................................................................................... ................................................................................................................................................... ................................................................................................................................................... ................................................................................................................................................... ................................................................................................................................................... ................................................................................................................................................... Forest ....................................................................................................................................... ................................................................................................................................................... ................................................................................................................................................... ................................................................................................................................................... ................................................................................................................................................... ................................................................................................................................................... ................................................................................................................................................... ...............................................................................................................................................[5] [Total: 20 marks]
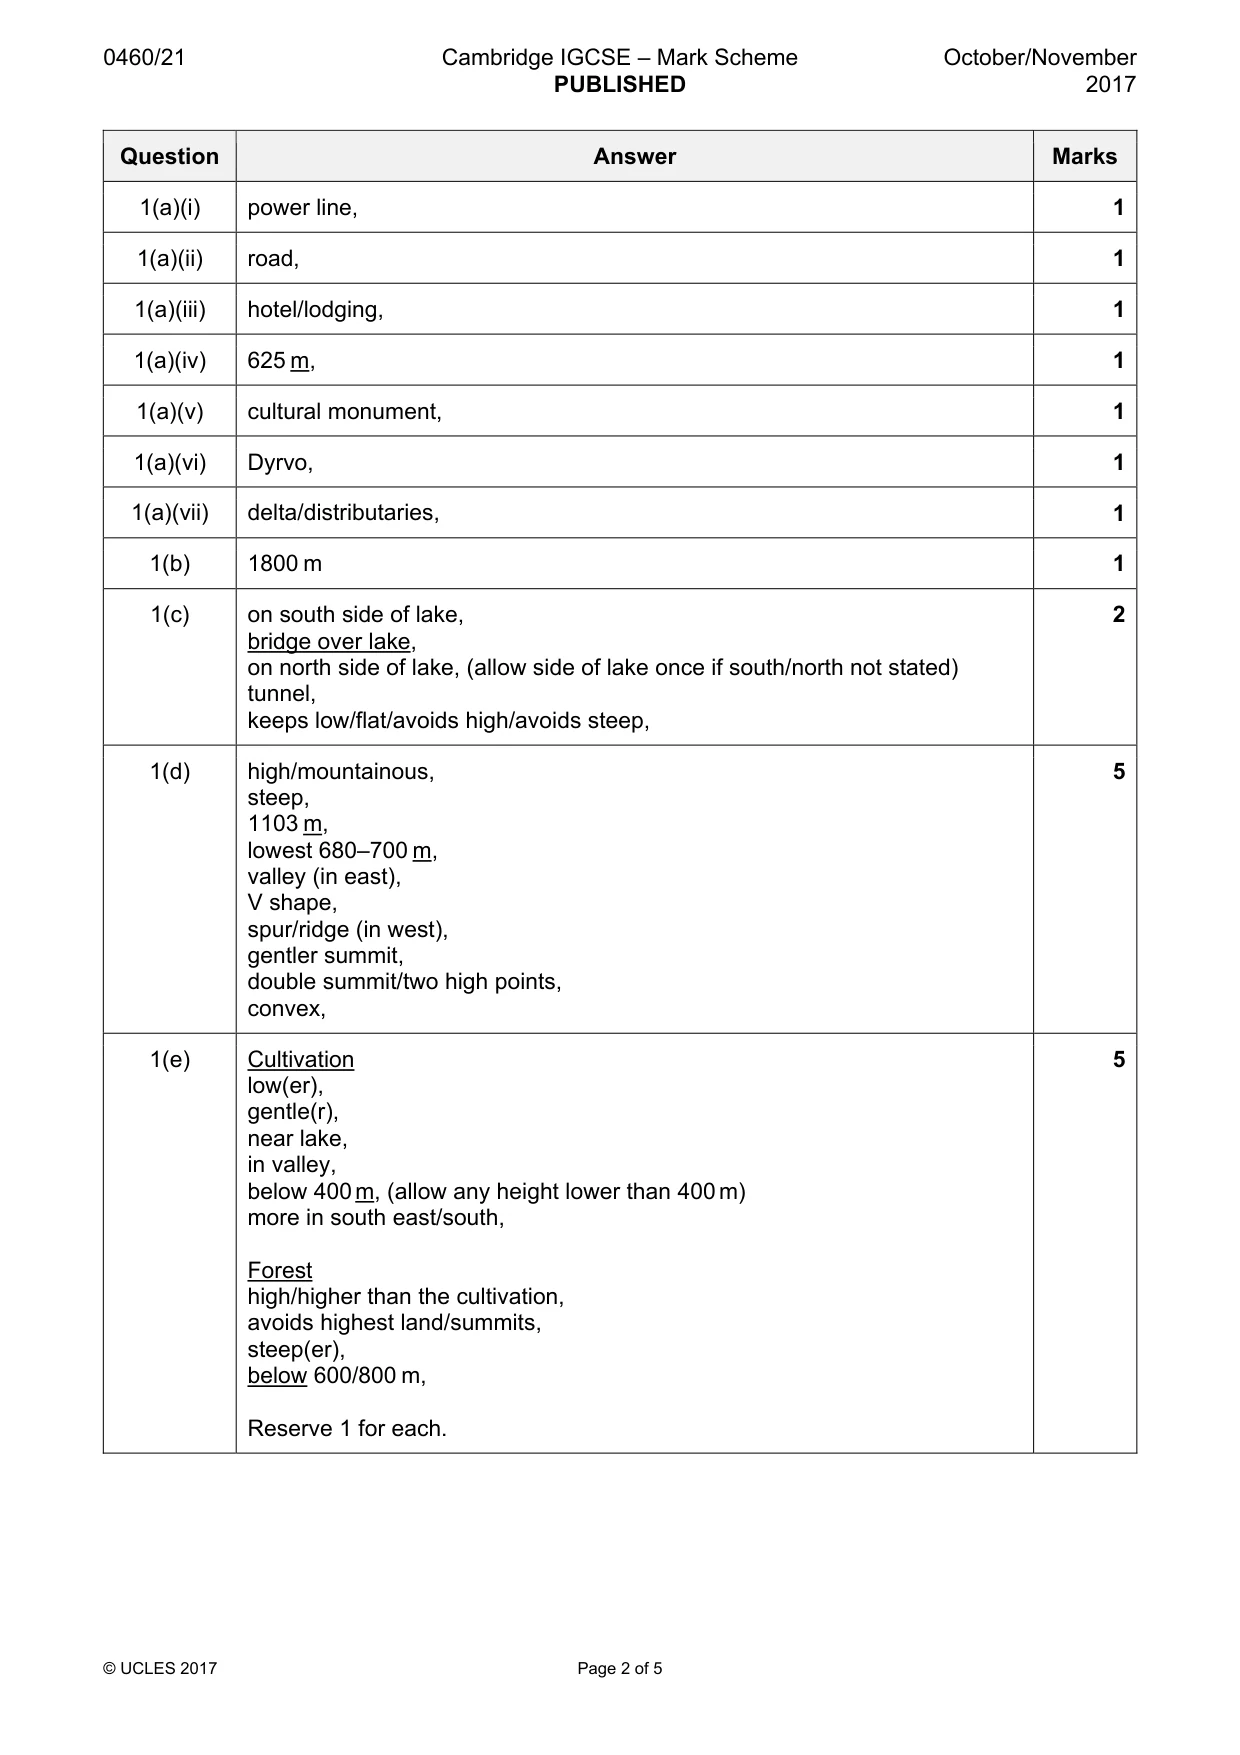
Mark scheme: Question Answer Marks 1(a)(i) power line, 1 1(a)(ii) road, 1 1(a)(iii) hotel/lodging, 1 1(a)(iv) 625 m, 1 1(a)(v) cultural monument, 1 1(a)(vi) Dyrvo, 1 1(a)(vii) delta/distributaries, 1 1(b) 1800 m 1 1(c) on south side of lake, 2 bridge over lake, on north side of lake, (allow side of lake once if south/north not stated) tunnel, keeps low/flat/avoids high/avoids steep, 1(d) high/mountainous, 5 steep, 1103 m, lowest 680–700 m, valley (in east), V shape, spur/ridge (in west), gentler summit, double summit/two high points, convex, 1(e) Cultivation 5 low(er), gentle(r), near lake, in valley, below 400 m, (allow any height lower than 400 m) more in south east/south, Forest high/higher than the cultivation, avoids highest land/summits, steep(er), below 600/800 m, Reserve 1 for each.
Q2 · The population structure of Angola, an LEDC
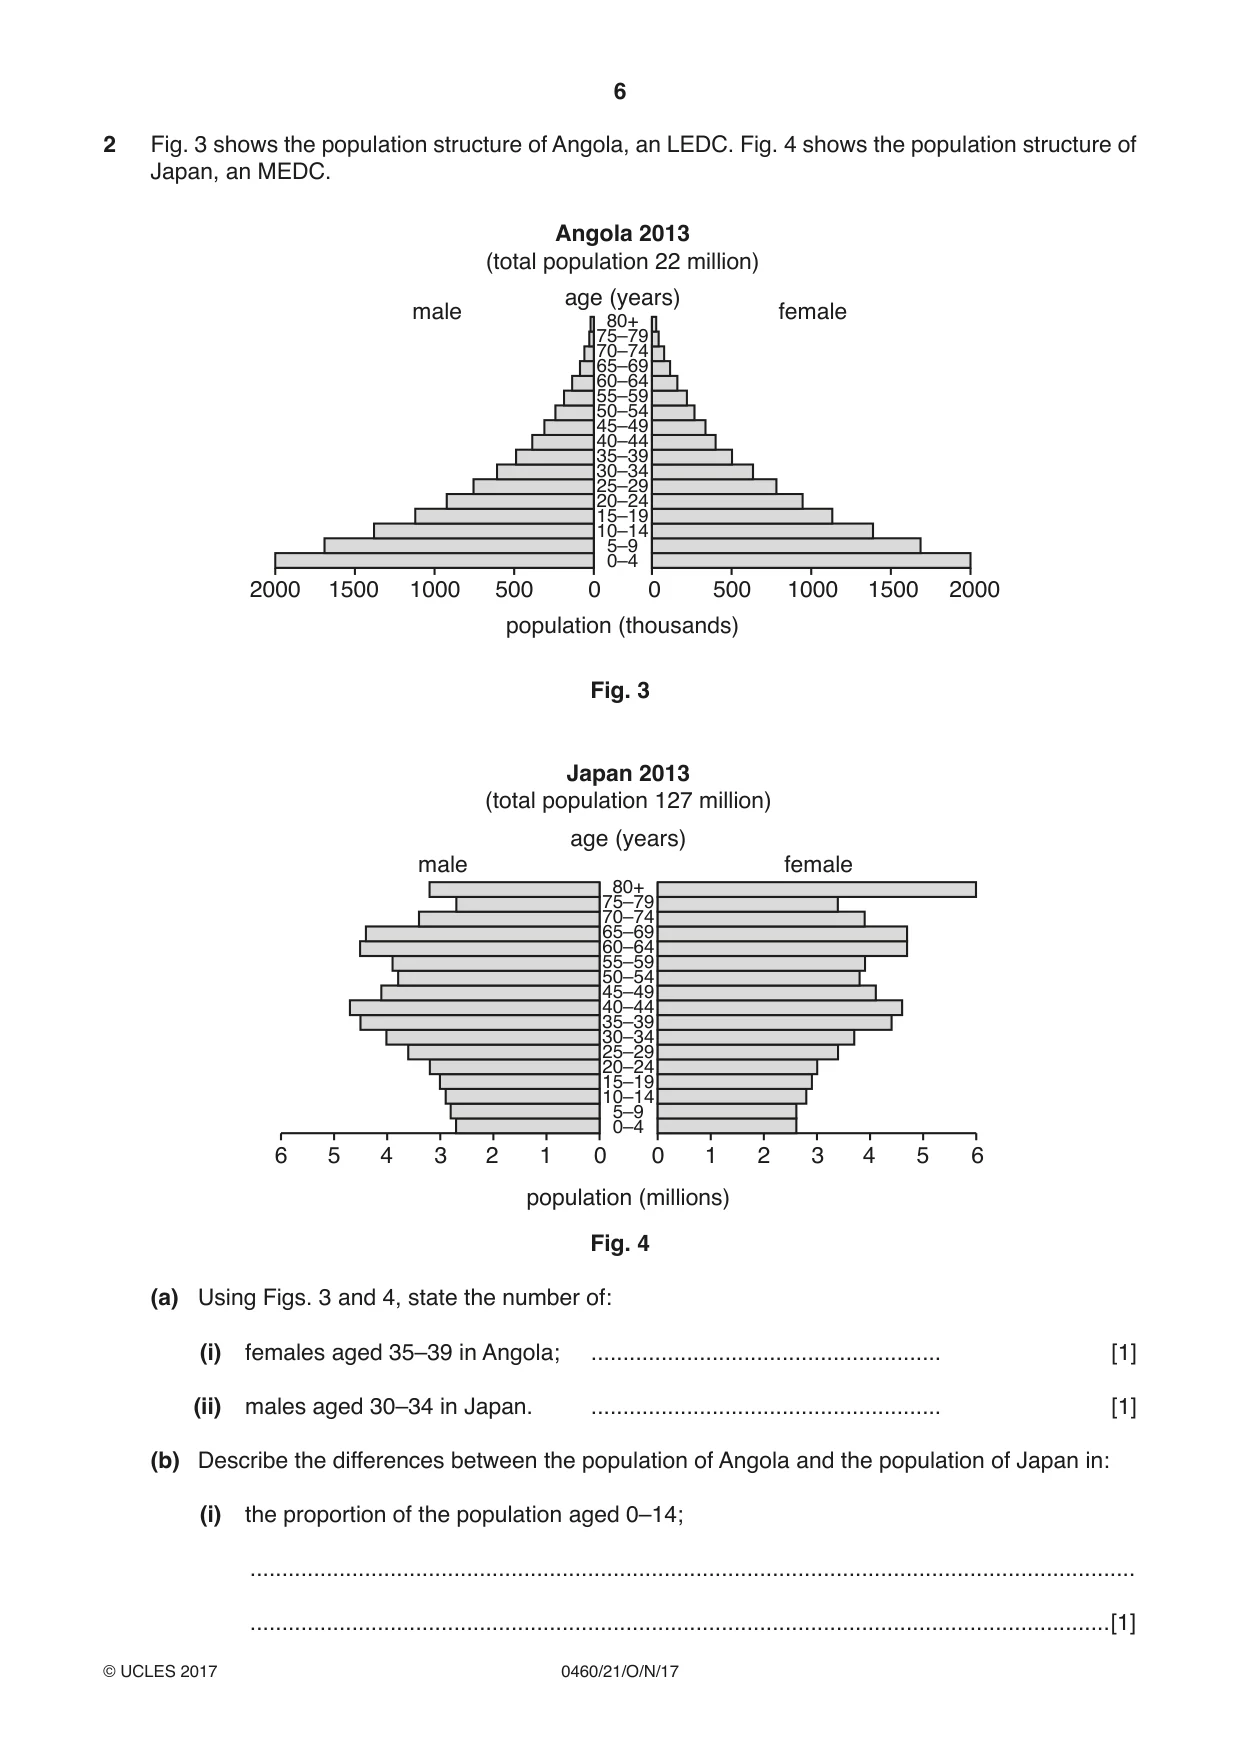
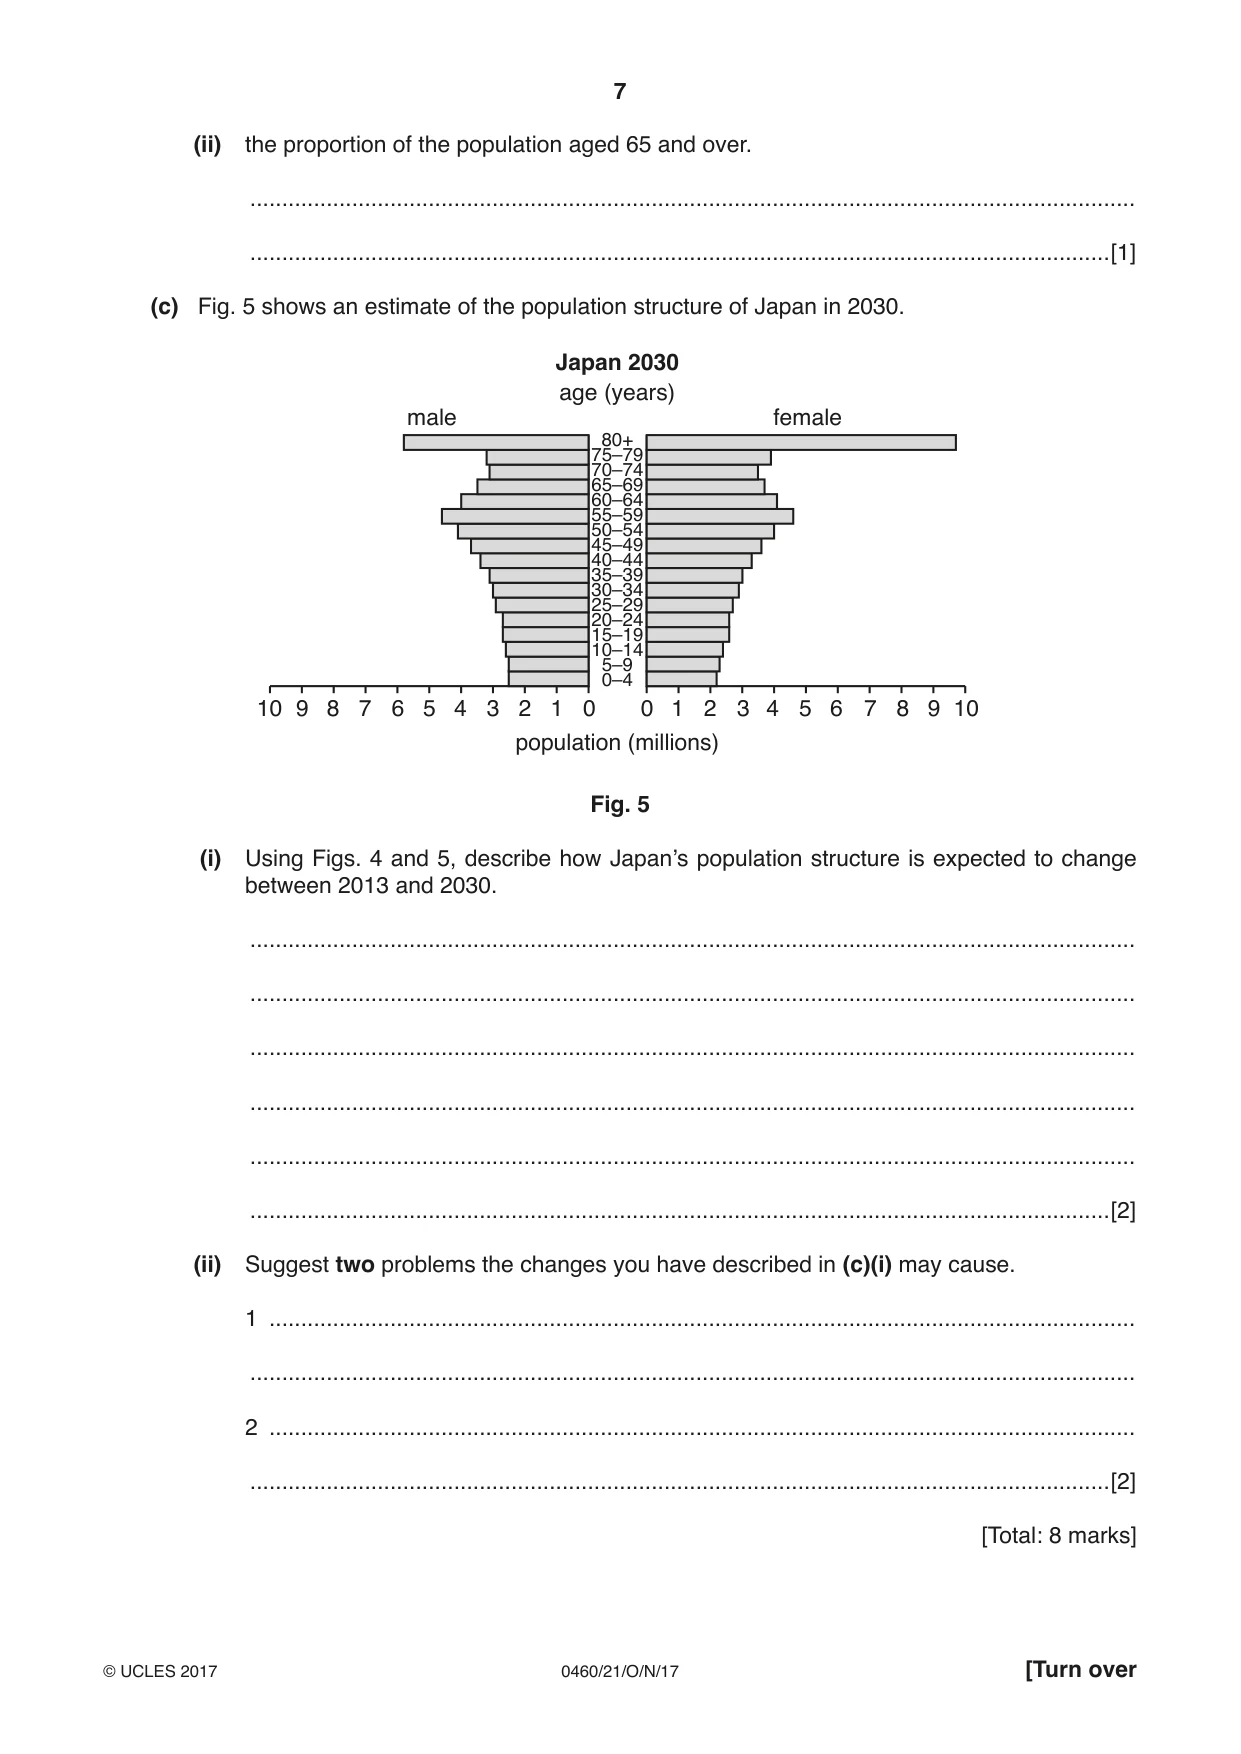
2 Fig. 3 shows the population structure of Angola, an LEDC. Fig. 4 shows the population structure of Japan, an MEDC. Angola 2013 (total population 22 million) age (years) male female 80+ 75–79 70–74 65–69 60–64 55–59 50–54 45–49 40–44 35–39 30–34 25–29 20–24 15–19 10–14 5–9 0–4 2000 1500 1000 500 0 0 500 1000 1500 2000 population (thousands) Fig. 3 Japan 2013 (total population 127 million) age (years) male female 80+ 75–79 70–74 65–69 60–64 55–59 50–54 45–49 40–44 35–39 30–34 25–29 20–24 15–19 10–14 5–9 0–4 6 5 4 3 2 1 0 0 1 2 3 4 5 6 population (millions) Fig. 4 (a) Using Figs. 3 and 4, state the number of: (i) females aged 35–39 in Angola; ....................................................... [1] (ii) males aged 30–34 in Japan. ....................................................... [1] (b) Describe the differences between the population of Angola and the population of Japan in: (i) the proportion of the population aged 0–14; ........................................................................................................................................... .......................................................................................................................................[1] (ii) the proportion of the population aged 65 and over. ........................................................................................................................................... .......................................................................................................................................[1] (c) Fig. 5 shows an estimate of the population structure of Japan in 2030. Japan 2030 age (years) male female 80+ 75–79 70–74 65–69 60–64 55–59 50–54 45–49 40–44 35–39 30–34 25–29 20–24 15–19 10–14 5–9 0–4 10 9 8 7 6 5 4 3 2 1 0 0 1 2 3 4 5 6 7 8 9 10 population (millions) Fig. 5 (i) Using Figs. 4 and 5, describe how Japan’s population structure is expected to change between 2013 and 2030. ........................................................................................................................................... ........................................................................................................................................... ........................................................................................................................................... ........................................................................................................................................... ........................................................................................................................................... .......................................................................................................................................[2] (ii) Suggest two problems the changes you have described in (c)(i) may cause. 1 ........................................................................................................................................ ........................................................................................................................................... 2 ........................................................................................................................................ .......................................................................................................................................[2] [Total: 8 marks]
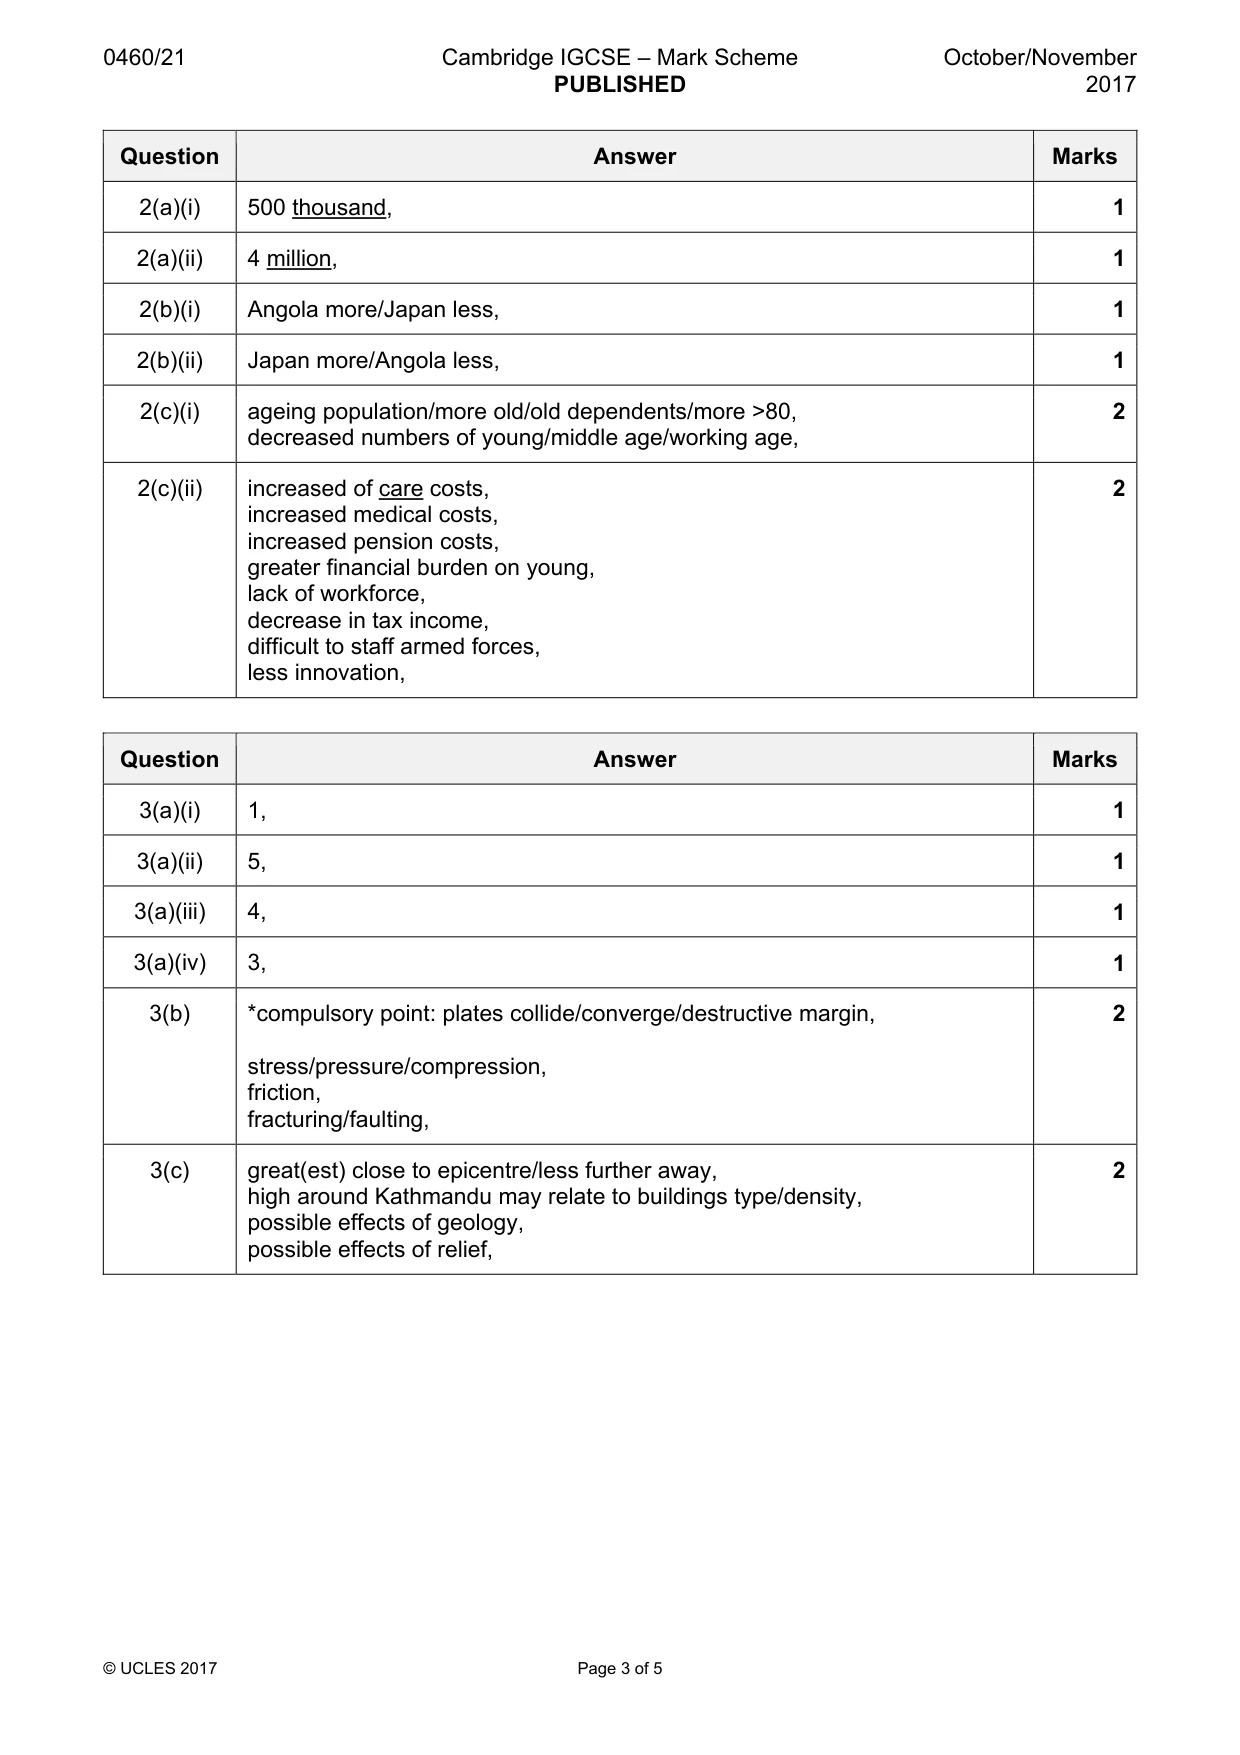
Mark scheme: 2(a)(i) 500 thousand, 1 2(a)(ii) 4 million, 1 2(b)(i) Angola more/Japan less, 1 2(b)(ii) Japan more/Angola less, 1 2(c)(i) ageing population/more old/old dependents/more >80, 2 decreased numbers of young/middle age/working age, 2(c)(ii) increased of care costs, 2 increased medical costs, increased pension costs, greater financial burden on young, lack of workforce, decrease in tax income, difficult to staff armed forces, less innovation,
Q3 · A map showing plates, plate boundaries and the directions of plate movement
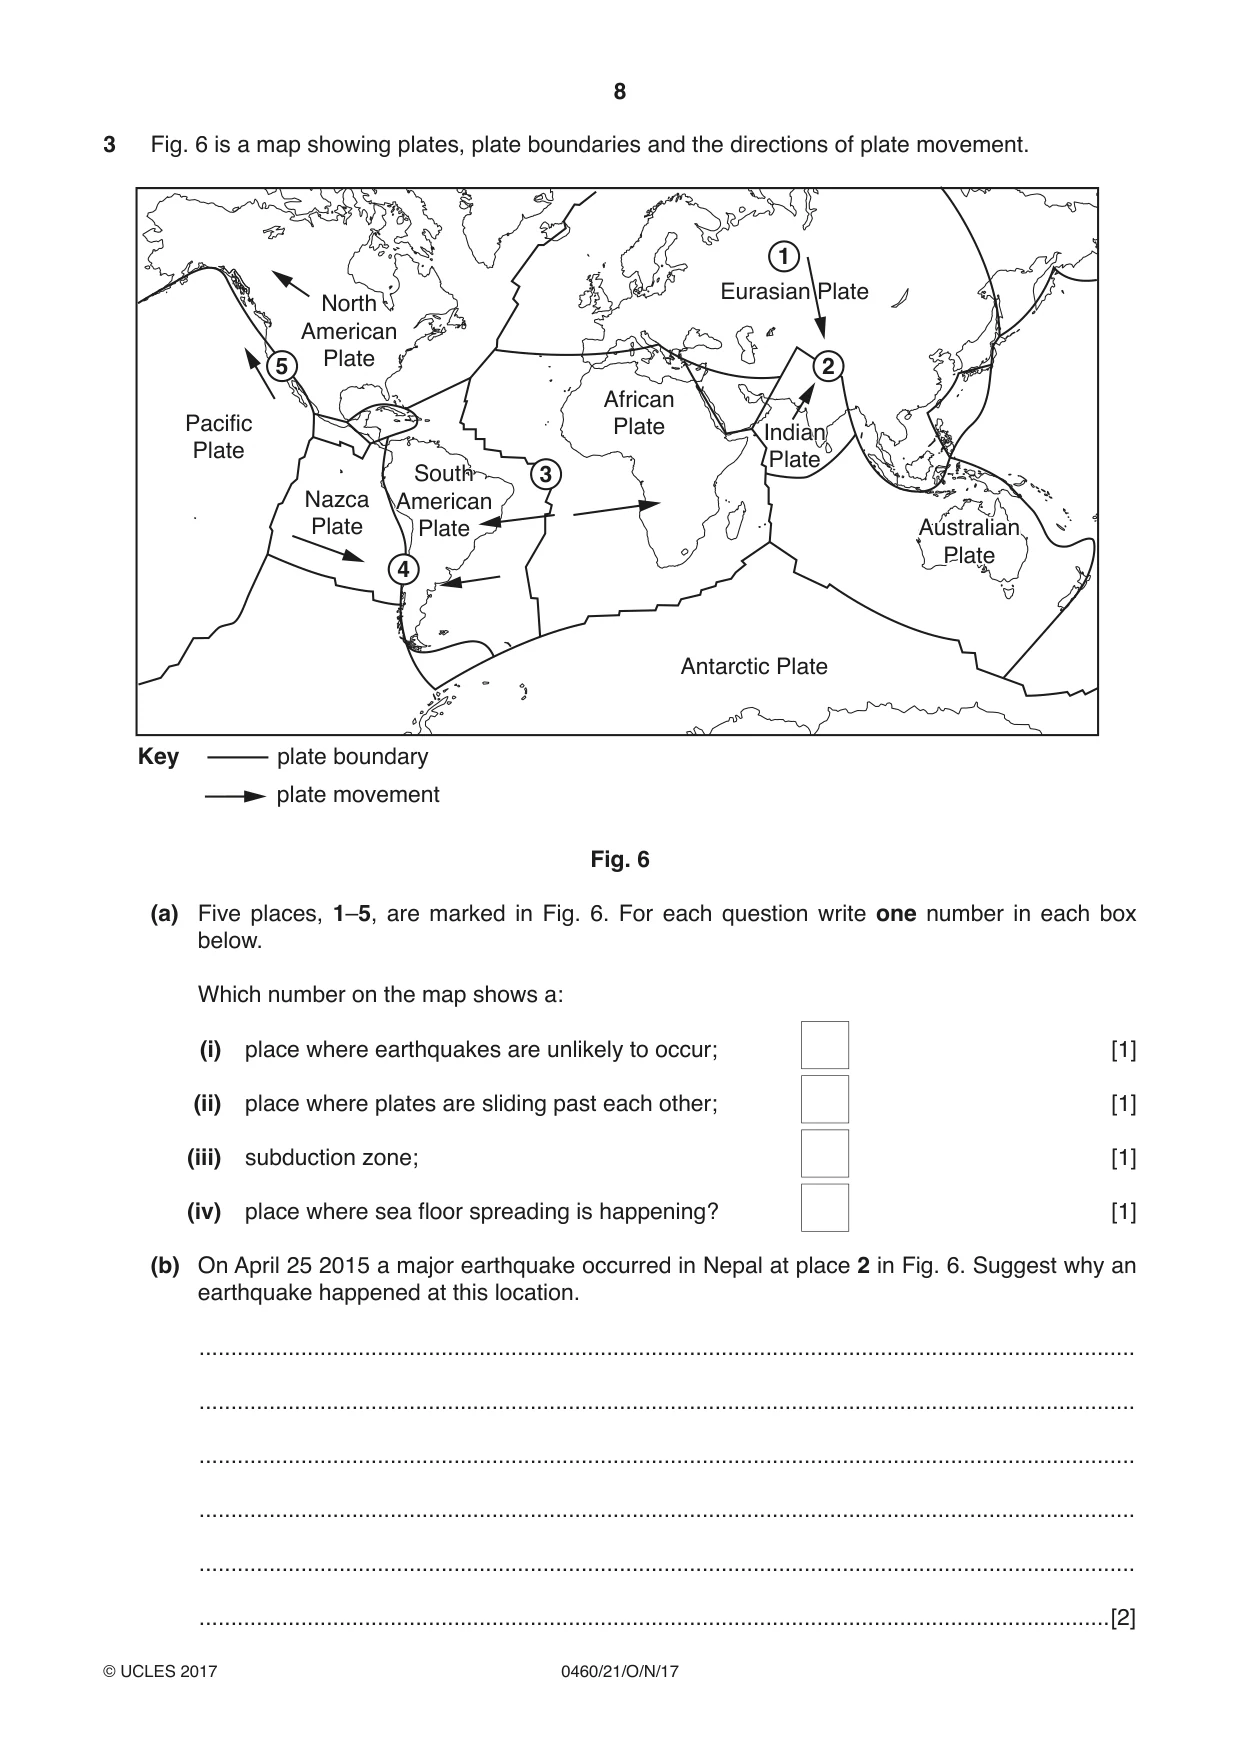
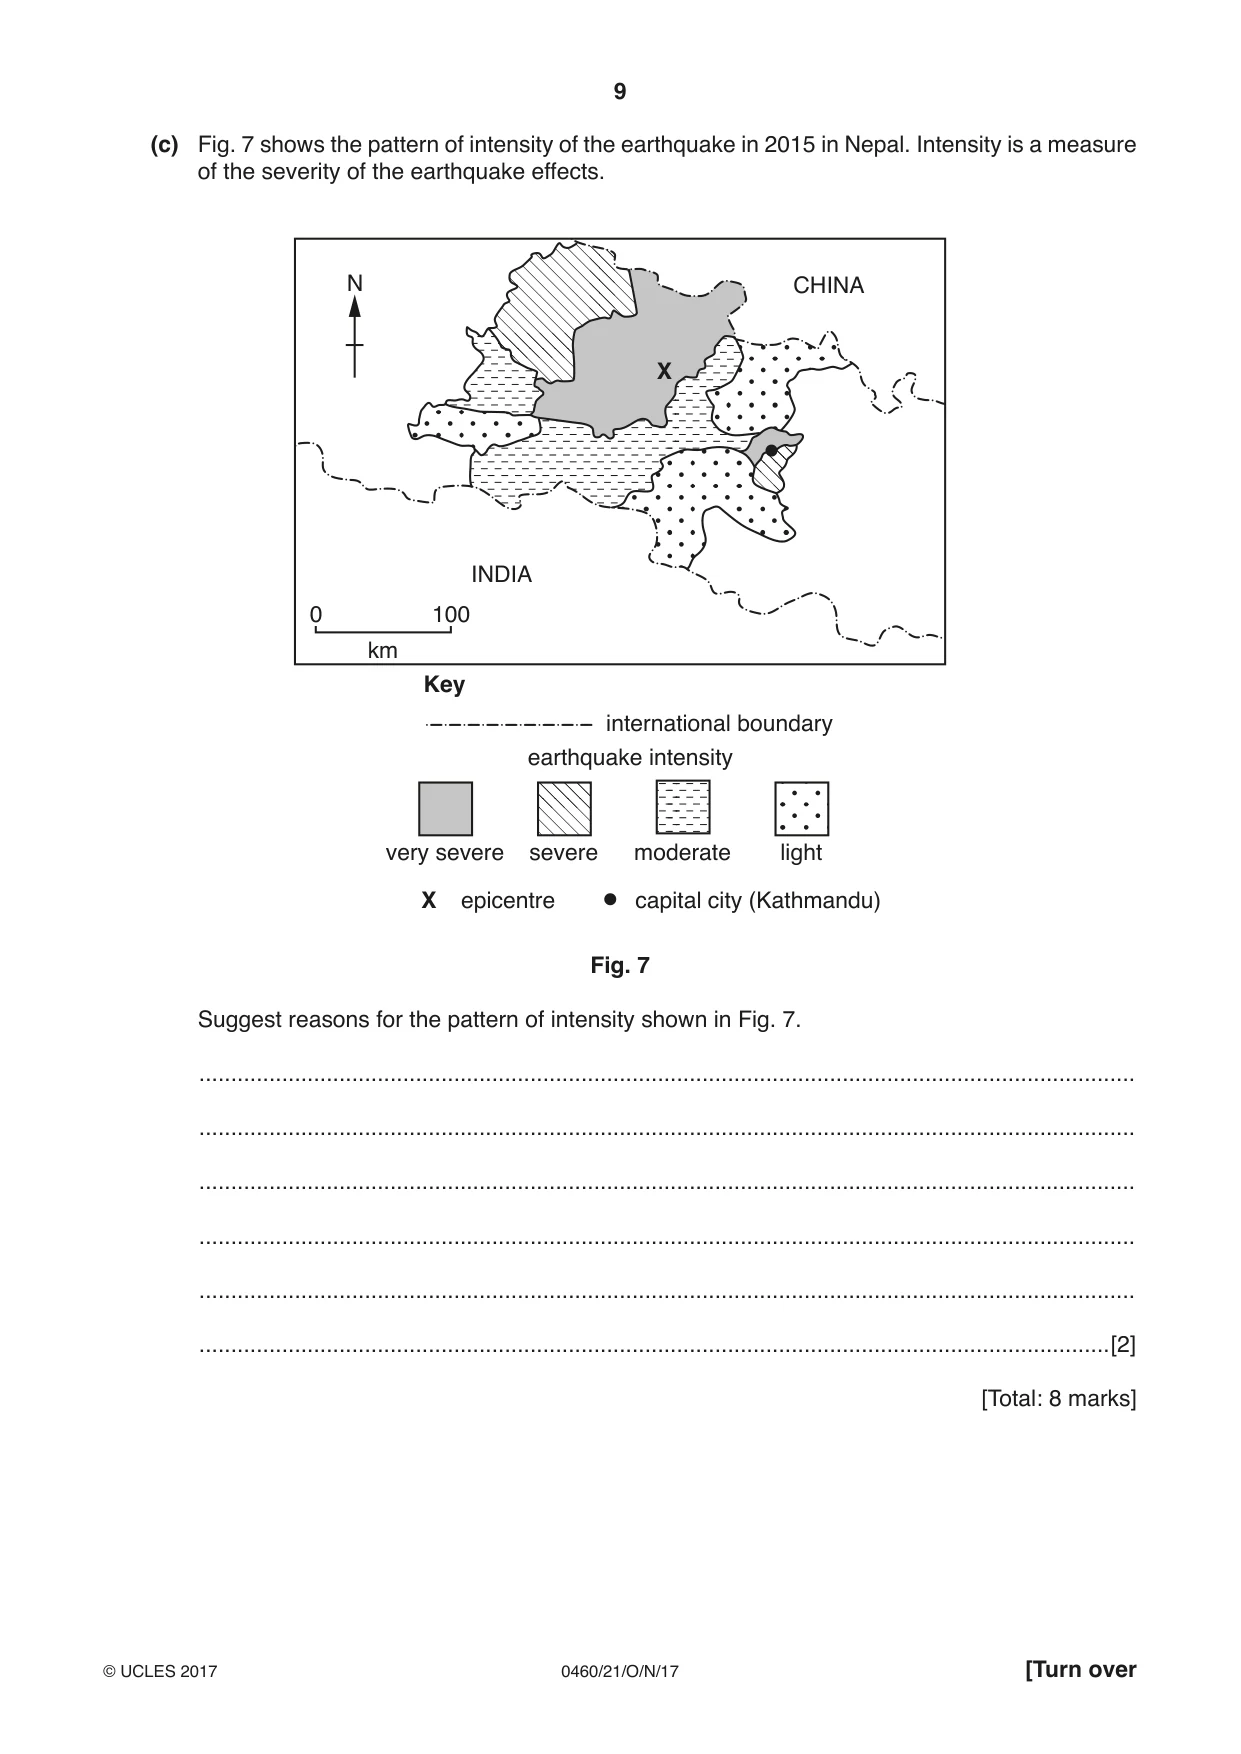
3 Fig. 6 is a map showing plates, plate boundaries and the directions of plate movement. 1 Eurasian Plate North American Plate 5 2 African Pacific Plate Indian Plate Plate South 3 Nazca American Plate Plate Australian Plate 4 Antarctic Plate Key plate boundary plate movement Fig. 6 (a) Five places, 1–5, are marked in Fig. 6. For each question write one number in each box below. Which number on the map shows a: (i) place where earthquakes are unlikely to occur; [1] (ii) place where plates are sliding past each other; [1] (iii) subduction zone; [1] (iv) place where sea floor spreading is happening? [1] (b) On April 25 2015 a major earthquake occurred in Nepal at place 2 in Fig. 6. Suggest why an earthquake happened at this location. ................................................................................................................................................... ................................................................................................................................................... ................................................................................................................................................... ................................................................................................................................................... ................................................................................................................................................... ...............................................................................................................................................[2] (c) Fig. 7 shows the pattern of intensity of the earthquake in 2015 in Nepal. Intensity is a measure of the severity of the earthquake effects. N CHINA X INDIA 0 100 km Key international boundary earthquake intensity very severe severe moderate light X epicentre capital city (Kathmandu) Fig. 7 Suggest reasons for the pattern of intensity shown in Fig. 7. ................................................................................................................................................... ................................................................................................................................................... ................................................................................................................................................... ................................................................................................................................................... ................................................................................................................................................... ...............................................................................................................................................[2] [Total: 8 marks]
Mark scheme: 3(a)(i) 1, 1 3(a)(ii) 5, 1 3(a)(iii) 4, 1 3(a)(iv) 3, 1 3(b) *compulsory point: plates collide/converge/destructive margin, 2 stress/pressure/compression, friction, fracturing/faulting, 3(c) great(est) close to epicentre/less further away, 2 high around Kathmandu may relate to buildings type/density, possible effects of geology, possible effects of relief,
Q4 · Photograph A (Insert) shows a weather station at a school in Zimbabwe
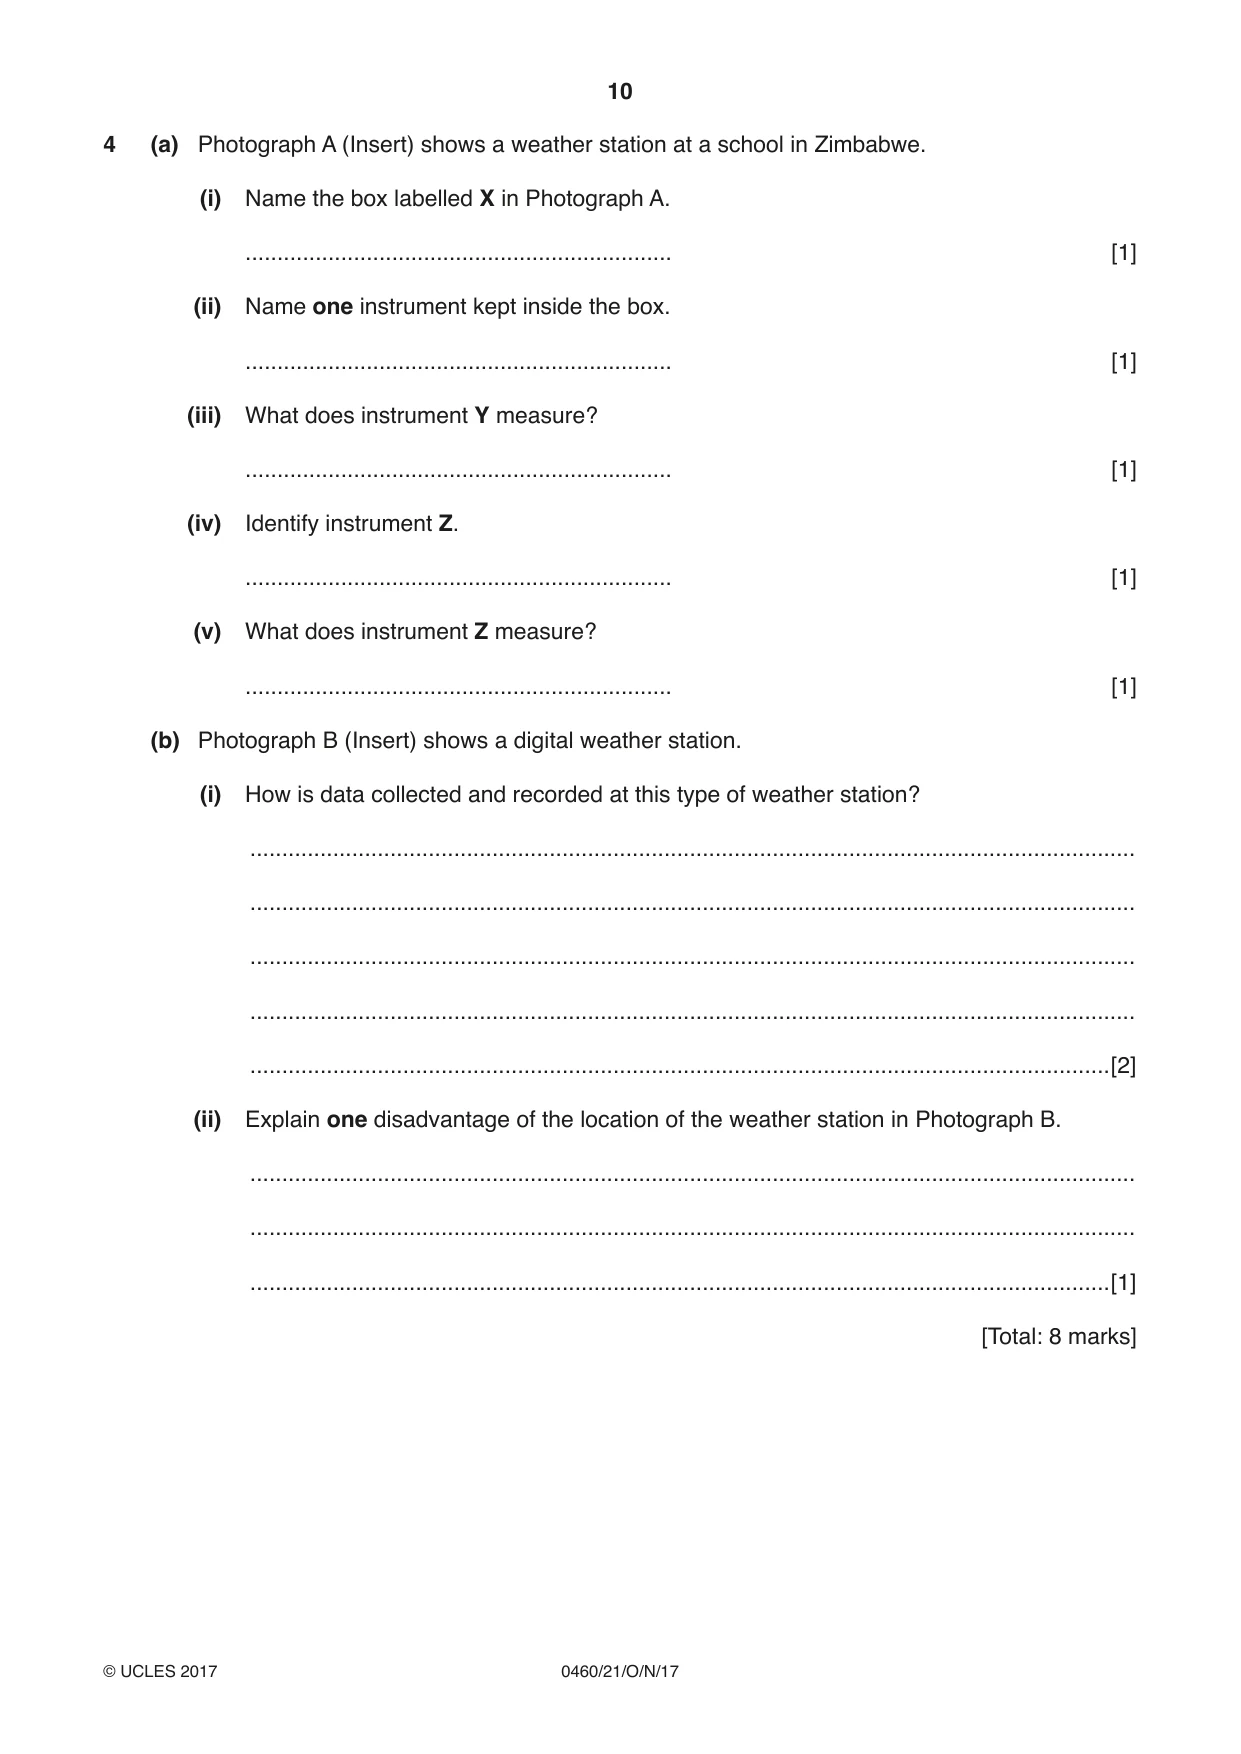
4 (a) Photograph A (Insert) shows a weather station at a school in Zimbabwe. (i) Name the box labelled X in Photograph A. ................................................................... [1] (ii) Name one instrument kept inside the box. ................................................................... [1] (iii) What does instrument Y measure? ................................................................... [1] (iv) Identify instrument Z. ................................................................... [1] (v) What does instrument Z measure? ................................................................... [1] (b) Photograph B (Insert) shows a digital weather station. (i) How is data collected and recorded at this type of weather station? ........................................................................................................................................... ........................................................................................................................................... ........................................................................................................................................... ........................................................................................................................................... .......................................................................................................................................[2] (ii) Explain one disadvantage of the location of the weather station in Photograph B. ........................................................................................................................................... ........................................................................................................................................... .......................................................................................................................................[1] [Total: 8 marks]
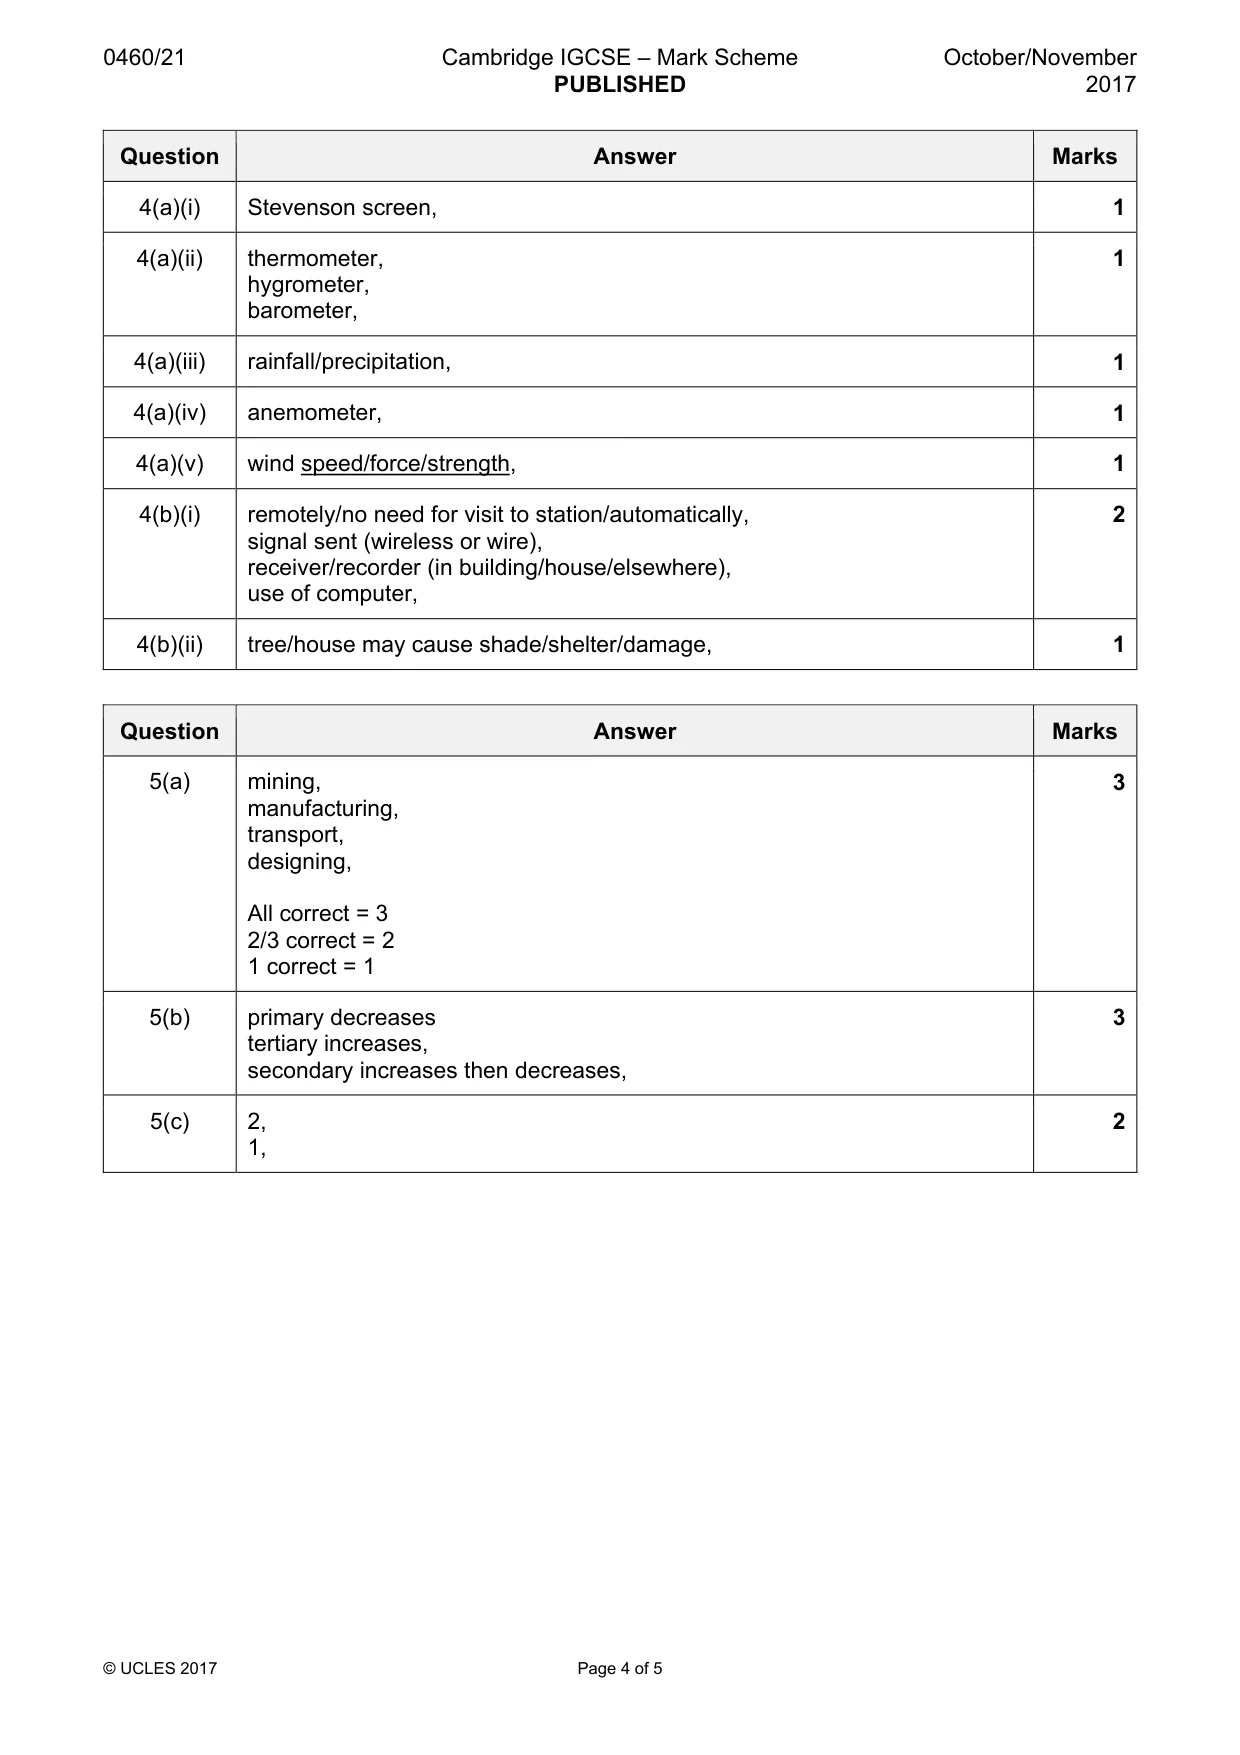
Mark scheme: 4(a)(i) Stevenson screen, 1 4(a)(ii) thermometer, 1 hygrometer, barometer, 4(a)(iii) rainfall/precipitation, 1 4(a)(iv) anemometer, 1 4(a)(v) wind speed/force/strength, 1 4(b)(i) remotely/no need for visit to station/automatically, 2 signal sent (wireless or wire), receiver/recorder (in building/house/elsewhere), use of computer, 4(b)(ii) tree/house may cause shade/shelter/damage, 1
Q5 · Employment can be classified as primary, secondary, tertiary and quaternary
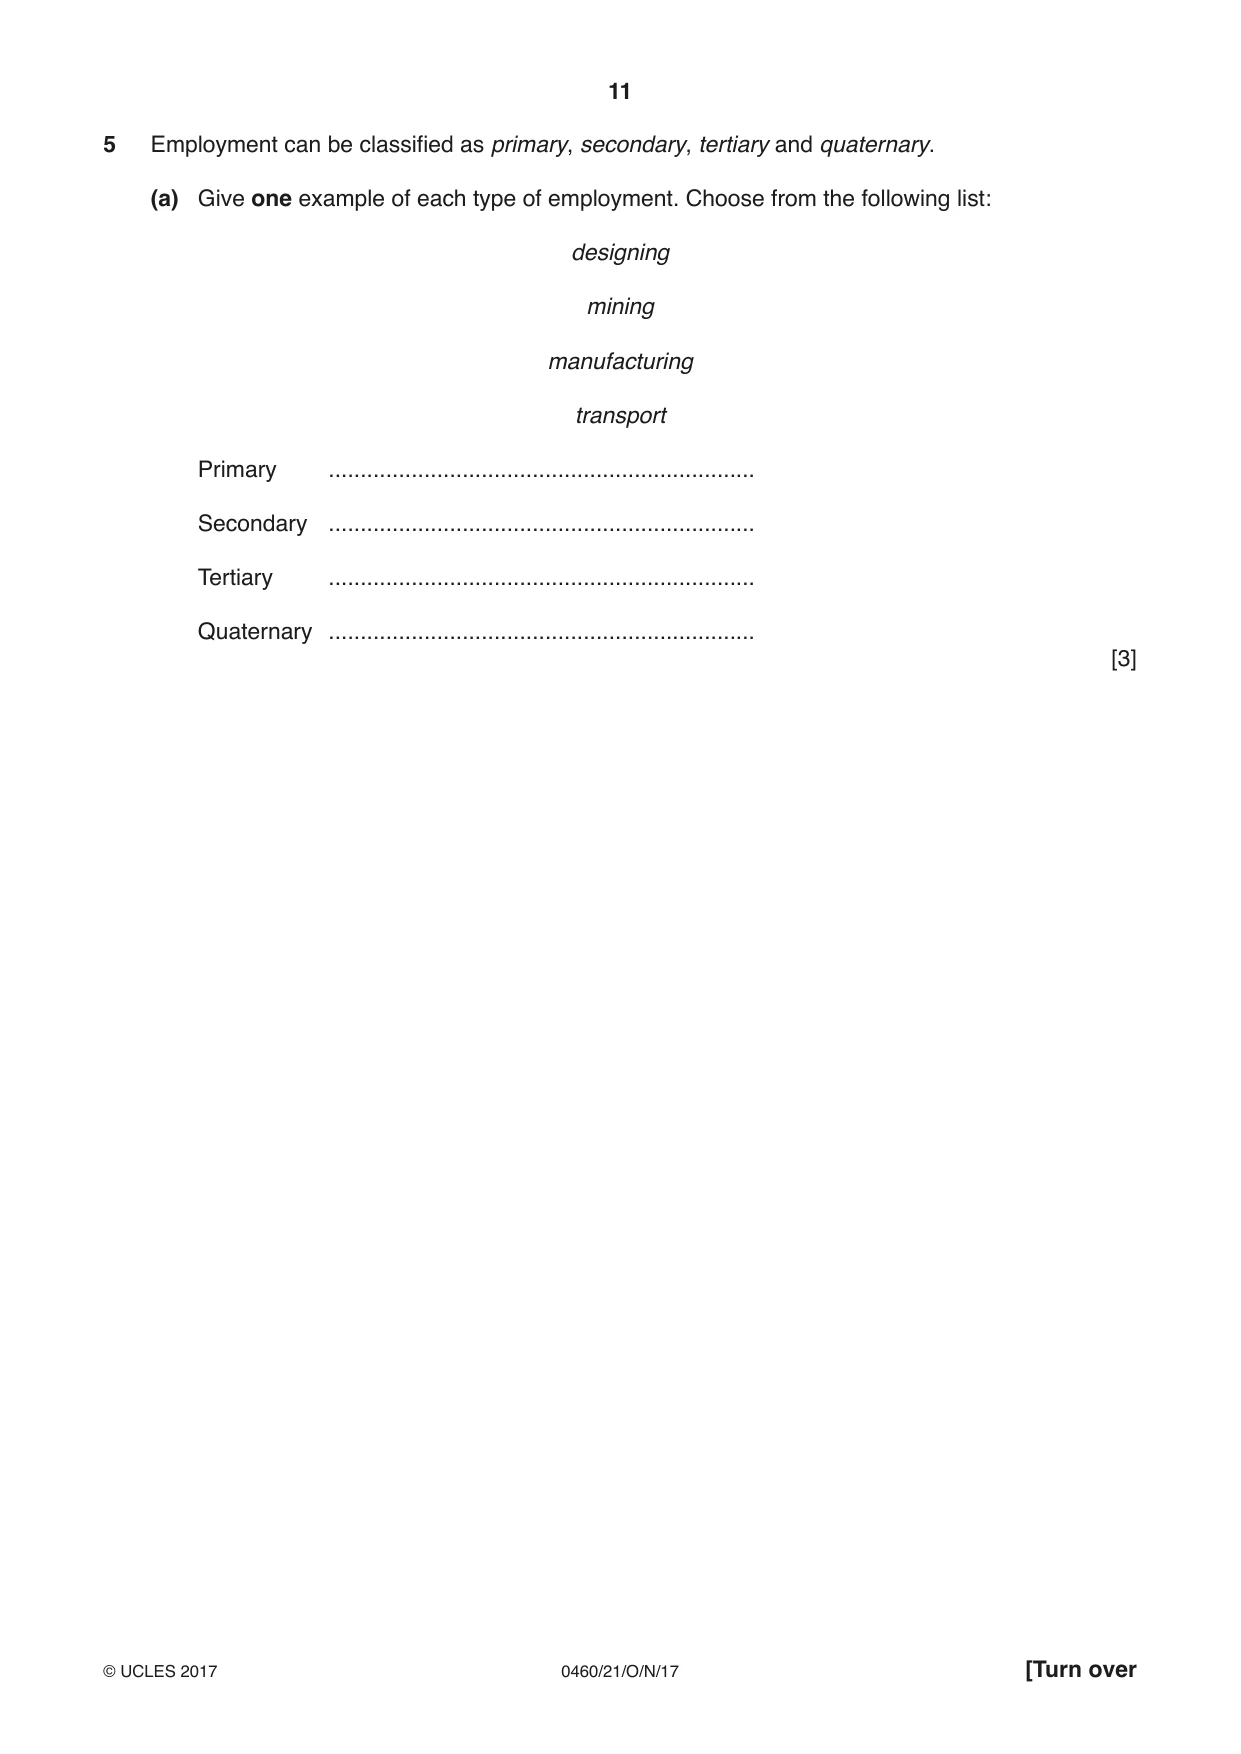
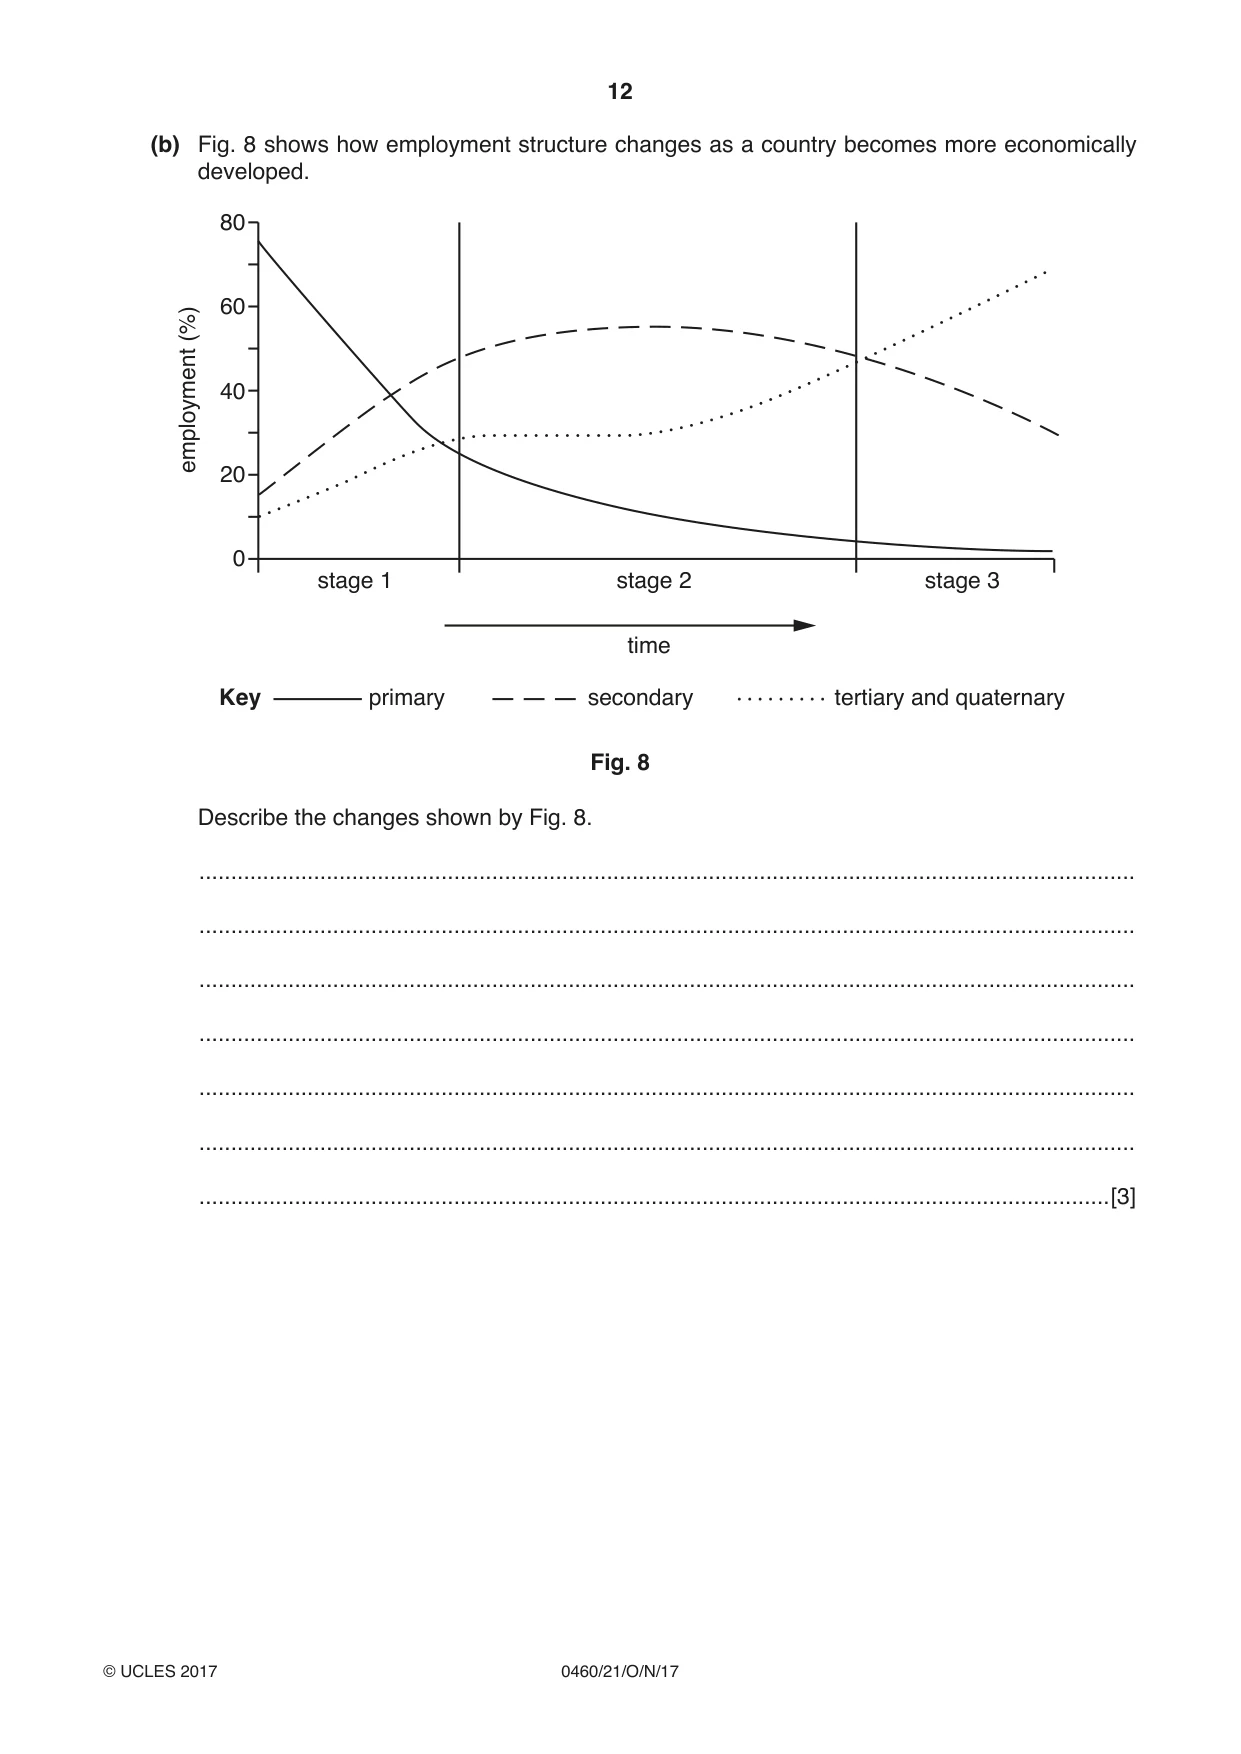
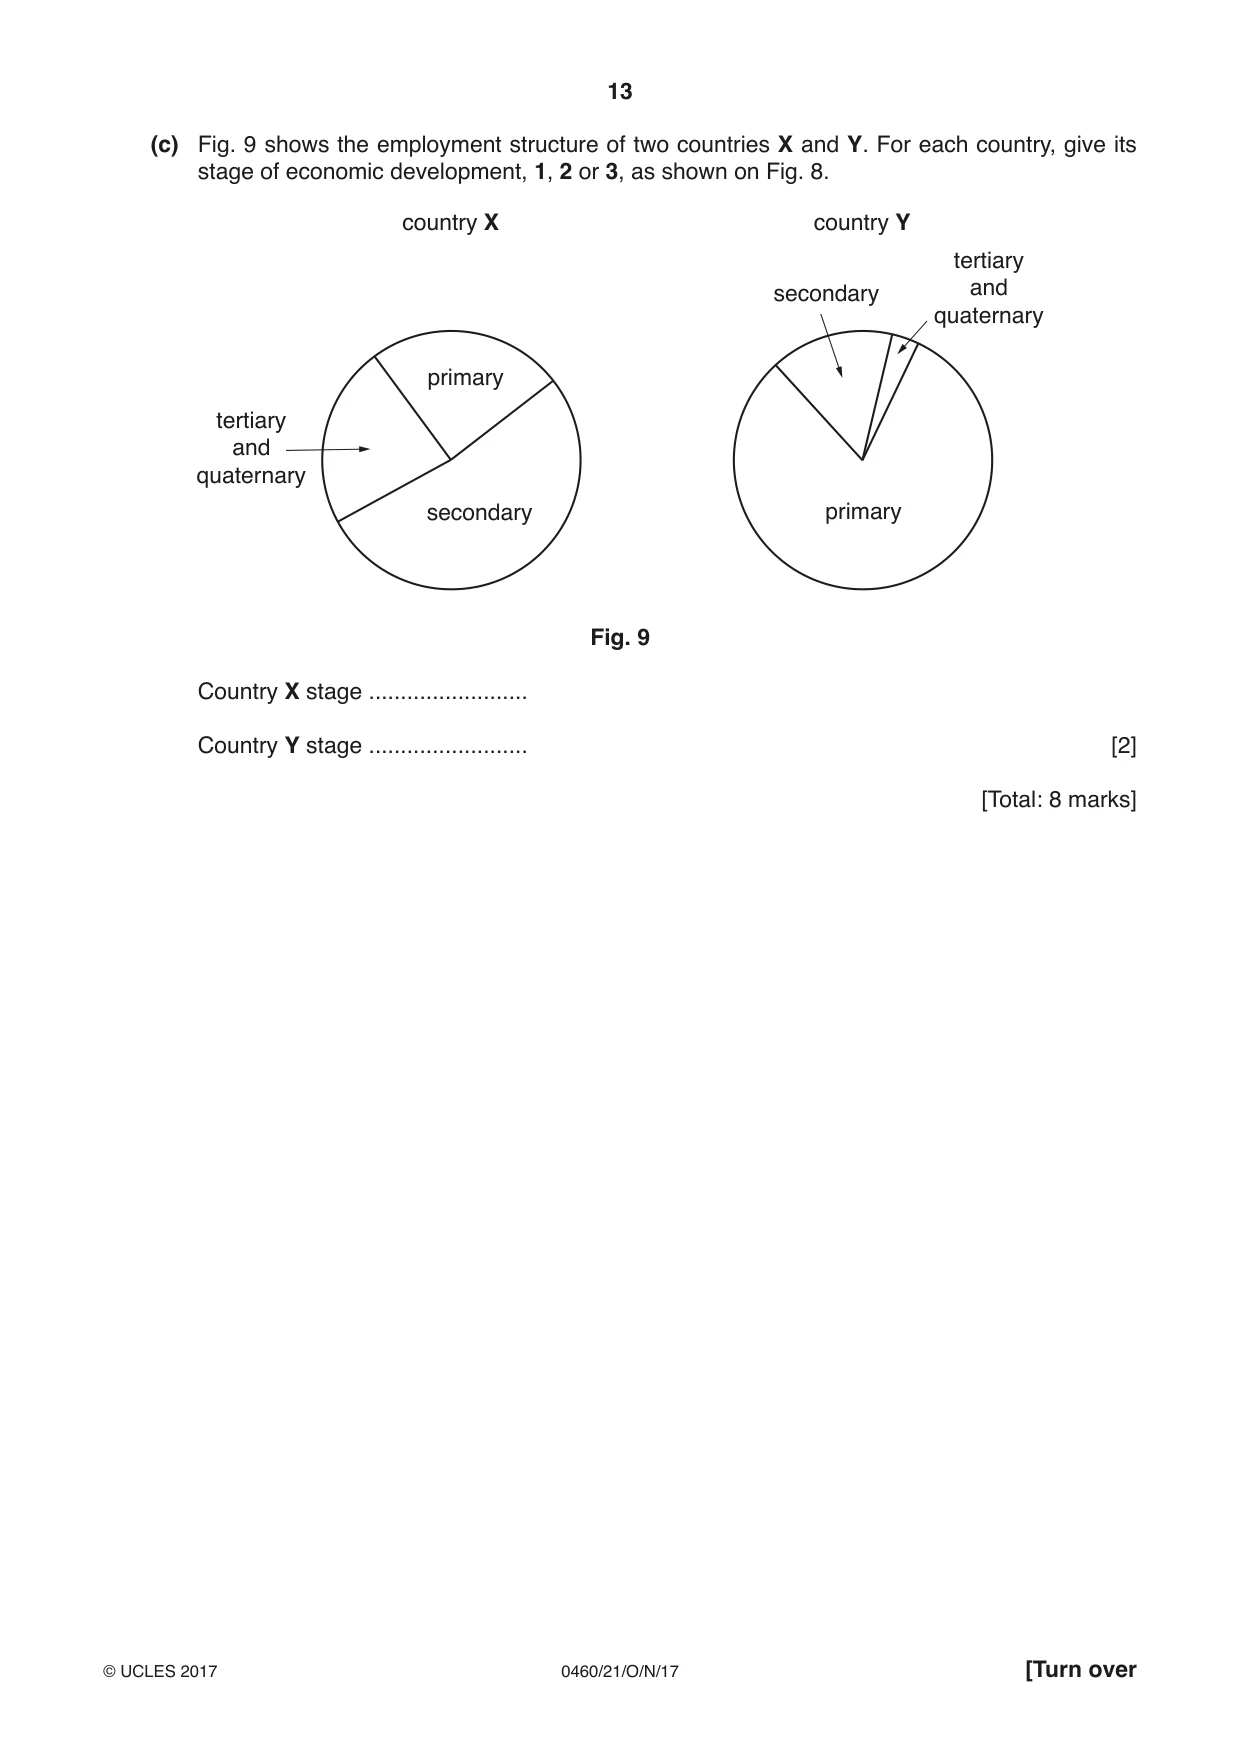
5 Employment can be classified as primary, secondary, tertiary and quaternary. (a) Give one example of each type of employment. Choose from the following list: designing mining manufacturing transport Primary ................................................................... Secondary ................................................................... Tertiary ................................................................... Quaternary ................................................................... [3] (b) Fig. 8 shows how employment structure changes as a country becomes more economically developed. 80 60 (%) 40 employment 20 0 stage 1 stage 2 stage 3 time Key primary secondary tertiary and quaternary Fig. 8 Describe the changes shown by Fig. 8. ................................................................................................................................................... ................................................................................................................................................... ................................................................................................................................................... ................................................................................................................................................... ................................................................................................................................................... ................................................................................................................................................... ...............................................................................................................................................[3] (c) Fig. 9 shows the employment structure of two countries X and Y. For each country, give its stage of economic development, 1, 2 or 3, as shown on Fig. 8. country X country Y tertiary secondary and quaternary primary tertiary and quaternary secondary primary Fig. 9 Country X stage ......................... Country Y stage ......................... [2] [Total: 8 marks]
Mark scheme: 5(a) mining, 3 manufacturing, transport, designing, All correct = 3 2/3 correct = 2 1 correct = 1 5(b) primary decreases 3 tertiary increases, secondary increases then decreases, 5(c) 2, 2 1,
Q6 · Information about the number of under-nourished people in the world
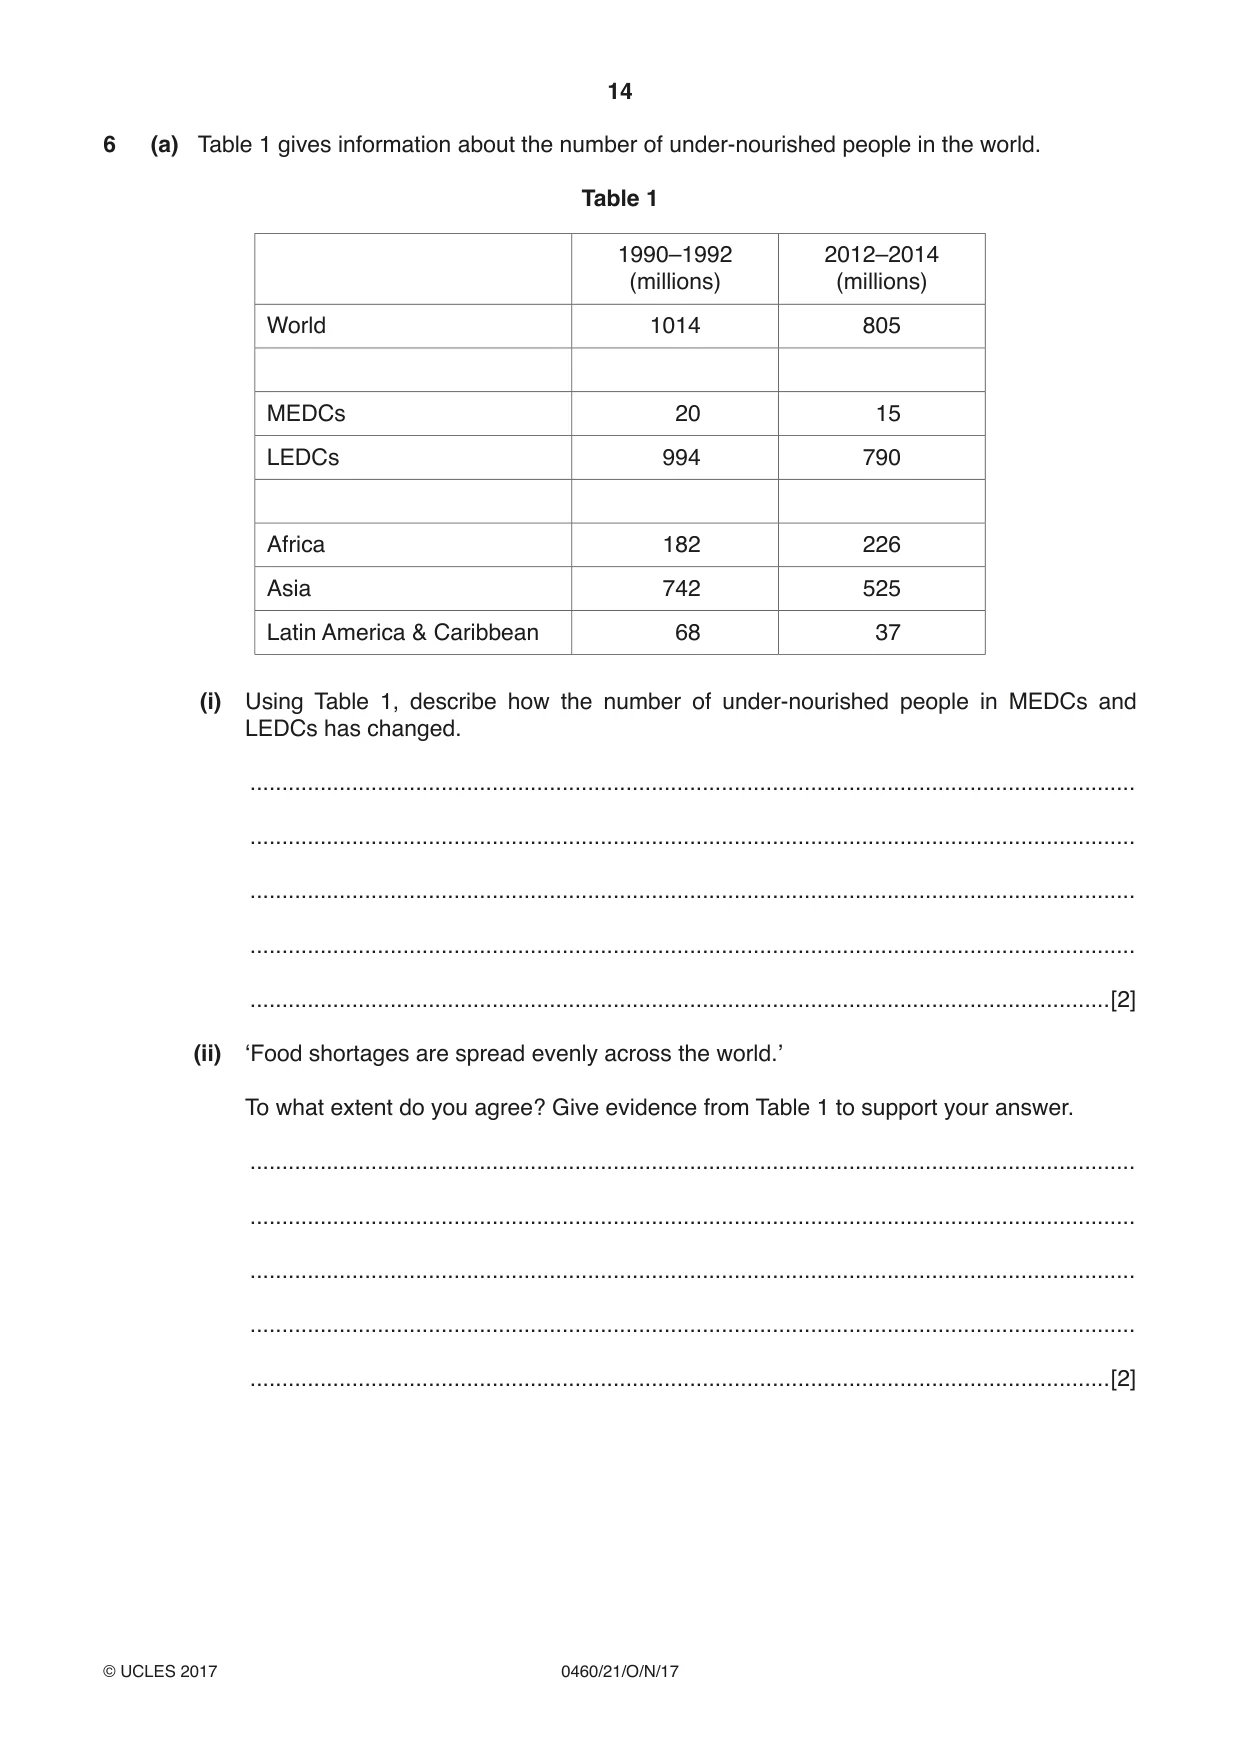
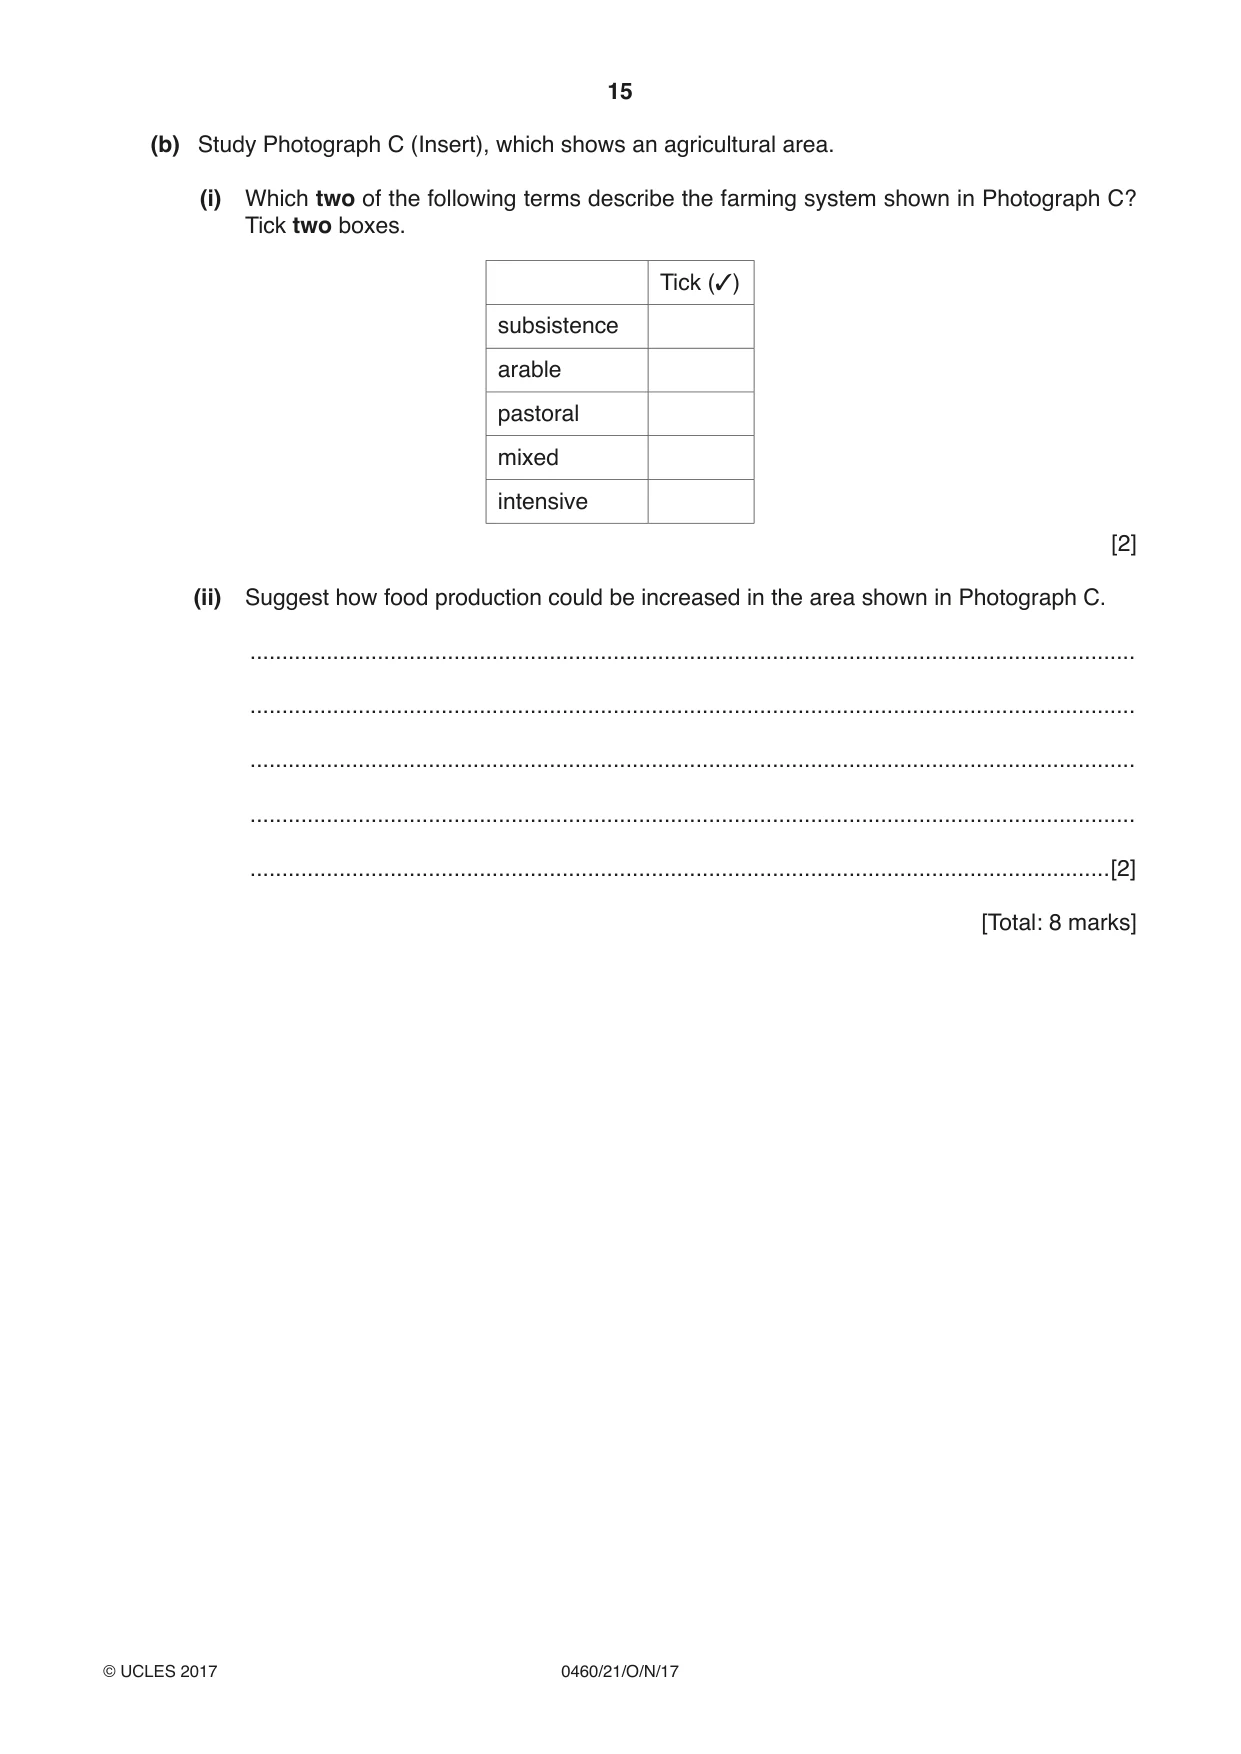
6 (a) Table 1 gives information about the number of under-nourished people in the world. Table 1 1990–1992 2012–2014 (millions) (millions) World 1014 805 MEDCs 20 15 LEDCs 994 790 Africa 182 226 Asia 742 525 Latin America & Caribbean 68 37 (i) Using Table 1, describe how the number of under-nourished people in MEDCs and LEDCs has changed. ........................................................................................................................................... ........................................................................................................................................... ........................................................................................................................................... ........................................................................................................................................... .......................................................................................................................................[2] (ii) ‘Food shortages are spread evenly across the world.’ To what extent do you agree? Give evidence from Table 1 to support your answer. ........................................................................................................................................... ........................................................................................................................................... ........................................................................................................................................... ........................................................................................................................................... .......................................................................................................................................[2] (b) Study Photograph C (Insert), which shows an agricultural area. (i) Which two of the following terms describe the farming system shown in Photograph C? Tick two boxes. Tick (3) subsistence arable pastoral mixed intensive [2] (ii) Suggest how food production could be increased in the area shown in Photograph C. ........................................................................................................................................... ........................................................................................................................................... ........................................................................................................................................... ........................................................................................................................................... .......................................................................................................................................[2] [Total: 8 marks] Additional Pages If you use the following pages to complete the answer(s) to any question(s), the question number(s) must be clearly shown. .................................................................................................................................................................. .................................................................................................................................................................. .................................................................................................................................................................. .................................................................................................................................................................. .................................................................................................................................................................. .................................................................................................................................................................. .................................................................................................................................................................. .................................................................................................................................................................. .................................................................................................................................................................. .................................................................................................................................................................. .................................................................................................................................................................. .................................................................................................................................................................. .................................................................................................................................................................. .................................................................................................................................................................. .................................................................................................................................................................. .................................................................................................................................................................. .................................................................................................................................................................. .................................................................................................................................................................. .................................................................................................................................................................. .................................................................................................................................................................. .................................................................................................................................................................. .................................................................................................................................................................. .................................................................................................................................................................. .................................................................................................................................................................. ..................................................................................................................................................................
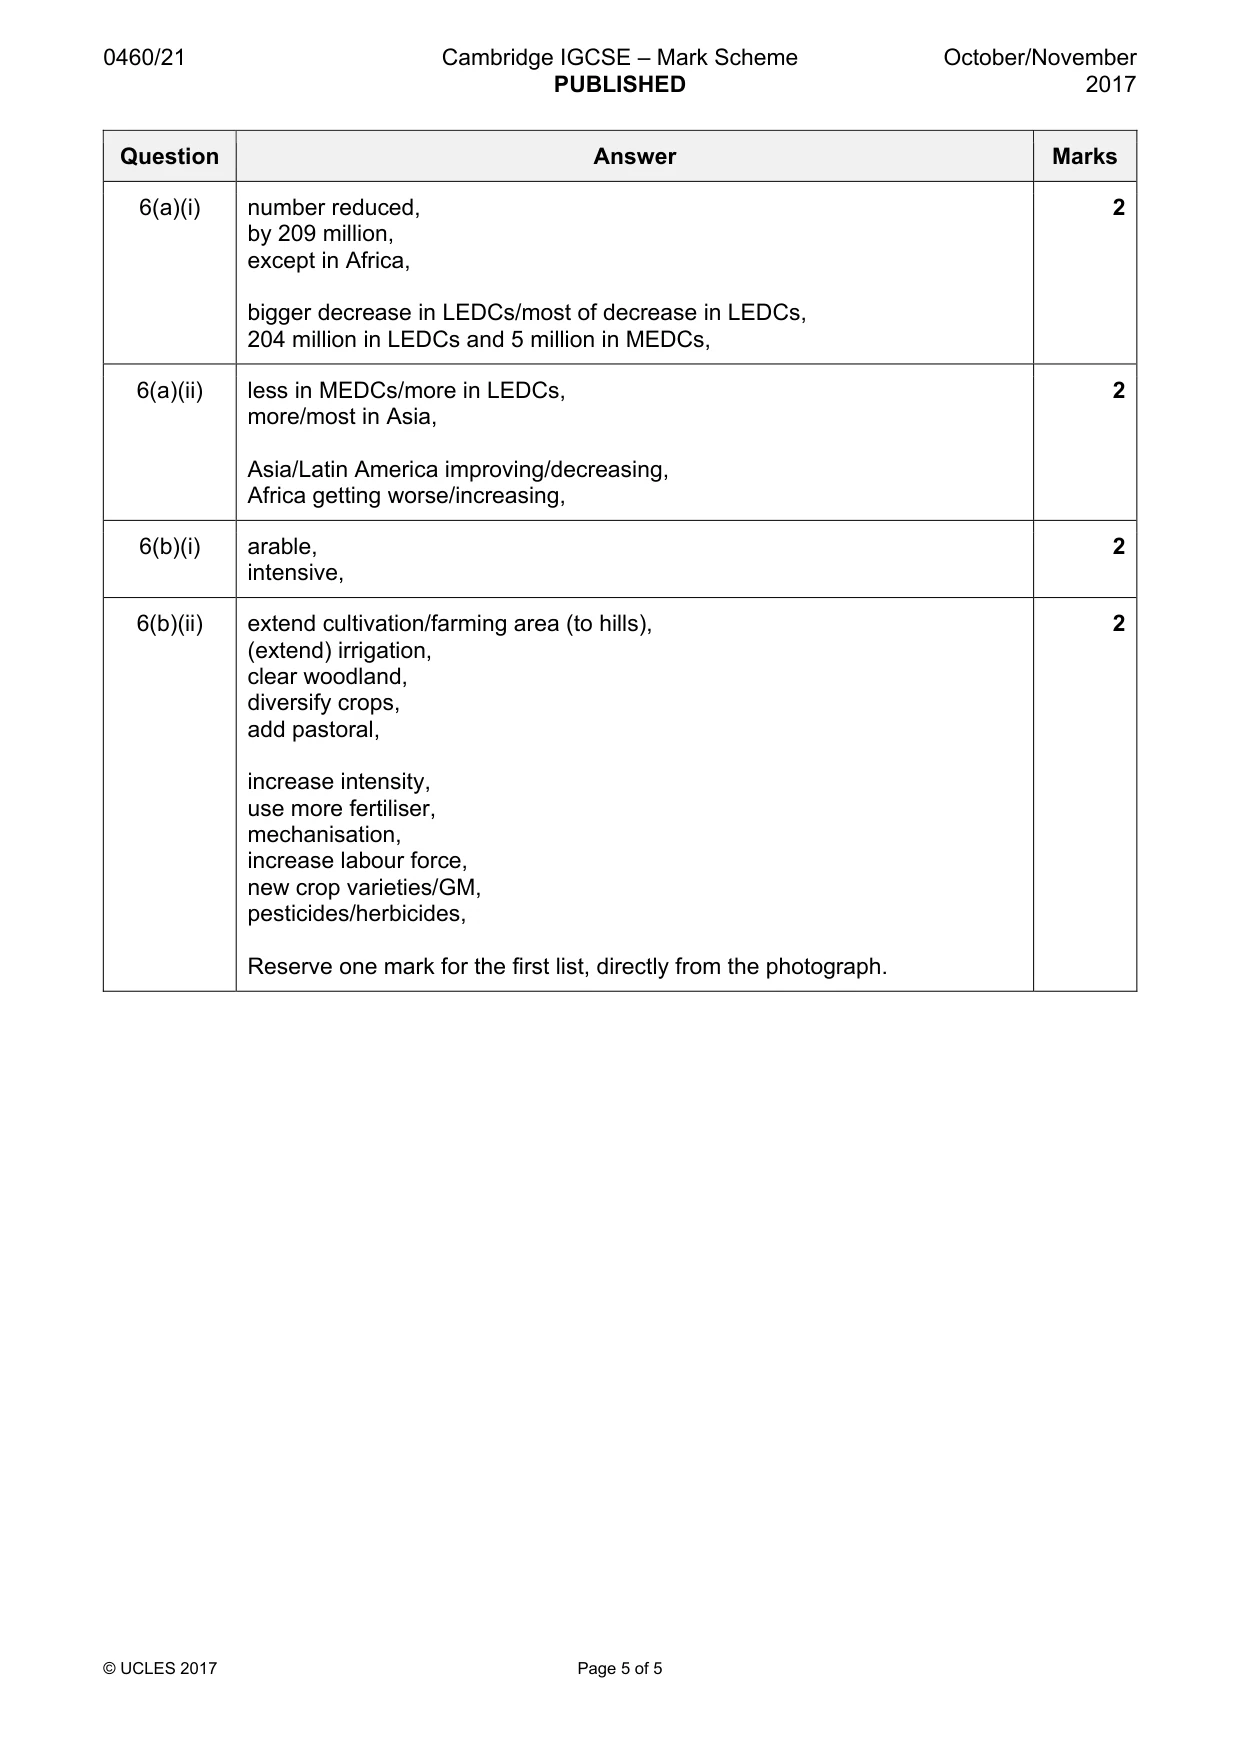
Mark scheme: 6(a)(i) number reduced, 2 by 209 million, except in Africa, bigger decrease in LEDCs/most of decrease in LEDCs, 204 million in LEDCs and 5 million in MEDCs, 6(a)(ii) less in MEDCs/more in LEDCs, 2 more/most in Asia, Asia/Latin America improving/decreasing, Africa getting worse/increasing, 6(b)(i) arable, 2 intensive, 6(b)(ii) extend cultivation/farming area (to hills), 2 (extend) irrigation, clear woodland, diversify crops, add pastoral, increase intensity, use more fertiliser, mechanisation, increase labour force, new crop varieties/GM, pesticides/herbicides, Reserve one mark for the first list, directly from the photograph.
What was in this paper
The subtopics covered by these 6 questions, and how many questions each got. Open one in a new tab to see every Cambridge question on it.
What you needed in this session
Cambridge’s own grade thresholds for 2017 Oct/Nov, Paper 2 · Variant 1. A higher threshold means an easier paper — the bar moves with how the cohort did.