Cambridge IGCSE Geography 0460 — 2025 May/June Paper 2 · Variant 2
0460/22/M/J/25 · 6 questions · 60 marks · 90 min
The question paper and its mark scheme, free to read here and free to download. This is Cambridge’s own paper, exactly as it was sat.
Question paper20 pages



Mark scheme13 pages
Answers below. Sit the paper first if you are practising.
Questions as text
Q1 · Study the map extract for the Île d’Oléron, France
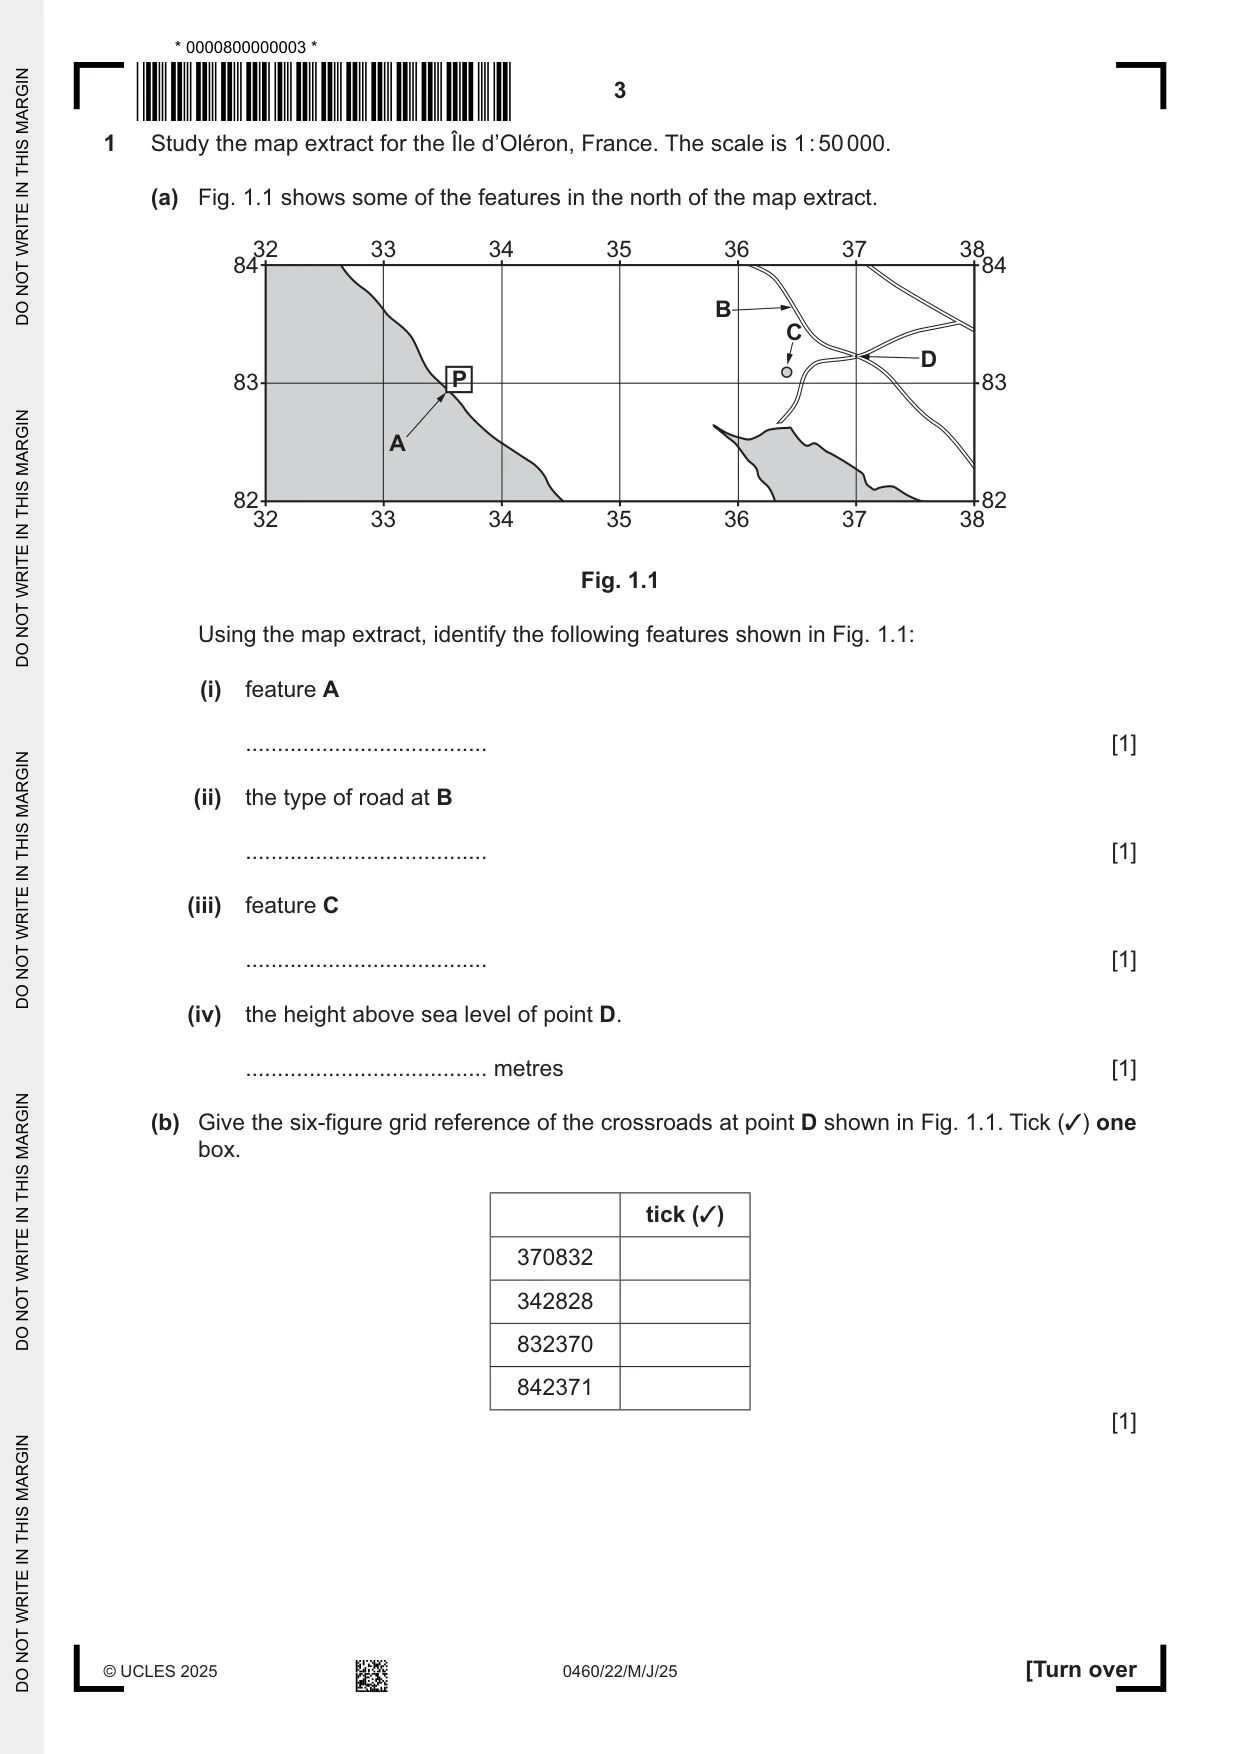
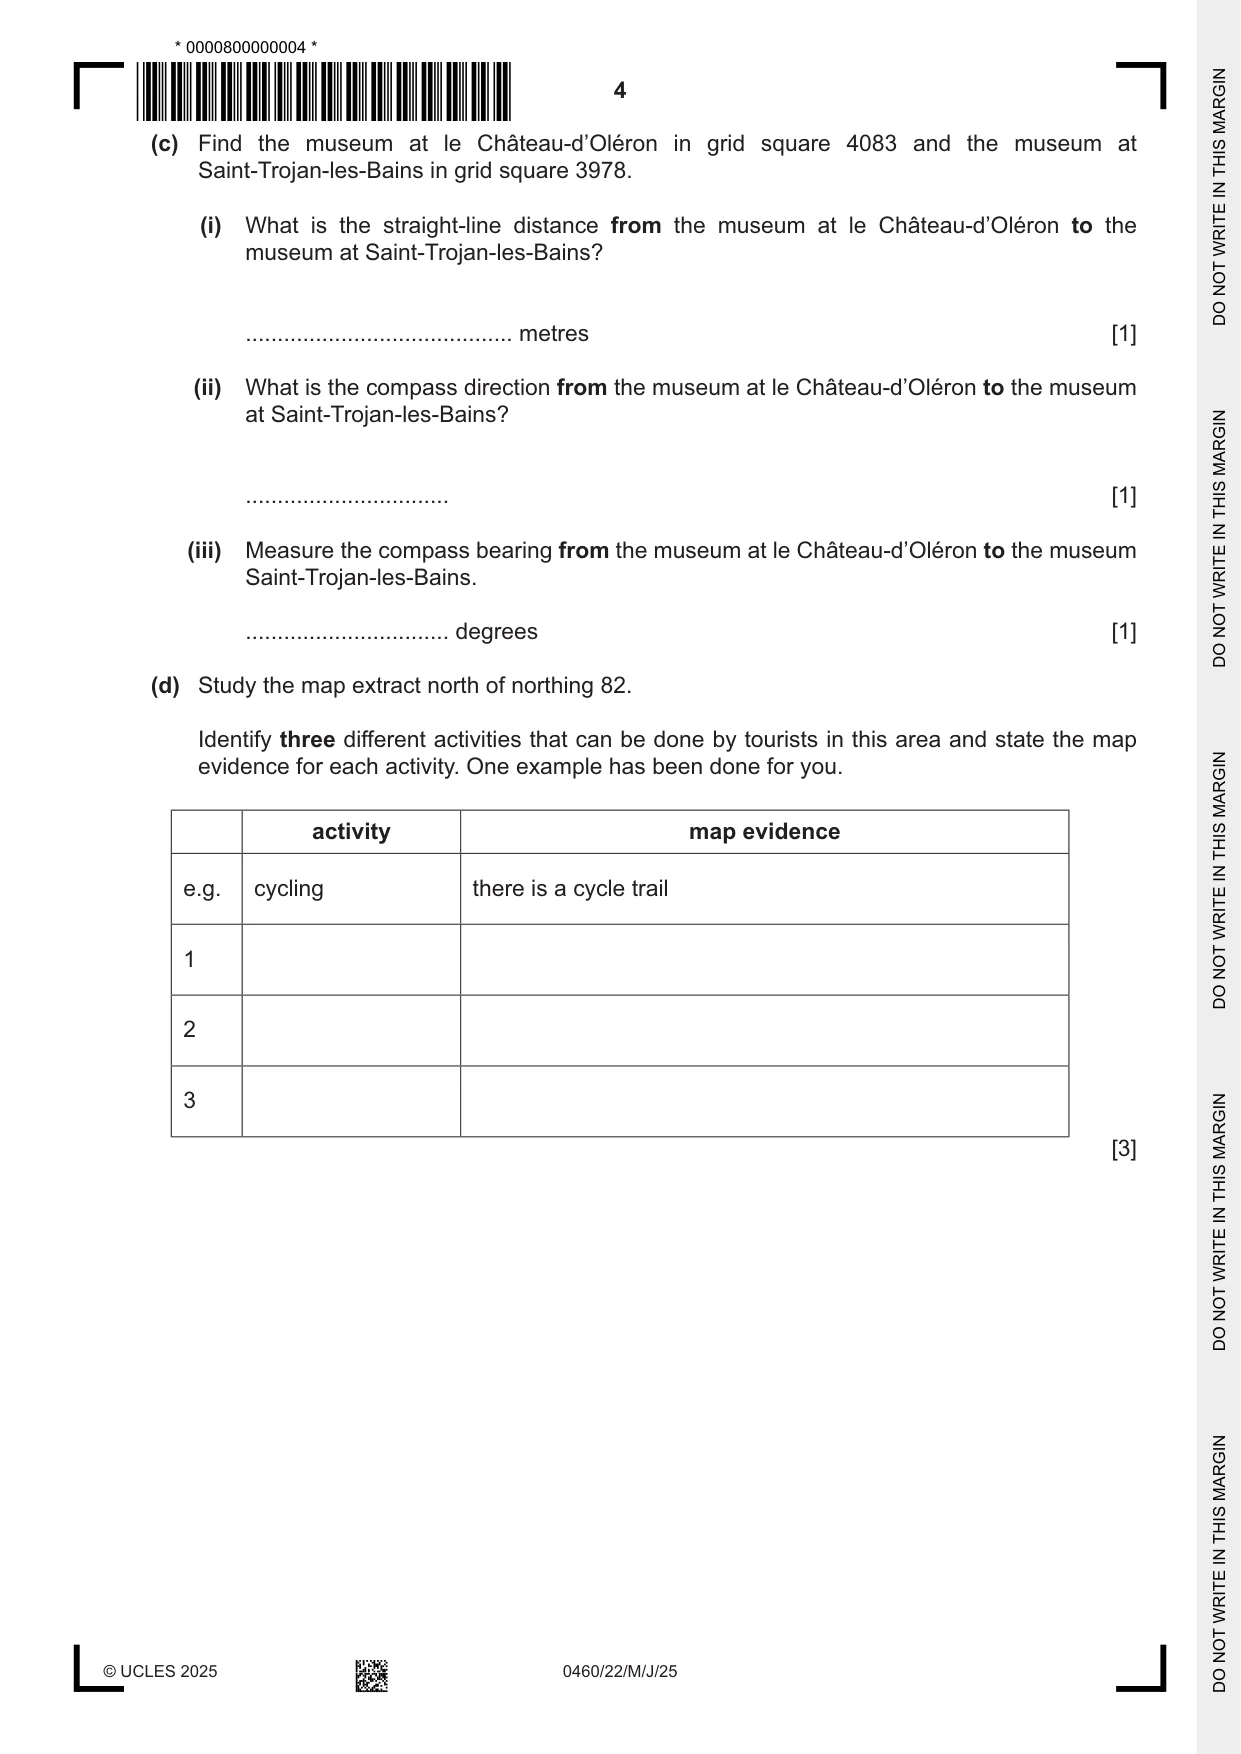
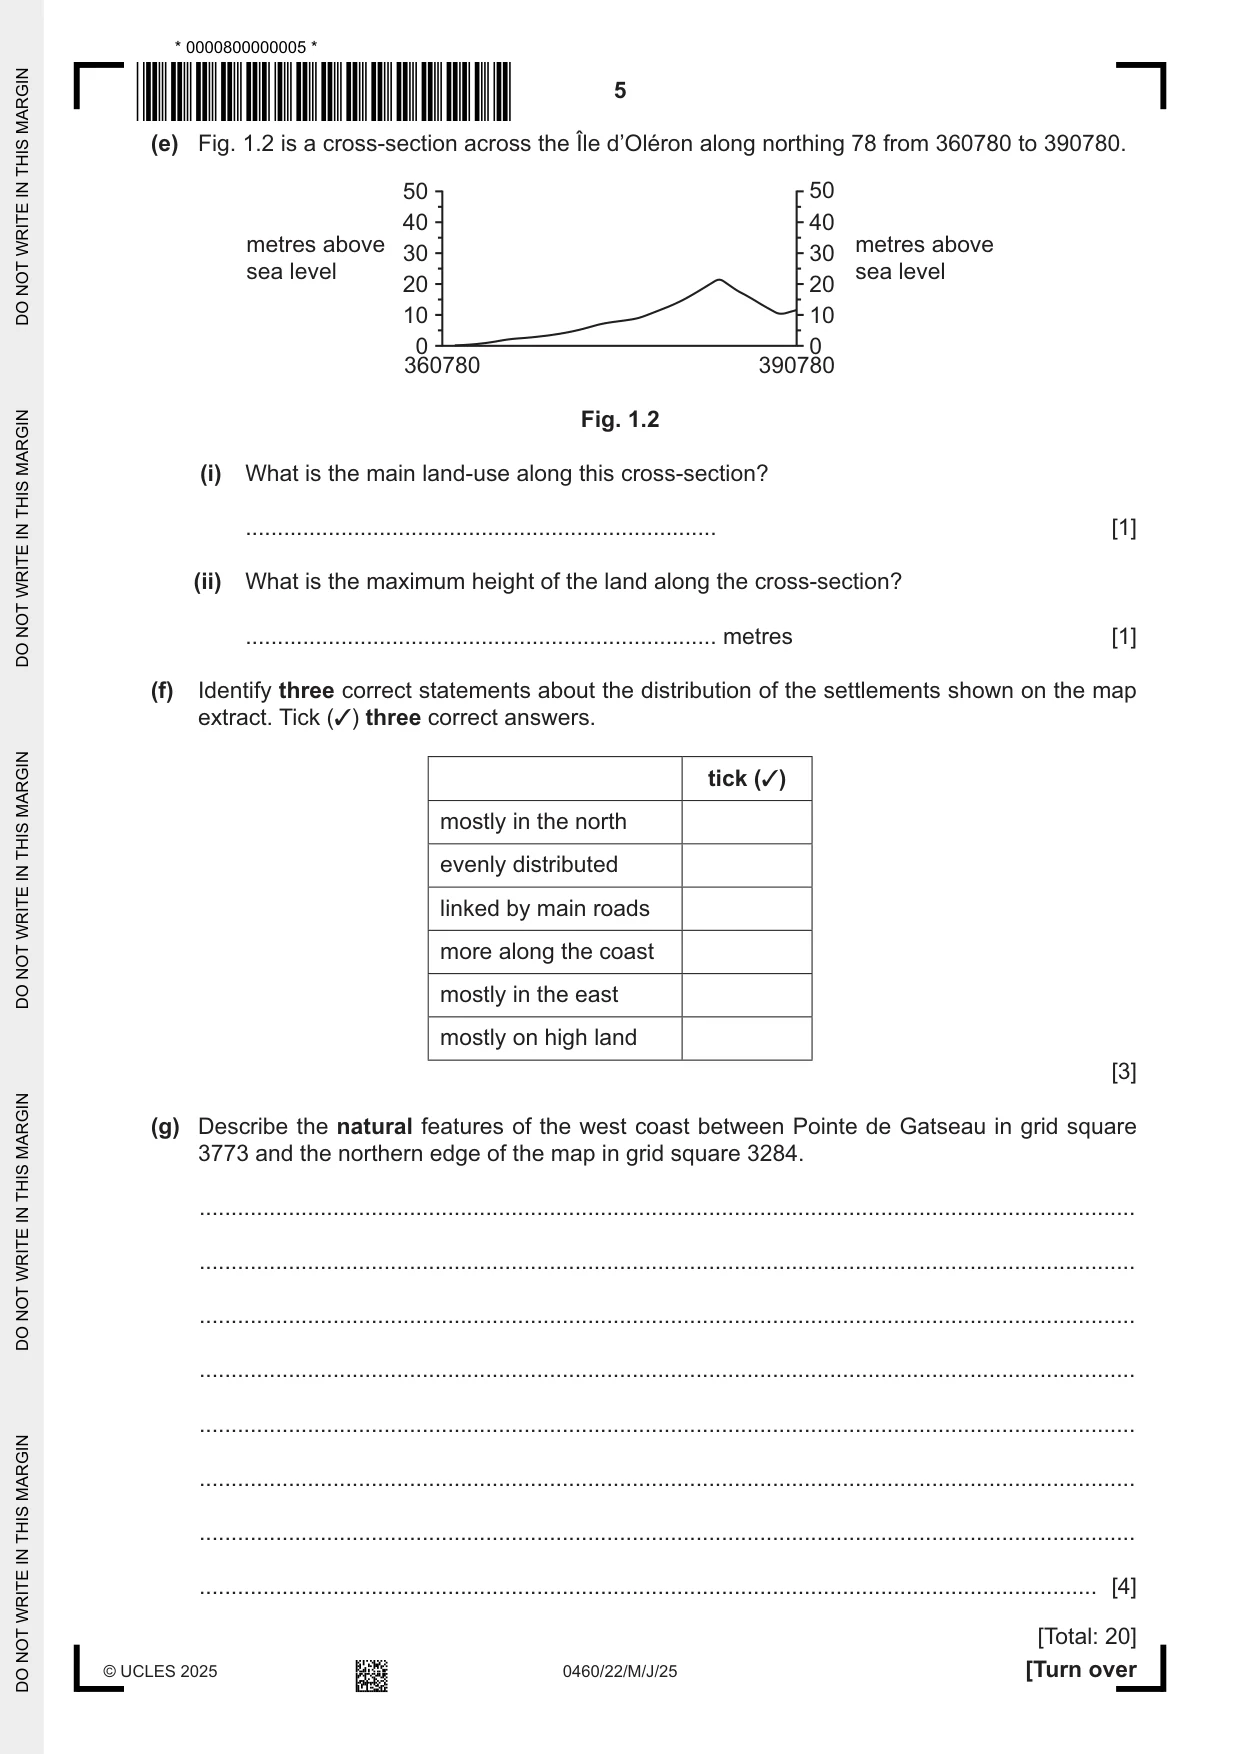
1 Study the map extract for the Île d’Oléron, France. The scale is 1 : 50 000. (a) Fig. 1.1 shows some of the features in the north of the map extract. 32 33 34 35 36 37 38 84 84 B C D 83 P 83 A 82 82 32 33 34 35 36 37 38 Fig. 1.1 Using the map extract, identify the following features shown in Fig. 1.1: (i) feature A ...................................... [1] (ii) the type of road at B ...................................... [1] (iii) feature C ...................................... [1] (iv) the height above sea level of point D. ...................................... metres [1] (b) Give the six-figure grid reference of the crossroads at point D shown in Fig. 1.1. Tick (✓) one box. tick (✓) 370832 342828 832370 842371 [1] (c) Find the museum at le Château-d’Oléron in grid square 4083 and the museum at Saint-Trojan-les-Bains in grid square 3978. (i) What is the straight-line distance from the museum at le Château-d’Oléron to the museum at Saint-Trojan-les-Bains? .......................................... metres [1] (ii) What is the compass direction from the museum at le Château-d’Oléron to the museum at Saint-Trojan-les-Bains? ................................ [1] (iii) Measure the compass bearing from the museum at le Château-d’Oléron to the museum Saint-Trojan-les-Bains. ................................ degrees [1] (d) Study the map extract north of northing 82. Identify three different activities that can be done by tourists in this area and state the map evidence for each activity. One example has been done for you. activity map evidence e.g. cycling there is a cycle trail 1 2 3 [3] (e) Fig. 1.2 is a cross-section across the Île d’Oléron along northing 78 from 360780 to 390780. 50 50 40 40 metres above metres above 30 30 sea level sea level 20 20 10 10 0 0 360780 390780 Fig. 1.2 (i) What is the main land-use along this cross-section? .......................................................................... [1] (ii) What is the maximum height of the land along the cross-section? .......................................................................... metres [1] (f) Identify three correct statements about the distribution of the settlements shown on the map extract. Tick (✓) three correct answers. tick (✓) mostly in the north evenly distributed linked by main roads more along the coast mostly in the east mostly on high land [3] (g) Describe the natural features of the west coast between Pointe de Gatseau in grid square 3773 and the northern edge of the map in grid square 3284. ................................................................................................................................................... ................................................................................................................................................... ................................................................................................................................................... ................................................................................................................................................... ................................................................................................................................................... ................................................................................................................................................... ................................................................................................................................................... ............................................................................................................................................. [4] [Total: 20]
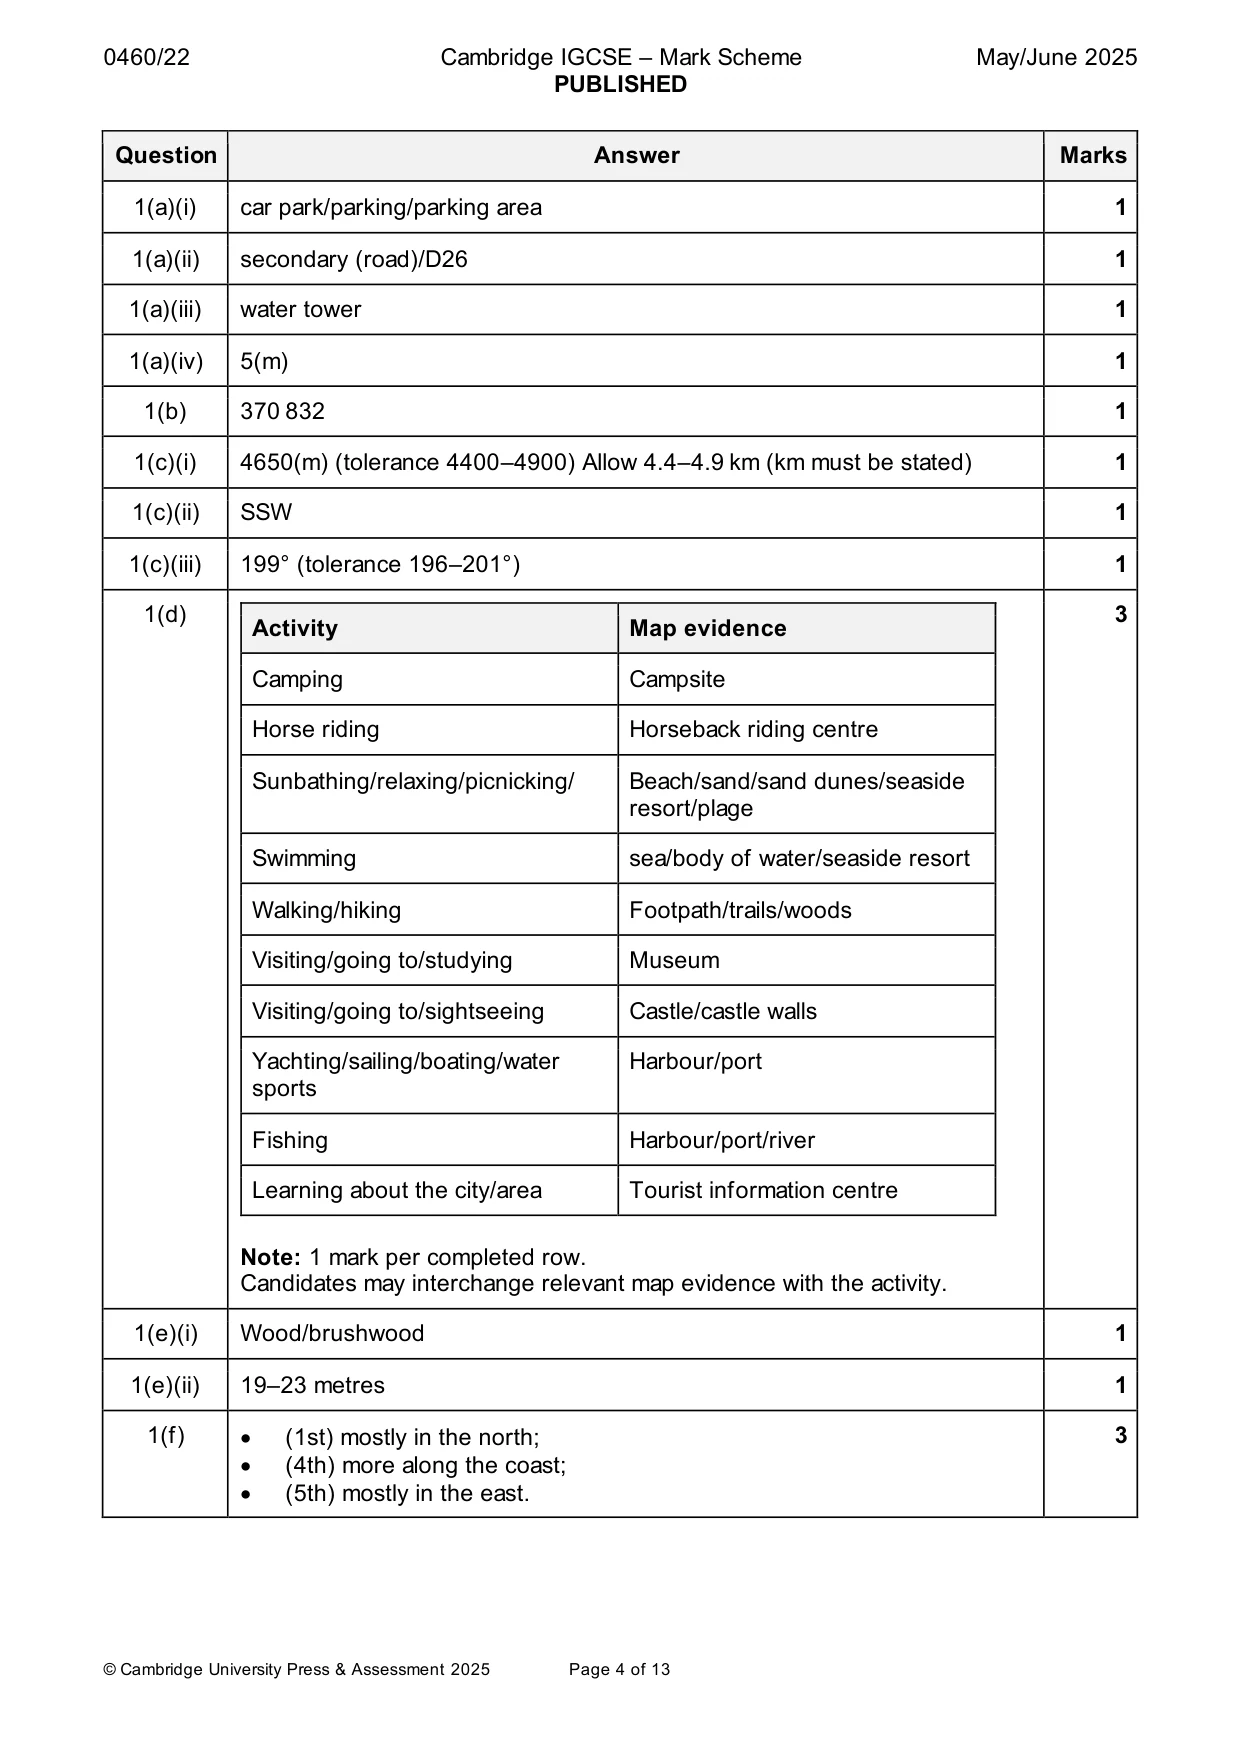
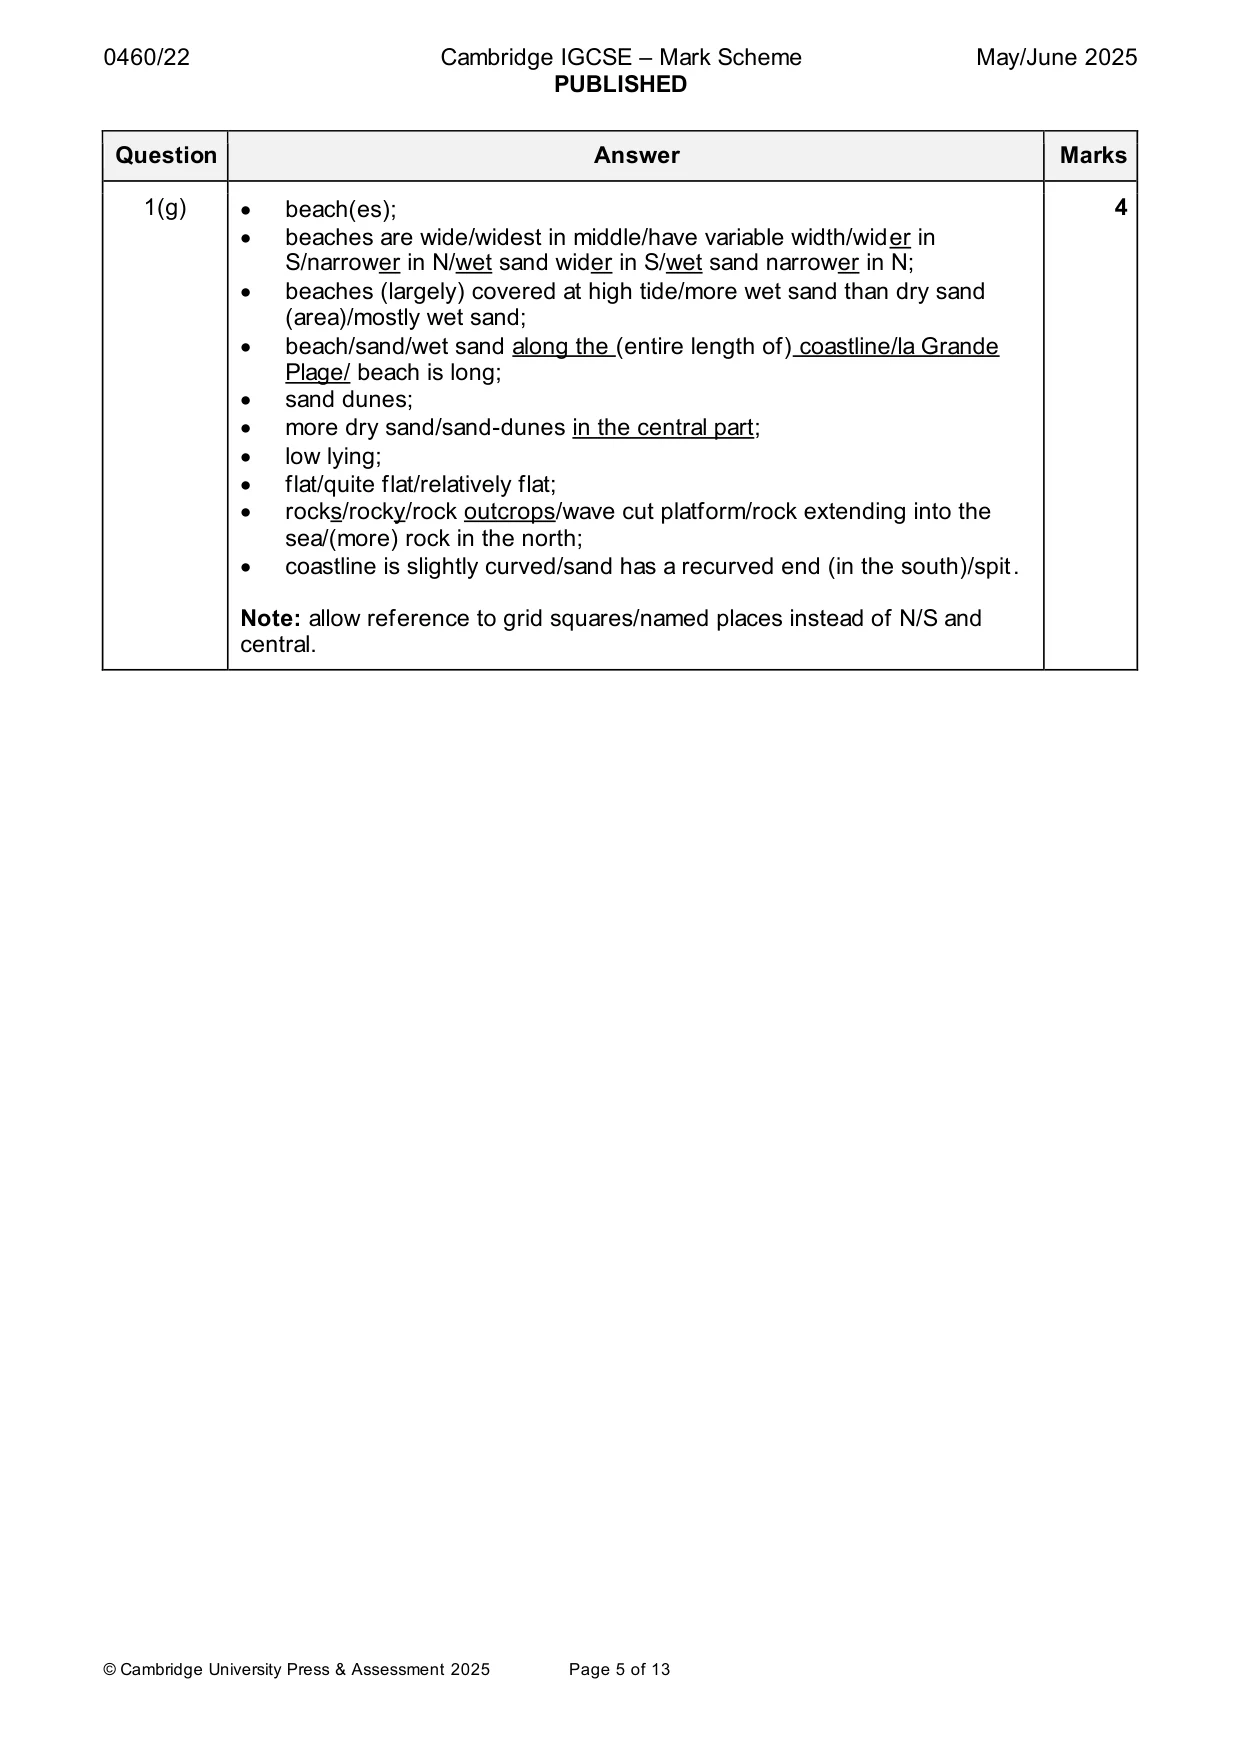
Mark scheme: Question Answer Marks 1(a)(i) car park/parking/parking area 1 1(a)(ii) secondary (road)/D26 1 1(a)(iii) water tower 1 1(a)(iv) 5(m) 1 1(b) 370 832 1 1(c)(i) 4650(m) (tolerance 4400–4900) Allow 4.4–4.9 km (km must be stated) 1 1(c)(ii) SSW 1 1(c)(iii) 199° (tolerance 196–201°) 1 1(d) 3 Activity Map evidence Camping Campsite Horse riding Horseback riding centre Sunbathing/relaxing/picnicking/ Beach/sand/sand dunes/seaside resort/plage Swimming sea/body of water/seaside resort Walking/hiking Footpath/trails/woods Visiting/going to/studying Museum Visiting/going to/sightseeing Castle/castle walls Yachting/sailing/boating/water Harbour/port sports Fishing Harbour/port/river Learning about the city/area Tourist information centre Note: 1 mark per completed row. Candidates may interchange relevant map evidence with the activity. 1(e)(i) Wood/brushwood 1 1(e)(ii) 19–23 metres 1 1(f) • (1st) mostly in the north; 3 • (4th) more along the coast; • (5th) mostly in the east. 1(g) • beach(es); 4 • beaches are wide/widest in middle/have variable width/wider in S/narrower in N/wet sand wider in S/wet sand narrower in N; • beaches (largely) covered at high tide/more wet sand than dry sand (area)/mostly wet sand; • beach/sand/wet sand along the (entire length of) coastline/la Grande Plage/ beach is long; • sand dunes; • more dry sand/sand-dunes in the central part; • low lying; • flat/quite flat/relatively flat; • rocks/rocky/rock outcrops/wave cut platform/rock extending into the sea/(more) rock in the north; • coastline is slightly curved/sand has a recurved end (in the south)/spit. Note: allow reference to grid squares/named places instead of N/S and central.
More questions on Settlements (rural and urban) and service provision
Q2 · The development of a tourist resort in the UK between 1800 and 2000
2 (a) Fig. 2.1 shows the development of a tourist resort in the UK between 1800 and 2000. Content removed due to copyright restrictions. Fig. 2.1 (i) How many tourists visited the resort at its peak in 1955? .................................. million [1] (ii) For how many years did the number of tourists to the resort decrease? .................................. years [1] (b) Using Fig. 2.1, identify four factors that helped explain the rise in the number of tourists. 1 ................................................................................................................................................ 2 ................................................................................................................................................ 3 ................................................................................................................................................ 4 ................................................................................................................................................ [2] (c) Using Fig. 2.1, suggest why the following factors resulted in fewer tourists visiting the resort. growth of package holidays ................................................................................................................................................... ................................................................................................................................................... ................................................................................................................................................... ................................................................................................................................................... resort now run down ................................................................................................................................................... ................................................................................................................................................... ................................................................................................................................................... ................................................................................................................................................... [4] [Total: 8]
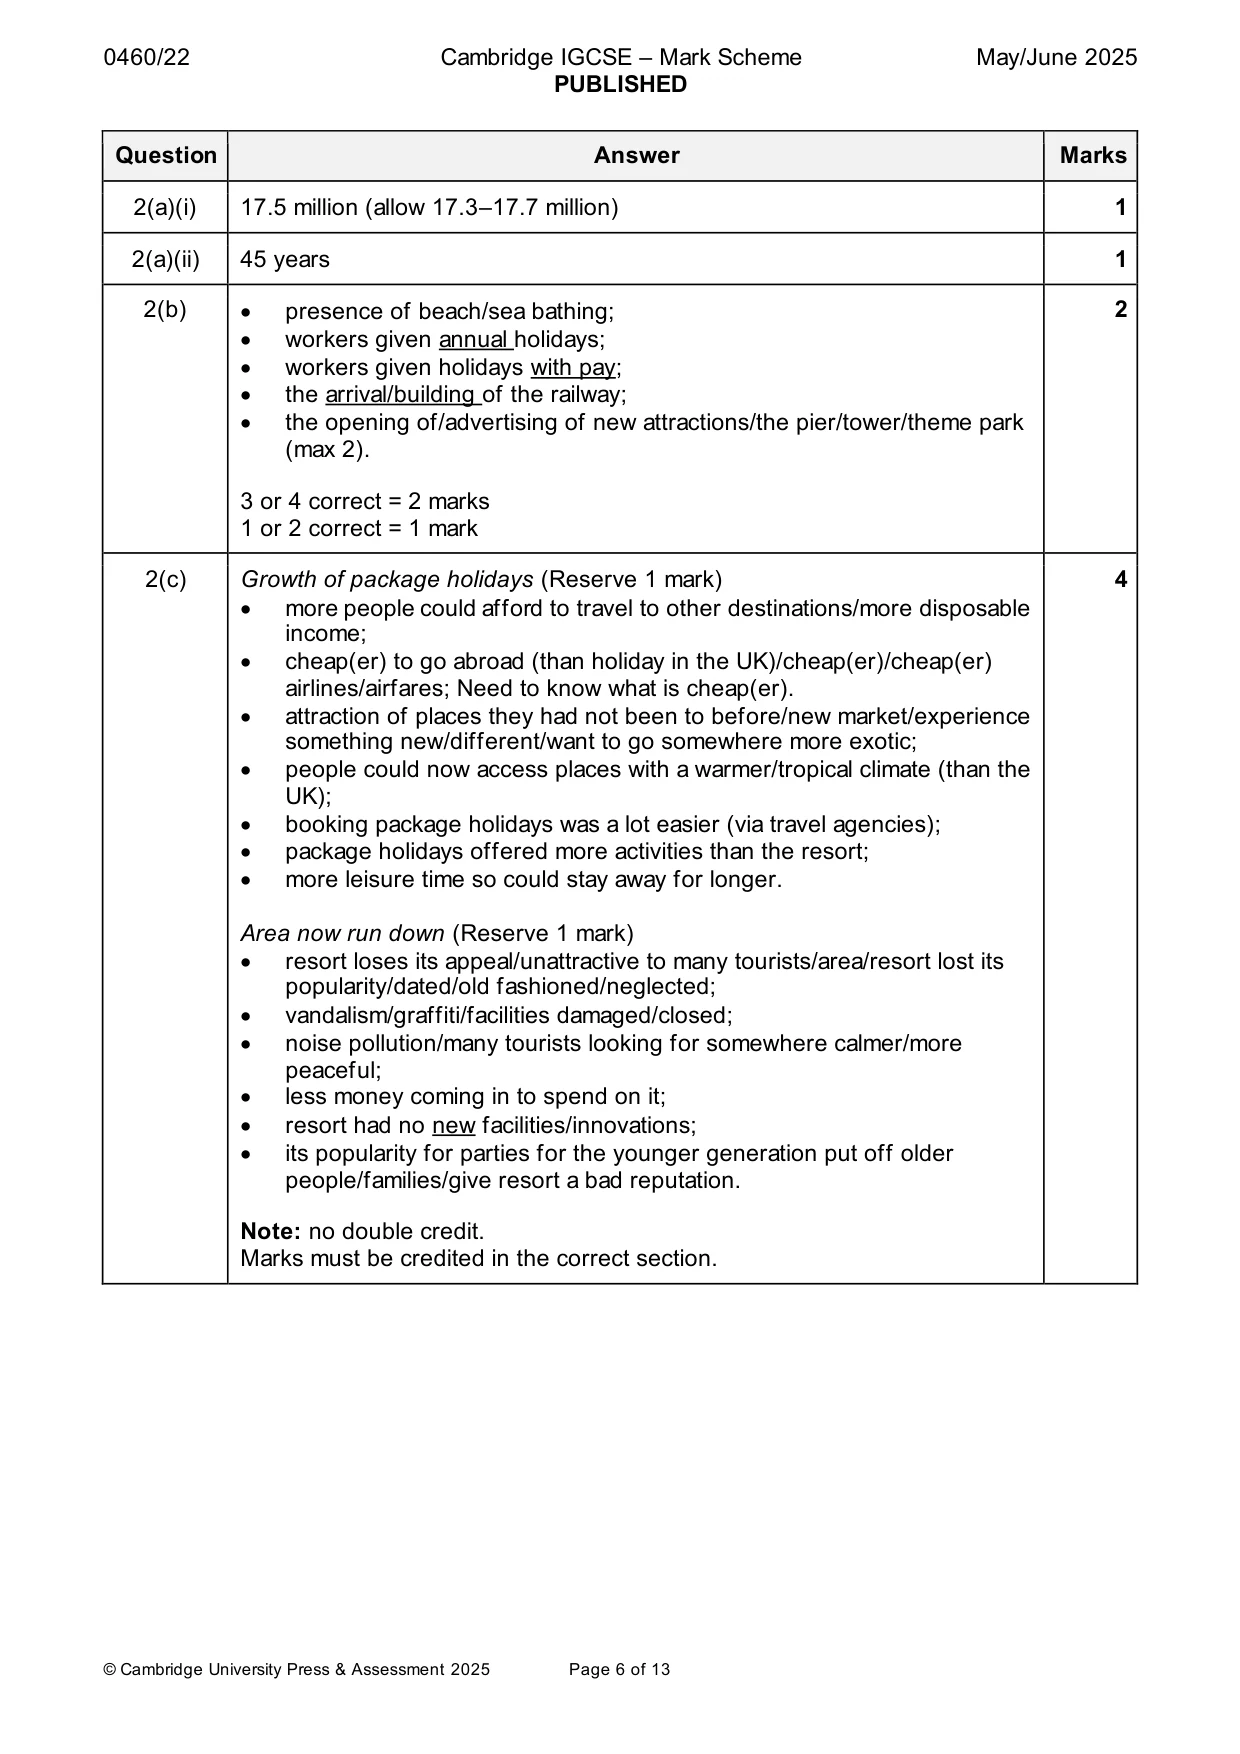
Mark scheme: 2(a)(i) 17.5 million (allow 17.3–17.7 million) 1 2(a)(ii) 45 years 1 2(b) • presence of beach/sea bathing; 2 • workers given annual holidays; • workers given holidays with pay; • the arrival/building of the railway; • the opening of/advertising of new attractions/the pier/tower/theme park (max 2). 3 or 4 correct = 2 marks 1 or 2 correct = 1 mark 2(c) Growth of package holidays (Reserve 1 mark) 4 • more people could afford to travel to other destinations/more disposable income; • cheap(er) to go abroad (than holiday in the UK)/cheap(er)/cheap(er) airlines/airfares; Need to know what is cheap(er). • attraction of places they had not been to before/new market/experience something new/different/want to go somewhere more exotic; • people could now access places with a warmer/tropical climate (than the UK); • booking package holidays was a lot easier (via travel agencies); • package holidays offered more activities than the resort; • more leisure time so could stay away for longer. Area now run down (Reserve 1 mark) • resort loses its appeal/unattractive to many tourists/area/resort lost its popularity/dated/old fashioned/neglected; • vandalism/graffiti/facilities damaged/closed; • noise pollution/many tourists looking for somewhere calmer/more peaceful; • less money coming in to spend on it; • resort had no new facilities/innovations; • its popularity for parties for the younger generation put off older people/families/give resort a bad reputation. Note: no double credit. Marks must be credited in the correct section.
Question 3
3 Figs. 3.1 and 3.2 (Insert) show agricultural areas in a tropical country. (a) Using Fig. 3.1, give four pieces of evidence which suggest this is a commercial farm. 1 ................................................................................................................................................ ................................................................................................................................................... 2 ................................................................................................................................................ ................................................................................................................................................... 3 ................................................................................................................................................ ................................................................................................................................................... 4 ................................................................................................................................................ ................................................................................................................................................... [4] (b) Using Fig. 3.2, describe the features of the farm. ................................................................................................................................................... ................................................................................................................................................... ................................................................................................................................................... ................................................................................................................................................... ................................................................................................................................................... ................................................................................................................................................... ................................................................................................................................................... ............................................................................................................................................. [4] [Total: 8]
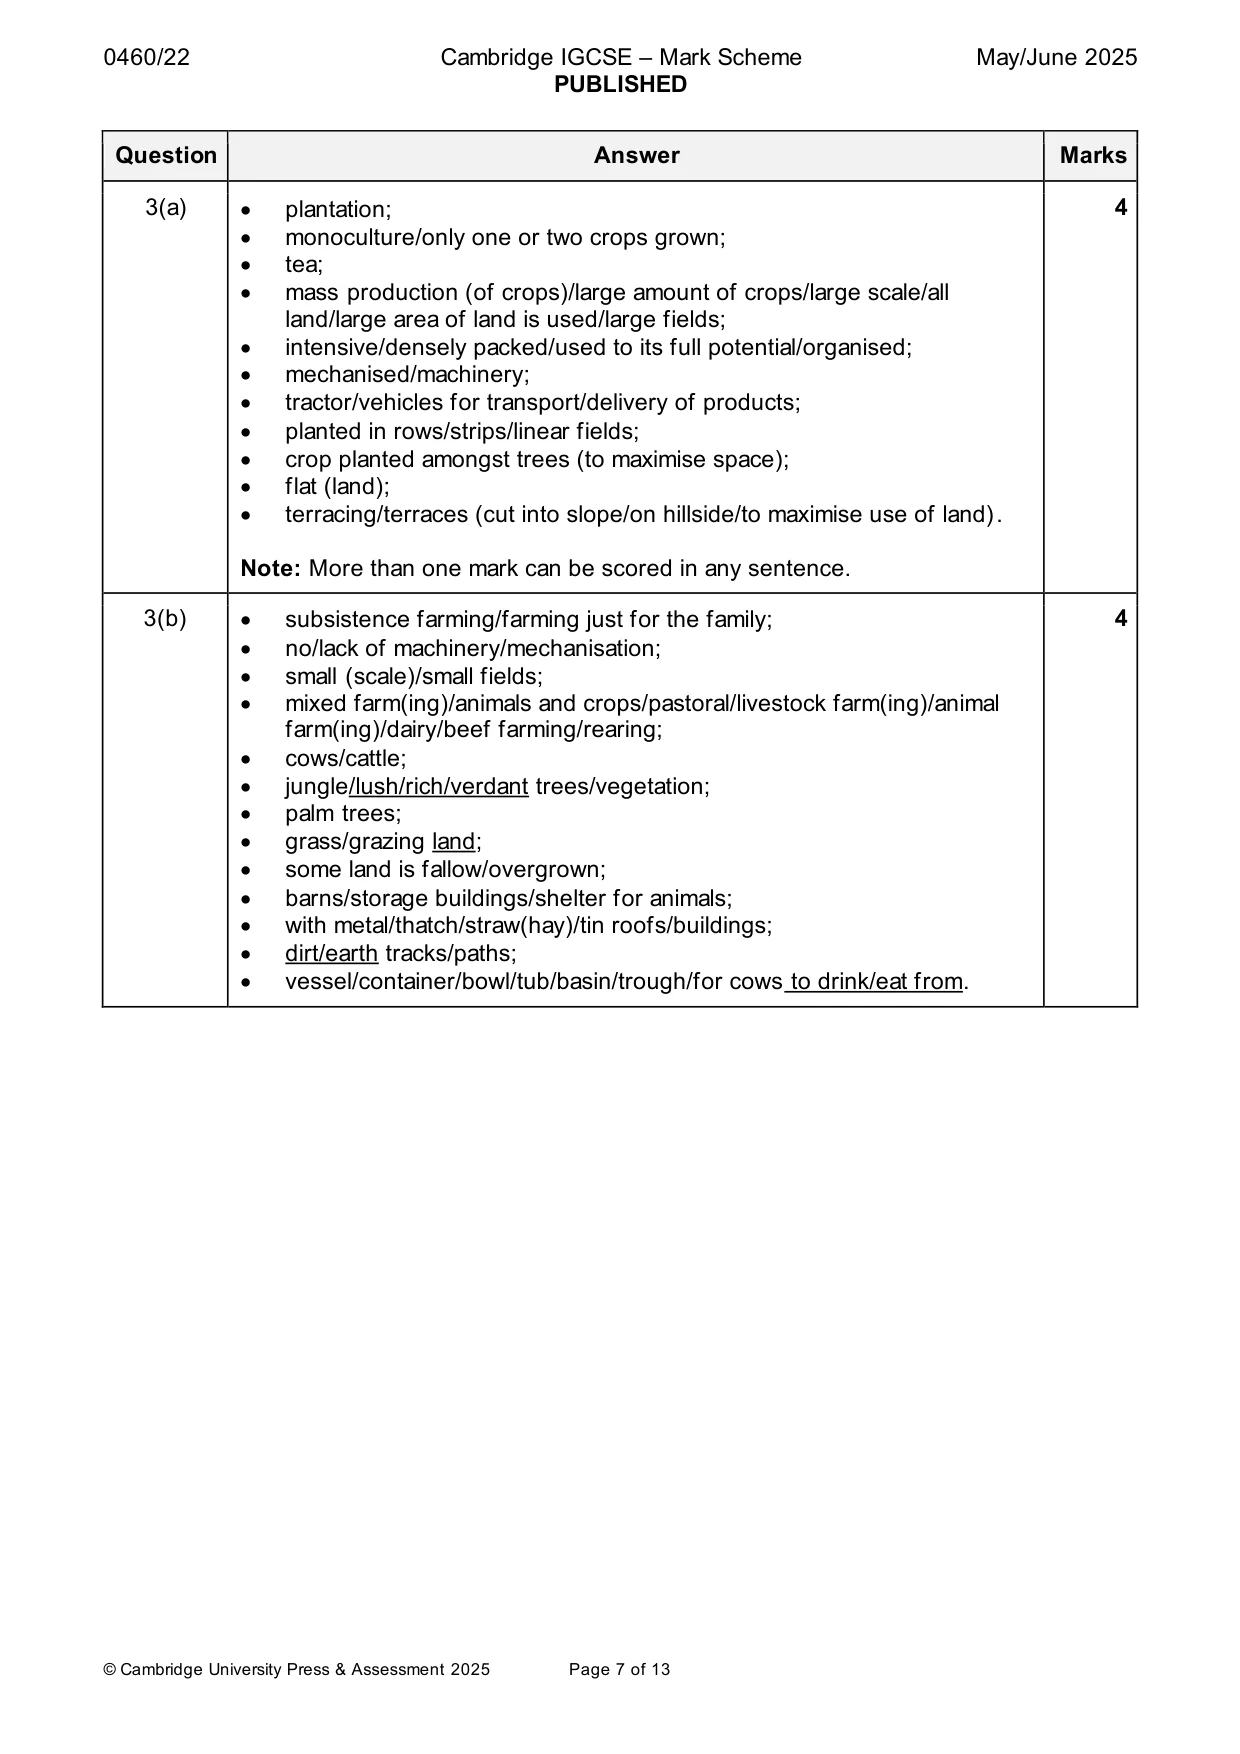
Mark scheme: 3(a) • plantation; 4 • monoculture/only one or two crops grown; • tea; • mass production (of crops)/large amount of crops/large scale/all land/large area of land is used/large fields; • intensive/densely packed/used to its full potential/organised; • mechanised/machinery; • tractor/vehicles for transport/delivery of products; • planted in rows/strips/linear fields; • crop planted amongst trees (to maximise space); • flat (land); • terracing/terraces (cut into slope/on hillside/to maximise use of land). Note: More than one mark can be scored in any sentence. 3(b) • subsistence farming/farming just for the family; 4 • no/lack of machinery/mechanisation; • small (scale)/small fields; • mixed farm(ing)/animals and crops/pastoral/livestock farm(ing)/animal farm(ing)/dairy/beef farming/rearing; • cows/cattle; • jungle/lush/rich/verdant trees/vegetation; • palm trees; • grass/grazing land; • some land is fallow/overgrown; • barns/storage buildings/shelter for animals; • with metal/thatch/straw(hay)/tin roofs/buildings; • dirt/earth tracks/paths; • vessel/container/bowl/tub/basin/trough/for cows to drink/eat from.
Q4 · A climate graph for Phoenix, in the USA
4 (a) Fig. 4.1 is a climate graph for Phoenix, in the USA. Content removed due to copyright restrictions. Fig. 4.1 (i) Using Fig. 4.1, calculate the annual rainfall. Tick (✓) the correct answer. rainfall tick (✓) (mm) 152 258 367 556 [1] (ii) Describe the pattern of rainfall shown in Fig. 4.1. Do not use statistics in your answer. ........................................................................................................................................... ........................................................................................................................................... ........................................................................................................................................... ........................................................................................................................................... ........................................................................................................................................... ..................................................................................................................................... [3] (b) Fig. 4.2 (Insert) shows some vegetation found in hot deserts. Using Fig. 4.2, explain two ways vegetation adapts to a desert climate. 1 ................................................................................................................................................ ................................................................................................................................................... ................................................................................................................................................... ................................................................................................................................................... 2 ................................................................................................................................................ ................................................................................................................................................... ................................................................................................................................................... ................................................................................................................................................... [4] [Total: 8]
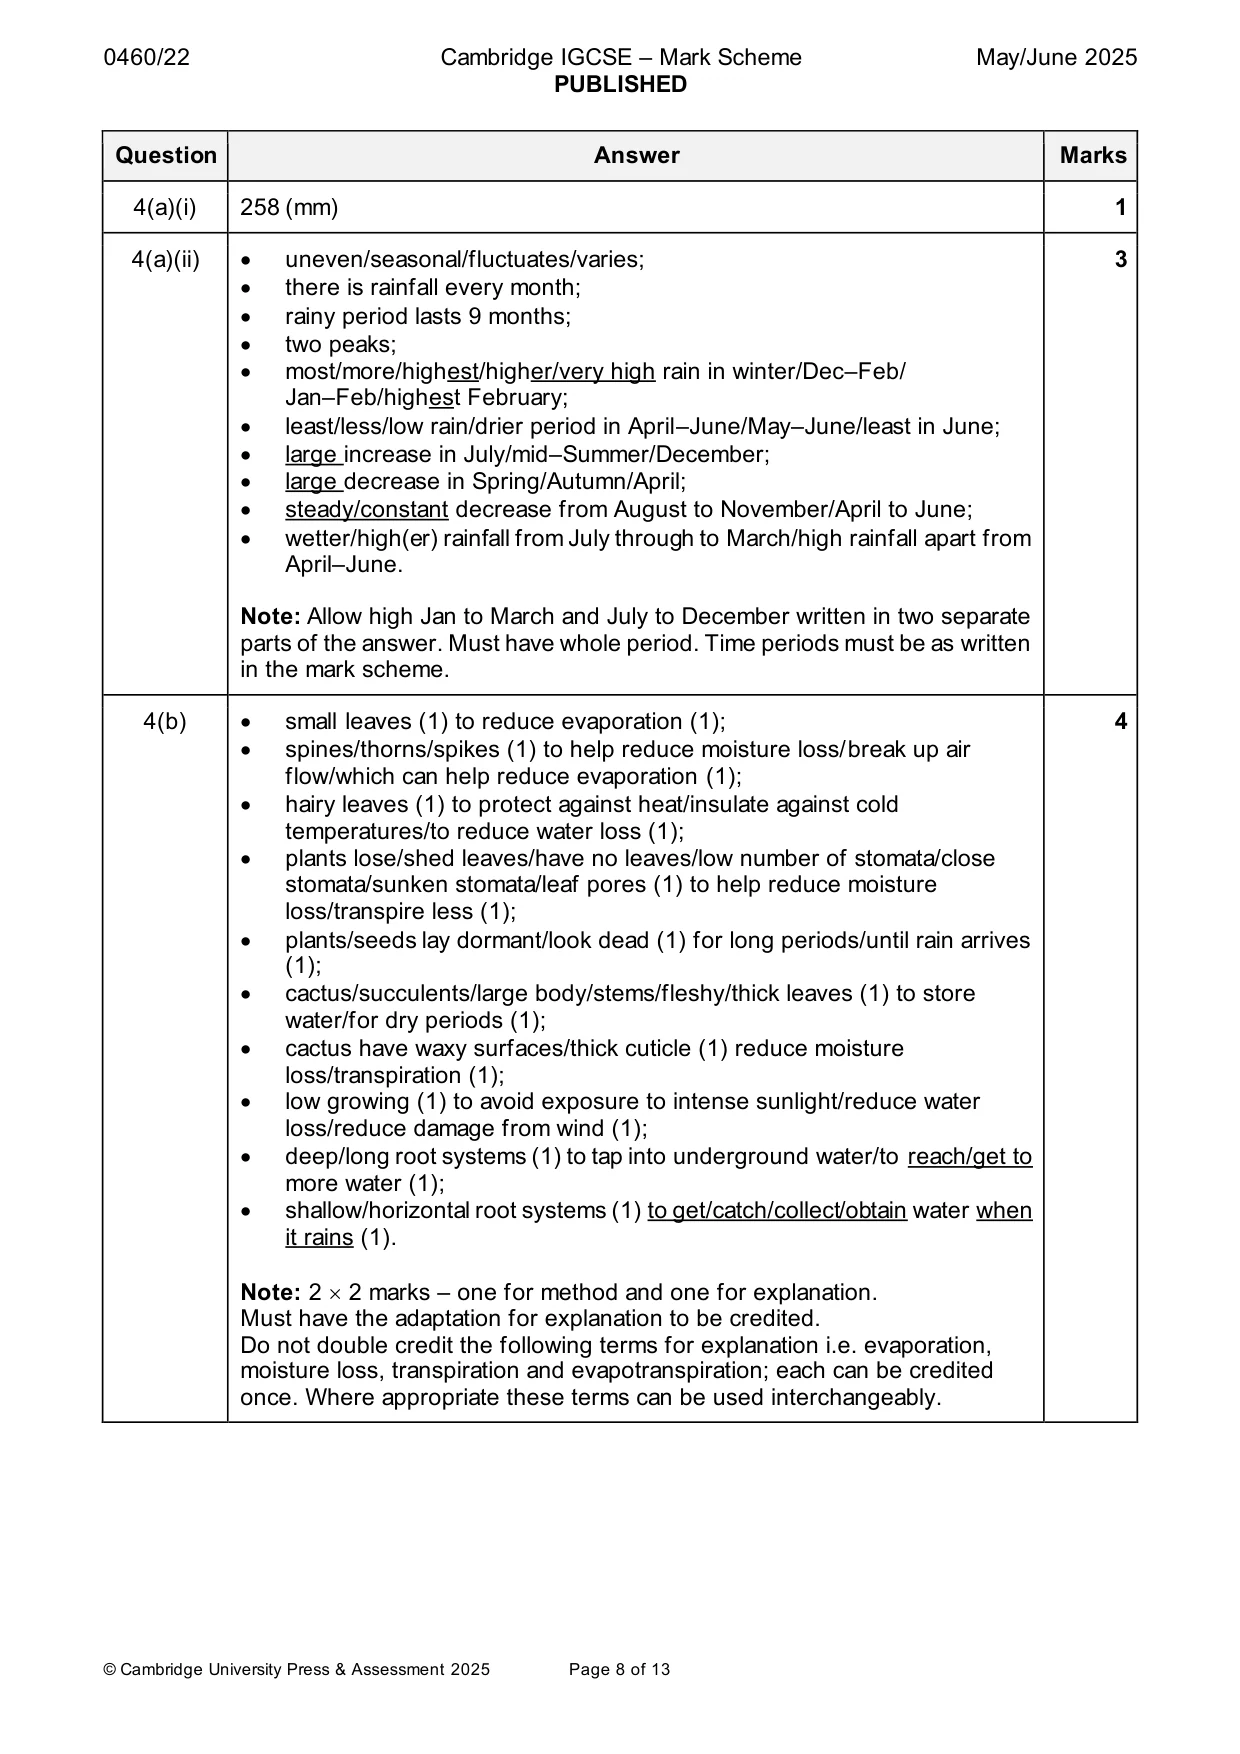
Mark scheme: 4(a)(i) 258 (mm) 1 4(a)(ii) • uneven/seasonal/fluctuates/varies; 3 • there is rainfall every month; • rainy period lasts 9 months; • two peaks; • most/more/highest/higher/very high rain in winter/Dec–Feb/ Jan–Feb/highest February; • least/less/low rain/drier period in April–June/May–June/least in June; • large increase in July/mid–Summer/December; • large decrease in Spring/Autumn/April; • steady/constant decrease from August to November/April to June; • wetter/high(er) rainfall from July through to March/high rainfall apart from April–June. Note: Allow high Jan to March and July to December written in two separate parts of the answer. Must have whole period. Time periods must be as written in the mark scheme. 4(b) • small leaves (1) to reduce evaporation (1); 4 • spines/thorns/spikes (1) to help reduce moisture loss/break up air flow/which can help reduce evaporation (1); • hairy leaves (1) to protect against heat/insulate against cold temperatures/to reduce water loss (1); • plants lose/shed leaves/have no leaves/low number of stomata/close stomata/sunken stomata/leaf pores (1) to help reduce moisture loss/transpire less (1); • plants/seeds lay dormant/look dead (1) for long periods/until rain arrives (1); • cactus/succulents/large body/stems/fleshy/thick leaves (1) to store water/for dry periods (1); • cactus have waxy surfaces/thick cuticle (1) reduce moisture loss/transpiration (1); • low growing (1) to avoid exposure to intense sunlight/reduce water loss/reduce damage from wind (1); • deep/long root systems (1) to tap into underground water/to reach/get to more water (1); • shallow/horizontal root systems (1) to get/catch/collect/obtain water when it rains (1). Note: 2 2 marks – one for method and one for explanation. Must have the adaptation for explanation to be credited. Do not double credit the following terms for explanation i.e. evaporation, moisture loss, transpiration and evapotranspiration; each can be credited once. Where appropriate these terms can be used interchangeably.
Question 5
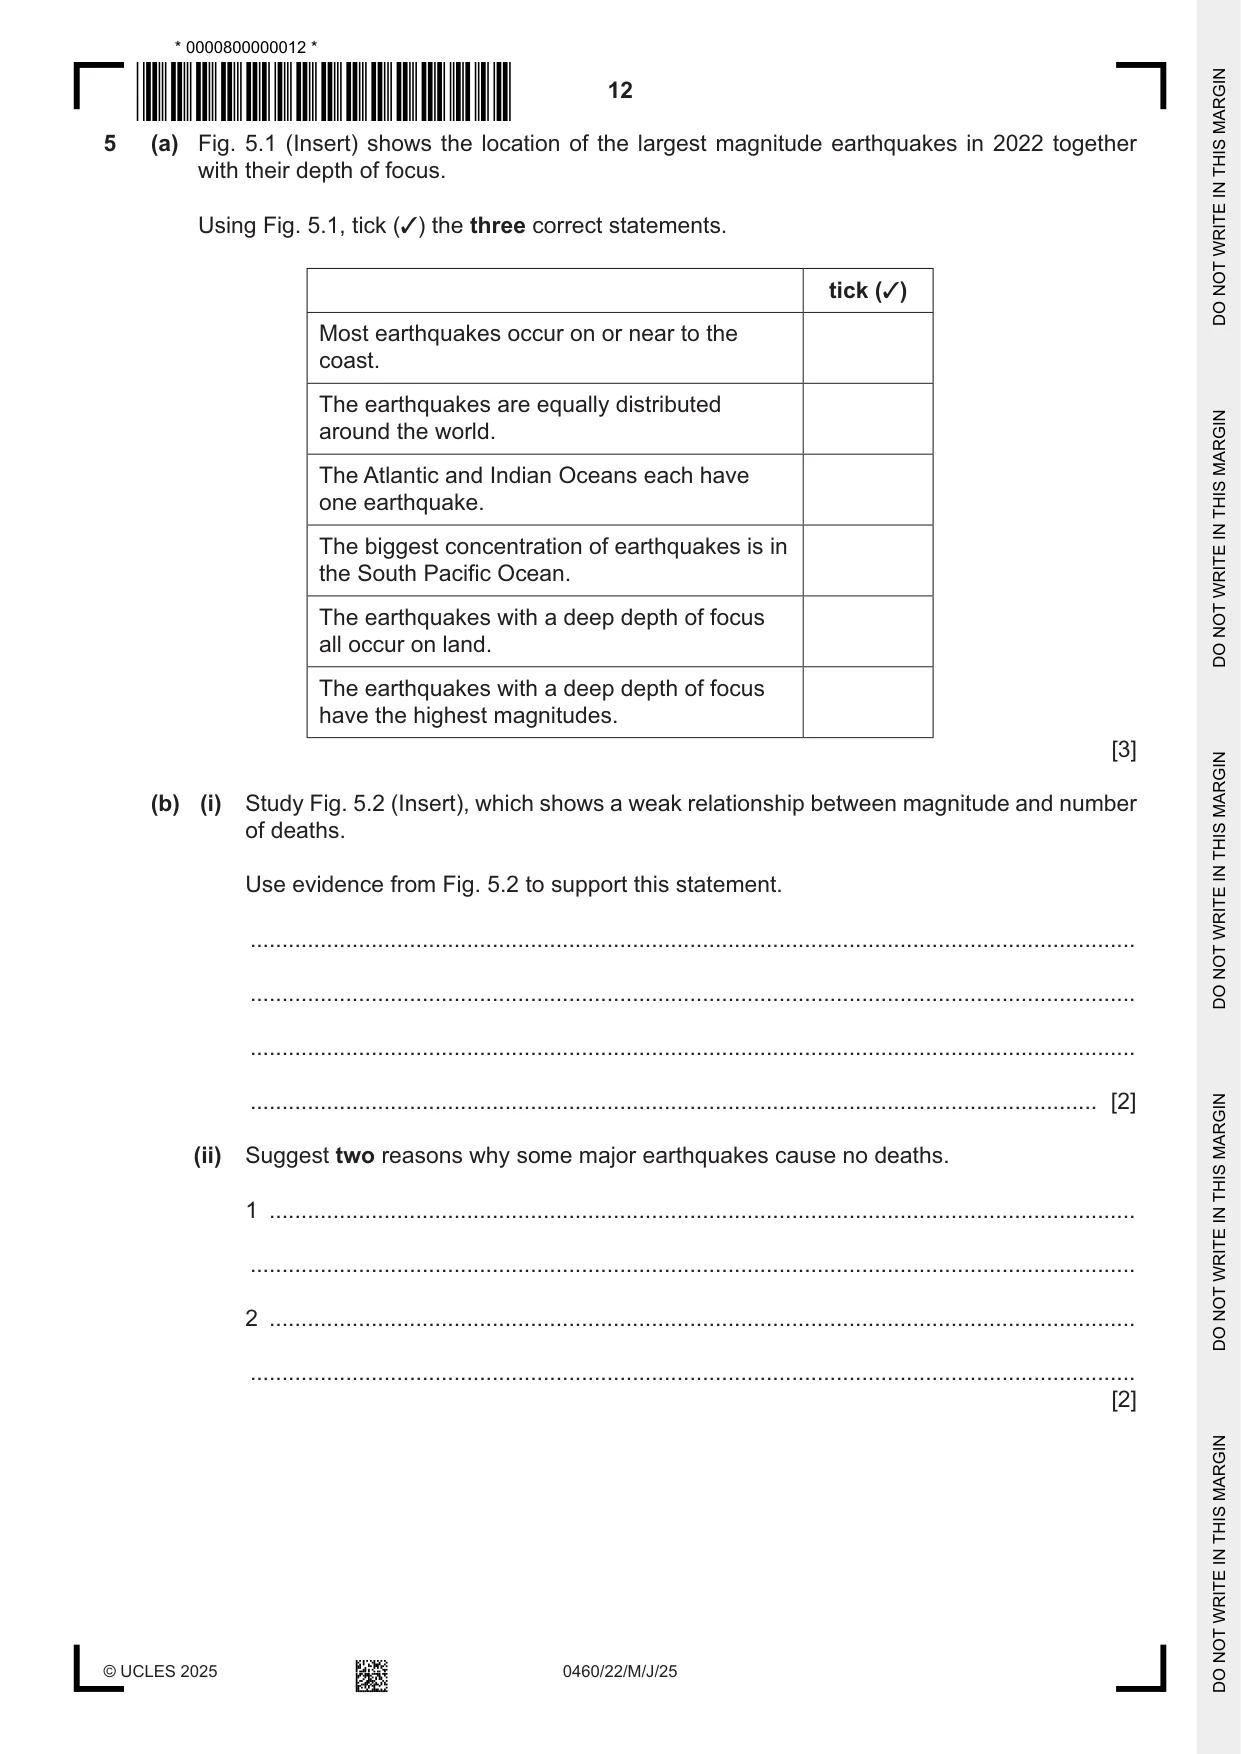
5 (a) Fig. 5.1 (Insert) shows the location of the largest magnitude earthquakes in 2022 together with their depth of focus. Using Fig. 5.1, tick (✓) the three correct statements. tick (✓) Most earthquakes occur on or near to the coast. The earthquakes are equally distributed around the world. The Atlantic and Indian Oceans each have one earthquake. The biggest concentration of earthquakes is in the South Pacific Ocean. The earthquakes with a deep depth of focus all occur on land. The earthquakes with a deep depth of focus have the highest magnitudes. [3] (b) (i) Study Fig. 5.2 (Insert), which shows a weak relationship between magnitude and number of deaths. Use evidence from Fig. 5.2 to support this statement. ........................................................................................................................................... ........................................................................................................................................... ........................................................................................................................................... ..................................................................................................................................... [2] (ii) Suggest two reasons why some major earthquakes cause no deaths. 1 ........................................................................................................................................ ........................................................................................................................................... 2 ........................................................................................................................................ ........................................................................................................................................... [2] (c) Earthquakes are caused by tectonic plate movement. Tick one box (✓) to show the cause of this movement. cause tick (✓) conduction convection radiation [1] [Total: 8]
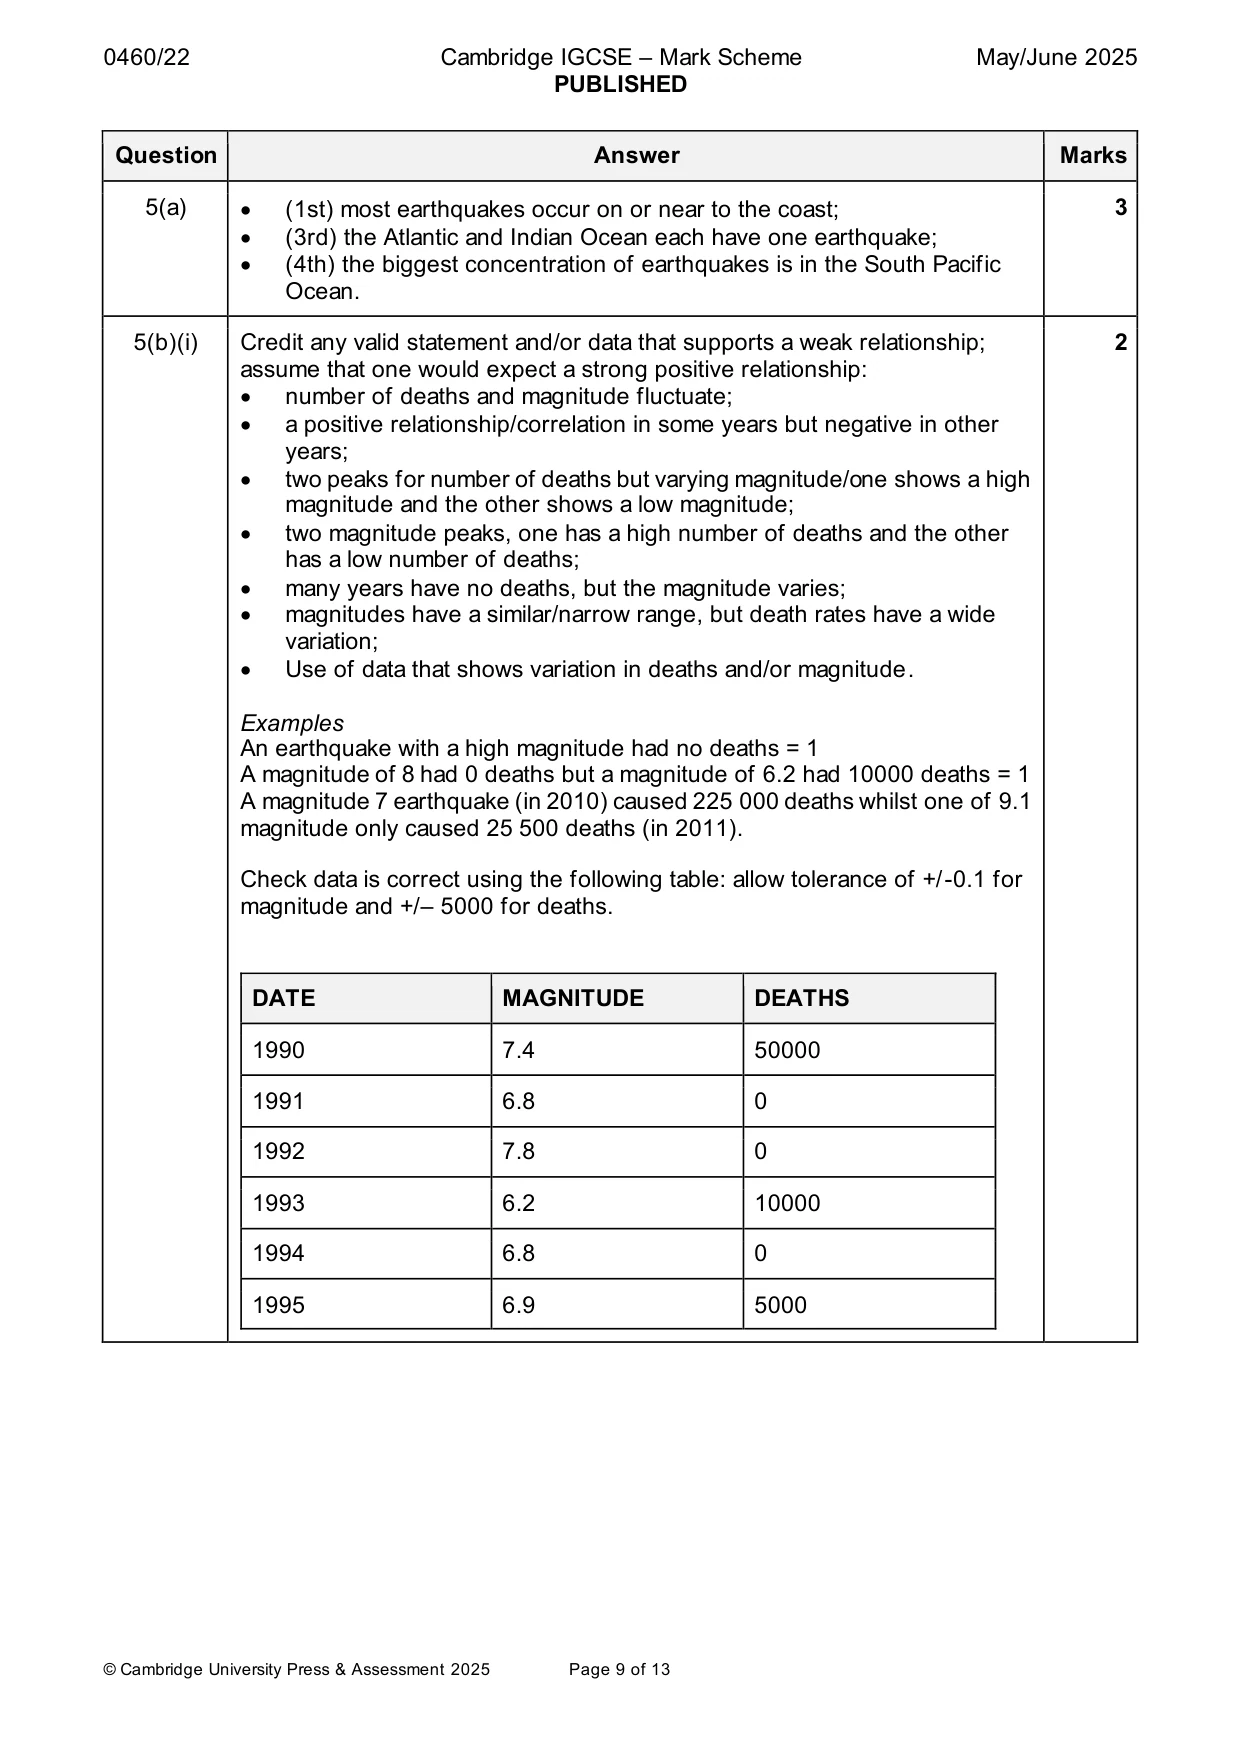
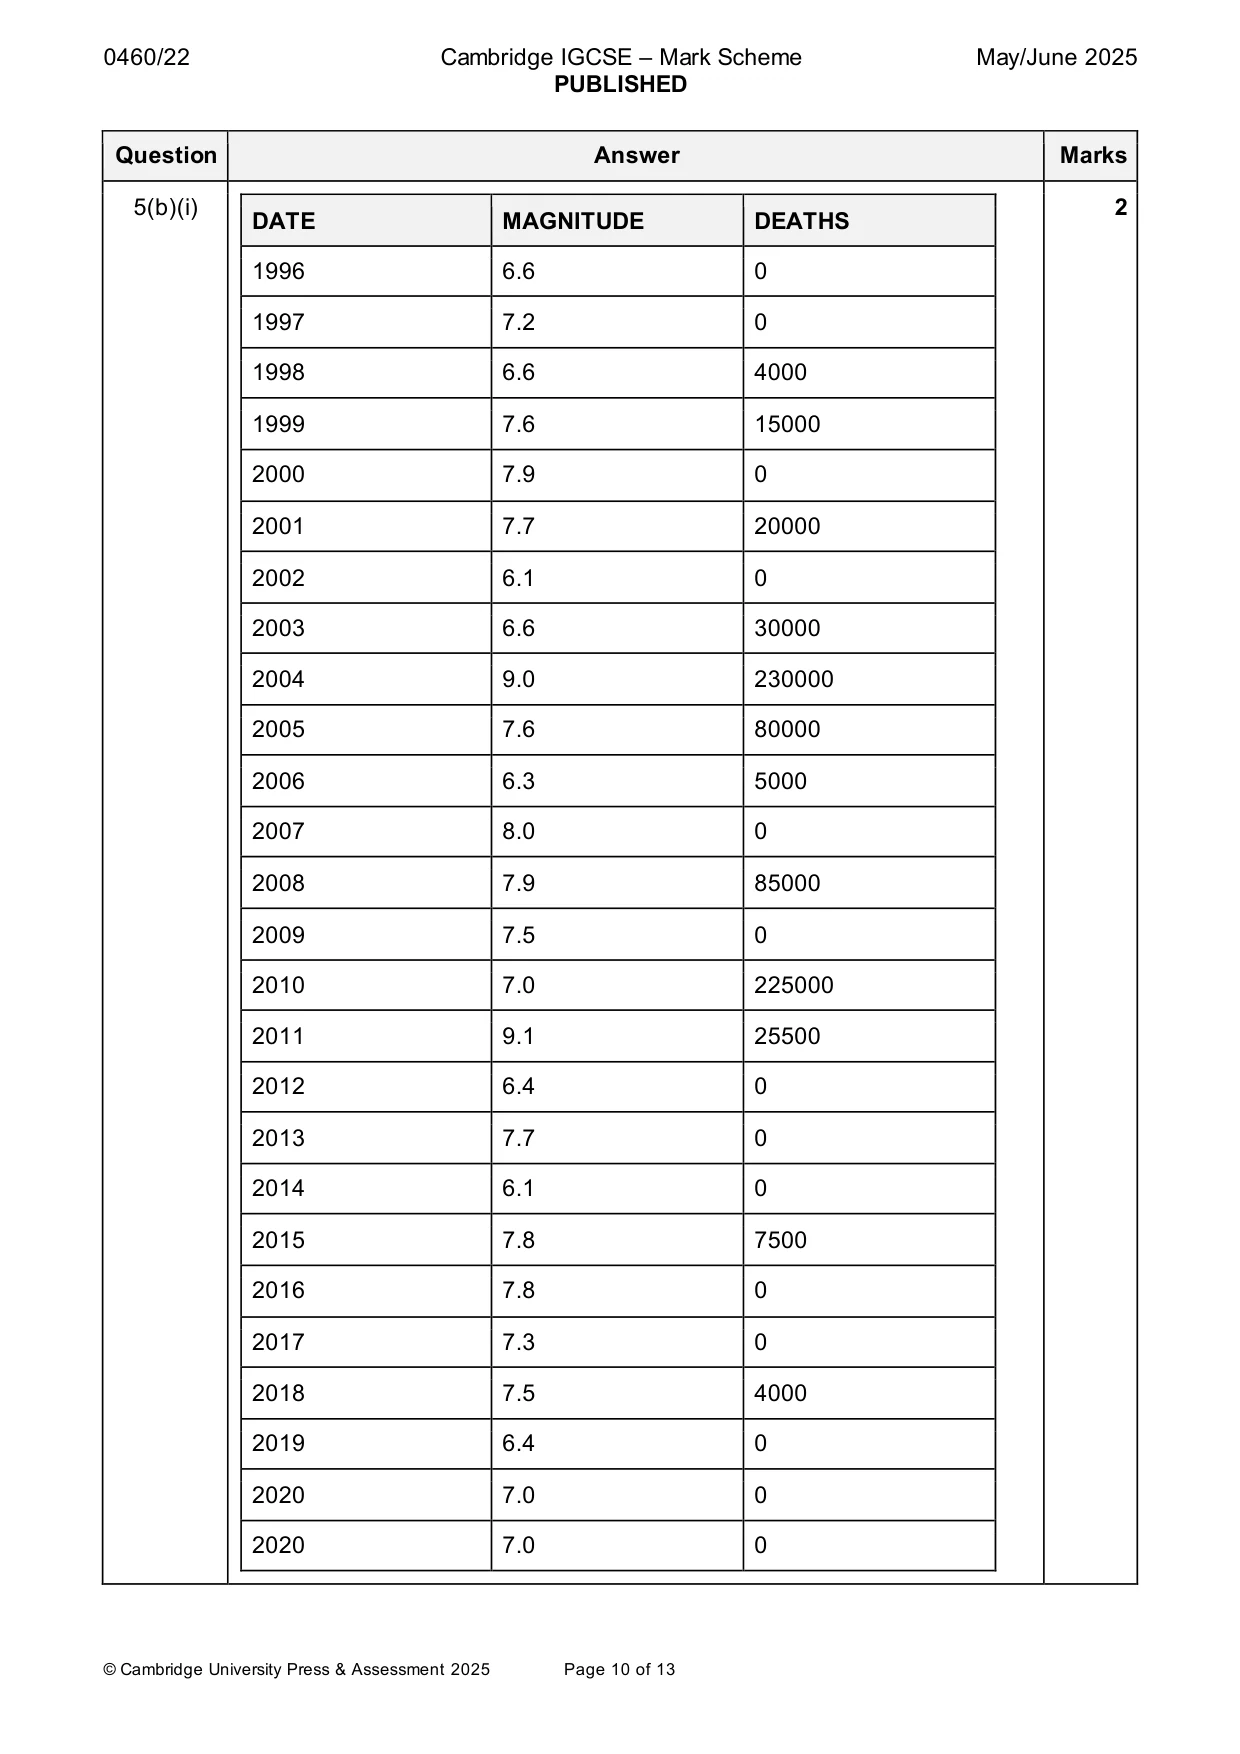
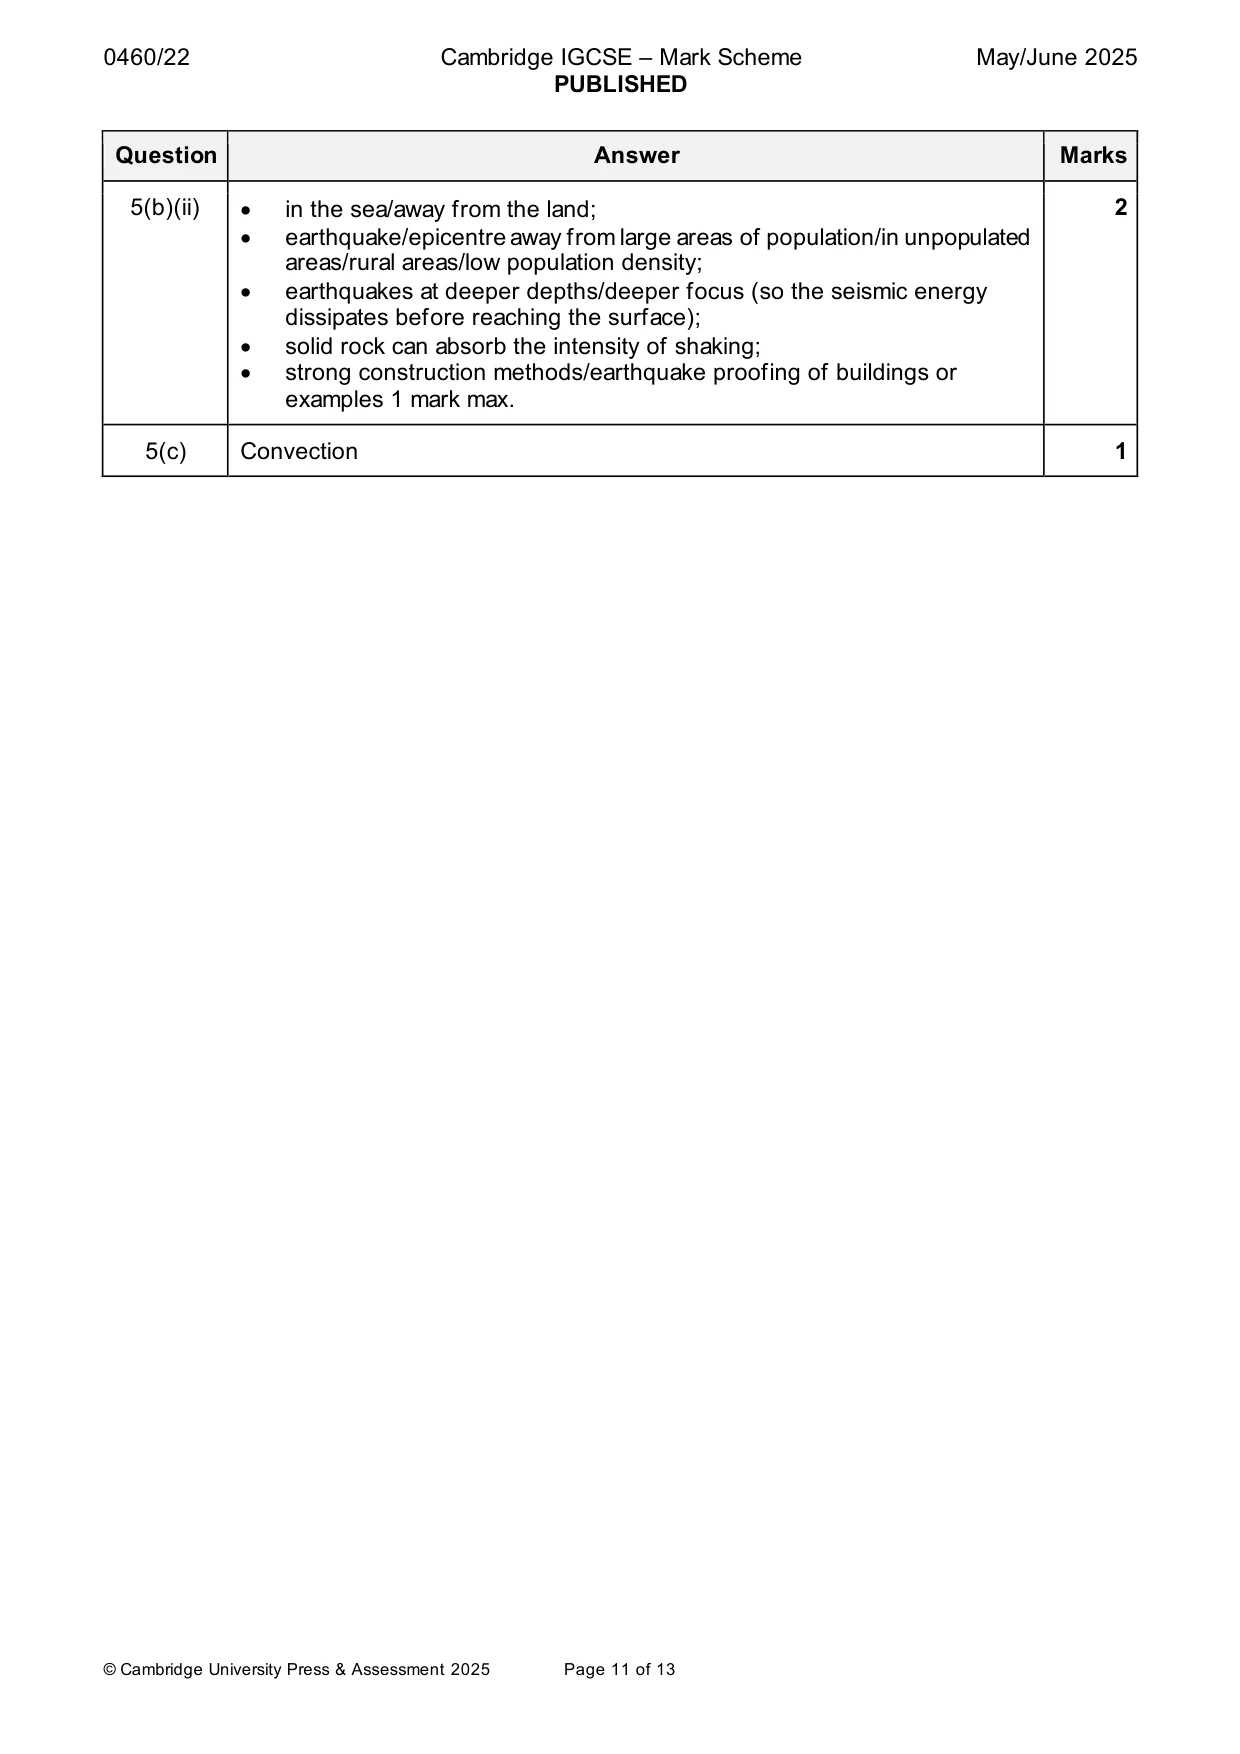
Mark scheme: 5(a) • (1st) most earthquakes occur on or near to the coast; 3 • (3rd) the Atlantic and Indian Ocean each have one earthquake; • (4th) the biggest concentration of earthquakes is in the South Pacific Ocean. 5(b)(i) Credit any valid statement and/or data that supports a weak relationship; 2 assume that one would expect a strong positive relationship: • number of deaths and magnitude fluctuate; • a positive relationship/correlation in some years but negative in other years; • two peaks for number of deaths but varying magnitude/one shows a high magnitude and the other shows a low magnitude; • two magnitude peaks, one has a high number of deaths and the other has a low number of deaths; • many years have no deaths, but the magnitude varies; • magnitudes have a similar/narrow range, but death rates have a wide variation; • Use of data that shows variation in deaths and/or magnitude. Examples An earthquake with a high magnitude had no deaths = 1 A magnitude of 8 had 0 deaths but a magnitude of 6.2 had 10000 deaths = 1 A magnitude 7 earthquake (in 2010) caused 225 000 deaths whilst one of 9.1 magnitude only caused 25 500 deaths (in 2011). Check data is correct using the following table: allow tolerance of +/-0.1 for magnitude and +/– 5000 for deaths. DATE MAGNITUDE DEATHS 1990 7.4 50000 1991 6.8 0 1992 7.8 0 1993 6.2 10000 1994 6.8 0 1995 6.9 5000 5(b)(i) 2 DATE MAGNITUDE DEATHS 1996 6.6 0 1997 7.2 0 1998 6.6 4000 1999 7.6 15000 2000 7.9 0 2001 7.7 20000 2002 6.1 0 2003 6.6 30000 2004 9.0 230000 2005 7.6 80000 2006 6.3 5000 2007 8.0 0 2008 7.9 85000 2009 7.5 0 2010 7.0 225000 2011 9.1 25500 2012 6.4 0 2013 7.7 0 2014 6.1 0 2015 7.8 7500 2016 7.8 0 2017 7.3 0 2018 7.5 4000 2019 6.4 0 2020 7.0 0 2020 7.0 0 5(b)(ii) • in the sea/away from the land; 2 • earthquake/epicentre away from large areas of population/in unpopulated areas/rural areas/low population density; • earthquakes at deeper depths/deeper focus (so the seismic energy dissipates before reaching the surface); • solid rock can absorb the intensity of shaking; • strong construction methods/earthquake proofing of buildings or examples 1 mark max. 5(c) Convection 1
Q6 · A mind map drawn by a student studying squatter settlements in a large LEDC city
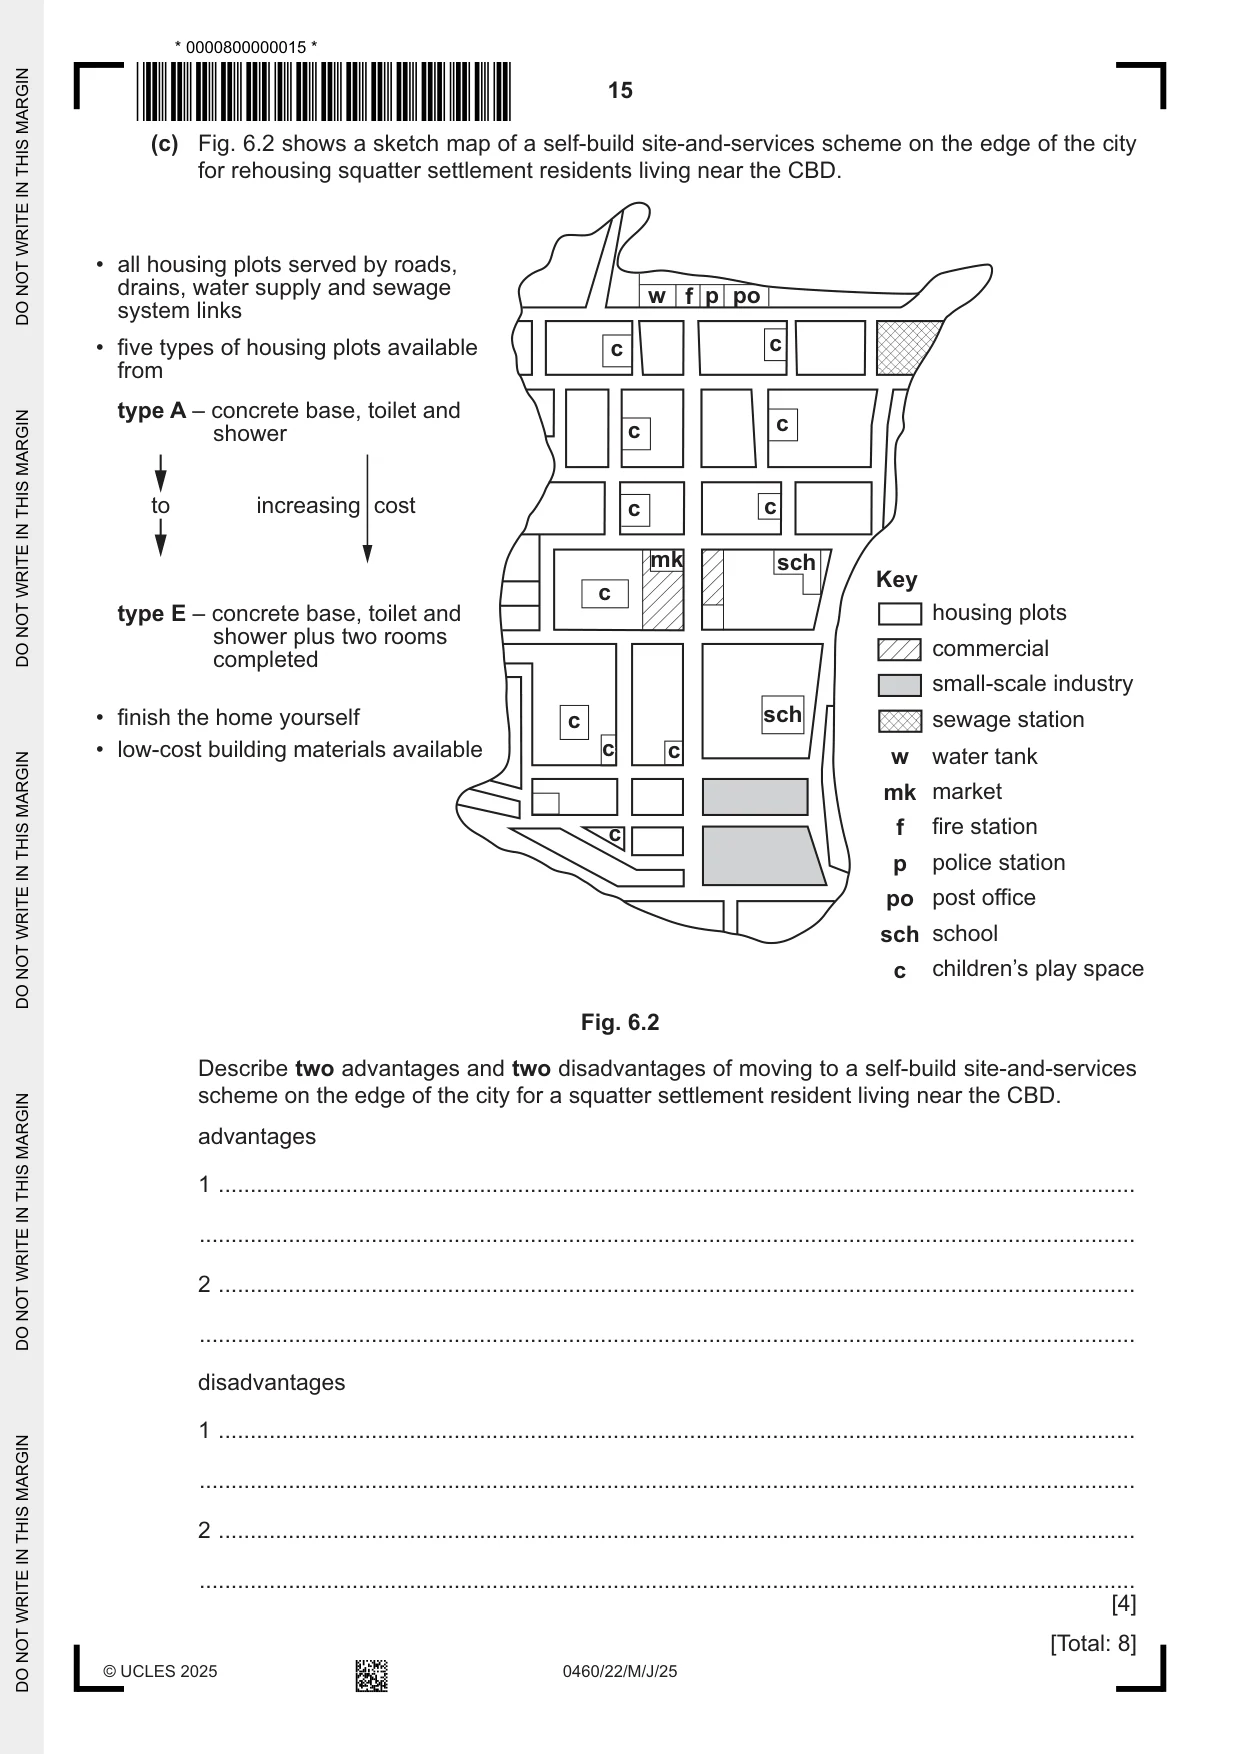
6 (a) Fig. 6.1 shows a mind map drawn by a student studying squatter settlements in a large LEDC city. Content removed due to copyright restrictions. Fig. 6.1 (i) Using Fig. 6.1, identify one reason why the squatter settlement residents face the threat of being removed from their homes. ..................................................................................................................................... [1] (ii) Add one point to Fig. 6.1 that the student could have made about the squatter settlement environment. [1] (b) Suggest two reasons why squatter settlements grow. 1 ................................................................................................................................................ ................................................................................................................................................... 2 ................................................................................................................................................ ................................................................................................................................................... [2] (c) Fig. 6.2 shows a sketch map of a self-build site-and-services scheme on the edge of the city for rehousing squatter settlement residents living near the CBD. • all housing plots served by roads, drains, water supply and sewage w f p po system links • five types of housing plots available c c from type A – concrete base, toilet and c shower c to increasing cost c c mk sch Key c type E – concrete base, toilet and housing plots shower plus two rooms commercial completed small-scale industry • finish the home yourself c sch sewage station • low-cost building materials available c c w water tank mk market c f fire station p police station po post office sch school c children’s play space Fig. 6.2 Describe two advantages and two disadvantages of moving to a self-build site-and-services scheme on the edge of the city for a squatter settlement resident living near the CBD. advantages 1 ................................................................................................................................................ ................................................................................................................................................... 2 ................................................................................................................................................ ................................................................................................................................................... disadvantages 1 ................................................................................................................................................ ................................................................................................................................................... 2 ................................................................................................................................................ ................................................................................................................................................... [4] [Total: 8] Additional pages If you use the following pages to complete the answer to any question, the question number must be clearly shown. .................................................................................................................................................................. .................................................................................................................................................................. .................................................................................................................................................................. .................................................................................................................................................................. .................................................................................................................................................................. .................................................................................................................................................................. .................................................................................................................................................................. .................................................................................................................................................................. .................................................................................................................................................................. .................................................................................................................................................................. .................................................................................................................................................................. .................................................................................................................................................................. .................................................................................................................................................................. .................................................................................................................................................................. .................................................................................................................................................................. .................................................................................................................................................................. .................................................................................................................................................................. .................................................................................................................................................................. .................................................................................................................................................................. .................................................................................................................................................................. .................................................................................................................................................................. .................................................................................................................................................................. .................................................................................................................................................................. .................................................................................................................................................................. .................................................................................................................................................................. .................................................................................................................................................................. © UCLES 2025 0460/22/M/J/25
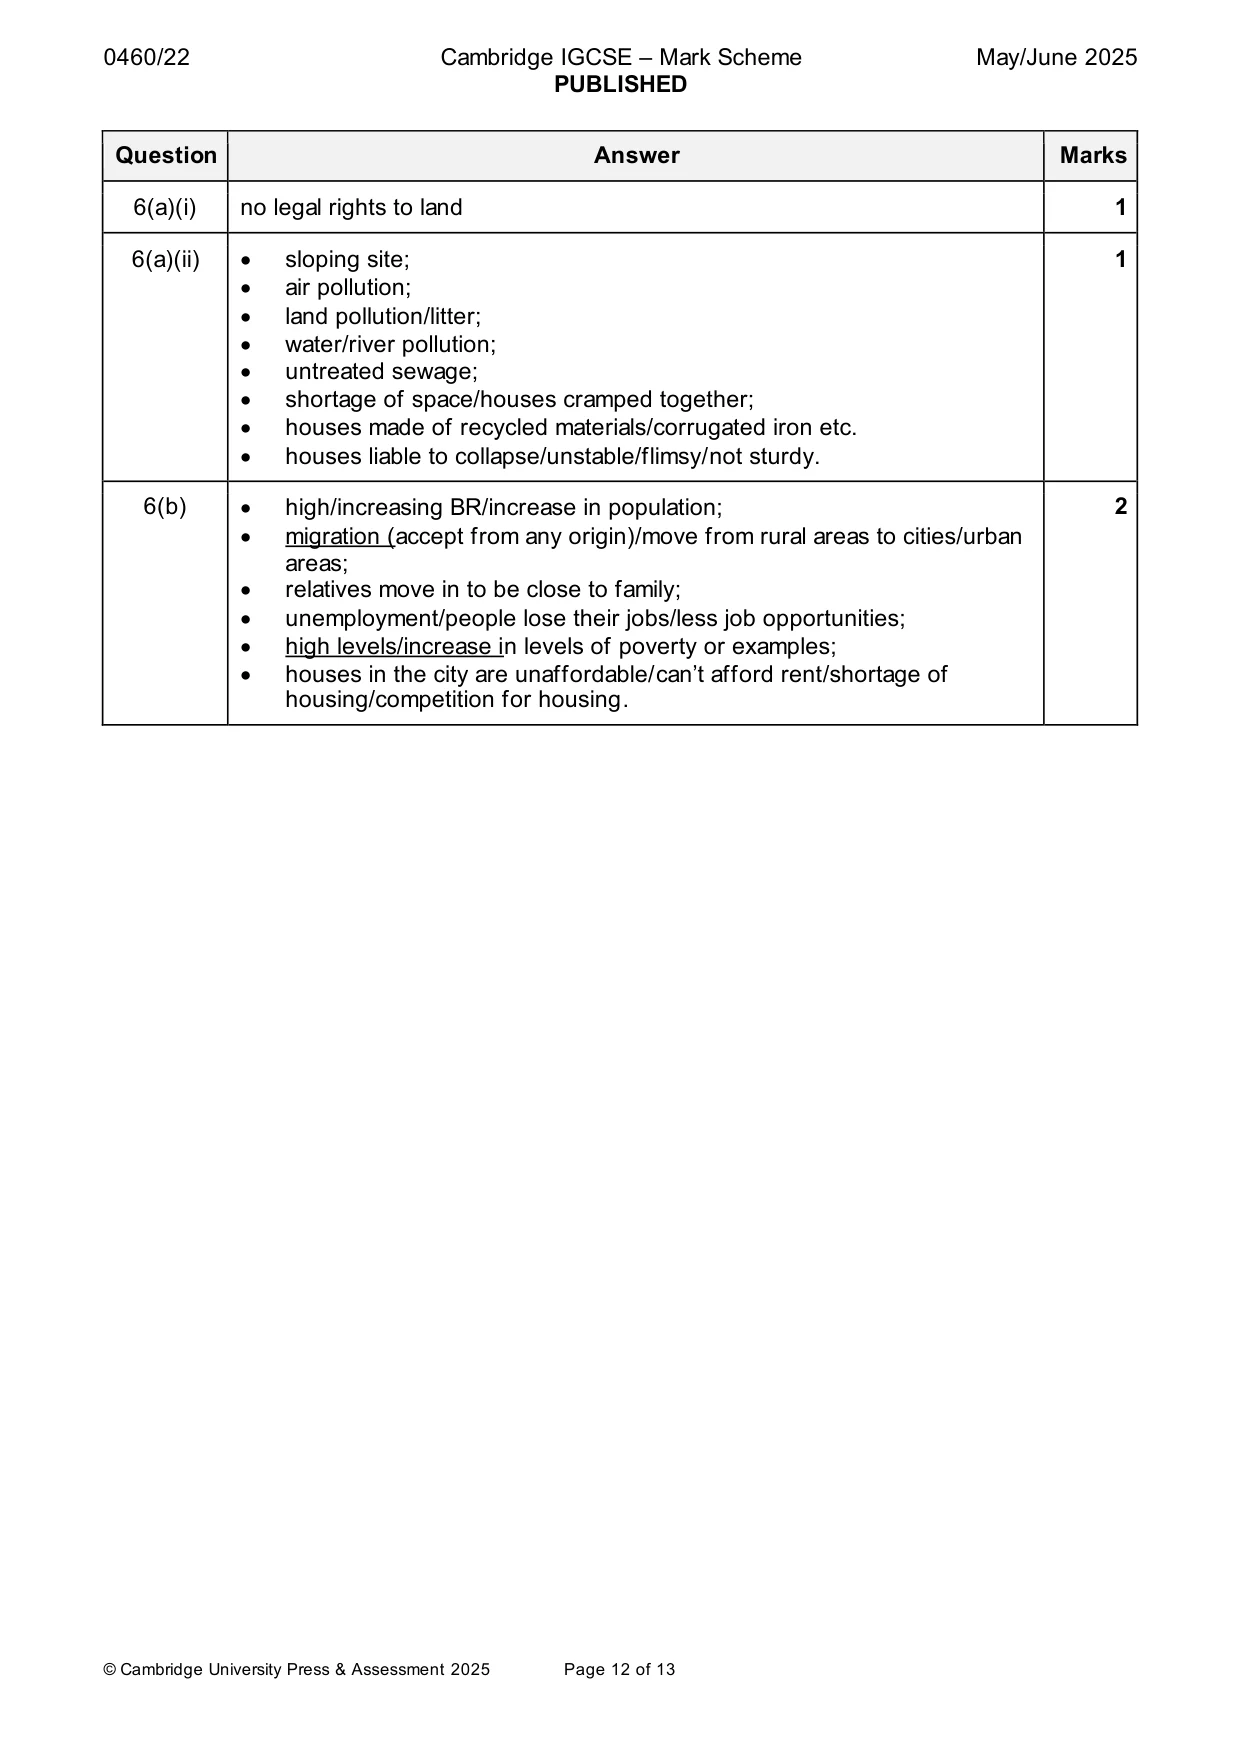
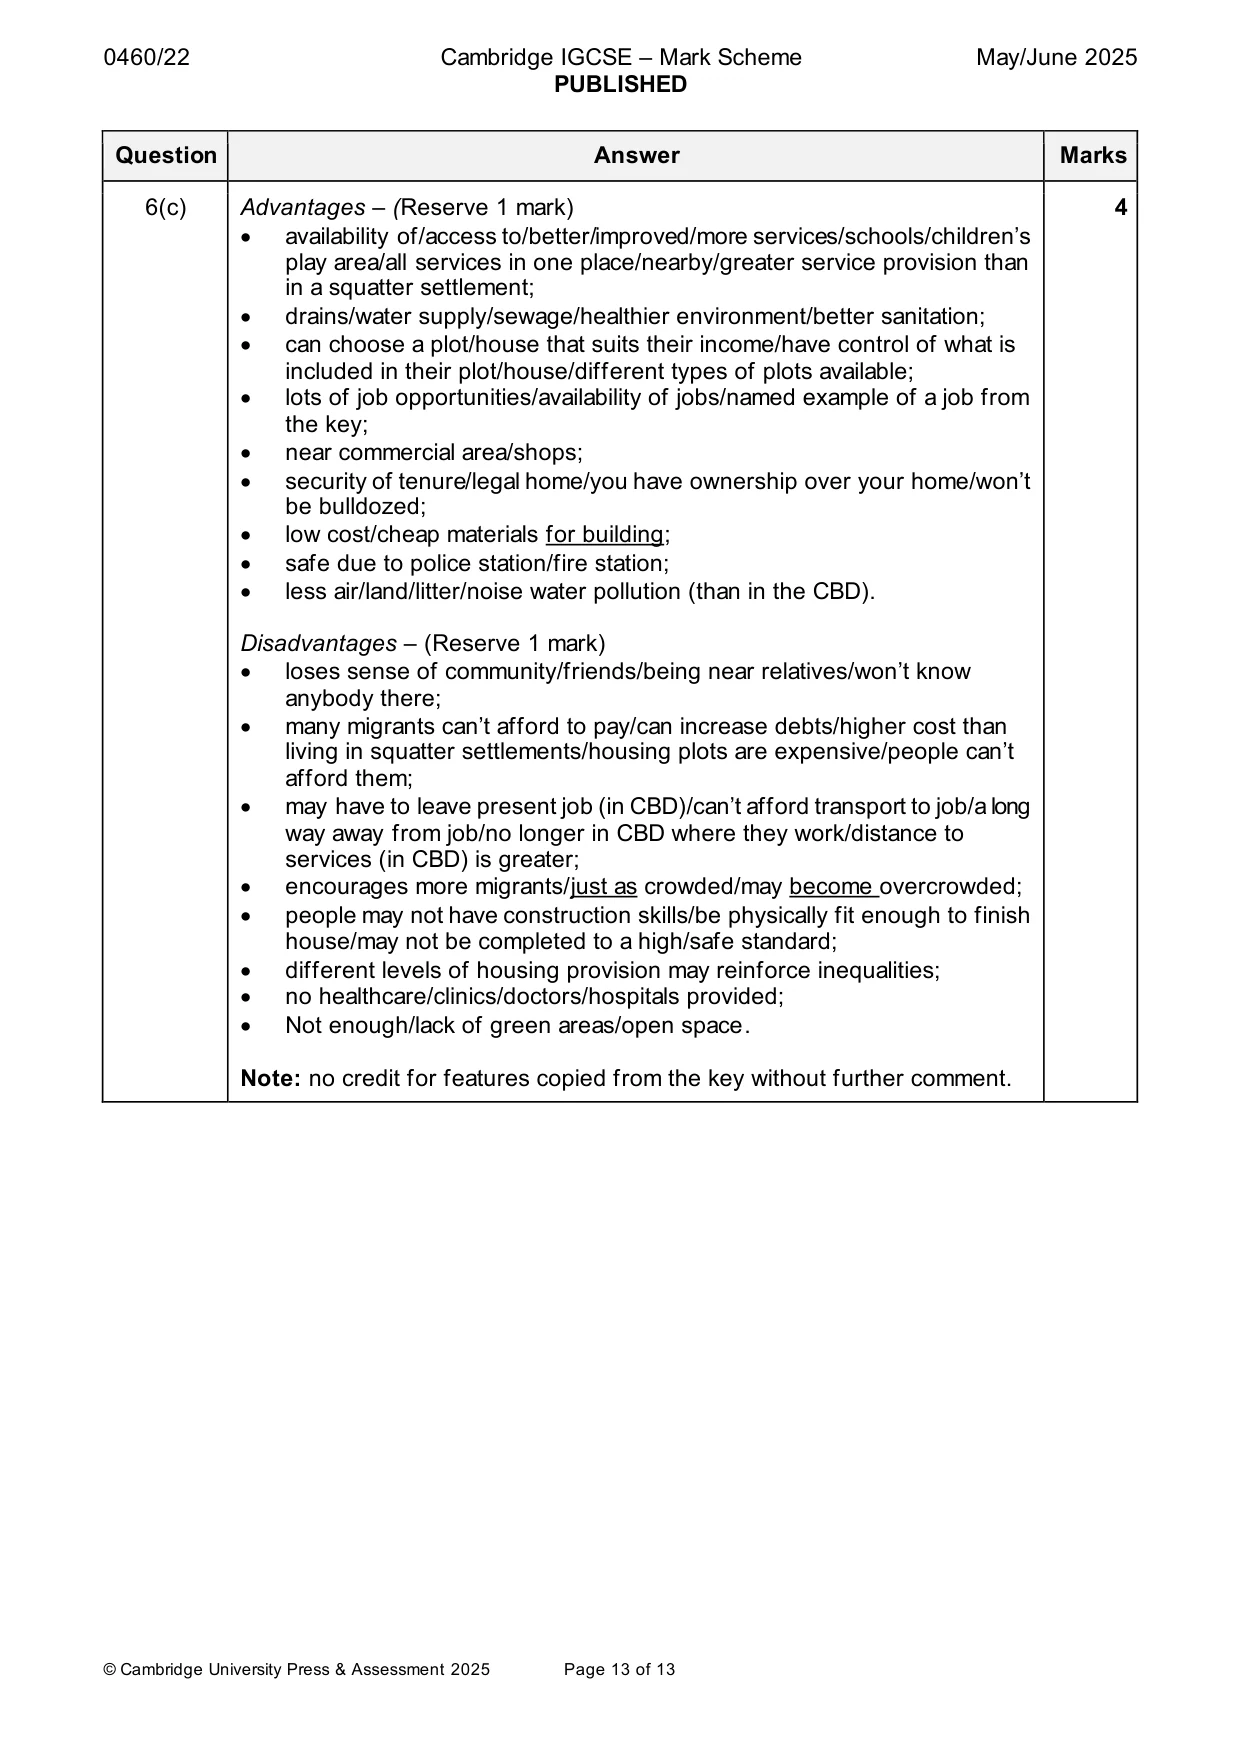
Mark scheme: 6(a)(i) no legal rights to land 1 6(a)(ii) • sloping site; 1 • air pollution; • land pollution/litter; • water/river pollution; • untreated sewage; • shortage of space/houses cramped together; • houses made of recycled materials/corrugated iron etc. • houses liable to collapse/unstable/flimsy/not sturdy. 6(b) • high/increasing BR/increase in population; 2 • migration (accept from any origin)/move from rural areas to cities/urban areas; • relatives move in to be close to family; • unemployment/people lose their jobs/less job opportunities; • high levels/increase in levels of poverty or examples; • houses in the city are unaffordable/can’t afford rent/shortage of housing/competition for housing. 6(c) Advantages – (Reserve 1 mark) 4 • availability of/access to/better/improved/more services/schools/children’s play area/all services in one place/nearby/greater service provision than in a squatter settlement; • drains/water supply/sewage/healthier environment/better sanitation; • can choose a plot/house that suits their income/have control of what is included in their plot/house/different types of plots available; • lots of job opportunities/availability of jobs/named example of a job from the key; • near commercial area/shops; • security of tenure/legal home/you have ownership over your home/won’t be bulldozed; • low cost/cheap materials for building; • safe due to police station/fire station; • less air/land/litter/noise water pollution (than in the CBD). Disadvantages – (Reserve 1 mark) • loses sense of community/friends/being near relatives/won’t know anybody there; • many migrants can’t afford to pay/can increase debts/higher cost than living in squatter settlements/housing plots are expensive/people can’t afford them; • may have to leave present job (in CBD)/can’t afford transport to job/a long way away from job/no longer in CBD where they work/distance to services (in CBD) is greater; • encourages more migrants/just as crowded/may become overcrowded; • people may not have construction skills/be physically fit enough to finish house/may not be completed to a high/safe standard; • different levels of housing provision may reinforce inequalities; • no healthcare/clinics/doctors/hospitals provided; • Not enough/lack of green areas/open space. Note: no credit for features copied from the key without further comment.
What was in this paper
The subtopics covered by these 6 questions, and how many questions each got. Open one in a new tab to see every Cambridge question on it.
What you needed in this session
Cambridge’s own grade thresholds for 2025 May/June, Paper 2 · Variant 2. A higher threshold means an easier paper — the bar moves with how the cohort did.