Cambridge IGCSE Geography 0460 — 2019 Oct/Nov Paper 2 · Variant 2
0460/22/O/N/19 · 6 questions · 60 marks · ≈68 min
The question paper and its mark scheme, free to read here and free to download. This is Cambridge’s own paper, exactly as it was sat.
Question paper20 pages




Mark scheme8 pages
Answers below. Sit the paper first if you are practising.
Questions as text
Q1 · Study the map extract for Degeberga, Sweden
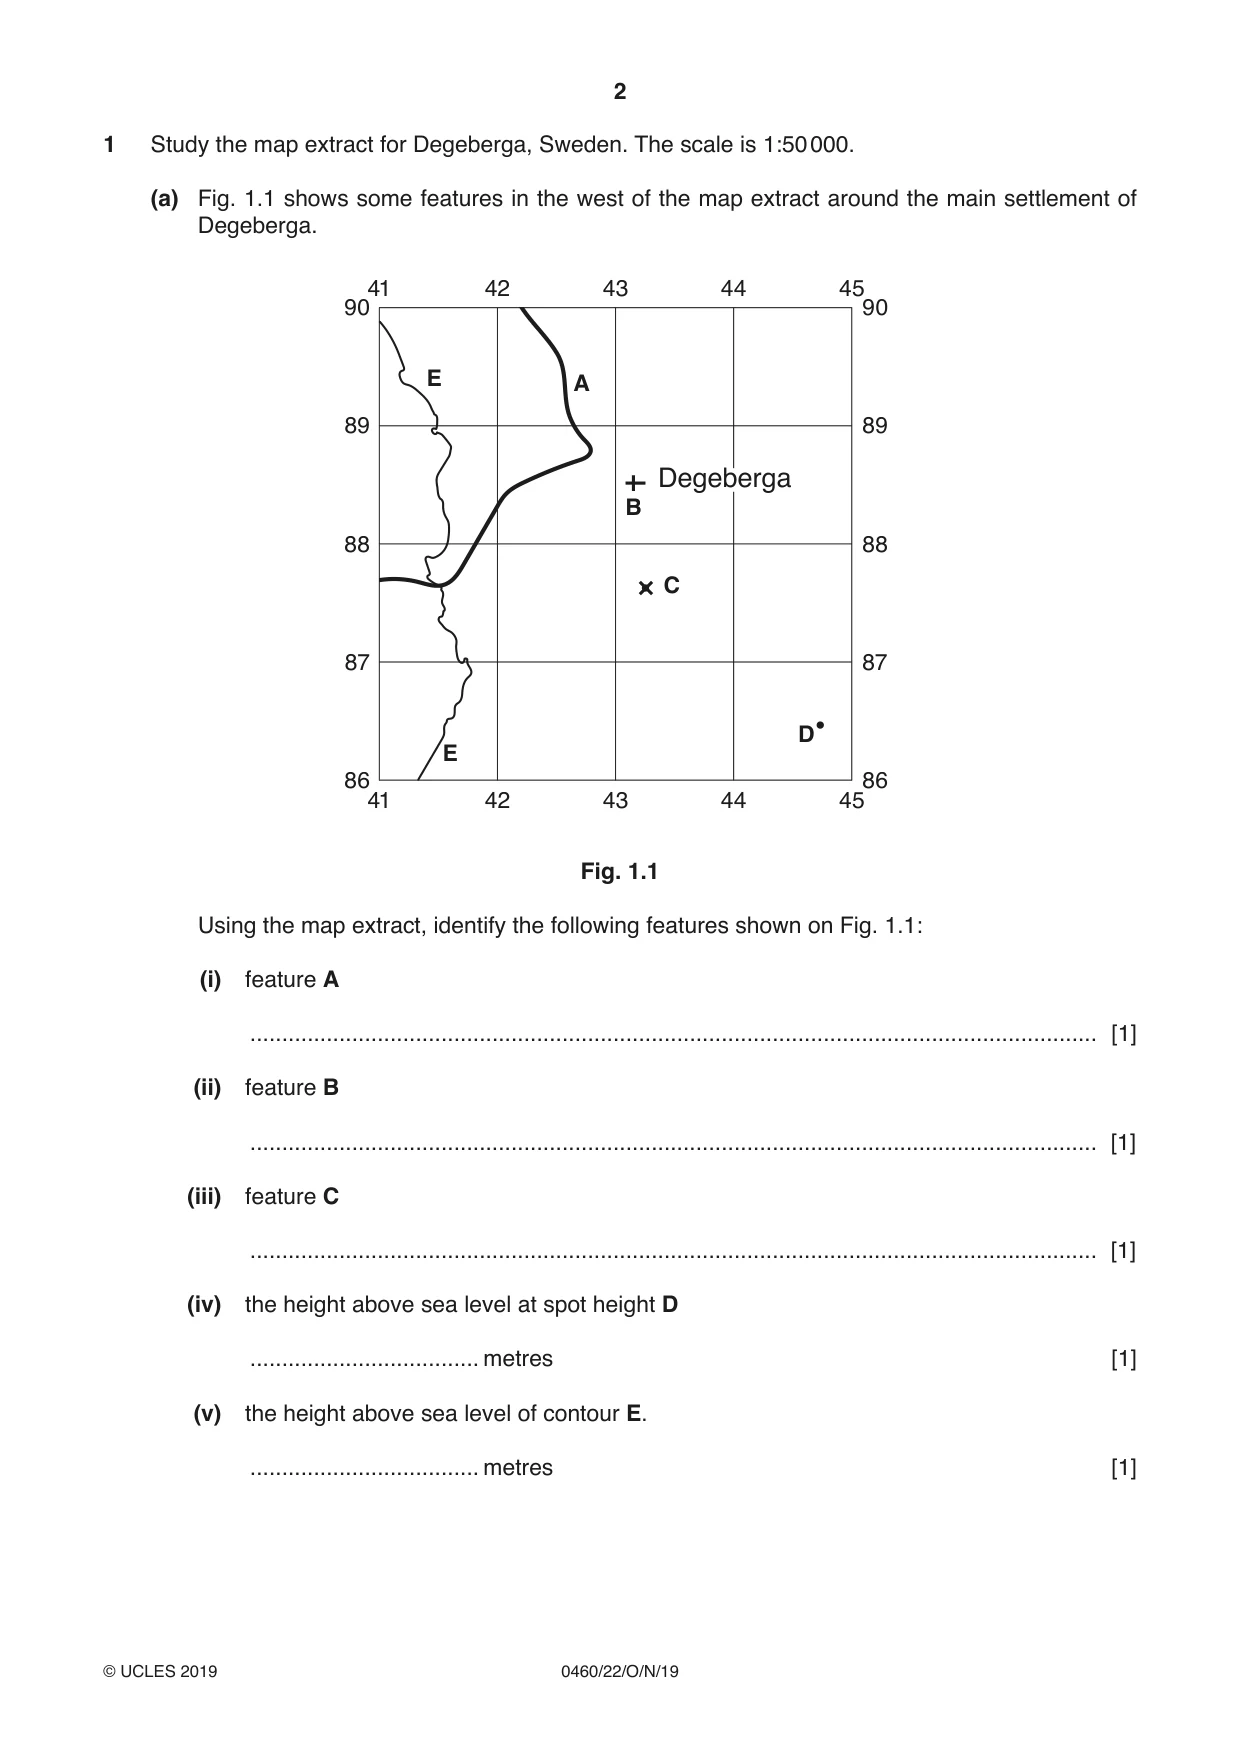
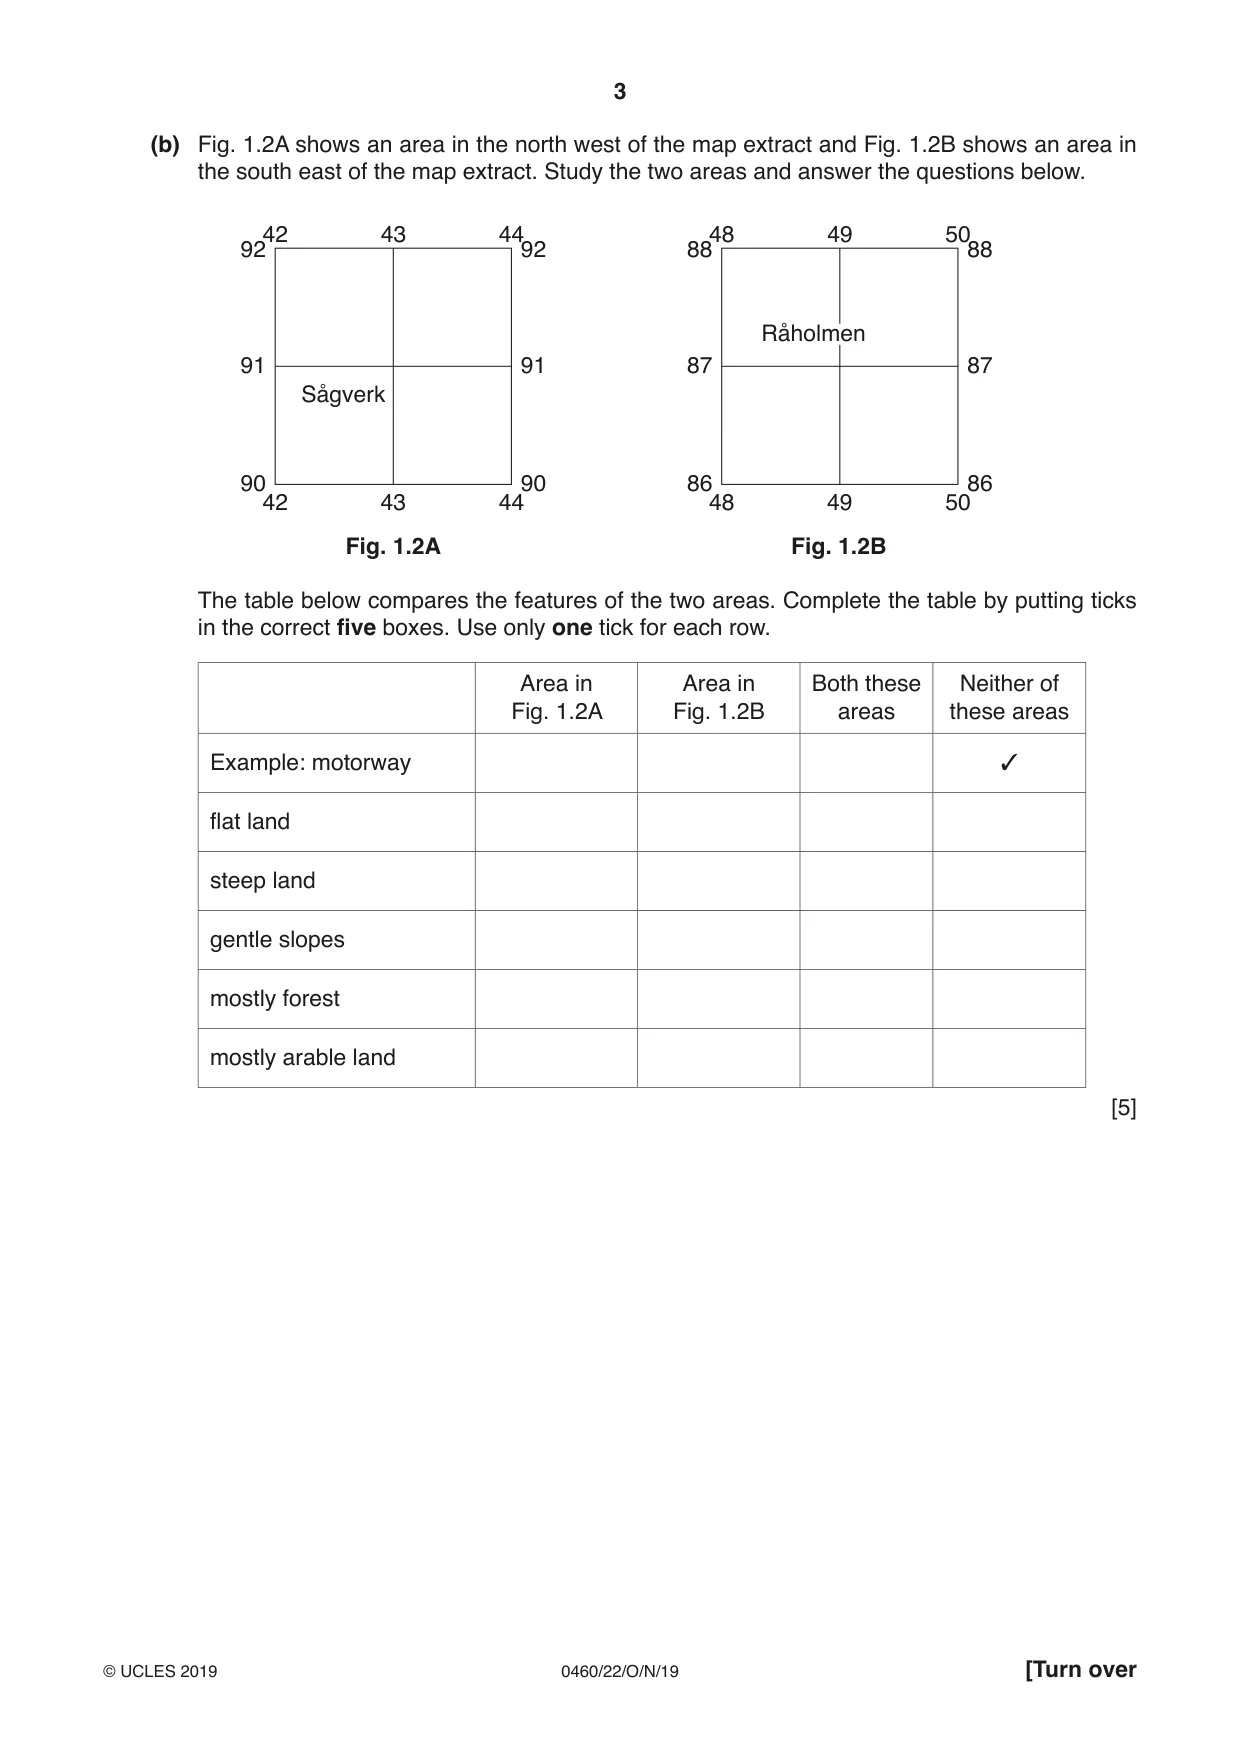
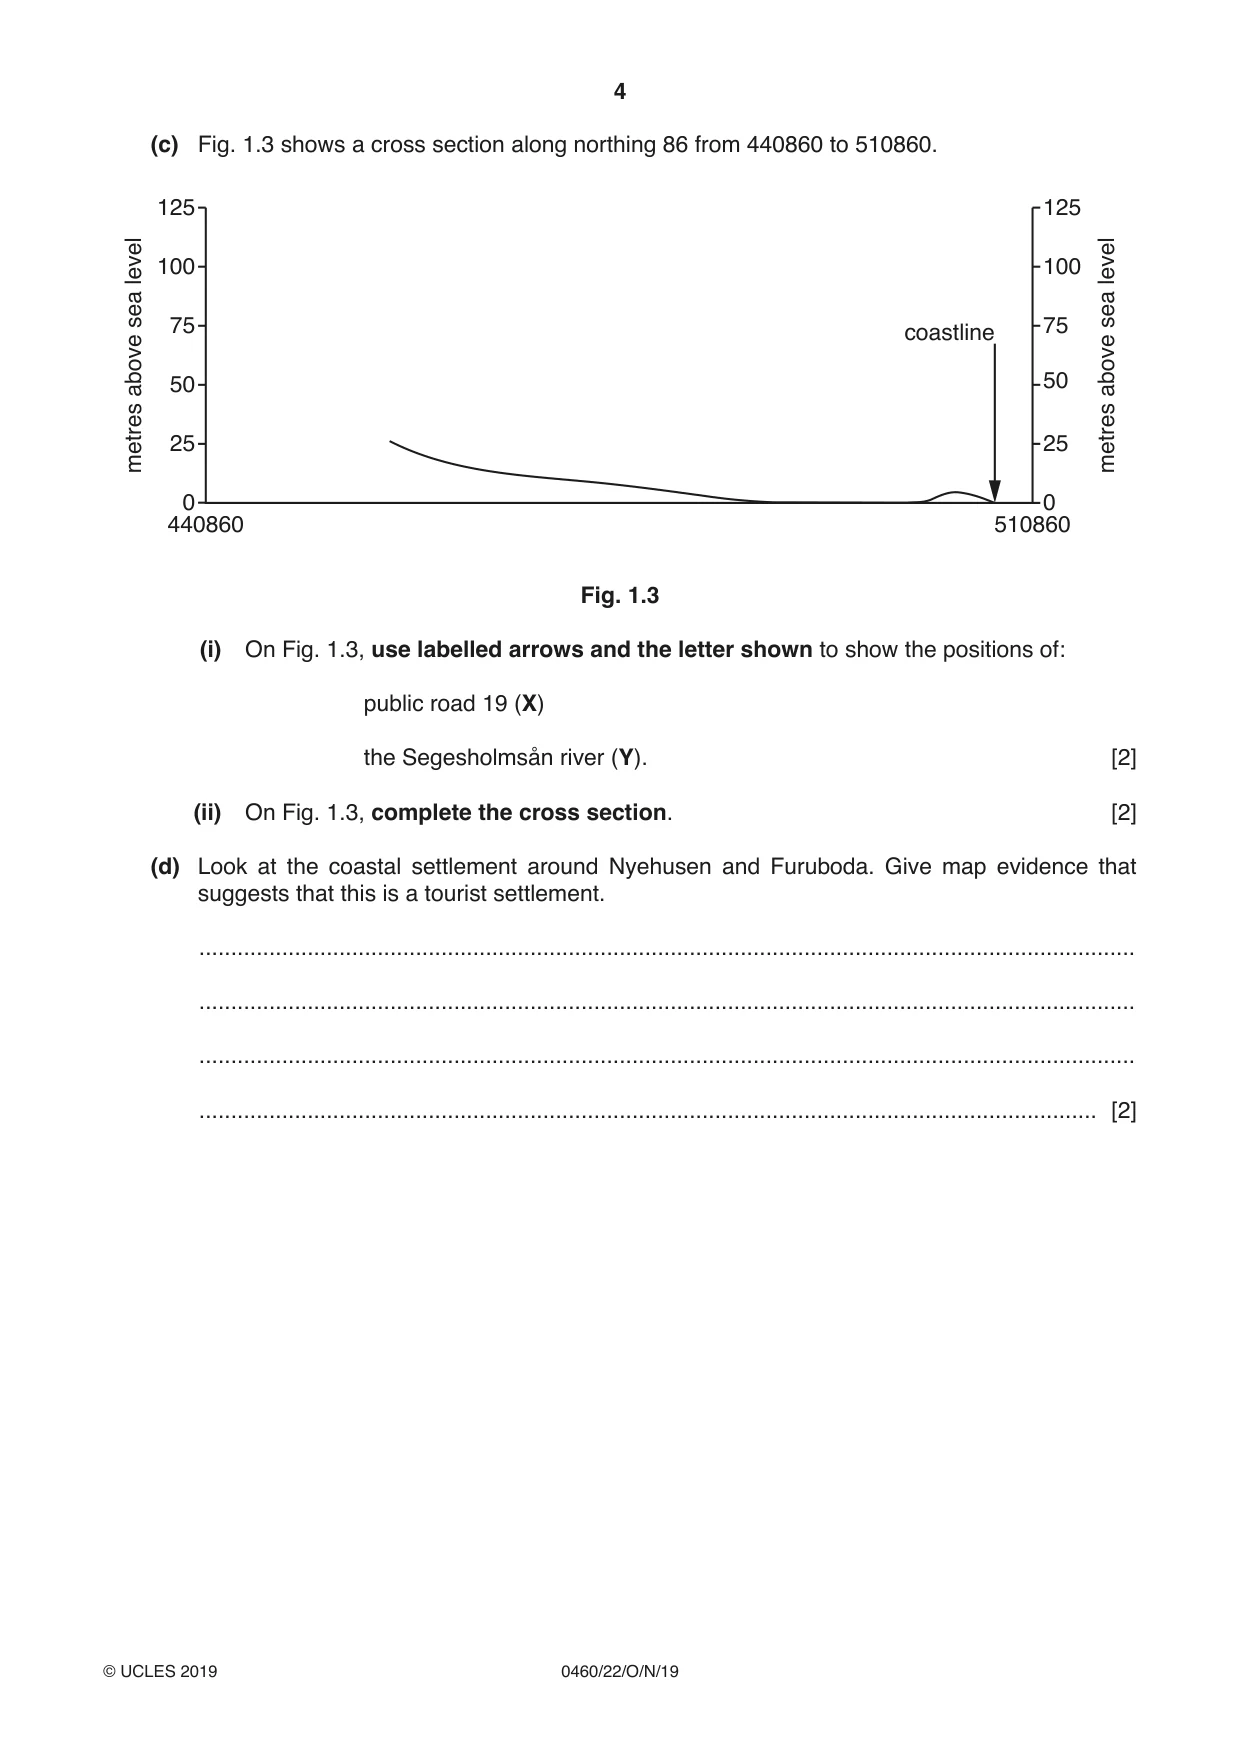
1 Study the map extract for Degeberga, Sweden. The scale is 1:50 000. (a) Fig. 1.1 shows some features in the west of the map extract around the main settlement of Degeberga. 41 42 43 44 45 90 90 E A 89 89 Degeberga B 88 88 C 87 87 D E 86 86 41 42 43 44 45 Fig. 1.1 Using the map extract, identify the following features shown on Fig. 1.1: (i) feature A ..................................................................................................................................... [1] (ii) feature B ..................................................................................................................................... [1] (iii) feature C ..................................................................................................................................... [1] (iv) the height above sea level at spot height D .................................... metres [1] (v) the height above sea level of contour E. .................................... metres [1] (b) Fig. 1.2A shows an area in the north west of the map extract and Fig. 1.2B shows an area in the south east of the map extract. Study the two areas and answer the questions below. 42 43 44 48 49 50 92 92 88 88 Råholmen 91 91 87 87 Sågverk 90 90 86 86 42 43 44 48 49 50 Fig. 1.2A Fig. 1.2B The table below compares the features of the two areas. Complete the table by putting ticks in the correct five boxes. Use only one tick for each row. Area in Area in Both these Neither of Fig. 1.2A Fig. 1.2B areas these areas ✓ Example: motorway flat land steep land gentle slopes mostly forest mostly arable land [5] (c) Fig. 1.3 shows a cross section along northing 86 from 440860 to 510860. 125 125 level 100 100 level sea sea 75 75 coastline above 50 50 above 25 25metres metres 0 0 440860 510860 Fig. 1.3 (i) On Fig. 1.3, use labelled arrows and the letter shown to show the positions of: public road 19 (X) the Segesholmsån river (Y). [2] (ii) On Fig. 1.3, complete the cross section. [2] (d) Look at the coastal settlement around Nyehusen and Furuboda. Give map evidence that suggests that this is a tourist settlement. ................................................................................................................................................... ................................................................................................................................................... ................................................................................................................................................... ............................................................................................................................................. [2] (e) Find the following two triangulation points: the 22 m triangulation point south of Nyehusen the 129 m triangulation point near Norrlia, south of Degeberga. (i) Give the compass direction from the 129 m triangulation point to the 22 m triangulation point. ............................................... [1] (ii) Measure the bearing from the 129 m triangulation point to the 22 m triangulation point. .................................. degrees [1] (iii) What is the six-figure grid reference of the 129 m triangulation point near Norrlia? ..................................................................................................................................... [2] [Total: 20]
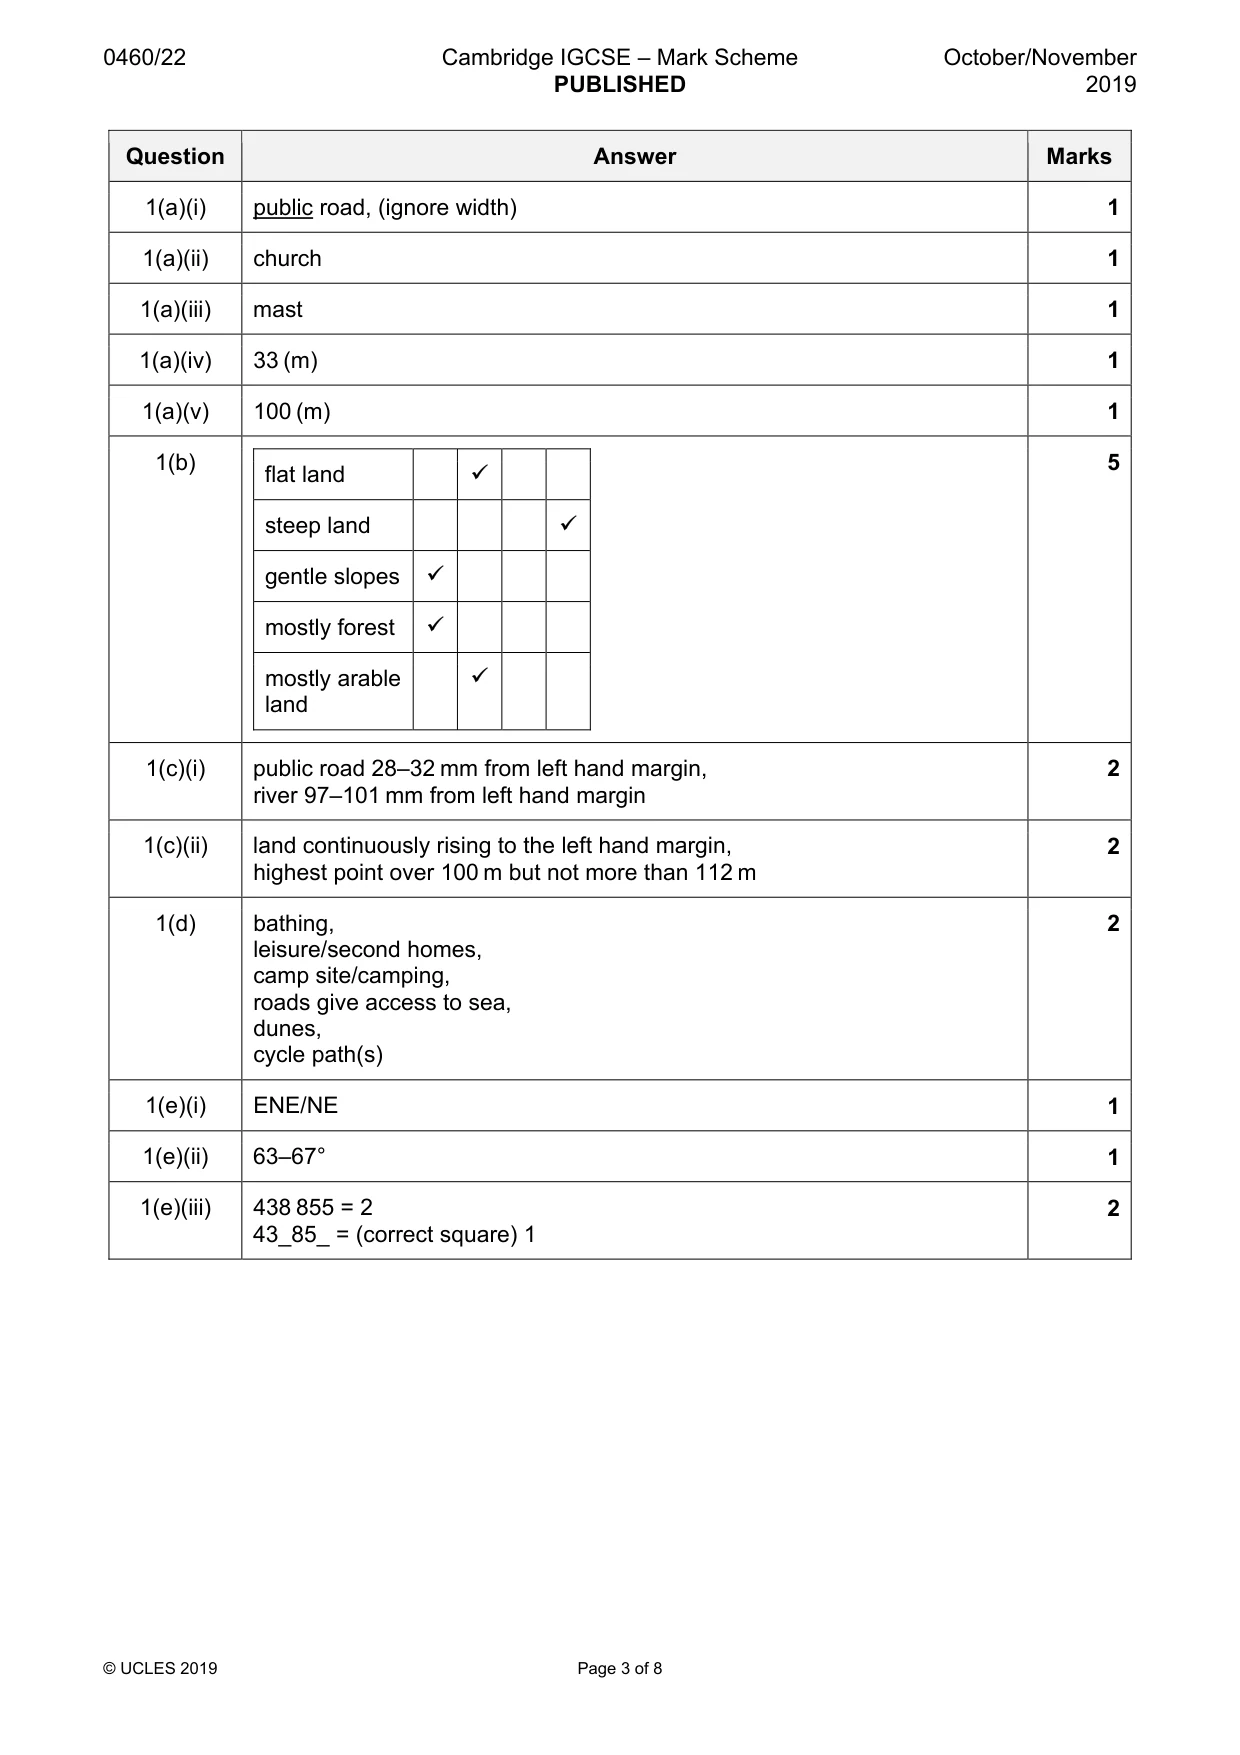
Mark scheme: Question Answer Marks 1(a)(i) public road, (ignore width) 1 1(a)(ii) church 1 1(a)(iii) mast 1 1(a)(iv) 33 (m) 1 1(a)(v) 100 (m) 1 1(b) 5 flat land 9 steep land 9 gentle slopes 9 mostly forest 9 mostly arable 9 land 1(c)(i) public road 28–32 mm from left hand margin, 2 river 97–101 mm from left hand margin 1(c)(ii) land continuously rising to the left hand margin, 2 highest point over 100 m but not more than 112 m 1(d) bathing, 2 leisure/second homes, camp site/camping, roads give access to sea, dunes, cycle path(s) 1(e)(i) ENE/NE 1 1(e)(ii) 63–67° 1 1(e)(iii) 438 855 = 2 2 43_85_ = (correct square) 1
More questions on Settlements (rural and urban) and service provision
Q2 · Which one of the following statements describes a settlement hierarchy?
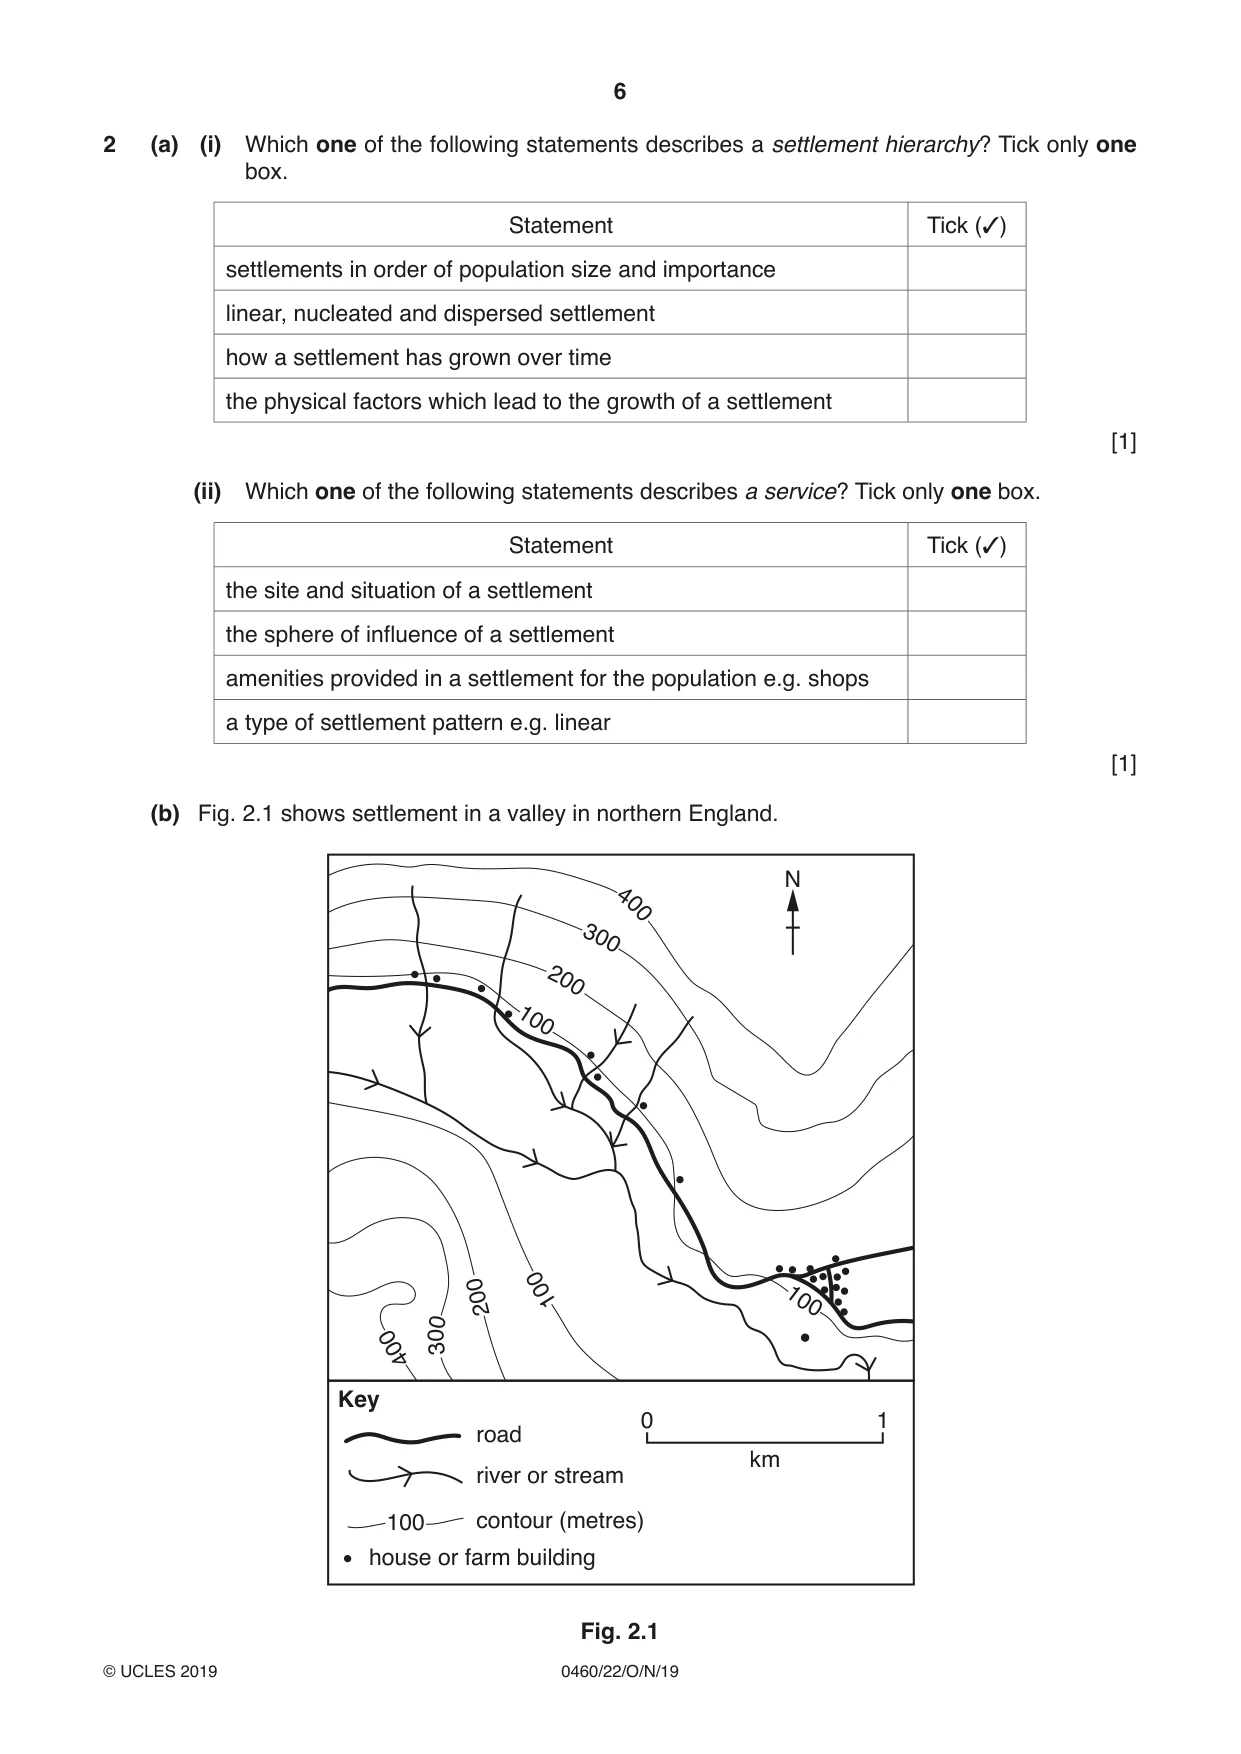
2 (a) (i) Which one of the following statements describes a settlement hierarchy? Tick only one box. Statement Tick (✓) settlements in order of population size and importance linear, nucleated and dispersed settlement how a settlement has grown over time the physical factors which lead to the growth of a settlement [1] (ii) Which one of the following statements describes a service? Tick only one box. Statement Tick (✓) the site and situation of a settlement the sphere of influence of a settlement amenities provided in a settlement for the population e.g. shops a type of settlement pattern e.g. linear [1] (b) Fig. 2.1 shows settlement in a valley in northern England. N 4 0 0 300 20 0 100 0 200 10 10 0 0 0 3 400 Key 0 1 road km river or stream 100 contour (metres) house or farm building Fig. 2.1 Suggest how each of the following factors has influenced the sites and growth of settlement in the area shown in Fig. 2.1: (i) transport and accessibility ........................................................................................................................................... ........................................................................................................................................... ........................................................................................................................................... ..................................................................................................................................... [2] (ii) water supply ........................................................................................................................................... ..................................................................................................................................... [1] (iii) protection from flooding ........................................................................................................................................... ..................................................................................................................................... [1] (iv) relief. ........................................................................................................................................... ........................................................................................................................................... ........................................................................................................................................... ........................................................................................................................................... ..................................................................................................................................... [2] [Total: 8]
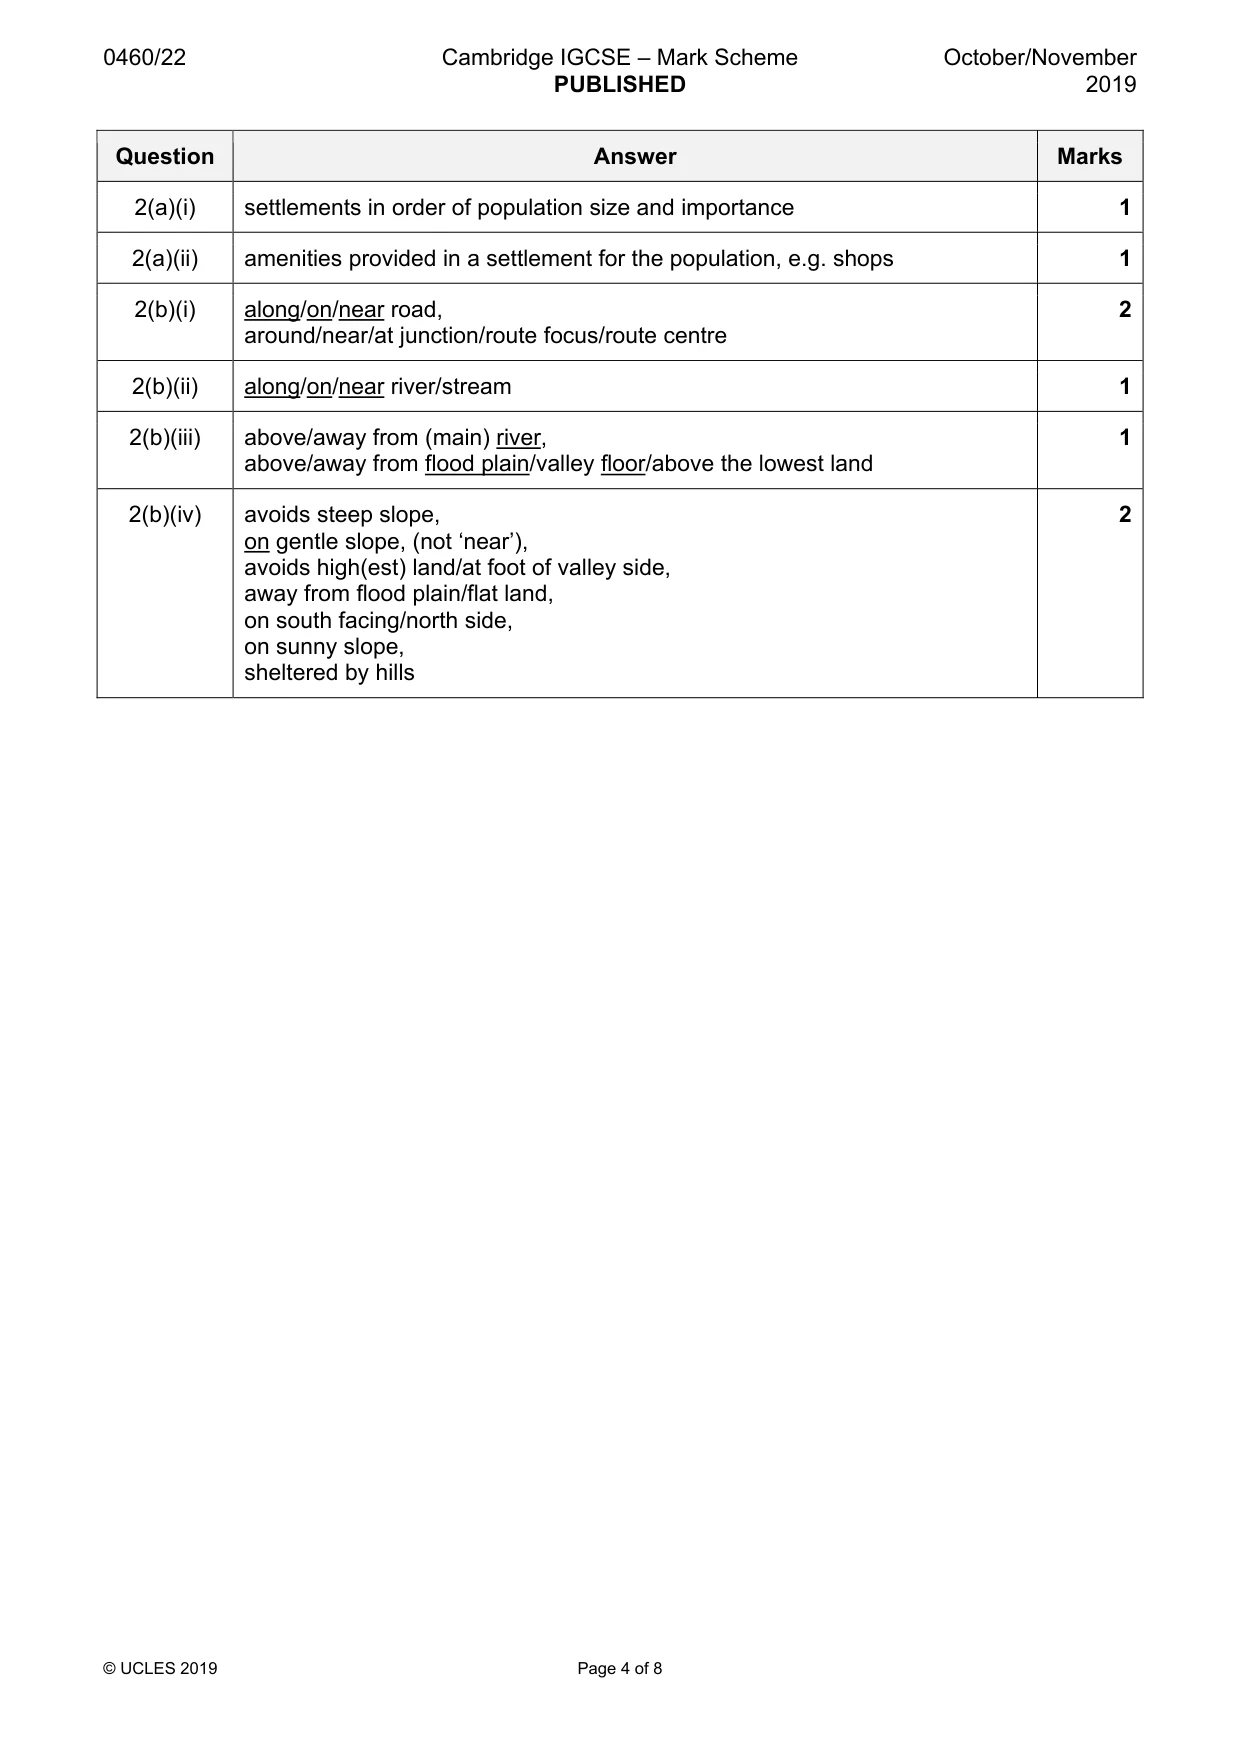
Mark scheme: 2(a)(i) settlements in order of population size and importance 1 2(a)(ii) amenities provided in a settlement for the population, e.g. shops 1 2(b)(i) along/on/near road, 2 around/near/at junction/route focus/route centre 2(b)(ii) along/on/near river/stream 1 2(b)(iii) above/away from (main) river, 1 above/away from flood plain/valley floor/above the lowest land 2(b)(iv) avoids steep slope, 2 on gentle slope, (not ‘near’), avoids high(est) land/at foot of valley side, away from flood plain/flat land, on south facing/north side, on sunny slope, sheltered by hills
More questions on Settlements (rural and urban) and service provision
Q3 · The temperatures and rainfall of an area of equatorial climate
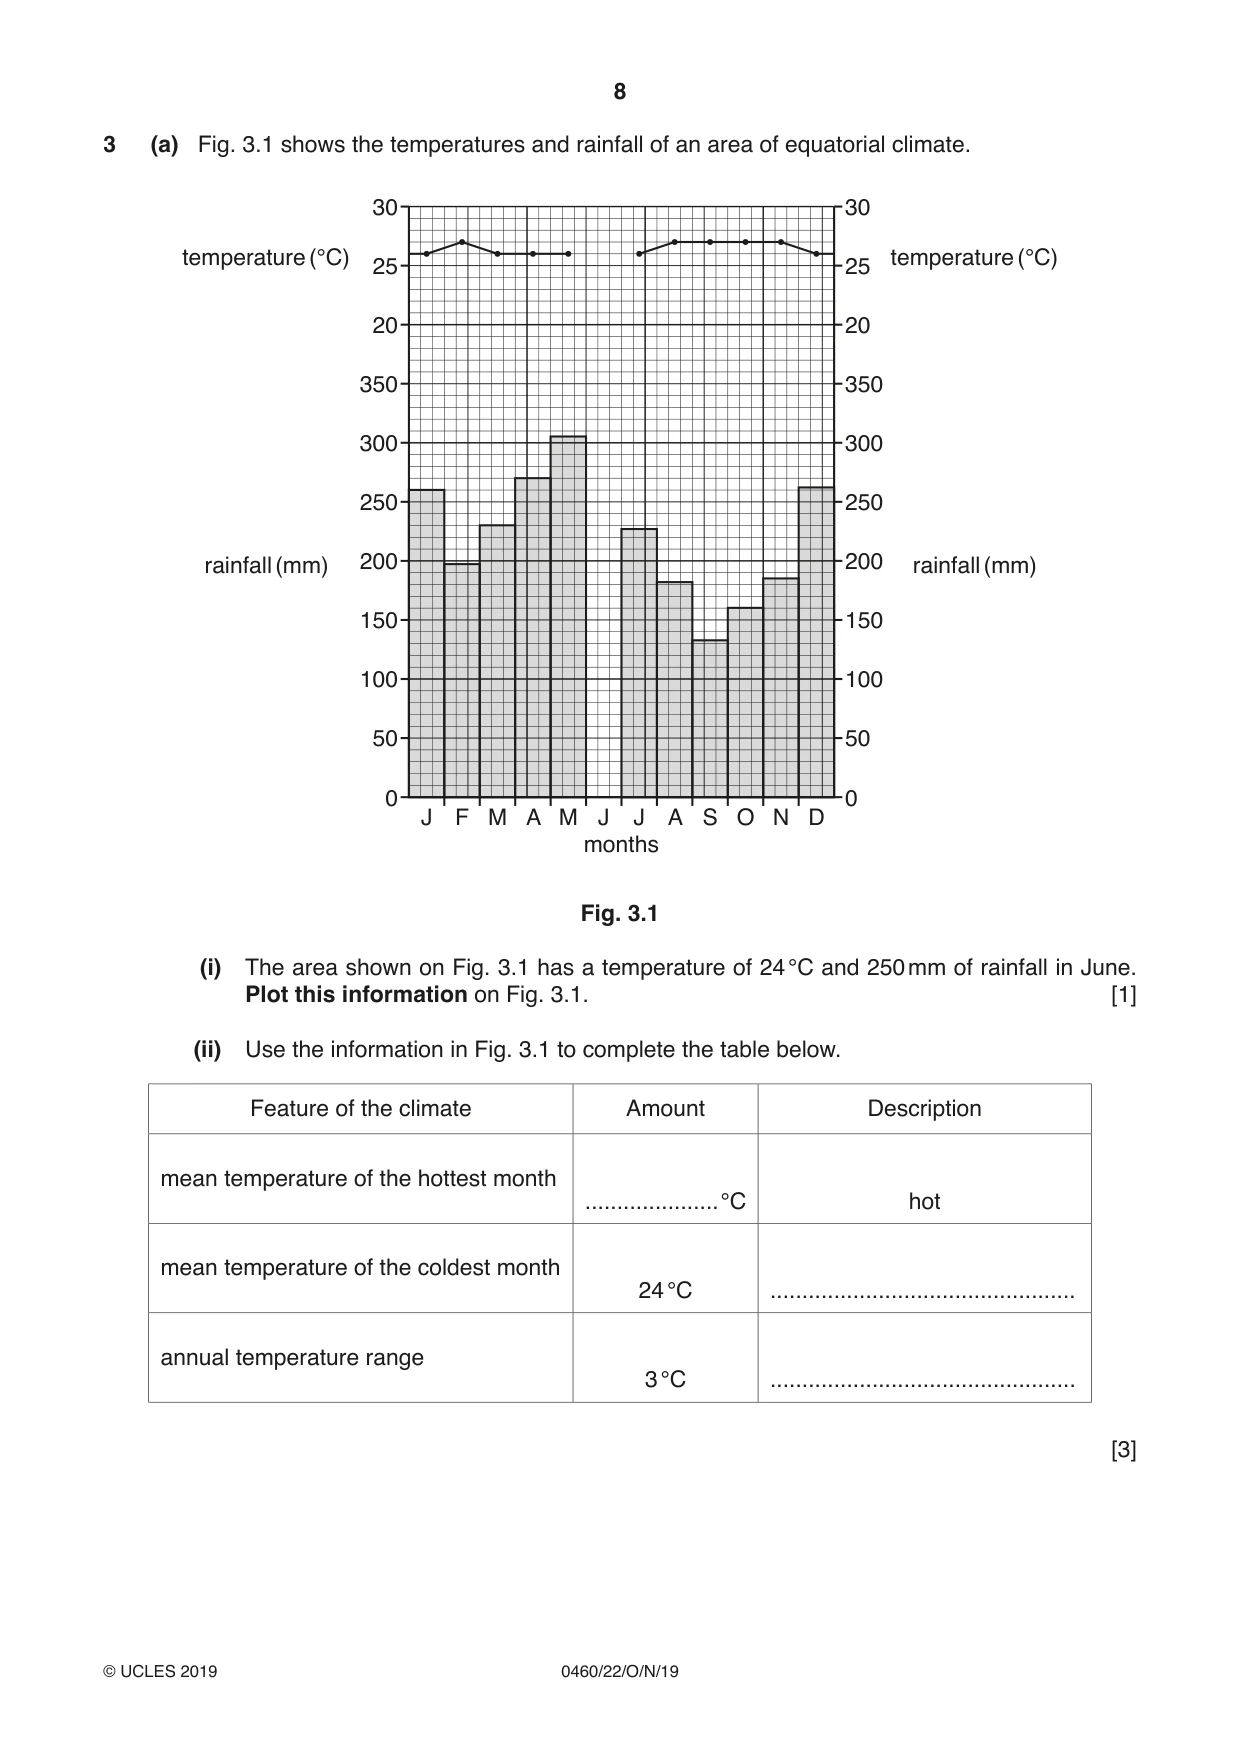
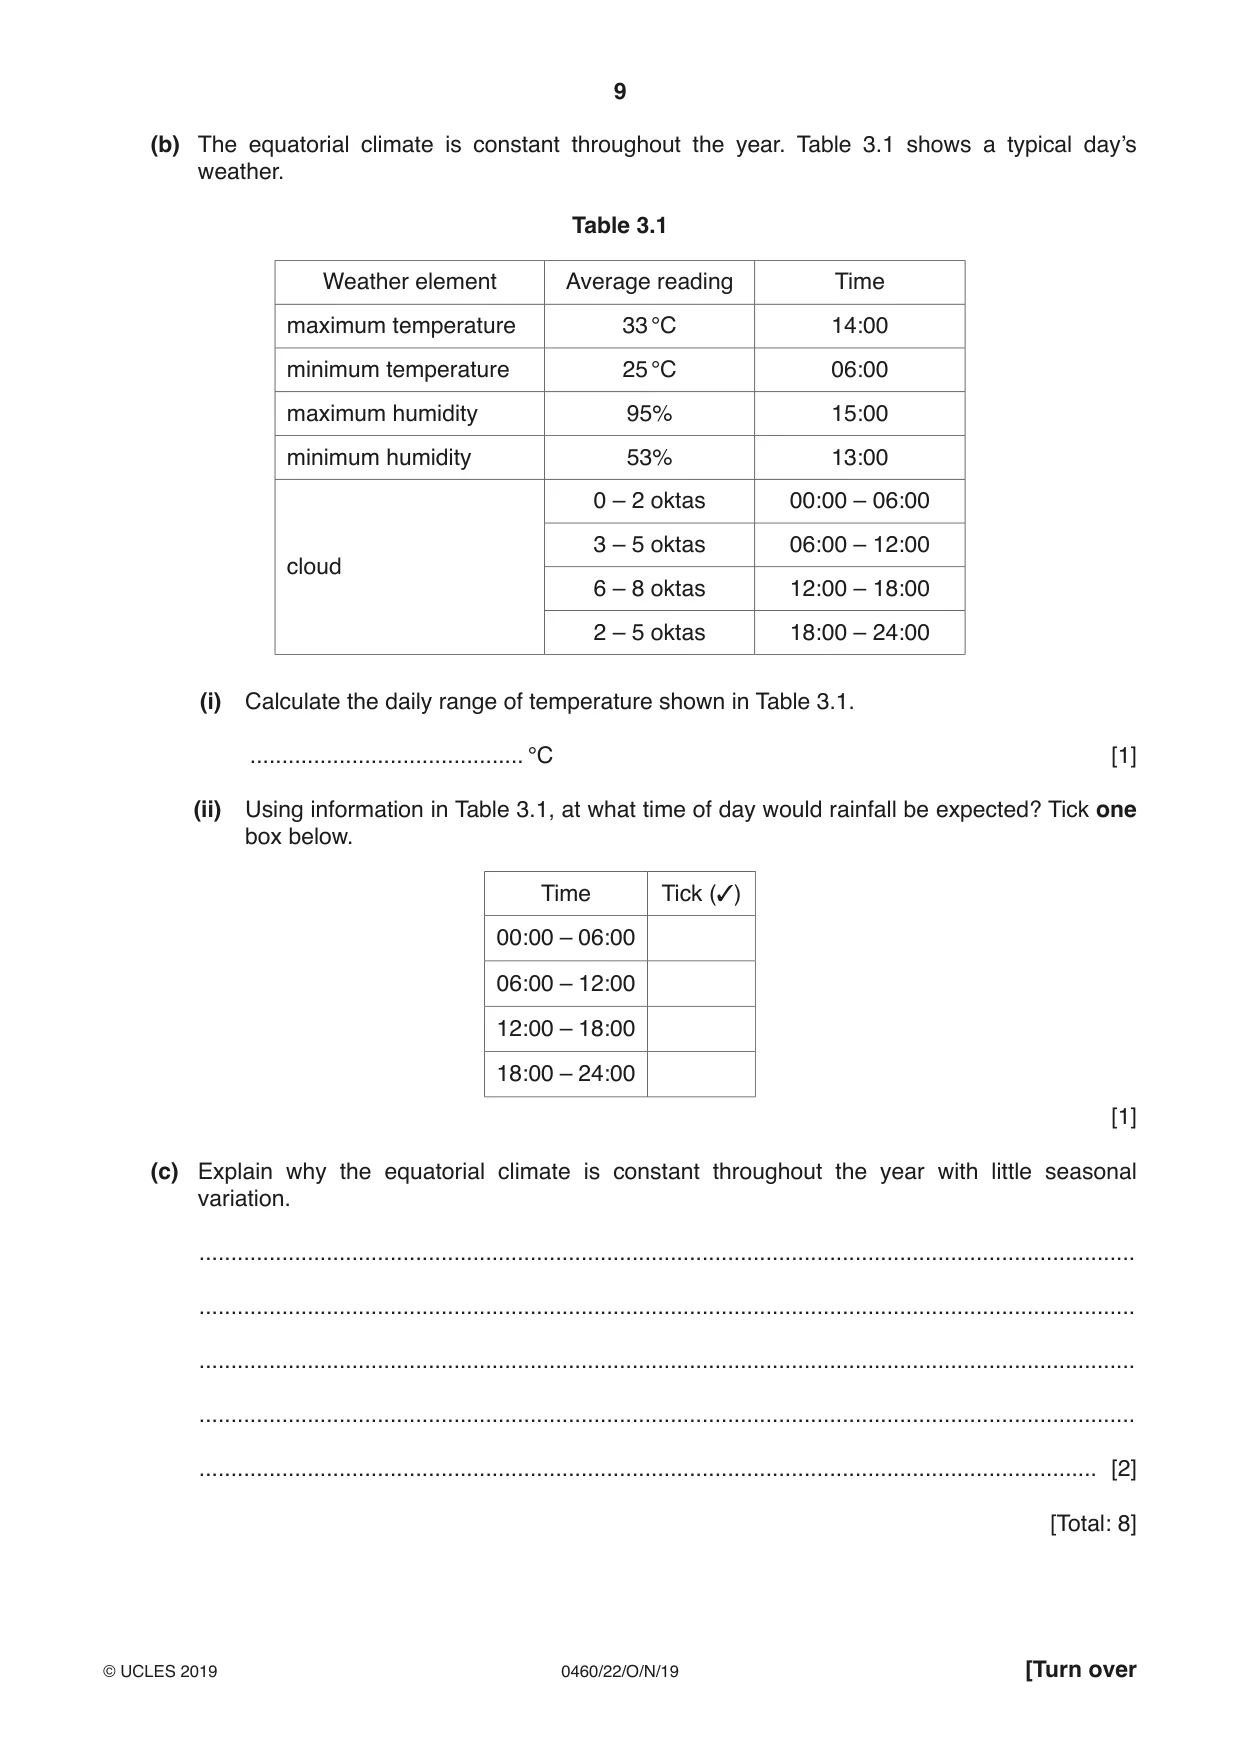
3 (a) Fig. 3.1 shows the temperatures and rainfall of an area of equatorial climate. 30 30 temperature (°C) temperature (°C) 25 25 20 20 350 350 300 300 250 250 rainfall (mm) 200 200 rainfall (mm) 150 150 100 100 50 50 0 0 J F M A M J J A S O N D months Fig. 3.1 (i) The area shown on Fig. 3.1 has a temperature of 24 °C and 250 mm of rainfall in June. Plot this information on Fig. 3.1. [1] (ii) Use the information in Fig. 3.1 to complete the table below. Feature of the climate Amount Description mean temperature of the hottest month .....................°C hot mean temperature of the coldest month 24 °C ................................................ annual temperature range 3 °C ................................................ [3] (b) The equatorial climate is constant throughout the year. Table 3.1 shows a typical day’s weather. Table 3.1 Weather element Average reading Time maximum temperature 33 °C 14:00 minimum temperature 25 °C 06:00 maximum humidity 95% 15:00 minimum humidity 53% 13:00 0 – 2 oktas 00:00 – 06:00 3 – 5 oktas 06:00 – 12:00 cloud 6 – 8 oktas 12:00 – 18:00 2 – 5 oktas 18:00 – 24:00 (i) Calculate the daily range of temperature shown in Table 3.1. ........................................... °C [1] (ii) Using information in Table 3.1, at what time of day would rainfall be expected? Tick one box below. Time Tick (✓) 00:00 – 06:00 06:00 – 12:00 12:00 – 18:00 18:00 – 24:00 [1] (c) Explain why the equatorial climate is constant throughout the year with little seasonal variation. ................................................................................................................................................... ................................................................................................................................................... ................................................................................................................................................... ................................................................................................................................................... ............................................................................................................................................. [2] [Total: 8]
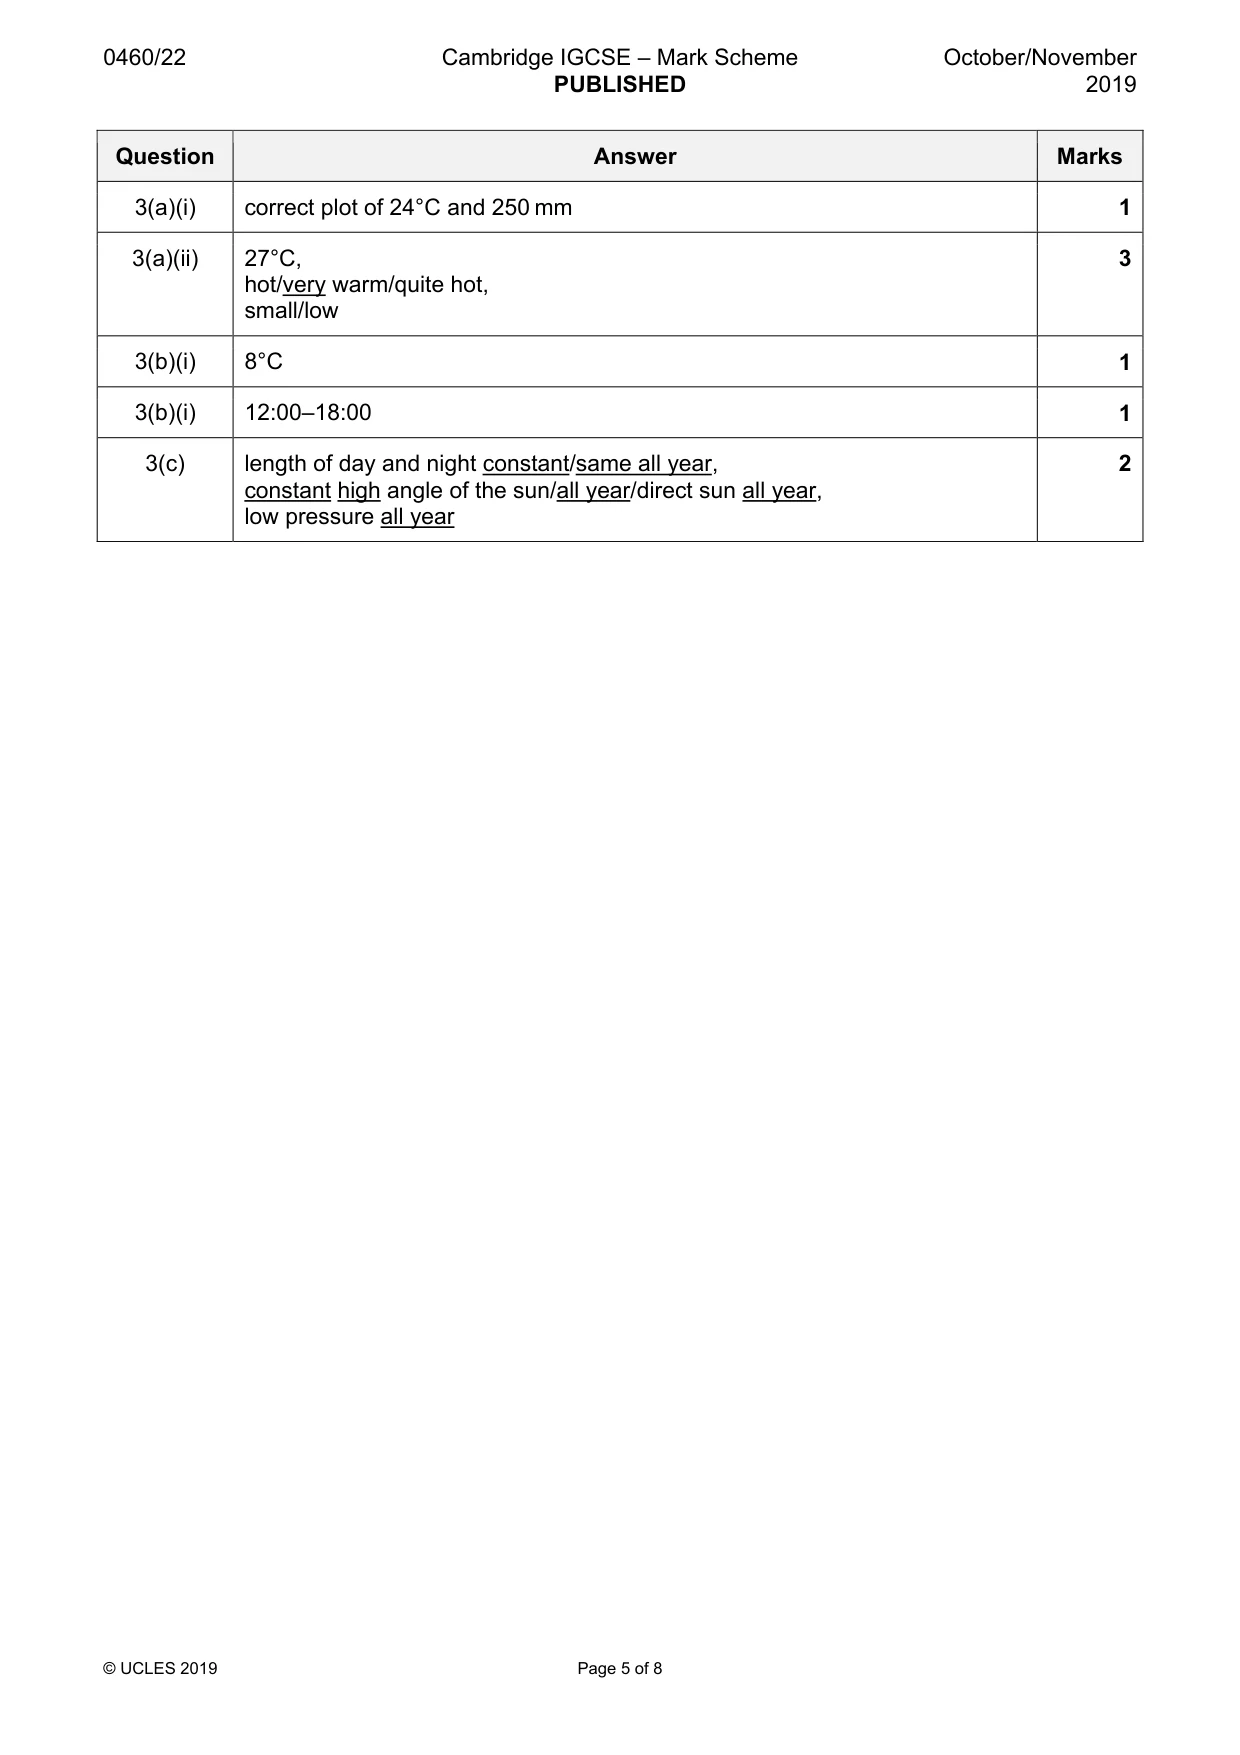
Mark scheme: 3(a)(i) correct plot of 24°C and 250 mm 1 3(a)(ii) 27°C, 3 hot/very warm/quite hot, small/low 3(b)(i) 8°C 1 3(b)(i) 12:00–18:00 1 3(c) length of day and night constant/same all year, 2 constant high angle of the sun/all year/direct sun all year, low pressure all year
Q4 · The definitions of some terms used in the study of earthquakes
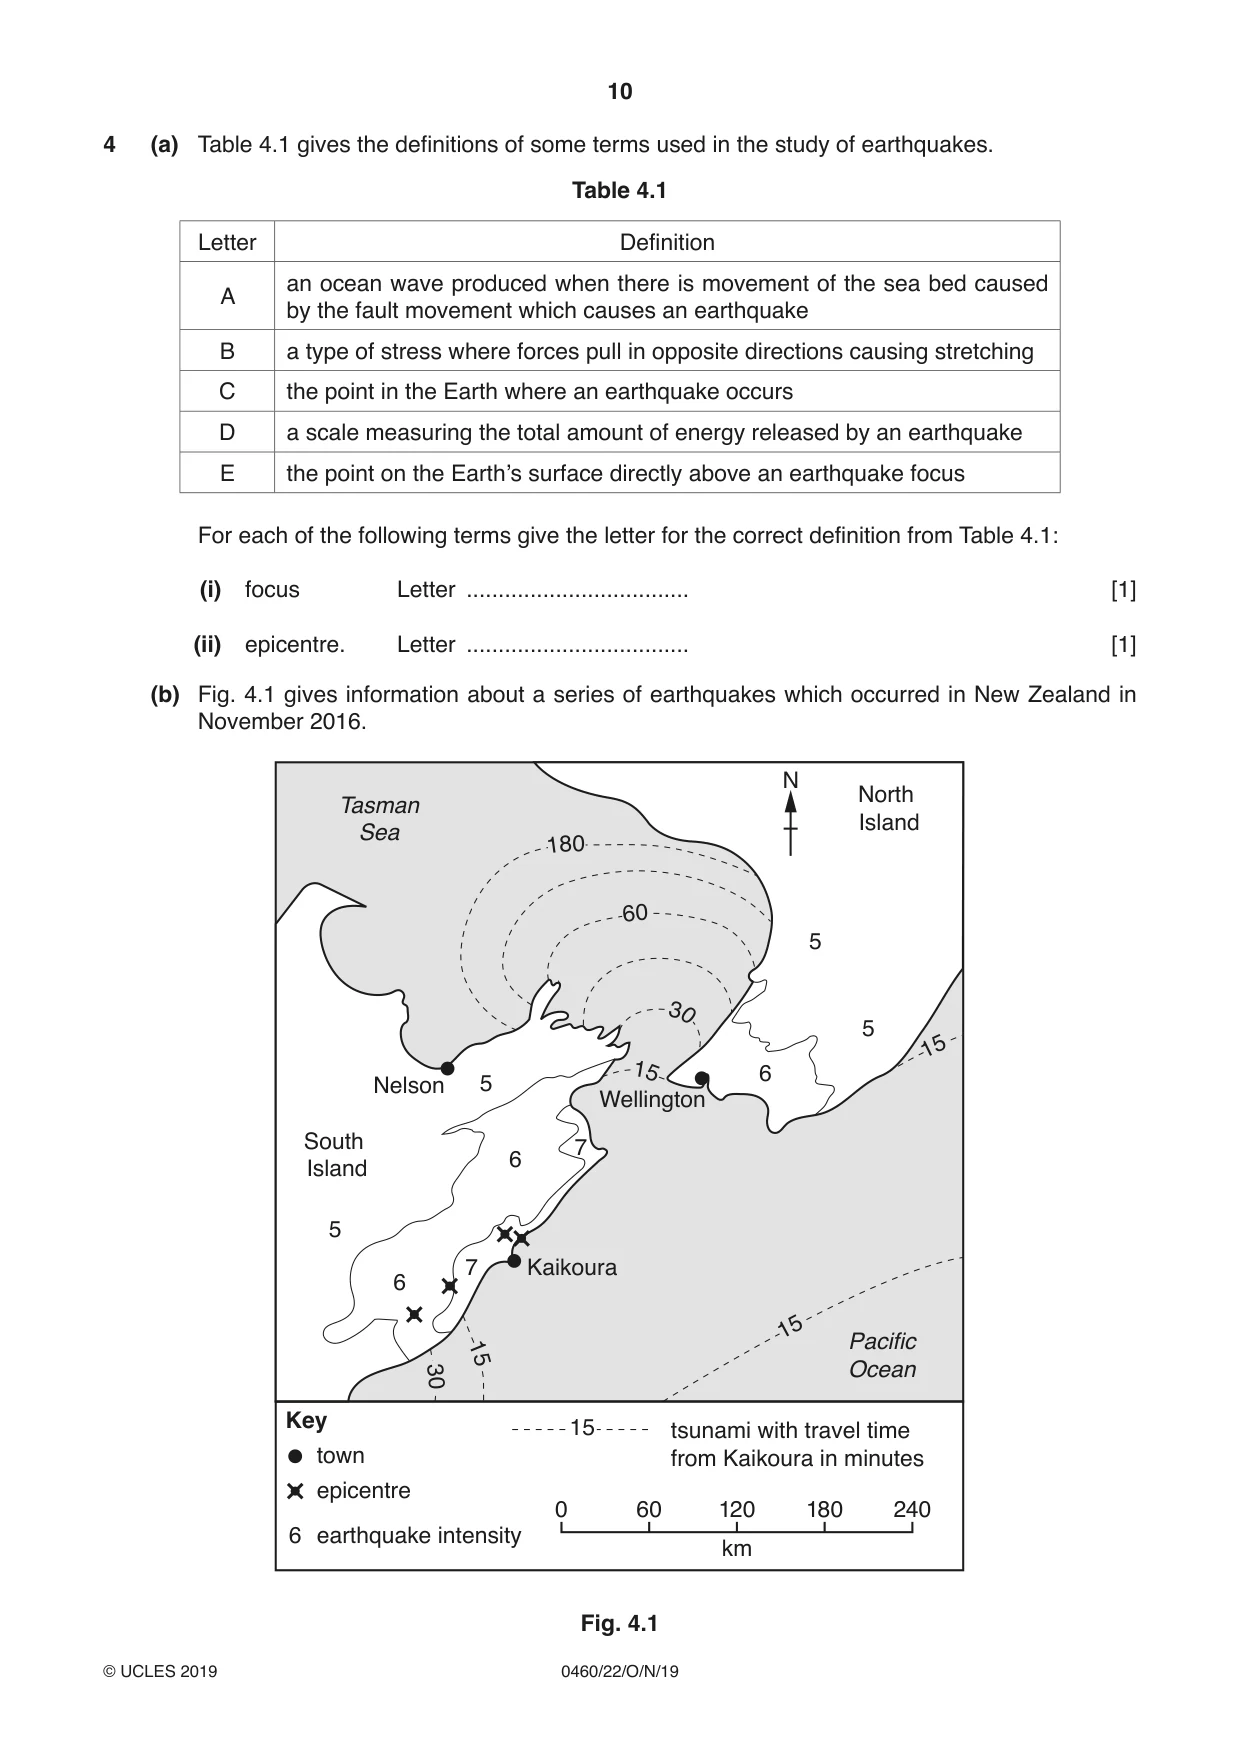
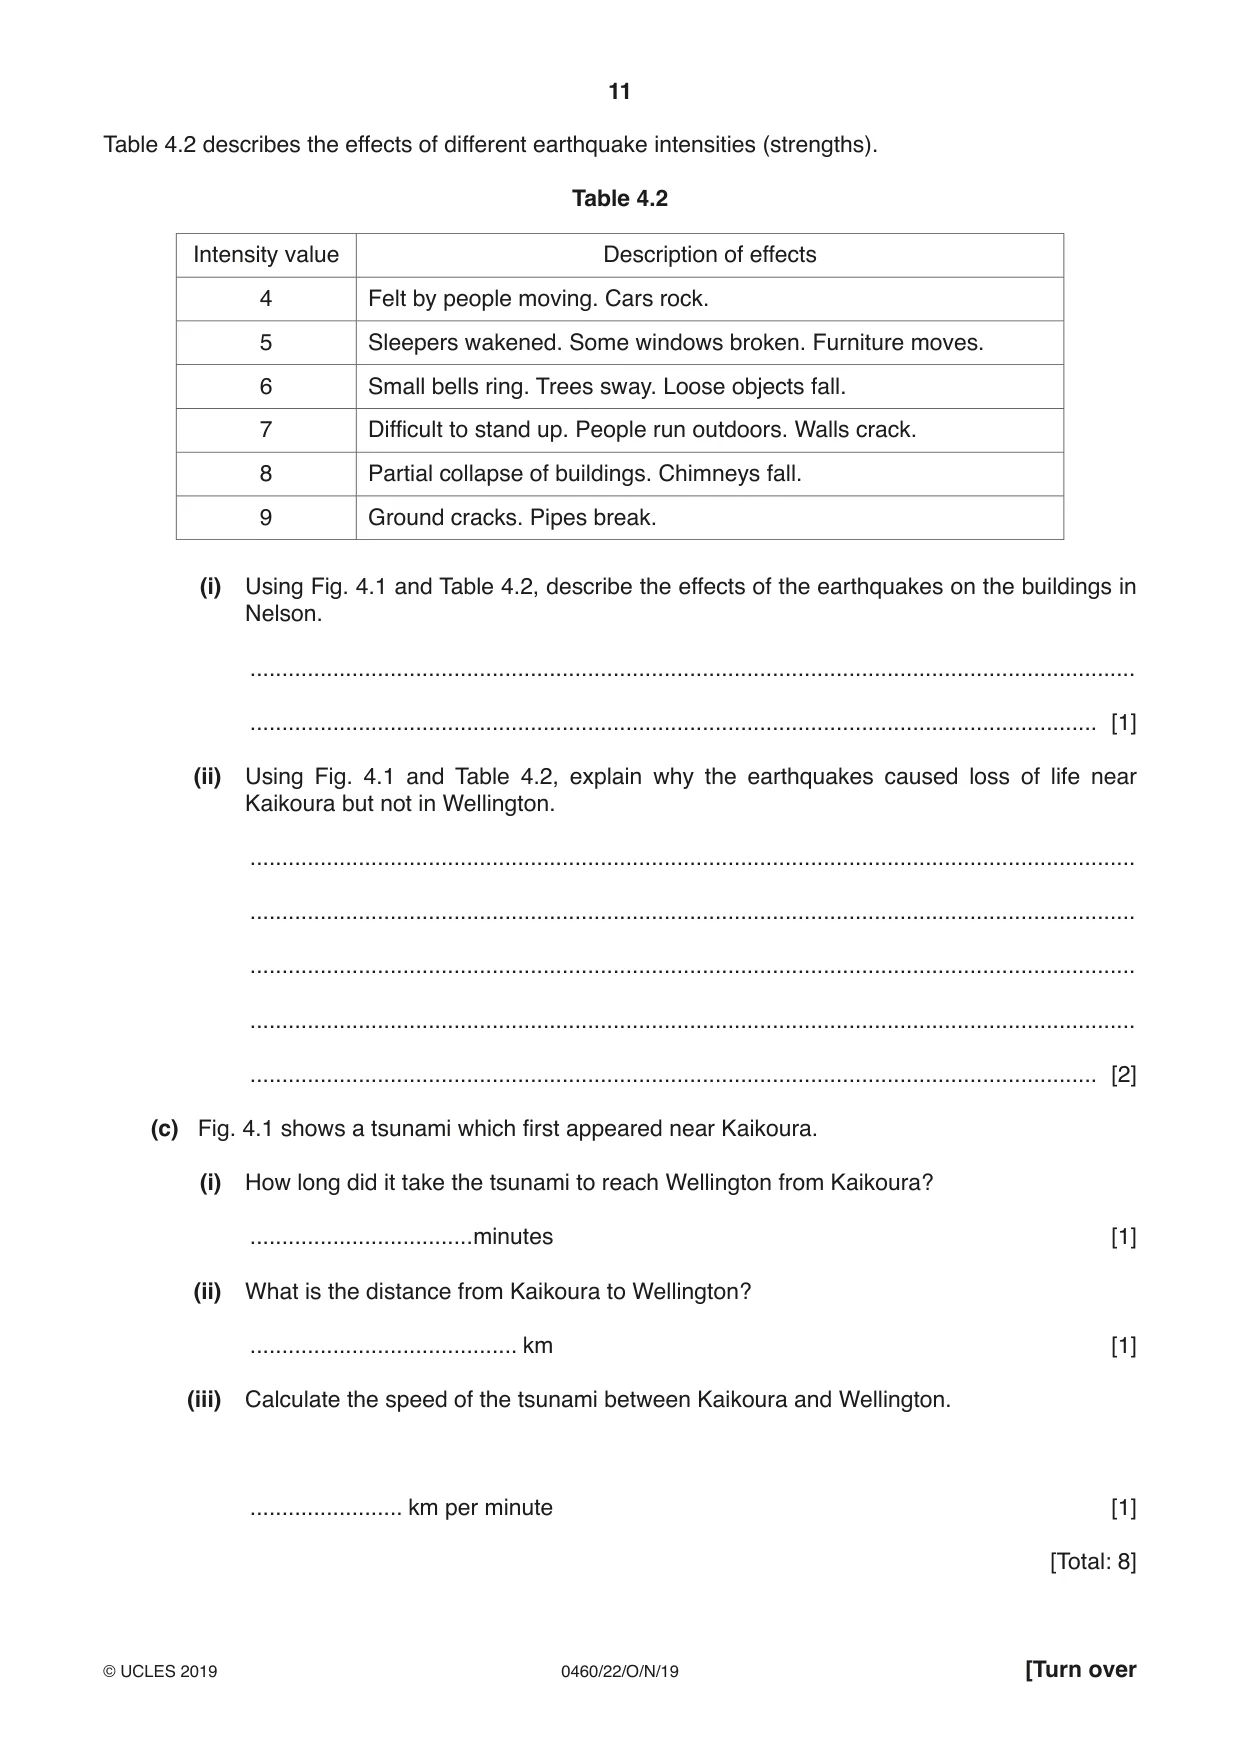
4 (a) Table 4.1 gives the definitions of some terms used in the study of earthquakes. Table 4.1 Letter Definition an ocean wave produced when there is movement of the sea bed caused A by the fault movement which causes an earthquake B a type of stress where forces pull in opposite directions causing stretching C the point in the Earth where an earthquake occurs D a scale measuring the total amount of energy released by an earthquake E the point on the Earth’s surface directly above an earthquake focus For each of the following terms give the letter for the correct definition from Table 4.1: (i) focus Letter ................................... [1] (ii) epicentre. Letter ................................... [1] (b) Fig. 4.1 gives information about a series of earthquakes which occurred in New Zealand in November 2016. N North Tasman Island Sea 180 60 5 30 5 15 15 6 Nelson 5 Wellington South 7 6 Island 5 7 Kaikoura 6 15 1 Pacific 5 3 0 Ocean Key 15 tsunami with travel time town from Kaikoura in minutes epicentre 0 60 120 180 240 6 earthquake intensity km Fig. 4.1 Table 4.2 describes the effects of different earthquake intensities (strengths). Table 4.2 Intensity value Description of effects 4 Felt by people moving. Cars rock. 5 Sleepers wakened. Some windows broken. Furniture moves. 6 Small bells ring. Trees sway. Loose objects fall. 7 Difficult to stand up. People run outdoors. Walls crack. 8 Partial collapse of buildings. Chimneys fall. 9 Ground cracks. Pipes break. (i) Using Fig. 4.1 and Table 4.2, describe the effects of the earthquakes on the buildings in Nelson. ........................................................................................................................................... ..................................................................................................................................... [1] (ii) Using Fig. 4.1 and Table 4.2, explain why the earthquakes caused loss of life near Kaikoura but not in Wellington. ........................................................................................................................................... ........................................................................................................................................... ........................................................................................................................................... ........................................................................................................................................... ..................................................................................................................................... [2] (c) Fig. 4.1 shows a tsunami which first appeared near Kaikoura. (i) How long did it take the tsunami to reach Wellington from Kaikoura? ...................................minutes [1] (ii) What is the distance from Kaikoura to Wellington? .......................................... km [1] (iii) Calculate the speed of the tsunami between Kaikoura and Wellington. ........................ km per minute [1] [Total: 8]
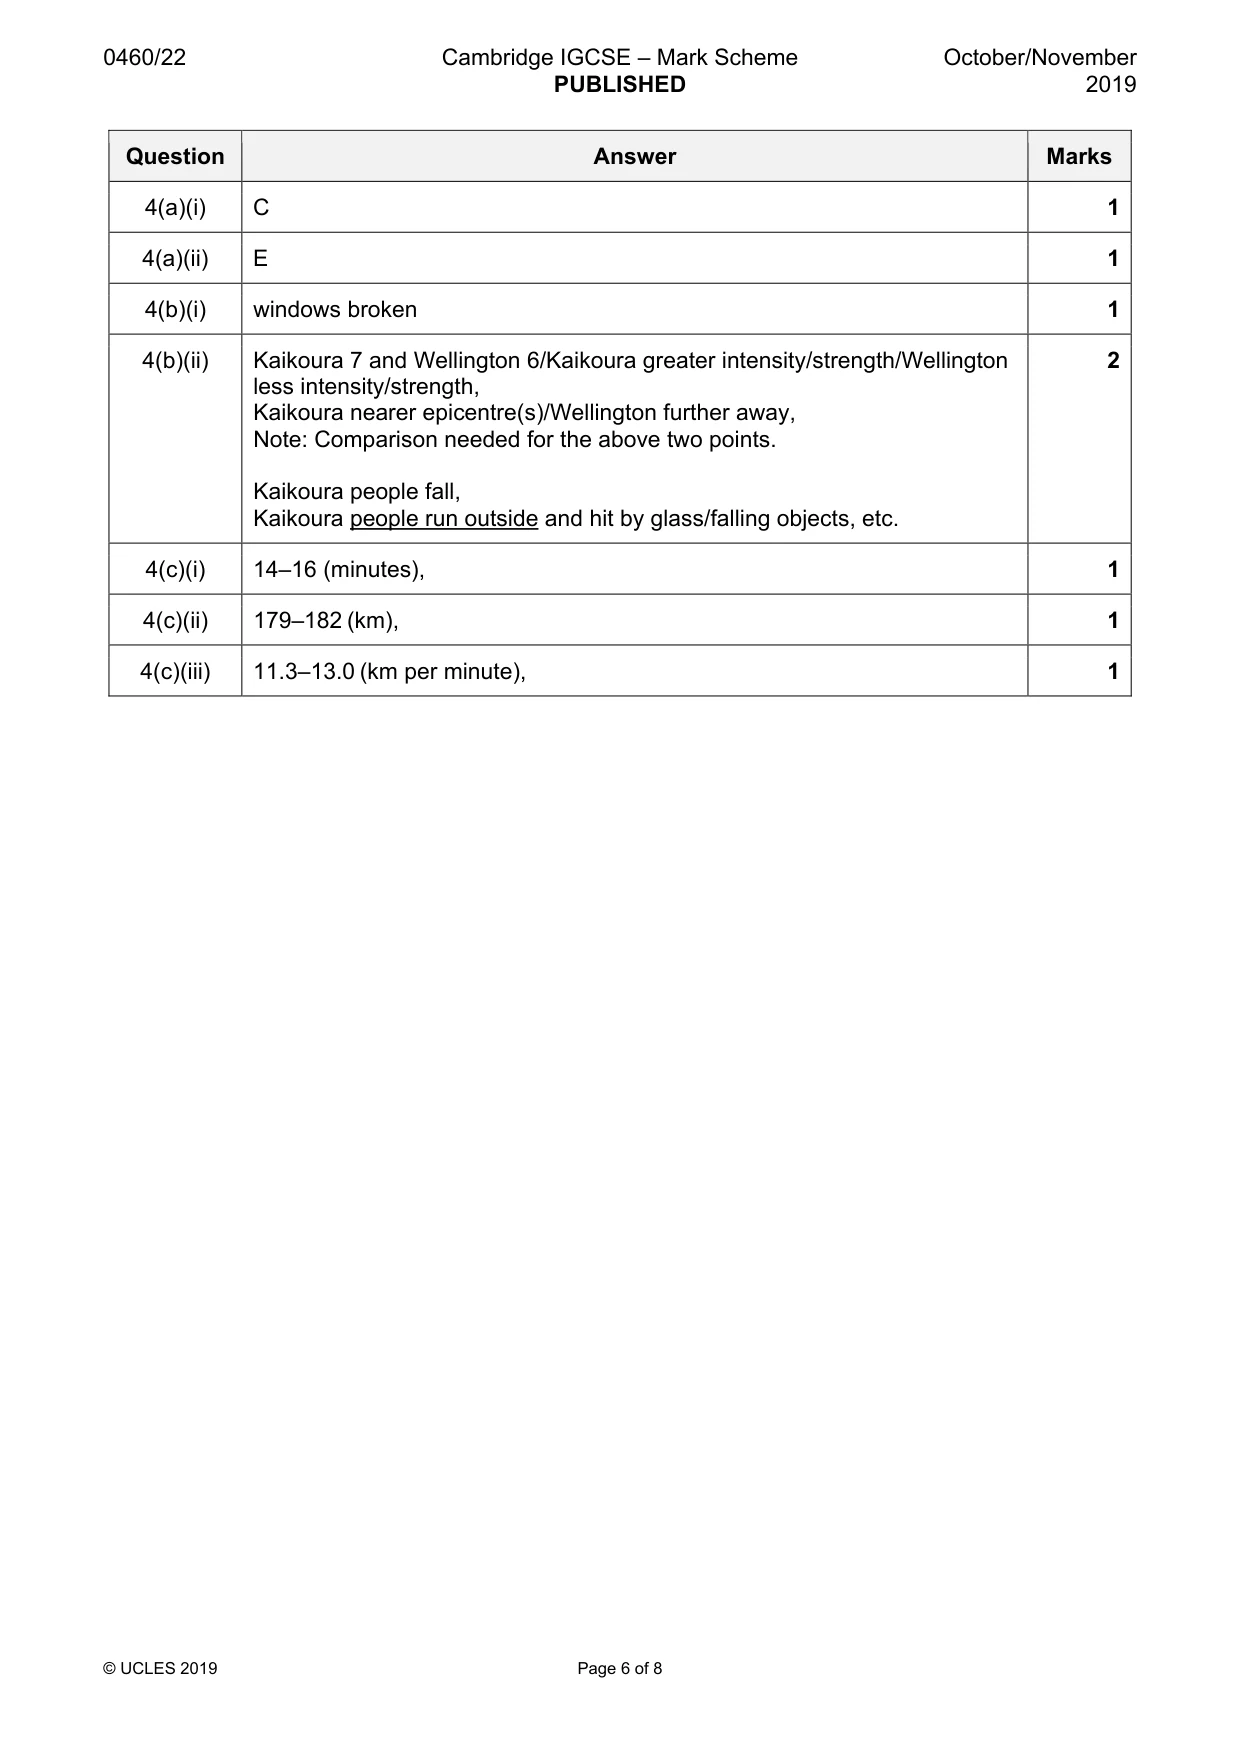
Mark scheme: 4(a)(i) C 1 4(a)(ii) E 1 4(b)(i) windows broken 1 4(b)(ii) Kaikoura 7 and Wellington 6/Kaikoura greater intensity/strength/Wellington 2 less intensity/strength, Kaikoura nearer epicentre(s)/Wellington further away, Note: Comparison needed for the above two points. Kaikoura people fall, Kaikoura people run outside and hit by glass/falling objects, etc. 4(c)(i) 14–16 (minutes), 1 4(c)(ii) 179–182 (km), 1 4(c)(iii) 11.3–13.0 (km per minute), 1
Question 5
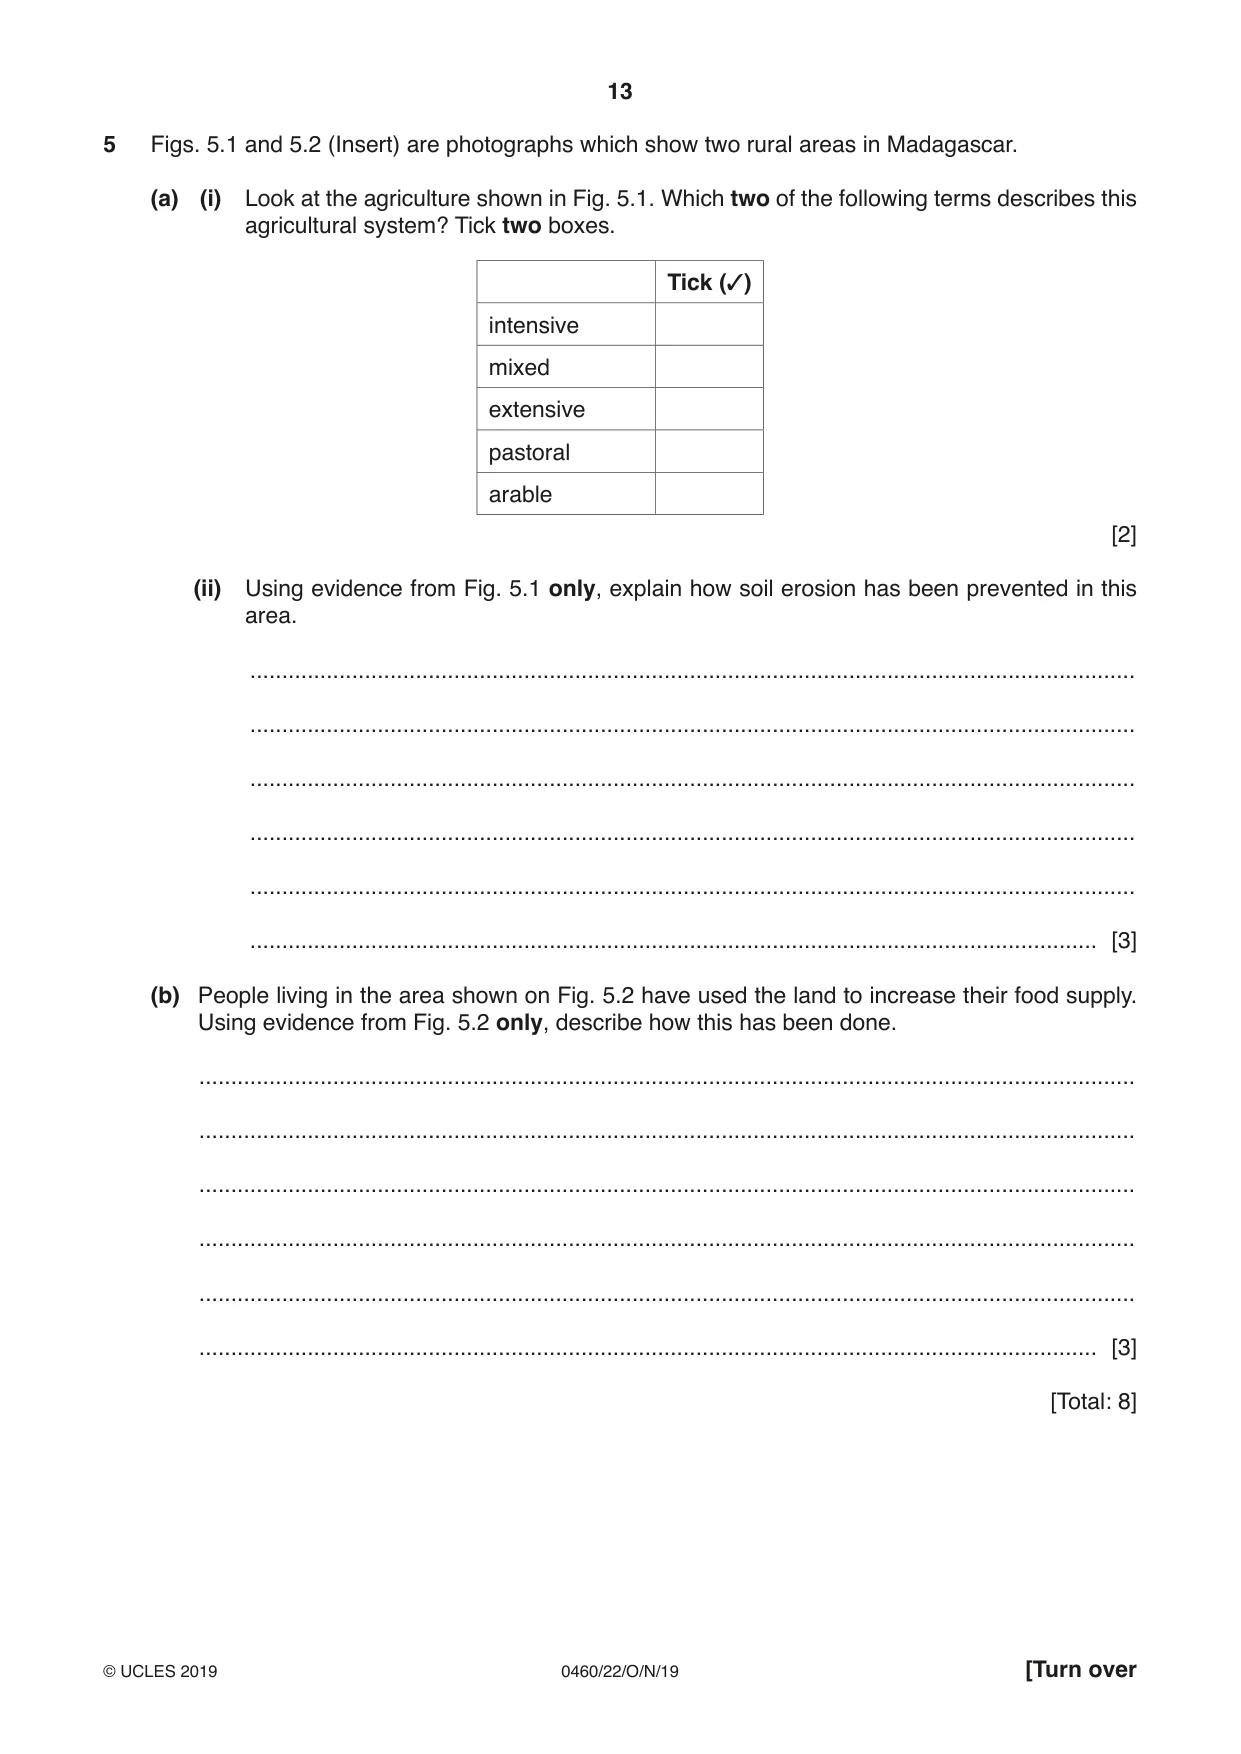
5 Figs. 5.1 and 5.2 (Insert) are photographs which show two rural areas in Madagascar. (a) (i) Look at the agriculture shown in Fig. 5.1. Which two of the following terms describes this agricultural system? Tick two boxes. Tick (✓) intensive mixed extensive pastoral arable [2] (ii) Using evidence from Fig. 5.1 only, explain how soil erosion has been prevented in this area. ........................................................................................................................................... ........................................................................................................................................... ........................................................................................................................................... ........................................................................................................................................... ........................................................................................................................................... ..................................................................................................................................... [3] (b) People living in the area shown on Fig. 5.2 have used the land to increase their food supply. Using evidence from Fig. 5.2 only, describe how this has been done. ................................................................................................................................................... ................................................................................................................................................... ................................................................................................................................................... ................................................................................................................................................... ................................................................................................................................................... ............................................................................................................................................. [3] [Total: 8]
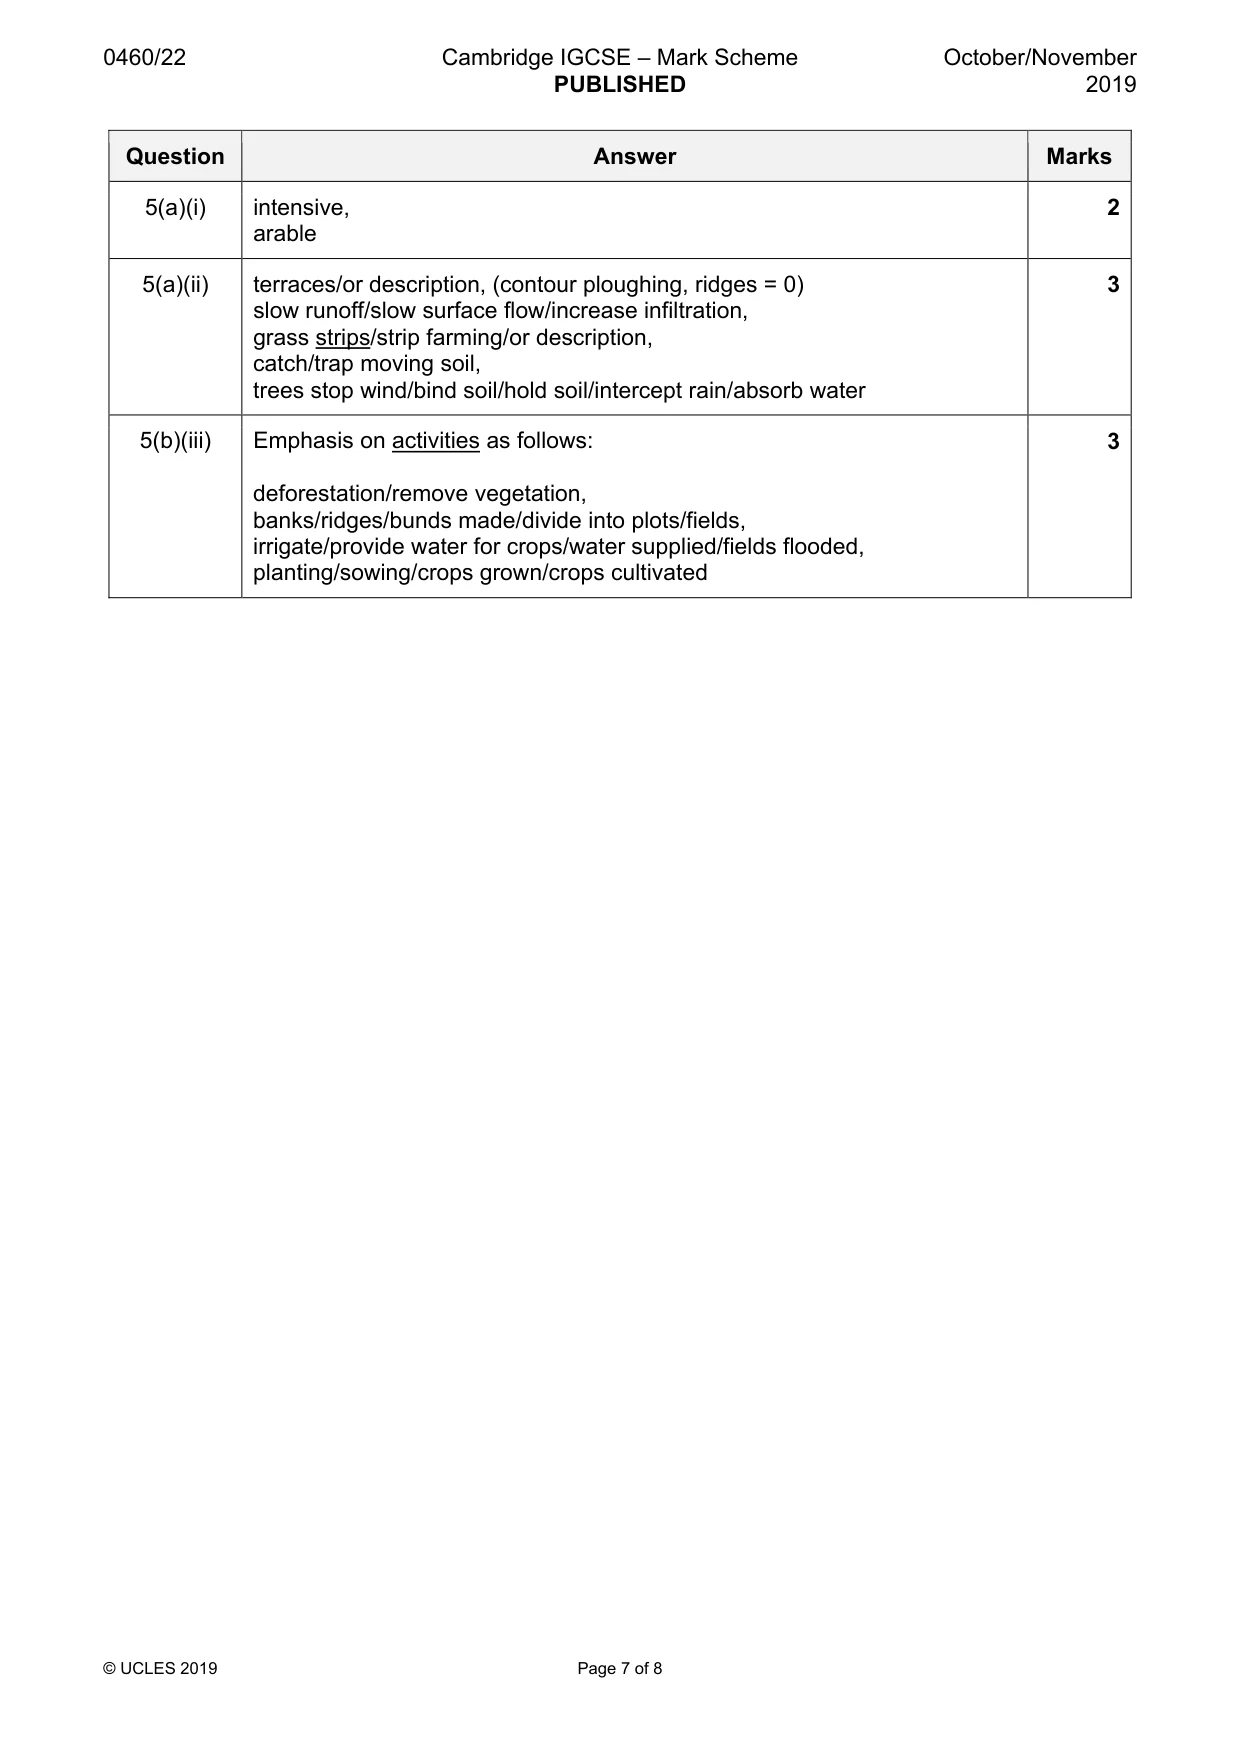
Mark scheme: 5(a)(i) intensive, 2 arable 5(a)(ii) terraces/or description, (contour ploughing, ridges = 0) 3 slow runoff/slow surface flow/increase infiltration, grass strips/strip farming/or description, catch/trap moving soil, trees stop wind/bind soil/hold soil/intercept rain/absorb water 5(b)(iii) Emphasis on activities as follows: 3 deforestation/remove vegetation, banks/ridges/bunds made/divide into plots/fields, irrigate/provide water for crops/water supplied/fields flooded, planting/sowing/crops grown/crops cultivated
Q6 · Changes in the share of world wealth production (GDP) in three world regions
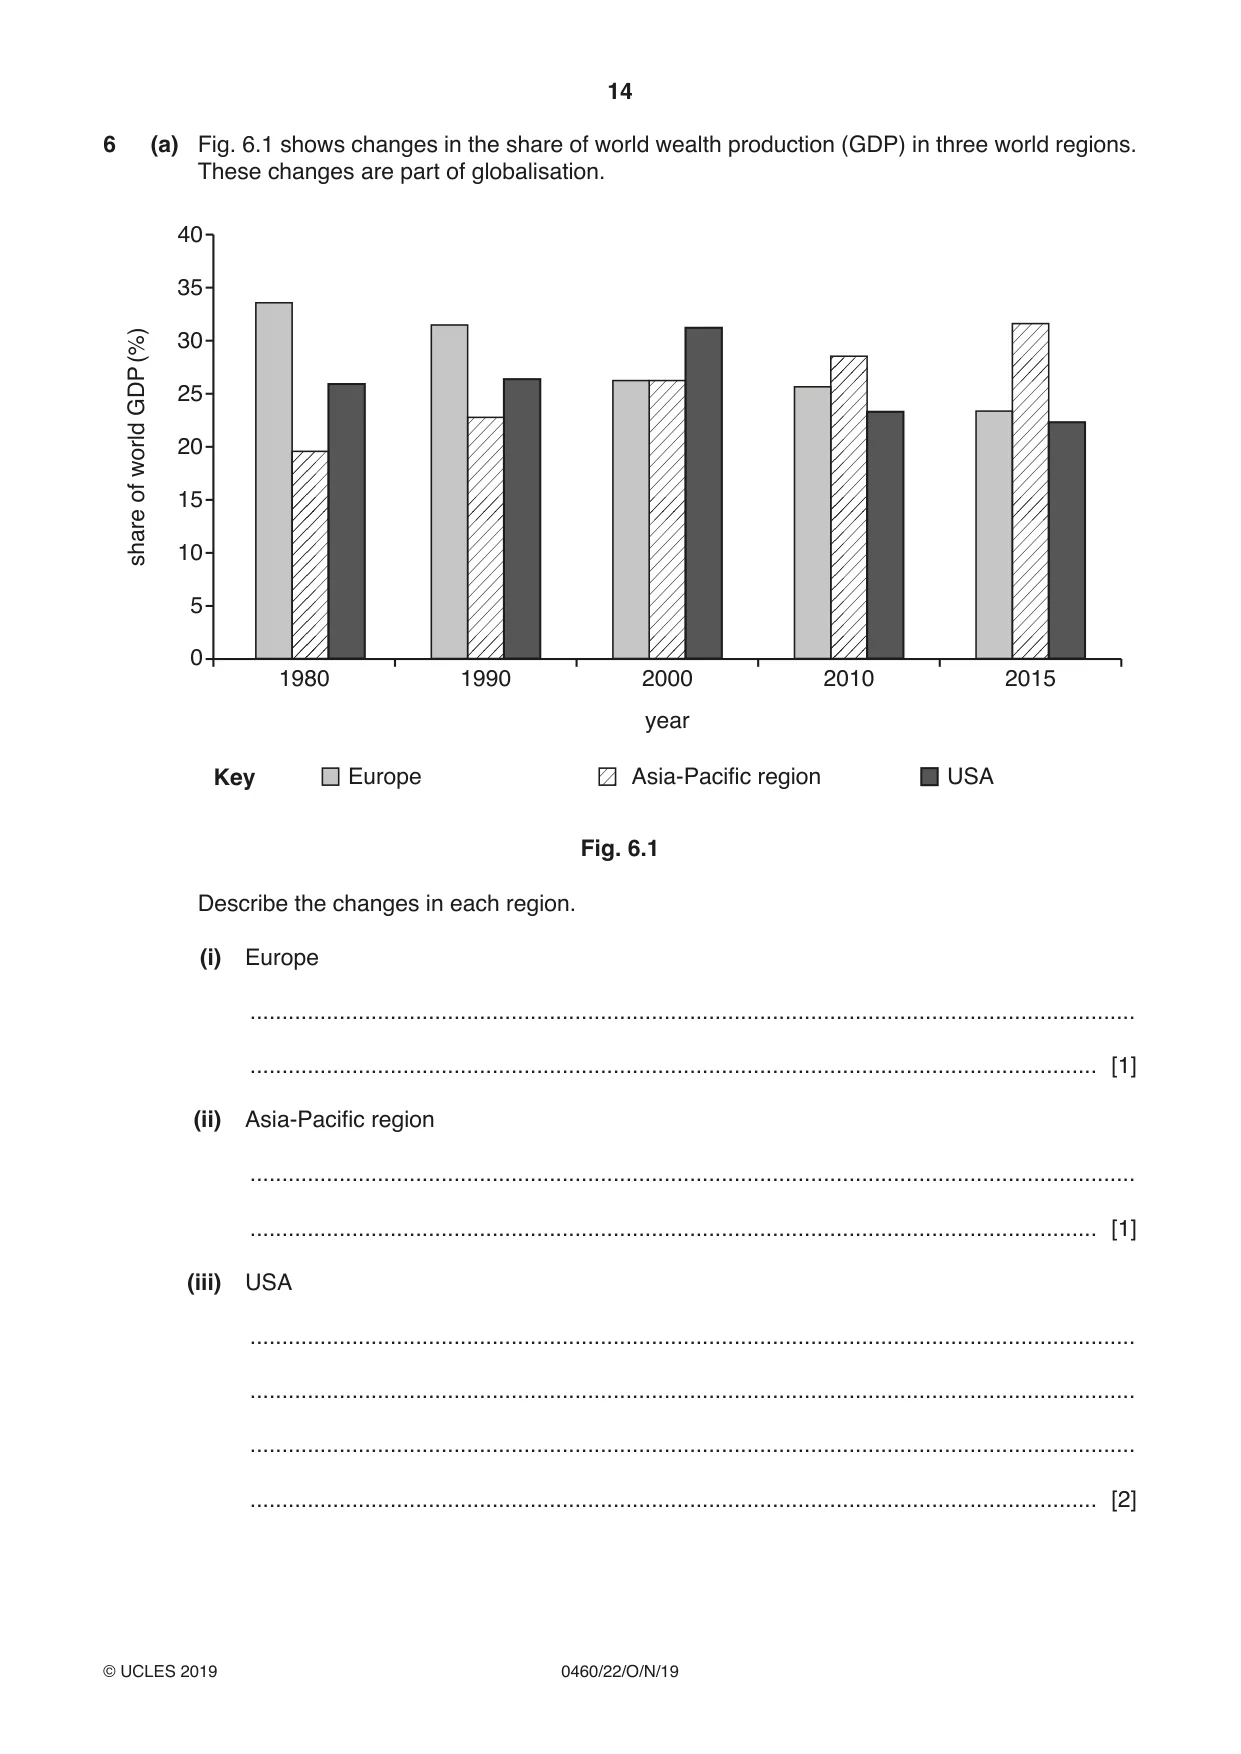
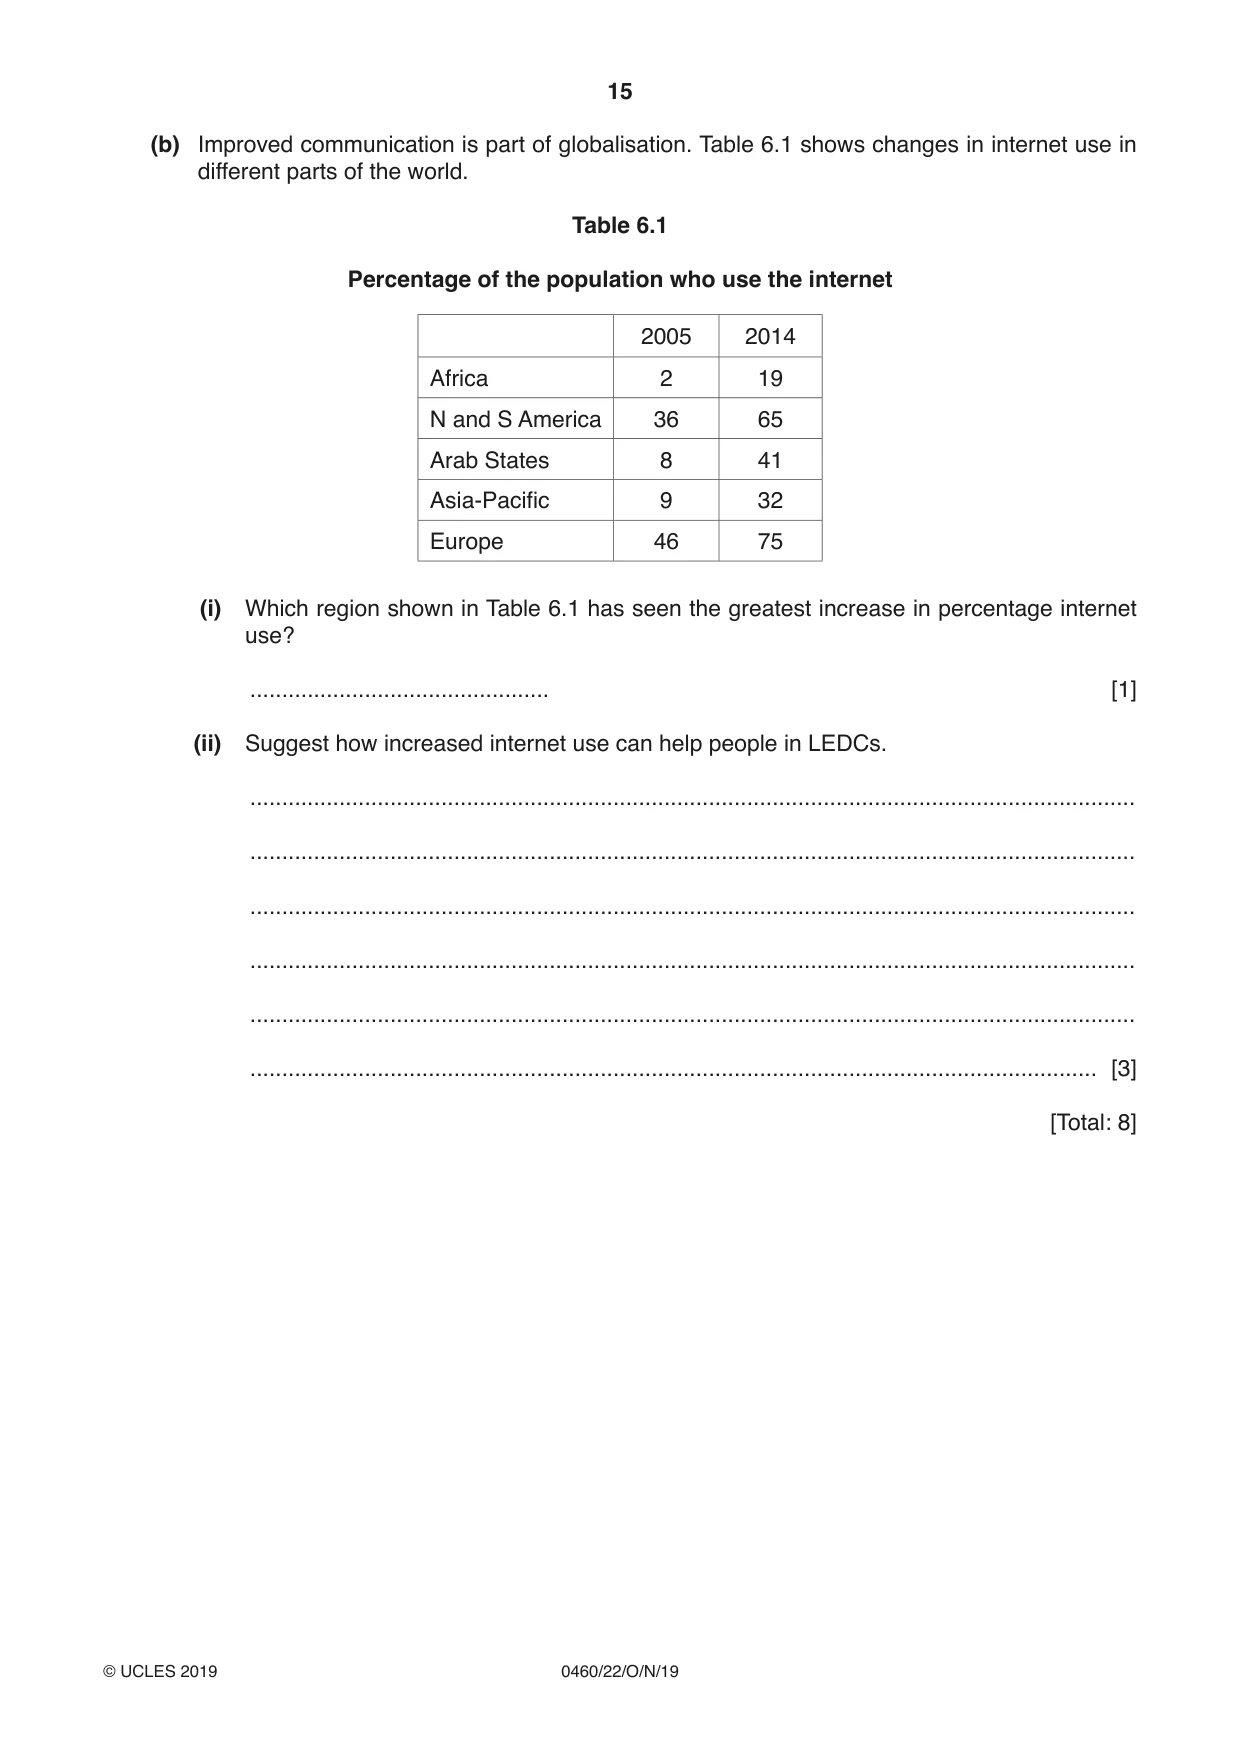
6 (a) Fig. 6.1 shows changes in the share of world wealth production (GDP) in three world regions. These changes are part of globalisation. 40 35 (%) 30 GDP 25 world 20 of 15 share 10 5 0 1980 1990 2000 2010 2015 year Key Europe Asia-Pacific region USA Fig. 6.1 Describe the changes in each region. (i) Europe ........................................................................................................................................... ..................................................................................................................................... [1] (ii) Asia-Pacific region ........................................................................................................................................... ..................................................................................................................................... [1] (iii) USA ........................................................................................................................................... ........................................................................................................................................... ........................................................................................................................................... ..................................................................................................................................... [2] (b) Improved communication is part of globalisation. Table 6.1 shows changes in internet use in different parts of the world. Table 6.1 Percentage of the population who use the internet 2005 2014 Africa 2 19 N and S America 36 65 Arab States 8 41 Asia-Pacific 9 32 Europe 46 75 (i) Which region shown in Table 6.1 has seen the greatest increase in percentage internet use? ............................................... [1] (ii) Suggest how increased internet use can help people in LEDCs. ........................................................................................................................................... ........................................................................................................................................... ........................................................................................................................................... ........................................................................................................................................... ........................................................................................................................................... ..................................................................................................................................... [3] [Total: 8] Additional Pages If you use the following lined pages to complete the answer(s) to any question(s), the question number(s) must be clearly shown. .................................................................................................................................................................. .................................................................................................................................................................. .................................................................................................................................................................. .................................................................................................................................................................. .................................................................................................................................................................. .................................................................................................................................................................. .................................................................................................................................................................. .................................................................................................................................................................. .................................................................................................................................................................. .................................................................................................................................................................. .................................................................................................................................................................. .................................................................................................................................................................. .................................................................................................................................................................. .................................................................................................................................................................. .................................................................................................................................................................. .................................................................................................................................................................. .................................................................................................................................................................. .................................................................................................................................................................. .................................................................................................................................................................. .................................................................................................................................................................. .................................................................................................................................................................. .................................................................................................................................................................. .................................................................................................................................................................. .................................................................................................................................................................. ..................................................................................................................................................................
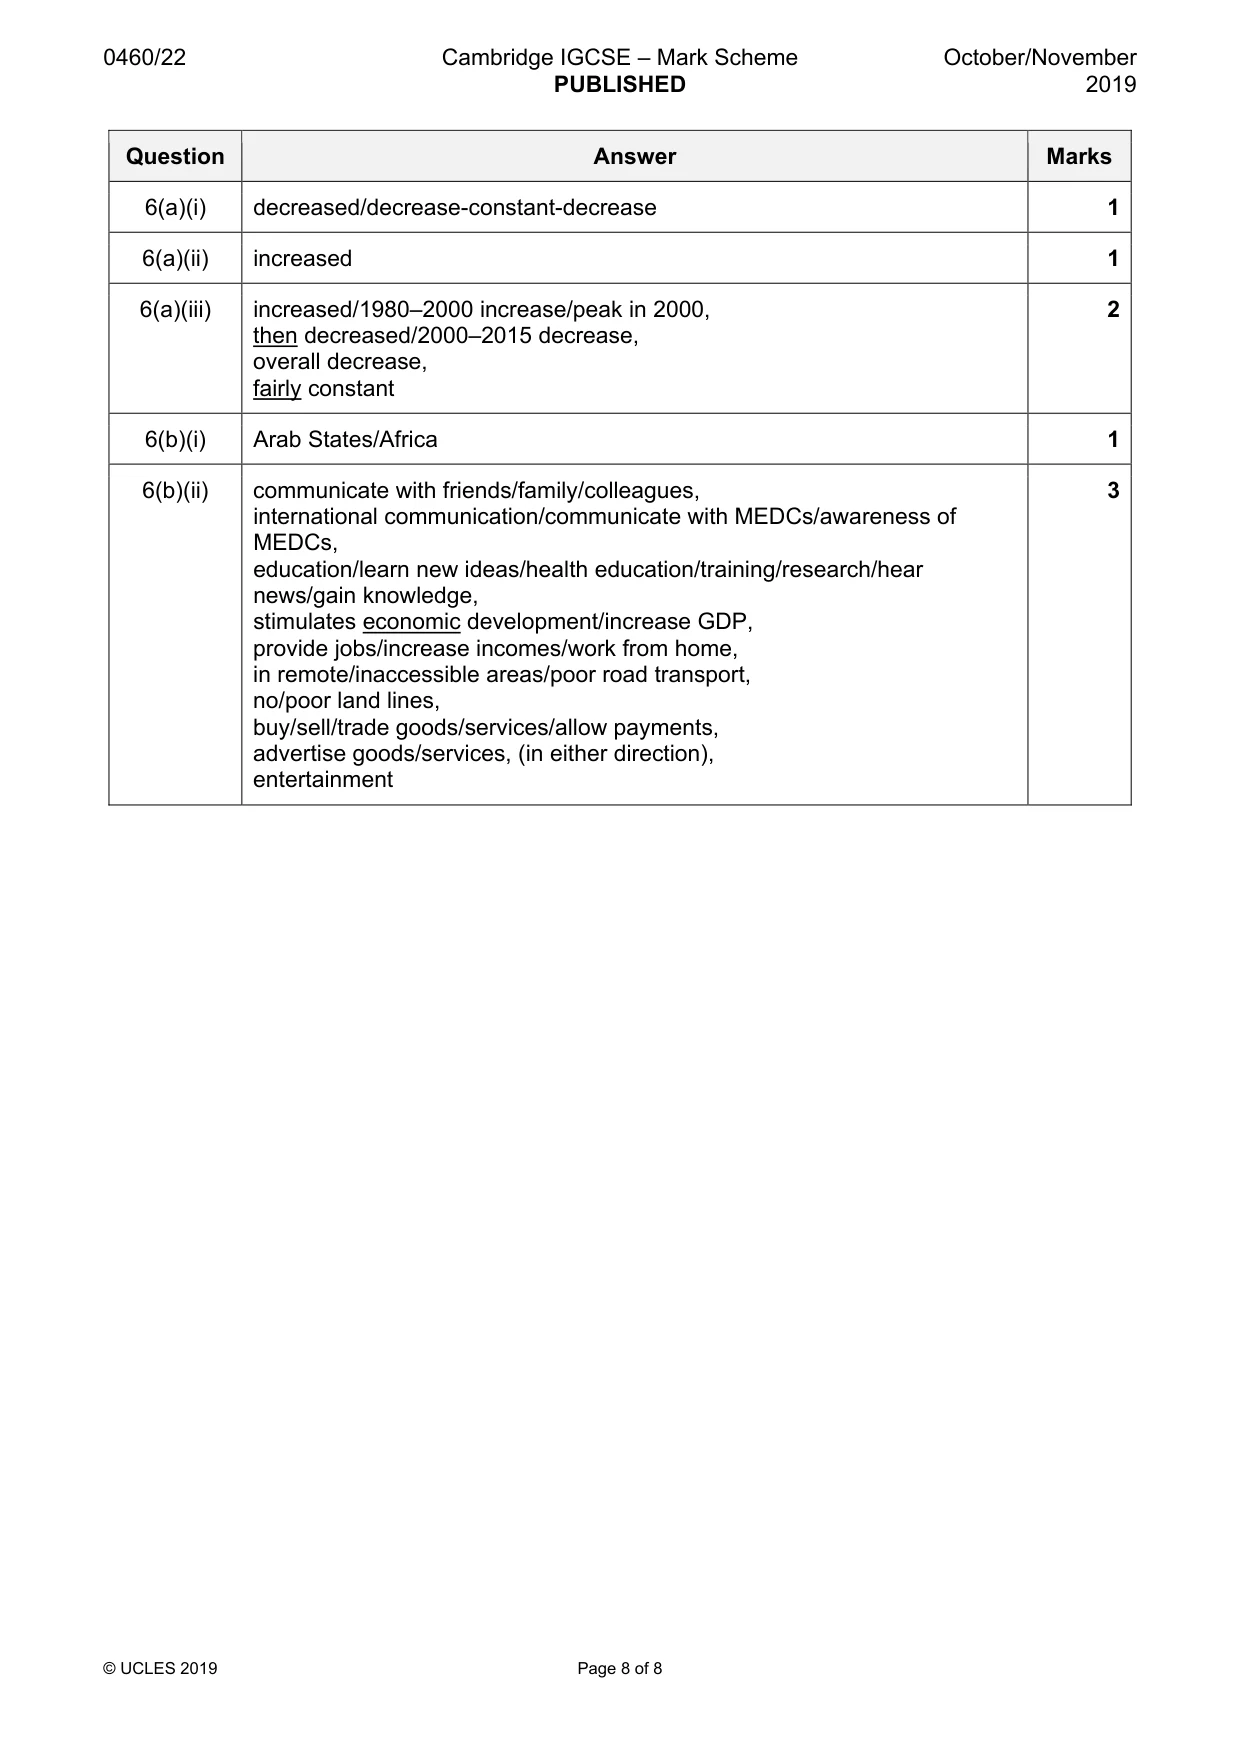
Mark scheme: 6(a)(i) decreased/decrease-constant-decrease 1 6(a)(ii) increased 1 6(a)(iii) increased/1980–2000 increase/peak in 2000, 2 then decreased/2000–2015 decrease, overall decrease, fairly constant 6(b)(i) Arab States/Africa 1 6(b)(ii) communicate with friends/family/colleagues, 3 international communication/communicate with MEDCs/awareness of MEDCs, education/learn new ideas/health education/training/research/hear news/gain knowledge, stimulates economic development/increase GDP, provide jobs/increase incomes/work from home, in remote/inaccessible areas/poor road transport, no/poor land lines, buy/sell/trade goods/services/allow payments, advertise goods/services, (in either direction), entertainment
What was in this paper
The subtopics covered by these 6 questions, and how many questions each got. Open one in a new tab to see every Cambridge question on it.
What you needed in this session
Cambridge’s own grade thresholds for 2019 Oct/Nov, Paper 2 · Variant 2. A higher threshold means an easier paper — the bar moves with how the cohort did.