Cambridge IGCSE Geography 0460 — 2020 Feb/March Paper 2 · Variant 2
0460/22/F/M/20 · 6 questions · 60 marks · ≈68 min
The question paper and its mark scheme, free to read here and free to download. This is Cambridge’s own paper, exactly as it was sat.
Question paper20 pages



Mark scheme9 pages
Answers below. Sit the paper first if you are practising.
Questions as text
Q1 · Study the map extract for Aywaille, Belgium
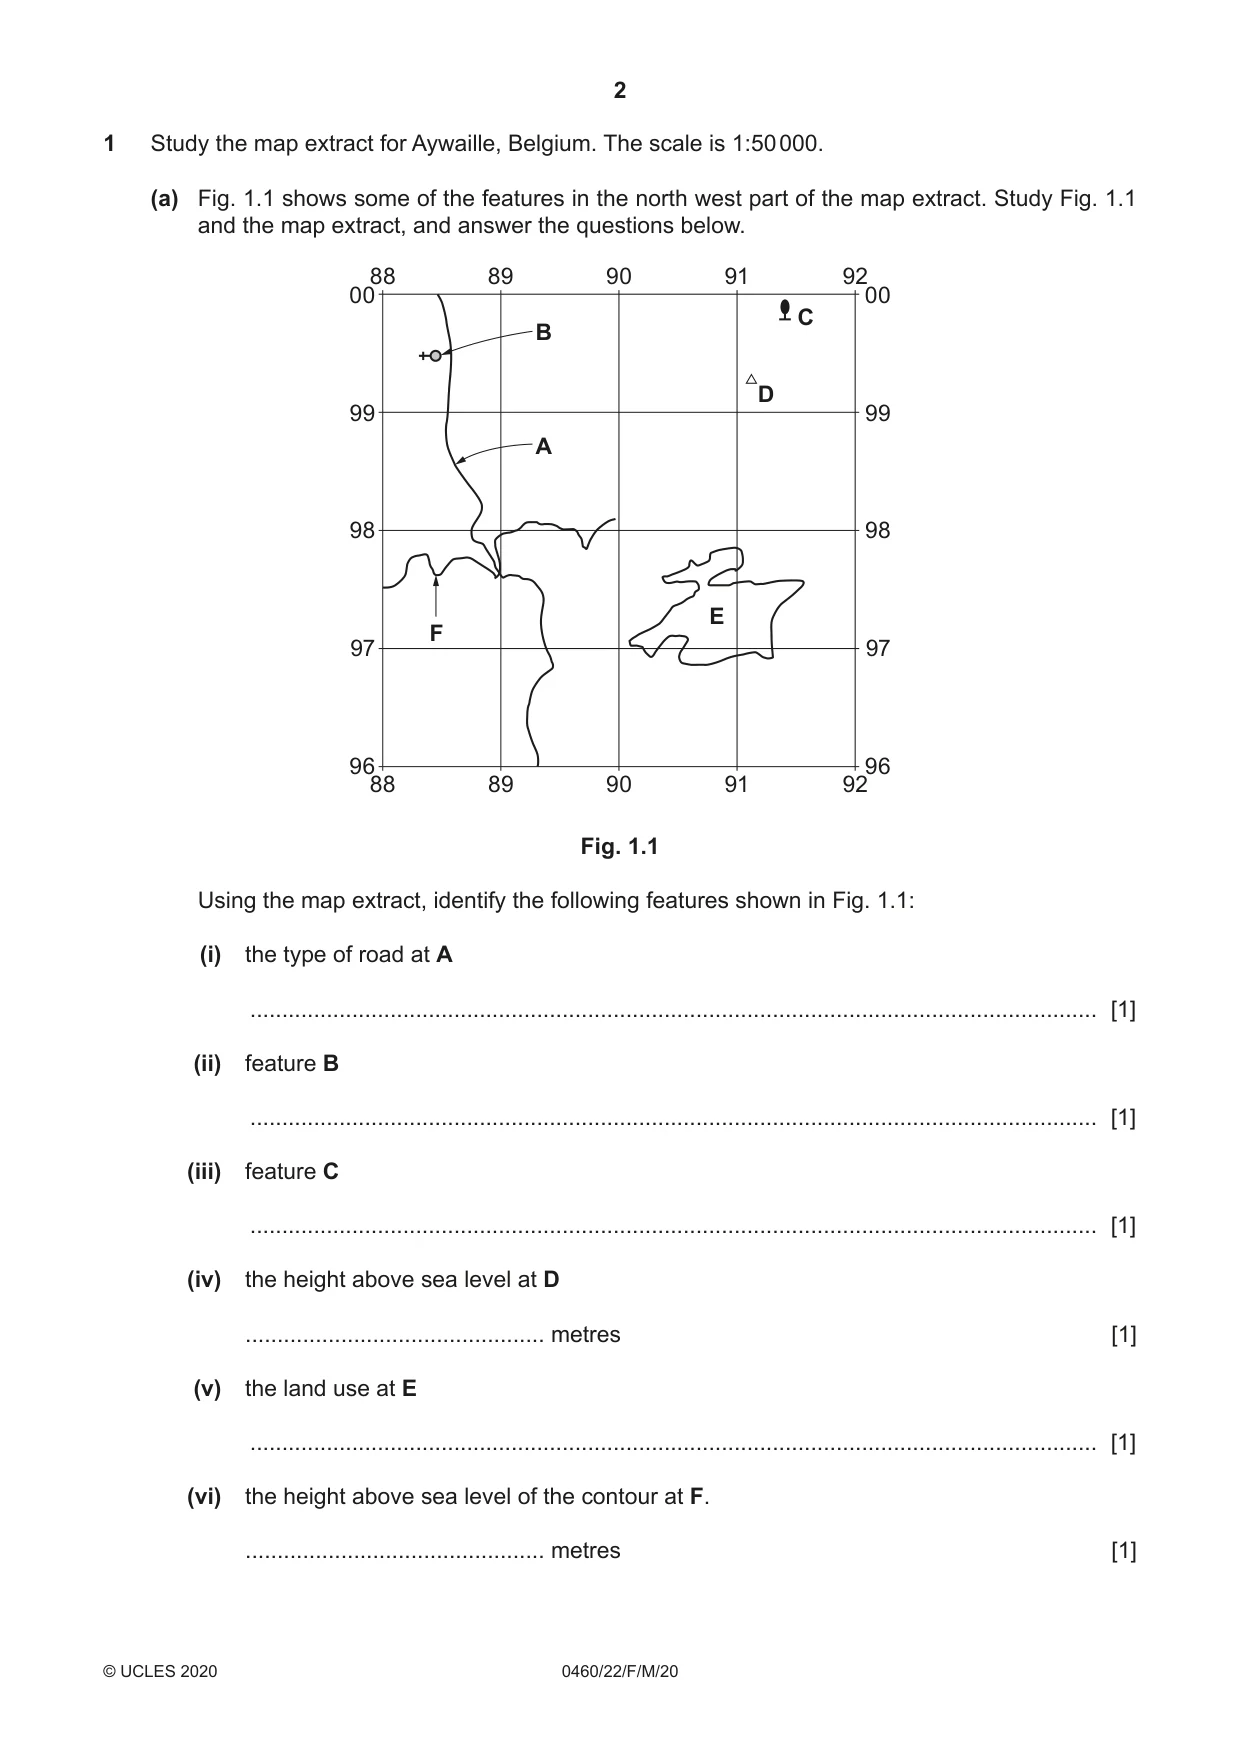
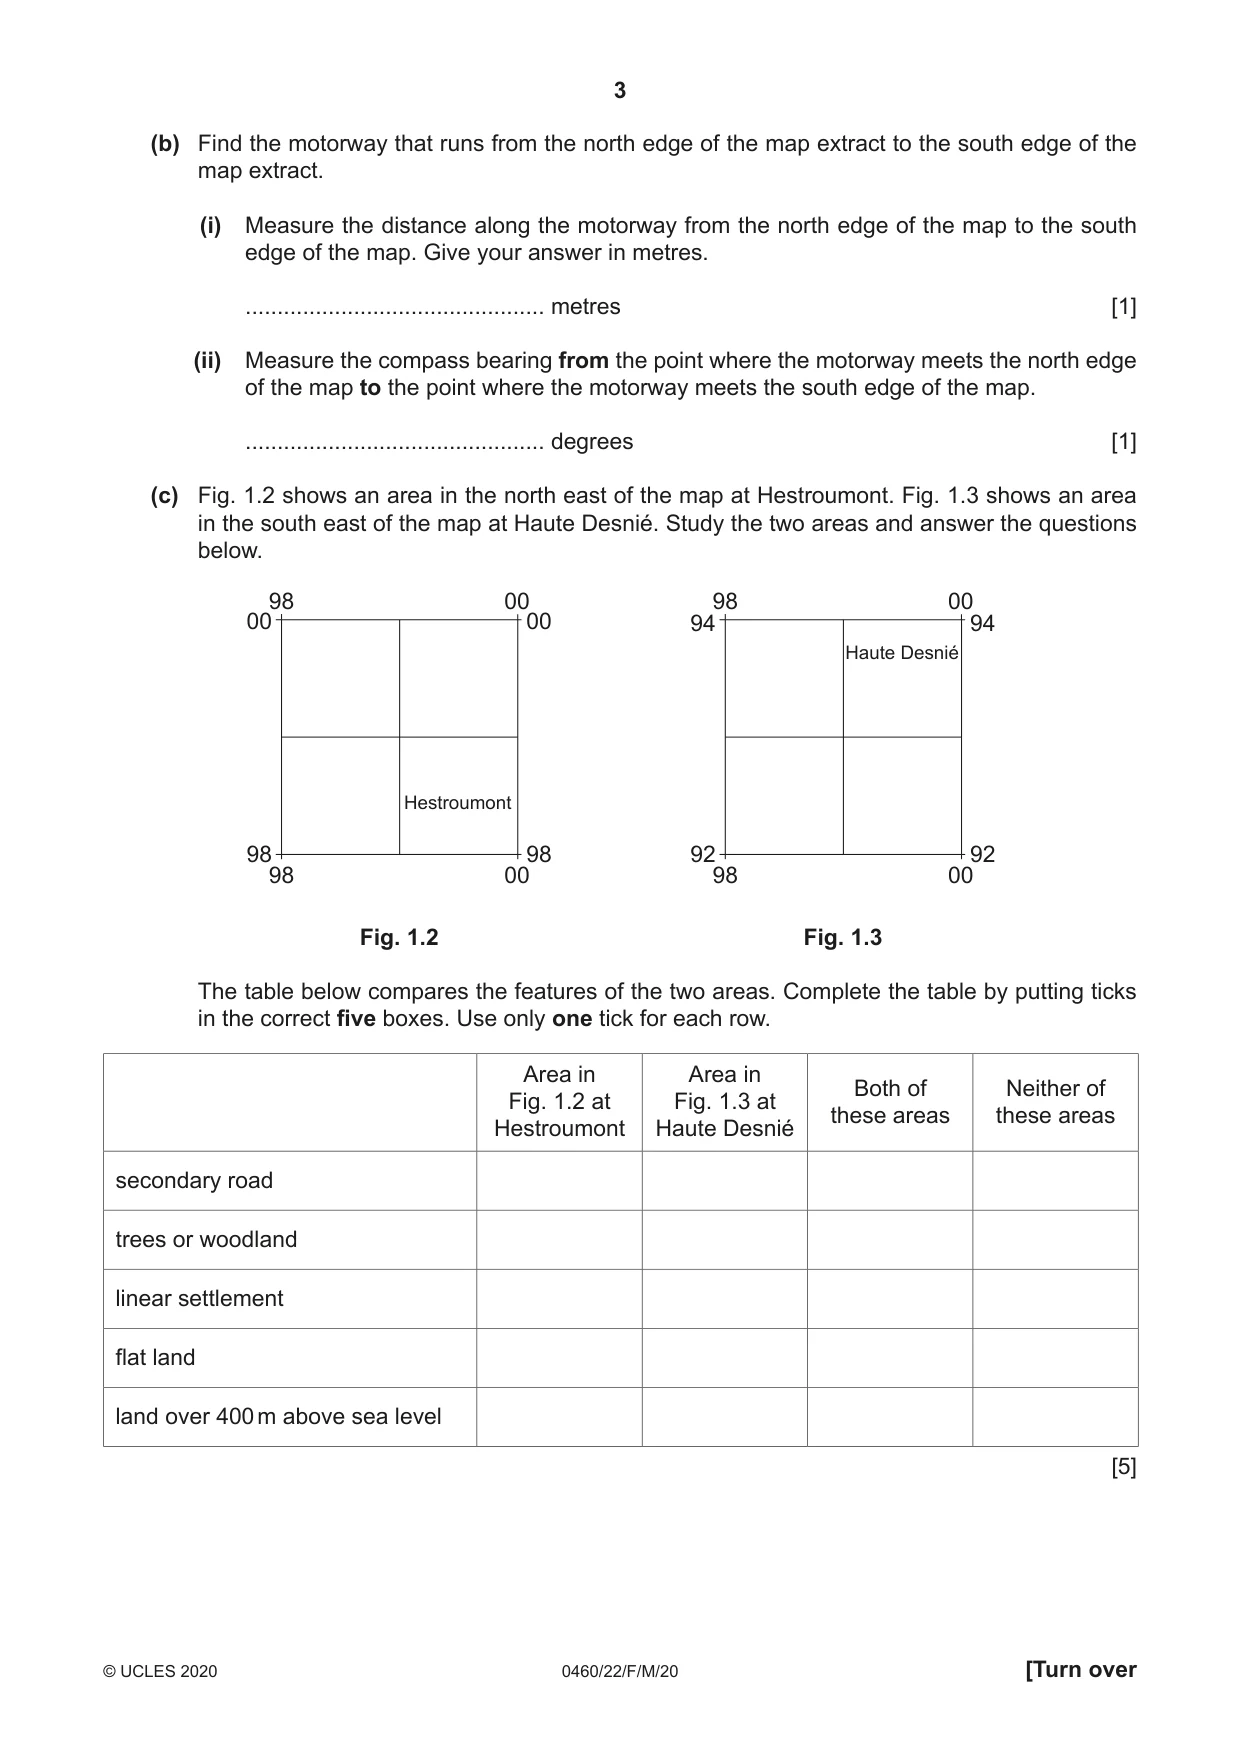
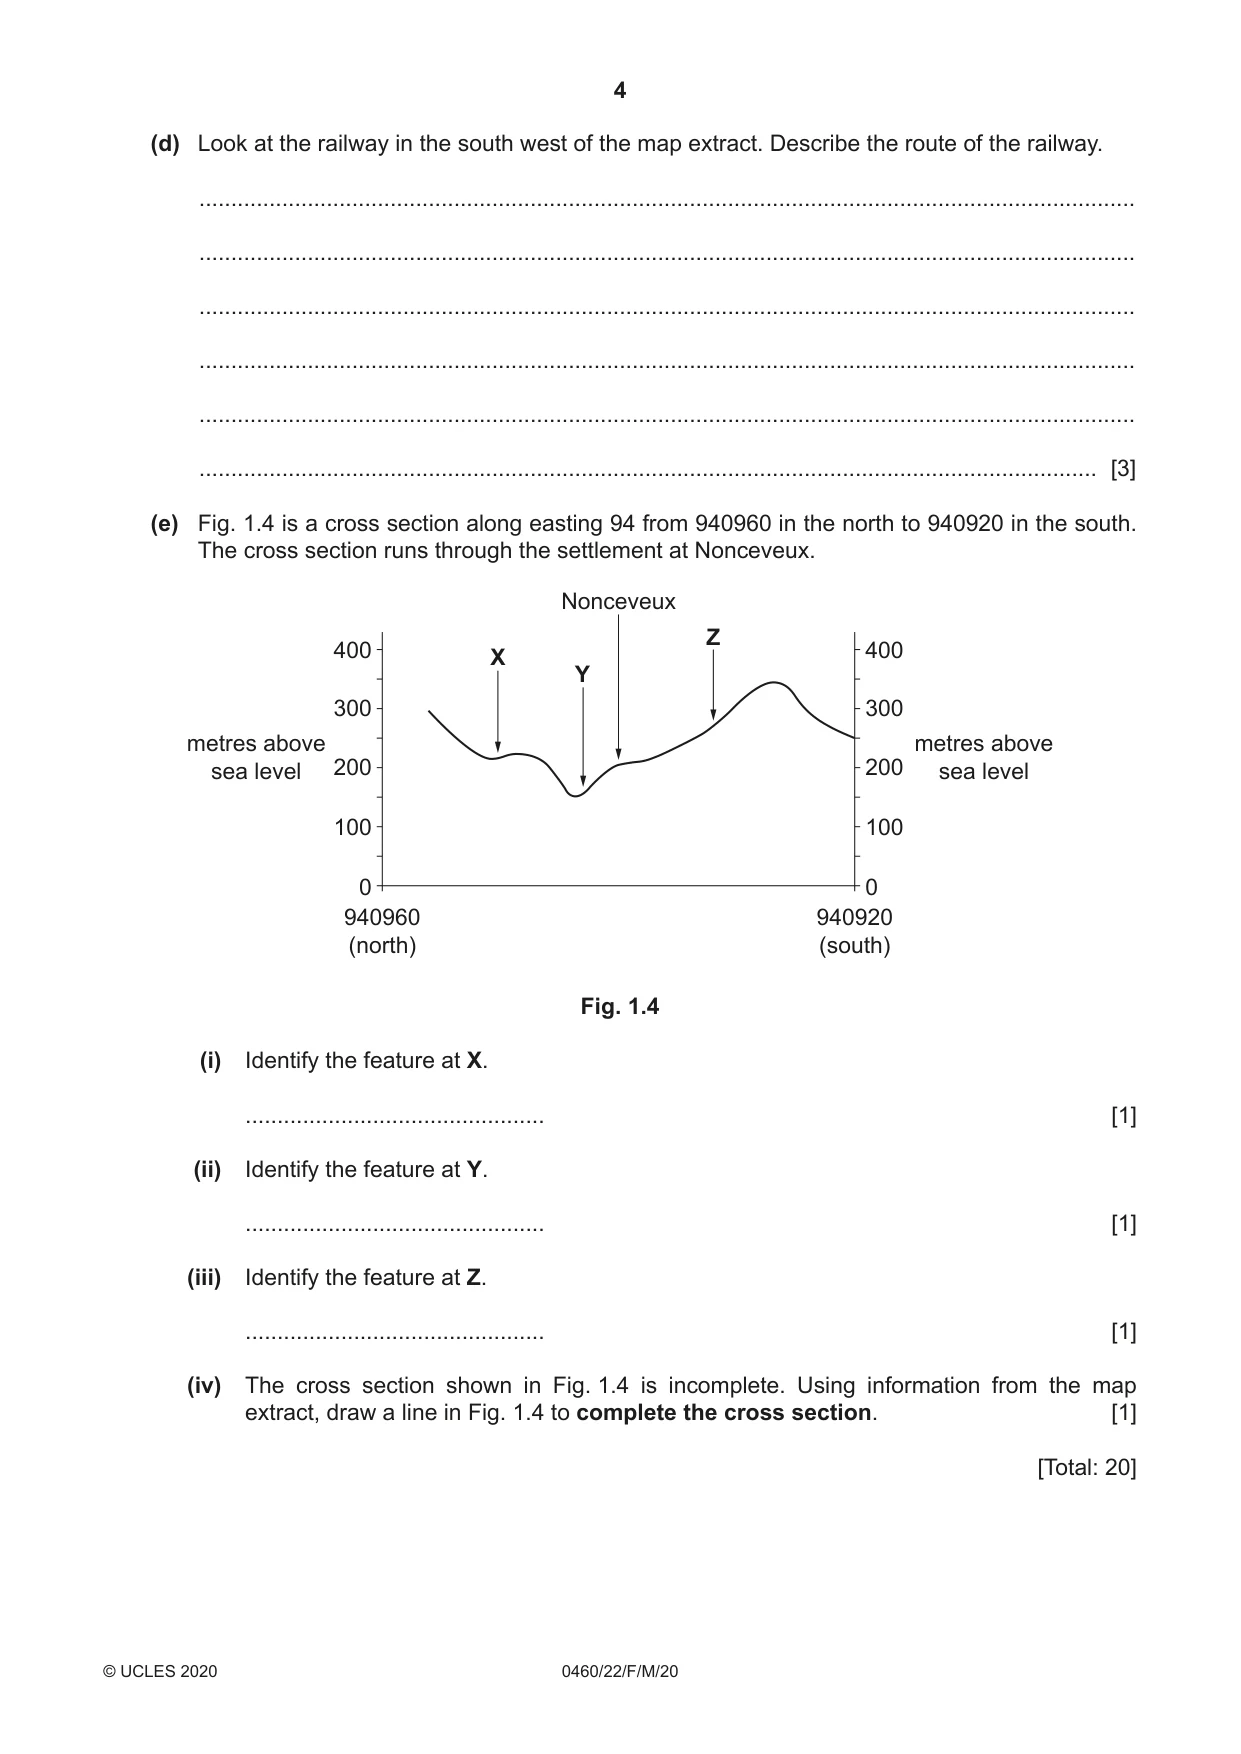
1 Study the map extract for Aywaille, Belgium. The scale is 1:50 000. (a) Fig. 1.1 shows some of the features in the north west part of the map extract. Study Fig. 1.1 and the map extract, and answer the questions below. 88 89 90 91 92 00 00 C B D 99 99 A 98 98 E F 97 97 96 96 88 89 90 91 92 Fig. 1.1 Using the map extract, identify the following features shown in Fig. 1.1: (i) the type of road at A ..................................................................................................................................... [1] (ii) feature B ..................................................................................................................................... [1] (iii) feature C ..................................................................................................................................... [1] (iv) the height above sea level at D ............................................... metres [1] (v) the land use at E ..................................................................................................................................... [1] (vi) the height above sea level of the contour at F. ............................................... metres [1] (b) Find the motorway that runs from the north edge of the map extract to the south edge of the map extract. (i) Measure the distance along the motorway from the north edge of the map to the south edge of the map. Give your answer in metres. ............................................... metres [1] (ii) Measure the compass bearing from the point where the motorway meets the north edge of the map to the point where the motorway meets the south edge of the map. ............................................... degrees [1] (c) Fig. 1.2 shows an area in the north east of the map at Hestroumont. Fig. 1.3 shows an area in the south east of the map at Haute Desnié. Study the two areas and answer the questions below. 98 00 98 00 00 00 94 94 Haute Desnié Hestroumont 98 98 92 92 98 00 98 00 Fig. 1.2 Fig. 1.3 The table below compares the features of the two areas. Complete the table by putting ticks in the correct five boxes. Use only one tick for each row. Area in Area in Both of Neither of Fig. 1.2 at Fig. 1.3 at these areas these areas Hestroumont Haute Desnié secondary road trees or woodland linear settlement flat land land over 400 m above sea level [5] (d) Look at the railway in the south west of the map extract. Describe the route of the railway. ................................................................................................................................................... ................................................................................................................................................... ................................................................................................................................................... ................................................................................................................................................... ................................................................................................................................................... ............................................................................................................................................. [3] (e) Fig. 1.4 is a cross section along easting 94 from 940960 in the north to 940920 in the south. The cross section runs through the settlement at Nonceveux. Nonceveux Z 400 400 X Y 300 300 metres above metres above sea level 200 200 sea level 100 100 0 0 940960 940920 (north) (south) Fig. 1.4 (i) Identify the feature at X. ............................................... [1] (ii) Identify the feature at Y. ............................................... [1] (iii) Identify the feature at Z. ............................................... [1] (iv) The cross section shown in Fig. 1.4 is incomplete. Using information from the map extract, draw a line in Fig. 1.4 to complete the cross section. [1] [Total: 20] TURN PAGE FOR QUESTION 2
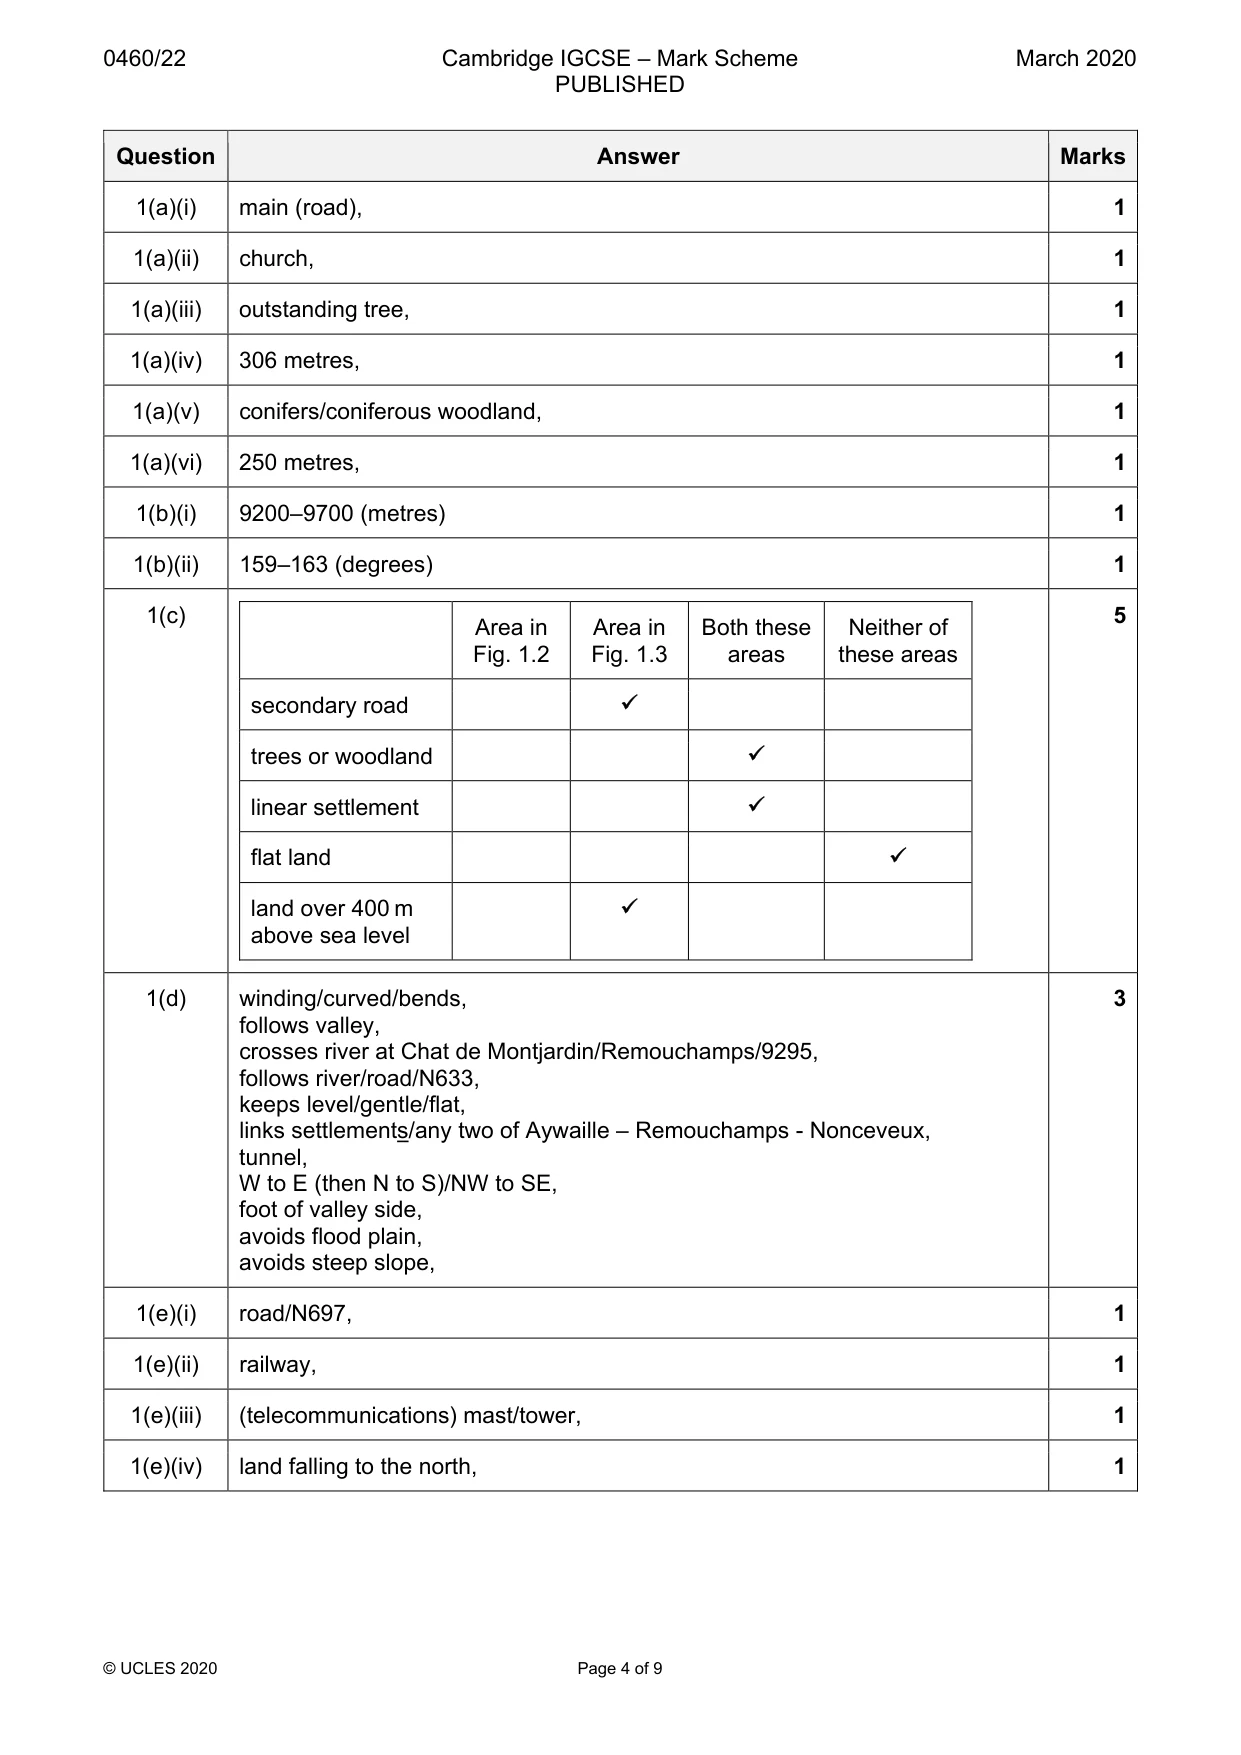
Mark scheme: Question Answer Marks 1(a)(i) main (road), 1 1(a)(ii) church, 1 1(a)(iii) outstanding tree, 1 1(a)(iv) 306 metres, 1 1(a)(v) conifers/coniferous woodland, 1 1(a)(vi) 250 metres, 1 1(b)(i) 9200–9700 (metres) 1 1(b)(ii) 159–163 (degrees) 1 1(c) 5 Area in Area in Both these Neither of Fig. 1.2 Fig. 1.3 areas these areas secondary road trees or woodland linear settlement flat land land over 400 m above sea level 1(d) winding/curved/bends, 3 follows valley, crosses river at Chat de Montjardin/Remouchamps/9295, follows river/road/N633, keeps level/gentle/flat, links settlements/any two of Aywaille – Remouchamps - Nonceveux, tunnel, W to E (then N to S)/NW to SE, foot of valley side, avoids flood plain, avoids steep slope, 1(e)(i) road/N697, 1 1(e)(ii) railway, 1 1(e)(iii) (telecommunications) mast/tower, 1 1(e)(iv) land falling to the north, 1
More questions on Settlements (rural and urban) and service provision
Q2 · The population densities of countries in Africa
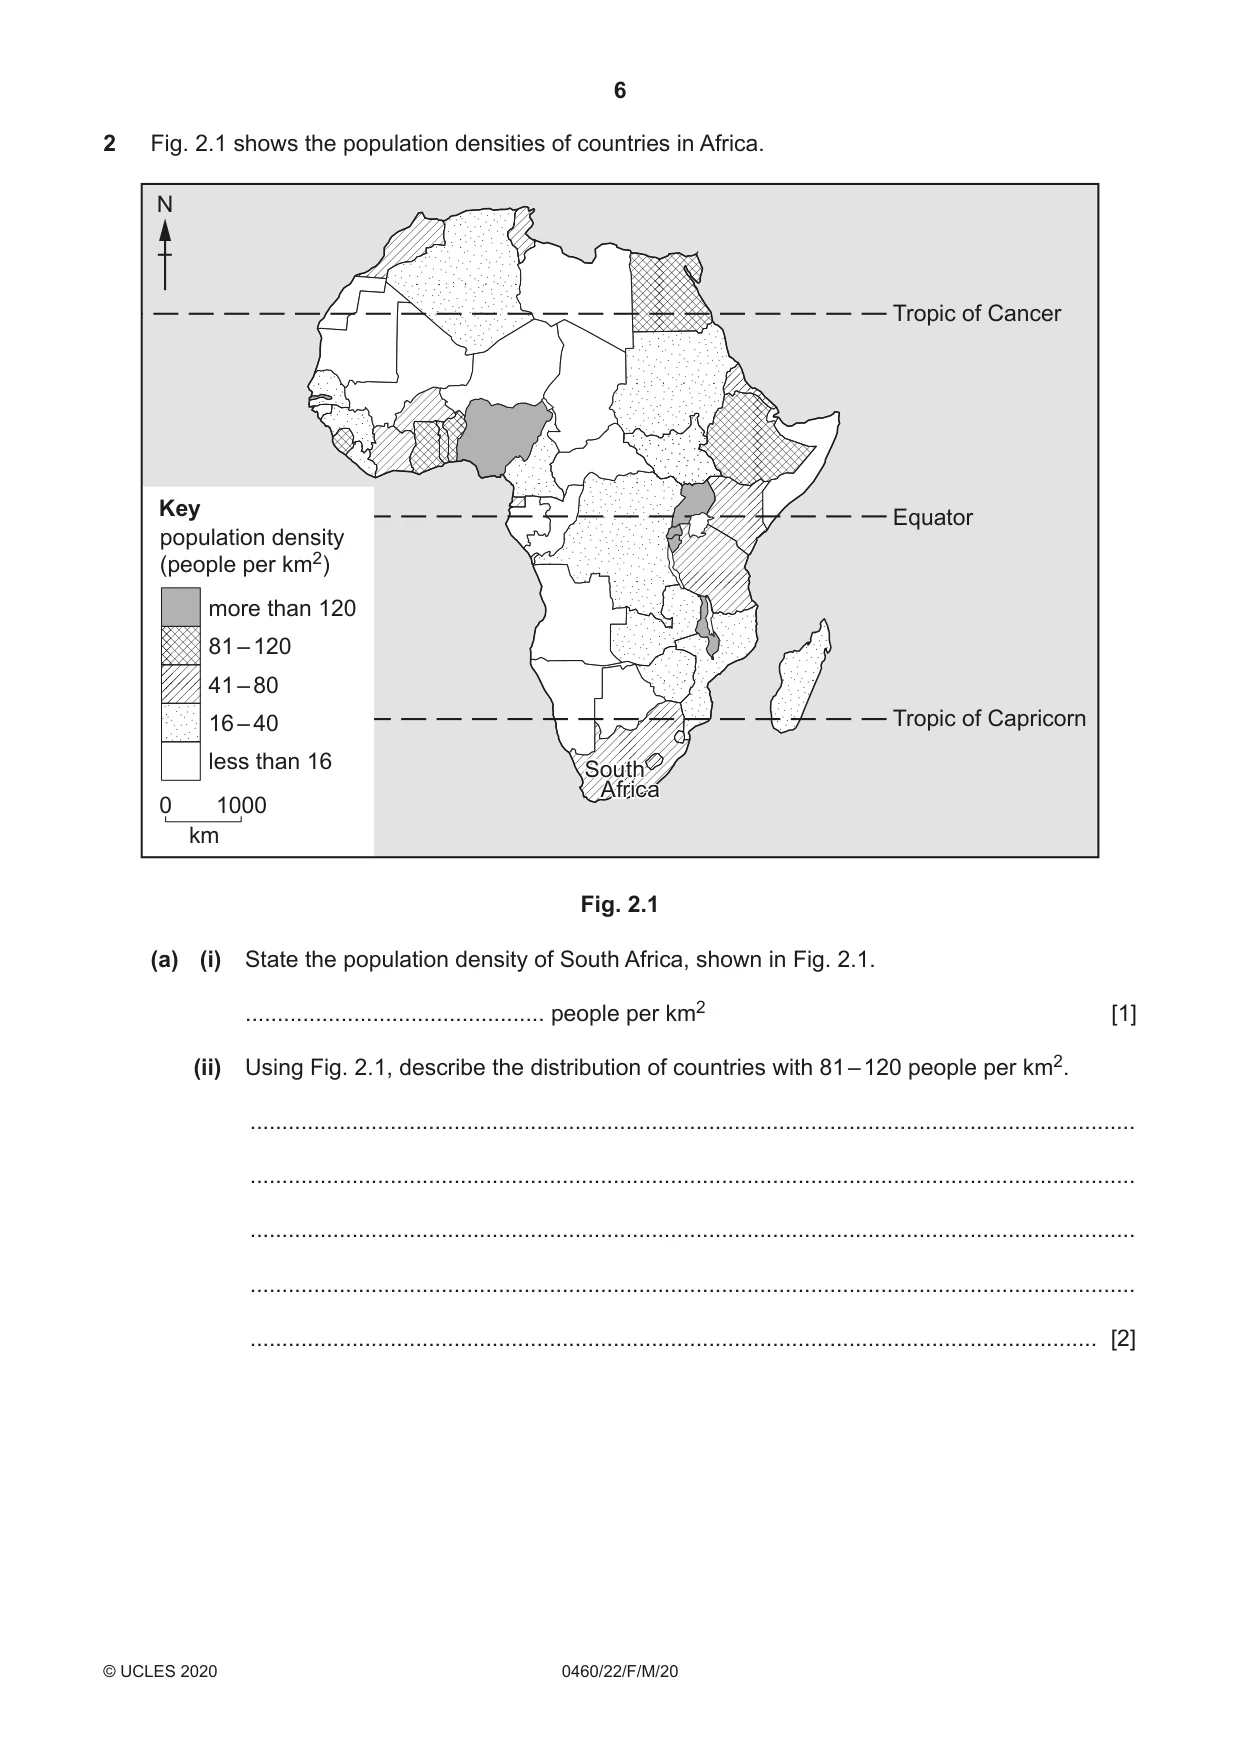
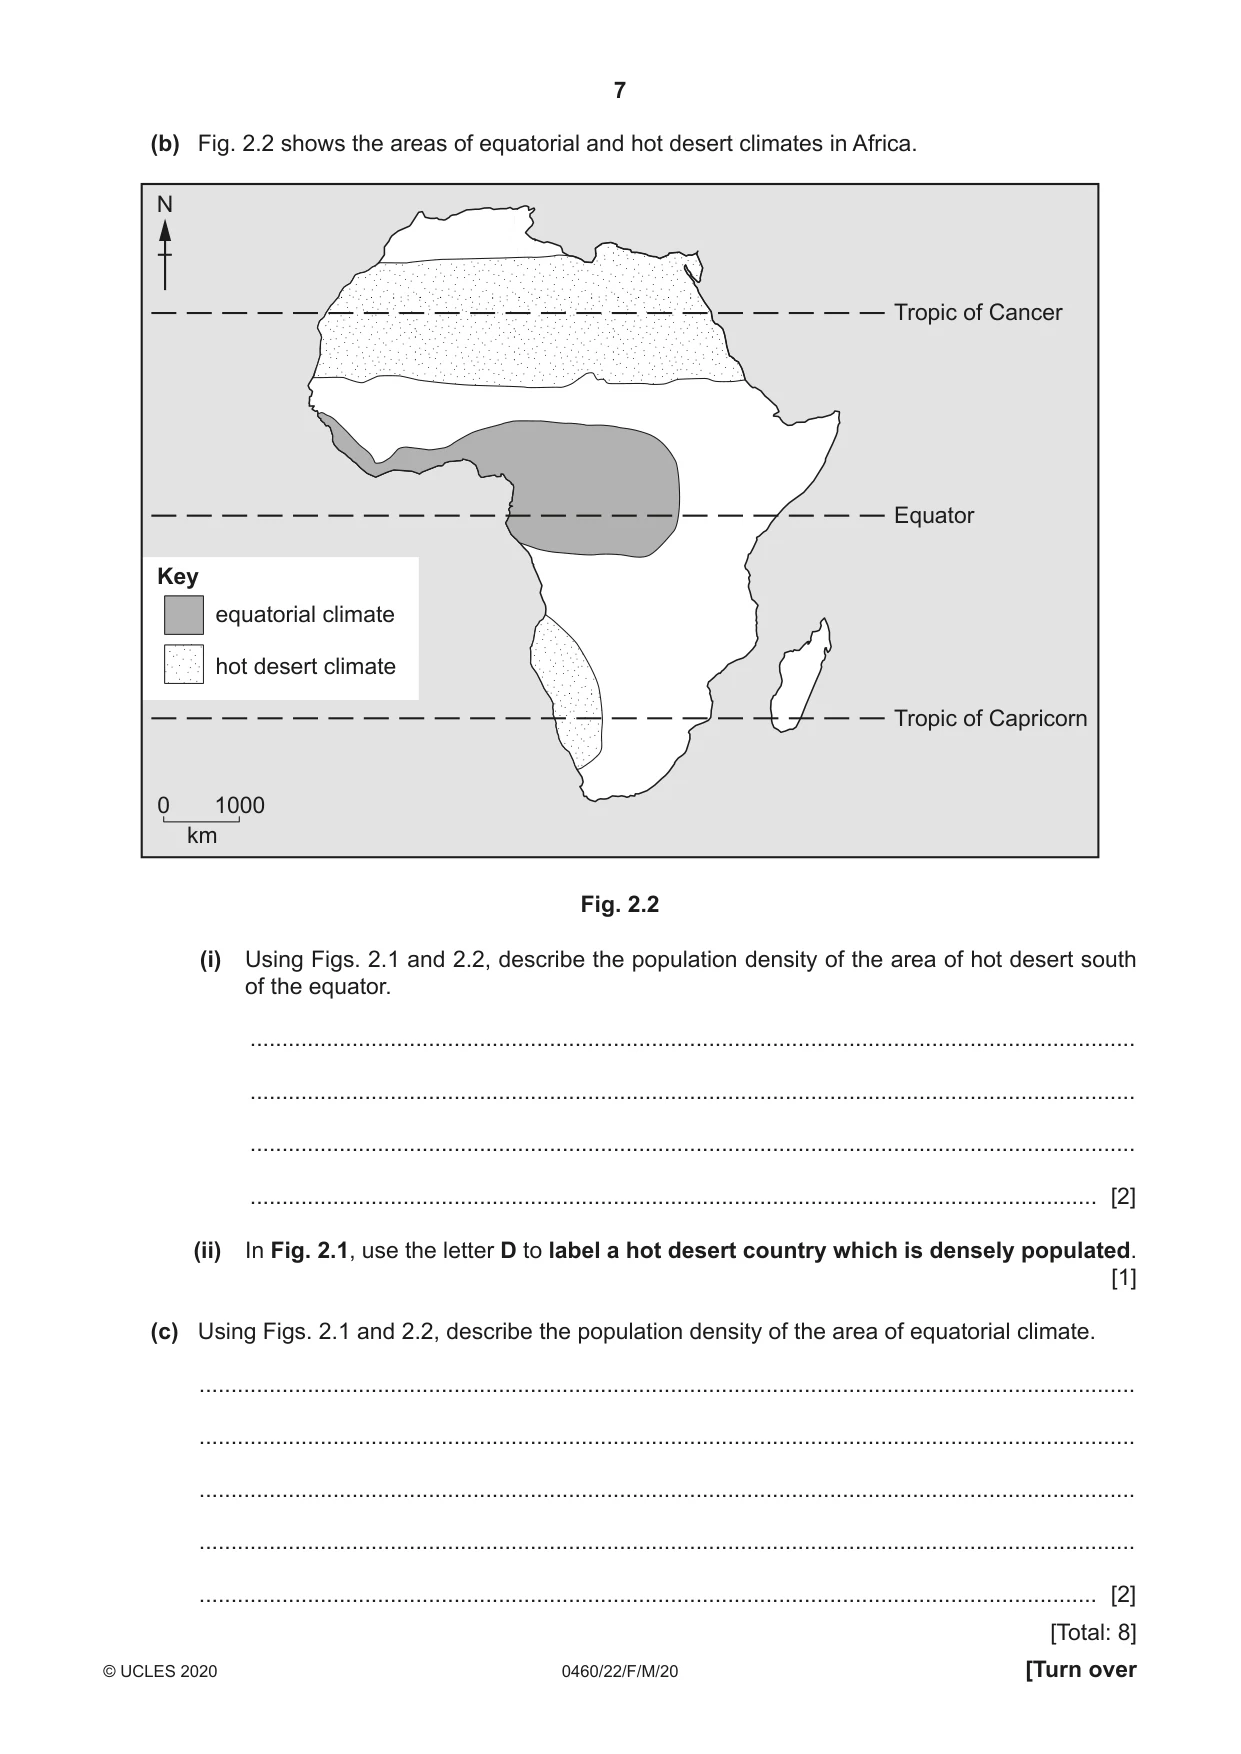
2 Fig. 2.1 shows the population densities of countries in Africa. N Tropic of Cancer Key Equator population density (people per km2) more than 120 81 – 120 41 – 80 16 – 40 Tropic of Capricorn less than 16 SouthSouth AfricaAfrica 0 1000 km Fig. 2.1 (a) (i) State the population density of South Africa, shown in Fig. 2.1. ............................................... people per km2 [1] (ii) Using Fig. 2.1, describe the distribution of countries with 81 – 120 people per km2. ........................................................................................................................................... ........................................................................................................................................... ........................................................................................................................................... ........................................................................................................................................... ..................................................................................................................................... [2] (b) Fig. 2.2 shows the areas of equatorial and hot desert climates in Africa. N Tropic of Cancer Equator Key equatorial climate hot desert climate Tropic of Capricorn 0 1000 km Fig. 2.2 (i) Using Figs. 2.1 and 2.2, describe the population density of the area of hot desert south of the equator. ........................................................................................................................................... ........................................................................................................................................... ........................................................................................................................................... ..................................................................................................................................... [2] (ii) In Fig. 2.1, use the letter D to label a hot desert country which is densely populated. [1] (c) Using Figs. 2.1 and 2.2, describe the population density of the area of equatorial climate. ................................................................................................................................................... ................................................................................................................................................... ................................................................................................................................................... ................................................................................................................................................... ............................................................................................................................................. [2] [Total: 8]
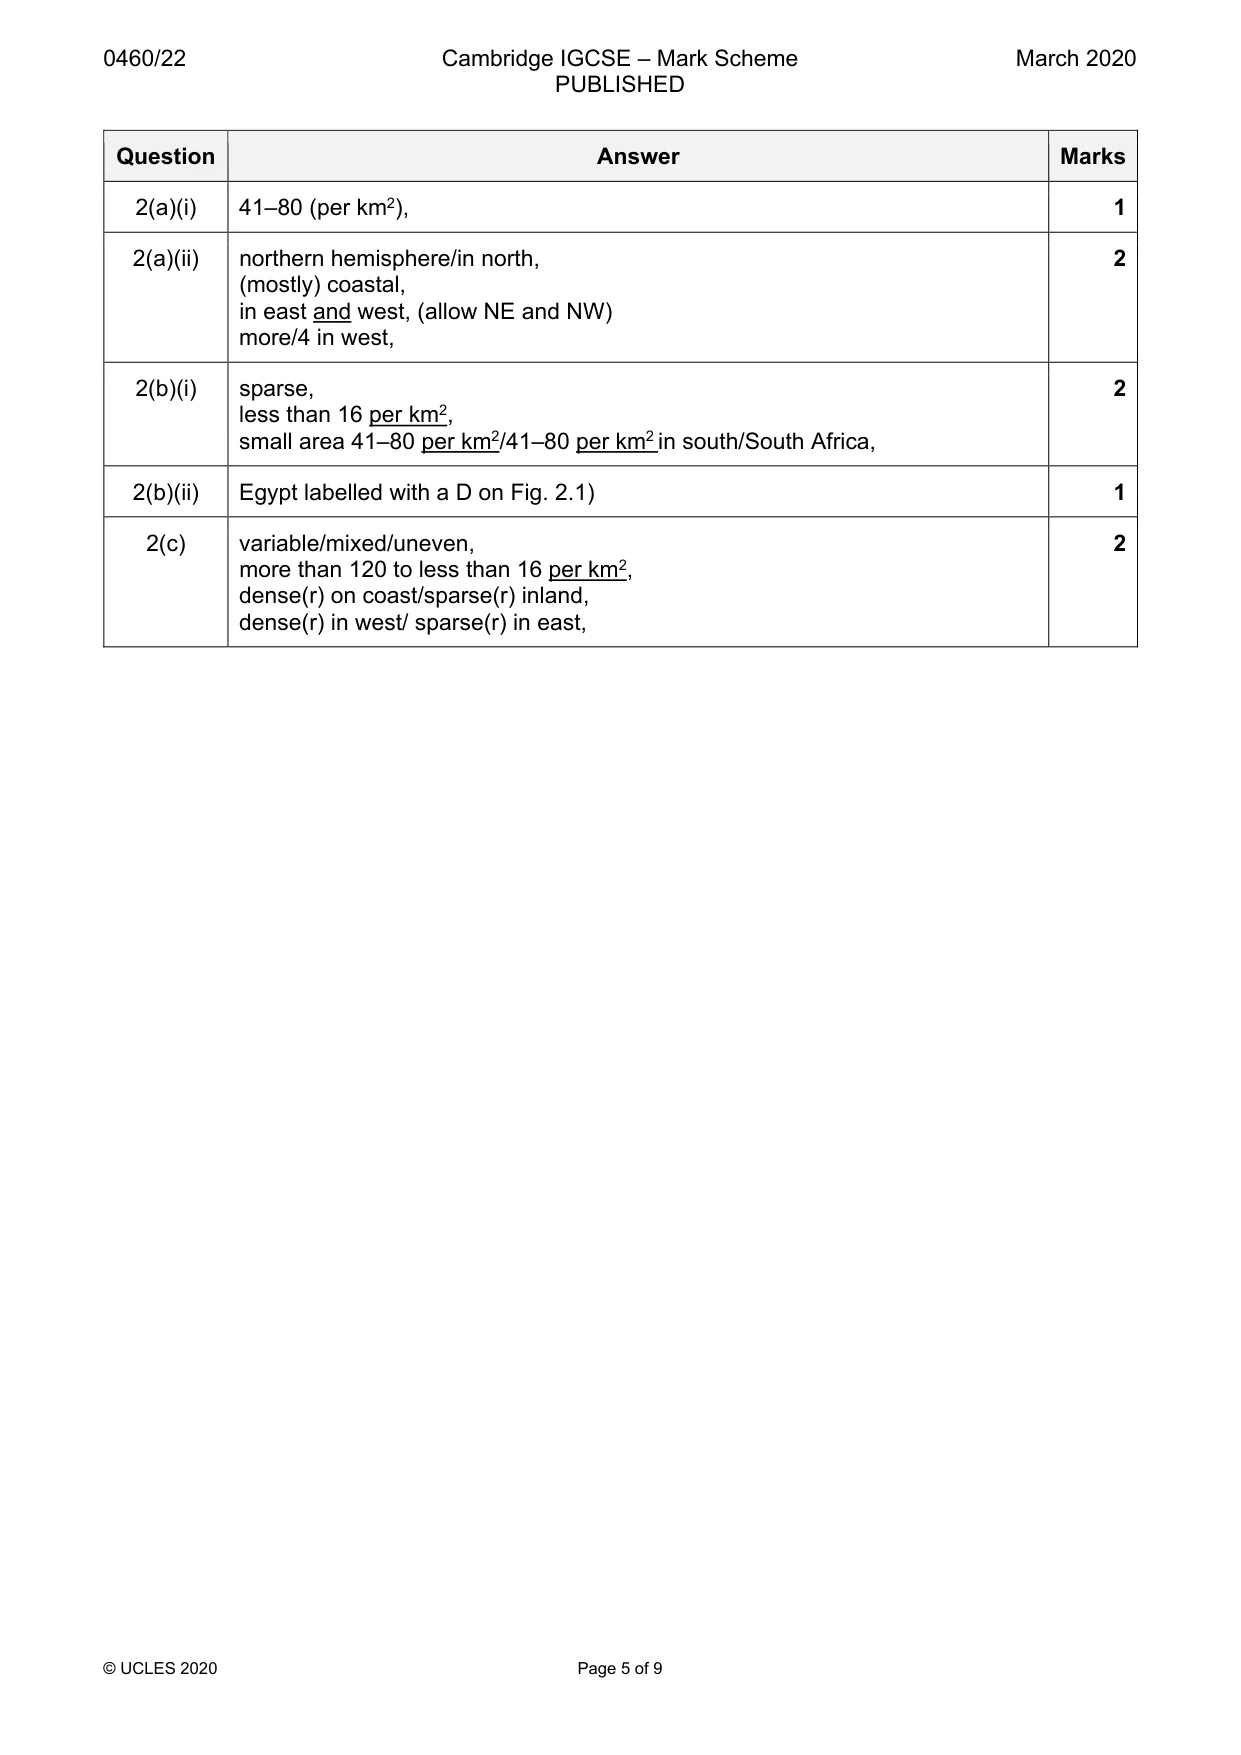
Mark scheme: 2(a)(i) 41–80 (per km2), 1 2(a)(ii) northern hemisphere/in north, 2 (mostly) coastal, in east and west, (allow NE and NW) more/4 in west, 2(b)(i) sparse, 2 less than 16 per km2, small area 41–80 per km2/41–80 per km2 in south/South Africa, 2(b)(ii) Egypt labelled with a D on Fig. 2.1) 1 2(c) variable/mixed/uneven, 2 more than 120 to less than 16 per km2, dense(r) on coast/sparse(r) inland, dense(r) in west/ sparse(r) in east,
Question 3
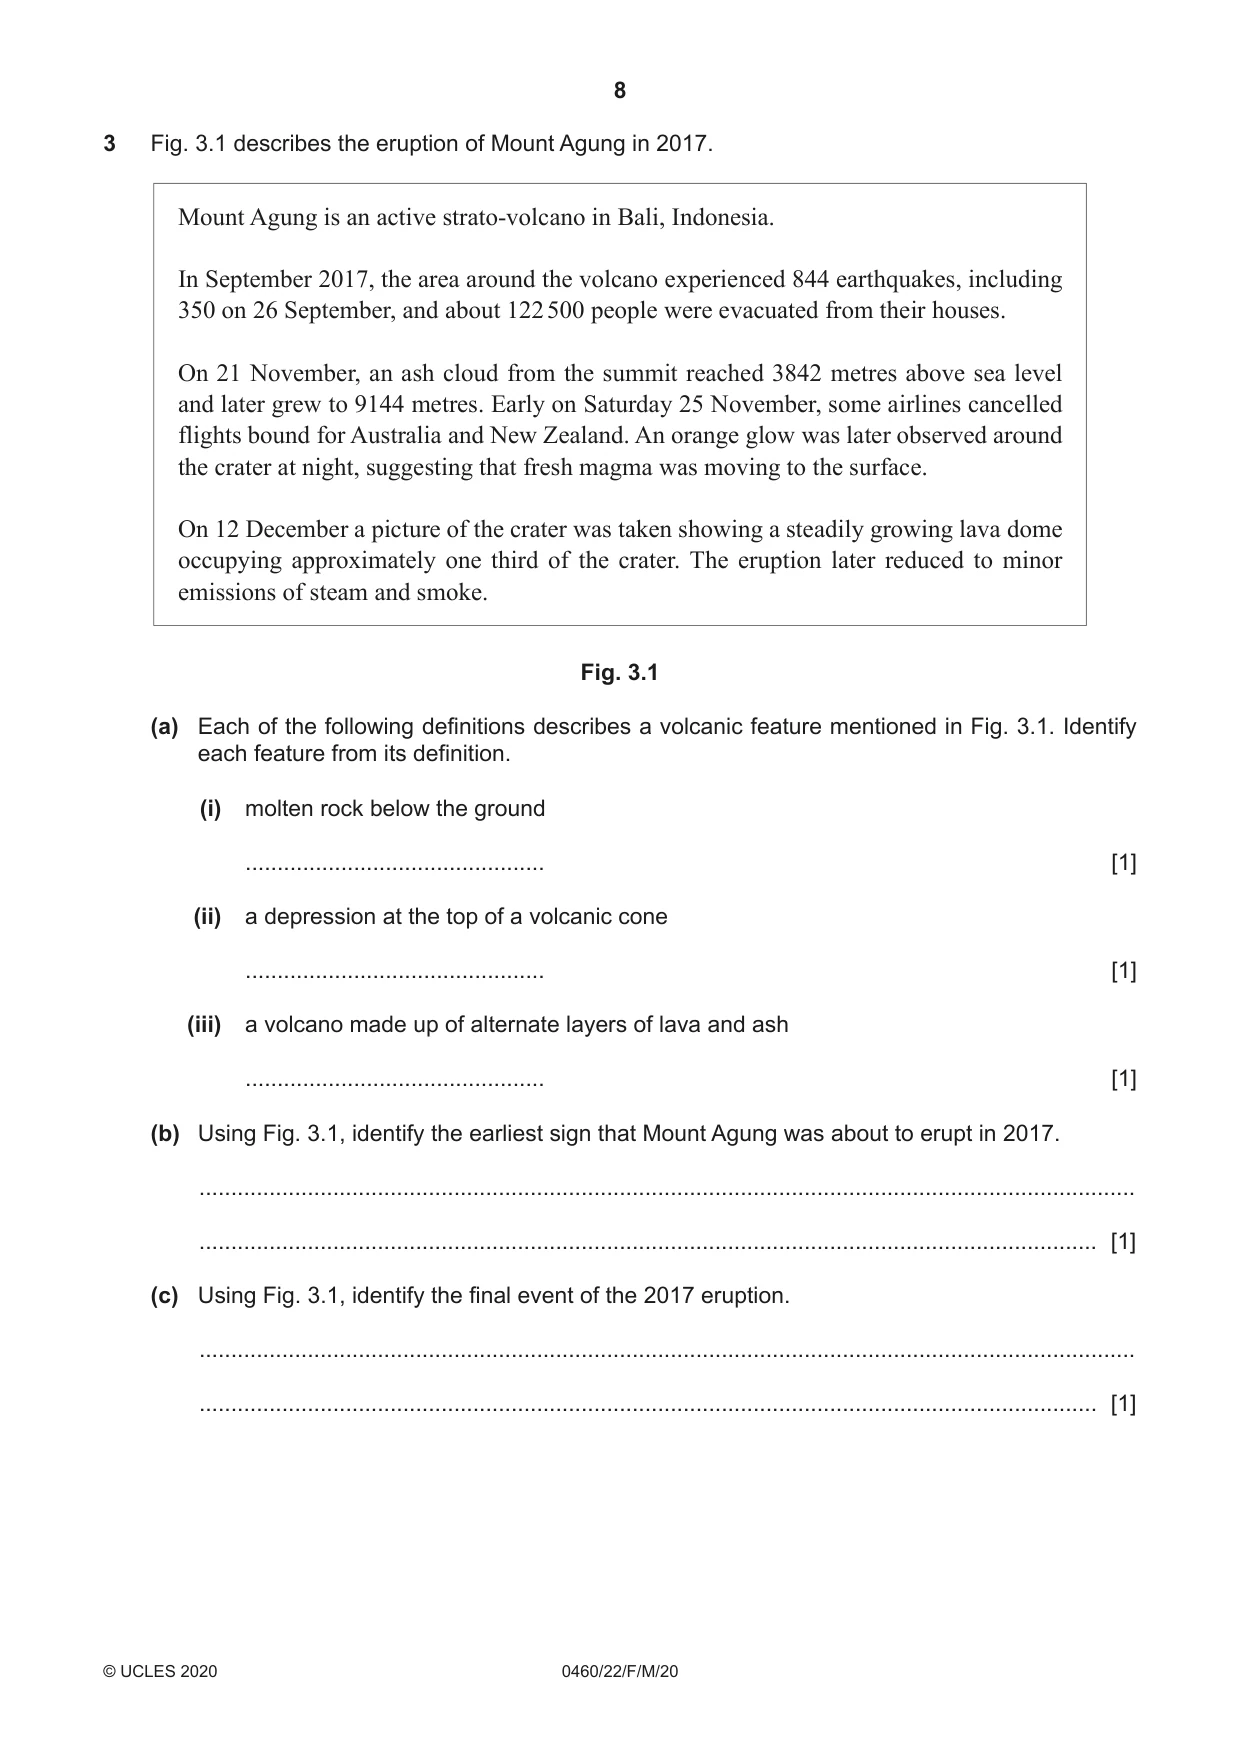
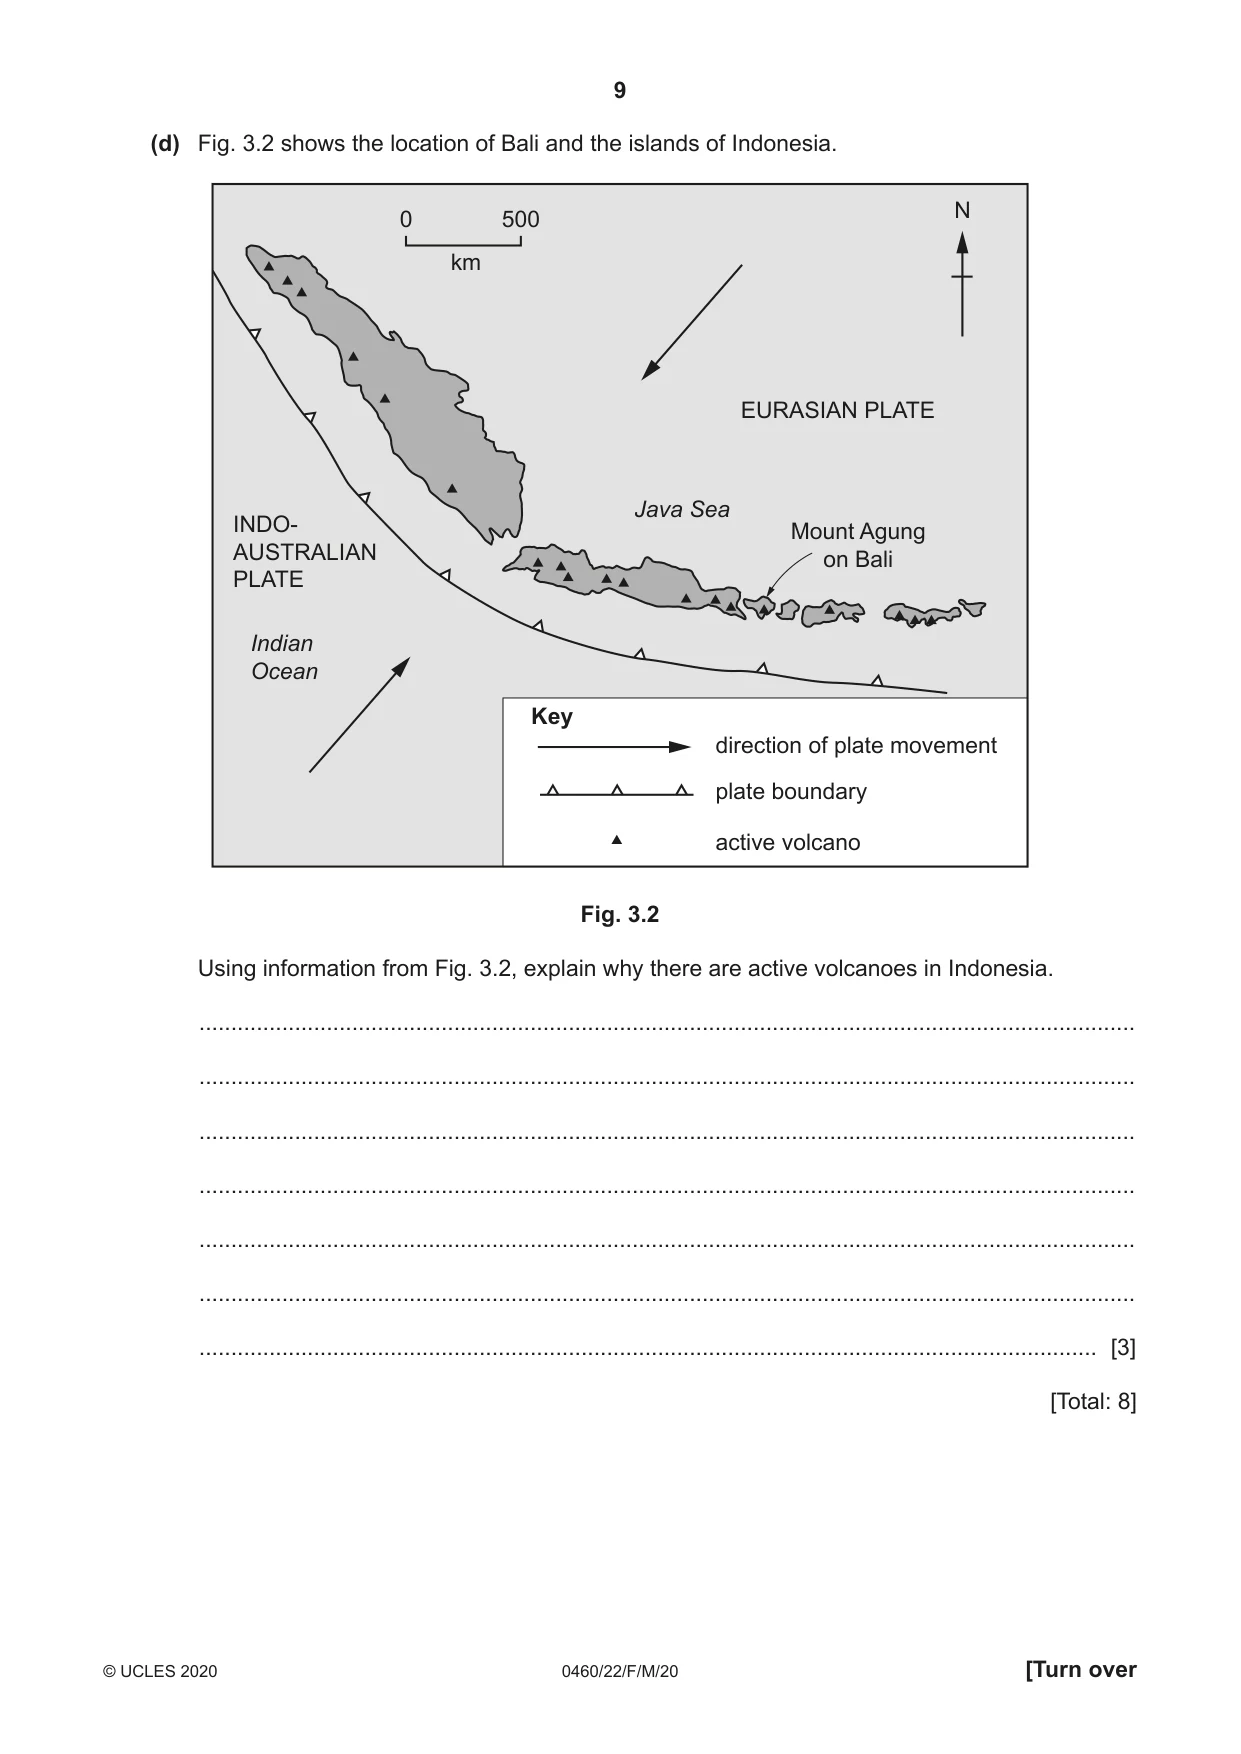
3 Fig. 3.1 describes the eruption of Mount Agung in 2017. Mount Agung is an active strato-volcano in Bali, Indonesia. In September 2017, the area around the volcano experienced 844 earthquakes, including 350 on 26 September, and about 122 500 people were evacuated from their houses. On 21 November, an ash cloud from the summit reached 3842 metres above sea level and later grew to 9144 metres. Early on Saturday 25 November, some airlines cancelled flights bound for Australia and New Zealand. An orange glow was later observed around the crater at night, suggesting that fresh magma was moving to the surface. On 12 December a picture of the crater was taken showing a steadily growing lava dome occupying approximately one third of the crater. The eruption later reduced to minor emissions of steam and smoke. Fig. 3.1 (a) Each of the following definitions describes a volcanic feature mentioned in Fig. 3.1. Identify each feature from its definition. (i) molten rock below the ground ............................................... [1] (ii) a depression at the top of a volcanic cone ............................................... [1] (iii) a volcano made up of alternate layers of lava and ash ............................................... [1] (b) Using Fig. 3.1, identify the earliest sign that Mount Agung was about to erupt in 2017. ................................................................................................................................................... ............................................................................................................................................. [1] (c) Using Fig. 3.1, identify the final event of the 2017 eruption. ................................................................................................................................................... ............................................................................................................................................. [1] (d) Fig. 3.2 shows the location of Bali and the islands of Indonesia. N 0 500 km EURASIAN PLATE Java Sea INDO- Mount Agung AUSTRALIAN on Bali PLATE Indian Ocean Key direction of plate movement plate boundary active volcano Fig. 3.2 Using information from Fig. 3.2, explain why there are active volcanoes in Indonesia. ................................................................................................................................................... ................................................................................................................................................... ................................................................................................................................................... ................................................................................................................................................... ................................................................................................................................................... ................................................................................................................................................... ............................................................................................................................................. [3] [Total: 8]
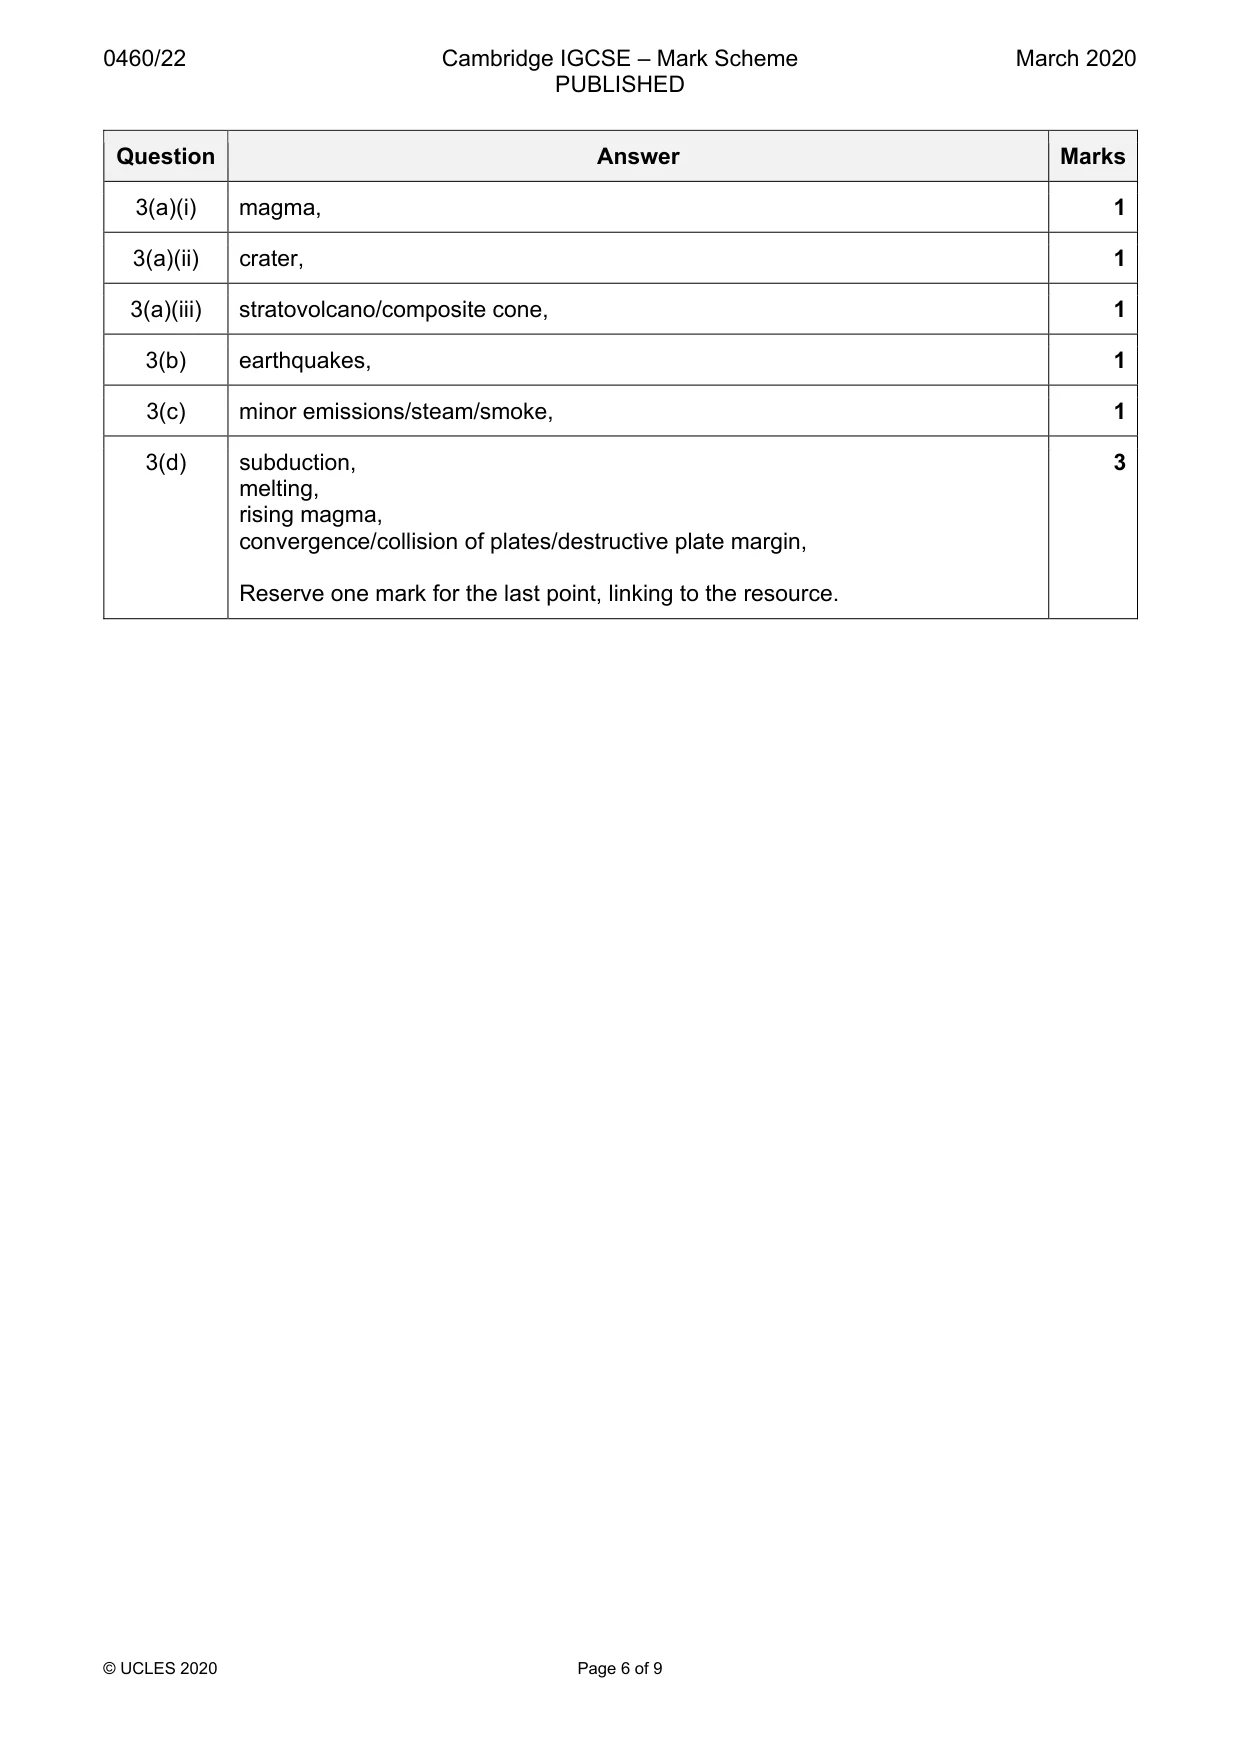
Mark scheme: 3(a)(i) magma, 1 3(a)(ii) crater, 1 3(a)(iii) stratovolcano/composite cone, 1 3(b) earthquakes, 1 3(c) minor emissions/steam/smoke, 1 3(d) subduction, 3 melting, rising magma, convergence/collision of plates/destructive plate margin, Reserve one mark for the last point, linking to the resource.
Q4 · The climate of a hot desert area in the southern hemisphere
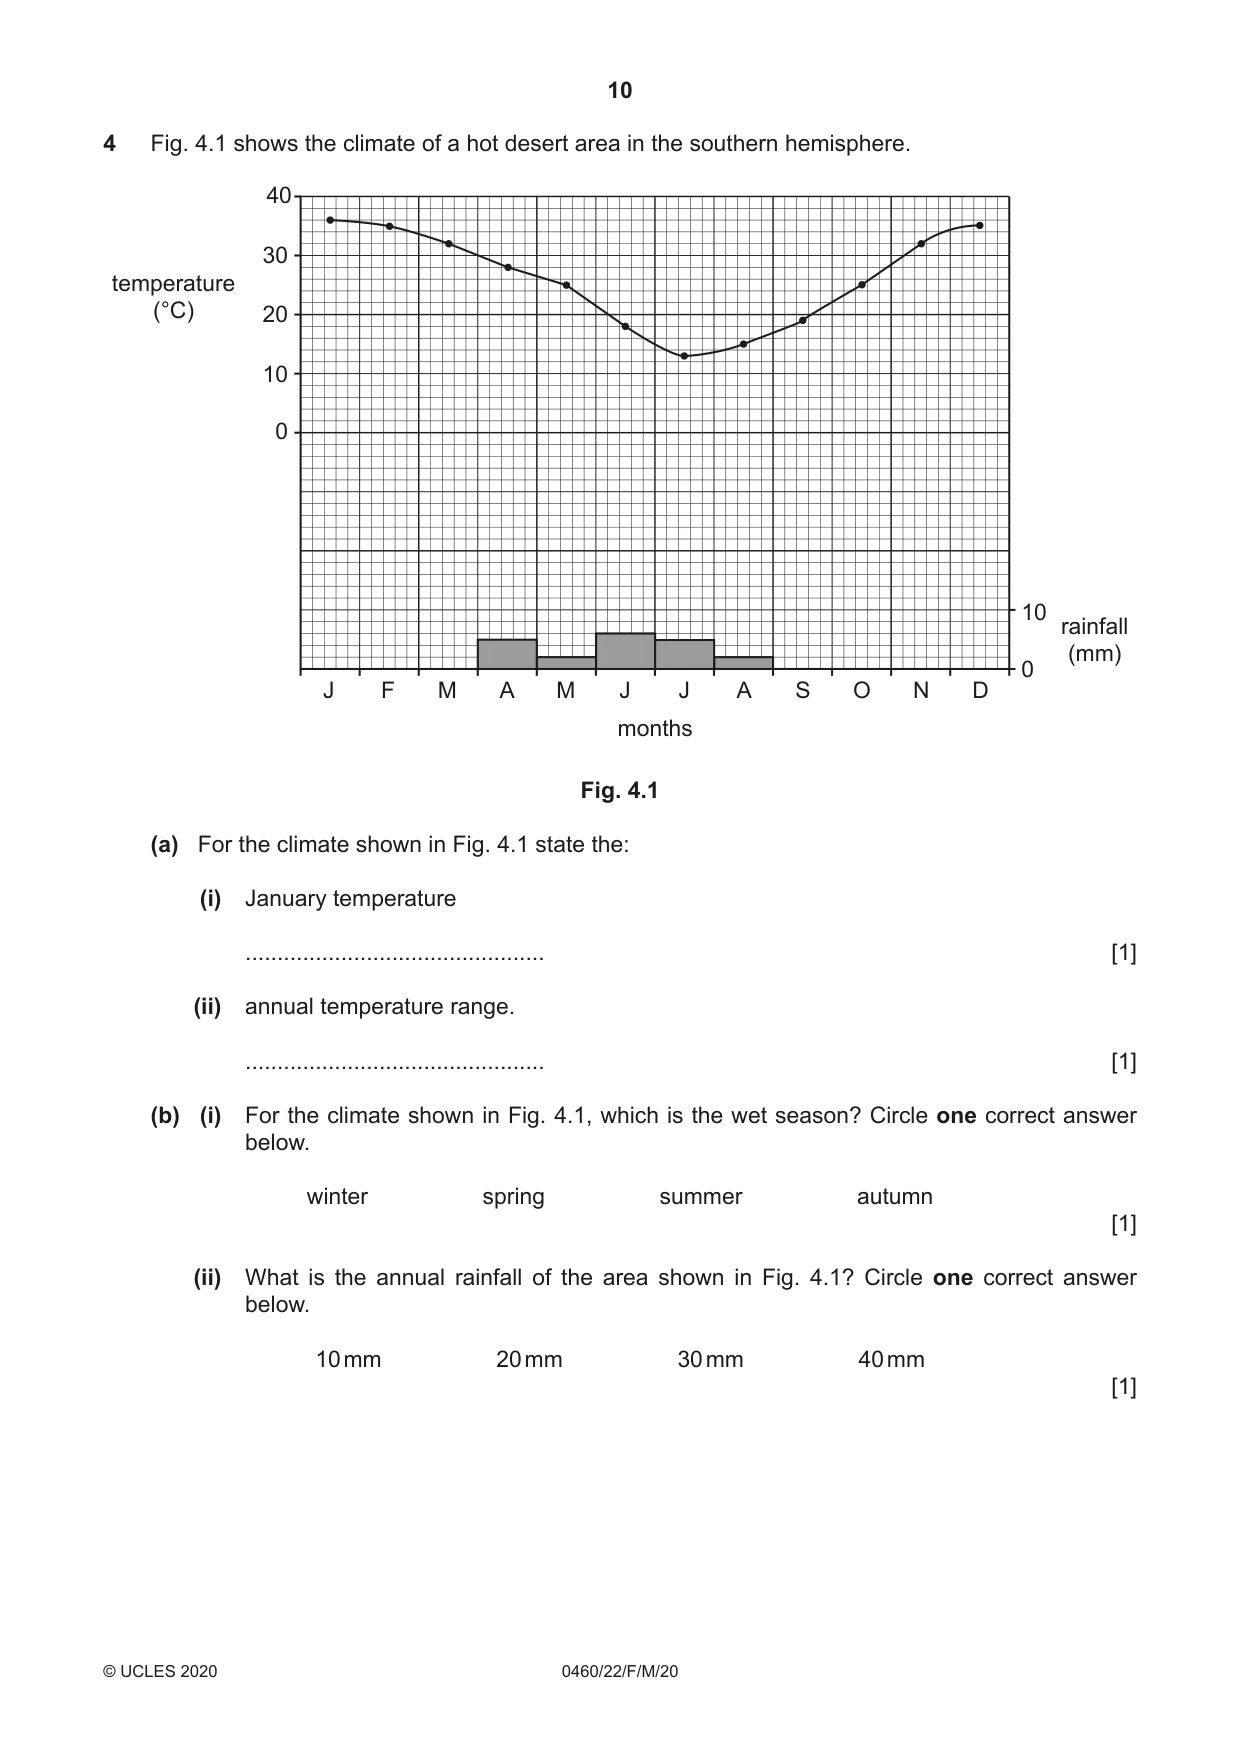
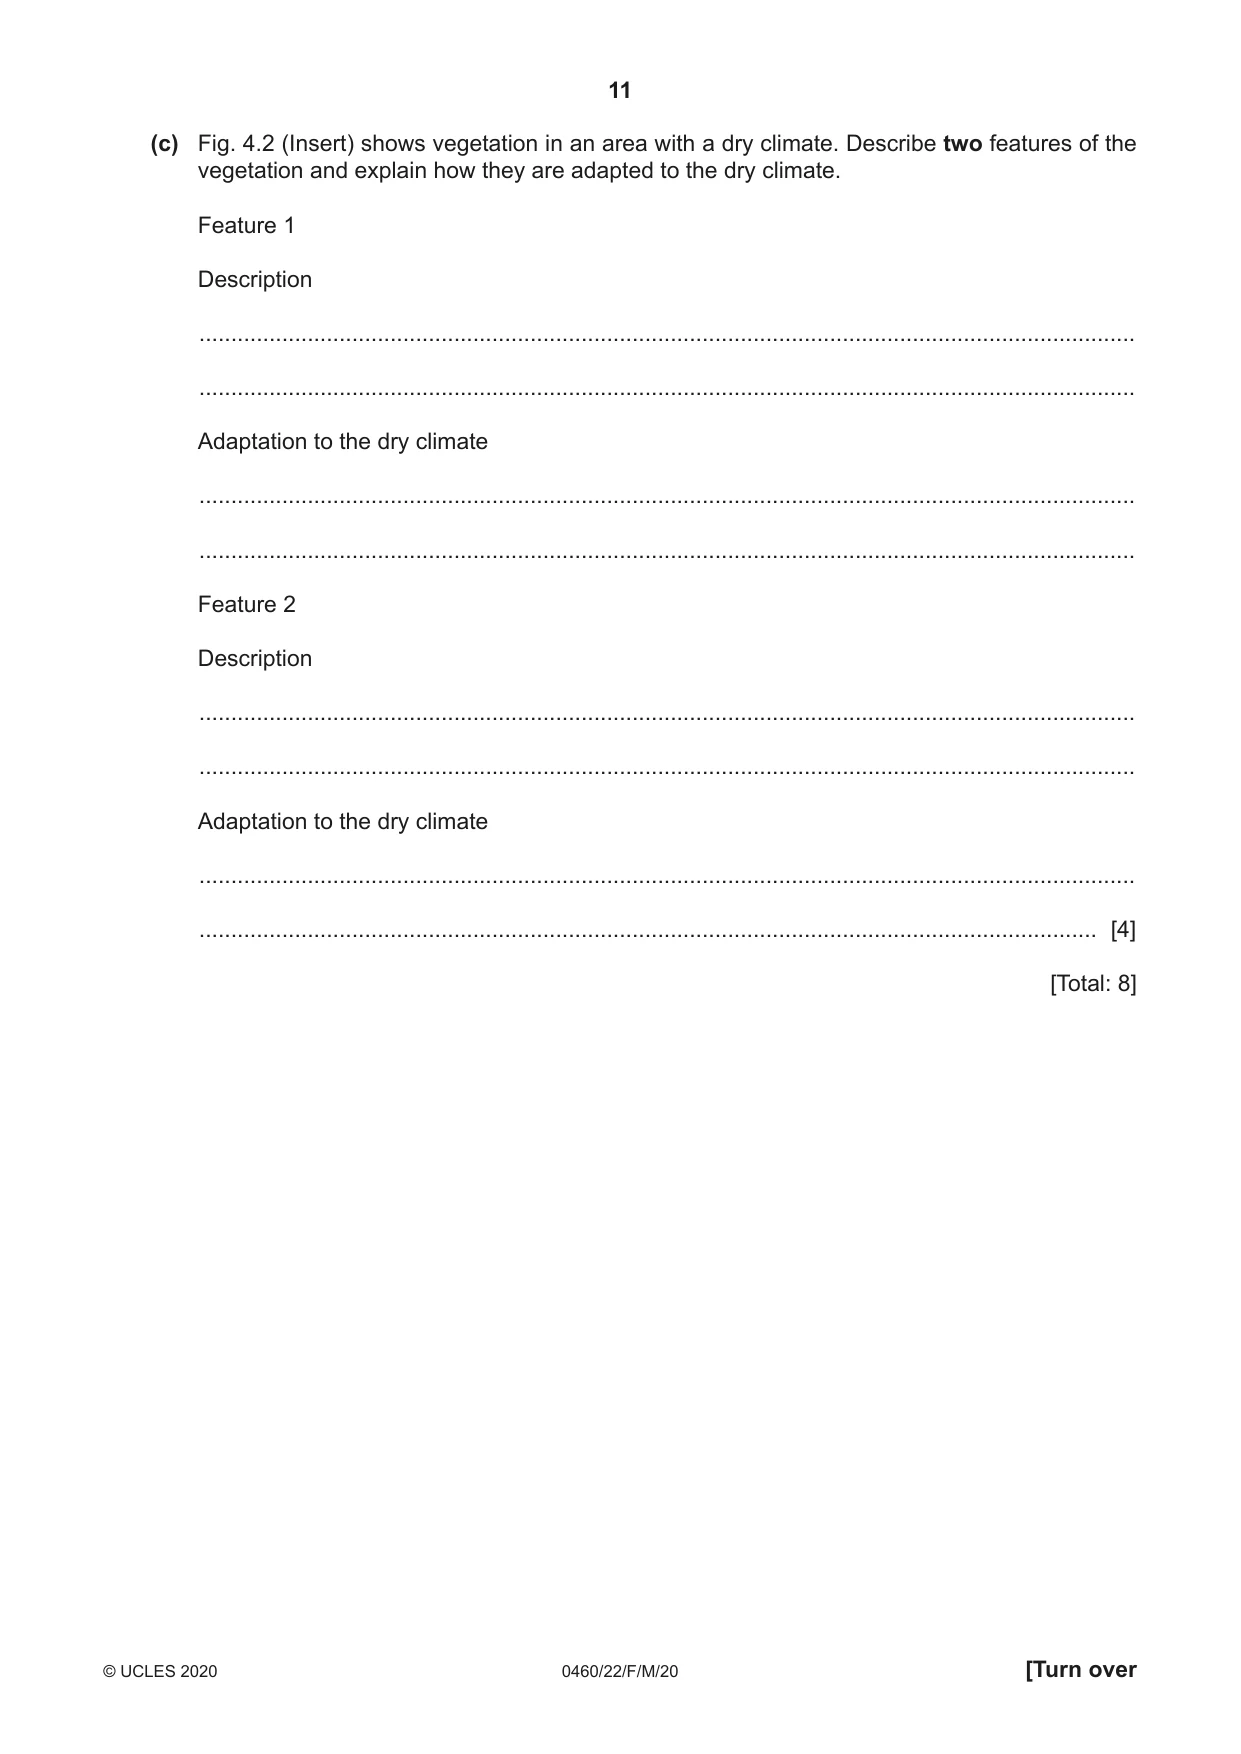
4 Fig. 4.1 shows the climate of a hot desert area in the southern hemisphere. 40 30 temperature (°C) 20 10 0 10 rainfall (mm) 0 J F M A M J J A S O N D months Fig. 4.1 (a) For the climate shown in Fig. 4.1 state the: (i) January temperature ............................................... [1] (ii) annual temperature range. ............................................... [1] (b) (i) For the climate shown in Fig. 4.1, which is the wet season? Circle one correct answer below. winter spring summer autumn [1] (ii) What is the annual rainfall of the area shown in Fig. 4.1? Circle one correct answer below. 10 mm 20 mm 30 mm 40 mm [1] (c) Fig. 4.2 (Insert) shows vegetation in an area with a dry climate. Describe two features of the vegetation and explain how they are adapted to the dry climate. Feature 1 Description ................................................................................................................................................... ................................................................................................................................................... Adaptation to the dry climate ................................................................................................................................................... ................................................................................................................................................... Feature 2 Description ................................................................................................................................................... ................................................................................................................................................... Adaptation to the dry climate ................................................................................................................................................... ............................................................................................................................................. [4] [Total: 8]
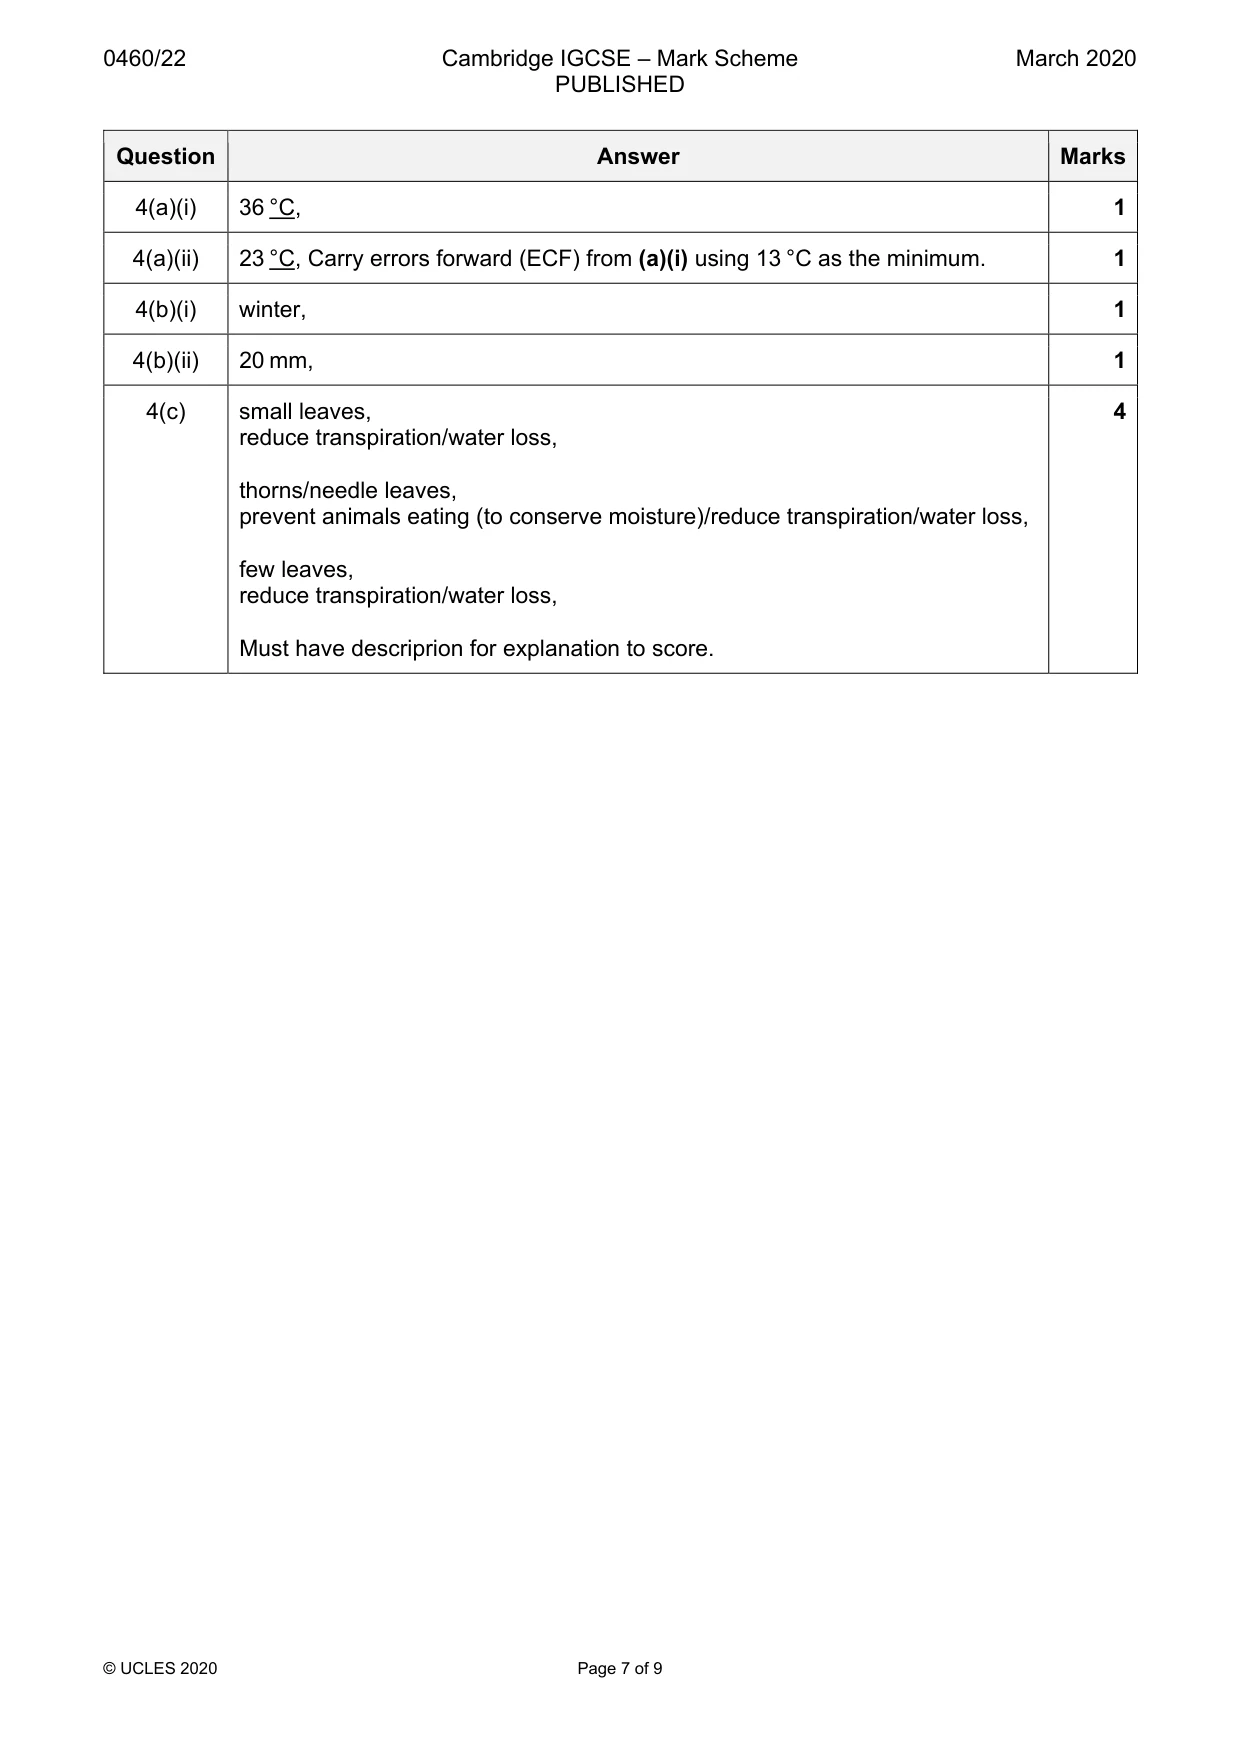
Mark scheme: 4(a)(i) 36 °C, 1 4(a)(ii) 23 °C, Carry errors forward (ECF) from (a)(i) using 13 °C as the minimum. 1 4(b)(i) winter, 1 4(b)(ii) 20 mm, 1 4(c) small leaves, 4 reduce transpiration/water loss, thorns/needle leaves, prevent animals eating (to conserve moisture)/reduce transpiration/water loss, few leaves, reduce transpiration/water loss, Must have descriprion for explanation to score.
Q5 · The United Nations publishes the HDI which measures inequality between countries
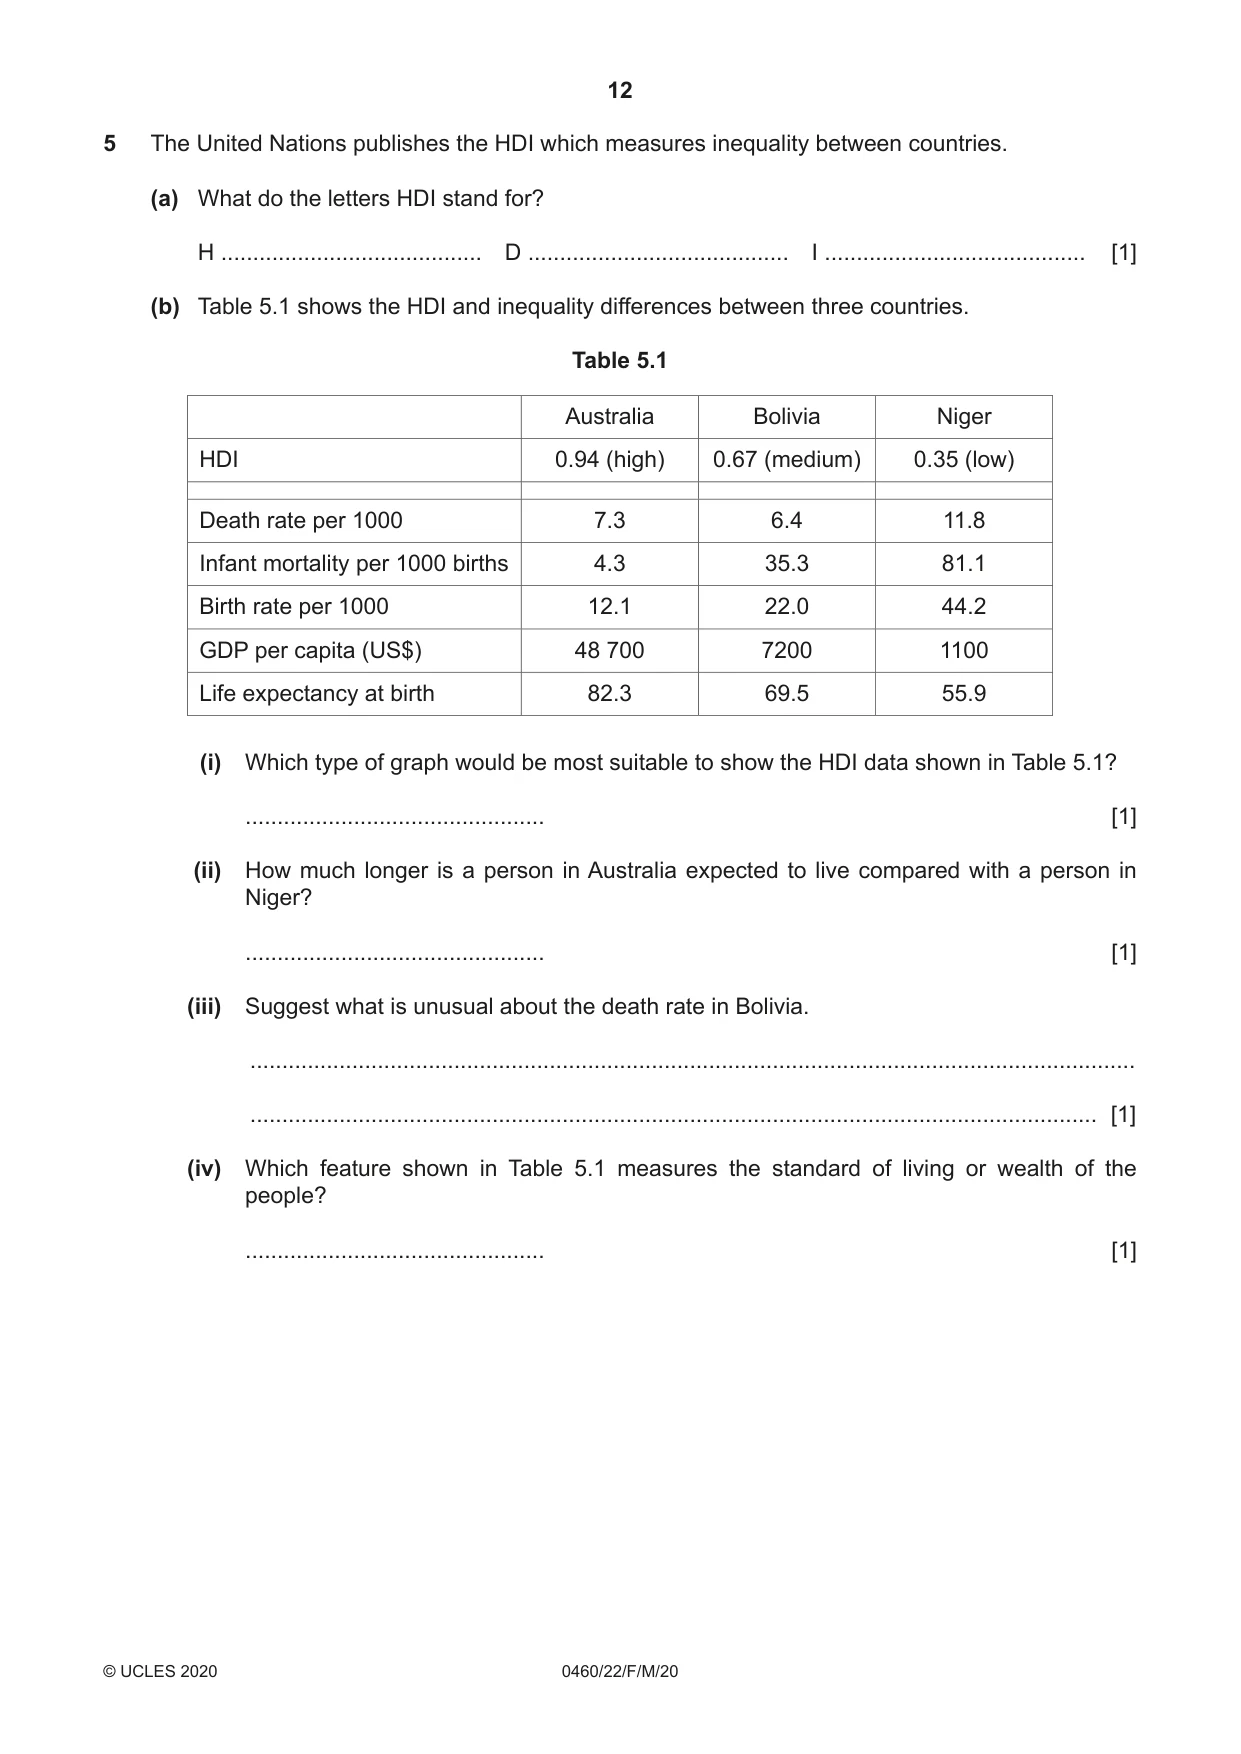
5 The United Nations publishes the HDI which measures inequality between countries. (a) What do the letters HDI stand for? H ......................................... D ......................................... I ......................................... [1] (b) Table 5.1 shows the HDI and inequality differences between three countries. Table 5.1 Australia Bolivia Niger HDI 0.94 (high) 0.67 (medium) 0.35 (low) Death rate per 1000 7.3 6.4 11.8 Infant mortality per 1000 births 4.3 35.3 81.1 Birth rate per 1000 12.1 22.0 44.2 GDP per capita (US$) 48 700 7200 1100 Life expectancy at birth 82.3 69.5 55.9 (i) Which type of graph would be most suitable to show the HDI data shown in Table 5.1? ............................................... [1] (ii) How much longer is a person in Australia expected to live compared with a person in Niger? ............................................... [1] (iii) Suggest what is unusual about the death rate in Bolivia. ........................................................................................................................................... ..................................................................................................................................... [1] (iv) Which feature shown in Table 5.1 measures the standard of living or wealth of the people? ............................................... [1] (c) Residential areas often show inequality in living standards. Figs. 5.1 and 5.2 (Insert) show residential areas in Africa. Describe the differences seen in the photographs which show inequality in living standards. ................................................................................................................................................... ................................................................................................................................................... ................................................................................................................................................... ................................................................................................................................................... ................................................................................................................................................... ................................................................................................................................................... ................................................................................................................................................... ................................................................................................................................................... ................................................................................................................................................... ............................................................................................................................................. [3] [Total: 8]
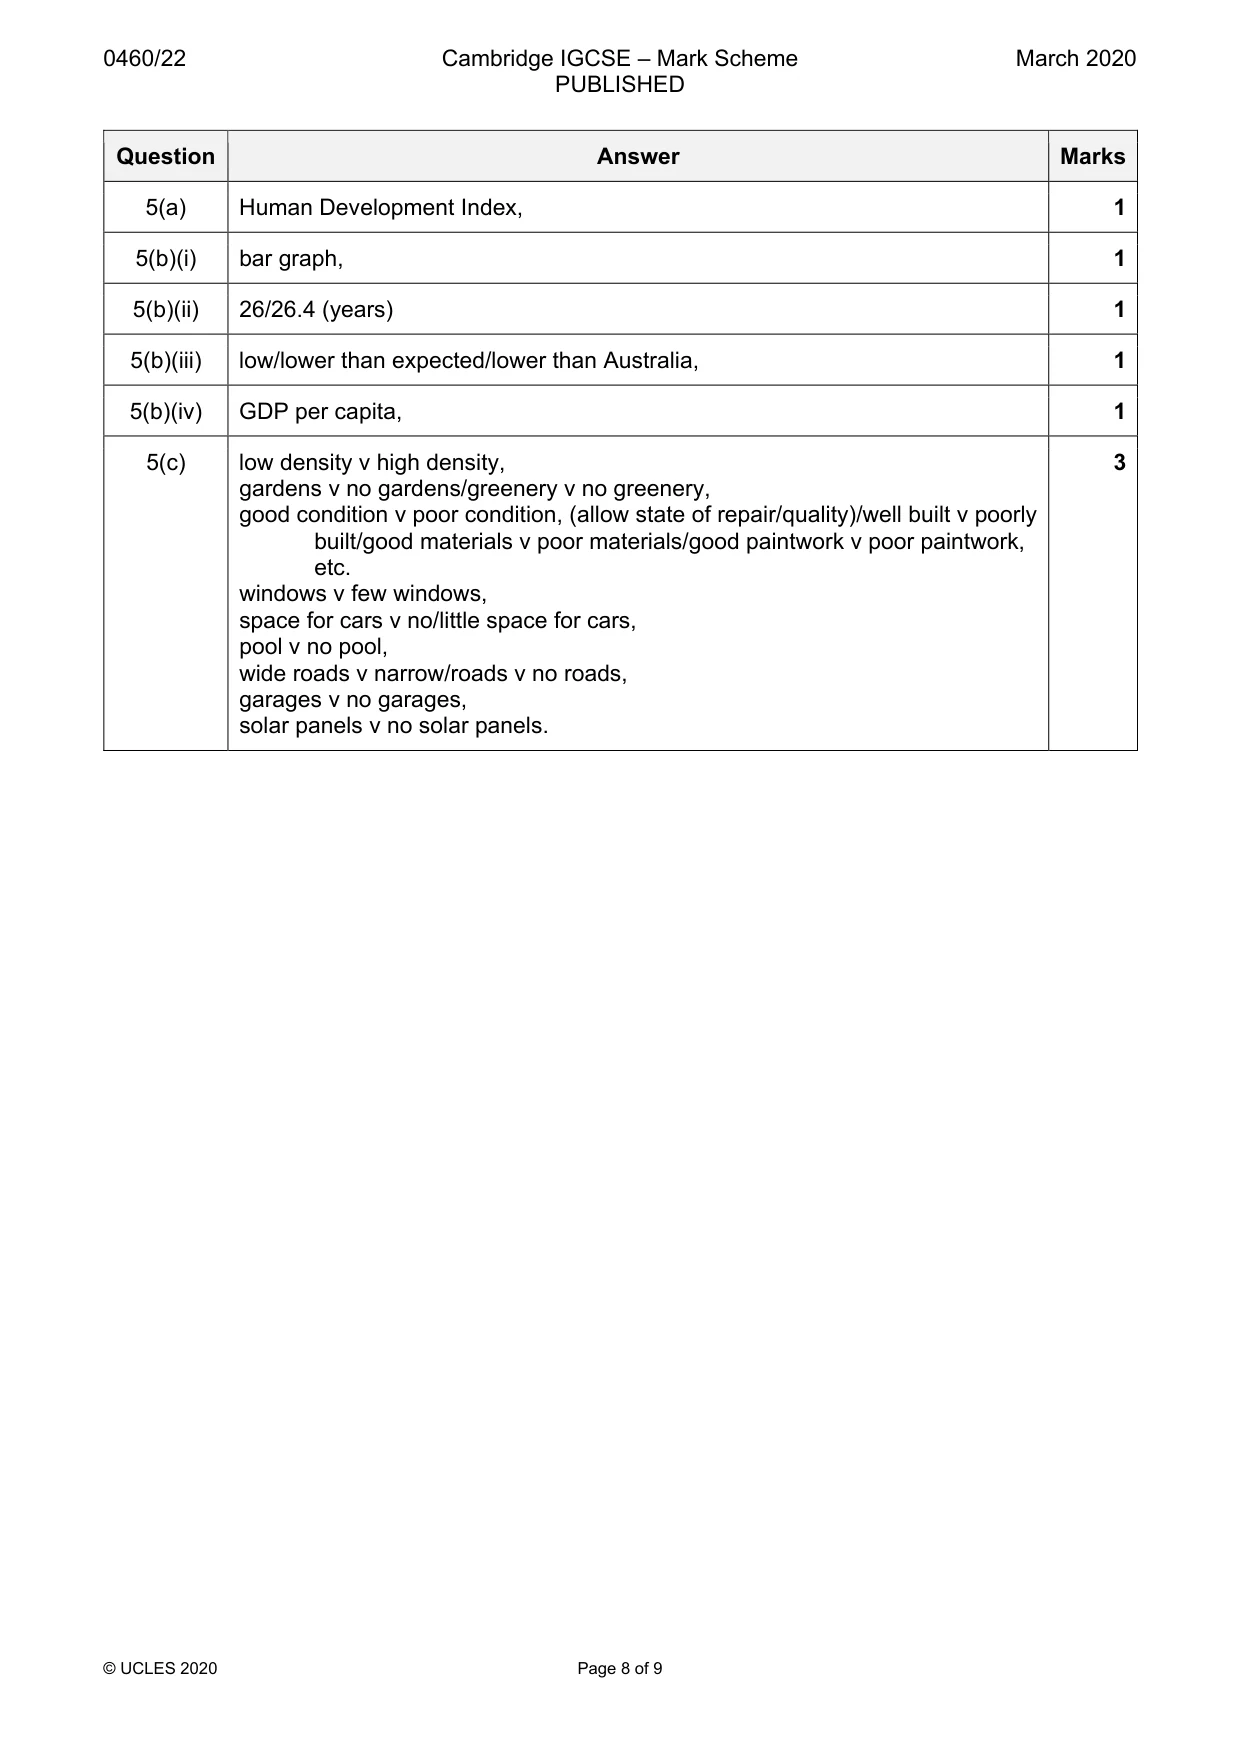
Mark scheme: 5(a) Human Development Index, 1 5(b)(i) bar graph, 1 5(b)(ii) 26/26.4 (years) 1 5(b)(iii) low/lower than expected/lower than Australia, 1 5(b)(iv) GDP per capita, 1 5(c) low density v high density, 3 gardens v no gardens/greenery v no greenery, good condition v poor condition, (allow state of repair/quality)/well built v poorly built/good materials v poor materials/good paintwork v poor paintwork, etc. windows v few windows, space for cars v no/little space for cars, pool v no pool, wide roads v narrow/roads v no roads, garages v no garages, solar panels v no solar panels.
Q6 · Electricity generation from HEP (hydroelectric power) and other renewables in the USA…
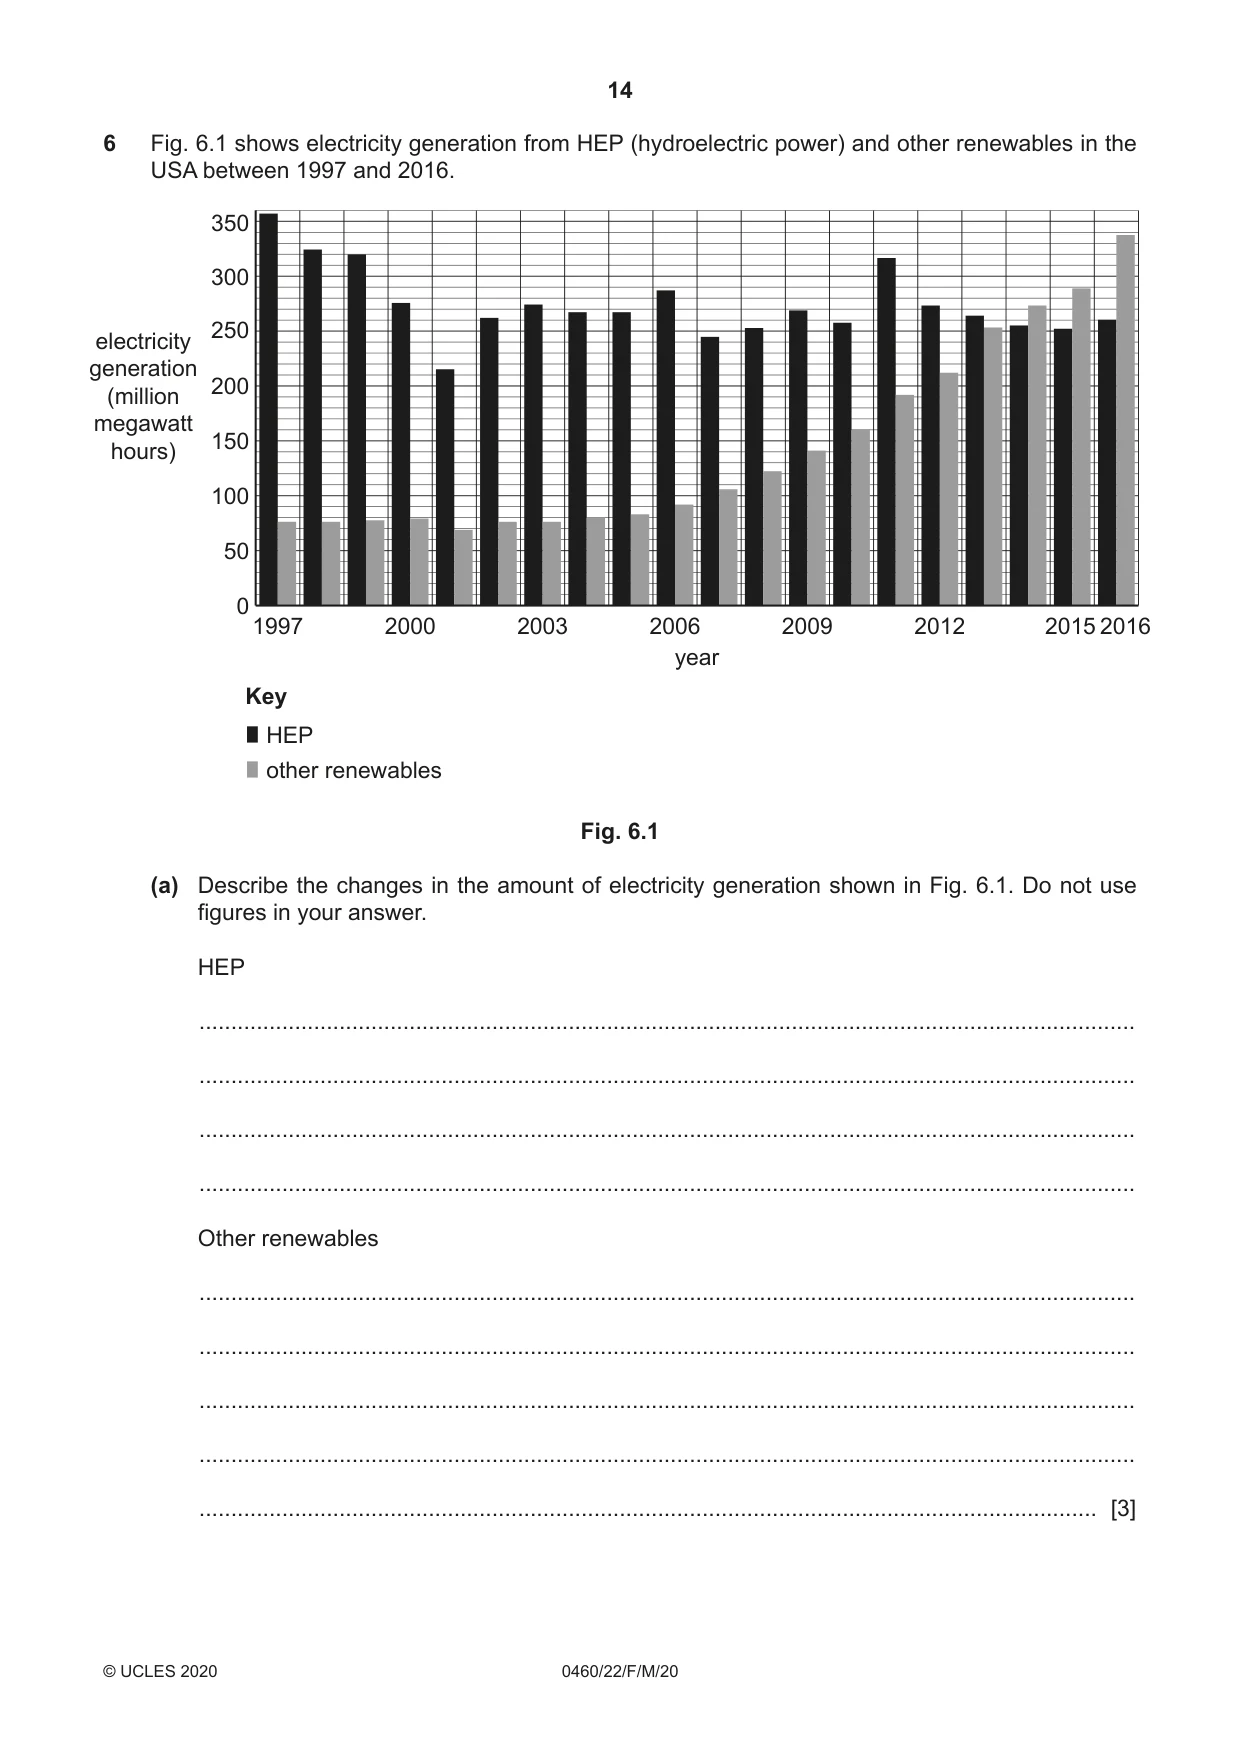
6 Fig. 6.1 shows electricity generation from HEP (hydroelectric power) and other renewables in the USA between 1997 and 2016. 350 300 250 electricity generation 200 (million megawatt 150 hours) 100 50 0 1997 2000 2003 2006 2009 2012 2015 2016 year Key HEP other renewables Fig. 6.1 (a) Describe the changes in the amount of electricity generation shown in Fig. 6.1. Do not use figures in your answer. HEP ................................................................................................................................................... ................................................................................................................................................... ................................................................................................................................................... ................................................................................................................................................... Other renewables ................................................................................................................................................... ................................................................................................................................................... ................................................................................................................................................... ................................................................................................................................................... ............................................................................................................................................. [3] (b) Fig. 6.2 (Insert) shows a dam used to produce HEP. Give two advantages of the site of the dam for producing HEP. 1 ................................................................................................................................................ ................................................................................................................................................... 2 ................................................................................................................................................ ............................................................................................................................................. [2] (c) Suggest reasons why some local people may have been for the construction of the dam and other local people may have been against it. For ................................................................................................................................................... ................................................................................................................................................... ................................................................................................................................................... ................................................................................................................................................... Against ................................................................................................................................................... ................................................................................................................................................... ................................................................................................................................................... ................................................................................................................................................... ................................................................................................................................................... ............................................................................................................................................. [3] [Total: 8] Additional Pages If you use the following lined pages to complete the answer(s) to any question(s), the question number(s) must be clearly shown. .................................................................................................................................................................. .................................................................................................................................................................. .................................................................................................................................................................. .................................................................................................................................................................. .................................................................................................................................................................. .................................................................................................................................................................. .................................................................................................................................................................. .................................................................................................................................................................. .................................................................................................................................................................. .................................................................................................................................................................. .................................................................................................................................................................. .................................................................................................................................................................. .................................................................................................................................................................. .................................................................................................................................................................. .................................................................................................................................................................. .................................................................................................................................................................. .................................................................................................................................................................. .................................................................................................................................................................. .................................................................................................................................................................. .................................................................................................................................................................. .................................................................................................................................................................. .................................................................................................................................................................. .................................................................................................................................................................. .................................................................................................................................................................. ..................................................................................................................................................................
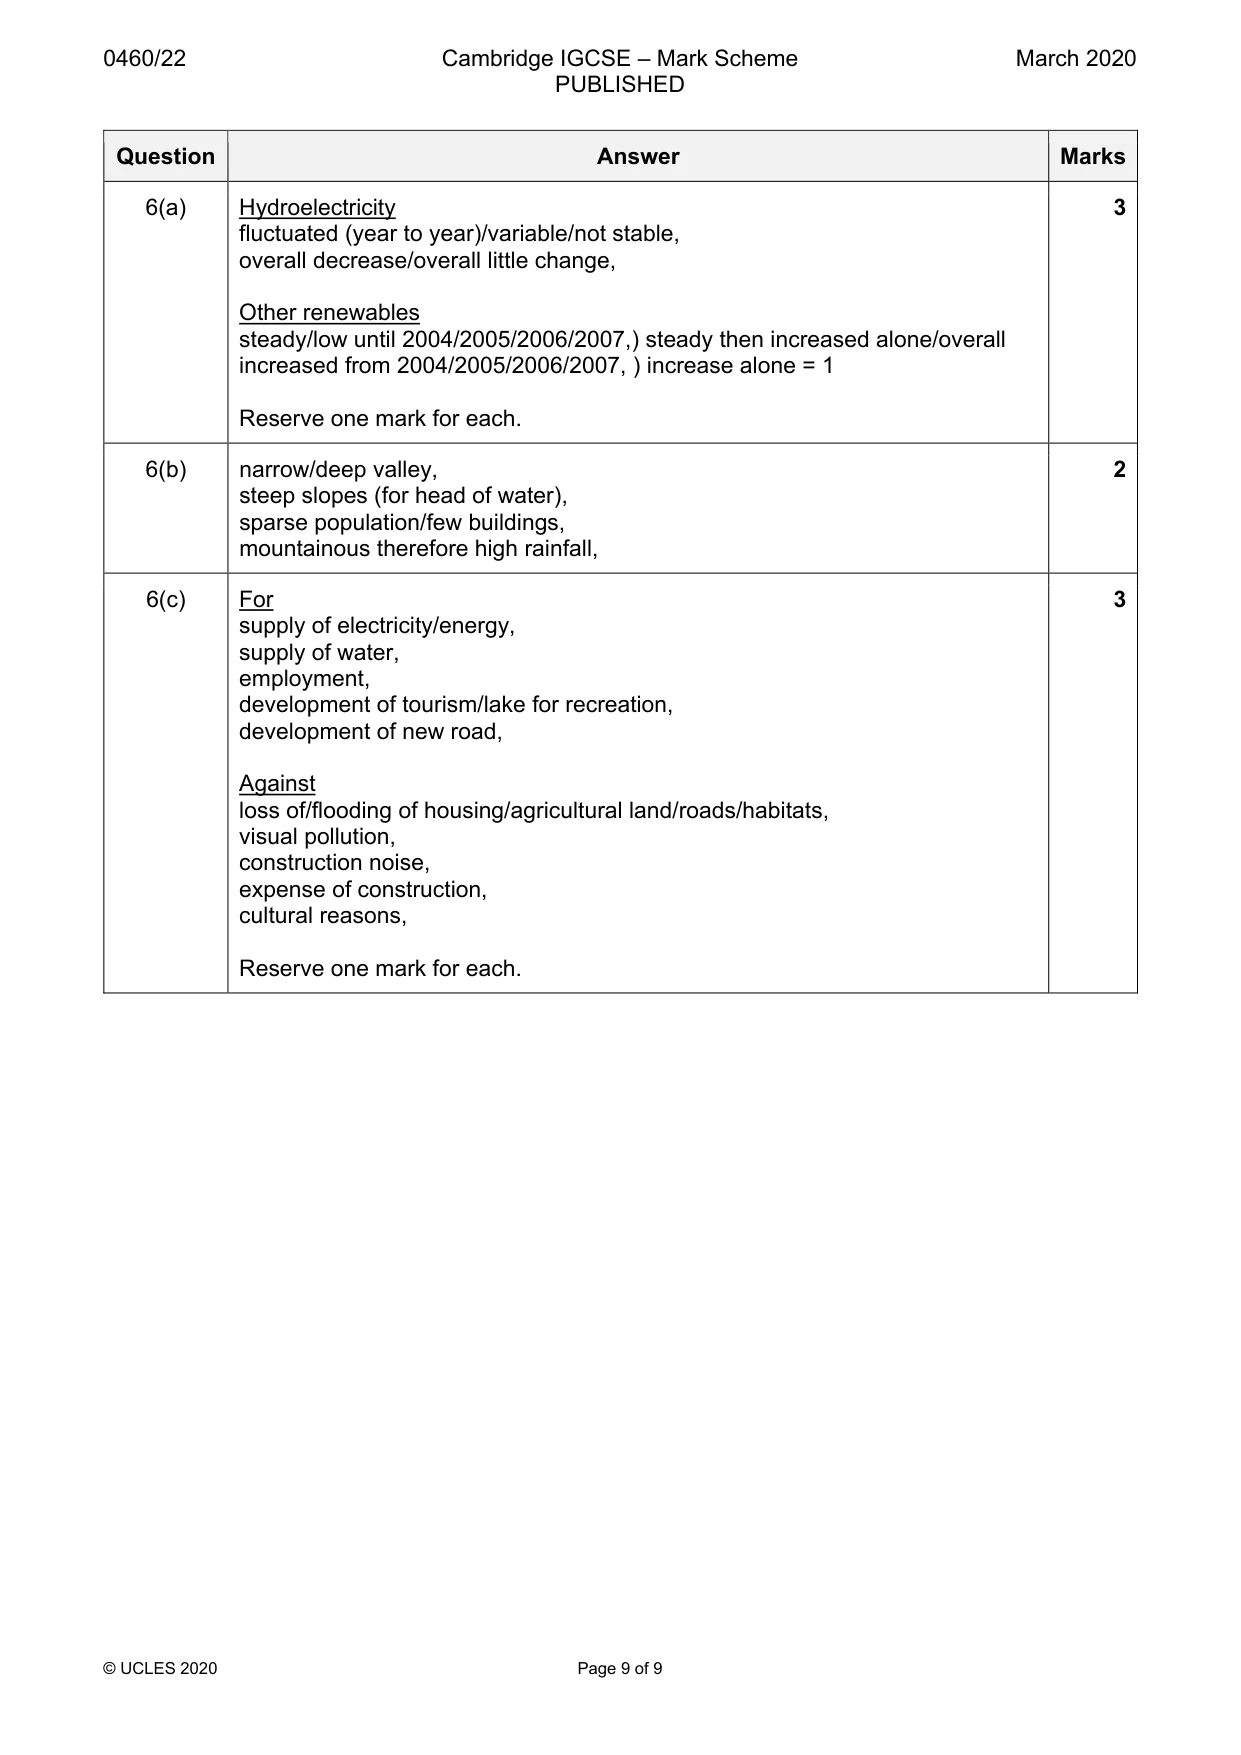
Mark scheme: 6(a) Hydroelectricity 3 fluctuated (year to year)/variable/not stable, overall decrease/overall little change, Other renewables steady/low until 2004/2005/2006/2007,) steady then increased alone/overall increased from 2004/2005/2006/2007, ) increase alone = 1 Reserve one mark for each. 6(b) narrow/deep valley, 2 steep slopes (for head of water), sparse population/few buildings, mountainous therefore high rainfall, 6(c) For 3 supply of electricity/energy, supply of water, employment, development of tourism/lake for recreation, development of new road, Against loss of/flooding of housing/agricultural land/roads/habitats, visual pollution, construction noise, expense of construction, cultural reasons, Reserve one mark for each.
What was in this paper
The subtopics covered by these 6 questions, and how many questions each got. Open one in a new tab to see every Cambridge question on it.
What you needed in this session
Cambridge’s own grade thresholds for 2020 Feb/March, Paper 2 · Variant 2. A higher threshold means an easier paper — the bar moves with how the cohort did.