Cambridge IGCSE Geography 0460 — 2022 May/June Paper 2 · Variant 3
0460/23/M/J/22 · 6 questions · 60 marks · ≈68 min
The question paper and its mark scheme, free to read here and free to download. This is Cambridge’s own paper, exactly as it was sat.
Question paper16 pages


Mark scheme7 pages
Answers below. Sit the paper first if you are practising.
Questions as text
Q1 · Study the map extract for Irvine, Scotland
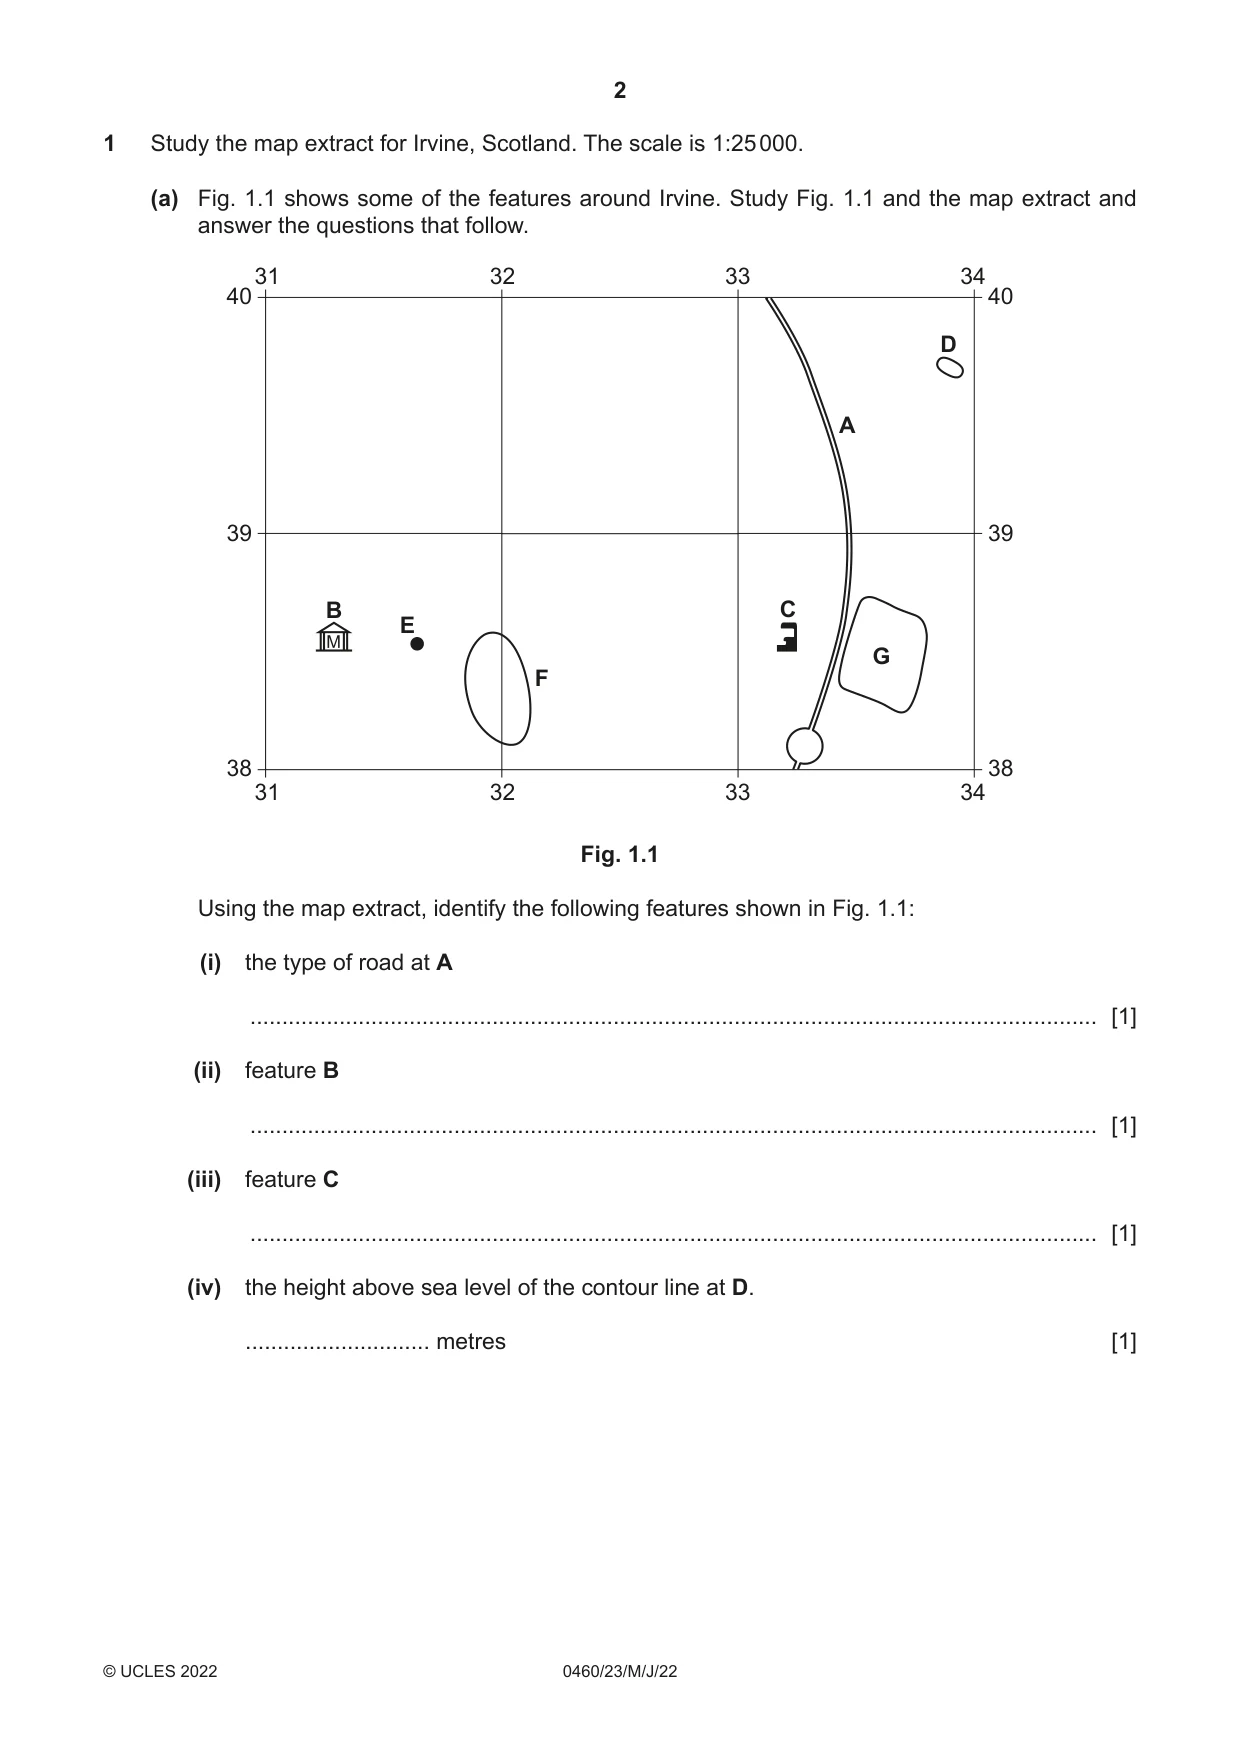
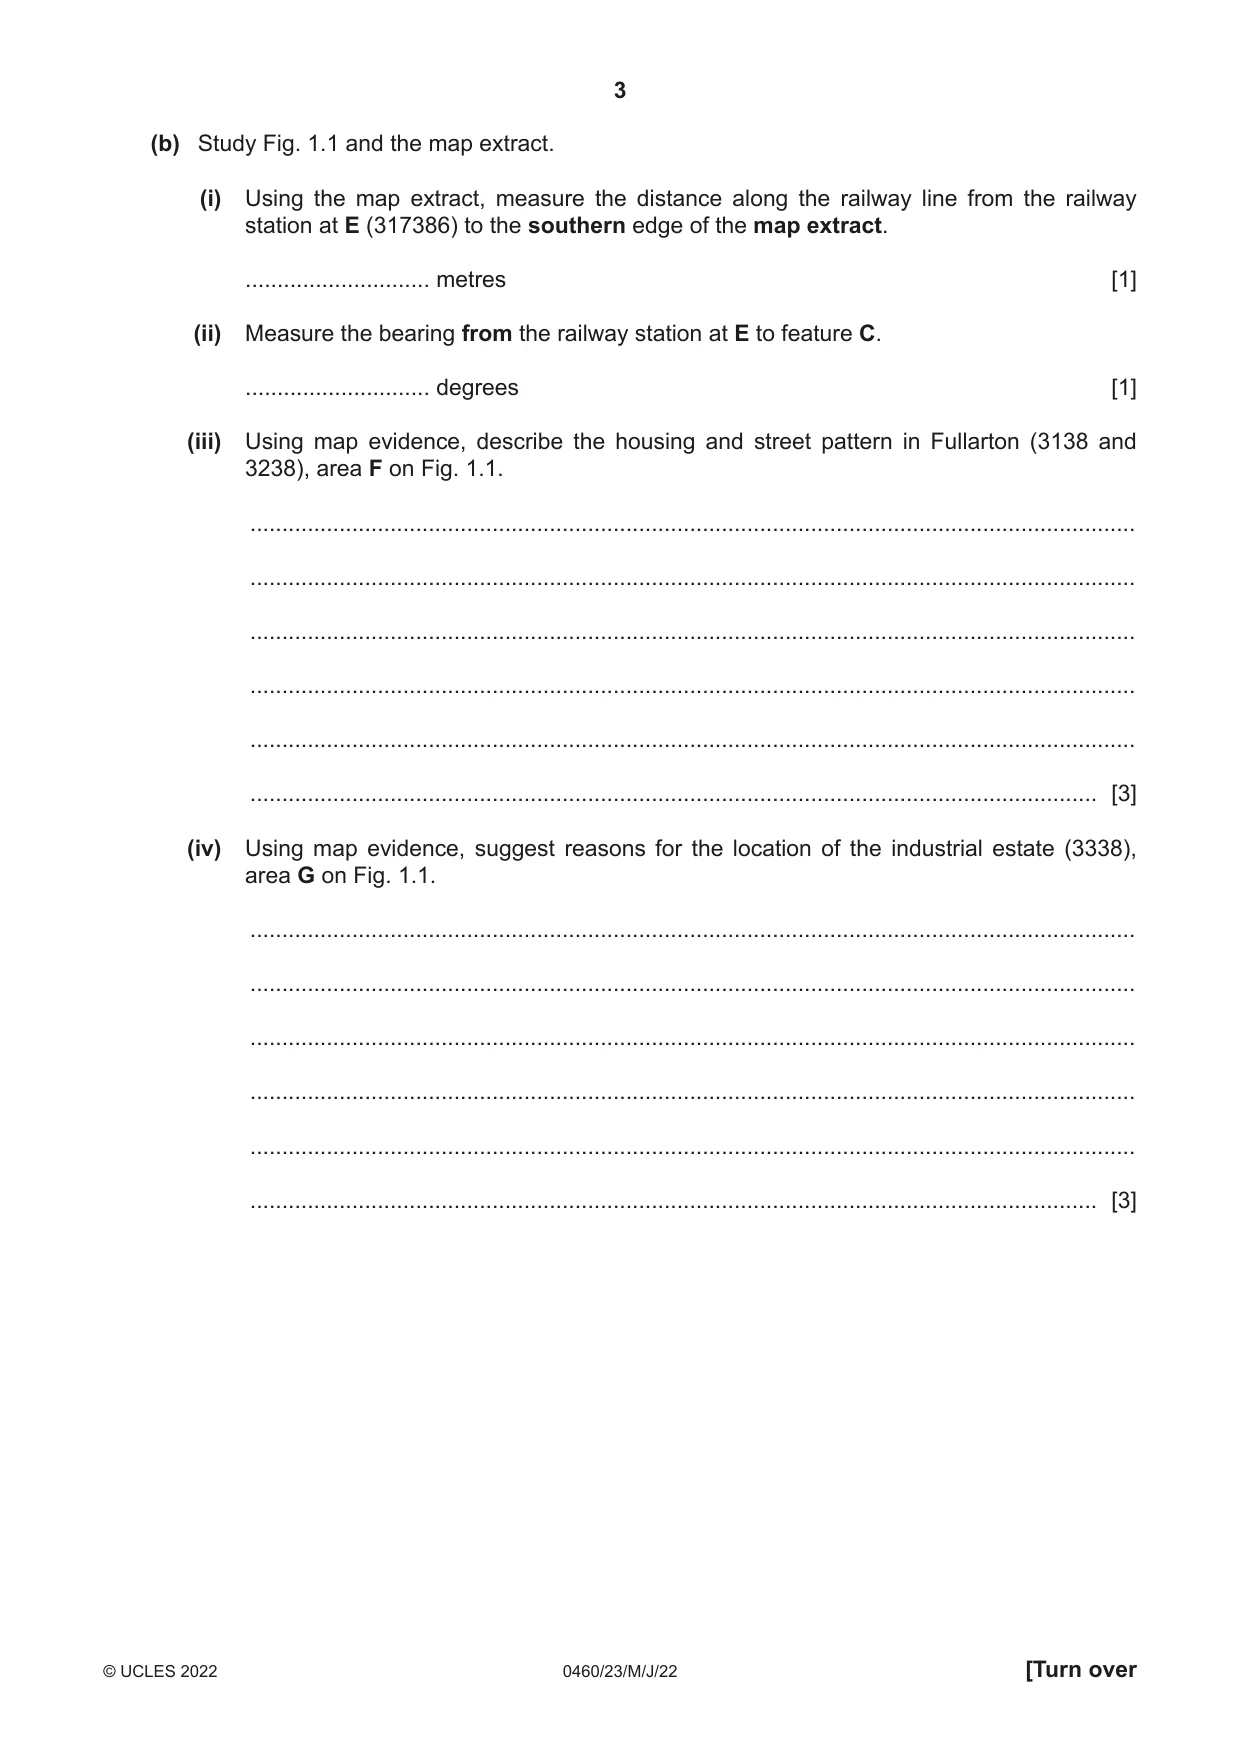
1 Study the map extract for Irvine, Scotland. The scale is 1:25 000. (a) Fig. 1.1 shows some of the features around Irvine. Study Fig. 1.1 and the map extract and answer the questions that follow. 31 32 33 34 40 40 D A 39 39 B C E G F 38 38 31 32 33 34 Fig. 1.1 Using the map extract, identify the following features shown in Fig. 1.1: (i) the type of road at A ..................................................................................................................................... [1] (ii) feature B ..................................................................................................................................... [1] (iii) feature C ..................................................................................................................................... [1] (iv) the height above sea level of the contour line at D. ............................. metres [1] (b) Study Fig. 1.1 and the map extract. (i) Using the map extract, measure the distance along the railway line from the railway station at E (317386) to the southern edge of the map extract. ............................. metres [1] (ii) Measure the bearing from the railway station at E to feature C. ............................. degrees [1] (iii) Using map evidence, describe the housing and street pattern in Fullarton (3138 and 3238), area F on Fig. 1.1. ........................................................................................................................................... ........................................................................................................................................... ........................................................................................................................................... ........................................................................................................................................... ........................................................................................................................................... ..................................................................................................................................... [3] (iv) Using map evidence, suggest reasons for the location of the industrial estate (3338), area G on Fig. 1.1. ........................................................................................................................................... ........................................................................................................................................... ........................................................................................................................................... ........................................................................................................................................... ........................................................................................................................................... ..................................................................................................................................... [3] (c) Describe the human and physical (natural) features of the River Garnock which flows in the west of the map extract. Human features ................................................................................................................................................... ................................................................................................................................................... ................................................................................................................................................... ................................................................................................................................................... ................................................................................................................................................... ................................................................................................................................................... ................................................................................................................................................... ................................................................................................................................................... ................................................................................................................................................... ................................................................................................................................................... Physical features ................................................................................................................................................... ................................................................................................................................................... ................................................................................................................................................... ................................................................................................................................................... ................................................................................................................................................... ................................................................................................................................................... ................................................................................................................................................... ................................................................................................................................................... ................................................................................................................................................... ............................................................................................................................................. [8] [Total: 20]
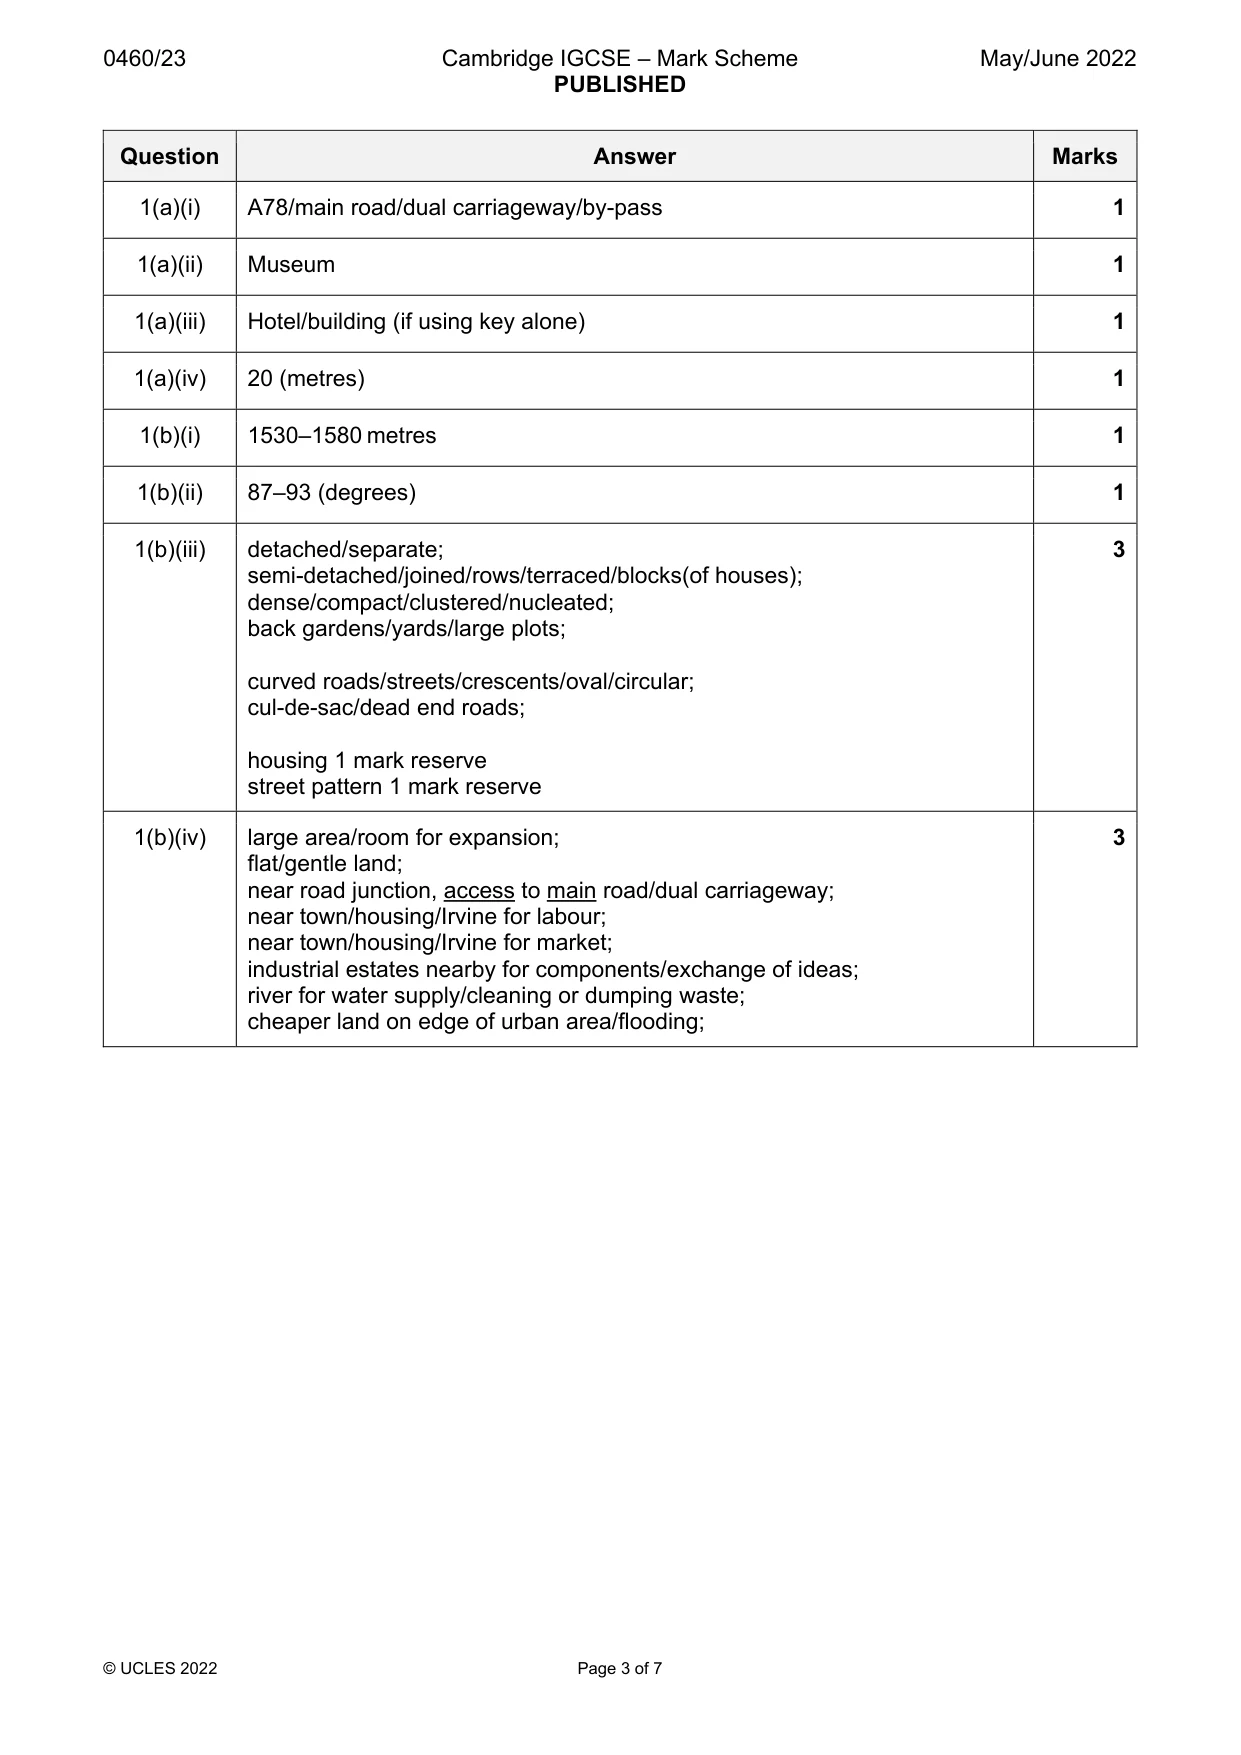
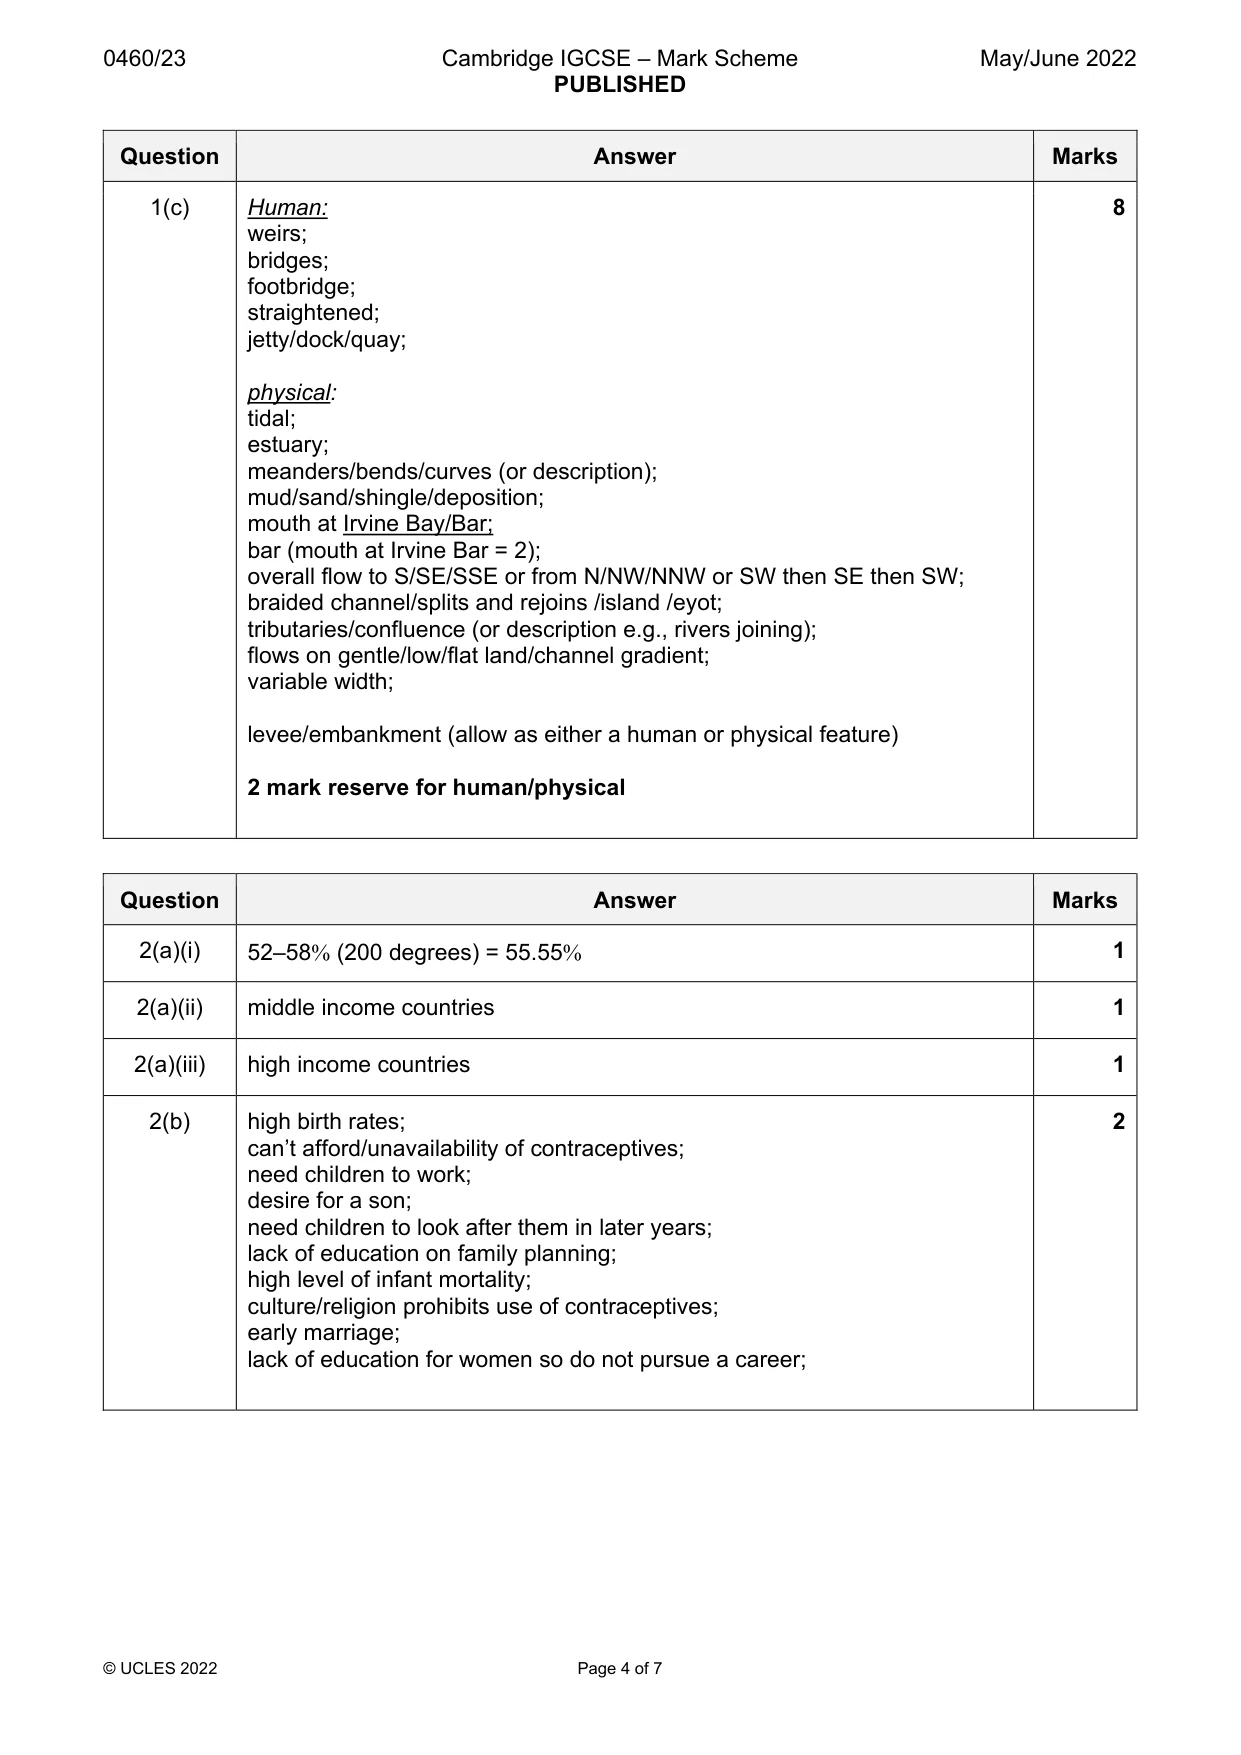
Mark scheme: Question Answer Marks 1(a)(i) A78/main road/dual carriageway/by-pass 1 1(a)(ii) Museum 1 1(a)(iii) Hotel/building (if using key alone) 1 1(a)(iv) 20 (metres) 1 1(b)(i) 1530–1580 metres 1 1(b)(ii) 87–93 (degrees) 1 1(b)(iii) detached/separate; 3 semi-detached/joined/rows/terraced/blocks(of houses); dense/compact/clustered/nucleated; back gardens/yards/large plots; curved roads/streets/crescents/oval/circular; cul-de-sac/dead end roads; housing 1 mark reserve street pattern 1 mark reserve 1(b)(iv) large area/room for expansion; 3 flat/gentle land; near road junction, access to main road/dual carriageway; near town/housing/Irvine for labour; near town/housing/Irvine for market; industrial estates nearby for components/exchange of ideas; river for water supply/cleaning or dumping waste; cheaper land on edge of urban area/flooding; 1(c) Human: 8 weirs; bridges; footbridge; straightened; jetty/dock/quay; physical: tidal; estuary; meanders/bends/curves (or description); mud/sand/shingle/deposition; mouth at Irvine Bay/Bar; bar (mouth at Irvine Bar = 2); overall flow to S/SE/SSE or from N/NW/NNW or SW then SE then SW; braided channel/splits and rejoins /island /eyot; tributaries/confluence (or description e.g., rivers joining); flows on gentle/low/flat land/channel gradient; variable width; levee/embankment (allow as either a human or physical feature) 2 mark reserve for human/physical
More questions on Settlements (rural and urban) and service provision
Question 2
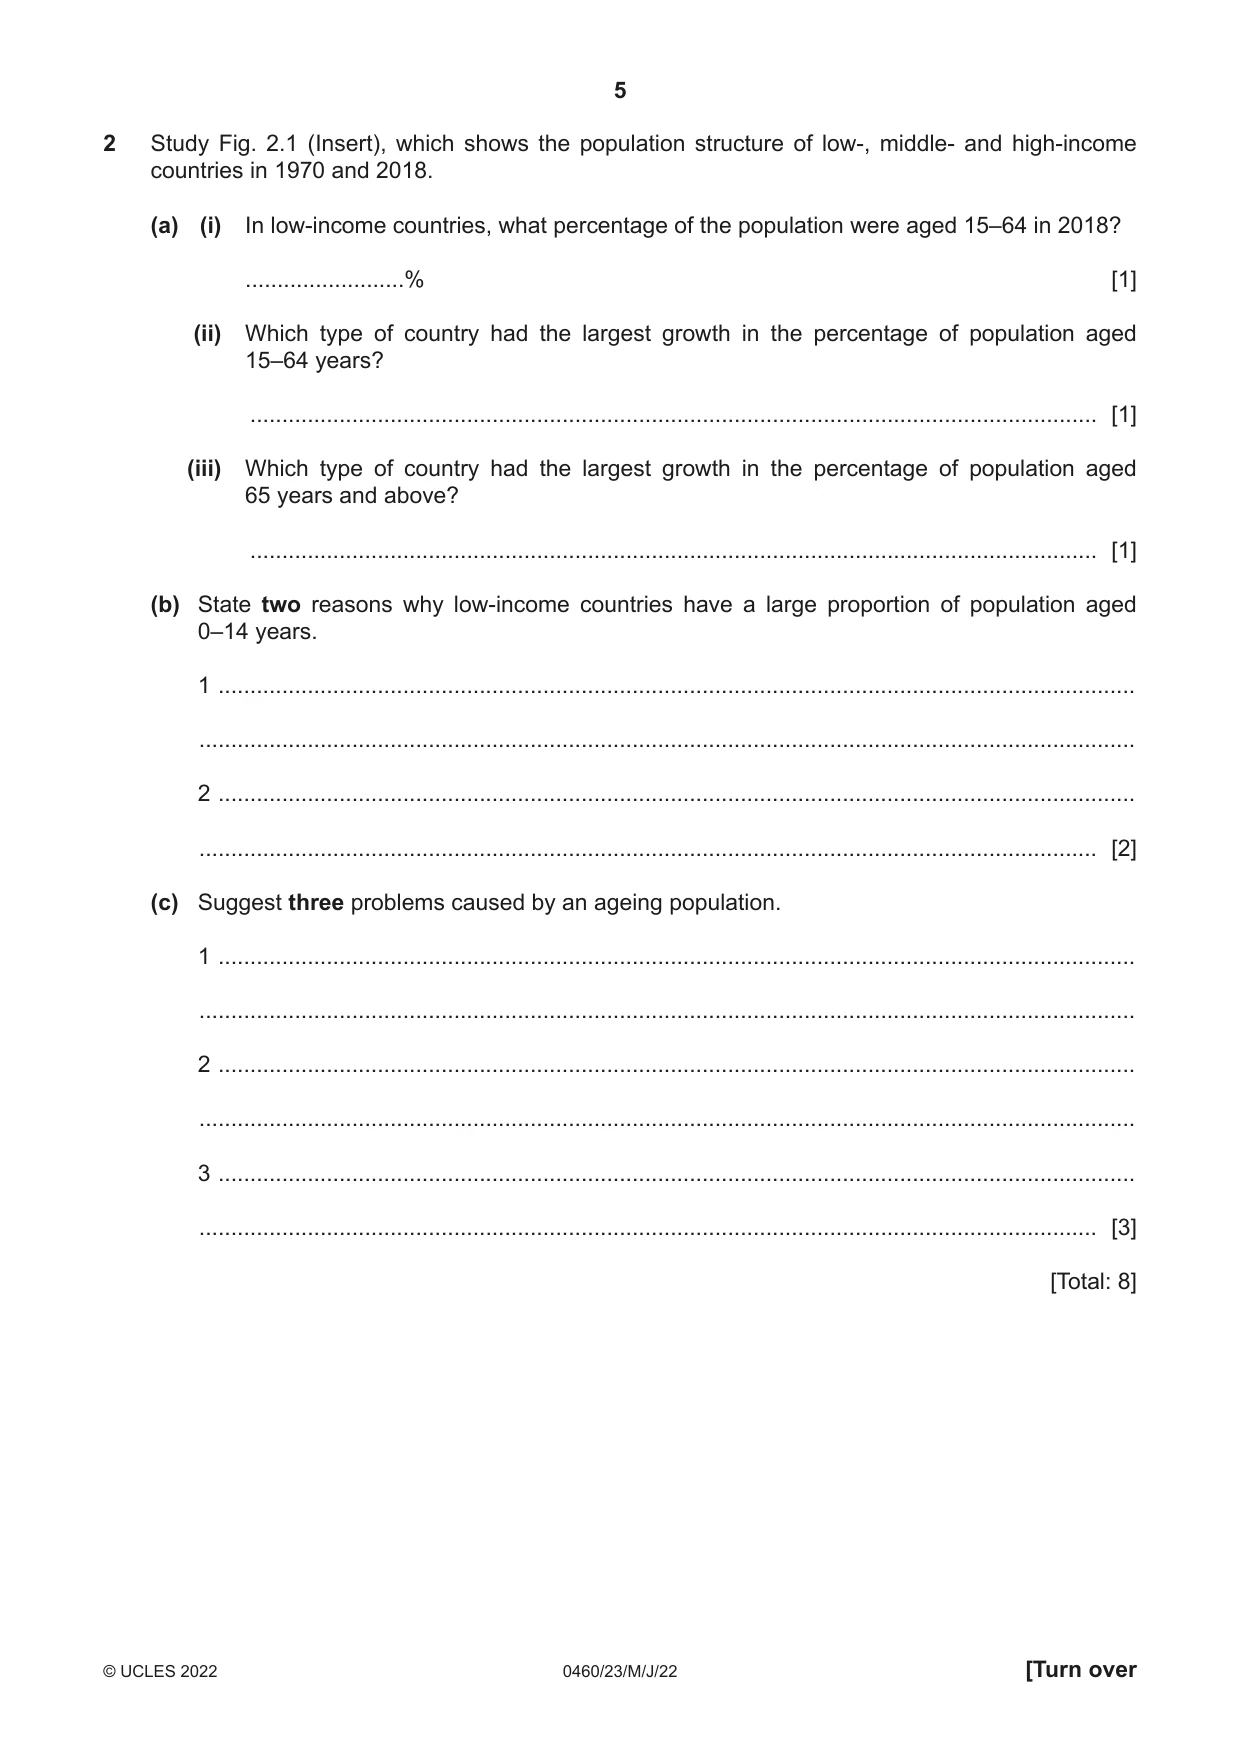
2 Study Fig. 2.1 (Insert), which shows the population structure of low-, middle- and high-income countries in 1970 and 2018. (a) (i) In low-income countries, what percentage of the population were aged 15–64 in 2018? .........................% [1] (ii) Which type of country had the largest growth in the percentage of population aged 15–64 years? ..................................................................................................................................... [1] (iii) Which type of country had the largest growth in the percentage of population aged 65 years and above? ..................................................................................................................................... [1] (b) State two reasons why low-income countries have a large proportion of population aged 0–14 years. 1 ................................................................................................................................................ ................................................................................................................................................... 2 ................................................................................................................................................ ............................................................................................................................................. [2] (c) Suggest three problems caused by an ageing population. 1 ................................................................................................................................................ ................................................................................................................................................... 2 ................................................................................................................................................ ................................................................................................................................................... 3 ................................................................................................................................................ ............................................................................................................................................. [3] [Total: 8]
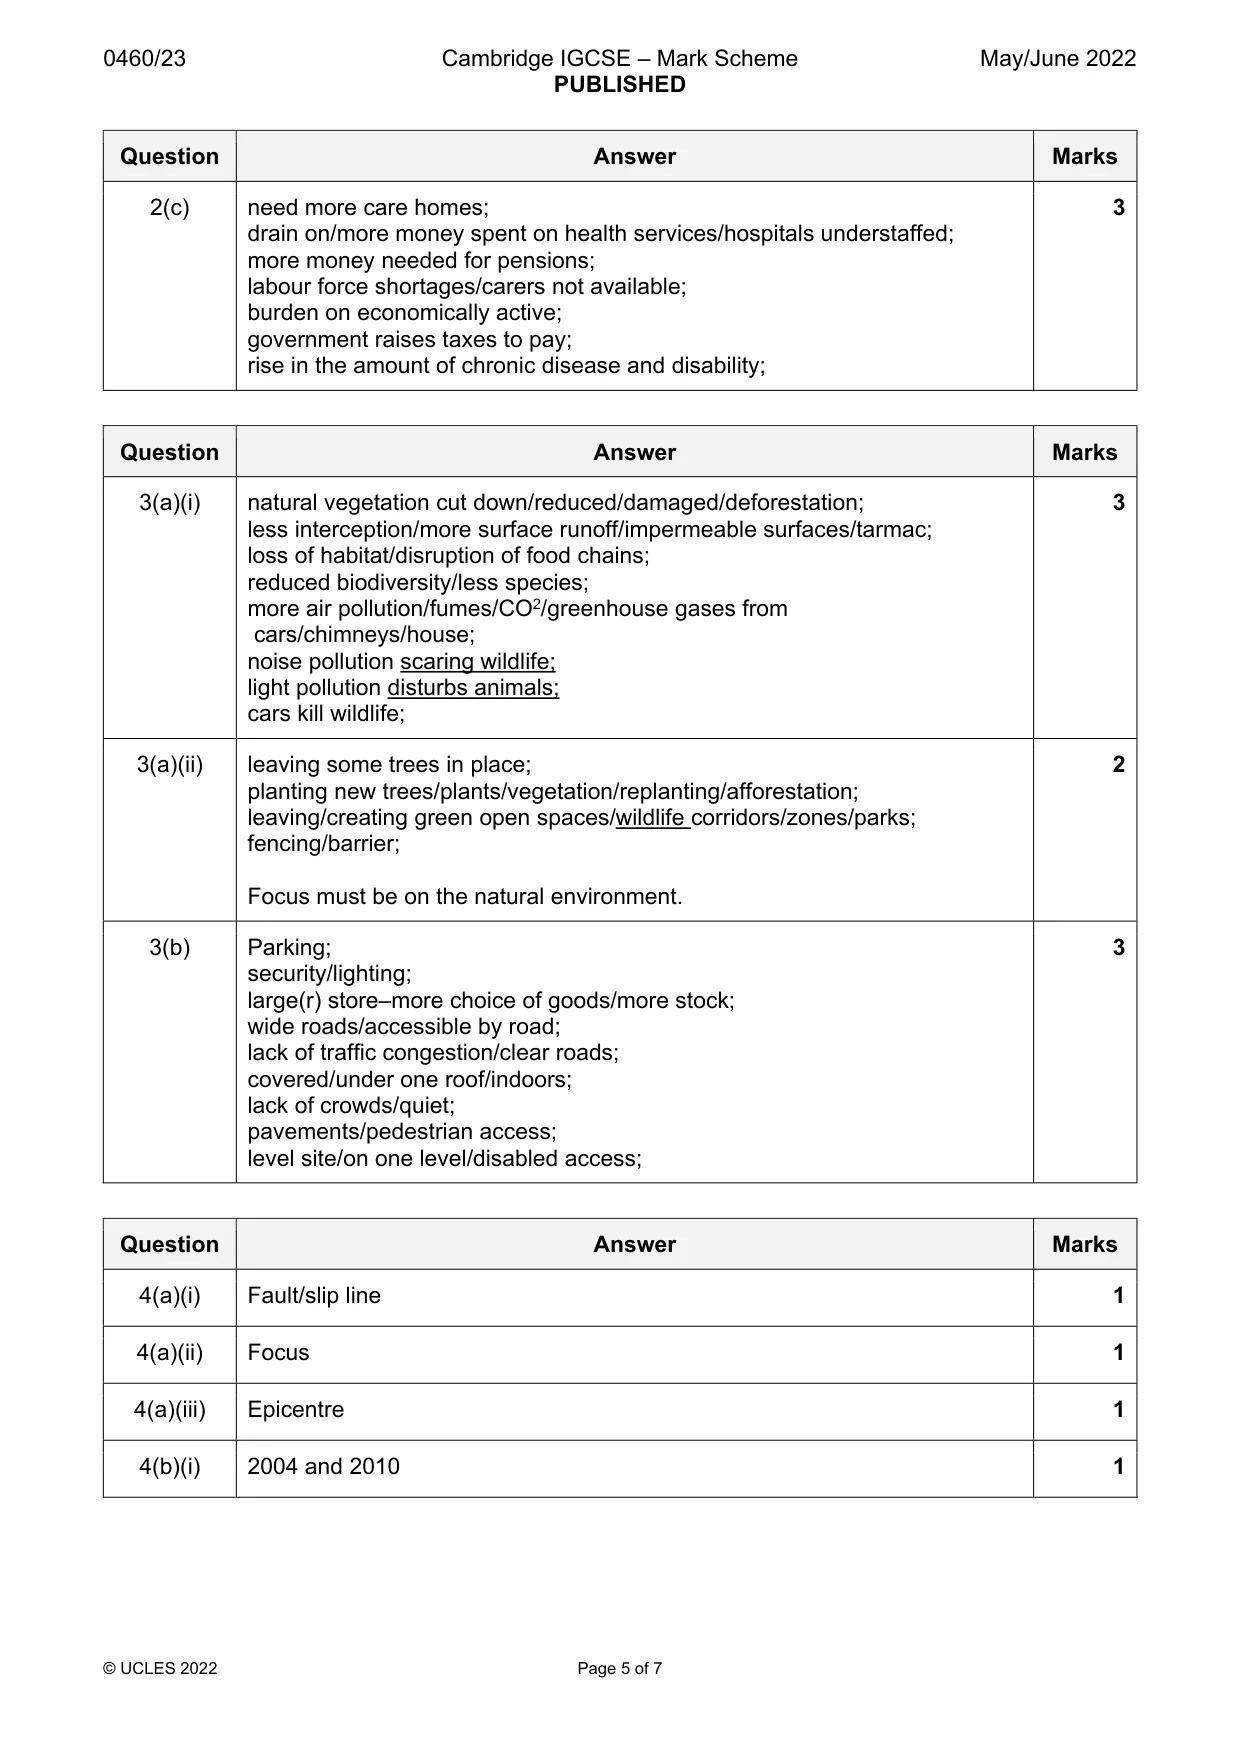
Mark scheme: 2(a)(i) 52–58 (200 degrees) = 55.55 1 2(a)(ii) middle income countries 1 2(a)(iii) high income countries 1 2(b) high birth rates; 2 can’t afford/unavailability of contraceptives; need children to work; desire for a son; need children to look after them in later years; lack of education on family planning; high level of infant mortality; culture/religion prohibits use of contraceptives; early marriage; lack of education for women so do not pursue a career; 2(c) need more care homes; 3 drain on/more money spent on health services/hospitals understaffed; more money needed for pensions; labour force shortages/carers not available; burden on economically active; government raises taxes to pay; rise in the amount of chronic disease and disability;
Q3 · Urbanisation can lead to urban sprawl which can affect the natural environment
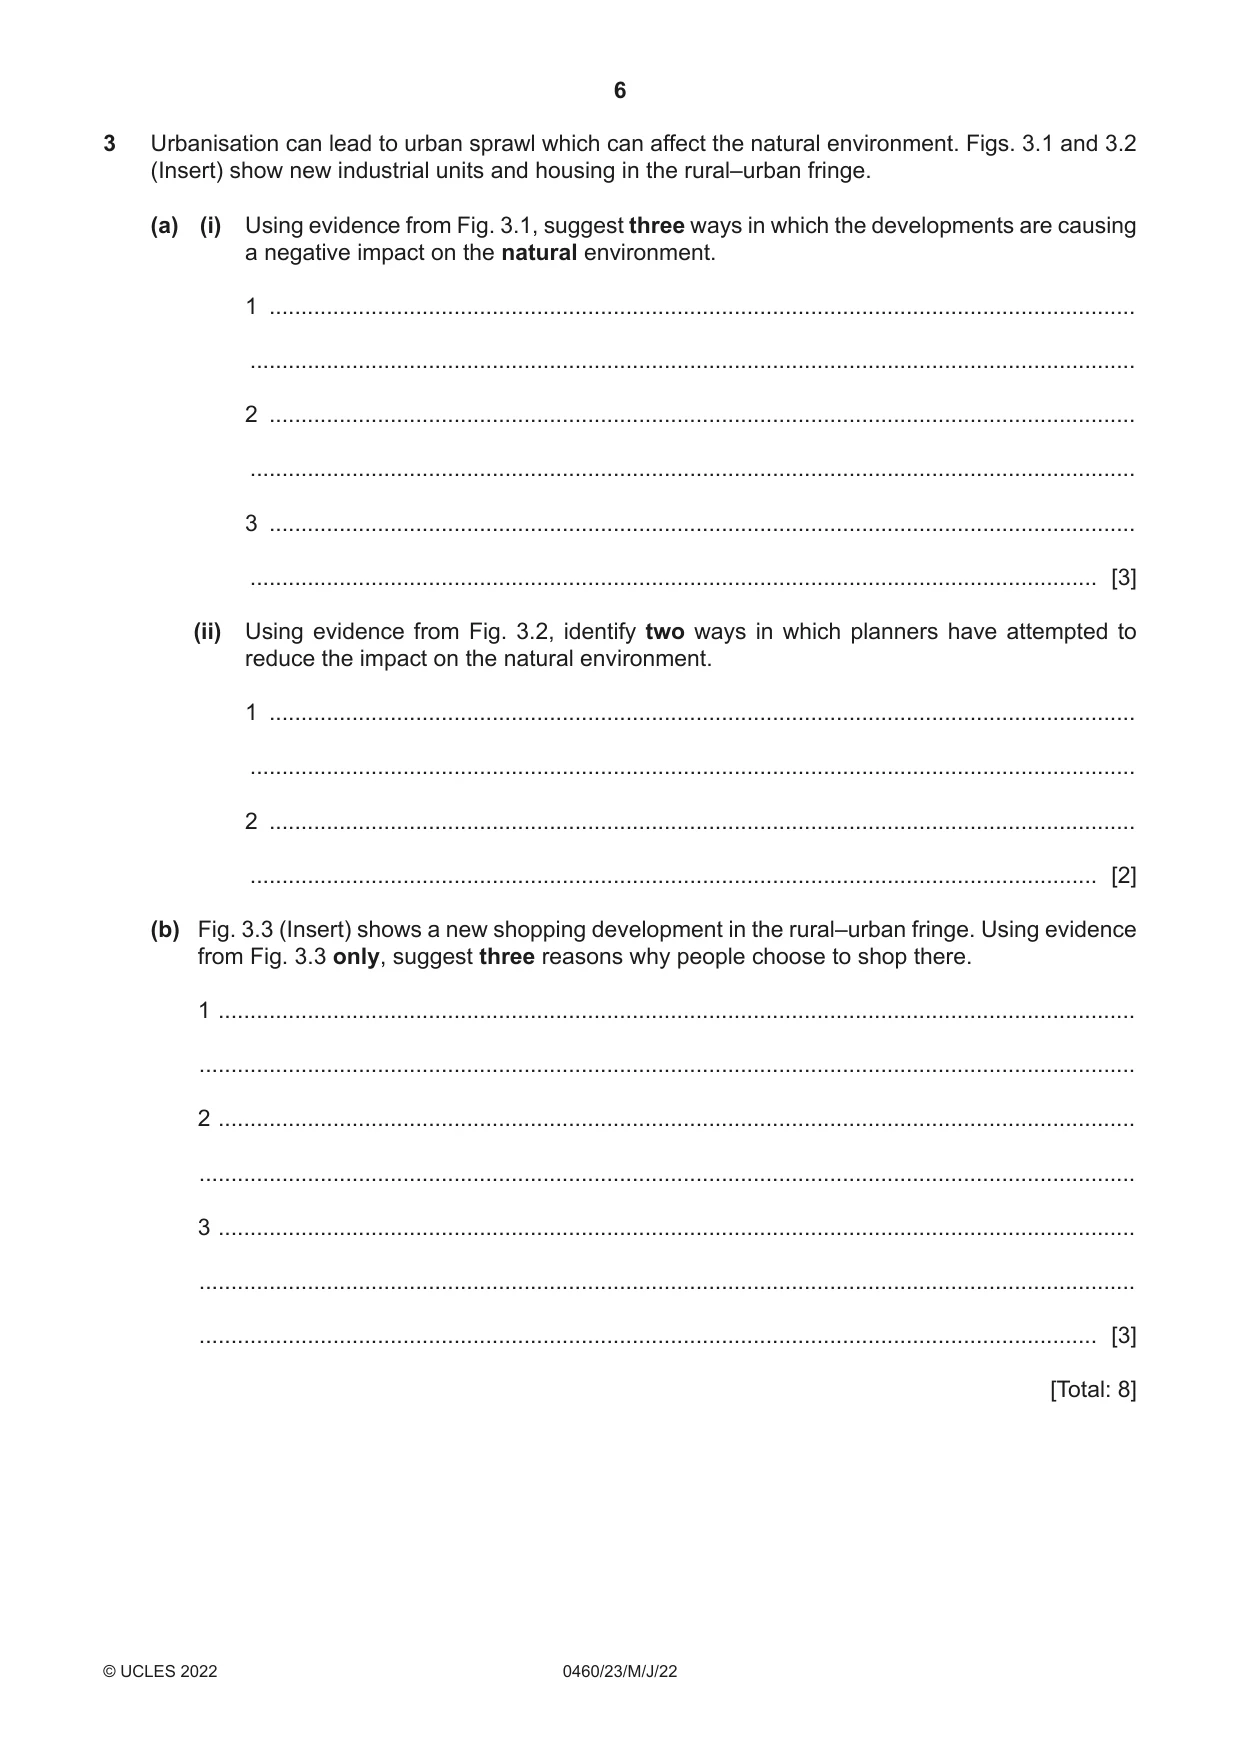
3 Urbanisation can lead to urban sprawl which can affect the natural environment. Figs. 3.1 and 3.2 (Insert) show new industrial units and housing in the rural–urban fringe. (a) (i) Using evidence from Fig. 3.1, suggest three ways in which the developments are causing a negative impact on the natural environment. 1 ........................................................................................................................................ ........................................................................................................................................... 2 ........................................................................................................................................ ........................................................................................................................................... 3 ........................................................................................................................................ ..................................................................................................................................... [3] (ii) Using evidence from Fig. 3.2, identify two ways in which planners have attempted to reduce the impact on the natural environment. 1 ........................................................................................................................................ ........................................................................................................................................... 2 ........................................................................................................................................ ..................................................................................................................................... [2] (b) Fig. 3.3 (Insert) shows a new shopping development in the rural–urban fringe. Using evidence from Fig. 3.3 only, suggest three reasons why people choose to shop there. 1 ................................................................................................................................................ ................................................................................................................................................... 2 ................................................................................................................................................ ................................................................................................................................................... 3 ................................................................................................................................................ ................................................................................................................................................... ............................................................................................................................................. [3] [Total: 8]
Mark scheme: 3(a)(i) natural vegetation cut down/reduced/damaged/deforestation; 3 less interception/more surface runoff/impermeable surfaces/tarmac; loss of habitat/disruption of food chains; reduced biodiversity/less species; more air pollution/fumes/CO2/greenhouse gases from cars/chimneys/house; noise pollution scaring wildlife; light pollution disturbs animals; cars kill wildlife; 3(a)(ii) leaving some trees in place; 2 planting new trees/plants/vegetation/replanting/afforestation; leaving/creating green open spaces/wildlife corridors/zones/parks; fencing/barrier; Focus must be on the natural environment. 3(b) Parking; 3 security/lighting; large(r) store–more choice of goods/more stock; wide roads/accessible by road; lack of traffic congestion/clear roads; covered/under one roof/indoors; lack of crowds/quiet; pavements/pedestrian access; level site/on one level/disabled access;
Q4 · A cross-section through an area affected by an earthquake
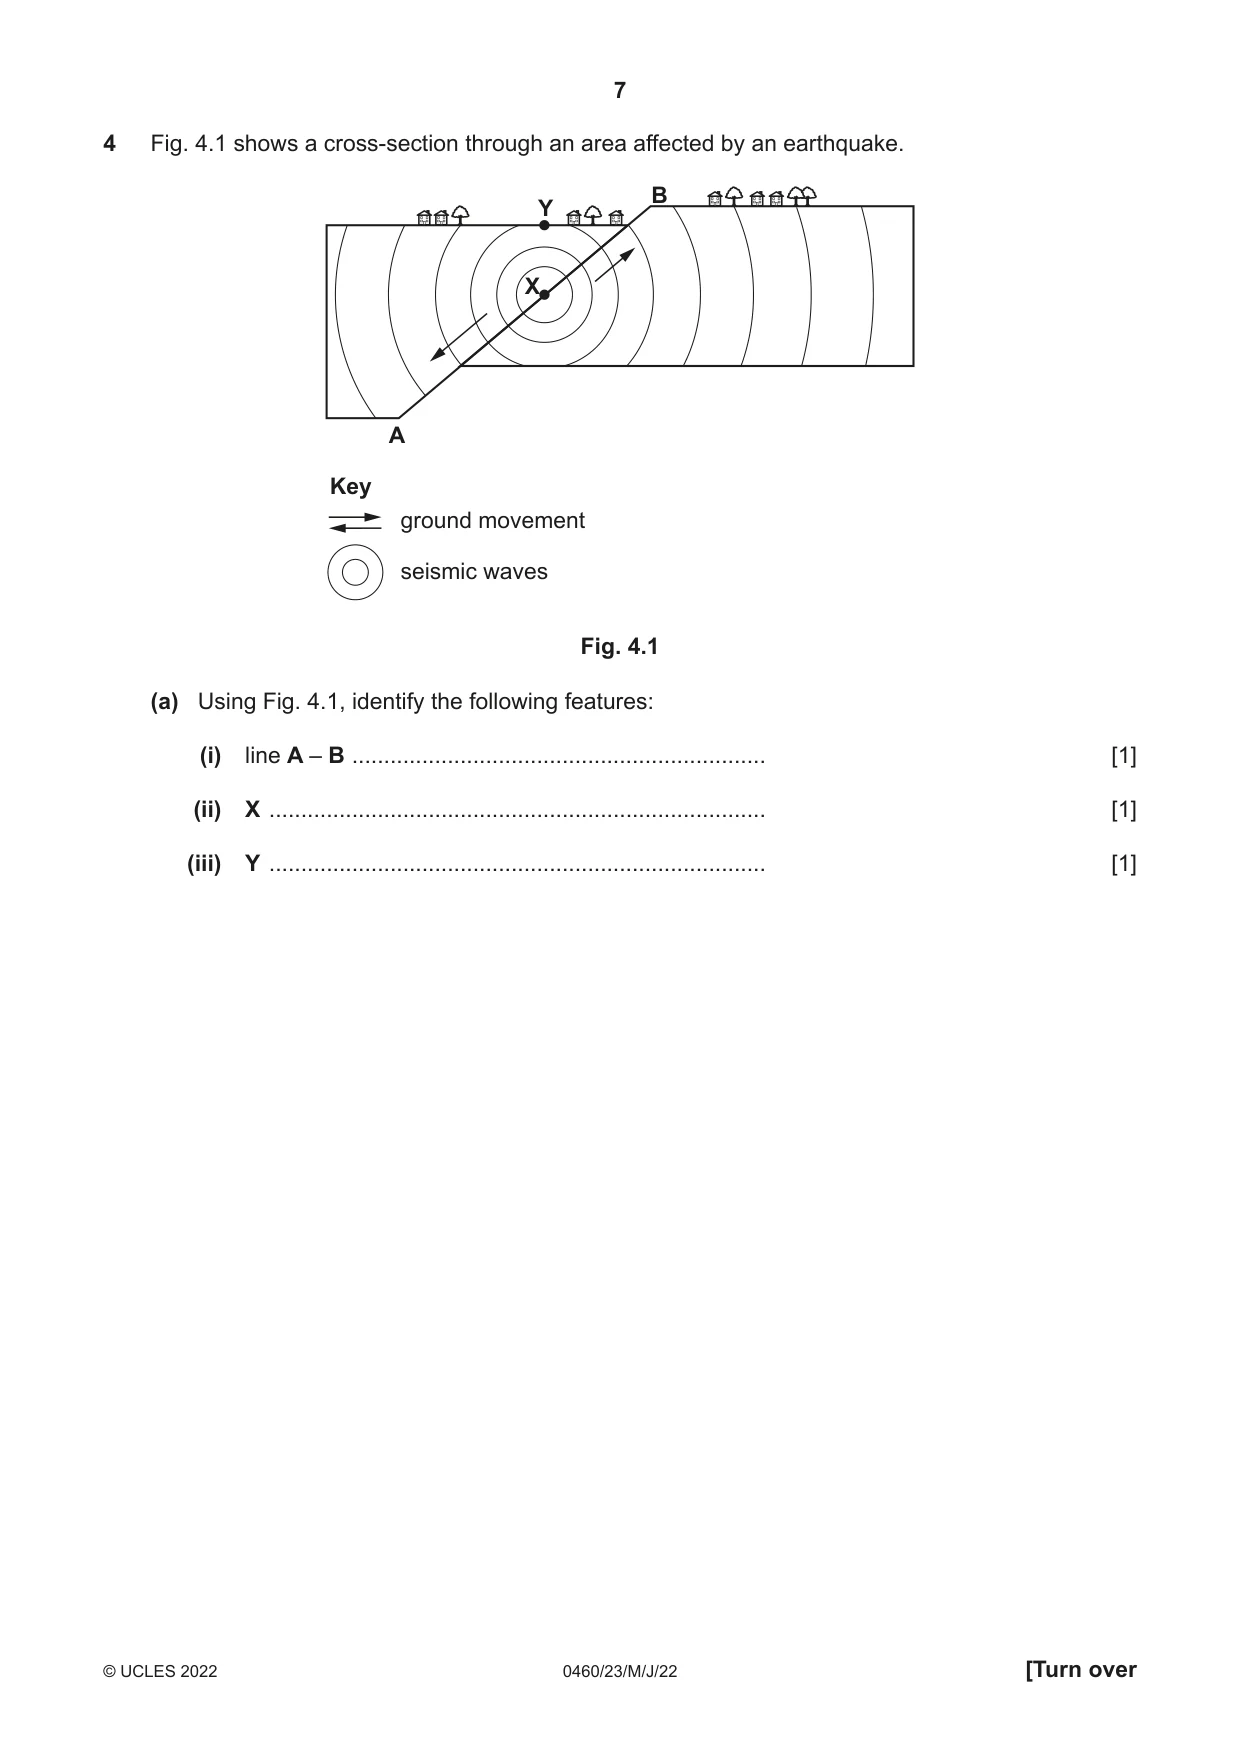
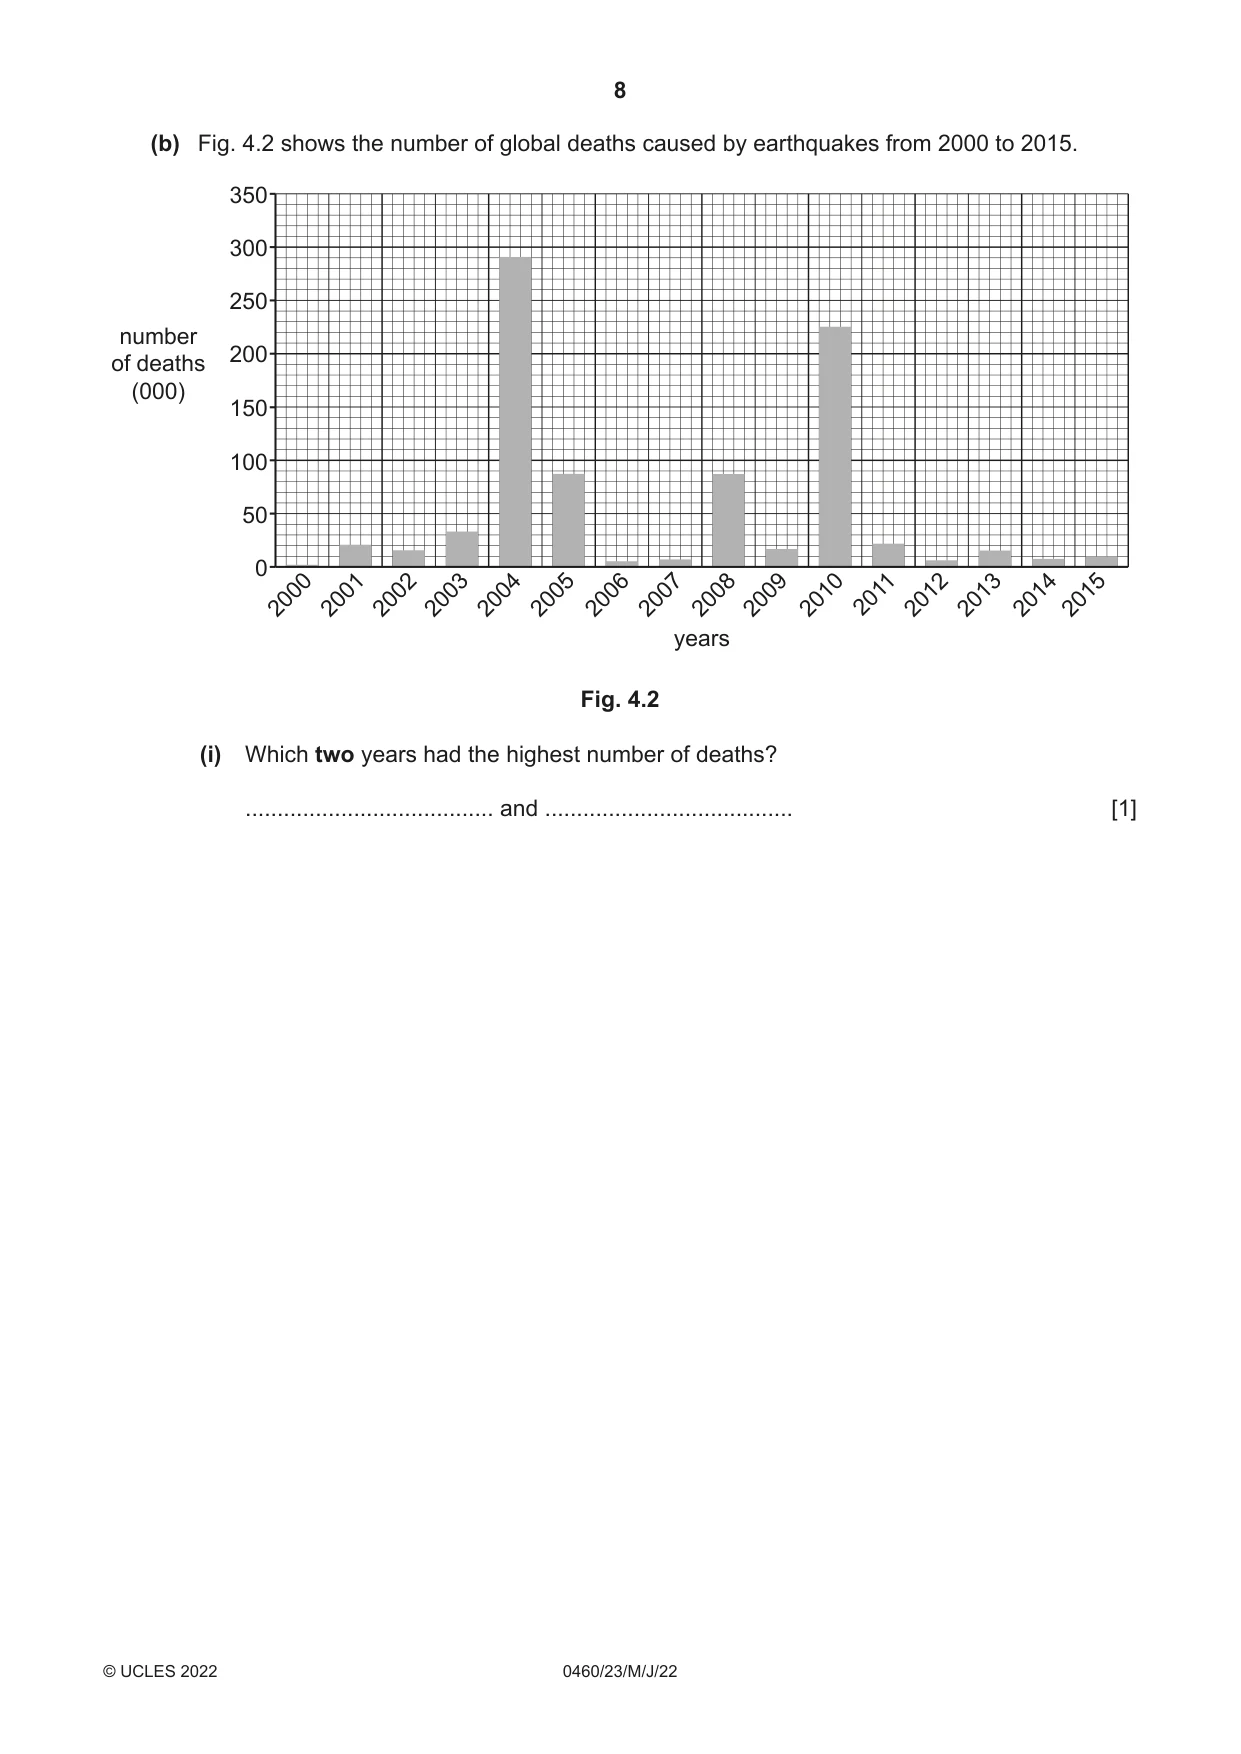
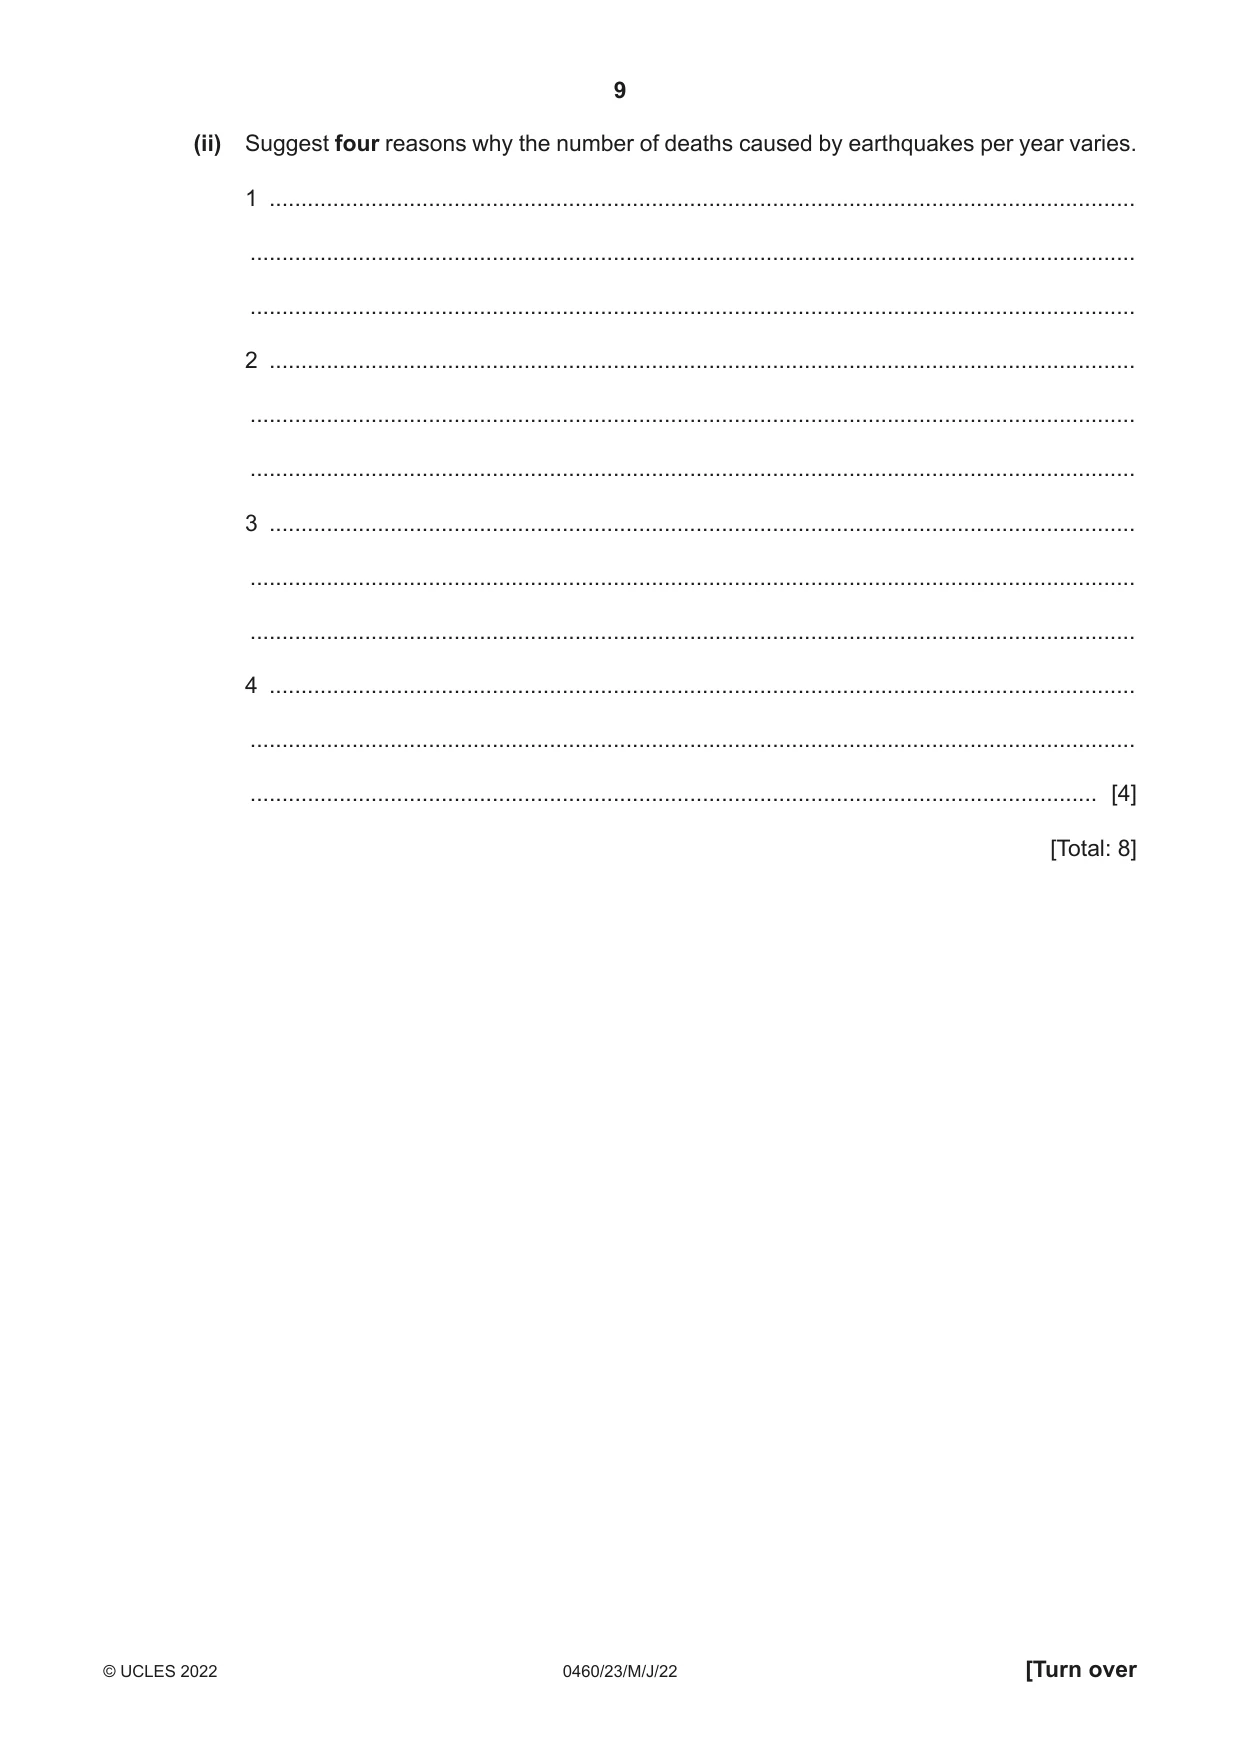
4 Fig. 4.1 shows a cross-section through an area affected by an earthquake. B Y X A Key ground movement seismic waves Fig. 4.1 (a) Using Fig. 4.1, identify the following features: (i) line A – B ................................................................. [1] (ii) X .............................................................................. [1] (iii) Y .............................................................................. [1] (b) Fig. 4.2 shows the number of global deaths caused by earthquakes from 2000 to 2015. 350 300 250 number 200of deaths (000) 150 100 50 0 2000200120022003200420052006200720082009201020112012201320142015 years Fig. 4.2 (i) Which two years had the highest number of deaths? ....................................... and ....................................... [1] (ii) Suggest four reasons why the number of deaths caused by earthquakes per year varies. 1 ........................................................................................................................................ ........................................................................................................................................... ........................................................................................................................................... 2 ........................................................................................................................................ ........................................................................................................................................... ........................................................................................................................................... 3 ........................................................................................................................................ ........................................................................................................................................... ........................................................................................................................................... 4 ........................................................................................................................................ ........................................................................................................................................... ..................................................................................................................................... [4] [Total: 8]
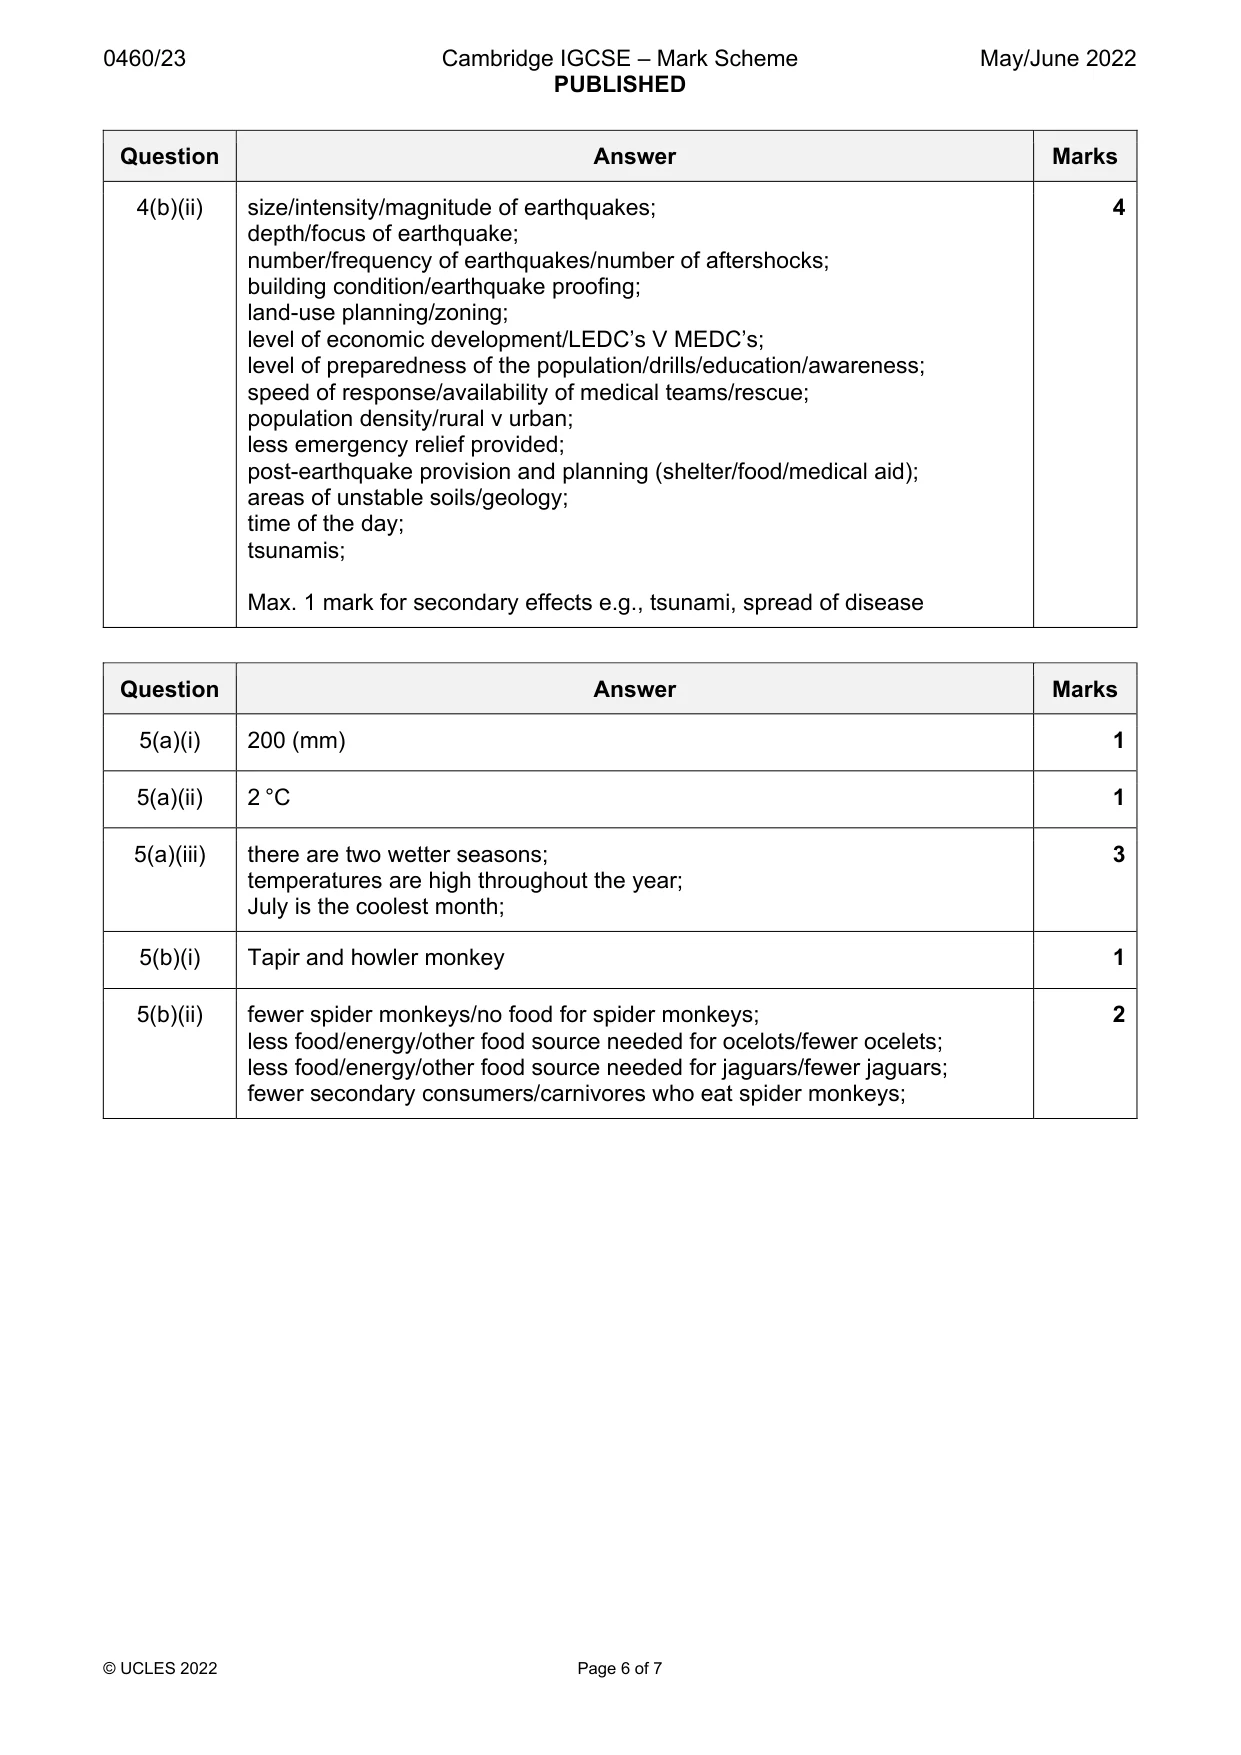
Mark scheme: 4(a)(i) Fault/slip line 1 4(a)(ii) Focus 1 4(a)(iii) Epicentre 1 4(b)(i) 2004 and 2010 1 4(b)(ii) size/intensity/magnitude of earthquakes; 4 depth/focus of earthquake; number/frequency of earthquakes/number of aftershocks; building condition/earthquake proofing; land-use planning/zoning; level of economic development/LEDC’s V MEDC’s; level of preparedness of the population/drills/education/awareness; speed of response/availability of medical teams/rescue; population density/rural v urban; less emergency relief provided; post-earthquake provision and planning (shelter/food/medical aid); areas of unstable soils/geology; time of the day; tsunamis; Max. 1 mark for secondary effects e.g., tsunami, spread of disease
Q5 · The climate of a place in Brazil
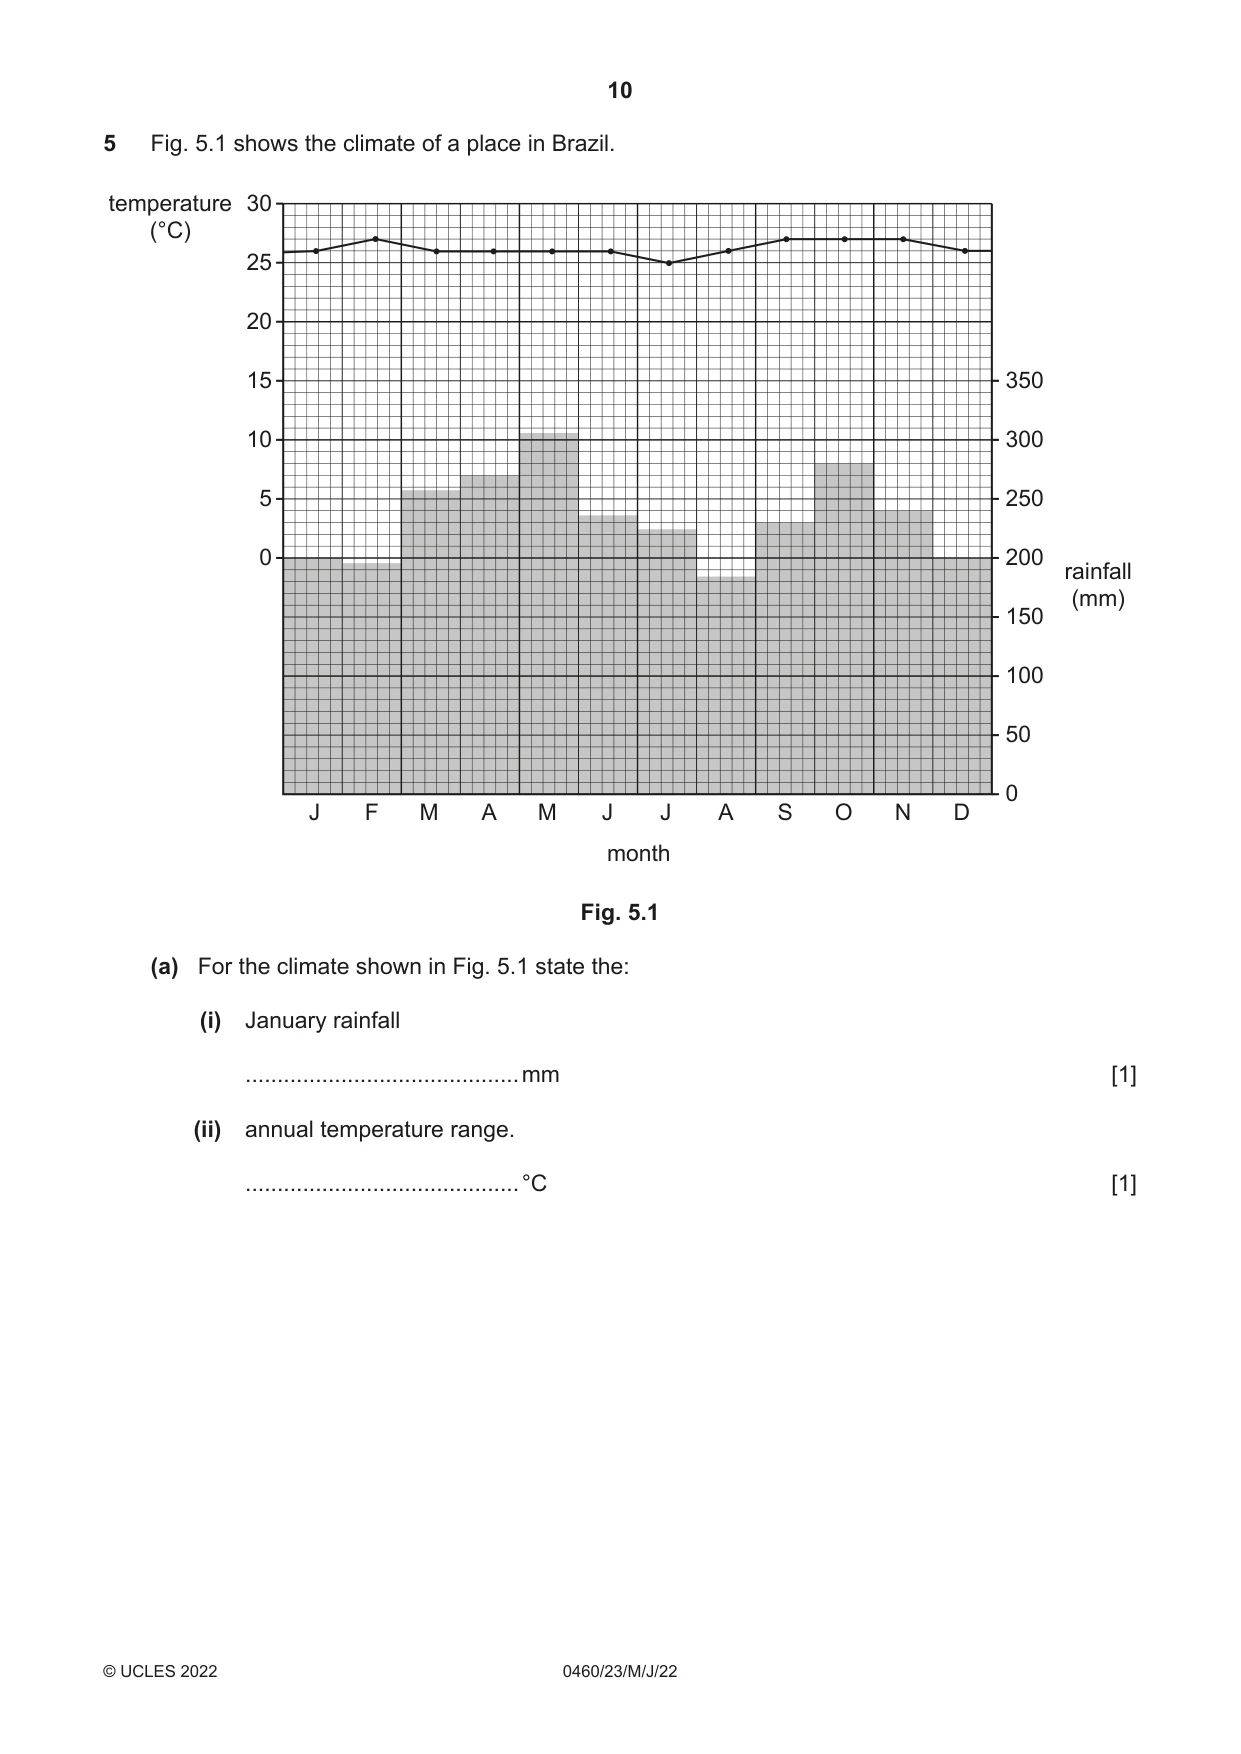
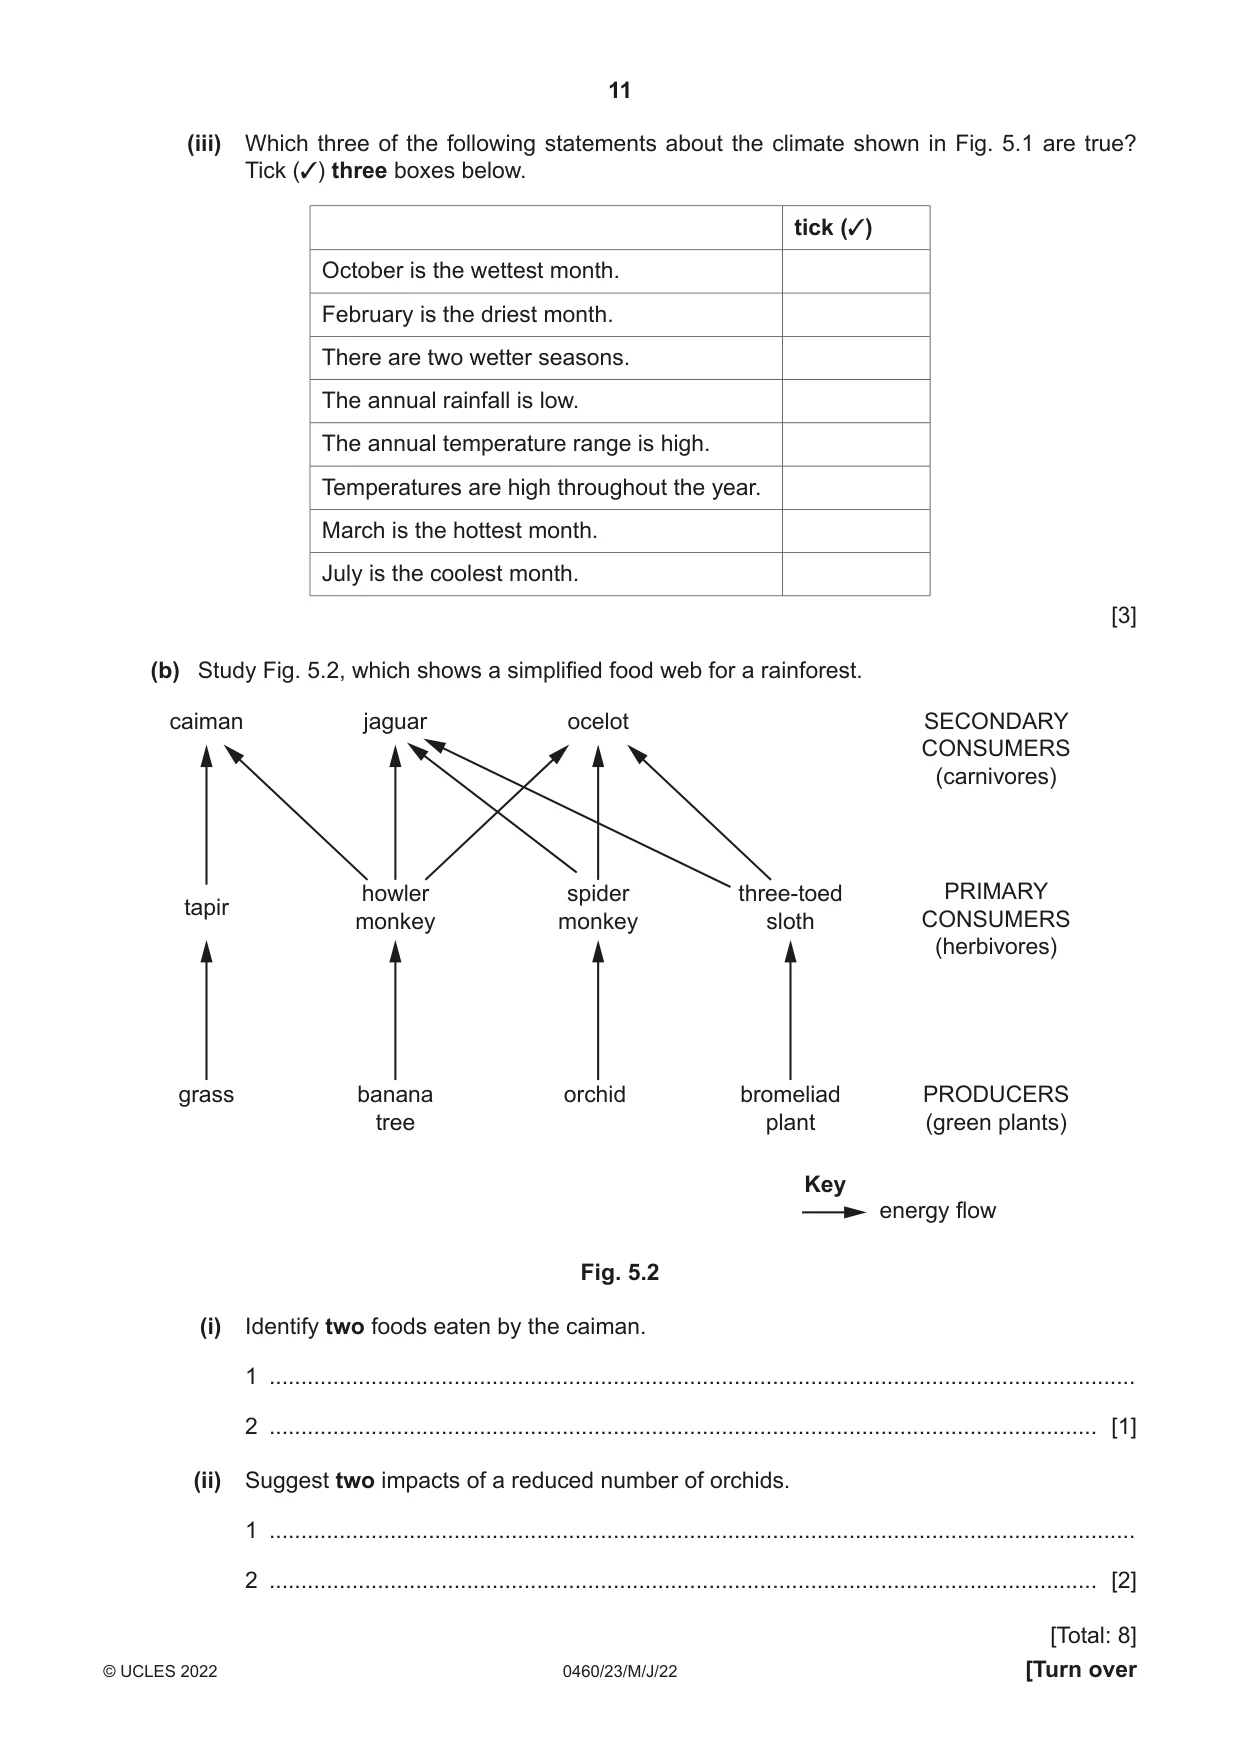
5 Fig. 5.1 shows the climate of a place in Brazil. temperature 30 (°C) 25 20 15 350 10 300 5 250 0 200 rainfall (mm) 150 100 50 0 J F M A M J J A S O N D month Fig. 5.1 (a) For the climate shown in Fig. 5.1 state the: (i) January rainfall ........................................... mm [1] (ii) annual temperature range. ........................................... °C [1] (iii) Which three of the following statements about the climate shown in Fig. 5.1 are true? Tick (3) three boxes below. tick (3) October is the wettest month. February is the driest month. There are two wetter seasons. The annual rainfall is low. The annual temperature range is high. Temperatures are high throughout the year. March is the hottest month. July is the coolest month. [3] (b) Study Fig. 5.2, which shows a simplified food web for a rainforest. caiman jaguar ocelot SECONDARY CONSUMERS (carnivores) howler spider three-toed PRIMARY tapir monkey monkey sloth CONSUMERS (herbivores) grass banana orchid bromeliad PRODUCERS tree plant (green plants) Key energy flow Fig. 5.2 (i) Identify two foods eaten by the caiman. 1 ........................................................................................................................................ 2 .................................................................................................................................. [1] (ii) Suggest two impacts of a reduced number of orchids. 1 ........................................................................................................................................ 2 .................................................................................................................................. [2] [Total: 8]
Mark scheme: 5(a)(i) 200 (mm) 1 5(a)(ii) 2 °C 1 5(a)(iii) there are two wetter seasons; 3 temperatures are high throughout the year; July is the coolest month; 5(b)(i) Tapir and howler monkey 1 5(b)(ii) fewer spider monkeys/no food for spider monkeys; 2 less food/energy/other food source needed for ocelots/fewer ocelets; less food/energy/other food source needed for jaguars/fewer jaguars; fewer secondary consumers/carnivores who eat spider monkeys;
Q6 · Information about a global coffee shop company
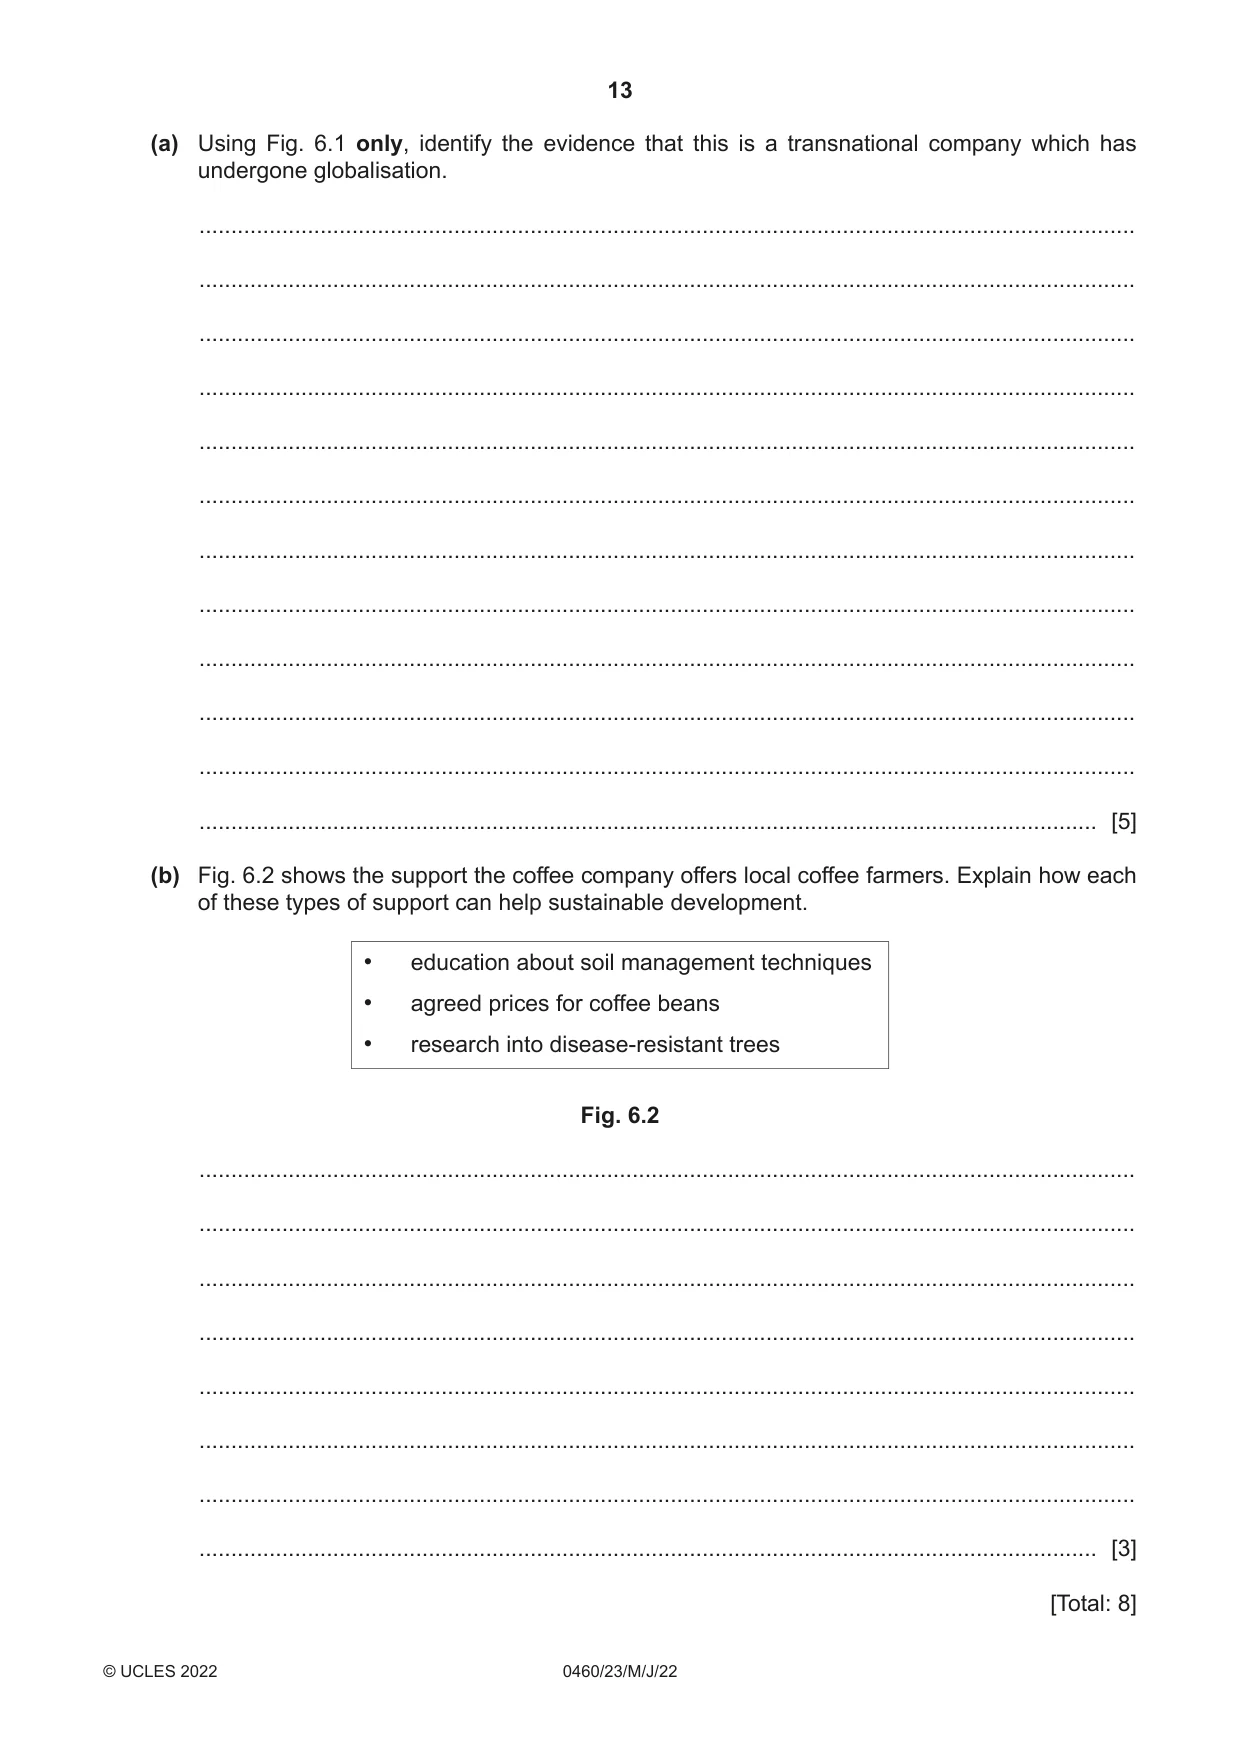
6 Fig. 6.1 shows information about a global coffee shop company. Content removed due to copyright restrictions. Fig. 6.1 (a) Using Fig. 6.1 only, identify the evidence that this is a transnational company which has undergone globalisation. ................................................................................................................................................... ................................................................................................................................................... ................................................................................................................................................... ................................................................................................................................................... ................................................................................................................................................... ................................................................................................................................................... ................................................................................................................................................... ................................................................................................................................................... ................................................................................................................................................... ................................................................................................................................................... ................................................................................................................................................... ............................................................................................................................................. [5] (b) Fig. 6.2 shows the support the coffee company offers local coffee farmers. Explain how each of these types of support can help sustainable development. • education about soil management techniques • agreed prices for coffee beans • research into disease-resistant trees Fig. 6.2 ................................................................................................................................................... ................................................................................................................................................... ................................................................................................................................................... ................................................................................................................................................... ................................................................................................................................................... ................................................................................................................................................... ................................................................................................................................................... ............................................................................................................................................. [3] [Total: 8] Additional pages If you use the following pages to complete the answer to any question, the question number must be clearly shown. .................................................................................................................................................................. .................................................................................................................................................................. .................................................................................................................................................................. .................................................................................................................................................................. .................................................................................................................................................................. .................................................................................................................................................................. .................................................................................................................................................................. .................................................................................................................................................................. .................................................................................................................................................................. .................................................................................................................................................................. .................................................................................................................................................................. .................................................................................................................................................................. .................................................................................................................................................................. .................................................................................................................................................................. .................................................................................................................................................................. .................................................................................................................................................................. .................................................................................................................................................................. .................................................................................................................................................................. .................................................................................................................................................................. .................................................................................................................................................................. .................................................................................................................................................................. .................................................................................................................................................................. .................................................................................................................................................................. .................................................................................................................................................................. ..................................................................................................................................................................
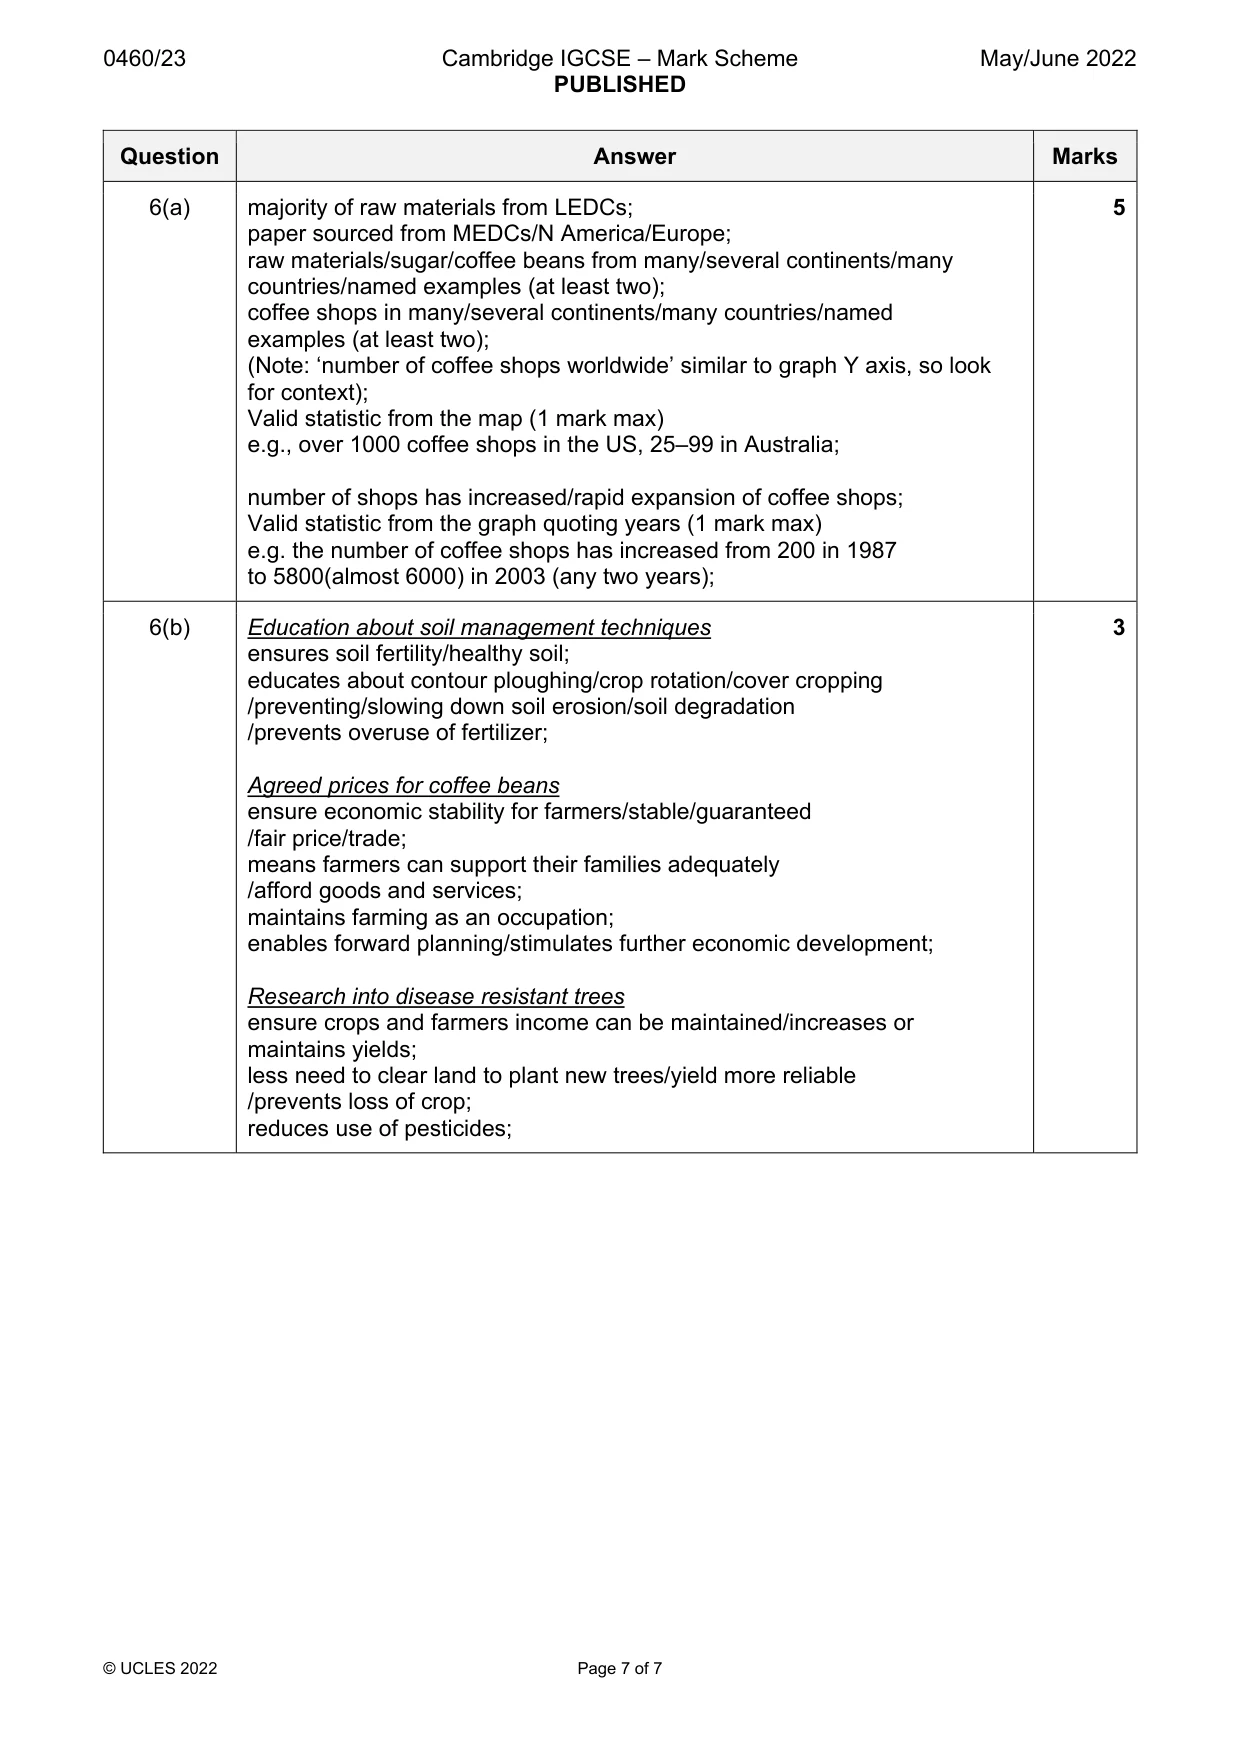
Mark scheme: 6(a) majority of raw materials from LEDCs; 5 paper sourced from MEDCs/N America/Europe; raw materials/sugar/coffee beans from many/several continents/many countries/named examples (at least two); coffee shops in many/several continents/many countries/named examples (at least two); (Note: ‘number of coffee shops worldwide’ similar to graph Y axis, so look for context); Valid statistic from the map (1 mark max) e.g., over 1000 coffee shops in the US, 25–99 in Australia; number of shops has increased/rapid expansion of coffee shops; Valid statistic from the graph quoting years (1 mark max) e.g. the number of coffee shops has increased from 200 in 1987 to 5800(almost 6000) in 2003 (any two years); 6(b) Education about soil management techniques 3 ensures soil fertility/healthy soil; educates about contour ploughing/crop rotation/cover cropping /preventing/slowing down soil erosion/soil degradation /prevents overuse of fertilizer; Agreed prices for coffee beans ensure economic stability for farmers/stable/guaranteed /fair price/trade; means farmers can support their families adequately /afford goods and services; maintains farming as an occupation; enables forward planning/stimulates further economic development; Research into disease resistant trees ensure crops and farmers income can be maintained/increases or maintains yields; less need to clear land to plant new trees/yield more reliable /prevents loss of crop; reduces use of pesticides;
What was in this paper
The subtopics covered by these 6 questions, and how many questions each got. Open one in a new tab to see every Cambridge question on it.
What you needed in this session
Cambridge’s own grade thresholds for 2022 May/June, Paper 2 · Variant 3. A higher threshold means an easier paper — the bar moves with how the cohort did.